
Payload Information
General Information of This Payload
| Payload ID | PAY0FSXOW |
|||||
|---|---|---|---|---|---|---|
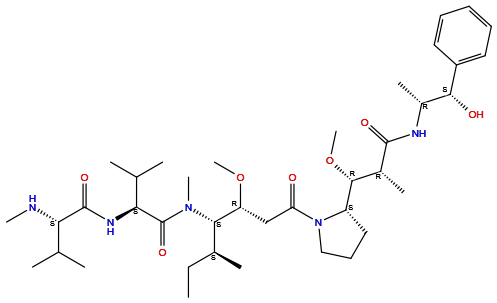
| Name | Monomethyl auristatin E |
|||||
| Synonyms |
Monomethyl auristatin E; 474645-27-7; MMAE; Monomethylauristatin E; MMAE (Monomethyl auristatin E); V7I58RC5EJ; SGD-1010; (2S)-N-[(2S)-1-[[(3R,4S,5S)-1-[(2S)-2-[(1R,2R)-3-[[(1S,2R)-1-hydroxy-1-phenylpropan-2-yl]amino]-1-methoxy-2-methyl-3-oxopropyl]pyrrolidin-1-yl]-3-methoxy-5-methyl-1-oxoheptan-4-yl]-methylamino]-3-methyl-1-oxobutan-2-yl]-3-methyl-2-(methylamino)butanamide; N-Methyl-L-valyl-N-((1S,2R)-4-((2S)-2-((1R,2R)-3-(((1R,2S)-2-hydroxy-1-methyl-2-phenylethyl)amino)-1-methoxy-2-methyl-3-oxopropyl)pyrrolidin-1-yl)-2-methoxy-1-((1S)-1-methylpropyl)-4-oxobutyl)-N-methyl-L-valinamide; MMAE peptide; N-methyl-L-valyl-N-[(3R,4S,5S)-1-{(2S)-2-[(1R,2R)-3-{[(1S,2R)-1-hydroxy-1-phenylpropan-2-yl]amino}-1-methoxy-2-methyl-3-oxopropyl]pyrrolidin-1-yl}-3-methoxy-5-methyl-1-oxoheptan-4-yl]-N-methyl-L-valinamide; UNII-V7I58RC5EJ; Monomethyl auristatin E (MMAE); MFCD22124498; 4Q5; MMAE, monomethyl auristatin E; SCHEMBL5402144; CHEMBL2103835; AMY9235; DTXSID101028844; MONOMETHYLAURISTATIN E [MI]; (S)-N-((3R,4S,5S)-1-((S)-2-((1R,2R)-3-(((1R,2R)-1-Hydroxy-1-phenylpropan-2-yl)amino)-1-methoxy-2-methyl-3-oxopropyl)pyrrolidin-1-yl)-3-methoxy-5-methyl-1-oxohe; n-methyl-l-valyl-n-[(1s,2r)-4-[(2s)-2-[(1r,2r)-3-[[(1r,2s)-2-hydroxy-1-methyl-2-phenylethyl]amino]-1-methoxy-2-methyl-3-oxopropyl]-1-pyrrolidinyl]-2-methoxy-1-[(1S)-1-methylpropyl]-4-oxobutyl]-n-methyl-l-valinamide; FD9056; NSC791792; NSC832263; s7721; CCG-270400; CS-0837; NSC-791792; NSC-832263; BP-22278; HY-15162; Q6901739; (S)-N-((3R,4S,5S)-1-((S)-2-((1R,2R)-3-(((1S,2R)-1-Hydroxy-1-phenylpropan-2-yl)amino)-1-methoxy-2-methyl-3-oxopropyl)pyrrolidin-1-yl)-3-methoxy-5-methyl-1-oxoheptan-4-yl)-N,3-dimethyl-2-((S)-3-methyl-2-(methylamino)butanamido)butanamide; L-Valinamide, N-methyl-L-valyl-N-((1S,2R)-4-((2S)-2-((1R,2R)-3-(((1R,2S)-2-hydroxy-1- methyl-2-phenylethyl)amino)-1-methoxy-2-methyl-3-oxopropyl)-1-pyrrolidinyl)-2- methoxy-1-((1S)-1-methylpropyl)-4-oxobutyl)-N-methyl-; N(sup 2)-(N-Methyl-L-valyl)-N(sup 1)-((1S,2R)-4-((2S)-2-((1R,2R)-3-(((1R,2S)-2-hydroxy-1-methyl-2- phenylethyl)amino)-1-methoxy-2-methyl-3-oxopropyl)pyrrolidin-1-yl)-2-methoxy-1-((1S)- 1-methylpropyl)-4-oxobutyl)-N(sup 1)-methyl-L-valinamide
Click to Show/Hide
|
|||||
| Target(s) | Microtubule (MT) | |||||
| Structure |
|
|||||
| Formula | C39H67N5O7 |
|||||
| Isosmiles | CC[C@H](C)[C@@H]([C@@H](CC(=O)N1CCC[C@H]1[C@@H]([C@@H](C)C(=O)N[C@H](C)[C@H](C2=CC=CC=C2)O)OC)OC)N(C)C(=O)[C@H](C(C)C)NC(=O)[C@H](C(C)C)NC |
|||||
| PubChem CID | ||||||
| InChI |
InChI=1S/C39H67N5O7/c1-13-25(6)34(43(10)39(49)33(24(4)5)42-38(48)32(40-9)23(2)3)30(50-11)22-31(45)44-21-17-20-29(44)36(51-12)26(7)37(47)41-27(8)35(46)28-18-15-14-16-19-28/h14-16,18-19,23-27,29-30,32-36,40,46H,13,17,20-22H2,1-12H3,(H,41,47)(H,42,48)/t25-,26+,27+,29-,30+,32-,33-,34-,35+,36+/m0/s1
|
|||||
| InChIKey |
DASWEROEPLKSEI-UIJRFTGLSA-N
|
|||||
| IUPAC Name |
(2S)-N-[(2S)-1-[[(3R,4S,5S)-1-[(2S)-2-[(1R,2R)-3-[[(1S,2R)-1-hydroxy-1-phenylpropan-2-yl]amino]-1-methoxy-2-methyl-3-oxopropyl]pyrrolidin-1-yl]-3-methoxy-5-methyl-1-oxoheptan-4-yl]-methylamino]-3-methyl-1-oxobutan-2-yl]-3-methyl-2-(methylamino)butanamide
|
|||||
| Pharmaceutical Properties | Molecule Weight |
718 |
Polar area |
150 |
||
Complexity |
1100 |
xlogp Value |
4.1 |
|||
Heavy Count |
51 |
Rot Bonds |
20 |
|||
Hbond acc |
8 |
Hbond Donor |
4 |
|||
The activity data of This Payload
| Standard Type | Value | Units | Cell line | Disease Model | Cell line ID | Reference |
|---|---|---|---|---|---|---|
| Half Maximal Inhibitory Concentration (IC50) | 0.13±0.02 | nM |
MDA-MB-231 cells
|
Breast adenocarcinoma
|
[1], [2] | |
| Half Maximal Inhibitory Concentration (IC50) | 0.25 | nM |
Granta-519 cells
|
Mantle cell lymphoma
|
[1], [2] | |
| Half Maximal Inhibitory Concentration (IC50) | 0.25 | nM |
SU-DHL-4 cells
|
Diffuse large B-cell lymphoma
|
[1], [2] | |
| Half Maximal Inhibitory Concentration (IC50) | 0.54 | nM |
BJAB cells
|
Burkitt lymphoma
|
[1], [2] | |
| Half Maximal Inhibitory Concentration (IC50) | 0.66±0.06 | nM |
MDA-MB-468 cells
|
Breast adenocarcinoma
|
[1], [2] | |
| Half Maximal Inhibitory Concentration (IC50) | 1.19 | nM |
SU-DHL-4 cells
|
Diffuse large B-cell lymphoma
|
[1], [2] |
Each Antibody-drug Conjugate Related to This Payload
Full Information of The Activity Data of The ADC(s) Related to This Payload
Brentuximab vedotin [Approved]
Identified from the Human Clinical Data
| Experiment 1 Reporting the Activity Date of This ADC | [3] | ||||
| Efficacy Data | Two-year Progression-Free Survival (PFS) |
97.30% (BV-AVD group); 92.60% (ABVD group)
|
|||
| Patients Enrolled |
34 patients with previously untreated classical Hodgkin lymphoma (cHL).
|
||||
| Administration Dosage |
After 2 cycles of Brentuximab vedotin, doxorubicin, dacarbazine combination therapy.
|
||||
| Related Clinical Trial | |||||
| NCT Number | NCT02505269 | Phase Status | Phase 2 | ||
| Clinical Description |
Brentuximab vedotin plus ad in non-bulky limited stage Hodgkin lymphoma.
|
||||
| Primary Endpoint |
For patients with high total metabolic tumor volume, the 2-year PFS rate was 90.90% and 70.70% in the BV-AVD and ABVD arms, respectively. 82.30% in the BV-AVD arm were PET-negative compared with 75.40% in the ABVD arm.
|
||||
| Experiment 2 Reporting the Activity Date of This ADC | [6] | ||||
| Efficacy Data | Objective Response Rate (ORR) |
59.00%
|
|||
| Patients Enrolled |
Eastern Cooperative Oncology Group performance status 2 with previously untreated CD30-positive PTCL (CD30 detected in 10% of neoplastic cells by local review.
|
||||
| Administration Dosage |
Patients were treated with six or eight 21-day cycles of either brentuximab vedotin, cyclophosphamide, doxorubicin, prednisone (A+CHP) or cyclophosphamide, doxorubicin, vincristine, prednisone (CHOP).
|
||||
| Related Clinical Trial | |||||
| NCT Number | NCT01777152 | Phase Status | Phase 3 | ||
| Clinical Description |
A randomized, double-blind, placebo-controlled, phase 3 study of brentuximab vedotin and CHP (A+CHP) versus CHOP in the frontline treatment of patients with CD30-positive mature T-cell lymphomas.
|
||||
| Primary Endpoint |
The median PFS = 62.30 months (95% CI: 42.00 months to not evaluable) for A+CHP. The median PFS = 23.80 months (95% CI: 13.60-60.80 months) for CHOP.
|
||||
| Other Endpoint |
5-year overall survival (OS) rates = 70.10% (95% CI: 63.30% to 75.90%) with A+CHP VS 61.00% (95% CI: 54.00% to 67.30%) with CHOP (hazard ratio = 0.72; 95% CI: 0.53-0.99), The PFS HR = 0.55 (95% CI: 0.39-0.79; P = 0.0009) in the subset of patients with sALCL, and the estimated 5-year PFS = 60.60% (95% CI: 49.50% to 69.90%) for A+CHP,the estimated 5-year PFS= 48.40% (95% CI: 39.60% to 56.70%) for CHOP The ORR with first subsequent therapy on the A+CHP arm = 42.00% (27.00% CR) VS The ORR with first subsequent therapy = 42.00% (19.00% CR) in the CHOP armCR=72.57% (82/113) in the A+CHP arm were in CR at EOT, and = 30.49% (25/82) underwent consolidative SCT.
Click to Show/Hide
|
||||
| Experiment 3 Reporting the Activity Date of This ADC | [7] | ||||
| Efficacy Data | Objective Response Rate (ORR) |
60.00%
|
Positive CD30 expression (CD30+++/++) | ||
| Patients Enrolled |
Relapsed or progressive Hodgkin lymphoma (HL).
|
||||
| Administration Dosage |
1.8 mg/kg IV once every 3 weeks for up to 16 cycles.
|
||||
| Related Clinical Trial | |||||
| NCT Number | NCT01100502 | Phase Status | Phase 3 | ||
| Clinical Description |
A phase 3 study of brentuximab vedotin (SGN-35) in patients at high risk of residual Hodgkin lymphoma following stem cell transplant (the AETHERA trial).
|
||||
| Primary Endpoint |
Objective response rate=60.00% (including 4 complete responses, 2 partial responses, 1 stable disease, 1 progressive disease, and 2 unknown).
|
||||
| Other Endpoint |
5-year PFS=59.00% (95% CI 51.00-66.00).
|
||||
| Experiment 4 Reporting the Activity Date of This ADC | [8] | ||||
| Efficacy Data | Objective Response Rate (ORR) |
60.13%
|
|||
| Patients Enrolled |
Elapsed or refractory classical Hodgkin lymphoma with measurable disease and an Eastern Cooperative Oncology Group performance status of 0 or 1 who were ineligible for or had relapsed after autologous haematopoietic stem-cell transplantation (HSCT).
|
||||
| Administration Dosage |
1.80 mg/kg intravenously every 3 weeks.
|
||||
| Related Clinical Trial | |||||
| NCT Number | NCT02684292 | Phase Status | Phase 3 | ||
| Clinical Description |
A phase 3, randomized, open-label, clinical trial to compare pembrolizumab with brentuximab vedotin in subjects with relapsed or refractory classical hodgkin lymphoma.
|
||||
| Primary Endpoint |
Median progression-free survival = 13.20 months (95% CI 10.90-19.40) for pembrolizumab vs median progression-free survival = 8.30 months (5.70-8.80) for brentuximab vedotin (hazard ratio 0.65 [95% CI 0.48-0.88].; p=0.0027).
|
||||
| Other Endpoint |
Objective responses (by investigator review) were recorded in 103 (68.21% [95% CI 60.1-75.5]) of 151 patients in the pembrolizumab group (40 [26.48%] complete responses and 63 [41.72%] partial responses), and in 92 (60.13% [51.9-67.9]) of 153 patients in the brentuximab vedotin group (36 [23.53%] complete responses and 56 [36.60%] partial responses).
Click to Show/Hide
|
||||
| Experiment 5 Reporting the Activity Date of This ADC | [10] | ||||
| Efficacy Data | Objective Response Rate (ORR) |
0.00%
|
Positive CD30 expression (CD30+++/++) | ||
| Patients Enrolled |
Histologically confirmed diagnoses of advSM (ASM, SM-AHN, or MCL).
|
||||
| Administration Dosage |
1.8 mg/kg IV every 3 weeks up to 8 cycles.
|
||||
| Related Clinical Trial | |||||
| NCT Number | NCT01807598 | Phase Status | Phase 2 | ||
| Clinical Description |
Brentuximab vedotin in treating patients with advanced systemic mastocytosis or mast cell leukemia.
|
||||
| Primary Endpoint |
Objective response rate=0.00%.
|
||||
| Other Endpoint |
Median progression-free survival=210 days (95% CI 77-343 days).
|
||||
| Experiment 6 Reporting the Activity Date of This ADC | [11] | ||||
| Efficacy Data | Objective Response Rate (ORR) |
8.00%
|
Positive CD30 expression (CD30+++/++) | ||
| Patients Enrolled |
CD30-expressing nonlymphomatous cancer, not have been treated with chemotherapy, radiotherapy, biologics.
|
||||
| Administration Dosage |
1.8 or 2.4 mg/kg BV once every three weeks.
|
||||
| Related Clinical Trial | |||||
| NCT Number | NCT01461538 | Phase Status | Phase 2 | ||
| Clinical Description |
Brentuximab vedotin in patients with CD30-positive nonlymphomatous malignancies.
|
||||
| Primary Endpoint |
Objective response rate= 8.00% (95% CI 1.10, 28.00).
|
||||
| Other Endpoint |
Median progression-free survival=2.10 months (95% CI 1.20- 2.80).
|
||||
| Experiment 7 Reporting the Activity Date of This ADC | [12] | ||||
| Efficacy Data | Objective Response Rate (ORR) |
13.33%
|
Negative Lewis Y expression (Lewis Y-); Positive CD30 expression (CD30+++/++) | ||
| Patients Enrolled |
Relapsed/refractory CD30+ primary mediastinal large B-cell lymphoma (PmLBCL).
|
||||
| Administration Dosage |
1.80 mg per kg as a single IV infusion on day 1 of each 21-day cycle.
|
||||
| Related Clinical Trial | |||||
| NCT Number | NCT02423291 | Phase Status | Phase 2 | ||
| Clinical Description |
A phase 2 study of SGN-35 (Brentuximab Vedotin) of patients with relapsed or refractory primary mediastinal large B-cell lymphoma (PmLBCL).
|
||||
| Primary Endpoint |
The ORR was 13.33% (2/15): 2 patients PR, 1 patient SD, and the remaining 12 patients PD.
|
||||
| Experiment 8 Reporting the Activity Date of This ADC | [14] | ||||
| Efficacy Data | Objective Response Rate (ORR) |
36.40%
|
Negative Lewis Y expression (Lewis Y-); Positive CD30 expression (CD30+++/++) | ||
| Patients Enrolled |
Any subtype of histologically confirmed high-CD30expressing non Hodgkin lymphoma (NHL), except anaplastic large-cell lymphoma (ALCL). High CD30 expression was defined as membranous CD30 expression in 30% of tumor cells detectable by visual assessment of routine immunohistochemistry staining using the anti-CD30 antibody on biopsy at the time of diagnosis or relapse. (2) A bidimensionally measurable lesion 1.5 cm in the greatest transverse diameter. (3) Age 20-75 years and an Eastern Cooperative Oncology Group performance status of 2. (4) Adequate bone marrow and organ function. (5) No history of another active cancer within the previous 5 years except basal cell carcinoma. Note that patients who had relapsed after autologous stem cell transplantation (SCT) were considered eligible. Exclusion criteria were: undergoing allogeneic SCT; active infection, human immunodeficiency virus infection, or hepatitis B or C; and lymphomatous involvement of the central nervous system. The 30% cutoff was established by consensus during an investigation initiation meeting of the pathologists from each of the study sites after they reviewed various cutoff values for positive and strong positive of CD30 expression across various subtypes of NHL.
Click to Show/Hide
|
||||
| Administration Dosage |
Intravenously at 1.80 mg/kg every 3 weeks and the primary endpoint was > 40% disease control rate.
|
||||
| Related Clinical Trial | |||||
| NCT Number | NCT02280785 | Phase Status | Phase 2 | ||
| Clinical Description |
A phase 2 study of brentuximab vedotin for relapsed/refractory CD30-positive non-Hodgkin lymphomas other than anaplastic large cell lymphoma.
|
||||
| Primary Endpoint |
For 1.80 mg/kg BV intravenously, the overall disease control rate was 48.48% (16/33).
|
||||
| Other Endpoint |
For 1.80 mg/kg BV intravenously, the median PFS and OS 1.90 months and 6.10 months.
|
||||
| Experiment 9 Reporting the Activity Date of This ADC | [15] | ||||
| Efficacy Data | Objective Response Rate (ORR) |
41.18% (In 34 evaluable patients)
54.00% (AITL) |
|||
| Patients Enrolled |
Relapsed/refractory CD30+ non-Hodgkin lymphomas; at least 1 prior systemic therapy, measurable disease, age 12 years, and Eastern Cooperative Oncology Group (ECOG) performance status of 2.
|
||||
| Administration Dosage |
1.80 mg/kg was administered every 3 weeks until progression or unacceptable toxicity.
|
||||
| Related Clinical Trial | |||||
| NCT Number | NCT01421667 | Phase Status | Phase 2 | ||
| Clinical Description |
A phase 2 study of brentuximab vedotin in relapsed or refractory non-hodgkin lymphoma (NHL).
|
||||
| Primary Endpoint |
In 34 evaluable patients, ORR was 41.18% (8 CRs, 6 PRs,and ORR was 54.00% in AITL (5 CRs, 2 PRs) with median PFS of 6.70 months thus far.
|
||||
| Other Endpoint |
Median baseline sCD30 for patients with AITL and PTCL-NOS was 1214 ng/mL (range, 108-9473 ng/mL) and 840 ng/mL, respectively. Median duration of response for all patients was 7.60 months (range, 1.30-14.10 months), 5.50 months for AITL patients,and 7.60 months (range, 1.40-10.11 months) for PTCL-NOS patients.
|
||||
| Experiment 10 Reporting the Activity Date of This ADC | [17] | ||||
| Efficacy Data | Objective Response Rate (ORR) |
48.00%
|
Positive CD30 expression (CD30+++/++; FACS analysis = 495) | ||
| Patients Enrolled |
EBV-positive and CD30- positive non-Hodgkin lymphomas with various levels of CD30 in the relapsed or refractory setting.
|
||||
| Administration Dosage |
1.80 mg/kg brentuximab vedotin intravenously every 3 weeks for up to 16 cycles or until disease progression.
|
||||
| Related Clinical Trial | |||||
| NCT Number | NCT02388490 | Phase Status | Phase 2 | ||
| Clinical Description |
A phase 2 study of brentuximab vedotin in patients with relapsed or refractory EBV-and CD30-positive lymphomas.
|
||||
| Primary Endpoint |
For 1.80 mg/kg BV intravenously, the ORR was 48.00% (90% CI: 31.00%-64.00%).
|
||||
| Other Endpoint |
For 1.80 mg/kg BV intravenously, Median Progression-Free Survival (mPFS)= 6.20 months (95% CI: 2.90-13.60), overall survival(mOS)=15.70 months (95% CI: 6.10-not reached).
|
||||
| Experiment 11 Reporting the Activity Date of This ADC | [19] | ||||
| Efficacy Data | Objective Response Rate (ORR) |
52.94%
|
Positive CD30 expression (CD30+++/++; FACS analysis = 116) | ||
| Patients Enrolled |
Elderly patients with relapsed/refractory Hodgkin lymphoma (R/R HL).
|
||||
| Administration Dosage |
1.80 mg/kg administered as a single outpatient intravenous infusion on Day 1 of each 21-day treatment cycle, for a maximum of 16 cycles.
|
||||
| Related Clinical Trial | |||||
| NCT Number | NCT02227433 | Phase Status | Phase 2 | ||
| Clinical Description |
A phase 2 study of brentuximab vedotin (BV) in the treatment of elderly Hodgkin lymphoma (HL) patients at first relapse or with primary refractory disease.
|
||||
| Primary Endpoint |
The efficacy of single agent BV was measured by overall objective response rate (ORR, sum of CR and partial response [PR] rates),Best response was reached at fourth cycle of BV therapy. ORR was 52.94% (9 of 17 patients) with a CR rate of 23.5% (4 of 17 patients).
|
||||
| Other Endpoint |
Secondary endpoints were CR rate, disease free survival (DFS), 1-year PFS, 1-year OS and safety and tolerability of BV. With a median follow-up of 24.90 months, median PFS was 8.80 months and median OS was 21.70 months.
|
||||
| Experiment 12 Reporting the Activity Date of This ADC | [21] | ||||
| Efficacy Data | Objective Response Rate (ORR) |
67.86% (HL and systemic ALCL retreatment patients)
60.00% (HL patients) 87.50% (systemic ALCL patients) |
|||
| Patients Enrolled |
Patients who previously experienced a CR or PR with brentuximab vedotin, discontinued treatment while in remission, and subsequently experienced disease progression or relapse. Patients who received an allogeneic stem cell transplant (SCT) were eligible if they were >100 days from transplant and had no evidence of cytomegalovirus by polymerase chain reaction.
Click to Show/Hide
|
||||
| Administration Dosage |
1.80 mg/kg intravenously approximately every 3 weeks over 30 minutes as an outpatient infusion.
|
||||
| Related Clinical Trial | |||||
| NCT Number | NCT00947856 | Phase Status | Phase 2 | ||
| Clinical Description |
Treatment with SGN-35 in patients with CD30-positive hematologic malignancies who have previously participated in an SGN-35 study.
|
||||
| Primary Endpoint |
The ORR for HL and systemic ALCL retreatment patients was 67.86% (95% CI; 47.60-84.10),with a CR rate of 39.29% (95% CI; 21.50-59.40). The ORR was 60.00% (30.00% CR) for HL patients and 87.50% (62.50% CR) for systemic ALCL patients. The majority of patients (81.00%) who received brentuximab vedotin retreatment experienced reduction in measurable tumor volume.
Click to Show/Hide
|
||||
| Other Endpoint |
The objective response rate = 60.00% (30.00% CR) in HL patients and 87.50% (62.50% CR) in systemic ALCL patients.
|
||||
| Experiment 13 Reporting the Activity Date of This ADC | [22] | ||||
| Efficacy Data | Objective Response Rate (ORR) |
71.00%
|
|||
| Patients Enrolled |
Relapsed or refractory Hodgkin lymphoma (HL) after auto-stem cell transplant.
|
||||
| Administration Dosage |
1.80 mg/kg IV once every 3 weeks over 30 minutes on an outpatient basis for up to 16 infusions.
|
||||
| Related Clinical Trial | |||||
| NCT Number | NCT00848926 | Phase Status | Phase 2 | ||
| Clinical Description |
A pivotal study of SGN-35 in treatment of patients with relapsed or refractory hodgkin lymphoma (HL).
|
||||
| Primary Endpoint |
OrR = 72.00% (33.00% CR, 38.00% PR).
|
||||
| Other Endpoint |
The estimated median DOR of PR in the 73 patients= 11.20 months (95% CI: 7.70, 18.70), The median DOR of CR in the 34 patients = not been reached (95% CI: 20.50 - NA months). The estimated median OS for all patients was 40.50 months (95% CI: 28.70-NA ). The estimated 3-year OS for the 34 patients with a CR to brentuximab vedotin was 73.00% (95% CI: 57%, 88%). The estimated median PFS for all patients was 9.30 months (95% CI: 7.10, 12.20). Three-year PFS was estimated at 58.00% (95% CI: 41.00%, 76.00%) for the 34 CR patients.
Click to Show/Hide
|
||||
| Experiment 14 Reporting the Activity Date of This ADC | [23] | ||||
| Efficacy Data | Objective Response Rate (ORR) |
75.00%
|
|||
| Patients Enrolled |
Relapsed or refractory Hodgkin lymphoma (HL) after high-dose chemotherapy and auto-stem cell transplant, histologically documented CD30-positive Hodgkin's Reed-Sternberg cells by central pathology review.
|
||||
| Administration Dosage |
1.80 mg/kg by intravenous infusion every 3 weeks; received a maximum of 16 cycle.
|
||||
| Related Clinical Trial | |||||
| NCT Number | NCT00848926 | Phase Status | Phase 2 | ||
| Clinical Description |
A pivotal study of SGN-35 in treatment of patients with relapsed or refractory hodgkin lymphoma (HL).
|
||||
| Primary Endpoint |
Tumor reductions were observed in 94% of patients. The ORR was 75.00% (95% CI, 64.90% to 82.60%); 34% of all patients achieved a CR (95% CI, 25.20% to 44.40%), and the overall disease control rate (CR + partial remission + stable disease) was 96% (95% CI, 90.30% to 98.90%). The median time to objective response was 5.70 weeks (range, 5.10 to 56 weeks),and the median time to CR was 12 weeks (range, 5.10 to 56 weeks).
Click to Show/Hide
|
||||
| Other Endpoint |
For patients who had an objective response,the median duration of response was 6.70 months (95% CI,3.60 to 14.80 months). The median duration of response for patients who achieved a CR was 20.50 months (95% CI,10.80 months to not estimable).
|
||||
| Experiment 15 Reporting the Activity Date of This ADC | [24] | ||||
| Efficacy Data | Objective Response Rate (ORR) |
86.00%
|
|||
| Patients Enrolled |
Relapsed or refractory systemic anaplastic large cell lymphoma (ALCL) after treatment failure of at least one prior therapy with curative intent, the most common being a combination of cyclophosphamide, doxorubicin, vincristine, and prednisone.
|
||||
| Administration Dosage |
1.80 mg/kg was administered intravenously once every 3 weeks over 30 minutes on an outpatient basis for up to 16 total doses.
|
||||
| Related Clinical Trial | |||||
| NCT Number | NCT00866047 | Phase Status | Phase 2 | ||
| Clinical Description |
A phase 2 study of SGN-35 in treatment of patients with relapsed or refractory systemic anaplastic large cell lymphoma (ALCL).
|
||||
| Primary Endpoint |
The ORR per independent review was 86.00% (95% CI,74.60% to 93.90%); 57% of patients achieved CR (95% CI, 43.20% to 69.80%), and 29.00% achieved partial remission. Tumor reductions were observed in 97.00% of patients.
|
||||
| Other Endpoint |
The estimated median PFS time per independent review was 13.30 months (95% CI,6.90 months to NE); in the subset of patients who achieved a CR,the median PFS was 14.60 months. Per investigator assessment,the median PFS with brentuximab vedotin was 14.30 months (95% CI,9.10 months to NE). The median OS had not yet been reached. The estimated 12-month survival rate was 70.00%.
Click to Show/Hide
|
||||
| Experiment 16 Reporting the Activity Date of This ADC | [25] | ||||
| Efficacy Data | Objective Response Rate (ORR) |
92.31%
|
|||
| Patients Enrolled |
Patients were aged 60 years with classical HL (ie, patients with nodular lymphocyte predominant HL [NLPHL] were excluded). Patients were treatment nave and were either ineligible for frontline conventional combination treatment of HL (eg, ABVD or bleomycin, etoposide, doxorubicin, cyclophosphamide, vincristine, procarbazine, and prednisone [BEACOPP]) in the investigators judgment or had declined the available chemotherapy options after being informed of the potential benefits and risks.
Click to Show/Hide
|
||||
| Administration Dosage |
1.80 mg/kg of IV brentuximab vedotin every 3 weeks for up to 16 doses.
|
||||
| Related Clinical Trial | |||||
| NCT Number | NCT01716806 | Phase Status | Phase 2 | ||
| Clinical Description |
A phase 2 open-label study of brentuximab vedotin in front-line therapy of Hodgkin lymphoma (HL) an dCD30-expressing peripheral t-cell lymphoma (PTCL) in older patients or patients with significant comorbidities ineligible for standard chemotherapy.
|
||||
| Primary Endpoint |
The ORR among the 26 efficacy-evaluable patients was 92.31% (n=24, 95% CI 74.90-99.10). The median duration of objective response was 9.10 months (range 2.80-20.90 months) for all responder.
|
||||
| Other Endpoint |
The CR among the 26 efficacy-evaluable patients was 73.08% (n=19, 95% CI 52.20-88.40), The median PFS was 10.50 months (range 2.61-22.31 months) for all efficacy evaluable patients and 11.80 months (range 4.10-22.31months) for CR.
|
||||
| Experiment 17 Reporting the Activity Date of This ADC | [26] | ||||
| Efficacy Data | Objective Response Rate (ORR) |
100.00% (for efficacy-evaluable patients treated with BV plus DTIC)
|
|||
| Patients Enrolled |
Had treatment-naive classical HL (excluding nodular lymphocyte predominant HL), fluorodeoxyglucose positron emission tomography (PET)-avid disease, bidimensional measurable disease of >=1.5 cm in the greatest transverse diameter, and an ECOG performance status of <=3 and were ineligible for or declined standard frontline chemotherapies (eg, ABVD or bleomycin, etoposide, Adriamycin, cyclophosphamide, Oncovin, procarbazine, and prednisone).
Click to Show/Hide
|
||||
| Administration Dosage |
1.80 mg/kg BV and 375 mg/m2 DTIC for up to 12 cycles, and 20 more patients received 1.80 mg/kg BV plus 90 or 70 mg/m2 bendamustine for up to 6 cycles (dose reduced due to toxicity).
|
||||
| Related Clinical Trial | |||||
| NCT Number | NCT01716806 | Phase Status | Phase 2 | ||
| Clinical Description |
A phase 2 open-label study of brentuximab vedotin in front-line therapy of hodgkin lymphoma (HL) an dCD30-expressing peripheral t-cell lymphoma (PTCL) in older patients or patients with significant comorbidities ineligible for standard chemotherapy.
|
||||
| Primary Endpoint |
For efficacy-evaluable patients treated with BV plus DTIC (n = 21), the ORR was 100.00%. For efficacy-evaluable patients treated with BV plus bendamustine (n = 17), the ORR was also 100.00%.
|
||||
| Other Endpoint |
For efficacy-evaluable patients treated with BV plus DTIC (n = 21), the CR rate was 62.00%. At the time of this analysis, the median observation time from first dose was 21.60 months (range, 14.80 to 29.00 months), and median PFS was 17.90 months (range, 4.20 to 29.00 months). For efficacy-evaluable patients treated with BV plus bendamustine (n = 17), the CR was also 88.00%. Out of 7 patients (57.00%) with B symptoms at baseline had resolution. The median observation time from first dose was 10.80 months (range, 2.90 to 18.20 months). Neither the median PFS (range, 2.90 to 18.00 months) nor the median OS (range, 2.90 to 18.20 months) was reached at the time of this analysis.
Click to Show/Hide
|
||||
| Experiment 18 Reporting the Activity Date of This ADC | [27] | ||||
| Efficacy Data | Objective Response Rate (ORR) |
100.00%
|
High CD30 expression (CD30+++) | ||
| Patients Enrolled |
35 patients with R/R Hodgkin lymphoma (HL).
|
||||
| Administration Dosage |
Any time before on-protocol consolidation (nivolumab + BV; BV + bendamustine).
|
||||
| Related Clinical Trial | |||||
| NCT Number | NCT02927769 | Phase Status | Phase 2 | ||
| Clinical Description |
Risk-based, response-adapted, phase II open-label trial of nivolumab + brentuximab vedotin (N + BV) for children, adolescents, and young adults with relapsed/refractory (R/R) CD30 + classic hodgkin lymphoma (cHL) after failure of first-line therapy, followed by brentuximab + bendamustine (BV + B) for participants with a suboptimal response (checkmate 744: checkpoint pathway and nivolumab clinical trial evaluation)
Click to Show/Hide
|
||||
| Experiment 19 Reporting the Activity Date of This ADC | [28] | ||||
| Efficacy Data | Objective Response Rate (ORR) |
100.00%
|
Positive CD30 expression (CD30 +++/++) | ||
| Patients Enrolled |
Patients with previously untreated, early-stage unfavorable Hodgkin lymphoma.
|
||||
| Administration Dosage |
Patients were randomly assigned (2:1) to four cycles of BV-AVD or standard doxorubicin, bleomycin, vincristine, and dacarbazine (ABVD), followed by 30 Gy involved node radiotherapy.
|
||||
| Related Clinical Trial | |||||
| NCT Number | NCT02292979 | Phase Status | Phase 2 | ||
| Clinical Description |
Brentuximab vedotin associated with chemotherapy in untreated patients with stage I/II unfavourable hodgkin lymphoma. a randomized phase ii lysa-fil-eortc intergroup study.
|
||||
| Primary Endpoint |
CRR was 94.12% (32/34).
|
||||
| Other Endpoint |
ORR was 100.00% (34/34).
|
||||
| Experiment 20 Reporting the Activity Date of This ADC | [35] | ||||
| Efficacy Data | Objective Response Rate (ORR) |
60.71% (in the Phase 1)
78.38% (in the Phase 2) |
|||
| Patients Enrolled |
Relapsed/refractory CD30+ biopsy proven Hodgkin lymphoma (HL) or anaplastic large cell lymphoma (ALCL) and an ECOG Performance Status 2.
|
||||
| Administration Dosage |
Bv was escalated from 1.20 mg/kg Day 1, and B from 70 mg/m2 Days 1 and 2 every 21 days until the MTD or recommended phase 2 dose (RP2D) was reached;Bv escalating to a dose of 1.80 mg/kg and B was escalated to 90 mg/m2.
|
||||
| Related Clinical Trial | |||||
| NCT Number | NCT01657331 | Phase Status | Phase 1/2 | ||
| Clinical Description |
A phase 1/2 clinical trial of the combination of brentuximab vedotin and bendamustine in patients with relapsed or refractory hodgkin lymphoma or anaplastic large cell lymphoma.
|
||||
| Primary Endpoint |
The MTD was not reached, based on the fact there was no maximum administrable dose identified. The RP2D was Bv at 1.80 mg/kg and B at 9.00 mg/kg. Only 1 of 11 patients qualified as a DLT (Grade 4 neutropenia) at the RP2D.
|
||||
| Other Endpoint |
17 of 28 (ORR 60.71%, 95% CI 41.00-79.00) of patients achieved a response in the Phase 1, with 5 of 28 (17.86%) being CR. In the Phase 2, 29 of 37 (ORR 78.38%, 95% CI 62.00-91.00) patients responded, with 16 of 37 (43.24%) attaining a CR.
|
||||
| Experiment 21 Reporting the Activity Date of This ADC | [41] | ||||
| Efficacy Data | Objective Response Rate (ORR) |
50.00%
|
Positive CD30 expression (CD30+++/++; FACS analysis = 102) | ||
| Patients Enrolled |
Patients had relapsed or refractory, histologically confirmed CD30-positive hematologic cancers. Patients with Hodgkin's lymphoma had received systemic chemotherapy either as induction therapy for advanced-stage disease or salvage therapy after initial radiotherapy for early-stage disease and had previously undergone autologous stem cell transplant (ASCT).
Click to Show/Hide
|
||||
| Administration Dosage |
Intravenously at doses of 0.10 to 3.60 mg per kilogram of body weight every 3 weeks (one cycle).
|
||||
| Related Clinical Trial | |||||
| NCT Number | NCT00430846 | Phase Status | Phase 1 | ||
| Clinical Description |
A phase 1 dose escalation study of SGN-35 in patients with relapsed/refractory CD30-positive hematologic malignancies.
|
||||
| Primary Endpoint |
Safety profile of brentuximab vedotin =1.80 mg/kg.
|
||||
| Other Endpoint |
Secondary objectives were to determine pharmacokinetic measures for the antibody-drug conjugate and MMAE, evaluate immunogenicity, and assess antitumor response.The median time to maximum concentration occurred immediately after infusion for the antibody-drug conjugate and approximately 2 to 3 days after infusion for MMAE. Steady-state pharmacokinetics for both the antibody-drug conjugate and MMAE occurred by approximately 21 days,consistent with the half-life estimates of 4 to 6 days and 3 to 4 days, respectively.
Click to Show/Hide
|
||||
| Experiment 22 Reporting the Activity Date of This ADC | [43] | ||||
| Efficacy Data | Objective Response Rate (ORR) |
73.00% (at a median follow-up of 11.1 months)
70.00% (BICR-assessed) |
|||
| Patients Enrolled |
R/R PMBL; had an Eastern Cooperative Oncology Group performance status of 0 to 1, had a CD30 expression level of 1% or greater in the tumor or tumor-infiltrating lymphocytes by local immunohistochemistry, and had 1 or more measurable sites of disease according to the Lugano 2014 classification.
|
||||
| Administration Dosage |
Received nivolumab (240 mg intravenously) and BV (1.80 mg/kg intravenously) every 3 weeks until disease progression or unacceptable toxicity.
|
||||
| Related Clinical Trial | |||||
| NCT Number | NCT02581631 | Phase Status | Phase 1 | ||
| Clinical Description |
A phase 1/ 2 study to evaluate the safety and preliminary efficacy of nivolumab in combination with brentuximab vedotin in subjects with relapsed refractory non hodgkin lymphomas with CD30 expression (checkmate 436: CHECK point pathway and nivolumab clinical trial evaluation 436).
|
||||
| Primary Endpoint |
For nivolumab (240 mg intravenously) and BV (1.8 mg/kg intravenously), ORR(95% CI) was 73.00% (54.00% to 88.00%), with a 37.00% complete remission rate per investigator, and ORR of 70.00% (51.00% to 85.00%), with a 43.00% complete metabolic response rate per independent review.
|
||||
| Other Endpoint |
For nivolumab (240 mg intravenously) and BV (1.80 mg/kg intravenously), the 6-month PFS rate was 63.50% (95% CI, 42.50 to 78.60), and the 6-month OS rate was 86.30% (95% CI, 67.50 to 94.60). Median PFS and median OS were not reached.
|
||||
| Experiment 23 Reporting the Activity Date of This ADC | [45] | ||||
| Efficacy Data | Objective Response Rate (ORR) |
81.97% (all treated patients)
83.33% (efficacy-evaluable patients) |
|||
| Patients Enrolled |
Refractory Hodgkin lymphoma (defined as not achieving a CR to frontline therapy or progression within 3 months of CR), or Hodgkin lymphoma that had relapsed (defined as progression 3 months after CR to frontline therapy).
|
||||
| Administration Dosage |
Received BV (1.80 mg/kg IV, 30-minute infusion) and Nivo (3.00 mg/kg IV, 60-minute infusion) in 3-week cycles for up to 12 weeks (4 cycles). During the first cycle, BV was administered on day 1 and Nivo on day 8. During cycles 2 to 4, BV and Nivo were administered on day 1, with Nivo given at least 30 minutes after BV.
|
||||
| Related Clinical Trial | |||||
| NCT Number | NCT02572167 | Phase Status | Phase 1 | ||
| Clinical Description |
A phase 1/2 study evaluating brentuximab vedotin in combination with nivolumab in patients with relapsed or refractory Hodgkin lymphoma after failure of frontline therapy.
|
||||
| Primary Endpoint |
Response rates and Deauville 5-point score for all treated patients (n = 61) and efficacy-evaluable patients (n = 60) are presented. The CR rate among all treated patients was 61.00% (95% CI,47.00%-73.00%). Among efficacy-evaluable patients,the CR rate was 62.00% (95% CI,48.00%-74.00%).
|
||||
| Other Endpoint |
Response rates and Deauville 5-point score for all treated patients (n = 61) and efficacy-evaluable patients (n = 60) are presented. The ORR rate among all treated patients was 81.97% (95% CI, 70.00%-91.00%). Among efficacy-evaluable patients, the ORR rate was 83.33% (95% CI,72.00%-92.00%).
|
||||
| Experiment 24 Reporting the Activity Date of This ADC | [46] | ||||
| Efficacy Data | Objective Response Rate (ORR) |
85.00%
|
|||
| Patients Enrolled |
Biopsy-proven primary refractory (ie, not achieving a CR or progression <3 months after CR) or relapsed Hodgkin lymphoma (HL; progression 3 months after CR).
|
||||
| Administration Dosage |
Received up to 4 cycles of BV 1.80 mg/kg every 3 weeks IV over 30 minutes followed by Nivo 3.00 mg/kg IV over 60 minutes. In parts 1/2 (staggered dosing), BV was administered on day 1 and Nivo on day 8 of cycle 1, with both agents administered on day 1 during cycles 2 to 4. During part 2, the protocol was amended to mandate prophylactic treatment with steroids (hydrocortisone 100 mg or equivalent) and antihistamines (diphenhydramine 25-50 mg or equivalent) at day 1 of each cycle beginning at cycle 2. Patients in part 3 (same-day dosing) received both BV and Nivo on day 1 of all cycles, based on the interim efficacy and safety results in parts 1 and 2 of this study and encouraging results with same-day dosing of both agents in the Eastern Cooperative Oncology Group and the American College of Radiology Imaging Network (ECOG-ACRIN) study E4412.
Click to Show/Hide
|
||||
| Related Clinical Trial | |||||
| NCT Number | NCT02572167 | Phase Status | Phase 1 | ||
| Clinical Description |
A phase 1/2 study evaluating brentuximab vedotin in combination with nivolumab in patients with relapsed or refractory Hodgkin lymphoma after failure of frontline therapy.
|
||||
| Primary Endpoint |
The objective response rate (ORR; N=91) = 85.00%, with 67.00% achieving a complete response (CR); progression-free survival (PFS) rate at 3 years = 77.00% (95% CI, 65.00% to 86.00%) and 91.00% (95% CI, 79.00% to 96.00%) for patients undergoing ASCT directly after study treatment.
|
||||
| Other Endpoint |
OS= 93.00% (95% CI, 85.00% to 97.00%) at 3 years.
|
||||
| Experiment 25 Reporting the Activity Date of This ADC | [47] | ||||
| Efficacy Data | Objective Response Rate (ORR) |
100.00%
|
Positive CD30 expression (CD30+++/++) | ||
| Patients Enrolled |
CD30 peripheral T-cell lymphoma.
|
||||
| Administration Dosage |
1.8 mg/kg IV once every 3 weeks for 6 cycles.
|
||||
| Related Clinical Trial | |||||
| NCT Number | NCT01309789 | Phase Status | Phase 1 | ||
| Clinical Description |
A phase 1 study of brentuximab vedotin given sequentially and combined with multi-agent chemotherapy for CD30-positive mature T-cell and NK-cell neoplasms.
|
||||
| Primary Endpoint |
Objective response rate=100.00%.
|
||||
| Other Endpoint |
5-year PFS= 52.00%; OS=80.00%
|
||||
| Experiment 26 Reporting the Activity Date of This ADC | [48] | ||||
| Efficacy Data | Objective Response Rate (ORR) |
73.00% (patients with Hodgkin lymphoma who relapsed after ASCT)
86.00% (patients with sALCL) |
|||
| Patients Enrolled |
Hodgkin lymphoma who had relapsed after autologous stem cell transplant (ASCT); systemic anaplastic large-cell lymphoma (sALCL) who had previously been treated with curative intent.
|
||||
| Administration Dosage |
1.80 mg/kg, i.v., once every 21 days; a maximum of 16 cycles.
|
||||
| Experiment 27 Reporting the Activity Date of This ADC | [49] | ||||
| Efficacy Data | Objective Response Rate (ORR) |
58.54%
|
|||
| Patients Enrolled |
Relapsed or refractory, histologically confirmed CD30-positive hematologic malignancies with bi-dimensional measurable disease of at least 1.5 cm by radiographic evaluation. Patients with Hodgkin lymphoma had received systemic chemotherapy as induction therapy for advanced-stage disease or salvage therapy after initial radiotherapy for early-stage disease and had previously undergone autologous stem cell transplantation (ASCT) unless they were ineligible for or had declined treatment. Patients with other CD30-positive malignancies had previously failed or were refractory to front-line chemotherapy. Patients who had transformed to systemic anaplastic large cell lymphoma (ALCL) were eligible.
Click to Show/Hide
|
||||
| Administration Dosage |
Intravenously on Days 1, 8, and 15, of each 28-day cycle at doses ranging from 0.40 to 1.40 mg/kg.
|
||||
| Experiment 28 Reporting the Activity Date of This ADC | [50] | ||||
| Efficacy Data | Complete Remission (CR) |
35.00%
|
|||
| Patients Enrolled |
Histologically confirmed rel/ref de novo or transformed diffuse large B-cell lymphoma (DLBCL) after at least 1 prior therapy, Eastern Cooperative Oncology Group (ECOG) performance status 2, and adequate organ function as defined in supplemental Methods.
|
||||
| Administration Dosage |
The treatment cycle was 21 days with intravenous BV administered on day 1 and Len administered on days 1 to 21 for a maximum of 16 cycles, the maximum tolerated dose of the combination was 1.20 mg/kg BV with 20 mg/d Len.
|
||||
| Related Clinical Trial | |||||
| NCT Number | NCT04404283 | Phase Status | Phase 3 | ||
| Clinical Description |
A randomized, double-blind, placebo-controlled, active-comparator, multicenter, phase 3 study of brentuximab vedotin or placebo in combination with lenalidomide and rituximab in subjects with relapsed or refractory diffuse large B-cell lymphoma (DLBCL).
|
||||
| Primary Endpoint |
The maximum tolerated dose of the combination was 1.20 mg/kg BV with 20 mg/d lenalidomide.
|
||||
| Other Endpoint |
The overall response rate was 57.00% (95% CI, 39.60-72.50), complete response rate, 35.00% (95% CI, 20.70-52.60); median duration of response, 13.10 months; median progression-free survival, 10.20 months (95% CI, 5.50-13.70); and median overall survival, 14.30 months (95% CI, 10.20-35.60).
|
||||
| Experiment 29 Reporting the Activity Date of This ADC | [51] | ||||
| Efficacy Data | Complete Remission (CR) |
61.54%
|
|||
| Patients Enrolled |
Previously untreated, histologically confirmed stage III/IV classical Hodgkin lymphoma (cHL).
|
||||
| Administration Dosage |
A+AVD (brentuximab vedotin, 1.20 mg/kg of bodyweight, doxorubicin 25 mg/m2 of body surface area, vinblastine 6 mg/m2, and dacarbazine 375 mg/m2) or ABVD (doxorubicin 25 mg/m2, bleomycin 10 U/m2, vinblastine 6 mg/m2, and dacarbazine 375 mg/m2) intravenously on days 1 and 15 of each 28-day cycle for up to six cycles.
Click to Show/Hide
|
||||
| Related Clinical Trial | |||||
| NCT Number | NCT01712490 | Phase Status | Phase 3 | ||
| Clinical Description |
A randomized, open-label, phase 3 trial of A+AVD versus ABVD as frontline therapy in patients with advanced classical hodgkin lymphoma.
|
||||
| Primary Endpoint |
For 1.20 mg/kg BV intravenously, the 3-year PFS rates=83.10% (95% CI, 79.90-85.90) in the A+AVD arm.
|
||||
| Other Endpoint |
For 1.20 mg/kg BV intravenously, complete resolution(CR)=61.54% of (272/442) in the A+AVD arm.
|
||||
| Experiment 30 Reporting the Activity Date of This ADC | [52] | ||||
| Efficacy Data | Complete Remission (CR) |
71.33%
|
|||
| Patients Enrolled |
Previously untreated patients (18 years with an Eastern Cooperative Oncology Group performance status of 2) with stage III or IV classical Hodgkin lymphoma.
|
||||
| Administration Dosage |
A+AVD (brentuximab vedotin, 1.20 mg/kg of bodyweight, doxorubicin 25 mg/m2 of body surface area, vinblastine 6 mg/m2, and dacarbazine 375 mg/m2) or ABVD (doxorubicin 25 mg/m2, bleomycin 10 U/m2, vinblastine 6 mg/m2, and dacarbazine 375 mg/m2) intravenously on days 1 and 15 of each 28-day cycle for up to six cycles.
Click to Show/Hide
|
||||
| Related Clinical Trial | |||||
| NCT Number | NCT01712490 | Phase Status | Phase 3 | ||
| Clinical Description |
A randomized, open-label, phase 3 trial of A+AVD versus ABVD as frontline therapy in patients with advanced classical hodgkin lymphoma.
|
||||
| Primary Endpoint |
For 1.20 mg/kg BV intravenously, 5-year PFS rates=82.20% (95% CI 79.00-85.00) with A+AVD.
|
||||
| Other Endpoint |
For 1.20 mg/kg BV intravenously, complete resolution(CR)=71.33% of (316/443) of patients with peripheral neuropathy in the A+AVD arm. Peripheral neuropathy occurred in 443 (66.91%) of 662 patients in the A+AVD group.
|
||||
| Experiment 31 Reporting the Activity Date of This ADC | [53] | ||||
| Efficacy Data | Complete Remission (CR) |
12.00%
|
|||
| Patients Enrolled |
Part (A) relapsed/refractory CD30-expressing mature T-cell and B-cell non-Hodgkin lymphomas (NHL), including DLBCL; Part (B) brentuximab vedotin plus rituximab in relapsed/refractory CD30-expressing DLBCL; and Part (C) single-agent brentuximab vedotin in relapsed/refractory CD30u DLBCL.
|
||||
| Administration Dosage |
1.80 mg/kg was administered IV every 21 days.
|
||||
| Related Clinical Trial | |||||
| NCT Number | NCT01421667 | Phase Status | Phase 2 | ||
| Clinical Description |
A phase 2 study of brentuximab vedotin in relapsed or refractory non-hodgkin lymphoma (NHL).
|
||||
| Primary Endpoint |
ORR=31.00%, median duration=4.70 months (range 0.50-11.60) for 16 patients enrolled on Part C.
|
||||
| Other Endpoint |
Six patients had CR (12.00%) with a median duration of 11.60 months (range,1.40±11.60) and median PFS of 15.60 months (range,3.8±15.6). Overall median PFS was 1.4 months (range, 0.40- 15.60). Median overall survival (OS) was 7.50 months (range, 0.7-18.6).
|
||||
| Experiment 32 Reporting the Activity Date of This ADC | [54] | ||||
| Efficacy Data | Complete Remission (CR) |
35.41%
|
|||
| Patients Enrolled |
A clinical and histologically confirmed diagnosis of CD30+ LyP, CD30+ pc-anaplastic large-cell lymphoma (ALCL), or myelofibrosis (MF). Eastern Cooperative Oncology Group performance status of 2 and adequate bone marrow and organ function were required.
|
||||
| Administration Dosage |
Intravenously at 1.80 mg/kg every 21 days for a maximum of eight doses.
|
||||
| Related Clinical Trial | |||||
| NCT Number | NCT01352520 | Phase Status | Phase 2 | ||
| Clinical Description |
Phase 2 trial of brentuximab vedotin (SGN-35) at dose of 1.80 mg/kg IV every 3 weeks in patients with CD30-positive lymphoproliferative disorders (cutaneous anaplastic large T-cell lymphoma (ALCL), mycosis fungoides, and extensive lymphomatoid papulosis (LyP).
|
||||
| Primary Endpoint |
Os rate=72.92% (95% CI, 60.00% to 86.00%; 35 of 48 patients), CR raate=35.41% (95% CI, 22.00% to 49.00%; 17 of 48 patients). Fifteen (53.57%; 95% CI, 31% to 59%) of 28 patients with MF responded, independent of CD30 expression.
|
||||
| Other Endpoint |
In patients with MF/Szary syndrome, the overall response rate was 50.00% (five of 10 patients) in patients with low CD30 expression (< 10%), 58.33% (seven of 12 patients) in patients with medium expression (10% to 50%), and 50.00% (three of six patients) in patients with high expression (50%).
|
||||
| Experiment 33 Reporting the Activity Date of This ADC | [55] | ||||
| Efficacy Data | Complete Remission (CR) |
43.00% (In 56 evaluable patients treated across cohorts)
|
|||
| Patients Enrolled |
Patients over 10 years of age with biopsy-proven cHL that had relapsed or was primary refractory (lack of CR or PD within 3months of upfront therapy) after standard initial therapy were eligible.
|
||||
| Administration Dosage |
1.80 mg/kg intravenously every 3 weeks for two cycles.
|
||||
| Related Clinical Trial | |||||
| NCT Number | NCT01393717 | Phase Status | Phase 2 | ||
| Clinical Description |
A phase 2 study of brentuximab vedotin as salvage therapy for hodgkin lymphoma prior to autologous hematopoietic stem cell transplantation.
|
||||
| Primary Endpoint |
The 2-year PFS among patients in CR at the time of AHCT (n=37) was 71% compared with 54% in patients not in CR (p=0.12). The 2-year PFS in patients who proceeded to AHCT directly after receiving BV alone was 77%.
|
||||
| Other Endpoint |
Of 56 evaluable patients treated across cohorts, the overall response rate (ORR) to second-line BV was 75.00% with 43.00% CR.
|
||||
| Experiment 34 Reporting the Activity Date of This ADC | [56] | ||||
| Efficacy Data | Complete Remission (CR) |
58.00%
|
|||
| Patients Enrolled |
LyP and were also required to have scarring, more than 10 lesions, or active lesions on the face, hands, or feet.
|
||||
| Administration Dosage |
Intravenous brentuximab vedotin 1.80 mg/kg infused over 30 minutes every 21 days.
|
||||
| Related Clinical Trial | |||||
| NCT Number | NCT01352520 | Phase Status | Phase 2 | ||
| Clinical Description |
Phase 2 trial of brentuximab vedotin (SGN-35) at dose of 1.80 mg/kg IV every 3 weeks in patients with CD30-positive lymphoproliferative disorders (cutaneous anaplastic large T-cell lymphoma (ALCL), mycosis fungoides, and extensive lymphomatoid papulosis (LyP).
|
||||
| Primary Endpoint |
The overall response rate was 100% and at 4 months was 80% (8 of 10 patients).
|
||||
| Experiment 35 Reporting the Activity Date of This ADC | [57] | ||||
| Efficacy Data | Complete Remission (CR) |
14.70%
|
|||
| Patients Enrolled |
Steroid-refractory acute graft-versus-host disease (SR-aGVHD).
|
||||
| Administration Dosage |
The study included weekly dosing for 3 weeks followed by maintenance dosing every 3 weeks for an 4 additional doses. A standard 3+3 dose-escalation cohort (0.60 mg/kg, 0.90 mg/kg, and 1.20 mg/kg) was planned to define the maximum tolerated dose (MTD). After treating the first 6 patients, the study was revised to dosing every 2 weeks for 4 doses only for safety purposes, and to enroll cohorts of 5 patients at each dose level (0.60 mg/kg, 0.80 mg/kg, 1.00 mg/kg, and 1.20 mg/kg).
Click to Show/Hide
|
||||
| Related Clinical Trial | |||||
| NCT Number | NCT01940796 | Phase Status | Phase 1 | ||
| Clinical Description |
Phase 1 trial of brentuximab vedotin for refractory chronic graft-vs.-host disease (GVHD).
|
||||
| Primary Endpoint |
The MTD was defined at 0.80 mg/kg with one DLT observed (sepsis).
|
||||
| Other Endpoint |
At day 28, the overall response rate was 38.20% with 5 complete responses (CR, 14.70%) and 8 very good partial responses (VGPR, 23.50%).Overall survival was 41.00% (95% CI, 25.00%-57.00%) at 6 months and 38.00% (95% CI, 22.00%-54.00%) at 12 months.
|
||||
| Experiment 36 Reporting the Activity Date of This ADC | [58] | ||||
| Efficacy Data | Complete Remission (CR) |
35.00%
|
|||
| Patients Enrolled |
Relapsed or refractory diffuse large B-cell lymphoma (DLBCL); have previously received at least two lines of therapy, including rituximab and an anthracycline; patients had either had a relapse after or were ineligible for autologous transplantation.
|
||||
| Administration Dosage |
1.20 mg/kg intravenously (IV) on Day 1 of every 21 day cycle.
|
||||
| Related Clinical Trial | |||||
| NCT Number | NCT02086604 | Phase Status | Phase 1 | ||
| Clinical Description |
A phase 1 trial of brentuximab vedotin in combination with lenalidomide in relapsed or refractory diffuse large B-cell lymphoma.
|
||||
| Primary Endpoint |
Most patients required granulocyte colony-stimulating factor support because of neutropenia. The overall response rate was 57.00% (95% CI, 39.60-72.50), complete response rate, 35.00% (95% CI, 20.70-52.60); median duration of response, 13.10 months; median progression-free survival, 10.20 months (95% CI, 5.50-13.70); and median overall survival, 14.30 months (95% CI, 10.20-35.60). Response rates were highest in patients with CD301 DLBCL (73.00%), but they did not differ according to cell of origin (P=5.96).
Click to Show/Hide
|
||||
| Experiment 37 Reporting the Activity Date of This ADC | [60] | ||||
| Efficacy Data | Complete Remission (CR) |
66.67%
|
|||
| Patients Enrolled |
Primary refractory Hodgkin Lymphoma or early relapse. Eligibility criteria included age 30 years; no prior Brentuximab vedotin exposure; and relapse <1 year from completion of initial therapy.
|
||||
| Administration Dosage |
Each 21-day cycle consisted of intravenous day 1 at 1.40 mg/kg or 1.80 mg/kg.
|
||||
| Related Clinical Trial | |||||
| NCT Number | NCT01780662 | Phase Status | Phase 1 | ||
| Clinical Description |
A phase 1/2 study of brentuximab vedotin (SGN35) in combination with gemcitabine for pediatric and young adult patients with relapsed or refractory Hodgkin lymphoma.
|
||||
| Primary Endpoint |
For four of the 13 patients with stable disease or partial response,all target lesions were Deauville score 3 on central review,and would thus be considered CRs by response criteria published after AHOD1221 opened. By these criteria,the complete response rate observed on AHOD1221 was 28 of 42 patients (66.67%; 95% CI, 51.00-80.00%).
|
||||
| Experiment 38 Reporting the Activity Date of This ADC | [61] | ||||
| Efficacy Data | Complete Remission (CR) |
74.00%
|
|||
| Patients Enrolled |
First relapse or primary refractory classic Hodgkin lymphoma (CHL) after one prior line of therapy.
|
||||
| Administration Dosage |
Days 1 and 8 at either 1.20 or 1.50 mg/kg IV (capped at 150 mg) with standard dosing of ICE on days 13 for two cycles.
|
||||
| Related Clinical Trial | |||||
| NCT Number | NCT02227199 | Phase Status | Phase 1 | ||
| Clinical Description |
A phase 1/2 trial of brentuximab vedotin (BV), ifosfamide (I), carboplatin (C), and etoposide (E) for patients with relapsed or refractory Hodgkin lymphoma (BV-ICE).
|
||||
| Primary Endpoint |
Rp2D=BV 1.50 mg/kg IV CR=74.00%.
|
||||
| Other Endpoint |
ORR=91.00%.
|
||||
| Experiment 39 Reporting the Activity Date of This ADC | [62] | ||||
| Efficacy Data | Complete Remission (CR) |
86.00%
|
|||
| Patients Enrolled |
CD30+ primary mediastinal large B-cell lymphoma (PMBCL), diffuse large B-cell lymphoma (DLBCL), or gray zone lymphoma (GZL). Patients with any stage, measurable disease, and an Eastern Cooperative Oncology Group Performance Status of 3 or less were eligible. The diagnostic biopsy had to demonstrate at least 1% or higher expression of CD30 on the lymphoma B cells by immunohistochemistry and was assessed independently by two pathologists. Patients with active central nervous system involvement and uncontrolled systemic infections were excluded.
Click to Show/Hide
|
||||
| Administration Dosage |
Six cycles of BV (1.80 mg/kg, maximum dose of 180 mg) administered with the R-CHOP regimen without vincristine, including: rituximab 375 mg/m2, cyclophosphamide 750 mg/m2, and doxorubicin 50 mg/m2 on day 1 and prednisone 100 mg (or equivalent) daily on days 1 through 5 of each 21-day cycle. For cycle 1, rituximab was split into two doses (100 mg/m2 on day 1 and 275 mg/m2 on day 2) to reduce risks of an infusion reaction to rituximab.
Click to Show/Hide
|
||||
| Related Clinical Trial | |||||
| NCT Number | NCT01994850 | Phase Status | Phase 1 | ||
| Clinical Description |
A phase 1/2 study of brentuximab vedotin in combination with multi-agent chemotherapy as front-line treatment in patients with CD30 positive primary mediastinal large B-cell, diffuse large B-cell, and grey zone lymphomas.
|
||||
| Primary Endpoint |
For Brentuximab vedotin dose of 1.80 mg/kg, the overall response rate was 100.00% (95%CI: 88.00-100.00) with 86.00% (95% CI: 68.00-96.00) of patients achieving complete response at the end of systemic treatment.
|
||||
| Other Endpoint |
For Brentuximab vedotin dose of 1.80 mg/kg, the 2-year PFS and overall survival rates were 85.00% (95%CI: 66.00-94.00) and 100.00%, respectively.
|
||||
| Experiment 40 Reporting the Activity Date of This ADC | [63] | ||||
| Efficacy Data | Complete Remission (CR) |
95.45% (brentuximab vedotin + ABVD)
96.00% (brentuximab vedotin + AVD) |
|||
| Patients Enrolled |
Newly diagnosed, treatment-naive, CD30-positive patients with Hodgkin's lymphoma who had histologically confirmed stage IIA bulky disease or stage IIB-IV disease and an Eastern Cooperative Oncology Group performance status of two or less.
|
||||
| Administration Dosage |
0.60, 0.90, or 1.20 mg/kg brentuximab vedotin by intravenous infusion every 2 weeks with either ABVD (25 mg/m(2) doxorubicin, 10 units/m(2) bleomycin, 6 mg/m(2) vinblastine, and 375 mg/m(2) dacarbazine) or AVD (ABVD modified regimen without the inclusion of bleomycin) for up to six cycles.
|
||||
| Related Clinical Trial | |||||
| NCT Number | NCT01060904 | Phase Status | Phase 1 | ||
| Clinical Description |
A phase 1 dose-escalation safety study of brentuximab vedotin in combination with multi-agent chemotherapy as frontline therapy in patients with Hodgkin lymphoma.
|
||||
| Primary Endpoint |
The MTD of brentuximab vedotin 1.20 mg/kg ; CR of brentuximab vedotin + ABVD = 95.45%(21/22); CR of brentuximab vedotin + AVD = 96.00%(24 /25 ).
|
||||
| Other Endpoint |
Maximum tolerated dose was not exceeded at 1.20 mg/kg of brentuximab vedotin combined with either ABVD or AVD.
|
||||
| Experiment 41 Reporting the Activity Date of This ADC | [65] | ||||
| Efficacy Data | Complete Remission (CR) |
60.00% (BV + R therapy)
|
|||
| Patients Enrolled |
Had prior solid organ or hematopoietic stem cell transplantation, received immunosuppressive therapy for a nonmalignant condition, and/or had an aggressive EBV+lymphoid malignancy.
|
||||
| Administration Dosage |
Induction therapy consisted of R 375 mg/m2 given on days 1, 8, 15, 22, and BV 1.20 mg/kg given on days 1, 8, 15, followed by restaging as assessed by CT imaging. MT consisted of BV 1.8 mg/kg every 3 weeks and R 375 mg/m2 every 6 weeks for up to one year of total therapy.
|
||||
| Experiment 42 Reporting the Activity Date of This ADC | [66] | ||||
| Patients Enrolled |
Previously untreated Hodgkins lymphoma of stage IIB with bulk tumor or stage IIIB, IVA, or IVB.
|
||||
| Administration Dosage |
Brentuximab vedotin (at a dose of 1.80 mg per kilogram) plus doxorubicin, vincristine, etoposide, prednisone, and cyclophosphamide or the standard bleomycin-containing chemotherapy regimen was administered every 21 days.
|
||||
| Related Clinical Trial | |||||
| NCT Number | NCT02166463 | Phase Status | Phase 3 | ||
| Clinical Description |
A randomized phase 3 study of brentuximab vedotin (SGN-35) for newly diagnosed high-risk classical hodgkin lymphoma (cHL) in children and young adults.
|
||||
| Primary Endpoint |
At a median follow-up of 42.10 months (range, 0.10 to 80.90), the 3-year event-free survival was 92.10% (95% confidence interval [CI],88.40 to 94.70) in the brentuximab vedotin group.
|
||||
| Other Endpoint |
Overall survival at 3 years was 99.30% (95% CI,97.30 to 99.80) in the brentuximab vedotin group.
|
||||
| Experiment 43 Reporting the Activity Date of This ADC | [67] | ||||
| Patients Enrolled |
III or IV Hodgkins lymphoma.
|
||||
| Administration Dosage |
1.20 mg of brentuximab vedotin per kilogram of body weight, 25 mg of doxorubicin per square meter of body-surface area, 6 mg of vinblastine per square meter, and 375 mg of dacarbazine per square meter; intravenously on days 1 and 15 of each 28-day cycle for up to six cycles.
|
||||
| Related Clinical Trial | |||||
| NCT Number | NCT01712490 | Phase Status | Phase 3 | ||
| Clinical Description |
A randomized, open-label, phase 3 trial of A+AVD Versus ABVD as frontline therapy in patients with advanced classical hodgkin lymphoma.
|
||||
| Primary Endpoint |
The analysis of overall survival significantly favored A+AVD over ABVD (95% CI,0.40-0.88).The 6-year overall survival estimates were 93.90% (95% CI,91.60 to 95.50) in the A+AVD group and 89.40% (95% CI,86.60 to 91.70) in the ABVD group.
|
||||
| Other Endpoint |
The median follow-up in the overall survival analysis was 73.00 months (95% CI,72.30 to 73.60; range,0.0 to 100.6). A total of 39 deaths occurred in the A+AVD group and 64 in the ABVD group.
|
||||
| Experiment 44 Reporting the Activity Date of This ADC | [68] | ||||
| Patients Enrolled |
Advanced classic Hodgkins lymphoma (Ann Arbor stage III or IV, as determined on a 4-point scale, with higher stages indicating more widespread disease),17 according to the World Health Organization classification system. Patients who had not been previously treated with systemic chemotherapy or radiotherapy were eligible. Patients were required to have an Eastern Cooperative Oncology Group performance status of 0, 1, or 2 (on a scale of 0 to 5, with higher scores indicating greater disability).
Click to Show/Hide
|
||||
| Administration Dosage |
A+AVD (1.20 mg of brentuximab vedotin per kilogram of body weight, 25 mg of doxorubicin per square meter of body-surface area, 6 mg of vinblastine per square meter, and 375 mg of dacarbazine per square meter) or ABVD (25 mg of doxorubicin per square meter, 10 units of bleomycin per square meter, 6 mg of vinblastine per square meter, and 375 mg of dacarbazine per square meter) intravenously on days 1 and 15 of each 28-day cycle for up to 6 cycles.
Click to Show/Hide
|
||||
| Related Clinical Trial | |||||
| NCT Number | NCT01712490 | Phase Status | Phase 3 | ||
| Clinical Description |
A randomized, open-label, phase 3 trial of A+AVD versus ABVD as frontline therapy in patients with advanced classical Hodgkin lymphoma.
|
||||
| Primary Endpoint |
After a median follow-up of 24.90 months (range, 0 to 49.30), the rate of the primary end point of independently determined modified progression-free survival was significantly higher in the A+AVD group than in the ABVD group (2-year modified progression-free survival rate, 82.10% [95% confidence interval {CI}, 78.70 to 85.00] vs. 77.20% [95% CI, 73.70 to 80.40]; hazard ratio for progression, death, or modified progression, 0.77 [95% CI, 0.60 to 0.98]; P = 0.03), corresponding to a 23.00% risk reduction.
Click to Show/Hide
|
||||
| Other Endpoint |
The interim 2-year overall survival rate for the A+AVD group was 96.60% (95% CI,94.80 to 97.70) and that for the ABVD group was 94.90% (95% CI,92.90 to 96.40),which corresponded to a reduction in the risk of death of 28.00% in favor of the A+AVD regimen (hazard ratio,0.72; 95% CI,0.44 to 1.17; P = 0.19).
|
||||
| Experiment 45 Reporting the Activity Date of This ADC | [69] | ||||
| Patients Enrolled |
CD30-positive mycosis fungoides or primary cutaneous anaplastic large-cell lymphoma who had been previously treated.
|
||||
| Administration Dosage |
Interactive voice and web response system to receive intravenous brentuximab vedotin 1.80 mg/kg once every 3 weeks, for up to 16 3-week cycles.
|
||||
| Related Clinical Trial | |||||
| NCT Number | NCT01578499 | Phase Status | Phase 3 | ||
| Clinical Description |
A randomized, open-label, phase 3 trial of brentuximab vedotin (SGN-35) versus physician's choice (methotrexate or bexarotene) in patients with CD30-positive cutaneous T-cell lymphoma.
|
||||
| Primary Endpoint |
At a median follow-up of 22.90 months (95% CI 18.40-26.10), the proportion of patients achieving an objective global response lasting at least 4 months was 56.25% (36 of 64 patients) with brentuximab vedotin versus 12.50% (8/64) with physicians choice, resulting in a between-group difference of 43.80% (95% CI 29.10-58.40).
|
||||
| Other Endpoint |
Median progression-free survival per EMA criteria was 16.70 months in the brentuximab vedotin group versus 3.50 months in the physicians choice group (HR 0.270, 95% CI 0.169-0.430).
|
||||
| Experiment 46 Reporting the Activity Date of This ADC | [70] | ||||
| Patients Enrolled |
Patients aged 18 years with previously treated CD30-expressing myelofibrosis (MF) or classic anaplastic large-cell lymphoma (after at least 1 prior systemic therapy or prior radiotherapy) were enrolled; CD30 positivity was defined as 10% of target lymphoid cells exhibiting a membrane, cytoplasmic, and/or Golgi staining pattern for CD30. An Eastern Cooperative Oncology Group performance status of 0 to 2 was required.
Click to Show/Hide
|
||||
| Administration Dosage |
Brentuximab vedotin (1.80 mg/kg IV every 3 weeks, for up to 16 cycles) or physicians choice (methotrexate, 5-50 mg orally once weekly or bexarotene 300 mg/m2 [target dose] orally once daily, for up to 48 weeks).
|
||||
| Related Clinical Trial | |||||
| NCT Number | NCT01578499 | Phase Status | Phase 3 | ||
| Clinical Description |
A previously treated, recurrent or metastatic cervical cancer (SGN-35) versus physician's choice (methotrexate or bexarotene) in patients with CD30-positive cutaneous T-cell lymphoma.
|
||||
| Primary Endpoint |
For 1.80 mg/kg BV intravenously, objective responses lasting 4 months (ORR4) was 54.70%; the ORR per IRF was 65.60%.
|
||||
| Other Endpoint |
For 1.80 mg/kg BV intravenously, the CR rate was 17.20%; median PFS 16.70 (95% CI, 0.25-0.58); 3-year estimates of OS was 64.40% (95% CI, 0.42-1.32); time to next treatment (TTNT) was 14.20 (95% CI, 0.17-0.42).
|
||||
| Experiment 47 Reporting the Activity Date of This ADC | [73] | ||||
| Patients Enrolled |
High-risk relapsed or refractory classic Hodgkin lymphoma, had an ECOG performance status of 0-2, and had adequate organ and bone marrow function.
|
||||
| Administration Dosage |
Enrolled patients received brentuximab vedotin (1.8 mg/kg) intravenously starting 30-60 days after autologous HSCT on day 1 of each 21-day cycle for up to 8 cycles.
|
||||
| Related Clinical Trial | |||||
| NCT Number | NCT03057795 | Phase Status | Phase 2 | ||
| Clinical Description |
A phase 2 study of nivolumab and brentuximab vedotin consolidation after autologous stem cell transplantation in patients with high-risk classical hodgkin lymphoma.
|
||||
| Primary Endpoint |
The 18-month progression-free survival in all 59 patients was 94% (95% CI 84-98).
|
||||
| Other Endpoint |
The 24-month overall survival was 98.00% (95% CI 88.00-100.00). The 24-month progression-free survival according to the number of risk factors was 94.00% (95% CI 67.00-99.00) in patients with one risk factor (n=21),96.00% (73.00-99.00) in patients with two risk factors (n=24), and 85.00% (51.00-96.00) in patients with three or more risk factors (n=14). The 24-month cumulative incidence of relapse and progression was 5.70% (95% CI 1.50-14.00); the 24-month cumulative incidence of non-relapse mortality was 1.80% (0.14-8.40).
Click to Show/Hide
|
||||
| Experiment 48 Reporting the Activity Date of This ADC | [74] | ||||
| Patients Enrolled |
Histologically proven anaplastic lymphoma kinase (ALK)+ anaplastic large-cell lymphoma (ALCL) and were younger than 22 years of age at diagnosis.
|
||||
| Administration Dosage |
Brentuximab vedotin was administered on day 1 of each of the 6 cycles for a total of 6 doses. The starting dose of brentuximab vedotin was 1.80 mg/kg (maximum dose, 180 mg) given IV over 30 minutes on day 1 of each cycle prior to all other chemotherapy. Dose reductions to 1.20 mg/kg (maximum dose, 120 mg), followed by 0.80 mg/kg (maximum dose, 80 mg), were mandated for certain toxicities.
Click to Show/Hide
|
||||
| Related Clinical Trial | |||||
| NCT Number | NCT01979536 | Phase Status | Phase 2 | ||
| Clinical Description |
A randomized phase 2 trial of brentuximab vedotin (SGN35, NSC# 749710), or crizotinib (NSC#749005, commercially labeled) in combination with chemotherapy for newly diagnosed patients with anaplastic large cell lymphoma (ALCL).
|
||||
| Primary Endpoint |
For 1.80 mg/kg BV intravenously, the complete response rate (complete response + complete response, unconfirmed) was 62.12% for patients who underwent evaluation after cycle 2 (41/66 patients) and 96.88% after cycle 6 (62/64 patients).
|
||||
| Other Endpoint |
For 1.80 mg/kg BV intravenously, The 2-year event-free survival (EFS)=79.10% (95%CI, 67.20-87.10). The 2-year overall survival (OS)=97.00% (95% CI, 88.10-99.20).
|
||||
| Experiment 49 Reporting the Activity Date of This ADC | [75] | ||||
| Patients Enrolled |
Metastatic non-seminomatous germ cell tumor (GCT) with the exception of pure teratoma who progressed after first-line cisplatin-based chemotherapy and after at least one salvage regimen.
|
||||
| Administration Dosage |
1.80 mg/kg IV every 3 weeks until disease progression or intolerable toxicities.
|
||||
| Related Clinical Trial | |||||
| NCT Number | NCT01461538 | Phase Status | Phase 2 | ||
| Clinical Description |
A phase 2, open-label study of brentuximab vedotin in patients with CD30-positive nonlymphomatous malignancies.
|
||||
| Primary Endpoint |
For 1.80 mg/kg BV intravenously, Median PFS in the CD30 positive cohort was 1.20 months (95% CI: 0.90-2.10) and in the CD30 negative cohort was 1.40 months (95% CI: 0.00-2.10). Median OS in the CD30 positive cohort was 2.50 months (95% CI: 1.10-12.90) and in the CD30 negative cohort was 5.90 months (95% CI: 1.60-8.20).
|
||||
| Experiment 50 Reporting the Activity Date of This ADC | [76] | ||||
| Patients Enrolled |
46 patients with classic Hodgkin lymphoma, unsuitable for standard chemotherapy because of a cardiac ejection fraction of less than 50%, pulmonary diffusion capacity of less than 80%, or a creatinine clearance of 30 mL/min or more but less than 60 mL/minrequired to have an Eastern Cooperative Oncology Group (ECOG) performance status of 0-2.
|
||||
| Administration Dosage |
Brentuximab vedotin (1.8 mg/kg, dose cap at 180 mg) and nivolumab (3 mg/kg) intravenously every 21 days for 8 cycles.
|
||||
| Related Clinical Trial | |||||
| NCT Number | NCT02758717 | Phase Status | Phase 2 | ||
| Clinical Description |
Phase II, multi-center trial of nivolumab and brentuximab vedotin in patients with untreated Hodgkin lymphoma over the age of 60 years or unable to receive standard adriamycin, bleomycin, vinblastine, and dacarbazine (ABVD) chemotherapy.
|
||||
| Primary Endpoint |
The overall response, defined as a partial metabolic response or complete metabolic response at the end of 8 cycles of treatment
|
||||
| Other Endpoint |
The complete metabolic response rate, safety and tolerability of the regimen in this population, duration of response, progression-free survival, and overall survival.
|
||||
| Experiment 51 Reporting the Activity Date of This ADC | [77] | ||||
| Related Clinical Trial | |||||
| NCT Number | NCT02686346 | Phase Status | Phase 1/2 | ||
| Clinical Description |
Phase 1/2 feasibility study of brentuximab vedotin in refractory/relapsed hodgkin lymphoma patients who are treated by chemotherapy (ICE) in second line and eligible for autologous transplantation.
|
||||
Discovered Using Cell Line-derived Xenograft Model
| Experiment 1 Reporting the Activity Date of This ADC | [82] | ||||
| Efficacy Data | Tumor Growth Inhibition value (TGI) |
0.00% (Day 40)
|
Positive CD30 expression (CD30+++/++) | ||
| Method Description |
3 mg conjugate/kg/inj.
|
||||
| In Vivo Model | L2987 cell line xenograft model | ||||
| In Vitro Model | Lung adenocarcinoma | L2987 cells | CVCL_H586 | ||
| Experiment 2 Reporting the Activity Date of This ADC | [84] | ||||
| Efficacy Data | Tumor Growth Inhibition value (TGI) | ≈ 28.40% (Day 35) | Positive CD30 expression (CD30+++/++) | ||
| Method Description |
The inhibitory activity of all possible combination Brentuximab Vedotin with TGR-1202 (PI3K- inhibitor) against cancer cell growth was evaluated in the HL xenograft model. Six- to eight-week-old NOD/SCID mice (20 to 25 g) were xenografted with L-540 (2.5x10⁶ cells/mouse) and KM-H2 (2.0x10⁶ cells/mouse) cells by inoculation into the left flank. When the tumor volume reached approximately 100 mg, the mice were randomly assigned to receive TGR-1202 (150 mg/kg/5 day/3 wks, PO) and/or BV (0.5 mg/kg/q4d/2 weeks, IP).
Click to Show/Hide
|
||||
| In Vivo Model | L-540 cell line xenograft model | ||||
| In Vitro Model | Hodgkin lymphoma | L-540 cells | CVCL_1362 | ||
| Experiment 3 Reporting the Activity Date of This ADC | [84] | ||||
| Efficacy Data | Tumor Growth Inhibition value (TGI) | ≈ 31.50% (Day 35) | Positive CD30 expression (CD30+++/++) | ||
| Method Description |
The inhibitory activity of all possible combination Brentuximab Vedotin with TGR-1202 (PI3K- inhibitor) against cancer cell growth was evaluated in the HL xenograft model. Six- to eight-week-old NOD/SCID mice (20 to 25 g) were xenografted with L-540 (2.5x10⁶ cells/mouse) and KM-H2 (2.0x10⁶ cells/mouse) cells by inoculation into the left flank. When the tumor volume reached approximately 100 mg, the mice were randomly assigned to receive TGR-1202 (150 mg/kg/5 day/3 wks, PO) and/or BV (0.5 mg/kg/q4d/2 weeks, IP).
Click to Show/Hide
|
||||
| In Vivo Model | KM-H2 cell line xenograft model | ||||
| In Vitro Model | Hodgkin lymphoma | KM-H2 cells | CVCL_1330 | ||
| Experiment 4 Reporting the Activity Date of This ADC | [84] | ||||
| Efficacy Data | Tumor Growth Inhibition value (TGI) | ≈ 51.70% (Day 53) | Positive CD30 expression (CD30+++/++) | ||
| Method Description |
The inhibitory activity of all possible combination Brentuximab Vedotin with TGR-1202 (PI3K- inhibitor) against cancer cell growth was evaluated in the HL xenograft model. Six- to eight-week-old NOD/SCID mice (20 to 25 g) were xenografted with L-540 (2.5x10⁶ cells/mouse) and KM-H2 (2.0x10⁶ cells/mouse) cells by inoculation into the left flank. When the tumor volume reached approximately 100 mg, the mice were randomly assigned to receive TGR-1202 (150 mg/kg/5 day/3 wks, PO) and/or BV (0.5 mg/kg/q4d/2 weeks, IP).
Click to Show/Hide
|
||||
| In Vivo Model | KM-H2 cell line xenograft model | ||||
| In Vitro Model | Hodgkin lymphoma | KM-H2 cells | CVCL_1330 | ||
| Experiment 5 Reporting the Activity Date of This ADC | [84] | ||||
| Efficacy Data | Tumor Growth Inhibition value (TGI) | ≈ 53.40% (Day 35) | Positive CD30 expression (CD30+++/++) | ||
| Method Description |
The inhibitory activity of all possible combination Brentuximab Vedotin with TGR-1202 (PI3K- inhibitor) against cancer cell growth was evaluated in the HL xenograft model. Six- to eight-week-old NOD/SCID mice (20 to 25 g) were xenografted with L-540 (2.5x10⁶ cells/mouse) and KM-H2 (2.0x10⁶ cells/mouse) cells by inoculation into the left flank. When the tumor volume reached approximately 100 mg, the mice were randomly assigned to receive TGR-1202 (150 mg/kg/5 day/3 wks, PO) and/or BV (0.5 mg/kg/q4d/2 weeks, IP).
Click to Show/Hide
|
||||
| In Vivo Model | KM-H2 cell line xenograft model | ||||
| In Vitro Model | Hodgkin lymphoma | KM-H2 cells | CVCL_1330 | ||
| Experiment 6 Reporting the Activity Date of This ADC | [84] | ||||
| Efficacy Data | Tumor Growth Inhibition value (TGI) | ≈ 65.80% (Day 35) | Positive CD30 expression (CD30+++/++) | ||
| Method Description |
The inhibitory activity of all possible combination Brentuximab Vedotin with TGR-1202 (PI3K- inhibitor) against cancer cell growth was evaluated in the HL xenograft model. Six- to eight-week-old NOD/SCID mice (20 to 25 g) were xenografted with L-540 (2.5x10⁶ cells/mouse) and KM-H2 (2.0x10⁶ cells/mouse) cells by inoculation into the left flank. When the tumor volume reached approximately 100 mg, the mice were randomly assigned to receive TGR-1202 (150 mg/kg/5 day/3 wks, PO) and/or BV (0.5 mg/kg/q4d/2 weeks, IP).
Click to Show/Hide
|
||||
| In Vivo Model | L-540 cell line xenograft model | ||||
| In Vitro Model | Hodgkin lymphoma | L-540 cells | CVCL_1362 | ||
| Experiment 7 Reporting the Activity Date of This ADC | [84] | ||||
| Efficacy Data | Tumor Growth Inhibition value (TGI) | ≈ 74.70% (Day 53) | Positive CD30 expression (CD30+++/++) | ||
| Method Description |
The inhibitory activity of all possible combination Brentuximab Vedotin with TGR-1202 (PI3K- inhibitor) against cancer cell growth was evaluated in the HL xenograft model. Six- to eight-week-old NOD/SCID mice (20 to 25 g) were xenografted with L-540 (2.5x10⁶ cells/mouse) and KM-H2 (2.0x10⁶ cells/mouse) cells by inoculation into the left flank. When the tumor volume reached approximately 100 mg, the mice were randomly assigned to receive TGR-1202 (150 mg/kg/5 day/3 wks, PO) and/or BV (0.5 mg/kg/q4d/2 weeks, IP).
Click to Show/Hide
|
||||
| In Vivo Model | KM-H2 cell line xenograft model | ||||
| In Vitro Model | Hodgkin lymphoma | KM-H2 cells | CVCL_1330 | ||
| Experiment 8 Reporting the Activity Date of This ADC | [85] | ||||
| Efficacy Data | Tumor Growth Inhibition value (TGI) | ≈ 78.80% (Day 56) | Positive CD30 expression (CD30+++/++) | ||
| Method Description |
The inhibitory activity of all possible combination regimens of ruxolitinib and BV against cancer cell growth was evaluated in the HDLM-2 xenograft mouse model of human HL. Mice of the ruxolitinib group received ruxolitinib at a dose of 50 mg/kg per day by s.c. inserted osmotic minipumps for 2 wk. Mice of the BV group received BV at 4 mg/kg by i.v. injection every 4 d for three injections. Mice of the combination group received a combination of ruxolitinb with BV at the same doses and dosing schedules as those in the ruxolitinib and BV groups.
Click to Show/Hide
|
||||
| In Vivo Model | HDLM-2 cell line xenograft model | ||||
| In Vitro Model | Hodgkin lymphoma | HDLM-2 cells | CVCL_0009 | ||
| Experiment 9 Reporting the Activity Date of This ADC | [85] | ||||
| Efficacy Data | Tumor Growth Inhibition value (TGI) | ≈ 87.30% (Day 21) | High CD30 expression (CD30+++) | ||
| Method Description |
The inhibitory activity of all possible combination regimens of ruxolitinib, Navitoclax, and BV against cancer cell growth was evaluated in the HDLM-2 xenograft mouse model of human HL. The xenograft tumor model of human HL HDLM-2 was established by s.c. injection of 2x10⁷ HDLM-2 cells into the right flank of female, 8-wk-old, NOD/SCID mice.
Click to Show/Hide
|
||||
| In Vivo Model | HDLM-2 cell line xenograft model | ||||
| In Vitro Model | Hodgkin lymphoma | HDLM-2 cells | CVCL_0009 | ||
| Experiment 10 Reporting the Activity Date of This ADC | [85] | ||||
| Efficacy Data | Tumor Growth Inhibition value (TGI) | ≈ 92.00% (Day 21) | Moderate CD30 expression (CD30++) | ||
| Method Description |
The inhibitory activity of all possible combination regimens of ruxolitinib, Navitoclax, and BV against cancer cell growth was evaluated in the HDLM-2 xenograft mouse model of human HL. The xenograft tumor model of human HL HDLM-2 was established by s.c. injection of 2x10⁷ HDLM-2 cells into the right flank of female, 8-wk-old, NOD/SCID mice.
Click to Show/Hide
|
||||
| In Vivo Model | HDLM-2 cell line xenograft model | ||||
| In Vitro Model | Hodgkin lymphoma | HDLM-2 cells | CVCL_0009 | ||
| Experiment 11 Reporting the Activity Date of This ADC | [85] | ||||
| Efficacy Data | Tumor Growth Inhibition value (TGI) | ≈ 94.70% (Day 21) | Negative CD30 expression (CD30-) | ||
| Method Description |
The inhibitory activity of all possible combination regimens of ruxolitinib, Navitoclax, and BV against cancer cell growth was evaluated in the HDLM-2 xenograft mouse model of human HL. The xenograft tumor model of human HL HDLM-2 was established by s.c. injection of 2x10⁷ HDLM-2 cells into the right flank of female, 8-wk-old, NOD/SCID mice.
Click to Show/Hide
|
||||
| In Vivo Model | HDLM-2 cell line xenograft model | ||||
| In Vitro Model | Hodgkin lymphoma | HDLM-2 cells | CVCL_0009 | ||
| Experiment 12 Reporting the Activity Date of This ADC | [82] | ||||
| Efficacy Data | Tumor Growth Inhibition value (TGI) |
96.83% (Day 30)
|
Positive CD30 expression (CD30+++/++) | ||
| Method Description |
1 mg conjugate/kg/inj.
|
||||
| In Vivo Model | Karpas 299 ALCL cell line xenograft model | ||||
| In Vitro Model | ALK-positive anaplastic large cell lymphoma | Karpas-299 cells | CVCL_1324 | ||
| Experiment 13 Reporting the Activity Date of This ADC | [82] | ||||
| Efficacy Data | Tumor Growth Inhibition value (TGI) |
99.20% (Day 15)
|
Positive CD30 expression (CD30+++/++) | ||
| Method Description |
0.5 mg/kg/in.
|
||||
| In Vivo Model | Karpas 299 ALCL cell line xenograft model | ||||
| In Vitro Model | ALK-positive anaplastic large cell lymphoma | Karpas-299 cells | CVCL_1324 | ||
| Experiment 14 Reporting the Activity Date of This ADC | [85] | ||||
| Efficacy Data | Tumor Growth Inhibition value (TGI) | ≈ 99.80% (Day 56) | High CD30 expression (CD30+++) | ||
| Method Description |
The inhibitory activity of all possible combination regimens of ruxolitinib and BV against cancer cell growth was evaluated in the HDLM-2 xenograft mouse model of human HL. Mice of the ruxolitinib group received ruxolitinib at a dose of 50 mg/kg per day by s.c. inserted osmotic minipumps for 2 wk. Mice of the BV group received BV at 4 mg/kg by i.v. injection every 4 d for three injections. Mice of the combination group received a combination of ruxolitinb with BV at the same doses and dosing schedules as those in the ruxolitinib and BV groups.
Click to Show/Hide
|
||||
| In Vivo Model | HDLM-2 cell line xenograft model | ||||
| In Vitro Model | Hodgkin lymphoma | HDLM-2 cells | CVCL_0009 | ||
| Experiment 15 Reporting the Activity Date of This ADC | [85] | ||||
| Efficacy Data | Tumor Growth Inhibition value (TGI) | ≈ 99.90% (Day 21) | High CD30 expression (CD30+++) | ||
| Method Description |
The inhibitory activity of all possible combination regimens of ruxolitinib, Navitoclax, and BV against cancer cell growth was evaluated in the HDLM-2 xenograft mouse model of human HL. The xenograft tumor model of human HL HDLM-2 was established by s.c. injection of 2x10⁷ HDLM-2 cells into the right flank of female, 8-wk-old, NOD/SCID mice.
Click to Show/Hide
|
||||
| In Vivo Model | HDLM-2 cell line xenograft model | ||||
| In Vitro Model | Hodgkin lymphoma | HDLM-2 cells | CVCL_0009 | ||
| Experiment 16 Reporting the Activity Date of This ADC | [87] | ||||
| Efficacy Data | Tumor Growth Delay (TGD) |
40 Day (Median)
|
High CD30 expression (CD30+++) | ||
| Method Description |
SCID mice were implanted with L540cy HL cells in the right flank. Groups of mice (9-10/group) were untreated or received SGN-35 (1 mg/kg, q4dx3, i.p.) and/or ABVD [Adriamycin (0.75 mg/kg, q4dx3, i.v.), Bleomycin (6u/kg, q4dx3, i.p.), Vinblastine (0.01 mg/kg, q4dx3, i.p.) and Dacarbazine (15 mg/kg, q3dx4, i.p.)] when tumour size averaged approximately 300 mm3.
Click to Show/Hide
|
||||
| In Vivo Model | L540cy cell line xenograft model | ||||
| In Vitro Model | Hodgkin's disease | L540cy cells | Homo sapiens | ||
| Experiment 17 Reporting the Activity Date of This ADC | [87] | ||||
| Efficacy Data | Tumor Growth Delay (TGD) |
61 Day (Median)
|
High CD30 expression (CD30+++/++) | ||
| Method Description |
SCID mice were implanted with L540cy HL cells in the right flank. Groups of mice (9-10/group) were untreated or received SGN-35 (1 mg/kg, q4dx3, i.p.) and/or ABVD [Adriamycin (0.75 mg/kg, q4dx3, i.v.), Bleomycin (6u/kg, q4dx3, i.p.), Vinblastine (0.01 mg/kg, q4dx3, i.p.) and Dacarbazine (15 mg/kg, q3dx4, i.p.)] when tumour size averaged approximately 300 mm3.
Click to Show/Hide
|
||||
| In Vivo Model | L540cy cell line xenograft model | ||||
| In Vitro Model | Hodgkin's disease | L540cy cells | Homo sapiens | ||
| Experiment 18 Reporting the Activity Date of This ADC | [87] | ||||
| Efficacy Data | Tumor Growth Delay (TGD) |
63 Day (Median)
|
High CD30 expression (CD30+++) | ||
| Method Description |
SCID mice were implanted with L540cy HL cells in the right flank. Groups of mice (9-10/group) were untreated or received SGN-35 (1 mg/kg, q4dx3, i.p.) and/or ABVD [Adriamycin (0.75 mg/kg, q4dx3, i.v.), Bleomycin (6u/kg, q4dx3, i.p.), Vinblastine (0.01 mg/kg, q4dx3, i.p.) and Dacarbazine (15 mg/kg, q3dx4, i.p.)] when tumour size averaged approximately 100 mm3.
Click to Show/Hide
|
||||
| In Vivo Model | L540cy cell line xenograft model | ||||
| In Vitro Model | Hodgkin's disease | L540cy cells | Homo sapiens | ||
| Experiment 19 Reporting the Activity Date of This ADC | [87] | ||||
| Efficacy Data | Tumor Growth Delay (TGD) | > 80 Day (Median) | Negative Lewis Y expression (Lewis Y-); Positive CD30 expression (CD30+++/++) | ||
| Method Description |
SCID mice were implanted with L540cy HL cells in the right flank. Groups of mice (9-10/group) were untreated or received SGN-35 (1 mg/kg, q4dx3, i.p.) and/or ABVD [Adriamycin (0.75 mg/kg, q4dx3, i.v.), Bleomycin (6u/kg, q4dx3, i.p.), Vinblastine (0.01 mg/kg, q4dx3, i.p.) and Dacarbazine (15 mg/kg, q3dx4, i.p.)] when tumour size averaged approximately 100 mm3.
Click to Show/Hide
|
||||
| In Vivo Model | L540cy cell line xenograft model | ||||
| In Vitro Model | Hodgkin's disease | L540cy cells | Homo sapiens | ||
| Experiment 20 Reporting the Activity Date of This ADC | [88] | ||||
| Efficacy Data | Half Maximal Inhibitory Concentration (IC50) |
2.50 ng/mL
|
|||
| Method Description |
The inhibitory activity of cAC10 vcMMAE against cancer cell growth was compared with other anti-CD30 mAbs against the growth of a variety of HD and ALCL cell lines in vitro. For localized, subcutaneous disease models of ALCL and HD,5x106 Karpas 299 or 2x10⁷ L540cy cells, respectively, were implanted into the right flanks of C.B.-17/IcrHsd-SCID mice (Harlan, Indianapolis, IN).Therapy with cAC10-vcMMAE or controls was initiated when the tumor size in each group of 5 animals averaged approximately 100 mm3.Treatment consisted of intravenous injections every fourth day for 4 injections (q4d x 4).
Click to Show/Hide
|
||||
| In Vitro Model | ALK-positive anaplastic large cell lymphoma | Karpas-299 cells | CVCL_1324 | ||
Revealed Based on the Cell Line Data
| Experiment 1 Reporting the Activity Date of This ADC | [90] | ||||
| Efficacy Data | Half Maximal Inhibitory Concentration (IC50) |
1.90 pM
|
|||
| Method Description |
The inhibitory activity of Brentuximab vedotin against cancer cell growth was evaluated in various human cancer cell lines in vitro.
|
||||
| In Vitro Model | ALK-positive anaplastic large cell lymphoma | Karpas-299 cells | CVCL_1324 | ||
| Experiment 2 Reporting the Activity Date of This ADC | [90] | ||||
| Efficacy Data | Half Maximal Inhibitory Concentration (IC50) |
6.70 pM
|
|||
| Method Description |
The inhibitory activity of Brentuximab vedotin against cancer cell growth was evaluated in various human cancer cell lines in vitro.
|
||||
| In Vitro Model | Hodgkin lymphoma | L-540 cells | CVCL_1362 | ||
| Experiment 3 Reporting the Activity Date of This ADC | [90] | ||||
| Efficacy Data | Half Maximal Inhibitory Concentration (IC50) |
14.20 pM
|
|||
| Method Description |
The inhibitory activity of Brentuximab vedotin against cancer cell growth was evaluated in various human cancer cell lines in vitro.
|
||||
| In Vitro Model | Adult acute myeloid leukemia | HL-60 cells | CVCL_0002 | ||
| Experiment 4 Reporting the Activity Date of This ADC | [90] | ||||
| Efficacy Data | Half Maximal Inhibitory Concentration (IC50) |
14.50 pM
|
|||
| Method Description |
The inhibitory activity of Brentuximab vedotin against cancer cell growth was evaluated in various human cancer cell lines in vitro.
|
||||
| In Vitro Model | Anaplastic large cell lymphoma | SU-DHL-1 cells | CVCL_0538 | ||
| Experiment 5 Reporting the Activity Date of This ADC | [91] | ||||
| Efficacy Data | Half Maximal Inhibitory Concentration (IC50) |
4.50 ng/mL
|
|||
| Method Description |
The inhibitory activity of the mAb-Val-Cit-MMAE conjugates exhibited greater in vitrospecificity and lower in vivo toxicity was compared with corresponding hydrazone conjugatescorresponding hydrazone conjugates on H3396 cells.The cytotoxic effects of the conjugates on H3396 cells (cBR96 Ag+,cAC10 Ag-) were determined using both pulsed (2 h) and long-term(97 h) drug exposure assays.
Click to Show/Hide
|
||||
| In Vitro Model | ALK-positive anaplastic large cell lymphoma | Karpas-299 cells | CVCL_1324 | ||
| Experiment 6 Reporting the Activity Date of This ADC | [81] | ||||
| Efficacy Data | Half Maximal Inhibitory Concentration (IC50) |
6.00 ng/mL
|
|||
| Method Description |
The inhibitory activity of the mAb-Val-Cit-MMAE conjugates exhibited greater in vitrospecificity and lower in vivo toxicity was compared with corresponding hydrazone conjugatescorresponding hydrazone conjugates on H3396 cells.The cytotoxic effects of the conjugates on H3396 cells (cBR96 Ag+,cAC10 Ag-) were determined using both pulsed (2 h) and long-term(97 h) drug exposure assays.
Click to Show/Hide
|
||||
| In Vitro Model | Adult acute myeloid leukemia | CESS cells | CVCL_0209 | ||
| Experiment 7 Reporting the Activity Date of This ADC | [81] | ||||
| Efficacy Data | Half Maximal Inhibitory Concentration (IC50) |
63.00 ng/mL
|
|||
| Method Description |
The inhibitory activity of the mAb-Val-Cit-MMAE conjugates exhibited greater in vitrospecificity and lower in vivo toxicity was compared with corresponding hydrazone conjugatescorresponding hydrazone conjugates on H3396 cells.The cytotoxic effects of the conjugates on H3396 cells (cBR96 Ag+,cAC10 Ag-) were determined using both pulsed (2 h) and long-term(97 h) drug exposure assays.
Click to Show/Hide
|
||||
| In Vitro Model | Hodgkin's disease | L540cy cells | Homo sapiens | ||
| Experiment 8 Reporting the Activity Date of This ADC | [81] | ||||
| Efficacy Data | Half Maximal Inhibitory Concentration (IC50) |
90.00 ng/mL
|
|||
| Method Description |
The inhibitory activity of the mAb-Val-Cit-MMAE conjugates exhibited greater in vitrospecificity and lower in vivo toxicity was compared with corresponding hydrazone conjugatescorresponding hydrazone conjugates on H3396 cells.The cytotoxic effects of the conjugates on H3396 cells (cBR96 Ag+,cAC10 Ag-) were determined using both pulsed (2 h) and long-term(97 h) drug exposure assays.
Click to Show/Hide
|
||||
| In Vitro Model | Hodgkin lymphoma | KM-H2 cells | CVCL_1330 | ||
| Experiment 9 Reporting the Activity Date of This ADC | [93] | ||||
| Efficacy Data | Half Maximal Inhibitory Concentration (IC50) |
219.50 ng/mL
|
|||
| Method Description |
The inhibitory activity of Brentuximab Vedotin against cancer cell growth was evaluated in CD30positive GCT27 cell line in vitro. The cells were treated with 250 ng/mL ADC for 96 hours.
|
||||
| In Vitro Model | Testicular teratoma | GCT 27 cells | CVCL_A344 | ||
| Experiment 10 Reporting the Activity Date of This ADC | [93] | ||||
| Efficacy Data | Half Maximal Inhibitory Concentration (IC50) |
1013.00 ng/mL
|
|||
| Method Description |
The inhibitory activity of Brentuximab Vedotin against cancer cell growth was evaluated in CD30negative JAR cell line in vitro. The cells were treated with 1000 ng/mL ADC for 96 hours.
|
||||
| In Vitro Model | Gestational choriocarcinoma | JAR cells | CVCL_0360 | ||
| Experiment 11 Reporting the Activity Date of This ADC | [93] | ||||
| Efficacy Data | Half Maximal Inhibitory Concentration (IC50) |
1400.80 ng/mL
|
|||
| Method Description |
The inhibitory activity of Brentuximab Vedotin against cancer cell growth was evaluated in moderate expression NCCIT cell line in vitro. The cells were treated with 500 ng/mL ADC for 96 hours.
|
||||
| In Vitro Model | Testicular embryonal carcinoma | NCC-IT cells | CVCL_1451 | ||
| Experiment 12 Reporting the Activity Date of This ADC | [94] | ||||
| Efficacy Data | Half Maximal Inhibitory Concentration (IC50) |
3300.00 ng/mL
1.30 ng/mL 9.90 ng/mL |
|||
| Method Description |
The antitumor activity of SGN-35 was prepared with 14C-labeled MMAE. Intracellular ADC activation on CD30+ and negative cell lines was determined using a combination of radiometric and liquid chromatograhpy/mass spectrometry-based assays. The bystander activity of SGN-35 was determined using mixed tumor cell cultures consisting of CD30+ and CD30 lines.
Click to Show/Hide
|
||||
| In Vitro Model | ALK-positive anaplastic large cell lymphoma | Karpas-299 cells | CVCL_1324 | ||
| Diffuse large B-cell lymphoma | WSU-NHL cells | CVCL_1793 | |||
| Hodgkin's disease | L540cy cells | Homo sapiens | |||
Tisotumab vedotin-tftv [Approved]
Identified from the Human Clinical Data
| Experiment 1 Reporting the Activity Date of This ADC | [4] | ||||
| Efficacy Data | Partial Response (PR) |
40.00%
|
Moderate Tissue factor expression (TF++; IHC H-score=155) | ||
| Patients Enrolled |
Ovary Cancer; Cervix Cancer; Endometrium Cancer; Bladder Cancer; Prostate Cancer; Esophagus Cancer; Lung Cancer, Nonsmall Cell; Squamous Cell Carcinoma of the Head and Neck.
|
||||
| Administration Dosage |
Once every 3 weeks intravenous (IV).
|
||||
| Related Clinical Trial | |||||
| NCT Number | NCT03245736 | Phase Status | Phase 2 | ||
| Clinical Description |
A multi-center, open-label trial investigating the efficacy and safety of continued treatment with tisotumab vedotin in patients with solid tumors known to express tissue factor.
|
||||
| Primary Endpoint |
Number of participants who experienced a treatment emergent adverse event (TEAE): 5/5 Participants (100%).
|
||||
| Other Endpoint |
Partial Response Rate=2/5 (40.00%), Stable Disease Rate=2/5(40.00%), Progressive Disease Rate=1/5 (20.00%), Increased Cancer Antigen (CA 125) Levels Rate=1/2 (50.00%).
|
||||
| Experiment 2 Reporting the Activity Date of This ADC | [13] | ||||
| Efficacy Data | Objective Response Rate (ORR) |
24.00%
|
High Tissue factor expression (TF+++; IHC H-score=250) | ||
| Patients Enrolled |
Recurrent or metastatic squamous cell, adenocarcinoma, or adenosquamous cervical cancer; disease progression on or after doublet chemotherapy with bevacizumab (if eligible by local standards); who had received two or fewer previous systemic regimens for recurrent or metastatic disease; had measurable disease based on Response Evaluation Criteria in Solid Tumors (RECIST; version 11); and had an Eastern Cooperative Oncology Group performance status of 0 or 1.
Click to Show/Hide
|
||||
| Administration Dosage |
20 mg/kg (up to a maximum of 200 mg) intravenously once every 3 weeks.
|
||||
| Related Clinical Trial | |||||
| NCT Number | NCT03438396 | Phase Status | Phase 2 | ||
| Clinical Description |
A Single arm, multicenter, international trial of tisotumab vedotin (HuMax-TF-ADC) in previously treated, recurrent or metastatic cervical cancer.
|
||||
| Primary Endpoint |
Objective response rate=24.00% (95% CI 16.00%-33.00%), comprising 7 (7.00%) complete responses and 17 (17.00%) partial responses, Disease Control Rate (DCR)=72.00%.
|
||||
| Other Endpoint |
Median duration of response=8.30 months, 62.00% (95% CI 3.70-8.00) of patients > 6months,median progression-free survival = 4.20 months (95% Cl 3.00-4.40), median overall survival = 12.10 months (95% Cl, 9.60-13.90).
|
||||
| Experiment 3 Reporting the Activity Date of This ADC | [29] | ||||
| Efficacy Data | Objective Response Rate (ORR) |
38.24% (second- or third-line group)
|
Low Tissue factor expression (TF+; <7,000 TF molecules/cell) | ||
| Patients Enrolled |
Recurrent/metastatic cervical cancer (r/mCC).
|
||||
| Administration Dosage |
20 mg/kg + pembro 200 mg IV Q3W.
|
||||
| Related Clinical Trial | |||||
| NCT Number | NCT03786081 | Phase Status | Phase 1b/2 | ||
| Clinical Description |
A phase 1b/2 open-label trial of tisotumab vedotin (HuMax-TF-ADC) monotherapy and in combination with other agents in subjects with recurrent or stage IVB cervical cancer.
|
||||
| Primary Endpoint |
In the second- or third-line group,objective response rate=38.24% (95% Cl 22.00-56.00), comprising 2 (5.88%) complete responses and 11 (32.35%) partial responses.
|
||||
| Other Endpoint |
In the second- or third-line group,median duration of response was 13.80 months, median progression-free survival was 5.60 months.
|
||||
| Experiment 4 Reporting the Activity Date of This ADC | [29] | ||||
| Efficacy Data | Objective Response Rate (ORR) |
54.55% (first-line treatment group)
|
High Tissue factor expression (TF+++; >300,000 TF molecules/cell) | ||
| Patients Enrolled |
Recurrent/metastatic cervical cancer (r/mCC).
|
||||
| Administration Dosage |
20 mg/kg + carbo AUC 5 IV every 3 weeks (Q3W).
|
||||
| Related Clinical Trial | |||||
| NCT Number | NCT03786081 | Phase Status | Phase 1b/2 | ||
| Clinical Description |
A phase 1b/2 open-label trial of tisotumab vedotin (HuMax-TF-ADC) monotherapy and in combination with other agents in subjects with recurrent or stage IVB cervical cancer.
|
||||
| Primary Endpoint |
In the first-line treatment group, objective response rate= 54.55%, comprising 4 (12.12%) complete responses and 14 (42.42%) partial responses.
|
||||
| Other Endpoint |
In the first-line treatment group, median duration of response=83 months,median progression-free survival was 95 months.
|
||||
| Experiment 5 Reporting the Activity Date of This ADC | [32] | ||||
| Efficacy Data | Objective Response Rate (ORR) |
15.65% (all patients)
26.67% (Bladder cancer) 26.47% (Cervical cancer) 7.14% (Endometrial cancer) 13.33% (Oesophageal cancer) 13.33% (NSCLC) 13.89% (Ovarian cancer) |
Low Tissue factor expression (TF+; <15,000 TF molecules/cell) | ||
| Patients Enrolled |
Relapsed, advanced, or metastatic cancer of the ovary, cervix, endometrium, bladder, prostate, oesophagus, squamous cell carcinoma of the head and neck or non-small-cell lung cancer; an Eastern Cooperative Oncology Group performance status of 0-1; and had relapsed after or were not eligible to receive the available standard of care.
|
||||
| Administration Dosage |
0.3 and 2.2 mg/kg intravenously once every 3 weeks in a traditional 3+3 design.
|
||||
| Related Clinical Trial | |||||
| NCT Number | NCT02001623 | Phase Status | Phase 1/2 | ||
| Clinical Description |
First-in-human, dose-escalating safety study of tissue factor specific antibody drug conjugate tisotumab vedotin (HuMax TF ADC) in patients with locally advanced and/or metastatic solid tumors known to express tissue factor.
|
||||
| Primary Endpoint |
OrR of all patients=15.65% (23/147, 95% Cl 10.20-22.00), ORR of Bladder cancer=26.67% (4/15, 95% Cl 7.80-55.10), ORR of Cervical cancer=26.47% (9/34, 95% Cl 12.90-44.40), ORR of Endometrial cancer=7.14% (1/14, 95% Cl 0.20-33.90), ORR of Oesophageal cancer=13.33% (2/15, 95% Cl 1.70-40.50), ORR of NSCLC=13.33% (2/15, 95% Cl 1.70-40.50), ORR of Ovarian cancer=13.89% (5/36, 95% Cl 4.70-29.50).
Click to Show/Hide
|
||||
| Experiment 6 Reporting the Activity Date of This ADC | [33] | ||||
| Efficacy Data | Objective Response Rate (ORR) |
24.00%
|
High Tissue factor expression (TF+++; IHC H-score=250) | ||
| Patients Enrolled |
Cervical cancer.
|
||||
| Administration Dosage |
20 mg/kg every 3 weeks.
|
||||
| Related Clinical Trial | |||||
| NCT Number | NCT02001623 | Phase Status | Phase 1/2 | ||
| Clinical Description |
First-in-human, dose-escalating safety study of tissue factor specific antibody drug conjugate tisotumab vedotin (HuMax TF ADC) in patients with locally advanced and/or metastatic solid tumors known to express tissue factor.
|
||||
| Primary Endpoint |
Objective response rate=24.00% (95% Cl 13.00%-37.00%).
|
||||
| Other Endpoint |
Median duration of response was 4.20 months (range: 1.00-9.70 months), comprising four patients responding for > 8 months Six-month progression-free survival was 29.00% (95% CI 17.00-43.00).
|
||||
| Experiment 7 Reporting the Activity Date of This ADC | [34] | ||||
| Efficacy Data | Objective Response Rate (ORR) |
29.41%
|
Positive Tissue factor expression (TF+++/++; 380,000 TF receptor copy number) | ||
| Patients Enrolled |
Recurrent/metastatic cervical cancer (r/mCC).
|
||||
| Administration Dosage |
15 or 20 mg/kg once every 3 weeks.
|
||||
| Related Clinical Trial | |||||
| NCT Number | NCT03913741 | Phase Status | Phase 1/2 | ||
| Clinical Description |
Open label phase 1/2 trial of tisotumab vedotin in japanese subjects with advanced solid malignancies.
|
||||
| Primary Endpoint |
OrR (CR+PR)=29.41% (95% Cl, 10.30-56.00), Disease Control Rate (DCR)=70.60% (95% Cl 44.00-89.70), CR=0/17 (0%), PR=5/17 (29.41%), SD=7/17 (41.17%), PD=2/17 (11.76%).
|
||||
| Other Endpoint |
Median TTR=12 months (range, 11-27 months), median DOR=7.10 months (range, 3.10 months to not reached), median OS=11.4 months (95% Cl 6.2 -not reached) Kaplan-Meier estimates showed that the percentages of patients with an OS 6 months and 12 months were 81.60% (95% CI, 53.00-93.70) and 25.70% (95% CI, 16.00-63.90), respectively.
|
||||
| Experiment 8 Reporting the Activity Date of This ADC | [4] | ||||
| Related Clinical Trial | |||||
| NCT Number | NCT04697628 | Phase Status | Phase 3 | ||
| Clinical Description |
A randomized, open-label, phase 3 trial of tisotumab vedotin vs investigator's choice chemotherapy in second- or third-line recurrent or metastatic cervical cancer.
|
||||
| Experiment 9 Reporting the Activity Date of This ADC | [4] | ||||
| Related Clinical Trial | |||||
| NCT Number | NCT03657043 | Phase Status | Phase 2 | ||
| Clinical Description |
Open label phase 2 study of tisotumab vedotin for patients with platinum-resistant ovarian cancer with a safety run-in of a dose-dense regimen.
|
||||
| Experiment 10 Reporting the Activity Date of This ADC | [4] | ||||
| Related Clinical Trial | |||||
| NCT Number | NCT03485209 | Phase Status | Phase 2 | ||
| Clinical Description |
Open label phase 2 study of tisotumab vedotin for locally advanced or metastatic disease in solid tumors.
|
||||
| Experiment 11 Reporting the Activity Date of This ADC | [4] | ||||
| Related Clinical Trial | |||||
| NCT Number | NCT02552121 | Phase Status | Phase 1/2 | ||
| Clinical Description |
Dose-escalating and cohort expansion safety trial of tissue factor specific antibody drug conjugate tisotumab vedotin (HuMax-TF-ADC) in patients with locally advanced and/or metastatic solid tumors known to express tissue factor.
|
||||
Discovered Using Patient-derived Xenograft Model
| Experiment 1 Reporting the Activity Date of This ADC | [81] | ||||
| Efficacy Data | Tumor Growth Inhibition value (TGI) |
72.00% (Day 46)
|
High Tissue factor expression (TF+++; >300,000 TF molecules/cell) | ||
| Method Description |
TF-positive patient-derived xenograft (PDX) models were performed in athymic nude mice to evaluate the efficacy of the ADCs in vivo. Study animals were implanted unilaterally on the left flank with tumor fragments. Animals were randomized and treated as indicated in the figures. Animals were removed from study and euthanized once tumor size reached 1,200 mm3 or skin ulceration was evident. In addition, the MTV curve for the treatment group in question was no longer shown once an animal was removed from study due to size TGI and statistical analyses were conducted in the same manner as for the CDX studies. The CR and PR response definitions were as follows for the PDX studies: a PR responder had a MTV 30% of MTV at day 1 for two consecutive measurements; a CR responder had an undetectable MTV for two consecutive measurement IHC analisys: Formalin-fixed paraffin-embedded (FFPE) tissues were sectioned at 4-m thickness and mounted onto positive-charged glass slides The tissue sections were stained with the anti-TF antibody HTF-1 ADC treatment started on day 1 after animals with a tumor size of approximately 190 mm3 The model dosed weekly at 25 mg/kg for 3 weeks.
Click to Show/Hide
|
||||
| In Vivo Model | Patient-derived xenograft (PDX) ovarian carcinomamodel | ||||
| Experiment 2 Reporting the Activity Date of This ADC | [81] | ||||
| Efficacy Data | Tumor Growth Inhibition value (TGI) |
100.00% (Day 60)
|
Low Tissue factor expression (TF+; <15,000 TF molecules/cell) | ||
| Method Description |
TF-positive patient-derived xenograft (PDX) models were performed in athymic nude mice to evaluate the efficacy of the ADCs in vivo. Study animals were implanted unilaterally on the left flank with tumor fragments. Animals were randomized and treated as indicated in the figures. Animals were removed from study and euthanized once tumor size reached 1,200 mm3 or skin ulceration was evident. In addition, the MTV curve for the treatment group in question was no longer shown once an animal was removed from study due to size TGI and statistical analyses were conducted in the same manner as for the CDX studies. The CR and PR response definitions were as follows for the PDX studies: a PR responder had a MTV 30% of MTV at day 1 for two consecutive measurements; a CR responder had an undetectable MTV for two consecutive measurement IHC analisys: Formalin-fixed paraffin-embedded (FFPE) tissues were sectioned at 4-m thickness and mounted onto positive-charged glass slides The tissue sections were stained with the anti-TF antibody HTF-1 ADC treatment started on day 1 after animals with a tumor size of approximately 210 mm3 The model dosed weekly at 5 mg/kg for 2 weeks.
Click to Show/Hide
|
||||
| In Vivo Model | Patient-derived head and neck carcinoma xenograft (PDX) model | ||||
| Experiment 3 Reporting the Activity Date of This ADC | [81] | ||||
| Efficacy Data | Tumor Growth Inhibition value (TGI) |
100.00% (Day 46)
|
Positive Tissue factor expression (TF+++/++; 570,000 TF receptor copy number) | ||
| Method Description |
TF-positive patient-derived xenograft (PDX) models were performed in athymic nude mice to evaluate the efficacy of the ADCs in vivo. Study animals were implanted unilaterally on the left flank with tumor fragments. Animals were randomized and treated as indicated in the figures. Animals were removed from study and euthanized once tumor size reached 1,200 mm3 or skin ulceration was evident. In addition, the MTV curve for the treatment group in question was no longer shown once an animal was removed from study due to size TGI and statistical analyses were conducted in the same manner as for the CDX studies. The CR and PR response definitions were as follows for the PDX studies: a PR responder had a MTV 30% of MTV at day 1 for two consecutive measurements; a CR responder had an undetectable MTV for two consecutive measurement IHC analisys: Formalin-fixed paraffin-embedded (FFPE) tissues were sectioned at 4-m thickness and mounted onto positive-charged glass slides The tissue sections were stained with the anti-TF antibody HTF-1 ADC treatment started on day 1 after animals with a tumor size of approximately 140 mm3 The model dosed weekly at 4 mg/kg for 3 weeks.
Click to Show/Hide
|
||||
| In Vivo Model | Patient-derived gastric adenocarcinoma xenograft (PDX) model | ||||
Discovered Using Cell Line-derived Xenograft Model
| Experiment 1 Reporting the Activity Date of This ADC | [81] | ||||
| Efficacy Data | Tumor Growth Inhibition value (TGI) |
71.40% (Day 20)
|
High Tissue factor expression (TF+++; >300,000 TF molecules/cell) | ||
| Method Description |
Cell line-derived xenograft models were established in female SCID mice by subcutaneous injection of 5x10⁶ (A431) tumor cells, and treatment with 3 mg/kg TF-ADCs (four injections in 2 weeks) was initiated at day 11 after tumor inoculationDetermined tumor volume after the experiment.
|
||||
| In Vivo Model | A431 cell line xenograft model | ||||
| In Vitro Model | Skin squamous cell carcinoma | A431 cells | CVCL_0037 | ||
| Experiment 2 Reporting the Activity Date of This ADC | [81] | ||||
| Efficacy Data | Tumor Growth Inhibition value (TGI) |
76.60% (Day 20)
|
Low FOLR1 expression (FOLR1+) | ||
| Method Description |
Cell line-derived xenograft models were established in female SCID mice by subcutaneous injection of 05x106 (HCT-116) tumor cells, and treatment with 3 mg/kg TF-ADCs (four injections in 2 weeks) was initiated at day 7 after tumor inoculationDetermined tumor volume after the experiment.
|
||||
| In Vivo Model | HCT-116 cell line xenograft model | ||||
| In Vitro Model | Colon carcinoma | HCT 116 cells | CVCL_0291 | ||
| Experiment 3 Reporting the Activity Date of This ADC | [86] | ||||
| Efficacy Data | Tumor Growth Inhibition value (TGI) |
100.00% (Day 59)
|
Low FOLR1 expression (FOLR1+) | ||
| Method Description |
Cell line-derived xenograft (CDX) models The A431 epidermoid carcinoma and the HPAF-II pancreatic carcinoma cell lines were implanted subcutaneously in the flank of athymic nude mice Animals were removed from study and euthanized once tumor size reached 1200 mm3 or skin ulceration was evident ADC was dosed weekly at 5 mg/kg for 3 weeks.
|
||||
| In Vivo Model | HPAF-II xenograft model | ||||
| In Vitro Model | Pancreatic ductal adenocarcinoma | HPAF-II cells | CVCL_0313 | ||
| Experiment 4 Reporting the Activity Date of This ADC | [81] | ||||
| Efficacy Data | Tumor Growth Inhibition value (TGI) |
100.00% (Day 20)
|
Low FOLR1 expression (FOLR1+) | ||
| Method Description |
Cell line-derived xenograft models were established in female SCID mice by subcutaneous injection of 2-10 x106 (HPAF-II) tumor cells, and treatment with 3 mg/kg TF-ADCs (four injections in 2 weeks) was initiated at day 13 after tumor inoculationDetermined tumor volume after the experiment.
|
||||
| In Vivo Model | HPAF-II cell line xenograft model | ||||
| In Vitro Model | Pancreatic ductal adenocarcinoma | HPAF-II cells | CVCL_0313 | ||
Revealed Based on the Cell Line Data
| Experiment 1 Reporting the Activity Date of This ADC | [86] | ||||
| Efficacy Data | Half Maximal Inhibitory Concentration (IC50) |
5.00 nM
|
|||
| Method Description |
To evaluate ADC cytotoxicity, cells were plated in 384-well plates Anti-TF antibodies conjugated to MC-vc-PAB-MMAE were serially diluted as shown Plates were incubated for 3 days, followed by lysis in CTG assay reagent For each ADC, the IC50 and its associated 95% confidence interval (95% CI) were calculated Titrations of the TF-specific ADCs were added to A431 cells, with a 72-hour incubationThis treatment resulted in efficacious cell killing.
Click to Show/Hide
|
||||
| In Vitro Model | Erythroleukemia | HEL 92.1.7 cells (Multidrug resistance) | CVCL_2481 | ||
| Experiment 2 Reporting the Activity Date of This ADC | [95] | ||||
| Efficacy Data | Half Maximal Effective Concentration (EC50) |
14.00 nM
|
|||
| Method Description |
A431 cells were pre-incubated for 30 min without or with 50 nM of FVIIa prior to the addition of an anti-TF ADC (Tisotumab Vedotin-tftv) titration After a 4 h incubation at 37°C, the FVIIa and ADC were washed out and the cells were cultured for another 68 h before cell viability assessment.
|
||||
| In Vitro Model | Skin squamous cell carcinoma | A431 cells | CVCL_0037 | ||
| Experiment 3 Reporting the Activity Date of This ADC | [95] | ||||
| Efficacy Data | Half Maximal Effective Concentration (EC50) |
14.00 nM
|
|||
| Method Description |
Cytotoxicity assay in vitroCells were seeded in 96-well plates (2,500-5,000 cells/well) and incubated for 6 hours (37°C), before adding ADCs After 3 to 5 days (37°C), the viability of the culture was assessed Staurosporine ( 10 ug/mL) was used a positive control (100% cell death) and untreated cells were used as a negative control.
|
||||
| In Vitro Model | Skin squamous cell carcinoma | A431 cells | CVCL_0037 | ||
| Experiment 4 Reporting the Activity Date of This ADC | [95] | ||||
| Efficacy Data | Half Maximal Effective Concentration (EC50) |
14.00 nM
|
|||
| Method Description |
To evaluate ADC cytotoxicity, cells were plated in 384-well plates Anti-TF antibodies conjugated to MC-vc-PAB-MMAE were serially diluted as shown Plates were incubated for 3 days, followed by lysis in CTG assay reagent For each ADC, the IC50 and its associated 95% confidence interval (95% CI) were calculated Titrations of the TF-specific ADCs were added to A431 cells, with a 4-hour incubation followed by removal of excess ADC and culture for another 68 hours This treatment resulted in efficacious cell killing.
Click to Show/Hide
|
||||
| In Vitro Model | Skin squamous cell carcinoma | A431 cells | CVCL_0037 | ||
| Experiment 5 Reporting the Activity Date of This ADC | [81] | ||||
| Efficacy Data | Half Maximal Effective Concentration (EC50) |
411.00 ng/mL
|
|||
| Method Description |
Cytotoxicity assay in vitroCells were seeded in 96-well plates (2,500-5,000 cells/well) and incubated for 6 hours (37°C), before adding ADCs After 3 to 5 days (37°C), the viability of the culture was assessed Staurosporine ( 10 ug/mL) was used a positive control (100% cell death) and untreated cells were used as a negative control.
|
||||
| In Vitro Model | Pancreatic ductal adenocarcinoma | HPAF-II cells | CVCL_0313 | ||
| Experiment 6 Reporting the Activity Date of This ADC | [81] | ||||
| Efficacy Data | Half Maximal Effective Concentration (EC50) | > 10.00 ug/mL | |||
| Method Description |
Cytotoxicity assay in vitroCells were seeded in 96-well plates (2,500-5,000 cells/well) and incubated for 6 hours (37°C), before adding ADCs After 3 to 5 days (37°C), the viability of the culture was assessed Staurosporine ( 10 ug/mL) was used a positive control (100% cell death) and untreated cells were used as a negative control.
|
||||
| In Vitro Model | Colon carcinoma | HCT 116 cells | CVCL_0291 | ||
| Experiment 7 Reporting the Activity Date of This ADC | [81] | ||||
| Efficacy Data | Half Maximal Effective Concentration (EC50) | > 10.00 mg/mL | |||
| Method Description |
Cytotoxicity assay in vitroCells were seeded in 96-well plates (2,500-5,000 cells/well) and incubated for 6 hours (37°C), before adding ADCs After 3 to 5 days (37°C), the viability of the culture was assessed Staurosporine ( 10 ug/mL) was used a positive control (100% cell death) and untreated cells were used as a negative control.
|
||||
| In Vitro Model | Ovarian clear cell adenocarcinoma | TOV-21G cells | CVCL_3613 | ||
Disitamab vedotin [Approved]
Identified from the Human Clinical Data
| Experiment 1 Reporting the Activity Date of This ADC | [5] | ||||
| Efficacy Data | Objective Response Rate (ORR) |
24.80%
|
High HER2 expression (HER2+++; IHC 3+) | ||
| Patients Enrolled |
Locally advanced or metastatic gastric cancer with HER2-overexpression.
|
||||
| Administration Dosage |
2.50 mg/kg IV every 2 weeks.
|
||||
| Related Clinical Trial | |||||
| NCT Number | NCT04714190 | Phase Status | Phase 3 | ||
| Clinical Description |
Randomized, controlled, multicenter phase 1/2 clinical study evaluating the efficacy and safety of RC48-ADC for the treatment of locally advanced or metastatic gastric cancer with HER2-overexpression.
|
||||
| Primary Endpoint |
The ORR was 24.80% (95% confidence interval [CI]: 17.50%-33.30%).
|
||||
| Other Endpoint |
The median PFS and OS were 4.10 months (95% CI: 3.70-4.90 months) and 7.90 months (95% CI: 6.70-9.90 months), respectively. The most frequently reported adverse events were decreased white blood cell count (53.60%), asthenia (53.60%), hair loss (53.60%), decreased neutrophil count (52.00%), anemia (49.60%), and increased aspartate aminotransferase level (43.20%). Serious adverse events (SAEs) occurred in 45 (36.00%) patients, and RC48-related SAEs were mainly decreased neutrophil count (3.20%). Seven patients had adverse events that led to death were not RC48-related.
Click to Show/Hide
|
||||
| Experiment 2 Reporting the Activity Date of This ADC | [5] | ||||
| Efficacy Data | Objective Response Rate (ORR) |
24.80%
|
High HER2 expression (HER2+++; IHC 3+) | ||
| Patients Enrolled |
HER2overexpressing (IHC 2+ or 3+), locally advanced or metastatic gastric or gastroesophageal junction cancer who were under at least secondline therapy.
|
||||
| Administration Dosage |
2.50 mg/kg alone by intravenous infusion during 30-90 min (60 min is recommended) every two weeks.
|
||||
| Related Clinical Trial | |||||
| NCT Number | NCT03556345 | Phase Status | Phase 2 | ||
| Clinical Description |
A multicenter, open label single arm, phase 2 study to evaluate the effect and safety of recombinant humanized anti-HER2 monoclonal antibody-mmae conjugate for injection in HER2 overexpressing local advanced or metastatic gastric cancer.
|
||||
| Primary Endpoint |
The ORR was 24.80% (95% confidence interval [CI]: 17.50%-33.30%).
|
||||
| Experiment 3 Reporting the Activity Date of This ADC | [37] | ||||
| Efficacy Data | Objective Response Rate (ORR) |
21.05% (all)
35.71% (HER2 IHC2+/FISH-) 20.00% (IHC2+/FISH+) 13.64% (IHC3+) 15.00% (in patients who were pretreated with HER2-targeted drugs) |
|||
| Patients Enrolled |
Patients with incurable, locally advanced or metastatic solid cancers were eligible for inclusion if their tumors showed HER2 protein overexpression by IHC (3+or 2+), regardless of whether FISH was positive or negative.
|
||||
| Administration Dosage |
0.10 mg/kg, 0.50 mg/kg, 1.00 mg/kg, 1.50 mg/kg, 2.00 mg/kg, 2.50 mg/kg, 3.00 mg/kg, 3.50 mg/kg, and 4.00 mg/kg; Q3W; dose expansion proceeded at the dose of 2.00 mg/kg Q2W.
|
||||
| Related Clinical Trial | |||||
| NCT Number | NCT02881190 | Phase Status | Phase 1 | ||
| Clinical Description |
A tolerance, safety and pharmacokinetic ascending dose phase 1 study of RC48-ADC administered intravenously to subjects with HER2-positive malignant in advanced malignant solid tumors.
|
||||
| Primary Endpoint |
The MTD was unavailable due to termination of 3.0 mg/kg cohort; 2.5 mg/kg Q2W was declared the RP2D.
|
||||
| Other Endpoint |
ORR and DCR were 21.05% (12/57) and 49.12% (28/57). Notably, patients who were HER2 IHC2+/FISH- responded similarly to those who were IHC2+/FISH+and IHC3+, with ORRs of 35.71% (5/14), 20.00% (2/10), and 13.64% (3/22), respectively. In patients who were pretreated with HER2-targeted drugs, RC48 also showed promising efcacy, with ORR of 15.00% (3/20) and DCR of 45.00% (9/20).
Click to Show/Hide
|
||||
| Experiment 4 Reporting the Activity Date of This ADC | [42] | ||||
| Efficacy Data | Objective Response Rate (ORR) |
51.20%
|
|||
| Patients Enrolled |
Advanced or metastatic urothelial cancer.
|
||||
| Related Clinical Trial | |||||
| NCT Number | NCT04264936 | Phase Status | Phase 1 | ||
| Clinical Description |
A open-label, single-arm, phase 1b/2 study of RC48-ADC and JS001 to evaluate the safety and pharmacokinetics of subjects with locally advanced or metastatic urothelial cancer.
|
||||
| Primary Endpoint |
The overall confirmed ORR as assessed by the BIRC was 51.20% (95% CI: 35.50%, 66.70%).
|
||||
| Other Endpoint |
For RC48-ADC at 2.00 mg/kg, The median PFS and OS were 6.90 months (95% CI: 5.60, 8.90) and 13.90 months (95% CI: 9.10, NE), respectively.
|
||||
| Experiment 5 Reporting the Activity Date of This ADC | [44] | ||||
| Efficacy Data | Objective Response Rate (ORR) |
80.00% (1L previously untreated mUC pts)
75.00% (pts with liver mets) 100.00% (pts with HER2% (3+)) 77.80% (HER2% (2+)) 66.70% (HER2% (1+)) 50.00% (HER2% (0)) 97.10% (in pts with PD-L1 CPS1) 50.00% (in CPS < 1) |
|||
| Patients Enrolled |
HER2-positive and even negative patients (pts) with metastatic urothelial carcinoma (mUC).
|
||||
| Administration Dosage |
1.50 or 2.00 mg/kg RC48-ADC + 3 mg/kg toripalimab with the traditional 3+3 escalation design. In the expansion cohort, patients received the recommended dose of RC48-ADC + toripalimab every 2 weeks. The primary endpoints were safety/tolerability and recommended RC48-ADC dose.
|
||||
| Related Clinical Trial | |||||
| NCT Number | NCT04264936 | Phase Status | Phase 1 | ||
| Clinical Description |
A open-label, single-arm, phase 1b/2 study of RC48-ADC and JS001 to evaluate the safety and pharmacokinetics of subjects with locally advanced or metastatic urothelial cancer.
|
||||
| Primary Endpoint |
At data cutoff, confirmed investigator-assessed ORR=75.00% (95%CI: 50.90-91.30), including 15.00% CRs; DCR=95.00% (95%CI: 75.10-99.90).
|
||||
| Other Endpoint |
The ORR for 1L previously untreated mUC pts was 80.00%. The ORR for pts with liver mets was 75.00%. The ORR was 100.00% for pts with HER2 (3+), 77.80% for HER2 (2+), 66.70% for HER2 (1+), and 50.00% for HER2 (0) respectively. The ORR was 97.10% in pts with PD-L1 CPS1 and 50.00% in CPS < 1.
|
||||
Discovered Using Patient-derived Xenograft Model
| Experiment 1 Reporting the Activity Date of This ADC | [80] | ||||
| Efficacy Data | Tumor Growth Inhibition value (TGI) | ≈ 61.20% (Day 22) | Moderate HER2 expression (HER2++) | ||
| Method Description |
The inhibitory activity of RC48 against cancer cell growth was evaluated in various human cancer cell lines in vitro. The cells were treated with RC48 for 22 days.
|
||||
| In Vivo Model | Gastric cancer PDX model (PDX: Model6) | ||||
| Experiment 2 Reporting the Activity Date of This ADC | [80] | ||||
| Efficacy Data | Tumor Growth Inhibition value (TGI) | ≈ 64.50% (Day 22) | High HER2 expression (HER2+++) | ||
| Method Description |
The inhibitory activity of RC48 against cancer cell growth was evaluated in various human cancer cell lines in vitro. The cells were treated with RC48 for 22 days.
|
||||
| In Vivo Model | Gastric cancer PDX model (PDX: Model8) | ||||
| Experiment 3 Reporting the Activity Date of This ADC | [80] | ||||
| Efficacy Data | Tumor Growth Inhibition value (TGI) | ≈ 70.80% (Day 22) | High HER2 expression (HER2+++) | ||
| Method Description |
The inhibitory activity of RC48 against cancer cell growth was evaluated in various human cancer cell lines in vitro. The cells were treated with RC48 for 22 days.
|
||||
| In Vivo Model | Gastric cancer PDX model (PDX: Model9) | ||||
| Experiment 4 Reporting the Activity Date of This ADC | [80] | ||||
| Efficacy Data | Tumor Growth Inhibition value (TGI) | ≈ 81.80% (Day 22) | High HER2 expression (HER2+++) | ||
| Method Description |
The inhibitory activity of RC48 against cancer cell growth was evaluated in various human cancer cell lines in vitro. The cells were treated with RC48 for 22 days.
|
||||
| In Vivo Model | Gastric cancer PDX model (PDX: Model3) | ||||
| Experiment 5 Reporting the Activity Date of This ADC | [80] | ||||
| Efficacy Data | Tumor Growth Inhibition value (TGI) | ≈ 89.60% (Day 22) | High HER2 expression (HER2+++) | ||
| Method Description |
The inhibitory activity of RC48 against cancer cell growth was evaluated in various human cancer cell lines in vitro. The cells were treated with RC48 for 22 days.
|
||||
| In Vivo Model | Gastric cancer PDX model (PDX: Model5) | ||||
| Experiment 6 Reporting the Activity Date of This ADC | [80] | ||||
| Efficacy Data | Tumor Growth Inhibition value (TGI) | ≈ 94.00% (Day 22) | High HER2 expression (HER2+++; IHC 3+) | ||
| Method Description |
The inhibitory activity of RC48 against cancer cell growth was evaluated in various human cancer cell lines in vitro. The cells were treated with RC48 for 22 days.
|
||||
| In Vivo Model | Gastric cancer PDX model (PDX: Model7) | ||||
| Experiment 7 Reporting the Activity Date of This ADC | [80] | ||||
| Efficacy Data | Tumor Growth Inhibition value (TGI) | ≈ 100.00% (Day 22) | High HER2 expression (HER2+++) | ||
| Method Description |
The inhibitory activity of RC48 against cancer cell growth was evaluated in various human cancer cell lines in vitro. The cells were treated with RC48 for 22 days.
|
||||
| In Vivo Model | Gastric cancer PDX model (PDX: Model1) | ||||
| Experiment 8 Reporting the Activity Date of This ADC | [80] | ||||
| Efficacy Data | Tumor Growth Inhibition value (TGI) | ≈ 100.00% (Day 22) | High HER2 expression (HER2+++) | ||
| Method Description |
The inhibitory activity of RC48 against cancer cell growth was evaluated in various human cancer cell lines in vitro. The cells were treated with RC48 for 22 days.
|
||||
| In Vivo Model | Gastric cancer PDX model (PDX: Model2) | ||||
| Experiment 9 Reporting the Activity Date of This ADC | [80] | ||||
| Efficacy Data | Tumor Growth Inhibition value (TGI) | ≈ 100.00% (Day 22) | Moderate HER2 expression (HER2++) | ||
| Method Description |
The inhibitory activity of RC48 against cancer cell growth was evaluated in various human cancer cell lines in vitro. The cells were treated with RC48 for 22 days.
|
||||
| In Vivo Model | Gastric cancer PDX model (PDX: Model4) | ||||
Discovered Using Cell Line-derived Xenograft Model
| Experiment 1 Reporting the Activity Date of This ADC | [89] | ||||
| Efficacy Data | Half Maximal Inhibitory Concentration (IC50) |
90.00 ng/mL
|
Low HER2 expression (HER2+; IHC 1+) | ||
| Method Description |
The inhibitory activity of RC48 against cancer cell growth was evaluated in various human cancer cell lines in vitro. The cells were treated with PBS, ADC (5 mg/kg), PD-1 antibody (10 mg/kg), or their combination (ADC+PD-1 antibody or ADC+PD-L1 antibody) for 10 days.
|
||||
| In Vivo Model | Triple-negative breast cancer cell line E0771-hHER2 xenograft model | ||||
| In Vitro Model | Mammary gland malignant neoplasms | EO771 cells | CVCL_GR23 | ||
| Experiment 2 Reporting the Activity Date of This ADC | [80] | ||||
| Efficacy Data | Half Maximal Inhibitory Concentration (IC50) |
0.80 ug/mL
|
High HER2 expression (HER2+++) | ||
| Method Description |
The inhibitory activity of RC48 against cancer cell growth was evaluated in various human cancer cell lines in vitro. The cells were treated with RC48 for 72 h.
|
||||
| In Vitro Model | Gastric tubular adenocarcinoma | NCI-N87 cells | CVCL_1603 | ||
| Experiment 3 Reporting the Activity Date of This ADC | [80] | ||||
| Efficacy Data | Half Maximal Inhibitory Concentration (IC50) |
1.30 ug/mL
|
High HER2 expression (HER2+++; IHC 3+) | ||
| Method Description |
The inhibitory activity of RC48 against cancer cell growth was evaluated in various human cancer cell lines in vitro. The cells were treated with RC48 for 72 h.
|
||||
| In Vitro Model | Gastric tubular adenocarcinoma | SNU-216 cells | CVCL_3946 | ||
| Experiment 4 Reporting the Activity Date of This ADC | [80] | ||||
| Efficacy Data | Half Maximal Inhibitory Concentration (IC50) |
3.80 ug/mL
|
Moderate HER2 expression (HER2++; IHC 2+) | ||
| Method Description |
The inhibitory activity of RC48 against cancer cell growth was evaluated in various human cancer cell lines in vitro. The cells were treated with RC48 for 72 h.
|
||||
| In Vitro Model | Gastric signet ring cell adenocarcinoma | NUGC-4 cells | CVCL_3082 | ||
| Experiment 5 Reporting the Activity Date of This ADC | [80] | ||||
| Efficacy Data | Half Maximal Inhibitory Concentration (IC50) |
52.40 ug/mL
|
Moderate HER2 expression (HER2++; IHC 2+) | ||
| Method Description |
The inhibitory activity of RC48 against cancer cell growth was evaluated in various human cancer cell lines in vitro. The cells were treated with RC48 for 72 h.
|
||||
| In Vitro Model | Gastric carcinoma | HGC-27 cells | CVCL_1279 | ||
Revealed Based on the Cell Line Data
| Experiment 1 Reporting the Activity Date of This ADC | [92] | ||||
| Efficacy Data | Half Maximal Inhibitory Concentration (IC50) |
4.91 ng/mL
|
High HER2 expression (HER2+++) | ||
| Method Description |
To test the anti-tumor effect of single drug, SK-BR-3, NCI-N87 and SK-OV-3 cells were selected for viability analysis following 72 h incubation with or without RC48ADC which was dispersed in a concentration gradient.
|
||||
| In Vitro Model | Breast adenocarcinoma | SK-BR-3 cells | CVCL_0033 | ||
| Experiment 2 Reporting the Activity Date of This ADC | [92] | ||||
| Efficacy Data | Half Maximal Inhibitory Concentration (IC50) |
11.28 ng/mL
|
High HER2 expression (HER2+++) | ||
| Method Description |
To test the anti-tumor effect of single drug, SK-BR-3, NCI-N87 and SK-OV-3 cells were selected for viability analysis following 72 h incubation with or without RC48ADC which was dispersed in a concentration gradient.
|
||||
| In Vitro Model | Ovarian serous cystadenocarcinoma | SK-OV-3 cells | CVCL_0532 | ||
| Experiment 3 Reporting the Activity Date of This ADC | [92] | ||||
| Efficacy Data | Half Maximal Inhibitory Concentration (IC50) |
14.54 ng/mL
|
High HER2 expression (HER2+++) | ||
| Method Description |
To test the anti-tumor effect of single drug, SK-BR-3, NCI-N87 and SK-OV-3 cells were selected for viability analysis following 72 h incubation with or without RC48ADC which was dispersed in a concentration gradient.
|
||||
| In Vitro Model | Gastric tubular adenocarcinoma | NCI-N87 cells | CVCL_1603 | ||
Enfortumab vedotin [Approved]
Identified from the Human Clinical Data
| Experiment 1 Reporting the Activity Date of This ADC | [9] | ||||
| Efficacy Data | Objective Response Rate (ORR) |
73.30%
|
|||
| Patients Enrolled |
Histologically documented locally advanced/metastatic urothelial carcinoma (la/mUC) (including squamous differentiation and mixed cell types), an Eastern Cooperative Oncology Group performance status score of 0 or 1 (on a 5-point scale; higher scores indicate greater disability), and an investigator-assessed life expectancy of 3 or more months.
|
||||
| Administration Dosage |
1.25 mg/kg once daily on days 1 and 8 intravenously once daily in 3-week cycles.
|
||||
| Related Clinical Trial | |||||
| NCT Number | NCT04223856 | Phase Status | Phase 3 | ||
| Clinical Description |
An open-label, randomized, controlled phase 3 study of enfortumab vedotin in combination with pembrolizumab versus chemotherapy alone in previously untreated locally advanced or metastatic urothelial cancer.
|
||||
| Primary Endpoint |
Safety: Seven patients (15.60%) experienced a serious TRAE, with no serious TRAE occurring more than once. TRAEs led to dose reductions in 14 (31.10%) patients and discontinuations in 11 (24.40%) patients and were not mutually exclusive. Peripheral sensory neuropathy was the most common TRAE leading to either dose reduction (six patients, 13.30%) or treatment discontinuation (four patients, 8.90%). No patients discontinued therapy because of a skin reaction or hyperglycemia. One patient (2.20%) died because of a TRAE (multiple organ dysfunction syndrome).
Click to Show/Hide
|
||||
| Other Endpoint |
The confirmed objective response rate after a median of nine cycles was 73.30% with a complete response rate of 15.60%. The median DOR and median OS were 25.60 months and 26.10 months, respectively.
|
||||
| Experiment 2 Reporting the Activity Date of This ADC | [16] | ||||
| Efficacy Data | Objective Response Rate (ORR) |
44.00%
|
High Nectin-4 expression (NECTIN4+++) | ||
| Patients Enrolled |
Locally advanced or metastatic urothelial carcinoma who were previously treated with platinum chemotherapy and antiPD-1/L1 therapy.
|
||||
| Administration Dosage |
1.25 mg/kg (intravenously on days 1, 8, and 15 of every 28-day cycle).
|
||||
| Related Clinical Trial | |||||
| NCT Number | NCT03219333 | Phase Status | Phase 2 | ||
| Clinical Description |
A single-arm, open-label, multicenter study of enfortumab vedotin (ASG-22CE) for Treatment of patients with locally advanced or metastatic urothelial cancer who previously received immune checkpoint inhibitor (CPI) Therapy.
|
||||
| Primary Endpoint |
Confirmed objective response rate was 44.00% (95% CI, 35.10% to 53.20%), including 12.00% complete responses.
|
||||
| Other Endpoint |
Median duration of response was 7.60 months (range, 0.95 to 11.30 months).
|
||||
| Experiment 3 Reporting the Activity Date of This ADC | [18] | ||||
| Efficacy Data | Objective Response Rate (ORR) |
51.68%
|
High Nectin-4 expression (NECTIN4+++) | ||
| Patients Enrolled |
Locally advanced or metastatic urothelial carcinoma previously treated with PD-1 or PD-L1 inhibitors; an Eastern Cooperative Oncology Group performance status score of 2 or less who were considered ineligible for cisplatin at enrolment and who had not received platinum-containing chemotherapy in the locally advanced or metastatic setting.
|
||||
| Administration Dosage |
Intravenously at a dose of 1.25 mg/kg on days 1, 8, and 15 of every 28-day cycle.
|
||||
| Related Clinical Trial | |||||
| NCT Number | NCT03219333 | Phase Status | Phase 2 | ||
| Clinical Description |
A single-arm, open-label, multicenter study of enfortumab vedotin (ASG-22CE) for treatment of patients with locally advanced or metastatic urothelial cancer who previously received immune checkpoint inhibitor (CPI) therapy.
|
||||
| Primary Endpoint |
The confirmed objective response rate was 51.68% (46 of 89 patients; 95% CI 41.00-62.00), with 18 (20.22%) of 89 patients achieving a complete response and 28 (31.46%) achieving a partial response.
|
||||
| Other Endpoint |
Duration of response, progression-free survival, objective response rate, overall survival, safety, and tolerability, plasma or serum pharmacokinetic parameters of enfortumab vedotin, MMAE, and total antibody, and incidence of antitherapeutic antibody to enfortumab vedotin.
|
||||
| Experiment 4 Reporting the Activity Date of This ADC | [38] | ||||
| Efficacy Data | Objective Response Rate (ORR) |
35.30%
|
Moderate Nectin-4 expression (NECTIN4++) | ||
| Patients Enrolled |
Histologically confirmed, locally advanced or metastatic transitional cell carcinoma of the urothelium (ie, cancer of the bladder, renal pelvis, ureter, or urethra), or UC with squamous differentiation or mixed cell types and an Eastern Cooperative Oncology Group (ECOG) performance status of 0 or 1.
|
||||
| Administration Dosage |
1.00 mg/kg (Arm A) or 1.25 mg/kg (Arm B) on Days 1, 8, and 15 of each 28-day cycle.
|
||||
| Related Clinical Trial | |||||
| NCT Number | NCT03070990 | Phase Status | Phase 1 | ||
| Clinical Description |
An open-label, randomized, phase 1 safety and pharmacokinetic study of enfortumab vedotin (ASG-22CE) in Japanese patients with locally advanced or metastatic urothelial carcinoma.
|
||||
| Primary Endpoint |
Safety/tolerability of EV, EV PK profile.
|
||||
| Experiment 5 Reporting the Activity Date of This ADC | [40] | ||||
| Efficacy Data | Objective Response Rate (ORR) |
43.00%
|
High Nectin-4 expression (NECTIN4+++) | ||
| Patients Enrolled |
Nectin-4positive solid tumors, including mUC, who progressed on 1 prior chemotherapy regimen or who were ineligible for cisplatin chemotherapy.
|
||||
| Administration Dosage |
Weight-based doses (0.50, 0.75, 1.00, and 1.25 mg/kg) through 30-minute infusion on days 1, 8, and 15 of a 28-day cycle.
|
||||
| Related Clinical Trial | |||||
| NCT Number | NCT02091999 | Phase Status | Phase 1 | ||
| Clinical Description |
A phase 1 study of the safety and pharmacokinetics of escalating doses of ASG-22CE given as monotherapy in subjects with metastatic urothelial cancer and other malignant solid tumors that express nectin-4.
|
||||
| Primary Endpoint |
The determination of safety/tolerability, recommended phase II dose (RP2D), and pharmacokinetic (PK) profile of EV.
|
||||
| Other Endpoint |
Antitumor activity,including confirmed investigator-assessed ORR (RECIST version 1.1), duration of response (DoR), progression-free survival (PFS), and overall survival (OS).
|
||||
| Experiment 6 Reporting the Activity Date of This ADC | [72] | ||||
| Patients Enrolled |
Histologically or cytologically confirmed urothelial carcinoma (including differentiation in squamous cells or in multiple cell types), radiologically documented metastatic or unresectable locally advanced disease at baseline, and an Eastern Cooperative Oncology Group (ECOG) performance-status score of 0 or 1 (scores range from 0 to 4, with higher scores indicating greater disability).
Click to Show/Hide
|
||||
| Administration Dosage |
Intravenous infusion over 30 minutes on days 1, 8, and 15 of a 28-day cycle.
|
||||
| Related Clinical Trial | |||||
| NCT Number | NCT03474107 | Phase Status | Phase 3 | ||
| Clinical Description |
An open-label, randomized phase 3 study to evaluate enfortumab vedotin vs chemotherapy in subjects with previously treated locally advanced or metastatic urothelial cancer (EV-301).
|
||||
| Primary Endpoint |
Overall survival was prolonged with enfortumab vedotin compared with chemotherapy (HR=0.70 [95% CI: 0.56-0.89];.
|
||||
| Other Endpoint |
Median overall survival: 12.88 vs 8.97 months, respectively). Progression-free survival was also longer in the enfortumab vedotin group compared with the chemotherapy group (HR=0.62 [95% CI: 0.51-0.75]; P<0.00001; median progression-free survival: 5.55 vs 3.71 months, respectively).
|
||||
Discovered Using Patient-derived Xenograft Model
| Experiment 1 Reporting the Activity Date of This ADC | [79] | ||||
| Efficacy Data | Tumor Growth Inhibition value (TGI) | ≈ 30.80% (Day 18) | High Nectin-4 expression (NECTIN4+++) | ||
| Method Description |
AGS-22M6E induces efficient tumor cell killing in PDX models of a bladder cancer cell with Nectin-4 high expression, dosed every 4 days at 0.4 mg/kg for 5 times.
|
||||
| In Vivo Model | Bladder cancer PDX model (PDX: AG-B1) | ||||
| Experiment 2 Reporting the Activity Date of This ADC | [79] | ||||
| Efficacy Data | Tumor Growth Inhibition value (TGI) | ≈ 33.90% (Day 24) | Moderate Nectin-4 expression (NECTIN4++) | ||
| Method Description |
AGS-22M6E induces efficient tumor cell killing in PDX models of a pancreatic cancer cell with Nectin-4 moderate expression, dosed every 4 days at 1 mg/kg for 6 times.
|
||||
| In Vivo Model | Pancreatic cancer PDX model (PDX: AG-Panc4) | ||||
| Experiment 3 Reporting the Activity Date of This ADC | [79] | ||||
| Efficacy Data | Tumor Growth Inhibition value (TGI) | ≈ 45.00% (Day 24) | High Nectin-4 expression (NECTIN4+++) | ||
| Method Description |
AGS-22M6E induces efficient tumor cell killing in PDX models of a breast cancer cell with Nectin-4 high expression, dosed every 4 days at 1 mg/kg for 6 times.
|
||||
| In Vivo Model | Breast cancer PDX model (PDX: AG-Br7) | ||||
| Experiment 4 Reporting the Activity Date of This ADC | [79] | ||||
| Efficacy Data | Tumor Growth Inhibition value (TGI) | ≈ 68.80% (Day 24) | Moderate Nectin-4 expression (NECTIN4++) | ||
| Method Description |
AGS-22M6E induces efficient tumor cell killing in PDX models of a pancreatic cancer cell with Nectin-4 moderate expression, dosed every 4 days at 3 mg/kg for 6 times.
|
||||
| In Vivo Model | Pancreatic cancer PDX model (PDX: AG-Panc4) | ||||
| Experiment 5 Reporting the Activity Date of This ADC | [79] | ||||
| Efficacy Data | Tumor Growth Inhibition value (TGI) | ≈ 80.70% (Day 18) | High Nectin-4 expression (NECTIN4+++) | ||
| Method Description |
AGS-22M6E induces efficient tumor cell killing in PDX models of a bladder cancer cell with Nectin-4 high expression, dosed every 4 days at 0.8 mg/kg for 5 times.
|
||||
| In Vivo Model | Bladder cancer PDX model (PDX: AG-B1) | ||||
| Experiment 6 Reporting the Activity Date of This ADC | [79] | ||||
| Efficacy Data | Tumor Growth Inhibition value (TGI) | ≈ 93.80% (Day 24) | High Nectin-4 expression (NECTIN4+++) | ||
| Method Description |
AGS-22M6E induces efficient tumor cell killing in PDX models of a breast cancer cell with Nectin-4 high expression, dosed every 4 days at 3 mg/kg for 6 times.
|
||||
| In Vivo Model | Breast cancer PDX model (PDX: AG-Br7) | ||||
| Experiment 7 Reporting the Activity Date of This ADC | [79] | ||||
| Efficacy Data | Tumor Growth Inhibition value (TGI) | ≈ 97.60% (Day 18) | High Nectin-4 expression (NECTIN4+++) | ||
| Method Description |
AGS-22M6E induces efficient tumor cell killing in orthotopic PDX models of a breast cancer cell with Nectin-4 high expression, established in mammary fat pads of SCID mice, dosed single 10 mg/kg.
|
||||
| In Vivo Model | Breast cancer orthotopic PDX model (PDX: AG-Br7) | ||||
| Experiment 8 Reporting the Activity Date of This ADC | [79] | ||||
| Efficacy Data | Tumor Growth Inhibition value (TGI) | ≈ 97.70% (Day 18) | High Nectin-4 expression (NECTIN4+++) | ||
| Method Description |
AGS-22M6E induces efficient tumor cell killing in orthotopic PDX models of a breast cancer cell with Nectin-4 high expression, established in mammary fat pads of SCID mice, dosed twice 5 mg/kg.
|
||||
| In Vivo Model | Breast cancer orthotopic PDX model (PDX: AG-Br7) | ||||
| Experiment 9 Reporting the Activity Date of This ADC | [79] | ||||
| Efficacy Data | Tumor Growth Inhibition value (TGI) | ≈ 98.70% (Day 18) | High Nectin-4 expression (NECTIN4+++) | ||
| Method Description |
AGS-22M6E induces efficient tumor cell killing in PDX models of a bladder cancer cell with Nectin-4 high expression, single 4 mg/kg dose.
|
||||
| In Vivo Model | Bladder cancer PDX model (PDX: AG-B1) | ||||
Discovered Using Cell Line-derived Xenograft Model
| Experiment 1 Reporting the Activity Date of This ADC | [79] | ||||
| Efficacy Data | Tumor Growth Inhibition value (TGI) | ≈ 26.00% (Day 18) | High Nectin-4 expression (NECTIN4+++) | ||
| Method Description |
AGS-22M6E induces efficient tumor cell killing in PDX models of a lung adenocarcinoma cell with Nectin-4 high expression, dosed every 4 days at 1 mg/kg for 5 times.
|
||||
| In Vivo Model | NCI-H322M CDX model | ||||
| In Vitro Model | Minimally invasive lung adenocarcinoma | NCI-H322M cells | CVCL_1557 | ||
| Experiment 2 Reporting the Activity Date of This ADC | [79] | ||||
| Efficacy Data | Tumor Growth Inhibition value (TGI) | ≈ 83.60% (Day 18) | High Nectin-4 expression (NECTIN4+++) | ||
| Method Description |
AGS-22M6E induces efficient tumor cell killing in PDX models of a lung adenocarcinoma cell with Nectin-4 high expression, dosed every 4 days at 3 mg/kg for 5 times.
|
||||
| In Vivo Model | NCI-H322M CDX model | ||||
| In Vitro Model | Minimally invasive lung adenocarcinoma | NCI-H322M cells | CVCL_1557 | ||
Revealed Based on the Cell Line Data
| Experiment 1 Reporting the Activity Date of This ADC | [79] | ||||
| Efficacy Data | Half Maximal Inhibitory Concentration (IC50) |
1.20 ng/mL
|
|||
| Method Description |
The inhibitory activity of AGS-22M6, AGS-22M6E ADC, and an isotype control ADC were added to various cancer cell lines in vitro and cell viability was measured after 5 days.
|
||||
| In Vitro Model | Prostate carcinoma | PC-3 cells | CVCL_0035 | ||
| Experiment 2 Reporting the Activity Date of This ADC | [79] | ||||
| Efficacy Data | Half Maximal Inhibitory Concentration (IC50) |
3.40 ng/mL
|
|||
| Method Description |
The inhibitory activity of AGS-22M6, AGS-22M6E ADC, and an isotype control ADC were added to various cancer cell lines in vitro and cell viability was measured after 5 days.
|
||||
| In Vitro Model | Prostate carcinoma | PC-3 cells | CVCL_0035 | ||
| Experiment 3 Reporting the Activity Date of This ADC | [79] | ||||
| Efficacy Data | Half Maximal Inhibitory Concentration (IC50) |
4.70 ng/mL
|
|||
| Method Description |
The inhibitory activity of AGS-22M6, AGS-22M6E ADC, and an isotype control ADC were added to various cancer cell lines in vitro and cell viability was measured after 5 days.
|
||||
| In Vitro Model | Prostate carcinoma | PC-3 cells | CVCL_0035 | ||
| Experiment 4 Reporting the Activity Date of This ADC | [79] | ||||
| Efficacy Data | Half Maximal Inhibitory Concentration (IC50) |
37.80 ng/mL
|
|||
| Method Description |
The inhibitory activity of AGS-22M6, AGS-22M6E ADC, and an isotype control ADC were added to various cancer cell lines in vitro and cell viability was measured after 5 days.
|
||||
| In Vitro Model | Invasive breast carcinoma | T-47D cells | CVCL_0553 | ||
Polatuzumab vedotin [Approved]
Identified from the Human Clinical Data
| Experiment 1 Reporting the Activity Date of This ADC | [20] | ||||
| Efficacy Data | Objective Response Rate (ORR) |
54.00%
|
|||
| Patients Enrolled |
Relapsed or refractory diffuse large B-cell lymphoma or relapsed or refractory grade 13a follicular lymphoma.
|
||||
| Administration Dosage |
Either rituximab (375 mg/m2) followed by pina (2.4 mg/kg) every 21 days, or rituximab (375 mg/m2) followed by pola (2.4 mg/kg) every 21 days until disease progression or unacceptable toxicity up to 1 year.
|
||||
| Related Clinical Trial | |||||
| NCT Number | NCT01691898 | Phase Status | Phase 2 | ||
| Clinical Description |
A randomized, open-label, multicenter, phase 2 trial evaluating the safety and activity of pinatuzumab vedotin (DCDT2980S) in combination with rituximab or polatuzumab vedotin (DCDS4501A) in combination with rituximab and a non-randomized phase 1b/2 evaluation of polatuzumab vedotin in combination with obinutuzumab in patients with relapsed or refractory B-cell non-Hodgkin's lymphoma.
Click to Show/Hide
|
||||
| Primary Endpoint |
Among patients with refractory diffuse large B-cell lymphoma, complete responses and median overall survival compares favourably with immunochemotherapy regimens reported in the SCHOLAR-1 study, in which 7.00% of patients achieved a complete response and a median overall survival of 6.30 months was observed.
|
||||
| Experiment 2 Reporting the Activity Date of This ADC | [30] | ||||
| Efficacy Data | Objective Response Rate (ORR) |
41.50% (pola + BR)
|
|||
| Patients Enrolled |
Patients aged 18 years were eligible if they had histologically confirmed R/R DLBCL (excluding transformed follicular lymphoma), received 1 prior line of therapy, had an Eastern Cooperative Oncology Group performance status of 0 to 2, and were considered transplant ineligible by the treating physician or experienced treatment failure with prior autologous SCT.
Click to Show/Hide
|
||||
| Administration Dosage |
Bendamustine 90 mg/m2 intravenously (IV) on days 2 and 3 of cycle 1, and days 1 and 2 of subsequent cycles, plus rituximab IV (375 mg/m2 on day 1 of each cycle); polatuzumab vedotin received 1.80 mg/kg IV on day 2 of cycle 1, and day 1 of subsequent cycles; up to six 21-day cycles.
|
||||
| Related Clinical Trial | |||||
| NCT Number | NCT02257567 | Phase Status | Phase 1b/2 | ||
| Clinical Description |
A phase 1b/2 study evaluating the safety, tolerability and anti-tumor activity of polatuzumab vedotin in combination with rituximab (R) or obinutuzumab (G) plus bendamustine (B) in relapsed or refractory follicular or diffuse large B-cell lymphoma.
|
||||
| Primary Endpoint |
With an additional 27 months of follow-up in the randomized pola + BR arm was 62.50% vs 25.00%; best CR rate was 52.50% vs 22.50%.
|
||||
| Other Endpoint |
The median IRC-assessed PFS (95% CI) was 9.20 months (6.00-13.90) with pola + BR vs 3.70 months (2.10-4.50) with BR (HR, 0.39; 95% CI, 0.23-0.66); median investigator-assessed PFS was 7.50 vs 2.00 months (HR, 0.33; 95% CI, 0.20-0.56) with pola + BR and BR, respectively. Median OS (95% CI) was 12.40 months (9.00-32.00) vs 4.70 months (3.70-8.30) with pola + BR vs BR (HR, 0.42; 95% CI, 0.24-0.72). The 24-month OS probability was 38% (95% CI, 22.50-53.90) with pola + BR vs 17.0% (3.60-30.40) with BR. The 24-month PFS probability was 28.40% (95% CI, 13.9-43.0) with pola + BR vs 9.10% (95% CI, 0.00-18.90) with BR.The median DOR was 9.50 months (95% CI, 7.90-12.10) by IRC assessment and 8.70 months (95% CI, 5.90-12.10) by investigator assessment. The median IRC-assessed PFS was 6.6 months (95% CI, 5.10-9.20). Median OS was 12.50 months (95% CI, 8.20-23.10); the 12-month OS probability was 50.20% (95% CI, 40.40-60.10).
Click to Show/Hide
|
||||
| Experiment 3 Reporting the Activity Date of This ADC | [31] | ||||
| Efficacy Data | Objective Response Rate (ORR) |
76.09%
|
|||
| Patients Enrolled |
CD20-positive relapsed or refractory follicular lymphoma (excluding grade 3b) and Eastern Cooperative Oncology Group performance status of 2 or less who had previously received anti-CD20-containing chemotherapy were eligible for inclusion.
|
||||
| Administration Dosage |
Six 28-day cycles of induction treatment with intravenous obinutuzumab 1000 mg (all cohorts), and intravenous polatuzumab vedotin and oral lenalidomide (Celgene, Summit, NJ, USA) in the following doses: 14 mg/kg polatuzumab vedotin and 10 mg lenalidomide (cohort 1); 18 mg/kg polatuzumab vedotin and 10 mg lenalidomide (cohort 2); 14 mg/kg polatuzumab vedotin and 15 mg lenalidomide (cohort 3); 18 mg/kg polatuzumab vedotin and 15 mg lenalidomide (cohort 4); 14 mg/kg polatuzumab vedotin and 20 mg lenalidomide (cohort 5); and 18 mg/kg polatuzumab vedotin and 20 mg lenalidomide (cohort 6). Polatuzumab vedotin was administered on day 1, lenalidomide on days 1-21, and obinutuzumab on days 1, 8, and 15 of cycle one and day 1 of cycles two to six of each 28-day cycle.
Click to Show/Hide
|
||||
| Related Clinical Trial | |||||
| NCT Number | NCT02600897 | Phase Status | Phase 1b/2 | ||
| Clinical Description |
A phase 1b/2 study evaluating the safety and efficacy of obinutuzumab in combination with polatuzumab vedotin and lenalidomide in patients with relapsed or refractory follicular lymphoma and rituximab in combination with polatuzumab vedotin and lenalidomide in patients with relapsed or refractory diffuse large B-cell lymphoma.
|
||||
| Primary Endpoint |
According to the Independent Review Committeeassessment, 29 (63.04%) of 46 patients (90% CI 50.00-75.00) had acomplete response and 35 (76.09%) patients (90% CI 64.00-86.00) had an objective response, per Modified Lugano 2014 criteria. Independent Review Committee assessment showed that 33 (71.74%) patients (90% CI59.00-82.00) had a complete metabolic response at the end ofinduction per Modified Lugano 2014 criteria.
Click to Show/Hide
|
||||
| Other Endpoint |
At data cut-off (median follow-up 26.70 months [IQR 22.20-31.30]),median progression-free survival had not been reached. As determined by the investigator, theprogression-free survival was 86.00% (95% CI 75.00-96.00) at 12 months and 67.00% (95% CI 51.00-83.00) at 24 months, and 11 (23.91%) of 46 patients had an event reported at the time of this analysis.
Click to Show/Hide
|
||||
| Experiment 4 Reporting the Activity Date of This ADC | [36] | ||||
| Efficacy Data | Objective Response Rate (ORR) |
33.00% (FL patients treated with G-atezo-pola at pola doses of 1.4 mg/kg)
57.00% (FL patients treated with G-atezo-pola at pola doses of 1.8 mg/kg) 25.00% (DLBCL patients who received R-atezo-pola) |
|||
| Patients Enrolled |
R/R follicular lymphoma (FL); R/R diffuse large B-cell lymphoma (DLBCL).
|
||||
| Administration Dosage |
FL patients received up to six 21-day cycles of obinutuzumab (1000 mg intravenously [IV], Day [D]1, D8, D15 of Cycle [C]1, and D1 of C26) and atezolizumab (1200 mg IV, D1 of C26) plus pola (1.40 or 1.80 mg/kg IV, D1 of C16). Subsequently, patients entered an expansion phase and received obinutuzumab and atezolizumab (same doses) plus pola at the RP2D (1.8 mg/kg). Patients who achieved at least stable disease at the end of induction (EOI; 68 weeks after D1C6) proceeded to obinutuzumab maintenance (1000 mg every 2 months) and atezolizumab (840 mg, D1 and D2 every month) for up to 2 years, or until progressive disease (PD). Unlike the FL cohort, the first seven DLBCL patients entered a safety run-in; once safety criteria were met, the cohort was expanded. All DLBCL patients received up to six 21-day cycles of rituximab (375 mg/m2 IV, D1 of C16), atezolizumab (1200 mg, D1 of C26), and pola (1.80 mg/kg, D1 of C16). Patients with at least a partial response (PR) at EOI (68 weeks after D1 of C6) received rituximab consolidation (375 mg/m2, D1 every 2 months) and atezolizumab (840 mg, D1 and D2 every month) for up to 8 months, or until PD.
Click to Show/Hide
|
||||
| Related Clinical Trial | |||||
| NCT Number | NCT02729896 | Phase Status | Phase 1b | ||
| Clinical Description |
A phase 1b/2 study evaluating the safety and efficacy of obinutuzumab in combination with atezolizumab plus polatuzumab vedotin in patients with relapsed or refractory follicular lymphoma and rituximab in combination with atezolizumab plus polatuzumab vedotin in patients with relapsed or refractory diffuse large B-cell lymphoma.
|
||||
| Primary Endpoint |
At EOI, CR rates in FL patients treated with G-atezo-pola at pola doses of 1.40 mg/kg (N=3) and 1.80 mg/kg (N=7) were 33.00% and 14.00% , respectively. In DLBCL patients who received R-atezo-pola, the CR rate at EOI was 13.00%.
|
||||
| Other Endpoint |
At EOI, ORR rates in FL patients treated with G-atezo-pola at pola doses of 1.40 mg/kg (N=3) and 1.80 mg/kg (N=7) were 33.00% and 57.00% , respectively. In DLBCL patients who received R-atezo-pola, the ORR rate at EOI was 25.00%.
|
||||
| Experiment 5 Reporting the Activity Date of This ADC | [39] | ||||
| Efficacy Data | Objective Response Rate (ORR) |
42.86%
|
|||
| Patients Enrolled |
Elapsed/refractory (R/R) diffuse large B-cell lymphoma (DLBCL) who received 1 prior line of therapy and were ineligible for autologous stem cell transplantation (ASCT) or experienced treatment failure with prior ASCT.
|
||||
| Administration Dosage |
Pola 1.80 mg/kg intravenously (IV) on day 2 of cycle 1 and day 1 of subsequent cycles; bendamustine 90 mg/m2IV on days 2 and 3 of cycle 1 and then days 1 and 2 of subsequent cycles; rituximab 375 mg/m2IV on day 1 of each cycle. Three weeks of treatment was regarded as one cycle, and patients received up to six cycles of treatment.
Click to Show/Hide
|
||||
| Related Clinical Trial | |||||
| NCT Number | NCT02257567 | Phase Status | Phase 1 | ||
| Clinical Description |
A phase 1b/2 study evaluating the safety, tolerability and anti-tumor activity of polatuzumab vedotin in combination with rituximab (R) or obinutuzumab (G) plus bendamustine (B) in relapsed or refractory follicular or diffuse large B-cell lymphoma.
|
||||
| Primary Endpoint |
2 patients (34.30%, 95% CI 19.1-52.2) achieved CR.
|
||||
| Other Endpoint |
Seven of 12 patients who achieved CR completed six cycles of treatment. Fifteen patients (42.86%, 95% CI 26.30-60.70) achieved an overall response (12 patients CR; 3 patients PR). At a median followup of 5.40 months, median DOR, PFS, and EFS were 6.60 months, 5.20 months, and 5.10 months, respectively. Twentythree patients (65.71%) were alive, and median OS was not reached (95% CI 8.40-not evaluable [NE]).
Click to Show/Hide
|
||||
| Experiment 6 Reporting the Activity Date of This ADC | [59] | ||||
| Efficacy Data | Complete Remission (CR) |
57.60% (FL)
23.50% (DLBCL) |
|||
| Patients Enrolled |
R/R follicular lymphoma (FL) and R/R diffuse large B-cell lymphoma (DLBCL); the majority had an Eastern Cooperative Oncology Group performance score of 0 or 1.
|
||||
| Administration Dosage |
Dose escalation FL cohorts (3 + 3 design); Dose escalation DLBCL cohorts (3 + 3 design); polatuzumab vedotin 1.80 mg/kg and venetoclax 800 mg.
|
||||
| Related Clinical Trial | |||||
| NCT Number | NCT02611323 | Phase Status | Phase 1 | ||
| Clinical Description |
A phase 1b/2 study evaluating the safety and efficacy of obinutuzumab in combination with polatuzumab vedotin and venetoclax in patients with relapsed or refractory follicular lymphoma and rituximab in combination with polatuzumab vedotin and venetoclax in patients with relapsed or refractory diffuse large B-cell lymphoma.
|
||||
| Primary Endpoint |
The overall response rate (ORR) for patients with FL was 75.80%, with 57.60% of patients achieving a complete response (CR). All patients in FL cohort 6 treated at the identified RP2D dose combination achieved CR at EOI. The ORR observed for patients with DLBCL was 29.40%; 23.50% achieved CR. Similar trends were seen in the DLBCL cohorts, with higher response rates in patients treated at the RP2D (37.5% vs. 22.2%).
Click to Show/Hide
|
||||
| Experiment 7 Reporting the Activity Date of This ADC | [64] | ||||
| Efficacy Data | Complete Remission (CR) |
50.00% (In the phase Ib pola-BR arm, EOT IRC-assessed)
40.00% (the randomly assigned cohort, IRC-assessed pola-BR) 17.50% (the randomly assigned cohort, IRC-assessed BR) |
|||
| Patients Enrolled |
Patients aged 18 years were eligible if they had biopsy-confirmed R/R DLBCL (excluding transformed lymphoma) after 1 prior line of therapy, an Eastern Cooperative Oncology Group (ECOG) performance status of 0-2, grade 1 peripheral neuropathy (PN), and were considered transplantation ineligible by the treating physician or experienced treatment failure with prior ASCT. Double- and triple-hit lymphomas were not excluded.
Click to Show/Hide
|
||||
| Administration Dosage |
1.80 mg/kg IV on day 2 of cycle 1 and day 1 of subsequent cycles. Patients were treated for up to six 21-day cycles.
|
||||
| Related Clinical Trial | |||||
| NCT Number | NCT01287741 | Phase Status | Phase Ib/II | ||
| Clinical Description |
A phase Ib/II, multicenter, open-label randomized trial comparing the efficacy of GA101 (RO5072759) in combination with CHOP (G-CHOP) versus rituximab and CHOP (R-CHOP) in previously untreated patients with CD20-positive diffuse large B-cell lymphoma (DLBCL).
|
||||
| Primary Endpoint |
In the phase Ib pola-BR arm, EOT IRC-assessed CR rate was 50.00% (3/6), with all 3 patients remaining in remission at a median follow-up of 37.60 months (DOR, > 28.90 to 38.20 months).
|
||||
| Other Endpoint |
After a median follow-up of 22.3 months, PFS, OS, and DOR were significantly improved with pola-BR versus BR. Consistent benefit in risk reduction was seen for IRC- and INV-assessed PFS (IRC: HR, 0.36; 95% CI, 0.21-0.63; INV: HR, 0.34; 95% CI 0.20-0.57) and for DOR (IRC: HR, 0.47; 95% CI, 0.19-1.14; INV: HR,0.44, 95% CI 0.20-0.95).
|
||||
| Experiment 8 Reporting the Activity Date of This ADC | [71] | ||||
| Patients Enrolled |
CD20-positive diffuse large B-cell lymphoma (DLBCL), had not received previous treatment for lymphoma, had an Eastern Cooperative Oncology Group performance status score of 0 to 2 (on a 5-point scale, with higher numbers indicating greater disability), had a baseline International Prognostic Index (IPI) score between 2 and 5 (on a 5-level prognostic scale, with higher numbers indicating a poorer prognosis), and had adequate hematologic, renal, hepatic, and cardiac function, regardless of the cell of origin or the presence of rearrangements in MYC, BCL2, BCL6, or a combination of these.
Click to Show/Hide
|
||||
| Administration Dosage |
Eight 21-day cycles of treatment were planned. During the first six cycles, patients received either pola-R-CHP or R-CHOP. On day 1 of each cycle, patients received either intravenous polatuzumab vedotin at a dose of 1.80 mg per kilogram of body weight and a placebo matching intravenous vincristine (pola-R-CHP group) or a placebo matching polatuzumab vedotin and intravenous vincristine at a dose of 1.40 mg per square meter of body-surface area (maximum of 2 mg) (R-CHOP group), plus intravenous doses of rituximab (375 mg per square meter), cyclophosphamide (750 mg per square meter), and doxorubicin (50 mg per square meter). All the patients also received oral prednisone at a dose of 100 mg once daily on days 1 through 5 of each of the first six cycles. During cycles 7 and 8, patients in both groups received rituximab monotherapy at a dose of 375 mg per square meter.
Click to Show/Hide
|
||||
| Related Clinical Trial | |||||
| NCT Number | NCT03274492 | Phase Status | Phase 3 | ||
| Clinical Description |
A phase 3, multicenter, randomized, double-blind, placebo-controlled trial comparing the efficacy and safety of polatuzumab vedotin in combination with rituximab and CHP (R-CHP) versus rituximab and CHOP (R-CHOP) in previously untreated patients with diffuse large B-cell lymphoma.
|
||||
| Primary Endpoint |
For the pola-R-CHP group, 2 years FPS=76.70% (95% CI, 72.70-80.80). For the R-CHOP group, 2 years FPS=70.20% (95% CI, 65.80-74.60).
|
||||
| Other Endpoint |
The relative risk of events was lower in the pola-R-CHP group than in the R-CHOP group (2-year event-free survival, 75.60% [95% CI, 71.50 to 79.70] and 69.40% [95% CI, 65.00 to 73.80%], respectively.
|
||||
| Experiment 9 Reporting the Activity Date of This ADC | [78] | ||||
| Patients Enrolled |
Non Hodgkin lymphoma (NHL) or chronic lymphocytic leukemia (CLL) expected to express CD79B (confirmation of CD79B expression was not required) and for whom no suitable therapy of curative intent or higher priority existed from 13 centres.
|
||||
| Administration Dosage |
0.124 mg/kg every 21 days.
|
||||
| Related Clinical Trial | |||||
| NCT Number | NCT01290549 | Phase Status | Phase 1 | ||
| Clinical Description |
An open-label, multicenter, phase 1 trial of the safety and pharmacokinetics of escalating doses of DCDS4501A in patients with relapsed or refractory B-cell non-Hodgkins lymphoma and chronic lymphocytic leukemia and DCDS4501A in combination with rituximab in patients with relapsed or refractory B-cell non-Hodgkins lymphoma.
|
||||
| Primary Endpoint |
Polatuzumab vedotin has an acceptable safety and tolerability profile in patients with NHL but not in those with CLL. Among 45 patients with NHL treated at the recommended phase 2 dose of single-agent polatuzumab vedotin, median progressionfree survival was 5.70 months (95% CI 3.00-7.90) and median duration of response was 6.2 months (95% CI 3.3-14.1). In patients with diffuse large B-cell lymphoma treated at the recommended phase 2 dose of single-agent polatuzumab, median progression-free survival was 5.00 months (95% CI 2.30-6.80) and median duration of response was 5.20 months (95% CI 2.40-13.10).
Click to Show/Hide
|
||||
Discovered Using Cell Line-derived Xenograft Model
| Experiment 1 Reporting the Activity Date of This ADC | [83] | ||||
| Efficacy Data | Tumor Growth Inhibition value (TGI) | ≈ 1.60% (Day 28) | High CD22 expression (CD22+++) | ||
| Method Description |
Cells were inoculated subcutaneously into the flanks of female CB17 ICR severe combined immunodeficient (SCID) mice. When mean tumor size reached desired volume,the mice were divided into groups of 7 to 9 mice with the same mean tumor size and dosed intravenously via the tail vein with ADCs or antibodies. Rituximab was dosed at 30 mg/kg intraperitoneally (i.p.). Polatuzumab vedotin was administered as a single injection at 1 mg/kg.
Click to Show/Hide
|
||||
| In Vivo Model | B-cell lymphoma CDX model | ||||
| In Vitro Model | Diffuse large B-cell lymphoma | WSU-DLCL2 cells | CVCL_1902 | ||
| Experiment 2 Reporting the Activity Date of This ADC | [83] | ||||
| Efficacy Data | Tumor Growth Inhibition value (TGI) | ≈ 5.40% (Day 28) | High CD22 expression (CD22+++) | ||
| Method Description |
Cells were inoculated subcutaneously into the flanks of female CB17 ICR severe combined immunodeficient (SCID) mice. When mean tumor size reached desired volume,the mice were divided into groups of 7 to 9 mice with the same mean tumor size and dosed intravenously via the tail vein with ADCs or antibodies. Rituximab was dosed at 30 mg/kg intraperitoneally (i.p.). Polatuzumab vedotin was administered as a single injection at 2 mg/kg.
Click to Show/Hide
|
||||
| In Vivo Model | B-cell lymphoma CDX model | ||||
| In Vitro Model | Diffuse large B-cell lymphoma | WSU-DLCL2 cells | CVCL_1902 | ||
| Experiment 3 Reporting the Activity Date of This ADC | [83] | ||||
| Efficacy Data | Tumor Growth Inhibition value (TGI) | ≈ 6.60% (Day 14) | Moderate CD22 expression (CD22++) | ||
| Method Description |
Cells were inoculated subcutaneously into the flanks of female CB17 ICR severe combined immunodeficient (SCID) mice. When mean tumor size reached desired volume,the mice were divided into groups of 7 to 9 mice with the same mean tumor size and dosed intravenously via the tail vein with ADCs or antibodies. Rituximab was dosed at 30 mg/kg intraperitoneally (i.p.). Polatuzumab vedotin was administered as a single injection at 0.1 mg/kg.
Click to Show/Hide
|
||||
| In Vivo Model | B-cell lymphoma CDX model | ||||
| In Vitro Model | Burkitt lymphoma | BJAB cells | CVCL_5711 | ||
| Experiment 4 Reporting the Activity Date of This ADC | [83] | ||||
| Efficacy Data | Tumor Growth Inhibition value (TGI) | ≈ 37.10% (Day 28) | High CD22 expression (CD22+++) | ||
| Method Description |
Cells were inoculated subcutaneously into the flanks of female CB17 ICR severe combined immunodeficient (SCID) mice. When mean tumor size reached desired volume,the mice were divided into groups of 7 to 9 mice with the same mean tumor size and dosed intravenously via the tail vein with ADCs or antibodies. Rituximab was dosed at 30 mg/kg intraperitoneally (i.p.). Polatuzumab vedotin was administered as a single injection at 4 mg/kg.
Click to Show/Hide
|
||||
| In Vivo Model | B-cell lymphoma CDX model | ||||
| In Vitro Model | Diffuse large B-cell lymphoma | WSU-DLCL2 cells | CVCL_1902 | ||
| Experiment 5 Reporting the Activity Date of This ADC | [83] | ||||
| Efficacy Data | Tumor Growth Inhibition value (TGI) | ≈ 61.20% (Day 14) | Moderate CD22 expression (CD22++) | ||
| Method Description |
Cells were inoculated subcutaneously into the flanks of female CB17 ICR severe combined immunodeficient (SCID) mice. When mean tumor size reached desired volume,the mice were divided into groups of 7 to 9 mice with the same mean tumor size and dosed intravenously via the tail vein with ADCs or antibodies. Rituximab was dosed at 30 mg/kg intraperitoneally (i.p.). Polatuzumab vedotin was administered as a single injection at 0.5 mg/kg.
Click to Show/Hide
|
||||
| In Vivo Model | B-cell lymphoma CDX model | ||||
| In Vitro Model | Burkitt lymphoma | BJAB cells | CVCL_5711 | ||
| Experiment 6 Reporting the Activity Date of This ADC | [83] | ||||
| Efficacy Data | Tumor Growth Inhibition value (TGI) | ≈ 82.90% (Day 28) | High CD22 expression (CD22+++) | ||
| Method Description |
Cells were inoculated subcutaneously into the flanks of female CB17 ICR severe combined immunodeficient (SCID) mice. When mean tumor size reached desired volume,the mice were divided into groups of 7 to 9 mice with the same mean tumor size and dosed intravenously via the tail vein with ADCs or antibodies. Rituximab was dosed at 30 mg/kg intraperitoneally (i.p.). Polatuzumab vedotin was administered as a single injection at 8 mg/kg.
Click to Show/Hide
|
||||
| In Vivo Model | B-cell lymphoma CDX model | ||||
| In Vitro Model | Diffuse large B-cell lymphoma | WSU-DLCL2 cells | CVCL_1902 | ||
| Experiment 7 Reporting the Activity Date of This ADC | [83] | ||||
| Efficacy Data | Tumor Growth Inhibition value (TGI) | ≈ 86.30% (Day 14) | Moderate CD22 expression (CD22++) | ||
| Method Description |
Cells were inoculated subcutaneously into the flanks of female CB17 ICR severe combined immunodeficient (SCID) mice. When mean tumor size reached desired volume,the mice were divided into groups of 7 to 9 mice with the same mean tumor size and dosed intravenously via the tail vein with ADCs or antibodies. Rituximab was dosed at 30 mg/kg intraperitoneally (i.p.). Polatuzumab vedotin was administered as a single injection at 1 mg/kg.
Click to Show/Hide
|
||||
| In Vivo Model | B-cell lymphoma CDX model | ||||
| In Vitro Model | Burkitt lymphoma | BJAB cells | CVCL_5711 | ||
| Experiment 8 Reporting the Activity Date of This ADC | [83] | ||||
| Efficacy Data | Tumor Growth Inhibition value (TGI) | ≈ 94.90% (Day 28) | High CD22 expression (CD22+++) | ||
| Method Description |
Cells were inoculated subcutaneously into the flanks of female CB17 ICR severe combined immunodeficient (SCID) mice. When mean tumor size reached desired volume,the mice were divided into groups of 7 to 9 mice with the same mean tumor size and dosed intravenously via the tail vein with ADCs or antibodies. Rituximab was dosed at 30 mg/kg intraperitoneally (i.p.). Polatuzumab vedotin was administered as a single injection at 12 mg/kg.
Click to Show/Hide
|
||||
| In Vivo Model | B-cell lymphoma CDX model | ||||
| In Vitro Model | Diffuse large B-cell lymphoma | WSU-DLCL2 cells | CVCL_1902 | ||
| Experiment 9 Reporting the Activity Date of This ADC | [83] | ||||
| Efficacy Data | Tumor Growth Inhibition value (TGI) | ≈ 97.10% (Day 14) | Moderate CD22 expression (CD22++) | ||
| Method Description |
Cells were inoculated subcutaneously into the flanks of female CB17 ICR severe combined immunodeficient (SCID) mice. When mean tumor size reached desired volume,the mice were divided into groups of 7 to 9 mice with the same mean tumor size and dosed intravenously via the tail vein with ADCs or antibodies. Rituximab was dosed at 30 mg/kg intraperitoneally (i.p.). Polatuzumab vedotin was administered as a single injection at 1.5 mg/kg.
Click to Show/Hide
|
||||
| In Vivo Model | B-cell lymphoma CDX model | ||||
| In Vitro Model | Burkitt lymphoma | BJAB cells | CVCL_5711 | ||
| Experiment 10 Reporting the Activity Date of This ADC | [83] | ||||
| Efficacy Data | Tumor Growth Inhibition value (TGI) | ≈ 97.90% (Day 28) | High CD22 expression (CD22+++) | ||
| Method Description |
Cells were inoculated subcutaneously into the flanks of female CB17 ICR severe combined immunodeficient (SCID) mice. When mean tumor size reached desired volume,the mice were divided into groups of 7 to 9 mice with the same mean tumor size and dosed intravenously via the tail vein with ADCs or antibodies. Rituximab was dosed at 30 mg/kg intraperitoneally (i.p.). Polatuzumab vedotin was administered as a single injection at 16 mg/kg.
Click to Show/Hide
|
||||
| In Vivo Model | B-cell lymphoma CDX model | ||||
| In Vitro Model | Diffuse large B-cell lymphoma | WSU-DLCL2 cells | CVCL_1902 | ||
| Experiment 11 Reporting the Activity Date of This ADC | [83] | ||||
| Efficacy Data | Tumor Growth Inhibition value (TGI) | ≈ 100.00% (Day 14) | Moderate CD22 expression (CD22++) | ||
| Method Description |
Cells were inoculated subcutaneously into the flanks of female CB17 ICR severe combined immunodeficient (SCID) mice. When mean tumor size reached desired volume,the mice were divided into groups of 7 to 9 mice with the same mean tumor size and dosed intravenously via the tail vein with ADCs or antibodies. Rituximab was dosed at 30 mg/kg intraperitoneally (i.p.). Polatuzumab vedotin was administered as a single injection at 2 mg/kg.
Click to Show/Hide
|
||||
| In Vivo Model | B-cell lymphoma CDX model | ||||
| In Vitro Model | Burkitt lymphoma | BJAB cells | CVCL_5711 | ||
| Experiment 12 Reporting the Activity Date of This ADC | [83] | ||||
| Efficacy Data | Tumor Growth Inhibition value (TGI) | ≈ 100.00% (Day 14) | Moderate CD22 expression (CD22++) | ||
| Method Description |
Cells were inoculated subcutaneously into the flanks of female CB17 ICR severe combined immunodeficient (SCID) mice. When mean tumor size reached desired volume,the mice were divided into groups of 7 to 9 mice with the same mean tumor size and dosed intravenously via the tail vein with ADCs or antibodies. Rituximab was dosed at 30 mg/kg intraperitoneally (i.p.). Polatuzumab vedotin was administered as a single injection at 4 mg/kg.
Click to Show/Hide
|
||||
| In Vivo Model | B-cell lymphoma CDX model | ||||
| In Vitro Model | Burkitt lymphoma | BJAB cells | CVCL_5711 | ||
Zilovertamab vedotin [Phase 2/3]
Identified from the Human Clinical Data
| Experiment 1 Reporting the Activity Date of This ADC | [96] | ||||
| Efficacy Data | Objective Response Rate (ORR) |
30.00%
|
|||
| Patients Enrolled |
Patients with diffuse large B-cell lymphoma (DLBCL), PET-positive disease, and ECOG PS of 0-2. Pts must have received 2 prior lines of therapy.
|
||||
| Administration Dosage |
2.50 mg/kg IV Q3W.
|
||||
| Related Clinical Trial | |||||
| NCT Number | NCT05144841 | Phase Status | Phase 2 | ||
| Clinical Description |
A phase 2 open-label clinical study to evaluate the efficacy and safety of zilovertamab vedotin (MK-2140) in participants with relapsed or refractory diffuse large B-cell lymphoma (waveline-004).
|
||||
| Experiment 2 Reporting the Activity Date of This ADC | [103] | ||||
| Efficacy Data | Objective Response Rate (ORR) |
47.00% (MCL)
60.00% (DLBCL) |
|||
| Patients Enrolled |
Patients with tumor histologies of mantle cell lymphoma (MCL), chronic lymphocytic leukemia, diffuse large B-cell lymphoma (DLBCL). Patients had received a median of four previous drug and/or cellular therapies.
|
||||
| Administration Dosage |
2.50 mg/kg every 3 week.
|
||||
| Related Clinical Trial | |||||
| NCT Number | NCT03833180 | Phase Status | Phase 1 | ||
| Clinical Description |
A phase 1 dose-escalation and cohort-expansion study of VLS-101 in subjects with hematological malignancies (waveline-001).
|
||||
| Experiment 3 Reporting the Activity Date of This ADC | [107] | ||||
| Patients Enrolled |
Patients with diffuse large B-cell lymphoma (DLBCL) after 1 line of prior therapy (cohort A) or 2 lines of prior therapy (cohort B).
|
||||
| Administration Dosage |
ZV (1.50, 1.75, 2.00, 2.25, and 2.50 mg/kg) with gemcitabine-oxaliplatin + rituximab (R-GemOx).
|
||||
| Related Clinical Trial | |||||
| NCT Number | NCT05139017 | Phase Status | Phase 2/3 | ||
| Clinical Description |
A phase 2/3 multicenter, open-label, randomized, active-control study of zilovertamab vedotin (MK-2140) in combination with standard of care in participants with relapsed or refractory diffuse large B-cell lymphoma (waveline-003).
|
||||
| Experiment 4 Reporting the Activity Date of This ADC | [109] | ||||
| Patients Enrolled |
Patients with mantle cell lymphoma (MCL), Richter's transformation (RT), chronic lymphocytic leukemia (CLL), or follicular lymphoma (FL), relapsed or refractory (R/R) disease, ECOG performance status of 0 to 2.
|
||||
| Administration Dosage |
ZV 2.0 to 2.50 mg/kg IV Q3W.
|
||||
| Related Clinical Trial | |||||
| NCT Number | NCT05458297 | Phase Status | Phase 2 | ||
| Clinical Description |
A multicenter, open-label, phase 2 basket study to evaluate the safety and efficacy of MK-2140 as a monotherapy and in combination in participants with aggressive and indolent B-cell malignancies.
|
||||
| Experiment 5 Reporting the Activity Date of This ADC | [110] | ||||
| Patients Enrolled |
Patients with previously untreated histologically confirmed diffuse large B-cell lymphoma (DLBCL), PET-positive and ECOG PS of 0 or 1.
|
||||
| Administration Dosage |
ZV was 1.75 mg/kg (modified to 1.50, 2.00, 2.25, or 2.50 mg/kg) administered as an intravenous infusion every 3 weeks (Q3W) in combination with R-CHP.
|
||||
| Related Clinical Trial | |||||
| NCT Number | NCT05406401 | Phase Status | Phase 2 | ||
| Clinical Description |
A multicenter, open-label, phase 2 dose escalation and confirmation, and efficacy expansion study of zilovertamab vedotin (MK-2140) in combination with r-chp in participants with DLBCL (waveline).
|
||||
| Experiment 6 Reporting the Activity Date of This ADC | [119] | ||||
| Patients Enrolled |
Patients with locally advanced or metastatic urothelial carcinoma (mUC) whose disease is resistant to treatment with programmed cell death-1/ligand 1 (PD-1/L1) inhibitors.
|
||||
| Related Clinical Trial | |||||
| NCT Number | NCT05562830 | Phase Status | Phase 1/2 | ||
| Clinical Description |
A phase 1/2 open-label rolling-arm umbrella platform study of investigational agents with or without pembrolizumab in participants with PD-1/L1 refractory locally advanced or metastatic urothelial carcinoma (keymaker-u04): substudy 04a.
|
||||
| Experiment 7 Reporting the Activity Date of This ADC | [123] | ||||
| Related Clinical Trial | |||||
| NCT Number | NCT04504916 | Phase Status | Phase 1 | ||
| Clinical Description |
A phase 2 study of VLS-101 in patients with solid tumors.
|
||||
Discovered Using Patient-derived Xenograft Model
| Experiment 1 Reporting the Activity Date of This ADC | [130] | ||||
| Efficacy Data | Tumor Growth Inhibition value (TGI) | ≈ 0.00% (Day 30) | Negative ROR1 expression (ROR1-) | ||
| Method Description |
VLS-101 induces efficient tumor cell killing in cell line-derived models of IP867/17 and RS1316 cells with UC-961 expression with high expression. After palpable tumors were evident (tumor volume of 0.2 cm3),animals were randomly assigned to vehicle,VLS 101 2.5 mg/kg.
|
||||
| In Vivo Model | Richter syndrome PDX model (PDX: RS9737) | ||||
| Experiment 2 Reporting the Activity Date of This ADC | [130] | ||||
| Efficacy Data | Tumor Growth Inhibition value (TGI) | ≈ 0.00% (Day 30) | Negative ROR1 expression (ROR1-) | ||
| Method Description |
VLS-101 induces efficient tumor cell killing in cell line-derived models of IP867/17 and RS1316 cells with UC-961 expression with high expression. After palpable tumors were evident (tumor volume of 0.2 cm3),animals were randomly assigned to vehicle,VLS 101 5 mg/kg.
|
||||
| In Vivo Model | Richter syndrome PDX model (PDX: RS9737) | ||||
| Experiment 3 Reporting the Activity Date of This ADC | [130] | ||||
| Efficacy Data | Tumor Growth Inhibition value (TGI) | ≈ 88.80% (Day 47) | High ROR1 expression (ROR1+++) | ||
| Method Description |
VLS-101 induces efficient tumor cell killing in cell line-derived models of IP867/17 and RS1316 cells with UC-961 expression with high expression. After palpable tumors were evident (tumor volume of 0.2 cm3),animals were randomly assigned to vehicle,VLS 101 2.5 mg/kg.
|
||||
| In Vivo Model | Richter syndrome PDX model (PDX: IP867/17) | ||||
| Experiment 4 Reporting the Activity Date of This ADC | [130] | ||||
| Efficacy Data | Tumor Growth Inhibition value (TGI) | ≈ 90.90% (Day 57) | Moderate ROR1 expression (ROR1++) | ||
| Method Description |
VLS-101 induces efficient tumor cell killing in cell line-derived models of IP867/17 and RS1316 cells with UC-961 expression with high expression. After palpable tumors were evident (tumor volume of 0.2 cm3),animals were randomly assigned to vehicle,VLS 101 2.5 mg/kg.
|
||||
| In Vivo Model | Richter syndrome PDX model (PDX: RS9737) | ||||
| Experiment 5 Reporting the Activity Date of This ADC | [130] | ||||
| Efficacy Data | Tumor Growth Inhibition value (TGI) | ≈ 100.00% (Day 47) | High ROR1 expression (ROR1+++) | ||
| Method Description |
VLS-101 induces efficient tumor cell killing in cell line-derived models of IP867/17 and RS1316 cells with UC-961 expression with high expression. After palpable tumors were evident (tumor volume of 0.2 cm3),animals were randomly assigned to vehicle,VLS 101 5 mg/kg.
|
||||
| In Vivo Model | Richter syndrome PDX model (PDX: IP867/17) | ||||
| Experiment 6 Reporting the Activity Date of This ADC | [130] | ||||
| Efficacy Data | Tumor Growth Inhibition value (TGI) | ≈ 100.00% (Day 47) | High ROR1 expression (ROR1+++) | ||
| Method Description |
VLS-101 induces efficient tumor cell killing in cell line-derived models of IP867/17 and RS1316 cells with UC-961 expression with high expression. After palpable tumors were evident (tumor volume of 0.2 cm3),animals were randomly assigned to vehicle,VLS 101 2.5 mg/kg.
|
||||
| In Vivo Model | Richter syndrome PDX model (PDX: RS9737) | ||||
| Experiment 7 Reporting the Activity Date of This ADC | [130] | ||||
| Efficacy Data | Tumor Growth Inhibition value (TGI) | ≈ 100.00% (Day 47) | High ROR1 expression (ROR1+++) | ||
| Method Description |
VLS-101 induces efficient tumor cell killing in cell line-derived models of IP867/17 and RS1316 cells with UC-961 expression with high expression. After palpable tumors were evident (tumor volume of 0.2 cm3),animals were randomly assigned to vehicle,VLS 101 5 mg/kg.
|
||||
| In Vivo Model | Richter syndrome PDX model (PDX: RS9737) | ||||
| Experiment 8 Reporting the Activity Date of This ADC | [130] | ||||
| Efficacy Data | Tumor Growth Inhibition value (TGI) | ≈ 100.00% (Day 57) | Moderate ROR1 expression (ROR1++) | ||
| Method Description |
VLS-101 induces efficient tumor cell killing in cell line-derived models of IP867/17 and RS1316 cells with UC-961 expression with high expression. After palpable tumors were evident (tumor volume of 0.2 cm3),animals were randomly assigned to vehicle,VLS 101 5 mg/kg.
|
||||
| In Vivo Model | Richter syndrome PDX model (PDX: RS9737) | ||||
MRG-002 [Phase 3]
Identified from the Human Clinical Data
| Experiment 1 Reporting the Activity Date of This ADC | [97] | ||||
| Efficacy Data | Objective Response Rate (ORR) |
34.70%
|
|||
| Patients Enrolled |
Advanced/metastatic HER2-low expressing breast cancer that failed standard therapies.
|
||||
| Administration Dosage |
MRG002 was administered intravenously once every 3 weeks at the dose of 2.60 mg/kg, until disease progression or unacceptable toxicity which ever occurred first.
|
||||
| Related Clinical Trial | |||||
| NCT Number | NCT04742153 | Phase Status | Phase 2 | ||
| Clinical Description |
A multicenter, non-randomized, open-label phase 2 clinical study to evaluate the efficacy and safety of MRG002 in the treatment of patients with HER2-low locally advanced or metastatic breast cancer (BC).
|
||||
| Experiment 2 Reporting the Activity Date of This ADC | [98] | ||||
| Efficacy Data | Objective Response Rate (ORR) |
65.00%
|
|||
| Patients Enrolled |
Histologically HER2-positive (IHC 2+ or 3+) UC pts confirmed by a central-laboratory, ECOG PS 0-1, prior received 1 standard treatment.
|
||||
| Administration Dosage |
Receive MRG002 at a dose of 2.60 mg/kg or 2.20 mg/kg administered by intravenous infusion every 3 weeks.
|
||||
| Related Clinical Trial | |||||
| NCT Number | NCT04839510 | Phase Status | Phase 2 | ||
| Clinical Description |
An open-label, single-arm, multi-center, phase 2 clinical study of MRG002 in the treatment of patients with HER2-positive unresectable locally advanced or metastatic urothelium cancer.
|
||||
| Experiment 3 Reporting the Activity Date of This ADC | [106] | ||||
| Related Clinical Trial | |||||
| NCT Number | NCT05754853 | Phase Status | Phase 3 | ||
| Clinical Description |
An open-label, randomized, multi-center, phase 3 clinical study of MRG002 versus investigator's choice of chemotherapy in the treatment of patients with HER2-positive unresectable locally advanced or metastatic urothelial cancer previously treated with platinum-based chemotherapy and PD-1/PD-L1 inhibitors.
|
||||
| Experiment 4 Reporting the Activity Date of This ADC | [108] | ||||
| Related Clinical Trial | |||||
| NCT Number | NCT04924699 | Phase Status | Phase 2/3 | ||
| Clinical Description |
A study of MRG002 in the treatment of patients with HER2-positive unresectable locally advanced or metastatic breast cancer.
|
||||
| Experiment 5 Reporting the Activity Date of This ADC | [111] | ||||
| Related Clinical Trial | |||||
| NCT Number | NCT05263869 | Phase Status | Phase 2 | ||
| Clinical Description |
An open-label, multi-center, single-arm phase 2 clinical study to evaluate the efficacy and safety of MRG002 in advanced HER-2 positive breast cancer patients previously treated with trastuzumab and TKIs (Magic-009).
|
||||
| Experiment 6 Reporting the Activity Date of This ADC | [112] | ||||
| Related Clinical Trial | |||||
| NCT Number | NCT05141786 | Phase Status | Phase 2 | ||
| Clinical Description |
An open-label, multi-center, non-randomized phase 2 clinical study to evaluate the efficacy and safety of MRG002 in patients With HER2-mutated unresectable/metastatic non-small cell lung cancer (NSCLC).
|
||||
| Experiment 7 Reporting the Activity Date of This ADC | [113] | ||||
| Related Clinical Trial | |||||
| NCT Number | NCT05141747 | Phase Status | Phase 2 | ||
| Clinical Description |
An open-label, multi-center, phase 2 clinical study to evaluate the safety, efficacy and pharmacokinetics of MRG002 in patients with HER2-positive/HER2-low locally advanced or metastatic gastric/ gastroesophageal junction cancer.
|
||||
| Experiment 8 Reporting the Activity Date of This ADC | [114] | ||||
| Related Clinical Trial | |||||
| NCT Number | NCT04837508 | Phase Status | Phase 2 | ||
| Clinical Description |
An open-label, single-arm, multi-center, phase 2 clinical study of MRG002 in the treatment of patients with HER2-positive unresectable, locally advanced or metastatic biliary tract cancer.
|
||||
| Experiment 9 Reporting the Activity Date of This ADC | [120] | ||||
| Related Clinical Trial | |||||
| NCT Number | NCT05338957 | Phase Status | Phase 1/2 | ||
| Clinical Description |
An open-label, multi-center, phase 1/2 dose escalation and expansion study to evaluate the safety, tolerability, pharmacokinetics and preliminary efficacy of MRG002 in combination with HX008 in patients with HER2-expressed advanced malignant solid tumors.
|
||||
| Experiment 10 Reporting the Activity Date of This ADC | [121] | ||||
| Related Clinical Trial | |||||
| NCT Number | NCT04492488 | Phase Status | Phase 1/2 | ||
| Clinical Description |
An open-label, multi-center phase 1/2 dose escalation and expansion study to assess the safety, efficacy and pharmacokinetics of MRG002 in patients with HER2-positive advanced solid tumors and locally advanced or metastatic gastric/gastroesophageal junction (GEJ) cancer.
|
||||
| Experiment 11 Reporting the Activity Date of This ADC | [124] | ||||
| Related Clinical Trial | |||||
| NCT Number | NCT04941339 | Phase Status | Phase 1 | ||
| Clinical Description |
A phase 1, open-label, multi-center, first in human, dose escalation and expansion study to assess the safety, tolerability, efficacy and pharmacokinetics of MRG002 in patients with HER2 positive advanced solid tumors.
|
||||
Discovered Using Patient-derived Xenograft Model
| Experiment 1 Reporting the Activity Date of This ADC | [131] | ||||
| Efficacy Data | Tumor Growth Inhibition value (TGI) |
0.00% (Day 21)
|
Moderate HER2 expression (HER2++; IHC 2+) | ||
| In Vivo Model | HER2-positive gastric cancer PDX model (PDX: STO#151) | ||||
| Experiment 2 Reporting the Activity Date of This ADC | [131] | ||||
| Efficacy Data | Tumor Growth Inhibition value (TGI) |
10.00% (Day 21)
|
Low HER2 expression (HER2+; IHC 1+) | ||
| In Vivo Model | HER2-positive gastric cancer PDX model (PDX: STO#395) | ||||
| Experiment 3 Reporting the Activity Date of This ADC | [131] | ||||
| Efficacy Data | Tumor Growth Inhibition value (TGI) |
17.00% (Day 21)
|
High HER2 expression (HER2+++; IHC 3+) | ||
| In Vivo Model | HER2-positive breast cancer PDX model (PDX: BC#239) | ||||
| Experiment 4 Reporting the Activity Date of This ADC | [131] | ||||
| Efficacy Data | Tumor Growth Inhibition value (TGI) |
19.00% (Day 21)
|
Moderate HER2 expression (HER2++; IHC 2+) | ||
| In Vivo Model | HER2-positive gastric cancer PDX model (PDX: STO#053) | ||||
| Experiment 5 Reporting the Activity Date of This ADC | [131] | ||||
| Efficacy Data | Tumor Growth Inhibition value (TGI) |
41.00% (Day 21)
|
Moderate HER2 expression (HER2++; IHC 2+) | ||
| In Vivo Model | HER2-positive gastric cancer PDX model (PDX: STO#240) | ||||
| Experiment 6 Reporting the Activity Date of This ADC | [131] | ||||
| Efficacy Data | Tumor Growth Inhibition value (TGI) | ≈ 55.10% (Day 63) | High HER2 expression (HER2+++; IHC 3+) | ||
| In Vivo Model | HER2-positive breast cancer PDX model (PDX: BC#046) | ||||
| Experiment 7 Reporting the Activity Date of This ADC | [131] | ||||
| Efficacy Data | Tumor Growth Inhibition value (TGI) | ≈ 70.00% (Day 56) | Moderate HER2 expression (HER2++; IHC 2+) | ||
| In Vivo Model | HER2-positive gastric cancer PDX model (PDX: STO#179) | ||||
| Experiment 8 Reporting the Activity Date of This ADC | [131] | ||||
| Efficacy Data | Tumor Growth Inhibition value (TGI) | ≈ 70.40% (Day 35) | High HER2 expression (HER2+++; IHC 3+) | ||
| In Vivo Model | HER2-positive gastric cancer PDX model (PDX: STO#410) | ||||
| Experiment 9 Reporting the Activity Date of This ADC | [131] | ||||
| Efficacy Data | Tumor Growth Inhibition value (TGI) | ≈ 78.90% (Day 24) | |||
| In Vivo Model | HER2-positive gastric cancer PDX model (PDX: STO#410) | ||||
| Experiment 10 Reporting the Activity Date of This ADC | [131] | ||||
| Efficacy Data | Tumor Growth Inhibition value (TGI) |
84.00% (Day 21)
|
|||
| In Vivo Model | HER2-positive gastric cancer PDX model (PDX: STO#410) | ||||
| Experiment 11 Reporting the Activity Date of This ADC | [131] | ||||
| Efficacy Data | Tumor Growth Inhibition value (TGI) | ≈ 87.90% (Day 70) | |||
| In Vivo Model | HER2-positive breast cancer PDX model (PDX: BC#197) | ||||
| Experiment 12 Reporting the Activity Date of This ADC | [131] | ||||
| Efficacy Data | Tumor Growth Inhibition value (TGI) |
90.00% (Day 21)
|
|||
| In Vivo Model | HER2-positive gastric cancer PDX model (PDX: STO#069) | ||||
| Experiment 13 Reporting the Activity Date of This ADC | [131] | ||||
| Efficacy Data | Tumor Growth Inhibition value (TGI) | ≈ 94.00% (Day 63) | |||
| In Vivo Model | HER2-positive breast cancer PDX model (PDX: BC#046) | ||||
| Experiment 14 Reporting the Activity Date of This ADC | [131] | ||||
| Efficacy Data | Tumor Growth Inhibition value (TGI) | ≈ 96.10% (Day 56) | |||
| In Vivo Model | HER2-positive gastric cancer PDX model (PDX: STO#179) | ||||
| Experiment 15 Reporting the Activity Date of This ADC | [131] | ||||
| Efficacy Data | Tumor Growth Inhibition value (TGI) | ≈ 100.00% (Day 70) | High HER2 expression (HER2+++; IHC 3+) | ||
| In Vivo Model | HER2-positive breast cancer PDX model (PDX: BC#197) | ||||
| Experiment 16 Reporting the Activity Date of This ADC | [131] | ||||
| Efficacy Data | Tumor Growth Inhibition value (TGI) | ≈ 100.00% (Day 35) | Low HER2 expression (HER2+; IHC 1+) | ||
| In Vivo Model | HER2-positive gastric cancer PDX model (PDX: STO#410) | ||||
Discovered Using Cell Line-derived Xenograft Model
| Experiment 1 Reporting the Activity Date of This ADC | [131] | ||||
| Efficacy Data | Tumor Growth Inhibition value (TGI) | ≈ 60.70% (Day 36) | Moderate HER2 expression (HER2++) | ||
| In Vivo Model | HER2-positive gastric cancer NCI-N87 CDX model | ||||
| In Vitro Model | Gastric tubular adenocarcinoma | NCI-N87 cells | CVCL_1603 | ||
| Experiment 2 Reporting the Activity Date of This ADC | [131] | ||||
| Efficacy Data | Tumor Growth Inhibition value (TGI) | ≈ 66.20% (Day 36) | High HER2 expression (HER2+++) | ||
| Method Description |
MRG-002 induces efficient tumor cell killing in PDX models of breast cancer or gastric cancer tissues with HER2 expression,administered with vehicle,MRG002,HX008 or MRG002 + HX008 combo intravenously.
|
||||
| In Vivo Model | HER2-positive breast cancer BT-474 CDX model | ||||
| In Vitro Model | Invasive breast carcinoma | BT-474 cells | CVCL_0179 | ||
| Experiment 3 Reporting the Activity Date of This ADC | [131] | ||||
| Efficacy Data | Tumor Growth Inhibition value (TGI) | ≈ 90.00% (Day 36) | Moderate HER2 expression (HER2++; IHC 2+) | ||
| In Vivo Model | HER2-positive breast cancer BT-474 CDX model | ||||
| In Vitro Model | Invasive breast carcinoma | BT-474 cells | CVCL_0179 | ||
| Experiment 4 Reporting the Activity Date of This ADC | [131] | ||||
| Efficacy Data | Tumor Growth Inhibition value (TGI) | ≈ 90.00% (Day 36) | Moderate HER2 expression (HER2++; IHC 2+) | ||
| In Vivo Model | HER2-positive breast cancer BT-474 CDX model | ||||
| In Vitro Model | Invasive breast carcinoma | BT-474 cells | CVCL_0179 | ||
| Experiment 5 Reporting the Activity Date of This ADC | [131] | ||||
| Efficacy Data | Tumor Growth Inhibition value (TGI) | ≈ 90.00% (Day 36) | High HER2 expression (HER2+++) | ||
| In Vivo Model | HER2-positive gastric cancer NCI-N87 CDX model | ||||
| In Vitro Model | Gastric tubular adenocarcinoma | NCI-N87 cells | CVCL_1603 | ||
| Experiment 6 Reporting the Activity Date of This ADC | [131] | ||||
| Efficacy Data | Tumor Growth Inhibition value (TGI) | ≈ 90.00% (Day 36) | High HER2 expression (HER2+++) | ||
| In Vivo Model | HER2-positive gastric cancer NCI-N87 CDX model | ||||
| In Vitro Model | Gastric tubular adenocarcinoma | NCI-N87 cells | CVCL_1603 | ||
Revealed Based on the Cell Line Data
| Experiment 1 Reporting the Activity Date of This ADC | [131] | ||||
| Efficacy Data | Half Maximal Inhibitory Concentration (IC50) |
0.01 nM
|
|||
| Method Description |
The inhibitory activity of MRG-002 against cancer cell growth was evaluated in various human cancer cell lines in vitro. The cells were treated with MRG-002 for 96±2 hrs.
|
||||
| In Vitro Model | Breast adenocarcinoma | SK-BR-3 cells | CVCL_0033 | ||
| Experiment 2 Reporting the Activity Date of This ADC | [131] | ||||
| Efficacy Data | Half Maximal Inhibitory Concentration (IC50) |
0.04 nM
|
|||
| Method Description |
The inhibitory activity of MRG-002 against cancer cell growth was evaluated in various human cancer cell lines in vitro. The cells were treated with MRG-002 for 96±2 hrs.
|
||||
| In Vitro Model | Invasive breast carcinoma | BT-474 cells | CVCL_0179 | ||
| Experiment 3 Reporting the Activity Date of This ADC | [131] | ||||
| Efficacy Data | Half Maximal Inhibitory Concentration (IC50) |
0.15 nM
|
|||
| Method Description |
The inhibitory activity of MRG-002 against cancer cell growth was evaluated in various human cancer cell lines in vitro. The cells were treated with MRG-002 for 96±2 hrs.
|
||||
| In Vitro Model | Gastric tubular adenocarcinoma | NCI-N87 cells | CVCL_1603 | ||
| Experiment 4 Reporting the Activity Date of This ADC | [131] | ||||
| Efficacy Data | Half Maximal Inhibitory Concentration (IC50) |
0.40 nM
|
|||
| Method Description |
The inhibitory activity of MRG-002 against cancer cell growth was evaluated in various human cancer cell lines in vitro. The cells were treated with MRG-002 for 96±2 hrs.
|
||||
| In Vitro Model | Breast adenocarcinoma | MDA-MB-453 cells | CVCL_0418 | ||
Telisotuzumab vedotin [Phase 3]
Identified from the Human Clinical Data
| Experiment 1 Reporting the Activity Date of This ADC | [99] | ||||
| Efficacy Data | Objective Response Rate (ORR) |
7.40%
|
|||
| Patients Enrolled |
Advanced non-small cell lung cancer (NSCLC).
|
||||
| Administration Dosage |
Teliso-V Q2W (1.60, 1.90, or 2.20 mg/kg, intravenous) with nivolumab (3 mg/kg, or 240 mg, or per locally approved label, intravenously).
|
||||
| Related Clinical Trial | |||||
| NCT Number | NCT02099058 | Phase Status | Phase 1 | ||
| Clinical Description |
A multicenter, phase 1/1b, open-label, dose-escalation study of ABBV-399, an antibody drug conjugate, in subjects with advanced solid tumors.
|
||||
| Primary Endpoint |
Most patients (97.30%, n=36) experienced one or more TEAE, with 23 (62.16%) reporting TEAEs grades 3 or higher. TEAEs considered possibly related to Teliso-V were reported in 78.38% (n=29) of patients; 32.43% (n=12) were grade greater than or equal to 3.
|
||||
| Other Endpoint |
Combination therapy with Teliso-V plus nivolumab was well tolerated in patients with c-Met-+NSCLC with limited antitumor activity. The ORR was 7.40% (95% CI: 0.90-24.30), with two patients (PD-L1+, n =1; PD-L1-, n=1) having a confirmed PR.Overall, 66.67% of patients (16 of 24) had evidence of tumor size reduction; three (12.5%) reported a greater than 30% reduction in target lesion. The overall median PFS (95% CI) was 7.20 months (3.30-8.90); 7.20 months(1.50-not reached [NR]) for PD-L1 patients, 4.50 months(1.50-NR) for PD-L1- patients, and NR (2.00-NR) for PD-L1-unk patients. The objective response rate was 7.40%, with two patients having a confirmed partial response. Overall median progression-free survival was 7.20 months.
Click to Show/Hide
|
||||
| Experiment 2 Reporting the Activity Date of This ADC | [100] | ||||
| Efficacy Data | Objective Response Rate (ORR) |
23.00% (all)
28.00% (in once every 2 weeks cohorts all) 18.00% (in once every 3 weeks cohorts) 18.00% (nonsquamous NSCLC) 31.00% (in once every 2 weeks cohorts nonsquamous NSCLC) 6.00% (in once every 3 weeks cohorts nonsquamous NSCLC) 43.00% (squamous NSCLC) |
|||
| Patients Enrolled |
Non-small cell lung cancer (NSCLC) and c-Met H-score 150 (c-Met+) or MET amplification/exon 14 skipping mutations.
|
||||
| Administration Dosage |
Intravenously once every 3 weeks (0.15-3.30 mg/kg) or once every 2 weeks (1.60-2.20 mg/kg).
|
||||
| Related Clinical Trial | |||||
| NCT Number | NCT02099058 | Phase Status | Phase 1 | ||
| Clinical Description |
A multicenter, phase 1/1b, open-label, dose-escalation study of ABBV-399, an antibody drug conjugate, in subjects with advanced solid tumors.
|
||||
| Primary Endpoint |
Four objective responses (ORR = 26.70%; 95% CI, 7.80-55.10) were observed in this subgroup, 3 in once every 2 weeks (ORR = 43.00%; 95% CI, 9.90-81.60), and 1 in once every 3 weeks (ORR = 13.00%; 95% CI, 0.30-52.70).
|
||||
| Other Endpoint |
The median PFS in once every 2 weeks cohorts was 8.00 months (range, 1.20-9.10) and the median treatment duration was 19.60 weeks (range, 0.10-60.10).
|
||||
| Experiment 3 Reporting the Activity Date of This ADC | [101] | ||||
| Efficacy Data | Objective Response Rate (ORR) |
30.55% (for all efficacy-evaluable patients)
32.10% (for EGFR-M+ patients) 52.60% (of EGFR-M+ patients, those who were c-Met high) |
|||
| Patients Enrolled |
Advanced non-small cell lung cancer (measurable per Response Evaluation Criteria in Solid Tumors v1.1) not amenable to resection or other approved therapies until disease progression, death, or withdrawal of consent.
|
||||
| Administration Dosage |
Teliso-V (2.70 mg/kg once every 21 days) plus erlotinib (150 mg once daily) until disease progression, death, or withdrawal of consent.
|
||||
| Related Clinical Trial | |||||
| NCT Number | NCT02099058 | Phase Status | Phase 1 | ||
| Clinical Description |
A multicenter, phase 1/1b, open-label, dose-escalation study of ABBV-399, an antibody drug conjugate, in subjects with advanced solid tumors.
|
||||
| Primary Endpoint |
OrR for all efficacy-evaluable patients was 30.55% (11/36; 95% CI, 16.30 to 48.10), and DCR was 86.11% (31/36; 95% CI, 70.5 to 95.3). Median PFS for all efficacy-evaluable patients was 5.90 months (95% CI, 2.80 to not reached [NR]).
|
||||
| Other Endpoint |
For EGFR-M+ patients (n = 28), ORR was 32.14% (9/28; 95% CI, 15.90 to 52.40), with one CR (3.57%) and eight PR (28.57%). DCR was 85.71% (24/28; 95% CI, 67.30 to 96.00) and median PFS was 5.90 months (95% CI, 2.80 to NR). Median PFS was 3.70 months (95% CI, 1.40 to NR) for T790M+ patients, compared with 6.80 months (95% CI, 4.30 to NR) for non-T790M+ patients. Of EGFR-M+ patients, those who were c-Met high (n = 15) had an ORR of 52.60%. Median PFS was 6.80 months for non-T790M+ and for those whose T790M status was unknown, versus 3.70 months for T790M+.
Click to Show/Hide
|
||||
| Experiment 4 Reporting the Activity Date of This ADC | [101] | ||||
| Efficacy Data | Objective Response Rate (ORR) |
30.60% (for all efficacy-evaluable patients)
32.18% (for EGFR-M+ patients) 52.60% (of EGFR-M+ patients, those who were c-Met high) |
|||
| Patients Enrolled |
Advanced non-small cell lung cancer (measurable per Response Evaluation Criteria in Solid Tumors v1.1) not amenable to resection or other approved therapies until disease progression, death, or withdrawal of consent.
|
||||
| Administration Dosage |
Teliso-V (2.70 mg/kg once every 21 days) plus erlotinib (150 mg once daily) until disease progression, death, or withdrawal of consent.
|
||||
| Related Clinical Trial | |||||
| NCT Number | NCT02099058 | Phase Status | Phase 1 | ||
| Clinical Description |
A multicenter, phase 1/1b, open-label, dose-escalation study of ABBV-399, an antibody drug conjugate, in subjects with advanced solid tumors.
|
||||
| Primary Endpoint |
Median PFS=5.90 months (95% CI, 2.80 to not reached). ORR for EGFR-M+ patients = 32.18% (n=28). EGFR-M+ patients ORR = 52.60%.
|
||||
| Other Endpoint |
Median PFS=6.80 months for non-T790M+.
|
||||
| Experiment 5 Reporting the Activity Date of This ADC | [104] | ||||
| Efficacy Data | Objective Response Rate (ORR) |
71.70% (plus lenalidomide)
70.60% (plus pomalidomide) |
|||
| Patients Enrolled |
Relapsed or refractory multiple myeloma, and ECOG performance status or Zubrod score of 2 or below, received indatuximab ravtansine with lenalidomide and dexamethasone (indatuximab ravtansine plus lenalidomide) had failure of at least one previous therapy.
|
||||
| Administration Dosage |
Intravenously on days 1, 8, and 15 of each 28-day cycle in dose of 100 mg/m2 plus lenalidomide or pomalidomide and dexamethasone.
|
||||
| Related Clinical Trial | |||||
| NCT Number | NCT01638936 | Phase Status | Phase 1 | ||
| Clinical Description |
A phase 1/2a multi-dose escalation study of BT062 in combination with lenalidomide or pomalidomide and dexamethasone in subjects with relapsed or relapsed/refractory multiple myeloma.
|
||||
| Experiment 6 Reporting the Activity Date of This ADC | [105] | ||||
| Efficacy Data | Objective Response Rate (ORR) |
75.00%
|
|||
| Patients Enrolled |
MA advanced GEC.
|
||||
| Administration Dosage |
15 mg/kg IV, once every 3 weeks.
|
||||
| Related Clinical Trial | |||||
| NCT Number | NCT01472016 | Phase Status | Phase 1 | ||
| Clinical Description |
A multi-center, phase 1/1b, open-label, dose escalation study of ABT-700, a monoclonal antibody in subjects with advanced solid tumors.
|
||||
| Primary Endpoint |
Among these patients, three achieved a partial response and one had progressive disease as best response (ORR=75.00%). The duration of disease control in responders ranged from 18-27 weeks and the median duration of response was 16.10 weeks. The median progression- free survival in MET-amplified patients was 17.90 weeks.
|
||||
| Experiment 7 Reporting the Activity Date of This ADC | [115] | ||||
| Related Clinical Trial | |||||
| NCT Number | NCT01915472 | Phase Status | Phase 2 | ||
| Clinical Description |
A phase 2 study of IMMU 130 (hmn-14-SN38 antibody drug conjugate) in patients with metastatic colorectal cancer.
|
||||
| Experiment 8 Reporting the Activity Date of This ADC | [122] | ||||
| Related Clinical Trial | |||||
| NCT Number | NCT01001442 | Phase Status | Phase 1/2 | ||
| Clinical Description |
A phase 1/2a multi-dose escalation study to evaluate maximum tolerated dose (MTD), pharmacokinetics (PK), safety and efficacy of BT062 in subjects with relapsed or relapsed/refractory multiple myeloma.
|
||||
| Experiment 9 Reporting the Activity Date of This ADC | [125] | ||||
| Patients Enrolled |
Nonsmall-cell lung cancer (NSCLC) with c-Metoverexpressing tumors (c-Met positive; immunohistochemistry membrane H-score 150).
|
||||
| Administration Dosage |
Teliso-V was administered by intravenous (IV) infusion to groups of three to six patients who were enrolled in eight-dose cohorts for dosing at 0.15 to 3.30 mg/kg on day 1, once every 21 days, or until disease progression or unacceptable toxicity.
|
||||
| Related Clinical Trial | |||||
| NCT Number | NCT02099058 | Phase Status | Phase 1 | ||
| Clinical Description |
A multicenter, phase 1/1b, open-label, dose-escalation study of ABBV-399, an antibody drug conjugate, in subjects with advanced solid tumors.
|
||||
| Primary Endpoint |
No formal MTD was identified.
|
||||
| Experiment 10 Reporting the Activity Date of This ADC | [126] | ||||
| Related Clinical Trial | |||||
| NCT Number | NCT01605318 | Phase Status | Phase 1 | ||
| Clinical Description |
A phase 1/2 study of once or twice weekly IMMU-130 (hMN-14-SN38, antibody-drug conjugate) in patients with colorectal cancer.
|
||||
| Experiment 11 Reporting the Activity Date of This ADC | [127] | ||||
| Related Clinical Trial | |||||
| NCT Number | NCT01270698 | Phase Status | Phase 1 | ||
| Clinical Description |
A phase 1 study of IMMU-130 (hmn-14-SN38 antibody drug conjugate) in patients with colorectal cancer.
|
||||
| Experiment 12 Reporting the Activity Date of This ADC | [128] | ||||
| Related Clinical Trial | |||||
| NCT Number | NCT00723359 | Phase Status | Phase 1 | ||
| Clinical Description |
A phase 1 dose escalation study to evaluate maximum tolerated dose (MTD), pharmacokinetics (PK), and safety of BT062 in subjects with relapsed or relapsed/refractory multiple myeloma.
|
||||
MRG-003 [Phase 3]
Identified from the Human Clinical Data
| Experiment 1 Reporting the Activity Date of This ADC | [102] | ||||
| Efficacy Data | Objective Response Rate (ORR) |
40.00% (SCCHN)
44.00% (NPC) 0.00% (CRC) |
|||
| Patients Enrolled |
Patients with advanced or metastatic solid tumors who had failed outcomes from or were not able to receive standard treatment were enrolled in phase 1a without EGFR prescreening. Phase 1b recruited EGFR-positive patients with refractory advanced squamous cell carcinomas of the head and neck (SCCHN), nasopharyngeal carcinoma (NPC), and colorectal cancer (CRC).
Click to Show/Hide
|
||||
| Administration Dosage |
An intravenous dose of 0.10 to 2.50 mg/kg of MRG003 was administered every 3 weeks during phase 1a. During phase 1b, patients were administered the recommended dose identified in phase 1a.
|
||||
| Related Clinical Trial | |||||
| NCT Number | NCT04868344 | Phase Status | Phase 1 | ||
| Clinical Description |
An open-label, dose-finding, phase 1 study in solid tumors.
|
||||
| Primary Endpoint |
The MRG003 recommended dose was 2.50 mg/kg.
|
||||
| Other Endpoint |
The objective response rates for SCCHN, NPC, and CRC were 40.00%, 44.00%, and 0.00%, and the disease control rates were 100.00%, 89.00%, and 25.00%, respectively. The median DOR of all patients was 5.60 months (SCCHN: DOR, 5.60 months; 95% CI,2.80-5.60; NPC: not estimable). The median PFS of all patients was 2.80 months (95% CI,1.20-4.10 months), and the PFS of SCCHN, NPC, and CRC was 2.80 (95% CI,0.60-6.80) months, 4.00 (95% CI, 1.20-not reached) months, and 1.20 (95% CI, 0.50-2.80) months, respectively. SCCHN cohort reached the median OS as of the data cutoff date, which was 11.80 (95% CI, 3.40-11.80) months.
Click to Show/Hide
|
||||
DP-303c [Phase 3]
Identified from the Human Clinical Data
| Experiment 1 Reporting the Activity Date of This ADC | [116] | ||||
| Related Clinical Trial | |||||
| NCT Number | NCT05334810 | Phase Status | Phase 2 | ||
| Clinical Description |
A multi-center, open-lable, single-arm phase 2 study to evaluate the efficacy and safety of DP303c in patients with HER2-positive unresectable locally advanced, relapsed, or metastatic breast cancer.
|
||||
| Experiment 2 Reporting the Activity Date of This ADC | [117] | ||||
| Related Clinical Trial | |||||
| NCT Number | NCT04828616 | Phase Status | Phase 2 | ||
| Clinical Description |
An open-label, multicentre, phase 2 study of DP303c injection in patients with HER2-expressing advanced ovarian cancer.
|
||||
| Experiment 3 Reporting the Activity Date of This ADC | [118] | ||||
| Related Clinical Trial | |||||
| NCT Number | NCT04826107 | Phase Status | Phase 2 | ||
| Clinical Description |
An open-label, multicentre, phase 2 study of DP303c injection in patients with unresectable locally advanced, recurrent or metastatic gastric cancer with HER2 expression.
|
||||
| Experiment 4 Reporting the Activity Date of This ADC | [129] | ||||
| Related Clinical Trial | |||||
| NCT Number | NCT04146610 | Phase Status | Phase 1 | ||
| Clinical Description |
A phase 1a, multicenter, open and dose-increasing study of DP303c to evaluate the safety , pharmacokinetics, immunogenicity and antitumor activity of subjects with HER2-positive advanced solid tumors.
|
||||
Discovered Using Cell Line-derived Xenograft Model
| Experiment 1 Reporting the Activity Date of This ADC | [132] | ||||
| Efficacy Data | Tumor Growth Inhibition value (TGI) | ≈ 7.60% (Day 32) | Moderate HER2 expression (HER2++) | ||
| Method Description |
DP001 (10 mg/kg).
|
||||
| In Vivo Model | JIMT -1 cell line xenograft model | ||||
| In Vitro Model | Breast ductal carcinoma | JIMT-1 cells | CVCL_2077 | ||
| Experiment 2 Reporting the Activity Date of This ADC | [132] | ||||
| Efficacy Data | Tumor Growth Inhibition value (TGI) | ≈ 16.20% (Day 32) | Moderate HER2 expression (HER2++) | ||
| Method Description |
T-DM1 (10 mg/kg).
|
||||
| In Vivo Model | JIMT -1 cell line xenograft model | ||||
| In Vitro Model | Breast ductal carcinoma | JIMT-1 cells | CVCL_2077 | ||
| Experiment 3 Reporting the Activity Date of This ADC | [132] | ||||
| Efficacy Data | Tumor Growth Inhibition value (TGI) | ≈ 28.47% (Day 18) | High HER2 expression (HER2+++/++) | ||
| Method Description |
DP001 (10 mg/kg).
|
||||
| In Vivo Model | SK-OV-3 cell line xenograft model | ||||
| In Vitro Model | Ovarian serous cystadenocarcinoma | SK-OV-3 cells | CVCL_0532 | ||
| Experiment 4 Reporting the Activity Date of This ADC | [132] | ||||
| Efficacy Data | Tumor Growth Inhibition value (TGI) | ≈ 33.60% (Day 25) | High HER2 expression (HER2+++/++) | ||
| Method Description |
DP001 (10 mg/kg).
|
||||
| In Vivo Model | NCI-N87 xenograft model | ||||
| In Vitro Model | Gastric tubular adenocarcinoma | NCI-N87 cells | CVCL_1603 | ||
| Experiment 5 Reporting the Activity Date of This ADC | [132] | ||||
| Efficacy Data | Tumor Growth Inhibition value (TGI) | ≈ 39.00% (Day 32) | Moderate HER2 expression (HER2++) | ||
| Method Description |
DP303c (0.3 mg/kg).
|
||||
| In Vivo Model | JIMT -1 cell line xenograft model | ||||
| In Vitro Model | Breast ductal carcinoma | JIMT-1 cells | CVCL_2077 | ||
| Experiment 6 Reporting the Activity Date of This ADC | [132] | ||||
| Efficacy Data | Tumor Growth Inhibition value (TGI) | ≈ 45.26% (Day 18) | High HER2 expression (HER2+++/++) | ||
| Method Description |
DP303c (1 mg/kg).
|
||||
| In Vivo Model | SK-OV-3 cell line xenograft model | ||||
| In Vitro Model | Ovarian serous cystadenocarcinoma | SK-OV-3 cells | CVCL_0532 | ||
| Experiment 7 Reporting the Activity Date of This ADC | [132] | ||||
| Efficacy Data | Tumor Growth Inhibition value (TGI) | ≈ 54.40% (Day 32) | Moderate HER2 expression (HER2++) | ||
| Method Description |
Pathogen-free female nude mice were injected subcutaneously with each cell suspension. According to tumor volumes,the mice were randomly divided in two groups: treatment and control groups. Each drug was given to the animals intravenously. The dosing frequency was once a week (qw), qw 2 or qw 3.DP303c induced obvious tumor growth inhibition at a single dose of 0.1 mg/kg.
Click to Show/Hide
|
||||
| In Vitro Model | Breast ductal carcinoma | JIMT-1 cells | CVCL_2077 | ||
| Experiment 8 Reporting the Activity Date of This ADC | [132] | ||||
| Efficacy Data | Tumor Growth Inhibition value (TGI) | ≈ 82.10% (Day 25) | High HER2 expression (HER2+++) | ||
| Method Description |
Pathogen-free female nude mice were injected subcutaneously with each cell suspension. According to tumor volumes,the mice were randomly divided in two groups: treatment and control groups. Each drug was given to the animals intravenously. The dosing frequency was once a week (qw), qw 2 or qw 3.DP303c induced obvious tumor growth inhibition at a single dose of 1 mg/kg.
Click to Show/Hide
|
||||
| In Vitro Model | Breast adenocarcinoma | SK-BR-3 cells | CVCL_0033 | ||
| Experiment 9 Reporting the Activity Date of This ADC | [132] | ||||
| Efficacy Data | Tumor Growth Inhibition value (TGI) | ≈ 83.94% (Day 18) | High HER2 expression (HER2+++/++) | ||
| Method Description |
DP303c (3 mg/kg).
|
||||
| In Vivo Model | SK-OV-3 cell line xenograft model | ||||
| In Vitro Model | Ovarian serous cystadenocarcinoma | SK-OV-3 cells | CVCL_0532 | ||
| Experiment 10 Reporting the Activity Date of This ADC | [132] | ||||
| Efficacy Data | Tumor Growth Inhibition value (TGI) | ≈ 90.48% (Day 21) | High HER2 expression (HER2+++/++) | ||
| Method Description |
DP001 (15 mg/kg).
|
||||
| In Vivo Model | HCC1954 cell line xenograft model | ||||
| In Vitro Model | Breast ductal carcinoma | HCC1954 cells | CVCL_1259 | ||
| Experiment 11 Reporting the Activity Date of This ADC | [132] | ||||
| Efficacy Data | Tumor Growth Inhibition value (TGI) | ≈ 91.60% (Day 25) | High HER2 expression (HER2+++/++) | ||
| Method Description |
T-DM1 (10 mg/kg).
|
||||
| In Vivo Model | NCI-N87 xenograft model | ||||
| In Vitro Model | Gastric tubular adenocarcinoma | NCI-N87 cells | CVCL_1603 | ||
| Experiment 12 Reporting the Activity Date of This ADC | [132] | ||||
| Efficacy Data | Tumor Growth Inhibition value (TGI) | ≈ 94.00% (Day 25) | High HER2 expression (HER2+++/++) | ||
| Method Description |
DP303c (10 mg/kg).
|
||||
| In Vivo Model | NCI-N87 xenograft model | ||||
| In Vitro Model | Gastric tubular adenocarcinoma | NCI-N87 cells | CVCL_1603 | ||
| Experiment 13 Reporting the Activity Date of This ADC | [132] | ||||
| Efficacy Data | Tumor Growth Inhibition value (TGI) | ≈ 94.00% (Day 25) | High HER2 expression (HER2+++/++) | ||
| Method Description |
DP303c (2.5 mg/kg).
|
||||
| In Vivo Model | NCI-N87 xenograft model | ||||
| In Vitro Model | Gastric tubular adenocarcinoma | NCI-N87 cells | CVCL_1603 | ||
| Experiment 14 Reporting the Activity Date of This ADC | [132] | ||||
| Efficacy Data | Tumor Growth Inhibition value (TGI) | ≈ 94.00% (Day 25) | High HER2 expression (HER2+++/++) | ||
| Method Description |
DP303c (5 mg/kg).
|
||||
| In Vivo Model | NCI-N87 xenograft model | ||||
| In Vitro Model | Gastric tubular adenocarcinoma | NCI-N87 cells | CVCL_1603 | ||
| Experiment 15 Reporting the Activity Date of This ADC | [132] | ||||
| Efficacy Data | Tumor Growth Inhibition value (TGI) | ≈ 94.10% (Day 18) | High HER2 expression (HER2+++) | ||
| Method Description |
Pathogen-free female nude mice were injected subcutaneously with each cell suspension. According to tumor volumes,the mice were randomly divided in two groups: treatment and control groups. Each drug was given to the animals intravenously. The dosing frequency was once a week (qw), qw 2 or qw 3.DP303c induced obvious tumor growth inhibition at a single dose of 3 mg/kg.
Click to Show/Hide
|
||||
| In Vitro Model | Breast adenocarcinoma | SK-BR-3 cells | CVCL_0033 | ||
| Experiment 16 Reporting the Activity Date of This ADC | [132] | ||||
| Efficacy Data | Tumor Growth Inhibition value (TGI) | ≈ 94.16% (Day 18) | High HER2 expression (HER2+++/++) | ||
| Method Description |
T-DM1 (10 mg/kg).
|
||||
| In Vivo Model | SK-OV-3 cell line xenograft model | ||||
| In Vitro Model | Ovarian serous cystadenocarcinoma | SK-OV-3 cells | CVCL_0532 | ||
| Experiment 17 Reporting the Activity Date of This ADC | [132] | ||||
| Efficacy Data | Tumor Growth Inhibition value (TGI) | ≈ 94.30% (Day 21) | High HER2 expression (HER2+++/++) | ||
| Method Description |
T-DM1 (15 mg/kg).
|
||||
| In Vivo Model | HCC1954 cell line xenograft model | ||||
| In Vitro Model | Breast ductal carcinoma | HCC1954 cells | CVCL_1259 | ||
| Experiment 18 Reporting the Activity Date of This ADC | [132] | ||||
| Efficacy Data | Tumor Growth Inhibition value (TGI) | ≈ 97.00% (Day 21) | High HER2 expression (HER2+++/++) | ||
| Method Description |
DP303c (10 mg/kg).
|
||||
| In Vivo Model | HCC1954 cell line xenograft model | ||||
| In Vitro Model | Breast ductal carcinoma | HCC1954 cells | CVCL_1259 | ||
| Experiment 19 Reporting the Activity Date of This ADC | [132] | ||||
| Efficacy Data | Tumor Growth Inhibition value (TGI) | ≈ 97.00% (Day 21) | High HER2 expression (HER2+++/++) | ||
| Method Description |
DP303c (15 mg/kg).
|
||||
| In Vivo Model | HCC1954 cell line xenograft model | ||||
| In Vitro Model | Breast ductal carcinoma | HCC1954 cells | CVCL_1259 | ||
| Experiment 20 Reporting the Activity Date of This ADC | [132] | ||||
| Efficacy Data | Tumor Growth Inhibition value (TGI) | ≈ 97.00% (Day 21) | High HER2 expression (HER2+++/++) | ||
| Method Description |
DP303c (3 mg/kg).
|
||||
| In Vivo Model | HCC1954 cell line xenograft model | ||||
| In Vitro Model | Breast ductal carcinoma | HCC1954 cells | CVCL_1259 | ||
| Experiment 21 Reporting the Activity Date of This ADC | [132] | ||||
| Efficacy Data | Tumor Growth Inhibition value (TGI) | ≈ 97.10% (Day 25) | High HER2 expression (HER2+++) | ||
| Method Description |
Pathogen-free female nude mice were injected subcutaneously with each cell suspension. According to tumor volumes,the mice were randomly divided in two groups: treatment and control groups. Each drug was given to the animals intravenously. The dosing frequency was once a week (qw), qw 2 or qw 3.DP303c induced obvious tumor growth inhibition at a single dose of 3 mg/kg.
Click to Show/Hide
|
||||
| In Vitro Model | Breast ductal carcinoma | HCC1954 cells | CVCL_1259 | ||
| Experiment 22 Reporting the Activity Date of This ADC | [132] | ||||
| Efficacy Data | Tumor Growth Inhibition value (TGI) | ≈ 97.50% (Day 25) | High HER2 expression (HER2+++) | ||
| Method Description |
Pathogen-free female nude mice were injected subcutaneously with each cell suspension. According to tumor volumes,the mice were randomly divided in two groups: treatment and control groups. Each drug was given to the animals intravenously. The dosing frequency was once a week (qw), qw 2 or qw 3.DP303c induced obvious tumor growth inhibition at a single dose of 2.5 mg/kg.
Click to Show/Hide
|
||||
| In Vitro Model | Gastric tubular adenocarcinoma | NCI-N87 cells | CVCL_1603 | ||
| Experiment 23 Reporting the Activity Date of This ADC | [132] | ||||
| Efficacy Data | Tumor Growth Inhibition value (TGI) | ≈ 97.50% (Day 25) | High HER2 expression (HER2+++) | ||
| Method Description |
Pathogen-free female nude mice were injected subcutaneously with each cell suspension. According to tumor volumes,the mice were randomly divided in two groups: treatment and control groups. Each drug was given to the animals intravenously. The dosing frequency was once a week (qw), qw 2 or qw 3.DP303c induced obvious tumor growth inhibition at a single dose of 10 mg/kg.
Click to Show/Hide
|
||||
| In Vitro Model | Breast ductal carcinoma | HCC1954 cells | CVCL_1259 | ||
| Experiment 24 Reporting the Activity Date of This ADC | [132] | ||||
| Efficacy Data | Tumor Growth Inhibition value (TGI) | ≈ 97.80% (Day 25) | High HER2 expression (HER2+++) | ||
| Method Description |
Pathogen-free female nude mice were injected subcutaneously with each cell suspension. According to tumor volumes,the mice were randomly divided in two groups: treatment and control groups. Each drug was given to the animals intravenously. The dosing frequency was once a week (qw), qw 2 or qw 3.DP303c induced obvious tumor growth inhibition at a single dose of 5 mg/kg.
Click to Show/Hide
|
||||
| In Vitro Model | Gastric tubular adenocarcinoma | NCI-N87 cells | CVCL_1603 | ||
| Experiment 25 Reporting the Activity Date of This ADC | [132] | ||||
| Efficacy Data | Tumor Growth Inhibition value (TGI) | ≈ 97.80% (Day 18) | High HER2 expression (HER2+++) | ||
| Method Description |
Pathogen-free female nude mice were injected subcutaneously with each cell suspension. According to tumor volumes,the mice were randomly divided in two groups: treatment and control groups. Each drug was given to the animals intravenously. The dosing frequency was once a week (qw), qw 2 or qw 3.DP303c induced obvious tumor growth inhibition at a single dose of 10 mg/kg.
Click to Show/Hide
|
||||
| In Vitro Model | Breast adenocarcinoma | SK-BR-3 cells | CVCL_0033 | ||
| Experiment 26 Reporting the Activity Date of This ADC | [132] | ||||
| Efficacy Data | Tumor Growth Inhibition value (TGI) | ≈ 97.80% (Day 32) | Moderate HER2 expression (HER2++) | ||
| Method Description |
Pathogen-free female nude mice were injected subcutaneously with each cell suspension. According to tumor volumes,the mice were randomly divided in two groups: treatment and control groups. Each drug was given to the animals intravenously. The dosing frequency was once a week (qw), qw 2 or qw 3.DP303c induced obvious tumor growth inhibition at a single dose of 1 mg/kg.
Click to Show/Hide
|
||||
| In Vitro Model | Breast ductal carcinoma | JIMT-1 cells | CVCL_2077 | ||
| Experiment 27 Reporting the Activity Date of This ADC | [132] | ||||
| Efficacy Data | Tumor Growth Inhibition value (TGI) | ≈ 98.50% (Day 25) | High HER2 expression (HER2+++) | ||
| Method Description |
Pathogen-free female nude mice were injected subcutaneously with each cell suspension. According to tumor volumes,the mice were randomly divided in two groups: treatment and control groups. Each drug was given to the animals intravenously. The dosing frequency was once a week (qw), qw 2 or qw 3.DP303c induced obvious tumor growth inhibition at a single dose of 10 mg/kg.
Click to Show/Hide
|
||||
| In Vitro Model | Gastric tubular adenocarcinoma | NCI-N87 cells | CVCL_1603 | ||
| Experiment 28 Reporting the Activity Date of This ADC | [132] | ||||
| Efficacy Data | Tumor Growth Inhibition value (TGI) | ≈ 98.54% (Day 18) | High HER2 expression (HER2+++/++) | ||
| Method Description |
DP303c (10 mg/kg).
|
||||
| In Vivo Model | SK-OV-3 cell line xenograft model | ||||
| In Vitro Model | Ovarian serous cystadenocarcinoma | SK-OV-3 cells | CVCL_0532 | ||
| Experiment 29 Reporting the Activity Date of This ADC | [132] | ||||
| Efficacy Data | Tumor Growth Inhibition value (TGI) | ≈ 98.80% (Day 32) | Moderate HER2 expression (HER2++) | ||
| Method Description |
Pathogen-free female nude mice were injected subcutaneously with each cell suspension. According to tumor volumes,the mice were randomly divided in two groups: treatment and control groups. Each drug was given to the animals intravenously. The dosing frequency was once a week (qw), qw 2 or qw 3.DP303c induced obvious tumor growth inhibition at a single dose of 3 mg/kg.
Click to Show/Hide
|
||||
| In Vitro Model | Breast ductal carcinoma | JIMT-1 cells | CVCL_2077 | ||
| Experiment 30 Reporting the Activity Date of This ADC | [132] | ||||
| Efficacy Data | Tumor Growth Inhibition value (TGI) | ≈ 99.10% (Day 25) | High HER2 expression (HER2+++) | ||
| Method Description |
Pathogen-free female nude mice were injected subcutaneously with each cell suspension. According to tumor volumes,the mice were randomly divided in two groups: treatment and control groups. Each drug was given to the animals intravenously. The dosing frequency was once a week (qw), qw 2 or qw 3.DP303c induced obvious tumor growth inhibition at a single dose of 15 mg/kg.
Click to Show/Hide
|
||||
| In Vitro Model | Breast ductal carcinoma | HCC1954 cells | CVCL_1259 | ||
| Experiment 31 Reporting the Activity Date of This ADC | [132] | ||||
| Efficacy Data | Tumor Growth Inhibition value (TGI) | ≈ 99.90% (Day 32) | Moderate HER2 expression (HER2++) | ||
| Method Description |
Pathogen-free female nude mice were injected subcutaneously with each cell suspension. According to tumor volumes,the mice were randomly divided in two groups: treatment and control groups. Each drug was given to the animals intravenously. The dosing frequency was once a week (qw), qw 2 or qw 3.DP303c induced obvious tumor growth inhibition at a single dose of 10 mg/kg.
Click to Show/Hide
|
||||
| In Vitro Model | Breast ductal carcinoma | JIMT-1 cells | CVCL_2077 | ||
| Experiment 32 Reporting the Activity Date of This ADC | [132] | ||||
| Efficacy Data | Tumor Growth Inhibition value (TGI) | ≈ 100.00% (Day 32) | Moderate HER2 expression (HER2++) | ||
| Method Description |
DP303c (1 mg/kg).
|
||||
| In Vivo Model | JIMT -1 cell line xenograft model | ||||
| In Vitro Model | Breast ductal carcinoma | JIMT-1 cells | CVCL_2077 | ||
| Experiment 33 Reporting the Activity Date of This ADC | [132] | ||||
| Efficacy Data | Tumor Growth Inhibition value (TGI) | ≈ 100.00% (Day 32) | Moderate HER2 expression (HER2++) | ||
| Method Description |
DP303c (10 mg/kg).
|
||||
| In Vivo Model | JIMT -1 cell line xenograft model | ||||
| In Vitro Model | Breast ductal carcinoma | JIMT-1 cells | CVCL_2077 | ||
| Experiment 34 Reporting the Activity Date of This ADC | [132] | ||||
| Efficacy Data | Tumor Growth Inhibition value (TGI) | ≈ 100.00% (Day 32) | Moderate HER2 expression (HER2++) | ||
| Method Description |
DP303c (3 mg/kg).
|
||||
| In Vivo Model | JIMT -1 cell line xenograft model | ||||
| In Vitro Model | Breast ductal carcinoma | JIMT-1 cells | CVCL_2077 | ||
Revealed Based on the Cell Line Data
| Experiment 1 Reporting the Activity Date of This ADC | [132] | ||||
| Efficacy Data | Half Maximal Inhibitory Concentration (IC50) |
0.07 nM
|
Moderate HER2 expression (HER2++; HER2 MFI=157,231) | ||
| Method Description |
Comparison of in vitro Activity Between DP303c and T -DM1 in Variable HER2 Cell Lines.
|
||||
| In Vitro Model | Breast adenocarcinoma | SK-BR-3 cells | CVCL_0033 | ||
| Experiment 2 Reporting the Activity Date of This ADC | [132] | ||||
| Efficacy Data | Half Maximal Inhibitory Concentration (IC50) |
0.07 nM
|
High HER2 expression (HER2+++) | ||
| Method Description |
To obtain a single-cell suspension, the cells were harvested and resuspended. The cell density was adjusted to 1 x10⁵ cells/mL and seeded in a 96-well cell culture plate at 100 uL/well (1 x10⁴ cells/well). DP303c labeled with DyLight 488 was added into the 96-well plate with a final concentration of 2 ug/mL.
|
||||
| In Vitro Model | Breast adenocarcinoma | SK-BR-3 cells | CVCL_0033 | ||
| Experiment 3 Reporting the Activity Date of This ADC | [132] | ||||
| Efficacy Data | Half Maximal Inhibitory Concentration (IC50) |
0.08 nM
|
High HER2 expression (HER2+++; HER2 MFI=987,353) | ||
| Method Description |
Comparison of in vitro Activity Between DP303c and T -DM1 in Variable HER2 Cell Lines.
|
||||
| In Vitro Model | Invasive breast carcinoma | BT-474 cells | CVCL_0179 | ||
| Experiment 4 Reporting the Activity Date of This ADC | [132] | ||||
| Efficacy Data | Half Maximal Inhibitory Concentration (IC50) |
0.08 nM
|
Negative HER2 expression (HER2-; HER2 MFI=256) | ||
| Method Description |
To obtain a single-cell suspension, the cells were harvested and resuspended. The cell density was adjusted to 1x10⁵ cells/mL and seeded in a 96-well cell culture plate at 100 uL/well (1 x10⁴ cells/well). DP303c labeled with DyLight 488 was added into the 96-well plate with a final concentration of 2 ug/mL.
|
||||
| In Vitro Model | Invasive breast carcinoma | BT-474 cells | CVCL_0179 | ||
| Experiment 5 Reporting the Activity Date of This ADC | [132] | ||||
| Efficacy Data | Half Maximal Inhibitory Concentration (IC50) |
0.15 nM
|
High HER2 expression (HER2+++) | ||
| Method Description |
Comparison of in vitro Activity Between DP303c and T -DM1 in Variable HER2 Cell Lines.
|
||||
| In Vitro Model | Breast ductal carcinoma | HCC1954 cells | CVCL_1259 | ||
| Experiment 6 Reporting the Activity Date of This ADC | [132] | ||||
| Efficacy Data | Half Maximal Inhibitory Concentration (IC50) |
0.15 nM
|
High HER2 expression (HER2+++) | ||
| Method Description |
To obtain a single-cell suspension, the cells were harvested and resuspended. The cell density was adjusted to 1 x10⁵ cells/mL and seeded in a 96-well cell culture plate at 100 uL/well (1 x10⁴ cells/well). DP303c labeled with DyLight 488 was added into the 96-well plate with a final concentration of 2 ug/mL.
|
||||
| In Vitro Model | Breast ductal carcinoma | HCC1954 cells | CVCL_1259 | ||
| Experiment 7 Reporting the Activity Date of This ADC | [132] | ||||
| Efficacy Data | Half Maximal Inhibitory Concentration (IC50) |
0.22 nM
|
Negative HER2 expression (HER2-) | ||
| Method Description |
Comparison of in vitro Activity Between DP303c and T -DM1 in Variable HER2 Cell Lines.
|
||||
| In Vitro Model | Ovarian serous cystadenocarcinoma | SK-OV-3 cells | CVCL_0532 | ||
| Experiment 8 Reporting the Activity Date of This ADC | [132] | ||||
| Efficacy Data | Half Maximal Inhibitory Concentration (IC50) |
0.22 nM
|
High HER2 expression (HER2+++) | ||
| Method Description |
To obtain a single-cell suspension, the cells were harvested and resuspended. The cell density was adjusted to 1 x10⁵ cells/mL and seeded in a 96-well cell culture plate at 100 uL/well (1 x10⁴ cells/well). DP303c labeled with DyLight 488 was added into the 96-well plate with a final concentration of 2 ug/mL.
|
||||
| In Vitro Model | Ovarian serous cystadenocarcinoma | SK-OV-3 cells | CVCL_0532 | ||
| Experiment 9 Reporting the Activity Date of This ADC | [132] | ||||
| Efficacy Data | Half Maximal Inhibitory Concentration (IC50) |
0.23 nM
|
High HER2 expression (HER2+++; HER2 MFI=804,573) | ||
| Method Description |
Comparison of in vitro Activity Between DP303c and T -DM1 in Variable HER2 Cell Lines.
|
||||
| In Vitro Model | Gastric tubular adenocarcinoma | NCI-N87 cells | CVCL_1603 | ||
| Experiment 10 Reporting the Activity Date of This ADC | [132] | ||||
| Efficacy Data | Half Maximal Inhibitory Concentration (IC50) |
0.23 nM
|
High HER2 expression (HER2+++; HER2 MFI=892,333) | ||
| Method Description |
To obtain a single-cell suspension, the cells were harvested and resuspended. The cell density was adjusted to 1 x10⁵ cells/mL and seeded in a 96-well cell culture plate at 100 uL/well (1 x10⁴ cells/well). DP303c labeled with DyLight 488 was added into the 96-well plate with a final concentration of 2 ug/mL.
|
||||
| In Vitro Model | Gastric tubular adenocarcinoma | NCI-N87 cells | CVCL_1603 | ||
| Experiment 11 Reporting the Activity Date of This ADC | [132] | ||||
| Efficacy Data | Half Maximal Inhibitory Concentration (IC50) |
3.39 nM
|
High HER2 expression (HER2+++) | ||
| Method Description |
Comparison of in vitro Activity Between DP303c and T -DM1 in Variable HER2 Cell Lines.
|
||||
| In Vitro Model | Breast ductal carcinoma | JIMT-1 cells | CVCL_2077 | ||
| Experiment 12 Reporting the Activity Date of This ADC | [132] | ||||
| Efficacy Data | Half Maximal Inhibitory Concentration (IC50) |
3.39 nM
|
Moderate HER2 expression (HER2++) | ||
| Method Description |
To obtain a single-cell suspension, the cells were harvested and resuspended. The cell density was adjusted to 1x10⁵ cells/mL and seeded in a 96-well cell culture plate at 100 uL/well (1x10⁴ cells/well). DP303c labeled with DyLight 488 was added into the 96-well plate with a final concentration of 2 ug/mL.
|
||||
| In Vitro Model | Breast ductal carcinoma | JIMT-1 cells | CVCL_2077 | ||
| Experiment 13 Reporting the Activity Date of This ADC | [132] | ||||
| Efficacy Data | Half Maximal Inhibitory Concentration (IC50) | > 50.00 nM | High HER2 expression (HER2+++; HER2 MFI=1,106,494) | ||
| Method Description |
To obtain a single-cell suspension, the cells were harvested and resuspended. The cell density was adjusted to 1x10⁵ cells/mL and seeded in a 96-well cell culture plate at 100 uL/well (1x10⁴ cells/well). DP303c labeled with DyLight 488 was added into the 96-well plate with a final concentration of 2 ug/mL.
|
||||
| In Vitro Model | Breast adenocarcinoma | MDA-MB-468 cells | CVCL_0419 | ||
| Experiment 14 Reporting the Activity Date of This ADC | [132] | ||||
| Efficacy Data | Half Maximal Inhibitory Concentration (IC50) | > 1000.00 nM | High HER2 expression (HER2+++; HER2 MFI=765,629) | ||
| Method Description |
Comparison of in vitro Activity Between DP303c and T -DM1 in Variable HER2 Cell Lines.
|
||||
| In Vitro Model | Breast adenocarcinoma | MDA-MB-468 cells | CVCL_0419 | ||
CDX-014 [Phase 2]
Identified from the Human Clinical Data
| Experiment 1 Reporting the Activity Date of This ADC | [133] | ||||
| Efficacy Data | Partial Response (PR) |
6.20%
|
|||
| Patients Enrolled |
Advanced clear cell or papillary renal cell carcinoma (RCC) who experienced progression after at least two lines of systemic therapy, including at least one TKI were included; Additional main inclusion criteria included measurable disease by Response Criteria in Solid Tumors (RECIST) 1.1 criteria, a Karnofsky performance status 70%, and adequate renal, hepatic, and hematological laboratory values.
Click to Show/Hide
|
||||
| Administration Dosage |
Intravenously at doses ranging from 0.15 to 2.00 mg/kg every 2 or 3 weeks until progression or unacceptable toxicity.
|
||||
| Related Clinical Trial | |||||
| NCT Number | NCT02837991 | Phase Status | Phase 1 | ||
| Clinical Description |
A phase l open-label, dose escalation and cohort expansion study, to assess the safety and activity of the antibody-drug conjugate CDX-014 in advanced or metastatic renal cell carcinoma (RCC) and advanced or metastatic ovarian clear cell carcinoma (OCCC).
|
||||
| Primary Endpoint |
One patient (6.20%) treated at 0.3 mg/kg every 3 weeks exhibited PR as best overall response,ongoing after 17 months on therapy; this patient had been on single agent PD-1 inhibition prior to initiating therapy with CDX-014. Five patients (31.00%) exhibited clinical benefit from CDX-014. PFS and OS were 2.70 months (95%CI 1.2-8.0) and 12.6 months (95%CI 5.7-12.6),respectively.
Click to Show/Hide
|
||||
| Other Endpoint |
Partial response (PR) = 6.00% of one patient treated at 0.30 mg/kg every 3 weeks as best overall response, clinical benefit from CDX-014 of five patients = (31.25%) exhibited of at least 6 months. PFS = 2.7 months (95%CI, 1.20-8.00) ,OS =12.6 months (95%CI, 5.70-12.60).
|
||||
Discovered Using Cell Line-derived Xenograft Model
| Experiment 1 Reporting the Activity Date of This ADC | [160] | ||||
| Efficacy Data | Tumor Growth Inhibition value (TGI) | ≈ 20.00% | Positive TIM1 expression (TIM1+++/++) | ||
| Method Description |
Anti-TIM-1-vcMMAE (CDX-014=300 g), CDX-014 inhibited the increase in tumor volumes relative to saline control treatment.
|
||||
| In Vivo Model | IGROV-1 xenograft mouse models | ||||
| In Vitro Model | Ovarian endometrioid adenocarcinoma | IGROV-1 cells | CVCL_1304 | ||
| Experiment 2 Reporting the Activity Date of This ADC | [160] | ||||
| Efficacy Data | Tumor Growth Inhibition value (TGI) | ≈ 21.00% | Positive TIM1 expression (TIM1+++/++) | ||
| Method Description |
Anti-TIM-1-vcMMAE (CDX-014=300 g).
|
||||
| In Vivo Model | A549 xenograft mouse models | ||||
| In Vitro Model | Lung adenocarcinoma | A-549 cells | CVCL_0023 | ||
| Experiment 3 Reporting the Activity Date of This ADC | [160] | ||||
| Efficacy Data | Tumor Growth Inhibition value (TGI) | ≈ 22.90% | Positive TIM1 expression (TIM1+++/++) | ||
| Method Description |
Anti-TIM-1-vcMMAE (CDX-014=300 g).
|
||||
| In Vivo Model | Caki-1 xenograft mouse model | ||||
| In Vitro Model | Clear cell renal cell carcinoma | Caki-1 cells | CVCL_0234 | ||
| Experiment 4 Reporting the Activity Date of This ADC | [160] | ||||
| Efficacy Data | Tumor Growth Inhibition value (TGI) | ≈ 40.50% | Positive TIM1 expression (TIM1+++/++) | ||
| Method Description |
Extended dosing of CDX-014 ADC in the A549 tumor model. Three cycles of four doses of CDX-014 prolong the inhibition of tumor growth.
|
||||
| In Vivo Model | A549 xenograft mouse models | ||||
| In Vitro Model | Lung adenocarcinoma | A-549 cells | CVCL_0023 | ||
Glembatumumab vedotin [Phase 2]
Identified from the Human Clinical Data
| Experiment 1 Reporting the Activity Date of This ADC | [134] | ||||
| Efficacy Data | Partial Response (PR) |
7.69%
|
|||
| Patients Enrolled |
Stage IIIB or IV squamous (or mixed adenosquamous) lung cancer measurable by Response Evaluation Criteria in Solid Tumors (RECIST 1.1).
|
||||
| Administration Dosage |
A dose of 1.90 mg/kg as a 90-minute intravenous infusion for the escalation phase, on the basis of previous clinical trial results using glembatumumab vedotin at 1.3 mg/kg one-dose level; every 3 weeks.
|
||||
| Related Clinical Trial | |||||
| NCT Number | NCT02713828 | Phase Status | Phase 1 | ||
| Clinical Description |
A phase 1/2 study of glembatumumab vedotin in patients with gpNMB-expressing, advanced or metastatic squamous cell carcinoma of the lung.
|
||||
| Primary Endpoint |
To further characterize the safety of this drug, the protocol was modified and additional three patients were added to cohort 1 for a total of nine patients at 1.90 mg/kg dose. A second DLT was observed in cohort 1. The patient experienced grade 3 treatment-related pruritus requiring hospital admission. The dose was de-escalated to dose level 1. No DLT was observed at dose level 1 of 1.30 mg/kg.
Click to Show/Hide
|
||||
| Other Endpoint |
The best objective response per RECIST 1.1 was of one patient who achieved a partial response (1 of 13 [7.69%], 90% CI: 0.40%-31.60%).The median OS in this heavily pretreated population was 5.70 months (90% CI: 2.50-16.80). All patients had disease progression or died. The median PFS was 2.50 months (90% CI: 1.60-5.30).
|
||||
| Experiment 2 Reporting the Activity Date of This ADC | [138] | ||||
| Efficacy Data | Objective Response Rate (ORR) |
11.00% (all)
21.00% (patients who developed rash during the first cycle) 7.00% (those who did not) |
|||
| Patients Enrolled |
Stage III or IV, histologically confirmed melanoma. Patients must had previously received no more than one prior chemotherapy-containing treatment regimen for advanced disease, at least one checkpoint inhibitor (ie, antiCTLA-4, PD-1, PD-L1targeted immunotherapy), and at least one BRAF-targeted and/or MEK-targeted therapy if melanoma harbored a BRAFV600 mutation, unless it was not clinically indicated or was refused by the patient.
Click to Show/Hide
|
||||
| Administration Dosage |
As a 90-minute intravenous infusion every 3 weeks at a starting dose of 1.90 mg/kg. Dose reductions to 1.30 and 1.00 mg/kg were allowed for toxicity.
|
||||
| Related Clinical Trial | |||||
| NCT Number | NCT02302339 | Phase Status | Phase 2 | ||
| Clinical Description |
A phase 2 study of glembatumumab vedotin, an anti-gpNMB antibody-drug conjugate, as monotherapy or in combination with immunotherapies in patients with advanced melanoma.
|
||||
| Primary Endpoint |
The ORR was 11.00% and the median response duration was 6.00 months (95% confidence interval [CI],4.10 months to not reached). The median PFS was 4.40 months (95% CI,2.60-5.50 months),and the median OS was 9.00 months (95% CI,6.10-11.70 months).
|
||||
| Other Endpoint |
For patients who developed rash during the first cycle versus those who did not,the ORR was 21.00% versus 7.00%, respectively, and there was an overall improvement in PFS (hazard ratio,0.43; P = 0.013) and OS (hazard ratio,0.43; P = 0.017).
|
||||
| Experiment 3 Reporting the Activity Date of This ADC | [141] | ||||
| Efficacy Data | Objective Response Rate (ORR) |
12.00% (for all evaluable patients treated at the phase II dose)
18.00% (evaluable patients with gpNMB-positive tumors) |
|||
| Patients Enrolled |
Locally advanced or metastatic carcinoma of the breast, progressive within 6 months of last therapy; received at least two prior chemotherapeutic regimens for breast cancer, with at least one given in the locally advanced or metastatic setting.
|
||||
| Administration Dosage |
Glembatumumab vedotin was administered as a 90 minute intravenous infusion, once every 3 weeks (day 1 of repeated 21 day cycles). Delays of up to 3 weeks and up to two dose reductions (to dose levels of 1.34, 1.00, and 0.75 mg/kg, as applicable) were permitted for toxicity. Dosing continued until unmanageable treatment-related toxicities, disease progression, or death.
Click to Show/Hide
|
||||
| Experiment 4 Reporting the Activity Date of This ADC | [142] | ||||
| Related Clinical Trial | |||||
| NCT Number | NCT01156753 | Phase Status | Phase 2 | ||
| Clinical Description |
A phase 2, randomized, multicenter study of CDX-011 (CR011-vcMMAE) in patients with advanced GPNMB-expressing breast cancer.
|
||||
Discovered Using Cell Line-derived Xenograft Model
| Experiment 1 Reporting the Activity Date of This ADC | [162] | ||||
| Efficacy Data | Tumor Growth Inhibition value (TGI) | ≈ 93.33% (Day 35) | High GPNMB expression (GPNMB+++) | ||
| Method Description |
Tumor xenografts were generated by injecting UOK124 cells subcutaneously into flanks of athymic nude mice. Mice were randomized into treatment groups (n = 10 mice/group) based on tumor volume and treated with the following agents, singly or in combination CDX-011.
|
||||
| In Vivo Model | UOK124 CDX model | ||||
| In Vitro Model | Papillary renal cell carcinoma | UOK124 cells | CVCL_B105 | ||
CBP-1008 [Phase 2]
Identified from the Human Clinical Data
| Experiment 1 Reporting the Activity Date of This ADC | [135] | ||||
| Efficacy Data | Partial Response (PR) |
15.90% (all)
33.30% (FOLR1/TRPV6 high) |
|||
| Patients Enrolled |
Patients with platinum-resistant ovarian cancer (OC), metastatic triple negative breast cancer (TNBC) and received median 3 prior regimens.
|
||||
| Administration Dosage |
0.15, 0.17, 0.18 mg/kg day1 and day15; q28d.
|
||||
| Related Clinical Trial | |||||
| NCT Number | NCT04740398 | Phase Status | Phase 1 | ||
| Clinical Description |
A phase 1a/1b, open-label, multi-center, first in human and expansion study to assess the safety, tolerance, and pharmacokinetics of the novel antitumor agent CBP-1008 in patients with advanced solid tumors.
|
||||
CX-2029 [Phase 2]
Identified from the Human Clinical Data
| Experiment 1 Reporting the Activity Date of This ADC | [136] | ||||
| Efficacy Data | Partial Response (PR) |
20.00% (dose of 3 mg/kg)
50.00% (dose of 5 mg/kg) |
High CD71 expression (CD71+++) | ||
| Patients Enrolled |
Metastatic or locally advanced unresectable solid tumors without approved life-prolonging treatment options.
|
||||
| Administration Dosage |
CX-2029 (0.10, 0.25, 0.50, 1, 2, 3, 4, or 5 mg/kg) i.v. over 90 minutes [later increased to 180 minutes to mitigate infusion-related reactions (IRR)] every 3 weeks.
|
||||
| Related Clinical Trial | |||||
| NCT Number | NCT03543813 | Phase Status | Phase 1 | ||
| Clinical Description |
A phase 1-2, first-in-human study of CX-2029 in adults with metastatic or locally advanced unresectable solid tumors or diffuse large B-cell lymphomas (PROCLAIM-CX-2029).
|
||||
| Primary Endpoint |
For the dose of 3 mg/kg, confirmed partial response rate=20.00% (n=2, 95% CI=2.50-55.60). For the dose of 5 mg/kg, confirmed partial response rate=50.00% (n=1, 95% CI=1.30-98.70).
|
||||
| Other Endpoint |
For the dose of 0.5 mg/kg, Disease controla rate=50.00% (n=3, 95% CI=11.80-82.20). For the dose of 2 mg/kg, Disease controla rate=28.60% (n=2, 95% CI=3.7-71.0). For the dose of 3 mg/kg, Disease controla rate=50.00% (n=5, 95% CI 18.70-81.30). For the dose of 5 mg/kg, Disease controla rate=50.00% (n=1, 95% CI 1.30-98.70).
|
||||
Discovered Using Patient-derived Xenograft Model
| Experiment 1 Reporting the Activity Date of This ADC | [158] | ||||
| Efficacy Data | Tumor Growth Inhibition value (TGI) | ≈ 74.10% (Day 60) | High CD71 expression (CD71+++) | ||
| Method Description |
Dosing started on the same day for all groups,and dosing volume was adjusted for each mouse based on body weight on day of dosing. PDX models were intravenously dosed with vehicle (PBS) , 3 mg/kg on day 0 and day 7. Mice were checked daily for morbidity and mortality. Tumors were measured twice weekly via calipers.
|
||||
| In Vivo Model | Pancreatic cancer PDX model (PDX: PA6237) | ||||
| Experiment 2 Reporting the Activity Date of This ADC | [158] | ||||
| Efficacy Data | Tumor Growth Inhibition value (TGI) | ≈ 80.80% (Day 18) | High CD71 expression (CD71+++) | ||
| Method Description |
Female BALB/c nude mice used for esophageal,gastric,pancreatic models,and NOD/SCID,NPG,or NOG mice used for DLBCL models and used at ages 5 to 7 weeks. Seven- to 8-week-old female Athymic Nude-Foxn1nu mice were used for breast,HNSCC,and NSCLC models (Envigo). Human cancer cell lines or tumor fragments 2 to 3 mm in diameter from stock mice inoculated with primary human tumor xenografts were harvested and used to inoculate study mice by subcutaneous injection into the right flank. When tumors reached approximately 100 to 200 mm3,mice were randomized into treatment groups based on tumor volume and body weight. Dosing started on the same day for all groups,and dosing volume was adjusted for each mouse based on body weight on day of dosing. PDX models were intravenously dosed with vehicle (PBS),1.5 mg/kg,3 mg/kg,or 6 mg anti-CD71 PDC on day 0 and day 9. Mice were checked daily for morbidity and mortality. Tumors were measured twice weekly via calipers.
Click to Show/Hide
|
||||
| In Vivo Model | CTG-820 PDX model | ||||
| Experiment 3 Reporting the Activity Date of This ADC | [158] | ||||
| Efficacy Data | Tumor Growth Inhibition value (TGI) | ≈ 97.60% (Day 60) | High CD71 expression (CD71+++) | ||
| Method Description |
Dosing started on the same day for all groups,and dosing volume was adjusted for each mouse based on body weight on day of dosing. PDX models were intravenously dosed with vehicle (PBS) , 6 mg/kg on day 0 and day 7. Mice were checked daily for morbidity and mortality. Tumors were measured twice weekly via calipers.
|
||||
| In Vivo Model | Non-small cell lung cancer PDX model (PDX: CTG-0860) | ||||
| Experiment 4 Reporting the Activity Date of This ADC | [158] | ||||
| Efficacy Data | Tumor Growth Inhibition value (TGI) | ≈ 98.00% (Day 32) | High CD71 expression (CD71+++) | ||
| Method Description |
Female BALB/c nude mice used for esophageal,gastric,pancreatic models,and NOD/SCID,NPG,or NOG mice used for DLBCL models and used at ages 5 to 7 weeks. Seven- to 8-week-old female Athymic Nude-Foxn1nu mice were used for breast,HNSCC,and NSCLC models (Envigo). Human cancer cell lines or tumor fragments 2 to 3 mm in diameter from stock mice inoculated with primary human tumor xenografts were harvested and used to inoculate study mice by subcutaneous injection into the right flank. When tumors reached approximately 100 to 200 mm3,mice were randomized into treatment groups based on tumor volume and body weight. Dosing started on the same day for all groups,and dosing volume was adjusted for each mouse based on body weight on day of dosing. PDX models were intravenously dosed with vehicle (PBS),1.5 mg/kg,3 mg/kg,or 6 mg anti-CD71 PDC on day 0 and day 10. Mice were checked daily for morbidity and mortality. Tumors were measured twice weekly via calipers.
Click to Show/Hide
|
||||
| In Vivo Model | CTG-820 PDX model | ||||
| Experiment 5 Reporting the Activity Date of This ADC | [158] | ||||
| Efficacy Data | Tumor Growth Inhibition value (TGI) | ≈ 98.00% (Day 18) | High CD71 expression (CD71+++) | ||
| Method Description |
Female BALB/c nude mice used for esophageal,gastric,pancreatic models,and NOD/SCID,NPG,or NOG mice used for DLBCL models and used at ages 5 to 7 weeks. Seven- to 8-week-old female Athymic Nude-Foxn1nu mice were used for breast,HNSCC,and NSCLC models (Envigo). Human cancer cell lines or tumor fragments 2 to 3 mm in diameter from stock mice inoculated with primary human tumor xenografts were harvested and used to inoculate study mice by subcutaneous injection into the right flank. When tumors reached approximately 100 to 200 mm3,mice were randomized into treatment groups based on tumor volume and body weight. Dosing started on the same day for all groups,and dosing volume was adjusted for each mouse based on body weight on day of dosing. PDX models were intravenously dosed with vehicle (PBS),1.5 mg/kg,3 mg/kg,or 6 mg anti-CD71 PDC on day 0 and day 13. Mice were checked daily for morbidity and mortality. Tumors were measured twice weekly via calipers.
Click to Show/Hide
|
||||
| In Vivo Model | CTG-820 PDX model | ||||
| Experiment 6 Reporting the Activity Date of This ADC | [158] | ||||
| Efficacy Data | Tumor Growth Inhibition value (TGI) | ≈ 99.40% (Day 60) | High CD71 expression (CD71+++) | ||
| Method Description |
Dosing started on the same day for all groups,and dosing volume was adjusted for each mouse based on body weight on day of dosing. PDX models were intravenously dosed with vehicle (PBS) , 3 mg/kg on day 0 and day 7. Mice were checked daily for morbidity and mortality. Tumors were measured twice weekly via calipers.
|
||||
| In Vivo Model | Gastric cancer PDX models (PDX: GA6881) | ||||
| Experiment 7 Reporting the Activity Date of This ADC | [158] | ||||
| Efficacy Data | Tumor Growth Inhibition value (TGI) | ≈ 99.80% (Day 60) | High CD71 expression (CD71+++) | ||
| Method Description |
Dosing started on the same day for all groups,and dosing volume was adjusted for each mouse based on body weight on day of dosing. PDX models were intravenously dosed with vehicle (PBS) , 3 mg/kg on day 0 and day 7. Mice were checked daily for morbidity and mortality. Tumors were measured twice weekly via calipers.
|
||||
| In Vivo Model | Breast cancer PDX model (PDX: CTG-0708) | ||||
| Experiment 8 Reporting the Activity Date of This ADC | [158] | ||||
| Efficacy Data | Tumor Growth Inhibition value (TGI) | ≈ 100.00% (Day 60) | High CD71 expression (CD71+++) | ||
| Method Description |
Dosing started on the same day for all groups,and dosing volume was adjusted for each mouse based on body weight on day of dosing. PDX models were intravenously dosed with vehicle (PBS) , 6 mg/kg on day 0 and day 7. Mice were checked daily for morbidity and mortality. Tumors were measured twice weekly via calipers.
|
||||
| In Vivo Model | Pancreatic cancer PDX model (PDX: PA6237) | ||||
| Experiment 9 Reporting the Activity Date of This ADC | [158] | ||||
| Efficacy Data | Tumor Growth Inhibition value (TGI) | ≈ 100.00% (Day 60) | High CD71 expression (CD71+++) | ||
| Method Description |
Dosing started on the same day for all groups,and dosing volume was adjusted for each mouse based on body weight on day of dosing. PDX models were intravenously dosed with vehicle (PBS) , 6 mg/kg on day 0 and day 7. Mice were checked daily for morbidity and mortality. Tumors were measured twice weekly via calipers.
|
||||
| In Vivo Model | Diffuse large B-cell lymphoma PDX model (PDX: LY6934) | ||||
| Experiment 10 Reporting the Activity Date of This ADC | [158] | ||||
| Efficacy Data | Tumor Growth Inhibition value (TGI) | ≈ 100.00% (Day 60) | High CD71 expression (CD71+++) | ||
| Method Description |
Dosing started on the same day for all groups,and dosing volume was adjusted for each mouse based on body weight on day of dosing. PDX models were intravenously dosed with vehicle (PBS) , 6 mg/kg on day 0 and day 7. Mice were checked daily for morbidity and mortality. Tumors were measured twice weekly via calipers.
|
||||
| In Vivo Model | Head and neck squamous cell carcinoma PDX model (PDX: CTG-820) | ||||
| Experiment 11 Reporting the Activity Date of This ADC | [158] | ||||
| Efficacy Data | Tumor Growth Inhibition value (TGI) | ≈ 100.00% (Day 60) | High CD71 expression (CD71+++) | ||
| Method Description |
Dosing started on the same day for all groups,and dosing volume was adjusted for each mouse based on body weight on day of dosing. PDX models were intravenously dosed with vehicle (PBS) , 6 mg/kg on day 0 and day 7. Mice were checked daily for morbidity and mortality. Tumors were measured twice weekly via calipers.
|
||||
| In Vivo Model | Breast cancer PDX model (PDX: CTG-0708) | ||||
| Experiment 12 Reporting the Activity Date of This ADC | [158] | ||||
| Efficacy Data | Tumor Growth Inhibition value (TGI) | ≈ 100.00% (Day 60) | High CD71 expression (CD71+++) | ||
| Method Description |
Dosing started on the same day for all groups,and dosing volume was adjusted for each mouse based on body weight on day of dosing. PDX models were intravenously dosed with vehicle (PBS) , 6 mg/kg on day 0 and day 7. Mice were checked daily for morbidity and mortality. Tumors were measured twice weekly via calipers.
|
||||
| In Vivo Model | Gastric cancer PDX models (PDX: GA6881) | ||||
| Experiment 13 Reporting the Activity Date of This ADC | [158] | ||||
| Efficacy Data | Tumor Growth Inhibition value (TGI) | ≈ 100.00% (Day 60) | High CD71 expression (CD71+++) | ||
| Method Description |
Dosing started on the same day for all groups,and dosing volume was adjusted for each mouse based on body weight on day of dosing. PDX models were intravenously dosed with vehicle (PBS) , 6 mg/kg on day 0 and day 7. Mice were checked daily for morbidity and mortality. Tumors were measured twice weekly via calipers.
|
||||
| In Vivo Model | Esophageal caner PDX model (PDX: ES0136) | ||||
| Experiment 14 Reporting the Activity Date of This ADC | [158] | ||||
| Efficacy Data | Tumor Growth Inhibition value (TGI) | ≈ 100.00% (Day 21) | High CD71 expression (CD71+++) | ||
| Method Description |
Female BALB/c nude mice used for esophageal,gastric,pancreatic models,and NOD/SCID,NPG,or NOG mice used for DLBCL models and used at ages 5 to 7 weeks. Seven- to 8-week-old female Athymic Nude-Foxn1nu mice were used for breast,HNSCC,and NSCLC models (Envigo). Human cancer cell lines or tumor fragments 2 to 3 mm in diameter from stock mice inoculated with primary human tumor xenografts were harvested and used to inoculate study mice by subcutaneous injection into the right flank. When tumors reached approximately 100 to 200 mm3,mice were randomized into treatment groups based on tumor volume and body weight. Dosing started on the same day for all groups,and dosing volume was adjusted for each mouse based on body weight on day of dosing. PDX models were intravenously dosed with vehicle (PBS),1.5 mg/kg,3 mg/kg,or 6 mg anti-CD71 PDC on day 0 and day 7. Mice were checked daily for morbidity and mortality. Tumors were measured twice weekly via calipers.
Click to Show/Hide
|
||||
| In Vivo Model | Pancreatic cancer PDX model (PDX: PA6237) | ||||
| Experiment 15 Reporting the Activity Date of This ADC | [158] | ||||
| Efficacy Data | Tumor Growth Inhibition value (TGI) | ≈ 100.00% (Day 18) | High CD71 expression (CD71+++) | ||
| Method Description |
Female BALB/c nude mice used for esophageal,gastric,pancreatic models,and NOD/SCID,NPG,or NOG mice used for DLBCL models and used at ages 5 to 7 weeks. Seven- to 8-week-old female Athymic Nude-Foxn1nu mice were used for breast,HNSCC,and NSCLC models (Envigo). Human cancer cell lines or tumor fragments 2 to 3 mm in diameter from stock mice inoculated with primary human tumor xenografts were harvested and used to inoculate study mice by subcutaneous injection into the right flank. When tumors reached approximately 100 to 200 mm3,mice were randomized into treatment groups based on tumor volume and body weight. Dosing started on the same day for all groups,and dosing volume was adjusted for each mouse based on body weight on day of dosing. PDX models were intravenously dosed with vehicle (PBS),1.5 mg/kg,3 mg/kg,or 6 mg anti-CD71 PDC on day 0 and day 8. Mice were checked daily for morbidity and mortality. Tumors were measured twice weekly via calipers.
Click to Show/Hide
|
||||
| In Vivo Model | Diffuse large B-cell lymphoma PDX model (PDX: LY6934) | ||||
| Experiment 16 Reporting the Activity Date of This ADC | [158] | ||||
| Efficacy Data | Tumor Growth Inhibition value (TGI) | ≈ 100.00% (Day 36) | High CD71 expression (CD71+++) | ||
| Method Description |
Female BALB/c nude mice used for esophageal,gastric,pancreatic models,and NOD/SCID,NPG,or NOG mice used for DLBCL models and used at ages 5 to 7 weeks. Seven- to 8-week-old female Athymic Nude-Foxn1nu mice were used for breast,HNSCC,and NSCLC models (Envigo). Human cancer cell lines or tumor fragments 2 to 3 mm in diameter from stock mice inoculated with primary human tumor xenografts were harvested and used to inoculate study mice by subcutaneous injection into the right flank. When tumors reached approximately 100 to 200 mm3,mice were randomized into treatment groups based on tumor volume and body weight. Dosing started on the same day for all groups,and dosing volume was adjusted for each mouse based on body weight on day of dosing. PDX models were intravenously dosed with vehicle (PBS),1.5 mg/kg,3 mg/kg,or 6 mg anti-CD71 PDC on day 0 and day 11. Mice were checked daily for morbidity and mortality. Tumors were measured twice weekly via calipers.
Click to Show/Hide
|
||||
| In Vivo Model | Gastric cancer PDX model (PDX: GA6881) | ||||
| Experiment 17 Reporting the Activity Date of This ADC | [158] | ||||
| Efficacy Data | Tumor Growth Inhibition value (TGI) | ≈ 100.00% (Day 40) | High CD71 expression (CD71+++) | ||
| Method Description |
Female BALB/c nude mice used for esophageal,gastric,pancreatic models,and NOD/SCID,NPG,or NOG mice used for DLBCL models and used at ages 5 to 7 weeks. Seven- to 8-week-old female Athymic Nude-Foxn1nu mice were used for breast,HNSCC,and NSCLC models (Envigo). Human cancer cell lines or tumor fragments 2 to 3 mm in diameter from stock mice inoculated with primary human tumor xenografts were harvested and used to inoculate study mice by subcutaneous injection into the right flank. When tumors reached approximately 100 to 200 mm3,mice were randomized into treatment groups based on tumor volume and body weight. Dosing started on the same day for all groups,and dosing volume was adjusted for each mouse based on body weight on day of dosing. PDX models were intravenously dosed with vehicle (PBS),1.5 mg/kg,3 mg/kg,or 6 mg anti-CD71 PDC on day 0 and day 12. Mice were checked daily for morbidity and mortality. Tumors were measured twice weekly via calipers.
Click to Show/Hide
|
||||
| In Vivo Model | Esophageal cancer PDX model (PDX: ES0136) | ||||
Revealed Based on the Cell Line Data
| Experiment 1 Reporting the Activity Date of This ADC | [158] | ||||
| Efficacy Data | Half Maximal Effective Concentration (EC50) |
1.20 nM
|
|||
| Method Description |
Suspension or adherent cells were plated at a density of 1, 000 cells/well in 50-mL complete media in a 96-well white-walled tissue culture plate and used immediately or allowed to adhere overnight. Cells were then incubated with 50 uL of a 2 final concentration of test article for 3 to 5 days at 37 and 5% CO2.
|
||||
| In Vitro Model | Lung squamous cell carcinoma | NCI-H520 cells | CVCL_1566 | ||
| Experiment 2 Reporting the Activity Date of This ADC | [158] | ||||
| Efficacy Data | Half Maximal Effective Concentration (EC50) |
1.30 nM
|
High CD71 expression (CD71+++) | ||
| Method Description |
Suspension or adherent cells were plated at a density of 1, 000 cells/well in 50-mL complete media in a 96-well white-walled tissue culture plate and used immediately or allowed to adhere overnight. Cells were then incubated with 50 uL of a 2 final concentration of test article for 3 to 5 days at 37 and 5% CO2.
|
||||
| In Vitro Model | Colon cancer | HT29 cells | CVCL_A8EZ | ||
FOR-46 [Phase 1/2]
Identified from the Human Clinical Data
| Experiment 1 Reporting the Activity Date of This ADC | [137] | ||||
| Efficacy Data | Partial Response (PR) |
22.20%
|
|||
| Patients Enrolled |
Metastatic castration-resistant prostate cancer (CRPC).
|
||||
| Administration Dosage |
Intravenous FOR46 on day 1 of every 21-day cycle. Dose levels ranged from 0.10 mg/kg. the starting dose level, to 3.00 mg/kg. The trial established 2.70 mg/kg to be the maximum tolerated dose (MTD) and the recommended phase 2 dose (RP2D) of the agent.
|
||||
| Related Clinical Trial | |||||
| NCT Number | NCT03575819 | Phase Status | Phase 1 | ||
| Clinical Description |
A phase 1 study of FOR46 administered every 21 days in patients with metastatic castration-resistant prostate cancer (mCRPC).
|
||||
| Primary Endpoint |
MtD and phase 1b dose=2.70 mg/kg.
|
||||
| Other Endpoint |
18 pts had measurable lesions; 8 of 18 (44.44%) had tumor regression, with 4 (22.22%) confirmed partial responses (PR). The median duration of response is > 14 wks (range 9 -31+ weeks).
|
||||
| Experiment 2 Reporting the Activity Date of This ADC | [147] | ||||
| Related Clinical Trial | |||||
| NCT Number | NCT05011188 | Phase Status | Phase 1/2 | ||
| Clinical Description |
A phase 1b/2 study of FOR46 in combination with enzalutamide in patients with metastatic castration resistant prostate cancer.
|
||||
| Experiment 3 Reporting the Activity Date of This ADC | [152] | ||||
| Related Clinical Trial | |||||
| NCT Number | NCT03650491 | Phase Status | Phase 1 | ||
| Clinical Description |
A phase 1 study of FOR46 administered every 21 days in patients with relapsed or refractory multiple myeloma (RRMM).
|
||||
Ladiratuzumab vedotin [Phase 2]
Identified from the Human Clinical Data
| Experiment 1 Reporting the Activity Date of This ADC | [139] | ||||
| Efficacy Data | Objective Response Rate (ORR) |
35.00%
|
|||
| Patients Enrolled |
Unresectable locally advanced or metastatic triple-negative breast cancer (mTNBC). Patients must have measureable disease per RECIST v1.1, an ECOG score of 0 or 1, and no prior cytotoxic or anti-PD-L1 treatment for advanced disease.
|
||||
| Administration Dosage |
LV 2.50 mg/kg + pembrolizumab 200 mg intravenously every three weeks.
|
||||
| Related Clinical Trial | |||||
| NCT Number | NCT03310957 | Phase Status | Phase 1/2 | ||
| Clinical Description |
Single arm, open label phase 1b/2 study of SGN-LIV1A in combination with pembrolizumab for first-line treatment of patients with unresectable locally-advanced or metastatic triple-negative breast cancer.
|
||||
| Experiment 2 Reporting the Activity Date of This ADC | [140] | ||||
| Efficacy Data | Objective Response Rate (ORR) |
32.00%
|
|||
| Patients Enrolled |
Women with LIV-1-positive, unresectable, locally advanced or metastatic breast cancer (LA/MBC).
|
||||
| Administration Dosage |
Received a median of 3 cycles (range, 112) of SGN-LIV1A at doses of 0.50-2.80 mg/kg.
|
||||
| Related Clinical Trial | |||||
| NCT Number | NCT01969643 | Phase Status | Phase 1 | ||
| Clinical Description |
A phase 1, open-label, dose-escalation study to evaluate the safety and tolerability of SGN-LIV1A in patients with metastatic breast cancer.
|
||||
| Experiment 3 Reporting the Activity Date of This ADC | [143] | ||||
| Related Clinical Trial | |||||
| NCT Number | NCT04032704 | Phase Status | Phase 2 | ||
| Clinical Description |
Open-label phase 2 study of ladiratuzumab vedotin (LV) for unresectable locally advanced or metastatic solid tumors.
|
||||
Revealed Based on the Cell Line Data
| Experiment 1 Reporting the Activity Date of This ADC | [166] | ||||
| Efficacy Data | Half Maximal Effective Concentration (EC50) |
6.30 ng/mL
|
|||
| Method Description |
The inhibitory activity of SGN-LIV1A against cancer cell growth was evaluated in various human cancer cell lines in vitro. The cells were treated 5 days.
|
||||
| In Vitro Model | Invasive breast carcinoma | MCF-7 cells | CVCL_0031 | ||
Mecbotamab vedotin [Phase 2]
Identified from the Human Clinical Data
| Experiment 1 Reporting the Activity Date of This ADC | [144] | ||||
| Related Clinical Trial | |||||
| NCT Number | NCT04681131 | Phase Status | Phase 2 | ||
| Clinical Description |
A phase 2 study of BA3011 alone and in combination with PD-1 inhibitor in adult patients with metastatic non-small cell lung cancer (NSCLC) who had prior disease progression on a PD-1/L-1 inhibitor.
|
||||
| Experiment 2 Reporting the Activity Date of This ADC | [154] | ||||
| Related Clinical Trial | |||||
| NCT Number | NCT03425279 | Phase Status | Phase 1 | ||
| Clinical Description |
A phase 1/ 2 safety and efficacy dose escalation/dose expansion study of a CAB-AXL-ADC, alone and in combination with a PD-1 inhibitor in adult patients with advanced solid tumors (phase 1) and adult and adolescent patients with advanced, refractory sarcoma (phase 2).
|
||||
RC-88 [Phase 1/2]
Identified from the Human Clinical Data
| Experiment 1 Reporting the Activity Date of This ADC | [145] | ||||
| Related Clinical Trial | |||||
| NCT Number | NCT04175847 | Phase Status | Phase 1/2 | ||
| Clinical Description |
To evaluate the safety of RC88 for injection in patients with advanced malignant solid tumors, multicenter, open, multi-cohort extension of efficacy and pharmacokinetic characteristics phase 1 /2a clinical study.
|
||||
| Experiment 2 Reporting the Activity Date of This ADC | [146] | ||||
| Patients Enrolled |
Patients with malignant pleural mesothelioma and MSLN in advanced malignant solid tumors.
|
||||
| Administration Dosage |
Dose of 0.10, 0.50, 1.00, 1.50, 2.00 and 2.50 mg/kg.
|
||||
| Related Clinical Trial | |||||
| NCT Number | NCT04175847 | Phase Status | Phase 1/2 | ||
| Clinical Description |
To evaluate the safety of RC88 for injection in patients with advanced malignant solid tumors, multicenter, open, multi-cohort extension of efficacy and pharmacokinetic characteristics phase 1 /2a clinical study.
|
||||
| Experiment 3 Reporting the Activity Date of This ADC | [148] | ||||
| Related Clinical Trial | |||||
| NCT Number | NCT05508334 | Phase Status | Phase 1 | ||
| Clinical Description |
An open-label, non-randomised, multicentre study to allow continued access to and assess the safety and tolerability of RC88 for patients with advanced solid tumours.
|
||||
RC-118 [Phase 1/2]
Identified from the Human Clinical Data
| Experiment 1 Reporting the Activity Date of This ADC | [149] | ||||
| Related Clinical Trial | |||||
| NCT Number | NCT05205850 | Phase Status | Phase 1 | ||
| Clinical Description |
An open, multi-center phase 1/2a clinical study of RC118 for injection in patients with locally advanced unresectable or metastatic malignant solid tumors with positive expression of CLAUDIN 18.2.
|
||||
| Experiment 2 Reporting the Activity Date of This ADC | [150] | ||||
| Related Clinical Trial | |||||
| NCT Number | NCT04914117 | Phase Status | Phase 1 | ||
| Clinical Description |
Phase 1, first-in-human, multicentre, open-label study of RC118 for injection in patients with locally advanced unresectable/metastatic solid tumours.
|
||||
| Experiment 3 Reporting the Activity Date of This ADC | [151] | ||||
| Related Clinical Trial | |||||
| NCT Number | NCT03895112 | Phase Status | Phase 1 | ||
| Clinical Description |
Phase 1 study of AVID200 in patients with myelofibrosis (myeloproliferative neoplasms research consortium [MPN-RC] 118).
|
||||
OBI-999 [Phase 1/2]
Identified from the Human Clinical Data
| Experiment 1 Reporting the Activity Date of This ADC | [153] | ||||
| Patients Enrolled |
Advanced solid tumors that had been previously treated with standard-of-care therapy and their physicians had determined that such therapy was no longer effective, or patients had declined to receive further standard-of-care treatments.
|
||||
| Administration Dosage |
The starting dose of 0.40 mg/kg on day 1 of each 21-day cycle; A standard 3 + 3 dose-escalation design was used, and doses of 0.80, 1.20, and 1.60 mg/kg were also administered on day 1 of each 21-day cycle; intravenous infusion over 60 minutes.
|
||||
| Related Clinical Trial | |||||
| NCT Number | NCT04084366 | Phase Status | Phase 1 | ||
| Clinical Description |
A phase 1/2, open-label, dose-escalation and cohort-expansion study evaluating the safety, pharmacokinetics, and therapeutic activity of OBI-999 in patients with advanced solid tumors.
|
||||
| Primary Endpoint |
The incidence of dose-limiting toxicities and adverse events and determination of the maximum tolerated dose (MTD)/recommended phase II dose.
|
||||
Discovered Using Cell Line-derived Xenograft Model
| Experiment 1 Reporting the Activity Date of This ADC | [161] | ||||
| Efficacy Data | Tumor Growth Inhibition value (TGI) | ≈ 34.00% (Day 26) | Positive Globo H expression (Globo H+++/++) | ||
| Method Description |
Mice were treated with an intravenous dose of the ADCs at 0.3 mg/kg, qw*6.
|
||||
| In Vivo Model | MCF-7 CDX model | ||||
| In Vitro Model | Invasive breast carcinoma | MCF-7 cells | CVCL_0031 | ||
| Experiment 2 Reporting the Activity Date of This ADC | [161] | ||||
| Efficacy Data | Tumor Growth Inhibition value (TGI) | ≈ 60.00% (Day 77) | Positive Globo H expression (Globo H+++/++) | ||
| Method Description |
Mice were treated with an intravenous dose of the ADCs at 1 mg/kg, qw*6.
|
||||
| In Vivo Model | MCF-7 CDX model | ||||
| In Vitro Model | Invasive breast carcinoma | MCF-7 cells | CVCL_0031 | ||
| Experiment 3 Reporting the Activity Date of This ADC | [161] | ||||
| Efficacy Data | Tumor Growth Inhibition value (TGI) | ≈ 83.00% (Day 53) | Positive Globo H expression (Globo H+++/++) | ||
| Method Description |
Mice were treated with an intravenous dose of the ADCs at 1 mg/kg, qw*4.
|
||||
| In Vivo Model | NCI-N87 CDX model | ||||
| In Vitro Model | Gastric tubular adenocarcinoma | NCI-N87 cells | CVCL_1603 | ||
| Experiment 4 Reporting the Activity Date of This ADC | [161] | ||||
| Efficacy Data | Tumor Growth Inhibition value (TGI) | ≈ 85.00% (Day 25) | Positive Globo H expression (Globo H+++/++) | ||
| Method Description |
Mice were treated with an intravenous dose of the ADCs at 10 mg/kg, qw*4.
|
||||
| In Vivo Model | NCI-H526 CDX model | ||||
| In Vitro Model | Lung small cell carcinoma | NCI-H526 cells | CVCL_1569 | ||
| Experiment 5 Reporting the Activity Date of This ADC | [161] | ||||
| Efficacy Data | Tumor Growth Inhibition value (TGI) | ≈ 95.00% (Day 77) | Positive Globo H expression (Globo H+++/++) | ||
| Method Description |
Mice were treated with an intravenous dose of the ADCs at 10 mg/kg, qw*2.
|
||||
| In Vivo Model | MCF-7 CDX model | ||||
| In Vitro Model | Invasive breast carcinoma | MCF-7 cells | CVCL_0031 | ||
| Experiment 6 Reporting the Activity Date of This ADC | [161] | ||||
| Efficacy Data | Tumor Growth Inhibition value (TGI) | ≈ 97.00% (Day 53) | Positive Globo H expression (Globo H+++/++) | ||
| Method Description |
Mice were treated with an intravenous dose of the ADCs at 10 mg/kg, qw*4.
|
||||
| In Vivo Model | NCI-N87 CDX model | ||||
| In Vitro Model | Gastric tubular adenocarcinoma | NCI-N87 cells | CVCL_1603 | ||
| Experiment 7 Reporting the Activity Date of This ADC | [161] | ||||
| Efficacy Data | Tumor Growth Inhibition value (TGI) | ≈ 97.00% (Day 53) | Positive Globo H expression (Globo H+++/++) | ||
| Method Description |
Mice were treated with an intravenous dose of the ADCs at 1-3 mg/kg, qw*4.
|
||||
| In Vivo Model | NCI-N87 CDX model | ||||
| In Vitro Model | Gastric tubular adenocarcinoma | NCI-N87 cells | CVCL_1603 | ||
| Experiment 8 Reporting the Activity Date of This ADC | [161] | ||||
| Efficacy Data | Tumor Growth Inhibition value (TGI) | ≈ 98.00% (Day 77) | Positive Globo H expression (Globo H+++/++) | ||
| Method Description |
Mice were treated with an intravenous dose of the ADCs at 3 mg/kg, qw*6.
|
||||
| In Vivo Model | MCF-7 CDX model | ||||
| In Vitro Model | Invasive breast carcinoma | MCF-7 cells | CVCL_0031 | ||
| Experiment 9 Reporting the Activity Date of This ADC | [161] | ||||
| Efficacy Data | Tumor Growth Inhibition value (TGI) | ≈ 99.00% (Day 37) | Positive Globo H expression (Globo H+++/++) | ||
| Method Description |
Mice were treated with an intravenous dose of the ADCs at 10 mg/kg, qw*4.
|
||||
| In Vivo Model | HPAC CDX model | ||||
| In Vitro Model | Pancreatic adenocarcinoma | HPAC cells | CVCL_3517 | ||
Revealed Based on the Cell Line Data
| Experiment 1 Reporting the Activity Date of This ADC | [164] | ||||
| Efficacy Data | Tumor Growth Inhibition value (TGI) | ≈ 70.70% | |||
| Method Description |
In vivo , In each animal study,the antitumor efficacy was evaluated with doses of 1.00, 3.00, or 10.00 mg/kg of OBI-999 via i.v. injection. In NCI-N87 xenograft model,treatment groups of MMAE 0.191 mg/kg and Ctrl-ADC 3 mg/kg were also included. Each study utilized 6 to 8 mice per group.
|
||||
| In Vitro Model | Breast adenocarcinoma | MDA-MB-231 cells | CVCL_0062 | ||
| Breast adenocarcinoma | HCC1428 cells | CVCL_1252 | |||
Enapotamab vedotin [Phase 2]
Discovered Using Patient-derived Xenograft Model
| Experiment 1 Reporting the Activity Date of This ADC | [155] | ||||
| Efficacy Data | Tumor Growth Inhibition value (TGI) | ≈ 0.00% (Day 35) | Positive AXL expression (AXL+++/++) | ||
| In Vivo Model | Non-small cell lung cancer PDX model (PDX: LXFE772; EGFR mutation) | ||||
| Experiment 2 Reporting the Activity Date of This ADC | [155] | ||||
| Efficacy Data | Tumor Growth Inhibition value (TGI) | ≈ 6.00% (Day 25) | Positive AXL expression (AXL+++/++) | ||
| Method Description |
Antitumor activity of EnaV in Nonresponder.
|
||||
| In Vivo Model | NSCLC PDX model | ||||
| Experiment 3 Reporting the Activity Date of This ADC | [156] | ||||
| Efficacy Data | Tumor Growth Inhibition value (TGI) | ≈ 13.30% (Day 21) | Positive AXL expression (AXL+++/++) | ||
| Method Description |
The antitumor activity of ADCT-601 was tested in a range of human solid tumor xenograft models covering multiple indications. Single-dose (0.30 mg/kg,q.d.). Enapotamab vedotin and isotype-control ADC (B12-PL1601) were administered intravenously (day 1) to treatment groups of 8 mice.
|
||||
| In Vivo Model | Pancreatic cancer PDX model (PDX: PAXF1657) | ||||
| Experiment 4 Reporting the Activity Date of This ADC | [155] | ||||
| Efficacy Data | Tumor Growth Inhibition value (TGI) | ≈ 16.50% (Day 35) | Positive AXL expression (AXL+++/++) | ||
| In Vivo Model | Non-small cell lung cancer PDX model (PDX: LU2511; EGFR mutation) | ||||
| Experiment 5 Reporting the Activity Date of This ADC | [155] | ||||
| Efficacy Data | Tumor Growth Inhibition value (TGI) | ≈ 16.50% (Day 35) | Positive AXL expression (AXL+++/++) | ||
| In Vivo Model | Non-small cell lung cancer PDX model (PDX: LU0858; EGFR L858R mutation) | ||||
| Experiment 6 Reporting the Activity Date of This ADC | [155] | ||||
| Efficacy Data | Tumor Growth Inhibition value (TGI) |
29.60% (Day 49)
|
Positive AXL expression (AXL+++/++) | ||
| Method Description |
EnaV=2 mg/kg.
|
||||
| In Vivo Model | Non-small cell lung cancer PDX model (PDX: LU0395) | ||||
| Experiment 7 Reporting the Activity Date of This ADC | [155] | ||||
| Efficacy Data | Tumor Growth Inhibition value (TGI) |
46.90% (Day 49)
|
Positive AXL expression (AXL+++/++) | ||
| Method Description |
EnaV=4 mg/kg.
|
||||
| In Vivo Model | Non-small cell lung cancer PDX model (PDX: LU0395) | ||||
| Experiment 8 Reporting the Activity Date of This ADC | [155] | ||||
| Efficacy Data | Tumor Growth Inhibition value (TGI) | ≈ 50.00% (Day 35) | Positive AXL expression (AXL+++/++) | ||
| In Vivo Model | Non-small cell lung cancer PDX model (PDX: LXFA677; EGFR mutation) | ||||
| Experiment 9 Reporting the Activity Date of This ADC | [155] | ||||
| Efficacy Data | Tumor Growth Inhibition value (TGI) | ≈ 50.00% (Day 35) | Positive AXL expression (AXL+++/++) | ||
| In Vivo Model | Non-small cell lung cancer PDX model (PDX: LU1868; EGFR L858R and T790Mmutations) | ||||
| Experiment 10 Reporting the Activity Date of This ADC | [155] | ||||
| Efficacy Data | Tumor Growth Inhibition value (TGI) | ≈ 50.00% (Day 35) | Positive AXL expression (AXL+++/++) | ||
| In Vivo Model | Non-small cell lung cancer PDX model (PDX: LCx-MR007; Osimertinib resistant) | ||||
| Experiment 11 Reporting the Activity Date of This ADC | [155] | ||||
| Efficacy Data | Tumor Growth Inhibition value (TGI) | ≈ 56.40% (Day 15) | Positive AXL expression (AXL+++/++) | ||
| Method Description |
Antitumor activity of EnaV in intermediate.
|
||||
| In Vivo Model | NSCLC PDX model | ||||
| Experiment 12 Reporting the Activity Date of This ADC | [155] | ||||
| Efficacy Data | Tumor Growth Inhibition value (TGI) |
60.00% (Day 10)
|
Moderate AXL expression (AXL++; IHC H-score=121) | ||
| Method Description |
EnaV=4 mg/kg.
|
||||
| In Vivo Model | Non-small cell lung cancer PDX model (PDX: LU2511) | ||||
| Experiment 13 Reporting the Activity Date of This ADC | [155] | ||||
| Efficacy Data | Tumor Growth Inhibition value (TGI) | ≈ 66.50% (Day 35) | Moderate AXL expression (AXL++; IHC H-score=101) | ||
| In Vivo Model | Non-small cell lung cancer PDX model (PDX: LXFA526) | ||||
| Experiment 14 Reporting the Activity Date of This ADC | [155] | ||||
| Efficacy Data | Tumor Growth Inhibition value (TGI) | ≈ 67.00% (Day 35) | High AXL expression (AXL+++; IHC H-score=248) | ||
| In Vivo Model | Non-small cell lung cancer PDX model (PDX: LU0395; EGFR mutation) | ||||
| Experiment 15 Reporting the Activity Date of This ADC | [157] | ||||
| Efficacy Data | Tumor Growth Inhibition value (TGI) | ≈ 72.70% (Day 23) | Moderate AXL expression (AXL++; IHC H-score=142) | ||
| Method Description |
The in vivo activity of Enapotamab vedotin was evaluated in additional cell line-derived and patient-derived xenograft (PDX) models representing different cancer types, including pancreas ,esophageal, lung, thyroid, ovarian, cervical cancer, melanoma and sarcoma. Enapotamab vedotin was administered at a dose of 2 mg/kg once a week for two weeks.
|
||||
| In Vivo Model | Non-small cell lung cancer PDX model (PDX: LXFA526) | ||||
| Experiment 16 Reporting the Activity Date of This ADC | [157] | ||||
| Efficacy Data | Tumor Growth Inhibition value (TGI) | ≈ 84.10% (Day 14) | Moderate AXL expression (AXL++; IHC H-score=141) | ||
| Method Description |
The anti-tumor activity of ADCs were determined in the pancreas cancer patient-derived xenograft (PDX) model PAXF1657. Before treatment,mice were divided into groups of 68 mice each,with equal tumor size distribution (average and variance). ADC is administered at a dose of 2.00 mg/kg in a single dose.
|
||||
| In Vivo Model | Pancreatic cancer PDX model (PDX: PAXF1657) | ||||
| Experiment 17 Reporting the Activity Date of This ADC | [157] | ||||
| Efficacy Data | Tumor Growth Inhibition value (TGI) | ≈ 94.80% (Day 32) | Moderate AXL expression (AXL++; IHC H-score=183) | ||
| Method Description |
The in vivo activity of Enapotamab vedotin was evaluated in additional cell line-derived and patient-derived xenograft (PDX) models representing different cancer types, including pancreas, esophageal, lung, thyroid, ovarian, cervical cancer, melanoma and sarcoma. Enapotamab vedotin was administered at a dose of 2 mg/kg once a week for two weeks.
|
||||
| In Vivo Model | Cervical cancer PDX model (PDX: CV1664) | ||||
| Experiment 18 Reporting the Activity Date of This ADC | [157] | ||||
| Efficacy Data | Tumor Growth Inhibition value (TGI) | ≈ 97.40% (Day 32) | Moderate AXL expression (AXL++; IHC H-score=104) | ||
| Method Description |
The in vivo activity of Enapotamab vedotin was evaluated in additional cell line-derived and patient-derived xenograft (PDX) models representing different cancer types, including pancreas, esophageal, lung, thyroid, ovarian, cervical cancer, melanoma and sarcoma. Enapotamab vedotin was administered at a dose of 4 mg/kg once a week for two weeks.
|
||||
| In Vivo Model | Cervical cancer PDX model (PDX: CV1664) | ||||
| Experiment 19 Reporting the Activity Date of This ADC | [157] | ||||
| Efficacy Data | Tumor Growth Inhibition value (TGI) | ≈ 98.30% (Day 14) | Negative AXL expression (AXL-; IHC H-score=0) | ||
| Method Description |
The anti-tumor activity of ADCs were determined in the pancreas cancer patient-derived xenograft (PDX) model PAXF1657. Before treatment,mice were divided into groups of 68 mice each,with equal tumor size distribution (average and variance). ADC is administered at a dose of 4.00 mg/kg in a single dose.
|
||||
| In Vivo Model | Pancreatic cancer PDX model (PDX: PAXF1657) | ||||
| Experiment 20 Reporting the Activity Date of This ADC | [156] | ||||
| Efficacy Data | Tumor Growth Inhibition value (TGI) | ≈ 99.30% (Day 21) | High AXL expression (AXL+++; IHC H-score=305) | ||
| Method Description |
The antitumor activity of ADCT-601 was tested in a range of human solid tumor xenograft models covering multiple indications. Single-dose (4 mg/kg,q.d.). Enapotamab vedotin and isotype-control ADC (B12-PL1601) were administered intravenously (day 1) to treatment groups of 8 mice.
|
||||
| In Vivo Model | Pancreatic cancer PDX model (PDX: PAXF1657) | ||||
| Experiment 21 Reporting the Activity Date of This ADC | [157] | ||||
| Efficacy Data | Tumor Growth Inhibition value (TGI) | ≈ 99.80% (Day 23) | Moderate AXL expression (AXL++; IHC H-score=117) | ||
| Method Description |
The in vivo activity of Enapotamab vedotin was evaluated in additional cell line-derived and patient-derived xenograft (PDX) models representing different cancer types, including pancreas, esophageal, lung, thyroid, ovarian, cervical cancer, melanoma and sarcoma. Enapotamab vedotin was administered at a dose of 4 mg/kg once a week for two weeks.
|
||||
| In Vivo Model | Non-small cell lung cancer PDX model (PDX: LXFA526) | ||||
| Experiment 22 Reporting the Activity Date of This ADC | [155] | ||||
| Efficacy Data | Tumor Growth Inhibition value (TGI) | ≈ 100.00% (Day 35) | Positive AXL expression (AXL+++/++) | ||
| In Vivo Model | Non-small cell lung cancer PDX model (PDX: LXFA677_R, EGFRi resistant) | ||||
| Experiment 23 Reporting the Activity Date of This ADC | [155] | ||||
| Efficacy Data | Tumor Growth Inhibition value (TGI) | ≈ 100.00% (Day 30) | Positive AXL expression (AXL+++/++) | ||
| Method Description |
Antitumor activity of EnaV in responder.
|
||||
| In Vivo Model | NSCLC PDX model | ||||
| Experiment 24 Reporting the Activity Date of This ADC | [157] | ||||
| Efficacy Data | Half Maximal Inhibitory Concentration (IC50) |
70.55 ng/mL
|
Moderate AXL expression (AXL++; 22,304 AXL receptor copy number) | ||
| Method Description |
All cell lines except melanoma were seeded at 1 x10³ cells per well in 96 well culture plates (Greiner) and incubated for 3 h at 37°C, 5% CO2.
|
||||
| In Vivo Model | Melanoma PDX model (PDX: M019R.X1.CL) | ||||
| In Vitro Model | Melanoma | M019R.X1.CL cells | Homo sapiens | ||
Discovered Using Cell Line-derived Xenograft Model
| Experiment 1 Reporting the Activity Date of This ADC | [159] | ||||
| Efficacy Data | Tumor Growth Inhibition value (TGI) | ≈ 1.00% (Day 34) | Positive AXL expression (AXL+++/++) | ||
| Method Description |
Treated with MART-1 T cells.
|
||||
| In Vivo Model | SkMel-147 cell line xenograft model | ||||
| In Vitro Model | Melanoma | SK-MEL-147 cells | CVCL_3876 | ||
| Experiment 2 Reporting the Activity Date of This ADC | [159] | ||||
| Efficacy Data | Tumor Growth Inhibition value (TGI) | ≈ 17.70% (Day 28) | Positive AXL expression (AXL+++/++) | ||
| Method Description |
Treated with MART-1 T cells + Ctrl ADC.
|
||||
| In Vivo Model | SkMel-147 cell line xenograft model | ||||
| In Vitro Model | Melanoma | SK-MEL-147 cells | CVCL_3876 | ||
| Experiment 3 Reporting the Activity Date of This ADC | [155] | ||||
| Efficacy Data | Tumor Growth Inhibition value (TGI) |
34.30% (Day 10)
|
Positive AXL expression (AXL+++/++) | ||
| Method Description |
EnaV=2 mg/kg.
|
||||
| In Vivo Model | LU2511 in NSCLC CDX model | ||||
| Experiment 4 Reporting the Activity Date of This ADC | [155] | ||||
| Efficacy Data | Tumor Growth Inhibition value (TGI) |
40.90% (Day 21)
|
Positive AXL expression (AXL+++/++) | ||
| Method Description |
EnaV=0.5 mg/kg.
|
||||
| In Vivo Model | LCLC-103H in NSCLC CDX model | ||||
| In Vitro Model | Lung large cell carcinoma | LCLC-103H cells | CVCL_1375 | ||
| Experiment 5 Reporting the Activity Date of This ADC | [159] | ||||
| Efficacy Data | Tumor Growth Inhibition value (TGI) | ≈ 43.40% (Day 34) | Positive AXL expression (AXL+++/++) | ||
| Method Description |
Treated with MART-1 T cells.
|
||||
| In Vivo Model | LCLC-103H xenograft model | ||||
| In Vitro Model | Lung large cell carcinoma | LCLC-103H cells | CVCL_1375 | ||
| Experiment 6 Reporting the Activity Date of This ADC | [159] | ||||
| Efficacy Data | Tumor Growth Inhibition value (TGI) | ≈ 64.00% (Day 28) | Positive AXL expression (AXL+++/++) | ||
| Method Description |
Treated with Ctrl T cells + EnaV.
|
||||
| In Vivo Model | SkMel-147 cell line xenograft model | ||||
| In Vitro Model | Melanoma | SK-MEL-147 cells | CVCL_3876 | ||
| Experiment 7 Reporting the Activity Date of This ADC | [159] | ||||
| Efficacy Data | Tumor Growth Inhibition value (TGI) | ≈ 64.70% (Day 22) | Positive AXL expression (AXL+++/++) | ||
| Method Description |
Treated with MART-1 T cells.
|
||||
| In Vivo Model | BLM cell line xenograft model | ||||
| In Vitro Model | Amelanotic melanoma | BLM cells | CVCL_7035 | ||
| Experiment 8 Reporting the Activity Date of This ADC | [155] | ||||
| Efficacy Data | Tumor Growth Inhibition value (TGI) | ≈ 66.50% (Day 35) | Positive AXL expression (AXL+++/++) | ||
| In Vivo Model | LCLC-103H CDX model | ||||
| In Vitro Model | Lung large cell carcinoma | LCLC-103H cells | CVCL_1375 | ||
| Experiment 9 Reporting the Activity Date of This ADC | [157] | ||||
| Efficacy Data | Tumor Growth Inhibition value (TGI) | ≈ 78.50% (Day 10) | Positive AXL expression (AXL+++/++) | ||
| Method Description |
The in vivo activity of Enapotamab vedotin was evaluated in additional cell line-derived and patient-derived xenograft (PDX) models representing different cancer types, including pancreas, esophageal, lung, thyroid, ovarian, cervical cancer, melanoma and sarcoma. Enapotamab vedotin was administered at a dose of 2 mg/kg once a week for two weeks.
|
||||
| In Vivo Model | Melanoma CDX model | ||||
| In Vitro Model | Melanoma | SK-MEL-147 cells | CVCL_3876 | ||
| Experiment 10 Reporting the Activity Date of This ADC | [159] | ||||
| Efficacy Data | Tumor Growth Inhibition value (TGI) | ≈ 85.20% (Day 28) | Positive AXL expression (AXL+++/++) | ||
| Method Description |
Treated with MART-1 T cells + EnaV.
|
||||
| In Vivo Model | SkMel-147 cell line xenograft model | ||||
| In Vitro Model | Melanoma | SK-MEL-147 cells | CVCL_3876 | ||
| Experiment 11 Reporting the Activity Date of This ADC | [157] | ||||
| Efficacy Data | Tumor Growth Inhibition value (TGI) | ≈ 92.70% (Day 18) | Positive AXL expression (AXL+++/++) | ||
| Method Description |
In the LCLC-103H xenograft model,therapeutic treatment with a single dose of 1 mg/kg in anti-tumor activity in the AXL-ADC panel.
|
||||
| In Vivo Model | Lung cancer CDX model | ||||
| In Vitro Model | Lung large cell carcinoma | LCLC-103H cells | CVCL_1375 | ||
| Experiment 12 Reporting the Activity Date of This ADC | [157] | ||||
| Efficacy Data | Tumor Growth Inhibition value (TGI) | ≈ 93.60% (Day 10) | Positive AXL expression (AXL+++/++) | ||
| Method Description |
The in vivo activity of Enapotamab vedotin was evaluated in additional cell line-derived and patient-derived xenograft (PDX) models representing different cancer types, including pancreas, esophageal, lung, thyroid, ovarian, cervical cancer, melanoma and sarcoma. Enapotamab vedotin was administered at a dose of 4 mg/kg once a week for two weeks.
|
||||
| In Vivo Model | Melanoma CDX model | ||||
| In Vitro Model | Melanoma | SK-MEL-147 cells | CVCL_3876 | ||
| Experiment 13 Reporting the Activity Date of This ADC | [155] | ||||
| Efficacy Data | Tumor Growth Inhibition value (TGI) |
96.80% (Day 21)
|
Positive AXL expression (AXL+++/++) | ||
| Method Description |
EnaV=1 mg/kg.
|
||||
| In Vivo Model | LCLC-103H in NSCLC CDX model | ||||
| In Vitro Model | Lung large cell carcinoma | LCLC-103H cells | CVCL_1375 | ||
Revealed Based on the Cell Line Data
| Experiment 1 Reporting the Activity Date of This ADC | [165] | ||||
| Efficacy Data | Half Maximal Inhibitory Concentration (IC50) |
0.08 nM±0.016 nM
|
High AXL expression (AXL+++) | ||
| Method Description |
Tumor cells were plated in 96-well plates at predetermined density, treated with AXL02-MMAE or hIgG1-MMAE for 5-8 days to ensure that the doubling of the cells is sufficient. Then MTS reagent solution was added with replacing fresh medium, and cells were incubated for an appropriate time.
|
||||
| In Vitro Model | Lung large cell carcinoma | LCLC-103H cells | CVCL_1375 | ||
| Experiment 2 Reporting the Activity Date of This ADC | [165] | ||||
| Efficacy Data | Half Maximal Inhibitory Concentration (IC50) |
0.09 nM±0.005 nM
|
High AXL expression (AXL+++) | ||
| Method Description |
Tumor cells were plated in 96-well plates at predetermined density, treated with AXL02-MMAE or hIgG1-MMAE for 5-8 days to ensure that the doubling of the cells is sufficient. Then MTS reagent solution was added with replacing fresh medium, and cells were incubated for an appropriate time.
|
||||
| In Vitro Model | Breast adenocarcinoma | MDA-MB-231 cells | CVCL_0062 | ||
| Experiment 3 Reporting the Activity Date of This ADC | [165] | ||||
| Efficacy Data | Half Maximal Inhibitory Concentration (IC50) |
0.09 nM±0.005 nM
|
Moderate AXL expression (AXL++) | ||
| Method Description |
Tumor cells were plated in 96-well plates at predetermined density, treated with AXL02-MMAE or hIgG1-MMAE for 5-8 days to ensure that the doubling of the cells is sufficient. Then MTS reagent solution was added with replacing fresh medium, and cells were incubated for an appropriate time.
|
||||
| In Vitro Model | Lung adenocarcinoma | PC-9 cells | CVCL_B260 | ||
| Experiment 4 Reporting the Activity Date of This ADC | [165] | ||||
| Efficacy Data | Half Maximal Inhibitory Concentration (IC50) |
0.17 nM
|
High AXL expression (AXL+++) | ||
| Method Description |
Tumor cells were plated in 96-well plates at predetermined density, treated with AXL02-MMAE or hIgG1-MMAE for 5-8 days to ensure that the doubling of the cells is sufficient. Then MTS reagent solution was added with replacing fresh medium, and cells were incubated for an appropriate time.
|
||||
| In Vitro Model | Lung squamous cell carcinoma | Calu-1 cells | CVCL_0608 | ||
| Experiment 5 Reporting the Activity Date of This ADC | [165] | ||||
| Efficacy Data | Half Maximal Inhibitory Concentration (IC50) | > 100 nM | Low AXL expression (AXL+) | ||
| Method Description |
Tumor cells were plated in 96-well plates at predetermined density, treated with AXL02-MMAE or hIgG1-MMAE for 5-8 days to ensure that the doubling of the cells is sufficient. Then MTS reagent solution was added with replacing fresh medium, and cells were incubated for an appropriate time.
|
||||
| In Vitro Model | Lung large cell carcinoma | NCI-H460 cells | CVCL_0459 | ||
| Experiment 6 Reporting the Activity Date of This ADC | [165] | ||||
| Efficacy Data | Half Maximal Inhibitory Concentration (IC50) | > 100 nM | Low AXL expression (AXL+) | ||
| Method Description |
Tumor cells were plated in 96-well plates at predetermined density, treated with AXL02-MMAE or hIgG1-MMAE for 5-8 days to ensure that the doubling of the cells is sufficient. Then MTS reagent solution was added with replacing fresh medium, and cells were incubated for an appropriate time.
|
||||
| In Vitro Model | Breast adenocarcinoma | MDA-MB-453 cells | CVCL_0418 | ||
| Experiment 7 Reporting the Activity Date of This ADC | [157] | ||||
| Efficacy Data | Half Maximal Inhibitory Concentration (IC50) |
5.50 ng/mL
|
Moderate AXL expression (AXL++; 37,235 AXL receptor copy number) | ||
| Method Description |
All cell lines except melanoma were seeded at 1 x10³ cells per well in 96 well culture plates (Greiner) and incubated for 3 h at 37°C, 5% CO2.
|
||||
| In Vitro Model | Melanoma | A-875 cells | CVCL_4733 | ||
| Experiment 8 Reporting the Activity Date of This ADC | [157] | ||||
| Efficacy Data | Half Maximal Inhibitory Concentration (IC50) |
15.34 ng/mL
|
Moderate AXL expression (AXL++; 54,946 AXL receptor copy number) | ||
| Method Description |
All cell lines except melanoma were seeded at 1 x10³ cells per well in 96 well culture plates (Greiner) and incubated for 3 h at 37°C, 5% CO2.
|
||||
| In Vitro Model | Cutaneous melanoma | SK-MEL-28 cells (BRAF inhibitor resistant) | CVCL_0526 | ||
| Experiment 9 Reporting the Activity Date of This ADC | [157] | ||||
| Efficacy Data | Half Maximal Inhibitory Concentration (IC50) |
20.70 ng/mL
|
High AXL expression (AXL+++; 117,665 AXL receptor copy number) | ||
| Method Description |
All cell lines except melanoma were seeded at 1 x10³ cells per well in 96 well culture plates (Greiner) and incubated for 3 h at 37°C, 5% CO2.
|
||||
| In Vitro Model | Lung large cell carcinoma | LCLC-103H cells | CVCL_1375 | ||
| Experiment 10 Reporting the Activity Date of This ADC | [157] | ||||
| Efficacy Data | Half Maximal Inhibitory Concentration (IC50) |
24.30 ng/mL
|
Moderate AXL expression (AXL++; 46,701 AXL receptor copy number) | ||
| Method Description |
All cell lines except melanoma were seeded at 1 x10³ cells per well in 96 well culture plates (Greiner) and incubated for 3 h at 37°C, 5% CO2.
|
||||
| In Vitro Model | Breast adenocarcinoma | MDA-MB-231 cells | CVCL_0062 | ||
| Experiment 11 Reporting the Activity Date of This ADC | [157] | ||||
| Efficacy Data | Half Maximal Inhibitory Concentration (IC50) |
42.06 ng/mL
|
Moderate AXL expression (AXL++; 35,452 AXL receptor copy number) | ||
| Method Description |
All cell lines except melanoma were seeded at 1 x10³ cells per well in 96 well culture plates (Greiner) and incubated for 3 h at 37°C, 5% CO2.
|
||||
| In Vitro Model | Melanoma | SK-MEL-147 cells | CVCL_3876 | ||
| Experiment 12 Reporting the Activity Date of This ADC | [157] | ||||
| Efficacy Data | Half Maximal Inhibitory Concentration (IC50) |
68.54 ng/mL
|
High AXL expression (AXL+++; 169,192 AXL receptor copy number) | ||
| Method Description |
All cell lines except melanoma were seeded at 1 x10³ cells per well in 96 well culture plates (Greiner) and incubated for 3 h at 37°C, 5% CO2.
|
||||
| In Vitro Model | Lung squamous cell carcinoma | Calu-1 cells | CVCL_0608 | ||
| Experiment 13 Reporting the Activity Date of This ADC | [157] | ||||
| Efficacy Data | Half Maximal Inhibitory Concentration (IC50) |
189.30 ng/mL
|
Moderate AXL expression (AXL++; 70,222 AXL receptor copy number) | ||
| Method Description |
All cell lines except melanoma were seeded at 1 x10³ cells per well in 96 well culture plates (Greiner) and incubated for 3 h at 37°C, 5% CO2.
|
||||
| In Vitro Model | Melanoma | SK-MEL-2 cells (MEK inhibitor-resistant) | CVCL_0069 | ||
| Experiment 14 Reporting the Activity Date of This ADC | [157] | ||||
| Efficacy Data | Half Maximal Inhibitory Concentration (IC50) |
190.90 ng/mL
|
Moderate AXL expression (AXL++; 83,986 AXL receptor copy number) | ||
| Method Description |
All cell lines except melanoma were seeded at 1 x10³ cells per well in 96 well culture plates (Greiner) and incubated for 3 h at 37°C, 5% CO2.
|
||||
| In Vitro Model | Skin squamous cell carcinoma | A431 cells | CVCL_0037 | ||
| Experiment 15 Reporting the Activity Date of This ADC | [157] | ||||
| Efficacy Data | Half Maximal Inhibitory Concentration (IC50) |
370.40 ng/mL
|
Moderate AXL expression (AXL++; 16,611 AXL receptor copy number) | ||
| Method Description |
All cell lines except melanoma were seeded at 1 x10³ cells per well in 96 well culture plates (Greiner) and incubated for 3 h at 37°C, 5% CO2.
|
||||
| In Vitro Model | Amelanotic melanoma | A375/R cells | CVCL_IW10 | ||
| Experiment 16 Reporting the Activity Date of This ADC | [157] | ||||
| Efficacy Data | Half Maximal Inhibitory Concentration (IC50) |
887.20 ng/mL
|
Moderate AXL expression (AXL++; 16,611 AXL receptor copy number) | ||
| Method Description |
All cell lines except melanoma were seeded at 1 x10³ cells per well in 96 well culture plates (Greiner) and incubated for 3 h at 37°C, 5% CO2.
|
||||
| In Vivo Model | Melanoma PDX model (PDX: M016.X1.CL) | ||||
| In Vitro Model | Cutaneous melanoma | SK-MEL-5 cells | CVCL_0527 | ||
| Experiment 17 Reporting the Activity Date of This ADC | [157] | ||||
| Efficacy Data | Half Maximal Inhibitory Concentration (IC50) |
1828.30 ng/mL
|
Moderate AXL expression (AXL++; 66,691 AXL receptor copy number) | ||
| Method Description |
All cell lines except melanoma were seeded at 1 x10³ cells per well in 96 well culture plates (Greiner) and incubated for 3 h at 37°C, 5% CO2.
|
||||
| In Vitro Model | Lung large cell carcinoma | NCI-H1299 cells | CVCL_0060 | ||
| Experiment 18 Reporting the Activity Date of This ADC | [157] | ||||
| Efficacy Data | Half Maximal Inhibitory Concentration (IC50) |
2090.30 ng/mL
|
Moderate AXL expression (AXL++; 34,978 AXL receptor copy number) | ||
| Method Description |
All cell lines except melanoma were seeded at 1 x10³ cells per well in 96 well culture plates (Greiner) and incubated for 3 h at 37°C, 5% CO2.
|
||||
| In Vitro Model | Ovarian serous cystadenocarcinoma | SK-OV-3 cells | CVCL_0532 | ||
| Experiment 19 Reporting the Activity Date of This ADC | [157] | ||||
| Efficacy Data | Half Maximal Inhibitory Concentration (IC50) |
2895.70 ng/mL
|
Moderate AXL expression (AXL++; 28,000 AXL receptor copy number) | ||
| Method Description |
All cell lines except melanoma were seeded at 1 x10³ cells per well in 96 well culture plates (Greiner) and incubated for 3 h at 37°C, 5% CO2.
|
||||
| In Vitro Model | Pancreatic ductal adenocarcinoma | BxPC-3 cells | CVCL_0186 | ||
| Experiment 20 Reporting the Activity Date of This ADC | [157] | ||||
| Efficacy Data | Half Maximal Inhibitory Concentration (IC50) |
6881.00 ng/mL
|
Low AXL expression (AXL+; 9,138 AXL receptor copy number) | ||
| Method Description |
All cell lines except melanoma were seeded at 1 x10³ cells per well in 96 well culture plates (Greiner) and incubated for 3 h at 37°C, 5% CO2.
|
||||
| In Vitro Model | Lung large cell carcinoma | NCI-H661 cells | CVCL_1577 | ||
| Experiment 21 Reporting the Activity Date of This ADC | [157] | ||||
| Efficacy Data | Half Maximal Inhibitory Concentration (IC50) | > 10.00 ug/mL | Negative AXL expression (AXL-; 528 AXL receptor copy number) | ||
| Method Description |
All cell lines except melanoma were seeded at 1 x10³ cells per well in 96 well culture plates (Greiner) and incubated for 3 h at 37°C, 5% CO2.
|
||||
| In Vitro Model | Colon adenocarcinoma | LS174T cells | CVCL_1384 | ||
| Experiment 22 Reporting the Activity Date of This ADC | [157] | ||||
| Efficacy Data | Half Maximal Inhibitory Concentration (IC50) | > 10.00 ug/mL | Moderate AXL expression (AXL++; 37,506 AXL receptor copy number) | ||
| Method Description |
All cell lines except melanoma were seeded at 1 x10³ cells per well in 96 well culture plates (Greiner) and incubated for 3 h at 37°C, 5% CO2.
|
||||
| In Vitro Model | Pleural epithelioid mesothelioma | NCI-H226 cells | CVCL_1544 | ||
| Experiment 23 Reporting the Activity Date of This ADC | [157] | ||||
| Efficacy Data | Half Maximal Inhibitory Concentration (IC50) | > 10.00 ug/mL | Low AXL expression (AXL+; 2,326 AXL receptor copy number) | ||
| Method Description |
All cell lines except melanoma were seeded at 1 x10³ cells per well in 96 well culture plates (Greiner) and incubated for 3 h at 37°C, 5% CO2.
|
||||
| In Vitro Model | Pancreatic ductal adenocarcinoma | HPAF-II cells | CVCL_0313 | ||
| Experiment 24 Reporting the Activity Date of This ADC | [157] | ||||
| Efficacy Data | Half Maximal Inhibitory Concentration (IC50) | > 10.00 ug/mL | Negative AXL expression (AXL-; 150 AXL receptor copy number) | ||
| Method Description |
All cell lines except melanoma were seeded at 1 x10³ cells per well in 96 well culture plates (Greiner) and incubated for 3 h at 37°C, 5% CO2.
|
||||
| In Vitro Model | Gastric tubular adenocarcinoma | NCI-N87 cells | CVCL_1603 | ||
| Experiment 25 Reporting the Activity Date of This ADC | [157] | ||||
| Efficacy Data | Half Maximal Inhibitory Concentration (IC50) | > 10.00 ug/mL | Negative AXL expression (AXL-; 250 AXL receptor copy number) | ||
| Method Description |
All cell lines except melanoma were seeded at 1 x10³ cells per well in 96 well culture plates (Greiner) and incubated for 3 h at 37°C, 5% CO2.
|
||||
| In Vitro Model | Cutaneous melanoma | SK-MEL-5 cells | CVCL_0527 | ||
| Experiment 26 Reporting the Activity Date of This ADC | [157] | ||||
| Efficacy Data | Half Maximal Inhibitory Concentration (IC50) | > 10.00 ug/mL | Negative AXL expression (AXL-; 325 AXL receptor copy number) | ||
| Method Description |
All cell lines except melanoma were seeded at 1 x10³ cells per well in 96 well culture plates (Greiner) and incubated for 3 h at 37°C, 5% CO2.
|
||||
| In Vitro Model | Cutaneous melanoma | SK-MEL-28 cells | CVCL_0526 | ||
| Experiment 27 Reporting the Activity Date of This ADC | [157] | ||||
| Efficacy Data | Half Maximal Inhibitory Concentration (IC50) | > 10.00 ug/mL | Negative AXL expression (AXL-; 100 AXL receptor copy number) | ||
| Method Description |
All cell lines except melanoma were seeded at 1 x10³ cells per well in 96 well culture plates (Greiner) and incubated for 3 h at 37°C, 5% CO2.
|
||||
| In Vitro Model | Melanoma | SK-MEL-2 cells | CVCL_0069 | ||
| Experiment 28 Reporting the Activity Date of This ADC | [165] | ||||
| Efficacy Data | Half Maximal Inhibitory Concentration (IC50) |
0.195±0.068
|
Moderate AXL expression (AXL++) | ||
| Method Description |
Tumor cells were plated in 96-well plates at predetermined density, treated with AXL02-MMAE or hIgG1-MMAE for 5-8 days to ensure that the doubling of the cells is sufficient. Then MTS reagent solution was added with replacing fresh medium, and cells were incubated for an appropriate time.
|
||||
| In Vitro Model | Glioblastoma | U-87MG cells | CVCL_0022 | ||
LM-305 [Phase 1/2]
Discovered Using Cell Line-derived Xenograft Model
| Experiment 1 Reporting the Activity Date of This ADC | [163] | ||||
| Efficacy Data | Tumor Growth Inhibition value (TGI) | ≈ 100.00% | High GPRC5D expression (GPRC5D+++) | ||
| Method Description |
The inhibitory activity of LM-305 against cancer cell growth was evaluated in Multiple myeloma CDX model in vivo. The dose of LM-305 was 3 mg/kg.
|
||||
| In Vivo Model | Multiple myeloma CDX model | ||||
| In Vitro Model | Multiple myeloma | Multiple myeloma cells | Homo sapiens | ||
Revealed Based on the Cell Line Data
| Experiment 1 Reporting the Activity Date of This ADC | [163] | ||||
| Efficacy Data | Half Maximal Inhibitory Concentration (IC50) |
0.10-0.30 nM
|
High GPRC5D expression (GPRC5D+++) | ||
| Method Description |
LM-305 was evaluated in vitro for its cytotoxic activity against a panel of multiple myeloma cell lines. LM-305 was co-cultured with multiple myeloma cells.
|
||||
| In Vitro Model | Plasma cell myeloma | NCI-H929 cells | CVCL_1600 | ||
| Experiment 2 Reporting the Activity Date of This ADC | [163] | ||||
| Efficacy Data | Half Maximal Inhibitory Concentration (IC50) |
0.10-0.30 nM
|
High GPRC5D expression (GPRC5D+++) | ||
| Method Description |
LM-305 was evaluated in vitro for its cytotoxic activity against a panel of multiple myeloma cell lines. LM-305 was co-cultured with multiple myeloma cells.
|
||||
| In Vitro Model | Plasma cell myeloma | MM1.R cells | CVCL_8794 | ||
Samrotamab vedotin [Phase 1]
Identified from the Human Clinical Data
| Experiment 1 Reporting the Activity Date of This ADC | [167] | ||||
| Efficacy Data | Objective Response Rate (ORR) |
2.10% (non-sarcomas all doses)
10.80% (sarcomas all dose) 20.00% (osteosarcoma+UPS 3.6 mg/kg) 20.00% (osteosarcoma 3.6 mg/kg) 20.00% (UPS 3.6 mg/kg) |
|||
| Patients Enrolled |
Patients with LRRC15 positive squamous cell carcinoma of the head and neck, NSCKC, breast cancer, undifferentiated pleomorphic sarcoma or osteosarcoma.
|
||||
| Administration Dosage |
0.30 up to 6.00 mg/kg on day 1, once every 2 weeks.
|
||||
| Related Clinical Trial | |||||
| NCT Number | NCT02565758 | Phase Status | Phase 1 | ||
| Clinical Description |
A multicenter, phase 1, open-label, dose-escalation study of ABBV-085, an antibody drug conjugate, in subjects with advanced solid tumors.
|
||||
| Experiment 2 Reporting the Activity Date of This ADC | [180] | ||||
| Related Clinical Trial | |||||
| NCT Number | NCT02565758 | Phase Status | Phase 1 | ||
| Clinical Description |
A multicenter, phase 1, open-label, dose-escalation study of ABBV-085, an antibody drug conjugate, in subjects with advanced solid tumors.
|
||||
Discovered Using Patient-derived Xenograft Model
| Experiment 1 Reporting the Activity Date of This ADC | [183] | ||||
| Efficacy Data | Tumor Growth Inhibition value (TGI) | ≈ 27.90% (Day 20) | Negative LRRC15 (LRRC15-) | ||
| Method Description |
The efficacy of ABBV-085 directed against LRRC15 was assessed in several patient-derived xenograft models of UPS,LMS,and DDLPS. For efficacy study,tumors were allowed to establish to 200±50 mm3 in size before randomization into various treatment groups with 7-9 mice per group. Isotype-control,isotype-MMAE,and ABBV-085,diluted in PBS were administered at 6 mg/kg once every 4 days intraperitoneally for a total of six injections.
Click to Show/Hide
|
||||
| In Vivo Model | Liposarcoma PDX model (PDX: LPS28) | ||||
| Experiment 2 Reporting the Activity Date of This ADC | [183] | ||||
| Efficacy Data | Tumor Growth Inhibition value (TGI) | ≈ 34.50% (Day 22) | Negative LRRC15 (LRRC15-) | ||
| Method Description |
The efficacy of ABBV-085 directed against LRRC15 was assessed in several patient-derived xenograft models of UPS,LMS,and DDLPS. For efficacy study,tumors were allowed to establish to 200±50 mm3 in size before randomization into various treatment groups with 7-9 mice per group. Isotype-control,isotype-MMAE,and ABBV-085,diluted in PBS were administered at 6 mg/kg once every 4 days intraperitoneally for a total of six injections.
Click to Show/Hide
|
||||
| In Vivo Model | Leiomyosarcoma PDX model (PDX: LMS33) | ||||
| Experiment 3 Reporting the Activity Date of This ADC | [183] | ||||
| Efficacy Data | Tumor Growth Inhibition value (TGI) | ≈ 38.10% (Day 43) | Negative LRRC15 (LRRC15-) | ||
| Method Description |
The efficacy of ABBV-085 directed against LRRC15 was assessed in several patient-derived xenograft models of UPS,LMS,and DDLPS. For efficacy study,tumors were allowed to establish to 200±50 mm3 in size before randomization into various treatment groups with 7-9 mice per group. Isotype-control,isotype-MMAE,and ABBV-085,diluted in PBS were administered at 6 mg/kg once every 4 days intraperitoneally for a total of six injections.
Click to Show/Hide
|
||||
| In Vivo Model | Liposarcoma PDX model (PDX: LPS28) | ||||
| Experiment 4 Reporting the Activity Date of This ADC | [183] | ||||
| Efficacy Data | Tumor Growth Inhibition value (TGI) | ≈ 87.20% (Day 20) | High LRRC15 expression (LRRC15+++) | ||
| Method Description |
The efficacy of ABBV-085 directed against LRRC15 was assessed in several patient-derived xenograft models of UPS,LMS,and DDLPS. For efficacy study,tumors were allowed to establish to 200±50 mm3 in size before randomization into various treatment groups with 7-9 mice per group. Isotype-control,isotype-MMAE,and ABBV-085,diluted in PBS were administered at 6 mg/kg once every 4 days intraperitoneally for a total of six injections.
Click to Show/Hide
|
||||
| In Vivo Model | Liposarcoma PDX model (PDX: LPS28) | ||||
| Experiment 5 Reporting the Activity Date of This ADC | [183] | ||||
| Efficacy Data | Tumor Growth Inhibition value (TGI) | ≈ 88.70% (Day 25) | High LRRC15 expression (LRRC15+++) | ||
| Method Description |
The efficacy of ABBV-085 directed against LRRC15 was assessed in several patient-derived xenograft models of UPS,LMS,and DDLPS. For efficacy study,tumors were allowed to establish to 200±50 mm3 in size before randomization into various treatment groups with 7-9 mice per group. Isotype-control,isotype-MMAE,and ABBV-085,diluted in PBS were administered at 6 mg/kg once every 4 days intraperitoneally for a total of six injections.
Click to Show/Hide
|
||||
| In Vivo Model | Leiomyosarcoma PDX model (PDX: LMS33) | ||||
| Experiment 6 Reporting the Activity Date of This ADC | [183] | ||||
| Efficacy Data | Tumor Growth Inhibition value (TGI) | ≈ 95.20% (Day 21) | High LRRC15 expression (LRRC15+++) | ||
| Method Description |
The efficacy of ABBV-085 directed against LRRC15 was assessed in several patient-derived xenograft models of UPS,LMS,and DDLPS. For efficacy study,tumors were allowed to establish to 200±50 mm3 in size before randomization into various treatment groups with 7-9 mice per group. Isotype-control,isotype-MMAE,and ABBV-085,diluted in PBS were administered at 6 mg/kg once every 4 days intraperitoneally for a total of six injections.
Click to Show/Hide
|
||||
| In Vivo Model | Leiomyosarcoma and undifferentiated sarcomas PDX model, (PDX: UPS7) | ||||
| Experiment 7 Reporting the Activity Date of This ADC | [183] | ||||
| Efficacy Data | Tumor Growth Inhibition value (TGI) | ≈ 100.00% (Day 22) | High LRRC15 expression (LRRC15+++) | ||
| Method Description |
The efficacy of ABBV-085 directed against LRRC15 was assessed in several patient-derived xenograft models of UPS,LMS,and DDLPS. For efficacy study,tumors were allowed to establish to 200±50 mm3 in size before randomization into various treatment groups with 7-9 mice per group. Isotype-control,isotype-MMAE,and ABBV-085,diluted in PBS were administered at 6 mg/kg once every 4 days intraperitoneally for a total of six injections.
Click to Show/Hide
|
||||
| In Vivo Model | Leiomyosarcoma and undifferentiated sarcomas PDX model, (PDX: UPS7) | ||||
Sirtratumab vedotin [Phase 1]
Identified from the Human Clinical Data
| Experiment 1 Reporting the Activity Date of This ADC | [168] | ||||
| Efficacy Data | Objective Response Rate (ORR) |
13.00% (0.50 mg/kg)
29.00% (0.75 mg/kg) 40.00% (1.00 mg/kg) 40.00% (1.25 mg/kg) |
High SLITRK6 expression (SLITRK6+++; IHC H-score=230) | ||
| Patients Enrolled |
Metastatic uroepithelial carcinoma (mUC) patients unselected for SLITRK6 expression (determined by an IHC assay) and previously treated with 1 prior chemo regimen or unfit for cisplatin.
|
||||
| Administration Dosage |
Administered IV weekly for 3 out of every 4 weeks.
|
||||
| Related Clinical Trial | |||||
| NCT Number | NCT01963052 | Phase Status | Phase 1 | ||
| Clinical Description |
A phase 1 study of the safety and pharmacokinetics of escalating doses of AGS15E given as monotherapy in subjects with metastatic urothelial cancer.
|
||||
Discovered Using Patient-derived Xenograft Model
| Experiment 1 Reporting the Activity Date of This ADC | [184] | ||||
| Efficacy Data | Tumor Growth Inhibition value (TGI) | ≈ 73.40% (Day 17) | Moderate SLITRK6 expression (SLITRK6++; IHC H-score=185) | ||
| Method Description |
PDX models were established by subcutaneous implantation of xenograft fragments (AG-B7 or AG-B8) in the flanks of SCID mice. When the tumor volume reached approximately 200 mm3,Sirtratumab Vedotin was dosed at 0.25 mg/kg,2x per week i.v in AG-B8 PDX model. The last dose was given on day 14.
|
||||
| In Vivo Model | Bladder cancer PDX model (PDX: AG-B8) | ||||
| Experiment 2 Reporting the Activity Date of This ADC | [184] | ||||
| Efficacy Data | Tumor Growth Inhibition value (TGI) | ≈ 86.90% (Day 25) | High SLITRK6 expression (SLITRK6+++; IHC H-score=280) | ||
| Method Description |
PDX models were established by subcutaneous implantation of xenograft fragments (AG-B7 or AG-B8) in the flanks of SCID mice. When the tumor volume reached approximately 200 mm3,Sirtratumab Vedotin was dosed at 0.5 mg/kg,2x per week i.v in AG-B7 PDX model. The last dose was given on day 21.
|
||||
| In Vivo Model | Bladder cancer PDX model (PDX: AG-B7) | ||||
| Experiment 3 Reporting the Activity Date of This ADC | [184] | ||||
| Efficacy Data | Tumor Growth Inhibition value (TGI) | ≈ 88.40% (Day 17) | High SLITRK6 expression (SLITRK6+++; IHC H-score=250) | ||
| Method Description |
PDX models were established by subcutaneous implantation of xenograft fragments (AG-B7 or AG-B8) in the flanks of SCID mice. When the tumor volume reached approximately 200 mm3,Sirtratumab Vedotin was dosed at 0.5 mg/kg,2x per week i.v in AG-B8 PDX model. The last dose was given on day 14.
|
||||
| In Vivo Model | Bladder cancer PDX model (PDX: AG-B8) | ||||
Discovered Using Cell Line-derived Xenograft Model
| Experiment 1 Reporting the Activity Date of This ADC | [184] | ||||
| Efficacy Data | Tumor Growth Inhibition value (TGI) | ≈ 88.90% (Day 30) | High SLITRK6 expression (SLITRK6+++) | ||
| Method Description |
CDX models were established by subcutaneous injection of between 2 and 10 million SW780, RT4 (ATCC) or NCI-H322M (NCI) cells in SCID mice. When the tumor volume reached approximately 230 mm3, a single dose of Sirtratumab Vedotin, 5 mg/kg intravenously, was administered intravenously (iv) to the mice.
|
||||
| In Vivo Model | Bladder cancer CDX model | ||||
| In Vitro Model | Bladder carcinoma | RT-4 cells | CVCL_0036 | ||
| Experiment 2 Reporting the Activity Date of This ADC | [184] | ||||
| Efficacy Data | Tumor Growth Inhibition value (TGI) | ≈ 91.10% (Day 21) | Negative SLITRK6 expression (SLITRK6-) | ||
| Method Description |
CDX models were established by subcutaneous injection of between 2 and 10 million SW780, RT4 (ATCC) or NCI-H322M (NCI) cells in SCID mice. Sirtratumab Vedotin was administered twice weekly at 3 mg/kg (n = 6) starting when the tumor volume reached approximately 200 mm3.
|
||||
| In Vivo Model | Lung cancer NCI-322M CDX model | ||||
| In Vitro Model | Lung cancer | NCI-322M cells | Homo sapiens | ||
Revealed Based on the Cell Line Data
| Experiment 1 Reporting the Activity Date of This ADC | [184] | ||||
| Efficacy Data | Half Maximal Inhibitory Concentration (IC50) |
0.99 nM
|
|||
| Method Description |
ASG-15ME was tested for its ability to kill several SLITRK6-positive cell lines in vitro. The viability of CHP-212 cells treated with ASG-15ME was compared with that of target negative cells (IGR-OV1) or cells treated with an isotype control antibody to determine IC50 values.
|
||||
| In Vitro Model | Neuroblastoma | CHP-212 cells | CVCL_1125 | ||
| Experiment 2 Reporting the Activity Date of This ADC | [184] | ||||
| Efficacy Data | Half Maximal Inhibitory Concentration (IC50) | > 10.00 uM | High SLITRK6 expression (SLITRK6+++; IHC H-score=250) | ||
| Method Description |
ASG-15ME was tested for its ability to kill several SLITRK6-positive cell lines in vitro. The viability of CHP-212 cells treated with ASG-15ME was compared with that of target negative cells (IGR-OV1) or cells treated with an isotype control antibody to determine IC50 values.
|
||||
| In Vitro Model | Ovarian endometrioid adenocarcinoma | IGROV-1 cells | CVCL_1304 | ||
RG-7841 [Phase 1]
Identified from the Human Clinical Data
| Experiment 1 Reporting the Activity Date of This ADC | [169] | ||||
| Efficacy Data | Objective Response Rate (ORR) |
17.76%
|
|||
| Patients Enrolled |
Eastern Cooperative Oncology Group (ECOG) performance status of 0-1, histologically or cytologically documented advanced or metastatic breast, ovarian, pancreatic, NSCLC, head and neck squamous cell carcinoma, or gastric cancer in dose escalation, adequate hematologic and end organ function, and measurable disease per RECIST v1.1.
|
||||
| Administration Dosage |
Intravenously at doses of 0.20, 0.40, 0.80, 1.60, or 2.40 mg/kg once every 3 weeks (Q3W).
|
||||
| Related Clinical Trial | |||||
| NCT Number | NCT02092792 | Phase Status | Phase 1 | ||
| Clinical Description |
A phase 1, open-label study evaluating the safety and tolerability of escalating doses of DLYE5953A in patients with refractory solid tumors.
|
||||
| Primary Endpoint |
The confirmed overall objective response rate was 17.76%. All responders (8/68 patients) had PR,and all had received the RP2D dose of 2.40 mg/kg. This included three patients with MBC, and five patients in the NSCLC expansion cohort (5/25; 20%).
|
||||
| Other Endpoint |
The recommended phase II dose (RP2D) was 2.40 mg/kg Q3W. No dose-limiting toxicities were identified during dose escalation (0.20-2.40 mg/kg; n = 20).
|
||||
MRG-001 [Phase 1]
Identified from the Human Clinical Data
| Experiment 1 Reporting the Activity Date of This ADC | [170] | ||||
| Efficacy Data | Objective Response Rate (ORR) |
23.81% (among 21 pts who had at least one tumor assessment)
33.33% (in the 1.8 mg/kg cohort, DLBCL) 66.7% ( in the 2.5 mg/kg cohort, FL) |
|||
| Patients Enrolled |
CD20-positive relapsed or refractory (R/R) B-cell non Hodgkin lymphoma (NHL).
|
||||
| Administration Dosage |
Six dose levels ranging from 0.15 to 2.50 mg/kg, intravenously once every 3 weeks (Q3W) for a maximum of 6 treatment cycles.
|
||||
| Related Clinical Trial | |||||
| NCT Number | NCT05155839 | Phase Status | Phase 1 | ||
| Clinical Description |
An open-label, multicenter, first-in-human, phase 1 dose-escalation and expansion clinical study to assess the safety, tolerability, pharmacokinetics and preliminary efficacy of MRG001 in patients with CD20-positive relapsed or refractory B-cell non-Hodgkin lymphoma (NHL).
|
||||
| Primary Endpoint |
Rp2D=1.80 mg/kg.
|
||||
| Other Endpoint |
Among 21 pts who had at least one tumor assessment, ORR=23.81% , PR rate=19.05% (N=4),CR rate=4.76% (N=1).
|
||||
| Experiment 2 Reporting the Activity Date of This ADC | [174] | ||||
| Related Clinical Trial | |||||
| NCT Number | NCT05844527 | Phase Status | Phase 2 | ||
| Clinical Description |
Safety and efficacy of MRG-001 in wound healing in pre-abdominoplasty surgical excisions and scar appearance in subjects undergoing abdominoplasty.
|
||||
AGS-67E [Phase 1]
Identified from the Human Clinical Data
| Experiment 1 Reporting the Activity Date of This ADC | [171] | ||||
| Efficacy Data | Objective Response Rate (ORR) |
24.00% (0.9
1.2 and 1.5 mg/kg) |
Low CD37 expression (CD37+; CD37 MFI ratio=82) | ||
| Patients Enrolled |
Relapsed / refractory non Hodgkin lymphomas (NHLs) and chronic lymphocytic leukemia (CLL).
|
||||
| Administration Dosage |
Administered intravenously (IV) once every 3 weeks (Q3 weeks) until disease progression or unacceptable toxicity.
|
||||
| Related Clinical Trial | |||||
| NCT Number | NCT02175433 | Phase Status | Phase 1 | ||
| Clinical Description |
A phase 1 study evaluating safety, tolerability, and pharmacokinetics of escalating doses of AGS67E given as monotherapy in subjects with refractory or relapsed lymphoid malignancies.
|
||||
| Experiment 2 Reporting the Activity Date of This ADC | [182] | ||||
| Related Clinical Trial | |||||
| NCT Number | NCT02610062 | Phase Status | Phase 1 | ||
| Clinical Description |
A phase 1 study evaluating safety, tolerability, and pharmacokinetics of escalating doses of AGS67E given as monotherapy in subjects with acute myeloid leukemia (AML).
|
||||
Discovered Using Cell Line-derived Xenograft Model
| Experiment 1 Reporting the Activity Date of This ADC | [187] | ||||
| Efficacy Data | Tumor Growth Inhibition value (TGI) |
0.00%
|
Low CD37 expression (CD37+; CD37 MFI ratio=82) | ||
| Method Description |
The in vivo antitumor activity of AGS-67E was evaluated in a CD37 positive NHL,CLL and AmL cell line xenograft models. Depending on the cell line,110e6 cells were injected into the flanks of individual SCID mice,and tumor volumes were allowed to reach 100 to 300 mm3. Animals and their tumors were size matched and randomized into treatment and control groups. Depending on the study,AGS67E and an isotype control ADC were dosed by i.v. bolus injection either at 0.25,0.75,1.5,or 3.0 mg/kg at biweekly (BIW) or weekly (QW) frequencies and for a total of 2 to 4 doses.
Click to Show/Hide
|
||||
| In Vivo Model | CD37-expressing Hel 92.1.7 AmL cancer xenograft model | ||||
| In Vitro Model | Erythroleukemia | HEL 92.1.7 cells | CVCL_2481 | ||
| Experiment 2 Reporting the Activity Date of This ADC | [187] | ||||
| Efficacy Data | Tumor Growth Inhibition value (TGI) |
27.00%
|
High CD37 expression (CD37+++; CD37 MFI ratio=580) | ||
| Method Description |
The in vivo antitumor activity of AGS-67E was evaluated in a CD37 positive NHL,CLL and AmL cell line xenograft models. Depending on the cell line,110e6 cells were injected into the flanks of individual SCID mice,and tumor volumes were allowed to reach 100 to 300 mm3. Animals and their tumors were size matched and randomized into treatment and control groups. Depending on the study,AGS67E and an isotype control ADC were dosed by i.v. bolus injection either at 0.25,0.75,1.5,or 3.0 mg/kg at biweekly (BIW) or weekly (QW) frequencies and for a total of 2 to 4 doses.
Click to Show/Hide
|
||||
| In Vivo Model | CD37-expressing DOHH2 FL cancer xenograft model | ||||
| In Vitro Model | Diffuse large B-cell lymphoma germinal center B-cell type | DoHH2 cells | CVCL_1179 | ||
| Experiment 3 Reporting the Activity Date of This ADC | [187] | ||||
| Efficacy Data | Tumor Growth Inhibition value (TGI) |
31.00%
|
High CD37 expression (CD37+++; CD37 MFI ratio=554) | ||
| Method Description |
The in vivo antitumor activity of AGS-67E was evaluated in a CD37 positive NHL,CLL and AmL cell line xenograft models. Depending on the cell line,110e6 cells were injected into the flanks of individual SCID mice,and tumor volumes were allowed to reach 100 to 300 mm3. Animals and their tumors were size matched and randomized into treatment and control groups. Depending on the study,AGS67E and an isotype control ADC were dosed by i.v. bolus injection either at 0.25,0.75,1.5,or 3.0 mg/kg at biweekly (BIW) or weekly (QW) frequencies and for a total of 2 to 4 doses.
Click to Show/Hide
|
||||
| In Vivo Model | CD37-expressing WSU-DLCL2 DBCL cancer xenograft model | ||||
| In Vitro Model | Diffuse large B-cell lymphoma | WSU-DLCL2 cells | CVCL_1902 | ||
| Experiment 4 Reporting the Activity Date of This ADC | [187] | ||||
| Efficacy Data | Tumor Growth Inhibition value (TGI) |
41.00%
|
Low CD37 expression (CD37+; CD37 MFI ratio=20) | ||
| Method Description |
The in vivo antitumor activity of AGS-67E was evaluated in a CD37 positive NHL,CLL and AmL cell line xenograft models. Depending on the cell line,110e6 cells were injected into the flanks of individual SCID mice,and tumor volumes were allowed to reach 100 to 300 mm3. Animals and their tumors were size matched and randomized into treatment and control groups. Depending on the study,AGS67E and an isotype control ADC were dosed by i.v. bolus injection either at 0.25,0.75,1.5,or 3.0 mg/kg at biweekly (BIW) or weekly (QW) frequencies and for a total of 2 to 4 doses.
Click to Show/Hide
|
||||
| In Vivo Model | CD37-expressing KG-1 AmL cancer xenograft model | ||||
| In Vitro Model | Adult acute myeloid leukemia | KG-1 cells | CVCL_0374 | ||
| Experiment 5 Reporting the Activity Date of This ADC | [187] | ||||
| Efficacy Data | Tumor Growth Inhibition value (TGI) |
51.00%
|
High CD37 expression (CD37+++; CD37 MFI ratio=300) | ||
| Method Description |
The in vivo antitumor activity of AGS-67E was evaluated in a CD37 positive NHL,CLL and AmL cell line xenograft models. Depending on the cell line,110e6 cells were injected into the flanks of individual SCID mice,and tumor volumes were allowed to reach 100 to 300 mm3. Animals and their tumors were size matched and randomized into treatment and control groups. Depending on the study,AGS67E and an isotype control ADC were dosed by i.v. bolus injection either at 0.25,0.75,1.5,or 3.0 mg/kg at biweekly (BIW) or weekly (QW) frequencies and for a total of 2 to 4 doses.
Click to Show/Hide
|
||||
| In Vivo Model | CD37-expressing Mino MCL cancer xenograft model | ||||
| In Vitro Model | Mantle cell lymphoma | Mino cells | CVCL_1872 | ||
| Experiment 6 Reporting the Activity Date of This ADC | [187] | ||||
| Efficacy Data | Tumor Growth Inhibition value (TGI) |
63.00%
|
Moderate CD37 expression (CD37++; CD37 MFI ratio=140) | ||
| Method Description |
The in vivo antitumor activity of AGS-67E was evaluated in a CD37 positive NHL,CLL and AmL cell line xenograft models. Depending on the cell line,110e6 cells were injected into the flanks of individual SCID mice,and tumor volumes were allowed to reach 100 to 300 mm3. Animals and their tumors were size matched and randomized into treatment and control groups. Depending on the study,AGS67E and an isotype control ADC were dosed by i.v. bolus injection either at 0.25,0.75,1.5,or 3.0 mg/kg at biweekly (BIW) or weekly (QW) frequencies and for a total of 2 to 4 doses.
Click to Show/Hide
|
||||
| In Vivo Model | CD37-expressing Ramos-RR-XcL Burkitt lymphoma cancer xenograft model | ||||
| In Vitro Model | Burkitt lymphoma | Ramos cells | CVCL_0597 | ||
| Experiment 7 Reporting the Activity Date of This ADC | [187] | ||||
| Efficacy Data | Tumor Growth Inhibition value (TGI) |
66.00%
|
High CD37 expression (CD37+++; CD37 MFI ratio=580) | ||
| Method Description |
The in vivo antitumor activity of AGS-67E was evaluated in a CD37 positive NHL,CLL and AmL cell line xenograft models. Depending on the cell line,110e6 cells were injected into the flanks of individual SCID mice,and tumor volumes were allowed to reach 100 to 300 mm3. Animals and their tumors were size matched and randomized into treatment and control groups. Depending on the study,AGS67E and an isotype control ADC were dosed by i.v. bolus injection either at 0.25,0.75,1.5,or 3.0 mg/kg at biweekly (BIW) or weekly (QW) frequencies and for a total of 2 to 4 doses.
Click to Show/Hide
|
||||
| In Vivo Model | CD37-expressing DOHH2 FL cancer xenograft model | ||||
| In Vitro Model | Diffuse large B-cell lymphoma germinal center B-cell type | DoHH2 cells | CVCL_1179 | ||
| Experiment 8 Reporting the Activity Date of This ADC | [187] | ||||
| Efficacy Data | Tumor Growth Inhibition value (TGI) |
69.00%
|
Low CD37 expression (CD37+; CD37 MFI ratio=25) | ||
| Method Description |
The in vivo antitumor activity of AGS-67E was evaluated in a CD37 positive NHL,CLL and AmL cell line xenograft models. Depending on the cell line,110e6 cells were injected into the flanks of individual SCID mice,and tumor volumes were allowed to reach 100 to 300 mm3. Animals and their tumors were size matched and randomized into treatment and control groups. Depending on the study,AGS67E and an isotype control ADC were dosed by i.v. bolus injection either at 0.25,0.75,1.5,or 3.0 mg/kg at biweekly (BIW) or weekly (QW) frequencies and for a total of 2 to 4 doses.
Click to Show/Hide
|
||||
| In Vivo Model | CD37-expressing MOLM-13 AmL cancer xenograft model | ||||
| In Vitro Model | Adult acute myeloid leukemia | MOLM-13 cells | CVCL_2119 | ||
| Experiment 9 Reporting the Activity Date of This ADC | [187] | ||||
| Efficacy Data | Tumor Growth Inhibition value (TGI) |
86.00%
|
Moderate CD37 expression (CD37++; CD37 MFI ratio=140) | ||
| Method Description |
The in vivo antitumor activity of AGS-67E was evaluated in a CD37 positive NHL,CLL and AmL cell line xenograft models. Depending on the cell line,110e6 cells were injected into the flanks of individual SCID mice,and tumor volumes were allowed to reach 100 to 300 mm3. Animals and their tumors were size matched and randomized into treatment and control groups. Depending on the study,AGS67E and an isotype control ADC were dosed by i.v. bolus injection either at 0.25,0.75,1.5,or 3.0 mg/kg at biweekly (BIW) or weekly (QW) frequencies and for a total of 2 to 4 doses.
Click to Show/Hide
|
||||
| In Vivo Model | CD37-expressing Ramos-RR-XcL Burkitt lymphoma cancer xenograft model | ||||
| In Vitro Model | Burkitt lymphoma | Ramos cells | CVCL_0597 | ||
| Experiment 10 Reporting the Activity Date of This ADC | [187] | ||||
| Efficacy Data | Tumor Growth Inhibition value (TGI) |
92.00%
|
High CD37 expression (CD37+++; CD37 MFI ratio=300) | ||
| Method Description |
The in vivo antitumor activity of AGS-67E was evaluated in a CD37 positive NHL,CLL and AmL cell line xenograft models. Depending on the cell line,110e6 cells were injected into the flanks of individual SCID mice,and tumor volumes were allowed to reach 100 to 300 mm3. Animals and their tumors were size matched and randomized into treatment and control groups. Depending on the study,AGS67E and an isotype control ADC were dosed by i.v. bolus injection either at 0.25,0.75,1.5,or 3.0 mg/kg at biweekly (BIW) or weekly (QW) frequencies and for a total of 2 to 4 doses.
Click to Show/Hide
|
||||
| In Vivo Model | CD37-expressing Mino MCL cancer xenograft model | ||||
| In Vitro Model | Mantle cell lymphoma | Mino cells | CVCL_1872 | ||
| Experiment 11 Reporting the Activity Date of This ADC | [187] | ||||
| Efficacy Data | Tumor Growth Inhibition value (TGI) |
95.00%
|
High CD37 expression (CD37+++; CD37 MFI ratio=580) | ||
| Method Description |
The in vivo antitumor activity of AGS-67E was evaluated in a CD37 positive NHL,CLL and AmL cell line xenograft models. Depending on the cell line,110e6 cells were injected into the flanks of individual SCID mice,and tumor volumes were allowed to reach 100 to 300 mm3. Animals and their tumors were size matched and randomized into treatment and control groups. Depending on the study,AGS67E and an isotype control ADC were dosed by i.v. bolus injection either at 0.25,0.75,1.5,or 3.0 mg/kg at biweekly (BIW) or weekly (QW) frequencies and for a total of 2 to 4 doses.
Click to Show/Hide
|
||||
| In Vivo Model | CD37-expressing DOHH2 FL cancer xenograft model | ||||
| In Vitro Model | Diffuse large B-cell lymphoma germinal center B-cell type | DoHH2 cells | CVCL_1179 | ||
| Experiment 12 Reporting the Activity Date of This ADC | [187] | ||||
| Efficacy Data | Tumor Growth Inhibition value (TGI) |
95.00%
|
Low CD37 expression (CD37+; CD37 MFI ratio=23) | ||
| Method Description |
The in vivo antitumor activity of AGS-67E was evaluated in a CD37 positive NHL,CLL and AmL cell line xenograft models. Depending on the cell line,110e6 cells were injected into the flanks of individual SCID mice,and tumor volumes were allowed to reach 100 to 300 mm3. Animals and their tumors were size matched and randomized into treatment and control groups. Depending on the study,AGS67E and an isotype control ADC were dosed by i.v. bolus injection either at 0.25,0.75,1.5,or 3.0 mg/kg at biweekly (BIW) or weekly (QW) frequencies and for a total of 2 to 4 doses.
Click to Show/Hide
|
||||
| In Vivo Model | CD37-expressing THP-1 AmL cancer xenograft models | ||||
| In Vitro Model | Childhood acute monocytic leukemia | THP-1 cells | CVCL_0006 | ||
| Experiment 13 Reporting the Activity Date of This ADC | [187] | ||||
| Efficacy Data | Tumor Growth Inhibition value (TGI) |
96.00%
|
High CD37 expression (CD37+++; CD37 MFI ratio=554) | ||
| Method Description |
The in vivo antitumor activity of AGS-67E was evaluated in a CD37 positive NHL,CLL and AmL cell line xenograft models. Depending on the cell line,110e6 cells were injected into the flanks of individual SCID mice,and tumor volumes were allowed to reach 100 to 300 mm3. Animals and their tumors were size matched and randomized into treatment and control groups. Depending on the study,AGS67E and an isotype control ADC were dosed by i.v. bolus injection either at 0.25,0.75,1.5,or 3.0 mg/kg at biweekly (BIW) or weekly (QW) frequencies and for a total of 2 to 4 doses.
Click to Show/Hide
|
||||
| In Vivo Model | CD37-expressing WSU-DLCL2 DBCL cancer xenograft model | ||||
| In Vitro Model | Diffuse large B-cell lymphoma | WSU-DLCL2 cells | CVCL_1902 | ||
| Experiment 14 Reporting the Activity Date of This ADC | [187] | ||||
| Efficacy Data | Tumor Growth Inhibition value (TGI) |
97.00%
|
Moderate CD37 expression (CD37++; CD37 MFI ratio=140) | ||
| Method Description |
The in vivo antitumor activity of AGS-67E was evaluated in a CD37 positive NHL,CLL and AmL cell line xenograft models. Depending on the cell line,110e6 cells were injected into the flanks of individual SCID mice,and tumor volumes were allowed to reach 100 to 300 mm3. Animals and their tumors were size matched and randomized into treatment and control groups. Depending on the study,AGS67E and an isotype control ADC were dosed by i.v. bolus injection either at 0.25,0.75,1.5,or 3.0 mg/kg at biweekly (BIW) or weekly (QW) frequencies and for a total of 2 to 4 doses.
Click to Show/Hide
|
||||
| In Vivo Model | CD37-expressing Ramos-RR-XcL Burkitt lymphoma cancer xenograft model | ||||
| In Vitro Model | Burkitt lymphoma | Ramos cells | CVCL_0597 | ||
| Experiment 15 Reporting the Activity Date of This ADC | [187] | ||||
| Efficacy Data | Tumor Growth Inhibition value (TGI) |
100.00%
|
Moderate CD37 expression (CD37++; CD37 MFI ratio=129) | ||
| Method Description |
The in vivo antitumor activity of AGS-67E was evaluated in a CD37 positive NHL,CLL and AmL cell line xenograft models. Depending on the cell line,110e6 cells were injected into the flanks of individual SCID mice,and tumor volumes were allowed to reach 100 to 300 mm3. Animals and their tumors were size matched and randomized into treatment and control groups. Depending on the study,AGS67E and an isotype control ADC were dosed by i.v. bolus injection either at 0.25,0.75,1.5,or 3.0 mg/kg at biweekly (BIW) or weekly (QW) frequencies and for a total of 2 to 4 doses.
Click to Show/Hide
|
||||
| In Vivo Model | CD38-expressing JVM3 xenograft CLL cancer model | ||||
| In Vitro Model | B-cell prolymphocytic leukemia | JVM-3 cells | CVCL_1320 | ||
| Experiment 16 Reporting the Activity Date of This ADC | [187] | ||||
| Efficacy Data | Tumor Growth Inhibition value (TGI) |
100.00%
|
Moderate CD37 expression (CD37++; CD37 MFI ratio=129) | ||
| Method Description |
The in vivo antitumor activity of AGS-67E was evaluated in a CD37 positive NHL,CLL and AmL cell line xenograft models. Depending on the cell line,110e6 cells were injected into the flanks of individual SCID mice,and tumor volumes were allowed to reach 100 to 300 mm3. Animals and their tumors were size matched and randomized into treatment and control groups. Depending on the study,AGS67E and an isotype control ADC were dosed by i.v. bolus injection either at 0.25,0.75,1.5,or 3.0 mg/kg at biweekly (BIW) or weekly (QW) frequencies and for a total of 2 to 4 doses.
Click to Show/Hide
|
||||
| In Vivo Model | CD38-expressing JVM3 xenograft CLL cancer model | ||||
| In Vitro Model | B-cell prolymphocytic leukemia | JVM-3 cells | CVCL_1320 | ||
| Experiment 17 Reporting the Activity Date of This ADC | [187] | ||||
| Efficacy Data | Tumor Growth Inhibition value (TGI) |
100.00%
|
Moderate CD37 expression (CD37++; CD37 MFI ratio=129) | ||
| Method Description |
The in vivo antitumor activity of AGS-67E was evaluated in a CD37 positive NHL,CLL and AmL cell line xenograft models. Depending on the cell line,110e6 cells were injected into the flanks of individual SCID mice,and tumor volumes were allowed to reach 100 to 300 mm3. Animals and their tumors were size matched and randomized into treatment and control groups. Depending on the study,AGS67E and an isotype control ADC were dosed by i.v. bolus injection either at 0.25,0.75,1.5,or 3.0 mg/kg at biweekly (BIW) or weekly (QW) frequencies and for a total of 2 to 4 doses.
Click to Show/Hide
|
||||
| In Vivo Model | CD38-expressing JVM3 xenograft CLL cancer model | ||||
| In Vitro Model | B-cell prolymphocytic leukemia | JVM-3 cells | CVCL_1320 | ||
| Experiment 18 Reporting the Activity Date of This ADC | [187] | ||||
| Efficacy Data | Tumor Growth Inhibition value (TGI) |
100.00%
|
Low CD37 expression (CD37+; CD37 MFI ratio=22) | ||
| Method Description |
The in vivo antitumor activity of AGS-67E was evaluated in a CD37 positive NHL,CLL and AmL cell line xenograft models. Depending on the cell line,110e6 cells were injected into the flanks of individual SCID mice,and tumor volumes were allowed to reach 100 to 300 mm3. Animals and their tumors were size matched and randomized into treatment and control groups. Depending on the study,AGS67E and an isotype control ADC were dosed by i.v. bolus injection either at 0.25,0.75,1.5,or 3.0 mg/kg at biweekly (BIW) or weekly (QW) frequencies and for a total of 2 to 4 doses.
Click to Show/Hide
|
||||
| In Vivo Model | CD38-expressing MV-411 AmL cancer xenograft model | ||||
| In Vitro Model | Childhood acute monocytic leukemia | MV4-11 cells | CVCL_0064 | ||
| Experiment 19 Reporting the Activity Date of This ADC | [187] | ||||
| Efficacy Data | Tumor Growth Inhibition value (TGI) |
100.00%
|
Low CD37 expression (CD37+; CD37 MFI ratio=22) | ||
| Method Description |
The in vivo antitumor activity of AGS-67E was evaluated in a CD37 positive NHL,CLL and AmL cell line xenograft models. Depending on the cell line,110e6 cells were injected into the flanks of individual SCID mice,and tumor volumes were allowed to reach 100 to 300 mm3. Animals and their tumors were size matched and randomized into treatment and control groups. Depending on the study,AGS67E and an isotype control ADC were dosed by i.v. bolus injection either at 0.25,0.75,1.5,or 3.0 mg/kg at biweekly (BIW) or weekly (QW) frequencies and for a total of 2 to 4 doses.
Click to Show/Hide
|
||||
| In Vivo Model | CD38-expressing MV-411 AmL cancer xenograft model | ||||
| In Vitro Model | Childhood acute monocytic leukemia | MV4-11 cells | CVCL_0064 | ||
| Experiment 20 Reporting the Activity Date of This ADC | [187] | ||||
| Efficacy Data | Tumor Growth Inhibition value (TGI) |
100.00%
|
Low CD37 expression (CD37+; CD37 MFI ratio=22) | ||
| Method Description |
The in vivo antitumor activity of AGS-67E was evaluated in a CD37 positive NHL,CLL and AmL cell line xenograft models. Depending on the cell line,110e6 cells were injected into the flanks of individual SCID mice,and tumor volumes were allowed to reach 100 to 300 mm3. Animals and their tumors were size matched and randomized into treatment and control groups. Depending on the study,AGS67E and an isotype control ADC were dosed by i.v. bolus injection either at 0.25,0.75,1.5,or 3.0 mg/kg at biweekly (BIW) or weekly (QW) frequencies and for a total of 2 to 4 doses.
Click to Show/Hide
|
||||
| In Vivo Model | CD38-expressing MV-411 AmL cancer xenograft model | ||||
| In Vitro Model | Childhood acute monocytic leukemia | MV4-11 cells | CVCL_0064 | ||
| Experiment 21 Reporting the Activity Date of This ADC | [187] | ||||
| Efficacy Data | Tumor Growth Inhibition value (TGI) |
100.00%
|
Low CD37 expression (CD37+; CD37 MFI ratio=25) | ||
| Method Description |
The in vivo antitumor activity of AGS-67E was evaluated in a CD37 positive NHL,CLL and AmL cell line xenograft models. Depending on the cell line,110e6 cells were injected into the flanks of individual SCID mice,and tumor volumes were allowed to reach 100 to 300 mm3. Animals and their tumors were size matched and randomized into treatment and control groups. Depending on the study,AGS67E and an isotype control ADC were dosed by i.v. bolus injection either at 0.25,0.75,1.5,or 3.0 mg/kg at biweekly (BIW) or weekly (QW) frequencies and for a total of 2 to 4 doses.
Click to Show/Hide
|
||||
| In Vivo Model | CD37-expressing MOLM-13 AmL cancer xenograft model | ||||
| In Vitro Model | Adult acute myeloid leukemia | MOLM-13 cells | CVCL_2119 | ||
| Experiment 22 Reporting the Activity Date of This ADC | [187] | ||||
| Efficacy Data | Tumor Growth Inhibition value (TGI) |
100.00%
|
Low CD37 expression (CD37+; CD37 MFI ratio=25) | ||
| Method Description |
The in vivo antitumor activity of AGS-67E was evaluated in a CD37 positive NHL,CLL and AmL cell line xenograft models. Depending on the cell line,110e6 cells were injected into the flanks of individual SCID mice,and tumor volumes were allowed to reach 100 to 300 mm3. Animals and their tumors were size matched and randomized into treatment and control groups. Depending on the study,AGS67E and an isotype control ADC were dosed by i.v. bolus injection either at 0.25,0.75,1.5,or 3.0 mg/kg at biweekly (BIW) or weekly (QW) frequencies and for a total of 2 to 4 doses.
Click to Show/Hide
|
||||
| In Vivo Model | CD37-expressing MOLM-13 AmL cancer xenograft model | ||||
| In Vitro Model | Adult acute myeloid leukemia | MOLM-13 cells | CVCL_2119 | ||
Revealed Based on the Cell Line Data
| Experiment 1 Reporting the Activity Date of This ADC | [187] | ||||
| Efficacy Data | Half Maximal Inhibitory Concentration (IC50) |
0.05±0.03 nM
|
Low CD37 expression (CD37+; CD37 MFI ratio=25) | ||
| Method Description |
The inhibitory activity of AGS-67E against cancer cell growth was evaluated in various human cancer cell lines in vitro. Exponentially growing cells with a viability of 95% or greater were plated in fresh RPMI-1640 (Gibco-Invitrogen) media containing phenol red supplemented with 10% FBS (heat inactivated),10 mmol/L Hepes,and 1 mmol/L sodium pyruvate. Cells were left overnight and treated with AGS67E and an isotype control. After 5 days of treatment and incubation at 37°C and 5% CO2,cell viability was measured following a 1 hour incubation at 37°C with Presto Blue Reagent (Invitrogen).
Click to Show/Hide
|
||||
| In Vitro Model | Burkitt lymphoma | Ramos cells | CVCL_0597 | ||
| Experiment 2 Reporting the Activity Date of This ADC | [187] | ||||
| Efficacy Data | Half Maximal Inhibitory Concentration (IC50) |
0.07±0.49 nM
|
Low CD37 expression (CD37+; CD37 MFI ratio=18) | ||
| Method Description |
The inhibitory activity of AGS-67E against cancer cell growth was evaluated in various human cancer cell lines in vitro. Exponentially growing cells with a viability of 95% or greater were plated in fresh RPMI-1640 (Gibco-Invitrogen) media containing phenol red supplemented with 10% FBS (heat inactivated),10 mmol/L Hepes,and 1 mmol/L sodium pyruvate. Cells were left overnight and treated with AGS67E and an isotype control. After 5 days of treatment and incubation at 37°C and 5% CO2,cell viability was measured following a 1 hour incubation at 37°C with Presto Blue Reagent (Invitrogen).
Click to Show/Hide
|
||||
| In Vitro Model | Mantle cell lymphoma | Mino cells | CVCL_1872 | ||
| Experiment 3 Reporting the Activity Date of This ADC | [187] | ||||
| Efficacy Data | Half Maximal Inhibitory Concentration (IC50) |
0.08±0.02 nM
|
|||
| Method Description |
The inhibitory activity of AGS-67E against cancer cell growth was evaluated in various human cancer cell lines in vitro. Exponentially growing cells with a viability of 95% or greater were plated in fresh RPMI-1640 (Gibco-Invitrogen) media containing phenol red supplemented with 10% FBS (heat inactivated),10 mmol/L Hepes,and 1 mmol/L sodium pyruvate. Cells were left overnight and treated with AGS67E and an isotype control. After 5 days of treatment and incubation at 37°C and 5% CO2,cell viability was measured following a 1 hour incubation at 37°C with Presto Blue Reagent (Invitrogen).
Click to Show/Hide
|
||||
| In Vitro Model | Burkitt lymphoma | Daudi cells | CVCL_0008 | ||
| Experiment 4 Reporting the Activity Date of This ADC | [187] | ||||
| Efficacy Data | Half Maximal Inhibitory Concentration (IC50) |
0.08±0.61 nM
|
Negative CD37 expression (CD37-; CD37 MFI ratio=3) | ||
| Method Description |
The inhibitory activity of AGS-67E against cancer cell growth was evaluated in various human cancer cell lines in vitro. Exponentially growing cells with a viability of 95% or greater were plated in fresh RPMI-1640 (Gibco-Invitrogen) media containing phenol red supplemented with 10% FBS (heat inactivated),10 mmol/L Hepes,and 1 mmol/L sodium pyruvate. Cells were left overnight and treated with AGS67E and an isotype control. After 5 days of treatment and incubation at 37°C and 5% CO2,cell viability was measured following a 1 hour incubation at 37°C with Presto Blue Reagent (Invitrogen).
Click to Show/Hide
|
||||
| In Vitro Model | Mantle cell lymphoma | Granta-519 cells | CVCL_1818 | ||
| Experiment 5 Reporting the Activity Date of This ADC | [187] | ||||
| Efficacy Data | Half Maximal Inhibitory Concentration (IC50) |
0.13±0.08 nM
|
High CD37 expression (CD37+++; CD37 MFI ratio=662) | ||
| Method Description |
The inhibitory activity of AGS-67E against cancer cell growth was evaluated in various human cancer cell lines in vitro. Exponentially growing cells with a viability of 95% or greater were plated in fresh RPMI-1640 (Gibco-Invitrogen) media containing phenol red supplemented with 10% FBS (heat inactivated),10 mmol/L Hepes,and 1 mmol/L sodium pyruvate. Cells were left overnight and treated with AGS67E and an isotype control. After 5 days of treatment and incubation at 37°C and 5% CO2,cell viability was measured following a 1 hour incubation at 37°C with Presto Blue Reagent (Invitrogen).
Click to Show/Hide
|
||||
| In Vitro Model | Childhood acute monocytic leukemia | THP-1 cells | CVCL_0006 | ||
| Experiment 6 Reporting the Activity Date of This ADC | [187] | ||||
| Efficacy Data | Half Maximal Inhibitory Concentration (IC50) |
0.23±0.30 nM
|
High CD37 expression (CD37+++; CD37 MFI ratio=534) | ||
| Method Description |
The inhibitory activity of AGS-67E against cancer cell growth was evaluated in various human cancer cell lines in vitro. Exponentially growing cells with a viability of 95% or greater were plated in fresh RPMI-1640 (Gibco-Invitrogen) media containing phenol red supplemented with 10% FBS (heat inactivated),10 mmol/L Hepes,and 1 mmol/L sodium pyruvate. Cells were left overnight and treated with AGS67E and an isotype control. After 5 days of treatment and incubation at 37°C and 5% CO2,cell viability was measured following a 1 hour incubation at 37°C with Presto Blue Reagent (Invitrogen).
Click to Show/Hide
|
||||
| In Vitro Model | Diffuse large B-cell lymphoma | SU-DHL-4 cells | CVCL_0539 | ||
| Experiment 7 Reporting the Activity Date of This ADC | [187] | ||||
| Efficacy Data | Half Maximal Inhibitory Concentration (IC50) |
0.50±0.72 nM
|
High CD37 expression (CD37+++; CD37 MFI ratio=581) | ||
| Method Description |
The inhibitory activity of AGS-67E against cancer cell growth was evaluated in various human cancer cell lines in vitro. Exponentially growing cells with a viability of 95% or greater were plated in fresh RPMI-1640 (Gibco-Invitrogen) media containing phenol red supplemented with 10% FBS (heat inactivated),10 mmol/L Hepes,and 1 mmol/L sodium pyruvate. Cells were left overnight and treated with AGS67E and an isotype control. After 5 days of treatment and incubation at 37°C and 5% CO2,cell viability was measured following a 1 hour incubation at 37°C with Presto Blue Reagent (Invitrogen).
Click to Show/Hide
|
||||
| In Vitro Model | B-cell prolymphocytic leukemia | JVM-3 cells | CVCL_1320 | ||
| Experiment 8 Reporting the Activity Date of This ADC | [187] | ||||
| Efficacy Data | Half Maximal Inhibitory Concentration (IC50) |
0.71±0.20 nM
|
Low CD37 expression (CD37+; CD37 MFI ratio=22) | ||
| Method Description |
The inhibitory activity of AGS-67E against cancer cell growth was evaluated in various human cancer cell lines in vitro. Exponentially growing cells with a viability of 95% or greater were plated in fresh RPMI-1640 (Gibco-Invitrogen) media containing phenol red supplemented with 10% FBS (heat inactivated),10 mmol/L Hepes,and 1 mmol/L sodium pyruvate. Cells were left overnight and treated with AGS67E and an isotype control. After 5 days of treatment and incubation at 37°C and 5% CO2,cell viability was measured following a 1 hour incubation at 37°C with Presto Blue Reagent (Invitrogen).
Click to Show/Hide
|
||||
| In Vitro Model | Acute myeloid leukemia | SKM-1 cells | CVCL_0098 | ||
| Experiment 9 Reporting the Activity Date of This ADC | [187] | ||||
| Efficacy Data | Half Maximal Inhibitory Concentration (IC50) |
0.98±1.10 nM
|
Negative CD37 expression (CD37-; CD37 MFI ratio=9) | ||
| Method Description |
The inhibitory activity of AGS-67E against cancer cell growth was evaluated in various human cancer cell lines in vitro. Exponentially growing cells with a viability of 95% or greater were plated in fresh RPMI-1640 (Gibco-Invitrogen) media containing phenol red supplemented with 10% FBS (heat inactivated),10 mmol/L Hepes,and 1 mmol/L sodium pyruvate. Cells were left overnight and treated with AGS67E and an isotype control. After 5 days of treatment and incubation at 37°C and 5% CO2,cell viability was measured following a 1 hour incubation at 37°C with Presto Blue Reagent (Invitrogen).
Click to Show/Hide
|
||||
| In Vitro Model | Diffuse large B-cell lymphoma germinal center B-cell type | DoHH2 cells | CVCL_1179 | ||
| Experiment 10 Reporting the Activity Date of This ADC | [187] | ||||
| Efficacy Data | Half Maximal Inhibitory Concentration (IC50) |
1.10±0.60 nM
|
Moderate CD37 expression (CD37++; CD37 MFI ratio=129) | ||
| Method Description |
The inhibitory activity of AGS-67E against cancer cell growth was evaluated in various human cancer cell lines in vitro. Exponentially growing cells with a viability of 95% or greater were plated in fresh RPMI-1640 (Gibco-Invitrogen) media containing phenol red supplemented with 10% FBS (heat inactivated),10 mmol/L Hepes,and 1 mmol/L sodium pyruvate. Cells were left overnight and treated with AGS67E and an isotype control. After 5 days of treatment and incubation at 37°C and 5% CO2,cell viability was measured following a 1 hour incubation at 37°C with Presto Blue Reagent (Invitrogen).
Click to Show/Hide
|
||||
| In Vitro Model | Adult acute myeloid leukemia | OCI-AML-2 cells | CVCL_1619 | ||
| Experiment 11 Reporting the Activity Date of This ADC | [187] | ||||
| Efficacy Data | Half Maximal Inhibitory Concentration (IC50) |
1.20±0.90 nM
|
Negative CD37 expression (CD37-; CD37 MFI ratio=1) | ||
| Method Description |
The inhibitory activity of AGS-67E against cancer cell growth was evaluated in various human cancer cell lines in vitro. Exponentially growing cells with a viability of 95% or greater were plated in fresh RPMI-1640 (Gibco-Invitrogen) media containing phenol red supplemented with 10% FBS (heat inactivated),10 mmol/L Hepes,and 1 mmol/L sodium pyruvate. Cells were left overnight and treated with AGS67E and an isotype control. After 5 days of treatment and incubation at 37°C and 5% CO2,cell viability was measured following a 1 hour incubation at 37°C with Presto Blue Reagent (Invitrogen).
Click to Show/Hide
|
||||
| In Vitro Model | Childhood acute monocytic leukemia | MV4-11 cells | CVCL_0064 | ||
| Experiment 12 Reporting the Activity Date of This ADC | [187] | ||||
| Efficacy Data | Half Maximal Inhibitory Concentration (IC50) |
1.30±0.50 nM
|
Low CD37 expression (CD37+; CD37 MFI ratio=20) | ||
| Method Description |
The inhibitory activity of AGS-67E against cancer cell growth was evaluated in various human cancer cell lines in vitro. Exponentially growing cells with a viability of 95% or greater were plated in fresh RPMI-1640 (Gibco-Invitrogen) media containing phenol red supplemented with 10% FBS (heat inactivated),10 mmol/L Hepes,and 1 mmol/L sodium pyruvate. Cells were left overnight and treated with AGS67E and an isotype control. After 5 days of treatment and incubation at 37°C and 5% CO2,cell viability was measured following a 1 hour incubation at 37°C with Presto Blue Reagent (Invitrogen).
Click to Show/Hide
|
||||
| In Vitro Model | Adult acute myeloid leukemia | MOLM-13 cells | CVCL_2119 | ||
| Experiment 13 Reporting the Activity Date of This ADC | [187] | ||||
| Efficacy Data | Half Maximal Inhibitory Concentration (IC50) |
3.50±0.70 nM
|
Low CD37 expression (CD37+; CD37 MFI ratio=11) | ||
| Method Description |
The inhibitory activity of AGS-67E against cancer cell growth was evaluated in various human cancer cell lines in vitro. Exponentially growing cells with a viability of 95% or greater were plated in fresh RPMI-1640 (Gibco-Invitrogen) media containing phenol red supplemented with 10% FBS (heat inactivated),10 mmol/L Hepes,and 1 mmol/L sodium pyruvate. Cells were left overnight and treated with AGS67E and an isotype control. After 5 days of treatment and incubation at 37°C and 5% CO2,cell viability was measured following a 1 hour incubation at 37°C with Presto Blue Reagent (Invitrogen).
Click to Show/Hide
|
||||
| In Vitro Model | Myeloid leukemia with maturation | Kasumi-1 cells | CVCL_0589 | ||
| Experiment 14 Reporting the Activity Date of This ADC | [187] | ||||
| Efficacy Data | Half Maximal Inhibitory Concentration (IC50) |
5.70±1.60 nM
|
Low CD37 expression (CD37+; CD37 MFI ratio=26) | ||
| Method Description |
The inhibitory activity of AGS-67E against cancer cell growth was evaluated in various human cancer cell lines in vitro. Exponentially growing cells with a viability of 95% or greater were plated in fresh RPMI-1640 (Gibco-Invitrogen) media containing phenol red supplemented with 10% FBS (heat inactivated),10 mmol/L Hepes,and 1 mmol/L sodium pyruvate. Cells were left overnight and treated with AGS67E and an isotype control. After 5 days of treatment and incubation at 37°C and 5% CO2,cell viability was measured following a 1 hour incubation at 37°C with Presto Blue Reagent (Invitrogen).
Click to Show/Hide
|
||||
| In Vitro Model | Acute myeloid leukemia | BDCM cells | CVCL_4613 | ||
| Experiment 15 Reporting the Activity Date of This ADC | [187] | ||||
| Efficacy Data | Half Maximal Inhibitory Concentration (IC50) |
19.70±3.00 nM
|
High CD37 expression (CD37+++; CD37 MFI ratio=341) | ||
| Method Description |
The inhibitory activity of AGS-67E against cancer cell growth was evaluated in various human cancer cell lines in vitro. Exponentially growing cells with a viability of 95% or greater were plated in fresh RPMI-1640 (Gibco-Invitrogen) media containing phenol red supplemented with 10% FBS (heat inactivated),10 mmol/L Hepes,and 1 mmol/L sodium pyruvate. Cells were left overnight and treated with AGS67E and an isotype control. After 5 days of treatment and incubation at 37°C and 5% CO2,cell viability was measured following a 1 hour incubation at 37°C with Presto Blue Reagent (Invitrogen).
Click to Show/Hide
|
||||
| In Vitro Model | Diffuse large B-cell lymphoma | WSU-DLCL2 cells | CVCL_1902 | ||
| Experiment 16 Reporting the Activity Date of This ADC | [187] | ||||
| Efficacy Data | Half Maximal Inhibitory Concentration (IC50) | > 10.00 uM | High CD37 expression (CD37+++; CD37 MFI ratio=301) | ||
| Method Description |
The inhibitory activity of AGS-67E against cancer cell growth was evaluated in various human cancer cell lines in vitro. Exponentially growing cells with a viability of 95% or greater were plated in fresh RPMI-1640 (Gibco-Invitrogen) media containing phenol red supplemented with 10% FBS (heat inactivated),10 mmol/L Hepes,and 1 mmol/L sodium pyruvate. Cells were left overnight and treated with AGS67E and an isotype control. After 5 days of treatment and incubation at 37°C and 5% CO2,cell viability was measured following a 1 hour incubation at 37°C with Presto Blue Reagent (Invitrogen).
Click to Show/Hide
|
||||
| In Vitro Model | Mantle cell lymphoma | REC-1 cells | CVCL_1884 | ||
| Experiment 17 Reporting the Activity Date of This ADC | [187] | ||||
| Efficacy Data | Half Maximal Inhibitory Concentration (IC50) | > 10.00 uM | High CD37 expression (CD37+++; CD37 MFI ratio=554) | ||
| Method Description |
The inhibitory activity of AGS-67E against cancer cell growth was evaluated in various human cancer cell lines in vitro. Exponentially growing cells with a viability of 95% or greater were plated in fresh RPMI-1640 (Gibco-Invitrogen) media containing phenol red supplemented with 10% FBS (heat inactivated),10 mmol/L Hepes,and 1 mmol/L sodium pyruvate. Cells were left overnight and treated with AGS67E and an isotype control. After 5 days of treatment and incubation at 37°C and 5% CO2,cell viability was measured following a 1 hour incubation at 37°C with Presto Blue Reagent (Invitrogen).
Click to Show/Hide
|
||||
| In Vitro Model | Acute myeloid leukemia | PL-21 cells | CVCL_2161 | ||
| Experiment 18 Reporting the Activity Date of This ADC | [187] | ||||
| Efficacy Data | Half Maximal Inhibitory Concentration (IC50) | > 10.00 uM | Low CD37 expression (CD37+; CD37 MFI ratio=39) | ||
| Method Description |
The inhibitory activity of AGS-67E against cancer cell growth was evaluated in various human cancer cell lines in vitro. Exponentially growing cells with a viability of 95% or greater were plated in fresh RPMI-1640 (Gibco-Invitrogen) media containing phenol red supplemented with 10% FBS (heat inactivated),10 mmol/L Hepes,and 1 mmol/L sodium pyruvate. Cells were left overnight and treated with AGS67E and an isotype control. After 5 days of treatment and incubation at 37°C and 5% CO2,cell viability was measured following a 1 hour incubation at 37°C with Presto Blue Reagent (Invitrogen).
Click to Show/Hide
|
||||
| In Vitro Model | Chronic eosinophilic leukemia | EoL-1 cells | CVCL_0258 | ||
| Experiment 19 Reporting the Activity Date of This ADC | [187] | ||||
| Efficacy Data | Half Maximal Inhibitory Concentration (IC50) | > 10.00 uM | High CD37 expression (CD37+++; CD37 MFI ratio=372) | ||
| Method Description |
The inhibitory activity of AGS-67E against cancer cell growth was evaluated in various human cancer cell lines in vitro. Exponentially growing cells with a viability of 95% or greater were plated in fresh RPMI-1640 (Gibco-Invitrogen) media containing phenol red supplemented with 10% FBS (heat inactivated),10 mmol/L Hepes,and 1 mmol/L sodium pyruvate. Cells were left overnight and treated with AGS67E and an isotype control. After 5 days of treatment and incubation at 37°C and 5% CO2,cell viability was measured following a 1 hour incubation at 37°C with Presto Blue Reagent (Invitrogen).
Click to Show/Hide
|
||||
| In Vitro Model | Adult acute myeloid leukemia | HL-60 cells | CVCL_0002 | ||
| Experiment 20 Reporting the Activity Date of This ADC | [187] | ||||
| Efficacy Data | Half Maximal Inhibitory Concentration (IC50) | > 10.00 uM | Negative CD37 expression (CD37-; CD37 MFI ratio=4) | ||
| Method Description |
The inhibitory activity of AGS-67E against cancer cell growth was evaluated in various human cancer cell lines in vitro. Exponentially growing cells with a viability of 95% or greater were plated in fresh RPMI-1640 (Gibco-Invitrogen) media containing phenol red supplemented with 10% FBS (heat inactivated),10 mmol/L Hepes,and 1 mmol/L sodium pyruvate. Cells were left overnight and treated with AGS67E and an isotype control. After 5 days of treatment and incubation at 37°C and 5% CO2,cell viability was measured following a 1 hour incubation at 37°C with Presto Blue Reagent (Invitrogen).
Click to Show/Hide
|
||||
| In Vitro Model | Adult acute megakaryoblastic leukemia | UT-7 cells | CVCL_2233 | ||
| Experiment 21 Reporting the Activity Date of This ADC | [187] | ||||
| Efficacy Data | Half Maximal Inhibitory Concentration (IC50) | > 10.00 uM | Negative CD37 expression (CD37-; CD37 MFI ratio=5) | ||
| Method Description |
The inhibitory activity of AGS-67E against cancer cell growth was evaluated in various human cancer cell lines in vitro. Exponentially growing cells with a viability of 95% or greater were plated in fresh RPMI-1640 (Gibco-Invitrogen) media containing phenol red supplemented with 10% FBS (heat inactivated),10 mmol/L Hepes,and 1 mmol/L sodium pyruvate. Cells were left overnight and treated with AGS67E and an isotype control. After 5 days of treatment and incubation at 37°C and 5% CO2,cell viability was measured following a 1 hour incubation at 37°C with Presto Blue Reagent (Invitrogen).
Click to Show/Hide
|
||||
| In Vitro Model | Adult acute myeloid leukemia | KG-1 cells | CVCL_0374 | ||
| Experiment 22 Reporting the Activity Date of This ADC | [187] | ||||
| Efficacy Data | Half Maximal Inhibitory Concentration (IC50) | > 10.00 uM | Low CD37 expression (CD37+; CD37 MFI ratio=30) | ||
| Method Description |
The inhibitory activity of AGS-67E against cancer cell growth was evaluated in various human cancer cell lines in vitro. Exponentially growing cells with a viability of 95% or greater were plated in fresh RPMI-1640 (Gibco-Invitrogen) media containing phenol red supplemented with 10% FBS (heat inactivated),10 mmol/L Hepes,and 1 mmol/L sodium pyruvate. Cells were left overnight and treated with AGS67E and an isotype control. After 5 days of treatment and incubation at 37°C and 5% CO2,cell viability was measured following a 1 hour incubation at 37°C with Presto Blue Reagent (Invitrogen).
Click to Show/Hide
|
||||
| In Vitro Model | Down syndrome | CMK cells | CVCL_0216 | ||
| Experiment 23 Reporting the Activity Date of This ADC | [187] | ||||
| Efficacy Data | Half Maximal Inhibitory Concentration (IC50) | > 10.00 uM | Low CD37 expression (CD37+; CD37 MFI ratio=10) | ||
| Method Description |
The inhibitory activity of AGS-67E against cancer cell growth was evaluated in various human cancer cell lines in vitro. Exponentially growing cells with a viability of 95% or greater were plated in fresh RPMI-1640 (Gibco-Invitrogen) media containing phenol red supplemented with 10% FBS (heat inactivated),10 mmol/L Hepes,and 1 mmol/L sodium pyruvate. Cells were left overnight and treated with AGS67E and an isotype control. After 5 days of treatment and incubation at 37°C and 5% CO2,cell viability was measured following a 1 hour incubation at 37°C with Presto Blue Reagent (Invitrogen).
Click to Show/Hide
|
||||
| In Vitro Model | Acute erythroid leukemia | TF-1a cells | CVCL_3608 | ||
| Experiment 24 Reporting the Activity Date of This ADC | [187] | ||||
| Efficacy Data | Half Maximal Inhibitory Concentration (IC50) | > 10.00 uM | Low CD37 expression (CD37+; CD37 MFI ratio=64) | ||
| Method Description |
The inhibitory activity of AGS-67E against cancer cell growth was evaluated in various human cancer cell lines in vitro. Exponentially growing cells with a viability of 95% or greater were plated in fresh RPMI-1640 (Gibco-Invitrogen) media containing phenol red supplemented with 10% FBS (heat inactivated),10 mmol/L Hepes,and 1 mmol/L sodium pyruvate. Cells were left overnight and treated with AGS67E and an isotype control. After 5 days of treatment and incubation at 37°C and 5% CO2,cell viability was measured following a 1 hour incubation at 37°C with Presto Blue Reagent (Invitrogen).
Click to Show/Hide
|
||||
| In Vitro Model | Acute erythroid leukemia | HEL 92.1 cells | CVCL_2481 | ||
| Experiment 25 Reporting the Activity Date of This ADC | [187] | ||||
| Efficacy Data | Half Maximal Inhibitory Concentration (IC50) | > 10.00 uM | Low CD37 expression (CD37+; CD37 MFI ratio=23) | ||
| Method Description |
The inhibitory activity of AGS-67E against cancer cell growth was evaluated in various human cancer cell lines in vitro. Exponentially growing cells with a viability of 95% or greater were plated in fresh RPMI-1640 (Gibco-Invitrogen) media containing phenol red supplemented with 10% FBS (heat inactivated),10 mmol/L Hepes,and 1 mmol/L sodium pyruvate. Cells were left overnight and treated with AGS67E and an isotype control. After 5 days of treatment and incubation at 37°C and 5% CO2,cell viability was measured following a 1 hour incubation at 37°C with Presto Blue Reagent (Invitrogen).
Click to Show/Hide
|
||||
| In Vitro Model | Adult T acute lymphoblastic leukemia | MOLT-4 cells | CVCL_0013 | ||
Iladatuzumab vedotin [Phase 1]
Identified from the Human Clinical Data
| Experiment 1 Reporting the Activity Date of This ADC | [172] | ||||
| Efficacy Data | Objective Response Rate (ORR) |
46.67%
|
|||
| Patients Enrolled |
B-non Hodgkin lymphoma (NHL) that had relapsed after or failed to respond to at least one prior treatment regimen and for which no suitable therapy of curative intent or higher priority existed.
|
||||
| Administration Dosage |
The phase Ia, starting dose of 0.30 mg/kg administered intravenously once every 3 weeks (Q3W; 1 cycle = 21 days); The phase Ib portion evaluated DCDS0780A in dose-escalation cohorts starting at one dose level below that tolerated by completed monotherapy cohorts, and in combination with a fixed dose of rituximab (375 mg/m2); up to approximately 1 year or until disease progression or unacceptable toxicity.
Click to Show/Hide
|
||||
| Related Clinical Trial | |||||
| NCT Number | NCT02453087 | Phase Status | Phase 1 | ||
| Clinical Description |
An open-label, multicenter, phase 1/1b dose escalation study evaluating the pharmacokinetics, safety, tolerability, and preliminary efficacy of DCDS0780A, alone or in combination with rituximab, or obinutuzumab, in patients with relapsed/refractory B-cell non-Hodgkin's lymphoma.
|
||||
| Primary Endpoint |
Response rate in all-treated patients (N=60) was 46.67% (n=28), including 17 complete responses (28.33%) and 11 partial responses (18.33%). The median duration of response (15.20 months) was the same for all responders (n=28) and patients with DLBCL (n=20).
|
||||
| Other Endpoint |
The median PFS for all patients on study (N =60) was 4.40 months [95% CI,2.60-13.20], and 3.90 months (95% CI,2.40-9.50) for patients with DLBCL (n=41); PFS for pooled subgroups are indicated. The median DoR for the 28 responders among all patients was 15.20 months (95% CI,8.40-N.E.).
|
||||
SYSA-1801 [Phase 1]
Identified from the Human Clinical Data
| Experiment 1 Reporting the Activity Date of This ADC | [173] | ||||
| Efficacy Data | Objective Response Rate (ORR) |
47.10% (gastric cancer)
33.30% (1.00 mg/kg) 40.00% (2.00 mg/kg) 100.00% (2.50 mg/kg) 20.00% (3.00 mg/kg) 38.10% (all) |
|||
| Patients Enrolled |
Patients with resistant/refractory solid tumors that express CLDN18.2 who progressed on or were intolerant to standard treatment, or had no standard treatment were recruited.. ECOG score of 0-2.
|
||||
| Administration Dosage |
0.50 up to 3.00 mg/kg on day 1, administered once every 3 weeks.
|
||||
| Related Clinical Trial | |||||
| NCT Number | NCT05009966 | Phase Status | Phase 1 | ||
| Clinical Description |
A phase 1 trial to evaluate safety, tolerability, pharmacokinetics, immunogenicity and initial efficacy of SYSA1801 in the treatment of CLDN 18.2 positive advanced malignant solid tumor.
|
||||
SGN-B6A [Phase 1]
Identified from the Human Clinical Data
| Experiment 1 Reporting the Activity Date of This ADC | [175] | ||||
| Patients Enrolled |
Patients with metastatic or unresectable solid tumors.
|
||||
| Administration Dosage |
30 patients in Q1W (0.80, 1.00, and 1.20 mg/kg); 18 patients in 2Q3W (1.20 or 1.25 mg/kg).
|
||||
| Related Clinical Trial | |||||
| NCT Number | NCT04389632 | Phase Status | Phase 1/2 | ||
| Clinical Description |
A phase 1 study of SGN-B6A in advanced solid tumors.
|
||||
SGN-PDL1V [Phase 1]
Identified from the Human Clinical Data
| Experiment 1 Reporting the Activity Date of This ADC | [176] | ||||
| Related Clinical Trial | |||||
| NCT Number | NCT05208762 | Phase Status | Phase 1 | ||
| Clinical Description |
A phase 1 study of SGN-PDL1V in advanced solid tumors.
|
||||
SGN-CD48A [Phase 1]
Identified from the Human Clinical Data
| Experiment 1 Reporting the Activity Date of This ADC | [177] | ||||
| Related Clinical Trial | |||||
| NCT Number | NCT03379584 | Phase Status | Phase 1 | ||
| Clinical Description |
A phase 1 study of SGN-CD48A in patients with relapsed or refractory multiple myeloma.
|
||||
Discovered Using Cell Line-derived Xenograft Model
| Experiment 1 Reporting the Activity Date of This ADC | [189] | ||||
| Efficacy Data | Tumor Growth Inhibition value (TGI) |
75.00%
|
Positive SLAMF2 expression (SLAMF2+++/++) | ||
| Method Description |
SGN-CD48A was evaluated in vivo for antitumor activity in a diffuse MM cell line xenograft model in mice. SGN-CD48A was administered at a single dose of 0.30 mg/kg.
|
||||
| In Vivo Model | Multiple myeloma CDX model | ||||
| In Vitro Model | Plasma cell myeloma | EJM cells | CVCL_2030 | ||
| Experiment 2 Reporting the Activity Date of This ADC | [189] | ||||
| Efficacy Data | Tumor Growth Inhibition value (TGI) |
87.50%
|
Positive SLAMF2 expression (SLAMF2+++/++) | ||
| Method Description |
SGN-CD48A was evaluated in vivo for antitumor activity in a diffuse MM cell line xenograft model in mice. SGN-CD48A was administered at a single dose of 1.00 mg/kg.
|
||||
| In Vivo Model | Multiple myeloma CDX model | ||||
| In Vitro Model | Plasma cell myeloma | U-266 cells | CVCL_0015 | ||
| Experiment 3 Reporting the Activity Date of This ADC | [189] | ||||
| Efficacy Data | Tumor Growth Inhibition value (TGI) |
100.00%
|
Positive SLAMF2 expression (SLAMF2+++/++) | ||
| Method Description |
SGN-CD48A was evaluated in vivo for antitumor activity in a diffuse MM cell line xenograft model in mice. SGN-CD48A was administered at a single dose of 0.30 mg/kg.
|
||||
| In Vivo Model | Multiple myeloma CDX model | ||||
| In Vitro Model | Plasma cell myeloma | NCI-H929 cells | CVCL_1600 | ||
Revealed Based on the Cell Line Data
| Experiment 1 Reporting the Activity Date of This ADC | [189] | ||||
| Efficacy Data | Half Maximal Effective Concentration (EC50) |
1.00-11.00 ng/mL
|
High CD48 expresion (CD48+++/++; 1260 MSLN molecules/cell) | ||
| Method Description |
Cytotoxic activity of SGN-CD48A was demonstrated in a panel of human MM cell lines in vitro.
|
||||
| In Vitro Model | Multiple myeloma | Multiple myeloma cells | Homo sapiens | ||
SGN-CD228A [Phase 1]
Identified from the Human Clinical Data
| Experiment 1 Reporting the Activity Date of This ADC | [178] | ||||
| Related Clinical Trial | |||||
| NCT Number | NCT04042480 | Phase Status | Phase 1 | ||
| Clinical Description |
A phase 1 study of SGN-CD228A in select advanced solid tumors.
|
||||
Discovered Using Patient-derived Xenograft Model
| Experiment 1 Reporting the Activity Date of This ADC | [185] | ||||
| Efficacy Data | Tumor Growth Inhibition value (TGI) |
75.00%
|
Positive CD228 expression (CD228+++/++) | ||
| Method Description |
SGN-CD228A was evaluated for antitumor activity in melanoma and NSCLC xenograft and PDX models.SGN-CD228A was administered at a single dose of 3.00 mg/kg.
|
||||
| In Vivo Model | NSCLC PDX model | ||||
| Experiment 2 Reporting the Activity Date of This ADC | [185] | ||||
| Efficacy Data | Tumor Growth Inhibition value (TGI) |
100.00%
|
Positive CD228 expression (CD228+++/++) | ||
| Method Description |
SGN-CD228A was evaluated for antitumor activity in melanoma and NSCLC xenograft and PDX models.SGN-CD228A was administered at a single dose of 1.00 mg/kg.
|
||||
| In Vivo Model | NSCLC PDX model | ||||
Discovered Using Cell Line-derived Xenograft Model
| Experiment 1 Reporting the Activity Date of This ADC | [185] | ||||
| Efficacy Data | Tumor Growth Inhibition value (TGI) |
50.00%
|
Positive CD228 expression (CD228+++/++) | ||
| Method Description |
SGN-CD228A was evaluated for antitumor activity in melanoma and NSCLC xenograft and PDX models.SGN-CD228A was administered at a single dose of 1.00 mg/kg.
|
||||
| In Vivo Model | Melanoma CDX model | ||||
| In Vitro Model | Cutaneous melanoma | SK-MEL-5 cells | CVCL_0527 | ||
| Experiment 2 Reporting the Activity Date of This ADC | [185] | ||||
| Efficacy Data | Tumor Growth Inhibition value (TGI) |
62.50%
|
Positive CD228 expression (CD228+++/++) | ||
| Method Description |
SGN-CD228A was evaluated for antitumor activity in melanoma and NSCLC xenograft and PDX models.SGN-CD228A was administered at a single dose of 1.00 mg/kg.
|
||||
| In Vivo Model | Melanoma CDX model | ||||
| In Vitro Model | Cutaneous melanoma | COLO 853 cells | CVCL_2003 | ||
| Experiment 3 Reporting the Activity Date of This ADC | [185] | ||||
| Efficacy Data | Tumor Growth Inhibition value (TGI) |
100.00%
|
Positive CD228 expression (CD228+++/++) | ||
| Method Description |
SGN-CD228A was evaluated for antitumor activity in melanoma and NSCLC xenograft and PDX models.SGN-CD228A was administered at a single dose of 1.00 mg/kg.
|
||||
| In Vivo Model | Squamous NSCLC CDX model | ||||
| In Vitro Model | Lung squamous cell carcinoma | Calu-1 cells | CVCL_0608 | ||
SGN-B7H4V [Phase 1]
Identified from the Human Clinical Data
| Experiment 1 Reporting the Activity Date of This ADC | [179] | ||||
| Patients Enrolled |
Locally advanced unresectable or metastatic solid tumors.
|
||||
| Related Clinical Trial | |||||
| NCT Number | NCT05194072 | Phase Status | Phase 1 | ||
| Clinical Description |
A phase 1 study of SGN-B7H4V in advanced solid tumors.
|
||||
Losatuxizumab vedotin [Phase 1]
Identified from the Human Clinical Data
| Experiment 1 Reporting the Activity Date of This ADC | [181] | ||||
| Patients Enrolled |
Patients with advanced solid tumor types typically associated with elevated levels of EGFR expression (e.g., head and neck squamous cell carcinoma [HNC], non-small cell lung cancer [NSCLC], triple-negative breast cancer, colorectal carcinoma, and GBM.
|
||||
| Administration Dosage |
A standard 3+3 design; intravenous (IV) infusion to groups of 3 to 6 patients. An every-3-week dosing cycle (0.30, 0.45, 0.67, 1.00, 1.50, 2.00, or 2.25 mg/kg losatuxizumab vedotin every 3 weeks [Q3W]) or alternative dosing schedules were evaluated (2.00 or 3.00 mg/kg losatuxizumab vedotin for 2 weeks on, 1 week off, or 4.50 or 6.00 mg/kg losatuxizumab vedotin weekly [over 3 weeks total]).
Click to Show/Hide
|
||||
| Related Clinical Trial | |||||
| NCT Number | NCT02365662 | Phase Status | Phase 1 | ||
| Clinical Description |
A phase 1 study of ABBV-221 in subjects with advanced solid tumor types likely to exhibit elevated levels of epidermal growth factor receptor.
|
||||
| Primary Endpoint |
The maximum tolerated dose (MTD) was not achieved.
|
||||
| Other Endpoint |
Stable disease (SD) for at least 2 cycles was observed in 19 patients (42.20%).
|
||||
Discovered Using Patient-derived Xenograft Model
| Experiment 1 Reporting the Activity Date of This ADC | [186] | ||||
| Efficacy Data | Tumor Growth Inhibition value (TGI) |
94.90% (Day 49)
|
High HER2 expression (HER2+++) | ||
| Method Description |
In vivo therapy studies were conducted in mesothelioma xenograft and patient-derived xenograft (PDX) tumor model.ABT-414 treatment 3 mg/kg q4 days.
|
||||
| In Vivo Model | Malignant Mesothelioma PDX model (PDX: MSTO-211H) | ||||
| Experiment 2 Reporting the Activity Date of This ADC | [186] | ||||
| Efficacy Data | Tumor Growth Inhibition value (TGI) |
98.30% (Day 49)
|
High HER2 expression (HER2+++) | ||
| Method Description |
In vivo therapy studies were conducted in mesothelioma xenograft and patient-derived xenograft (PDX) tumor model.ABBV-221 treatment 3 mg/kg q4 days.
|
||||
| In Vivo Model | Malignant Mesothelioma PDX model (PDX: MSTO-211H) | ||||
Discovered Using Cell Line-derived Xenograft Model
| Experiment 1 Reporting the Activity Date of This ADC | [188] | ||||
| Efficacy Data | Tumor Growth Inhibition value (TGI) | ≈ 0.23% (Day 120) | Low EGFR expression (EGFR+) | ||
| Method Description |
To generate xenografts, a suspension of viable tumors cells mixed with an equal amount of Matrigel was injected subcutaneously into the flank of 6- to 8-week old mice. The injection volume was 0.2 mL composed of a 1:1 mixture of S-MEM and Matrigel. Tumors were size matched at approximately 200-250 mm3. Treatments ABBV-221 at 6 mg/kg every 4th day by intraperitoneal injection.
Click to Show/Hide
|
||||
| In Vivo Model | NCI-H292 lung xenograft tumor model | ||||
| In Vitro Model | Lung mucoepidermoid carcinoma | NCI-H292 cells | CVCL_0455 | ||
| Experiment 2 Reporting the Activity Date of This ADC | [188] | ||||
| Efficacy Data | Tumor Growth Inhibition value (TGI) | ≈ 5.45% (Day 95) | Low EGFR expression (EGFR+) | ||
| Method Description |
To generate xenografts, a suspension of viable tumors cells mixed with an equal amount of Matrigel was injected subcutaneously into the flank of 6- to 8-week old mice. The injection volume was 0.2 mL composed of a 1:1 mixture of S-MEM and Matrigel. Tumors were size matched at approximately 200-250 mm3. Treatments ABBV-221 at 3 mg/kg every 4th day by intraperitoneal injection.
Click to Show/Hide
|
||||
| In Vivo Model | NCI-H441 lung xenograft tumor model | ||||
| In Vitro Model | Lung papillary adenocarcinoma | NCI-H441 cells | CVCL_1561 | ||
| Experiment 3 Reporting the Activity Date of This ADC | [188] | ||||
| Efficacy Data | Tumor Growth Inhibition value (TGI) | ≈ 66.60% (Day 113) | High EGFR expression (EGFR+++) | ||
| Method Description |
To generate xenografts, a suspension of viable tumors cells mixed with an equal amount of Matrigel was injected subcutaneously into the flank of 6- to 8-week old mice. The injection volume was 0.2 mL composed of a 1:1 mixture of S-MEM and Matrigel. Tumors were size matched at approximately 200-250 mm3. Treatments ABBV-221 at 4 mg/kg every 4th day by intraperitoneal injection.
Click to Show/Hide
|
||||
| In Vivo Model | EBC1 lung xenograft tumor model | ||||
| In Vitro Model | Lung squamous cell carcinoma | EBC-1 cells | CVCL_2891 | ||
| Experiment 4 Reporting the Activity Date of This ADC | [188] | ||||
| Efficacy Data | Tumor Growth Inhibition value (TGI) | ≈ 100.00% (Day 113) | High EGFR expression (EGFR+++) | ||
| Method Description |
To generate xenografts, a suspension of viable tumors cells mixed with an equal amount of Matrigel was injected subcutaneously into the flank of 6- to 8-week old mice. The injection volume was 0.2 mL composed of a 1:1 mixture of S-MEM and Matrigel. Tumors were size matched at approximately 200-250 mm3. Treatments ABBV-221 at 1 mg/kg every 4th day by intraperitoneal injection.
Click to Show/Hide
|
||||
| In Vivo Model | NCI-H1703 lung xenograft tumor model | ||||
| In Vitro Model | Lung squamous cell carcinoma | NCI-H1703 cells | CVCL_1490 | ||
Revealed Based on the Cell Line Data
| Experiment 1 Reporting the Activity Date of This ADC | [190] | ||||
| Efficacy Data | Tumor Growth Inhibition value (TGI) | ≈ 89.80% (Day 40) | Positive EGFR expression (EGFR+++/++) | ||
| Method Description |
To establish xenografts, 2 x 10⁶ MSTO-211H cells mixed with 75-uL Matrigel were injected subcutaneously in the right flank of 5 to 6-week-old female BALB/c nu/nu miceFor the MSTO-211H study, mice received either ABT-414, ABBV-221 or ADC control (3 mg/kg) every 4 days.
|
||||
| In Vivo Model | MSTO-211H CDX model | ||||
| In Vitro Model | Pleural biphasic mesothelioma | MSTO-211H cells | CVCL_1430 | ||
| Experiment 2 Reporting the Activity Date of This ADC | [188] | ||||
| Efficacy Data | Half Maximal Inhibitory Concentration (IC50) |
0.20 nM
|
Positive EGFR vIII expression (EGFR vIII+++/++) | ||
| Method Description |
Cells were plated at 1,000 to 3,000 cells/well in complete growth medium containing 10% FBS in 96-well plates. The following day medium was removed and replaced with fresh media containing titrations of antibodies or ADCs, and cells were incubated for 72 hours at 37°C in a humidified CO2 incubator. Cell viability was then assessed using an ATPlite luminescence assay.Cell viability was determined following incubation with ABBV-221 for 72 hours.
Click to Show/Hide
|
||||
| In Vitro Model | Glioblastoma | U87MGde2-7 cells (EGFRvIII overexpression) | CVCL_0022 | ||
| Experiment 3 Reporting the Activity Date of This ADC | [188] | ||||
| Efficacy Data | Half Maximal Inhibitory Concentration (IC50) |
1.00 nM
|
High EGFR expression (EGFR+++) | ||
| Method Description |
Cells were plated at 1,000 to 3,000 cells/well in complete growth medium containing 10% FBS in 96-well plates. The following day medium was removed and replaced with fresh media containing titrations of antibodies or ADCs, and cells were incubated for 72 hours at 37°C in a humidified CO2 incubator. Cell viability was then assessed using an ATPlite luminescence assay.Cell viability was determined following incubation with ABBV-221 for 72 hours.
Click to Show/Hide
|
||||
| In Vitro Model | Skin squamous cell carcinoma | A431 cells | CVCL_0037 | ||
| Experiment 4 Reporting the Activity Date of This ADC | [188] | ||||
| Efficacy Data | Half Maximal Inhibitory Concentration (IC50) |
4.00 nM
|
High EGFR expression (EGFR+++) | ||
| Method Description |
Cells were plated at 1,000 to 3,000 cells/well in complete growth medium containing 10% FBS in 96-well plates. The following day medium was removed and replaced with fresh media containing titrations of antibodies or ADCs, and cells were incubated for 72 hours at 37°C in a humidified CO2 incubator. Cell viability was then assessed using an ATPlite luminescence assay.Cell viability was determined following incubation with ABBV-221 for 72 hours.
Click to Show/Hide
|
||||
| In Vitro Model | Lung squamous cell carcinoma | NCI-H1703 cells | CVCL_1490 | ||
| Experiment 5 Reporting the Activity Date of This ADC | [188] | ||||
| Efficacy Data | Half Maximal Inhibitory Concentration (IC50) |
8.00 nM
|
High EGFR expression (EGFR+++) | ||
| Method Description |
Cells were plated at 1,000 to 3,000 cells/well in complete growth medium containing 10% FBS in 96-well plates. The following day medium was removed and replaced with fresh media containing titrations of antibodies or ADCs, and cells were incubated for 72 hours at 37°C in a humidified CO2 incubator. Cell viability was then assessed using an ATPlite luminescence assay.Cell viability was determined following incubation with ABBV-221 for 72 hours.
Click to Show/Hide
|
||||
| In Vitro Model | Lung mucoepidermoid carcinoma | NCI-H292 cells | CVCL_0455 | ||
| Experiment 6 Reporting the Activity Date of This ADC | [188] | ||||
| Efficacy Data | Half Maximal Inhibitory Concentration (IC50) |
8.00 nM
|
High EGFR expression (EGFR+++) | ||
| Method Description |
Cells were plated at 1,000 to 3,000 cells/well in complete growth medium containing 10% FBS in 96-well plates. The following day medium was removed and replaced with fresh media containing titrations of antibodies or ADCs, and cells were incubated for 72 hours at 37°C in a humidified CO2 incubator. Cell viability was then assessed using an ATPlite luminescence assay.Cell viability was determined following incubation with ABBV-221 for 72 hours.
Click to Show/Hide
|
||||
| In Vitro Model | Colon adenocarcinoma | LoVo cells | CVCL_0399 | ||
| Experiment 7 Reporting the Activity Date of This ADC | [188] | ||||
| Efficacy Data | Half Maximal Inhibitory Concentration (IC50) |
11.00 nM
|
High EGFR expression (EGFR+++) | ||
| Method Description |
Cells were plated at 1,000 to 3,000 cells/well in complete growth medium containing 10% FBS in 96-well plates. The following day medium was removed and replaced with fresh media containing titrations of antibodies or ADCs, and cells were incubated for 72 hours at 37°C in a humidified CO2 incubator. Cell viability was then assessed using an ATPlite luminescence assay.Cell viability was determined following incubation with ABBV-221 for 72 hours.
Click to Show/Hide
|
||||
| In Vitro Model | Lung adenocarcinoma | HCC827ER cells | CVCL_V408 | ||
| Experiment 8 Reporting the Activity Date of This ADC | [188] | ||||
| Efficacy Data | Half Maximal Inhibitory Concentration (IC50) |
69.00 nM
|
Moderate EGFR expression (EGFR++) | ||
| Method Description |
Cells were plated at 1,000 to 3,000 cells/well in complete growth medium containing 10% FBS in 96-well plates. The following day medium was removed and replaced with fresh media containing titrations of antibodies or ADCs, and cells were incubated for 72 hours at 37°C in a humidified CO2 incubator. Cell viability was then assessed using an ATPlite luminescence assay.Cell viability was determined following incubation with ABBV-221 for 72 hours.
Click to Show/Hide
|
||||
| In Vitro Model | Lung squamous cell carcinoma | EBC-1 cells | CVCL_2891 | ||
| Experiment 9 Reporting the Activity Date of This ADC | [188] | ||||
| Efficacy Data | Half Maximal Inhibitory Concentration (IC50) |
80.00 nM
|
Moderate EGFR expression (EGFR++) | ||
| Method Description |
Cells were plated at 1,000 to 3,000 cells/well in complete growth medium containing 10% FBS in 96-well plates. The following day medium was removed and replaced with fresh media containing titrations of antibodies or ADCs, and cells were incubated for 72 hours at 37°C in a humidified CO2 incubator. Cell viability was then assessed using an ATPlite luminescence assay.Cell viability was determined following incubation with ABBV-221 for 72 hours.
Click to Show/Hide
|
||||
| In Vitro Model | Lung papillary adenocarcinoma | NCI-H441 cells | CVCL_1561 | ||
| Experiment 10 Reporting the Activity Date of This ADC | [188] | ||||
| Efficacy Data | Half Maximal Inhibitory Concentration (IC50) | > 1000.00 nM | Low EGFR expression (EGFR+) | ||
| Method Description |
Cells were plated at 1,000 to 3,000 cells/well in complete growth medium containing 10% FBS in 96-well plates. The following day medium was removed and replaced with fresh media containing titrations of antibodies or ADCs, and cells were incubated for 72 hours at 37°C in a humidified CO2 incubator. Cell viability was then assessed using an ATPlite luminescence assay.Cell viability was determined following incubation with ABBV-221 for 72 hours.
Click to Show/Hide
|
||||
| In Vitro Model | Colon adenocarcinoma | HCT 15 cells | CVCL_0292 | ||
| Experiment 11 Reporting the Activity Date of This ADC | [188] | ||||
| Efficacy Data | Half Maximal Inhibitory Concentration (IC50) | > 1000.00 nM | Low EGFR expression (EGFR+) | ||
| Method Description |
Cells were plated at 1,000 to 3,000 cells/well in complete growth medium containing 10% FBS in 96-well plates. The following day medium was removed and replaced with fresh media containing titrations of antibodies or ADCs, and cells were incubated for 72 hours at 37°C in a humidified CO2 incubator. Cell viability was then assessed using an ATPlite luminescence assay.Cell viability was determined following incubation with ABBV-221 for 72 hours.
Click to Show/Hide
|
||||
| In Vitro Model | Colon adenocarcinoma | SW620 cells | CVCL_0547 | ||
Brentuximab-8 [Clinical candidate]
Revealed Based on the Cell Line Data
| Experiment 1 Reporting the Activity Date of This ADC | [90] | ||||
| Efficacy Data | Half Maximal Inhibitory Concentration (IC50) |
0.60 pM
|
High CD30 expression (CD30+++) | ||
| Method Description |
The inhibitory activity of Brentuximab-8 against cancer cell growth was evaluated in various human cancer cell lines in vitro.
|
||||
| In Vitro Model | ALK-positive anaplastic large cell lymphoma | Karpas-299 cells | CVCL_1324 | ||
| Experiment 2 Reporting the Activity Date of This ADC | [90] | ||||
| Efficacy Data | Half Maximal Inhibitory Concentration (IC50) |
1.50 pM
|
High CD30 expression (CD30+++) | ||
| Method Description |
The inhibitory activity of Brentuximab-8 against cancer cell growth was evaluated in various human cancer cell lines in vitro.
|
||||
| In Vitro Model | Hodgkin lymphoma | L-540 cells | CVCL_1362 | ||
| Experiment 3 Reporting the Activity Date of This ADC | [90] | ||||
| Efficacy Data | Half Maximal Inhibitory Concentration (IC50) |
4.20 pM
|
High CD30 expression (CD30+++) | ||
| Method Description |
The inhibitory activity of Brentuximab-8 against cancer cell growth was evaluated in various human cancer cell lines in vitro.
|
||||
| In Vitro Model | Anaplastic large cell lymphoma | SU-DHL-1 cells | CVCL_0538 | ||
| Experiment 4 Reporting the Activity Date of This ADC | [90] | ||||
| Efficacy Data | Half Maximal Inhibitory Concentration (IC50) |
5.10 pM
|
High CD30 expression (CD30+++) | ||
| Method Description |
The inhibitory activity of Brentuximab-8 against cancer cell growth was evaluated in various human cancer cell lines in vitro.
|
||||
| In Vitro Model | Adult acute myeloid leukemia | HL-60 cells | CVCL_0002 | ||
Brentuximab-7 [Clinical candidate]
Revealed Based on the Cell Line Data
| Experiment 1 Reporting the Activity Date of This ADC | [90] | ||||
| Efficacy Data | Half Maximal Inhibitory Concentration (IC50) |
1.40 pM
|
High CD30 expression (CD30+++) | ||
| Method Description |
The inhibitory activity of Brentuximab-7 against cancer cell growth was evaluated in various human cancer cell lines in vitro.
|
||||
| In Vitro Model | ALK-positive anaplastic large cell lymphoma | Karpas-299 cells | CVCL_1324 | ||
| Experiment 2 Reporting the Activity Date of This ADC | [90] | ||||
| Efficacy Data | Half Maximal Inhibitory Concentration (IC50) |
6.40 pM
|
High CD30 expression (CD30+++) | ||
| Method Description |
The inhibitory activity of Brentuximab-7 against cancer cell growth was evaluated in various human cancer cell lines in vitro.
|
||||
| In Vitro Model | Hodgkin lymphoma | L-540 cells | CVCL_1362 | ||
| Experiment 3 Reporting the Activity Date of This ADC | [90] | ||||
| Efficacy Data | Half Maximal Inhibitory Concentration (IC50) |
10.20 pM
|
High CD30 expression (CD30+++) | ||
| Method Description |
The inhibitory activity of Brentuximab-7 against cancer cell growth was evaluated in various human cancer cell lines in vitro.
|
||||
| In Vitro Model | Adult acute myeloid leukemia | HL-60 cells | CVCL_0002 | ||
| Experiment 4 Reporting the Activity Date of This ADC | [90] | ||||
| Efficacy Data | Half Maximal Inhibitory Concentration (IC50) |
10.50 pM
|
High CD30 expression (CD30+++) | ||
| Method Description |
The inhibitory activity of Brentuximab-7 against cancer cell growth was evaluated in various human cancer cell lines in vitro.
|
||||
| In Vitro Model | Anaplastic large cell lymphoma | SU-DHL-1 cells | CVCL_0538 | ||
Septuximab vedotin [Clinical candidate]
Revealed Based on the Cell Line Data
| Experiment 1 Reporting the Activity Date of This ADC | [191] | ||||
| Efficacy Data | Half Maximal Inhibitory Concentration (IC50) |
0.03 nM
|
Positive FZD7 expression (FZD7+++/++) | ||
| Method Description |
Cells were seeded in a 96-well plate the day before drug treatment. MA-148, PA-1, and MA-148 FZD7-KO were incubated with the indicated drugs for 3 days.
|
||||
| In Vitro Model | Ovarian serous adenocarcinoma | OVCAR-3 cells (FZD7 overexpression) | CVCL_0465 | ||
| Experiment 2 Reporting the Activity Date of This ADC | [191] | ||||
| Efficacy Data | Half Maximal Inhibitory Concentration (IC50) |
5.00 nM
|
Positive FZD7 expression (FZD7+++/++) | ||
| Method Description |
Cells were seeded in a 96-well plate the day before drug treatment. MA-148, PA-1, and MA-148 FZD7-KO were incubated with the indicated drugs for 3 days.
|
||||
| In Vitro Model | Ovarian cystadenocarcinoma | MA148 cells | CVCL_AK47 | ||
| Experiment 3 Reporting the Activity Date of This ADC | [191] | ||||
| Efficacy Data | Half Maximal Inhibitory Concentration (IC50) |
5.00 nM
|
Positive FZD7 expression (FZD7+++/++) | ||
| Method Description |
Cells were seeded in a 96-well plate the day before drug treatment. MA-148, PA-1, and MA-148 FZD7-KO were incubated with the indicated drugs for 3 days.
|
||||
| In Vitro Model | Ovarian mixed germ cell tumor | PA-1 cells | CVCL_0479 | ||
| Experiment 4 Reporting the Activity Date of This ADC | [191] | ||||
| Efficacy Data | Half Maximal Inhibitory Concentration (IC50) |
25.00 nM
|
Negative FZD7 expression (FZD7-) | ||
| Method Description |
Cells were seeded in a 96-well plate the day before drug treatment. MA-148, PA-1, and MA-148 FZD7-KO were incubated with the indicated drugs for 3 days.
|
||||
| In Vitro Model | Ovarian serous adenocarcinoma | OVCAR-3 cells | CVCL_0465 | ||
| Experiment 5 Reporting the Activity Date of This ADC | [191] | ||||
| Efficacy Data | Half Maximal Inhibitory Concentration (IC50) |
60.00 nM
|
Negative FZD7 expression (FZD7-) | ||
| Method Description |
Cells were seeded in a 96-well plate the day before drug treatment. MA-148, PA-1, and MA-148 FZD7-KO were incubated with the indicated drugs for 3 days.
|
||||
| In Vitro Model | Ovarian cystadenocarcinoma | MA148 cells (FZD7 knock-out) | CVCL_AK47 | ||
lgG1-Mc-Val-Cit-MMAE [Investigative]
Discovered Using Patient-derived Xenograft Model
| Experiment 1 Reporting the Activity Date of This ADC | [192] | ||||
| Efficacy Data | Tumor Growth Inhibition value (TGI) | ≈ 42.13% (Day 21) | Positive MET expression (MET+++/++) | ||
| Method Description |
Inoculate mice with gastric cancer cells at 3 million cells/mouse suspended in HBSS/matrigel, in the thoracic mammary fat pad at a volume of 0.2 ml. When tumors have reached a mean tumor volume of 100-250 mm3, they will be grouped. A single treatment will be administered intravenously (10 mg/kg) via the tail vein on Day 0.
|
||||
| In Vivo Model | Gastric cancer PDX model (PDX: GA0045) | ||||
Discovered Using Cell Line-derived Xenograft Model
| Experiment 1 Reporting the Activity Date of This ADC | [192] | ||||
| Efficacy Data | Tumor Growth Inhibition value (TGI) | ≈ 0.00% (Day 21) | Positive MET expression (MET+++/++) | ||
| Method Description |
Inoculate mice with MKN-45 cells at 3 million cells/mouse suspended in HBSS/matrigel, in the thoracic mammary fat pad at a volume of 0.2 ml. When tumors have reached a mean tumor volume of 100-250 mm3, they will be grouped. A single treatment will be administered intravenously (3 mg/kg) via the tail vein on Day 0.
|
||||
| In Vivo Model | MKN-45 CDX model | ||||
| In Vitro Model | Gastric adenocarcinoma | MKN45 cells | CVCL_0434 | ||
LSR-ADC [Investigative]
Discovered Using Patient-derived Xenograft Model
| Experiment 1 Reporting the Activity Date of This ADC | [193] | ||||
| Efficacy Data | Tumor Growth Inhibition value (TGI) | ≈ 44.53% (Day 70) | High LSR expression (LSR+++; 89,382.9 LSR expression (ABC/cell)) | ||
| Method Description |
The model was Ovx6 PDX,which was generated by implanting human tumor tissues expressing LSR at high levels. When the mean tumor size of each cancer type reached approximately 110 mm3,PBS or LSR-ADC (1 mg/kg) were intravenously injected twice a week,for a total of four times.
|
||||
| In Vivo Model | Ovarian cancer PDX model (PDX: Ovx6) | ||||
| Experiment 2 Reporting the Activity Date of This ADC | [193] | ||||
| Efficacy Data | Tumor Growth Inhibition value (TGI) | ≈ 55.47% (Day 70) | High LSR expression (LSR+++; 89,382.9 LSR expression (ABC/cell)) | ||
| Method Description |
The model was Ovx6 PDX,which was generated by implanting human tumor tissues expressing LSR at high levels. When the mean tumor size of each cancer type reached approximately 110 mm3,PBS or LSR-ADC (3 mg/kg) were intravenously injected twice a week,for a total of four times.
|
||||
| In Vivo Model | Ovarian cancer PDX model (PDX: Ovx6) | ||||
| Experiment 3 Reporting the Activity Date of This ADC | [193] | ||||
| Efficacy Data | Tumor Growth Inhibition value (TGI) | ≈ 67.50% (Day 21) | High LSR expression (LSR+++; 89,382.9 LSR expression (ABC/cell)) | ||
| Method Description |
To assess the efficacy of LSR-ADC against omental/bowel metastasis,OVCAR3-Luc xenograft models were used. The OVCAR3-Luc xenograft models was established by implanting OVCAR3-Luc cells intraperitoneally,into the subscapular areas. Six or seven weeks after the inoculation,the treatment was initiated. PBS and 10 mg/kg of LSR-ADC were intravenously injected twice a week,for a total of four times.
Click to Show/Hide
|
||||
| In Vivo Model | Ovarian high-grade serous carcinoma PDX model (PDX: OVCAR3-LUC) | ||||
| Experiment 4 Reporting the Activity Date of This ADC | [193] | ||||
| Efficacy Data | Tumor Growth Inhibition value (TGI) | ≈ 97.24% (Day 70) | High LSR expression (LSR+++; 86,697.7 LSR expression (ABC/cell)) | ||
| Method Description |
The model was Ovx6 PDX,which was generated by implanting human tumor tissues expressing LSR at high levels. When the mean tumor size of each cancer type reached approximately 110 mm3,PBS or LSR-ADC (10 mg/kg) were intravenously injected twice a week,for a total of four times.
|
||||
| In Vivo Model | Ovarian cancer PDX model (PDX: Ovx6) | ||||
Discovered Using Cell Line-derived Xenograft Model
| Experiment 1 Reporting the Activity Date of This ADC | [193] | ||||
| Efficacy Data | Tumor Growth Inhibition value (TGI) | ≈ 21.41% (Day 28) | High LSR expression (LSR+++) | ||
| Method Description |
The model was established by subcutaneously implanting OVCAR3 cells into CB17/SCID mice. When the mean tumor size of each cancer type reached approximately 110 mm3,PBS or LSR-ADC (1 mg/kg) were intravenously injected twice a week,for a total of four times.
|
||||
| In Vivo Model | Ovarian high-grade serous carcinoma CDX model | ||||
| In Vitro Model | Ovarian serous adenocarcinoma | OVCAR-3 cells | CVCL_0465 | ||
| Experiment 2 Reporting the Activity Date of This ADC | [193] | ||||
| Efficacy Data | Tumor Growth Inhibition value (TGI) | ≈ 46.43% (Day 28) | High LSR expression (LSR+++) | ||
| Method Description |
The model was established by subcutaneously implanting OVCAR3 cells into CB17/SCID mice. When the mean tumor size of each cancer type reached approximately 110 mm3,PBS or LSR-ADC (3 mg/kg) were intravenously injected twice a week,for a total of four times.
|
||||
| In Vivo Model | Ovarian high-grade serous carcinoma CDX model | ||||
| In Vitro Model | Ovarian serous adenocarcinoma | OVCAR-3 cells | CVCL_0465 | ||
| Experiment 3 Reporting the Activity Date of This ADC | [193] | ||||
| Efficacy Data | Tumor Growth Inhibition value (TGI) | ≈ 99.01% (Day 28) | High LSR expression (LSR+++) | ||
| Method Description |
The model was established by subcutaneously implanting OVCAR3 cells into CB17/SCID mice. When the mean tumor size of each cancer type reached approximately 110 mm3,PBS or LSR-ADC (10 mg/kg) were intravenously injected twice a week,for a total of four times.
|
||||
| In Vivo Model | Ovarian high-grade serous carcinoma CDX model | ||||
| In Vitro Model | Ovarian serous adenocarcinoma | OVCAR-3 cells | CVCL_0465 | ||
Revealed Based on the Cell Line Data
| Experiment 1 Reporting the Activity Date of This ADC | [193] | ||||
| Efficacy Data | Half Maximal Inhibitory Concentration (IC50) |
449.00 pM
|
High LSR expression (LSR+++; 89,382.9 LSR expression (ABC/cell)) | ||
| Method Description |
Cytotoxicity assays were performed in the presence of the anti-LSR mAb (#16-6),the mouse IgG2a isotype control antibody,the LSR-ADC or the control-ADC. After 24 h,the cells were incubated with serial dilutions of the agents in triplicate wells for 144 h,at 37°C,in a humidified 5% CO2 atmosphere. Cell viability was determined with the CellTiter-Glo Luminescent Cell Viability Assay Kit.
Click to Show/Hide
|
||||
| In Vitro Model | Ovarian serous adenocarcinoma | OVCAR-3 cells | CVCL_0465 | ||
| Experiment 2 Reporting the Activity Date of This ADC | [193] | ||||
| Efficacy Data | Half Maximal Inhibitory Concentration (IC50) |
0.19 nM
|
High LSR expression (LSR+++; 86,697.7 LSR expression (ABC/cell)) | ||
| Method Description |
Cytotoxicity assays were performed in the presence of the anti-LSR mAb (#16-6),the mouse IgG2a isotype control antibody,the LSR-ADC or the control-ADC. After 24 h,the cells were incubated with serial dilutions of the agents in triplicate wells for 144 h,at 37°C,in a humidified 5% CO2 atmosphere. Cell viability was determined with the CellTiter-Glo Luminescent Cell Viability Assay Kit.
Click to Show/Hide
|
||||
| In Vitro Model | Ovarian serous adenocarcinoma | OVCAR-3 Luc cells | CVCL_0465 | ||
| Experiment 3 Reporting the Activity Date of This ADC | [193] | ||||
| Efficacy Data | Half Maximal Inhibitory Concentration (IC50) |
1.74 nM
|
High LSR expression (LSR+++; 84,008.8 LSR expression (ABC/cell)) | ||
| Method Description |
Cytotoxicity assays were performed in the presence of the anti-LSR mAb (#16-6),the mouse IgG2a isotype control antibody,the LSR-ADC or the control-ADC. After 24 h,the cells were incubated with serial dilutions of the agents in triplicate wells for 144 h,at 37°C,in a humidified 5% CO2 atmosphere. Cell viability was determined with the CellTiter-Glo Luminescent Cell Viability Assay Kit.
Click to Show/Hide
|
||||
| In Vitro Model | Ovarian cancer ascites | NOVC-7C cells | Homo sapiens | ||
| Experiment 4 Reporting the Activity Date of This ADC | [193] | ||||
| Efficacy Data | Half Maximal Inhibitory Concentration (IC50) | > 10.00 uM | Moderate LSR expression (LSR++; 2,631.9 LSR expression (ABC/cell)) | ||
| Method Description |
Cytotoxicity assays were performed in the presence of the anti-LSR mAb (#16-6),the mouse IgG2a isotype control antibody,the LSR-ADC or the control-ADC. After 24 h,the cells were incubated with serial dilutions of the agents in triplicate wells for 144 h,at 37°C,in a humidified 5% CO2 atmosphere. Cell viability was determined with the CellTiter-Glo Luminescent Cell Viability Assay Kit.
Click to Show/Hide
|
||||
| In Vitro Model | Ewing sarcoma | ES2 cells | CVCL_AX39 | ||
AXL-733-MMAE [Investigative]
Discovered Using Patient-derived Xenograft Model
| Experiment 1 Reporting the Activity Date of This ADC | [157] | ||||
| Efficacy Data | Tumor Growth Inhibition value (TGI) | ≈ 57.70% (Day 14) | Positive AXL expression (AXL+++/++) | ||
| Method Description |
The anti-tumor activity of ADCs were determined in the pancreas cancer patient-derived xenograft (PDX) model PAXF1657. Before treatment,mice were divided into groups of 68 mice each,with equal tumor size distribution (average and variance). ADC is administered at a dose of 2.00 mg/kg in a single dose.
|
||||
| In Vivo Model | Pancreatic cancer PDX model (PDX: PAXF1657) | ||||
| Experiment 2 Reporting the Activity Date of This ADC | [157] | ||||
| Efficacy Data | Tumor Growth Inhibition value (TGI) | ≈ 95.30% (Day 14) | Positive AXL expression (AXL+++/++) | ||
| Method Description |
The anti-tumor activity of ADCs were determined in the pancreas cancer patient-derived xenograft (PDX) model PAXF1657. Before treatment,mice were divided into groups of 68 mice each,with equal tumor size distribution (average and variance). ADC is administered at a dose of 4.00 mg/kg in a single dose.
|
||||
| In Vivo Model | Pancreatic cancer PDX model (PDX: PAXF1657) | ||||
Discovered Using Cell Line-derived Xenograft Model
| Experiment 1 Reporting the Activity Date of This ADC | [157] | ||||
| Efficacy Data | Tumor Growth Inhibition value (TGI) | ≈ 28.20% (Day 18) | Positive AXL expression (AXL+++/++) | ||
| Method Description |
In the LCLC-103H xenograft model,therapeutic treatment with a single dose of 1 mg/kg in anti-tumor activity in the AXL-ADC panel.
|
||||
| In Vivo Model | Lung cancer CDX model | ||||
| In Vitro Model | Lung large cell carcinoma | LCLC-103H cells | CVCL_1375 | ||
IMAB362-MC-Val-Cit-PAB-MMAE [Investigative]
Discovered Using Patient-derived Xenograft Model
| Experiment 1 Reporting the Activity Date of This ADC | [194] | ||||
| Efficacy Data | Tumor Growth Inhibition value (TGI) | ≈ 63.30% (Day 67) | Positive CLDN18.2 expression (CLDN18.2 +++/++) | ||
| Method Description |
Conjugates of the exemplary antibodies were tested using an established PDX model of pancreatic cancer cell implanted subcutaneous into SCID mice. Mice were randomized by body weight into treatment groups and treated once post cell inoculation with 5 mg/kg of one of the conjugates listed above or with PBS only.
|
||||
| In Vivo Model | Pancreatic cancer PDX model | ||||
Revealed Based on the Cell Line Data
| Experiment 1 Reporting the Activity Date of This ADC | [194] | ||||
| Efficacy Data | Half Maximal Inhibitory Concentration (IC50) |
501 ng/mL
|
Positive CLDN18.2 expression (CLDN18.2 +++/++) | ||
| Method Description |
Cells were plated at about 500 cells per well in a 96-well plate in 100 uL of media. In vitro activity and targeted delivery of ADCs, the isotype-matched negative controls ADCs, and naked antibodies control were assessed in cells.
|
||||
| In Vitro Model | Gastric tubular adenocarcinoma | NCI-N87 cells | CVCL_1603 | ||
RGCLN18.2-MC-Val-Cit-PAB-MMAE [Investigative]
Discovered Using Patient-derived Xenograft Model
| Experiment 1 Reporting the Activity Date of This ADC | [194] | ||||
| Efficacy Data | Tumor Growth Inhibition value (TGI) | ≈ 70.00% (Day 67) | Positive CLDN18.2 expression (CLDN18.2 +++/++) | ||
| Method Description |
Conjugates of the exemplary antibodies were tested using an established PDX model of pancreatic cancer cell implanted subcutaneous into SCID mice. Mice were randomized by body weight into treatment groups and treated once post cell inoculation with 5 mg/kg of one of the conjugates listed above or with PBS only.
|
||||
| In Vivo Model | Pancreatic cancer PDX model | ||||
Revealed Based on the Cell Line Data
| Experiment 1 Reporting the Activity Date of This ADC | [194] | ||||
| Efficacy Data | Half Maximal Inhibitory Concentration (IC50) |
10.51 ng/mL
|
Positive CLDN18.2 expression (CLDN18.2 +++/++) | ||
| Method Description |
Cells were plated at about 500 cells per well in a 96-well plate in 100 uL of media. In vitro activity and targeted delivery of ADCs, the isotype-matched negative controls ADCs, and naked antibodies control were assessed in cells.
|
||||
| In Vitro Model | Gastric tubular adenocarcinoma | NCI-N87 cells | CVCL_1603 | ||
25A-Val-Cit-MMAE [Investigative]
Discovered Using Patient-derived Xenograft Model
| Experiment 1 Reporting the Activity Date of This ADC | [86] | ||||
| Efficacy Data | Tumor Growth Inhibition value (TGI) |
71.00% (Day 46)
|
Moderate Tissue factor expression (TF++; IHC H-score=155) | ||
| Method Description |
TF-positive patient-derived xenograft (PDX) models were performed in athymic nude mice to evaluate the efficacy of the ADCs in vivo. Study animals were implanted unilaterally on the left flank with tumor fragments. Animals were randomized and treated as indicated in the figures. Animals were removed from study and euthanized once tumor size reached 1,200 mm3 or skin ulceration was evident. In addition, the MTV curve for the treatment group in question was no longer shown once an animal was removed from study due to size TGI and statistical analyses were conducted in the same manner as for the CDX studies. The CR and PR response definitions were as follows for the PDX studies: a PR responder had a MTV 30% of MTV at day 1 for two consecutive measurements; a CR responder had an undetectable MTV for two consecutive measurement IHC analisys: Formalin-fixed paraffin-embedded (FFPE) tissues were sectioned at 4-m thickness and mounted onto positive-charged glass slides The tissue sections were stained with the anti-TF antibody HTF-1 ADC treatment started on day 1 after animals with a tumor size of approximately 190 mm3 The model dosed weekly at 25 mg/kg for 3 weeks.
Click to Show/Hide
|
||||
| In Vivo Model | Patient-derived xenograft (PDX) ovarian carcinomamodel | ||||
| Experiment 2 Reporting the Activity Date of This ADC | [86] | ||||
| Efficacy Data | Tumor Growth Inhibition value (TGI) |
100.00% (Day 60)
|
Positive Tissue factor expression (TF+++/++; 320,000 TF receptor copy number) | ||
| Method Description |
TF-positive patient-derived xenograft (PDX) models were performed in athymic nude mice to evaluate the efficacy of the ADCs in vivo. Study animals were implanted unilaterally on the left flank with tumor fragments. Animals were randomized and treated as indicated in the figures. Animals were removed from study and euthanized once tumor size reached 1,200 mm3 or skin ulceration was evident. In addition, the MTV curve for the treatment group in question was no longer shown once an animal was removed from study due to size TGI and statistical analyses were conducted in the same manner as for the CDX studies. The CR and PR response definitions were as follows for the PDX studies: a PR responder had a MTV 30% of MTV at day 1 for two consecutive measurements; a CR responder had an undetectable MTV for two consecutive measurement IHC analisys: Formalin-fixed paraffin-embedded (FFPE) tissues were sectioned at 4-m thickness and mounted onto positive-charged glass slides The tissue sections were stained with the anti-TF antibody HTF-1 ADC treatment started on day 1 after animals with a tumor size of approximately 210 mm3 The model dosed weekly at 5 mg/kg for 2 weeks.
Click to Show/Hide
|
||||
| In Vivo Model | Patient-derived head and neck carcinoma xenograft (PDX) model | ||||
| Experiment 3 Reporting the Activity Date of This ADC | [86] | ||||
| Efficacy Data | Tumor Growth Inhibition value (TGI) |
100.00% (Day 46)
|
Positive Tissue factor expression (TF+++/++; 320,000 TF receptor copy number) | ||
| Method Description |
TF-positive patient-derived xenograft (PDX) models were performed in athymic nude mice to evaluate the efficacy of the ADCs in vivo. Study animals were implanted unilaterally on the left flank with tumor fragments. Animals were randomized and treated as indicated in the figures. Animals were removed from study and euthanized once tumor size reached 1,200 mm3 or skin ulceration was evident. In addition, the MTV curve for the treatment group in question was no longer shown once an animal was removed from study due to size TGI and statistical analyses were conducted in the same manner as for the CDX studies. The CR and PR response definitions were as follows for the PDX studies: a PR responder had a MTV 30% of MTV at day 1 for two consecutive measurements; a CR responder had an undetectable MTV for two consecutive measurement IHC analisys: Formalin-fixed paraffin-embedded (FFPE) tissues were sectioned at 4-m thickness and mounted onto positive-charged glass slides The tissue sections were stained with the anti-TF antibody HTF-1 ADC treatment started on day 1 after animals with a tumor size of approximately 140 mm3 The model dosed weekly at 4 mg/kg for 3 weeks.
Click to Show/Hide
|
||||
| In Vivo Model | Patient-derived gastric adenocarcinoma xenograft (PDX) model | ||||
Discovered Using Cell Line-derived Xenograft Model
| Experiment 1 Reporting the Activity Date of This ADC | [86] | ||||
| Efficacy Data | Tumor Growth Inhibition value (TGI) |
67.00% (Day 49)
|
Positive Tissue factor expression (TF+++/++; 570,000 TF receptor copy number) | ||
| Method Description |
Cell line-derived xenograft (CDX) models MDA-MB-231 epidermoid carcinoma and the HPAF-II pancreatic carcinoma cell lines were implanted subcutaneously in the flank of athymic nude mice Animals were removed from study and euthanized once tumor size reached 1200 mm3 or skin ulceration was evident ADC was dosed weekly at 2 mg/kg for 2 weeks.
Click to Show/Hide
|
||||
| In Vivo Model | MDA-MB-231 cell line xenograft model | ||||
| In Vitro Model | Breast adenocarcinoma | MDA-MB-231 cells | CVCL_0062 | ||
| Experiment 2 Reporting the Activity Date of This ADC | [86] | ||||
| Efficacy Data | Tumor Growth Inhibition value (TGI) |
98.00% (Day 49)
|
Positive Tissue factor expression (TF+++/++; 570,000 TF receptor copy number) | ||
| Method Description |
Cell line-derived xenograft (CDX) models MDA-MB-231 epidermoid carcinoma and the HPAF-II pancreatic carcinoma cell lines were implanted subcutaneously in the flank of athymic nude mice Animals were removed from study and euthanized once tumor size reached 1200 mm3 or skin ulceration was evident ADC was dosed weekly at 4 mg/kg for 2 weeks.
Click to Show/Hide
|
||||
| In Vivo Model | MDA-MB-231 cell line xenograft model | ||||
| In Vitro Model | Breast adenocarcinoma | MDA-MB-231 cells | CVCL_0062 | ||
| Experiment 3 Reporting the Activity Date of This ADC | [86] | ||||
| Efficacy Data | Tumor Growth Inhibition value (TGI) |
100.00% (Day 59)
|
Low FOLR1 expression (FOLR1+) | ||
| Method Description |
Cell line-derived xenograft (CDX) models The A431 epidermoid carcinoma and the HPAF-II pancreatic carcinoma cell lines were implanted subcutaneously in the flank of athymic nude mice Animals were removed from study and euthanized once tumor size reached 1200 mm3 or skin ulceration was evident ADC was dosed weekly at 5 mg/kg for 3 weeks.
|
||||
| In Vivo Model | HPAF-II xenograft model | ||||
| In Vitro Model | Pancreatic ductal adenocarcinoma | HPAF-II cells | CVCL_0313 | ||
| Experiment 4 Reporting the Activity Date of This ADC | [86] | ||||
| Efficacy Data | Tumor Growth Inhibition value (TGI) |
100.00% (Day 39)
|
Low FOLR1 expression (FOLR1+) | ||
| Method Description |
Cell line-derived xenograft (CDX) models The A431 epidermoid carcinoma and the HPAF-II pancreatic carcinoma cell lines were implanted subcutaneously in the flank of athymic nude mice Animals were removed from study and euthanized once tumor size reached 1200 mm3 or skin ulceration was evident ADC was dosed weekly at 2 mg/kg for 2 weeks.
|
||||
| In Vivo Model | HPAF-II xenograft model | ||||
| In Vitro Model | Pancreatic ductal adenocarcinoma | HPAF-II cells | CVCL_0313 | ||
| Experiment 5 Reporting the Activity Date of This ADC | [86] | ||||
| Efficacy Data | Half Maximal Effective Concentration (EC50) |
26.00 nM
|
Positive Tissue factor expression (TF+++/++; 320,000 TF receptor copy number) | ||
| Method Description |
Antibody-dependent cellular cytotoxicity (ADCC) A431 cells were plated on a microtiter plate The following day, the cells were incubated with a ten-point 1:3 dilution titration of anti-TF antibodies or the ADCs starting at 50 nM An ADCC effector-to-target cell ratio of 8:1 was added to each well and incubated for 6 h at 37°C Luciferase Assay Reagent was added to each well to measure luminescence on an Envision plate reader Antibody-dependent cellular cytotoxicity (ADCC) reporter luminescence was evaluated after a 6-hour incubation of the reporter Jurkat cell line with TF-positive A431 cells and a titration of anti-TF antibody or ADC The ADCC reporter luminescence EC50 values for each anti-TF antibody or ADC are listed.
Click to Show/Hide
|
||||
| In Vitro Model | Breast adenocarcinoma | MDA-MB-231 cells | CVCL_0062 | ||
Revealed Based on the Cell Line Data
| Experiment 1 Reporting the Activity Date of This ADC | [86] | ||||
| Efficacy Data | Half Maximal Inhibitory Concentration (IC50) |
6.00 nM
|
High Tissue factor expression (TF+++; IHC H-score=250) | ||
| Method Description |
To evaluate ADC cytotoxicity, cells were plated in 384-well plates Anti-TF antibodies conjugated to MC-vc-PAB-MMAE were serially diluted as shown Plates were incubated for 3 days, followed by lysis in CTG assay reagent For each ADC, the IC50 and its associated 95% confidence interval (95% CI) were calculated Titrations of the TF-specific ADCs were added to HPAF-II cells, with a 72-hour incubationThis treatment resulted in efficacious cell killing.
Click to Show/Hide
|
||||
| In Vitro Model | Pancreatic ductal adenocarcinoma | HPAF-II cells | CVCL_0313 | ||
| Experiment 2 Reporting the Activity Date of This ADC | [86] | ||||
| Efficacy Data | Half Maximal Inhibitory Concentration (IC50) |
14.00 nM
|
Positive Tissue factor expression (TF+++/++; 570,000 TF receptor copy number) | ||
| Method Description |
To evaluate ADC cytotoxicity, cells were plated in 384-well plates Anti-TF antibodies conjugated to MC-vc-PAB-MMAE were serially diluted as shown Plates were incubated for 3 days, followed by lysis in CTG assay reagent For each ADC, the IC50 and its associated 95% confidence interval (95% CI) were calculated Titrations of the TF-specific ADCs were added to 5-day old cultures of MDA-MB-231 cells, with a 72-hour incubationThis treatment resulted in efficacious cell killing.
Click to Show/Hide
|
||||
| In Vitro Model | Breast adenocarcinoma | MDA-MB-231 cells | CVCL_0062 | ||
| Experiment 3 Reporting the Activity Date of This ADC | [86] | ||||
| Efficacy Data | Half Maximal Inhibitory Concentration (IC50) |
18.00 nM
|
High Tissue factor expression (TF+++; IHC H-score=250) | ||
| Method Description |
A431 cells were pre-incubated for 30 min without or with 50 nM of FVIIa prior to the addition of an anti-TF ADC (25A-vc-MMAE) titration After a 4 h incubation at 37°C, the FVIIa and ADC were washed out and the cells were cultured for another 68 h before cell viability assessment.
|
||||
| In Vitro Model | Skin squamous cell carcinoma | A431 cells | CVCL_0037 | ||
| Experiment 4 Reporting the Activity Date of This ADC | [95] | ||||
| Efficacy Data | Half Maximal Effective Concentration (EC50) |
14.00 nM
|
Positive Tissue factor expression (TF+++/++; 380,000 TF receptor copy number) | ||
| Method Description |
To evaluate ADC cytotoxicity, cells were plated in 384-well plates Anti-TF antibodies conjugated to MC-vc-PAB-MMAE were serially diluted as shown Plates were incubated for 3 days, followed by lysis in CTG assay reagent For each ADC, the IC50 and its associated 95% confidence interval (95% CI) were calculated Titrations of the TF-specific ADCs were added to A431 cells, with a 72-hour incubationThis treatment resulted in efficacious cell killing.
Click to Show/Hide
|
||||
| In Vitro Model | Skin squamous cell carcinoma | A431 cells | CVCL_0037 | ||
| Experiment 5 Reporting the Activity Date of This ADC | [95] | ||||
| Efficacy Data | Half Maximal Effective Concentration (EC50) |
14.00 nM
|
Positive Tissue factor expression (TF+++/++; 320,000 TF receptor copy number) | ||
| Method Description |
To evaluate ADC cytotoxicity, cells were plated in 384-well plates Anti-TF antibodies conjugated to MC-vc-PAB-MMAE were serially diluted as shown Plates were incubated for 3 days, followed by lysis in CTG assay reagent For each ADC, the IC50 and its associated 95% confidence interval (95% CI) were calculated Titrations of the TF-specific ADCs were added to A431 cells, with a 4-hour incubation followed by removal of excess ADC and culture for another 68 hours This treatment resulted in efficacious cell killing.
Click to Show/Hide
|
||||
| In Vitro Model | Skin squamous cell carcinoma | A431 cells | CVCL_0037 | ||
AXL-148-MMAE [Investigative]
Discovered Using Patient-derived Xenograft Model
| Experiment 1 Reporting the Activity Date of This ADC | [157] | ||||
| Efficacy Data | Tumor Growth Inhibition value (TGI) | ≈ 73.30% (Day 14) | Positive AXL expression (AXL+++/++) | ||
| Method Description |
The anti-tumor activity of ADCs were determined in the pancreas cancer patient-derived xenograft (PDX) model PAXF1657. Before treatment,mice were divided into groups of 68 mice each,with equal tumor size distribution (average and variance). ADC is administered at a dose of 2.00 mg/kg in a single dose.
|
||||
| In Vivo Model | Pancreatic cancer PDX model (PDX: PAXF1657) | ||||
| Experiment 2 Reporting the Activity Date of This ADC | [157] | ||||
| Efficacy Data | Tumor Growth Inhibition value (TGI) | ≈ 97.20% (Day 14) | Positive AXL expression (AXL+++/++) | ||
| Method Description |
The anti-tumor activity of ADCs were determined in the pancreas cancer patient-derived xenograft (PDX) model PAXF1657. Before treatment,mice were divided into groups of 68 mice each,with equal tumor size distribution (average and variance). ADC is administered at a dose of 4.00 mg/kg in a single dose.
|
||||
| In Vivo Model | Pancreatic cancer PDX model (PDX: PAXF1657) | ||||
Discovered Using Cell Line-derived Xenograft Model
| Experiment 1 Reporting the Activity Date of This ADC | [157] | ||||
| Efficacy Data | Tumor Growth Inhibition value (TGI) | ≈ 88.10% (Day 18) | Positive AXL expression (AXL+++/++) | ||
| Method Description |
In the LCLC-103H xenograft model,therapeutic treatment with a single dose of 1 mg/kg in anti-tumor activity in the AXL-ADC panel.
|
||||
| In Vivo Model | Lung cancer CDX model | ||||
| In Vitro Model | Lung large cell carcinoma | LCLC-103H cells | CVCL_1375 | ||
43Ea-Val-Cit-MMAE [Investigative]
Discovered Using Patient-derived Xenograft Model
| Experiment 1 Reporting the Activity Date of This ADC | [86] | ||||
| Efficacy Data | Tumor Growth Inhibition value (TGI) |
74.00% (Day 46)
|
Positive Tissue factor expression (TF+++/++; 570,000 TF receptor copy number) | ||
| Method Description |
TF-positive patient-derived xenograft (PDX) models were performed in athymic nude mice to evaluate the efficacy of the ADCs in vivo. Study animals were implanted unilaterally on the left flank with tumor fragments. Animals were randomized and treated as indicated in the figures. Animals were removed from study and euthanized once tumor size reached 1,200 mm3 or skin ulceration was evident. In addition, the MTV curve for the treatment group in question was no longer shown once an animal was removed from study due to size TGI and statistical analyses were conducted in the same manner as for the CDX studies. The CR and PR response definitions were as follows for the PDX studies: a PR responder had a MTV 30% of MTV at day 1 for two consecutive measurements; a CR responder had an undetectable MTV for two consecutive measurement IHC analisys: Formalin-fixed paraffin-embedded (FFPE) tissues were sectioned at 4-m thickness and mounted onto positive-charged glass slides The tissue sections were stained with the anti-TF antibody HTF-1 ADC treatment started on day 1 after animals with a tumor size of approximately 190 mm3 The model dosed weekly at 25 mg/kg for 3 weeks.
Click to Show/Hide
|
||||
| In Vivo Model | Patient-derived xenograft (PDX) ovarian carcinomamodel | ||||
| Experiment 2 Reporting the Activity Date of This ADC | [86] | ||||
| Efficacy Data | Tumor Growth Inhibition value (TGI) |
100.00% (Day 60)
|
Low FOLR1 expression (FOLR1+) | ||
| Method Description |
TF-positive patient-derived xenograft (PDX) models were performed in athymic nude mice to evaluate the efficacy of the ADCs in vivo. Study animals were implanted unilaterally on the left flank with tumor fragments. Animals were randomized and treated as indicated in the figures. Animals were removed from study and euthanized once tumor size reached 1,200 mm3 or skin ulceration was evident. In addition, the MTV curve for the treatment group in question was no longer shown once an animal was removed from study due to size TGI and statistical analyses were conducted in the same manner as for the CDX studies. The CR and PR response definitions were as follows for the PDX studies: a PR responder had a MTV 30% of MTV at day 1 for two consecutive measurements; a CR responder had an undetectable MTV for two consecutive measurement IHC analisys: Formalin-fixed paraffin-embedded (FFPE) tissues were sectioned at 4-m thickness and mounted onto positive-charged glass slides The tissue sections were stained with the anti-TF antibody HTF-1 ADC treatment started on day 1 after animals with a tumor size of approximately 210 mm3 The model dosed weekly at 5 mg/kg for 2 weeks.
Click to Show/Hide
|
||||
| In Vivo Model | Patient-derived xenograft (PDX) head and neck carcinoma model | ||||
Discovered Using Cell Line-derived Xenograft Model
| Experiment 1 Reporting the Activity Date of This ADC | [86] | ||||
| Efficacy Data | Tumor Growth Inhibition value (TGI) |
48.00% (Day 49)
|
Low FOLR1 expression (FOLR1+) | ||
| Method Description |
Cell line-derived xenograft (CDX) models MDA-MB-231 epidermoid carcinoma and the HPAF-II pancreatic carcinoma cell lines were implanted subcutaneously in the flank of athymic nude mice Animals were removed from study and euthanized once tumor size reached 1200 mm3 or skin ulceration was evident ADC was dosed weekly at 2 mg/kg for 2 weeks.
Click to Show/Hide
|
||||
| In Vivo Model | MDA-MB-231 cell line xenograft model | ||||
| In Vitro Model | Breast adenocarcinoma | MDA-MB-231 cells | CVCL_0062 | ||
| Experiment 2 Reporting the Activity Date of This ADC | [86] | ||||
| Efficacy Data | Tumor Growth Inhibition value (TGI) |
95.00% (Day 49)
|
Low FOLR1 expression (FOLR1+) | ||
| Method Description |
Cell line-derived xenograft (CDX) models MDA-MB-231 epidermoid carcinoma and the HPAF-II pancreatic carcinoma cell lines were implanted subcutaneously in the flank of athymic nude mice Animals were removed from study and euthanized once tumor size reached 1200 mm3 or skin ulceration was evident ADC was dosed weekly at 4 mg/kg for 2 weeks.
Click to Show/Hide
|
||||
| In Vivo Model | MDA-MB-231 cell line xenograft model | ||||
| In Vitro Model | Breast adenocarcinoma | MDA-MB-231 cells | CVCL_0062 | ||
| Experiment 3 Reporting the Activity Date of This ADC | [86] | ||||
| Efficacy Data | Tumor Growth Inhibition value (TGI) |
100.00% (Day 59)
|
|||
| Method Description |
Cell line-derived xenograft (CDX) models The A431 epidermoid carcinoma and the HPAF-II pancreatic carcinoma cell lines were implanted subcutaneously in the flank of athymic nude mice Animals were removed from study and euthanized once tumor size reached 1200 mm3 or skin ulceration was evident ADC was dosed weekly at 5 mg/kg for 3 weeks.
|
||||
| In Vivo Model | HPAF-II xenograft model | ||||
| In Vitro Model | Pancreatic ductal adenocarcinoma | HPAF-II cells | CVCL_0313 | ||
| Experiment 4 Reporting the Activity Date of This ADC | [86] | ||||
| Efficacy Data | Tumor Growth Inhibition value (TGI) |
100.00% (Day 39)
|
|||
| Method Description |
Cell line-derived xenograft (CDX) models The A431 epidermoid carcinoma and the HPAF-II pancreatic carcinoma cell lines were implanted subcutaneously in the flank of athymic nude mice Animals were removed from study and euthanized once tumor size reached 1200 mm3 or skin ulceration was evident ADC was dosed weekly at 2 mg/kg for 2 weeks.
|
||||
| In Vivo Model | HPAF-II xenograft model | ||||
| In Vitro Model | Pancreatic ductal adenocarcinoma | HPAF-II cells | CVCL_0313 | ||
| Experiment 5 Reporting the Activity Date of This ADC | [86] | ||||
| Efficacy Data | Half Maximal Effective Concentration (EC50) |
43.00 nM
|
Positive Tissue factor expression (TF+++/++; 320,000 TF receptor copy number) | ||
| Method Description |
Antibody-dependent cellular cytotoxicity (ADCC) A431 cells were plated on a microtiter plate The following day, the cells were incubated with a ten-point 1:3 dilution titration of anti-TF antibodies or the ADCs starting at 50 nM An ADCC effector-to-target cell ratio of 8:1 was added to each well and incubated for 6 h at 37°C Luciferase Assay Reagent was added to each well to measure luminescence on an Envision plate reader Antibody-dependent cellular cytotoxicity (ADCC) reporter luminescence was evaluated after a 6-hour incubation of the reporter Jurkat cell line with TF-positive A431 cells and a titration of anti-TF antibody or ADC The ADCC reporter luminescence EC50 values for each anti-TF antibody or ADC are listed.
Click to Show/Hide
|
||||
| In Vitro Model | Breast adenocarcinoma | MDA-MB-231 cells | CVCL_0062 | ||
Revealed Based on the Cell Line Data
| Experiment 1 Reporting the Activity Date of This ADC | [86] | ||||
| Efficacy Data | Half Maximal Inhibitory Concentration (IC50) |
6.00 nM
|
Positive Tissue factor expression (TF+++/++; 570,000 TF receptor copy number) | ||
| Method Description |
To evaluate ADC cytotoxicity, cells were plated in 384-well plates Anti-TF antibodies conjugated to MC-vc-PAB-MMAE were serially diluted as shown Plates were incubated for 3 days, followed by lysis in CTG assay reagent For each ADC, the IC50 and its associated 95% confidence interval (95% CI) were calculated Titrations of the TF-specific ADCs were added to HPAF-II cells, with a 72-hour incubationThis treatment resulted in efficacious cell killing.
Click to Show/Hide
|
||||
| In Vitro Model | Pancreatic ductal adenocarcinoma | HPAF-II cells | CVCL_0313 | ||
| Experiment 2 Reporting the Activity Date of This ADC | [86] | ||||
| Efficacy Data | Half Maximal Inhibitory Concentration (IC50) |
15.00 nM
|
Positive Tissue factor expression (TF+++/++; 320,000 TF receptor copy number) | ||
| Method Description |
To evaluate ADC cytotoxicity, cells were plated in 384-well plates Anti-TF antibodies conjugated to MC-vc-PAB-MMAE were serially diluted as shown Plates were incubated for 3 days, followed by lysis in CTG assay reagent For each ADC, the IC50 and its associated 95% confidence interval (95% CI) were calculated Titrations of the TF-specific ADCs were added to 5-day old cultures of MDA-MB-231 cells, with a 72-hour incubationThis treatment resulted in efficacious cell killing.
Click to Show/Hide
|
||||
| In Vitro Model | Breast adenocarcinoma | MDA-MB-231 cells | CVCL_0062 | ||
| Experiment 3 Reporting the Activity Date of This ADC | [95] | ||||
| Efficacy Data | Half Maximal Effective Concentration (EC50) |
14.00 nM
|
Positive Tissue factor expression (TF+++/++; 320,000 TF receptor copy number) | ||
| Method Description |
A431 cells were pre-incubated for 30 min without or with 50 nM of FVIIa prior to the addition of an anti-TF ADC (43Ea-vc-MMAE) titration After a 4 h incubation at 37°C, the FVIIa and ADC were washed out and the cells were cultured for another 68 h before cell viability assessment.
|
||||
| In Vitro Model | Skin squamous cell carcinoma | A431 cells | CVCL_0037 | ||
| Experiment 4 Reporting the Activity Date of This ADC | [95] | ||||
| Efficacy Data | Half Maximal Effective Concentration (EC50) |
14.00 nM
|
Positive Tissue factor expression (TF+++/++; 320,000 TF receptor copy number) | ||
| Method Description |
To evaluate ADC cytotoxicity, cells were plated in 384-well plates Anti-TF antibodies conjugated to MC-vc-PAB-MMAE were serially diluted as shown Plates were incubated for 3 days, followed by lysis in CTG assay reagent For each ADC, the IC50 and its associated 95% confidence interval (95% CI) were calculated Titrations of the TF-specific ADCs were added to A431 cells, with a 72-hour incubationThis treatment resulted in efficacious cell killing.
Click to Show/Hide
|
||||
| In Vitro Model | Skin squamous cell carcinoma | A431 cells | CVCL_0037 | ||
| Experiment 5 Reporting the Activity Date of This ADC | [95] | ||||
| Efficacy Data | Half Maximal Effective Concentration (EC50) |
14.00 nM
|
Positive Tissue factor expression (TF+++/++; 570,000 TF receptor copy number) | ||
| Method Description |
To evaluate ADC cytotoxicity, cells were plated in 384-well plates Anti-TF antibodies conjugated to MC-vc-PAB-MMAE were serially diluted as shown Plates were incubated for 3 days, followed by lysis in CTG assay reagent For each ADC, the IC50 and its associated 95% confidence interval (95% CI) were calculated Titrations of the TF-specific ADCs were added to A431 cells, with a 4-hour incubation followed by removal of excess ADC and culture for another 68 hours This treatment resulted in efficacious cell killing.
Click to Show/Hide
|
||||
| In Vitro Model | Skin squamous cell carcinoma | A431 cells | CVCL_0037 | ||
AAJ8D6-Mc-Val-Cit-MMAE [Investigative]
Discovered Using Patient-derived Xenograft Model
| Experiment 1 Reporting the Activity Date of This ADC | [192] | ||||
| Efficacy Data | Tumor Growth Inhibition value (TGI) | ≈ 85.49% (Day 21) | Positive MET expression (MET+++/++) | ||
| Method Description |
Inoculate mice with gastric cancer cells at 3 million cells/mouse suspended in HBSS/matrigel, in the thoracic mammary fat pad at a volume of 0.2 ml. When tumors have reached a mean tumor volume of 100-250 mm3, they will be grouped. A single treatment will be administered intravenously (1.1 mg/kg) via the tail vein on Day 0.
|
||||
| In Vivo Model | Gastric cancer PDX model (PDX: LU2535) | ||||
| Experiment 2 Reporting the Activity Date of This ADC | [192] | ||||
| Efficacy Data | Tumor Growth Inhibition value (TGI) | ≈ 100.00% (Day 21) | Positive MET expression (MET+++/++) | ||
| Method Description |
Inoculate mice with gastric cancer cells at 3 million cells/mouse suspended in HBSS/matrigel, in the thoracic mammary fat pad at a volume of 0.2 ml. When tumors have reached a mean tumor volume of 100-250 mm3, they will be grouped. A single treatment will be administered intravenously (10 mg/kg) via the tail vein on Day 0.
|
||||
| In Vivo Model | Gastric cancer PDX model (PDX: GA0045) | ||||
| Experiment 3 Reporting the Activity Date of This ADC | [192] | ||||
| Efficacy Data | Tumor Growth Inhibition value (TGI) | ≈ 100.00% (Day 21) | Positive MET expression (MET+++/++) | ||
| Method Description |
Inoculate mice with gastric cancer cells at 3 million cells/mouse suspended in HBSS/matrigel, in the thoracic mammary fat pad at a volume of 0.2 ml. When tumors have reached a mean tumor volume of 100-250 mm3, they will be grouped. A single treatment will be administered intravenously (3.3 mg/kg) via the tail vein on Day 0.
|
||||
| In Vivo Model | Gastric cancer PDX model (PDX: LU2535) | ||||
| Experiment 4 Reporting the Activity Date of This ADC | [192] | ||||
| Efficacy Data | Tumor Growth Inhibition value (TGI) | ≈ 100.00% (Day 21) | Positive MET expression (MET+++/++) | ||
| Method Description |
Inoculate mice with gastric cancer cells at 3 million cells/mouse suspended in HBSS/matrigel, in the thoracic mammary fat pad at a volume of 0.2 ml. When tumors have reached a mean tumor volume of 100-250 mm3, they will be grouped. A single treatment will be administered intravenously (10 mg/kg) via the tail vein on Day 0.
|
||||
| In Vivo Model | Gastric cancer PDX model (PDX: LU2535) | ||||
Discovered Using Cell Line-derived Xenograft Model
| Experiment 1 Reporting the Activity Date of This ADC | [192] | ||||
| Efficacy Data | Tumor Growth Inhibition value (TGI) | ≈ 22.00% (Day 21) | Positive MET expression (MET+++/++) | ||
| Method Description |
Inoculate mice with MKN-45 cells at 3 million cells/mouse suspended in HBSS/matrigel, in the thoracic mammary fat pad at a volume of 0.2 ml. When tumors have reached a mean tumor volume of 100-250 mm3, they will be grouped. A single treatment will be administered intravenously (0.75 mg/kg) via the tail vein on Day 0.
|
||||
| In Vivo Model | MKN-45 CDX model | ||||
| In Vitro Model | Gastric adenocarcinoma | MKN45 cells | CVCL_0434 | ||
| Experiment 2 Reporting the Activity Date of This ADC | [192] | ||||
| Efficacy Data | Tumor Growth Inhibition value (TGI) | ≈ 70.00% (Day 21) | Positive MET expression (MET+++/++) | ||
| Method Description |
Inoculate mice with MKN-45 cells at 3 million cells/mouse suspended in HBSS/matrigel, in the thoracic mammary fat pad at a volume of 0.2 ml. When tumors have reached a mean tumor volume of 100-250 mm3, they will be grouped. A single treatment will be administered intravenously (1.5 mg/kg) via the tail vein on Day 0.
|
||||
| In Vivo Model | MKN-45 CDX model | ||||
| In Vitro Model | Gastric adenocarcinoma | MKN45 cells | CVCL_0434 | ||
| Experiment 3 Reporting the Activity Date of This ADC | [192] | ||||
| Efficacy Data | Tumor Growth Inhibition value (TGI) | ≈ 99.00% (Day 21) | Positive MET expression (MET+++/++) | ||
| Method Description |
Inoculate mice with MKN-45 cells at 3 million cells/mouse suspended in HBSS/matrigel, in the thoracic mammary fat pad at a volume of 0.2 ml. When tumors have reached a mean tumor volume of 100-250 mm3, they will be grouped. A single treatment will be administered intravenously (3 mg/kg) via the tail vein on Day 0.
|
||||
| In Vivo Model | MKN-45 CDX model | ||||
| In Vitro Model | Gastric adenocarcinoma | MKN45 cells | CVCL_0434 | ||
GPC1-ADC-MMAE [Investigative]
Discovered Using Patient-derived Xenograft Model
| Experiment 1 Reporting the Activity Date of This ADC | [195] | ||||
| Efficacy Data | Tumor Growth Inhibition value (TGI) | ≈ 88.80% (Day 35) | High GPC1 expression (GPC1+++) | ||
| In Vivo Model | Pancreatic cancer PDX model (PDX: PK645) | ||||
| Experiment 2 Reporting the Activity Date of This ADC | [195] | ||||
| Efficacy Data | Tumor Growth Inhibition value (TGI) | ≈ 98.70% (Day 28) | High GPC1 expression (GPC1+++) | ||
| In Vivo Model | Pancreatic cancer PDX model (PDX: PK565) | ||||
Revealed Based on the Cell Line Data
| Experiment 1 Reporting the Activity Date of This ADC | [195] | ||||
| Efficacy Data | Half Maximal Inhibitory Concentration (IC50) |
80.90 pM
|
High GPC1 expression (GPC1+++) | ||
| Method Description |
GPC1-ADC(MMAE) induces efficient tumor cell killing in cells PDX models from a Pancreatic ductal adenocarcinoma (PDAC) patient with GPC1 expression.
|
||||
| In Vitro Model | Pancreatic carcinoma | KP-2 cells | CVCL_3004 | ||
| Experiment 2 Reporting the Activity Date of This ADC | [195] | ||||
| Efficacy Data | Half Maximal Inhibitory Concentration (IC50) |
0.55 nM
|
High GPC1 expression (GPC1+++) | ||
| Method Description |
GPC1-ADC(MMAE) induces efficient tumor cell killing in cells PDX models from a Pancreatic ductal adenocarcinoma (PDAC) patient with GPC1 expression.
|
||||
| In Vitro Model | Pancreatic ductal adenocarcinoma | PK-8 cells | CVCL_4718 | ||
| Experiment 3 Reporting the Activity Date of This ADC | [195] | ||||
| Efficacy Data | Half Maximal Inhibitory Concentration (IC50) |
0.68 nM
|
High GPC1 expression (GPC1+++) | ||
| Method Description |
GPC1-ADC(MMAE) induces efficient tumor cell killing in cells PDX models from a Pancreatic ductal adenocarcinoma (PDAC) patient with GPC1 expression.
|
||||
| In Vitro Model | Pancreatic ductal adenocarcinoma | BxPC-3 cells | CVCL_0186 | ||
10D7-MMAE [Investigative]
Discovered Using Patient-derived Xenograft Model
| Experiment 1 Reporting the Activity Date of This ADC | [196] | ||||
| Efficacy Data | Tumor Growth Inhibition value (TGI) | ≈ 100.00% (Day 24) | Positive CDCP1 expression (CDCP1 +++/++) | ||
| Method Description |
Mice were randomized into groups of six and administered a single intravenous treatment of 10D7 MMAE (5 mg/kg), 10D7 (5 mg/kg), MMAE (0.17 mg/kg; equivalent to a four molar excess of the 10D7-MMAE dose) or vehicle.
|
||||
| In Vivo Model | Ovarian cancer PDX model (PDX: PH250) | ||||
PODO447-ADC [Investigative]
Discovered Using Patient-derived Xenograft Model
| Experiment 1 Reporting the Activity Date of This ADC | [197] | ||||
| Efficacy Data | Tumor Growth Inhibition value (TGI) | ≈ 100.00% (Day 56) | High PODXL expression (PODXL+++) | ||
| Method Description |
MIA PaCa-2 (1x10⁶) or OV3331 (1x10⁶) cells were injected subcutaneously into the right flank of NSG or nude mice. Tumor dimensions were measured twice a week and tumor volumes (cm3) were calculated by. Once tumors reached 0.15cm3, mice were treated with either PODO447- or palivizumab-Vedotin at concentrations ranging from 4 2 mg/kg. ADC treatments were administered intravenously every 4 days.
Click to Show/Hide
|
||||
| In Vivo Model | Pancreas cancer PDX model (PDX: MIA PaCa-2) | ||||
EGFR ADC-22 [Investigative]
Discovered Using Cell Line-derived Xenograft Model
| Experiment 1 Reporting the Activity Date of This ADC | [198] | ||||
| Efficacy Data | Tumor Growth Inhibition value (TGI) | ≈ 0.00% (Day 40) | Negative EGFR expression (EGFR -) | ||
| Method Description |
After acclimatization for one week, healthy mice were subcutaneously implanted with 5 x 10⁶ NCI-H2228 cells. Fourteen days after implantation the mice were divided into three groups (n = 8 each): 21, 22 and PBS as control. All the groups received four doses of 20 mg/kg on days 0, 4, 8 and 12, injected intravenously.
|
||||
| In Vivo Model | NCI-H2228 CDX model | ||||
| In Vitro Model | Lung adenocarcinoma | NCI-H2228 cells | CVCL_1543 | ||
| Experiment 2 Reporting the Activity Date of This ADC | [198] | ||||
| Efficacy Data | Tumor Growth Inhibition value (TGI) | ≈ 98.65% (Day 40) | Positive EGFR expression (EGFR +++/++) | ||
| Method Description |
After acclimatization for one week, healthy mice were subcutaneously implanted with 5 x 10⁶ HCC827 cells. Fourteen days after implantation the mice were divided into three groups (n = 8 each): 21, 22 and PBS as control. All the groups received four doses of 20 mg/kg on days 0, 4, 8 and 12, injected intravenously.
|
||||
| In Vivo Model | HCC827 CDX model | ||||
| In Vitro Model | Lung adenocarcinoma | HCC827 cells | CVCL_2063 | ||
Revealed Based on the Cell Line Data
| Experiment 1 Reporting the Activity Date of This ADC | [198] | ||||
| Efficacy Data | Half Maximal Inhibitory Concentration (IC50) |
0.50 nM±0.10 nM
|
Positive EGFR expression (EGFR +++/++) | ||
| Method Description |
ADCs 21-23 was performed on HCC827 and NCI-H2228 cells. cells (5 x 10³ cells/well) were cultured in 96-well plates with 100 uL complete medium, and 24 h later the cells were treated in triplicate with varying concentrations of ADCs for 72 h.
|
||||
| In Vitro Model | Lung adenocarcinoma | HCC827 cells | CVCL_2063 | ||
| Experiment 2 Reporting the Activity Date of This ADC | [198] | ||||
| Efficacy Data | Half Maximal Inhibitory Concentration (IC50) | > 500 nM | Negative EGFR expression (EGFR -) | ||
| Method Description |
ADCs 21-23 was performed on HCC827 and NCI-H2228 cells. cells (5 x 10³ cells/well) were cultured in 96-well plates with 100 uL complete medium, and 24 h later the cells were treated in triplicate with varying concentrations of ADCs for 72 h.
|
||||
| In Vitro Model | Lung adenocarcinoma | NCI-H2228 cells | CVCL_1543 | ||
EGFR ADC-21 [Investigative]
Discovered Using Cell Line-derived Xenograft Model
| Experiment 1 Reporting the Activity Date of This ADC | [198] | ||||
| Efficacy Data | Tumor Growth Inhibition value (TGI) | ≈ 0.00% (Day 40) | Negative EGFR expression (EGFR -) | ||
| Method Description |
After acclimatization for one week, healthy mice were subcutaneously implanted with 5 x 10⁶ NCI-H2228 cells. Fourteen days after implantation the mice were divided into three groups (n = 8 each): 21, 22 and PBS as control. All the groups received four doses of 20 mg/kg on days 0, 4, 8 and 12, injected intravenously.
|
||||
| In Vivo Model | NCI-H2228 CDX model | ||||
| In Vitro Model | Lung adenocarcinoma | NCI-H2228 cells | CVCL_1543 | ||
| Experiment 2 Reporting the Activity Date of This ADC | [198] | ||||
| Efficacy Data | Tumor Growth Inhibition value (TGI) | ≈ 98.65% (Day 40) | Positive EGFR expression (EGFR +++/++) | ||
| Method Description |
After acclimatization for one week, healthy mice were subcutaneously implanted with 5 x 10⁶ HCC827 cells. Fourteen days after implantation the mice were divided into three groups (n = 8 each): 21, 22 and PBS as control. All the groups received four doses of 20 mg/kg on days 0, 4, 8 and 12, injected intravenously.
|
||||
| In Vivo Model | HCC827 CDX model | ||||
| In Vitro Model | Lung adenocarcinoma | HCC827 cells | CVCL_2063 | ||
Revealed Based on the Cell Line Data
| Experiment 1 Reporting the Activity Date of This ADC | [198] | ||||
| Efficacy Data | Half Maximal Inhibitory Concentration (IC50) |
0.50 nM±0.10 nM
|
Positive EGFR expression (EGFR +++/++) | ||
| Method Description |
ADCs 21-23 was performed on HCC827 and NCI-H2228 cells. cells (5 x 10³ cells/well) were cultured in 96-well plates with 100 uL complete medium, and 24 h later the cells were treated in triplicate with varying concentrations of ADCs for 72 h.
|
||||
| In Vitro Model | Lung adenocarcinoma | HCC827 cells | CVCL_2063 | ||
| Experiment 2 Reporting the Activity Date of This ADC | [198] | ||||
| Efficacy Data | Half Maximal Inhibitory Concentration (IC50) | > 500 nM | Negative EGFR expression (EGFR -) | ||
| Method Description |
ADCs 21-23 was performed on HCC827 and NCI-H2228 cells. cells (5 x 10³ cells/well) were cultured in 96-well plates with 100 uL complete medium, and 24 h later the cells were treated in triplicate with varying concentrations of ADCs for 72 h.
|
||||
| In Vitro Model | Lung adenocarcinoma | NCI-H2228 cells | CVCL_1543 | ||
WO2007011968A2 c1F6-9a [Investigative]
Discovered Using Cell Line-derived Xenograft Model
| Experiment 1 Reporting the Activity Date of This ADC | [199] | ||||
| Efficacy Data | Tumor Growth Inhibition value (TGI) | ≈ 0.00% (Day 27) | Positive CD30 expression (CD30+++/++); Negative CD70 expression (CD70-) | ||
| Method Description |
An in vivo therapy experiments with c1F6-9a was undertaken in nude mice with subcutaneous Karpas 299 ALCL tumors. The animals (5 per group)were treated with a single intravenous dose of c1F6-9a at 3 mg/kg (mAb component) on day 14.
|
||||
| In Vivo Model | Karpas-299 CDX model | ||||
| In Vitro Model | ALK-positive anaplastic large cell lymphoma | Karpas-299 cells | CVCL_1324 | ||
Revealed Based on the Cell Line Data
| Experiment 1 Reporting the Activity Date of This ADC | [199] | ||||
| Efficacy Data | Half Maximal Inhibitory Concentration (IC50) |
0.45 nM
|
Positive CD70 expression (CD70+++/++); Negative CD30 expression (CD30-) | ||
| Method Description |
Cell-based in vitro assays are used to measure viability (proliferation), cytotoxicity,and induction of apoptosis of the ADC of the invention. Culturing the cells for a period from about 6 hours to about 5 days and measuring cell viability.
|
||||
| In Vitro Model | Clear cell renal cell carcinoma | Caki-1 cells | CVCL_0234 | ||
| Experiment 2 Reporting the Activity Date of This ADC | [199] | ||||
| Efficacy Data | Half Maximal Inhibitory Concentration (IC50) | > 30.00 nM | Positive CD30 expression (CD30+++/++); Negative CD70 expression (CD70-) | ||
| Method Description |
Cell-based in vitro assays are used to measure viability (proliferation), cytotoxicity,and induction of apoptosis of the ADC of the invention. Culturing the cells for a period from about 6 hours to about 5 days and measuring cell viability.
|
||||
| In Vitro Model | ALK-positive anaplastic large cell lymphoma | Karpas-299 cells | CVCL_1324 | ||
| Experiment 3 Reporting the Activity Date of This ADC | [199] | ||||
| Efficacy Data | Half Maximal Inhibitory Concentration (IC50) | > 50.00 nM | Positive CD70 expression (CD70+++/++); Negative CD30 expression (CD30-) | ||
| Method Description |
Cell-based in vitro assays are used to measure viability (proliferation), cytotoxicity,and induction of apoptosis of the ADC of the invention. Culturing the cells for a period from about 6 hours to about 5 days and measuring cell viability.
|
||||
| In Vitro Model | Renal cell carcinoma | 786-O cells | CVCL_1051 | ||
MYK-3 [Investigative]
Discovered Using Cell Line-derived Xenograft Model
| Experiment 1 Reporting the Activity Date of This ADC | [200] | ||||
| Efficacy Data | Tumor Growth Inhibition value (TGI) | ≈ 0.00% (Day 35) | Moderate EGFR expression (EGFR ++) | ||
| Method Description |
Conjugates of the exemplary antibodies were tested using an established xenograft model implanted subcutaneous into SCID mice. Mice were randomized by body weight into treatment groups and treated once post cell inoculation with 0.3 mg/kg, i.v., q4d*4 of one of the conjugates listed above or with PBS only.
|
||||
| In Vivo Model | LoVo CDX model | ||||
| In Vitro Model | Colon adenocarcinoma | LoVo cells | CVCL_0399 | ||
| Experiment 2 Reporting the Activity Date of This ADC | [200] | ||||
| Efficacy Data | Tumor Growth Inhibition value (TGI) | ≈ 46.00% (Day 18) | Positive EGFR expression (EGFR +++/++) | ||
| Method Description |
Conjugates of the exemplary antibodies were tested using an established xenograft model implanted subcutaneous into SCID mice. Mice were randomized by body weight into treatment groups and treated once post cell inoculation with 1 mg/kg, i.v., q4d*4 of one of the conjugates listed above or with PBS only.
|
||||
| In Vivo Model | HT-29 CDX model | ||||
| In Vitro Model | Colon cancer | HT29 cells | CVCL_A8EZ | ||
| Experiment 3 Reporting the Activity Date of This ADC | [200] | ||||
| Efficacy Data | Tumor Growth Inhibition value (TGI) | ≈ 54.00% (Day 18) | Positive EGFR expression (EGFR +++/++) | ||
| Method Description |
Conjugates of the exemplary antibodies were tested using an established xenograft model implanted subcutaneous into SCID mice. Mice were randomized by body weight into treatment groups and treated once post cell inoculation with 5 mg/kg, i.v., q4d*4 of one of the conjugates listed above or with PBS only.
|
||||
| In Vivo Model | HT-29 CDX model | ||||
| In Vitro Model | Colon cancer | HT29 cells | CVCL_A8EZ | ||
| Experiment 4 Reporting the Activity Date of This ADC | [200] | ||||
| Efficacy Data | Tumor Growth Inhibition value (TGI) | ≈ 72.70% (Day 35) | Moderate EGFR expression (EGFR ++) | ||
| Method Description |
Conjugates of the exemplary antibodies were tested using an established xenograft model implanted subcutaneous into SCID mice. Mice were randomized by body weight into treatment groups and treated once post cell inoculation with 1 mg/kg, i.v., q4d*4 of one of the conjugates listed above or with PBS only.
|
||||
| In Vivo Model | LoVo CDX model | ||||
| In Vitro Model | Colon adenocarcinoma | LoVo cells | CVCL_0399 | ||
| Experiment 5 Reporting the Activity Date of This ADC | [200] | ||||
| Efficacy Data | Tumor Growth Inhibition value (TGI) | ≈ 88.60% (Day 35) | Moderate EGFR expression (EGFR ++) | ||
| Method Description |
Conjugates of the exemplary antibodies were tested using an established xenograft model implanted subcutaneous into SCID mice. Mice were randomized by body weight into treatment groups and treated once post cell inoculation with 3 mg/kg, i.v., q4d*4 of one of the conjugates listed above or with PBS only.
|
||||
| In Vivo Model | LoVo CDX model | ||||
| In Vitro Model | Colon adenocarcinoma | LoVo cells | CVCL_0399 | ||
Revealed Based on the Cell Line Data
| Experiment 1 Reporting the Activity Date of This ADC | [200] | ||||
| Efficacy Data | Half Maximal Effective Concentration (EC50) |
5.10 ng/mL
|
Positive EGFR expression (EGFR +++/++) | ||
| Method Description |
Cells were plated at about 500 cells per well in a 96-well plate in 100 uL of media. In vitro activity and targeted delivery of ADCs, the isotype-matched negative controls ADCs, and naked antibodies control were assessed in cells.
|
||||
| In Vitro Model | Colorectal carcinoma | DiFi cells | CVCL_6895 | ||
| Experiment 2 Reporting the Activity Date of This ADC | [200] | ||||
| Efficacy Data | Half Maximal Effective Concentration (EC50) |
9.80 ng/mL
|
Positive EGFR expression (EGFR +++/++) | ||
| Method Description |
Cells were plated at about 500 cells per well in a 96-well plate in 100 uL of media. In vitro activity and targeted delivery of ADCs, the isotype-matched negative controls ADCs, and naked antibodies control were assessed in cells.
|
||||
| In Vitro Model | Colorectal carcinoma | DiFi cells | CVCL_6895 | ||
| Experiment 3 Reporting the Activity Date of This ADC | [200] | ||||
| Efficacy Data | Half Maximal Effective Concentration (EC50) |
611.00 ng/mL
|
Positive EGFR expression (EGFR +++/++) | ||
| Method Description |
Cells were plated at about 500 cells per well in a 96-well plate in 100 uL of media. In vitro activity and targeted delivery of ADCs, the isotype-matched negative controls ADCs, and naked antibodies control were assessed in cells.
|
||||
| In Vitro Model | Colon cancer | HT29 cells | CVCL_A8EZ | ||
| Experiment 4 Reporting the Activity Date of This ADC | [200] | ||||
| Efficacy Data | Half Maximal Effective Concentration (EC50) |
3.20 ug/mL
|
Moderate EGFR expression (EGFR ++) | ||
| Method Description |
Cells were plated at about 500 cells per well in a 96-well plate in 100 uL of media. In vitro activity and targeted delivery of ADCs, the isotype-matched negative controls ADCs, and naked antibodies control were assessed in cells.
|
||||
| In Vitro Model | Colon adenocarcinoma | LoVo cells | CVCL_0399 | ||
| Experiment 5 Reporting the Activity Date of This ADC | [200] | ||||
| Efficacy Data | Half Maximal Effective Concentration (EC50) |
5.30 ug/mL
|
Positive EGFR expression (EGFR +++/++) | ||
| Method Description |
Cells were plated at about 500 cells per well in a 96-well plate in 100 uL of media. In vitro activity and targeted delivery of ADCs, the isotype-matched negative controls ADCs, and naked antibodies control were assessed in cells.
|
||||
| In Vitro Model | Glioblastoma | U-87MG cells | CVCL_0022 | ||
| Experiment 6 Reporting the Activity Date of This ADC | [200] | ||||
| Efficacy Data | Half Maximal Effective Concentration (EC50) |
28.30 ug/mL
|
Positive EGFR expression (EGFR +++/++) | ||
| Method Description |
Cells were plated at about 500 cells per well in a 96-well plate in 100 uL of media. In vitro activity and targeted delivery of ADCs, the isotype-matched negative controls ADCs, and naked antibodies control were assessed in cells.
|
||||
| In Vitro Model | Lung adenocarcinoma | A-549 cells | CVCL_0023 | ||
chmAb-D B7-H3-ADC [Investigative]
Discovered Using Cell Line-derived Xenograft Model
| Experiment 1 Reporting the Activity Date of This ADC | [201] | ||||
| Efficacy Data | Tumor Growth Inhibition value (TGI) | ≈ 0.00% (Day 70) | Moderate CD276 expression (CD276 ++) | ||
| Method Description |
The results of this study with respect to mammary fat pad implanted PA-1 ovarian cancer cells, and show responsiveness against the PA-1 tumor cells. The dose was 1 mg/kg on day 30.
|
||||
| In Vivo Model | PA-1 CDX model | ||||
| In Vitro Model | Ovarian mixed germ cell tumor | PA-1 cells | CVCL_0479 | ||
| Experiment 2 Reporting the Activity Date of This ADC | [201] | ||||
| Efficacy Data | Tumor Growth Inhibition value (TGI) | ≈ 18.98% (Day 49) | Moderate CD276 expression (CD276 ++) | ||
| Method Description |
The results of this study with respect to mammary fat pad implanted A375.52 melanoma cells, and show responsiveness against the A375.52 tumor cells. The dose was 1 mg/kg on day 30.
|
||||
| In Vivo Model | A375.52 CDX model | ||||
| In Vitro Model | Amelanotic melanoma | A375.S2 cells | CVCL_0136 | ||
| Experiment 3 Reporting the Activity Date of This ADC | [201] | ||||
| Efficacy Data | Tumor Growth Inhibition value (TGI) | ≈ 26.28% (Day 91) | Moderate CD276 expression (CD276 ++) | ||
| Method Description |
The results of this study with respect to mammary fat pad implanted NCI-H1703 non-small cell lung cancer cells, and show responsiveness against the NCI-H1703 tumor cells. The dose was 1 mg/kg on day 30.
|
||||
| In Vivo Model | NCI-H1703 CDX model | ||||
| In Vitro Model | Lung squamous cell carcinoma | NCI-H1703 cells | CVCL_1490 | ||
| Experiment 4 Reporting the Activity Date of This ADC | [201] | ||||
| Efficacy Data | Tumor Growth Inhibition value (TGI) | ≈ 41.70% (Day 70) | Moderate CD276 expression (CD276 ++) | ||
| Method Description |
The results of this study with respect to mammary fat pad implanted PA-1 ovarian cancer cells, and show responsiveness against the PA-1 tumor cells. The dose was 3 mg/kg on day 30.
|
||||
| In Vivo Model | PA-1 CDX model | ||||
| In Vitro Model | Ovarian mixed germ cell tumor | PA-1 cells | CVCL_0479 | ||
| Experiment 5 Reporting the Activity Date of This ADC | [201] | ||||
| Efficacy Data | Tumor Growth Inhibition value (TGI) | ≈ 44.30% (Day 43) | Moderate CD276 expression (CD276 ++) | ||
| Method Description |
The results of this study with respect to mammary fat pad implanted Calu-6 lung cancer cells, and show responsiveness against the Calu-6 tumor cells. The dose was 1 mg/kg on day 30.
|
||||
| In Vivo Model | Calu-6 CDX model | ||||
| In Vitro Model | Lung adenocarcinoma | Calu-6 cells | CVCL_0236 | ||
| Experiment 6 Reporting the Activity Date of This ADC | [201] | ||||
| Efficacy Data | Tumor Growth Inhibition value (TGI) | ≈ 56.51% (Day 43) | Moderate CD276 expression (CD276 ++) | ||
| Method Description |
The results of this study with respect to mammary fat pad implanted Calu-6 lung cancer cells, and show responsiveness against the Calu-6 tumor cells. The dose was 3 mg/kg on day 30.
|
||||
| In Vivo Model | Calu-6 CDX model | ||||
| In Vitro Model | Lung adenocarcinoma | Calu-6 cells | CVCL_0236 | ||
| Experiment 7 Reporting the Activity Date of This ADC | [201] | ||||
| Efficacy Data | Tumor Growth Inhibition value (TGI) | ≈ 59.57% (Day 70) | Moderate CD276 expression (CD276 ++) | ||
| Method Description |
The results of this study with respect to mammary fat pad implanted Calu-6 lung cancer cells, and show responsiveness against the Calu-6 tumor cells. The dose was 10 mg/kg on day 30.
|
||||
| In Vivo Model | Calu-6 CDX model | ||||
| In Vitro Model | Lung adenocarcinoma | Calu-6 cells | CVCL_0236 | ||
| Experiment 8 Reporting the Activity Date of This ADC | [201] | ||||
| Efficacy Data | Tumor Growth Inhibition value (TGI) | ≈ 69.92% (Day 49) | Moderate CD276 expression (CD276 ++) | ||
| Method Description |
The results of this study with respect to mammary fat pad implanted A375.52 melanoma cells, and show responsiveness against the A375.52 tumor cells. The dose was 10 mg/kg on day 30.
|
||||
| In Vivo Model | A375.52 CDX model | ||||
| In Vitro Model | Amelanotic melanoma | A375.S2 cells | CVCL_0136 | ||
| Experiment 9 Reporting the Activity Date of This ADC | [201] | ||||
| Efficacy Data | Tumor Growth Inhibition value (TGI) | ≈ 86.81% (Day 70) | Moderate CD276 expression (CD276 ++) | ||
| Method Description |
The results of this study with respect to mammary fat pad implanted PA-1 ovarian cancer cells, and show responsiveness against the PA-1 tumor cells. The dose was 10 mg/kg on day 30.
|
||||
| In Vivo Model | PA-1 CDX model | ||||
| In Vitro Model | Ovarian mixed germ cell tumor | PA-1 cells | CVCL_0479 | ||
| Experiment 10 Reporting the Activity Date of This ADC | [201] | ||||
| Efficacy Data | Tumor Growth Inhibition value (TGI) | ≈ 91.92% (Day 49) | Moderate CD276 expression (CD276 ++) | ||
| Method Description |
The results of this study with respect to mammary fat pad implanted A375.52 melanoma cells, and show responsiveness against the A375.52 tumor cells. The dose was 3 mg/kg on day 30.
|
||||
| In Vivo Model | A375.52 CDX model | ||||
| In Vitro Model | Amelanotic melanoma | A375.S2 cells | CVCL_0136 | ||
| Experiment 11 Reporting the Activity Date of This ADC | [201] | ||||
| Efficacy Data | Tumor Growth Inhibition value (TGI) | ≈ 93.77% (Day 91) | Moderate CD276 expression (CD276 ++) | ||
| Method Description |
The results of this study with respect to mammary fat pad implanted NCI-H1703 non-small cell lung cancer cells, and show responsiveness against the NCI-H1703 tumor cells. The dose was 3 mg/kg on day 30.
|
||||
| In Vivo Model | NCI-H1703 CDX model | ||||
| In Vitro Model | Lung squamous cell carcinoma | NCI-H1703 cells | CVCL_1490 | ||
| Experiment 12 Reporting the Activity Date of This ADC | [201] | ||||
| Efficacy Data | Tumor Growth Inhibition value (TGI) | ≈ 95.10% (Day 77) | Moderate CD276 expression (CD276 ++) | ||
| Method Description |
The results of this study with respect to mammary fat pad implanted MDAMB-468 breast cancer tumor cells, and show responsiveness against the MDA-MB-468 tumor cells. The dose was 10 mg/kg on day 30.
|
||||
| In Vivo Model | MDA-MB-468 CDX model | ||||
| In Vitro Model | Breast adenocarcinoma | MDA-MB-468 cells | CVCL_0419 | ||
| Experiment 13 Reporting the Activity Date of This ADC | [201] | ||||
| Efficacy Data | Tumor Growth Inhibition value (TGI) | ≈ 98.25% (Day 91) | Moderate CD276 expression (CD276 ++) | ||
| Method Description |
The results of this study with respect to mammary fat pad implanted NCI-H1703 non-small cell lung cancer cells, and show responsiveness against the NCI-H1703 tumor cells. The dose was 10 mg/kg on day 30.
|
||||
| In Vivo Model | NCI-H1703 CDX model | ||||
| In Vitro Model | Lung squamous cell carcinoma | NCI-H1703 cells | CVCL_1490 | ||
Revealed Based on the Cell Line Data
| Experiment 1 Reporting the Activity Date of This ADC | [201] | ||||
| Efficacy Data | Half Maximal Inhibitory Concentration (IC50) |
0.16 nM
|
Moderate CD276 expression (CD276 ++) | ||
| Method Description |
Briefly, B7-H3-ADCs and controls are diluted and plated intomicrotiter plates, 5000 cells are added to each well and incubated at 37°C for 4-7 daysAlamar Blue Reagent is added to the plates andread according to the manufacturer's protocol. The number of antibody binding sites presenton these cells was determined using a Bangs QFACSTM Kit.
|
||||
| In Vitro Model | Lung adenocarcinoma | NCI-H1975 cells | CVCL_1511 | ||
| Experiment 2 Reporting the Activity Date of This ADC | [201] | ||||
| Efficacy Data | Half Maximal Inhibitory Concentration (IC50) |
0.17 nM
|
Moderate CD276 expression (CD276 ++) | ||
| Method Description |
Briefly, B7-H3-ADCs and controls are diluted and plated intomicrotiter plates, 5000 cells are added to each well and incubated at 37°C for 4-7 daysAlamar Blue Reagent is added to the plates andread according to the manufacturer's protocol. The number of antibody binding sites presenton these cells was determined using a Bangs QFACSTM Kit.
|
||||
| In Vitro Model | Lung adenocarcinoma | Calu-6 cells | CVCL_0236 | ||
| Experiment 3 Reporting the Activity Date of This ADC | [201] | ||||
| Efficacy Data | Half Maximal Inhibitory Concentration (IC50) |
0.22 nM
|
Moderate CD276 expression (CD276 ++) | ||
| Method Description |
Briefly, B7-H3-ADCs and controls are diluted and plated intomicrotiter plates, 5000 cells are added to each well and incubated at 37°C for 4-7 daysAlamar Blue Reagent is added to the plates andread according to the manufacturer's protocol. The number of antibody binding sites presenton these cells was determined using a Bangs QFACSTM Kit.
|
||||
| In Vitro Model | Lung squamous cell carcinoma | NCI-H1703 cells | CVCL_1490 | ||
| Experiment 4 Reporting the Activity Date of This ADC | [201] | ||||
| Efficacy Data | Half Maximal Inhibitory Concentration (IC50) |
0.30 nM
|
High CD276 expression (CD276 +++) | ||
| Method Description |
Briefly, B7-H3-ADCs and controls are diluted and plated intomicrotiter plates, 5000 cells are added to each well and incubated at 37°C for 4-7 daysAlamar Blue Reagent is added to the plates andread according to the manufacturer's protocol. The number of antibody binding sites presenton these cells was determined using a Bangs QFACSTM Kit.
|
||||
| In Vitro Model | Neoplasm | Hs 700T cells | CVCL_0858 | ||
| Experiment 5 Reporting the Activity Date of This ADC | [201] | ||||
| Efficacy Data | Half Maximal Inhibitory Concentration (IC50) |
0.74 nM
|
High CD276 expression (CD276 +++) | ||
| Method Description |
Briefly, B7-H3-ADCs and controls are diluted and plated intomicrotiter plates, 5000 cells are added to each well and incubated at 37°C for 4-7 daysAlamar Blue Reagent is added to the plates andread according to the manufacturer's protocol. The number of antibody binding sites presenton these cells was determined using a Bangs QFACSTM Kit.
|
||||
| In Vitro Model | Breast ductal carcinoma | JIMT-1 cells | CVCL_2077 | ||
| Experiment 6 Reporting the Activity Date of This ADC | [201] | ||||
| Efficacy Data | Half Maximal Inhibitory Concentration (IC50) |
0.89 nM
|
Moderate CD276 expression (CD276 ++) | ||
| Method Description |
Briefly, B7-H3-ADCs and controls are diluted and plated intomicrotiter plates, 5000 cells are added to each well and incubated at 37°C for 4-7 daysAlamar Blue Reagent is added to the plates andread according to the manufacturer's protocol. The number of antibody binding sites presenton these cells was determined using a Bangs QFACSTM Kit.
|
||||
| In Vitro Model | Amelanotic melanoma | A375.S2 cells | CVCL_0136 | ||
| Experiment 7 Reporting the Activity Date of This ADC | [201] | ||||
| Efficacy Data | Half Maximal Inhibitory Concentration (IC50) |
1.38 nM
|
Moderate CD276 expression (CD276 ++) | ||
| Method Description |
Briefly, B7-H3-ADCs and controls are diluted and plated intomicrotiter plates, 5000 cells are added to each well and incubated at 37°C for 4-7 daysAlamar Blue Reagent is added to the plates andread according to the manufacturer's protocol. The number of antibody binding sites presenton these cells was determined using a Bangs QFACSTM Kit.
|
||||
| In Vitro Model | Breast adenocarcinoma | MDA-MB-468 cells | CVCL_0419 | ||
| Experiment 8 Reporting the Activity Date of This ADC | [201] | ||||
| Efficacy Data | Half Maximal Inhibitory Concentration (IC50) |
1.80 nM
|
Moderate CD276 expression (CD276 ++) | ||
| Method Description |
Briefly, B7-H3-ADCs and controls are diluted and plated intomicrotiter plates, 5000 cells are added to each well and incubated at 37°C for 4-7 daysAlamar Blue Reagent is added to the plates andread according to the manufacturer's protocol. The number of antibody binding sites presenton these cells was determined using a Bangs QFACSTM Kit.
|
||||
| In Vitro Model | Ovarian mixed germ cell tumor | PA-1 cells | CVCL_0479 | ||
| Experiment 9 Reporting the Activity Date of This ADC | [201] | ||||
| Efficacy Data | Half Maximal Inhibitory Concentration (IC50) |
2.59 nM
|
Low CD276 expression (CD276 +) | ||
| Method Description |
Briefly, B7-H3-ADCs and controls are diluted and plated intomicrotiter plates, 5000 cells are added to each well and incubated at 37°C for 4-7 daysAlamar Blue Reagent is added to the plates andread according to the manufacturer's protocol. The number of antibody binding sites presenton these cells was determined using a Bangs QFACSTM Kit.
|
||||
| In Vitro Model | Prostate carcinoma | DU145 cells | CVCL_0105 | ||
| Experiment 10 Reporting the Activity Date of This ADC | [201] | ||||
| Efficacy Data | Half Maximal Inhibitory Concentration (IC50) | > 100 nM | Negative CD276 expression (CD276 -) | ||
| Method Description |
Briefly, B7-H3-ADCs and controls are diluted and plated intomicrotiter plates, 5000 cells are added to each well and incubated at 37°C for 4-7 daysAlamar Blue Reagent is added to the plates andread according to the manufacturer's protocol. The number of antibody binding sites presenton these cells was determined using a Bangs QFACSTM Kit.
|
||||
| In Vitro Model | EBV-related Burkitt lymphoma | Raji cells | CVCL_0511 | ||
HuM25-vcMMAE-E2 [Investigative]
Discovered Using Cell Line-derived Xenograft Model
| Experiment 1 Reporting the Activity Date of This ADC | [202] | ||||
| Efficacy Data | Tumor Growth Inhibition value (TGI) |
0.00% (Day 28)
|
Moderate LRRC15 expression (LRRC15++; IHC 2+) | ||
| Method Description |
LRRC15 expression on stromal cells asassessed by IHC in an untreated xenograft tumor of 200-800 mm in volume, representative for eachxenograft model. In vivo activity of huM25-VCMMAE-E2 (12 mg/kg) was demonstrated in MC-38 xenografts.
|
||||
| In Vivo Model | MC-38 CDX model | ||||
| In Vitro Model | Mouse colon adenocarcinoma | MC-38 cells | CVCL_B288 | ||
| Experiment 2 Reporting the Activity Date of This ADC | [202] | ||||
| Efficacy Data | Tumor Growth Inhibition value (TGI) |
59.41% (Day 38)
|
High LRRC15 expression (LRRC15+++; IHC 3+) | ||
| Method Description |
LRRC15 expression on stromal cells asassessed by IHC in an untreated xenograft tumor of 200-800 mm in volume, representative for eachxenograft model. In vivo activity of huM25-VCMMAE-E2 (6 mg/kg) was demonstrated in HPAF-II xenografts.
|
||||
| In Vivo Model | HPAF-II CDX model | ||||
| In Vitro Model | Pancreatic ductal adenocarcinoma | HPAF-II cells | CVCL_0313 | ||
| Experiment 3 Reporting the Activity Date of This ADC | [202] | ||||
| Efficacy Data | Tumor Growth Inhibition value (TGI) |
64.94% (Day 23)
|
High LRRC15 expression (LRRC15+++; IHC 3+) | ||
| Method Description |
LRRC15 expression on stromal cells asassessed by IHC in an untreated xenograft tumor of 200-800 mm in volume, representative for eachxenograft model. In vivo activity of huM25-VCMMAE-E2 (12 mg/kg) was demonstrated in SCC-15 xenografts.
|
||||
| In Vivo Model | SCC-15 CDX model | ||||
| In Vitro Model | Squamous carcinoma | SCC-15 cells | CVCL_1681 | ||
| Experiment 4 Reporting the Activity Date of This ADC | [202] | ||||
| Efficacy Data | Tumor Growth Inhibition value (TGI) |
71.99% (Day 11)
|
High LRRC15 expression (LRRC15+++; IHC 3+) | ||
| Method Description |
LRRC15 expression on stromal cells asassessed by IHC in an untreated xenograft tumor of 200-800 mm in volume, representative for eachxenograft model. In vivo activity of huM25-VCMMAE-E2 (6 mg/kg) was demonstrated in EBC-1 xenografts.
|
||||
| In Vivo Model | EBC-1 CDX model | ||||
| In Vitro Model | Lung squamous cell carcinoma | EBC-1 cells | CVCL_2891 | ||
| Experiment 5 Reporting the Activity Date of This ADC | [202] | ||||
| Efficacy Data | Tumor Growth Inhibition value (TGI) |
80.57% (Day 28)
|
Moderate LRRC15 expression (LRRC15++; IHC 2+) | ||
| Method Description |
LRRC15 expression on stromal cells asassessed by IHC in an untreated xenograft tumor of 200-800 mm in volume, representative for eachxenograft model. In vivo activity of huM25-VCMMAE-E2 (12 mg/kg) plus anti-PD1 mAb (2 mg/kg) were demonstrated in MC-38 xenografts.
|
||||
| In Vivo Model | MC-38 CDX model | ||||
| In Vitro Model | Mouse colon adenocarcinoma | MC-38 cells | CVCL_B288 | ||
| Experiment 6 Reporting the Activity Date of This ADC | [202] | ||||
| Efficacy Data | Tumor Growth Inhibition value (TGI) |
87.45% (Day 78)
|
High LRRC15 expression (LRRC15+++; IHC 3+) | ||
| Method Description |
LRRC15 expression on stromal cells asassessed by IHC in an untreated xenograft tumor of 200-800 mm in volume, representative for eachxenograft model. In vivo activity of huM25-VCMMAE-E2 (12 mg/kg) was demonstrated in NW-231 xenografts.
|
||||
| In Vivo Model | PANC-1 CDX model | ||||
| In Vitro Model | Pancreatic ductal adenocarcinoma | PANC-1 cells | CVCL_0480 | ||
| Experiment 7 Reporting the Activity Date of This ADC | [202] | ||||
| Efficacy Data | Tumor Growth Inhibition value (TGI) |
88.36 % (Day 26)
|
High LRRC15 expression (LRRC15+++; IHC 3+) | ||
| Method Description |
LRRC15 expression on stromal cells asassessed by IHC in an untreated xenograft tumor of 200-800 mm in volume, representative for eachxenograft model. In vivo activity of huM25-VCMMAE-E2 (4.5 mg/kg) was demonstrated in HN-5 xenografts.
|
||||
| In Vivo Model | HPAF-II CDX model | ||||
| In Vitro Model | Pancreatic ductal adenocarcinoma | HPAF-II cells | CVCL_0313 | ||
| Experiment 8 Reporting the Activity Date of This ADC | [202] | ||||
| Efficacy Data | Tumor Growth Inhibition value (TGI) |
88.55% (Day 23)
|
High LRRC15 expression (LRRC15+++; IHC 3+) | ||
| Method Description |
LRRC15 expression on stromal cells asassessed by IHC in an untreated xenograft tumor of 200-800 mm in volume, representative for eachxenograft model. In vivo activity of huM25-VCMMAE-E2 (12 mg/kg) plus Carboplatin (50 mg/kg) were demonstrated in SCC-15 xenografts.
|
||||
| In Vivo Model | SCC-15 CDX model | ||||
| In Vitro Model | Squamous carcinoma | SCC-15 cells | CVCL_1681 | ||
| Experiment 9 Reporting the Activity Date of This ADC | [202] | ||||
| Efficacy Data | Tumor Growth Inhibition value (TGI) |
89.39% (Day 72)
|
Positive LRRC15 expression (LRRC15 +++/++) | ||
| Method Description |
LRRC15 expression on stromal cells asassessed by IHC in an untreated xenograft tumor of 200-800 mm in volume, representative for eachxenograft model. In vivo activity of huM25-VCMMAE-E2 (12 mg/kg) was demonstrated in PANC-1 xenografts.
|
||||
| In Vivo Model | PANC-1 CDX model | ||||
| In Vitro Model | Pancreatic ductal adenocarcinoma | PANC-1 cells | CVCL_0480 | ||
| Experiment 10 Reporting the Activity Date of This ADC | [202] | ||||
| Efficacy Data | Tumor Growth Inhibition value (TGI) |
89.73% (Day 23)
|
High LRRC15 expression (LRRC15+++; IHC 3+) | ||
| Method Description |
LRRC15 expression on stromal cells asassessed by IHC in an untreated xenograft tumor of 200-800 mm in volume, representative for eachxenograft model. In vivo activity of huM25-VCMMAE-E2 (12 mg/kg) plus Cetuximab (3 mg/kg) were demonstrated in SCC-15 xenografts.
|
||||
| In Vivo Model | SCC-15 CDX model | ||||
| In Vitro Model | Squamous carcinoma | SCC-15 cells | CVCL_1681 | ||
| Experiment 11 Reporting the Activity Date of This ADC | [202] | ||||
| Efficacy Data | Tumor Growth Inhibition value (TGI) |
90.12% (Day 30)
|
Moderate LRRC15 expression (LRRC15++; IHC 2+) | ||
| Method Description |
LRRC15 expression on stromal cells asassessed by IHC in an untreated xenograft tumor of 200-800 mm in volume, representative for eachxenograft model. In vivo activity of huM25-VCMMAE-E2 (12 mg/kg) was demonstrated in NW-231 xenografts.
|
||||
| In Vivo Model | NW-231 CDX model | ||||
| In Vitro Model | Triple negative breast cancer | NW231 cells | Homo sapiens | ||
| Experiment 12 Reporting the Activity Date of This ADC | [202] | ||||
| Efficacy Data | Tumor Growth Inhibition value (TGI) |
91.24% (Day 21)
|
High LRRC15 expression (LRRC15+++; IHC 3+) | ||
| Method Description |
LRRC15 expression on stromal cells asassessed by IHC in an untreated xenograft tumor of 200-800 mm in volume, representative for eachxenograft model. In vivo activity of huM25-VCMMAE-E2 (6 mg/kg) was demonstrated in EBC-1 xenografts.
|
||||
| In Vivo Model | EBC-1 CDX model | ||||
| In Vitro Model | Lung squamous cell carcinoma | EBC-1 cells | CVCL_2891 | ||
| Experiment 13 Reporting the Activity Date of This ADC | [202] | ||||
| Efficacy Data | Tumor Growth Inhibition value (TGI) |
91.66% (Day 18)
|
High LRRC15 expression (LRRC15+++; IHC 3+) | ||
| Method Description |
LRRC15 expression on stromal cells asassessed by IHC in an untreated xenograft tumor of 200-800 mm in volume, representative for eachxenograft model. In vivo activity of huM25-VCMMAE-E2 (3 mg/kg) was demonstrated in EBC-1 xenografts.
|
||||
| In Vivo Model | EBC-1 CDX model | ||||
| In Vitro Model | Lung squamous cell carcinoma | EBC-1 cells | CVCL_2891 | ||
| Experiment 14 Reporting the Activity Date of This ADC | [202] | ||||
| Efficacy Data | Tumor Growth Inhibition value (TGI) |
91.84% (Day 27)
|
High LRRC15 expression (LRRC15+++; IHC 3+) | ||
| Method Description |
LRRC15 expression on stromal cells asassessed by IHC in an untreated xenograft tumor of 200-800 mm in volume, representative for eachxenograft model. In vivo activity of huM25-VCMMAE-E2 (6 mg/kg) was demonstrated in SCC-15 xenografts.
|
||||
| In Vivo Model | NCI-H1650 CDX model | ||||
| In Vitro Model | Lung adenocarcinoma | NCI-H1650 cells | CVCL_1483 | ||
| Experiment 15 Reporting the Activity Date of This ADC | [202] | ||||
| Efficacy Data | Tumor Growth Inhibition value (TGI) |
91.86% (Day 21)
|
High LRRC15 expression (LRRC15+++; IHC 3+) | ||
| Method Description |
LRRC15 expression on stromal cells asassessed by IHC in an untreated xenograft tumor of 200-800 mm in volume, representative for eachxenograft model. In vivo activity of huM25-VCMMAE-E2 (6 mg/kg) was demonstrated in EBC-1 xenografts.
|
||||
| In Vivo Model | EBC-1 CDX model | ||||
| In Vitro Model | Lung squamous cell carcinoma | EBC-1 cells | CVCL_2891 | ||
| Experiment 16 Reporting the Activity Date of This ADC | [202] | ||||
| Efficacy Data | Tumor Growth Inhibition value (TGI) |
92.25% (Day 23)
|
High LRRC15 expression (LRRC15+++; IHC 3+) | ||
| Method Description |
LRRC15 expression on stromal cells asassessed by IHC in an untreated xenograft tumor of 200-800 mm in volume, representative for eachxenograft model. In vivo activity of huM25-VCMMAE-E2 (12 mg/kg) plus Radiation (15 Gy) were demonstrated in SCC-15 xenografts.
|
||||
| In Vivo Model | SCC-15 CDX model | ||||
| In Vitro Model | Squamous carcinoma | SCC-15 cells | CVCL_1681 | ||
| Experiment 17 Reporting the Activity Date of This ADC | [202] | ||||
| Efficacy Data | Tumor Growth Inhibition value (TGI) |
92.71% (Day27)
|
High LRRC15 expression (LRRC15+++; IHC 3+) | ||
| Method Description |
LRRC15 expression on stromal cells asassessed by IHC in an untreated xenograft tumor of 200-800 mm in volume, representative for eachxenograft model. In vivo activity of huM25-VCMMAE-E2 (6 mg/kg) was demonstrated in NCI-H1650 xenografts.
|
||||
| In Vivo Model | NCI-H1650 CDX model | ||||
| In Vitro Model | Lung adenocarcinoma | NCI-H1650 cells | CVCL_1483 | ||
| Experiment 18 Reporting the Activity Date of This ADC | [202] | ||||
| Efficacy Data | Tumor Growth Inhibition value (TGI) |
93.56% (Day 38)
|
High LRRC15 expression (LRRC15+++; IHC 3+) | ||
| Method Description |
LRRC15 expression on stromal cells asassessed by IHC in an untreated xenograft tumor of 200-800 mm in volume, representative for eachxenograft model. In vivo activity of huM25-VCMMAE-E2 (6 mg/kg) plus Gemcitabine (80 mg/kg) were demonstrated in HPAF-II xenografts.
|
||||
| In Vivo Model | HPAF-II CDX model | ||||
| In Vitro Model | Pancreatic ductal adenocarcinoma | HPAF-II cells | CVCL_0313 | ||
| Experiment 19 Reporting the Activity Date of This ADC | [202] | ||||
| Efficacy Data | Tumor Growth Inhibition value (TGI) |
96.35% (Day 33)
|
High LRRC15 expression (LRRC15+++; IHC 3+) | ||
| Method Description |
LRRC15 expression on stromal cells asassessed by IHC in an untreated xenograft tumor of 200-800 mm in volume, representative for eachxenograft model. In vivo activity of huM25-VCMMAE-E2 (6 mg/kg) was demonstrated in NCI-H1650 xenografts.
|
||||
| In Vivo Model | HN-5 CDX model | ||||
| In Vitro Model | Squamous cell carcinoma | HN-5 cells | CVCL_8128 | ||
| Experiment 20 Reporting the Activity Date of This ADC | [202] | ||||
| Efficacy Data | Tumor Growth Inhibition value (TGI) |
97.05 % (Day 16)
|
High LRRC15 expression (LRRC15+++; IHC 3+) | ||
| Method Description |
LRRC15 expression on stromal cells asassessed by IHC in an untreated xenograft tumor of 200-800 mm in volume, representative for eachxenograft model. In vivo activity of huM25-VCMMAE-E2 (6 mg/kg) was demonstrated in EBC-1 xenografts.
|
||||
| In Vivo Model | EBC-1 CDX model | ||||
| In Vitro Model | Lung squamous cell carcinoma | EBC-1 cells | CVCL_2891 | ||
| Experiment 21 Reporting the Activity Date of This ADC | [202] | ||||
| Efficacy Data | Tumor Growth Inhibition value (TGI) |
98.10% (Day 21)
|
High LRRC15 expression (LRRC15+++; IHC 3+) | ||
| Method Description |
LRRC15 expression on stromal cells asassessed by IHC in an untreated xenograft tumor of 200-800 mm in volume, representative for eachxenograft model. In vivo activity of huM25-VCMMAE-E2 (6 mg/kg) plus Gemcitabine (100 mg/kg) were demonstrated in EBC-1 xenografts.
|
||||
| In Vivo Model | EBC-1 CDX model | ||||
| In Vitro Model | Lung squamous cell carcinoma | EBC-1 cells | CVCL_2891 | ||
| Experiment 22 Reporting the Activity Date of This ADC | [202] | ||||
| Efficacy Data | Tumor Growth Inhibition value (TGI) |
98.18% (Day 27)
|
High LRRC15 expression (LRRC15+++; IHC 3+) | ||
| Method Description |
LRRC15 expression on stromal cells asassessed by IHC in an untreated xenograft tumor of 200-800 mm in volume, representative for eachxenograft model. In vivo activity of huM25-VCMMAE-E2 (6 mg/kg) plus Erlotinib (100 mg/kg) were demonstrated in SCC-15 xenografts.
|
||||
| In Vivo Model | NCI-H1650 CDX model | ||||
| In Vitro Model | Lung adenocarcinoma | NCI-H1650 cells | CVCL_1483 | ||
| Experiment 23 Reporting the Activity Date of This ADC | [202] | ||||
| Efficacy Data | Tumor Growth Inhibition value (TGI) |
99.13% (Day 18)
|
High LRRC15 expression (LRRC15+++; IHC 3+) | ||
| Method Description |
LRRC15 expression on stromal cells asassessed by IHC in an untreated xenograft tumor of 200-800 mm in volume, representative for eachxenograft model. In vivo activity of huM25-VCMMAE-E2 (3 mg/kg) plus Docetaxel (7.5 mg/kg) were demonstrated in EBC-1 xenografts.
|
||||
| In Vivo Model | EBC-1 CDX model | ||||
| In Vitro Model | Lung squamous cell carcinoma | EBC-1 cells | CVCL_2891 | ||
Revealed Based on the Cell Line Data
| Experiment 1 Reporting the Activity Date of This ADC | [202] | ||||
| Efficacy Data | Half Maximal Inhibitory Concentration (IC50) |
0.10 nM
|
Positive LRRC15 expression (LRRC15 +++/++) | ||
| Method Description |
Cancer cell lines were incubated with compounds for 72 h. IC50 values were determined by quantitating viable cells using a CellTiter-Glo luminescent assay.
|
||||
| In Vitro Model | Colon carcinoma | HCT 116 cells | CVCL_0291 | ||
IgG1 (trastuzumab)-vc-MMAE [Investigative]
Discovered Using Cell Line-derived Xenograft Model
| Experiment 1 Reporting the Activity Date of This ADC | [203] | ||||
| Efficacy Data | Tumor Growth Inhibition value (TGI) | ≈ 3.53% (Day 21) | Positive HER2 expression (HER2 +++/++) | ||
| Method Description |
N87 tumors were implanted to NOD/SCID mice to the size of about 100 mm3 (day 0) and were then treated with ADCs at day 0, day 7 and day 14 at the dosage of 10 mg/kg.
|
||||
| In Vivo Model | NCI-N87 CDX model | ||||
| In Vitro Model | Gastric tubular adenocarcinoma | NCI-N87 cells | CVCL_1603 | ||
| Experiment 2 Reporting the Activity Date of This ADC | [203] | ||||
| Efficacy Data | Tumor Growth Inhibition value (TGI) | ≈ 15.69% (Day 21) | Positive HER2 expression (HER2 +++/++) | ||
| Method Description |
N87 tumors were implanted to NOD/SCID mice to the size of about 100 mm3 (day 0) and were then treated with ADCs at day 0, day 7 and day 14 at the dosage of 10 mg/kg.
|
||||
| In Vivo Model | NCI-N87 CDX model | ||||
| In Vitro Model | Gastric tubular adenocarcinoma | NCI-N87 cells | CVCL_1603 | ||
| Experiment 3 Reporting the Activity Date of This ADC | [203] | ||||
| Efficacy Data | Tumor Growth Inhibition value (TGI) | ≈ 22.02% (Day 21) | Positive HER2 expression (HER2 +++/++) | ||
| Method Description |
N87 tumors were implanted to NOD/SCID mice to the size of about 100 mm3 (day 0) and were then treated with ADCs at day 0, day 7 and day 14 at the dosage of 10 mg/kg.
|
||||
| In Vivo Model | NCI-N87 CDX model | ||||
| In Vitro Model | Gastric tubular adenocarcinoma | NCI-N87 cells | CVCL_1603 | ||
| Experiment 4 Reporting the Activity Date of This ADC | [203] | ||||
| Efficacy Data | Tumor Growth Inhibition value (TGI) | ≈ 28.11% (Day 21) | Positive HER2 expression (HER2 +++/++) | ||
| Method Description |
N87 tumors were implanted to NOD/SCID mice to the size of about 100 mm3 (day 0) and were then treated with ADCs at day 0, day 7 and day 14 at the dosage of 10 mg/kg.
|
||||
| In Vivo Model | NCI-N87 CDX model | ||||
| In Vitro Model | Gastric tubular adenocarcinoma | NCI-N87 cells | CVCL_1603 | ||
| Experiment 5 Reporting the Activity Date of This ADC | [203] | ||||
| Efficacy Data | Tumor Growth Inhibition value (TGI) | ≈ 30.13% (Day 21) | Positive HER2 expression (HER2 +++/++) | ||
| Method Description |
N87 tumors were implanted to NOD/SCID mice to the size of about 100 mm3 (day 0) and were then treated with ADCs at day 0, day 7 and day 14 at the dosage of 10 mg/kg.
|
||||
| In Vivo Model | NCI-N87 CDX model | ||||
| In Vitro Model | Gastric tubular adenocarcinoma | NCI-N87 cells | CVCL_1603 | ||
| Experiment 6 Reporting the Activity Date of This ADC | [203] | ||||
| Efficacy Data | Tumor Growth Inhibition value (TGI) | ≈ 52.51% (Day 21) | Positive HER2 expression (HER2 +++/++) | ||
| Method Description |
N87 tumors were implanted to NOD/SCID mice to the size of about 100 mm3 (day 0) and were then treated with ADCs at day 0, day 7 and day 14 at the dosage of 30 mg/kg.
|
||||
| In Vivo Model | NCI-N87 CDX model | ||||
| In Vitro Model | Gastric tubular adenocarcinoma | NCI-N87 cells | CVCL_1603 | ||
Revealed Based on the Cell Line Data
| Experiment 1 Reporting the Activity Date of This ADC | [203] | ||||
| Efficacy Data | Half Maximal Inhibitory Concentration (IC50) |
27.40 nM
|
Positive HER2 expression (HER2 +++/++) | ||
| Method Description |
N87 cells (10000) were seeded in 96-well plates for the IC50 measurements of cell viability. After incubation at 37°C for 16 h, the medium was replaced by fresh normal medium with serum and the cytotoxicity was assessed using the WST-1 reagent after 72 h of incubation at 37°C.
|
||||
| In Vitro Model | Gastric tubular adenocarcinoma | NCI-N87 cells | CVCL_1603 | ||
chmAb-B B7-H3-ADC [Investigative]
Discovered Using Cell Line-derived Xenograft Model
| Experiment 1 Reporting the Activity Date of This ADC | [201] | ||||
| Efficacy Data | Tumor Growth Inhibition value (TGI) | ≈ 5.27% (Day 70) | Moderate CD276 expression (CD276 ++) | ||
| Method Description |
The results of this study with respect to mammary fat pad implanted PA-1 ovarian cancer cells, and show responsiveness against the PA-1 tumor cells. The dose was 1 mg/kg on day 30.
|
||||
| In Vivo Model | PA-1 CDX model | ||||
| In Vitro Model | Ovarian mixed germ cell tumor | PA-1 cells | CVCL_0479 | ||
| Experiment 2 Reporting the Activity Date of This ADC | [201] | ||||
| Efficacy Data | Tumor Growth Inhibition value (TGI) | ≈ 22.47% (Day 91) | Moderate CD276 expression (CD276 ++) | ||
| Method Description |
The results of this study with respect to mammary fat pad implanted NCI-H1703 non-small cell lung cancer cells, and show responsiveness against the NCI-H1703 tumor cells. The dose was 1 mg/kg on day 30.
|
||||
| In Vivo Model | NCI-H1703 CDX model | ||||
| In Vitro Model | Lung squamous cell carcinoma | NCI-H1703 cells | CVCL_1490 | ||
| Experiment 3 Reporting the Activity Date of This ADC | [201] | ||||
| Efficacy Data | Tumor Growth Inhibition value (TGI) | ≈ 34.64% (Day 70) | Moderate CD276 expression (CD276 ++) | ||
| Method Description |
The results of this study with respect to mammary fat pad implanted PA-1 ovarian cancer cells, and show responsiveness against the PA-1 tumor cells. The dose was 3 mg/kg on day 30.
|
||||
| In Vivo Model | PA-1 CDX model | ||||
| In Vitro Model | Ovarian mixed germ cell tumor | PA-1 cells | CVCL_0479 | ||
| Experiment 4 Reporting the Activity Date of This ADC | [201] | ||||
| Efficacy Data | Tumor Growth Inhibition value (TGI) | ≈ 34.70% (Day 49) | Moderate CD276 expression (CD276 ++) | ||
| Method Description |
The results of this study with respect to mammary fat pad implanted A375.52 melanoma cells, and show responsiveness against the A375.52 tumor cells. The dose was 1 mg/kg on day 30.
|
||||
| In Vivo Model | A375.52 CDX model | ||||
| In Vitro Model | Amelanotic melanoma | A375.S2 cells | CVCL_0136 | ||
| Experiment 5 Reporting the Activity Date of This ADC | [201] | ||||
| Efficacy Data | Tumor Growth Inhibition value (TGI) | ≈ 36.36% (Day 43) | Moderate CD276 expression (CD276 ++) | ||
| Method Description |
The results of this study with respect to mammary fat pad implanted Calu-6 lung cancer cells, and show responsiveness against the Calu-6 tumor cells. The dose was 1 mg/kg on day 30.
|
||||
| In Vivo Model | Calu-6 CDX model | ||||
| In Vitro Model | Lung adenocarcinoma | Calu-6 cells | CVCL_0236 | ||
| Experiment 6 Reporting the Activity Date of This ADC | [201] | ||||
| Efficacy Data | Tumor Growth Inhibition value (TGI) | ≈ 65.15% (Day 91) | Moderate CD276 expression (CD276 ++) | ||
| Method Description |
The results of this study with respect to mammary fat pad implanted NCI-H1703 non-small cell lung cancer cells, and show responsiveness against the NCI-H1703 tumor cells. The dose was 10 mg/kg on day 30.
|
||||
| In Vivo Model | NCI-H1703 CDX model | ||||
| In Vitro Model | Lung squamous cell carcinoma | NCI-H1703 cells | CVCL_1490 | ||
| Experiment 7 Reporting the Activity Date of This ADC | [201] | ||||
| Efficacy Data | Tumor Growth Inhibition value (TGI) | ≈ 65.31% (Day 43) | Moderate CD276 expression (CD276 ++) | ||
| Method Description |
The results of this study with respect to mammary fat pad implanted Calu-6 lung cancer cells, and show responsiveness against the Calu-6 tumor cells. The dose was 3 mg/kg on day 30.
|
||||
| In Vivo Model | Calu-6 CDX model | ||||
| In Vitro Model | Lung adenocarcinoma | Calu-6 cells | CVCL_0236 | ||
| Experiment 8 Reporting the Activity Date of This ADC | [201] | ||||
| Efficacy Data | Tumor Growth Inhibition value (TGI) | ≈ 77.67% (Day 91) | Moderate CD276 expression (CD276 ++) | ||
| Method Description |
The results of this study with respect to mammary fat pad implanted NCI-H1703 non-small cell lung cancer cells, and show responsiveness against the NCI-H1703 tumor cells. The dose was 3 mg/kg on day 30.
|
||||
| In Vivo Model | NCI-H1703 CDX model | ||||
| In Vitro Model | Lung squamous cell carcinoma | NCI-H1703 cells | CVCL_1490 | ||
| Experiment 9 Reporting the Activity Date of This ADC | [201] | ||||
| Efficacy Data | Tumor Growth Inhibition value (TGI) | ≈ 80.74% (Day 77) | Moderate CD276 expression (CD276 ++) | ||
| Method Description |
The results of this study with respect to mammary fat pad implanted MDAMB-468 breast cancer tumor cells, and show responsiveness against the MDA-MB-468 tumor cells. The dose was 10 mg/kg on day 30.
|
||||
| In Vivo Model | MDA-MB-468 CDX model | ||||
| In Vitro Model | Breast adenocarcinoma | MDA-MB-468 cells | CVCL_0419 | ||
| Experiment 10 Reporting the Activity Date of This ADC | [201] | ||||
| Efficacy Data | Tumor Growth Inhibition value (TGI) | ≈ 83.27% (Day 70) | Moderate CD276 expression (CD276 ++) | ||
| Method Description |
The results of this study with respect to mammary fat pad implanted Calu-6 lung cancer cells, and show responsiveness against the Calu-6 tumor cells. The dose was 10 mg/kg on day 30.
|
||||
| In Vivo Model | Calu-6 CDX model | ||||
| In Vitro Model | Lung adenocarcinoma | Calu-6 cells | CVCL_0236 | ||
| Experiment 11 Reporting the Activity Date of This ADC | [201] | ||||
| Efficacy Data | Tumor Growth Inhibition value (TGI) | ≈ 87.12% (Day 49) | Moderate CD276 expression (CD276 ++) | ||
| Method Description |
The results of this study with respect to mammary fat pad implanted A375.52 melanoma cells, and show responsiveness against the A375.52 tumor cells. The dose was 3 mg/kg on day 30.
|
||||
| In Vivo Model | A375.52 CDX model | ||||
| In Vitro Model | Amelanotic melanoma | A375.S2 cells | CVCL_0136 | ||
| Experiment 12 Reporting the Activity Date of This ADC | [201] | ||||
| Efficacy Data | Tumor Growth Inhibition value (TGI) | ≈ 92.55% (Day 49) | Moderate CD276 expression (CD276 ++) | ||
| Method Description |
The results of this study with respect to mammary fat pad implanted A375.52 melanoma cells, and show responsiveness against the A375.52 tumor cells. The dose was 10 mg/kg on day 30.
|
||||
| In Vivo Model | A375.52 CDX model | ||||
| In Vitro Model | Amelanotic melanoma | A375.S2 cells | CVCL_0136 | ||
| Experiment 13 Reporting the Activity Date of This ADC | [201] | ||||
| Efficacy Data | Tumor Growth Inhibition value (TGI) | ≈ 97.28% (Day 70) | Moderate CD276 expression (CD276 ++) | ||
| Method Description |
The results of this study with respect to mammary fat pad implanted PA-1 ovarian cancer cells, and show responsiveness against the PA-1 tumor cells. The dose was 10 mg/kg on day 30.
|
||||
| In Vivo Model | PA-1 CDX model | ||||
| In Vitro Model | Ovarian mixed germ cell tumor | PA-1 cells | CVCL_0479 | ||
Revealed Based on the Cell Line Data
| Experiment 1 Reporting the Activity Date of This ADC | [201] | ||||
| Efficacy Data | Half Maximal Inhibitory Concentration (IC50) |
31.00 pM
|
Moderate CD276 expression (CD276 ++) | ||
| Method Description |
Briefly, B7-H3-ADCs and controls are diluted and plated intomicrotiter plates, 5000 cells are added to each well and incubated at 37°C for 4-7 daysAlamar Blue Reagent is added to the plates andread according to the manufacturer's protocol. The number of antibody binding sites presenton these cells was determined using a Bangs QFACSTM Kit.
|
||||
| In Vitro Model | Lung adenocarcinoma | NCI-H1975 cells | CVCL_1511 | ||
| Experiment 2 Reporting the Activity Date of This ADC | [201] | ||||
| Efficacy Data | Half Maximal Inhibitory Concentration (IC50) |
59.00 pM
|
Moderate CD276 expression (CD276 ++) | ||
| Method Description |
Briefly, B7-H3-ADCs and controls are diluted and plated intomicrotiter plates, 5000 cells are added to each well and incubated at 37°C for 4-7 daysAlamar Blue Reagent is added to the plates andread according to the manufacturer's protocol. The number of antibody binding sites presenton these cells was determined using a Bangs QFACSTM Kit.
|
||||
| In Vitro Model | Lung adenocarcinoma | Calu-6 cells | CVCL_0236 | ||
| Experiment 3 Reporting the Activity Date of This ADC | [201] | ||||
| Efficacy Data | Half Maximal Inhibitory Concentration (IC50) |
90.00 pM
|
Moderate CD276 expression (CD276 ++) | ||
| Method Description |
Briefly, B7-H3-ADCs and controls are diluted and plated intomicrotiter plates, 5000 cells are added to each well and incubated at 37°C for 4-7 daysAlamar Blue Reagent is added to the plates andread according to the manufacturer's protocol. The number of antibody binding sites presenton these cells was determined using a Bangs QFACSTM Kit.
|
||||
| In Vitro Model | Lung squamous cell carcinoma | NCI-H1703 cells | CVCL_1490 | ||
| Experiment 4 Reporting the Activity Date of This ADC | [201] | ||||
| Efficacy Data | Half Maximal Inhibitory Concentration (IC50) |
0.15 nM
|
Moderate CD276 expression (CD276 ++) | ||
| Method Description |
Briefly, B7-H3-ADCs and controls are diluted and plated intomicrotiter plates, 5000 cells are added to each well and incubated at 37°C for 4-7 daysAlamar Blue Reagent is added to the plates andread according to the manufacturer's protocol. The number of antibody binding sites presenton these cells was determined using a Bangs QFACSTM Kit.
|
||||
| In Vitro Model | Amelanotic melanoma | A375.S2 cells | CVCL_0136 | ||
| Experiment 5 Reporting the Activity Date of This ADC | [201] | ||||
| Efficacy Data | Half Maximal Inhibitory Concentration (IC50) |
0.16 nM
|
High CD276 expression (CD276 +++) | ||
| Method Description |
Briefly, B7-H3-ADCs and controls are diluted and plated intomicrotiter plates, 5000 cells are added to each well and incubated at 37°C for 4-7 daysAlamar Blue Reagent is added to the plates andread according to the manufacturer's protocol. The number of antibody binding sites presenton these cells was determined using a Bangs QFACSTM Kit.
|
||||
| In Vitro Model | Neoplasm | Hs 700T cells | CVCL_0858 | ||
| Experiment 6 Reporting the Activity Date of This ADC | [201] | ||||
| Efficacy Data | Half Maximal Inhibitory Concentration (IC50) |
0.22 nM
|
High CD276 expression (CD276 +++) | ||
| Method Description |
Briefly, B7-H3-ADCs and controls are diluted and plated intomicrotiter plates, 5000 cells are added to each well and incubated at 37°C for 4-7 daysAlamar Blue Reagent is added to the plates andread according to the manufacturer's protocol. The number of antibody binding sites presenton these cells was determined using a Bangs QFACSTM Kit.
|
||||
| In Vitro Model | Breast ductal carcinoma | JIMT-1 cells | CVCL_2077 | ||
| Experiment 7 Reporting the Activity Date of This ADC | [201] | ||||
| Efficacy Data | Half Maximal Inhibitory Concentration (IC50) |
0.35 nM
|
Moderate CD276 expression (CD276 ++) | ||
| Method Description |
Briefly, B7-H3-ADCs and controls are diluted and plated intomicrotiter plates, 5000 cells are added to each well and incubated at 37°C for 4-7 daysAlamar Blue Reagent is added to the plates andread according to the manufacturer's protocol. The number of antibody binding sites presenton these cells was determined using a Bangs QFACSTM Kit.
|
||||
| In Vitro Model | Breast adenocarcinoma | MDA-MB-468 cells | CVCL_0419 | ||
| Experiment 8 Reporting the Activity Date of This ADC | [201] | ||||
| Efficacy Data | Half Maximal Inhibitory Concentration (IC50) |
0.56 nM
|
Moderate CD276 expression (CD276 ++) | ||
| Method Description |
Briefly, B7-H3-ADCs and controls are diluted and plated intomicrotiter plates, 5000 cells are added to each well and incubated at 37°C for 4-7 daysAlamar Blue Reagent is added to the plates andread according to the manufacturer's protocol. The number of antibody binding sites presenton these cells was determined using a Bangs QFACSTM Kit.
|
||||
| In Vitro Model | Ovarian mixed germ cell tumor | PA-1 cells | CVCL_0479 | ||
| Experiment 9 Reporting the Activity Date of This ADC | [201] | ||||
| Efficacy Data | Half Maximal Inhibitory Concentration (IC50) |
3.77 nM
|
Low CD276 expression (CD276 +) | ||
| Method Description |
Briefly, B7-H3-ADCs and controls are diluted and plated intomicrotiter plates, 5000 cells are added to each well and incubated at 37°C for 4-7 daysAlamar Blue Reagent is added to the plates andread according to the manufacturer's protocol. The number of antibody binding sites presenton these cells was determined using a Bangs QFACSTM Kit.
|
||||
| In Vitro Model | Prostate carcinoma | DU145 cells | CVCL_0105 | ||
| Experiment 10 Reporting the Activity Date of This ADC | [201] | ||||
| Efficacy Data | Half Maximal Inhibitory Concentration (IC50) | > 100 nM | Negative CD276 expression (CD276 -) | ||
| Method Description |
Briefly, B7-H3-ADCs and controls are diluted and plated intomicrotiter plates, 5000 cells are added to each well and incubated at 37°C for 4-7 daysAlamar Blue Reagent is added to the plates andread according to the manufacturer's protocol. The number of antibody binding sites presenton these cells was determined using a Bangs QFACSTM Kit.
|
||||
| In Vitro Model | EBV-related Burkitt lymphoma | Raji cells | CVCL_0511 | ||
IgG1 (GH2-75)-vc-MMAE [Investigative]
Discovered Using Cell Line-derived Xenograft Model
| Experiment 1 Reporting the Activity Date of This ADC | [203] | ||||
| Efficacy Data | Tumor Growth Inhibition value (TGI) | ≈ 5.54% (Day 21) | Positive HER2 expression (HER2 +++/++) | ||
| Method Description |
N87 tumors were implanted to NOD/SCID mice to the size of about 100 mm3 (day 0) and were then treated with ADCs at day 0, day 7 and day 14 at the dosage of 30 mg/kg.
|
||||
| In Vivo Model | NCI-N87 CDX model | ||||
| In Vitro Model | Gastric tubular adenocarcinoma | NCI-N87 cells | CVCL_1603 | ||
Revealed Based on the Cell Line Data
| Experiment 1 Reporting the Activity Date of This ADC | [203] | ||||
| Efficacy Data | Half Maximal Inhibitory Concentration (IC50) |
128.50 nM
|
Positive HER2 expression (HER2 +++/++) | ||
| Method Description |
N87 cells (10000) were seeded in 96-well plates for the IC50 measurements of cell viability. After incubation at 37°C for 16 h, the medium was replaced by fresh normal medium with serum and the cytotoxicity was assessed using the WST-1 reagent after 72 h of incubation at 37°C.
|
||||
| In Vitro Model | Gastric tubular adenocarcinoma | NCI-N87 cells | CVCL_1603 | ||
HuM25-vcMMAE-DAR4 [Investigative]
Discovered Using Cell Line-derived Xenograft Model
| Experiment 1 Reporting the Activity Date of This ADC | [202] | ||||
| Efficacy Data | Tumor Growth Inhibition value (TGI) |
11.00% (Day 26)
|
High LRRC15 expression (LRRC15+++; IHC 3+) | ||
| Method Description |
LRRC15 expression on stromal cells asassessed by IHC in an untreated xenograft tumor of 200-800 mm in volume, representative for eachxenograft model. In vivo activity of huM25-vcMMAE-DAR4 (10 mg/kg) was demonstrated in HCC-827-ER xenografts.
|
||||
| In Vivo Model | HCC-827-ER CDX model | ||||
| In Vitro Model | Lung adenocarcinoma | HCC827 ER1 cells | CVCL_EJ07 | ||
| Experiment 2 Reporting the Activity Date of This ADC | [202] | ||||
| Efficacy Data | Tumor Growth Inhibition value (TGI) |
59.49% (Day 60)
|
High LRRC15 expression (LRRC15+++; IHC 3+) | ||
| Method Description |
LRRC15 expression on stromal cells asassessed by IHC in an untreated xenograft tumor of 200-800 mm in volume, representative for eachxenograft model. In vivo activity of huM25-vcMMAE-DAR4 (3 mg/kg) was demonstrated in SUM190PT xenografts.
|
||||
| In Vivo Model | SUM190PT CDX model | ||||
| In Vitro Model | Breast inflammatory carcinoma | SUM190PT cells | CVCL_3423 | ||
| Experiment 3 Reporting the Activity Date of This ADC | [202] | ||||
| Efficacy Data | Tumor Growth Inhibition value (TGI) |
84.03% (Day 21)
|
High LRRC15 expression (LRRC15+++; IHC 3+) | ||
| Method Description |
LRRC15 expression on stromal cells asassessed by IHC in an untreated xenograft tumor of 200-800 mm in volume, representative for eachxenograft model. In vivo activity of huM25-vcMMAE-DAR4 (3 mg/kg) was demonstrated in EBC-1 xenografts.
|
||||
| In Vivo Model | EBC-1 CDX model | ||||
| In Vitro Model | Lung squamous cell carcinoma | EBC-1 cells | CVCL_2891 | ||
WO2021044208A1 ADC10 [Investigative]
Discovered Using Cell Line-derived Xenograft Model
| Experiment 1 Reporting the Activity Date of This ADC | [204] | ||||
| Efficacy Data | Tumor Growth Inhibition value (TGI) | ≈ 11.64% (Day 26) | Positive ROR1 expression (ROR1+++/++) | ||
| Method Description |
1 x 10⁷ cells/head of human ROR-1 expressing lung cancer cell line Calu-3 were grafted to severe combined immunodeficient (SCID) mice to prepare human cancergrafted mice. After grafting, the mice were grouped when tumor size reached 111mm3 on average (Day 1), and 0.25 mg/kg of ADC9.
|
||||
| In Vivo Model | Calu-3 CDX model | ||||
| In Vitro Model | Lung adenocarcinoma | Calu-3 cells | CVCL_0609 | ||
| Experiment 2 Reporting the Activity Date of This ADC | [204] | ||||
| Efficacy Data | Tumor Growth Inhibition value (TGI) | ≈ 51.60% (Day 26) | Positive ROR1 expression (ROR1+++/++) | ||
| Method Description |
1 x 10⁷ cells/head of human ROR-1 expressing lung cancer cell line Calu-3 were grafted to severe combined immunodeficient (SCID) mice to prepare human cancergrafted mice. After grafting, the mice were grouped when tumor size reached 111mm3 on average (Day 1), and 1 mg/kg of ADC9.
|
||||
| In Vivo Model | Calu-3 CDX model | ||||
| In Vitro Model | Lung adenocarcinoma | Calu-3 cells | CVCL_0609 | ||
Revealed Based on the Cell Line Data
| Experiment 1 Reporting the Activity Date of This ADC | [204] | ||||
| Efficacy Data | Half Maximal Inhibitory Concentration (IC50) |
19.50 nM
|
Positive ROR1 expression (ROR1+++/++) | ||
| Method Description |
In a 96-well plate, each well was seeded with 4,000 to 5,000 of the respective cancer cell lines. After culturing for 24 hours, they were treated with the ADCs at a concentra-tion of 0.0015 to 10.0 nM (serially diluted threefold). 72 hours later, the number of live cells was measured using WST-8.
|
||||
| In Vitro Model | Lung adenocarcinoma | NCI-H2228 cells | CVCL_1543 | ||
| Experiment 2 Reporting the Activity Date of This ADC | [204] | ||||
| Efficacy Data | Half Maximal Inhibitory Concentration (IC50) |
23.58 nM
|
Positive ROR1 expression (ROR1+++/++) | ||
| Method Description |
In a 96-well plate, each well was seeded with 4,000 to 5,000 of the respective cancer cell lines. After culturing for 24 hours, they were treated with the ADCs at a concentra-tion of 0.0015 to 10.0 nM (serially diluted threefold). 72 hours later, the number of live cells was measured using WST-8.
|
||||
| In Vitro Model | Breast squamous cell carcinoma | HCC1806 cells | CVCL_1258 | ||
| Experiment 3 Reporting the Activity Date of This ADC | [204] | ||||
| Efficacy Data | Half Maximal Inhibitory Concentration (IC50) |
32.05 nM
|
Positive ROR1 expression (ROR1+++/++) | ||
| Method Description |
In a 96-well plate, each well was seeded with 4,000 to 5,000 of the respective cancer cell lines. After culturing for 24 hours, they were treated with the ADCs at a concentra-tion of 0.0015 to 10.0 nM (serially diluted threefold). 72 hours later, the number of live cells was measured using WST-8.
|
||||
| In Vitro Model | Invasive breast carcinoma | MCF-7 cells | CVCL_0031 | ||
| Experiment 4 Reporting the Activity Date of This ADC | [204] | ||||
| Efficacy Data | Half Maximal Inhibitory Concentration (IC50) |
7.26 uM
|
Positive ROR1 expression (ROR1+++/++) | ||
| Method Description |
In a 96-well plate, each well was seeded with 4,000 to 5,000 of the respective cancer cell lines. After culturing for 24 hours, they were treated with the ADCs at a concentra-tion of 0.0015 to 10.0 nM (serially diluted threefold). 72 hours later, the number of live cells was measured using WST-8.
|
||||
| In Vitro Model | Mantle cell lymphoma | JeKo-1 cells | CVCL_1865 | ||
| Experiment 5 Reporting the Activity Date of This ADC | [204] | ||||
| Efficacy Data | Half Maximal Inhibitory Concentration (IC50) |
17.81 uM
|
Positive ROR1 expression (ROR1+++/++) | ||
| Method Description |
In a 96-well plate, each well was seeded with 4,000 to 5,000 of the respective cancer cell lines. After culturing for 24 hours, they were treated with the ADCs at a concentra-tion of 0.0015 to 10.0 nM (serially diluted threefold). 72 hours later, the number of live cells was measured using WST-8.
|
||||
| In Vitro Model | Breast adenocarcinoma | MDA-MB-231 cells | CVCL_0062 | ||
CTX-MMAE [Investigative]
Discovered Using Cell Line-derived Xenograft Model
| Experiment 1 Reporting the Activity Date of This ADC | [205] | ||||
| Efficacy Data | Tumor Growth Inhibition value (TGI) | ≈ 12.50% (Day 10 | Positive EGFR expression (EGFR +++/++) | ||
| Method Description |
CB17 SCID mice bearing subcutaneous MIA PaCa-2 (n = 4-5 pergroup) xenografts were intravenously injected with saline, CTX-MMAE (0.1 mg/kg) on day 0 and 8 of the study (indicated by vertical dashed lines).
|
||||
| In Vivo Model | MIA PaCa-2 CDX model | ||||
| In Vitro Model | Pancreatic ductal adenocarcinoma | MIA PaCa-2 cells | CVCL_0428 | ||
| Experiment 2 Reporting the Activity Date of This ADC | [205] | ||||
| Efficacy Data | Tumor Growth Inhibition value (TGI) | ≈ 15.63% (Day 20) | Positive EGFR expression (EGFR +++/++) | ||
| Method Description |
CB17 SCID mice bearing subcutaneous PANC-1 (n = 4-5 pergroup) xenografts were intravenously injected with saline, CTX-MMAE (0.1 mg/kg) on day 0 and 8 of the study (indicated by vertical dashed lines).
|
||||
| In Vivo Model | PANC-1 CDX model | ||||
| In Vitro Model | Pancreatic ductal adenocarcinoma | PANC-1 cells | CVCL_0480 | ||
| Experiment 3 Reporting the Activity Date of This ADC | [205] | ||||
| Efficacy Data | Tumor Growth Inhibition value (TGI) | ≈ 45.63% (Day 20) | Positive EGFR expression (EGFR +++/++) | ||
| Method Description |
CB17 SCID mice bearing subcutaneous PANC-1 (n = 4-5 pergroup) xenografts were intravenously injected with saline, CTX-MMAE (1 mg/kg) on day 0 and 8 of the study (indicated by vertical dashed lines).
|
||||
| In Vivo Model | PANC-1 CDX model | ||||
| In Vitro Model | Pancreatic ductal adenocarcinoma | PANC-1 cells | CVCL_0480 | ||
| Experiment 4 Reporting the Activity Date of This ADC | [205] | ||||
| Efficacy Data | Tumor Growth Inhibition value (TGI) | ≈ 54.17% (Day 10) | Positive EGFR expression (EGFR +++/++) | ||
| Method Description |
CB17 SCID mice bearing subcutaneous MIA PaCa-2 (n = 4-5 pergroup) xenografts were intravenously injected with saline, CTX-MMAE (1 mg/kg) on day 0 and 8 of the study (indicated by vertical dashed lines).
|
||||
| In Vivo Model | MIA PaCa-2 CDX model | ||||
| In Vitro Model | Pancreatic ductal adenocarcinoma | MIA PaCa-2 cells | CVCL_0428 | ||
| Experiment 5 Reporting the Activity Date of This ADC | [205] | ||||
| Efficacy Data | Tumor Growth Inhibition value (TGI) | ≈ 87.50% (Day 20) | Positive EGFR expression (EGFR +++/++) | ||
| Method Description |
CB17 SCID mice bearing subcutaneous PANC-1 (n = 4-5 pergroup) xenografts were intravenously injected with saline, CTX-MMAE (5 mg/kg) on day 0 and 8 of the study (indicated by vertical dashed lines).
|
||||
| In Vivo Model | PANC-1 CDX model | ||||
| In Vitro Model | Pancreatic ductal adenocarcinoma | PANC-1 cells | CVCL_0480 | ||
| Experiment 6 Reporting the Activity Date of This ADC | [205] | ||||
| Efficacy Data | Tumor Growth Inhibition value (TGI) | ≈ 100.00% (Day 10) | Positive EGFR expression (EGFR +++/++) | ||
| Method Description |
CB17 SCID mice bearing subcutaneous MIA PaCa-2 (n = 4-5 pergroup) xenografts were intravenously injected with saline, CTX-MMAE (5 mg/kg) on day 0 and 8 of the study (indicated by vertical dashed lines).
|
||||
| In Vivo Model | MIA PaCa-2 CDX model | ||||
| In Vitro Model | Pancreatic ductal adenocarcinoma | MIA PaCa-2 cells | CVCL_0428 | ||
| Experiment 7 Reporting the Activity Date of This ADC | [205] | ||||
| Efficacy Data | Median survival time (MST) |
14 Day
|
Positive EGFR expression (EGFR +++/++) | ||
| Method Description |
CB17 SCID mice bearing subcutaneous MIA PaCa-2 (n = 4-5 pergroup) xenografts were intravenously injected with saline, CTX-MMAE (0.1 mg/kg) on day 0 and 8 of the study (indicated by vertical dashed lines).
|
||||
| In Vivo Model | MIA PaCa-2 CDX model | ||||
| In Vitro Model | Pancreatic ductal adenocarcinoma | MIA PaCa-2 cells | CVCL_0428 | ||
| Experiment 8 Reporting the Activity Date of This ADC | [205] | ||||
| Efficacy Data | Median survival time (MST) |
23 Day
|
Positive EGFR expression (EGFR +++/++) | ||
| Method Description |
CB17 SCID mice bearing subcutaneous PANC-1 (n = 4-5 pergroup) xenografts were intravenously injected with saline, CTX-MMAE (0.1 mg/kg) on day 0 and 8 of the study (indicated by vertical dashed lines).
|
||||
| In Vivo Model | PANC-1 CDX model | ||||
| In Vitro Model | Pancreatic ductal adenocarcinoma | PANC-1 cells | CVCL_0480 | ||
| Experiment 9 Reporting the Activity Date of This ADC | [205] | ||||
| Efficacy Data | Median survival time (MST) |
24 Day
|
Positive EGFR expression (EGFR +++/++) | ||
| Method Description |
CB17 SCID mice bearing subcutaneous MIA PaCa-2 (n = 4-5 pergroup) xenografts were intravenously injected with saline, CTX-MMAE (1 mg/kg) on day 0 and 8 of the study (indicated by vertical dashed lines).
|
||||
| In Vivo Model | MIA PaCa-2 CDX model | ||||
| In Vitro Model | Pancreatic ductal adenocarcinoma | MIA PaCa-2 cells | CVCL_0428 | ||
| Experiment 10 Reporting the Activity Date of This ADC | [205] | ||||
| Efficacy Data | Median survival time (MST) |
30 Day
|
Positive EGFR expression (EGFR +++/++) | ||
| Method Description |
CB17 SCID mice bearing subcutaneous PANC-1 (n = 4-5 pergroup) xenografts were intravenously injected with saline, CTX-MMAE (1 mg/kg) on day 0 and 8 of the study (indicated by vertical dashed lines).
|
||||
| In Vivo Model | PANC-1 CDX model | ||||
| In Vitro Model | Pancreatic ductal adenocarcinoma | PANC-1 cells | CVCL_0480 | ||
| Experiment 11 Reporting the Activity Date of This ADC | [205] | ||||
| Efficacy Data | Median survival time (MST) |
60 Day
|
Positive EGFR expression (EGFR +++/++) | ||
| Method Description |
CB17 SCID mice bearing subcutaneous MIA PaCa-2 (n = 4-5 pergroup) xenografts were intravenously injected with saline, CTX-MMAE (5 mg/kg) on day 0 and 8 of the study (indicated by vertical dashed lines).
|
||||
| In Vivo Model | MIA PaCa-2 CDX model | ||||
| In Vitro Model | Pancreatic ductal adenocarcinoma | MIA PaCa-2 cells | CVCL_0428 | ||
| Experiment 12 Reporting the Activity Date of This ADC | [205] | ||||
| Efficacy Data | Median survival time (MST) |
61 Day
|
Positive EGFR expression (EGFR +++/++) | ||
| Method Description |
CB17 SCID mice bearing subcutaneous PANC-1 (n = 4-5 pergroup) xenografts were intravenously injected with saline, CTX-MMAE (5 mg/kg) on day 0 and 8 of the study (indicated by vertical dashed lines).
|
||||
| In Vivo Model | PANC-1 CDX model | ||||
| In Vitro Model | Pancreatic ductal adenocarcinoma | PANC-1 cells | CVCL_0480 | ||
Revealed Based on the Cell Line Data
| Experiment 1 Reporting the Activity Date of This ADC | [205] | ||||
| Efficacy Data | Half Maximal Inhibitory Concentration (IC50) |
39.00 pM
|
Positive EGFR expression (EGFR +++/++) | ||
| Method Description |
MIA PaCa-2 and PANC-1 cells were seeded at 1000 and 1500 per well, respectively, in a 96-well plate and left to adhere overnight. Cells were treated with a 5-fold dilution series of CTX-MMAE or CTX ranging from 0.000256 to 500 nM for 96 h.
|
||||
| In Vitro Model | Pancreatic ductal adenocarcinoma | PANC-1 cells | CVCL_0480 | ||
| Experiment 2 Reporting the Activity Date of This ADC | [205] | ||||
| Efficacy Data | Half Maximal Inhibitory Concentration (IC50) |
1.38 nM
|
Positive EGFR expression (EGFR +++/++) | ||
| Method Description |
MIA PaCa-2 and PANC-1 cells were seeded at 1000 and 1500 per well, respectively, in a 96-well plate and left to adhere overnight. Cells were treated with a 5-fold dilution series of CTX-MMAE or CTX ranging from 0.000256 to 500 nM for 96 h.
|
||||
| In Vitro Model | Pancreatic ductal adenocarcinoma | MIA PaCa-2 cells | CVCL_0428 | ||
chmAb-C B7-H3-ADC [Investigative]
Discovered Using Cell Line-derived Xenograft Model
| Experiment 1 Reporting the Activity Date of This ADC | [201] | ||||
| Efficacy Data | Tumor Growth Inhibition value (TGI) | ≈ 13.21% (Day 70) | Moderate CD276 expression (CD276 ++) | ||
| Method Description |
The results of this study with respect to mammary fat pad implanted PA-1 ovarian cancer cells, and show responsiveness against the PA-1 tumor cells. The dose was 1 mg/kg on day 30.
|
||||
| In Vivo Model | PA-1 CDX model | ||||
| In Vitro Model | Ovarian mixed germ cell tumor | PA-1 cells | CVCL_0479 | ||
| Experiment 2 Reporting the Activity Date of This ADC | [201] | ||||
| Efficacy Data | Tumor Growth Inhibition value (TGI) | ≈ 14.62% (Day 43) | Moderate CD276 expression (CD276 ++) | ||
| Method Description |
The results of this study with respect to mammary fat pad implanted Calu-6 lung cancer cells, and show responsiveness against the Calu-6 tumor cells. The dose was 3 mg/kg on day 30.
|
||||
| In Vivo Model | Calu-6 CDX model | ||||
| In Vitro Model | Lung adenocarcinoma | Calu-6 cells | CVCL_0236 | ||
| Experiment 3 Reporting the Activity Date of This ADC | [201] | ||||
| Efficacy Data | Tumor Growth Inhibition value (TGI) | ≈ 25.99% (Day 70) | Moderate CD276 expression (CD276 ++) | ||
| Method Description |
The results of this study with respect to mammary fat pad implanted PA-1 ovarian cancer cells, and show responsiveness against the PA-1 tumor cells. The dose was 3 mg/kg on day 30.
|
||||
| In Vivo Model | PA-1 CDX model | ||||
| In Vitro Model | Ovarian mixed germ cell tumor | PA-1 cells | CVCL_0479 | ||
| Experiment 4 Reporting the Activity Date of This ADC | [201] | ||||
| Efficacy Data | Tumor Growth Inhibition value (TGI) | ≈ 30.46% (Day 49) | Moderate CD276 expression (CD276 ++) | ||
| Method Description |
The results of this study with respect to mammary fat pad implanted A375.52 melanoma cells, and show responsiveness against the A375.52 tumor cells. The dose was 1 mg/kg on day 30.
|
||||
| In Vivo Model | A375.52 CDX model | ||||
| In Vitro Model | Amelanotic melanoma | A375.S2 cells | CVCL_0136 | ||
| Experiment 5 Reporting the Activity Date of This ADC | [201] | ||||
| Efficacy Data | Tumor Growth Inhibition value (TGI) | ≈ 30.91% (Day 91) | Moderate CD276 expression (CD276 ++) | ||
| Method Description |
The results of this study with respect to mammary fat pad implanted NCI-H1703 non-small cell lung cancer cells, and show responsiveness against the NCI-H1703 tumor cells. The dose was 1 mg/kg on day 30.
|
||||
| In Vivo Model | NCI-H1703 CDX model | ||||
| In Vitro Model | Lung squamous cell carcinoma | NCI-H1703 cells | CVCL_1490 | ||
| Experiment 6 Reporting the Activity Date of This ADC | [201] | ||||
| Efficacy Data | Tumor Growth Inhibition value (TGI) | ≈ 32.04% (Day 43) | Moderate CD276 expression (CD276 ++) | ||
| Method Description |
The results of this study with respect to mammary fat pad implanted Calu-6 lung cancer cells, and show responsiveness against the Calu-6 tumor cells. The dose was 1 mg/kg on day 30.
|
||||
| In Vivo Model | Calu-6 CDX model | ||||
| In Vitro Model | Lung adenocarcinoma | Calu-6 cells | CVCL_0236 | ||
| Experiment 7 Reporting the Activity Date of This ADC | [201] | ||||
| Efficacy Data | Tumor Growth Inhibition value (TGI) | ≈ 63.42% (Day 70) | Moderate CD276 expression (CD276 ++) | ||
| Method Description |
The results of this study with respect to mammary fat pad implanted PA-1 ovarian cancer cells, and show responsiveness against the PA-1 tumor cells. The dose was 10 mg/kg on day 30.
|
||||
| In Vivo Model | PA-1 CDX model | ||||
| In Vitro Model | Ovarian mixed germ cell tumor | PA-1 cells | CVCL_0479 | ||
| Experiment 8 Reporting the Activity Date of This ADC | [201] | ||||
| Efficacy Data | Tumor Growth Inhibition value (TGI) | ≈ 69.12% (Day 91) | Moderate CD276 expression (CD276 ++) | ||
| Method Description |
The results of this study with respect to mammary fat pad implanted NCI-H1703 non-small cell lung cancer cells, and show responsiveness against the NCI-H1703 tumor cells. The dose was 10 mg/kg on day 30.
|
||||
| In Vivo Model | NCI-H1703 CDX model | ||||
| In Vitro Model | Lung squamous cell carcinoma | NCI-H1703 cells | CVCL_1490 | ||
| Experiment 9 Reporting the Activity Date of This ADC | [201] | ||||
| Efficacy Data | Tumor Growth Inhibition value (TGI) | ≈ 77.78% (Day 49) | Moderate CD276 expression (CD276 ++) | ||
| Method Description |
The results of this study with respect to mammary fat pad implanted A375.52 melanoma cells, and show responsiveness against the A375.52 tumor cells. The dose was 3 mg/kg on day 30.
|
||||
| In Vivo Model | A375.52 CDX model | ||||
| In Vitro Model | Amelanotic melanoma | A375.S2 cells | CVCL_0136 | ||
| Experiment 10 Reporting the Activity Date of This ADC | [201] | ||||
| Efficacy Data | Tumor Growth Inhibition value (TGI) | ≈ 87.78% (Day 91) | Moderate CD276 expression (CD276 ++) | ||
| Method Description |
The results of this study with respect to mammary fat pad implanted NCI-H1703 non-small cell lung cancer cells, and show responsiveness against the NCI-H1703 tumor cells. The dose was 3 mg/kg on day 30.
|
||||
| In Vivo Model | NCI-H1703 CDX model | ||||
| In Vitro Model | Lung squamous cell carcinoma | NCI-H1703 cells | CVCL_1490 | ||
| Experiment 11 Reporting the Activity Date of This ADC | [201] | ||||
| Efficacy Data | Tumor Growth Inhibition value (TGI) | ≈ 90.90% (Day 77) | Moderate CD276 expression (CD276 ++) | ||
| Method Description |
The results of this study with respect to mammary fat pad implanted MDAMB-468 breast cancer tumor cells, and show responsiveness against the MDA-MB-468 tumor cells. The dose was 10 mg/kg on day 30.
|
||||
| In Vivo Model | MDA-MB-468 CDX model | ||||
| In Vitro Model | Breast adenocarcinoma | MDA-MB-468 cells | CVCL_0419 | ||
| Experiment 12 Reporting the Activity Date of This ADC | [201] | ||||
| Efficacy Data | Tumor Growth Inhibition value (TGI) | ≈ 91.77% (Day 49) | Moderate CD276 expression (CD276 ++) | ||
| Method Description |
The results of this study with respect to mammary fat pad implanted A375.52 melanoma cells, and show responsiveness against the A375.52 tumor cells. The dose was 10 mg/kg on day 30.
|
||||
| In Vivo Model | A375.52 CDX model | ||||
| In Vitro Model | Amelanotic melanoma | A375.S2 cells | CVCL_0136 | ||
| Experiment 13 Reporting the Activity Date of This ADC | [201] | ||||
| Efficacy Data | Tumor Growth Inhibition value (TGI) | ≈ 97.44% (Day 70) | Moderate CD276 expression (CD276 ++) | ||
| Method Description |
The results of this study with respect to mammary fat pad implanted Calu-6 lung cancer cells, and show responsiveness against the Calu-6 tumor cells. The dose was 10 mg/kg on day 30.
|
||||
| In Vivo Model | Calu-6 CDX model | ||||
| In Vitro Model | Lung adenocarcinoma | Calu-6 cells | CVCL_0236 | ||
Revealed Based on the Cell Line Data
| Experiment 1 Reporting the Activity Date of This ADC | [201] | ||||
| Efficacy Data | Half Maximal Inhibitory Concentration (IC50) |
16.00 pM
|
Moderate CD276 expression (CD276 ++) | ||
| Method Description |
Briefly, B7-H3-ADCs and controls are diluted and plated intomicrotiter plates, 5000 cells are added to each well and incubated at 37°C for 4-7 daysAlamar Blue Reagent is added to the plates andread according to the manufacturer's protocol. The number of antibody binding sites presenton these cells was determined using a Bangs QFACSTM Kit.
|
||||
| In Vitro Model | Lung adenocarcinoma | NCI-H1975 cells | CVCL_1511 | ||
| Experiment 2 Reporting the Activity Date of This ADC | [201] | ||||
| Efficacy Data | Half Maximal Inhibitory Concentration (IC50) |
30.00 pM
|
Moderate CD276 expression (CD276 ++) | ||
| Method Description |
Briefly, B7-H3-ADCs and controls are diluted and plated intomicrotiter plates, 5000 cells are added to each well and incubated at 37°C for 4-7 daysAlamar Blue Reagent is added to the plates andread according to the manufacturer's protocol. The number of antibody binding sites presenton these cells was determined using a Bangs QFACSTM Kit.
|
||||
| In Vitro Model | Lung adenocarcinoma | Calu-6 cells | CVCL_0236 | ||
| Experiment 3 Reporting the Activity Date of This ADC | [201] | ||||
| Efficacy Data | Half Maximal Inhibitory Concentration (IC50) |
43.00 pM
|
Moderate CD276 expression (CD276 ++) | ||
| Method Description |
Briefly, B7-H3-ADCs and controls are diluted and plated intomicrotiter plates, 5000 cells are added to each well and incubated at 37°C for 4-7 daysAlamar Blue Reagent is added to the plates andread according to the manufacturer's protocol. The number of antibody binding sites presenton these cells was determined using a Bangs QFACSTM Kit.
|
||||
| In Vitro Model | Lung squamous cell carcinoma | NCI-H1703 cells | CVCL_1490 | ||
| Experiment 4 Reporting the Activity Date of This ADC | [201] | ||||
| Efficacy Data | Half Maximal Inhibitory Concentration (IC50) |
0.11 nM
|
High CD276 expression (CD276 +++) | ||
| Method Description |
Briefly, B7-H3-ADCs and controls are diluted and plated intomicrotiter plates, 5000 cells are added to each well and incubated at 37°C for 4-7 daysAlamar Blue Reagent is added to the plates andread according to the manufacturer's protocol. The number of antibody binding sites presenton these cells was determined using a Bangs QFACSTM Kit.
|
||||
| In Vitro Model | Neoplasm | Hs 700T cells | CVCL_0858 | ||
| Experiment 5 Reporting the Activity Date of This ADC | [201] | ||||
| Efficacy Data | Half Maximal Inhibitory Concentration (IC50) |
0.12 nM
|
High CD276 expression (CD276 +++) | ||
| Method Description |
Briefly, B7-H3-ADCs and controls are diluted and plated intomicrotiter plates, 5000 cells are added to each well and incubated at 37°C for 4-7 daysAlamar Blue Reagent is added to the plates andread according to the manufacturer's protocol. The number of antibody binding sites presenton these cells was determined using a Bangs QFACSTM Kit.
|
||||
| In Vitro Model | Breast ductal carcinoma | JIMT-1 cells | CVCL_2077 | ||
| Experiment 6 Reporting the Activity Date of This ADC | [201] | ||||
| Efficacy Data | Half Maximal Inhibitory Concentration (IC50) |
0.20 nM
|
Moderate CD276 expression (CD276 ++) | ||
| Method Description |
Briefly, B7-H3-ADCs and controls are diluted and plated intomicrotiter plates, 5000 cells are added to each well and incubated at 37°C for 4-7 daysAlamar Blue Reagent is added to the plates andread according to the manufacturer's protocol. The number of antibody binding sites presenton these cells was determined using a Bangs QFACSTM Kit.
|
||||
| In Vitro Model | Breast adenocarcinoma | MDA-MB-468 cells | CVCL_0419 | ||
| Experiment 7 Reporting the Activity Date of This ADC | [201] | ||||
| Efficacy Data | Half Maximal Inhibitory Concentration (IC50) |
0.27 nM
|
Moderate CD276 expression (CD276 ++) | ||
| Method Description |
Briefly, B7-H3-ADCs and controls are diluted and plated intomicrotiter plates, 5000 cells are added to each well and incubated at 37°C for 4-7 daysAlamar Blue Reagent is added to the plates andread according to the manufacturer's protocol. The number of antibody binding sites presenton these cells was determined using a Bangs QFACSTM Kit.
|
||||
| In Vitro Model | Amelanotic melanoma | A375.S2 cells | CVCL_0136 | ||
| Experiment 8 Reporting the Activity Date of This ADC | [201] | ||||
| Efficacy Data | Half Maximal Inhibitory Concentration (IC50) |
0.41 nM
|
Moderate CD276 expression (CD276 ++) | ||
| Method Description |
Briefly, B7-H3-ADCs and controls are diluted and plated intomicrotiter plates, 5000 cells are added to each well and incubated at 37°C for 4-7 daysAlamar Blue Reagent is added to the plates andread according to the manufacturer's protocol. The number of antibody binding sites presenton these cells was determined using a Bangs QFACSTM Kit.
|
||||
| In Vitro Model | Ovarian mixed germ cell tumor | PA-1 cells | CVCL_0479 | ||
| Experiment 9 Reporting the Activity Date of This ADC | [201] | ||||
| Efficacy Data | Half Maximal Inhibitory Concentration (IC50) |
0.47 nM
|
Low CD276 expression (CD276 +) | ||
| Method Description |
Briefly, B7-H3-ADCs and controls are diluted and plated intomicrotiter plates, 5000 cells are added to each well and incubated at 37°C for 4-7 daysAlamar Blue Reagent is added to the plates andread according to the manufacturer's protocol. The number of antibody binding sites presenton these cells was determined using a Bangs QFACSTM Kit.
|
||||
| In Vitro Model | Prostate carcinoma | DU145 cells | CVCL_0105 | ||
| Experiment 10 Reporting the Activity Date of This ADC | [201] | ||||
| Efficacy Data | Half Maximal Inhibitory Concentration (IC50) | > 100 nM | Negative CD276 expression (CD276 -) | ||
| Method Description |
Briefly, B7-H3-ADCs and controls are diluted and plated intomicrotiter plates, 5000 cells are added to each well and incubated at 37°C for 4-7 daysAlamar Blue Reagent is added to the plates andread according to the manufacturer's protocol. The number of antibody binding sites presenton these cells was determined using a Bangs QFACSTM Kit.
|
||||
| In Vitro Model | EBV-related Burkitt lymphoma | Raji cells | CVCL_0511 | ||
AXL-183-N52Q-MMAE [Investigative]
Discovered Using Cell Line-derived Xenograft Model
| Experiment 1 Reporting the Activity Date of This ADC | [157] | ||||
| Efficacy Data | Tumor Growth Inhibition value (TGI) | ≈ 24.70% (Day 18) | Positive AXL expression (AXL+++/++) | ||
| Method Description |
In the LCLC-103H xenograft model,therapeutic treatment with a single dose of 1 mg/kg in anti-tumor activity in the AXL-ADC panel.
|
||||
| In Vivo Model | Lung cancer CDX model | ||||
| In Vitro Model | Lung large cell carcinoma | LCLC-103H cells | CVCL_1375 | ||
HER2-gsADC-5 [Investigative]
Discovered Using Cell Line-derived Xenograft Model
| Experiment 1 Reporting the Activity Date of This ADC | [206] | ||||
| Efficacy Data | Tumor Growth Inhibition value (TGI) | ≈ 26.50% (Day 51) | Positive HER2 expression (HER2+++/++) | ||
| Method Description |
To further evaluate the gsADCs, we determined the in vivo tumor-inhibitory activity in an NCI-N87 nude mice xenograft model. The mice were randomly grouped into 10 groups (n = 5), including a PBS control group, when the tumors grew to 200 mm3. The experimental groups were 3.0 mg/kg gsADCs q3d.
|
||||
| In Vivo Model | NCI-N87 CDX model | ||||
| In Vitro Model | Gastric tubular adenocarcinoma | NCI-N87 cells | CVCL_1603 | ||
WO2021044208A1 ADC3 [Investigative]
Discovered Using Cell Line-derived Xenograft Model
| Experiment 1 Reporting the Activity Date of This ADC | [204] | ||||
| Efficacy Data | Tumor Growth Inhibition value (TGI) | ≈ 26.90% (Day 26) | Positive ROR1 expression (ROR1+++/++) | ||
| Method Description |
1 x 10⁷ cells/head of human ROR-1 expressing lung cancer cell line Calu-3 were grafted to severe combined immunodeficient (SCID) mice to prepare human cancergrafted mice. After grafting, the mice were grouped when tumor size reached 111mm3 on average (Day 1), and 1 mg/kg QDx1 of ADC2.
|
||||
| In Vivo Model | Calu-3 CDX model | ||||
| In Vitro Model | Lung adenocarcinoma | Calu-3 cells | CVCL_0609 | ||
| Experiment 2 Reporting the Activity Date of This ADC | [204] | ||||
| Efficacy Data | Tumor Growth Inhibition value (TGI) | ≈ 84.36% (Day 35) | Positive ROR1 expression (ROR1+++/++) | ||
| Method Description |
1 x 10⁷ cells/head of human ROR-1 expressing lung cancer cell line Calu-3 were grafted to severe combined immunodeficient (SCID) mice to prepare human cancergrafted mice. After grafting, the mice were grouped when tumor size reached 184mm3 on average (Day 1), and 3 mg/kg QWx4 of ADC2.
|
||||
| In Vivo Model | Calu-3 CDX model | ||||
| In Vitro Model | Lung adenocarcinoma | Calu-3 cells | CVCL_0609 | ||
| Experiment 3 Reporting the Activity Date of This ADC | [204] | ||||
| Efficacy Data | Tumor Growth Inhibition value (TGI) | ≈ 85.43% (Day 26) | Positive ROR1 expression (ROR1+++/++) | ||
| Method Description |
1 x 10⁷ cells/head of human ROR-1 expressing lung cancer cell line Calu-3 were grafted to severe combined immunodeficient (SCID) mice to prepare human cancergrafted mice. After grafting, the mice were grouped when tumor size reached 111mm3 on average (Day 1), and 4 mg/kg of ADC2.
|
||||
| In Vivo Model | Calu-3 CDX model | ||||
| In Vitro Model | Lung adenocarcinoma | Calu-3 cells | CVCL_0609 | ||
| Experiment 4 Reporting the Activity Date of This ADC | [204] | ||||
| Efficacy Data | Tumor Growth Inhibition value (TGI) | ≈ 92.22% (Day 33) | Positive ROR1 expression (ROR1+++/++) | ||
| Method Description |
1 x 10⁷ cells/head of human ROR-1 expressing mantle cell lymphoma cell line JeKo-1 were grafted to severe combined immunodeficient (SCID) mice to prepare human cancergrafted mice. After grafting, the mice were grouped when tumor size reached 184mm3 on average (Day 1), and 3 mg/kg QWx4 of ADC2.
|
||||
| In Vivo Model | JeKo-1 CDX model | ||||
| In Vitro Model | Mantle cell lymphoma | JeKo-1 cells | CVCL_1865 | ||
| Experiment 5 Reporting the Activity Date of This ADC | [204] | ||||
| Efficacy Data | Tumor Growth Inhibition value (TGI) | ≈ 98.81% (Day 41) | Positive ROR1 expression (ROR1+++/++) | ||
| Method Description |
1 x 10⁷ cells/head of human ROR-1 expressing breast cancer cell line HCC1187 were grafted to severe combined immunodeficient (SCID) mice to prepare human cancergrafted mice. After grafting, the mice were grouped when tumor size reached 110 mm3 on average (Day 1), and 0.31 mg/kg QWx4 of ADC5.
|
||||
| In Vivo Model | HCC1187 CDX model | ||||
| In Vitro Model | Breast ductal carcinoma | HCC1187 cells | CVCL_1247 | ||
Revealed Based on the Cell Line Data
| Experiment 1 Reporting the Activity Date of This ADC | [204] | ||||
| Efficacy Data | Half Maximal Inhibitory Concentration (IC50) |
11.59 nM
|
Positive ROR1 expression (ROR1+++/++) | ||
| Method Description |
In a 96-well plate, each well was seeded with 4,000 to 5,000 of the respective cancer cell lines. After culturing for 24 hours, they were treated with the ADCs at a concentra-tion of 0.0015 to 10.0 nM (serially diluted threefold). 72 hours later, the number of live cells was measured using WST-8.
|
||||
| In Vitro Model | Lung adenocarcinoma | NCI-H2228 cells | CVCL_1543 | ||
| Experiment 2 Reporting the Activity Date of This ADC | [204] | ||||
| Efficacy Data | Half Maximal Inhibitory Concentration (IC50) |
12.57 nM
|
Positive ROR1 expression (ROR1+++/++) | ||
| Method Description |
In a 96-well plate, each well was seeded with 4,000 to 5,000 of the respective cancer cell lines. After culturing for 24 hours, they were treated with the ADCs at a concentra-tion of 0.0015 to 10.0 nM (serially diluted threefold). 72 hours later, the number of live cells was measured using WST-8.
|
||||
| In Vitro Model | Invasive breast carcinoma | MCF-7 cells | CVCL_0031 | ||
| Experiment 3 Reporting the Activity Date of This ADC | [204] | ||||
| Efficacy Data | Half Maximal Inhibitory Concentration (IC50) |
15.53 nM
|
Positive ROR1 expression (ROR1+++/++) | ||
| Method Description |
In a 96-well plate, each well was seeded with 4,000 to 5,000 of the respective cancer cell lines. After culturing for 24 hours, they were treated with the ADCs at a concentra-tion of 0.0015 to 10.0 nM (serially diluted threefold). 72 hours later, the number of live cells was measured using WST-8.
|
||||
| In Vitro Model | Breast squamous cell carcinoma | HCC1806 cells | CVCL_1258 | ||
| Experiment 4 Reporting the Activity Date of This ADC | [204] | ||||
| Efficacy Data | Half Maximal Inhibitory Concentration (IC50) |
2.91 uM
|
Positive ROR1 expression (ROR1+++/++) | ||
| Method Description |
In a 96-well plate, each well was seeded with 4,000 to 5,000 of the respective cancer cell lines. After culturing for 24 hours, they were treated with the ADCs at a concentra-tion of 0.0015 to 10.0 nM (serially diluted threefold). 72 hours later, the number of live cells was measured using WST-8.
|
||||
| In Vitro Model | Mantle cell lymphoma | JeKo-1 cells | CVCL_1865 | ||
| Experiment 5 Reporting the Activity Date of This ADC | [204] | ||||
| Efficacy Data | Half Maximal Inhibitory Concentration (IC50) |
10.28 uM
|
Positive ROR1 expression (ROR1+++/++) | ||
| Method Description |
In a 96-well plate, each well was seeded with 4,000 to 5,000 of the respective cancer cell lines. After culturing for 24 hours, they were treated with the ADCs at a concentra-tion of 0.0015 to 10.0 nM (serially diluted threefold). 72 hours later, the number of live cells was measured using WST-8.
|
||||
| In Vitro Model | Breast adenocarcinoma | MDA-MB-231 cells | CVCL_0062 | ||
TF-mAb-MMAE [Investigative]
Discovered Using Cell Line-derived Xenograft Model
| Experiment 1 Reporting the Activity Date of This ADC | [200] | ||||
| Efficacy Data | Tumor Growth Inhibition value (TGI) | ≈ 27.70% (Day 13) | Positive TF expression (TF +++) | ||
| Method Description |
Conjugates of the exemplary antibodies were tested using an established xenograft model implanted subcutaneous into SCID mice. Mice were randomized by body weight into treatment groups and treated once post cell inoculation with 0.7 mg/kg, i.v., qw of one of the conjugates listed above or with PBS only.
|
||||
| In Vivo Model | HCC1806 CDX model | ||||
| In Vitro Model | Breast squamous cell carcinoma | HCC1806 cells | CVCL_1258 | ||
| Experiment 2 Reporting the Activity Date of This ADC | [200] | ||||
| Efficacy Data | Tumor Growth Inhibition value (TGI) | ≈ 33.30% (Day 13) | Positive TF expression (TF +++) | ||
| Method Description |
Conjugates of the exemplary antibodies were tested using an established xenograft model implanted subcutaneous into SCID mice. Mice were randomized by body weight into treatment groups and treated once post cell inoculation with 2 mg/kg, i.v., qw of one of the conjugates listed above or with PBS only.
|
||||
| In Vivo Model | HCC1806 CDX model | ||||
| In Vitro Model | Breast squamous cell carcinoma | HCC1806 cells | CVCL_1258 | ||
| Experiment 3 Reporting the Activity Date of This ADC | [200] | ||||
| Efficacy Data | Tumor Growth Inhibition value (TGI) | ≈ 90.00% (Day 58) | Positive TF expression (TF +++) | ||
| Method Description |
Conjugates of the exemplary antibodies were tested using an established xenograft model implanted subcutaneous into SCID mice. Mice were randomized by body weight into treatment groups and treated once post cell inoculation with 3.75 mg/kg, i.v., qw of one of the conjugates listed above or with PBS only.
|
||||
| In Vivo Model | BxPC3 CDX model | ||||
| In Vitro Model | Pancreatic ductal adenocarcinoma | BxPC-3 cells | CVCL_0186 | ||
| Experiment 4 Reporting the Activity Date of This ADC | [200] | ||||
| Efficacy Data | Tumor Growth Inhibition value (TGI) | ≈ 91.00% (Day 13) | Positive TF expression (TF +++) | ||
| Method Description |
Conjugates of the exemplary antibodies were tested using an established xenograft model implanted subcutaneous into SCID mice. Mice were randomized by body weight into treatment groups and treated once post cell inoculation with 7 mg/kg, i.v., qw of one of the conjugates listed above or with PBS only.
|
||||
| In Vivo Model | HCC1806 CDX model | ||||
| In Vitro Model | Breast squamous cell carcinoma | HCC1806 cells | CVCL_1258 | ||
| Experiment 5 Reporting the Activity Date of This ADC | [200] | ||||
| Efficacy Data | Tumor Growth Inhibition value (TGI) | ≈ 92.60% (Day 20) | Positive TF expression (TF +++) | ||
| Method Description |
Conjugates of the exemplary antibodies were tested using an established xenograft model implanted subcutaneous into SCID mice. Mice were randomized by body weight into treatment groups and treated once post cell inoculation with 3.75 mg/kg, i.v., qw of one of the conjugates listed above or with PBS only.
|
||||
| In Vivo Model | HCC1806 CDX model | ||||
| In Vitro Model | Breast squamous cell carcinoma | HCC1806 cells | CVCL_1258 | ||
| Experiment 6 Reporting the Activity Date of This ADC | [200] | ||||
| Efficacy Data | Tumor Growth Inhibition value (TGI) | ≈ 99.00% (Day 58) | Positive TF expression (TF +++) | ||
| Method Description |
Conjugates of the exemplary antibodies were tested using an established xenograft model implanted subcutaneous into SCID mice. Mice were randomized by body weight into treatment groups and treated once post cell inoculation with 15 mg/kg, i.v., qw of one of the conjugates listed above or with PBS only.
|
||||
| In Vivo Model | BxPC3 CDX model | ||||
| In Vitro Model | Pancreatic ductal adenocarcinoma | BxPC-3 cells | CVCL_0186 | ||
| Experiment 7 Reporting the Activity Date of This ADC | [200] | ||||
| Efficacy Data | Tumor Growth Inhibition value (TGI) | ≈ 100.00% (Day 20) | Positive TF expression (TF +++) | ||
| Method Description |
Conjugates of the exemplary antibodies were tested using an established xenograft model implanted subcutaneous into SCID mice. Mice were randomized by body weight into treatment groups and treated once post cell inoculation with 15 mg/kg, i.v., qw of one of the conjugates listed above or with PBS only.
|
||||
| In Vivo Model | HCC1806 CDX model | ||||
| In Vitro Model | Breast squamous cell carcinoma | HCC1806 cells | CVCL_1258 | ||
Revealed Based on the Cell Line Data
| Experiment 1 Reporting the Activity Date of This ADC | [200] | ||||
| Efficacy Data | Half Maximal Inhibitory Concentration (IC50) |
0.05 nM
|
Positive TF expression (TF +++) | ||
| Method Description |
Cells were plated at about 500 cells per well in a 96-well plate in 100 uL of media. In vitro activity and targeted delivery of ADCs, the isotype-matched negative controls ADCs, and naked antibodies control were assessed in cells.
|
||||
| In Vitro Model | Pancreatic ductal adenocarcinoma | BxPC-3 cells | CVCL_0186 | ||
| Experiment 2 Reporting the Activity Date of This ADC | [200] | ||||
| Efficacy Data | Half Maximal Inhibitory Concentration (IC50) |
0.09 nM
|
Positive TF expression (TF +++) | ||
| Method Description |
Cells were plated at about 500 cells per well in a 96-well plate in 100 uL of media. In vitro activity and targeted delivery of ADCs, the isotype-matched negative controls ADCs, and naked antibodies control were assessed in cells.
|
||||
| In Vitro Model | Breast squamous cell carcinoma | HCC1806 cells | CVCL_1258 | ||
| Experiment 3 Reporting the Activity Date of This ADC | [200] | ||||
| Efficacy Data | Half Maximal Inhibitory Concentration (IC50) |
0.11 nM
|
Positive TF expression (TF +++) | ||
| Method Description |
Cells were plated at about 500 cells per well in a 96-well plate in 100 uL of media. In vitro activity and targeted delivery of ADCs, the isotype-matched negative controls ADCs, and naked antibodies control were assessed in cells.
|
||||
| In Vitro Model | Breast adenocarcinoma | MDA-MB-231 cells | CVCL_0062 | ||
| Experiment 4 Reporting the Activity Date of This ADC | [200] | ||||
| Efficacy Data | Half Maximal Inhibitory Concentration (IC50) |
0.55 nM
|
Positive TF expression (TF +++) | ||
| Method Description |
Cells were plated at about 500 cells per well in a 96-well plate in 100 uL of media. In vitro activity and targeted delivery of ADCs, the isotype-matched negative controls ADCs, and naked antibodies control were assessed in cells.
|
||||
| In Vitro Model | Lung adenocarcinoma | NCI-H1975 cells | CVCL_1511 | ||
| Experiment 5 Reporting the Activity Date of This ADC | [200] | ||||
| Efficacy Data | Half Maximal Inhibitory Concentration (IC50) |
32.49 nM
|
Positive TF expression (TF +++) | ||
| Method Description |
Cells were plated at about 500 cells per well in a 96-well plate in 100 uL of media. In vitro activity and targeted delivery of ADCs, the isotype-matched negative controls ADCs, and naked antibodies control were assessed in cells.
|
||||
| In Vitro Model | Glioblastoma | U-87MG cells | CVCL_0022 | ||
| Experiment 6 Reporting the Activity Date of This ADC | [200] | ||||
| Efficacy Data | Half Maximal Inhibitory Concentration (IC50) | > 100 nM | Positive TF expression (TF +++) | ||
| Method Description |
Cells were plated at about 500 cells per well in a 96-well plate in 100 uL of media. In vitro activity and targeted delivery of ADCs, the isotype-matched negative controls ADCs, and naked antibodies control were assessed in cells.
|
||||
| In Vitro Model | Breast adenocarcinoma | MDA-MB-453 cells | CVCL_0418 | ||
| Experiment 7 Reporting the Activity Date of This ADC | [200] | ||||
| Efficacy Data | Half Maximal Inhibitory Concentration (IC50) | > 100 nM | Positive TF expression (TF +++) | ||
| Method Description |
Cells were plated at about 500 cells per well in a 96-well plate in 100 uL of media. In vitro activity and targeted delivery of ADCs, the isotype-matched negative controls ADCs, and naked antibodies control were assessed in cells.
|
||||
| In Vitro Model | Invasive breast carcinoma | MCF-7 cells | CVCL_0031 | ||
| Experiment 8 Reporting the Activity Date of This ADC | [200] | ||||
| Efficacy Data | Half Maximal Inhibitory Concentration (IC50) | > 100 nM | Positive TF expression (TF +++) | ||
| Method Description |
Cells were plated at about 500 cells per well in a 96-well plate in 100 uL of media. In vitro activity and targeted delivery of ADCs, the isotype-matched negative controls ADCs, and naked antibodies control were assessed in cells.
|
||||
| In Vitro Model | Invasive breast carcinoma | T-47D cells | CVCL_0553 | ||
| Experiment 9 Reporting the Activity Date of This ADC | [200] | ||||
| Efficacy Data | Half Maximal Inhibitory Concentration (IC50) | > 100 nM | Positive TF expression (TF +++) | ||
| Method Description |
Cells were plated at about 500 cells per well in a 96-well plate in 100 uL of media. In vitro activity and targeted delivery of ADCs, the isotype-matched negative controls ADCs, and naked antibodies control were assessed in cells.
|
||||
| In Vitro Model | Lung adenocarcinoma | A-549 cells | CVCL_0023 | ||
h1F6-MC-vc-PABC-MMAF DAR8 [Investigative]
Discovered Using Cell Line-derived Xenograft Model
| Experiment 1 Reporting the Activity Date of This ADC | [207] | ||||
| Efficacy Data | Tumor Growth Inhibition value (TGI) | ≈ 32.10% (Day 42) | Positive CD70 expression (CD70+++/++) | ||
| Method Description |
To establish 786-O tumors, 5 x 10⁶ cells were implanted into the right flank of athymic nu/nu female donor mice. When tumors reached ~100 mm3 mice were randomly allocated to treatment groups. The dose of ADC was 2 mg/kg.
|
||||
| In Vivo Model | 786-O CDX model | ||||
| In Vitro Model | Renal cell carcinoma | 786-O cells | CVCL_1051 | ||
hBU12-MC-vc-PABC-MMAF DAR8 [Investigative]
Discovered Using Cell Line-derived Xenograft Model
| Experiment 1 Reporting the Activity Date of This ADC | [207] | ||||
| Efficacy Data | Tumor Growth Inhibition value (TGI) | ≈ 32.10% (Day 42) | Positive CD70 expression (CD70+++/++) | ||
| Method Description |
To establish 786-O tumors, 5 x 10⁶ cells were implanted into the right flank of athymic nu/nu female donor mice. When tumors reached ~100 mm3 mice were randomly allocated to treatment groups. The dose of ADC was 2 mg/kg.
|
||||
| In Vivo Model | 786-O CDX model | ||||
| In Vitro Model | Renal cell carcinoma | 786-O cells | CVCL_1051 | ||
HA15-1C25E [Investigative]
Discovered Using Cell Line-derived Xenograft Model
| Experiment 1 Reporting the Activity Date of This ADC | [184] | ||||
| Efficacy Data | Tumor Growth Inhibition value (TGI) | ≈ 32.20% (Day 30) | High SLITRK6 expression (SLITRK6+++; IHC H-score=280) | ||
| Method Description |
CDX models were established by subcutaneous injection of between 2 and 10 million SW780, RT4 (ATCC) or NCI-H322M (NCI) cells in SCID mice. When the tumor volume reached approximately 230 mm3, a single dose of Ha15-1c25E, 5 mg/kg intravenously, was administered intravenously (iv) to the mice.
|
||||
| In Vivo Model | Bladder cancer CDX model | ||||
| In Vitro Model | Bladder carcinoma | RT-4 cells | CVCL_0036 | ||
HzMUC1-MMAE [Investigative]
Discovered Using Cell Line-derived Xenograft Model
| Experiment 1 Reporting the Activity Date of This ADC | [208] | ||||
| Efficacy Data | Tumor Growth Inhibition value (TGI) | ≈ 33.50% (Day 21) | High MUC1 expression (MUC1+++) | ||
| Method Description |
To examine the efficacy of the HzMUC1-MMAE in decreasing pancreatic tumor growth in vivo,pancreatic tumor xenograft mouse model was established. BALB/c nu/nu mice were subcutaneously injected with CFPAC-1 cells. When the CFPAC-1 tumors reached the sizes of 150 mm3,mice were randomized into two groups and treated with PBS and HzMUC1-MMAE (5 mg/kg,every 6 days,for 2 doses).
Click to Show/Hide
|
||||
| In Vivo Model | Pancreatic cancer CDX model | ||||
| In Vitro Model | Breast ductal carcinoma | HCC1954 cells | CVCL_1259 | ||
| Experiment 2 Reporting the Activity Date of This ADC | [208] | ||||
| Efficacy Data | Tumor Growth Inhibition value (TGI) | ≈ 83.10% (Day 28) | High MUC1 expression (MUC1+++) | ||
| Method Description |
To examine the efficacy of the HzMUC1-MMAE in decreasing pancreatic tumor growth in vivo,pancreatic tumor xenograft mouse model was established. BALB/c nu/nu mice were subcutaneously injected with Capan-2 cells. When the Capan-2 tumors reached the sizes of 120 mm3,mice were randomized into two groups and treated with PBS and HzMUC1-MMAE (5 mg/kg,every 6 days,for 2 doses).
Click to Show/Hide
|
||||
| In Vivo Model | Pancreatic cancer CDX model | ||||
| In Vitro Model | Pancreatic cancer | Pancreatic cancer cells | Homo sapiens | ||
Revealed Based on the Cell Line Data
| Experiment 1 Reporting the Activity Date of This ADC | [208] | ||||
| Efficacy Data | Half Maximal Inhibitory Concentration (IC50) |
26.00 nM
|
High MUC1 expression (MUC1+++) | ||
| Method Description |
The inhibitory activity of HzMUC1-ADC against cancer cell growth was evaluated in various human cancer cell lines in vitro. The cells were treated 5 days.
|
||||
| In Vitro Model | Pancreatic ductal adenocarcinoma | Capan-2 cells | CVCL_0026 | ||
| Experiment 2 Reporting the Activity Date of This ADC | [208] | ||||
| Efficacy Data | Half Maximal Inhibitory Concentration (IC50) |
50.00 nM
|
High MUC1 expression (MUC1+++) | ||
| Method Description |
The inhibitory activity of HzMUC1-ADC against cancer cell growth was evaluated in various human cancer cell lines in vitro. The cells were treated 5 days.
|
||||
| In Vitro Model | Pancreatic ductal adenocarcinoma | CFPAC-1 cells | CVCL_1119 | ||
| Experiment 3 Reporting the Activity Date of This ADC | [208] | ||||
| Efficacy Data | Half Maximal Inhibitory Concentration (IC50) |
59.00 nM
|
Moderate MUC1 expression (MUC1++) | ||
| Method Description |
The inhibitory activity of HzMUC1-ADC against cancer cell growth was evaluated in various human cancer cell lines in vitro. The cells were treated 5 days.
|
||||
| In Vitro Model | Pancreatic ductal adenocarcinoma | PANC-1 cells | CVCL_0480 | ||
| Experiment 4 Reporting the Activity Date of This ADC | [208] | ||||
| Efficacy Data | Half Maximal Inhibitory Concentration (IC50) | > 10.00 uM | Negative MUC1 expression (MUC1-) | ||
| Method Description |
The inhibitory activity of HzMUC1-ADC against cancer cell growth was evaluated in various human cancer cell lines in vitro. The cells were treated 5 days.
|
||||
| In Vitro Model | Pancreatic adenocarcinoma | SW1990 cells | CVCL_1723 | ||
HER2-gsADC-46 [Investigative]
Discovered Using Cell Line-derived Xenograft Model
| Experiment 1 Reporting the Activity Date of This ADC | [206] | ||||
| Efficacy Data | Tumor Growth Inhibition value (TGI) | ≈ 37.39% (Day 28) | Positive HER2 expression (HER2+++/++) | ||
| Method Description |
To further evaluate the gsADCs, we determined the in vivo tumor-inhibitory activity in an NCI-N87 nude mice xenograft model. The mice were randomly grouped into 10 groups (n = 5), including a PBS control group, when the tumors grew to 200 mm3. The experimental groups were 3.0 mg/kg gsADCs q3d.
|
||||
| In Vivo Model | NCI-N87 CDX model | ||||
| In Vitro Model | Gastric tubular adenocarcinoma | NCI-N87 cells | CVCL_1603 | ||
| Experiment 2 Reporting the Activity Date of This ADC | [206] | ||||
| Efficacy Data | Tumor Growth Inhibition value (TGI) | ≈ 94.15% (Day 57) | Positive HER2 expression (HER2+++/++) | ||
| Method Description |
To further evaluate the gsADCs, we determined the in vivo tumor-inhibitory activity in an NCI-N87 nude mice xenograft model. The mice were randomly grouped into 10 groups (n = 5), including a PBS control group, when the tumors grew to 200 mm3. The experimental groups were 3.0 mg/kg gsADCs q3d.
|
||||
| In Vivo Model | NCI-N87 CDX model | ||||
| In Vitro Model | Gastric tubular adenocarcinoma | NCI-N87 cells | CVCL_1603 | ||
Revealed Based on the Cell Line Data
| Experiment 1 Reporting the Activity Date of This ADC | [206] | ||||
| Efficacy Data | Half Maximal Inhibitory Concentration (IC50) |
0.04 nM
|
Positive HER2 expression (HER2+++/++) | ||
| Method Description |
Cells were cultured in a 10% fetal bovine serum (FBS)-containing RPMI 1640 medium and were planted into 96-well plates with 6000 cells per well. The plates were incubated overnight at 37°C in a 5% CO2 cell incubator.
|
||||
| In Vitro Model | Breast adenocarcinoma | SK-BR-3 cells | CVCL_0033 | ||
| Experiment 2 Reporting the Activity Date of This ADC | [206] | ||||
| Efficacy Data | Half Maximal Inhibitory Concentration (IC50) |
0.16 nM
|
Positive HER2 expression (HER2+++/++) | ||
| Method Description |
Cells were cultured in a 10% fetal bovine serum (FBS)-containing RPMI 1640 medium and were planted into 96-well plates with 6000 cells per well. The plates were incubated overnight at 37°C in a 5% CO2 cell incubator.
|
||||
| In Vitro Model | Gastric tubular adenocarcinoma | NCI-N87 cells | CVCL_1603 | ||
| Experiment 3 Reporting the Activity Date of This ADC | [206] | ||||
| Efficacy Data | Half Maximal Inhibitory Concentration (IC50) | > 66.00 nM | Negative HER2 expression (HER2 -) | ||
| Method Description |
Cells were cultured in a 10% fetal bovine serum (FBS)-containing RPMI 1640 medium and were planted into 96-well plates with 6000 cells per well. The plates were incubated overnight at 37°C in a 5% CO2 cell incubator.
|
||||
| In Vitro Model | Breast adenocarcinoma | MDA-MB-231 cells | CVCL_0062 | ||
h1F6-17 MMAE DAR4 [Investigative]
Discovered Using Cell Line-derived Xenograft Model
| Experiment 1 Reporting the Activity Date of This ADC | [207] | ||||
| Efficacy Data | Tumor Growth Inhibition value (TGI) | ≈ 40.21% (Day 25) | Positive CD70 expression (CD70+++/++) | ||
| Method Description |
To establish 786-O tumors, 5 x 10⁶ cells were implanted into the right flank of athymic nu/nu female donor mice. When tumors reached ~100 mm3 mice were randomly allocated to treatment groups. The dose of ADC was 0.5 mg/kg single.
|
||||
| In Vivo Model | 786-O CDX model | ||||
| In Vitro Model | Renal cell carcinoma | 786-O cells | CVCL_1051 | ||
hBU12-17 MMAE DAR4 [Investigative]
Discovered Using Cell Line-derived Xenograft Model
| Experiment 1 Reporting the Activity Date of This ADC | [207] | ||||
| Efficacy Data | Tumor Growth Inhibition value (TGI) | ≈ 40.21% (Day 25) | Positive CD70 expression (CD70+++/++) | ||
| Method Description |
To establish 786-O tumors, 5 x 10⁶ cells were implanted into the right flank of athymic nu/nu female donor mice. When tumors reached ~100 mm3 mice were randomly allocated to treatment groups. The dose of ADC was 0.5 mg/kg single.
|
||||
| In Vivo Model | 786-O CDX model | ||||
| In Vitro Model | Renal cell carcinoma | 786-O cells | CVCL_1051 | ||
IgG1 (H32)-vc-MMAE [Investigative]
Discovered Using Cell Line-derived Xenograft Model
| Experiment 1 Reporting the Activity Date of This ADC | [203] | ||||
| Efficacy Data | Tumor Growth Inhibition value (TGI) | ≈ 40.94% (Day 21) | Positive HER2 expression (HER2 +++/++) | ||
| Method Description |
N87 tumors were implanted to NOD/SCID mice to the size of about 100 mm3 (day 0) and were then treated with ADCs at day 0, day 7 and day 14 at the dosage of 30 mg/kg.
|
||||
| In Vivo Model | NCI-N87 CDX model | ||||
| In Vitro Model | Gastric tubular adenocarcinoma | NCI-N87 cells | CVCL_1603 | ||
Revealed Based on the Cell Line Data
| Experiment 1 Reporting the Activity Date of This ADC | [203] | ||||
| Efficacy Data | Half Maximal Inhibitory Concentration (IC50) |
14.80 nM
|
Positive HER2 expression (HER2 +++/++) | ||
| Method Description |
N87 cells (10000) were seeded in 96-well plates for the IC50 measurements of cell viability. After incubation at 37°C for 16 h, the medium was replaced by fresh normal medium with serum and the cytotoxicity was assessed using the WST-1 reagent after 72 h of incubation at 37°C.
|
||||
| In Vitro Model | Gastric tubular adenocarcinoma | NCI-N87 cells | CVCL_1603 | ||
CBR96-Phe-Lys-MMAE [Investigative]
Discovered Using Cell Line-derived Xenograft Model
| Experiment 1 Reporting the Activity Date of This ADC | [82] | ||||
| Efficacy Data | Tumor Growth Inhibition value (TGI) |
41.21% (Day 30)
|
Negative Lewis Y expression (Lewis Y-); Positive CD30 expression (CD30+++/++) | ||
| Method Description |
1 mg conjugate/kg/inj.
|
||||
| In Vivo Model | Karpas 299 ALCL cell line xenograft model | ||||
| In Vitro Model | ALK-positive anaplastic large cell lymphoma | Karpas-299 cells | CVCL_1324 | ||
| Experiment 2 Reporting the Activity Date of This ADC | [82] | ||||
| Efficacy Data | Tumor Growth Inhibition value (TGI) |
88.67% (Day 40)
|
Negative Lewis Y expression (Lewis Y-); Positive CD30 expression (CD30+++/++) | ||
| Method Description |
3 mg conjugate/kg/inj.
|
||||
| In Vivo Model | L2987 cell line xenograft model | ||||
| In Vitro Model | Lung adenocarcinoma | L2987 cells | CVCL_H586 | ||
| Experiment 3 Reporting the Activity Date of This ADC | [82] | ||||
| Efficacy Data | Tumor Growth Inhibition value (TGI) |
91.60% (Day 40)
|
Negative Lewis Y expression (Lewis Y-); Positive CD30 expression (CD30+++/++) | ||
| Method Description |
3 mg conjugate/kg/inj.
|
||||
| In Vivo Model | L2987 cell line xenograft model | ||||
| In Vitro Model | Lung adenocarcinoma | L2987 cells | CVCL_H586 | ||
Revealed Based on the Cell Line Data
| Experiment 1 Reporting the Activity Date of This ADC | [81] | ||||
| Efficacy Data | Half Maximal Inhibitory Concentration (IC50) |
10.00 ng/mL
|
Positive Lewis Y expression (Lewis Y+++/++; FACS analysis =2,111) | ||
| Method Description |
The inhibitory activity of the mAb-Val-Cit-MMAE conjugates exhibited greater in vitrospecificity and lower in vivo toxicity was compared with corresponding hydrazone conjugatescorresponding hydrazone conjugates on H3396 cells.The cytotoxic effects of the conjugates on H3396 cells (cBR96 Ag+,cAC10 Ag-) were determined using both pulsed (2 h) and long-term(97 h) drug exposure assays.
Click to Show/Hide
|
||||
| In Vitro Model | Ovarian serous adenocarcinoma | OVCAR-3 cells | CVCL_0465 | ||
| Experiment 2 Reporting the Activity Date of This ADC | [81] | ||||
| Efficacy Data | Half Maximal Inhibitory Concentration (IC50) |
13.00 ng/mL
|
Positive Lewis Y expression (Lewis Y+++/++; FACS analysis =3,500) | ||
| Method Description |
The inhibitory activity of the mAb-Val-Cit-MMAE conjugates exhibited greater in vitrospecificity and lower in vivo toxicity was compared with corresponding hydrazone conjugatescorresponding hydrazone conjugates on H3396 cells.The cytotoxic effects of the conjugates on H3396 cells (cBR96 Ag+,cAC10 Ag-) were determined using both pulsed (2 h) and long-term(97 h) drug exposure assays.
Click to Show/Hide
|
||||
| In Vitro Model | Breast adenocarcinoma | SK-BR-3 cells | CVCL_0033 | ||
| Experiment 3 Reporting the Activity Date of This ADC | [81] | ||||
| Efficacy Data | Half Maximal Inhibitory Concentration (IC50) |
18.00 ng/mL
|
Positive Lewis Y expression (Lewis Y+++/++; FACS analysis =755) | ||
| Method Description |
The inhibitory activity of the mAb-Val-Cit-MMAE conjugates exhibited greater in vitrospecificity and lower in vivo toxicity was compared with corresponding hydrazone conjugatescorresponding hydrazone conjugates on H3396 cells.The cytotoxic effects of the conjugates on H3396 cells (cBR96 Ag+,cAC10 Ag-) were determined using both pulsed (2 h) and long-term(97 h) drug exposure assays.
Click to Show/Hide
|
||||
| In Vitro Model | Breast carcinoma | H3396 cells | CVCL_D348 | ||
| Experiment 4 Reporting the Activity Date of This ADC | [81] | ||||
| Efficacy Data | Half Maximal Inhibitory Concentration (IC50) |
80.00 ng/mL
|
Positive Lewis Y expression (Lewis Y+++/++; FACS analysis =922) | ||
| Method Description |
The inhibitory activity of the mAb-Val-Cit-MMAE conjugates exhibited greater in vitrospecificity and lower in vivo toxicity was compared with corresponding hydrazone conjugatescorresponding hydrazone conjugates on H3396 cells.The cytotoxic effects of the conjugates on H3396 cells (cBR96 Ag+,cAC10 Ag-) were determined using both pulsed (2 h) and long-term(97 h) drug exposure assays.
Click to Show/Hide
|
||||
| In Vitro Model | Amelanotic melanoma | MDA-MB-435 cells | CVCL_0417 | ||
| Experiment 5 Reporting the Activity Date of This ADC | [81] | ||||
| Efficacy Data | Half Maximal Inhibitory Concentration (IC50) |
80.00 ng/mL
|
Positive Lewis Y expression (Lewis Y+++/++; FACS analysis =600) | ||
| Method Description |
The inhibitory activity of the mAb-Val-Cit-MMAE conjugates exhibited greater in vitrospecificity and lower in vivo toxicity was compared with corresponding hydrazone conjugatescorresponding hydrazone conjugates on H3396 cells.The cytotoxic effects of the conjugates on H3396 cells (cBR96 Ag+,cAC10 Ag-) were determined using both pulsed (2 h) and long-term(97 h) drug exposure assays.
Click to Show/Hide
|
||||
| In Vitro Model | Colon carcinoma | RCA cells | CVCL_R735 | ||
| Experiment 6 Reporting the Activity Date of This ADC | [81] | ||||
| Efficacy Data | Half Maximal Inhibitory Concentration (IC50) |
80.00 ng/mL
|
Positive Lewis Y expression (Lewis Y+++/++; FACS analysis =645) | ||
| Method Description |
The inhibitory activity of the mAb-Val-Cit-MMAE conjugates exhibited greater in vitrospecificity and lower in vivo toxicity was compared with corresponding hydrazone conjugatescorresponding hydrazone conjugates on H3396 cells.The cytotoxic effects of the conjugates on H3396 cells (cBR96 Ag+,cAC10 Ag-) were determined using both pulsed (2 h) and long-term(97 h) drug exposure assays.
Click to Show/Hide
|
||||
| In Vitro Model | Invasive breast carcinoma | MCF-7 cells | CVCL_0031 | ||
HER2-gsADC-43 [Investigative]
Discovered Using Cell Line-derived Xenograft Model
| Experiment 1 Reporting the Activity Date of This ADC | [206] | ||||
| Efficacy Data | Tumor Growth Inhibition value (TGI) | ≈ 44.77% (Day 28) | Positive HER2 expression (HER2+++/++) | ||
| Method Description |
To further evaluate the gsADCs, we determined the in vivo tumor-inhibitory activity in an NCI-N87 nude mice xenograft model. The mice were randomly grouped into 10 groups (n = 5), including a PBS control group, when the tumors grew to 200 mm3. The experimental groups were 3.0 mg/kg gsADCs q3d.
|
||||
| In Vivo Model | NCI-N87 CDX model | ||||
| In Vitro Model | Gastric tubular adenocarcinoma | NCI-N87 cells | CVCL_1603 | ||
| Experiment 2 Reporting the Activity Date of This ADC | [206] | ||||
| Efficacy Data | Tumor Growth Inhibition value (TGI) | ≈ 97.85% (Day 57) | Positive HER2 expression (HER2+++/++) | ||
| Method Description |
To further evaluate the gsADCs, we determined the in vivo tumor-inhibitory activity in an NCI-N87 nude mice xenograft model. The mice were randomly grouped into 10 groups (n = 5), including a PBS control group, when the tumors grew to 200 mm3. The experimental groups were 3.0 mg/kg gsADCs q3d.
|
||||
| In Vivo Model | NCI-N87 CDX model | ||||
| In Vitro Model | Gastric tubular adenocarcinoma | NCI-N87 cells | CVCL_1603 | ||
Revealed Based on the Cell Line Data
| Experiment 1 Reporting the Activity Date of This ADC | [206] | ||||
| Efficacy Data | Half Maximal Inhibitory Concentration (IC50) |
0.09 nM
|
Positive HER2 expression (HER2+++/++) | ||
| Method Description |
Cells were cultured in a 10% fetal bovine serum (FBS)-containing RPMI 1640 medium and were planted into 96-well plates with 6000 cells per well. The plates were incubated overnight at 37°C in a 5% CO2 cell incubator.
|
||||
| In Vitro Model | Breast adenocarcinoma | SK-BR-3 cells | CVCL_0033 | ||
| Experiment 2 Reporting the Activity Date of This ADC | [206] | ||||
| Efficacy Data | Half Maximal Inhibitory Concentration (IC50) | > 66.00 nM | Positive HER2 expression (HER2+++/++) | ||
| Method Description |
Cells were cultured in a 10% fetal bovine serum (FBS)-containing RPMI 1640 medium and were planted into 96-well plates with 6000 cells per well. The plates were incubated overnight at 37°C in a 5% CO2 cell incubator.
|
||||
| In Vitro Model | Gastric tubular adenocarcinoma | NCI-N87 cells | CVCL_1603 | ||
| Experiment 3 Reporting the Activity Date of This ADC | [206] | ||||
| Efficacy Data | Half Maximal Inhibitory Concentration (IC50) | > 66.00 nM | Negative HER2 expression (HER2 -) | ||
| Method Description |
Cells were cultured in a 10% fetal bovine serum (FBS)-containing RPMI 1640 medium and were planted into 96-well plates with 6000 cells per well. The plates were incubated overnight at 37°C in a 5% CO2 cell incubator.
|
||||
| In Vitro Model | Breast adenocarcinoma | MDA-MB-231 cells | CVCL_0062 | ||
TF-mAb-H44-MMAE [Investigative]
Discovered Using Cell Line-derived Xenograft Model
| Experiment 1 Reporting the Activity Date of This ADC | [200] | ||||
| Efficacy Data | Tumor Growth Inhibition value (TGI) | ≈ 46.00% (Day 14) | Positive TF expression (TF +++) | ||
| Method Description |
Conjugates of the exemplary antibodies were tested using an established xenograft model implanted subcutaneous into SCID mice. Mice were randomized by body weight into treatment groups and treated once post cell inoculation with 1 mg/kg, i.v., qw of one of the conjugates listed above or with PBS only.
|
||||
| In Vivo Model | HCC1806 CDX model | ||||
| In Vitro Model | Breast squamous cell carcinoma | HCC1806 cells | CVCL_1258 | ||
| Experiment 2 Reporting the Activity Date of This ADC | [200] | ||||
| Efficacy Data | Tumor Growth Inhibition value (TGI) | ≈ 93.80% (Day 36) | Positive TF expression (TF +++) | ||
| Method Description |
Conjugates of the exemplary antibodies were tested using an established xenograft model implanted subcutaneous into SCID mice. Mice were randomized by body weight into treatment groups and treated once post cell inoculation with 1 mg/kg, i.v., qw of one of the conjugates listed above or with PBS only.
|
||||
| In Vivo Model | BxPC3 CDX model | ||||
| In Vitro Model | Pancreatic ductal adenocarcinoma | BxPC-3 cells | CVCL_0186 | ||
| Experiment 3 Reporting the Activity Date of This ADC | [200] | ||||
| Efficacy Data | Tumor Growth Inhibition value (TGI) | ≈ 100.00% (Day 36) | Positive TF expression (TF +++) | ||
| Method Description |
Conjugates of the exemplary antibodies were tested using an established xenograft model implanted subcutaneous into SCID mice. Mice were randomized by body weight into treatment groups and treated once post cell inoculation with 10 mg/kg, i.v., qw of one of the conjugates listed above or with PBS only.
|
||||
| In Vivo Model | BxPC3 CDX model | ||||
| In Vitro Model | Pancreatic ductal adenocarcinoma | BxPC-3 cells | CVCL_0186 | ||
| Experiment 4 Reporting the Activity Date of This ADC | [200] | ||||
| Efficacy Data | Tumor Growth Inhibition value (TGI) | ≈ 100.00% (Day 14) | Positive TF expression (TF +++) | ||
| Method Description |
Conjugates of the exemplary antibodies were tested using an established xenograft model implanted subcutaneous into SCID mice. Mice were randomized by body weight into treatment groups and treated once post cell inoculation with 3 mg/kg, i.v., qw of one of the conjugates listed above or with PBS only.
|
||||
| In Vivo Model | HCC1806 CDX model | ||||
| In Vitro Model | Breast squamous cell carcinoma | HCC1806 cells | CVCL_1258 | ||
| Experiment 5 Reporting the Activity Date of This ADC | [200] | ||||
| Efficacy Data | Tumor Growth Inhibition value (TGI) | ≈ 100.00% (Day 36) | Positive TF expression (TF +++) | ||
| Method Description |
Conjugates of the exemplary antibodies were tested using an established xenograft model implanted subcutaneous into SCID mice. Mice were randomized by body weight into treatment groups and treated once post cell inoculation with 3 mg/kg, i.v., qw of one of the conjugates listed above or with PBS only.
|
||||
| In Vivo Model | BxPC3 CDX model | ||||
| In Vitro Model | Pancreatic ductal adenocarcinoma | BxPC-3 cells | CVCL_0186 | ||
Revealed Based on the Cell Line Data
| Experiment 1 Reporting the Activity Date of This ADC | [200] | ||||
| Efficacy Data | Half Maximal Inhibitory Concentration (IC50) |
0.02 nM
|
Positive TF expression (TF +++) | ||
| Method Description |
Cells were plated at about 500 cells per well in a 96-well plate in 100 uL of media. In vitro activity and targeted delivery of ADCs, the isotype-matched negative controls ADCs, and naked antibodies control were assessed in cells.
|
||||
| In Vitro Model | Breast adenocarcinoma | MDA-MB-231 cells | CVCL_0062 | ||
| Experiment 2 Reporting the Activity Date of This ADC | [200] | ||||
| Efficacy Data | Half Maximal Inhibitory Concentration (IC50) |
0.03 nM
|
Positive TF expression (TF +++) | ||
| Method Description |
Cells were plated at about 500 cells per well in a 96-well plate in 100 uL of media. In vitro activity and targeted delivery of ADCs, the isotype-matched negative controls ADCs, and naked antibodies control were assessed in cells.
|
||||
| In Vitro Model | Pancreatic ductal adenocarcinoma | BxPC-3 cells | CVCL_0186 | ||
| Experiment 3 Reporting the Activity Date of This ADC | [200] | ||||
| Efficacy Data | Half Maximal Inhibitory Concentration (IC50) |
0.05 nM
|
Positive TF expression (TF +++) | ||
| Method Description |
Cells were plated at about 500 cells per well in a 96-well plate in 100 uL of media. In vitro activity and targeted delivery of ADCs, the isotype-matched negative controls ADCs, and naked antibodies control were assessed in cells.
|
||||
| In Vitro Model | Breast ductal carcinoma | HCC1937 cells | CVCL_0290 | ||
| Experiment 4 Reporting the Activity Date of This ADC | [200] | ||||
| Efficacy Data | Half Maximal Inhibitory Concentration (IC50) |
0.06 nM
|
Positive TF expression (TF +++) | ||
| Method Description |
Cells were plated at about 500 cells per well in a 96-well plate in 100 uL of media. In vitro activity and targeted delivery of ADCs, the isotype-matched negative controls ADCs, and naked antibodies control were assessed in cells.
|
||||
| In Vitro Model | Breast squamous cell carcinoma | HCC1806 cells | CVCL_1258 | ||
| Experiment 5 Reporting the Activity Date of This ADC | [200] | ||||
| Efficacy Data | Half Maximal Inhibitory Concentration (IC50) |
0.14 nM
|
Positive TF expression (TF +++) | ||
| Method Description |
Cells were plated at about 500 cells per well in a 96-well plate in 100 uL of media. In vitro activity and targeted delivery of ADCs, the isotype-matched negative controls ADCs, and naked antibodies control were assessed in cells.
|
||||
| In Vitro Model | Breast ductal carcinoma | HCC38 cells | CVCL_1267 | ||
| Experiment 6 Reporting the Activity Date of This ADC | [200] | ||||
| Efficacy Data | Half Maximal Inhibitory Concentration (IC50) | > 100 nM | Positive TF expression (TF +++) | ||
| Method Description |
Cells were plated at about 500 cells per well in a 96-well plate in 100 uL of media. In vitro activity and targeted delivery of ADCs, the isotype-matched negative controls ADCs, and naked antibodies control were assessed in cells.
|
||||
| In Vitro Model | Breast adenocarcinoma | MDA-MB-453 cells | CVCL_0418 | ||
| Experiment 7 Reporting the Activity Date of This ADC | [200] | ||||
| Efficacy Data | Half Maximal Inhibitory Concentration (IC50) | > 100 nM | Positive TF expression (TF +++) | ||
| Method Description |
Cells were plated at about 500 cells per well in a 96-well plate in 100 uL of media. In vitro activity and targeted delivery of ADCs, the isotype-matched negative controls ADCs, and naked antibodies control were assessed in cells.
|
||||
| In Vitro Model | Invasive breast carcinoma | T-47D cells | CVCL_0553 | ||
| Experiment 8 Reporting the Activity Date of This ADC | [200] | ||||
| Efficacy Data | Half Maximal Inhibitory Concentration (IC50) | > 100 nM | Positive TF expression (TF +++) | ||
| Method Description |
Cells were plated at about 500 cells per well in a 96-well plate in 100 uL of media. In vitro activity and targeted delivery of ADCs, the isotype-matched negative controls ADCs, and naked antibodies control were assessed in cells.
|
||||
| In Vitro Model | Pancreatic ductal adenocarcinoma | PANC-1 cells | CVCL_0480 | ||
IgG1 (GH2-20)-vc-MMAE [Investigative]
Discovered Using Cell Line-derived Xenograft Model
| Experiment 1 Reporting the Activity Date of This ADC | [203] | ||||
| Efficacy Data | Tumor Growth Inhibition value (TGI) | ≈ 47.70% (Day 21) | Positive HER2 expression (HER2 +++/++) | ||
| Method Description |
N87 tumors were implanted to NOD/SCID mice to the size of about 100 mm3 (day 0) and were then treated with ADCs at day 0, day 7 and day 14 at the dosage of 30 mg/kg.
|
||||
| In Vivo Model | NCI-N87 CDX model | ||||
| In Vitro Model | Gastric tubular adenocarcinoma | NCI-N87 cells | CVCL_1603 | ||
Revealed Based on the Cell Line Data
| Experiment 1 Reporting the Activity Date of This ADC | [203] | ||||
| Efficacy Data | Half Maximal Inhibitory Concentration (IC50) |
234 nM
|
Positive HER2 expression (HER2 +++/++) | ||
| Method Description |
N87 cells (10000) were seeded in 96-well plates for the IC50 measurements of cell viability. After incubation at 37°C for 16 h, the medium was replaced by fresh normal medium with serum and the cytotoxicity was assessed using the WST-1 reagent after 72 h of incubation at 37°C.
|
||||
| In Vitro Model | Gastric tubular adenocarcinoma | NCI-N87 cells | CVCL_1603 | ||
43D7-Val-Cit-MMAE [Investigative]
Discovered Using Cell Line-derived Xenograft Model
| Experiment 1 Reporting the Activity Date of This ADC | [86] | ||||
| Efficacy Data | Tumor Growth Inhibition value (TGI) |
49.00% (Day 49)
|
Low FOLR1 expression (FOLR1+) | ||
| Method Description |
Cell line-derived xenograft (CDX) models MDA-MB-231 epidermoid carcinoma and the HPAF-II pancreatic carcinoma cell lines were implanted subcutaneously in the flank of athymic nude mice Animals were removed from study and euthanized once tumor size reached 1200 mm3 or skin ulceration was evident ADC was dosed weekly at 2 mg/kg for 2 weeks.
Click to Show/Hide
|
||||
| In Vivo Model | MDA-MB-231 cell line xenograft model | ||||
| In Vitro Model | Breast adenocarcinoma | MDA-MB-231 cells | CVCL_0062 | ||
| Experiment 2 Reporting the Activity Date of This ADC | [86] | ||||
| Efficacy Data | Tumor Growth Inhibition value (TGI) |
93.00% (Day 49)
|
Low FOLR1 expression (FOLR1+) | ||
| Method Description |
Cell line-derived xenograft (CDX) models MDA-MB-231 epidermoid carcinoma and the HPAF-II pancreatic carcinoma cell lines were implanted subcutaneously in the flank of athymic nude mice Animals were removed from study and euthanized once tumor size reached 1200 mm3 or skin ulceration was evident ADC was dosed weekly at 4 mg/kg for 2 weeks.
Click to Show/Hide
|
||||
| In Vivo Model | MDA-MB-231 cell line xenograft model | ||||
| In Vitro Model | Breast adenocarcinoma | MDA-MB-231 cells | CVCL_0062 | ||
| Experiment 3 Reporting the Activity Date of This ADC | [86] | ||||
| Efficacy Data | Tumor Growth Inhibition value (TGI) |
100.00% (Day 39)
|
Low FOLR1 expression (FOLR1+) | ||
| Method Description |
Cell line-derived xenograft (CDX) models The A431 epidermoid carcinoma and the HPAF-II pancreatic carcinoma cell lines were implanted subcutaneously in the flank of athymic nude mice Animals were removed from study and euthanized once tumor size reached 1200 mm3 or skin ulceration was evident ADC was dosed weekly at 2 mg/kg for 2 weeks.
|
||||
| In Vivo Model | HPAF-II xenograft model | ||||
| In Vitro Model | Pancreatic ductal adenocarcinoma | HPAF-II cells | CVCL_0313 | ||
| Experiment 4 Reporting the Activity Date of This ADC | [86] | ||||
| Efficacy Data | Half Maximal Effective Concentration (EC50) |
27.00 nM
|
Positive Tissue factor expression (TF+++/++; 320,000 TF receptor copy number) | ||
| Method Description |
Antibody-dependent cellular cytotoxicity (ADCC) A431 cells were plated on a microtiter plate The following day, the cells were incubated with a ten-point 1:3 dilution titration of anti-TF antibodies or the ADCs starting at 50 nM An ADCC effector-to-target cell ratio of 8:1 was added to each well and incubated for 6 h at 37°C Luciferase Assay Reagent was added to each well to measure luminescence on an Envision plate reader Antibody-dependent cellular cytotoxicity (ADCC) reporter luminescence was evaluated after a 6-hour incubation of the reporter Jurkat cell line with TF-positive A431 cells and a titration of anti-TF antibody or ADC The ADCC reporter luminescence EC50 values for each anti-TF antibody or ADC are listed.
Click to Show/Hide
|
||||
| In Vitro Model | Breast adenocarcinoma | MDA-MB-231 cells | CVCL_0062 | ||
Revealed Based on the Cell Line Data
| Experiment 1 Reporting the Activity Date of This ADC | [86] | ||||
| Efficacy Data | Half Maximal Inhibitory Concentration (IC50) |
5.00 nM
|
Positive Tissue factor expression (TF+++/++; 570,000 TF receptor copy number) | ||
| Method Description |
To evaluate ADC cytotoxicity, cells were plated in 384-well plates Anti-TF antibodies conjugated to MC-vc-PAB-MMAE were serially diluted as shown Plates were incubated for 3 days, followed by lysis in CTG assay reagent For each ADC, the IC50 and its associated 95% confidence interval (95% CI) were calculated Titrations of the TF-specific ADCs were added to HPAF-II cells, with a 72-hour incubationThis treatment resulted in efficacious cell killing.
Click to Show/Hide
|
||||
| In Vitro Model | Pancreatic ductal adenocarcinoma | HPAF-II cells | CVCL_0313 | ||
| Experiment 2 Reporting the Activity Date of This ADC | [86] | ||||
| Efficacy Data | Half Maximal Inhibitory Concentration (IC50) |
14.00 nM
|
Positive Tissue factor expression (TF+++/++; 320,000 TF receptor copy number) | ||
| Method Description |
To evaluate ADC cytotoxicity, cells were plated in 384-well plates Anti-TF antibodies conjugated to MC-vc-PAB-MMAE were serially diluted as shown Plates were incubated for 3 days, followed by lysis in CTG assay reagent For each ADC, the IC50 and its associated 95% confidence interval (95% CI) were calculated Titrations of the TF-specific ADCs were added to 5-day old cultures of MDA-MB-231 cells, with a 72-hour incubationThis treatment resulted in efficacious cell killing.
Click to Show/Hide
|
||||
| In Vitro Model | Breast adenocarcinoma | MDA-MB-231 cells | CVCL_0062 | ||
| Experiment 3 Reporting the Activity Date of This ADC | [95] | ||||
| Efficacy Data | Half Maximal Effective Concentration (EC50) |
14.00 nM
|
Positive Tissue factor expression (TF+++/++; 320,000 TF receptor copy number) | ||
| Method Description |
A431 cells were pre-incubated for 30 min without or with 50 nM of FVIIa prior to the addition of an anti-TF ADC (43D7-vc-MMAE) titration After a 4 h incubation at 37°C, the FVIIa and ADC were washed out and the cells were cultured for another 68 h before cell viability assessment.
|
||||
| In Vitro Model | Skin squamous cell carcinoma | A431 cells | CVCL_0037 | ||
| Experiment 4 Reporting the Activity Date of This ADC | [95] | ||||
| Efficacy Data | Half Maximal Effective Concentration (EC50) |
14.00 nM
|
Positive Tissue factor expression (TF+++/++; 320,000 TF receptor copy number) | ||
| Method Description |
To evaluate ADC cytotoxicity, cells were plated in 384-well plates Anti-TF antibodies conjugated to MC-vc-PAB-MMAE were serially diluted as shown Plates were incubated for 3 days, followed by lysis in CTG assay reagent For each ADC, the IC50 and its associated 95% confidence interval (95% CI) were calculated Titrations of the TF-specific ADCs were added to A431 cells, with a 72-hour incubationThis treatment resulted in efficacious cell killing.
Click to Show/Hide
|
||||
| In Vitro Model | Skin squamous cell carcinoma | A431 cells | CVCL_0037 | ||
| Experiment 5 Reporting the Activity Date of This ADC | [95] | ||||
| Efficacy Data | Half Maximal Effective Concentration (EC50) |
14.00 nM
|
Positive Tissue factor expression (TF+++/++; 570,000 TF receptor copy number) | ||
| Method Description |
To evaluate ADC cytotoxicity, cells were plated in 384-well plates Anti-TF antibodies conjugated to MC-vc-PAB-MMAE were serially diluted as shown Plates were incubated for 3 days, followed by lysis in CTG assay reagent For each ADC, the IC50 and its associated 95% confidence interval (95% CI) were calculated Titrations of the TF-specific ADCs were added to A431 cells, with a 4-hour incubation followed by removal of excess ADC and culture for another 68 hours This treatment resulted in efficacious cell killing.
Click to Show/Hide
|
||||
| In Vitro Model | Skin squamous cell carcinoma | A431 cells | CVCL_0037 | ||
WO2021044208A1 ADC 2A2-4 [Investigative]
Discovered Using Cell Line-derived Xenograft Model
| Experiment 1 Reporting the Activity Date of This ADC | [204] | ||||
| Efficacy Data | Tumor Growth Inhibition value (TGI) | ≈ 49.63% (Day 26) | Positive ROR1 expression (ROR1+++/++) | ||
| Method Description |
1 x 10⁷ cells/head of human ROR-1 expressing lung cancer cell line Calu-3 were grafted to severe combined immunodeficient (SCID) mice to prepare human cancergrafted mice. After grafting, the mice were grouped when tumor size reached 111mm3 on average (Day 1), and 0.25 mg/kg of 2A2 dPBD ADC.
|
||||
| In Vivo Model | Calu-3 CDX model | ||||
| In Vitro Model | Lung adenocarcinoma | Calu-3 cells | CVCL_0609 | ||
| Experiment 2 Reporting the Activity Date of This ADC | [204] | ||||
| Efficacy Data | Tumor Growth Inhibition value (TGI) | ≈ 100.00% (Day 26) | Positive ROR1 expression (ROR1+++/++) | ||
| Method Description |
1 x 10⁷ cells/head of human ROR-1 expressing lung cancer cell line Calu-3 were grafted to severe combined immunodeficient (SCID) mice to prepare human cancergrafted mice. After grafting, the mice were grouped when tumor size reached 111mm3 on average (Day 1), and 1 mg/kg of 2A2 dPBD ADC.
|
||||
| In Vivo Model | Calu-3 CDX model | ||||
| In Vitro Model | Lung adenocarcinoma | Calu-3 cells | CVCL_0609 | ||
Revealed Based on the Cell Line Data
| Experiment 1 Reporting the Activity Date of This ADC | [204] | ||||
| Efficacy Data | Half Maximal Inhibitory Concentration (IC50) |
1000 pM
|
Positive ROR1 expression (ROR1+++/++) | ||
| Method Description |
In a 96-well plate, each well was seeded with 4,000 to 5,000 of the respective cancer cell lines. After culturing for 24 hours, they were treated with the ADCs at a concentra-tion of 0.0015 to 10.0 nM (serially diluted threefold). 72 hours later, the number of live cells was measured using WST-8.
|
||||
| In Vitro Model | Breast adenocarcinoma | MDA-MB-231 cells | CVCL_0062 | ||
| Experiment 2 Reporting the Activity Date of This ADC | [204] | ||||
| Efficacy Data | Half Maximal Inhibitory Concentration (IC50) |
0.48 nM
|
Positive ROR1 expression (ROR1+++/++) | ||
| Method Description |
In a 96-well plate, each well was seeded with 4,000 to 5,000 of the respective cancer cell lines. After culturing for 24 hours, they were treated with the ADCs at a concentra-tion of 0.0015 to 10.0 nM (serially diluted threefold). 72 hours later, the number of live cells was measured using WST-8.
|
||||
| In Vitro Model | Mantle cell lymphoma | JeKo-1 cells | CVCL_1865 | ||
| Experiment 3 Reporting the Activity Date of This ADC | [204] | ||||
| Efficacy Data | Half Maximal Inhibitory Concentration (IC50) | > 10.00 nM | Positive ROR1 expression (ROR1+++/++) | ||
| Method Description |
In a 96-well plate, each well was seeded with 4,000 to 5,000 of the respective cancer cell lines. After culturing for 24 hours, they were treated with the ADCs at a concentra-tion of 0.0015 to 10.0 nM (serially diluted threefold). 72 hours later, the number of live cells was measured using WST-8.
|
||||
| In Vitro Model | Lung adenocarcinoma | NCI-H2228 cells | CVCL_1543 | ||
| Experiment 4 Reporting the Activity Date of This ADC | [204] | ||||
| Efficacy Data | Half Maximal Inhibitory Concentration (IC50) | > 10.00 nM | Positive ROR1 expression (ROR1+++/++) | ||
| Method Description |
In a 96-well plate, each well was seeded with 4,000 to 5,000 of the respective cancer cell lines. After culturing for 24 hours, they were treated with the ADCs at a concentra-tion of 0.0015 to 10.0 nM (serially diluted threefold). 72 hours later, the number of live cells was measured using WST-8.
|
||||
| In Vitro Model | Invasive breast carcinoma | MCF-7 cells | CVCL_0031 | ||
| Experiment 5 Reporting the Activity Date of This ADC | [204] | ||||
| Efficacy Data | Half Maximal Inhibitory Concentration (IC50) |
23.43 nM
|
Positive ROR1 expression (ROR1+++/++) | ||
| Method Description |
In a 96-well plate, each well was seeded with 4,000 to 5,000 of the respective cancer cell lines. After culturing for 24 hours, they were treated with the ADCs at a concentra-tion of 0.0015 to 10.0 nM (serially diluted threefold). 72 hours later, the number of live cells was measured using WST-8.
|
||||
| In Vitro Model | Breast squamous cell carcinoma | HCC1806 cells | CVCL_1258 | ||
h1F6-6 MMAE DAR4 [Investigative]
Discovered Using Cell Line-derived Xenograft Model
| Experiment 1 Reporting the Activity Date of This ADC | [207] | ||||
| Efficacy Data | Tumor Growth Inhibition value (TGI) | ≈ 50.60% (Day 42) | Positive CD70 expression (CD70+++/++) | ||
| Method Description |
To establish 786-O tumors, 5 x 10⁶ cells were implanted into the right flank of athymic nu/nu female donor mice. When tumors reached ~100 mm3 mice were randomly allocated to treatment groups. The dose of ADC was 0.5 mg/kg.
|
||||
| In Vivo Model | 786-O CDX model | ||||
| In Vitro Model | Renal cell carcinoma | 786-O cells | CVCL_1051 | ||
| Experiment 2 Reporting the Activity Date of This ADC | [207] | ||||
| Efficacy Data | Tumor Growth Inhibition value (TGI) | ≈ 89.85% (Day 18) | Positive CD19 expression (CD19+++/++) | ||
| Method Description |
To establish DOHH1 tumors, 5 x 10⁶ cells were implanted into the right flank of athymic nu/nu female donor mice (Harlan,Indianapolis, IN). When tumors reached ~100 mm3 mice were randomly allocated to treatment groups. The dose of ADC was 4 mg/kg single.
|
||||
| In Vivo Model | DOHH1 CDX model | ||||
| In Vitro Model | Diffuse large B-cell lymphoma germinal center B-cell type | DoHH2 cells | CVCL_1179 | ||
Revealed Based on the Cell Line Data
| Experiment 1 Reporting the Activity Date of This ADC | [207] | ||||
| Efficacy Data | Half Maximal Inhibitory Concentration (IC50) |
23.00 ng/mL
|
Positive CD70 expression (CD70+++/++) | ||
| Method Description |
Log phase cultures of cells were collected and cells plated at seeding densities ranging from 500 - 10,000 cells/well according to pre-determined conditions.After incubating 24 hours to allow surface protein reconstitution, serial dilutions of test conjugates were added and cultures incubated further for 4 days.
|
||||
| In Vitro Model | Clear cell renal cell carcinoma | Caki-1 cells | CVCL_0234 | ||
| Experiment 2 Reporting the Activity Date of This ADC | [207] | ||||
| Efficacy Data | Half Maximal Inhibitory Concentration (IC50) |
26.00 ng/mL
|
Positive CD70 expression (CD70+++/++) | ||
| Method Description |
Log phase cultures of cells were collected and cells plated at seeding densities ranging from 500 - 10,000 cells/well according to pre-determined conditions.After incubating 24 hours to allow surface protein reconstitution, serial dilutions of test conjugates were added and cultures incubated further for 4 days.
|
||||
| In Vitro Model | Renal cell carcinoma | 786-O cells | CVCL_1051 | ||
hBU12-6 MMAE DAR4 [Investigative]
Discovered Using Cell Line-derived Xenograft Model
| Experiment 1 Reporting the Activity Date of This ADC | [207] | ||||
| Efficacy Data | Tumor Growth Inhibition value (TGI) | ≈ 50.60% (Day 42) | Positive CD70 expression (CD70+++/++) | ||
| Method Description |
To establish 786-O tumors, 5 x 10⁶ cells were implanted into the right flank of athymic nu/nu female donor mice. When tumors reached ~100 mm3 mice were randomly allocated to treatment groups. The dose of ADC was 0.5 mg/kg.
|
||||
| In Vivo Model | 786-O CDX model | ||||
| In Vitro Model | Renal cell carcinoma | 786-O cells | CVCL_1051 | ||
| Experiment 2 Reporting the Activity Date of This ADC | [207] | ||||
| Efficacy Data | Tumor Growth Inhibition value (TGI) | ≈ 89.85% (Day 18) | Positive CD19 expression (CD19+++/++) | ||
| Method Description |
To establish DOHH1 tumors, 5 x 10⁶ cells were implanted into the right flank of athymic nu/nu female donor mice (Harlan,Indianapolis, IN). When tumors reached ~100 mm3 mice were randomly allocated to treatment groups. The dose of ADC was 4 mg/kg single.
|
||||
| In Vivo Model | DOHH1 CDX model | ||||
| In Vitro Model | Diffuse large B-cell lymphoma germinal center B-cell type | DoHH2 cells | CVCL_1179 | ||
Revealed Based on the Cell Line Data
| Experiment 1 Reporting the Activity Date of This ADC | [207] | ||||
| Efficacy Data | Half Maximal Inhibitory Concentration (IC50) |
23.00 ng/mL
|
Positive CD70 expression (CD70+++/++) | ||
| Method Description |
Log phase cultures of cells were collected and cells plated at seeding densities ranging from 500 - 10,000 cells/well according to pre-determined conditions.After incubating 24 hours to allow surface protein reconstitution, serial dilutions of test conjugates were added and cultures incubated further for 4 days.
|
||||
| In Vitro Model | Clear cell renal cell carcinoma | Caki-1 cells | CVCL_0234 | ||
| Experiment 2 Reporting the Activity Date of This ADC | [207] | ||||
| Efficacy Data | Half Maximal Inhibitory Concentration (IC50) |
26.00 ng/mL
|
Positive CD70 expression (CD70+++/++) | ||
| Method Description |
Log phase cultures of cells were collected and cells plated at seeding densities ranging from 500 - 10,000 cells/well according to pre-determined conditions.After incubating 24 hours to allow surface protein reconstitution, serial dilutions of test conjugates were added and cultures incubated further for 4 days.
|
||||
| In Vitro Model | Renal cell carcinoma | 786-O cells | CVCL_1051 | ||
CLDN1 ADC [Investigative]
Discovered Using Cell Line-derived Xenograft Model
| Experiment 1 Reporting the Activity Date of This ADC | [209] | ||||
| Efficacy Data | Tumor Growth Inhibition value (TGI) | ≈ 51.93% (Day 26) | Positive CLDN1 expression (CLDN1 +++/++) | ||
| Method Description |
100,000 SW620 cells were suspended in culture medium and Matrigel (v/v) and injected subcutaneously into the right flank of 6-week-old female athymic nude mice. When the tumor volume reached approximately 100 mm3, mice were randomized in different groups. For ADC experiments, mice received by iv injection 0.9% NaCl or ADCs (5 mg/kg per injection) twice per week for 4 weeks.
Click to Show/Hide
|
||||
| In Vivo Model | SW620 CDX model | ||||
| In Vitro Model | Colon adenocarcinoma | SW620 cells | CVCL_0547 | ||
| Experiment 2 Reporting the Activity Date of This ADC | [209] | ||||
| Efficacy Data | Tumor Growth Inhibition value (TGI) | ≈ 55.59% (Day 22) | Positive CLDN1 expression (CLDN1 +++/++) | ||
| Method Description |
100,000 SW620 cells were suspended in culture medium and Matrigel (v/v) and injected subcutaneously into the right flank of 6-week-old female athymic nude mice. For the sequential combination experiments, mice received oxaliplatin at 3 mg/kg once per week followed by an iv injection of ADC-6F6 at 5 mg/kg after 3 and 6 days.
|
||||
| In Vivo Model | SW620 CDX model | ||||
| In Vitro Model | Colon adenocarcinoma | SW620 cells | CVCL_0547 | ||
TF-mAb-H39-MMAE [Investigative]
Discovered Using Cell Line-derived Xenograft Model
| Experiment 1 Reporting the Activity Date of This ADC | [200] | ||||
| Efficacy Data | Tumor Growth Inhibition value (TGI) | ≈ 52.00% (Day 14) | Positive TF expression (TF +++) | ||
| Method Description |
Conjugates of the exemplary antibodies were tested using an established xenograft model implanted subcutaneous into SCID mice. Mice were randomized by body weight into treatment groups and treated once post cell inoculation with 1 mg/kg, i.v., qw of one of the conjugates listed above or with PBS only.
|
||||
| In Vivo Model | HCC1806 CDX model | ||||
| In Vitro Model | Breast squamous cell carcinoma | HCC1806 cells | CVCL_1258 | ||
| Experiment 2 Reporting the Activity Date of This ADC | [200] | ||||
| Efficacy Data | Tumor Growth Inhibition value (TGI) | ≈ 56.70% (Day 40) | Positive TF expression (TF +++) | ||
| Method Description |
Conjugates of the exemplary antibodies were tested using an established xenograft model implanted subcutaneous into SCID mice. Mice were randomized by body weight into treatment groups and treated once post cell inoculation with 0.3 mg/kg, i.v., qw of one of the conjugates listed above or with PBS only.
|
||||
| In Vivo Model | BxPC3 CDX model | ||||
| In Vitro Model | Pancreatic ductal adenocarcinoma | BxPC-3 cells | CVCL_0186 | ||
| Experiment 3 Reporting the Activity Date of This ADC | [200] | ||||
| Efficacy Data | Tumor Growth Inhibition value (TGI) | ≈ 94.00% (Day 14) | Positive TF expression (TF +++) | ||
| Method Description |
Conjugates of the exemplary antibodies were tested using an established xenograft model implanted subcutaneous into SCID mice. Mice were randomized by body weight into treatment groups and treated once post cell inoculation with 3 mg/kg, i.v., qw of one of the conjugates listed above or with PBS only.
|
||||
| In Vivo Model | HCC1806 CDX model | ||||
| In Vitro Model | Breast squamous cell carcinoma | HCC1806 cells | CVCL_1258 | ||
Revealed Based on the Cell Line Data
| Experiment 1 Reporting the Activity Date of This ADC | [200] | ||||
| Efficacy Data | Tumor Growth Inhibition value (TGI) | ≈ 95.80% (Day 40) | Positive TF expression (TF +++) | ||
| Method Description |
Cells were plated at about 500 cells per well in a 96-well plate in 100 uL of media. In vitro activity and targeted delivery of ADCs, the isotype-matched negative controls ADCs, and naked antibodies control were assessed in cells.
|
||||
| In Vitro Model | Pancreatic ductal adenocarcinoma | BxPC-3 cells | CVCL_0186 | ||
| Experiment 2 Reporting the Activity Date of This ADC | [200] | ||||
| Efficacy Data | Half Maximal Inhibitory Concentration (IC50) |
0.02 nM
|
Positive TF expression (TF +++) | ||
| Method Description |
Cells were plated at about 500 cells per well in a 96-well plate in 100 uL of media. In vitro activity and targeted delivery of ADCs, the isotype-matched negative controls ADCs, and naked antibodies control were assessed in cells.
|
||||
| In Vitro Model | Breast adenocarcinoma | MDA-MB-231 cells | CVCL_0062 | ||
| Experiment 3 Reporting the Activity Date of This ADC | [200] | ||||
| Efficacy Data | Half Maximal Inhibitory Concentration (IC50) |
0.02 nM
|
Positive TF expression (TF +++) | ||
| Method Description |
Cells were plated at about 500 cells per well in a 96-well plate in 100 uL of media. In vitro activity and targeted delivery of ADCs, the isotype-matched negative controls ADCs, and naked antibodies control were assessed in cells.
|
||||
| In Vitro Model | Pancreatic ductal adenocarcinoma | BxPC-3 cells | CVCL_0186 | ||
| Experiment 4 Reporting the Activity Date of This ADC | [200] | ||||
| Efficacy Data | Half Maximal Inhibitory Concentration (IC50) |
0.05 nM
|
Positive TF expression (TF +++) | ||
| Method Description |
Cells were plated at about 500 cells per well in a 96-well plate in 100 uL of media. In vitro activity and targeted delivery of ADCs, the isotype-matched negative controls ADCs, and naked antibodies control were assessed in cells.
|
||||
| In Vitro Model | Breast ductal carcinoma | HCC1937 cells | CVCL_0290 | ||
| Experiment 5 Reporting the Activity Date of This ADC | [200] | ||||
| Efficacy Data | Half Maximal Inhibitory Concentration (IC50) |
0.05 nM
|
Positive TF expression (TF +++) | ||
| Method Description |
Cells were plated at about 500 cells per well in a 96-well plate in 100 uL of media. In vitro activity and targeted delivery of ADCs, the isotype-matched negative controls ADCs, and naked antibodies control were assessed in cells.
|
||||
| In Vitro Model | Breast squamous cell carcinoma | HCC1806 cells | CVCL_1258 | ||
| Experiment 6 Reporting the Activity Date of This ADC | [200] | ||||
| Efficacy Data | Half Maximal Inhibitory Concentration (IC50) |
0.18 nM
|
Positive TF expression (TF +++) | ||
| Method Description |
Cells were plated at about 500 cells per well in a 96-well plate in 100 uL of media. In vitro activity and targeted delivery of ADCs, the isotype-matched negative controls ADCs, and naked antibodies control were assessed in cells.
|
||||
| In Vitro Model | Breast ductal carcinoma | HCC38 cells | CVCL_1267 | ||
| Experiment 7 Reporting the Activity Date of This ADC | [200] | ||||
| Efficacy Data | Half Maximal Inhibitory Concentration (IC50) | > 100 nM | Positive TF expression (TF +++) | ||
| Method Description |
Cells were plated at about 500 cells per well in a 96-well plate in 100 uL of media. In vitro activity and targeted delivery of ADCs, the isotype-matched negative controls ADCs, and naked antibodies control were assessed in cells.
|
||||
| In Vitro Model | Breast adenocarcinoma | MDA-MB-453 cells | CVCL_0418 | ||
| Experiment 8 Reporting the Activity Date of This ADC | [200] | ||||
| Efficacy Data | Half Maximal Inhibitory Concentration (IC50) | > 100 nM | Positive TF expression (TF +++) | ||
| Method Description |
Cells were plated at about 500 cells per well in a 96-well plate in 100 uL of media. In vitro activity and targeted delivery of ADCs, the isotype-matched negative controls ADCs, and naked antibodies control were assessed in cells.
|
||||
| In Vitro Model | Invasive breast carcinoma | T-47D cells | CVCL_0553 | ||
| Experiment 9 Reporting the Activity Date of This ADC | [200] | ||||
| Efficacy Data | Half Maximal Inhibitory Concentration (IC50) | > 100 nM | Positive TF expression (TF +++) | ||
| Method Description |
Cells were plated at about 500 cells per well in a 96-well plate in 100 uL of media. In vitro activity and targeted delivery of ADCs, the isotype-matched negative controls ADCs, and naked antibodies control were assessed in cells.
|
||||
| In Vitro Model | Pancreatic ductal adenocarcinoma | PANC-1 cells | CVCL_0480 | ||
LRG1-ADC 5 [Investigative]
Discovered Using Cell Line-derived Xenograft Model
| Experiment 1 Reporting the Activity Date of This ADC | [210] | ||||
| Efficacy Data | Tumor Growth Inhibition value (TGI) | ≈ 52.40% (Day 16) | Positive LRG1 expression (LRG1+++/++) | ||
| Method Description |
Single-cell suspensions of 1 x10⁶ B16F0 cells were injected subcutaneously into the lower back of Lrg1+/+ C57BL/6 mice in 100 mL PBS. Tumours were measured and therapy was initiated when tumour volumes reached 0.1 cm3. ADC was administered at a dose of 20 mg/kg treatments were administered by a single intraperitoneal injection every 7 days for 3 weeks.
Click to Show/Hide
|
||||
| In Vivo Model | Melanoma CDX model | ||||
| In Vitro Model | Melanoma | Melanoma cells | Homo sapiens | ||
Revealed Based on the Cell Line Data
| Experiment 1 Reporting the Activity Date of This ADC | [210] | ||||
| Efficacy Data | Half Maximal Inhibitory Concentration (IC50) |
0.90 nM
|
Positive LRG1 expression (LRG1+++/++) | ||
| Method Description |
5 x10⁴ cells were seeded in 96-well plates and incubated at 37 overnight. Cells were thenexposed to a range of concentrations of the test compounds diluted in growth medium at pH 6.5 and at 37 as ADC 5 (0100 nM, 72 h). MTT reagent (12 mM) was then added to each well and cells were incubated for 4 h at 37 , followed by the addition of DMSO and further incubation at 37 1C for 1 h.
Click to Show/Hide
|
||||
| In Vitro Model | Mouse melanoma | B16-F0 cells | CVCL_0604 | ||
IgG1 (GH2-61)-vc-MMAE [Investigative]
Discovered Using Cell Line-derived Xenograft Model
| Experiment 1 Reporting the Activity Date of This ADC | [203] | ||||
| Efficacy Data | Tumor Growth Inhibition value (TGI) | ≈ 53.70% (Day 21) | Positive HER2 expression (HER2 +++/++) | ||
| Method Description |
N87 tumors were implanted to NOD/SCID mice to the size of about 100 mm3 (day 0) and were then treated with ADCs at day 0, day 7 and day 14 at the dosage of 30 mg/kg.
|
||||
| In Vivo Model | NCI-N87 CDX model | ||||
| In Vitro Model | Gastric tubular adenocarcinoma | NCI-N87 cells | CVCL_1603 | ||
Revealed Based on the Cell Line Data
| Experiment 1 Reporting the Activity Date of This ADC | [203] | ||||
| Efficacy Data | Half Maximal Inhibitory Concentration (IC50) |
46.70 nM
|
Positive HER2 expression (HER2 +++/++) | ||
| Method Description |
N87 cells (10000) were seeded in 96-well plates for the IC50 measurements of cell viability. After incubation at 37°C for 16 h, the medium was replaced by fresh normal medium with serum and the cytotoxicity was assessed using the WST-1 reagent after 72 h of incubation at 37°C.
|
||||
| In Vitro Model | Gastric tubular adenocarcinoma | NCI-N87 cells | CVCL_1603 | ||
WO2017089890A1 ADC33 [Investigative]
Discovered Using Cell Line-derived Xenograft Model
| Experiment 1 Reporting the Activity Date of This ADC | [211] | ||||
| Efficacy Data | Tumor Growth Inhibition value (TGI) | ≈ 53.99% (Day 36) | Moderate HER2 expression (HER2++) | ||
| Method Description |
JIMT-1 Cells of 5,000,000 suspended in 50 uL cold-saline were implanted intoright hind leg of balb/c-nude mouse. When the tumor volume reaches to about 200 mm3, mice having average valuewere selected and grouped according to tumor volume. Then, mice were treated with PBs (vehicle control), or ADCs (2 mg/kg, single).
|
||||
| In Vivo Model | JIMT-1 CDX model | ||||
| In Vitro Model | Breast ductal carcinoma | JIMT-1 cells | CVCL_2077 | ||
| Experiment 2 Reporting the Activity Date of This ADC | [211] | ||||
| Efficacy Data | Tumor Growth Inhibition value (TGI) | ≈ 89.50% (Day 36) | Moderate HER2 expression (HER2++) | ||
| Method Description |
JIMT-1 Cells of 5,000,000 suspended in 50 uL cold-saline were implanted intoright hind leg of balb/c-nude mouse. When the tumor volume reaches to about 200 mm3, mice having average valuewere selected and grouped according to tumor volume. Then, mice were treated with PBs (vehicle control), or ADCs (5 mg/kg, single).
|
||||
| In Vivo Model | JIMT-1 CDX model | ||||
| In Vitro Model | Breast ductal carcinoma | JIMT-1 cells | CVCL_2077 | ||
Revealed Based on the Cell Line Data
| Experiment 1 Reporting the Activity Date of This ADC | [211] | ||||
| Efficacy Data | Half Maximal Inhibitory Concentration (IC50) |
0.04 nM
|
High HER2 expression (HER2 +++) | ||
| Method Description |
Anti-proliferation activities of the antibodies, drugs, and conjugates with regard tothe cancer cell lines were measured. The cells were plated in 96-well, tissue culture platesat 10,000 cells per well. After 24 hour incubation, the antibodies, drugs, and conjugateswere added in various concentrations. The number of viable cells after 72 hours werecounted using SRB assay.
Click to Show/Hide
|
||||
| In Vitro Model | Breast adenocarcinoma | SK-BR-3 cells | CVCL_0033 | ||
| Experiment 2 Reporting the Activity Date of This ADC | [211] | ||||
| Efficacy Data | Half Maximal Inhibitory Concentration (IC50) |
0.23 nM
|
Moderate HER2 expression (HER2++) | ||
| Method Description |
Anti-proliferation activities of the antibodies, drugs, and conjugates with regard tothe cancer cell lines were measured. The cells were plated in 96-well, tissue culture platesat 10,000 cells per well. After 24 hour incubation, the antibodies, drugs, and conjugateswere added in various concentrations. The number of viable cells after 72 hours werecounted using SRB assay.
Click to Show/Hide
|
||||
| In Vitro Model | Breast ductal carcinoma | JIMT-1 cells | CVCL_2077 | ||
| Experiment 3 Reporting the Activity Date of This ADC | [211] | ||||
| Efficacy Data | Half Maximal Inhibitory Concentration (IC50) |
0.27 nM
|
High HER2 expression (HER2+++) | ||
| Method Description |
Anti-proliferation activities of the antibodies, drugs, and conjugates with regard tothe cancer cell lines were measured. The cells were plated in 96-well, tissue culture platesat 10,000 cells per well. After 24 hour incubation, the antibodies, drugs, and conjugateswere added in various concentrations. The number of viable cells after 72 hours werecounted using SRB assay.
Click to Show/Hide
|
||||
| In Vitro Model | Gastric tubular adenocarcinoma | NCI-N87 cells | CVCL_1603 | ||
| Experiment 4 Reporting the Activity Date of This ADC | [211] | ||||
| Efficacy Data | Half Maximal Inhibitory Concentration (IC50) |
0.33 nM
|
High HER2 expression (HER2+++) | ||
| Method Description |
Anti-proliferation activities of the antibodies, drugs, and conjugates with regard tothe cancer cell lines were measured. The cells were plated in 96-well, tissue culture platesat 10,000 cells per well. After 24 hour incubation, the antibodies, drugs, and conjugateswere added in various concentrations. The number of viable cells after 72 hours werecounted using SRB assay.
Click to Show/Hide
|
||||
| In Vitro Model | Ovarian serous cystadenocarcinoma | SK-OV-3 cells | CVCL_0532 | ||
| Experiment 5 Reporting the Activity Date of This ADC | [211] | ||||
| Efficacy Data | Half Maximal Inhibitory Concentration (IC50) | > 33.30 nM | Negative HER2 expression (HER2-) | ||
| Method Description |
Anti-proliferation activities of the antibodies, drugs, and conjugates with regard tothe cancer cell lines were measured. The cells were plated in 96-well, tissue culture platesat 10,000 cells per well. After 24 hour incubation, the antibodies, drugs, and conjugateswere added in various concentrations. The number of viable cells after 72 hours werecounted using SRB assay.
Click to Show/Hide
|
||||
| In Vitro Model | Invasive breast carcinoma | MCF-7 cells | CVCL_0031 | ||
HA15-1ABE16E [Investigative]
Discovered Using Cell Line-derived Xenograft Model
| Experiment 1 Reporting the Activity Date of This ADC | [184] | ||||
| Efficacy Data | Tumor Growth Inhibition value (TGI) | ≈ 54.00% (Day 30) | High SLITRK6 expression (SLITRK6+++; IHC H-score=280) | ||
| Method Description |
CDX models were established by subcutaneous injection of between 2 and 10 million SW780, RT4 (ATCC) or NCI-H322M (NCI) cells in SCID mice. When the tumor volume reached approximately 230 mm3, a single dose of Ha15-1abe16E, 5 mg/kg intravenously, was administered intravenously (iv) to the mice.
|
||||
| In Vivo Model | Bladder cancer CDX model | ||||
| In Vitro Model | Bladder cancer | Bladder cancer cells | Homo sapiens | ||
HER2-gsADC-48 [Investigative]
Discovered Using Cell Line-derived Xenograft Model
| Experiment 1 Reporting the Activity Date of This ADC | [206] | ||||
| Efficacy Data | Tumor Growth Inhibition value (TGI) | ≈ 56.18% (Day 28) | Positive HER2 expression (HER2+++/++) | ||
| Method Description |
To further evaluate the gsADCs, we determined the in vivo tumor-inhibitory activity in an NCI-N87 nude mice xenograft model. The mice were randomly grouped into 10 groups (n = 5), including a PBS control group, when the tumors grew to 200 mm3. The experimental groups were 3.0 mg/kg gsADCs q3d.
|
||||
| In Vivo Model | NCI-N87 CDX model | ||||
| In Vitro Model | Gastric tubular adenocarcinoma | NCI-N87 cells | CVCL_1603 | ||
| Experiment 2 Reporting the Activity Date of This ADC | [206] | ||||
| Efficacy Data | Tumor Growth Inhibition value (TGI) | ≈ 98.50% (Day 57) | Positive HER2 expression (HER2+++/++) | ||
| Method Description |
To further evaluate the gsADCs, we determined the in vivo tumor-inhibitory activity in an NCI-N87 nude mice xenograft model. The mice were randomly grouped into 10 groups (n = 5), including a PBS control group, when the tumors grew to 200 mm3. The experimental groups were 3.0 mg/kg gsADCs q3d.
|
||||
| In Vivo Model | NCI-N87 CDX model | ||||
| In Vitro Model | Gastric tubular adenocarcinoma | NCI-N87 cells | CVCL_1603 | ||
Revealed Based on the Cell Line Data
| Experiment 1 Reporting the Activity Date of This ADC | [206] | ||||
| Efficacy Data | Half Maximal Inhibitory Concentration (IC50) |
0.08 nM
|
Positive HER2 expression (HER2+++/++) | ||
| Method Description |
Cells were cultured in a 10% fetal bovine serum (FBS)-containing RPMI 1640 medium and were planted into 96-well plates with 6000 cells per well. The plates were incubated overnight at 37°C in a 5% CO2 cell incubator.
|
||||
| In Vitro Model | Breast adenocarcinoma | SK-BR-3 cells | CVCL_0033 | ||
| Experiment 2 Reporting the Activity Date of This ADC | [206] | ||||
| Efficacy Data | Half Maximal Inhibitory Concentration (IC50) |
0.09 nM
|
Positive HER2 expression (HER2+++/++) | ||
| Method Description |
Cells were cultured in a 10% fetal bovine serum (FBS)-containing RPMI 1640 medium and were planted into 96-well plates with 6000 cells per well. The plates were incubated overnight at 37°C in a 5% CO2 cell incubator.
|
||||
| In Vitro Model | Gastric tubular adenocarcinoma | NCI-N87 cells | CVCL_1603 | ||
| Experiment 3 Reporting the Activity Date of This ADC | [206] | ||||
| Efficacy Data | Half Maximal Inhibitory Concentration (IC50) | > 66.00 nM | Negative HER2 expression (HER2 -) | ||
| Method Description |
Cells were cultured in a 10% fetal bovine serum (FBS)-containing RPMI 1640 medium and were planted into 96-well plates with 6000 cells per well. The plates were incubated overnight at 37°C in a 5% CO2 cell incubator.
|
||||
| In Vitro Model | Breast adenocarcinoma | MDA-MB-231 cells | CVCL_0062 | ||
AXL-613-MMAE [Investigative]
Discovered Using Cell Line-derived Xenograft Model
| Experiment 1 Reporting the Activity Date of This ADC | [157] | ||||
| Efficacy Data | Tumor Growth Inhibition value (TGI) | ≈ 56.90% (Day 18) | Positive AXL expression (AXL+++/++) | ||
| Method Description |
In the LCLC-103H xenograft model,therapeutic treatment with a single dose of 1 mg/kg in anti-tumor activity in the AXL-ADC panel.
|
||||
| In Vivo Model | Lung cancer CDX model | ||||
| In Vitro Model | Lung large cell carcinoma | LCLC-103H cells | CVCL_1375 | ||
AXL-171-MMAE [Investigative]
Discovered Using Cell Line-derived Xenograft Model
| Experiment 1 Reporting the Activity Date of This ADC | [157] | ||||
| Efficacy Data | Tumor Growth Inhibition value (TGI) | ≈ 57.60% (Day 18) | Positive AXL expression (AXL+++/++) | ||
| Method Description |
In the LCLC-103H xenograft model,therapeutic treatment with a single dose of 1 mg/kg in anti-tumor activity in the AXL-ADC panel.
|
||||
| In Vivo Model | Lung cancer CDX model | ||||
| In Vitro Model | Lung large cell carcinoma | LCLC-103H cells | CVCL_1375 | ||
Anti-HER2 mAb-Compound 75 [Investigative]
Discovered Using Cell Line-derived Xenograft Model
| Experiment 1 Reporting the Activity Date of This ADC | [212] | ||||
| Efficacy Data | Tumor Growth Inhibition value (TGI) | ≈ 58.49% (Day 21) | Negative HER2 expression (HER2-) | ||
| Method Description |
The nude mice were implanted with a human cancer cell line(MDA-MB-231) and the ADCs (10 mg/kg) were administered through intraperitoneal injection when the tumor volume reached about 100 cubic millimeters. The tumor volumes were monitored every 3 days and animals were sacrificed at the end of 21 days and the tumors were dissected and weighed.
|
||||
| In Vivo Model | MDA-MB-231 CDX model | ||||
| In Vitro Model | Breast adenocarcinoma | MDA-MB-231 cells | CVCL_0062 | ||
1131-MMAE [Investigative]
Discovered Using Cell Line-derived Xenograft Model
| Experiment 1 Reporting the Activity Date of This ADC | [213] | ||||
| Efficacy Data | Tumor Growth Inhibition value (TGI) | ≈ 58.80% (Day 21) | Positive KKLC1 expression (KKLC1+++/++) | ||
| Method Description |
The inhibitory activity of 1131-MMAE against cancer cell growth was evaluated in various human cancer cell lines in vivo. The cells were treated with 0.3 mg/kg.
|
||||
| In Vivo Model | Gastric cancer CDX model | ||||
| In Vitro Model | Gastric adenocarcinoma | MKN45 cells | CVCL_0434 | ||
| Experiment 2 Reporting the Activity Date of This ADC | [213] | ||||
| Efficacy Data | Tumor Growth Inhibition value (TGI) | ≈ 80.36% (Day 21) | Positive KKLC1 expression (KKLC1+++/++) | ||
| Method Description |
The inhibitory activity of 1131-MMAE against cancer cell growth was evaluated in various human cancer cell lines in vivo. The cells were treated with 1 mg/kg.
|
||||
| In Vivo Model | Gastric cancer CDX model | ||||
| In Vitro Model | Gastric adenocarcinoma | MKN45 cells | CVCL_0434 | ||
| Experiment 3 Reporting the Activity Date of This ADC | [213] | ||||
| Efficacy Data | Tumor Growth Inhibition value (TGI) | ≈ 83.05% (Day 5) | Positive KKLC1 expression (KKLC1+++/++) | ||
| Method Description |
The inhibitory activity of 1131-MMAE against cancer cell growth was evaluated in various human cancer cell lines in vivo. The cells were treated with 3 mg/kg.
|
||||
| In Vivo Model | Gastric cancer CDX model | ||||
| In Vitro Model | Gastric adenocarcinoma | MKN45 cells | CVCL_0434 | ||
| Experiment 4 Reporting the Activity Date of This ADC | [213] | ||||
| Efficacy Data | Tumor Growth Inhibition value (TGI) | ≈ 93.92% (Day 21) | Positive KKLC1 expression (KKLC1+++/++) | ||
| Method Description |
The inhibitory activity of 1131-MMAE against cancer cell growth was evaluated in various human cancer cell lines in vivo. The cells were treated with 2 mg/kg.
|
||||
| In Vivo Model | Gastric cancer CDX model | ||||
| In Vitro Model | Gastric adenocarcinoma | MKN45 cells | CVCL_0434 | ||
Revealed Based on the Cell Line Data
| Experiment 1 Reporting the Activity Date of This ADC | [213] | ||||
| Efficacy Data | Half Maximal Inhibitory Concentration (IC50) |
3.87 nM
|
Positive KKLC1 expression (KKLC1+++/++) | ||
| Method Description |
The inhibitory activity of 1131-MMAE against cancer cell growth was evaluated in various human cancer cell lines in vitro.
|
||||
| In Vitro Model | Gastric signet ring cell adenocarcinoma | NUGC-4 cells | CVCL_3082 | ||
| Experiment 2 Reporting the Activity Date of This ADC | [213] | ||||
| Efficacy Data | Half Maximal Inhibitory Concentration (IC50) |
5.26 nM
|
Positive KKLC1 expression (KKLC1+++/++) | ||
| Method Description |
The inhibitory activity of 1131-MMAE against cancer cell growth was evaluated in various human cancer cell lines in vitro.
|
||||
| In Vitro Model | Gastric adenocarcinoma | MKN45 cells | CVCL_0434 | ||
| Experiment 3 Reporting the Activity Date of This ADC | [213] | ||||
| Efficacy Data | Half Maximal Inhibitory Concentration (IC50) |
786.00 nM
|
Positive KKLC1 expression (KKLC1+++/++) | ||
| Method Description |
The inhibitory activity of 1131-MMAE against cancer cell growth was evaluated in various human cancer cell lines in vitro.
|
||||
| In Vitro Model | Gastric carcinoma | HGC-27 cells | CVCL_1279 | ||
HER2-gsADC-29 [Investigative]
Discovered Using Cell Line-derived Xenograft Model
| Experiment 1 Reporting the Activity Date of This ADC | [206] | ||||
| Efficacy Data | Tumor Growth Inhibition value (TGI) | ≈ 59.61% (Day 28) | Positive HER2 expression (HER2+++/++) | ||
| Method Description |
To further evaluate the gsADCs, we determined the in vivo tumor-inhibitory activity in an NCI-N87 nude mice xenograft model. The mice were randomly grouped into 10 groups (n = 5), including a PBS control group, when the tumors grew to 200 mm3. The experimental groups were 3.0 mg/kg gsADCs q3d.
|
||||
| In Vivo Model | NCI-N87 CDX model | ||||
| In Vitro Model | Gastric tubular adenocarcinoma | NCI-N87 cells | CVCL_1603 | ||
| Experiment 2 Reporting the Activity Date of This ADC | [206] | ||||
| Efficacy Data | Tumor Growth Inhibition value (TGI) | ≈ 96.75% (Day 51) | Positive HER2 expression (HER2+++/++) | ||
| Method Description |
To further evaluate the gsADCs, we determined the in vivo tumor-inhibitory activity in an NCI-N87 nude mice xenograft model. The mice were randomly grouped into 10 groups (n = 5), including a PBS control group, when the tumors grew to 200 mm3. The experimental groups were 3.0 mg/kg gsADCs q3d.
|
||||
| In Vivo Model | NCI-N87 CDX model | ||||
| In Vitro Model | Gastric tubular adenocarcinoma | NCI-N87 cells | CVCL_1603 | ||
Revealed Based on the Cell Line Data
| Experiment 1 Reporting the Activity Date of This ADC | [206] | ||||
| Efficacy Data | Half Maximal Inhibitory Concentration (IC50) |
0.02 nM
|
Positive HER2 expression (HER2+++/++) | ||
| Method Description |
Cells were cultured in a 10% fetal bovine serum (FBS)-containing RPMI 1640 medium and were planted into 96-well plates with 6000 cells per well. The plates were incubated overnight at 37°C in a 5% CO2 cell incubator.
|
||||
| In Vitro Model | Breast adenocarcinoma | SK-BR-3 cells | CVCL_0033 | ||
| Experiment 2 Reporting the Activity Date of This ADC | [206] | ||||
| Efficacy Data | Half Maximal Inhibitory Concentration (IC50) |
0.17 nM
|
Positive HER2 expression (HER2+++/++) | ||
| Method Description |
Cells were cultured in a 10% fetal bovine serum (FBS)-containing RPMI 1640 medium and were planted into 96-well plates with 6000 cells per well. The plates were incubated overnight at 37°C in a 5% CO2 cell incubator.
|
||||
| In Vitro Model | Gastric tubular adenocarcinoma | NCI-N87 cells | CVCL_1603 | ||
| Experiment 3 Reporting the Activity Date of This ADC | [206] | ||||
| Efficacy Data | Half Maximal Inhibitory Concentration (IC50) | > 66.00 nM | Negative HER2 expression (HER2 -) | ||
| Method Description |
Cells were cultured in a 10% fetal bovine serum (FBS)-containing RPMI 1640 medium and were planted into 96-well plates with 6000 cells per well. The plates were incubated overnight at 37°C in a 5% CO2 cell incubator.
|
||||
| In Vitro Model | Breast adenocarcinoma | MDA-MB-231 cells | CVCL_0062 | ||
AXL-511-MMAE [Investigative]
Discovered Using Cell Line-derived Xenograft Model
| Experiment 1 Reporting the Activity Date of This ADC | [157] | ||||
| Efficacy Data | Tumor Growth Inhibition value (TGI) | ≈ 59.70% (Day 18) | Positive AXL expression (AXL+++/++) | ||
| Method Description |
In the LCLC-103H xenograft model,therapeutic treatment with a single dose of 1 mg/kg in anti-tumor activity in the AXL-ADC panel.
|
||||
| In Vivo Model | Lung cancer CDX model | ||||
| In Vitro Model | Lung large cell carcinoma | LCLC-103H cells | CVCL_1375 | ||
IC1-MMAE [Investigative]
Discovered Using Cell Line-derived Xenograft Model
| Experiment 1 Reporting the Activity Date of This ADC | [214] | ||||
| Efficacy Data | Tumor Growth Inhibition value (TGI) | ≈ 62.76% (Day 25) | Positive ICAM1 expression (ICAM1 +++/++) | ||
| Method Description |
IC1-MMAE (1 m ug/kg, every seven days x3) induces efficient tumor cell killing in cell line-derived models of MDA-MB-436 or MDA-MB-231 cells with ICAM1 expression with high expression.
|
||||
| In Vivo Model | MDA-MB-436 CDX model | ||||
| In Vitro Model | Metastasis of ductal carcinoma | MDA-MB-436 cells | CVCL_0623 | ||
| Experiment 2 Reporting the Activity Date of This ADC | [214] | ||||
| Efficacy Data | Tumor Growth Inhibition value (TGI) | ≈ 96.70% (Day 25) | Positive ICAM1 expression (ICAM1 +++/++) | ||
| Method Description |
IC1-MMAE (5 m ug/kg, every seven days x3) induces efficient tumor cell killing in cell line-derived models of MDA-MB-436 or MDA-MB-231 cells with ICAM1 expression with high expression.
|
||||
| In Vivo Model | MDA-MB-231 CDX model | ||||
| In Vitro Model | Breast adenocarcinoma | MDA-MB-231 cells | CVCL_0062 | ||
| Experiment 3 Reporting the Activity Date of This ADC | [214] | ||||
| Efficacy Data | Tumor Growth Inhibition value (TGI) | ≈ 99.50% (Day 25) | Positive ICAM1 expression (ICAM1 +++/++) | ||
| Method Description |
IC1-MMAE (10 m ug/kg, every seven days x3) induces efficient tumor cell killing in cell line-derived models of MDA-MB-436 or MDA-MB-231 cells with ICAM1 expression with high expression.
|
||||
| In Vivo Model | MDA-MB-436 CDX model | ||||
| In Vitro Model | Metastasis of ductal carcinoma | MDA-MB-436 cells | CVCL_0623 | ||
| Experiment 4 Reporting the Activity Date of This ADC | [214] | ||||
| Efficacy Data | Tumor Growth Inhibition value (TGI) | ≈ 99.50% (Day 25) | Positive ICAM1 expression (ICAM1 +++/++) | ||
| Method Description |
IC1-MMAE (5 m ug/kg, every seven days x3) induces efficient tumor cell killing in cell line-derived models of MDA-MB-436 or MDA-MB-231 cells with ICAM1 expression with high expression.
|
||||
| In Vivo Model | MDA-MB-436 CDX model | ||||
| In Vitro Model | Metastasis of ductal carcinoma | MDA-MB-436 cells | CVCL_0623 | ||
Revealed Based on the Cell Line Data
| Experiment 1 Reporting the Activity Date of This ADC | [214] | ||||
| Efficacy Data | Half Maximal Inhibitory Concentration (IC50) |
13.10 pM
|
Positive ICAM1 expression (ICAM1 +++/++) | ||
| Method Description |
In vitro cytotoxicity of four ICAM1 ADCs against a panel of four human TNBC cell lines.
|
||||
| In Vitro Model | Metastasis of ductal carcinoma | MDA-MB-436 cells | CVCL_0623 | ||
| Experiment 2 Reporting the Activity Date of This ADC | [214] | ||||
| Efficacy Data | Half Maximal Inhibitory Concentration (IC50) |
0.22 nM
|
Positive ICAM1 expression (ICAM1 +++/++) | ||
| Method Description |
In vitro cytotoxicity of four ICAM1 ADCs against a panel of four human TNBC cell lines.
|
||||
| In Vitro Model | Breast carcinoma | MDA-MB-157 cells | CVCL_0618 | ||
| Experiment 3 Reporting the Activity Date of This ADC | [214] | ||||
| Efficacy Data | Half Maximal Inhibitory Concentration (IC50) |
0.25 nM
|
Positive ICAM1 expression (ICAM1 +++/++) | ||
| Method Description |
In vitro cytotoxicity of four ICAM1 ADCs against a panel of four human TNBC cell lines.
|
||||
| In Vitro Model | Breast adenocarcinoma | MDA-MB-468 cells | CVCL_0419 | ||
25G1-Val-Cit-MMAE [Investigative]
Discovered Using Cell Line-derived Xenograft Model
| Experiment 1 Reporting the Activity Date of This ADC | [86] | ||||
| Efficacy Data | Tumor Growth Inhibition value (TGI) |
63.00% (Day 49)
|
Low FOLR1 expression (FOLR1+) | ||
| Method Description |
Cell line-derived xenograft (CDX) models MDA-MB-231 epidermoid carcinoma and the HPAF-II pancreatic carcinoma cell lines were implanted subcutaneously in the flank of athymic nude mice Animals were removed from study and euthanized once tumor size reached 1200 mm3 or skin ulceration was evident ADC was dosed weekly at 2 mg/kg for 2 weeks.
Click to Show/Hide
|
||||
| In Vivo Model | MDA-MB-231 cell line xenograft model | ||||
| In Vitro Model | Breast adenocarcinoma | MDA-MB-231 cells | CVCL_0062 | ||
| Experiment 2 Reporting the Activity Date of This ADC | [86] | ||||
| Efficacy Data | Tumor Growth Inhibition value (TGI) |
69.00% (Day 49)
|
Low FOLR1 expression (FOLR1+) | ||
| Method Description |
Cell line-derived xenograft (CDX) models MDA-MB-231 epidermoid carcinoma and the HPAF-II pancreatic carcinoma cell lines were implanted subcutaneously in the flank of athymic nude mice Animals were removed from study and euthanized once tumor size reached 1200 mm3 or skin ulceration was evident ADC was dosed weekly at 4 mg/kg for 2 weeks.
Click to Show/Hide
|
||||
| In Vivo Model | MDA-MB-231 cell line xenograft model | ||||
| In Vitro Model | Breast adenocarcinoma | MDA-MB-231 cells | CVCL_0062 | ||
| Experiment 3 Reporting the Activity Date of This ADC | [86] | ||||
| Efficacy Data | Tumor Growth Inhibition value (TGI) |
100.00% (Day 39)
|
Low FOLR1 expression (FOLR1+) | ||
| Method Description |
Cell line-derived xenograft (CDX) models The A431 epidermoid carcinoma and the HPAF-II pancreatic carcinoma cell lines were implanted subcutaneously in the flank of athymic nude mice Animals were removed from study and euthanized once tumor size reached 1200 mm3 or skin ulceration was evident ADC was dosed weekly at 2 mg/kg for 2 weeks.
|
||||
| In Vivo Model | HPAF-II xenograft model | ||||
| In Vitro Model | Pancreatic ductal adenocarcinoma | HPAF-II cells | CVCL_0313 | ||
| Experiment 4 Reporting the Activity Date of This ADC | [86] | ||||
| Efficacy Data | Half Maximal Effective Concentration (EC50) |
18.00 nM
|
Positive Tissue factor expression (TF+++/++; 320,000 TF receptor copy number) | ||
| Method Description |
Antibody-dependent cellular cytotoxicity (ADCC) A431 cells were plated on a microtiter plate The following day, the cells were incubated with a ten-point 1:3 dilution titration of anti-TF antibodies or the ADCs starting at 50 nM An ADCC effector-to-target cell ratio of 8:1 was added to each well and incubated for 6 h at 37°C Luciferase Assay Reagent was added to each well to measure luminescence on an Envision plate reader Antibody-dependent cellular cytotoxicity (ADCC) reporter luminescence was evaluated after a 6-hour incubation of the reporter Jurkat cell line with TF-positive A431 cells and a titration of anti-TF antibody or ADC The ADCC reporter luminescence EC50 values for each anti-TF antibody or ADC are listed.
Click to Show/Hide
|
||||
| In Vitro Model | Breast adenocarcinoma | MDA-MB-231 cells | CVCL_0062 | ||
Revealed Based on the Cell Line Data
| Experiment 1 Reporting the Activity Date of This ADC | [86] | ||||
| Efficacy Data | Half Maximal Inhibitory Concentration (IC50) |
4.00 nM
|
Positive Tissue factor expression (TF+++/++; 570,000 TF receptor copy number) | ||
| Method Description |
To evaluate ADC cytotoxicity, cells were plated in 384-well plates Anti-TF antibodies conjugated to MC-vc-PAB-MMAE were serially diluted as shown Plates were incubated for 3 days, followed by lysis in CTG assay reagent For each ADC, the IC50 and its associated 95% confidence interval (95% CI) were calculated Titrations of the TF-specific ADCs were added to HPAF-II cells, with a 72-hour incubationThis treatment resulted in efficacious cell killing.
Click to Show/Hide
|
||||
| In Vitro Model | Pancreatic ductal adenocarcinoma | HPAF-II cells | CVCL_0313 | ||
| Experiment 2 Reporting the Activity Date of This ADC | [86] | ||||
| Efficacy Data | Half Maximal Inhibitory Concentration (IC50) |
9.00 nM
|
Positive Tissue factor expression (TF+++/++; 320,000 TF receptor copy number) | ||
| Method Description |
To evaluate ADC cytotoxicity, cells were plated in 384-well plates Anti-TF antibodies conjugated to MC-vc-PAB-MMAE were serially diluted as shown Plates were incubated for 3 days, followed by lysis in CTG assay reagent For each ADC, the IC50 and its associated 95% confidence interval (95% CI) were calculated Titrations of the TF-specific ADCs were added to 5-day old cultures of MDA-MB-231 cells, with a 72-hour incubationThis treatment resulted in efficacious cell killing.
Click to Show/Hide
|
||||
| In Vitro Model | Breast adenocarcinoma | MDA-MB-231 cells | CVCL_0062 | ||
| Experiment 3 Reporting the Activity Date of This ADC | [95] | ||||
| Efficacy Data | Half Maximal Effective Concentration (EC50) |
14.00 nM
|
Positive Tissue factor expression (TF+++/++; 320,000 TF receptor copy number) | ||
| Method Description |
A431 cells were pre-incubated for 30 min without or with 50 nM of FVIIa prior to the addition of an anti-TF ADC (25G1-vc-MMAE) titration After a 4 h incubation at 37°C, the FVIIa and ADC were washed out and the cells were cultured for another 68 h before cell viability assessment.
|
||||
| In Vitro Model | Skin squamous cell carcinoma | A431 cells | CVCL_0037 | ||
| Experiment 4 Reporting the Activity Date of This ADC | [95] | ||||
| Efficacy Data | Half Maximal Effective Concentration (EC50) |
14.00 nM
|
Positive Tissue factor expression (TF+++/++; 320,000 TF receptor copy number) | ||
| Method Description |
To evaluate ADC cytotoxicity, cells were plated in 384-well plates Anti-TF antibodies conjugated to MC-vc-PAB-MMAE were serially diluted as shown Plates were incubated for 3 days, followed by lysis in CTG assay reagent For each ADC, the IC50 and its associated 95% confidence interval (95% CI) were calculated Titrations of the TF-specific ADCs were added to A431 cells, with a 72-hour incubationThis treatment resulted in efficacious cell killing.
Click to Show/Hide
|
||||
| In Vitro Model | Skin squamous cell carcinoma | A431 cells | CVCL_0037 | ||
| Experiment 5 Reporting the Activity Date of This ADC | [95] | ||||
| Efficacy Data | Half Maximal Effective Concentration (EC50) |
14.00 nM
|
Positive Tissue factor expression (TF+++/++; 570,000 TF receptor copy number) | ||
| Method Description |
To evaluate ADC cytotoxicity, cells were plated in 384-well plates Anti-TF antibodies conjugated to MC-vc-PAB-MMAE were serially diluted as shown Plates were incubated for 3 days, followed by lysis in CTG assay reagent For each ADC, the IC50 and its associated 95% confidence interval (95% CI) were calculated Titrations of the TF-specific ADCs were added to A431 cells, with a 4-hour incubation followed by removal of excess ADC and culture for another 68 hours This treatment resulted in efficacious cell killing.
Click to Show/Hide
|
||||
| In Vitro Model | Skin squamous cell carcinoma | A431 cells | CVCL_0037 | ||
Ch14.18-MMAE [Investigative]
Discovered Using Cell Line-derived Xenograft Model
| Experiment 1 Reporting the Activity Date of This ADC | [215] | ||||
| Efficacy Data | Tumor Growth Inhibition value (TGI) | ≈ 63.68% (Day 43) | Positive GD2 expression (GD2+++/++) | ||
| Method Description |
When tumors reached 50 mm3 volume. Three groups received intravenous injections of 100 ug (5 mg/kg) ch14.18-MMAE, ch14.18-MMAF, or naked antibody for five times with an interval of 4 days, and the control group was injected with PBS.
|
||||
| In Vivo Model | B78-D14 CDX model | ||||
| In Vitro Model | Amelanotic melanoma | B78-D14 cells | Homo sapiens | ||
Revealed Based on the Cell Line Data
| Experiment 1 Reporting the Activity Date of This ADC | [215] | ||||
| Efficacy Data | Half Maximal Inhibitory Concentration (IC50) |
0.29 nM
|
High GD2 expression (GD2+++) | ||
| Method Description |
Cells were sub-cultured and seeded at 5,000 cells/well in complete growth medium in 96-well tissue culture plates, and incubated at 37°C, 5% CO2 overnight. Test reagents were serially diluted and added to the cell plates (initial concentration of 100 nM). Plates were incubated at 37°C, 5% CO2 for an additional 3 d.
|
||||
| In Vitro Model | Thymoma | EL4 cells | CVCL_0255 | ||
| Experiment 2 Reporting the Activity Date of This ADC | [215] | ||||
| Efficacy Data | Half Maximal Inhibitory Concentration (IC50) |
0.30 nM
|
High GD2 expression (GD2+++) | ||
| Method Description |
Cells were sub-cultured and seeded at 5,000 cells/well in complete growth medium in 96-well tissue culture plates, and incubated at 37°C, 5% CO2 overnight. Test reagents were serially diluted and added to the cell plates (initial concentration of 100 nM). Plates were incubated at 37°C, 5% CO2 for an additional 3 d.
|
||||
| In Vitro Model | Neuroblastoma | IMR-32 cells | CVCL_0346 | ||
| Experiment 3 Reporting the Activity Date of This ADC | [215] | ||||
| Efficacy Data | Half Maximal Inhibitory Concentration (IC50) |
0.40 nM
|
High GD2 expression (GD2+++) | ||
| Method Description |
Cells were sub-cultured and seeded at 5,000 cells/well in complete growth medium in 96-well tissue culture plates, and incubated at 37°C, 5% CO2 overnight. Test reagents were serially diluted and added to the cell plates (initial concentration of 100 nM). Plates were incubated at 37°C, 5% CO2 for an additional 3 d.
|
||||
| In Vitro Model | Amelanotic melanoma | COLO 38 cells | CVCL_3934 | ||
| Experiment 4 Reporting the Activity Date of This ADC | [215] | ||||
| Efficacy Data | Half Maximal Inhibitory Concentration (IC50) |
0.44 nM
|
High GD2 expression (GD2+++) | ||
| Method Description |
Cells were sub-cultured and seeded at 5,000 cells/well in complete growth medium in 96-well tissue culture plates, and incubated at 37°C, 5% CO2 overnight. Test reagents were serially diluted and added to the cell plates (initial concentration of 100 nM). Plates were incubated at 37°C, 5% CO2 for an additional 3 d.
|
||||
| In Vitro Model | Amelanotic melanoma | B78-D14 cells | Homo sapiens | ||
| Experiment 5 Reporting the Activity Date of This ADC | [215] | ||||
| Efficacy Data | Half Maximal Inhibitory Concentration (IC50) |
0.51 nM
|
Moderate GD2 expression (GD2++) | ||
| Method Description |
Cells were sub-cultured and seeded at 5,000 cells/well in complete growth medium in 96-well tissue culture plates, and incubated at 37°C, 5% CO2 overnight. Test reagents were serially diluted and added to the cell plates (initial concentration of 100 nM). Plates were incubated at 37°C, 5% CO2 for an additional 3 d.
|
||||
| In Vitro Model | Pleural malignant mesothelioma | MS-1 [Human mesothelioma] cells | CVCL_E993 | ||
| Experiment 6 Reporting the Activity Date of This ADC | [215] | ||||
| Efficacy Data | Half Maximal Inhibitory Concentration (IC50) |
0.68 nM
|
High GD2 expression (GD2+++) | ||
| Method Description |
Cells were sub-cultured and seeded at 5,000 cells/well in complete growth medium in 96-well tissue culture plates, and incubated at 37°C, 5% CO2 overnight. Test reagents were serially diluted and added to the cell plates (initial concentration of 100 nM). Plates were incubated at 37°C, 5% CO2 for an additional 3 d.
|
||||
| In Vitro Model | Glioblastoma | T98G cells | CVCL_0556 | ||
| Experiment 7 Reporting the Activity Date of This ADC | [215] | ||||
| Efficacy Data | Half Maximal Inhibitory Concentration (IC50) |
0.69 nM
|
Moderate GD2 expression (GD2++) | ||
| Method Description |
Cells were sub-cultured and seeded at 5,000 cells/well in complete growth medium in 96-well tissue culture plates, and incubated at 37°C, 5% CO2 overnight. Test reagents were serially diluted and added to the cell plates (initial concentration of 100 nM). Plates were incubated at 37°C, 5% CO2 for an additional 3 d.
|
||||
| In Vitro Model | Osteosarcoma | U2OS cells | CVCL_0042 | ||
| Experiment 8 Reporting the Activity Date of This ADC | [215] | ||||
| Efficacy Data | Half Maximal Inhibitory Concentration (IC50) |
0.93 nM
|
Moderate GD2 expression (GD2++) | ||
| Method Description |
Cells were sub-cultured and seeded at 5,000 cells/well in complete growth medium in 96-well tissue culture plates, and incubated at 37°C, 5% CO2 overnight. Test reagents were serially diluted and added to the cell plates (initial concentration of 100 nM). Plates were incubated at 37°C, 5% CO2 for an additional 3 d.
|
||||
| In Vitro Model | Invasive breast carcinoma | Hs 578T cells | CVCL_0332 | ||
| Experiment 9 Reporting the Activity Date of This ADC | [215] | ||||
| Efficacy Data | Half Maximal Inhibitory Concentration (IC50) |
2.48 nM
|
Low GD2 expression (GD2+) | ||
| Method Description |
Cells were sub-cultured and seeded at 5,000 cells/well in complete growth medium in 96-well tissue culture plates, and incubated at 37°C, 5% CO2 overnight. Test reagents were serially diluted and added to the cell plates (initial concentration of 100 nM). Plates were incubated at 37°C, 5% CO2 for an additional 3 d.
|
||||
| In Vitro Model | Bone marrow neuroblastoma | SH-SY5Y cells | CVCL_0019 | ||
| Experiment 10 Reporting the Activity Date of This ADC | [215] | ||||
| Efficacy Data | Half Maximal Inhibitory Concentration (IC50) |
4.28 nM
|
Low GD2 expression (GD2+) | ||
| Method Description |
Cells were sub-cultured and seeded at 5,000 cells/well in complete growth medium in 96-well tissue culture plates, and incubated at 37°C, 5% CO2 overnight. Test reagents were serially diluted and added to the cell plates (initial concentration of 100 nM). Plates were incubated at 37°C, 5% CO2 for an additional 3 d.
|
||||
| In Vitro Model | Astrocytoma | 1321N1 cells | CVCL_0110 | ||
| Experiment 11 Reporting the Activity Date of This ADC | [215] | ||||
| Efficacy Data | Half Maximal Inhibitory Concentration (IC50) |
7.80 nM
|
Low GD2 expression (GD2+) | ||
| Method Description |
Cells were sub-cultured and seeded at 5,000 cells/well in complete growth medium in 96-well tissue culture plates, and incubated at 37°C, 5% CO2 overnight. Test reagents were serially diluted and added to the cell plates (initial concentration of 100 nM). Plates were incubated at 37°C, 5% CO2 for an additional 3 d.
|
||||
| In Vitro Model | Amelanotic melanoma | A375 cells | CVCL_0132 | ||
| Experiment 12 Reporting the Activity Date of This ADC | [215] | ||||
| Efficacy Data | Half Maximal Inhibitory Concentration (IC50) |
9.40 nM
|
Low GD2 expression (GD2+) | ||
| Method Description |
Cells were sub-cultured and seeded at 5,000 cells/well in complete growth medium in 96-well tissue culture plates, and incubated at 37°C, 5% CO2 overnight. Test reagents were serially diluted and added to the cell plates (initial concentration of 100 nM). Plates were incubated at 37°C, 5% CO2 for an additional 3 d.
|
||||
| In Vitro Model | Invasive breast carcinoma | MCF-7 cells | CVCL_0031 | ||
| Experiment 13 Reporting the Activity Date of This ADC | [215] | ||||
| Efficacy Data | Half Maximal Inhibitory Concentration (IC50) |
13.10 nM
|
Low GD2 expression (GD2+) | ||
| Method Description |
Cells were sub-cultured and seeded at 5,000 cells/well in complete growth medium in 96-well tissue culture plates, and incubated at 37°C, 5% CO2 overnight. Test reagents were serially diluted and added to the cell plates (initial concentration of 100 nM). Plates were incubated at 37°C, 5% CO2 for an additional 3 d.
|
||||
| In Vitro Model | Osteosarcoma | MG-63 cells | CVCL_0426 | ||
| Experiment 14 Reporting the Activity Date of This ADC | [215] | ||||
| Efficacy Data | Half Maximal Inhibitory Concentration (IC50) | > 40.00 nM | Negative GD2 expression (GD2-) | ||
| Method Description |
Cells were sub-cultured and seeded at 5,000 cells/well in complete growth medium in 96-well tissue culture plates, and incubated at 37°C, 5% CO2 overnight. Test reagents were serially diluted and added to the cell plates (initial concentration of 100 nM). Plates were incubated at 37°C, 5% CO2 for an additional 3 d.
|
||||
| In Vitro Model | Neuroblastoma | NGP-127 cells | CVCL_UF75 | ||
| Experiment 15 Reporting the Activity Date of This ADC | [215] | ||||
| Efficacy Data | Half Maximal Inhibitory Concentration (IC50) | > 40.00 nM | Low GD2 expression (GD2+) | ||
| Method Description |
Cells were sub-cultured and seeded at 5,000 cells/well in complete growth medium in 96-well tissue culture plates, and incubated at 37°C, 5% CO2 overnight. Test reagents were serially diluted and added to the cell plates (initial concentration of 100 nM). Plates were incubated at 37°C, 5% CO2 for an additional 3 d.
|
||||
| In Vitro Model | Glioblastoma | U-87MG cells | CVCL_0022 | ||
| Experiment 16 Reporting the Activity Date of This ADC | [215] | ||||
| Efficacy Data | Half Maximal Inhibitory Concentration (IC50) | > 40.00 nM | Negative GD2 expression (GD2-) | ||
| Method Description |
Cells were sub-cultured and seeded at 5,000 cells/well in complete growth medium in 96-well tissue culture plates, and incubated at 37°C, 5% CO2 overnight. Test reagents were serially diluted and added to the cell plates (initial concentration of 100 nM). Plates were incubated at 37°C, 5% CO2 for an additional 3 d.
|
||||
| In Vitro Model | Osteosarcoma | HOS cells | CVCL_0312 | ||
| Experiment 17 Reporting the Activity Date of This ADC | [215] | ||||
| Efficacy Data | Half Maximal Inhibitory Concentration (IC50) | > 40.00 nM | Negative GD2 expression (GD2-) | ||
| Method Description |
Cells were sub-cultured and seeded at 5,000 cells/well in complete growth medium in 96-well tissue culture plates, and incubated at 37°C, 5% CO2 overnight. Test reagents were serially diluted and added to the cell plates (initial concentration of 100 nM). Plates were incubated at 37°C, 5% CO2 for an additional 3 d.
|
||||
| In Vitro Model | Breast adenocarcinoma | SK-BR-3 cells | CVCL_0033 | ||
| Experiment 18 Reporting the Activity Date of This ADC | [215] | ||||
| Efficacy Data | Half Maximal Inhibitory Concentration (IC50) | > 40.00 nM | Negative GD2 expression (GD2-) | ||
| Method Description |
Cells were sub-cultured and seeded at 5,000 cells/well in complete growth medium in 96-well tissue culture plates, and incubated at 37°C, 5% CO2 overnight. Test reagents were serially diluted and added to the cell plates (initial concentration of 100 nM). Plates were incubated at 37°C, 5% CO2 for an additional 3 d.
|
||||
| In Vitro Model | Melanoma | B16 cells | CVCL_F936 | ||
| Experiment 19 Reporting the Activity Date of This ADC | [215] | ||||
| Efficacy Data | Half Maximal Inhibitory Concentration (IC50) | > 40.00 nM | Negative GD2 expression (GD2-) | ||
| Method Description |
Cells were sub-cultured and seeded at 5,000 cells/well in complete growth medium in 96-well tissue culture plates, and incubated at 37°C, 5% CO2 overnight. Test reagents were serially diluted and added to the cell plates (initial concentration of 100 nM). Plates were incubated at 37°C, 5% CO2 for an additional 3 d.
|
||||
| In Vitro Model | Malignant neoplasms of the mouse mammary gland | M3 cells | CVCL_4Y25 | ||
| Experiment 20 Reporting the Activity Date of This ADC | [215] | ||||
| Efficacy Data | 20% Maximal Inhibitory Concentration (IC20) |
0.09 nM
|
High GD2 expression (GD2+++) | ||
| Method Description |
Cells were sub-cultured and seeded at 5,000 cells/well in complete growth medium in 96-well tissue culture plates, and incubated at 37°C, 5% CO2 overnight. Test reagents were serially diluted and added to the cell plates (initial concentration of 100 nM). Plates were incubated at 37°C, 5% CO2 for an additional 3 d.
|
||||
| In Vitro Model | Thymoma | EL4 cells | CVCL_0255 | ||
| Experiment 21 Reporting the Activity Date of This ADC | [215] | ||||
| Efficacy Data | 20% Maximal Inhibitory Concentration (IC20) |
0.14 nM
|
High GD2 expression (GD2+++) | ||
| Method Description |
Cells were sub-cultured and seeded at 5,000 cells/well in complete growth medium in 96-well tissue culture plates, and incubated at 37°C, 5% CO2 overnight. Test reagents were serially diluted and added to the cell plates (initial concentration of 100 nM). Plates were incubated at 37°C, 5% CO2 for an additional 3 d.
|
||||
| In Vitro Model | Amelanotic melanoma | COLO 38 cells | CVCL_3934 | ||
| Experiment 22 Reporting the Activity Date of This ADC | [215] | ||||
| Efficacy Data | 20% Maximal Inhibitory Concentration (IC20) |
0.15 nM
|
High GD2 expression (GD2+++) | ||
| Method Description |
Cells were sub-cultured and seeded at 5,000 cells/well in complete growth medium in 96-well tissue culture plates, and incubated at 37°C, 5% CO2 overnight. Test reagents were serially diluted and added to the cell plates (initial concentration of 100 nM). Plates were incubated at 37°C, 5% CO2 for an additional 3 d.
|
||||
| In Vitro Model | Neuroblastoma | IMR-32 cells | CVCL_0346 | ||
| Experiment 23 Reporting the Activity Date of This ADC | [215] | ||||
| Efficacy Data | 20% Maximal Inhibitory Concentration (IC20) |
0.20 nM
|
Moderate GD2 expression (GD2++) | ||
| Method Description |
Cells were sub-cultured and seeded at 5,000 cells/well in complete growth medium in 96-well tissue culture plates, and incubated at 37°C, 5% CO2 overnight. Test reagents were serially diluted and added to the cell plates (initial concentration of 100 nM). Plates were incubated at 37°C, 5% CO2 for an additional 3 d.
|
||||
| In Vitro Model | Pleural malignant mesothelioma | MS-1 [Human mesothelioma] cells | CVCL_E993 | ||
| Experiment 24 Reporting the Activity Date of This ADC | [215] | ||||
| Efficacy Data | 20% Maximal Inhibitory Concentration (IC20) |
0.22 nM
|
High GD2 expression (GD2+++) | ||
| Method Description |
Cells were sub-cultured and seeded at 5,000 cells/well in complete growth medium in 96-well tissue culture plates, and incubated at 37°C, 5% CO2 overnight. Test reagents were serially diluted and added to the cell plates (initial concentration of 100 nM). Plates were incubated at 37°C, 5% CO2 for an additional 3 d.
|
||||
| In Vitro Model | Amelanotic melanoma | B78-D14 cells | Homo sapiens | ||
| Experiment 25 Reporting the Activity Date of This ADC | [215] | ||||
| Efficacy Data | 20% Maximal Inhibitory Concentration (IC20) |
0.23 nM
|
High GD2 expression (GD2+++) | ||
| Method Description |
Cells were sub-cultured and seeded at 5,000 cells/well in complete growth medium in 96-well tissue culture plates, and incubated at 37°C, 5% CO2 overnight. Test reagents were serially diluted and added to the cell plates (initial concentration of 100 nM). Plates were incubated at 37°C, 5% CO2 for an additional 3 d.
|
||||
| In Vitro Model | Glioblastoma | T98G cells | CVCL_0556 | ||
| Experiment 26 Reporting the Activity Date of This ADC | [215] | ||||
| Efficacy Data | 20% Maximal Inhibitory Concentration (IC20) |
0.28 nM
|
Moderate GD2 expression (GD2++) | ||
| Method Description |
Cells were sub-cultured and seeded at 5,000 cells/well in complete growth medium in 96-well tissue culture plates, and incubated at 37°C, 5% CO2 overnight. Test reagents were serially diluted and added to the cell plates (initial concentration of 100 nM). Plates were incubated at 37°C, 5% CO2 for an additional 3 d.
|
||||
| In Vitro Model | Osteosarcoma | U2OS cells | CVCL_0042 | ||
| Experiment 27 Reporting the Activity Date of This ADC | [215] | ||||
| Efficacy Data | 20% Maximal Inhibitory Concentration (IC20) |
0.38 nM
|
Moderate GD2 expression (GD2++) | ||
| Method Description |
Cells were sub-cultured and seeded at 5,000 cells/well in complete growth medium in 96-well tissue culture plates, and incubated at 37°C, 5% CO2 overnight. Test reagents were serially diluted and added to the cell plates (initial concentration of 100 nM). Plates were incubated at 37°C, 5% CO2 for an additional 3 d.
|
||||
| In Vitro Model | Invasive breast carcinoma | Hs 578T cells | CVCL_0332 | ||
| Experiment 28 Reporting the Activity Date of This ADC | [215] | ||||
| Efficacy Data | 20% Maximal Inhibitory Concentration (IC20) |
0.48 nM
|
Low GD2 expression (GD2+) | ||
| Method Description |
Cells were sub-cultured and seeded at 5,000 cells/well in complete growth medium in 96-well tissue culture plates, and incubated at 37°C, 5% CO2 overnight. Test reagents were serially diluted and added to the cell plates (initial concentration of 100 nM). Plates were incubated at 37°C, 5% CO2 for an additional 3 d.
|
||||
| In Vitro Model | Astrocytoma | 1321N1 cells | CVCL_0110 | ||
| Experiment 29 Reporting the Activity Date of This ADC | [215] | ||||
| Efficacy Data | 20% Maximal Inhibitory Concentration (IC20) |
0.51 nM
|
Low GD2 expression (GD2+) | ||
| Method Description |
Cells were sub-cultured and seeded at 5,000 cells/well in complete growth medium in 96-well tissue culture plates, and incubated at 37°C, 5% CO2 overnight. Test reagents were serially diluted and added to the cell plates (initial concentration of 100 nM). Plates were incubated at 37°C, 5% CO2 for an additional 3 d.
|
||||
| In Vitro Model | Bone marrow neuroblastoma | SH-SY5Y cells | CVCL_0019 | ||
| Experiment 30 Reporting the Activity Date of This ADC | [215] | ||||
| Efficacy Data | 20% Maximal Inhibitory Concentration (IC20) |
2.70 nM
|
Low GD2 expression (GD2+) | ||
| Method Description |
Cells were sub-cultured and seeded at 5,000 cells/well in complete growth medium in 96-well tissue culture plates, and incubated at 37°C, 5% CO2 overnight. Test reagents were serially diluted and added to the cell plates (initial concentration of 100 nM). Plates were incubated at 37°C, 5% CO2 for an additional 3 d.
|
||||
| In Vitro Model | Amelanotic melanoma | A375 cells | CVCL_0132 | ||
| Experiment 31 Reporting the Activity Date of This ADC | [215] | ||||
| Efficacy Data | 20% Maximal Inhibitory Concentration (IC20) |
2.98 nM
|
Low GD2 expression (GD2+) | ||
| Method Description |
Cells were sub-cultured and seeded at 5,000 cells/well in complete growth medium in 96-well tissue culture plates, and incubated at 37°C, 5% CO2 overnight. Test reagents were serially diluted and added to the cell plates (initial concentration of 100 nM). Plates were incubated at 37°C, 5% CO2 for an additional 3 d.
|
||||
| In Vitro Model | Osteosarcoma | MG-63 cells | CVCL_0426 | ||
| Experiment 32 Reporting the Activity Date of This ADC | [215] | ||||
| Efficacy Data | 20% Maximal Inhibitory Concentration (IC20) |
3.00 nM
|
Low GD2 expression (GD2+) | ||
| Method Description |
Cells were sub-cultured and seeded at 5,000 cells/well in complete growth medium in 96-well tissue culture plates, and incubated at 37°C, 5% CO2 overnight. Test reagents were serially diluted and added to the cell plates (initial concentration of 100 nM). Plates were incubated at 37°C, 5% CO2 for an additional 3 d.
|
||||
| In Vitro Model | Invasive breast carcinoma | MCF-7 cells | CVCL_0031 | ||
| Experiment 33 Reporting the Activity Date of This ADC | [215] | ||||
| Efficacy Data | 20% Maximal Inhibitory Concentration (IC20) |
8.47 nM
|
Low GD2 expression (GD2+) | ||
| Method Description |
Cells were sub-cultured and seeded at 5,000 cells/well in complete growth medium in 96-well tissue culture plates, and incubated at 37°C, 5% CO2 overnight. Test reagents were serially diluted and added to the cell plates (initial concentration of 100 nM). Plates were incubated at 37°C, 5% CO2 for an additional 3 d.
|
||||
| In Vitro Model | Glioblastoma | U-87MG cells | CVCL_0022 | ||
| Experiment 34 Reporting the Activity Date of This ADC | [215] | ||||
| Efficacy Data | 20% Maximal Inhibitory Concentration (IC20) |
17.00 nM
|
Negative GD2 expression (GD2-) | ||
| Method Description |
Cells were sub-cultured and seeded at 5,000 cells/well in complete growth medium in 96-well tissue culture plates, and incubated at 37°C, 5% CO2 overnight. Test reagents were serially diluted and added to the cell plates (initial concentration of 100 nM). Plates were incubated at 37°C, 5% CO2 for an additional 3 d.
|
||||
| In Vitro Model | Melanoma | B16 cells | CVCL_F936 | ||
| Experiment 35 Reporting the Activity Date of This ADC | [215] | ||||
| Efficacy Data | 20% Maximal Inhibitory Concentration (IC20) | > 20.00 nM | Negative GD2 expression (GD2-) | ||
| Method Description |
Cells were sub-cultured and seeded at 5,000 cells/well in complete growth medium in 96-well tissue culture plates, and incubated at 37°C, 5% CO2 overnight. Test reagents were serially diluted and added to the cell plates (initial concentration of 100 nM). Plates were incubated at 37°C, 5% CO2 for an additional 3 d.
|
||||
| In Vitro Model | Neuroblastoma | NGP-127 cells | CVCL_UF75 | ||
| Experiment 36 Reporting the Activity Date of This ADC | [215] | ||||
| Efficacy Data | 20% Maximal Inhibitory Concentration (IC20) | > 20.00 nM | Negative GD2 expression (GD2-) | ||
| Method Description |
Cells were sub-cultured and seeded at 5,000 cells/well in complete growth medium in 96-well tissue culture plates, and incubated at 37°C, 5% CO2 overnight. Test reagents were serially diluted and added to the cell plates (initial concentration of 100 nM). Plates were incubated at 37°C, 5% CO2 for an additional 3 d.
|
||||
| In Vitro Model | Osteosarcoma | HOS cells | CVCL_0312 | ||
| Experiment 37 Reporting the Activity Date of This ADC | [215] | ||||
| Efficacy Data | 20% Maximal Inhibitory Concentration (IC20) | > 20.00 nM | Negative GD2 expression (GD2-) | ||
| Method Description |
Cells were sub-cultured and seeded at 5,000 cells/well in complete growth medium in 96-well tissue culture plates, and incubated at 37°C, 5% CO2 overnight. Test reagents were serially diluted and added to the cell plates (initial concentration of 100 nM). Plates were incubated at 37°C, 5% CO2 for an additional 3 d.
|
||||
| In Vitro Model | Breast adenocarcinoma | SK-BR-3 cells | CVCL_0033 | ||
| Experiment 38 Reporting the Activity Date of This ADC | [215] | ||||
| Efficacy Data | 20% Maximal Inhibitory Concentration (IC20) | > 20.00 nM | Negative GD2 expression (GD2-) | ||
| Method Description |
Cells were sub-cultured and seeded at 5,000 cells/well in complete growth medium in 96-well tissue culture plates, and incubated at 37°C, 5% CO2 overnight. Test reagents were serially diluted and added to the cell plates (initial concentration of 100 nM). Plates were incubated at 37°C, 5% CO2 for an additional 3 d.
|
||||
| In Vitro Model | Malignant neoplasms of the mouse mammary gland | M3 cells | CVCL_4Y25 | ||
AXL-154-M103L-MMAE [Investigative]
Discovered Using Cell Line-derived Xenograft Model
| Experiment 1 Reporting the Activity Date of This ADC | [157] | ||||
| Efficacy Data | Tumor Growth Inhibition value (TGI) | ≈ 64.30% (Day 18) | Positive AXL expression (AXL+++/++) | ||
| Method Description |
In the LCLC-103H xenograft model,therapeutic treatment with a single dose of 1 mg/kg in anti-tumor activity in the AXL-ADC panel.
|
||||
| In Vivo Model | Lung cancer CDX model | ||||
| In Vitro Model | Lung large cell carcinoma | LCLC-103H cells | CVCL_1375 | ||
WO2017089890A1 ADC24 [Investigative]
Discovered Using Cell Line-derived Xenograft Model
| Experiment 1 Reporting the Activity Date of This ADC | [211] | ||||
| Efficacy Data | Tumor Growth Inhibition value (TGI) | ≈ 64.72% (Day 52) | Moderate HER2 expression (HER2++) | ||
| Method Description |
JIMT-1 Cells of 5,000,000 suspended in 50 uL cold-saline were implanted intoright hind leg of balb/c-nude mouse. When the tumor volume reaches to about 200 mm3, mice having average valuewere selected and grouped according to tumor volume. Then, mice were treated with PBs (vehicle control), or ADCs (2 mg/kg, single).
|
||||
| In Vivo Model | JIMT-1 CDX model | ||||
| In Vitro Model | Breast ductal carcinoma | JIMT-1 cells | CVCL_2077 | ||
| Experiment 2 Reporting the Activity Date of This ADC | [211] | ||||
| Efficacy Data | Tumor Growth Inhibition value (TGI) | ≈ 94.72% (Day 52) | Moderate HER2 expression (HER2++) | ||
| Method Description |
JIMT-1 Cells of 5,000,000 suspended in 50 uL cold-saline were implanted intoright hind leg of balb/c-nude mouse. When the tumor volume reaches to about 200 mm3, mice having average valuewere selected and grouped according to tumor volume. Then, mice were treated with PBs (vehicle control), or ADCs (5 mg/kg, single).
|
||||
| In Vivo Model | JIMT-1 CDX model | ||||
| In Vitro Model | Breast ductal carcinoma | JIMT-1 cells | CVCL_2077 | ||
Revealed Based on the Cell Line Data
| Experiment 1 Reporting the Activity Date of This ADC | [211] | ||||
| Efficacy Data | Half Maximal Inhibitory Concentration (IC50) |
0.14 nM
|
High HER2 expression (HER2 +++) | ||
| Method Description |
Anti-proliferation activities of the antibodies, drugs, and conjugates with regard tothe cancer cell lines were measured. The cells were plated in 96-well, tissue culture platesat 10,000 cells per well. After 24 hour incubation, the antibodies, drugs, and conjugateswere added in various concentrations. The number of viable cells after 72 hours werecounted using SRB assay.
Click to Show/Hide
|
||||
| In Vitro Model | Breast adenocarcinoma | SK-BR-3 cells | CVCL_0033 | ||
| Experiment 2 Reporting the Activity Date of This ADC | [211] | ||||
| Efficacy Data | Half Maximal Inhibitory Concentration (IC50) |
0.17 nM
|
High HER2 expression (HER2+++) | ||
| Method Description |
Anti-proliferation activities of the antibodies, drugs, and conjugates with regard tothe cancer cell lines were measured. The cells were plated in 96-well, tissue culture platesat 10,000 cells per well. After 24 hour incubation, the antibodies, drugs, and conjugateswere added in various concentrations. The number of viable cells after 72 hours werecounted using SRB assay.
Click to Show/Hide
|
||||
| In Vitro Model | Gastric tubular adenocarcinoma | NCI-N87 cells | CVCL_1603 | ||
| Experiment 3 Reporting the Activity Date of This ADC | [211] | ||||
| Efficacy Data | Half Maximal Inhibitory Concentration (IC50) |
0.26 nM
|
Moderate HER2 expression (HER2++) | ||
| Method Description |
Anti-proliferation activities of the antibodies, drugs, and conjugates with regard tothe cancer cell lines were measured. The cells were plated in 96-well, tissue culture platesat 10,000 cells per well. After 24 hour incubation, the antibodies, drugs, and conjugateswere added in various concentrations. The number of viable cells after 72 hours werecounted using SRB assay.
Click to Show/Hide
|
||||
| In Vitro Model | Breast ductal carcinoma | JIMT-1 cells | CVCL_2077 | ||
| Experiment 4 Reporting the Activity Date of This ADC | [211] | ||||
| Efficacy Data | Half Maximal Inhibitory Concentration (IC50) |
0.37 nM
|
High HER2 expression (HER2+++) | ||
| Method Description |
Anti-proliferation activities of the antibodies, drugs, and conjugates with regard tothe cancer cell lines were measured. The cells were plated in 96-well, tissue culture platesat 10,000 cells per well. After 24 hour incubation, the antibodies, drugs, and conjugateswere added in various concentrations. The number of viable cells after 72 hours werecounted using SRB assay.
Click to Show/Hide
|
||||
| In Vitro Model | Ovarian serous cystadenocarcinoma | SK-OV-3 cells | CVCL_0532 | ||
| Experiment 5 Reporting the Activity Date of This ADC | [211] | ||||
| Efficacy Data | Half Maximal Inhibitory Concentration (IC50) | > 33.30 nM | Negative HER2 expression (HER2-) | ||
| Method Description |
Anti-proliferation activities of the antibodies, drugs, and conjugates with regard tothe cancer cell lines were measured. The cells were plated in 96-well, tissue culture platesat 10,000 cells per well. After 24 hour incubation, the antibodies, drugs, and conjugateswere added in various concentrations. The number of viable cells after 72 hours werecounted using SRB assay.
Click to Show/Hide
|
||||
| In Vitro Model | Invasive breast carcinoma | MCF-7 cells | CVCL_0031 | ||
h1F6-12 MMAE DAR4 [Investigative]
Discovered Using Cell Line-derived Xenograft Model
| Experiment 1 Reporting the Activity Date of This ADC | [207] | ||||
| Efficacy Data | Tumor Growth Inhibition value (TGI) | ≈ 67.63% (Day 29) | Positive CD70 expression (CD70+++/++) | ||
| Method Description |
To establish 786-O tumors, 5 x 10⁶ cells were implanted into the right flank of athymic nu/nu female donor mice. When tumors reached ~100 mm3 mice were randomly allocated to treatment groups. The dose of ADC was 1 mg/kg single.
|
||||
| In Vivo Model | 786-O CDX model | ||||
| In Vitro Model | Renal cell carcinoma | 786-O cells | CVCL_1051 | ||
Revealed Based on the Cell Line Data
| Experiment 1 Reporting the Activity Date of This ADC | [207] | ||||
| Efficacy Data | Half Maximal Inhibitory Concentration (IC50) |
4.00 ng/mL
|
Positive CD70 expression (CD70+++/++) | ||
| Method Description |
Log phase cultures of cells were collected and cells plated at seeding densities ranging from 500 - 10,000 cells/well according to pre-determined conditions.After incubating 24 hours to allow surface protein reconstitution, serial dilutions of test conjugates were added and cultures incubated further for 4 days.
|
||||
| In Vitro Model | Renal cell carcinoma | 786-O cells | CVCL_1051 | ||
| Experiment 2 Reporting the Activity Date of This ADC | [207] | ||||
| Efficacy Data | Half Maximal Inhibitory Concentration (IC50) |
12.00 ng/mL
|
Positive CD70 expression (CD70+++/++) | ||
| Method Description |
Log phase cultures of cells were collected and cells plated at seeding densities ranging from 500 - 10,000 cells/well according to pre-determined conditions.After incubating 24 hours to allow surface protein reconstitution, serial dilutions of test conjugates were added and cultures incubated further for 4 days.
|
||||
| In Vitro Model | Clear cell renal cell carcinoma | Caki-1 cells | CVCL_0234 | ||
hBU12-12 MMAE DAR4 [Investigative]
Discovered Using Cell Line-derived Xenograft Model
| Experiment 1 Reporting the Activity Date of This ADC | [207] | ||||
| Efficacy Data | Tumor Growth Inhibition value (TGI) | ≈ 67.63% (Day 29) | Positive CD70 expression (CD70+++/++) | ||
| Method Description |
To establish 786-O tumors, 5 x 10⁶ cells were implanted into the right flank of athymic nu/nu female donor mice. When tumors reached ~100 mm3 mice were randomly allocated to treatment groups. The dose of ADC was 1 mg/kg single.
|
||||
| In Vivo Model | 786-O CDX model | ||||
| In Vitro Model | Renal cell carcinoma | 786-O cells | CVCL_1051 | ||
Revealed Based on the Cell Line Data
| Experiment 1 Reporting the Activity Date of This ADC | [207] | ||||
| Efficacy Data | Half Maximal Inhibitory Concentration (IC50) |
4.00 ng/mL
|
Positive CD70 expression (CD70+++/++) | ||
| Method Description |
Log phase cultures of cells were collected and cells plated at seeding densities ranging from 500 - 10,000 cells/well according to pre-determined conditions.After incubating 24 hours to allow surface protein reconstitution, serial dilutions of test conjugates were added and cultures incubated further for 4 days.
|
||||
| In Vitro Model | Renal cell carcinoma | 786-O cells | CVCL_1051 | ||
| Experiment 2 Reporting the Activity Date of This ADC | [207] | ||||
| Efficacy Data | Half Maximal Inhibitory Concentration (IC50) |
12.00 ng/mL
|
Positive CD70 expression (CD70+++/++) | ||
| Method Description |
Log phase cultures of cells were collected and cells plated at seeding densities ranging from 500 - 10,000 cells/well according to pre-determined conditions.After incubating 24 hours to allow surface protein reconstitution, serial dilutions of test conjugates were added and cultures incubated further for 4 days.
|
||||
| In Vitro Model | Clear cell renal cell carcinoma | Caki-1 cells | CVCL_0234 | ||
25A3-Val-Cit-MMAE [Investigative]
Discovered Using Cell Line-derived Xenograft Model
| Experiment 1 Reporting the Activity Date of This ADC | [86] | ||||
| Efficacy Data | Tumor Growth Inhibition value (TGI) |
68.00% (Day 49)
|
Positive Tissue factor expression (TF+++/++; 570,000 TF receptor copy number) | ||
| Method Description |
Cell line-derived xenograft (CDX) models MDA-MB-231 epidermoid carcinoma and the HPAF-II pancreatic carcinoma cell lines were implanted subcutaneously in the flank of athymic nude mice Animals were removed from study and euthanized once tumor size reached 1200 mm3 or skin ulceration was evident ADC was dosed weekly at 2 mg/kg for 2 weeks.
Click to Show/Hide
|
||||
| In Vivo Model | MDA-MB-231 cell line xenograft model | ||||
| In Vitro Model | Breast adenocarcinoma | MDA-MB-231 cells | CVCL_0062 | ||
| Experiment 2 Reporting the Activity Date of This ADC | [86] | ||||
| Efficacy Data | Tumor Growth Inhibition value (TGI) |
100.00% (Day 49)
|
Low FOLR1 expression (FOLR1+) | ||
| Method Description |
Cell line-derived xenograft (CDX) models MDA-MB-231 epidermoid carcinoma and the HPAF-II pancreatic carcinoma cell lines were implanted subcutaneously in the flank of athymic nude mice Animals were removed from study and euthanized once tumor size reached 1200 mm3 or skin ulceration was evident ADC was dosed weekly at 4 mg/kg for 2 weeks.
Click to Show/Hide
|
||||
| In Vivo Model | MDA-MB-231 cell line xenograft model | ||||
| In Vitro Model | Breast adenocarcinoma | MDA-MB-231 cells | CVCL_0062 | ||
| Experiment 3 Reporting the Activity Date of This ADC | [86] | ||||
| Efficacy Data | Tumor Growth Inhibition value (TGI) |
100.00% (Day 39)
|
Low FOLR1 expression (FOLR1+) | ||
| Method Description |
Cell line-derived xenograft (CDX) models The A431 epidermoid carcinoma and the HPAF-II pancreatic carcinoma cell lines were implanted subcutaneously in the flank of athymic nude mice Animals were removed from study and euthanized once tumor size reached 1200 mm3 or skin ulceration was evident ADC was dosed weekly at 2 mg/kg for 2 weeks.
|
||||
| In Vivo Model | HPAF-II xenograft model | ||||
| In Vitro Model | Pancreatic ductal adenocarcinoma | HPAF-II cells | CVCL_0313 | ||
| Experiment 4 Reporting the Activity Date of This ADC | [86] | ||||
| Efficacy Data | Half Maximal Effective Concentration (EC50) |
24.00 nM
|
Positive Tissue factor expression (TF+++/++; 380,000 TF receptor copy number) | ||
| Method Description |
Antibody-dependent cellular cytotoxicity (ADCC) A431 cells were plated on a microtiter plate The following day, the cells were incubated with a ten-point 1:3 dilution titration of anti-TF antibodies or the ADCs starting at 50 nM An ADCC effector-to-target cell ratio of 8:1 was added to each well and incubated for 6 h at 37°C Luciferase Assay Reagent was added to each well to measure luminescence on an Envision plate reader Antibody-dependent cellular cytotoxicity (ADCC) reporter luminescence was evaluated after a 6-hour incubation of the reporter Jurkat cell line with TF-positive A431 cells and a titration of anti-TF antibody or ADC The ADCC reporter luminescence EC50 values for each anti-TF antibody or ADC are listed.
Click to Show/Hide
|
||||
| In Vitro Model | Human papillomavirus-related endocervical adenocarcinoma | KB cells | CVCL_0372 | ||
Revealed Based on the Cell Line Data
| Experiment 1 Reporting the Activity Date of This ADC | [86] | ||||
| Efficacy Data | Half Maximal Inhibitory Concentration (IC50) |
5.00 nM
|
Positive Tissue factor expression (TF+++/++; 320,000 TF receptor copy number) | ||
| Method Description |
To evaluate ADC cytotoxicity, cells were plated in 384-well plates Anti-TF antibodies conjugated to MC-vc-PAB-MMAE were serially diluted as shown Plates were incubated for 3 days, followed by lysis in CTG assay reagent For each ADC, the IC50 and its associated 95% confidence interval (95% CI) were calculated Titrations of the TF-specific ADCs were added to HPAF-II cells, with a 72-hour incubationThis treatment resulted in efficacious cell killing.
Click to Show/Hide
|
||||
| In Vitro Model | Pancreatic ductal adenocarcinoma | HPAF-II cells | CVCL_0313 | ||
| Experiment 2 Reporting the Activity Date of This ADC | [86] | ||||
| Efficacy Data | Half Maximal Inhibitory Concentration (IC50) |
11.00 nM
|
Positive Tissue factor expression (TF+++/++; 570,000 TF receptor copy number) | ||
| Method Description |
To evaluate ADC cytotoxicity, cells were plated in 384-well plates Anti-TF antibodies conjugated to MC-vc-PAB-MMAE were serially diluted as shown Plates were incubated for 3 days, followed by lysis in CTG assay reagent For each ADC, the IC50 and its associated 95% confidence interval (95% CI) were calculated Titrations of the TF-specific ADCs were added to 5-day old cultures of MDA-MB-231 cells, with a 72-hour incubationThis treatment resulted in efficacious cell killing.
Click to Show/Hide
|
||||
| In Vitro Model | Breast adenocarcinoma | MDA-MB-231 cells | CVCL_0062 | ||
| Experiment 3 Reporting the Activity Date of This ADC | [86] | ||||
| Efficacy Data | Half Maximal Inhibitory Concentration (IC50) |
12.00 nM
|
Positive Tissue factor expression (TF+++/++; 320,000 TF receptor copy number) | ||
| Method Description |
A431 cells were pre-incubated for 30 min without or with 50 nM of FVIIa prior to the addition of an anti-TF ADC (25A3-vc-MMAE) titration After a 4 h incubation at 37°C, the FVIIa and ADC were washed out and the cells were cultured for another 68 h before cell viability assessment.
|
||||
| In Vitro Model | Skin squamous cell carcinoma | A431 cells | CVCL_0037 | ||
| Experiment 4 Reporting the Activity Date of This ADC | [95] | ||||
| Efficacy Data | Half Maximal Effective Concentration (EC50) |
14.00 nM
|
Positive Tissue factor expression (TF+++/++; 320,000 TF receptor copy number) | ||
| Method Description |
To evaluate ADC cytotoxicity, cells were plated in 384-well plates Anti-TF antibodies conjugated to MC-vc-PAB-MMAE were serially diluted as shown Plates were incubated for 3 days, followed by lysis in CTG assay reagent For each ADC, the IC50 and its associated 95% confidence interval (95% CI) were calculated Titrations of the TF-specific ADCs were added to A431 cells, with a 72-hour incubationThis treatment resulted in efficacious cell killing.
Click to Show/Hide
|
||||
| In Vitro Model | Skin squamous cell carcinoma | A431 cells | CVCL_0037 | ||
| Experiment 5 Reporting the Activity Date of This ADC | [95] | ||||
| Efficacy Data | Half Maximal Effective Concentration (EC50) |
14.00 nM
|
Positive Tissue factor expression (TF+++/++; 320,000 TF receptor copy number) | ||
| Method Description |
To evaluate ADC cytotoxicity, cells were plated in 384-well plates Anti-TF antibodies conjugated to MC-vc-PAB-MMAE were serially diluted as shown Plates were incubated for 3 days, followed by lysis in CTG assay reagent For each ADC, the IC50 and its associated 95% confidence interval (95% CI) were calculated Titrations of the TF-specific ADCs were added to A431 cells, with a 4-hour incubation followed by removal of excess ADC and culture for another 68 hours This treatment resulted in efficacious cell killing.
Click to Show/Hide
|
||||
| In Vitro Model | Skin squamous cell carcinoma | A431 cells | CVCL_0037 | ||
Cys-linker-MMAE-based ADC 15 [Investigative]
Discovered Using Cell Line-derived Xenograft Model
| Experiment 1 Reporting the Activity Date of This ADC | [216] | ||||
| Efficacy Data | Tumor Growth Inhibition value (TGI) | ≈ 69.34% (Day 60) | High HER2 expression (HER2 +++) | ||
| Method Description |
An NCI-N87 xenograft model of HER2-positive gastric cancer cells in BALB/c nude mice was designed to assess the efficacy of ADC in vivo. The mice were given vehicle, mil40, or ADC (5 mg/kg) on days 0, 7, 14, and 21.
|
||||
| In Vivo Model | NCI-N87 CDX model | ||||
| In Vitro Model | Gastric tubular adenocarcinoma | NCI-N87 cells | CVCL_1603 | ||
| Experiment 2 Reporting the Activity Date of This ADC | [216] | ||||
| Efficacy Data | Tumor Growth Inhibition value (TGI) | ≈ 92.21% (Day 60) | High HER2 expression (HER2 +++) | ||
| Method Description |
An NCI-N87 xenograft model of HER2-positive gastric cancer cells in BALB/c nude mice was designed to assess the efficacy of ADC in vivo. The mice were given vehicle, mil40, or ADC (10 mg/kg) on days 0, 7, 14, and 21.
|
||||
| In Vivo Model | NCI-N87 CDX model | ||||
| In Vitro Model | Gastric tubular adenocarcinoma | NCI-N87 cells | CVCL_1603 | ||
Revealed Based on the Cell Line Data
| Experiment 1 Reporting the Activity Date of This ADC | [216] | ||||
| Efficacy Data | Half Maximal Inhibitory Concentration (IC50) |
0.09 nM
|
High HER2 expression (HER2 +++) | ||
| Method Description |
Cells (33000 cells/well) were added to each well of 384-well plates and incubated at 37°C overnight, after which 10 uL of compound aliquots were added to the assay plate.
|
||||
| In Vitro Model | Breast ductal carcinoma | HCC1954 cells | CVCL_1259 | ||
| Experiment 2 Reporting the Activity Date of This ADC | [216] | ||||
| Efficacy Data | Half Maximal Inhibitory Concentration (IC50) |
0.12 nM
|
High HER2 expression (HER2 +++) | ||
| Method Description |
Cells (33000 cells/well) were added to each well of 384-well plates and incubated at 37°C overnight, after which 10 uL of compound aliquots were added to the assay plate.
|
||||
| In Vitro Model | Gastric tubular adenocarcinoma | NCI-N87 cells | CVCL_1603 | ||
| Experiment 3 Reporting the Activity Date of This ADC | [216] | ||||
| Efficacy Data | Half Maximal Inhibitory Concentration (IC50) |
0.35 nM
|
High HER2 expression (HER2 +++) | ||
| Method Description |
Cells (33000 cells/well) were added to each well of 384-well plates and incubated at 37°C overnight, after which 10 uL of compound aliquots were added to the assay plate.
|
||||
| In Vitro Model | Invasive breast carcinoma | BT-474 cells | CVCL_0179 | ||
| Experiment 4 Reporting the Activity Date of This ADC | [216] | ||||
| Efficacy Data | Half Maximal Inhibitory Concentration (IC50) |
97.62 nM
|
Negative HER2 expression (HER2-) | ||
| Method Description |
Cells (33000 cells/well) were added to each well of 384-well plates and incubated at 37°C overnight, after which 10 uL of compound aliquots were added to the assay plate.
|
||||
| In Vitro Model | Breast adenocarcinoma | MDA-MB-468 cells | CVCL_0419 | ||
| Experiment 5 Reporting the Activity Date of This ADC | [216] | ||||
| Efficacy Data | Half Maximal Inhibitory Concentration (IC50) |
110.54 nM
|
Negative HER2 expression (HER2-) | ||
| Method Description |
Cells (33000 cells/well) were added to each well of 384-well plates and incubated at 37°C overnight, after which 10 uL of compound aliquots were added to the assay plate.
|
||||
| In Vitro Model | Invasive breast carcinoma | MCF-7 cells | CVCL_0031 | ||
43B1-Val-Cit-MMAE [Investigative]
Discovered Using Cell Line-derived Xenograft Model
| Experiment 1 Reporting the Activity Date of This ADC | [86] | ||||
| Efficacy Data | Tumor Growth Inhibition value (TGI) |
70.00% (Day 49)
|
Low FOLR1 expression (FOLR1+) | ||
| Method Description |
Cell line-derived xenograft (CDX) models MDA-MB-231 epidermoid carcinoma and the HPAF-II pancreatic carcinoma cell lines were implanted subcutaneously in the flank of athymic nude mice Animals were removed from study and euthanized once tumor size reached 1200 mm3 or skin ulceration was evident ADC was dosed weekly at 2 mg/kg for 2 weeks.
Click to Show/Hide
|
||||
| In Vivo Model | MDA-MB-231 cell line xenograft model | ||||
| In Vitro Model | Breast adenocarcinoma | MDA-MB-231 cells | CVCL_0062 | ||
| Experiment 2 Reporting the Activity Date of This ADC | [86] | ||||
| Efficacy Data | Tumor Growth Inhibition value (TGI) |
92.00% (Day 49)
|
Low FOLR1 expression (FOLR1+) | ||
| Method Description |
Cell line-derived xenograft (CDX) models MDA-MB-231 epidermoid carcinoma and the HPAF-II pancreatic carcinoma cell lines were implanted subcutaneously in the flank of athymic nude mice Animals were removed from study and euthanized once tumor size reached 1200 mm3 or skin ulceration was evident ADC was dosed weekly at 4 mg/kg for 2 weeks.
Click to Show/Hide
|
||||
| In Vivo Model | MDA-MB-231 cell line xenograft model | ||||
| In Vitro Model | Breast adenocarcinoma | MDA-MB-231 cells | CVCL_0062 | ||
| Experiment 3 Reporting the Activity Date of This ADC | [86] | ||||
| Efficacy Data | Tumor Growth Inhibition value (TGI) |
100.00% (Day 39)
|
Low FOLR1 expression (FOLR1+) | ||
| Method Description |
Cell line-derived xenograft (CDX) models The A431 epidermoid carcinoma and the HPAF-II pancreatic carcinoma cell lines were implanted subcutaneously in the flank of athymic nude mice Animals were removed from study and euthanized once tumor size reached 1200 mm3 or skin ulceration was evident ADC was dosed weekly at 2 mg/kg for 2 weeks.
|
||||
| In Vivo Model | HPAF-II xenograft model | ||||
| In Vitro Model | Pancreatic ductal adenocarcinoma | HPAF-II cells | CVCL_0313 | ||
| Experiment 4 Reporting the Activity Date of This ADC | [86] | ||||
| Efficacy Data | Half Maximal Effective Concentration (EC50) |
42.00 nM
|
Positive Tissue factor expression (TF+++/++; 320,000 TF receptor copy number) | ||
| Method Description |
Antibody-dependent cellular cytotoxicity (ADCC) A431 cells were plated on a microtiter plate The following day, the cells were incubated with a ten-point 1:3 dilution titration of anti-TF antibodies or the ADCs starting at 50 nM An ADCC effector-to-target cell ratio of 8:1 was added to each well and incubated for 6 h at 37°C Luciferase Assay Reagent was added to each well to measure luminescence on an Envision plate reader Antibody-dependent cellular cytotoxicity (ADCC) reporter luminescence was evaluated after a 6-hour incubation of the reporter Jurkat cell line with TF-positive A431 cells and a titration of anti-TF antibody or ADC The ADCC reporter luminescence EC50 values for each anti-TF antibody or ADC are listed.
Click to Show/Hide
|
||||
| In Vitro Model | Breast adenocarcinoma | MDA-MB-231 cells | CVCL_0062 | ||
Revealed Based on the Cell Line Data
| Experiment 1 Reporting the Activity Date of This ADC | [86] | ||||
| Efficacy Data | Half Maximal Inhibitory Concentration (IC50) |
5.00 nM
|
Positive Tissue factor expression (TF+++/++; 570,000 TF receptor copy number) | ||
| Method Description |
To evaluate ADC cytotoxicity, cells were plated in 384-well plates Anti-TF antibodies conjugated to MC-vc-PAB-MMAE were serially diluted as shown Plates were incubated for 3 days, followed by lysis in CTG assay reagent For each ADC, the IC50 and its associated 95% confidence interval (95% CI) were calculated Titrations of the TF-specific ADCs were added to HPAF-II cells, with a 72-hour incubationThis treatment resulted in efficacious cell killing.
Click to Show/Hide
|
||||
| In Vitro Model | Pancreatic ductal adenocarcinoma | HPAF-II cells | CVCL_0313 | ||
| Experiment 2 Reporting the Activity Date of This ADC | [86] | ||||
| Efficacy Data | Half Maximal Inhibitory Concentration (IC50) |
14.00 nM
|
Positive Tissue factor expression (TF+++/++; 320,000 TF receptor copy number) | ||
| Method Description |
To evaluate ADC cytotoxicity, cells were plated in 384-well plates Anti-TF antibodies conjugated to MC-vc-PAB-MMAE were serially diluted as shown Plates were incubated for 3 days, followed by lysis in CTG assay reagent For each ADC, the IC50 and its associated 95% confidence interval (95% CI) were calculated Titrations of the TF-specific ADCs were added to 5-day old cultures of MDA-MB-231 cells, with a 72-hour incubationThis treatment resulted in efficacious cell killing.
Click to Show/Hide
|
||||
| In Vitro Model | Breast adenocarcinoma | MDA-MB-231 cells | CVCL_0062 | ||
| Experiment 3 Reporting the Activity Date of This ADC | [95] | ||||
| Efficacy Data | Half Maximal Effective Concentration (EC50) |
14.00 nM
|
Positive Tissue factor expression (TF+++/++; 320,000 TF receptor copy number) | ||
| Method Description |
A431 cells were pre-incubated for 30 min without or with 50 nM of FVIIa prior to the addition of an anti-TF ADC (43B1-vc-MMAE) titration After a 4 h incubation at 37°C, the FVIIa and ADC were washed out and the cells were cultured for another 68 h before cell viability assessment.
|
||||
| In Vitro Model | Skin squamous cell carcinoma | A431 cells | CVCL_0037 | ||
| Experiment 4 Reporting the Activity Date of This ADC | [95] | ||||
| Efficacy Data | Half Maximal Effective Concentration (EC50) |
14.00 nM
|
Positive Tissue factor expression (TF+++/++; 320,000 TF receptor copy number) | ||
| Method Description |
To evaluate ADC cytotoxicity, cells were plated in 384-well plates Anti-TF antibodies conjugated to MC-vc-PAB-MMAE were serially diluted as shown Plates were incubated for 3 days, followed by lysis in CTG assay reagent For each ADC, the IC50 and its associated 95% confidence interval (95% CI) were calculated Titrations of the TF-specific ADCs were added to A431 cells, with a 72-hour incubationThis treatment resulted in efficacious cell killing.
Click to Show/Hide
|
||||
| In Vitro Model | Skin squamous cell carcinoma | A431 cells | CVCL_0037 | ||
| Experiment 5 Reporting the Activity Date of This ADC | [95] | ||||
| Efficacy Data | Half Maximal Effective Concentration (EC50) |
14.00 nM
|
Positive Tissue factor expression (TF+++/++; 570,000 TF receptor copy number) | ||
| Method Description |
To evaluate ADC cytotoxicity, cells were plated in 384-well plates Anti-TF antibodies conjugated to MC-vc-PAB-MMAE were serially diluted as shown Plates were incubated for 3 days, followed by lysis in CTG assay reagent For each ADC, the IC50 and its associated 95% confidence interval (95% CI) were calculated Titrations of the TF-specific ADCs were added to A431 cells, with a 4-hour incubation followed by removal of excess ADC and culture for another 68 hours This treatment resulted in efficacious cell killing.
Click to Show/Hide
|
||||
| In Vitro Model | Skin squamous cell carcinoma | A431 cells | CVCL_0037 | ||
2G10 RED-388 MMAE 4 [Investigative]
Discovered Using Cell Line-derived Xenograft Model
| Experiment 1 Reporting the Activity Date of This ADC | [217] | ||||
| Efficacy Data | Tumor Growth Inhibition value (TGI) | ≈ 70.42% (Day 56) | Positive PLAUR expression (PLAUR +++/++) | ||
| Method Description |
To compare the in vivo anti-tumor efficacy of the various ADC constructs, we used MDA-MB-231 xenografts in mice. Animals with tumors of approximately 100 mm3 were treated once a week for four weeks with a 10 mg/kg dose of a variety of DAR 4 ADCs or 2G10 antibody.
|
||||
| In Vivo Model | MDA-MB-231 CDX model | ||||
| In Vitro Model | Breast adenocarcinoma | MDA-MB-231 cells | CVCL_0062 | ||
Revealed Based on the Cell Line Data
| Experiment 1 Reporting the Activity Date of This ADC | [217] | ||||
| Efficacy Data | Half Maximal Inhibitory Concentration (IC50) |
50.00 nM-500.00 nM
|
Positive PLAUR expression (PLAUR +++/++) | ||
| Method Description |
MDA-MB-231 cells (0.5x10⁴ cells/well) were seeded in 96-well plates at the density and incubated for 120 h (5 days) with of ADCs or IgG. After 5 days of drug treatment at 37°C with 5% CO2.
|
||||
| In Vitro Model | Breast adenocarcinoma | MDA-MB-231 cells | CVCL_0062 | ||
2G10 RED-412 MMAE 4 [Investigative]
Discovered Using Cell Line-derived Xenograft Model
| Experiment 1 Reporting the Activity Date of This ADC | [217] | ||||
| Efficacy Data | Tumor Growth Inhibition value (TGI) | ≈ 72.92% (Day 56) | Positive PLAUR expression (PLAUR +++/++) | ||
| Method Description |
To compare the in vivo anti-tumor efficacy of the various ADC constructs, we used MDA-MB-231 xenografts in mice. Animals with tumors of approximately 100 mm3 were treated once a week for four weeks with a 10 mg/kg dose of a variety of DAR 4 ADCs or 2G10 antibody.
|
||||
| In Vivo Model | MDA-MB-231 CDX model | ||||
| In Vitro Model | Breast adenocarcinoma | MDA-MB-231 cells | CVCL_0062 | ||
Revealed Based on the Cell Line Data
| Experiment 1 Reporting the Activity Date of This ADC | [217] | ||||
| Efficacy Data | Half Maximal Inhibitory Concentration (IC50) |
50.00 nM-500.00 nM
|
Positive PLAUR expression (PLAUR +++/++) | ||
| Method Description |
MDA-MB-231 cells (0.5x10⁴ cells/well) were seeded in 96-well plates at the density and incubated for 120 h (5 days) with of ADCs or IgG. After 5 days of drug treatment at 37°C with 5% CO2.
|
||||
| In Vitro Model | Breast adenocarcinoma | MDA-MB-231 cells | CVCL_0062 | ||
THL4-vcMMAE [Investigative]
Discovered Using Cell Line-derived Xenograft Model
| Experiment 1 Reporting the Activity Date of This ADC | [205] | ||||
| Efficacy Data | Tumor Growth Inhibition value (TGI) | ≈ 73.19% (Day 24) | Positive DLL4 expression (DLL4 +++/++) | ||
| Method Description |
Drugs were intravenously (i.v.) administered in total three times on days 1, 4 and 7. 5 mg/kg HLvM4 was intravenously administered once every three days for three weeks.
|
||||
| In Vivo Model | A549 CDX model | ||||
| In Vitro Model | Lung adenocarcinoma | A-549 cells | CVCL_0023 | ||
| Experiment 2 Reporting the Activity Date of This ADC | [205] | ||||
| Efficacy Data | Tumor Growth Inhibition value (TGI) | ≈ 82.33% (Day 24) | Positive DLL4 expression (DLL4 +++/++) | ||
| Method Description |
Drugs were intravenously (i.v.) administered in total three times on days 1, 4 and 7. 5 mg/kg HLvM4 was intravenously administered once every three days for three weeks.
|
||||
| In Vivo Model | MDA-MB-231 CDX model | ||||
| In Vitro Model | Breast adenocarcinoma | MDA-MB-231 cells | CVCL_0062 | ||
Revealed Based on the Cell Line Data
| Experiment 1 Reporting the Activity Date of This ADC | [205] | ||||
| Efficacy Data | Half Maximal Inhibitory Concentration (IC50) |
40.53 nM
|
Positive DLL4 expression (DLL4 +++/++) | ||
| Method Description |
In vitro cytotoxicity and mechanism of anti-DLL4 ADCs. The cytotoxicity of ADCs was assessed by MTT assay. The percentage of cell inhibition relative to untreated control HUVEC cells was calculated for each drug concentration.
|
||||
| In Vitro Model | Normal | HUVEC-C cells | CVCL_2959 | ||
h1F6-11 MMAE DAR8 [Investigative]
Discovered Using Cell Line-derived Xenograft Model
| Experiment 1 Reporting the Activity Date of This ADC | [207] | ||||
| Efficacy Data | Tumor Growth Inhibition value (TGI) | ≈ 74.65% (Day 29) | Positive CD70 expression (CD70+++/++) | ||
| Method Description |
To establish 786-O tumors, 5 x 10⁶ cells were implanted into the right flank of athymic nu/nu female donor mice. When tumors reached ~100 mm3 mice were randomly allocated to treatment groups. The dose of ADC was 1 mg/kg single.
|
||||
| In Vivo Model | 786-O CDX model | ||||
| In Vitro Model | Renal cell carcinoma | 786-O cells | CVCL_1051 | ||
hBU12-11 MMAE DAR8 [Investigative]
Discovered Using Cell Line-derived Xenograft Model
| Experiment 1 Reporting the Activity Date of This ADC | [207] | ||||
| Efficacy Data | Tumor Growth Inhibition value (TGI) | ≈ 74.65% (Day 29) | Positive CD70 expression (CD70+++/++) | ||
| Method Description |
To establish 786-O tumors, 5 x 10⁶ cells were implanted into the right flank of athymic nu/nu female donor mice. When tumors reached ~100 mm3 mice were randomly allocated to treatment groups. The dose of ADC was 1 mg/kg single.
|
||||
| In Vivo Model | 786-O CDX model | ||||
| In Vitro Model | Renal cell carcinoma | 786-O cells | CVCL_1051 | ||
GMF-1A3-MMAE [Investigative]
Discovered Using Cell Line-derived Xenograft Model
| Experiment 1 Reporting the Activity Date of This ADC | [218] | ||||
| Efficacy Data | Tumor Growth Inhibition value (TGI) | ≈ 75.00% (Day 73) | Low HER2 expression (HER2+) | ||
| Method Description |
1A3-MMAE=5 mg/kg.
|
||||
| In Vivo Model | MCF7 breast cancer xenograft model | ||||
| In Vitro Model | Invasive breast carcinoma | MCF-7 cells | CVCL_0031 | ||
| Experiment 2 Reporting the Activity Date of This ADC | [218] | ||||
| Efficacy Data | Tumor Growth Inhibition value (TGI) | ≈ 100.00% (Day 21) | Low HER2 expression (HER2+) | ||
| Method Description |
1A3-MMAE=5 mg/kg.
|
||||
| In Vivo Model | MCF7-F breast cancer xenograft model | ||||
| In Vitro Model | Invasive breast carcinoma | MCF7-F (fulvestrant resistant) cells | CVCL_0031 | ||
h1F6-13 MMAE DAR4 [Investigative]
Discovered Using Cell Line-derived Xenograft Model
| Experiment 1 Reporting the Activity Date of This ADC | [207] | ||||
| Efficacy Data | Tumor Growth Inhibition value (TGI) | ≈ 78.50% (Day 42) | Positive CD70 expression (CD70+++/++) | ||
| Method Description |
To establish 786-O tumors, 5 x 10⁶ cells were implanted into the right flank of athymic nu/nu female donor mice. When tumors reached ~100 mm3 mice were randomly allocated to treatment groups. The dose of ADC was 0.5 mg/kg.
|
||||
| In Vivo Model | 786-O CDX model | ||||
| In Vitro Model | Renal cell carcinoma | 786-O cells | CVCL_1051 | ||
Revealed Based on the Cell Line Data
| Experiment 1 Reporting the Activity Date of This ADC | [207] | ||||
| Efficacy Data | Half Maximal Inhibitory Concentration (IC50) |
5.00 ng/mL
|
Positive CD70 expression (CD70+++/++) | ||
| Method Description |
Log phase cultures of cells were collected and cells plated at seeding densities ranging from 500 - 10,000 cells/well according to pre-determined conditions.After incubating 24 hours to allow surface protein reconstitution, serial dilutions of test conjugates were added and cultures incubated further for 4 days.
|
||||
| In Vitro Model | Renal cell carcinoma | 786-O cells | CVCL_1051 | ||
| Experiment 2 Reporting the Activity Date of This ADC | [207] | ||||
| Efficacy Data | Half Maximal Inhibitory Concentration (IC50) |
60.00 ng/mL
|
Positive CD70 expression (CD70+++/++) | ||
| Method Description |
Log phase cultures of cells were collected and cells plated at seeding densities ranging from 500 - 10,000 cells/well according to pre-determined conditions.After incubating 24 hours to allow surface protein reconstitution, serial dilutions of test conjugates were added and cultures incubated further for 4 days.
|
||||
| In Vitro Model | Clear cell renal cell carcinoma | Caki-1 cells | CVCL_0234 | ||
hBU12-13 MMAE DAR4 [Investigative]
Discovered Using Cell Line-derived Xenograft Model
| Experiment 1 Reporting the Activity Date of This ADC | [207] | ||||
| Efficacy Data | Tumor Growth Inhibition value (TGI) | ≈ 78.50% (Day 42) | Positive CD70 expression (CD70+++/++) | ||
| Method Description |
To establish 786-O tumors, 5 x 10⁶ cells were implanted into the right flank of athymic nu/nu female donor mice. When tumors reached ~100 mm3 mice were randomly allocated to treatment groups. The dose of ADC was 0.5 mg/kg.
|
||||
| In Vivo Model | 786-O CDX model | ||||
| In Vitro Model | Renal cell carcinoma | 786-O cells | CVCL_1051 | ||
Revealed Based on the Cell Line Data
| Experiment 1 Reporting the Activity Date of This ADC | [207] | ||||
| Efficacy Data | Half Maximal Inhibitory Concentration (IC50) |
5.00 ng/mL
|
Positive CD70 expression (CD70+++/++) | ||
| Method Description |
Log phase cultures of cells were collected and cells plated at seeding densities ranging from 500 - 10,000 cells/well according to pre-determined conditions.After incubating 24 hours to allow surface protein reconstitution, serial dilutions of test conjugates were added and cultures incubated further for 4 days.
|
||||
| In Vitro Model | Renal cell carcinoma | 786-O cells | CVCL_1051 | ||
| Experiment 2 Reporting the Activity Date of This ADC | [207] | ||||
| Efficacy Data | Half Maximal Inhibitory Concentration (IC50) |
60.00 ng/mL
|
Positive CD70 expression (CD70+++/++) | ||
| Method Description |
Log phase cultures of cells were collected and cells plated at seeding densities ranging from 500 - 10,000 cells/well according to pre-determined conditions.After incubating 24 hours to allow surface protein reconstitution, serial dilutions of test conjugates were added and cultures incubated further for 4 days.
|
||||
| In Vitro Model | Clear cell renal cell carcinoma | Caki-1 cells | CVCL_0234 | ||
HER2-gsADC-47 [Investigative]
Discovered Using Cell Line-derived Xenograft Model
| Experiment 1 Reporting the Activity Date of This ADC | [206] | ||||
| Efficacy Data | Tumor Growth Inhibition value (TGI) | ≈ 78.82% (Day 28) | Positive HER2 expression (HER2+++/++) | ||
| Method Description |
To further evaluate the gsADCs, we determined the in vivo tumor-inhibitory activity in an NCI-N87 nude mice xenograft model. The mice were randomly grouped into 10 groups (n = 5), including a PBS control group, when the tumors grew to 200 mm3. The experimental groups were 3.0 mg/kg gsADCs q3d.
|
||||
| In Vivo Model | NCI-N87 CDX model | ||||
| In Vitro Model | Gastric tubular adenocarcinoma | NCI-N87 cells | CVCL_1603 | ||
| Experiment 2 Reporting the Activity Date of This ADC | [206] | ||||
| Efficacy Data | Tumor Growth Inhibition value (TGI) | ≈ 99.97% (Day 57) | Positive HER2 expression (HER2+++/++) | ||
| Method Description |
To further evaluate the gsADCs, we determined the in vivo tumor-inhibitory activity in an NCI-N87 nude mice xenograft model. The mice were randomly grouped into 10 groups (n = 5), including a PBS control group, when the tumors grew to 200 mm3. The experimental groups were 3.0 mg/kg gsADCs q3d.
|
||||
| In Vivo Model | NCI-N87 CDX model | ||||
| In Vitro Model | Gastric tubular adenocarcinoma | NCI-N87 cells | CVCL_1603 | ||
Revealed Based on the Cell Line Data
| Experiment 1 Reporting the Activity Date of This ADC | [206] | ||||
| Efficacy Data | Half Maximal Inhibitory Concentration (IC50) |
0.06 nM
|
Positive HER2 expression (HER2+++/++) | ||
| Method Description |
Cells were cultured in a 10% fetal bovine serum (FBS)-containing RPMI 1640 medium and were planted into 96-well plates with 6000 cells per well. The plates were incubated overnight at 37°C in a 5% CO2 cell incubator.
|
||||
| In Vitro Model | Breast adenocarcinoma | SK-BR-3 cells | CVCL_0033 | ||
| Experiment 2 Reporting the Activity Date of This ADC | [206] | ||||
| Efficacy Data | Half Maximal Inhibitory Concentration (IC50) |
0.16 nM
|
Positive HER2 expression (HER2+++/++) | ||
| Method Description |
Cells were cultured in a 10% fetal bovine serum (FBS)-containing RPMI 1640 medium and were planted into 96-well plates with 6000 cells per well. The plates were incubated overnight at 37°C in a 5% CO2 cell incubator.
|
||||
| In Vitro Model | Gastric tubular adenocarcinoma | NCI-N87 cells | CVCL_1603 | ||
| Experiment 3 Reporting the Activity Date of This ADC | [206] | ||||
| Efficacy Data | Half Maximal Inhibitory Concentration (IC50) | > 66.00 nM | Negative HER2 expression (HER2 -) | ||
| Method Description |
Cells were cultured in a 10% fetal bovine serum (FBS)-containing RPMI 1640 medium and were planted into 96-well plates with 6000 cells per well. The plates were incubated overnight at 37°C in a 5% CO2 cell incubator.
|
||||
| In Vitro Model | Breast adenocarcinoma | MDA-MB-231 cells | CVCL_0062 | ||
Promiximab-MMAE [Investigative]
Discovered Using Cell Line-derived Xenograft Model
| Experiment 1 Reporting the Activity Date of This ADC | [219] | ||||
| Efficacy Data | Tumor Growth Inhibition value (TGI) | ≈ 78.90% (Day 37) | Positive CD56 expression (CD56 +++/++) | ||
| Method Description |
One or two weeks later until the tumor sizes reached about 200 mm3, the mice were divided into four groups, with 6-7 mice in each group. Promiximab-MMAE (2.5 mg/kg), Promiximab (10 mg/kg) and a control (vehicle) were administered via tail vein into the mice every three days, with a total of three times.
|
||||
| In Vivo Model | NCI-H69 CDX model | ||||
| In Vitro Model | Small cell lung carcinoma | NCI-H69 cells | CVCL_1579 | ||
| Experiment 2 Reporting the Activity Date of This ADC | [219] | ||||
| Efficacy Data | Tumor Growth Inhibition value (TGI) | ≈ 89.50% (Day 37) | Positive CD56 expression (CD56 +++/++) | ||
| Method Description |
One or two weeks later until the tumor sizes reached about 200 mm3, the mice were divided into four groups, with 6-7 mice in each group. Promiximab-MMAE (5 mg/kg), Promiximab (10 mg/kg) and a control (vehicle) were administered via tail vein into the mice every three days, with a total of three times.
|
||||
| In Vivo Model | NCI-H69 CDX model | ||||
| In Vitro Model | Small cell lung carcinoma | NCI-H69 cells | CVCL_1579 | ||
| Experiment 3 Reporting the Activity Date of This ADC | [219] | ||||
| Efficacy Data | Tumor Growth Inhibition value (TGI) | ≈ 90.00% (Day 37) | Positive CD56 expression (CD56 +++/++) | ||
| Method Description |
One or two weeks later until the tumor sizes reached about 200 mm3, the mice were divided into four groups, with 6-7 mice in each group. Promiximab-MMAE (10 mg/kg), Promiximab (10 mg/kg) and a control (vehicle) were administered via tail vein into the mice every three days, with a total of three times.
|
||||
| In Vivo Model | NCI-H526 CDX model | ||||
| In Vitro Model | Lung small cell carcinoma | NCI-H526 cells | CVCL_1569 | ||
| Experiment 4 Reporting the Activity Date of This ADC | [219] | ||||
| Efficacy Data | Tumor Growth Inhibition value (TGI) | ≈ 91.00% (Day 37) | Positive CD56 expression (CD56 +++/++) | ||
| Method Description |
One or two weeks later until the tumor sizes reached about 200 mm3, the mice were divided into four groups, with 6-7 mice in each group. Promiximab-MMAE (10 mg/kg), Promiximab (10 mg/kg) and a control (vehicle) were administered via tail vein into the mice every three days, with a total of three times.
|
||||
| In Vivo Model | NCI-H526 CDX model | ||||
| In Vitro Model | Lung small cell carcinoma | NCI-H526 cells | CVCL_1569 | ||
| Experiment 5 Reporting the Activity Date of This ADC | [219] | ||||
| Efficacy Data | Tumor Growth Inhibition value (TGI) | ≈ 100.00% (Day 37) | Positive CD56 expression (CD56 +++/++) | ||
| Method Description |
One or two weeks later until the tumor sizes reached about 200 mm3, the mice were divided into four groups, with 6-7 mice in each group. Promiximab-MMAE (10 mg/kg), Promiximab (10 mg/kg) and a control (vehicle) were administered via tail vein into the mice every three days, with a total of three times.
|
||||
| In Vivo Model | NCI-H69 CDX model | ||||
| In Vitro Model | Small cell lung carcinoma | NCI-H69 cells | CVCL_1579 | ||
| Experiment 6 Reporting the Activity Date of This ADC | [219] | ||||
| Efficacy Data | Tumor Growth Inhibition value (TGI) | ≈ 100.00% (Day 37) | Positive CD56 expression (CD56 +++/++) | ||
| Method Description |
One or two weeks later until the tumor sizes reached about 200 mm3, the mice were divided into four groups, with 6-7 mice in each group. Promiximab-MMAE (10 mg/kg), Promiximab (10 mg/kg) and a control (vehicle) were administered via tail vein into the mice every three days, with a total of three times.
|
||||
| In Vivo Model | NCI-H526 CDX model | ||||
| In Vitro Model | Lung small cell carcinoma | NCI-H526 cells | CVCL_1569 | ||
Revealed Based on the Cell Line Data
| Experiment 1 Reporting the Activity Date of This ADC | [219] | ||||
| Efficacy Data | Half Maximal Inhibitory Concentration (IC50) |
0.32 nM
|
Positive CD56 expression (CD56 +++/++) | ||
| Method Description |
SCLC cell lines and human NK cells were treated with various concentrations of Promiximab and Promiximab-MMAE for 72 h.
|
||||
| In Vitro Model | Small cell lung carcinoma | NCI-H69 cells | CVCL_1579 | ||
| Experiment 2 Reporting the Activity Date of This ADC | [219] | ||||
| Efficacy Data | Half Maximal Inhibitory Concentration (IC50) |
5.23 nM
|
Positive CD56 expression (CD56 +++/++) | ||
| Method Description |
SCLC cell lines and human NK cells were treated with various concentrations of Promiximab and Promiximab-MMAE for 72 h.
|
||||
| In Vitro Model | Lung small cell carcinoma | NCI-H526 cells | CVCL_1569 | ||
| Experiment 3 Reporting the Activity Date of This ADC | [219] | ||||
| Efficacy Data | Half Maximal Inhibitory Concentration (IC50) |
19.24 nM
|
Positive CD56 expression (CD56 +++/++) | ||
| Method Description |
SCLC cell lines and human NK cells were treated with various concentrations of Promiximab and Promiximab-MMAE for 72 h.
|
||||
| In Vitro Model | Lung small cell carcinoma | NCI-H524 cells | CVCL_1568 | ||
| Experiment 4 Reporting the Activity Date of This ADC | [219] | ||||
| Efficacy Data | Half Maximal Inhibitory Concentration (IC50) | > 1200 nM | Negative CD56 expression (CD56 -) | ||
| Method Description |
SCLC cell lines and human NK cells were treated with various concentrations of Promiximab and Promiximab-MMAE for 72 h.
|
||||
| In Vitro Model | Normal | NK cells | Homo sapiens | ||
h1F6-24 MMAE DAR4 [Investigative]
Discovered Using Cell Line-derived Xenograft Model
| Experiment 1 Reporting the Activity Date of This ADC | [207] | ||||
| Efficacy Data | Tumor Growth Inhibition value (TGI) | ≈ 79.49% (Day 25) | Positive CD70 expression (CD70+++/++) | ||
| Method Description |
To establish 786-O tumors, 5 x 10⁶ cells were implanted into the right flank of athymic nu/nu female donor mice. When tumors reached ~100 mm3 mice were randomly allocated to treatment groups. The dose of ADC was 0.5 mg/kg single.
|
||||
| In Vivo Model | 786-O CDX model | ||||
| In Vitro Model | Renal cell carcinoma | 786-O cells | CVCL_1051 | ||
hBU12-24 MMAE DAR4 [Investigative]
Discovered Using Cell Line-derived Xenograft Model
| Experiment 1 Reporting the Activity Date of This ADC | [207] | ||||
| Efficacy Data | Tumor Growth Inhibition value (TGI) | ≈ 79.49% (Day 25) | Positive CD70 expression (CD70+++/++) | ||
| Method Description |
To establish 786-O tumors, 5 x 10⁶ cells were implanted into the right flank of athymic nu/nu female donor mice. When tumors reached ~100 mm3 mice were randomly allocated to treatment groups. The dose of ADC was 0.5 mg/kg single.
|
||||
| In Vivo Model | 786-O CDX model | ||||
| In Vitro Model | Renal cell carcinoma | 786-O cells | CVCL_1051 | ||
Mil40-12B [Investigative]
Discovered Using Cell Line-derived Xenograft Model
| Experiment 1 Reporting the Activity Date of This ADC | [220] | ||||
| Efficacy Data | Tumor Growth Inhibition value (TGI) | ≈ 80.00% (Day 60) | High HER2 expression (HER2+++) | ||
| Method Description |
Mil40-12b induces efficient tumor cell killing in cell PDX models from a breast cancer patient with HER2 expression.
|
||||
| In Vivo Model | Breast ductal carcinoma CDX model | ||||
| In Vitro Model | Breast ductal carcinoma | Breast ductal carcinoma cells | Homo sapiens | ||
Revealed Based on the Cell Line Data
| Experiment 1 Reporting the Activity Date of This ADC | [220] | ||||
| Efficacy Data | Half Maximal Inhibitory Concentration (IC50) |
25.80 pM
|
High HER2 expression (HER2+++) | ||
| Method Description |
To evaluate the cytotoxicity, multiple tumor cell lines were treated with three generated maleamic methyl ester-based ADCs. Each group was established three holes, tumor cells (3x10⁴ cells/mL) were added to each well of plate after which 10uL of test compounds solution was added.
|
||||
| In Vitro Model | Breast adenocarcinoma | SK-BR-3 cells | CVCL_0033 | ||
| Experiment 2 Reporting the Activity Date of This ADC | [220] | ||||
| Efficacy Data | Half Maximal Inhibitory Concentration (IC50) |
53.60 pM
|
High HER2 expression (HER2+++) | ||
| Method Description |
To evaluate the cytotoxicity, multiple tumor cell lines were treated with three generated maleamic methyl ester-based ADCs. Each group was established three holes, tumor cells (3x10⁴ cells/mL) were added to each well of plate after which 10uL of test compounds solution was added.
|
||||
| In Vitro Model | Gastric tubular adenocarcinoma | NCI-N87 cells | CVCL_1603 | ||
| Experiment 3 Reporting the Activity Date of This ADC | [220] | ||||
| Efficacy Data | Half Maximal Inhibitory Concentration (IC50) |
102.60 pM
|
High HER2 expression (HER2+++) | ||
| Method Description |
To evaluate the cytotoxicity, multiple tumor cell lines were treated with three generated maleamic methyl ester-based ADCs. Each group was established three holes, tumor cells (x104 cells/mL) were added to each well of plate after which 10uL of test compounds solution was added.
|
||||
| In Vitro Model | Invasive breast carcinoma | BT-474 cells | CVCL_0179 | ||
| Experiment 4 Reporting the Activity Date of This ADC | [220] | ||||
| Efficacy Data | Half Maximal Inhibitory Concentration (IC50) |
207.40 pM
|
High HER2 expression (HER2+++) | ||
| Method Description |
To evaluate the cytotoxicity, multiple tumor cell lines were treated with three generated maleamic methyl ester-based ADCs. Each group was established three holes, tumor cells (3x10⁴ cells/mL) were added to each well of plate after which 10uL of test compounds solution was added.
|
||||
| In Vitro Model | Ovarian serous cystadenocarcinoma | SK-OV-3 cells | CVCL_0532 | ||
| Experiment 5 Reporting the Activity Date of This ADC | [220] | ||||
| Efficacy Data | Half Maximal Inhibitory Concentration (IC50) |
11.52 nM
|
Negative HER2 expression (HER2-) | ||
| Method Description |
To evaluate the cytotoxicity, multiple tumor cell lines were treated with three generated maleamic methyl ester-based ADCs. Each group was established three holes, tumor cells (3x10⁴ cells/mL) were added to each well of plate after which 10uL of test compounds solution was added.
|
||||
| In Vitro Model | Breast adenocarcinoma | MDA-MB-468 cells | CVCL_0419 | ||
| Experiment 6 Reporting the Activity Date of This ADC | [220] | ||||
| Efficacy Data | Half Maximal Inhibitory Concentration (IC50) |
26.44 nM
|
Negative HER2 expression (HER2-) | ||
| Method Description |
To evaluate the cytotoxicity, multiple tumor cell lines were treated with three generated maleamic methyl ester-based ADCs. Each group was established three holes, tumor cells (3x10⁴ cells/mL) were added to each well of plate after which 10uL of test compounds solution was added.
|
||||
| In Vitro Model | Invasive breast carcinoma | MCF-7 cells | CVCL_0031 | ||
Anti-PIEZO1-MMAE [Investigative]
Discovered Using Cell Line-derived Xenograft Model
| Experiment 1 Reporting the Activity Date of This ADC | [221] | ||||
| Efficacy Data | Tumor Growth Inhibition value (TGI) | ≈ 80.00% (Day 27) | High PIEZO1 expression (PIEZO1+++) | ||
| Method Description |
1 x10⁷ TE1 cells were suspended in Matrigel and injected subcutaneously in the right armpit. The treatment of AntiPIEZO1MMAE or control reagents started when the tumor volume reached 300mm3. Treatments for each group were given every 3 days in total four times.
|
||||
| In Vivo Model | Esophageal squamous cell carcinoma CDX model | ||||
| In Vitro Model | Esophageal squamous cell carcinoma | Esophageal squamous cell carcinoma cells | Homo sapiens | ||
h1F6-29 MMAE DAR4 [Investigative]
Discovered Using Cell Line-derived Xenograft Model
| Experiment 1 Reporting the Activity Date of This ADC | [207] | ||||
| Efficacy Data | Tumor Growth Inhibition value (TGI) | ≈ 80.21% (Day 25) | Positive CD70 expression (CD70+++/++) | ||
| Method Description |
To establish 786-O tumors, 5 x 10⁶ cells were implanted into the right flank of athymic nu/nu female donor mice. When tumors reached ~100 mm3 mice were randomly allocated to treatment groups. The dose of ADC was 0.5 mg/kg single.
|
||||
| In Vivo Model | 786-O CDX model | ||||
| In Vitro Model | Renal cell carcinoma | 786-O cells | CVCL_1051 | ||
hBU12-29 MMAE DAR4 [Investigative]
Discovered Using Cell Line-derived Xenograft Model
| Experiment 1 Reporting the Activity Date of This ADC | [207] | ||||
| Efficacy Data | Tumor Growth Inhibition value (TGI) | ≈ 80.21% (Day 25) | Positive CD70 expression (CD70+++/++) | ||
| Method Description |
To establish 786-O tumors, 5 x 10⁶ cells were implanted into the right flank of athymic nu/nu female donor mice. When tumors reached ~100 mm3 mice were randomly allocated to treatment groups. The dose of ADC was 0.5 mg/kg single.
|
||||
| In Vivo Model | 786-O CDX model | ||||
| In Vitro Model | Renal cell carcinoma | 786-O cells | CVCL_1051 | ||
2G10 RED-426 MMAE 4 [Investigative]
Discovered Using Cell Line-derived Xenograft Model
| Experiment 1 Reporting the Activity Date of This ADC | [217] | ||||
| Efficacy Data | Tumor Growth Inhibition value (TGI) | ≈ 80.63% (Day 56) | Positive PLAUR expression (PLAUR +++/++) | ||
| Method Description |
To compare the in vivo anti-tumor efficacy of the various ADC constructs, we used MDA-MB-231 xenografts in mice. Animals with tumors of approximately 100 mm3 were treated once a week for four weeks with a 10 mg/kg dose of a variety of DAR 4 ADCs or 2G10 antibody.
|
||||
| In Vivo Model | MDA-MB-231 CDX model | ||||
| In Vitro Model | Breast adenocarcinoma | MDA-MB-231 cells | CVCL_0062 | ||
Revealed Based on the Cell Line Data
| Experiment 1 Reporting the Activity Date of This ADC | [217] | ||||
| Efficacy Data | Half Maximal Inhibitory Concentration (IC50) | > 500 nM | Positive PLAUR expression (PLAUR +++/++) | ||
| Method Description |
MDA-MB-231 cells (0.5x10⁴ cells/well) were seeded in 96-well plates at the density and incubated for 120 h (5 days) with of ADCs or IgG. After 5 days of drug treatment at 37°C with 5% CO2.
|
||||
| In Vitro Model | Breast adenocarcinoma | MDA-MB-231 cells | CVCL_0062 | ||
h1F6-20 MMAE DAR4 [Investigative]
Discovered Using Cell Line-derived Xenograft Model
| Experiment 1 Reporting the Activity Date of This ADC | [207] | ||||
| Efficacy Data | Tumor Growth Inhibition value (TGI) | ≈ 81.85% (Day 25) | Positive CD70 expression (CD70+++/++) | ||
| Method Description |
To establish 786-O tumors, 5 x 10⁶ cells were implanted into the right flank of athymic nu/nu female donor mice. When tumors reached ~100 mm3 mice were randomly allocated to treatment groups. The dose of ADC was 0.5 mg/kg single.
|
||||
| In Vivo Model | 786-O CDX model | ||||
| In Vitro Model | Renal cell carcinoma | 786-O cells | CVCL_1051 | ||
hBU12-20 MMAE DAR4 [Investigative]
Discovered Using Cell Line-derived Xenograft Model
| Experiment 1 Reporting the Activity Date of This ADC | [207] | ||||
| Efficacy Data | Tumor Growth Inhibition value (TGI) | ≈ 81.85% (Day 25) | Positive CD70 expression (CD70+++/++) | ||
| Method Description |
To establish 786-O tumors, 5 x 10⁶ cells were implanted into the right flank of athymic nu/nu female donor mice. When tumors reached ~100 mm3 mice were randomly allocated to treatment groups. The dose of ADC was 0.5 mg/kg single.
|
||||
| In Vivo Model | 786-O CDX model | ||||
| In Vitro Model | Renal cell carcinoma | 786-O cells | CVCL_1051 | ||
Anti-HER-AO-Cys-MC-VC-PABC-MMAE [Investigative]
Discovered Using Cell Line-derived Xenograft Model
| Experiment 1 Reporting the Activity Date of This ADC | [222] | ||||
| Efficacy Data | Tumor Growth Inhibition value (TGI) | ≈ 82.83% (Day 67) | Positive HER2 expression (HER2+++/++) | ||
| Method Description |
Nude mice were implanted with SK-OV-3 tumor cells which were allowed to establish tumors of ~150 mm3 prior to initiation of treatment. ADCs at 10 mg/kg doses were injected through tail vein on days 38, 45, 52 and 59. There were ~10 mice per group. The tumor volume of mice in different group was measured and their survival was recorded.
|
||||
| In Vivo Model | SK-OV-3 CDX model | ||||
| In Vitro Model | Ovarian serous cystadenocarcinoma | SK-OV-3 cells | CVCL_0532 | ||
Revealed Based on the Cell Line Data
| Experiment 1 Reporting the Activity Date of This ADC | [222] | ||||
| Efficacy Data | Half Maximal Inhibitory Concentration (IC50) |
4.70 nM
|
High HER2 expression (HER2+++) | ||
| Method Description |
Cells were plated at a density of 5,000 cells per well in black walled 96-well plate and allowed to adhere overnight in a humidified at mosphere of 5% CO2. CellTiter-Glo reagent was added to the wells at room temperature and the luminescent signal was measuredafter 10 min using a SpectraMax M5 plate reader.
|
||||
| In Vitro Model | Breast adenocarcinoma | SK-BR-3 cells | CVCL_0033 | ||
| Experiment 2 Reporting the Activity Date of This ADC | [222] | ||||
| Efficacy Data | Half Maximal Inhibitory Concentration (IC50) | > 100.00 nM | Negative HER2 expression (HER2-) | ||
| Method Description |
Cells were plated at a density of 5,000 cells per well in black walled 96-well plate and allowed to adhere overnight in a humidified at mosphere of 5% CO2. CellTiter-Glo reagent was added to the wells at room temperature and the luminescent signal was measuredafter 10 min using a SpectraMax M5 plate reader.
|
||||
| In Vitro Model | Breast adenocarcinoma | MDA-MB-231 cells | CVCL_0062 | ||
HA15-10AC14E [Investigative]
Discovered Using Cell Line-derived Xenograft Model
| Experiment 1 Reporting the Activity Date of This ADC | [184] | ||||
| Efficacy Data | Tumor Growth Inhibition value (TGI) | ≈ 83.10% (Day 30) | High SLITRK6 expression (SLITRK6+++; IHC H-score=280) | ||
| Method Description |
CDX models were established by subcutaneous injection of between 2 and 10 million SW780, RT4 (ATCC) or NCI-H322M (NCI) cells in SCID mice. When the tumor volume reached approximately 230 mm3, a single dose of Ha15-10ac14E, 5 mg/kg intravenously, was administered intravenously (iv) to the mice.
|
||||
| In Vivo Model | Bladder cancer CDX model | ||||
| In Vitro Model | Bladder cancer | Bladder cancer cells | Homo sapiens | ||
CC2B-h15H3-gluc-MMAE [Investigative]
Discovered Using Cell Line-derived Xenograft Model
| Experiment 1 Reporting the Activity Date of This ADC | [223] | ||||
| Efficacy Data | Tumor Growth Inhibition value (TGI) | ≈ 86.40% (Day 25) | Positive ITGA5 expression (ITGA5 +++/++) | ||
| Method Description |
Mice were administered a single 3 mg/kg IP dose once tumors reached 100 mm3 and tumor size was measured at various time points.
|
||||
| In Vivo Model | HPAF-II CDX model | ||||
| In Vitro Model | Pancreatic ductal adenocarcinoma | HPAF-II cells | CVCL_0313 | ||
| Experiment 2 Reporting the Activity Date of This ADC | [223] | ||||
| Efficacy Data | Tumor Growth Inhibition value (TGI) | ≈ 96.10% (Day 29) | Positive ITGA5 expression (ITGA5 +++/++) | ||
| Method Description |
Mice were administered a single 3 mg/kg IP dose once tumors reached 100 mm3 and tumor size was measured at various time points.
|
||||
| In Vivo Model | Detroit 562 CDX model | ||||
| In Vitro Model | Pharyngeal squamous cell carcinoma | Detroit 562 cells | CVCL_1171 | ||
HuAD208.4.1-vcMMAE-DAR4 [Investigative]
Discovered Using Cell Line-derived Xenograft Model
| Experiment 1 Reporting the Activity Date of This ADC | [202] | ||||
| Efficacy Data | Tumor Growth Inhibition value (TGI) |
86.91% (Day 21)
|
High LRRC15 expression (LRRC15+++; IHC 3+) | ||
| Method Description |
LRRC15 expression on stromal cells asassessed by IHC in an untreated xenograft tumor of 200-800 mm in volume, representative for eachxenograft model. In vivo activity of huAD208.4.1-vcMMAE-DAR4 (3 mg/kg) was demonstrated in EBC-1 xenografts.
|
||||
| In Vivo Model | EBC-1 CDX model | ||||
| In Vitro Model | Lung squamous cell carcinoma | EBC-1 cells | CVCL_2891 | ||
h1F6-MC-vc-PABC-MMAF DAR4 [Investigative]
Discovered Using Cell Line-derived Xenograft Model
| Experiment 1 Reporting the Activity Date of This ADC | [207] | ||||
| Efficacy Data | Tumor Growth Inhibition value (TGI) | ≈ 87.40% (Day 42) | Positive CD70 expression (CD70+++/++) | ||
| Method Description |
To establish 786-O tumors, 5 x 10⁶ cells were implanted into the right flank of athymic nu/nu female donor mice. When tumors reached ~100 mm3 mice were randomly allocated to treatment groups. The dose of ADC was 2 mg/kg.
|
||||
| In Vivo Model | 786-O CDX model | ||||
| In Vitro Model | Renal cell carcinoma | 786-O cells | CVCL_1051 | ||
hBU12-MC-vc-PABC-MMAF DAR4 [Investigative]
Discovered Using Cell Line-derived Xenograft Model
| Experiment 1 Reporting the Activity Date of This ADC | [207] | ||||
| Efficacy Data | Tumor Growth Inhibition value (TGI) | ≈ 87.40% (Day 42) | Positive CD70 expression (CD70+++/++) | ||
| Method Description |
To establish 786-O tumors, 5 x 10⁶ cells were implanted into the right flank of athymic nu/nu female donor mice. When tumors reached ~100 mm3 mice were randomly allocated to treatment groups. The dose of ADC was 2 mg/kg.
|
||||
| In Vivo Model | 786-O CDX model | ||||
| In Vitro Model | Renal cell carcinoma | 786-O cells | CVCL_1051 | ||
MMAE.VC.SA.617 [Investigative]
Discovered Using Cell Line-derived Xenograft Model
| Experiment 1 Reporting the Activity Date of This ADC | [224] | ||||
| Efficacy Data | Tumor Growth Inhibition value (TGI) | ≈ 87.50% (Day 30) | Positive PSMA expression (PSMA +++/++) | ||
| Method Description |
In order to specify the pharmacological properties of MMAE.VC.SA.617 we inoculated LNCaP cells into NOD/SCID mice to generate a xenograft model. In vivo therapeutic efficacy studies were conducted with MMAE.VC.SA.617, namely 1.0 mg/kg (corresponding to 0.49 mg MMAE).
|
||||
| In Vivo Model | LNCaP CDX model | ||||
| In Vitro Model | Prostate carcinoma | LNCaP cells | CVCL_0395 | ||
mesoADC [Investigative]
Discovered Using Cell Line-derived Xenograft Model
| Experiment 1 Reporting the Activity Date of This ADC | [225] | ||||
| Efficacy Data | Tumor Growth Inhibition value (TGI) | ≈ 88.80% (Day 18) | High GSDME expression (GSDME +++) | ||
| Method Description |
Comparison of the maximum tested dose of mesoADC (4.4 mg/kg) to PBS vehicle or isotype control ADC confirmed the antitumor effectiveness of the ADC up to day 18 .
|
||||
| In Vivo Model | EMT6 CDX model | ||||
| In Vitro Model | Mammary gland malignant neoplasms | EMT6 cells | CVCL_1923 | ||
Revealed Based on the Cell Line Data
| Experiment 1 Reporting the Activity Date of This ADC | [225] | ||||
| Efficacy Data | Half Maximal Inhibitory Concentration (IC50) |
0.25 ug/mL
|
High GSDME expression (GSDME +++) | ||
| Method Description |
EMT6 cells were pulsed with 1 ug/mL mesoADC for 30min then chased for 30 and 60min at 37°C.
|
||||
| In Vitro Model | Mammary gland malignant neoplasms | EMT6 cells | CVCL_1923 | ||
| Experiment 2 Reporting the Activity Date of This ADC | [225] | ||||
| Efficacy Data | Half Maximal Inhibitory Concentration (IC50) |
9.50 ug/mL
|
Low GSDME expression (GSDME +) | ||
| Method Description |
CT26 cells were pulsed with 1 ug/mL mesoADC for 30min then chased for 30 and 60min at 37°C.
|
||||
| In Vitro Model | Colon carcinoma | CT26 cells | CVCL_7254 | ||
h15H3-gluc-MMAE [Investigative]
Discovered Using Cell Line-derived Xenograft Model
| Experiment 1 Reporting the Activity Date of This ADC | [223] | ||||
| Efficacy Data | Tumor Growth Inhibition value (TGI) | ≈ 88.93% (Day 29) | Positive ITGA5 expression (ITGA5 +++/++) | ||
| Method Description |
Mice were administered a single 3 mg/kg IP dose once tumors reached 100 mm3 and tumor size was measured at various time points.
|
||||
| In Vivo Model | Detroit 562 CDX model | ||||
| In Vitro Model | Pharyngeal squamous cell carcinoma | Detroit 562 cells | CVCL_1171 | ||
| Experiment 2 Reporting the Activity Date of This ADC | [223] | ||||
| Efficacy Data | Tumor Growth Inhibition value (TGI) | ≈ 88.94% (Day 25) | Positive ITGA5 expression (ITGA5 +++/++) | ||
| Method Description |
Mice were administered a single 3 mg/kg IP dose once tumors reached 100 mm3 and tumor size was measured at various time points.
|
||||
| In Vivo Model | HPAF-II CDX model | ||||
| In Vitro Model | Pancreatic ductal adenocarcinoma | HPAF-II cells | CVCL_0313 | ||
M25ADCMMAE [Investigative]
Discovered Using Cell Line-derived Xenograft Model
| Experiment 1 Reporting the Activity Date of This ADC | [226] | ||||
| Efficacy Data | Tumor Growth Inhibition value (TGI) | ≈ 89.73% (Day 45) | Positive ALPPL2 expression (ALPPL2+++/++) | ||
| Method Description |
Nude mice were subcutaneously (s.c.) implanted with one million M28 cells. When the average tumor volume reached 250 mm3, the mice were randomized into three study groups and treated intravenously (i.v.) with M25ADCMMAF for 3 mg/kg very four days for a total of 5 doses.
|
||||
| In Vivo Model | M28 CDX model | ||||
| In Vitro Model | Pleural malignant mesothelioma | M28K cells | CVCL_8106 | ||
| Experiment 2 Reporting the Activity Date of This ADC | [226] | ||||
| Efficacy Data | Tumor Growth Inhibition value (TGI) | ≈ 97.89% (Day 45) | Positive ALPPL2 expression (ALPPL2+++/++) | ||
| Method Description |
Nude mice were subcutaneously (s.c.) implanted with one million M28 cells. When the average tumor volume reached 250 mm3, the mice were randomized into three study groups and treated intravenously (i.v.) with M25ADCMMAF for 5 mg/kg very four days for a total of 5 doses.
|
||||
| In Vivo Model | M28 CDX model | ||||
| In Vitro Model | Pleural malignant mesothelioma | M28K cells | CVCL_8106 | ||
Revealed Based on the Cell Line Data
| Experiment 1 Reporting the Activity Date of This ADC | [226] | ||||
| Efficacy Data | Half Maximal Effective Concentration (EC50) |
0.30 nM
|
Positive ALPPL2 expression (ALPPL2+++/++) | ||
| Method Description |
Anti-ALPPL2 ADC and control ADC were assessed for cytotoxicity in vitro against mesothelioma (M28 and VAMT-1) and control cells (normal human fibroblasts, kidney cells, and primary liver cells).
|
||||
| In Vitro Model | Pleural malignant mesothelioma | M28K cells | CVCL_8106 | ||
| Experiment 2 Reporting the Activity Date of This ADC | [226] | ||||
| Efficacy Data | Half Maximal Effective Concentration (EC50) |
0.44 nM
|
Positive ALPPL2 expression (ALPPL2+++/++) | ||
| Method Description |
Anti-ALPPL2 ADC and control ADC were assessed for cytotoxicity in vitro against mesothelioma (M28 and VAMT-1) and control cells (normal human fibroblasts, kidney cells, and primary liver cells).
|
||||
| In Vitro Model | Pleural sarcomatoid mesothelioma | VAMT-1 cells | CVCL_A731 | ||
| Experiment 3 Reporting the Activity Date of This ADC | [226] | ||||
| Efficacy Data | Half Maximal Effective Concentration (EC50) | > 100 nM | Positive ALPPL2 expression (ALPPL2+++/++) | ||
| Method Description |
Anti-ALPPL2 ADC and control ADC were assessed for cytotoxicity in vitro against mesothelioma (M28 and VAMT-1) and control cells (normal human fibroblasts, kidney cells, and primary liver cells).
|
||||
| In Vitro Model | Normal | HK-2 [Human kidney] cells | CVCL_0302 | ||
| Experiment 4 Reporting the Activity Date of This ADC | [226] | ||||
| Efficacy Data | Half Maximal Effective Concentration (EC50) | > 100 nM | Positive ALPPL2 expression (ALPPL2+++/++) | ||
| Method Description |
Anti-ALPPL2 ADC and control ADC were assessed for cytotoxicity in vitro against mesothelioma (M28 and VAMT-1) and control cells (normal human fibroblasts, kidney cells, and primary liver cells).
|
||||
| In Vitro Model | Normal | HS775Li cells | Homo sapiens | ||
| Experiment 5 Reporting the Activity Date of This ADC | [226] | ||||
| Efficacy Data | Half Maximal Effective Concentration (EC50) | > 100 nM | Positive ALPPL2 expression (ALPPL2+++/++) | ||
| Method Description |
Anti-ALPPL2 ADC and control ADC were assessed for cytotoxicity in vitro against mesothelioma (M28 and VAMT-1) and control cells (normal human fibroblasts, kidney cells, and primary liver cells).
|
||||
| In Vitro Model | Normal | HS-27 cells | CVCL_0E34 | ||
HuAD208.14.1-vcMMAE-DAR4 [Investigative]
Discovered Using Cell Line-derived Xenograft Model
| Experiment 1 Reporting the Activity Date of This ADC | [202] | ||||
| Efficacy Data | Tumor Growth Inhibition value (TGI) |
90.12% (Day 21)
|
High LRRC15 expression (LRRC15+++; IHC 3+) | ||
| Method Description |
LRRC15 expression on stromal cells asassessed by IHC in an untreated xenograft tumor of 200-800 mm in volume, representative for eachxenograft model. In vivo activity of huAD208.14.1-vcMMAE-DAR4 (3 mg/kg) was demonstrated in EBC-1 xenografts.
|
||||
| In Vivo Model | EBC-1 CDX model | ||||
| In Vitro Model | Lung squamous cell carcinoma | EBC-1 cells | CVCL_2891 | ||
A5/158-vc-MMAE [Investigative]
Discovered Using Cell Line-derived Xenograft Model
| Experiment 1 Reporting the Activity Date of This ADC | [227] | ||||
| Efficacy Data | Tumor Growth Inhibition value (TGI) | ≈ 91.20% (Day 32) | Positive MRC2 expression (MRC2 +++/++) | ||
| Method Description |
Vehicle (PBS) or 10 mg/kg of A5/158-vc-MMAE were administered into the lateral tail vein of mice twice a week for 2 weeks. Primary tumors were weighed at necropsy.
|
||||
| In Vivo Model | MG-63-mChLuc2 CDX model | ||||
| In Vitro Model | Osteosarcoma | MG-63 cells | CVCL_0426 | ||
39A-Val-Cit-MMAE [Investigative]
Discovered Using Cell Line-derived Xenograft Model
| Experiment 1 Reporting the Activity Date of This ADC | [86] | ||||
| Efficacy Data | Tumor Growth Inhibition value (TGI) |
92.00% (Day 49)
|
Low FOLR1 expression (FOLR1+) | ||
| Method Description |
Cell line-derived xenograft (CDX) models MDA-MB-231 epidermoid carcinoma and the HPAF-II pancreatic carcinoma cell lines were implanted subcutaneously in the flank of athymic nude mice Animals were removed from study and euthanized once tumor size reached 1200 mm3 or skin ulceration was evident ADC was dosed weekly at 2 mg/kg for 2 weeks.
Click to Show/Hide
|
||||
| In Vivo Model | MDA-MB-231 cell line xenograft model | ||||
| In Vitro Model | Breast adenocarcinoma | MDA-MB-231 cells | CVCL_0062 | ||
| Experiment 2 Reporting the Activity Date of This ADC | [86] | ||||
| Efficacy Data | Tumor Growth Inhibition value (TGI) |
99.00% (Day 49)
|
Low FOLR1 expression (FOLR1+) | ||
| Method Description |
Cell line-derived xenograft (CDX) models MDA-MB-231 epidermoid carcinoma and the HPAF-II pancreatic carcinoma cell lines were implanted subcutaneously in the flank of athymic nude mice Animals were removed from study and euthanized once tumor size reached 1200 mm3 or skin ulceration was evident ADC was dosed weekly at 4 mg/kg for 2 weeks.
Click to Show/Hide
|
||||
| In Vivo Model | MDA-MB-231 cell line xenograft model | ||||
| In Vitro Model | Breast adenocarcinoma | MDA-MB-231 cells | CVCL_0062 | ||
| Experiment 3 Reporting the Activity Date of This ADC | [86] | ||||
| Efficacy Data | Tumor Growth Inhibition value (TGI) |
100.00% (Day 39)
|
Low FOLR1 expression (FOLR1+) | ||
| Method Description |
Cell line-derived xenograft (CDX) models The A431 epidermoid carcinoma and the HPAF-II pancreatic carcinoma cell lines were implanted subcutaneously in the flank of athymic nude mice Animals were removed from study and euthanized once tumor size reached 1200 mm3 or skin ulceration was evident ADC was dosed weekly at 2 mg/kg for 2 weeks.
|
||||
| In Vivo Model | HPAF-II xenograft model | ||||
| In Vitro Model | Pancreatic ductal adenocarcinoma | HPAF-II cells | CVCL_0313 | ||
| Experiment 4 Reporting the Activity Date of This ADC | [86] | ||||
| Efficacy Data | Half Maximal Effective Concentration (EC50) |
26.00 nM
|
Positive Tissue factor expression (TF+++/++; 320,000 TF receptor copy number) | ||
| Method Description |
Antibody-dependent cellular cytotoxicity (ADCC) A431 cells were plated on a microtiter plate The following day, the cells were incubated with a ten-point 1:3 dilution titration of anti-TF antibodies or the ADCs starting at 50 nM An ADCC effector-to-target cell ratio of 8:1 was added to each well and incubated for 6 h at 37°C Luciferase Assay Reagent was added to each well to measure luminescence on an Envision plate reader Antibody-dependent cellular cytotoxicity (ADCC) reporter luminescence was evaluated after a 6-hour incubation of the reporter Jurkat cell line with TF-positive A431 cells and a titration of anti-TF antibody or ADC The ADCC reporter luminescence EC50 values for each anti-TF antibody or ADC are listed.
Click to Show/Hide
|
||||
| In Vitro Model | Breast adenocarcinoma | MDA-MB-231 cells | CVCL_0062 | ||
Revealed Based on the Cell Line Data
| Experiment 1 Reporting the Activity Date of This ADC | [86] | ||||
| Efficacy Data | Half Maximal Inhibitory Concentration (IC50) |
4.00 nM
|
Positive Tissue factor expression (TF+++/++; 570,000 TF receptor copy number) | ||
| Method Description |
To evaluate ADC cytotoxicity, cells were plated in 384-well plates Anti-TF antibodies conjugated to MC-vc-PAB-MMAE were serially diluted as shown Plates were incubated for 3 days, followed by lysis in CTG assay reagent For each ADC, the IC50 and its associated 95% confidence interval (95% CI) were calculated Titrations of the TF-specific ADCs were added to HPAF-II cells, with a 72-hour incubationThis treatment resulted in efficacious cell killing.
Click to Show/Hide
|
||||
| In Vitro Model | Pancreatic ductal adenocarcinoma | HPAF-II cells | CVCL_0313 | ||
| Experiment 2 Reporting the Activity Date of This ADC | [86] | ||||
| Efficacy Data | Half Maximal Inhibitory Concentration (IC50) |
5.00 nM
|
Positive Tissue factor expression (TF+++/++; 320,000 TF receptor copy number) | ||
| Method Description |
To evaluate ADC cytotoxicity, cells were plated in 384-well plates Anti-TF antibodies conjugated to MC-vc-PAB-MMAE were serially diluted as shown Plates were incubated for 3 days, followed by lysis in CTG assay reagent For each ADC, the IC50 and its associated 95% confidence interval (95% CI) were calculated Titrations of the TF-specific ADCs were added to 5-day old cultures of MDA-MB-231 cells, with a 72-hour incubationThis treatment resulted in efficacious cell killing.
Click to Show/Hide
|
||||
| In Vitro Model | Breast adenocarcinoma | MDA-MB-231 cells | CVCL_0062 | ||
| Experiment 3 Reporting the Activity Date of This ADC | [95] | ||||
| Efficacy Data | Half Maximal Effective Concentration (EC50) |
14.00 nM
|
Positive Tissue factor expression (TF+++/++; 320,000 TF receptor copy number) | ||
| Method Description |
A431 cells were pre-incubated for 30 min without or with 50 nM of FVIIa prior to the addition of an anti-TF ADC (39A-vc-MMAE) titration After a 4 h incubation at 37°C, the FVIIa and ADC were washed out and the cells were cultured for another 68 h before cell viability assessment.
|
||||
| In Vitro Model | Skin squamous cell carcinoma | A431 cells | CVCL_0037 | ||
| Experiment 4 Reporting the Activity Date of This ADC | [95] | ||||
| Efficacy Data | Half Maximal Effective Concentration (EC50) |
14.00 nM
|
Positive Tissue factor expression (TF+++/++; 320,000 TF receptor copy number) | ||
| Method Description |
To evaluate ADC cytotoxicity, cells were plated in 384-well plates Anti-TF antibodies conjugated to MC-vc-PAB-MMAE were serially diluted as shown Plates were incubated for 3 days, followed by lysis in CTG assay reagent For each ADC, the IC50 and its associated 95% confidence interval (95% CI) were calculated Titrations of the TF-specific ADCs were added to A431 cells, with a 72-hour incubationThis treatment resulted in efficacious cell killing.
Click to Show/Hide
|
||||
| In Vitro Model | Skin squamous cell carcinoma | A431 cells | CVCL_0037 | ||
| Experiment 5 Reporting the Activity Date of This ADC | [95] | ||||
| Efficacy Data | Half Maximal Effective Concentration (EC50) |
14.00 nM
|
Positive Tissue factor expression (TF+++/++; 570,000 TF receptor copy number) | ||
| Method Description |
To evaluate ADC cytotoxicity, cells were plated in 384-well plates Anti-TF antibodies conjugated to MC-vc-PAB-MMAE were serially diluted as shown Plates were incubated for 3 days, followed by lysis in CTG assay reagent For each ADC, the IC50 and its associated 95% confidence interval (95% CI) were calculated Titrations of the TF-specific ADCs were added to A431 cells, with a 4-hour incubation followed by removal of excess ADC and culture for another 68 hours This treatment resulted in efficacious cell killing.
Click to Show/Hide
|
||||
| In Vitro Model | Skin squamous cell carcinoma | A431 cells | CVCL_0037 | ||
2G10 RED-244 MMAE 4 [Investigative]
Discovered Using Cell Line-derived Xenograft Model
| Experiment 1 Reporting the Activity Date of This ADC | [217] | ||||
| Efficacy Data | Tumor Growth Inhibition value (TGI) | ≈ 92.91% (Day 56) | Positive PLAUR expression (PLAUR +++/++) | ||
| Method Description |
To compare the in vivo anti-tumor efficacy of the various ADC constructs, we used MDA-MB-231 xenografts in mice. Animals with tumors of approximately 100 mm3 were treated once a week for four weeks with a 10 mg/kg dose of a variety of DAR 4 ADCs or 2G10 antibody.
|
||||
| In Vivo Model | MDA-MB-231 CDX model | ||||
| In Vitro Model | Breast adenocarcinoma | MDA-MB-231 cells | CVCL_0062 | ||
Revealed Based on the Cell Line Data
| Experiment 1 Reporting the Activity Date of This ADC | [217] | ||||
| Efficacy Data | Half Maximal Inhibitory Concentration (IC50) | > 500 nM | Positive PLAUR expression (PLAUR +++/++) | ||
| Method Description |
MDA-MB-231 cells (0.5x10⁴ cells/well) were seeded in 96-well plates at the density and incubated for 120 h (5 days) with of ADCs or IgG. After 5 days of drug treatment at 37°C with 5% CO2.
|
||||
| In Vitro Model | Breast adenocarcinoma | MDA-MB-231 cells | CVCL_0062 | ||
h1F6-5 MMAE DAR4 [Investigative]
Discovered Using Cell Line-derived Xenograft Model
| Experiment 1 Reporting the Activity Date of This ADC | [207] | ||||
| Efficacy Data | Tumor Growth Inhibition value (TGI) | ≈ 92.97% (Day 29) | Positive CD70 expression (CD70+++/++) | ||
| Method Description |
To establish 786-O tumors, 5 x 10⁶ cells were implanted into the right flank of athymic nu/nu female donor mice. When tumors reached ~100 mm3 mice were randomly allocated to treatment groups. The dose of ADC was 1 mg/kg single.
|
||||
| In Vivo Model | 786-O CDX model | ||||
| In Vitro Model | Renal cell carcinoma | 786-O cells | CVCL_1051 | ||
Revealed Based on the Cell Line Data
| Experiment 1 Reporting the Activity Date of This ADC | [207] | ||||
| Efficacy Data | Half Maximal Inhibitory Concentration (IC50) |
32.00 ng/mL
|
Positive CD70 expression (CD70+++/++) | ||
| Method Description |
Log phase cultures of cells were collected and cells plated at seeding densities ranging from 500 - 10,000 cells/well according to pre-determined conditions.After incubating 24 hours to allow surface protein reconstitution, serial dilutions of test conjugates were added and cultures incubated further for 4 days.
|
||||
| In Vitro Model | Renal cell carcinoma | 786-O cells | CVCL_1051 | ||
| Experiment 2 Reporting the Activity Date of This ADC | [207] | ||||
| Efficacy Data | Half Maximal Inhibitory Concentration (IC50) |
39.00 ng/mL
|
Positive CD70 expression (CD70+++/++) | ||
| Method Description |
Log phase cultures of cells were collected and cells plated at seeding densities ranging from 500 - 10,000 cells/well according to pre-determined conditions.After incubating 24 hours to allow surface protein reconstitution, serial dilutions of test conjugates were added and cultures incubated further for 4 days.
|
||||
| In Vitro Model | Clear cell renal cell carcinoma | Caki-1 cells | CVCL_0234 | ||
hBU12-5 MMAE DAR4 [Investigative]
Discovered Using Cell Line-derived Xenograft Model
| Experiment 1 Reporting the Activity Date of This ADC | [207] | ||||
| Efficacy Data | Tumor Growth Inhibition value (TGI) | ≈ 92.97% (Day 29) | Positive CD70 expression (CD70+++/++) | ||
| Method Description |
To establish 786-O tumors, 5 x 10⁶ cells were implanted into the right flank of athymic nu/nu female donor mice. When tumors reached ~100 mm3 mice were randomly allocated to treatment groups. The dose of ADC was 1 mg/kg single.
|
||||
| In Vivo Model | 786-O CDX model | ||||
| In Vitro Model | Renal cell carcinoma | 786-O cells | CVCL_1051 | ||
Revealed Based on the Cell Line Data
| Experiment 1 Reporting the Activity Date of This ADC | [207] | ||||
| Efficacy Data | Half Maximal Inhibitory Concentration (IC50) |
32.00 ng/mL
|
Positive CD70 expression (CD70+++/++) | ||
| Method Description |
Log phase cultures of cells were collected and cells plated at seeding densities ranging from 500 - 10,000 cells/well according to pre-determined conditions.After incubating 24 hours to allow surface protein reconstitution, serial dilutions of test conjugates were added and cultures incubated further for 4 days.
|
||||
| In Vitro Model | Renal cell carcinoma | 786-O cells | CVCL_1051 | ||
| Experiment 2 Reporting the Activity Date of This ADC | [207] | ||||
| Efficacy Data | Half Maximal Inhibitory Concentration (IC50) |
39.00 ng/mL
|
Positive CD70 expression (CD70+++/++) | ||
| Method Description |
Log phase cultures of cells were collected and cells plated at seeding densities ranging from 500 - 10,000 cells/well according to pre-determined conditions.After incubating 24 hours to allow surface protein reconstitution, serial dilutions of test conjugates were added and cultures incubated further for 4 days.
|
||||
| In Vitro Model | Clear cell renal cell carcinoma | Caki-1 cells | CVCL_0234 | ||
ADC Mil40-6 [Investigative]
Discovered Using Cell Line-derived Xenograft Model
| Experiment 1 Reporting the Activity Date of This ADC | [228] | ||||
| Efficacy Data | Tumor Growth Inhibition value (TGI) | ≈ 93.60% (Day 32) | High HER2 expression (HER2+++) | ||
| Method Description |
The animals were given vehicle, mil40, and ADC on days 0, 7, 14, and 21, and 4 intravenous injections of ADC at doses of 5 mg/kg.
|
||||
| In Vivo Model | NCI-N87 CDX model | ||||
| In Vitro Model | Gastric tubular adenocarcinoma | NCI-N87 cells | CVCL_1603 | ||
Revealed Based on the Cell Line Data
| Experiment 1 Reporting the Activity Date of This ADC | [228] | ||||
| Efficacy Data | Maximum inhibition efficiency (MIE) | < 10.00% | Negative HER2 expression (HER2-) | ||
| Method Description |
HER2 antigen expressing cells or non-expressing cells were seeded in 96-well cell culture plates for 24h before treatment. Cells were treated with 3-fold serially diluted antibody-drug conjugates or free compoundsin duplicate at 10 concentrations.
|
||||
| In Vitro Model | Breast adenocarcinoma | MDA-MB-231 cells | CVCL_0062 | ||
| Experiment 2 Reporting the Activity Date of This ADC | [228] | ||||
| Efficacy Data | Maximum inhibition efficiency (MIE) |
47.80%
|
Negative HER2 expression (HER2-) | ||
| Method Description |
HER2 antigen expressing cells or non-expressing cells were seeded in 96-well cell culture plates for 24h before treatment. Cells were treated with 3-fold serially diluted antibody-drug conjugates or free compoundsin duplicate at 10 concentrations.
|
||||
| In Vitro Model | Invasive breast carcinoma | MCF-7 cells | CVCL_0031 | ||
| Experiment 3 Reporting the Activity Date of This ADC | [228] | ||||
| Efficacy Data | Maximum inhibition efficiency (MIE) |
50.50%
|
High HER2 expression (HER2+++) | ||
| Method Description |
HER2 antigen expressing cells or non-expressing cells were seeded in 96-well cell culture plates for 24h before treatment. Cells were treated with 3-fold serially diluted antibody-drug conjugates or free compoundsin duplicate at 10 concentrations.
|
||||
| In Vitro Model | Invasive breast carcinoma | BT-474 cells | CVCL_0179 | ||
| Experiment 4 Reporting the Activity Date of This ADC | [228] | ||||
| Efficacy Data | Maximum inhibition efficiency (MIE) |
87.30%
|
Moderate HER2 expression (HER2++) | ||
| Method Description |
HER2 antigen expressing cells or non-expressing cells were seeded in 96-well cell culture plates for 24h before treatment. Cells were treated with 3-fold serially diluted antibody-drug conjugates or free compoundsin duplicate at 10 concentrations.
|
||||
| In Vitro Model | Breast adenocarcinoma | MDA-MB-453 cells | CVCL_0418 | ||
| Experiment 5 Reporting the Activity Date of This ADC | [228] | ||||
| Efficacy Data | Maximum inhibition efficiency (MIE) |
93.54%
|
High HER2 expression (HER2+++) | ||
| Method Description |
HER2 antigen expressing cells or non-expressing cells were seeded in 96-well cell culture plates for 24h before treatment. Cells were treated with 3-fold serially diluted antibody-drug conjugates or free compoundsin duplicate at 10 concentrations.
|
||||
| In Vitro Model | Gastric tubular adenocarcinoma | NCI-N87 cells | CVCL_1603 | ||
| Experiment 6 Reporting the Activity Date of This ADC | [228] | ||||
| Efficacy Data | Half Maximal Inhibitory Concentration (IC50) |
0.03 nM
|
High HER2 expression (HER2+++) | ||
| Method Description |
HER2 antigen expressing cells or non-expressing cells were seeded in 96-well cell culture plates for 24h before treatment. Cells were treated with 3-fold serially diluted antibody-drug conjugates or free compoundsin duplicate at 10 concentrations.
|
||||
| In Vitro Model | Gastric tubular adenocarcinoma | NCI-N87 cells | CVCL_1603 | ||
| Experiment 7 Reporting the Activity Date of This ADC | [228] | ||||
| Efficacy Data | Half Maximal Inhibitory Concentration (IC50) |
0.10 nM
|
Moderate HER2 expression (HER2++) | ||
| Method Description |
HER2 antigen expressing cells or non-expressing cells were seeded in 96-well cell culture plates for 24h before treatment. Cells were treated with 3-fold serially diluted antibody-drug conjugates or free compoundsin duplicate at 10 concentrations.
|
||||
| In Vitro Model | Breast adenocarcinoma | MDA-MB-453 cells | CVCL_0418 | ||
| Experiment 8 Reporting the Activity Date of This ADC | [228] | ||||
| Efficacy Data | Half Maximal Inhibitory Concentration (IC50) |
0.17 nM
|
High HER2 expression (HER2+++) | ||
| Method Description |
HER2 antigen expressing cells or non-expressing cells were seeded in 96-well cell culture plates for 24h before treatment. Cells were treated with 3-fold serially diluted antibody-drug conjugates or free compoundsin duplicate at 10 concentrations.
|
||||
| In Vitro Model | Invasive breast carcinoma | BT-474 cells | CVCL_0179 | ||
| Experiment 9 Reporting the Activity Date of This ADC | [228] | ||||
| Efficacy Data | Half Maximal Inhibitory Concentration (IC50) |
7.74 nM
|
Negative HER2 expression (HER2-) | ||
| Method Description |
HER2 antigen expressing cells or non-expressing cells were seeded in 96-well cell culture plates for 24h before treatment. Cells were treated with 3-fold serially diluted antibody-drug conjugates or free compoundsin duplicate at 10 concentrations.
|
||||
| In Vitro Model | Invasive breast carcinoma | MCF-7 cells | CVCL_0031 | ||
| Experiment 10 Reporting the Activity Date of This ADC | [228] | ||||
| Efficacy Data | Half Maximal Inhibitory Concentration (IC50) | > 1000 nM | Negative HER2 expression (HER2-) | ||
| Method Description |
HER2 antigen expressing cells or non-expressing cells were seeded in 96-well cell culture plates for 24h before treatment. Cells were treated with 3-fold serially diluted antibody-drug conjugates or free compoundsin duplicate at 10 concentrations.
|
||||
| In Vitro Model | Breast adenocarcinoma | MDA-MB-231 cells | CVCL_0062 | ||
HER2-gsADC-7 [Investigative]
Discovered Using Cell Line-derived Xenograft Model
| Experiment 1 Reporting the Activity Date of This ADC | [206] | ||||
| Efficacy Data | Tumor Growth Inhibition value (TGI) | ≈ 94.34% (Day 28) | Positive HER2 expression (HER2+++/++) | ||
| Method Description |
To further evaluate the gsADCs, we determined the in vivo tumor-inhibitory activity in an NCI-N87 nude mice xenograft model. The mice were randomly grouped into 10 groups (n = 5), including a PBS control group, when the tumors grew to 200 mm3. The experimental groups were 3.0 mg/kg gsADCs q3d.
|
||||
| In Vivo Model | NCI-N87 CDX model | ||||
| In Vitro Model | Gastric tubular adenocarcinoma | NCI-N87 cells | CVCL_1603 | ||
| Experiment 2 Reporting the Activity Date of This ADC | [206] | ||||
| Efficacy Data | Tumor Growth Inhibition value (TGI) | ≈ 99.45% (Day 51) | Positive HER2 expression (HER2+++/++) | ||
| Method Description |
To further evaluate the gsADCs, we determined the in vivo tumor-inhibitory activity in an NCI-N87 nude mice xenograft model. The mice were randomly grouped into 10 groups (n = 5), including a PBS control group, when the tumors grew to 200 mm3. The experimental groups were 3.0 mg/kg gsADCs q3d.
|
||||
| In Vivo Model | NCI-N87 CDX model | ||||
| In Vitro Model | Gastric tubular adenocarcinoma | NCI-N87 cells | CVCL_1603 | ||
Revealed Based on the Cell Line Data
| Experiment 1 Reporting the Activity Date of This ADC | [206] | ||||
| Efficacy Data | Half Maximal Inhibitory Concentration (IC50) |
0.04 nM
|
Positive HER2 expression (HER2+++/++) | ||
| Method Description |
Cells were cultured in a 10% fetal bovine serum (FBS)-containing RPMI 1640 medium and were planted into 96-well plates with 6000 cells per well. The plates were incubated overnight at 37°C in a 5% CO2 cell incubator.
|
||||
| In Vitro Model | Breast adenocarcinoma | SK-BR-3 cells | CVCL_0033 | ||
| Experiment 2 Reporting the Activity Date of This ADC | [206] | ||||
| Efficacy Data | Half Maximal Inhibitory Concentration (IC50) |
0.21 nM
|
Positive HER2 expression (HER2+++/++) | ||
| Method Description |
Cells were cultured in a 10% fetal bovine serum (FBS)-containing RPMI 1640 medium and were planted into 96-well plates with 6000 cells per well. The plates were incubated overnight at 37°C in a 5% CO2 cell incubator.
|
||||
| In Vitro Model | Gastric tubular adenocarcinoma | NCI-N87 cells | CVCL_1603 | ||
| Experiment 3 Reporting the Activity Date of This ADC | [206] | ||||
| Efficacy Data | Half Maximal Inhibitory Concentration (IC50) | > 66.00 nM | Negative HER2 expression (HER2 -) | ||
| Method Description |
Cells were cultured in a 10% fetal bovine serum (FBS)-containing RPMI 1640 medium and were planted into 96-well plates with 6000 cells per well. The plates were incubated overnight at 37°C in a 5% CO2 cell incubator.
|
||||
| In Vitro Model | Breast adenocarcinoma | MDA-MB-231 cells | CVCL_0062 | ||
RC88-PY-MAA-Val-Cit-PAB-MMAE [Investigative]
Discovered Using Cell Line-derived Xenograft Model
| Experiment 1 Reporting the Activity Date of This ADC | [229] | ||||
| Efficacy Data | Tumor Growth Inhibition value (TGI) | ≈ 95.00% (Day 21) | High MSLN expression (MSLN+++/++) | ||
| Method Description |
Inoculate mice with gastric cancer cells at 3 million cells/mouse suspended in HBSS/matrigel, in the thoracic mammary fat pad at a volume of 0.2 ml. When tumors have reached a mean tumor volume of 100-250 mm3, they will be grouped. A single treatment will be administered intravenously (2 mg/kg, qwx3) via the tail vein on Day 0.
|
||||
| In Vivo Model | Oval-CitAR-3 CDX model | ||||
| In Vitro Model | Ovarian cancer | Oval-CitAR-3 cells | Homo sapiens | ||
| Experiment 2 Reporting the Activity Date of This ADC | [229] | ||||
| Efficacy Data | Tumor Growth Inhibition value (TGI) | ≈ 100.00% (Day 10) | High MSLN expression (MSLN+++/++) | ||
| Method Description |
Inoculate mice with gastric cancer cells at 3 million cells/mouse suspended in HBSS/matrigel, in the thoracic mammary fat pad at a volume of 0.2 ml. When tumors have reached a mean tumor volume of 100-250 mm3, they will be grouped. A single treatment will be administered intravenously (3 mg/kg, qwx3) via the tail vein on Day 0.
|
||||
| In Vivo Model | Oval-CitAR-3 CDX model | ||||
| In Vitro Model | Ovarian cancer | Oval-CitAR-3 cells | Homo sapiens | ||
| Experiment 3 Reporting the Activity Date of This ADC | [229] | ||||
| Efficacy Data | Tumor Growth Inhibition value (TGI) | ≈ 100.00% (Day 17) | High MSLN expression (MSLN+++/++) | ||
| Method Description |
Inoculate mice with gastric cancer cells at 3 million cells/mouse suspended in HBSS/matrigel, in the thoracic mammary fat pad at a volume of 0.2 ml. When tumors have reached a mean tumor volume of 100-250 mm3, they will be grouped. A single treatment will be administered intravenously (1.5 mg/kg, qwx3) via the tail vein on Day 0.
|
||||
| In Vivo Model | Oval-CitAR-3 CDX model | ||||
| In Vitro Model | Ovarian cancer | Oval-CitAR-3 cells | Homo sapiens | ||
| Experiment 4 Reporting the Activity Date of This ADC | [229] | ||||
| Efficacy Data | Tumor Growth Inhibition value (TGI) | ≈ 100.00% (Day 17) | High MSLN expression (MSLN+++/++) | ||
| Method Description |
Inoculate mice with gastric cancer cells at 3 million cells/mouse suspended in HBSS/matrigel, in the thoracic mammary fat pad at a volume of 0.2 ml. When tumors have reached a mean tumor volume of 100-250 mm3, they will be grouped. A single treatment will be administered intravenously (0.75 mg/kg, qwx3) via the tail vein on Day 0.
|
||||
| In Vivo Model | Oval-CitAR-3 CDX model | ||||
| In Vitro Model | Ovarian cancer | Oval-CitAR-3 cells | Homo sapiens | ||
Revealed Based on the Cell Line Data
| Experiment 1 Reporting the Activity Date of This ADC | [229] | ||||
| Efficacy Data | Half Maximal Inhibitory Concentration (IC50) |
0.09 nM
|
High MSLN expression (MSLN+++/++) | ||
| Method Description |
Cell-based in vitro assays are used to measure viability (proliferation), cytotoxicity,and induction of apoptosis of the ADC of the invention. Culturing the cells for a period from about 6 hours to about 5 days and measuring cell viability.
|
||||
| In Vitro Model | Ovarian cancer | Oval-CitAR-3 cells | Homo sapiens | ||
| Experiment 2 Reporting the Activity Date of This ADC | [229] | ||||
| Efficacy Data | Half Maximal Effective Concentration (EC50) |
153.50 ng/mL
|
High MSLN expression (MSLN+++/++) | ||
| Method Description |
Cell-based in vitro assays are used to measure viability (proliferation), cytotoxicity,and induction of apoptosis of the ADC of the invention. Culturing the cells for a period from about 6 hours to about 5 days and measuring cell viability.
|
||||
| In Vitro Model | Ovarian cancer | Oval-CitAR-3 cells | Homo sapiens | ||
h1F6-29 MMAE [Investigative]
Discovered Using Cell Line-derived Xenograft Model
| Experiment 1 Reporting the Activity Date of This ADC | [207] | ||||
| Efficacy Data | Tumor Growth Inhibition value (TGI) | ≈ 95.28% (Day 25) | Positive CD70 expression (CD70+++/++) | ||
| Method Description |
To establish 786-O tumors, 5 x 10⁶ cells were implanted into the right flank of athymic nu/nu female donor mice. When tumors reached ~100 mm3 mice were randomly allocated to treatment groups. The dose of ADC was 0.5 mg/kg single.
|
||||
| In Vivo Model | 786-O CDX model | ||||
| In Vitro Model | Renal cell carcinoma | 786-O cells | CVCL_1051 | ||
Revealed Based on the Cell Line Data
| Experiment 1 Reporting the Activity Date of This ADC | [207] | ||||
| Efficacy Data | Half Maximal Inhibitory Concentration (IC50) |
31.00 ng/mL
|
Positive CD70 expression (CD70+++/++) | ||
| Method Description |
Log phase cultures of cells were collected and cells plated at seeding densities ranging from 500 - 10,000 cells/well according to pre-determined conditions.After incubating 24 hours to allow surface protein reconstitution, serial dilutions of test conjugates were added and cultures incubated further for 4 days.
|
||||
| In Vitro Model | Renal cell carcinoma | 786-O cells | CVCL_1051 | ||
| Experiment 2 Reporting the Activity Date of This ADC | [207] | ||||
| Efficacy Data | Half Maximal Inhibitory Concentration (IC50) |
33.00 ng/mL
|
Positive CD70 expression (CD70+++/++) | ||
| Method Description |
Log phase cultures of cells were collected and cells plated at seeding densities ranging from 500 - 10,000 cells/well according to pre-determined conditions.After incubating 24 hours to allow surface protein reconstitution, serial dilutions of test conjugates were added and cultures incubated further for 4 days.
|
||||
| In Vitro Model | Clear cell renal cell carcinoma | Caki-1 cells | CVCL_0234 | ||
hBU12-29 MMAE [Investigative]
Discovered Using Cell Line-derived Xenograft Model
| Experiment 1 Reporting the Activity Date of This ADC | [207] | ||||
| Efficacy Data | Tumor Growth Inhibition value (TGI) | ≈ 95.28% (Day 25) | Positive CD70 expression (CD70+++/++) | ||
| Method Description |
To establish 786-O tumors, 5 x 10⁶ cells were implanted into the right flank of athymic nu/nu female donor mice. When tumors reached ~100 mm3 mice were randomly allocated to treatment groups. The dose of ADC was 0.5 mg/kg single.
|
||||
| In Vivo Model | 786-O CDX model | ||||
| In Vitro Model | Renal cell carcinoma | 786-O cells | CVCL_1051 | ||
Revealed Based on the Cell Line Data
| Experiment 1 Reporting the Activity Date of This ADC | [207] | ||||
| Efficacy Data | Half Maximal Inhibitory Concentration (IC50) |
31.00 ng/mL
|
Positive CD70 expression (CD70+++/++) | ||
| Method Description |
Log phase cultures of cells were collected and cells plated at seeding densities ranging from 500 - 10,000 cells/well according to pre-determined conditions.After incubating 24 hours to allow surface protein reconstitution, serial dilutions of test conjugates were added and cultures incubated further for 4 days.
|
||||
| In Vitro Model | Renal cell carcinoma | 786-O cells | CVCL_1051 | ||
| Experiment 2 Reporting the Activity Date of This ADC | [207] | ||||
| Efficacy Data | Half Maximal Inhibitory Concentration (IC50) |
33.00 ng/mL
|
Positive CD70 expression (CD70+++/++) | ||
| Method Description |
Log phase cultures of cells were collected and cells plated at seeding densities ranging from 500 - 10,000 cells/well according to pre-determined conditions.After incubating 24 hours to allow surface protein reconstitution, serial dilutions of test conjugates were added and cultures incubated further for 4 days.
|
||||
| In Vitro Model | Clear cell renal cell carcinoma | Caki-1 cells | CVCL_0234 | ||
h1F6-17 MMAE [Investigative]
Discovered Using Cell Line-derived Xenograft Model
| Experiment 1 Reporting the Activity Date of This ADC | [207] | ||||
| Efficacy Data | Tumor Growth Inhibition value (TGI) | ≈ 95.28% (Day 25) | Positive CD70 expression (CD70+++/++) | ||
| Method Description |
To establish 786-O tumors, 5 x 10⁶ cells were implanted into the right flank of athymic nu/nu female donor mice. When tumors reached ~100 mm3 mice were randomly allocated to treatment groups. The dose of ADC was 0.5 mg/kg single.
|
||||
| In Vivo Model | 786-O CDX model | ||||
| In Vitro Model | Renal cell carcinoma | 786-O cells | CVCL_1051 | ||
Revealed Based on the Cell Line Data
| Experiment 1 Reporting the Activity Date of This ADC | [207] | ||||
| Efficacy Data | Half Maximal Inhibitory Concentration (IC50) |
6.00 ng/mL
|
Positive CD70 expression (CD70+++/++) | ||
| Method Description |
Log phase cultures of cells were collected and cells plated at seeding densities ranging from 500 - 10,000 cells/well according to pre-determined conditions.After incubating 24 hours to allow surface protein reconstitution, serial dilutions of test conjugates were added and cultures incubated further for 4 days.
|
||||
| In Vitro Model | Renal cell carcinoma | 786-O cells | CVCL_1051 | ||
| Experiment 2 Reporting the Activity Date of This ADC | [207] | ||||
| Efficacy Data | Half Maximal Inhibitory Concentration (IC50) |
14.00 ng/mL
|
Positive CD70 expression (CD70+++/++) | ||
| Method Description |
Log phase cultures of cells were collected and cells plated at seeding densities ranging from 500 - 10,000 cells/well according to pre-determined conditions.After incubating 24 hours to allow surface protein reconstitution, serial dilutions of test conjugates were added and cultures incubated further for 4 days.
|
||||
| In Vitro Model | Clear cell renal cell carcinoma | Caki-1 cells | CVCL_0234 | ||
hBU12-17 MMAE [Investigative]
Discovered Using Cell Line-derived Xenograft Model
| Experiment 1 Reporting the Activity Date of This ADC | [207] | ||||
| Efficacy Data | Tumor Growth Inhibition value (TGI) | ≈ 95.28% (Day 25) | Positive CD70 expression (CD70+++/++) | ||
| Method Description |
To establish 786-O tumors, 5 x 10⁶ cells were implanted into the right flank of athymic nu/nu female donor mice. When tumors reached ~100 mm3 mice were randomly allocated to treatment groups. The dose of ADC was 0.5 mg/kg single.
|
||||
| In Vivo Model | 786-O CDX model | ||||
| In Vitro Model | Renal cell carcinoma | 786-O cells | CVCL_1051 | ||
Revealed Based on the Cell Line Data
| Experiment 1 Reporting the Activity Date of This ADC | [207] | ||||
| Efficacy Data | Half Maximal Inhibitory Concentration (IC50) |
6.00 ng/mL
|
Positive CD70 expression (CD70+++/++) | ||
| Method Description |
Log phase cultures of cells were collected and cells plated at seeding densities ranging from 500 - 10,000 cells/well according to pre-determined conditions.After incubating 24 hours to allow surface protein reconstitution, serial dilutions of test conjugates were added and cultures incubated further for 4 days.
|
||||
| In Vitro Model | Renal cell carcinoma | 786-O cells | CVCL_1051 | ||
| Experiment 2 Reporting the Activity Date of This ADC | [207] | ||||
| Efficacy Data | Half Maximal Inhibitory Concentration (IC50) |
14.00 ng/mL
|
Positive CD70 expression (CD70+++/++) | ||
| Method Description |
Log phase cultures of cells were collected and cells plated at seeding densities ranging from 500 - 10,000 cells/well according to pre-determined conditions.After incubating 24 hours to allow surface protein reconstitution, serial dilutions of test conjugates were added and cultures incubated further for 4 days.
|
||||
| In Vitro Model | Clear cell renal cell carcinoma | Caki-1 cells | CVCL_0234 | ||
h1F6-20 MMAE [Investigative]
Discovered Using Cell Line-derived Xenograft Model
| Experiment 1 Reporting the Activity Date of This ADC | [207] | ||||
| Efficacy Data | Tumor Growth Inhibition value (TGI) | ≈ 95.79% (Day 25) | Positive CD70 expression (CD70+++/++) | ||
| Method Description |
To establish 786-O tumors, 5 x 10⁶ cells were implanted into the right flank of athymic nu/nu female donor mice. When tumors reached ~100 mm3 mice were randomly allocated to treatment groups. The dose of ADC was 0.5 mg/kg single.
|
||||
| In Vivo Model | 786-O CDX model | ||||
| In Vitro Model | Renal cell carcinoma | 786-O cells | CVCL_1051 | ||
Revealed Based on the Cell Line Data
| Experiment 1 Reporting the Activity Date of This ADC | [207] | ||||
| Efficacy Data | Half Maximal Inhibitory Concentration (IC50) |
7.00 ng/mL
|
Positive CD70 expression (CD70+++/++) | ||
| Method Description |
Log phase cultures of cells were collected and cells plated at seeding densities ranging from 500 - 10,000 cells/well according to pre-determined conditions.After incubating 24 hours to allow surface protein reconstitution, serial dilutions of test conjugates were added and cultures incubated further for 4 days.
|
||||
| In Vitro Model | Renal cell carcinoma | 786-O cells | CVCL_1051 | ||
| Experiment 2 Reporting the Activity Date of This ADC | [207] | ||||
| Efficacy Data | Half Maximal Inhibitory Concentration (IC50) |
9.00 ng/mL
|
Positive CD70 expression (CD70+++/++) | ||
| Method Description |
Log phase cultures of cells were collected and cells plated at seeding densities ranging from 500 - 10,000 cells/well according to pre-determined conditions.After incubating 24 hours to allow surface protein reconstitution, serial dilutions of test conjugates were added and cultures incubated further for 4 days.
|
||||
| In Vitro Model | Clear cell renal cell carcinoma | Caki-1 cells | CVCL_0234 | ||
hBU12-20 MMAE [Investigative]
Discovered Using Cell Line-derived Xenograft Model
| Experiment 1 Reporting the Activity Date of This ADC | [207] | ||||
| Efficacy Data | Tumor Growth Inhibition value (TGI) | ≈ 95.79% (Day 25) | Positive CD70 expression (CD70+++/++) | ||
| Method Description |
To establish 786-O tumors, 5 x 10⁶ cells were implanted into the right flank of athymic nu/nu female donor mice. When tumors reached ~100 mm3 mice were randomly allocated to treatment groups. The dose of ADC was 0.5 mg/kg single.
|
||||
| In Vivo Model | 786-O CDX model | ||||
| In Vitro Model | Renal cell carcinoma | 786-O cells | CVCL_1051 | ||
Revealed Based on the Cell Line Data
| Experiment 1 Reporting the Activity Date of This ADC | [207] | ||||
| Efficacy Data | Half Maximal Inhibitory Concentration (IC50) |
7.00 ng/mL
|
Positive CD70 expression (CD70+++/++) | ||
| Method Description |
Log phase cultures of cells were collected and cells plated at seeding densities ranging from 500 - 10,000 cells/well according to pre-determined conditions.After incubating 24 hours to allow surface protein reconstitution, serial dilutions of test conjugates were added and cultures incubated further for 4 days.
|
||||
| In Vitro Model | Renal cell carcinoma | 786-O cells | CVCL_1051 | ||
| Experiment 2 Reporting the Activity Date of This ADC | [207] | ||||
| Efficacy Data | Half Maximal Inhibitory Concentration (IC50) |
9.00 ng/mL
|
Positive CD70 expression (CD70+++/++) | ||
| Method Description |
Log phase cultures of cells were collected and cells plated at seeding densities ranging from 500 - 10,000 cells/well according to pre-determined conditions.After incubating 24 hours to allow surface protein reconstitution, serial dilutions of test conjugates were added and cultures incubated further for 4 days.
|
||||
| In Vitro Model | Clear cell renal cell carcinoma | Caki-1 cells | CVCL_0234 | ||
h1F6-6 MMAE DAR8 [Investigative]
Discovered Using Cell Line-derived Xenograft Model
| Experiment 1 Reporting the Activity Date of This ADC | [207] | ||||
| Efficacy Data | Tumor Growth Inhibition value (TGI) | ≈ 96.10% (Day 42) | Positive CD70 expression (CD70+++/++) | ||
| Method Description |
To establish 786-O tumors, 5 x 10⁶ cells were implanted into the right flank of athymic nu/nu female donor mice. When tumors reached ~100 mm3 mice were randomly allocated to treatment groups. The dose of ADC was 0.5 mg/kg.
|
||||
| In Vivo Model | 786-O CDX model | ||||
| In Vitro Model | Renal cell carcinoma | 786-O cells | CVCL_1051 | ||
| Experiment 2 Reporting the Activity Date of This ADC | [207] | ||||
| Efficacy Data | Tumor Growth Inhibition value (TGI) | ≈ 99.77% (Day 18) | Positive CD19 expression (CD19+++/++) | ||
| Method Description |
To establish DOHH1 tumors, 5 x 10⁶ cells were implanted into the right flank of athymic nu/nu female donor mice (Harlan,Indianapolis, IN). When tumors reached ~100 mm3 mice were randomly allocated to treatment groups. The dose of ADC was 4 mg/kg single.
|
||||
| In Vivo Model | DOHH1 CDX model | ||||
| In Vitro Model | Diffuse large B-cell lymphoma germinal center B-cell type | DoHH2 cells | CVCL_1179 | ||
Revealed Based on the Cell Line Data
| Experiment 1 Reporting the Activity Date of This ADC | [207] | ||||
| Efficacy Data | Half Maximal Inhibitory Concentration (IC50) |
7.00 ng/mL
|
Positive CD70 expression (CD70+++/++) | ||
| Method Description |
Log phase cultures of cells were collected and cells plated at seeding densities ranging from 500 - 10,000 cells/well according to pre-determined conditions.After incubating 24 hours to allow surface protein reconstitution, serial dilutions of test conjugates were added and cultures incubated further for 4 days.
|
||||
| In Vitro Model | Clear cell renal cell carcinoma | Caki-1 cells | CVCL_0234 | ||
| Experiment 2 Reporting the Activity Date of This ADC | [207] | ||||
| Efficacy Data | Half Maximal Inhibitory Concentration (IC50) |
9.00 ng/mL
|
Positive CD70 expression (CD70+++/++) | ||
| Method Description |
Log phase cultures of cells were collected and cells plated at seeding densities ranging from 500 - 10,000 cells/well according to pre-determined conditions.After incubating 24 hours to allow surface protein reconstitution, serial dilutions of test conjugates were added and cultures incubated further for 4 days.
|
||||
| In Vitro Model | Renal cell carcinoma | 786-O cells | CVCL_1051 | ||
hBU12-6 MMAE DAR8 [Investigative]
Discovered Using Cell Line-derived Xenograft Model
| Experiment 1 Reporting the Activity Date of This ADC | [207] | ||||
| Efficacy Data | Tumor Growth Inhibition value (TGI) | ≈ 96.10% (Day 42) | Positive CD70 expression (CD70+++/++) | ||
| Method Description |
To establish 786-O tumors, 5 x 10⁶ cells were implanted into the right flank of athymic nu/nu female donor mice. When tumors reached ~100 mm3 mice were randomly allocated to treatment groups. The dose of ADC was 0.5 mg/kg.
|
||||
| In Vivo Model | 786-O CDX model | ||||
| In Vitro Model | Renal cell carcinoma | 786-O cells | CVCL_1051 | ||
| Experiment 2 Reporting the Activity Date of This ADC | [207] | ||||
| Efficacy Data | Tumor Growth Inhibition value (TGI) | ≈ 99.77% (Day 18) | Positive CD19 expression (CD19+++/++) | ||
| Method Description |
To establish DOHH1 tumors, 5 x 10⁶ cells were implanted into the right flank of athymic nu/nu female donor mice (Harlan,Indianapolis, IN). When tumors reached ~100 mm3 mice were randomly allocated to treatment groups. The dose of ADC was 4 mg/kg single.
|
||||
| In Vivo Model | DOHH1 CDX model | ||||
| In Vitro Model | Diffuse large B-cell lymphoma germinal center B-cell type | DoHH2 cells | CVCL_1179 | ||
Revealed Based on the Cell Line Data
| Experiment 1 Reporting the Activity Date of This ADC | [207] | ||||
| Efficacy Data | Half Maximal Inhibitory Concentration (IC50) |
7.00 ng/mL
|
Positive CD70 expression (CD70+++/++) | ||
| Method Description |
Log phase cultures of cells were collected and cells plated at seeding densities ranging from 500 - 10,000 cells/well according to pre-determined conditions.After incubating 24 hours to allow surface protein reconstitution, serial dilutions of test conjugates were added and cultures incubated further for 4 days.
|
||||
| In Vitro Model | Clear cell renal cell carcinoma | Caki-1 cells | CVCL_0234 | ||
| Experiment 2 Reporting the Activity Date of This ADC | [207] | ||||
| Efficacy Data | Half Maximal Inhibitory Concentration (IC50) |
9.00 ng/mL
|
Positive CD70 expression (CD70+++/++) | ||
| Method Description |
Log phase cultures of cells were collected and cells plated at seeding densities ranging from 500 - 10,000 cells/well according to pre-determined conditions.After incubating 24 hours to allow surface protein reconstitution, serial dilutions of test conjugates were added and cultures incubated further for 4 days.
|
||||
| In Vitro Model | Renal cell carcinoma | 786-O cells | CVCL_1051 | ||
AXL02 [Investigative]
Discovered Using Cell Line-derived Xenograft Model
| Experiment 1 Reporting the Activity Date of This ADC | [230] | ||||
| Efficacy Data | Tumor Growth Inhibition value (TGI) | ≈ 96.10% (Day 35) | High AXL expression (AXL+++) | ||
| Method Description |
Cells were suspended in PBS then injected subcutaneously to the flank of Balb/c female nude mice (46 weeks old). Tumors were measured by caliper every 23 days. Before therapeutic treatment,tumor-bearing mice were staged at initial tumor volume of 100 to 300 mm3 (growth) or 1800 mm3 (regression) and randomized into treatment groups(n = 8). The ADCs were dosed i.v. once weekly,or total twice during entire study.
Click to Show/Hide
|
||||
| In Vivo Model | Lung cancer CDX model | ||||
| In Vitro Model | Lung adenocarcinoma | PC-9 cells | CVCL_B260 | ||
| Experiment 2 Reporting the Activity Date of This ADC | [230] | ||||
| Efficacy Data | Tumor Growth Inhibition value (TGI) | ≈ 96.70% (Day 35) | High AXL expression (AXL+++) | ||
| Method Description |
Cells were suspended in PBS then injected subcutaneously to the flank of Balb/c female nude mice (46 weeks old). Tumors were measured by caliper every 23 days. Before therapeutic treatment,tumor-bearing mice were staged at initial tumor volume of 100 to 300 mm3 (growth) or 1800 mm3 (regression) and randomized into treatment groups(n = 8). The ADCs were dosed i.v. once weekly,or total twice during entire study.
Click to Show/Hide
|
||||
| In Vivo Model | Non-small cell lung cancer CDX model | ||||
| In Vitro Model | Lung large cell carcinoma | NCI-H1299 cells | CVCL_0060 | ||
| Experiment 3 Reporting the Activity Date of This ADC | [230] | ||||
| Efficacy Data | Tumor Growth Inhibition value (TGI) | ≈ 98.70% (Day 35) | High AXL expression (AXL+++) | ||
| Method Description |
Cells were suspended in PBS then injected subcutaneously to the flank of Balb/c female nude mice (46 weeks old). Tumors were measured by caliper every 23 days. Before therapeutic treatment,tumor-bearing mice were staged at initial tumor volume of 100 to 300 mm3 (growth) or 1800 mm3 (regression) and randomized into treatment groups(n = 8). The ADCs were dosed i.v. once weekly,or total twice during entire study.
Click to Show/Hide
|
||||
| In Vivo Model | Lung cancer CDX model | ||||
| In Vitro Model | Lung large cell carcinoma | LCLC-103H cells | CVCL_1375 | ||
| Experiment 4 Reporting the Activity Date of This ADC | [230] | ||||
| Efficacy Data | Tumor Growth Inhibition value (TGI) | ≈ 99.50% (Day 32) | High AXL expression (AXL+++) | ||
| Method Description |
Cells were suspended in PBS then injected subcutaneously to the flank of Balb/c female nude mice (46 weeks old). Tumors were measured by caliper every 23 days. Before therapeutic treatment,tumor-bearing mice were staged at initial tumor volume of 100 to 300 mm3 (growth) or 1800 mm3 (regression) and randomized into treatment groups(n = 8). The ADCs were dosed i.v. once weekly,or total twice during entire study.
Click to Show/Hide
|
||||
| In Vivo Model | Astrocytic glioblastoma CDX model | ||||
| In Vitro Model | Glioblastoma | U-87MG cells | CVCL_0022 | ||
h1F6-12 MMAE DAR8 [Investigative]
Discovered Using Cell Line-derived Xenograft Model
| Experiment 1 Reporting the Activity Date of This ADC | [207] | ||||
| Efficacy Data | Tumor Growth Inhibition value (TGI) | ≈ 96.27% (Day 29) | Positive CD70 expression (CD70+++/++) | ||
| Method Description |
To establish 786-O tumors, 5 x 10⁶ cells were implanted into the right flank of athymic nu/nu female donor mice. When tumors reached ~100 mm3 mice were randomly allocated to treatment groups. The dose of ADC was 1 mg/kg single.
|
||||
| In Vivo Model | 786-O CDX model | ||||
| In Vitro Model | Renal cell carcinoma | 786-O cells | CVCL_1051 | ||
hBU12-12 MMAE DAR8 [Investigative]
Discovered Using Cell Line-derived Xenograft Model
| Experiment 1 Reporting the Activity Date of This ADC | [207] | ||||
| Efficacy Data | Tumor Growth Inhibition value (TGI) | ≈ 96.27% (Day 29) | Positive CD70 expression (CD70+++/++) | ||
| Method Description |
To establish 786-O tumors, 5 x 10⁶ cells were implanted into the right flank of athymic nu/nu female donor mice. When tumors reached ~100 mm3 mice were randomly allocated to treatment groups. The dose of ADC was 1 mg/kg single.
|
||||
| In Vivo Model | 786-O CDX model | ||||
| In Vitro Model | Renal cell carcinoma | 786-O cells | CVCL_1051 | ||
29E-Val-Cit-MMAE [Investigative]
Discovered Using Cell Line-derived Xenograft Model
| Experiment 1 Reporting the Activity Date of This ADC | [86] | ||||
| Efficacy Data | Tumor Growth Inhibition value (TGI) |
97.00% (Day 49)
|
Low FOLR1 expression (FOLR1+) | ||
| Method Description |
Cell line-derived xenograft (CDX) models MDA-MB-231 epidermoid carcinoma and the HPAF-II pancreatic carcinoma cell lines were implanted subcutaneously in the flank of athymic nude mice Animals were removed from study and euthanized once tumor size reached 1200 mm3 or skin ulceration was evident ADC was dosed weekly at 4 mg/kg for 2 weeks.
Click to Show/Hide
|
||||
| In Vivo Model | MDA-MB-231 cell line xenograft model | ||||
| In Vitro Model | Breast adenocarcinoma | MDA-MB-231 cells | CVCL_0062 | ||
| Experiment 2 Reporting the Activity Date of This ADC | [86] | ||||
| Efficacy Data | Half Maximal Effective Concentration (EC50) |
28.00 nM
|
Positive Tissue factor expression (TF+++/++; 320,000 TF receptor copy number) | ||
| Method Description |
Antibody-dependent cellular cytotoxicity (ADCC) A431 cells were plated on a microtiter plate The following day, the cells were incubated with a ten-point 1:3 dilution titration of anti-TF antibodies or the ADCs starting at 50 nM An ADCC effector-to-target cell ratio of 8:1 was added to each well and incubated for 6 h at 37°C Luciferase Assay Reagent was added to each well to measure luminescence on an Envision plate reader Antibody-dependent cellular cytotoxicity (ADCC) reporter luminescence was evaluated after a 6-hour incubation of the reporter Jurkat cell line with TF-positive A431 cells and a titration of anti-TF antibody or ADC The ADCC reporter luminescence EC50 values for each anti-TF antibody or ADC are listed.
Click to Show/Hide
|
||||
| In Vitro Model | Breast adenocarcinoma | MDA-MB-231 cells | CVCL_0062 | ||
Revealed Based on the Cell Line Data
| Experiment 1 Reporting the Activity Date of This ADC | [86] | ||||
| Efficacy Data | Half Maximal Inhibitory Concentration (IC50) |
4.00 nM
|
Low FOLR1 expression (FOLR1+) | ||
| Method Description |
To evaluate ADC cytotoxicity, cells were plated in 384-well plates Anti-TF antibodies conjugated to MC-vc-PAB-MMAE were serially diluted as shown Plates were incubated for 3 days, followed by lysis in CTG assay reagent For each ADC, the IC50 and its associated 95% confidence interval (95% CI) were calculated Titrations of the TF-specific ADCs were added to HPAF-II cells, with a 72-hour incubationThis treatment resulted in efficacious cell killing.
Click to Show/Hide
|
||||
| In Vitro Model | Pancreatic ductal adenocarcinoma | HPAF-II cells | CVCL_0313 | ||
| Experiment 2 Reporting the Activity Date of This ADC | [86] | ||||
| Efficacy Data | Half Maximal Inhibitory Concentration (IC50) |
6.00 nM
|
Positive Tissue factor expression (TF+++/++; 320,000 TF receptor copy number) | ||
| Method Description |
To evaluate ADC cytotoxicity, cells were plated in 384-well plates Anti-TF antibodies conjugated to MC-vc-PAB-MMAE were serially diluted as shown Plates were incubated for 3 days, followed by lysis in CTG assay reagent For each ADC, the IC50 and its associated 95% confidence interval (95% CI) were calculated Titrations of the TF-specific ADCs were added to A431 cells, with a 72-hour incubationThis treatment resulted in efficacious cell killing.
Click to Show/Hide
|
||||
| In Vitro Model | Breast adenocarcinoma | MDA-MB-468 cells | CVCL_0419 | ||
| Experiment 3 Reporting the Activity Date of This ADC | [86] | ||||
| Efficacy Data | Half Maximal Inhibitory Concentration (IC50) |
7.00 nM
|
Positive Tissue factor expression (TF+++/++; 570,000 TF receptor copy number) | ||
| Method Description |
To evaluate ADC cytotoxicity, cells were plated in 384-well plates Anti-TF antibodies conjugated to MC-vc-PAB-MMAE were serially diluted as shown Plates were incubated for 3 days, followed by lysis in CTG assay reagent For each ADC, the IC50 and its associated 95% confidence interval (95% CI) were calculated Titrations of the TF-specific ADCs were added to 5-day old cultures of MDA-MB-231 cells, with a 72-hour incubationThis treatment resulted in efficacious cell killing.
Click to Show/Hide
|
||||
| In Vitro Model | Breast adenocarcinoma | MDA-MB-231 cells | CVCL_0062 | ||
| Experiment 4 Reporting the Activity Date of This ADC | [95] | ||||
| Efficacy Data | Half Maximal Effective Concentration (EC50) |
14.00 nM
|
Positive Tissue factor expression (TF+++/++; 320,000 TF receptor copy number) | ||
| Method Description |
A431 cells were pre-incubated for 30 min without or with 50 nM of FVIIa prior to the addition of an anti-TF ADC (29E-vc-MMAE) titration After a 4 h incubation at 37°C, the FVIIa and ADC were washed out and the cells were cultured for another 68 h before cell viability assessment.
|
||||
| In Vitro Model | Skin squamous cell carcinoma | A431 cells | CVCL_0037 | ||
| Experiment 5 Reporting the Activity Date of This ADC | [95] | ||||
| Efficacy Data | Half Maximal Effective Concentration (EC50) |
14.00 nM
|
Positive Tissue factor expression (TF+++/++; 380,000 TF receptor copy number) | ||
| Method Description |
To evaluate ADC cytotoxicity, cells were plated in 384-well plates Anti-TF antibodies conjugated to MC-vc-PAB-MMAE were serially diluted as shown Plates were incubated for 3 days, followed by lysis in CTG assay reagent For each ADC, the IC50 and its associated 95% confidence interval (95% CI) were calculated Titrations of the TF-specific ADCs were added to A431 cells, with a 4-hour incubation followed by removal of excess ADC and culture for another 68 hours This treatment resulted in efficacious cell killing.
Click to Show/Hide
|
||||
| In Vitro Model | Skin squamous cell carcinoma | A431 cells | CVCL_0037 | ||
h1F6-11 MMAE [Investigative]
Discovered Using Cell Line-derived Xenograft Model
| Experiment 1 Reporting the Activity Date of This ADC | [207] | ||||
| Efficacy Data | Tumor Growth Inhibition value (TGI) | ≈ 97.02% (Day 29) | Positive CD70 expression (CD70+++/++) | ||
| Method Description |
To establish 786-O tumors, 5 x 10⁶ cells were implanted into the right flank of athymic nu/nu female donor mice. When tumors reached ~100 mm3 mice were randomly allocated to treatment groups. The dose of ADC was 1 mg/kg single.
|
||||
| In Vivo Model | 786-O CDX model | ||||
| In Vitro Model | Renal cell carcinoma | 786-O cells | CVCL_1051 | ||
Revealed Based on the Cell Line Data
| Experiment 1 Reporting the Activity Date of This ADC | [207] | ||||
| Efficacy Data | Half Maximal Inhibitory Concentration (IC50) |
1.00 ng/mL
|
Positive CD70 expression (CD70+++/++) | ||
| Method Description |
Log phase cultures of cells were collected and cells plated at seeding densities ranging from 500 - 10,000 cells/well according to pre-determined conditions.After incubating 24 hours to allow surface protein reconstitution, serial dilutions of test conjugates were added and cultures incubated further for 4 days.
|
||||
| In Vitro Model | Renal cell carcinoma | 786-O cells | CVCL_1051 | ||
| Experiment 2 Reporting the Activity Date of This ADC | [207] | ||||
| Efficacy Data | Half Maximal Inhibitory Concentration (IC50) |
9.00 ng/mL
|
Positive CD70 expression (CD70+++/++) | ||
| Method Description |
Log phase cultures of cells were collected and cells plated at seeding densities ranging from 500 - 10,000 cells/well according to pre-determined conditions.After incubating 24 hours to allow surface protein reconstitution, serial dilutions of test conjugates were added and cultures incubated further for 4 days.
|
||||
| In Vitro Model | Clear cell renal cell carcinoma | Caki-1 cells | CVCL_0234 | ||
hBU12-11 MMAE [Investigative]
Discovered Using Cell Line-derived Xenograft Model
| Experiment 1 Reporting the Activity Date of This ADC | [207] | ||||
| Efficacy Data | Tumor Growth Inhibition value (TGI) | ≈ 97.02% (Day 29) | Positive CD70 expression (CD70+++/++) | ||
| Method Description |
To establish 786-O tumors, 5 x 10⁶ cells were implanted into the right flank of athymic nu/nu female donor mice. When tumors reached ~100 mm3 mice were randomly allocated to treatment groups. The dose of ADC was 1 mg/kg single.
|
||||
| In Vivo Model | 786-O CDX model | ||||
| In Vitro Model | Renal cell carcinoma | 786-O cells | CVCL_1051 | ||
Revealed Based on the Cell Line Data
| Experiment 1 Reporting the Activity Date of This ADC | [207] | ||||
| Efficacy Data | Half Maximal Inhibitory Concentration (IC50) |
1.00 ng/mL
|
Positive CD70 expression (CD70+++/++) | ||
| Method Description |
Log phase cultures of cells were collected and cells plated at seeding densities ranging from 500 - 10,000 cells/well according to pre-determined conditions.After incubating 24 hours to allow surface protein reconstitution, serial dilutions of test conjugates were added and cultures incubated further for 4 days.
|
||||
| In Vitro Model | Renal cell carcinoma | 786-O cells | CVCL_1051 | ||
| Experiment 2 Reporting the Activity Date of This ADC | [207] | ||||
| Efficacy Data | Half Maximal Inhibitory Concentration (IC50) |
9.00 ng/mL
|
Positive CD70 expression (CD70+++/++) | ||
| Method Description |
Log phase cultures of cells were collected and cells plated at seeding densities ranging from 500 - 10,000 cells/well according to pre-determined conditions.After incubating 24 hours to allow surface protein reconstitution, serial dilutions of test conjugates were added and cultures incubated further for 4 days.
|
||||
| In Vitro Model | Clear cell renal cell carcinoma | Caki-1 cells | CVCL_0234 | ||
h1F6-5 MMAE DAR8 [Investigative]
Discovered Using Cell Line-derived Xenograft Model
| Experiment 1 Reporting the Activity Date of This ADC | [207] | ||||
| Efficacy Data | Tumor Growth Inhibition value (TGI) | ≈ 97.23% (Day 29) | Positive CD70 expression (CD70+++/++) | ||
| Method Description |
To establish 786-O tumors, 5 x 10⁶ cells were implanted into the right flank of athymic nu/nu female donor mice. When tumors reached ~100 mm3 mice were randomly allocated to treatment groups. The dose of ADC was 1 mg/kg single.
|
||||
| In Vivo Model | 786-O CDX model | ||||
| In Vitro Model | Renal cell carcinoma | 786-O cells | CVCL_1051 | ||
Revealed Based on the Cell Line Data
| Experiment 1 Reporting the Activity Date of This ADC | [207] | ||||
| Efficacy Data | Half Maximal Inhibitory Concentration (IC50) |
19.00 ng/mL
|
Positive CD70 expression (CD70+++/++) | ||
| Method Description |
Log phase cultures of cells were collected and cells plated at seeding densities ranging from 500 - 10,000 cells/well according to pre-determined conditions.After incubating 24 hours to allow surface protein reconstitution, serial dilutions of test conjugates were added and cultures incubated further for 4 days.
|
||||
| In Vitro Model | Renal cell carcinoma | 786-O cells | CVCL_1051 | ||
| Experiment 2 Reporting the Activity Date of This ADC | [207] | ||||
| Efficacy Data | Half Maximal Inhibitory Concentration (IC50) |
22.00 ng/mL
|
Positive CD70 expression (CD70+++/++) | ||
| Method Description |
Log phase cultures of cells were collected and cells plated at seeding densities ranging from 500 - 10,000 cells/well according to pre-determined conditions.After incubating 24 hours to allow surface protein reconstitution, serial dilutions of test conjugates were added and cultures incubated further for 4 days.
|
||||
| In Vitro Model | Clear cell renal cell carcinoma | Caki-1 cells | CVCL_0234 | ||
hBU12-5 MMAE DAR8 [Investigative]
Discovered Using Cell Line-derived Xenograft Model
| Experiment 1 Reporting the Activity Date of This ADC | [207] | ||||
| Efficacy Data | Tumor Growth Inhibition value (TGI) | ≈ 97.23% (Day 29) | Positive CD70 expression (CD70+++/++) | ||
| Method Description |
To establish 786-O tumors, 5 x 10⁶ cells were implanted into the right flank of athymic nu/nu female donor mice. When tumors reached ~100 mm3 mice were randomly allocated to treatment groups. The dose of ADC was 1 mg/kg single.
|
||||
| In Vivo Model | 786-O CDX model | ||||
| In Vitro Model | Renal cell carcinoma | 786-O cells | CVCL_1051 | ||
Revealed Based on the Cell Line Data
| Experiment 1 Reporting the Activity Date of This ADC | [207] | ||||
| Efficacy Data | Half Maximal Inhibitory Concentration (IC50) |
19.00 ng/mL
|
Positive CD70 expression (CD70+++/++) | ||
| Method Description |
Log phase cultures of cells were collected and cells plated at seeding densities ranging from 500 - 10,000 cells/well according to pre-determined conditions.After incubating 24 hours to allow surface protein reconstitution, serial dilutions of test conjugates were added and cultures incubated further for 4 days.
|
||||
| In Vitro Model | Renal cell carcinoma | 786-O cells | CVCL_1051 | ||
| Experiment 2 Reporting the Activity Date of This ADC | [207] | ||||
| Efficacy Data | Half Maximal Inhibitory Concentration (IC50) |
22.00 ng/mL
|
Positive CD70 expression (CD70+++/++) | ||
| Method Description |
Log phase cultures of cells were collected and cells plated at seeding densities ranging from 500 - 10,000 cells/well according to pre-determined conditions.After incubating 24 hours to allow surface protein reconstitution, serial dilutions of test conjugates were added and cultures incubated further for 4 days.
|
||||
| In Vitro Model | Clear cell renal cell carcinoma | Caki-1 cells | CVCL_0234 | ||
h1F6-24 MMAE [Investigative]
Discovered Using Cell Line-derived Xenograft Model
| Experiment 1 Reporting the Activity Date of This ADC | [207] | ||||
| Efficacy Data | Tumor Growth Inhibition value (TGI) | ≈ 97.64% (Day 25) | Positive CD70 expression (CD70+++/++) | ||
| Method Description |
To establish 786-O tumors, 5 x 10⁶ cells were implanted into the right flank of athymic nu/nu female donor mice. When tumors reached ~100 mm3 mice were randomly allocated to treatment groups. The dose of ADC was 0.5 mg/kg single.
|
||||
| In Vivo Model | 786-O CDX model | ||||
| In Vitro Model | Renal cell carcinoma | 786-O cells | CVCL_1051 | ||
Revealed Based on the Cell Line Data
| Experiment 1 Reporting the Activity Date of This ADC | [207] | ||||
| Efficacy Data | Half Maximal Inhibitory Concentration (IC50) |
11.00 ng/mL
|
Positive CD70 expression (CD70+++/++) | ||
| Method Description |
Log phase cultures of cells were collected and cells plated at seeding densities ranging from 500 - 10,000 cells/well according to pre-determined conditions.After incubating 24 hours to allow surface protein reconstitution, serial dilutions of test conjugates were added and cultures incubated further for 4 days.
|
||||
| In Vitro Model | Renal cell carcinoma | 786-O cells | CVCL_1051 | ||
| Experiment 2 Reporting the Activity Date of This ADC | [207] | ||||
| Efficacy Data | Half Maximal Inhibitory Concentration (IC50) |
33.00 ng/mL
|
Positive CD70 expression (CD70+++/++) | ||
| Method Description |
Log phase cultures of cells were collected and cells plated at seeding densities ranging from 500 - 10,000 cells/well according to pre-determined conditions.After incubating 24 hours to allow surface protein reconstitution, serial dilutions of test conjugates were added and cultures incubated further for 4 days.
|
||||
| In Vitro Model | Clear cell renal cell carcinoma | Caki-1 cells | CVCL_0234 | ||
hBU12-24 MMAE [Investigative]
Discovered Using Cell Line-derived Xenograft Model
| Experiment 1 Reporting the Activity Date of This ADC | [207] | ||||
| Efficacy Data | Tumor Growth Inhibition value (TGI) | ≈ 97.64% (Day 25) | Positive CD70 expression (CD70+++/++) | ||
| Method Description |
To establish 786-O tumors, 5 x 10⁶ cells were implanted into the right flank of athymic nu/nu female donor mice. When tumors reached ~100 mm3 mice were randomly allocated to treatment groups. The dose of ADC was 0.5 mg/kg single.
|
||||
| In Vivo Model | 786-O CDX model | ||||
| In Vitro Model | Renal cell carcinoma | 786-O cells | CVCL_1051 | ||
Revealed Based on the Cell Line Data
| Experiment 1 Reporting the Activity Date of This ADC | [207] | ||||
| Efficacy Data | Half Maximal Inhibitory Concentration (IC50) |
11.00 ng/mL
|
Positive CD70 expression (CD70+++/++) | ||
| Method Description |
Log phase cultures of cells were collected and cells plated at seeding densities ranging from 500 - 10,000 cells/well according to pre-determined conditions.After incubating 24 hours to allow surface protein reconstitution, serial dilutions of test conjugates were added and cultures incubated further for 4 days.
|
||||
| In Vitro Model | Renal cell carcinoma | 786-O cells | CVCL_1051 | ||
| Experiment 2 Reporting the Activity Date of This ADC | [207] | ||||
| Efficacy Data | Half Maximal Inhibitory Concentration (IC50) |
33.00 ng/mL
|
Positive CD70 expression (CD70+++/++) | ||
| Method Description |
Log phase cultures of cells were collected and cells plated at seeding densities ranging from 500 - 10,000 cells/well according to pre-determined conditions.After incubating 24 hours to allow surface protein reconstitution, serial dilutions of test conjugates were added and cultures incubated further for 4 days.
|
||||
| In Vitro Model | Clear cell renal cell carcinoma | Caki-1 cells | CVCL_0234 | ||
HER2 WT-Mc-Val-Cit-PABC-MMAE [Investigative]
Discovered Using Cell Line-derived Xenograft Model
| Experiment 1 Reporting the Activity Date of This ADC | [222] | ||||
| Efficacy Data | Tumor Growth Inhibition value (TGI) | ≈ 97.76% (Day 67) | Positive HER2 expression (HER2+++/++) | ||
| Method Description |
Nude mice were implanted with SK-OV-3 tumor cells which were allowed to establish tumors of ~150 mm3 prior to initiation of treatment. ADCs at 10 mg/kg doses were injected through tail vein on days 38, 45, 52 and 59. There were ~10 mice per group. The tumor volume of mice in different group was measured and their survival was recorded.
|
||||
| In Vivo Model | SK-OV-3 CDX model | ||||
| In Vitro Model | Ovarian serous cystadenocarcinoma | SK-OV-3 cells | CVCL_0532 | ||
Revealed Based on the Cell Line Data
| Experiment 1 Reporting the Activity Date of This ADC | [222] | ||||
| Efficacy Data | Half Maximal Inhibitory Concentration (IC50) |
2.30 nM
|
High HER2 expression (HER2+++) | ||
| Method Description |
Cells were plated at a density of 5,000 cells per well in black walled 96-well plate and allowed to adhere overnight in a humidified at mosphere of 5% CO2. CellTiter-Glo reagent was added to the wells at room temperature and the luminescent signal was measuredafter 10 min using a SpectraMax M5 plate reader.
|
||||
| In Vitro Model | Breast adenocarcinoma | SK-BR-3 cells | CVCL_0033 | ||
| Experiment 2 Reporting the Activity Date of This ADC | [222] | ||||
| Efficacy Data | Half Maximal Inhibitory Concentration (IC50) | > 100.00 nM | Negative HER2 expression (HER2-) | ||
| Method Description |
Cells were plated at a density of 5,000 cells per well in black walled 96-well plate and allowed to adhere overnight in a humidified at mosphere of 5% CO2. CellTiter-Glo reagent was added to the wells at room temperature and the luminescent signal was measuredafter 10 min using a SpectraMax M5 plate reader.
|
||||
| In Vitro Model | Breast adenocarcinoma | MDA-MB-231 cells | CVCL_0062 | ||
AXL-726-M101L-MMAE [Investigative]
Discovered Using Cell Line-derived Xenograft Model
| Experiment 1 Reporting the Activity Date of This ADC | [157] | ||||
| Efficacy Data | Tumor Growth Inhibition value (TGI) | ≈ 97.90% (Day 18) | Positive AXL expression (AXL+++/++) | ||
| Method Description |
In the LCLC-103H xenograft model,therapeutic treatment with a single dose of 1 mg/kg in anti-tumor activity in the AXL-ADC panel.
|
||||
| In Vivo Model | Lung cancer CDX model | ||||
| In Vitro Model | Lung large cell carcinoma | LCLC-103H cells | CVCL_1375 | ||
HER2-gsADC-50 [Investigative]
Discovered Using Cell Line-derived Xenograft Model
| Experiment 1 Reporting the Activity Date of This ADC | [206] | ||||
| Efficacy Data | Tumor Growth Inhibition value (TGI) | ≈ 97.95% (Day 57) | Positive HER2 expression (HER2+++/++) | ||
| Method Description |
To further evaluate the gsADCs, we determined the in vivo tumor-inhibitory activity in an NCI-N87 nude mice xenograft model. The mice were randomly grouped into 10 groups (n = 5), including a PBS control group, when the tumors grew to 200 mm3. The experimental groups were 3.0 mg/kg gsADCs q3d.
|
||||
| In Vivo Model | NCI-N87 CDX model | ||||
| In Vitro Model | Gastric tubular adenocarcinoma | NCI-N87 cells | CVCL_1603 | ||
Revealed Based on the Cell Line Data
| Experiment 1 Reporting the Activity Date of This ADC | [206] | ||||
| Efficacy Data | Half Maximal Inhibitory Concentration (IC50) |
0.08 nM
|
Positive HER2 expression (HER2+++/++) | ||
| Method Description |
Cells were cultured in a 10% fetal bovine serum (FBS)-containing RPMI 1640 medium and were planted into 96-well plates with 6000 cells per well. The plates were incubated overnight at 37°C in a 5% CO2 cell incubator.
|
||||
| In Vitro Model | Breast adenocarcinoma | SK-BR-3 cells | CVCL_0033 | ||
| Experiment 2 Reporting the Activity Date of This ADC | [206] | ||||
| Efficacy Data | Half Maximal Inhibitory Concentration (IC50) |
0.09 nM
|
Positive HER2 expression (HER2+++/++) | ||
| Method Description |
Cells were cultured in a 10% fetal bovine serum (FBS)-containing RPMI 1640 medium and were planted into 96-well plates with 6000 cells per well. The plates were incubated overnight at 37°C in a 5% CO2 cell incubator.
|
||||
| In Vitro Model | Gastric tubular adenocarcinoma | NCI-N87 cells | CVCL_1603 | ||
| Experiment 3 Reporting the Activity Date of This ADC | [206] | ||||
| Efficacy Data | Half Maximal Inhibitory Concentration (IC50) | > 66.00 nM | Negative HER2 expression (HER2 -) | ||
| Method Description |
Cells were cultured in a 10% fetal bovine serum (FBS)-containing RPMI 1640 medium and were planted into 96-well plates with 6000 cells per well. The plates were incubated overnight at 37°C in a 5% CO2 cell incubator.
|
||||
| In Vitro Model | Breast adenocarcinoma | MDA-MB-231 cells | CVCL_0062 | ||
RC88-Mc-Val-Cit-PAB-MMAE [Investigative]
Discovered Using Cell Line-derived Xenograft Model
| Experiment 1 Reporting the Activity Date of This ADC | [229] | ||||
| Efficacy Data | Tumor Growth Inhibition value (TGI) | ≈ 99.00% (Day 21) | High MSLN expression (MSLN+++/++) | ||
| Method Description |
Inoculate mice with gastric cancer cells at 3 million cells/mouse suspended in HBSS/matrigel, in the thoracic mammary fat pad at a volume of 0.2 ml. When tumors have reached a mean tumor volume of 100-250 mm3, they will be grouped. A single treatment will be administered intravenously (2 mg/kg, qwx3) via the tail vein on Day 0.
|
||||
| In Vivo Model | Oval-CitAR-3 CDX model | ||||
| In Vitro Model | Ovarian cancer | Oval-CitAR-3 cells | Homo sapiens | ||
Revealed Based on the Cell Line Data
| Experiment 1 Reporting the Activity Date of This ADC | [229] | ||||
| Efficacy Data | Half Maximal Inhibitory Concentration (IC50) |
0.10 nM
|
High MSLN expression (MSLN+++/++) | ||
| Method Description |
Cell-based in vitro assays are used to measure viability (proliferation), cytotoxicity,and induction of apoptosis of the ADC of the invention. Culturing the cells for a period from about 6 hours to about 5 days and measuring cell viability.
|
||||
| In Vitro Model | Ovarian cancer | Oval-CitAR-3 cells | Homo sapiens | ||
h1F6-13 MMAE DAR8 [Investigative]
Discovered Using Cell Line-derived Xenograft Model
| Experiment 1 Reporting the Activity Date of This ADC | [207] | ||||
| Efficacy Data | Tumor Growth Inhibition value (TGI) | ≈ 100.00% (Day 42) | Positive CD70 expression (CD70+++/++) | ||
| Method Description |
To establish 786-O tumors, 5 x 10⁶ cells were implanted into the right flank of athymic nu/nu female donor mice. When tumors reached ~100 mm3 mice were randomly allocated to treatment groups. The dose of ADC was 0.5 mg/kg.
|
||||
| In Vivo Model | 786-O CDX model | ||||
| In Vitro Model | Renal cell carcinoma | 786-O cells | CVCL_1051 | ||
hBU12-13 MMAE DAR8 [Investigative]
Discovered Using Cell Line-derived Xenograft Model
| Experiment 1 Reporting the Activity Date of This ADC | [207] | ||||
| Efficacy Data | Tumor Growth Inhibition value (TGI) | ≈ 100.00% (Day 42) | Positive CD70 expression (CD70+++/++) | ||
| Method Description |
To establish 786-O tumors, 5 x 10⁶ cells were implanted into the right flank of athymic nu/nu female donor mice. When tumors reached ~100 mm3 mice were randomly allocated to treatment groups. The dose of ADC was 0.5 mg/kg.
|
||||
| In Vivo Model | 786-O CDX model | ||||
| In Vitro Model | Renal cell carcinoma | 786-O cells | CVCL_1051 | ||
WO2007011968A2 cAC10-9a [Investigative]
Discovered Using Cell Line-derived Xenograft Model
| Experiment 1 Reporting the Activity Date of This ADC | [199] | ||||
| Efficacy Data | Tumor Growth Inhibition value (TGI) | ≈ 100.00% (Day 27) | Positive CD30 expression (CD30+++/++); Negative CD70 expression (CD70-) | ||
| Method Description |
An in vivo therapy experiments with cAC10-9a was undertaken in nude mice with subcutaneous Karpas 299 ALCL tumors. The animals (5 per group)were treated with a single intravenous dose of cAC10-9a at 0.75 mg/kg (mAb component) on day 14.
|
||||
| In Vivo Model | Karpas-299 CDX model | ||||
| In Vitro Model | ALK-positive anaplastic large cell lymphoma | Karpas-299 cells | CVCL_1324 | ||
| Experiment 2 Reporting the Activity Date of This ADC | [199] | ||||
| Efficacy Data | Tumor Growth Inhibition value (TGI) | ≈ 100.00% (Day 27) | Positive CD30 expression (CD30+++/++); Negative CD70 expression (CD70-) | ||
| Method Description |
An in vivo therapy experiments with cAC10-9a was undertaken in nude mice with subcutaneous Karpas 299 ALCL tumors. The animals (5 per group)were treated with a single intravenous dose of cAC10-9a at 1 mg/kg (mAb component) on day 14.
|
||||
| In Vivo Model | Karpas-299 CDX model | ||||
| In Vitro Model | ALK-positive anaplastic large cell lymphoma | Karpas-299 cells | CVCL_1324 | ||
| Experiment 3 Reporting the Activity Date of This ADC | [199] | ||||
| Efficacy Data | Tumor Growth Inhibition value (TGI) | ≈ 100.00% (Day 27) | Positive CD30 expression (CD30+++/++); Negative CD70 expression (CD70-) | ||
| Method Description |
An in vivo therapy experiments with cAC10-9a was undertaken in nude mice with subcutaneous Karpas 299 ALCL tumors. The animals (5 per group)were treated with a single intravenous dose of cAC10-9a at 3 mg/kg (mAb component) on day 14.
|
||||
| In Vivo Model | Karpas-299 CDX model | ||||
| In Vitro Model | ALK-positive anaplastic large cell lymphoma | Karpas-299 cells | CVCL_1324 | ||
Revealed Based on the Cell Line Data
| Experiment 1 Reporting the Activity Date of This ADC | [199] | ||||
| Efficacy Data | Half Maximal Inhibitory Concentration (IC50) |
0.06 nM
|
Positive CD30 expression (CD30+++/++); Negative CD70 expression (CD70-) | ||
| Method Description |
Cell-based in vitro assays are used to measure viability (proliferation), cytotoxicity,and induction of apoptosis of the ADC of the invention. Culturing the cells for a period from about 6 hours to about 5 days and measuring cell viability.
|
||||
| In Vitro Model | ALK-positive anaplastic large cell lymphoma | Karpas-299 cells | CVCL_1324 | ||
| Experiment 2 Reporting the Activity Date of This ADC | [199] | ||||
| Efficacy Data | Half Maximal Inhibitory Concentration (IC50) | > 50.00 nM | Positive CD70 expression (CD70+++/++); Negative CD30 expression (CD30-) | ||
| Method Description |
Cell-based in vitro assays are used to measure viability (proliferation), cytotoxicity,and induction of apoptosis of the ADC of the invention. Culturing the cells for a period from about 6 hours to about 5 days and measuring cell viability.
|
||||
| In Vitro Model | Renal cell carcinoma | 786-O cells | CVCL_1051 | ||
| Experiment 3 Reporting the Activity Date of This ADC | [199] | ||||
| Efficacy Data | Half Maximal Inhibitory Concentration (IC50) | > 55.00 nM | Positive CD70 expression (CD70+++/++); Negative CD30 expression (CD30-) | ||
| Method Description |
Cell-based in vitro assays are used to measure viability (proliferation), cytotoxicity,and induction of apoptosis of the ADC of the invention. Culturing the cells for a period from about 6 hours to about 5 days and measuring cell viability.
|
||||
| In Vitro Model | Clear cell renal cell carcinoma | Caki-1 cells | CVCL_0234 | ||
Zt/g4-MMAE [Investigative]
Discovered Using Cell Line-derived Xenograft Model
| Experiment 1 Reporting the Activity Date of This ADC | [231] | ||||
| Efficacy Data | Tumor Growth Inhibition value (TGI) | ≈ 100.00% (Day 40) | Positive RON expression (RON +++/++) | ||
| Method Description |
Treatment began when tumors reached a mean tumor volume of 100 to 150 mm3. Zt/g4-MMAE or Zt/g4-DM1 at 20 mg/kg in a Q12 2 regimen was injected through the tail vein.
|
||||
| In Vivo Model | BxPC3 CDX model | ||||
| In Vitro Model | Pancreatic ductal adenocarcinoma | BxPC-3 cells | CVCL_0186 | ||
3A5-mc-VC-PAB-MMAE [Investigative]
Discovered Using Cell Line-derived Xenograft Model
| Experiment 1 Reporting the Activity Date of This ADC | [232] | ||||
| Efficacy Data | Tumor Growth Inhibition value (TGI) | ≈ 100.00% (Day 50) | Positive MUC16 expression (MUC16 +++/++) | ||
| Method Description |
In vivo efficacy of MUC16 targeting ADCs in the Ovcar3 tumor model. 3A5-mc-VC-PAB-MMAE ADC dosed at 5 mg/kg (in each study with the exact dosing for control) IV in SCID mice.
|
||||
| In Vivo Model | OVCR-3 CDX model | ||||
| In Vitro Model | Ovarian serous adenocarcinoma | OVCAR-3 cells | CVCL_0465 | ||
Revealed Based on the Cell Line Data
| Experiment 1 Reporting the Activity Date of This ADC | [232] | ||||
| Efficacy Data | Half Maximal Inhibitory Concentration (IC50) |
0.82 nM
|
Positive MUC16 expression (MUC16 +++/++) | ||
| Method Description |
Cells were seeded in 96 well plates at 3000 cells per well in complete growth media and grown overnight. For cell viability curves, serially diluted conjugates or payloads were added to the cells at final concentrations ranging from 300 nM to 5 pM and incubated for 8 days.
|
||||
| In Vitro Model | Ovarian serous adenocarcinoma | OVCAR-3 cells | CVCL_0465 | ||
| Experiment 2 Reporting the Activity Date of This ADC | [232] | ||||
| Efficacy Data | Half Maximal Inhibitory Concentration (IC50) | > 100 nM | Negative MUC16 expression (MUC16-) | ||
| Method Description |
Cells were seeded in 96 well plates at 3000 cells per well in complete growth media and grown overnight. For cell viability curves, serially diluted conjugates or payloads were added to the cells at final concentrations ranging from 300 nM to 5 pM and incubated for 8 days.
|
||||
| In Vitro Model | Normal | HEK293 cells | CVCL_0045 | ||
LR004-Val-Cit-MMAE [Investigative]
Discovered Using Cell Line-derived Xenograft Model
| Experiment 1 Reporting the Activity Date of This ADC | [233] | ||||
| Efficacy Data | Tumor Growth Inhibition value (TGI) | ≈ 100.00% (Day 52) | High EGFR expression (EGFR+++) | ||
| Method Description |
For the tumor xenograft model, 5.0x10⁶ MDA-MB-468 cells or 3.0x10⁶ MDA-MB-231 cells were injected subcutaneously into the right flank of each 6 week-old female BALB/c nude mice. when the tumor volumes reached approximately 100 mm3 (approximately 8 days), the 24 mice were randomly divided into 4 groups (6 mice per group): control group, LR004 antibody group, LR004-VC-MMAE group, and doxorubicin (positive control) group, which were treated with PBS or different drugs (LR004 antibody 10 mg/kg, LR004-VC-MMAE 10 mg/kg, doxorubicin 2 mg/kg) every 5 days for 4 times through i.v. injections.
Click to Show/Hide
|
||||
| In Vivo Model | Triple-negative breast cancer CDX model | ||||
| In Vitro Model | Breast adenocarcinoma | MDA-MB-468 cells | CVCL_0419 | ||
AbA-vcMMAE [Investigative]
Discovered Using Cell Line-derived Xenograft Model
| Experiment 1 Reporting the Activity Date of This ADC | [234] | ||||
| Efficacy Data | Tumor Growth Inhibition value (TGI) | ≈ 100.00% (Day 49) | Positive EGFR expression (EGFR+++/++) | ||
| Method Description |
Cells were subcutaneously inoculated at a dose of 1,000,000 cells to the right flank region of each female nude mouse (Day 0). On the day 7 of grouping, the antibody-drug conjugate was intravenously administered at doses of 1 mg/kg to thetail of each mouse.
|
||||
| In Vivo Model | NCI-H1703 CDX model | ||||
| In Vitro Model | Lung squamous cell carcinoma | NCI-H1703 cells | CVCL_1490 | ||
AbA-mcMMAE [Investigative]
Discovered Using Cell Line-derived Xenograft Model
| Experiment 1 Reporting the Activity Date of This ADC | [234] | ||||
| Efficacy Data | Tumor Growth Inhibition value (TGI) | ≈ 100.00% (Day 33) | Positive EGFR expression (EGFR+++/++) | ||
| Method Description |
Cells were subcutaneously inoculated at a dose of 1,000,000 cells to the right flank region of each female nude mouse (Day 0). On the day 7 of grouping, the antibody-drug conjugate was intravenously administered at doses of 3 mg/kg to thetail of each mouse.
|
||||
| In Vivo Model | EBC-1 CDX model | ||||
| In Vitro Model | Lung squamous cell carcinoma | EBC-1 cells | CVCL_2891 | ||
WO2017089895A1 ADC33 [Investigative]
Discovered Using Cell Line-derived Xenograft Model
| Experiment 1 Reporting the Activity Date of This ADC | [235] | ||||
| Efficacy Data | Half Maximal Inhibitory Concentration (IC50) |
53.68% (Day 36)
|
Positive HER2 expression (HER2+++/++) | ||
| Method Description |
JIMT-1 cells of the best condition that the viability was more than 95% were used for implantation. Cells of 5x 10⁶ suspended in 50 L cold-saline were implanted into right hind leg of balb/c-nude mouse.Then, mice were treated with PBS (vehicle control), or ADCs (0.5 mg/kg).
|
||||
| In Vivo Model | JIMT-1 CDX model | ||||
| In Vitro Model | Breast ductal carcinoma | JIMT-1 cells | CVCL_2077 | ||
| Experiment 2 Reporting the Activity Date of This ADC | [235] | ||||
| Efficacy Data | Half Maximal Inhibitory Concentration (IC50) |
89.84% (Day 36)
|
Positive HER2 expression (HER2+++/++) | ||
| Method Description |
JIMT-1 cells of the best condition that the viability was more than 95% were used for implantation. Cells of 5x 10⁶ suspended in 50 L cold-saline were implanted into right hind leg of balb/c-nude mouse.Then, mice were treated with PBS (vehicle control), or ADCs (2 mg/kg).
|
||||
| In Vivo Model | JIMT-1 CDX model | ||||
| In Vitro Model | Breast ductal carcinoma | JIMT-1 cells | CVCL_2077 | ||
Revealed Based on the Cell Line Data
| Experiment 1 Reporting the Activity Date of This ADC | [235] | ||||
| Efficacy Data | Half Maximal Inhibitory Concentration (IC50) |
0.04 nM
|
Positive HER2 expression (HER2+++/++) | ||
| Method Description |
ADCs wereincubated in human plasma for 5 seconds (0h), followed by SRB invitro cytotoxicity test using SK-BR3 cells for 72hr.
|
||||
| In Vitro Model | Breast adenocarcinoma | SK-BR-3 cells | CVCL_0033 | ||
| Experiment 2 Reporting the Activity Date of This ADC | [235] | ||||
| Efficacy Data | Half Maximal Inhibitory Concentration (IC50) |
0.04 nM
|
Positive HER2 expression (HER2+++/++) | ||
| Method Description |
Anti-proliferation activities of the antibodies, drugs, and conjugates with regard tothe cancer cell lines were measured. The cells were plated in 96-well, tissue culture platesat 10,000 cells per well. After 24 hour incubation, the antibodies, drugs, and conjugateswere added in various concentrations. The number of viable cells after 72 hours were counted using SRB assay.
Click to Show/Hide
|
||||
| In Vitro Model | Breast adenocarcinoma | SK-BR-3 cells | CVCL_0033 | ||
| Experiment 3 Reporting the Activity Date of This ADC | [235] | ||||
| Efficacy Data | Half Maximal Inhibitory Concentration (IC50) |
0.09 nM
|
Positive HER2 expression (HER2+++/++) | ||
| Method Description |
ADCs wereincubated in human plasma for 168 hours (168h), followed by SRB invitro cytotoxicity test using SK-BR3 cells for 72hr.
|
||||
| In Vitro Model | Breast adenocarcinoma | SK-BR-3 cells | CVCL_0033 | ||
| Experiment 4 Reporting the Activity Date of This ADC | [235] | ||||
| Efficacy Data | Half Maximal Inhibitory Concentration (IC50) |
0.23 nM
|
Positive HER2 expression (HER2+++/++) | ||
| Method Description |
Anti-proliferation activities of the antibodies, drugs, and conjugates with regard tothe cancer cell lines were measured. The cells were plated in 96-well, tissue culture platesat 10,000 cells per well. After 24 hour incubation, the antibodies, drugs, and conjugateswere added in various concentrations. The number of viable cells after 72 hours were counted using SRB assay.
Click to Show/Hide
|
||||
| In Vitro Model | Breast ductal carcinoma | JIMT-1 cells | CVCL_2077 | ||
| Experiment 5 Reporting the Activity Date of This ADC | [235] | ||||
| Efficacy Data | Half Maximal Inhibitory Concentration (IC50) |
0.27 nM
|
Positive HER2 expression (HER2+++/++) | ||
| Method Description |
Anti-proliferation activities of the antibodies, drugs, and conjugates with regard tothe cancer cell lines were measured. The cells were plated in 96-well, tissue culture platesat 10,000 cells per well. After 24 hour incubation, the antibodies, drugs, and conjugateswere added in various concentrations. The number of viable cells after 72 hours were counted using SRB assay.
Click to Show/Hide
|
||||
| In Vitro Model | Gastric tubular adenocarcinoma | NCI-N87 cells | CVCL_1603 | ||
| Experiment 6 Reporting the Activity Date of This ADC | [235] | ||||
| Efficacy Data | Half Maximal Inhibitory Concentration (IC50) |
0.33 nM
|
Positive HER2 expression (HER2+++/++) | ||
| Method Description |
Anti-proliferation activities of the antibodies, drugs, and conjugates with regard tothe cancer cell lines were measured. The cells were plated in 96-well, tissue culture platesat 10,000 cells per well. After 24 hour incubation, the antibodies, drugs, and conjugateswere added in various concentrations. The number of viable cells after 72 hours were counted using SRB assay.
Click to Show/Hide
|
||||
| In Vitro Model | Ovarian serous cystadenocarcinoma | SK-OV-3 cells | CVCL_0532 | ||
| Experiment 7 Reporting the Activity Date of This ADC | [235] | ||||
| Efficacy Data | Half Maximal Inhibitory Concentration (IC50) | > 33.33 nM | Negative HER2 expression (HER2-) | ||
| Method Description |
Anti-proliferation activities of the antibodies, drugs, and conjugates with regard tothe cancer cell lines were measured. The cells were plated in 96-well, tissue culture platesat 10,000 cells per well. After 24 hour incubation, the antibodies, drugs, and conjugateswere added in various concentrations. The number of viable cells after 72 hours were counted using SRB assay.
Click to Show/Hide
|
||||
| In Vitro Model | Invasive breast carcinoma | MCF-7 cells | CVCL_0031 | ||
WO2017089895A1 ADC24 [Investigative]
Discovered Using Cell Line-derived Xenograft Model
| Experiment 1 Reporting the Activity Date of This ADC | [235] | ||||
| Efficacy Data | Half Maximal Inhibitory Concentration (IC50) |
64.86% (Day 52)
|
Positive HER2 expression (HER2+++/++) | ||
| Method Description |
JIMT-1 cells of the best condition that the viability was more than 95% were used for implantation. Cells of 5x 10⁶ suspended in 50 L cold-saline were implanted into right hind leg of balb/c-nude mouse.Then, mice were treated with PBS (vehicle control), or ADCs (2 mg/kg).
|
||||
| In Vivo Model | JIMT-1 CDX model | ||||
| In Vitro Model | Breast ductal carcinoma | JIMT-1 cells | CVCL_2077 | ||
| Experiment 2 Reporting the Activity Date of This ADC | [235] | ||||
| Efficacy Data | Half Maximal Inhibitory Concentration (IC50) |
95.44% (Day 52)
|
Positive HER2 expression (HER2+++/++) | ||
| Method Description |
JIMT-1 cells of the best condition that the viability was more than 95% were used for implantation. Cells of 5x 10⁶ suspended in 50 L cold-saline were implanted into right hind leg of balb/c-nude mouse.Then, mice were treated with PBS (vehicle control), or ADCs (5 mg/kg).
|
||||
| In Vivo Model | JIMT-1 CDX model | ||||
| In Vitro Model | Breast ductal carcinoma | JIMT-1 cells | CVCL_2077 | ||
Revealed Based on the Cell Line Data
| Experiment 1 Reporting the Activity Date of This ADC | [235] | ||||
| Efficacy Data | Half Maximal Inhibitory Concentration (IC50) |
0.08 nM
|
Positive HER2 expression (HER2+++/++) | ||
| Method Description |
ADCs wereincubated in human plasma for 5 seconds (0h), followed by SRB invitro cytotoxicity test using SK-BR3 cells for 72hr.
|
||||
| In Vitro Model | Breast adenocarcinoma | SK-BR-3 cells | CVCL_0033 | ||
| Experiment 2 Reporting the Activity Date of This ADC | [235] | ||||
| Efficacy Data | Half Maximal Inhibitory Concentration (IC50) |
0.11 nM
|
Positive HER2 expression (HER2+++/++) | ||
| Method Description |
ADCs wereincubated in human plasma for 168 hours (168h), followed by SRB invitro cytotoxicity test using SK-BR3 cells for 72hr.
|
||||
| In Vitro Model | Breast adenocarcinoma | SK-BR-3 cells | CVCL_0033 | ||
| Experiment 3 Reporting the Activity Date of This ADC | [235] | ||||
| Efficacy Data | Half Maximal Inhibitory Concentration (IC50) |
0.14 nM
|
Positive HER2 expression (HER2+++/++) | ||
| Method Description |
Anti-proliferation activities of the antibodies, drugs, and conjugates with regard tothe cancer cell lines were measured. The cells were plated in 96-well, tissue culture platesat 10,000 cells per well. After 24 hour incubation, the antibodies, drugs, and conjugateswere added in various concentrations. The number of viable cells after 72 hours were counted using SRB assay.
Click to Show/Hide
|
||||
| In Vitro Model | Breast adenocarcinoma | SK-BR-3 cells | CVCL_0033 | ||
| Experiment 4 Reporting the Activity Date of This ADC | [235] | ||||
| Efficacy Data | Half Maximal Inhibitory Concentration (IC50) |
0.17 nM
|
Positive HER2 expression (HER2+++/++) | ||
| Method Description |
Anti-proliferation activities of the antibodies, drugs, and conjugates with regard tothe cancer cell lines were measured. The cells were plated in 96-well, tissue culture platesat 10,000 cells per well. After 24 hour incubation, the antibodies, drugs, and conjugateswere added in various concentrations. The number of viable cells after 72 hours were counted using SRB assay.
Click to Show/Hide
|
||||
| In Vitro Model | Gastric tubular adenocarcinoma | NCI-N87 cells | CVCL_1603 | ||
| Experiment 5 Reporting the Activity Date of This ADC | [235] | ||||
| Efficacy Data | Half Maximal Inhibitory Concentration (IC50) |
0.26 nM
|
Positive HER2 expression (HER2+++/++) | ||
| Method Description |
Anti-proliferation activities of the antibodies, drugs, and conjugates with regard tothe cancer cell lines were measured. The cells were plated in 96-well, tissue culture platesat 10,000 cells per well. After 24 hour incubation, the antibodies, drugs, and conjugateswere added in various concentrations. The number of viable cells after 72 hours were counted using SRB assay.
Click to Show/Hide
|
||||
| In Vitro Model | Breast ductal carcinoma | JIMT-1 cells | CVCL_2077 | ||
| Experiment 6 Reporting the Activity Date of This ADC | [235] | ||||
| Efficacy Data | Half Maximal Inhibitory Concentration (IC50) |
0.37 nM
|
Positive HER2 expression (HER2+++/++) | ||
| Method Description |
Anti-proliferation activities of the antibodies, drugs, and conjugates with regard tothe cancer cell lines were measured. The cells were plated in 96-well, tissue culture platesat 10,000 cells per well. After 24 hour incubation, the antibodies, drugs, and conjugateswere added in various concentrations. The number of viable cells after 72 hours were counted using SRB assay.
Click to Show/Hide
|
||||
| In Vitro Model | Ovarian serous cystadenocarcinoma | SK-OV-3 cells | CVCL_0532 | ||
| Experiment 7 Reporting the Activity Date of This ADC | [235] | ||||
| Efficacy Data | Half Maximal Inhibitory Concentration (IC50) | > 33.33 nM | Negative HER2 expression (HER2-) | ||
| Method Description |
Anti-proliferation activities of the antibodies, drugs, and conjugates with regard tothe cancer cell lines were measured. The cells were plated in 96-well, tissue culture platesat 10,000 cells per well. After 24 hour incubation, the antibodies, drugs, and conjugateswere added in various concentrations. The number of viable cells after 72 hours were counted using SRB assay.
Click to Show/Hide
|
||||
| In Vitro Model | Invasive breast carcinoma | MCF-7 cells | CVCL_0031 | ||
54E-Val-Cit-MMAE [Investigative]
Discovered Using Cell Line-derived Xenograft Model
| Experiment 1 Reporting the Activity Date of This ADC | [86] | ||||
| Efficacy Data | Half Maximal Effective Concentration (EC50) |
3.00 nM
|
Positive Tissue factor expression (TF+++/++; 320,000 TF receptor copy number) | ||
| Method Description |
Antibody-dependent cellular cytotoxicity (ADCC) A431 cells were plated on a microtiter plate The following day, the cells were incubated with a ten-point 1:3 dilution titration of anti-TF antibodies or the ADCs starting at 50 nM An ADCC effector-to-target cell ratio of 8:1 was added to each well and incubated for 6 h at 37°C Luciferase Assay Reagent was added to each well to measure luminescence on an Envision plate reader Antibody-dependent cellular cytotoxicity (ADCC) reporter luminescence was evaluated after a 6-hour incubation of the reporter Jurkat cell line with TF-positive A431 cells and a titration of anti-TF antibody or ADC The ADCC reporter luminescence EC50 values for each anti-TF antibody or ADC are listed.
Click to Show/Hide
|
||||
| In Vitro Model | Breast adenocarcinoma | MDA-MB-231 cells | CVCL_0062 | ||
Revealed Based on the Cell Line Data
| Experiment 1 Reporting the Activity Date of This ADC | [95] | ||||
| Efficacy Data | Half Maximal Effective Concentration (EC50) |
14.00 nM
|
Low FOLR1 expression (FOLR1+) | ||
| Method Description |
A431 cells were pre-incubated for 30 min without or with 50 nM of FVIIa prior to the addition of an anti-TF ADC (54E-vc-MMAE) titration After a 4 h incubation at 37°C, the FVIIa and ADC were washed out and the cells were cultured for another 68 h before cell viability assessment.
|
||||
| In Vitro Model | Skin squamous cell carcinoma | A431 cells | CVCL_0037 | ||
| Experiment 2 Reporting the Activity Date of This ADC | [95] | ||||
| Efficacy Data | Half Maximal Effective Concentration (EC50) |
14.00 nM
|
Low FOLR1 expression (FOLR1+) | ||
| Method Description |
To evaluate ADC cytotoxicity, cells were plated in 384-well plates Anti-TF antibodies conjugated to MC-vc-PAB-MMAE were serially diluted as shown Plates were incubated for 3 days, followed by lysis in CTG assay reagent For each ADC, the IC50 and its associated 95% confidence interval (95% CI) were calculated Titrations of the TF-specific ADCs were added to A431 cells, with a 72-hour incubationThis treatment resulted in efficacious cell killing.
Click to Show/Hide
|
||||
| In Vitro Model | Skin squamous cell carcinoma | A431 cells | CVCL_0037 | ||
| Experiment 3 Reporting the Activity Date of This ADC | [95] | ||||
| Efficacy Data | Half Maximal Effective Concentration (EC50) |
14.00 nM
|
Low FOLR1 expression (FOLR1+) | ||
| Method Description |
To evaluate ADC cytotoxicity, cells were plated in 384-well plates Anti-TF antibodies conjugated to MC-vc-PAB-MMAE were serially diluted as shown Plates were incubated for 3 days, followed by lysis in CTG assay reagent For each ADC, the IC50 and its associated 95% confidence interval (95% CI) were calculated Titrations of the TF-specific ADCs were added to A431 cells, with a 4-hour incubation followed by removal of excess ADC and culture for another 68 hours This treatment resulted in efficacious cell killing.
Click to Show/Hide
|
||||
| In Vitro Model | Skin squamous cell carcinoma | A431 cells | CVCL_0037 | ||
MMAE-9F7-F11 ADC [Investigative]
Revealed Based on the Cell Line Data
| Experiment 1 Reporting the Activity Date of This ADC | [236] | ||||
| Efficacy Data | Tumor Growth Inhibition value (TGI) | ≈ 1.98 ng/mL±0.74 ng/mL | Positive HER3 expression (HER3+++/++) | ||
| Method Description |
Cells were plated in 96-well flat-bottom plates the day before starvation in 1% FCS for 24hr. HER3-ADC at different dilutions was then added for 5 days, with 50ng/ml NRG1. In the absence of NRG1 stimulation, cells were maintained in 10% FCS and treated with HER3-ADC.
|
||||
| In Vitro Model | Pancreatic ductal adenocarcinoma | BxPC-3 cells | CVCL_0186 | ||
M69-MMAE [Investigative]
Revealed Based on the Cell Line Data
| Experiment 1 Reporting the Activity Date of This ADC | [237] | ||||
| Efficacy Data | Tumor Growth Inhibition value (TGI) | ≈ 82.10% (Day 18) | Positive ST14 expression (ST14+++/++) | ||
| Method Description |
Five thousand cells per well were plated in RPMI 1,640 media supplemented with 10% FBS. After overnight culture, media was removed and fresh media containing the ADC was added and incubated for different time periods.
|
||||
| In Vitro Model | Mantle cell lymphoma | JeKo-1 cells | CVCL_1865 | ||
| Experiment 2 Reporting the Activity Date of This ADC | [237] | ||||
| Efficacy Data | Half Maximal Inhibitory Concentration (IC50) |
5.29 ug/mL±0.28 ug/mL
|
Positive ST14 expression (ST14+++/++) | ||
| Method Description |
Five thousand cells per well were plated in RPMI 1,640 media supplemented with 10% FBS. After overnight culture, media was removed and fresh media containing the ADC was added and incubated for different time periods.
|
||||
| In Vitro Model | Mantle cell lymphoma | Mino cells | CVCL_1872 | ||
| Experiment 3 Reporting the Activity Date of This ADC | [237] | ||||
| Efficacy Data | Half Maximal Inhibitory Concentration (IC50) |
7.20 ug/mL±2.01 ug/mL
|
Positive ST14 expression (ST14+++/++) | ||
| Method Description |
Five thousand cells per well were plated in RPMI 1,640 media supplemented with 10% FBS. After overnight culture, media was removed and fresh media containing the ADC was added and incubated for different time periods.
|
||||
| In Vitro Model | Mantle cell lymphoma | MAVER-1 cells | CVCL_1831 | ||
| Experiment 4 Reporting the Activity Date of This ADC | [237] | ||||
| Efficacy Data | Half Maximal Inhibitory Concentration (IC50) |
7.69 ug/mL±0.29 ug/mL
|
Positive ST14 expression (ST14+++/++) | ||
| Method Description |
Five thousand cells per well were plated in RPMI 1,640 media supplemented with 10% FBS. After overnight culture, media was removed and fresh media containing the ADC was added and incubated for different time periods.
|
||||
| In Vitro Model | Mantle cell lymphoma | Z-138 cells | CVCL_B077 | ||
| Experiment 5 Reporting the Activity Date of This ADC | [237] | ||||
| Efficacy Data | Half Maximal Inhibitory Concentration (IC50) |
13.78 ug/mL±2.15 ug/mL
|
Positive ST14 expression (ST14+++/++) | ||
| Method Description |
Five thousand cells per well were plated in RPMI 1,640 media supplemented with 10% FBS. After overnight culture, media was removed and fresh media containing the ADC was added and incubated for different time periods.
|
||||
| In Vitro Model | Mantle cell lymphoma | JeKo-1 cells | CVCL_1865 | ||
hL49_3x_Ala-ADC [Investigative]
Revealed Based on the Cell Line Data
| Experiment 1 Reporting the Activity Date of This ADC | [238] | ||||
| Efficacy Data | Maximum inhibition efficiency (MIE) |
8.00%
|
Moderate CD228 expression (CD228++) | ||
| Method Description |
Tumor cells were incubated with CD228 antibody-drug conjugates comprising theindicated anti-CD228 antibody, a linker, and MMAE for 96-144 hours at 37 . Cell viability was measured using Cell Titer Glo according to manufacturer's instructions.
|
||||
| In Vitro Model | Melanoma | A2058 cells | CVCL_1059 | ||
| Experiment 2 Reporting the Activity Date of This ADC | [238] | ||||
| Efficacy Data | Maximum inhibition efficiency (MIE) |
65.00%
|
Low CD228 expression (CD228+) | ||
| Method Description |
Tumor cells were incubated with CD228 antibody-drug conjugates comprising theindicated anti-CD228 antibody, a linker, and MMAE for 96-144 hours at 37 . Cell viability was measured using Cell Titer Glo according to manufacturer's instructions.
|
||||
| In Vitro Model | Amelanotic melanoma | A-375 cells | CVCL_0132 | ||
| Experiment 3 Reporting the Activity Date of This ADC | [238] | ||||
| Efficacy Data | Maximum inhibition efficiency (MIE) |
72.00%
|
Positive CD228 expression (CD228+++/++) | ||
| Method Description |
Tumor cells were incubated with CD228 antibody-drug conjugates comprising theindicated anti-CD228 antibody, a linker, and MMAE for 96-144 hours at 37 . Cell viability was measured using Cell Titer Glo according to manufacturer's instructions.
|
||||
| In Vitro Model | Cutaneous melanoma | SK-MEL-28 cells | CVCL_0526 | ||
| Experiment 4 Reporting the Activity Date of This ADC | [238] | ||||
| Efficacy Data | Maximum inhibition efficiency (MIE) |
80.00%
|
Positive CD228 expression (CD228+++/++) | ||
| Method Description |
Tumor cells were incubated with CD228 antibody-drug conjugates comprising theindicated anti-CD228 antibody, a linker, and MMAE for 96-144 hours at 37 . Cell viability was measured using Cell Titer Glo according to manufacturer's instructions.
|
||||
| In Vitro Model | Cutaneous melanoma | COLO 853 cells | CVCL_2003 | ||
| Experiment 5 Reporting the Activity Date of This ADC | [238] | ||||
| Efficacy Data | Maximum inhibition efficiency (MIE) |
84.00%
|
Positive CD228 expression (CD228+++/++) | ||
| Method Description |
Tumor cells were incubated with CD228 antibody-drug conjugates comprising theindicated anti-CD228 antibody, a linker, and MMAE for 96-144 hours at 37 . Cell viability was measured using Cell Titer Glo according to manufacturer's instructions.
|
||||
| In Vitro Model | Melanoma | IGR-37 cells | CVCL_2075 | ||
| Experiment 6 Reporting the Activity Date of This ADC | [238] | ||||
| Efficacy Data | Maximum inhibition efficiency (MIE) |
87.00%
|
Positive CD228 expression (CD228+++/++) | ||
| Method Description |
Tumor cells were incubated with CD228 antibody-drug conjugates comprising theindicated anti-CD228 antibody, a linker, and MMAE for 96-144 hours at 37 . Cell viability was measured using Cell Titer Glo according to manufacturer's instructions.
|
||||
| In Vitro Model | Cutaneous melanoma | SK-MEL-5 cells | CVCL_0527 | ||
| Experiment 7 Reporting the Activity Date of This ADC | [238] | ||||
| Efficacy Data | Half Maximal Inhibitory Concentration (IC50) |
5.00 nM
|
Positive CD228 expression (CD228+++/++) | ||
| Method Description |
Tumor cells were incubated with CD228 antibody-drug conjugates comprising theindicated anti-CD228 antibody, a linker, and MMAE for 96-144 hours at 37 . Cell viability was measured using Cell Titer Glo according to manufacturer's instructions.
|
||||
| In Vitro Model | Cutaneous melanoma | SK-MEL-28 cells | CVCL_0526 | ||
| Experiment 8 Reporting the Activity Date of This ADC | [238] | ||||
| Efficacy Data | Half Maximal Inhibitory Concentration (IC50) |
6.00 nM
|
Positive CD228 expression (CD228+++/++) | ||
| Method Description |
Tumor cells were incubated with CD228 antibody-drug conjugates comprising theindicated anti-CD228 antibody, a linker, and MMAE for 96-144 hours at 37 . Cell viability was measured using Cell Titer Glo according to manufacturer's instructions.
|
||||
| In Vitro Model | Cutaneous melanoma | SK-MEL-5 cells | CVCL_0527 | ||
| Experiment 9 Reporting the Activity Date of This ADC | [238] | ||||
| Efficacy Data | Half Maximal Inhibitory Concentration (IC50) |
10.00 nM
|
Positive CD228 expression (CD228+++/++) | ||
| Method Description |
Tumor cells were incubated with CD228 antibody-drug conjugates comprising theindicated anti-CD228 antibody, a linker, and MMAE for 96-144 hours at 37 . Cell viability was measured using Cell Titer Glo according to manufacturer's instructions.
|
||||
| In Vitro Model | Cutaneous melanoma | COLO 853 cells | CVCL_2003 | ||
| Experiment 10 Reporting the Activity Date of This ADC | [238] | ||||
| Efficacy Data | Half Maximal Inhibitory Concentration (IC50) |
162 nM
|
Positive CD228 expression (CD228+++/++) | ||
| Method Description |
Tumor cells were incubated with CD228 antibody-drug conjugates comprising theindicated anti-CD228 antibody, a linker, and MMAE for 96-144 hours at 37 . Cell viability was measured using Cell Titer Glo according to manufacturer's instructions.
|
||||
| In Vitro Model | Melanoma | IGR-37 cells | CVCL_2075 | ||
| Experiment 11 Reporting the Activity Date of This ADC | [238] | ||||
| Efficacy Data | Half Maximal Inhibitory Concentration (IC50) | > 2000 nM | Moderate CD228 expression (CD228++) | ||
| Method Description |
Tumor cells were incubated with CD228 antibody-drug conjugates comprising theindicated anti-CD228 antibody, a linker, and MMAE for 96-144 hours at 37 . Cell viability was measured using Cell Titer Glo according to manufacturer's instructions.
|
||||
| In Vitro Model | Melanoma | A2058 cells | CVCL_1059 | ||
| Experiment 12 Reporting the Activity Date of This ADC | [238] | ||||
| Efficacy Data | Half Maximal Inhibitory Concentration (IC50) |
1.32 uM
|
Low CD228 expression (CD228+) | ||
| Method Description |
Tumor cells were incubated with CD228 antibody-drug conjugates comprising theindicated anti-CD228 antibody, a linker, and MMAE for 96-144 hours at 37 . Cell viability was measured using Cell Titer Glo according to manufacturer's instructions.
|
||||
| In Vitro Model | Amelanotic melanoma | A-375 cells | CVCL_0132 | ||
hL49-ADC [Investigative]
Revealed Based on the Cell Line Data
| Experiment 1 Reporting the Activity Date of This ADC | [238] | ||||
| Efficacy Data | Maximum inhibition efficiency (MIE) |
32.00%
|
Low CD228 expression (CD228+) | ||
| Method Description |
Tumor cells were incubated with CD228 antibody-drug conjugates comprising theindicated anti-CD228 antibody, a linker, and MMAE for 96-144 hours at 37 . Cell viability was measured using Cell Titer Glo according to manufacturer's instructions.
|
||||
| In Vitro Model | Amelanotic melanoma | A-375 cells | CVCL_0132 | ||
| Experiment 2 Reporting the Activity Date of This ADC | [238] | ||||
| Efficacy Data | Maximum inhibition efficiency (MIE) |
72.00%
|
Positive CD228 expression (CD228+++/++) | ||
| Method Description |
Tumor cells were incubated with CD228 antibody-drug conjugates comprising theindicated anti-CD228 antibody, a linker, and MMAE for 96-144 hours at 37 . Cell viability was measured using Cell Titer Glo according to manufacturer's instructions.
|
||||
| In Vitro Model | Melanoma | IGR-37 cells | CVCL_2075 | ||
| Experiment 3 Reporting the Activity Date of This ADC | [238] | ||||
| Efficacy Data | Maximum inhibition efficiency (MIE) |
78.00%
|
Moderate CD228 expression (CD228++) | ||
| Method Description |
Tumor cells were incubated with CD228 antibody-drug conjugates comprising theindicated anti-CD228 antibody, a linker, and MMAE for 96-144 hours at 37 . Cell viability was measured using Cell Titer Glo according to manufacturer's instructions.
|
||||
| In Vitro Model | Melanoma | A2058 cells | CVCL_1059 | ||
| Experiment 4 Reporting the Activity Date of This ADC | [238] | ||||
| Efficacy Data | Maximum inhibition efficiency (MIE) |
79.00%
|
Positive CD228 expression (CD228+++/++) | ||
| Method Description |
Tumor cells were incubated with CD228 antibody-drug conjugates comprising theindicated anti-CD228 antibody, a linker, and MMAE for 96-144 hours at 37 . Cell viability was measured using Cell Titer Glo according to manufacturer's instructions.
|
||||
| In Vitro Model | Cutaneous melanoma | SK-MEL-28 cells | CVCL_0526 | ||
| Experiment 5 Reporting the Activity Date of This ADC | [238] | ||||
| Efficacy Data | Maximum inhibition efficiency (MIE) |
80.00%
|
Positive CD228 expression (CD228+++/++) | ||
| Method Description |
Tumor cells were incubated with CD228 antibody-drug conjugates comprising theindicated anti-CD228 antibody, a linker, and MMAE for 96-144 hours at 37 . Cell viability was measured using Cell Titer Glo according to manufacturer's instructions.
|
||||
| In Vitro Model | Cutaneous melanoma | COLO 853 cells | CVCL_2003 | ||
| Experiment 6 Reporting the Activity Date of This ADC | [238] | ||||
| Efficacy Data | Maximum inhibition efficiency (MIE) |
86.00%
|
Positive CD228 expression (CD228+++/++) | ||
| Method Description |
Tumor cells were incubated with CD228 antibody-drug conjugates comprising theindicated anti-CD228 antibody, a linker, and MMAE for 96-144 hours at 37 . Cell viability was measured using Cell Titer Glo according to manufacturer's instructions.
|
||||
| In Vitro Model | Cutaneous melanoma | SK-MEL-5 cells | CVCL_0527 | ||
| Experiment 7 Reporting the Activity Date of This ADC | [238] | ||||
| Efficacy Data | Half Maximal Inhibitory Concentration (IC50) |
2.00 nM
|
Positive CD228 expression (CD228+++/++) | ||
| Method Description |
Tumor cells were incubated with CD228 antibody-drug conjugates comprising theindicated anti-CD228 antibody, a linker, and MMAE for 96-144 hours at 37 . Cell viability was measured using Cell Titer Glo according to manufacturer's instructions.
|
||||
| In Vitro Model | Cutaneous melanoma | SK-MEL-5 cells | CVCL_0527 | ||
| Experiment 8 Reporting the Activity Date of This ADC | [238] | ||||
| Efficacy Data | Half Maximal Inhibitory Concentration (IC50) |
3.00 nM
|
Positive CD228 expression (CD228+++/++) | ||
| Method Description |
Tumor cells were incubated with CD228 antibody-drug conjugates comprising theindicated anti-CD228 antibody, a linker, and MMAE for 96-144 hours at 37 . Cell viability was measured using Cell Titer Glo according to manufacturer's instructions.
|
||||
| In Vitro Model | Cutaneous melanoma | SK-MEL-28 cells | CVCL_0526 | ||
| Experiment 9 Reporting the Activity Date of This ADC | [238] | ||||
| Efficacy Data | Half Maximal Inhibitory Concentration (IC50) |
4.00 nM
|
Positive CD228 expression (CD228+++/++) | ||
| Method Description |
Tumor cells were incubated with CD228 antibody-drug conjugates comprising theindicated anti-CD228 antibody, a linker, and MMAE for 96-144 hours at 37 . Cell viability was measured using Cell Titer Glo according to manufacturer's instructions.
|
||||
| In Vitro Model | Cutaneous melanoma | COLO 853 cells | CVCL_2003 | ||
| Experiment 10 Reporting the Activity Date of This ADC | [238] | ||||
| Efficacy Data | Half Maximal Inhibitory Concentration (IC50) |
21.00 nM
|
Positive CD228 expression (CD228+++/++) | ||
| Method Description |
Tumor cells were incubated with CD228 antibody-drug conjugates comprising theindicated anti-CD228 antibody, a linker, and MMAE for 96-144 hours at 37 . Cell viability was measured using Cell Titer Glo according to manufacturer's instructions.
|
||||
| In Vitro Model | Melanoma | IGR-37 cells | CVCL_2075 | ||
| Experiment 11 Reporting the Activity Date of This ADC | [238] | ||||
| Efficacy Data | Half Maximal Inhibitory Concentration (IC50) |
31.00 nM
|
Moderate CD228 expression (CD228++) | ||
| Method Description |
Tumor cells were incubated with CD228 antibody-drug conjugates comprising theindicated anti-CD228 antibody, a linker, and MMAE for 96-144 hours at 37 . Cell viability was measured using Cell Titer Glo according to manufacturer's instructions.
|
||||
| In Vitro Model | Melanoma | A2058 cells | CVCL_1059 | ||
| Experiment 12 Reporting the Activity Date of This ADC | [238] | ||||
| Efficacy Data | Half Maximal Inhibitory Concentration (IC50) | > 2000 nM | Low CD228 expression (CD228+) | ||
| Method Description |
Tumor cells were incubated with CD228 antibody-drug conjugates comprising theindicated anti-CD228 antibody, a linker, and MMAE for 96-144 hours at 37 . Cell viability was measured using Cell Titer Glo according to manufacturer's instructions.
|
||||
| In Vitro Model | Amelanotic melanoma | A-375 cells | CVCL_0132 | ||
hL49_34_Gln-ADC [Investigative]
Revealed Based on the Cell Line Data
| Experiment 1 Reporting the Activity Date of This ADC | [238] | ||||
| Efficacy Data | Maximum inhibition efficiency (MIE) |
33.00%
|
Moderate CD228 expression (CD228++) | ||
| Method Description |
Tumor cells were incubated with CD228 antibody-drug conjugates comprising theindicated anti-CD228 antibody, a linker, and MMAE for 96-144 hours at 37 . Cell viability was measured using Cell Titer Glo according to manufacturer's instructions.
|
||||
| In Vitro Model | Melanoma | A2058 cells | CVCL_1059 | ||
| Experiment 2 Reporting the Activity Date of This ADC | [238] | ||||
| Efficacy Data | Maximum inhibition efficiency (MIE) |
72.00%
|
Positive CD228 expression (CD228+++/++) | ||
| Method Description |
Tumor cells were incubated with CD228 antibody-drug conjugates comprising theindicated anti-CD228 antibody, a linker, and MMAE for 96-144 hours at 37 . Cell viability was measured using Cell Titer Glo according to manufacturer's instructions.
|
||||
| In Vitro Model | Cutaneous melanoma | SK-MEL-28 cells | CVCL_0526 | ||
| Experiment 3 Reporting the Activity Date of This ADC | [238] | ||||
| Efficacy Data | Maximum inhibition efficiency (MIE) |
83.00%
|
Low CD228 expression (CD228+) | ||
| Method Description |
Tumor cells were incubated with CD228 antibody-drug conjugates comprising theindicated anti-CD228 antibody, a linker, and MMAE for 96-144 hours at 37 . Cell viability was measured using Cell Titer Glo according to manufacturer's instructions.
|
||||
| In Vitro Model | Amelanotic melanoma | A-375 cells | CVCL_0132 | ||
| Experiment 4 Reporting the Activity Date of This ADC | [238] | ||||
| Efficacy Data | Maximum inhibition efficiency (MIE) |
83.00%
|
Positive CD228 expression (CD228+++/++) | ||
| Method Description |
Tumor cells were incubated with CD228 antibody-drug conjugates comprising theindicated anti-CD228 antibody, a linker, and MMAE for 96-144 hours at 37 . Cell viability was measured using Cell Titer Glo according to manufacturer's instructions.
|
||||
| In Vitro Model | Cutaneous melanoma | COLO 853 cells | CVCL_2003 | ||
| Experiment 5 Reporting the Activity Date of This ADC | [238] | ||||
| Efficacy Data | Maximum inhibition efficiency (MIE) |
86.00%
|
Positive CD228 expression (CD228+++/++) | ||
| Method Description |
Tumor cells were incubated with CD228 antibody-drug conjugates comprising theindicated anti-CD228 antibody, a linker, and MMAE for 96-144 hours at 37 . Cell viability was measured using Cell Titer Glo according to manufacturer's instructions.
|
||||
| In Vitro Model | Melanoma | IGR-37 cells | CVCL_2075 | ||
| Experiment 6 Reporting the Activity Date of This ADC | [238] | ||||
| Efficacy Data | Maximum inhibition efficiency (MIE) |
88.00%
|
Positive CD228 expression (CD228+++/++) | ||
| Method Description |
Tumor cells were incubated with CD228 antibody-drug conjugates comprising theindicated anti-CD228 antibody, a linker, and MMAE for 96-144 hours at 37 . Cell viability was measured using Cell Titer Glo according to manufacturer's instructions.
|
||||
| In Vitro Model | Cutaneous melanoma | SK-MEL-5 cells | CVCL_0527 | ||
| Experiment 7 Reporting the Activity Date of This ADC | [238] | ||||
| Efficacy Data | Half Maximal Inhibitory Concentration (IC50) |
4.00 nM
|
Positive CD228 expression (CD228+++/++) | ||
| Method Description |
Tumor cells were incubated with CD228 antibody-drug conjugates comprising theindicated anti-CD228 antibody, a linker, and MMAE for 96-144 hours at 37 . Cell viability was measured using Cell Titer Glo according to manufacturer's instructions.
|
||||
| In Vitro Model | Cutaneous melanoma | SK-MEL-28 cells | CVCL_0526 | ||
| Experiment 8 Reporting the Activity Date of This ADC | [238] | ||||
| Efficacy Data | Half Maximal Inhibitory Concentration (IC50) |
5.00 nM
|
Positive CD228 expression (CD228+++/++) | ||
| Method Description |
Tumor cells were incubated with CD228 antibody-drug conjugates comprising theindicated anti-CD228 antibody, a linker, and MMAE for 96-144 hours at 37 . Cell viability was measured using Cell Titer Glo according to manufacturer's instructions.
|
||||
| In Vitro Model | Cutaneous melanoma | SK-MEL-5 cells | CVCL_0527 | ||
| Experiment 9 Reporting the Activity Date of This ADC | [238] | ||||
| Efficacy Data | Half Maximal Inhibitory Concentration (IC50) |
7.00 nM
|
Positive CD228 expression (CD228+++/++) | ||
| Method Description |
Tumor cells were incubated with CD228 antibody-drug conjugates comprising theindicated anti-CD228 antibody, a linker, and MMAE for 96-144 hours at 37 . Cell viability was measured using Cell Titer Glo according to manufacturer's instructions.
|
||||
| In Vitro Model | Cutaneous melanoma | COLO 853 cells | CVCL_2003 | ||
| Experiment 10 Reporting the Activity Date of This ADC | [238] | ||||
| Efficacy Data | Half Maximal Inhibitory Concentration (IC50) |
104 nM
|
Positive CD228 expression (CD228+++/++) | ||
| Method Description |
Tumor cells were incubated with CD228 antibody-drug conjugates comprising theindicated anti-CD228 antibody, a linker, and MMAE for 96-144 hours at 37 . Cell viability was measured using Cell Titer Glo according to manufacturer's instructions.
|
||||
| In Vitro Model | Melanoma | IGR-37 cells | CVCL_2075 | ||
| Experiment 11 Reporting the Activity Date of This ADC | [238] | ||||
| Efficacy Data | Half Maximal Inhibitory Concentration (IC50) |
1.10 uM
|
Low CD228 expression (CD228+) | ||
| Method Description |
Tumor cells were incubated with CD228 antibody-drug conjugates comprising theindicated anti-CD228 antibody, a linker, and MMAE for 96-144 hours at 37 . Cell viability was measured using Cell Titer Glo according to manufacturer's instructions.
|
||||
| In Vitro Model | Amelanotic melanoma | A-375 cells | CVCL_0132 | ||
| Experiment 12 Reporting the Activity Date of This ADC | [238] | ||||
| Efficacy Data | Half Maximal Inhibitory Concentration (IC50) |
1.64 uM
|
Moderate CD228 expression (CD228++) | ||
| Method Description |
Tumor cells were incubated with CD228 antibody-drug conjugates comprising theindicated anti-CD228 antibody, a linker, and MMAE for 96-144 hours at 37 . Cell viability was measured using Cell Titer Glo according to manufacturer's instructions.
|
||||
| In Vitro Model | Melanoma | A2058 cells | CVCL_1059 | ||
hL49_34_Tyr-ADC [Investigative]
Revealed Based on the Cell Line Data
| Experiment 1 Reporting the Activity Date of This ADC | [238] | ||||
| Efficacy Data | Maximum inhibition efficiency (MIE) |
36.00%
|
Low CD228 expression (CD228+) | ||
| Method Description |
Tumor cells were incubated with CD228 antibody-drug conjugates comprising theindicated anti-CD228 antibody, a linker, and MMAE for 96-144 hours at 37 . Cell viability was measured using Cell Titer Glo according to manufacturer's instructions.
|
||||
| In Vitro Model | Amelanotic melanoma | A-375 cells | CVCL_0132 | ||
| Experiment 2 Reporting the Activity Date of This ADC | [238] | ||||
| Efficacy Data | Maximum inhibition efficiency (MIE) |
74.00%
|
Positive CD228 expression (CD228+++/++) | ||
| Method Description |
Tumor cells were incubated with CD228 antibody-drug conjugates comprising theindicated anti-CD228 antibody, a linker, and MMAE for 96-144 hours at 37 . Cell viability was measured using Cell Titer Glo according to manufacturer's instructions.
|
||||
| In Vitro Model | Melanoma | IGR-37 cells | CVCL_2075 | ||
| Experiment 3 Reporting the Activity Date of This ADC | [238] | ||||
| Efficacy Data | Maximum inhibition efficiency (MIE) |
76.00%
|
Positive CD228 expression (CD228+++/++) | ||
| Method Description |
Tumor cells were incubated with CD228 antibody-drug conjugates comprising theindicated anti-CD228 antibody, a linker, and MMAE for 96-144 hours at 37 . Cell viability was measured using Cell Titer Glo according to manufacturer's instructions.
|
||||
| In Vitro Model | Cutaneous melanoma | SK-MEL-28 cells | CVCL_0526 | ||
| Experiment 4 Reporting the Activity Date of This ADC | [238] | ||||
| Efficacy Data | Maximum inhibition efficiency (MIE) |
85.00%
|
Positive CD228 expression (CD228+++/++) | ||
| Method Description |
Tumor cells were incubated with CD228 antibody-drug conjugates comprising theindicated anti-CD228 antibody, a linker, and MMAE for 96-144 hours at 37 . Cell viability was measured using Cell Titer Glo according to manufacturer's instructions.
|
||||
| In Vitro Model | Cutaneous melanoma | COLO 853 cells | CVCL_2003 | ||
| Experiment 5 Reporting the Activity Date of This ADC | [238] | ||||
| Efficacy Data | Maximum inhibition efficiency (MIE) |
85.00%
|
Positive CD228 expression (CD228+++/++) | ||
| Method Description |
Tumor cells were incubated with CD228 antibody-drug conjugates comprising theindicated anti-CD228 antibody, a linker, and MMAE for 96-144 hours at 37 . Cell viability was measured using Cell Titer Glo according to manufacturer's instructions.
|
||||
| In Vitro Model | Cutaneous melanoma | SK-MEL-5 cells | CVCL_0527 | ||
| Experiment 6 Reporting the Activity Date of This ADC | [238] | ||||
| Efficacy Data | Maximum inhibition efficiency (MIE) |
90.00%
|
Moderate CD228 expression (CD228++) | ||
| Method Description |
Tumor cells were incubated with CD228 antibody-drug conjugates comprising theindicated anti-CD228 antibody, a linker, and MMAE for 96-144 hours at 37 . Cell viability was measured using Cell Titer Glo according to manufacturer's instructions.
|
||||
| In Vitro Model | Melanoma | A2058 cells | CVCL_1059 | ||
| Experiment 7 Reporting the Activity Date of This ADC | [238] | ||||
| Efficacy Data | Half Maximal Inhibitory Concentration (IC50) |
28.00 nM
|
Positive CD228 expression (CD228+++/++) | ||
| Method Description |
Tumor cells were incubated with CD228 antibody-drug conjugates comprising theindicated anti-CD228 antibody, a linker, and MMAE for 96-144 hours at 37 . Cell viability was measured using Cell Titer Glo according to manufacturer's instructions.
|
||||
| In Vitro Model | Cutaneous melanoma | SK-MEL-28 cells | CVCL_0526 | ||
| Experiment 8 Reporting the Activity Date of This ADC | [238] | ||||
| Efficacy Data | Half Maximal Inhibitory Concentration (IC50) |
60.00 nM
|
Positive CD228 expression (CD228+++/++) | ||
| Method Description |
Tumor cells were incubated with CD228 antibody-drug conjugates comprising theindicated anti-CD228 antibody, a linker, and MMAE for 96-144 hours at 37 . Cell viability was measured using Cell Titer Glo according to manufacturer's instructions.
|
||||
| In Vitro Model | Cutaneous melanoma | SK-MEL-5 cells | CVCL_0527 | ||
| Experiment 9 Reporting the Activity Date of This ADC | [238] | ||||
| Efficacy Data | Half Maximal Inhibitory Concentration (IC50) |
64.00 nM
|
Positive CD228 expression (CD228+++/++) | ||
| Method Description |
Tumor cells were incubated with CD228 antibody-drug conjugates comprising theindicated anti-CD228 antibody, a linker, and MMAE for 96-144 hours at 37 . Cell viability was measured using Cell Titer Glo according to manufacturer's instructions.
|
||||
| In Vitro Model | Cutaneous melanoma | COLO 853 cells | CVCL_2003 | ||
| Experiment 10 Reporting the Activity Date of This ADC | [238] | ||||
| Efficacy Data | Half Maximal Inhibitory Concentration (IC50) |
369 nM
|
Moderate CD228 expression (CD228++) | ||
| Method Description |
Tumor cells were incubated with CD228 antibody-drug conjugates comprising theindicated anti-CD228 antibody, a linker, and MMAE for 96-144 hours at 37 . Cell viability was measured using Cell Titer Glo according to manufacturer's instructions.
|
||||
| In Vitro Model | Melanoma | A2058 cells | CVCL_1059 | ||
| Experiment 11 Reporting the Activity Date of This ADC | [238] | ||||
| Efficacy Data | Half Maximal Inhibitory Concentration (IC50) |
678 nM
|
Positive CD228 expression (CD228+++/++) | ||
| Method Description |
Tumor cells were incubated with CD228 antibody-drug conjugates comprising theindicated anti-CD228 antibody, a linker, and MMAE for 96-144 hours at 37 . Cell viability was measured using Cell Titer Glo according to manufacturer's instructions.
|
||||
| In Vitro Model | Melanoma | IGR-37 cells | CVCL_2075 | ||
| Experiment 12 Reporting the Activity Date of This ADC | [238] | ||||
| Efficacy Data | Half Maximal Inhibitory Concentration (IC50) | > 2000 nM | Low CD228 expression (CD228+) | ||
| Method Description |
Tumor cells were incubated with CD228 antibody-drug conjugates comprising theindicated anti-CD228 antibody, a linker, and MMAE for 96-144 hours at 37 . Cell viability was measured using Cell Titer Glo according to manufacturer's instructions.
|
||||
| In Vitro Model | Amelanotic melanoma | A-375 cells | CVCL_0132 | ||
hL49_27D_Ala-ADC [Investigative]
Revealed Based on the Cell Line Data
| Experiment 1 Reporting the Activity Date of This ADC | [238] | ||||
| Efficacy Data | Maximum inhibition efficiency (MIE) |
41.00%
|
Low CD228 expression (CD228+) | ||
| Method Description |
Tumor cells were incubated with CD228 antibody-drug conjugates comprising theindicated anti-CD228 antibody, a linker, and MMAE for 96-144 hours at 37 . Cell viability was measured using Cell Titer Glo according to manufacturer's instructions.
|
||||
| In Vitro Model | Amelanotic melanoma | A-375 cells | CVCL_0132 | ||
| Experiment 2 Reporting the Activity Date of This ADC | [238] | ||||
| Efficacy Data | Maximum inhibition efficiency (MIE) |
71.00%
|
Moderate CD228 expression (CD228++) | ||
| Method Description |
Tumor cells were incubated with CD228 antibody-drug conjugates comprising theindicated anti-CD228 antibody, a linker, and MMAE for 96-144 hours at 37 . Cell viability was measured using Cell Titer Glo according to manufacturer's instructions.
|
||||
| In Vitro Model | Melanoma | A2058 cells | CVCL_1059 | ||
| Experiment 3 Reporting the Activity Date of This ADC | [238] | ||||
| Efficacy Data | Maximum inhibition efficiency (MIE) |
77.00%
|
Positive CD228 expression (CD228+++/++) | ||
| Method Description |
Tumor cells were incubated with CD228 antibody-drug conjugates comprising theindicated anti-CD228 antibody, a linker, and MMAE for 96-144 hours at 37 . Cell viability was measured using Cell Titer Glo according to manufacturer's instructions.
|
||||
| In Vitro Model | Cutaneous melanoma | SK-MEL-28 cells | CVCL_0526 | ||
| Experiment 4 Reporting the Activity Date of This ADC | [238] | ||||
| Efficacy Data | Maximum inhibition efficiency (MIE) |
78.00%
|
Positive CD228 expression (CD228+++/++) | ||
| Method Description |
Tumor cells were incubated with CD228 antibody-drug conjugates comprising theindicated anti-CD228 antibody, a linker, and MMAE for 96-144 hours at 37 . Cell viability was measured using Cell Titer Glo according to manufacturer's instructions.
|
||||
| In Vitro Model | Melanoma | IGR-37 cells | CVCL_2075 | ||
| Experiment 5 Reporting the Activity Date of This ADC | [238] | ||||
| Efficacy Data | Maximum inhibition efficiency (MIE) |
81.00%
|
Positive CD228 expression (CD228+++/++) | ||
| Method Description |
Tumor cells were incubated with CD228 antibody-drug conjugates comprising theindicated anti-CD228 antibody, a linker, and MMAE for 96-144 hours at 37 . Cell viability was measured using Cell Titer Glo according to manufacturer's instructions.
|
||||
| In Vitro Model | Cutaneous melanoma | COLO 853 cells | CVCL_2003 | ||
| Experiment 6 Reporting the Activity Date of This ADC | [238] | ||||
| Efficacy Data | Maximum inhibition efficiency (MIE) |
85.00%
|
Positive CD228 expression (CD228+++/++) | ||
| Method Description |
Tumor cells were incubated with CD228 antibody-drug conjugates comprising theindicated anti-CD228 antibody, a linker, and MMAE for 96-144 hours at 37 . Cell viability was measured using Cell Titer Glo according to manufacturer's instructions.
|
||||
| In Vitro Model | Cutaneous melanoma | SK-MEL-5 cells | CVCL_0527 | ||
| Experiment 7 Reporting the Activity Date of This ADC | [238] | ||||
| Efficacy Data | Half Maximal Inhibitory Concentration (IC50) |
2.00 nM
|
Positive CD228 expression (CD228+++/++) | ||
| Method Description |
Tumor cells were incubated with CD228 antibody-drug conjugates comprising theindicated anti-CD228 antibody, a linker, and MMAE for 96-144 hours at 37 . Cell viability was measured using Cell Titer Glo according to manufacturer's instructions.
|
||||
| In Vitro Model | Cutaneous melanoma | SK-MEL-5 cells | CVCL_0527 | ||
| Experiment 8 Reporting the Activity Date of This ADC | [238] | ||||
| Efficacy Data | Half Maximal Inhibitory Concentration (IC50) |
2.00 nM
|
Positive CD228 expression (CD228+++/++) | ||
| Method Description |
Tumor cells were incubated with CD228 antibody-drug conjugates comprising theindicated anti-CD228 antibody, a linker, and MMAE for 96-144 hours at 37 . Cell viability was measured using Cell Titer Glo according to manufacturer's instructions.
|
||||
| In Vitro Model | Cutaneous melanoma | SK-MEL-28 cells | CVCL_0526 | ||
| Experiment 9 Reporting the Activity Date of This ADC | [238] | ||||
| Efficacy Data | Half Maximal Inhibitory Concentration (IC50) |
3.00 nM
|
Positive CD228 expression (CD228+++/++) | ||
| Method Description |
Tumor cells were incubated with CD228 antibody-drug conjugates comprising theindicated anti-CD228 antibody, a linker, and MMAE for 96-144 hours at 37 . Cell viability was measured using Cell Titer Glo according to manufacturer's instructions.
|
||||
| In Vitro Model | Cutaneous melanoma | COLO 853 cells | CVCL_2003 | ||
| Experiment 10 Reporting the Activity Date of This ADC | [238] | ||||
| Efficacy Data | Half Maximal Inhibitory Concentration (IC50) |
17.00 nM
|
Moderate CD228 expression (CD228++) | ||
| Method Description |
Tumor cells were incubated with CD228 antibody-drug conjugates comprising theindicated anti-CD228 antibody, a linker, and MMAE for 96-144 hours at 37 . Cell viability was measured using Cell Titer Glo according to manufacturer's instructions.
|
||||
| In Vitro Model | Melanoma | A2058 cells | CVCL_1059 | ||
| Experiment 11 Reporting the Activity Date of This ADC | [238] | ||||
| Efficacy Data | Half Maximal Inhibitory Concentration (IC50) |
27.00 nM
|
Positive CD228 expression (CD228+++/++) | ||
| Method Description |
Tumor cells were incubated with CD228 antibody-drug conjugates comprising theindicated anti-CD228 antibody, a linker, and MMAE for 96-144 hours at 37 . Cell viability was measured using Cell Titer Glo according to manufacturer's instructions.
|
||||
| In Vitro Model | Melanoma | IGR-37 cells | CVCL_2075 | ||
| Experiment 12 Reporting the Activity Date of This ADC | [238] | ||||
| Efficacy Data | Half Maximal Inhibitory Concentration (IC50) | > 2000 nM | Low CD228 expression (CD228+) | ||
| Method Description |
Tumor cells were incubated with CD228 antibody-drug conjugates comprising theindicated anti-CD228 antibody, a linker, and MMAE for 96-144 hours at 37 . Cell viability was measured using Cell Titer Glo according to manufacturer's instructions.
|
||||
| In Vitro Model | Amelanotic melanoma | A-375 cells | CVCL_0132 | ||
hL49_27D_Gln-ADC [Investigative]
Revealed Based on the Cell Line Data
| Experiment 1 Reporting the Activity Date of This ADC | [238] | ||||
| Efficacy Data | Maximum inhibition efficiency (MIE) |
46.00%
|
Low CD228 expression (CD228+) | ||
| Method Description |
Tumor cells were incubated with CD228 antibody-drug conjugates comprising theindicated anti-CD228 antibody, a linker, and MMAE for 96-144 hours at 37 . Cell viability was measured using Cell Titer Glo according to manufacturer's instructions.
|
||||
| In Vitro Model | Amelanotic melanoma | A-375 cells | CVCL_0132 | ||
| Experiment 2 Reporting the Activity Date of This ADC | [238] | ||||
| Efficacy Data | Maximum inhibition efficiency (MIE) |
75.00%
|
Moderate CD228 expression (CD228++) | ||
| Method Description |
Tumor cells were incubated with CD228 antibody-drug conjugates comprising theindicated anti-CD228 antibody, a linker, and MMAE for 96-144 hours at 37 . Cell viability was measured using Cell Titer Glo according to manufacturer's instructions.
|
||||
| In Vitro Model | Melanoma | A2058 cells | CVCL_1059 | ||
| Experiment 3 Reporting the Activity Date of This ADC | [238] | ||||
| Efficacy Data | Maximum inhibition efficiency (MIE) |
76.00%
|
Positive CD228 expression (CD228+++/++) | ||
| Method Description |
Tumor cells were incubated with CD228 antibody-drug conjugates comprising theindicated anti-CD228 antibody, a linker, and MMAE for 96-144 hours at 37 . Cell viability was measured using Cell Titer Glo according to manufacturer's instructions.
|
||||
| In Vitro Model | Cutaneous melanoma | SK-MEL-28 cells | CVCL_0526 | ||
| Experiment 4 Reporting the Activity Date of This ADC | [238] | ||||
| Efficacy Data | Maximum inhibition efficiency (MIE) |
78.00%
|
Positive CD228 expression (CD228+++/++) | ||
| Method Description |
Tumor cells were incubated with CD228 antibody-drug conjugates comprising theindicated anti-CD228 antibody, a linker, and MMAE for 96-144 hours at 37 . Cell viability was measured using Cell Titer Glo according to manufacturer's instructions.
|
||||
| In Vitro Model | Cutaneous melanoma | COLO 853 cells | CVCL_2003 | ||
| Experiment 5 Reporting the Activity Date of This ADC | [238] | ||||
| Efficacy Data | Maximum inhibition efficiency (MIE) |
80.00%
|
Positive CD228 expression (CD228+++/++) | ||
| Method Description |
Tumor cells were incubated with CD228 antibody-drug conjugates comprising theindicated anti-CD228 antibody, a linker, and MMAE for 96-144 hours at 37 . Cell viability was measured using Cell Titer Glo according to manufacturer's instructions.
|
||||
| In Vitro Model | Melanoma | IGR-37 cells | CVCL_2075 | ||
| Experiment 6 Reporting the Activity Date of This ADC | [238] | ||||
| Efficacy Data | Maximum inhibition efficiency (MIE) |
81.00%
|
Positive CD228 expression (CD228+++/++) | ||
| Method Description |
Tumor cells were incubated with CD228 antibody-drug conjugates comprising theindicated anti-CD228 antibody, a linker, and MMAE for 96-144 hours at 37 . Cell viability was measured using Cell Titer Glo according to manufacturer's instructions.
|
||||
| In Vitro Model | Cutaneous melanoma | SK-MEL-5 cells | CVCL_0527 | ||
| Experiment 7 Reporting the Activity Date of This ADC | [238] | ||||
| Efficacy Data | Half Maximal Inhibitory Concentration (IC50) |
2.00 nM
|
Positive CD228 expression (CD228+++/++) | ||
| Method Description |
Tumor cells were incubated with CD228 antibody-drug conjugates comprising theindicated anti-CD228 antibody, a linker, and MMAE for 96-144 hours at 37 . Cell viability was measured using Cell Titer Glo according to manufacturer's instructions.
|
||||
| In Vitro Model | Cutaneous melanoma | COLO 853 cells | CVCL_2003 | ||
| Experiment 8 Reporting the Activity Date of This ADC | [238] | ||||
| Efficacy Data | Half Maximal Inhibitory Concentration (IC50) |
2.00 nM
|
Positive CD228 expression (CD228+++/++) | ||
| Method Description |
Tumor cells were incubated with CD228 antibody-drug conjugates comprising theindicated anti-CD228 antibody, a linker, and MMAE for 96-144 hours at 37 . Cell viability was measured using Cell Titer Glo according to manufacturer's instructions.
|
||||
| In Vitro Model | Cutaneous melanoma | SK-MEL-5 cells | CVCL_0527 | ||
| Experiment 9 Reporting the Activity Date of This ADC | [238] | ||||
| Efficacy Data | Half Maximal Inhibitory Concentration (IC50) |
3.00 nM
|
Positive CD228 expression (CD228+++/++) | ||
| Method Description |
Tumor cells were incubated with CD228 antibody-drug conjugates comprising theindicated anti-CD228 antibody, a linker, and MMAE for 96-144 hours at 37 . Cell viability was measured using Cell Titer Glo according to manufacturer's instructions.
|
||||
| In Vitro Model | Cutaneous melanoma | SK-MEL-28 cells | CVCL_0526 | ||
| Experiment 10 Reporting the Activity Date of This ADC | [238] | ||||
| Efficacy Data | Half Maximal Inhibitory Concentration (IC50) |
13.00 nM
|
Moderate CD228 expression (CD228++) | ||
| Method Description |
Tumor cells were incubated with CD228 antibody-drug conjugates comprising theindicated anti-CD228 antibody, a linker, and MMAE for 96-144 hours at 37 . Cell viability was measured using Cell Titer Glo according to manufacturer's instructions.
|
||||
| In Vitro Model | Melanoma | A2058 cells | CVCL_1059 | ||
| Experiment 11 Reporting the Activity Date of This ADC | [238] | ||||
| Efficacy Data | Half Maximal Inhibitory Concentration (IC50) |
25.00 nM
|
Positive CD228 expression (CD228+++/++) | ||
| Method Description |
Tumor cells were incubated with CD228 antibody-drug conjugates comprising theindicated anti-CD228 antibody, a linker, and MMAE for 96-144 hours at 37 . Cell viability was measured using Cell Titer Glo according to manufacturer's instructions.
|
||||
| In Vitro Model | Melanoma | IGR-37 cells | CVCL_2075 | ||
| Experiment 12 Reporting the Activity Date of This ADC | [238] | ||||
| Efficacy Data | Half Maximal Inhibitory Concentration (IC50) |
1.37 uM
|
Low CD228 expression (CD228+) | ||
| Method Description |
Tumor cells were incubated with CD228 antibody-drug conjugates comprising theindicated anti-CD228 antibody, a linker, and MMAE for 96-144 hours at 37 . Cell viability was measured using Cell Titer Glo according to manufacturer's instructions.
|
||||
| In Vitro Model | Amelanotic melanoma | A-375 cells | CVCL_0132 | ||
hL49_3x_Gln-ADC [Investigative]
Revealed Based on the Cell Line Data
| Experiment 1 Reporting the Activity Date of This ADC | [238] | ||||
| Efficacy Data | Maximum inhibition efficiency (MIE) |
48.00%
|
Low CD228 expression (CD228+) | ||
| Method Description |
Tumor cells were incubated with CD228 antibody-drug conjugates comprising theindicated anti-CD228 antibody, a linker, and MMAE for 96-144 hours at 37 . Cell viability was measured using Cell Titer Glo according to manufacturer's instructions.
|
||||
| In Vitro Model | Amelanotic melanoma | A-375 cells | CVCL_0132 | ||
| Experiment 2 Reporting the Activity Date of This ADC | [238] | ||||
| Efficacy Data | Maximum inhibition efficiency (MIE) |
77.00%
|
Positive CD228 expression (CD228+++/++) | ||
| Method Description |
Tumor cells were incubated with CD228 antibody-drug conjugates comprising theindicated anti-CD228 antibody, a linker, and MMAE for 96-144 hours at 37 . Cell viability was measured using Cell Titer Glo according to manufacturer's instructions.
|
||||
| In Vitro Model | Cutaneous melanoma | SK-MEL-28 cells | CVCL_0526 | ||
| Experiment 3 Reporting the Activity Date of This ADC | [238] | ||||
| Efficacy Data | Maximum inhibition efficiency (MIE) |
84.00%
|
Positive CD228 expression (CD228+++/++) | ||
| Method Description |
Tumor cells were incubated with CD228 antibody-drug conjugates comprising theindicated anti-CD228 antibody, a linker, and MMAE for 96-144 hours at 37 . Cell viability was measured using Cell Titer Glo according to manufacturer's instructions.
|
||||
| In Vitro Model | Melanoma | IGR-37 cells | CVCL_2075 | ||
| Experiment 4 Reporting the Activity Date of This ADC | [238] | ||||
| Efficacy Data | Maximum inhibition efficiency (MIE) |
87.00%
|
Moderate CD228 expression (CD228++) | ||
| Method Description |
Tumor cells were incubated with CD228 antibody-drug conjugates comprising theindicated anti-CD228 antibody, a linker, and MMAE for 96-144 hours at 37 . Cell viability was measured using Cell Titer Glo according to manufacturer's instructions.
|
||||
| In Vitro Model | Melanoma | A2058 cells | CVCL_1059 | ||
| Experiment 5 Reporting the Activity Date of This ADC | [238] | ||||
| Efficacy Data | Maximum inhibition efficiency (MIE) |
87.00%
|
Positive CD228 expression (CD228+++/++) | ||
| Method Description |
Tumor cells were incubated with CD228 antibody-drug conjugates comprising theindicated anti-CD228 antibody, a linker, and MMAE for 96-144 hours at 37 . Cell viability was measured using Cell Titer Glo according to manufacturer's instructions.
|
||||
| In Vitro Model | Cutaneous melanoma | COLO 853 cells | CVCL_2003 | ||
| Experiment 6 Reporting the Activity Date of This ADC | [238] | ||||
| Efficacy Data | Maximum inhibition efficiency (MIE) |
88.00%
|
Positive CD228 expression (CD228+++/++) | ||
| Method Description |
Tumor cells were incubated with CD228 antibody-drug conjugates comprising theindicated anti-CD228 antibody, a linker, and MMAE for 96-144 hours at 37 . Cell viability was measured using Cell Titer Glo according to manufacturer's instructions.
|
||||
| In Vitro Model | Cutaneous melanoma | SK-MEL-5 cells | CVCL_0527 | ||
| Experiment 7 Reporting the Activity Date of This ADC | [238] | ||||
| Efficacy Data | Half Maximal Inhibitory Concentration (IC50) |
4.00 nM
|
Positive CD228 expression (CD228+++/++) | ||
| Method Description |
Tumor cells were incubated with CD228 antibody-drug conjugates comprising theindicated anti-CD228 antibody, a linker, and MMAE for 96-144 hours at 37 . Cell viability was measured using Cell Titer Glo according to manufacturer's instructions.
|
||||
| In Vitro Model | Cutaneous melanoma | SK-MEL-28 cells | CVCL_0526 | ||
| Experiment 8 Reporting the Activity Date of This ADC | [238] | ||||
| Efficacy Data | Half Maximal Inhibitory Concentration (IC50) |
10.00 nM
|
Positive CD228 expression (CD228+++/++) | ||
| Method Description |
Tumor cells were incubated with CD228 antibody-drug conjugates comprising theindicated anti-CD228 antibody, a linker, and MMAE for 96-144 hours at 37 . Cell viability was measured using Cell Titer Glo according to manufacturer's instructions.
|
||||
| In Vitro Model | Cutaneous melanoma | SK-MEL-5 cells | CVCL_0527 | ||
| Experiment 9 Reporting the Activity Date of This ADC | [238] | ||||
| Efficacy Data | Half Maximal Inhibitory Concentration (IC50) |
13.00 nM
|
Positive CD228 expression (CD228+++/++) | ||
| Method Description |
Tumor cells were incubated with CD228 antibody-drug conjugates comprising theindicated anti-CD228 antibody, a linker, and MMAE for 96-144 hours at 37 . Cell viability was measured using Cell Titer Glo according to manufacturer's instructions.
|
||||
| In Vitro Model | Cutaneous melanoma | COLO 853 cells | CVCL_2003 | ||
| Experiment 10 Reporting the Activity Date of This ADC | [238] | ||||
| Efficacy Data | Half Maximal Inhibitory Concentration (IC50) |
56.00 nM
|
Moderate CD228 expression (CD228++) | ||
| Method Description |
Tumor cells were incubated with CD228 antibody-drug conjugates comprising theindicated anti-CD228 antibody, a linker, and MMAE for 96-144 hours at 37 . Cell viability was measured using Cell Titer Glo according to manufacturer's instructions.
|
||||
| In Vitro Model | Melanoma | A2058 cells | CVCL_1059 | ||
| Experiment 11 Reporting the Activity Date of This ADC | [238] | ||||
| Efficacy Data | Half Maximal Inhibitory Concentration (IC50) |
215 nM
|
Positive CD228 expression (CD228+++/++) | ||
| Method Description |
Tumor cells were incubated with CD228 antibody-drug conjugates comprising theindicated anti-CD228 antibody, a linker, and MMAE for 96-144 hours at 37 . Cell viability was measured using Cell Titer Glo according to manufacturer's instructions.
|
||||
| In Vitro Model | Melanoma | IGR-37 cells | CVCL_2075 | ||
| Experiment 12 Reporting the Activity Date of This ADC | [238] | ||||
| Efficacy Data | Half Maximal Inhibitory Concentration (IC50) |
1.62 uM
|
Low CD228 expression (CD228+) | ||
| Method Description |
Tumor cells were incubated with CD228 antibody-drug conjugates comprising theindicated anti-CD228 antibody, a linker, and MMAE for 96-144 hours at 37 . Cell viability was measured using Cell Titer Glo according to manufacturer's instructions.
|
||||
| In Vitro Model | Amelanotic melanoma | A-375 cells | CVCL_0132 | ||
hL49_27D_Tyr-ADC [Investigative]
Revealed Based on the Cell Line Data
| Experiment 1 Reporting the Activity Date of This ADC | [238] | ||||
| Efficacy Data | Maximum inhibition efficiency (MIE) |
50.00%
|
Low CD228 expression (CD228+) | ||
| Method Description |
Tumor cells were incubated with CD228 antibody-drug conjugates comprising theindicated anti-CD228 antibody, a linker, and MMAE for 96-144 hours at 37 . Cell viability was measured using Cell Titer Glo according to manufacturer's instructions.
|
||||
| In Vitro Model | Amelanotic melanoma | A-375 cells | CVCL_0132 | ||
| Experiment 2 Reporting the Activity Date of This ADC | [238] | ||||
| Efficacy Data | Maximum inhibition efficiency (MIE) |
70.00%
|
Moderate CD228 expression (CD228++) | ||
| Method Description |
Tumor cells were incubated with CD228 antibody-drug conjugates comprising theindicated anti-CD228 antibody, a linker, and MMAE for 96-144 hours at 37 . Cell viability was measured using Cell Titer Glo according to manufacturer's instructions.
|
||||
| In Vitro Model | Melanoma | A2058 cells | CVCL_1059 | ||
| Experiment 3 Reporting the Activity Date of This ADC | [238] | ||||
| Efficacy Data | Maximum inhibition efficiency (MIE) |
75.00%
|
Positive CD228 expression (CD228+++/++) | ||
| Method Description |
Tumor cells were incubated with CD228 antibody-drug conjugates comprising theindicated anti-CD228 antibody, a linker, and MMAE for 96-144 hours at 37 . Cell viability was measured using Cell Titer Glo according to manufacturer's instructions.
|
||||
| In Vitro Model | Cutaneous melanoma | SK-MEL-28 cells | CVCL_0526 | ||
| Experiment 4 Reporting the Activity Date of This ADC | [238] | ||||
| Efficacy Data | Maximum inhibition efficiency (MIE) |
80.00%
|
Positive CD228 expression (CD228+++/++) | ||
| Method Description |
Tumor cells were incubated with CD228 antibody-drug conjugates comprising theindicated anti-CD228 antibody, a linker, and MMAE for 96-144 hours at 37 . Cell viability was measured using Cell Titer Glo according to manufacturer's instructions.
|
||||
| In Vitro Model | Melanoma | IGR-37 cells | CVCL_2075 | ||
| Experiment 5 Reporting the Activity Date of This ADC | [238] | ||||
| Efficacy Data | Maximum inhibition efficiency (MIE) |
80.00%
|
Positive CD228 expression (CD228+++/++) | ||
| Method Description |
Tumor cells were incubated with CD228 antibody-drug conjugates comprising theindicated anti-CD228 antibody, a linker, and MMAE for 96-144 hours at 37 . Cell viability was measured using Cell Titer Glo according to manufacturer's instructions.
|
||||
| In Vitro Model | Cutaneous melanoma | COLO 853 cells | CVCL_2003 | ||
| Experiment 6 Reporting the Activity Date of This ADC | [238] | ||||
| Efficacy Data | Maximum inhibition efficiency (MIE) |
85.00%
|
Positive CD228 expression (CD228+++/++) | ||
| Method Description |
Tumor cells were incubated with CD228 antibody-drug conjugates comprising theindicated anti-CD228 antibody, a linker, and MMAE for 96-144 hours at 37 . Cell viability was measured using Cell Titer Glo according to manufacturer's instructions.
|
||||
| In Vitro Model | Cutaneous melanoma | SK-MEL-5 cells | CVCL_0527 | ||
| Experiment 7 Reporting the Activity Date of This ADC | [238] | ||||
| Efficacy Data | Half Maximal Inhibitory Concentration (IC50) |
2.00 nM
|
Positive CD228 expression (CD228+++/++) | ||
| Method Description |
Tumor cells were incubated with CD228 antibody-drug conjugates comprising theindicated anti-CD228 antibody, a linker, and MMAE for 96-144 hours at 37 . Cell viability was measured using Cell Titer Glo according to manufacturer's instructions.
|
||||
| In Vitro Model | Cutaneous melanoma | SK-MEL-5 cells | CVCL_0527 | ||
| Experiment 8 Reporting the Activity Date of This ADC | [238] | ||||
| Efficacy Data | Half Maximal Inhibitory Concentration (IC50) |
3.00 nM
|
Positive CD228 expression (CD228+++/++) | ||
| Method Description |
Tumor cells were incubated with CD228 antibody-drug conjugates comprising theindicated anti-CD228 antibody, a linker, and MMAE for 96-144 hours at 37 . Cell viability was measured using Cell Titer Glo according to manufacturer's instructions.
|
||||
| In Vitro Model | Cutaneous melanoma | COLO 853 cells | CVCL_2003 | ||
| Experiment 9 Reporting the Activity Date of This ADC | [238] | ||||
| Efficacy Data | Half Maximal Inhibitory Concentration (IC50) |
3.00 nM
|
Positive CD228 expression (CD228+++/++) | ||
| Method Description |
Tumor cells were incubated with CD228 antibody-drug conjugates comprising theindicated anti-CD228 antibody, a linker, and MMAE for 96-144 hours at 37 . Cell viability was measured using Cell Titer Glo according to manufacturer's instructions.
|
||||
| In Vitro Model | Cutaneous melanoma | SK-MEL-28 cells | CVCL_0526 | ||
| Experiment 10 Reporting the Activity Date of This ADC | [238] | ||||
| Efficacy Data | Half Maximal Inhibitory Concentration (IC50) |
15.00 nM
|
Moderate CD228 expression (CD228++) | ||
| Method Description |
Tumor cells were incubated with CD228 antibody-drug conjugates comprising theindicated anti-CD228 antibody, a linker, and MMAE for 96-144 hours at 37 . Cell viability was measured using Cell Titer Glo according to manufacturer's instructions.
|
||||
| In Vitro Model | Melanoma | A2058 cells | CVCL_1059 | ||
| Experiment 11 Reporting the Activity Date of This ADC | [238] | ||||
| Efficacy Data | Half Maximal Inhibitory Concentration (IC50) |
24.00 nM
|
Positive CD228 expression (CD228+++/++) | ||
| Method Description |
Tumor cells were incubated with CD228 antibody-drug conjugates comprising theindicated anti-CD228 antibody, a linker, and MMAE for 96-144 hours at 37 . Cell viability was measured using Cell Titer Glo according to manufacturer's instructions.
|
||||
| In Vitro Model | Melanoma | IGR-37 cells | CVCL_2075 | ||
| Experiment 12 Reporting the Activity Date of This ADC | [238] | ||||
| Efficacy Data | Half Maximal Inhibitory Concentration (IC50) |
1.41 uM
|
Low CD228 expression (CD228+) | ||
| Method Description |
Tumor cells were incubated with CD228 antibody-drug conjugates comprising theindicated anti-CD228 antibody, a linker, and MMAE for 96-144 hours at 37 . Cell viability was measured using Cell Titer Glo according to manufacturer's instructions.
|
||||
| In Vitro Model | Amelanotic melanoma | A-375 cells | CVCL_0132 | ||
hL49_34_Ala-ADC [Investigative]
Revealed Based on the Cell Line Data
| Experiment 1 Reporting the Activity Date of This ADC | [238] | ||||
| Efficacy Data | Maximum inhibition efficiency (MIE) |
69.00%
|
Low CD228 expression (CD228+) | ||
| Method Description |
Tumor cells were incubated with CD228 antibody-drug conjugates comprising theindicated anti-CD228 antibody, a linker, and MMAE for 96-144 hours at 37 . Cell viability was measured using Cell Titer Glo according to manufacturer's instructions.
|
||||
| In Vitro Model | Amelanotic melanoma | A-375 cells | CVCL_0132 | ||
| Experiment 2 Reporting the Activity Date of This ADC | [238] | ||||
| Efficacy Data | Maximum inhibition efficiency (MIE) |
73.00%
|
Positive CD228 expression (CD228+++/++) | ||
| Method Description |
Tumor cells were incubated with CD228 antibody-drug conjugates comprising theindicated anti-CD228 antibody, a linker, and MMAE for 96-144 hours at 37 . Cell viability was measured using Cell Titer Glo according to manufacturer's instructions.
|
||||
| In Vitro Model | Cutaneous melanoma | SK-MEL-28 cells | CVCL_0526 | ||
| Experiment 3 Reporting the Activity Date of This ADC | [238] | ||||
| Efficacy Data | Maximum inhibition efficiency (MIE) |
83.00%
|
Positive CD228 expression (CD228+++/++) | ||
| Method Description |
Tumor cells were incubated with CD228 antibody-drug conjugates comprising theindicated anti-CD228 antibody, a linker, and MMAE for 96-144 hours at 37 . Cell viability was measured using Cell Titer Glo according to manufacturer's instructions.
|
||||
| In Vitro Model | Cutaneous melanoma | COLO 853 cells | CVCL_2003 | ||
| Experiment 4 Reporting the Activity Date of This ADC | [238] | ||||
| Efficacy Data | Maximum inhibition efficiency (MIE) |
85.00%
|
Positive CD228 expression (CD228+++/++) | ||
| Method Description |
Tumor cells were incubated with CD228 antibody-drug conjugates comprising theindicated anti-CD228 antibody, a linker, and MMAE for 96-144 hours at 37 . Cell viability was measured using Cell Titer Glo according to manufacturer's instructions.
|
||||
| In Vitro Model | Melanoma | IGR-37 cells | CVCL_2075 | ||
| Experiment 5 Reporting the Activity Date of This ADC | [238] | ||||
| Efficacy Data | Maximum inhibition efficiency (MIE) |
87.00%
|
Positive CD228 expression (CD228+++/++) | ||
| Method Description |
Tumor cells were incubated with CD228 antibody-drug conjugates comprising theindicated anti-CD228 antibody, a linker, and MMAE for 96-144 hours at 37 . Cell viability was measured using Cell Titer Glo according to manufacturer's instructions.
|
||||
| In Vitro Model | Cutaneous melanoma | SK-MEL-5 cells | CVCL_0527 | ||
| Experiment 6 Reporting the Activity Date of This ADC | [238] | ||||
| Efficacy Data | Maximum inhibition efficiency (MIE) |
95.00%
|
Moderate CD228 expression (CD228++) | ||
| Method Description |
Tumor cells were incubated with CD228 antibody-drug conjugates comprising theindicated anti-CD228 antibody, a linker, and MMAE for 96-144 hours at 37 . Cell viability was measured using Cell Titer Glo according to manufacturer's instructions.
|
||||
| In Vitro Model | Melanoma | A2058 cells | CVCL_1059 | ||
| Experiment 7 Reporting the Activity Date of This ADC | [238] | ||||
| Efficacy Data | Half Maximal Inhibitory Concentration (IC50) |
2.00 nM
|
Positive CD228 expression (CD228+++/++) | ||
| Method Description |
Tumor cells were incubated with CD228 antibody-drug conjugates comprising theindicated anti-CD228 antibody, a linker, and MMAE for 96-144 hours at 37 . Cell viability was measured using Cell Titer Glo according to manufacturer's instructions.
|
||||
| In Vitro Model | Cutaneous melanoma | SK-MEL-28 cells | CVCL_0526 | ||
| Experiment 8 Reporting the Activity Date of This ADC | [238] | ||||
| Efficacy Data | Half Maximal Inhibitory Concentration (IC50) |
3.00 nM
|
Positive CD228 expression (CD228+++/++) | ||
| Method Description |
Tumor cells were incubated with CD228 antibody-drug conjugates comprising theindicated anti-CD228 antibody, a linker, and MMAE for 96-144 hours at 37 . Cell viability was measured using Cell Titer Glo according to manufacturer's instructions.
|
||||
| In Vitro Model | Cutaneous melanoma | SK-MEL-5 cells | CVCL_0527 | ||
| Experiment 9 Reporting the Activity Date of This ADC | [238] | ||||
| Efficacy Data | Half Maximal Inhibitory Concentration (IC50) |
4.00 nM
|
Positive CD228 expression (CD228+++/++) | ||
| Method Description |
Tumor cells were incubated with CD228 antibody-drug conjugates comprising theindicated anti-CD228 antibody, a linker, and MMAE for 96-144 hours at 37 . Cell viability was measured using Cell Titer Glo according to manufacturer's instructions.
|
||||
| In Vitro Model | Cutaneous melanoma | COLO 853 cells | CVCL_2003 | ||
| Experiment 10 Reporting the Activity Date of This ADC | [238] | ||||
| Efficacy Data | Half Maximal Inhibitory Concentration (IC50) |
7.00 nM
|
Moderate CD228 expression (CD228++) | ||
| Method Description |
Tumor cells were incubated with CD228 antibody-drug conjugates comprising theindicated anti-CD228 antibody, a linker, and MMAE for 96-144 hours at 37 . Cell viability was measured using Cell Titer Glo according to manufacturer's instructions.
|
||||
| In Vitro Model | Melanoma | A2058 cells | CVCL_1059 | ||
| Experiment 11 Reporting the Activity Date of This ADC | [238] | ||||
| Efficacy Data | Half Maximal Inhibitory Concentration (IC50) |
52.00 nM
|
Positive CD228 expression (CD228+++/++) | ||
| Method Description |
Tumor cells were incubated with CD228 antibody-drug conjugates comprising theindicated anti-CD228 antibody, a linker, and MMAE for 96-144 hours at 37 . Cell viability was measured using Cell Titer Glo according to manufacturer's instructions.
|
||||
| In Vitro Model | Melanoma | IGR-37 cells | CVCL_2075 | ||
| Experiment 12 Reporting the Activity Date of This ADC | [238] | ||||
| Efficacy Data | Half Maximal Inhibitory Concentration (IC50) |
856 nM
|
Low CD228 expression (CD228+) | ||
| Method Description |
Tumor cells were incubated with CD228 antibody-drug conjugates comprising theindicated anti-CD228 antibody, a linker, and MMAE for 96-144 hours at 37 . Cell viability was measured using Cell Titer Glo according to manufacturer's instructions.
|
||||
| In Vitro Model | Amelanotic melanoma | A-375 cells | CVCL_0132 | ||
hL49_3x_Tyr-ADC [Investigative]
Revealed Based on the Cell Line Data
| Experiment 1 Reporting the Activity Date of This ADC | [238] | ||||
| Efficacy Data | Maximum inhibition efficiency (MIE) |
74.00%
|
Positive CD228 expression (CD228+++/++) | ||
| Method Description |
Tumor cells were incubated with CD228 antibody-drug conjugates comprising theindicated anti-CD228 antibody, a linker, and MMAE for 96-144 hours at 37 . Cell viability was measured using Cell Titer Glo according to manufacturer's instructions.
|
||||
| In Vitro Model | Cutaneous melanoma | SK-MEL-28 cells | CVCL_0526 | ||
| Experiment 2 Reporting the Activity Date of This ADC | [238] | ||||
| Efficacy Data | Maximum inhibition efficiency (MIE) |
81.00%
|
Low CD228 expression (CD228+) | ||
| Method Description |
Tumor cells were incubated with CD228 antibody-drug conjugates comprising theindicated anti-CD228 antibody, a linker, and MMAE for 96-144 hours at 37 . Cell viability was measured using Cell Titer Glo according to manufacturer's instructions.
|
||||
| In Vitro Model | Amelanotic melanoma | A-375 cells | CVCL_0132 | ||
| Experiment 3 Reporting the Activity Date of This ADC | [238] | ||||
| Efficacy Data | Maximum inhibition efficiency (MIE) |
84.00%
|
Positive CD228 expression (CD228+++/++) | ||
| Method Description |
Tumor cells were incubated with CD228 antibody-drug conjugates comprising theindicated anti-CD228 antibody, a linker, and MMAE for 96-144 hours at 37 . Cell viability was measured using Cell Titer Glo according to manufacturer's instructions.
|
||||
| In Vitro Model | Cutaneous melanoma | COLO 853 cells | CVCL_2003 | ||
| Experiment 4 Reporting the Activity Date of This ADC | [238] | ||||
| Efficacy Data | Maximum inhibition efficiency (MIE) |
87.00%
|
Positive CD228 expression (CD228+++/++) | ||
| Method Description |
Tumor cells were incubated with CD228 antibody-drug conjugates comprising theindicated anti-CD228 antibody, a linker, and MMAE for 96-144 hours at 37 . Cell viability was measured using Cell Titer Glo according to manufacturer's instructions.
|
||||
| In Vitro Model | Cutaneous melanoma | SK-MEL-5 cells | CVCL_0527 | ||
| Experiment 5 Reporting the Activity Date of This ADC | [238] | ||||
| Efficacy Data | Maximum inhibition efficiency (MIE) |
89.00%
|
Positive CD228 expression (CD228+++/++) | ||
| Method Description |
Tumor cells were incubated with CD228 antibody-drug conjugates comprising theindicated anti-CD228 antibody, a linker, and MMAE for 96-144 hours at 37 . Cell viability was measured using Cell Titer Glo according to manufacturer's instructions.
|
||||
| In Vitro Model | Melanoma | IGR-37 cells | CVCL_2075 | ||
| Experiment 6 Reporting the Activity Date of This ADC | [238] | ||||
| Efficacy Data | Maximum inhibition efficiency (MIE) |
93.00%
|
Moderate CD228 expression (CD228++) | ||
| Method Description |
Tumor cells were incubated with CD228 antibody-drug conjugates comprising theindicated anti-CD228 antibody, a linker, and MMAE for 96-144 hours at 37 . Cell viability was measured using Cell Titer Glo according to manufacturer's instructions.
|
||||
| In Vitro Model | Melanoma | A2058 cells | CVCL_1059 | ||
| Experiment 7 Reporting the Activity Date of This ADC | [238] | ||||
| Efficacy Data | Half Maximal Inhibitory Concentration (IC50) |
4.00 nM
|
Positive CD228 expression (CD228+++/++) | ||
| Method Description |
Tumor cells were incubated with CD228 antibody-drug conjugates comprising theindicated anti-CD228 antibody, a linker, and MMAE for 96-144 hours at 37 . Cell viability was measured using Cell Titer Glo according to manufacturer's instructions.
|
||||
| In Vitro Model | Cutaneous melanoma | COLO 853 cells | CVCL_2003 | ||
| Experiment 8 Reporting the Activity Date of This ADC | [238] | ||||
| Efficacy Data | Half Maximal Inhibitory Concentration (IC50) |
5.00 nM
|
Positive CD228 expression (CD228+++/++) | ||
| Method Description |
Tumor cells were incubated with CD228 antibody-drug conjugates comprising theindicated anti-CD228 antibody, a linker, and MMAE for 96-144 hours at 37 . Cell viability was measured using Cell Titer Glo according to manufacturer's instructions.
|
||||
| In Vitro Model | Cutaneous melanoma | SK-MEL-28 cells | CVCL_0526 | ||
| Experiment 9 Reporting the Activity Date of This ADC | [238] | ||||
| Efficacy Data | Half Maximal Inhibitory Concentration (IC50) |
6.00 nM
|
Positive CD228 expression (CD228+++/++) | ||
| Method Description |
Tumor cells were incubated with CD228 antibody-drug conjugates comprising theindicated anti-CD228 antibody, a linker, and MMAE for 96-144 hours at 37 . Cell viability was measured using Cell Titer Glo according to manufacturer's instructions.
|
||||
| In Vitro Model | Cutaneous melanoma | SK-MEL-5 cells | CVCL_0527 | ||
| Experiment 10 Reporting the Activity Date of This ADC | [238] | ||||
| Efficacy Data | Half Maximal Inhibitory Concentration (IC50) |
52.00 nM
|
Moderate CD228 expression (CD228++) | ||
| Method Description |
Tumor cells were incubated with CD228 antibody-drug conjugates comprising theindicated anti-CD228 antibody, a linker, and MMAE for 96-144 hours at 37 . Cell viability was measured using Cell Titer Glo according to manufacturer's instructions.
|
||||
| In Vitro Model | Melanoma | A2058 cells | CVCL_1059 | ||
| Experiment 11 Reporting the Activity Date of This ADC | [238] | ||||
| Efficacy Data | Half Maximal Inhibitory Concentration (IC50) |
100 nM
|
Positive CD228 expression (CD228+++/++) | ||
| Method Description |
Tumor cells were incubated with CD228 antibody-drug conjugates comprising theindicated anti-CD228 antibody, a linker, and MMAE for 96-144 hours at 37 . Cell viability was measured using Cell Titer Glo according to manufacturer's instructions.
|
||||
| In Vitro Model | Melanoma | IGR-37 cells | CVCL_2075 | ||
| Experiment 12 Reporting the Activity Date of This ADC | [238] | ||||
| Efficacy Data | Half Maximal Inhibitory Concentration (IC50) |
1.14 uM
|
Low CD228 expression (CD228+) | ||
| Method Description |
Tumor cells were incubated with CD228 antibody-drug conjugates comprising theindicated anti-CD228 antibody, a linker, and MMAE for 96-144 hours at 37 . Cell viability was measured using Cell Titer Glo according to manufacturer's instructions.
|
||||
| In Vitro Model | Amelanotic melanoma | A-375 cells | CVCL_0132 | ||
WO2015177360A1 ADC-wt-vcMMAE [Investigative]
Revealed Based on the Cell Line Data
| Experiment 1 Reporting the Activity Date of This ADC | [239] | ||||
| Efficacy Data | Max inhibition rate (MIR) |
89.00%
|
Positive PSMA expression (PSMA+++/++) | ||
| Method Description |
LNCaP C4-2 cells were incubated with increasing concentrations of each ADCs at 37°C for 6 days in complete culture medium.
|
||||
| In Vitro Model | Lymph node metastasis of prostate carcinoma | LNCaP C4-2 cells | CVCL_4782 | ||
| Experiment 2 Reporting the Activity Date of This ADC | [239] | ||||
| Efficacy Data | Max inhibition rate (MIR) |
96.00%
|
Negative PSMA expression (PSMA-) | ||
| Method Description |
To assess the sensitivity towards cathepsin B, the ADCs were treated for 2 minutes and 4 hours with activated cathepsin B. To measure release of the respective free toxins DUBA or MMAE, PSMA-negative DU-145 cells (1,000 cells/well) was cultured with the ADCs for 6 days,and the cell viability was measured after 6 days using the CellTiter-GloTM (CTG) assay kit.
Click to Show/Hide
|
||||
| In Vitro Model | Prostate carcinoma | DU145 cells | CVCL_0105 | ||
| Experiment 3 Reporting the Activity Date of This ADC | [239] | ||||
| Efficacy Data | Half Maximal Inhibitory Concentration (IC50) |
0.34 nM
|
Positive PSMA expression (PSMA+++/++) | ||
| Method Description |
LNCaP C4-2 cells were incubated with increasing concentrations of each ADCs at 37°C for 6 days in complete culture medium.
|
||||
| In Vitro Model | Lymph node metastasis of prostate carcinoma | LNCaP C4-2 cells | CVCL_4782 | ||
| Experiment 4 Reporting the Activity Date of This ADC | [239] | ||||
| Efficacy Data | Half Maximal Inhibitory Concentration (IC50) |
0.63 nM
|
Negative PSMA expression (PSMA-) | ||
| Method Description |
To assess the sensitivity towards cathepsin B, the ADCs were treated for 2 minutes and 4 hours with activated cathepsin B. To measure release of the respective free toxins DUBA or MMAE, PSMA-negative DU-145 cells (1,000 cells/well) was cultured with the ADCs for 6 days,and the cell viability was measured after 6 days using the CellTiter-GloTM (CTG) assay kit.
Click to Show/Hide
|
||||
| In Vitro Model | Prostate carcinoma | DU145 cells | CVCL_0105 | ||
| Experiment 5 Reporting the Activity Date of This ADC | [239] | ||||
| Efficacy Data | Half Maximal Inhibitory Concentration (IC50) | > 70.00 nM | Negative PSMA expression (PSMA-) | ||
| Method Description |
DU-145 cells were incubated with increasing concentrations of each ADCs at 37°C for 6 days in complete culture medium.
|
||||
| In Vitro Model | Prostate carcinoma | DU145 cells | CVCL_0105 | ||
WO2015177360A1 ADC-LC40-vcMMAE [Investigative]
Revealed Based on the Cell Line Data
| Experiment 1 Reporting the Activity Date of This ADC | [239] | ||||
| Efficacy Data | Max inhibition rate (MIR) |
90.00%
|
Positive PSMA expression (PSMA+++/++) | ||
| Method Description |
LNCaP C4-2 cells were incubated with increasing concentrations of each ADCs at 37°C for 6 days in complete culture medium.
|
||||
| In Vitro Model | Lymph node metastasis of prostate carcinoma | LNCaP C4-2 cells | CVCL_4782 | ||
| Experiment 2 Reporting the Activity Date of This ADC | [239] | ||||
| Efficacy Data | Max inhibition rate (MIR) |
96.00%
|
Negative PSMA expression (PSMA-) | ||
| Method Description |
To assess the sensitivity towards cathepsin B, the ADCs were treated for 2 minutes and 4 hours with activated cathepsin B. To measure release of the respective free toxins DUBA or MMAE, PSMA-negative DU-145 cells (1,000 cells/well) was cultured with the ADCs for 6 days,and the cell viability was measured after 6 days using the CellTiter-GloTM (CTG) assay kit.
Click to Show/Hide
|
||||
| In Vitro Model | Prostate carcinoma | DU145 cells | CVCL_0105 | ||
| Experiment 3 Reporting the Activity Date of This ADC | [239] | ||||
| Efficacy Data | Half Maximal Inhibitory Concentration (IC50) |
0.31 nM
|
Positive PSMA expression (PSMA+++/++) | ||
| Method Description |
LNCaP C4-2 cells were incubated with increasing concentrations of each ADCs at 37°C for 6 days in complete culture medium.
|
||||
| In Vitro Model | Lymph node metastasis of prostate carcinoma | LNCaP C4-2 cells | CVCL_4782 | ||
| Experiment 4 Reporting the Activity Date of This ADC | [239] | ||||
| Efficacy Data | Half Maximal Inhibitory Concentration (IC50) |
0.60 nM
|
Negative PSMA expression (PSMA-) | ||
| Method Description |
To assess the sensitivity towards cathepsin B, the ADCs were treated for 2 minutes and 4 hours with activated cathepsin B. To measure release of the respective free toxins DUBA or MMAE, PSMA-negative DU-145 cells (1,000 cells/well) was cultured with the ADCs for 6 days,and the cell viability was measured after 6 days using the CellTiter-GloTM (CTG) assay kit.
Click to Show/Hide
|
||||
| In Vitro Model | Prostate carcinoma | DU145 cells | CVCL_0105 | ||
| Experiment 5 Reporting the Activity Date of This ADC | [239] | ||||
| Efficacy Data | Half Maximal Inhibitory Concentration (IC50) | > 70.00 nM | Negative PSMA expression (PSMA-) | ||
| Method Description |
DU-145 cells were incubated with increasing concentrations of each ADCs at 37°C for 6 days in complete culture medium.
|
||||
| In Vitro Model | Prostate carcinoma | DU145 cells | CVCL_0105 | ||
WO2015177360A1 ADC-LC41-vcMMAE [Investigative]
Revealed Based on the Cell Line Data
| Experiment 1 Reporting the Activity Date of This ADC | [239] | ||||
| Efficacy Data | Max inhibition rate (MIR) |
90.00%
|
Positive PSMA expression (PSMA+++/++) | ||
| Method Description |
LNCaP C4-2 cells were incubated with increasing concentrations of each ADCs at 37°C for 6 days in complete culture medium.
|
||||
| In Vitro Model | Lymph node metastasis of prostate carcinoma | LNCaP C4-2 cells | CVCL_4782 | ||
| Experiment 2 Reporting the Activity Date of This ADC | [239] | ||||
| Efficacy Data | Max inhibition rate (MIR) |
96.00%
|
Negative PSMA expression (PSMA-) | ||
| Method Description |
To assess the sensitivity towards cathepsin B, the ADCs were treated for 2 minutes and 4 hours with activated cathepsin B. To measure release of the respective free toxins DUBA or MMAE, PSMA-negative DU-145 cells (1,000 cells/well) was cultured with the ADCs for 6 days,and the cell viability was measured after 6 days using the CellTiter-GloTM (CTG) assay kit.
Click to Show/Hide
|
||||
| In Vitro Model | Prostate carcinoma | DU145 cells | CVCL_0105 | ||
| Experiment 3 Reporting the Activity Date of This ADC | [239] | ||||
| Efficacy Data | Half Maximal Inhibitory Concentration (IC50) |
0.33 nM
|
Positive PSMA expression (PSMA+++/++) | ||
| Method Description |
LNCaP C4-2 cells were incubated with increasing concentrations of each ADCs at 37°C for 6 days in complete culture medium.
|
||||
| In Vitro Model | Lymph node metastasis of prostate carcinoma | LNCaP C4-2 cells | CVCL_4782 | ||
| Experiment 4 Reporting the Activity Date of This ADC | [239] | ||||
| Efficacy Data | Half Maximal Inhibitory Concentration (IC50) |
4.28 nM
|
Negative PSMA expression (PSMA-) | ||
| Method Description |
To assess the sensitivity towards cathepsin B, the ADCs were treated for 2 minutes and 4 hours with activated cathepsin B. To measure release of the respective free toxins DUBA or MMAE, PSMA-negative DU-145 cells (1,000 cells/well) was cultured with the ADCs for 6 days,and the cell viability was measured after 6 days using the CellTiter-GloTM (CTG) assay kit.
Click to Show/Hide
|
||||
| In Vitro Model | Prostate carcinoma | DU145 cells | CVCL_0105 | ||
| Experiment 5 Reporting the Activity Date of This ADC | [239] | ||||
| Efficacy Data | Half Maximal Inhibitory Concentration (IC50) | > 70.00 nM | Negative PSMA expression (PSMA-) | ||
| Method Description |
DU-145 cells were incubated with increasing concentrations of each ADCs at 37°C for 6 days in complete culture medium.
|
||||
| In Vitro Model | Prostate carcinoma | DU145 cells | CVCL_0105 | ||
WO2015177360A1 ADC-HC41-vcMMAE [Investigative]
Revealed Based on the Cell Line Data
| Experiment 1 Reporting the Activity Date of This ADC | [239] | ||||
| Efficacy Data | Max inhibition rate (MIR) |
91.00%
|
Positive PSMA expression (PSMA+++/++) | ||
| Method Description |
LNCaP C4-2 cells were incubated with increasing concentrations of each ADCs at 37°C for 6 days in complete culture medium.
|
||||
| In Vitro Model | Lymph node metastasis of prostate carcinoma | LNCaP C4-2 cells | CVCL_4782 | ||
| Experiment 2 Reporting the Activity Date of This ADC | [239] | ||||
| Efficacy Data | Max inhibition rate (MIR) |
97.00%
|
Negative PSMA expression (PSMA-) | ||
| Method Description |
To assess the sensitivity towards cathepsin B, the ADCs were treated for 2 minutes and 4 hours with activated cathepsin B. To measure release of the respective free toxins DUBA or MMAE, PSMA-negative DU-145 cells (1,000 cells/well) was cultured with the ADCs for 6 days,and the cell viability was measured after 6 days using the CellTiter-GloTM (CTG) assay kit.
Click to Show/Hide
|
||||
| In Vitro Model | Prostate carcinoma | DU145 cells | CVCL_0105 | ||
| Experiment 3 Reporting the Activity Date of This ADC | [239] | ||||
| Efficacy Data | Half Maximal Inhibitory Concentration (IC50) |
0.39 nM
|
Positive PSMA expression (PSMA+++/++) | ||
| Method Description |
LNCaP C4-2 cells were incubated with increasing concentrations of each ADCs at 37°C for 6 days in complete culture medium.
|
||||
| In Vitro Model | Lymph node metastasis of prostate carcinoma | LNCaP C4-2 cells | CVCL_4782 | ||
| Experiment 4 Reporting the Activity Date of This ADC | [239] | ||||
| Efficacy Data | Half Maximal Inhibitory Concentration (IC50) |
2.28 nM
|
Negative PSMA expression (PSMA-) | ||
| Method Description |
To assess the sensitivity towards cathepsin B, the ADCs were treated for 2 minutes and 4 hours with activated cathepsin B. To measure release of the respective free toxins DUBA or MMAE, PSMA-negative DU-145 cells (1,000 cells/well) was cultured with the ADCs for 6 days,and the cell viability was measured after 6 days using the CellTiter-GloTM (CTG) assay kit.
Click to Show/Hide
|
||||
| In Vitro Model | Prostate carcinoma | DU145 cells | CVCL_0105 | ||
| Experiment 5 Reporting the Activity Date of This ADC | [239] | ||||
| Efficacy Data | Half Maximal Inhibitory Concentration (IC50) | > 70.00 nM | Negative PSMA expression (PSMA-) | ||
| Method Description |
DU-145 cells were incubated with increasing concentrations of each ADCs at 37°C for 6 days in complete culture medium.
|
||||
| In Vitro Model | Prostate carcinoma | DU145 cells | CVCL_0105 | ||
B10 225-M-vc-MMAE [Investigative]
Revealed Based on the Cell Line Data
| Experiment 1 Reporting the Activity Date of This ADC | [240] | ||||
| Efficacy Data | Inhibition rate (50 nM) |
90.00%
|
High EGFR expression (EGFR+++/++); Low MET expression (MET-) | ||
| Method Description |
Cells were plated in 96-well tissue culture plates (SigmaAldrich) 1 day before treatment, serum-starved, and treated with serially diluted antibodies (0-167 nM in starvation medium) for 1 h.
|
||||
| In Vitro Model | Skin squamous cell carcinoma | A431 cells | CVCL_0037 | ||
| Experiment 2 Reporting the Activity Date of This ADC | [240] | ||||
| Efficacy Data | Half Maximal Effective Concentration (EC50) |
0.70 nM
|
High EGFR expression (EGFR+++/++); Low MET expression (MET-) | ||
| Method Description |
Cells were plated in 96-well tissue culture plates (SigmaAldrich) 1 day before treatment, serum-starved, and treated with serially diluted antibodies (0-167 nM in starvation medium) for 1 h.
|
||||
| In Vitro Model | Skin squamous cell carcinoma | A431 cells | CVCL_0037 | ||
| Experiment 3 Reporting the Activity Date of This ADC | [240] | ||||
| Efficacy Data | Half Maximal Effective Concentration (EC50) | > 20.00 nM | |||
| Method Description |
Cells were plated in 96-well tissue culture plates (SigmaAldrich) 1 day before treatment, serum-starved, and treated with serially diluted antibodies (0-167 nM in starvation medium) for 1 h.
|
||||
| In Vitro Model | Normal | NHEK-iPSCs #1 cells | CVCL_A4HY | ||
| Experiment 4 Reporting the Activity Date of This ADC | [240] | ||||
| Efficacy Data | 80% Effective Dose (ED80) |
3.60 nM
|
High EGFR expression (EGFR+++/++); Low MET expression (MET-) | ||
| Method Description |
Cells were plated in 96-well tissue culture plates (SigmaAldrich) 1 day before treatment, serum-starved, and treated with serially diluted antibodies (0-167 nM in starvation medium) for 1 h.
|
||||
| In Vitro Model | Skin squamous cell carcinoma | A431 cells | CVCL_0037 | ||
B10v5 225-M-vc-MMAE [Investigative]
Revealed Based on the Cell Line Data
| Experiment 1 Reporting the Activity Date of This ADC | [240] | ||||
| Efficacy Data | Inhibition rate (50 nM) |
91.00%
|
High EGFR expression (EGFR+++/++); Low MET expression (MET-) | ||
| Method Description |
Cells were plated in 96-well tissue culture plates (SigmaAldrich) 1 day before treatment, serum-starved, and treated with serially diluted antibodies (0-167 nM in starvation medium) for 1 h.
|
||||
| In Vitro Model | Skin squamous cell carcinoma | A431 cells | CVCL_0037 | ||
| Experiment 2 Reporting the Activity Date of This ADC | [240] | ||||
| Efficacy Data | Half Maximal Effective Concentration (EC50) |
1.00 nM
|
High EGFR expression (EGFR+++/++); Low MET expression (MET-) | ||
| Method Description |
Cells were plated in 96-well tissue culture plates (SigmaAldrich) 1 day before treatment, serum-starved, and treated with serially diluted antibodies (0-167 nM in starvation medium) for 1 h.
|
||||
| In Vitro Model | Skin squamous cell carcinoma | A431 cells | CVCL_0037 | ||
| Experiment 3 Reporting the Activity Date of This ADC | [240] | ||||
| Efficacy Data | Half Maximal Effective Concentration (EC50) |
5.90 nM
|
|||
| Method Description |
Cells were plated in 96-well tissue culture plates (SigmaAldrich) 1 day before treatment, serum-starved, and treated with serially diluted antibodies (0-167 nM in starvation medium) for 1 h.
|
||||
| In Vitro Model | Normal | NHEK-iPSCs #1 cells | CVCL_A4HY | ||
| Experiment 4 Reporting the Activity Date of This ADC | [240] | ||||
| Efficacy Data | 80% Effective Dose (ED80) |
4.40 nM
|
High EGFR expression (EGFR+++/++); Low MET expression (MET-) | ||
| Method Description |
Cells were plated in 96-well tissue culture plates (SigmaAldrich) 1 day before treatment, serum-starved, and treated with serially diluted antibodies (0-167 nM in starvation medium) for 1 h.
|
||||
| In Vitro Model | Skin squamous cell carcinoma | A431 cells | CVCL_0037 | ||
Cetuximab-vc-MMAE [Investigative]
Revealed Based on the Cell Line Data
| Experiment 1 Reporting the Activity Date of This ADC | [240] | ||||
| Efficacy Data | Inhibition rate (50 nM) |
92.00%
|
High EGFR expression (EGFR+++/++); Low MET expression (MET-) | ||
| Method Description |
Cells were plated in 96-well tissue culture plates (SigmaAldrich) 1 day before treatment, serum-starved, and treated with serially diluted antibodies (0-167 nM in starvation medium) for 1 h.
|
||||
| In Vitro Model | Skin squamous cell carcinoma | A431 cells | CVCL_0037 | ||
| Experiment 2 Reporting the Activity Date of This ADC | [240] | ||||
| Efficacy Data | Half Maximal Effective Concentration (EC50) |
0.10 nM
|
High EGFR expression (EGFR+++/++); Low MET expression (MET-) | ||
| Method Description |
Cells were plated in 96-well tissue culture plates (SigmaAldrich) 1 day before treatment, serum-starved, and treated with serially diluted antibodies (0-167 nM in starvation medium) for 1 h.
|
||||
| In Vitro Model | Skin squamous cell carcinoma | A431 cells | CVCL_0037 | ||
| Experiment 3 Reporting the Activity Date of This ADC | [240] | ||||
| Efficacy Data | Half Maximal Effective Concentration (EC50) |
1.00 nM
|
|||
| Method Description |
Cells were plated in 96-well tissue culture plates (SigmaAldrich) 1 day before treatment, serum-starved, and treated with serially diluted antibodies (0-167 nM in starvation medium) for 1 h.
|
||||
| In Vitro Model | Normal | NHEK-iPSCs #1 cells | CVCL_A4HY | ||
| Experiment 4 Reporting the Activity Date of This ADC | [240] | ||||
| Efficacy Data | 80% Effective Dose (ED80) |
0.70 nM
|
High EGFR expression (EGFR+++/++); Low MET expression (MET-) | ||
| Method Description |
Cells were plated in 96-well tissue culture plates (SigmaAldrich) 1 day before treatment, serum-starved, and treated with serially diluted antibodies (0-167 nM in starvation medium) for 1 h.
|
||||
| In Vitro Model | Skin squamous cell carcinoma | A431 cells | CVCL_0037 | ||
B10v5 225-H-vc-MMAE [Investigative]
Revealed Based on the Cell Line Data
| Experiment 1 Reporting the Activity Date of This ADC | [240] | ||||
| Efficacy Data | Inhibition rate (50 nM) |
93.00%
|
High EGFR expression (EGFR+++/++); Low MET expression (MET-) | ||
| Method Description |
Cells were plated in 96-well tissue culture plates (SigmaAldrich) 1 day before treatment, serum-starved, and treated with serially diluted antibodies (0-167 nM in starvation medium) for 1 h.
|
||||
| In Vitro Model | Skin squamous cell carcinoma | A431 cells | CVCL_0037 | ||
| Experiment 2 Reporting the Activity Date of This ADC | [240] | ||||
| Efficacy Data | Half Maximal Effective Concentration (EC50) |
0.40 nM
|
High EGFR expression (EGFR+++/++); Low MET expression (MET-) | ||
| Method Description |
Cells were plated in 96-well tissue culture plates (SigmaAldrich) 1 day before treatment, serum-starved, and treated with serially diluted antibodies (0-167 nM in starvation medium) for 1 h.
|
||||
| In Vitro Model | Skin squamous cell carcinoma | A431 cells | CVCL_0037 | ||
| Experiment 3 Reporting the Activity Date of This ADC | [240] | ||||
| Efficacy Data | Half Maximal Effective Concentration (EC50) | > 19.00 nM | |||
| Method Description |
Cells were plated in 96-well tissue culture plates (SigmaAldrich) 1 day before treatment, serum-starved, and treated with serially diluted antibodies (0-167 nM in starvation medium) for 1 h.
|
||||
| In Vitro Model | Normal | NHEK-iPSCs #1 cells | CVCL_A4HY | ||
| Experiment 4 Reporting the Activity Date of This ADC | [240] | ||||
| Efficacy Data | 80% Effective Dose (ED80) |
2.10 nM
|
High EGFR expression (EGFR+++/++); Low MET expression (MET-) | ||
| Method Description |
Cells were plated in 96-well tissue culture plates (SigmaAldrich) 1 day before treatment, serum-starved, and treated with serially diluted antibodies (0-167 nM in starvation medium) for 1 h.
|
||||
| In Vitro Model | Skin squamous cell carcinoma | A431 cells | CVCL_0037 | ||
TTZ-2-MMAE [Investigative]
Revealed Based on the Cell Line Data
| Experiment 1 Reporting the Activity Date of This ADC | [241] | ||||
| Efficacy Data | Half Maximal Inhibitory Concentration (IC50) |
15.70 pM
|
Positive HER2 expression (HER2+++/++) | ||
| Method Description |
Cytotoxicity data for 5-8 on the HER2 overexpressing cell line SK-BR-3. EC50 of TTZ is significantly different from those of all ADCs.
|
||||
| In Vitro Model | Breast adenocarcinoma | SK-BR-3 cells | CVCL_0033 | ||
Crown Ether ADC 4f [Investigative]
Revealed Based on the Cell Line Data
| Experiment 1 Reporting the Activity Date of This ADC | [242] | ||||
| Efficacy Data | Half Maximal Inhibitory Concentration (IC50) |
16.00 pM
|
Positive CD30 expression (CD30+++/++) | ||
| Method Description |
Cells were incubated for 24 h at 37°C with 5% CO2. The cells were treated by addition of ADCs 4a-f, 5a-b and 6a-b, dilution series (50 uL/well) and were then incubated at 37°C/5% CO2 for a further 96 h. Cell viability assays were carried out using CellTiter-Glo Luminescent reagent as per the manufacturers instructions.
|
||||
| In Vitro Model | ALK-positive anaplastic large cell lymphoma | Karpas-299 cells | CVCL_1324 | ||
Crown Ether ADC 4d [Investigative]
Revealed Based on the Cell Line Data
| Experiment 1 Reporting the Activity Date of This ADC | [242] | ||||
| Efficacy Data | Half Maximal Inhibitory Concentration (IC50) |
16.00 pM
|
Positive CD30 expression (CD30+++/++) | ||
| Method Description |
Cells were incubated for 24 h at 37°C with 5% CO2. The cells were treated by addition of ADCs 4a-f, 5a-b and 6a-b, dilution series (50 uL/well) and were then incubated at 37°C/5% CO2 for a further 96 h. Cell viability assays were carried out using CellTiter-Glo Luminescent reagent as per the manufacturers instructions.
|
||||
| In Vitro Model | ALK-positive anaplastic large cell lymphoma | Karpas-299 cells | CVCL_1324 | ||
5E3-vedotin [Investigative]
Revealed Based on the Cell Line Data
| Experiment 1 Reporting the Activity Date of This ADC | [243] | ||||
| Efficacy Data | Half Maximal Inhibitory Concentration (IC50) |
17.90 pM
|
Positive SEMA4A expression (SEMA4A +++/++) | ||
| Method Description |
Cells were seeded at 5000 per well in a 96-well plate in complete RPMI 1640. Antibody-ZAP complexes (Advanced Targeting Systems; produced according to manufacturer's instructions) or ADCs were added to the cells and plates incubated for 72 hours and 5% carbon dioxide.
|
||||
| In Vitro Model | Plasma cell myeloma | NCI-H929 cells | CVCL_1600 | ||
| Experiment 2 Reporting the Activity Date of This ADC | [243] | ||||
| Efficacy Data | Half Maximal Inhibitory Concentration (IC50) |
98.00 pM
|
Positive SEMA4A expression (SEMA4A +++/++) | ||
| Method Description |
Cells were seeded at 5000 per well in a 96-well plate in complete RPMI 1640. Antibody-ZAP complexes (Advanced Targeting Systems; produced according to manufacturer's instructions) or ADCs were added to the cells and plates incubated for 72 hours and 5% carbon dioxide.
|
||||
| In Vitro Model | Plasma cell myeloma | INA-6 cells | CVCL_5209 | ||
| Experiment 3 Reporting the Activity Date of This ADC | [243] | ||||
| Efficacy Data | Half Maximal Inhibitory Concentration (IC50) |
0.10 nM
|
Positive SEMA4A expression (SEMA4A +++/++) | ||
| Method Description |
Cells were seeded at 5000 per well in a 96-well plate in complete RPMI 1640. Antibody-ZAP complexes (Advanced Targeting Systems; produced according to manufacturer's instructions) or ADCs were added to the cells and plates incubated for 72 hours and 5% carbon dioxide.
|
||||
| In Vitro Model | Plasma cell myeloma | MM1.S cells | CVCL_8792 | ||
| Experiment 4 Reporting the Activity Date of This ADC | [243] | ||||
| Efficacy Data | Half Maximal Inhibitory Concentration (IC50) |
3.60 nM
|
Positive SEMA4A expression (SEMA4A +++/++) | ||
| Method Description |
Cells were seeded at 5000 per well in a 96-well plate in complete RPMI 1640. Antibody-ZAP complexes (Advanced Targeting Systems; produced according to manufacturer's instructions) or ADCs were added to the cells and plates incubated for 72 hours and 5% carbon dioxide.
|
||||
| In Vitro Model | Plasma cell myeloma | KMS-12-BM cells | CVCL_1334 | ||
| Experiment 5 Reporting the Activity Date of This ADC | [243] | ||||
| Efficacy Data | Half Maximal Inhibitory Concentration (IC50) |
30.10 nM
|
Positive SEMA4A expression (SEMA4A +++/++) | ||
| Method Description |
Cells were seeded at 5000 per well in a 96-well plate in complete RPMI 1640. Antibody-ZAP complexes (Advanced Targeting Systems; produced according to manufacturer's instructions) or ADCs were added to the cells and plates incubated for 72 hours and 5% carbon dioxide.
|
||||
| In Vitro Model | Multiple myeloma | SK-MM-1 cells | CVCL_A478 | ||
| Experiment 6 Reporting the Activity Date of This ADC | [243] | ||||
| Efficacy Data | Half Maximal Inhibitory Concentration (IC50) |
46.10 nM
|
Positive SEMA4A expression (SEMA4A +++/++) | ||
| Method Description |
Cells were seeded at 5000 per well in a 96-well plate in complete RPMI 1640. Antibody-ZAP complexes (Advanced Targeting Systems; produced according to manufacturer's instructions) or ADCs were added to the cells and plates incubated for 72 hours and 5% carbon dioxide.
|
||||
| In Vitro Model | Plasma cell myeloma | OCI-My5 cells | CVCL_E332 | ||
| Experiment 7 Reporting the Activity Date of This ADC | [243] | ||||
| Efficacy Data | Half Maximal Inhibitory Concentration (IC50) |
60.90 nM
|
Positive SEMA4A expression (SEMA4A +++/++) | ||
| Method Description |
Cells were seeded at 5000 per well in a 96-well plate in complete RPMI 1640. Antibody-ZAP complexes (Advanced Targeting Systems; produced according to manufacturer's instructions) or ADCs were added to the cells and plates incubated for 72 hours and 5% carbon dioxide.
|
||||
| In Vitro Model | Plasma cell myeloma | OCI-My7 cells | CVCL_E333 | ||
| Experiment 8 Reporting the Activity Date of This ADC | [243] | ||||
| Efficacy Data | Half Maximal Inhibitory Concentration (IC50) | > 100 nM | Positive SEMA4A expression (SEMA4A +++/++) | ||
| Method Description |
Cells were seeded at 5000 per well in a 96-well plate in complete RPMI 1640. Antibody-ZAP complexes (Advanced Targeting Systems; produced according to manufacturer's instructions) or ADCs were added to the cells and plates incubated for 72 hours and 5% carbon dioxide.
|
||||
| In Vitro Model | Plasma cell myeloma | JIM3 cells | CVCL_2533 | ||
| Experiment 9 Reporting the Activity Date of This ADC | [243] | ||||
| Efficacy Data | Half Maximal Inhibitory Concentration (IC50) | > 100 nM | Positive SEMA4A expression (SEMA4A +++/++) | ||
| Method Description |
Cells were seeded at 5000 per well in a 96-well plate in complete RPMI 1640. Antibody-ZAP complexes (Advanced Targeting Systems; produced according to manufacturer's instructions) or ADCs were added to the cells and plates incubated for 72 hours and 5% carbon dioxide.
|
||||
| In Vitro Model | Plasma cell myeloma | LP-1 cells | CVCL_0012 | ||
| Experiment 10 Reporting the Activity Date of This ADC | [243] | ||||
| Efficacy Data | Half Maximal Inhibitory Concentration (IC50) |
14.00 uM
|
Positive SEMA4A expression (SEMA4A +++/++) | ||
| Method Description |
Cells were seeded at 5000 per well in a 96-well plate in complete RPMI 1640. Antibody-ZAP complexes (Advanced Targeting Systems; produced according to manufacturer's instructions) or ADCs were added to the cells and plates incubated for 72 hours and 5% carbon dioxide.
|
||||
| In Vitro Model | Plasma cell myeloma | OPM-2 cells | CVCL_1625 | ||
Crown Ether ADC 6b [Investigative]
Revealed Based on the Cell Line Data
| Experiment 1 Reporting the Activity Date of This ADC | [242] | ||||
| Efficacy Data | Half Maximal Inhibitory Concentration (IC50) |
19.00 pM
|
Positive CD30 expression (CD30+++/++) | ||
| Method Description |
Cells were incubated for 24 h at 37°C with 5% CO2. The cells were treated by addition of ADCs 4a-f, 5a-b and 6a-b, dilution series (50 uL/well) and were then incubated at 37°C/5% CO2 for a further 96 h. Cell viability assays were carried out using CellTiter-Glo Luminescent reagent as per the manufacturers instructions.
|
||||
| In Vitro Model | ALK-positive anaplastic large cell lymphoma | Karpas-299 cells | CVCL_1324 | ||
Crown Ether ADC 4e [Investigative]
Revealed Based on the Cell Line Data
| Experiment 1 Reporting the Activity Date of This ADC | [242] | ||||
| Efficacy Data | Half Maximal Inhibitory Concentration (IC50) |
19.00 pM
|
Positive CD30 expression (CD30+++/++) | ||
| Method Description |
Cells were incubated for 24 h at 37°C with 5% CO2. The cells were treated by addition of ADCs 4a-f, 5a-b and 6a-b, dilution series (50 uL/well) and were then incubated at 37°C/5% CO2 for a further 96 h. Cell viability assays were carried out using CellTiter-Glo Luminescent reagent as per the manufacturers instructions.
|
||||
| In Vitro Model | ALK-positive anaplastic large cell lymphoma | Karpas-299 cells | CVCL_1324 | ||
TTZ-1-MMAE [Investigative]
Revealed Based on the Cell Line Data
| Experiment 1 Reporting the Activity Date of This ADC | [241] | ||||
| Efficacy Data | Half Maximal Inhibitory Concentration (IC50) |
20.00 pM
|
Positive HER2 expression (HER2+++/++) | ||
| Method Description |
Cytotoxicity data for 5-8 on the HER2 overexpressing cell line SK-BR-3. EC50 of TTZ is significantly different from those of all ADCs.
|
||||
| In Vitro Model | Breast adenocarcinoma | SK-BR-3 cells | CVCL_0033 | ||
Crown Ether ADC 4b [Investigative]
Revealed Based on the Cell Line Data
| Experiment 1 Reporting the Activity Date of This ADC | [242] | ||||
| Efficacy Data | Half Maximal Inhibitory Concentration (IC50) |
22.00 pM
|
Positive CD30 expression (CD30+++/++) | ||
| Method Description |
Cells were incubated for 24 h at 37°C with 5% CO2. The cells were treated by addition of ADCs 4a-f, 5a-b and 6a-b, dilution series (50 uL/well) and were then incubated at 37°C/5% CO2 for a further 96 h. Cell viability assays were carried out using CellTiter-Glo Luminescent reagent as per the manufacturers instructions.
|
||||
| In Vitro Model | ALK-positive anaplastic large cell lymphoma | Karpas-299 cells | CVCL_1324 | ||
TTZ-4-MMAE [Investigative]
Revealed Based on the Cell Line Data
| Experiment 1 Reporting the Activity Date of This ADC | [241] | ||||
| Efficacy Data | Half Maximal Inhibitory Concentration (IC50) |
22.10 pM
|
Positive HER2 expression (HER2+++/++) | ||
| Method Description |
Cytotoxicity data for 5-8 on the HER2 overexpressing cell line SK-BR-3. EC50 of TTZ is significantly different from those of all ADCs.
|
||||
| In Vitro Model | Breast adenocarcinoma | SK-BR-3 cells | CVCL_0033 | ||
TTZ-3-MMAE [Investigative]
Revealed Based on the Cell Line Data
| Experiment 1 Reporting the Activity Date of This ADC | [241] | ||||
| Efficacy Data | Half Maximal Inhibitory Concentration (IC50) |
27.20 pM
|
Positive HER2 expression (HER2+++/++) | ||
| Method Description |
Cytotoxicity data for 5-8 on the HER2 overexpressing cell line SK-BR-3. EC50 of TTZ is significantly different from those of all ADCs.
|
||||
| In Vitro Model | Breast adenocarcinoma | SK-BR-3 cells | CVCL_0033 | ||
Crown Ether ADC 4c [Investigative]
Revealed Based on the Cell Line Data
| Experiment 1 Reporting the Activity Date of This ADC | [242] | ||||
| Efficacy Data | Half Maximal Inhibitory Concentration (IC50) |
28.00 pM
|
Positive CD30 expression (CD30+++/++) | ||
| Method Description |
Cells were incubated for 24 h at 37°C with 5% CO2. The cells were treated by addition of ADCs 4a-f, 5a-b and 6a-b, dilution series (50 uL/well) and were then incubated at 37°C/5% CO2 for a further 96 h. Cell viability assays were carried out using CellTiter-Glo Luminescent reagent as per the manufacturers instructions.
|
||||
| In Vitro Model | ALK-positive anaplastic large cell lymphoma | Karpas-299 cells | CVCL_1324 | ||
Crown Ether ADC 5a [Investigative]
Revealed Based on the Cell Line Data
| Experiment 1 Reporting the Activity Date of This ADC | [242] | ||||
| Efficacy Data | Half Maximal Inhibitory Concentration (IC50) |
30.00 pM
|
Positive CD30 expression (CD30+++/++) | ||
| Method Description |
Cells were incubated for 24 h at 37°C with 5% CO2. The cells were treated by addition of ADCs 4a-f, 5a-b and 6a-b, dilution series (50 uL/well) and were then incubated at 37°C/5% CO2 for a further 96 h. Cell viability assays were carried out using CellTiter-Glo Luminescent reagent as per the manufacturers instructions.
|
||||
| In Vitro Model | ALK-positive anaplastic large cell lymphoma | Karpas-299 cells | CVCL_1324 | ||
Crown Ether ADC 4a [Investigative]
Revealed Based on the Cell Line Data
| Experiment 1 Reporting the Activity Date of This ADC | [242] | ||||
| Efficacy Data | Half Maximal Inhibitory Concentration (IC50) |
30.00 pM
|
Positive CD30 expression (CD30+++/++) | ||
| Method Description |
Cells were incubated for 24 h at 37°C with 5% CO2. The cells were treated by addition of ADCs 4a-f, 5a-b and 6a-b, dilution series (50 uL/well) and were then incubated at 37°C/5% CO2 for a further 96 h. Cell viability assays were carried out using CellTiter-Glo Luminescent reagent as per the manufacturers instructions.
|
||||
| In Vitro Model | ALK-positive anaplastic large cell lymphoma | Karpas-299 cells | CVCL_1324 | ||
Crown Ether ADC 6a [Investigative]
Revealed Based on the Cell Line Data
| Experiment 1 Reporting the Activity Date of This ADC | [242] | ||||
| Efficacy Data | Half Maximal Inhibitory Concentration (IC50) |
32.00 pM
|
Positive CD30 expression (CD30+++/++) | ||
| Method Description |
Cells were incubated for 24 h at 37°C with 5% CO2. The cells were treated by addition of ADCs 4a-f, 5a-b and 6a-b, dilution series (50 uL/well) and were then incubated at 37°C/5% CO2 for a further 96 h. Cell viability assays were carried out using CellTiter-Glo Luminescent reagent as per the manufacturers instructions.
|
||||
| In Vitro Model | ALK-positive anaplastic large cell lymphoma | Karpas-299 cells | CVCL_1324 | ||
Crown Ether ADC 5b [Investigative]
Revealed Based on the Cell Line Data
| Experiment 1 Reporting the Activity Date of This ADC | [242] | ||||
| Efficacy Data | Half Maximal Inhibitory Concentration (IC50) |
34.00 pM
|
Positive CD30 expression (CD30+++/++) | ||
| Method Description |
Cells were incubated for 24 h at 37°C with 5% CO2. The cells were treated by addition of ADCs 4a-f, 5a-b and 6a-b, dilution series (50 uL/well) and were then incubated at 37°C/5% CO2 for a further 96 h. Cell viability assays were carried out using CellTiter-Glo Luminescent reagent as per the manufacturers instructions.
|
||||
| In Vitro Model | ALK-positive anaplastic large cell lymphoma | Karpas-299 cells | CVCL_1324 | ||
IgG1 (GH2-75)-AL1-MMAE [Investigative]
Revealed Based on the Cell Line Data
| Experiment 1 Reporting the Activity Date of This ADC | [203] | ||||
| Efficacy Data | Half Maximal Inhibitory Concentration (IC50) |
36.40 pM
|
Positive HER2 expression (HER2 +++/++) | ||
| Method Description |
N87 cells (10000) were seeded in 96-well plates for the IC50 measurements of cell viability. After incubation at 37°C for 16 h, the medium was replaced by fresh normal medium with serum and the cytotoxicity was assessed using the WST-1 reagent after 72 h of incubation at 37°C.
|
||||
| In Vitro Model | Gastric tubular adenocarcinoma | NCI-N87 cells | CVCL_1603 | ||
IgG1 (H32)-AL1-MMAE [Investigative]
Revealed Based on the Cell Line Data
| Experiment 1 Reporting the Activity Date of This ADC | [203] | ||||
| Efficacy Data | Half Maximal Inhibitory Concentration (IC50) |
41.60 pM
|
Positive HER2 expression (HER2 +++/++) | ||
| Method Description |
N87 cells (10000) were seeded in 96-well plates for the IC50 measurements of cell viability. After incubation at 37°C for 16 h, the medium was replaced by fresh normal medium with serum and the cytotoxicity was assessed using the WST-1 reagent after 72 h of incubation at 37°C.
|
||||
| In Vitro Model | Gastric tubular adenocarcinoma | NCI-N87 cells | CVCL_1603 | ||
IgG1 (GH2-61)-AL1-MMAE [Investigative]
Revealed Based on the Cell Line Data
| Experiment 1 Reporting the Activity Date of This ADC | [203] | ||||
| Efficacy Data | Half Maximal Inhibitory Concentration (IC50) |
53.90 pM
|
Positive HER2 expression (HER2 +++/++) | ||
| Method Description |
N87 cells (10000) were seeded in 96-well plates for the IC50 measurements of cell viability. After incubation at 37°C for 16 h, the medium was replaced by fresh normal medium with serum and the cytotoxicity was assessed using the WST-1 reagent after 72 h of incubation at 37°C.
|
||||
| In Vitro Model | Gastric tubular adenocarcinoma | NCI-N87 cells | CVCL_1603 | ||
IgG1 (GH2-20)-AL1-MMAE [Investigative]
Revealed Based on the Cell Line Data
| Experiment 1 Reporting the Activity Date of This ADC | [203] | ||||
| Efficacy Data | Half Maximal Inhibitory Concentration (IC50) |
59.90 pM
|
Positive HER2 expression (HER2 +++/++) | ||
| Method Description |
N87 cells (10000) were seeded in 96-well plates for the IC50 measurements of cell viability. After incubation at 37°C for 16 h, the medium was replaced by fresh normal medium with serum and the cytotoxicity was assessed using the WST-1 reagent after 72 h of incubation at 37°C.
|
||||
| In Vitro Model | Gastric tubular adenocarcinoma | NCI-N87 cells | CVCL_1603 | ||
HER2-azide-alkyne MMAE conjugate [Investigative]
Revealed Based on the Cell Line Data
| Experiment 1 Reporting the Activity Date of This ADC | [244] | ||||
| Efficacy Data | Half Maximal Inhibitory Concentration (IC50) |
88.00 pM
|
Positive HER2 expression (HER2 +++/++) | ||
| Method Description |
Cells were incubated with increasing concentrations in tested compounds for 96 h and cell viability was determined by MTS assay.
|
||||
| In Vitro Model | Breast adenocarcinoma | SK-BR-3 cells | CVCL_0033 | ||
| Experiment 2 Reporting the Activity Date of This ADC | [244] | ||||
| Efficacy Data | Half Maximal Inhibitory Concentration (IC50) |
13.90 ng/mL
|
Positive HER2 expression (HER2 +++/++) | ||
| Method Description |
Cells were incubated with increasing concentrations in tested compounds for 96 h and cell viability was determined by MTS assay.
|
||||
| In Vitro Model | Breast adenocarcinoma | SK-BR-3 cells | CVCL_0033 | ||
| Experiment 3 Reporting the Activity Date of This ADC | [244] | ||||
| Efficacy Data | Half Maximal Inhibitory Concentration (IC50) | > 10.00 ug/mL | Low HER2 expression (HER2+) | ||
| Method Description |
Cells were incubated with increasing concentrations in tested compounds for 96 h and cell viability was determined by MTS assay.
|
||||
| In Vitro Model | Invasive breast carcinoma | T-47D cells | CVCL_0553 | ||
AXL02-MMAE [Investigative]
Revealed Based on the Cell Line Data
| Experiment 1 Reporting the Activity Date of This ADC | [165] | ||||
| Efficacy Data | Half Maximal Inhibitory Concentration (IC50) |
0.01 nM
|
High AXL expression (AXL+++) | ||
| Method Description |
Tumor cells were plated in 96-well plates at predetermined density, treated with AXL02-MMAE or hIgG1-MMAE for 5-8 days to ensure that the doubling of the cells is sufficient. Then MTS reagent solution was added with replacing fresh medium, and cells were incubated for an appropriate time.
|
||||
| In Vitro Model | Lung squamous cell carcinoma | Calu-1 cells | CVCL_0608 | ||
| Experiment 2 Reporting the Activity Date of This ADC | [165] | ||||
| Efficacy Data | Half Maximal Inhibitory Concentration (IC50) |
0.03 nM
|
High AXL expression (AXL+++) | ||
| Method Description |
Tumor cells were plated in 96-well plates at predetermined density, treated with AXL02-MMAE or hIgG1-MMAE for 5-8 days to ensure that the doubling of the cells is sufficient. Then MTS reagent solution was added with replacing fresh medium, and cells were incubated for an appropriate time.
|
||||
| In Vitro Model | Lung large cell carcinoma | LCLC-103H cells | CVCL_1375 | ||
| Experiment 3 Reporting the Activity Date of This ADC | [165] | ||||
| Efficacy Data | Half Maximal Inhibitory Concentration (IC50) |
0.04 nM
|
High AXL expression (AXL+++) | ||
| Method Description |
Tumor cells were plated in 96-well plates at predetermined density, treated with AXL02-MMAE or hIgG1-MMAE for 5-8 days to ensure that the doubling of the cells is sufficient. Then MTS reagent solution was added with replacing fresh medium, and cells were incubated for an appropriate time.
|
||||
| In Vitro Model | Breast adenocarcinoma | MDA-MB-231 cells | CVCL_0062 | ||
| Experiment 4 Reporting the Activity Date of This ADC | [165] | ||||
| Efficacy Data | Half Maximal Inhibitory Concentration (IC50) |
0.04 nM
|
Moderate AXL expression (AXL++) | ||
| Method Description |
Tumor cells were plated in 96-well plates at predetermined density, treated with AXL02-MMAE or hIgG1-MMAE for 5-8 days to ensure that the doubling of the cells is sufficient. Then MTS reagent solution was added with replacing fresh medium, and cells were incubated for an appropriate time.
|
||||
| In Vitro Model | Glioblastoma | U-87MG cells | CVCL_0022 | ||
| Experiment 5 Reporting the Activity Date of This ADC | [165] | ||||
| Efficacy Data | Half Maximal Inhibitory Concentration (IC50) |
0.05 nM±0.001 nM
|
Moderate AXL expression (AXL++) | ||
| Method Description |
Tumor cells were plated in 96-well plates at predetermined density, treated with AXL02-MMAE or hIgG1-MMAE for 5-8 days to ensure that the doubling of the cells is sufficient. Then MTS reagent solution was added with replacing fresh medium, and cells were incubated for an appropriate time.
|
||||
| In Vitro Model | Lung adenocarcinoma | PC-9 cells | CVCL_B260 | ||
| Experiment 6 Reporting the Activity Date of This ADC | [165] | ||||
| Efficacy Data | Half Maximal Inhibitory Concentration (IC50) | > 100 nM | Low AXL expression (AXL+) | ||
| Method Description |
Tumor cells were plated in 96-well plates at predetermined density, treated with AXL02-MMAE or hIgG1-MMAE for 5-8 days to ensure that the doubling of the cells is sufficient. Then MTS reagent solution was added with replacing fresh medium, and cells were incubated for an appropriate time.
|
||||
| In Vitro Model | Lung large cell carcinoma | NCI-H460 cells | CVCL_0459 | ||
| Experiment 7 Reporting the Activity Date of This ADC | [165] | ||||
| Efficacy Data | Half Maximal Inhibitory Concentration (IC50) | > 100 nM | Low AXL expression (AXL+) | ||
| Method Description |
Tumor cells were plated in 96-well plates at predetermined density, treated with AXL02-MMAE or hIgG1-MMAE for 5-8 days to ensure that the doubling of the cells is sufficient. Then MTS reagent solution was added with replacing fresh medium, and cells were incubated for an appropriate time.
|
||||
| In Vitro Model | Breast adenocarcinoma | MDA-MB-453 cells | CVCL_0418 | ||
HER2-gsADC-39 [Investigative]
Revealed Based on the Cell Line Data
| Experiment 1 Reporting the Activity Date of This ADC | [206] | ||||
| Efficacy Data | Half Maximal Inhibitory Concentration (IC50) |
0.01 nM
|
Positive HER2 expression (HER2+++/++) | ||
| Method Description |
Cells were cultured in a 10% fetal bovine serum (FBS)-containing RPMI 1640 medium and were planted into 96-well plates with 6000 cells per well. The plates were incubated overnight at 37°C in a 5% CO2 cell incubator.
|
||||
| In Vitro Model | Breast adenocarcinoma | SK-BR-3 cells | CVCL_0033 | ||
| Experiment 2 Reporting the Activity Date of This ADC | [206] | ||||
| Efficacy Data | Half Maximal Inhibitory Concentration (IC50) |
0.06 nM
|
Positive HER2 expression (HER2+++/++) | ||
| Method Description |
Cells were cultured in a 10% fetal bovine serum (FBS)-containing RPMI 1640 medium and were planted into 96-well plates with 6000 cells per well. The plates were incubated overnight at 37°C in a 5% CO2 cell incubator.
|
||||
| In Vitro Model | Gastric tubular adenocarcinoma | NCI-N87 cells | CVCL_1603 | ||
| Experiment 3 Reporting the Activity Date of This ADC | [206] | ||||
| Efficacy Data | Half Maximal Inhibitory Concentration (IC50) | > 66.00 nM | Negative HER2 expression (HER2 -) | ||
| Method Description |
Cells were cultured in a 10% fetal bovine serum (FBS)-containing RPMI 1640 medium and were planted into 96-well plates with 6000 cells per well. The plates were incubated overnight at 37°C in a 5% CO2 cell incubator.
|
||||
| In Vitro Model | Breast adenocarcinoma | MDA-MB-231 cells | CVCL_0062 | ||
HER2-gsADC-37 [Investigative]
Revealed Based on the Cell Line Data
| Experiment 1 Reporting the Activity Date of This ADC | [206] | ||||
| Efficacy Data | Half Maximal Inhibitory Concentration (IC50) |
0.01 nM
|
Positive HER2 expression (HER2+++/++) | ||
| Method Description |
Cells were cultured in a 10% fetal bovine serum (FBS)-containing RPMI 1640 medium and were planted into 96-well plates with 6000 cells per well. The plates were incubated overnight at 37°C in a 5% CO2 cell incubator.
|
||||
| In Vitro Model | Breast adenocarcinoma | SK-BR-3 cells | CVCL_0033 | ||
| Experiment 2 Reporting the Activity Date of This ADC | [206] | ||||
| Efficacy Data | Half Maximal Inhibitory Concentration (IC50) |
0.06 nM
|
Positive HER2 expression (HER2+++/++) | ||
| Method Description |
Cells were cultured in a 10% fetal bovine serum (FBS)-containing RPMI 1640 medium and were planted into 96-well plates with 6000 cells per well. The plates were incubated overnight at 37°C in a 5% CO2 cell incubator.
|
||||
| In Vitro Model | Gastric tubular adenocarcinoma | NCI-N87 cells | CVCL_1603 | ||
| Experiment 3 Reporting the Activity Date of This ADC | [206] | ||||
| Efficacy Data | Half Maximal Inhibitory Concentration (IC50) | > 66.00 nM | Negative HER2 expression (HER2 -) | ||
| Method Description |
Cells were cultured in a 10% fetal bovine serum (FBS)-containing RPMI 1640 medium and were planted into 96-well plates with 6000 cells per well. The plates were incubated overnight at 37°C in a 5% CO2 cell incubator.
|
||||
| In Vitro Model | Breast adenocarcinoma | MDA-MB-231 cells | CVCL_0062 | ||
HER2-gsADC-31 [Investigative]
Revealed Based on the Cell Line Data
| Experiment 1 Reporting the Activity Date of This ADC | [206] | ||||
| Efficacy Data | Half Maximal Inhibitory Concentration (IC50) |
0.01 nM
|
Positive HER2 expression (HER2+++/++) | ||
| Method Description |
Cells were cultured in a 10% fetal bovine serum (FBS)-containing RPMI 1640 medium and were planted into 96-well plates with 6000 cells per well. The plates were incubated overnight at 37°C in a 5% CO2 cell incubator.
|
||||
| In Vitro Model | Breast adenocarcinoma | SK-BR-3 cells | CVCL_0033 | ||
| Experiment 2 Reporting the Activity Date of This ADC | [206] | ||||
| Efficacy Data | Half Maximal Inhibitory Concentration (IC50) | > 66.00 nM | Positive HER2 expression (HER2+++/++) | ||
| Method Description |
Cells were cultured in a 10% fetal bovine serum (FBS)-containing RPMI 1640 medium and were planted into 96-well plates with 6000 cells per well. The plates were incubated overnight at 37°C in a 5% CO2 cell incubator.
|
||||
| In Vitro Model | Gastric tubular adenocarcinoma | NCI-N87 cells | CVCL_1603 | ||
| Experiment 3 Reporting the Activity Date of This ADC | [206] | ||||
| Efficacy Data | Half Maximal Inhibitory Concentration (IC50) | > 66.00 nM | Negative HER2 expression (HER2 -) | ||
| Method Description |
Cells were cultured in a 10% fetal bovine serum (FBS)-containing RPMI 1640 medium and were planted into 96-well plates with 6000 cells per well. The plates were incubated overnight at 37°C in a 5% CO2 cell incubator.
|
||||
| In Vitro Model | Breast adenocarcinoma | MDA-MB-231 cells | CVCL_0062 | ||
HER2-gsADC-27 [Investigative]
Revealed Based on the Cell Line Data
| Experiment 1 Reporting the Activity Date of This ADC | [206] | ||||
| Efficacy Data | Half Maximal Inhibitory Concentration (IC50) |
0.01 nM
|
Positive HER2 expression (HER2+++/++) | ||
| Method Description |
Cells were cultured in a 10% fetal bovine serum (FBS)-containing RPMI 1640 medium and were planted into 96-well plates with 6000 cells per well. The plates were incubated overnight at 37°C in a 5% CO2 cell incubator.
|
||||
| In Vitro Model | Breast adenocarcinoma | SK-BR-3 cells | CVCL_0033 | ||
| Experiment 2 Reporting the Activity Date of This ADC | [206] | ||||
| Efficacy Data | Half Maximal Inhibitory Concentration (IC50) |
0.04 nM
|
Positive HER2 expression (HER2+++/++) | ||
| Method Description |
Cells were cultured in a 10% fetal bovine serum (FBS)-containing RPMI 1640 medium and were planted into 96-well plates with 6000 cells per well. The plates were incubated overnight at 37°C in a 5% CO2 cell incubator.
|
||||
| In Vitro Model | Gastric tubular adenocarcinoma | NCI-N87 cells | CVCL_1603 | ||
| Experiment 3 Reporting the Activity Date of This ADC | [206] | ||||
| Efficacy Data | Half Maximal Inhibitory Concentration (IC50) | > 66.00 nM | Negative HER2 expression (HER2 -) | ||
| Method Description |
Cells were cultured in a 10% fetal bovine serum (FBS)-containing RPMI 1640 medium and were planted into 96-well plates with 6000 cells per well. The plates were incubated overnight at 37°C in a 5% CO2 cell incubator.
|
||||
| In Vitro Model | Breast adenocarcinoma | MDA-MB-231 cells | CVCL_0062 | ||
HER2-gsADC-26 [Investigative]
Revealed Based on the Cell Line Data
| Experiment 1 Reporting the Activity Date of This ADC | [206] | ||||
| Efficacy Data | Half Maximal Inhibitory Concentration (IC50) |
0.01 nM
|
Positive HER2 expression (HER2+++/++) | ||
| Method Description |
Cells were cultured in a 10% fetal bovine serum (FBS)-containing RPMI 1640 medium and were planted into 96-well plates with 6000 cells per well. The plates were incubated overnight at 37°C in a 5% CO2 cell incubator.
|
||||
| In Vitro Model | Breast adenocarcinoma | SK-BR-3 cells | CVCL_0033 | ||
| Experiment 2 Reporting the Activity Date of This ADC | [206] | ||||
| Efficacy Data | Half Maximal Inhibitory Concentration (IC50) |
0.06 nM
|
Positive HER2 expression (HER2+++/++) | ||
| Method Description |
Cells were cultured in a 10% fetal bovine serum (FBS)-containing RPMI 1640 medium and were planted into 96-well plates with 6000 cells per well. The plates were incubated overnight at 37°C in a 5% CO2 cell incubator.
|
||||
| In Vitro Model | Gastric tubular adenocarcinoma | NCI-N87 cells | CVCL_1603 | ||
| Experiment 3 Reporting the Activity Date of This ADC | [206] | ||||
| Efficacy Data | Half Maximal Inhibitory Concentration (IC50) | > 66.00 nM | Negative HER2 expression (HER2 -) | ||
| Method Description |
Cells were cultured in a 10% fetal bovine serum (FBS)-containing RPMI 1640 medium and were planted into 96-well plates with 6000 cells per well. The plates were incubated overnight at 37°C in a 5% CO2 cell incubator.
|
||||
| In Vitro Model | Breast adenocarcinoma | MDA-MB-231 cells | CVCL_0062 | ||
HER2-gsADC-25 [Investigative]
Revealed Based on the Cell Line Data
| Experiment 1 Reporting the Activity Date of This ADC | [206] | ||||
| Efficacy Data | Half Maximal Inhibitory Concentration (IC50) |
0.01 nM
|
Positive HER2 expression (HER2+++/++) | ||
| Method Description |
Cells were cultured in a 10% fetal bovine serum (FBS)-containing RPMI 1640 medium and were planted into 96-well plates with 6000 cells per well. The plates were incubated overnight at 37°C in a 5% CO2 cell incubator.
|
||||
| In Vitro Model | Breast adenocarcinoma | SK-BR-3 cells | CVCL_0033 | ||
| Experiment 2 Reporting the Activity Date of This ADC | [206] | ||||
| Efficacy Data | Half Maximal Inhibitory Concentration (IC50) |
0.08 nM
|
Positive HER2 expression (HER2+++/++) | ||
| Method Description |
Cells were cultured in a 10% fetal bovine serum (FBS)-containing RPMI 1640 medium and were planted into 96-well plates with 6000 cells per well. The plates were incubated overnight at 37°C in a 5% CO2 cell incubator.
|
||||
| In Vitro Model | Gastric tubular adenocarcinoma | NCI-N87 cells | CVCL_1603 | ||
| Experiment 3 Reporting the Activity Date of This ADC | [206] | ||||
| Efficacy Data | Half Maximal Inhibitory Concentration (IC50) | > 66.00 nM | Negative HER2 expression (HER2 -) | ||
| Method Description |
Cells were cultured in a 10% fetal bovine serum (FBS)-containing RPMI 1640 medium and were planted into 96-well plates with 6000 cells per well. The plates were incubated overnight at 37°C in a 5% CO2 cell incubator.
|
||||
| In Vitro Model | Breast adenocarcinoma | MDA-MB-231 cells | CVCL_0062 | ||
Cetux Fab-vc-MMAE [Investigative]
Revealed Based on the Cell Line Data
| Experiment 1 Reporting the Activity Date of This ADC | [245] | ||||
| Efficacy Data | Half Maximal Inhibitory Concentration (IC50) |
0.01 nM
|
High EGFR expression (EGFR+++/++) | ||
| Method Description |
Cells were incubated with a serial dilution of conjugate, and a mixture of conjugate and excess, unconjugated anti-EGFR. After 4 days of continuous treatment with conjugates, cell viability was determined using Cell Titer Glo reagent.
|
||||
| In Vitro Model | Glioblastoma | U-87MG cells | CVCL_0022 | ||
HER2-gsADC-38 [Investigative]
Revealed Based on the Cell Line Data
| Experiment 1 Reporting the Activity Date of This ADC | [206] | ||||
| Efficacy Data | Half Maximal Inhibitory Concentration (IC50) |
0.02 nM
|
Positive HER2 expression (HER2+++/++) | ||
| Method Description |
Cells were cultured in a 10% fetal bovine serum (FBS)-containing RPMI 1640 medium and were planted into 96-well plates with 6000 cells per well. The plates were incubated overnight at 37°C in a 5% CO2 cell incubator.
|
||||
| In Vitro Model | Breast adenocarcinoma | SK-BR-3 cells | CVCL_0033 | ||
| Experiment 2 Reporting the Activity Date of This ADC | [206] | ||||
| Efficacy Data | Half Maximal Inhibitory Concentration (IC50) |
0.04 nM
|
Positive HER2 expression (HER2+++/++) | ||
| Method Description |
Cells were cultured in a 10% fetal bovine serum (FBS)-containing RPMI 1640 medium and were planted into 96-well plates with 6000 cells per well. The plates were incubated overnight at 37°C in a 5% CO2 cell incubator.
|
||||
| In Vitro Model | Gastric tubular adenocarcinoma | NCI-N87 cells | CVCL_1603 | ||
| Experiment 3 Reporting the Activity Date of This ADC | [206] | ||||
| Efficacy Data | Half Maximal Inhibitory Concentration (IC50) | > 66.00 nM | Negative HER2 expression (HER2 -) | ||
| Method Description |
Cells were cultured in a 10% fetal bovine serum (FBS)-containing RPMI 1640 medium and were planted into 96-well plates with 6000 cells per well. The plates were incubated overnight at 37°C in a 5% CO2 cell incubator.
|
||||
| In Vitro Model | Breast adenocarcinoma | MDA-MB-231 cells | CVCL_0062 | ||
HER2-gsADC-36 [Investigative]
Revealed Based on the Cell Line Data
| Experiment 1 Reporting the Activity Date of This ADC | [206] | ||||
| Efficacy Data | Half Maximal Inhibitory Concentration (IC50) |
0.02 nM
|
Positive HER2 expression (HER2+++/++) | ||
| Method Description |
Cells were cultured in a 10% fetal bovine serum (FBS)-containing RPMI 1640 medium and were planted into 96-well plates with 6000 cells per well. The plates were incubated overnight at 37°C in a 5% CO2 cell incubator.
|
||||
| In Vitro Model | Breast adenocarcinoma | SK-BR-3 cells | CVCL_0033 | ||
| Experiment 2 Reporting the Activity Date of This ADC | [206] | ||||
| Efficacy Data | Half Maximal Inhibitory Concentration (IC50) |
0.05 nM
|
Positive HER2 expression (HER2+++/++) | ||
| Method Description |
Cells were cultured in a 10% fetal bovine serum (FBS)-containing RPMI 1640 medium and were planted into 96-well plates with 6000 cells per well. The plates were incubated overnight at 37°C in a 5% CO2 cell incubator.
|
||||
| In Vitro Model | Gastric tubular adenocarcinoma | NCI-N87 cells | CVCL_1603 | ||
| Experiment 3 Reporting the Activity Date of This ADC | [206] | ||||
| Efficacy Data | Half Maximal Inhibitory Concentration (IC50) | > 66.00 nM | Negative HER2 expression (HER2 -) | ||
| Method Description |
Cells were cultured in a 10% fetal bovine serum (FBS)-containing RPMI 1640 medium and were planted into 96-well plates with 6000 cells per well. The plates were incubated overnight at 37°C in a 5% CO2 cell incubator.
|
||||
| In Vitro Model | Breast adenocarcinoma | MDA-MB-231 cells | CVCL_0062 | ||
HER2-gsADC-24 [Investigative]
Revealed Based on the Cell Line Data
| Experiment 1 Reporting the Activity Date of This ADC | [206] | ||||
| Efficacy Data | Half Maximal Inhibitory Concentration (IC50) |
0.02 nM
|
Positive HER2 expression (HER2+++/++) | ||
| Method Description |
Cells were cultured in a 10% fetal bovine serum (FBS)-containing RPMI 1640 medium and were planted into 96-well plates with 6000 cells per well. The plates were incubated overnight at 37°C in a 5% CO2 cell incubator.
|
||||
| In Vitro Model | Breast adenocarcinoma | SK-BR-3 cells | CVCL_0033 | ||
| Experiment 2 Reporting the Activity Date of This ADC | [206] | ||||
| Efficacy Data | Half Maximal Inhibitory Concentration (IC50) |
0.04 nM
|
Positive HER2 expression (HER2+++/++) | ||
| Method Description |
Cells were cultured in a 10% fetal bovine serum (FBS)-containing RPMI 1640 medium and were planted into 96-well plates with 6000 cells per well. The plates were incubated overnight at 37°C in a 5% CO2 cell incubator.
|
||||
| In Vitro Model | Gastric tubular adenocarcinoma | NCI-N87 cells | CVCL_1603 | ||
| Experiment 3 Reporting the Activity Date of This ADC | [206] | ||||
| Efficacy Data | Half Maximal Inhibitory Concentration (IC50) | > 66.00 nM | Negative HER2 expression (HER2 -) | ||
| Method Description |
Cells were cultured in a 10% fetal bovine serum (FBS)-containing RPMI 1640 medium and were planted into 96-well plates with 6000 cells per well. The plates were incubated overnight at 37°C in a 5% CO2 cell incubator.
|
||||
| In Vitro Model | Breast adenocarcinoma | MDA-MB-231 cells | CVCL_0062 | ||
HER2-gsADC-23 [Investigative]
Revealed Based on the Cell Line Data
| Experiment 1 Reporting the Activity Date of This ADC | [206] | ||||
| Efficacy Data | Half Maximal Inhibitory Concentration (IC50) |
0.02 nM
|
Positive HER2 expression (HER2+++/++) | ||
| Method Description |
Cells were cultured in a 10% fetal bovine serum (FBS)-containing RPMI 1640 medium and were planted into 96-well plates with 6000 cells per well. The plates were incubated overnight at 37°C in a 5% CO2 cell incubator.
|
||||
| In Vitro Model | Breast adenocarcinoma | SK-BR-3 cells | CVCL_0033 | ||
| Experiment 2 Reporting the Activity Date of This ADC | [206] | ||||
| Efficacy Data | Half Maximal Inhibitory Concentration (IC50) | > 66.00 nM | Positive HER2 expression (HER2+++/++) | ||
| Method Description |
Cells were cultured in a 10% fetal bovine serum (FBS)-containing RPMI 1640 medium and were planted into 96-well plates with 6000 cells per well. The plates were incubated overnight at 37°C in a 5% CO2 cell incubator.
|
||||
| In Vitro Model | Gastric tubular adenocarcinoma | NCI-N87 cells | CVCL_1603 | ||
| Experiment 3 Reporting the Activity Date of This ADC | [206] | ||||
| Efficacy Data | Half Maximal Inhibitory Concentration (IC50) | > 66.00 nM | Negative HER2 expression (HER2 -) | ||
| Method Description |
Cells were cultured in a 10% fetal bovine serum (FBS)-containing RPMI 1640 medium and were planted into 96-well plates with 6000 cells per well. The plates were incubated overnight at 37°C in a 5% CO2 cell incubator.
|
||||
| In Vitro Model | Breast adenocarcinoma | MDA-MB-231 cells | CVCL_0062 | ||
HER2-gsADC-13 [Investigative]
Revealed Based on the Cell Line Data
| Experiment 1 Reporting the Activity Date of This ADC | [206] | ||||
| Efficacy Data | Half Maximal Inhibitory Concentration (IC50) |
0.02 nM
|
Positive HER2 expression (HER2+++/++) | ||
| Method Description |
Cells were cultured in a 10% fetal bovine serum (FBS)-containing RPMI 1640 medium and were planted into 96-well plates with 6000 cells per well. The plates were incubated overnight at 37°C in a 5% CO2 cell incubator.
|
||||
| In Vitro Model | Gastric tubular adenocarcinoma | NCI-N87 cells | CVCL_1603 | ||
| Experiment 2 Reporting the Activity Date of This ADC | [206] | ||||
| Efficacy Data | Half Maximal Inhibitory Concentration (IC50) |
0.09 nM
|
Positive HER2 expression (HER2+++/++) | ||
| Method Description |
Cells were cultured in a 10% fetal bovine serum (FBS)-containing RPMI 1640 medium and were planted into 96-well plates with 6000 cells per well. The plates were incubated overnight at 37°C in a 5% CO2 cell incubator.
|
||||
| In Vitro Model | Breast adenocarcinoma | SK-BR-3 cells | CVCL_0033 | ||
| Experiment 3 Reporting the Activity Date of This ADC | [206] | ||||
| Efficacy Data | Half Maximal Inhibitory Concentration (IC50) | > 66.00 nM | Negative HER2 expression (HER2 -) | ||
| Method Description |
Cells were cultured in a 10% fetal bovine serum (FBS)-containing RPMI 1640 medium and were planted into 96-well plates with 6000 cells per well. The plates were incubated overnight at 37°C in a 5% CO2 cell incubator.
|
||||
| In Vitro Model | Breast adenocarcinoma | MDA-MB-231 cells | CVCL_0062 | ||
HER2-gsADC-3 [Investigative]
Revealed Based on the Cell Line Data
| Experiment 1 Reporting the Activity Date of This ADC | [206] | ||||
| Efficacy Data | Half Maximal Inhibitory Concentration (IC50) |
0.02 nM
|
Positive HER2 expression (HER2+++/++) | ||
| Method Description |
Cells were cultured in a 10% fetal bovine serum (FBS)-containing RPMI 1640 medium and were planted into 96-well plates with 6000 cells per well. The plates were incubated overnight at 37°C in a 5% CO2 cell incubator.
|
||||
| In Vitro Model | Breast adenocarcinoma | SK-BR-3 cells | CVCL_0033 | ||
| Experiment 2 Reporting the Activity Date of This ADC | [206] | ||||
| Efficacy Data | Half Maximal Inhibitory Concentration (IC50) |
0.03 nM
|
Positive HER2 expression (HER2+++/++) | ||
| Method Description |
Cells were cultured in a 10% fetal bovine serum (FBS)-containing RPMI 1640 medium and were planted into 96-well plates with 6000 cells per well. The plates were incubated overnight at 37°C in a 5% CO2 cell incubator.
|
||||
| In Vitro Model | Gastric tubular adenocarcinoma | NCI-N87 cells | CVCL_1603 | ||
| Experiment 3 Reporting the Activity Date of This ADC | [206] | ||||
| Efficacy Data | Half Maximal Inhibitory Concentration (IC50) | > 66.00 nM | Negative HER2 expression (HER2 -) | ||
| Method Description |
Cells were cultured in a 10% fetal bovine serum (FBS)-containing RPMI 1640 medium and were planted into 96-well plates with 6000 cells per well. The plates were incubated overnight at 37°C in a 5% CO2 cell incubator.
|
||||
| In Vitro Model | Breast adenocarcinoma | MDA-MB-231 cells | CVCL_0062 | ||
H32-VCMMAE_6.6 [Investigative]
Revealed Based on the Cell Line Data
| Experiment 1 Reporting the Activity Date of This ADC | [246] | ||||
| Efficacy Data | Half Maximal Inhibitory Concentration (IC50) |
0.02 nM
|
High HER2 expression (HER2 +++) | ||
| Method Description |
To determine the IC50 values of the ADCs, different concentrations of each conjugate was directly added to the culture medium. After the cells were cultured for 3 days at 37°C, the number of viable cells was quantified by using the WST- reagent, and the absorbance was measured at OD450.
|
||||
| In Vitro Model | Invasive breast carcinoma | BT-474 cells | CVCL_0179 | ||
| Experiment 2 Reporting the Activity Date of This ADC | [246] | ||||
| Efficacy Data | Half Maximal Inhibitory Concentration (IC50) |
0.03 nM
|
High HER2 expression (HER2 +++) | ||
| Method Description |
To determine the IC50 values of the ADCs, different concentrations of each conjugate was directly added to the culture medium. After the cells were cultured for 3 days at 37°C, the number of viable cells was quantified by using the WST- reagent, and the absorbance was measured at OD450.
|
||||
| In Vitro Model | Breast adenocarcinoma | SK-BR-3 cells | CVCL_0033 | ||
| Experiment 3 Reporting the Activity Date of This ADC | [246] | ||||
| Efficacy Data | Half Maximal Inhibitory Concentration (IC50) |
0.50 nM±0.04 nM
|
High HER2 expression (HER2 +++) | ||
| Method Description |
To determine the IC50 values of the ADCs, different concentrations of each conjugate was directly added to the culture medium. After the cells were cultured for 3 days at 37°C, the number of viable cells was quantified by using the WST- reagent, and the absorbance was measured at OD450.
|
||||
| In Vitro Model | Gastric tubular adenocarcinoma | NCI-N87 cells | CVCL_1603 | ||
Trastuzumab biosimilar mil40 12c [Investigative]
Revealed Based on the Cell Line Data
| Experiment 1 Reporting the Activity Date of This ADC | [247] | ||||
| Efficacy Data | Half Maximal Inhibitory Concentration (IC50) |
0.02 nM
|
Positive HER2 expression (HER2 +++/++) | ||
| Method Description |
Each group was established three holes, tumor cells (30,000 cells/mL) were added to each well of plate after which 10L of test compounds solution was added. The plates were incubated for seven days at 37°C, then, incubated at RT. Cell Titer Glo reagent (40L) was added to each well, and incubated the plates for another 30min.
|
||||
| In Vitro Model | Breast adenocarcinoma | SK-BR-3 cells | CVCL_0033 | ||
| Experiment 2 Reporting the Activity Date of This ADC | [247] | ||||
| Efficacy Data | Half Maximal Inhibitory Concentration (IC50) |
0.06 nM
|
Positive HER2 expression (HER2 +++/++) | ||
| Method Description |
Each group was established three holes, tumor cells (30,000 cells/mL) were added to each well of plate after which 10L of test compounds solution was added. The plates were incubated for seven days at 37°C, then, incubated at RT. Cell Titer Glo reagent (40L) was added to each well, and incubated the plates for another 30min.
|
||||
| In Vitro Model | Gastric tubular adenocarcinoma | NCI-N87 cells | CVCL_1603 | ||
| Experiment 3 Reporting the Activity Date of This ADC | [247] | ||||
| Efficacy Data | Half Maximal Inhibitory Concentration (IC50) |
0.10 nM
|
Positive HER2 expression (HER2 +++/++) | ||
| Method Description |
Each group was established three holes, tumor cells (30,000 cells/mL) were added to each well of plate after which 10L of test compounds solution was added. The plates were incubated for seven days at 37°C, then, incubated at RT. Cell Titer Glo reagent (40L) was added to each well, and incubated the plates for another 30min.
|
||||
| In Vitro Model | Invasive breast carcinoma | BT-474 cells | CVCL_0179 | ||
| Experiment 4 Reporting the Activity Date of This ADC | [247] | ||||
| Efficacy Data | Half Maximal Inhibitory Concentration (IC50) |
0.24 nM
|
Positive HER2 expression (HER2 +++/++) | ||
| Method Description |
Each group was established three holes, tumor cells (30,000 cells/mL) were added to each well of plate after which 10L of test compounds solution was added. The plates were incubated for seven days at 37°C, then, incubated at RT. Cell Titer Glo reagent (40L) was added to each well, and incubated the plates for another 30min.
|
||||
| In Vitro Model | Ovarian serous cystadenocarcinoma | SK-OV-3 cells | CVCL_0532 | ||
| Experiment 5 Reporting the Activity Date of This ADC | [247] | ||||
| Efficacy Data | Half Maximal Inhibitory Concentration (IC50) |
12.71 nM
|
Negative HER2 expression (HER2 -) | ||
| Method Description |
Each group was established three holes, tumor cells (30,000 cells/mL) were added to each well of plate after which 10L of test compounds solution was added. The plates were incubated for seven days at 37°C, then, incubated at RT. Cell Titer Glo reagent (40L) was added to each well, and incubated the plates for another 30min.
|
||||
| In Vitro Model | Breast adenocarcinoma | MDA-MB-468 cells | CVCL_0419 | ||
| Experiment 6 Reporting the Activity Date of This ADC | [247] | ||||
| Efficacy Data | Half Maximal Inhibitory Concentration (IC50) |
20.07 nM
|
Negative HER2 expression (HER2 -) | ||
| Method Description |
Each group was established three holes, tumor cells (30,000 cells/mL) were added to each well of plate after which 10L of test compounds solution was added. The plates were incubated for seven days at 37°C, then, incubated at RT. Cell Titer Glo reagent (40L) was added to each well, and incubated the plates for another 30min.
|
||||
| In Vitro Model | Invasive breast carcinoma | MCF-7 cells | CVCL_0031 | ||
Trastuzumab biosimilar mil40 12a [Investigative]
Revealed Based on the Cell Line Data
| Experiment 1 Reporting the Activity Date of This ADC | [247] | ||||
| Efficacy Data | Half Maximal Inhibitory Concentration (IC50) |
0.02 nM
|
Positive HER2 expression (HER2 +++/++) | ||
| Method Description |
Each group was established three holes, tumor cells (30,000 cells/mL) were added to each well of plate after which 10L of test compounds solution was added. The plates were incubated for seven days at 37°C, then, incubated at RT. Cell Titer Glo reagent (40L) was added to each well, and incubated the plates for another 30min.
|
||||
| In Vitro Model | Breast adenocarcinoma | SK-BR-3 cells | CVCL_0033 | ||
| Experiment 2 Reporting the Activity Date of This ADC | [247] | ||||
| Efficacy Data | Half Maximal Inhibitory Concentration (IC50) |
0.05 nM
|
Positive HER2 expression (HER2 +++/++) | ||
| Method Description |
Each group was established three holes, tumor cells (30,000 cells/mL) were added to each well of plate after which 10L of test compounds solution was added. The plates were incubated for seven days at 37°C, then, incubated at RT. Cell Titer Glo reagent (40L) was added to each well, and incubated the plates for another 30min.
|
||||
| In Vitro Model | Gastric tubular adenocarcinoma | NCI-N87 cells | CVCL_1603 | ||
| Experiment 3 Reporting the Activity Date of This ADC | [247] | ||||
| Efficacy Data | Half Maximal Inhibitory Concentration (IC50) |
0.09 nM
|
Positive HER2 expression (HER2 +++/++) | ||
| Method Description |
Each group was established three holes, tumor cells (30,000 cells/mL) were added to each well of plate after which 10L of test compounds solution was added. The plates were incubated for seven days at 37°C, then, incubated at RT. Cell Titer Glo reagent (40L) was added to each well, and incubated the plates for another 30min.
|
||||
| In Vitro Model | Invasive breast carcinoma | BT-474 cells | CVCL_0179 | ||
| Experiment 4 Reporting the Activity Date of This ADC | [247] | ||||
| Efficacy Data | Half Maximal Inhibitory Concentration (IC50) |
0.22 nM
|
Positive HER2 expression (HER2 +++/++) | ||
| Method Description |
Each group was established three holes, tumor cells (30,000 cells/mL) were added to each well of plate after which 10L of test compounds solution was added. The plates were incubated for seven days at 37°C, then, incubated at RT. Cell Titer Glo reagent (40L) was added to each well, and incubated the plates for another 30min.
|
||||
| In Vitro Model | Ovarian serous cystadenocarcinoma | SK-OV-3 cells | CVCL_0532 | ||
| Experiment 5 Reporting the Activity Date of This ADC | [247] | ||||
| Efficacy Data | Half Maximal Inhibitory Concentration (IC50) |
23.31 nM
|
Negative HER2 expression (HER2 -) | ||
| Method Description |
Each group was established three holes, tumor cells (30,000 cells/mL) were added to each well of plate after which 10L of test compounds solution was added. The plates were incubated for seven days at 37°C, then, incubated at RT. Cell Titer Glo reagent (40L) was added to each well, and incubated the plates for another 30min.
|
||||
| In Vitro Model | Invasive breast carcinoma | MCF-7 cells | CVCL_0031 | ||
| Experiment 6 Reporting the Activity Date of This ADC | [247] | ||||
| Efficacy Data | Half Maximal Inhibitory Concentration (IC50) |
24.14 nM
|
Negative HER2 expression (HER2 -) | ||
| Method Description |
Each group was established three holes, tumor cells (30,000 cells/mL) were added to each well of plate after which 10L of test compounds solution was added. The plates were incubated for seven days at 37°C, then, incubated at RT. Cell Titer Glo reagent (40L) was added to each well, and incubated the plates for another 30min.
|
||||
| In Vitro Model | Breast adenocarcinoma | MDA-MB-468 cells | CVCL_0419 | ||
Glyco-cetuximab Fab-vc-MMAE [Investigative]
Revealed Based on the Cell Line Data
| Experiment 1 Reporting the Activity Date of This ADC | [245] | ||||
| Efficacy Data | Half Maximal Inhibitory Concentration (IC50) |
0.02 nM
|
High EGFR expression (EGFR+++) | ||
| Method Description |
The effect of MMAE-conjugated cetuximab ADCs on the viability of U87 glioblastoma cells that express EGFR.
|
||||
| In Vitro Model | Glioblastoma | U-87MG cells | CVCL_0022 | ||
Mil40-12C [Investigative]
Revealed Based on the Cell Line Data
| Experiment 1 Reporting the Activity Date of This ADC | [220] | ||||
| Efficacy Data | Half Maximal Inhibitory Concentration (IC50) |
0.02 nM
|
High HER2 expression (HER2+++) | ||
| Method Description |
To evaluate the cytotoxicity, multiple tumor cell lines were treated with three generated maleamic methyl ester-based ADCs. Each group was established three holes, tumor cells (3 x10⁴ cells/mL) were added to each well of plate after which 10uL of test compounds solution was added.
|
||||
| In Vitro Model | Breast adenocarcinoma | SK-BR-3 cells | CVCL_0033 | ||
| Experiment 2 Reporting the Activity Date of This ADC | [220] | ||||
| Efficacy Data | Half Maximal Inhibitory Concentration (IC50) |
0.06 nM
|
High HER2 expression (HER2+++) | ||
| Method Description |
To evaluate the cytotoxicity, multiple tumor cell lines were treated with three generated maleamic methyl ester-based ADCs. Each group was established three holes, tumor cells (3 x10⁴ cells/mL) were added to each well of plate after which 10uL of test compounds solution was added.
|
||||
| In Vitro Model | Gastric tubular adenocarcinoma | NCI-N87 cells | CVCL_1603 | ||
| Experiment 3 Reporting the Activity Date of This ADC | [220] | ||||
| Efficacy Data | Half Maximal Inhibitory Concentration (IC50) |
0.10 nM
|
High HER2 expression (HER2+++) | ||
| Method Description |
To evaluate the cytotoxicity, multiple tumor cell lines were treated with three generated maleamic methyl ester-based ADCs. Each group was established three holes, tumor cells (3 x10⁴ cells/mL) were added to each well of plate after which 10uL of test compounds solution was added.
|
||||
| In Vitro Model | Invasive breast carcinoma | BT-474 cells | CVCL_0179 | ||
| Experiment 4 Reporting the Activity Date of This ADC | [220] | ||||
| Efficacy Data | Half Maximal Inhibitory Concentration (IC50) |
0.24 nM
|
High HER2 expression (HER2+++) | ||
| Method Description |
To evaluate the cytotoxicity, multiple tumor cell lines were treated with three generated maleamic methyl ester-based ADCs. Each group was established three holes, tumor cells (3 x10⁴ cells/mL) were added to each well of plate after which 10uL of test compounds solution was added.
|
||||
| In Vitro Model | Ovarian serous cystadenocarcinoma | SK-OV-3 cells | CVCL_0532 | ||
| Experiment 5 Reporting the Activity Date of This ADC | [220] | ||||
| Efficacy Data | Half Maximal Inhibitory Concentration (IC50) |
12.71 nM
|
Negative HER2 expression (HER2-) | ||
| Method Description |
To evaluate the cytotoxicity, multiple tumor cell lines were treated with three generated maleamic methyl ester-based ADCs. Each group was established three holes, tumor cells (3x10⁴ cells/mL) were added to each well of plate after which 10uL of test compounds solution was added.
|
||||
| In Vitro Model | Breast adenocarcinoma | MDA-MB-468 cells | CVCL_0419 | ||
| Experiment 6 Reporting the Activity Date of This ADC | [220] | ||||
| Efficacy Data | Half Maximal Inhibitory Concentration (IC50) |
20.07 nM
|
Negative HER2 expression (HER2-) | ||
| Method Description |
To evaluate the cytotoxicity, multiple tumor cell lines were treated with three generated maleamic methyl ester-based ADCs. Each group was established three holes, tumor cells (3x10⁴ cells/mL) were added to each well of plate after which 10uL of test compounds solution was added.
|
||||
| In Vitro Model | Invasive breast carcinoma | MCF-7 cells | CVCL_0031 | ||
Mil40-12A [Investigative]
Revealed Based on the Cell Line Data
| Experiment 1 Reporting the Activity Date of This ADC | [220] | ||||
| Efficacy Data | Half Maximal Inhibitory Concentration (IC50) |
0.02 nM
|
High HER2 expression (HER2+++) | ||
| Method Description |
To evaluate the cytotoxicity, multiple tumor cell lines were treated with three generated maleamic methyl ester-based ADCs. Each group was established three holes, tumor cells (3 x10⁴ cells/mL) were added to each well of plate after which 10uL of test compounds solution was added.
|
||||
| In Vitro Model | Breast adenocarcinoma | SK-BR-3 cells | CVCL_0033 | ||
| Experiment 2 Reporting the Activity Date of This ADC | [220] | ||||
| Efficacy Data | Half Maximal Inhibitory Concentration (IC50) |
0.05 nM
|
High HER2 expression (HER2+++) | ||
| Method Description |
To evaluate the cytotoxicity, multiple tumor cell lines were treated with three generated maleamic methyl ester-based ADCs. Each group was established three holes, tumor cells (3 x10⁴ cells/mL) were added to each well of plate after which 10uL of test compounds solution was added.
|
||||
| In Vitro Model | Gastric tubular adenocarcinoma | NCI-N87 cells | CVCL_1603 | ||
| Experiment 3 Reporting the Activity Date of This ADC | [220] | ||||
| Efficacy Data | Half Maximal Inhibitory Concentration (IC50) |
0.09 nM
|
High HER2 expression (HER2+++) | ||
| Method Description |
To evaluate the cytotoxicity, multiple tumor cell lines were treated with three generated maleamic methyl ester-based ADCs. Each group was established three holes, tumor cells (3 x10⁴ cells/mL) were added to each well of plate after which 10uL of test compounds solution was added.
|
||||
| In Vitro Model | Invasive breast carcinoma | BT-474 cells | CVCL_0179 | ||
| Experiment 4 Reporting the Activity Date of This ADC | [220] | ||||
| Efficacy Data | Half Maximal Inhibitory Concentration (IC50) |
0.22 nM
|
High HER2 expression (HER2+++) | ||
| Method Description |
To evaluate the cytotoxicity, multiple tumor cell lines were treated with three generated maleamic methyl ester-based ADCs. Each group was established three holes, tumor cells (3 x10⁴ cells/mL) were added to each well of plate after which 10uL of test compounds solution was added.
|
||||
| In Vitro Model | Ovarian serous cystadenocarcinoma | SK-OV-3 cells | CVCL_0532 | ||
| Experiment 5 Reporting the Activity Date of This ADC | [220] | ||||
| Efficacy Data | Half Maximal Inhibitory Concentration (IC50) |
23.31 nM
|
Negative HER2 expression (HER2-) | ||
| Method Description |
To evaluate the cytotoxicity, multiple tumor cell lines were treated with three generated maleamic methyl ester-based ADCs. Each group was established three holes, tumor cells (3x10⁴ cells/mL) were added to each well of plate after which 10uL of test compounds solution was added.
|
||||
| In Vitro Model | Invasive breast carcinoma | MCF-7 cells | CVCL_0031 | ||
| Experiment 6 Reporting the Activity Date of This ADC | [220] | ||||
| Efficacy Data | Half Maximal Inhibitory Concentration (IC50) |
24.14 nM
|
Negative HER2 expression (HER2-) | ||
| Method Description |
To evaluate the cytotoxicity, multiple tumor cell lines were treated with three generated maleamic methyl ester-based ADCs. Each group was established three holes, tumor cells (3x10⁴ cells/mL) were added to each well of plate after which 10uL of test compounds solution was added.
|
||||
| In Vitro Model | Breast adenocarcinoma | MDA-MB-468 cells | CVCL_0419 | ||
HER2-gsADC-49 [Investigative]
Revealed Based on the Cell Line Data
| Experiment 1 Reporting the Activity Date of This ADC | [206] | ||||
| Efficacy Data | Half Maximal Inhibitory Concentration (IC50) |
0.03 nM
|
Positive HER2 expression (HER2+++/++) | ||
| Method Description |
Cells were cultured in a 10% fetal bovine serum (FBS)-containing RPMI 1640 medium and were planted into 96-well plates with 6000 cells per well. The plates were incubated overnight at 37°C in a 5% CO2 cell incubator.
|
||||
| In Vitro Model | Breast adenocarcinoma | SK-BR-3 cells | CVCL_0033 | ||
| Experiment 2 Reporting the Activity Date of This ADC | [206] | ||||
| Efficacy Data | Half Maximal Inhibitory Concentration (IC50) |
0.31 nM
|
Positive HER2 expression (HER2+++/++) | ||
| Method Description |
Cells were cultured in a 10% fetal bovine serum (FBS)-containing RPMI 1640 medium and were planted into 96-well plates with 6000 cells per well. The plates were incubated overnight at 37°C in a 5% CO2 cell incubator.
|
||||
| In Vitro Model | Gastric tubular adenocarcinoma | NCI-N87 cells | CVCL_1603 | ||
| Experiment 3 Reporting the Activity Date of This ADC | [206] | ||||
| Efficacy Data | Half Maximal Inhibitory Concentration (IC50) | > 66.00 nM | Negative HER2 expression (HER2 -) | ||
| Method Description |
Cells were cultured in a 10% fetal bovine serum (FBS)-containing RPMI 1640 medium and were planted into 96-well plates with 6000 cells per well. The plates were incubated overnight at 37°C in a 5% CO2 cell incubator.
|
||||
| In Vitro Model | Breast adenocarcinoma | MDA-MB-231 cells | CVCL_0062 | ||
HER2-gsADC-22 [Investigative]
Revealed Based on the Cell Line Data
| Experiment 1 Reporting the Activity Date of This ADC | [206] | ||||
| Efficacy Data | Half Maximal Inhibitory Concentration (IC50) |
0.03 nM
|
Positive HER2 expression (HER2+++/++) | ||
| Method Description |
Cells were cultured in a 10% fetal bovine serum (FBS)-containing RPMI 1640 medium and were planted into 96-well plates with 6000 cells per well. The plates were incubated overnight at 37°C in a 5% CO2 cell incubator.
|
||||
| In Vitro Model | Breast adenocarcinoma | SK-BR-3 cells | CVCL_0033 | ||
| Experiment 2 Reporting the Activity Date of This ADC | [206] | ||||
| Efficacy Data | Half Maximal Inhibitory Concentration (IC50) | > 66.00 nM | Positive HER2 expression (HER2+++/++) | ||
| Method Description |
Cells were cultured in a 10% fetal bovine serum (FBS)-containing RPMI 1640 medium and were planted into 96-well plates with 6000 cells per well. The plates were incubated overnight at 37°C in a 5% CO2 cell incubator.
|
||||
| In Vitro Model | Gastric tubular adenocarcinoma | NCI-N87 cells | CVCL_1603 | ||
| Experiment 3 Reporting the Activity Date of This ADC | [206] | ||||
| Efficacy Data | Half Maximal Inhibitory Concentration (IC50) | > 66.00 nM | Negative HER2 expression (HER2 -) | ||
| Method Description |
Cells were cultured in a 10% fetal bovine serum (FBS)-containing RPMI 1640 medium and were planted into 96-well plates with 6000 cells per well. The plates were incubated overnight at 37°C in a 5% CO2 cell incubator.
|
||||
| In Vitro Model | Breast adenocarcinoma | MDA-MB-231 cells | CVCL_0062 | ||
HER2-gsADC-2 [Investigative]
Revealed Based on the Cell Line Data
| Experiment 1 Reporting the Activity Date of This ADC | [206] | ||||
| Efficacy Data | Half Maximal Inhibitory Concentration (IC50) |
0.03 nM
|
Positive HER2 expression (HER2+++/++) | ||
| Method Description |
Cells were cultured in a 10% fetal bovine serum (FBS)-containing RPMI 1640 medium and were planted into 96-well plates with 6000 cells per well. The plates were incubated overnight at 37°C in a 5% CO2 cell incubator.
|
||||
| In Vitro Model | Gastric tubular adenocarcinoma | NCI-N87 cells | CVCL_1603 | ||
| Experiment 2 Reporting the Activity Date of This ADC | [206] | ||||
| Efficacy Data | Half Maximal Inhibitory Concentration (IC50) |
0.11 nM
|
Positive HER2 expression (HER2+++/++) | ||
| Method Description |
Cells were cultured in a 10% fetal bovine serum (FBS)-containing RPMI 1640 medium and were planted into 96-well plates with 6000 cells per well. The plates were incubated overnight at 37°C in a 5% CO2 cell incubator.
|
||||
| In Vitro Model | Breast adenocarcinoma | SK-BR-3 cells | CVCL_0033 | ||
| Experiment 3 Reporting the Activity Date of This ADC | [206] | ||||
| Efficacy Data | Half Maximal Inhibitory Concentration (IC50) | > 66.00 nM | Negative HER2 expression (HER2 -) | ||
| Method Description |
Cells were cultured in a 10% fetal bovine serum (FBS)-containing RPMI 1640 medium and were planted into 96-well plates with 6000 cells per well. The plates were incubated overnight at 37°C in a 5% CO2 cell incubator.
|
||||
| In Vitro Model | Breast adenocarcinoma | MDA-MB-231 cells | CVCL_0062 | ||
Trastuzumab biosimilar mil40 12b [Investigative]
Revealed Based on the Cell Line Data
| Experiment 1 Reporting the Activity Date of This ADC | [247] | ||||
| Efficacy Data | Half Maximal Inhibitory Concentration (IC50) |
0.03 nM
|
Positive HER2 expression (HER2 +++/++) | ||
| Method Description |
Each group was established three holes, tumor cells (30,000 cells/mL) were added to each well of plate after which 10L of test compounds solution was added. The plates were incubated for seven days at 37°C, then, incubated at RT. Cell Titer Glo reagent (40L) was added to each well, and incubated the plates for another 30min.
|
||||
| In Vitro Model | Breast adenocarcinoma | SK-BR-3 cells | CVCL_0033 | ||
| Experiment 2 Reporting the Activity Date of This ADC | [247] | ||||
| Efficacy Data | Half Maximal Inhibitory Concentration (IC50) |
0.05 nM
|
Positive HER2 expression (HER2 +++/++) | ||
| Method Description |
Each group was established three holes, tumor cells (30,000 cells/mL) were added to each well of plate after which 10L of test compounds solution was added. The plates were incubated for seven days at 37°C, then, incubated at RT. Cell Titer Glo reagent (40L) was added to each well, and incubated the plates for another 30min.
|
||||
| In Vitro Model | Gastric tubular adenocarcinoma | NCI-N87 cells | CVCL_1603 | ||
| Experiment 3 Reporting the Activity Date of This ADC | [247] | ||||
| Efficacy Data | Half Maximal Inhibitory Concentration (IC50) |
0.10 nM
|
Positive HER2 expression (HER2 +++/++) | ||
| Method Description |
Each group was established three holes, tumor cells (30,000 cells/mL) were added to each well of plate after which 10L of test compounds solution was added. The plates were incubated for seven days at 37°C, then, incubated at RT. Cell Titer Glo reagent (40L) was added to each well, and incubated the plates for another 30min.
|
||||
| In Vitro Model | Invasive breast carcinoma | BT-474 cells | CVCL_0179 | ||
| Experiment 4 Reporting the Activity Date of This ADC | [247] | ||||
| Efficacy Data | Half Maximal Inhibitory Concentration (IC50) |
0.21 nM
|
Positive HER2 expression (HER2 +++/++) | ||
| Method Description |
Each group was established three holes, tumor cells (30,000 cells/mL) were added to each well of plate after which 10L of test compounds solution was added. The plates were incubated for seven days at 37°C, then, incubated at RT. Cell Titer Glo reagent (40L) was added to each well, and incubated the plates for another 30min.
|
||||
| In Vitro Model | Ovarian serous cystadenocarcinoma | SK-OV-3 cells | CVCL_0532 | ||
| Experiment 5 Reporting the Activity Date of This ADC | [247] | ||||
| Efficacy Data | Half Maximal Inhibitory Concentration (IC50) |
11.51 nM
|
Negative HER2 expression (HER2 -) | ||
| Method Description |
Each group was established three holes, tumor cells (30,000 cells/mL) were added to each well of plate after which 10L of test compounds solution was added. The plates were incubated for seven days at 37°C, then, incubated at RT. Cell Titer Glo reagent (40L) was added to each well, and incubated the plates for another 30min.
|
||||
| In Vitro Model | Breast adenocarcinoma | MDA-MB-468 cells | CVCL_0419 | ||
| Experiment 6 Reporting the Activity Date of This ADC | [247] | ||||
| Efficacy Data | Half Maximal Inhibitory Concentration (IC50) |
26.44 nM
|
Negative HER2 expression (HER2 -) | ||
| Method Description |
Each group was established three holes, tumor cells (30,000 cells/mL) were added to each well of plate after which 10L of test compounds solution was added. The plates were incubated for seven days at 37°C, then, incubated at RT. Cell Titer Glo reagent (40L) was added to each well, and incubated the plates for another 30min.
|
||||
| In Vitro Model | Invasive breast carcinoma | MCF-7 cells | CVCL_0031 | ||
Cetux Fc/Fab-vc-MMAE [Investigative]
Revealed Based on the Cell Line Data
| Experiment 1 Reporting the Activity Date of This ADC | [245] | ||||
| Efficacy Data | Half Maximal Inhibitory Concentration (IC50) |
0.03 nM
|
High EGFR expression (EGFR+++/++) | ||
| Method Description |
Cells were incubated with a serial dilution of conjugate, and a mixture of conjugate and excess, unconjugated anti-EGFR. After 4 days of continuous treatment with conjugates, cell viability was determined using Cell Titer Glo reagent.
|
||||
| In Vitro Model | Glioblastoma | U-87MG cells | CVCL_0022 | ||
| Experiment 2 Reporting the Activity Date of This ADC | [245] | ||||
| Efficacy Data | Half Maximal Inhibitory Concentration (IC50) |
0.03 nM
|
High EGFR expression (EGFR+++) | ||
| Method Description |
The effect of MMAE-conjugated cetuximab ADCs on the viability of U87 glioblastoma cells that express EGFR.
|
||||
| In Vitro Model | Glioblastoma | U-87MG cells | CVCL_0022 | ||
Cetux Cys-vc-MMAE [Investigative]
Revealed Based on the Cell Line Data
| Experiment 1 Reporting the Activity Date of This ADC | [245] | ||||
| Efficacy Data | Half Maximal Inhibitory Concentration (IC50) |
0.03 nM
|
High EGFR expression (EGFR+++/++) | ||
| Method Description |
Cells were incubated with a serial dilution of conjugate, and a mixture of conjugate and excess, unconjugated anti-EGFR. After 4 days of continuous treatment with conjugates, cell viability was determined using Cell Titer Glo reagent.
|
||||
| In Vitro Model | Glioblastoma | U-87MG cells | CVCL_0022 | ||
| Experiment 2 Reporting the Activity Date of This ADC | [245] | ||||
| Efficacy Data | Half Maximal Inhibitory Concentration (IC50) |
0.03 nM
|
High EGFR expression (EGFR+++) | ||
| Method Description |
The effect of MMAE-conjugated cetuximab ADCs on the viability of U87 glioblastoma cells that express EGFR.
|
||||
| In Vitro Model | Glioblastoma | U-87MG cells | CVCL_0022 | ||
WO2017089895A1 ADC49 [Investigative]
Revealed Based on the Cell Line Data
| Experiment 1 Reporting the Activity Date of This ADC | [235] | ||||
| Efficacy Data | Half Maximal Inhibitory Concentration (IC50) |
0.03 nM
|
Positive HER2 expression (HER2+++/++) | ||
| Method Description |
Anti-proliferation activities of the antibodies, drugs, and conjugates with regard tothe cancer cell lines were measured. The cells were plated in 96-well, tissue culture platesat 10,000 cells per well. After 24 hour incubation, the antibodies, drugs, and conjugateswere added in various concentrations. The number of viable cells after 72 hours were counted using SRB assay.
Click to Show/Hide
|
||||
| In Vitro Model | Breast adenocarcinoma | SK-BR-3 cells | CVCL_0033 | ||
| Experiment 2 Reporting the Activity Date of This ADC | [235] | ||||
| Efficacy Data | Half Maximal Inhibitory Concentration (IC50) |
0.05 nM
|
Positive HER2 expression (HER2+++/++) | ||
| Method Description |
Anti-proliferation activities of the antibodies, drugs, and conjugates with regard tothe cancer cell lines were measured. The cells were plated in 96-well, tissue culture platesat 10,000 cells per well. After 24 hour incubation, the antibodies, drugs, and conjugateswere added in various concentrations. The number of viable cells after 72 hours were counted using SRB assay.
Click to Show/Hide
|
||||
| In Vitro Model | Breast ductal carcinoma | JIMT-1 cells | CVCL_2077 | ||
| Experiment 3 Reporting the Activity Date of This ADC | [235] | ||||
| Efficacy Data | Half Maximal Inhibitory Concentration (IC50) | > 33.33 nM | Negative HER2 expression (HER2-) | ||
| Method Description |
Anti-proliferation activities of the antibodies, drugs, and conjugates with regard tothe cancer cell lines were measured. The cells were plated in 96-well, tissue culture platesat 10,000 cells per well. After 24 hour incubation, the antibodies, drugs, and conjugateswere added in various concentrations. The number of viable cells after 72 hours were counted using SRB assay.
Click to Show/Hide
|
||||
| In Vitro Model | Invasive breast carcinoma | MCF-7 cells | CVCL_0031 | ||
WO2017089895A1 ADC45 [Investigative]
Revealed Based on the Cell Line Data
| Experiment 1 Reporting the Activity Date of This ADC | [235] | ||||
| Efficacy Data | Half Maximal Inhibitory Concentration (IC50) |
0.03 nM
|
Positive HER2 expression (HER2+++/++) | ||
| Method Description |
Anti-proliferation activities of the antibodies, drugs, and conjugates with regard tothe cancer cell lines were measured. The cells were plated in 96-well, tissue culture platesat 10,000 cells per well. After 24 hour incubation, the antibodies, drugs, and conjugateswere added in various concentrations. The number of viable cells after 72 hours were counted using SRB assay.
Click to Show/Hide
|
||||
| In Vitro Model | Breast adenocarcinoma | SK-BR-3 cells | CVCL_0033 | ||
| Experiment 2 Reporting the Activity Date of This ADC | [235] | ||||
| Efficacy Data | Half Maximal Inhibitory Concentration (IC50) |
0.04 nM
|
Positive HER2 expression (HER2+++/++) | ||
| Method Description |
ADCs wereincubated in human plasma for 5 seconds (0h), followed by SRB invitro cytotoxicity test using SK-BR3 cells for 72hr.
|
||||
| In Vitro Model | Breast adenocarcinoma | SK-BR-3 cells | CVCL_0033 | ||
| Experiment 3 Reporting the Activity Date of This ADC | [235] | ||||
| Efficacy Data | Half Maximal Inhibitory Concentration (IC50) |
0.05 nM
|
Positive HER2 expression (HER2+++/++) | ||
| Method Description |
ADCs wereincubated in human plasma for 168 hours (168h), followed by SRB invitro cytotoxicity test using SK-BR3 cells for 72hr.
|
||||
| In Vitro Model | Breast adenocarcinoma | SK-BR-3 cells | CVCL_0033 | ||
| Experiment 4 Reporting the Activity Date of This ADC | [235] | ||||
| Efficacy Data | Half Maximal Inhibitory Concentration (IC50) |
0.08 nM
|
Positive HER2 expression (HER2+++/++) | ||
| Method Description |
Anti-proliferation activities of the antibodies, drugs, and conjugates with regard tothe cancer cell lines were measured. The cells were plated in 96-well, tissue culture platesat 10,000 cells per well. After 24 hour incubation, the antibodies, drugs, and conjugateswere added in various concentrations. The number of viable cells after 72 hours were counted using SRB assay.
Click to Show/Hide
|
||||
| In Vitro Model | Breast ductal carcinoma | JIMT-1 cells | CVCL_2077 | ||
| Experiment 5 Reporting the Activity Date of This ADC | [235] | ||||
| Efficacy Data | Half Maximal Inhibitory Concentration (IC50) | > 33.33 nM | Negative HER2 expression (HER2-) | ||
| Method Description |
Anti-proliferation activities of the antibodies, drugs, and conjugates with regard tothe cancer cell lines were measured. The cells were plated in 96-well, tissue culture platesat 10,000 cells per well. After 24 hour incubation, the antibodies, drugs, and conjugateswere added in various concentrations. The number of viable cells after 72 hours were counted using SRB assay.
Click to Show/Hide
|
||||
| In Vitro Model | Invasive breast carcinoma | MCF-7 cells | CVCL_0031 | ||
WO2017089895A1 ADC43 [Investigative]
Revealed Based on the Cell Line Data
| Experiment 1 Reporting the Activity Date of This ADC | [235] | ||||
| Efficacy Data | Half Maximal Inhibitory Concentration (IC50) |
0.03 nM
|
Positive HER2 expression (HER2+++/++) | ||
| Method Description |
Anti-proliferation activities of the antibodies, drugs, and conjugates with regard tothe cancer cell lines were measured. The cells were plated in 96-well, tissue culture platesat 10,000 cells per well. After 24 hour incubation, the antibodies, drugs, and conjugateswere added in various concentrations. The number of viable cells after 72 hours were counted using SRB assay.
Click to Show/Hide
|
||||
| In Vitro Model | Breast adenocarcinoma | SK-BR-3 cells | CVCL_0033 | ||
| Experiment 2 Reporting the Activity Date of This ADC | [235] | ||||
| Efficacy Data | Half Maximal Inhibitory Concentration (IC50) |
0.04 nM
|
Positive HER2 expression (HER2+++/++) | ||
| Method Description |
Anti-proliferation activities of the antibodies, drugs, and conjugates with regard tothe cancer cell lines were measured. The cells were plated in 96-well, tissue culture platesat 10,000 cells per well. After 24 hour incubation, the antibodies, drugs, and conjugateswere added in various concentrations. The number of viable cells after 72 hours were counted using SRB assay.
Click to Show/Hide
|
||||
| In Vitro Model | Breast ductal carcinoma | JIMT-1 cells | CVCL_2077 | ||
| Experiment 3 Reporting the Activity Date of This ADC | [235] | ||||
| Efficacy Data | Half Maximal Inhibitory Concentration (IC50) | > 33.33 nM | Negative HER2 expression (HER2-) | ||
| Method Description |
Anti-proliferation activities of the antibodies, drugs, and conjugates with regard tothe cancer cell lines were measured. The cells were plated in 96-well, tissue culture platesat 10,000 cells per well. After 24 hour incubation, the antibodies, drugs, and conjugateswere added in various concentrations. The number of viable cells after 72 hours were counted using SRB assay.
Click to Show/Hide
|
||||
| In Vitro Model | Invasive breast carcinoma | MCF-7 cells | CVCL_0031 | ||
WO2017089895A1 ADC41 [Investigative]
Revealed Based on the Cell Line Data
| Experiment 1 Reporting the Activity Date of This ADC | [235] | ||||
| Efficacy Data | Half Maximal Inhibitory Concentration (IC50) |
0.03 nM
|
Positive HER2 expression (HER2+++/++) | ||
| Method Description |
Anti-proliferation activities of the antibodies, drugs, and conjugates with regard tothe cancer cell lines were measured. The cells were plated in 96-well, tissue culture platesat 10,000 cells per well. After 24 hour incubation, the antibodies, drugs, and conjugateswere added in various concentrations. The number of viable cells after 72 hours were counted using SRB assay.
Click to Show/Hide
|
||||
| In Vitro Model | Breast adenocarcinoma | SK-BR-3 cells | CVCL_0033 | ||
| Experiment 2 Reporting the Activity Date of This ADC | [235] | ||||
| Efficacy Data | Half Maximal Inhibitory Concentration (IC50) |
0.10 nM
|
Positive HER2 expression (HER2+++/++) | ||
| Method Description |
Anti-proliferation activities of the antibodies, drugs, and conjugates with regard tothe cancer cell lines were measured. The cells were plated in 96-well, tissue culture platesat 10,000 cells per well. After 24 hour incubation, the antibodies, drugs, and conjugateswere added in various concentrations. The number of viable cells after 72 hours were counted using SRB assay.
Click to Show/Hide
|
||||
| In Vitro Model | Breast ductal carcinoma | JIMT-1 cells | CVCL_2077 | ||
| Experiment 3 Reporting the Activity Date of This ADC | [235] | ||||
| Efficacy Data | Half Maximal Inhibitory Concentration (IC50) | > 33.33 nM | Negative HER2 expression (HER2-) | ||
| Method Description |
Anti-proliferation activities of the antibodies, drugs, and conjugates with regard tothe cancer cell lines were measured. The cells were plated in 96-well, tissue culture platesat 10,000 cells per well. After 24 hour incubation, the antibodies, drugs, and conjugateswere added in various concentrations. The number of viable cells after 72 hours were counted using SRB assay.
Click to Show/Hide
|
||||
| In Vitro Model | Invasive breast carcinoma | MCF-7 cells | CVCL_0031 | ||
WO2017089895A1 ADC39 [Investigative]
Revealed Based on the Cell Line Data
| Experiment 1 Reporting the Activity Date of This ADC | [235] | ||||
| Efficacy Data | Half Maximal Inhibitory Concentration (IC50) |
0.03 nM
|
Positive HER2 expression (HER2+++/++) | ||
| Method Description |
Anti-proliferation activities of the antibodies, drugs, and conjugates with regard tothe cancer cell lines were measured. The cells were plated in 96-well, tissue culture platesat 10,000 cells per well. After 24 hour incubation, the antibodies, drugs, and conjugateswere added in various concentrations. The number of viable cells after 72 hours were counted using SRB assay.
Click to Show/Hide
|
||||
| In Vitro Model | Breast adenocarcinoma | SK-BR-3 cells | CVCL_0033 | ||
| Experiment 2 Reporting the Activity Date of This ADC | [235] | ||||
| Efficacy Data | Half Maximal Inhibitory Concentration (IC50) |
0.11 nM
|
Positive HER2 expression (HER2+++/++) | ||
| Method Description |
Anti-proliferation activities of the antibodies, drugs, and conjugates with regard tothe cancer cell lines were measured. The cells were plated in 96-well, tissue culture platesat 10,000 cells per well. After 24 hour incubation, the antibodies, drugs, and conjugateswere added in various concentrations. The number of viable cells after 72 hours were counted using SRB assay.
Click to Show/Hide
|
||||
| In Vitro Model | Breast ductal carcinoma | JIMT-1 cells | CVCL_2077 | ||
| Experiment 3 Reporting the Activity Date of This ADC | [235] | ||||
| Efficacy Data | Half Maximal Inhibitory Concentration (IC50) |
0.12 nM
|
Positive HER2 expression (HER2+++/++) | ||
| Method Description |
ADCs wereincubated in human plasma for 5 seconds (0h), followed by SRB invitro cytotoxicity test using SK-BR3 cells for 72hr.
|
||||
| In Vitro Model | Breast adenocarcinoma | SK-BR-3 cells | CVCL_0033 | ||
| Experiment 4 Reporting the Activity Date of This ADC | [235] | ||||
| Efficacy Data | Half Maximal Inhibitory Concentration (IC50) |
0.17 nM
|
Positive HER2 expression (HER2+++/++) | ||
| Method Description |
ADCs wereincubated in human plasma for 168 hours (168h), followed by SRB invitro cytotoxicity test using SK-BR3 cells for 72hr.
|
||||
| In Vitro Model | Breast adenocarcinoma | SK-BR-3 cells | CVCL_0033 | ||
| Experiment 5 Reporting the Activity Date of This ADC | [235] | ||||
| Efficacy Data | Half Maximal Inhibitory Concentration (IC50) | > 33.33 nM | Negative HER2 expression (HER2-) | ||
| Method Description |
Anti-proliferation activities of the antibodies, drugs, and conjugates with regard tothe cancer cell lines were measured. The cells were plated in 96-well, tissue culture platesat 10,000 cells per well. After 24 hour incubation, the antibodies, drugs, and conjugateswere added in various concentrations. The number of viable cells after 72 hours were counted using SRB assay.
Click to Show/Hide
|
||||
| In Vitro Model | Invasive breast carcinoma | MCF-7 cells | CVCL_0031 | ||
WO2017089895A1 ADC32 [Investigative]
Revealed Based on the Cell Line Data
| Experiment 1 Reporting the Activity Date of This ADC | [235] | ||||
| Efficacy Data | Half Maximal Inhibitory Concentration (IC50) |
0.03 nM
|
Positive HER2 expression (HER2+++/++) | ||
| Method Description |
Anti-proliferation activities of the antibodies, drugs, and conjugates with regard tothe cancer cell lines were measured. The cells were plated in 96-well, tissue culture platesat 10,000 cells per well. After 24 hour incubation, the antibodies, drugs, and conjugateswere added in various concentrations. The number of viable cells after 72 hours were counted using SRB assay.
Click to Show/Hide
|
||||
| In Vitro Model | Breast adenocarcinoma | SK-BR-3 cells | CVCL_0033 | ||
| Experiment 2 Reporting the Activity Date of This ADC | [235] | ||||
| Efficacy Data | Half Maximal Inhibitory Concentration (IC50) |
0.05 nM
|
Positive HER2 expression (HER2+++/++) | ||
| Method Description |
ADCs wereincubated in human plasma for 5 seconds (0h), followed by SRB invitro cytotoxicity test using SK-BR3 cells for 72hr.
|
||||
| In Vitro Model | Breast adenocarcinoma | SK-BR-3 cells | CVCL_0033 | ||
| Experiment 3 Reporting the Activity Date of This ADC | [235] | ||||
| Efficacy Data | Half Maximal Inhibitory Concentration (IC50) |
0.09 nM
|
Positive HER2 expression (HER2+++/++) | ||
| Method Description |
ADCs wereincubated in human plasma for 168 hours (168h), followed by SRB invitro cytotoxicity test using SK-BR3 cells for 72hr.
|
||||
| In Vitro Model | Breast adenocarcinoma | SK-BR-3 cells | CVCL_0033 | ||
| Experiment 4 Reporting the Activity Date of This ADC | [235] | ||||
| Efficacy Data | Half Maximal Inhibitory Concentration (IC50) |
0.32 nM
|
Positive HER2 expression (HER2+++/++) | ||
| Method Description |
Anti-proliferation activities of the antibodies, drugs, and conjugates with regard tothe cancer cell lines were measured. The cells were plated in 96-well, tissue culture platesat 10,000 cells per well. After 24 hour incubation, the antibodies, drugs, and conjugateswere added in various concentrations. The number of viable cells after 72 hours were counted using SRB assay.
Click to Show/Hide
|
||||
| In Vitro Model | Gastric tubular adenocarcinoma | NCI-N87 cells | CVCL_1603 | ||
| Experiment 5 Reporting the Activity Date of This ADC | [235] | ||||
| Efficacy Data | Half Maximal Inhibitory Concentration (IC50) |
0.35 nM
|
Positive HER2 expression (HER2+++/++) | ||
| Method Description |
Anti-proliferation activities of the antibodies, drugs, and conjugates with regard tothe cancer cell lines were measured. The cells were plated in 96-well, tissue culture platesat 10,000 cells per well. After 24 hour incubation, the antibodies, drugs, and conjugateswere added in various concentrations. The number of viable cells after 72 hours were counted using SRB assay.
Click to Show/Hide
|
||||
| In Vitro Model | Ovarian serous cystadenocarcinoma | SK-OV-3 cells | CVCL_0532 | ||
| Experiment 6 Reporting the Activity Date of This ADC | [235] | ||||
| Efficacy Data | Half Maximal Inhibitory Concentration (IC50) |
0.40 nM
|
Positive HER2 expression (HER2+++/++) | ||
| Method Description |
Anti-proliferation activities of the antibodies, drugs, and conjugates with regard tothe cancer cell lines were measured. The cells were plated in 96-well, tissue culture platesat 10,000 cells per well. After 24 hour incubation, the antibodies, drugs, and conjugateswere added in various concentrations. The number of viable cells after 72 hours were counted using SRB assay.
Click to Show/Hide
|
||||
| In Vitro Model | Breast ductal carcinoma | JIMT-1 cells | CVCL_2077 | ||
| Experiment 7 Reporting the Activity Date of This ADC | [235] | ||||
| Efficacy Data | Half Maximal Inhibitory Concentration (IC50) | > 33.33 nM | Negative HER2 expression (HER2-) | ||
| Method Description |
Anti-proliferation activities of the antibodies, drugs, and conjugates with regard tothe cancer cell lines were measured. The cells were plated in 96-well, tissue culture platesat 10,000 cells per well. After 24 hour incubation, the antibodies, drugs, and conjugateswere added in various concentrations. The number of viable cells after 72 hours were counted using SRB assay.
Click to Show/Hide
|
||||
| In Vitro Model | Invasive breast carcinoma | MCF-7 cells | CVCL_0031 | ||
WO2017089895A1 ADC29 [Investigative]
Revealed Based on the Cell Line Data
| Experiment 1 Reporting the Activity Date of This ADC | [235] | ||||
| Efficacy Data | Half Maximal Inhibitory Concentration (IC50) |
0.03 nM
|
Positive HER2 expression (HER2+++/++) | ||
| Method Description |
Anti-proliferation activities of the antibodies, drugs, and conjugates with regard tothe cancer cell lines were measured. The cells were plated in 96-well, tissue culture platesat 10,000 cells per well. After 24 hour incubation, the antibodies, drugs, and conjugateswere added in various concentrations. The number of viable cells after 72 hours were counted using SRB assay.
Click to Show/Hide
|
||||
| In Vitro Model | Breast adenocarcinoma | SK-BR-3 cells | CVCL_0033 | ||
| Experiment 2 Reporting the Activity Date of This ADC | [235] | ||||
| Efficacy Data | Half Maximal Inhibitory Concentration (IC50) |
0.06 nM
|
Positive HER2 expression (HER2+++/++) | ||
| Method Description |
ADCs wereincubated in human plasma for 5 seconds (0h), followed by SRB invitro cytotoxicity test using SK-BR3 cells for 72hr.
|
||||
| In Vitro Model | Breast adenocarcinoma | SK-BR-3 cells | CVCL_0033 | ||
| Experiment 3 Reporting the Activity Date of This ADC | [235] | ||||
| Efficacy Data | Half Maximal Inhibitory Concentration (IC50) |
0.08 nM
|
Positive HER2 expression (HER2+++/++) | ||
| Method Description |
ADCs wereincubated in human plasma for 168 hours (168h), followed by SRB invitro cytotoxicity test using SK-BR3 cells for 72hr.
|
||||
| In Vitro Model | Breast adenocarcinoma | SK-BR-3 cells | CVCL_0033 | ||
| Experiment 4 Reporting the Activity Date of This ADC | [235] | ||||
| Efficacy Data | Half Maximal Inhibitory Concentration (IC50) |
0.31 nM
|
Positive HER2 expression (HER2+++/++) | ||
| Method Description |
Anti-proliferation activities of the antibodies, drugs, and conjugates with regard tothe cancer cell lines were measured. The cells were plated in 96-well, tissue culture platesat 10,000 cells per well. After 24 hour incubation, the antibodies, drugs, and conjugateswere added in various concentrations. The number of viable cells after 72 hours were counted using SRB assay.
Click to Show/Hide
|
||||
| In Vitro Model | Gastric tubular adenocarcinoma | NCI-N87 cells | CVCL_1603 | ||
| Experiment 5 Reporting the Activity Date of This ADC | [235] | ||||
| Efficacy Data | Half Maximal Inhibitory Concentration (IC50) |
0.41 nM
|
Positive HER2 expression (HER2+++/++) | ||
| Method Description |
Anti-proliferation activities of the antibodies, drugs, and conjugates with regard tothe cancer cell lines were measured. The cells were plated in 96-well, tissue culture platesat 10,000 cells per well. After 24 hour incubation, the antibodies, drugs, and conjugateswere added in various concentrations. The number of viable cells after 72 hours were counted using SRB assay.
Click to Show/Hide
|
||||
| In Vitro Model | Breast ductal carcinoma | JIMT-1 cells | CVCL_2077 | ||
| Experiment 6 Reporting the Activity Date of This ADC | [235] | ||||
| Efficacy Data | Half Maximal Inhibitory Concentration (IC50) |
0.49 nM
|
Positive HER2 expression (HER2+++/++) | ||
| Method Description |
Anti-proliferation activities of the antibodies, drugs, and conjugates with regard tothe cancer cell lines were measured. The cells were plated in 96-well, tissue culture platesat 10,000 cells per well. After 24 hour incubation, the antibodies, drugs, and conjugateswere added in various concentrations. The number of viable cells after 72 hours were counted using SRB assay.
Click to Show/Hide
|
||||
| In Vitro Model | Ovarian serous cystadenocarcinoma | SK-OV-3 cells | CVCL_0532 | ||
| Experiment 7 Reporting the Activity Date of This ADC | [235] | ||||
| Efficacy Data | Half Maximal Inhibitory Concentration (IC50) | > 33.33 nM | Negative HER2 expression (HER2-) | ||
| Method Description |
Anti-proliferation activities of the antibodies, drugs, and conjugates with regard tothe cancer cell lines were measured. The cells were plated in 96-well, tissue culture platesat 10,000 cells per well. After 24 hour incubation, the antibodies, drugs, and conjugateswere added in various concentrations. The number of viable cells after 72 hours were counted using SRB assay.
Click to Show/Hide
|
||||
| In Vitro Model | Invasive breast carcinoma | MCF-7 cells | CVCL_0031 | ||
WO2017089895A1 ADC28 [Investigative]
Revealed Based on the Cell Line Data
| Experiment 1 Reporting the Activity Date of This ADC | [235] | ||||
| Efficacy Data | Half Maximal Inhibitory Concentration (IC50) |
0.03 nM
|
Positive HER2 expression (HER2+++/++) | ||
| Method Description |
Anti-proliferation activities of the antibodies, drugs, and conjugates with regard tothe cancer cell lines were measured. The cells were plated in 96-well, tissue culture platesat 10,000 cells per well. After 24 hour incubation, the antibodies, drugs, and conjugateswere added in various concentrations. The number of viable cells after 72 hours were counted using SRB assay.
Click to Show/Hide
|
||||
| In Vitro Model | Breast adenocarcinoma | SK-BR-3 cells | CVCL_0033 | ||
| Experiment 2 Reporting the Activity Date of This ADC | [235] | ||||
| Efficacy Data | Half Maximal Inhibitory Concentration (IC50) |
0.07 nM
|
Positive HER2 expression (HER2+++/++) | ||
| Method Description |
ADCs wereincubated in human plasma for 5 seconds (0h), followed by SRB invitro cytotoxicity test using SK-BR3 cells for 72hr.
|
||||
| In Vitro Model | Breast adenocarcinoma | SK-BR-3 cells | CVCL_0033 | ||
| Experiment 3 Reporting the Activity Date of This ADC | [235] | ||||
| Efficacy Data | Half Maximal Inhibitory Concentration (IC50) |
0.08 nM
|
Positive HER2 expression (HER2+++/++) | ||
| Method Description |
ADCs wereincubated in human plasma for 168 hours (168h), followed by SRB invitro cytotoxicity test using SK-BR3 cells for 72hr.
|
||||
| In Vitro Model | Breast adenocarcinoma | SK-BR-3 cells | CVCL_0033 | ||
| Experiment 4 Reporting the Activity Date of This ADC | [235] | ||||
| Efficacy Data | Half Maximal Inhibitory Concentration (IC50) |
0.12 nM
|
Positive HER2 expression (HER2+++/++) | ||
| Method Description |
Anti-proliferation activities of the antibodies, drugs, and conjugates with regard tothe cancer cell lines were measured. The cells were plated in 96-well, tissue culture platesat 10,000 cells per well. After 24 hour incubation, the antibodies, drugs, and conjugateswere added in various concentrations. The number of viable cells after 72 hours were counted using SRB assay.
Click to Show/Hide
|
||||
| In Vitro Model | Breast ductal carcinoma | JIMT-1 cells | CVCL_2077 | ||
| Experiment 5 Reporting the Activity Date of This ADC | [235] | ||||
| Efficacy Data | Half Maximal Inhibitory Concentration (IC50) |
0.36 nM
|
Positive HER2 expression (HER2+++/++) | ||
| Method Description |
Anti-proliferation activities of the antibodies, drugs, and conjugates with regard tothe cancer cell lines were measured. The cells were plated in 96-well, tissue culture platesat 10,000 cells per well. After 24 hour incubation, the antibodies, drugs, and conjugateswere added in various concentrations. The number of viable cells after 72 hours were counted using SRB assay.
Click to Show/Hide
|
||||
| In Vitro Model | Gastric tubular adenocarcinoma | NCI-N87 cells | CVCL_1603 | ||
| Experiment 6 Reporting the Activity Date of This ADC | [235] | ||||
| Efficacy Data | Half Maximal Inhibitory Concentration (IC50) |
0.36 nM
|
Positive HER2 expression (HER2+++/++) | ||
| Method Description |
Anti-proliferation activities of the antibodies, drugs, and conjugates with regard tothe cancer cell lines were measured. The cells were plated in 96-well, tissue culture platesat 10,000 cells per well. After 24 hour incubation, the antibodies, drugs, and conjugateswere added in various concentrations. The number of viable cells after 72 hours were counted using SRB assay.
Click to Show/Hide
|
||||
| In Vitro Model | Ovarian serous cystadenocarcinoma | SK-OV-3 cells | CVCL_0532 | ||
| Experiment 7 Reporting the Activity Date of This ADC | [235] | ||||
| Efficacy Data | Half Maximal Inhibitory Concentration (IC50) | > 33.33 nM | Negative HER2 expression (HER2-) | ||
| Method Description |
Anti-proliferation activities of the antibodies, drugs, and conjugates with regard tothe cancer cell lines were measured. The cells were plated in 96-well, tissue culture platesat 10,000 cells per well. After 24 hour incubation, the antibodies, drugs, and conjugateswere added in various concentrations. The number of viable cells after 72 hours were counted using SRB assay.
Click to Show/Hide
|
||||
| In Vitro Model | Invasive breast carcinoma | MCF-7 cells | CVCL_0031 | ||
WO2017089895A1 ADC25 [Investigative]
Revealed Based on the Cell Line Data
| Experiment 1 Reporting the Activity Date of This ADC | [235] | ||||
| Efficacy Data | Half Maximal Inhibitory Concentration (IC50) |
0.03 nM
|
Positive HER2 expression (HER2+++/++) | ||
| Method Description |
Anti-proliferation activities of the antibodies, drugs, and conjugates with regard tothe cancer cell lines were measured. The cells were plated in 96-well, tissue culture platesat 10,000 cells per well. After 24 hour incubation, the antibodies, drugs, and conjugateswere added in various concentrations. The number of viable cells after 72 hours were counted using SRB assay.
Click to Show/Hide
|
||||
| In Vitro Model | Breast adenocarcinoma | SK-BR-3 cells | CVCL_0033 | ||
| Experiment 2 Reporting the Activity Date of This ADC | [235] | ||||
| Efficacy Data | Half Maximal Inhibitory Concentration (IC50) |
0.07 nM
|
Positive HER2 expression (HER2+++/++) | ||
| Method Description |
ADCs wereincubated in human plasma for 5 seconds (0h), followed by SRB invitro cytotoxicity test using SK-BR3 cells for 72hr.
|
||||
| In Vitro Model | Breast adenocarcinoma | SK-BR-3 cells | CVCL_0033 | ||
| Experiment 3 Reporting the Activity Date of This ADC | [235] | ||||
| Efficacy Data | Half Maximal Inhibitory Concentration (IC50) |
0.10 nM
|
Positive HER2 expression (HER2+++/++) | ||
| Method Description |
Anti-proliferation activities of the antibodies, drugs, and conjugates with regard tothe cancer cell lines were measured. The cells were plated in 96-well, tissue culture platesat 10,000 cells per well. After 24 hour incubation, the antibodies, drugs, and conjugateswere added in various concentrations. The number of viable cells after 72 hours were counted using SRB assay.
Click to Show/Hide
|
||||
| In Vitro Model | Breast ductal carcinoma | JIMT-1 cells | CVCL_2077 | ||
| Experiment 4 Reporting the Activity Date of This ADC | [235] | ||||
| Efficacy Data | Half Maximal Inhibitory Concentration (IC50) |
0.12 nM
|
Positive HER2 expression (HER2+++/++) | ||
| Method Description |
ADCs wereincubated in human plasma for 168 hours (168h), followed by SRB invitro cytotoxicity test using SK-BR3 cells for 72hr.
|
||||
| In Vitro Model | Breast adenocarcinoma | SK-BR-3 cells | CVCL_0033 | ||
| Experiment 5 Reporting the Activity Date of This ADC | [235] | ||||
| Efficacy Data | Half Maximal Inhibitory Concentration (IC50) |
0.36 nM
|
Positive HER2 expression (HER2+++/++) | ||
| Method Description |
Anti-proliferation activities of the antibodies, drugs, and conjugates with regard tothe cancer cell lines were measured. The cells were plated in 96-well, tissue culture platesat 10,000 cells per well. After 24 hour incubation, the antibodies, drugs, and conjugateswere added in various concentrations. The number of viable cells after 72 hours were counted using SRB assay.
Click to Show/Hide
|
||||
| In Vitro Model | Gastric tubular adenocarcinoma | NCI-N87 cells | CVCL_1603 | ||
| Experiment 6 Reporting the Activity Date of This ADC | [235] | ||||
| Efficacy Data | Half Maximal Inhibitory Concentration (IC50) |
0.37 nM
|
Positive HER2 expression (HER2+++/++) | ||
| Method Description |
Anti-proliferation activities of the antibodies, drugs, and conjugates with regard tothe cancer cell lines were measured. The cells were plated in 96-well, tissue culture platesat 10,000 cells per well. After 24 hour incubation, the antibodies, drugs, and conjugateswere added in various concentrations. The number of viable cells after 72 hours were counted using SRB assay.
Click to Show/Hide
|
||||
| In Vitro Model | Ovarian serous cystadenocarcinoma | SK-OV-3 cells | CVCL_0532 | ||
| Experiment 7 Reporting the Activity Date of This ADC | [235] | ||||
| Efficacy Data | Half Maximal Inhibitory Concentration (IC50) | > 33.33 nM | Negative HER2 expression (HER2-) | ||
| Method Description |
Anti-proliferation activities of the antibodies, drugs, and conjugates with regard tothe cancer cell lines were measured. The cells were plated in 96-well, tissue culture platesat 10,000 cells per well. After 24 hour incubation, the antibodies, drugs, and conjugateswere added in various concentrations. The number of viable cells after 72 hours were counted using SRB assay.
Click to Show/Hide
|
||||
| In Vitro Model | Invasive breast carcinoma | MCF-7 cells | CVCL_0031 | ||
WO2017089895A1 ADC17 [Investigative]
Revealed Based on the Cell Line Data
| Experiment 1 Reporting the Activity Date of This ADC | [235] | ||||
| Efficacy Data | Half Maximal Inhibitory Concentration (IC50) |
0.03 nM
|
Positive HER2 expression (HER2+++/++) | ||
| Method Description |
Anti-proliferation activities of the antibodies, drugs, and conjugates with regard tothe cancer cell lines were measured. The cells were plated in 96-well, tissue culture platesat 10,000 cells per well. After 24 hour incubation, the antibodies, drugs, and conjugateswere added in various concentrations. The number of viable cells after 72 hours were counted using SRB assay.
Click to Show/Hide
|
||||
| In Vitro Model | Breast adenocarcinoma | SK-BR-3 cells | CVCL_0033 | ||
| Experiment 2 Reporting the Activity Date of This ADC | [235] | ||||
| Efficacy Data | Half Maximal Inhibitory Concentration (IC50) |
0.11 nM
|
Positive HER2 expression (HER2+++/++) | ||
| Method Description |
Anti-proliferation activities of the antibodies, drugs, and conjugates with regard tothe cancer cell lines were measured. The cells were plated in 96-well, tissue culture platesat 10,000 cells per well. After 24 hour incubation, the antibodies, drugs, and conjugateswere added in various concentrations. The number of viable cells after 72 hours were counted using SRB assay.
Click to Show/Hide
|
||||
| In Vitro Model | Breast ductal carcinoma | JIMT-1 cells | CVCL_2077 | ||
| Experiment 3 Reporting the Activity Date of This ADC | [235] | ||||
| Efficacy Data | Half Maximal Inhibitory Concentration (IC50) | > 33.33 nM | Negative HER2 expression (HER2-) | ||
| Method Description |
Anti-proliferation activities of the antibodies, drugs, and conjugates with regard tothe cancer cell lines were measured. The cells were plated in 96-well, tissue culture platesat 10,000 cells per well. After 24 hour incubation, the antibodies, drugs, and conjugateswere added in various concentrations. The number of viable cells after 72 hours were counted using SRB assay.
Click to Show/Hide
|
||||
| In Vitro Model | Invasive breast carcinoma | MCF-7 cells | CVCL_0031 | ||
WO2017089890A1 ADC17 [Investigative]
Revealed Based on the Cell Line Data
| Experiment 1 Reporting the Activity Date of This ADC | [211] | ||||
| Efficacy Data | Half Maximal Inhibitory Concentration (IC50) |
0.03 nM
|
High HER2 expression (HER2 +++) | ||
| Method Description |
Anti-proliferation activities of the antibodies, drugs, and conjugates with regard tothe cancer cell lines were measured. The cells were plated in 96-well, tissue culture platesat 10,000 cells per well. After 24 hour incubation, the antibodies, drugs, and conjugateswere added in various concentrations. The number of viable cells after 72 hours werecounted using SRB assay.
Click to Show/Hide
|
||||
| In Vitro Model | Breast adenocarcinoma | SK-BR-3 cells | CVCL_0033 | ||
| Experiment 2 Reporting the Activity Date of This ADC | [211] | ||||
| Efficacy Data | Half Maximal Inhibitory Concentration (IC50) |
0.11 nM
|
Moderate HER2 expression (HER2++) | ||
| Method Description |
Anti-proliferation activities of the antibodies, drugs, and conjugates with regard tothe cancer cell lines were measured. The cells were plated in 96-well, tissue culture platesat 10,000 cells per well. After 24 hour incubation, the antibodies, drugs, and conjugateswere added in various concentrations. The number of viable cells after 72 hours werecounted using SRB assay.
Click to Show/Hide
|
||||
| In Vitro Model | Breast ductal carcinoma | JIMT-1 cells | CVCL_2077 | ||
| Experiment 3 Reporting the Activity Date of This ADC | [211] | ||||
| Efficacy Data | Half Maximal Inhibitory Concentration (IC50) | > 33.30 nM | Negative HER2 expression (HER2-) | ||
| Method Description |
Anti-proliferation activities of the antibodies, drugs, and conjugates with regard tothe cancer cell lines were measured. The cells were plated in 96-well, tissue culture platesat 10,000 cells per well. After 24 hour incubation, the antibodies, drugs, and conjugateswere added in various concentrations. The number of viable cells after 72 hours werecounted using SRB assay.
Click to Show/Hide
|
||||
| In Vitro Model | Invasive breast carcinoma | MCF-7 cells | CVCL_0031 | ||
WO2017089890A1 ADC53 [Investigative]
Revealed Based on the Cell Line Data
| Experiment 1 Reporting the Activity Date of This ADC | [211] | ||||
| Efficacy Data | Half Maximal Inhibitory Concentration (IC50) |
0.03 nM
|
High HER2 expression (HER2 +++) | ||
| Method Description |
Anti-proliferation activities of the antibodies, drugs, and conjugates with regard tothe cancer cell lines were measured. The cells were plated in 96-well, tissue culture platesat 10,000 cells per well. After 24 hour incubation, the antibodies, drugs, and conjugateswere added in various concentrations. The number of viable cells after 72 hours werecounted using SRB assay.
Click to Show/Hide
|
||||
| In Vitro Model | Breast adenocarcinoma | SK-BR-3 cells | CVCL_0033 | ||
| Experiment 2 Reporting the Activity Date of This ADC | [211] | ||||
| Efficacy Data | Half Maximal Inhibitory Concentration (IC50) |
0.05 nM
|
Moderate HER2 expression (HER2++) | ||
| Method Description |
Anti-proliferation activities of the antibodies, drugs, and conjugates with regard tothe cancer cell lines were measured. The cells were plated in 96-well, tissue culture platesat 10,000 cells per well. After 24 hour incubation, the antibodies, drugs, and conjugateswere added in various concentrations. The number of viable cells after 72 hours werecounted using SRB assay.
Click to Show/Hide
|
||||
| In Vitro Model | Breast ductal carcinoma | JIMT-1 cells | CVCL_2077 | ||
| Experiment 3 Reporting the Activity Date of This ADC | [211] | ||||
| Efficacy Data | Half Maximal Inhibitory Concentration (IC50) | > 33.30 nM | Negative HER2 expression (HER2-) | ||
| Method Description |
Anti-proliferation activities of the antibodies, drugs, and conjugates with regard tothe cancer cell lines were measured. The cells were plated in 96-well, tissue culture platesat 10,000 cells per well. After 24 hour incubation, the antibodies, drugs, and conjugateswere added in various concentrations. The number of viable cells after 72 hours werecounted using SRB assay.
Click to Show/Hide
|
||||
| In Vitro Model | Invasive breast carcinoma | MCF-7 cells | CVCL_0031 | ||
WO2017089890A1 ADC25 [Investigative]
Revealed Based on the Cell Line Data
| Experiment 1 Reporting the Activity Date of This ADC | [211] | ||||
| Efficacy Data | Half Maximal Inhibitory Concentration (IC50) |
0.03 nM
|
High HER2 expression (HER2 +++) | ||
| Method Description |
Anti-proliferation activities of the antibodies, drugs, and conjugates with regard tothe cancer cell lines were measured. The cells were plated in 96-well, tissue culture platesat 10,000 cells per well. After 24 hour incubation, the antibodies, drugs, and conjugateswere added in various concentrations. The number of viable cells after 72 hours werecounted using SRB assay.
Click to Show/Hide
|
||||
| In Vitro Model | Breast adenocarcinoma | SK-BR-3 cells | CVCL_0033 | ||
| Experiment 2 Reporting the Activity Date of This ADC | [211] | ||||
| Efficacy Data | Half Maximal Inhibitory Concentration (IC50) |
0.10 nM
|
Moderate HER2 expression (HER2++) | ||
| Method Description |
Anti-proliferation activities of the antibodies, drugs, and conjugates with regard tothe cancer cell lines were measured. The cells were plated in 96-well, tissue culture platesat 10,000 cells per well. After 24 hour incubation, the antibodies, drugs, and conjugateswere added in various concentrations. The number of viable cells after 72 hours werecounted using SRB assay.
Click to Show/Hide
|
||||
| In Vitro Model | Breast ductal carcinoma | JIMT-1 cells | CVCL_2077 | ||
| Experiment 3 Reporting the Activity Date of This ADC | [211] | ||||
| Efficacy Data | Half Maximal Inhibitory Concentration (IC50) |
0.36 nM
|
High HER2 expression (HER2+++) | ||
| Method Description |
Anti-proliferation activities of the antibodies, drugs, and conjugates with regard tothe cancer cell lines were measured. The cells were plated in 96-well, tissue culture platesat 10,000 cells per well. After 24 hour incubation, the antibodies, drugs, and conjugateswere added in various concentrations. The number of viable cells after 72 hours werecounted using SRB assay.
Click to Show/Hide
|
||||
| In Vitro Model | Gastric tubular adenocarcinoma | NCI-N87 cells | CVCL_1603 | ||
| Experiment 4 Reporting the Activity Date of This ADC | [211] | ||||
| Efficacy Data | Half Maximal Inhibitory Concentration (IC50) |
0.37 nM
|
High HER2 expression (HER2+++) | ||
| Method Description |
Anti-proliferation activities of the antibodies, drugs, and conjugates with regard tothe cancer cell lines were measured. The cells were plated in 96-well, tissue culture platesat 10,000 cells per well. After 24 hour incubation, the antibodies, drugs, and conjugateswere added in various concentrations. The number of viable cells after 72 hours werecounted using SRB assay.
Click to Show/Hide
|
||||
| In Vitro Model | Ovarian serous cystadenocarcinoma | SK-OV-3 cells | CVCL_0532 | ||
| Experiment 5 Reporting the Activity Date of This ADC | [211] | ||||
| Efficacy Data | Half Maximal Inhibitory Concentration (IC50) | > 33.30 nM | Negative HER2 expression (HER2-) | ||
| Method Description |
Anti-proliferation activities of the antibodies, drugs, and conjugates with regard tothe cancer cell lines were measured. The cells were plated in 96-well, tissue culture platesat 10,000 cells per well. After 24 hour incubation, the antibodies, drugs, and conjugateswere added in various concentrations. The number of viable cells after 72 hours werecounted using SRB assay.
Click to Show/Hide
|
||||
| In Vitro Model | Invasive breast carcinoma | MCF-7 cells | CVCL_0031 | ||
WO2017089890A1 ADC28 [Investigative]
Revealed Based on the Cell Line Data
| Experiment 1 Reporting the Activity Date of This ADC | [211] | ||||
| Efficacy Data | Half Maximal Inhibitory Concentration (IC50) |
0.03 nM
|
High HER2 expression (HER2 +++) | ||
| Method Description |
Anti-proliferation activities of the antibodies, drugs, and conjugates with regard tothe cancer cell lines were measured. The cells were plated in 96-well, tissue culture platesat 10,000 cells per well. After 24 hour incubation, the antibodies, drugs, and conjugateswere added in various concentrations. The number of viable cells after 72 hours werecounted using SRB assay.
Click to Show/Hide
|
||||
| In Vitro Model | Breast adenocarcinoma | SK-BR-3 cells | CVCL_0033 | ||
| Experiment 2 Reporting the Activity Date of This ADC | [211] | ||||
| Efficacy Data | Half Maximal Inhibitory Concentration (IC50) |
0.12 nM
|
Moderate HER2 expression (HER2++) | ||
| Method Description |
Anti-proliferation activities of the antibodies, drugs, and conjugates with regard tothe cancer cell lines were measured. The cells were plated in 96-well, tissue culture platesat 10,000 cells per well. After 24 hour incubation, the antibodies, drugs, and conjugateswere added in various concentrations. The number of viable cells after 72 hours werecounted using SRB assay.
Click to Show/Hide
|
||||
| In Vitro Model | Breast ductal carcinoma | JIMT-1 cells | CVCL_2077 | ||
| Experiment 3 Reporting the Activity Date of This ADC | [211] | ||||
| Efficacy Data | Half Maximal Inhibitory Concentration (IC50) |
0.36 nM
|
High HER2 expression (HER2+++) | ||
| Method Description |
Anti-proliferation activities of the antibodies, drugs, and conjugates with regard tothe cancer cell lines were measured. The cells were plated in 96-well, tissue culture platesat 10,000 cells per well. After 24 hour incubation, the antibodies, drugs, and conjugateswere added in various concentrations. The number of viable cells after 72 hours werecounted using SRB assay.
Click to Show/Hide
|
||||
| In Vitro Model | Gastric tubular adenocarcinoma | NCI-N87 cells | CVCL_1603 | ||
| Experiment 4 Reporting the Activity Date of This ADC | [211] | ||||
| Efficacy Data | Half Maximal Inhibitory Concentration (IC50) |
0.36 nM
|
High HER2 expression (HER2+++) | ||
| Method Description |
Anti-proliferation activities of the antibodies, drugs, and conjugates with regard tothe cancer cell lines were measured. The cells were plated in 96-well, tissue culture platesat 10,000 cells per well. After 24 hour incubation, the antibodies, drugs, and conjugateswere added in various concentrations. The number of viable cells after 72 hours werecounted using SRB assay.
Click to Show/Hide
|
||||
| In Vitro Model | Ovarian serous cystadenocarcinoma | SK-OV-3 cells | CVCL_0532 | ||
| Experiment 5 Reporting the Activity Date of This ADC | [211] | ||||
| Efficacy Data | Half Maximal Inhibitory Concentration (IC50) | > 33.30 nM | Negative HER2 expression (HER2-) | ||
| Method Description |
Anti-proliferation activities of the antibodies, drugs, and conjugates with regard tothe cancer cell lines were measured. The cells were plated in 96-well, tissue culture platesat 10,000 cells per well. After 24 hour incubation, the antibodies, drugs, and conjugateswere added in various concentrations. The number of viable cells after 72 hours werecounted using SRB assay.
Click to Show/Hide
|
||||
| In Vitro Model | Invasive breast carcinoma | MCF-7 cells | CVCL_0031 | ||
WO2017089890A1 ADC29 [Investigative]
Revealed Based on the Cell Line Data
| Experiment 1 Reporting the Activity Date of This ADC | [211] | ||||
| Efficacy Data | Half Maximal Inhibitory Concentration (IC50) |
0.03 nM
|
High HER2 expression (HER2 +++) | ||
| Method Description |
Anti-proliferation activities of the antibodies, drugs, and conjugates with regard tothe cancer cell lines were measured. The cells were plated in 96-well, tissue culture platesat 10,000 cells per well. After 24 hour incubation, the antibodies, drugs, and conjugateswere added in various concentrations. The number of viable cells after 72 hours werecounted using SRB assay.
Click to Show/Hide
|
||||
| In Vitro Model | Breast adenocarcinoma | SK-BR-3 cells | CVCL_0033 | ||
| Experiment 2 Reporting the Activity Date of This ADC | [211] | ||||
| Efficacy Data | Half Maximal Inhibitory Concentration (IC50) |
0.31 nM
|
High HER2 expression (HER2+++) | ||
| Method Description |
Anti-proliferation activities of the antibodies, drugs, and conjugates with regard tothe cancer cell lines were measured. The cells were plated in 96-well, tissue culture platesat 10,000 cells per well. After 24 hour incubation, the antibodies, drugs, and conjugateswere added in various concentrations. The number of viable cells after 72 hours werecounted using SRB assay.
Click to Show/Hide
|
||||
| In Vitro Model | Gastric tubular adenocarcinoma | NCI-N87 cells | CVCL_1603 | ||
| Experiment 3 Reporting the Activity Date of This ADC | [211] | ||||
| Efficacy Data | Half Maximal Inhibitory Concentration (IC50) |
0.41 nM
|
Moderate HER2 expression (HER2++) | ||
| Method Description |
Anti-proliferation activities of the antibodies, drugs, and conjugates with regard tothe cancer cell lines were measured. The cells were plated in 96-well, tissue culture platesat 10,000 cells per well. After 24 hour incubation, the antibodies, drugs, and conjugateswere added in various concentrations. The number of viable cells after 72 hours werecounted using SRB assay.
Click to Show/Hide
|
||||
| In Vitro Model | Breast ductal carcinoma | JIMT-1 cells | CVCL_2077 | ||
| Experiment 4 Reporting the Activity Date of This ADC | [211] | ||||
| Efficacy Data | Half Maximal Inhibitory Concentration (IC50) |
0.49 nM
|
High HER2 expression (HER2+++) | ||
| Method Description |
Anti-proliferation activities of the antibodies, drugs, and conjugates with regard tothe cancer cell lines were measured. The cells were plated in 96-well, tissue culture platesat 10,000 cells per well. After 24 hour incubation, the antibodies, drugs, and conjugateswere added in various concentrations. The number of viable cells after 72 hours werecounted using SRB assay.
Click to Show/Hide
|
||||
| In Vitro Model | Ovarian serous cystadenocarcinoma | SK-OV-3 cells | CVCL_0532 | ||
| Experiment 5 Reporting the Activity Date of This ADC | [211] | ||||
| Efficacy Data | Half Maximal Inhibitory Concentration (IC50) | > 33.30 nM | Negative HER2 expression (HER2-) | ||
| Method Description |
Anti-proliferation activities of the antibodies, drugs, and conjugates with regard tothe cancer cell lines were measured. The cells were plated in 96-well, tissue culture platesat 10,000 cells per well. After 24 hour incubation, the antibodies, drugs, and conjugateswere added in various concentrations. The number of viable cells after 72 hours werecounted using SRB assay.
Click to Show/Hide
|
||||
| In Vitro Model | Invasive breast carcinoma | MCF-7 cells | CVCL_0031 | ||
WO2017089890A1 ADC32 [Investigative]
Revealed Based on the Cell Line Data
| Experiment 1 Reporting the Activity Date of This ADC | [211] | ||||
| Efficacy Data | Half Maximal Inhibitory Concentration (IC50) |
0.03 nM
|
High HER2 expression (HER2 +++) | ||
| Method Description |
Anti-proliferation activities of the antibodies, drugs, and conjugates with regard tothe cancer cell lines were measured. The cells were plated in 96-well, tissue culture platesat 10,000 cells per well. After 24 hour incubation, the antibodies, drugs, and conjugateswere added in various concentrations. The number of viable cells after 72 hours werecounted using SRB assay.
Click to Show/Hide
|
||||
| In Vitro Model | Breast adenocarcinoma | SK-BR-3 cells | CVCL_0033 | ||
| Experiment 2 Reporting the Activity Date of This ADC | [211] | ||||
| Efficacy Data | Half Maximal Inhibitory Concentration (IC50) |
0.32 nM
|
High HER2 expression (HER2+++) | ||
| Method Description |
Anti-proliferation activities of the antibodies, drugs, and conjugates with regard tothe cancer cell lines were measured. The cells were plated in 96-well, tissue culture platesat 10,000 cells per well. After 24 hour incubation, the antibodies, drugs, and conjugateswere added in various concentrations. The number of viable cells after 72 hours werecounted using SRB assay.
Click to Show/Hide
|
||||
| In Vitro Model | Gastric tubular adenocarcinoma | NCI-N87 cells | CVCL_1603 | ||
| Experiment 3 Reporting the Activity Date of This ADC | [211] | ||||
| Efficacy Data | Half Maximal Inhibitory Concentration (IC50) |
0.35 nM
|
High HER2 expression (HER2+++) | ||
| Method Description |
Anti-proliferation activities of the antibodies, drugs, and conjugates with regard tothe cancer cell lines were measured. The cells were plated in 96-well, tissue culture platesat 10,000 cells per well. After 24 hour incubation, the antibodies, drugs, and conjugateswere added in various concentrations. The number of viable cells after 72 hours werecounted using SRB assay.
Click to Show/Hide
|
||||
| In Vitro Model | Ovarian serous cystadenocarcinoma | SK-OV-3 cells | CVCL_0532 | ||
| Experiment 4 Reporting the Activity Date of This ADC | [211] | ||||
| Efficacy Data | Half Maximal Inhibitory Concentration (IC50) |
0.40 nM
|
Moderate HER2 expression (HER2++) | ||
| Method Description |
Anti-proliferation activities of the antibodies, drugs, and conjugates with regard tothe cancer cell lines were measured. The cells were plated in 96-well, tissue culture platesat 10,000 cells per well. After 24 hour incubation, the antibodies, drugs, and conjugateswere added in various concentrations. The number of viable cells after 72 hours werecounted using SRB assay.
Click to Show/Hide
|
||||
| In Vitro Model | Breast ductal carcinoma | JIMT-1 cells | CVCL_2077 | ||
| Experiment 5 Reporting the Activity Date of This ADC | [211] | ||||
| Efficacy Data | Half Maximal Inhibitory Concentration (IC50) | > 33.30 nM | Negative HER2 expression (HER2-) | ||
| Method Description |
Anti-proliferation activities of the antibodies, drugs, and conjugates with regard tothe cancer cell lines were measured. The cells were plated in 96-well, tissue culture platesat 10,000 cells per well. After 24 hour incubation, the antibodies, drugs, and conjugateswere added in various concentrations. The number of viable cells after 72 hours werecounted using SRB assay.
Click to Show/Hide
|
||||
| In Vitro Model | Invasive breast carcinoma | MCF-7 cells | CVCL_0031 | ||
WO2017089890A1 ADC39 [Investigative]
Revealed Based on the Cell Line Data
| Experiment 1 Reporting the Activity Date of This ADC | [211] | ||||
| Efficacy Data | Half Maximal Inhibitory Concentration (IC50) |
0.03 nM
|
High HER2 expression (HER2 +++) | ||
| Method Description |
Anti-proliferation activities of the antibodies, drugs, and conjugates with regard tothe cancer cell lines were measured. The cells were plated in 96-well, tissue culture platesat 10,000 cells per well. After 24 hour incubation, the antibodies, drugs, and conjugateswere added in various concentrations. The number of viable cells after 72 hours werecounted using SRB assay.
Click to Show/Hide
|
||||
| In Vitro Model | Breast adenocarcinoma | SK-BR-3 cells | CVCL_0033 | ||
| Experiment 2 Reporting the Activity Date of This ADC | [211] | ||||
| Efficacy Data | Half Maximal Inhibitory Concentration (IC50) |
0.11 nM
|
Moderate HER2 expression (HER2++) | ||
| Method Description |
Anti-proliferation activities of the antibodies, drugs, and conjugates with regard tothe cancer cell lines were measured. The cells were plated in 96-well, tissue culture platesat 10,000 cells per well. After 24 hour incubation, the antibodies, drugs, and conjugateswere added in various concentrations. The number of viable cells after 72 hours werecounted using SRB assay.
Click to Show/Hide
|
||||
| In Vitro Model | Breast ductal carcinoma | JIMT-1 cells | CVCL_2077 | ||
| Experiment 3 Reporting the Activity Date of This ADC | [211] | ||||
| Efficacy Data | Half Maximal Inhibitory Concentration (IC50) | > 33.30 nM | Negative HER2 expression (HER2-) | ||
| Method Description |
Anti-proliferation activities of the antibodies, drugs, and conjugates with regard tothe cancer cell lines were measured. The cells were plated in 96-well, tissue culture platesat 10,000 cells per well. After 24 hour incubation, the antibodies, drugs, and conjugateswere added in various concentrations. The number of viable cells after 72 hours werecounted using SRB assay.
Click to Show/Hide
|
||||
| In Vitro Model | Invasive breast carcinoma | MCF-7 cells | CVCL_0031 | ||
WO2017089890A1 ADC41 [Investigative]
Revealed Based on the Cell Line Data
| Experiment 1 Reporting the Activity Date of This ADC | [211] | ||||
| Efficacy Data | Half Maximal Inhibitory Concentration (IC50) |
0.03 nM
|
High HER2 expression (HER2 +++) | ||
| Method Description |
Anti-proliferation activities of the antibodies, drugs, and conjugates with regard tothe cancer cell lines were measured. The cells were plated in 96-well, tissue culture platesat 10,000 cells per well. After 24 hour incubation, the antibodies, drugs, and conjugateswere added in various concentrations. The number of viable cells after 72 hours werecounted using SRB assay.
Click to Show/Hide
|
||||
| In Vitro Model | Breast adenocarcinoma | SK-BR-3 cells | CVCL_0033 | ||
| Experiment 2 Reporting the Activity Date of This ADC | [211] | ||||
| Efficacy Data | Half Maximal Inhibitory Concentration (IC50) |
0.10 nM
|
Moderate HER2 expression (HER2++) | ||
| Method Description |
Anti-proliferation activities of the antibodies, drugs, and conjugates with regard tothe cancer cell lines were measured. The cells were plated in 96-well, tissue culture platesat 10,000 cells per well. After 24 hour incubation, the antibodies, drugs, and conjugateswere added in various concentrations. The number of viable cells after 72 hours werecounted using SRB assay.
Click to Show/Hide
|
||||
| In Vitro Model | Breast ductal carcinoma | JIMT-1 cells | CVCL_2077 | ||
| Experiment 3 Reporting the Activity Date of This ADC | [211] | ||||
| Efficacy Data | Half Maximal Inhibitory Concentration (IC50) | > 33.30 nM | Negative HER2 expression (HER2-) | ||
| Method Description |
Anti-proliferation activities of the antibodies, drugs, and conjugates with regard tothe cancer cell lines were measured. The cells were plated in 96-well, tissue culture platesat 10,000 cells per well. After 24 hour incubation, the antibodies, drugs, and conjugateswere added in various concentrations. The number of viable cells after 72 hours werecounted using SRB assay.
Click to Show/Hide
|
||||
| In Vitro Model | Invasive breast carcinoma | MCF-7 cells | CVCL_0031 | ||
WO2017089890A1 ADC43 [Investigative]
Revealed Based on the Cell Line Data
| Experiment 1 Reporting the Activity Date of This ADC | [211] | ||||
| Efficacy Data | Half Maximal Inhibitory Concentration (IC50) |
0.03 nM
|
High HER2 expression (HER2 +++) | ||
| Method Description |
Anti-proliferation activities of the antibodies, drugs, and conjugates with regard tothe cancer cell lines were measured. The cells were plated in 96-well, tissue culture platesat 10,000 cells per well. After 24 hour incubation, the antibodies, drugs, and conjugateswere added in various concentrations. The number of viable cells after 72 hours werecounted using SRB assay.
Click to Show/Hide
|
||||
| In Vitro Model | Breast adenocarcinoma | SK-BR-3 cells | CVCL_0033 | ||
| Experiment 2 Reporting the Activity Date of This ADC | [211] | ||||
| Efficacy Data | Half Maximal Inhibitory Concentration (IC50) |
0.04 nM
|
Moderate HER2 expression (HER2++) | ||
| Method Description |
Anti-proliferation activities of the antibodies, drugs, and conjugates with regard tothe cancer cell lines were measured. The cells were plated in 96-well, tissue culture platesat 10,000 cells per well. After 24 hour incubation, the antibodies, drugs, and conjugateswere added in various concentrations. The number of viable cells after 72 hours werecounted using SRB assay.
Click to Show/Hide
|
||||
| In Vitro Model | Breast ductal carcinoma | JIMT-1 cells | CVCL_2077 | ||
| Experiment 3 Reporting the Activity Date of This ADC | [211] | ||||
| Efficacy Data | Half Maximal Inhibitory Concentration (IC50) | > 33.30 nM | Negative HER2 expression (HER2-) | ||
| Method Description |
Anti-proliferation activities of the antibodies, drugs, and conjugates with regard tothe cancer cell lines were measured. The cells were plated in 96-well, tissue culture platesat 10,000 cells per well. After 24 hour incubation, the antibodies, drugs, and conjugateswere added in various concentrations. The number of viable cells after 72 hours werecounted using SRB assay.
Click to Show/Hide
|
||||
| In Vitro Model | Invasive breast carcinoma | MCF-7 cells | CVCL_0031 | ||
WO2017089890A1 ADC45 [Investigative]
Revealed Based on the Cell Line Data
| Experiment 1 Reporting the Activity Date of This ADC | [211] | ||||
| Efficacy Data | Half Maximal Inhibitory Concentration (IC50) |
0.03 nM
|
High HER2 expression (HER2 +++) | ||
| Method Description |
Anti-proliferation activities of the antibodies, drugs, and conjugates with regard tothe cancer cell lines were measured. The cells were plated in 96-well, tissue culture platesat 10,000 cells per well. After 24 hour incubation, the antibodies, drugs, and conjugateswere added in various concentrations. The number of viable cells after 72 hours werecounted using SRB assay.
Click to Show/Hide
|
||||
| In Vitro Model | Breast adenocarcinoma | SK-BR-3 cells | CVCL_0033 | ||
| Experiment 2 Reporting the Activity Date of This ADC | [211] | ||||
| Efficacy Data | Half Maximal Inhibitory Concentration (IC50) |
0.08 nM
|
Moderate HER2 expression (HER2++) | ||
| Method Description |
Anti-proliferation activities of the antibodies, drugs, and conjugates with regard tothe cancer cell lines were measured. The cells were plated in 96-well, tissue culture platesat 10,000 cells per well. After 24 hour incubation, the antibodies, drugs, and conjugateswere added in various concentrations. The number of viable cells after 72 hours werecounted using SRB assay.
Click to Show/Hide
|
||||
| In Vitro Model | Breast ductal carcinoma | JIMT-1 cells | CVCL_2077 | ||
| Experiment 3 Reporting the Activity Date of This ADC | [211] | ||||
| Efficacy Data | Half Maximal Inhibitory Concentration (IC50) | > 33.30 nM | Negative HER2 expression (HER2-) | ||
| Method Description |
Anti-proliferation activities of the antibodies, drugs, and conjugates with regard tothe cancer cell lines were measured. The cells were plated in 96-well, tissue culture platesat 10,000 cells per well. After 24 hour incubation, the antibodies, drugs, and conjugateswere added in various concentrations. The number of viable cells after 72 hours werecounted using SRB assay.
Click to Show/Hide
|
||||
| In Vitro Model | Invasive breast carcinoma | MCF-7 cells | CVCL_0031 | ||
WO2017089890A1 ADC49 [Investigative]
Revealed Based on the Cell Line Data
| Experiment 1 Reporting the Activity Date of This ADC | [211] | ||||
| Efficacy Data | Half Maximal Inhibitory Concentration (IC50) |
0.03 nM
|
High HER2 expression (HER2 +++) | ||
| Method Description |
Anti-proliferation activities of the antibodies, drugs, and conjugates with regard tothe cancer cell lines were measured. The cells were plated in 96-well, tissue culture platesat 10,000 cells per well. After 24 hour incubation, the antibodies, drugs, and conjugateswere added in various concentrations. The number of viable cells after 72 hours werecounted using SRB assay.
Click to Show/Hide
|
||||
| In Vitro Model | Breast adenocarcinoma | SK-BR-3 cells | CVCL_0033 | ||
| Experiment 2 Reporting the Activity Date of This ADC | [211] | ||||
| Efficacy Data | Half Maximal Inhibitory Concentration (IC50) |
0.05 nM
|
Moderate HER2 expression (HER2++) | ||
| Method Description |
Anti-proliferation activities of the antibodies, drugs, and conjugates with regard tothe cancer cell lines were measured. The cells were plated in 96-well, tissue culture platesat 10,000 cells per well. After 24 hour incubation, the antibodies, drugs, and conjugateswere added in various concentrations. The number of viable cells after 72 hours werecounted using SRB assay.
Click to Show/Hide
|
||||
| In Vitro Model | Breast ductal carcinoma | JIMT-1 cells | CVCL_2077 | ||
| Experiment 3 Reporting the Activity Date of This ADC | [211] | ||||
| Efficacy Data | Half Maximal Inhibitory Concentration (IC50) | > 33.30 nM | Negative HER2 expression (HER2-) | ||
| Method Description |
Anti-proliferation activities of the antibodies, drugs, and conjugates with regard tothe cancer cell lines were measured. The cells were plated in 96-well, tissue culture platesat 10,000 cells per well. After 24 hour incubation, the antibodies, drugs, and conjugateswere added in various concentrations. The number of viable cells after 72 hours werecounted using SRB assay.
Click to Show/Hide
|
||||
| In Vitro Model | Invasive breast carcinoma | MCF-7 cells | CVCL_0031 | ||
HER2-gsADC-32 [Investigative]
Revealed Based on the Cell Line Data
| Experiment 1 Reporting the Activity Date of This ADC | [206] | ||||
| Efficacy Data | Half Maximal Inhibitory Concentration (IC50) |
0.04 nM
|
Positive HER2 expression (HER2+++/++) | ||
| Method Description |
Cells were cultured in a 10% fetal bovine serum (FBS)-containing RPMI 1640 medium and were planted into 96-well plates with 6000 cells per well. The plates were incubated overnight at 37°C in a 5% CO2 cell incubator.
|
||||
| In Vitro Model | Breast adenocarcinoma | SK-BR-3 cells | CVCL_0033 | ||
| Experiment 2 Reporting the Activity Date of This ADC | [206] | ||||
| Efficacy Data | Half Maximal Inhibitory Concentration (IC50) | > 66.00 nM | Positive HER2 expression (HER2+++/++) | ||
| Method Description |
Cells were cultured in a 10% fetal bovine serum (FBS)-containing RPMI 1640 medium and were planted into 96-well plates with 6000 cells per well. The plates were incubated overnight at 37°C in a 5% CO2 cell incubator.
|
||||
| In Vitro Model | Gastric tubular adenocarcinoma | NCI-N87 cells | CVCL_1603 | ||
| Experiment 3 Reporting the Activity Date of This ADC | [206] | ||||
| Efficacy Data | Half Maximal Inhibitory Concentration (IC50) | > 66.00 nM | Negative HER2 expression (HER2 -) | ||
| Method Description |
Cells were cultured in a 10% fetal bovine serum (FBS)-containing RPMI 1640 medium and were planted into 96-well plates with 6000 cells per well. The plates were incubated overnight at 37°C in a 5% CO2 cell incubator.
|
||||
| In Vitro Model | Breast adenocarcinoma | MDA-MB-231 cells | CVCL_0062 | ||
HER2-gsADC-30 [Investigative]
Revealed Based on the Cell Line Data
| Experiment 1 Reporting the Activity Date of This ADC | [206] | ||||
| Efficacy Data | Half Maximal Inhibitory Concentration (IC50) |
0.04 nM
|
Positive HER2 expression (HER2+++/++) | ||
| Method Description |
Cells were cultured in a 10% fetal bovine serum (FBS)-containing RPMI 1640 medium and were planted into 96-well plates with 6000 cells per well. The plates were incubated overnight at 37°C in a 5% CO2 cell incubator.
|
||||
| In Vitro Model | Breast adenocarcinoma | SK-BR-3 cells | CVCL_0033 | ||
| Experiment 2 Reporting the Activity Date of This ADC | [206] | ||||
| Efficacy Data | Half Maximal Inhibitory Concentration (IC50) |
0.15 nM
|
Positive HER2 expression (HER2+++/++) | ||
| Method Description |
Cells were cultured in a 10% fetal bovine serum (FBS)-containing RPMI 1640 medium and were planted into 96-well plates with 6000 cells per well. The plates were incubated overnight at 37°C in a 5% CO2 cell incubator.
|
||||
| In Vitro Model | Gastric tubular adenocarcinoma | NCI-N87 cells | CVCL_1603 | ||
| Experiment 3 Reporting the Activity Date of This ADC | [206] | ||||
| Efficacy Data | Half Maximal Inhibitory Concentration (IC50) | > 66.00 nM | Negative HER2 expression (HER2 -) | ||
| Method Description |
Cells were cultured in a 10% fetal bovine serum (FBS)-containing RPMI 1640 medium and were planted into 96-well plates with 6000 cells per well. The plates were incubated overnight at 37°C in a 5% CO2 cell incubator.
|
||||
| In Vitro Model | Breast adenocarcinoma | MDA-MB-231 cells | CVCL_0062 | ||
H32-VCMMAE_3.8 [Investigative]
Revealed Based on the Cell Line Data
| Experiment 1 Reporting the Activity Date of This ADC | [246] | ||||
| Efficacy Data | Half Maximal Inhibitory Concentration (IC50) |
0.04 nM
|
High HER2 expression (HER2 +++) | ||
| Method Description |
To determine the IC50 values of the ADCs, different concentrations of each conjugate was directly added to the culture medium. After the cells were cultured for 3 days at 37°C, the number of viable cells was quantified by using the WST- reagent, and the absorbance was measured at OD450.
|
||||
| In Vitro Model | Breast adenocarcinoma | SK-BR-3 cells | CVCL_0033 | ||
| Experiment 2 Reporting the Activity Date of This ADC | [246] | ||||
| Efficacy Data | Half Maximal Inhibitory Concentration (IC50) |
0.06 nM±0.01 nM
|
High HER2 expression (HER2 +++) | ||
| Method Description |
To determine the IC50 values of the ADCs, different concentrations of each conjugate was directly added to the culture medium. After the cells were cultured for 3 days at 37°C, the number of viable cells was quantified by using the WST- reagent, and the absorbance was measured at OD450.
|
||||
| In Vitro Model | Invasive breast carcinoma | BT-474 cells | CVCL_0179 | ||
| Experiment 3 Reporting the Activity Date of This ADC | [246] | ||||
| Efficacy Data | Half Maximal Inhibitory Concentration (IC50) |
0.62 nM±0.08 nM
|
High HER2 expression (HER2 +++) | ||
| Method Description |
To determine the IC50 values of the ADCs, different concentrations of each conjugate was directly added to the culture medium. After the cells were cultured for 3 days at 37°C, the number of viable cells was quantified by using the WST- reagent, and the absorbance was measured at OD450.
|
||||
| In Vitro Model | Gastric tubular adenocarcinoma | NCI-N87 cells | CVCL_1603 | ||
WO2017089895A1 ADC68 [Investigative]
Revealed Based on the Cell Line Data
| Experiment 1 Reporting the Activity Date of This ADC | [235] | ||||
| Efficacy Data | Half Maximal Inhibitory Concentration (IC50) |
0.04 nM
|
Positive CD19 expression (CD19+++/++) | ||
| Method Description |
ADCs wereincubated in human plasma for 5 seconds (0h), followed by SRB invitro cytotoxicity test using Ramos cells for 72hr.
|
||||
| In Vitro Model | Burkitt lymphoma | Ramos cells | CVCL_0597 | ||
| Experiment 2 Reporting the Activity Date of This ADC | [235] | ||||
| Efficacy Data | Half Maximal Inhibitory Concentration (IC50) |
0.05 nM
|
Positive CD19 expression (CD19+++/++) | ||
| Method Description |
ADCs wereincubated in human plasma for 168 hours (168h), followed by SRB invitro cytotoxicity test using Ramos cells for 72hr.
|
||||
| In Vitro Model | Burkitt lymphoma | Ramos cells | CVCL_0597 | ||
| Experiment 3 Reporting the Activity Date of This ADC | [235] | ||||
| Efficacy Data | Half Maximal Inhibitory Concentration (IC50) |
0.09 nM
|
Positive CD19 expression (CD19+++/++) | ||
| Method Description |
Ramos cells were seeded in a 96-wellplate at 20,000 cells/well in 100 uL of growth media. The cells were incubated at 37°C in5% CO, for 1 day. Serial dilutions of ADCs from 33.33 nM to 5.1 pM in 100 uL media were added to the wells, and the cells were incubated with the antibody & ADCs for 72 hours.
|
||||
| In Vitro Model | Burkitt lymphoma | Ramos cells | CVCL_0597 | ||
| Experiment 4 Reporting the Activity Date of This ADC | [235] | ||||
| Efficacy Data | Half Maximal Inhibitory Concentration (IC50) | > 33.30 nM | Negative CD19 expression (CD19-) | ||
| Method Description |
K562 cells were seeded in a 96-wellplate at 20,000 cells/well in 100 uL of growth media. The cells were incubated at 37°C in5% CO, for 1 day. Serial dilutions of ADCs from 33.33 nM to 5.1 pM in 100 uL media were added to the wells, and the cells were incubated with the antibody & ADCs for 72 hours.
|
||||
| In Vitro Model | Chronic myeloid leukemia | K562 cells | CVCL_0004 | ||
WO2017089895A1 ADC51 [Investigative]
Revealed Based on the Cell Line Data
| Experiment 1 Reporting the Activity Date of This ADC | [235] | ||||
| Efficacy Data | Half Maximal Inhibitory Concentration (IC50) |
0.04 nM
|
Positive HER2 expression (HER2+++/++) | ||
| Method Description |
Anti-proliferation activities of the antibodies, drugs, and conjugates with regard tothe cancer cell lines were measured. The cells were plated in 96-well, tissue culture platesat 10,000 cells per well. After 24 hour incubation, the antibodies, drugs, and conjugateswere added in various concentrations. The number of viable cells after 72 hours were counted using SRB assay.
Click to Show/Hide
|
||||
| In Vitro Model | Breast adenocarcinoma | SK-BR-3 cells | CVCL_0033 | ||
| Experiment 2 Reporting the Activity Date of This ADC | [235] | ||||
| Efficacy Data | Half Maximal Inhibitory Concentration (IC50) |
0.24 nM
|
Positive HER2 expression (HER2+++/++) | ||
| Method Description |
Anti-proliferation activities of the antibodies, drugs, and conjugates with regard tothe cancer cell lines were measured. The cells were plated in 96-well, tissue culture platesat 10,000 cells per well. After 24 hour incubation, the antibodies, drugs, and conjugateswere added in various concentrations. The number of viable cells after 72 hours were counted using SRB assay.
Click to Show/Hide
|
||||
| In Vitro Model | Breast ductal carcinoma | JIMT-1 cells | CVCL_2077 | ||
| Experiment 3 Reporting the Activity Date of This ADC | [235] | ||||
| Efficacy Data | Half Maximal Inhibitory Concentration (IC50) |
0.34 nM
|
Positive HER2 expression (HER2+++/++) | ||
| Method Description |
Anti-proliferation activities of the antibodies, drugs, and conjugates with regard tothe cancer cell lines were measured. The cells were plated in 96-well, tissue culture platesat 10,000 cells per well. After 24 hour incubation, the antibodies, drugs, and conjugateswere added in various concentrations. The number of viable cells after 72 hours were counted using SRB assay.
Click to Show/Hide
|
||||
| In Vitro Model | Gastric tubular adenocarcinoma | NCI-N87 cells | CVCL_1603 | ||
| Experiment 4 Reporting the Activity Date of This ADC | [235] | ||||
| Efficacy Data | Half Maximal Inhibitory Concentration (IC50) | > 33.33 nM | Negative HER2 expression (HER2-) | ||
| Method Description |
Anti-proliferation activities of the antibodies, drugs, and conjugates with regard tothe cancer cell lines were measured. The cells were plated in 96-well, tissue culture platesat 10,000 cells per well. After 24 hour incubation, the antibodies, drugs, and conjugateswere added in various concentrations. The number of viable cells after 72 hours were counted using SRB assay.
Click to Show/Hide
|
||||
| In Vitro Model | Invasive breast carcinoma | MCF-7 cells | CVCL_0031 | ||
WO2017089895A1 ADC47 [Investigative]
Revealed Based on the Cell Line Data
| Experiment 1 Reporting the Activity Date of This ADC | [235] | ||||
| Efficacy Data | Half Maximal Inhibitory Concentration (IC50) |
0.04 nM
|
Positive HER2 expression (HER2+++/++) | ||
| Method Description |
ADCs wereincubated in human plasma for 5 seconds (0h), followed by SRB invitro cytotoxicity test using SK-BR3 cells for 72hr.
|
||||
| In Vitro Model | Breast adenocarcinoma | SK-BR-3 cells | CVCL_0033 | ||
| Experiment 2 Reporting the Activity Date of This ADC | [235] | ||||
| Efficacy Data | Half Maximal Inhibitory Concentration (IC50) |
0.04 nM
|
Positive HER2 expression (HER2+++/++) | ||
| Method Description |
Anti-proliferation activities of the antibodies, drugs, and conjugates with regard tothe cancer cell lines were measured. The cells were plated in 96-well, tissue culture platesat 10,000 cells per well. After 24 hour incubation, the antibodies, drugs, and conjugateswere added in various concentrations. The number of viable cells after 72 hours were counted using SRB assay.
Click to Show/Hide
|
||||
| In Vitro Model | Breast adenocarcinoma | SK-BR-3 cells | CVCL_0033 | ||
| Experiment 3 Reporting the Activity Date of This ADC | [235] | ||||
| Efficacy Data | Half Maximal Inhibitory Concentration (IC50) |
0.05 nM
|
Positive HER2 expression (HER2+++/++) | ||
| Method Description |
ADCs wereincubated in human plasma for 168 hours (168h), followed by SRB invitro cytotoxicity test using SK-BR3 cells for 72hr.
|
||||
| In Vitro Model | Breast adenocarcinoma | SK-BR-3 cells | CVCL_0033 | ||
| Experiment 4 Reporting the Activity Date of This ADC | [235] | ||||
| Efficacy Data | Half Maximal Inhibitory Concentration (IC50) |
0.07 nM
|
Positive HER2 expression (HER2+++/++) | ||
| Method Description |
Anti-proliferation activities of the antibodies, drugs, and conjugates with regard tothe cancer cell lines were measured. The cells were plated in 96-well, tissue culture platesat 10,000 cells per well. After 24 hour incubation, the antibodies, drugs, and conjugateswere added in various concentrations. The number of viable cells after 72 hours were counted using SRB assay.
Click to Show/Hide
|
||||
| In Vitro Model | Breast ductal carcinoma | JIMT-1 cells | CVCL_2077 | ||
| Experiment 5 Reporting the Activity Date of This ADC | [235] | ||||
| Efficacy Data | Half Maximal Inhibitory Concentration (IC50) | > 33.33 nM | Negative HER2 expression (HER2-) | ||
| Method Description |
Anti-proliferation activities of the antibodies, drugs, and conjugates with regard tothe cancer cell lines were measured. The cells were plated in 96-well, tissue culture platesat 10,000 cells per well. After 24 hour incubation, the antibodies, drugs, and conjugateswere added in various concentrations. The number of viable cells after 72 hours were counted using SRB assay.
Click to Show/Hide
|
||||
| In Vitro Model | Invasive breast carcinoma | MCF-7 cells | CVCL_0031 | ||
WO2017089895A1 ADC37 [Investigative]
Revealed Based on the Cell Line Data
| Experiment 1 Reporting the Activity Date of This ADC | [235] | ||||
| Efficacy Data | Half Maximal Inhibitory Concentration (IC50) |
0.04 nM
|
Positive HER2 expression (HER2+++/++) | ||
| Method Description |
Anti-proliferation activities of the antibodies, drugs, and conjugates with regard tothe cancer cell lines were measured. The cells were plated in 96-well, tissue culture platesat 10,000 cells per well. After 24 hour incubation, the antibodies, drugs, and conjugateswere added in various concentrations. The number of viable cells after 72 hours were counted using SRB assay.
Click to Show/Hide
|
||||
| In Vitro Model | Breast adenocarcinoma | SK-BR-3 cells | CVCL_0033 | ||
| Experiment 2 Reporting the Activity Date of This ADC | [235] | ||||
| Efficacy Data | Half Maximal Inhibitory Concentration (IC50) |
0.07 nM
|
Positive HER2 expression (HER2+++/++) | ||
| Method Description |
Anti-proliferation activities of the antibodies, drugs, and conjugates with regard tothe cancer cell lines were measured. The cells were plated in 96-well, tissue culture platesat 10,000 cells per well. After 24 hour incubation, the antibodies, drugs, and conjugateswere added in various concentrations. The number of viable cells after 72 hours were counted using SRB assay.
Click to Show/Hide
|
||||
| In Vitro Model | Breast ductal carcinoma | JIMT-1 cells | CVCL_2077 | ||
| Experiment 3 Reporting the Activity Date of This ADC | [235] | ||||
| Efficacy Data | Half Maximal Inhibitory Concentration (IC50) | > 33.33 nM | Negative HER2 expression (HER2-) | ||
| Method Description |
Anti-proliferation activities of the antibodies, drugs, and conjugates with regard tothe cancer cell lines were measured. The cells were plated in 96-well, tissue culture platesat 10,000 cells per well. After 24 hour incubation, the antibodies, drugs, and conjugateswere added in various concentrations. The number of viable cells after 72 hours were counted using SRB assay.
Click to Show/Hide
|
||||
| In Vitro Model | Invasive breast carcinoma | MCF-7 cells | CVCL_0031 | ||
WO2017089890A1 ADC37 [Investigative]
Revealed Based on the Cell Line Data
| Experiment 1 Reporting the Activity Date of This ADC | [211] | ||||
| Efficacy Data | Half Maximal Inhibitory Concentration (IC50) |
0.04 nM
|
High HER2 expression (HER2 +++) | ||
| Method Description |
Anti-proliferation activities of the antibodies, drugs, and conjugates with regard tothe cancer cell lines were measured. The cells were plated in 96-well, tissue culture platesat 10,000 cells per well. After 24 hour incubation, the antibodies, drugs, and conjugateswere added in various concentrations. The number of viable cells after 72 hours werecounted using SRB assay.
Click to Show/Hide
|
||||
| In Vitro Model | Breast adenocarcinoma | SK-BR-3 cells | CVCL_0033 | ||
| Experiment 2 Reporting the Activity Date of This ADC | [211] | ||||
| Efficacy Data | Half Maximal Inhibitory Concentration (IC50) |
0.07 nM
|
Moderate HER2 expression (HER2++) | ||
| Method Description |
Anti-proliferation activities of the antibodies, drugs, and conjugates with regard tothe cancer cell lines were measured. The cells were plated in 96-well, tissue culture platesat 10,000 cells per well. After 24 hour incubation, the antibodies, drugs, and conjugateswere added in various concentrations. The number of viable cells after 72 hours werecounted using SRB assay.
Click to Show/Hide
|
||||
| In Vitro Model | Breast ductal carcinoma | JIMT-1 cells | CVCL_2077 | ||
| Experiment 3 Reporting the Activity Date of This ADC | [211] | ||||
| Efficacy Data | Half Maximal Inhibitory Concentration (IC50) | > 33.30 nM | Negative HER2 expression (HER2-) | ||
| Method Description |
Anti-proliferation activities of the antibodies, drugs, and conjugates with regard tothe cancer cell lines were measured. The cells were plated in 96-well, tissue culture platesat 10,000 cells per well. After 24 hour incubation, the antibodies, drugs, and conjugateswere added in various concentrations. The number of viable cells after 72 hours werecounted using SRB assay.
Click to Show/Hide
|
||||
| In Vitro Model | Invasive breast carcinoma | MCF-7 cells | CVCL_0031 | ||
WO2017089890A1 ADC47 [Investigative]
Revealed Based on the Cell Line Data
| Experiment 1 Reporting the Activity Date of This ADC | [211] | ||||
| Efficacy Data | Half Maximal Inhibitory Concentration (IC50) |
0.04 nM
|
High HER2 expression (HER2 +++) | ||
| Method Description |
Anti-proliferation activities of the antibodies, drugs, and conjugates with regard tothe cancer cell lines were measured. The cells were plated in 96-well, tissue culture platesat 10,000 cells per well. After 24 hour incubation, the antibodies, drugs, and conjugateswere added in various concentrations. The number of viable cells after 72 hours werecounted using SRB assay.
Click to Show/Hide
|
||||
| In Vitro Model | Breast adenocarcinoma | SK-BR-3 cells | CVCL_0033 | ||
| Experiment 2 Reporting the Activity Date of This ADC | [211] | ||||
| Efficacy Data | Half Maximal Inhibitory Concentration (IC50) |
0.07 nM
|
Moderate HER2 expression (HER2++) | ||
| Method Description |
Anti-proliferation activities of the antibodies, drugs, and conjugates with regard tothe cancer cell lines were measured. The cells were plated in 96-well, tissue culture platesat 10,000 cells per well. After 24 hour incubation, the antibodies, drugs, and conjugateswere added in various concentrations. The number of viable cells after 72 hours werecounted using SRB assay.
Click to Show/Hide
|
||||
| In Vitro Model | Breast ductal carcinoma | JIMT-1 cells | CVCL_2077 | ||
| Experiment 3 Reporting the Activity Date of This ADC | [211] | ||||
| Efficacy Data | Half Maximal Inhibitory Concentration (IC50) | > 33.30 nM | Negative HER2 expression (HER2-) | ||
| Method Description |
Anti-proliferation activities of the antibodies, drugs, and conjugates with regard tothe cancer cell lines were measured. The cells were plated in 96-well, tissue culture platesat 10,000 cells per well. After 24 hour incubation, the antibodies, drugs, and conjugateswere added in various concentrations. The number of viable cells after 72 hours werecounted using SRB assay.
Click to Show/Hide
|
||||
| In Vitro Model | Invasive breast carcinoma | MCF-7 cells | CVCL_0031 | ||
WO2017089890A1 ADC51 [Investigative]
Revealed Based on the Cell Line Data
| Experiment 1 Reporting the Activity Date of This ADC | [211] | ||||
| Efficacy Data | Half Maximal Inhibitory Concentration (IC50) |
0.04 nM
|
High HER2 expression (HER2 +++) | ||
| Method Description |
Anti-proliferation activities of the antibodies, drugs, and conjugates with regard tothe cancer cell lines were measured. The cells were plated in 96-well, tissue culture platesat 10,000 cells per well. After 24 hour incubation, the antibodies, drugs, and conjugateswere added in various concentrations. The number of viable cells after 72 hours werecounted using SRB assay.
Click to Show/Hide
|
||||
| In Vitro Model | Breast adenocarcinoma | SK-BR-3 cells | CVCL_0033 | ||
| Experiment 2 Reporting the Activity Date of This ADC | [211] | ||||
| Efficacy Data | Half Maximal Inhibitory Concentration (IC50) |
0.24 nM
|
Moderate HER2 expression (HER2++) | ||
| Method Description |
Anti-proliferation activities of the antibodies, drugs, and conjugates with regard tothe cancer cell lines were measured. The cells were plated in 96-well, tissue culture platesat 10,000 cells per well. After 24 hour incubation, the antibodies, drugs, and conjugateswere added in various concentrations. The number of viable cells after 72 hours werecounted using SRB assay.
Click to Show/Hide
|
||||
| In Vitro Model | Breast ductal carcinoma | JIMT-1 cells | CVCL_2077 | ||
| Experiment 3 Reporting the Activity Date of This ADC | [211] | ||||
| Efficacy Data | Half Maximal Inhibitory Concentration (IC50) |
0.34 nM
|
High HER2 expression (HER2+++) | ||
| Method Description |
Anti-proliferation activities of the antibodies, drugs, and conjugates with regard tothe cancer cell lines were measured. The cells were plated in 96-well, tissue culture platesat 10,000 cells per well. After 24 hour incubation, the antibodies, drugs, and conjugateswere added in various concentrations. The number of viable cells after 72 hours werecounted using SRB assay.
Click to Show/Hide
|
||||
| In Vitro Model | Gastric tubular adenocarcinoma | NCI-N87 cells | CVCL_1603 | ||
| Experiment 4 Reporting the Activity Date of This ADC | [211] | ||||
| Efficacy Data | Half Maximal Inhibitory Concentration (IC50) | > 33.30 nM | Negative HER2 expression (HER2-) | ||
| Method Description |
Anti-proliferation activities of the antibodies, drugs, and conjugates with regard tothe cancer cell lines were measured. The cells were plated in 96-well, tissue culture platesat 10,000 cells per well. After 24 hour incubation, the antibodies, drugs, and conjugateswere added in various concentrations. The number of viable cells after 72 hours werecounted using SRB assay.
Click to Show/Hide
|
||||
| In Vitro Model | Invasive breast carcinoma | MCF-7 cells | CVCL_0031 | ||
WO2017089890A1 ADC55 [Investigative]
Revealed Based on the Cell Line Data
| Experiment 1 Reporting the Activity Date of This ADC | [211] | ||||
| Efficacy Data | Half Maximal Inhibitory Concentration (IC50) |
0.04 nM
|
High HER2 expression (HER2 +++) | ||
| Method Description |
Anti-proliferation activities of the antibodies, drugs, and conjugates with regard tothe cancer cell lines were measured. The cells were plated in 96-well, tissue culture platesat 10,000 cells per well. After 24 hour incubation, the antibodies, drugs, and conjugateswere added in various concentrations. The number of viable cells after 72 hours werecounted using SRB assay.
Click to Show/Hide
|
||||
| In Vitro Model | Breast adenocarcinoma | SK-BR-3 cells | CVCL_0033 | ||
| Experiment 2 Reporting the Activity Date of This ADC | [211] | ||||
| Efficacy Data | Half Maximal Inhibitory Concentration (IC50) |
0.07 nM
|
Moderate HER2 expression (HER2++) | ||
| Method Description |
Anti-proliferation activities of the antibodies, drugs, and conjugates with regard tothe cancer cell lines were measured. The cells were plated in 96-well, tissue culture platesat 10,000 cells per well. After 24 hour incubation, the antibodies, drugs, and conjugateswere added in various concentrations. The number of viable cells after 72 hours werecounted using SRB assay.
Click to Show/Hide
|
||||
| In Vitro Model | Breast ductal carcinoma | JIMT-1 cells | CVCL_2077 | ||
| Experiment 3 Reporting the Activity Date of This ADC | [211] | ||||
| Efficacy Data | Half Maximal Inhibitory Concentration (IC50) | > 33.30 nM | Negative HER2 expression (HER2-) | ||
| Method Description |
Anti-proliferation activities of the antibodies, drugs, and conjugates with regard tothe cancer cell lines were measured. The cells were plated in 96-well, tissue culture platesat 10,000 cells per well. After 24 hour incubation, the antibodies, drugs, and conjugateswere added in various concentrations. The number of viable cells after 72 hours werecounted using SRB assay.
Click to Show/Hide
|
||||
| In Vitro Model | Invasive breast carcinoma | MCF-7 cells | CVCL_0031 | ||
WO2017089890A1 ADC52 [Investigative]
Revealed Based on the Cell Line Data
| Experiment 1 Reporting the Activity Date of This ADC | [211] | ||||
| Efficacy Data | Half Maximal Inhibitory Concentration (IC50) |
0.04 nM
|
Moderate HER2 expression (HER2++) | ||
| Method Description |
Anti-proliferation activities of the antibodies, drugs, and conjugates with regard tothe cancer cell lines were measured. The cells were plated in 96-well, tissue culture platesat 10,000 cells per well. After 24 hour incubation, the antibodies, drugs, and conjugateswere added in various concentrations. The number of viable cells after 72 hours werecounted using SRB assay.
Click to Show/Hide
|
||||
| In Vitro Model | Breast ductal carcinoma | JIMT-1 cells | CVCL_2077 | ||
| Experiment 2 Reporting the Activity Date of This ADC | [211] | ||||
| Efficacy Data | Half Maximal Inhibitory Concentration (IC50) |
0.07 nM
|
High HER2 expression (HER2 +++) | ||
| Method Description |
Anti-proliferation activities of the antibodies, drugs, and conjugates with regard tothe cancer cell lines were measured. The cells were plated in 96-well, tissue culture platesat 10,000 cells per well. After 24 hour incubation, the antibodies, drugs, and conjugateswere added in various concentrations. The number of viable cells after 72 hours werecounted using SRB assay.
Click to Show/Hide
|
||||
| In Vitro Model | Breast adenocarcinoma | SK-BR-3 cells | CVCL_0033 | ||
| Experiment 3 Reporting the Activity Date of This ADC | [211] | ||||
| Efficacy Data | Half Maximal Inhibitory Concentration (IC50) |
0.37 nM
|
High HER2 expression (HER2+++) | ||
| Method Description |
Anti-proliferation activities of the antibodies, drugs, and conjugates with regard tothe cancer cell lines were measured. The cells were plated in 96-well, tissue culture platesat 10,000 cells per well. After 24 hour incubation, the antibodies, drugs, and conjugateswere added in various concentrations. The number of viable cells after 72 hours werecounted using SRB assay.
Click to Show/Hide
|
||||
| In Vitro Model | Gastric tubular adenocarcinoma | NCI-N87 cells | CVCL_1603 | ||
| Experiment 4 Reporting the Activity Date of This ADC | [211] | ||||
| Efficacy Data | Half Maximal Inhibitory Concentration (IC50) | > 33.30 nM | Negative HER2 expression (HER2-) | ||
| Method Description |
Anti-proliferation activities of the antibodies, drugs, and conjugates with regard tothe cancer cell lines were measured. The cells were plated in 96-well, tissue culture platesat 10,000 cells per well. After 24 hour incubation, the antibodies, drugs, and conjugateswere added in various concentrations. The number of viable cells after 72 hours werecounted using SRB assay.
Click to Show/Hide
|
||||
| In Vitro Model | Invasive breast carcinoma | MCF-7 cells | CVCL_0031 | ||
HER2-gsADC-34 [Investigative]
Revealed Based on the Cell Line Data
| Experiment 1 Reporting the Activity Date of This ADC | [206] | ||||
| Efficacy Data | Half Maximal Inhibitory Concentration (IC50) |
0.05 nM
|
Positive HER2 expression (HER2+++/++) | ||
| Method Description |
Cells were cultured in a 10% fetal bovine serum (FBS)-containing RPMI 1640 medium and were planted into 96-well plates with 6000 cells per well. The plates were incubated overnight at 37°C in a 5% CO2 cell incubator.
|
||||
| In Vitro Model | Breast adenocarcinoma | SK-BR-3 cells | CVCL_0033 | ||
| Experiment 2 Reporting the Activity Date of This ADC | [206] | ||||
| Efficacy Data | Half Maximal Inhibitory Concentration (IC50) | > 66.00 nM | Positive HER2 expression (HER2+++/++) | ||
| Method Description |
Cells were cultured in a 10% fetal bovine serum (FBS)-containing RPMI 1640 medium and were planted into 96-well plates with 6000 cells per well. The plates were incubated overnight at 37°C in a 5% CO2 cell incubator.
|
||||
| In Vitro Model | Gastric tubular adenocarcinoma | NCI-N87 cells | CVCL_1603 | ||
| Experiment 3 Reporting the Activity Date of This ADC | [206] | ||||
| Efficacy Data | Half Maximal Inhibitory Concentration (IC50) | > 66.00 nM | Negative HER2 expression (HER2 -) | ||
| Method Description |
Cells were cultured in a 10% fetal bovine serum (FBS)-containing RPMI 1640 medium and were planted into 96-well plates with 6000 cells per well. The plates were incubated overnight at 37°C in a 5% CO2 cell incubator.
|
||||
| In Vitro Model | Breast adenocarcinoma | MDA-MB-231 cells | CVCL_0062 | ||
HER2-gsADC-28 [Investigative]
Revealed Based on the Cell Line Data
| Experiment 1 Reporting the Activity Date of This ADC | [206] | ||||
| Efficacy Data | Half Maximal Inhibitory Concentration (IC50) |
0.05 nM
|
Positive HER2 expression (HER2+++/++) | ||
| Method Description |
Cells were cultured in a 10% fetal bovine serum (FBS)-containing RPMI 1640 medium and were planted into 96-well plates with 6000 cells per well. The plates were incubated overnight at 37°C in a 5% CO2 cell incubator.
|
||||
| In Vitro Model | Breast adenocarcinoma | SK-BR-3 cells | CVCL_0033 | ||
| Experiment 2 Reporting the Activity Date of This ADC | [206] | ||||
| Efficacy Data | Half Maximal Inhibitory Concentration (IC50) | > 66.00 nM | Positive HER2 expression (HER2+++/++) | ||
| Method Description |
Cells were cultured in a 10% fetal bovine serum (FBS)-containing RPMI 1640 medium and were planted into 96-well plates with 6000 cells per well. The plates were incubated overnight at 37°C in a 5% CO2 cell incubator.
|
||||
| In Vitro Model | Gastric tubular adenocarcinoma | NCI-N87 cells | CVCL_1603 | ||
| Experiment 3 Reporting the Activity Date of This ADC | [206] | ||||
| Efficacy Data | Half Maximal Inhibitory Concentration (IC50) | > 66.00 nM | Negative HER2 expression (HER2 -) | ||
| Method Description |
Cells were cultured in a 10% fetal bovine serum (FBS)-containing RPMI 1640 medium and were planted into 96-well plates with 6000 cells per well. The plates were incubated overnight at 37°C in a 5% CO2 cell incubator.
|
||||
| In Vitro Model | Breast adenocarcinoma | MDA-MB-231 cells | CVCL_0062 | ||
HER2-gsADC-20 [Investigative]
Revealed Based on the Cell Line Data
| Experiment 1 Reporting the Activity Date of This ADC | [206] | ||||
| Efficacy Data | Half Maximal Inhibitory Concentration (IC50) |
0.05 nM
|
Positive HER2 expression (HER2+++/++) | ||
| Method Description |
Cells were cultured in a 10% fetal bovine serum (FBS)-containing RPMI 1640 medium and were planted into 96-well plates with 6000 cells per well. The plates were incubated overnight at 37°C in a 5% CO2 cell incubator.
|
||||
| In Vitro Model | Breast adenocarcinoma | SK-BR-3 cells | CVCL_0033 | ||
| Experiment 2 Reporting the Activity Date of This ADC | [206] | ||||
| Efficacy Data | Half Maximal Inhibitory Concentration (IC50) |
0.05 nM
|
Positive HER2 expression (HER2+++/++) | ||
| Method Description |
Cells were cultured in a 10% fetal bovine serum (FBS)-containing RPMI 1640 medium and were planted into 96-well plates with 6000 cells per well. The plates were incubated overnight at 37°C in a 5% CO2 cell incubator.
|
||||
| In Vitro Model | Gastric tubular adenocarcinoma | NCI-N87 cells | CVCL_1603 | ||
| Experiment 3 Reporting the Activity Date of This ADC | [206] | ||||
| Efficacy Data | Half Maximal Inhibitory Concentration (IC50) | > 66.00 nM | Negative HER2 expression (HER2 -) | ||
| Method Description |
Cells were cultured in a 10% fetal bovine serum (FBS)-containing RPMI 1640 medium and were planted into 96-well plates with 6000 cells per well. The plates were incubated overnight at 37°C in a 5% CO2 cell incubator.
|
||||
| In Vitro Model | Breast adenocarcinoma | MDA-MB-231 cells | CVCL_0062 | ||
HER2-gsADC-14 [Investigative]
Revealed Based on the Cell Line Data
| Experiment 1 Reporting the Activity Date of This ADC | [206] | ||||
| Efficacy Data | Half Maximal Inhibitory Concentration (IC50) |
0.05 nM
|
Positive HER2 expression (HER2+++/++) | ||
| Method Description |
Cells were cultured in a 10% fetal bovine serum (FBS)-containing RPMI 1640 medium and were planted into 96-well plates with 6000 cells per well. The plates were incubated overnight at 37°C in a 5% CO2 cell incubator.
|
||||
| In Vitro Model | Gastric tubular adenocarcinoma | NCI-N87 cells | CVCL_1603 | ||
| Experiment 2 Reporting the Activity Date of This ADC | [206] | ||||
| Efficacy Data | Half Maximal Inhibitory Concentration (IC50) |
0.09 nM
|
Positive HER2 expression (HER2+++/++) | ||
| Method Description |
Cells were cultured in a 10% fetal bovine serum (FBS)-containing RPMI 1640 medium and were planted into 96-well plates with 6000 cells per well. The plates were incubated overnight at 37°C in a 5% CO2 cell incubator.
|
||||
| In Vitro Model | Breast adenocarcinoma | SK-BR-3 cells | CVCL_0033 | ||
| Experiment 3 Reporting the Activity Date of This ADC | [206] | ||||
| Efficacy Data | Half Maximal Inhibitory Concentration (IC50) | > 66.00 nM | Negative HER2 expression (HER2 -) | ||
| Method Description |
Cells were cultured in a 10% fetal bovine serum (FBS)-containing RPMI 1640 medium and were planted into 96-well plates with 6000 cells per well. The plates were incubated overnight at 37°C in a 5% CO2 cell incubator.
|
||||
| In Vitro Model | Breast adenocarcinoma | MDA-MB-231 cells | CVCL_0062 | ||
HER2-gsADC-12 [Investigative]
Revealed Based on the Cell Line Data
| Experiment 1 Reporting the Activity Date of This ADC | [206] | ||||
| Efficacy Data | Half Maximal Inhibitory Concentration (IC50) |
0.05 nM
|
Positive HER2 expression (HER2+++/++) | ||
| Method Description |
Cells were cultured in a 10% fetal bovine serum (FBS)-containing RPMI 1640 medium and were planted into 96-well plates with 6000 cells per well. The plates were incubated overnight at 37°C in a 5% CO2 cell incubator.
|
||||
| In Vitro Model | Gastric tubular adenocarcinoma | NCI-N87 cells | CVCL_1603 | ||
| Experiment 2 Reporting the Activity Date of This ADC | [206] | ||||
| Efficacy Data | Half Maximal Inhibitory Concentration (IC50) |
0.09 nM
|
Positive HER2 expression (HER2+++/++) | ||
| Method Description |
Cells were cultured in a 10% fetal bovine serum (FBS)-containing RPMI 1640 medium and were planted into 96-well plates with 6000 cells per well. The plates were incubated overnight at 37°C in a 5% CO2 cell incubator.
|
||||
| In Vitro Model | Breast adenocarcinoma | SK-BR-3 cells | CVCL_0033 | ||
| Experiment 3 Reporting the Activity Date of This ADC | [206] | ||||
| Efficacy Data | Half Maximal Inhibitory Concentration (IC50) | > 66.00 nM | Negative HER2 expression (HER2 -) | ||
| Method Description |
Cells were cultured in a 10% fetal bovine serum (FBS)-containing RPMI 1640 medium and were planted into 96-well plates with 6000 cells per well. The plates were incubated overnight at 37°C in a 5% CO2 cell incubator.
|
||||
| In Vitro Model | Breast adenocarcinoma | MDA-MB-231 cells | CVCL_0062 | ||
HER2-gsADC-10 [Investigative]
Revealed Based on the Cell Line Data
| Experiment 1 Reporting the Activity Date of This ADC | [206] | ||||
| Efficacy Data | Half Maximal Inhibitory Concentration (IC50) |
0.05 nM
|
Positive HER2 expression (HER2+++/++) | ||
| Method Description |
Cells were cultured in a 10% fetal bovine serum (FBS)-containing RPMI 1640 medium and were planted into 96-well plates with 6000 cells per well. The plates were incubated overnight at 37°C in a 5% CO2 cell incubator.
|
||||
| In Vitro Model | Gastric tubular adenocarcinoma | NCI-N87 cells | CVCL_1603 | ||
| Experiment 2 Reporting the Activity Date of This ADC | [206] | ||||
| Efficacy Data | Half Maximal Inhibitory Concentration (IC50) |
0.13 nM
|
Positive HER2 expression (HER2+++/++) | ||
| Method Description |
Cells were cultured in a 10% fetal bovine serum (FBS)-containing RPMI 1640 medium and were planted into 96-well plates with 6000 cells per well. The plates were incubated overnight at 37°C in a 5% CO2 cell incubator.
|
||||
| In Vitro Model | Breast adenocarcinoma | SK-BR-3 cells | CVCL_0033 | ||
| Experiment 3 Reporting the Activity Date of This ADC | [206] | ||||
| Efficacy Data | Half Maximal Inhibitory Concentration (IC50) | > 66.00 nM | Negative HER2 expression (HER2 -) | ||
| Method Description |
Cells were cultured in a 10% fetal bovine serum (FBS)-containing RPMI 1640 medium and were planted into 96-well plates with 6000 cells per well. The plates were incubated overnight at 37°C in a 5% CO2 cell incubator.
|
||||
| In Vitro Model | Breast adenocarcinoma | MDA-MB-231 cells | CVCL_0062 | ||
HER2-gsADC-4 [Investigative]
Revealed Based on the Cell Line Data
| Experiment 1 Reporting the Activity Date of This ADC | [206] | ||||
| Efficacy Data | Half Maximal Inhibitory Concentration (IC50) |
0.05 nM
|
Positive HER2 expression (HER2+++/++) | ||
| Method Description |
Cells were cultured in a 10% fetal bovine serum (FBS)-containing RPMI 1640 medium and were planted into 96-well plates with 6000 cells per well. The plates were incubated overnight at 37°C in a 5% CO2 cell incubator.
|
||||
| In Vitro Model | Breast adenocarcinoma | SK-BR-3 cells | CVCL_0033 | ||
| Experiment 2 Reporting the Activity Date of This ADC | [206] | ||||
| Efficacy Data | Half Maximal Inhibitory Concentration (IC50) | > 66.00 nM | Positive HER2 expression (HER2+++/++) | ||
| Method Description |
Cells were cultured in a 10% fetal bovine serum (FBS)-containing RPMI 1640 medium and were planted into 96-well plates with 6000 cells per well. The plates were incubated overnight at 37°C in a 5% CO2 cell incubator.
|
||||
| In Vitro Model | Gastric tubular adenocarcinoma | NCI-N87 cells | CVCL_1603 | ||
| Experiment 3 Reporting the Activity Date of This ADC | [206] | ||||
| Efficacy Data | Half Maximal Inhibitory Concentration (IC50) | > 66.00 nM | Negative HER2 expression (HER2 -) | ||
| Method Description |
Cells were cultured in a 10% fetal bovine serum (FBS)-containing RPMI 1640 medium and were planted into 96-well plates with 6000 cells per well. The plates were incubated overnight at 37°C in a 5% CO2 cell incubator.
|
||||
| In Vitro Model | Breast adenocarcinoma | MDA-MB-231 cells | CVCL_0062 | ||
H32-VCMMAE_3.2 [Investigative]
Revealed Based on the Cell Line Data
| Experiment 1 Reporting the Activity Date of This ADC | [246] | ||||
| Efficacy Data | Half Maximal Inhibitory Concentration (IC50) |
0.05 nM±0.01 nM
|
High HER2 expression (HER2 +++) | ||
| Method Description |
To determine the IC50 values of the ADCs, different concentrations of each conjugate was directly added to the culture medium. After the cells were cultured for 3 days at 37°C, the number of viable cells was quantified by using the WST- reagent, and the absorbance was measured at OD450.
|
||||
| In Vitro Model | Breast adenocarcinoma | SK-BR-3 cells | CVCL_0033 | ||
| Experiment 2 Reporting the Activity Date of This ADC | [246] | ||||
| Efficacy Data | Half Maximal Inhibitory Concentration (IC50) |
0.08 nM±0.02 nM
|
High HER2 expression (HER2 +++) | ||
| Method Description |
To determine the IC50 values of the ADCs, different concentrations of each conjugate was directly added to the culture medium. After the cells were cultured for 3 days at 37°C, the number of viable cells was quantified by using the WST- reagent, and the absorbance was measured at OD450.
|
||||
| In Vitro Model | Invasive breast carcinoma | BT-474 cells | CVCL_0179 | ||
| Experiment 3 Reporting the Activity Date of This ADC | [246] | ||||
| Efficacy Data | Half Maximal Inhibitory Concentration (IC50) |
0.10 nM±0.21 nM
|
High HER2 expression (HER2 +++) | ||
| Method Description |
To determine the IC50 values of the ADCs, different concentrations of each conjugate was directly added to the culture medium. After the cells were cultured for 3 days at 37°C, the number of viable cells was quantified by using the WST- reagent, and the absorbance was measured at OD450.
|
||||
| In Vitro Model | Gastric tubular adenocarcinoma | NCI-N87 cells | CVCL_1603 | ||
WO2017089895A1 ADC30 [Investigative]
Revealed Based on the Cell Line Data
| Experiment 1 Reporting the Activity Date of This ADC | [235] | ||||
| Efficacy Data | Half Maximal Inhibitory Concentration (IC50) |
0.05 nM
|
Positive HER2 expression (HER2+++/++) | ||
| Method Description |
Anti-proliferation activities of the antibodies, drugs, and conjugates with regard tothe cancer cell lines were measured. The cells were plated in 96-well, tissue culture platesat 10,000 cells per well. After 24 hour incubation, the antibodies, drugs, and conjugateswere added in various concentrations. The number of viable cells after 72 hours were counted using SRB assay.
Click to Show/Hide
|
||||
| In Vitro Model | Breast adenocarcinoma | SK-BR-3 cells | CVCL_0033 | ||
| Experiment 2 Reporting the Activity Date of This ADC | [235] | ||||
| Efficacy Data | Half Maximal Inhibitory Concentration (IC50) |
0.15 nM
|
Positive HER2 expression (HER2+++/++) | ||
| Method Description |
ADCs wereincubated in human plasma for 5 seconds (0h), followed by SRB invitro cytotoxicity test using SK-BR3 cells for 72hr.
|
||||
| In Vitro Model | Breast adenocarcinoma | SK-BR-3 cells | CVCL_0033 | ||
| Experiment 3 Reporting the Activity Date of This ADC | [235] | ||||
| Efficacy Data | Half Maximal Inhibitory Concentration (IC50) |
0.19 nM
|
Positive HER2 expression (HER2+++/++) | ||
| Method Description |
ADCs wereincubated in human plasma for 168 hours (168h), followed by SRB invitro cytotoxicity test using SK-BR3 cells for 72hr.
|
||||
| In Vitro Model | Breast adenocarcinoma | SK-BR-3 cells | CVCL_0033 | ||
| Experiment 4 Reporting the Activity Date of This ADC | [235] | ||||
| Efficacy Data | Half Maximal Inhibitory Concentration (IC50) |
0.30 nM
|
Positive HER2 expression (HER2+++/++) | ||
| Method Description |
Anti-proliferation activities of the antibodies, drugs, and conjugates with regard tothe cancer cell lines were measured. The cells were plated in 96-well, tissue culture platesat 10,000 cells per well. After 24 hour incubation, the antibodies, drugs, and conjugateswere added in various concentrations. The number of viable cells after 72 hours were counted using SRB assay.
Click to Show/Hide
|
||||
| In Vitro Model | Gastric tubular adenocarcinoma | NCI-N87 cells | CVCL_1603 | ||
| Experiment 5 Reporting the Activity Date of This ADC | [235] | ||||
| Efficacy Data | Half Maximal Inhibitory Concentration (IC50) |
0.35 nM
|
Positive HER2 expression (HER2+++/++) | ||
| Method Description |
Anti-proliferation activities of the antibodies, drugs, and conjugates with regard tothe cancer cell lines were measured. The cells were plated in 96-well, tissue culture platesat 10,000 cells per well. After 24 hour incubation, the antibodies, drugs, and conjugateswere added in various concentrations. The number of viable cells after 72 hours were counted using SRB assay.
Click to Show/Hide
|
||||
| In Vitro Model | Ovarian serous cystadenocarcinoma | SK-OV-3 cells | CVCL_0532 | ||
| Experiment 6 Reporting the Activity Date of This ADC | [235] | ||||
| Efficacy Data | Half Maximal Inhibitory Concentration (IC50) |
0.41 nM
|
Positive HER2 expression (HER2+++/++) | ||
| Method Description |
Anti-proliferation activities of the antibodies, drugs, and conjugates with regard tothe cancer cell lines were measured. The cells were plated in 96-well, tissue culture platesat 10,000 cells per well. After 24 hour incubation, the antibodies, drugs, and conjugateswere added in various concentrations. The number of viable cells after 72 hours were counted using SRB assay.
Click to Show/Hide
|
||||
| In Vitro Model | Breast ductal carcinoma | JIMT-1 cells | CVCL_2077 | ||
| Experiment 7 Reporting the Activity Date of This ADC | [235] | ||||
| Efficacy Data | Half Maximal Inhibitory Concentration (IC50) | > 33.33 nM | Negative HER2 expression (HER2-) | ||
| Method Description |
Anti-proliferation activities of the antibodies, drugs, and conjugates with regard tothe cancer cell lines were measured. The cells were plated in 96-well, tissue culture platesat 10,000 cells per well. After 24 hour incubation, the antibodies, drugs, and conjugateswere added in various concentrations. The number of viable cells after 72 hours were counted using SRB assay.
Click to Show/Hide
|
||||
| In Vitro Model | Invasive breast carcinoma | MCF-7 cells | CVCL_0031 | ||
WO2017089895A1 ADC27 [Investigative]
Revealed Based on the Cell Line Data
| Experiment 1 Reporting the Activity Date of This ADC | [235] | ||||
| Efficacy Data | Half Maximal Inhibitory Concentration (IC50) |
0.05 nM
|
Positive HER2 expression (HER2+++/++) | ||
| Method Description |
Anti-proliferation activities of the antibodies, drugs, and conjugates with regard tothe cancer cell lines were measured. The cells were plated in 96-well, tissue culture platesat 10,000 cells per well. After 24 hour incubation, the antibodies, drugs, and conjugateswere added in various concentrations. The number of viable cells after 72 hours were counted using SRB assay.
Click to Show/Hide
|
||||
| In Vitro Model | Breast adenocarcinoma | SK-BR-3 cells | CVCL_0033 | ||
| Experiment 2 Reporting the Activity Date of This ADC | [235] | ||||
| Efficacy Data | Half Maximal Inhibitory Concentration (IC50) |
0.10 nM
|
Positive HER2 expression (HER2+++/++) | ||
| Method Description |
ADCs wereincubated in human plasma for 5 seconds (0h), followed by SRB invitro cytotoxicity test using SK-BR3 cells for 72hr.
|
||||
| In Vitro Model | Breast adenocarcinoma | SK-BR-3 cells | CVCL_0033 | ||
| Experiment 3 Reporting the Activity Date of This ADC | [235] | ||||
| Efficacy Data | Half Maximal Inhibitory Concentration (IC50) |
0.14 nM
|
Positive HER2 expression (HER2+++/++) | ||
| Method Description |
ADCs wereincubated in human plasma for 168 hours (168h), followed by SRB invitro cytotoxicity test using SK-BR3 cells for 72hr.
|
||||
| In Vitro Model | Breast adenocarcinoma | SK-BR-3 cells | CVCL_0033 | ||
| Experiment 4 Reporting the Activity Date of This ADC | [235] | ||||
| Efficacy Data | Half Maximal Inhibitory Concentration (IC50) |
0.29 nM
|
Positive HER2 expression (HER2+++/++) | ||
| Method Description |
Anti-proliferation activities of the antibodies, drugs, and conjugates with regard tothe cancer cell lines were measured. The cells were plated in 96-well, tissue culture platesat 10,000 cells per well. After 24 hour incubation, the antibodies, drugs, and conjugateswere added in various concentrations. The number of viable cells after 72 hours were counted using SRB assay.
Click to Show/Hide
|
||||
| In Vitro Model | Gastric tubular adenocarcinoma | NCI-N87 cells | CVCL_1603 | ||
| Experiment 5 Reporting the Activity Date of This ADC | [235] | ||||
| Efficacy Data | Half Maximal Inhibitory Concentration (IC50) |
0.38 nM
|
Positive HER2 expression (HER2+++/++) | ||
| Method Description |
Anti-proliferation activities of the antibodies, drugs, and conjugates with regard tothe cancer cell lines were measured. The cells were plated in 96-well, tissue culture platesat 10,000 cells per well. After 24 hour incubation, the antibodies, drugs, and conjugateswere added in various concentrations. The number of viable cells after 72 hours were counted using SRB assay.
Click to Show/Hide
|
||||
| In Vitro Model | Ovarian serous cystadenocarcinoma | SK-OV-3 cells | CVCL_0532 | ||
| Experiment 6 Reporting the Activity Date of This ADC | [235] | ||||
| Efficacy Data | Half Maximal Inhibitory Concentration (IC50) |
0.43 nM
|
Positive HER2 expression (HER2+++/++) | ||
| Method Description |
Anti-proliferation activities of the antibodies, drugs, and conjugates with regard tothe cancer cell lines were measured. The cells were plated in 96-well, tissue culture platesat 10,000 cells per well. After 24 hour incubation, the antibodies, drugs, and conjugateswere added in various concentrations. The number of viable cells after 72 hours were counted using SRB assay.
Click to Show/Hide
|
||||
| In Vitro Model | Breast ductal carcinoma | JIMT-1 cells | CVCL_2077 | ||
| Experiment 7 Reporting the Activity Date of This ADC | [235] | ||||
| Efficacy Data | Half Maximal Inhibitory Concentration (IC50) | > 33.33 nM | Negative HER2 expression (HER2-) | ||
| Method Description |
Anti-proliferation activities of the antibodies, drugs, and conjugates with regard tothe cancer cell lines were measured. The cells were plated in 96-well, tissue culture platesat 10,000 cells per well. After 24 hour incubation, the antibodies, drugs, and conjugateswere added in various concentrations. The number of viable cells after 72 hours were counted using SRB assay.
Click to Show/Hide
|
||||
| In Vitro Model | Invasive breast carcinoma | MCF-7 cells | CVCL_0031 | ||
WO2017089890A1 ADC27 [Investigative]
Revealed Based on the Cell Line Data
| Experiment 1 Reporting the Activity Date of This ADC | [211] | ||||
| Efficacy Data | Half Maximal Inhibitory Concentration (IC50) |
0.05 nM
|
High HER2 expression (HER2 +++) | ||
| Method Description |
Anti-proliferation activities of the antibodies, drugs, and conjugates with regard tothe cancer cell lines were measured. The cells were plated in 96-well, tissue culture platesat 10,000 cells per well. After 24 hour incubation, the antibodies, drugs, and conjugateswere added in various concentrations. The number of viable cells after 72 hours werecounted using SRB assay.
Click to Show/Hide
|
||||
| In Vitro Model | Breast adenocarcinoma | SK-BR-3 cells | CVCL_0033 | ||
| Experiment 2 Reporting the Activity Date of This ADC | [211] | ||||
| Efficacy Data | Half Maximal Inhibitory Concentration (IC50) |
0.29 nM
|
High HER2 expression (HER2+++) | ||
| Method Description |
Anti-proliferation activities of the antibodies, drugs, and conjugates with regard tothe cancer cell lines were measured. The cells were plated in 96-well, tissue culture platesat 10,000 cells per well. After 24 hour incubation, the antibodies, drugs, and conjugateswere added in various concentrations. The number of viable cells after 72 hours werecounted using SRB assay.
Click to Show/Hide
|
||||
| In Vitro Model | Gastric tubular adenocarcinoma | NCI-N87 cells | CVCL_1603 | ||
| Experiment 3 Reporting the Activity Date of This ADC | [211] | ||||
| Efficacy Data | Half Maximal Inhibitory Concentration (IC50) |
0.38 nM
|
High HER2 expression (HER2+++) | ||
| Method Description |
Anti-proliferation activities of the antibodies, drugs, and conjugates with regard tothe cancer cell lines were measured. The cells were plated in 96-well, tissue culture platesat 10,000 cells per well. After 24 hour incubation, the antibodies, drugs, and conjugateswere added in various concentrations. The number of viable cells after 72 hours werecounted using SRB assay.
Click to Show/Hide
|
||||
| In Vitro Model | Ovarian serous cystadenocarcinoma | SK-OV-3 cells | CVCL_0532 | ||
| Experiment 4 Reporting the Activity Date of This ADC | [211] | ||||
| Efficacy Data | Half Maximal Inhibitory Concentration (IC50) |
0.43 nM
|
Moderate HER2 expression (HER2++) | ||
| Method Description |
Anti-proliferation activities of the antibodies, drugs, and conjugates with regard tothe cancer cell lines were measured. The cells were plated in 96-well, tissue culture platesat 10,000 cells per well. After 24 hour incubation, the antibodies, drugs, and conjugateswere added in various concentrations. The number of viable cells after 72 hours werecounted using SRB assay.
Click to Show/Hide
|
||||
| In Vitro Model | Breast ductal carcinoma | JIMT-1 cells | CVCL_2077 | ||
| Experiment 5 Reporting the Activity Date of This ADC | [211] | ||||
| Efficacy Data | Half Maximal Inhibitory Concentration (IC50) | > 33.30 nM | Negative HER2 expression (HER2-) | ||
| Method Description |
Anti-proliferation activities of the antibodies, drugs, and conjugates with regard tothe cancer cell lines were measured. The cells were plated in 96-well, tissue culture platesat 10,000 cells per well. After 24 hour incubation, the antibodies, drugs, and conjugateswere added in various concentrations. The number of viable cells after 72 hours werecounted using SRB assay.
Click to Show/Hide
|
||||
| In Vitro Model | Invasive breast carcinoma | MCF-7 cells | CVCL_0031 | ||
WO2017089890A1 ADC30 [Investigative]
Revealed Based on the Cell Line Data
| Experiment 1 Reporting the Activity Date of This ADC | [211] | ||||
| Efficacy Data | Half Maximal Inhibitory Concentration (IC50) |
0.05 nM
|
High HER2 expression (HER2 +++) | ||
| Method Description |
Anti-proliferation activities of the antibodies, drugs, and conjugates with regard tothe cancer cell lines were measured. The cells were plated in 96-well, tissue culture platesat 10,000 cells per well. After 24 hour incubation, the antibodies, drugs, and conjugateswere added in various concentrations. The number of viable cells after 72 hours werecounted using SRB assay.
Click to Show/Hide
|
||||
| In Vitro Model | Breast adenocarcinoma | SK-BR-3 cells | CVCL_0033 | ||
| Experiment 2 Reporting the Activity Date of This ADC | [211] | ||||
| Efficacy Data | Half Maximal Inhibitory Concentration (IC50) |
0.30 nM
|
High HER2 expression (HER2+++) | ||
| Method Description |
Anti-proliferation activities of the antibodies, drugs, and conjugates with regard tothe cancer cell lines were measured. The cells were plated in 96-well, tissue culture platesat 10,000 cells per well. After 24 hour incubation, the antibodies, drugs, and conjugateswere added in various concentrations. The number of viable cells after 72 hours werecounted using SRB assay.
Click to Show/Hide
|
||||
| In Vitro Model | Gastric tubular adenocarcinoma | NCI-N87 cells | CVCL_1603 | ||
| Experiment 3 Reporting the Activity Date of This ADC | [211] | ||||
| Efficacy Data | Half Maximal Inhibitory Concentration (IC50) |
0.35 nM
|
High HER2 expression (HER2+++) | ||
| Method Description |
Anti-proliferation activities of the antibodies, drugs, and conjugates with regard tothe cancer cell lines were measured. The cells were plated in 96-well, tissue culture platesat 10,000 cells per well. After 24 hour incubation, the antibodies, drugs, and conjugateswere added in various concentrations. The number of viable cells after 72 hours werecounted using SRB assay.
Click to Show/Hide
|
||||
| In Vitro Model | Ovarian serous cystadenocarcinoma | SK-OV-3 cells | CVCL_0532 | ||
| Experiment 4 Reporting the Activity Date of This ADC | [211] | ||||
| Efficacy Data | Half Maximal Inhibitory Concentration (IC50) |
0.41 nM
|
Moderate HER2 expression (HER2++) | ||
| Method Description |
Anti-proliferation activities of the antibodies, drugs, and conjugates with regard tothe cancer cell lines were measured. The cells were plated in 96-well, tissue culture platesat 10,000 cells per well. After 24 hour incubation, the antibodies, drugs, and conjugateswere added in various concentrations. The number of viable cells after 72 hours werecounted using SRB assay.
Click to Show/Hide
|
||||
| In Vitro Model | Breast ductal carcinoma | JIMT-1 cells | CVCL_2077 | ||
| Experiment 5 Reporting the Activity Date of This ADC | [211] | ||||
| Efficacy Data | Half Maximal Inhibitory Concentration (IC50) | > 33.30 nM | Negative HER2 expression (HER2-) | ||
| Method Description |
Anti-proliferation activities of the antibodies, drugs, and conjugates with regard tothe cancer cell lines were measured. The cells were plated in 96-well, tissue culture platesat 10,000 cells per well. After 24 hour incubation, the antibodies, drugs, and conjugateswere added in various concentrations. The number of viable cells after 72 hours werecounted using SRB assay.
Click to Show/Hide
|
||||
| In Vitro Model | Invasive breast carcinoma | MCF-7 cells | CVCL_0031 | ||
HER2-gsADC-15 [Investigative]
Revealed Based on the Cell Line Data
| Experiment 1 Reporting the Activity Date of This ADC | [206] | ||||
| Efficacy Data | Half Maximal Inhibitory Concentration (IC50) |
0.06 nM
|
Positive HER2 expression (HER2+++/++) | ||
| Method Description |
Cells were cultured in a 10% fetal bovine serum (FBS)-containing RPMI 1640 medium and were planted into 96-well plates with 6000 cells per well. The plates were incubated overnight at 37°C in a 5% CO2 cell incubator.
|
||||
| In Vitro Model | Breast adenocarcinoma | SK-BR-3 cells | CVCL_0033 | ||
| Experiment 2 Reporting the Activity Date of This ADC | [206] | ||||
| Efficacy Data | Half Maximal Inhibitory Concentration (IC50) | > 66.00 nM | Positive HER2 expression (HER2+++/++) | ||
| Method Description |
Cells were cultured in a 10% fetal bovine serum (FBS)-containing RPMI 1640 medium and were planted into 96-well plates with 6000 cells per well. The plates were incubated overnight at 37°C in a 5% CO2 cell incubator.
|
||||
| In Vitro Model | Gastric tubular adenocarcinoma | NCI-N87 cells | CVCL_1603 | ||
| Experiment 3 Reporting the Activity Date of This ADC | [206] | ||||
| Efficacy Data | Half Maximal Inhibitory Concentration (IC50) | > 66.00 nM | Negative HER2 expression (HER2 -) | ||
| Method Description |
Cells were cultured in a 10% fetal bovine serum (FBS)-containing RPMI 1640 medium and were planted into 96-well plates with 6000 cells per well. The plates were incubated overnight at 37°C in a 5% CO2 cell incubator.
|
||||
| In Vitro Model | Breast adenocarcinoma | MDA-MB-231 cells | CVCL_0062 | ||
HER2-gsADC-9 [Investigative]
Revealed Based on the Cell Line Data
| Experiment 1 Reporting the Activity Date of This ADC | [206] | ||||
| Efficacy Data | Half Maximal Inhibitory Concentration (IC50) |
0.06 nM
|
Positive HER2 expression (HER2+++/++) | ||
| Method Description |
Cells were cultured in a 10% fetal bovine serum (FBS)-containing RPMI 1640 medium and were planted into 96-well plates with 6000 cells per well. The plates were incubated overnight at 37°C in a 5% CO2 cell incubator.
|
||||
| In Vitro Model | Breast adenocarcinoma | SK-BR-3 cells | CVCL_0033 | ||
| Experiment 2 Reporting the Activity Date of This ADC | [206] | ||||
| Efficacy Data | Half Maximal Inhibitory Concentration (IC50) |
0.07 nM
|
Positive HER2 expression (HER2+++/++) | ||
| Method Description |
Cells were cultured in a 10% fetal bovine serum (FBS)-containing RPMI 1640 medium and were planted into 96-well plates with 6000 cells per well. The plates were incubated overnight at 37°C in a 5% CO2 cell incubator.
|
||||
| In Vitro Model | Gastric tubular adenocarcinoma | NCI-N87 cells | CVCL_1603 | ||
| Experiment 3 Reporting the Activity Date of This ADC | [206] | ||||
| Efficacy Data | Half Maximal Inhibitory Concentration (IC50) | > 66.00 nM | Negative HER2 expression (HER2 -) | ||
| Method Description |
Cells were cultured in a 10% fetal bovine serum (FBS)-containing RPMI 1640 medium and were planted into 96-well plates with 6000 cells per well. The plates were incubated overnight at 37°C in a 5% CO2 cell incubator.
|
||||
| In Vitro Model | Breast adenocarcinoma | MDA-MB-231 cells | CVCL_0062 | ||
HER2-gsADC-40 [Investigative]
Revealed Based on the Cell Line Data
| Experiment 1 Reporting the Activity Date of This ADC | [206] | ||||
| Efficacy Data | Half Maximal Inhibitory Concentration (IC50) |
0.07 nM
|
Positive HER2 expression (HER2+++/++) | ||
| Method Description |
Cells were cultured in a 10% fetal bovine serum (FBS)-containing RPMI 1640 medium and were planted into 96-well plates with 6000 cells per well. The plates were incubated overnight at 37°C in a 5% CO2 cell incubator.
|
||||
| In Vitro Model | Breast adenocarcinoma | SK-BR-3 cells | CVCL_0033 | ||
| Experiment 2 Reporting the Activity Date of This ADC | [206] | ||||
| Efficacy Data | Half Maximal Inhibitory Concentration (IC50) | > 66.00 nM | Positive HER2 expression (HER2+++/++) | ||
| Method Description |
Cells were cultured in a 10% fetal bovine serum (FBS)-containing RPMI 1640 medium and were planted into 96-well plates with 6000 cells per well. The plates were incubated overnight at 37°C in a 5% CO2 cell incubator.
|
||||
| In Vitro Model | Gastric tubular adenocarcinoma | NCI-N87 cells | CVCL_1603 | ||
| Experiment 3 Reporting the Activity Date of This ADC | [206] | ||||
| Efficacy Data | Half Maximal Inhibitory Concentration (IC50) | > 66.00 nM | Negative HER2 expression (HER2 -) | ||
| Method Description |
Cells were cultured in a 10% fetal bovine serum (FBS)-containing RPMI 1640 medium and were planted into 96-well plates with 6000 cells per well. The plates were incubated overnight at 37°C in a 5% CO2 cell incubator.
|
||||
| In Vitro Model | Breast adenocarcinoma | MDA-MB-231 cells | CVCL_0062 | ||
HER2-gsADC-35 [Investigative]
Revealed Based on the Cell Line Data
| Experiment 1 Reporting the Activity Date of This ADC | [206] | ||||
| Efficacy Data | Half Maximal Inhibitory Concentration (IC50) |
0.07 nM
|
Positive HER2 expression (HER2+++/++) | ||
| Method Description |
Cells were cultured in a 10% fetal bovine serum (FBS)-containing RPMI 1640 medium and were planted into 96-well plates with 6000 cells per well. The plates were incubated overnight at 37°C in a 5% CO2 cell incubator.
|
||||
| In Vitro Model | Breast adenocarcinoma | SK-BR-3 cells | CVCL_0033 | ||
| Experiment 2 Reporting the Activity Date of This ADC | [206] | ||||
| Efficacy Data | Half Maximal Inhibitory Concentration (IC50) | > 66.00 nM | Positive HER2 expression (HER2+++/++) | ||
| Method Description |
Cells were cultured in a 10% fetal bovine serum (FBS)-containing RPMI 1640 medium and were planted into 96-well plates with 6000 cells per well. The plates were incubated overnight at 37°C in a 5% CO2 cell incubator.
|
||||
| In Vitro Model | Gastric tubular adenocarcinoma | NCI-N87 cells | CVCL_1603 | ||
| Experiment 3 Reporting the Activity Date of This ADC | [206] | ||||
| Efficacy Data | Half Maximal Inhibitory Concentration (IC50) | > 66.00 nM | Negative HER2 expression (HER2 -) | ||
| Method Description |
Cells were cultured in a 10% fetal bovine serum (FBS)-containing RPMI 1640 medium and were planted into 96-well plates with 6000 cells per well. The plates were incubated overnight at 37°C in a 5% CO2 cell incubator.
|
||||
| In Vitro Model | Breast adenocarcinoma | MDA-MB-231 cells | CVCL_0062 | ||
HER2-gsADC-19 [Investigative]
Revealed Based on the Cell Line Data
| Experiment 1 Reporting the Activity Date of This ADC | [206] | ||||
| Efficacy Data | Half Maximal Inhibitory Concentration (IC50) |
0.07 nM
|
Positive HER2 expression (HER2+++/++) | ||
| Method Description |
Cells were cultured in a 10% fetal bovine serum (FBS)-containing RPMI 1640 medium and were planted into 96-well plates with 6000 cells per well. The plates were incubated overnight at 37°C in a 5% CO2 cell incubator.
|
||||
| In Vitro Model | Breast adenocarcinoma | SK-BR-3 cells | CVCL_0033 | ||
| Experiment 2 Reporting the Activity Date of This ADC | [206] | ||||
| Efficacy Data | Half Maximal Inhibitory Concentration (IC50) | > 66.00 nM | Positive HER2 expression (HER2+++/++) | ||
| Method Description |
Cells were cultured in a 10% fetal bovine serum (FBS)-containing RPMI 1640 medium and were planted into 96-well plates with 6000 cells per well. The plates were incubated overnight at 37°C in a 5% CO2 cell incubator.
|
||||
| In Vitro Model | Gastric tubular adenocarcinoma | NCI-N87 cells | CVCL_1603 | ||
| Experiment 3 Reporting the Activity Date of This ADC | [206] | ||||
| Efficacy Data | Half Maximal Inhibitory Concentration (IC50) | > 66.00 nM | Negative HER2 expression (HER2 -) | ||
| Method Description |
Cells were cultured in a 10% fetal bovine serum (FBS)-containing RPMI 1640 medium and were planted into 96-well plates with 6000 cells per well. The plates were incubated overnight at 37°C in a 5% CO2 cell incubator.
|
||||
| In Vitro Model | Breast adenocarcinoma | MDA-MB-231 cells | CVCL_0062 | ||
H32-VCMMAE_2.1 [Investigative]
Revealed Based on the Cell Line Data
| Experiment 1 Reporting the Activity Date of This ADC | [246] | ||||
| Efficacy Data | Half Maximal Inhibitory Concentration (IC50) |
0.07 nM±0.01 nM
|
High HER2 expression (HER2 +++) | ||
| Method Description |
To determine the IC50 values of the ADCs, different concentrations of each conjugate was directly added to the culture medium. After the cells were cultured for 3 days at 37°C, the number of viable cells was quantified by using the WST- reagent, and the absorbance was measured at OD450.
|
||||
| In Vitro Model | Breast adenocarcinoma | SK-BR-3 cells | CVCL_0033 | ||
| Experiment 2 Reporting the Activity Date of This ADC | [246] | ||||
| Efficacy Data | Half Maximal Inhibitory Concentration (IC50) |
0.11 nM±0.02 nM
|
High HER2 expression (HER2 +++) | ||
| Method Description |
To determine the IC50 values of the ADCs, different concentrations of each conjugate was directly added to the culture medium. After the cells were cultured for 3 days at 37°C, the number of viable cells was quantified by using the WST- reagent, and the absorbance was measured at OD450.
|
||||
| In Vitro Model | Invasive breast carcinoma | BT-474 cells | CVCL_0179 | ||
| Experiment 3 Reporting the Activity Date of This ADC | [246] | ||||
| Efficacy Data | Half Maximal Inhibitory Concentration (IC50) |
0.78 nM±0.02 nM
|
High HER2 expression (HER2 +++) | ||
| Method Description |
To determine the IC50 values of the ADCs, different concentrations of each conjugate was directly added to the culture medium. After the cells were cultured for 3 days at 37°C, the number of viable cells was quantified by using the WST- reagent, and the absorbance was measured at OD450.
|
||||
| In Vitro Model | Gastric tubular adenocarcinoma | NCI-N87 cells | CVCL_1603 | ||
WO2017089895A1 ADC52 [Investigative]
Revealed Based on the Cell Line Data
| Experiment 1 Reporting the Activity Date of This ADC | [235] | ||||
| Efficacy Data | Half Maximal Inhibitory Concentration (IC50) |
0.07 nM
|
Positive HER2 expression (HER2+++/++) | ||
| Method Description |
Anti-proliferation activities of the antibodies, drugs, and conjugates with regard tothe cancer cell lines were measured. The cells were plated in 96-well, tissue culture platesat 10,000 cells per well. After 24 hour incubation, the antibodies, drugs, and conjugateswere added in various concentrations. The number of viable cells after 72 hours were counted using SRB assay.
Click to Show/Hide
|
||||
| In Vitro Model | Breast adenocarcinoma | SK-BR-3 cells | CVCL_0033 | ||
| Experiment 2 Reporting the Activity Date of This ADC | [235] | ||||
| Efficacy Data | Half Maximal Inhibitory Concentration (IC50) |
0.37 nM
|
Positive HER2 expression (HER2+++/++) | ||
| Method Description |
Anti-proliferation activities of the antibodies, drugs, and conjugates with regard tothe cancer cell lines were measured. The cells were plated in 96-well, tissue culture platesat 10,000 cells per well. After 24 hour incubation, the antibodies, drugs, and conjugateswere added in various concentrations. The number of viable cells after 72 hours were counted using SRB assay.
Click to Show/Hide
|
||||
| In Vitro Model | Gastric tubular adenocarcinoma | NCI-N87 cells | CVCL_1603 | ||
| Experiment 3 Reporting the Activity Date of This ADC | [235] | ||||
| Efficacy Data | Half Maximal Inhibitory Concentration (IC50) |
0.40 nM
|
Positive HER2 expression (HER2+++/++) | ||
| Method Description |
Anti-proliferation activities of the antibodies, drugs, and conjugates with regard tothe cancer cell lines were measured. The cells were plated in 96-well, tissue culture platesat 10,000 cells per well. After 24 hour incubation, the antibodies, drugs, and conjugateswere added in various concentrations. The number of viable cells after 72 hours were counted using SRB assay.
Click to Show/Hide
|
||||
| In Vitro Model | Breast ductal carcinoma | JIMT-1 cells | CVCL_2077 | ||
| Experiment 4 Reporting the Activity Date of This ADC | [235] | ||||
| Efficacy Data | Half Maximal Inhibitory Concentration (IC50) | > 33.33 nM | Negative HER2 expression (HER2-) | ||
| Method Description |
Anti-proliferation activities of the antibodies, drugs, and conjugates with regard tothe cancer cell lines were measured. The cells were plated in 96-well, tissue culture platesat 10,000 cells per well. After 24 hour incubation, the antibodies, drugs, and conjugateswere added in various concentrations. The number of viable cells after 72 hours were counted using SRB assay.
Click to Show/Hide
|
||||
| In Vitro Model | Invasive breast carcinoma | MCF-7 cells | CVCL_0031 | ||
HER2-gsADC-33 [Investigative]
Revealed Based on the Cell Line Data
| Experiment 1 Reporting the Activity Date of This ADC | [206] | ||||
| Efficacy Data | Half Maximal Inhibitory Concentration (IC50) |
0.08 nM
|
Positive HER2 expression (HER2+++/++) | ||
| Method Description |
Cells were cultured in a 10% fetal bovine serum (FBS)-containing RPMI 1640 medium and were planted into 96-well plates with 6000 cells per well. The plates were incubated overnight at 37°C in a 5% CO2 cell incubator.
|
||||
| In Vitro Model | Breast adenocarcinoma | SK-BR-3 cells | CVCL_0033 | ||
| Experiment 2 Reporting the Activity Date of This ADC | [206] | ||||
| Efficacy Data | Half Maximal Inhibitory Concentration (IC50) | > 66.00 nM | Positive HER2 expression (HER2+++/++) | ||
| Method Description |
Cells were cultured in a 10% fetal bovine serum (FBS)-containing RPMI 1640 medium and were planted into 96-well plates with 6000 cells per well. The plates were incubated overnight at 37°C in a 5% CO2 cell incubator.
|
||||
| In Vitro Model | Gastric tubular adenocarcinoma | NCI-N87 cells | CVCL_1603 | ||
| Experiment 3 Reporting the Activity Date of This ADC | [206] | ||||
| Efficacy Data | Half Maximal Inhibitory Concentration (IC50) | > 66.00 nM | Negative HER2 expression (HER2 -) | ||
| Method Description |
Cells were cultured in a 10% fetal bovine serum (FBS)-containing RPMI 1640 medium and were planted into 96-well plates with 6000 cells per well. The plates were incubated overnight at 37°C in a 5% CO2 cell incubator.
|
||||
| In Vitro Model | Breast adenocarcinoma | MDA-MB-231 cells | CVCL_0062 | ||
HER2-gsADC-11 [Investigative]
Revealed Based on the Cell Line Data
| Experiment 1 Reporting the Activity Date of This ADC | [206] | ||||
| Efficacy Data | Half Maximal Inhibitory Concentration (IC50) |
0.08 nM
|
Positive HER2 expression (HER2+++/++) | ||
| Method Description |
Cells were cultured in a 10% fetal bovine serum (FBS)-containing RPMI 1640 medium and were planted into 96-well plates with 6000 cells per well. The plates were incubated overnight at 37°C in a 5% CO2 cell incubator.
|
||||
| In Vitro Model | Breast adenocarcinoma | SK-BR-3 cells | CVCL_0033 | ||
| Experiment 2 Reporting the Activity Date of This ADC | [206] | ||||
| Efficacy Data | Half Maximal Inhibitory Concentration (IC50) |
0.08 nM
|
Positive HER2 expression (HER2+++/++) | ||
| Method Description |
Cells were cultured in a 10% fetal bovine serum (FBS)-containing RPMI 1640 medium and were planted into 96-well plates with 6000 cells per well. The plates were incubated overnight at 37°C in a 5% CO2 cell incubator.
|
||||
| In Vitro Model | Gastric tubular adenocarcinoma | NCI-N87 cells | CVCL_1603 | ||
| Experiment 3 Reporting the Activity Date of This ADC | [206] | ||||
| Efficacy Data | Half Maximal Inhibitory Concentration (IC50) | > 66.00 nM | Negative HER2 expression (HER2 -) | ||
| Method Description |
Cells were cultured in a 10% fetal bovine serum (FBS)-containing RPMI 1640 medium and were planted into 96-well plates with 6000 cells per well. The plates were incubated overnight at 37°C in a 5% CO2 cell incubator.
|
||||
| In Vitro Model | Breast adenocarcinoma | MDA-MB-231 cells | CVCL_0062 | ||
HER2-gsADC-1 [Investigative]
Revealed Based on the Cell Line Data
| Experiment 1 Reporting the Activity Date of This ADC | [206] | ||||
| Efficacy Data | Half Maximal Inhibitory Concentration (IC50) |
0.08 nM
|
Positive HER2 expression (HER2+++/++) | ||
| Method Description |
Cells were cultured in a 10% fetal bovine serum (FBS)-containing RPMI 1640 medium and were planted into 96-well plates with 6000 cells per well. The plates were incubated overnight at 37°C in a 5% CO2 cell incubator.
|
||||
| In Vitro Model | Gastric tubular adenocarcinoma | NCI-N87 cells | CVCL_1603 | ||
| Experiment 2 Reporting the Activity Date of This ADC | [206] | ||||
| Efficacy Data | Half Maximal Inhibitory Concentration (IC50) |
0.14 nM
|
Positive HER2 expression (HER2+++/++) | ||
| Method Description |
Cells were cultured in a 10% fetal bovine serum (FBS)-containing RPMI 1640 medium and were planted into 96-well plates with 6000 cells per well. The plates were incubated overnight at 37°C in a 5% CO2 cell incubator.
|
||||
| In Vitro Model | Breast adenocarcinoma | SK-BR-3 cells | CVCL_0033 | ||
| Experiment 3 Reporting the Activity Date of This ADC | [206] | ||||
| Efficacy Data | Half Maximal Inhibitory Concentration (IC50) | > 66.00 nM | Negative HER2 expression (HER2 -) | ||
| Method Description |
Cells were cultured in a 10% fetal bovine serum (FBS)-containing RPMI 1640 medium and were planted into 96-well plates with 6000 cells per well. The plates were incubated overnight at 37°C in a 5% CO2 cell incubator.
|
||||
| In Vitro Model | Breast adenocarcinoma | MDA-MB-231 cells | CVCL_0062 | ||
WO2017089895A1 ADC31 [Investigative]
Revealed Based on the Cell Line Data
| Experiment 1 Reporting the Activity Date of This ADC | [235] | ||||
| Efficacy Data | Half Maximal Inhibitory Concentration (IC50) |
0.08 nM
|
Positive HER2 expression (HER2+++/++) | ||
| Method Description |
ADCs wereincubated in human plasma for 5 seconds (0h), followed by SRB invitro cytotoxicity test using SK-BR3 cells for 72hr.
|
||||
| In Vitro Model | Breast adenocarcinoma | SK-BR-3 cells | CVCL_0033 | ||
| Experiment 2 Reporting the Activity Date of This ADC | [235] | ||||
| Efficacy Data | Half Maximal Inhibitory Concentration (IC50) |
0.12 nM
|
Positive HER2 expression (HER2+++/++) | ||
| Method Description |
ADCs wereincubated in human plasma for 168 hours (168h), followed by SRB invitro cytotoxicity test using SK-BR3 cells for 72hr.
|
||||
| In Vitro Model | Breast adenocarcinoma | SK-BR-3 cells | CVCL_0033 | ||
| Experiment 3 Reporting the Activity Date of This ADC | [235] | ||||
| Efficacy Data | Half Maximal Inhibitory Concentration (IC50) |
0.14 nM
|
Positive HER2 expression (HER2+++/++) | ||
| Method Description |
Anti-proliferation activities of the antibodies, drugs, and conjugates with regard tothe cancer cell lines were measured. The cells were plated in 96-well, tissue culture platesat 10,000 cells per well. After 24 hour incubation, the antibodies, drugs, and conjugateswere added in various concentrations. The number of viable cells after 72 hours were counted using SRB assay.
Click to Show/Hide
|
||||
| In Vitro Model | Breast adenocarcinoma | SK-BR-3 cells | CVCL_0033 | ||
| Experiment 4 Reporting the Activity Date of This ADC | [235] | ||||
| Efficacy Data | Half Maximal Inhibitory Concentration (IC50) |
0.24 nM
|
Positive HER2 expression (HER2+++/++) | ||
| Method Description |
Anti-proliferation activities of the antibodies, drugs, and conjugates with regard tothe cancer cell lines were measured. The cells were plated in 96-well, tissue culture platesat 10,000 cells per well. After 24 hour incubation, the antibodies, drugs, and conjugateswere added in various concentrations. The number of viable cells after 72 hours were counted using SRB assay.
Click to Show/Hide
|
||||
| In Vitro Model | Breast ductal carcinoma | JIMT-1 cells | CVCL_2077 | ||
| Experiment 5 Reporting the Activity Date of This ADC | [235] | ||||
| Efficacy Data | Half Maximal Inhibitory Concentration (IC50) | > 33.33 nM | Negative HER2 expression (HER2-) | ||
| Method Description |
Anti-proliferation activities of the antibodies, drugs, and conjugates with regard tothe cancer cell lines were measured. The cells were plated in 96-well, tissue culture platesat 10,000 cells per well. After 24 hour incubation, the antibodies, drugs, and conjugateswere added in various concentrations. The number of viable cells after 72 hours were counted using SRB assay.
Click to Show/Hide
|
||||
| In Vitro Model | Invasive breast carcinoma | MCF-7 cells | CVCL_0031 | ||
WO2017089895A1 ADC26 [Investigative]
Revealed Based on the Cell Line Data
| Experiment 1 Reporting the Activity Date of This ADC | [235] | ||||
| Efficacy Data | Half Maximal Inhibitory Concentration (IC50) |
0.08 nM
|
Positive HER2 expression (HER2+++/++) | ||
| Method Description |
Anti-proliferation activities of the antibodies, drugs, and conjugates with regard tothe cancer cell lines were measured. The cells were plated in 96-well, tissue culture platesat 10,000 cells per well. After 24 hour incubation, the antibodies, drugs, and conjugateswere added in various concentrations. The number of viable cells after 72 hours were counted using SRB assay.
Click to Show/Hide
|
||||
| In Vitro Model | Breast adenocarcinoma | SK-BR-3 cells | CVCL_0033 | ||
| Experiment 2 Reporting the Activity Date of This ADC | [235] | ||||
| Efficacy Data | Half Maximal Inhibitory Concentration (IC50) |
0.14 nM
|
Positive HER2 expression (HER2+++/++) | ||
| Method Description |
Anti-proliferation activities of the antibodies, drugs, and conjugates with regard tothe cancer cell lines were measured. The cells were plated in 96-well, tissue culture platesat 10,000 cells per well. After 24 hour incubation, the antibodies, drugs, and conjugateswere added in various concentrations. The number of viable cells after 72 hours were counted using SRB assay.
Click to Show/Hide
|
||||
| In Vitro Model | Breast ductal carcinoma | JIMT-1 cells | CVCL_2077 | ||
| Experiment 3 Reporting the Activity Date of This ADC | [235] | ||||
| Efficacy Data | Half Maximal Inhibitory Concentration (IC50) |
0.17 nM
|
Positive HER2 expression (HER2+++/++) | ||
| Method Description |
ADCs wereincubated in human plasma for 5 seconds (0h), followed by SRB invitro cytotoxicity test using SK-BR3 cells for 72hr.
|
||||
| In Vitro Model | Breast adenocarcinoma | SK-BR-3 cells | CVCL_0033 | ||
| Experiment 4 Reporting the Activity Date of This ADC | [235] | ||||
| Efficacy Data | Half Maximal Inhibitory Concentration (IC50) |
0.22 nM
|
Positive HER2 expression (HER2+++/++) | ||
| Method Description |
ADCs wereincubated in human plasma for 168 hours (168h), followed by SRB invitro cytotoxicity test using SK-BR3 cells for 72hr.
|
||||
| In Vitro Model | Breast adenocarcinoma | SK-BR-3 cells | CVCL_0033 | ||
| Experiment 5 Reporting the Activity Date of This ADC | [235] | ||||
| Efficacy Data | Half Maximal Inhibitory Concentration (IC50) | > 33.33 nM | Negative HER2 expression (HER2-) | ||
| Method Description |
Anti-proliferation activities of the antibodies, drugs, and conjugates with regard tothe cancer cell lines were measured. The cells were plated in 96-well, tissue culture platesat 10,000 cells per well. After 24 hour incubation, the antibodies, drugs, and conjugateswere added in various concentrations. The number of viable cells after 72 hours were counted using SRB assay.
Click to Show/Hide
|
||||
| In Vitro Model | Invasive breast carcinoma | MCF-7 cells | CVCL_0031 | ||
WO2017089890A1 ADC26 [Investigative]
Revealed Based on the Cell Line Data
| Experiment 1 Reporting the Activity Date of This ADC | [211] | ||||
| Efficacy Data | Half Maximal Inhibitory Concentration (IC50) |
0.08 nM
|
High HER2 expression (HER2 +++) | ||
| Method Description |
Anti-proliferation activities of the antibodies, drugs, and conjugates with regard tothe cancer cell lines were measured. The cells were plated in 96-well, tissue culture platesat 10,000 cells per well. After 24 hour incubation, the antibodies, drugs, and conjugateswere added in various concentrations. The number of viable cells after 72 hours werecounted using SRB assay.
Click to Show/Hide
|
||||
| In Vitro Model | Breast adenocarcinoma | SK-BR-3 cells | CVCL_0033 | ||
| Experiment 2 Reporting the Activity Date of This ADC | [211] | ||||
| Efficacy Data | Half Maximal Inhibitory Concentration (IC50) |
0.14 nM
|
Moderate HER2 expression (HER2++) | ||
| Method Description |
Anti-proliferation activities of the antibodies, drugs, and conjugates with regard tothe cancer cell lines were measured. The cells were plated in 96-well, tissue culture platesat 10,000 cells per well. After 24 hour incubation, the antibodies, drugs, and conjugateswere added in various concentrations. The number of viable cells after 72 hours werecounted using SRB assay.
Click to Show/Hide
|
||||
| In Vitro Model | Breast ductal carcinoma | JIMT-1 cells | CVCL_2077 | ||
| Experiment 3 Reporting the Activity Date of This ADC | [211] | ||||
| Efficacy Data | Half Maximal Inhibitory Concentration (IC50) | > 33.30 nM | Negative HER2 expression (HER2-) | ||
| Method Description |
Anti-proliferation activities of the antibodies, drugs, and conjugates with regard tothe cancer cell lines were measured. The cells were plated in 96-well, tissue culture platesat 10,000 cells per well. After 24 hour incubation, the antibodies, drugs, and conjugateswere added in various concentrations. The number of viable cells after 72 hours werecounted using SRB assay.
Click to Show/Hide
|
||||
| In Vitro Model | Invasive breast carcinoma | MCF-7 cells | CVCL_0031 | ||
WO2017089895A1 ADC36 [Investigative]
Revealed Based on the Cell Line Data
| Experiment 1 Reporting the Activity Date of This ADC | [235] | ||||
| Efficacy Data | Half Maximal Inhibitory Concentration (IC50) |
0.09 nM
|
Positive HER2 expression (HER2+++/++) | ||
| Method Description |
ADCs wereincubated in human plasma for 5 seconds (0h), followed by SRB invitro cytotoxicity test using SK-BR3 cells for 72hr.
|
||||
| In Vitro Model | Breast adenocarcinoma | SK-BR-3 cells | CVCL_0033 | ||
| Experiment 2 Reporting the Activity Date of This ADC | [235] | ||||
| Efficacy Data | Half Maximal Inhibitory Concentration (IC50) |
0.12 nM
|
Positive HER2 expression (HER2+++/++) | ||
| Method Description |
ADCs wereincubated in human plasma for 168 hours (168h), followed by SRB invitro cytotoxicity test using SK-BR3 cells for 72hr.
|
||||
| In Vitro Model | Breast adenocarcinoma | SK-BR-3 cells | CVCL_0033 | ||
| Experiment 3 Reporting the Activity Date of This ADC | [235] | ||||
| Efficacy Data | Half Maximal Inhibitory Concentration (IC50) |
0.13 nM
|
Positive HER2 expression (HER2+++/++) | ||
| Method Description |
Anti-proliferation activities of the antibodies, drugs, and conjugates with regard tothe cancer cell lines were measured. The cells were plated in 96-well, tissue culture platesat 10,000 cells per well. After 24 hour incubation, the antibodies, drugs, and conjugateswere added in various concentrations. The number of viable cells after 72 hours were counted using SRB assay.
Click to Show/Hide
|
||||
| In Vitro Model | Breast adenocarcinoma | SK-BR-3 cells | CVCL_0033 | ||
| Experiment 4 Reporting the Activity Date of This ADC | [235] | ||||
| Efficacy Data | Half Maximal Inhibitory Concentration (IC50) |
0.22 nM
|
Positive HER2 expression (HER2+++/++) | ||
| Method Description |
Anti-proliferation activities of the antibodies, drugs, and conjugates with regard tothe cancer cell lines were measured. The cells were plated in 96-well, tissue culture platesat 10,000 cells per well. After 24 hour incubation, the antibodies, drugs, and conjugateswere added in various concentrations. The number of viable cells after 72 hours were counted using SRB assay.
Click to Show/Hide
|
||||
| In Vitro Model | Breast ductal carcinoma | JIMT-1 cells | CVCL_2077 | ||
| Experiment 5 Reporting the Activity Date of This ADC | [235] | ||||
| Efficacy Data | Half Maximal Inhibitory Concentration (IC50) | > 33.33 nM | Negative HER2 expression (HER2-) | ||
| Method Description |
Anti-proliferation activities of the antibodies, drugs, and conjugates with regard tothe cancer cell lines were measured. The cells were plated in 96-well, tissue culture platesat 10,000 cells per well. After 24 hour incubation, the antibodies, drugs, and conjugateswere added in various concentrations. The number of viable cells after 72 hours were counted using SRB assay.
Click to Show/Hide
|
||||
| In Vitro Model | Invasive breast carcinoma | MCF-7 cells | CVCL_0031 | ||
WO2017089890A1 ADC68 [Investigative]
Revealed Based on the Cell Line Data
| Experiment 1 Reporting the Activity Date of This ADC | [211] | ||||
| Efficacy Data | Half Maximal Inhibitory Concentration (IC50) |
0.09 nM
|
Positive CD19 expression (CD19+++/++) | ||
| Method Description |
Ramos cells, which are human Burkitt's lymphoma cells, were seeded in a 96-well plate at 20,000 cells/well in 100 pL of growth media. The cells were incubated at 37°C in5% CO2, for 1 day. Serial dilutions of anti-CD19 ADCs were added to the wells, and the cells were incubated with the antibody & ADCs for 72 hours.
|
||||
| In Vitro Model | Burkitt lymphoma | Ramos cells | CVCL_0597 | ||
| Experiment 2 Reporting the Activity Date of This ADC | [211] | ||||
| Efficacy Data | Half Maximal Inhibitory Concentration (IC50) | > 33.30 nM | Negative CD19 expression (CD19-) | ||
| Method Description |
Cells were seeded in a 96-well plate at 20,000 cells/well in 100 pL of growth media. The cells were incubated at 37°C in5% CO2, for 1 day. Serial dilutions of anti-CD19 ADCs were added to the wells, and the cells were incubated with the antibody & ADCs for 72 hours.
|
||||
| In Vitro Model | Chronic myeloid leukemia | K562 cells | CVCL_0004 | ||
WO2017089895A1 ADC9 [Investigative]
Revealed Based on the Cell Line Data
| Experiment 1 Reporting the Activity Date of This ADC | [235] | ||||
| Efficacy Data | Half Maximal Inhibitory Concentration (IC50) |
0.10 nM
|
Positive HER2 expression (HER2+++/++) | ||
| Method Description |
Anti-proliferation activities of the antibodies, drugs, and conjugates with regard tothe cancer cell lines were measured. The cells were plated in 96-well, tissue culture platesat 10,000 cells per well. After 24 hour incubation, the antibodies, drugs, and conjugateswere added in various concentrations. The number of viable cells after 72 hours were counted using SRB assay.
Click to Show/Hide
|
||||
| In Vitro Model | Breast adenocarcinoma | SK-BR-3 cells | CVCL_0033 | ||
| Experiment 2 Reporting the Activity Date of This ADC | [235] | ||||
| Efficacy Data | Half Maximal Inhibitory Concentration (IC50) | > 33.33 nM | Positive HER2 expression (HER2+++/++) | ||
| Method Description |
Anti-proliferation activities of the antibodies, drugs, and conjugates with regard tothe cancer cell lines were measured. The cells were plated in 96-well, tissue culture platesat 10,000 cells per well. After 24 hour incubation, the antibodies, drugs, and conjugateswere added in various concentrations. The number of viable cells after 72 hours were counted using SRB assay.
Click to Show/Hide
|
||||
| In Vitro Model | Breast ductal carcinoma | JIMT-1 cells | CVCL_2077 | ||
| Experiment 3 Reporting the Activity Date of This ADC | [235] | ||||
| Efficacy Data | Half Maximal Inhibitory Concentration (IC50) | > 33.33 nM | Negative HER2 expression (HER2-) | ||
| Method Description |
Anti-proliferation activities of the antibodies, drugs, and conjugates with regard tothe cancer cell lines were measured. The cells were plated in 96-well, tissue culture platesat 10,000 cells per well. After 24 hour incubation, the antibodies, drugs, and conjugateswere added in various concentrations. The number of viable cells after 72 hours were counted using SRB assay.
Click to Show/Hide
|
||||
| In Vitro Model | Invasive breast carcinoma | MCF-7 cells | CVCL_0031 | ||
WO2017089895A1 ADC7 [Investigative]
Revealed Based on the Cell Line Data
| Experiment 1 Reporting the Activity Date of This ADC | [235] | ||||
| Efficacy Data | Half Maximal Inhibitory Concentration (IC50) |
0.10 nM
|
Positive HER2 expression (HER2+++/++) | ||
| Method Description |
Anti-proliferation activities of the antibodies, drugs, and conjugates with regard tothe cancer cell lines were measured. The cells were plated in 96-well, tissue culture platesat 10,000 cells per well. After 24 hour incubation, the antibodies, drugs, and conjugateswere added in various concentrations. The number of viable cells after 72 hours were counted using SRB assay.
Click to Show/Hide
|
||||
| In Vitro Model | Breast adenocarcinoma | SK-BR-3 cells | CVCL_0033 | ||
| Experiment 2 Reporting the Activity Date of This ADC | [235] | ||||
| Efficacy Data | Half Maximal Inhibitory Concentration (IC50) |
0.17 nM
|
Positive HER2 expression (HER2+++/++) | ||
| Method Description |
ADCs wereincubated in human plasma for 5 seconds (0h), followed by SRB invitro cytotoxicity test using SK-BR3 cells for 72hr.
|
||||
| In Vitro Model | Breast adenocarcinoma | SK-BR-3 cells | CVCL_0033 | ||
| Experiment 3 Reporting the Activity Date of This ADC | [235] | ||||
| Efficacy Data | Half Maximal Inhibitory Concentration (IC50) |
0.26 nM
|
Positive HER2 expression (HER2+++/++) | ||
| Method Description |
ADCs wereincubated in human plasma for 168 hours (168h), followed by SRB invitro cytotoxicity test using SK-BR3 cells for 72hr.
|
||||
| In Vitro Model | Breast adenocarcinoma | SK-BR-3 cells | CVCL_0033 | ||
| Experiment 4 Reporting the Activity Date of This ADC | [235] | ||||
| Efficacy Data | Half Maximal Inhibitory Concentration (IC50) | > 10.00 nM | Positive HER2 expression (HER2+++/++) | ||
| Method Description |
Anti-proliferation activities of the antibodies, drugs, and conjugates with regard tothe cancer cell lines were measured. The cells were plated in 96-well, tissue culture platesat 10,000 cells per well. After 24 hour incubation, the antibodies, drugs, and conjugateswere added in various concentrations. The number of viable cells after 72 hours were counted using SRB assay.
Click to Show/Hide
|
||||
| In Vitro Model | Breast ductal carcinoma | JIMT-1 cells | CVCL_2077 | ||
| Experiment 5 Reporting the Activity Date of This ADC | [235] | ||||
| Efficacy Data | Half Maximal Inhibitory Concentration (IC50) | > 10.00 nM | Negative HER2 expression (HER2-) | ||
| Method Description |
Anti-proliferation activities of the antibodies, drugs, and conjugates with regard tothe cancer cell lines were measured. The cells were plated in 96-well, tissue culture platesat 10,000 cells per well. After 24 hour incubation, the antibodies, drugs, and conjugateswere added in various concentrations. The number of viable cells after 72 hours were counted using SRB assay.
Click to Show/Hide
|
||||
| In Vitro Model | Invasive breast carcinoma | MCF-7 cells | CVCL_0031 | ||
| Experiment 6 Reporting the Activity Date of This ADC | [235] | ||||
| Efficacy Data | Half Maximal Inhibitory Concentration (IC50) |
13.44 nM
|
Positive HER2 expression (HER2+++/++) | ||
| Method Description |
Anti-proliferation activities of the antibodies, drugs, and conjugates with regard tothe cancer cell lines were measured. The cells were plated in 96-well, tissue culture platesat 10,000 cells per well. After 24 hour incubation, the antibodies, drugs, and conjugateswere added in various concentrations. The number of viable cells after 72 hours were counted using SRB assay.
Click to Show/Hide
|
||||
| In Vitro Model | Breast ductal carcinoma | JIMT-1 cells | CVCL_2077 | ||
| Experiment 7 Reporting the Activity Date of This ADC | [235] | ||||
| Efficacy Data | Half Maximal Inhibitory Concentration (IC50) | > 33.33 nM | Negative HER2 expression (HER2-) | ||
| Method Description |
Anti-proliferation activities of the antibodies, drugs, and conjugates with regard tothe cancer cell lines were measured. The cells were plated in 96-well, tissue culture platesat 10,000 cells per well. After 24 hour incubation, the antibodies, drugs, and conjugateswere added in various concentrations. The number of viable cells after 72 hours were counted using SRB assay.
Click to Show/Hide
|
||||
| In Vitro Model | Invasive breast carcinoma | MCF-7 cells | CVCL_0031 | ||
MAb-DMBA-SIL-MMAE [Investigative]
Revealed Based on the Cell Line Data
| Experiment 1 Reporting the Activity Date of This ADC | [248] | ||||
| Efficacy Data | Half Maximal Inhibitory Concentration (IC50) |
0.10 nM
|
|||
| Method Description |
Cytotoxicity of non-irradiated or X-ray-irradiated (8 Gy) mAb-DMBA-SIL-MMAE conjugate in comparison to free MMAE in anaplastic thyroid cancer.
|
||||
| In Vitro Model | Thyroid gland anaplastic carcinoma | 8505C cells | CVCL_1054 | ||
WO2017089890A1 ADC7 [Investigative]
Revealed Based on the Cell Line Data
| Experiment 1 Reporting the Activity Date of This ADC | [211] | ||||
| Efficacy Data | Half Maximal Inhibitory Concentration (IC50) |
0.10 nM
|
High HER2 expression (HER2 +++) | ||
| Method Description |
Anti-proliferation activities of the antibodies, drugs, and conjugates with regard tothe cancer cell lines were measured. The cells were plated in 96-well, tissue culture platesat 10,000 cells per well. After 24 hour incubation, the antibodies, drugs, and conjugateswere added in various concentrations. The number of viable cells after 72 hours werecounted using SRB assay.
Click to Show/Hide
|
||||
| In Vitro Model | Breast adenocarcinoma | SK-BR-3 cells | CVCL_0033 | ||
| Experiment 2 Reporting the Activity Date of This ADC | [211] | ||||
| Efficacy Data | Half Maximal Inhibitory Concentration (IC50) |
13.44 nM
|
Moderate HER2 expression (HER2++) | ||
| Method Description |
Anti-proliferation activities of the antibodies, drugs, and conjugates with regard tothe cancer cell lines were measured. The cells were plated in 96-well, tissue culture platesat 10,000 cells per well. After 24 hour incubation, the antibodies, drugs, and conjugateswere added in various concentrations. The number of viable cells after 72 hours werecounted using SRB assay.
Click to Show/Hide
|
||||
| In Vitro Model | Breast ductal carcinoma | JIMT-1 cells | CVCL_2077 | ||
| Experiment 3 Reporting the Activity Date of This ADC | [211] | ||||
| Efficacy Data | Half Maximal Inhibitory Concentration (IC50) | > 33.30 nM | Negative HER2 expression (HER2-) | ||
| Method Description |
Anti-proliferation activities of the antibodies, drugs, and conjugates with regard tothe cancer cell lines were measured. The cells were plated in 96-well, tissue culture platesat 10,000 cells per well. After 24 hour incubation, the antibodies, drugs, and conjugateswere added in various concentrations. The number of viable cells after 72 hours werecounted using SRB assay.
Click to Show/Hide
|
||||
| In Vitro Model | Invasive breast carcinoma | MCF-7 cells | CVCL_0031 | ||
WO2017089890A1 ADC9 [Investigative]
Revealed Based on the Cell Line Data
| Experiment 1 Reporting the Activity Date of This ADC | [211] | ||||
| Efficacy Data | Half Maximal Inhibitory Concentration (IC50) |
0.10 nM
|
High HER2 expression (HER2 +++) | ||
| Method Description |
Anti-proliferation activities of the antibodies, drugs, and conjugates with regard tothe cancer cell lines were measured. The cells were plated in 96-well, tissue culture platesat 10,000 cells per well. After 24 hour incubation, the antibodies, drugs, and conjugateswere added in various concentrations. The number of viable cells after 72 hours werecounted using SRB assay.
Click to Show/Hide
|
||||
| In Vitro Model | Breast adenocarcinoma | SK-BR-3 cells | CVCL_0033 | ||
| Experiment 2 Reporting the Activity Date of This ADC | [211] | ||||
| Efficacy Data | Half Maximal Inhibitory Concentration (IC50) | > 33.30 nM | Moderate HER2 expression (HER2++) | ||
| Method Description |
Anti-proliferation activities of the antibodies, drugs, and conjugates with regard tothe cancer cell lines were measured. The cells were plated in 96-well, tissue culture platesat 10,000 cells per well. After 24 hour incubation, the antibodies, drugs, and conjugateswere added in various concentrations. The number of viable cells after 72 hours werecounted using SRB assay.
Click to Show/Hide
|
||||
| In Vitro Model | Breast ductal carcinoma | JIMT-1 cells | CVCL_2077 | ||
| Experiment 3 Reporting the Activity Date of This ADC | [211] | ||||
| Efficacy Data | Half Maximal Inhibitory Concentration (IC50) | > 33.30 nM | Negative HER2 expression (HER2-) | ||
| Method Description |
Anti-proliferation activities of the antibodies, drugs, and conjugates with regard tothe cancer cell lines were measured. The cells were plated in 96-well, tissue culture platesat 10,000 cells per well. After 24 hour incubation, the antibodies, drugs, and conjugateswere added in various concentrations. The number of viable cells after 72 hours werecounted using SRB assay.
Click to Show/Hide
|
||||
| In Vitro Model | Invasive breast carcinoma | MCF-7 cells | CVCL_0031 | ||
WO2017089895A1 ADC35 [Investigative]
Revealed Based on the Cell Line Data
| Experiment 1 Reporting the Activity Date of This ADC | [235] | ||||
| Efficacy Data | Half Maximal Inhibitory Concentration (IC50) |
0.11 nM
|
Positive HER2 expression (HER2+++/++) | ||
| Method Description |
ADCs wereincubated in human plasma for 5 seconds (0h), followed by SRB invitro cytotoxicity test using SK-BR3 cells for 72hr.
|
||||
| In Vitro Model | Breast adenocarcinoma | SK-BR-3 cells | CVCL_0033 | ||
| Experiment 2 Reporting the Activity Date of This ADC | [235] | ||||
| Efficacy Data | Half Maximal Inhibitory Concentration (IC50) |
0.13 nM
|
Positive HER2 expression (HER2+++/++) | ||
| Method Description |
Anti-proliferation activities of the antibodies, drugs, and conjugates with regard tothe cancer cell lines were measured. The cells were plated in 96-well, tissue culture platesat 10,000 cells per well. After 24 hour incubation, the antibodies, drugs, and conjugateswere added in various concentrations. The number of viable cells after 72 hours were counted using SRB assay.
Click to Show/Hide
|
||||
| In Vitro Model | Breast adenocarcinoma | SK-BR-3 cells | CVCL_0033 | ||
| Experiment 3 Reporting the Activity Date of This ADC | [235] | ||||
| Efficacy Data | Half Maximal Inhibitory Concentration (IC50) |
0.19 nM
|
Positive HER2 expression (HER2+++/++) | ||
| Method Description |
Anti-proliferation activities of the antibodies, drugs, and conjugates with regard tothe cancer cell lines were measured. The cells were plated in 96-well, tissue culture platesat 10,000 cells per well. After 24 hour incubation, the antibodies, drugs, and conjugateswere added in various concentrations. The number of viable cells after 72 hours were counted using SRB assay.
Click to Show/Hide
|
||||
| In Vitro Model | Breast ductal carcinoma | JIMT-1 cells | CVCL_2077 | ||
| Experiment 4 Reporting the Activity Date of This ADC | [235] | ||||
| Efficacy Data | Half Maximal Inhibitory Concentration (IC50) |
21.00 nM
|
Positive HER2 expression (HER2+++/++) | ||
| Method Description |
ADCs wereincubated in human plasma for 168 hours (168h), followed by SRB invitro cytotoxicity test using SK-BR3 cells for 72hr.
|
||||
| In Vitro Model | Breast adenocarcinoma | SK-BR-3 cells | CVCL_0033 | ||
| Experiment 5 Reporting the Activity Date of This ADC | [235] | ||||
| Efficacy Data | Half Maximal Inhibitory Concentration (IC50) | > 33.33 nM | Negative HER2 expression (HER2-) | ||
| Method Description |
Anti-proliferation activities of the antibodies, drugs, and conjugates with regard tothe cancer cell lines were measured. The cells were plated in 96-well, tissue culture platesat 10,000 cells per well. After 24 hour incubation, the antibodies, drugs, and conjugateswere added in various concentrations. The number of viable cells after 72 hours were counted using SRB assay.
Click to Show/Hide
|
||||
| In Vitro Model | Invasive breast carcinoma | MCF-7 cells | CVCL_0031 | ||
Trastuzumab deglycosylated WT-MMAE [Investigative]
Revealed Based on the Cell Line Data
| Experiment 1 Reporting the Activity Date of This ADC | [249] | ||||
| Efficacy Data | Half Maximal Inhibitory Concentration (IC50) |
0.12 nM
|
Positive HER2 expression (HER2+++/++) | ||
| Method Description |
Cytotoxicity of MMAE-conjugated trastuzumab I253Q variant. Serial dilutions of trastuzumab variants (0.01 nM to 20 nM) were incubated for 3 days on SK-BR-3 (HER2) cells.
|
||||
| In Vitro Model | Breast adenocarcinoma | SK-BR-3 cells | CVCL_0033 | ||
| Experiment 2 Reporting the Activity Date of This ADC | [206] | ||||
| Efficacy Data | Half Maximal Inhibitory Concentration (IC50) | > 100 nM | Negative HER2 expression (HER2 -) | ||
| Method Description |
Cytotoxicity of MMAE-conjugated trastuzumab I253Q variant. Serial dilutions of trastuzumab variants (0.01 nM to 20 nM) were incubated for 3 days on SK-BR-3 (HER2) cells.
|
||||
| In Vitro Model | Endocervical adenocarcinoma | HeLa cells | CVCL_0030 | ||
WO2017089895A1 ADC10 [Investigative]
Revealed Based on the Cell Line Data
| Experiment 1 Reporting the Activity Date of This ADC | [235] | ||||
| Efficacy Data | Half Maximal Inhibitory Concentration (IC50) |
0.12 nM
|
Positive HER2 expression (HER2+++/++) | ||
| Method Description |
Anti-proliferation activities of the antibodies, drugs, and conjugates with regard tothe cancer cell lines were measured. The cells were plated in 96-well, tissue culture platesat 10,000 cells per well. After 24 hour incubation, the antibodies, drugs, and conjugateswere added in various concentrations. The number of viable cells after 72 hours were counted using SRB assay.
Click to Show/Hide
|
||||
| In Vitro Model | Breast adenocarcinoma | SK-BR-3 cells | CVCL_0033 | ||
| Experiment 2 Reporting the Activity Date of This ADC | [235] | ||||
| Efficacy Data | Half Maximal Inhibitory Concentration (IC50) |
0.64 nM
|
Positive HER2 expression (HER2+++/++) | ||
| Method Description |
Anti-proliferation activities of the antibodies, drugs, and conjugates with regard tothe cancer cell lines were measured. The cells were plated in 96-well, tissue culture platesat 10,000 cells per well. After 24 hour incubation, the antibodies, drugs, and conjugateswere added in various concentrations. The number of viable cells after 72 hours were counted using SRB assay.
Click to Show/Hide
|
||||
| In Vitro Model | Breast ductal carcinoma | JIMT-1 cells | CVCL_2077 | ||
WO2017089890A1 ADC10 [Investigative]
Revealed Based on the Cell Line Data
| Experiment 1 Reporting the Activity Date of This ADC | [211] | ||||
| Efficacy Data | Half Maximal Inhibitory Concentration (IC50) |
0.12 nM
|
High HER2 expression (HER2 +++) | ||
| Method Description |
Anti-proliferation activities of the antibodies, drugs, and conjugates with regard tothe cancer cell lines were measured. The cells were plated in 96-well, tissue culture platesat 10,000 cells per well. After 24 hour incubation, the antibodies, drugs, and conjugateswere added in various concentrations. The number of viable cells after 72 hours werecounted using SRB assay.
Click to Show/Hide
|
||||
| In Vitro Model | Breast adenocarcinoma | SK-BR-3 cells | CVCL_0033 | ||
| Experiment 2 Reporting the Activity Date of This ADC | [211] | ||||
| Efficacy Data | Half Maximal Inhibitory Concentration (IC50) |
0.64 nM
|
Moderate HER2 expression (HER2++) | ||
| Method Description |
Anti-proliferation activities of the antibodies, drugs, and conjugates with regard tothe cancer cell lines were measured. The cells were plated in 96-well, tissue culture platesat 10,000 cells per well. After 24 hour incubation, the antibodies, drugs, and conjugateswere added in various concentrations. The number of viable cells after 72 hours werecounted using SRB assay.
Click to Show/Hide
|
||||
| In Vitro Model | Breast ductal carcinoma | JIMT-1 cells | CVCL_2077 | ||
| Experiment 3 Reporting the Activity Date of This ADC | [211] | ||||
| Efficacy Data | Half Maximal Inhibitory Concentration (IC50) | > 33.30 nM | Negative HER2 expression (HER2-) | ||
| Method Description |
Anti-proliferation activities of the antibodies, drugs, and conjugates with regard tothe cancer cell lines were measured. The cells were plated in 96-well, tissue culture platesat 10,000 cells per well. After 24 hour incubation, the antibodies, drugs, and conjugateswere added in various concentrations. The number of viable cells after 72 hours werecounted using SRB assay.
Click to Show/Hide
|
||||
| In Vitro Model | Invasive breast carcinoma | MCF-7 cells | CVCL_0031 | ||
HER2-gsADC-41 [Investigative]
Revealed Based on the Cell Line Data
| Experiment 1 Reporting the Activity Date of This ADC | [206] | ||||
| Efficacy Data | Half Maximal Inhibitory Concentration (IC50) |
0.13 nM
|
Positive HER2 expression (HER2+++/++) | ||
| Method Description |
Cells were cultured in a 10% fetal bovine serum (FBS)-containing RPMI 1640 medium and were planted into 96-well plates with 6000 cells per well. The plates were incubated overnight at 37°C in a 5% CO2 cell incubator.
|
||||
| In Vitro Model | Breast adenocarcinoma | SK-BR-3 cells | CVCL_0033 | ||
| Experiment 2 Reporting the Activity Date of This ADC | [206] | ||||
| Efficacy Data | Half Maximal Inhibitory Concentration (IC50) | > 66.00 nM | Positive HER2 expression (HER2+++/++) | ||
| Method Description |
Cells were cultured in a 10% fetal bovine serum (FBS)-containing RPMI 1640 medium and were planted into 96-well plates with 6000 cells per well. The plates were incubated overnight at 37°C in a 5% CO2 cell incubator.
|
||||
| In Vitro Model | Gastric tubular adenocarcinoma | NCI-N87 cells | CVCL_1603 | ||
| Experiment 3 Reporting the Activity Date of This ADC | [206] | ||||
| Efficacy Data | Half Maximal Inhibitory Concentration (IC50) | > 66.00 nM | Negative HER2 expression (HER2 -) | ||
| Method Description |
Cells were cultured in a 10% fetal bovine serum (FBS)-containing RPMI 1640 medium and were planted into 96-well plates with 6000 cells per well. The plates were incubated overnight at 37°C in a 5% CO2 cell incubator.
|
||||
| In Vitro Model | Breast adenocarcinoma | MDA-MB-231 cells | CVCL_0062 | ||
WO2017089895A1 ADC19 [Investigative]
Revealed Based on the Cell Line Data
| Experiment 1 Reporting the Activity Date of This ADC | [235] | ||||
| Efficacy Data | Half Maximal Inhibitory Concentration (IC50) |
0.13 nM
|
Positive HER2 expression (HER2+++/++) | ||
| Method Description |
Anti-proliferation activities of the antibodies, drugs, and conjugates with regard tothe cancer cell lines were measured. The cells were plated in 96-well, tissue culture platesat 10,000 cells per well. After 24 hour incubation, the antibodies, drugs, and conjugateswere added in various concentrations. The number of viable cells after 72 hours were counted using SRB assay.
Click to Show/Hide
|
||||
| In Vitro Model | Breast adenocarcinoma | SK-BR-3 cells | CVCL_0033 | ||
| Experiment 2 Reporting the Activity Date of This ADC | [235] | ||||
| Efficacy Data | Half Maximal Inhibitory Concentration (IC50) |
0.38 nM
|
Positive HER2 expression (HER2+++/++) | ||
| Method Description |
Anti-proliferation activities of the antibodies, drugs, and conjugates with regard tothe cancer cell lines were measured. The cells were plated in 96-well, tissue culture platesat 10,000 cells per well. After 24 hour incubation, the antibodies, drugs, and conjugateswere added in various concentrations. The number of viable cells after 72 hours were counted using SRB assay.
Click to Show/Hide
|
||||
| In Vitro Model | Breast ductal carcinoma | JIMT-1 cells | CVCL_2077 | ||
| Experiment 3 Reporting the Activity Date of This ADC | [235] | ||||
| Efficacy Data | Half Maximal Inhibitory Concentration (IC50) | > 33.33 nM | Negative HER2 expression (HER2-) | ||
| Method Description |
Anti-proliferation activities of the antibodies, drugs, and conjugates with regard tothe cancer cell lines were measured. The cells were plated in 96-well, tissue culture platesat 10,000 cells per well. After 24 hour incubation, the antibodies, drugs, and conjugateswere added in various concentrations. The number of viable cells after 72 hours were counted using SRB assay.
Click to Show/Hide
|
||||
| In Vitro Model | Invasive breast carcinoma | MCF-7 cells | CVCL_0031 | ||
WO2017089890A1 ADC19 [Investigative]
Revealed Based on the Cell Line Data
| Experiment 1 Reporting the Activity Date of This ADC | [211] | ||||
| Efficacy Data | Half Maximal Inhibitory Concentration (IC50) |
0.13 nM
|
High HER2 expression (HER2 +++) | ||
| Method Description |
Anti-proliferation activities of the antibodies, drugs, and conjugates with regard tothe cancer cell lines were measured. The cells were plated in 96-well, tissue culture platesat 10,000 cells per well. After 24 hour incubation, the antibodies, drugs, and conjugateswere added in various concentrations. The number of viable cells after 72 hours werecounted using SRB assay.
Click to Show/Hide
|
||||
| In Vitro Model | Breast adenocarcinoma | SK-BR-3 cells | CVCL_0033 | ||
| Experiment 2 Reporting the Activity Date of This ADC | [211] | ||||
| Efficacy Data | Half Maximal Inhibitory Concentration (IC50) |
0.38 nM
|
Moderate HER2 expression (HER2++) | ||
| Method Description |
Anti-proliferation activities of the antibodies, drugs, and conjugates with regard tothe cancer cell lines were measured. The cells were plated in 96-well, tissue culture platesat 10,000 cells per well. After 24 hour incubation, the antibodies, drugs, and conjugateswere added in various concentrations. The number of viable cells after 72 hours werecounted using SRB assay.
Click to Show/Hide
|
||||
| In Vitro Model | Breast ductal carcinoma | JIMT-1 cells | CVCL_2077 | ||
| Experiment 3 Reporting the Activity Date of This ADC | [211] | ||||
| Efficacy Data | Half Maximal Inhibitory Concentration (IC50) | > 33.30 nM | Negative HER2 expression (HER2-) | ||
| Method Description |
Anti-proliferation activities of the antibodies, drugs, and conjugates with regard tothe cancer cell lines were measured. The cells were plated in 96-well, tissue culture platesat 10,000 cells per well. After 24 hour incubation, the antibodies, drugs, and conjugateswere added in various concentrations. The number of viable cells after 72 hours werecounted using SRB assay.
Click to Show/Hide
|
||||
| In Vitro Model | Invasive breast carcinoma | MCF-7 cells | CVCL_0031 | ||
WO2017089890A1 ADC35 [Investigative]
Revealed Based on the Cell Line Data
| Experiment 1 Reporting the Activity Date of This ADC | [211] | ||||
| Efficacy Data | Half Maximal Inhibitory Concentration (IC50) |
0.13 nM
|
High HER2 expression (HER2 +++) | ||
| Method Description |
Anti-proliferation activities of the antibodies, drugs, and conjugates with regard tothe cancer cell lines were measured. The cells were plated in 96-well, tissue culture platesat 10,000 cells per well. After 24 hour incubation, the antibodies, drugs, and conjugateswere added in various concentrations. The number of viable cells after 72 hours werecounted using SRB assay.
Click to Show/Hide
|
||||
| In Vitro Model | Breast adenocarcinoma | SK-BR-3 cells | CVCL_0033 | ||
| Experiment 2 Reporting the Activity Date of This ADC | [211] | ||||
| Efficacy Data | Half Maximal Inhibitory Concentration (IC50) |
0.19 nM
|
Moderate HER2 expression (HER2++) | ||
| Method Description |
Anti-proliferation activities of the antibodies, drugs, and conjugates with regard tothe cancer cell lines were measured. The cells were plated in 96-well, tissue culture platesat 10,000 cells per well. After 24 hour incubation, the antibodies, drugs, and conjugateswere added in various concentrations. The number of viable cells after 72 hours werecounted using SRB assay.
Click to Show/Hide
|
||||
| In Vitro Model | Breast ductal carcinoma | JIMT-1 cells | CVCL_2077 | ||
| Experiment 3 Reporting the Activity Date of This ADC | [211] | ||||
| Efficacy Data | Half Maximal Inhibitory Concentration (IC50) | > 33.30 nM | Negative HER2 expression (HER2-) | ||
| Method Description |
Anti-proliferation activities of the antibodies, drugs, and conjugates with regard tothe cancer cell lines were measured. The cells were plated in 96-well, tissue culture platesat 10,000 cells per well. After 24 hour incubation, the antibodies, drugs, and conjugateswere added in various concentrations. The number of viable cells after 72 hours werecounted using SRB assay.
Click to Show/Hide
|
||||
| In Vitro Model | Invasive breast carcinoma | MCF-7 cells | CVCL_0031 | ||
WO2017089890A1 ADC36 [Investigative]
Revealed Based on the Cell Line Data
| Experiment 1 Reporting the Activity Date of This ADC | [211] | ||||
| Efficacy Data | Half Maximal Inhibitory Concentration (IC50) |
0.13 nM
|
High HER2 expression (HER2 +++) | ||
| Method Description |
Anti-proliferation activities of the antibodies, drugs, and conjugates with regard tothe cancer cell lines were measured. The cells were plated in 96-well, tissue culture platesat 10,000 cells per well. After 24 hour incubation, the antibodies, drugs, and conjugateswere added in various concentrations. The number of viable cells after 72 hours werecounted using SRB assay.
Click to Show/Hide
|
||||
| In Vitro Model | Breast adenocarcinoma | SK-BR-3 cells | CVCL_0033 | ||
| Experiment 2 Reporting the Activity Date of This ADC | [211] | ||||
| Efficacy Data | Half Maximal Inhibitory Concentration (IC50) |
0.22 nM
|
Moderate HER2 expression (HER2++) | ||
| Method Description |
Anti-proliferation activities of the antibodies, drugs, and conjugates with regard tothe cancer cell lines were measured. The cells were plated in 96-well, tissue culture platesat 10,000 cells per well. After 24 hour incubation, the antibodies, drugs, and conjugateswere added in various concentrations. The number of viable cells after 72 hours werecounted using SRB assay.
Click to Show/Hide
|
||||
| In Vitro Model | Breast ductal carcinoma | JIMT-1 cells | CVCL_2077 | ||
| Experiment 3 Reporting the Activity Date of This ADC | [211] | ||||
| Efficacy Data | Half Maximal Inhibitory Concentration (IC50) | > 33.30 nM | Negative HER2 expression (HER2-) | ||
| Method Description |
Anti-proliferation activities of the antibodies, drugs, and conjugates with regard tothe cancer cell lines were measured. The cells were plated in 96-well, tissue culture platesat 10,000 cells per well. After 24 hour incubation, the antibodies, drugs, and conjugateswere added in various concentrations. The number of viable cells after 72 hours werecounted using SRB assay.
Click to Show/Hide
|
||||
| In Vitro Model | Invasive breast carcinoma | MCF-7 cells | CVCL_0031 | ||
HER2-norbornene-tetrazine MMAE conjugate [Investigative]
Revealed Based on the Cell Line Data
| Experiment 1 Reporting the Activity Date of This ADC | [244] | ||||
| Efficacy Data | Half Maximal Inhibitory Concentration (IC50) |
0.14 nM
|
Positive HER2 expression (HER2 +++/++) | ||
| Method Description |
Cells were incubated with increasing concentrations in tested compounds for 96 h and cell viability was determined by MTS assay.
|
||||
| In Vitro Model | Breast adenocarcinoma | SK-BR-3 cells | CVCL_0033 | ||
| Experiment 2 Reporting the Activity Date of This ADC | [244] | ||||
| Efficacy Data | Half Maximal Inhibitory Concentration (IC50) |
21.80 ng/mL
|
Positive HER2 expression (HER2 +++/++) | ||
| Method Description |
Cells were incubated with increasing concentrations in tested compounds for 96 h and cell viability was determined by MTS assay.
|
||||
| In Vitro Model | Breast adenocarcinoma | SK-BR-3 cells | CVCL_0033 | ||
| Experiment 3 Reporting the Activity Date of This ADC | [244] | ||||
| Efficacy Data | Half Maximal Inhibitory Concentration (IC50) | > 10.00 ug/mL | Low HER2 expression (HER2+) | ||
| Method Description |
Cells were incubated with increasing concentrations in tested compounds for 96 h and cell viability was determined by MTS assay.
|
||||
| In Vitro Model | Invasive breast carcinoma | T-47D cells | CVCL_0553 | ||
WO2017089890A1 ADC31 [Investigative]
Revealed Based on the Cell Line Data
| Experiment 1 Reporting the Activity Date of This ADC | [211] | ||||
| Efficacy Data | Half Maximal Inhibitory Concentration (IC50) |
0.14 nM
|
High HER2 expression (HER2 +++) | ||
| Method Description |
Anti-proliferation activities of the antibodies, drugs, and conjugates with regard tothe cancer cell lines were measured. The cells were plated in 96-well, tissue culture platesat 10,000 cells per well. After 24 hour incubation, the antibodies, drugs, and conjugateswere added in various concentrations. The number of viable cells after 72 hours werecounted using SRB assay.
Click to Show/Hide
|
||||
| In Vitro Model | Breast adenocarcinoma | SK-BR-3 cells | CVCL_0033 | ||
| Experiment 2 Reporting the Activity Date of This ADC | [211] | ||||
| Efficacy Data | Half Maximal Inhibitory Concentration (IC50) |
0.24 nM
|
Moderate HER2 expression (HER2++) | ||
| Method Description |
Anti-proliferation activities of the antibodies, drugs, and conjugates with regard tothe cancer cell lines were measured. The cells were plated in 96-well, tissue culture platesat 10,000 cells per well. After 24 hour incubation, the antibodies, drugs, and conjugateswere added in various concentrations. The number of viable cells after 72 hours werecounted using SRB assay.
Click to Show/Hide
|
||||
| In Vitro Model | Breast ductal carcinoma | JIMT-1 cells | CVCL_2077 | ||
| Experiment 3 Reporting the Activity Date of This ADC | [211] | ||||
| Efficacy Data | Half Maximal Inhibitory Concentration (IC50) | > 33.30 nM | Negative HER2 expression (HER2-) | ||
| Method Description |
Anti-proliferation activities of the antibodies, drugs, and conjugates with regard tothe cancer cell lines were measured. The cells were plated in 96-well, tissue culture platesat 10,000 cells per well. After 24 hour incubation, the antibodies, drugs, and conjugateswere added in various concentrations. The number of viable cells after 72 hours werecounted using SRB assay.
Click to Show/Hide
|
||||
| In Vitro Model | Invasive breast carcinoma | MCF-7 cells | CVCL_0031 | ||
HER2-gsADC-18 [Investigative]
Revealed Based on the Cell Line Data
| Experiment 1 Reporting the Activity Date of This ADC | [206] | ||||
| Efficacy Data | Half Maximal Inhibitory Concentration (IC50) |
0.15 nM
|
Positive HER2 expression (HER2+++/++) | ||
| Method Description |
Cells were cultured in a 10% fetal bovine serum (FBS)-containing RPMI 1640 medium and were planted into 96-well plates with 6000 cells per well. The plates were incubated overnight at 37°C in a 5% CO2 cell incubator.
|
||||
| In Vitro Model | Breast adenocarcinoma | SK-BR-3 cells | CVCL_0033 | ||
| Experiment 2 Reporting the Activity Date of This ADC | [206] | ||||
| Efficacy Data | Half Maximal Inhibitory Concentration (IC50) | > 66.00 nM | Positive HER2 expression (HER2+++/++) | ||
| Method Description |
Cells were cultured in a 10% fetal bovine serum (FBS)-containing RPMI 1640 medium and were planted into 96-well plates with 6000 cells per well. The plates were incubated overnight at 37°C in a 5% CO2 cell incubator.
|
||||
| In Vitro Model | Gastric tubular adenocarcinoma | NCI-N87 cells | CVCL_1603 | ||
| Experiment 3 Reporting the Activity Date of This ADC | [206] | ||||
| Efficacy Data | Half Maximal Inhibitory Concentration (IC50) | > 66.00 nM | Negative HER2 expression (HER2 -) | ||
| Method Description |
Cells were cultured in a 10% fetal bovine serum (FBS)-containing RPMI 1640 medium and were planted into 96-well plates with 6000 cells per well. The plates were incubated overnight at 37°C in a 5% CO2 cell incubator.
|
||||
| In Vitro Model | Breast adenocarcinoma | MDA-MB-231 cells | CVCL_0062 | ||
WO2017089895A1 ADC5 [Investigative]
Revealed Based on the Cell Line Data
| Experiment 1 Reporting the Activity Date of This ADC | [235] | ||||
| Efficacy Data | Half Maximal Inhibitory Concentration (IC50) |
0.15 nM
|
Positive HER2 expression (HER2+++/++) | ||
| Method Description |
Anti-proliferation activities of the antibodies, drugs, and conjugates with regard tothe cancer cell lines were measured. The cells were plated in 96-well, tissue culture platesat 10,000 cells per well. After 24 hour incubation, the antibodies, drugs, and conjugateswere added in various concentrations. The number of viable cells after 72 hours were counted using SRB assay.
Click to Show/Hide
|
||||
| In Vitro Model | Breast adenocarcinoma | SK-BR-3 cells | CVCL_0033 | ||
| Experiment 2 Reporting the Activity Date of This ADC | [235] | ||||
| Efficacy Data | Half Maximal Inhibitory Concentration (IC50) |
0.19 nM
|
Positive HER2 expression (HER2+++/++) | ||
| Method Description |
ADCs wereincubated in human plasma for 5 seconds (0h), followed by SRB invitro cytotoxicity test using SK-BR3 cells for 72hr.
|
||||
| In Vitro Model | Breast adenocarcinoma | SK-BR-3 cells | CVCL_0033 | ||
| Experiment 3 Reporting the Activity Date of This ADC | [235] | ||||
| Efficacy Data | Half Maximal Inhibitory Concentration (IC50) |
0.31 nM
|
Positive HER2 expression (HER2+++/++) | ||
| Method Description |
ADCs wereincubated in human plasma for 168 hours (168h), followed by SRB invitro cytotoxicity test using SK-BR3 cells for 72hr.
|
||||
| In Vitro Model | Breast adenocarcinoma | SK-BR-3 cells | CVCL_0033 | ||
| Experiment 4 Reporting the Activity Date of This ADC | [235] | ||||
| Efficacy Data | Half Maximal Inhibitory Concentration (IC50) |
0.40 nM
|
Positive HER2 expression (HER2+++/++) | ||
| Method Description |
Anti-proliferation activities of the antibodies, drugs, and conjugates with regard tothe cancer cell lines were measured. The cells were plated in 96-well, tissue culture platesat 10,000 cells per well. After 24 hour incubation, the antibodies, drugs, and conjugateswere added in various concentrations. The number of viable cells after 72 hours were counted using SRB assay.
Click to Show/Hide
|
||||
| In Vitro Model | Gastric tubular adenocarcinoma | NCI-N87 cells | CVCL_1603 | ||
| Experiment 5 Reporting the Activity Date of This ADC | [235] | ||||
| Efficacy Data | Half Maximal Inhibitory Concentration (IC50) |
0.97 nM
|
Positive HER2 expression (HER2+++/++) | ||
| Method Description |
Anti-proliferation activities of the antibodies, drugs, and conjugates with regard tothe cancer cell lines were measured. The cells were plated in 96-well, tissue culture platesat 10,000 cells per well. After 24 hour incubation, the antibodies, drugs, and conjugateswere added in various concentrations. The number of viable cells after 72 hours were counted using SRB assay.
Click to Show/Hide
|
||||
| In Vitro Model | Breast ductal carcinoma | JIMT-1 cells | CVCL_2077 | ||
| Experiment 6 Reporting the Activity Date of This ADC | [235] | ||||
| Efficacy Data | Half Maximal Inhibitory Concentration (IC50) |
1.01 nM
|
Negative HER2 expression (HER2-) | ||
| Method Description |
Anti-proliferation activities of the antibodies, drugs, and conjugates with regard tothe cancer cell lines were measured. The cells were plated in 96-well, tissue culture platesat 10,000 cells per well. After 24 hour incubation, the antibodies, drugs, and conjugateswere added in various concentrations. The number of viable cells after 72 hours were counted using SRB assay.
Click to Show/Hide
|
||||
| In Vitro Model | Invasive breast carcinoma | MCF-7 cells | CVCL_0031 | ||
| Experiment 7 Reporting the Activity Date of This ADC | [235] | ||||
| Efficacy Data | Half Maximal Inhibitory Concentration (IC50) |
1.04 nM
|
Positive HER2 expression (HER2+++/++) | ||
| Method Description |
Anti-proliferation activities of the antibodies, drugs, and conjugates with regard tothe cancer cell lines were measured. The cells were plated in 96-well, tissue culture platesat 10,000 cells per well. After 24 hour incubation, the antibodies, drugs, and conjugateswere added in various concentrations. The number of viable cells after 72 hours were counted using SRB assay.
Click to Show/Hide
|
||||
| In Vitro Model | Ovarian serous cystadenocarcinoma | SK-OV-3 cells | CVCL_0532 | ||
| Experiment 8 Reporting the Activity Date of This ADC | [235] | ||||
| Efficacy Data | Half Maximal Inhibitory Concentration (IC50) | > 10.00 nM | Positive HER2 expression (HER2+++/++) | ||
| Method Description |
Anti-proliferation activities of the antibodies, drugs, and conjugates with regard tothe cancer cell lines were measured. The cells were plated in 96-well, tissue culture platesat 10,000 cells per well. After 24 hour incubation, the antibodies, drugs, and conjugateswere added in various concentrations. The number of viable cells after 72 hours were counted using SRB assay.
Click to Show/Hide
|
||||
| In Vitro Model | Breast ductal carcinoma | JIMT-1 cells | CVCL_2077 | ||
| Experiment 9 Reporting the Activity Date of This ADC | [235] | ||||
| Efficacy Data | Half Maximal Inhibitory Concentration (IC50) | > 33.33 nM | Negative HER2 expression (HER2-) | ||
| Method Description |
Anti-proliferation activities of the antibodies, drugs, and conjugates with regard tothe cancer cell lines were measured. The cells were plated in 96-well, tissue culture platesat 10,000 cells per well. After 24 hour incubation, the antibodies, drugs, and conjugateswere added in various concentrations. The number of viable cells after 72 hours were counted using SRB assay.
Click to Show/Hide
|
||||
| In Vitro Model | Invasive breast carcinoma | MCF-7 cells | CVCL_0031 | ||
WO2017089890A1 ADC5 [Investigative]
Revealed Based on the Cell Line Data
| Experiment 1 Reporting the Activity Date of This ADC | [211] | ||||
| Efficacy Data | Half Maximal Inhibitory Concentration (IC50) |
0.15 nM
|
High HER2 expression (HER2 +++) | ||
| Method Description |
Anti-proliferation activities of the antibodies, drugs, and conjugates with regard tothe cancer cell lines were measured. The cells were plated in 96-well, tissue culture platesat 10,000 cells per well. After 24 hour incubation, the antibodies, drugs, and conjugateswere added in various concentrations. The number of viable cells after 72 hours werecounted using SRB assay.
Click to Show/Hide
|
||||
| In Vitro Model | Breast adenocarcinoma | SK-BR-3 cells | CVCL_0033 | ||
| Experiment 2 Reporting the Activity Date of This ADC | [211] | ||||
| Efficacy Data | Half Maximal Inhibitory Concentration (IC50) |
0.40 nM
|
High HER2 expression (HER2+++) | ||
| Method Description |
Anti-proliferation activities of the antibodies, drugs, and conjugates with regard tothe cancer cell lines were measured. The cells were plated in 96-well, tissue culture platesat 10,000 cells per well. After 24 hour incubation, the antibodies, drugs, and conjugateswere added in various concentrations. The number of viable cells after 72 hours werecounted using SRB assay.
Click to Show/Hide
|
||||
| In Vitro Model | Gastric tubular adenocarcinoma | NCI-N87 cells | CVCL_1603 | ||
| Experiment 3 Reporting the Activity Date of This ADC | [211] | ||||
| Efficacy Data | Half Maximal Inhibitory Concentration (IC50) |
0.97 nM
|
Moderate HER2 expression (HER2++) | ||
| Method Description |
Anti-proliferation activities of the antibodies, drugs, and conjugates with regard tothe cancer cell lines were measured. The cells were plated in 96-well, tissue culture platesat 10,000 cells per well. After 24 hour incubation, the antibodies, drugs, and conjugateswere added in various concentrations. The number of viable cells after 72 hours werecounted using SRB assay.
Click to Show/Hide
|
||||
| In Vitro Model | Breast ductal carcinoma | JIMT-1 cells | CVCL_2077 | ||
| Experiment 4 Reporting the Activity Date of This ADC | [211] | ||||
| Efficacy Data | Half Maximal Inhibitory Concentration (IC50) |
1.04 nM
|
High HER2 expression (HER2+++) | ||
| Method Description |
Anti-proliferation activities of the antibodies, drugs, and conjugates with regard tothe cancer cell lines were measured. The cells were plated in 96-well, tissue culture platesat 10,000 cells per well. After 24 hour incubation, the antibodies, drugs, and conjugateswere added in various concentrations. The number of viable cells after 72 hours werecounted using SRB assay.
Click to Show/Hide
|
||||
| In Vitro Model | Ovarian serous cystadenocarcinoma | SK-OV-3 cells | CVCL_0532 | ||
| Experiment 5 Reporting the Activity Date of This ADC | [211] | ||||
| Efficacy Data | Half Maximal Inhibitory Concentration (IC50) | > 33.30 nM | Negative HER2 expression (HER2-) | ||
| Method Description |
Anti-proliferation activities of the antibodies, drugs, and conjugates with regard tothe cancer cell lines were measured. The cells were plated in 96-well, tissue culture platesat 10,000 cells per well. After 24 hour incubation, the antibodies, drugs, and conjugateswere added in various concentrations. The number of viable cells after 72 hours werecounted using SRB assay.
Click to Show/Hide
|
||||
| In Vitro Model | Invasive breast carcinoma | MCF-7 cells | CVCL_0031 | ||
Trastuzumab I253Q-MMAE [Investigative]
Revealed Based on the Cell Line Data
| Experiment 1 Reporting the Activity Date of This ADC | [249] | ||||
| Efficacy Data | Half Maximal Inhibitory Concentration (IC50) |
0.16 nM
|
Positive HER2 expression (HER2+++/++) | ||
| Method Description |
Cytotoxicity of MMAE-conjugated trastuzumab I253Q variant. Serial dilutions of trastuzumab variants (0.01 nM to 20 nM) were incubated for 3 days on SK-BR-3 (HER2) cells.
|
||||
| In Vitro Model | Breast adenocarcinoma | SK-BR-3 cells | CVCL_0033 | ||
| Experiment 2 Reporting the Activity Date of This ADC | [206] | ||||
| Efficacy Data | Half Maximal Inhibitory Concentration (IC50) | > 100 nM | Negative HER2 expression (HER2 -) | ||
| Method Description |
Cytotoxicity of MMAE-conjugated trastuzumab I253Q variant. Serial dilutions of trastuzumab variants (0.01 nM to 20 nM) were incubated for 3 days on SK-BR-3 (HER2) cells.
|
||||
| In Vitro Model | Endocervical adenocarcinoma | HeLa cells | CVCL_0030 | ||
HER2-cyclopropene-tetrazine MMAE conjugate [Investigative]
Revealed Based on the Cell Line Data
| Experiment 1 Reporting the Activity Date of This ADC | [244] | ||||
| Efficacy Data | Half Maximal Inhibitory Concentration (IC50) |
0.16 nM
|
Positive HER2 expression (HER2 +++/++) | ||
| Method Description |
Cells were incubated with increasing concentrations in tested compounds for 96 h and cell viability was determined by MTS assay.
|
||||
| In Vitro Model | Breast adenocarcinoma | SK-BR-3 cells | CVCL_0033 | ||
| Experiment 2 Reporting the Activity Date of This ADC | [244] | ||||
| Efficacy Data | Half Maximal Inhibitory Concentration (IC50) |
15.40 ng/mL
|
Positive HER2 expression (HER2 +++/++) | ||
| Method Description |
Cells were incubated with increasing concentrations in tested compounds for 96 h and cell viability was determined by MTS assay.
|
||||
| In Vitro Model | Breast adenocarcinoma | SK-BR-3 cells | CVCL_0033 | ||
| Experiment 3 Reporting the Activity Date of This ADC | [244] | ||||
| Efficacy Data | Half Maximal Inhibitory Concentration (IC50) | > 10.00 ug/mL | Low HER2 expression (HER2+) | ||
| Method Description |
Cells were incubated with increasing concentrations in tested compounds for 96 h and cell viability was determined by MTS assay.
|
||||
| In Vitro Model | Invasive breast carcinoma | T-47D cells | CVCL_0553 | ||
HER2-gsADC-17 [Investigative]
Revealed Based on the Cell Line Data
| Experiment 1 Reporting the Activity Date of This ADC | [206] | ||||
| Efficacy Data | Half Maximal Inhibitory Concentration (IC50) |
0.17 nM
|
Positive HER2 expression (HER2+++/++) | ||
| Method Description |
Cells were cultured in a 10% fetal bovine serum (FBS)-containing RPMI 1640 medium and were planted into 96-well plates with 6000 cells per well. The plates were incubated overnight at 37°C in a 5% CO2 cell incubator.
|
||||
| In Vitro Model | Breast adenocarcinoma | SK-BR-3 cells | CVCL_0033 | ||
| Experiment 2 Reporting the Activity Date of This ADC | [206] | ||||
| Efficacy Data | Half Maximal Inhibitory Concentration (IC50) | > 66.00 nM | Positive HER2 expression (HER2+++/++) | ||
| Method Description |
Cells were cultured in a 10% fetal bovine serum (FBS)-containing RPMI 1640 medium and were planted into 96-well plates with 6000 cells per well. The plates were incubated overnight at 37°C in a 5% CO2 cell incubator.
|
||||
| In Vitro Model | Gastric tubular adenocarcinoma | NCI-N87 cells | CVCL_1603 | ||
| Experiment 3 Reporting the Activity Date of This ADC | [206] | ||||
| Efficacy Data | Half Maximal Inhibitory Concentration (IC50) | > 66.00 nM | Negative HER2 expression (HER2 -) | ||
| Method Description |
Cells were cultured in a 10% fetal bovine serum (FBS)-containing RPMI 1640 medium and were planted into 96-well plates with 6000 cells per well. The plates were incubated overnight at 37°C in a 5% CO2 cell incubator.
|
||||
| In Vitro Model | Breast adenocarcinoma | MDA-MB-231 cells | CVCL_0062 | ||
WO2017089895A1 ADC65 [Investigative]
Revealed Based on the Cell Line Data
| Experiment 1 Reporting the Activity Date of This ADC | [235] | ||||
| Efficacy Data | Half Maximal Inhibitory Concentration (IC50) |
0.17 nM
|
Moderate EGFR expression (EGFR++) | ||
| Method Description |
The cells were incubated at 37°C in 5% CO2, for 24 hours. Then, serial dilutions of ADCs were added to the cells at concentrations of 100 to 0.00128 nM. The cells were incubated for 72 hours and then fixed for 1 hour at 4C afteradding 100 uL of ice-cold 10% trichloroacetic acid to each well.
|
||||
| In Vitro Model | Lung adenocarcinoma | HCC827 cells | CVCL_2063 | ||
| Experiment 2 Reporting the Activity Date of This ADC | [235] | ||||
| Efficacy Data | Half Maximal Inhibitory Concentration (IC50) | > 33.30 nM | Low EGFR expression (EGFR+) | ||
| Method Description |
The cells were incubated at 37°C in 5% CO2, for 24 hours. Then, serial dilutions of ADCs were added to the cells at concentrations of 100 to 0.00128 nM. The cells were incubated for 72 hours and then fixed for 1 hour at 4C afteradding 100 uL of ice-cold 10% trichloroacetic acid to each well.
|
||||
| In Vitro Model | Invasive breast carcinoma | MCF-7 cells | CVCL_0031 | ||
WO2017089895A1 ADC15 [Investigative]
Revealed Based on the Cell Line Data
| Experiment 1 Reporting the Activity Date of This ADC | [235] | ||||
| Efficacy Data | Half Maximal Inhibitory Concentration (IC50) |
0.17 nM
|
Positive HER2 expression (HER2+++/++) | ||
| Method Description |
Anti-proliferation activities of the antibodies, drugs, and conjugates with regard tothe cancer cell lines were measured. The cells were plated in 96-well, tissue culture platesat 10,000 cells per well. After 24 hour incubation, the antibodies, drugs, and conjugateswere added in various concentrations. The number of viable cells after 72 hours were counted using SRB assay.
Click to Show/Hide
|
||||
| In Vitro Model | Breast adenocarcinoma | SK-BR-3 cells | CVCL_0033 | ||
| Experiment 2 Reporting the Activity Date of This ADC | [235] | ||||
| Efficacy Data | Half Maximal Inhibitory Concentration (IC50) |
0.52 nM
|
Positive HER2 expression (HER2+++/++) | ||
| Method Description |
ADCs wereincubated in human plasma for 5 seconds (0h), followed by SRB invitro cytotoxicity test using SK-BR3 cells for 72hr.
|
||||
| In Vitro Model | Breast adenocarcinoma | SK-BR-3 cells | CVCL_0033 | ||
| Experiment 3 Reporting the Activity Date of This ADC | [235] | ||||
| Efficacy Data | Half Maximal Inhibitory Concentration (IC50) |
0.70 nM
|
Positive HER2 expression (HER2+++/++) | ||
| Method Description |
ADCs wereincubated in human plasma for 168 hours (168h), followed by SRB invitro cytotoxicity test using SK-BR3 cells for 72hr.
|
||||
| In Vitro Model | Breast adenocarcinoma | SK-BR-3 cells | CVCL_0033 | ||
| Experiment 4 Reporting the Activity Date of This ADC | [235] | ||||
| Efficacy Data | Half Maximal Inhibitory Concentration (IC50) | > 33.33 nM | Positive HER2 expression (HER2+++/++) | ||
| Method Description |
Anti-proliferation activities of the antibodies, drugs, and conjugates with regard tothe cancer cell lines were measured. The cells were plated in 96-well, tissue culture platesat 10,000 cells per well. After 24 hour incubation, the antibodies, drugs, and conjugateswere added in various concentrations. The number of viable cells after 72 hours were counted using SRB assay.
Click to Show/Hide
|
||||
| In Vitro Model | Breast ductal carcinoma | JIMT-1 cells | CVCL_2077 | ||
| Experiment 5 Reporting the Activity Date of This ADC | [235] | ||||
| Efficacy Data | Half Maximal Inhibitory Concentration (IC50) | > 33.33 nM | Negative HER2 expression (HER2-) | ||
| Method Description |
Anti-proliferation activities of the antibodies, drugs, and conjugates with regard tothe cancer cell lines were measured. The cells were plated in 96-well, tissue culture platesat 10,000 cells per well. After 24 hour incubation, the antibodies, drugs, and conjugateswere added in various concentrations. The number of viable cells after 72 hours were counted using SRB assay.
Click to Show/Hide
|
||||
| In Vitro Model | Invasive breast carcinoma | MCF-7 cells | CVCL_0031 | ||
WO2017089890A1 ADC15 [Investigative]
Revealed Based on the Cell Line Data
| Experiment 1 Reporting the Activity Date of This ADC | [211] | ||||
| Efficacy Data | Half Maximal Inhibitory Concentration (IC50) |
0.17 nM
|
High HER2 expression (HER2 +++) | ||
| Method Description |
Anti-proliferation activities of the antibodies, drugs, and conjugates with regard tothe cancer cell lines were measured. The cells were plated in 96-well, tissue culture platesat 10,000 cells per well. After 24 hour incubation, the antibodies, drugs, and conjugateswere added in various concentrations. The number of viable cells after 72 hours werecounted using SRB assay.
Click to Show/Hide
|
||||
| In Vitro Model | Breast adenocarcinoma | SK-BR-3 cells | CVCL_0033 | ||
| Experiment 2 Reporting the Activity Date of This ADC | [211] | ||||
| Efficacy Data | Half Maximal Inhibitory Concentration (IC50) | > 33.30 nM | Moderate HER2 expression (HER2++) | ||
| Method Description |
Anti-proliferation activities of the antibodies, drugs, and conjugates with regard tothe cancer cell lines were measured. The cells were plated in 96-well, tissue culture platesat 10,000 cells per well. After 24 hour incubation, the antibodies, drugs, and conjugateswere added in various concentrations. The number of viable cells after 72 hours werecounted using SRB assay.
Click to Show/Hide
|
||||
| In Vitro Model | Breast ductal carcinoma | JIMT-1 cells | CVCL_2077 | ||
| Experiment 3 Reporting the Activity Date of This ADC | [211] | ||||
| Efficacy Data | Half Maximal Inhibitory Concentration (IC50) | > 33.30 nM | Negative HER2 expression (HER2-) | ||
| Method Description |
Anti-proliferation activities of the antibodies, drugs, and conjugates with regard tothe cancer cell lines were measured. The cells were plated in 96-well, tissue culture platesat 10,000 cells per well. After 24 hour incubation, the antibodies, drugs, and conjugateswere added in various concentrations. The number of viable cells after 72 hours werecounted using SRB assay.
Click to Show/Hide
|
||||
| In Vitro Model | Invasive breast carcinoma | MCF-7 cells | CVCL_0031 | ||
WO2017089890A1 ADC65 [Investigative]
Revealed Based on the Cell Line Data
| Experiment 1 Reporting the Activity Date of This ADC | [211] | ||||
| Efficacy Data | Half Maximal Inhibitory Concentration (IC50) |
0.17 nM
|
Moderate EGFR expression (EGFR++) | ||
| Method Description |
The cells were incubated at 37°C in 5% CO, for 24 hours. Then, serial dilutions of monomethyl auristatin F ADCs were added to the cells at concentrations of 100 to 0.00128 nM. The cells were incubated for 72 hours and then fixed for 1 hour at 4after adding 100 L ofice-cold 10% trichloroacetic acid to each well.
|
||||
| In Vitro Model | Lung adenocarcinoma | HCC827 cells | CVCL_2063 | ||
| Experiment 2 Reporting the Activity Date of This ADC | [211] | ||||
| Efficacy Data | Half Maximal Inhibitory Concentration (IC50) | > 33.30 nM | Negative EGFR expression (EGFR-) | ||
| Method Description |
The cells were incubated at 37°C in 5% CO, for 24 hours. Then, serial dilutions of monomethyl auristatin F ADCs were added to the cells at concentrations of 100 to 0.00128 nM. The cells were incubated for 72 hours and then fixed for 1 hour at 4after adding 100 L ofice-cold 10% trichloroacetic acid to each well.
|
||||
| In Vitro Model | Invasive breast carcinoma | MCF-7 cells | CVCL_0031 | ||
Trastuzumab-Val-Cit linker-MMAE 2 [Investigative]
Revealed Based on the Cell Line Data
| Experiment 1 Reporting the Activity Date of This ADC | [250] | ||||
| Efficacy Data | Half Maximal Inhibitory Concentration (IC50) |
0.18 nM
|
Positive HER2 expression (HER2+++/++) | ||
| Method Description |
Cells were seeded at 2000 cells per well in black 96-well proliferation plates and dosed with a titration of conjugates for 3 to 5 days, until control untreated cells reached 80 to 90% confluence.
|
||||
| In Vitro Model | Invasive breast carcinoma | BT-474 cells | CVCL_0179 | ||
Fcab-1-MMAE [Investigative]
Revealed Based on the Cell Line Data
| Experiment 1 Reporting the Activity Date of This ADC | [251] | ||||
| Efficacy Data | Half Maximal Inhibitory Concentration (IC50) |
0.18±0.03 nM
|
High EGFR expression (EGFR+++/++) | ||
| Method Description |
The inhibitory activity of Fcab-1-MMAE against cancer cell growth was evaluated in various human cancer cell lines in vitro.
|
||||
| In Vitro Model | Breast adenocarcinoma | MDA-MB-468 cells | CVCL_0419 | ||
| Experiment 2 Reporting the Activity Date of This ADC | [251] | ||||
| Efficacy Data | Half Maximal Inhibitory Concentration (IC50) | > 100.00 nM | Negative EGFR expression (EGFR-) | ||
| Method Description |
The inhibitory activity of Fcab-1-MMAE against cancer cell growth was evaluated in various human cancer cell lines in vitro.
|
||||
| In Vitro Model | Invasive breast carcinoma | MCF-7 cells | CVCL_0031 | ||
| Experiment 3 Reporting the Activity Date of This ADC | [95] | ||||
| Efficacy Data | Half Maximal Effective Concentration (EC50) |
1.40 nM
|
Low FOLR1 expression (FOLR1+) | ||
| Method Description |
The inhibitory activity of Fcab-1-MMAE against cancer cell growth was evaluated in various human cancer cell lines in vitro.
|
||||
| In Vitro Model | Skin squamous cell carcinoma | A431 cells | CVCL_0037 | ||
HER2-gsADC-16 [Investigative]
Revealed Based on the Cell Line Data
| Experiment 1 Reporting the Activity Date of This ADC | [206] | ||||
| Efficacy Data | Half Maximal Inhibitory Concentration (IC50) |
0.19 nM
|
Positive HER2 expression (HER2+++/++) | ||
| Method Description |
Cells were cultured in a 10% fetal bovine serum (FBS)-containing RPMI 1640 medium and were planted into 96-well plates with 6000 cells per well. The plates were incubated overnight at 37°C in a 5% CO2 cell incubator.
|
||||
| In Vitro Model | Breast adenocarcinoma | SK-BR-3 cells | CVCL_0033 | ||
| Experiment 2 Reporting the Activity Date of This ADC | [206] | ||||
| Efficacy Data | Half Maximal Inhibitory Concentration (IC50) | > 66.00 nM | Positive HER2 expression (HER2+++/++) | ||
| Method Description |
Cells were cultured in a 10% fetal bovine serum (FBS)-containing RPMI 1640 medium and were planted into 96-well plates with 6000 cells per well. The plates were incubated overnight at 37°C in a 5% CO2 cell incubator.
|
||||
| In Vitro Model | Gastric tubular adenocarcinoma | NCI-N87 cells | CVCL_1603 | ||
| Experiment 3 Reporting the Activity Date of This ADC | [206] | ||||
| Efficacy Data | Half Maximal Inhibitory Concentration (IC50) | > 66.00 nM | Negative HER2 expression (HER2 -) | ||
| Method Description |
Cells were cultured in a 10% fetal bovine serum (FBS)-containing RPMI 1640 medium and were planted into 96-well plates with 6000 cells per well. The plates were incubated overnight at 37°C in a 5% CO2 cell incubator.
|
||||
| In Vitro Model | Breast adenocarcinoma | MDA-MB-231 cells | CVCL_0062 | ||
WO2017089895A1 ADC13 [Investigative]
Revealed Based on the Cell Line Data
| Experiment 1 Reporting the Activity Date of This ADC | [235] | ||||
| Efficacy Data | Half Maximal Inhibitory Concentration (IC50) |
0.19 nM
|
Positive HER2 expression (HER2+++/++) | ||
| Method Description |
Anti-proliferation activities of the antibodies, drugs, and conjugates with regard tothe cancer cell lines were measured. The cells were plated in 96-well, tissue culture platesat 10,000 cells per well. After 24 hour incubation, the antibodies, drugs, and conjugateswere added in various concentrations. The number of viable cells after 72 hours were counted using SRB assay.
Click to Show/Hide
|
||||
| In Vitro Model | Breast adenocarcinoma | SK-BR-3 cells | CVCL_0033 | ||
| Experiment 2 Reporting the Activity Date of This ADC | [235] | ||||
| Efficacy Data | Half Maximal Inhibitory Concentration (IC50) |
0.63 nM
|
Positive HER2 expression (HER2+++/++) | ||
| Method Description |
ADCs wereincubated in human plasma for 5 seconds (0h), followed by SRB invitro cytotoxicity test using SK-BR3 cells for 72hr.
|
||||
| In Vitro Model | Breast adenocarcinoma | SK-BR-3 cells | CVCL_0033 | ||
| Experiment 3 Reporting the Activity Date of This ADC | [235] | ||||
| Efficacy Data | Half Maximal Inhibitory Concentration (IC50) |
0.87 nM
|
Positive HER2 expression (HER2+++/++) | ||
| Method Description |
ADCs wereincubated in human plasma for 168 hours (168h), followed by SRB invitro cytotoxicity test using SK-BR3 cells for 72hr.
|
||||
| In Vitro Model | Breast adenocarcinoma | SK-BR-3 cells | CVCL_0033 | ||
| Experiment 4 Reporting the Activity Date of This ADC | [235] | ||||
| Efficacy Data | Half Maximal Inhibitory Concentration (IC50) |
1.09 nM
|
Positive HER2 expression (HER2+++/++) | ||
| Method Description |
Anti-proliferation activities of the antibodies, drugs, and conjugates with regard tothe cancer cell lines were measured. The cells were plated in 96-well, tissue culture platesat 10,000 cells per well. After 24 hour incubation, the antibodies, drugs, and conjugateswere added in various concentrations. The number of viable cells after 72 hours were counted using SRB assay.
Click to Show/Hide
|
||||
| In Vitro Model | Breast ductal carcinoma | JIMT-1 cells | CVCL_2077 | ||
| Experiment 5 Reporting the Activity Date of This ADC | [235] | ||||
| Efficacy Data | Half Maximal Inhibitory Concentration (IC50) | > 33.33 nM | Negative HER2 expression (HER2-) | ||
| Method Description |
Anti-proliferation activities of the antibodies, drugs, and conjugates with regard tothe cancer cell lines were measured. The cells were plated in 96-well, tissue culture platesat 10,000 cells per well. After 24 hour incubation, the antibodies, drugs, and conjugateswere added in various concentrations. The number of viable cells after 72 hours were counted using SRB assay.
Click to Show/Hide
|
||||
| In Vitro Model | Invasive breast carcinoma | MCF-7 cells | CVCL_0031 | ||
Fcab-2-MMAE [Investigative]
Revealed Based on the Cell Line Data
| Experiment 1 Reporting the Activity Date of This ADC | [251] | ||||
| Efficacy Data | Half Maximal Inhibitory Concentration (IC50) |
0.19±0.05 nM
|
High EGFR expression (EGFR+++/++) | ||
| Method Description |
The inhibitory activity of Fcab-2-MMAE against cancer cell growth was evaluated in various human cancer cell lines in vitro.
|
||||
| In Vitro Model | Breast adenocarcinoma | MDA-MB-468 cells | CVCL_0419 | ||
| Experiment 2 Reporting the Activity Date of This ADC | [251] | ||||
| Efficacy Data | Half Maximal Inhibitory Concentration (IC50) | > 100.00 nM | Negative EGFR expression (EGFR-) | ||
| Method Description |
The inhibitory activity of Fcab-2-MMAE against cancer cell growth was evaluated in various human cancer cell lines in vitro.
|
||||
| In Vitro Model | Invasive breast carcinoma | MCF-7 cells | CVCL_0031 | ||
| Experiment 3 Reporting the Activity Date of This ADC | [95] | ||||
| Efficacy Data | Half Maximal Effective Concentration (EC50) |
1.40 nM
|
Low FOLR1 expression (FOLR1+) | ||
| Method Description |
The inhibitory activity of Fcab-2-MMAE against cancer cell growth was evaluated in various human cancer cell lines in vitro.
|
||||
| In Vitro Model | Skin squamous cell carcinoma | A431 cells | CVCL_0037 | ||
WO2017089890A1 ADC13 [Investigative]
Revealed Based on the Cell Line Data
| Experiment 1 Reporting the Activity Date of This ADC | [211] | ||||
| Efficacy Data | Half Maximal Inhibitory Concentration (IC50) |
0.19 nM
|
High HER2 expression (HER2 +++) | ||
| Method Description |
Anti-proliferation activities of the antibodies, drugs, and conjugates with regard tothe cancer cell lines were measured. The cells were plated in 96-well, tissue culture platesat 10,000 cells per well. After 24 hour incubation, the antibodies, drugs, and conjugateswere added in various concentrations. The number of viable cells after 72 hours werecounted using SRB assay.
Click to Show/Hide
|
||||
| In Vitro Model | Breast adenocarcinoma | SK-BR-3 cells | CVCL_0033 | ||
| Experiment 2 Reporting the Activity Date of This ADC | [211] | ||||
| Efficacy Data | Half Maximal Inhibitory Concentration (IC50) |
1.09 nM
|
Moderate HER2 expression (HER2++) | ||
| Method Description |
Anti-proliferation activities of the antibodies, drugs, and conjugates with regard tothe cancer cell lines were measured. The cells were plated in 96-well, tissue culture platesat 10,000 cells per well. After 24 hour incubation, the antibodies, drugs, and conjugateswere added in various concentrations. The number of viable cells after 72 hours werecounted using SRB assay.
Click to Show/Hide
|
||||
| In Vitro Model | Breast ductal carcinoma | JIMT-1 cells | CVCL_2077 | ||
| Experiment 3 Reporting the Activity Date of This ADC | [211] | ||||
| Efficacy Data | Half Maximal Inhibitory Concentration (IC50) | > 33.30 nM | Negative HER2 expression (HER2-) | ||
| Method Description |
Anti-proliferation activities of the antibodies, drugs, and conjugates with regard tothe cancer cell lines were measured. The cells were plated in 96-well, tissue culture platesat 10,000 cells per well. After 24 hour incubation, the antibodies, drugs, and conjugateswere added in various concentrations. The number of viable cells after 72 hours werecounted using SRB assay.
Click to Show/Hide
|
||||
| In Vitro Model | Invasive breast carcinoma | MCF-7 cells | CVCL_0031 | ||
FOLR1-Mal-Caproyl-Val-Cit-PABC-MMAE [Investigative]
Revealed Based on the Cell Line Data
| Experiment 1 Reporting the Activity Date of This ADC | [252] | ||||
| Efficacy Data | Half Maximal Inhibitory Concentration (IC50) |
0.20 nM
|
High FOLR1 expression(FOLR1+++) | ||
| Method Description |
Cells were sub-cultured and seeded at 5,000 cells/well in complete growth medium in 96-well tissue culture plates, and incubated at 37°C, 5% CO2 overnight. Test reagents were serially diluted and added to the cell plates (initial concentration of 100 nM). Plates were incubated at 37°C, 5% CO2 for an additional 3 d.
|
||||
| In Vitro Model | Ovarian endometrioid adenocarcinoma | IGROV-1 cells | CVCL_1304 | ||
| Experiment 2 Reporting the Activity Date of This ADC | [252] | ||||
| Efficacy Data | Half Maximal Inhibitory Concentration (IC50) | > 100 nM | Moderate FOLR1 expression(FOLR1++) | ||
| Method Description |
Cells were sub-cultured and seeded at 5,000 cells/well in complete growth medium in 96-well tissue culture plates, and incubated at 37°C, 5% CO2 overnight. Test reagents were serially diluted and added to the cell plates (initial concentration of 100 nM). Plates were incubated at 37°C, 5% CO2 for an additional 3 d.
|
||||
| In Vitro Model | Lung non-small cell carcinoma | NCI-H2110 cells | CVCL_1530 | ||
| Experiment 3 Reporting the Activity Date of This ADC | [252] | ||||
| Efficacy Data | Half Maximal Inhibitory Concentration (IC50) | > 100 nM | Low FOLR1 expression(FOLR1+) | ||
| Method Description |
Cells were sub-cultured and seeded at 5,000 cells/well in complete growth medium in 96-well tissue culture plates, and incubated at 37°C, 5% CO2 overnight. Test reagents were serially diluted and added to the cell plates (initial concentration of 100 nM). Plates were incubated at 37°C, 5% CO2 for an additional 3 d.
|
||||
| In Vitro Model | Skin squamous cell carcinoma | A431 cells | CVCL_0037 | ||
| Experiment 4 Reporting the Activity Date of This ADC | [252] | ||||
| Efficacy Data | Half Maximal Inhibitory Concentration (IC50) | > 100 nM | Negative FOLR1 expression(FOLR1-) | ||
| Method Description |
Cells were sub-cultured and seeded at 5,000 cells/well in complete growth medium in 96-well tissue culture plates, and incubated at 37°C, 5% CO2 overnight. Test reagents were serially diluted and added to the cell plates (initial concentration of 100 nM). Plates were incubated at 37°C, 5% CO2 for an additional 3 d.
|
||||
| In Vitro Model | Osteosarcoma | SJSA-1 cells | CVCL_1697 | ||
ScFvGPIIb/IIIa-MMAE [Investigative]
Revealed Based on the Cell Line Data
| Experiment 1 Reporting the Activity Date of This ADC | [253] | ||||
| Efficacy Data | Half Maximal Inhibitory Concentration (IC50) |
0.20 nM
|
High ITGA2B expression (ITGA2B+++/++) | ||
| Method Description |
The MTT-based cytotoxicity assay in MDA-MB-231 cells that displayed a dose dependent cell killing of ADC treatment.
|
||||
| In Vitro Model | Breast adenocarcinoma | MDA-MB-231 cells | CVCL_0062 | ||
WO2017089895A1 ADC12 [Investigative]
Revealed Based on the Cell Line Data
| Experiment 1 Reporting the Activity Date of This ADC | [235] | ||||
| Efficacy Data | Half Maximal Inhibitory Concentration (IC50) |
0.20 nM
|
Positive HER2 expression (HER2+++/++) | ||
| Method Description |
Anti-proliferation activities of the antibodies, drugs, and conjugates with regard tothe cancer cell lines were measured. The cells were plated in 96-well, tissue culture platesat 10,000 cells per well. After 24 hour incubation, the antibodies, drugs, and conjugateswere added in various concentrations. The number of viable cells after 72 hours were counted using SRB assay.
Click to Show/Hide
|
||||
| In Vitro Model | Breast adenocarcinoma | SK-BR-3 cells | CVCL_0033 | ||
| Experiment 2 Reporting the Activity Date of This ADC | [235] | ||||
| Efficacy Data | Half Maximal Inhibitory Concentration (IC50) |
0.51 nM
|
Positive HER2 expression (HER2+++/++) | ||
| Method Description |
ADCs wereincubated in human plasma for 5 seconds (0h), followed by SRB invitro cytotoxicity test using SK-BR3 cells for 72hr.
|
||||
| In Vitro Model | Breast adenocarcinoma | SK-BR-3 cells | CVCL_0033 | ||
| Experiment 3 Reporting the Activity Date of This ADC | [235] | ||||
| Efficacy Data | Half Maximal Inhibitory Concentration (IC50) |
0.79 nM
|
Positive HER2 expression (HER2+++/++) | ||
| Method Description |
ADCs wereincubated in human plasma for 168 hours (168h), followed by SRB invitro cytotoxicity test using SK-BR3 cells for 72hr.
|
||||
| In Vitro Model | Breast adenocarcinoma | SK-BR-3 cells | CVCL_0033 | ||
| Experiment 4 Reporting the Activity Date of This ADC | [235] | ||||
| Efficacy Data | Half Maximal Inhibitory Concentration (IC50) |
2.01 nM
|
Positive HER2 expression (HER2+++/++) | ||
| Method Description |
Anti-proliferation activities of the antibodies, drugs, and conjugates with regard tothe cancer cell lines were measured. The cells were plated in 96-well, tissue culture platesat 10,000 cells per well. After 24 hour incubation, the antibodies, drugs, and conjugateswere added in various concentrations. The number of viable cells after 72 hours were counted using SRB assay.
Click to Show/Hide
|
||||
| In Vitro Model | Breast ductal carcinoma | JIMT-1 cells | CVCL_2077 | ||
| Experiment 5 Reporting the Activity Date of This ADC | [235] | ||||
| Efficacy Data | Half Maximal Inhibitory Concentration (IC50) | > 33.33 nM | Negative HER2 expression (HER2-) | ||
| Method Description |
Anti-proliferation activities of the antibodies, drugs, and conjugates with regard tothe cancer cell lines were measured. The cells were plated in 96-well, tissue culture platesat 10,000 cells per well. After 24 hour incubation, the antibodies, drugs, and conjugateswere added in various concentrations. The number of viable cells after 72 hours were counted using SRB assay.
Click to Show/Hide
|
||||
| In Vitro Model | Invasive breast carcinoma | MCF-7 cells | CVCL_0031 | ||
WO2017089895A1 ADC3 [Investigative]
Revealed Based on the Cell Line Data
| Experiment 1 Reporting the Activity Date of This ADC | [235] | ||||
| Efficacy Data | Half Maximal Inhibitory Concentration (IC50) |
0.20 nM
|
Positive HER2 expression (HER2+++/++) | ||
| Method Description |
ADCs wereincubated in human plasma for 5 seconds (0h), followed by SRB invitro cytotoxicity test using SK-BR3 cells for 72hr.
|
||||
| In Vitro Model | Breast adenocarcinoma | SK-BR-3 cells | CVCL_0033 | ||
| Experiment 2 Reporting the Activity Date of This ADC | [235] | ||||
| Efficacy Data | Half Maximal Inhibitory Concentration (IC50) |
0.29 nM
|
Positive HER2 expression (HER2+++/++) | ||
| Method Description |
Anti-proliferation activities of the antibodies, drugs, and conjugates with regard tothe cancer cell lines were measured. The cells were plated in 96-well, tissue culture platesat 10,000 cells per well. After 24 hour incubation, the antibodies, drugs, and conjugateswere added in various concentrations. The number of viable cells after 72 hours were counted using SRB assay.
Click to Show/Hide
|
||||
| In Vitro Model | Breast adenocarcinoma | SK-BR-3 cells | CVCL_0033 | ||
| Experiment 3 Reporting the Activity Date of This ADC | [235] | ||||
| Efficacy Data | Half Maximal Inhibitory Concentration (IC50) |
0.32 nM
|
Positive HER2 expression (HER2+++/++) | ||
| Method Description |
ADCs wereincubated in human plasma for 168 hours (168h), followed by SRB invitro cytotoxicity test using SK-BR3 cells for 72hr.
|
||||
| In Vitro Model | Breast adenocarcinoma | SK-BR-3 cells | CVCL_0033 | ||
| Experiment 4 Reporting the Activity Date of This ADC | [235] | ||||
| Efficacy Data | Half Maximal Inhibitory Concentration (IC50) |
1.04 nM
|
Positive HER2 expression (HER2+++/++) | ||
| Method Description |
Anti-proliferation activities of the antibodies, drugs, and conjugates with regard tothe cancer cell lines were measured. The cells were plated in 96-well, tissue culture platesat 10,000 cells per well. After 24 hour incubation, the antibodies, drugs, and conjugateswere added in various concentrations. The number of viable cells after 72 hours were counted using SRB assay.
Click to Show/Hide
|
||||
| In Vitro Model | Gastric tubular adenocarcinoma | NCI-N87 cells | CVCL_1603 | ||
| Experiment 5 Reporting the Activity Date of This ADC | [235] | ||||
| Efficacy Data | Half Maximal Inhibitory Concentration (IC50) |
1.34 nM
|
Positive HER2 expression (HER2+++/++) | ||
| Method Description |
Anti-proliferation activities of the antibodies, drugs, and conjugates with regard tothe cancer cell lines were measured. The cells were plated in 96-well, tissue culture platesat 10,000 cells per well. After 24 hour incubation, the antibodies, drugs, and conjugateswere added in various concentrations. The number of viable cells after 72 hours were counted using SRB assay.
Click to Show/Hide
|
||||
| In Vitro Model | Ovarian serous cystadenocarcinoma | SK-OV-3 cells | CVCL_0532 | ||
| Experiment 6 Reporting the Activity Date of This ADC | [235] | ||||
| Efficacy Data | Half Maximal Inhibitory Concentration (IC50) |
1.63 nM
|
Positive HER2 expression (HER2+++/++) | ||
| Method Description |
Anti-proliferation activities of the antibodies, drugs, and conjugates with regard tothe cancer cell lines were measured. The cells were plated in 96-well, tissue culture platesat 10,000 cells per well. After 24 hour incubation, the antibodies, drugs, and conjugateswere added in various concentrations. The number of viable cells after 72 hours were counted using SRB assay.
Click to Show/Hide
|
||||
| In Vitro Model | Breast ductal carcinoma | JIMT-1 cells | CVCL_2077 | ||
| Experiment 7 Reporting the Activity Date of This ADC | [235] | ||||
| Efficacy Data | Half Maximal Inhibitory Concentration (IC50) | > 10.00 nM | Positive HER2 expression (HER2+++/++) | ||
| Method Description |
Anti-proliferation activities of the antibodies, drugs, and conjugates with regard tothe cancer cell lines were measured. The cells were plated in 96-well, tissue culture platesat 10,000 cells per well. After 24 hour incubation, the antibodies, drugs, and conjugateswere added in various concentrations. The number of viable cells after 72 hours were counted using SRB assay.
Click to Show/Hide
|
||||
| In Vitro Model | Breast ductal carcinoma | JIMT-1 cells | CVCL_2077 | ||
| Experiment 8 Reporting the Activity Date of This ADC | [235] | ||||
| Efficacy Data | Half Maximal Inhibitory Concentration (IC50) | > 10.00 nM | Negative HER2 expression (HER2-) | ||
| Method Description |
Anti-proliferation activities of the antibodies, drugs, and conjugates with regard tothe cancer cell lines were measured. The cells were plated in 96-well, tissue culture platesat 10,000 cells per well. After 24 hour incubation, the antibodies, drugs, and conjugateswere added in various concentrations. The number of viable cells after 72 hours were counted using SRB assay.
Click to Show/Hide
|
||||
| In Vitro Model | Invasive breast carcinoma | MCF-7 cells | CVCL_0031 | ||
| Experiment 9 Reporting the Activity Date of This ADC | [235] | ||||
| Efficacy Data | Half Maximal Inhibitory Concentration (IC50) | > 33.33 nM | Negative HER2 expression (HER2-) | ||
| Method Description |
Anti-proliferation activities of the antibodies, drugs, and conjugates with regard tothe cancer cell lines were measured. The cells were plated in 96-well, tissue culture platesat 10,000 cells per well. After 24 hour incubation, the antibodies, drugs, and conjugateswere added in various concentrations. The number of viable cells after 72 hours were counted using SRB assay.
Click to Show/Hide
|
||||
| In Vitro Model | Invasive breast carcinoma | MCF-7 cells | CVCL_0031 | ||
T-CpHK-Mal-ADC [Investigative]
Revealed Based on the Cell Line Data
| Experiment 1 Reporting the Activity Date of This ADC | [254] | ||||
| Efficacy Data | Half Maximal Inhibitory Concentration (IC50) |
0.20 nM
|
High HER2 expression (HER2+++) | ||
| Method Description |
ADCs were subjected to cytotoxicity assays to confirm potency toward cell lines with high and low HER2 expression.
|
||||
| In Vitro Model | Breast adenocarcinoma | SK-BR-3 cells | CVCL_0033 | ||
| Experiment 2 Reporting the Activity Date of This ADC | [254] | ||||
| Efficacy Data | Half Maximal Inhibitory Concentration (IC50) |
0.40 nM
|
High HER2 expression (HER2+++) | ||
| Method Description |
ADCs were subjected to cytotoxicity assays to confirm potency toward cell lines with high and low HER2 expression.
|
||||
| In Vitro Model | Gastric tubular adenocarcinoma | NCI-N87 cells | CVCL_1603 | ||
| Experiment 3 Reporting the Activity Date of This ADC | [254] | ||||
| Efficacy Data | Half Maximal Inhibitory Concentration (IC50) |
45.00 nM
|
Moderate HER2 expression (HER2++) | ||
| Method Description |
ADCs were subjected to cytotoxicity assays to confirm potency toward cell lines with high and low HER2 expression.
|
||||
| In Vitro Model | Invasive breast carcinoma | ZR-75-1 cells | CVCL_0588 | ||
WO2017089890A1 ADC12 [Investigative]
Revealed Based on the Cell Line Data
| Experiment 1 Reporting the Activity Date of This ADC | [211] | ||||
| Efficacy Data | Half Maximal Inhibitory Concentration (IC50) |
0.20 nM
|
High HER2 expression (HER2 +++) | ||
| Method Description |
Anti-proliferation activities of the antibodies, drugs, and conjugates with regard tothe cancer cell lines were measured. The cells were plated in 96-well, tissue culture platesat 10,000 cells per well. After 24 hour incubation, the antibodies, drugs, and conjugateswere added in various concentrations. The number of viable cells after 72 hours werecounted using SRB assay.
Click to Show/Hide
|
||||
| In Vitro Model | Breast adenocarcinoma | SK-BR-3 cells | CVCL_0033 | ||
| Experiment 2 Reporting the Activity Date of This ADC | [211] | ||||
| Efficacy Data | Half Maximal Inhibitory Concentration (IC50) |
2.01 nM
|
Moderate HER2 expression (HER2++) | ||
| Method Description |
Anti-proliferation activities of the antibodies, drugs, and conjugates with regard tothe cancer cell lines were measured. The cells were plated in 96-well, tissue culture platesat 10,000 cells per well. After 24 hour incubation, the antibodies, drugs, and conjugateswere added in various concentrations. The number of viable cells after 72 hours werecounted using SRB assay.
Click to Show/Hide
|
||||
| In Vitro Model | Breast ductal carcinoma | JIMT-1 cells | CVCL_2077 | ||
| Experiment 3 Reporting the Activity Date of This ADC | [211] | ||||
| Efficacy Data | Half Maximal Inhibitory Concentration (IC50) | > 33.30 nM | Negative HER2 expression (HER2-) | ||
| Method Description |
Anti-proliferation activities of the antibodies, drugs, and conjugates with regard tothe cancer cell lines were measured. The cells were plated in 96-well, tissue culture platesat 10,000 cells per well. After 24 hour incubation, the antibodies, drugs, and conjugateswere added in various concentrations. The number of viable cells after 72 hours werecounted using SRB assay.
Click to Show/Hide
|
||||
| In Vitro Model | Invasive breast carcinoma | MCF-7 cells | CVCL_0031 | ||
Fcab-3-MMAE [Investigative]
Revealed Based on the Cell Line Data
| Experiment 1 Reporting the Activity Date of This ADC | [251] | ||||
| Efficacy Data | Half Maximal Inhibitory Concentration (IC50) |
0.22±0.01 nM
|
High EGFR expression (EGFR+++/++) | ||
| Method Description |
The inhibitory activity of Fcab-3-MMAE against cancer cell growth was evaluated in various human cancer cell lines in vitro.
|
||||
| In Vitro Model | Breast adenocarcinoma | MDA-MB-468 cells | CVCL_0419 | ||
| Experiment 2 Reporting the Activity Date of This ADC | [251] | ||||
| Efficacy Data | Half Maximal Inhibitory Concentration (IC50) | > 100.00 nM | Negative EGFR expression (EGFR-) | ||
| Method Description |
The inhibitory activity of Fcab-3-MMAE against cancer cell growth was evaluated in various human cancer cell lines in vitro.
|
||||
| In Vitro Model | Invasive breast carcinoma | MCF-7 cells | CVCL_0031 | ||
| Experiment 3 Reporting the Activity Date of This ADC | [95] | ||||
| Efficacy Data | Half Maximal Effective Concentration (EC50) |
1.40 nM
|
Low FOLR1 expression (FOLR1+) | ||
| Method Description |
The inhibitory activity of Fcab-3-MMAE against cancer cell growth was evaluated in various human cancer cell lines in vitro.
|
||||
| In Vitro Model | Skin squamous cell carcinoma | A431 cells | CVCL_0037 | ||
WO2017089895A1 ADC1 [Investigative]
Revealed Based on the Cell Line Data
| Experiment 1 Reporting the Activity Date of This ADC | [235] | ||||
| Efficacy Data | Half Maximal Inhibitory Concentration (IC50) |
0.26 nM
|
Positive HER2 expression (HER2+++/++) | ||
| Method Description |
ADCs wereincubated in human plasma for 5 seconds (0h), followed by SRB invitro cytotoxicity test using SK-BR3 cells for 72hr.
|
||||
| In Vitro Model | Breast adenocarcinoma | SK-BR-3 cells | CVCL_0033 | ||
| Experiment 2 Reporting the Activity Date of This ADC | [235] | ||||
| Efficacy Data | Half Maximal Inhibitory Concentration (IC50) |
0.41 nM
|
Positive HER2 expression (HER2+++/++) | ||
| Method Description |
ADCs wereincubated in human plasma for 168 hours (168h), followed by SRB invitro cytotoxicity test using SK-BR3 cells for 72hr.
|
||||
| In Vitro Model | Breast adenocarcinoma | SK-BR-3 cells | CVCL_0033 | ||
| Experiment 3 Reporting the Activity Date of This ADC | [235] | ||||
| Efficacy Data | Half Maximal Inhibitory Concentration (IC50) |
0.47 nM
|
Positive HER2 expression (HER2+++/++) | ||
| Method Description |
Anti-proliferation activities of the antibodies, drugs, and conjugates with regard tothe cancer cell lines were measured. The cells were plated in 96-well, tissue culture platesat 10,000 cells per well. After 24 hour incubation, the antibodies, drugs, and conjugateswere added in various concentrations. The number of viable cells after 72 hours were counted using SRB assay.
Click to Show/Hide
|
||||
| In Vitro Model | Breast adenocarcinoma | SK-BR-3 cells | CVCL_0033 | ||
| Experiment 4 Reporting the Activity Date of This ADC | [235] | ||||
| Efficacy Data | Half Maximal Inhibitory Concentration (IC50) |
0.69 nM
|
Positive HER2 expression (HER2+++/++) | ||
| Method Description |
Anti-proliferation activities of the antibodies, drugs, and conjugates with regard tothe cancer cell lines were measured. The cells were plated in 96-well, tissue culture platesat 10,000 cells per well. After 24 hour incubation, the antibodies, drugs, and conjugateswere added in various concentrations. The number of viable cells after 72 hours were counted using SRB assay.
Click to Show/Hide
|
||||
| In Vitro Model | Gastric tubular adenocarcinoma | NCI-N87 cells | CVCL_1603 | ||
| Experiment 5 Reporting the Activity Date of This ADC | [235] | ||||
| Efficacy Data | Half Maximal Inhibitory Concentration (IC50) | > 10.00 nM | Positive HER2 expression (HER2+++/++) | ||
| Method Description |
Anti-proliferation activities of the antibodies, drugs, and conjugates with regard tothe cancer cell lines were measured. The cells were plated in 96-well, tissue culture platesat 10,000 cells per well. After 24 hour incubation, the antibodies, drugs, and conjugateswere added in various concentrations. The number of viable cells after 72 hours were counted using SRB assay.
Click to Show/Hide
|
||||
| In Vitro Model | Breast ductal carcinoma | JIMT-1 cells | CVCL_2077 | ||
| Experiment 6 Reporting the Activity Date of This ADC | [235] | ||||
| Efficacy Data | Half Maximal Inhibitory Concentration (IC50) | > 10.00 nM | Negative HER2 expression (HER2-) | ||
| Method Description |
Anti-proliferation activities of the antibodies, drugs, and conjugates with regard tothe cancer cell lines were measured. The cells were plated in 96-well, tissue culture platesat 10,000 cells per well. After 24 hour incubation, the antibodies, drugs, and conjugateswere added in various concentrations. The number of viable cells after 72 hours were counted using SRB assay.
Click to Show/Hide
|
||||
| In Vitro Model | Invasive breast carcinoma | MCF-7 cells | CVCL_0031 | ||
| Experiment 7 Reporting the Activity Date of This ADC | [235] | ||||
| Efficacy Data | Half Maximal Inhibitory Concentration (IC50) | > 33.33 nM | Negative HER2 expression (HER2-) | ||
| Method Description |
Anti-proliferation activities of the antibodies, drugs, and conjugates with regard tothe cancer cell lines were measured. The cells were plated in 96-well, tissue culture platesat 10,000 cells per well. After 24 hour incubation, the antibodies, drugs, and conjugateswere added in various concentrations. The number of viable cells after 72 hours were counted using SRB assay.
Click to Show/Hide
|
||||
| In Vitro Model | Invasive breast carcinoma | MCF-7 cells | CVCL_0031 | ||
| Experiment 8 Reporting the Activity Date of This ADC | [235] | ||||
| Efficacy Data | Half Maximal Inhibitory Concentration (IC50) |
241 nM
|
Positive HER2 expression (HER2+++/++) | ||
| Method Description |
Anti-proliferation activities of the antibodies, drugs, and conjugates with regard tothe cancer cell lines were measured. The cells were plated in 96-well, tissue culture platesat 10,000 cells per well. After 24 hour incubation, the antibodies, drugs, and conjugateswere added in various concentrations. The number of viable cells after 72 hours were counted using SRB assay.
Click to Show/Hide
|
||||
| In Vitro Model | Ovarian serous cystadenocarcinoma | SK-OV-3 cells | CVCL_0532 | ||
| Experiment 9 Reporting the Activity Date of This ADC | [235] | ||||
| Efficacy Data | Half Maximal Inhibitory Concentration (IC50) |
275 nM
|
Positive HER2 expression (HER2+++/++) | ||
| Method Description |
Anti-proliferation activities of the antibodies, drugs, and conjugates with regard tothe cancer cell lines were measured. The cells were plated in 96-well, tissue culture platesat 10,000 cells per well. After 24 hour incubation, the antibodies, drugs, and conjugateswere added in various concentrations. The number of viable cells after 72 hours were counted using SRB assay.
Click to Show/Hide
|
||||
| In Vitro Model | Breast ductal carcinoma | JIMT-1 cells | CVCL_2077 | ||
WO2017089890A1 ADC3 [Investigative]
Revealed Based on the Cell Line Data
| Experiment 1 Reporting the Activity Date of This ADC | [211] | ||||
| Efficacy Data | Half Maximal Inhibitory Concentration (IC50) |
0.29 nM
|
High HER2 expression (HER2 +++) | ||
| Method Description |
Anti-proliferation activities of the antibodies, drugs, and conjugates with regard tothe cancer cell lines were measured. The cells were plated in 96-well, tissue culture platesat 10,000 cells per well. After 24 hour incubation, the antibodies, drugs, and conjugateswere added in various concentrations. The number of viable cells after 72 hours werecounted using SRB assay.
Click to Show/Hide
|
||||
| In Vitro Model | Breast adenocarcinoma | SK-BR-3 cells | CVCL_0033 | ||
| Experiment 2 Reporting the Activity Date of This ADC | [211] | ||||
| Efficacy Data | Half Maximal Inhibitory Concentration (IC50) |
1.04 nM
|
High HER2 expression (HER2+++) | ||
| Method Description |
Anti-proliferation activities of the antibodies, drugs, and conjugates with regard tothe cancer cell lines were measured. The cells were plated in 96-well, tissue culture platesat 10,000 cells per well. After 24 hour incubation, the antibodies, drugs, and conjugateswere added in various concentrations. The number of viable cells after 72 hours werecounted using SRB assay.
Click to Show/Hide
|
||||
| In Vitro Model | Gastric tubular adenocarcinoma | NCI-N87 cells | CVCL_1603 | ||
| Experiment 3 Reporting the Activity Date of This ADC | [211] | ||||
| Efficacy Data | Half Maximal Inhibitory Concentration (IC50) |
1.34 nM
|
High HER2 expression (HER2+++) | ||
| Method Description |
Anti-proliferation activities of the antibodies, drugs, and conjugates with regard tothe cancer cell lines were measured. The cells were plated in 96-well, tissue culture platesat 10,000 cells per well. After 24 hour incubation, the antibodies, drugs, and conjugateswere added in various concentrations. The number of viable cells after 72 hours werecounted using SRB assay.
Click to Show/Hide
|
||||
| In Vitro Model | Ovarian serous cystadenocarcinoma | SK-OV-3 cells | CVCL_0532 | ||
| Experiment 4 Reporting the Activity Date of This ADC | [211] | ||||
| Efficacy Data | Half Maximal Inhibitory Concentration (IC50) |
1.63 nM
|
Moderate HER2 expression (HER2++) | ||
| Method Description |
Anti-proliferation activities of the antibodies, drugs, and conjugates with regard tothe cancer cell lines were measured. The cells were plated in 96-well, tissue culture platesat 10,000 cells per well. After 24 hour incubation, the antibodies, drugs, and conjugateswere added in various concentrations. The number of viable cells after 72 hours werecounted using SRB assay.
Click to Show/Hide
|
||||
| In Vitro Model | Breast ductal carcinoma | JIMT-1 cells | CVCL_2077 | ||
| Experiment 5 Reporting the Activity Date of This ADC | [211] | ||||
| Efficacy Data | Half Maximal Inhibitory Concentration (IC50) | > 33.30 nM | Negative HER2 expression (HER2-) | ||
| Method Description |
Anti-proliferation activities of the antibodies, drugs, and conjugates with regard tothe cancer cell lines were measured. The cells were plated in 96-well, tissue culture platesat 10,000 cells per well. After 24 hour incubation, the antibodies, drugs, and conjugateswere added in various concentrations. The number of viable cells after 72 hours werecounted using SRB assay.
Click to Show/Hide
|
||||
| In Vitro Model | Invasive breast carcinoma | MCF-7 cells | CVCL_0031 | ||
ADC Trast-10 [Investigative]
Revealed Based on the Cell Line Data
| Experiment 1 Reporting the Activity Date of This ADC | [255] | ||||
| Efficacy Data | Half Maximal Inhibitory Concentration (IC50) |
0.30 nM
|
High HER2 expression (HER2+++) | ||
| Method Description |
In vitro cytotoxicity of ADCs against a panel of four human breast cancer cell lines.
|
||||
| In Vitro Model | Invasive breast carcinoma | BT-474 cells | CVCL_0179 | ||
| Experiment 2 Reporting the Activity Date of This ADC | [255] | ||||
| Efficacy Data | Half Maximal Inhibitory Concentration (IC50) | > 100 nM | Negative HER2 expression (HER2-) | ||
| Method Description |
In vitro cytotoxicity of ADCs against a panel of four human breast cancer cell lines.
|
||||
| In Vitro Model | Breast adenocarcinoma | MDA-MB-231 cells | CVCL_0062 | ||
T-CpHK-Tet-ADC [Investigative]
Revealed Based on the Cell Line Data
| Experiment 1 Reporting the Activity Date of This ADC | [254] | ||||
| Efficacy Data | Half Maximal Inhibitory Concentration (IC50) |
0.30 nM
|
High HER2 expression (HER2+++) | ||
| Method Description |
ADCs were subjected to cytotoxicity assays to confirm potency toward cell lines with high and low HER2 expression.
|
||||
| In Vitro Model | Breast adenocarcinoma | SK-BR-3 cells | CVCL_0033 | ||
| Experiment 2 Reporting the Activity Date of This ADC | [254] | ||||
| Efficacy Data | Half Maximal Inhibitory Concentration (IC50) |
0.40 nM
|
High HER2 expression (HER2+++) | ||
| Method Description |
ADCs were subjected to cytotoxicity assays to confirm potency toward cell lines with high and low HER2 expression.
|
||||
| In Vitro Model | Gastric tubular adenocarcinoma | NCI-N87 cells | CVCL_1603 | ||
| Experiment 3 Reporting the Activity Date of This ADC | [254] | ||||
| Efficacy Data | Half Maximal Inhibitory Concentration (IC50) |
68.00 nM
|
Moderate HER2 expression (HER2++) | ||
| Method Description |
ADCs were subjected to cytotoxicity assays to confirm potency toward cell lines with high and low HER2 expression.
|
||||
| In Vitro Model | Invasive breast carcinoma | ZR-75-1 cells | CVCL_0588 | ||
WO2017089895A1 ADC61 [Investigative]
Revealed Based on the Cell Line Data
| Experiment 1 Reporting the Activity Date of This ADC | [235] | ||||
| Efficacy Data | Half Maximal Inhibitory Concentration (IC50) |
0.32 nM
|
Positive HER2 expression (HER2+++/++) | ||
| Method Description |
ADCs wereincubated in human plasma for 168 hours (168h), followed by SRB invitro cytotoxicity test using SK-BR3 cells for 72hr.
|
||||
| In Vitro Model | Breast adenocarcinoma | SK-BR-3 cells | CVCL_0033 | ||
| Experiment 2 Reporting the Activity Date of This ADC | [235] | ||||
| Efficacy Data | Half Maximal Inhibitory Concentration (IC50) |
0.32 nM
|
Positive HER2 expression (HER2+++/++) | ||
| Method Description |
ADCs wereincubated in human plasma for 5 seconds (0h), followed by SRB invitro cytotoxicity test using SK-BR3 cells for 72hr.
|
||||
| In Vitro Model | Breast adenocarcinoma | SK-BR-3 cells | CVCL_0033 | ||
C-IgG-Val-Cit-MMAE [Investigative]
Revealed Based on the Cell Line Data
| Experiment 1 Reporting the Activity Date of This ADC | [251] | ||||
| Efficacy Data | Half Maximal Inhibitory Concentration (IC50) |
0.44±0.03 nM
|
High EGFR expression (EGFR+++/++) | ||
| Method Description |
The inhibitory activity of C-IgG-MMAE against cancer cell growth was evaluated in various human cancer cell lines in vitro.
|
||||
| In Vitro Model | Breast adenocarcinoma | MDA-MB-468 cells | CVCL_0419 | ||
| Experiment 2 Reporting the Activity Date of This ADC | [251] | ||||
| Efficacy Data | Half Maximal Inhibitory Concentration (IC50) | > 100.00 nM | Negative EGFR expression (EGFR-) | ||
| Method Description |
The inhibitory activity of C-IgG-MMAE against cancer cell growth was evaluated in various human cancer cell lines in vitro.
|
||||
| In Vitro Model | Invasive breast carcinoma | MCF-7 cells | CVCL_0031 | ||
| Experiment 3 Reporting the Activity Date of This ADC | [95] | ||||
| Efficacy Data | Half Maximal Effective Concentration (EC50) |
1.40 nM
|
Low FOLR1 expression (FOLR1+) | ||
| Method Description |
The inhibitory activity of C-IgG-MMAE against cancer cell growth was evaluated in various human cancer cell lines in vitro.
|
||||
| In Vitro Model | Skin squamous cell carcinoma | A431 cells | CVCL_0037 | ||
ADC Trast-7 [Investigative]
Revealed Based on the Cell Line Data
| Experiment 1 Reporting the Activity Date of This ADC | [255] | ||||
| Efficacy Data | Half Maximal Inhibitory Concentration (IC50) |
0.46 nM
|
High HER2 expression (HER2+++) | ||
| Method Description |
In vitro cytotoxicity of ADCs against a panel of four human breast cancer cell lines.
|
||||
| In Vitro Model | Invasive breast carcinoma | BT-474 cells | CVCL_0179 | ||
| Experiment 2 Reporting the Activity Date of This ADC | [255] | ||||
| Efficacy Data | Half Maximal Inhibitory Concentration (IC50) | > 100 nM | Negative HER2 expression (HER2-) | ||
| Method Description |
In vitro cytotoxicity of ADCs against a panel of four human breast cancer cell lines.
|
||||
| In Vitro Model | Breast adenocarcinoma | MDA-MB-231 cells | CVCL_0062 | ||
WO2017089890A1 ADC1 [Investigative]
Revealed Based on the Cell Line Data
| Experiment 1 Reporting the Activity Date of This ADC | [211] | ||||
| Efficacy Data | Half Maximal Inhibitory Concentration (IC50) |
0.47 nM
|
High HER2 expression (HER2 +++) | ||
| Method Description |
Anti-proliferation activities of the antibodies, drugs, and conjugates with regard tothe cancer cell lines were measured. The cells were plated in 96-well, tissue culture platesat 10,000 cells per well. After 24 hour incubation, the antibodies, drugs, and conjugateswere added in various concentrations. The number of viable cells after 72 hours werecounted using SRB assay.
Click to Show/Hide
|
||||
| In Vitro Model | Breast adenocarcinoma | SK-BR-3 cells | CVCL_0033 | ||
| Experiment 2 Reporting the Activity Date of This ADC | [211] | ||||
| Efficacy Data | Half Maximal Inhibitory Concentration (IC50) |
0.69 nM
|
High HER2 expression (HER2+++) | ||
| Method Description |
Anti-proliferation activities of the antibodies, drugs, and conjugates with regard tothe cancer cell lines were measured. The cells were plated in 96-well, tissue culture platesat 10,000 cells per well. After 24 hour incubation, the antibodies, drugs, and conjugateswere added in various concentrations. The number of viable cells after 72 hours werecounted using SRB assay.
Click to Show/Hide
|
||||
| In Vitro Model | Gastric tubular adenocarcinoma | NCI-N87 cells | CVCL_1603 | ||
| Experiment 3 Reporting the Activity Date of This ADC | [211] | ||||
| Efficacy Data | Half Maximal Inhibitory Concentration (IC50) | > 33.30 nM | Negative HER2 expression (HER2-) | ||
| Method Description |
Anti-proliferation activities of the antibodies, drugs, and conjugates with regard tothe cancer cell lines were measured. The cells were plated in 96-well, tissue culture platesat 10,000 cells per well. After 24 hour incubation, the antibodies, drugs, and conjugateswere added in various concentrations. The number of viable cells after 72 hours werecounted using SRB assay.
Click to Show/Hide
|
||||
| In Vitro Model | Invasive breast carcinoma | MCF-7 cells | CVCL_0031 | ||
| Experiment 4 Reporting the Activity Date of This ADC | [211] | ||||
| Efficacy Data | Half Maximal Inhibitory Concentration (IC50) |
241.00 nM
|
High HER2 expression (HER2+++) | ||
| Method Description |
Anti-proliferation activities of the antibodies, drugs, and conjugates with regard tothe cancer cell lines were measured. The cells were plated in 96-well, tissue culture platesat 10,000 cells per well. After 24 hour incubation, the antibodies, drugs, and conjugateswere added in various concentrations. The number of viable cells after 72 hours werecounted using SRB assay.
Click to Show/Hide
|
||||
| In Vitro Model | Ovarian serous cystadenocarcinoma | SK-OV-3 cells | CVCL_0532 | ||
| Experiment 5 Reporting the Activity Date of This ADC | [211] | ||||
| Efficacy Data | Half Maximal Inhibitory Concentration (IC50) |
275.00 nM
|
Moderate HER2 expression (HER2++) | ||
| Method Description |
Anti-proliferation activities of the antibodies, drugs, and conjugates with regard tothe cancer cell lines were measured. The cells were plated in 96-well, tissue culture platesat 10,000 cells per well. After 24 hour incubation, the antibodies, drugs, and conjugateswere added in various concentrations. The number of viable cells after 72 hours werecounted using SRB assay.
Click to Show/Hide
|
||||
| In Vitro Model | Breast ductal carcinoma | JIMT-1 cells | CVCL_2077 | ||
IgG1 (trastuzumab)-AL1-MMAE [Investigative]
Revealed Based on the Cell Line Data
| Experiment 1 Reporting the Activity Date of This ADC | [203] | ||||
| Efficacy Data | Half Maximal Inhibitory Concentration (IC50) |
0.50 nM
|
Positive HER2 expression (HER2 +++/++) | ||
| Method Description |
N87 cells (10000) were seeded in 96-well plates for the IC50 measurements of cell viability. After incubation at 37°C for 16 h, the medium was replaced by fresh normal medium with serum and the cytotoxicity was assessed using the WST-1 reagent after 72 h of incubation at 37°C.
|
||||
| In Vitro Model | Gastric tubular adenocarcinoma | NCI-N87 cells | CVCL_1603 | ||
chmAb-A B7-H3-ADC [Investigative]
Revealed Based on the Cell Line Data
| Experiment 1 Reporting the Activity Date of This ADC | [201] | ||||
| Efficacy Data | Half Maximal Inhibitory Concentration (IC50) |
0.61 nM
|
High CD276 expression (CD276 +++) | ||
| Method Description |
Briefly, B7-H3-ADCs and controls are diluted and plated intomicrotiter plates, 5000 cells are added to each well and incubated at 37°C for 4-7 daysAlamar Blue Reagent is added to the plates andread according to the manufacturer's protocol. The number of antibody binding sites presenton these cells was determined using a Bangs QFACSTM Kit.
|
||||
| In Vitro Model | Neoplasm | Hs 700T cells | CVCL_0858 | ||
| Experiment 2 Reporting the Activity Date of This ADC | [201] | ||||
| Efficacy Data | Half Maximal Inhibitory Concentration (IC50) |
0.70 nM
|
Moderate CD276 expression (CD276 ++) | ||
| Method Description |
Briefly, B7-H3-ADCs and controls are diluted and plated intomicrotiter plates, 5000 cells are added to each well and incubated at 37°C for 4-7 daysAlamar Blue Reagent is added to the plates andread according to the manufacturer's protocol. The number of antibody binding sites presenton these cells was determined using a Bangs QFACSTM Kit.
|
||||
| In Vitro Model | Amelanotic melanoma | A375.S2 cells | CVCL_0136 | ||
| Experiment 3 Reporting the Activity Date of This ADC | [201] | ||||
| Efficacy Data | Half Maximal Inhibitory Concentration (IC50) |
1.00 nM
|
Moderate CD276 expression (CD276 ++) | ||
| Method Description |
Briefly, B7-H3-ADCs and controls are diluted and plated intomicrotiter plates, 5000 cells are added to each well and incubated at 37°C for 4-7 daysAlamar Blue Reagent is added to the plates andread according to the manufacturer's protocol. The number of antibody binding sites presenton these cells was determined using a Bangs QFACSTM Kit.
|
||||
| In Vitro Model | Lung adenocarcinoma | Calu-6 cells | CVCL_0236 | ||
| Experiment 4 Reporting the Activity Date of This ADC | [201] | ||||
| Efficacy Data | Half Maximal Inhibitory Concentration (IC50) |
1.52 nM
|
Moderate CD276 expression (CD276 ++) | ||
| Method Description |
Briefly, B7-H3-ADCs and controls are diluted and plated intomicrotiter plates, 5000 cells are added to each well and incubated at 37°C for 4-7 daysAlamar Blue Reagent is added to the plates andread according to the manufacturer's protocol. The number of antibody binding sites presenton these cells was determined using a Bangs QFACSTM Kit.
|
||||
| In Vitro Model | Lung squamous cell carcinoma | NCI-H1703 cells | CVCL_1490 | ||
| Experiment 5 Reporting the Activity Date of This ADC | [201] | ||||
| Efficacy Data | Half Maximal Inhibitory Concentration (IC50) |
8.10 nM
|
Moderate CD276 expression (CD276 ++) | ||
| Method Description |
Briefly, B7-H3-ADCs and controls are diluted and plated intomicrotiter plates, 5000 cells are added to each well and incubated at 37°C for 4-7 daysAlamar Blue Reagent is added to the plates andread according to the manufacturer's protocol. The number of antibody binding sites presenton these cells was determined using a Bangs QFACSTM Kit.
|
||||
| In Vitro Model | Breast adenocarcinoma | MDA-MB-468 cells | CVCL_0419 | ||
| Experiment 6 Reporting the Activity Date of This ADC | [201] | ||||
| Efficacy Data | Half Maximal Inhibitory Concentration (IC50) |
8.33 nM
|
Moderate CD276 expression (CD276 ++) | ||
| Method Description |
Briefly, B7-H3-ADCs and controls are diluted and plated intomicrotiter plates, 5000 cells are added to each well and incubated at 37°C for 4-7 daysAlamar Blue Reagent is added to the plates andread according to the manufacturer's protocol. The number of antibody binding sites presenton these cells was determined using a Bangs QFACSTM Kit.
|
||||
| In Vitro Model | Ovarian mixed germ cell tumor | PA-1 cells | CVCL_0479 | ||
| Experiment 7 Reporting the Activity Date of This ADC | [201] | ||||
| Efficacy Data | Half Maximal Inhibitory Concentration (IC50) |
9.10 nM
|
High CD276 expression (CD276 +++) | ||
| Method Description |
Briefly, B7-H3-ADCs and controls are diluted and plated intomicrotiter plates, 5000 cells are added to each well and incubated at 37°C for 4-7 daysAlamar Blue Reagent is added to the plates andread according to the manufacturer's protocol. The number of antibody binding sites presenton these cells was determined using a Bangs QFACSTM Kit.
|
||||
| In Vitro Model | Breast ductal carcinoma | JIMT-1 cells | CVCL_2077 | ||
| Experiment 8 Reporting the Activity Date of This ADC | [201] | ||||
| Efficacy Data | Half Maximal Inhibitory Concentration (IC50) |
20.15 nM
|
Low CD276 expression (CD276 +) | ||
| Method Description |
Briefly, B7-H3-ADCs and controls are diluted and plated intomicrotiter plates, 5000 cells are added to each well and incubated at 37°C for 4-7 daysAlamar Blue Reagent is added to the plates andread according to the manufacturer's protocol. The number of antibody binding sites presenton these cells was determined using a Bangs QFACSTM Kit.
|
||||
| In Vitro Model | Prostate carcinoma | DU145 cells | CVCL_0105 | ||
| Experiment 9 Reporting the Activity Date of This ADC | [201] | ||||
| Efficacy Data | Half Maximal Inhibitory Concentration (IC50) |
26.98 nM
|
Moderate CD276 expression (CD276 ++) | ||
| Method Description |
Briefly, B7-H3-ADCs and controls are diluted and plated intomicrotiter plates, 5000 cells are added to each well and incubated at 37°C for 4-7 daysAlamar Blue Reagent is added to the plates andread according to the manufacturer's protocol. The number of antibody binding sites presenton these cells was determined using a Bangs QFACSTM Kit.
|
||||
| In Vitro Model | Lung adenocarcinoma | NCI-H1975 cells | CVCL_1511 | ||
| Experiment 10 Reporting the Activity Date of This ADC | [201] | ||||
| Efficacy Data | Half Maximal Inhibitory Concentration (IC50) | > 100 nM | Negative CD276 expression (CD276 -) | ||
| Method Description |
Briefly, B7-H3-ADCs and controls are diluted and plated intomicrotiter plates, 5000 cells are added to each well and incubated at 37°C for 4-7 daysAlamar Blue Reagent is added to the plates andread according to the manufacturer's protocol. The number of antibody binding sites presenton these cells was determined using a Bangs QFACSTM Kit.
|
||||
| In Vitro Model | EBV-related Burkitt lymphoma | Raji cells | CVCL_0511 | ||
Alb-DMBA-SIL-MMAE [Investigative]
Revealed Based on the Cell Line Data
| Experiment 1 Reporting the Activity Date of This ADC | [248] | ||||
| Efficacy Data | Half Maximal Inhibitory Concentration (IC50) |
0.76 nM
|
|||
| Method Description |
The inhibitory activity of Alb-DMBA-SIL-MMAE against cancer cell growth was evaluated in various human cancer cell lines in vitro. Caged and conjugated MMAE is selectively cytotoxic and activated by X-ray irradiation.
|
||||
| In Vitro Model | Thyroid gland anaplastic carcinoma | 8505C cells | CVCL_1054 | ||
| Experiment 2 Reporting the Activity Date of This ADC | [248] | ||||
| Efficacy Data | Half Maximal Inhibitory Concentration (IC50) |
2.00 nM
|
|||
| Method Description |
The inhibitory activity of Alb-DMBA-SIL-MMAE against cancer cell growth was evaluated in various human cancer cell lines in vitro. Caged and conjugated MMAE is selectively cytotoxic and activated by X-ray irradiation.
|
||||
| In Vitro Model | Mouse colon adenocarcinoma | MC-38 cells | CVCL_B288 | ||
| Experiment 3 Reporting the Activity Date of This ADC | [248] | ||||
| Efficacy Data | Half Maximal Inhibitory Concentration (IC50) |
7.29 nM
|
Low FOLR1 expression (FOLR1+) | ||
| Method Description |
The inhibitory activity of Alb-DMBA-SIL-MMAE against cancer cell growth was evaluated in various human cancer cell lines in vitro. Caged and conjugated MMAE is selectively cytotoxic and activated by X-ray irradiation.
|
||||
| In Vitro Model | Acute erythroid leukemia | TBP-3743 cancer cells | Mus musculus | ||
| Experiment 4 Reporting the Activity Date of This ADC | [248] | ||||
| Efficacy Data | Half Maximal Inhibitory Concentration (IC50) |
8.92 nM
|
|||
| Method Description |
The inhibitory activity of Alb-DMBA-SIL-MMAE against cancer cell growth was evaluated in various human cancer cell lines in vitro. Caged and conjugated MMAE is selectively cytotoxic and activated by X-ray irradiation.
|
||||
| In Vitro Model | Oral cavity squamous cell carcinoma | MOC-L2 cells | CVCL_A9X4 | ||
| Experiment 5 Reporting the Activity Date of This ADC | [95] | ||||
| Efficacy Data | Half Maximal Effective Concentration (EC50) |
1.40 nM
|
|||
| Method Description |
The inhibitory activity of Alb-DMBA-SIL-MMAE against cancer cell growth was evaluated in various human cancer cell lines in vitro. Caged and conjugated MMAE is selectively cytotoxic and activated by X-ray irradiation.
|
||||
| In Vitro Model | Skin squamous cell carcinoma | A431 cells | CVCL_0037 | ||
C-Fab-MMAE [Investigative]
Revealed Based on the Cell Line Data
| Experiment 1 Reporting the Activity Date of This ADC | [251] | ||||
| Efficacy Data | Half Maximal Inhibitory Concentration (IC50) |
0.78±0.03 nM
|
High EGFR expression (EGFR+++/++) | ||
| Method Description |
The inhibitory activity of C-Fab-MMAE against cancer cell growth was evaluated in various human cancer cell lines in vitro.
|
||||
| In Vitro Model | Breast adenocarcinoma | MDA-MB-468 cells | CVCL_0419 | ||
| Experiment 2 Reporting the Activity Date of This ADC | [251] | ||||
| Efficacy Data | Half Maximal Inhibitory Concentration (IC50) | > 100.00 nM | Negative EGFR expression (EGFR-) | ||
| Method Description |
The inhibitory activity of C-Fab-MMAE against cancer cell growth was evaluated in various human cancer cell lines in vitro.
|
||||
| In Vitro Model | Invasive breast carcinoma | MCF-7 cells | CVCL_0031 | ||
| Experiment 3 Reporting the Activity Date of This ADC | [95] | ||||
| Efficacy Data | Half Maximal Effective Concentration (EC50) |
1.40 nM
|
Low FOLR1 expression (FOLR1+) | ||
| Method Description |
The inhibitory activity of C-Fab-MMAE against cancer cell growth was evaluated in various human cancer cell lines in vitro.
|
||||
| In Vitro Model | Skin squamous cell carcinoma | A431 cells | CVCL_0037 | ||
EGFR ADC-23 [Investigative]
Revealed Based on the Cell Line Data
| Experiment 1 Reporting the Activity Date of This ADC | [198] | ||||
| Efficacy Data | Half Maximal Inhibitory Concentration (IC50) |
0.80 nM±0.10 nM
|
Positive EGFR expression (EGFR +++/++) | ||
| Method Description |
ADCs 21-23 was performed on HCC827 and NCI-H2228 cells. cells (5 x 10³ cells/well) were cultured in 96-well plates with 100 uL complete medium, and 24 h later the cells were treated in triplicate with varying concentrations of ADCs for 72 h.
|
||||
| In Vitro Model | Lung adenocarcinoma | HCC827 cells | CVCL_2063 | ||
| Experiment 2 Reporting the Activity Date of This ADC | [198] | ||||
| Efficacy Data | Half Maximal Inhibitory Concentration (IC50) | > 500 nM | Negative EGFR expression (EGFR -) | ||
| Method Description |
ADCs 21-23 was performed on HCC827 and NCI-H2228 cells. cells (5 x 10³ cells/well) were cultured in 96-well plates with 100 uL complete medium, and 24 h later the cells were treated in triplicate with varying concentrations of ADCs for 72 h.
|
||||
| In Vitro Model | Lung adenocarcinoma | NCI-H2228 cells | CVCL_1543 | ||
scFvF7-Fc-vcMMAE [Investigative]
Revealed Based on the Cell Line Data
| Experiment 1 Reporting the Activity Date of This ADC | [256] | ||||
| Efficacy Data | Half Maximal Inhibitory Concentration (IC50) |
0.89 nM
|
Positive FGFR2 expression (FGFR2+++/++) | ||
| Method Description |
SNU-16, NCI-H716 and U2OS cells were seeded at a density of 5000 cells per well in a 96-well culture plate and treated with vcMMAE, scFvF7-Fc, or antibody-vcMMAE conjugate scFvF7-Fc-MMAE for 96 hours.
|
||||
| In Vitro Model | Gastric adenocarcinoma | SNU-16 cells | CVCL_0076 | ||
| Experiment 2 Reporting the Activity Date of This ADC | [256] | ||||
| Efficacy Data | Half Maximal Inhibitory Concentration (IC50) |
7.70 nM
|
Positive FGFR2 expression (FGFR2+++/++) | ||
| Method Description |
SNU-16, NCI-H716 and U2OS cells were seeded at a density of 5000 cells per well in a 96-well culture plate and treated with vcMMAE, scFvF7-Fc, or antibody-vcMMAE conjugate scFvF7-Fc-MMAE for 96 hours.
|
||||
| In Vitro Model | Cecum adenocarcinoma | NCI-H716 cells | CVCL_1581 | ||
Trastuzumab-DVP-linker-MMAE 1 [Investigative]
Revealed Based on the Cell Line Data
| Experiment 1 Reporting the Activity Date of This ADC | [250] | ||||
| Efficacy Data | Half Maximal Inhibitory Concentration (IC50) |
1.00 nM
|
Positive HER2 expression (HER2+++/++) | ||
| Method Description |
Cells were seeded at 2000 cells per well in black 96-well proliferation plates and dosed with a titration of conjugates for 3 to 5 days, until control untreated cells reached 80 to 90% confluence.
|
||||
| In Vitro Model | Invasive breast carcinoma | BT-474 cells | CVCL_0179 | ||
AB-3A4-Val-Cit-MMAE [Investigative]
Revealed Based on the Cell Line Data
| Experiment 1 Reporting the Activity Date of This ADC | [257] | ||||
| Efficacy Data | Half Maximal Inhibitory Concentration (IC50) |
1.00 nM-2.00 nM
|
Positive KAAG1 expression (KAAG1 +++/++) | ||
| Method Description |
In vitro cytotoxicity of ADCs against a panel of four multiple human cancer cell lines.
|
||||
| In Vitro Model | Ovarian serous cystadenocarcinoma | SK-OV-3 cells | CVCL_0532 | ||
| Experiment 2 Reporting the Activity Date of This ADC | [257] | ||||
| Efficacy Data | Half Maximal Inhibitory Concentration (IC50) |
1.00 nM-2.00 nM
|
Positive KAAG1 expression (KAAG1 +++/++) | ||
| Method Description |
In vitro cytotoxicity of ADCs against a panel of four multiple human cancer cell lines.
|
||||
| In Vitro Model | Breast adenocarcinoma | MDA-MB-231 cells | CVCL_0062 | ||
| Experiment 3 Reporting the Activity Date of This ADC | [257] | ||||
| Efficacy Data | Half Maximal Inhibitory Concentration (IC50) |
1.00 nM-2.00 nM
|
Positive KAAG1 expression (KAAG1 +++/++) | ||
| Method Description |
In vitro cytotoxicity of ADCs against a panel of four multiple human cancer cell lines.
|
||||
| In Vitro Model | Prostate carcinoma | PC-3 cells | CVCL_0035 | ||
MMAE-IgG1 3G12 [Investigative]
Revealed Based on the Cell Line Data
| Experiment 1 Reporting the Activity Date of This ADC | [258] | ||||
| Efficacy Data | Half Maximal Inhibitory Concentration (IC50) |
1.00 nM-10.00 nM
|
Positive ENPP1 expression (ENPP1 +++/++) | ||
| Method Description |
For the cell-killing activity of ADC,293T, 293T-ENPP1, and HepG2 cells were seeded at 2000 cells/well in 96-well white plate and incubated in cell growth medium overnight at 37°C in 5%CO2.
|
||||
| In Vitro Model | Hepatoma | HEK293T cells (ENPP1 expression) | CVCL_0063 | ||
| Experiment 2 Reporting the Activity Date of This ADC | [258] | ||||
| Efficacy Data | Half Maximal Inhibitory Concentration (IC50) | > 100 nM | Negative ENPP1 expression (ENPP1-) | ||
| Method Description |
For the cell-killing activity of ADC,293T, 293T-ENPP1, and HepG2 cells were seeded at 2000 cells/well in 96-well white plate and incubated in cell growth medium overnight at 37°C in 5%CO2.
|
||||
| In Vitro Model | Normal | HEK293T cells | CVCL_0063 | ||
| Experiment 3 Reporting the Activity Date of This ADC | [258] | ||||
| Efficacy Data | Half Maximal Inhibitory Concentration (IC50) |
100 nM
|
Positive ENPP1 expression (ENPP1 +++/++) | ||
| Method Description |
For the cell-killing activity of ADC,293T, 293T-ENPP1, and HepG2 cells were seeded at 2000 cells/well in 96-well white plate and incubated in cell growth medium overnight at 37°C in 5%CO2.
|
||||
| In Vitro Model | Hepatoblastoma | Hep-G2 cells | CVCL_0027 | ||
MMAE-IgG1 17 [Investigative]
Revealed Based on the Cell Line Data
| Experiment 1 Reporting the Activity Date of This ADC | [258] | ||||
| Efficacy Data | Half Maximal Inhibitory Concentration (IC50) |
1.00 nM-10.00 nM
|
Positive ENPP1 expression (ENPP1 +++/++) | ||
| Method Description |
For the cell-killing activity of ADC,293T, 293T-ENPP1, and HepG2 cells were seeded at 2000 cells/well in 96-well white plate and incubated in cell growth medium overnight at 37°C in 5%CO2.
|
||||
| In Vitro Model | Hepatoma | HEK293T cells (ENPP1 expression) | CVCL_0063 | ||
| Experiment 2 Reporting the Activity Date of This ADC | [258] | ||||
| Efficacy Data | Half Maximal Inhibitory Concentration (IC50) |
65.00 nM
|
Positive ENPP1 expression (ENPP1 +++/++) | ||
| Method Description |
For the cell-killing activity of ADC,293T, 293T-ENPP1, and HepG2 cells were seeded at 2000 cells/well in 96-well white plate and incubated in cell growth medium overnight at 37°C in 5%CO2.
|
||||
| In Vitro Model | Hepatoblastoma | Hep-G2 cells | CVCL_0027 | ||
| Experiment 3 Reporting the Activity Date of This ADC | [258] | ||||
| Efficacy Data | Half Maximal Inhibitory Concentration (IC50) | > 100 nM | Negative ENPP1 expression (ENPP1-) | ||
| Method Description |
For the cell-killing activity of ADC,293T, 293T-ENPP1, and HepG2 cells were seeded at 2000 cells/well in 96-well white plate and incubated in cell growth medium overnight at 37°C in 5%CO2.
|
||||
| In Vitro Model | Normal | HEK293T cells | CVCL_0063 | ||
Trastuzumab-DVP-linker-MMAE 4 [Investigative]
Revealed Based on the Cell Line Data
| Experiment 1 Reporting the Activity Date of This ADC | [250] | ||||
| Efficacy Data | Half Maximal Inhibitory Concentration (IC50) |
1.45 nM
|
Negative HER2 expression (HER2-) | ||
| Method Description |
Cells were seeded at 2000 cells per well in black 96-well proliferation plates and dosed with a titration of conjugates for 3 to 5 days, until control untreated cells reached 80 to 90% confluence.
|
||||
| In Vitro Model | Invasive breast carcinoma | MCF-7 cells | CVCL_0031 | ||
WO2017089895A1 ADC71 [Investigative]
Revealed Based on the Cell Line Data
| Experiment 1 Reporting the Activity Date of This ADC | [235] | ||||
| Efficacy Data | Half Maximal Inhibitory Concentration (IC50) |
1.47 nM
|
Positive CD20 expression (CD20+++/++) | ||
| Method Description |
Ramos cells were seeded in a 96-wellplate at 20,000 cells/well in 100 uL of growth media. The cells were incubated at 37°C in5% CO, for 1 day. Serial dilutions of ADCs from 33.33 nM to 5.1 pM in 100 uL media were added to the wells, and the cells were incubated with the antibody & ADCs for 72 hours.
|
||||
| In Vitro Model | Burkitt lymphoma | Ramos cells | CVCL_0597 | ||
| Experiment 2 Reporting the Activity Date of This ADC | [235] | ||||
| Efficacy Data | Half Maximal Inhibitory Concentration (IC50) |
4.00 nM
|
Positive CD20 expression (CD20+++/++) | ||
| Method Description |
ADCs wereincubated in human plasma for 5 seconds (0h), followed by SRB invitro cytotoxicity test using Ramos cells for 72hr.
|
||||
| In Vitro Model | Burkitt lymphoma | Ramos cells | CVCL_0597 | ||
| Experiment 3 Reporting the Activity Date of This ADC | [235] | ||||
| Efficacy Data | Half Maximal Inhibitory Concentration (IC50) |
4.13 nM
|
Positive CD20 expression (CD20+++/++) | ||
| Method Description |
ADCs wereincubated in human plasma for 168 hours (168h), followed by SRB invitro cytotoxicity test using Ramos cells for 72hr.
|
||||
| In Vitro Model | Burkitt lymphoma | Ramos cells | CVCL_0597 | ||
| Experiment 4 Reporting the Activity Date of This ADC | [235] | ||||
| Efficacy Data | Half Maximal Inhibitory Concentration (IC50) | > 33.30 nM | Negative CD20 expression (CD20-) | ||
| Method Description |
K562 cells were seeded in a 96-wellplate at 20,000 cells/well in 100 uL of growth media. The cells were incubated at 37°C in5% CO, for 1 day. Serial dilutions of ADCs from 33.33 nM to 5.1 pM in 100 uL media were added to the wells, and the cells were incubated with the antibody & ADCs for 72 hours.
|
||||
| In Vitro Model | Chronic myeloid leukemia | K562 cells | CVCL_0004 | ||
WO2017089890A1 ADC71 [Investigative]
Revealed Based on the Cell Line Data
| Experiment 1 Reporting the Activity Date of This ADC | [211] | ||||
| Efficacy Data | Half Maximal Inhibitory Concentration (IC50) |
1.47 nM
|
Positive CD20 expression (CD20+++/++) | ||
| Method Description |
Ramos cells, which are human Burkitt's lymphoma cells, were seeded in a 96-well plate at 20,000 cells/well in 100 pL of growth media. The cells were incubated at 37°C in5% CO2, for 1 day. Serial dilutions of anti-CD19 ADCs were added to the wells, and the cells were incubated with the antibody & ADCs for 72 hours.
|
||||
| In Vitro Model | Burkitt lymphoma | Ramos cells | CVCL_0597 | ||
| Experiment 2 Reporting the Activity Date of This ADC | [211] | ||||
| Efficacy Data | Half Maximal Inhibitory Concentration (IC50) | > 33.30 nM | Negative CD20 expression (CD20-) | ||
| Method Description |
Cells were seeded in a 96-well plate at 20,000 cells/well in 100 pL of growth media. The cells were incubated at 37°C in5% CO2, for 1 day. Serial dilutions of anti-CD19 ADCs were added to the wells, and the cells were incubated with the antibody & ADCs for 72 hours.
|
||||
| In Vitro Model | Chronic myeloid leukemia | K562 cells | CVCL_0004 | ||
Trastuzumab-DVP-linker-MMAE 3 [Investigative]
Revealed Based on the Cell Line Data
| Experiment 1 Reporting the Activity Date of This ADC | [250] | ||||
| Efficacy Data | Half Maximal Inhibitory Concentration (IC50) |
2.40 nM
|
Positive HER2 expression (HER2+++/++) | ||
| Method Description |
Cells were seeded at 2000 cells per well in black 96-well proliferation plates and dosed with a titration of conjugates for 3 to 5 days, until control untreated cells reached 80 to 90% confluence.
|
||||
| In Vitro Model | Invasive breast carcinoma | BT-474 cells | CVCL_0179 | ||
40H3-MCVCPAB-MMAE [Investigative]
Revealed Based on the Cell Line Data
| Experiment 1 Reporting the Activity Date of This ADC | [259] | ||||
| Efficacy Data | Half Maximal Inhibitory Concentration (IC50) |
3.45 nM
|
High EGFR expression (EGFR+++) | ||
| Method Description |
1 x10⁴ cells per well in a volume of 100 ul were plated in 96-well tissue culture plates. After 24 h, ADCs were added at the indicated concentrations. After 72 h, the medium was removed and the viability was determined using the CellTiter-Glo luminescent cell viability assay kit.
|
||||
| In Vitro Model | Breast adenocarcinoma | MDA-MB-468 cells | CVCL_0419 | ||
| Experiment 2 Reporting the Activity Date of This ADC | [259] | ||||
| Efficacy Data | Half Maximal Inhibitory Concentration (IC50) |
9.13 nM
|
High EGFR expression (EGFR+++) | ||
| Method Description |
1 x10⁴ cells per well in a volume of 100 ul were plated in 96-well tissue culture plates. After 24 h, ADCs were added at the indicated concentrations. After 72 h, the medium was removed and the viability was determined using the CellTiter-Glo luminescent cell viability assay kit.
|
||||
| In Vitro Model | Skin squamous cell carcinoma | A431 cells | CVCL_0037 | ||
| Experiment 3 Reporting the Activity Date of This ADC | [259] | ||||
| Efficacy Data | Half Maximal Inhibitory Concentration (IC50) |
18.58 nM
|
Moderate EGFR expression (EGFR++) | ||
| Method Description |
1 x10⁴ cells per well in a volume of 100 ull were plated in 96-well tissue culture plates. After 24 h, ADCs were added at the indicated concentrations. After 72 h, the medium was removed and the viability was determined using the CellTiter-Glo luminescent cell viability assay kit.
|
||||
| In Vitro Model | Invasive breast carcinoma of no special type | BT-20 cells | CVCL_0178 | ||
| Experiment 4 Reporting the Activity Date of This ADC | [259] | ||||
| Efficacy Data | Half Maximal Inhibitory Concentration (IC50) | > 100.00 nM | Negative EGFR expression (EGFR-) | ||
| Method Description |
1 x10⁴ cells per well in a volume of 100 ul were plated in 96-well tissue culture plates. After 24 h, ADCs were added at the indicated concentrations. After 72 h, the medium was removed and the viability was determined using the CellTiter-Glo luminescent cell viability assay kit.
|
||||
| In Vitro Model | Breast adenocarcinoma | MDA-MB-231 cells | CVCL_0062 | ||
HER2 ADC-19 [Investigative]
Revealed Based on the Cell Line Data
| Experiment 1 Reporting the Activity Date of This ADC | [198] | ||||
| Efficacy Data | Half Maximal Inhibitory Concentration (IC50) |
4.80 nM±1.40 nM
|
Positive HER2 expression (HER2 +++/++) | ||
| Method Description |
ADCs 21-23 was performed on HCC827 and NCI-H2228 cells. cells (5 x 10³ cells/well) were cultured in 96-well plates with 100 uL complete medium, and 24 h later the cells were treated in triplicate with varying concentrations of ADCs for 72 h.
|
||||
| In Vitro Model | Breast adenocarcinoma | SK-BR-3 cells | CVCL_0033 | ||
| Experiment 2 Reporting the Activity Date of This ADC | [198] | ||||
| Efficacy Data | Half Maximal Inhibitory Concentration (IC50) | > 500 nM | Negative HER2 expression (HER2 -) | ||
| Method Description |
ADCs 21-23 was performed on HCC827 and NCI-H2228 cells. cells (5 x 10³ cells/well) were cultured in 96-well plates with 100 uL complete medium, and 24 h later the cells were treated in triplicate with varying concentrations of ADCs for 72 h.
|
||||
| In Vitro Model | Lung adenocarcinoma | HCC827 cells | CVCL_2063 | ||
| Experiment 3 Reporting the Activity Date of This ADC | [198] | ||||
| Efficacy Data | Half Maximal Inhibitory Concentration (IC50) | > 500 nM | Negative HER2 expression (HER2 -) | ||
| Method Description |
ADCs 21-23 was performed on HCC827 and NCI-H2228 cells. cells (5 x 10³ cells/well) were cultured in 96-well plates with 100 uL complete medium, and 24 h later the cells were treated in triplicate with varying concentrations of ADCs for 72 h.
|
||||
| In Vitro Model | Breast adenocarcinoma | MDA-MB-468 cells | CVCL_0419 | ||
| Experiment 4 Reporting the Activity Date of This ADC | [198] | ||||
| Efficacy Data | Half Maximal Inhibitory Concentration (IC50) | > 500 nM | Negative HER2 expression (HER2 -) | ||
| Method Description |
ADCs 21-23 was performed on HCC827 and NCI-H2228 cells. cells (5 x 10³ cells/well) were cultured in 96-well plates with 100 uL complete medium, and 24 h later the cells were treated in triplicate with varying concentrations of ADCs for 72 h.
|
||||
| In Vitro Model | Invasive breast carcinoma | MCF-7 cells | CVCL_0031 | ||
ZHER2-ABD-mcMMAE [Investigative]
Revealed Based on the Cell Line Data
| Experiment 1 Reporting the Activity Date of This ADC | [260] | ||||
| Efficacy Data | Half Maximal Inhibitory Concentration (IC50) |
8.20 nM
|
High HER2 expression (HER2 +++) | ||
| Method Description |
HER2-expressing cell lines were incubated with concentration series of the drug conjugates, and the viability of the cells was measured.
|
||||
| In Vitro Model | Breast adenocarcinoma | SK-BR-3 cells | CVCL_0033 | ||
| Experiment 2 Reporting the Activity Date of This ADC | [260] | ||||
| Efficacy Data | Half Maximal Inhibitory Concentration (IC50) |
24.00 nM
|
High HER2 expression (HER2 +++) | ||
| Method Description |
HER2-expressing cell lines were incubated with concentration series of the drug conjugates, and the viability of the cells was measured.
|
||||
| In Vitro Model | Breast adenocarcinoma | AU565 cells | CVCL_1074 | ||
HER2 ADC-20 [Investigative]
Revealed Based on the Cell Line Data
| Experiment 1 Reporting the Activity Date of This ADC | [198] | ||||
| Efficacy Data | Half Maximal Inhibitory Concentration (IC50) |
11.30 nM±2.70 nM
|
Positive HER2 expression (HER2 +++/++) | ||
| Method Description |
ADCs 21-23 was performed on HCC827 and NCI-H2228 cells. cells (5 x 10³ cells/well) were cultured in 96-well plates with 100 uL complete medium, and 24 h later the cells were treated in triplicate with varying concentrations of ADCs for 72 h.
|
||||
| In Vitro Model | Breast adenocarcinoma | SK-BR-3 cells | CVCL_0033 | ||
| Experiment 2 Reporting the Activity Date of This ADC | [198] | ||||
| Efficacy Data | Half Maximal Inhibitory Concentration (IC50) | > 500 nM | Negative HER2 expression (HER2 -) | ||
| Method Description |
ADCs 21-23 was performed on HCC827 and NCI-H2228 cells. cells (5 x 10³ cells/well) were cultured in 96-well plates with 100 uL complete medium, and 24 h later the cells were treated in triplicate with varying concentrations of ADCs for 72 h.
|
||||
| In Vitro Model | Lung adenocarcinoma | HCC827 cells | CVCL_2063 | ||
| Experiment 3 Reporting the Activity Date of This ADC | [198] | ||||
| Efficacy Data | Half Maximal Inhibitory Concentration (IC50) | > 500 nM | Negative HER2 expression (HER2 -) | ||
| Method Description |
ADCs 21-23 was performed on HCC827 and NCI-H2228 cells. cells (5 x 10³ cells/well) were cultured in 96-well plates with 100 uL complete medium, and 24 h later the cells were treated in triplicate with varying concentrations of ADCs for 72 h.
|
||||
| In Vitro Model | Breast adenocarcinoma | MDA-MB-468 cells | CVCL_0419 | ||
| Experiment 4 Reporting the Activity Date of This ADC | [198] | ||||
| Efficacy Data | Half Maximal Inhibitory Concentration (IC50) | > 500 nM | Negative HER2 expression (HER2 -) | ||
| Method Description |
ADCs 21-23 was performed on HCC827 and NCI-H2228 cells. cells (5 x 10³ cells/well) were cultured in 96-well plates with 100 uL complete medium, and 24 h later the cells were treated in triplicate with varying concentrations of ADCs for 72 h.
|
||||
| In Vitro Model | Invasive breast carcinoma | MCF-7 cells | CVCL_0031 | ||
HER2 ADC-18 [Investigative]
Revealed Based on the Cell Line Data
| Experiment 1 Reporting the Activity Date of This ADC | [198] | ||||
| Efficacy Data | Half Maximal Inhibitory Concentration (IC50) |
14.00 nM±5.90 nM
|
Positive HER2 expression (HER2 +++/++) | ||
| Method Description |
ADCs 21-23 was performed on HCC827 and NCI-H2228 cells. cells (5 x 10³ cells/well) were cultured in 96-well plates with 100 uL complete medium, and 24 h later the cells were treated in triplicate with varying concentrations of ADCs for 72 h.
|
||||
| In Vitro Model | Breast adenocarcinoma | SK-BR-3 cells | CVCL_0033 | ||
| Experiment 2 Reporting the Activity Date of This ADC | [198] | ||||
| Efficacy Data | Half Maximal Inhibitory Concentration (IC50) |
487.00 nM±194.00 nM
|
Negative HER2 expression (HER2 -) | ||
| Method Description |
ADCs 21-23 was performed on HCC827 and NCI-H2228 cells. cells (5 x 10³ cells/well) were cultured in 96-well plates with 100 uL complete medium, and 24 h later the cells were treated in triplicate with varying concentrations of ADCs for 72 h.
|
||||
| In Vitro Model | Breast adenocarcinoma | MDA-MB-468 cells | CVCL_0419 | ||
| Experiment 3 Reporting the Activity Date of This ADC | [198] | ||||
| Efficacy Data | Half Maximal Inhibitory Concentration (IC50) | > 500 nM | Negative HER2 expression (HER2 -) | ||
| Method Description |
ADCs 21-23 was performed on HCC827 and NCI-H2228 cells. cells (5 x 10³ cells/well) were cultured in 96-well plates with 100 uL complete medium, and 24 h later the cells were treated in triplicate with varying concentrations of ADCs for 72 h.
|
||||
| In Vitro Model | Lung adenocarcinoma | HCC827 cells | CVCL_2063 | ||
| Experiment 4 Reporting the Activity Date of This ADC | [198] | ||||
| Efficacy Data | Half Maximal Inhibitory Concentration (IC50) | > 500 nM | Negative HER2 expression (HER2 -) | ||
| Method Description |
ADCs 21-23 was performed on HCC827 and NCI-H2228 cells. cells (5 x 10³ cells/well) were cultured in 96-well plates with 100 uL complete medium, and 24 h later the cells were treated in triplicate with varying concentrations of ADCs for 72 h.
|
||||
| In Vitro Model | Invasive breast carcinoma | MCF-7 cells | CVCL_0031 | ||
CD4-Val-Cit-MMAE [Investigative]
Revealed Based on the Cell Line Data
| Experiment 1 Reporting the Activity Date of This ADC | [261] | ||||
| Efficacy Data | Half Maximal Inhibitory Concentration (IC50) |
18.00 nM
|
Positive CD4 expression (CD4 +++/++) | ||
| Method Description |
Receptors (R2) as a function of ADC concentrations, upon incubation with the antibody and following additional 48 h.
|
||||
| In Vitro Model | Adult T acute lymphoblastic leukemia | MOLT-4 cells | CVCL_0013 | ||
| Experiment 2 Reporting the Activity Date of This ADC | [261] | ||||
| Efficacy Data | Half Maximal Inhibitory Concentration (IC50) |
22.00 nM
|
Positive CD4 expression (CD4 +++/++) | ||
| Method Description |
Receptors (R1) as a function of ADC concentrations, upon incubation with the antibody and following additional 48 h.
|
||||
| In Vitro Model | Adult T acute lymphoblastic leukemia | MOLT-4 cells | CVCL_0013 | ||
| Experiment 3 Reporting the Activity Date of This ADC | [261] | ||||
| Efficacy Data | Half Maximal Inhibitory Concentration (IC50) |
40.00 nM
|
Positive CD4 expression (CD4 +++/++) | ||
| Method Description |
Receptors (R4) as a function of ADC concentrations, upon incubation with the antibody and following additional 48 h.
|
||||
| In Vitro Model | Adult T acute lymphoblastic leukemia | MOLT-4 cells | CVCL_0013 | ||
NS Cys-vc-MMAE [Investigative]
Revealed Based on the Cell Line Data
| Experiment 1 Reporting the Activity Date of This ADC | [245] | ||||
| Efficacy Data | Half Maximal Inhibitory Concentration (IC50) |
34.00 nM
|
High EGFR expression (EGFR+++) | ||
| Method Description |
The effect of MMAE-conjugated cetuximab ADCs on the viability of U87 glioblastoma cells that express EGFR.
|
||||
| In Vitro Model | Glioblastoma | U-87MG cells | CVCL_0022 | ||
Anti-MSL1 mAb-Compound 75 [Investigative]
Revealed Based on the Cell Line Data
| Experiment 1 Reporting the Activity Date of This ADC | [212] | ||||
| Efficacy Data | Half Maximal Inhibitory Concentration (IC50) |
50.00 nM
|
Positive MSL expression (MSL+++/++) | ||
| Method Description |
The cells were incubated in a CO2 incubat or with saturated water overnight, On the second day, two covalent thiol conjugated ADCs were serially diluted conjugates were added to the 96 well plate containing OVCAR3 cells, 100uL per well. The initial conjugate was 100000 ng/ml and diluted to 0.001 ng/ml. OVCAR3 cells with added ADC were incubated at 37 for 72 hours.
Click to Show/Hide
|
||||
| In Vitro Model | Ovarian serous adenocarcinoma | OVCAR-3 cells | CVCL_0465 | ||
HER2-gsADC-45 [Investigative]
Revealed Based on the Cell Line Data
| Experiment 1 Reporting the Activity Date of This ADC | [206] | ||||
| Efficacy Data | Half Maximal Inhibitory Concentration (IC50) | > 66.00 nM | Positive HER2 expression (HER2+++/++) | ||
| Method Description |
Cells were cultured in a 10% fetal bovine serum (FBS)-containing RPMI 1640 medium and were planted into 96-well plates with 6000 cells per well. The plates were incubated overnight at 37°C in a 5% CO2 cell incubator.
|
||||
| In Vitro Model | Breast adenocarcinoma | SK-BR-3 cells | CVCL_0033 | ||
| Experiment 2 Reporting the Activity Date of This ADC | [206] | ||||
| Efficacy Data | Half Maximal Inhibitory Concentration (IC50) | > 66.00 nM | Positive HER2 expression (HER2+++/++) | ||
| Method Description |
Cells were cultured in a 10% fetal bovine serum (FBS)-containing RPMI 1640 medium and were planted into 96-well plates with 6000 cells per well. The plates were incubated overnight at 37°C in a 5% CO2 cell incubator.
|
||||
| In Vitro Model | Gastric tubular adenocarcinoma | NCI-N87 cells | CVCL_1603 | ||
| Experiment 3 Reporting the Activity Date of This ADC | [206] | ||||
| Efficacy Data | Half Maximal Inhibitory Concentration (IC50) | > 66.00 nM | Negative HER2 expression (HER2 -) | ||
| Method Description |
Cells were cultured in a 10% fetal bovine serum (FBS)-containing RPMI 1640 medium and were planted into 96-well plates with 6000 cells per well. The plates were incubated overnight at 37°C in a 5% CO2 cell incubator.
|
||||
| In Vitro Model | Breast adenocarcinoma | MDA-MB-231 cells | CVCL_0062 | ||
HER2-gsADC-44 [Investigative]
Revealed Based on the Cell Line Data
| Experiment 1 Reporting the Activity Date of This ADC | [206] | ||||
| Efficacy Data | Half Maximal Inhibitory Concentration (IC50) | > 66.00 nM | Positive HER2 expression (HER2+++/++) | ||
| Method Description |
Cells were cultured in a 10% fetal bovine serum (FBS)-containing RPMI 1640 medium and were planted into 96-well plates with 6000 cells per well. The plates were incubated overnight at 37°C in a 5% CO2 cell incubator.
|
||||
| In Vitro Model | Breast adenocarcinoma | SK-BR-3 cells | CVCL_0033 | ||
| Experiment 2 Reporting the Activity Date of This ADC | [206] | ||||
| Efficacy Data | Half Maximal Inhibitory Concentration (IC50) | > 66.00 nM | Positive HER2 expression (HER2+++/++) | ||
| Method Description |
Cells were cultured in a 10% fetal bovine serum (FBS)-containing RPMI 1640 medium and were planted into 96-well plates with 6000 cells per well. The plates were incubated overnight at 37°C in a 5% CO2 cell incubator.
|
||||
| In Vitro Model | Gastric tubular adenocarcinoma | NCI-N87 cells | CVCL_1603 | ||
| Experiment 3 Reporting the Activity Date of This ADC | [206] | ||||
| Efficacy Data | Half Maximal Inhibitory Concentration (IC50) | > 66.00 nM | Negative HER2 expression (HER2 -) | ||
| Method Description |
Cells were cultured in a 10% fetal bovine serum (FBS)-containing RPMI 1640 medium and were planted into 96-well plates with 6000 cells per well. The plates were incubated overnight at 37°C in a 5% CO2 cell incubator.
|
||||
| In Vitro Model | Breast adenocarcinoma | MDA-MB-231 cells | CVCL_0062 | ||
HuFc-MMAE [Investigative]
Revealed Based on the Cell Line Data
| Experiment 1 Reporting the Activity Date of This ADC | [251] | ||||
| Efficacy Data | Half Maximal Inhibitory Concentration (IC50) | > 100.00 nM | Negative EGFR expression (EGFR-) | ||
| Method Description |
The inhibitory activity of huFc-MMAE against cancer cell growth was evaluated in various human cancer cell lines in vitro.
|
||||
| In Vitro Model | Invasive breast carcinoma | MCF-7 cells | CVCL_0031 | ||
| Experiment 2 Reporting the Activity Date of This ADC | [251] | ||||
| Efficacy Data | Half Maximal Inhibitory Concentration (IC50) | > 300.00 nM | High EGFR expression (EGFR+++/++) | ||
| Method Description |
The inhibitory activity of huFc-MMAE against cancer cell growth was evaluated in various human cancer cell lines in vitro.
|
||||
| In Vitro Model | Breast adenocarcinoma | MDA-MB-468 cells | CVCL_0419 | ||
| Experiment 3 Reporting the Activity Date of This ADC | [95] | ||||
| Efficacy Data | Half Maximal Effective Concentration (EC50) |
1.40 nM
|
Low FOLR1 expression (FOLR1+) | ||
| Method Description |
The inhibitory activity of huFc-MMAE against cancer cell growth was evaluated in various human cancer cell lines in vitro.
|
||||
| In Vitro Model | Skin squamous cell carcinoma | A431 cells | CVCL_0037 | ||
Anti-FAP B11-MC-VC-PABC-MMAE [Investigative]
Revealed Based on the Cell Line Data
| Experiment 1 Reporting the Activity Date of This ADC | [222] | ||||
| Efficacy Data | Half Maximal Inhibitory Concentration (IC50) | > 100.00 nM | Negative HER2 expression (HER2-) | ||
| Method Description |
Cells were plated at a density of 5,000 cells per well in black walled 96-well plate and allowed to adhere overnight in a humidified at mosphere of 5% CO2. CellTiter-Glo reagent was added to the wells at room temperature and the luminescent signal was measuredafter 10 min using a SpectraMax M5 plate reader.
|
||||
| In Vitro Model | Breast adenocarcinoma | MDA-MB-231 cells | CVCL_0062 | ||
| Experiment 2 Reporting the Activity Date of This ADC | [222] | ||||
| Efficacy Data | Half Maximal Inhibitory Concentration (IC50) |
382.40 nM
|
High HER2 expression (HER2+++) | ||
| Method Description |
Cells were plated at a density of 5,000 cells per well in black walled 96-well plate and allowed to adhere overnight in a humidified at mosphere of 5% CO2. CellTiter-Glo reagent was added to the wells at room temperature and the luminescent signal was measuredafter 10 min using a SpectraMax M5 plate reader.
|
||||
| In Vitro Model | Breast adenocarcinoma | SK-BR-3 cells | CVCL_0033 | ||
Anti-FAP B11-AO-Cys-MC-VC-PABC-MMAE [Investigative]
Revealed Based on the Cell Line Data
| Experiment 1 Reporting the Activity Date of This ADC | [222] | ||||
| Efficacy Data | Half Maximal Inhibitory Concentration (IC50) | > 100.00 nM | Negative HER2 expression (HER2-) | ||
| Method Description |
Cells were plated at a density of 5,000 cells per well in black walled 96-well plate and allowed to adhere overnight in a humidified at mosphere of 5% CO2. CellTiter-Glo reagent was added to the wells at room temperature and the luminescent signal was measuredafter 10 min using a SpectraMax M5 plate reader.
|
||||
| In Vitro Model | Breast adenocarcinoma | MDA-MB-231 cells | CVCL_0062 | ||
| Experiment 2 Reporting the Activity Date of This ADC | [222] | ||||
| Efficacy Data | Half Maximal Inhibitory Concentration (IC50) |
682.40 nM
|
High HER2 expression (HER2+++) | ||
| Method Description |
Cells were plated at a density of 5,000 cells per well in black walled 96-well plate and allowed to adhere overnight in a humidified at mosphere of 5% CO2. CellTiter-Glo reagent was added to the wells at room temperature and the luminescent signal was measuredafter 10 min using a SpectraMax M5 plate reader.
|
||||
| In Vitro Model | Breast adenocarcinoma | SK-BR-3 cells | CVCL_0033 | ||
PD-L1 ADC 1 [Investigative]
Revealed Based on the Cell Line Data
| Experiment 1 Reporting the Activity Date of This ADC | [262] | ||||
| Efficacy Data | Half Maximal Inhibitory Concentration (IC50) |
265.30 nM
|
High PD-L1 expression (PD-L1+++) | ||
| Method Description |
The in vitro cytotoxicity of ADC 1 and ADC 2 was evaluated in three PD-L1-positive cell lines, i.e., Calu-1, MDA-MB-231, and SK-MES, and one PD-L1-negative cell line, i.e., AsPC-1.
|
||||
| In Vitro Model | Lung squamous cell carcinoma | SK-MES-1 cells | CVCL_0630 | ||
| Experiment 2 Reporting the Activity Date of This ADC | [262] | ||||
| Efficacy Data | Half Maximal Inhibitory Concentration (IC50) | > 663.08 nM | High PD-L1 expression (PD-L1+++) | ||
| Method Description |
The in vitro cytotoxicity of ADC 1 and ADC 2 was evaluated in three PD-L1-positive cell lines, i.e., Calu-1, MDA-MB-231, and SK-MES, and one PD-L1-negative cell line, i.e., AsPC-1.
|
||||
| In Vitro Model | Lung squamous cell carcinoma | Calu-1 cells | CVCL_0608 | ||
| Experiment 3 Reporting the Activity Date of This ADC | [262] | ||||
| Efficacy Data | Half Maximal Inhibitory Concentration (IC50) | > 663.08 nM | High PD-L1 expression (PD-L1+++) | ||
| Method Description |
The in vitro cytotoxicity of ADC 1 and ADC 2 was evaluated in three PD-L1-positive cell lines, i.e., Calu-1, MDA-MB-231, and SK-MES, and one PD-L1-negative cell line, i.e., AsPC-1.
|
||||
| In Vitro Model | Breast adenocarcinoma | MDA-MB-231 cells | CVCL_0062 | ||
| Experiment 4 Reporting the Activity Date of This ADC | [262] | ||||
| Efficacy Data | Half Maximal Inhibitory Concentration (IC50) | > 663.08 nM | Negative PD-L1 expression (PD-L1-) | ||
| Method Description |
The in vitro cytotoxicity of ADC 1 and ADC 2 was evaluated in three PD-L1-positive cell lines, i.e., Calu-1, MDA-MB-231, and SK-MES, and one PD-L1-negative cell line, i.e., AsPC-1.
|
||||
| In Vitro Model | Pancreatic ductal adenocarcinoma | AsPC-1 cells | CVCL_0152 | ||
PD-L1 ADC 2 [Investigative]
Revealed Based on the Cell Line Data
| Experiment 1 Reporting the Activity Date of This ADC | [262] | ||||
| Efficacy Data | Half Maximal Inhibitory Concentration (IC50) |
272.10 nM
|
High PD-L1 expression (PD-L1+++) | ||
| Method Description |
The in vitro cytotoxicity of ADC 1 and ADC 2 was evaluated in three PD-L1-positive cell lines, i.e., Calu-1, MDA-MB-231, and SK-MES, and one PD-L1-negative cell line, i.e., AsPC-1.
|
||||
| In Vitro Model | Lung squamous cell carcinoma | SK-MES-1 cells | CVCL_0630 | ||
| Experiment 2 Reporting the Activity Date of This ADC | [262] | ||||
| Efficacy Data | Half Maximal Inhibitory Concentration (IC50) | > 653.93 nM | High PD-L1 expression (PD-L1+++) | ||
| Method Description |
The in vitro cytotoxicity of ADC 1 and ADC 2 was evaluated in three PD-L1-positive cell lines, i.e., Calu-1, MDA-MB-231, and SK-MES, and one PD-L1-negative cell line, i.e., AsPC-1.
|
||||
| In Vitro Model | Lung squamous cell carcinoma | Calu-1 cells | CVCL_0608 | ||
| Experiment 3 Reporting the Activity Date of This ADC | [262] | ||||
| Efficacy Data | Half Maximal Inhibitory Concentration (IC50) | > 653.93 nM | High PD-L1 expression (PD-L1+++) | ||
| Method Description |
The in vitro cytotoxicity of ADC 1 and ADC 2 was evaluated in three PD-L1-positive cell lines, i.e., Calu-1, MDA-MB-231, and SK-MES, and one PD-L1-negative cell line, i.e., AsPC-1.
|
||||
| In Vitro Model | Breast adenocarcinoma | MDA-MB-231 cells | CVCL_0062 | ||
| Experiment 4 Reporting the Activity Date of This ADC | [262] | ||||
| Efficacy Data | Half Maximal Inhibitory Concentration (IC50) | > 653.93 nM | Negative PD-L1 expression (PD-L1-) | ||
| Method Description |
The in vitro cytotoxicity of ADC 1 and ADC 2 was evaluated in three PD-L1-positive cell lines, i.e., Calu-1, MDA-MB-231, and SK-MES, and one PD-L1-negative cell line, i.e., AsPC-1.
|
||||
| In Vitro Model | Pancreatic ductal adenocarcinoma | AsPC-1 cells | CVCL_0152 | ||
2G10 RED-244 MMAE 2 [Investigative]
Revealed Based on the Cell Line Data
| Experiment 1 Reporting the Activity Date of This ADC | [217] | ||||
| Efficacy Data | Half Maximal Inhibitory Concentration (IC50) | > 500 nM | Positive PLAUR expression (PLAUR +++/++) | ||
| Method Description |
MDA-MB-231 cells (0.5x10⁴ cells/well) were seeded in 96-well plates at the density and incubated for 120 h (5 days) with of ADCs or IgG. After 5 days of drug treatment at 37°C with 5% CO2.
|
||||
| In Vitro Model | Breast adenocarcinoma | MDA-MB-231 cells | CVCL_0062 | ||
WO2015095755A1 cAC10-2.0 [Investigative]
Revealed Based on the Cell Line Data
| Experiment 1 Reporting the Activity Date of This ADC | [263] | ||||
| Efficacy Data | Half Maximal Inhibitory Concentration (IC50) |
0.40 ng/mL
|
Positive CD30 expression (CD30+++/++); Negative CD70 expression (CD70-) | ||
| Method Description |
Cell-based in vitro assays are used to measure viability (proliferation), cytotoxicity,and induction of apoptosis of the ADC of the invention. Culturing the cells for a period from about 6 hours to about 5 days and measuring cell viability.
|
||||
| In Vitro Model | ALK-positive anaplastic large cell lymphoma | Karpas-299 cells | CVCL_1324 | ||
| Experiment 2 Reporting the Activity Date of This ADC | [263] | ||||
| Efficacy Data | Half Maximal Inhibitory Concentration (IC50) |
3.00 ng/mL
|
Positive CD30 expression (CD30+++/++); Low CD70 expression (CD70+) | ||
| Method Description |
Cell-based in vitro assays are used to measure viability (proliferation), cytotoxicity,and induction of apoptosis of the ADC of the invention. Culturing the cells for a period from about 6 hours to about 5 days and measuring cell viability.
|
||||
| In Vitro Model | Hodgkin's disease | L540cy cells | Homo sapiens | ||
| Experiment 3 Reporting the Activity Date of This ADC | [263] | ||||
| Efficacy Data | Half Maximal Inhibitory Concentration (IC50) |
65.00 ng/mL
|
Moderate CD30 expression (CD30++); Low CD70 expression (CD70+) | ||
| Method Description |
Cell-based in vitro assays are used to measure viability (proliferation), cytotoxicity,and induction of apoptosis of the ADC of the invention. Culturing the cells for a period from about 6 hours to about 5 days and measuring cell viability.
|
||||
| In Vitro Model | Hodgkin lymphoma | L-428 cells | CVCL_1361 | ||
| Experiment 4 Reporting the Activity Date of This ADC | [263] | ||||
| Efficacy Data | Half Maximal Inhibitory Concentration (IC50) | > 1000 ng/mL | Negative CD30 expression (CD30-); Negative CD70 expression (CD70-) | ||
| Method Description |
Cell-based in vitro assays are used to measure viability (proliferation), cytotoxicity,and induction of apoptosis of the ADC of the invention. Culturing the cells for a period from about 6 hours to about 5 days and measuring cell viability.
|
||||
| In Vitro Model | Erythroleukemia | HEL 92.1.7 cells | CVCL_2481 | ||
h1F6-36 MMAE [Investigative]
Revealed Based on the Cell Line Data
| Experiment 1 Reporting the Activity Date of This ADC | [207] | ||||
| Efficacy Data | Half Maximal Inhibitory Concentration (IC50) |
0.50 ng/mL
|
Positive CD70 expression (CD70+++/++) | ||
| Method Description |
Log phase cultures of cells were collected and cells plated at seeding densities ranging from 500 - 10,000 cells/well according to pre-determined conditions.After incubating 24 hours to allow surface protein reconstitution, serial dilutions of test conjugates were added and cultures incubated further for 4 days.
|
||||
| In Vitro Model | Clear cell renal cell carcinoma | Caki-1 cells | CVCL_0234 | ||
| Experiment 2 Reporting the Activity Date of This ADC | [207] | ||||
| Efficacy Data | Half Maximal Inhibitory Concentration (IC50) |
0.70 ng/mL
|
Positive CD70 expression (CD70+++/++) | ||
| Method Description |
Log phase cultures of cells were collected and cells plated at seeding densities ranging from 500 - 10,000 cells/well according to pre-determined conditions.After incubating 24 hours to allow surface protein reconstitution, serial dilutions of test conjugates were added and cultures incubated further for 4 days.
|
||||
| In Vitro Model | Renal cell carcinoma | 786-O cells | CVCL_1051 | ||
hBU12-36 MMAE [Investigative]
Revealed Based on the Cell Line Data
| Experiment 1 Reporting the Activity Date of This ADC | [207] | ||||
| Efficacy Data | Half Maximal Inhibitory Concentration (IC50) |
0.50 ng/mL
|
Positive CD70 expression (CD70+++/++) | ||
| Method Description |
Log phase cultures of cells were collected and cells plated at seeding densities ranging from 500 - 10,000 cells/well according to pre-determined conditions.After incubating 24 hours to allow surface protein reconstitution, serial dilutions of test conjugates were added and cultures incubated further for 4 days.
|
||||
| In Vitro Model | Clear cell renal cell carcinoma | Caki-1 cells | CVCL_0234 | ||
| Experiment 2 Reporting the Activity Date of This ADC | [207] | ||||
| Efficacy Data | Half Maximal Inhibitory Concentration (IC50) |
0.70 ng/mL
|
Positive CD70 expression (CD70+++/++) | ||
| Method Description |
Log phase cultures of cells were collected and cells plated at seeding densities ranging from 500 - 10,000 cells/well according to pre-determined conditions.After incubating 24 hours to allow surface protein reconstitution, serial dilutions of test conjugates were added and cultures incubated further for 4 days.
|
||||
| In Vitro Model | Renal cell carcinoma | 786-O cells | CVCL_1051 | ||
h1F6-33 MMAE [Investigative]
Revealed Based on the Cell Line Data
| Experiment 1 Reporting the Activity Date of This ADC | [207] | ||||
| Efficacy Data | Half Maximal Inhibitory Concentration (IC50) |
0.80 ng/mL
|
Positive CD70 expression (CD70+++/++) | ||
| Method Description |
Log phase cultures of cells were collected and cells plated at seeding densities ranging from 500 - 10,000 cells/well according to pre-determined conditions.After incubating 24 hours to allow surface protein reconstitution, serial dilutions of test conjugates were added and cultures incubated further for 4 days.
|
||||
| In Vitro Model | Renal cell carcinoma | 786-O cells | CVCL_1051 | ||
| Experiment 2 Reporting the Activity Date of This ADC | [207] | ||||
| Efficacy Data | Half Maximal Inhibitory Concentration (IC50) |
0.80 ng/mL
|
Positive CD70 expression (CD70+++/++) | ||
| Method Description |
Log phase cultures of cells were collected and cells plated at seeding densities ranging from 500 - 10,000 cells/well according to pre-determined conditions.After incubating 24 hours to allow surface protein reconstitution, serial dilutions of test conjugates were added and cultures incubated further for 4 days.
|
||||
| In Vitro Model | Clear cell renal cell carcinoma | Caki-1 cells | CVCL_0234 | ||
hBU12-33 MMAE [Investigative]
Revealed Based on the Cell Line Data
| Experiment 1 Reporting the Activity Date of This ADC | [207] | ||||
| Efficacy Data | Half Maximal Inhibitory Concentration (IC50) |
0.80 ng/mL
|
Positive CD70 expression (CD70+++/++) | ||
| Method Description |
Log phase cultures of cells were collected and cells plated at seeding densities ranging from 500 - 10,000 cells/well according to pre-determined conditions.After incubating 24 hours to allow surface protein reconstitution, serial dilutions of test conjugates were added and cultures incubated further for 4 days.
|
||||
| In Vitro Model | Renal cell carcinoma | 786-O cells | CVCL_1051 | ||
| Experiment 2 Reporting the Activity Date of This ADC | [207] | ||||
| Efficacy Data | Half Maximal Inhibitory Concentration (IC50) |
0.80 ng/mL
|
Positive CD70 expression (CD70+++/++) | ||
| Method Description |
Log phase cultures of cells were collected and cells plated at seeding densities ranging from 500 - 10,000 cells/well according to pre-determined conditions.After incubating 24 hours to allow surface protein reconstitution, serial dilutions of test conjugates were added and cultures incubated further for 4 days.
|
||||
| In Vitro Model | Clear cell renal cell carcinoma | Caki-1 cells | CVCL_0234 | ||
WO2015095755A1 cAC10-1.3 [Investigative]
Revealed Based on the Cell Line Data
| Experiment 1 Reporting the Activity Date of This ADC | [263] | ||||
| Efficacy Data | Half Maximal Inhibitory Concentration (IC50) |
0.80 ng/mL
|
Positive CD30 expression (CD30+++/++); Negative CD70 expression (CD70-) | ||
| Method Description |
Cell-based in vitro assays are used to measure viability (proliferation), cytotoxicity,and induction of apoptosis of the ADC of the invention. Culturing the cells for a period from about 6 hours to about 5 days and measuring cell viability.
|
||||
| In Vitro Model | ALK-positive anaplastic large cell lymphoma | Karpas-299 cells | CVCL_1324 | ||
| Experiment 2 Reporting the Activity Date of This ADC | [263] | ||||
| Efficacy Data | Half Maximal Inhibitory Concentration (IC50) |
3.00 ng/mL
|
Positive CD30 expression (CD30+++/++); Low CD70 expression (CD70+) | ||
| Method Description |
Cell-based in vitro assays are used to measure viability (proliferation), cytotoxicity,and induction of apoptosis of the ADC of the invention. Culturing the cells for a period from about 6 hours to about 5 days and measuring cell viability.
|
||||
| In Vitro Model | Hodgkin's disease | L540cy cells | Homo sapiens | ||
| Experiment 3 Reporting the Activity Date of This ADC | [263] | ||||
| Efficacy Data | Half Maximal Inhibitory Concentration (IC50) | > 1000 ng/mL | Positive CD70 expression (CD70+++/++); Negative CD30 expression (CD30-) | ||
| Method Description |
Cell-based in vitro assays are used to measure viability (proliferation), cytotoxicity,and induction of apoptosis of the ADC of the invention. Culturing the cells for a period from about 6 hours to about 5 days and measuring cell viability.
|
||||
| In Vitro Model | Renal cell carcinoma | 786-O cells | CVCL_1051 | ||
| Experiment 4 Reporting the Activity Date of This ADC | [263] | ||||
| Efficacy Data | Half Maximal Inhibitory Concentration (IC50) | > 1000 ng/mL | Positive CD70 expression (CD70+++/++); Negative CD30 expression (CD30-) | ||
| Method Description |
Cell-based in vitro assays are used to measure viability (proliferation), cytotoxicity,and induction of apoptosis of the ADC of the invention. Culturing the cells for a period from about 6 hours to about 5 days and measuring cell viability.
|
||||
| In Vitro Model | Clear cell renal cell carcinoma | Caki-1 cells | CVCL_0234 | ||
h1F6-39 MMAE [Investigative]
Revealed Based on the Cell Line Data
| Experiment 1 Reporting the Activity Date of This ADC | [207] | ||||
| Efficacy Data | Half Maximal Inhibitory Concentration (IC50) |
3.00 ng/mL
|
Positive CD70 expression (CD70+++/++) | ||
| Method Description |
Log phase cultures of cells were collected and cells plated at seeding densities ranging from 500 - 10,000 cells/well according to pre-determined conditions.After incubating 24 hours to allow surface protein reconstitution, serial dilutions of test conjugates were added and cultures incubated further for 4 days.
|
||||
| In Vitro Model | Renal cell carcinoma | 786-O cells | CVCL_1051 | ||
| Experiment 2 Reporting the Activity Date of This ADC | [207] | ||||
| Efficacy Data | Half Maximal Inhibitory Concentration (IC50) |
3.00 ng/mL
|
Positive CD70 expression (CD70+++/++) | ||
| Method Description |
Log phase cultures of cells were collected and cells plated at seeding densities ranging from 500 - 10,000 cells/well according to pre-determined conditions.After incubating 24 hours to allow surface protein reconstitution, serial dilutions of test conjugates were added and cultures incubated further for 4 days.
|
||||
| In Vitro Model | Clear cell renal cell carcinoma | Caki-1 cells | CVCL_0234 | ||
hBU12-39 MMAE [Investigative]
Revealed Based on the Cell Line Data
| Experiment 1 Reporting the Activity Date of This ADC | [207] | ||||
| Efficacy Data | Half Maximal Inhibitory Concentration (IC50) |
3.00 ng/mL
|
Positive CD70 expression (CD70+++/++) | ||
| Method Description |
Log phase cultures of cells were collected and cells plated at seeding densities ranging from 500 - 10,000 cells/well according to pre-determined conditions.After incubating 24 hours to allow surface protein reconstitution, serial dilutions of test conjugates were added and cultures incubated further for 4 days.
|
||||
| In Vitro Model | Renal cell carcinoma | 786-O cells | CVCL_1051 | ||
| Experiment 2 Reporting the Activity Date of This ADC | [207] | ||||
| Efficacy Data | Half Maximal Inhibitory Concentration (IC50) |
3.00 ng/mL
|
Positive CD70 expression (CD70+++/++) | ||
| Method Description |
Log phase cultures of cells were collected and cells plated at seeding densities ranging from 500 - 10,000 cells/well according to pre-determined conditions.After incubating 24 hours to allow surface protein reconstitution, serial dilutions of test conjugates were added and cultures incubated further for 4 days.
|
||||
| In Vitro Model | Clear cell renal cell carcinoma | Caki-1 cells | CVCL_0234 | ||
h1F6-38 MMAE [Investigative]
Revealed Based on the Cell Line Data
| Experiment 1 Reporting the Activity Date of This ADC | [207] | ||||
| Efficacy Data | Half Maximal Inhibitory Concentration (IC50) |
3.00 ng/mL
|
Positive CD70 expression (CD70+++/++) | ||
| Method Description |
Log phase cultures of cells were collected and cells plated at seeding densities ranging from 500 - 10,000 cells/well according to pre-determined conditions.After incubating 24 hours to allow surface protein reconstitution, serial dilutions of test conjugates were added and cultures incubated further for 4 days.
|
||||
| In Vitro Model | Renal cell carcinoma | 786-O cells | CVCL_1051 | ||
| Experiment 2 Reporting the Activity Date of This ADC | [207] | ||||
| Efficacy Data | Half Maximal Inhibitory Concentration (IC50) |
3.00 ng/mL
|
Positive CD70 expression (CD70+++/++) | ||
| Method Description |
Log phase cultures of cells were collected and cells plated at seeding densities ranging from 500 - 10,000 cells/well according to pre-determined conditions.After incubating 24 hours to allow surface protein reconstitution, serial dilutions of test conjugates were added and cultures incubated further for 4 days.
|
||||
| In Vitro Model | Clear cell renal cell carcinoma | Caki-1 cells | CVCL_0234 | ||
hBU12-38 MMAE [Investigative]
Revealed Based on the Cell Line Data
| Experiment 1 Reporting the Activity Date of This ADC | [207] | ||||
| Efficacy Data | Half Maximal Inhibitory Concentration (IC50) |
3.00 ng/mL
|
Positive CD70 expression (CD70+++/++) | ||
| Method Description |
Log phase cultures of cells were collected and cells plated at seeding densities ranging from 500 - 10,000 cells/well according to pre-determined conditions.After incubating 24 hours to allow surface protein reconstitution, serial dilutions of test conjugates were added and cultures incubated further for 4 days.
|
||||
| In Vitro Model | Renal cell carcinoma | 786-O cells | CVCL_1051 | ||
| Experiment 2 Reporting the Activity Date of This ADC | [207] | ||||
| Efficacy Data | Half Maximal Inhibitory Concentration (IC50) |
3.00 ng/mL
|
Positive CD70 expression (CD70+++/++) | ||
| Method Description |
Log phase cultures of cells were collected and cells plated at seeding densities ranging from 500 - 10,000 cells/well according to pre-determined conditions.After incubating 24 hours to allow surface protein reconstitution, serial dilutions of test conjugates were added and cultures incubated further for 4 days.
|
||||
| In Vitro Model | Clear cell renal cell carcinoma | Caki-1 cells | CVCL_0234 | ||
h1F6-35 MMAE [Investigative]
Revealed Based on the Cell Line Data
| Experiment 1 Reporting the Activity Date of This ADC | [207] | ||||
| Efficacy Data | Half Maximal Inhibitory Concentration (IC50) |
3.00 ng/mL
|
Positive CD70 expression (CD70+++/++) | ||
| Method Description |
Log phase cultures of cells were collected and cells plated at seeding densities ranging from 500 - 10,000 cells/well according to pre-determined conditions.After incubating 24 hours to allow surface protein reconstitution, serial dilutions of test conjugates were added and cultures incubated further for 4 days.
|
||||
| In Vitro Model | Renal cell carcinoma | 786-O cells | CVCL_1051 | ||
| Experiment 2 Reporting the Activity Date of This ADC | [207] | ||||
| Efficacy Data | Half Maximal Inhibitory Concentration (IC50) |
3.00 ng/mL
|
Positive CD70 expression (CD70+++/++) | ||
| Method Description |
Log phase cultures of cells were collected and cells plated at seeding densities ranging from 500 - 10,000 cells/well according to pre-determined conditions.After incubating 24 hours to allow surface protein reconstitution, serial dilutions of test conjugates were added and cultures incubated further for 4 days.
|
||||
| In Vitro Model | Clear cell renal cell carcinoma | Caki-1 cells | CVCL_0234 | ||
hBU12-35 MMAE [Investigative]
Revealed Based on the Cell Line Data
| Experiment 1 Reporting the Activity Date of This ADC | [207] | ||||
| Efficacy Data | Half Maximal Inhibitory Concentration (IC50) |
3.00 ng/mL
|
Positive CD70 expression (CD70+++/++) | ||
| Method Description |
Log phase cultures of cells were collected and cells plated at seeding densities ranging from 500 - 10,000 cells/well according to pre-determined conditions.After incubating 24 hours to allow surface protein reconstitution, serial dilutions of test conjugates were added and cultures incubated further for 4 days.
|
||||
| In Vitro Model | Renal cell carcinoma | 786-O cells | CVCL_1051 | ||
| Experiment 2 Reporting the Activity Date of This ADC | [207] | ||||
| Efficacy Data | Half Maximal Inhibitory Concentration (IC50) |
3.00 ng/mL
|
Positive CD70 expression (CD70+++/++) | ||
| Method Description |
Log phase cultures of cells were collected and cells plated at seeding densities ranging from 500 - 10,000 cells/well according to pre-determined conditions.After incubating 24 hours to allow surface protein reconstitution, serial dilutions of test conjugates were added and cultures incubated further for 4 days.
|
||||
| In Vitro Model | Clear cell renal cell carcinoma | Caki-1 cells | CVCL_0234 | ||
h1F6-34 MMAE [Investigative]
Revealed Based on the Cell Line Data
| Experiment 1 Reporting the Activity Date of This ADC | [207] | ||||
| Efficacy Data | Half Maximal Inhibitory Concentration (IC50) |
3.00 ng/mL
|
Positive CD70 expression (CD70+++/++) | ||
| Method Description |
Log phase cultures of cells were collected and cells plated at seeding densities ranging from 500 - 10,000 cells/well according to pre-determined conditions.After incubating 24 hours to allow surface protein reconstitution, serial dilutions of test conjugates were added and cultures incubated further for 4 days.
|
||||
| In Vitro Model | Renal cell carcinoma | 786-O cells | CVCL_1051 | ||
| Experiment 2 Reporting the Activity Date of This ADC | [207] | ||||
| Efficacy Data | Half Maximal Inhibitory Concentration (IC50) |
6.00 ng/mL
|
Positive CD70 expression (CD70+++/++) | ||
| Method Description |
Log phase cultures of cells were collected and cells plated at seeding densities ranging from 500 - 10,000 cells/well according to pre-determined conditions.After incubating 24 hours to allow surface protein reconstitution, serial dilutions of test conjugates were added and cultures incubated further for 4 days.
|
||||
| In Vitro Model | Clear cell renal cell carcinoma | Caki-1 cells | CVCL_0234 | ||
hBU12-34 MMAE [Investigative]
Revealed Based on the Cell Line Data
| Experiment 1 Reporting the Activity Date of This ADC | [207] | ||||
| Efficacy Data | Half Maximal Inhibitory Concentration (IC50) |
3.00 ng/mL
|
Positive CD70 expression (CD70+++/++) | ||
| Method Description |
Log phase cultures of cells were collected and cells plated at seeding densities ranging from 500 - 10,000 cells/well according to pre-determined conditions.After incubating 24 hours to allow surface protein reconstitution, serial dilutions of test conjugates were added and cultures incubated further for 4 days.
|
||||
| In Vitro Model | Renal cell carcinoma | 786-O cells | CVCL_1051 | ||
| Experiment 2 Reporting the Activity Date of This ADC | [207] | ||||
| Efficacy Data | Half Maximal Inhibitory Concentration (IC50) |
6.00 ng/mL
|
Positive CD70 expression (CD70+++/++) | ||
| Method Description |
Log phase cultures of cells were collected and cells plated at seeding densities ranging from 500 - 10,000 cells/well according to pre-determined conditions.After incubating 24 hours to allow surface protein reconstitution, serial dilutions of test conjugates were added and cultures incubated further for 4 days.
|
||||
| In Vitro Model | Clear cell renal cell carcinoma | Caki-1 cells | CVCL_0234 | ||
h1F6-32 MMAE [Investigative]
Revealed Based on the Cell Line Data
| Experiment 1 Reporting the Activity Date of This ADC | [207] | ||||
| Efficacy Data | Half Maximal Inhibitory Concentration (IC50) |
3.00 ng/mL
|
Positive CD70 expression (CD70+++/++) | ||
| Method Description |
Log phase cultures of cells were collected and cells plated at seeding densities ranging from 500 - 10,000 cells/well according to pre-determined conditions.After incubating 24 hours to allow surface protein reconstitution, serial dilutions of test conjugates were added and cultures incubated further for 4 days.
|
||||
| In Vitro Model | Clear cell renal cell carcinoma | Caki-1 cells | CVCL_0234 | ||
| Experiment 2 Reporting the Activity Date of This ADC | [207] | ||||
| Efficacy Data | Half Maximal Inhibitory Concentration (IC50) |
5.00 ng/mL
|
Positive CD70 expression (CD70+++/++) | ||
| Method Description |
Log phase cultures of cells were collected and cells plated at seeding densities ranging from 500 - 10,000 cells/well according to pre-determined conditions.After incubating 24 hours to allow surface protein reconstitution, serial dilutions of test conjugates were added and cultures incubated further for 4 days.
|
||||
| In Vitro Model | Renal cell carcinoma | 786-O cells | CVCL_1051 | ||
hBU12-32 MMAE [Investigative]
Revealed Based on the Cell Line Data
| Experiment 1 Reporting the Activity Date of This ADC | [207] | ||||
| Efficacy Data | Half Maximal Inhibitory Concentration (IC50) |
3.00 ng/mL
|
Positive CD70 expression (CD70+++/++) | ||
| Method Description |
Log phase cultures of cells were collected and cells plated at seeding densities ranging from 500 - 10,000 cells/well according to pre-determined conditions.After incubating 24 hours to allow surface protein reconstitution, serial dilutions of test conjugates were added and cultures incubated further for 4 days.
|
||||
| In Vitro Model | Clear cell renal cell carcinoma | Caki-1 cells | CVCL_0234 | ||
| Experiment 2 Reporting the Activity Date of This ADC | [207] | ||||
| Efficacy Data | Half Maximal Inhibitory Concentration (IC50) |
5.00 ng/mL
|
Positive CD70 expression (CD70+++/++) | ||
| Method Description |
Log phase cultures of cells were collected and cells plated at seeding densities ranging from 500 - 10,000 cells/well according to pre-determined conditions.After incubating 24 hours to allow surface protein reconstitution, serial dilutions of test conjugates were added and cultures incubated further for 4 days.
|
||||
| In Vitro Model | Renal cell carcinoma | 786-O cells | CVCL_1051 | ||
h1F6-9 MMAE [Investigative]
Revealed Based on the Cell Line Data
| Experiment 1 Reporting the Activity Date of This ADC | [207] | ||||
| Efficacy Data | Half Maximal Inhibitory Concentration (IC50) |
3.00 ng/mL
|
Positive CD70 expression (CD70+++/++) | ||
| Method Description |
Log phase cultures of cells were collected and cells plated at seeding densities ranging from 500 - 10,000 cells/well according to pre-determined conditions.After incubating 24 hours to allow surface protein reconstitution, serial dilutions of test conjugates were added and cultures incubated further for 4 days.
|
||||
| In Vitro Model | Renal cell carcinoma | 786-O cells | CVCL_1051 | ||
| Experiment 2 Reporting the Activity Date of This ADC | [207] | ||||
| Efficacy Data | Half Maximal Inhibitory Concentration (IC50) |
21.00 ng/mL
|
Positive CD70 expression (CD70+++/++) | ||
| Method Description |
Log phase cultures of cells were collected and cells plated at seeding densities ranging from 500 - 10,000 cells/well according to pre-determined conditions.After incubating 24 hours to allow surface protein reconstitution, serial dilutions of test conjugates were added and cultures incubated further for 4 days.
|
||||
| In Vitro Model | Clear cell renal cell carcinoma | Caki-1 cells | CVCL_0234 | ||
hBU12-9 MMAE [Investigative]
Revealed Based on the Cell Line Data
| Experiment 1 Reporting the Activity Date of This ADC | [207] | ||||
| Efficacy Data | Half Maximal Inhibitory Concentration (IC50) |
3.00 ng/mL
|
Positive CD70 expression (CD70+++/++) | ||
| Method Description |
Log phase cultures of cells were collected and cells plated at seeding densities ranging from 500 - 10,000 cells/well according to pre-determined conditions.After incubating 24 hours to allow surface protein reconstitution, serial dilutions of test conjugates were added and cultures incubated further for 4 days.
|
||||
| In Vitro Model | Renal cell carcinoma | 786-O cells | CVCL_1051 | ||
| Experiment 2 Reporting the Activity Date of This ADC | [207] | ||||
| Efficacy Data | Half Maximal Inhibitory Concentration (IC50) |
21.00 ng/mL
|
Positive CD70 expression (CD70+++/++) | ||
| Method Description |
Log phase cultures of cells were collected and cells plated at seeding densities ranging from 500 - 10,000 cells/well according to pre-determined conditions.After incubating 24 hours to allow surface protein reconstitution, serial dilutions of test conjugates were added and cultures incubated further for 4 days.
|
||||
| In Vitro Model | Clear cell renal cell carcinoma | Caki-1 cells | CVCL_0234 | ||
h1F6-37 MMAE [Investigative]
Revealed Based on the Cell Line Data
| Experiment 1 Reporting the Activity Date of This ADC | [207] | ||||
| Efficacy Data | Half Maximal Inhibitory Concentration (IC50) |
4.00 ng/mL
|
Positive CD70 expression (CD70+++/++) | ||
| Method Description |
Log phase cultures of cells were collected and cells plated at seeding densities ranging from 500 - 10,000 cells/well according to pre-determined conditions.After incubating 24 hours to allow surface protein reconstitution, serial dilutions of test conjugates were added and cultures incubated further for 4 days.
|
||||
| In Vitro Model | Renal cell carcinoma | 786-O cells | CVCL_1051 | ||
| Experiment 2 Reporting the Activity Date of This ADC | [207] | ||||
| Efficacy Data | Half Maximal Inhibitory Concentration (IC50) |
4.00 ng/mL
|
Positive CD70 expression (CD70+++/++) | ||
| Method Description |
Log phase cultures of cells were collected and cells plated at seeding densities ranging from 500 - 10,000 cells/well according to pre-determined conditions.After incubating 24 hours to allow surface protein reconstitution, serial dilutions of test conjugates were added and cultures incubated further for 4 days.
|
||||
| In Vitro Model | Clear cell renal cell carcinoma | Caki-1 cells | CVCL_0234 | ||
hBU12-37 MMAE [Investigative]
Revealed Based on the Cell Line Data
| Experiment 1 Reporting the Activity Date of This ADC | [207] | ||||
| Efficacy Data | Half Maximal Inhibitory Concentration (IC50) |
4.00 ng/mL
|
Positive CD70 expression (CD70+++/++) | ||
| Method Description |
Log phase cultures of cells were collected and cells plated at seeding densities ranging from 500 - 10,000 cells/well according to pre-determined conditions.After incubating 24 hours to allow surface protein reconstitution, serial dilutions of test conjugates were added and cultures incubated further for 4 days.
|
||||
| In Vitro Model | Renal cell carcinoma | 786-O cells | CVCL_1051 | ||
| Experiment 2 Reporting the Activity Date of This ADC | [207] | ||||
| Efficacy Data | Half Maximal Inhibitory Concentration (IC50) |
4.00 ng/mL
|
Positive CD70 expression (CD70+++/++) | ||
| Method Description |
Log phase cultures of cells were collected and cells plated at seeding densities ranging from 500 - 10,000 cells/well according to pre-determined conditions.After incubating 24 hours to allow surface protein reconstitution, serial dilutions of test conjugates were added and cultures incubated further for 4 days.
|
||||
| In Vitro Model | Clear cell renal cell carcinoma | Caki-1 cells | CVCL_0234 | ||
h1F6-8 MMAE [Investigative]
Revealed Based on the Cell Line Data
| Experiment 1 Reporting the Activity Date of This ADC | [207] | ||||
| Efficacy Data | Half Maximal Inhibitory Concentration (IC50) |
4.00 ng/mL
|
Positive CD70 expression (CD70+++/++) | ||
| Method Description |
Log phase cultures of cells were collected and cells plated at seeding densities ranging from 500 - 10,000 cells/well according to pre-determined conditions.After incubating 24 hours to allow surface protein reconstitution, serial dilutions of test conjugates were added and cultures incubated further for 4 days.
|
||||
| In Vitro Model | Renal cell carcinoma | 786-O cells | CVCL_1051 | ||
| Experiment 2 Reporting the Activity Date of This ADC | [207] | ||||
| Efficacy Data | Half Maximal Inhibitory Concentration (IC50) |
19.00 ng/mL
|
Positive CD70 expression (CD70+++/++) | ||
| Method Description |
Log phase cultures of cells were collected and cells plated at seeding densities ranging from 500 - 10,000 cells/well according to pre-determined conditions.After incubating 24 hours to allow surface protein reconstitution, serial dilutions of test conjugates were added and cultures incubated further for 4 days.
|
||||
| In Vitro Model | Clear cell renal cell carcinoma | Caki-1 cells | CVCL_0234 | ||
hBU12-8 MMAE [Investigative]
Revealed Based on the Cell Line Data
| Experiment 1 Reporting the Activity Date of This ADC | [207] | ||||
| Efficacy Data | Half Maximal Inhibitory Concentration (IC50) |
4.00 ng/mL
|
Positive CD70 expression (CD70+++/++) | ||
| Method Description |
Log phase cultures of cells were collected and cells plated at seeding densities ranging from 500 - 10,000 cells/well according to pre-determined conditions.After incubating 24 hours to allow surface protein reconstitution, serial dilutions of test conjugates were added and cultures incubated further for 4 days.
|
||||
| In Vitro Model | Renal cell carcinoma | 786-O cells | CVCL_1051 | ||
| Experiment 2 Reporting the Activity Date of This ADC | [207] | ||||
| Efficacy Data | Half Maximal Inhibitory Concentration (IC50) |
19.00 ng/mL
|
Positive CD70 expression (CD70+++/++) | ||
| Method Description |
Log phase cultures of cells were collected and cells plated at seeding densities ranging from 500 - 10,000 cells/well according to pre-determined conditions.After incubating 24 hours to allow surface protein reconstitution, serial dilutions of test conjugates were added and cultures incubated further for 4 days.
|
||||
| In Vitro Model | Clear cell renal cell carcinoma | Caki-1 cells | CVCL_0234 | ||
h1F6-7 MMAE DAR8 [Investigative]
Revealed Based on the Cell Line Data
| Experiment 1 Reporting the Activity Date of This ADC | [207] | ||||
| Efficacy Data | Half Maximal Inhibitory Concentration (IC50) |
4.00 ng/mL
|
Positive CD70 expression (CD70+++/++) | ||
| Method Description |
Log phase cultures of cells were collected and cells plated at seeding densities ranging from 500 - 10,000 cells/well according to pre-determined conditions.After incubating 24 hours to allow surface protein reconstitution, serial dilutions of test conjugates were added and cultures incubated further for 4 days.
|
||||
| In Vitro Model | Renal cell carcinoma | 786-O cells | CVCL_1051 | ||
| Experiment 2 Reporting the Activity Date of This ADC | [207] | ||||
| Efficacy Data | Half Maximal Inhibitory Concentration (IC50) |
24.00 ng/mL
|
Positive CD70 expression (CD70+++/++) | ||
| Method Description |
Log phase cultures of cells were collected and cells plated at seeding densities ranging from 500 - 10,000 cells/well according to pre-determined conditions.After incubating 24 hours to allow surface protein reconstitution, serial dilutions of test conjugates were added and cultures incubated further for 4 days.
|
||||
| In Vitro Model | Clear cell renal cell carcinoma | Caki-1 cells | CVCL_0234 | ||
hBU12-7 MMAE DAR8 [Investigative]
Revealed Based on the Cell Line Data
| Experiment 1 Reporting the Activity Date of This ADC | [207] | ||||
| Efficacy Data | Half Maximal Inhibitory Concentration (IC50) |
4.00 ng/mL
|
Positive CD70 expression (CD70+++/++) | ||
| Method Description |
Log phase cultures of cells were collected and cells plated at seeding densities ranging from 500 - 10,000 cells/well according to pre-determined conditions.After incubating 24 hours to allow surface protein reconstitution, serial dilutions of test conjugates were added and cultures incubated further for 4 days.
|
||||
| In Vitro Model | Renal cell carcinoma | 786-O cells | CVCL_1051 | ||
| Experiment 2 Reporting the Activity Date of This ADC | [207] | ||||
| Efficacy Data | Half Maximal Inhibitory Concentration (IC50) |
24.00 ng/mL
|
Positive CD70 expression (CD70+++/++) | ||
| Method Description |
Log phase cultures of cells were collected and cells plated at seeding densities ranging from 500 - 10,000 cells/well according to pre-determined conditions.After incubating 24 hours to allow surface protein reconstitution, serial dilutions of test conjugates were added and cultures incubated further for 4 days.
|
||||
| In Vitro Model | Clear cell renal cell carcinoma | Caki-1 cells | CVCL_0234 | ||
RGCLN18.2-D07-Val-Cit-PAB-MMAE [Investigative]
Revealed Based on the Cell Line Data
| Experiment 1 Reporting the Activity Date of This ADC | [194] | ||||
| Efficacy Data | Half Maximal Inhibitory Concentration (IC50) |
4.94 ng/mL
|
Positive CLDN18.2 expression (CLDN18.2 +++/++) | ||
| Method Description |
Cells were plated at about 500 cells per well in a 96-well plate in 100 uL of media. In vitro activity and targeted delivery of ADCs, the isotype-matched negative controls ADCs, and naked antibodies control were assessed in cells.
|
||||
| In Vitro Model | Gastric tubular adenocarcinoma | NCI-N87 cells | CVCL_1603 | ||
h1F6-10 MMAE [Investigative]
Revealed Based on the Cell Line Data
| Experiment 1 Reporting the Activity Date of This ADC | [207] | ||||
| Efficacy Data | Half Maximal Inhibitory Concentration (IC50) |
5.00 ng/mL
|
Positive CD70 expression (CD70+++/++) | ||
| Method Description |
Log phase cultures of cells were collected and cells plated at seeding densities ranging from 500 - 10,000 cells/well according to pre-determined conditions.After incubating 24 hours to allow surface protein reconstitution, serial dilutions of test conjugates were added and cultures incubated further for 4 days.
|
||||
| In Vitro Model | Renal cell carcinoma | 786-O cells | CVCL_1051 | ||
| Experiment 2 Reporting the Activity Date of This ADC | [207] | ||||
| Efficacy Data | Half Maximal Inhibitory Concentration (IC50) |
57.00 ng/mL
|
Positive CD70 expression (CD70+++/++) | ||
| Method Description |
Log phase cultures of cells were collected and cells plated at seeding densities ranging from 500 - 10,000 cells/well according to pre-determined conditions.After incubating 24 hours to allow surface protein reconstitution, serial dilutions of test conjugates were added and cultures incubated further for 4 days.
|
||||
| In Vitro Model | Clear cell renal cell carcinoma | Caki-1 cells | CVCL_0234 | ||
hBU12-10 MMAE [Investigative]
Revealed Based on the Cell Line Data
| Experiment 1 Reporting the Activity Date of This ADC | [207] | ||||
| Efficacy Data | Half Maximal Inhibitory Concentration (IC50) |
5.00 ng/mL
|
Positive CD70 expression (CD70+++/++) | ||
| Method Description |
Log phase cultures of cells were collected and cells plated at seeding densities ranging from 500 - 10,000 cells/well according to pre-determined conditions.After incubating 24 hours to allow surface protein reconstitution, serial dilutions of test conjugates were added and cultures incubated further for 4 days.
|
||||
| In Vitro Model | Renal cell carcinoma | 786-O cells | CVCL_1051 | ||
| Experiment 2 Reporting the Activity Date of This ADC | [207] | ||||
| Efficacy Data | Half Maximal Inhibitory Concentration (IC50) |
57.00 ng/mL
|
Positive CD70 expression (CD70+++/++) | ||
| Method Description |
Log phase cultures of cells were collected and cells plated at seeding densities ranging from 500 - 10,000 cells/well according to pre-determined conditions.After incubating 24 hours to allow surface protein reconstitution, serial dilutions of test conjugates were added and cultures incubated further for 4 days.
|
||||
| In Vitro Model | Clear cell renal cell carcinoma | Caki-1 cells | CVCL_0234 | ||
RGCLN18.2-PY-Val-Cit-PAB-MMAE [Investigative]
Revealed Based on the Cell Line Data
| Experiment 1 Reporting the Activity Date of This ADC | [194] | ||||
| Efficacy Data | Half Maximal Inhibitory Concentration (IC50) |
6.23 ng/mL
|
Positive CLDN18.2 expression (CLDN18.2 +++/++) | ||
| Method Description |
Cells were plated at about 500 cells per well in a 96-well plate in 100 uL of media. In vitro activity and targeted delivery of ADCs, the isotype-matched negative controls ADCs, and naked antibodies control were assessed in cells.
|
||||
| In Vitro Model | Gastric tubular adenocarcinoma | NCI-N87 cells | CVCL_1603 | ||
H-1-vcMMAE [Investigative]
Revealed Based on the Cell Line Data
| Experiment 1 Reporting the Activity Date of This ADC | [264] | ||||
| Efficacy Data | Half Maximal Inhibitory Concentration (IC50) |
6.70 ng/mL
|
High HER2 expression (HER2+++) | ||
| Method Description |
The MTS cell proliferation assay was performed as follows: CellTiter 96 Aqueous Non-Radioactive Cell proliferation Kit is used to determine the number of viable cells in cell proliferation assay. Tumor cells are plated at certain seeding densities in sterile 384-well black clear bottom Matrix plates at 40 uL per well and incubated overnight at 37°C in 5% CO2 before assaying.
Click to Show/Hide
|
||||
| In Vitro Model | Breast adenocarcinoma | SK-BR-3 cells | CVCL_0033 | ||
h1F6-28 MMAE [Investigative]
Revealed Based on the Cell Line Data
| Experiment 1 Reporting the Activity Date of This ADC | [207] | ||||
| Efficacy Data | Half Maximal Inhibitory Concentration (IC50) |
7.00 ng/mL
|
Positive CD70 expression (CD70+++/++) | ||
| Method Description |
Log phase cultures of cells were collected and cells plated at seeding densities ranging from 500 - 10,000 cells/well according to pre-determined conditions.After incubating 24 hours to allow surface protein reconstitution, serial dilutions of test conjugates were added and cultures incubated further for 4 days.
|
||||
| In Vitro Model | Renal cell carcinoma | 786-O cells | CVCL_1051 | ||
| Experiment 2 Reporting the Activity Date of This ADC | [207] | ||||
| Efficacy Data | Half Maximal Inhibitory Concentration (IC50) |
21.00 ng/mL
|
Positive CD70 expression (CD70+++/++) | ||
| Method Description |
Log phase cultures of cells were collected and cells plated at seeding densities ranging from 500 - 10,000 cells/well according to pre-determined conditions.After incubating 24 hours to allow surface protein reconstitution, serial dilutions of test conjugates were added and cultures incubated further for 4 days.
|
||||
| In Vitro Model | Clear cell renal cell carcinoma | Caki-1 cells | CVCL_0234 | ||
hBU12-28 MMAE [Investigative]
Revealed Based on the Cell Line Data
| Experiment 1 Reporting the Activity Date of This ADC | [207] | ||||
| Efficacy Data | Half Maximal Inhibitory Concentration (IC50) |
7.00 ng/mL
|
Positive CD70 expression (CD70+++/++) | ||
| Method Description |
Log phase cultures of cells were collected and cells plated at seeding densities ranging from 500 - 10,000 cells/well according to pre-determined conditions.After incubating 24 hours to allow surface protein reconstitution, serial dilutions of test conjugates were added and cultures incubated further for 4 days.
|
||||
| In Vitro Model | Renal cell carcinoma | 786-O cells | CVCL_1051 | ||
| Experiment 2 Reporting the Activity Date of This ADC | [207] | ||||
| Efficacy Data | Half Maximal Inhibitory Concentration (IC50) |
21.00 ng/mL
|
Positive CD70 expression (CD70+++/++) | ||
| Method Description |
Log phase cultures of cells were collected and cells plated at seeding densities ranging from 500 - 10,000 cells/well according to pre-determined conditions.After incubating 24 hours to allow surface protein reconstitution, serial dilutions of test conjugates were added and cultures incubated further for 4 days.
|
||||
| In Vitro Model | Clear cell renal cell carcinoma | Caki-1 cells | CVCL_0234 | ||
h1F6-27 MMAE [Investigative]
Revealed Based on the Cell Line Data
| Experiment 1 Reporting the Activity Date of This ADC | [207] | ||||
| Efficacy Data | Half Maximal Inhibitory Concentration (IC50) |
7.00 ng/mL
|
Positive CD70 expression (CD70+++/++) | ||
| Method Description |
Log phase cultures of cells were collected and cells plated at seeding densities ranging from 500 - 10,000 cells/well according to pre-determined conditions.After incubating 24 hours to allow surface protein reconstitution, serial dilutions of test conjugates were added and cultures incubated further for 4 days.
|
||||
| In Vitro Model | Renal cell carcinoma | 786-O cells | CVCL_1051 | ||
| Experiment 2 Reporting the Activity Date of This ADC | [207] | ||||
| Efficacy Data | Half Maximal Inhibitory Concentration (IC50) |
15.00 ng/mL
|
Positive CD70 expression (CD70+++/++) | ||
| Method Description |
Log phase cultures of cells were collected and cells plated at seeding densities ranging from 500 - 10,000 cells/well according to pre-determined conditions.After incubating 24 hours to allow surface protein reconstitution, serial dilutions of test conjugates were added and cultures incubated further for 4 days.
|
||||
| In Vitro Model | Clear cell renal cell carcinoma | Caki-1 cells | CVCL_0234 | ||
hBU12-27 MMAE [Investigative]
Revealed Based on the Cell Line Data
| Experiment 1 Reporting the Activity Date of This ADC | [207] | ||||
| Efficacy Data | Half Maximal Inhibitory Concentration (IC50) |
7.00 ng/mL
|
Positive CD70 expression (CD70+++/++) | ||
| Method Description |
Log phase cultures of cells were collected and cells plated at seeding densities ranging from 500 - 10,000 cells/well according to pre-determined conditions.After incubating 24 hours to allow surface protein reconstitution, serial dilutions of test conjugates were added and cultures incubated further for 4 days.
|
||||
| In Vitro Model | Renal cell carcinoma | 786-O cells | CVCL_1051 | ||
| Experiment 2 Reporting the Activity Date of This ADC | [207] | ||||
| Efficacy Data | Half Maximal Inhibitory Concentration (IC50) |
15.00 ng/mL
|
Positive CD70 expression (CD70+++/++) | ||
| Method Description |
Log phase cultures of cells were collected and cells plated at seeding densities ranging from 500 - 10,000 cells/well according to pre-determined conditions.After incubating 24 hours to allow surface protein reconstitution, serial dilutions of test conjugates were added and cultures incubated further for 4 days.
|
||||
| In Vitro Model | Clear cell renal cell carcinoma | Caki-1 cells | CVCL_0234 | ||
h1F6-19 MMAE [Investigative]
Revealed Based on the Cell Line Data
| Experiment 1 Reporting the Activity Date of This ADC | [207] | ||||
| Efficacy Data | Half Maximal Inhibitory Concentration (IC50) |
7.00 ng/mL
|
Positive CD70 expression (CD70+++/++) | ||
| Method Description |
Log phase cultures of cells were collected and cells plated at seeding densities ranging from 500 - 10,000 cells/well according to pre-determined conditions.After incubating 24 hours to allow surface protein reconstitution, serial dilutions of test conjugates were added and cultures incubated further for 4 days.
|
||||
| In Vitro Model | Renal cell carcinoma | 786-O cells | CVCL_1051 | ||
| Experiment 2 Reporting the Activity Date of This ADC | [207] | ||||
| Efficacy Data | Half Maximal Inhibitory Concentration (IC50) |
20.00 ng/mL
|
Positive CD70 expression (CD70+++/++) | ||
| Method Description |
Log phase cultures of cells were collected and cells plated at seeding densities ranging from 500 - 10,000 cells/well according to pre-determined conditions.After incubating 24 hours to allow surface protein reconstitution, serial dilutions of test conjugates were added and cultures incubated further for 4 days.
|
||||
| In Vitro Model | Clear cell renal cell carcinoma | Caki-1 cells | CVCL_0234 | ||
hBU12-19 MMAE [Investigative]
Revealed Based on the Cell Line Data
| Experiment 1 Reporting the Activity Date of This ADC | [207] | ||||
| Efficacy Data | Half Maximal Inhibitory Concentration (IC50) |
7.00 ng/mL
|
Positive CD70 expression (CD70+++/++) | ||
| Method Description |
Log phase cultures of cells were collected and cells plated at seeding densities ranging from 500 - 10,000 cells/well according to pre-determined conditions.After incubating 24 hours to allow surface protein reconstitution, serial dilutions of test conjugates were added and cultures incubated further for 4 days.
|
||||
| In Vitro Model | Renal cell carcinoma | 786-O cells | CVCL_1051 | ||
| Experiment 2 Reporting the Activity Date of This ADC | [207] | ||||
| Efficacy Data | Half Maximal Inhibitory Concentration (IC50) |
20.00 ng/mL
|
Positive CD70 expression (CD70+++/++) | ||
| Method Description |
Log phase cultures of cells were collected and cells plated at seeding densities ranging from 500 - 10,000 cells/well according to pre-determined conditions.After incubating 24 hours to allow surface protein reconstitution, serial dilutions of test conjugates were added and cultures incubated further for 4 days.
|
||||
| In Vitro Model | Clear cell renal cell carcinoma | Caki-1 cells | CVCL_0234 | ||
h1F6-2 MMAE DAR8 [Investigative]
Revealed Based on the Cell Line Data
| Experiment 1 Reporting the Activity Date of This ADC | [207] | ||||
| Efficacy Data | Half Maximal Inhibitory Concentration (IC50) |
7.00 ng/mL
|
Positive CD70 expression (CD70+++/++) | ||
| Method Description |
Log phase cultures of cells were collected and cells plated at seeding densities ranging from 500 - 10,000 cells/well according to pre-determined conditions.After incubating 24 hours to allow surface protein reconstitution, serial dilutions of test conjugates were added and cultures incubated further for 4 days.
|
||||
| In Vitro Model | Clear cell renal cell carcinoma | Caki-1 cells | CVCL_0234 | ||
| Experiment 2 Reporting the Activity Date of This ADC | [207] | ||||
| Efficacy Data | Half Maximal Inhibitory Concentration (IC50) |
7.00 ng/mL
|
Positive CD70 expression (CD70+++/++) | ||
| Method Description |
Log phase cultures of cells were collected and cells plated at seeding densities ranging from 500 - 10,000 cells/well according to pre-determined conditions.After incubating 24 hours to allow surface protein reconstitution, serial dilutions of test conjugates were added and cultures incubated further for 4 days.
|
||||
| In Vitro Model | Renal cell carcinoma | 786-O cells | CVCL_1051 | ||
hBU12-2 MMAE DAR8 [Investigative]
Revealed Based on the Cell Line Data
| Experiment 1 Reporting the Activity Date of This ADC | [207] | ||||
| Efficacy Data | Half Maximal Inhibitory Concentration (IC50) |
7.00 ng/mL
|
Positive CD70 expression (CD70+++/++) | ||
| Method Description |
Log phase cultures of cells were collected and cells plated at seeding densities ranging from 500 - 10,000 cells/well according to pre-determined conditions.After incubating 24 hours to allow surface protein reconstitution, serial dilutions of test conjugates were added and cultures incubated further for 4 days.
|
||||
| In Vitro Model | Clear cell renal cell carcinoma | Caki-1 cells | CVCL_0234 | ||
| Experiment 2 Reporting the Activity Date of This ADC | [207] | ||||
| Efficacy Data | Half Maximal Inhibitory Concentration (IC50) |
7.00 ng/mL
|
Positive CD70 expression (CD70+++/++) | ||
| Method Description |
Log phase cultures of cells were collected and cells plated at seeding densities ranging from 500 - 10,000 cells/well according to pre-determined conditions.After incubating 24 hours to allow surface protein reconstitution, serial dilutions of test conjugates were added and cultures incubated further for 4 days.
|
||||
| In Vitro Model | Renal cell carcinoma | 786-O cells | CVCL_1051 | ||
h1F6-1 MMAE DAR8 [Investigative]
Revealed Based on the Cell Line Data
| Experiment 1 Reporting the Activity Date of This ADC | [207] | ||||
| Efficacy Data | Half Maximal Inhibitory Concentration (IC50) |
7.00 ng/mL
|
Positive CD70 expression (CD70+++/++) | ||
| Method Description |
Log phase cultures of cells were collected and cells plated at seeding densities ranging from 500 - 10,000 cells/well according to pre-determined conditions.After incubating 24 hours to allow surface protein reconstitution, serial dilutions of test conjugates were added and cultures incubated further for 4 days.
|
||||
| In Vitro Model | Renal cell carcinoma | 786-O cells | CVCL_1051 | ||
| Experiment 2 Reporting the Activity Date of This ADC | [207] | ||||
| Efficacy Data | Half Maximal Inhibitory Concentration (IC50) |
8.00 ng/mL
|
Positive CD70 expression (CD70+++/++) | ||
| Method Description |
Log phase cultures of cells were collected and cells plated at seeding densities ranging from 500 - 10,000 cells/well according to pre-determined conditions.After incubating 24 hours to allow surface protein reconstitution, serial dilutions of test conjugates were added and cultures incubated further for 4 days.
|
||||
| In Vitro Model | Clear cell renal cell carcinoma | Caki-1 cells | CVCL_0234 | ||
hBU12-1 MMAE DAR8 [Investigative]
Revealed Based on the Cell Line Data
| Experiment 1 Reporting the Activity Date of This ADC | [207] | ||||
| Efficacy Data | Half Maximal Inhibitory Concentration (IC50) |
7.00 ng/mL
|
Positive CD70 expression (CD70+++/++) | ||
| Method Description |
Log phase cultures of cells were collected and cells plated at seeding densities ranging from 500 - 10,000 cells/well according to pre-determined conditions.After incubating 24 hours to allow surface protein reconstitution, serial dilutions of test conjugates were added and cultures incubated further for 4 days.
|
||||
| In Vitro Model | Renal cell carcinoma | 786-O cells | CVCL_1051 | ||
| Experiment 2 Reporting the Activity Date of This ADC | [207] | ||||
| Efficacy Data | Half Maximal Inhibitory Concentration (IC50) |
8.00 ng/mL
|
Positive CD70 expression (CD70+++/++) | ||
| Method Description |
Log phase cultures of cells were collected and cells plated at seeding densities ranging from 500 - 10,000 cells/well according to pre-determined conditions.After incubating 24 hours to allow surface protein reconstitution, serial dilutions of test conjugates were added and cultures incubated further for 4 days.
|
||||
| In Vitro Model | Clear cell renal cell carcinoma | Caki-1 cells | CVCL_0234 | ||
H-3-vcMMAE [Investigative]
Revealed Based on the Cell Line Data
| Experiment 1 Reporting the Activity Date of This ADC | [264] | ||||
| Efficacy Data | Half Maximal Inhibitory Concentration (IC50) |
7.10 ng/mL
|
High HER2 expression (HER2+++) | ||
| Method Description |
The MTS cell proliferation assay was performed as follows: CellTiter 96 Aqueous Non-Radioactive Cell proliferation Kit is used to determine the number of viable cells in cell proliferation assay. Tumor cells are plated at certain seeding densities in sterile 384-well black clear bottom Matrix plates at 40 uL per well and incubated overnight at 37°C in 5% CO2 before assaying.
Click to Show/Hide
|
||||
| In Vitro Model | Breast adenocarcinoma | SK-BR-3 cells | CVCL_0033 | ||
h1F6-18 MMAE [Investigative]
Revealed Based on the Cell Line Data
| Experiment 1 Reporting the Activity Date of This ADC | [207] | ||||
| Efficacy Data | Half Maximal Inhibitory Concentration (IC50) |
8.00 ng/mL
|
Positive CD70 expression (CD70+++/++) | ||
| Method Description |
Log phase cultures of cells were collected and cells plated at seeding densities ranging from 500 - 10,000 cells/well according to pre-determined conditions.After incubating 24 hours to allow surface protein reconstitution, serial dilutions of test conjugates were added and cultures incubated further for 4 days.
|
||||
| In Vitro Model | Renal cell carcinoma | 786-O cells | CVCL_1051 | ||
| Experiment 2 Reporting the Activity Date of This ADC | [207] | ||||
| Efficacy Data | Half Maximal Inhibitory Concentration (IC50) |
18.00 ng/mL
|
Positive CD70 expression (CD70+++/++) | ||
| Method Description |
Log phase cultures of cells were collected and cells plated at seeding densities ranging from 500 - 10,000 cells/well according to pre-determined conditions.After incubating 24 hours to allow surface protein reconstitution, serial dilutions of test conjugates were added and cultures incubated further for 4 days.
|
||||
| In Vitro Model | Clear cell renal cell carcinoma | Caki-1 cells | CVCL_0234 | ||
hBU12-18 MMAE [Investigative]
Revealed Based on the Cell Line Data
| Experiment 1 Reporting the Activity Date of This ADC | [207] | ||||
| Efficacy Data | Half Maximal Inhibitory Concentration (IC50) |
8.00 ng/mL
|
Positive CD70 expression (CD70+++/++) | ||
| Method Description |
Log phase cultures of cells were collected and cells plated at seeding densities ranging from 500 - 10,000 cells/well according to pre-determined conditions.After incubating 24 hours to allow surface protein reconstitution, serial dilutions of test conjugates were added and cultures incubated further for 4 days.
|
||||
| In Vitro Model | Renal cell carcinoma | 786-O cells | CVCL_1051 | ||
| Experiment 2 Reporting the Activity Date of This ADC | [207] | ||||
| Efficacy Data | Half Maximal Inhibitory Concentration (IC50) |
18.00 ng/mL
|
Positive CD70 expression (CD70+++/++) | ||
| Method Description |
Log phase cultures of cells were collected and cells plated at seeding densities ranging from 500 - 10,000 cells/well according to pre-determined conditions.After incubating 24 hours to allow surface protein reconstitution, serial dilutions of test conjugates were added and cultures incubated further for 4 days.
|
||||
| In Vitro Model | Clear cell renal cell carcinoma | Caki-1 cells | CVCL_0234 | ||
h1F6-15 MMAE [Investigative]
Revealed Based on the Cell Line Data
| Experiment 1 Reporting the Activity Date of This ADC | [207] | ||||
| Efficacy Data | Half Maximal Inhibitory Concentration (IC50) |
8.00 ng/mL
|
Positive CD70 expression (CD70+++/++) | ||
| Method Description |
Log phase cultures of cells were collected and cells plated at seeding densities ranging from 500 - 10,000 cells/well according to pre-determined conditions.After incubating 24 hours to allow surface protein reconstitution, serial dilutions of test conjugates were added and cultures incubated further for 4 days.
|
||||
| In Vitro Model | Renal cell carcinoma | 786-O cells | CVCL_1051 | ||
| Experiment 2 Reporting the Activity Date of This ADC | [207] | ||||
| Efficacy Data | Half Maximal Inhibitory Concentration (IC50) |
18.00 ng/mL
|
Positive CD70 expression (CD70+++/++) | ||
| Method Description |
Log phase cultures of cells were collected and cells plated at seeding densities ranging from 500 - 10,000 cells/well according to pre-determined conditions.After incubating 24 hours to allow surface protein reconstitution, serial dilutions of test conjugates were added and cultures incubated further for 4 days.
|
||||
| In Vitro Model | Clear cell renal cell carcinoma | Caki-1 cells | CVCL_0234 | ||
hBU12-15 MMAE [Investigative]
Revealed Based on the Cell Line Data
| Experiment 1 Reporting the Activity Date of This ADC | [207] | ||||
| Efficacy Data | Half Maximal Inhibitory Concentration (IC50) |
8.00 ng/mL
|
Positive CD70 expression (CD70+++/++) | ||
| Method Description |
Log phase cultures of cells were collected and cells plated at seeding densities ranging from 500 - 10,000 cells/well according to pre-determined conditions.After incubating 24 hours to allow surface protein reconstitution, serial dilutions of test conjugates were added and cultures incubated further for 4 days.
|
||||
| In Vitro Model | Renal cell carcinoma | 786-O cells | CVCL_1051 | ||
| Experiment 2 Reporting the Activity Date of This ADC | [207] | ||||
| Efficacy Data | Half Maximal Inhibitory Concentration (IC50) |
18.00 ng/mL
|
Positive CD70 expression (CD70+++/++) | ||
| Method Description |
Log phase cultures of cells were collected and cells plated at seeding densities ranging from 500 - 10,000 cells/well according to pre-determined conditions.After incubating 24 hours to allow surface protein reconstitution, serial dilutions of test conjugates were added and cultures incubated further for 4 days.
|
||||
| In Vitro Model | Clear cell renal cell carcinoma | Caki-1 cells | CVCL_0234 | ||
h1F6-14 MMAE [Investigative]
Revealed Based on the Cell Line Data
| Experiment 1 Reporting the Activity Date of This ADC | [207] | ||||
| Efficacy Data | Half Maximal Inhibitory Concentration (IC50) |
8.00 ng/mL
|
Positive CD70 expression (CD70+++/++) | ||
| Method Description |
Log phase cultures of cells were collected and cells plated at seeding densities ranging from 500 - 10,000 cells/well according to pre-determined conditions.After incubating 24 hours to allow surface protein reconstitution, serial dilutions of test conjugates were added and cultures incubated further for 4 days.
|
||||
| In Vitro Model | Renal cell carcinoma | 786-O cells | CVCL_1051 | ||
| Experiment 2 Reporting the Activity Date of This ADC | [207] | ||||
| Efficacy Data | Half Maximal Inhibitory Concentration (IC50) |
19.00 ng/mL
|
Positive CD70 expression (CD70+++/++) | ||
| Method Description |
Log phase cultures of cells were collected and cells plated at seeding densities ranging from 500 - 10,000 cells/well according to pre-determined conditions.After incubating 24 hours to allow surface protein reconstitution, serial dilutions of test conjugates were added and cultures incubated further for 4 days.
|
||||
| In Vitro Model | Clear cell renal cell carcinoma | Caki-1 cells | CVCL_0234 | ||
hBU12-14 MMAE [Investigative]
Revealed Based on the Cell Line Data
| Experiment 1 Reporting the Activity Date of This ADC | [207] | ||||
| Efficacy Data | Half Maximal Inhibitory Concentration (IC50) |
8.00 ng/mL
|
Positive CD70 expression (CD70+++/++) | ||
| Method Description |
Log phase cultures of cells were collected and cells plated at seeding densities ranging from 500 - 10,000 cells/well according to pre-determined conditions.After incubating 24 hours to allow surface protein reconstitution, serial dilutions of test conjugates were added and cultures incubated further for 4 days.
|
||||
| In Vitro Model | Renal cell carcinoma | 786-O cells | CVCL_1051 | ||
| Experiment 2 Reporting the Activity Date of This ADC | [207] | ||||
| Efficacy Data | Half Maximal Inhibitory Concentration (IC50) |
19.00 ng/mL
|
Positive CD70 expression (CD70+++/++) | ||
| Method Description |
Log phase cultures of cells were collected and cells plated at seeding densities ranging from 500 - 10,000 cells/well according to pre-determined conditions.After incubating 24 hours to allow surface protein reconstitution, serial dilutions of test conjugates were added and cultures incubated further for 4 days.
|
||||
| In Vitro Model | Clear cell renal cell carcinoma | Caki-1 cells | CVCL_0234 | ||
h1F6-26 MMAE [Investigative]
Revealed Based on the Cell Line Data
| Experiment 1 Reporting the Activity Date of This ADC | [207] | ||||
| Efficacy Data | Half Maximal Inhibitory Concentration (IC50) |
9.00 ng/mL
|
Positive CD70 expression (CD70+++/++) | ||
| Method Description |
Log phase cultures of cells were collected and cells plated at seeding densities ranging from 500 - 10,000 cells/well according to pre-determined conditions.After incubating 24 hours to allow surface protein reconstitution, serial dilutions of test conjugates were added and cultures incubated further for 4 days.
|
||||
| In Vitro Model | Renal cell carcinoma | 786-O cells | CVCL_1051 | ||
| Experiment 2 Reporting the Activity Date of This ADC | [207] | ||||
| Efficacy Data | Half Maximal Inhibitory Concentration (IC50) |
19.00 ng/mL
|
Positive CD70 expression (CD70+++/++) | ||
| Method Description |
Log phase cultures of cells were collected and cells plated at seeding densities ranging from 500 - 10,000 cells/well according to pre-determined conditions.After incubating 24 hours to allow surface protein reconstitution, serial dilutions of test conjugates were added and cultures incubated further for 4 days.
|
||||
| In Vitro Model | Clear cell renal cell carcinoma | Caki-1 cells | CVCL_0234 | ||
hBU12-26 MMAE [Investigative]
Revealed Based on the Cell Line Data
| Experiment 1 Reporting the Activity Date of This ADC | [207] | ||||
| Efficacy Data | Half Maximal Inhibitory Concentration (IC50) |
9.00 ng/mL
|
Positive CD70 expression (CD70+++/++) | ||
| Method Description |
Log phase cultures of cells were collected and cells plated at seeding densities ranging from 500 - 10,000 cells/well according to pre-determined conditions.After incubating 24 hours to allow surface protein reconstitution, serial dilutions of test conjugates were added and cultures incubated further for 4 days.
|
||||
| In Vitro Model | Renal cell carcinoma | 786-O cells | CVCL_1051 | ||
| Experiment 2 Reporting the Activity Date of This ADC | [207] | ||||
| Efficacy Data | Half Maximal Inhibitory Concentration (IC50) |
19.00 ng/mL
|
Positive CD70 expression (CD70+++/++) | ||
| Method Description |
Log phase cultures of cells were collected and cells plated at seeding densities ranging from 500 - 10,000 cells/well according to pre-determined conditions.After incubating 24 hours to allow surface protein reconstitution, serial dilutions of test conjugates were added and cultures incubated further for 4 days.
|
||||
| In Vitro Model | Clear cell renal cell carcinoma | Caki-1 cells | CVCL_0234 | ||
h1F6-16 MMAE [Investigative]
Revealed Based on the Cell Line Data
| Experiment 1 Reporting the Activity Date of This ADC | [207] | ||||
| Efficacy Data | Half Maximal Inhibitory Concentration (IC50) |
9.00 ng/mL
|
Positive CD70 expression (CD70+++/++) | ||
| Method Description |
Log phase cultures of cells were collected and cells plated at seeding densities ranging from 500 - 10,000 cells/well according to pre-determined conditions.After incubating 24 hours to allow surface protein reconstitution, serial dilutions of test conjugates were added and cultures incubated further for 4 days.
|
||||
| In Vitro Model | Renal cell carcinoma | 786-O cells | CVCL_1051 | ||
| Experiment 2 Reporting the Activity Date of This ADC | [207] | ||||
| Efficacy Data | Half Maximal Inhibitory Concentration (IC50) |
12.00 ng/mL
|
Positive CD70 expression (CD70+++/++) | ||
| Method Description |
Log phase cultures of cells were collected and cells plated at seeding densities ranging from 500 - 10,000 cells/well according to pre-determined conditions.After incubating 24 hours to allow surface protein reconstitution, serial dilutions of test conjugates were added and cultures incubated further for 4 days.
|
||||
| In Vitro Model | Clear cell renal cell carcinoma | Caki-1 cells | CVCL_0234 | ||
hBU12-16 MMAE [Investigative]
Revealed Based on the Cell Line Data
| Experiment 1 Reporting the Activity Date of This ADC | [207] | ||||
| Efficacy Data | Half Maximal Inhibitory Concentration (IC50) |
9.00 ng/mL
|
Positive CD70 expression (CD70+++/++) | ||
| Method Description |
Log phase cultures of cells were collected and cells plated at seeding densities ranging from 500 - 10,000 cells/well according to pre-determined conditions.After incubating 24 hours to allow surface protein reconstitution, serial dilutions of test conjugates were added and cultures incubated further for 4 days.
|
||||
| In Vitro Model | Renal cell carcinoma | 786-O cells | CVCL_1051 | ||
| Experiment 2 Reporting the Activity Date of This ADC | [207] | ||||
| Efficacy Data | Half Maximal Inhibitory Concentration (IC50) |
12.00 ng/mL
|
Positive CD70 expression (CD70+++/++) | ||
| Method Description |
Log phase cultures of cells were collected and cells plated at seeding densities ranging from 500 - 10,000 cells/well according to pre-determined conditions.After incubating 24 hours to allow surface protein reconstitution, serial dilutions of test conjugates were added and cultures incubated further for 4 days.
|
||||
| In Vitro Model | Clear cell renal cell carcinoma | Caki-1 cells | CVCL_0234 | ||
h1F6-4 MMAE DAR8 [Investigative]
Revealed Based on the Cell Line Data
| Experiment 1 Reporting the Activity Date of This ADC | [207] | ||||
| Efficacy Data | Half Maximal Inhibitory Concentration (IC50) |
9.00 ng/mL
|
Positive CD70 expression (CD70+++/++) | ||
| Method Description |
Log phase cultures of cells were collected and cells plated at seeding densities ranging from 500 - 10,000 cells/well according to pre-determined conditions.After incubating 24 hours to allow surface protein reconstitution, serial dilutions of test conjugates were added and cultures incubated further for 4 days.
|
||||
| In Vitro Model | Renal cell carcinoma | 786-O cells | CVCL_1051 | ||
| Experiment 2 Reporting the Activity Date of This ADC | [207] | ||||
| Efficacy Data | Half Maximal Inhibitory Concentration (IC50) |
11.00 ng/mL
|
Positive CD70 expression (CD70+++/++) | ||
| Method Description |
Log phase cultures of cells were collected and cells plated at seeding densities ranging from 500 - 10,000 cells/well according to pre-determined conditions.After incubating 24 hours to allow surface protein reconstitution, serial dilutions of test conjugates were added and cultures incubated further for 4 days.
|
||||
| In Vitro Model | Clear cell renal cell carcinoma | Caki-1 cells | CVCL_0234 | ||
hBU12-4 MMAE DAR8 [Investigative]
Revealed Based on the Cell Line Data
| Experiment 1 Reporting the Activity Date of This ADC | [207] | ||||
| Efficacy Data | Half Maximal Inhibitory Concentration (IC50) |
9.00 ng/mL
|
Positive CD70 expression (CD70+++/++) | ||
| Method Description |
Log phase cultures of cells were collected and cells plated at seeding densities ranging from 500 - 10,000 cells/well according to pre-determined conditions.After incubating 24 hours to allow surface protein reconstitution, serial dilutions of test conjugates were added and cultures incubated further for 4 days.
|
||||
| In Vitro Model | Renal cell carcinoma | 786-O cells | CVCL_1051 | ||
| Experiment 2 Reporting the Activity Date of This ADC | [207] | ||||
| Efficacy Data | Half Maximal Inhibitory Concentration (IC50) |
11.00 ng/mL
|
Positive CD70 expression (CD70+++/++) | ||
| Method Description |
Log phase cultures of cells were collected and cells plated at seeding densities ranging from 500 - 10,000 cells/well according to pre-determined conditions.After incubating 24 hours to allow surface protein reconstitution, serial dilutions of test conjugates were added and cultures incubated further for 4 days.
|
||||
| In Vitro Model | Clear cell renal cell carcinoma | Caki-1 cells | CVCL_0234 | ||
h1F6-7 MMAE DAR4 [Investigative]
Revealed Based on the Cell Line Data
| Experiment 1 Reporting the Activity Date of This ADC | [207] | ||||
| Efficacy Data | Half Maximal Inhibitory Concentration (IC50) |
10.00 ng/mL
|
Positive CD70 expression (CD70+++/++) | ||
| Method Description |
Log phase cultures of cells were collected and cells plated at seeding densities ranging from 500 - 10,000 cells/well according to pre-determined conditions.After incubating 24 hours to allow surface protein reconstitution, serial dilutions of test conjugates were added and cultures incubated further for 4 days.
|
||||
| In Vitro Model | Renal cell carcinoma | 786-O cells | CVCL_1051 | ||
| Experiment 2 Reporting the Activity Date of This ADC | [207] | ||||
| Efficacy Data | Half Maximal Inhibitory Concentration (IC50) |
80 ng/mL
|
Positive CD70 expression (CD70+++/++) | ||
| Method Description |
Log phase cultures of cells were collected and cells plated at seeding densities ranging from 500 - 10,000 cells/well according to pre-determined conditions.After incubating 24 hours to allow surface protein reconstitution, serial dilutions of test conjugates were added and cultures incubated further for 4 days.
|
||||
| In Vitro Model | Clear cell renal cell carcinoma | Caki-1 cells | CVCL_0234 | ||
hBU12-7 MMAE DAR4 [Investigative]
Revealed Based on the Cell Line Data
| Experiment 1 Reporting the Activity Date of This ADC | [207] | ||||
| Efficacy Data | Half Maximal Inhibitory Concentration (IC50) |
10.00 ng/mL
|
Positive CD70 expression (CD70+++/++) | ||
| Method Description |
Log phase cultures of cells were collected and cells plated at seeding densities ranging from 500 - 10,000 cells/well according to pre-determined conditions.After incubating 24 hours to allow surface protein reconstitution, serial dilutions of test conjugates were added and cultures incubated further for 4 days.
|
||||
| In Vitro Model | Renal cell carcinoma | 786-O cells | CVCL_1051 | ||
| Experiment 2 Reporting the Activity Date of This ADC | [207] | ||||
| Efficacy Data | Half Maximal Inhibitory Concentration (IC50) |
80 ng/mL
|
Positive CD70 expression (CD70+++/++) | ||
| Method Description |
Log phase cultures of cells were collected and cells plated at seeding densities ranging from 500 - 10,000 cells/well according to pre-determined conditions.After incubating 24 hours to allow surface protein reconstitution, serial dilutions of test conjugates were added and cultures incubated further for 4 days.
|
||||
| In Vitro Model | Clear cell renal cell carcinoma | Caki-1 cells | CVCL_0234 | ||
H-4-vcMMAE [Investigative]
Revealed Based on the Cell Line Data
| Experiment 1 Reporting the Activity Date of This ADC | [264] | ||||
| Efficacy Data | Half Maximal Inhibitory Concentration (IC50) |
10.10 ng/mL
|
High HER2 expression (HER2+++) | ||
| Method Description |
The MTS cell proliferation assay was performed as follows: CellTiter 96 Aqueous Non-Radioactive Cell proliferation Kit is used to determine the number of viable cells in cell proliferation assay. Tumor cells are plated at certain seeding densities in sterile 384-well black clear bottom Matrix plates at 40 uL per well and incubated overnight at 37°C in 5% CO2 before assaying.
Click to Show/Hide
|
||||
| In Vitro Model | Breast adenocarcinoma | SK-BR-3 cells | CVCL_0033 | ||
h1F6-23 MMAE [Investigative]
Revealed Based on the Cell Line Data
| Experiment 1 Reporting the Activity Date of This ADC | [207] | ||||
| Efficacy Data | Half Maximal Inhibitory Concentration (IC50) |
11.00 ng/mL
|
Positive CD70 expression (CD70+++/++) | ||
| Method Description |
Log phase cultures of cells were collected and cells plated at seeding densities ranging from 500 - 10,000 cells/well according to pre-determined conditions.After incubating 24 hours to allow surface protein reconstitution, serial dilutions of test conjugates were added and cultures incubated further for 4 days.
|
||||
| In Vitro Model | Renal cell carcinoma | 786-O cells | CVCL_1051 | ||
| Experiment 2 Reporting the Activity Date of This ADC | [207] | ||||
| Efficacy Data | Half Maximal Inhibitory Concentration (IC50) |
18.00 ng/mL
|
Positive CD70 expression (CD70+++/++) | ||
| Method Description |
Log phase cultures of cells were collected and cells plated at seeding densities ranging from 500 - 10,000 cells/well according to pre-determined conditions.After incubating 24 hours to allow surface protein reconstitution, serial dilutions of test conjugates were added and cultures incubated further for 4 days.
|
||||
| In Vitro Model | Clear cell renal cell carcinoma | Caki-1 cells | CVCL_0234 | ||
hBU12-23 MMAE [Investigative]
Revealed Based on the Cell Line Data
| Experiment 1 Reporting the Activity Date of This ADC | [207] | ||||
| Efficacy Data | Half Maximal Inhibitory Concentration (IC50) |
11.00 ng/mL
|
Positive CD70 expression (CD70+++/++) | ||
| Method Description |
Log phase cultures of cells were collected and cells plated at seeding densities ranging from 500 - 10,000 cells/well according to pre-determined conditions.After incubating 24 hours to allow surface protein reconstitution, serial dilutions of test conjugates were added and cultures incubated further for 4 days.
|
||||
| In Vitro Model | Renal cell carcinoma | 786-O cells | CVCL_1051 | ||
| Experiment 2 Reporting the Activity Date of This ADC | [207] | ||||
| Efficacy Data | Half Maximal Inhibitory Concentration (IC50) |
18.00 ng/mL
|
Positive CD70 expression (CD70+++/++) | ||
| Method Description |
Log phase cultures of cells were collected and cells plated at seeding densities ranging from 500 - 10,000 cells/well according to pre-determined conditions.After incubating 24 hours to allow surface protein reconstitution, serial dilutions of test conjugates were added and cultures incubated further for 4 days.
|
||||
| In Vitro Model | Clear cell renal cell carcinoma | Caki-1 cells | CVCL_0234 | ||
h1F6-30 MMAE [Investigative]
Revealed Based on the Cell Line Data
| Experiment 1 Reporting the Activity Date of This ADC | [207] | ||||
| Efficacy Data | Half Maximal Inhibitory Concentration (IC50) |
12.00 ng/mL
|
Positive CD70 expression (CD70+++/++) | ||
| Method Description |
Log phase cultures of cells were collected and cells plated at seeding densities ranging from 500 - 10,000 cells/well according to pre-determined conditions.After incubating 24 hours to allow surface protein reconstitution, serial dilutions of test conjugates were added and cultures incubated further for 4 days.
|
||||
| In Vitro Model | Renal cell carcinoma | 786-O cells | CVCL_1051 | ||
| Experiment 2 Reporting the Activity Date of This ADC | [207] | ||||
| Efficacy Data | Half Maximal Inhibitory Concentration (IC50) |
18.00 ng/mL
|
Positive CD70 expression (CD70+++/++) | ||
| Method Description |
Log phase cultures of cells were collected and cells plated at seeding densities ranging from 500 - 10,000 cells/well according to pre-determined conditions.After incubating 24 hours to allow surface protein reconstitution, serial dilutions of test conjugates were added and cultures incubated further for 4 days.
|
||||
| In Vitro Model | Clear cell renal cell carcinoma | Caki-1 cells | CVCL_0234 | ||
hBU12-30 MMAE [Investigative]
Revealed Based on the Cell Line Data
| Experiment 1 Reporting the Activity Date of This ADC | [207] | ||||
| Efficacy Data | Half Maximal Inhibitory Concentration (IC50) |
12.00 ng/mL
|
Positive CD70 expression (CD70+++/++) | ||
| Method Description |
Log phase cultures of cells were collected and cells plated at seeding densities ranging from 500 - 10,000 cells/well according to pre-determined conditions.After incubating 24 hours to allow surface protein reconstitution, serial dilutions of test conjugates were added and cultures incubated further for 4 days.
|
||||
| In Vitro Model | Renal cell carcinoma | 786-O cells | CVCL_1051 | ||
| Experiment 2 Reporting the Activity Date of This ADC | [207] | ||||
| Efficacy Data | Half Maximal Inhibitory Concentration (IC50) |
18.00 ng/mL
|
Positive CD70 expression (CD70+++/++) | ||
| Method Description |
Log phase cultures of cells were collected and cells plated at seeding densities ranging from 500 - 10,000 cells/well according to pre-determined conditions.After incubating 24 hours to allow surface protein reconstitution, serial dilutions of test conjugates were added and cultures incubated further for 4 days.
|
||||
| In Vitro Model | Clear cell renal cell carcinoma | Caki-1 cells | CVCL_0234 | ||
h1F6-21 MMAE [Investigative]
Revealed Based on the Cell Line Data
| Experiment 1 Reporting the Activity Date of This ADC | [207] | ||||
| Efficacy Data | Half Maximal Inhibitory Concentration (IC50) |
12.00 ng/mL
|
Positive CD70 expression (CD70+++/++) | ||
| Method Description |
Log phase cultures of cells were collected and cells plated at seeding densities ranging from 500 - 10,000 cells/well according to pre-determined conditions.After incubating 24 hours to allow surface protein reconstitution, serial dilutions of test conjugates were added and cultures incubated further for 4 days.
|
||||
| In Vitro Model | Renal cell carcinoma | 786-O cells | CVCL_1051 | ||
| Experiment 2 Reporting the Activity Date of This ADC | [207] | ||||
| Efficacy Data | Half Maximal Inhibitory Concentration (IC50) |
22.00 ng/mL
|
Positive CD70 expression (CD70+++/++) | ||
| Method Description |
Log phase cultures of cells were collected and cells plated at seeding densities ranging from 500 - 10,000 cells/well according to pre-determined conditions.After incubating 24 hours to allow surface protein reconstitution, serial dilutions of test conjugates were added and cultures incubated further for 4 days.
|
||||
| In Vitro Model | Clear cell renal cell carcinoma | Caki-1 cells | CVCL_0234 | ||
hBU12-21 MMAE [Investigative]
Revealed Based on the Cell Line Data
| Experiment 1 Reporting the Activity Date of This ADC | [207] | ||||
| Efficacy Data | Half Maximal Inhibitory Concentration (IC50) |
12.00 ng/mL
|
Positive CD70 expression (CD70+++/++) | ||
| Method Description |
Log phase cultures of cells were collected and cells plated at seeding densities ranging from 500 - 10,000 cells/well according to pre-determined conditions.After incubating 24 hours to allow surface protein reconstitution, serial dilutions of test conjugates were added and cultures incubated further for 4 days.
|
||||
| In Vitro Model | Renal cell carcinoma | 786-O cells | CVCL_1051 | ||
| Experiment 2 Reporting the Activity Date of This ADC | [207] | ||||
| Efficacy Data | Half Maximal Inhibitory Concentration (IC50) |
22.00 ng/mL
|
Positive CD70 expression (CD70+++/++) | ||
| Method Description |
Log phase cultures of cells were collected and cells plated at seeding densities ranging from 500 - 10,000 cells/well according to pre-determined conditions.After incubating 24 hours to allow surface protein reconstitution, serial dilutions of test conjugates were added and cultures incubated further for 4 days.
|
||||
| In Vitro Model | Clear cell renal cell carcinoma | Caki-1 cells | CVCL_0234 | ||
h1F6-31 MMAE [Investigative]
Revealed Based on the Cell Line Data
| Experiment 1 Reporting the Activity Date of This ADC | [207] | ||||
| Efficacy Data | Half Maximal Inhibitory Concentration (IC50) |
13.00 ng/mL
|
Positive CD70 expression (CD70+++/++) | ||
| Method Description |
Log phase cultures of cells were collected and cells plated at seeding densities ranging from 500 - 10,000 cells/well according to pre-determined conditions.After incubating 24 hours to allow surface protein reconstitution, serial dilutions of test conjugates were added and cultures incubated further for 4 days.
|
||||
| In Vitro Model | Renal cell carcinoma | 786-O cells | CVCL_1051 | ||
| Experiment 2 Reporting the Activity Date of This ADC | [207] | ||||
| Efficacy Data | Half Maximal Inhibitory Concentration (IC50) |
20.00 ng/mL
|
Positive CD70 expression (CD70+++/++) | ||
| Method Description |
Log phase cultures of cells were collected and cells plated at seeding densities ranging from 500 - 10,000 cells/well according to pre-determined conditions.After incubating 24 hours to allow surface protein reconstitution, serial dilutions of test conjugates were added and cultures incubated further for 4 days.
|
||||
| In Vitro Model | Clear cell renal cell carcinoma | Caki-1 cells | CVCL_0234 | ||
hBU12-31 MMAE [Investigative]
Revealed Based on the Cell Line Data
| Experiment 1 Reporting the Activity Date of This ADC | [207] | ||||
| Efficacy Data | Half Maximal Inhibitory Concentration (IC50) |
13.00 ng/mL
|
Positive CD70 expression (CD70+++/++) | ||
| Method Description |
Log phase cultures of cells were collected and cells plated at seeding densities ranging from 500 - 10,000 cells/well according to pre-determined conditions.After incubating 24 hours to allow surface protein reconstitution, serial dilutions of test conjugates were added and cultures incubated further for 4 days.
|
||||
| In Vitro Model | Renal cell carcinoma | 786-O cells | CVCL_1051 | ||
| Experiment 2 Reporting the Activity Date of This ADC | [207] | ||||
| Efficacy Data | Half Maximal Inhibitory Concentration (IC50) |
20.00 ng/mL
|
Positive CD70 expression (CD70+++/++) | ||
| Method Description |
Log phase cultures of cells were collected and cells plated at seeding densities ranging from 500 - 10,000 cells/well according to pre-determined conditions.After incubating 24 hours to allow surface protein reconstitution, serial dilutions of test conjugates were added and cultures incubated further for 4 days.
|
||||
| In Vitro Model | Clear cell renal cell carcinoma | Caki-1 cells | CVCL_0234 | ||
h1F6-3 MMAE DAR8 [Investigative]
Revealed Based on the Cell Line Data
| Experiment 1 Reporting the Activity Date of This ADC | [207] | ||||
| Efficacy Data | Half Maximal Inhibitory Concentration (IC50) |
13.00 ng/mL
|
Positive CD70 expression (CD70+++/++) | ||
| Method Description |
Log phase cultures of cells were collected and cells plated at seeding densities ranging from 500 - 10,000 cells/well according to pre-determined conditions.After incubating 24 hours to allow surface protein reconstitution, serial dilutions of test conjugates were added and cultures incubated further for 4 days.
|
||||
| In Vitro Model | Clear cell renal cell carcinoma | Caki-1 cells | CVCL_0234 | ||
| Experiment 2 Reporting the Activity Date of This ADC | [207] | ||||
| Efficacy Data | Half Maximal Inhibitory Concentration (IC50) |
13.00 ng/mL
|
Positive CD70 expression (CD70+++/++) | ||
| Method Description |
Log phase cultures of cells were collected and cells plated at seeding densities ranging from 500 - 10,000 cells/well according to pre-determined conditions.After incubating 24 hours to allow surface protein reconstitution, serial dilutions of test conjugates were added and cultures incubated further for 4 days.
|
||||
| In Vitro Model | Renal cell carcinoma | 786-O cells | CVCL_1051 | ||
hBU12-3 MMAE DAR8 [Investigative]
Revealed Based on the Cell Line Data
| Experiment 1 Reporting the Activity Date of This ADC | [207] | ||||
| Efficacy Data | Half Maximal Inhibitory Concentration (IC50) |
13.00 ng/mL
|
Positive CD70 expression (CD70+++/++) | ||
| Method Description |
Log phase cultures of cells were collected and cells plated at seeding densities ranging from 500 - 10,000 cells/well according to pre-determined conditions.After incubating 24 hours to allow surface protein reconstitution, serial dilutions of test conjugates were added and cultures incubated further for 4 days.
|
||||
| In Vitro Model | Clear cell renal cell carcinoma | Caki-1 cells | CVCL_0234 | ||
| Experiment 2 Reporting the Activity Date of This ADC | [207] | ||||
| Efficacy Data | Half Maximal Inhibitory Concentration (IC50) |
13.00 ng/mL
|
Positive CD70 expression (CD70+++/++) | ||
| Method Description |
Log phase cultures of cells were collected and cells plated at seeding densities ranging from 500 - 10,000 cells/well according to pre-determined conditions.After incubating 24 hours to allow surface protein reconstitution, serial dilutions of test conjugates were added and cultures incubated further for 4 days.
|
||||
| In Vitro Model | Renal cell carcinoma | 786-O cells | CVCL_1051 | ||
h1F6-25 MMAE [Investigative]
Revealed Based on the Cell Line Data
| Experiment 1 Reporting the Activity Date of This ADC | [207] | ||||
| Efficacy Data | Half Maximal Inhibitory Concentration (IC50) |
14.00 ng/mL
|
Positive CD70 expression (CD70+++/++) | ||
| Method Description |
Log phase cultures of cells were collected and cells plated at seeding densities ranging from 500 - 10,000 cells/well according to pre-determined conditions.After incubating 24 hours to allow surface protein reconstitution, serial dilutions of test conjugates were added and cultures incubated further for 4 days.
|
||||
| In Vitro Model | Renal cell carcinoma | 786-O cells | CVCL_1051 | ||
| Experiment 2 Reporting the Activity Date of This ADC | [207] | ||||
| Efficacy Data | Half Maximal Inhibitory Concentration (IC50) |
34.00 ng/mL
|
Positive CD70 expression (CD70+++/++) | ||
| Method Description |
Log phase cultures of cells were collected and cells plated at seeding densities ranging from 500 - 10,000 cells/well according to pre-determined conditions.After incubating 24 hours to allow surface protein reconstitution, serial dilutions of test conjugates were added and cultures incubated further for 4 days.
|
||||
| In Vitro Model | Clear cell renal cell carcinoma | Caki-1 cells | CVCL_0234 | ||
hBU12-25 MMAE [Investigative]
Revealed Based on the Cell Line Data
| Experiment 1 Reporting the Activity Date of This ADC | [207] | ||||
| Efficacy Data | Half Maximal Inhibitory Concentration (IC50) |
14.00 ng/mL
|
Positive CD70 expression (CD70+++/++) | ||
| Method Description |
Log phase cultures of cells were collected and cells plated at seeding densities ranging from 500 - 10,000 cells/well according to pre-determined conditions.After incubating 24 hours to allow surface protein reconstitution, serial dilutions of test conjugates were added and cultures incubated further for 4 days.
|
||||
| In Vitro Model | Renal cell carcinoma | 786-O cells | CVCL_1051 | ||
| Experiment 2 Reporting the Activity Date of This ADC | [207] | ||||
| Efficacy Data | Half Maximal Inhibitory Concentration (IC50) |
34.00 ng/mL
|
Positive CD70 expression (CD70+++/++) | ||
| Method Description |
Log phase cultures of cells were collected and cells plated at seeding densities ranging from 500 - 10,000 cells/well according to pre-determined conditions.After incubating 24 hours to allow surface protein reconstitution, serial dilutions of test conjugates were added and cultures incubated further for 4 days.
|
||||
| In Vitro Model | Clear cell renal cell carcinoma | Caki-1 cells | CVCL_0234 | ||
h1F6-2 MMAE DAR4 [Investigative]
Revealed Based on the Cell Line Data
| Experiment 1 Reporting the Activity Date of This ADC | [207] | ||||
| Efficacy Data | Half Maximal Inhibitory Concentration (IC50) |
17.00 ng/mL
|
Positive CD70 expression (CD70+++/++) | ||
| Method Description |
Log phase cultures of cells were collected and cells plated at seeding densities ranging from 500 - 10,000 cells/well according to pre-determined conditions.After incubating 24 hours to allow surface protein reconstitution, serial dilutions of test conjugates were added and cultures incubated further for 4 days.
|
||||
| In Vitro Model | Clear cell renal cell carcinoma | Caki-1 cells | CVCL_0234 | ||
| Experiment 2 Reporting the Activity Date of This ADC | [207] | ||||
| Efficacy Data | Half Maximal Inhibitory Concentration (IC50) |
21.00 ng/mL
|
Positive CD70 expression (CD70+++/++) | ||
| Method Description |
Log phase cultures of cells were collected and cells plated at seeding densities ranging from 500 - 10,000 cells/well according to pre-determined conditions.After incubating 24 hours to allow surface protein reconstitution, serial dilutions of test conjugates were added and cultures incubated further for 4 days.
|
||||
| In Vitro Model | Renal cell carcinoma | 786-O cells | CVCL_1051 | ||
hBU12-2 MMAE DAR4 [Investigative]
Revealed Based on the Cell Line Data
| Experiment 1 Reporting the Activity Date of This ADC | [207] | ||||
| Efficacy Data | Half Maximal Inhibitory Concentration (IC50) |
17.00 ng/mL
|
Positive CD70 expression (CD70+++/++) | ||
| Method Description |
Log phase cultures of cells were collected and cells plated at seeding densities ranging from 500 - 10,000 cells/well according to pre-determined conditions.After incubating 24 hours to allow surface protein reconstitution, serial dilutions of test conjugates were added and cultures incubated further for 4 days.
|
||||
| In Vitro Model | Clear cell renal cell carcinoma | Caki-1 cells | CVCL_0234 | ||
| Experiment 2 Reporting the Activity Date of This ADC | [207] | ||||
| Efficacy Data | Half Maximal Inhibitory Concentration (IC50) |
21.00 ng/mL
|
Positive CD70 expression (CD70+++/++) | ||
| Method Description |
Log phase cultures of cells were collected and cells plated at seeding densities ranging from 500 - 10,000 cells/well according to pre-determined conditions.After incubating 24 hours to allow surface protein reconstitution, serial dilutions of test conjugates were added and cultures incubated further for 4 days.
|
||||
| In Vitro Model | Renal cell carcinoma | 786-O cells | CVCL_1051 | ||
WO2015095755A1 h1F6-1.3 [Investigative]
Revealed Based on the Cell Line Data
| Experiment 1 Reporting the Activity Date of This ADC | [263] | ||||
| Efficacy Data | Half Maximal Inhibitory Concentration (IC50) |
19.00 ng/mL
|
Positive CD70 expression (CD70+++/++); Negative CD30 expression (CD30-) | ||
| Method Description |
Cell-based in vitro assays are used to measure viability (proliferation), cytotoxicity,and induction of apoptosis of the ADC of the invention. Culturing the cells for a period from about 6 hours to about 5 days and measuring cell viability.
|
||||
| In Vitro Model | Clear cell renal cell carcinoma | Caki-1 cells | CVCL_0234 | ||
| Experiment 2 Reporting the Activity Date of This ADC | [263] | ||||
| Efficacy Data | Half Maximal Inhibitory Concentration (IC50) | > 1000 ng/mL | Positive CD30 expression (CD30+++/++); Negative CD70 expression (CD70-) | ||
| Method Description |
Cell-based in vitro assays are used to measure viability (proliferation), cytotoxicity,and induction of apoptosis of the ADC of the invention. Culturing the cells for a period from about 6 hours to about 5 days and measuring cell viability.
|
||||
| In Vitro Model | ALK-positive anaplastic large cell lymphoma | Karpas-299 cells | CVCL_1324 | ||
| Experiment 3 Reporting the Activity Date of This ADC | [263] | ||||
| Efficacy Data | Half Maximal Inhibitory Concentration (IC50) | > 1000 ng/mL | Positive CD30 expression (CD30+++/++); Low CD70 expression (CD70+) | ||
| Method Description |
Cell-based in vitro assays are used to measure viability (proliferation), cytotoxicity,and induction of apoptosis of the ADC of the invention. Culturing the cells for a period from about 6 hours to about 5 days and measuring cell viability.
|
||||
| In Vitro Model | Hodgkin's disease | L540cy cells | Homo sapiens | ||
| Experiment 4 Reporting the Activity Date of This ADC | [263] | ||||
| Efficacy Data | Half Maximal Inhibitory Concentration (IC50) | > 1000 ng/mL | Positive CD70 expression (CD70+++/++); Negative CD30 expression (CD30-) | ||
| Method Description |
Cell-based in vitro assays are used to measure viability (proliferation), cytotoxicity,and induction of apoptosis of the ADC of the invention. Culturing the cells for a period from about 6 hours to about 5 days and measuring cell viability.
|
||||
| In Vitro Model | Renal cell carcinoma | 786-O cells | CVCL_1051 | ||
h1F6-4 MMAE DAR4 [Investigative]
Revealed Based on the Cell Line Data
| Experiment 1 Reporting the Activity Date of This ADC | [207] | ||||
| Efficacy Data | Half Maximal Inhibitory Concentration (IC50) |
20.00 ng/mL
|
Positive CD70 expression (CD70+++/++) | ||
| Method Description |
Log phase cultures of cells were collected and cells plated at seeding densities ranging from 500 - 10,000 cells/well according to pre-determined conditions.After incubating 24 hours to allow surface protein reconstitution, serial dilutions of test conjugates were added and cultures incubated further for 4 days.
|
||||
| In Vitro Model | Clear cell renal cell carcinoma | Caki-1 cells | CVCL_0234 | ||
| Experiment 2 Reporting the Activity Date of This ADC | [207] | ||||
| Efficacy Data | Half Maximal Inhibitory Concentration (IC50) |
21.00 ng/mL
|
Positive CD70 expression (CD70+++/++) | ||
| Method Description |
Log phase cultures of cells were collected and cells plated at seeding densities ranging from 500 - 10,000 cells/well according to pre-determined conditions.After incubating 24 hours to allow surface protein reconstitution, serial dilutions of test conjugates were added and cultures incubated further for 4 days.
|
||||
| In Vitro Model | Renal cell carcinoma | 786-O cells | CVCL_1051 | ||
hBU12-4 MMAE DAR4 [Investigative]
Revealed Based on the Cell Line Data
| Experiment 1 Reporting the Activity Date of This ADC | [207] | ||||
| Efficacy Data | Half Maximal Inhibitory Concentration (IC50) |
20.00 ng/mL
|
Positive CD70 expression (CD70+++/++) | ||
| Method Description |
Log phase cultures of cells were collected and cells plated at seeding densities ranging from 500 - 10,000 cells/well according to pre-determined conditions.After incubating 24 hours to allow surface protein reconstitution, serial dilutions of test conjugates were added and cultures incubated further for 4 days.
|
||||
| In Vitro Model | Clear cell renal cell carcinoma | Caki-1 cells | CVCL_0234 | ||
| Experiment 2 Reporting the Activity Date of This ADC | [207] | ||||
| Efficacy Data | Half Maximal Inhibitory Concentration (IC50) |
21.00 ng/mL
|
Positive CD70 expression (CD70+++/++) | ||
| Method Description |
Log phase cultures of cells were collected and cells plated at seeding densities ranging from 500 - 10,000 cells/well according to pre-determined conditions.After incubating 24 hours to allow surface protein reconstitution, serial dilutions of test conjugates were added and cultures incubated further for 4 days.
|
||||
| In Vitro Model | Renal cell carcinoma | 786-O cells | CVCL_1051 | ||
h1F6-22 MMAE [Investigative]
Revealed Based on the Cell Line Data
| Experiment 1 Reporting the Activity Date of This ADC | [207] | ||||
| Efficacy Data | Half Maximal Inhibitory Concentration (IC50) |
21.00 ng/mL
|
Positive CD70 expression (CD70+++/++) | ||
| Method Description |
Log phase cultures of cells were collected and cells plated at seeding densities ranging from 500 - 10,000 cells/well according to pre-determined conditions.After incubating 24 hours to allow surface protein reconstitution, serial dilutions of test conjugates were added and cultures incubated further for 4 days.
|
||||
| In Vitro Model | Clear cell renal cell carcinoma | Caki-1 cells | CVCL_0234 | ||
| Experiment 2 Reporting the Activity Date of This ADC | [207] | ||||
| Efficacy Data | Half Maximal Inhibitory Concentration (IC50) |
24.00 ng/mL
|
Positive CD70 expression (CD70+++/++) | ||
| Method Description |
Log phase cultures of cells were collected and cells plated at seeding densities ranging from 500 - 10,000 cells/well according to pre-determined conditions.After incubating 24 hours to allow surface protein reconstitution, serial dilutions of test conjugates were added and cultures incubated further for 4 days.
|
||||
| In Vitro Model | Renal cell carcinoma | 786-O cells | CVCL_1051 | ||
hBU12-22 MMAE [Investigative]
Revealed Based on the Cell Line Data
| Experiment 1 Reporting the Activity Date of This ADC | [207] | ||||
| Efficacy Data | Half Maximal Inhibitory Concentration (IC50) |
21.00 ng/mL
|
Positive CD70 expression (CD70+++/++) | ||
| Method Description |
Log phase cultures of cells were collected and cells plated at seeding densities ranging from 500 - 10,000 cells/well according to pre-determined conditions.After incubating 24 hours to allow surface protein reconstitution, serial dilutions of test conjugates were added and cultures incubated further for 4 days.
|
||||
| In Vitro Model | Clear cell renal cell carcinoma | Caki-1 cells | CVCL_0234 | ||
| Experiment 2 Reporting the Activity Date of This ADC | [207] | ||||
| Efficacy Data | Half Maximal Inhibitory Concentration (IC50) |
24.00 ng/mL
|
Positive CD70 expression (CD70+++/++) | ||
| Method Description |
Log phase cultures of cells were collected and cells plated at seeding densities ranging from 500 - 10,000 cells/well according to pre-determined conditions.After incubating 24 hours to allow surface protein reconstitution, serial dilutions of test conjugates were added and cultures incubated further for 4 days.
|
||||
| In Vitro Model | Renal cell carcinoma | 786-O cells | CVCL_1051 | ||
h1F6-1 MMAE DAR4 [Investigative]
Revealed Based on the Cell Line Data
| Experiment 1 Reporting the Activity Date of This ADC | [207] | ||||
| Efficacy Data | Half Maximal Inhibitory Concentration (IC50) |
21.00 ng/mL
|
Positive CD70 expression (CD70+++/++) | ||
| Method Description |
Log phase cultures of cells were collected and cells plated at seeding densities ranging from 500 - 10,000 cells/well according to pre-determined conditions.After incubating 24 hours to allow surface protein reconstitution, serial dilutions of test conjugates were added and cultures incubated further for 4 days.
|
||||
| In Vitro Model | Clear cell renal cell carcinoma | Caki-1 cells | CVCL_0234 | ||
| Experiment 2 Reporting the Activity Date of This ADC | [207] | ||||
| Efficacy Data | Half Maximal Inhibitory Concentration (IC50) |
21.00 ng/mL
|
Positive CD70 expression (CD70+++/++) | ||
| Method Description |
Log phase cultures of cells were collected and cells plated at seeding densities ranging from 500 - 10,000 cells/well according to pre-determined conditions.After incubating 24 hours to allow surface protein reconstitution, serial dilutions of test conjugates were added and cultures incubated further for 4 days.
|
||||
| In Vitro Model | Renal cell carcinoma | 786-O cells | CVCL_1051 | ||
hBU12-1 MMAE DAR4 [Investigative]
Revealed Based on the Cell Line Data
| Experiment 1 Reporting the Activity Date of This ADC | [207] | ||||
| Efficacy Data | Half Maximal Inhibitory Concentration (IC50) |
21.00 ng/mL
|
Positive CD70 expression (CD70+++/++) | ||
| Method Description |
Log phase cultures of cells were collected and cells plated at seeding densities ranging from 500 - 10,000 cells/well according to pre-determined conditions.After incubating 24 hours to allow surface protein reconstitution, serial dilutions of test conjugates were added and cultures incubated further for 4 days.
|
||||
| In Vitro Model | Clear cell renal cell carcinoma | Caki-1 cells | CVCL_0234 | ||
| Experiment 2 Reporting the Activity Date of This ADC | [207] | ||||
| Efficacy Data | Half Maximal Inhibitory Concentration (IC50) |
21.00 ng/mL
|
Positive CD70 expression (CD70+++/++) | ||
| Method Description |
Log phase cultures of cells were collected and cells plated at seeding densities ranging from 500 - 10,000 cells/well according to pre-determined conditions.After incubating 24 hours to allow surface protein reconstitution, serial dilutions of test conjugates were added and cultures incubated further for 4 days.
|
||||
| In Vitro Model | Renal cell carcinoma | 786-O cells | CVCL_1051 | ||
h1F6-3 MMAE DAR4 [Investigative]
Revealed Based on the Cell Line Data
| Experiment 1 Reporting the Activity Date of This ADC | [207] | ||||
| Efficacy Data | Half Maximal Inhibitory Concentration (IC50) |
27.00 ng/mL
|
Positive CD70 expression (CD70+++/++) | ||
| Method Description |
Log phase cultures of cells were collected and cells plated at seeding densities ranging from 500 - 10,000 cells/well according to pre-determined conditions.After incubating 24 hours to allow surface protein reconstitution, serial dilutions of test conjugates were added and cultures incubated further for 4 days.
|
||||
| In Vitro Model | Clear cell renal cell carcinoma | Caki-1 cells | CVCL_0234 | ||
| Experiment 2 Reporting the Activity Date of This ADC | [207] | ||||
| Efficacy Data | Half Maximal Inhibitory Concentration (IC50) |
28.00 ng/mL
|
Positive CD70 expression (CD70+++/++) | ||
| Method Description |
Log phase cultures of cells were collected and cells plated at seeding densities ranging from 500 - 10,000 cells/well according to pre-determined conditions.After incubating 24 hours to allow surface protein reconstitution, serial dilutions of test conjugates were added and cultures incubated further for 4 days.
|
||||
| In Vitro Model | Renal cell carcinoma | 786-O cells | CVCL_1051 | ||
hBU12-3 MMAE DAR4 [Investigative]
Revealed Based on the Cell Line Data
| Experiment 1 Reporting the Activity Date of This ADC | [207] | ||||
| Efficacy Data | Half Maximal Inhibitory Concentration (IC50) |
27.00 ng/mL
|
Positive CD70 expression (CD70+++/++) | ||
| Method Description |
Log phase cultures of cells were collected and cells plated at seeding densities ranging from 500 - 10,000 cells/well according to pre-determined conditions.After incubating 24 hours to allow surface protein reconstitution, serial dilutions of test conjugates were added and cultures incubated further for 4 days.
|
||||
| In Vitro Model | Clear cell renal cell carcinoma | Caki-1 cells | CVCL_0234 | ||
| Experiment 2 Reporting the Activity Date of This ADC | [207] | ||||
| Efficacy Data | Half Maximal Inhibitory Concentration (IC50) |
28.00 ng/mL
|
Positive CD70 expression (CD70+++/++) | ||
| Method Description |
Log phase cultures of cells were collected and cells plated at seeding densities ranging from 500 - 10,000 cells/well according to pre-determined conditions.After incubating 24 hours to allow surface protein reconstitution, serial dilutions of test conjugates were added and cultures incubated further for 4 days.
|
||||
| In Vitro Model | Renal cell carcinoma | 786-O cells | CVCL_1051 | ||
Bevacizumab vedotin [Investigative]
Revealed Based on the Cell Line Data
| Experiment 1 Reporting the Activity Date of This ADC | [265] | ||||
| Efficacy Data | Half Maximal Inhibitory Concentration (IC50) |
0.14 ug/mL
|
Positive VEGFA expression (VEGFA +++/++) | ||
| Method Description |
The anti-proliferative activity of Bevacizumab Vedotin and Bevacizumab against three different cell lines was determined by MTT method.
|
||||
| In Vitro Model | Invasive breast carcinoma | MCF-7 cells | CVCL_0031 | ||
| Experiment 2 Reporting the Activity Date of This ADC | [265] | ||||
| Efficacy Data | Half Maximal Inhibitory Concentration (IC50) |
0.65 ug/mL
|
Positive VEGFA expression (VEGFA +++/++) | ||
| Method Description |
The anti-proliferative activity of Bevacizumab Vedotin and Bevacizumab against three different cell lines was determined by MTT method.
|
||||
| In Vitro Model | Hepatoblastoma | Hep-G2 cells | CVCL_0027 | ||
| Experiment 3 Reporting the Activity Date of This ADC | [265] | ||||
| Efficacy Data | Half Maximal Inhibitory Concentration (IC50) |
14.17 ug/mL
|
Positive VEGFA expression (VEGFA +++/++) | ||
| Method Description |
The anti-proliferative activity of Bevacizumab Vedotin and Bevacizumab against three different cell lines was determined by MTT method.
|
||||
| In Vitro Model | Glioblastoma | U-87MG cells | CVCL_0022 | ||
PeptibodyC19-PEG4-Val-Cit-MMAE [Investigative]
Revealed Based on the Cell Line Data
| Experiment 1 Reporting the Activity Date of This ADC | [266] | ||||
| Efficacy Data | Half Maximal Effective Concentration (EC50) |
4.55 nM
|
High FGFR1 expression (FGFR1+++) | ||
| Method Description |
Human lung cancer cell lines showing FGFR1 overexpression (NCI-H520 and NCI-H1581) was chosen and a cell line with physiological, low levels of FGFR1 (HCC95) was chosen as a control,.
|
||||
| In Vitro Model | Lung large cell carcinoma | NCI-H1581 cells | CVCL_1479 | ||
| Experiment 2 Reporting the Activity Date of This ADC | [266] | ||||
| Efficacy Data | Half Maximal Effective Concentration (EC50) |
90.49 nM
|
High FGFR1 expression (FGFR1+++) | ||
| Method Description |
Human lung cancer cell lines showing FGFR1 overexpression (NCI-H520 and NCI-H1581) was chosen and a cell line with physiological, low levels of FGFR1 (HCC95) was chosen as a control,.
|
||||
| In Vitro Model | Lung squamous cell carcinoma | NCI-H520 cells | CVCL_1566 | ||
| Experiment 3 Reporting the Activity Date of This ADC | [266] | ||||
| Efficacy Data | Half Maximal Effective Concentration (EC50) | > 1000.00 nM | Negative FGFR1 expression (FGFR1-) | ||
| Method Description |
Human lung cancer cell lines showing FGFR1 overexpression (NCI-H520 and NCI-H1581) was chosen and a cell line with physiological, low levels of FGFR1 (HCC95) was chosen as a control,.
|
||||
| In Vitro Model | Lung squamous cell carcinoma | HCC95 cells | CVCL_5137 | ||
PD-L1 ADC 3 [Investigative]
Revealed Based on the Cell Line Data
| Experiment 1 Reporting the Activity Date of This ADC | [262] | ||||
| Efficacy Data | Half Maximal Effective Concentration (EC50) |
9.75 nM
|
High PD-L1 expression (PD-L1+++) | ||
| Method Description |
The in vitro cytotoxicity of ADC 3 was quickly evaluated in three PD-L1-positive cell lines, ie, MDA-MB-231, PC 9, and A431, and one PD-L1-negative cell line, ie, Romas.
|
||||
| In Vitro Model | Lung adenocarcinoma | PC-9 cells | CVCL_B260 | ||
| Experiment 2 Reporting the Activity Date of This ADC | [262] | ||||
| Efficacy Data | Half Maximal Effective Concentration (EC50) |
10.33 nM
|
High PD-L1 expression (PD-L1+++) | ||
| Method Description |
The in vitro cytotoxicity of ADC 3 was quickly evaluated in three PD-L1-positive cell lines, ie, MDA-MB-231, PC 9, and A431, and one PD-L1-negative cell line, ie, Romas.
|
||||
| In Vitro Model | Breast adenocarcinoma | MDA-MB-231 cells | CVCL_0062 | ||
| Experiment 3 Reporting the Activity Date of This ADC | [262] | ||||
| Efficacy Data | Half Maximal Effective Concentration (EC50) |
11.94 nM
|
High PD-L1 expression (PD-L1+++) | ||
| Method Description |
The in vitro cytotoxicity of ADC 3 was quickly evaluated in three PD-L1-positive cell lines, ie, MDA-MB-231, PC 9, and A431, and one PD-L1-negative cell line, ie, Romas.
|
||||
| In Vitro Model | Skin squamous cell carcinoma | A431 cells | CVCL_0037 | ||
BA03-MCC-MMAE [Investigative]
Revealed Based on the Cell Line Data
| Experiment 1 Reporting the Activity Date of This ADC | [200] | ||||
| Efficacy Data | Half Maximal Effective Concentration (EC50) |
71.60 ng/mL
|
Positive EGFR expression (EGFR +++/++) | ||
| Method Description |
Cells were plated at about 500 cells per well in a 96-well plate in 100 uL of media. In vitro activity and targeted delivery of ADCs, the isotype-matched negative controls ADCs, and naked antibodies control were assessed in cells.
|
||||
| In Vitro Model | Colorectal carcinoma | DiFi cells | CVCL_6895 | ||
BA03-MC-MMAE [Investigative]
Revealed Based on the Cell Line Data
| Experiment 1 Reporting the Activity Date of This ADC | [200] | ||||
| Efficacy Data | Half Maximal Effective Concentration (EC50) |
72.60 ng/mL
|
Positive EGFR expression (EGFR +++/++) | ||
| Method Description |
Cells were plated at about 500 cells per well in a 96-well plate in 100 uL of media. In vitro activity and targeted delivery of ADCs, the isotype-matched negative controls ADCs, and naked antibodies control were assessed in cells.
|
||||
| In Vitro Model | Colorectal carcinoma | DiFi cells | CVCL_6895 | ||
Trastuzumab-MMAE conjugate DAR12 [Investigative]
Revealed Based on the Cell Line Data
| Experiment 1 Reporting the Activity Date of This ADC | [267] | ||||
| Efficacy Data | Half Maximal Effective Concentration (EC50) | > 10.00 uM | Negative HER2 expression (HER2-) | ||
| Method Description |
The cytotoxicity of the synthetic ADCs were tested in breast cancer cell lines BT474 that have high levels of HER2 expression, and T47D that has low level expression of HER2 antigen.
|
||||
| In Vitro Model | Invasive breast carcinoma | T-47D cells | CVCL_0553 | ||
| Experiment 2 Reporting the Activity Date of This ADC | [267] | ||||
| Efficacy Data | Half Maximal Effective Concentration (EC50) |
0.04 nM
7.13 ng/mL |
High HER2 expression (HER2+++) | ||
| Method Description |
The cytotoxicity of the synthetic ADCs were tested in breast cancer cell lines BT474 that have high levels of HER2 expression, and T47D that has low level expression of HER2 antigen.
|
||||
| In Vitro Model | Invasive breast carcinoma | BT-474 cells | CVCL_0179 | ||
Trastuzumab-MMAE conjugate DAR8 [Investigative]
Revealed Based on the Cell Line Data
| Experiment 1 Reporting the Activity Date of This ADC | [267] | ||||
| Efficacy Data | Half Maximal Effective Concentration (EC50) | > 10.00 uM | Negative HER2 expression (HER2-) | ||
| Method Description |
The cytotoxicity of the synthetic ADCs were tested in breast cancer cell lines BT474 that have high levels of HER2 expression, and T47D that has low level expression of HER2 antigen.
|
||||
| In Vitro Model | Invasive breast carcinoma | T-47D cells | CVCL_0553 | ||
| Experiment 2 Reporting the Activity Date of This ADC | [267] | ||||
| Efficacy Data | Half Maximal Effective Concentration (EC50) |
0.05 nM
8.79 ng/mL |
High HER2 expression (HER2+++) | ||
| Method Description |
The cytotoxicity of the synthetic ADCs were tested in breast cancer cell lines BT474 that have high levels of HER2 expression, and T47D that has low level expression of HER2 antigen.
|
||||
| In Vitro Model | Invasive breast carcinoma | BT-474 cells | CVCL_0179 | ||
Trastuzumab-MMAE conjugate DAR6 [Investigative]
Revealed Based on the Cell Line Data
| Experiment 1 Reporting the Activity Date of This ADC | [267] | ||||
| Efficacy Data | Half Maximal Effective Concentration (EC50) | > 10.00 uM | Negative HER2 expression (HER2-) | ||
| Method Description |
The cytotoxicity of the synthetic ADCs were tested in breast cancer cell lines BT474 that have high levels of HER2 expression, and T47D that has low level expression of HER2 antigen.
|
||||
| In Vitro Model | Invasive breast carcinoma | T-47D cells | CVCL_0553 | ||
| Experiment 2 Reporting the Activity Date of This ADC | [267] | ||||
| Efficacy Data | Half Maximal Effective Concentration (EC50) |
0.08 nM
12.68 ng/mL |
High HER2 expression (HER2+++) | ||
| Method Description |
The cytotoxicity of the synthetic ADCs were tested in breast cancer cell lines BT474 that have high levels of HER2 expression, and T47D that has low level expression of HER2 antigen.
|
||||
| In Vitro Model | Invasive breast carcinoma | BT-474 cells | CVCL_0179 | ||
Trastuzumab-MMAE conjugate DAR4 [Investigative]
Revealed Based on the Cell Line Data
| Experiment 1 Reporting the Activity Date of This ADC | [267] | ||||
| Efficacy Data | Half Maximal Effective Concentration (EC50) | > 10.00 uM | Negative HER2 expression (HER2-) | ||
| Method Description |
The cytotoxicity of the synthetic ADCs were tested in breast cancer cell lines BT474 that have high levels of HER2 expression, and T47D that has low level expression of HER2 antigen.
|
||||
| In Vitro Model | Invasive breast carcinoma | T-47D cells | CVCL_0553 | ||
| Experiment 2 Reporting the Activity Date of This ADC | [267] | ||||
| Efficacy Data | Half Maximal Effective Concentration (EC50) |
0.10 nM
16.05 ng/mL |
High HER2 expression (HER2+++) | ||
| Method Description |
The cytotoxicity of the synthetic ADCs were tested in breast cancer cell lines BT474 that have high levels of HER2 expression, and T47D that has low level expression of HER2 antigen.
|
||||
| In Vitro Model | Invasive breast carcinoma | BT-474 cells | CVCL_0179 | ||
Trastuzumab-MMAE conjugate DAR2 [Investigative]
Revealed Based on the Cell Line Data
| Experiment 1 Reporting the Activity Date of This ADC | [268] | ||||
| Efficacy Data | Half Maximal Effective Concentration (EC50) | > 10.00 uM | Negative HER2 expression (HER2-) | ||
| Method Description |
The cytotoxicity of the synthetic ADCs were tested in breast cancer cell lines SK-BR-3 and BT474 that have high levels of HER2 expression, and T47D that has low level expression of HER2 antigen.
|
||||
| In Vitro Model | Invasive breast carcinoma | T-47D cells | CVCL_0553 | ||
| Experiment 2 Reporting the Activity Date of This ADC | [268] | ||||
| Efficacy Data | Half Maximal Effective Concentration (EC50) |
0.07 nM
10.67 ng/mL |
High HER2 expression (HER2+++) | ||
| Method Description |
The cytotoxicity of the synthetic ADCs were tested in breast cancer cell lines SK-BR-3 and BT474 that have high levels of HER2 expression, and T47D that has low level expression of HER2 antigen.
|
||||
| In Vitro Model | Breast adenocarcinoma | SK-BR-3 cells | CVCL_0033 | ||
| Experiment 3 Reporting the Activity Date of This ADC | [268] | ||||
| Efficacy Data | Half Maximal Effective Concentration (EC50) |
0.41 nM
6.20 ng/mL |
High HER2 expression (HER2+++) | ||
| Method Description |
The cytotoxicity of the synthetic ADCs were tested in breast cancer cell lines SK-BR-3 and BT474 that have high levels of HER2 expression, and T47D that has low level expression of HER2 antigen.
|
||||
| In Vitro Model | Invasive breast carcinoma | BT-474 cells | CVCL_0179 | ||
Trastuzumab-Gal-beta-1,4GlcNAc-MMAE [Investigative]
Revealed Based on the Cell Line Data
| Experiment 1 Reporting the Activity Date of This ADC | [268] | ||||
| Efficacy Data | Half Maximal Effective Concentration (EC50) | > 10.00 uM | Negative HER2 expression (HER2-) | ||
| Method Description |
The cytotoxicity of the synthetic ADCs were tested in breast cancer cell lines SK-BR-3 and BT474 that have high levels of HER2 expression, and T47D that has low level expression of HER2 antigen.
|
||||
| In Vitro Model | Invasive breast carcinoma | T-47D cells | CVCL_0553 | ||
| Experiment 2 Reporting the Activity Date of This ADC | [268] | ||||
| Efficacy Data | Half Maximal Effective Concentration (EC50) |
0.04 nM
6.08 ng/mL |
High HER2 expression (HER2+++) | ||
| Method Description |
The cytotoxicity of the synthetic ADCs were tested in breast cancer cell lines SK-BR-3 and BT474 that have high levels of HER2 expression, and T47D that has low level expression of HER2 antigen.
|
||||
| In Vitro Model | Invasive breast carcinoma | BT-474 cells | CVCL_0179 | ||
| Experiment 3 Reporting the Activity Date of This ADC | [268] | ||||
| Efficacy Data | Half Maximal Effective Concentration (EC50) |
0.07 nM
11.07 ng/mL |
High HER2 expression (HER2+++) | ||
| Method Description |
The cytotoxicity of the synthetic ADCs were tested in breast cancer cell lines SK-BR-3 and BT474 that have high levels of HER2 expression, and T47D that has low level expression of HER2 antigen.
|
||||
| In Vitro Model | Breast adenocarcinoma | SK-BR-3 cells | CVCL_0033 | ||
Trastuzumab-Glc-beta-1,4GlcNAc-MMAE [Investigative]
Revealed Based on the Cell Line Data
| Experiment 1 Reporting the Activity Date of This ADC | [268] | ||||
| Efficacy Data | Half Maximal Effective Concentration (EC50) | > 10.00 uM | Negative HER2 expression (HER2-) | ||
| Method Description |
The cytotoxicity of the synthetic ADCs were tested in breast cancer cell lines SK-BR-3 and BT474 that have high levels of HER2 expression, and T47D that has low level expression of HER2 antigen.
|
||||
| In Vitro Model | Invasive breast carcinoma | T-47D cells | CVCL_0553 | ||
| Experiment 2 Reporting the Activity Date of This ADC | [268] | ||||
| Efficacy Data | Half Maximal Effective Concentration (EC50) |
0.04 nM
6.39 ng/mL |
High HER2 expression (HER2+++) | ||
| Method Description |
The cytotoxicity of the synthetic ADCs were tested in breast cancer cell lines SK-BR-3 and BT474 that have high levels of HER2 expression, and T47D that has low level expression of HER2 antigen.
|
||||
| In Vitro Model | Invasive breast carcinoma | BT-474 cells | CVCL_0179 | ||
| Experiment 3 Reporting the Activity Date of This ADC | [268] | ||||
| Efficacy Data | Half Maximal Effective Concentration (EC50) |
0.07 nM
10.67 ng/mL |
High HER2 expression (HER2+++) | ||
| Method Description |
The cytotoxicity of the synthetic ADCs were tested in breast cancer cell lines SK-BR-3 and BT474 that have high levels of HER2 expression, and T47D that has low level expression of HER2 antigen.
|
||||
| In Vitro Model | Breast adenocarcinoma | SK-BR-3 cells | CVCL_0033 | ||
Trastuzumab-Man-beta-1,4GlcNAc-MMAE [Investigative]
Revealed Based on the Cell Line Data
| Experiment 1 Reporting the Activity Date of This ADC | [268] | ||||
| Efficacy Data | Half Maximal Effective Concentration (EC50) | > 10.00 uM | Negative HER2 expression (HER2-) | ||
| Method Description |
The cytotoxicity of the synthetic ADCs were tested in breast cancer cell lines SK-BR-3 and BT474 that have high levels of HER2 expression, and T47D that has low level expression of HER2 antigen.
|
||||
| In Vitro Model | Invasive breast carcinoma | T-47D cells | CVCL_0553 | ||
| Experiment 2 Reporting the Activity Date of This ADC | [268] | ||||
| Efficacy Data | Half Maximal Effective Concentration (EC50) |
0.05 nM
7.06 ng/mL |
High HER2 expression (HER2+++) | ||
| Method Description |
The cytotoxicity of the synthetic ADCs were tested in breast cancer cell lines SK-BR-3 and BT474 that have high levels of HER2 expression, and T47D that has low level expression of HER2 antigen.
|
||||
| In Vitro Model | Invasive breast carcinoma | BT-474 cells | CVCL_0179 | ||
| Experiment 3 Reporting the Activity Date of This ADC | [268] | ||||
| Efficacy Data | Half Maximal Effective Concentration (EC50) |
0.07 nM
11.07 ng/mL |
High HER2 expression (HER2+++) | ||
| Method Description |
The cytotoxicity of the synthetic ADCs were tested in breast cancer cell lines SK-BR-3 and BT474 that have high levels of HER2 expression, and T47D that has low level expression of HER2 antigen.
|
||||
| In Vitro Model | Breast adenocarcinoma | SK-BR-3 cells | CVCL_0033 | ||
Lifastuzumab vedotin [Terminated in phase 2]
Identified from the Human Clinical Data
| Experiment 1 Reporting the Activity Date of This ADC | [269] | ||||
| Efficacy Data | Partial Response (PR) |
7.84% (patients with NSCLC, active doses 1.8 mg/kg)
45.83% (patients with PROC, active doses 1.8 mg/kg) 25.00% (1.8 mg/kg, in the NSCLC cohorts) 6.67% (2.4 mg/kg, in the NSCLC cohorts) |
|||
| Patients Enrolled |
Incurable, locally advanced, or metastatic disease (non-squamous NSCLC or non-mucinous PROC) that had progressed on or following prior chemotherapy and for which no standard therapy existed, Eastern Cooperative Oncology Group (ECOG) performance status of 0 or 1.
|
||||
| Administration Dosage |
The starting dose for LIFA was 0.20 mg/kg administered by intravenous infusion (IV) every 3 weeks (Q3W), in this 3+3 dose-escalation design, followed by cohort expansion at the recommended phase II dose (RP2D).
|
||||
| Related Clinical Trial | |||||
| NCT Number | NCT01911598 | Phase Status | Phase 1a | ||
| Clinical Description |
A phase 1b open-label study of the safety and pharmacokinetics of MEHD7945A in combination with either cisplatin and 5-fu or paclitaxel and carboplatin in patients with recurrent/metastatic squamous cell carcinoma of the head and neck.
|
||||
| Primary Endpoint |
The MTD was not reached on this study and the maximum administered dose (MAD) was 2.80 mg/kg. Upon evaluation of the safety data of the 6 patients treated at the MAD, the dose of 2.40 mg/kg was established as the RP2D.
|
||||
| Other Endpoint |
At active doses 1.80 mg/kg, partial responses were observed in four of 51 (7.84%) patients with NSCLC and 11 of 24 (45.83%) patients. In the NSCLC cohorts, PRs were seen in 1 of 4 (25.00%) at 1.80 mg/kg and in 3 of 45 (6.67%) patients at 2.40 mg/kg, mDoR=161 days. In PROC, PRs were seen at 1.80 mg/kg in one of two (50.00%), at 2.40 mg/kg in seven of 18 (38.89%), and at 2.80 mg/kg in three of four (75.00%) patients; mDoR=342 days.
Click to Show/Hide
|
||||
| Experiment 2 Reporting the Activity Date of This ADC | [273] | ||||
| Efficacy Data | Objective Response Rate (ORR) |
34.00% (ITT population)
36.00% (NaPi2bx high patients) |
|||
| Patients Enrolled |
Advanced epithelial ovarian, primary peritoneal, or fallopian tube cancer that had progressed or relapsed within 6months of the most recent treatment with a platinum-containing chemotherapy regimen and for whom PLD was considered an appropriate therapy.
|
||||
| Administration Dosage |
2.40 mg/kg, intravenously, every 3 weeks (Q3W).
|
||||
| Related Clinical Trial | |||||
| NCT Number | NCT01991210 | Phase Status | Phase 2 | ||
| Clinical Description |
A randomized, open-label, multicenter, phase 2 trial evaluating the safety and activity of DNIB0600A compared to pegylated liposomal doxorubicin administered intravenously to patients with platinum-resistant ovarian cancer.
|
||||
| Primary Endpoint |
The stratified PFS hazard ratio was 0.78 (95% CI,0.46-1.31; p=0.34) with a median PFS of 5.30 vs. 3.10 months (LIFA vs. PLD arm,respectively) in the ITT population, and 0.71 (95% CI,0.40-1.26; p=0.24) with a median PFS of 5.30 vs. 3.40 months (LIFA vs. PLD arm,respectively) in NaPi2bxhigh patients. The objective response rate (ORR) was 34.00% (95% CI,22.00-49.00%,LIFA) vs. 15.00% (95% CI, 7.00-28.00%,PLD) in the ITT population (p=0.03), and 36.00% (95% CI, 22.00-52.00%,LIFA) vs.14.00% (95% CI,6.00-27.00%,PLD) in NaPi2bxhigh patients (p=0.02).
Click to Show/Hide
|
||||
| Experiment 3 Reporting the Activity Date of This ADC | [274] | ||||
| Efficacy Data | Objective Response Rate (ORR) |
34.00% (all)
36.00% (SLC34A2 2+/3+) |
|||
| Patients Enrolled |
Platinum-resistant patients with histologically documented advanced epithelial ovarian, primary peritoneal, or fallopian tube cancer.
|
||||
| Administration Dosage |
2.40 mg/kg, intravenously, every 3 weeks (Q3W).
|
||||
| Related Clinical Trial | |||||
| NCT Number | NCT01991210 | Phase Status | Phase 2 | ||
| Clinical Description |
A randomized, open-label, multicenter, phase 2 trial evaluating the safety and activity of DNIB0600A compared to pegylated liposomal doxorubicin administered intravenously to patients with platinum-resistant ovarian cancer.
|
||||
| Experiment 4 Reporting the Activity Date of This ADC | [276] | ||||
| Efficacy Data | Objective Response Rate (ORR) |
25.00% (1.8 mg/kg NSCLC)
7.00% (2.4 mg/kg NSCLC) 50.00% (1.8 mg/kg PROC) 39.00% (2.4 mg/kg PROC) 75.00% (2.8 mg/kg PROC) |
|||
| Patients Enrolled |
Patients with nonsmall cell lung cancer (NSCLC) and platinum-resistant ovarian cancer (PROC).
|
||||
| Administration Dosage |
Dose-escalation: 0.20-2.80 mg/kg once every 3 weeks, dose-expansion: 4 mg/kg once every 3 weeks.
|
||||
| Related Clinical Trial | |||||
| NCT Number | NCT01363947 | Phase Status | Phase 1 | ||
| Clinical Description |
A phase 1, open-label study of the safety and pharmacokinetics of escalating doses of DNIB0600A in patients with non-small cell lung cancer and platinum-resistant ovarian cancer.
|
||||
| Experiment 5 Reporting the Activity Date of This ADC | [279] | ||||
| Efficacy Data | Complete Remission (CR) |
58.54%
|
|||
| Patients Enrolled |
Polycystic ovary syndrome (PSOC) patients (epithelial ovarian cancer, primary peritoneal cancer, or fallopian tube cancer) with documented radiographic progression or relapse according to RECIST v1.1.
|
||||
| Administration Dosage |
The starting dose of LIFA was 1.20 mg/kg, once every 3 weeks (Q3W) on the first day of 21-day cycles, traditional 3 + 3 study design.
|
||||
| Related Clinical Trial | |||||
| NCT Number | NCT01995188 | Phase Status | Phase 1b | ||
| Clinical Description |
A phase 1b, open-label, dose-escalation study of the safety and pharmacology of DNIB0600A in combination with carboplatin (with or without bevacizumab) in patients with platinum-sensitive ovarian cancer or non-squamous non-small cell lung cancer.
|
||||
| Primary Endpoint |
The median duration of progression-free survival was 10.71 months (95% CI: 8.54,13.86) with confirmed complete/partial responses in 24 (58.54%) patients.
|
||||
| Other Endpoint |
The maximum tolerated dose was not reached. The recommended phase 2 dose (RP2D) was LIFA 2.40 mg/kg + carboplatin AUC6 (cycles 16), with or without bevacizumab 15 mg/kg.
|
||||
| Experiment 6 Reporting the Activity Date of This ADC | [282] | ||||
| Related Clinical Trial | |||||
| NCT Number | NCT01995188 | Phase Status | Phase 1 | ||
| Clinical Description |
A phase 1b, open-label, dose-escalation study of the safety and pharmacology of DNIB0600A in combination with carboplatin (with or without bevacizumab) in patients with platinum-sensitive ovarian cancer or non-squamous non-small cell lung cancer.
|
||||
Discovered Using Patient-derived Xenograft Model
| Experiment 1 Reporting the Activity Date of This ADC | [283] | ||||
| Efficacy Data | Tumor Growth Inhibition value (TGI) | ≈ 19.60% (Day 17) | Moderate SLC34A2 expression (SLC34A2++) | ||
| Method Description |
Animals were randomized into treatment groups (n = 10) when the tumor target volume reached 100-150 mm3. Test articles were administered intravenously via tail vein injection. Mice received a single dose of either saline vehicle; XMT-1535 at 3 mg/kg; XMT-1536 (DAR 12.4) at 3 mg/kg; IgG1-Dolaflexin (DAR 18.1) at 3 mg/kg,or lifastuzumab vedotin (DAR 4.1) at 3 mg/kg. Tumors were measured twice per week. XMT-1536 and lifastuzumab vedotin were administered at a single dose of 3 mg/kg qwk x 3.
Click to Show/Hide
|
||||
| In Vivo Model | Non-small cell lung cancer PDX model (PDX: CTG-0860) | ||||
| Experiment 2 Reporting the Activity Date of This ADC | [283] | ||||
| Efficacy Data | Tumor Growth Inhibition value (TGI) | ≈ 25.40% (Day 35) | Moderate SLC34A2 expression (SLC34A2++) | ||
| Method Description |
Animals were randomized into treatment groups (n = 10) when the tumor target volume reached 100-150 mm3. Test articles were administered intravenously via tail vein injection. Mice received a single dose of either saline vehicle; XMT-1535 at 3 mg/kg; XMT-1536 (DAR 12.4) at 3 mg/kg; IgG1-Dolaflexin (DAR 18.1) at 3 mg/kg,or lifastuzumab vedotin (DAR 4.1) at 3 mg/kg. Tumors were measured twice per week. XMT-1536 and lifastuzumab vedotin were administered at a single dose of 3 mg/kg qwk x 3.
Click to Show/Hide
|
||||
| In Vivo Model | Lung cancer PDX model (PDX: CTG-0178) | ||||
| Experiment 3 Reporting the Activity Date of This ADC | [283] | ||||
| Efficacy Data | Tumor Growth Inhibition value (TGI) | ≈ 27.60% (Day 28) | Moderate SLC34A2 expression (SLC34A2++) | ||
| Method Description |
Animals were randomized into treatment groups (n = 10) when the tumor target volume reached 100-150 mm3. Test articles were administered intravenously via tail vein injection. Mice received a single dose of either saline vehicle; XMT-1535 at 3 mg/kg; XMT-1536 (DAR 12.4) at 3 mg/kg; IgG1-Dolaflexin (DAR 18.1) at 3 mg/kg,or lifastuzumab vedotin (DAR 4.1) at 3 mg/kg. Tumors were measured twice per week. XMT-1536 and lifastuzumab vedotin were administered at a single dose of 3 mg/kg qwk x 3.
Click to Show/Hide
|
||||
| In Vivo Model | Lung cancer PDX model (PDX: CTG-0178) | ||||
| Experiment 4 Reporting the Activity Date of This ADC | [283] | ||||
| Efficacy Data | Tumor Growth Inhibition value (TGI) | ≈ 59.30% (Day 62) | High SLC34A2 expression (SLC34A2+++) | ||
| Method Description |
Animals were randomized into treatment groups (n = 10) when the tumor target volume reached 100-150 mm3. Test articles were administered intravenously via tail vein injection. Mice received a single dose of either saline vehicle; XMT-1535 at 3 mg/kg; XMT-1536 (DAR 12.4) at 3 mg/kg; IgG1-Dolaflexin (DAR 18.1) at 3 mg/kg,or lifastuzumab vedotin (DAR 4.1) at 3 mg/kg. Tumors were measured twice per week. XMT-1536 and lifastuzumab vedotin were administered at a single dose of 3 mg/kg qwk x 3.
Click to Show/Hide
|
||||
| In Vivo Model | Lung cancer PDX model (PDX: CTG-0852) | ||||
| Experiment 5 Reporting the Activity Date of This ADC | [283] | ||||
| Efficacy Data | Tumor Growth Inhibition value (TGI) | ≈ 62.70% (Day 35) | High SLC34A2 expression (SLC34A2+++) | ||
| Method Description |
Animals were randomized into treatment groups (n = 10) when the tumor target volume reached 100-150 mm3. Test articles were administered intravenously via tail vein injection. Mice received a single dose of either saline vehicle; XMT-1535 at 3 mg/kg; XMT-1536 (DAR 12.4) at 3 mg/kg; IgG1-Dolaflexin (DAR 18.1) at 3 mg/kg,or lifastuzumab vedotin (DAR 4.1) at 3 mg/kg. Tumors were measured twice per week. XMT-1536 and lifastuzumab vedotin were administered at a single dose of 3 mg/kg qwk x 3.
Click to Show/Hide
|
||||
| In Vivo Model | Lung cancer PDX model (PDX: CTG-0852) | ||||
| Experiment 6 Reporting the Activity Date of This ADC | [283] | ||||
| Efficacy Data | Tumor Growth Inhibition value (TGI) | ≈ 62.80% (Day 28) | High SLC34A2 expression (SLC34A2+++) | ||
| Method Description |
Animals were randomized into treatment groups (n = 10) when the tumor target volume reached 100-150 mm3. Test articles were administered intravenously via tail vein injection. Mice received a single dose of either saline vehicle; XMT-1535 at 3 mg/kg; XMT-1536 (DAR 12.4) at 3 mg/kg; IgG1-Dolaflexin (DAR 18.1) at 3 mg/kg,or lifastuzumab vedotin (DAR 4.1) at 3 mg/kg. Tumors were measured twice per week. XMT-1536 and lifastuzumab vedotin were administered at a single dose of 3 mg/kg qwk x 3.
Click to Show/Hide
|
||||
| In Vivo Model | Lung cancer PDX model (PDX: CTG-0852) | ||||
Discovered Using Cell Line-derived Xenograft Model
| Experiment 1 Reporting the Activity Date of This ADC | [283] | ||||
| Efficacy Data | Tumor Growth Inhibition value (TGI) | ≈ 41.20% (Day 28) | High SLC34A2 expression (SLC34A2+++) | ||
| Method Description |
Animals were randomized into treatment groups (n = 10) when the tumor target volume reached 100-150 mm3. Test articles were administered intravenously via tail vein injection. Mice received a single dose of either saline vehicle; XMT-1535 at 3 mg/kg; XMT-1536 (DAR 12.4) at 3 mg/kg; IgG1-Dolaflexin (DAR 18.1) at 3 mg/kg,or lifastuzumab vedotin (DAR 4.1) at 3 mg/kg. Tumors were measured twice per week. XMT-1536 and lifastuzumab vedotin were administered at a single dose of 3 mg/kg.
Click to Show/Hide
|
||||
| In Vivo Model | Ovarian adenocarcinoma CDX model | ||||
| In Vitro Model | Ovarian serous adenocarcinoma | OVCAR-3 cells | CVCL_0465 | ||
Indusatumab vedotin [Terminated in phase 2]
Identified from the Human Clinical Data
| Experiment 1 Reporting the Activity Date of This ADC | [270] | ||||
| Efficacy Data | Objective Response Rate (ORR) |
2.56%
|
High GCC expression (GCC+++) | ||
| Patients Enrolled |
Advanced or metastatic adenocarcinoma of the pancreas expressing GCC (H-score 10, as indicated by immunohistochemistry [IHC]), and previously treated with one or more prior chemotherapies.
|
||||
| Administration Dosage |
1.80 mg/kg on day 1 of 3-week cycles as single 30-min intravenous (IV) infusions for up to 1 year or until disease progression (PD) or unacceptable toxicity.
|
||||
| Related Clinical Trial | |||||
| NCT Number | NCT02202785 | Phase Status | Phase 2 | ||
| Clinical Description |
A phase 2 trial of mLN0264 in previously treated patients with advanced or metastatic pancreatic adenocarcinoma expressing guanylyl cyclase C (GCC).
|
||||
| Primary Endpoint |
OrR (CR+PR)=2.56% (N=1/39), one patient achieving PR, DOR=103 days. Nine (23.07%) patients achieved SD, among those nine patients, two patients (18%, low-GCC),four patients (31%, intermediate-GCC), and three patients (20%, high-GCC).
|
||||
| Other Endpoint |
Median OS=162 days (range 36-282) and PFS=9-82 days in the low-cohort,median OS=140 days (range 43-443) and PFS=1-218 days in the intermediate-cohort,median OS=162 days (range 49-435) and PFS=16-137 days in the high-cohort,.
|
||||
| Experiment 2 Reporting the Activity Date of This ADC | [271] | ||||
| Efficacy Data | Objective Response Rate (ORR) |
2.63%
|
High GCC expression (GCC+++) | ||
| Patients Enrolled |
GI carcinoma expressing GCC (H-score 10, as indicated by immunohistochemistry [IHC]), included gastric carcinoma, esophageal carcinoma, colorectal carcinoma, small intestine carcinoma, pancreatic carcinoma, and biliary carcinoma.
|
||||
| Administration Dosage |
1.80 mg/kg on day 1 of 3-week cycles as single 30-min intravenous (IV) infusions for up to 1 year or until disease progression (PD) or unacceptable toxicity.
|
||||
| Related Clinical Trial | |||||
| NCT Number | NCT02202785 | Phase Status | Phase 2 | ||
| Clinical Description |
A phase 2 trial of mLN0264 in previously treated patients with advanced or metastatic pancreatic adenocarcinoma expressing guanylyl cyclase C (GCC).
|
||||
| Primary Endpoint |
OrR (CR+PR)=2.63% (N=1/38), one patient identified as PR, nine patients (23.68%) had stable disease.
|
||||
| Experiment 3 Reporting the Activity Date of This ADC | [272] | ||||
| Efficacy Data | Objective Response Rate (ORR) |
5.56%
|
High GCC expression (GCC+++) | ||
| Patients Enrolled |
Metastatic or recurrent adenocarcinoma of the stomach or gastroesophageal junction expressing GCC (H-score 10, as indicated by immunohistochemistry [IHC]) who progressed on at least one line of treatment.
|
||||
| Administration Dosage |
TAK-264 1.80 mg/kg was administered as a 30 minute intravenous (IV) infusion on day 1 of a 21-day cycle for up to 1 year or until disease progression or unacceptable toxicity.
|
||||
| Related Clinical Trial | |||||
| NCT Number | NCT02202759 | Phase Status | Phase 2 | ||
| Clinical Description |
A phase 2 trial of mLN0264 in previously treated patients with metastatic or recurrent adenocarcinoma of the stomach or gastroesophageal junction expressing guanylyl cyclase C (GCC).
|
||||
| Primary Endpoint |
OrR (CR+PR)=5.56% (N=2/36),2 patients achieved a PR with intermediate GCC expression.
|
||||
| Other Endpoint |
The disease control rate (CR+PR+SD with a minimum duration of 12 weeks)=36.00%, 7 patients with high GCC expression, 4 patients with intermediate GCC expression, 4 patients with low GCC expression.
|
||||
| Experiment 4 Reporting the Activity Date of This ADC | [275] | ||||
| Efficacy Data | Objective Response Rate (ORR) |
0.00%
|
High GCC expression (GCC+++) | ||
| Patients Enrolled |
GI carcinoma expressing GCC (H-score 10, as indicated by immunohistochemistry [IHC]), included gastric carcinoma, esophageal carcinoma, colorectal carcinoma, small intestine carcinoma, pancreatic carcinoma, and biliary carcinoma.
|
||||
| Administration Dosage |
A conventional 3+3 dose-escalation scheme, TAK-264 doses (planned dose levels, 1.20, 1.50, 1.80, 2.10, 2.40, and 2.70 mg/kg) on day 1 of 3-week cycles as 30-minute intravenous infusions for up to 1 year or until disease progression or unacceptable toxicity.
|
||||
| Related Clinical Trial | |||||
| NCT Number | NCT02391038 | Phase Status | Phase 1 | ||
| Clinical Description |
A phase 1/2 trial of mLN0264 in previously treated asian patients with advanced gastrointestinal (GI) carcinoma (phase 1) or metastatic or recurrent gastric or gastroesophageal junction adenocarcinoma (phase 2) expressing guanylyl cyclase C (GCC).
|
||||
| Primary Endpoint |
None of the patients experienced a DLT and the MTD was not determined.
|
||||
| Other Endpoint |
There were no objective responses; three patients had stable disease.
|
||||
| Experiment 5 Reporting the Activity Date of This ADC | [280] | ||||
| Related Clinical Trial | |||||
| NCT Number | NCT02391038 | Phase Status | Phase 1 | ||
| Clinical Description |
A phase 1/2 trial of mLN0264 in previously treated asian patients with advanced gastrointestinal (GI) carcinoma (phase 1) or Metastatic or recurrent gastric or gastroesophageal junction adenocarcinoma (phase 2) expressing guanylyl cyclase C (GCC).
|
||||
| Experiment 6 Reporting the Activity Date of This ADC | [281] | ||||
| Patients Enrolled |
GCC-expressing gastrointestinal malignancy (H-score 10, derivation described below), for whom standard treatment was no longer effective or did not offer curative or life-prolonging potential, metastatic colorectal cancer, gastric carcinoma, esophageal carcinoma, small intestine cancer, pancreatic cancer, and unknown primary malignancies.
|
||||
| Administration Dosage |
Once every 3 weeks as a 30-minute intravenous infusion (day 1 of 21-day cycles) for up to 17 cycles or until disease progression or occurrence of unacceptable TAK-264related toxicity.
|
||||
| Related Clinical Trial | |||||
| NCT Number | NCT01577758 | Phase Status | Phase 1 | ||
| Clinical Description |
An open-label, dose escalation, phase 1, first-in-human study of mLN0264 in Adult patients with advanced gastrointestinal malignancies expressing guanylyl cyclase C.
|
||||
| Primary Endpoint |
21 patients (53.85%, N=39) experienced progressive disease, 3 patients (7.69%, N=39) experienced stable disease. Median PFS=44 days (95% CI,39-83). No association between GCC expression and PFS.
|
||||
| Other Endpoint |
MTD=1.80 mg/kg.
|
||||
Discovered Using Patient-derived Xenograft Model
| Experiment 1 Reporting the Activity Date of This ADC | [284] | ||||
| Efficacy Data | Tumor Growth Inhibition value (TGI) | ≈ 34.00% (Day 17) | High GCC expression (GCC+++) | ||
| Method Description |
To evaluate the efficacy of TAK-264 in mouse models of pancreatic cancer,ten pancreatic PDX models were treated with 10 mg/kg of TAK-264 for at least 17 days. Each treatment group contained 56 mice with tumor pieces (~3mm3 fragments) injected into the right and left flank to give ~10 evaluable tumors. Mice were randomized into control or TAK-264 groups when tumor volumes reached ~150-300 mm3.
Click to Show/Hide
|
||||
| In Vivo Model | Pancreatic cancer PDX model (PDX: PANC137) | ||||
| Experiment 2 Reporting the Activity Date of This ADC | [284] | ||||
| Efficacy Data | Tumor Growth Inhibition value (TGI) | ≈ 46.00% (Day 28) | High GCC expression (GCC+++) | ||
| Method Description |
To evaluate the efficacy of TAK-264 in mouse models of pancreatic cancer,ten pancreatic PDX models were treated with 10 mg/kg of TAK-264 for at least 17 days. Each treatment group contained 56 mice with tumor pieces (~3mm3 fragments) injected into the right and left flank to give ~10 evaluable tumors. Mice were randomized into control or TAK-264 groups when tumor volumes reached ~150-300 mm3.
Click to Show/Hide
|
||||
| In Vivo Model | Pancreatic cancer PDX model (PDX: PANC129) | ||||
| Experiment 3 Reporting the Activity Date of This ADC | [284] | ||||
| Efficacy Data | Tumor Growth Inhibition value (TGI) | ≈ 48.70% (Day 28) | High GCC expression (GCC+++) | ||
| Method Description |
To evaluate the efficacy of TAK-264 in mouse models of pancreatic cancer,ten pancreatic PDX models were treated with 10 mg/kg of TAK-264 for at least 17 days. Each treatment group contained 56 mice with tumor pieces (~3mm3 fragments) injected into the right and left flank to give ~10 evaluable tumors. Mice were randomized into control or TAK-264 groups when tumor volumes reached ~150-300 mm3.
Click to Show/Hide
|
||||
| In Vivo Model | Pancreatic cancer PDX model (PDX: PANC269) | ||||
| Experiment 4 Reporting the Activity Date of This ADC | [284] | ||||
| Efficacy Data | Tumor Growth Inhibition value (TGI) | ≈ 60.90% (Day 28) | High GCC expression (GCC+++) | ||
| Method Description |
To evaluate the efficacy of TAK-264 in mouse models of pancreatic cancer,ten pancreatic PDX models were treated with 10 mg/kg of TAK-264 for at least 17 days. Each treatment group contained 56 mice with tumor pieces (~3mm3 fragments) injected into the right and left flank to give ~10 evaluable tumors. Mice were randomized into control or TAK-264 groups when tumor volumes reached ~150-300 mm3.
Click to Show/Hide
|
||||
| In Vivo Model | Pancreatic cancer PDX model (PDX: PANC277) | ||||
| Experiment 5 Reporting the Activity Date of This ADC | [284] | ||||
| Efficacy Data | Tumor Growth Inhibition value (TGI) | ≈ 61.90% (Day 50) | High GCC expression (GCC+++) | ||
| Method Description |
To evaluate the efficacy of TAK-264 in mouse models of pancreatic cancer,ten pancreatic PDX models were treated with 10 mg/kg of TAK-264 for at least 17 days. Each treatment group contained 56 mice with tumor pieces (~3mm3 fragments) injected into the right and left flank to give ~10 evaluable tumors. Mice were randomized into control or TAK-264 groups when tumor volumes reached ~150-300 mm3.
Click to Show/Hide
|
||||
| In Vivo Model | Pancreatic cancer PDX model (PDX: PANC266) | ||||
| Experiment 6 Reporting the Activity Date of This ADC | [284] | ||||
| Efficacy Data | Tumor Growth Inhibition value (TGI) | ≈ 64.20% (Day 17) | High GCC expression (GCC+++) | ||
| Method Description |
To evaluate the efficacy of TAK-264 in mouse models of pancreatic cancer,ten pancreatic PDX models were treated with 10 mg/kg of TAK-264 for at least 17 days. Each treatment group contained 56 mice with tumor pieces (~3mm3 fragments) injected into the right and left flank to give ~10 evaluable tumors. Mice were randomized into control or TAK-264 groups when tumor volumes reached ~150-300 mm3.
Click to Show/Hide
|
||||
| In Vivo Model | Pancreatic cancer PDX model (PDX: PANC193) | ||||
| Experiment 7 Reporting the Activity Date of This ADC | [284] | ||||
| Efficacy Data | Tumor Growth Inhibition value (TGI) | ≈ 67.50% (Day 29) | High GCC expression (GCC+++) | ||
| Method Description |
To evaluate the efficacy of TAK-264 in mouse models of pancreatic cancer,ten pancreatic PDX models were treated with 10 mg/kg of TAK-264 for at least 17 days. Each treatment group contained 56 mice with tumor pieces (~3mm3 fragments) injected into the right and left flank to give ~10 evaluable tumors. Mice were randomized into control or TAK-264 groups when tumor volumes reached ~150-300 mm3.
Click to Show/Hide
|
||||
| In Vivo Model | Pancreatic cancer PDX model (PDX: PANC272) | ||||
| Experiment 8 Reporting the Activity Date of This ADC | [284] | ||||
| Efficacy Data | Tumor Growth Inhibition value (TGI) | ≈ 69.60% (Day 28) | High GCC expression (GCC+++) | ||
| Method Description |
To evaluate the efficacy of TAK-264 in mouse models of pancreatic cancer,ten pancreatic PDX models were treated with 10 mg/kg of TAK-264 for at least 17 days. Each treatment group contained 56 mice with tumor pieces (~3mm3 fragments) injected into the right and left flank to give ~10 evaluable tumors. Mice were randomized into control or TAK-264 groups when tumor volumes reached ~150-300 mm3.
Click to Show/Hide
|
||||
| In Vivo Model | Pancreatic cancer PDX model (PDX: PANC150) | ||||
| Experiment 9 Reporting the Activity Date of This ADC | [284] | ||||
| Efficacy Data | Tumor Growth Inhibition value (TGI) | ≈ 69.60% (Day 24) | High GCC expression (GCC+++) | ||
| Method Description |
To evaluate the efficacy of TAK-264 in mouse models of pancreatic cancer,ten pancreatic PDX models were treated with 10 mg/kg of TAK-264 for at least 17 days. Each treatment group contained 56 mice with tumor pieces (~3mm3 fragments) injected into the right and left flank to give ~10 evaluable tumors. Mice were randomized into control or TAK-264 groups when tumor volumes reached ~150-300 mm3.
Click to Show/Hide
|
||||
| In Vivo Model | Pancreatic cancer PDX model (PDX: PANC268) | ||||
| Experiment 10 Reporting the Activity Date of This ADC | [284] | ||||
| Efficacy Data | Tumor Growth Inhibition value (TGI) | ≈ 70.10% (Day 28) | High GCC expression (GCC+++) | ||
| Method Description |
To evaluate the efficacy of TAK-264 in mouse models of pancreatic cancer,ten pancreatic PDX models were treated with 10 mg/kg of TAK-264 for at least 17 days. Each treatment group contained 56 mice with tumor pieces (~3mm3 fragments) injected into the right and left flank to give ~10 evaluable tumors. Mice were randomized into control or TAK-264 groups when tumor volumes reached ~150-300 mm3.
Click to Show/Hide
|
||||
| In Vivo Model | Pancreatic cancer PDX model (PDX: PANC122) | ||||
Revealed Based on the Cell Line Data
| Experiment 1 Reporting the Activity Date of This ADC | [284] | ||||
| Efficacy Data | Half Maximal Inhibitory Concentration (IC50) | < 25.00 ug/mL | |||
| Method Description |
Anti-proliferative Effects of TAK-264 Against Pancreatic Cancer Cell Lines. Eleven pancreatic cancer cell lines were treated with TAK-264 (dose range 0.4-25 ug/mL) for 72 hours and analyzed by a SRB proliferation assay. Cell lines were deemed more responsive if proliferation was less than 50% after treatment with 25g/mL of TAK-264.
|
||||
| In Vitro Model | Pancreatic adenosquamous carcinoma | L3.6pl cells | CVCL_0384 | ||
| Experiment 2 Reporting the Activity Date of This ADC | [284] | ||||
| Efficacy Data | Half Maximal Inhibitory Concentration (IC50) | < 25.00 ug/mL | |||
| Method Description |
Anti-proliferative Effects of TAK-264 Against Pancreatic Cancer Cell Lines. Eleven pancreatic cancer cell lines were treated with TAK-264 (dose range 0.4-25 ug/mL) for 72 hours and analyzed by a SRB proliferation assay. Cell lines were deemed more responsive if proliferation was less than 50% after treatment with 25g/mL of TAK-264.
|
||||
| In Vitro Model | Pancreatic ductal adenocarcinoma | MIA PaCa-2 cells | CVCL_0428 | ||
| Experiment 3 Reporting the Activity Date of This ADC | [284] | ||||
| Efficacy Data | Half Maximal Inhibitory Concentration (IC50) | < 25.00 ug/mL | |||
| Method Description |
Anti-proliferative Effects of TAK-264 Against Pancreatic Cancer Cell Lines. Eleven pancreatic cancer cell lines were treated with TAK-264 (dose range 0.4-25 ug/mL) for 72 hours and analyzed by a SRB proliferation assay. Cell lines were deemed more responsive if proliferation was less than 50% after treatment with 25g/mL of TAK-264.
|
||||
| In Vitro Model | Pancreatic adenocarcinoma | Panc 03.27 cells | CVCL_1635 | ||
| Experiment 4 Reporting the Activity Date of This ADC | [284] | ||||
| Efficacy Data | Half Maximal Inhibitory Concentration (IC50) | < 25.00 ug/mL | High GCC expression (GCC+++) | ||
| Method Description |
Anti-proliferative Effects of TAK-264 Against Pancreatic Cancer Cell Lines. Eleven pancreatic cancer cell lines were treated with TAK-264 (dose range 0.4-25 ug/mL) for 72 hours and analyzed by a SRB proliferation assay. Cell lines were deemed more responsive if proliferation was less than 50% after treatment with 25g/mL of TAK-264.
|
||||
| In Vitro Model | Pancreatic ductal adenocarcinoma | Panc 05.04 cells | CVCL_1637 | ||
| Experiment 5 Reporting the Activity Date of This ADC | [284] | ||||
| Efficacy Data | Half Maximal Inhibitory Concentration (IC50) | < 25.00 ug/mL | |||
| Method Description |
Anti-proliferative Effects of TAK-264 Against Pancreatic Cancer Cell Lines. Eleven pancreatic cancer cell lines were treated with TAK-264 (dose range 0.4-25 ug/mL) for 72 hours and analyzed by a SRB proliferation assay. Cell lines were deemed more responsive if proliferation was less than 50% after treatment with 25g/mL of TAK-264.
|
||||
| In Vitro Model | Pancreatic adenocarcinoma | Panc 02.03 cells | CVCL_1633 | ||
Pinatuzumab vedotin [Terminated in phase 2]
Identified from the Human Clinical Data
| Experiment 1 Reporting the Activity Date of This ADC | [277] | ||||
| Efficacy Data | Objective Response Rate (ORR) |
36.00% (DLBCL)
50.00% (iNHL) |
|||
| Patients Enrolled |
Relapsed/refractory (r/r) diffuse diffuse large B-cell lymphoma (DLBCL), iNHL (including follicular lymphoma, marginal zone lymphoma, and small lymphocytic lymphoma), mantle cell lymphoma (MCL), and chronic lymphocytic leukemia (CLL), and for whom no suitable therapy of curative intent or higher priority existed.
|
||||
| Administration Dosage |
Intravenously over 30-90 minutes in 21-day cycles, starting dose of 0.10 mg/kg.
|
||||
| Related Clinical Trial | |||||
| NCT Number | NCT01209130 | Phase Status | Phase 1 | ||
| Clinical Description |
An open-label, multicenter, phase 1 trial of the safety and pharmacokinetics of escalating doses of DCDT2980S in patients with relapsed or refractory B-cell non-Hodgkin's lymphoma and chronic lymphocytic leukemia and DCDT2980S in combination with rituximab in patients with relapsed or refractory B-cell non Hodgkin's lymphoma.
|
||||
| Primary Endpoint |
On the basis of these observations, while 3.20 mg/kg did not exceed the protocol-defined MTD.
|
||||
| Experiment 2 Reporting the Activity Date of This ADC | [278] | ||||
| Efficacy Data | Objective Response Rate (ORR) |
54.05% (R/R DLBCL, PiV% (CD22) + RTX)
66.67% (R/R FL, PiV% (CD22) + RTX) |
|||
| Patients Enrolled |
R/R diffuse large B-cell lymphoma (DLBCL), R/R follicular lymphoma (FL).
|
||||
| Administration Dosage |
PiV + RTX (ADC 2.40 mg/kg + RTX 375 mg/m2) every 21 days.
|
||||
| Related Clinical Trial | |||||
| NCT Number | NCT01691898 | Phase Status | Phase 1 | ||
| Clinical Description |
A randomized, open-label, multicenter, phase 2 trial evaluating the safety and activity of pinatuzumab vedotin (DCDT2980S) in combination with rituximab or polatuzumab vedotin (DCDS4501A) in combination with rituximab and a non-randomized phase 1b/2 evaluation of polatuzumab vedotin in combination with obinutuzumab in patients with relapsed or refractory B-cell non-Hodgkin's lymphoma.
Click to Show/Hide
|
||||
| Primary Endpoint |
For R/R DLBCL, ORR=51.35% (N=19/37, 95% Cl, 34.00-68.00), CR rate=13.51% (N=5/37, 95% Cl, 5.00-29.00) and PR rate=37.84% (N=14/37,95% Cl, 23.00-55.00) in patients treated with PoV (CD79b) + RTX. For R/R DLBCL, ORR=54.05% (N=20/37,95% Cl, 37.00-71.00),CR rate=18.92% (N=7/37,95% Cl, 8.00-35.00) and PR rate=35.14% (N=13/37,95% Cl, 20.00-53.00) in patients treated with PiV (CD22) + RTX.
Click to Show/Hide
|
||||
| Other Endpoint |
For R/R FL, ORR=60.00% (N=12/20,95% Cl 36.00-81.00), CR rate=30.00% (N=6/20, 95% Cl 12.00-54.00) and PR rate=30.00% (N=6/20,95% Cl 12.00-54.00) in patients treated with PoV (CD79b) + RTX. For R/R FL, ORR=66.67% (N=14/21,95% Cl 43.00-85.00), CR rate=4.76% (N=1/21, 95% Cl 0.10-24.00) and PR rate=61.90% (N=13/21,95% Cl 38.00-52.00) in patients treated with PiV (CD22) + RTX.
Click to Show/Hide
|
||||
| Experiment 3 Reporting the Activity Date of This ADC | [20] | ||||
| Efficacy Data | Objective Response Rate (ORR) |
60.00% (diffuse large B-cell lymphoma)
62.00% (follicular lymphoma cohort) |
|||
| Patients Enrolled |
Relapsed or refractory diffuse large B-cell lymphoma or relapsed or refractory grade 13a follicular lymphoma.
|
||||
| Administration Dosage |
R-pina (375 mg/m2 rituximab plus 24 mg/kg ADCs) every 21 days until disease progression or unacceptable toxicity up to 1 year.
|
||||
| Related Clinical Trial | |||||
| NCT Number | NCT01691898 | Phase Status | Phase 1 | ||
| Clinical Description |
A randomized, open-label, multicenter, phase 2 trial evaluating the safety and activity of pinatuzumab vedotin (DCDT2980S) in combination with rituximab or polatuzumab vedotin (DCDS4501A) in combination with rituximab and a non-randomized phase 1b/2 evaluation of polatuzumab vedotin in combination with obinutuzumab in patients with relapsed or refractory B-cell non-Hodgkin's lymphoma.
Click to Show/Hide
|
||||
| Primary Endpoint |
Pr=60.00%, CR=26.00% for large B-cell lymphoma. PR=62.00%,CR=70.00% for follicular lymphoma.
|
||||
Vandortuzumab vedotin [Terminated in phase 1]
Identified from the Human Clinical Data
| Experiment 1 Reporting the Activity Date of This ADC | [285] | ||||
| Efficacy Data | Partial Response (PR) |
4.00%
|
|||
| Patients Enrolled |
Metastatic castration-resistant prostate cancer (CRPC).
|
||||
| Administration Dosage |
3 + 3 dose escalation study, 0.30 to 2.80 mg/kg intravenously given once every 3 weeks followed by cohort expansion at the recommended phase II dose or weekly (0.80 to 1.00 mg/kg).
|
||||
| Related Clinical Trial | |||||
| NCT Number | NCT01283373 | Phase Status | Phase 1 | ||
| Clinical Description |
A phase 1, open-label study of the safety and pharmacokinetics of escalating doses of DSTP3086S in patients with metastatic castration-resistant prostate cancer.
|
||||
| Primary Endpoint |
DsTP3086S has acceptable safety at the recommended phase II dose level of 2.40 mg/kg once every 3 weeks.
|
||||
| Experiment 2 Reporting the Activity Date of This ADC | [287] | ||||
| Related Clinical Trial | |||||
| NCT Number | NCT01283373 | Phase Status | Phase 1 | ||
| Clinical Description |
A phase 1, open-label study of the safety and pharmacokinetics of escalating doses of DSTP3086S in patients with metastatic castration-resistant prostate cancer.
|
||||
Azintuxizumab vedotin [Terminated in phase 1]
Identified from the Human Clinical Data
| Experiment 1 Reporting the Activity Date of This ADC | [286] | ||||
| Efficacy Data | Objective Response Rate (ORR) |
10.67%
|
|||
| Patients Enrolled |
Relapsed or refractory multiple myeloma (RRMM) and Eastern Cooperative Oncology Group (ECOG) performance status of 0-2; were not eligible for stem cell/bone marrow transplant or had refused stem cell/bone marrow transplant, or had relapsed after autologous or allogeneic stem cell/bone marrow transplant.
|
||||
| Administration Dosage |
ABBV-838 (3+3 design) intravenously starting from 0.60 mg/kg up to 6.00 mg/kg for 3-week dosing intervals (Q3W). Patients could continue ABBV-838 for up to 24 months. Assessment of alternate dosing intervals (Q1W and Q2W) was conducted in parallel.
|
||||
| Related Clinical Trial | |||||
| NCT Number | NCT02462525 | Phase Status | Phase 1 | ||
| Clinical Description |
A multicenter, phase 1/1b, open-label, dose-escalation study of ABBV-838, an antibody drug conjugate, in subjects with relapsed and refractory multiple myeloma.
|
||||
| Primary Endpoint |
OrR=10.67% (N=8/75, 95% Cl 4.7-19.9), very good partial response (VGPR)=2.67% (N=2), PR=8.00% (N=6). Median DOR=4 months.
|
||||
| Other Endpoint |
The MTD was not reached. The selected recommended dose for the expansion cohort was 5.00 mg/kg Q3W.
|
||||
| Experiment 2 Reporting the Activity Date of This ADC | [290] | ||||
| Related Clinical Trial | |||||
| NCT Number | NCT02951117 | Phase Status | Phase 1 | ||
| Clinical Description |
A phase 1b, open label, multicenter, dose escalation study of venetoclax and ABBV-838 combination therapy with dexamethasone in subjects with relapsed or refractory multiple myeloma.
|
||||
| Experiment 3 Reporting the Activity Date of This ADC | [291] | ||||
| Related Clinical Trial | |||||
| NCT Number | NCT02462525 | Phase Status | Phase 1 | ||
| Clinical Description |
A multicenter, phase 1/1b, open-label, dose-escalation study of ABBV-838, an antibody drug conjugate, in subjects with relapsed and refractory multiple myeloma.
|
||||
BAY-794620 [Terminated in phase 1]
Identified from the Human Clinical Data
| Experiment 1 Reporting the Activity Date of This ADC | [288] | ||||
| Related Clinical Trial | |||||
| NCT Number | NCT01065623 | Phase Status | Phase 1 | ||
| Clinical Description |
An open label phase 1 dose-escalation study to evaluate the safety, tolerability, pharmacokinetics, and maximum tolerated dose of BAY79-4620 administered as an intravenous infusion once every 2 weeks in patients with advanced solid tumors.
|
||||
| Experiment 2 Reporting the Activity Date of This ADC | [289] | ||||
| Related Clinical Trial | |||||
| NCT Number | NCT01028755 | Phase Status | Phase 1 | ||
| Clinical Description |
An open label phase 1 study to evaluate the safety, tolerability, pharmacokinetics and maximum tolerated dose of BAY79-4620 in patients with advanced solid tumors.
|
||||
References
If you find any error in data or bug in web service, please kindly report it to Dr. Shen et al.