
Antibody-drug Conjugate Information
General Information of This Antibody-drug Conjugate (ID: DRG0JEVIM)
| ADC Name |
Disitamab vedotin
|
|||||
|---|---|---|---|---|---|---|
| Brand Name |
Aidixi
|
|||||
| Synonyms |
disitamab vedotin; hertuzumab-vc-MMAE; RC48-ADC; aidixi; veldicitumab; RC48; vedicitumab
Click to Show/Hide
|
|||||
| Organization |
RemeGen (Originator);Seagen (Top20 MNC)
|
|||||
| Drug Status |
Approved in 2021
|
|||||
| Drug-to-Antibody Ratio |
4
|
|||||
| Structure |
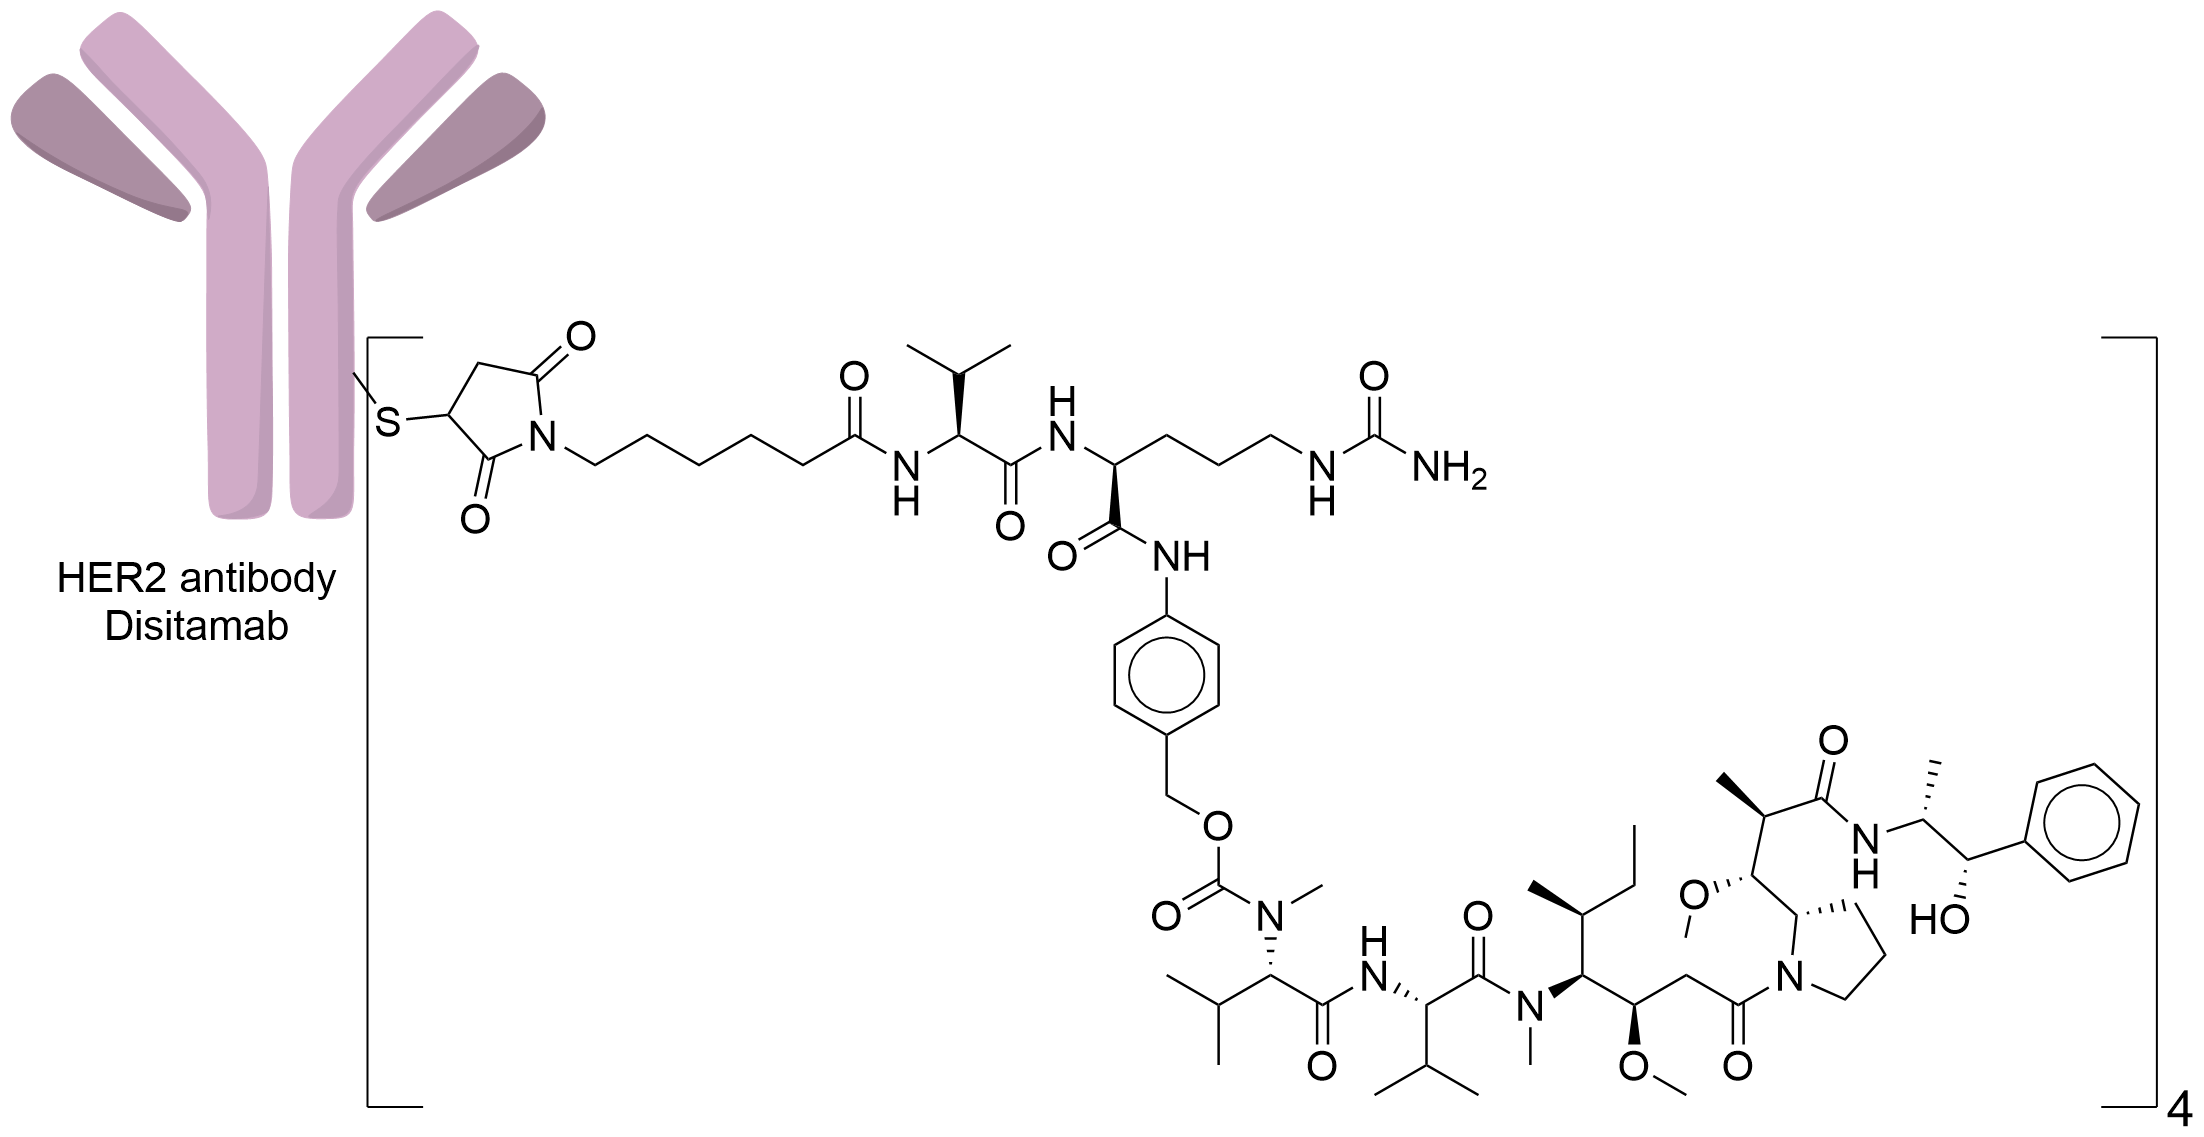
|
|||||
| Antibody Name |
Hertuzumab
|
Antibody Info | ||||
| Antigen Name |
Receptor tyrosine-protein kinase erbB-2 (HER2)
|
Antigen Info | ||||
| Payload Name |
Monomethyl auristatin E
|
Payload Info | ||||
| Payload Target |
Microtubule (MT)
|
Target Info | ||||
| Linker Name |
Mc-Val-Cit-PABC
|
Linker Info | ||||
| Conjugate Type |
Random Cysteines
|
|||||
| Combination Type |
vedotin
|
|||||
| Special Approval(s) |
Breakthrough therapy (FDA); Fast track (FDA); Orphan drug (FDA); Conditional marketing authorisation (NMPA); Priority review (NMPA)
|
|||||
2027 Update
The disease landscape of This ADC
2027 Update
The clinical trial pipelines of This ADC
| Disease Name | Phase 1 | Phase 2 | Phase 3 | Approved |
|---|---|---|---|---|
| Oral cavity cancer | ||||
| Gastric cancer | ||||
| Pancreatic cancer | ||||
| Biliary tract cancer | ||||
| Lung cancer | ||||
| Melanoma | ||||
| Peritoneal cancer | ||||
| Breast cancer | ||||
| Vulvar cancer | ||||
| Vaginal cancer | ||||
| Ovarian cancer | ||||
| Fallopian tube cancer | ||||
| Endometrial cancer | ||||
| Cervical cancer | ||||
| Prostate cancer | ||||
| Urothelial cancer | ||||
| Head and neck cancer | ||||
| Extramammary paget's disease | ||||
| Unspecific solid tumor |
2027 Update
ADC-specific functional property
Binding Affinity
| Dissocation Constant (Kd) | Binding Target | Description | Reference |
|---|---|---|---|
| 0.5 nM |
HER2
|
Disitamab Vedotin (RC48) is an ADC with a higher affinity for HER2 than the targeted drug trastuzumab (KD, 5.0E-10M vs KD, 1.9E-09M)
|
[1]
|
Bystander Killing Effect
| Bystander Killing Effect | Description | Reference |
|---|---|---|
| yes |
the proposed mechanism of action (MOA) of DV occurs through direct cytotoxicity of HER2-expressing tumor cells following internalization of DV and intracellular release of MMAE. DV may also induce antitumor activity through bystander-mediated cytotoxicity of neighboring cells and via the inhibition of HER2 signaling pathways.
Click to Show/Hide
|
[1]
|
2027 Update
General Information of The ADMET Data Related to This ADC
Absorption
| Standard Type | Value | Units | Description | Reference |
|---|---|---|---|---|
| Maximum Observed Concentration (Cmax) | 66.07 | ug/mL |
After monkeys were intravenously infused with Disitamab vedotin (3 mg/kg, n=6), the exposure levels of ADC was positively correlated with the dose and basically a linear pharmacokinetic profile was noted.
Click to Show/Hide
|
[2] |
| Maximum Observed Concentration (Cmax) | 142.39 | ug/mL |
After monkeys were intravenously infused with Disitamab vedotin (6 mg/kg, n=10), the exposure levels of ADC was positively correlated with the dose and basically a linear pharmacokinetic profile was noted.
Click to Show/Hide
|
[2] |
| Maximum Observed Concentration (Cmax) | 259.2 | ug/mL |
After monkeys were intravenously infused with Disitamab vedotin (12 mg/kg, n=14), the exposure levels of ADC was positively correlated with the dose and basically a linear pharmacokinetic profile was noted.
Click to Show/Hide
|
[2] |
| Area Under the Concentration-Time Curve (AUC) | 1179.48 | ug·h/mL |
After monkeys were intravenously infused with Disitamab vedotin (3 mg/kg, n=6), the exposure levels of ADC was positively correlated with the dose and basically a linear pharmacokinetic profile was noted.
Click to Show/Hide
|
[2] |
| Area Under the Concentration-Time Curve (AUC) | 2227.16 | ug·h/mL |
After monkeys were intravenously infused with Disitamab vedotin (6 mg/kg, n=10), the exposure levels of ADC was positively correlated with the dose and basically a linear pharmacokinetic profile was noted.
Click to Show/Hide
|
[2] |
| Area Under the Concentration-Time Curve (AUC) | 5725.56 | ug·h/mL |
After monkeys were intravenously infused with Disitamab vedotin (12 mg/kg, n=14), the exposure levels of ADC was positively correlated with the dose and basically a linear pharmacokinetic profile was noted.
Click to Show/Hide
|
[2] |
| Maximum Observed Concentration (Cmax) | 8911.59 | ng/mL |
PK parameters of disitamab vedotin in patients after a single administration in the C001 CANCER and C003 CANCER studies, 0.5 mg/kg.
|
[4] |
| Maximum Observed Concentration (Cmax) | 17895.71 | ng/mL |
PK parameters of disitamab vedotin in patients after a single administration in the C001 CANCER and C003 CANCER studies, 1 mg/kg.
|
[4] |
| Maximum Observed Concentration (Cmax) | 38833.71 | ng/mL |
PK parameters of disitamab vedotin in patients after a single administration in the C001 CANCER and C003 CANCER studies, 1.5 mg/kg.
|
[4] |
| Maximum Observed Concentration (Cmax) | 33988.74 | ng/mL |
PK parameters of disitamab vedotin in patients after a single administration in the C001 CANCER and C003 CANCER studies, 2 mg/kg.
|
[4] |
| Maximum Observed Concentration (Cmax) | 51822.75 | ng/mL |
PK parameters of disitamab vedotin in patients after a single administration in the C001 CANCER and C003 CANCER studies, 2.5 mg/kg.
|
[4] |
| Area Under the Concentration-Time Curve (AUC) | 127540.78 | ng·h/mL |
PK parameters of disitamab vedotin in patients after a single administration in the C001 CANCER and C003 CANCER studies, 0.5 mg/kg.
|
[4] |
| Area Under the Concentration-Time Curve (AUC) | 238733.48 | ng·h/mL |
PK parameters of disitamab vedotin in patients after a single administration in the C001 CANCER and C003 CANCER studies, 1 mg/kg.
|
[4] |
| Area Under the Concentration-Time Curve (AUC) | 460847.62 | ng·h/mL |
PK parameters of disitamab vedotin in patients after a single administration in the C001 CANCER and C003 CANCER studies, 1.5 mg/kg.
|
[4] |
| Area Under the Concentration-Time Curve (AUC) | 724141.06 | ng·h/mL |
PK parameters of disitamab vedotin in patients after a single administration in the C001 CANCER and C003 CANCER studies, 2 mg/kg.
|
[4] |
| Area Under the Concentration-Time Curve (AUC) | 1118314.75 | ng·h/mL |
PK parameters of disitamab vedotin in patients after a single administration in the C001 CANCER and C003 CANCER studies, 2.5 mg/kg.
|
[4] |
| Maximum Observed Concentration (Cmax) | 3862.58 | ng/mL |
PK parameters of disitamab vedotin in patients after multiple administration in the C001 CANCER and C003 CANCER studies, 0.5 mg/kg.
|
[4] |
| Maximum Observed Concentration (Cmax) | 22495.4 | ng/mL |
PK parameters of disitamab vedotin in patients after multiple administration in the C001 CANCER and C003 CANCER studies, 1 mg/kg.
|
[4] |
| Maximum Observed Concentration (Cmax) | 26736.66 | ng/mL |
PK parameters of disitamab vedotin in patients after multiple administration in the C001 CANCER and C003 CANCER studies, 1.5 mg/kg.
|
[4] |
| Maximum Observed Concentration (Cmax) | 52698.97 | ng/mL |
PK parameters of disitamab vedotin in patients after multiple administration in the C001 CANCER and C003 CANCER studies, 2 mg/kg.
|
[4] |
| Maximum Observed Concentration (Cmax) | 51192.24 | ng/mL |
PK parameters of disitamab vedotin in patients after multiple administration in the C001 CANCER and C003 CANCER studies, 2.5 mg/kg.
|
[4] |
| Area Under the Concentration-Time Curve (AUC) | 405764.85 | ng·h/mL |
PK parameters of disitamab vedotin in patients after multiple administration in the C001 CANCER and C003 CANCER studies, 1 mg/kg.
|
[4] |
| Area Under the Concentration-Time Curve (AUC) | 460866.73 | ng·h/mL |
PK parameters of disitamab vedotin in patients after multiple administration in the C001 CANCER and C003 CANCER studies, 1.5 mg/kg.
|
[4] |
| Area Under the Concentration-Time Curve (AUC) | 827377.82 | ng·h/mL |
PK parameters of disitamab vedotin in patients after multiple administration in the C001 CANCER and C003 CANCER studies, 2 mg/kg.
|
[4] |
| Area Under the Concentration-Time Curve (AUC) | 1110759.12 | ng·h/mL |
PK parameters of disitamab vedotin in patients after multiple administration in the C001 CANCER and C003 CANCER studies, 2.5 mg/kg.
|
[4] |
Distribution
| Standard Type | Value | Units | Description | Reference |
|---|---|---|---|---|
| Volume of Distribution (Vd) | 124.73-340.8 | mL/kg |
The apparent volume of distribution of MMAE-bound antibody at steady state is 124.7-340.8 mL/kg and that of total antibody is 72.1-87.2 mL/kg (average values)
|
[1] |
| Clearance (CL) | 0.009 | L/h/kg |
Mouse PK Parameters, Distribution clearance of ADC
|
[3] |
| Volume of Distribution (Vd) | 0.1218 | L/kg |
Mouse PK Parameters, ADC volume of distribution for central compartment
|
[3] |
| Volume of Distribution (Vd) | 0.1499 | L/kg |
Mouse PK Parameters, ADC volume of distribution for peripheral compartmen
|
[3] |
| Clearance (CL) | 0.0023 | L/h/kg |
Monkey PK, Distribution clearance of ADC
|
[3] |
| Volume of Distribution (Vd) | 0.039 | L/kg |
Monkey PK, ADC volume of distribution for central compartment
|
[3] |
| Volume of Distribution (Vd) | 0.0154 | L/kg |
Monkey PK, ADC volume of distribution for peripheral compartment
|
[3] |
| Clearance (CL) | 0.0023 | L/h/kg |
Predicted human PK, Distribution clearance of ADC
|
[3] |
| Volume of Distribution (Vd) | 0.039 | L/kg |
Predicted human PK, ADC volume of distribution for central compartment
|
[3] |
| Volume of Distribution (Vd) | 0.0154 | L/kg |
Predicted human PK, ADC volume of distribution for peripheral compartment
|
[3] |
| Clearance (CL) | 0.009 | L/h/kg |
Mouse PK Parameters, Distribution clearance of ADC: The total antibody, conjugated antibody and payload were characterized by a two-compartment linear model. The conjugated antibody released into the central compartment through elimination and nonspecific dissociation (Kdec).
Click to Show/Hide
|
[3] |
| Volume of Distribution (Vd) | 0.1218 | L/kg |
Mouse PK Parameters, ADC volume of distribution for central compartment: The total antibody, conjugated antibody and payload were characterized by a two-compartment linear model. The conjugated antibody released into the central compartment through elimination and nonspecific dissociation (Kdec).
Click to Show/Hide
|
[3] |
| Volume of Distribution (Vd) | 0.1499 | L/kg |
Mouse PK Parameters, ADC volume of distribution for peripheral compartment: The total antibody, conjugated antibody and payload were characterized by a two-compartment linear model. The conjugated antibody released into the central compartment through elimination and nonspecific dissociation (Kdec).
Click to Show/Hide
|
[3] |
| Clearance (CL) | 0.0023 | L/h/kg |
Monkey PK, Distribution clearance of ADC: The total antibody, conjugated antibody and payload were characterized by a two-compartment linear model. The conjugated antibody released into the central compartment through elimination and nonspecific dissociation (Kdec).
Click to Show/Hide
|
[3] |
| Volume of Distribution (Vd) | 0.039 | L/kg |
Monkey PK, ADC volume of distribution for central compartment: The total antibody, conjugated antibody and payload were characterized by a two-compartment linear model. The conjugated antibody released into the central compartment through elimination and nonspecific dissociation (Kdec).
Click to Show/Hide
|
[3] |
| Volume of Distribution (Vd) | 0.0154 | L/kg |
Monkey PK, ADC volume of distribution for peripheral compartment: The total antibody, conjugated antibody and payload were characterized by a two-compartment linear model. The conjugated antibody released into the central compartment through elimination and nonspecific dissociation (Kdec).
Click to Show/Hide
|
[3] |
| Clearance (CL) | 0.0023 | L/h/kg |
Predicted human PK, Distribution clearance of ADC: The total antibody, conjugated antibody and payload were characterized by a two-compartment linear model. The conjugated antibody released into the central compartment through elimination and nonspecific dissociation (Kdec).
Click to Show/Hide
|
[3] |
| Volume of Distribution (Vd) | 0.039 | L/kg |
Predicted human PK, ADC volume of distribution for central compartment: The total antibody, conjugated antibody and payload were characterized by a two-compartment linear model. The conjugated antibody released into the central compartment through elimination and nonspecific dissociation (Kdec).
Click to Show/Hide
|
[3] |
| Volume of Distribution (Vd) | 0.0154 | L/kg |
Predicted human PK, ADC volume of distribution for peripheral compartment: The total antibody, conjugated antibody and payload were characterized by a two-compartment linear model. The conjugated antibody released into the central compartment through elimination and nonspecific dissociation (Kdec).
Click to Show/Hide
|
[3] |
Excretion
| Standard Type | Value | Units | Description | Reference |
|---|---|---|---|---|
| Clearance (CL) | 2.8 | mL/h/kg |
After single doses of 2.0 mg/kg, the half-lives of MMAE-bound antibody are 33.1 and 45.7 h and those of free MMAE are 66.5 and 64.0 h; the respective serum clearance rates for MMAE-bound antibody are 2.8 and 2.4 mL/h/kg
Click to Show/Hide
|
[1] |
| Clearance (CL) | 2.4 | mL/h/kg |
After single doses of 2.5 mg/kg, the half-lives of MMAE-bound antibody are 33.1 and 45.7 h and those of free MMAE are 66.5 and 64.0 h; the respective serum clearance rates for MMAE-bound antibody are 2.8 and 2.4 mL/h/kg
Click to Show/Hide
|
[1] |
| Elimination Half-Life (t1/2) | 33.1 | h |
After single doses of 2.0 mg/kg, the half-lives of MMAE-bound antibody are 33.1 and 45.7 h and those of free MMAE are 66.5 and 64.0 h; the respective serum clearance rates for MMAE-bound antibody are 2.8 and 2.4 mL/h/kg
Click to Show/Hide
|
[1] |
| Elimination Half-Life (t1/2) | 45.7 | h |
After single doses of 2.5 mg/kg, the half-lives of MMAE-bound antibody are 33.1 and 45.7 h and those of free MMAE are 66.5 and 64.0 h; the respective serum clearance rates for MMAE-bound antibody are 2.8 and 2.4 mL/h/kg
Click to Show/Hide
|
[1] |
| Elimination Half-Life (t1/2) | 0.5 | h |
After monkeys were intravenously infused with Disitamab vedotin (3 mg/kg, n=6), the exposure levels of ADC was positively correlated with the dose and basically a linear pharmacokinetic profile was noted.
Click to Show/Hide
|
[2] |
| Elimination Half-Life (t1/2) | 0.5 | h |
After monkeys were intravenously infused with Disitamab vedotin (6 mg/kg, n=10), the exposure levels of ADC was positively correlated with the dose and basically a linear pharmacokinetic profile was noted.
Click to Show/Hide
|
[2] |
| Elimination Half-Life (t1/2) | 0.5 | h |
After monkeys were intravenously infused with Disitamab vedotin (12 mg/kg, n=14), the exposure levels of ADC was positively correlated with the dose and basically a linear pharmacokinetic profile was noted.
Click to Show/Hide
|
[2] |
| Clearance (CL) | 0.0026 | L/h/kg |
Mouse PK Parameters, Plasma clearance of ADC
|
[3] |
| Clearance (CL) | 0.0016 | L/h/kg |
Monkey PK, Plasma clearance of ADC
|
[3] |
| Clearance (CL) | 0.0016 | L/h/kg |
Predicted human PK, Plasma clearance of ADC
|
[3] |
| Elimination Half-Life (t1/2) | 17.38 | h |
PK parameters of disitamab vedotin in patients after a single administration in the C001 CANCER and C003 CANCER studies, 0.5 mg/kg.
|
[4] |
| Elimination Half-Life (t1/2) | 20.87 | h |
PK parameters of disitamab vedotin in patients after a single administration in the C001 CANCER and C003 CANCER studies, 1 mg/kg.
|
[4] |
| Elimination Half-Life (t1/2) | 31.48 | h |
PK parameters of disitamab vedotin in patients after a single administration in the C001 CANCER and C003 CANCER studies, 1.5 mg/kg.
|
[4] |
| Elimination Half-Life (t1/2) | 30.73 | h |
PK parameters of disitamab vedotin in patients after a single administration in the C001 CANCER and C003 CANCER studies, 2 mg/kg.
|
[4] |
| Elimination Half-Life (t1/2) | 32.71 | h |
PK parameters of disitamab vedotin in patients after a single administration in the C001 CANCER and C003 CANCER studies, 2.5 mg/kg.
|
[4] |
| Elimination Half-Life (t1/2) | 16.32 | h |
PK parameters of disitamab vedotin in patients after multiple administration in the C001 CANCER and C003 CANCER studies, 1 mg/kg.
|
[4] |
| Elimination Half-Life (t1/2) | 26.42 | h |
PK parameters of disitamab vedotin in patients after multiple administration in the C001 CANCER and C003 CANCER studies, 1.5 mg/kg.
|
[4] |
| Elimination Half-Life (t1/2) | 33.56 | h |
PK parameters of disitamab vedotin in patients after multiple administration in the C001 CANCER and C003 CANCER studies, 2 mg/kg.
|
[4] |
| Elimination Half-Life (t1/2) | 38.88 | h |
PK parameters of disitamab vedotin in patients after multiple administration in the C001 CANCER and C003 CANCER studies, 2.5 mg/kg.
|
[4] |
| Clearance (CL) | 0.0026 | L/h/kg |
Mouse PK Parameters, Plasma clearance of ADC: The total antibody, conjugated antibody and payload were characterized by a two-compartment linear model. The conjugated antibody released into the central compartment through elimination and nonspecific dissociation (Kdec).
Click to Show/Hide
|
[3] |
| Clearance (CL) | 0.0016 | L/h/kg |
Monkey PK, Plasma clearance of ADC: The total antibody, conjugated antibody and payload were characterized by a two-compartment linear model. The conjugated antibody released into the central compartment through elimination and nonspecific dissociation (Kdec).
Click to Show/Hide
|
[3] |
| Clearance (CL) | 0.0016 | L/h/kg |
Predicted human PK Plasma clearance of ADC: The total antibody, conjugated antibody and payload were characterized by a two-compartment linear model. The conjugated antibody released into the central compartment through elimination and nonspecific dissociation (Kdec).
Click to Show/Hide
|
[3] |
General Information of The Activity Data Related to This ADC
Identified from the Human Clinical Data
Discovered Using Patient-derived Xenograft Model
Discovered Using Cell Line-derived Xenograft Model
Revealed Based on the Cell Line Data
Full List of Activity Data of This Antibody-drug Conjugate
Identified from the Human Clinical Data
| Experiment 1 Reporting the Activity Date of This ADC | [5] | ||||
| Efficacy Data | Objective Response Rate (ORR) | 24.80% | High HER2 expression (HER2+++; IHC 3+) | ||
| Patients Enrolled |
Locally advanced or metastatic gastric cancer with HER2-overexpression.
|
||||
| Administration Dosage |
2.50 mg/kg IV every 2 weeks.
|
||||
| Related Clinical Trial | |||||
| NCT Number | NCT04714190 | Clinical Status | Phase 3 | ||
| Clinical Description | Randomized, controlled, multicenter phase 1/2 clinical study evaluating the efficacy and safety of RC48-ADC for the treatment of locally advanced or metastatic gastric cancer with HER2-overexpression. | ||||
| Primary Endpoint |
The ORR was 24.80% (95% confidence interval [CI]: 17.50%-33.30%).
|
||||
| Other Endpoint |
The median PFS and OS were 4.10 months (95% CI: 3.70-4.90 months) and 7.90 months (95% CI: 6.70-9.90 months), respectively. The most frequently reported adverse events were decreased white blood cell count (53.60%), asthenia (53.60%), hair loss (53.60%), decreased neutrophil count (52.00%), anemia (49.60%), and increased aspartate aminotransferase level (43.20%). Serious adverse events (SAEs) occurred in 45 (36.00%) patients, and RC48-related SAEs were mainly decreased neutrophil count (3.20%). Seven patients had adverse events that led to death were not RC48-related.
Click to Show/Hide
|
||||
| Experiment 2 Reporting the Activity Date of This ADC | [5] | ||||
| Efficacy Data | Objective Response Rate (ORR) | 24.80% | High HER2 expression (HER2+++; IHC 3+) | ||
| Patients Enrolled |
HER2overexpressing (IHC 2+ or 3+), locally advanced or metastatic gastric or gastroesophageal junction cancer who were under at least secondline therapy.
|
||||
| Administration Dosage |
2.50 mg/kg alone by intravenous infusion during 30-90 min (60 min is recommended) every two weeks.
|
||||
| Related Clinical Trial | |||||
| NCT Number | NCT03556345 | Clinical Status | Phase 2 | ||
| Clinical Description | A multicenter, open label single arm, phase 2 study to evaluate the effect and safety of recombinant humanized anti-HER2 monoclonal antibody-mmae conjugate for injection in HER2 overexpressing local advanced or metastatic gastric cancer. | ||||
| Primary Endpoint |
The ORR was 24.80% (95% confidence interval [CI]: 17.50%-33.30%).
|
||||
| Experiment 3 Reporting the Activity Date of This ADC | [6] | ||||
| Efficacy Data | Objective Response Rate (ORR) |
21.05
35.71 20.00 13.64 15.00 % |
|||
| Patients Enrolled |
Patients with incurable, locally advanced or metastatic solid cancers were eligible for inclusion if their tumors showed HER2 protein overexpression by IHC (3+or 2+), regardless of whether FISH was positive or negative.
|
||||
| Administration Dosage |
0.10 mg/kg, 0.50 mg/kg, 1.00 mg/kg, 1.50 mg/kg, 2.00 mg/kg, 2.50 mg/kg, 3.00 mg/kg, 3.50 mg/kg, and 4.00 mg/kg; Q3W; dose expansion proceeded at the dose of 2.00 mg/kg Q2W.
|
||||
| Related Clinical Trial | |||||
| NCT Number | NCT02881190 | Clinical Status | Phase 1 | ||
| Clinical Description | A tolerance, safety and pharmacokinetic ascending dose phase 1 study of RC48-ADC administered intravenously to subjects with HER2-positive malignant in advanced malignant solid tumors. | ||||
| Primary Endpoint |
The MTD was unavailable due to termination of 3.0 mg/kg cohort; 2.5 mg/kg Q2W was declared the RP2D.
|
||||
| Other Endpoint |
ORR and DCR were 21.05% (12/57) and 49.12% (28/57). Notably, patients who were HER2 IHC2+/FISH- responded similarly to those who were IHC2+/FISH+and IHC3+, with ORRs of 35.71% (5/14), 20.00% (2/10), and 13.64% (3/22), respectively. In patients who were pretreated with HER2-targeted drugs, RC48 also showed promising efcacy, with ORR of 15.00% (3/20) and DCR of 45.00% (9/20).
Click to Show/Hide
|
||||
| Experiment 4 Reporting the Activity Date of This ADC | [7] | ||||
| Efficacy Data | Objective Response Rate (ORR) |
51.20%
|
|||
| Patients Enrolled |
Advanced or metastatic urothelial cancer.
|
||||
| Administration Dosage |
.
|
||||
| Related Clinical Trial | |||||
| NCT Number | NCT04264936 | Clinical Status | Phase 1 | ||
| Clinical Description | A open-label, single-arm, phase 1b/2 study of RC48-ADC and JS001 to evaluate the safety and pharmacokinetics of subjects with locally advanced or metastatic urothelial cancer. | ||||
| Primary Endpoint |
The overall confirmed ORR as assessed by the BIRC was 51.20% (95% CI: 35.50%, 66.70%).
|
||||
| Other Endpoint |
For RC48-ADC at 2.00 mg/kg, The median PFS and OS were 6.90 months (95% CI: 5.60, 8.90) and 13.90 months (95% CI: 9.10, NE), respectively.
|
||||
| Experiment 5 Reporting the Activity Date of This ADC | [8] | ||||
| Efficacy Data | Objective Response Rate (ORR) |
80.00
75.00 100.00 77.80 66.70 50.00 97.10 50.00 % |
|||
| Patients Enrolled |
HER2-positive and even negative patients (pts) with metastatic urothelial carcinoma (mUC).
|
||||
| Administration Dosage |
1.50 or 2.00 mg/kg RC48-ADC + 3 mg/kg toripalimab with the traditional 3+3 escalation design. In the expansion cohort, patients received the recommended dose of RC48-ADC + toripalimab every 2 weeks. The primary endpoints were safety/tolerability and recommended RC48-ADC dose.
|
||||
| Related Clinical Trial | |||||
| NCT Number | NCT04264936 | Clinical Status | Phase 1 | ||
| Clinical Description | A open-label, single-arm, phase 1b/2 study of RC48-ADC and JS001 to evaluate the safety and pharmacokinetics of subjects with locally advanced or metastatic urothelial cancer. | ||||
| Primary Endpoint |
At data cutoff, confirmed investigator-assessed ORR=75.00% (95%CI: 50.90-91.30), including 15.00% CRs; DCR=95.00% (95%CI: 75.10-99.90).
|
||||
| Other Endpoint |
The ORR for 1L previously untreated mUC pts was 80.00%. The ORR for pts with liver mets was 75.00%. The ORR was 100.00% for pts with HER2 (3+), 77.80% for HER2 (2+), 66.70% for HER2 (1+), and 50.00% for HER2 (0) respectively. The ORR was 97.10% in pts with PD-L1 CPS1 and 50.00% in CPS < 1.
|
||||
Discovered Using Patient-derived Xenograft Model
| Experiment 1 Reporting the Activity Date of This ADC | [9] | ||||
| Efficacy Data | Tumor Growth Inhibition value (TGI) | ≈ 61.20% | Moderate HER2 expression (HER2++) | ||
| Method Description |
The inhibitory activity of RC48 against cancer cell growth was evaluated in various human cancer cell lines in vitro. The cells were treated with RC48 for 22 days.
|
||||
| In Vivo Model | Gastric cancer PDX model (PDX: Model6) | ||||
| Experiment 2 Reporting the Activity Date of This ADC | [9] | ||||
| Efficacy Data | Tumor Growth Inhibition value (TGI) | ≈ 64.50% | High HER2 expression (HER2+++) | ||
| Method Description |
The inhibitory activity of RC48 against cancer cell growth was evaluated in various human cancer cell lines in vitro. The cells were treated with RC48 for 22 days.
|
||||
| In Vivo Model | Gastric cancer PDX model (PDX: Model8) | ||||
| Experiment 3 Reporting the Activity Date of This ADC | [9] | ||||
| Efficacy Data | Tumor Growth Inhibition value (TGI) | ≈ 70.80% | High HER2 expression (HER2+++) | ||
| Method Description |
The inhibitory activity of RC48 against cancer cell growth was evaluated in various human cancer cell lines in vitro. The cells were treated with RC48 for 22 days.
|
||||
| In Vivo Model | Gastric cancer PDX model (PDX: Model9) | ||||
| Experiment 4 Reporting the Activity Date of This ADC | [9] | ||||
| Efficacy Data | Tumor Growth Inhibition value (TGI) | ≈ 81.80% | High HER2 expression (HER2+++) | ||
| Method Description |
The inhibitory activity of RC48 against cancer cell growth was evaluated in various human cancer cell lines in vitro. The cells were treated with RC48 for 22 days.
|
||||
| In Vivo Model | Gastric cancer PDX model (PDX: Model3) | ||||
| Experiment 5 Reporting the Activity Date of This ADC | [9] | ||||
| Efficacy Data | Tumor Growth Inhibition value (TGI) | ≈ 89.60% | High HER2 expression (HER2+++) | ||
| Method Description |
The inhibitory activity of RC48 against cancer cell growth was evaluated in various human cancer cell lines in vitro. The cells were treated with RC48 for 22 days.
|
||||
| In Vivo Model | Gastric cancer PDX model (PDX: Model5) | ||||
| Experiment 6 Reporting the Activity Date of This ADC | [9] | ||||
| Efficacy Data | Tumor Growth Inhibition value (TGI) | ≈ 94% | High HER2 expression (HER2+++; IHC 3+) | ||
| Method Description |
The inhibitory activity of RC48 against cancer cell growth was evaluated in various human cancer cell lines in vitro. The cells were treated with RC48 for 22 days.
|
||||
| In Vivo Model | Gastric cancer PDX model (PDX: Model7) | ||||
| Experiment 7 Reporting the Activity Date of This ADC | [9] | ||||
| Efficacy Data | Tumor Growth Inhibition value (TGI) | ≈ 100% | Moderate HER2 expression (HER2++) | ||
| Method Description |
The inhibitory activity of RC48 against cancer cell growth was evaluated in various human cancer cell lines in vitro. The cells were treated with RC48 for 22 days.
|
||||
| In Vivo Model | Gastric cancer PDX model (PDX: Model4) | ||||
| Experiment 8 Reporting the Activity Date of This ADC | [9] | ||||
| Efficacy Data | Tumor Growth Inhibition value (TGI) | ≈ 100% | High HER2 expression (HER2+++) | ||
| Method Description |
The inhibitory activity of RC48 against cancer cell growth was evaluated in various human cancer cell lines in vitro. The cells were treated with RC48 for 22 days.
|
||||
| In Vivo Model | Gastric cancer PDX model (PDX: Model2) | ||||
| Experiment 9 Reporting the Activity Date of This ADC | [9] | ||||
| Efficacy Data | Tumor Growth Inhibition value (TGI) | ≈ 100% | High HER2 expression (HER2+++) | ||
| Method Description |
The inhibitory activity of RC48 against cancer cell growth was evaluated in various human cancer cell lines in vitro. The cells were treated with RC48 for 22 days.
|
||||
| In Vivo Model | Gastric cancer PDX model (PDX: Model1) | ||||
Discovered Using Cell Line-derived Xenograft Model
| Experiment 1 Reporting the Activity Date of This ADC | [10] | ||||
| Efficacy Data | Half Maximal Inhibitory Concentration (IC50) | 90 ng/mL | Low HER2 expression (HER2+; IHC 1+) | ||
| Method Description |
The inhibitory activity of RC48 against cancer cell growth was evaluated in various human cancer cell lines in vitro. The cells were treated with PBS, ADC (5 mg/kg), PD-1 antibody (10 mg/kg), or their combination (ADC+PD-1 antibody or ADC+PD-L1 antibody) for 10 days.
|
||||
| In Vivo Model | Triple-negative breast cancer cell line E0771-hHER2 xenograft model | ||||
| In Vitro Model | Mammary gland malignant neoplasms | EO771 cells | CVCL_GR23 | ||
| Experiment 2 Reporting the Activity Date of This ADC | [9] | ||||
| Efficacy Data | Half Maximal Inhibitory Concentration (IC50) | 0.8 ug/mL | High HER2 expression (HER2+++) | ||
| Method Description |
The inhibitory activity of RC48 against cancer cell growth was evaluated in various human cancer cell lines in vitro. The cells were treated with RC48 for 72 h.
|
||||
| In Vitro Model | Gastric tubular adenocarcinoma | NCI-N87 cells | CVCL_1603 | ||
| Experiment 3 Reporting the Activity Date of This ADC | [9] | ||||
| Efficacy Data | Half Maximal Inhibitory Concentration (IC50) | 1.3 ug/mL | High HER2 expression (HER2+++; IHC 3+) | ||
| Method Description |
The inhibitory activity of RC48 against cancer cell growth was evaluated in various human cancer cell lines in vitro. The cells were treated with RC48 for 72 h.
|
||||
| In Vitro Model | Gastric tubular adenocarcinoma | SNU-216 cells | CVCL_3946 | ||
| Experiment 4 Reporting the Activity Date of This ADC | [9] | ||||
| Efficacy Data | Half Maximal Inhibitory Concentration (IC50) | 3.8 ug/mL | Moderate HER2 expression (HER2++; IHC 2+) | ||
| Method Description |
The inhibitory activity of RC48 against cancer cell growth was evaluated in various human cancer cell lines in vitro. The cells were treated with RC48 for 72 h.
|
||||
| In Vitro Model | Gastric signet ring cell adenocarcinoma | NUGC-4 cells | CVCL_3082 | ||
| Experiment 5 Reporting the Activity Date of This ADC | [9] | ||||
| Efficacy Data | Half Maximal Inhibitory Concentration (IC50) | 52.4 ug/mL | Moderate HER2 expression (HER2++; IHC 2+) | ||
| Method Description |
The inhibitory activity of RC48 against cancer cell growth was evaluated in various human cancer cell lines in vitro. The cells were treated with RC48 for 72 h.
|
||||
| In Vitro Model | Gastric carcinoma | HGC-27 cells | CVCL_1279 | ||
Revealed Based on the Cell Line Data
| Experiment 1 Reporting the Activity Date of This ADC | [11] | ||||
| Efficacy Data | Half Maximal Inhibitory Concentration (IC50) | 4.91 ng/mL | High HER2 expression (HER2+++) | ||
| Method Description |
To test the anti-tumor effect of single drug, SK-BR-3, NCI-N87 and SK-OV-3 cells were selected for viability analysis following 72 h incubation with or without RC48ADC which was dispersed in a concentration gradient.
|
||||
| In Vitro Model | Breast adenocarcinoma | SK-BR-3 cells | CVCL_0033 | ||
| Experiment 2 Reporting the Activity Date of This ADC | [11] | ||||
| Efficacy Data | Half Maximal Inhibitory Concentration (IC50) | 11.28 ng/mL | High HER2 expression (HER2+++) | ||
| Method Description |
To test the anti-tumor effect of single drug, SK-BR-3, NCI-N87 and SK-OV-3 cells were selected for viability analysis following 72 h incubation with or without RC48ADC which was dispersed in a concentration gradient.
|
||||
| In Vitro Model | Ovarian serous cystadenocarcinoma | SK-OV-3 cells | CVCL_0532 | ||
| Experiment 3 Reporting the Activity Date of This ADC | [11] | ||||
| Efficacy Data | Half Maximal Inhibitory Concentration (IC50) | 14.54 ng/mL | High HER2 expression (HER2+++) | ||
| Method Description |
To test the anti-tumor effect of single drug, SK-BR-3, NCI-N87 and SK-OV-3 cells were selected for viability analysis following 72 h incubation with or without RC48ADC which was dispersed in a concentration gradient.
|
||||
| In Vitro Model | Gastric tubular adenocarcinoma | NCI-N87 cells | CVCL_1603 | ||
References