
Antibody-drug Conjugate Information
General Information of This Antibody-drug Conjugate (ID: DRG0UQTJG)
| ADC Name |
Lifastuzumab vedotin
|
|||||
|---|---|---|---|---|---|---|
| Synonyms |
lifastuzumab vedotin; RG7599; DNIB0600A; RO5541081
Click to Show/Hide
|
|||||
| Organization |
Roche (Top20 MNC) (Originator)
|
|||||
| Drug Status |
Phase 2 (discontinued)
|
|||||
| Drug-to-Antibody Ratio |
3 to 4
|
|||||
| Structure |
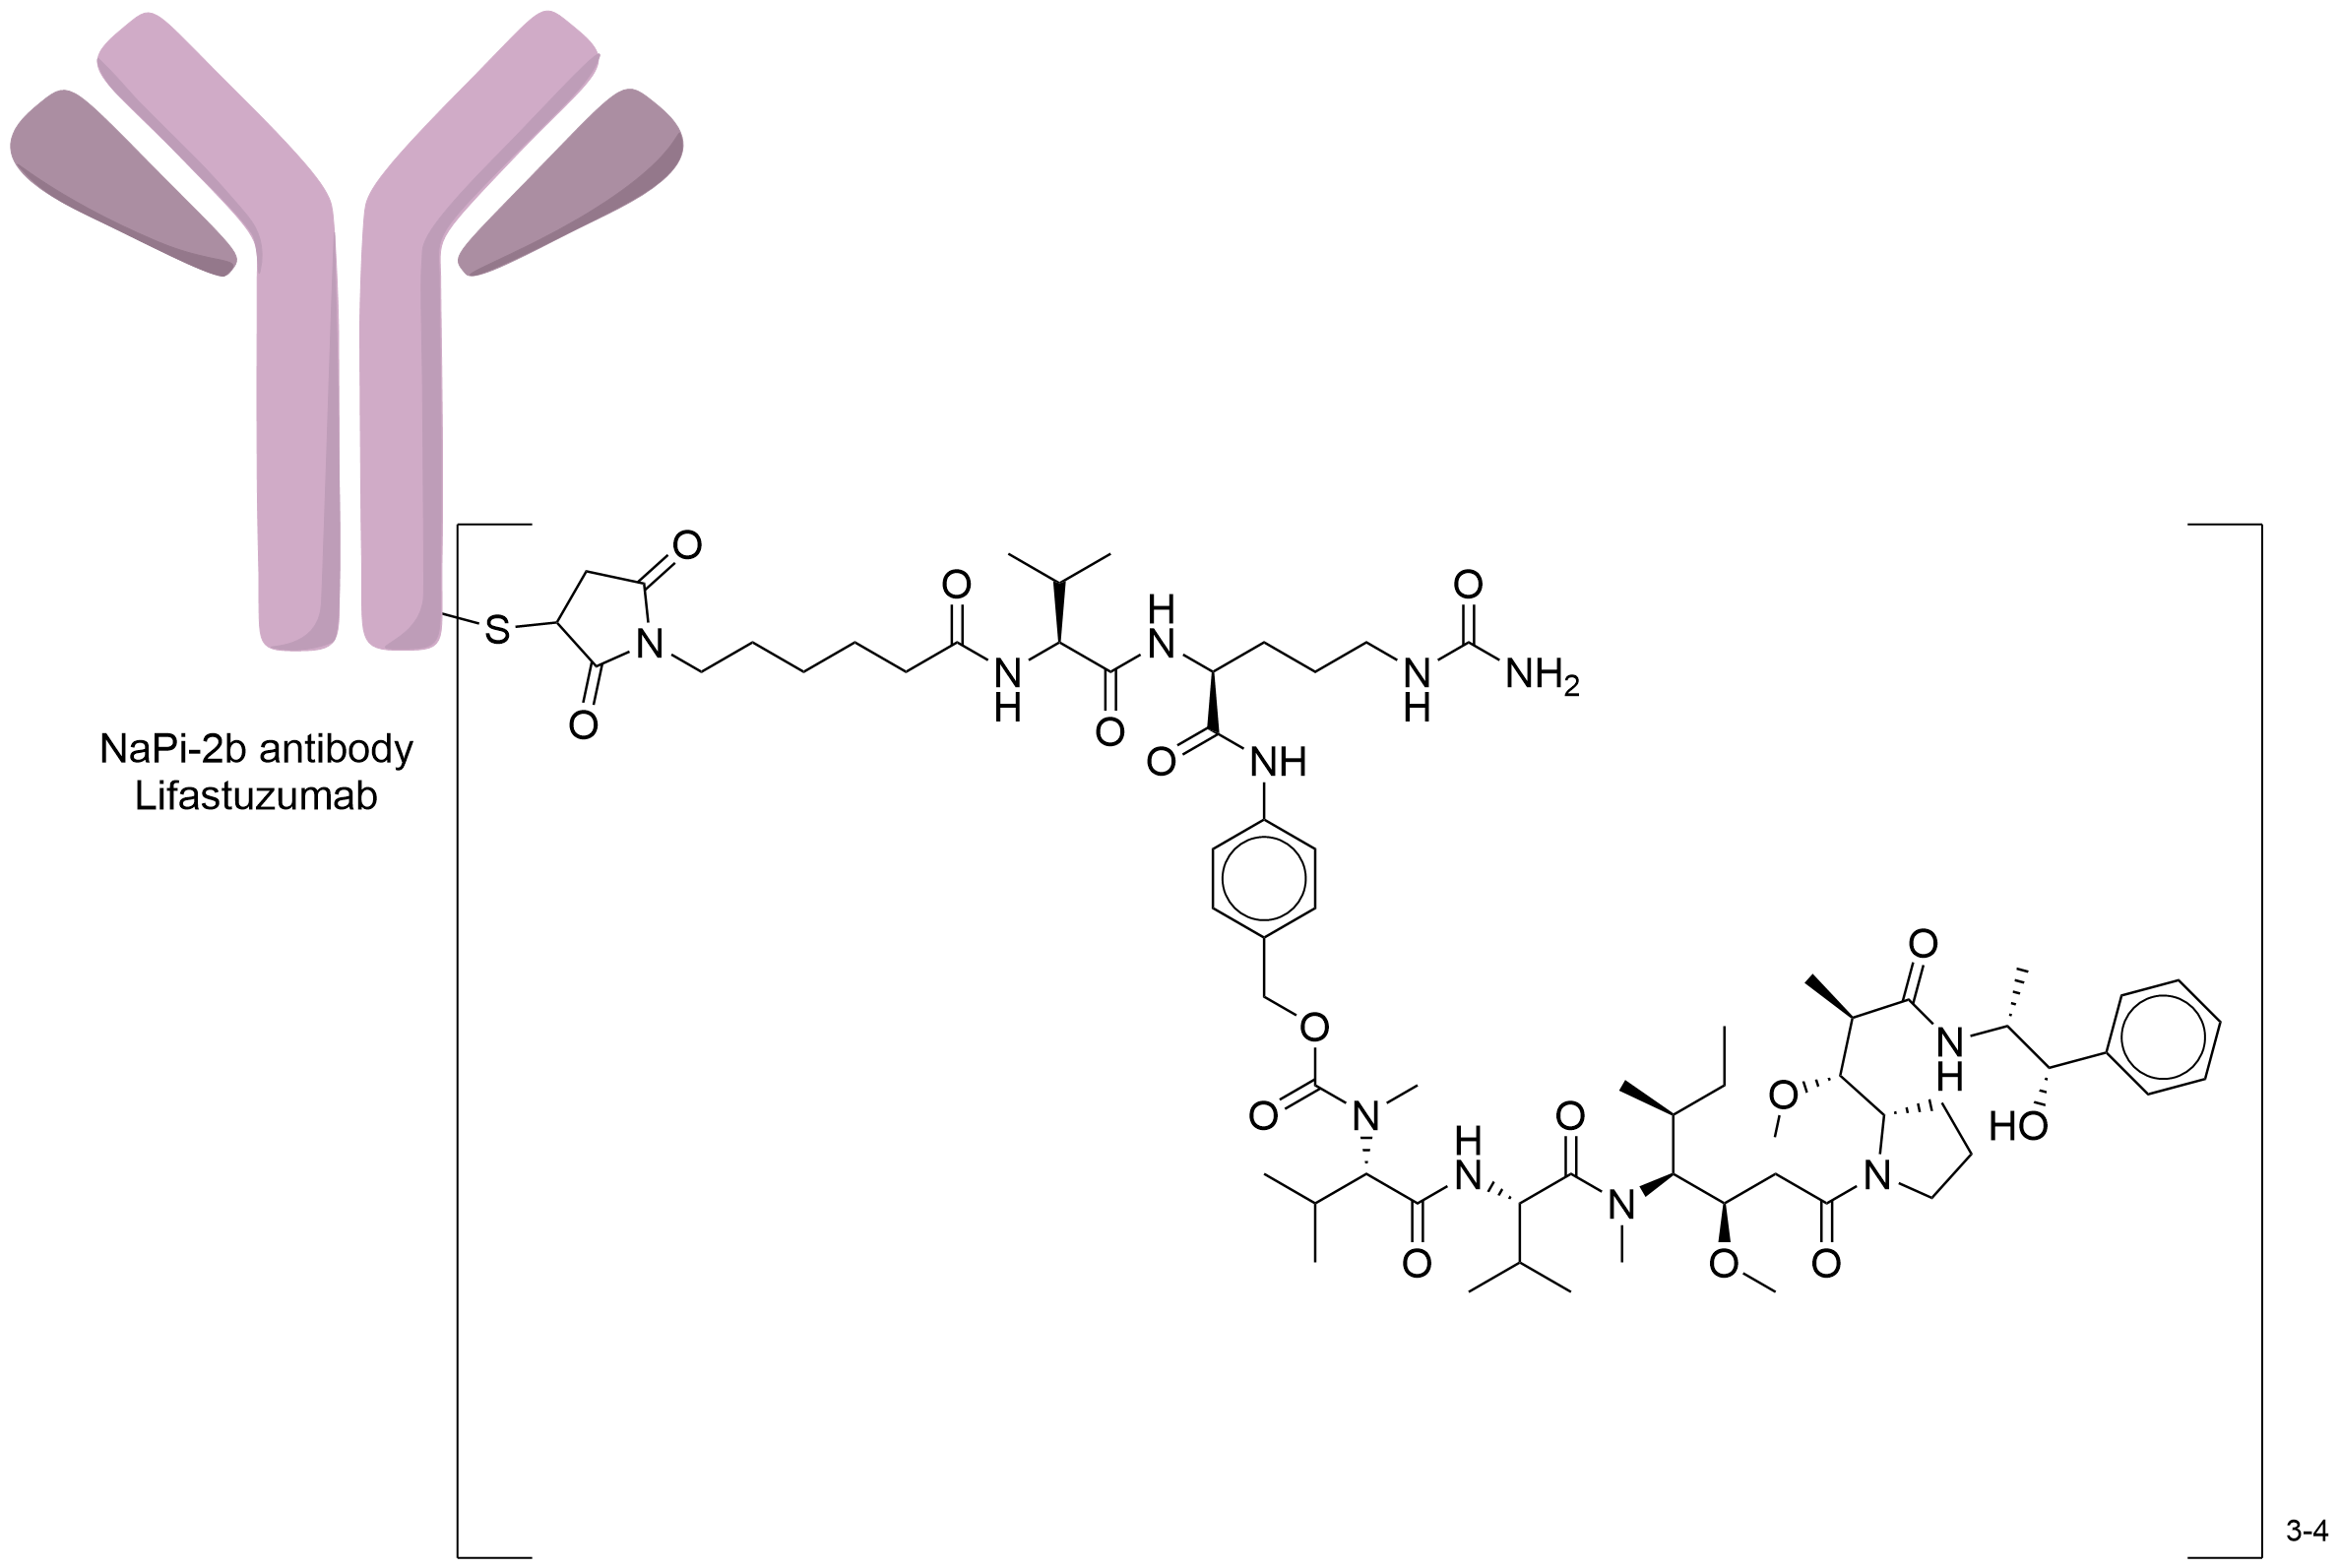
|
|||||
| Antibody Name |
Lifastuzumab
|
Antibody Info | ||||
| Antigen Name |
Sodium-dependent phosphate transport protein 2B (SLC34A2)
|
Antigen Info | ||||
| Payload Name |
Monomethyl auristatin E
|
Payload Info | ||||
| Payload Target |
Microtubule (MT)
|
Target Info | ||||
| Linker Name |
Mc-Val-Cit-PABC
|
Linker Info | ||||
| Conjugate Type |
Random Cysteines
|
|||||
| Combination Type |
vedotin
|
|||||
2027 Update
The disease landscape of This ADC
2027 Update
The clinical trial pipelines of This ADC
| Indication | Phase 1 | Phase 2 | Phase 3 | Approved | ||||
|---|---|---|---|---|---|---|---|---|
| Lung cancer |
1 Trials
|
|||||||
| Ovarian cancer |
1 Trials
|
1 Trials
|
2027 Update
General Information of The ADMET Data Related to This ADC
Absorption
| Standard Type | Value | Units | Description | Reference |
|---|---|---|---|---|
| Maximum Observed Concentration (Cmax) | 530 | ng/mL |
Mean (standard deviation) of the pharmacokinetic parameters for antibody-conjugated MMAE in plasma:LIFA 1.2 mg/kg + carboplatin (n=4) .
|
[1] |
| Maximum Observed Concentration (Cmax) | 687 | ng/mL |
Mean (standard deviation) of the pharmacokinetic parameters for antibody-conjugated MMAE in plasma:LIFA 1.8 mg/kg + carboplatin (n=5) .
|
[1] |
| Maximum Observed Concentration (Cmax) | 1130 | ng/mL |
Mean (standard deviation) of the pharmacokinetic parameters for antibody-conjugated MMAE in plasma: LIFA 2.4 mg/kg + carboplatin (n=7) .
|
[1] |
| Maximum Observed Concentration (Cmax) | 945 | ng/mL |
Mean (standard deviation) of the pharmacokinetic parameters for antibody-conjugated MMAE in plasma: LIFA 2.4 mg/kg, 1.8 mg/kg + carboplatin (n=11) .
|
[1] |
| Maximum Observed Concentration (Cmax) | 1050 | ng/mL |
Mean (standard deviation) of the pharmacokinetic parameters for antibody-conjugated MMAE in plasma: LIFA 2.4 mg/kg + carboplatin + bevacizumab (n=12) .
|
[1] |
| Area Under the Concentration-Time Curve (AUC) | 1650 | ng·day/mL |
Mean (standard deviation) of the pharmacokinetic parameters for antibody-conjugated MMAE in plasma:LIFA 1.2 mg/kg + carboplatin (n=4), AUCinf.
|
[1] |
| Area Under the Concentration-Time Curve (AUC) | 2250 | ng·day/mL |
Mean (standard deviation) of the pharmacokinetic parameters for antibody-conjugated MMAE in plasma:LIFA 1.8 mg/kg + carboplatin (n=5), AUCinf.
|
[1] |
| Area Under the Concentration-Time Curve (AUC) | 3530 | ng·day/mL |
Mean (standard deviation) of the pharmacokinetic parameters for antibody-conjugated MMAE in plasma: LIFA 2.4 mg/kg + carboplatin (n=7), AUCinf.
|
[1] |
| Area Under the Concentration-Time Curve (AUC) | 3230 | ng·day/mL |
Mean (standard deviation) of the pharmacokinetic parameters for antibody-conjugated MMAE in plasma: LIFA 2.4 mg/kg, 1.8 mg/kg + carboplatin (n=11), AUCinf.
|
[1] |
| Area Under the Concentration-Time Curve (AUC) | 3510 | ng·day/mL |
Mean (standard deviation) of the pharmacokinetic parameters for antibody-conjugated MMAE in plasma: LIFA 2.4 mg/kg + carboplatin + bevacizumab (n=12), AUCinf.
|
[1] |
| Maximum Observed Concentration (Cmax) | 855 | ng/mL |
Exposure and Pharmacokinetics of Analytesof acMMAE.
|
[2] |
| Area Under the Concentration-Time Curve (AUC) | 2685 | ng·day/mL |
Exposure and Pharmacokinetics of Analytesof acMMAE, AUCinf.
|
[2] |
| Maximum Observed Concentration (Cmax) | 70.6 | ng/mL |
Mean (standard deviation) of the pharmacokinetic parameters for antibody-conjugated MMAE in plasma, Cohort 1, 0.2 mg/kg. (n=3)
|
[3] |
| Maximum Observed Concentration (Cmax) | 136 | ng/mL |
Mean (standard deviation) of the pharmacokinetic parameters for antibody-conjugated MMAE in plasma, Cohort 2, 0.4 mg/kg. (n=3)
|
[3] |
| Maximum Observed Concentration (Cmax) | 291 | ng/mL |
Mean (standard deviation) of the pharmacokinetic parameters for antibody-conjugated MMAE in plasma, Cohort 3, 0.7 mg/kg. (n=3)
|
[3] |
| Maximum Observed Concentration (Cmax) | 469 | ng/mL |
Mean (standard deviation) of the pharmacokinetic parameters for antibody-conjugated MMAE in plasma, Cohort 4, 1.2 mg/kg. (n=3)
|
[3] |
| Maximum Observed Concentration (Cmax) | 691 | ng/mL |
Mean (standard deviation) of the pharmacokinetic parameters for antibody-conjugated MMAE in plasma, Cohort 5, 1.8 mg/kg. (n=3)
|
[3] |
| Maximum Observed Concentration (Cmax) | 831 | ng/mL |
Mean (standard deviation) of the pharmacokinetic parameters for antibody-conjugated MMAE in plasma, Cohort 6, 2.4 mg/kg. (n=3)
|
[3] |
| Maximum Observed Concentration (Cmax) | 1050 | ng/mL |
Mean (standard deviation) of the pharmacokinetic parameters for antibody-conjugated MMAE in plasma, Cohort 7, 2.8 mg/kg. (n=3)
|
[3] |
| Maximum Observed Concentration (Cmax) | 996 | ng/mL |
Mean (standard deviation) of the pharmacokinetic parameters for antibody-conjugated MMAE in plasma, Cohort 8, 2.4 mg/kg. (n=15)
|
[3] |
| Maximum Observed Concentration (Cmax) | 904 | ng/mL |
Mean (standard deviation) of the pharmacokinetic parameters for antibody-conjugated MMAE in plasma, Cohort 9, 2.4 mg/kg. (n=30)
|
[3] |
| Maximum Observed Concentration (Cmax) | 837 | ng/mL |
Mean (standard deviation) of the pharmacokinetic parameters for antibody-conjugated MMAE in plasma, Cohort 10, 2.4 mg/kg. (n=4)
|
[3] |
| Area Under the Concentration-Time Curve (AUC) | 145 | ng·day/mL |
Mean (standard deviation) of the pharmacokinetic parameters for antibody-conjugated MMAE in plasma, Cohort 1, 0.2 mg/kg, AUCinf. (n=3)
|
[3] |
| Area Under the Concentration-Time Curve (AUC) | 249 | ng·day/mL |
Mean (standard deviation) of the pharmacokinetic parameters for antibody-conjugated MMAE in plasma, Cohort 2, 0.4 mg/kg, AUCinf. (n=3)
|
[3] |
| Area Under the Concentration-Time Curve (AUC) | 590 | ng·day/mL |
Mean (standard deviation) of the pharmacokinetic parameters for antibody-conjugated MMAE in plasma, Cohort 3, 0.7 mg/kg, AUCinf. (n=3)
|
[3] |
| Area Under the Concentration-Time Curve (AUC) | 1120 | ng·day/mL |
Mean (standard deviation) of the pharmacokinetic parameters for antibody-conjugated MMAE in plasma, Cohort 4, 1.2 mg/kg, AUCinf. (n=3)
|
[3] |
| Area Under the Concentration-Time Curve (AUC) | 1610 | ng·day/mL |
Mean (standard deviation) of the pharmacokinetic parameters for antibody-conjugated MMAE in plasma, Cohort 5, 1.8 mg/kg, AUCinf. (n=3)
|
[3] |
| Area Under the Concentration-Time Curve (AUC) | 1990 | ng·day/mL |
Mean (standard deviation) of the pharmacokinetic parameters for antibody-conjugated MMAE in plasma, Cohort 6, 2.4 mg/kg, AUCinf. (n=3)
|
[3] |
| Area Under the Concentration-Time Curve (AUC) | 2790 | ng·day/mL |
Mean (standard deviation) of the pharmacokinetic parameters for antibody-conjugated MMAE in plasma, Cohort 7, 2.8 mg/kg, AUCinf. (n=3)
|
[3] |
| Area Under the Concentration-Time Curve (AUC) | 2560 | ng·day/mL |
Mean (standard deviation) of the pharmacokinetic parameters for antibody-conjugated MMAE in plasma, Cohort 8, 2.4 mg/kg, AUCinf. (n=15)
|
[3] |
| Area Under the Concentration-Time Curve (AUC) | 2240 | ng·day/mL |
Mean (standard deviation) of the pharmacokinetic parameters for antibody-conjugated MMAE in plasma, Cohort 9, 2.4 mg/kg, AUCinf. (n=30)
|
[3] |
| Area Under the Concentration-Time Curve (AUC) | 2580 | ng·day/mL |
Mean (standard deviation) of the pharmacokinetic parameters for antibody-conjugated MMAE in plasma, Cohort 10, 2.4 mg/kg, AUCinf. (n=4)
|
[3] |
Distribution
| Standard Type | Value | Units | Description | Reference |
|---|---|---|---|---|
| Volume of Distribution (Vd) | 56.27 | mL/kg |
Mean (standard deviation) of the pharmacokinetic parameters for antibody-conjugated MMAE in plasma:LIFA 1.2 mg/kg + carboplatin (n=4) .
|
[1] |
| Volume of Distribution (Vd) | 56.79 | mL/kg |
Mean (standard deviation) of the pharmacokinetic parameters for antibody-conjugated MMAE in plasma:LIFA 1.8 mg/kg + carboplatin (n=5) .
|
[1] |
| Volume of Distribution (Vd) | 48.53 | mL/kg |
Mean (standard deviation) of the pharmacokinetic parameters for antibody-conjugated MMAE in plasma: LIFA 2.4 mg/kg + carboplatin (n=7) .
|
[1] |
| Volume of Distribution (Vd) | 59.88 | mL/kg |
Mean (standard deviation) of the pharmacokinetic parameters for antibody-conjugated MMAE in plasma: LIFA 2.4 mg/kg, 1.8 mg/kg + carboplatin (n=11) .
|
[1] |
| Volume of Distribution (Vd) | 58.33 | mL/kg |
Mean (standard deviation) of the pharmacokinetic parameters for antibody-conjugated MMAE in plasma: LIFA 2.4 mg/kg + carboplatin + bevacizumab (n=12) .
|
[1] |
| Volume of Distribution (Vd) | 70 | mL/kg |
Exposure and Pharmacokinetics of Analytesof acMMAE.
|
[2] |
| Volume of Distribution (Vd) | 112.91 | mL/kg |
Mean (standard deviation) of the pharmacokinetic parameters for antibody-conjugated MMAE in plasma, Cohort 1, 0.2 mg/kg. (n=3)
|
[3] |
| Volume of Distribution (Vd) | 96.07 | mL/kg |
Mean (standard deviation) of the pharmacokinetic parameters for antibody-conjugated MMAE in plasma, Cohort 2, 0.4 mg/kg. (n=3)
|
[3] |
| Volume of Distribution (Vd) | 71.05 | mL/kg |
Mean (standard deviation) of the pharmacokinetic parameters for antibody-conjugated MMAE in plasma, Cohort 3, 0.7 mg/kg. (n=3)
|
[3] |
| Volume of Distribution (Vd) | 77.18 | mL/kg |
Mean (standard deviation) of the pharmacokinetic parameters for antibody-conjugated MMAE in plasma, Cohort 4, 1.2 mg/kg. (n=3)
|
[3] |
| Volume of Distribution (Vd) | 86.37 | mL/kg |
Mean (standard deviation) of the pharmacokinetic parameters for antibody-conjugated MMAE in plasma, Cohort 5, 1.8 mg/kg. (n=3)
|
[3] |
| Volume of Distribution (Vd) | 115.85 | mL/kg |
Mean (standard deviation) of the pharmacokinetic parameters for antibody-conjugated MMAE in plasma, Cohort 6, 2.4 mg/kg. (n=3)
|
[3] |
| Volume of Distribution (Vd) | 97.62 | mL/kg |
Mean (standard deviation) of the pharmacokinetic parameters for antibody-conjugated MMAE in plasma, Cohort 7, 2.8 mg/kg. (n=3)
|
[3] |
| Volume of Distribution (Vd) | 79.91 | mL/kg |
Mean (standard deviation) of the pharmacokinetic parameters for antibody-conjugated MMAE in plasma, Cohort 8, 2.4 mg/kg. (n=15)
|
[3] |
| Volume of Distribution (Vd) | 93.86 | mL/kg |
Mean (standard deviation) of the pharmacokinetic parameters for antibody-conjugated MMAE in plasma, Cohort 9, 2.4 mg/kg. (n=30)
|
[3] |
| Volume of Distribution (Vd) | 85.25 | mL/kg |
Mean (standard deviation) of the pharmacokinetic parameters for antibody-conjugated MMAE in plasma, Cohort 10, 2.4 mg/kg. (n=4)
|
[3] |
Excretion
| Standard Type | Value | Units | Description | Reference |
|---|---|---|---|---|
| Elimination Half-Life (t1/2) | 5.61 | day |
Mean (standard deviation) of the pharmacokinetic parameters for antibody-conjugated MMAE in plasma:LIFA 1.2 mg/kg + carboplatin (n=4) .
|
[1] |
| Elimination Half-Life (t1/2) | 5.59 | day |
Mean (standard deviation) of the pharmacokinetic parameters for antibody-conjugated MMAE in plasma:LIFA 1.8 mg/kg + carboplatin (n=5) .
|
[1] |
| Elimination Half-Life (t1/2) | 4.71 | day |
Mean (standard deviation) of the pharmacokinetic parameters for antibody-conjugated MMAE in plasma: LIFA 2.4 mg/kg + carboplatin (n=7) .
|
[1] |
| Elimination Half-Life (t1/2) | 5.04 | day |
Mean (standard deviation) of the pharmacokinetic parameters for antibody-conjugated MMAE in plasma: LIFA 2.4 mg/kg, 1.8 mg/kg + carboplatin (n=11) .
|
[1] |
| Elimination Half-Life (t1/2) | 5 | day |
Mean (standard deviation) of the pharmacokinetic parameters for antibody-conjugated MMAE in plasma: LIFA 2.4 mg/kg + carboplatin + bevacizumab (n=12) .
|
[1] |
| Elimination Half-Life (t1/2) | 5.1 | day |
Exposure and Pharmacokinetics of Analytesof acMMAE.
|
[2] |
| Clearance (CL) | 16 | mL/kg/day |
Exposure and Pharmacokinetics of Analytesof acMMAE.
|
[2] |
| Elimination Half-Life (t1/2) | 6.11 | day |
Mean (standard deviation) of the pharmacokinetic parameters for antibody-conjugated MMAE in plasma, Cohort 1, 0.2 mg/kg. (n=3)
|
[3] |
| Elimination Half-Life (t1/2) | 4.33 | day |
Mean (standard deviation) of the pharmacokinetic parameters for antibody-conjugated MMAE in plasma, Cohort 2, 0.4 mg/kg. (n=3)
|
[3] |
| Elimination Half-Life (t1/2) | 3.77 | day |
Mean (standard deviation) of the pharmacokinetic parameters for antibody-conjugated MMAE in plasma, Cohort 3, 0.7 mg/kg. (n=3)
|
[3] |
| Elimination Half-Life (t1/2) | 4.79 | day |
Mean (standard deviation) of the pharmacokinetic parameters for antibody-conjugated MMAE in plasma, Cohort 4, 1.2 mg/kg. (n=3)
|
[3] |
| Elimination Half-Life (t1/2) | 5.88 | day |
Mean (standard deviation) of the pharmacokinetic parameters for antibody-conjugated MMAE in plasma, Cohort 5, 1.8 mg/kg. (n=3)
|
[3] |
| Elimination Half-Life (t1/2) | 6.14 | day |
Mean (standard deviation) of the pharmacokinetic parameters for antibody-conjugated MMAE in plasma, Cohort 6, 2.4 mg/kg. (n=3)
|
[3] |
| Elimination Half-Life (t1/2) | 5.52 | day |
Mean (standard deviation) of the pharmacokinetic parameters for antibody-conjugated MMAE in plasma, Cohort 7, 2.8 mg/kg. (n=3)
|
[3] |
| Elimination Half-Life (t1/2) | 5.14 | day |
Mean (standard deviation) of the pharmacokinetic parameters for antibody-conjugated MMAE in plasma, Cohort 8, 2.4 mg/kg. (n=15)
|
[3] |
| Elimination Half-Life (t1/2) | 5.48 | day |
Mean (standard deviation) of the pharmacokinetic parameters for antibody-conjugated MMAE in plasma, Cohort 9, 2.4 mg/kg. (n=30)
|
[3] |
| Elimination Half-Life (t1/2) | 6.09 | day |
Mean (standard deviation) of the pharmacokinetic parameters for antibody-conjugated MMAE in plasma, Cohort 10, 2.4 mg/kg. (n=4)
|
[3] |
| Clearance (CL) | 24.81 | mL/day/kg |
Mean (standard deviation) of the pharmacokinetic parameters for antibody-conjugated MMAE in plasma, Cohort 1, 0.2 mg/kg. (n=3)
|
[3] |
| Clearance (CL) | 29.3 | mL/day/kg |
Mean (standard deviation) of the pharmacokinetic parameters for antibody-conjugated MMAE in plasma, Cohort 2, 0.4 mg/kg. (n=3)
|
[3] |
| Clearance (CL) | 22.65 | mL/day/kg |
Mean (standard deviation) of the pharmacokinetic parameters for antibody-conjugated MMAE in plasma, Cohort 3, 0.7 mg/kg. (n=3)
|
[3] |
| Clearance (CL) | 18.91 | mL/day/kg |
Mean (standard deviation) of the pharmacokinetic parameters for antibody-conjugated MMAE in plasma, Cohort 4, 1.2 mg/kg. (n=3)
|
[3] |
| Clearance (CL) | 20.19 | mL/day/kg |
Mean (standard deviation) of the pharmacokinetic parameters for antibody-conjugated MMAE in plasma, Cohort 5, 1.8 mg/kg. (n=3)
|
[3] |
| Clearance (CL) | 22.71 | mL/day/kg |
Mean (standard deviation) of the pharmacokinetic parameters for antibody-conjugated MMAE in plasma, Cohort 6, 2.4 mg/kg. (n=3)
|
[3] |
| Clearance (CL) | 19.73 | mL/day/kg |
Mean (standard deviation) of the pharmacokinetic parameters for antibody-conjugated MMAE in plasma, Cohort 7, 2.8 mg/kg. (n=3)
|
[3] |
| Clearance (CL) | 17.08 | mL/day/kg |
Mean (standard deviation) of the pharmacokinetic parameters for antibody-conjugated MMAE in plasma, Cohort 8, 2.4 mg/kg. (n=15)
|
[3] |
| Clearance (CL) | 19.83 | mL/day/kg |
Mean (standard deviation) of the pharmacokinetic parameters for antibody-conjugated MMAE in plasma, Cohort 9, 2.4 mg/kg. (n=30)
|
[3] |
| Clearance (CL) | 16.45 | mL/day/kg |
Mean (standard deviation) of the pharmacokinetic parameters for antibody-conjugated MMAE in plasma, Cohort 10, 2.4 mg/kg. (n=4)
|
[3] |
General Information of The Activity Data Related to This ADC
Identified from the Human Clinical Data
Discovered Using Patient-derived Xenograft Model
Discovered Using Cell Line-derived Xenograft Model
| Standard Type | Value | Units | Cell Line | Disease Model |
|---|---|---|---|---|
| Tumor Growth Inhibition value (TGI) |
≈ 41.2
|
%
|
OVCAR-3 cells
|
Ovarian serous adenocarcinoma
|
Full List of Activity Data of This Antibody-drug Conjugate
Identified from the Human Clinical Data
| Experiment 1 Reporting the Activity Date of This ADC | [1] | ||||
| Efficacy Data | Progression Free Survival |
10.7 months
|
|||
| Patients Enrolled |
Inclusion criteria: ECOG 0-1; histologically confirmed platinum-sensitive ovarian, peritoneal, or fallopian tube cancer or NSCLC with ≤2 prior regimens (additional targeted therapy permitted for EGFR/ALK mutations). NSCLC requires NaPi2b IHC 2+/3+. Exclusions: recent anti-tumor therapy/surgery, active infections, untreated CNS metastases, prior NaPi2b therapy, or specific contraindications for bevacizumab (e.g., uncontrolled hypertension, recent thrombosis).
Click to Show/Hide
|
||||
| Administration Dosage |
Patients received LIFA at 1.2, 1.8, and 2.4 mg (n = 4, 5, and 20, respectively) with carboplatin.
|
||||
| Related Clinical Trial | |||||
| NCT Number | NCT01995188 | Clinical Status | PHASE1 | ||
| Clinical Description | A Phase Ib, Open-Label, Dose-Escalation Study of the Safety and Pharmacology of DNIB0600A in Combination With Carboplatin (With or Without Bevacizumab) in Patients With Platinum-Sensitive Ovarian Cancer or Non-Squamous Non-small Cell Lung Cancer | ||||
| Primary Endpoint |
The study evaluates dose-limiting toxicities (DLTs) in participants over 21 days, tracks adverse events (AEs) and serious adverse events (SAEs) from Day 1 until 30 days post-last infusion (up to ~3 years), and monitors anti-DNIB0600A antibodies at pre-infusion, specific cycles, and 30 days post-last infusion.
|
||||
| Other Endpoint |
Pharmacokinetic parameters include AUC (0-inf), Cmax, Cmin, CL, Vss, and t1/2, measured at pre-infusion, post-infusion time points, and follow-up (up to ~3 years). Efficacy is assessed via RECIST v1.1, measuring objective response rate, duration of response, and progression-free survival (PFS) from screening until disease progression or death.
|
||||
| Experiment 2 Reporting the Activity Date of This ADC | [2] | ||||
| Efficacy Data | Objective Response Rate (ORR) |
34
15 36 14 % |
|||
| Patients Enrolled |
Eligible patients must have ECOG 0-1, histologically confirmed advanced ovarian, peritoneal, or fallopian tube cancer refractory to platinum therapy, ≤2 prior regimens, adequate organ function, and contraception compliance. Exclusions include prior anthracycline/NaPi2b therapy, major surgery within 4 weeks, uncontrolled comorbidities, active infections, hepatitis/HIV, CNS metastases, pregnancy, NaPi2b deficiency, or severe hypersensitivity to monoclonal antibodies.
Click to Show/Hide
|
||||
| Administration Dosage |
DNIB0600A will be administered at a dose of 2.4 mg/kg IV every 3 weeks.
|
||||
| Related Clinical Trial | |||||
| NCT Number | NCT01991210 | Clinical Status | PHASE2 | ||
| Clinical Description | A Randomized, Open-Label, Multicenter, Phase II Trial Evaluating the Safety and Activity of DNIB0600A Compared to Pegylated Liposomal Doxorubicin Administered Intravenously to Patients With Platinum-Resistant Ovarian Cancer | ||||
| Primary Endpoint |
The primary endpoint is progression-free survival (PFS) based on RECIST v1.1, measured from baseline until disease progression or death within 30 days of last study drug administration, with an overall timeframe of approximately 2.5 years.
|
||||
| Other Endpoint |
Secondary endpoints include objective response rate (ORR) and duration of response per RECIST v1.1, overall survival (OS), incidence of adverse events (AEs), and pharmacokinetic parameters such as AUC, Cmax, CL, t½, and Vss of DNIB0600A, along with anti-therapeutic antibody (ATA) formation. Assessments span from baseline up to 30 days post-treatment or longer, with detailed time points for PK analysis.
Click to Show/Hide
|
||||
| Experiment 3 Reporting the Activity Date of This ADC | [1] | ||||
| Efficacy Data | Objective Response Rate (ORR) |
59%
|
|||
| Patients Enrolled |
Inclusion criteria: ECOG 0-1; histologically confirmed platinum-sensitive ovarian, peritoneal, or fallopian tube cancer or NSCLC with ≤2 prior regimens (additional targeted therapy permitted for EGFR/ALK mutations). NSCLC requires NaPi2b IHC 2+/3+. Exclusions: recent anti-tumor therapy/surgery, active infections, untreated CNS metastases, prior NaPi2b therapy, or specific contraindications for bevacizumab (e.g., uncontrolled hypertension, recent thrombosis).
Click to Show/Hide
|
||||
| Administration Dosage |
Patients received LIFA at 1.2, 1.8, and 2.4 mg (n = 4, 5, and 20, respectively) with carboplatin.
|
||||
| Related Clinical Trial | |||||
| NCT Number | NCT01995188 | Clinical Status | PHASE1 | ||
| Clinical Description | A Phase Ib, Open-Label, Dose-Escalation Study of the Safety and Pharmacology of DNIB0600A in Combination With Carboplatin (With or Without Bevacizumab) in Patients With Platinum-Sensitive Ovarian Cancer or Non-Squamous Non-small Cell Lung Cancer | ||||
| Primary Endpoint |
The study evaluates dose-limiting toxicities (DLTs) in participants over 21 days, tracks adverse events (AEs) and serious adverse events (SAEs) from Day 1 until 30 days post-last infusion (up to ~3 years), and monitors anti-DNIB0600A antibodies at pre-infusion, specific cycles, and 30 days post-last infusion.
|
||||
| Other Endpoint |
Pharmacokinetic parameters include AUC (0-inf), Cmax, Cmin, CL, Vss, and t1/2, measured at pre-infusion, post-infusion time points, and follow-up (up to ~3 years). Efficacy is assessed via RECIST v1.1, measuring objective response rate, duration of response, and progression-free survival (PFS) from screening until disease progression or death.
|
||||
| Experiment 4 Reporting the Activity Date of This ADC | [4] | ||||
| Patients Enrolled |
Outcomes included safety (AE incidence), pharmacokinetics (Cmax of DNIB0600A components), immunogenicity (ADA development), and efficacy (OR and DOR per RECIST v1.1). Key endpoints spanned up to 84 weeks, assessing tumor response dynamics-complete or partial shrinkage (≥30% reduction), stable disease, or progression (≥20% increase or new lesions)-while monitoring drug-related toxicities and immunologic reactions. Rigorous eligibility criteria balanced participant safety with disease relevance, excluding high-risk conditions or recent therapies to isolate investigational drug effects.
Click to Show/Hide
|
||||
| Administration Dosage |
Several dose levels will be evaluated for DNIB0600A administered via IV infusion on Day 1 of each 21-day cycle until disease progression.
|
||||
| Related Clinical Trial | |||||
| NCT Number | NCT01363947 | Clinical Status | PHASE1 | ||
| Clinical Description | A Phase I, Open-Label Study of the Safety and Pharmacokinetics of Escalating Doses of DNIB0600A in Patients With Non-Small Cell Lung Cancer and Platinum-Resistant Ovarian Cancer | ||||
| Primary Endpoint |
The study assessed adverse events (AEs) over approximately 2 years, defined as any unfavorable or unintended sign, symptom, or disease temporally linked to investigational medicinal product (IMP) use, irrespective of causality. Peak concentrations (Cmax) of DNIB0600A components-acMMAE, total antibody, and unconjugated MMAE-were evaluated on Day 21, alongside the percentage of participants developing anti-drug antibodies (ADAs) over 84 weeks, measuring baseline prevalence and post-baseline incidence. Objective response (OR) per RECIST v1.1 criteria, including complete response (disappearance of target lesions) and partial response (≥30% decrease in lesion diameters), was tracked for 84 weeks, along with duration of response (DOR), stable disease, and progression criteria (≥20% increase in lesion diameters or new lesions).
Click to Show/Hide
|
||||
| Other Endpoint |
Inclusion criteria required an ECOG performance status of 0 or 1, histologic evidence of incurable locally advanced/metastatic disease (e.g., non-squamous NSCLC or platinum-resistant ovarian cancer), measurable disease, access to archival tumor samples, and contraception use for fertile participants. Exclusion criteria encompassed recent anti-tumor therapy, major surgery within 4 weeks, active infections, significant liver disease, untreated CNS metastases, oxygen dependency, uncontrolled comorbidities, and prior treatments (≤2 regimens for NSCLC expansion cohort). Pregnancy or breastfeeding also disqualified participation.
Click to Show/Hide
|
||||
| Experiment 5 Reporting the Activity Date of This ADC | [5] | ||||
| Efficacy Data | Partial Response (PR) |
7.84
45.83 25.00 6.67 % |
|||
| Patients Enrolled |
Incurable, locally advanced, or metastatic disease (non-squamous NSCLC or non-mucinous PROC) that had progressed on or following prior chemotherapy and for which no standard therapy existed, Eastern Cooperative Oncology Group (ECOG) performance status of 0 or 1.
|
||||
| Administration Dosage |
The starting dose for LIFA was 0.20 mg/kg administered by intravenous infusion (IV) every 3 weeks (Q3W), in this 3+3 dose-escalation design, followed by cohort expansion at the recommended phase II dose (RP2D).
|
||||
| Related Clinical Trial | |||||
| NCT Number | NCT01911598 | Clinical Status | Phase 1a | ||
| Clinical Description | A phase 1b open-label study of the safety and pharmacokinetics of MEHD7945A in combination with either cisplatin and 5-fu or paclitaxel and carboplatin in patients with recurrent/metastatic squamous cell carcinoma of the head and neck. | ||||
| Primary Endpoint |
The MTD was not reached on this study and the maximum administered dose (MAD) was 2.80 mg/kg. Upon evaluation of the safety data of the 6 patients treated at the MAD, the dose of 2.40 mg/kg was established as the RP2D.
|
||||
| Other Endpoint |
At active doses 1.80 mg/kg, partial responses were observed in four of 51 (7.84%) patients with NSCLC and 11 of 24 (45.83%) patients. In the NSCLC cohorts, PRs were seen in 1 of 4 (25.00%) at 1.80 mg/kg and in 3 of 45 (6.67%) patients at 2.40 mg/kg, mDoR=161 days. In PROC, PRs were seen at 1.80 mg/kg in one of two (50.00%), at 2.40 mg/kg in seven of 18 (38.89%), and at 2.80 mg/kg in three of four (75.00%) patients; mDoR=342 days.
Click to Show/Hide
|
||||
| Experiment 6 Reporting the Activity Date of This ADC | [6] | ||||
| Efficacy Data | Objective Response Rate (ORR) |
34.00
36.00 % |
|||
| Patients Enrolled |
Platinum-resistant patients with histologically documented advanced epithelial ovarian, primary peritoneal, or fallopian tube cancer.
|
||||
| Administration Dosage |
2.40 mg/kg, intravenously, every 3 weeks (Q3W).
|
||||
| Related Clinical Trial | |||||
| NCT Number | NCT01991210 | Clinical Status | Phase 2 | ||
| Clinical Description | A randomized, open-label, multicenter, phase 2 trial evaluating the safety and activity of DNIB0600A compared to pegylated liposomal doxorubicin administered intravenously to patients with platinum-resistant ovarian cancer. | ||||
| Experiment 7 Reporting the Activity Date of This ADC | [7] | ||||
| Efficacy Data | Objective Response Rate (ORR) |
34.00
36.00 % |
|||
| Patients Enrolled |
Advanced epithelial ovarian, primary peritoneal, or fallopian tube cancer that had progressed or relapsed within 6months of the most recent treatment with a platinum-containing chemotherapy regimen and for whom PLD was considered an appropriate therapy.
|
||||
| Administration Dosage |
2.40 mg/kg, intravenously, every 3 weeks (Q3W).
|
||||
| Related Clinical Trial | |||||
| NCT Number | NCT01991210 | Clinical Status | Phase 2 | ||
| Clinical Description | A randomized, open-label, multicenter, phase 2 trial evaluating the safety and activity of DNIB0600A compared to pegylated liposomal doxorubicin administered intravenously to patients with platinum-resistant ovarian cancer. | ||||
| Primary Endpoint |
The stratified PFS hazard ratio was 0.78 (95% CI,0.46-1.31; p=0.34) with a median PFS of 5.30 vs. 3.10 months (LIFA vs. PLD arm,respectively) in the ITT population, and 0.71 (95% CI,0.40-1.26; p=0.24) with a median PFS of 5.30 vs. 3.40 months (LIFA vs. PLD arm,respectively) in NaPi2bxhigh patients. The objective response rate (ORR) was 34.00% (95% CI,22.00-49.00%,LIFA) vs. 15.00% (95% CI, 7.00-28.00%,PLD) in the ITT population (p=0.03), and 36.00% (95% CI, 22.00-52.00%,LIFA) vs.14.00% (95% CI,6.00-27.00%,PLD) in NaPi2bxhigh patients (p=0.02).
Click to Show/Hide
|
||||
| Experiment 8 Reporting the Activity Date of This ADC | [8] | ||||
| Efficacy Data | Objective Response Rate (ORR) |
25.00
7.00 50.00 39.00 75.00 % |
|||
| Patients Enrolled |
Patients with nonsmall cell lung cancer (NSCLC) and platinum-resistant ovarian cancer (PROC).
|
||||
| Administration Dosage |
Dose-escalation: 0.20-2.80 mg/kg once every 3 weeks, dose-expansion: 4 mg/kg once every 3 weeks.
|
||||
| Related Clinical Trial | |||||
| NCT Number | NCT01363947 | Clinical Status | Phase 1 | ||
| Clinical Description | A phase 1, open-label study of the safety and pharmacokinetics of escalating doses of DNIB0600A in patients with non-small cell lung cancer and platinum-resistant ovarian cancer. | ||||
| Experiment 9 Reporting the Activity Date of This ADC | [9] | ||||
| Efficacy Data | Complete Remission (CR) |
58.54%
|
|||
| Patients Enrolled |
Polycystic ovary syndrome (PSOC) patients (epithelial ovarian cancer, primary peritoneal cancer, or fallopian tube cancer) with documented radiographic progression or relapse according to RECIST v1.1.
|
||||
| Administration Dosage |
The starting dose of LIFA was 1.20 mg/kg, once every 3 weeks (Q3W) on the first day of 21-day cycles, traditional 3 + 3 study design.
|
||||
| Related Clinical Trial | |||||
| NCT Number | NCT01995188 | Clinical Status | Phase 1b | ||
| Clinical Description | A phase 1b, open-label, dose-escalation study of the safety and pharmacology of DNIB0600A in combination with carboplatin (with or without bevacizumab) in patients with platinum-sensitive ovarian cancer or non-squamous non-small cell lung cancer. | ||||
| Primary Endpoint |
The median duration of progression-free survival was 10.71 months (95% CI: 8.54,13.86) with confirmed complete/partial responses in 24 (58.54%) patients.
|
||||
| Other Endpoint |
The maximum tolerated dose was not reached. The recommended phase 2 dose (RP2D) was LIFA 2.40 mg/kg + carboplatin AUC6 (cycles 16), with or without bevacizumab 15 mg/kg.
|
||||
| Experiment 10 Reporting the Activity Date of This ADC | [10] | ||||
| Related Clinical Trial | |||||
| NCT Number | NCT01995188 | Clinical Status | Phase 1 | ||
| Clinical Description | A phase 1b, open-label, dose-escalation study of the safety and pharmacology of DNIB0600A in combination with carboplatin (with or without bevacizumab) in patients with platinum-sensitive ovarian cancer or non-squamous non-small cell lung cancer. | ||||
Discovered Using Patient-derived Xenograft Model
| Experiment 1 Reporting the Activity Date of This ADC | [11] | ||||
| Efficacy Data | Tumor Growth Inhibition value (TGI) | ≈ 19.60% | Moderate SLC34A2 expression (SLC34A2++) | ||
| Method Description |
Animals were randomized into treatment groups (n = 10) when the tumor target volume reached 100-150 mm3. Test articles were administered intravenously via tail vein injection. Mice received a single dose of either saline vehicle; XMT-1535 at 3 mg/kg; XMT-1536 (DAR 12.4) at 3 mg/kg; IgG1-Dolaflexin (DAR 18.1) at 3 mg/kg,or lifastuzumab vedotin (DAR 4.1) at 3 mg/kg. Tumors were measured twice per week. XMT-1536 and lifastuzumab vedotin were administered at a single dose of 3 mg/kg qwk x 3.
Click to Show/Hide
|
||||
| In Vivo Model | Non-small cell lung cancer PDX model (PDX: CTG-0860) | ||||
| Experiment 2 Reporting the Activity Date of This ADC | [11] | ||||
| Efficacy Data | Tumor Growth Inhibition value (TGI) | ≈ 25.40% | Moderate SLC34A2 expression (SLC34A2++) | ||
| Method Description |
Animals were randomized into treatment groups (n = 10) when the tumor target volume reached 100-150 mm3. Test articles were administered intravenously via tail vein injection. Mice received a single dose of either saline vehicle; XMT-1535 at 3 mg/kg; XMT-1536 (DAR 12.4) at 3 mg/kg; IgG1-Dolaflexin (DAR 18.1) at 3 mg/kg,or lifastuzumab vedotin (DAR 4.1) at 3 mg/kg. Tumors were measured twice per week. XMT-1536 and lifastuzumab vedotin were administered at a single dose of 3 mg/kg qwk x 3.
Click to Show/Hide
|
||||
| In Vivo Model | Lung cancer PDX model (PDX: CTG-0178) | ||||
| Experiment 3 Reporting the Activity Date of This ADC | [11] | ||||
| Efficacy Data | Tumor Growth Inhibition value (TGI) | ≈ 27.60% | Moderate SLC34A2 expression (SLC34A2++) | ||
| Method Description |
Animals were randomized into treatment groups (n = 10) when the tumor target volume reached 100-150 mm3. Test articles were administered intravenously via tail vein injection. Mice received a single dose of either saline vehicle; XMT-1535 at 3 mg/kg; XMT-1536 (DAR 12.4) at 3 mg/kg; IgG1-Dolaflexin (DAR 18.1) at 3 mg/kg,or lifastuzumab vedotin (DAR 4.1) at 3 mg/kg. Tumors were measured twice per week. XMT-1536 and lifastuzumab vedotin were administered at a single dose of 3 mg/kg qwk x 3.
Click to Show/Hide
|
||||
| In Vivo Model | Lung cancer PDX model (PDX: CTG-0178) | ||||
| Experiment 4 Reporting the Activity Date of This ADC | [11] | ||||
| Efficacy Data | Tumor Growth Inhibition value (TGI) | ≈ 59.30% | High SLC34A2 expression (SLC34A2+++) | ||
| Method Description |
Animals were randomized into treatment groups (n = 10) when the tumor target volume reached 100-150 mm3. Test articles were administered intravenously via tail vein injection. Mice received a single dose of either saline vehicle; XMT-1535 at 3 mg/kg; XMT-1536 (DAR 12.4) at 3 mg/kg; IgG1-Dolaflexin (DAR 18.1) at 3 mg/kg,or lifastuzumab vedotin (DAR 4.1) at 3 mg/kg. Tumors were measured twice per week. XMT-1536 and lifastuzumab vedotin were administered at a single dose of 3 mg/kg qwk x 3.
Click to Show/Hide
|
||||
| In Vivo Model | Lung cancer PDX model (PDX: CTG-0852) | ||||
| Experiment 5 Reporting the Activity Date of This ADC | [11] | ||||
| Efficacy Data | Tumor Growth Inhibition value (TGI) | ≈ 62.70% | High SLC34A2 expression (SLC34A2+++) | ||
| Method Description |
Animals were randomized into treatment groups (n = 10) when the tumor target volume reached 100-150 mm3. Test articles were administered intravenously via tail vein injection. Mice received a single dose of either saline vehicle; XMT-1535 at 3 mg/kg; XMT-1536 (DAR 12.4) at 3 mg/kg; IgG1-Dolaflexin (DAR 18.1) at 3 mg/kg,or lifastuzumab vedotin (DAR 4.1) at 3 mg/kg. Tumors were measured twice per week. XMT-1536 and lifastuzumab vedotin were administered at a single dose of 3 mg/kg qwk x 3.
Click to Show/Hide
|
||||
| In Vivo Model | Lung cancer PDX model (PDX: CTG-0852) | ||||
| Experiment 6 Reporting the Activity Date of This ADC | [11] | ||||
| Efficacy Data | Tumor Growth Inhibition value (TGI) | ≈ 62.80% | High SLC34A2 expression (SLC34A2+++) | ||
| Method Description |
Animals were randomized into treatment groups (n = 10) when the tumor target volume reached 100-150 mm3. Test articles were administered intravenously via tail vein injection. Mice received a single dose of either saline vehicle; XMT-1535 at 3 mg/kg; XMT-1536 (DAR 12.4) at 3 mg/kg; IgG1-Dolaflexin (DAR 18.1) at 3 mg/kg,or lifastuzumab vedotin (DAR 4.1) at 3 mg/kg. Tumors were measured twice per week. XMT-1536 and lifastuzumab vedotin were administered at a single dose of 3 mg/kg qwk x 3.
Click to Show/Hide
|
||||
| In Vivo Model | Lung cancer PDX model (PDX: CTG-0852) | ||||
Discovered Using Cell Line-derived Xenograft Model
| Experiment 1 Reporting the Activity Date of This ADC | [11] | ||||
| Efficacy Data | Tumor Growth Inhibition value (TGI) | ≈ 41.20% | High SLC34A2 expression (SLC34A2+++) | ||
| Method Description |
Animals were randomized into treatment groups (n = 10) when the tumor target volume reached 100-150 mm3. Test articles were administered intravenously via tail vein injection. Mice received a single dose of either saline vehicle; XMT-1535 at 3 mg/kg; XMT-1536 (DAR 12.4) at 3 mg/kg; IgG1-Dolaflexin (DAR 18.1) at 3 mg/kg,or lifastuzumab vedotin (DAR 4.1) at 3 mg/kg. Tumors were measured twice per week. XMT-1536 and lifastuzumab vedotin were administered at a single dose of 3 mg/kg.
Click to Show/Hide
|
||||
| In Vivo Model | Ovarian adenocarcinoma CDX model | ||||
| In Vitro Model | Ovarian serous adenocarcinoma | OVCAR-3 cells | CVCL_0465 | ||
References