
Antibody-drug Conjugate Information
General Information of This Antibody-drug Conjugate (ID: DRG0BBQSE)
| ADC Name |
Enfortumab vedotin
|
|||||
|---|---|---|---|---|---|---|
| Brand Name |
Padcev
|
|||||
| Synonyms |
enfortumab vedotin; ASG-22ME; AGS-22M6E; ASG-22CE; Padcev; enfortumab vedotin-ejfv
Click to Show/Hide
|
|||||
| Organization |
Seagen (Top20 MNC) (Originator);Agensys (Top20 MNC) (Originator)
|
|||||
| Drug Status |
Approved in 2019
|
|||||
| Drug-to-Antibody Ratio |
3.8~4
|
|||||
| Structure |
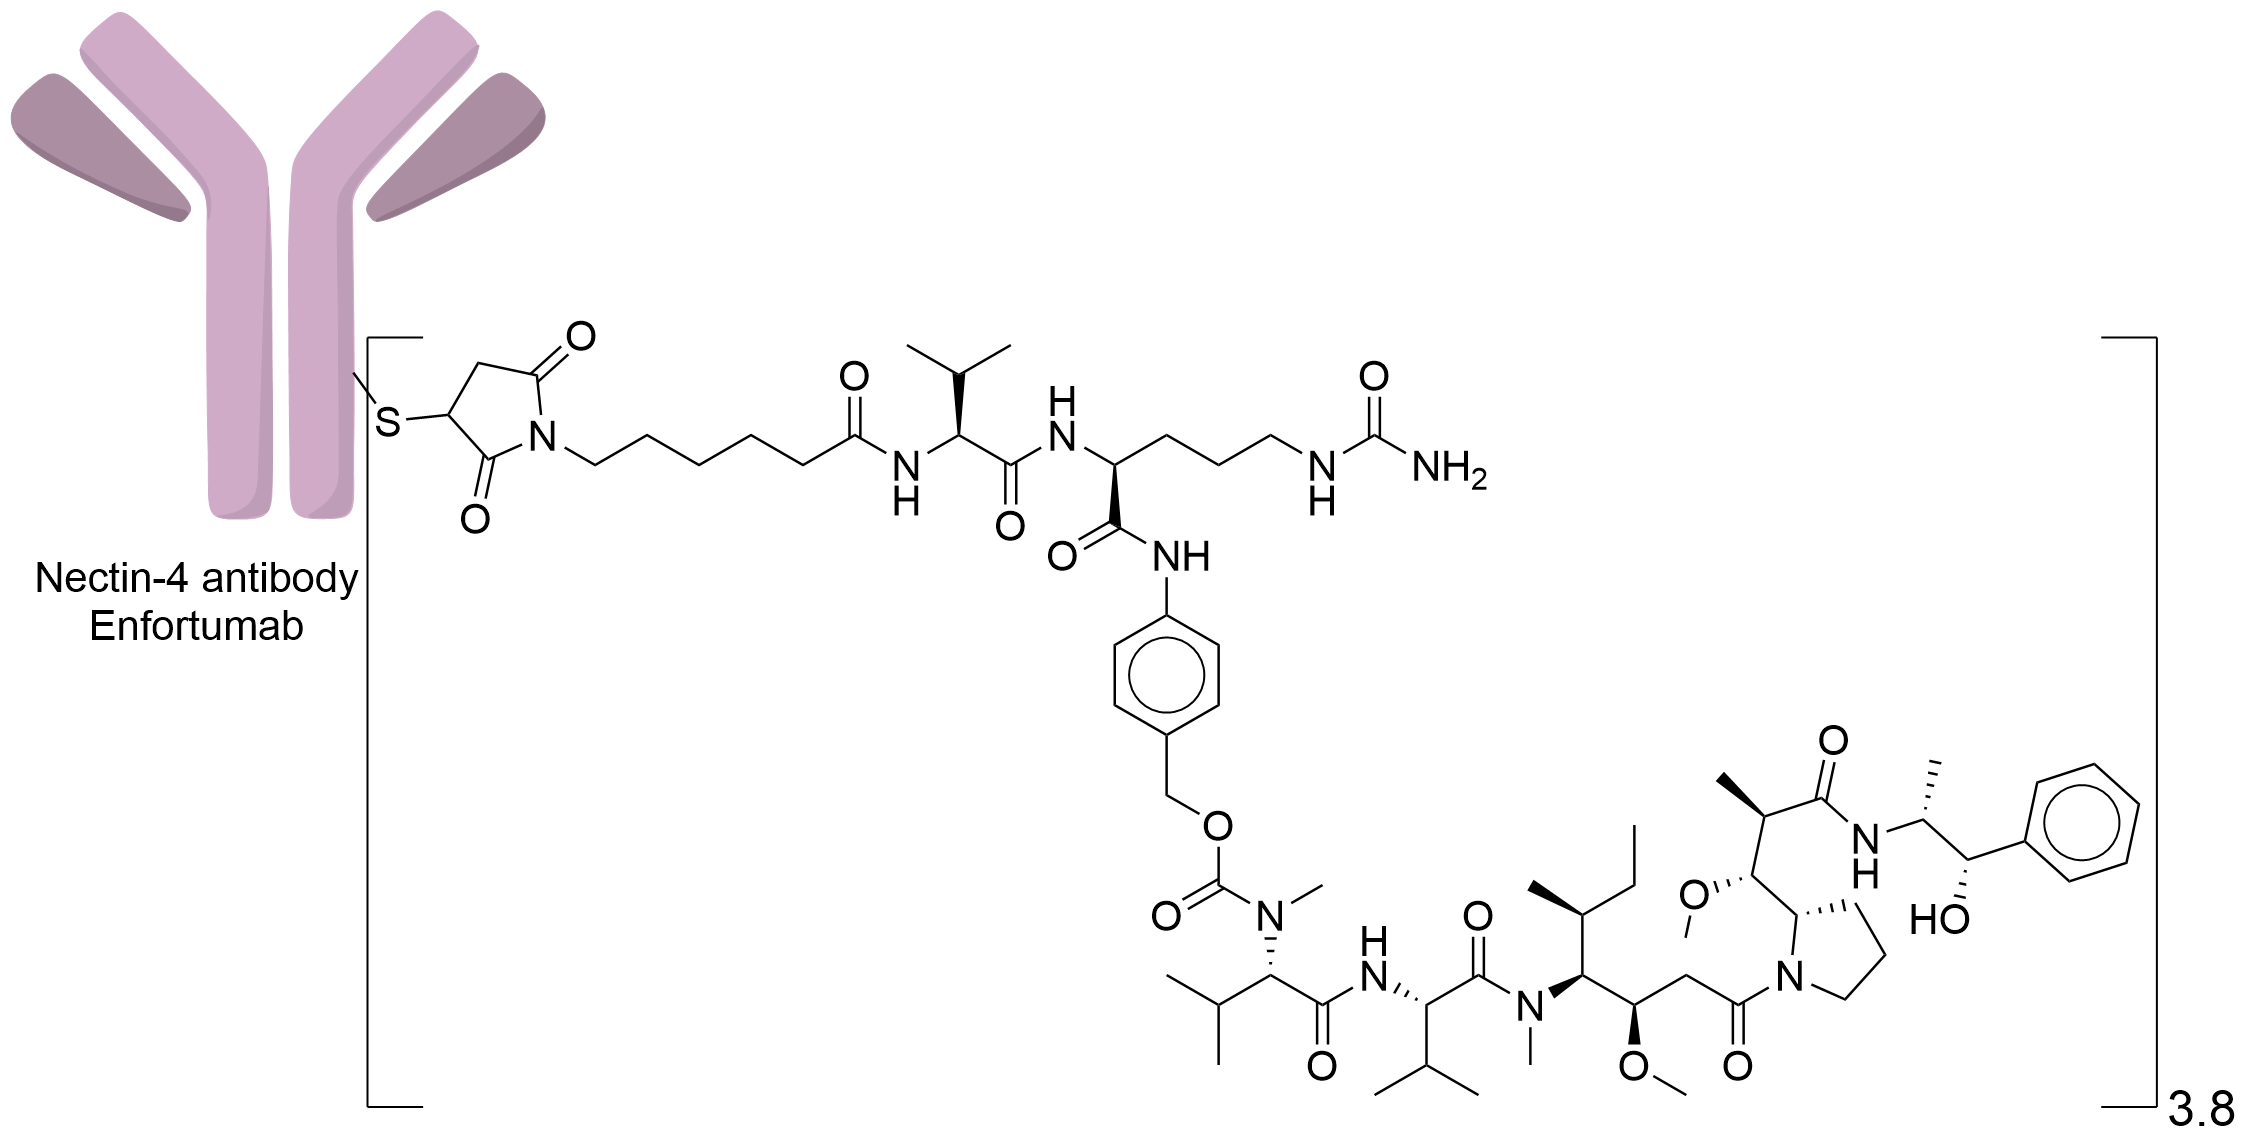
|
|||||
| Antibody Name |
Enfortumab
|
Antibody Info | ||||
| Antigen Name |
Nectin-4 (NECTIN4)
|
Antigen Info | ||||
| Payload Name |
Monomethyl auristatin E
|
Payload Info | ||||
| Payload Target |
Microtubule (MT)
|
Target Info | ||||
| Linker Name |
Mc-Val-Cit-PABC
|
Linker Info | ||||
| Conjugate Type |
Random Cysteines
|
|||||
| Combination Type |
vedotin
|
|||||
| Special Approval(s) |
Accelerated approval (FDA); Breakthrough therapy (FDA)
|
|||||
2027 Update
The disease landscape of This ADC
2027 Update
The clinical trial pipelines of This ADC
| Indication | Phase 1 | Phase 2 | Phase 3 | Approved | |||||||||||||||
|---|---|---|---|---|---|---|---|---|---|---|---|---|---|---|---|---|---|---|---|
| Unspecific solid tumor |
2 Trials
|
4 Trials
|
|||||||||||||||||
| Oral cavity cancer |
1 Trials
|
||||||||||||||||||
| Oesophageal cancer |
1 Trials
|
||||||||||||||||||
| Gastroesophageal junction adenocarcinoma |
1 Trials
|
||||||||||||||||||
| Gastric cancer |
1 Trials
|
||||||||||||||||||
| Small bowel cancer |
1 Trials
|
||||||||||||||||||
| Colorectal cancer |
1 Trials
|
||||||||||||||||||
| Pancreatic cancer |
1 Trials
|
||||||||||||||||||
| Liver cancer |
1 Trials
|
||||||||||||||||||
| Lung cancer |
1 Trials
|
||||||||||||||||||
| Breast cancer |
1 Trials
|
||||||||||||||||||
| Endometrial cancer |
1 Trials
|
||||||||||||||||||
| Testicular cancer |
1 Trials
|
||||||||||||||||||
| Penile cancer |
1 Trials
|
||||||||||||||||||
| Prostate cancer |
1 Trials
|
||||||||||||||||||
| Kidney cancer |
2 Trials
|
||||||||||||||||||
| Urothelial cancer |
3 Trials
|
7 Trials
|
2 Trials
|
|
|||||||||||||||
| Head and neck cancer |
1 Trials
|
2027 Update
ADC-specific functional property
Binding Affinity
| Dissocation Constant (Kd) | Binding Target | Description | Reference |
|---|---|---|---|
| Undisclosed |
nectin-4
|
The EV antibody binds with high affinity and cross-reactivity with other nectin-expressing cells. specificity to nectin-4 expressing cells avoiding
|
[1]
|
Bystander Killing Effect
| Bystander Killing Effect | Description | Reference |
|---|---|---|
| yes |
Here we demonstrated that EV may promote multiple mechanisms of action including bystander cell killing and hallmarks of immunogenic cell death.EV demonstrated a bystander effect by release of the cell permeable MMAE from Nectin-4 positive cells to kill Nectin-4 negative cancer cells in an admixed cellular assay. (ICD) including ER stress, immune cell recruitment and activation.
Click to Show/Hide
|
[1]
|
2027 Update
General Information of The ADMET Data Related to This ADC
Absorption
| Standard Type | Value | Units | Description | Reference |
|---|---|---|---|---|
| Maximum Observed Concentration (Cmax) | 28 | ug/mL |
For enfortumab vedotin (1.25 mg/kg), mean Cmax was 28 (ug/mL) and mean AUC was 111 (ug x day/mL) following the first treatment cycle (28 days).
|
[1] |
| Area Under the Concentration-Time Curve (AUC) | 111 | day·ug/mL |
For enfortumab vedotin (1.25 mg/kg), mean Cmax was 28 (ug/mL) and mean AUC was 111 (ug x day/mL) following the first treatment cycle (28 days).
|
[1] |
| Maximum Observed Concentration (Cmax) | 27 | ug/mL |
Phase 1 Clinical Study PK Parameters for Enfortumab Vedotin (Single Dose, 1.0mg/kg)
|
[2] |
| Maximum Observed Concentration (Cmax) | 38 | ug/mL |
Phase 1 Clinical Study PK Parameters for Enfortumab Vedotin (Single Dose, 1.25mg/kg)
|
[2] |
| Area Under the Concentration-Time Curve (AUC) | 23 | day·ug/mL |
Phase 1 Clinical Study PK Parameters for Enfortumab Vedotin (Single Dose, 1.0mg/kg)
|
[2] |
| Area Under the Concentration-Time Curve (AUC) | 32 | day·ug/mL |
Phase 1 Clinical Study PK Parameters for Enfortumab Vedotin (Single Dose, 1.25mg/kg)
|
[2] |
| Area Under the Concentration-Time Curve (AUC) | 134 | day·ug/mL |
At Day 1, Phase 1 Clinical Study PK Parameters, following multiple intravenous doses of enfortumab vedotin 1.25 mg/kg
|
[2] |
| Area Under the Concentration-Time Curve (AUC) | 93 | day·ug/mL |
At Day 15, Phase 1 Clinical Study PK Parameters, following multiple intravenous doses of enfortumab vedotin 1.25 mg/kg
|
[2] |
| Maximum Observed Concentration (Cmax) | 143 | ug/mL |
At Day 1, Phase 1 Clinical Study PK Parameters, following multiple intravenous doses of enfortumab vedotin 1.25 mg/kg
|
[2] |
| Maximum Observed Concentration (Cmax) | 112 | ug/mL |
At Day 15, Phase 1 Clinical Study PK Parameters, following multiple intravenous doses of enfortumab vedotin 1.25 mg/kg
|
[2] |
| Maximum Observed Concentration (Cmax) | 135 | ug/mL |
Single bolus injection 10 mg/kg Enfortumab Vedotin on mice model.
|
[3] |
| Area Under the Concentration-Time Curve (AUC) | 336 | day·ug/mL |
Single bolus injection 10 mg/kg,0-Last Observable Time Point Enfortumab Vedotin on mice model.
|
[3] |
| Area Under the Concentration-Time Curve (AUC) | 339 | day·ug/mL |
Single bolus injection 10 mg/kg,0-∞ Enfortumab Vedotin on mice model.
|
[3] |
| Maximum Observed Concentration (Cmax) | 26.6 | ug/mL |
Cycle 1, dose 1, day 1,n=125:PK parameters of ADC after administration of enfortumab vedotin 1.25 mg/kg in patients with locally advanced or metastatic urothelial carcinoma previously treated with platinum chemotherapy and a PD-1/L1 inhibitor in the EV-201 study
Click to Show/Hide
|
[4] |
| Area Under the Concentration-Time Curve (AUC) | 34.6 | day·ug/mL |
Cycle 1, dose 1, day 1,n=125:PK parameters of ADC after administration of enfortumab vedotin 1.25 mg/kg in patients with locally advanced or metastatic urothelial carcinoma previously treated with platinum chemotherapy and a PD-1/L1 inhibitor in the EV-201 study
Click to Show/Hide
|
[4] |
| Maximum Observed Concentration (Cmax) | 26 | ug/mL |
Cycle 1, dose 3, day 15,n=125:PK parameters of ADC after administration of enfortumab vedotin 1.25 mg/kg in patients with locally advanced or metastatic urothelial carcinoma previously treated with platinum chemotherapy and a PD-1/L1 inhibitor in the EV-201 study
Click to Show/Hide
|
[4] |
| Area Under the Concentration-Time Curve (AUC) | 31.3 | day·ug/mL |
Cycle 1, dose 3, day 15,n=125:PK parameters of ADC after administration of enfortumab vedotin 1.25 mg/kg in patients with locally advanced or metastatic urothelial carcinoma previously treated with platinum chemotherapy and a PD-1/L1 inhibitor in the EV-201 study
Click to Show/Hide
|
[4] |
| Maximum Observed Concentration (Cmax) | 24.5 | ug/mL |
Cycle 2, dose 1, day 1,n=125:PK parameters of ADC after administration of enfortumab vedotin 1.25 mg/kg in patients with locally advanced or metastatic urothelial carcinoma previously treated with platinum chemotherapy and a PD-1/L1 inhibitor in the EV-201 study
Click to Show/Hide
|
[4] |
| Area Under the Concentration-Time Curve (AUC) | 36.4 | day·ug/mL |
Cycle 2, dose 1, day 1,n=125:PK parameters of ADC after administration of enfortumab vedotin 1.25 mg/kg in patients with locally advanced or metastatic urothelial carcinoma previously treated with platinum chemotherapy and a PD-1/L1 inhibitor in the EV-201 study
Click to Show/Hide
|
[4] |
| Maximum Observed Concentration (Cmax) | 26.3 | ug/mL |
Cycle 2, dose 3, day 15,n=125:PK parameters of ADC after administration of enfortumab vedotin 1.25 mg/kg in patients with locally advanced or metastatic urothelial carcinoma previously treated with platinum chemotherapy and a PD-1/L1 inhibitor in the EV-201 study
Click to Show/Hide
|
[4] |
| Area Under the Concentration-Time Curve (AUC) | 35.9 | day·ug/mL |
Cycle 2, dose 3, day 15,n=125:PK parameters of ADC after administration of enfortumab vedotin 1.25 mg/kg in patients with locally advanced or metastatic urothelial carcinoma previously treated with platinum chemotherapy and a PD-1/L1 inhibitor in the EV-201 study
Click to Show/Hide
|
[4] |
Distribution
| Standard Type | Value | Units | Description | Reference |
|---|---|---|---|---|
| Volume of Distribution (Vd) | 11 | L |
The estimated steady-state volume of distribution is 11 L.
|
[1] |
| Volume of Distribution (Vd) | 78.1 | mL/kg |
Single bolus injection 10 mg/kg Enfortumab Vedotin on mice model.
|
[3] |
| Volume of Distribution (Vd) | 3.47 | L |
Volume of distribution of enfortumab vedotin to the central ,on Base model: A total of 10,355 enfortumab vedotin concentration records were used. The final models, a linear 3-compartment model with first-order elimination for enfortumab vedotin. compartment
Click to Show/Hide
|
[5] |
| Clearance (CL) | 0.00437 | L/h |
Intercompartment clearance of enfortumab vedotin to the first peripheral compartment ,on Base model: A total of 10,355 enfortumab vedotin concentration records were used. The final models, a linear 3-compartment model with first-order elimination for enfortumab vedotin.
Click to Show/Hide
|
[5] |
| Volume of Distribution (Vd) | 5.5 | L |
Volume of distribution of enfortumab vedotin to the first ,on Base model: A total of 10,355 enfortumab vedotin concentration records were used. The final models, a linear 3-compartment model with first-order elimination for enfortumab vedotin. peripheral compartment
Click to Show/Hide
|
[5] |
| Clearance (CL) | 0.0381 | L/h |
Intercompartment clearance of enfortumab vedotin to the second ,on Base model: A total of 10,355 enfortumab vedotin concentration records were used. The final models, a linear 3-compartment model with first-order elimination for enfortumab vedotin. peripheral compartment
Click to Show/Hide
|
[5] |
| Volume of Distribution (Vd) | 2.78 | L |
Volume of distribution of enfortumab vedotin to the second ,on Base model: A total of 10,355 enfortumab vedotin concentration records were used. The final models, a linear 3-compartment model with first-order elimination for enfortumab vedotin. peripheral compartment
Click to Show/Hide
|
[5] |
| Volume of Distribution (Vd) | 3.63 | L |
Volume of distribution of enfortumab vedotin to the central ,on Final model: A total of 10,355 enfortumab vedotin concentration records were used. The final models, a linear 3-compartment model with first-order elimination for enfortumab vedotin. compartment
Click to Show/Hide
|
[5] |
| Clearance (CL) | 0.00446 | L/h |
Intercompartment clearance of enfortumab vedotin to the first peripheral compartment ,on Final model: A total of 10,355 enfortumab vedotin concentration records were used. The final models, a linear 3-compartment model with first-order elimination for enfortumab vedotin.
Click to Show/Hide
|
[5] |
| Volume of Distribution (Vd) | 5.79 | L |
Volume of distribution of enfortumab vedotin to the first peripheral compartment ,on Final model: A total of 10,355 enfortumab vedotin concentration records were used. The final models, a linear 3-compartment model with first-order elimination for enfortumab vedotin.
Click to Show/Hide
|
[5] |
| Clearance (CL) | 0.0397 | L/h |
Intercompartment clearance of enfortumab vedotin to the second peripheral compartment ,on Final model: A total of 10,355 enfortumab vedotin concentration records were used. The final models, a linear 3-compartment model with first-order elimination for enfortumab vedotin.
Click to Show/Hide
|
[5] |
| Volume of Distribution (Vd) | 3.42 | L |
Volume of distribution of enfortumab vedotin to the second peripheral compartment ,on Final model: A total of 10,355 enfortumab vedotin concentration records were used. The final models, a linear 3-compartment model with first-order elimination for enfortumab vedotin.
Click to Show/Hide
|
[5] |
Metabolism
| Standard Type | Value | Units | Description | Reference |
|---|---|---|---|---|
| Undisclosed | Undisclosed | Undisclosed |
The catabolism of enfortumab vedotin has not been studied in humans. Given its structure, it is expected to be catabolized to smaller peptides, amino acids, unconjugated MMAE, and MMAE metabolites. MMAE is released from enfortumab vedotin via proteolytic cleavage by intracellular proteases and is metabolized primarily by CYP3A4 in vitro.
Click to Show/Hide
|
[6] |
Excretion
| Standard Type | Value | Units | Description | Reference |
|---|---|---|---|---|
| Elimination Half-Life (t1/2) | 3.4 | days |
The elimination half-lives of enfortumab vedotin and MMAE are 3.4 days and 2.4 days, respectively
|
[1] |
| Clearance (CL) | 0.1 | L/h |
The mean clearance of enfortumab vedotin and free MMAE was 0.10 L/h and 2.7 L/h, respectively. The clearance of MMAE appears to be limited by its rate of release from enfortumab vedotin.
|
[1] |
| Elimination Half-Life (t1/2) | 28 | days |
Phase 1 Clinical Study PK Parameters for Enfortumab Vedotin (Single Dose, 1.25mg/kg)
|
[2] |
| Elimination Half-Life (t1/2) | 33 | days |
Phase 1 Clinical Study PK Parameters for Enfortumab Vedotin (Single Dose, 1.25mg/kg)
|
[2] |
| Elimination Half-Life (t1/2) | 1.53 | days |
Single bolus injection 10 mg/kg Enfortumab Vedotin on mice model.
|
[3] |
| Clearance (CL) | 29.4 | mL/day/kg |
Single bolus injection 10 mg/kg Enfortumab Vedotin on mice model.
|
[3] |
| Clearance (CL) | 0.101 | L/h |
Clearance of enfortumab vedotin ,on Base model: A total of 10,355 enfortumab vedotin concentration records were used. The final models, a linear 3-compartment model with first-order elimination for enfortumab vedotin.
Click to Show/Hide
|
[5] |
| Clearance (CL) | 0.11 | L/h |
Clearance of enfortumab vedotin ,on Final model: A total of 10,355 enfortumab vedotin concentration records were used. The final models, a linear 3-compartment model with first-order elimination for enfortumab vedotin.
Click to Show/Hide
|
[5] |
Toxicity
| Standard Type | Value | Units | Description | Reference |
|---|---|---|---|---|
| Undisclosed | Undisclosed | Undisclosed |
Toxicity information regarding sacituzumab govitecan is not readily available. Patients experiencing an overdose are at an increased risk of severe adverse effects such as neutropenia, diarrhea, hypersensitivity, nausea/vomiting, and other systemic effects related to cytotoxic drugs. Symptomatic and supportive measures are recommended.
Click to Show/Hide
|
[6] |
General Information of The Activity Data Related to This ADC
Identified from the Human Clinical Data
Discovered Using Patient-derived Xenograft Model
Discovered Using Cell Line-derived Xenograft Model
Revealed Based on the Cell Line Data
Full List of Activity Data of This Antibody-drug Conjugate
Identified from the Human Clinical Data
| Experiment 1 Reporting the Activity Date of This ADC | [7] | ||||
| Efficacy Data | Objective Response Rate (ORR) |
73.30%
|
|||
| Patients Enrolled |
Histologically documented locally advanced/metastatic urothelial carcinoma (la/mUC) (including squamous differentiation and mixed cell types), an Eastern Cooperative Oncology Group performance status score of 0 or 1 (on a 5-point scale; higher scores indicate greater disability), and an investigator-assessed life expectancy of 3 or more months.
|
||||
| Administration Dosage |
1.25 mg/kg once daily on days 1 and 8 intravenously once daily in 3-week cycles.
|
||||
| Related Clinical Trial | |||||
| NCT Number | NCT04223856 | Clinical Status | Phase 3 | ||
| Clinical Description | An open-label, randomized, controlled phase 3 study of enfortumab vedotin in combination with pembrolizumab versus chemotherapy alone in previously untreated locally advanced or metastatic urothelial cancer. | ||||
| Primary Endpoint |
Safety: Seven patients (15.60%) experienced a serious TRAE, with no serious TRAE occurring more than once. TRAEs led to dose reductions in 14 (31.10%) patients and discontinuations in 11 (24.40%) patients and were not mutually exclusive. Peripheral sensory neuropathy was the most common TRAE leading to either dose reduction (six patients, 13.30%) or treatment discontinuation (four patients, 8.90%). No patients discontinued therapy because of a skin reaction or hyperglycemia. One patient (2.20%) died because of a TRAE (multiple organ dysfunction syndrome).
Click to Show/Hide
|
||||
| Other Endpoint |
The confirmed objective response rate after a median of nine cycles was 73.30% with a complete response rate of 15.60%. The median DOR and median OS were 25.60 months and 26.10 months, respectively.
|
||||
| Experiment 2 Reporting the Activity Date of This ADC | [8] | ||||
| Efficacy Data | Objective Response Rate (ORR) | 44% | High Nectin-4 expression (NECTIN4+++) | ||
| Patients Enrolled |
Locally advanced or metastatic urothelial carcinoma who were previously treated with platinum chemotherapy and antiPD-1/L1 therapy.
|
||||
| Administration Dosage |
1.25 mg/kg (intravenously on days 1, 8, and 15 of every 28-day cycle).
|
||||
| Related Clinical Trial | |||||
| NCT Number | NCT03219333 | Clinical Status | Phase 2 | ||
| Clinical Description | A single-arm, open-label, multicenter study of enfortumab vedotin (ASG-22CE) for Treatment of patients with locally advanced or metastatic urothelial cancer who previously received immune checkpoint inhibitor (CPI) Therapy. | ||||
| Primary Endpoint |
Confirmed objective response rate was 44.00% (95% CI, 35.10% to 53.20%), including 12.00% complete responses.
|
||||
| Other Endpoint |
Median duration of response was 7.60 months (range, 0.95 to 11.30 months).
|
||||
| Experiment 3 Reporting the Activity Date of This ADC | [9] | ||||
| Efficacy Data | Objective Response Rate (ORR) | 51.68% | High Nectin-4 expression (NECTIN4+++) | ||
| Patients Enrolled |
Locally advanced or metastatic urothelial carcinoma previously treated with PD-1 or PD-L1 inhibitors; an Eastern Cooperative Oncology Group performance status score of 2 or less who were considered ineligible for cisplatin at enrolment and who had not received platinum-containing chemotherapy in the locally advanced or metastatic setting.
|
||||
| Administration Dosage |
Intravenously at a dose of 1.25 mg/kg on days 1, 8, and 15 of every 28-day cycle.
|
||||
| Related Clinical Trial | |||||
| NCT Number | NCT03219333 | Clinical Status | Phase 2 | ||
| Clinical Description | A single-arm, open-label, multicenter study of enfortumab vedotin (ASG-22CE) for treatment of patients with locally advanced or metastatic urothelial cancer who previously received immune checkpoint inhibitor (CPI) therapy. | ||||
| Primary Endpoint |
The confirmed objective response rate was 51.68% (46 of 89 patients; 95% CI 41.00-62.00), with 18 (20.22%) of 89 patients achieving a complete response and 28 (31.46%) achieving a partial response.
|
||||
| Other Endpoint |
Duration of response, progression-free survival, objective response rate, overall survival, safety, and tolerability, plasma or serum pharmacokinetic parameters of enfortumab vedotin, MMAE, and total antibody, and incidence of antitherapeutic antibody to enfortumab vedotin.
|
||||
| Experiment 4 Reporting the Activity Date of This ADC | [10] | ||||
| Efficacy Data | Objective Response Rate (ORR) | 35.30% | Moderate Nectin-4 expression (NECTIN4++) | ||
| Patients Enrolled |
Histologically confirmed, locally advanced or metastatic transitional cell carcinoma of the urothelium (ie, cancer of the bladder, renal pelvis, ureter, or urethra), or UC with squamous differentiation or mixed cell types and an Eastern Cooperative Oncology Group (ECOG) performance status of 0 or 1.
|
||||
| Administration Dosage |
1.00 mg/kg (Arm A) or 1.25 mg/kg (Arm B) on Days 1, 8, and 15 of each 28-day cycle.
|
||||
| Related Clinical Trial | |||||
| NCT Number | NCT03070990 | Clinical Status | Phase 1 | ||
| Clinical Description | An open-label, randomized, phase 1 safety and pharmacokinetic study of enfortumab vedotin (ASG-22CE) in Japanese patients with locally advanced or metastatic urothelial carcinoma. | ||||
| Primary Endpoint |
Safety/tolerability of EV, EV PK profile.
|
||||
| Experiment 5 Reporting the Activity Date of This ADC | [11] | ||||
| Efficacy Data | Objective Response Rate (ORR) | 43% | High Nectin-4 expression (NECTIN4+++) | ||
| Patients Enrolled |
Nectin-4positive solid tumors, including mUC, who progressed on 1 prior chemotherapy regimen or who were ineligible for cisplatin chemotherapy.
|
||||
| Administration Dosage |
Weight-based doses (0.50, 0.75, 1.00, and 1.25 mg/kg) through 30-minute infusion on days 1, 8, and 15 of a 28-day cycle.
|
||||
| Related Clinical Trial | |||||
| NCT Number | NCT02091999 | Clinical Status | Phase 1 | ||
| Clinical Description | A phase 1 study of the safety and pharmacokinetics of escalating doses of ASG-22CE given as monotherapy in subjects with metastatic urothelial cancer and other malignant solid tumors that express nectin-4. | ||||
| Primary Endpoint |
The determination of safety/tolerability, recommended phase II dose (RP2D), and pharmacokinetic (PK) profile of EV.
|
||||
| Other Endpoint |
Antitumor activity,including confirmed investigator-assessed ORR (RECIST version 1.1), duration of response (DoR), progression-free survival (PFS), and overall survival (OS).
|
||||
| Experiment 6 Reporting the Activity Date of This ADC | [12] | ||||
| Patients Enrolled |
Histologically or cytologically confirmed urothelial carcinoma (including differentiation in squamous cells or in multiple cell types), radiologically documented metastatic or unresectable locally advanced disease at baseline, and an Eastern Cooperative Oncology Group (ECOG) performance-status score of 0 or 1 (scores range from 0 to 4, with higher scores indicating greater disability).
Click to Show/Hide
|
||||
| Administration Dosage |
Intravenous infusion over 30 minutes on days 1, 8, and 15 of a 28-day cycle.
|
||||
| Related Clinical Trial | |||||
| NCT Number | NCT03474107 | Clinical Status | Phase 3 | ||
| Clinical Description | An open-label, randomized phase 3 study to evaluate enfortumab vedotin vs chemotherapy in subjects with previously treated locally advanced or metastatic urothelial cancer (EV-301). | ||||
| Primary Endpoint |
Overall survival was prolonged with enfortumab vedotin compared with chemotherapy (HR=0.70 [95% CI: 0.56-0.89];.
|
||||
| Other Endpoint |
Median overall survival: 12.88 vs 8.97 months, respectively). Progression-free survival was also longer in the enfortumab vedotin group compared with the chemotherapy group (HR=0.62 [95% CI: 0.51-0.75]; P<0.00001; median progression-free survival: 5.55 vs 3.71 months, respectively).
|
||||
Discovered Using Patient-derived Xenograft Model
| Experiment 1 Reporting the Activity Date of This ADC | [13] | ||||
| Efficacy Data | Tumor Growth Inhibition value (TGI) | ≈ 30.80% | High Nectin-4 expression (NECTIN4+++) | ||
| Method Description |
AGS-22M6E induces efficient tumor cell killing in PDX models of a bladder cancer cell with Nectin-4 high expression, dosed every 4 days at 0.4 mg/kg for 5 times.
|
||||
| In Vivo Model | Bladder cancer PDX model (PDX: AG-B1) | ||||
| Experiment 2 Reporting the Activity Date of This ADC | [13] | ||||
| Efficacy Data | Tumor Growth Inhibition value (TGI) | ≈ 33.90% | Moderate Nectin-4 expression (NECTIN4++) | ||
| Method Description |
AGS-22M6E induces efficient tumor cell killing in PDX models of a pancreatic cancer cell with Nectin-4 moderate expression, dosed every 4 days at 1 mg/kg for 6 times.
|
||||
| In Vivo Model | Pancreatic cancer PDX model (PDX: AG-Panc4) | ||||
| Experiment 3 Reporting the Activity Date of This ADC | [13] | ||||
| Efficacy Data | Tumor Growth Inhibition value (TGI) | ≈ 45% | High Nectin-4 expression (NECTIN4+++) | ||
| Method Description |
AGS-22M6E induces efficient tumor cell killing in PDX models of a breast cancer cell with Nectin-4 high expression, dosed every 4 days at 1 mg/kg for 6 times.
|
||||
| In Vivo Model | Breast cancer PDX model (PDX: AG-Br7) | ||||
| Experiment 4 Reporting the Activity Date of This ADC | [13] | ||||
| Efficacy Data | Tumor Growth Inhibition value (TGI) | ≈ 68.80% | Moderate Nectin-4 expression (NECTIN4++) | ||
| Method Description |
AGS-22M6E induces efficient tumor cell killing in PDX models of a pancreatic cancer cell with Nectin-4 moderate expression, dosed every 4 days at 3 mg/kg for 6 times.
|
||||
| In Vivo Model | Pancreatic cancer PDX model (PDX: AG-Panc4) | ||||
| Experiment 5 Reporting the Activity Date of This ADC | [13] | ||||
| Efficacy Data | Tumor Growth Inhibition value (TGI) | ≈ 80.70% | High Nectin-4 expression (NECTIN4+++) | ||
| Method Description |
AGS-22M6E induces efficient tumor cell killing in PDX models of a bladder cancer cell with Nectin-4 high expression, dosed every 4 days at 0.8 mg/kg for 5 times.
|
||||
| In Vivo Model | Bladder cancer PDX model (PDX: AG-B1) | ||||
| Experiment 6 Reporting the Activity Date of This ADC | [13] | ||||
| Efficacy Data | Tumor Growth Inhibition value (TGI) | ≈ 93.80% | High Nectin-4 expression (NECTIN4+++) | ||
| Method Description |
AGS-22M6E induces efficient tumor cell killing in PDX models of a breast cancer cell with Nectin-4 high expression, dosed every 4 days at 3 mg/kg for 6 times.
|
||||
| In Vivo Model | Breast cancer PDX model (PDX: AG-Br7) | ||||
| Experiment 7 Reporting the Activity Date of This ADC | [13] | ||||
| Efficacy Data | Tumor Growth Inhibition value (TGI) | ≈ 97.60% | High Nectin-4 expression (NECTIN4+++) | ||
| Method Description |
AGS-22M6E induces efficient tumor cell killing in orthotopic PDX models of a breast cancer cell with Nectin-4 high expression, established in mammary fat pads of SCID mice, dosed single 10 mg/kg.
|
||||
| In Vivo Model | Breast cancer orthotopic PDX model (PDX: AG-Br7) | ||||
| Experiment 8 Reporting the Activity Date of This ADC | [13] | ||||
| Efficacy Data | Tumor Growth Inhibition value (TGI) | ≈ 97.70% | High Nectin-4 expression (NECTIN4+++) | ||
| Method Description |
AGS-22M6E induces efficient tumor cell killing in orthotopic PDX models of a breast cancer cell with Nectin-4 high expression, established in mammary fat pads of SCID mice, dosed twice 5 mg/kg.
|
||||
| In Vivo Model | Breast cancer orthotopic PDX model (PDX: AG-Br7) | ||||
| Experiment 9 Reporting the Activity Date of This ADC | [13] | ||||
| Efficacy Data | Tumor Growth Inhibition value (TGI) | ≈ 98.70% | High Nectin-4 expression (NECTIN4+++) | ||
| Method Description |
AGS-22M6E induces efficient tumor cell killing in PDX models of a bladder cancer cell with Nectin-4 high expression, single 4 mg/kg dose.
|
||||
| In Vivo Model | Bladder cancer PDX model (PDX: AG-B1) | ||||
Discovered Using Cell Line-derived Xenograft Model
| Experiment 1 Reporting the Activity Date of This ADC | [13] | ||||
| Efficacy Data | Tumor Growth Inhibition value (TGI) | ≈ 26% | High Nectin-4 expression (NECTIN4+++) | ||
| Method Description |
AGS-22M6E induces efficient tumor cell killing in PDX models of a lung adenocarcinoma cell with Nectin-4 high expression, dosed every 4 days at 1 mg/kg for 5 times.
|
||||
| In Vivo Model | NCI-H322M CDX model | ||||
| In Vitro Model | Minimally invasive lung adenocarcinoma | NCI-H322M cells | CVCL_1557 | ||
| Experiment 2 Reporting the Activity Date of This ADC | [13] | ||||
| Efficacy Data | Tumor Growth Inhibition value (TGI) | ≈ 83.60% | High Nectin-4 expression (NECTIN4+++) | ||
| Method Description |
AGS-22M6E induces efficient tumor cell killing in PDX models of a lung adenocarcinoma cell with Nectin-4 high expression, dosed every 4 days at 3 mg/kg for 5 times.
|
||||
| In Vivo Model | NCI-H322M CDX model | ||||
| In Vitro Model | Minimally invasive lung adenocarcinoma | NCI-H322M cells | CVCL_1557 | ||
Revealed Based on the Cell Line Data
| Experiment 1 Reporting the Activity Date of This ADC | [13] | ||||
| Efficacy Data | Half Maximal Inhibitory Concentration (IC50) |
1.2 ng/mL
|
|||
| Method Description |
The inhibitory activity of AGS-22M6, AGS-22M6E ADC, and an isotype control ADC were added to various cancer cell lines in vitro and cell viability was measured after 5 days.
|
||||
| In Vitro Model | Prostate carcinoma | PC-3 cells | CVCL_0035 | ||
| Experiment 2 Reporting the Activity Date of This ADC | [13] | ||||
| Efficacy Data | Half Maximal Inhibitory Concentration (IC50) |
3.4 ng/mL
|
|||
| Method Description |
The inhibitory activity of AGS-22M6, AGS-22M6E ADC, and an isotype control ADC were added to various cancer cell lines in vitro and cell viability was measured after 5 days.
|
||||
| In Vitro Model | Prostate carcinoma | PC-3 cells | CVCL_0035 | ||
| Experiment 3 Reporting the Activity Date of This ADC | [13] | ||||
| Efficacy Data | Half Maximal Inhibitory Concentration (IC50) |
4.7 ng/mL
|
|||
| Method Description |
The inhibitory activity of AGS-22M6, AGS-22M6E ADC, and an isotype control ADC were added to various cancer cell lines in vitro and cell viability was measured after 5 days.
|
||||
| In Vitro Model | Prostate carcinoma | PC-3 cells | CVCL_0035 | ||
| Experiment 4 Reporting the Activity Date of This ADC | [13] | ||||
| Efficacy Data | Half Maximal Inhibitory Concentration (IC50) |
37.8 ng/mL
|
|||
| Method Description |
The inhibitory activity of AGS-22M6, AGS-22M6E ADC, and an isotype control ADC were added to various cancer cell lines in vitro and cell viability was measured after 5 days.
|
||||
| In Vitro Model | Invasive breast carcinoma | T-47D cells | CVCL_0553 | ||
References