Antigen Information
General Information of This Antigen
| Antigen ID | TAR0UYFIF |
|||||
|---|---|---|---|---|---|---|
| Antigen Name | Epidermal growth factor receptor (EGFR) |
|||||
| Gene Name | EGFR |
|||||
| Gene ID | ||||||
| Synonym | ERBB; ERBB1; HER1; Proto-oncogene c-ErbB-1;Receptor tyrosine-protein kinase erbB-1 |
|||||
| Sequence |
MRPSGTAGAALLALLAALCPASRALEEKKVCQGTSNKLTQLGTFEDHFLSLQRMFNNCEV
VLGNLEITYVQRNYDLSFLKTIQEVAGYVLIALNTVERIPLENLQIIRGNMYYENSYALA VLSNYDANKTGLKELPMRNLQEILHGAVRFSNNPALCNVESIQWRDIVSSDFLSNMSMDF QNHLGSCQKCDPSCPNGSCWGAGEENCQKLTKIICAQQCSGRCRGKSPSDCCHNQCAAGC TGPRESDCLVCRKFRDEATCKDTCPPLMLYNPTTYQMDVNPEGKYSFGATCVKKCPRNYV VTDHGSCVRACGADSYEMEEDGVRKCKKCEGPCRKVCNGIGIGEFKDSLSINATNIKHFK NCTSISGDLHILPVAFRGDSFTHTPPLDPQELDILKTVKEITGFLLIQAWPENRTDLHAF ENLEIIRGRTKQHGQFSLAVVSLNITSLGLRSLKEISDGDVIISGNKNLCYANTINWKKL FGTSGQKTKIISNRGENSCKATGQVCHALCSPEGCWGPEPRDCVSCRNVSRGRECVDKCN LLEGEPREFVENSECIQCHPECLPQAMNITCTGRGPDNCIQCAHYIDGPHCVKTCPAGVM GENNTLVWKYADAGHVCHLCHPNCTYGCTGPGLEGCPTNGPKIPSIATGMVGALLLLLVV ALGIGLFMRRRHIVRKRTLRRLLQERELVEPLTPSGEAPNQALLRILKETEFKKIKVLGS GAFGTVYKGLWIPEGEKVKIPVAIKELREATSPKANKEILDEAYVMASVDNPHVCRLLGI CLTSTVQLITQLMPFGCLLDYVREHKDNIGSQYLLNWCVQIAKGMNYLEDRRLVHRDLAA RNVLVKTPQHVKITDFGLAKLLGAEEKEYHAEGGKVPIKWMALESILHRIYTHQSDVWSY GVTVWELMTFGSKPYDGIPASEISSILEKGERLPQPPICTIDVYMIMVKCWMIDADSRPK FRELIIEFSKMARDPQRYLVIQGDERMHLPSPTDSNFYRALMDEEDMDDVVDADEYLIPQ QGFFSSPSTSRTPLLSSLSATSNNSTVACIDRNGLQSCPIKEDSFLQRYSSDPTGALTED SIDDTFLPVPEYINQSVPKRPAGSVQNPVYHNQPLNPAPSRDPHYQDPHSTAVGNPEYLN TVQPTCVNSTFDSPAHWAQKGSHQISLDNPDYQQDFFPKEAKPNGIFKGSTAENAEYLRV APQSSEFIGA Click to Show/Hide
|
|||||
| Family | Tyr protein family |
|||||
| Function |
Receptor tyrosine kinase binding ligands of the EGF family and activating several signaling cascades to convert extracellular cues into appropriate cellular responses. Known ligands include EGF, TGFA/TGF-alpha, AREG, epigen/EPGN, BTC/betacellulin, epiregulin/EREG and HBEGF/heparin- binding EGF. Ligand binding triggers receptor homo- and/or heterodimerization and autophosphorylation on key cytoplasmic residues. The phosphorylated receptor recruits adapter proteins like GRB2 which in turn activates complex downstream signaling cascades. Activates at least 4 major downstream signaling cascades including the RAS-RAF-MEK-ERK, PI3 kinase-AKT, PLCgamma-PKC and STATs modules. May also activate the NF-kappa-B signaling cascade. Also directly phosphorylates other proteins like RGS16, activating its GTPase activity and probably coupling the EGF receptor signaling to the G protein-coupled receptor signaling. Also phosphorylates MUC1 and increases its interaction with SRC and CTNNB1/beta-catenin. Positively regulates cell migration via interaction with CCDC88A/GIV which retains EGFR at the cell membrane following ligand stimulation, promoting EGFR signaling which triggers cell migration. Plays a role in enhancing learning and memory performance. Plays a role in mammalian pain signaling (long-lasting hypersensitivity).
Click to Show/Hide
|
|||||
| Uniprot Entry | ||||||
| HGNC ID | ||||||
| KEGG ID | ||||||
Each Antibody-drug Conjuate AND It's Component Related to This Antigen
Full List of The ADC Related to This Antigen
1711/425 scFv-SNAP
| ADC Info | ADC Name | Payload | Target | Linker | Ref |
|---|---|---|---|---|---|
1711 (scFv)-SNAP-AuriF |
Auristatin F |
Microtubule (MT) |
BG based linker |
[1] |
9G8-7D12-Fc
| ADC Info | ADC Name | Payload | Target | Linker | Ref |
|---|---|---|---|---|---|
S7 ADC |
Monomethyl auristatin E |
Microtubule (MT) |
Mc-Val-Cit-PABC |
[2] |
9G8-7D12-Fc with E430G
| ADC Info | ADC Name | Payload | Target | Linker | Ref |
|---|---|---|---|---|---|
S7-E430G ADC |
Monomethyl auristatin E |
Microtubule (MT) |
Mc-Val-Cit-PABC |
[2] |
A highly specific humanized IgG1 anti-EGFR
| ADC Info | ADC Name | Payload | Target | Linker | Ref |
|---|---|---|---|---|---|
HLX-42 |
DNA topoisomerase-I inhibitor |
DNA topoisomerase 1 (TOP1) |
Undisclosed |
[3] |
Anti-EGFR Ab1
| ADC Info | ADC Name | Payload | Target | Linker | Ref |
|---|---|---|---|---|---|
Ab1-mcMMAF |
Monomethyl auristatin F |
Microtubule (MT) |
Maleimido-caproyl |
[4] |
Anti-EGFR Ab3
| ADC Info | ADC Name | Payload | Target | Linker | Ref |
|---|---|---|---|---|---|
Ab3-mcMMAF |
Monomethyl auristatin F |
Microtubule (MT) |
Maleimido-caproyl |
[4] |
Anti-EGFR AbA
| ADC Info | ADC Name | Payload | Target | Linker | Ref |
|---|---|---|---|---|---|
AbA-mcMMAE |
Monomethyl auristatin E |
Microtubule (MT) |
Maleimido-caproyl |
[4] | |
AbA-vcMMAE |
Monomethyl auristatin E |
Microtubule (MT) |
Mc-Val-Cit-PABC |
[4] |
Anti-EGFR huFc
| ADC Info | ADC Name | Payload | Target | Linker | Ref |
|---|---|---|---|---|---|
HuFc-MMAE |
Monomethyl auristatin E |
Microtubule (MT) |
Gly3-Val-Cit-PABC |
[5] |
Anti-EGFR mAb
| ADC Info | ADC Name | Payload | Target | Linker | Ref |
|---|---|---|---|---|---|
Anti-EGFR-Ala-Ala-IGN |
Indolinobenzodiazepine dimer |
Human Deoxyribonucleic acid (hDNA) |
Ala-Ala dipeptide |
[6] | |
Anti-EGFR-Sulfo-SMCC-DM1 |
Mertansine DM1 |
Microtubule (MT) |
Sulfo-SMCC |
[7] | |
Anti-EGFR-Val-Gln-IGN |
Indolinobenzodiazepine dimer |
Human Deoxyribonucleic acid (hDNA) |
Val-Gln dipeptide linker |
[6] | |
EGFR-ADC 13a |
PBD dimer 14a |
Human Deoxyribonucleic acid (hDNA) |
Adipic acid-Val-Ala-PABC |
[8] | |
EGFR-ADC 13b |
PBD dimer 14b |
Human Deoxyribonucleic acid (hDNA) |
Adipic acid-Val-Ala-PABC |
[8] | |
EGFR-ADC 13c |
PBD dimer 14c |
Human Deoxyribonucleic acid (hDNA) |
Adipic acid-Val-Ala-PABC |
[8] |
Anti-EGFR mAb 40H3
| ADC Info | ADC Name | Payload | Target | Linker | Ref |
|---|---|---|---|---|---|
40H3-CL2A-SN38 |
Active metabolite of irinotecan SN38 |
DNA topoisomerase 1 (TOP1) |
CL2A |
[9] | |
40H3-Deruxtecan |
DX-8951 derivative (DXd) |
DNA topoisomerase 1 (TOP1) |
Mc-Gly-Gly-Phe-Gly |
[9] | |
40H3-MCVCPAB-MMAE |
Monomethyl auristatin E |
Microtubule (MT) |
Mc-Val-Cit-PABC |
[9] | |
40H3-SMCC-DM1 |
Mertansine DM1 |
Microtubule (MT) |
Succinimidyl-4-(N-maleimidomethyl)cyclohexane-1-carboxylate (SMCC) |
[9] | |
40H3-Tesirine |
SG3199 |
Human Deoxyribonucleic acid (hDNA) |
Mal-PEG8-Val-Ala-PABC |
[9] |
Anti-EGFR mAb hR3-YTE
| ADC Info | ADC Name | Payload | Target | Linker | Ref |
|---|---|---|---|---|---|
SHR-A1307 |
SHR152852 |
Microtubule (MT) |
L2-MC |
[10] |
Anti-EGFR mAb LA22
| ADC Info | ADC Name | Payload | Target | Linker | Ref |
|---|---|---|---|---|---|
LA22-MMC |
Mitomycin C |
Human Deoxyribonucleic acid (hDNA) |
N-succinimidyl 3-(2-pyridyldithio) propionate (SPDP) |
[11] |
Anti-EGFR mAb rat IgG2a
| ADC Info | ADC Name | Payload | Target | Linker | Ref |
|---|---|---|---|---|---|
Anti-EGFR-PEG4-Mal-DM1 |
Mertansine DM1 |
Microtubule (MT) |
PEG4-Mal |
[12] |
BA03
| ADC Info | ADC Name | Payload | Target | Linker | Ref |
|---|---|---|---|---|---|
BA03-MCC-MMAE |
Monomethyl auristatin E |
Microtubule (MT) |
Mc-Val-Cit-PABC |
[13] | |
BA03-MC-MMAE |
Monomethyl auristatin E |
Microtubule (MT) |
Mc-Val-Cit-PABC |
[13] | |
MYK-3 |
Monomethyl auristatin E |
Microtubule (MT) |
Mc-Val-Cit-PABC |
[13] |
Cetuximab
| ADC Info | ADC Name | Payload | Target | Linker | Ref |
|---|---|---|---|---|---|
Cetuximab sarotalocan |
IRDye 700DX |
Unclear |
Linear alkyl/alkoxy linker |
[14] | |
Cetux Cys-vc-MMAE |
Monomethyl auristatin E |
Microtubule (MT) |
Mc-Val-Cit-PABC |
[15] | |
Cet-DM1 |
Mertansine DM1 |
Microtubule (MT) |
Succinimidyl-4-(N-maleimidomethyl)cyclohexane-1-carboxylate (SMCC) |
[16] | |
Cet-TPL |
Triptolide |
Nuclear factor NF-kappa-B p105 subunit (NFKB1) |
N-hydroxysuccinimide based linker |
[17] | |
Cetuximab- (FGX16-11) |
FGX8-46 |
Human Deoxyribonucleic acid (hDNA) |
Mc-Val-Ala-PABC |
[18] | |
Cetuximab-Comound (Ia) |
NeoDegrader P1 |
Protein cereblon (CRBN) |
Cetuximab-Comound (Ia) linker |
[19] | |
Cetuximab-Compound 17 |
Mertansine DM4 |
Microtubule (MT) |
Cetuximab-Compound 17 linker |
[20] | |
Cetuximab-Compound 25 |
Monomethyl auristatin E |
Microtubule (MT) |
Cetuximab-Compound 25 linker |
[20] | |
Cetuximab-Compound 31 |
Auristatin 0101 |
Microtubule (MT) |
Cetuximab-Compound 31 linker |
[20] | |
Cetuximab-Compound 36 |
Monomethyl auristatin E |
Microtubule (MT) |
Cetuximab-Compound 36 linker |
[20] | |
Cetuximab-Compound 43 |
PBD dimer |
Human Deoxyribonucleic acid (hDNA) |
Cetuximab-Compound 43 linker |
[20] | |
Cetuximab-Compound 49 |
PBD dimer |
Human Deoxyribonucleic acid (hDNA) |
Cetuximab-Compound 49 linker |
[20] | |
Cetuximab-Compound 55 |
Mertansine DM1 |
Microtubule (MT) |
Cetuximab-Compound 55 linker |
[20] | |
Cetuximab-Compound 59 |
Mertansine DM4 |
Microtubule (MT) |
Cetuximab-Compound 59 linker |
[20] | |
Cetuximab-Compound 64 |
Monomethyl auristatin E |
Microtubule (MT) |
Cetuximab-Compound 64 linker |
[20] | |
Cetuximab-Compound 69 |
Monomethyl auristatin E |
Microtubule (MT) |
Cetuximab-Compound 69 linker |
[20] | |
Cetuximab-Compound 74 |
PBD dimer |
Human Deoxyribonucleic acid (hDNA) |
Cetuximab-Compound 74 linker |
[20] | |
Cetuximab-Compound 75 |
Monomethyl auristatin E |
Microtubule (MT) |
Cetuximab-Compound 75 linker |
[20] | |
Cetuximab-Compound 76 |
Monomethyl auristatin E |
Microtubule (MT) |
Cetuximab-Compound 76 linker |
[20] | |
Cetuximab-Compound 77 |
Mertansine DM1 |
Microtubule (MT) |
Cetuximab-Compound 77 linker |
[20] | |
Cetuximab-Compound 78 |
Auristatin 0101 |
Microtubule (MT) |
Cetuximab-Compound 78 linker |
[20] | |
Cetuximab-Compound 79 |
Auristatin 0101 |
Microtubule (MT) |
Cetuximab-Compound 79 linker |
[20] | |
Cetuximab-Compound 80 |
Mertansine DM4 |
Microtubule (MT) |
Cetuximab-Compound 80 linker |
[20] | |
Cetuximab-Compound 9 |
Mertansine DM1 |
Microtubule (MT) |
Cetuximab-Compound 9 linker |
[20] | |
Cetuximab-DNA conjugate |
DNA mimics |
Human Deoxyribonucleic acid (hDNA) |
Undisclosed |
[21] | |
Cetuximab-Puromycin |
Puromycin |
Ribosome (RB) |
Succinimidyl acetylthiopropionate (SATP) |
[22] | |
Cetuximab-Val-Cit-Dox |
Doxorubicin |
DNA topoisomerase 2-alpha (TOP2A) |
Mc-Val-Cit-PABC |
[23] | |
Cetuximab-vc-MMAE |
Monomethyl auristatin E |
Microtubule (MT) |
Mc-Val-Cit-PABC |
[24] | |
Cet-ZA ADC |
Zoledronic acid |
Geranylgeranyl pyrophosphate synthase (GGPS1) |
Undisclosed |
[25] | |
C-IgG-Val-Cit-MMAE |
Monomethyl auristatin E |
Microtubule (MT) |
Gly3-Val-Cit-PABC |
[5] | |
CN114917361A ADC-1 |
CN114917361A ADC-1 payload |
Undisclosed |
CN114917361A ADC-1 linker |
[26] | |
CN114917361A ADC-11 |
CN114917361A ADC-11 payload |
Undisclosed |
CN114917361A ADC-11 linker |
[26] | |
CN114917361A ADC-13 |
CN114917361A ADC-13 payload |
Undisclosed |
CN114917361A ADC-13 linker |
[26] | |
CN114917361A ADC-16 |
CN114917361A ADC-16 payload |
Undisclosed |
CN114917361A ADC-16 linker |
[26] | |
CN114917361A ADC-19 |
CN114917361A ADC-19 payload |
Undisclosed |
CN114917361A ADC-19 linker |
[26] | |
CN114917361A ADC-21 |
CN114917361A ADC-21 payload |
Undisclosed |
CN114917361A ADC-21 linker |
[26] | |
CN114917361A ADC-25 |
CN114917361A ADC-25 payload |
Undisclosed |
CN114917361A ADC-25 linker |
[26] | |
CN114917361A ADC-27 |
CN114917361A ADC-27 payload |
Undisclosed |
CN114917361A ADC-27 linker |
[26] | |
CN114917361A ADC-30 |
CN114917361A ADC-30 payload |
Undisclosed |
CN114917361A ADC-30 linker |
[26] | |
CN114917361A ADC-33 |
CN114917361A ADC-33 payload |
Undisclosed |
CN114917361A ADC-33 linker |
[26] | |
CN114917361A ADC-36 |
CN114917361A ADC-36 payload |
Undisclosed |
CN114917361A ADC-36 linker |
[26] | |
CN114917361A ADC-39 |
CN114917361A ADC-39 payload |
Undisclosed |
CN114917361A ADC-39 linker |
[26] | |
CN114917361A ADC-41 |
CN114917361A ADC-41 payload |
Undisclosed |
CN114917361A ADC-41 linker |
[26] | |
CN114917361A ADC-44 |
CN114917361A ADC-44 payload |
Undisclosed |
CN114917361A ADC-44 linker |
[26] | |
CN114917361A ADC-47 |
CN114917361A ADC-47 payload |
Undisclosed |
CN114917361A ADC-47 linker |
[26] | |
CN114917361A ADC-50 |
CN114917361A ADC-50 payload |
Undisclosed |
CN114917361A ADC-50 linker |
[26] | |
CN114917361A ADC-55 |
CN114917361A ADC-55 payload |
Undisclosed |
CN114917361A ADC-55 linker |
[26] | |
CN114917361A ADC-58 |
CN114917361A ADC-58 payload |
Undisclosed |
CN114917361A ADC-58 linker |
[26] | |
CN114917361A ADC-6 |
CN114917361A ADC-6 payload |
Undisclosed |
CN114917361A ADC-6 linker |
[26] | |
CN114917361A ADC-61 |
CN114917361A ADC-61 payload |
Undisclosed |
CN114917361A ADC-61 linker |
[26] | |
CN114917361A ADC-64 |
CN114917361A ADC-64 payload |
Undisclosed |
CN114917361A ADC-64 linker |
[26] | |
CN114917361A ADC-67 |
CN114917361A ADC-67 payload |
Undisclosed |
CN114917361A ADC-67 linker |
[26] | |
CN114917361A ADC-70 |
CN114917361A ADC-70 payload |
Undisclosed |
CN114917361A ADC-70 linker |
[26] | |
CN114917361A ADC-73 |
CN114917361A ADC-73 payload |
Undisclosed |
CN114917361A ADC-73 linker |
[26] | |
CN114917361A ADC-76 |
CN114917361A ADC-76 payload |
Undisclosed |
CN114917361A ADC-76 linker |
[26] | |
CN114917361A ADC-79 |
CN114917361A ADC-79 payload |
Undisclosed |
CN114917361A ADC-79 linker |
[26] | |
CN114917361A ADC-82 |
CN114917361A ADC-82 payload |
Undisclosed |
CN114917361A ADC-82 linker |
[26] | |
CTX-MMAE |
Monomethyl auristatin E |
Microtubule (MT) |
PD-Val-Cit-PABC |
[27] | |
EGFR ADC-21 |
Monomethyl auristatin E |
Microtubule (MT) |
Vinylsulfonamide based linker 15 |
[28] | |
EGFR ADC-22 |
Monomethyl auristatin E |
Microtubule (MT) |
Vinylsulfonamide based linker 16 |
[28] | |
EGFR ADC-23 |
Monomethyl auristatin E |
Microtubule (MT) |
Vinylsulfonamide based linker 17 |
[28] | |
EGFR-ADC-07 (DAR4) |
EGFR-ADC-07(DAR4) payload |
Undisclosed |
EGFR-ADC-07(DAR4) linker |
[29] | |
EGFR-ADC-07 (DAR8) |
EGFR-ADC-07(DAR8) payload |
Undisclosed |
EGFR-ADC-07(DAR8) linker |
[29] | |
EGFR-ADC-08 (DAR4) |
EGFR-ADC-08(DAR4) payload |
Undisclosed |
EGFR-ADC-08(DAR4) linker |
[29] | |
EGFR-ADC-08 (DAR8) |
EGFR-ADC-08(DAR8) payload |
Undisclosed |
EGFR-ADC-08(DAR8) linker |
[29] | |
EGFR-ADC-32 (DAR4) |
EGFR-ADC-32(DAR4) payload |
Undisclosed |
EGFR-ADC-32(DAR4) linker |
[29] | |
EGFR-MMAU ADC |
Glucuronyl-monomethyl-auristatin E (MMAU) |
Microtubule (MT) |
Mc-Val-Cit-PABC |
[30] | |
Erbitux-MHT-71 |
Auristatin F |
Microtubule (MT) |
MHT-71 |
[31] | |
Hu-Alpha-EGFR-172 |
IMSA172 |
Stimulator of interferon genes protein (STING1) |
Mc-Val-Cit-PABC |
[32] | |
ITcetuximab |
Saporin |
Microtubule (MT) |
Undisclosed |
[33] | |
MAb-DMBA-SIL-Dox |
Doxorubicin |
DNA topoisomerase 2-alpha (TOP2A) |
DMBA-SIL |
[34] | |
MAb-DMBA-SIL-MMAE |
Monomethyl auristatin E |
Microtubule (MT) |
DMBA-SIL |
[34] | |
Quinoin cetuximab immunoconjugate |
Quinoin |
Receptor-interacting serine/threonine-protein kinase 1 (RIPK1) |
N-succinimidyl 3-(2-pyridyldithio) propionate (SPDP) |
[35] | |
WO2017089890A1 ADC64 |
Monomethyl auristatin F |
Microtubule (MT) |
WO2017089890A1_ADC64 linker |
[36] | |
WO2017089890A1 ADC65 |
Monomethyl auristatin E |
Microtubule (MT) |
WO2017089890A1_ADC65 linker |
[36] | |
WO2017089890A1 ADC66 |
Monomethyl auristatin F |
Microtubule (MT) |
WO2017089890A1_ADC66 linker |
[36] | |
WO2017089895A1 ADC64 |
Monomethyl auristatin F |
Microtubule (MT) |
WO2017089895A1_ADC64 linker |
[37] | |
WO2017089895A1 ADC65 |
Monomethyl auristatin E |
Microtubule (MT) |
WO2017089895A1_ADC65 linker |
[37] | |
WO2017089895A1 ADC66 |
Monomethyl auristatin F |
Microtubule (MT) |
WO2017089895A1_ADC66 linker |
[37] | |
WO2022078260A1 ADC-10 |
Ln-D7 |
DNA topoisomerase 1 (TOP1) |
WO2022078260A1_ADC-10 linker |
[38] | |
WO2022078260A1 ADC-9 |
Ln-D2 |
DNA topoisomerase 1 (TOP1) |
WO2022078260A1_ADC-9 linker |
[38] | |
Cetuximab based antibody-drug conjugate |
Mertansine DM1 |
Microtubule (MT) |
Succinimidyl-4-(N-maleimidomethyl)cyclohexane-1-carboxylate (SMCC) |
[39] |
Cetuximab (Fc/Fab labeled with Neu5NAz)
| ADC Info | ADC Name | Payload | Target | Linker | Ref |
|---|---|---|---|---|---|
Cetux Fc/Fab-vc-MMAE |
Monomethyl auristatin E |
Microtubule (MT) |
Mc-Val-Cit-PABC |
[15] |
Cetuximab (LC)
| ADC Info | ADC Name | Payload | Target | Linker | Ref |
|---|---|---|---|---|---|
Cetuximab (LC)-2i |
Monomethyl auristatin F |
Microtubule (MT) |
Cetuximab(LC)-2i linker |
[40] | |
Cetuximab (LC)-3i |
Monomethyl auristatin F |
Microtubule (MT) |
Cetuximab(LC)-3i linker |
[40] | |
Cetuximab (LC)-4i |
Monomethyl auristatin F |
Microtubule (MT) |
Cetuximab(LC)-4i linker |
[40] | |
Cetuximab (LC)-6e |
Monomethyl auristatin E |
Microtubule (MT) |
Cetuximab(LC)-6e linker |
[40] | |
Cetuximab (LC)-amanitin |
Alpha-amanitin |
DNA-directed RNA polymerase II subunit RPB2 (POLR2B); DNA-directed RNA polymerase III subunit RPC7 (POLR3G) |
Cetuximab(LC)-amanitin linker |
[40] |
Cetuximab (LC) G7-CVIM
| ADC Info | ADC Name | Payload | Target | Linker | Ref |
|---|---|---|---|---|---|
ADC14-0810 |
Monomethyl auristatin F |
Microtubule (MT) |
ADC14-0810 linker |
[40] | |
Cetuximab (LC) G7-CVIM-3i |
Monomethyl auristatin F |
Microtubule (MT) |
Cetuximab(LC) G7-CVIM-3i linker |
[40] | |
Cetuximab (LC) G7-CVIM-4i |
Monomethyl auristatin F |
Microtubule (MT) |
Cetuximab(LC) G7-CVIM-4i linker |
[40] | |
Cetuximab (LC) G7-CVIM-6e |
Monomethyl auristatin E |
Microtubule (MT) |
Cetuximab(LC) G7-CVIM-6e linker |
[40] | |
Cetuximab (LC) G7-CVIM-amanitin |
Alpha-amanitin |
DNA-directed RNA polymerase II subunit RPB2 (POLR2B); DNA-directed RNA polymerase III subunit RPC7 (POLR3G) |
Cetuximab(LC) G7-CVIM-amanitin linker |
[40] |
Cetuximab (LV) G7-CVIM
| ADC Info | ADC Name | Payload | Target | Linker | Ref |
|---|---|---|---|---|---|
Cetuximab (LV) G7-CVIM-3i |
Monomethyl auristatin F |
Microtubule (MT) |
Cetuximab(LV) G7-CVIM-3i linker |
[40] | |
Cetuximab (LV) G7-CVIM-4i |
Monomethyl auristatin F |
Microtubule (MT) |
Cetuximab(LV) G7-CVIM-4i linker |
[40] | |
Cetuximab (LV) G7-CVIM-6e |
Monomethyl auristatin E |
Microtubule (MT) |
Cetuximab(LV) G7-CVIM-6e linker |
[40] | |
Cetuximab (LV) G7-CVIM-amanitin |
Alpha-amanitin |
DNA-directed RNA polymerase II subunit RPB2 (POLR2B); DNA-directed RNA polymerase III subunit RPC7 (POLR3G) |
Cetuximab(LV) G7-CVIM-amanitin linker |
[40] | |
LCB14-0645 |
Monomethyl auristatin F |
Microtubule (MT) |
LCB14-0645 linker |
[40] |
Cetuximab Fab
| ADC Info | ADC Name | Payload | Target | Linker | Ref |
|---|---|---|---|---|---|
C-Fab-MMAE |
Monomethyl auristatin E |
Microtubule (MT) |
Gly3-Val-Cit-PABC |
[5] |
Cetuximab Fab (conjugate to glycan residues)
| ADC Info | ADC Name | Payload | Target | Linker | Ref |
|---|---|---|---|---|---|
Cetux Fab-vc-MMAE |
Monomethyl auristatin E |
Microtubule (MT) |
Mc-Val-Cit-PABC |
[15] |
Demupitamab
| ADC Info | ADC Name | Payload | Target | Linker | Ref |
|---|---|---|---|---|---|
Demupitamab-ADC-Tb5-1 |
Demupitamab-ADC-Tb5-1 payload |
Undisclosed |
Demupitamab-ADC-Tb5-1 linker |
[29] | |
Demupitamab-ADC-Tb5-2 |
Demupitamab-ADC-Tb5-2 payload |
Undisclosed |
Demupitamab-ADC-Tb5-2 linker |
[29] |
Depatuxizumab
| ADC Info | ADC Name | Payload | Target | Linker | Ref |
|---|---|---|---|---|---|
Depatuxizumab mafodotin |
Monomethyl auristatin F |
Microtubule (MT) |
Maleimido-caproyl |
[41] | |
Depatuxizumab-ADC-Tb5-1 |
Depatuxizumab-ADC-Tb5-1 payload |
Undisclosed |
Depatuxizumab-ADC-Tb5-1 linker |
[29] | |
Depatuxizumab-ADC-Tb5-2 |
Depatuxizumab-ADC-Tb5-2 payload |
Undisclosed |
Depatuxizumab-ADC-Tb5-2 linker |
[29] | |
WO2017089890A1 ADC73 |
Monomethyl auristatin F |
Microtubule (MT) |
WO2017089890A1_ADC73 linker |
[36] | |
WO2017089890A1 ADC74 |
Monomethyl auristatin E |
Microtubule (MT) |
WO2017089890A1_ADC74 linker |
[36] | |
WO2017089890A1 ADC75 |
Monomethyl auristatin F |
Microtubule (MT) |
WO2017089890A1_ADC75 linker |
[36] |
Depatuxizumab S238C
| ADC Info | ADC Name | Payload | Target | Linker | Ref |
|---|---|---|---|---|---|
ABBV-322 |
PBD dimer |
Human Deoxyribonucleic acid (hDNA) |
Mc-Val-Ala |
[42] |
EGFR Ab-L
| ADC Info | ADC Name | Payload | Target | Linker | Ref |
|---|---|---|---|---|---|
RN765C |
Auristatin 0101 |
Microtubule (MT) |
AcLys-Val-Cit-PABC |
[43] |
ERC6 bispecific Anti-ody (fuse Anti-cotinine scFv to cetuximab CH3 domain)
| ADC Info | ADC Name | Payload | Target | Linker | Ref |
|---|---|---|---|---|---|
Cotinine-duocarmycin |
Duocarmycin Sa |
Human Deoxyribonucleic acid (hDNA) |
Mc-Val-Cit-PABC-DMAE |
[44] |
Fcab-1
| ADC Info | ADC Name | Payload | Target | Linker | Ref |
|---|---|---|---|---|---|
Fcab-1-MMAE |
Monomethyl auristatin E |
Microtubule (MT) |
Gly3-Val-Cit-PABC |
[5] |
Fcab-2
| ADC Info | ADC Name | Payload | Target | Linker | Ref |
|---|---|---|---|---|---|
Fcab-2-MMAE |
Monomethyl auristatin E |
Microtubule (MT) |
Gly3-Val-Cit-PABC |
[5] |
Fcab-3
| ADC Info | ADC Name | Payload | Target | Linker | Ref |
|---|---|---|---|---|---|
Fcab-3-MMAE |
Monomethyl auristatin E |
Microtubule (MT) |
Gly3-Val-Cit-PABC |
[5] |
Futuximab
| ADC Info | ADC Name | Payload | Target | Linker | Ref |
|---|---|---|---|---|---|
Futuximab-ADC-Tb5-1 |
Futuximab-ADC-Tb5-1 payload |
Undisclosed |
Futuximab-ADC-Tb5-1 linker |
[29] | |
Futuximab-ADC-Tb5-2 |
Futuximab-ADC-Tb5-2 payload |
Undisclosed |
Futuximab-ADC-Tb5-2 linker |
[29] |
Fv-LDP-D3
| ADC Info | ADC Name | Payload | Target | Linker | Ref |
|---|---|---|---|---|---|
Fv-LDP-D3-AE |
Lidamycin |
Human Deoxyribonucleic acid (hDNA) |
Undisclosed |
[45] |
Glyco-engineered cetuximab
| ADC Info | ADC Name | Payload | Target | Linker | Ref |
|---|---|---|---|---|---|
Cetux Cys-vc-MMAE |
Monomethyl auristatin E |
Microtubule (MT) |
Mc-Val-Cit-PABC |
[15] |
Glyco-engineered cetuximab Fab
| ADC Info | ADC Name | Payload | Target | Linker | Ref |
|---|---|---|---|---|---|
Glyco-cetuximab Fab-vc-MMAE |
Monomethyl auristatin E |
Microtubule (MT) |
Mc-Val-Cit-PABC |
[15] |
Glyco-engineered cetuximab Fc/Fab
| ADC Info | ADC Name | Payload | Target | Linker | Ref |
|---|---|---|---|---|---|
Cetux Fc/Fab-vc-MMAE |
Monomethyl auristatin E |
Microtubule (MT) |
Mc-Val-Cit-PABC |
[15] |
hu-alpha-EGFR(ACVC), cetuximab with A114C and V205C mutations
| ADC Info | ADC Name | Payload | Target | Linker | Ref |
|---|---|---|---|---|---|
Hu-Alpha-EGFR (ACVC)-172 |
IMSA172 |
Stimulator of interferon genes protein (STING1) |
Mc-Val-Cit-PABC |
[32] |
Imgatuzumab
| ADC Info | ADC Name | Payload | Target | Linker | Ref |
|---|---|---|---|---|---|
Imgatuzumab-ADC-Tb5-1 |
Imgatuzumab-ADC-Tb5-1 payload |
Undisclosed |
Imgatuzumab-ADC-Tb5-1 linker |
[29] | |
Imgatuzumab-ADC-Tb5-2 |
Imgatuzumab-ADC-Tb5-2 payload |
Undisclosed |
Imgatuzumab-ADC-Tb5-2 linker |
[29] |
JMT101
| ADC Info | ADC Name | Payload | Target | Linker | Ref |
|---|---|---|---|---|---|
Becotatug vedotin |
Monomethyl auristatin E |
Microtubule (MT) |
Mc-Val-Cit-PABC |
[46] |
Laprituximab
| ADC Info | ADC Name | Payload | Target | Linker | Ref |
|---|---|---|---|---|---|
Laprituximab emtansine |
Mertansine DM1 |
Microtubule (MT) |
Succinimidyl-4-(N-maleimidomethyl)cyclohexane-1-carboxylate (SMCC) |
[47] | |
Laprituximab-ADC-Tb5-1 |
Laprituximab-ADC-Tb5-1 payload |
Undisclosed |
Laprituximab-ADC-Tb5-1 linker |
[29] | |
Laprituximab-ADC-Tb5-2 |
Laprituximab-ADC-Tb5-2 payload |
Undisclosed |
Laprituximab-ADC-Tb5-2 linker |
[29] |
Losatuxizumab
| ADC Info | ADC Name | Payload | Target | Linker | Ref |
|---|---|---|---|---|---|
Losatuxizumab vedotin |
Monomethyl auristatin E |
Microtubule (MT) |
Mc-Val-Cit-PABC |
[48] |
Losatuxzumab
| ADC Info | ADC Name | Payload | Target | Linker | Ref |
|---|---|---|---|---|---|
Losatuxzumab-ADC-Tb5-1 |
Losatuxzumab-ADC-Tb5-1 payload |
Undisclosed |
Losatuxzumab-ADC-Tb5-1 linker |
[29] | |
Losatuxzumab-ADC-Tb5-2 |
Losatuxzumab-ADC-Tb5-2 payload |
Undisclosed |
Losatuxzumab-ADC-Tb5-2 linker |
[29] |
LR004
| ADC Info | ADC Name | Payload | Target | Linker | Ref |
|---|---|---|---|---|---|
LR004-Val-Cit-MMAE |
Monomethyl auristatin E |
Microtubule (MT) |
Mc-Val-Cit-PABC |
[49] | |
LR-DM1 |
Mertansine DM1 |
Microtubule (MT) |
Succinimidyl-4-(N-maleimidomethyl)cyclohexane-1-carboxylate (SMCC) |
[50] |
MAB100
| ADC Info | ADC Name | Payload | Target | Linker | Ref |
|---|---|---|---|---|---|
AVID-100 |
Mertansine DM1 |
Microtubule (MT) |
Succinimidyl-4-(N-maleimidomethyl)cyclohexane-1-carboxylate (SMCC) |
[51] |
Matuzumab
| ADC Info | ADC Name | Payload | Target | Linker | Ref |
|---|---|---|---|---|---|
Matuzumab-ADC-Tb5-1 |
Matuzumab-ADC-Tb5-1 payload |
Undisclosed |
Matuzumab-ADC-Tb5-1 linker |
[29] | |
Matuzumab-ADC-Tb5-2 |
Matuzumab-ADC-Tb5-2 payload |
Undisclosed |
Matuzumab-ADC-Tb5-2 linker |
[29] |
Modotuximab
| ADC Info | ADC Name | Payload | Target | Linker | Ref |
|---|---|---|---|---|---|
Modotuximab-ADC-Tb5-1 |
Modotuximab-ADC-Tb5-1 payload |
Undisclosed |
Modotuximab-ADC-Tb5-1 linker |
[29] | |
Modotuximab-ADC-Tb5-2 |
Modotuximab-ADC-Tb5-2 payload |
Undisclosed |
Modotuximab-ADC-Tb5-2 linker |
[29] |
mu-alpha-EGFR
| ADC Info | ADC Name | Payload | Target | Linker | Ref |
|---|---|---|---|---|---|
Mu-Alpha-EGFR-172 |
IMSA172 |
Stimulator of interferon genes protein (STING1) |
Mc-Val-Cit-PABC |
[32] |
NCAB001
| ADC Info | ADC Name | Payload | Target | Linker | Ref |
|---|---|---|---|---|---|
NC-6201 |
E7974 |
Microtubule (MT) |
Undisclosed |
[52] |
Necitumumab
| ADC Info | ADC Name | Payload | Target | Linker | Ref |
|---|---|---|---|---|---|
Necitumumab-ADC-Tb5-1 |
Necitumumab-ADC-Tb5-1 payload |
Undisclosed |
Necitumumab-ADC-Tb5-1 linker |
[29] | |
Necitumumab-ADC-Tb5-2 |
Necitumumab-ADC-Tb5-2 payload |
Undisclosed |
Necitumumab-ADC-Tb5-2 linker |
[29] |
Nimotuzumab
| ADC Info | ADC Name | Payload | Target | Linker | Ref |
|---|---|---|---|---|---|
CN114917361A ADC-3 |
CN114917361A ADC-3 payload |
Undisclosed |
CN114917361A ADC-3 linker |
[26] | |
Nimotuzumab-ADC-24-1 |
Nimotuzumab-ADC-24-1 payload |
Undisclosed |
Nimotuzumab-ADC-24-1 linker |
[53] | |
Nimotuzumab-ADC-24-10 |
Nimotuzumab-ADC-24-10 payload |
Undisclosed |
Nimotuzumab-ADC-24-10 linker |
[53] | |
Nimotuzumab-ADC-24-11 |
Nimotuzumab-ADC-24-11 payload |
Undisclosed |
Nimotuzumab-ADC-24-11 linker |
[53] | |
Nimotuzumab-ADC-24-12 |
Nimotuzumab-ADC-24-12 payload |
Undisclosed |
Nimotuzumab-ADC-24-12 linker |
[53] | |
Nimotuzumab-ADC-24-13 |
Nimotuzumab-ADC-24-13 payload |
Undisclosed |
Nimotuzumab-ADC-24-13 linker |
[53] | |
Nimotuzumab-ADC-24-2 |
Nimotuzumab-ADC-24-2 payload |
Undisclosed |
Nimotuzumab-ADC-24-2 linker |
[53] | |
Nimotuzumab-ADC-24-3 |
Nimotuzumab-ADC-24-3 payload |
Undisclosed |
Nimotuzumab-ADC-24-3 linker |
[53] | |
Nimotuzumab-ADC-24-4 |
Nimotuzumab-ADC-24-4 payload |
Undisclosed |
Nimotuzumab-ADC-24-4 linker |
[53] | |
Nimotuzumab-ADC-24-5 |
Nimotuzumab-ADC-24-5 payload |
Undisclosed |
Nimotuzumab-ADC-24-5 linker |
[53] | |
Nimotuzumab-ADC-24-6 |
Nimotuzumab-ADC-24-6 payload |
Undisclosed |
Nimotuzumab-ADC-24-6 linker |
[53] | |
Nimotuzumab-ADC-24-7 |
Nimotuzumab-ADC-24-7 payload |
Undisclosed |
Nimotuzumab-ADC-24-7 linker |
[53] | |
Nimotuzumab-ADC-24-8 |
Nimotuzumab-ADC-24-8 payload |
Undisclosed |
Nimotuzumab-ADC-24-8 linker |
[53] | |
Nimotuzumab-ADC-24-9 |
Nimotuzumab-ADC-24-9 payload |
Undisclosed |
Nimotuzumab-ADC-24-9 linker |
[53] | |
Nimotuzumab-ADC-Tb5-1 |
Nimotuzumab-ADC-Tb5-1 payload |
Undisclosed |
Nimotuzumab-ADC-Tb5-1 linker |
[29] | |
Nimotuzumab-ADC-Tb5-2 |
Nimotuzumab-ADC-Tb5-2 payload |
Undisclosed |
Nimotuzumab-ADC-Tb5-2 linker |
[29] | |
Nimotuzumab-Compound 17 |
Mertansine DM4 |
Microtubule (MT) |
Nimotuzumab-Compound 17 linker |
[20] | |
Nimotuzumab-Compound 25 |
Monomethyl auristatin E |
Microtubule (MT) |
Nimotuzumab-Compound 25 linker |
[20] | |
Nimotuzumab-Compound 31 |
Auristatin 0101 |
Microtubule (MT) |
Nimotuzumab-Compound 31 linker |
[20] | |
Nimotuzumab-Compound 36 |
Monomethyl auristatin E |
Microtubule (MT) |
Nimotuzumab-Compound 36 linker |
[20] | |
Nimotuzumab-Compound 43 |
PBD dimer |
Human Deoxyribonucleic acid (hDNA) |
Nimotuzumab-Compound 43 linker |
[20] | |
Nimotuzumab-Compound 49 |
PBD dimer |
Human Deoxyribonucleic acid (hDNA) |
Nimotuzumab-Compound 49 linker |
[20] | |
Nimotuzumab-Compound 55 |
Mertansine DM1 |
Microtubule (MT) |
Nimotuzumab-Compound 55 linker |
[20] | |
Nimotuzumab-Compound 59 |
Mertansine DM4 |
Microtubule (MT) |
Nimotuzumab-Compound 59 linker |
[20] | |
Nimotuzumab-Compound 64 |
Monomethyl auristatin E |
Microtubule (MT) |
Nimotuzumab-Compound 64 linker |
[20] | |
Nimotuzumab-Compound 69 |
Monomethyl auristatin E |
Microtubule (MT) |
Nimotuzumab-Compound 69 linker |
[20] | |
Nimotuzumab-Compound 74 |
PBD dimer |
Human Deoxyribonucleic acid (hDNA) |
Nimotuzumab-Compound 74 linker |
[20] | |
Nimotuzumab-Compound 75 |
Monomethyl auristatin E |
Microtubule (MT) |
Nimotuzumab-Compound 75 linker |
[20] | |
Nimotuzumab-Compound 76 |
Monomethyl auristatin E |
Microtubule (MT) |
Nimotuzumab-Compound 76 linker |
[20] | |
Nimotuzumab-Compound 77 |
Mertansine DM1 |
Microtubule (MT) |
Nimotuzumab-Compound 77 linker |
[20] | |
Nimotuzumab-Compound 78 |
Auristatin 0101 |
Microtubule (MT) |
Nimotuzumab-Compound 78 linker |
[20] | |
Nimotuzumab-Compound 79 |
Auristatin 0101 |
Microtubule (MT) |
Nimotuzumab-Compound 79 linker |
[20] | |
Nimotuzumab-Compound 80 |
Mertansine DM4 |
Microtubule (MT) |
Nimotuzumab-Compound 80 linker |
[20] | |
Nimotuzumab-Compound 9 |
Mertansine DM1 |
Microtubule (MT) |
Nimotuzumab-Compound 9 linker |
[20] |
Nimotuzumab derivative
| ADC Info | ADC Name | Payload | Target | Linker | Ref |
|---|---|---|---|---|---|
DXC-004A |
Tubulysin B analog |
Microtubule (MT) |
Undisclosed |
[54] |
Panitumumab
| ADC Info | ADC Name | Payload | Target | Linker | Ref |
|---|---|---|---|---|---|
AVID-300 |
Mertansine DM1 |
Microtubule (MT) |
Undisclosed |
[55] | |
CyEt-Pan-Duo |
DEAEA duocarmycin |
Human Deoxyribonucleic acid (hDNA) |
Mal-PEG4-Triazol-Cyanine cage |
[56] | |
Panitumumab-ADC-Tb5-1 |
Panitumumab-ADC-Tb5-1 payload |
Undisclosed |
Panitumumab-ADC-Tb5-1 linker |
[29] | |
Panitumumab-ADC-Tb5-2 |
Panitumumab-ADC-Tb5-2 payload |
Undisclosed |
Panitumumab-ADC-Tb5-2 linker |
[29] | |
Panitumumab-Compound 17 |
Mertansine DM4 |
Microtubule (MT) |
Panitumumab-Compound 17 linker |
[20] | |
Panitumumab-Compound 25 |
Monomethyl auristatin E |
Microtubule (MT) |
Panitumumab-Compound 25 linker |
[20] | |
Panitumumab-Compound 31 |
Auristatin 0101 |
Microtubule (MT) |
Panitumumab-Compound 31 linker |
[20] | |
Panitumumab-Compound 36 |
Monomethyl auristatin E |
Microtubule (MT) |
Panitumumab-Compound 36 linker |
[20] | |
Panitumumab-Compound 43 |
PBD dimer |
Human Deoxyribonucleic acid (hDNA) |
Panitumumab-Compound 43 linker |
[20] | |
Panitumumab-Compound 49 |
PBD dimer |
Human Deoxyribonucleic acid (hDNA) |
Panitumumab-Compound 49 linker |
[20] | |
Panitumumab-Compound 55 |
Mertansine DM1 |
Microtubule (MT) |
Panitumumab-Compound 55 linker |
[20] | |
Panitumumab-Compound 59 |
Mertansine DM4 |
Microtubule (MT) |
Panitumumab-Compound 59 linker |
[20] | |
Panitumumab-Compound 64 |
Monomethyl auristatin E |
Microtubule (MT) |
Panitumumab-Compound 64 linker |
[20] | |
Panitumumab-Compound 69 |
Monomethyl auristatin E |
Microtubule (MT) |
Panitumumab-Compound 69 linker |
[20] | |
Panitumumab-Compound 74 |
PBD dimer |
Human Deoxyribonucleic acid (hDNA) |
Panitumumab-Compound 74 linker |
[20] | |
Panitumumab-Compound 75 |
Monomethyl auristatin E |
Microtubule (MT) |
Panitumumab-Compound 75 linker |
[20] | |
Panitumumab-Compound 76 |
Monomethyl auristatin E |
Microtubule (MT) |
Panitumumab-Compound 76 linker |
[20] | |
Panitumumab-Compound 77 |
Mertansine DM1 |
Microtubule (MT) |
Panitumumab-Compound 77 linker |
[20] | |
Panitumumab-Compound 78 |
Auristatin 0101 |
Microtubule (MT) |
Panitumumab-Compound 78 linker |
[20] | |
Panitumumab-Compound 79 |
Auristatin 0101 |
Microtubule (MT) |
Panitumumab-Compound 79 linker |
[20] | |
Panitumumab-Compound 80 |
Mertansine DM4 |
Microtubule (MT) |
Panitumumab-Compound 80 linker |
[20] | |
Panitumumab-Compound 9 |
Mertansine DM1 |
Microtubule (MT) |
Panitumumab-Compound 9 linker |
[20] | |
Panitumumab-DNA conjugate |
DNA mimics |
Human Deoxyribonucleic acid (hDNA) |
Undisclosed |
[21] |
Pimurutamab
| ADC Info | ADC Name | Payload | Target | Linker | Ref |
|---|---|---|---|---|---|
Pimurutamab-ADC-Tb5-1 |
Pimurutamab-ADC-Tb5-1 payload |
Undisclosed |
Pimurutamab-ADC-Tb5-1 linker |
[29] | |
Pimurutamab-ADC-Tb5-2 |
Pimurutamab-ADC-Tb5-2 payload |
Undisclosed |
Pimurutamab-ADC-Tb5-2 linker |
[29] |
RC68
| ADC Info | ADC Name | Payload | Target | Linker | Ref |
|---|---|---|---|---|---|
RC68-Mc-Val-Cit-PABC-MMAE |
Monomethyl auristatin E |
Microtubule (MT) |
Mc-Val-Cit-PABC |
[57] | |
RC68-PY-Val-Cit-PABC-MMAE |
Monomethyl auristatin E |
Microtubule (MT) |
PY-VC-PABC |
[57] |
Serclutamab
| ADC Info | ADC Name | Payload | Target | Linker | Ref |
|---|---|---|---|---|---|
Serclutamab talirine |
SGD-1882 |
Human Deoxyribonucleic acid (hDNA) |
Mc-Val-Ala |
[58] | |
Serclutamab-ADC-Tb5-1 |
Serclutamab-ADC-Tb5-1 payload |
Undisclosed |
Serclutamab-ADC-Tb5-1 linker |
[29] | |
Serclutamab-ADC-Tb5-2 |
Serclutamab-ADC-Tb5-2 payload |
Undisclosed |
Serclutamab-ADC-Tb5-2 linker |
[29] |
Tomuzotuximab
| ADC Info | ADC Name | Payload | Target | Linker | Ref |
|---|---|---|---|---|---|
Tomuzotuximab-ADC-Tb5-1 |
Tomuzotuximab-ADC-Tb5-1 payload |
Undisclosed |
Tomuzotuximab-ADC-Tb5-1 linker |
[29] | |
Tomuzotuximab-ADC-Tb5-2 |
Tomuzotuximab-ADC-Tb5-2 payload |
Undisclosed |
Tomuzotuximab-ADC-Tb5-2 linker |
[29] |
Zalutumumab
| ADC Info | ADC Name | Payload | Target | Linker | Ref |
|---|---|---|---|---|---|
Zalutumumab-ADC-Tb5-1 |
Zalutumumab-ADC-Tb5-1 payload |
Undisclosed |
Zalutumumab-ADC-Tb5-1 linker |
[29] | |
Zalutumumab-ADC-Tb5-2 |
Zalutumumab-ADC-Tb5-2 payload |
Undisclosed |
Zalutumumab-ADC-Tb5-2 linker |
[29] |
Undisclosed
| ADC Info | ADC Name | Payload | Target | Linker | Ref |
|---|---|---|---|---|---|
SYS6010 |
JS-1 |
DNA topoisomerase 1 (TOP1) |
GGFG |
[59] | |
BB-1705 |
Eribulin |
Microtubule (MT) |
Mc-PEG2-Val-Cit-PABC |
[60] | |
ABBV-637 |
BCL-XL inhibitor |
Bcl-2-like protein 1 (BCL2L1) |
Undisclosed |
||
HTI-1511 |
Undisclosed |
Undisclosed |
Undisclosed |
[61] | |
Recombinant humanized anti-EGFR mAb-DUO-5 conjugate |
Duostatin 5 |
Human Deoxyribonucleic acid (hDNA) |
Undisclosed |
[62] | |
NS Cys-vc-MMAE |
Monomethyl auristatin E |
Microtubule (MT) |
Mc-Val-Cit-PABC |
[15] | |
PBX-003 |
Undisclosed |
Undisclosed |
Undisclosed |
[63] | |
Probody drug conjugate (CytomX Therapeutics) |
Undisclosed |
Undisclosed |
Undisclosed |
[64] | |
STI-A020X |
Undisclosed |
Undisclosed |
Undisclosed |
[65] |
Tissue/Disease specific Abundances of This Antigen
Tissue specific Abundances of This Antigen
ICD Disease Classification 01
| Differential expression pattern of antigen in diseases | ||
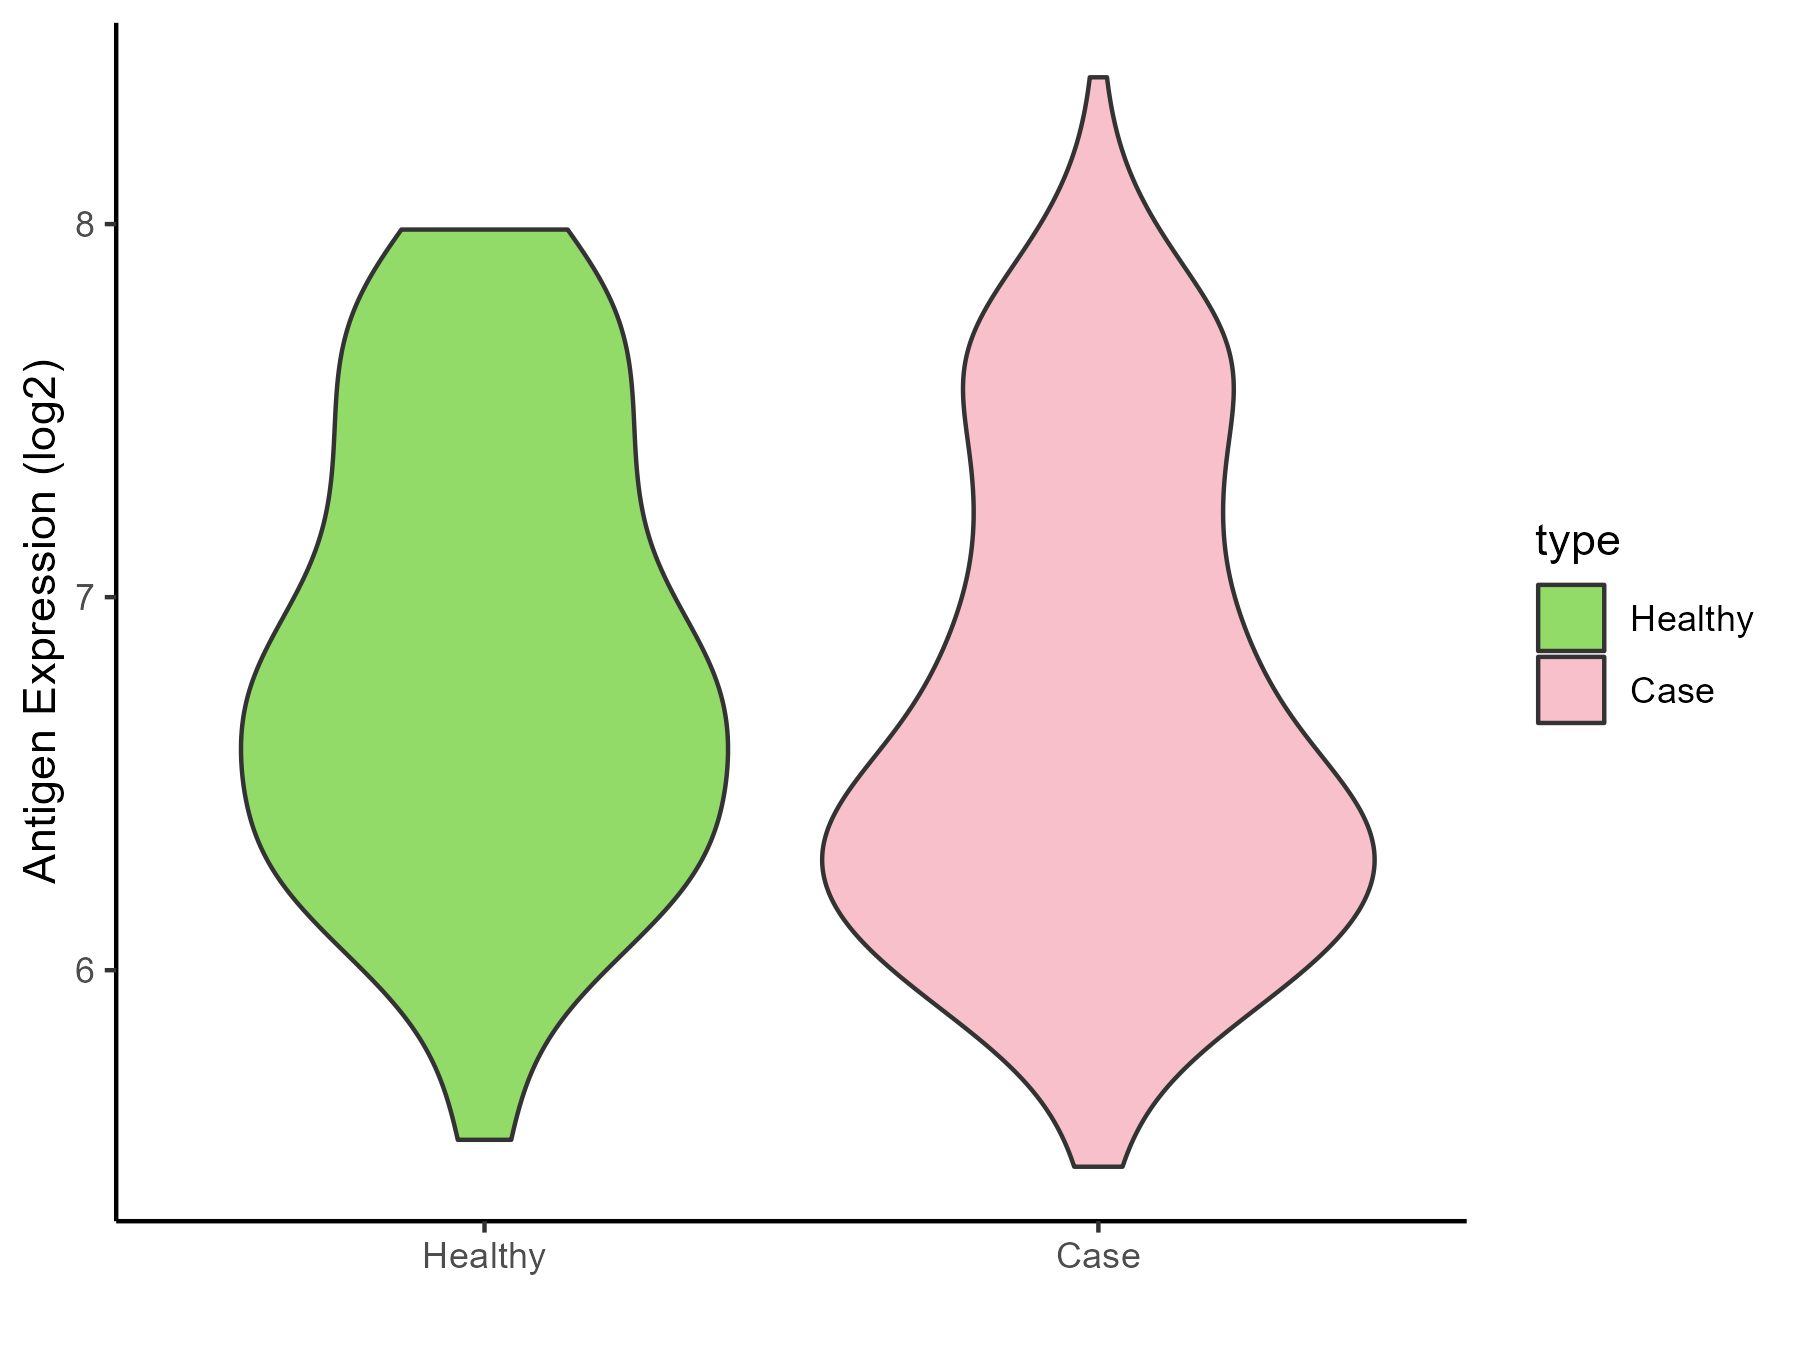
| The Studied Tissue | Gingival | |
| The Specific Disease | Bacterial infection of gingival | |
| The Expression Level of Disease Section Compare with the Healthy Individual Tissue | p-value: 0.121787504; Fold-change: -0.254498943; Z-score: -0.419900828 | |
| Disease-specific Antigen Abundances |
|
Click to View the Clearer Original Diagram |
ICD Disease Classification 02
| Differential expression pattern of antigen in diseases | ||
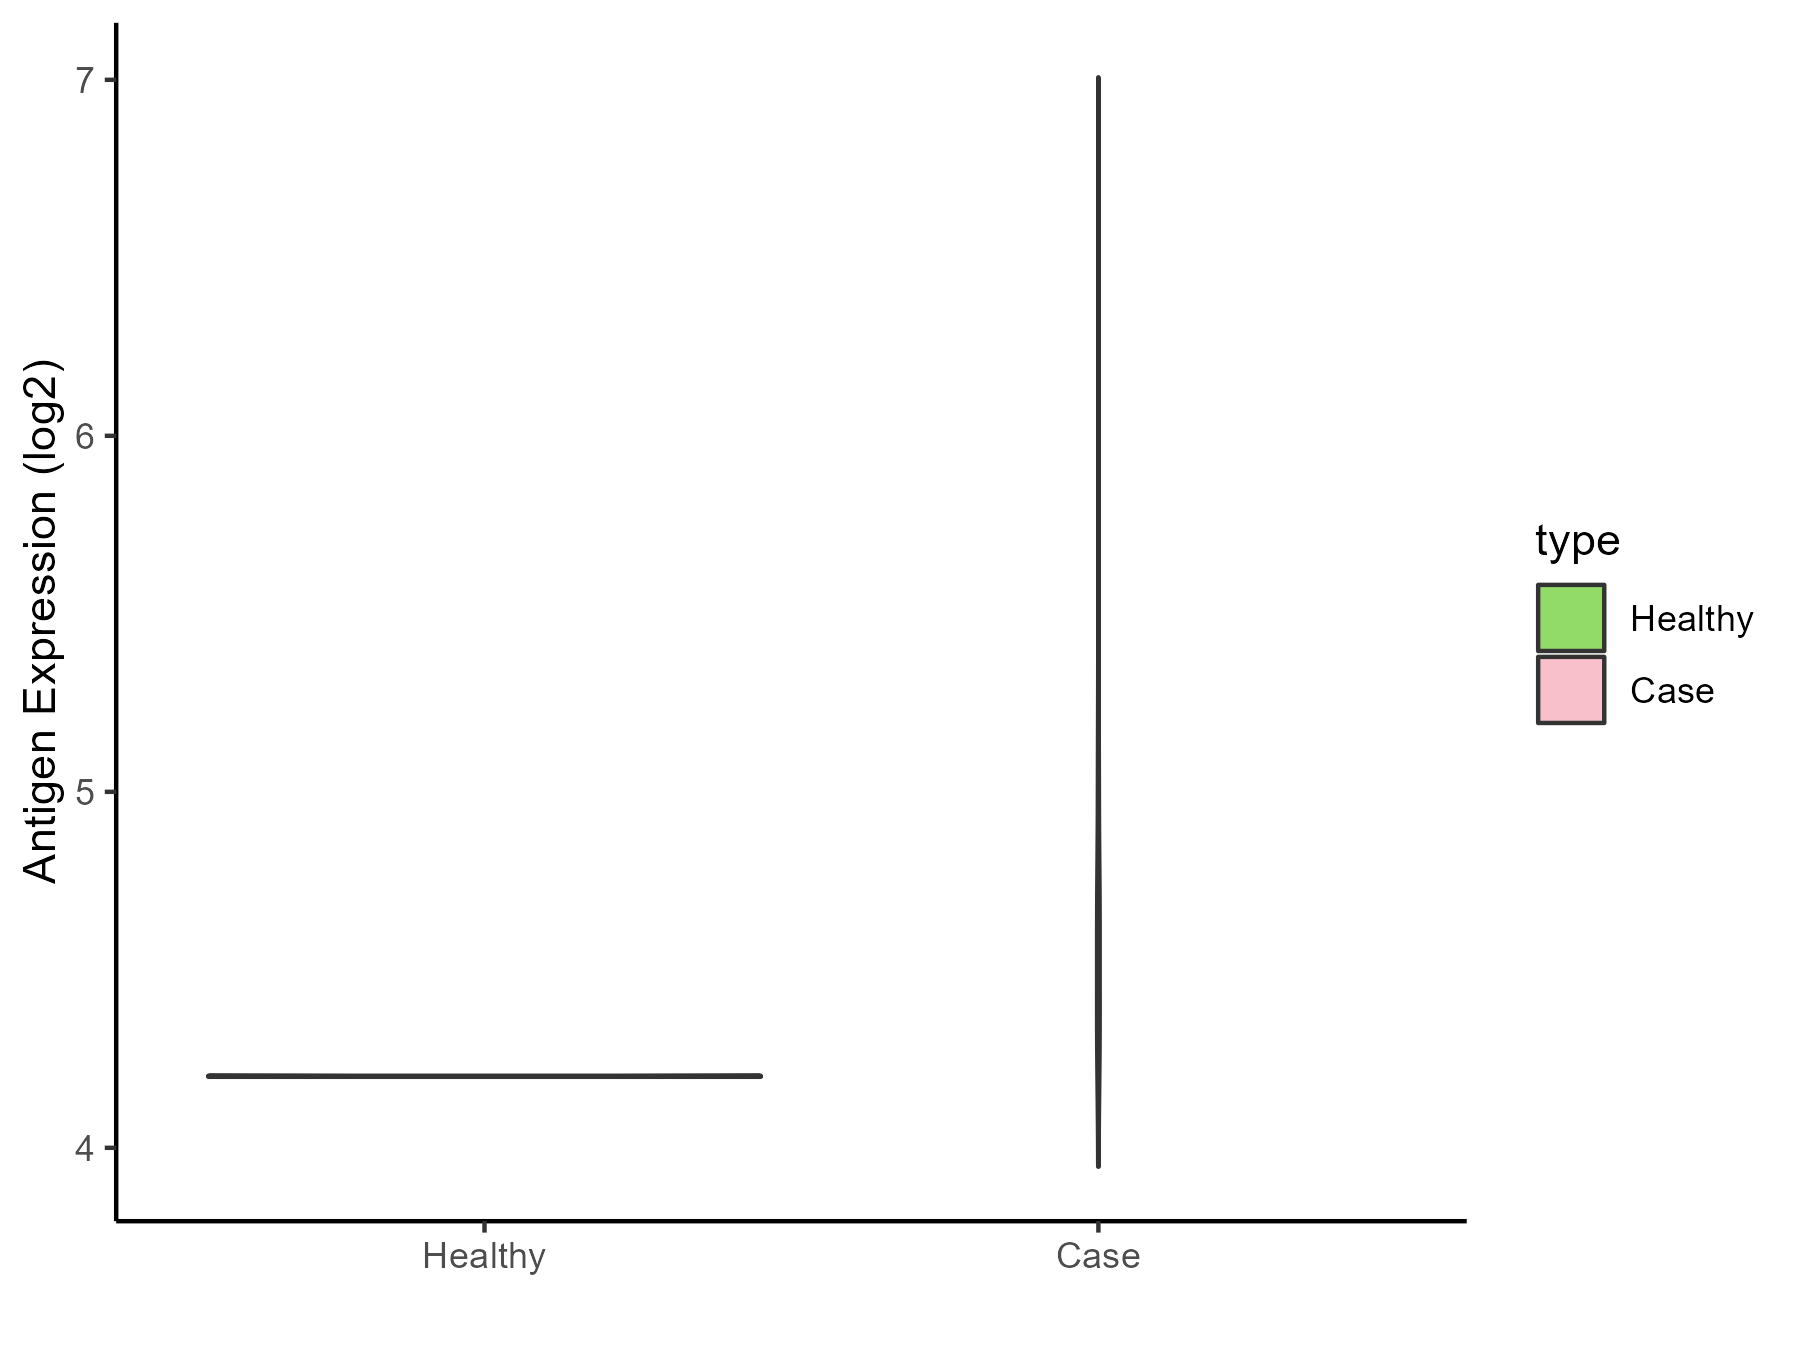
| The Studied Tissue | Brainstem | |
| The Specific Disease | Glioma | |
| The Expression Level of Disease Section Compare with the Healthy Individual Tissue | p-value: 2.09E-05; Fold-change: 0.396422438; Z-score: 190.0757185 | |
| Disease-specific Antigen Abundances |
|
Click to View the Clearer Original Diagram |
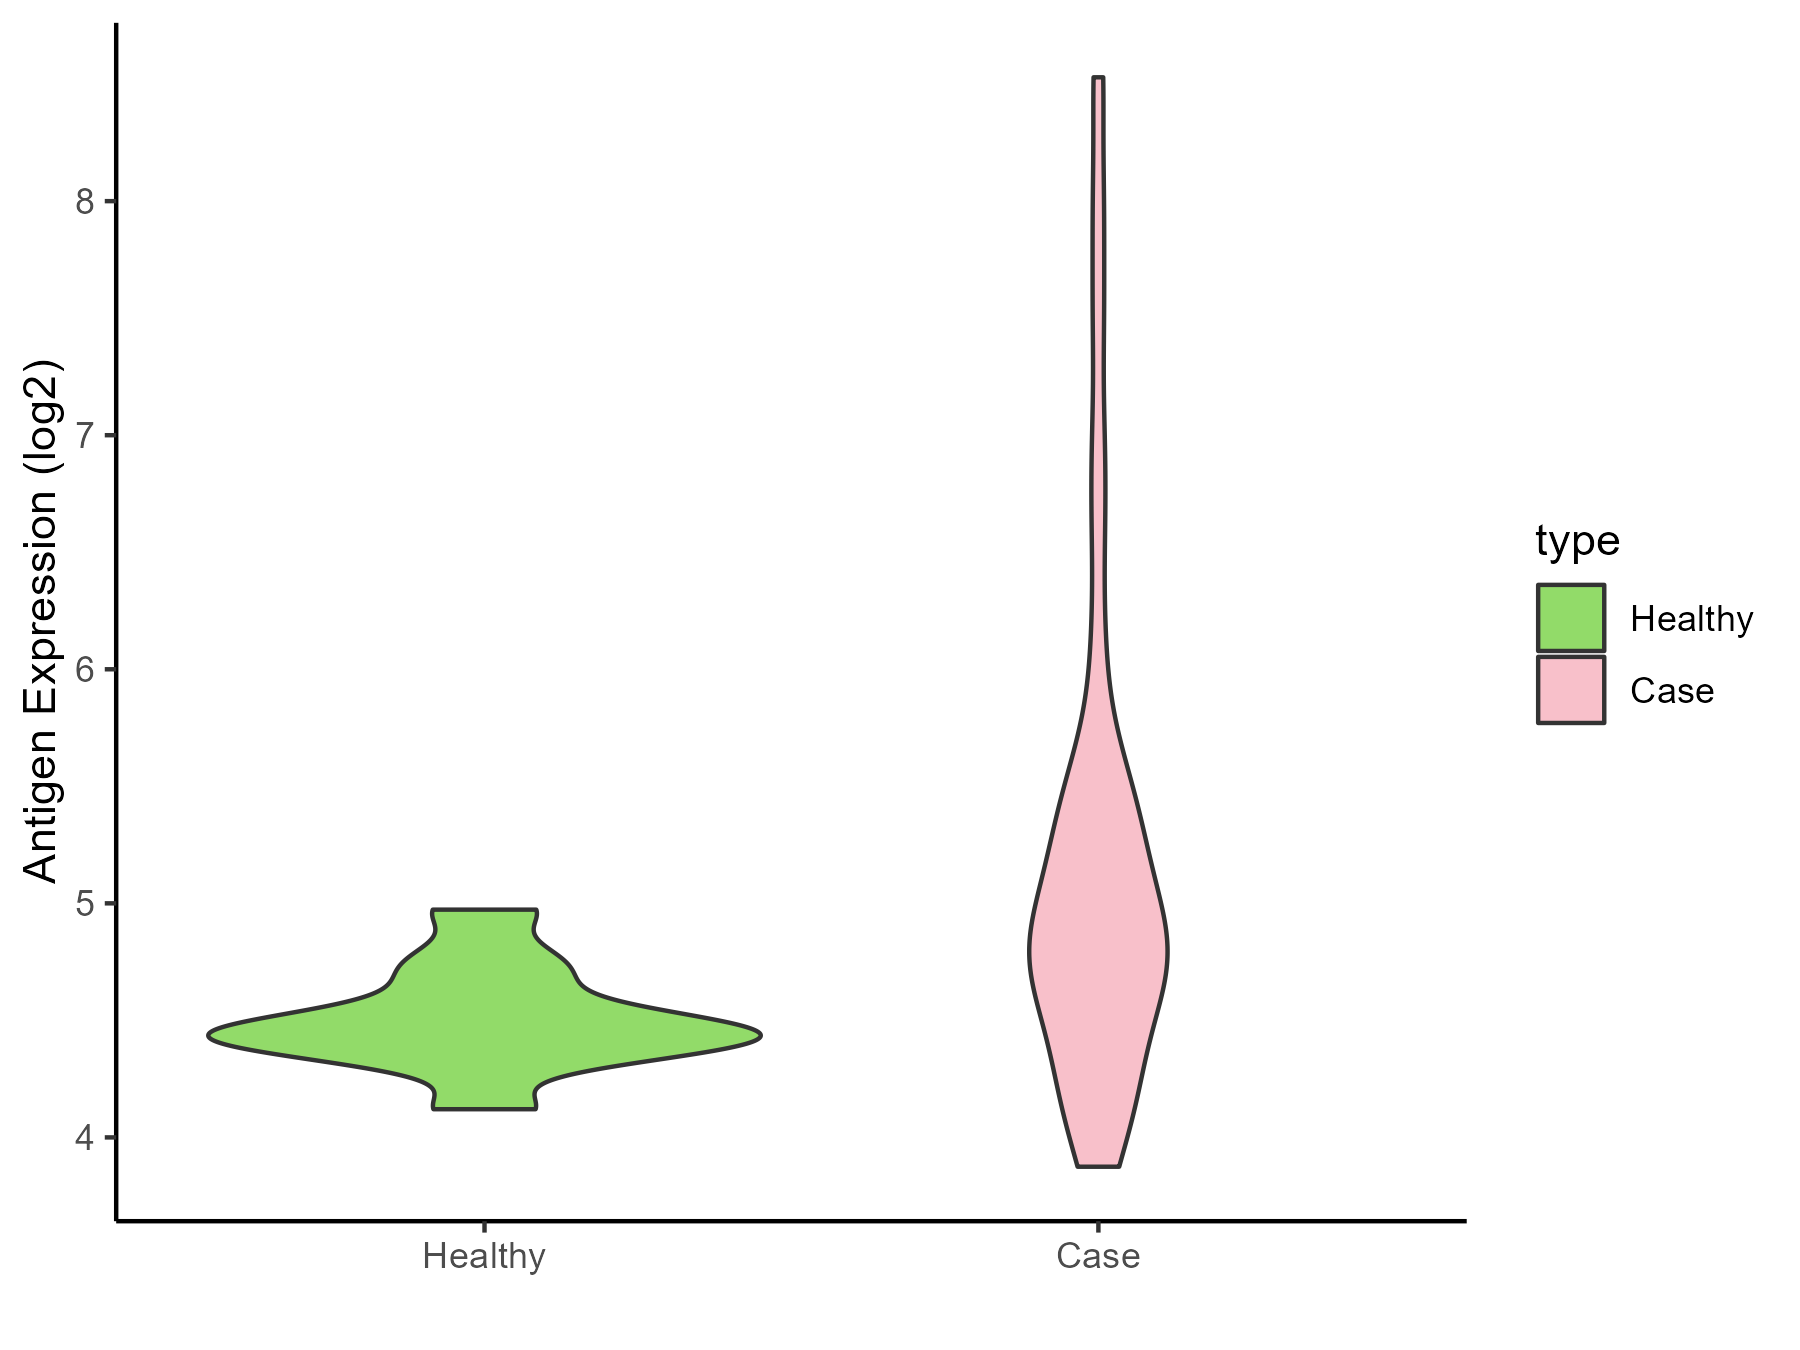
| The Studied Tissue | White matter | |
| The Specific Disease | Glioma | |
| The Expression Level of Disease Section Compare with the Healthy Individual Tissue | p-value: 0.000631625; Fold-change: 0.387503368; Z-score: 1.694165237 | |
| Disease-specific Antigen Abundances |
|
Click to View the Clearer Original Diagram |
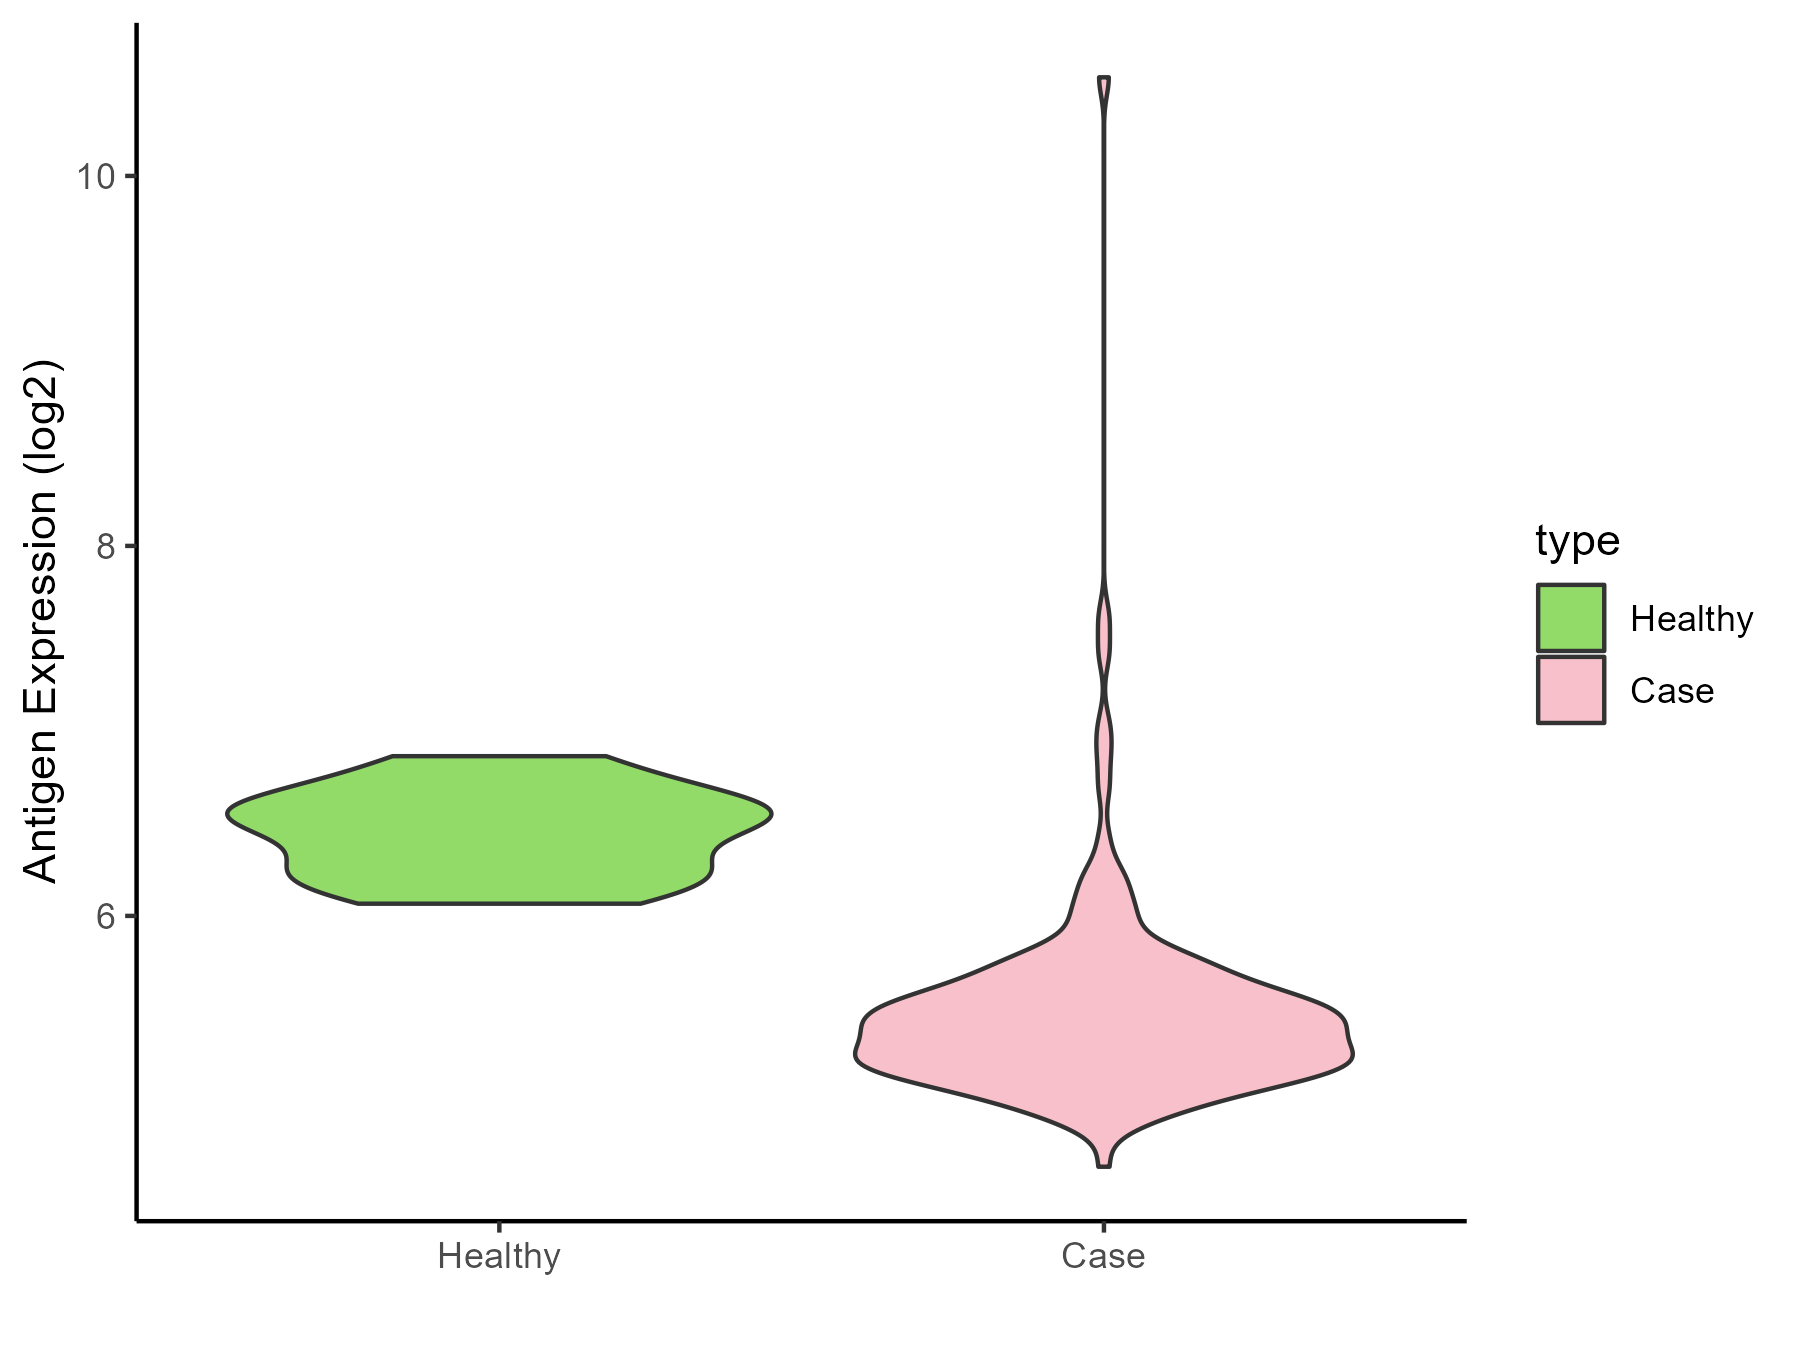
| The Studied Tissue | Brainstem | |
| The Specific Disease | Neuroectodermal tumor | |
| The Expression Level of Disease Section Compare with the Healthy Individual Tissue | p-value: 1.84E-08; Fold-change: -1.120738166; Z-score: -4.445591048 | |
| Disease-specific Antigen Abundances |
|
Click to View the Clearer Original Diagram |
| The Studied Tissue | Nervous | |
| The Specific Disease | Brain cancer | |
| The Expression Level of Disease Section Compare with the Healthy Individual Tissue | p-value: 8.30E-26; Fold-change: 0.062080465; Z-score: 0.13172412 | |
| Disease-specific Antigen Abundances |
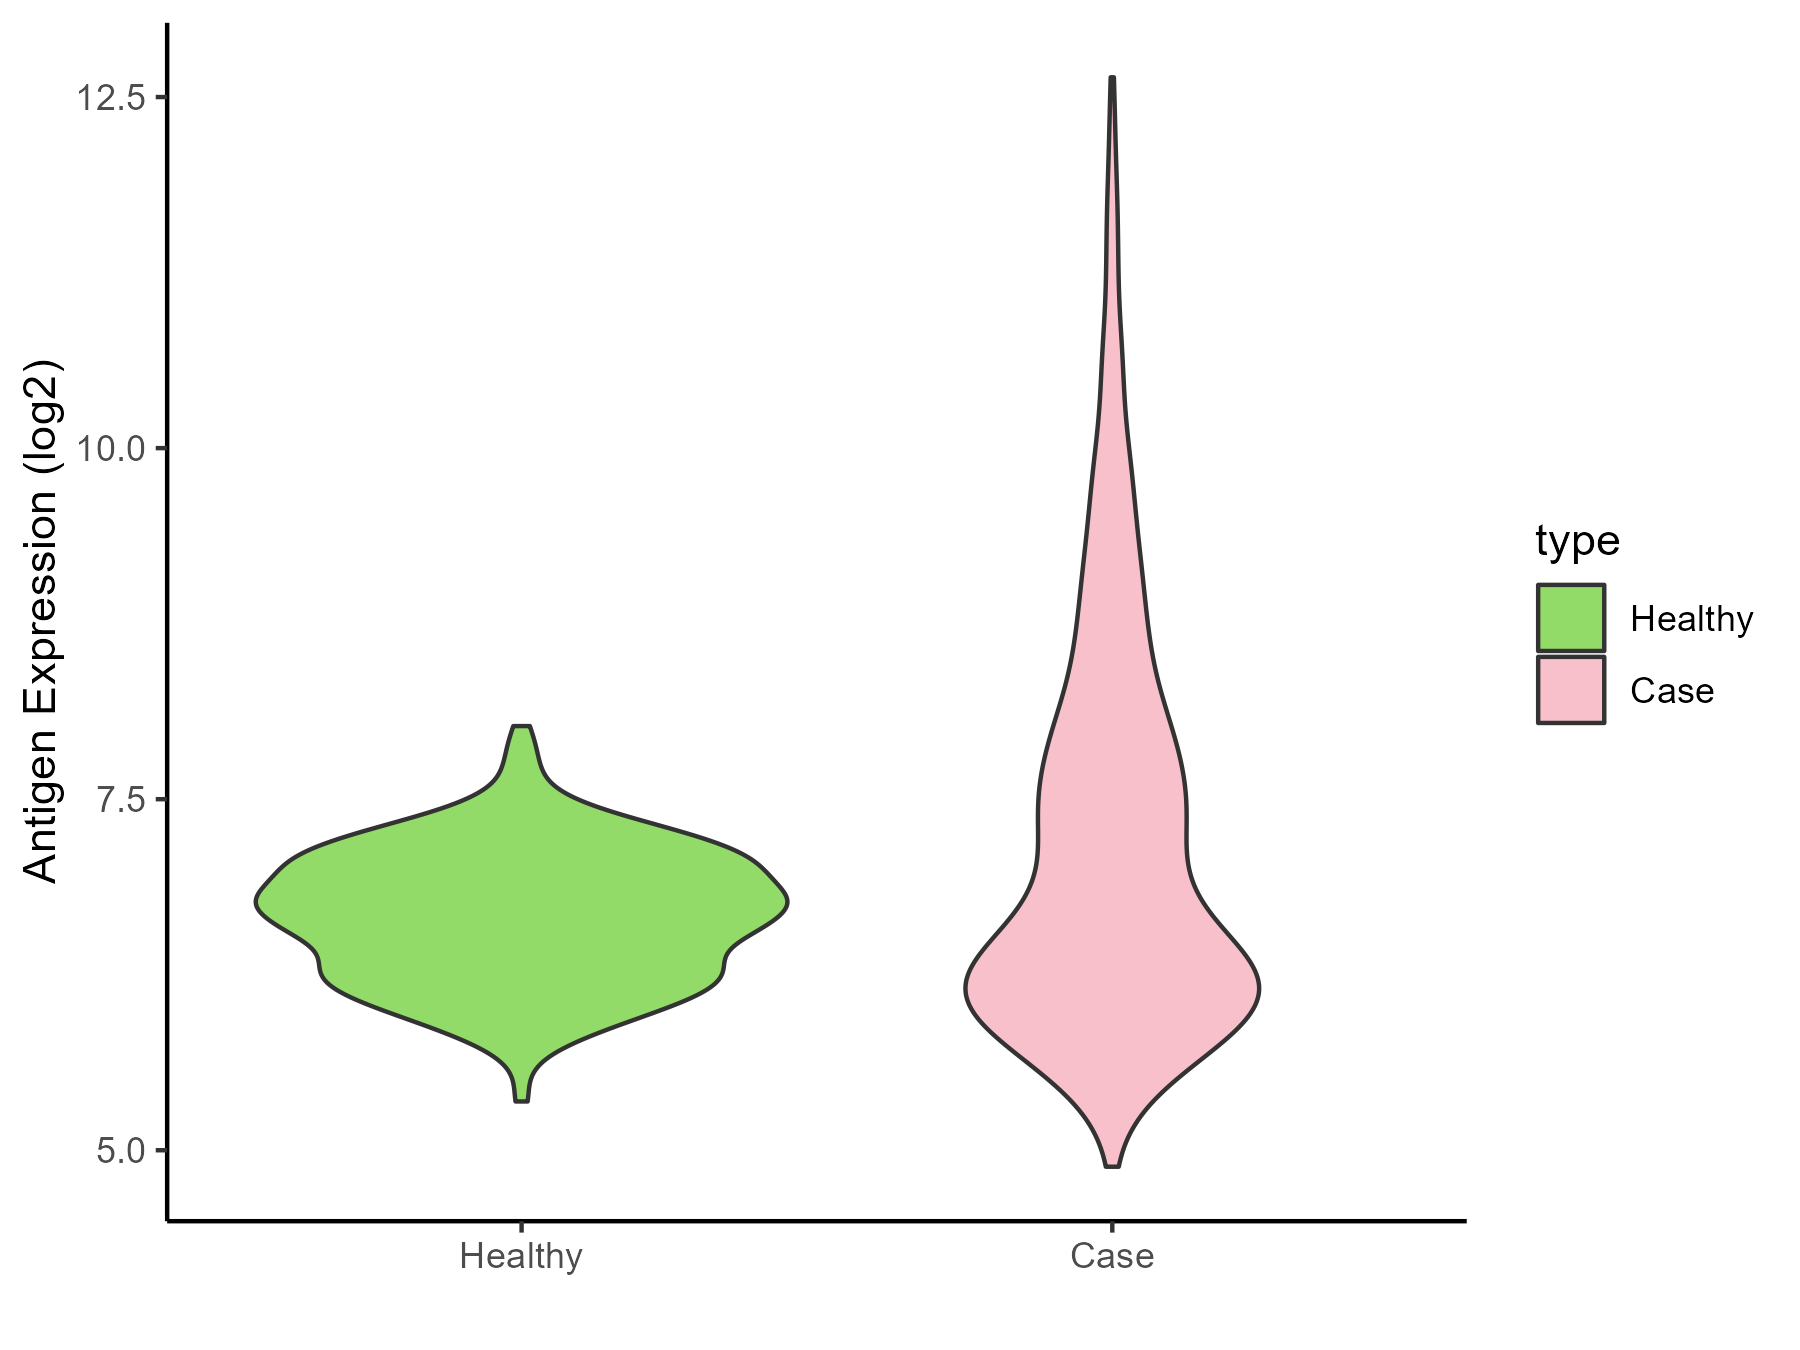
|
Click to View the Clearer Original Diagram |
| Differential expression pattern of antigen in diseases | ||
| The Studied Tissue | Whole blood | |
| The Specific Disease | Polycythemia vera | |
| The Expression Level of Disease Section Compare with the Healthy Individual Tissue | p-value: 0.023361705; Fold-change: 0.035974971; Z-score: 0.227643588 | |
| Disease-specific Antigen Abundances |
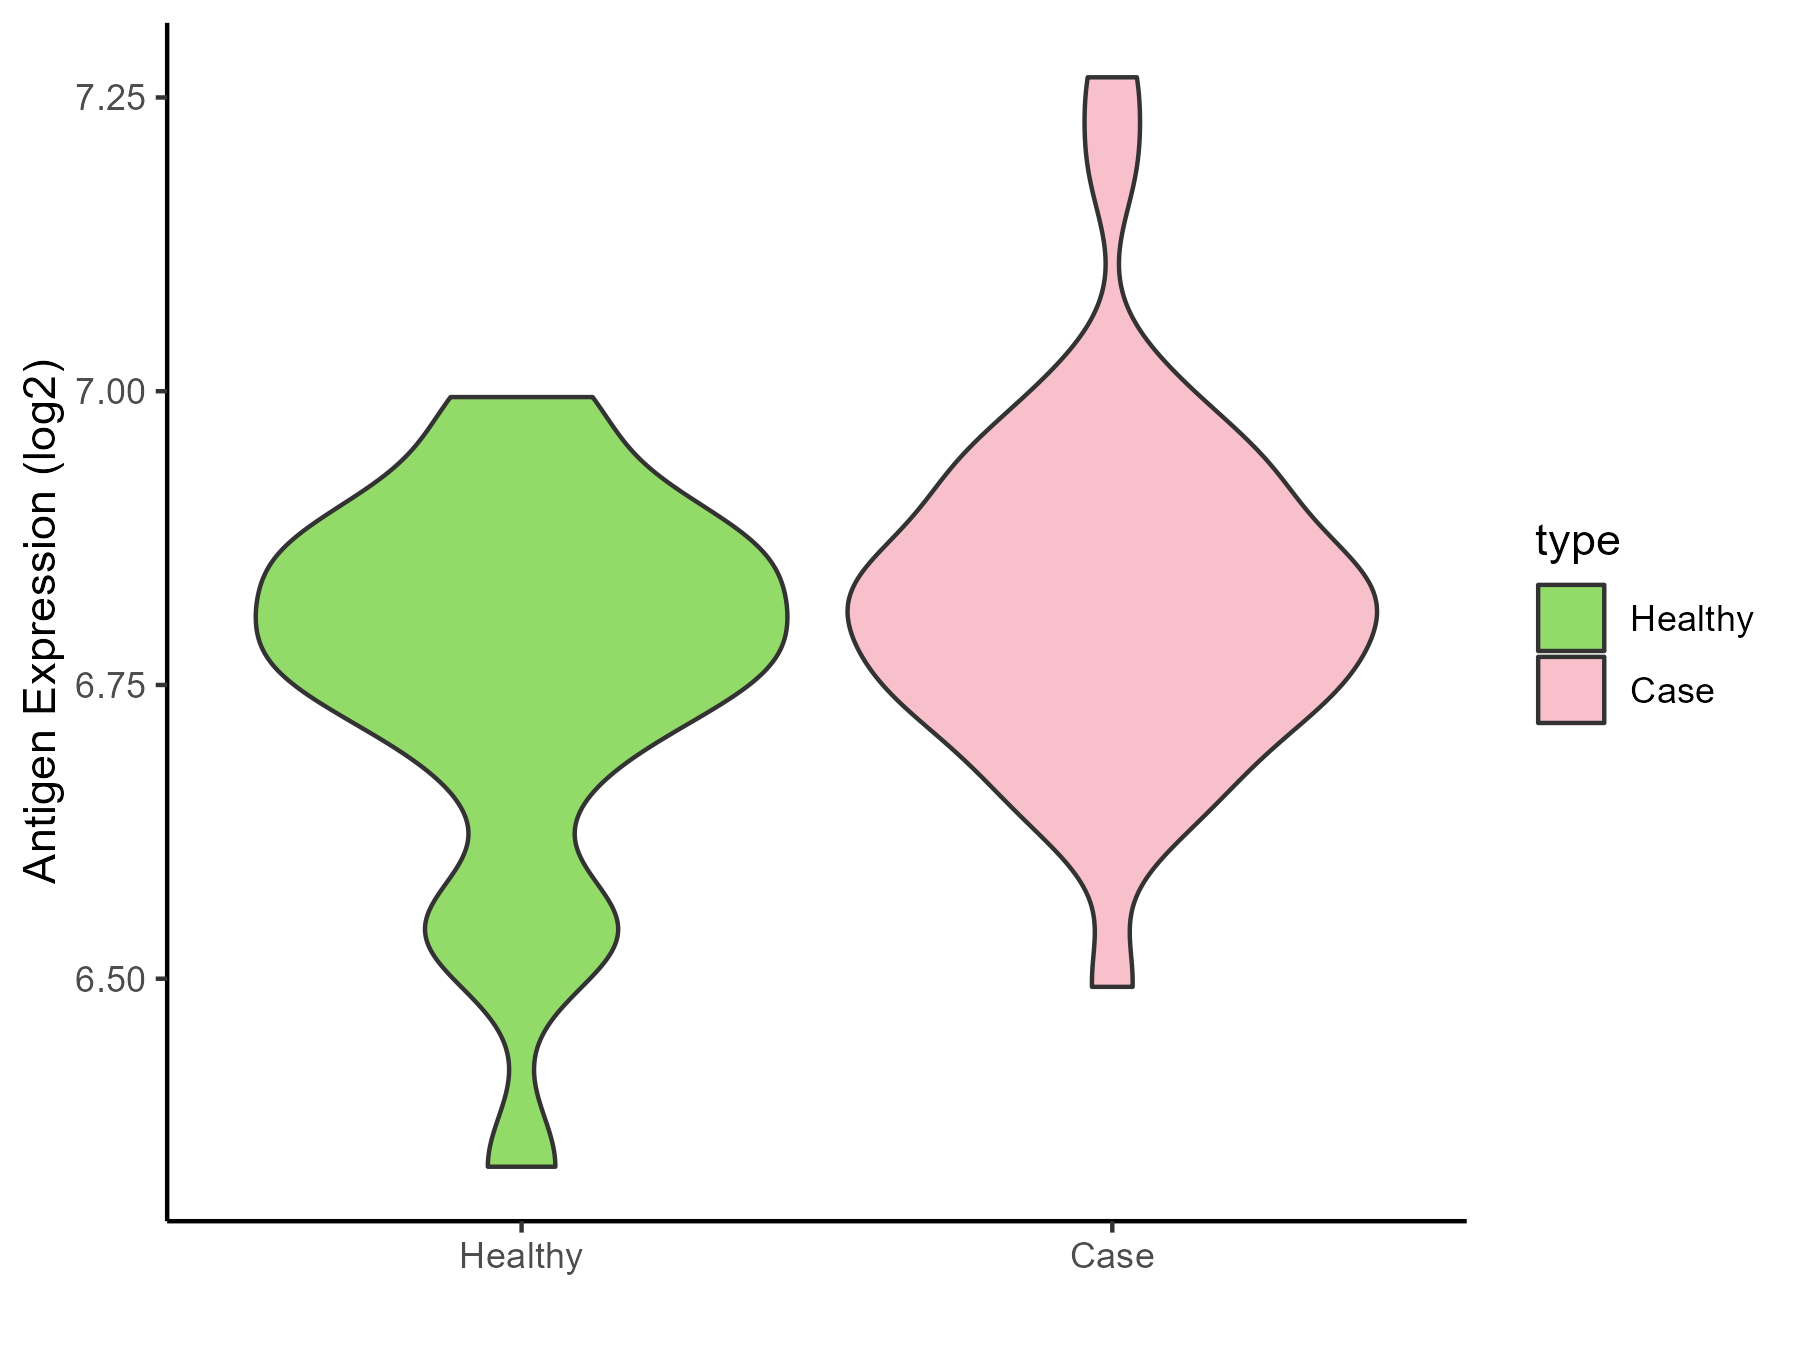
|
Click to View the Clearer Original Diagram |
| The Studied Tissue | Whole blood | |
| The Specific Disease | Myelofibrosis | |
| The Expression Level of Disease Section Compare with the Healthy Individual Tissue | p-value: 0.780007905; Fold-change: -0.012254581; Z-score: -0.090792428 | |
| Disease-specific Antigen Abundances |
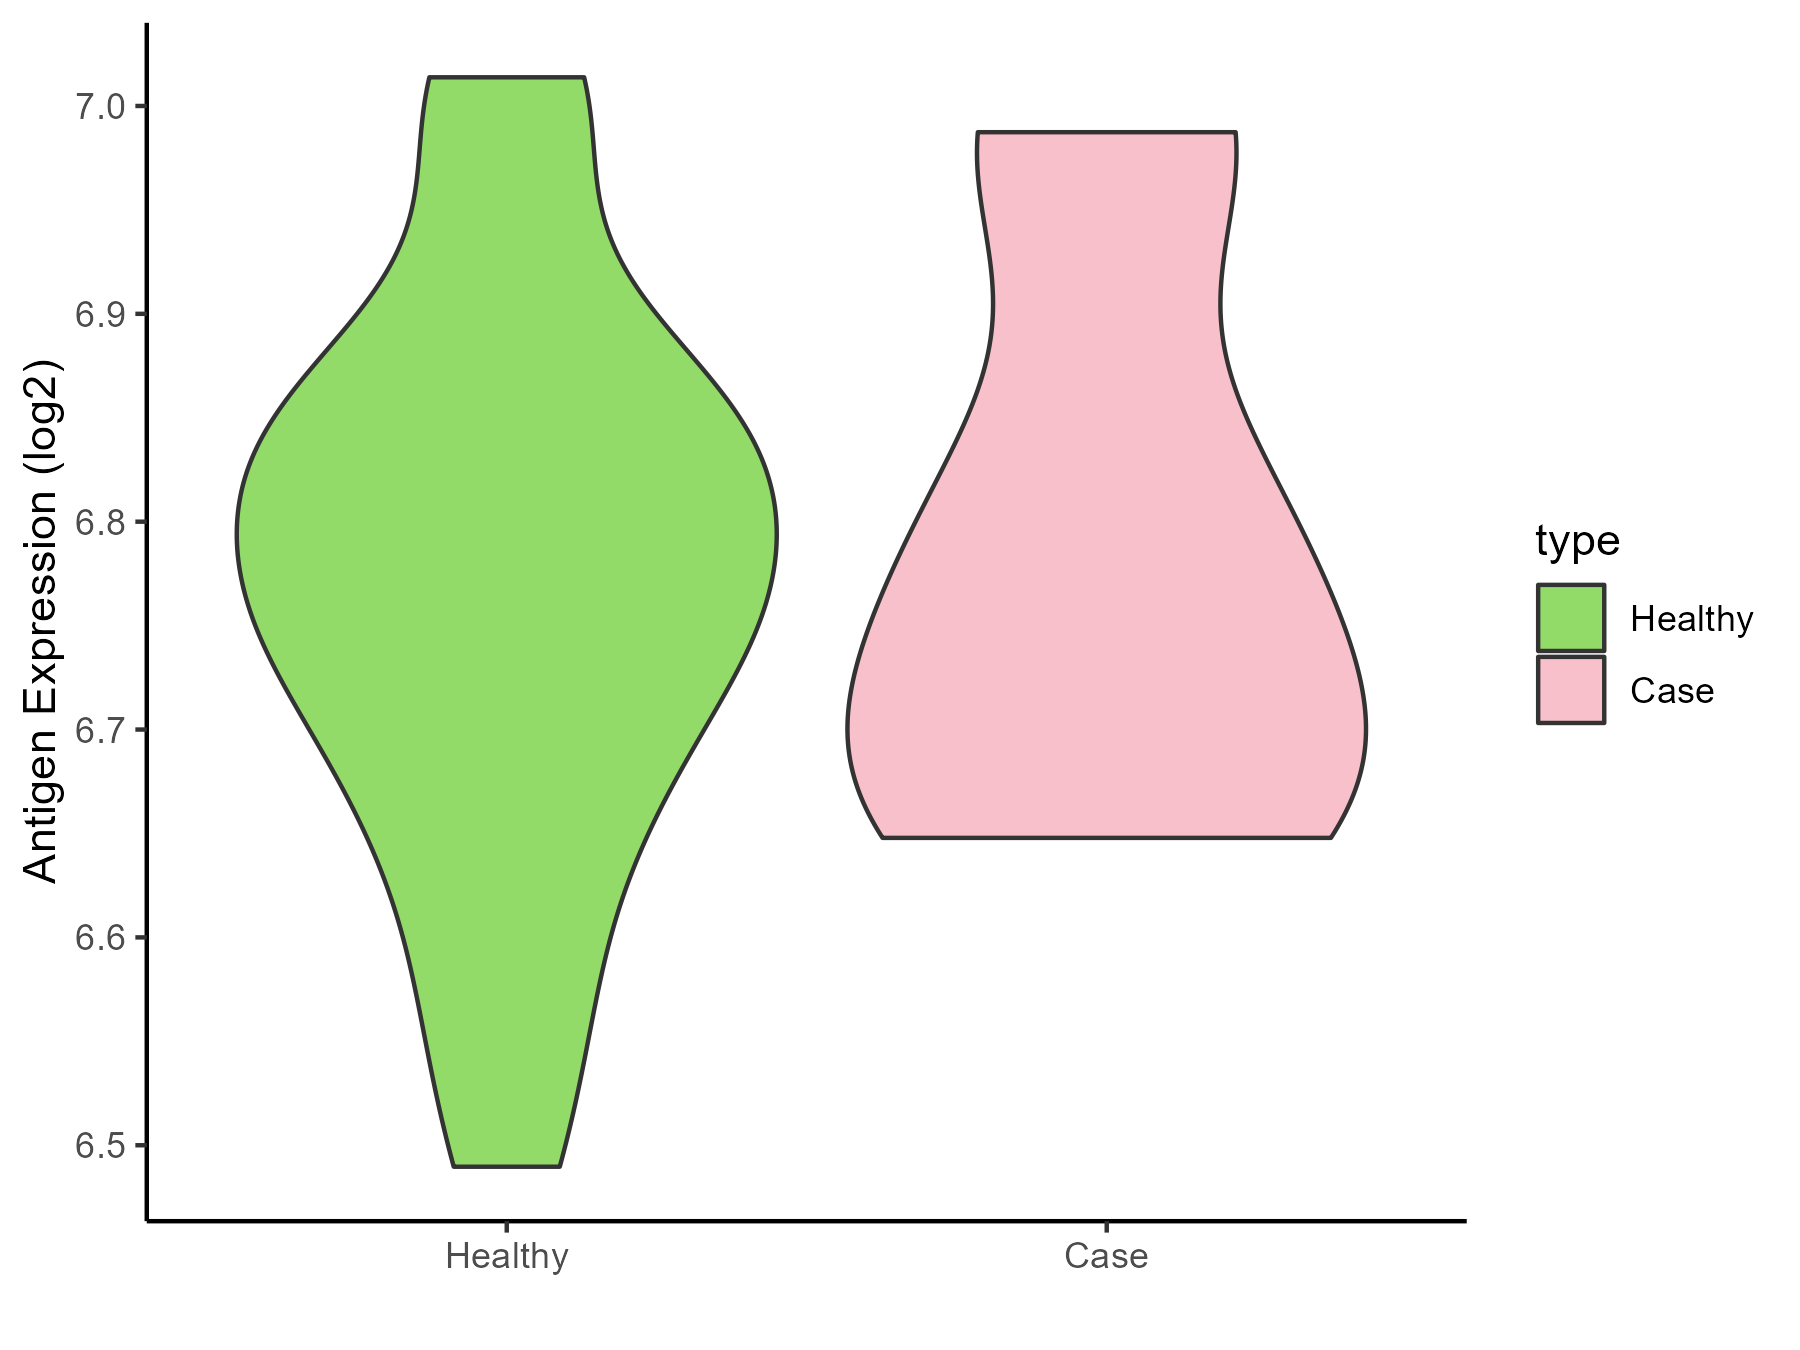
|
Click to View the Clearer Original Diagram |
| Differential expression pattern of antigen in diseases | ||
| The Studied Tissue | Bone marrow | |
| The Specific Disease | Myelodysplastic syndromes | |
| The Expression Level of Disease Section Compare with the Healthy Individual Tissue | p-value: 0.245724038; Fold-change: 0.010369981; Z-score: 0.049585497 | |
| The Expression Level of Disease Section Compare with the Adjacent Tissue | p-value: 0.168196738; Fold-change: -0.06784742; Z-score: -0.779471035 | |
| Disease-specific Antigen Abundances |
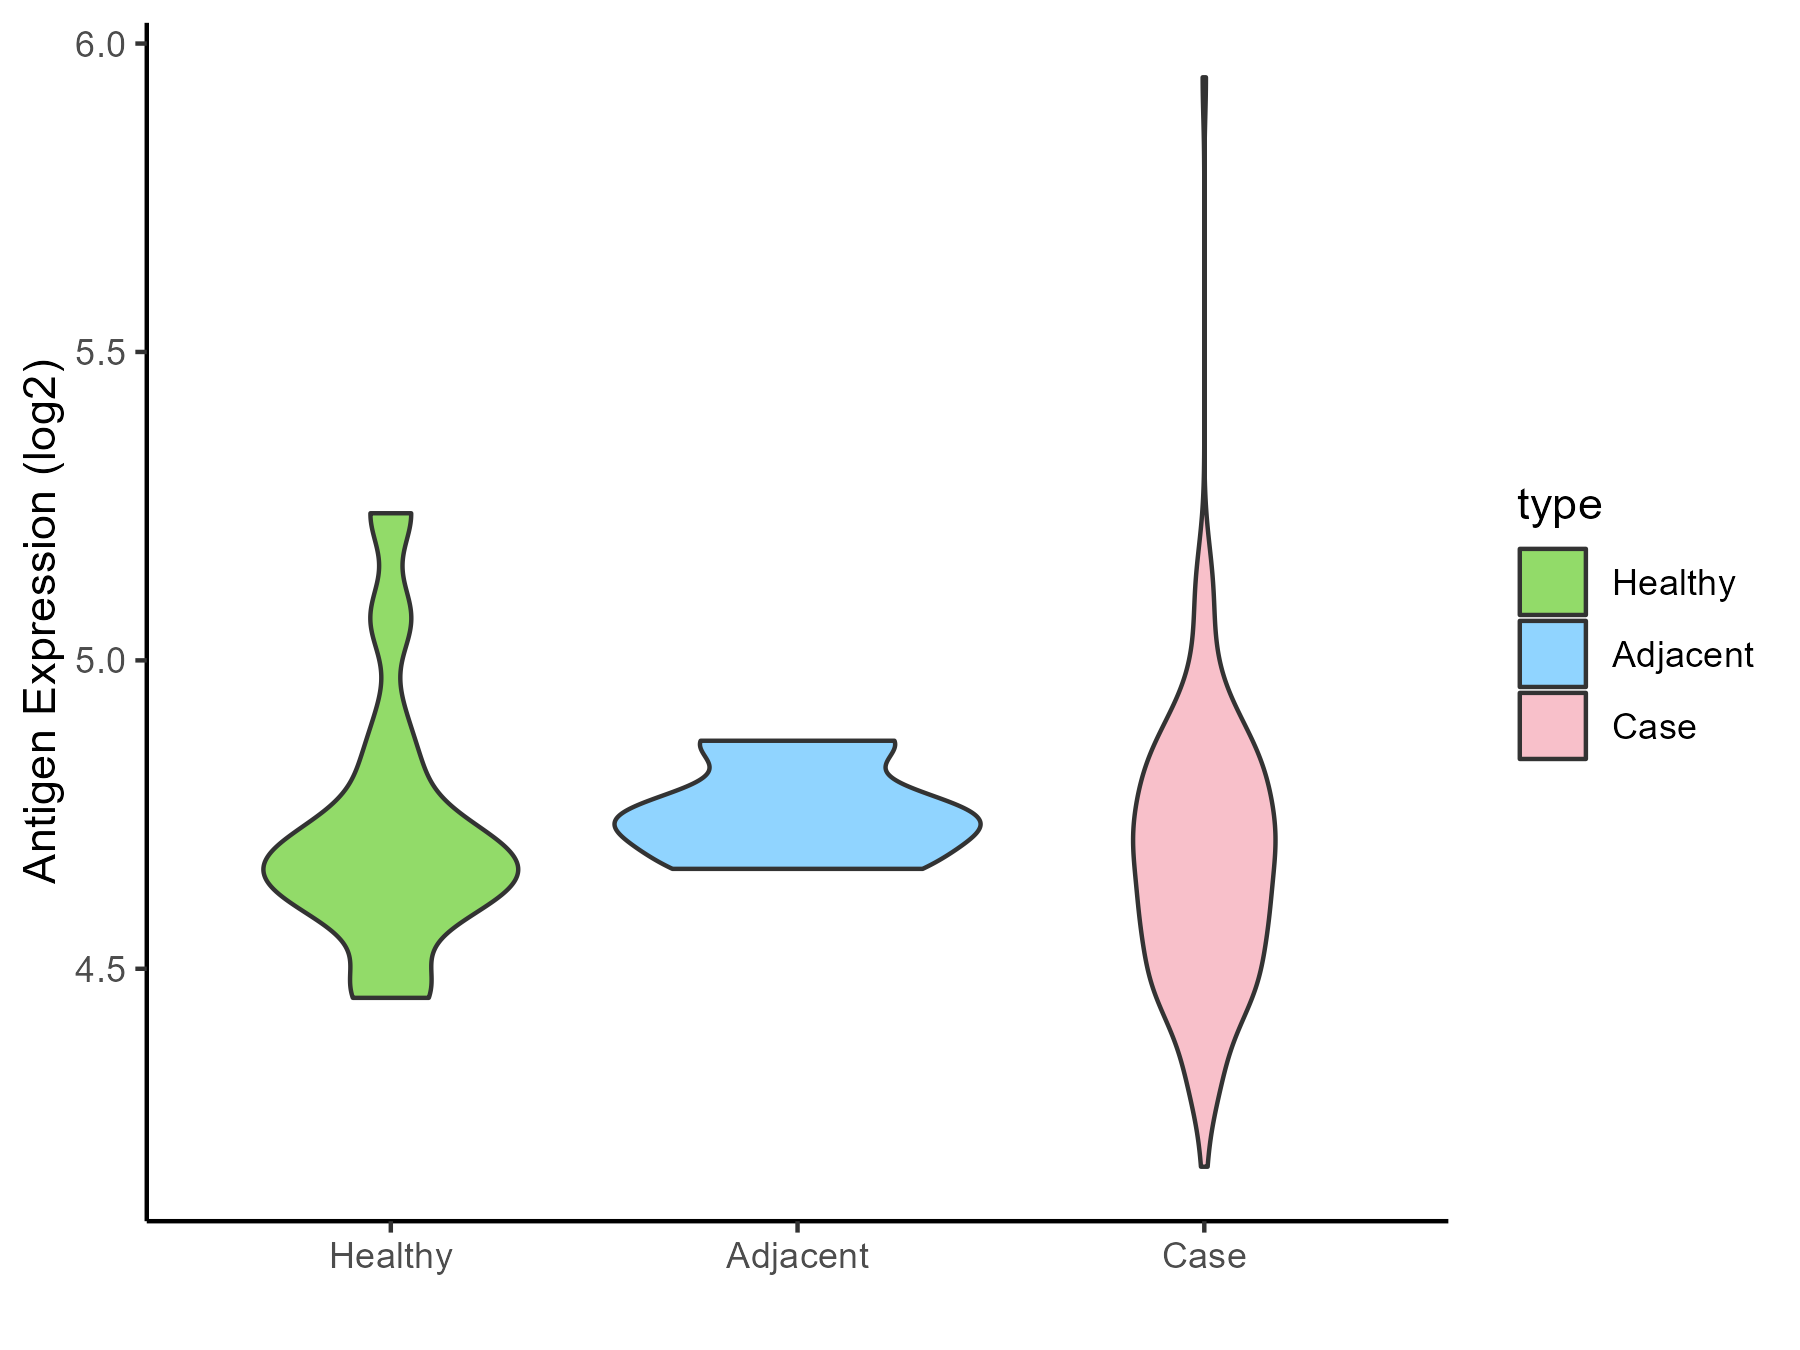
|
Click to View the Clearer Original Diagram |
| Differential expression pattern of antigen in diseases | ||
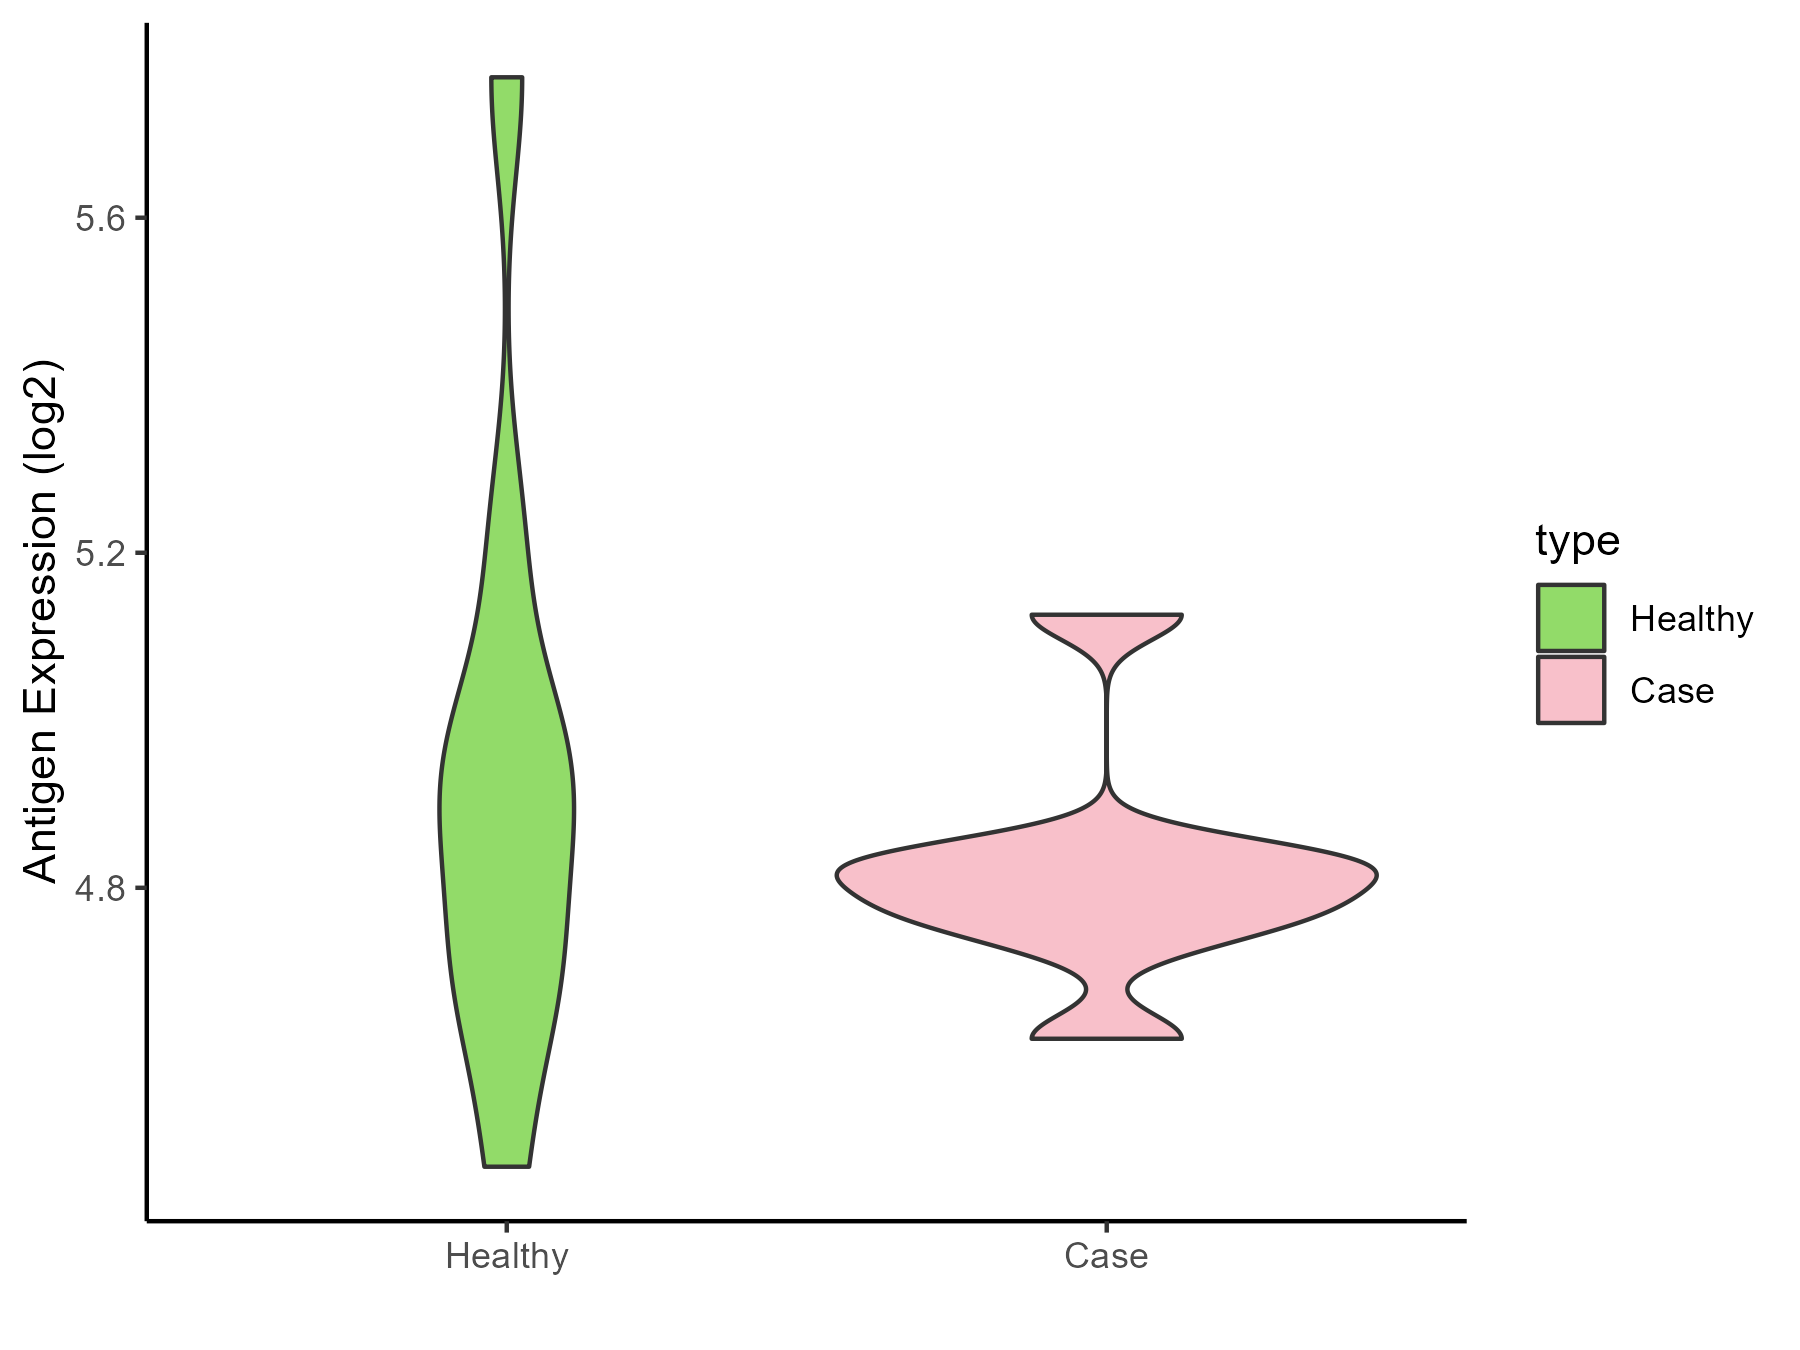
| The Studied Tissue | Tonsil | |
| The Specific Disease | Lymphoma | |
| The Expression Level of Disease Section Compare with the Healthy Individual Tissue | p-value: 0.382643541; Fold-change: -0.113681087; Z-score: -0.315728038 | |
| Disease-specific Antigen Abundances |
|
Click to View the Clearer Original Diagram |
| Differential expression pattern of antigen in diseases | ||
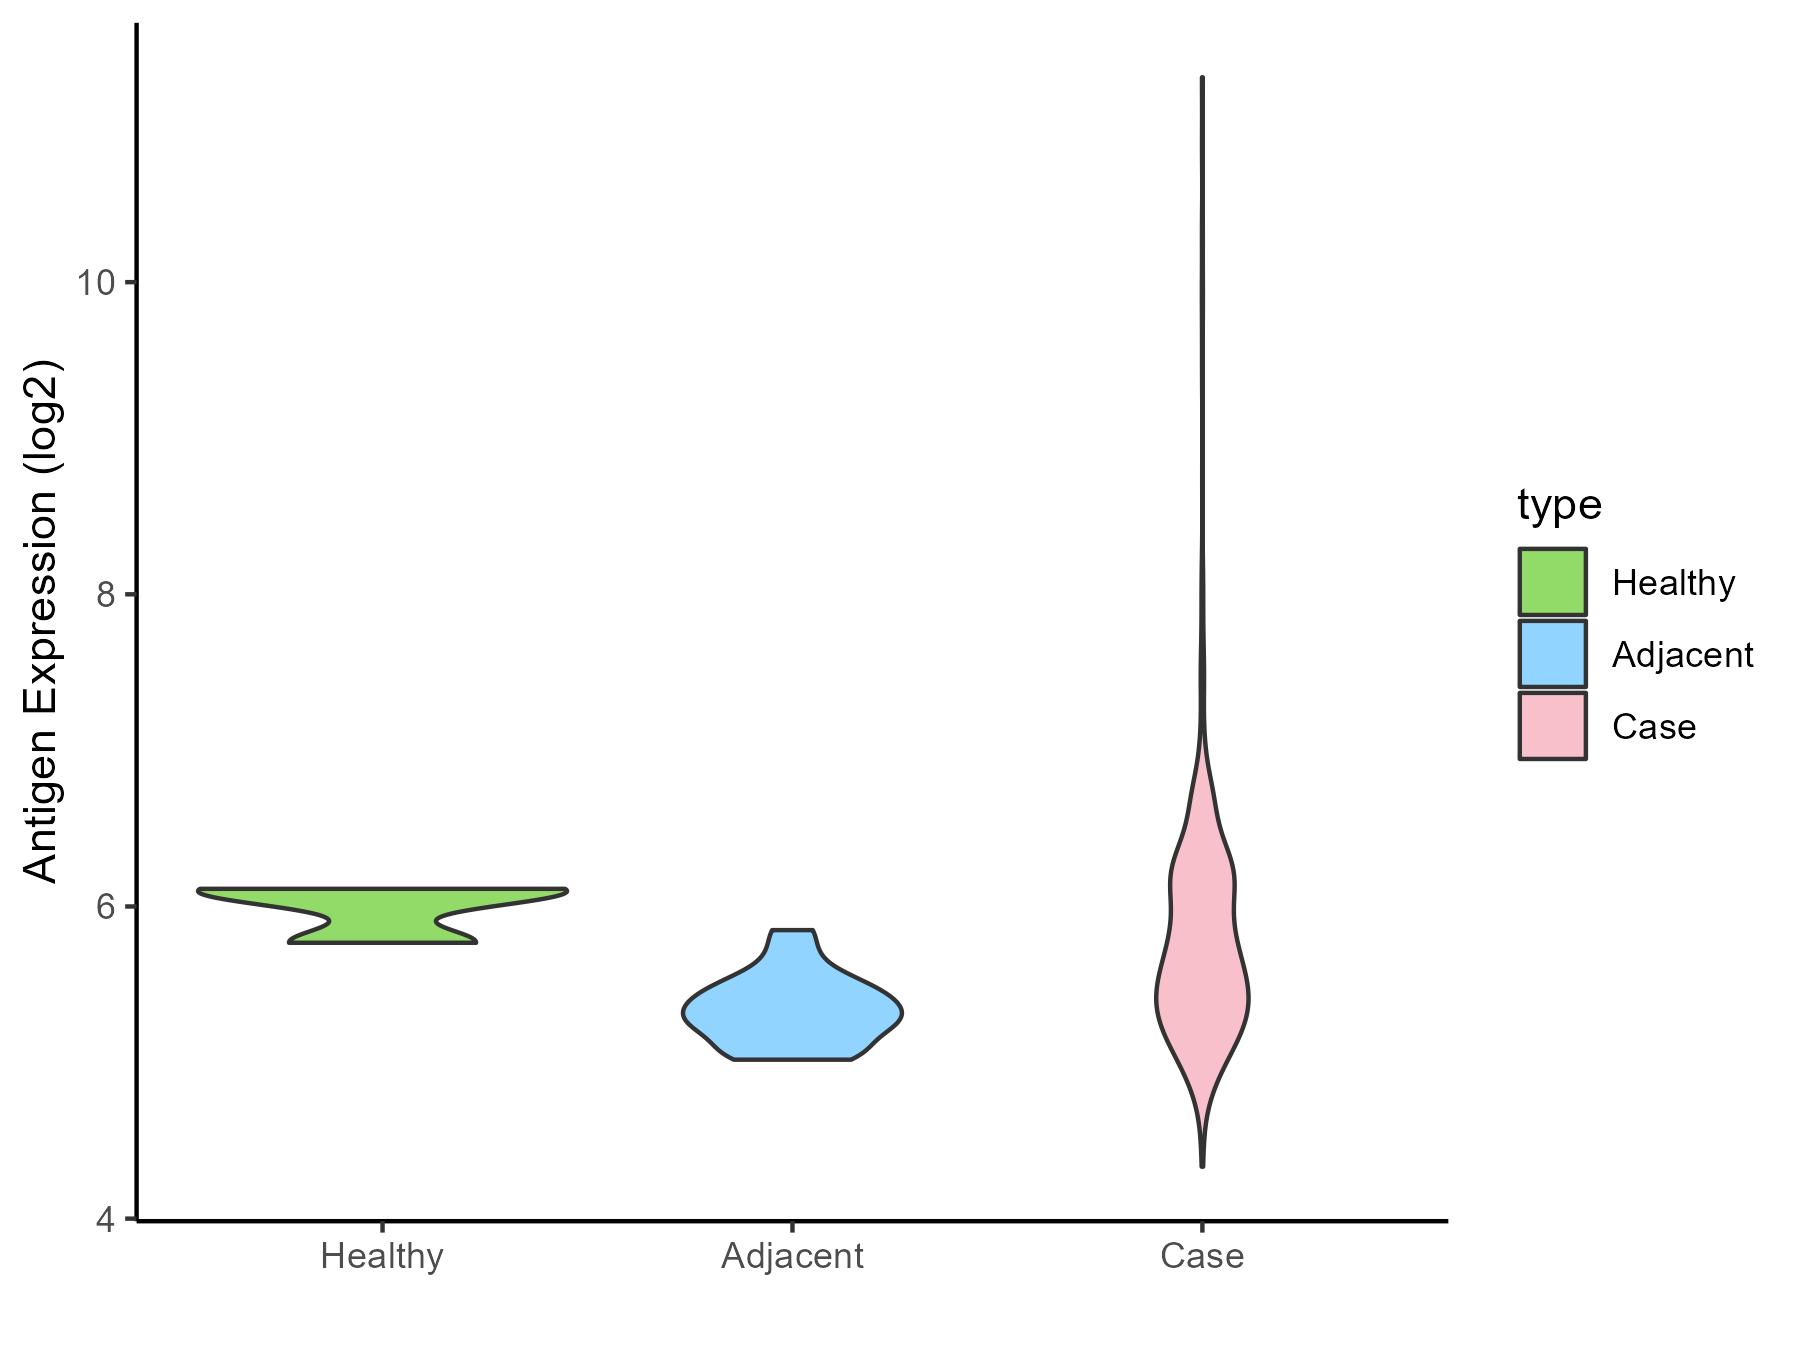
| The Studied Tissue | Gastric | |
| The Specific Disease | Gastric cancer | |
| The Expression Level of Disease Section Compare with the Healthy Individual Tissue | p-value: 0.252471843; Fold-change: -0.417321215; Z-score: -2.17289188 | |
| The Expression Level of Disease Section Compare with the Adjacent Tissue | p-value: 5.61E-08; Fold-change: 0.32109048; Z-score: 1.408689643 | |
| Disease-specific Antigen Abundances |
|
Click to View the Clearer Original Diagram |
| Differential expression pattern of antigen in diseases | ||
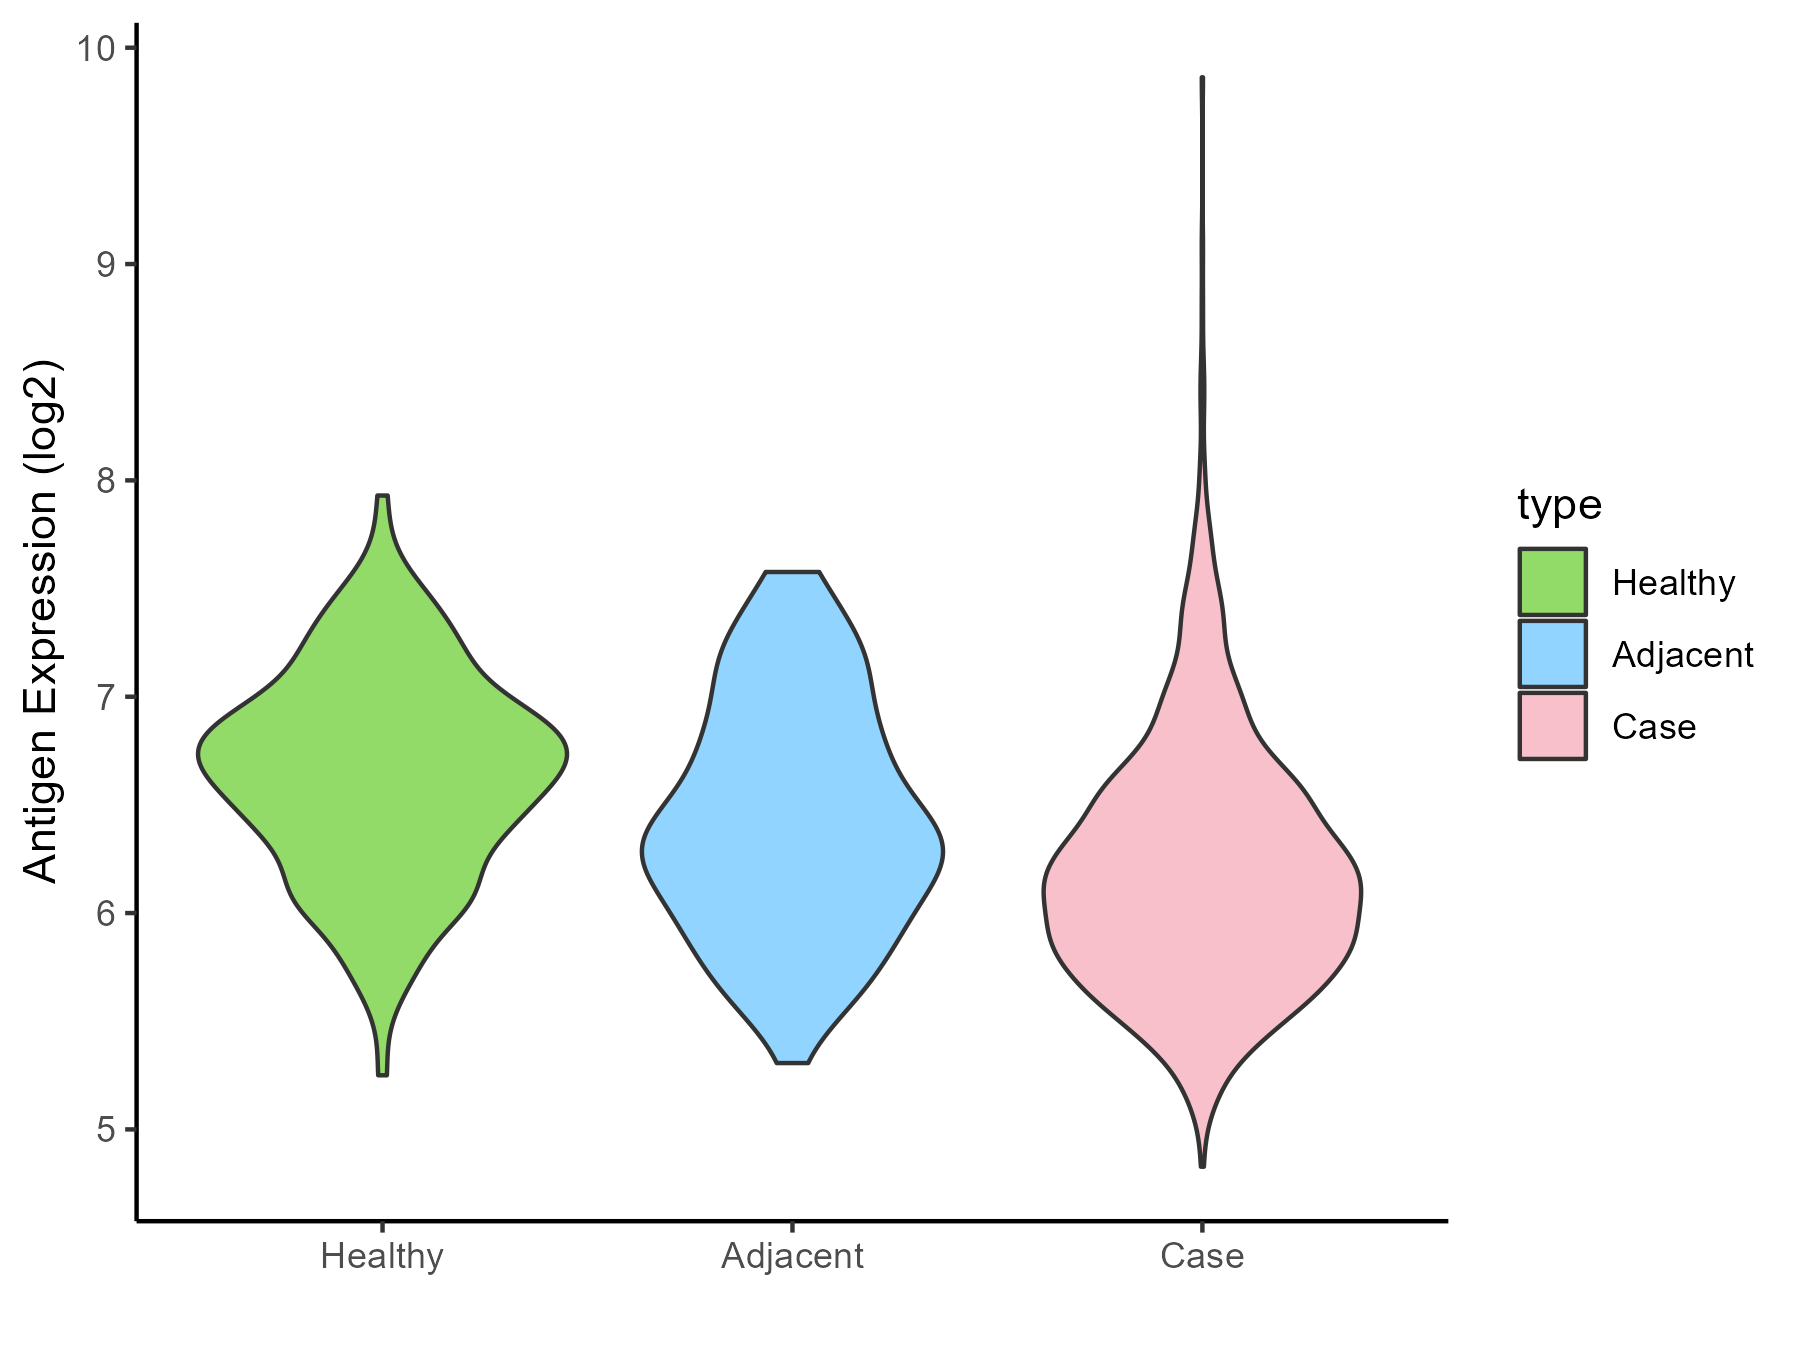
| The Studied Tissue | Colon | |
| The Specific Disease | Colon cancer | |
| The Expression Level of Disease Section Compare with the Healthy Individual Tissue | p-value: 5.14E-21; Fold-change: -0.549885654; Z-score: -1.154337396 | |
| The Expression Level of Disease Section Compare with the Adjacent Tissue | p-value: 1.48E-05; Fold-change: -0.209904054; Z-score: -0.392291048 | |
| Disease-specific Antigen Abundances |
|
Click to View the Clearer Original Diagram |
| Differential expression pattern of antigen in diseases | ||
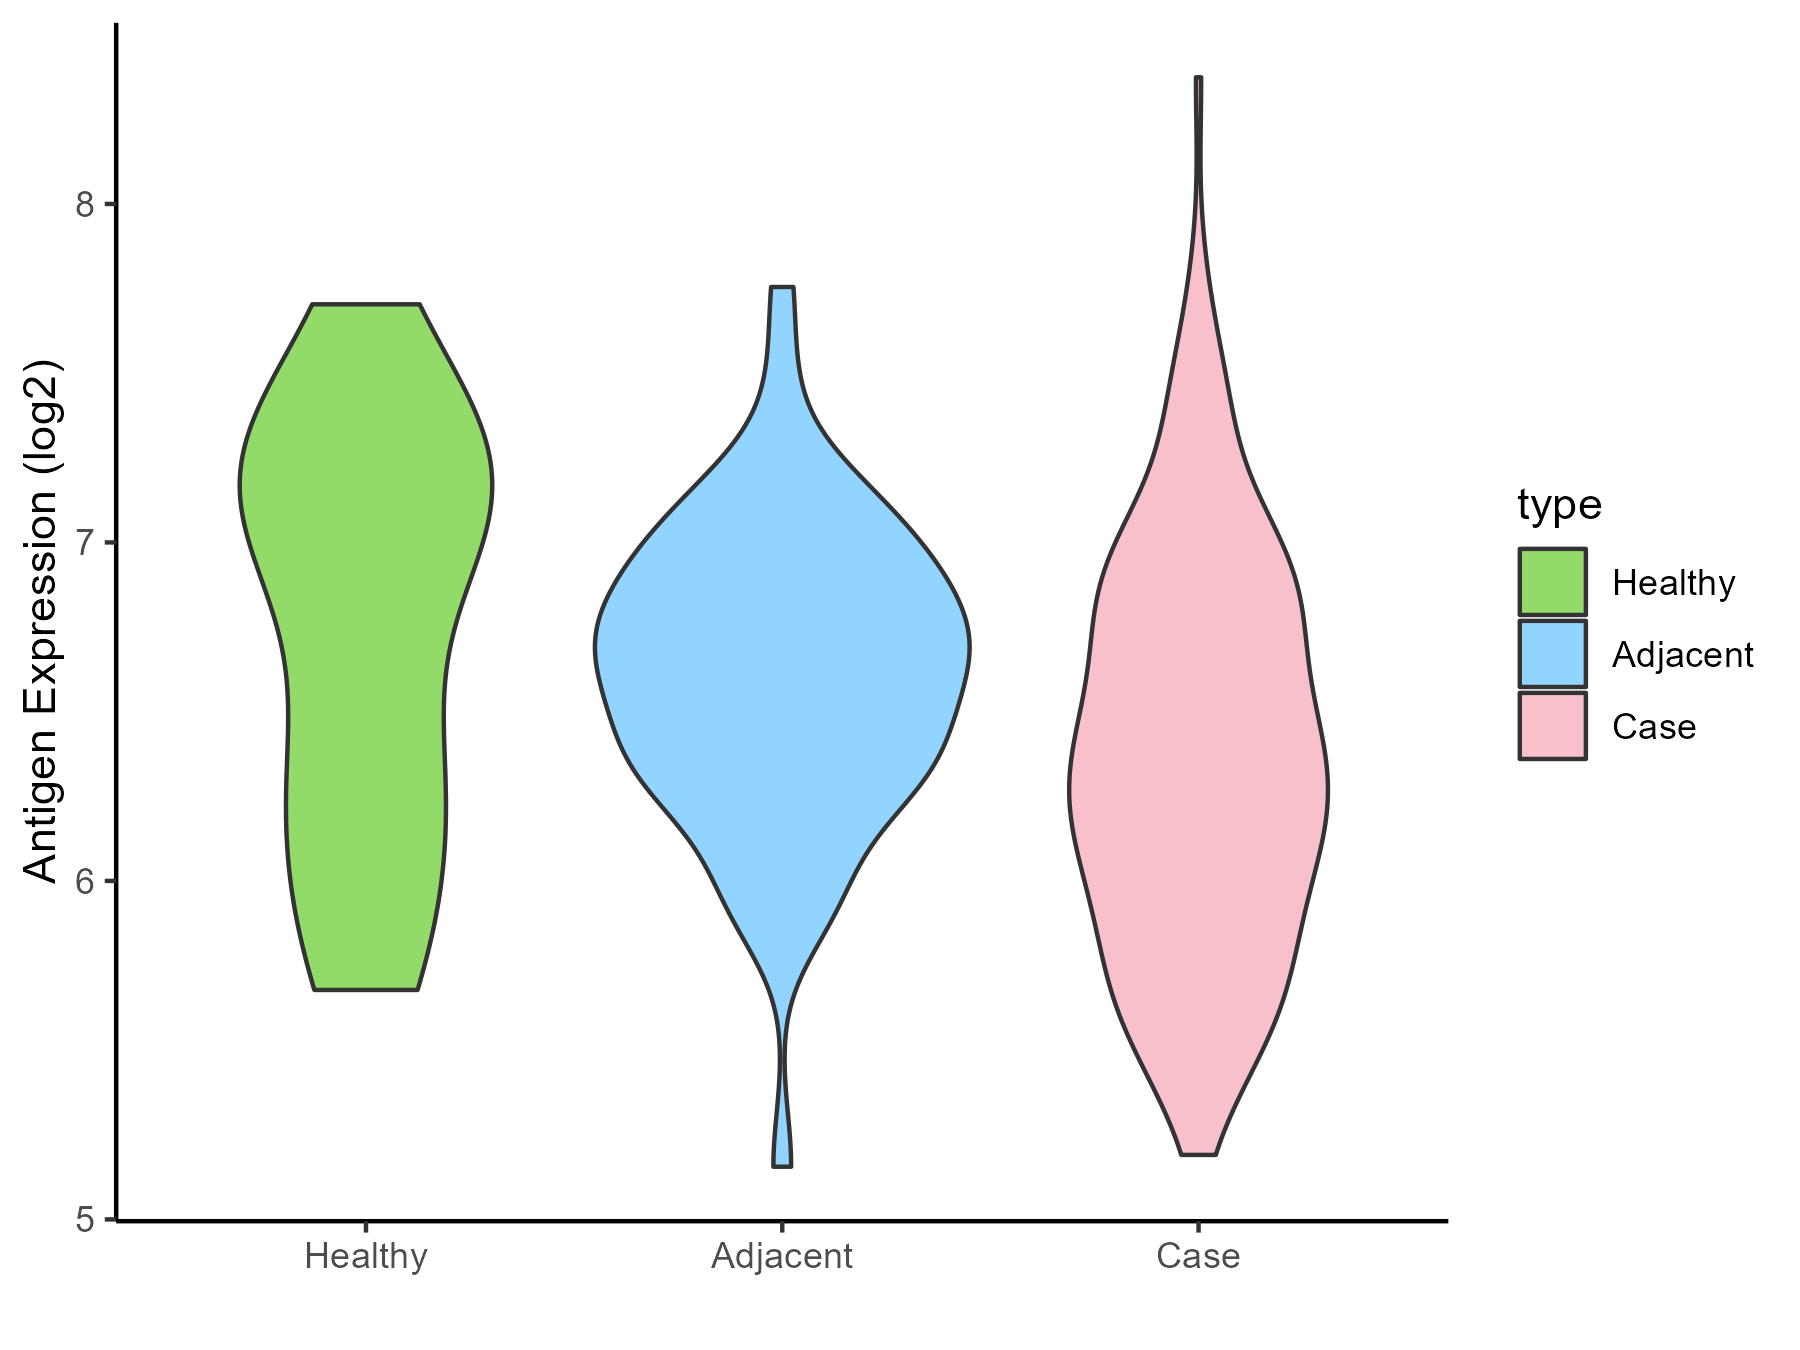
| The Studied Tissue | Pancreas | |
| The Specific Disease | Pancreatic cancer | |
| The Expression Level of Disease Section Compare with the Healthy Individual Tissue | p-value: 0.03639932; Fold-change: -0.64126062; Z-score: -1.023741138 | |
| The Expression Level of Disease Section Compare with the Adjacent Tissue | p-value: 0.001755119; Fold-change: -0.285448426; Z-score: -0.648715881 | |
| Disease-specific Antigen Abundances |
|
Click to View the Clearer Original Diagram |
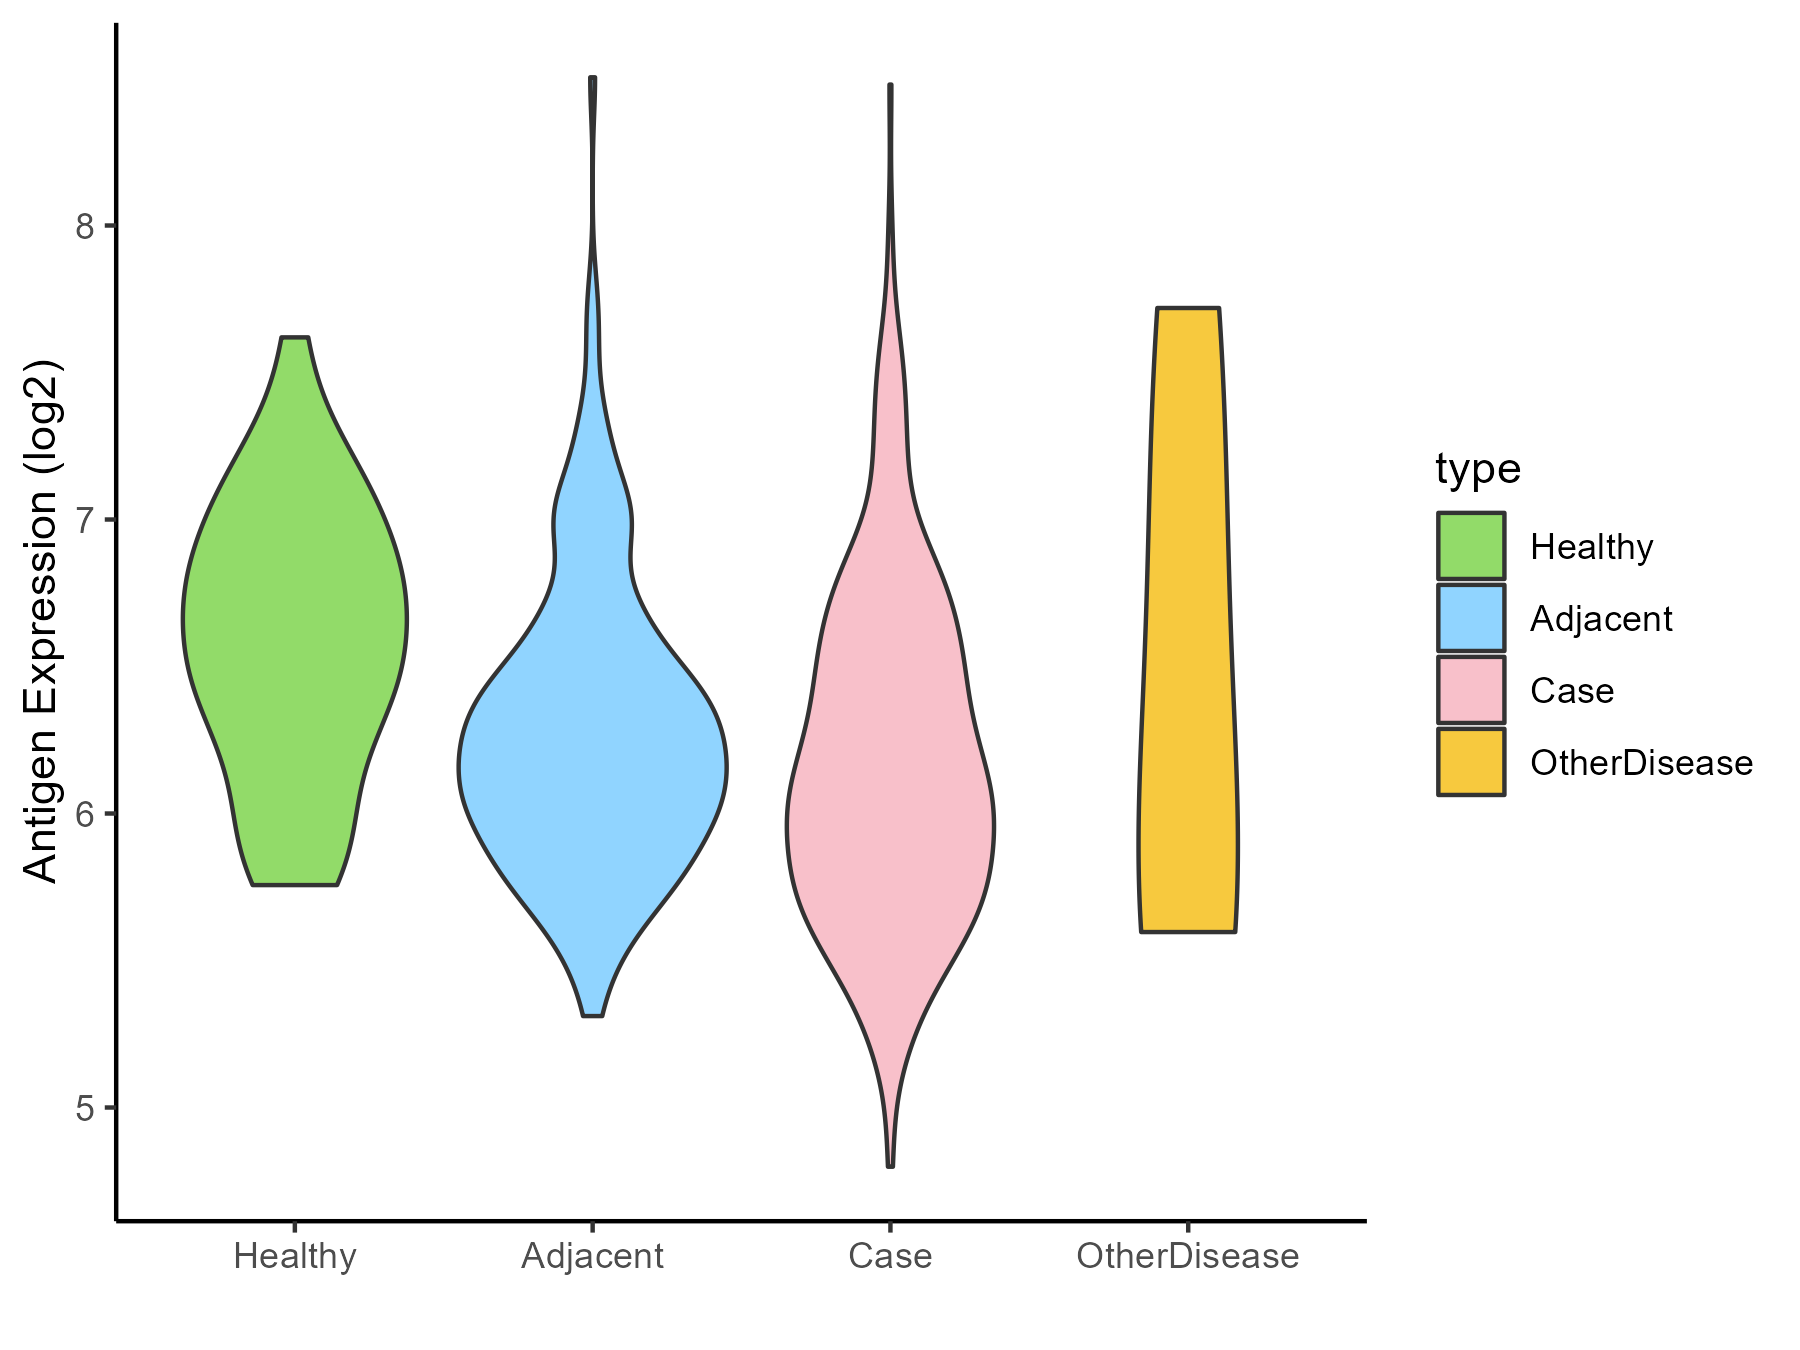
| Differential expression pattern of antigen in diseases | ||
| The Studied Tissue | Liver | |
| The Specific Disease | Liver cancer | |
| The Expression Level of Disease Section Compare with the Healthy Individual Tissue | p-value: 2.70E-06; Fold-change: -0.504393522; Z-score: -1.087146684 | |
| The Expression Level of Disease Section Compare with the Adjacent Tissue | p-value: 0.033310941; Fold-change: -0.131769897; Z-score: -0.267655476 | |
| The Expression Level of Disease Section Compare with the Other Disease Section | p-value: 0.608500766; Fold-change: -0.18721522; Z-score: -0.18802746 | |
| Disease-specific Antigen Abundances |
|
Click to View the Clearer Original Diagram |
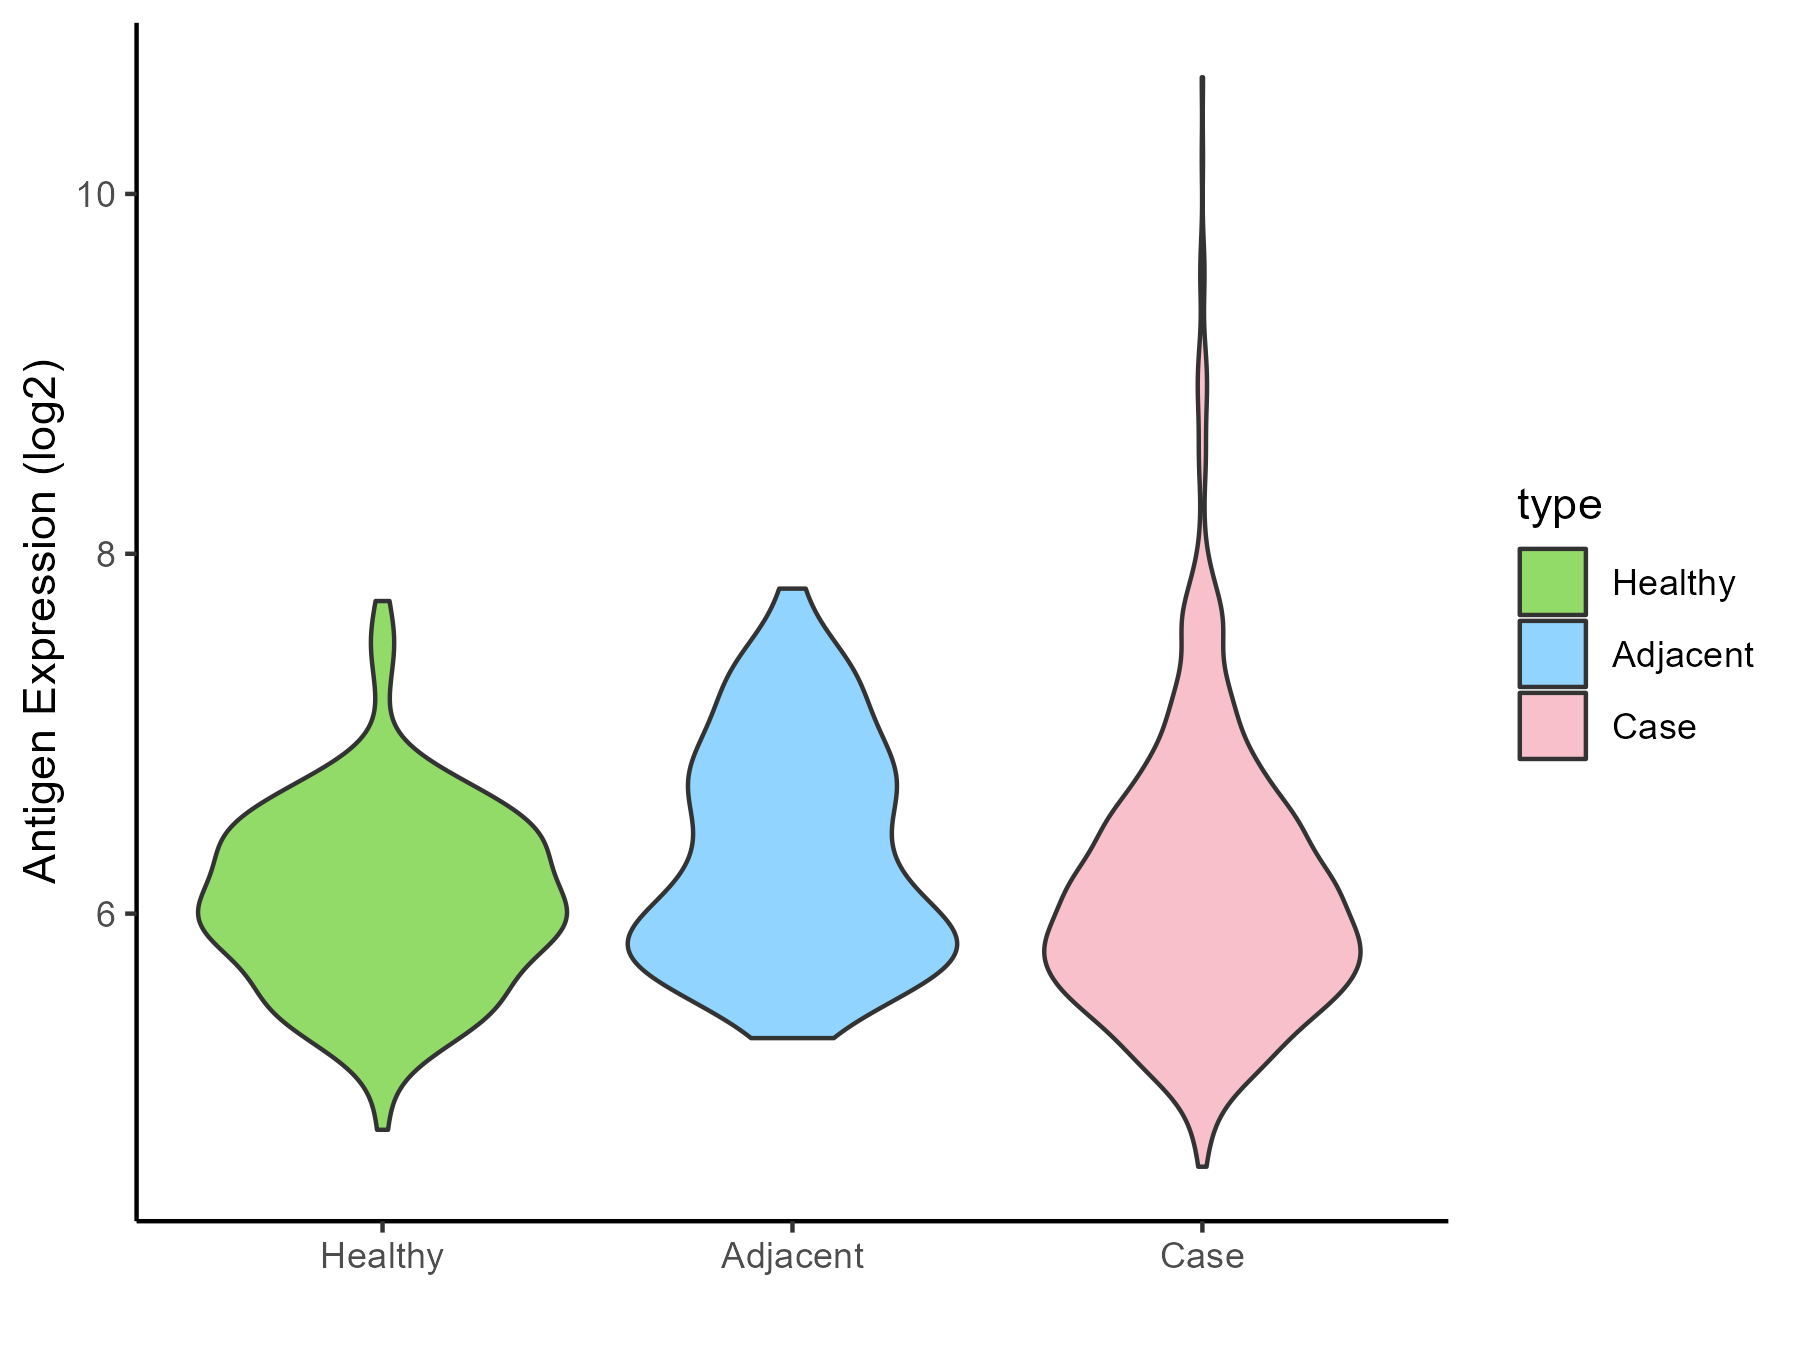
| Differential expression pattern of antigen in diseases | ||
| The Studied Tissue | Lung | |
| The Specific Disease | Lung cancer | |
| The Expression Level of Disease Section Compare with the Healthy Individual Tissue | p-value: 0.164956308; Fold-change: -0.042320445; Z-score: -0.085238641 | |
| The Expression Level of Disease Section Compare with the Adjacent Tissue | p-value: 0.001575769; Fold-change: -0.213812939; Z-score: -0.347873589 | |
| Disease-specific Antigen Abundances |
|
Click to View the Clearer Original Diagram |
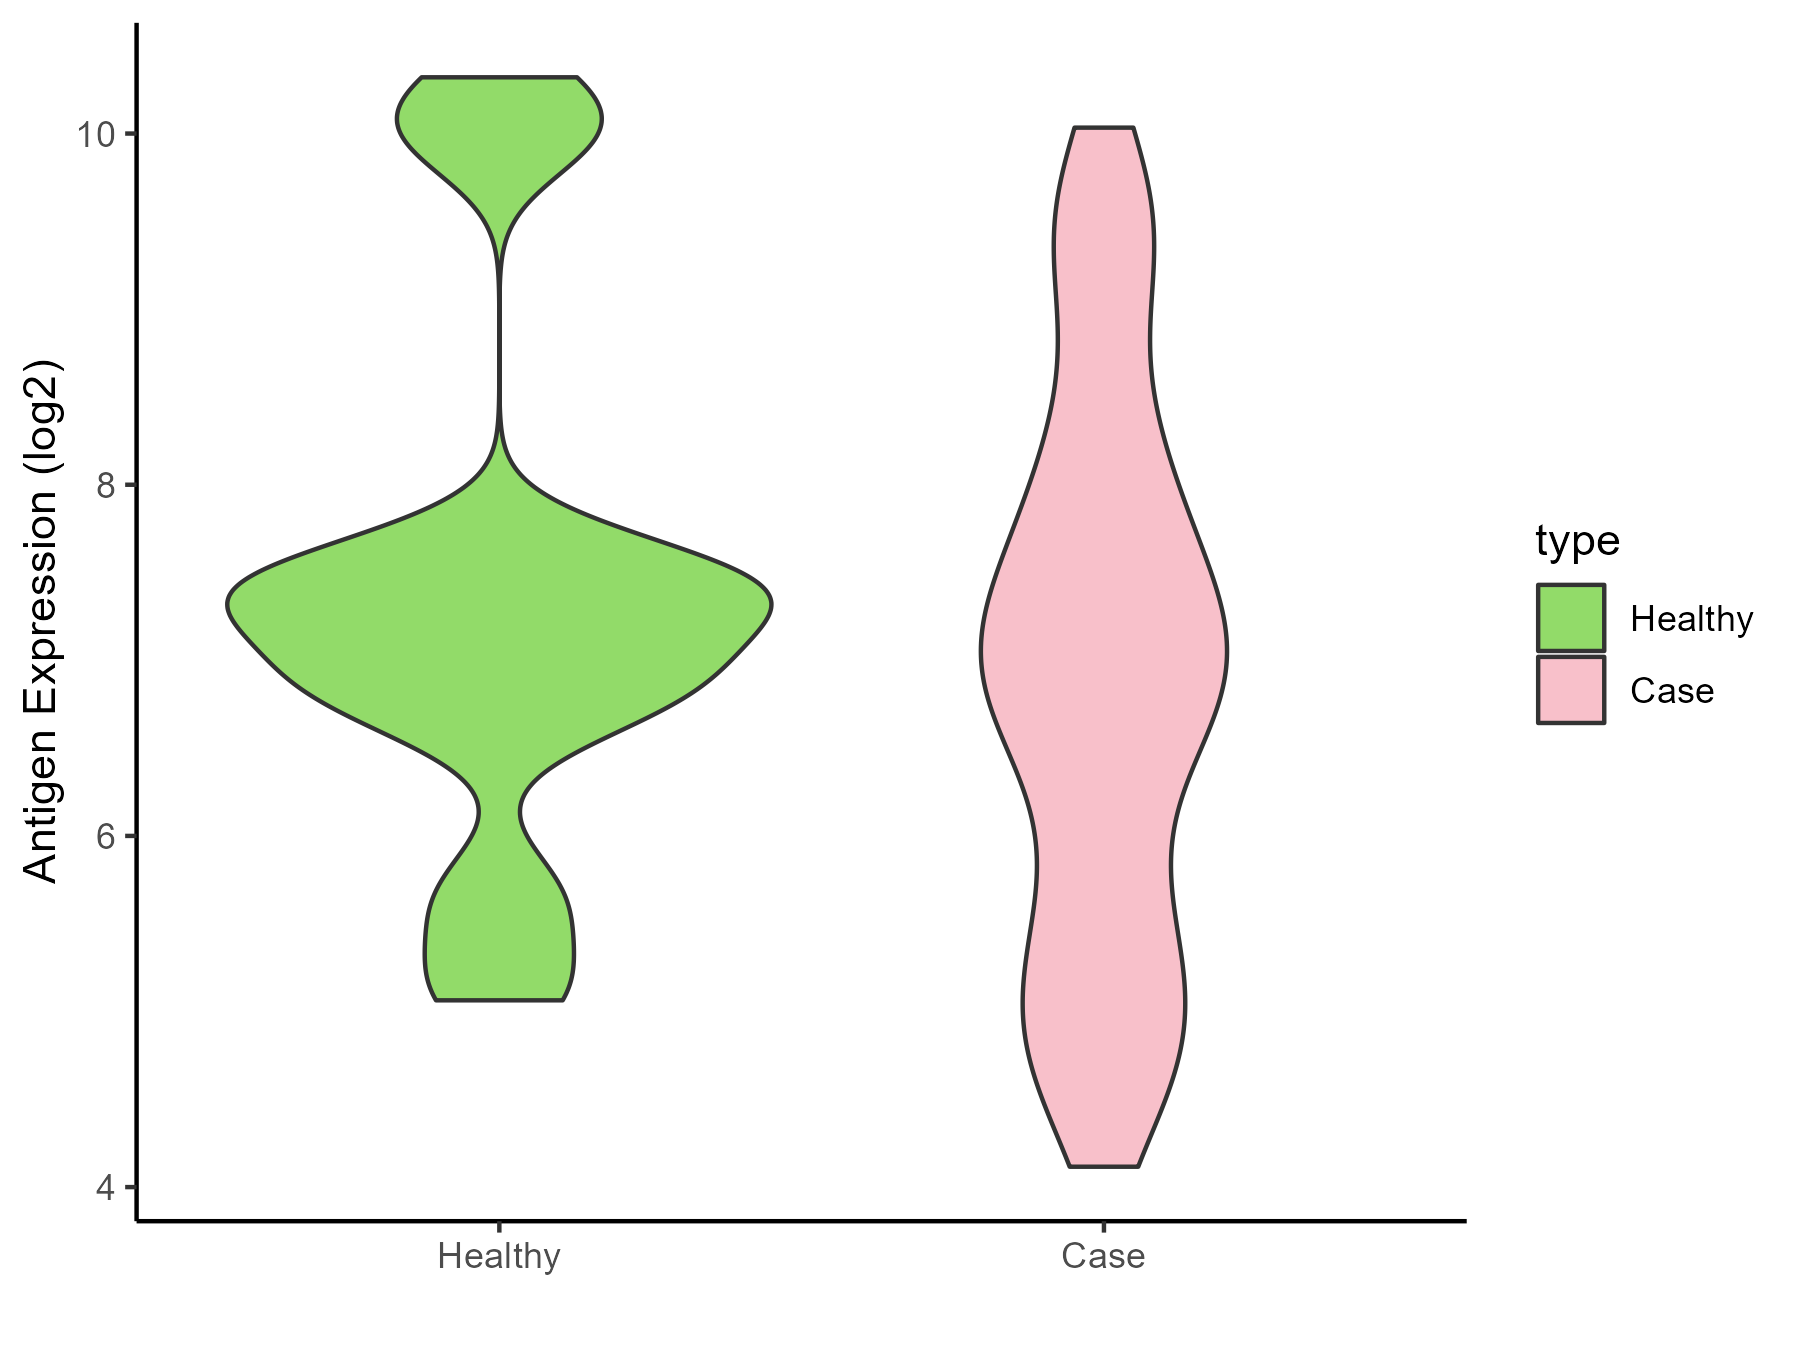
| Differential expression pattern of antigen in diseases | ||
| The Studied Tissue | Skin | |
| The Specific Disease | Melanoma | |
| The Expression Level of Disease Section Compare with the Healthy Individual Tissue | p-value: 0.160431517; Fold-change: -0.338741165; Z-score: -0.229797397 | |
| Disease-specific Antigen Abundances |
|
Click to View the Clearer Original Diagram |
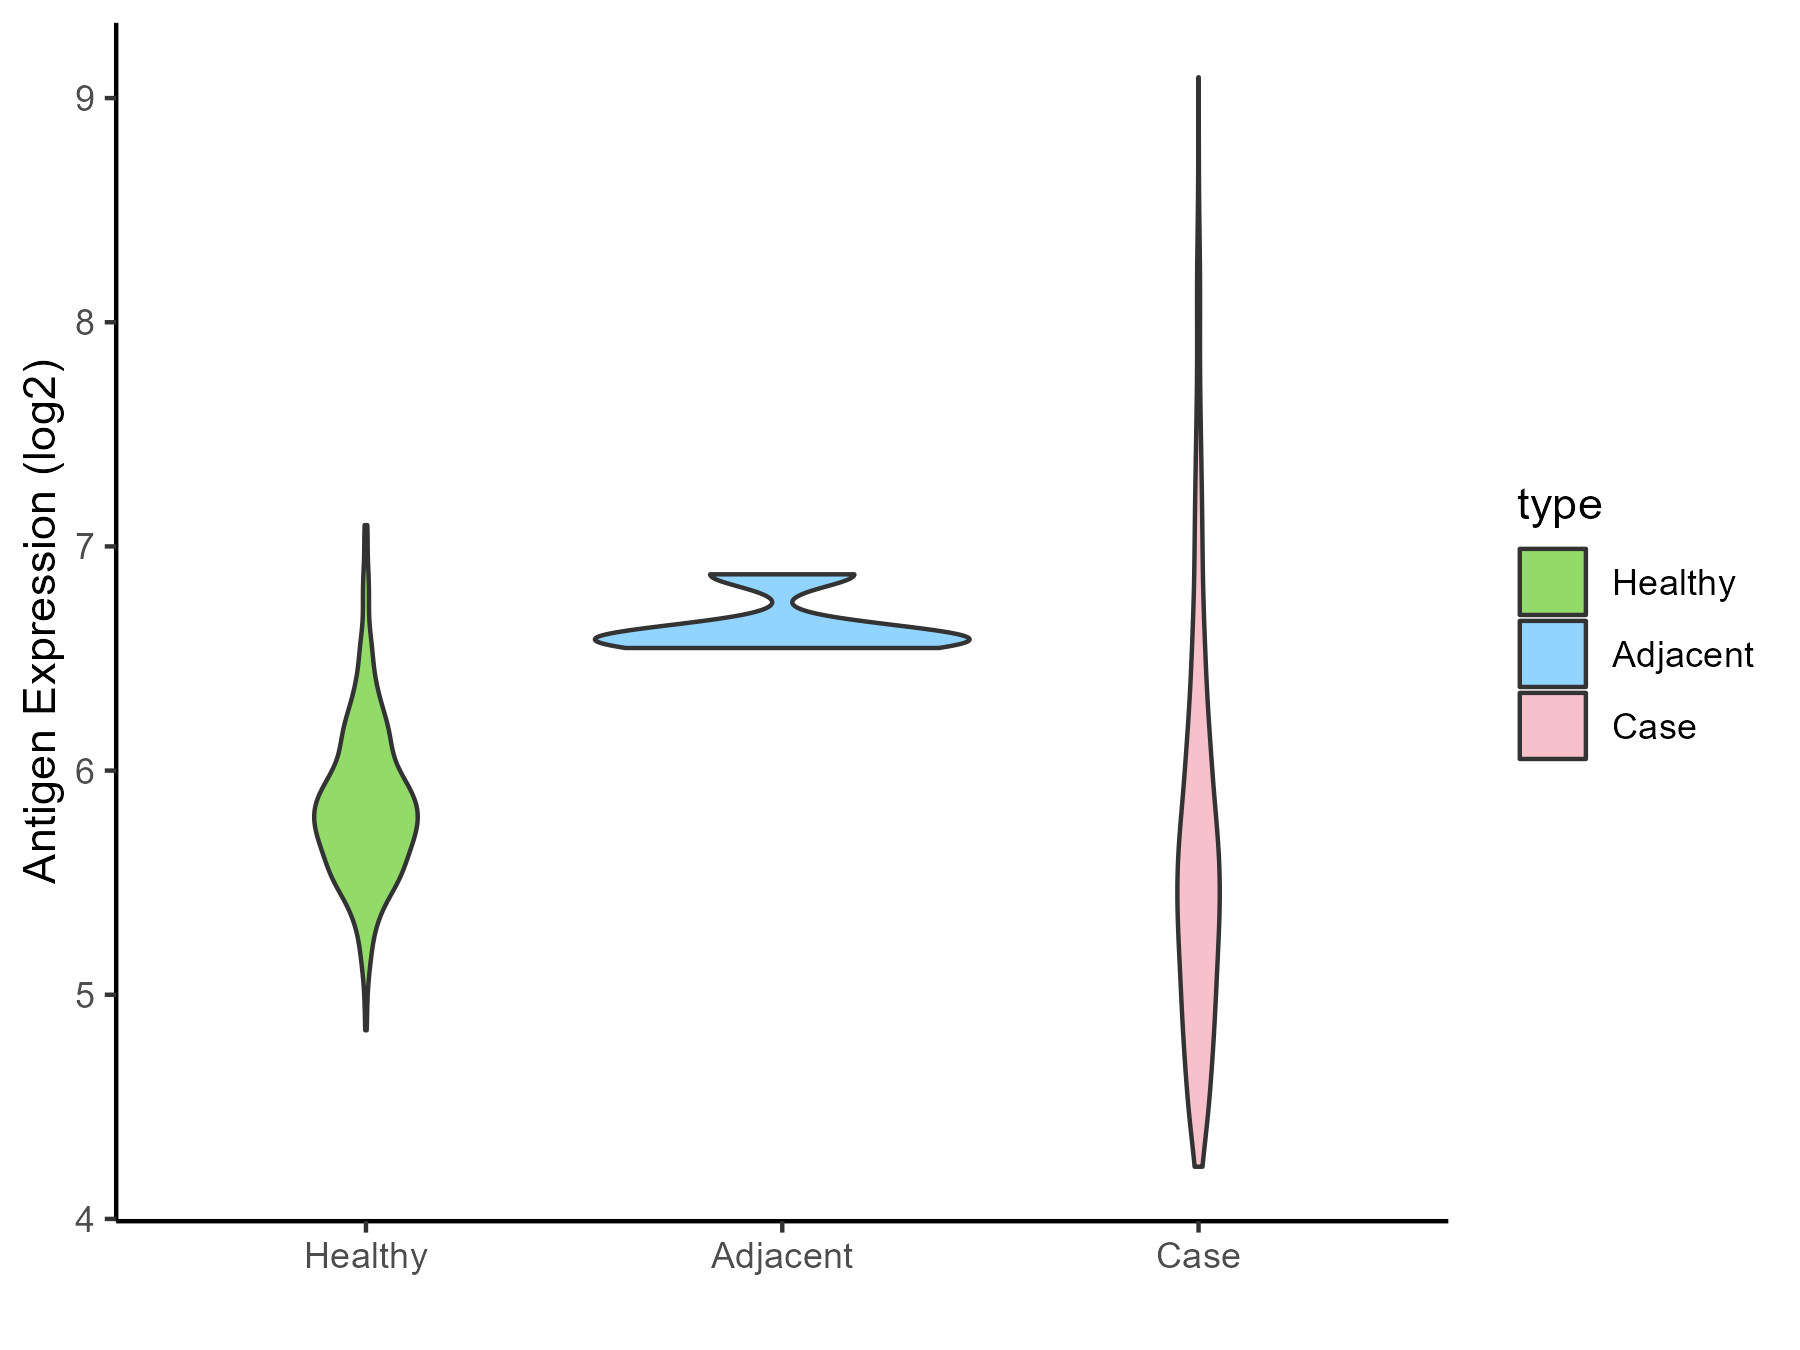
| Differential expression pattern of antigen in diseases | ||
| The Studied Tissue | Muscle | |
| The Specific Disease | Sarcoma | |
| The Expression Level of Disease Section Compare with the Healthy Individual Tissue | p-value: 3.73E-07; Fold-change: -0.312000231; Z-score: -0.878853628 | |
| The Expression Level of Disease Section Compare with the Adjacent Tissue | p-value: 0.000108127; Fold-change: -1.098281997; Z-score: -7.394373073 | |
| Disease-specific Antigen Abundances |
|
Click to View the Clearer Original Diagram |
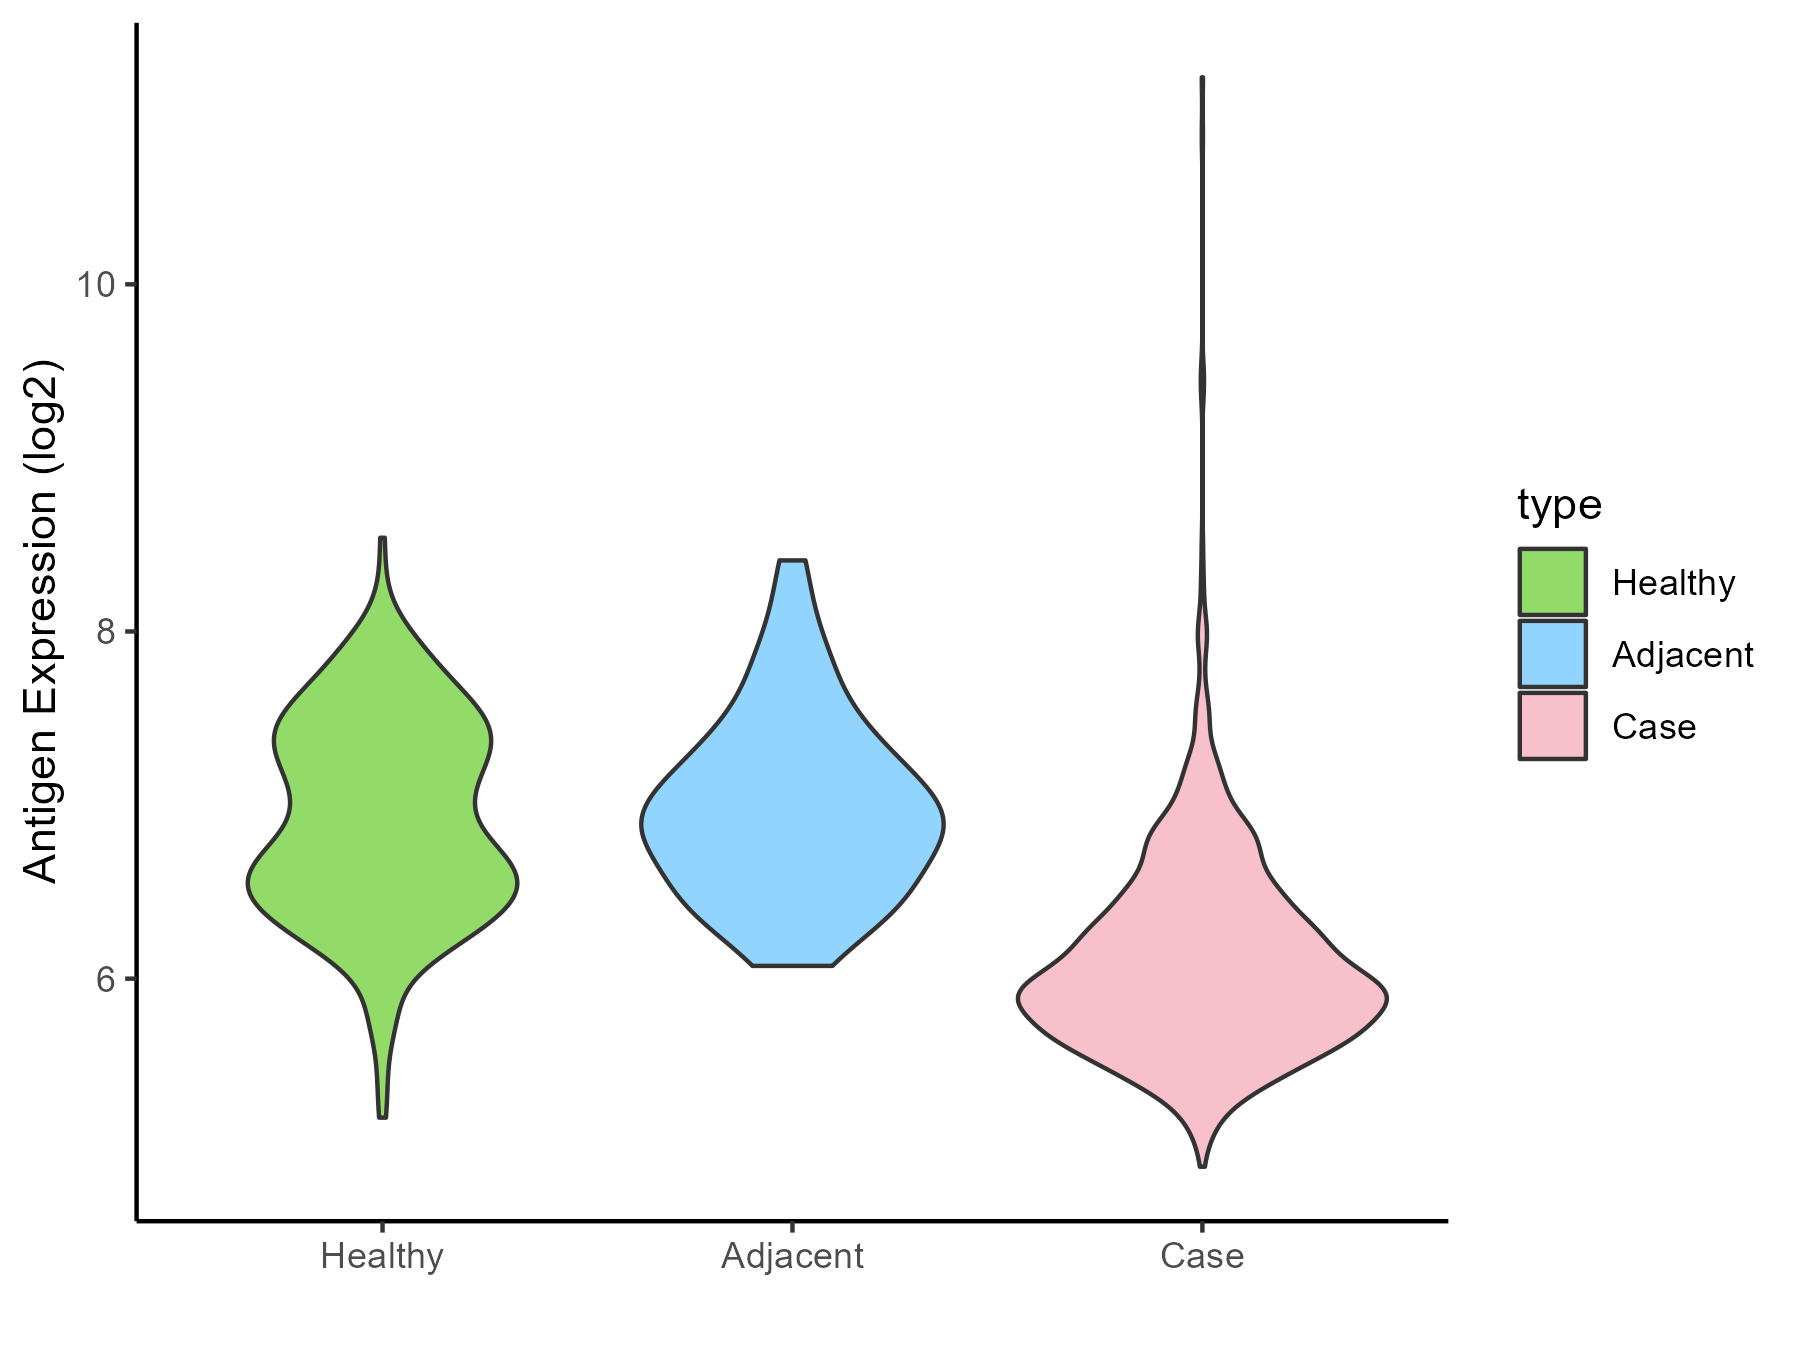
| Differential expression pattern of antigen in diseases | ||
| The Studied Tissue | Breast | |
| The Specific Disease | Breast cancer | |
| The Expression Level of Disease Section Compare with the Healthy Individual Tissue | p-value: 1.04E-65; Fold-change: -0.887115361; Z-score: -1.532278 | |
| The Expression Level of Disease Section Compare with the Adjacent Tissue | p-value: 2.77E-16; Fold-change: -0.949187635; Z-score: -1.790429737 | |
| Disease-specific Antigen Abundances |
|
Click to View the Clearer Original Diagram |
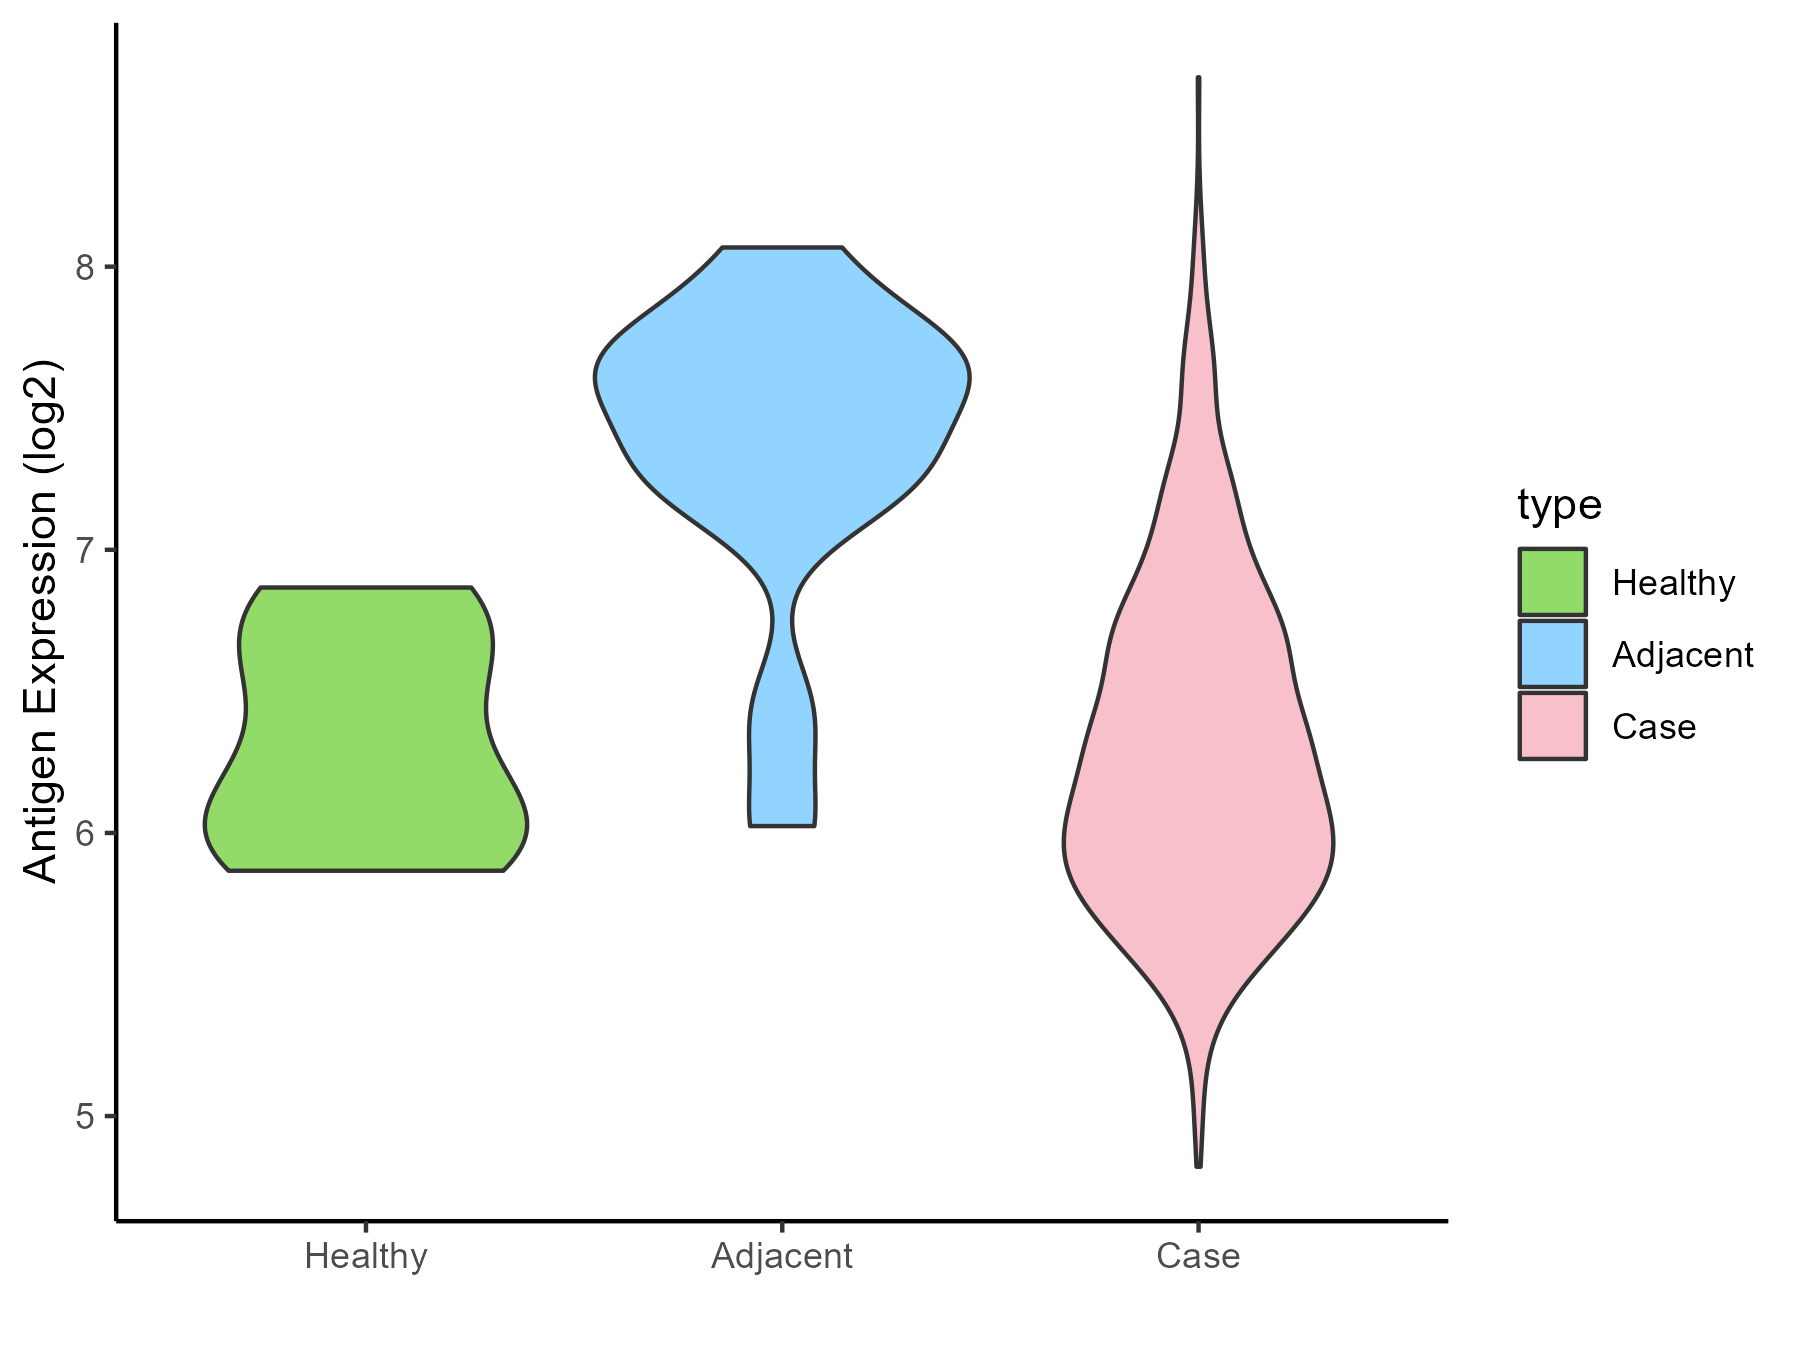
| Differential expression pattern of antigen in diseases | ||
| The Studied Tissue | Ovarian | |
| The Specific Disease | Ovarian cancer | |
| The Expression Level of Disease Section Compare with the Healthy Individual Tissue | p-value: 0.925191665; Fold-change: -0.010248209; Z-score: -0.026218784 | |
| The Expression Level of Disease Section Compare with the Adjacent Tissue | p-value: 6.76E-06; Fold-change: -1.284050058; Z-score: -2.322986612 | |
| Disease-specific Antigen Abundances |
|
Click to View the Clearer Original Diagram |
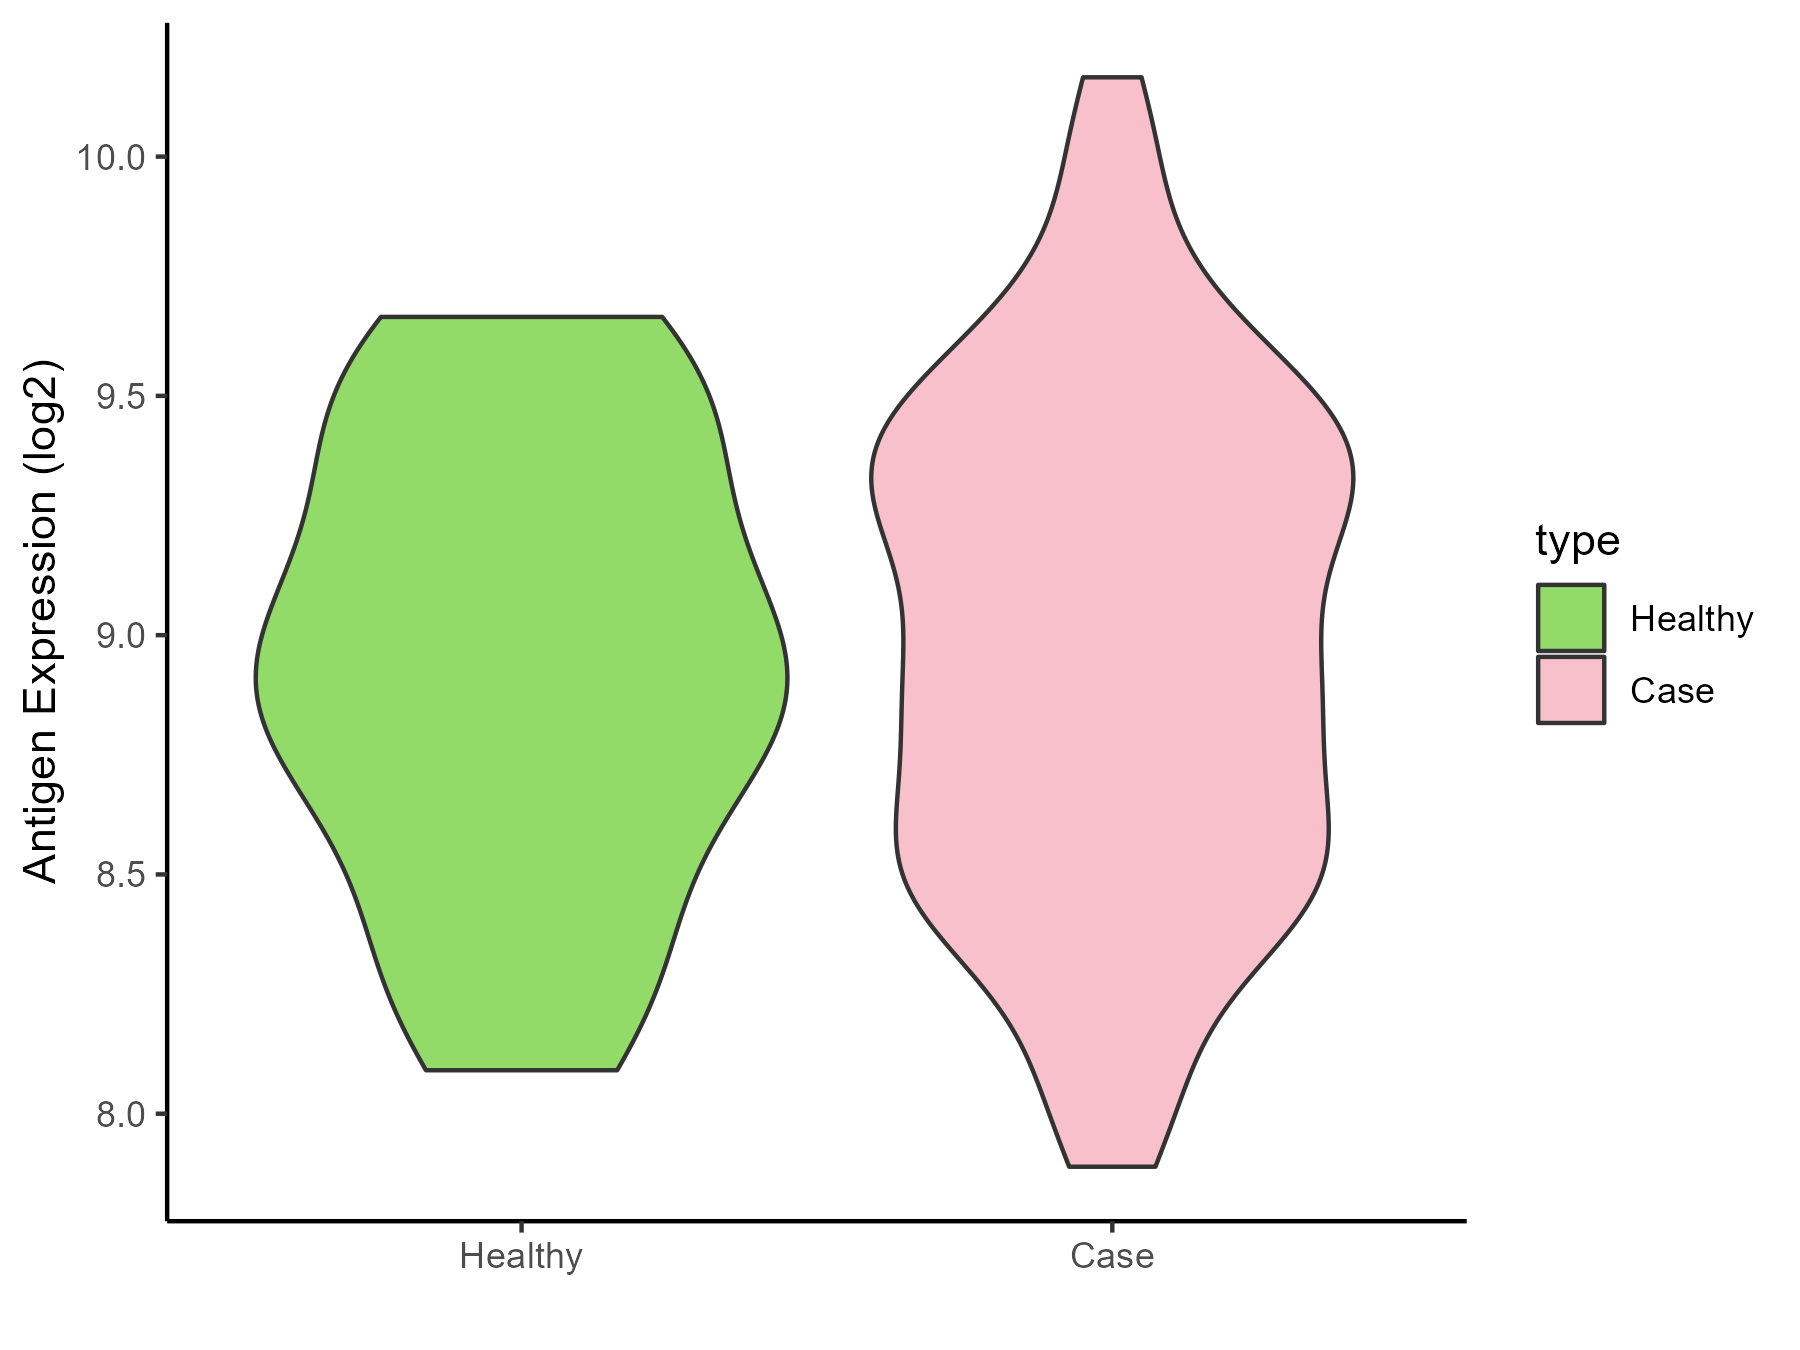
| Differential expression pattern of antigen in diseases | ||
| The Studied Tissue | Cervical | |
| The Specific Disease | Cervical cancer | |
| The Expression Level of Disease Section Compare with the Healthy Individual Tissue | p-value: 0.769460628; Fold-change: 0.010058153; Z-score: 0.021355021 | |
| Disease-specific Antigen Abundances |
|
Click to View the Clearer Original Diagram |
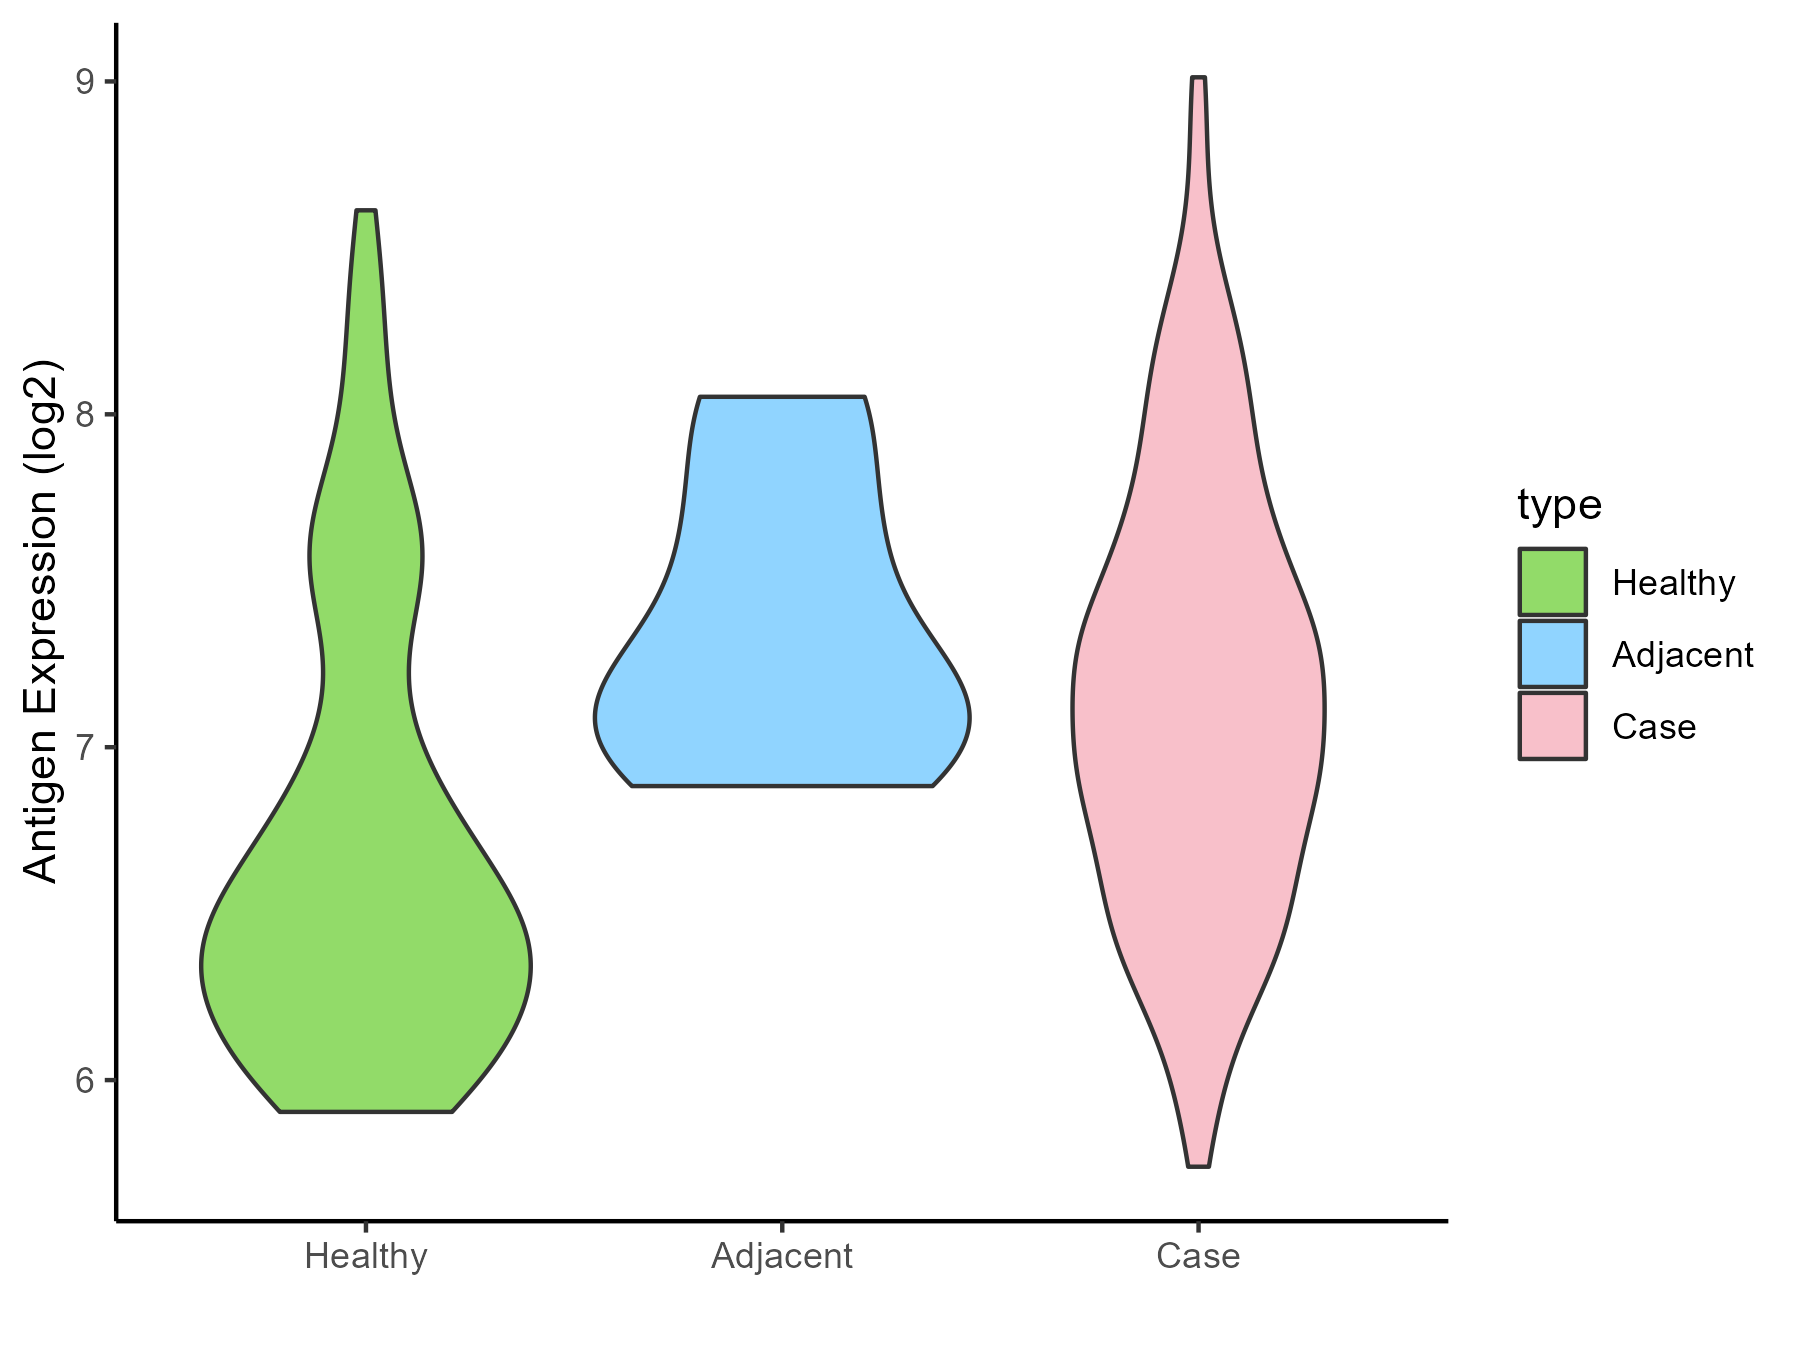
| Differential expression pattern of antigen in diseases | ||
| The Studied Tissue | Endometrium | |
| The Specific Disease | Uterine cancer | |
| The Expression Level of Disease Section Compare with the Healthy Individual Tissue | p-value: 1.71E-09; Fold-change: 0.623510206; Z-score: 0.938068284 | |
| The Expression Level of Disease Section Compare with the Adjacent Tissue | p-value: 0.390101917; Fold-change: -0.057920151; Z-score: -0.123770742 | |
| Disease-specific Antigen Abundances |
|
Click to View the Clearer Original Diagram |
| Differential expression pattern of antigen in diseases | ||
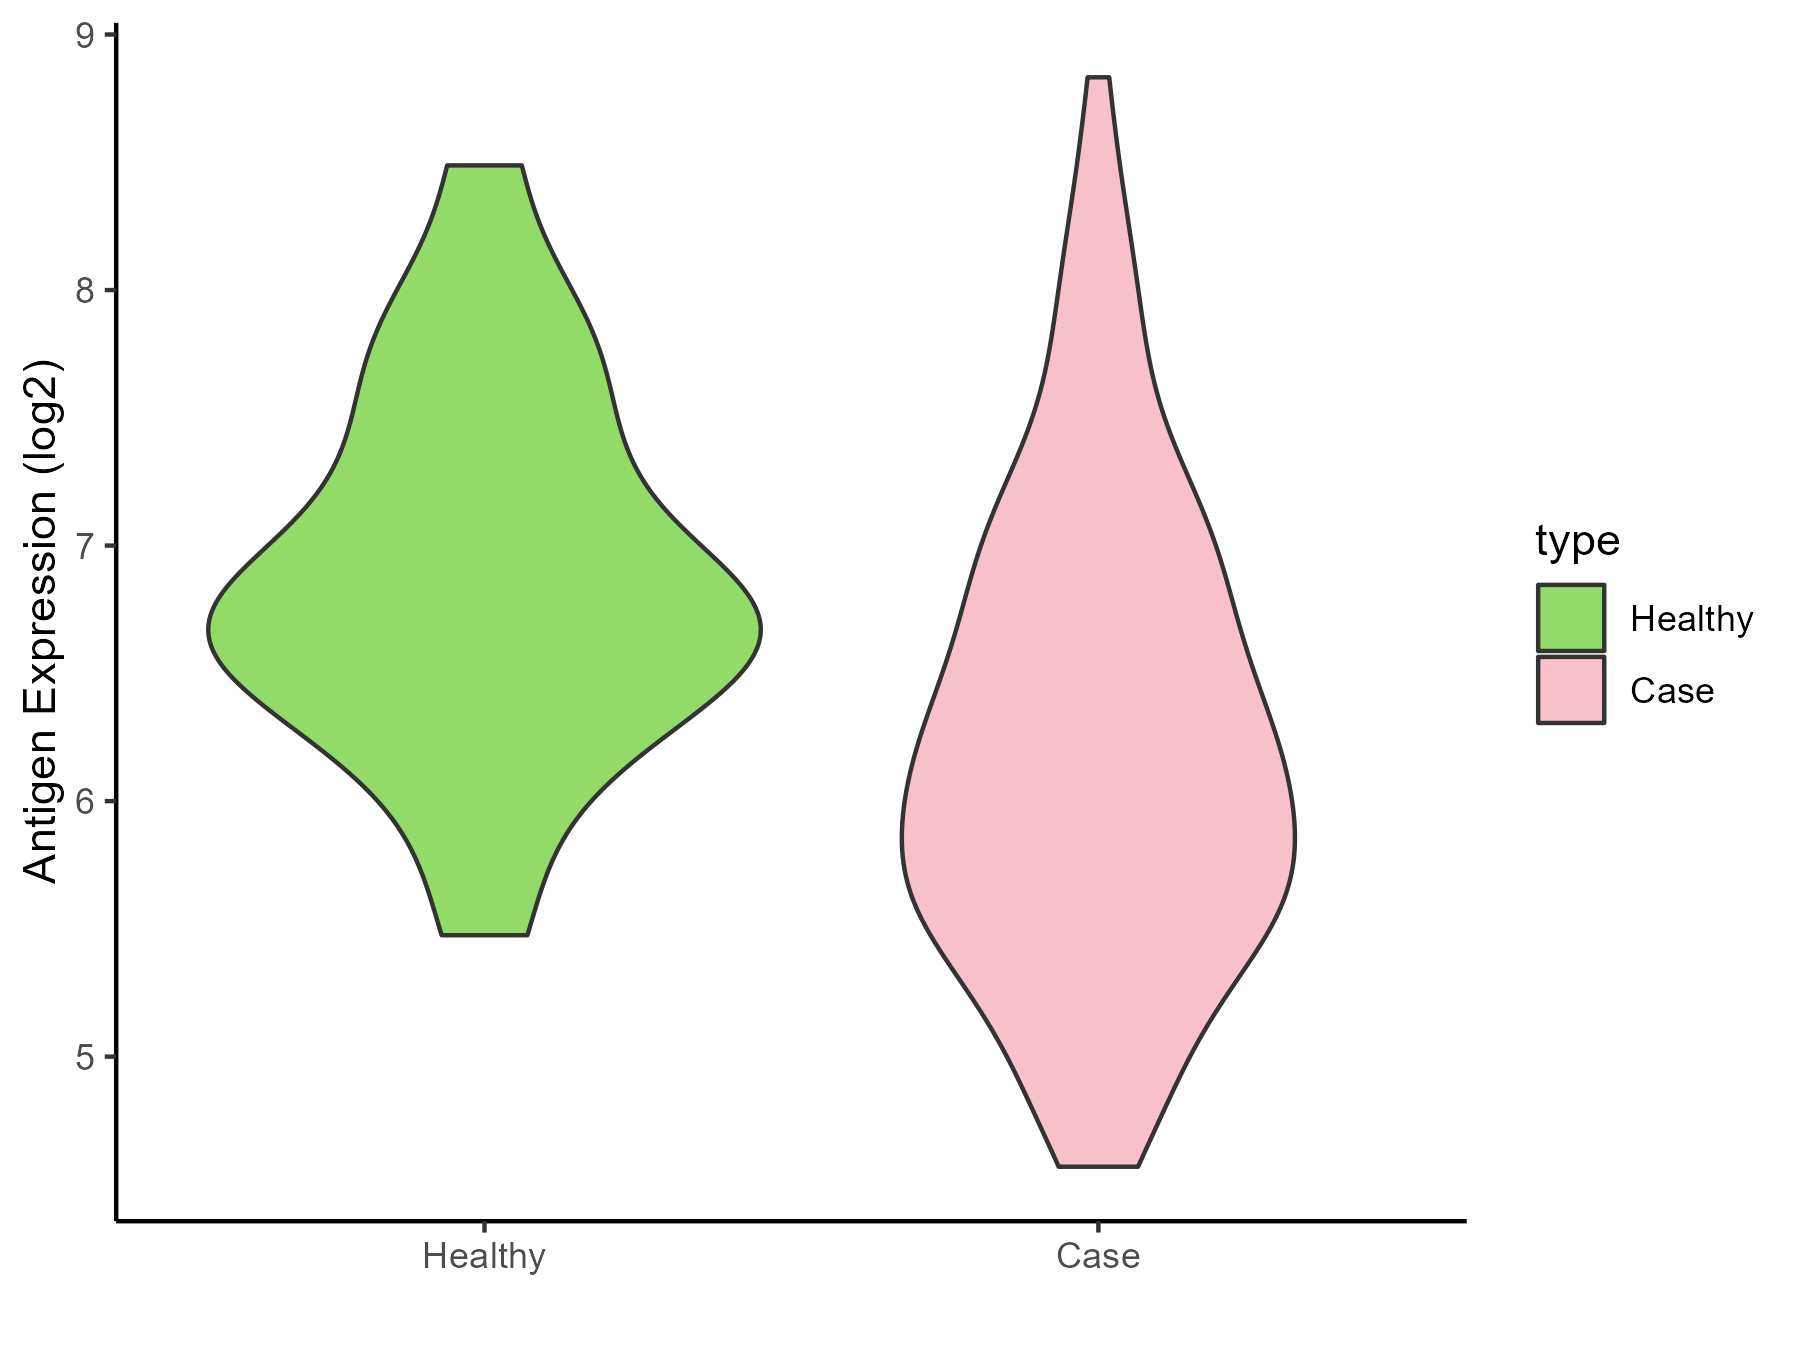
| The Studied Tissue | Prostate | |
| The Specific Disease | Prostate cancer | |
| The Expression Level of Disease Section Compare with the Healthy Individual Tissue | p-value: 0.000743224; Fold-change: -0.592164553; Z-score: -0.822129897 | |
| Disease-specific Antigen Abundances |
|
Click to View the Clearer Original Diagram |
| Differential expression pattern of antigen in diseases | ||
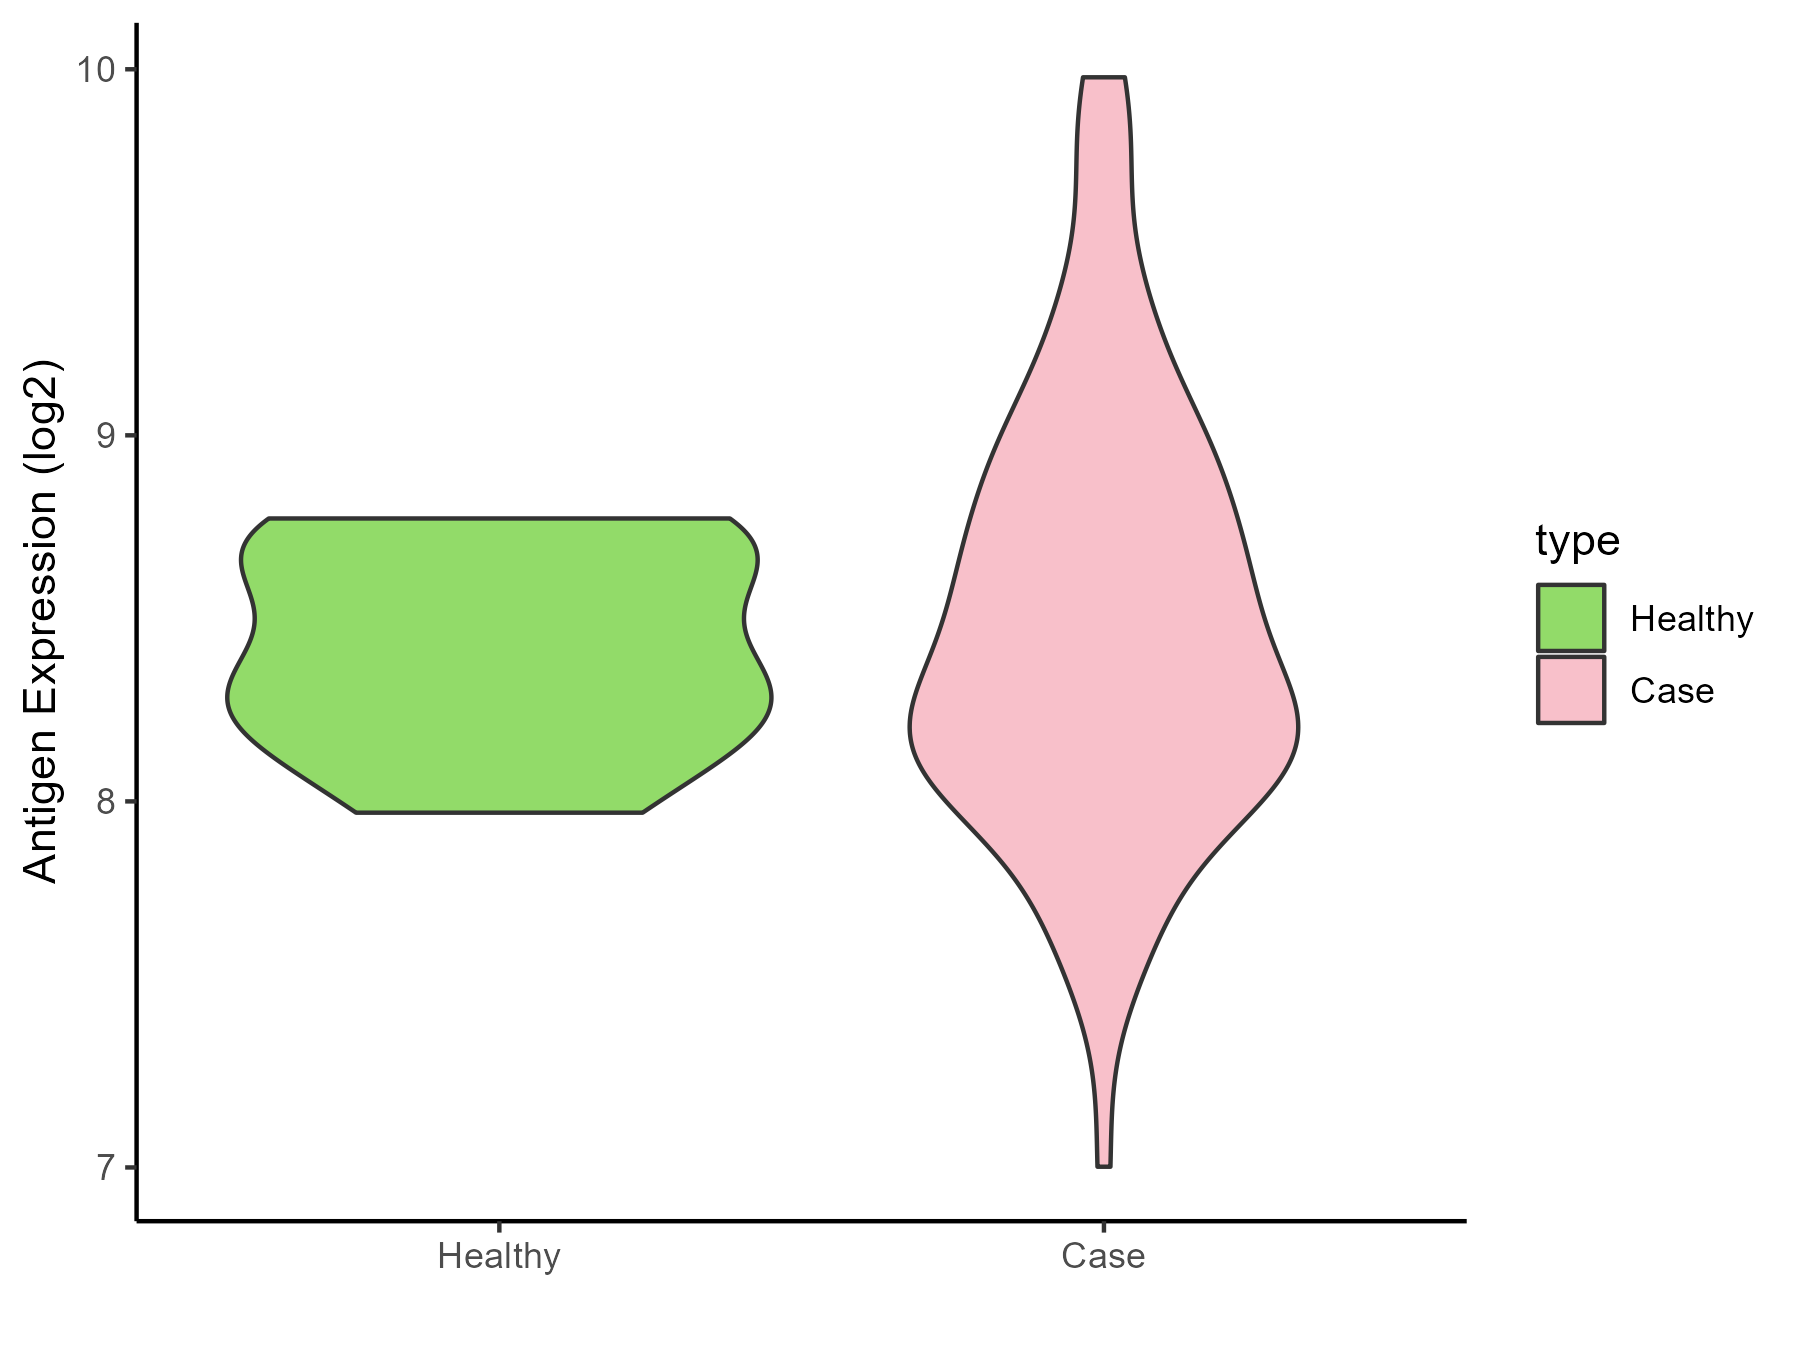
| The Studied Tissue | Bladder | |
| The Specific Disease | Bladder cancer | |
| The Expression Level of Disease Section Compare with the Healthy Individual Tissue | p-value: 0.58673616; Fold-change: 0.085155974; Z-score: 0.286686437 | |
| Disease-specific Antigen Abundances |
|
Click to View the Clearer Original Diagram |
| Differential expression pattern of antigen in diseases | ||
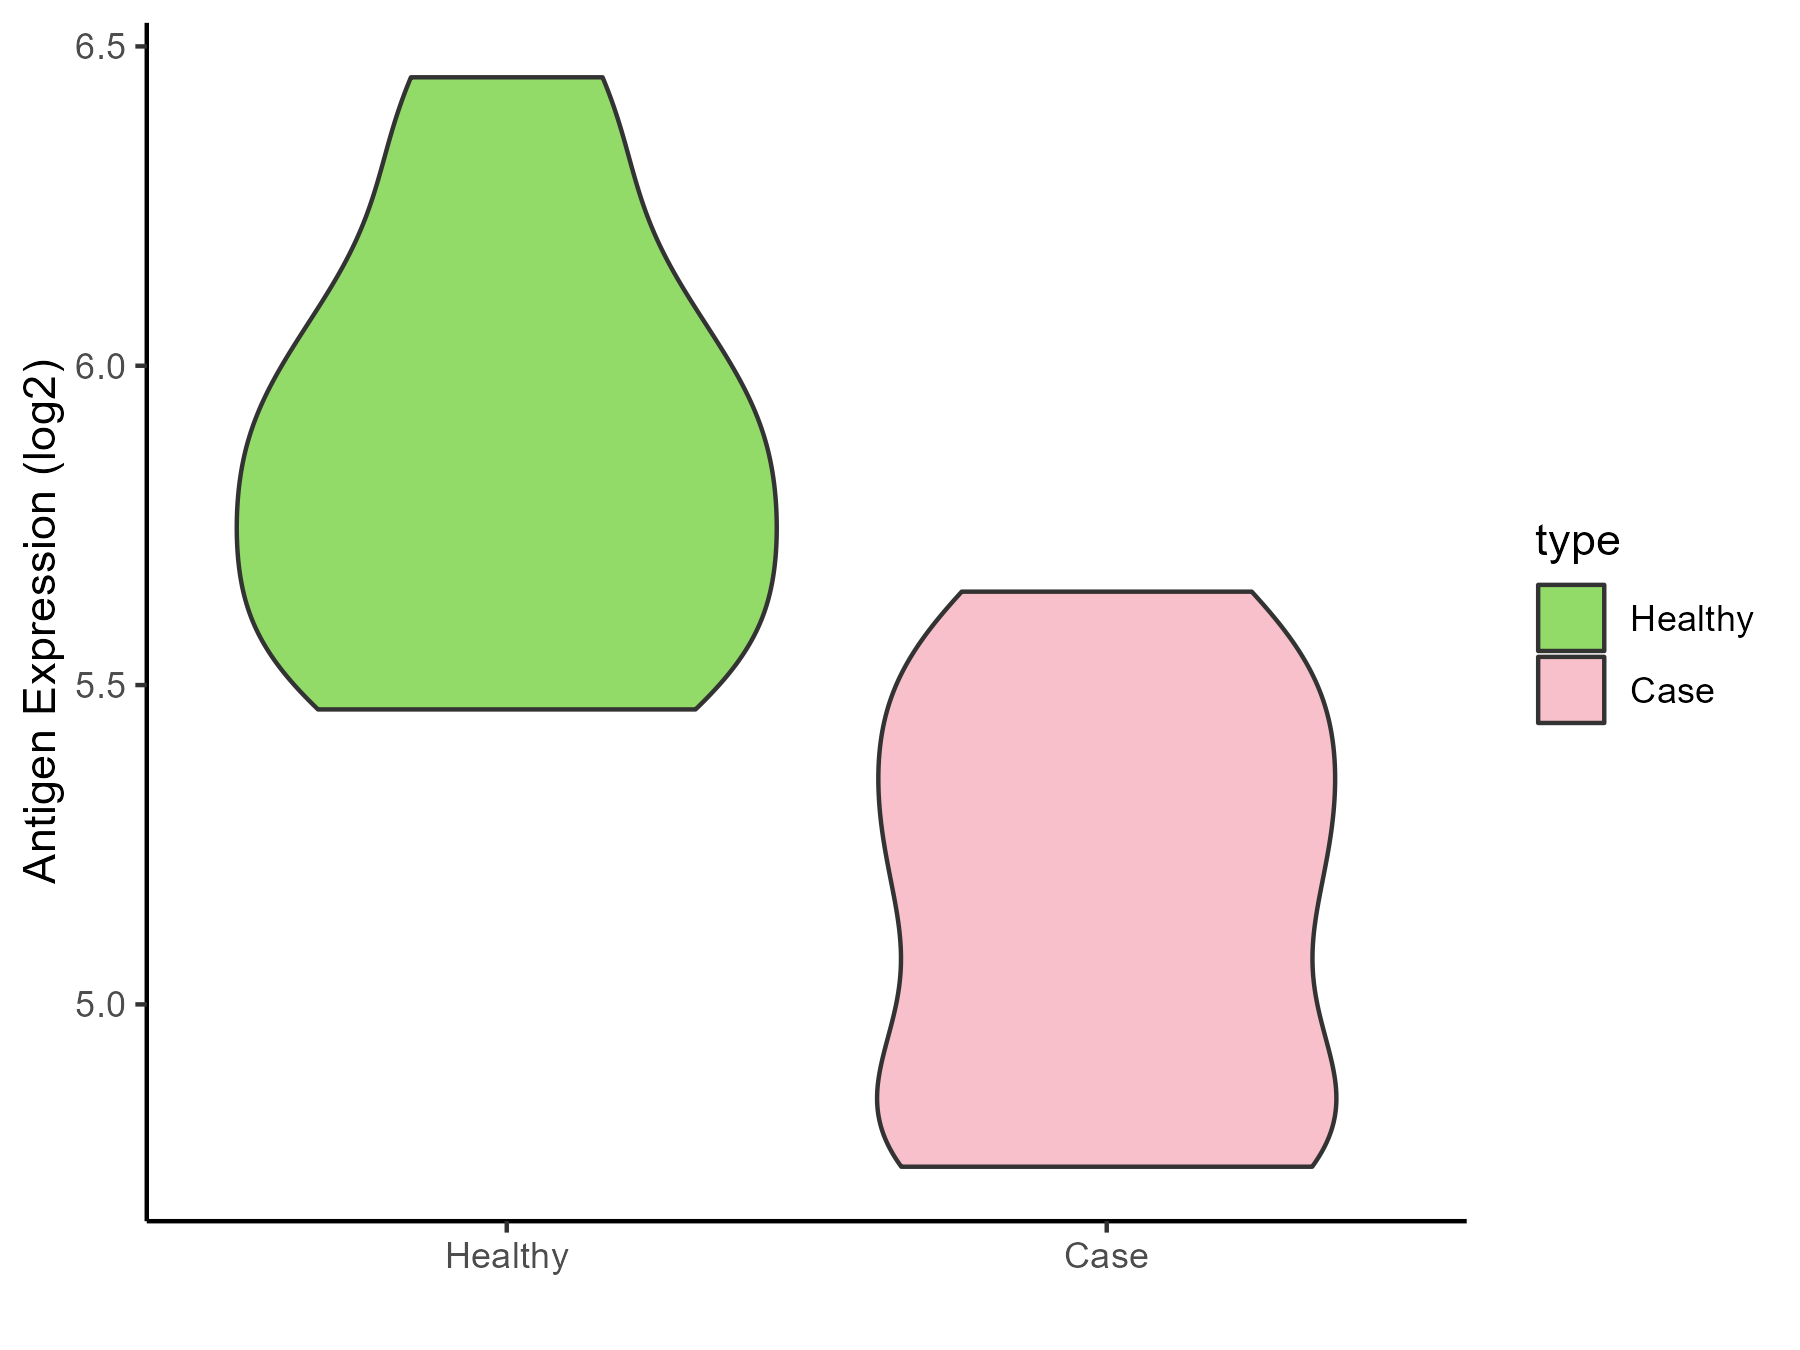
| The Studied Tissue | Uvea | |
| The Specific Disease | Retinoblastoma tumor | |
| The Expression Level of Disease Section Compare with the Healthy Individual Tissue | p-value: 7.30E-06; Fold-change: -0.662124792; Z-score: -2.090981006 | |
| Disease-specific Antigen Abundances |
|
Click to View the Clearer Original Diagram |
| Differential expression pattern of antigen in diseases | ||
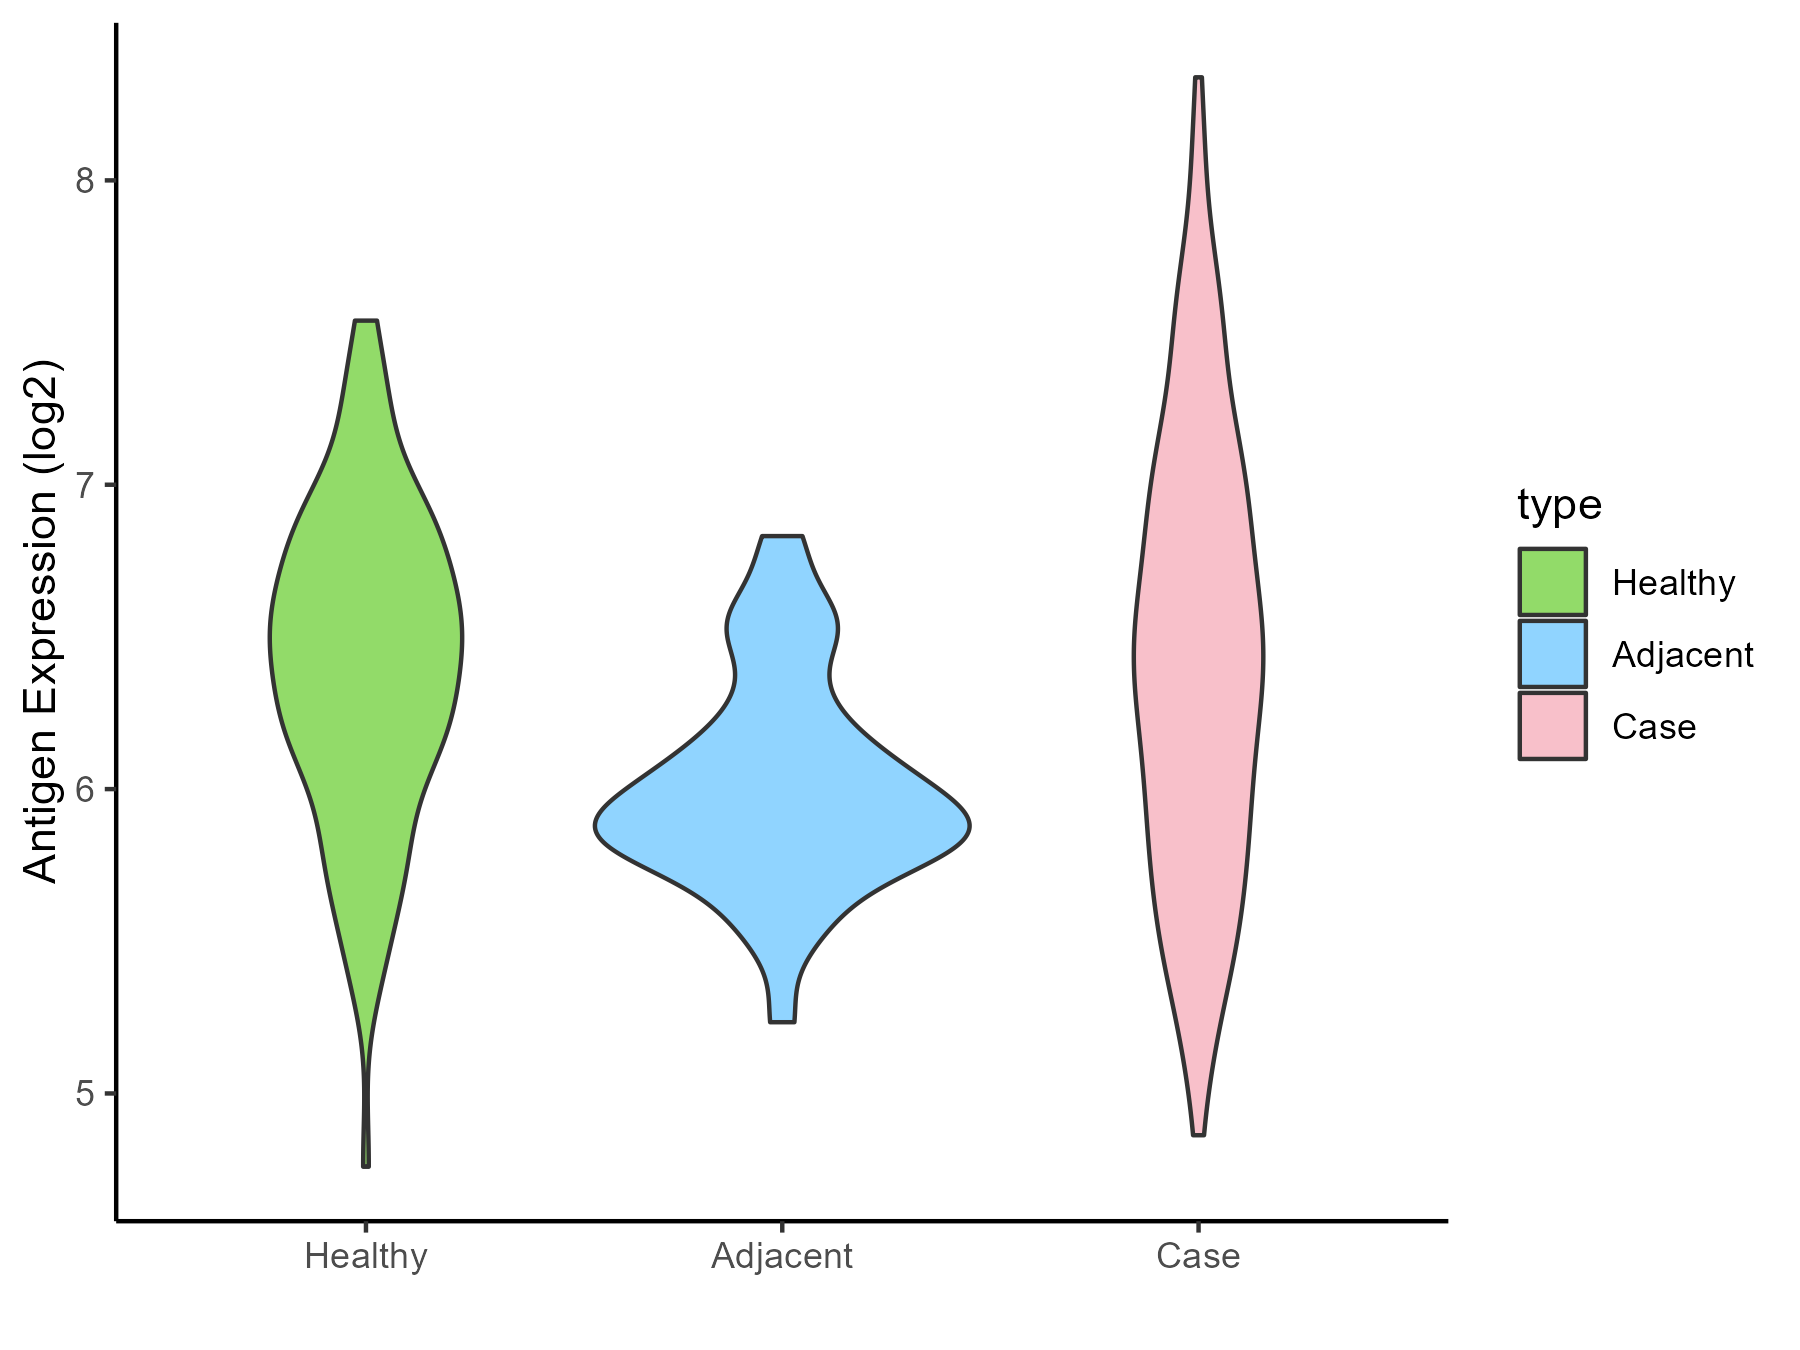
| The Studied Tissue | Thyroid | |
| The Specific Disease | Thyroid cancer | |
| The Expression Level of Disease Section Compare with the Healthy Individual Tissue | p-value: 0.683903471; Fold-change: -0.029613946; Z-score: -0.057603505 | |
| The Expression Level of Disease Section Compare with the Adjacent Tissue | p-value: 1.68E-08; Fold-change: 0.500840739; Z-score: 1.453378587 | |
| Disease-specific Antigen Abundances |
|
Click to View the Clearer Original Diagram |
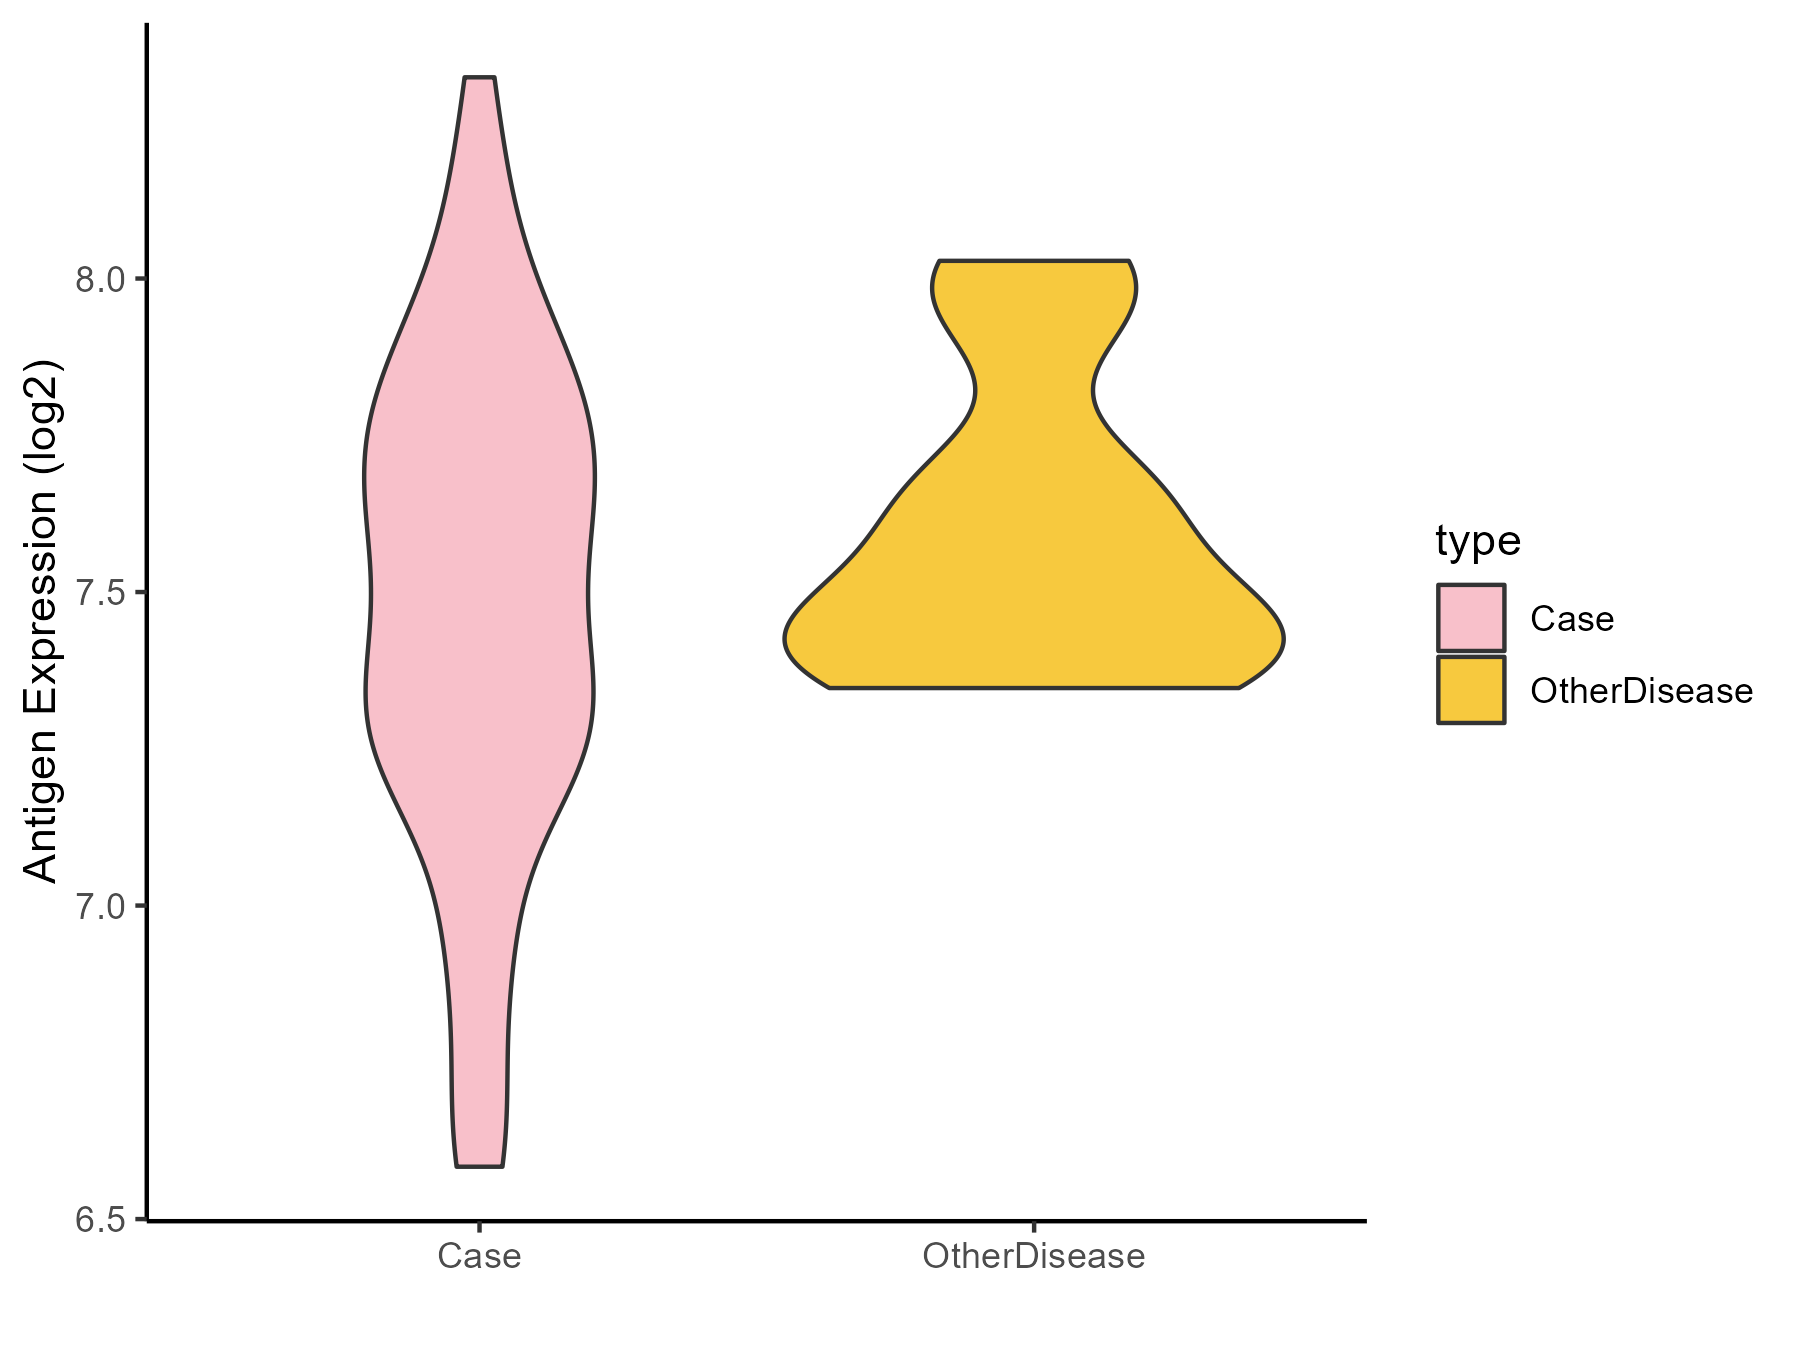
| Differential expression pattern of antigen in diseases | ||
| The Studied Tissue | Adrenal cortex | |
| The Specific Disease | Adrenocortical carcinoma | |
| The Expression Level of Disease Section Compare with the Other Disease Section | p-value: 0.109089592; Fold-change: 0.031285712; Z-score: 0.129918335 | |
| Disease-specific Antigen Abundances |
|
Click to View the Clearer Original Diagram |
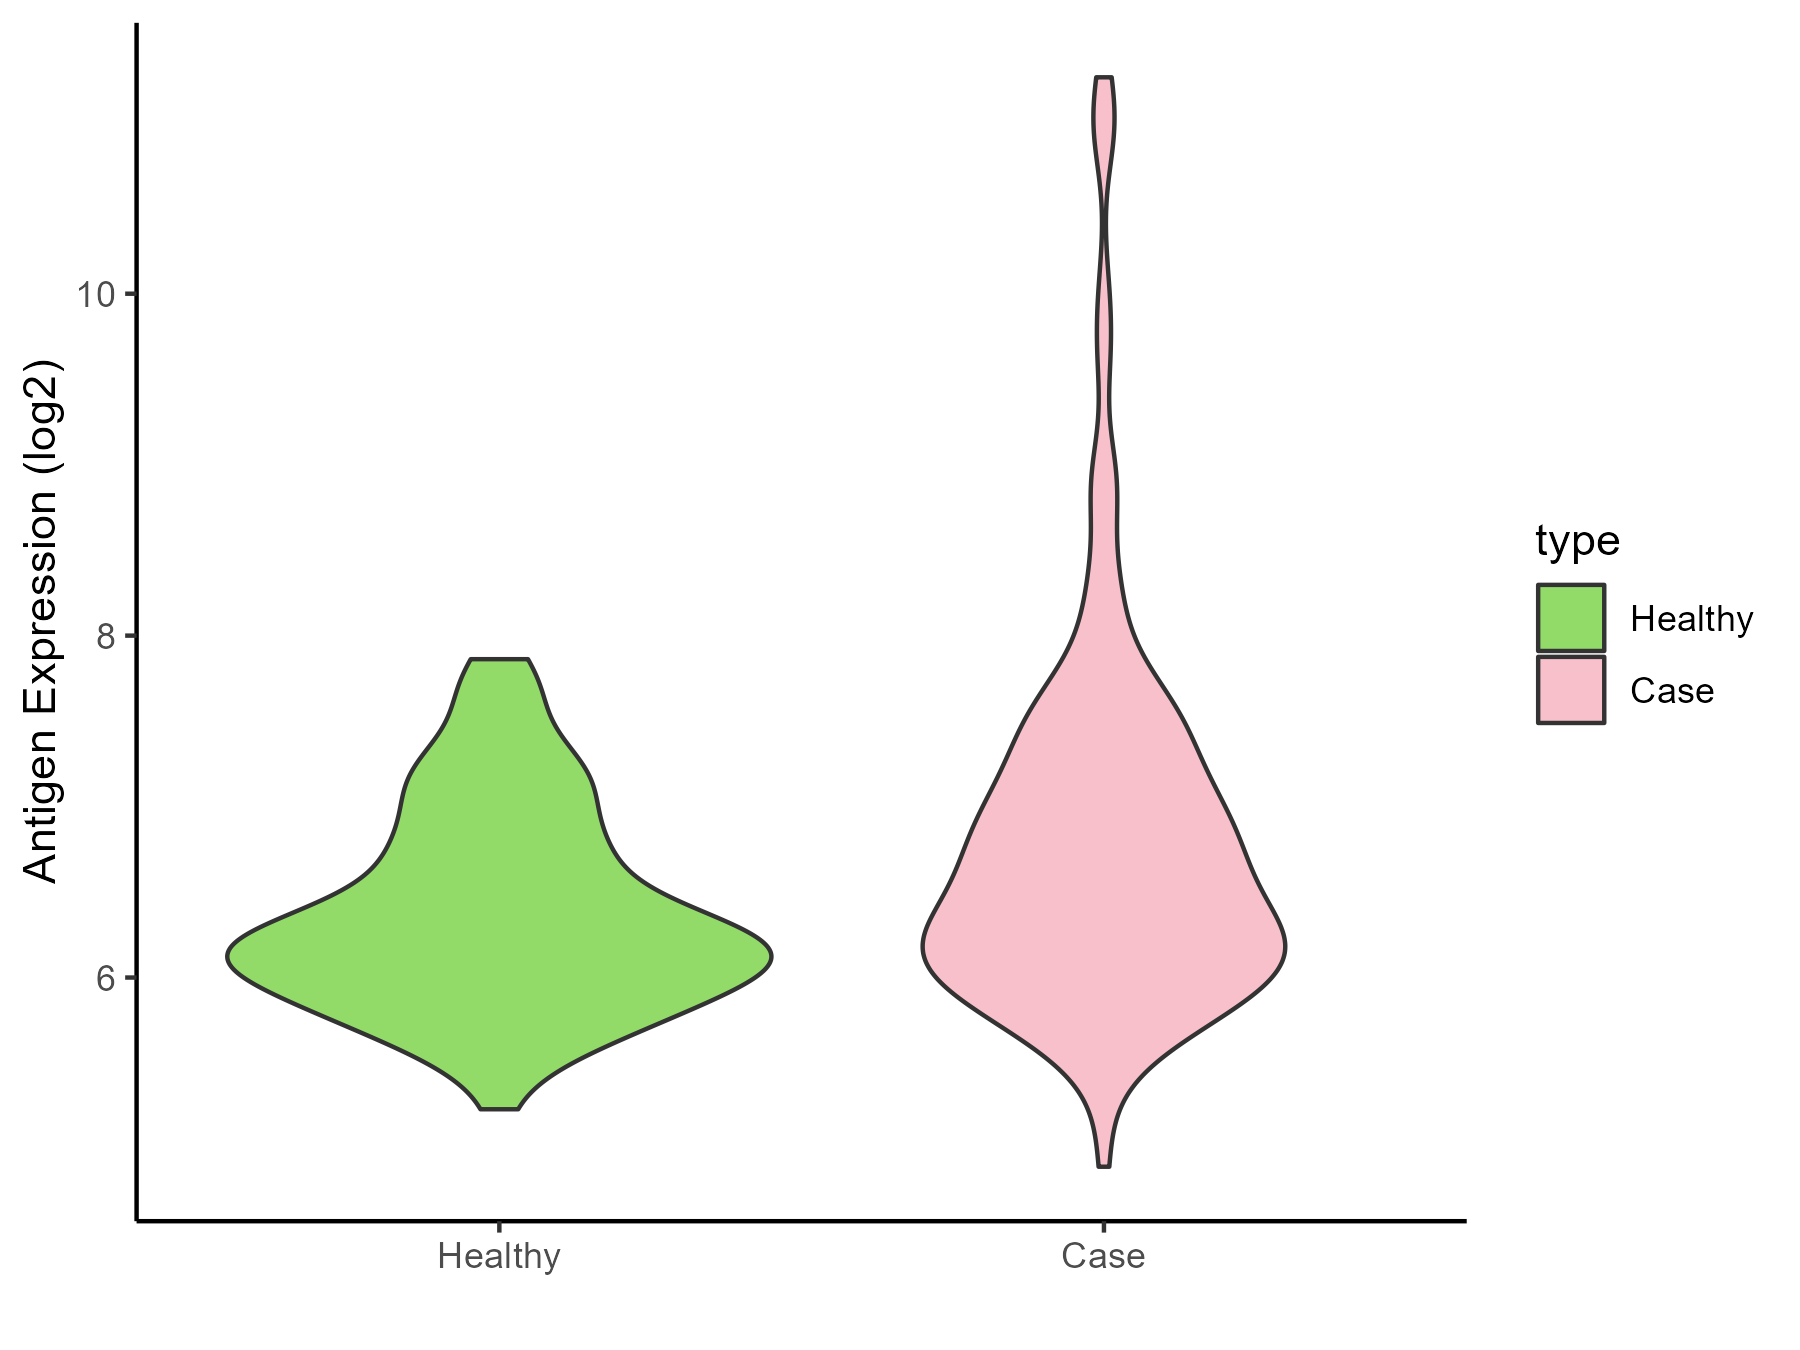
| Differential expression pattern of antigen in diseases | ||
| The Studied Tissue | Head and neck | |
| The Specific Disease | Head and neck cancer | |
| The Expression Level of Disease Section Compare with the Healthy Individual Tissue | p-value: 5.84E-05; Fold-change: 0.319225343; Z-score: 0.547839158 | |
| Disease-specific Antigen Abundances |
|
Click to View the Clearer Original Diagram |
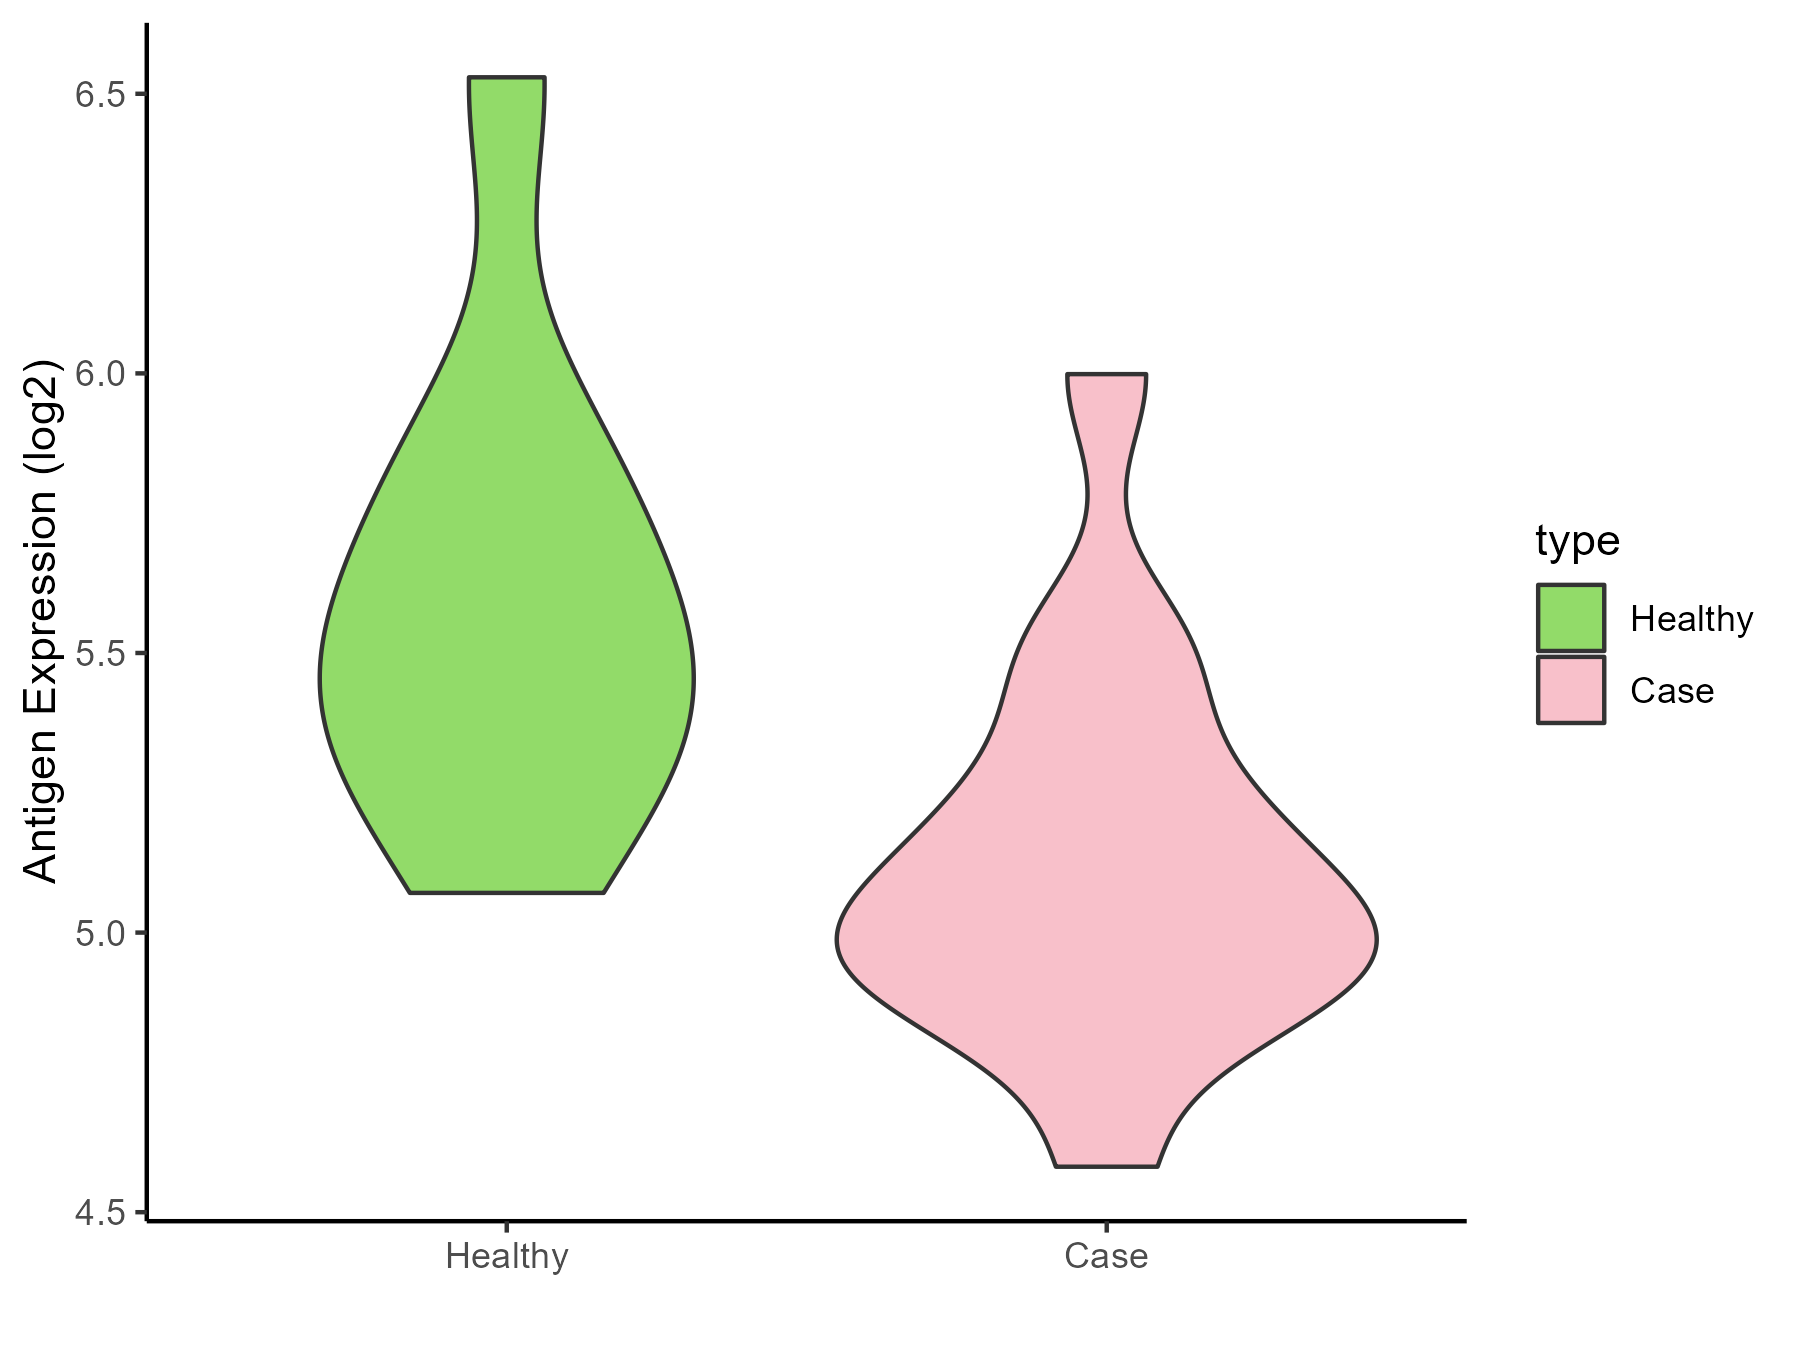
| Differential expression pattern of antigen in diseases | ||
| The Studied Tissue | Pituitary | |
| The Specific Disease | Pituitary gonadotrope tumor | |
| The Expression Level of Disease Section Compare with the Healthy Individual Tissue | p-value: 0.015412629; Fold-change: -0.489406007; Z-score: -1.140504972 | |
| Disease-specific Antigen Abundances |
|
Click to View the Clearer Original Diagram |
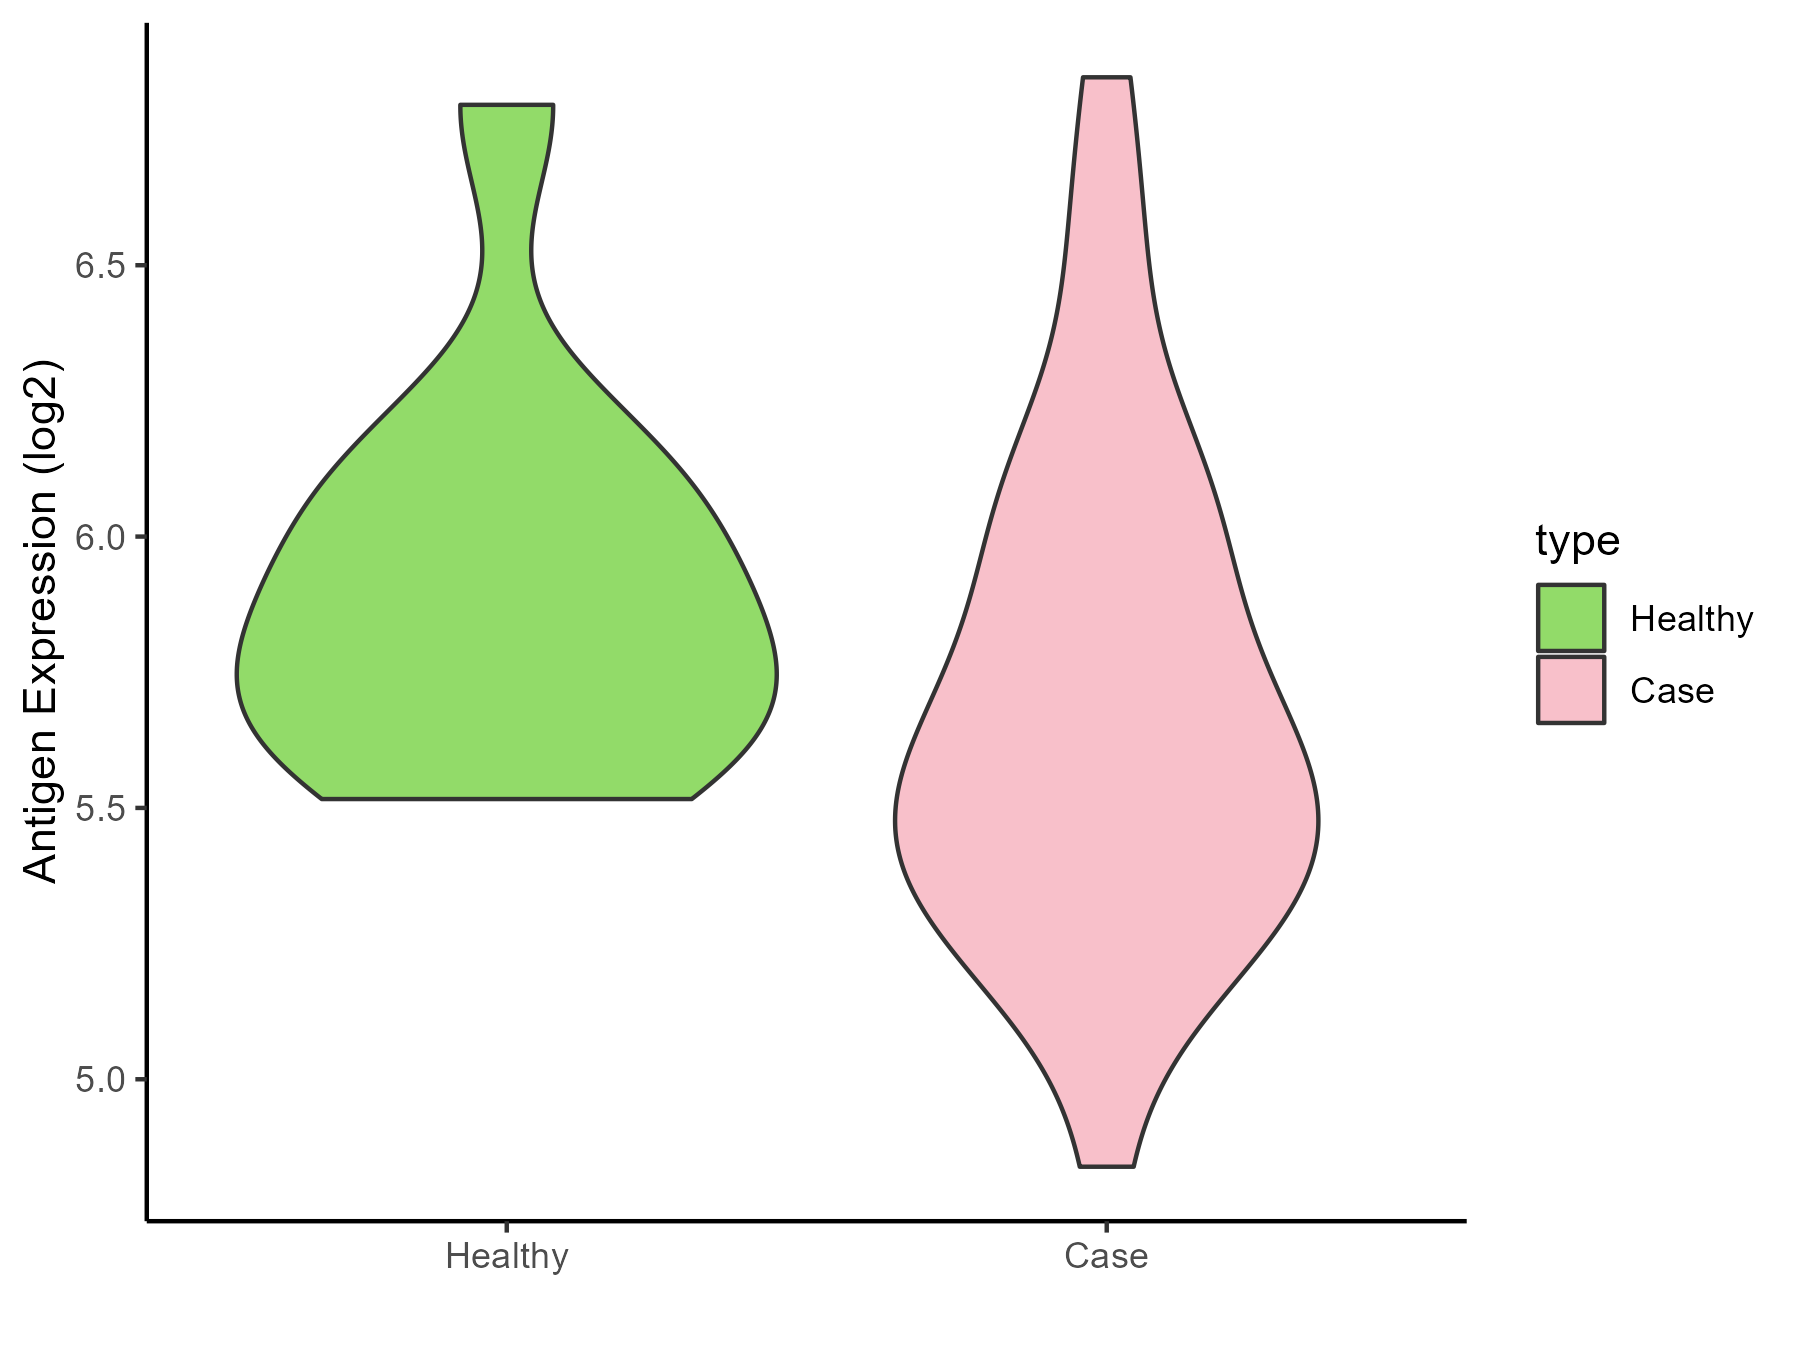
| The Studied Tissue | Pituitary | |
| The Specific Disease | Pituitary cancer | |
| The Expression Level of Disease Section Compare with the Healthy Individual Tissue | p-value: 0.122089427; Fold-change: -0.293885551; Z-score: -0.80993597 | |
| Disease-specific Antigen Abundances |
|
Click to View the Clearer Original Diagram |
ICD Disease Classification 03
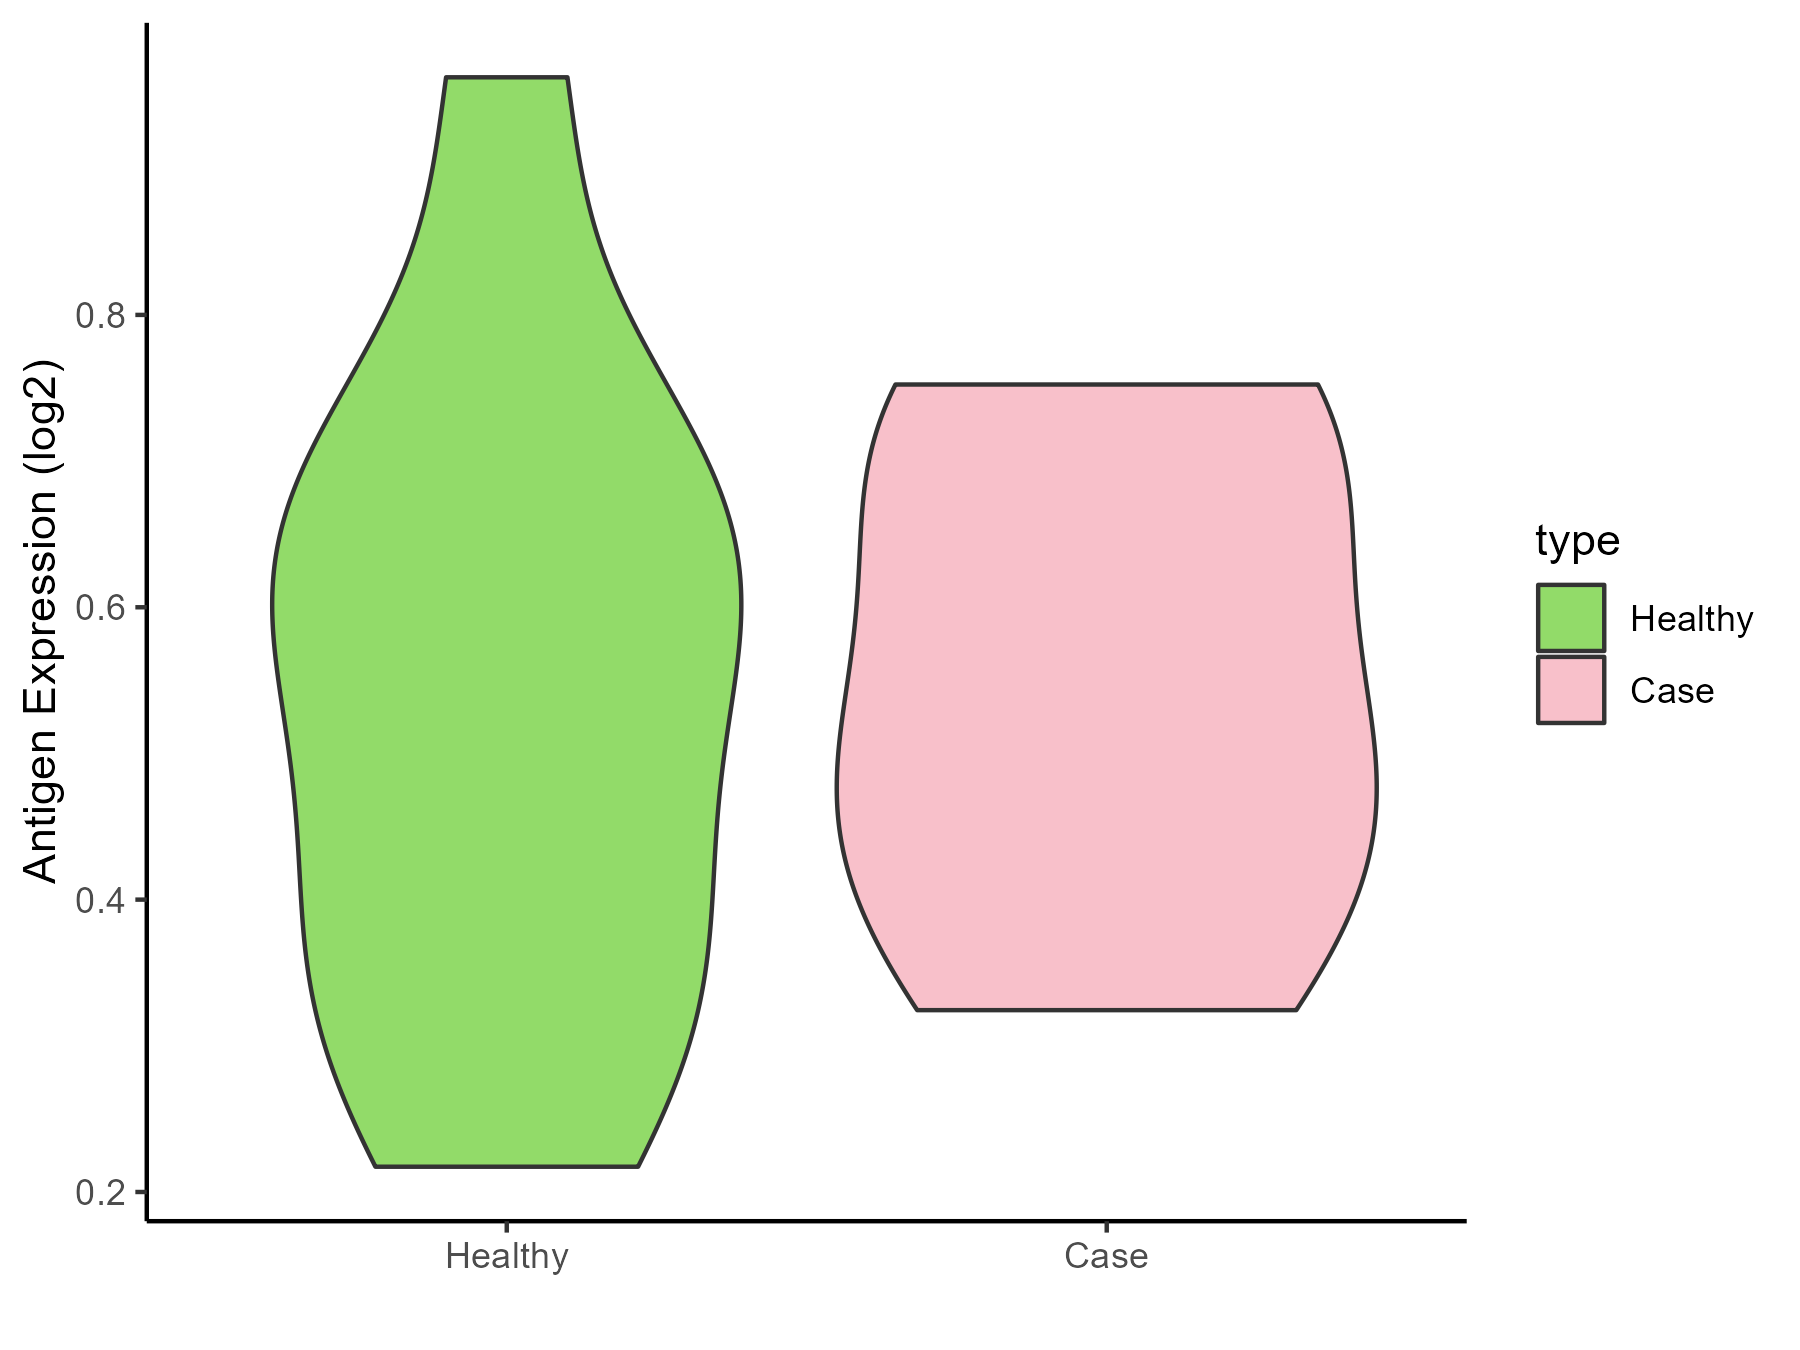
| Differential expression pattern of antigen in diseases | ||
| The Studied Tissue | Whole blood | |
| The Specific Disease | Thrombocytopenia | |
| The Expression Level of Disease Section Compare with the Healthy Individual Tissue | p-value: 0.942721697; Fold-change: -0.042865227; Z-score: -0.191437293 | |
| Disease-specific Antigen Abundances |
|
Click to View the Clearer Original Diagram |
ICD Disease Classification 04
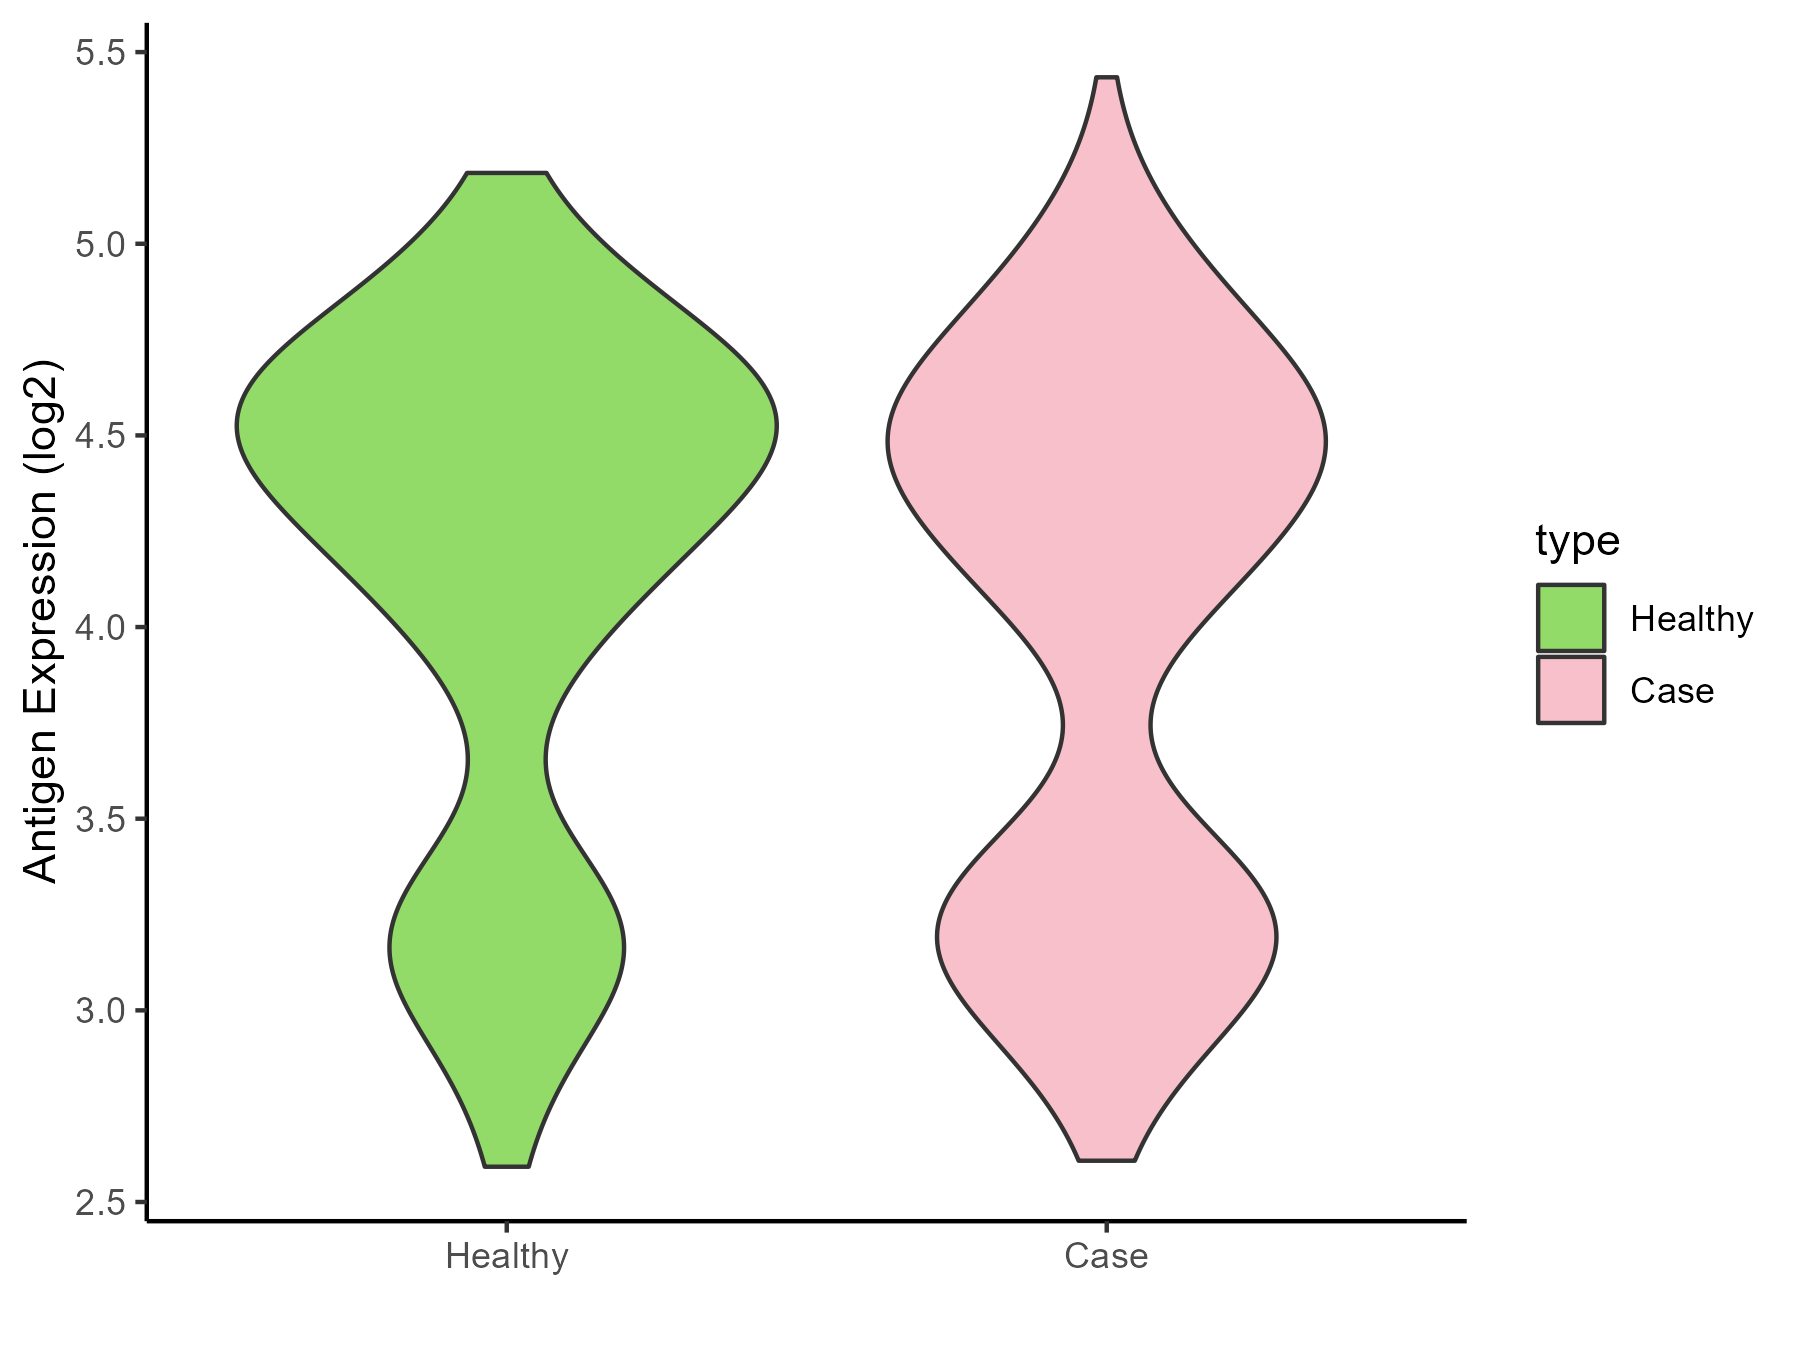
| Differential expression pattern of antigen in diseases | ||
| The Studied Tissue | Whole blood | |
| The Specific Disease | Lupus erythematosus | |
| The Expression Level of Disease Section Compare with the Healthy Individual Tissue | p-value: 0.060176056; Fold-change: -0.170491985; Z-score: -0.261805293 | |
| Disease-specific Antigen Abundances |
|
Click to View the Clearer Original Diagram |
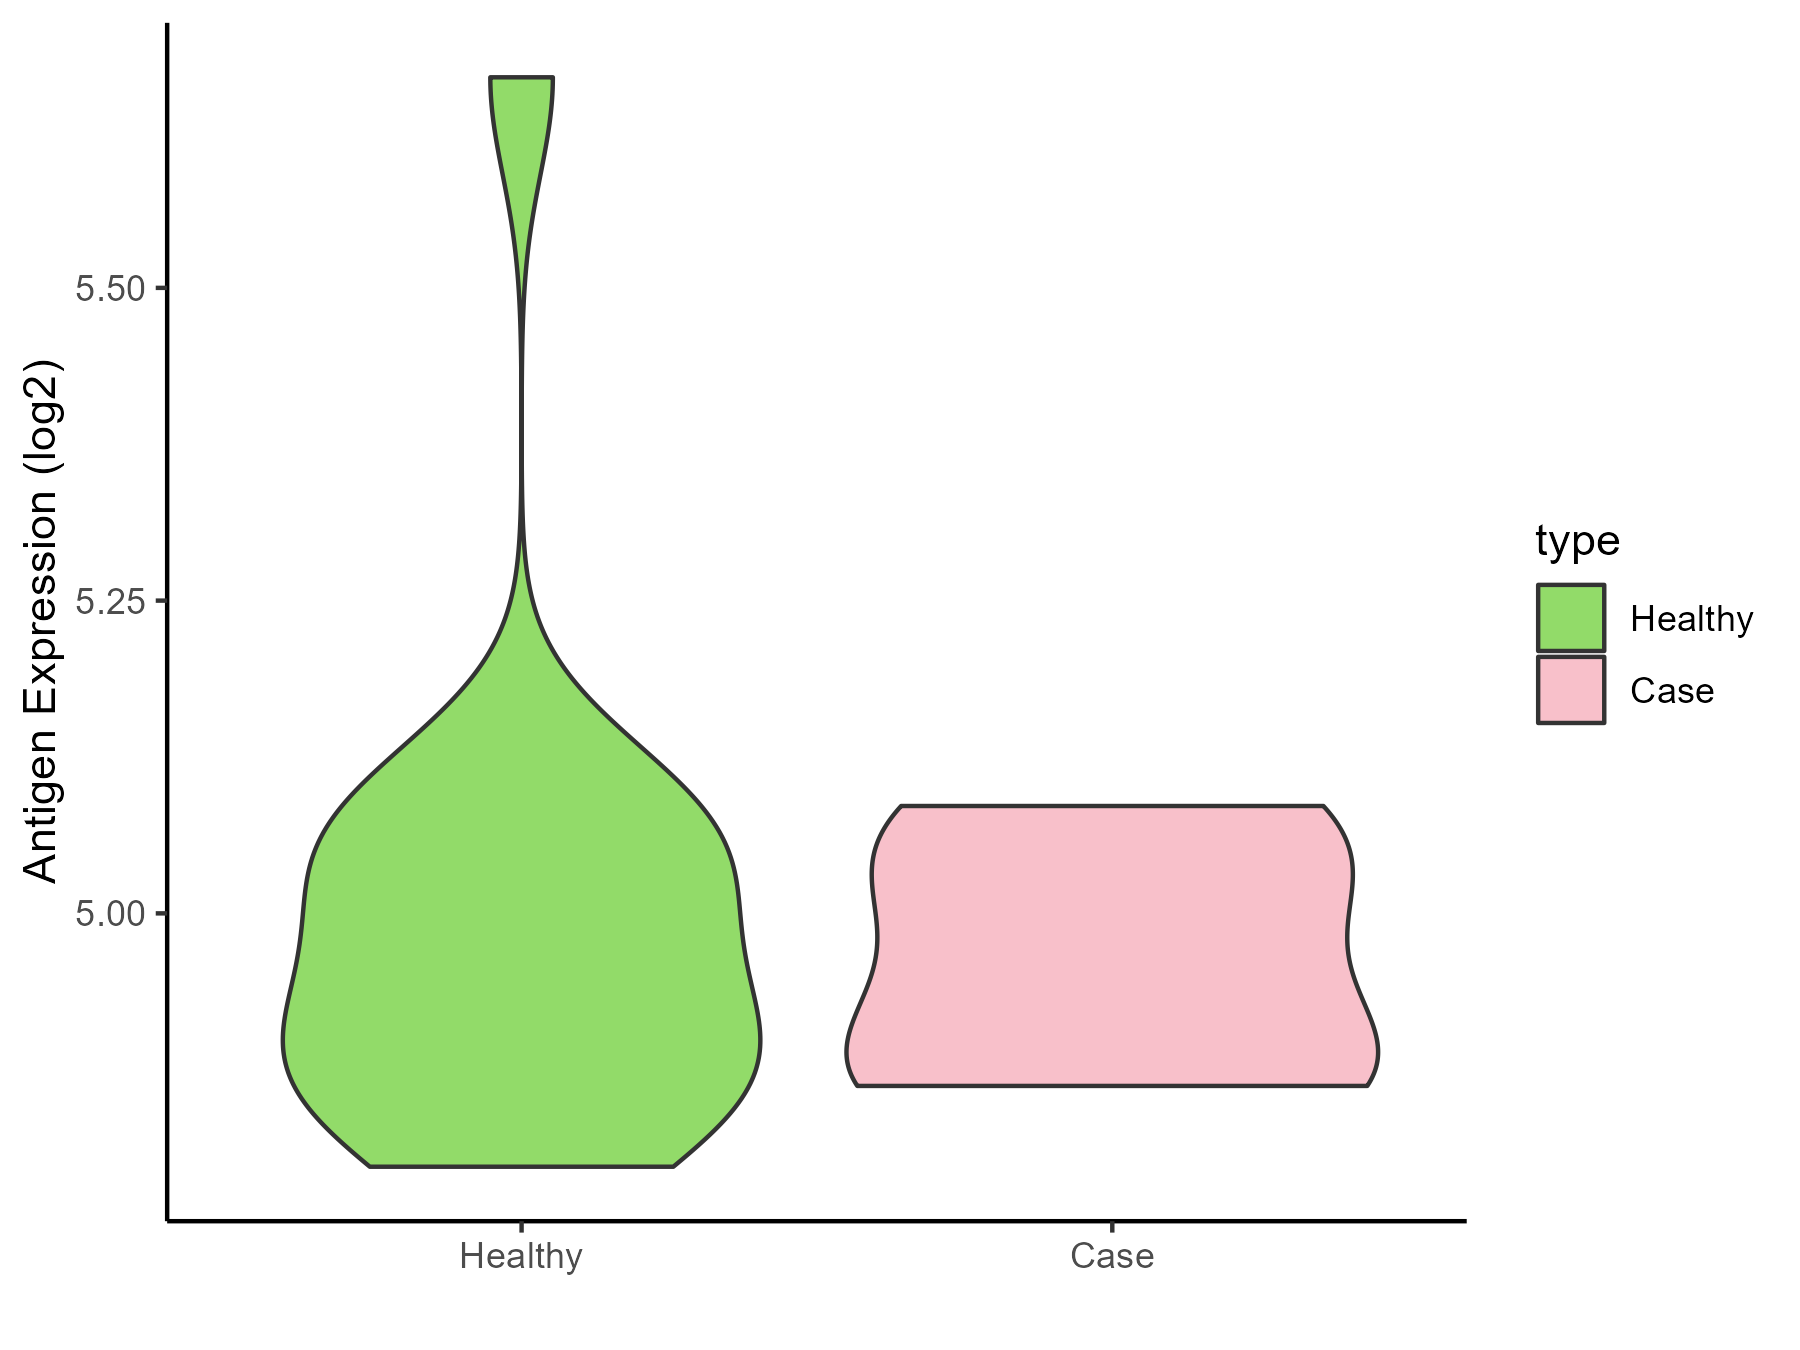
| Differential expression pattern of antigen in diseases | ||
| The Studied Tissue | Peripheral monocyte | |
| The Specific Disease | Autoimmune uveitis | |
| The Expression Level of Disease Section Compare with the Healthy Individual Tissue | p-value: 0.634565667; Fold-change: 0.029451646; Z-score: 0.140909164 | |
| Disease-specific Antigen Abundances |
|
Click to View the Clearer Original Diagram |
ICD Disease Classification 05
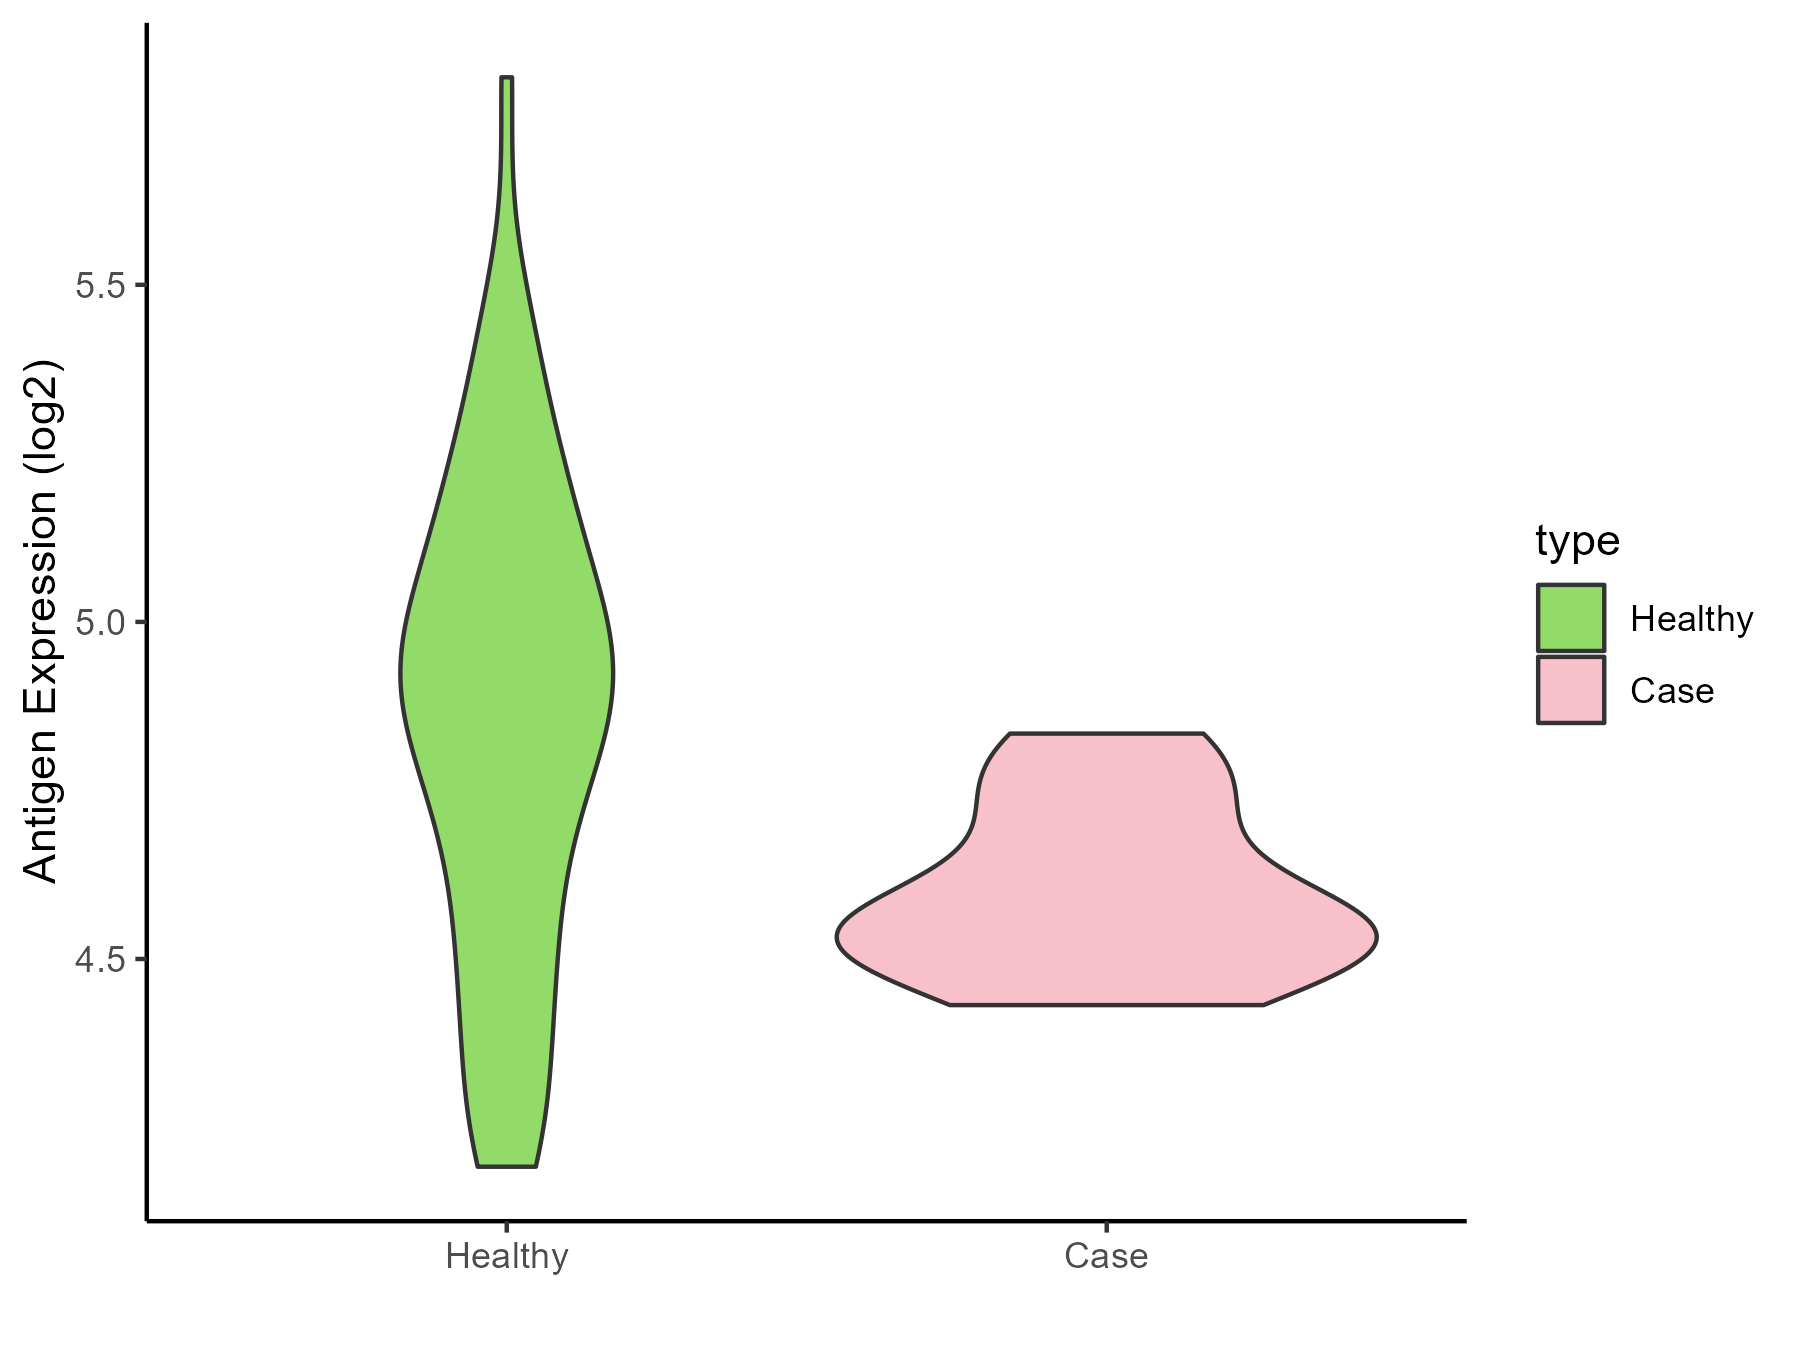
| Differential expression pattern of antigen in diseases | ||
| The Studied Tissue | Whole blood | |
| The Specific Disease | Familial hypercholesterolemia | |
| The Expression Level of Disease Section Compare with the Healthy Individual Tissue | p-value: 0.000346456; Fold-change: -0.350577711; Z-score: -0.993142958 | |
| Disease-specific Antigen Abundances |
|
Click to View the Clearer Original Diagram |
ICD Disease Classification 06
| Differential expression pattern of antigen in diseases | ||
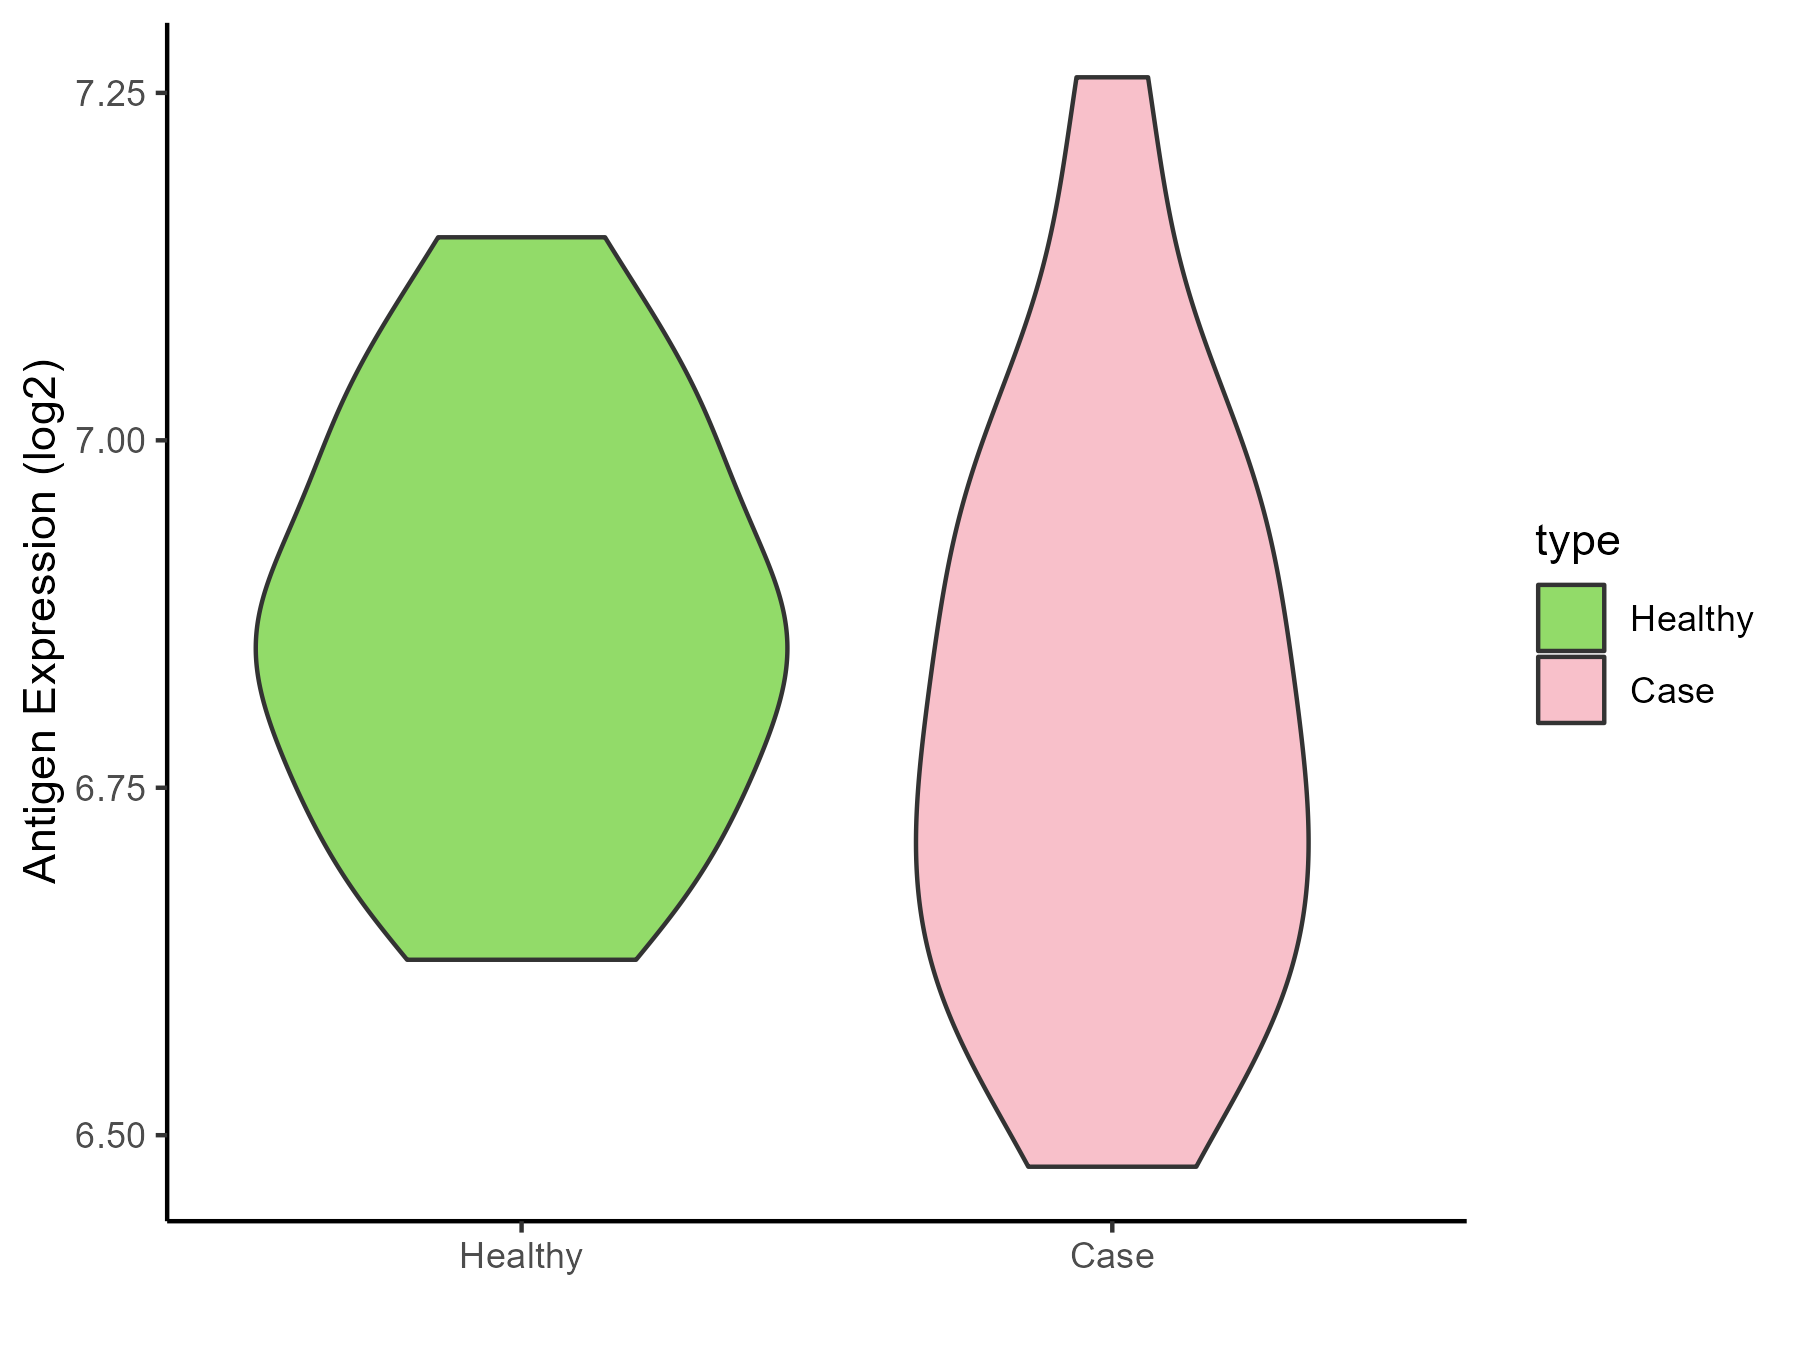
| The Studied Tissue | Superior temporal cortex | |
| The Specific Disease | Schizophrenia | |
| The Expression Level of Disease Section Compare with the Healthy Individual Tissue | p-value: 0.23777059; Fold-change: -0.084417876; Z-score: -0.573046233 | |
| Disease-specific Antigen Abundances |
|
Click to View the Clearer Original Diagram |
ICD Disease Classification 08
| Differential expression pattern of antigen in diseases | ||
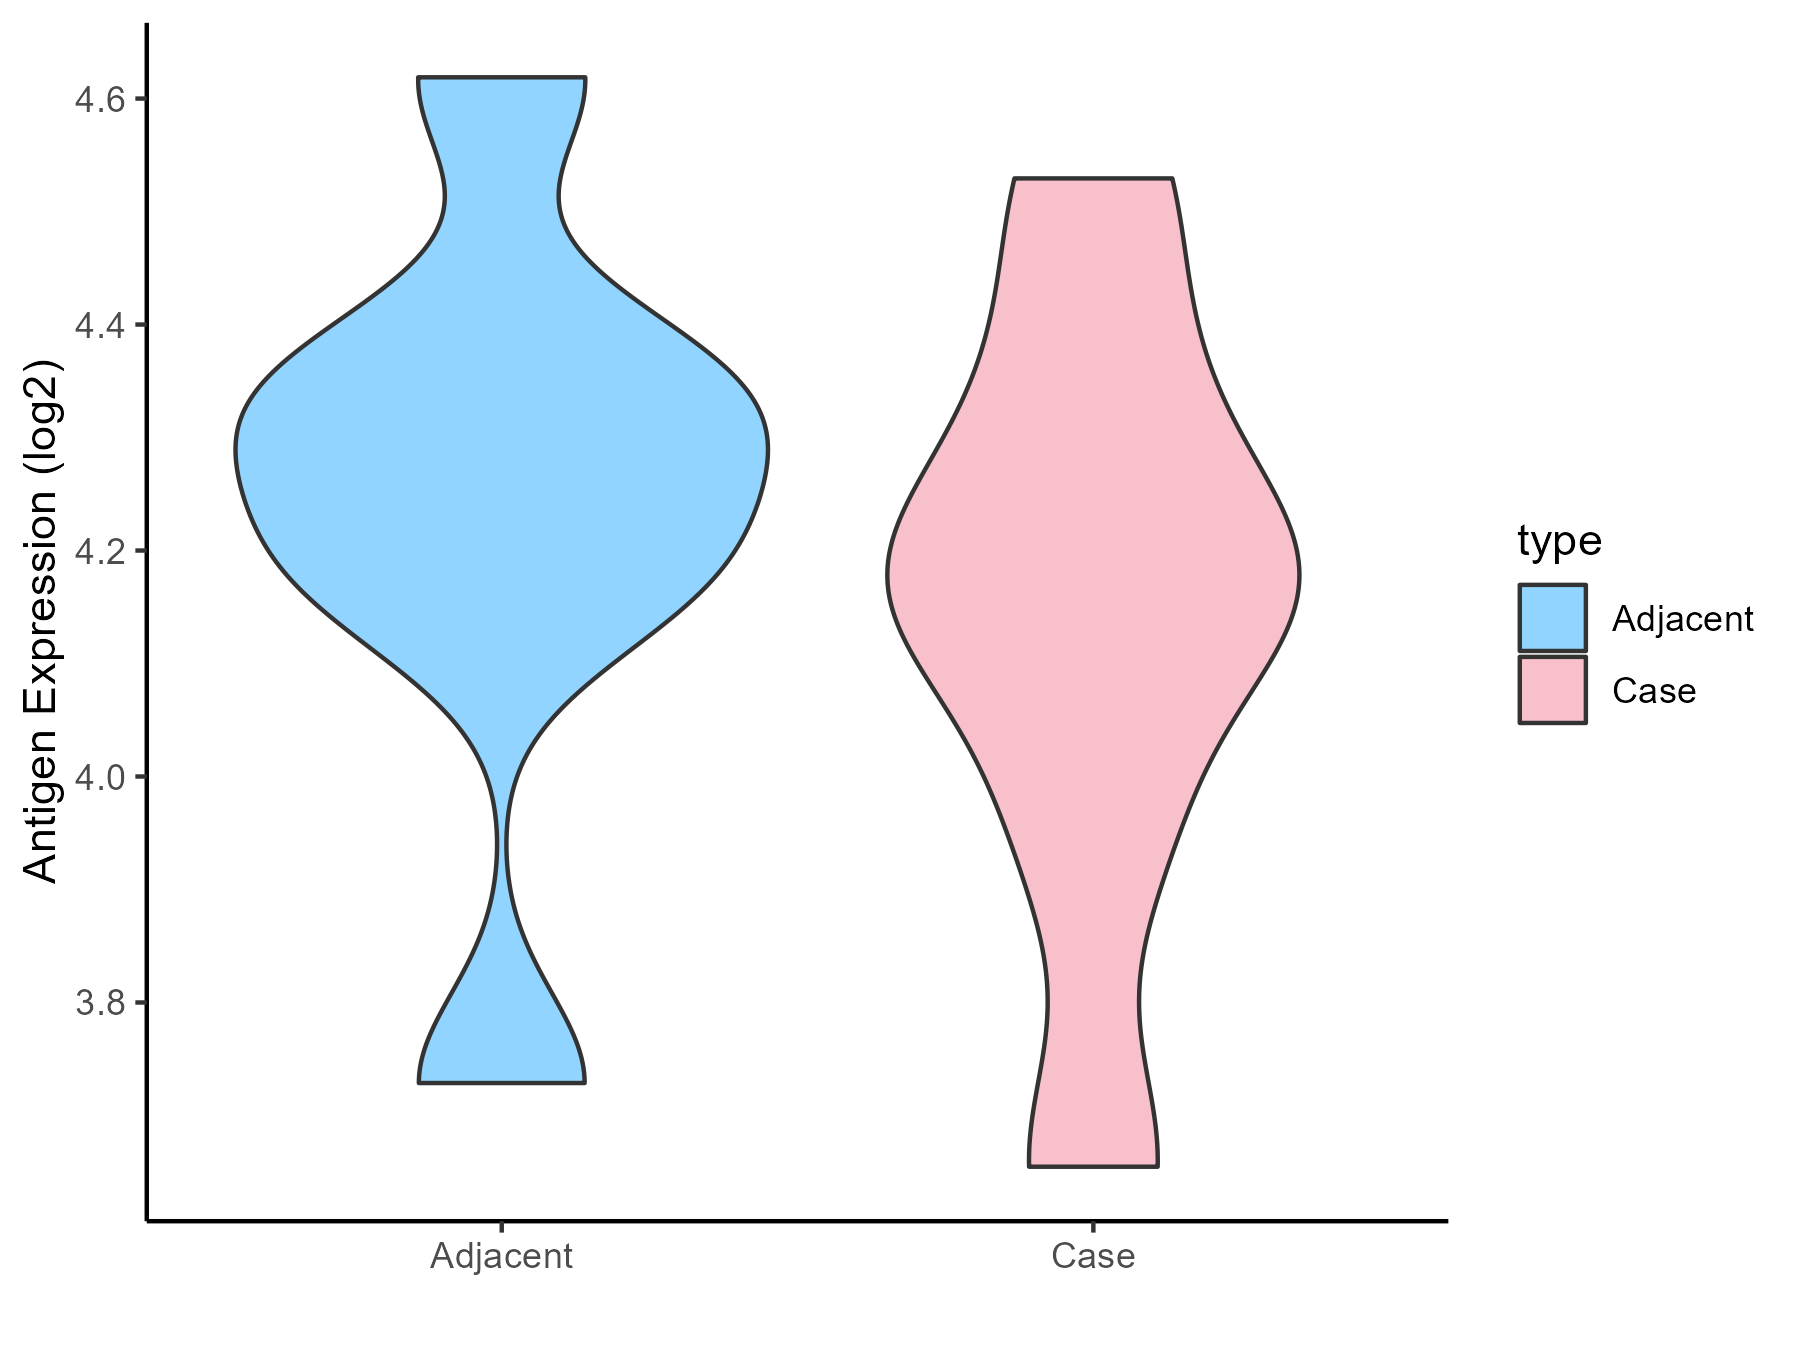
| The Studied Tissue | Spinal cord | |
| The Specific Disease | Multiple sclerosis | |
| The Expression Level of Disease Section Compare with the Adjacent Tissue | p-value: 0.520674685; Fold-change: -0.119960855; Z-score: -0.442952499 | |
| Disease-specific Antigen Abundances |
|
Click to View the Clearer Original Diagram |
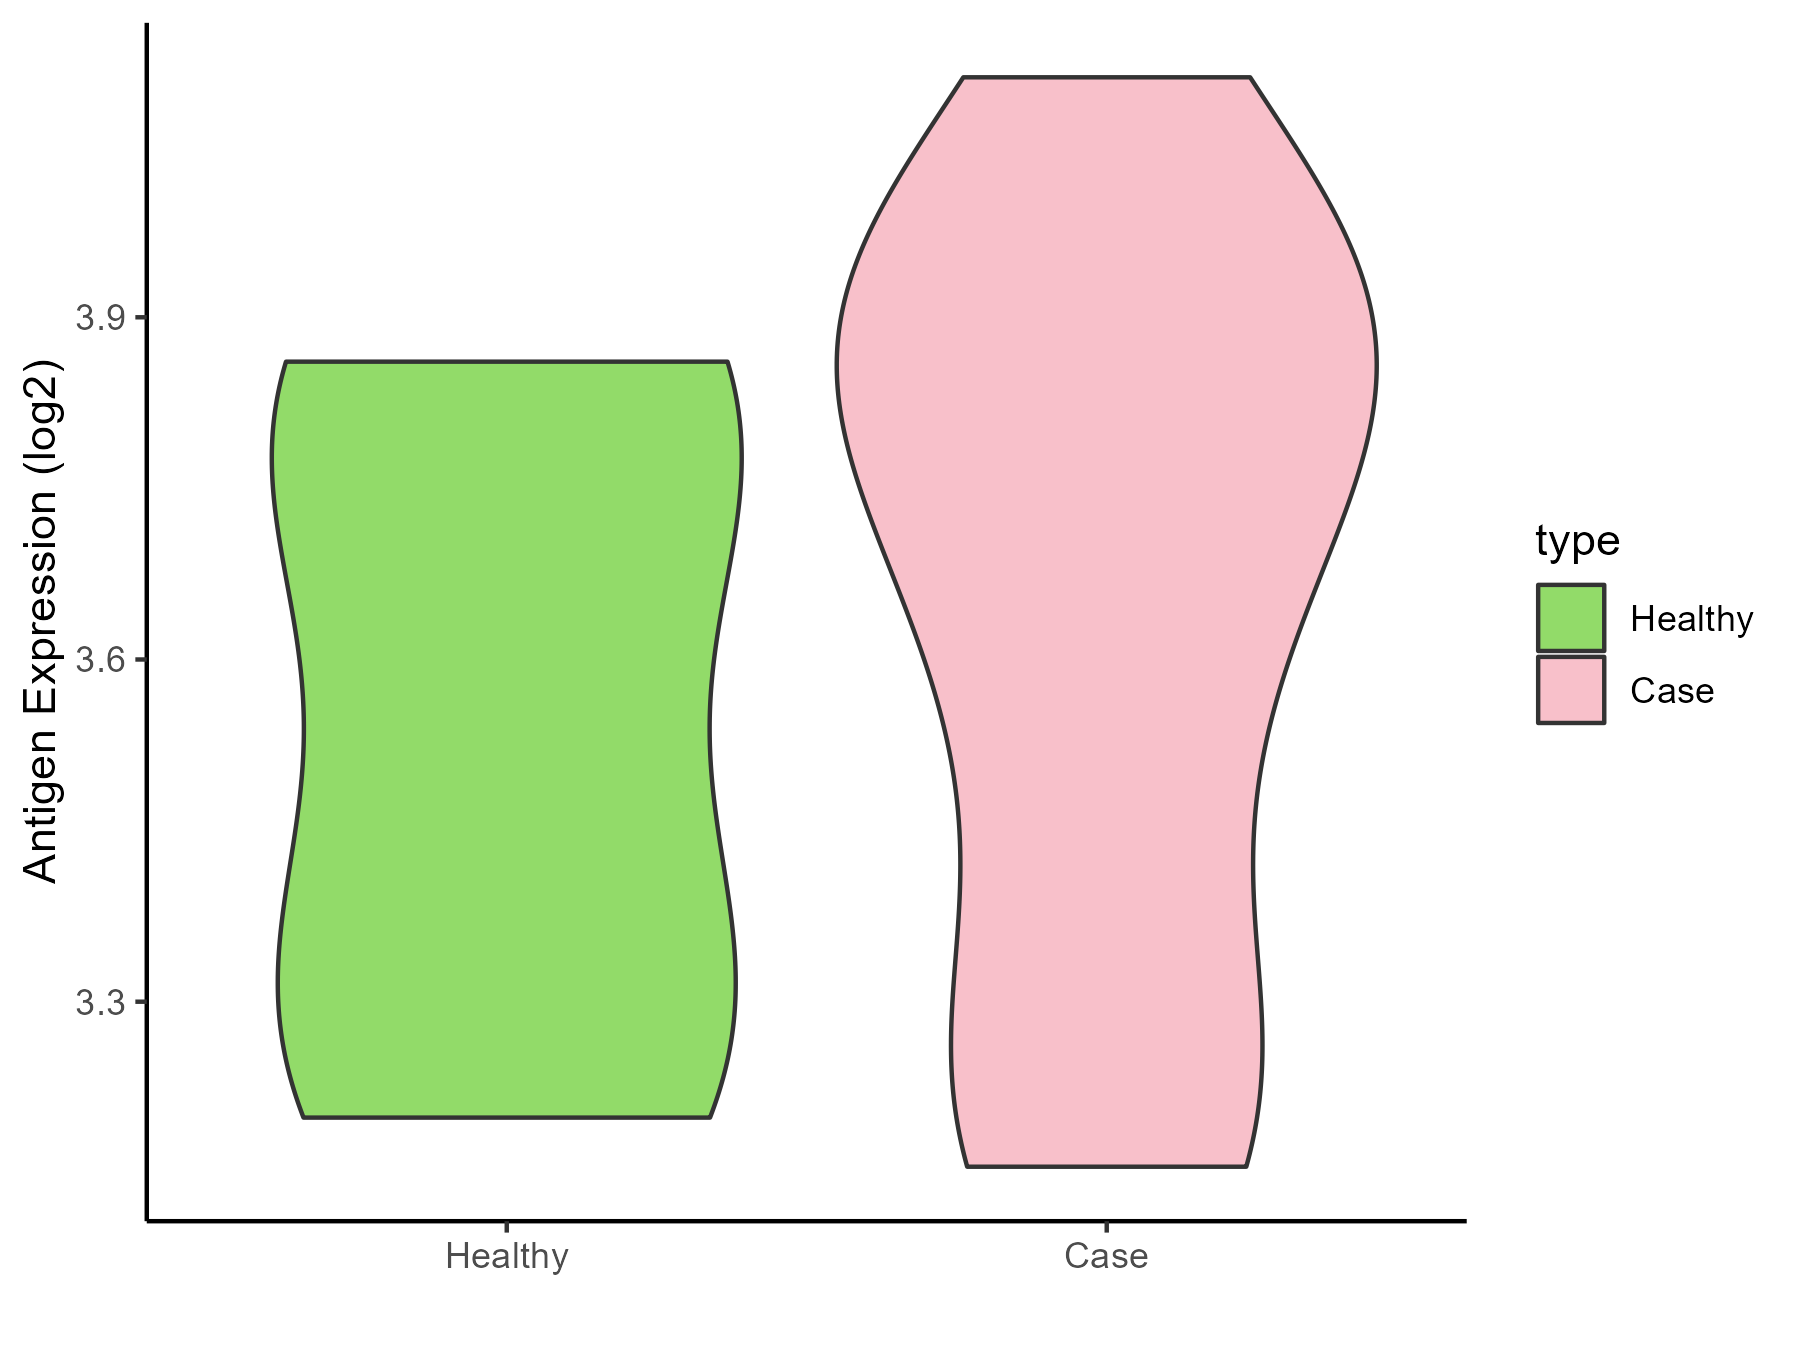
| The Studied Tissue | Plasmacytoid dendritic cells | |
| The Specific Disease | Multiple sclerosis | |
| The Expression Level of Disease Section Compare with the Healthy Individual Tissue | p-value: 0.474407287; Fold-change: 0.195749632; Z-score: 0.662938559 | |
| Disease-specific Antigen Abundances |
|
Click to View the Clearer Original Diagram |
| Differential expression pattern of antigen in diseases | ||
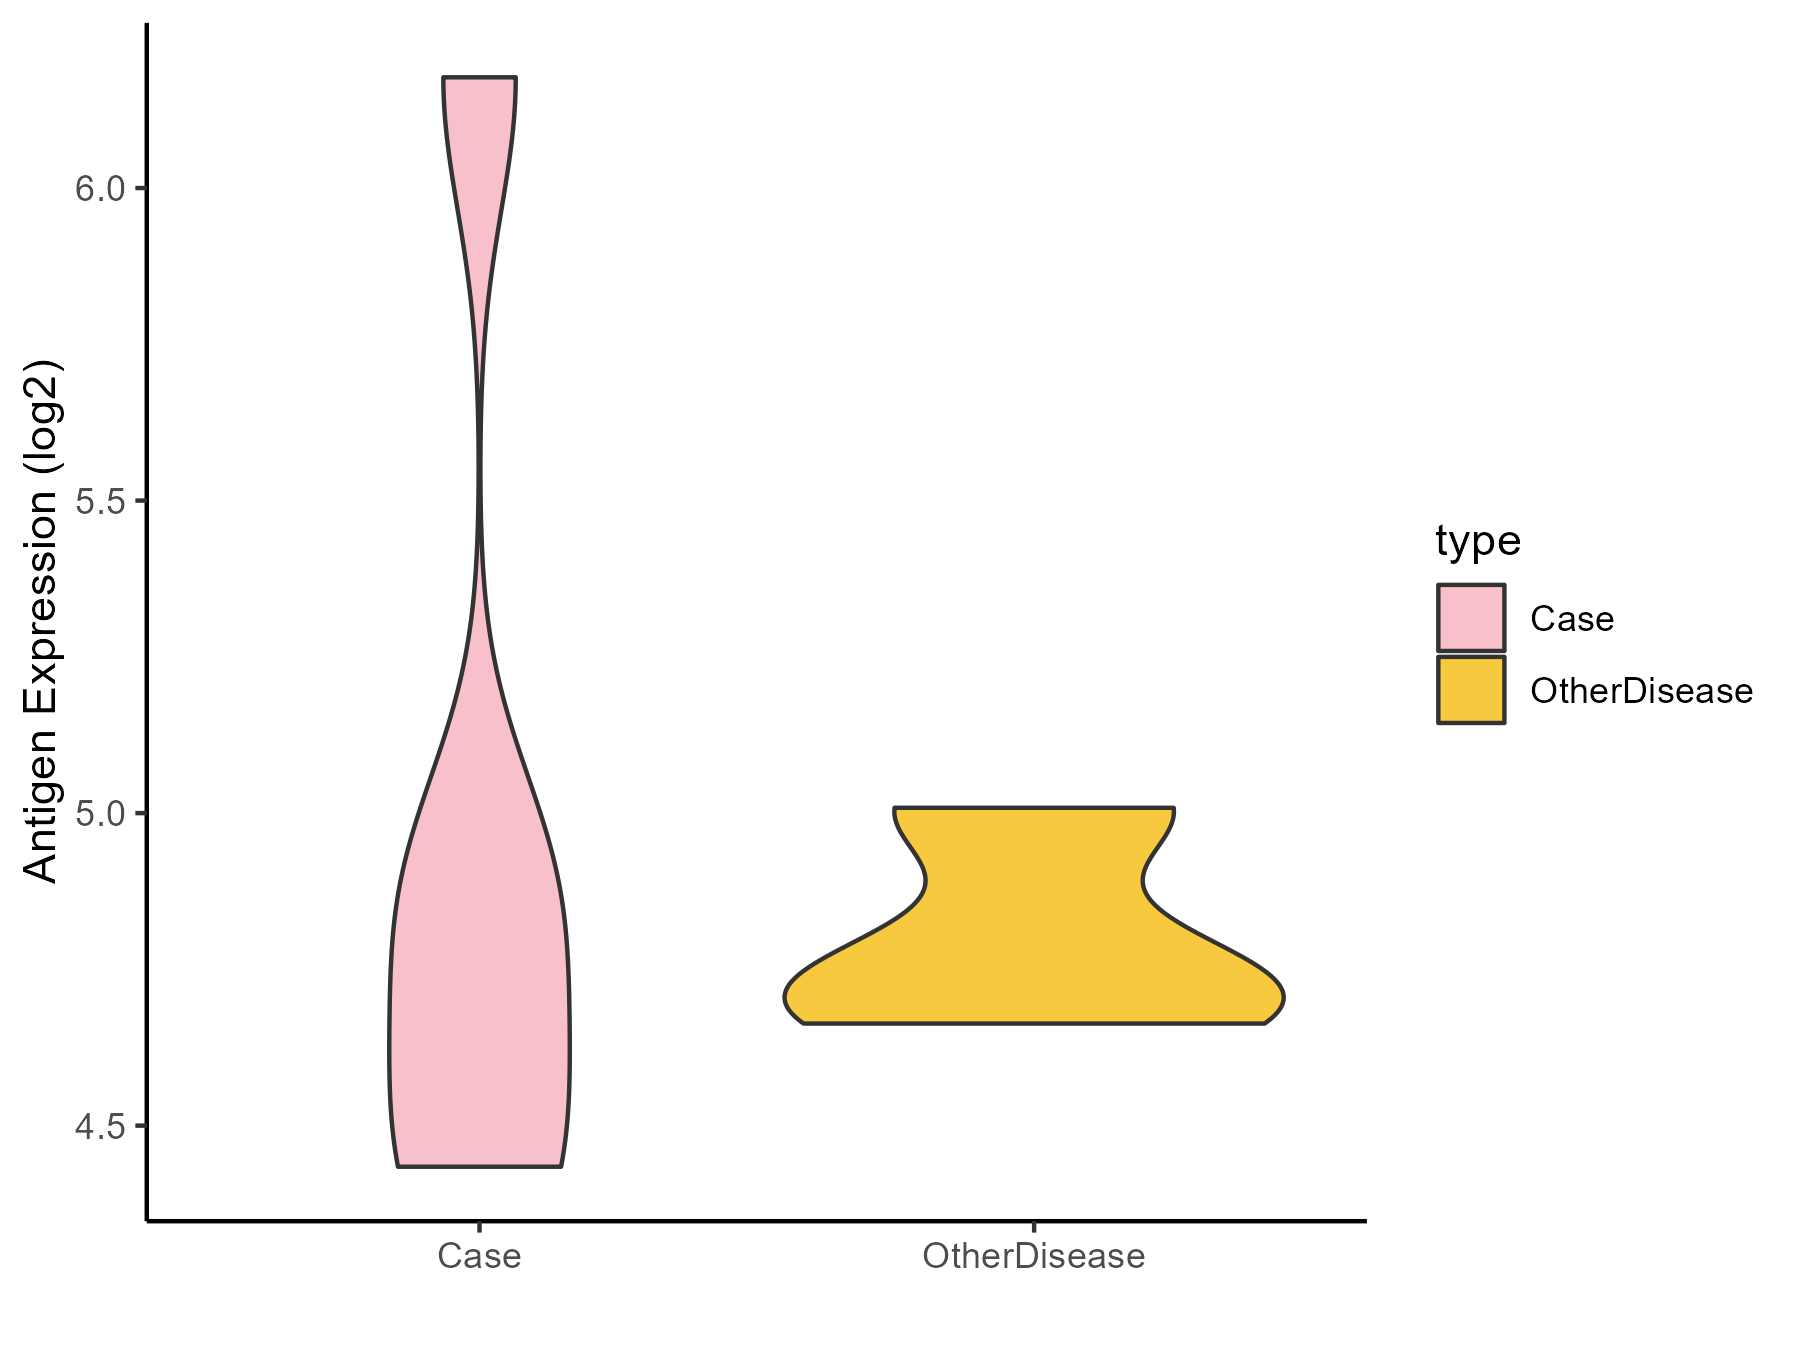
| The Studied Tissue | Peritumoral cortex | |
| The Specific Disease | Epilepsy | |
| The Expression Level of Disease Section Compare with the Other Disease Section | p-value: 0.659908366; Fold-change: 0.078503686; Z-score: 0.435042009 | |
| Disease-specific Antigen Abundances |
|
Click to View the Clearer Original Diagram |
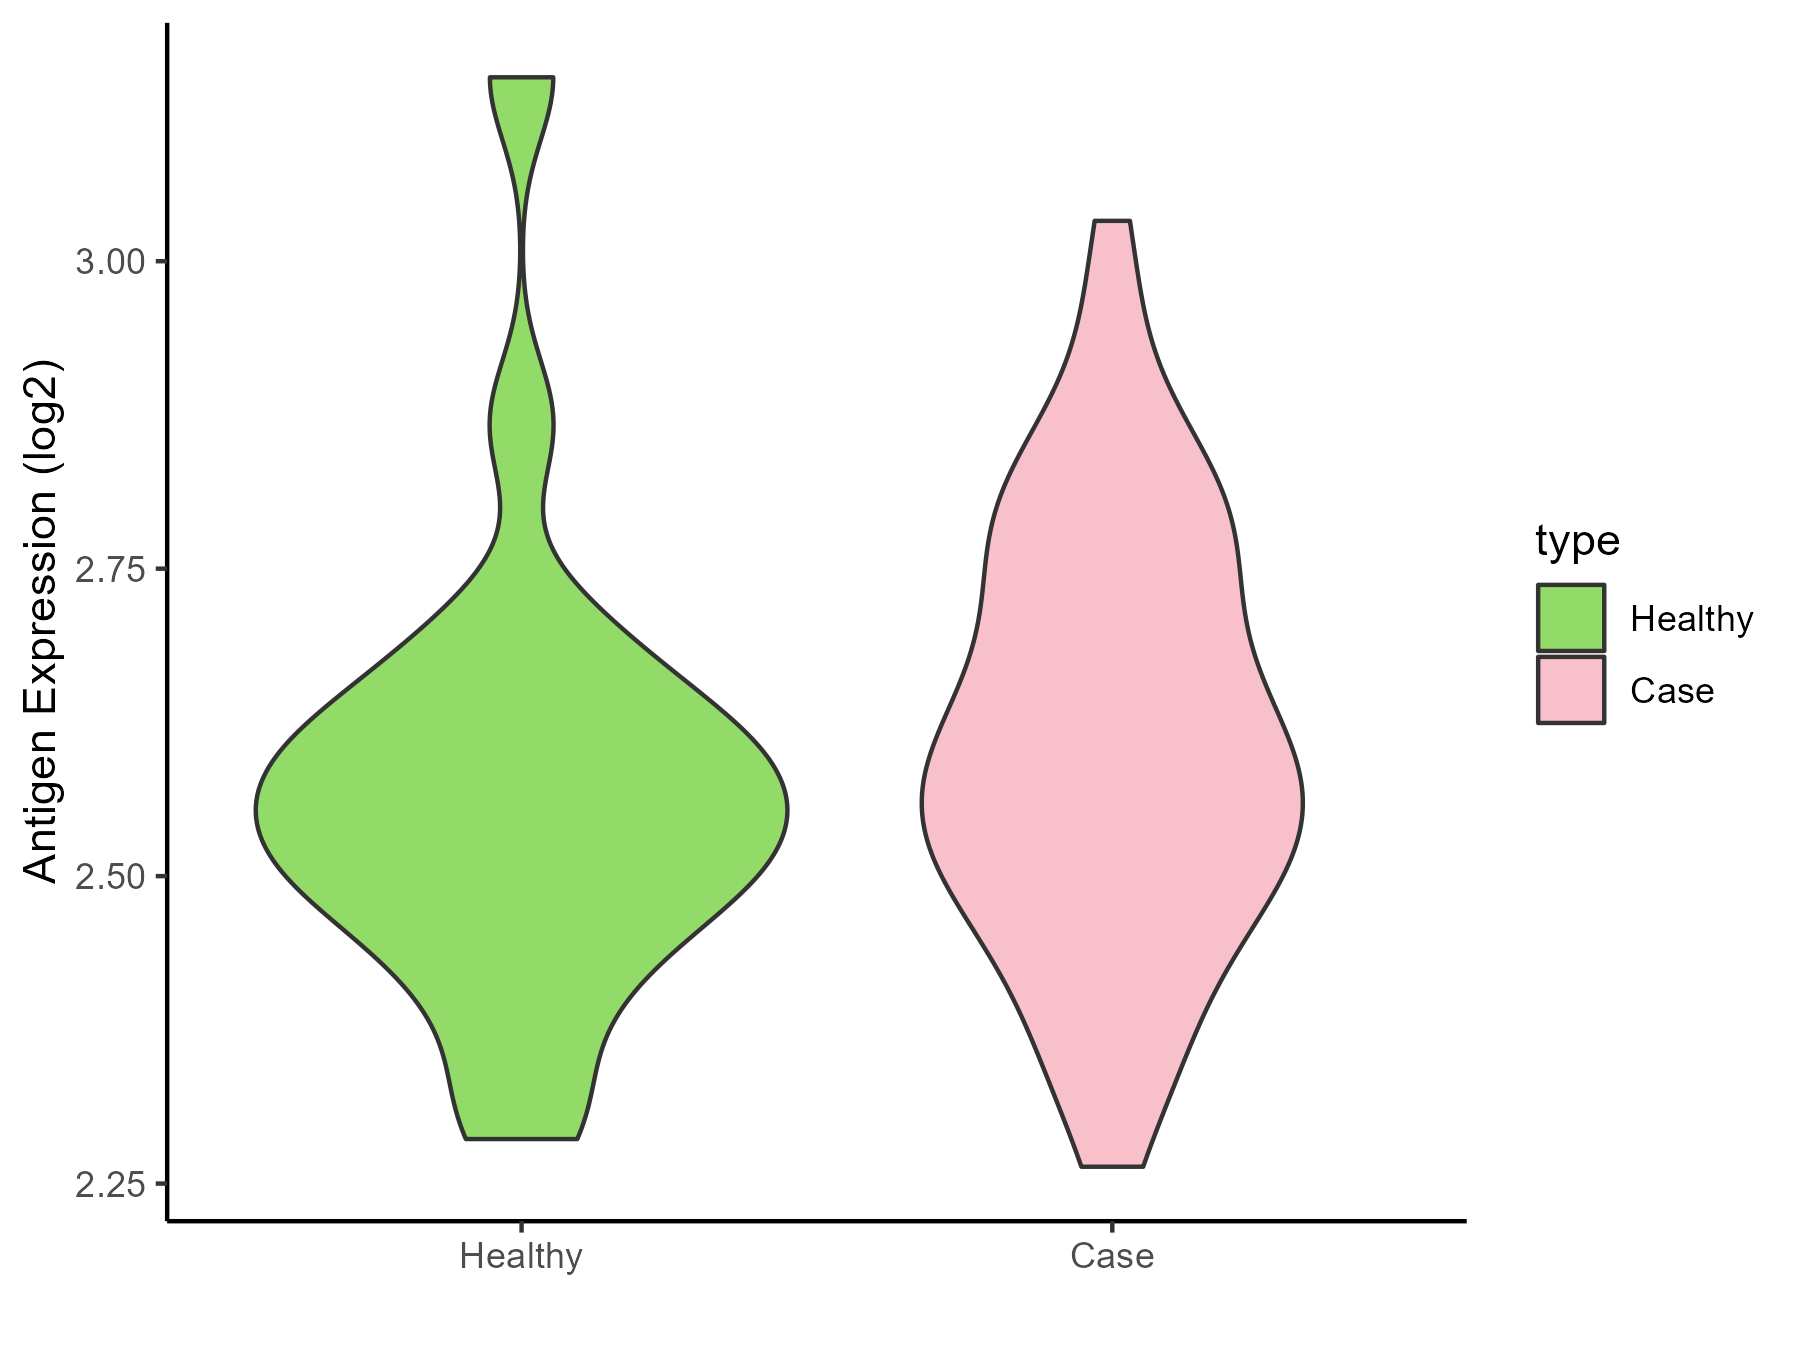
| Differential expression pattern of antigen in diseases | ||
| The Studied Tissue | Whole blood | |
| The Specific Disease | Cardioembolic Stroke | |
| The Expression Level of Disease Section Compare with the Healthy Individual Tissue | p-value: 0.39698865; Fold-change: 0.035946392; Z-score: 0.19461223 | |
| Disease-specific Antigen Abundances |
|
Click to View the Clearer Original Diagram |
| The Studied Tissue | Peripheral blood | |
| The Specific Disease | Ischemic stroke | |
| The Expression Level of Disease Section Compare with the Healthy Individual Tissue | p-value: 0.073526156; Fold-change: 0.108240012; Z-score: 0.73718389 | |
| Disease-specific Antigen Abundances |
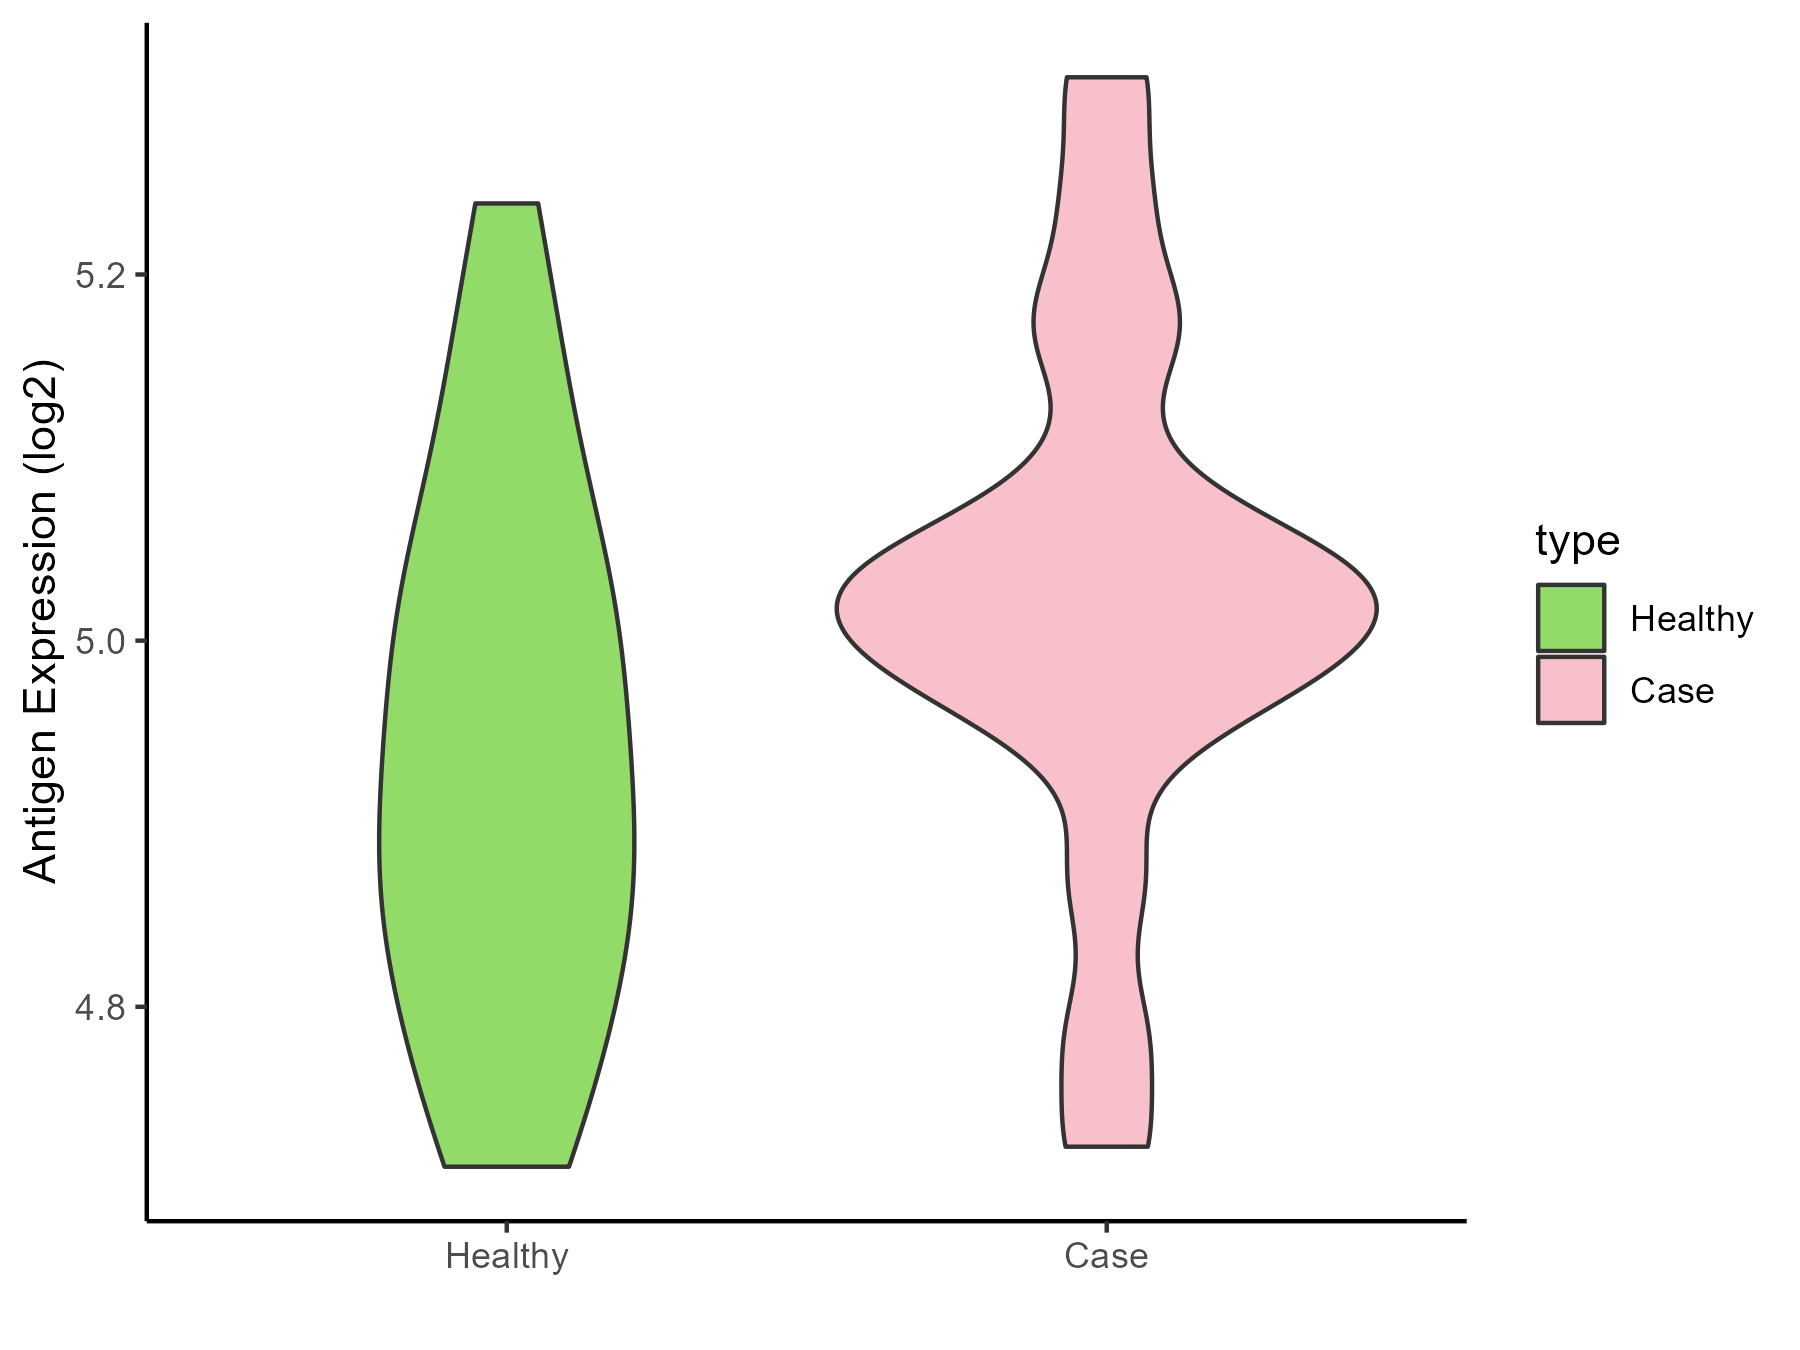
|
Click to View the Clearer Original Diagram |
ICD Disease Classification 1
| Differential expression pattern of antigen in diseases | ||
| The Studied Tissue | White matter | |
| The Specific Disease | HIV | |
| The Expression Level of Disease Section Compare with the Healthy Individual Tissue | p-value: 0.133889529; Fold-change: -0.176283458; Z-score: -0.387609293 | |
| Disease-specific Antigen Abundances |
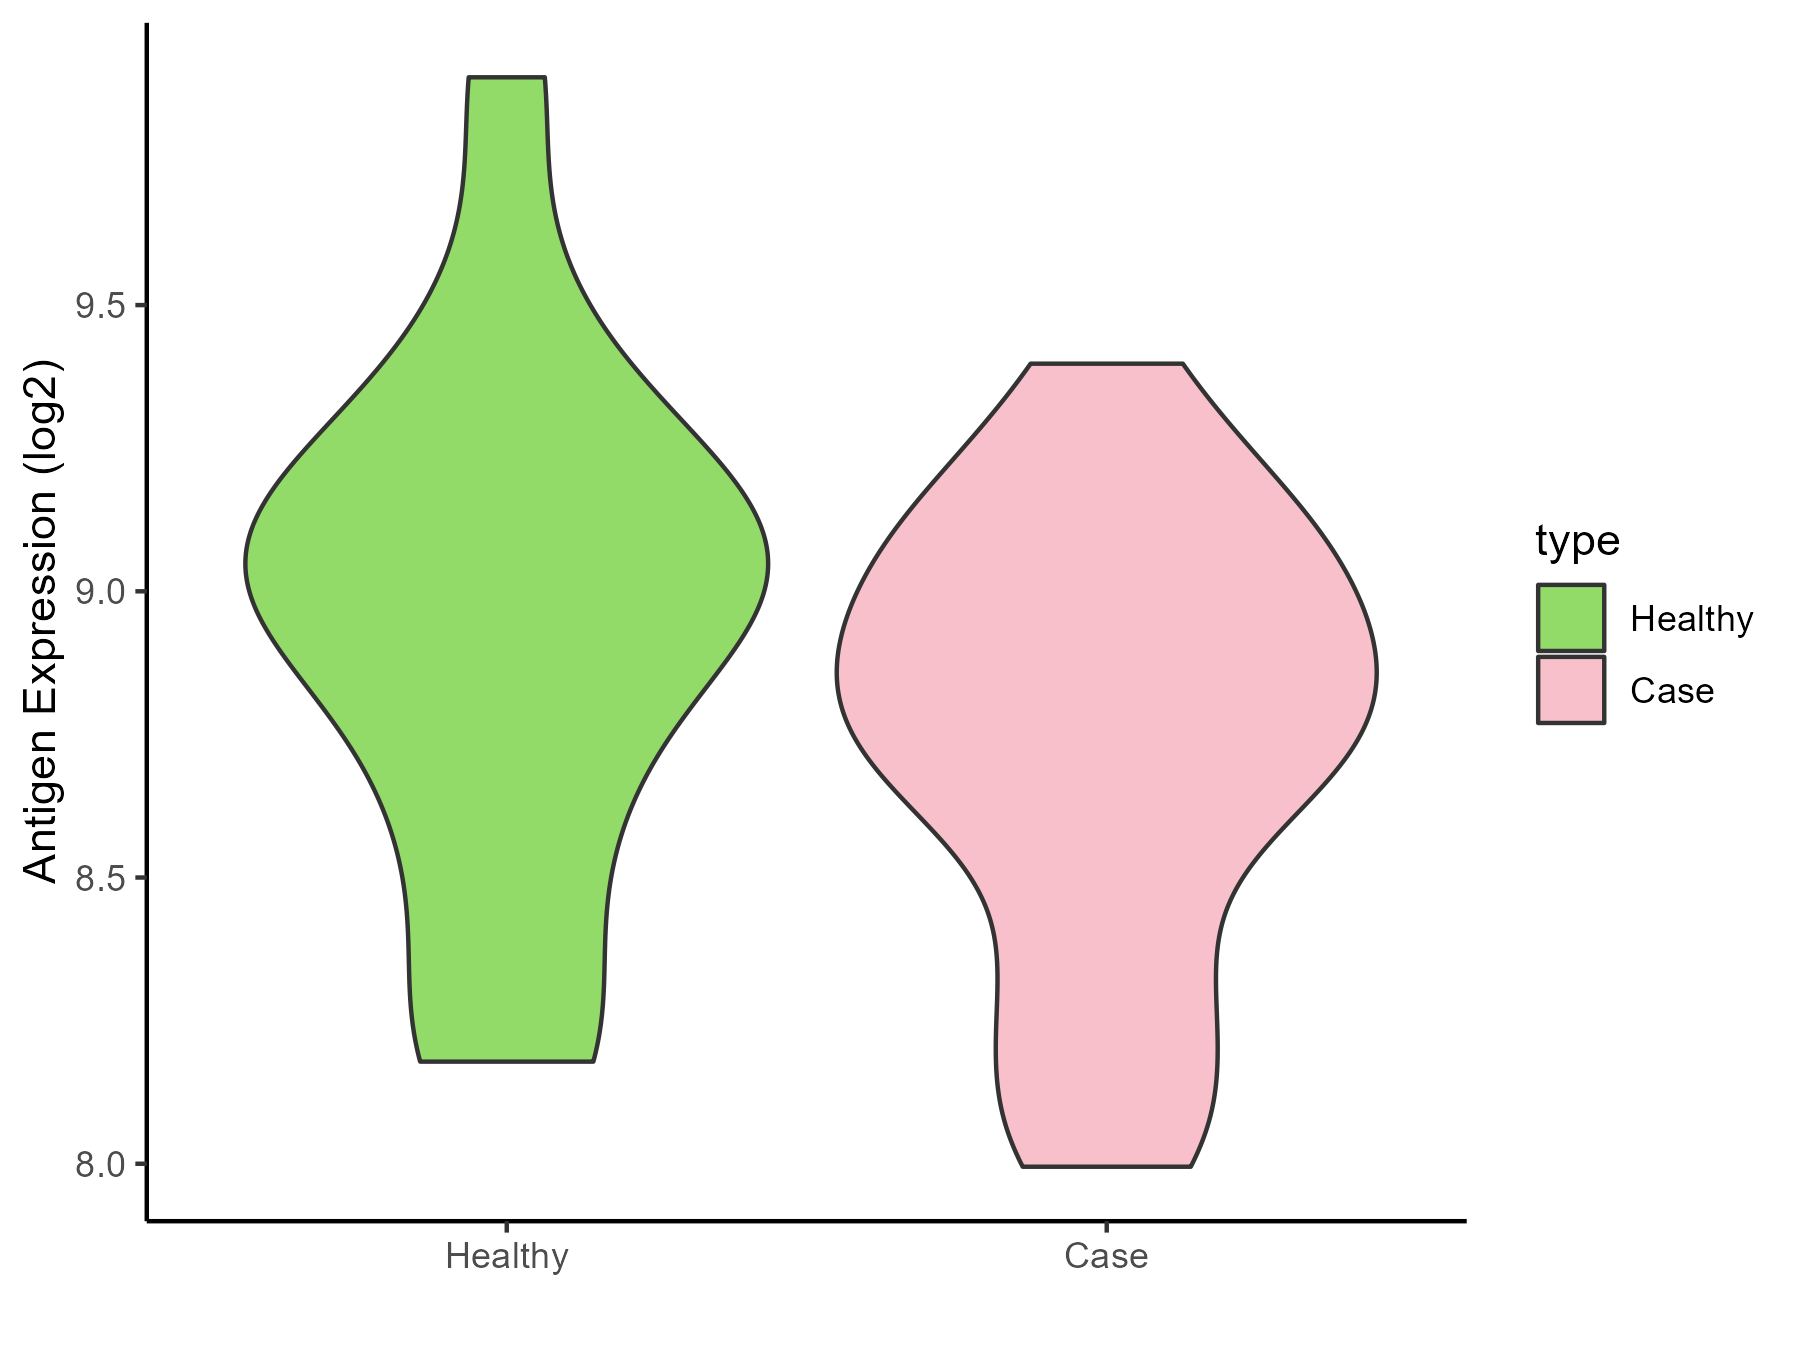
|
Click to View the Clearer Original Diagram |
| Differential expression pattern of antigen in diseases | ||
| The Studied Tissue | Whole blood | |
| The Specific Disease | Influenza | |
| The Expression Level of Disease Section Compare with the Healthy Individual Tissue | p-value: 0.139528889; Fold-change: 0.412341351; Z-score: 1.852115602 | |
| Disease-specific Antigen Abundances |
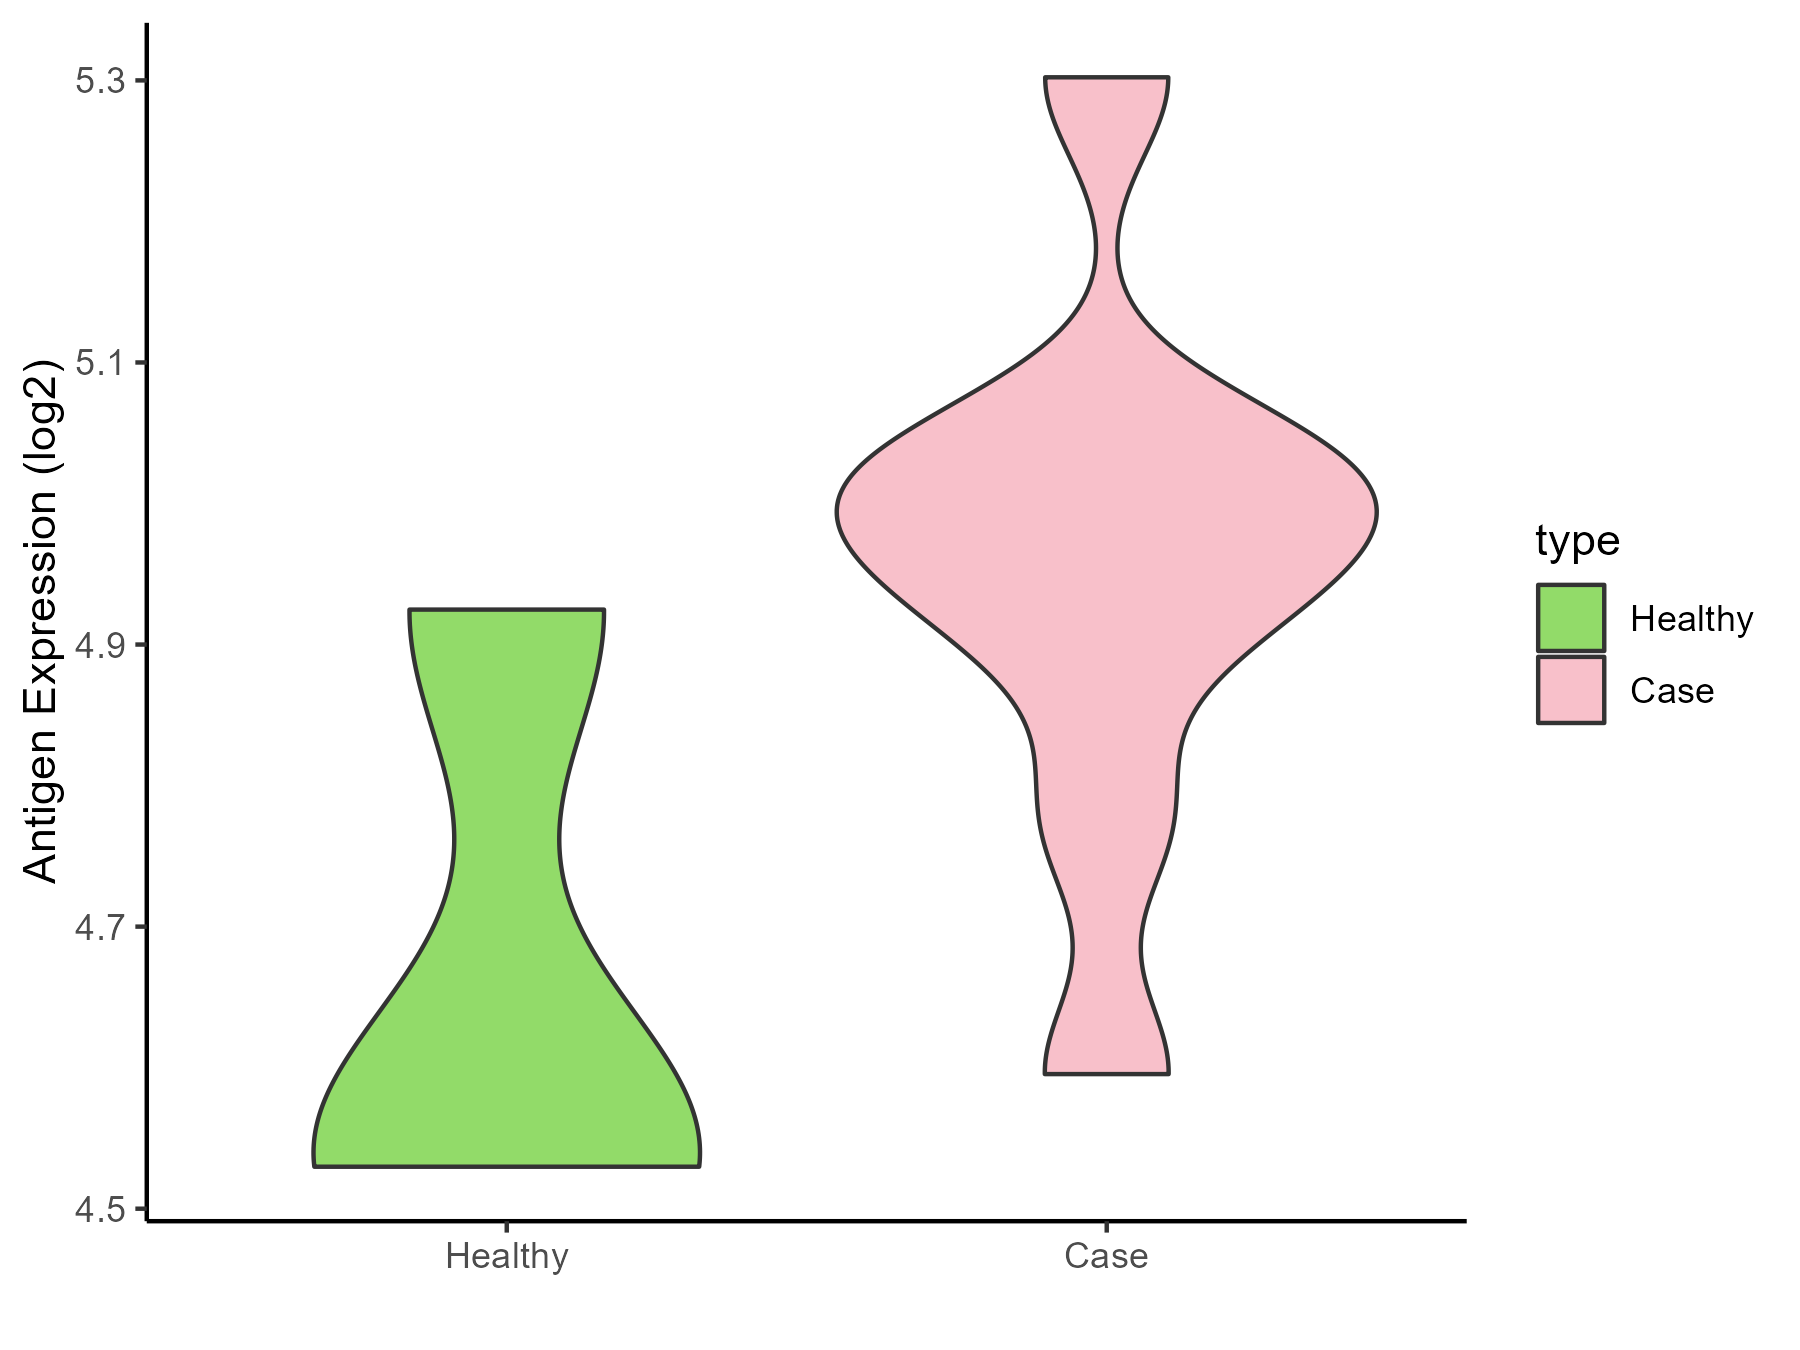
|
Click to View the Clearer Original Diagram |
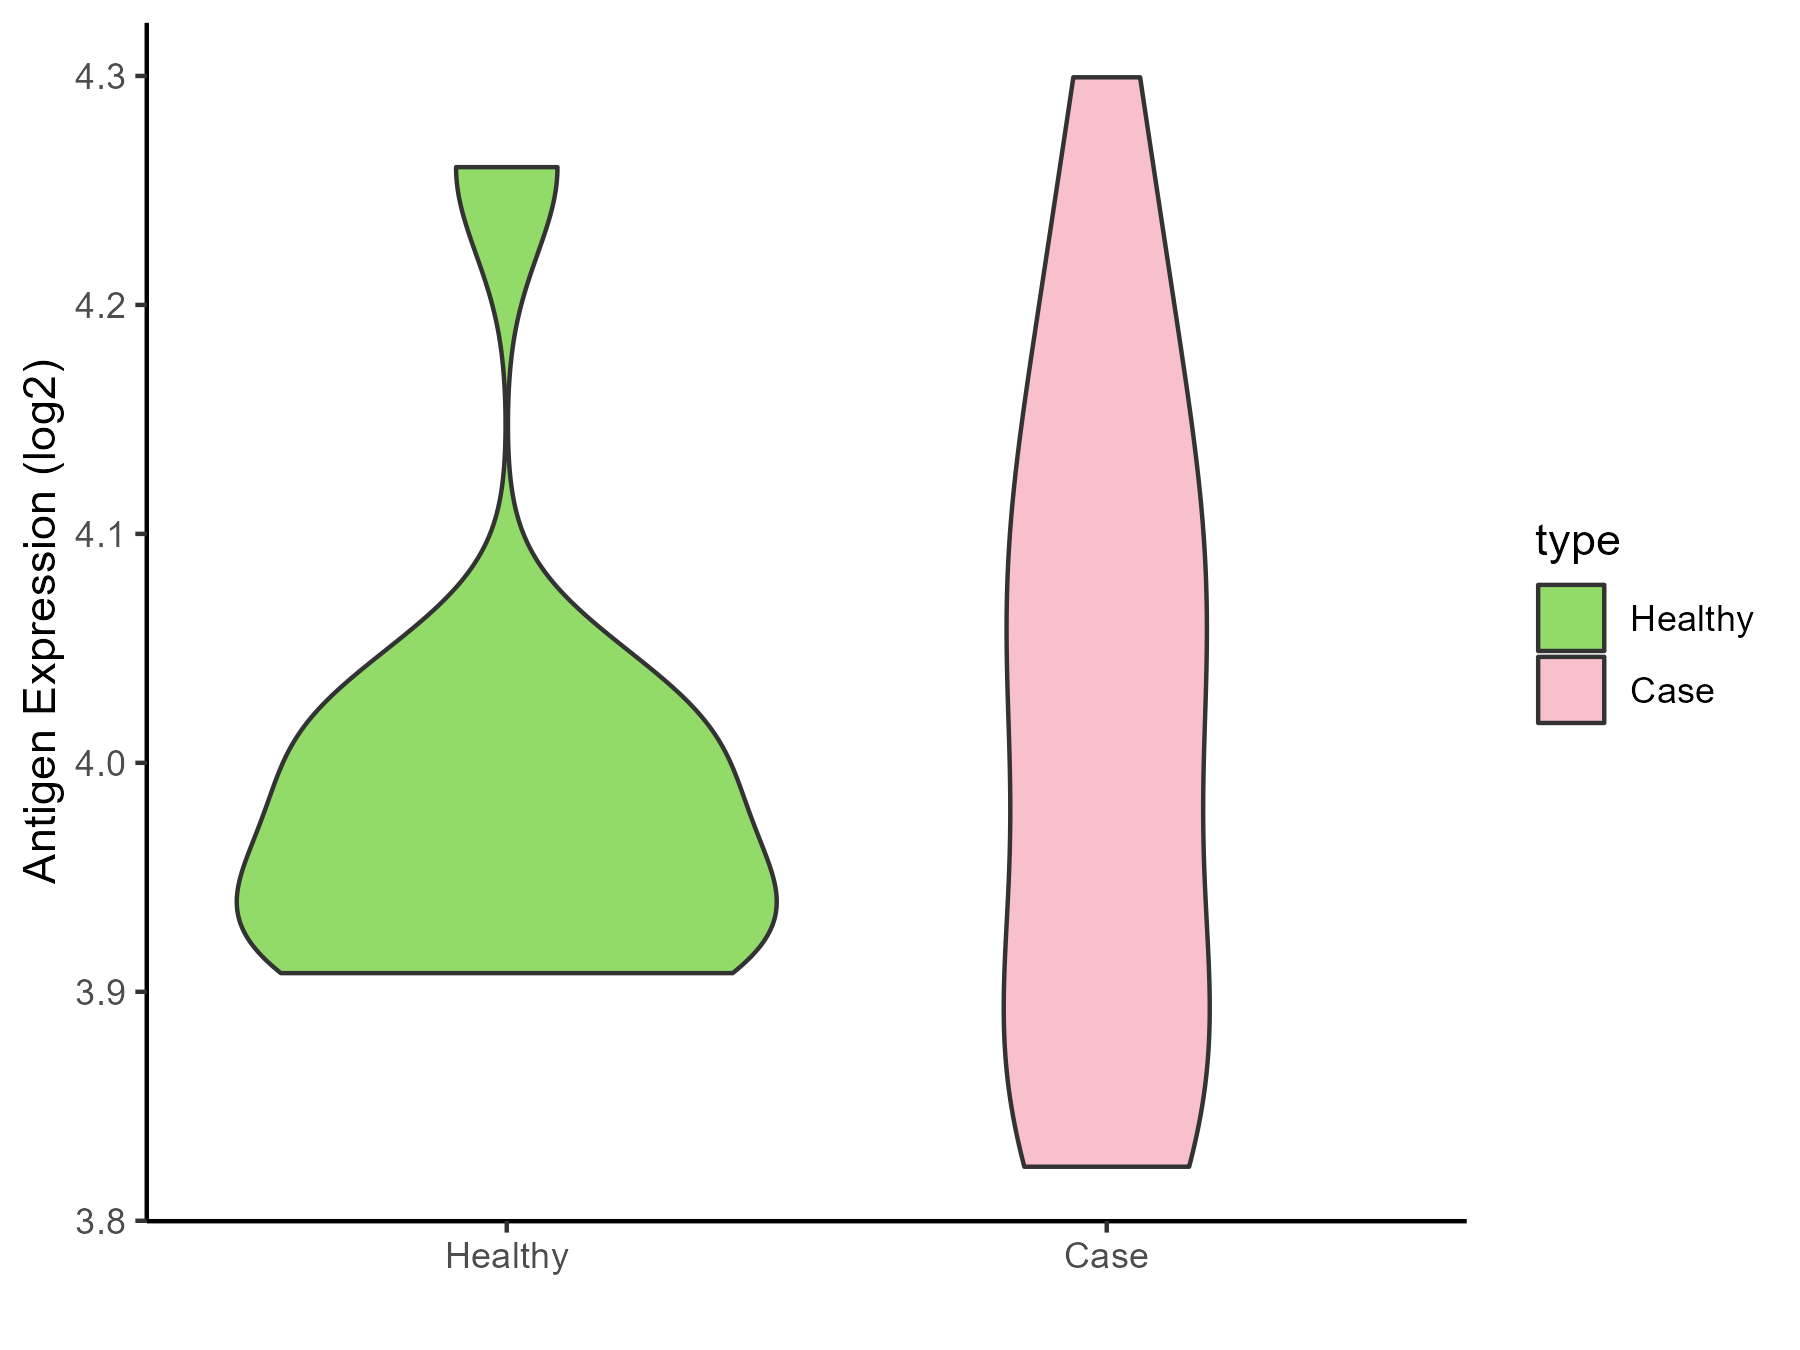
| Differential expression pattern of antigen in diseases | ||
| The Studied Tissue | Whole blood | |
| The Specific Disease | Chronic hepatitis C | |
| The Expression Level of Disease Section Compare with the Healthy Individual Tissue | p-value: 0.582291712; Fold-change: 0.047900891; Z-score: 0.46130085 | |
| Disease-specific Antigen Abundances |
|
Click to View the Clearer Original Diagram |
| Differential expression pattern of antigen in diseases | ||
| The Studied Tissue | Whole blood | |
| The Specific Disease | Sepsis | |
| The Expression Level of Disease Section Compare with the Healthy Individual Tissue | p-value: 0.402318482; Fold-change: 0.039282315; Z-score: 0.13131953 | |
| Disease-specific Antigen Abundances |

|
Click to View the Clearer Original Diagram |
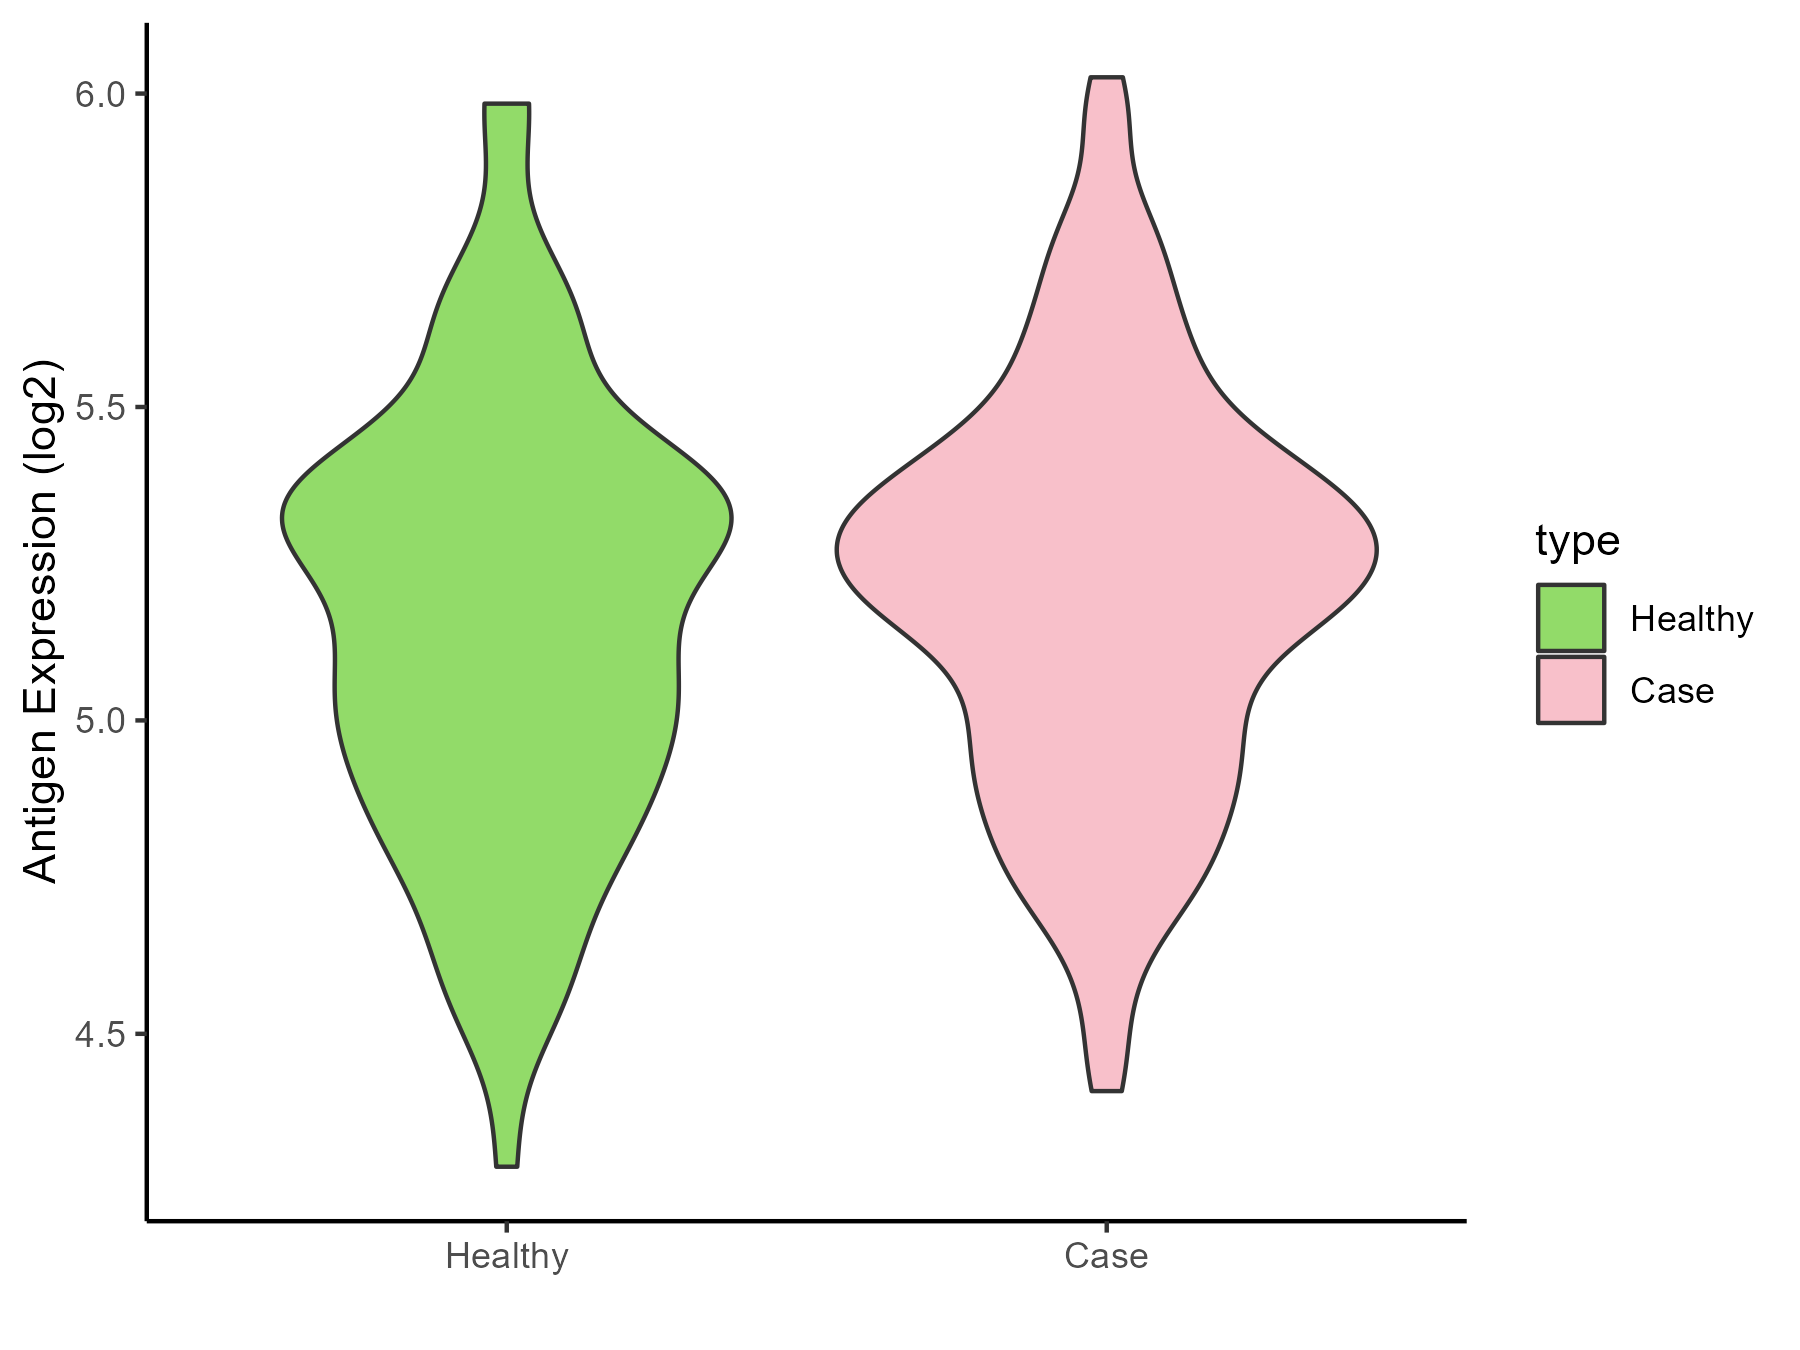
| Differential expression pattern of antigen in diseases | ||
| The Studied Tissue | Whole blood | |
| The Specific Disease | Septic shock | |
| The Expression Level of Disease Section Compare with the Healthy Individual Tissue | p-value: 0.086003296; Fold-change: 0.069049426; Z-score: 0.200171879 | |
| Disease-specific Antigen Abundances |
|
Click to View the Clearer Original Diagram |
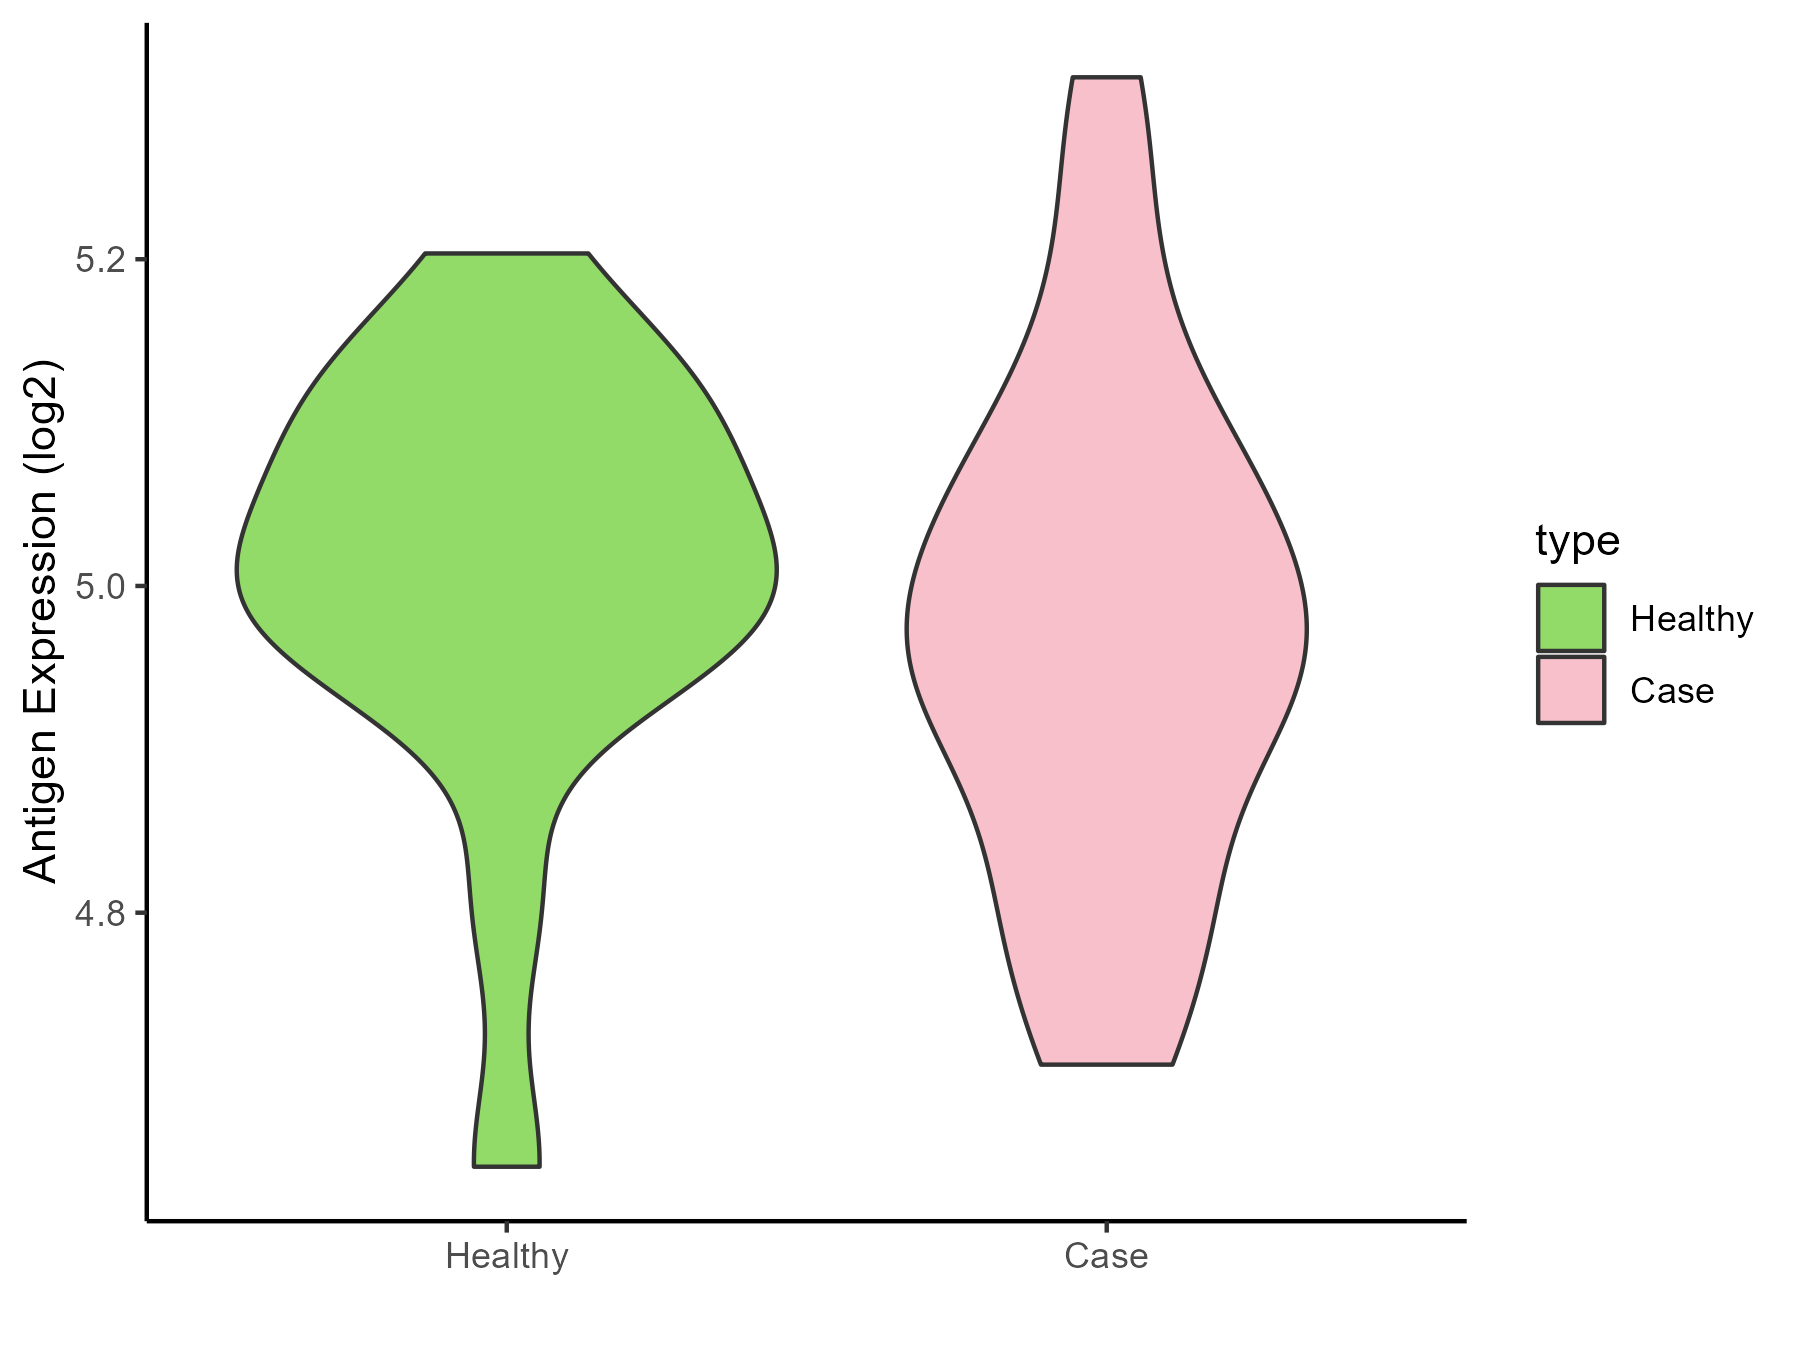
| Differential expression pattern of antigen in diseases | ||
| The Studied Tissue | Peripheral blood | |
| The Specific Disease | Pediatric respiratory syncytial virus infection | |
| The Expression Level of Disease Section Compare with the Healthy Individual Tissue | p-value: 0.395692091; Fold-change: -0.06026284; Z-score: -0.455226207 | |
| Disease-specific Antigen Abundances |
|
Click to View the Clearer Original Diagram |
ICD Disease Classification 11
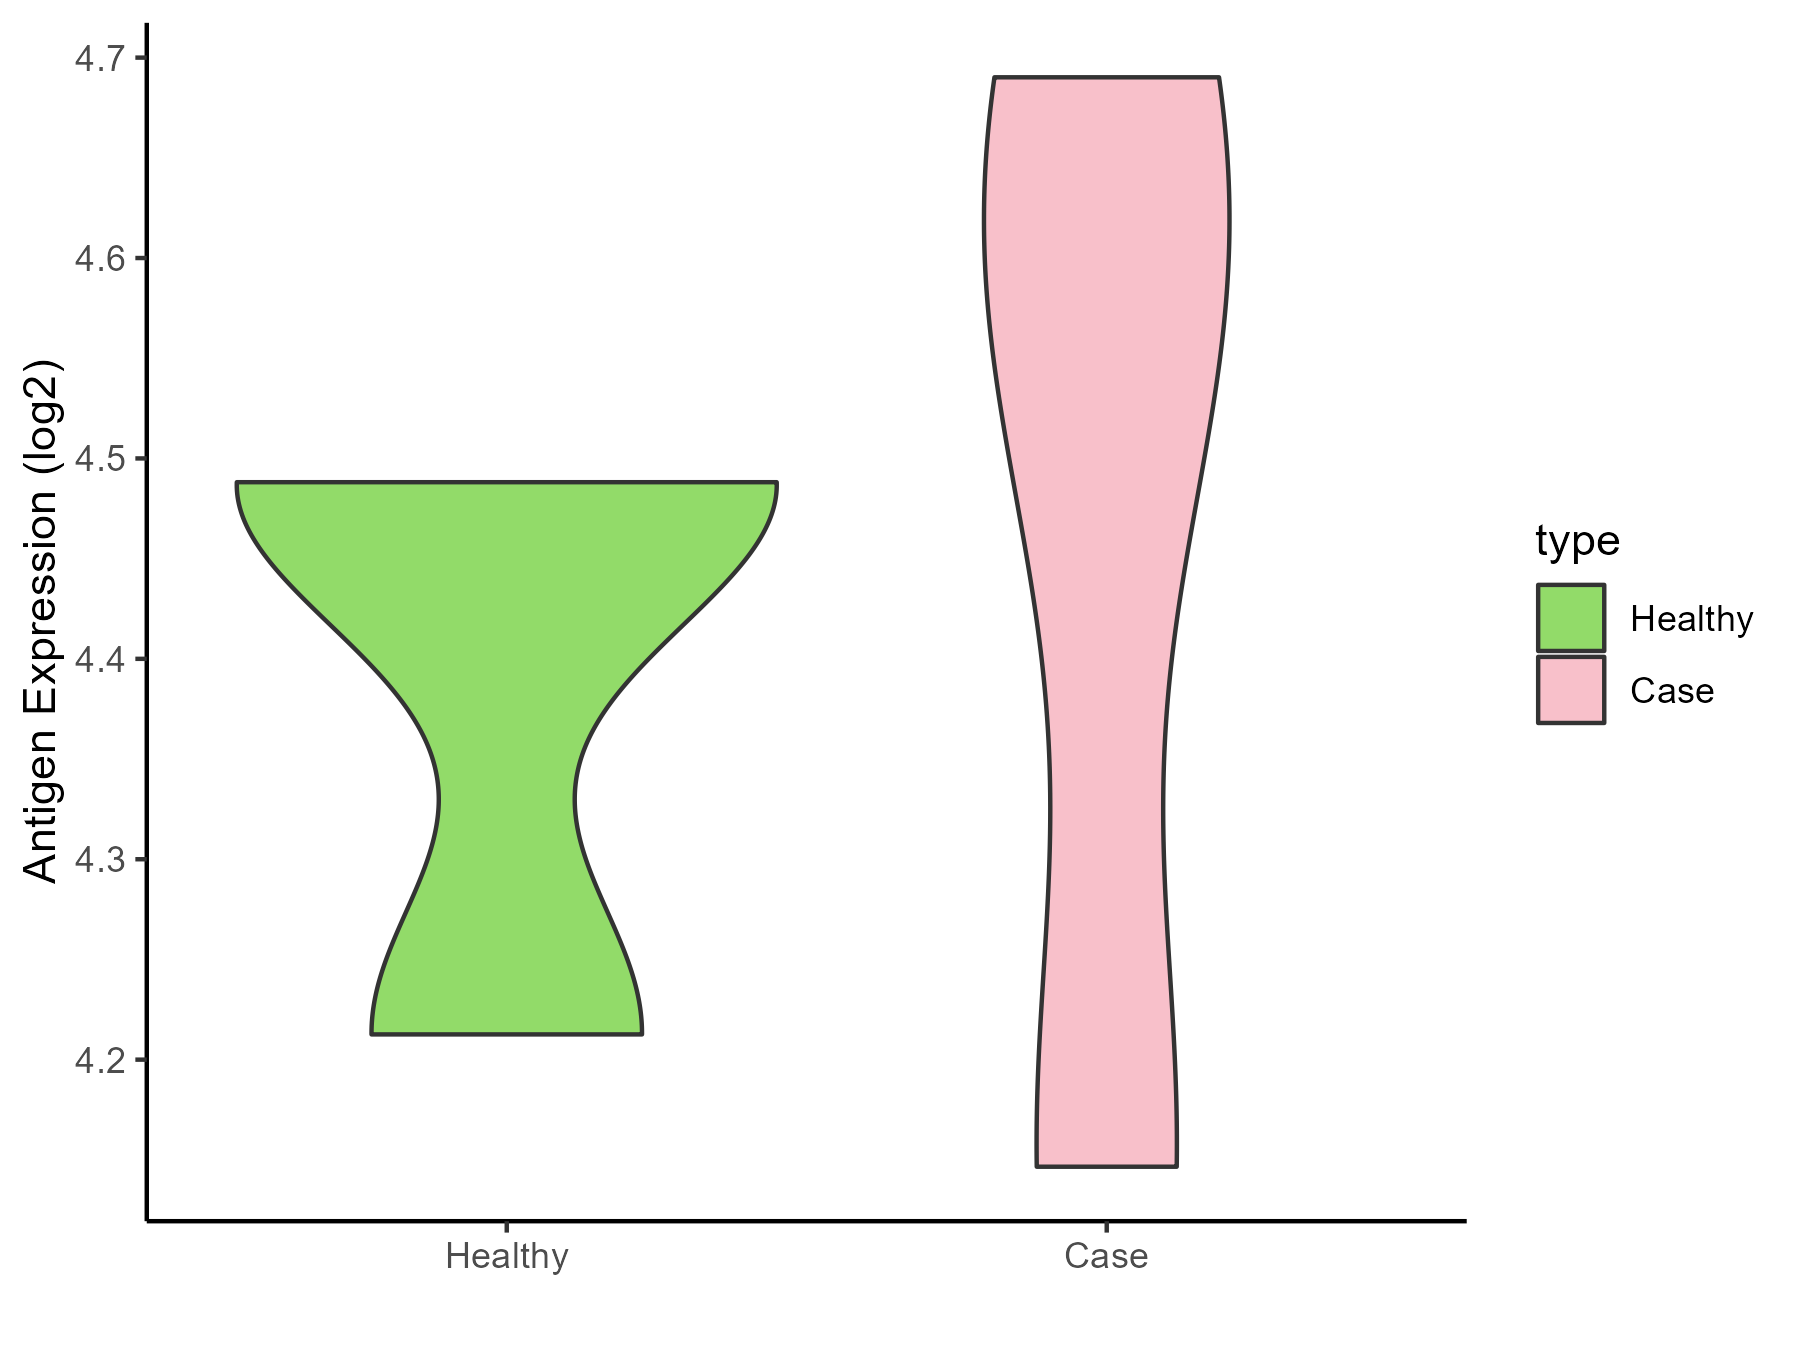
| Differential expression pattern of antigen in diseases | ||
| The Studied Tissue | Peripheral blood | |
| The Specific Disease | Essential hypertension | |
| The Expression Level of Disease Section Compare with the Healthy Individual Tissue | p-value: 0.741457622; Fold-change: 0.066107405; Z-score: 0.417449878 | |
| Disease-specific Antigen Abundances |
|
Click to View the Clearer Original Diagram |
| Differential expression pattern of antigen in diseases | ||
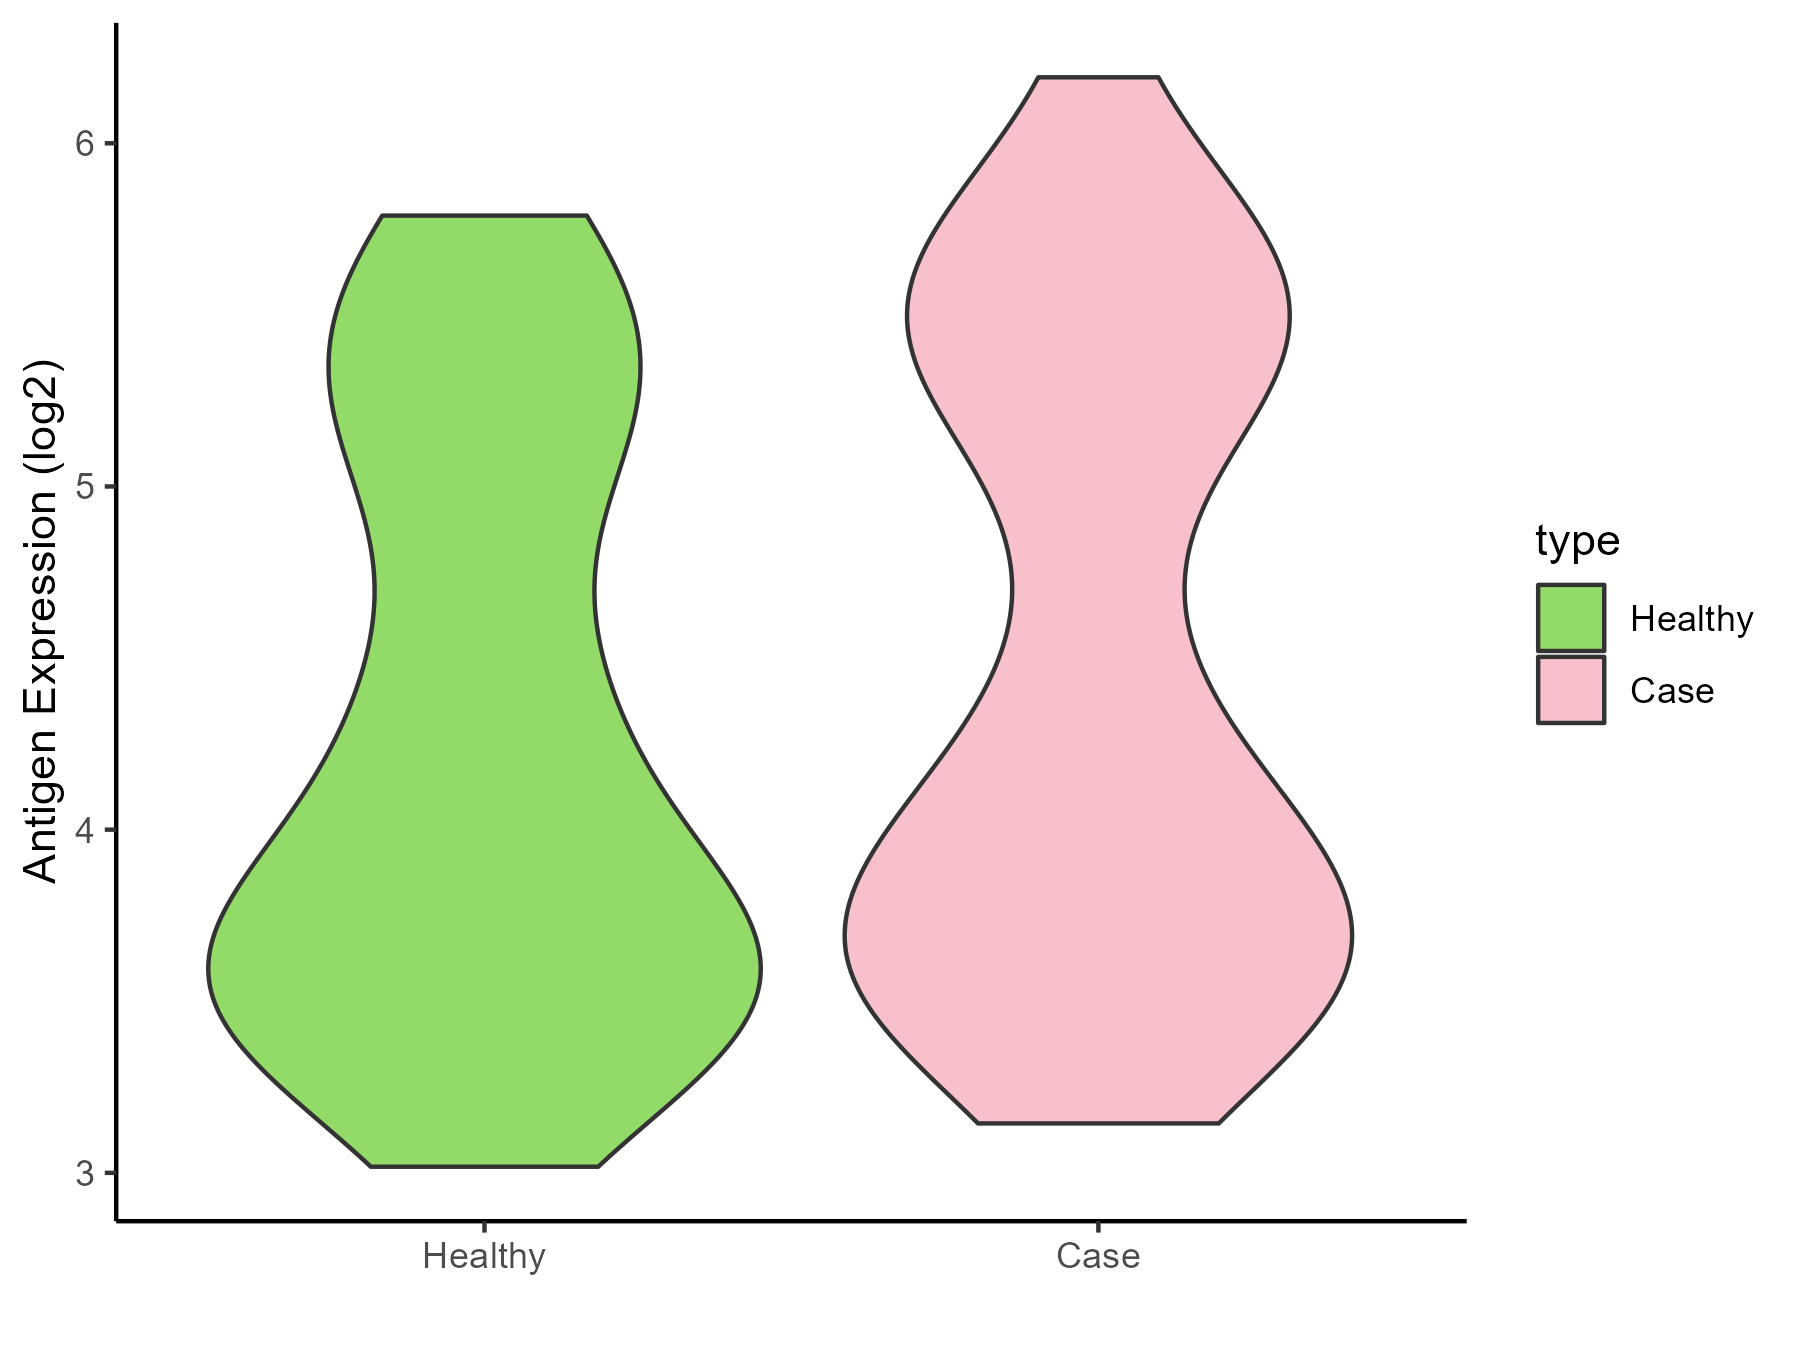
| The Studied Tissue | Peripheral blood | |
| The Specific Disease | Myocardial infarction | |
| The Expression Level of Disease Section Compare with the Healthy Individual Tissue | p-value: 0.176114839; Fold-change: 0.198467306; Z-score: 0.232030886 | |
| Disease-specific Antigen Abundances |
|
Click to View the Clearer Original Diagram |
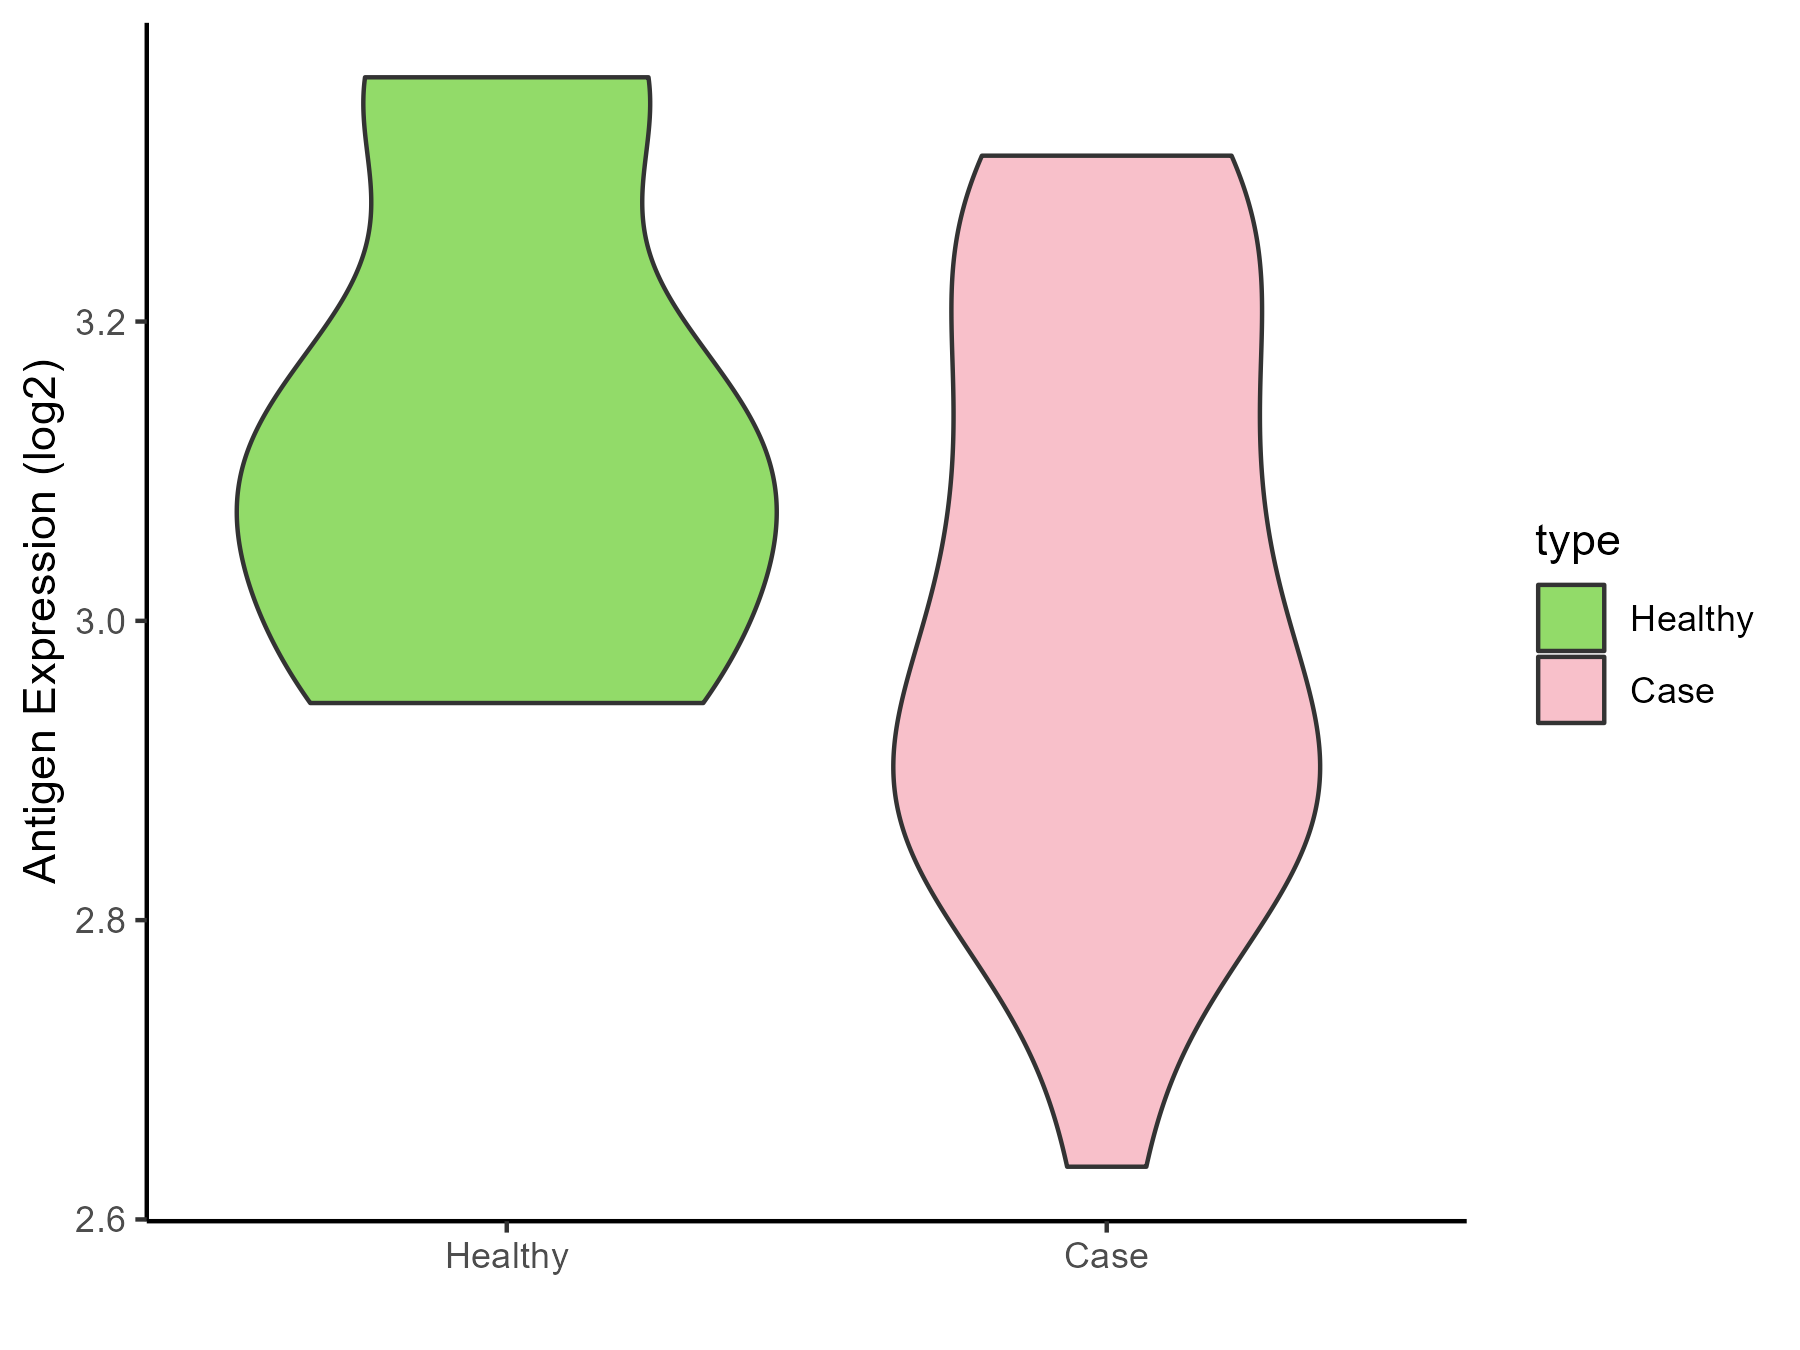
| Differential expression pattern of antigen in diseases | ||
| The Studied Tissue | Peripheral blood | |
| The Specific Disease | Coronary artery disease | |
| The Expression Level of Disease Section Compare with the Healthy Individual Tissue | p-value: 0.314246566; Fold-change: -0.117301611; Z-score: -0.664369762 | |
| Disease-specific Antigen Abundances |
|
Click to View the Clearer Original Diagram |
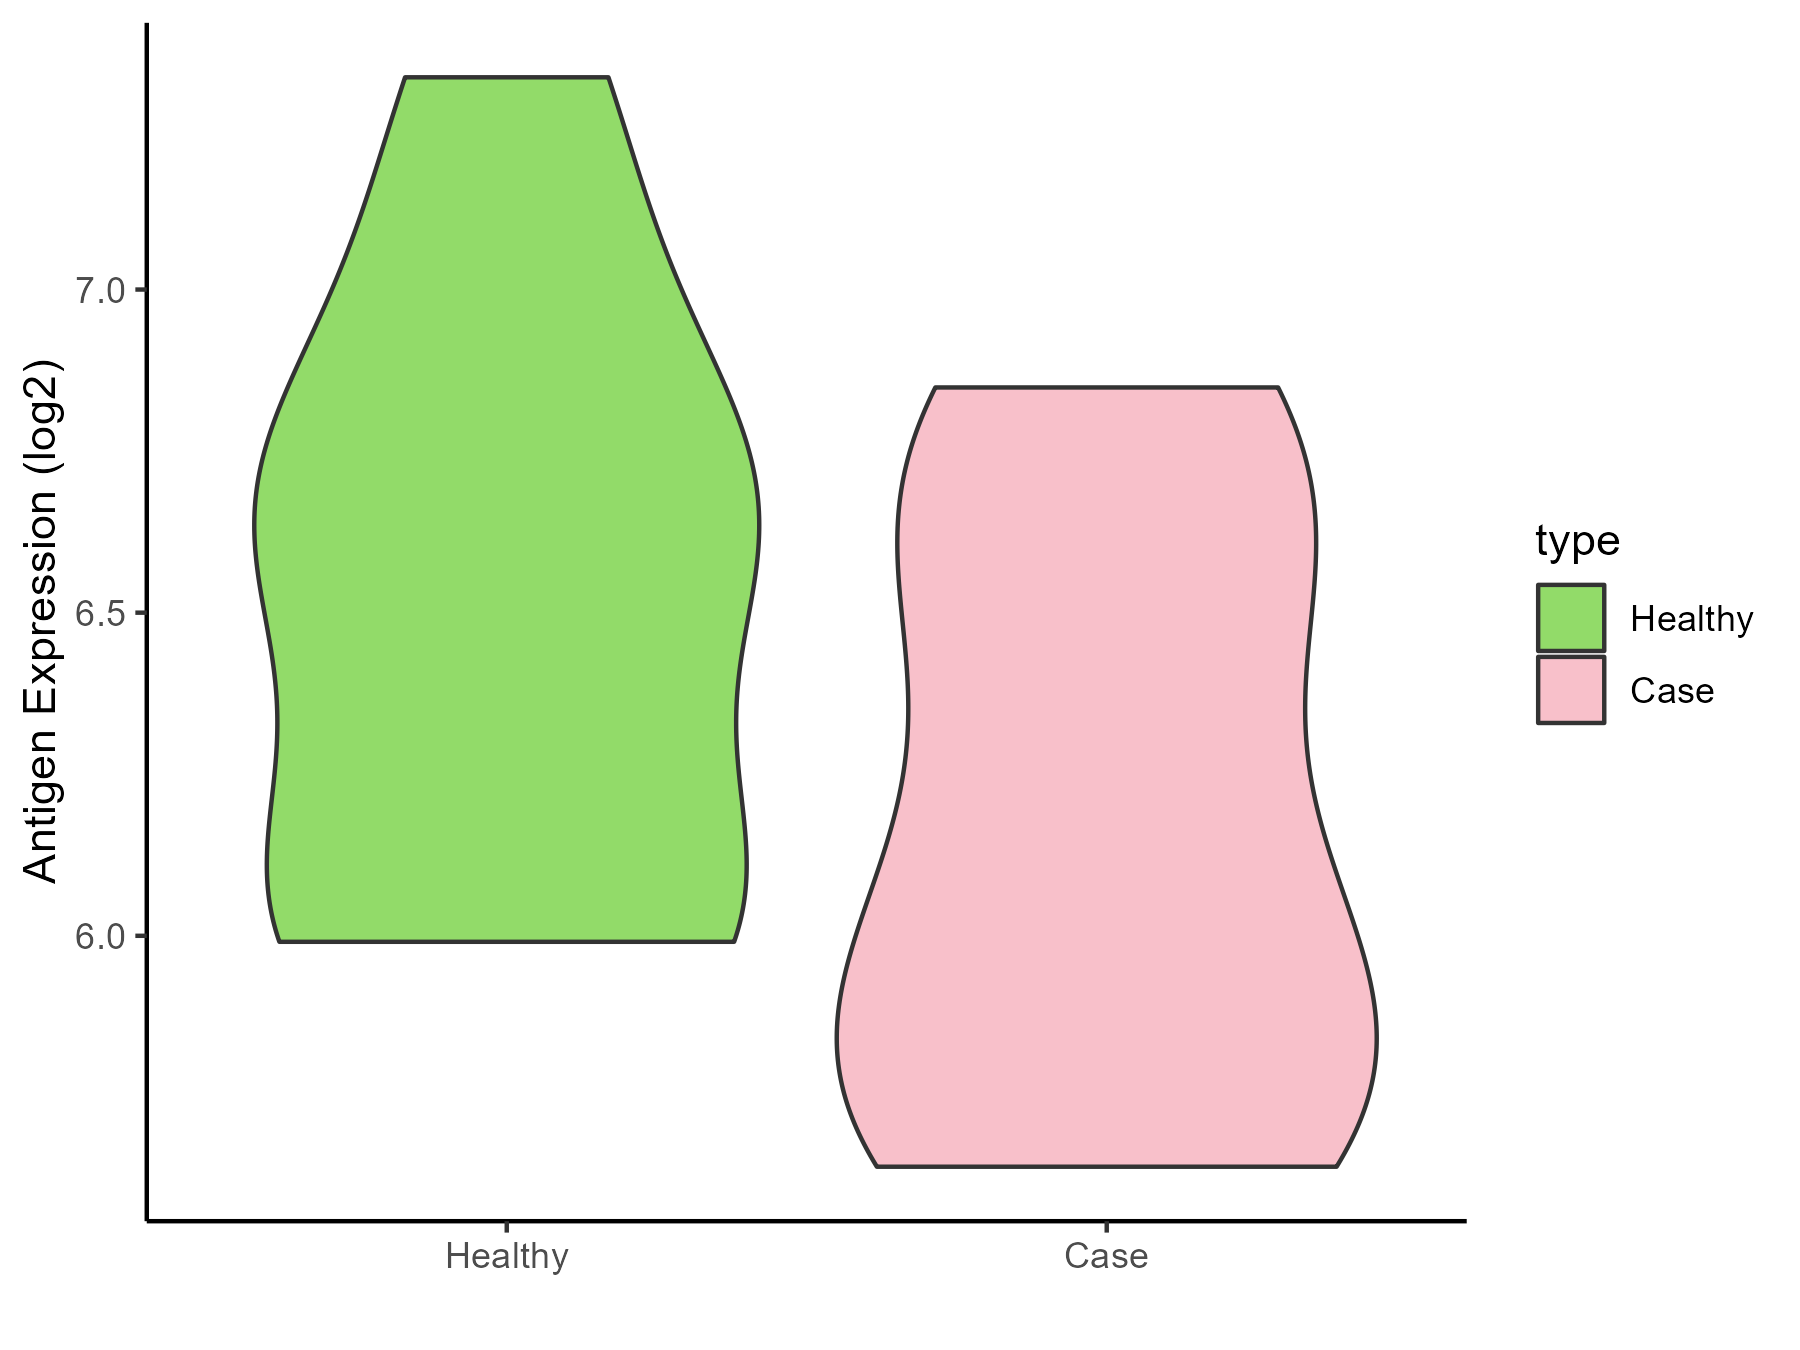
| Differential expression pattern of antigen in diseases | ||
| The Studied Tissue | Calcified aortic valve | |
| The Specific Disease | Aortic stenosis | |
| The Expression Level of Disease Section Compare with the Healthy Individual Tissue | p-value: 0.130891099; Fold-change: -0.540734048; Z-score: -1.146145153 | |
| Disease-specific Antigen Abundances |
|
Click to View the Clearer Original Diagram |
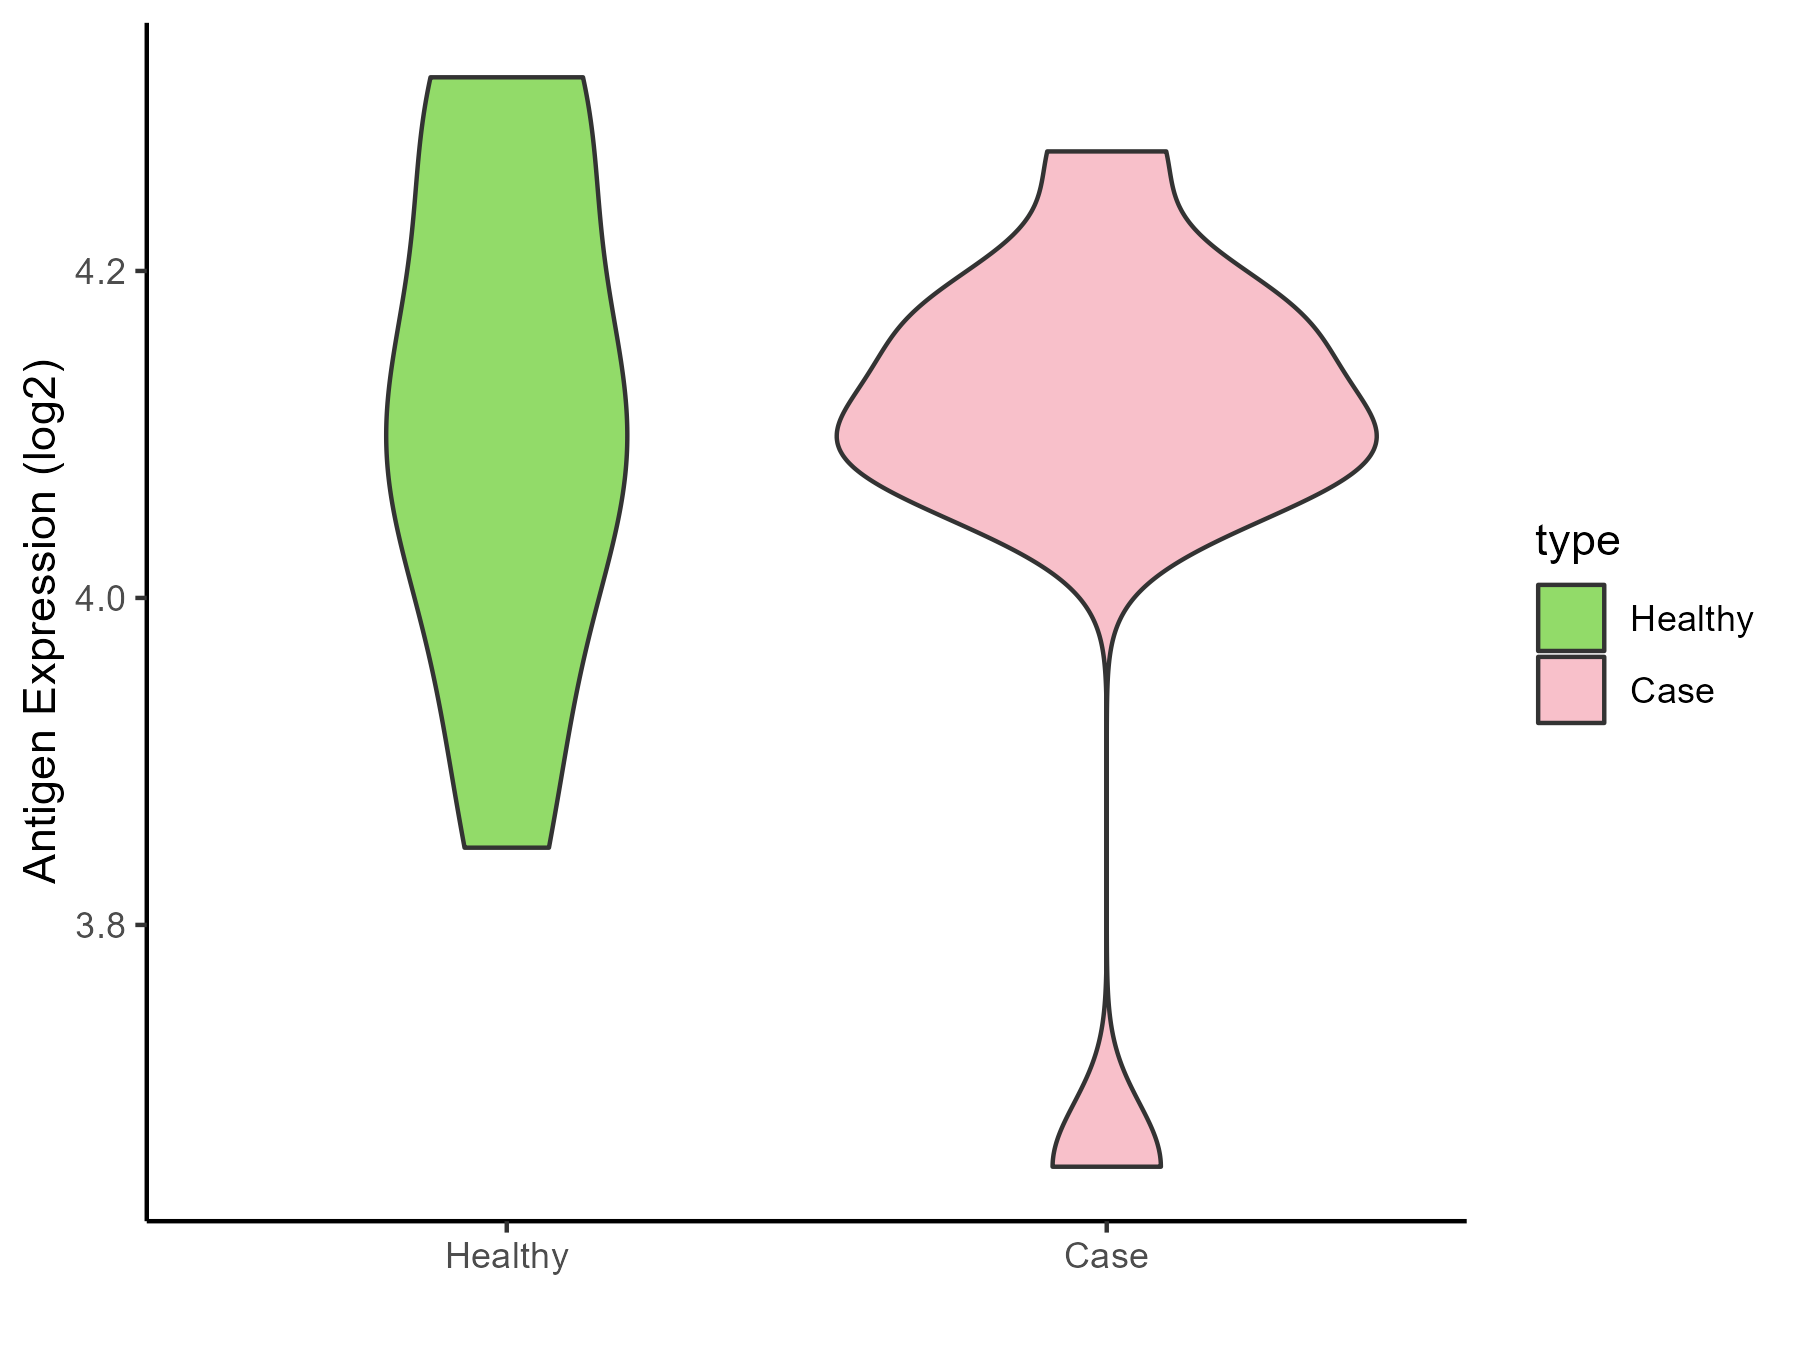
| Differential expression pattern of antigen in diseases | ||
| The Studied Tissue | Peripheral blood | |
| The Specific Disease | Arteriosclerosis | |
| The Expression Level of Disease Section Compare with the Healthy Individual Tissue | p-value: 0.696195472; Fold-change: -0.002257291; Z-score: -0.014839449 | |
| Disease-specific Antigen Abundances |
|
Click to View the Clearer Original Diagram |
| Differential expression pattern of antigen in diseases | ||
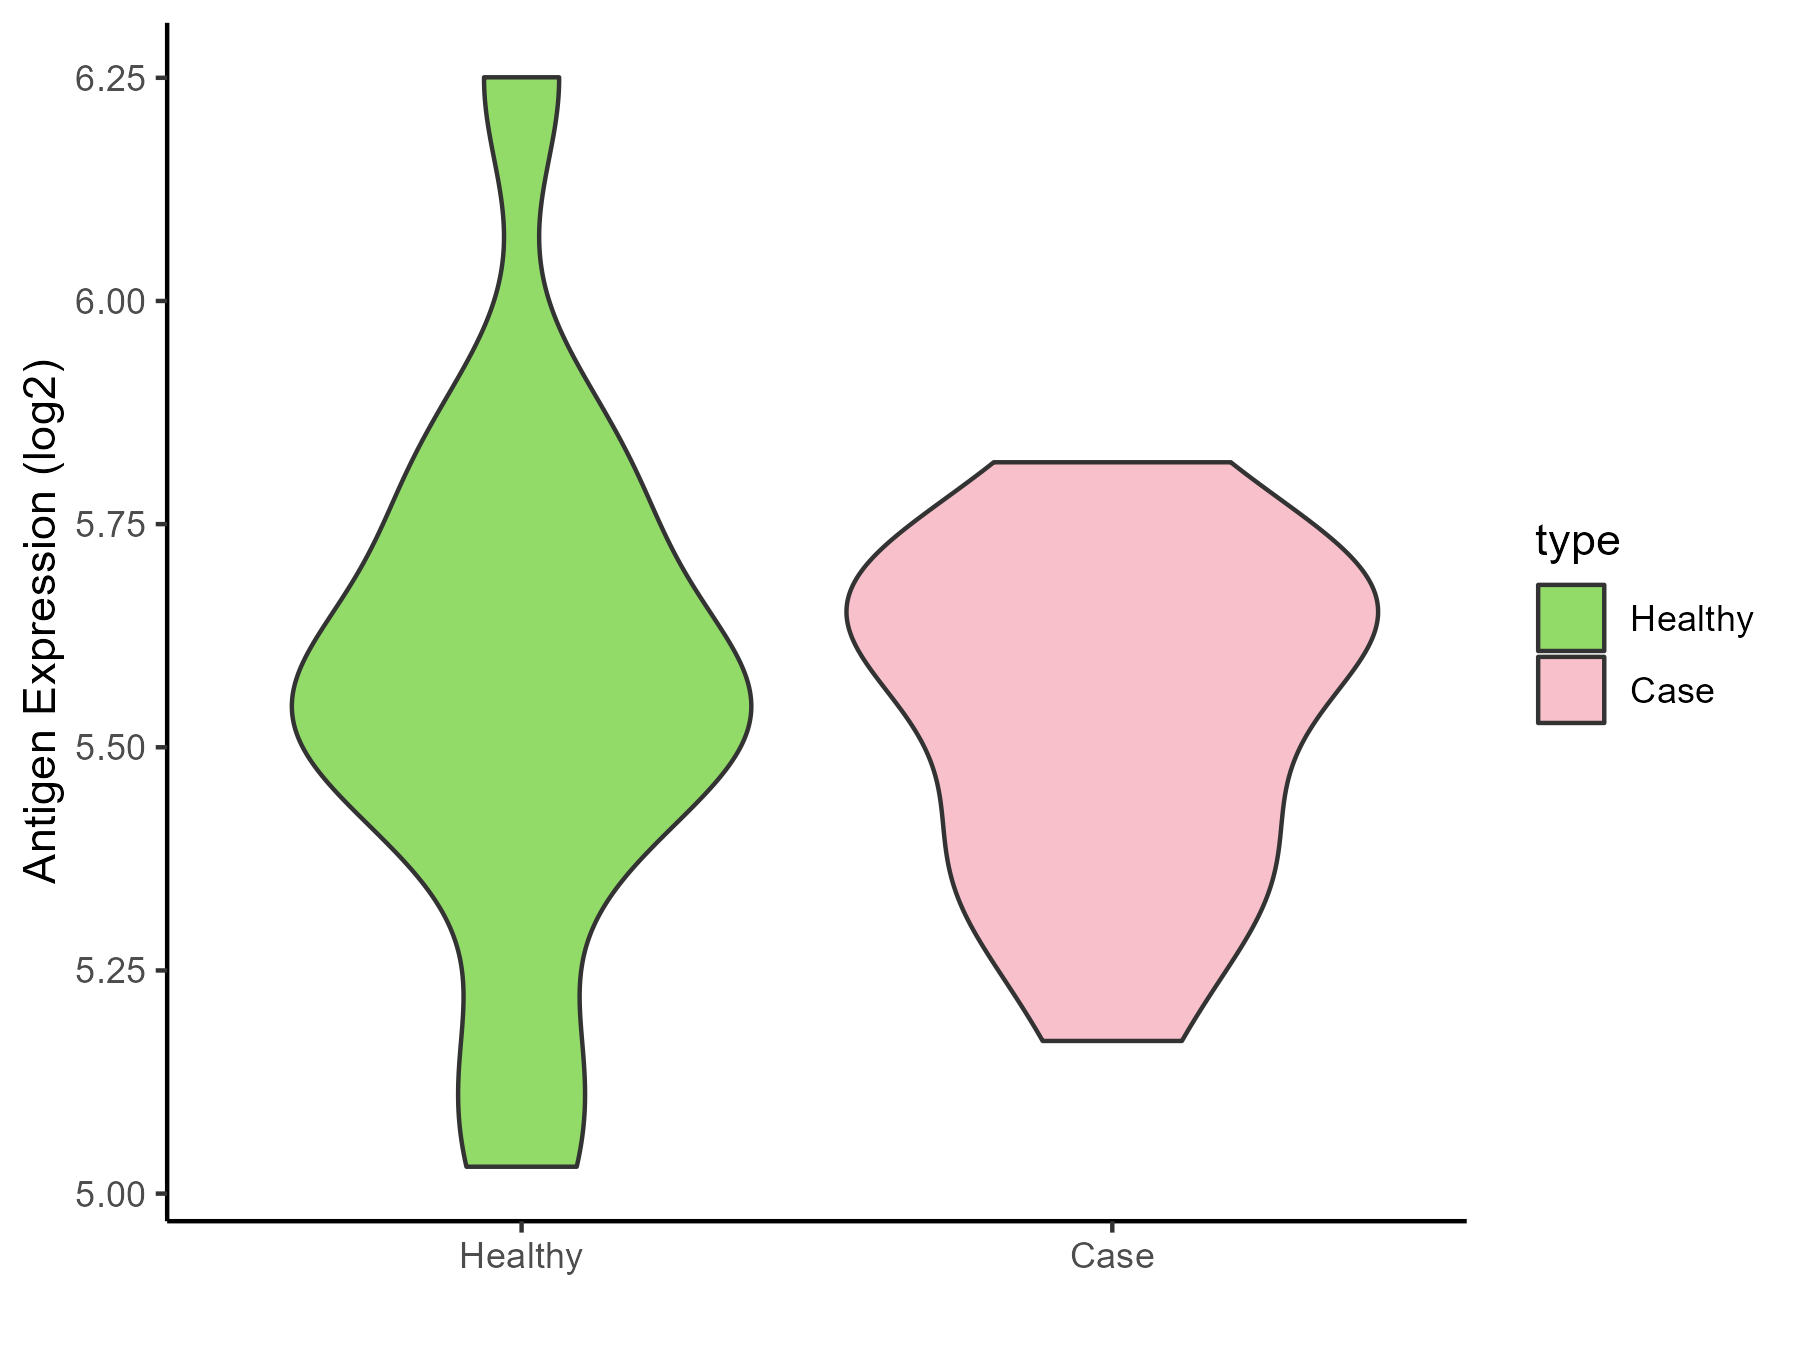
| The Studied Tissue | Intracranial artery | |
| The Specific Disease | Aneurysm | |
| The Expression Level of Disease Section Compare with the Healthy Individual Tissue | p-value: 0.712803996; Fold-change: 0.021868361; Z-score: 0.07116771 | |
| Disease-specific Antigen Abundances |
|
Click to View the Clearer Original Diagram |
ICD Disease Classification 12
| Differential expression pattern of antigen in diseases | ||
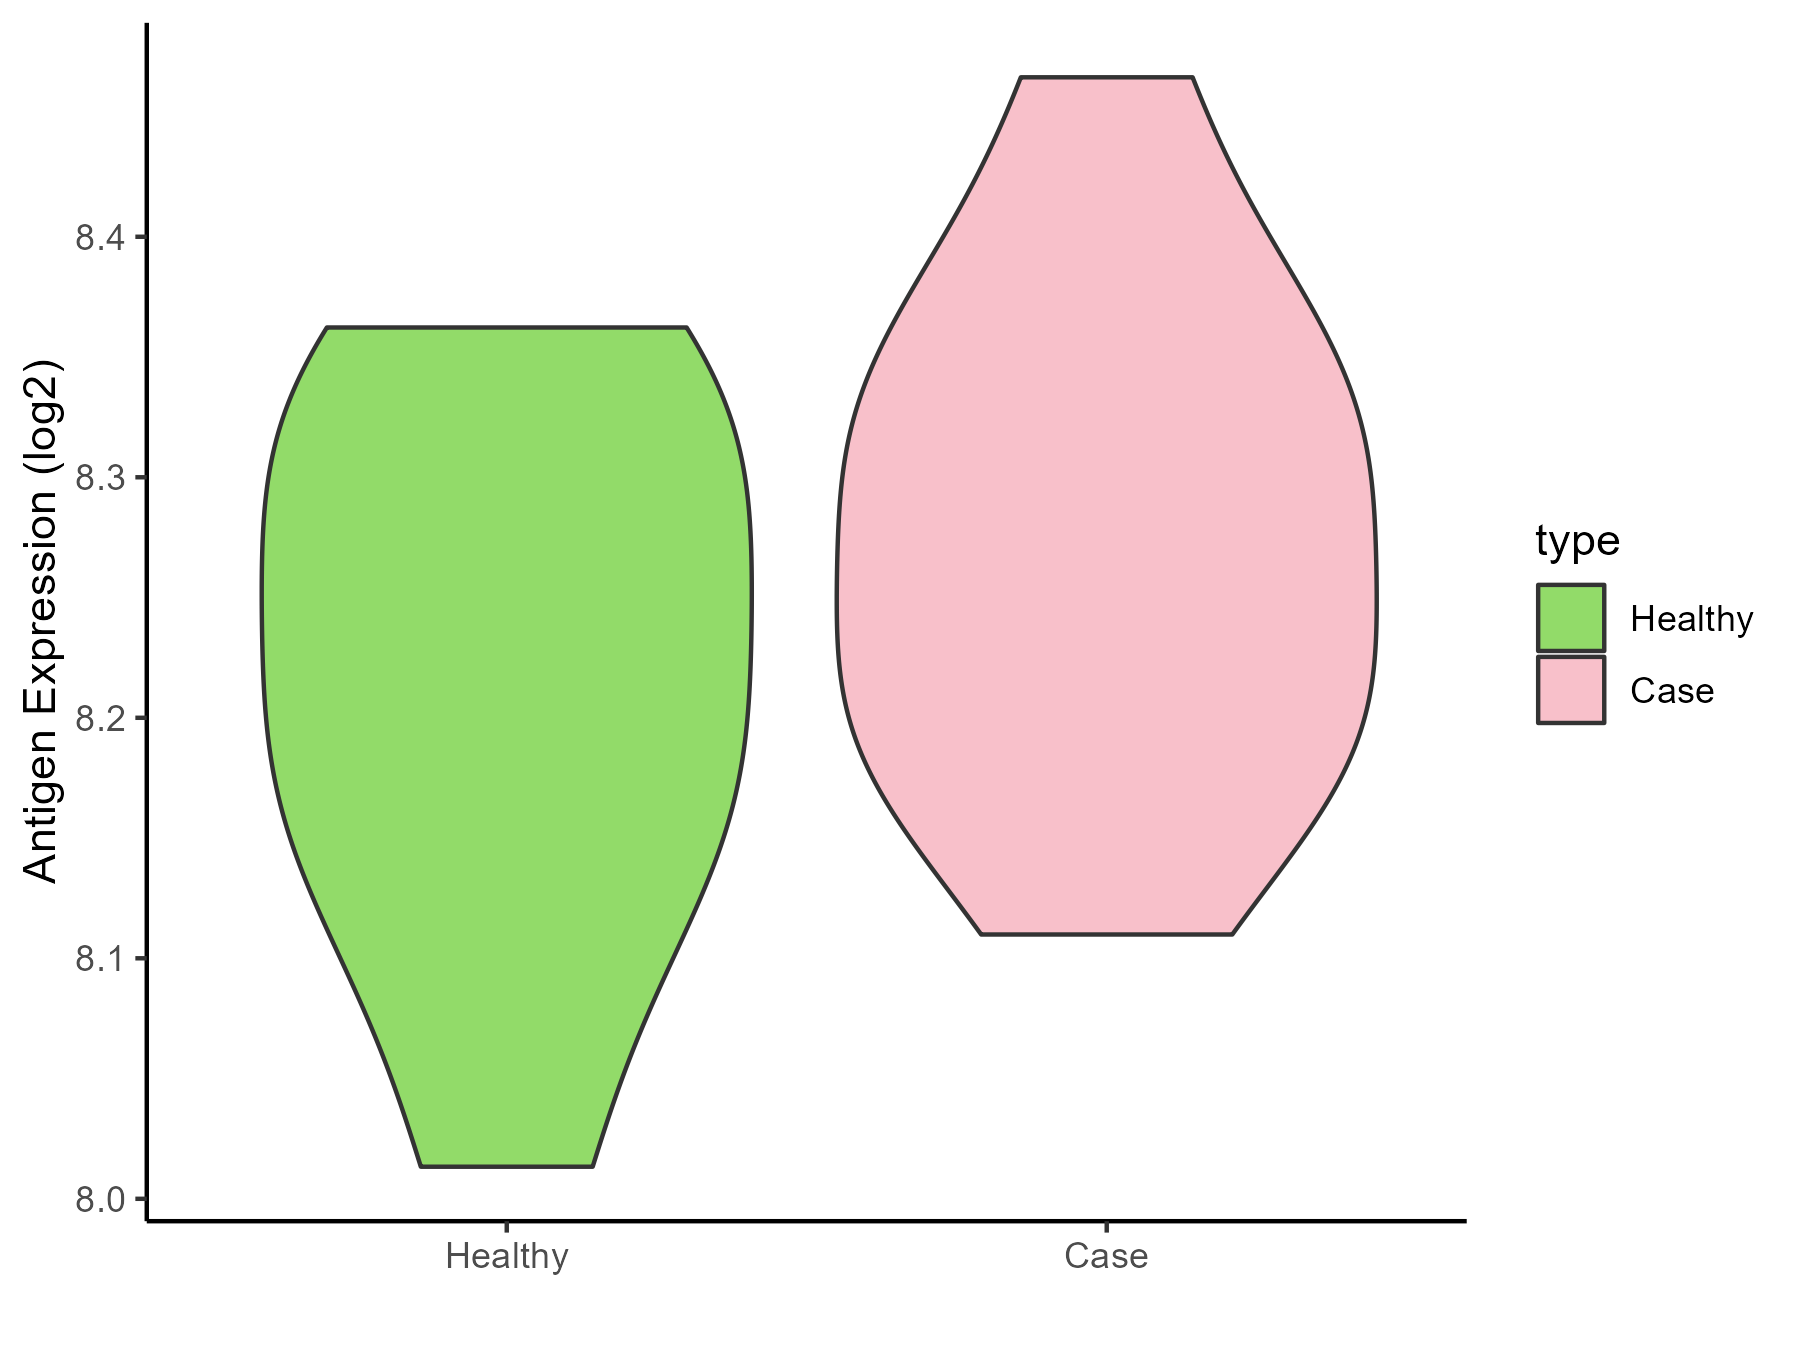
| The Studied Tissue | Peripheral blood | |
| The Specific Disease | Immunodeficiency | |
| The Expression Level of Disease Section Compare with the Healthy Individual Tissue | p-value: 0.258565971; Fold-change: 0.061648407; Z-score: 0.539830147 | |
| Disease-specific Antigen Abundances |
|
Click to View the Clearer Original Diagram |
| Differential expression pattern of antigen in diseases | ||
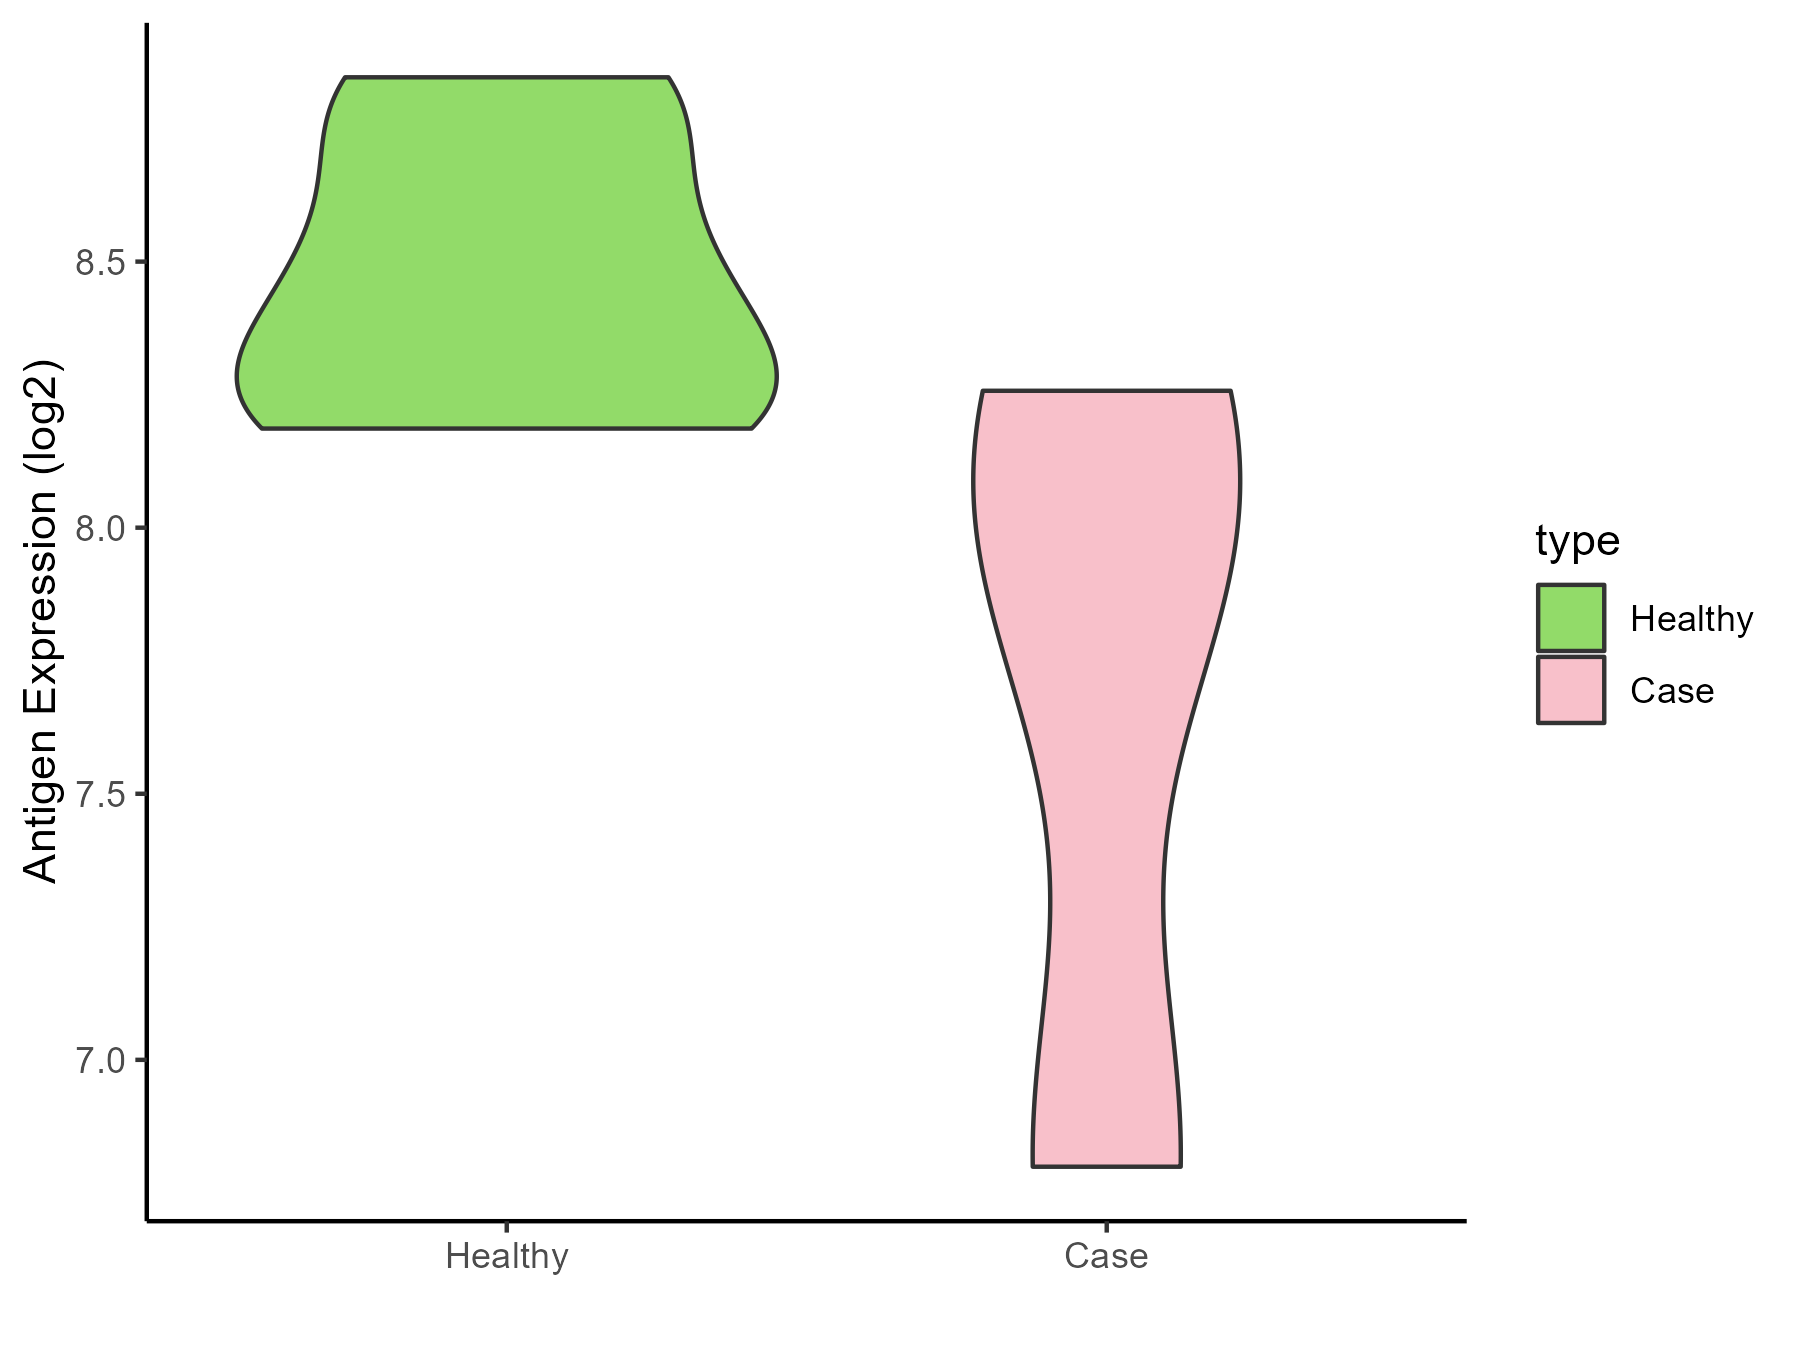
| The Studied Tissue | Hyperplastic tonsil | |
| The Specific Disease | Apnea | |
| The Expression Level of Disease Section Compare with the Healthy Individual Tissue | p-value: 0.204433132; Fold-change: -0.516404571; Z-score: -1.886059739 | |
| Disease-specific Antigen Abundances |
|
Click to View the Clearer Original Diagram |
| Differential expression pattern of antigen in diseases | ||
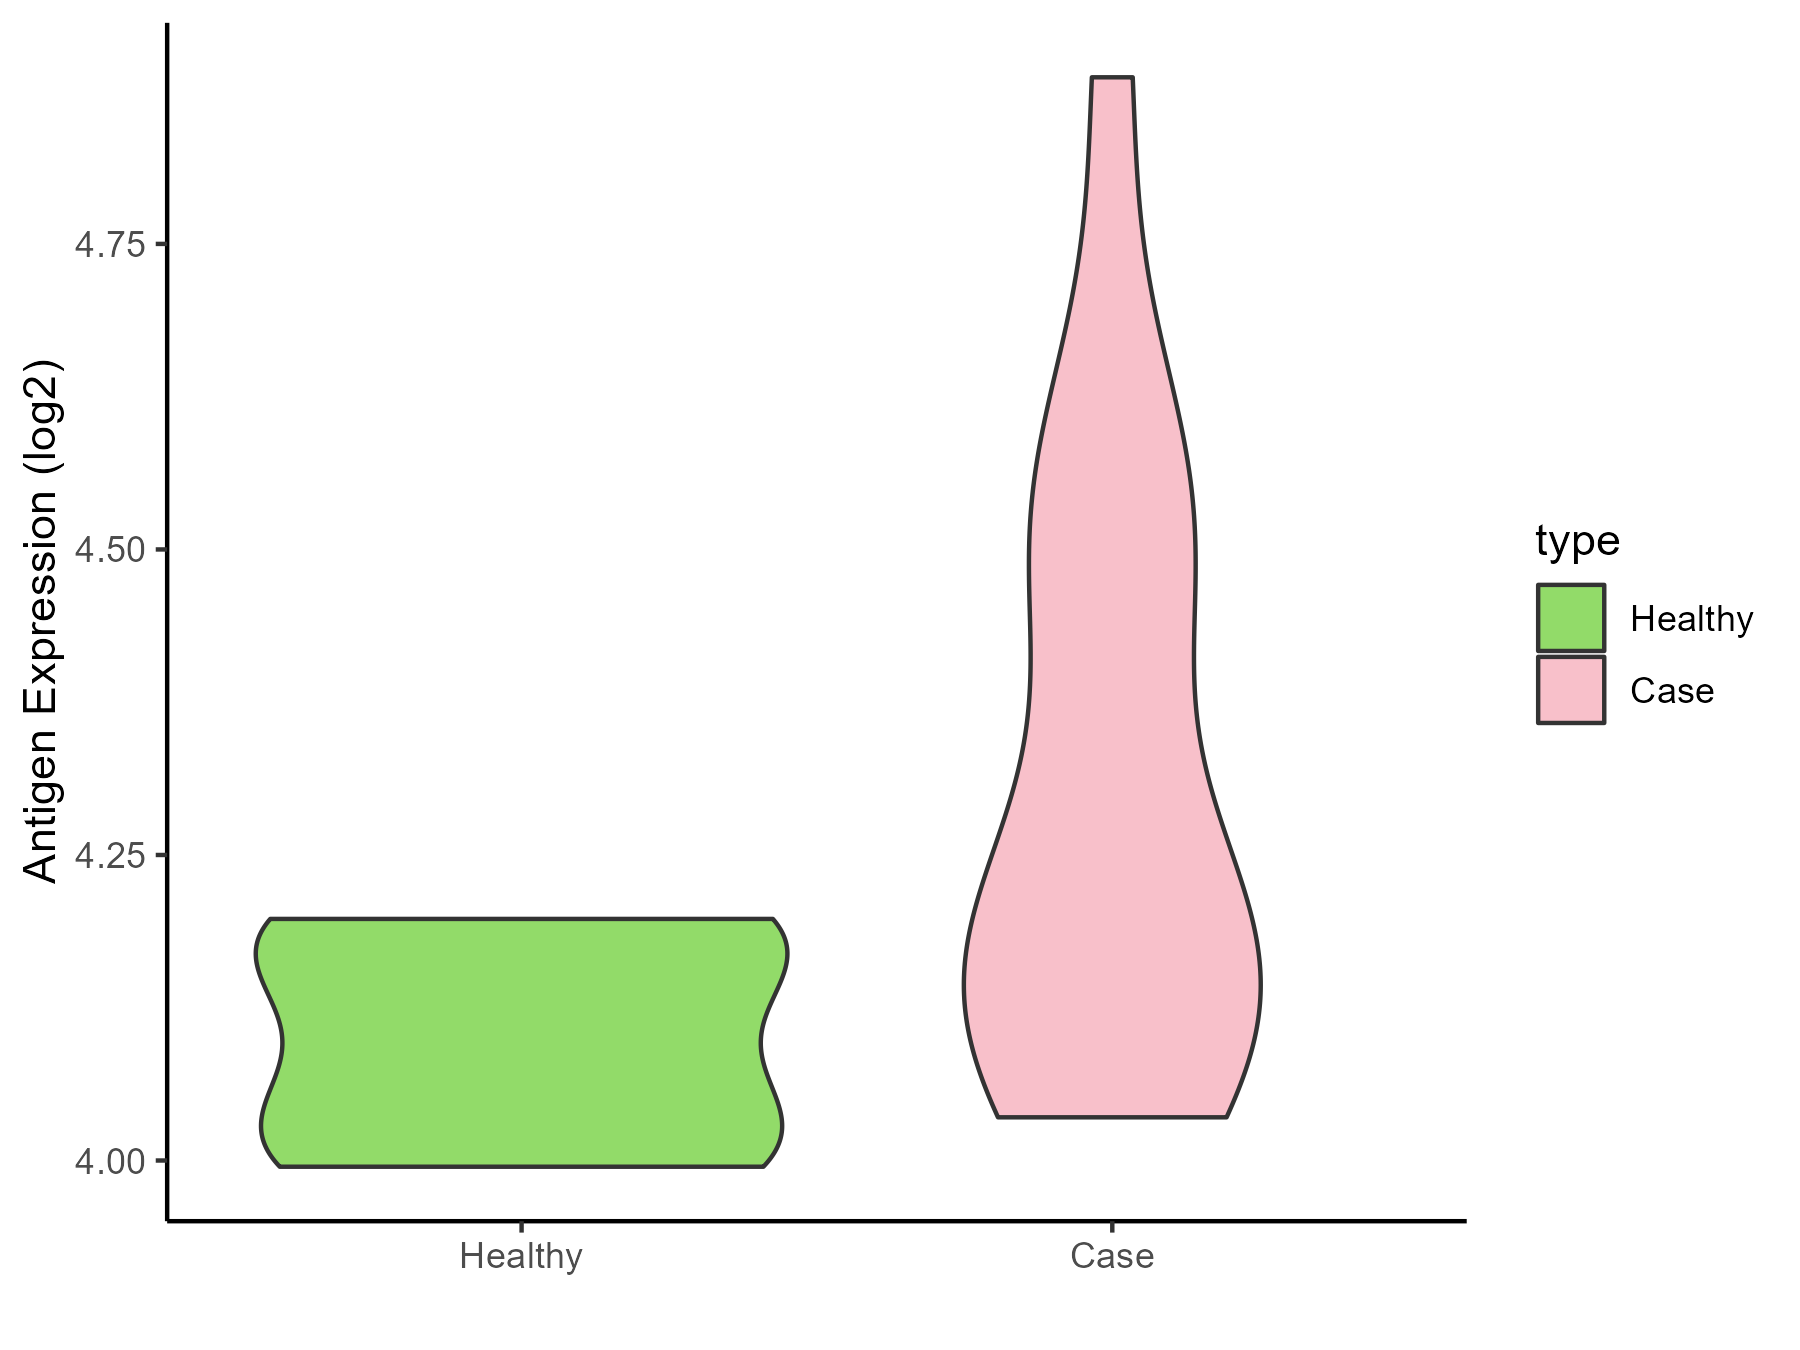
| The Studied Tissue | Peripheral blood | |
| The Specific Disease | Olive pollen allergy | |
| The Expression Level of Disease Section Compare with the Healthy Individual Tissue | p-value: 0.022020098; Fold-change: 0.07425653; Z-score: 0.747551657 | |
| Disease-specific Antigen Abundances |
|
Click to View the Clearer Original Diagram |
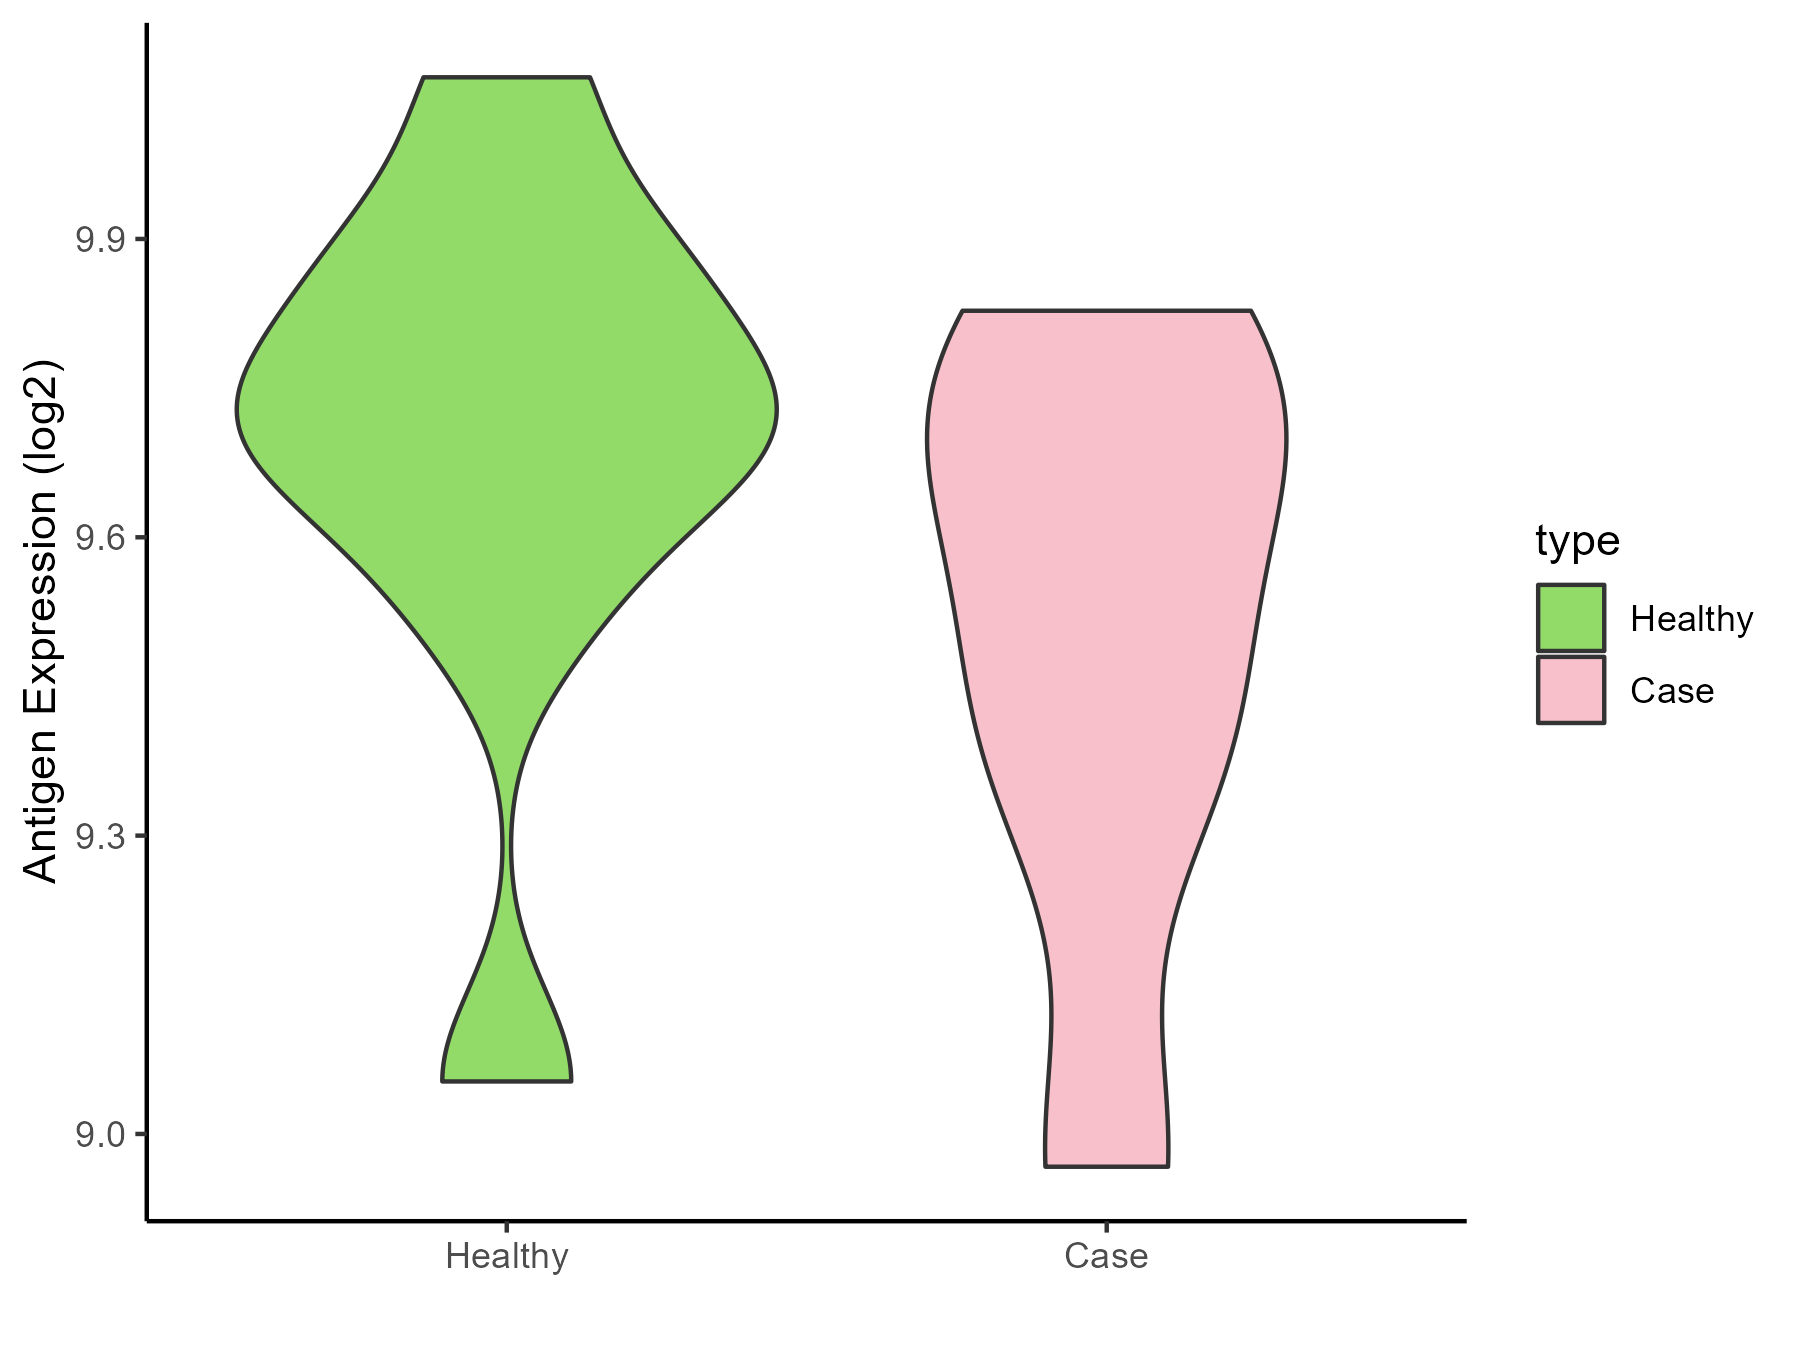
| Differential expression pattern of antigen in diseases | ||
| The Studied Tissue | Sinus mucosa | |
| The Specific Disease | Chronic rhinosinusitis | |
| The Expression Level of Disease Section Compare with the Healthy Individual Tissue | p-value: 0.259827013; Fold-change: -0.146718283; Z-score: -0.51397612 | |
| Disease-specific Antigen Abundances |
|
Click to View the Clearer Original Diagram |
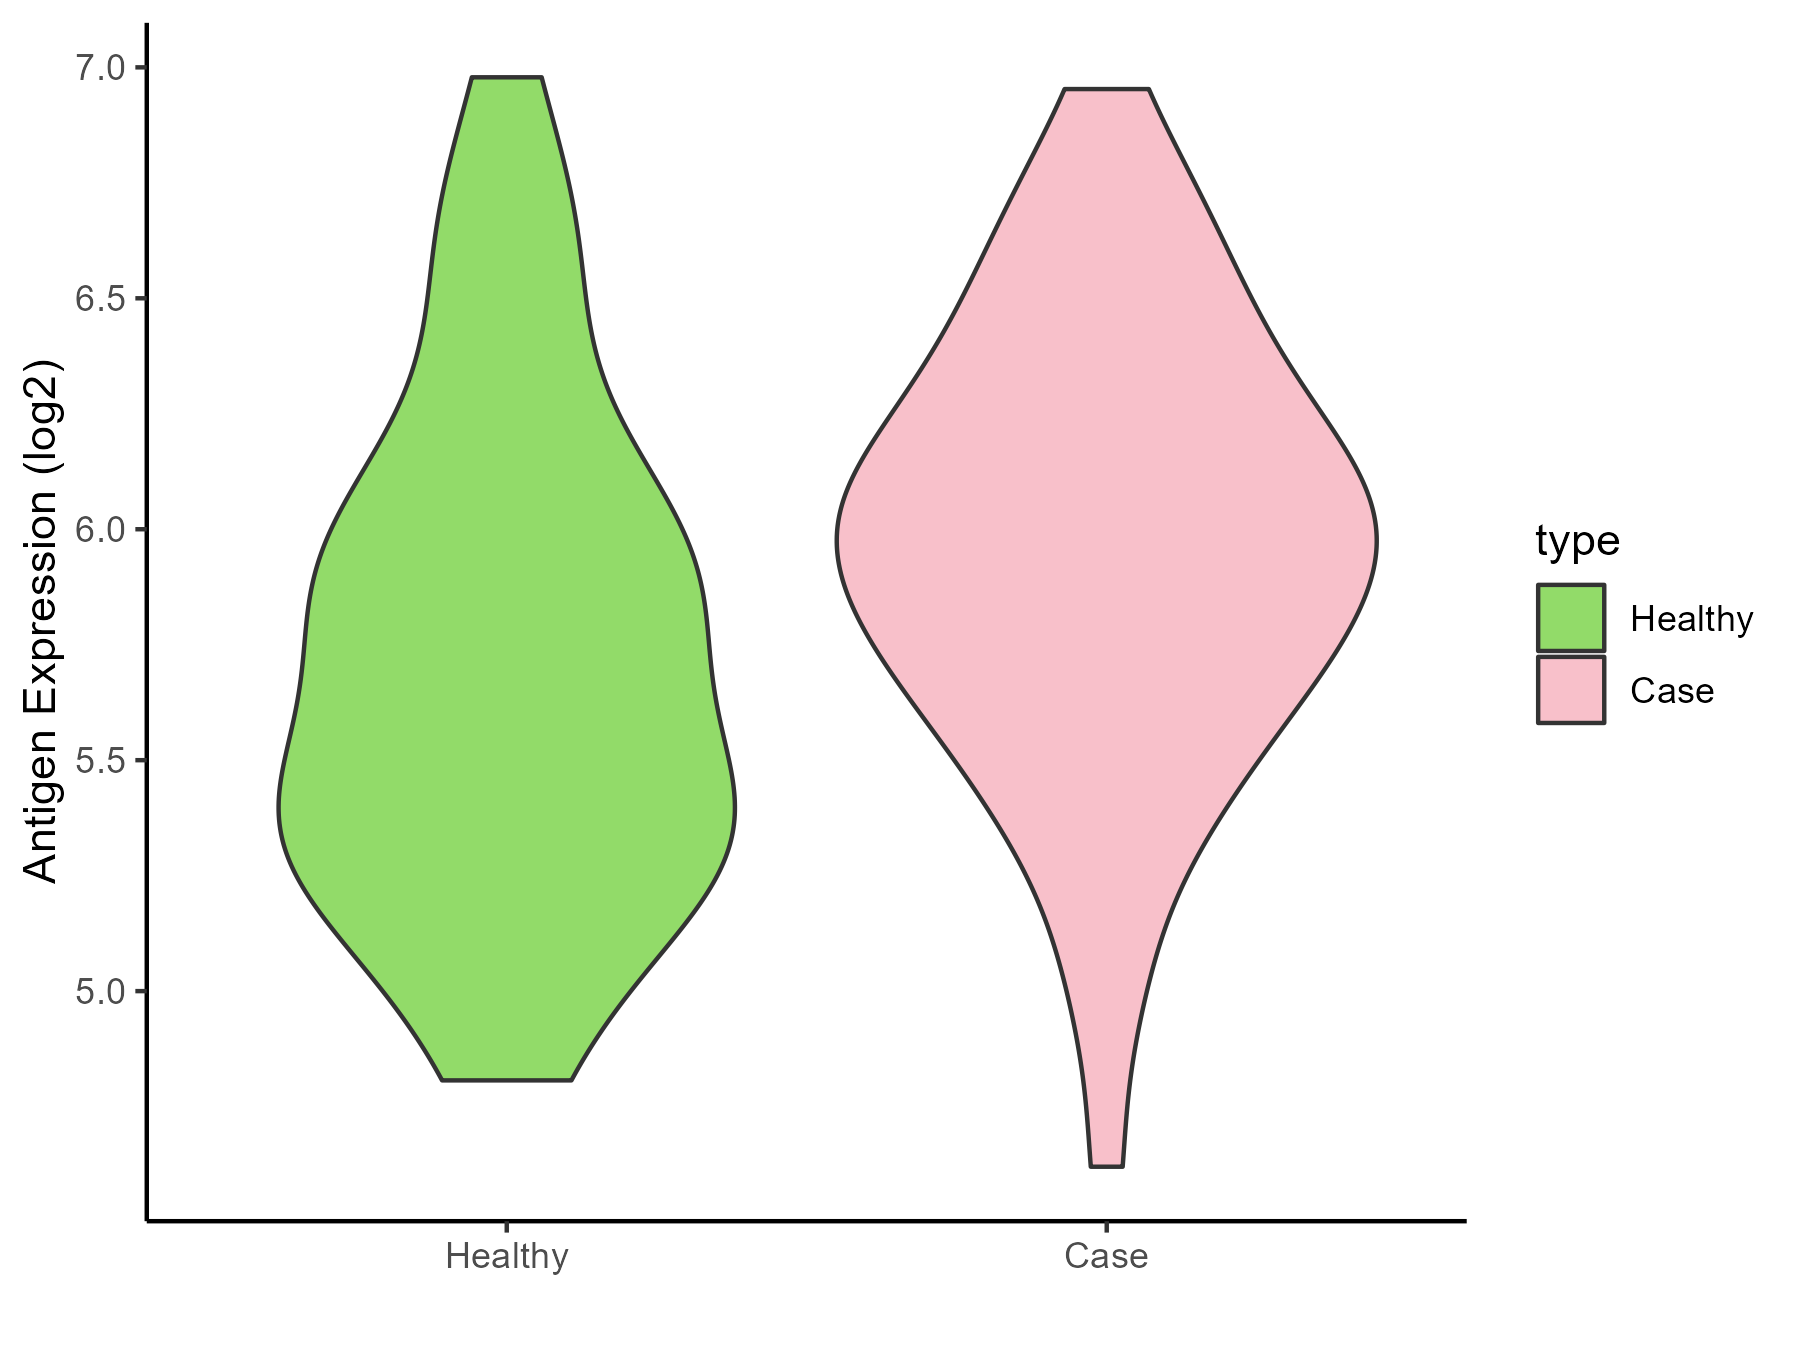
| Differential expression pattern of antigen in diseases | ||
| The Studied Tissue | Lung | |
| The Specific Disease | Chronic obstructive pulmonary disease | |
| The Expression Level of Disease Section Compare with the Healthy Individual Tissue | p-value: 0.025955331; Fold-change: 0.299929709; Z-score: 0.559328432 | |
| Disease-specific Antigen Abundances |
|
Click to View the Clearer Original Diagram |
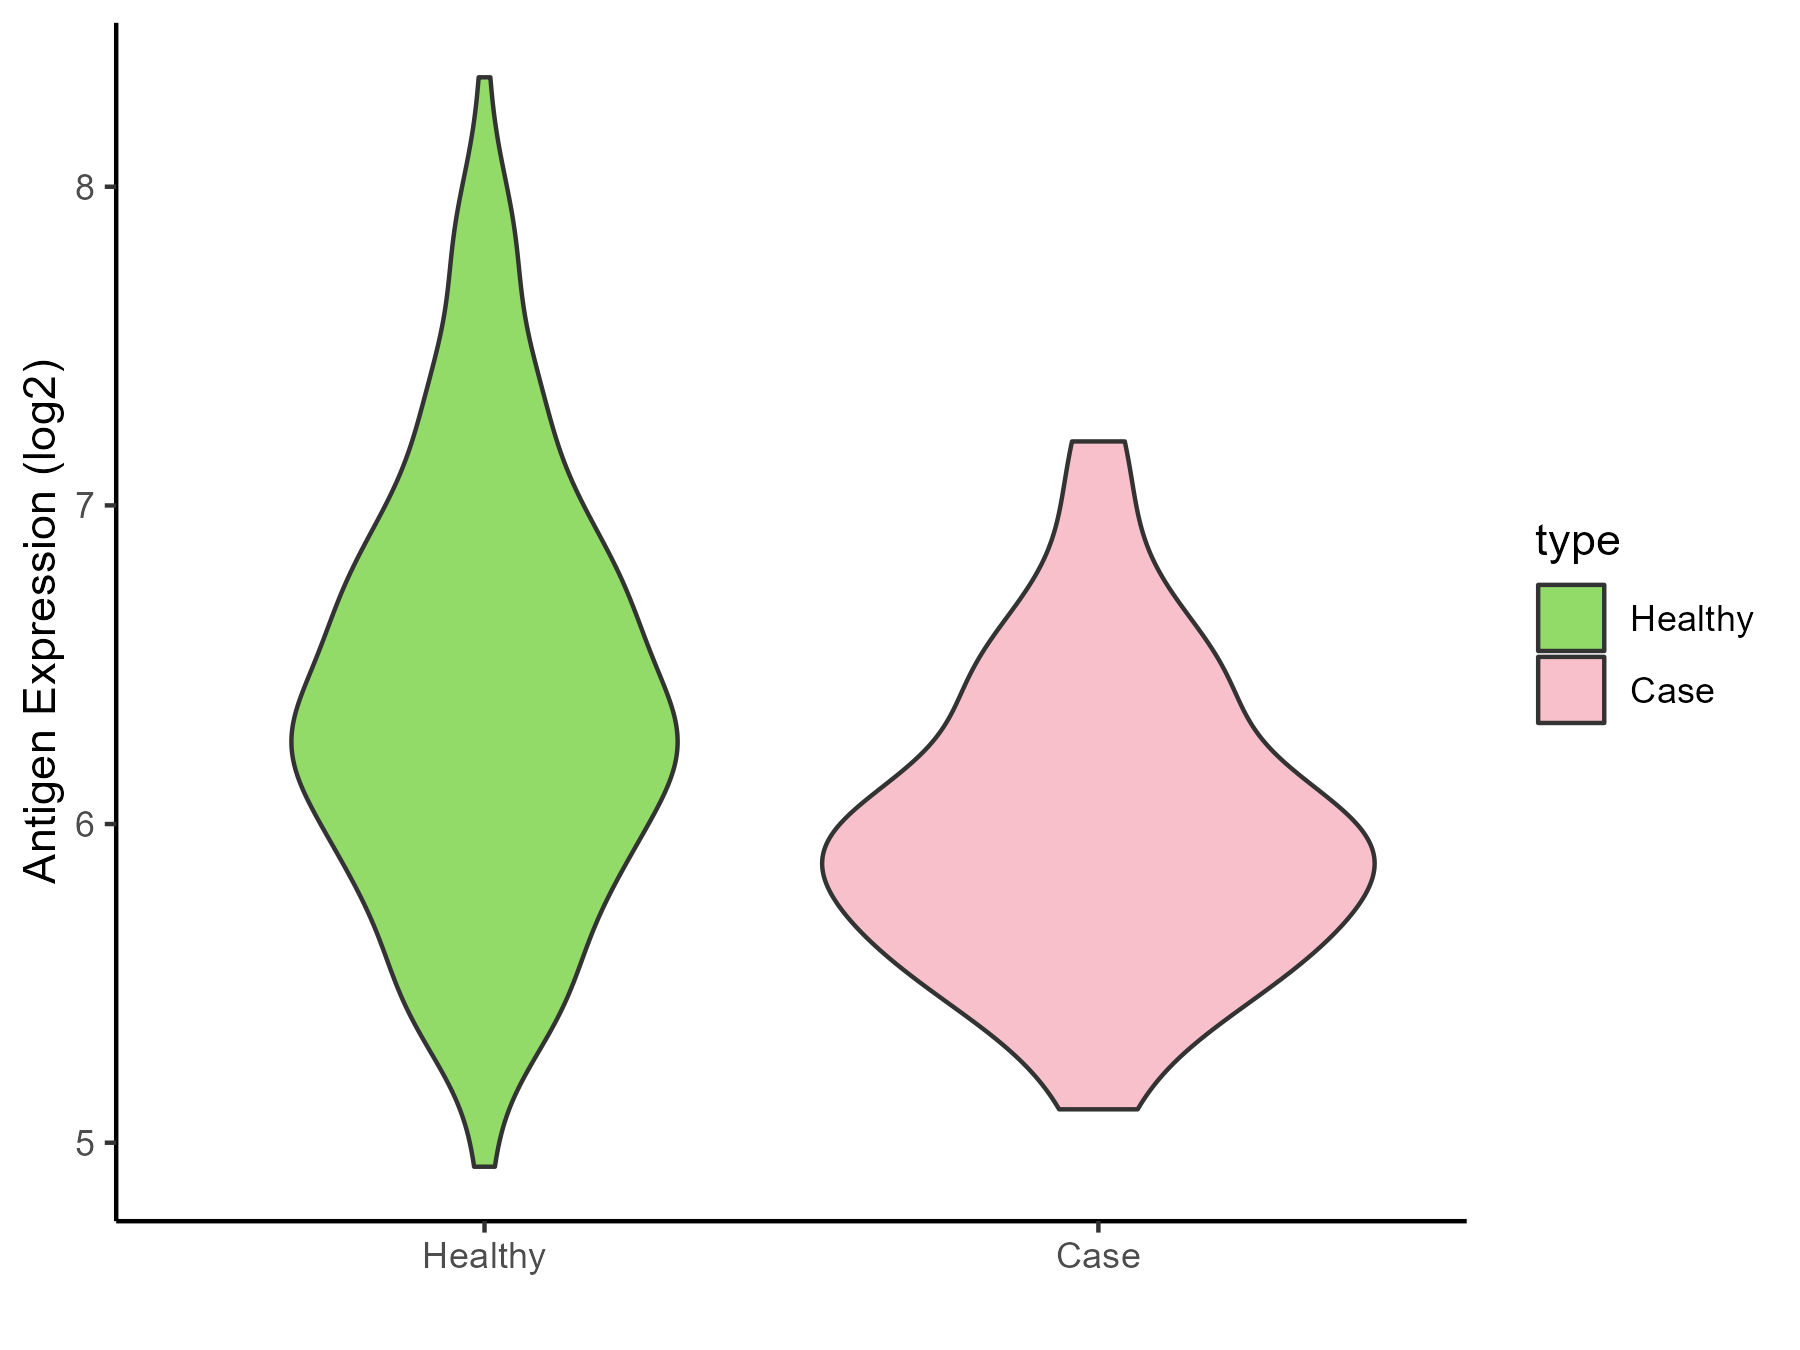
| The Studied Tissue | Small airway epithelium | |
| The Specific Disease | Chronic obstructive pulmonary disease | |
| The Expression Level of Disease Section Compare with the Healthy Individual Tissue | p-value: 1.48E-05; Fold-change: -0.377524026; Z-score: -0.569260054 | |
| Disease-specific Antigen Abundances |
|
Click to View the Clearer Original Diagram |
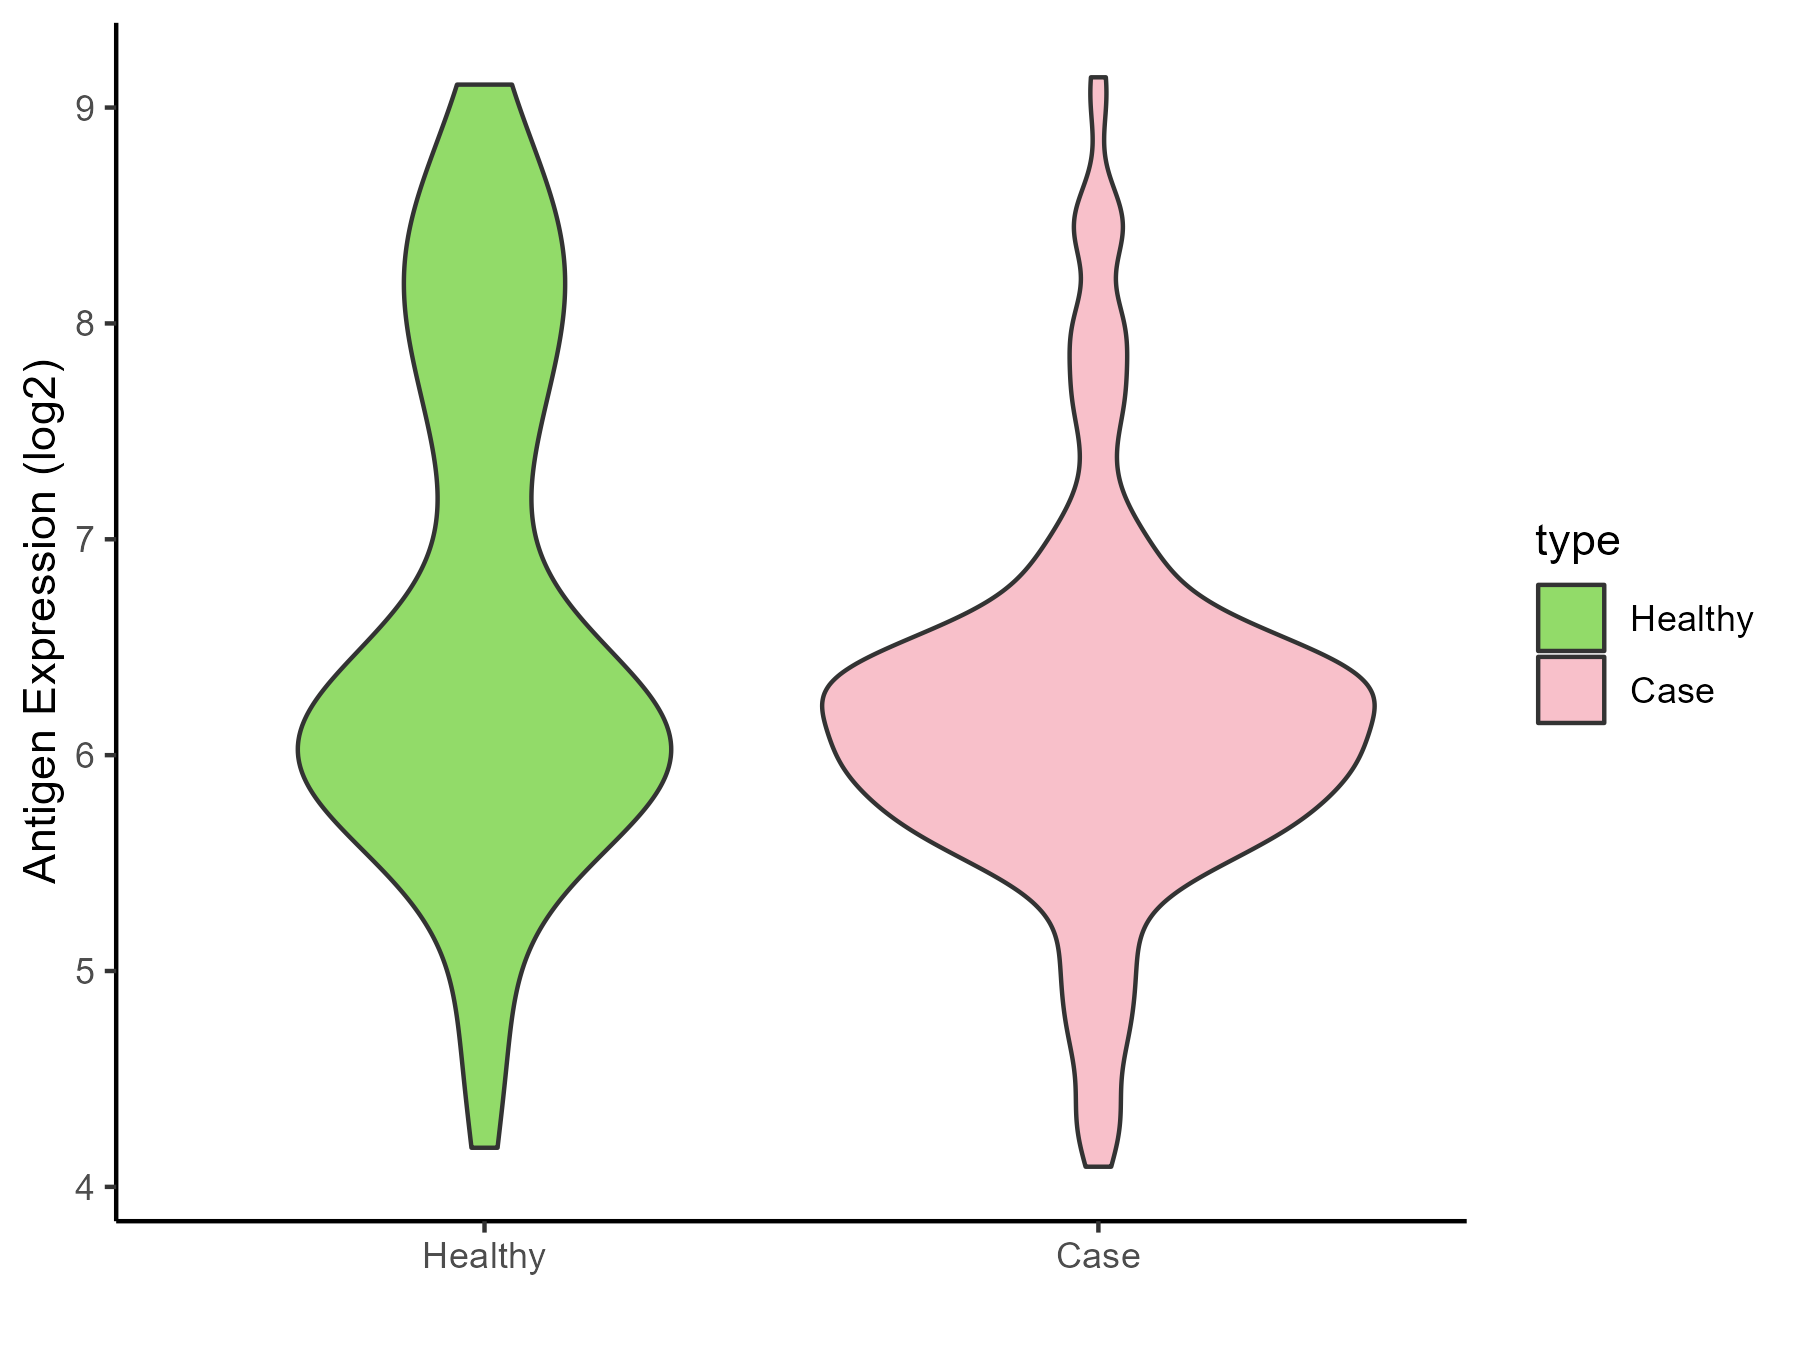
| Differential expression pattern of antigen in diseases | ||
| The Studied Tissue | Nasal and bronchial airway | |
| The Specific Disease | Asthma | |
| The Expression Level of Disease Section Compare with the Healthy Individual Tissue | p-value: 0.000167329; Fold-change: -0.029477334; Z-score: -0.025194139 | |
| Disease-specific Antigen Abundances |
|
Click to View the Clearer Original Diagram |
| Differential expression pattern of antigen in diseases | ||
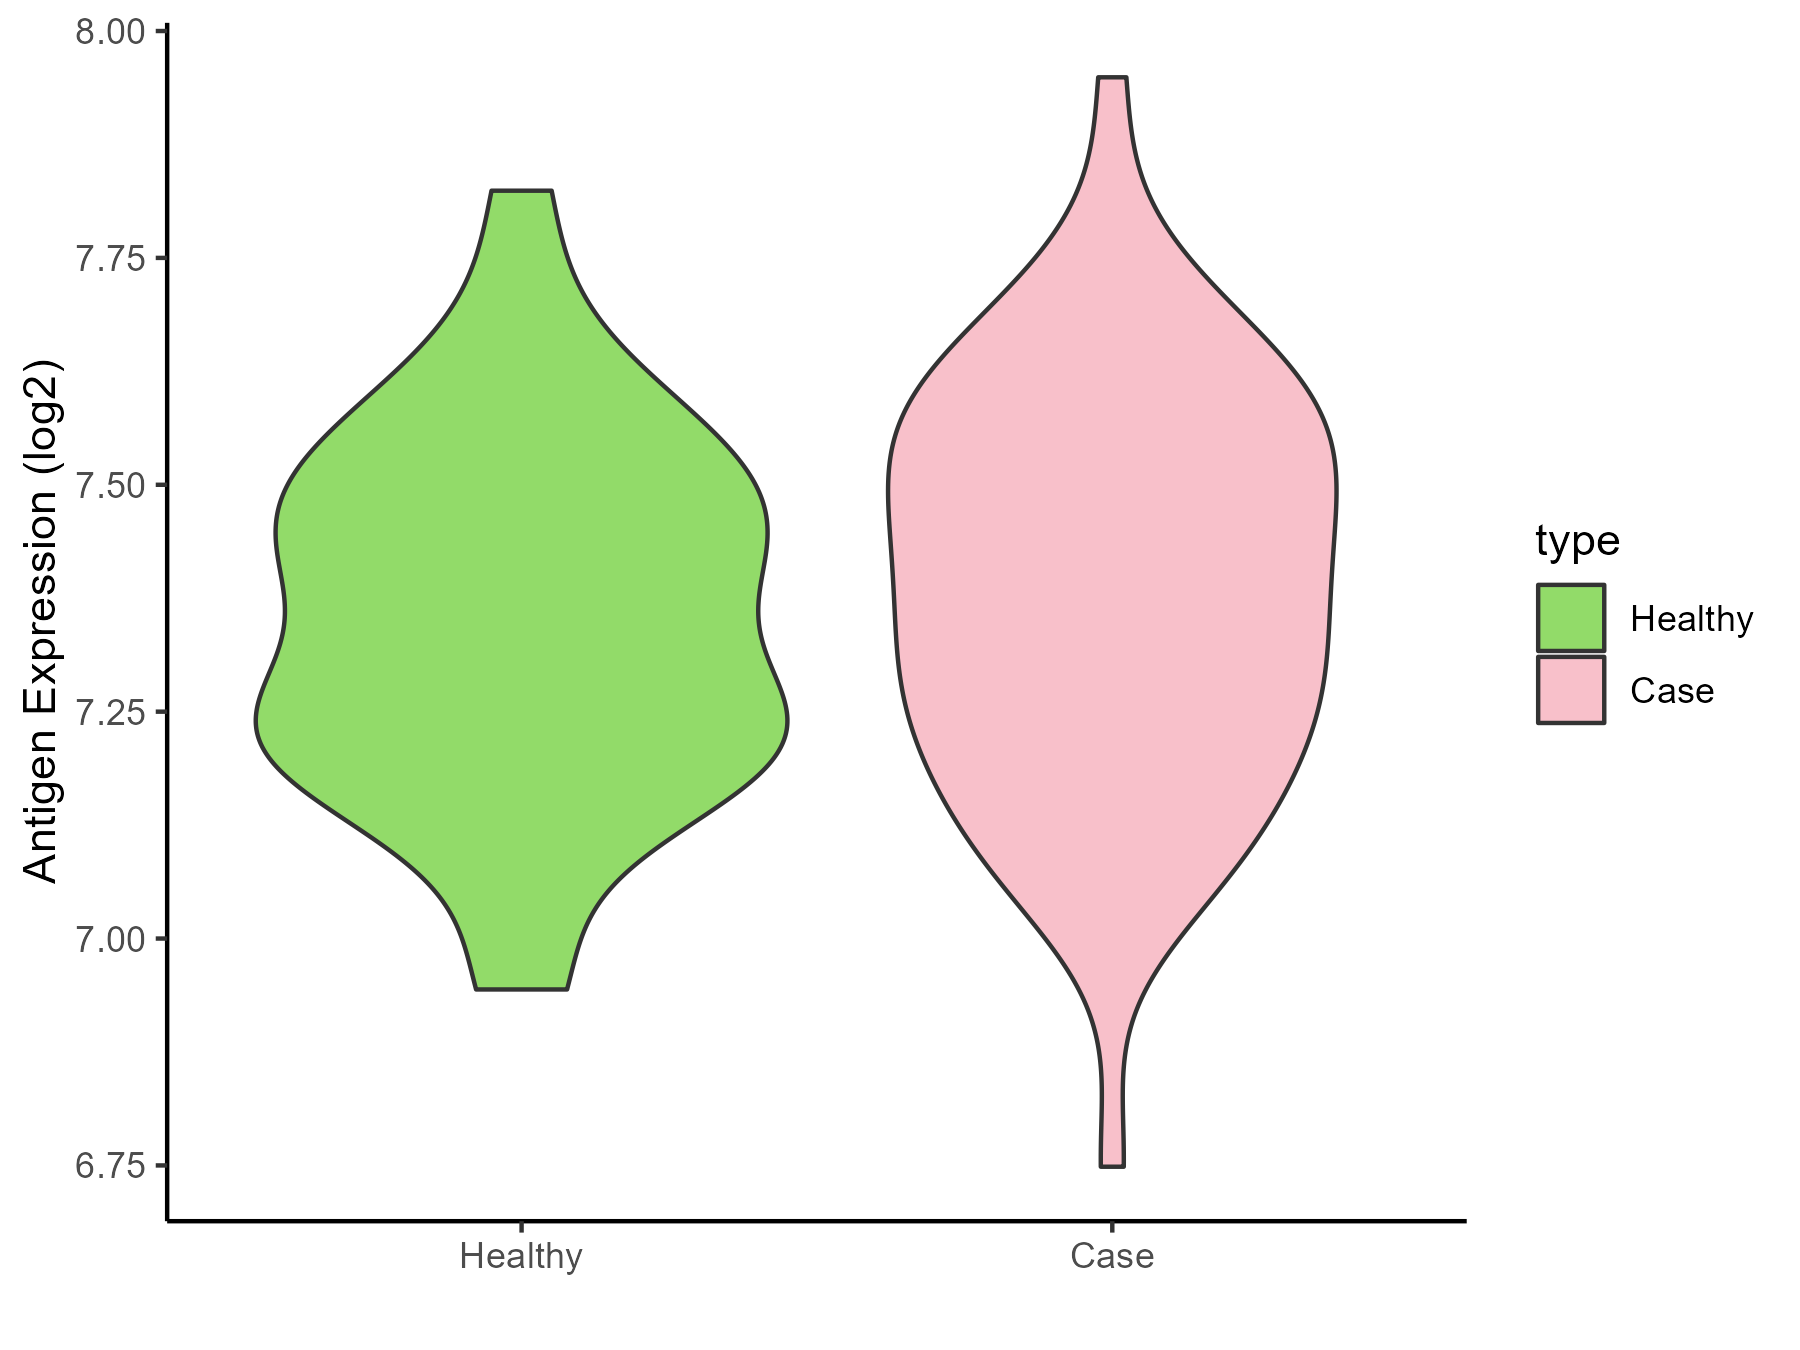
| The Studied Tissue | Nasal Epithelium | |
| The Specific Disease | Human rhinovirus infection | |
| The Expression Level of Disease Section Compare with the Healthy Individual Tissue | p-value: 0.502808824; Fold-change: 0.01809045; Z-score: 0.091197206 | |
| Disease-specific Antigen Abundances |
|
Click to View the Clearer Original Diagram |
| Differential expression pattern of antigen in diseases | ||
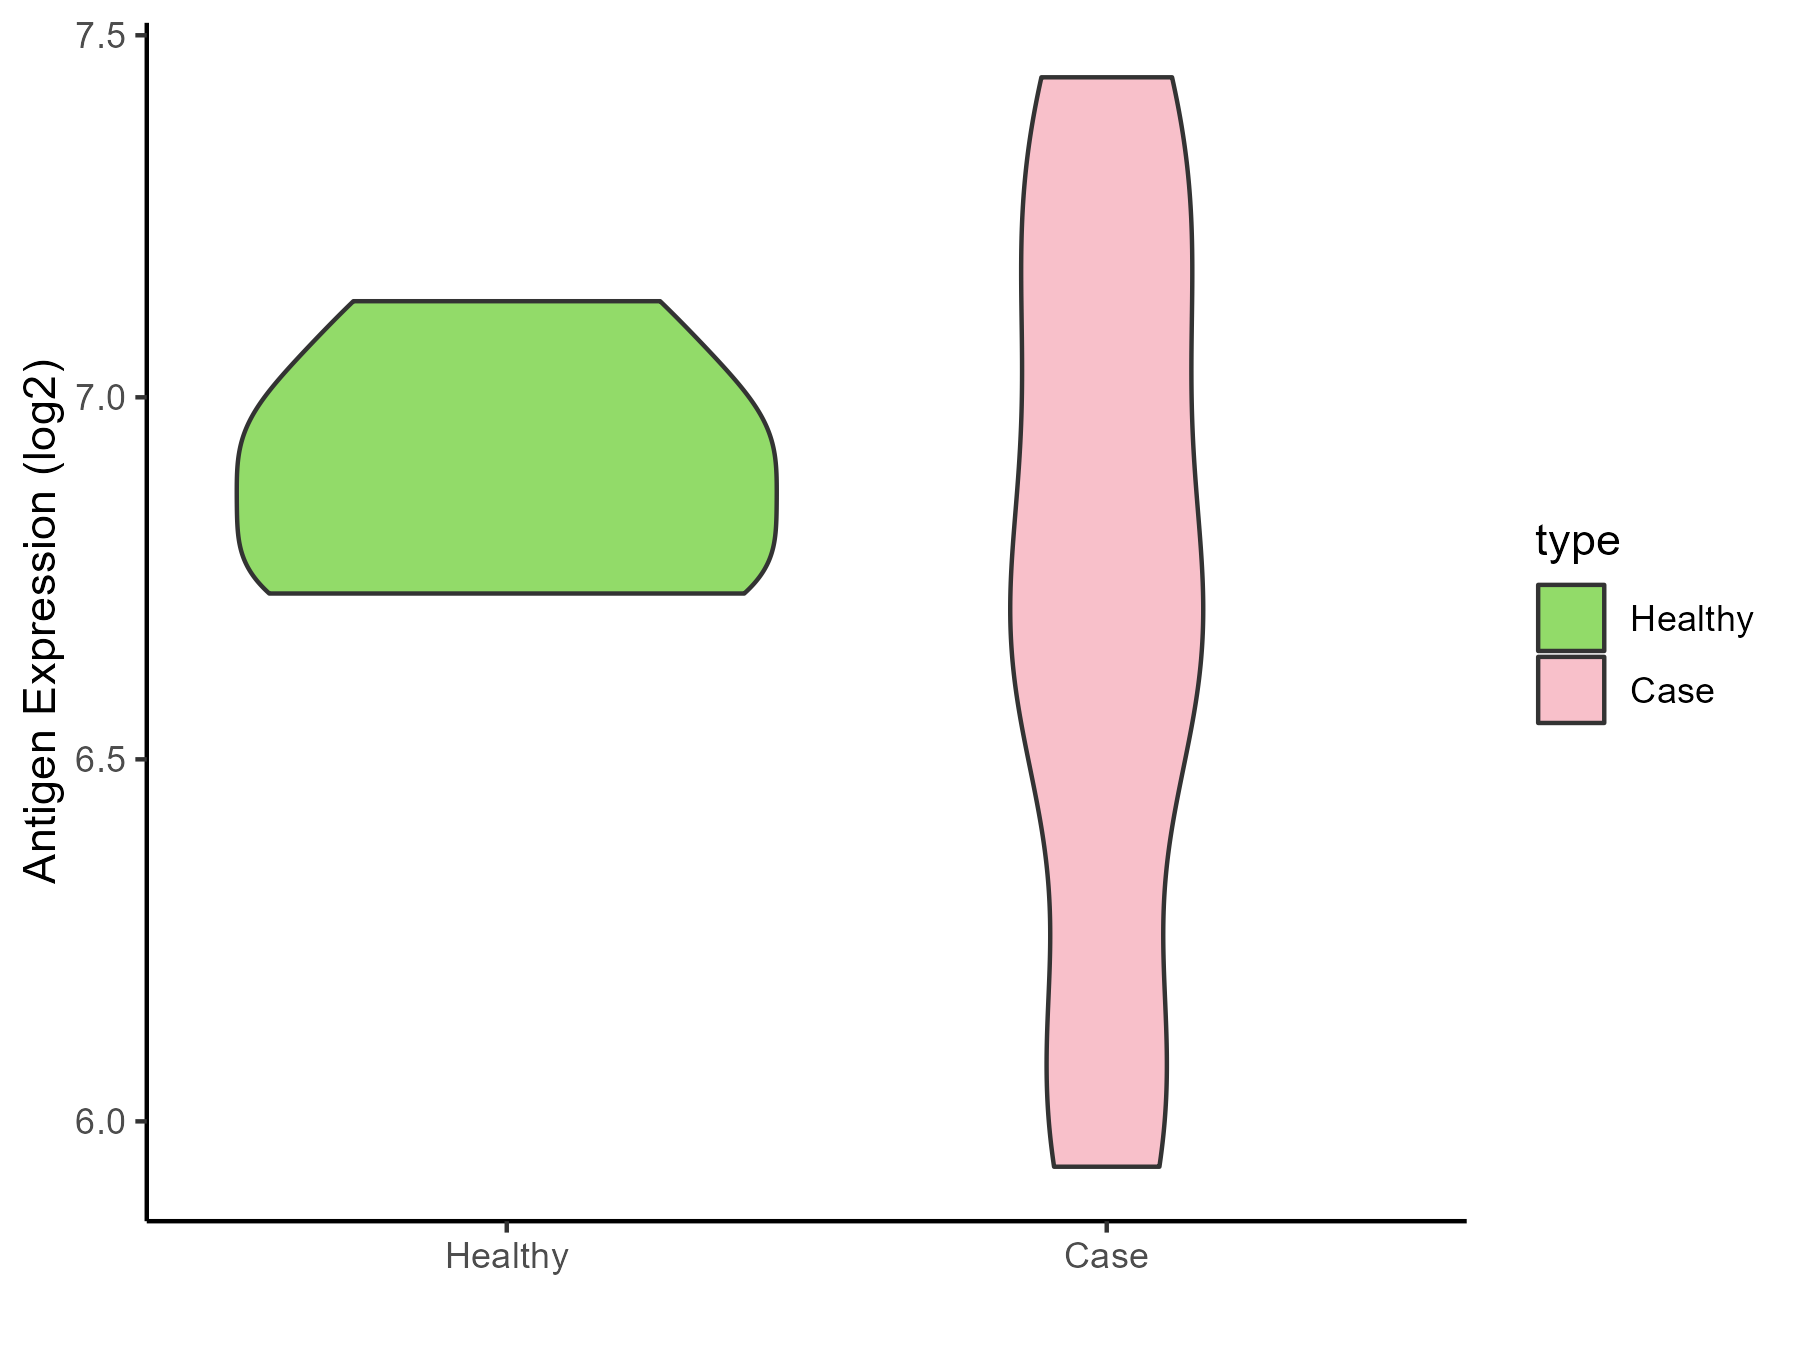
| The Studied Tissue | Lung | |
| The Specific Disease | Idiopathic pulmonary fibrosis | |
| The Expression Level of Disease Section Compare with the Healthy Individual Tissue | p-value: 0.284675553; Fold-change: -0.211015104; Z-score: -1.280194482 | |
| Disease-specific Antigen Abundances |
|
Click to View the Clearer Original Diagram |
ICD Disease Classification 13
| Differential expression pattern of antigen in diseases | ||
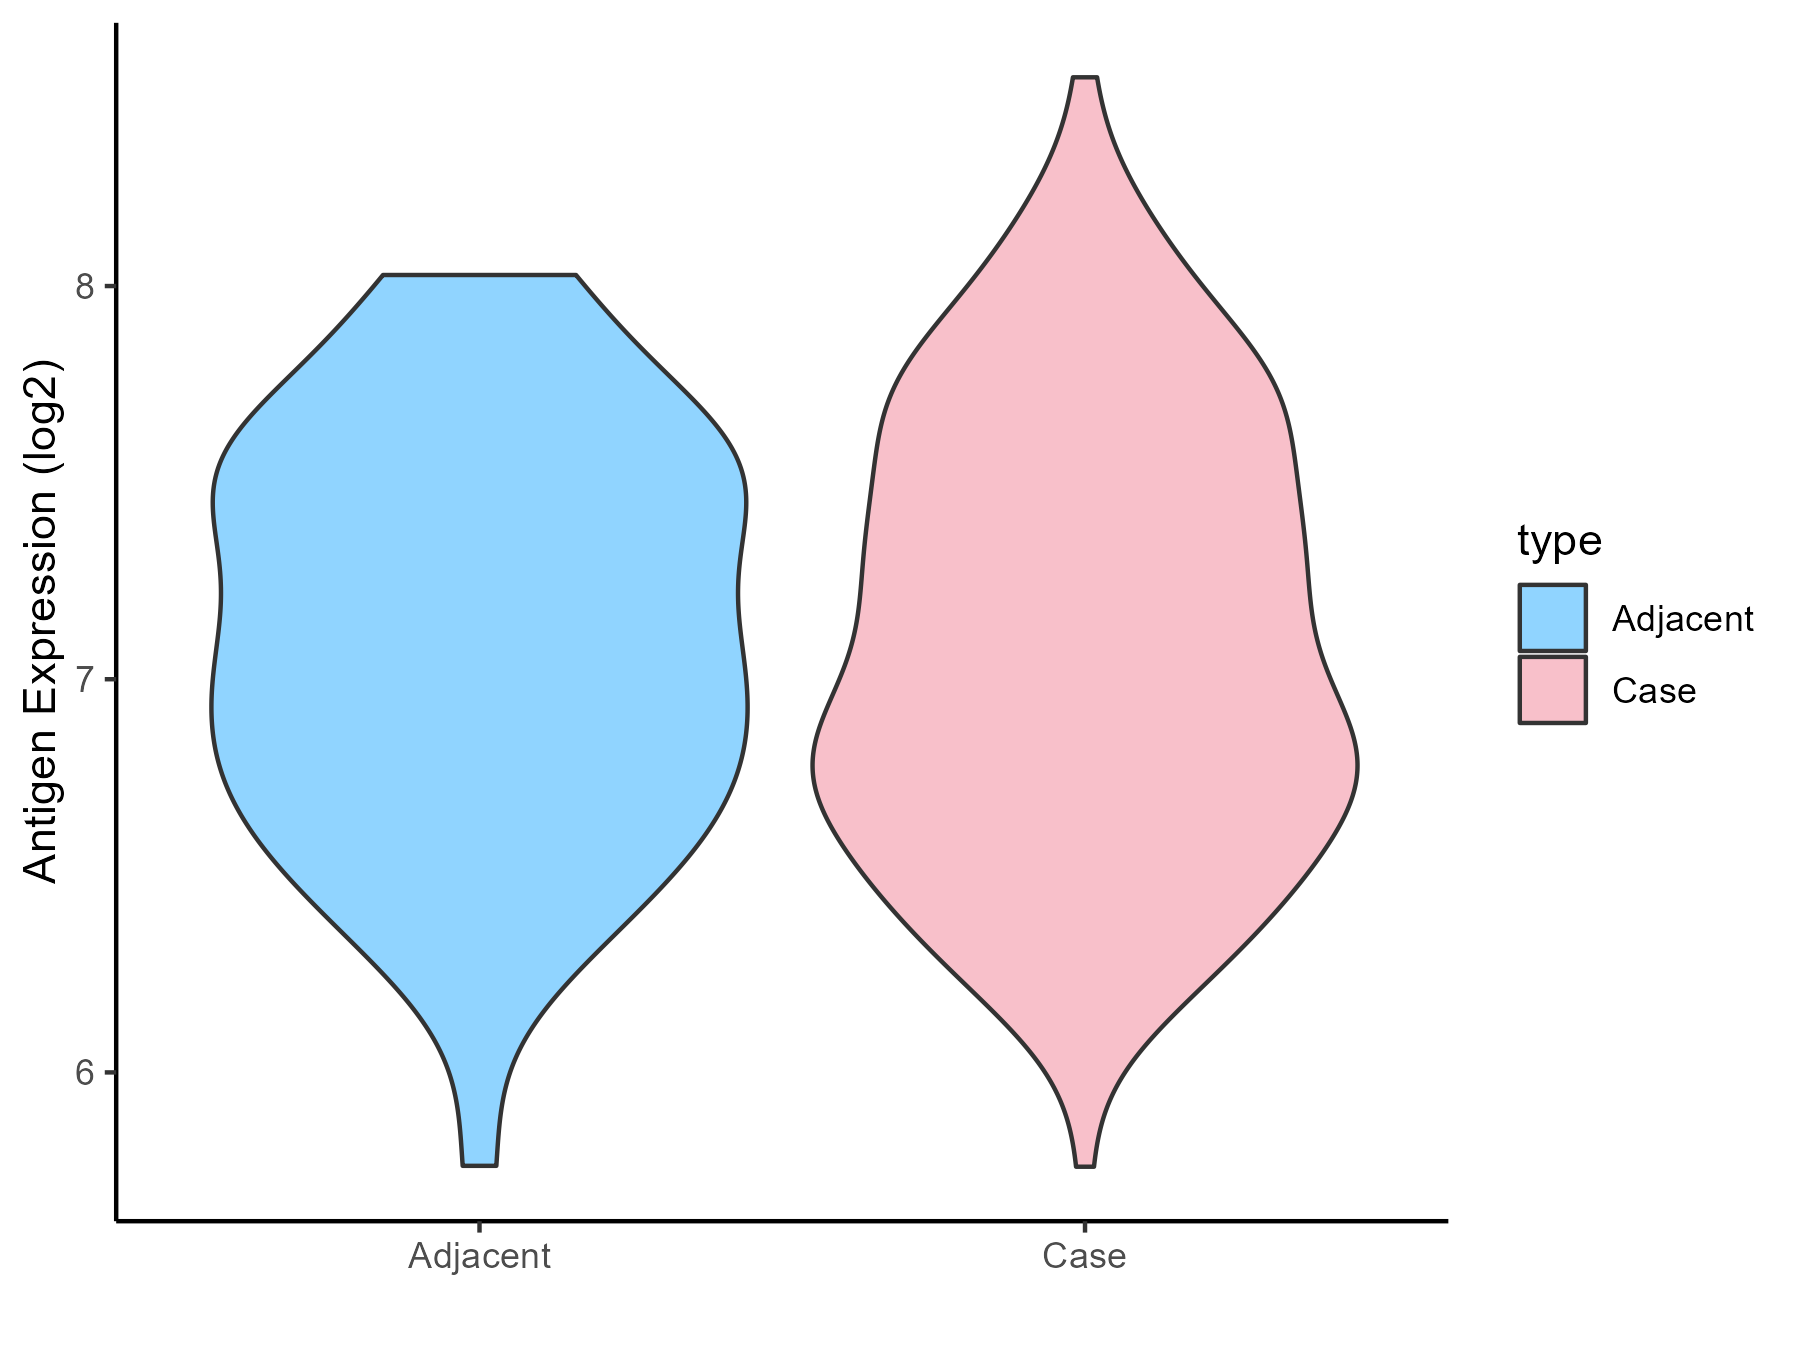
| The Studied Tissue | Gingival | |
| The Specific Disease | Periodontal disease | |
| The Expression Level of Disease Section Compare with the Adjacent Tissue | p-value: 0.881106979; Fold-change: -0.029473829; Z-score: -0.057108694 | |
| Disease-specific Antigen Abundances |
|
Click to View the Clearer Original Diagram |
| Differential expression pattern of antigen in diseases | ||
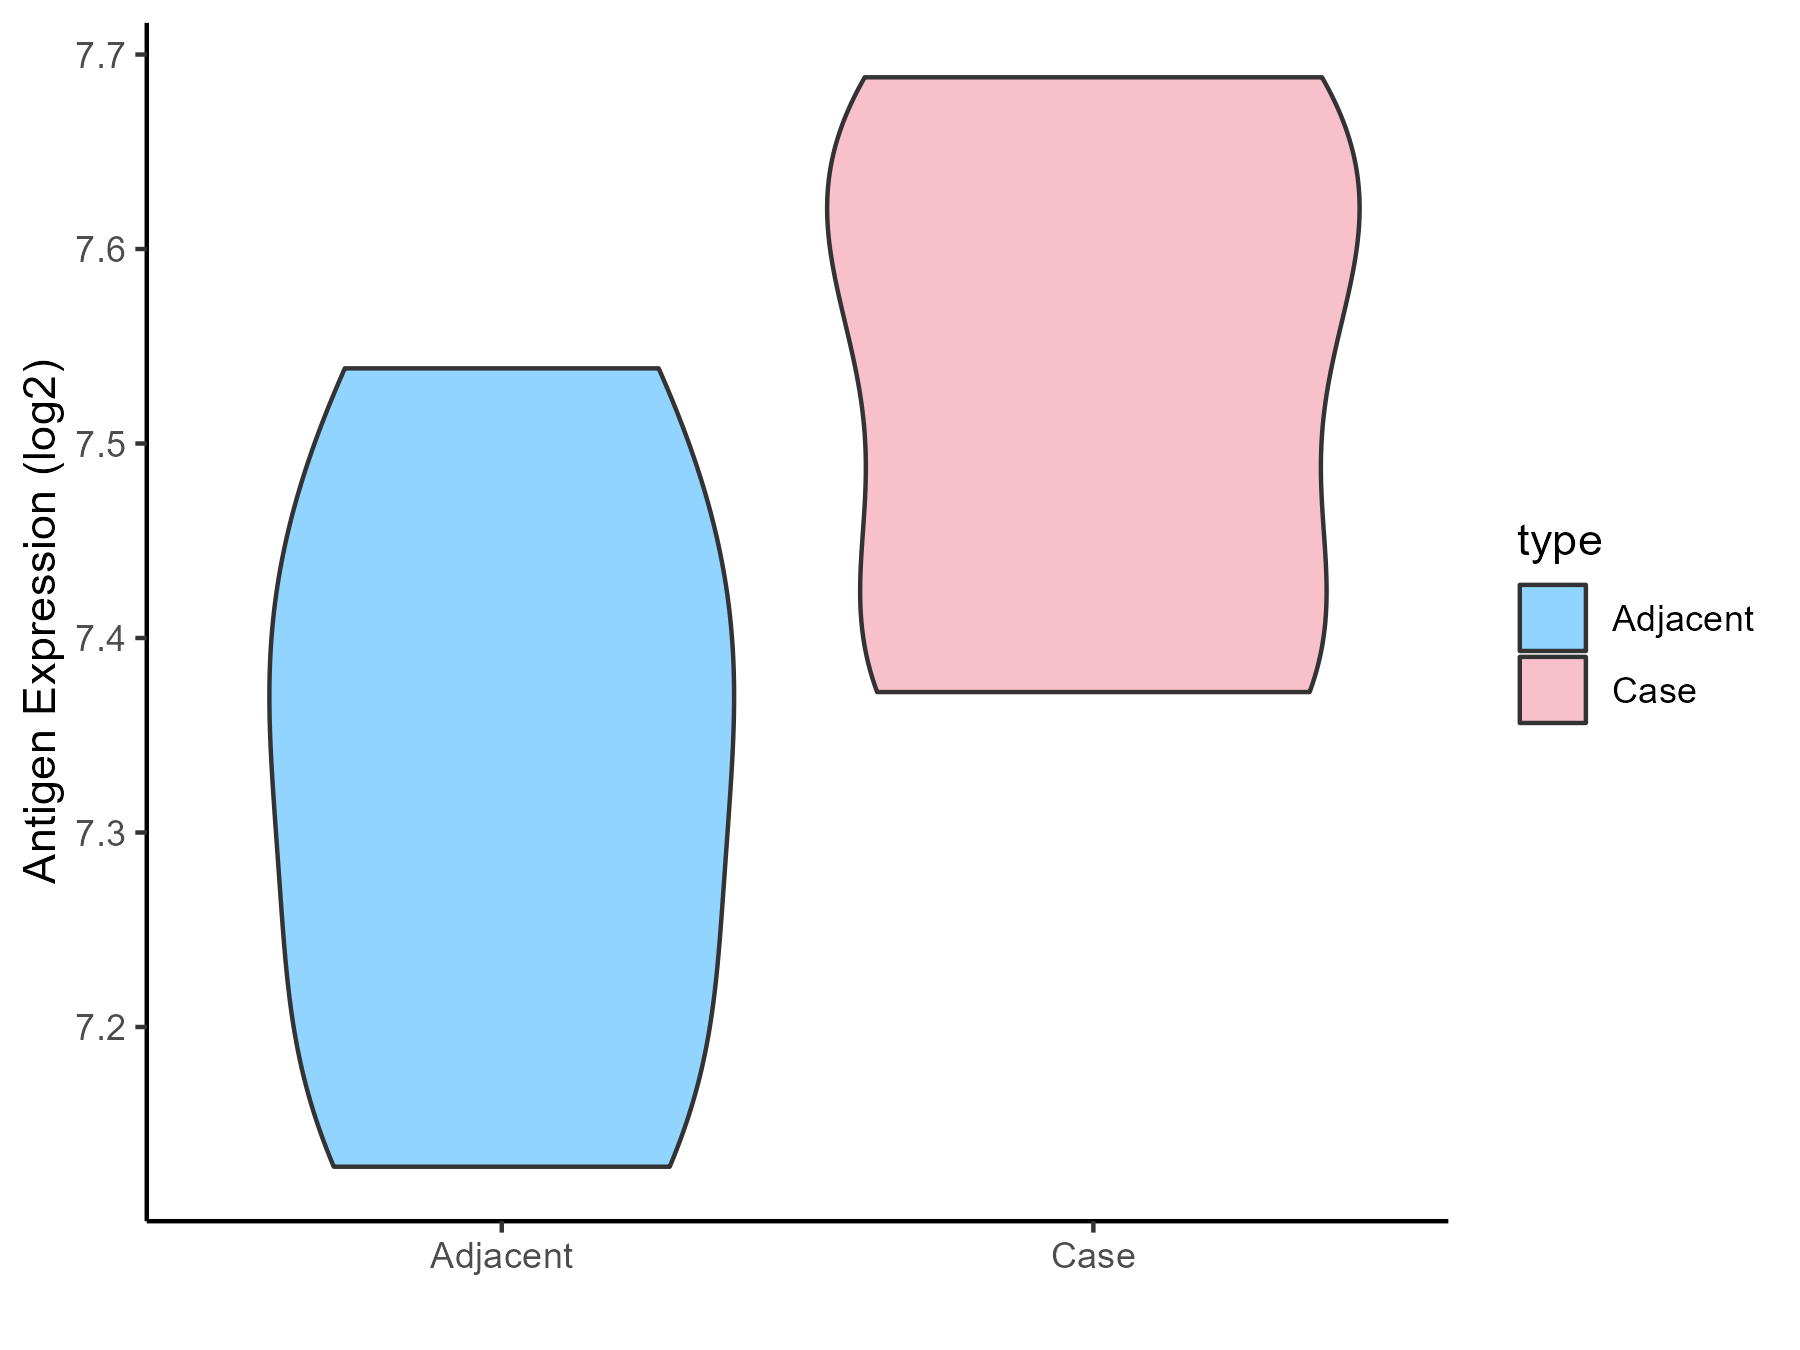
| The Studied Tissue | Gastric antrum | |
| The Specific Disease | Eosinophilic gastritis | |
| The Expression Level of Disease Section Compare with the Adjacent Tissue | p-value: 0.069975734; Fold-change: 0.210013435; Z-score: 1.295629095 | |
| Disease-specific Antigen Abundances |
|
Click to View the Clearer Original Diagram |
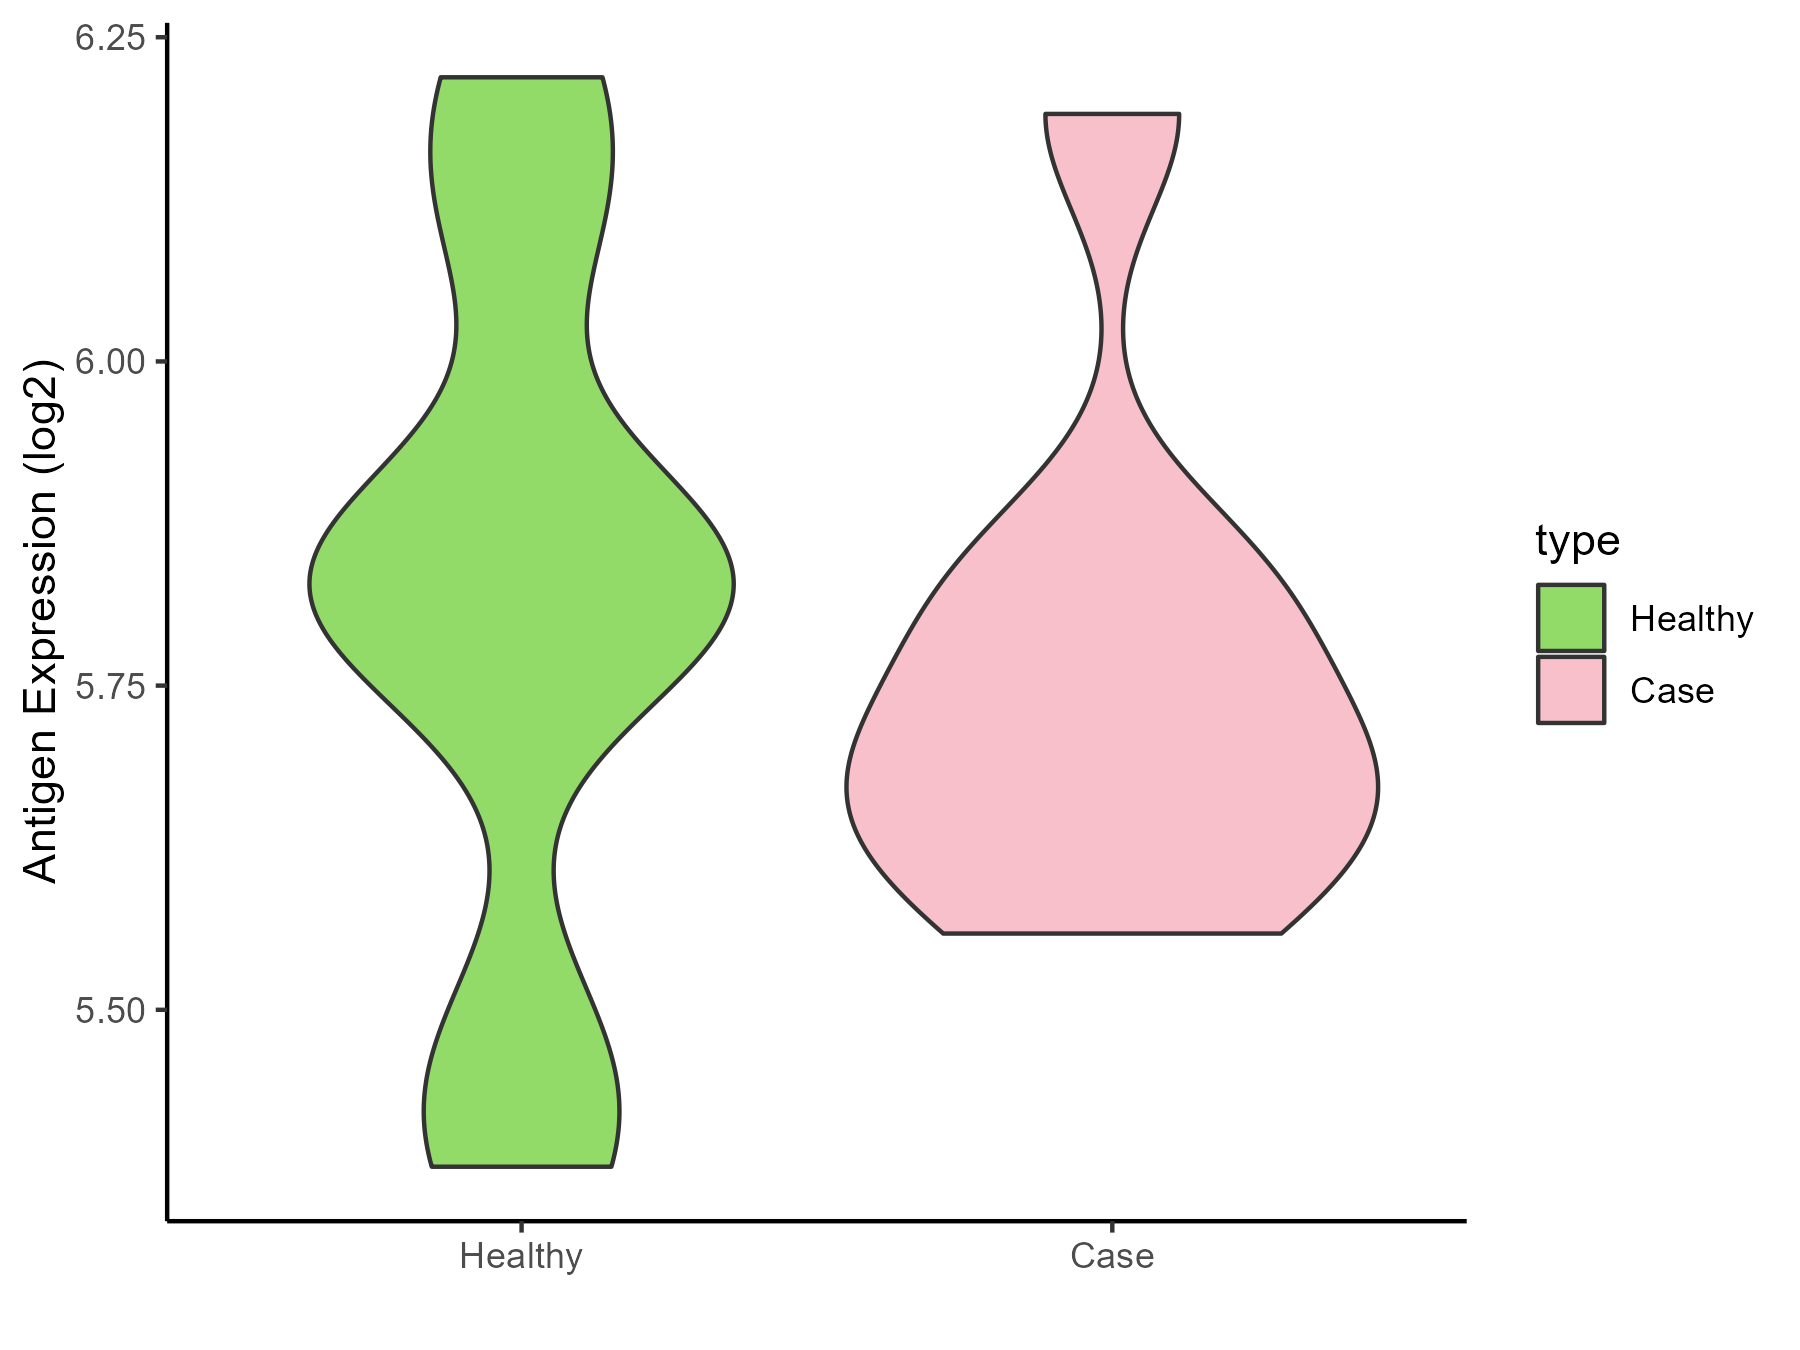
| Differential expression pattern of antigen in diseases | ||
| The Studied Tissue | Liver | |
| The Specific Disease | Liver failure | |
| The Expression Level of Disease Section Compare with the Healthy Individual Tissue | p-value: 0.693235121; Fold-change: -0.121806232; Z-score: -0.428675273 | |
| Disease-specific Antigen Abundances |
|
Click to View the Clearer Original Diagram |
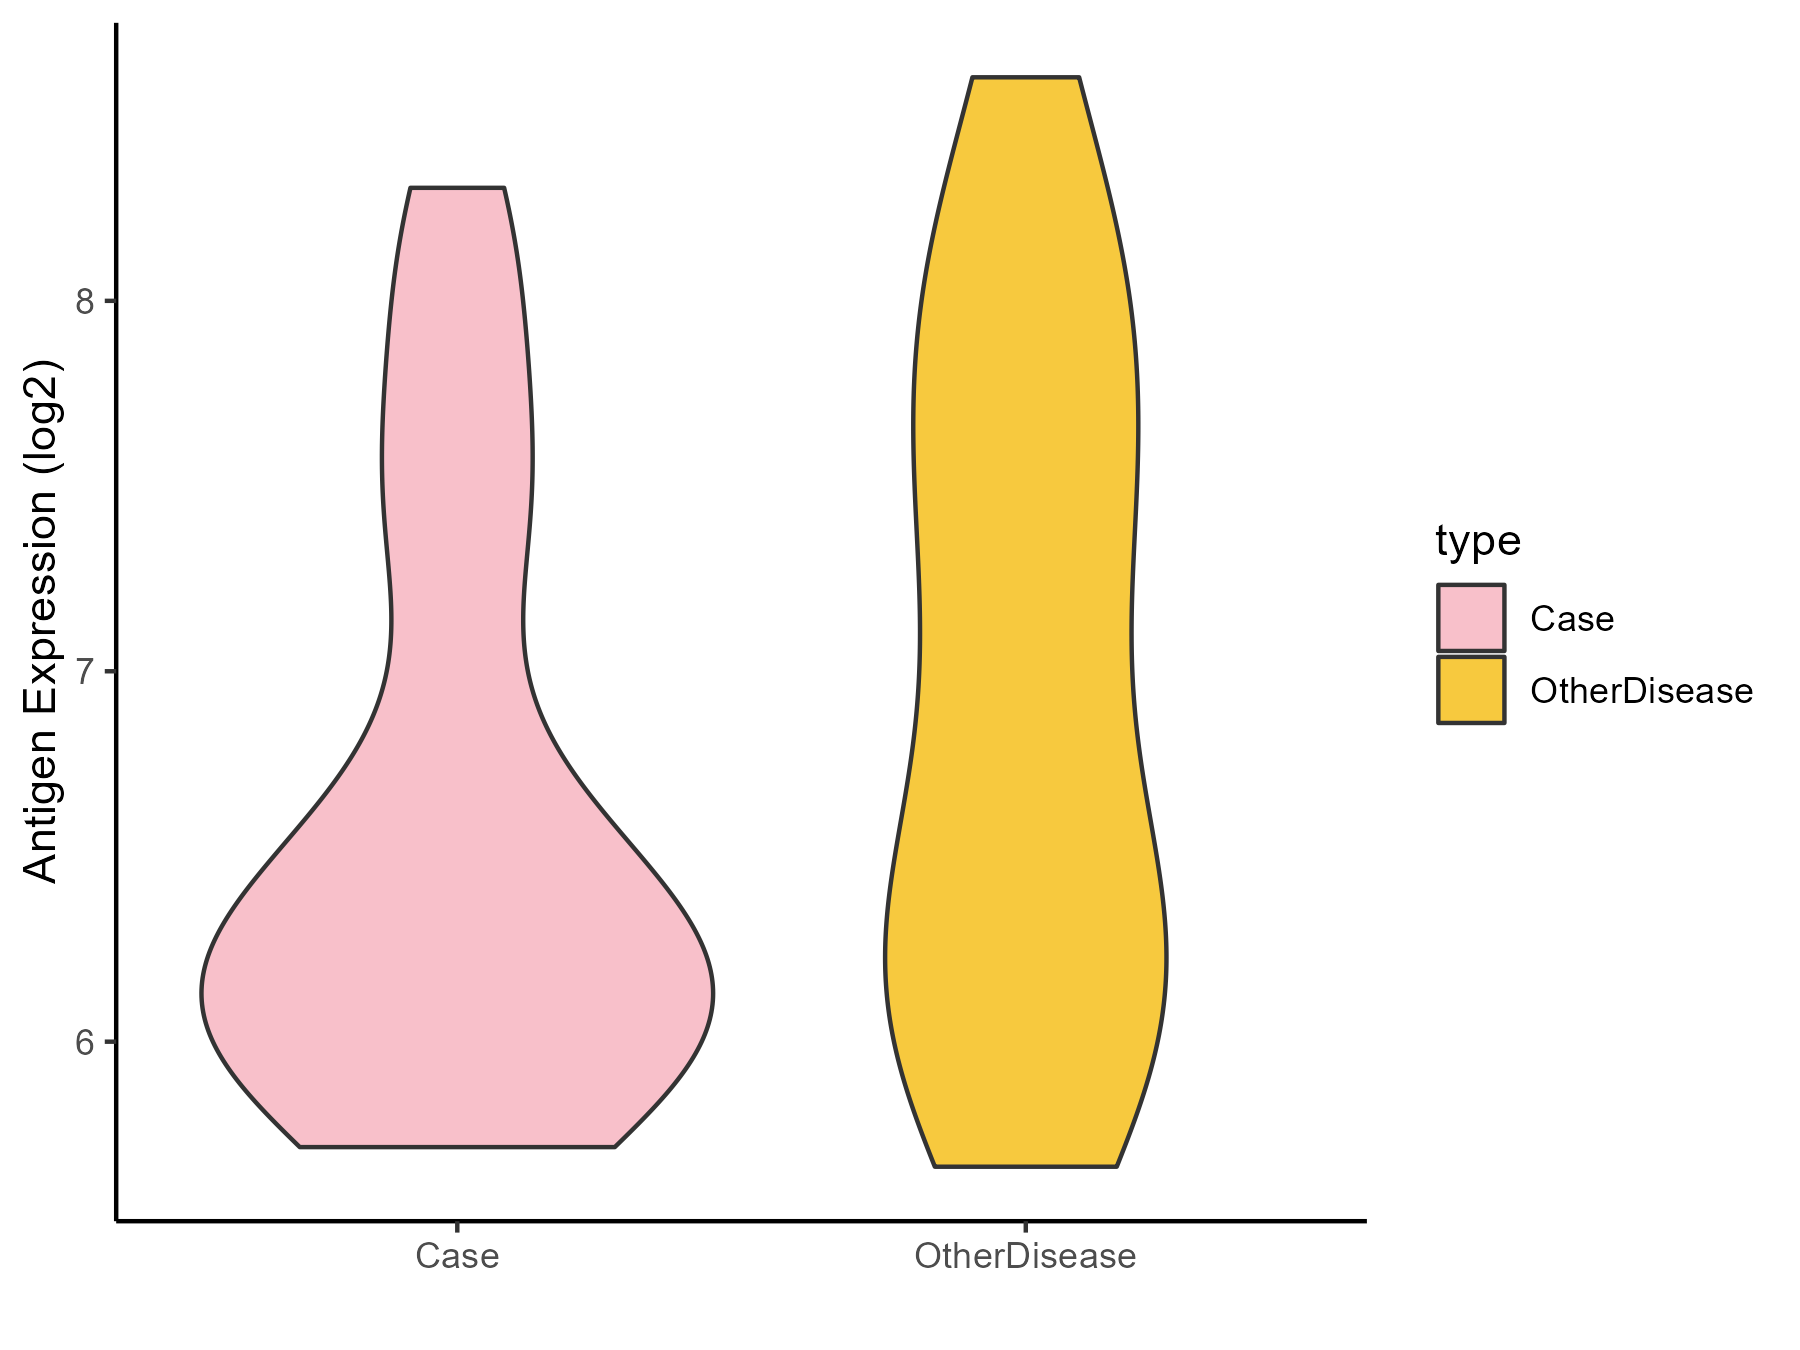
| Differential expression pattern of antigen in diseases | ||
| The Studied Tissue | Colon mucosal | |
| The Specific Disease | Ulcerative colitis | |
| The Expression Level of Disease Section Compare with the Adjacent Tissue | p-value: 0.128069098; Fold-change: -0.582105542; Z-score: -0.634041508 | |
| Disease-specific Antigen Abundances |
|
Click to View the Clearer Original Diagram |
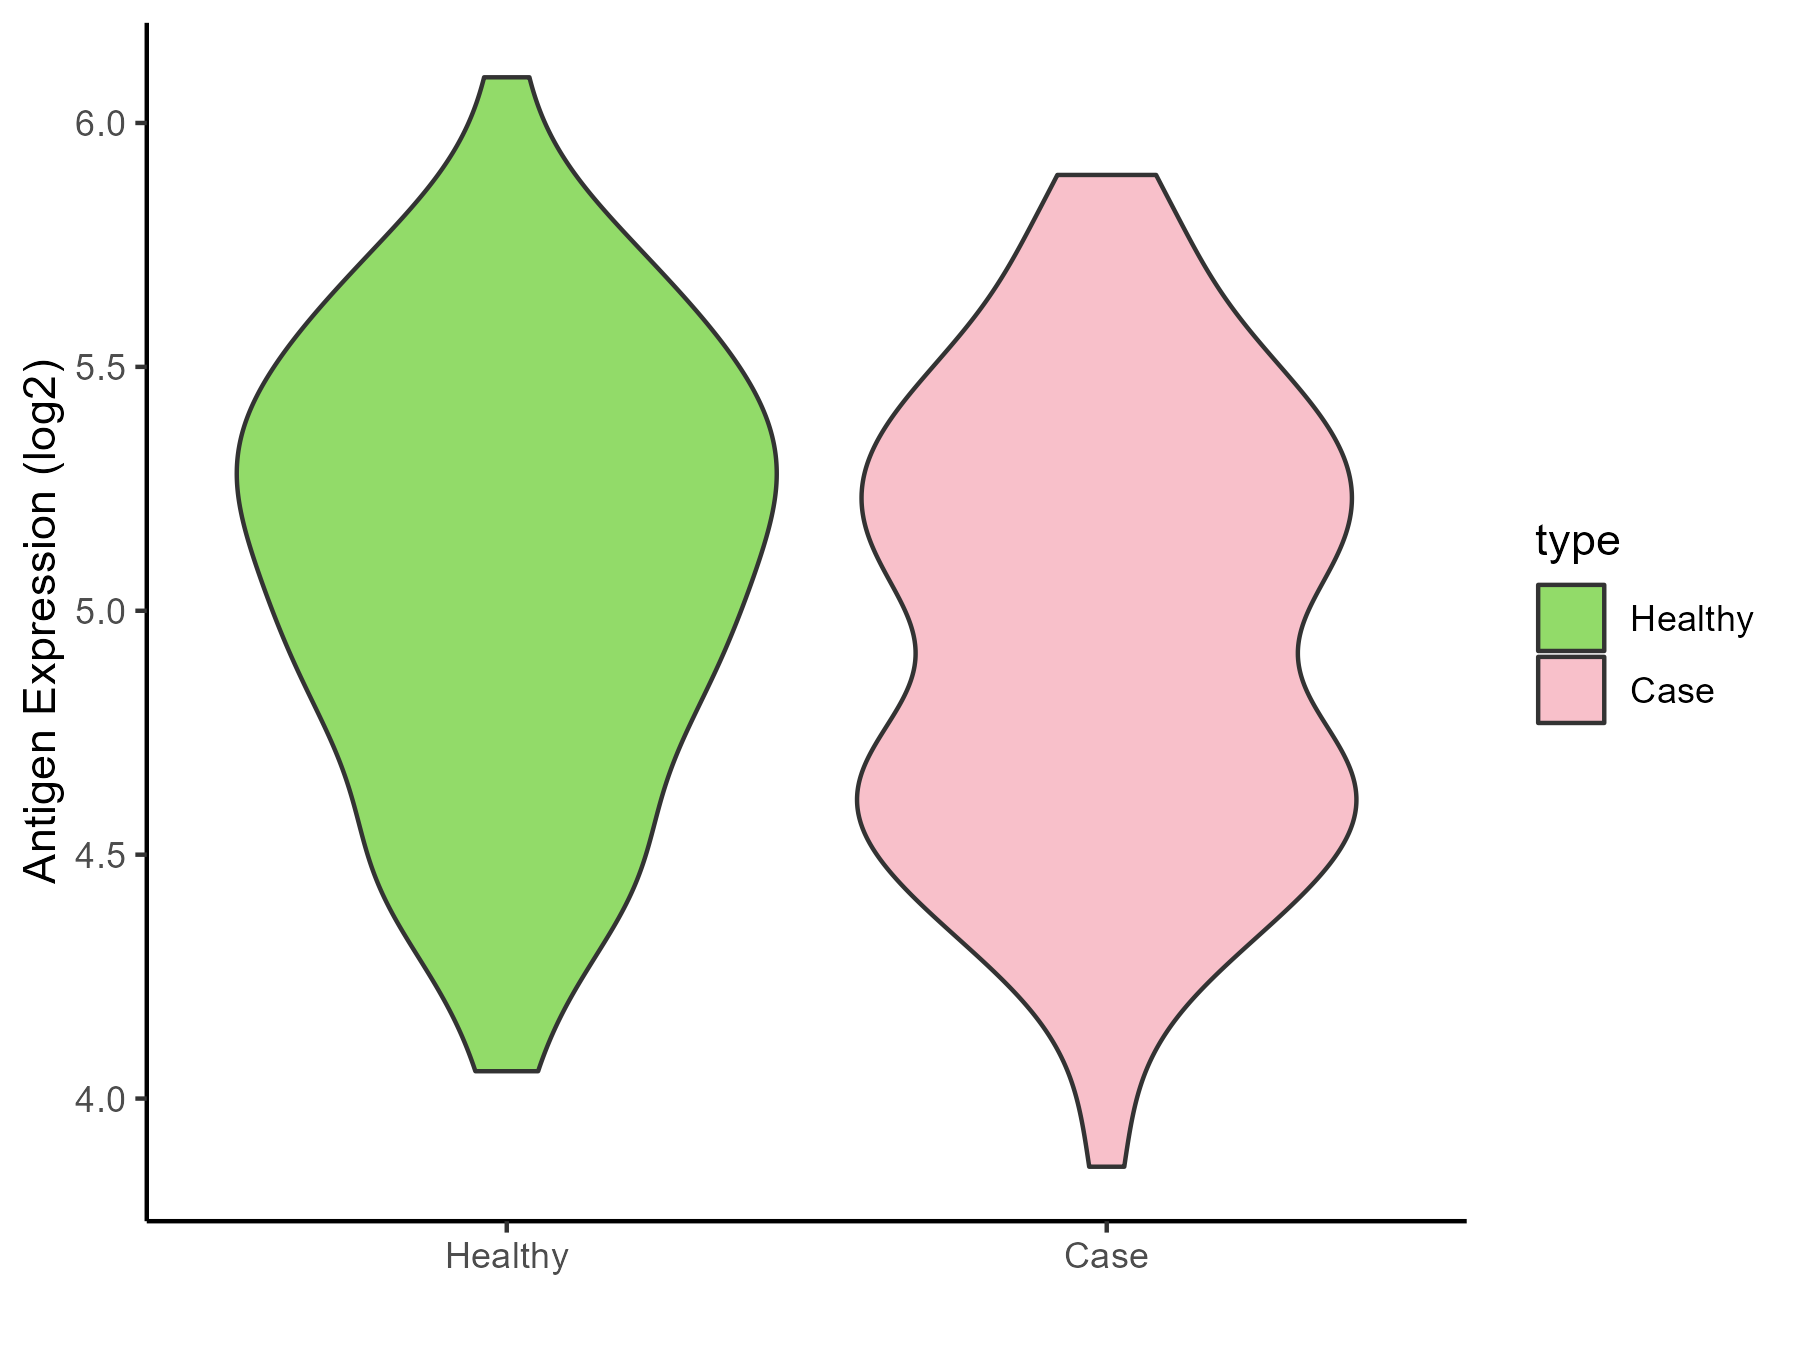
| Differential expression pattern of antigen in diseases | ||
| The Studied Tissue | Rectal colon | |
| The Specific Disease | Irritable bowel syndrome | |
| The Expression Level of Disease Section Compare with the Healthy Individual Tissue | p-value: 0.04321468; Fold-change: -0.108196459; Z-score: -0.240973064 | |
| Disease-specific Antigen Abundances |
|
Click to View the Clearer Original Diagram |
ICD Disease Classification 14
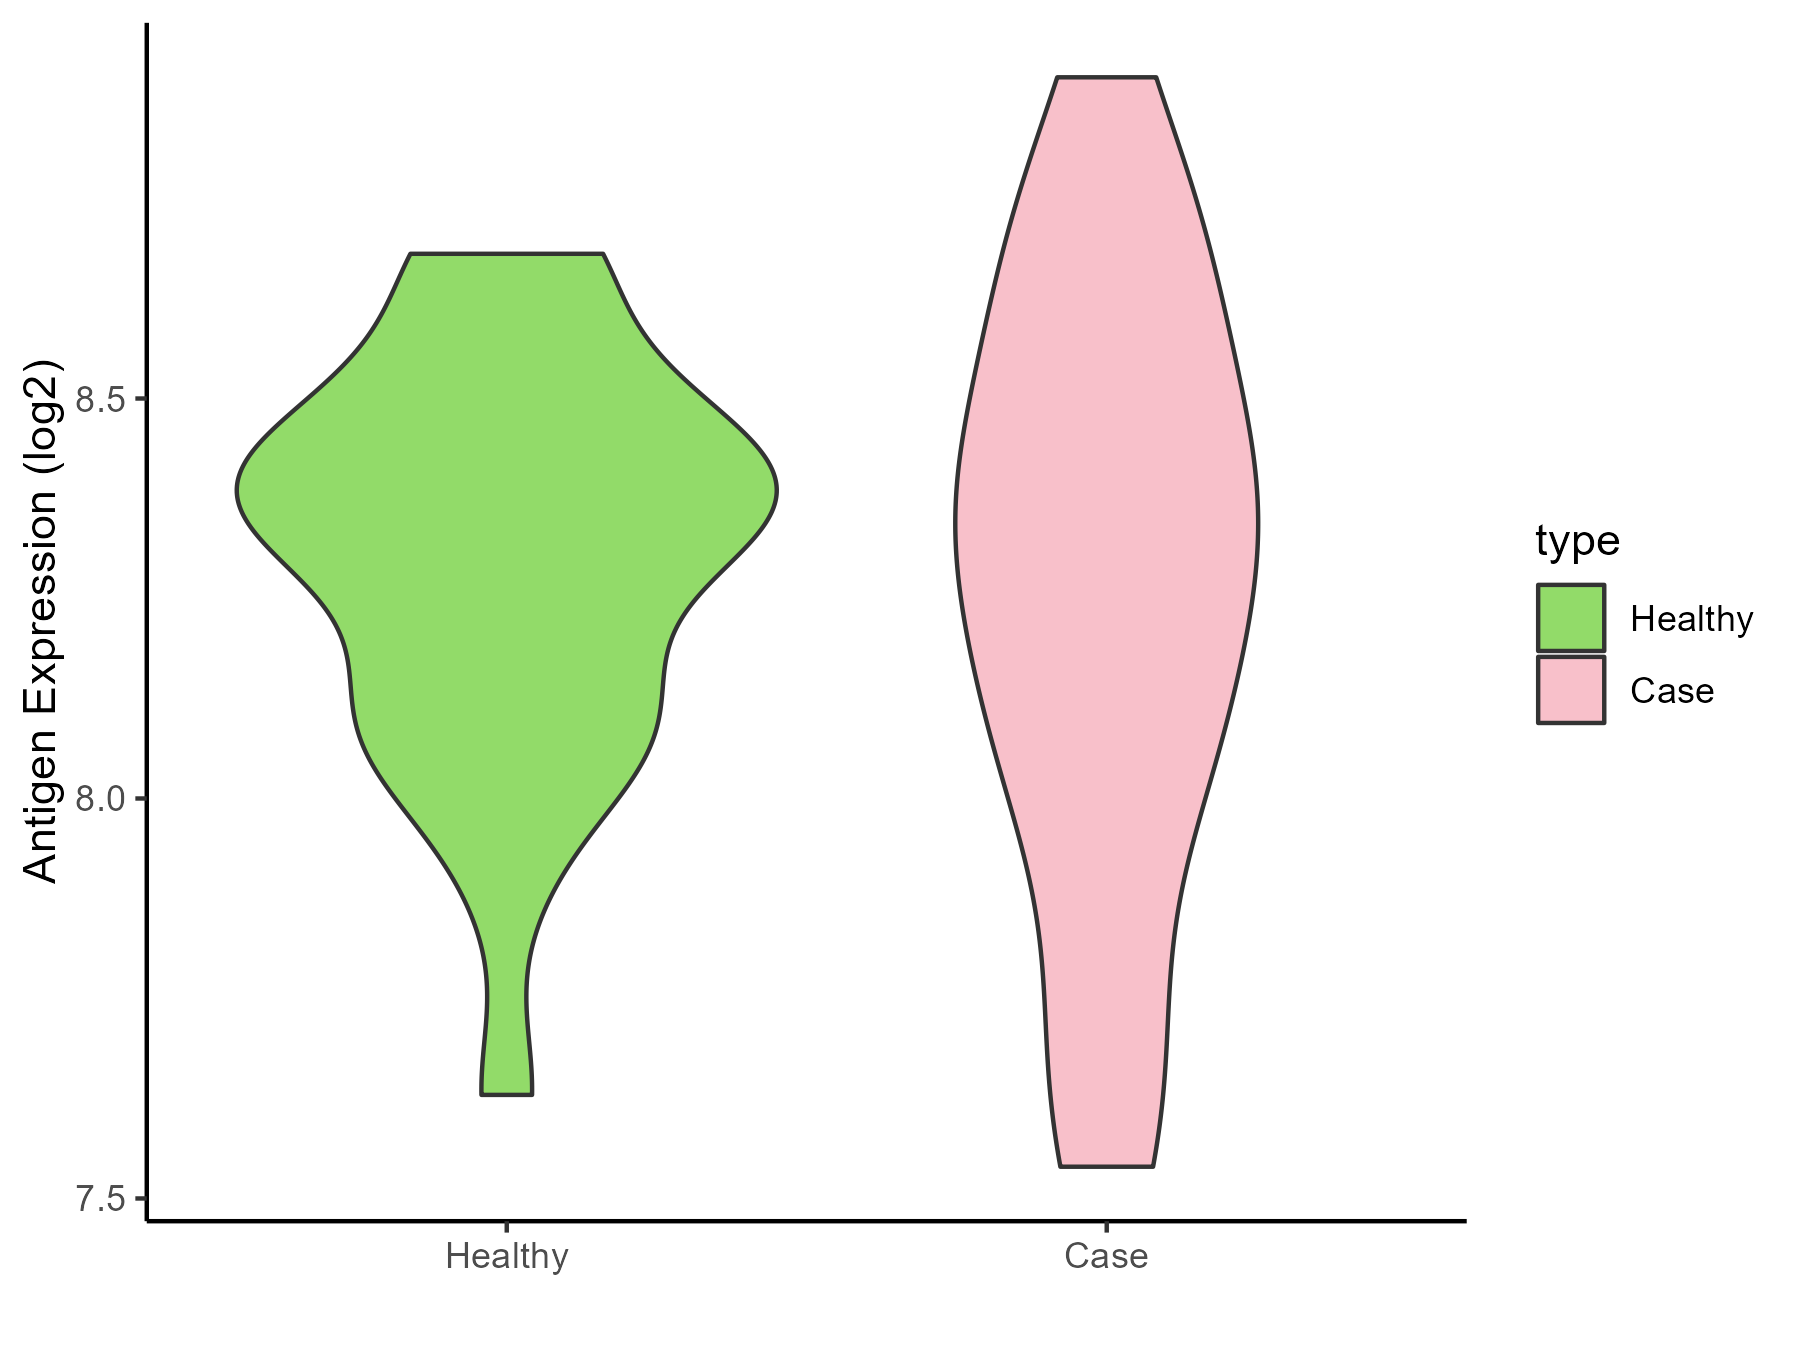
| Differential expression pattern of antigen in diseases | ||
| The Studied Tissue | Skin | |
| The Specific Disease | Atopic dermatitis | |
| The Expression Level of Disease Section Compare with the Healthy Individual Tissue | p-value: 0.607264349; Fold-change: -0.037926194; Z-score: -0.150138764 | |
| Disease-specific Antigen Abundances |
|
Click to View the Clearer Original Diagram |
| Differential expression pattern of antigen in diseases | ||
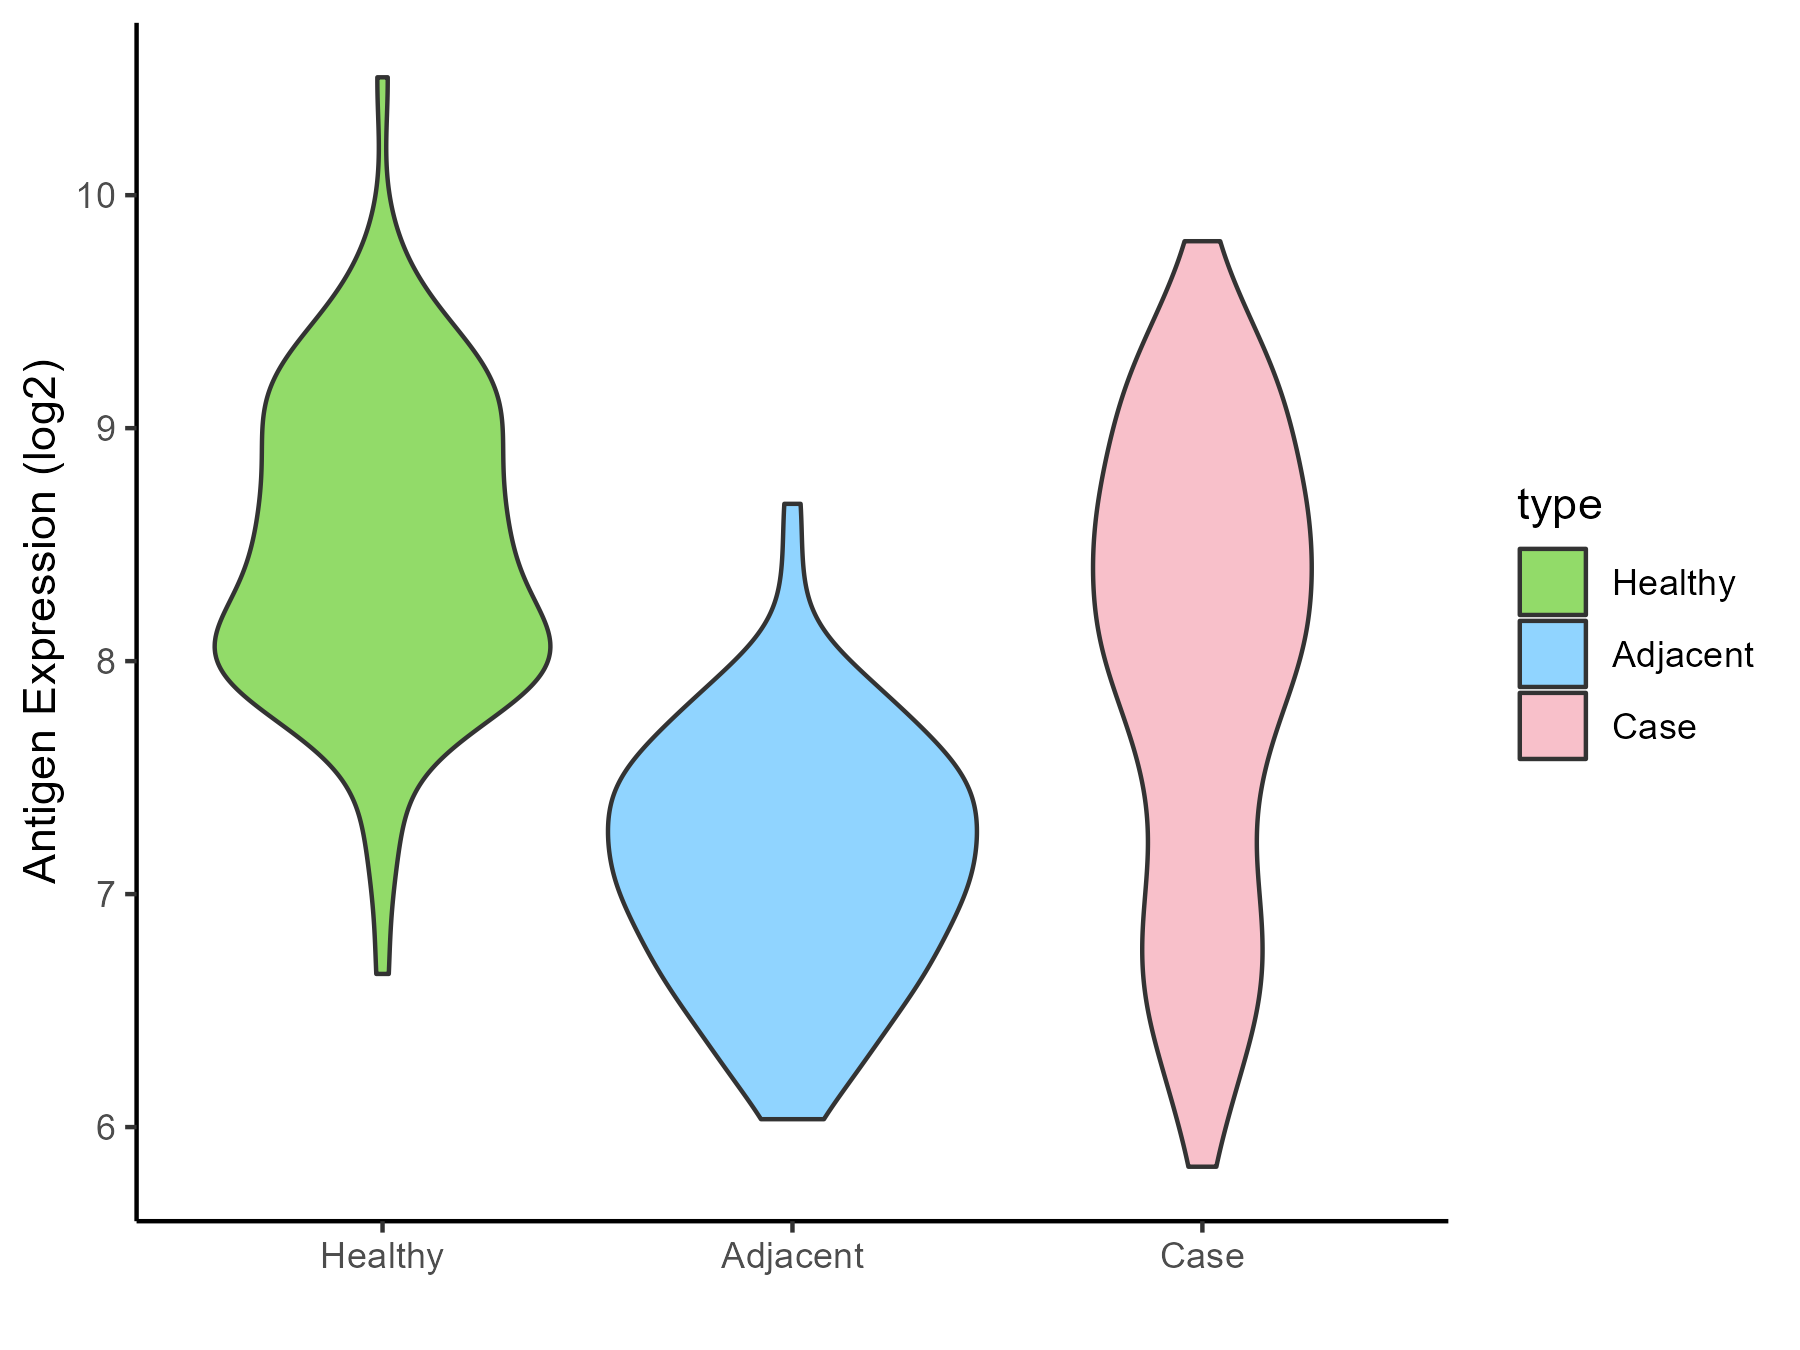
| The Studied Tissue | Skin | |
| The Specific Disease | Psoriasis | |
| The Expression Level of Disease Section Compare with the Healthy Individual Tissue | p-value: 1.86E-07; Fold-change: -0.273914732; Z-score: -0.422333791 | |
| The Expression Level of Disease Section Compare with the Adjacent Tissue | p-value: 1.31E-21; Fold-change: 1.020001767; Z-score: 1.933164624 | |
| Disease-specific Antigen Abundances |
|
Click to View the Clearer Original Diagram |
| Differential expression pattern of antigen in diseases | ||
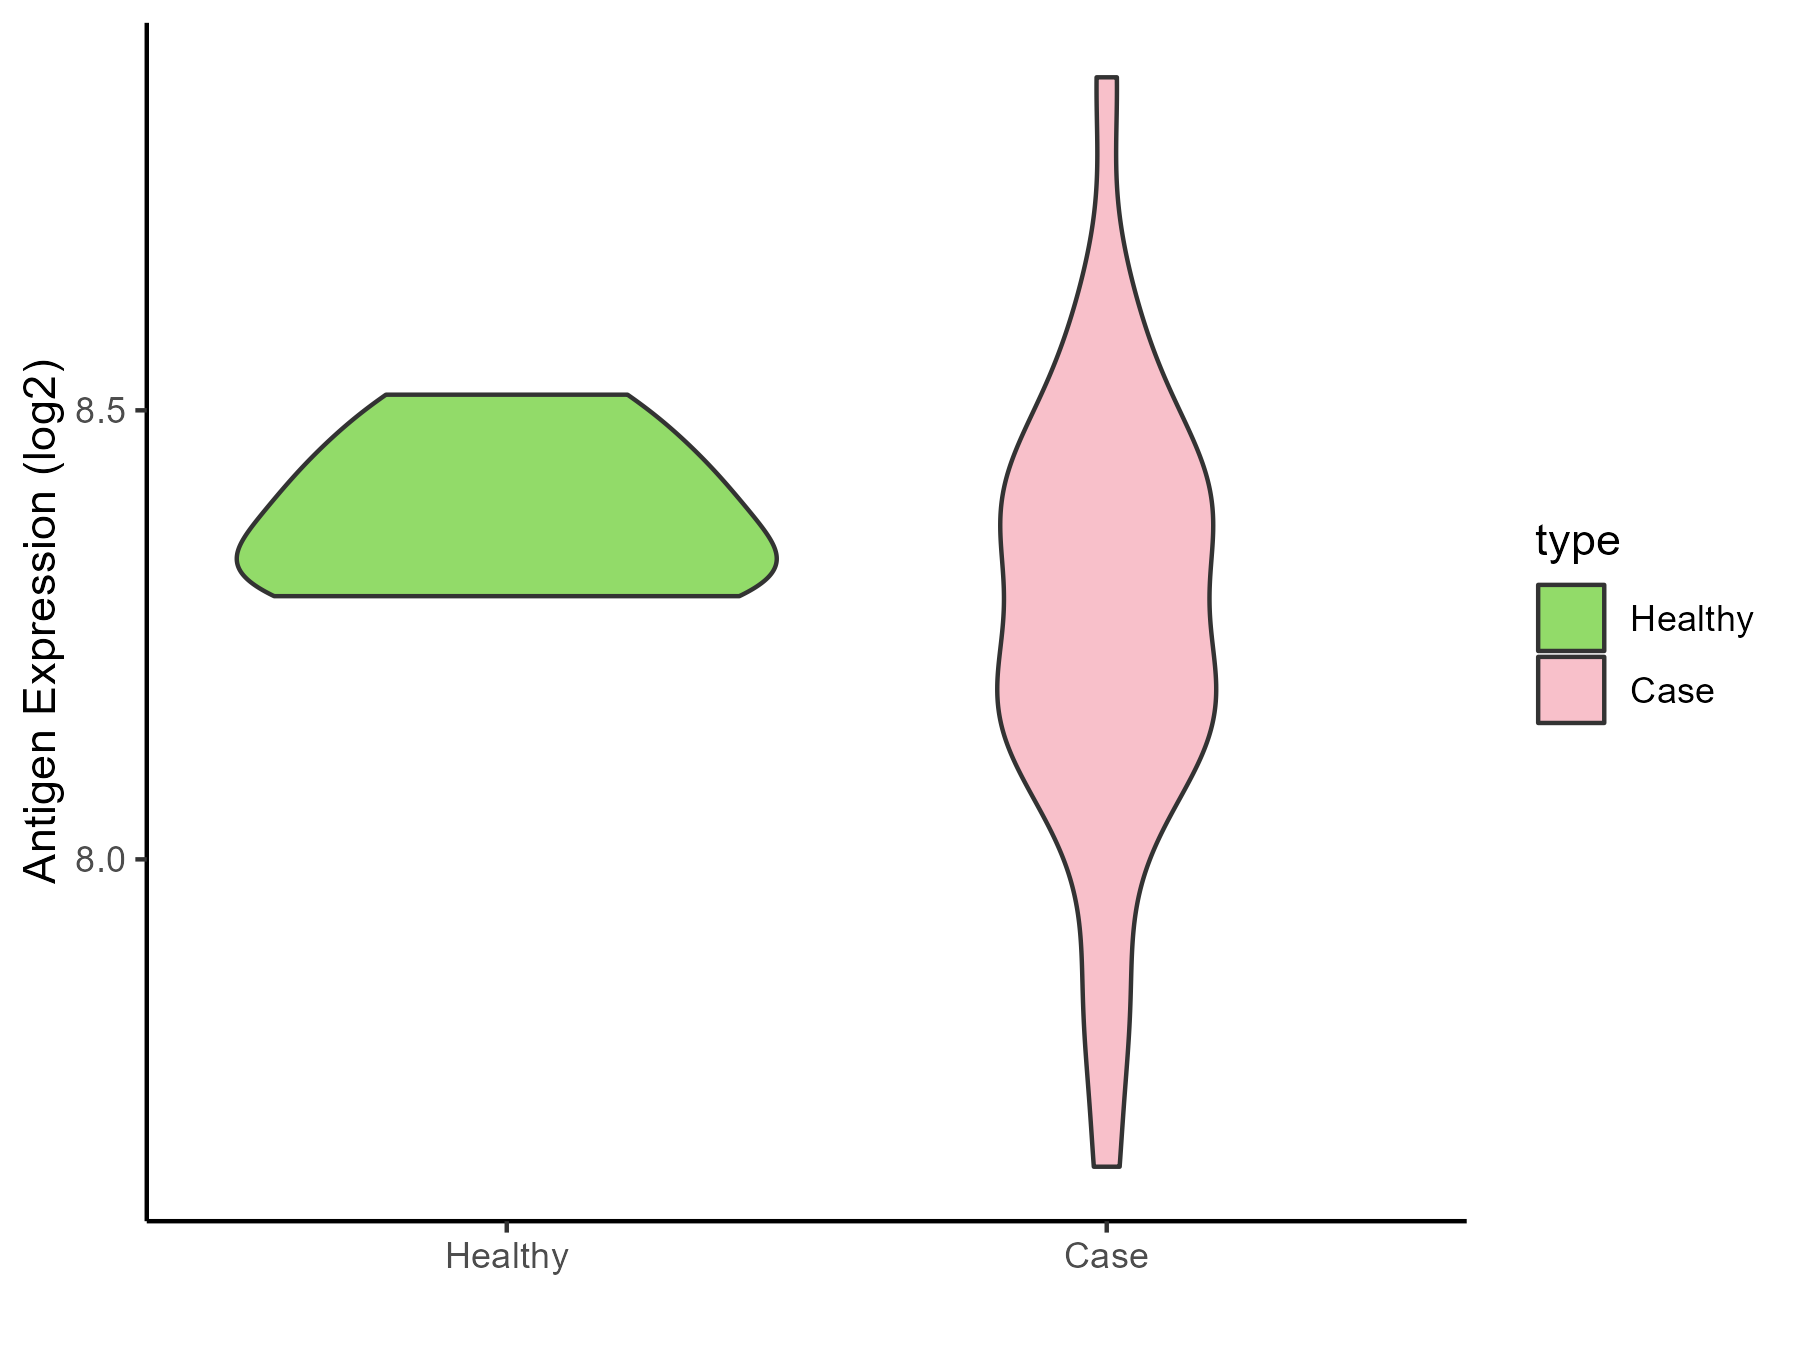
| The Studied Tissue | Skin | |
| The Specific Disease | Vitiligo | |
| The Expression Level of Disease Section Compare with the Healthy Individual Tissue | p-value: 0.039775146; Fold-change: -0.12804772; Z-score: -1.523423318 | |
| Disease-specific Antigen Abundances |
|
Click to View the Clearer Original Diagram |
| Differential expression pattern of antigen in diseases | ||
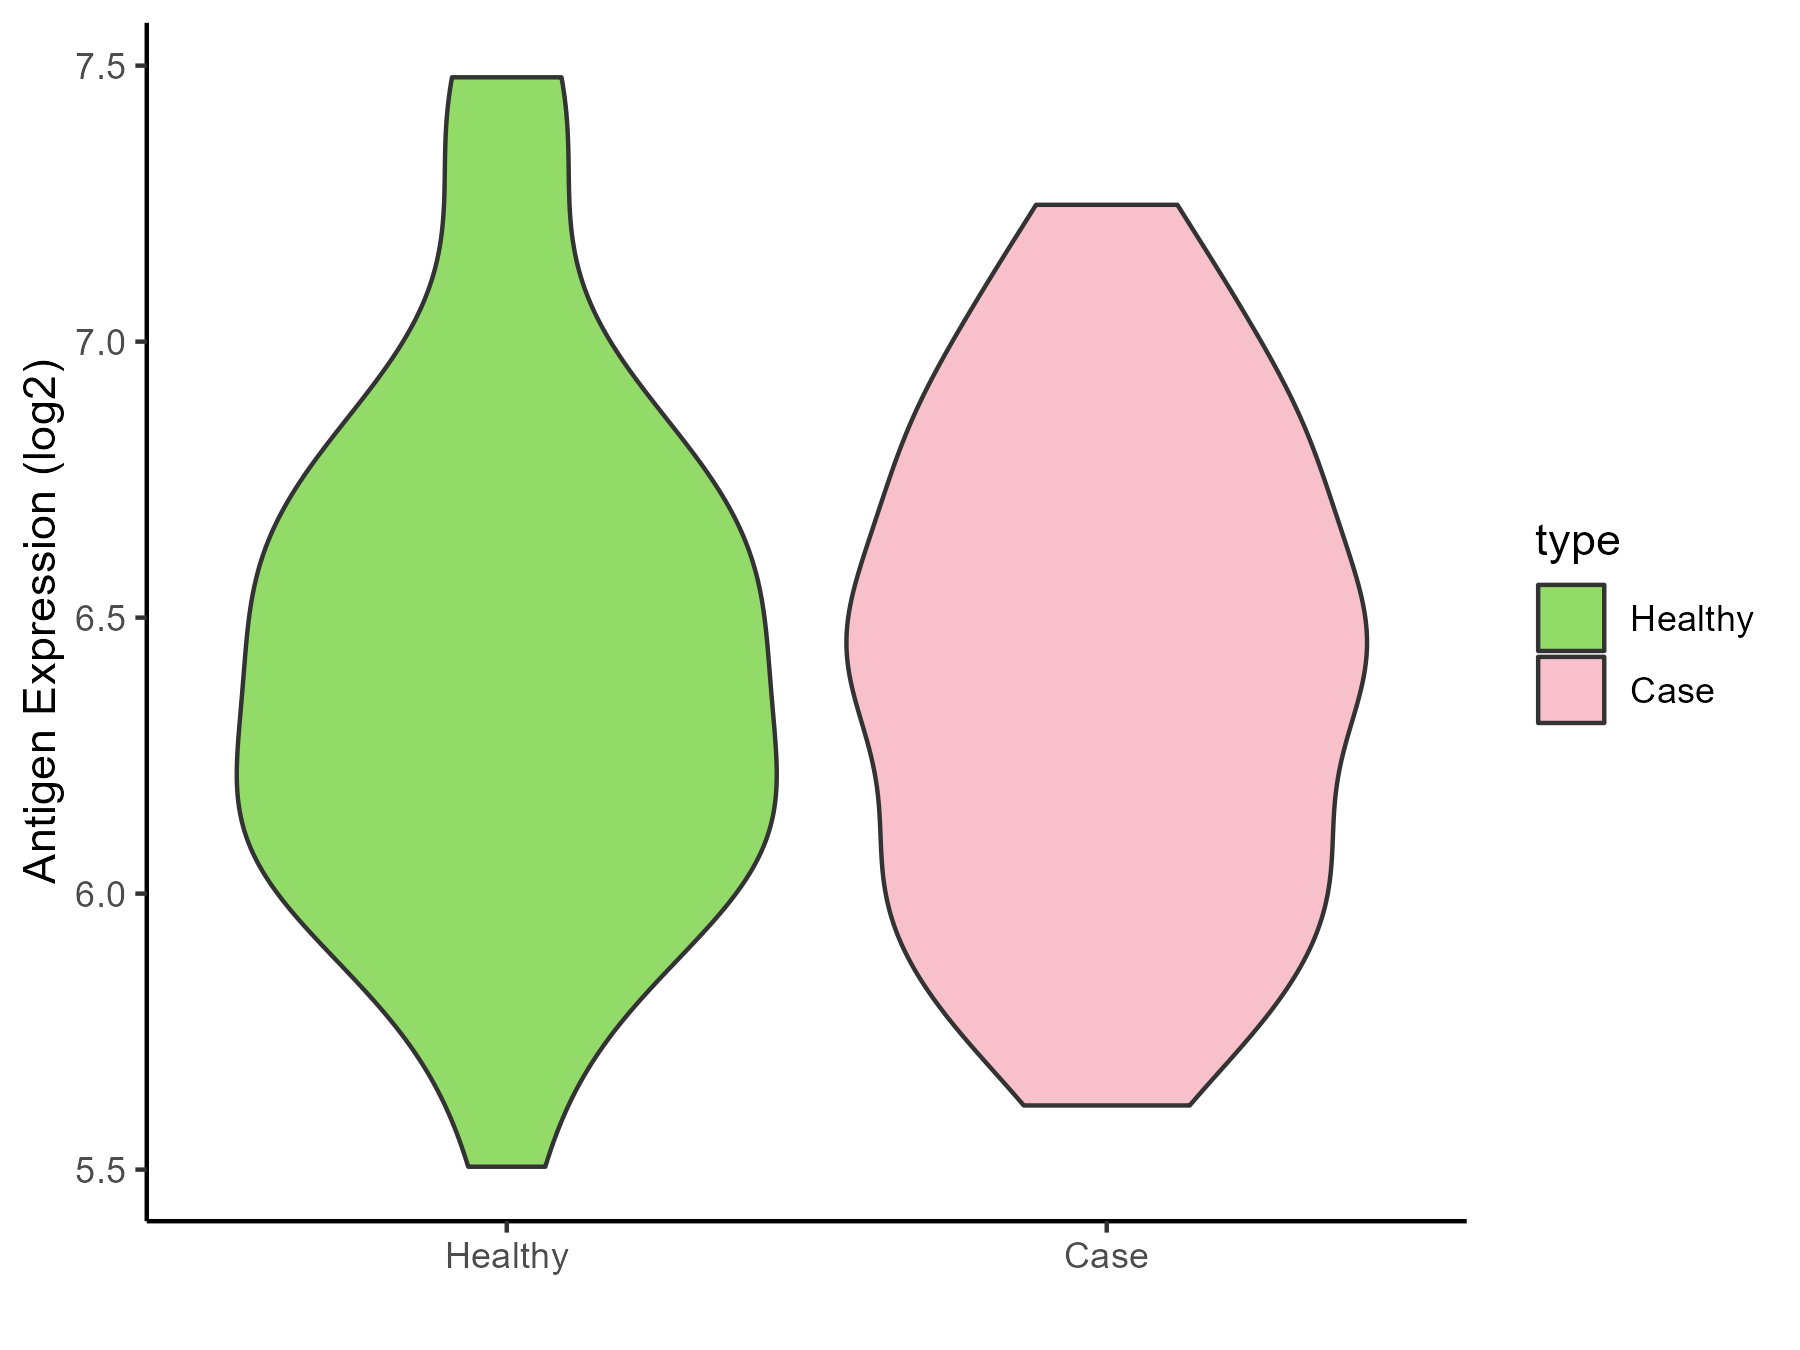
| The Studied Tissue | Skin from scalp | |
| The Specific Disease | Alopecia | |
| The Expression Level of Disease Section Compare with the Healthy Individual Tissue | p-value: 0.761815148; Fold-change: 0.010639659; Z-score: 0.023002255 | |
| Disease-specific Antigen Abundances |
|
Click to View the Clearer Original Diagram |
| Differential expression pattern of antigen in diseases | ||
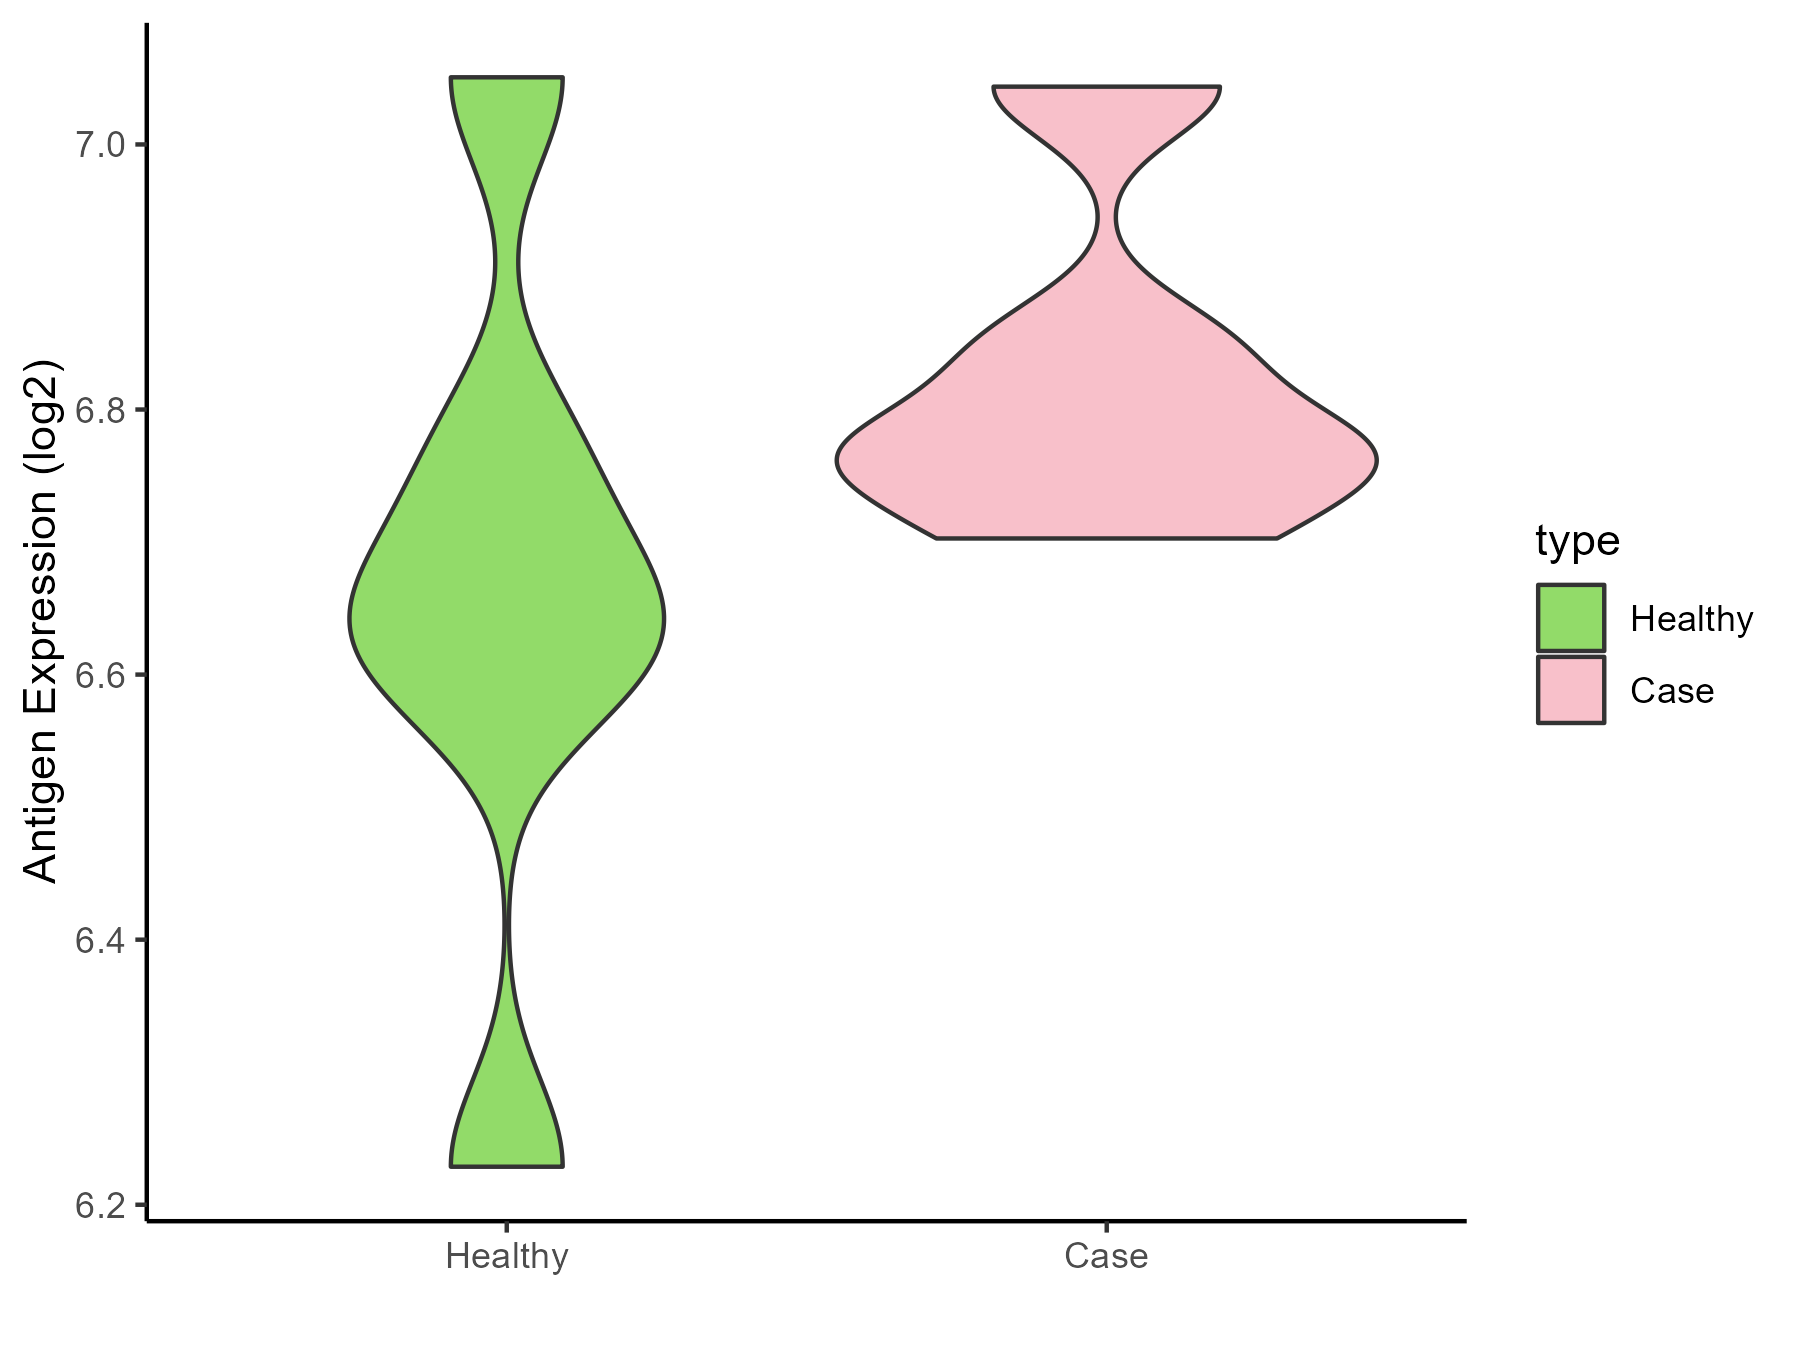
| The Studied Tissue | Skin | |
| The Specific Disease | Sensitive skin | |
| The Expression Level of Disease Section Compare with the Healthy Individual Tissue | p-value: 0.218614761; Fold-change: 0.115539239; Z-score: 0.433164694 | |
| Disease-specific Antigen Abundances |
|
Click to View the Clearer Original Diagram |
ICD Disease Classification 15
| Differential expression pattern of antigen in diseases | ||
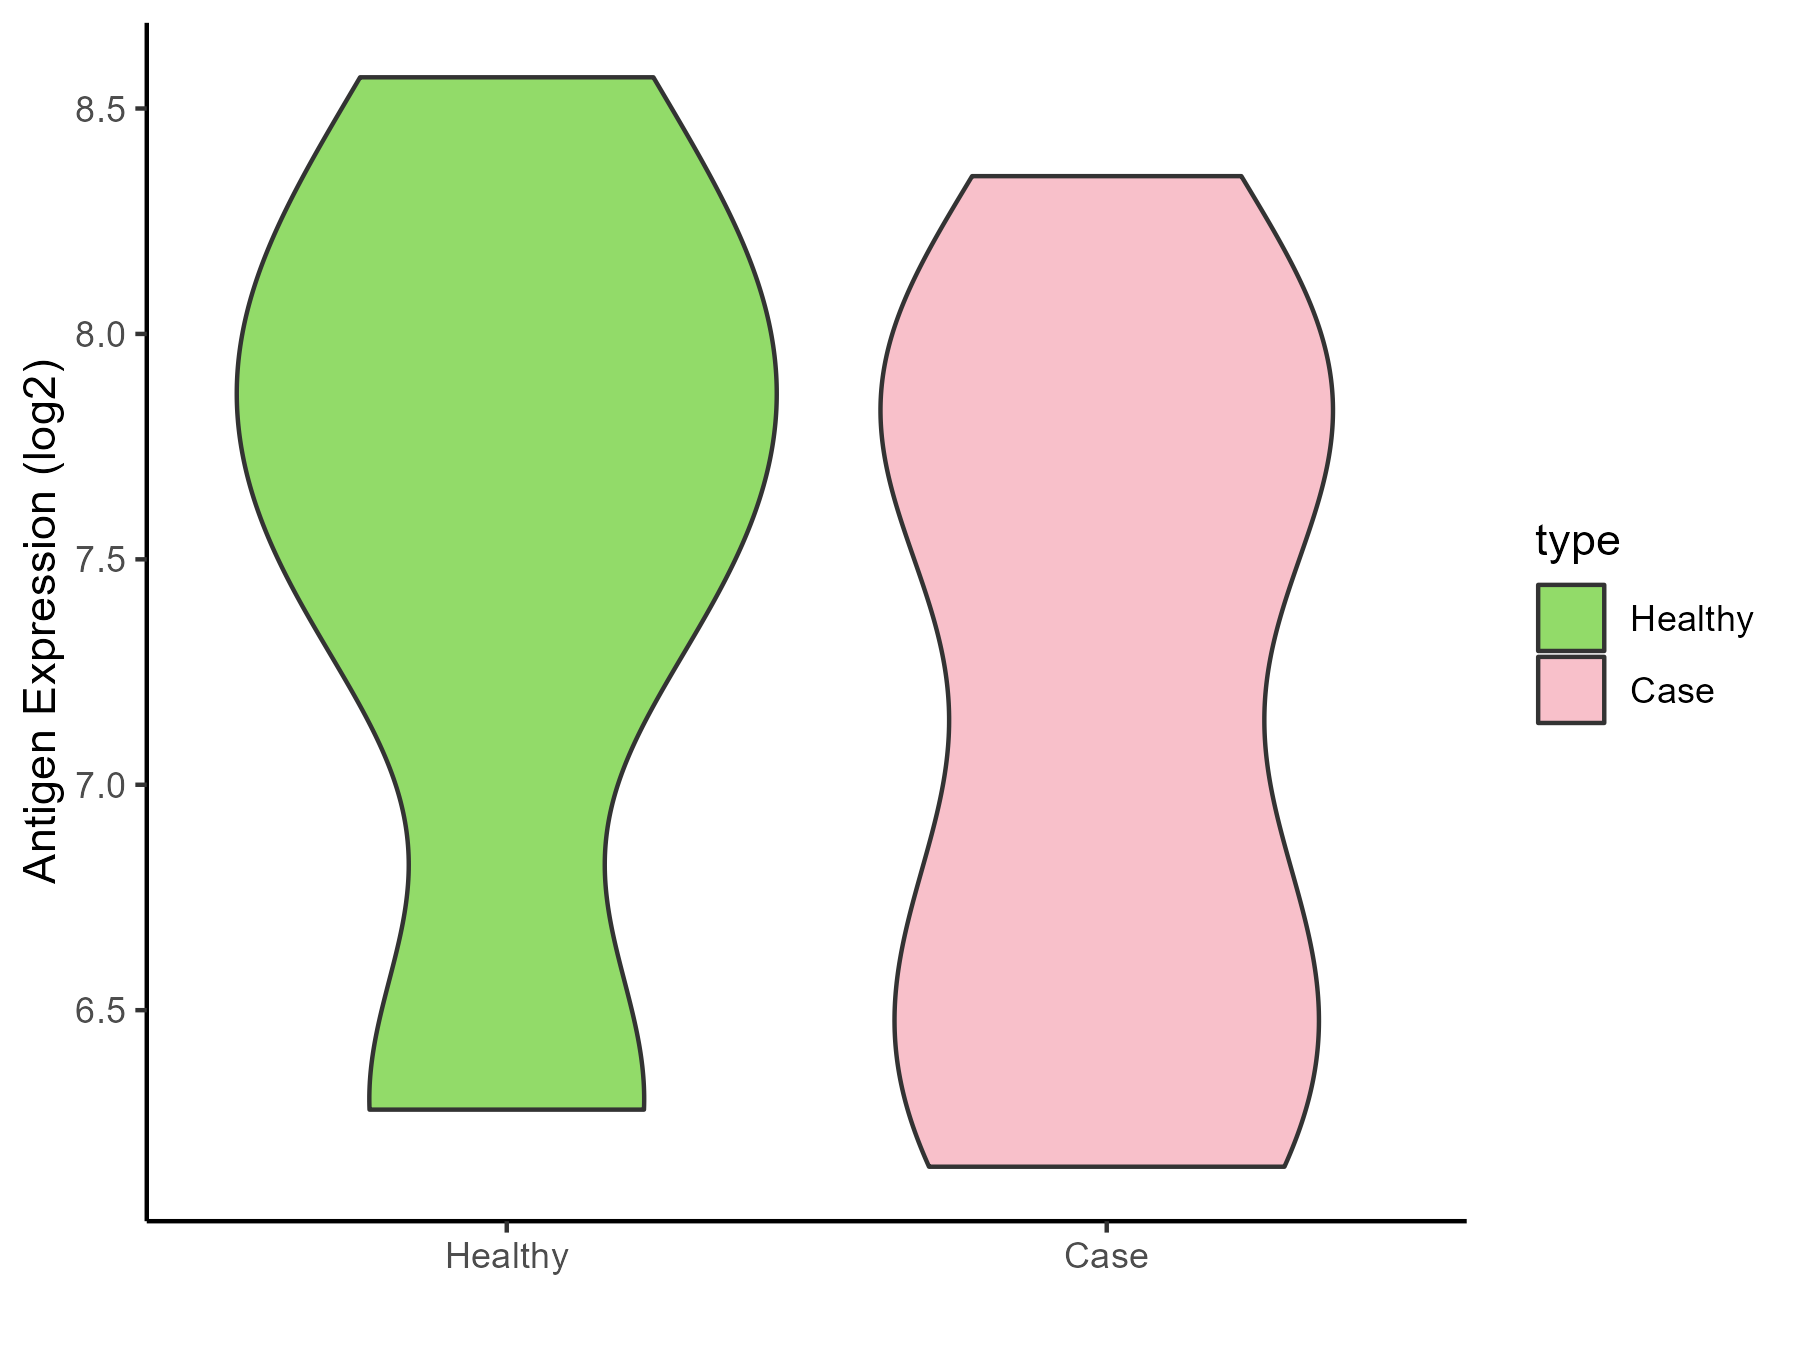
| The Studied Tissue | Synovial | |
| The Specific Disease | Osteoarthritis | |
| The Expression Level of Disease Section Compare with the Healthy Individual Tissue | p-value: 0.374847232; Fold-change: -0.43201832; Z-score: -0.514913639 | |
| Disease-specific Antigen Abundances |
|
Click to View the Clearer Original Diagram |
| Differential expression pattern of antigen in diseases | ||
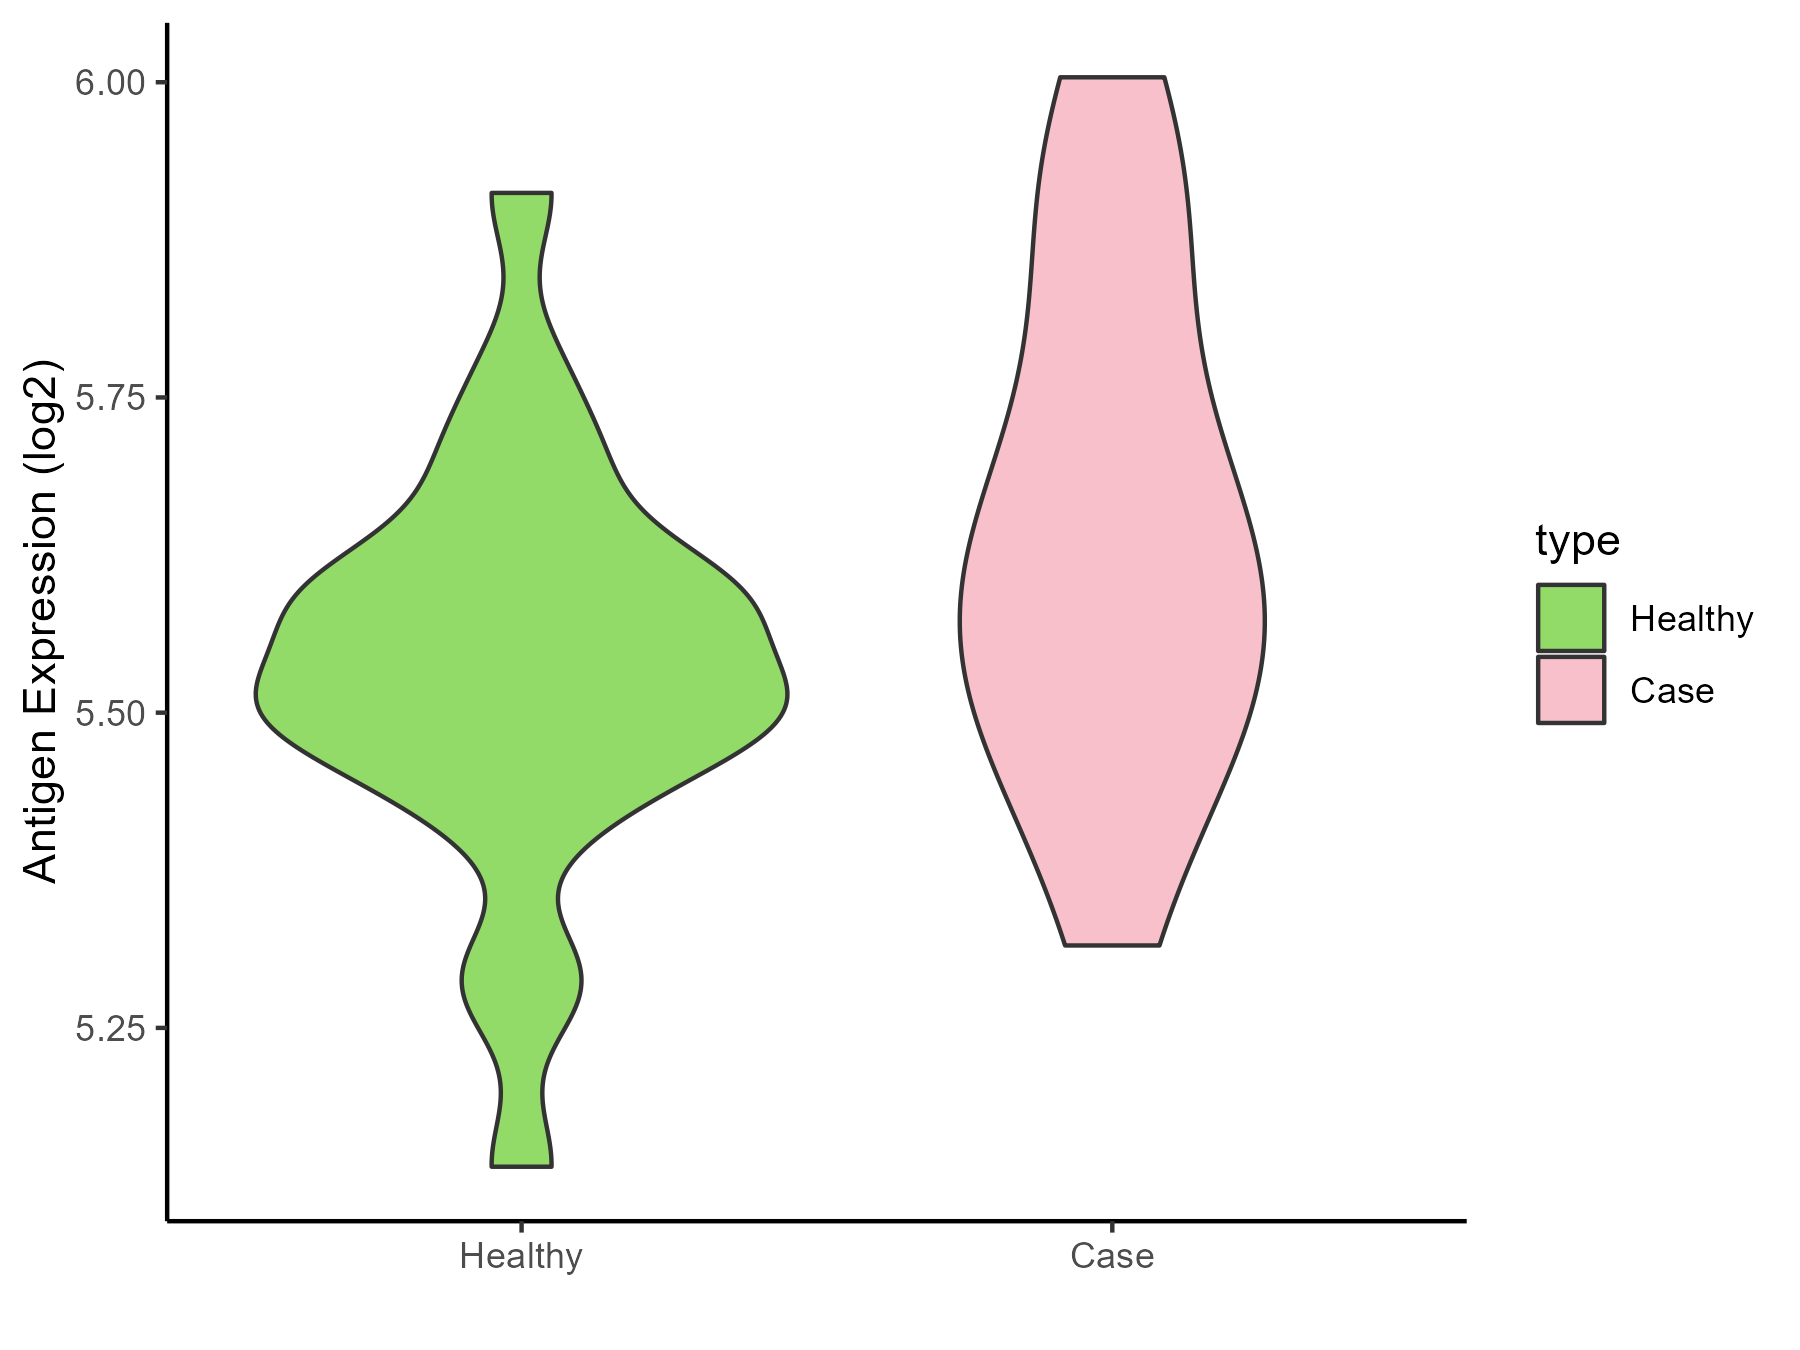
| The Studied Tissue | Peripheral blood | |
| The Specific Disease | Arthropathy | |
| The Expression Level of Disease Section Compare with the Healthy Individual Tissue | p-value: 0.081997621; Fold-change: 0.093549116; Z-score: 0.578331579 | |
| Disease-specific Antigen Abundances |
|
Click to View the Clearer Original Diagram |
| Differential expression pattern of antigen in diseases | ||
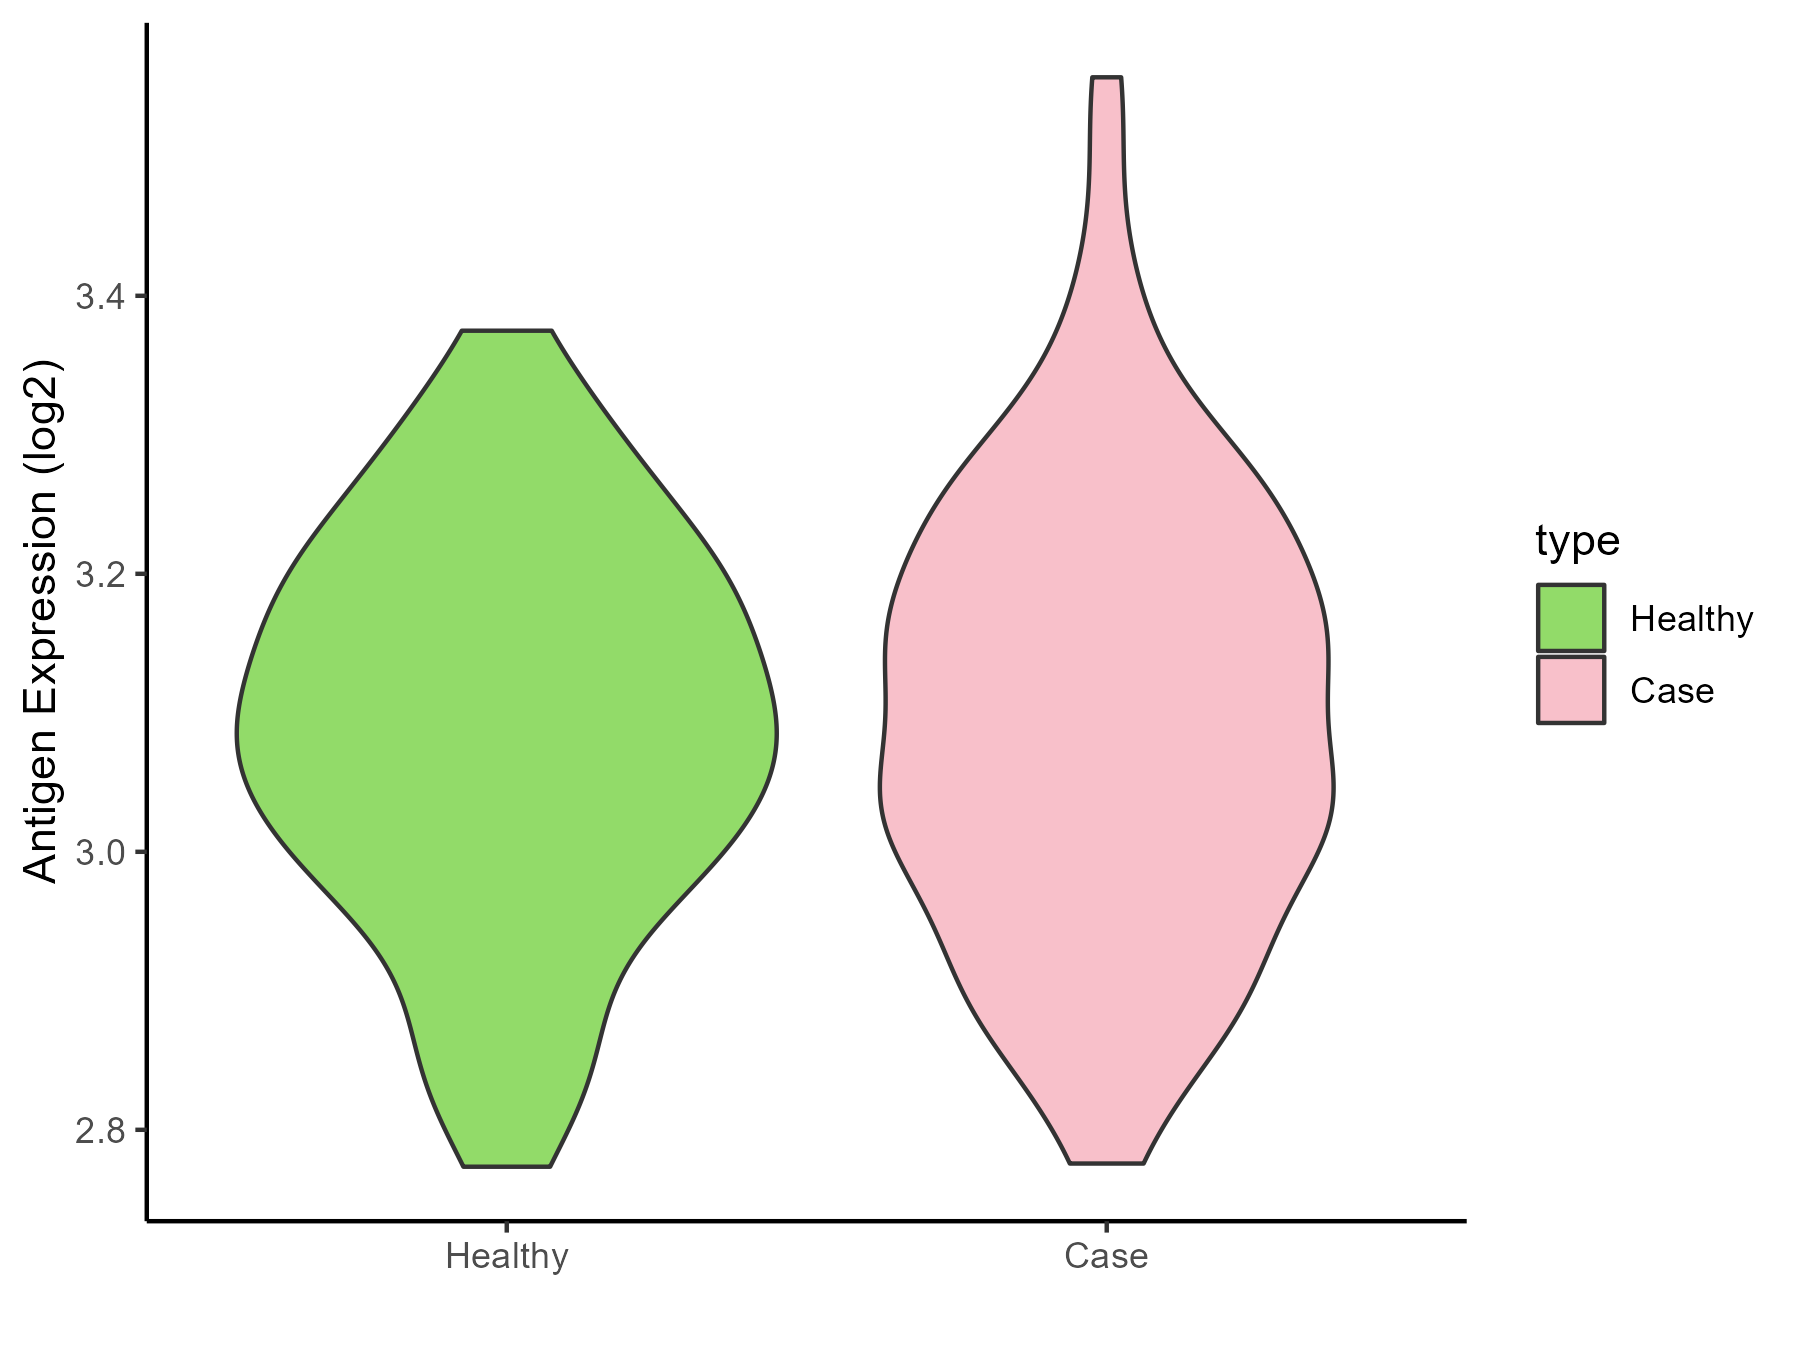
| The Studied Tissue | Peripheral blood | |
| The Specific Disease | Arthritis | |
| The Expression Level of Disease Section Compare with the Healthy Individual Tissue | p-value: 0.660682419; Fold-change: 0.011173661; Z-score: 0.080134733 | |
| Disease-specific Antigen Abundances |
|
Click to View the Clearer Original Diagram |
| Differential expression pattern of antigen in diseases | ||
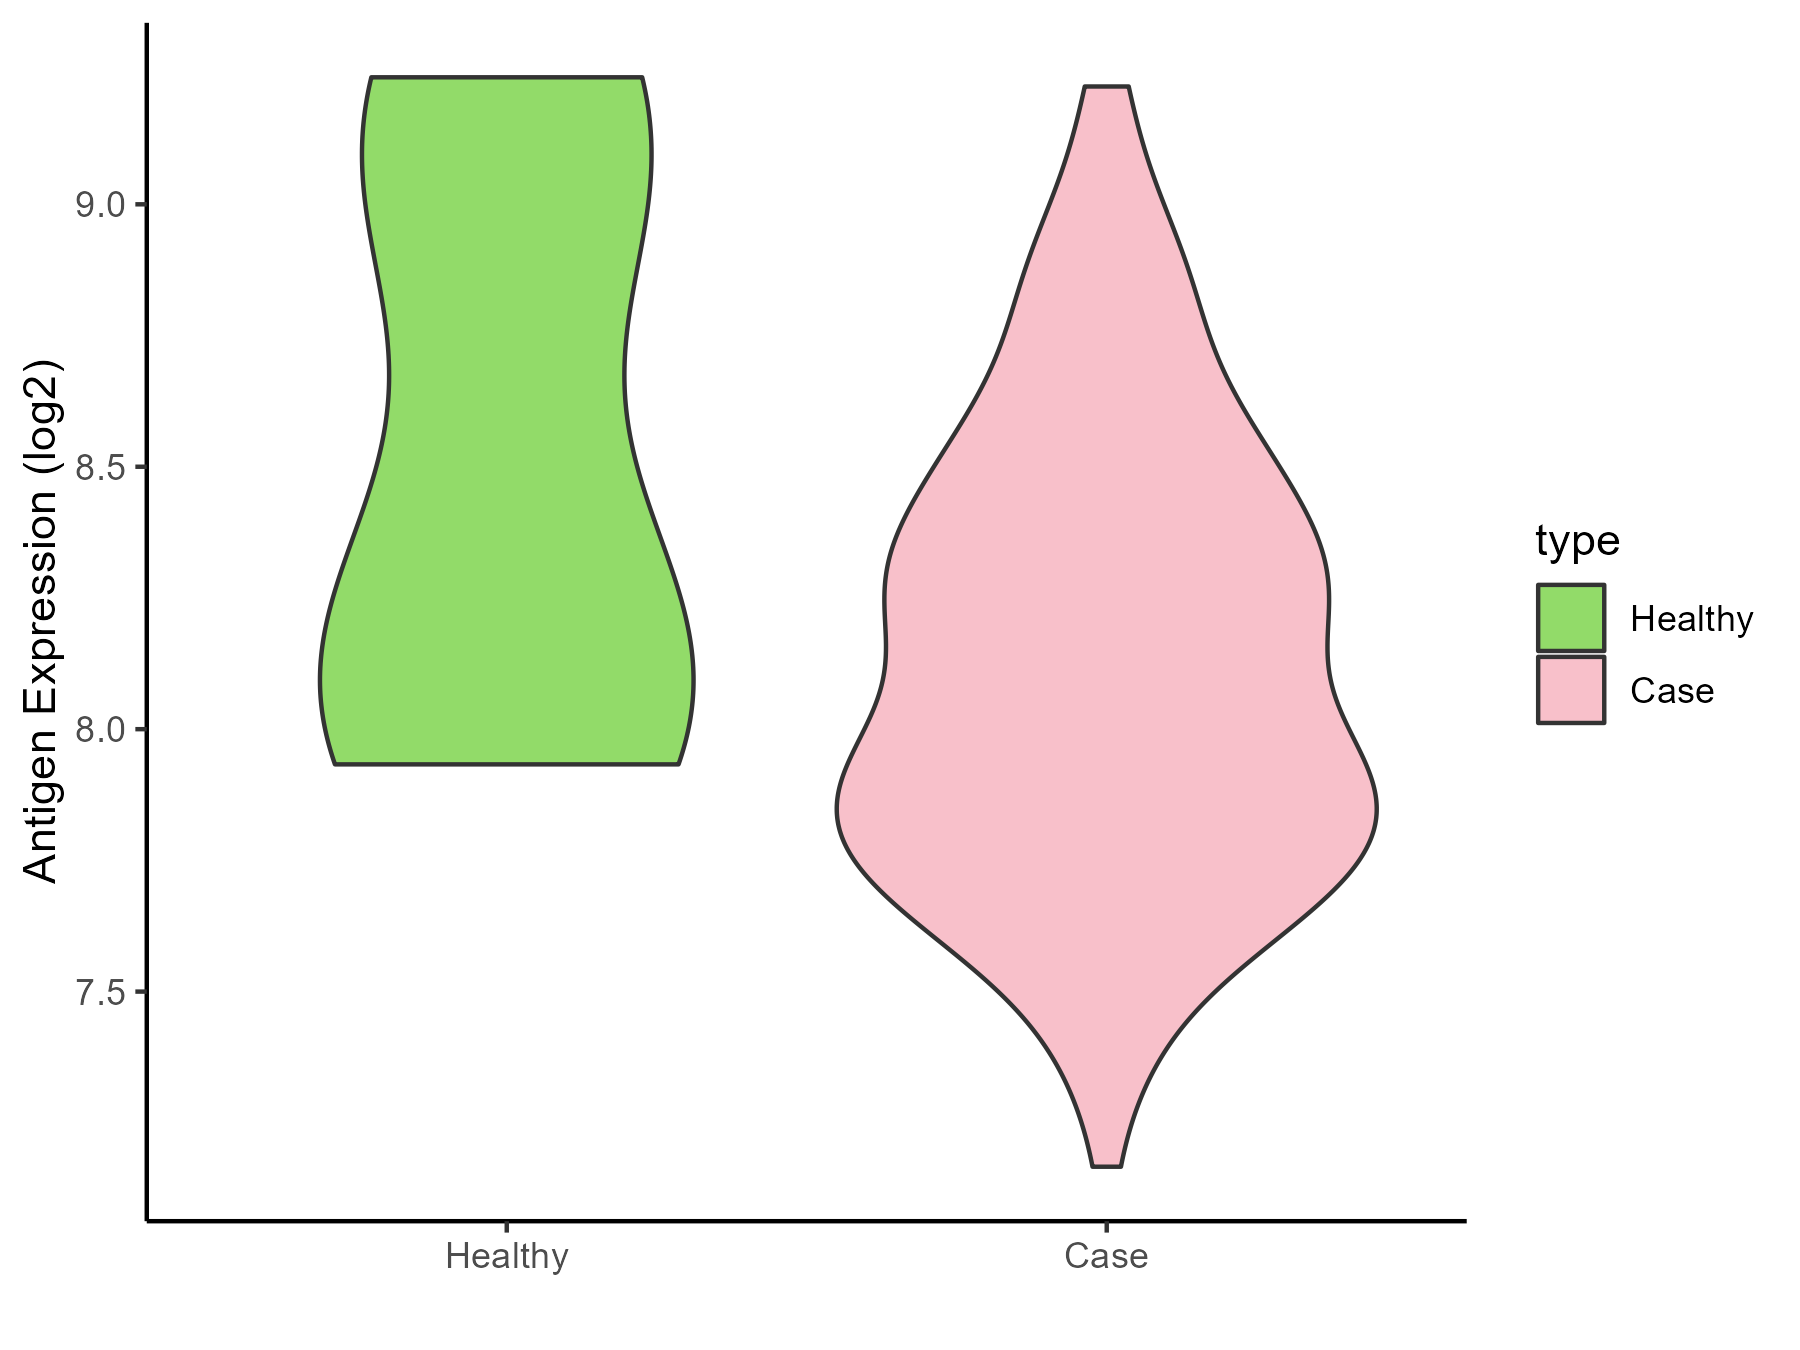
| The Studied Tissue | Synovial | |
| The Specific Disease | Rheumatoid arthritis | |
| The Expression Level of Disease Section Compare with the Healthy Individual Tissue | p-value: 0.122507686; Fold-change: -0.125025436; Z-score: -0.217847322 | |
| Disease-specific Antigen Abundances |
|
Click to View the Clearer Original Diagram |
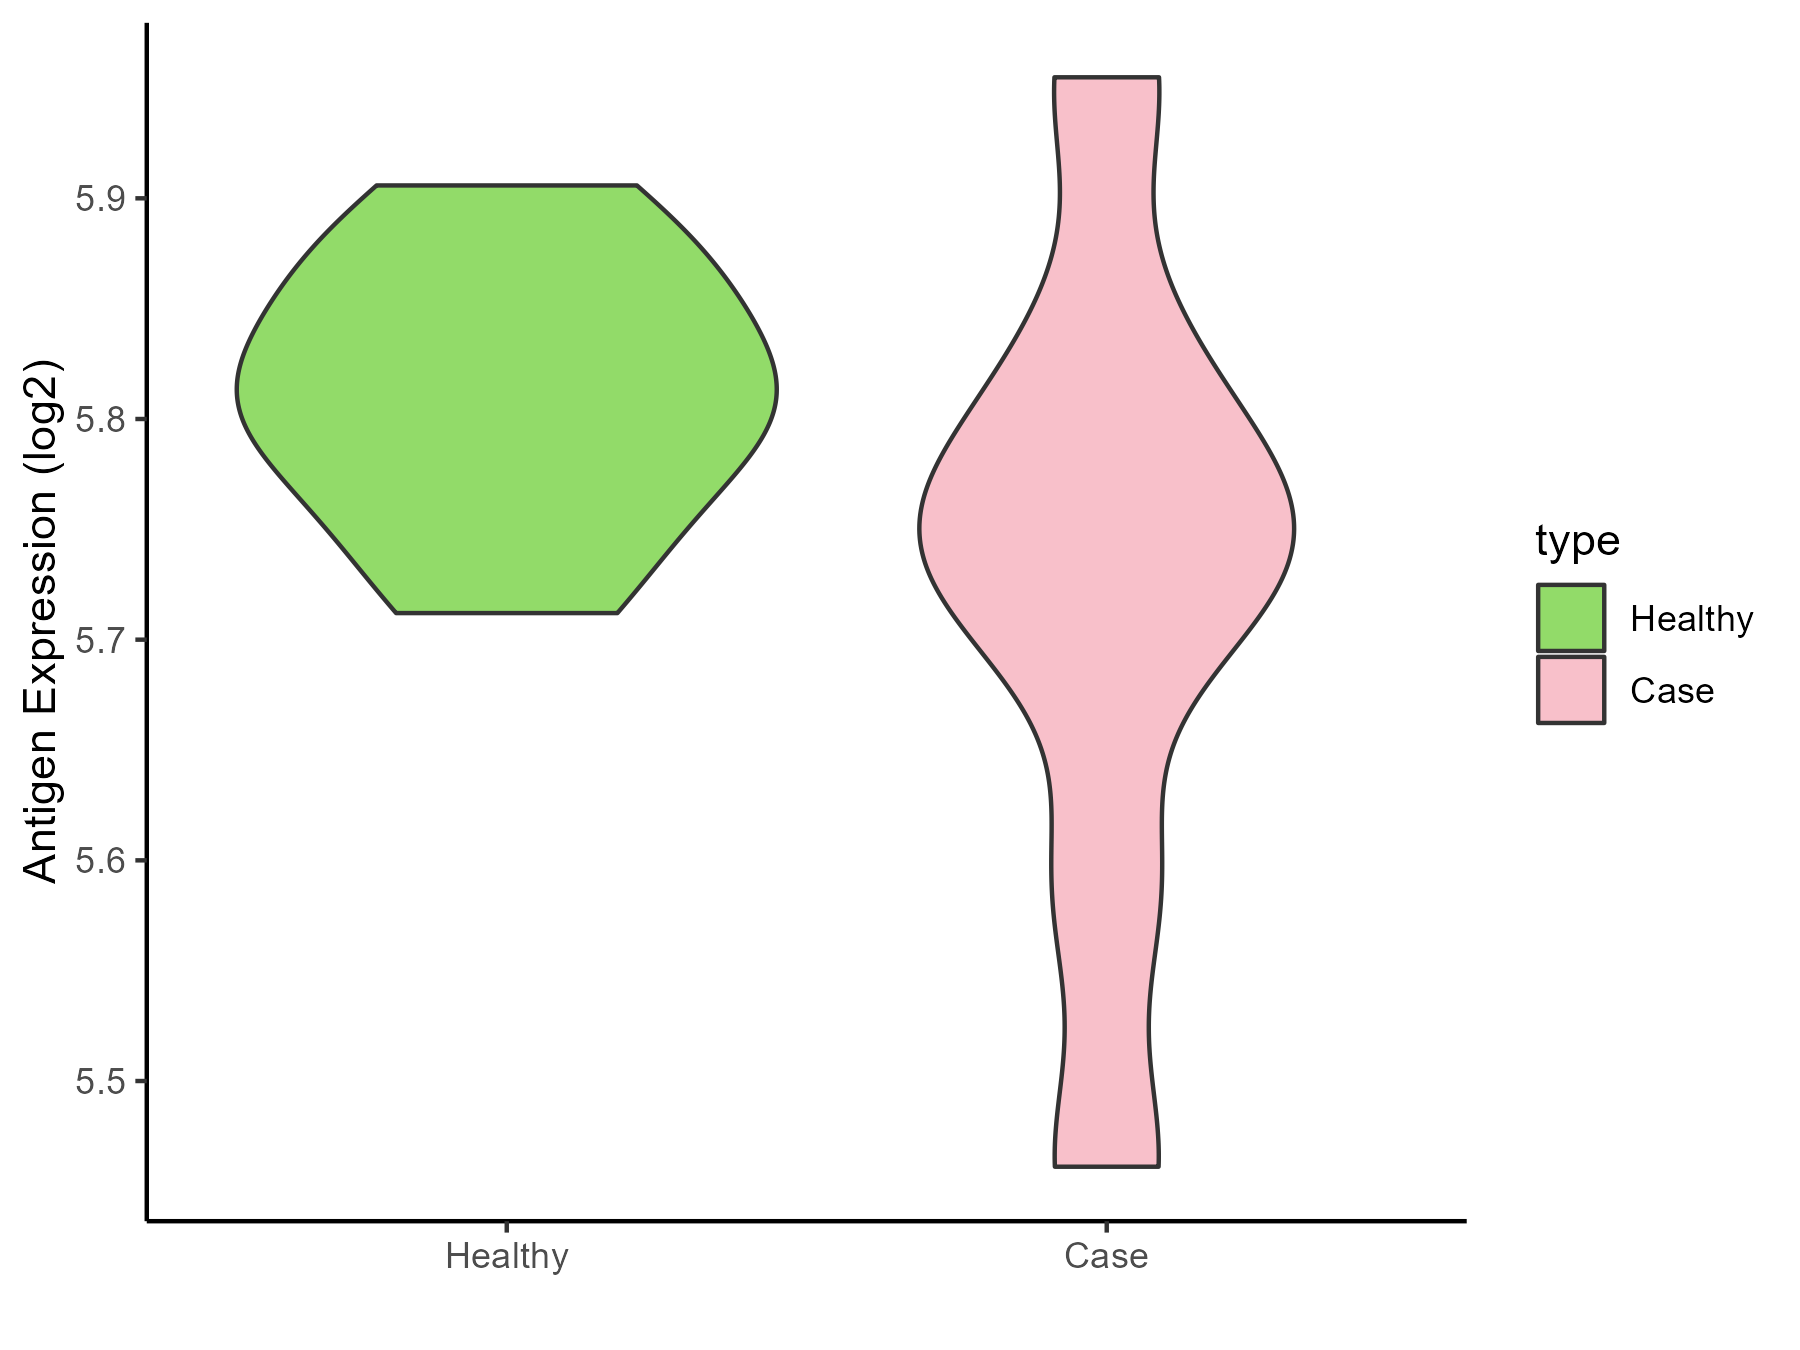
| Differential expression pattern of antigen in diseases | ||
| The Studied Tissue | Pheripheral blood | |
| The Specific Disease | Ankylosing spondylitis | |
| The Expression Level of Disease Section Compare with the Healthy Individual Tissue | p-value: 0.158435174; Fold-change: -0.062122187; Z-score: -1.017017264 | |
| Disease-specific Antigen Abundances |
|
Click to View the Clearer Original Diagram |
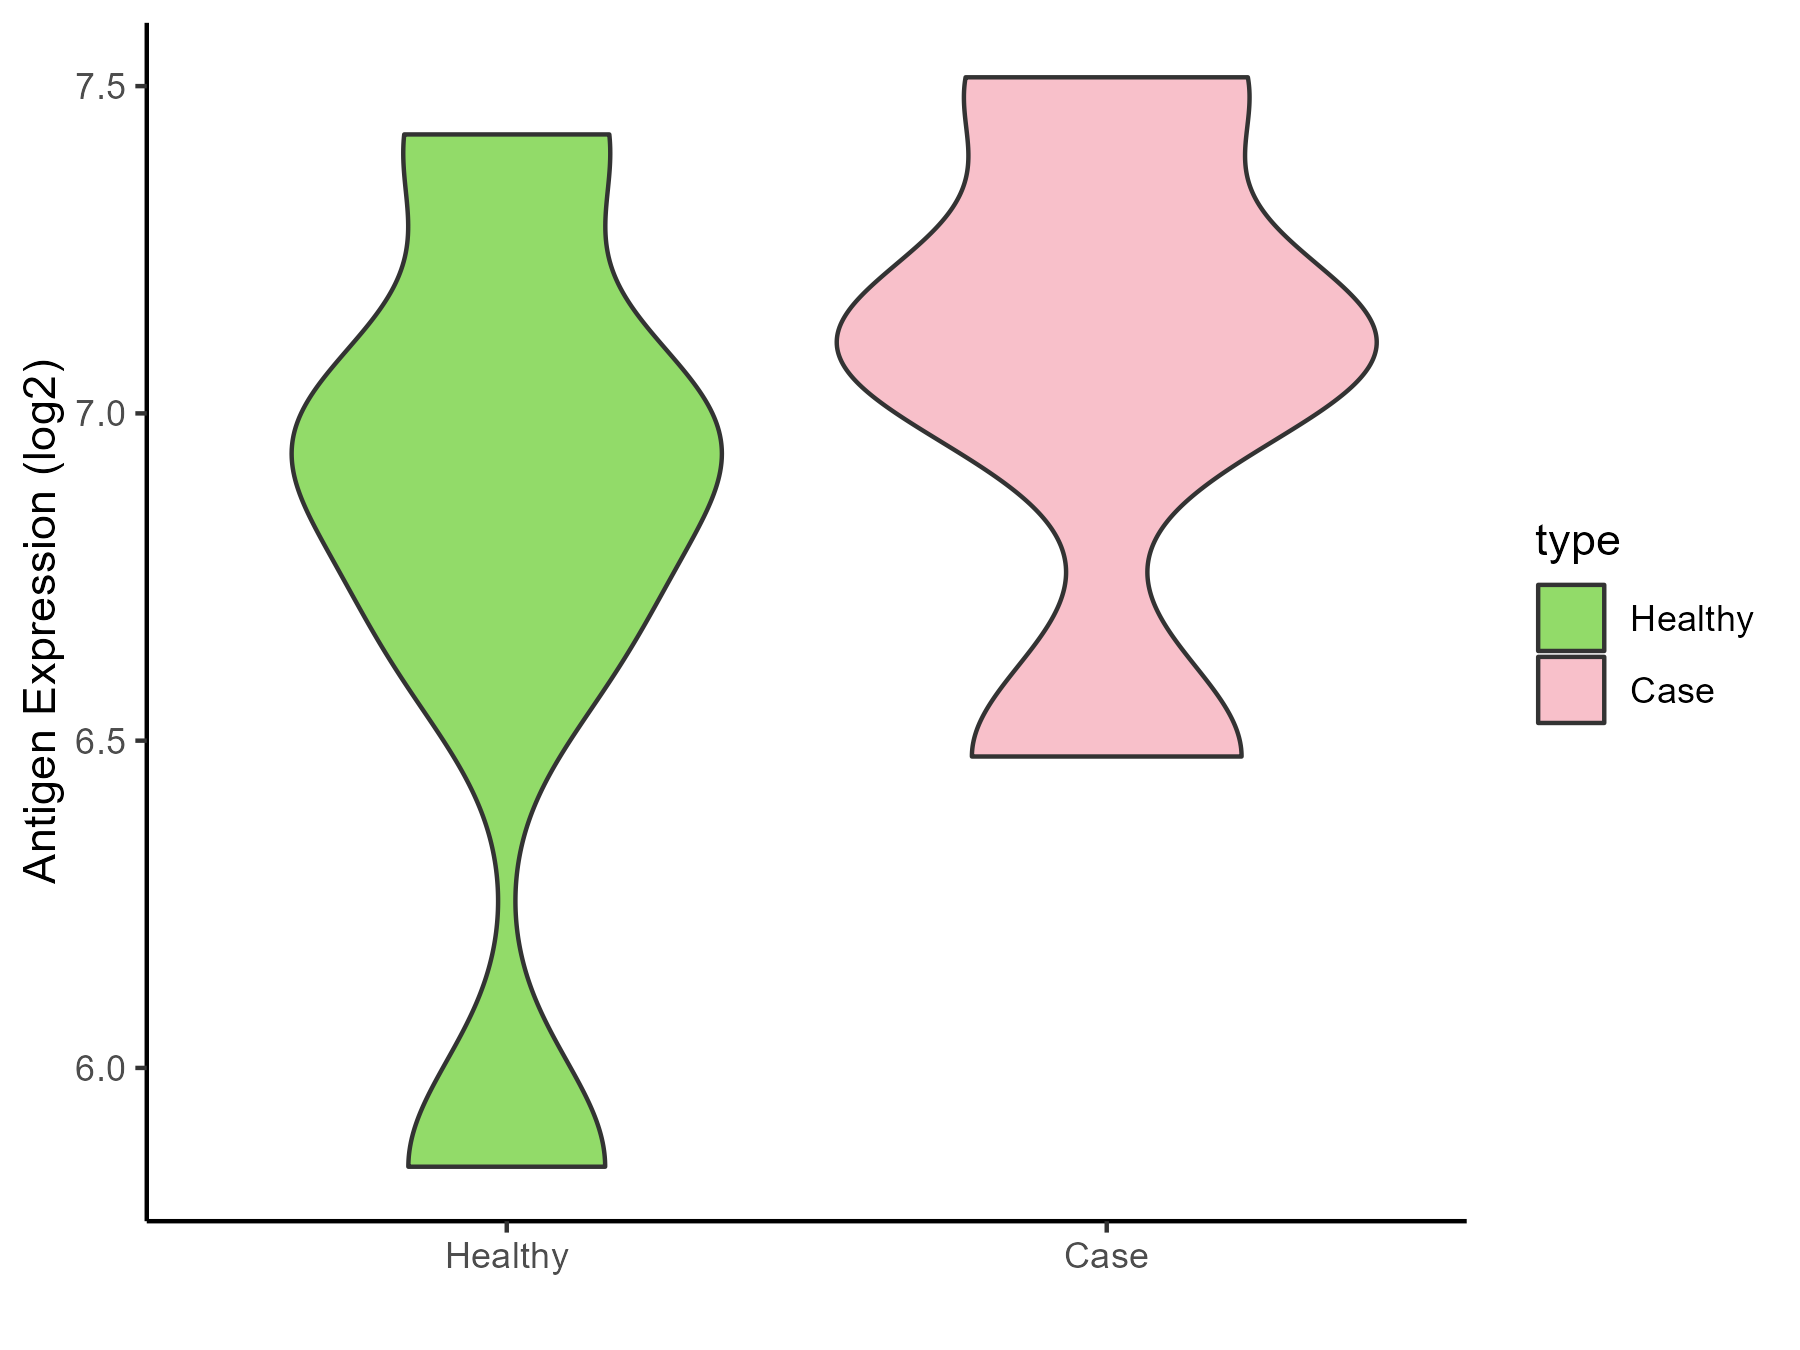
| Differential expression pattern of antigen in diseases | ||
| The Studied Tissue | Bone marrow | |
| The Specific Disease | Osteoporosis | |
| The Expression Level of Disease Section Compare with the Healthy Individual Tissue | p-value: 0.445033355; Fold-change: 0.159205073; Z-score: 0.271891529 | |
| Disease-specific Antigen Abundances |
|
Click to View the Clearer Original Diagram |
ICD Disease Classification 16
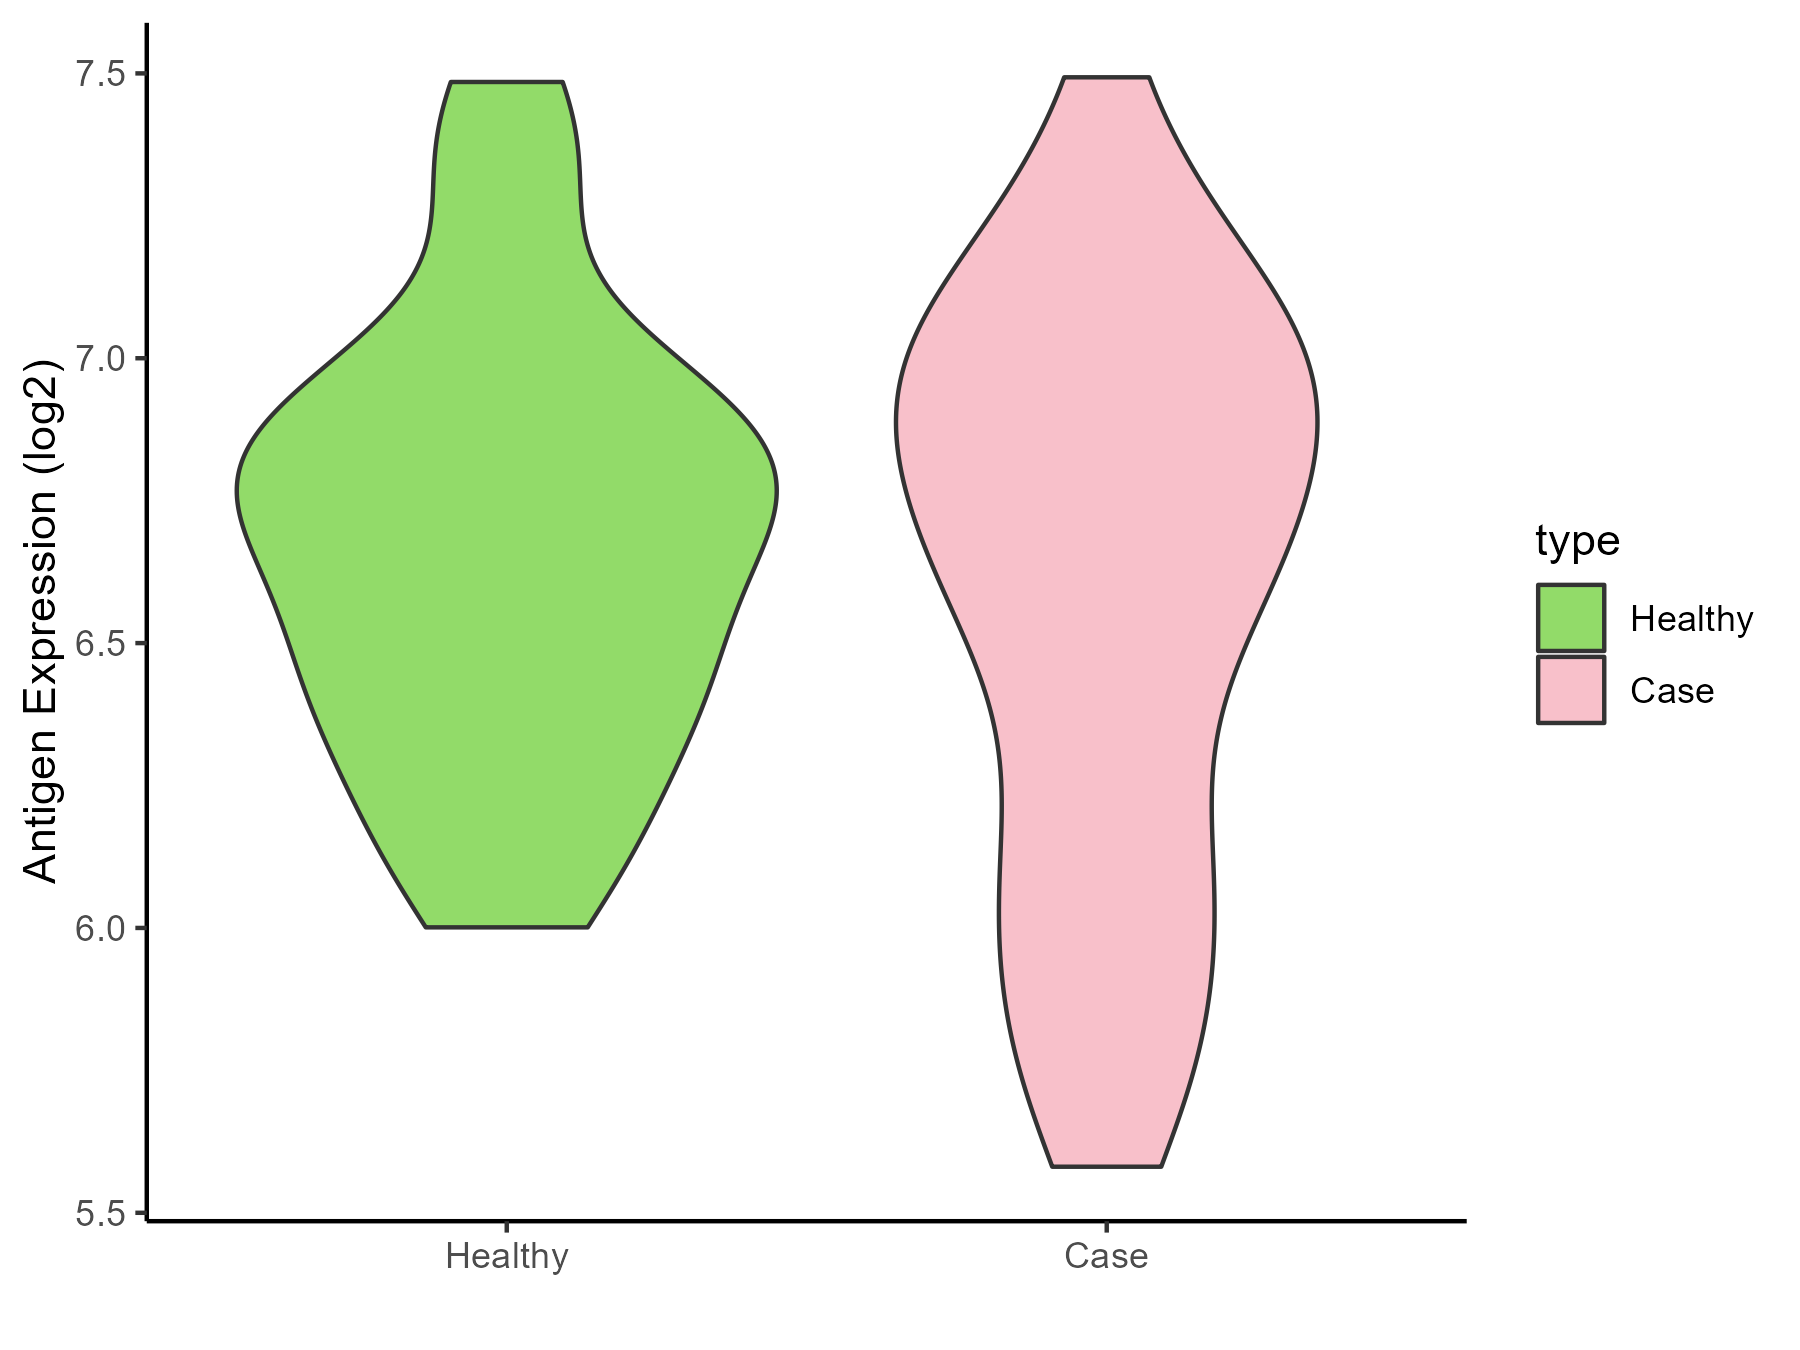
| Differential expression pattern of antigen in diseases | ||
| The Studied Tissue | Endometrium | |
| The Specific Disease | Endometriosis | |
| The Expression Level of Disease Section Compare with the Healthy Individual Tissue | p-value: 0.439314111; Fold-change: -0.042348765; Z-score: -0.111463532 | |
| Disease-specific Antigen Abundances |
|
Click to View the Clearer Original Diagram |
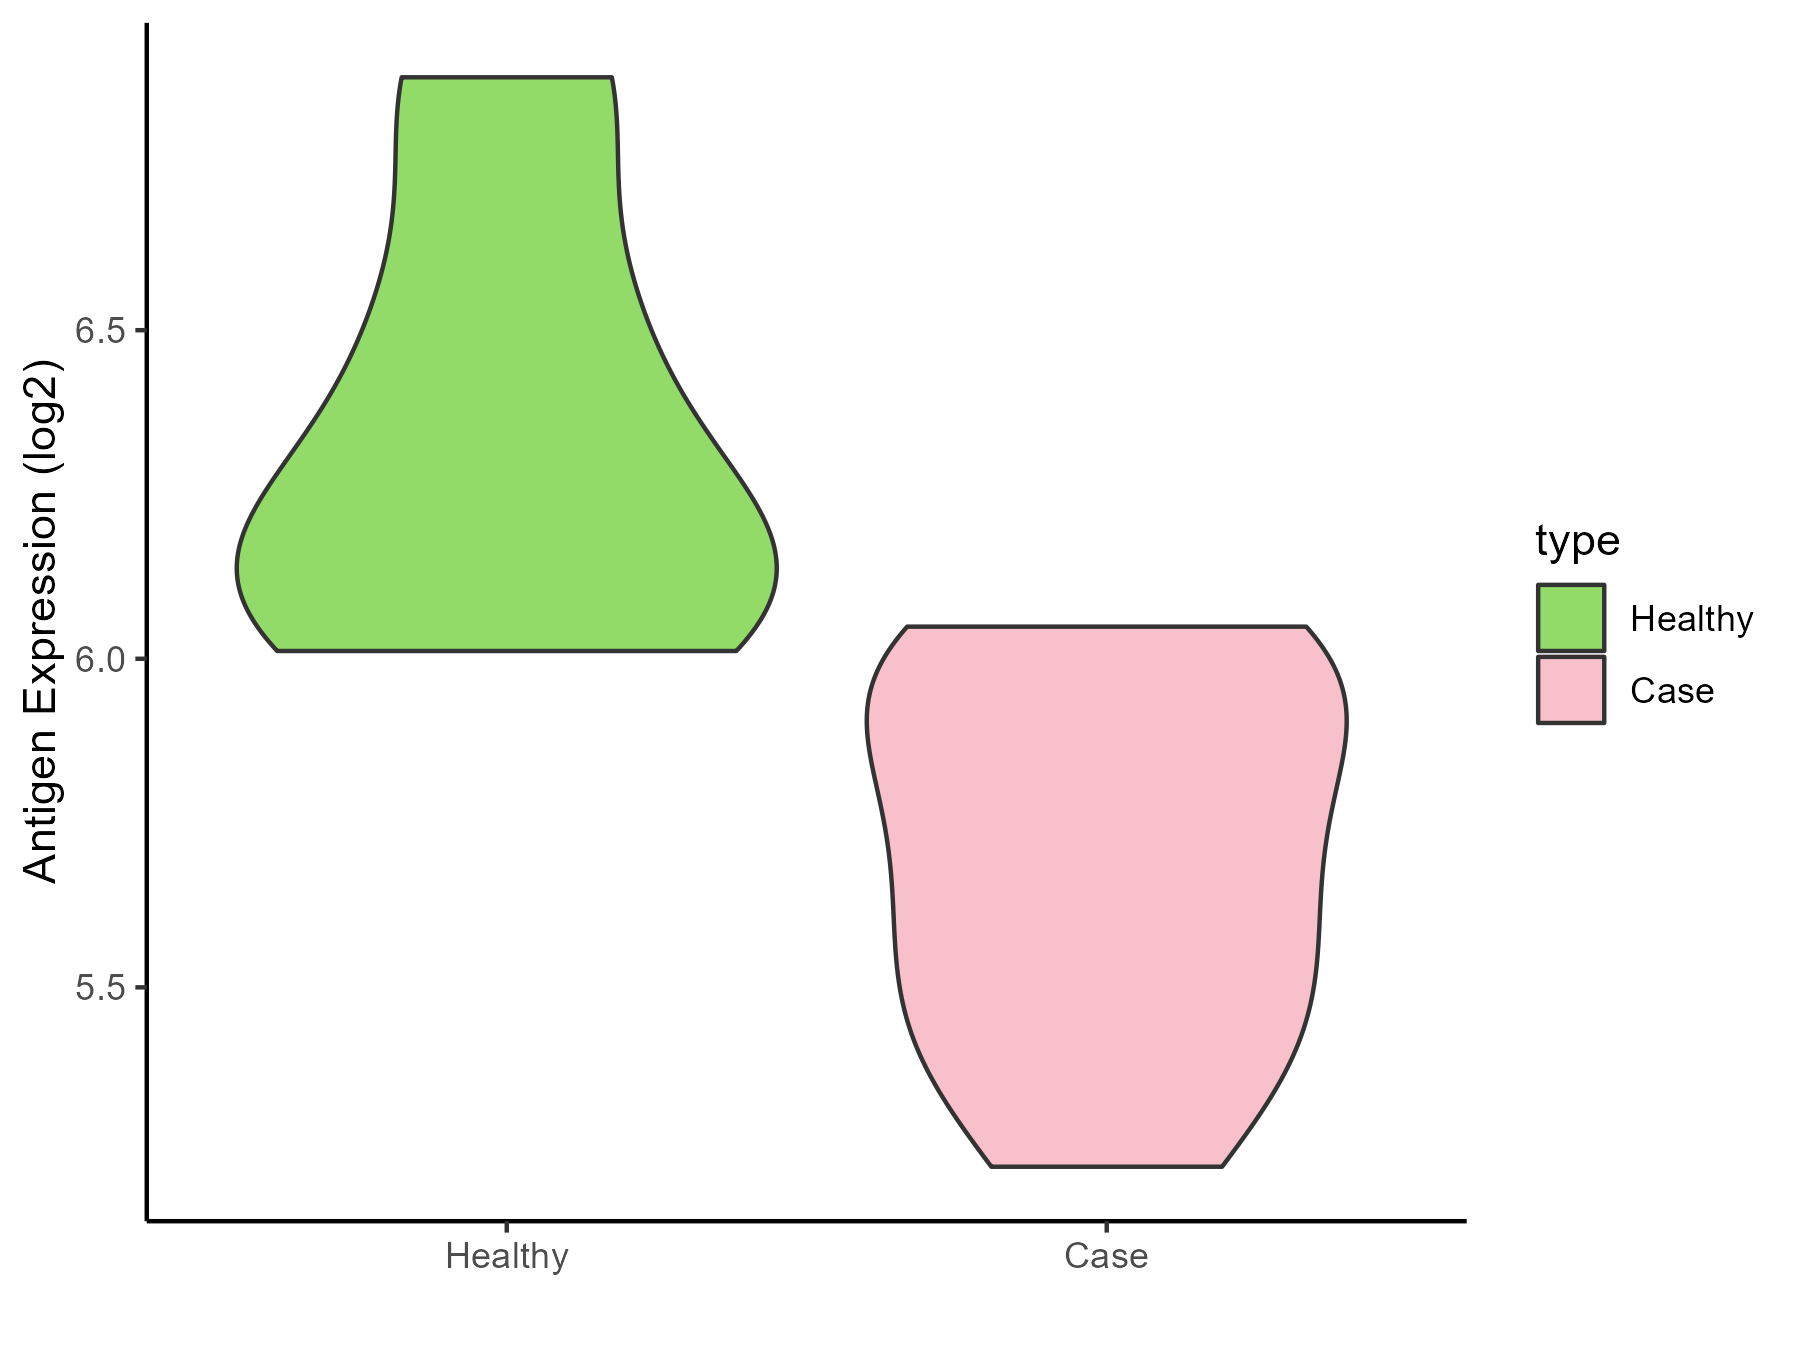
| Differential expression pattern of antigen in diseases | ||
| The Studied Tissue | Bladder | |
| The Specific Disease | Interstitial cystitis | |
| The Expression Level of Disease Section Compare with the Healthy Individual Tissue | p-value: 0.009627001; Fold-change: -0.491183087; Z-score: -1.395256103 | |
| Disease-specific Antigen Abundances |
|
Click to View the Clearer Original Diagram |
ICD Disease Classification 19
| Differential expression pattern of antigen in diseases | ||
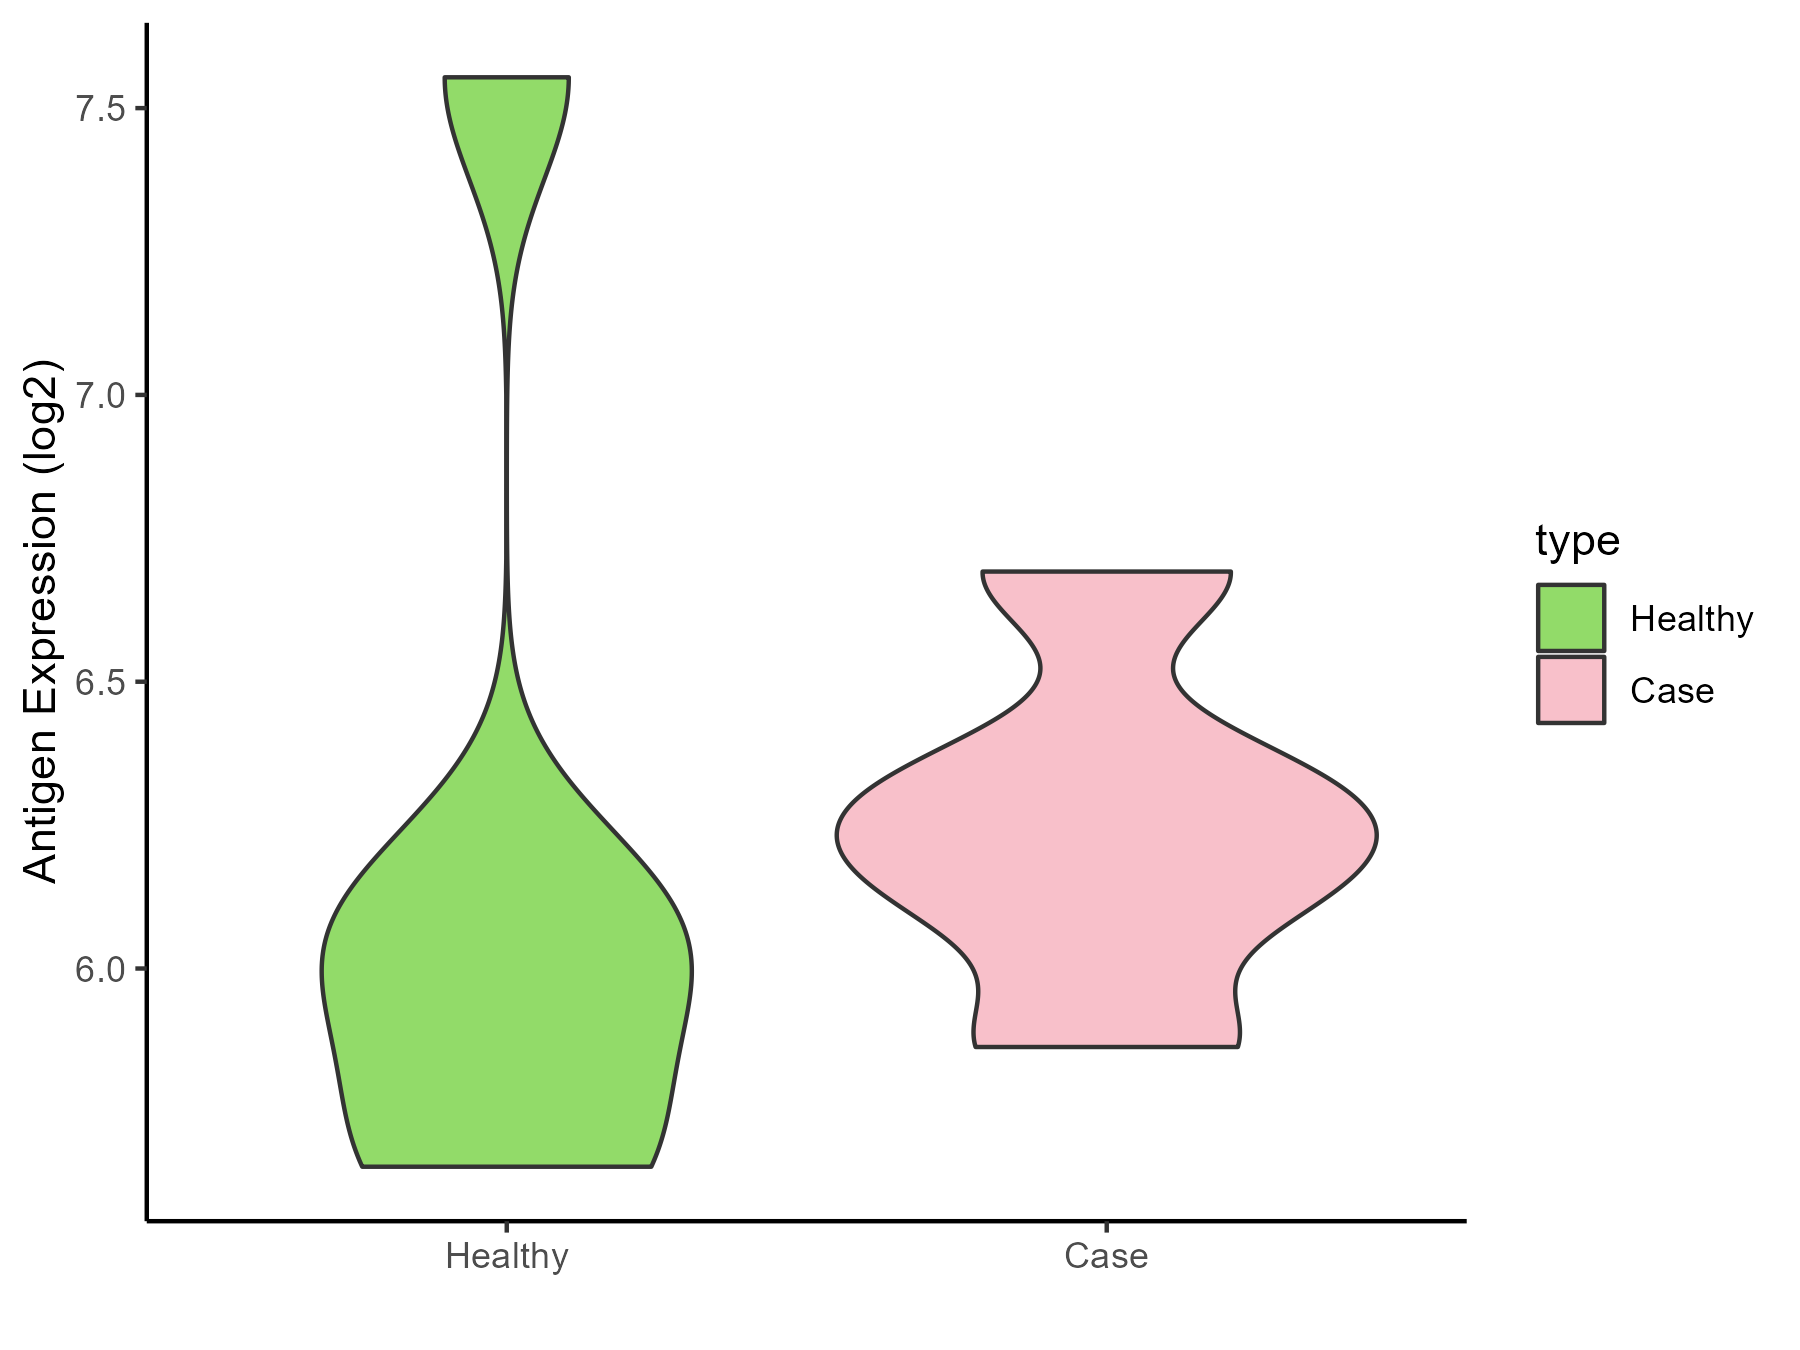
| The Studied Tissue | Myometrium | |
| The Specific Disease | Preterm birth | |
| The Expression Level of Disease Section Compare with the Healthy Individual Tissue | p-value: 0.818446567; Fold-change: 0.232284409; Z-score: 0.329395343 | |
| Disease-specific Antigen Abundances |
|
Click to View the Clearer Original Diagram |
ICD Disease Classification 2
| Differential expression pattern of antigen in diseases | ||
| The Studied Tissue | Bone marrow | |
| The Specific Disease | Acute myelocytic leukemia | |
| The Expression Level of Disease Section Compare with the Healthy Individual Tissue | p-value: 0.004841358; Fold-change: 0.05212256; Z-score: 0.265545336 | |
| Disease-specific Antigen Abundances |
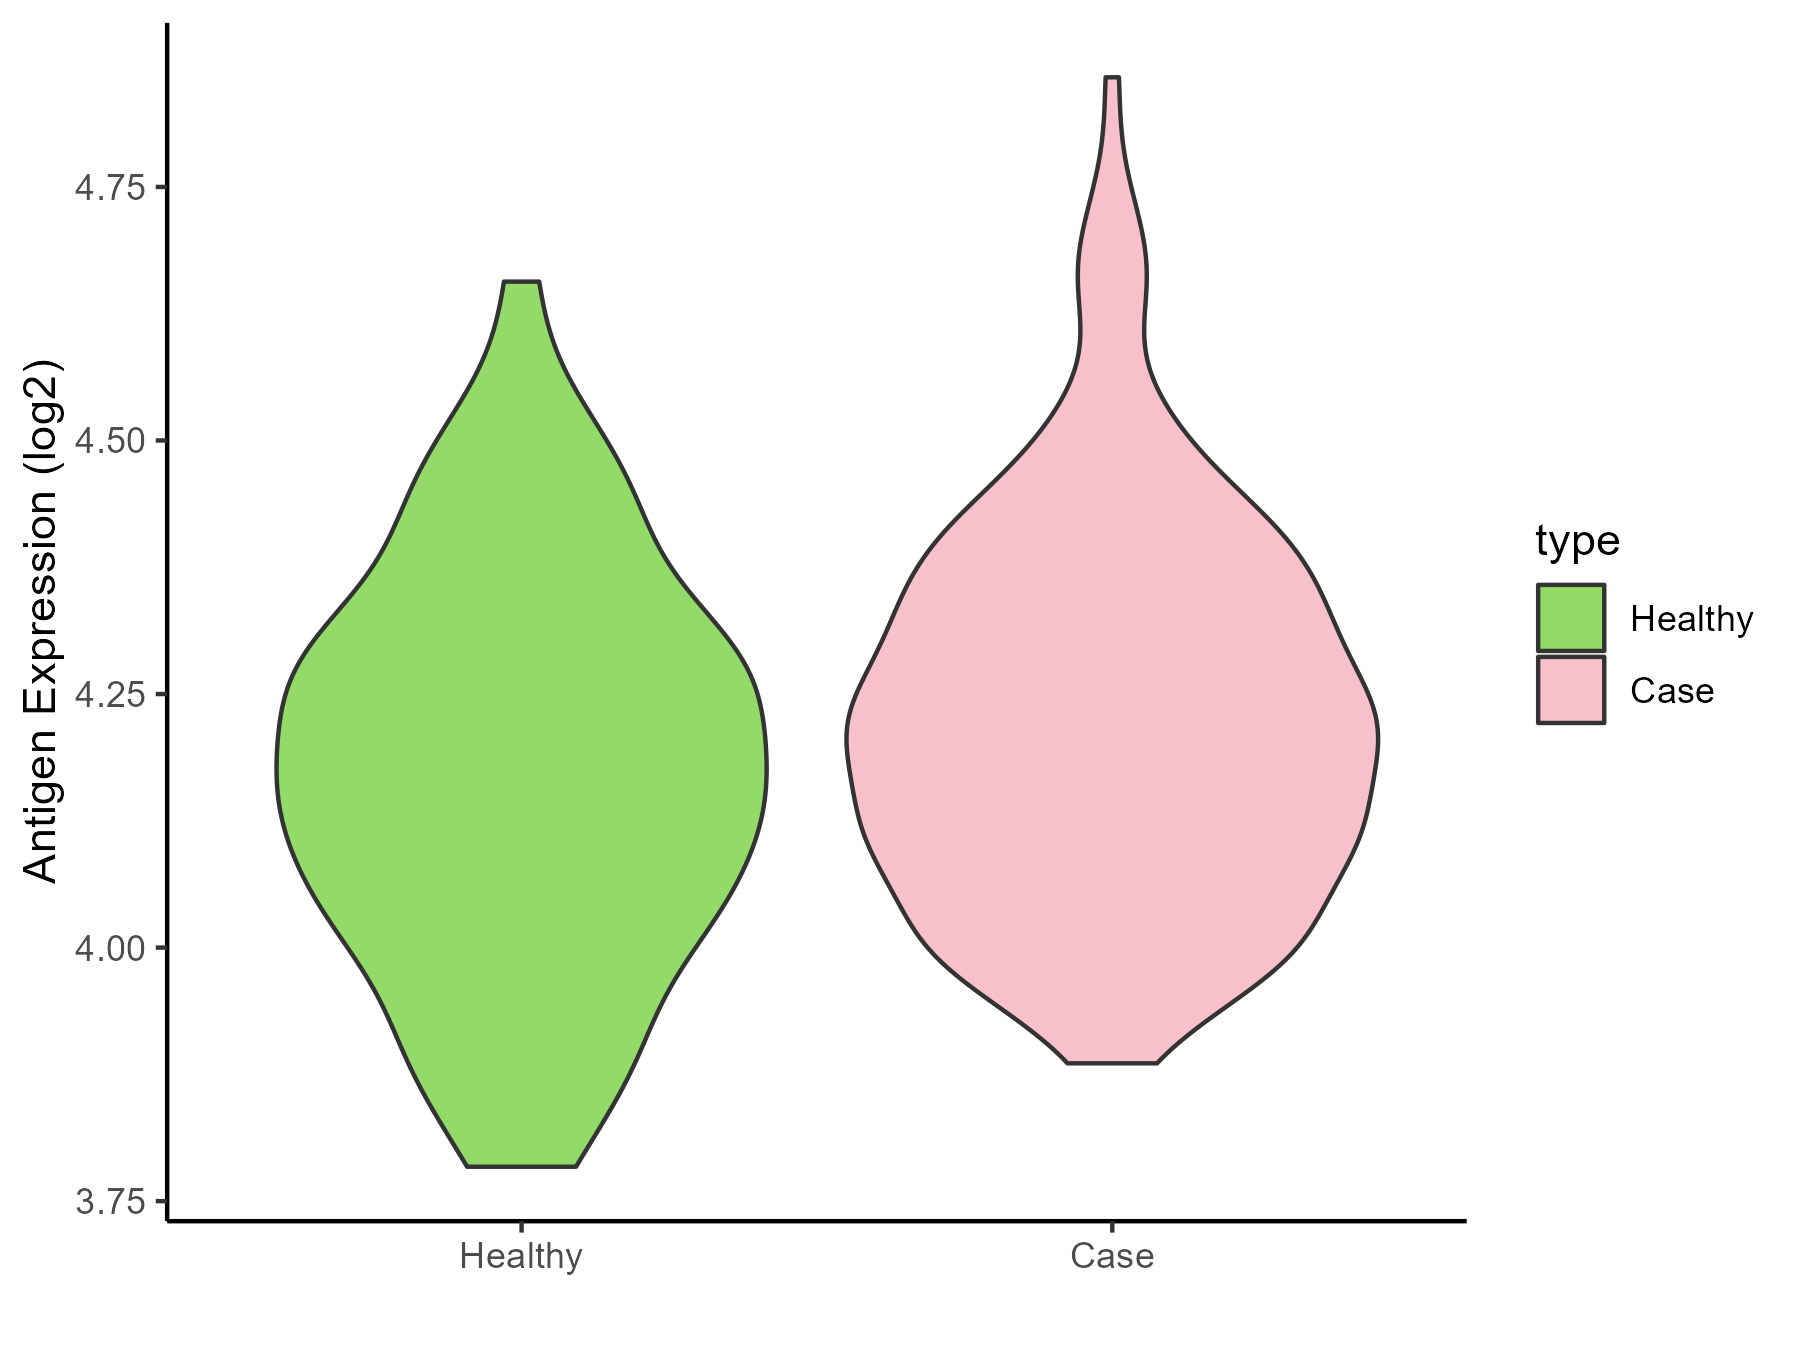
|
Click to View the Clearer Original Diagram |
| Differential expression pattern of antigen in diseases | ||
| The Studied Tissue | Bone marrow | |
| The Specific Disease | Myeloma | |
| The Expression Level of Disease Section Compare with the Healthy Individual Tissue | p-value: 0.003869536; Fold-change: -0.239001275; Z-score: -1.376881647 | |
| Disease-specific Antigen Abundances |
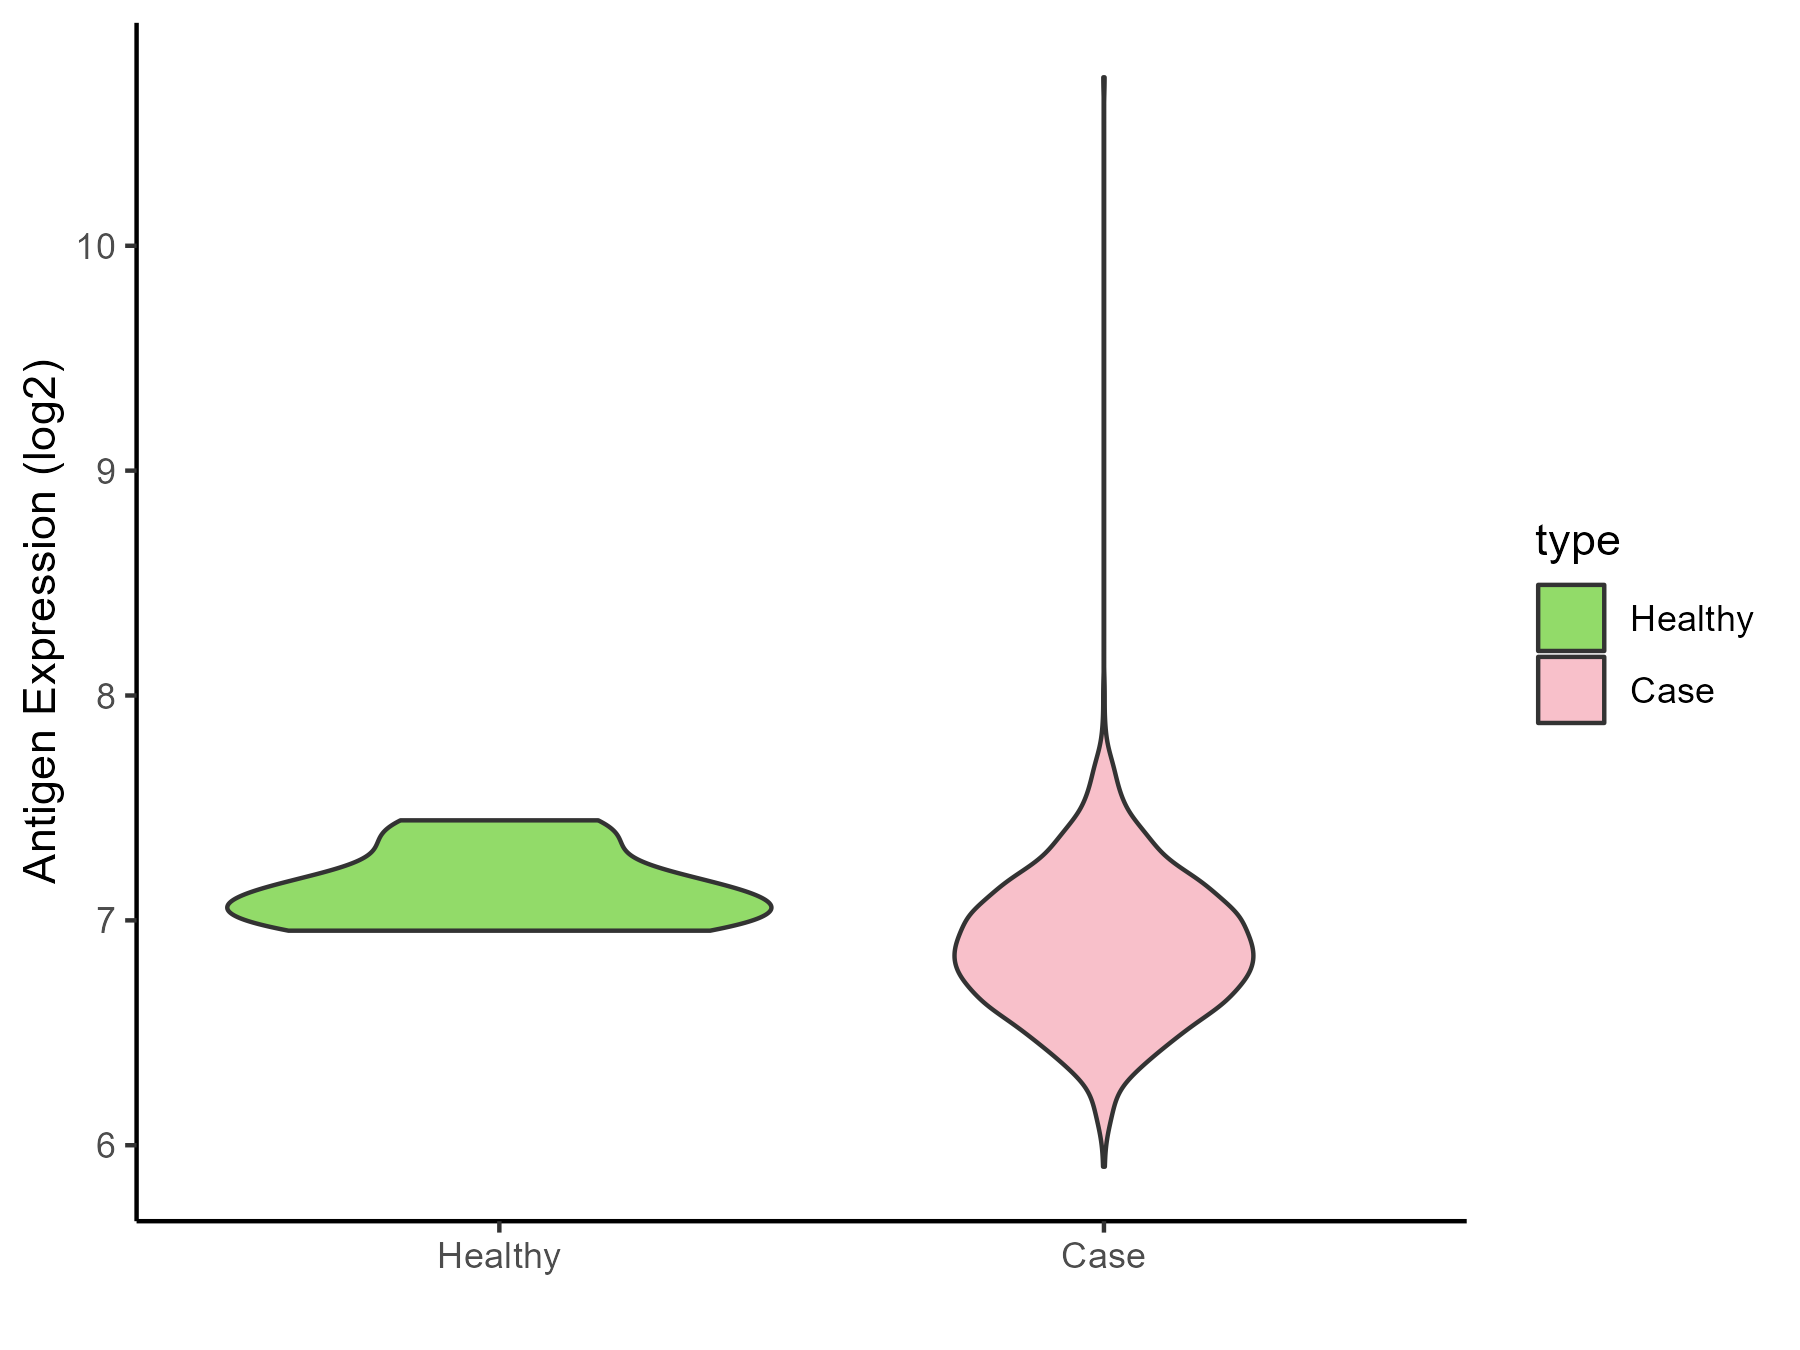
|
Click to View the Clearer Original Diagram |
| The Studied Tissue | Peripheral blood | |
| The Specific Disease | Myeloma | |
| The Expression Level of Disease Section Compare with the Healthy Individual Tissue | p-value: 0.208147725; Fold-change: 0.177778545; Z-score: 0.795850504 | |
| Disease-specific Antigen Abundances |
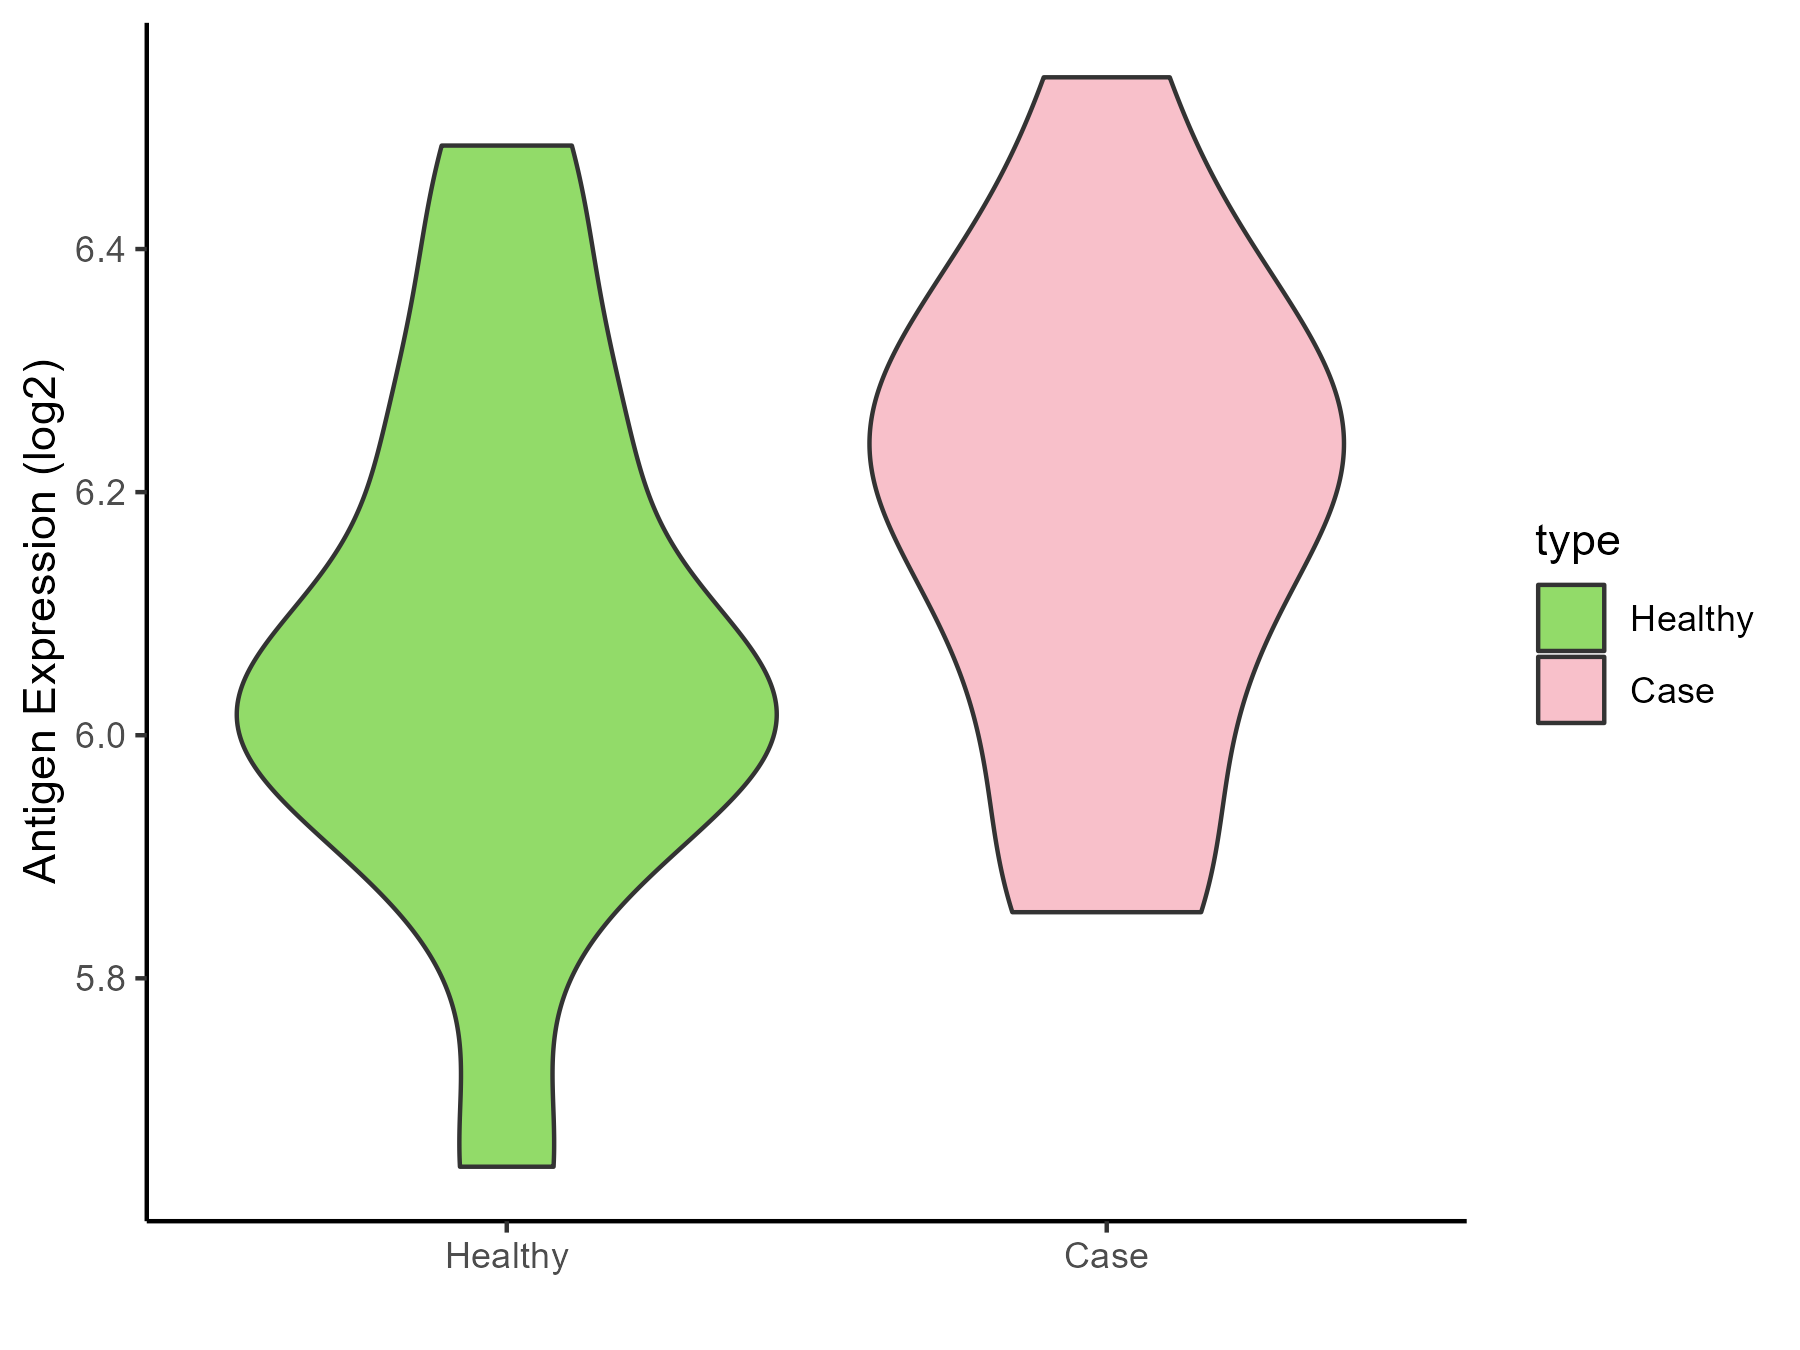
|
Click to View the Clearer Original Diagram |
| Differential expression pattern of antigen in diseases | ||
| The Studied Tissue | Oral | |
| The Specific Disease | Oral cancer | |
| The Expression Level of Disease Section Compare with the Healthy Individual Tissue | p-value: 0.212472997; Fold-change: 0.032061442; Z-score: 0.041211697 | |
| The Expression Level of Disease Section Compare with the Adjacent Tissue | p-value: 0.993394276; Fold-change: -0.043058508; Z-score: -0.06018442 | |
| Disease-specific Antigen Abundances |
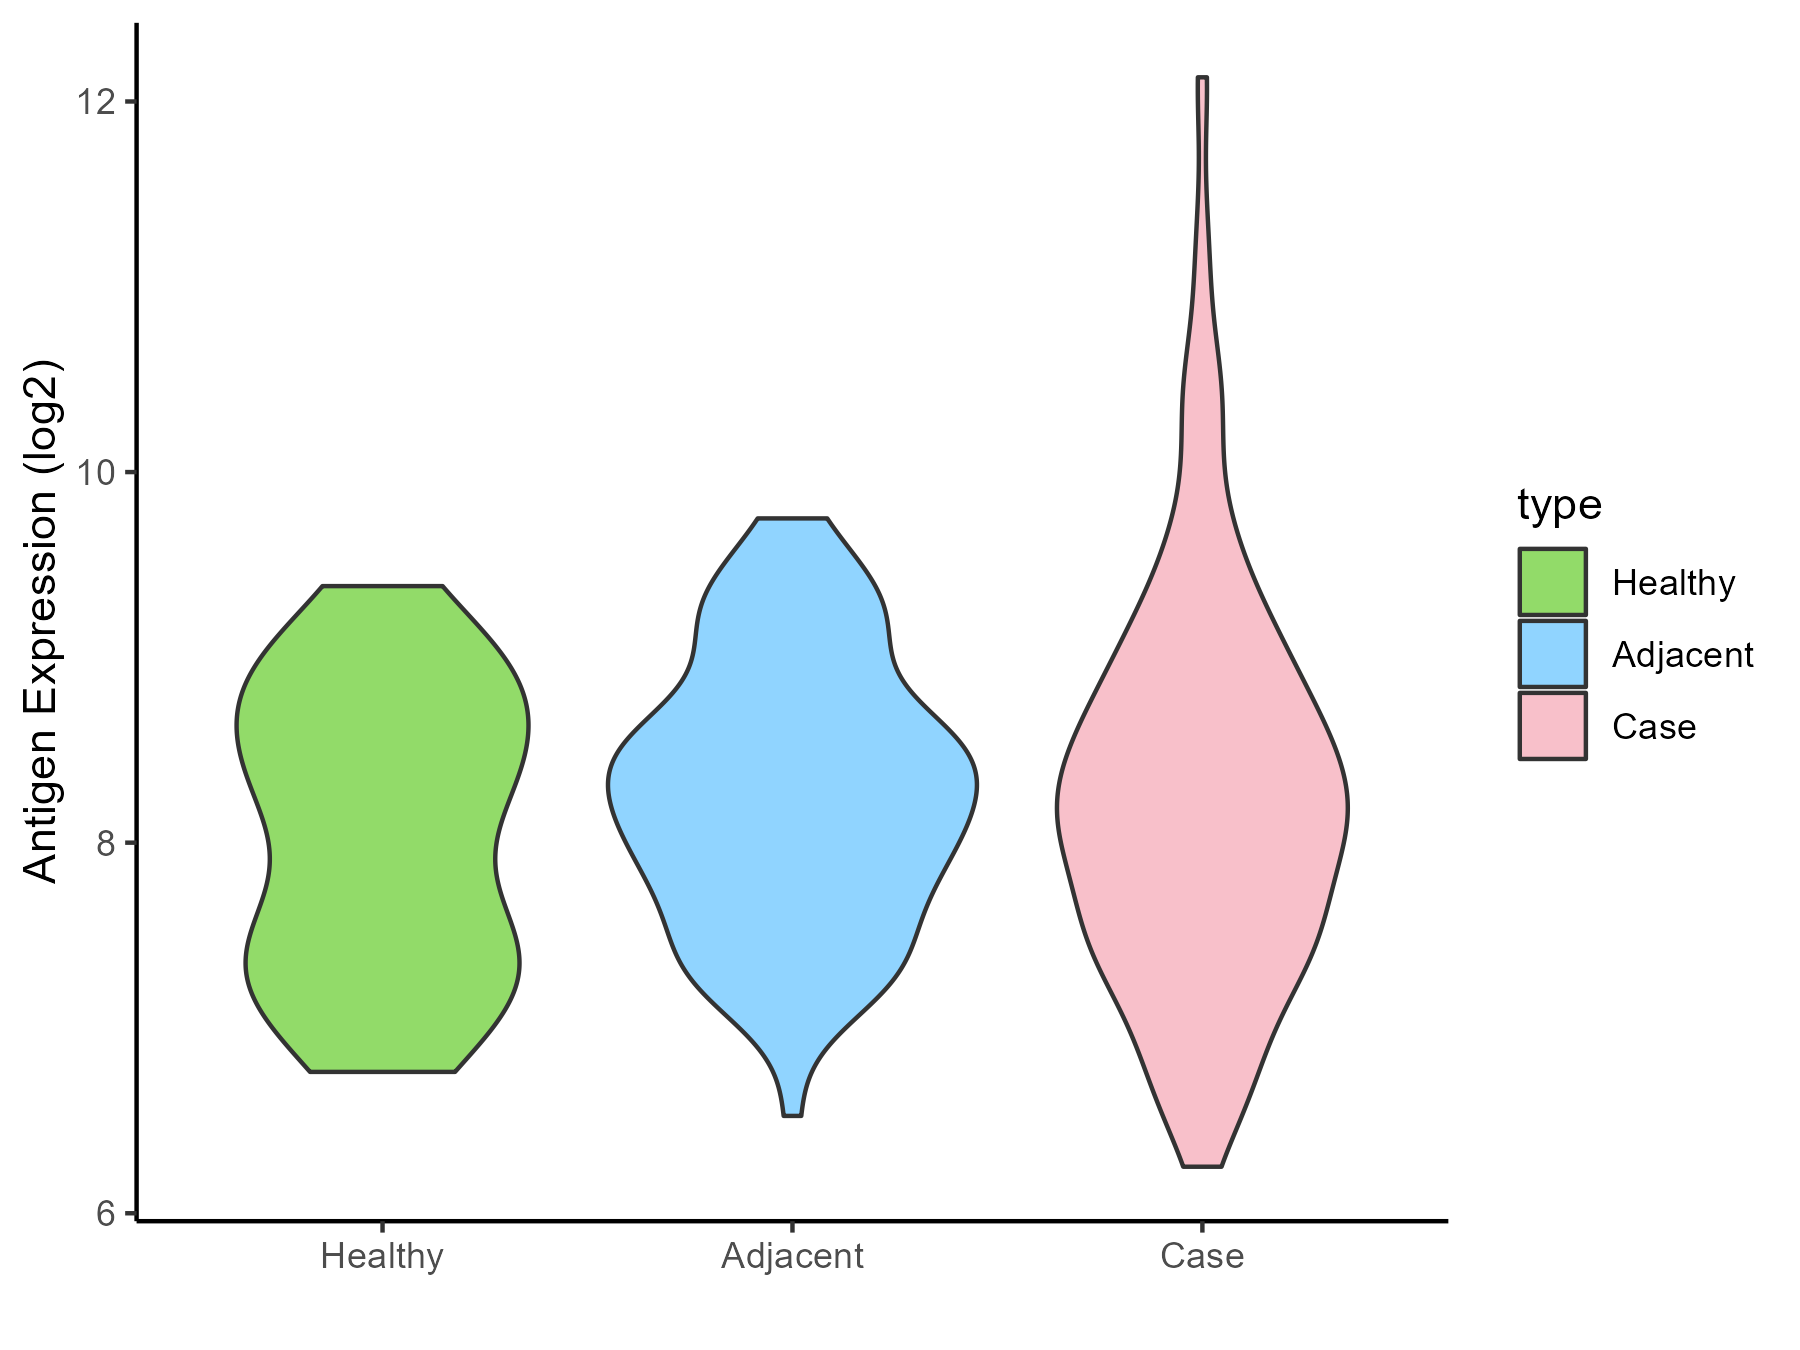
|
Click to View the Clearer Original Diagram |
| Differential expression pattern of antigen in diseases | ||
| The Studied Tissue | Esophagus | |
| The Specific Disease | Esophagal cancer | |
| The Expression Level of Disease Section Compare with the Adjacent Tissue | p-value: 0.744114966; Fold-change: -0.927773326; Z-score: -1.08206894 | |
| Disease-specific Antigen Abundances |
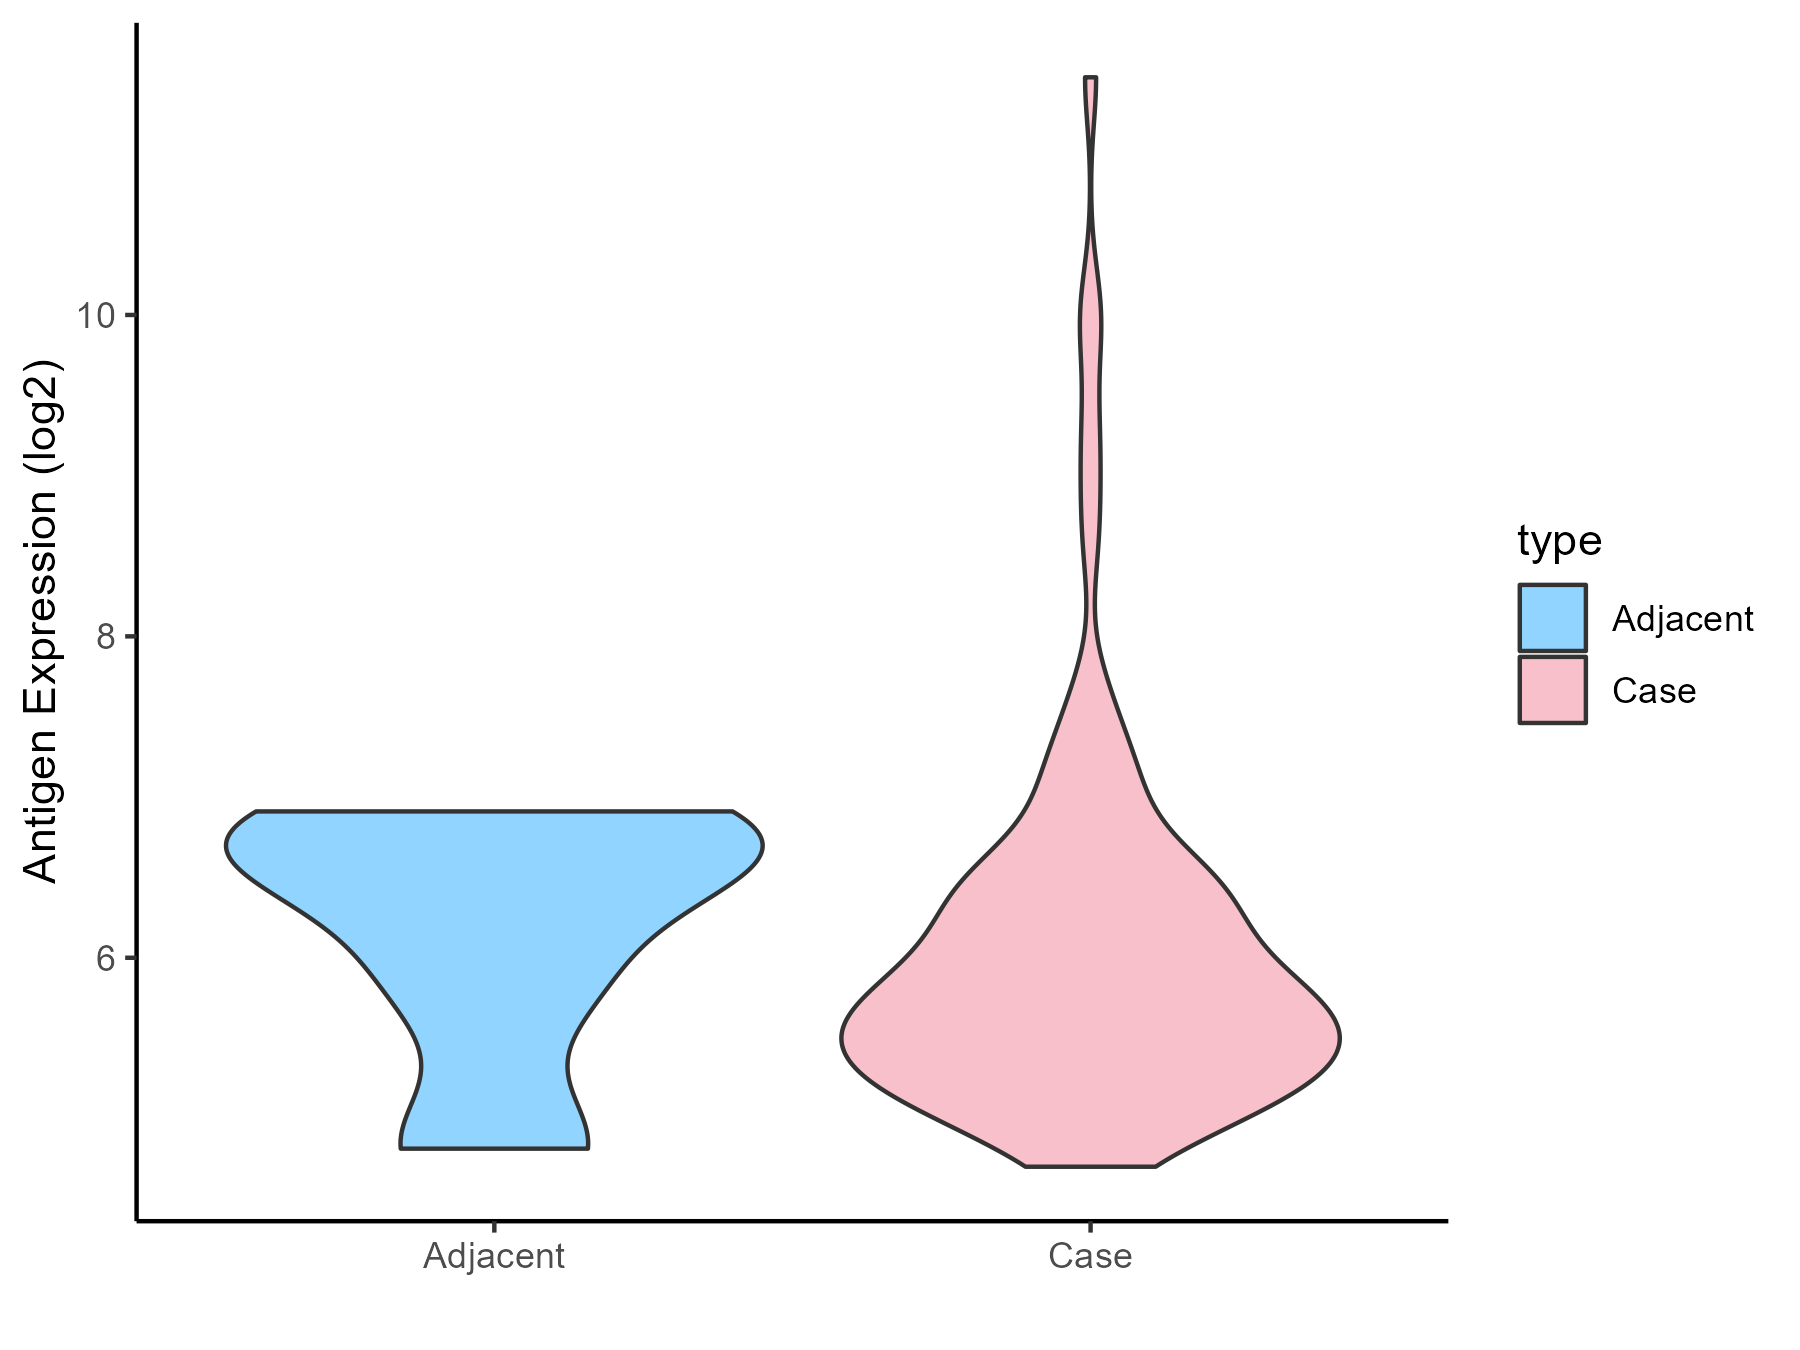
|
Click to View the Clearer Original Diagram |
| Differential expression pattern of antigen in diseases | ||
| The Studied Tissue | Rectal colon | |
| The Specific Disease | Rectal cancer | |
| The Expression Level of Disease Section Compare with the Healthy Individual Tissue | p-value: 0.010708348; Fold-change: -0.247293493; Z-score: -1.631764056 | |
| The Expression Level of Disease Section Compare with the Adjacent Tissue | p-value: 0.000124299; Fold-change: -0.588712023; Z-score: -3.166205249 | |
| Disease-specific Antigen Abundances |
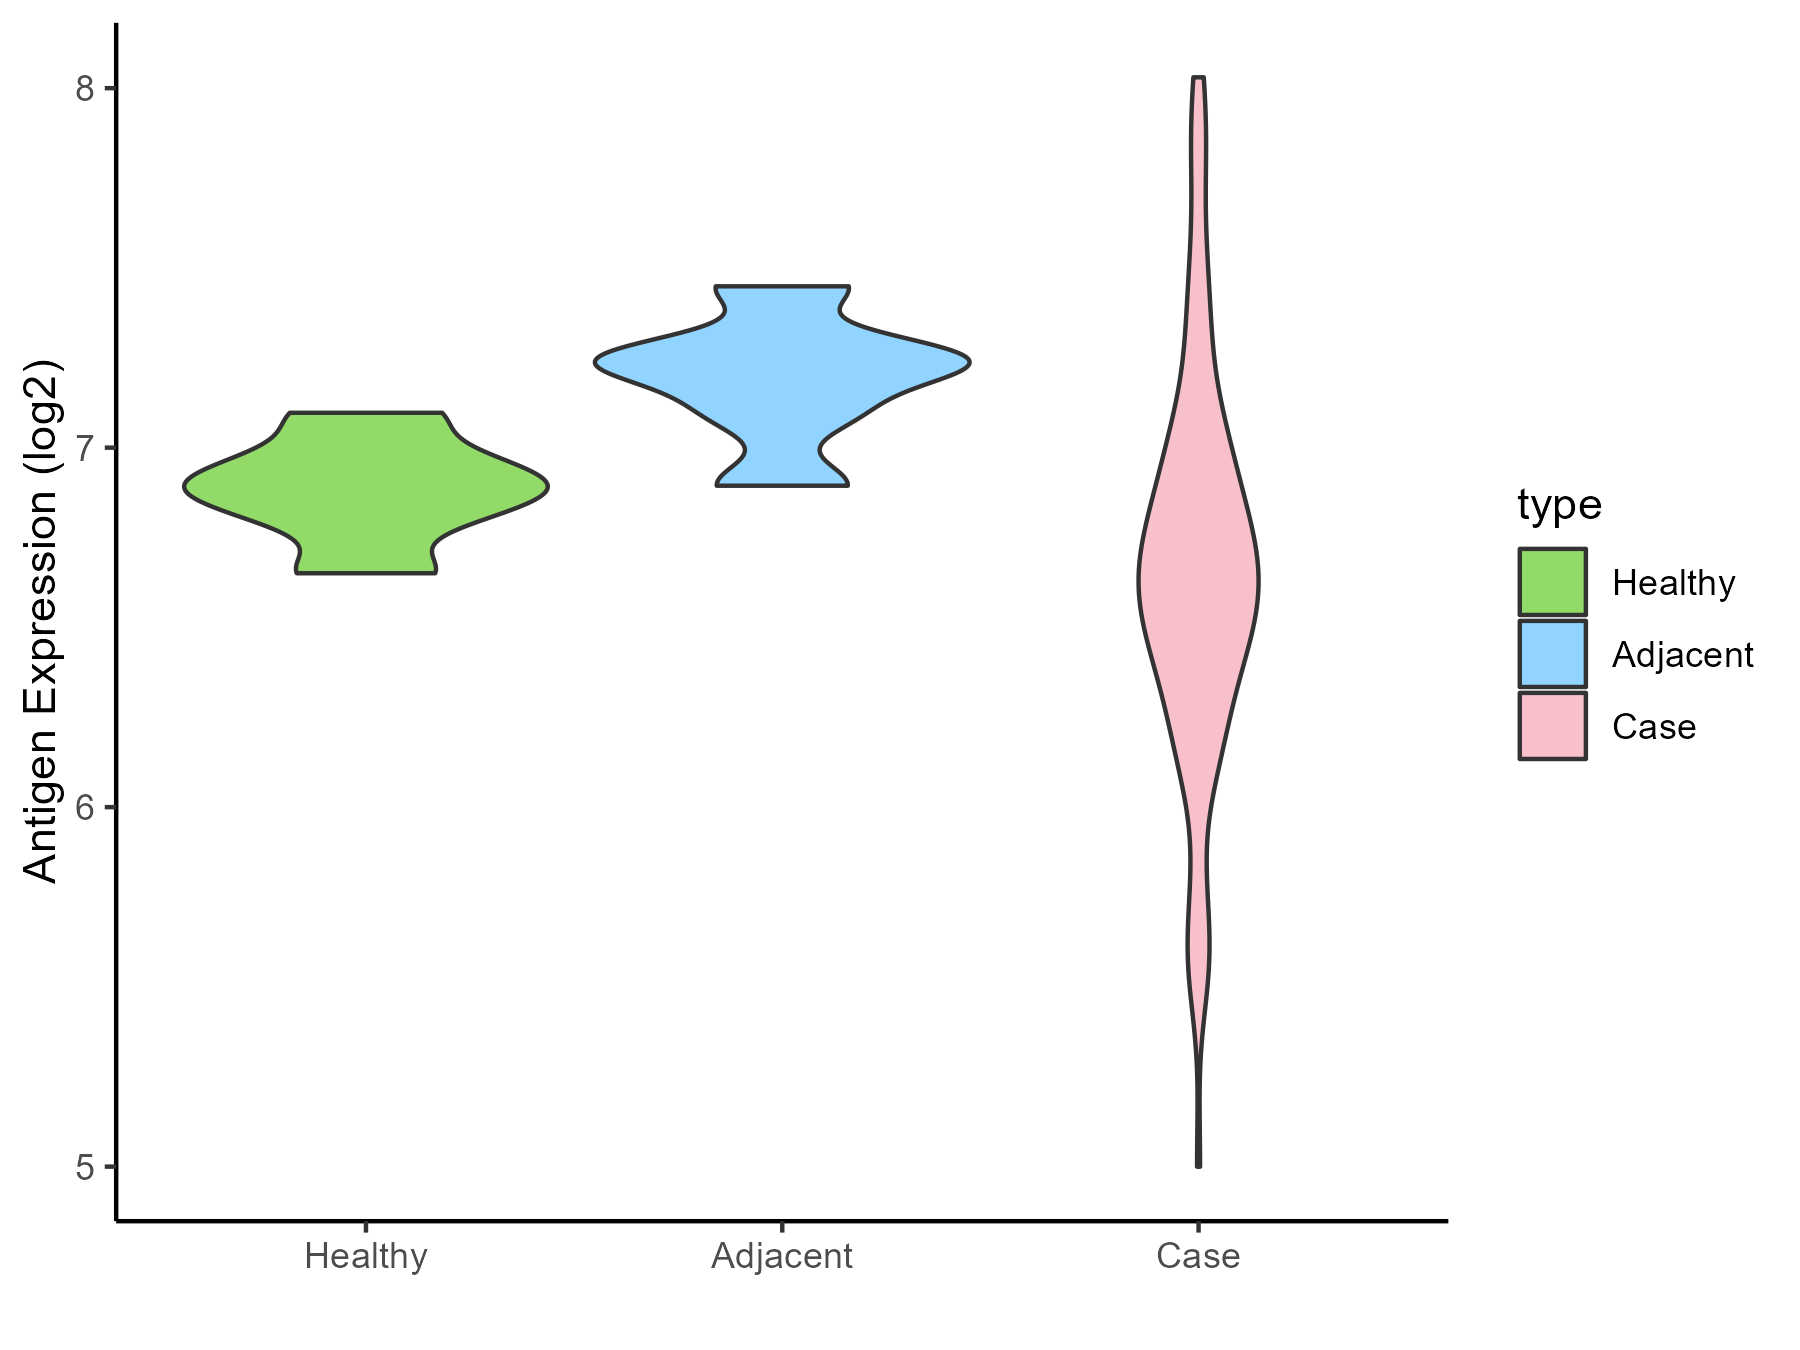
|
Click to View the Clearer Original Diagram |
| Differential expression pattern of antigen in diseases | ||
| The Studied Tissue | Skin | |
| The Specific Disease | Skin cancer | |
| The Expression Level of Disease Section Compare with the Healthy Individual Tissue | p-value: 2.11E-56; Fold-change: -1.777974925; Z-score: -2.29660524 | |
| The Expression Level of Disease Section Compare with the Adjacent Tissue | p-value: 1.45E-13; Fold-change: -0.830092946; Z-score: -1.578689736 | |
| Disease-specific Antigen Abundances |
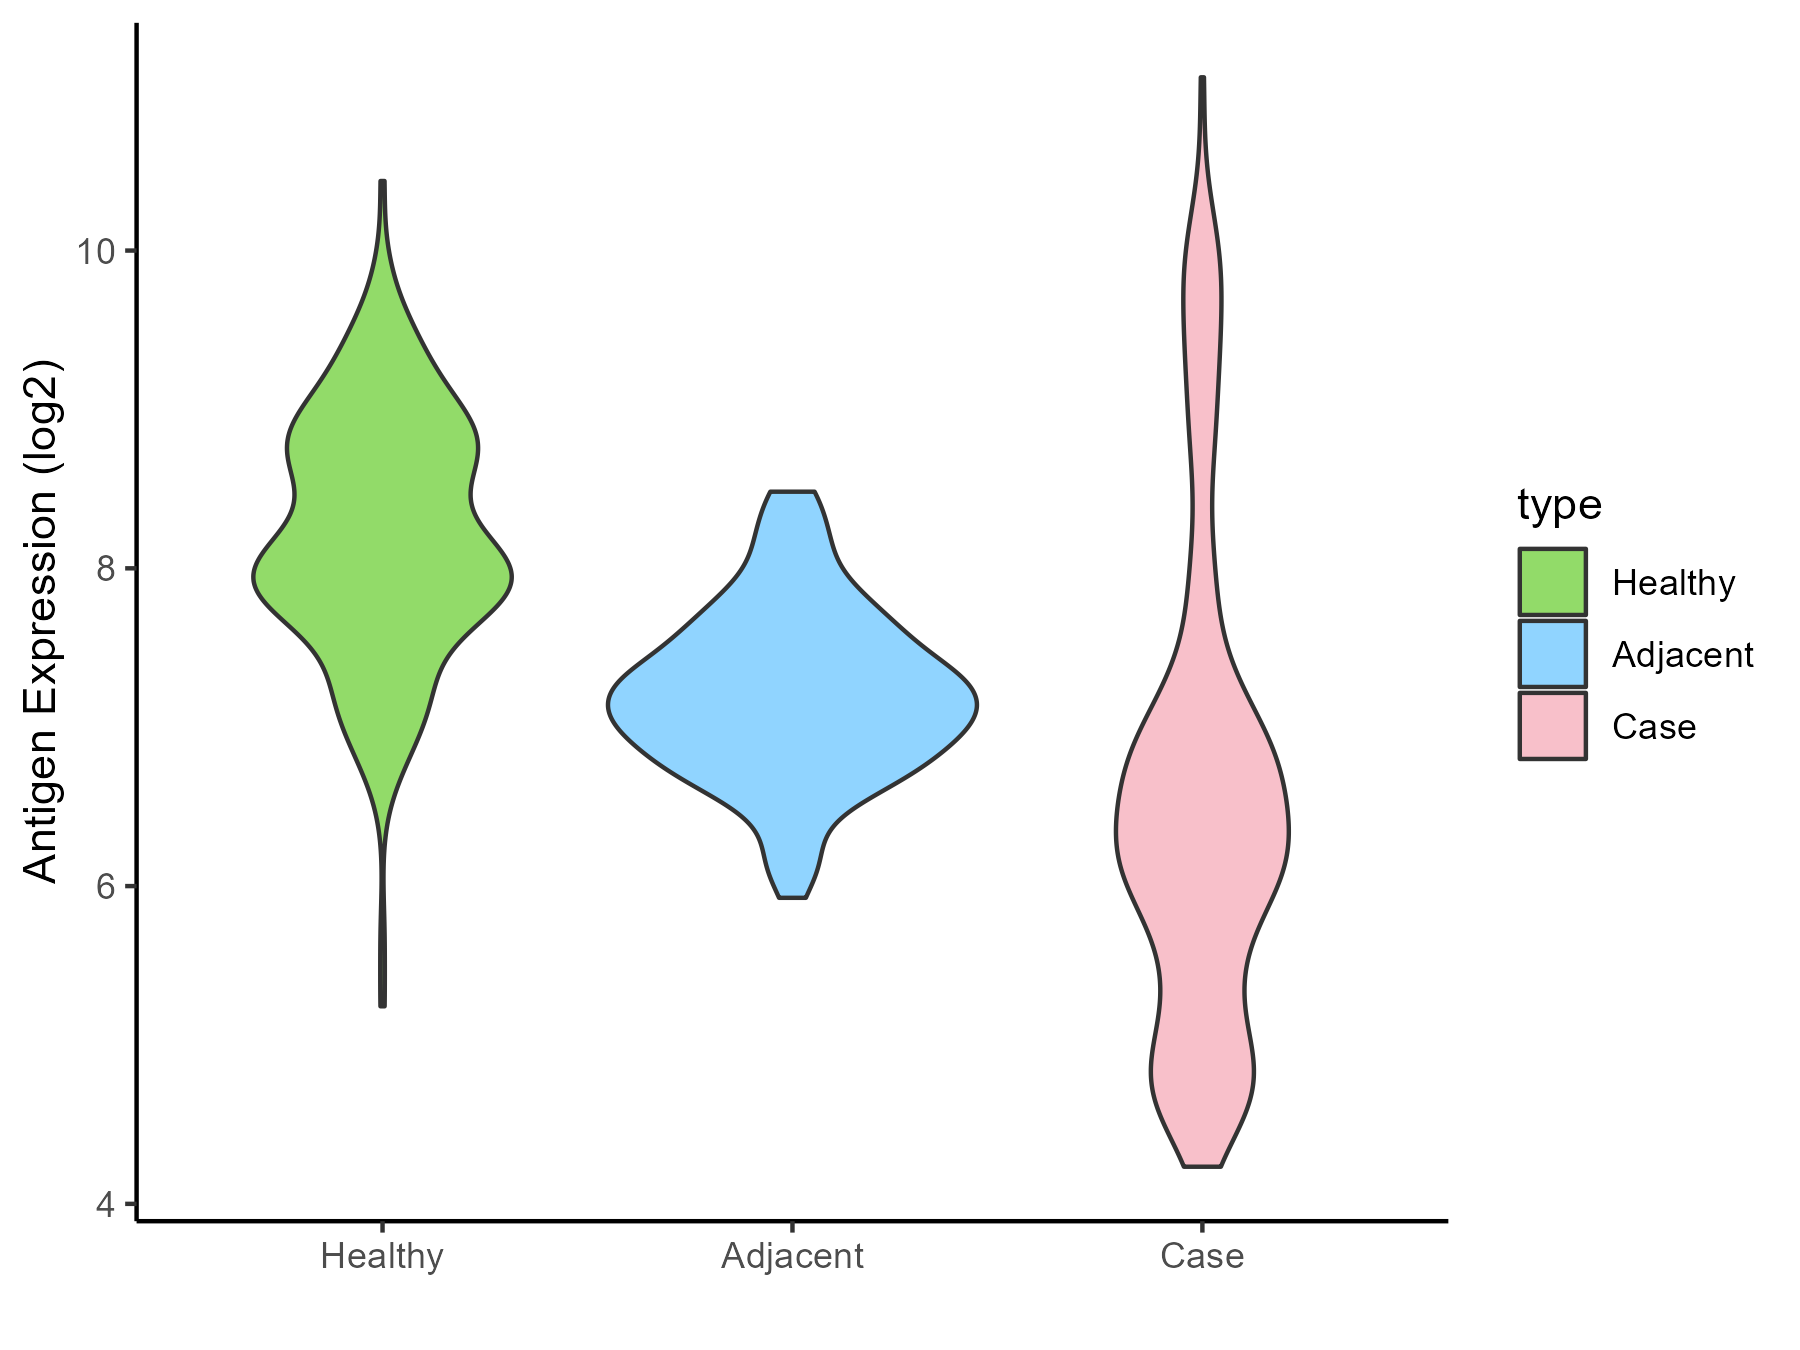
|
Click to View the Clearer Original Diagram |
| Differential expression pattern of antigen in diseases | ||
| The Studied Tissue | Kidney | |
| The Specific Disease | Renal cancer | |
| The Expression Level of Disease Section Compare with the Healthy Individual Tissue | p-value: 0.344182483; Fold-change: -0.222447507; Z-score: -0.552134691 | |
| The Expression Level of Disease Section Compare with the Adjacent Tissue | p-value: 0.141472764; Fold-change: -0.30395708; Z-score: -0.480230635 | |
| Disease-specific Antigen Abundances |
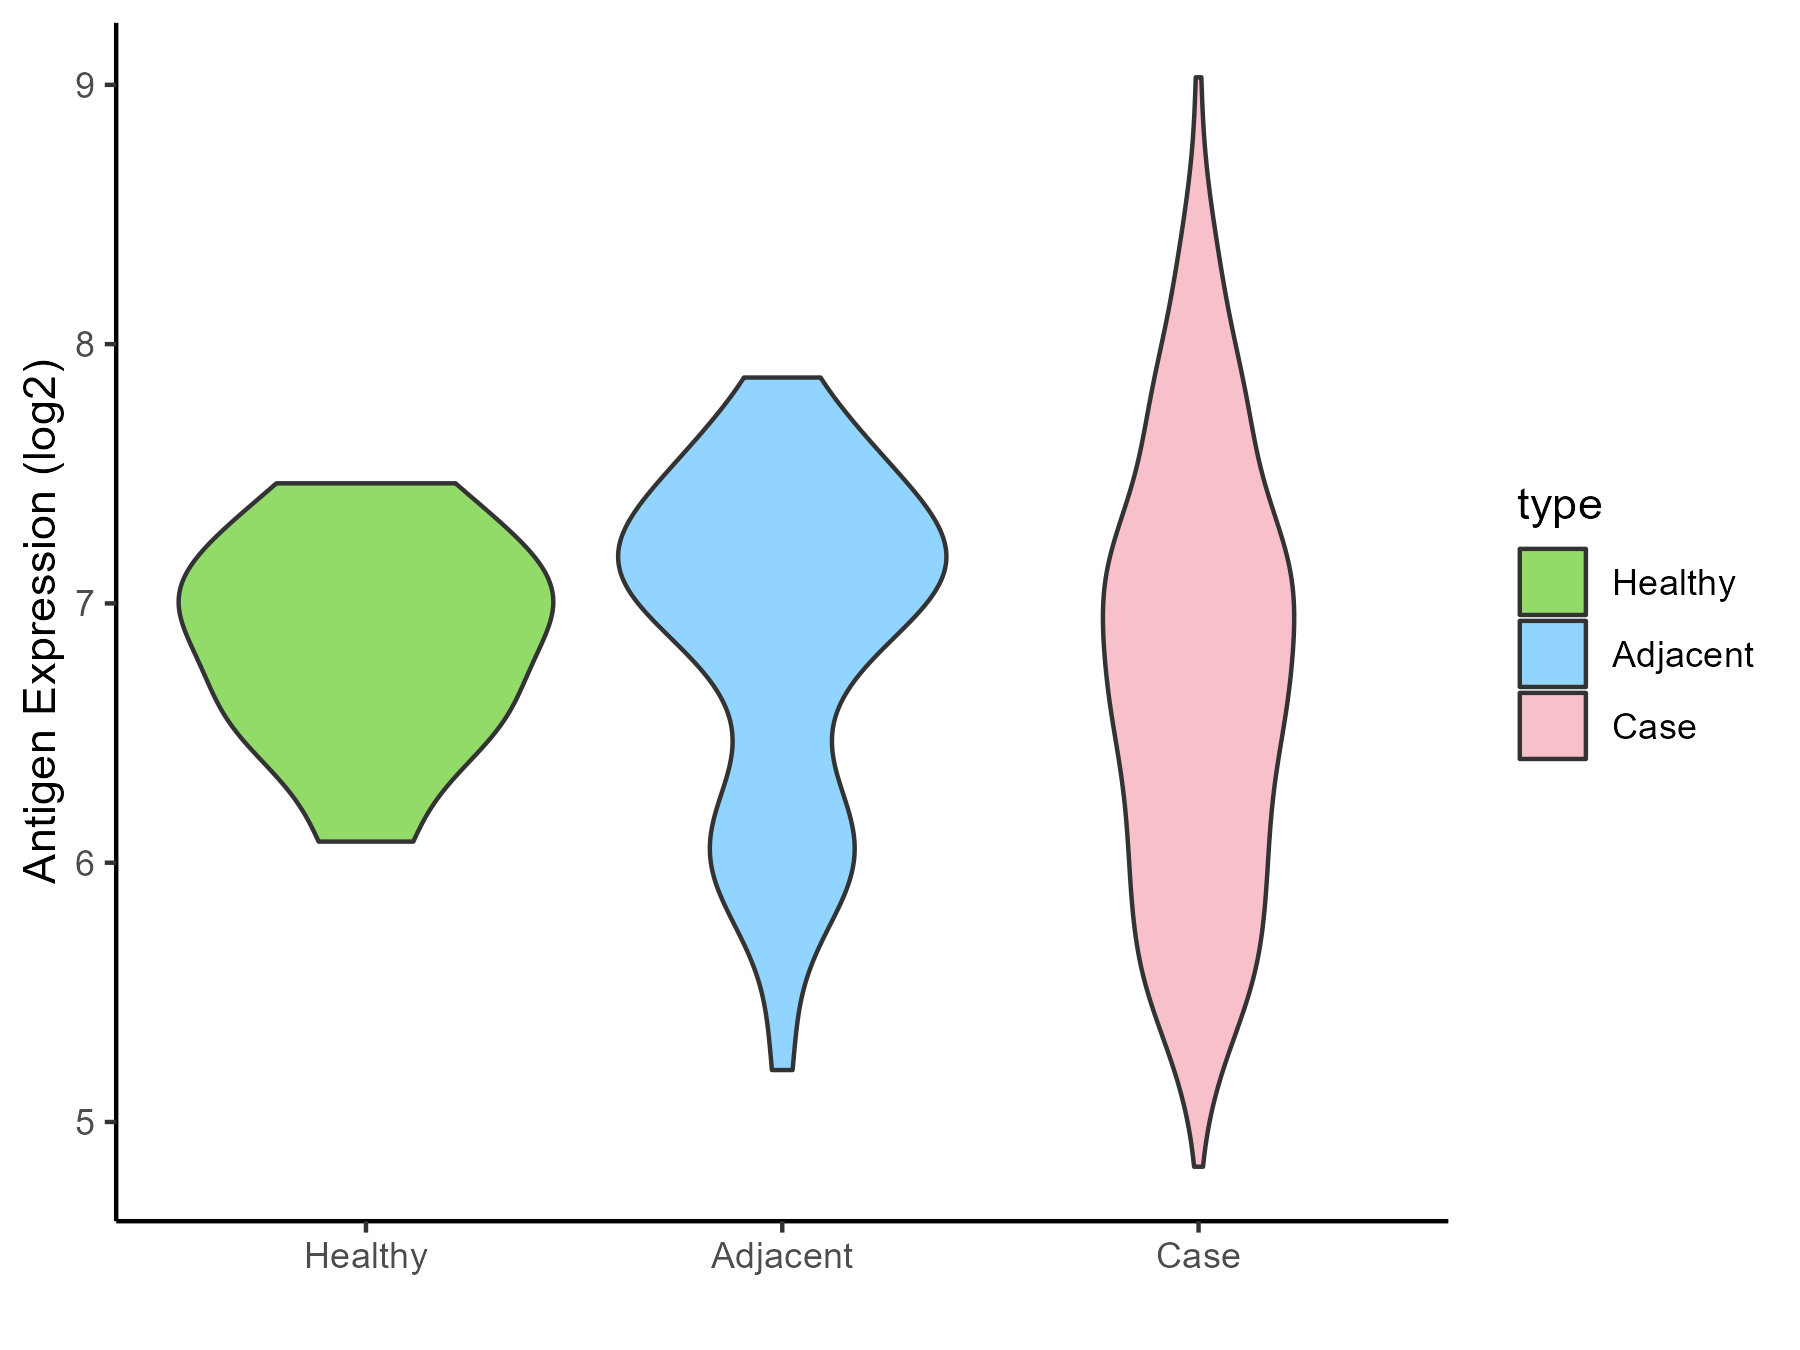
|
Click to View the Clearer Original Diagram |
| Differential expression pattern of antigen in diseases | ||
| The Studied Tissue | Urothelium | |
| The Specific Disease | Ureter cancer | |
| The Expression Level of Disease Section Compare with the Healthy Individual Tissue | p-value: 0.534150833; Fold-change: -0.07320583; Z-score: -0.70982248 | |
| Disease-specific Antigen Abundances |
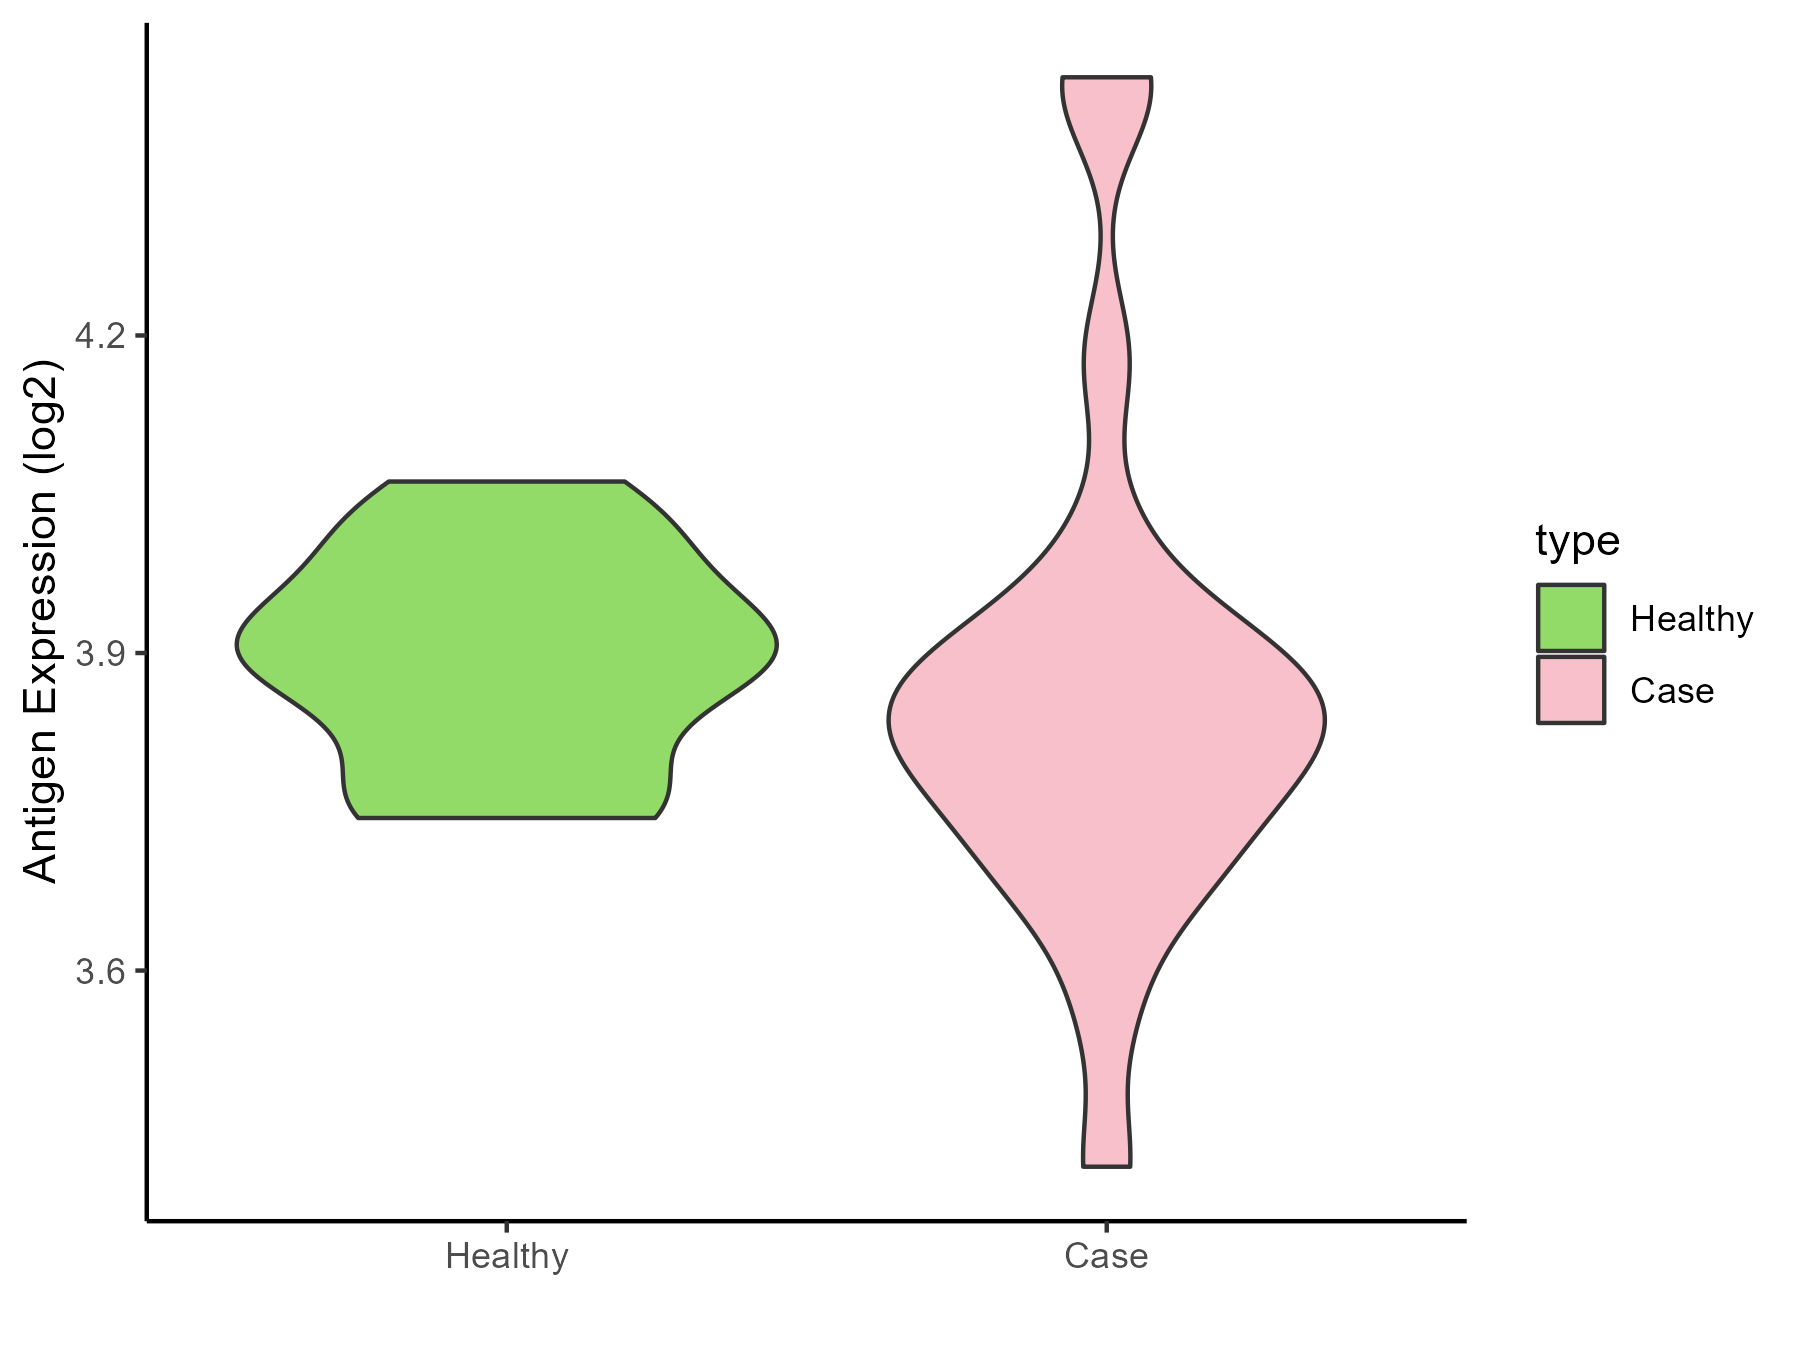
|
Click to View the Clearer Original Diagram |
ICD Disease Classification 20
| Differential expression pattern of antigen in diseases | ||
| The Studied Tissue | Adipose | |
| The Specific Disease | Simpson golabi behmel syndrome | |
| The Expression Level of Disease Section Compare with the Healthy Individual Tissue | p-value: 0.532863679; Fold-change: 0.260946163; Z-score: 0.844238137 | |
| Disease-specific Antigen Abundances |
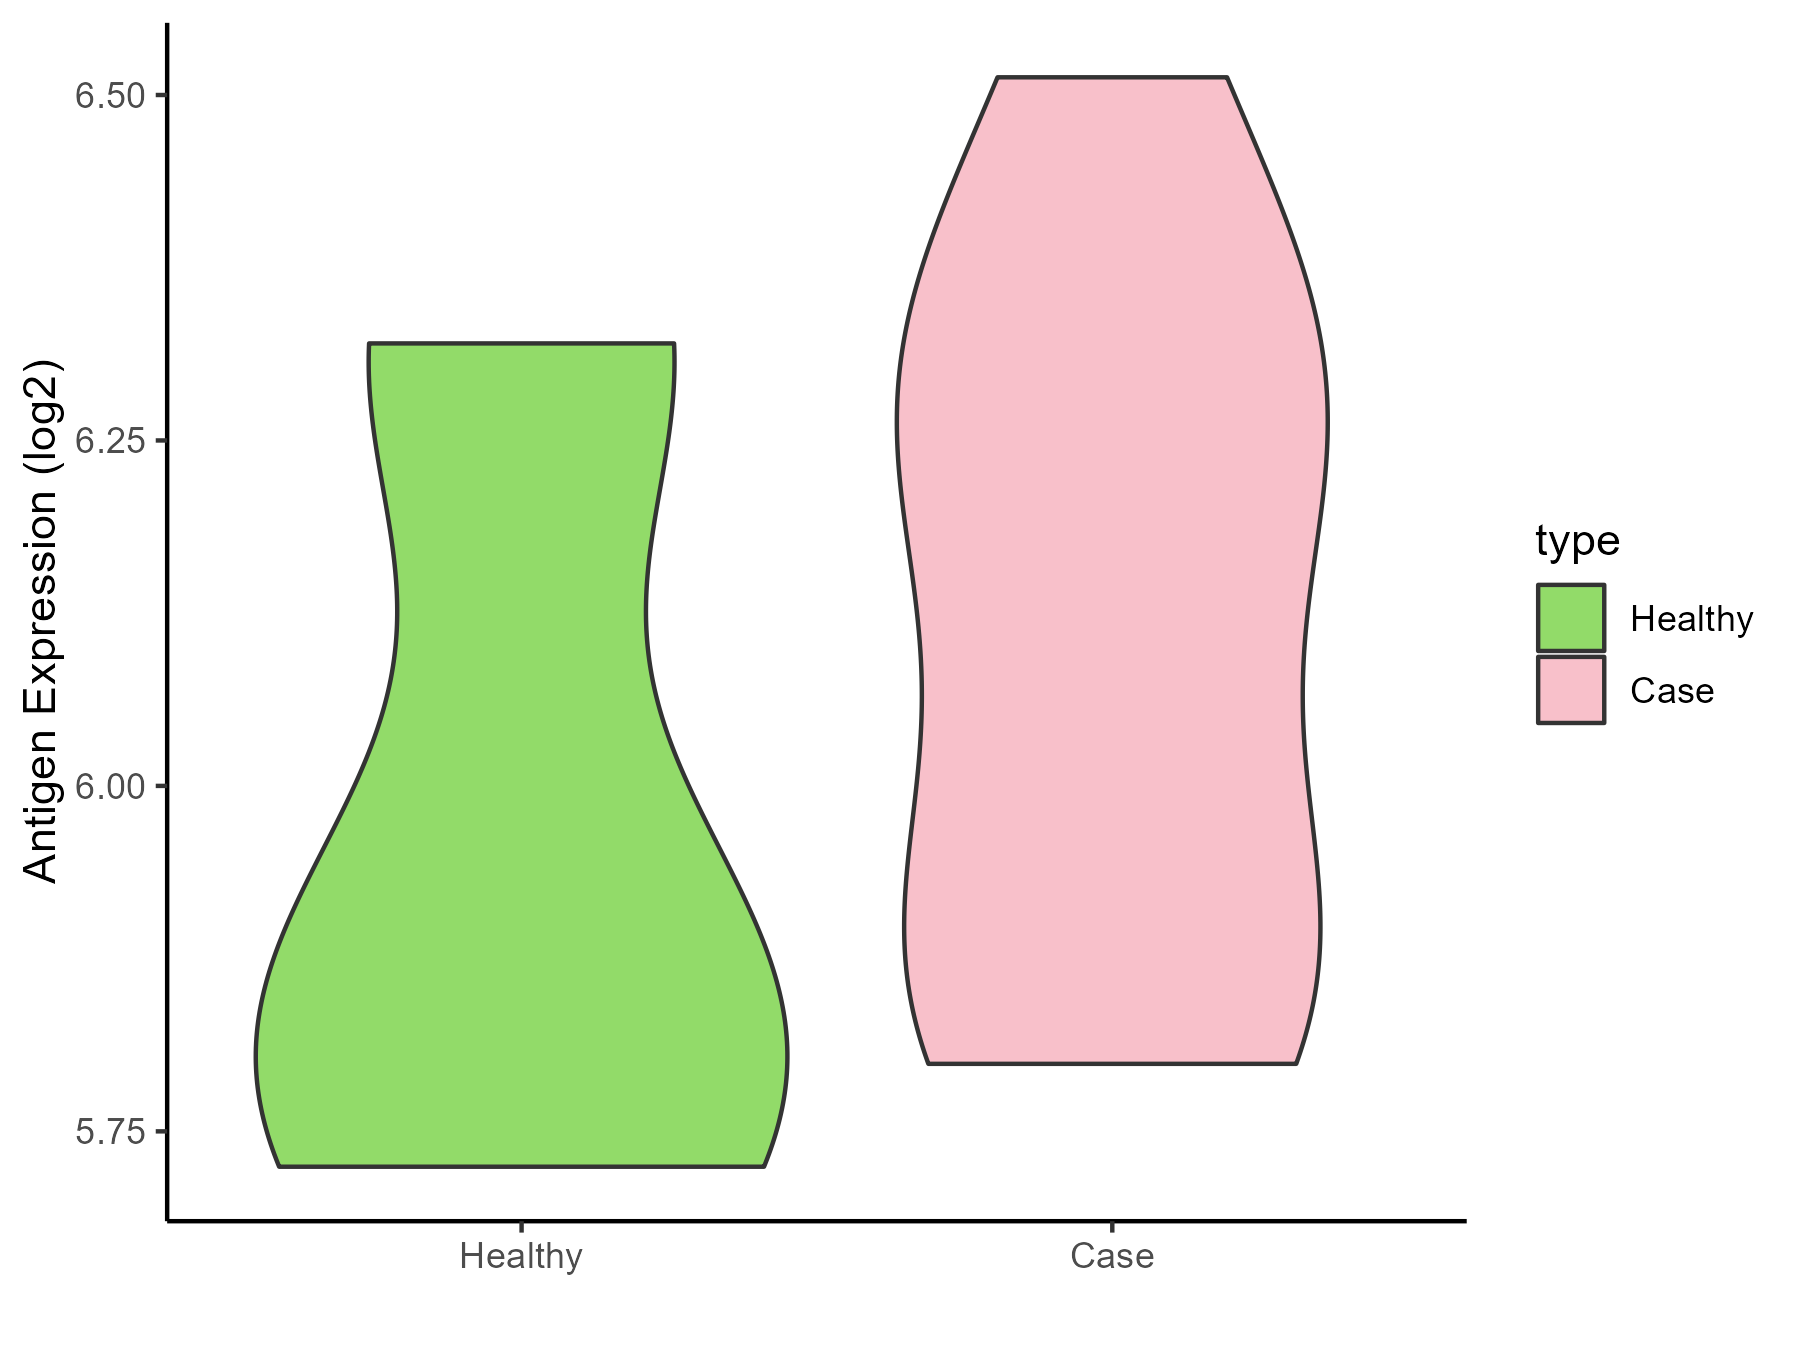
|
Click to View the Clearer Original Diagram |
| Differential expression pattern of antigen in diseases | ||
| The Studied Tissue | Perituberal | |
| The Specific Disease | Tuberous sclerosis complex | |
| The Expression Level of Disease Section Compare with the Healthy Individual Tissue | p-value: 0.076094338; Fold-change: 0.246412841; Z-score: 1.045838611 | |
| Disease-specific Antigen Abundances |
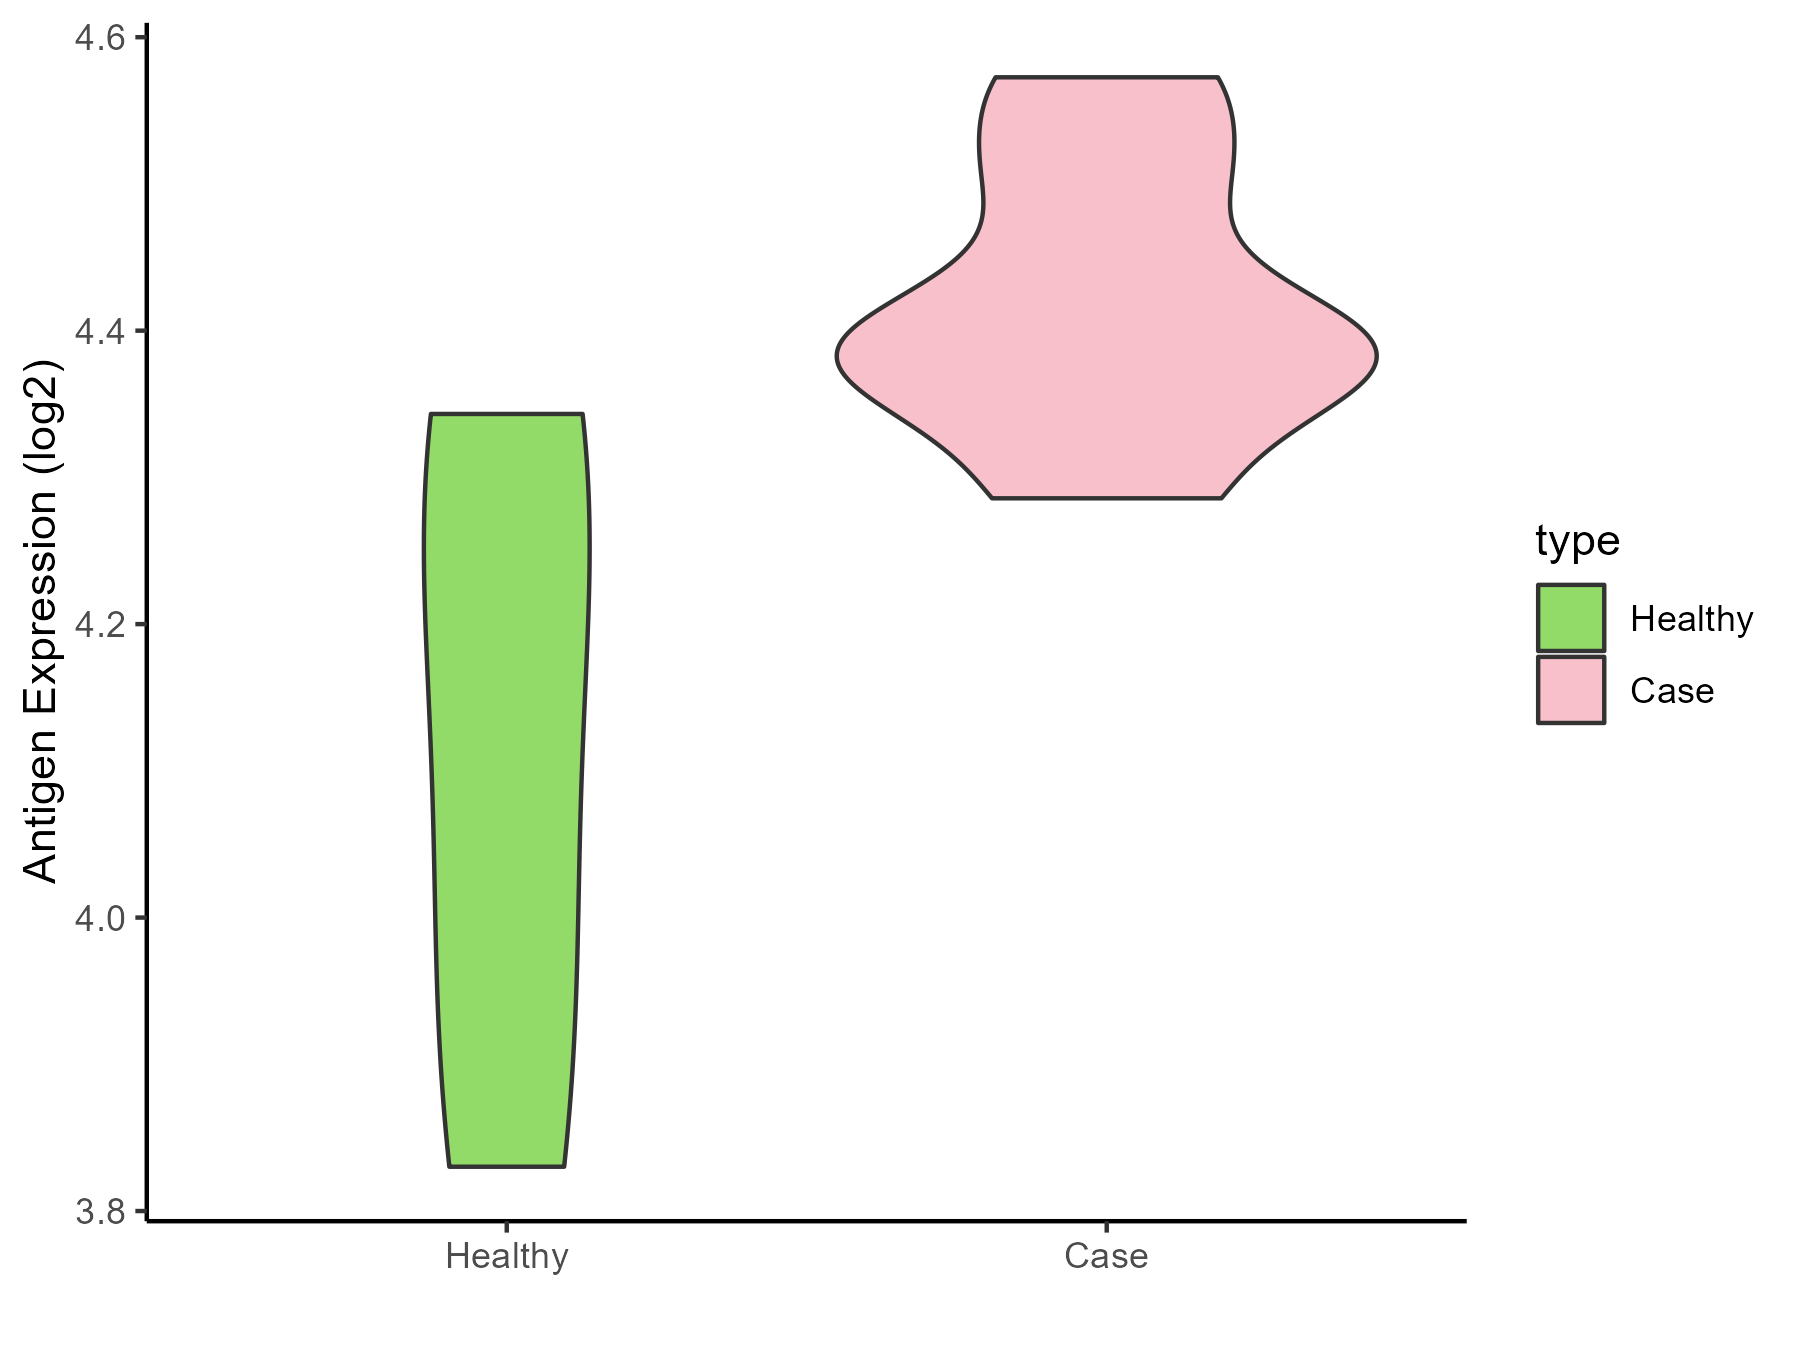
|
Click to View the Clearer Original Diagram |
ICD Disease Classification 3
| Differential expression pattern of antigen in diseases | ||
| The Studied Tissue | Bone marrow | |
| The Specific Disease | Anemia | |
| The Expression Level of Disease Section Compare with the Healthy Individual Tissue | p-value: 0.056871452; Fold-change: 0.714282409; Z-score: 1.667897026 | |
| Disease-specific Antigen Abundances |
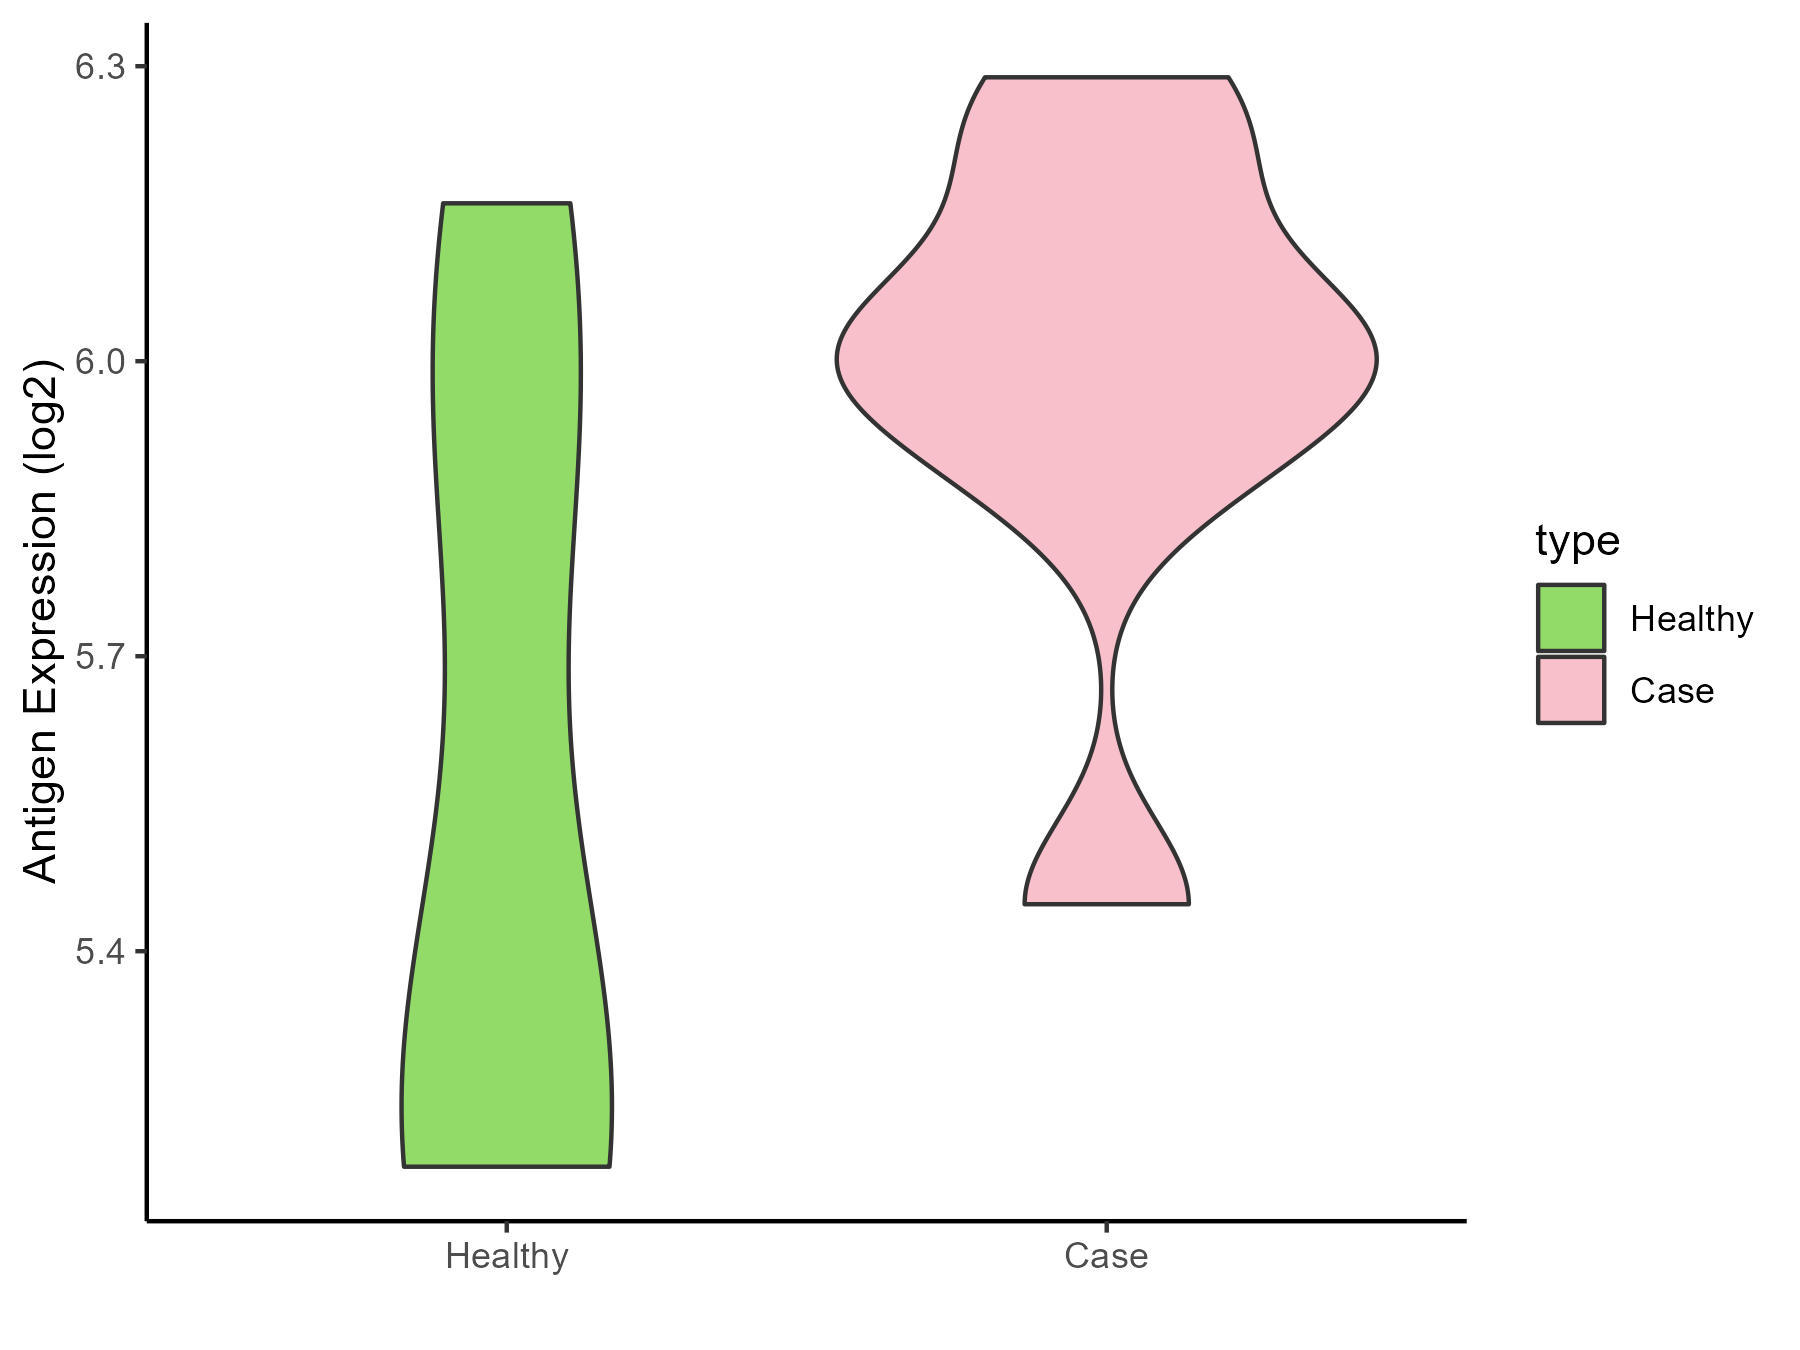
|
Click to View the Clearer Original Diagram |
| Differential expression pattern of antigen in diseases | ||
| The Studied Tissue | Peripheral blood | |
| The Specific Disease | Sickle cell disease | |
| The Expression Level of Disease Section Compare with the Healthy Individual Tissue | p-value: 0.277108; Fold-change: 0.095389332; Z-score: 0.392017394 | |
| Disease-specific Antigen Abundances |
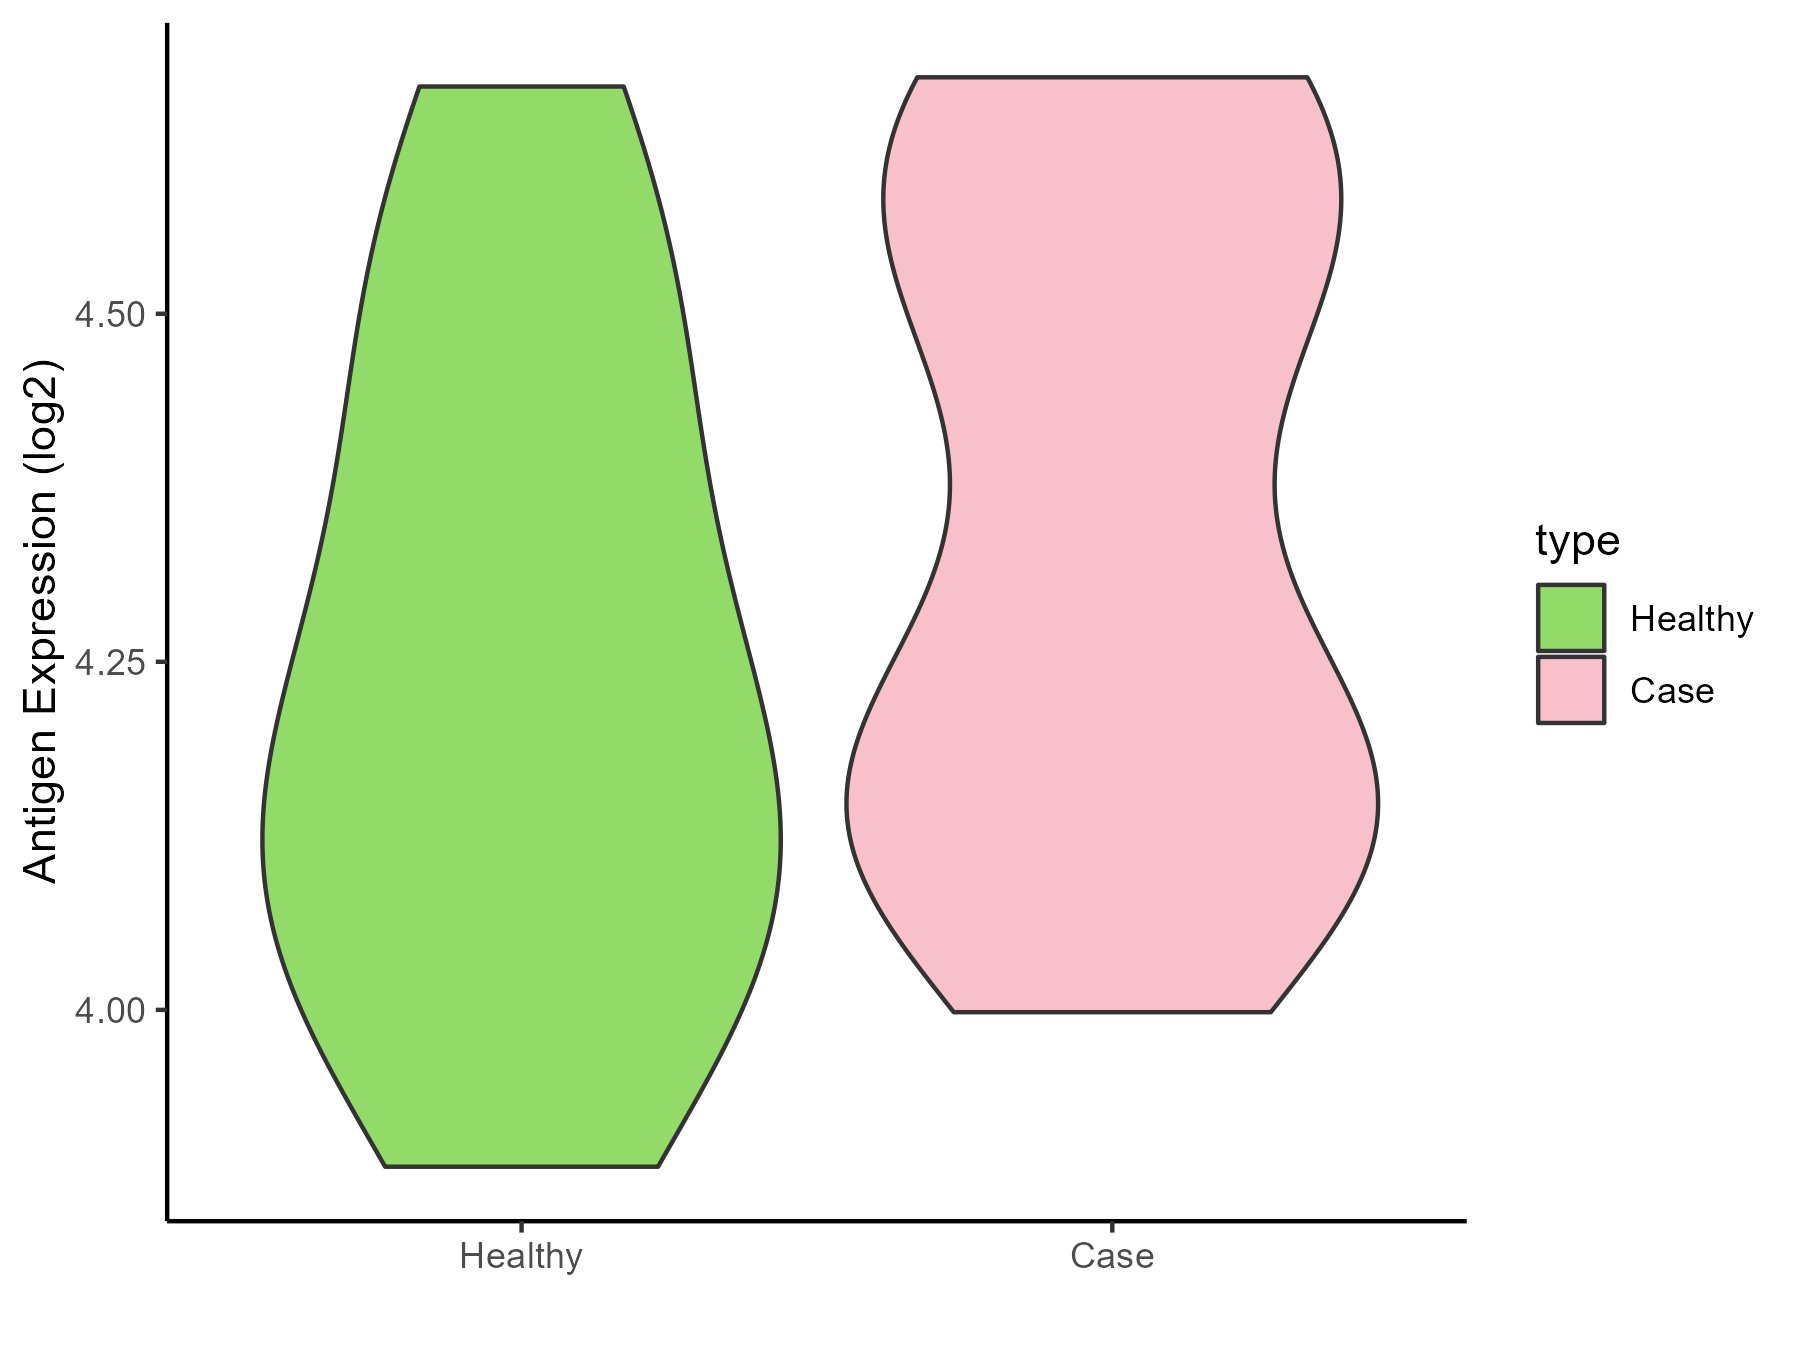
|
Click to View the Clearer Original Diagram |
| Differential expression pattern of antigen in diseases | ||
| The Studied Tissue | Whole blood | |
| The Specific Disease | Thrombocythemia | |
| The Expression Level of Disease Section Compare with the Healthy Individual Tissue | p-value: 0.203720308; Fold-change: 0.06210334; Z-score: 0.408177455 | |
| Disease-specific Antigen Abundances |
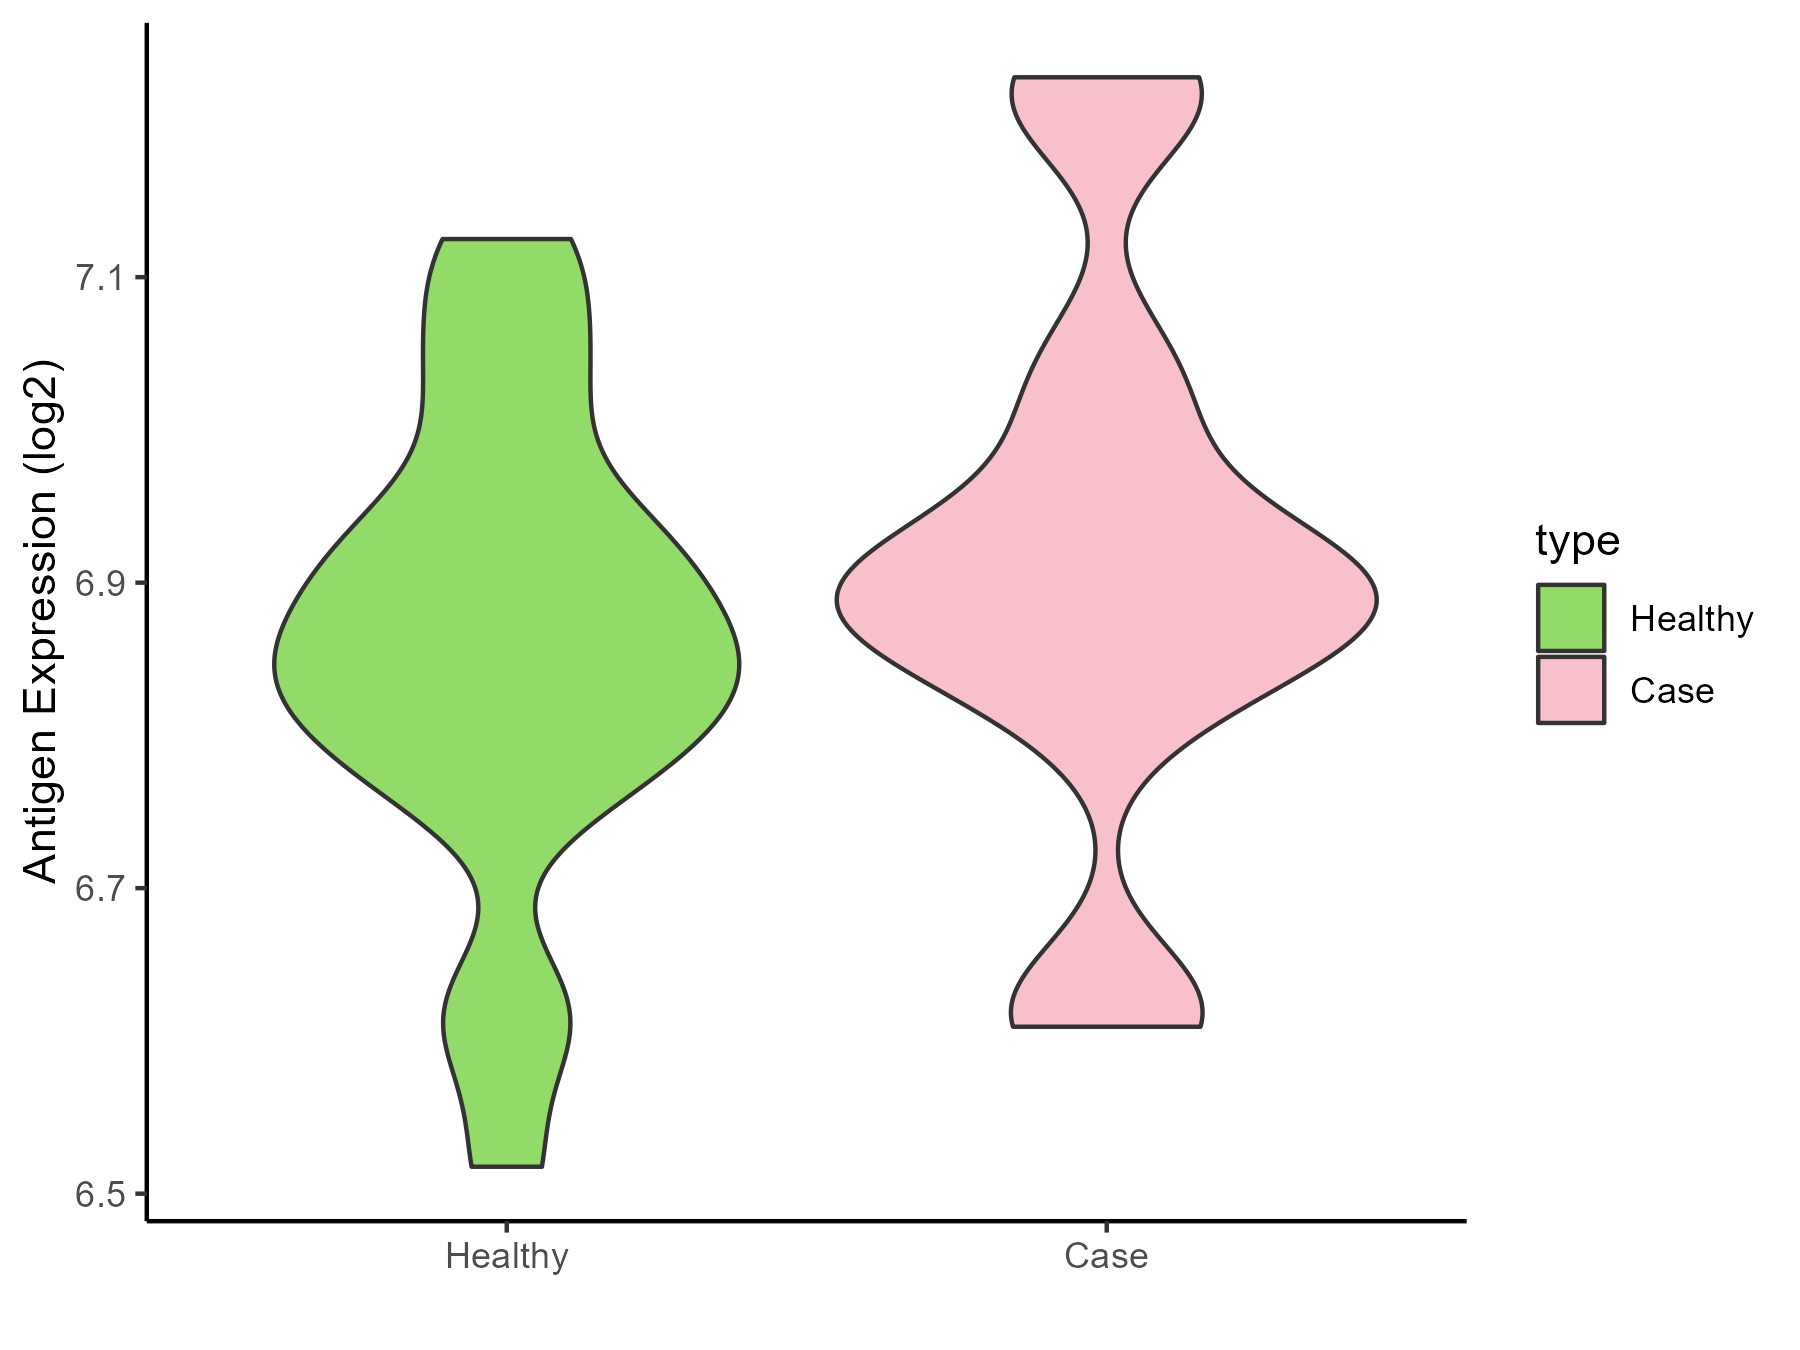
|
Click to View the Clearer Original Diagram |
ICD Disease Classification 4
| Differential expression pattern of antigen in diseases | ||
| The Studied Tissue | Whole blood | |
| The Specific Disease | Scleroderma | |
| The Expression Level of Disease Section Compare with the Healthy Individual Tissue | p-value: 0.017626982; Fold-change: -0.16727954; Z-score: -1.270306628 | |
| Disease-specific Antigen Abundances |
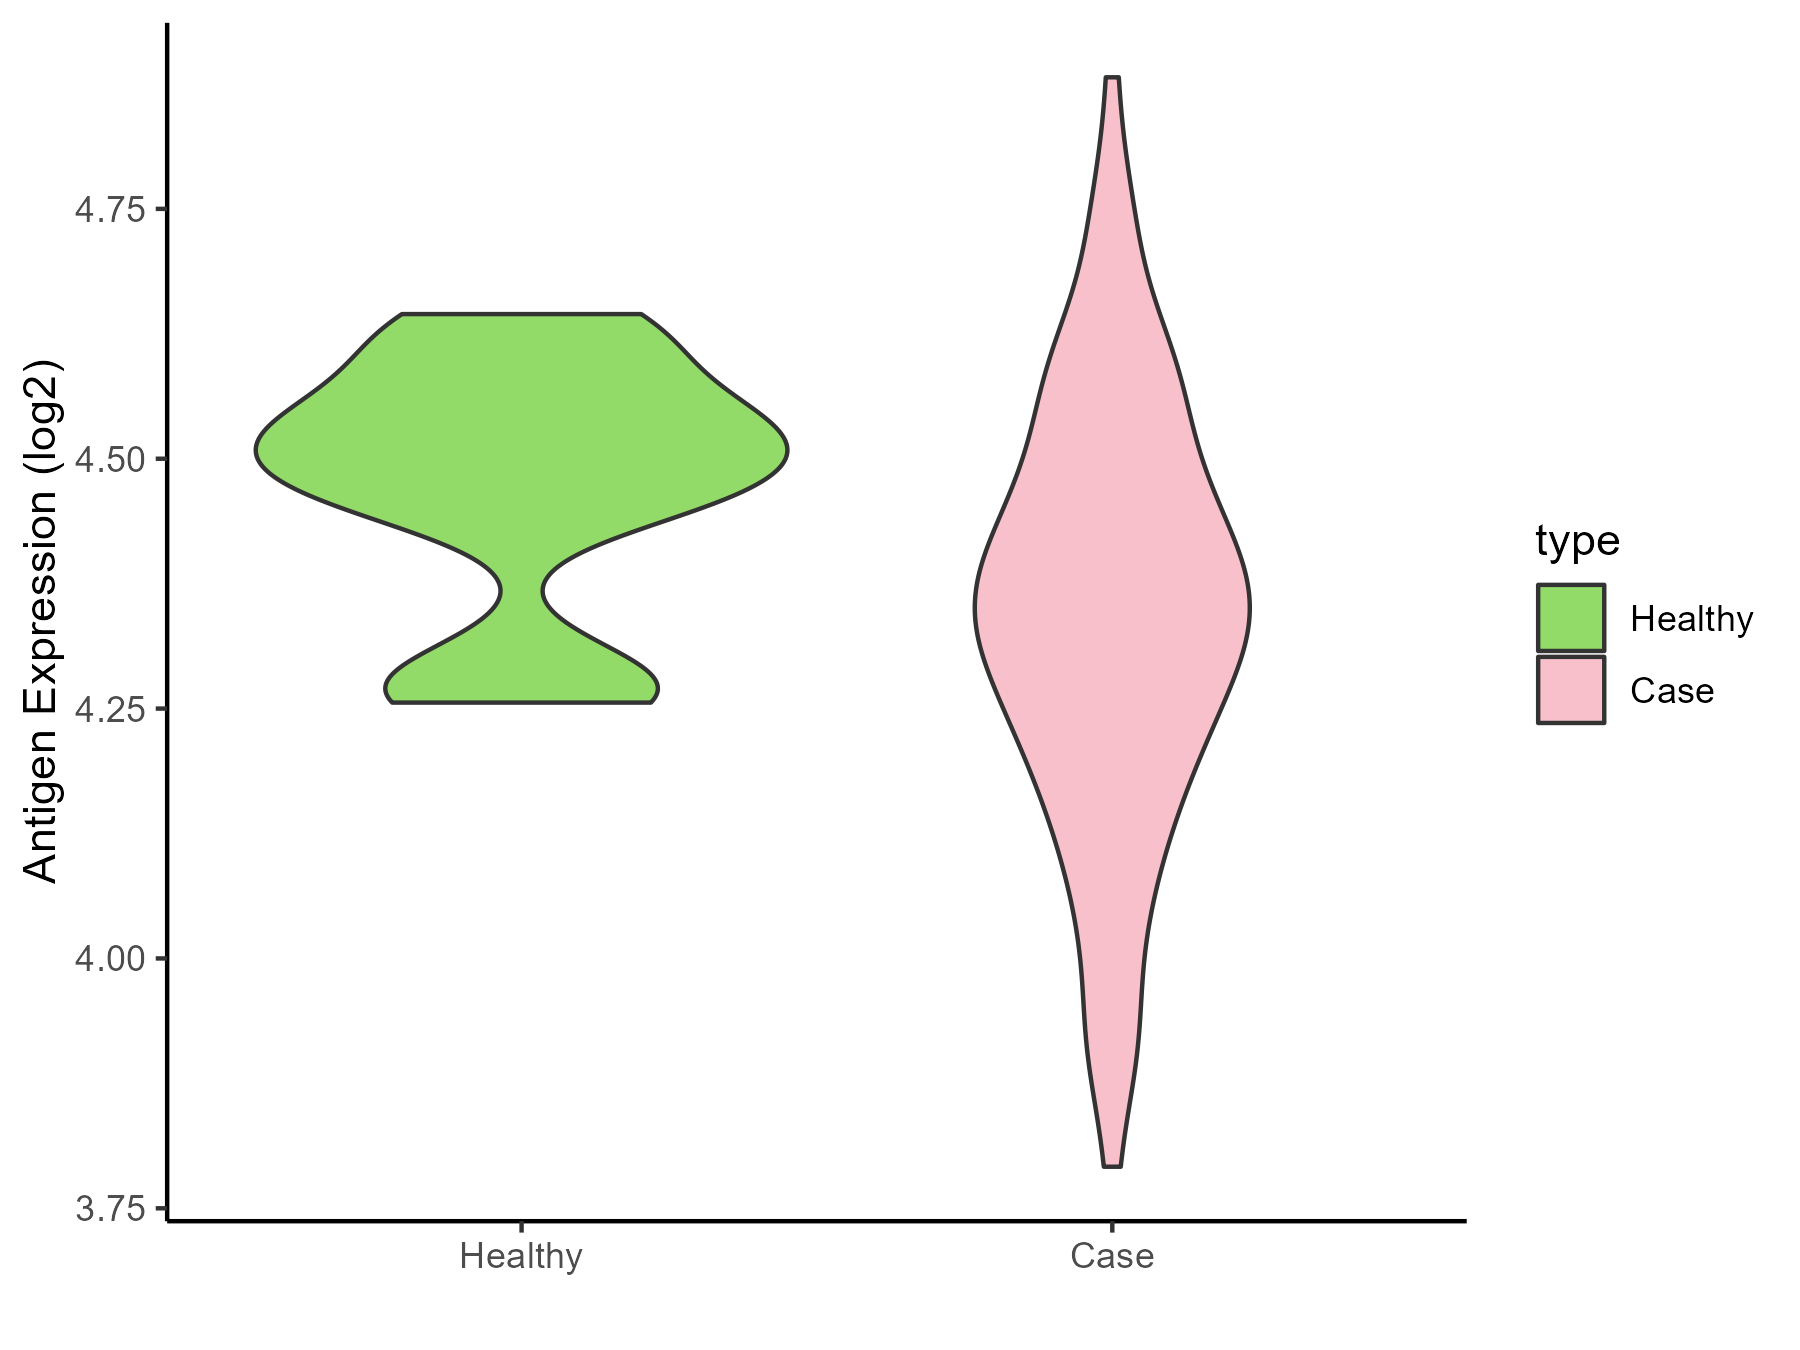
|
Click to View the Clearer Original Diagram |
| Differential expression pattern of antigen in diseases | ||
| The Studied Tissue | Salivary gland | |
| The Specific Disease | Sjogren syndrome | |
| The Expression Level of Disease Section Compare with the Healthy Individual Tissue | p-value: 0.219555624; Fold-change: 0.401515374; Z-score: 0.802727293 | |
| The Expression Level of Disease Section Compare with the Adjacent Tissue | p-value: 0.002961811; Fold-change: -0.842359448; Z-score: -2.480067337 | |
| Disease-specific Antigen Abundances |
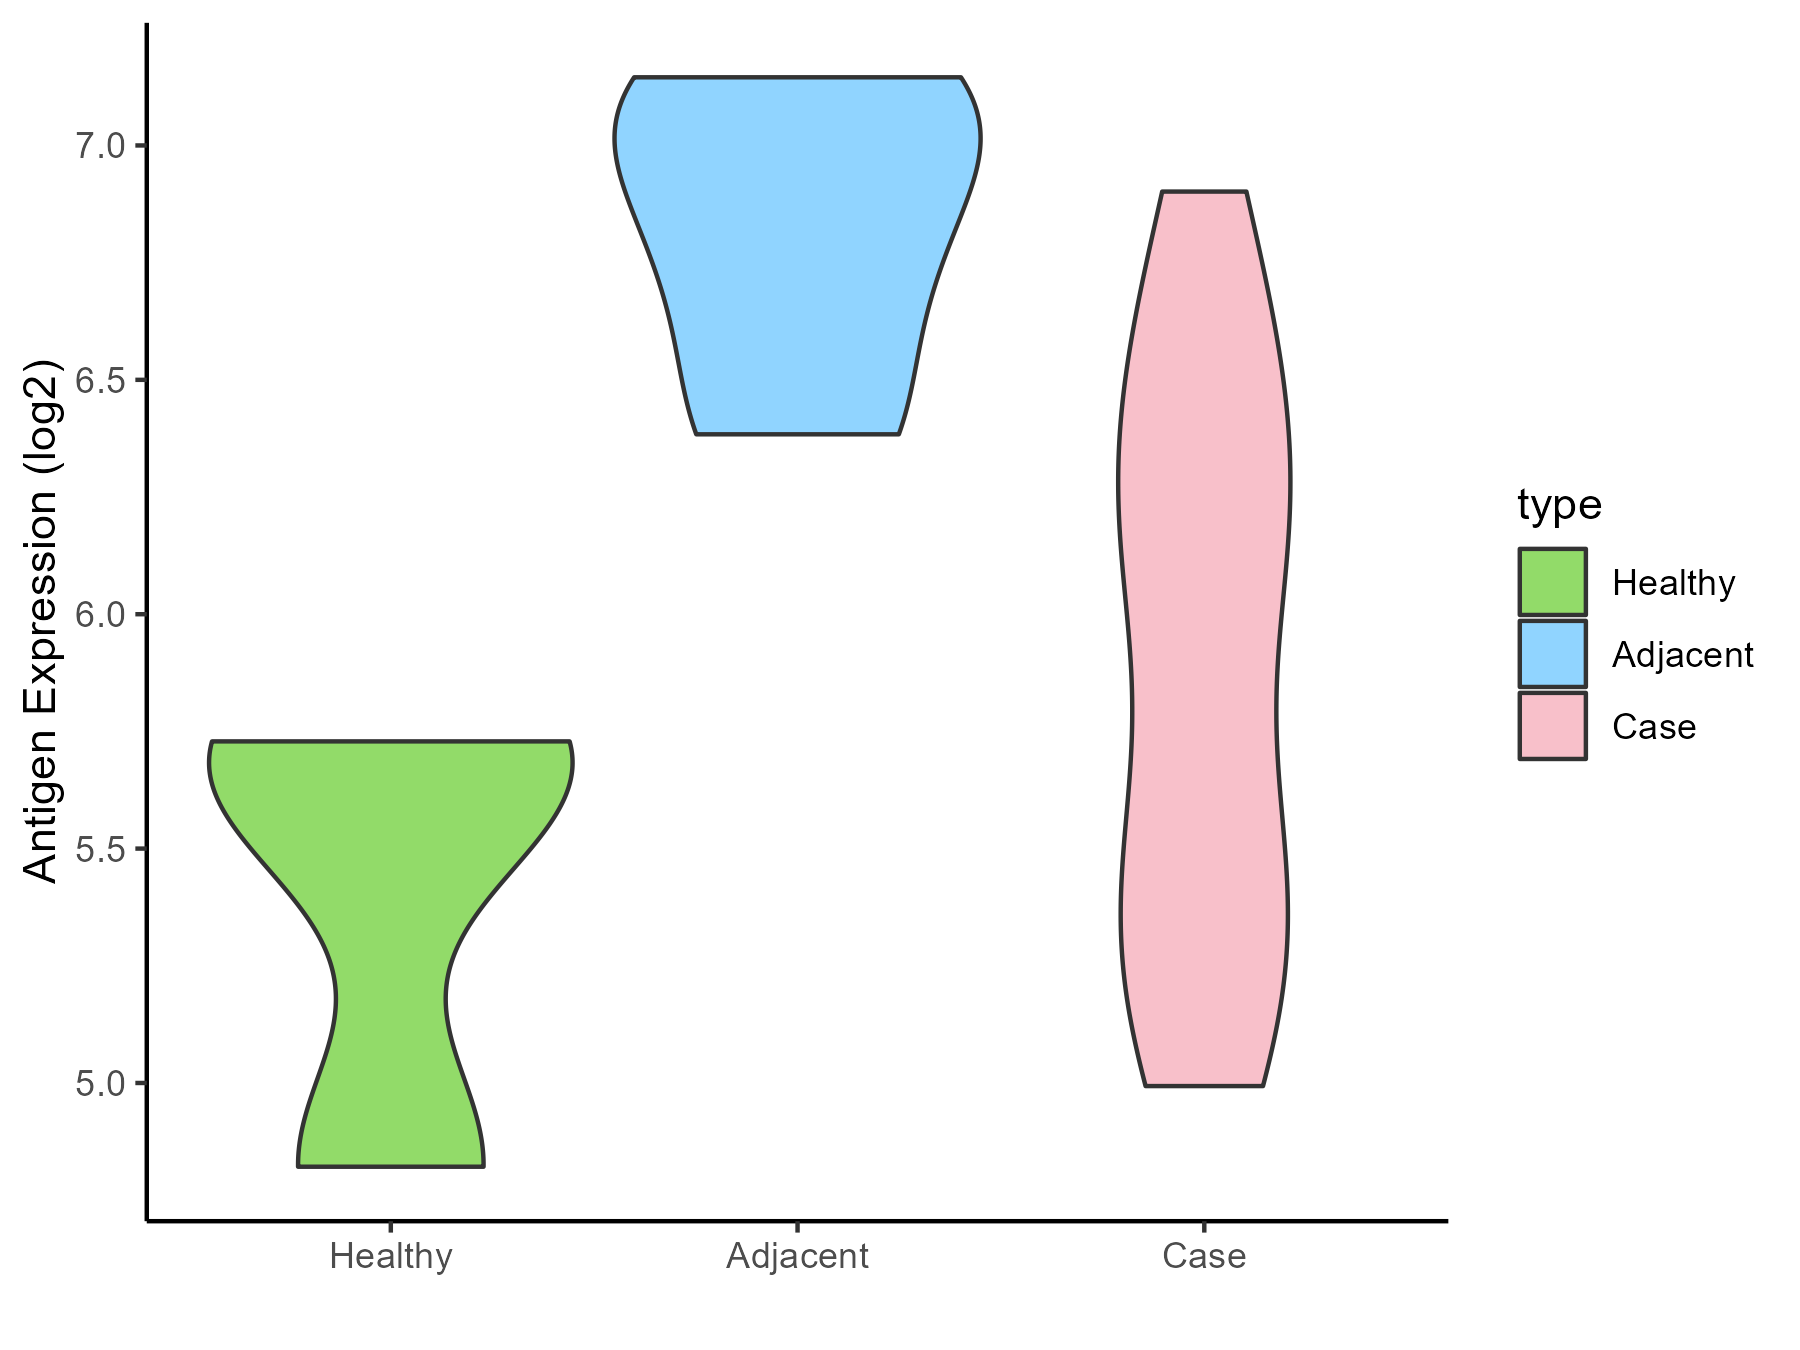
|
Click to View the Clearer Original Diagram |
| Differential expression pattern of antigen in diseases | ||
| The Studied Tissue | Peripheral blood | |
| The Specific Disease | Behcet disease | |
| The Expression Level of Disease Section Compare with the Healthy Individual Tissue | p-value: 0.596404505; Fold-change: -0.018694152; Z-score: -0.097984568 | |
| Disease-specific Antigen Abundances |
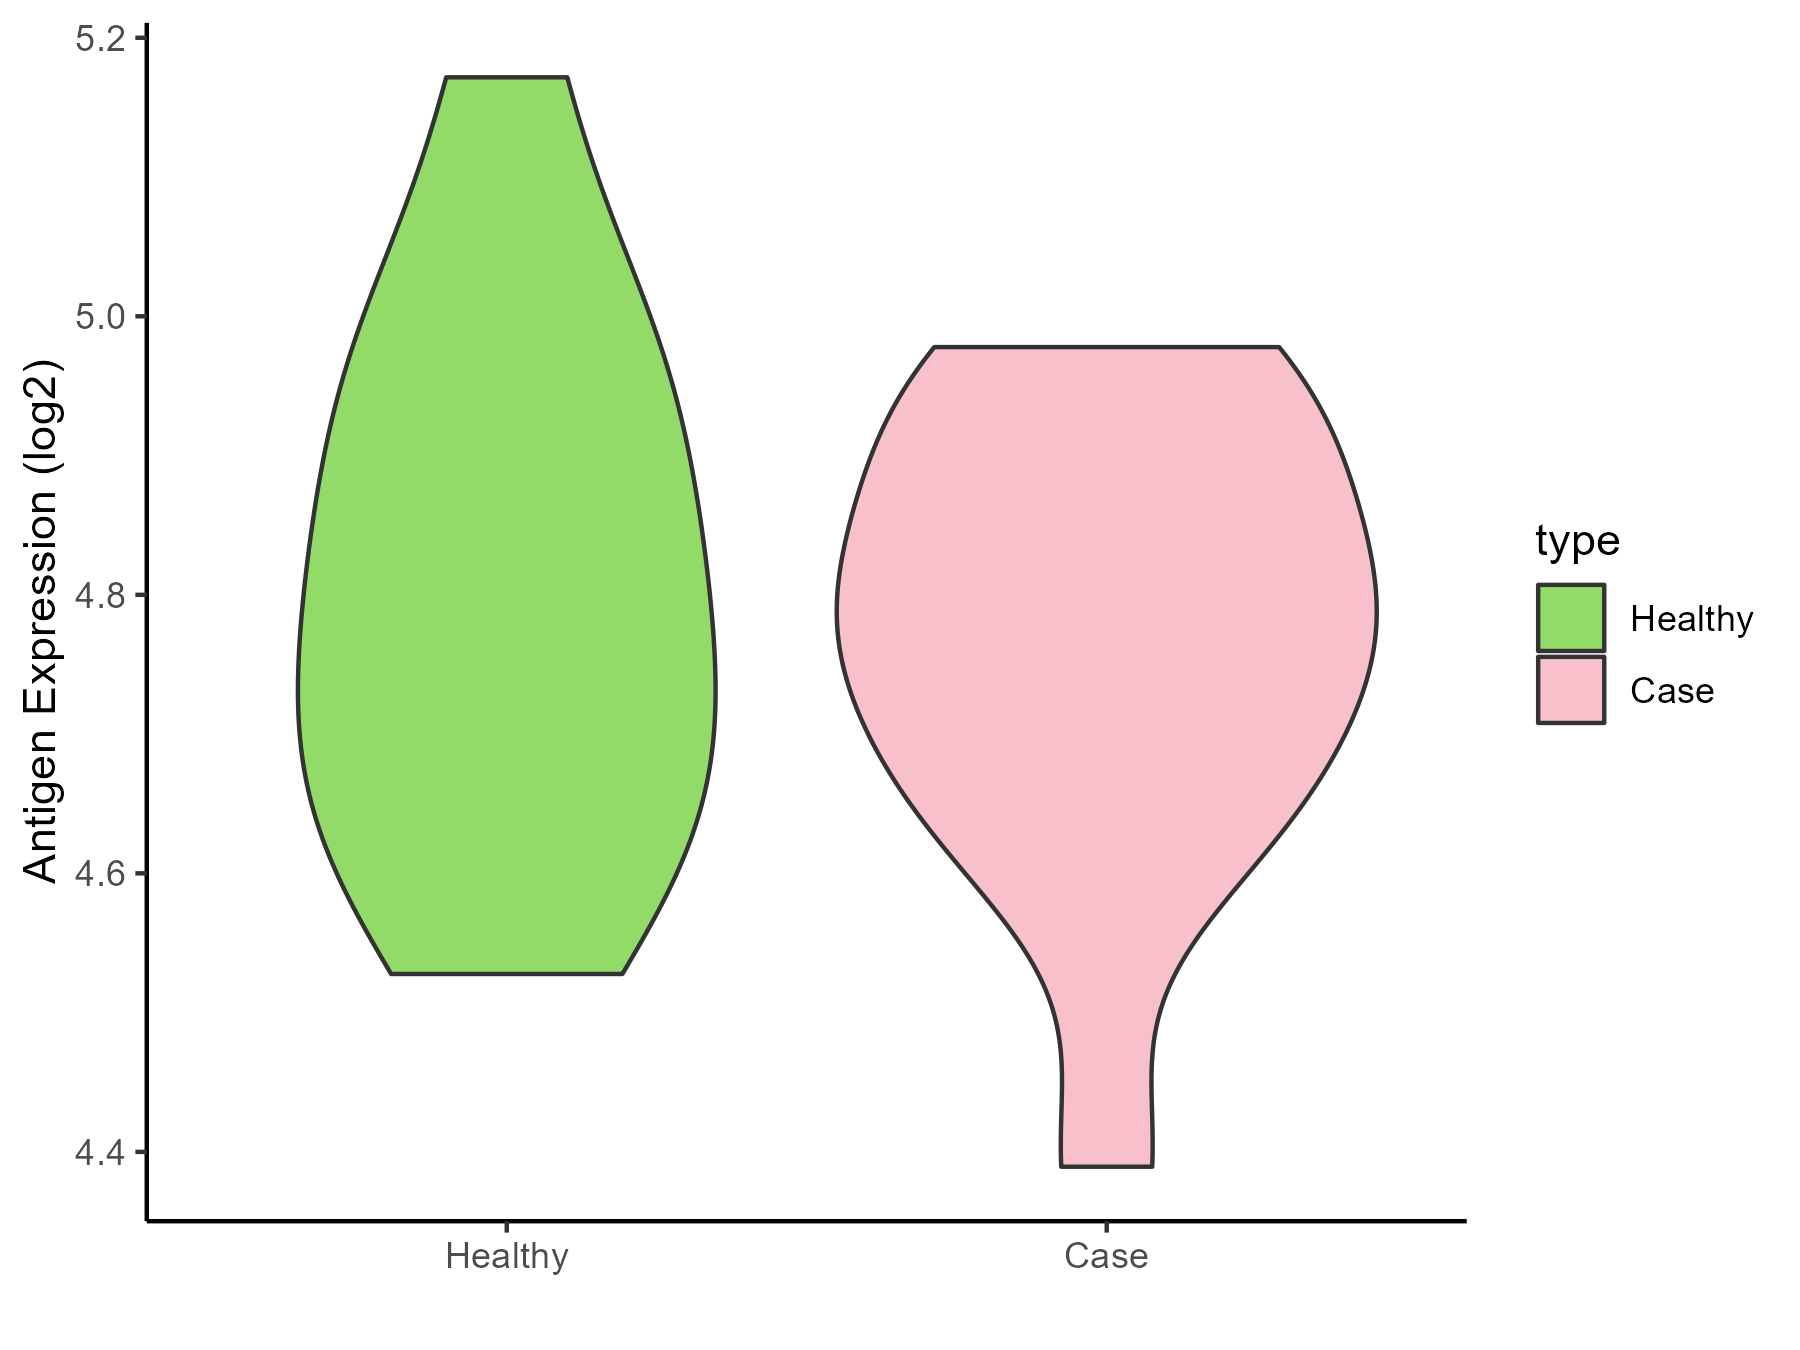
|
Click to View the Clearer Original Diagram |
| Differential expression pattern of antigen in diseases | ||
| The Studied Tissue | Whole blood | |
| The Specific Disease | Autosomal dominant monocytopenia | |
| The Expression Level of Disease Section Compare with the Healthy Individual Tissue | p-value: 0.778417804; Fold-change: -0.053832; Z-score: -0.46066501 | |
| Disease-specific Antigen Abundances |
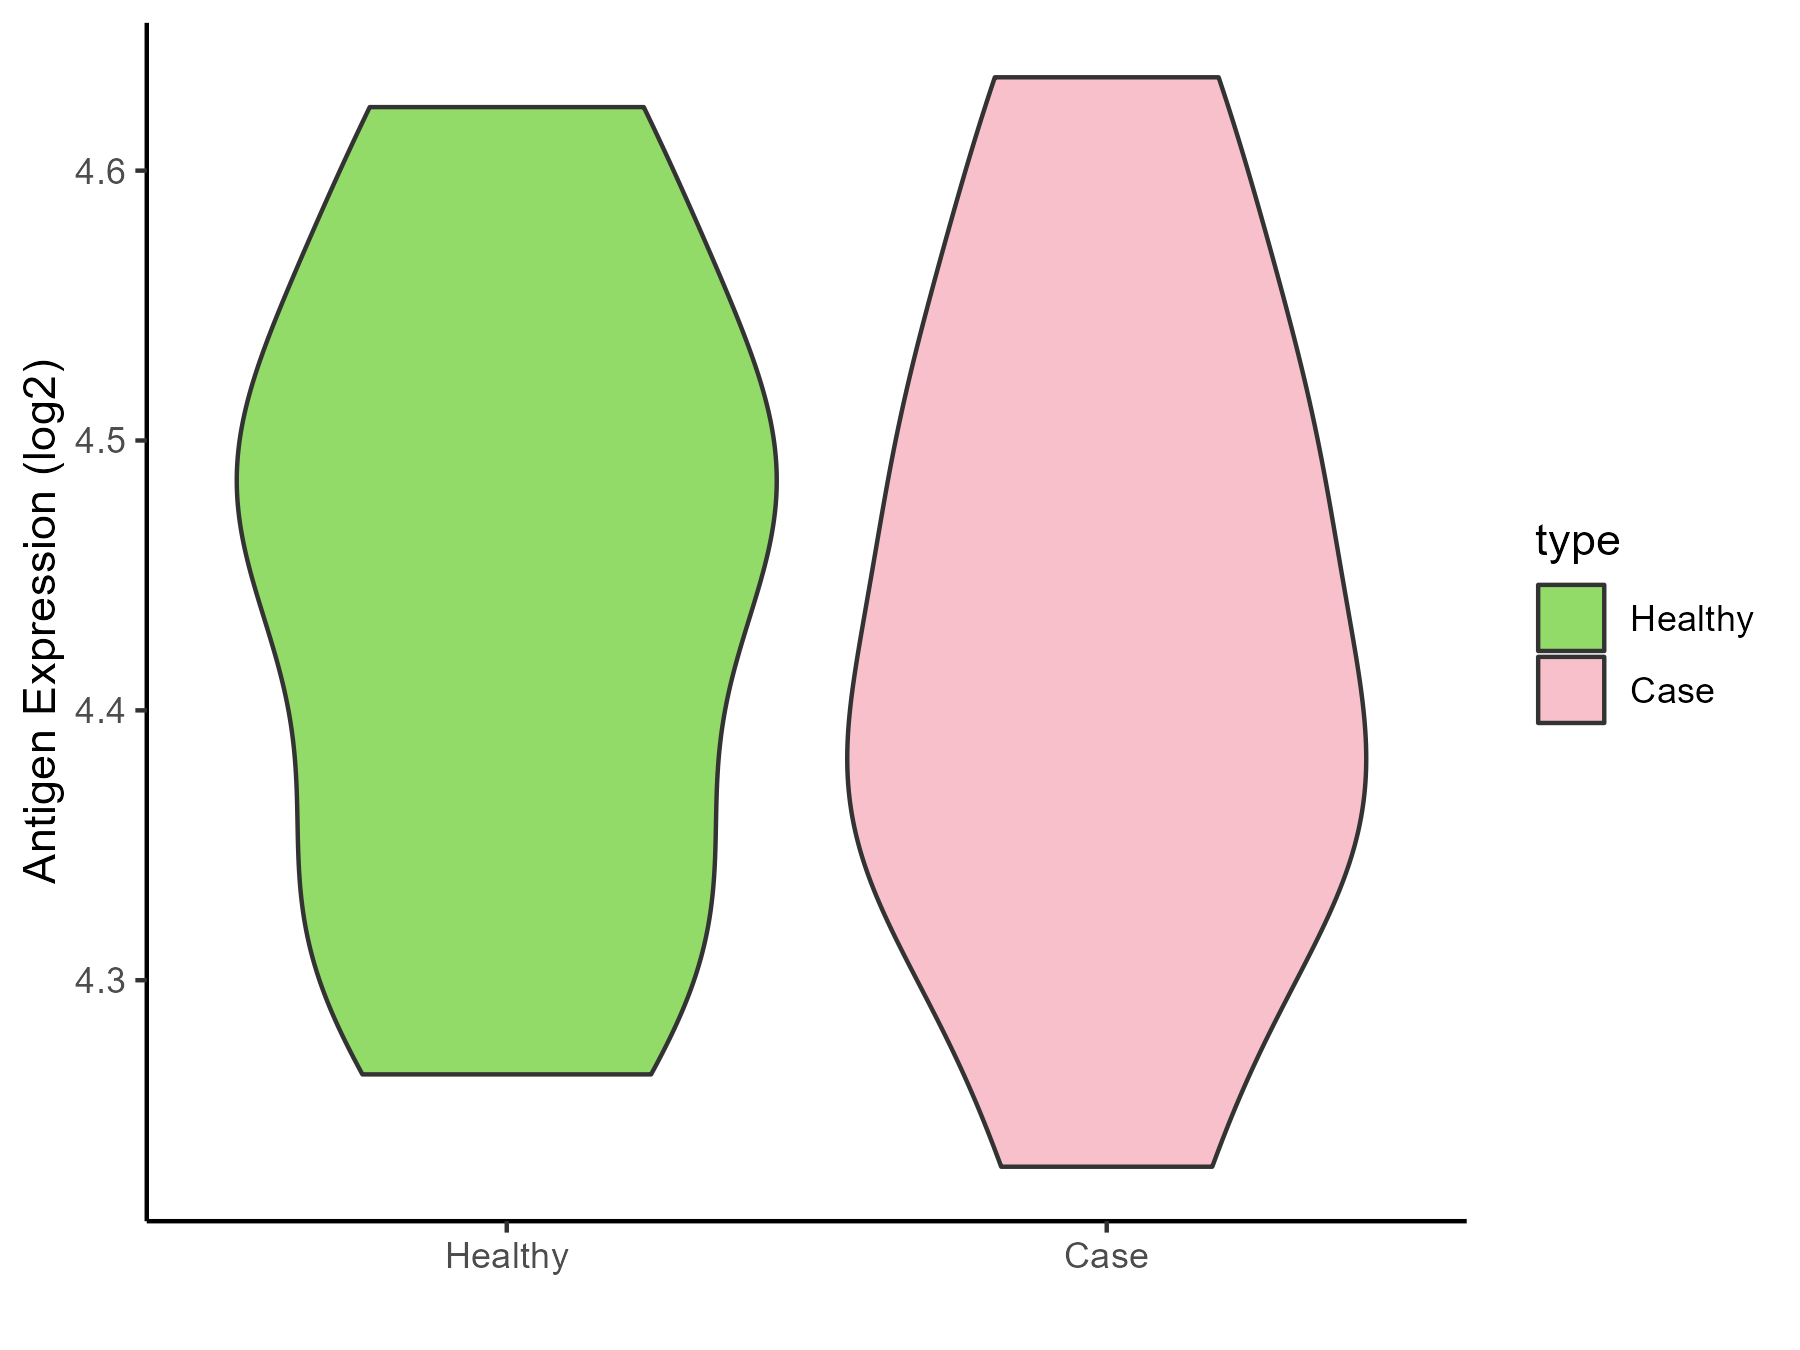
|
Click to View the Clearer Original Diagram |
ICD Disease Classification 5
| Differential expression pattern of antigen in diseases | ||
| The Studied Tissue | Liver | |
| The Specific Disease | Type 2 diabetes | |
| The Expression Level of Disease Section Compare with the Healthy Individual Tissue | p-value: 0.949677634; Fold-change: -0.406337736; Z-score: -0.511049171 | |
| Disease-specific Antigen Abundances |
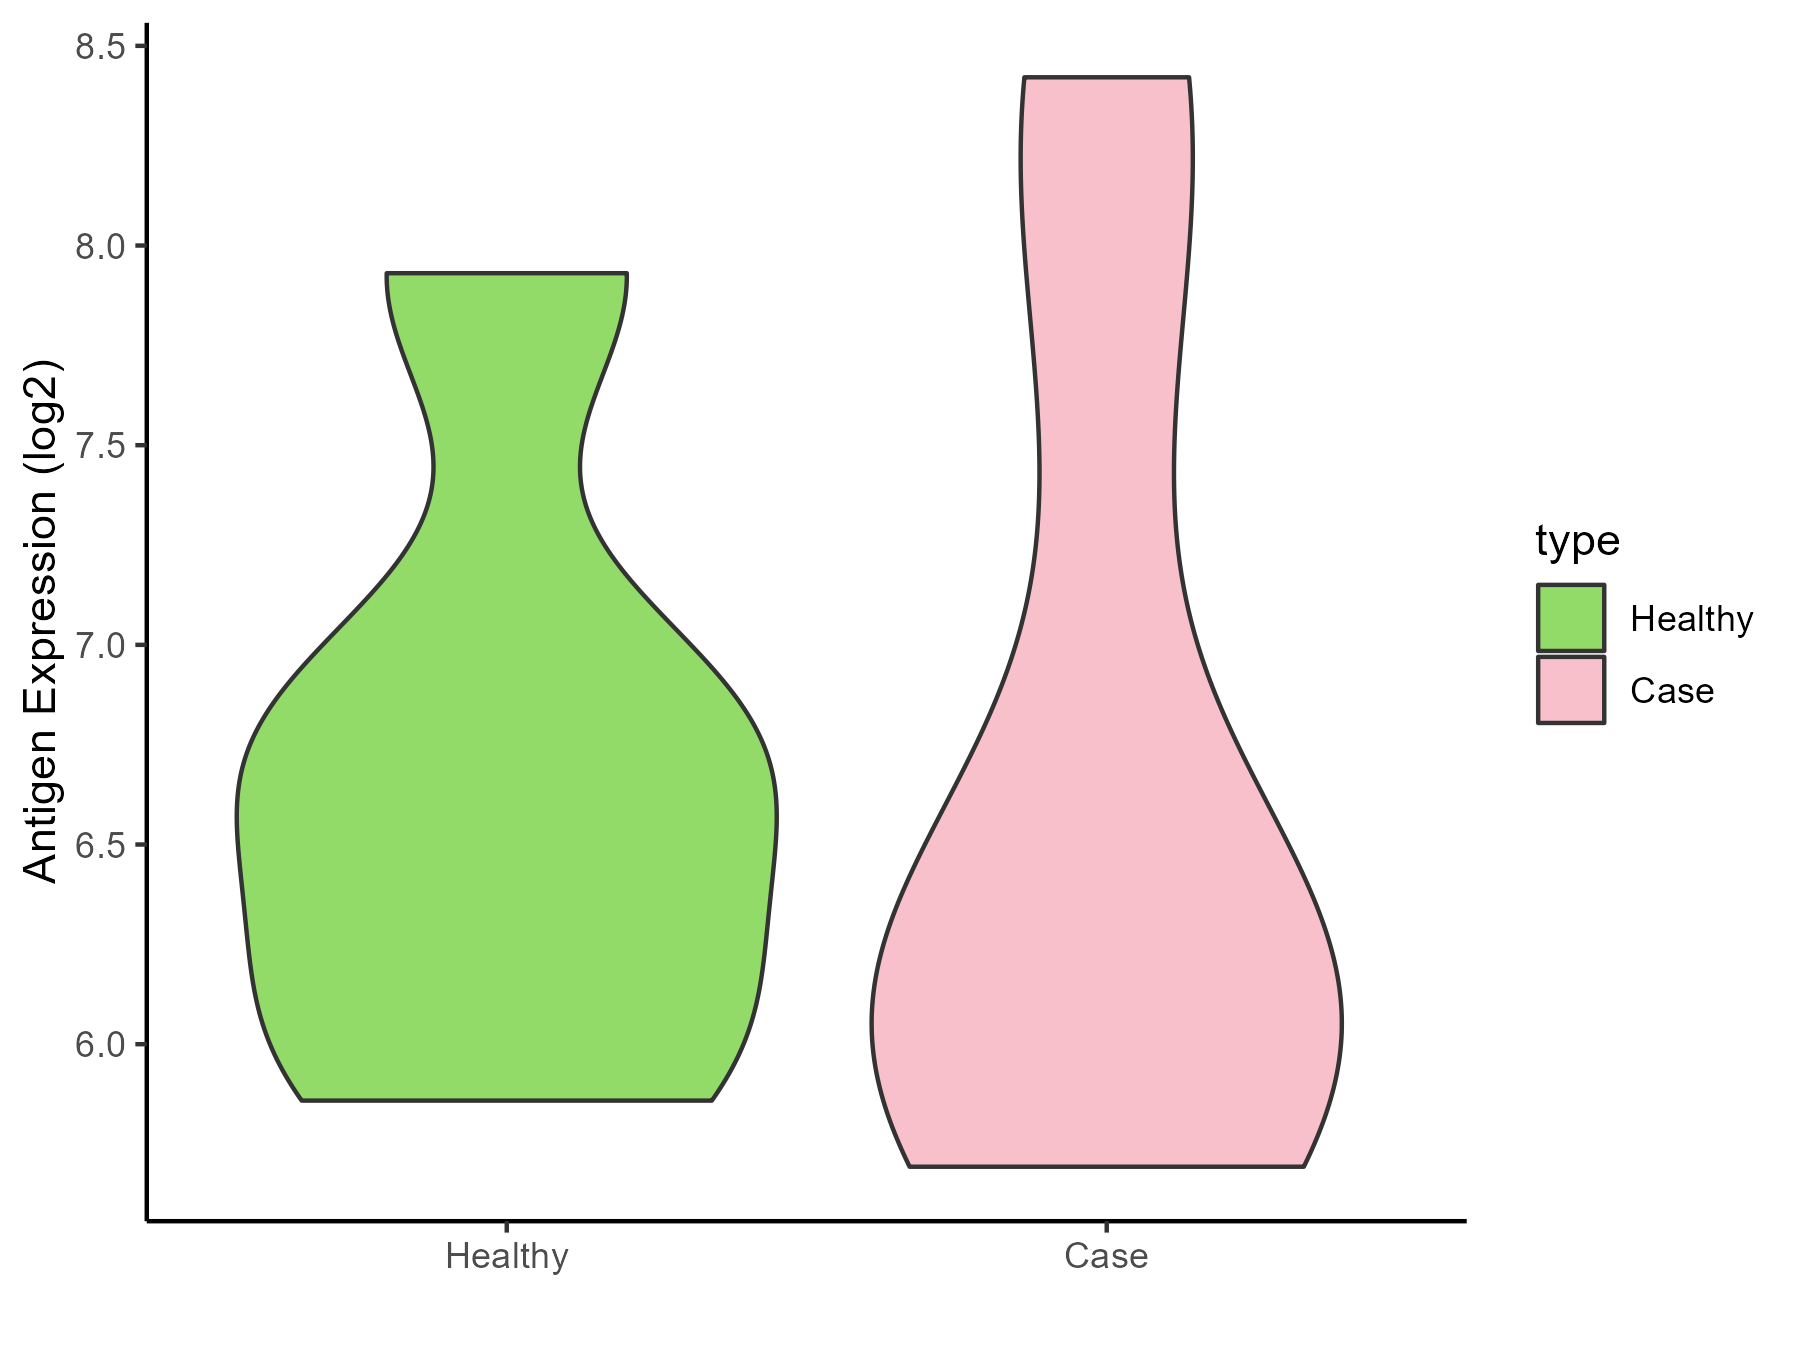
|
Click to View the Clearer Original Diagram |
| Differential expression pattern of antigen in diseases | ||
| The Studied Tissue | Vastus lateralis muscle | |
| The Specific Disease | Polycystic ovary syndrome | |
| The Expression Level of Disease Section Compare with the Healthy Individual Tissue | p-value: 0.546835014; Fold-change: -0.06801586; Z-score: -0.280234912 | |
| Disease-specific Antigen Abundances |
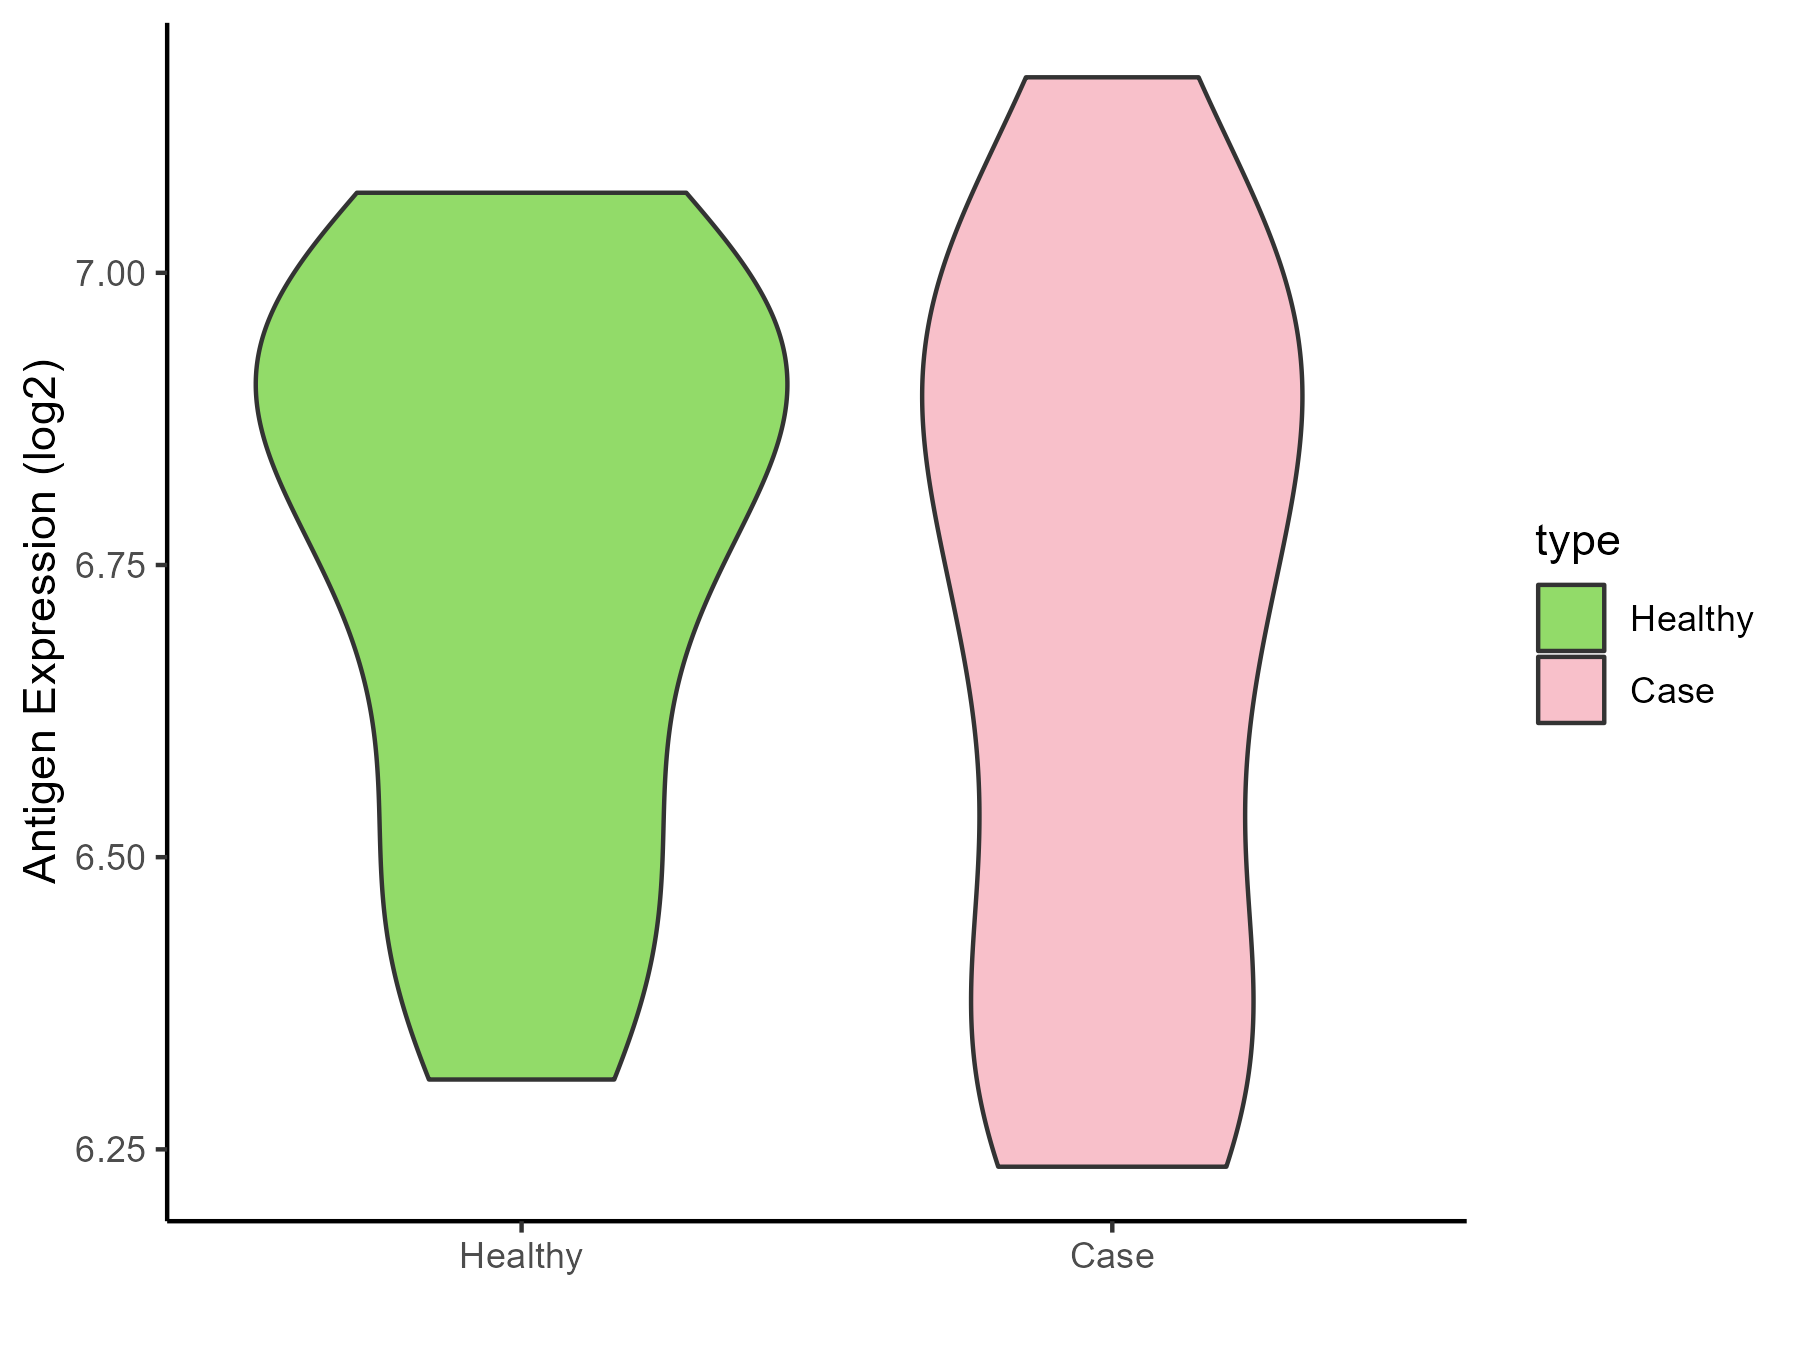
|
Click to View the Clearer Original Diagram |
| Differential expression pattern of antigen in diseases | ||
| The Studied Tissue | Subcutaneous Adipose | |
| The Specific Disease | Obesity | |
| The Expression Level of Disease Section Compare with the Healthy Individual Tissue | p-value: 0.124507134; Fold-change: -0.078661149; Z-score: -0.36928348 | |
| Disease-specific Antigen Abundances |
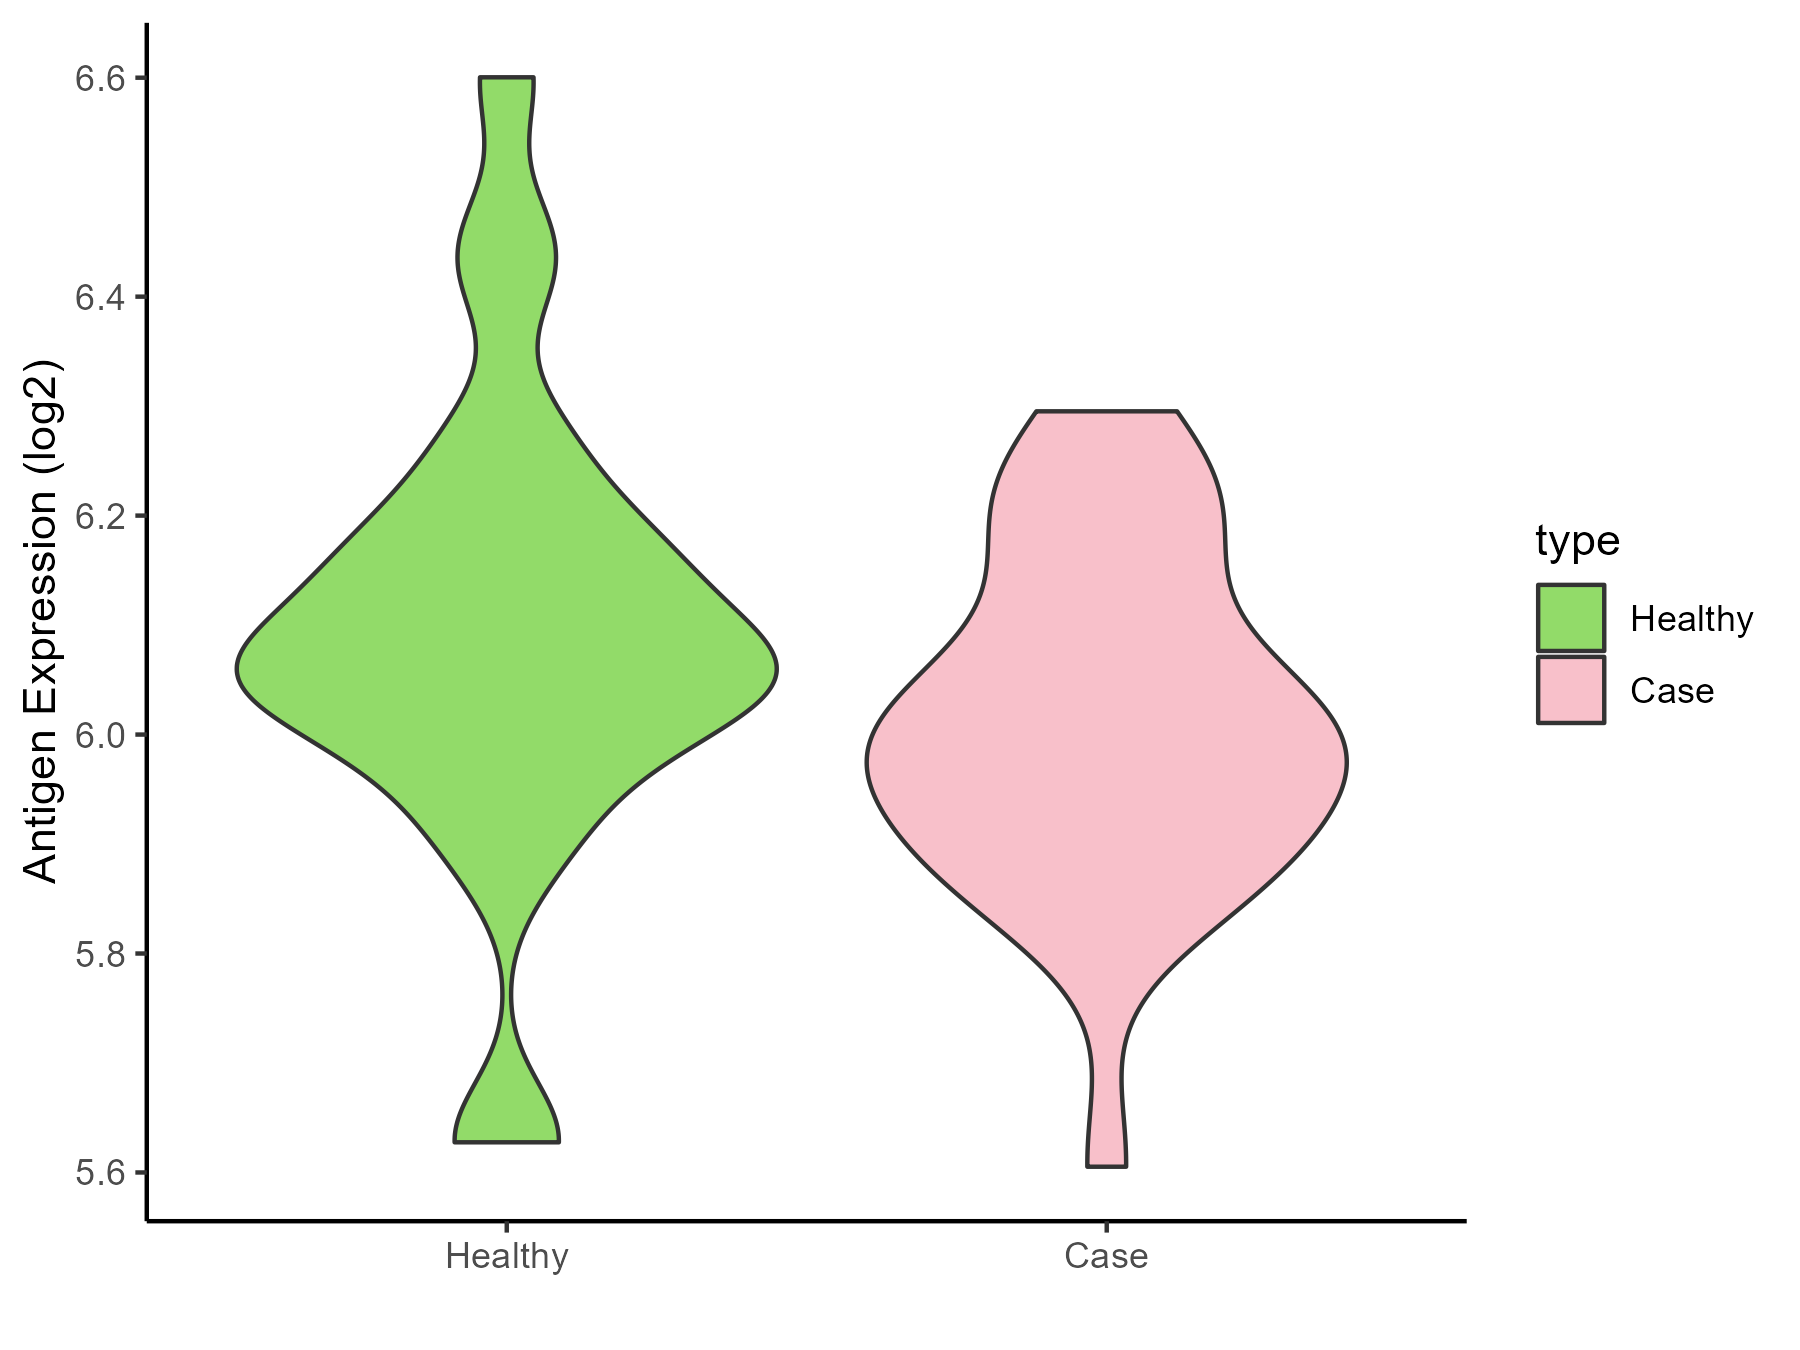
|
Click to View the Clearer Original Diagram |
| Differential expression pattern of antigen in diseases | ||
| The Studied Tissue | Biceps muscle | |
| The Specific Disease | Pompe disease | |
| The Expression Level of Disease Section Compare with the Healthy Individual Tissue | p-value: 0.144693726; Fold-change: 0.282351398; Z-score: 0.912041551 | |
| Disease-specific Antigen Abundances |
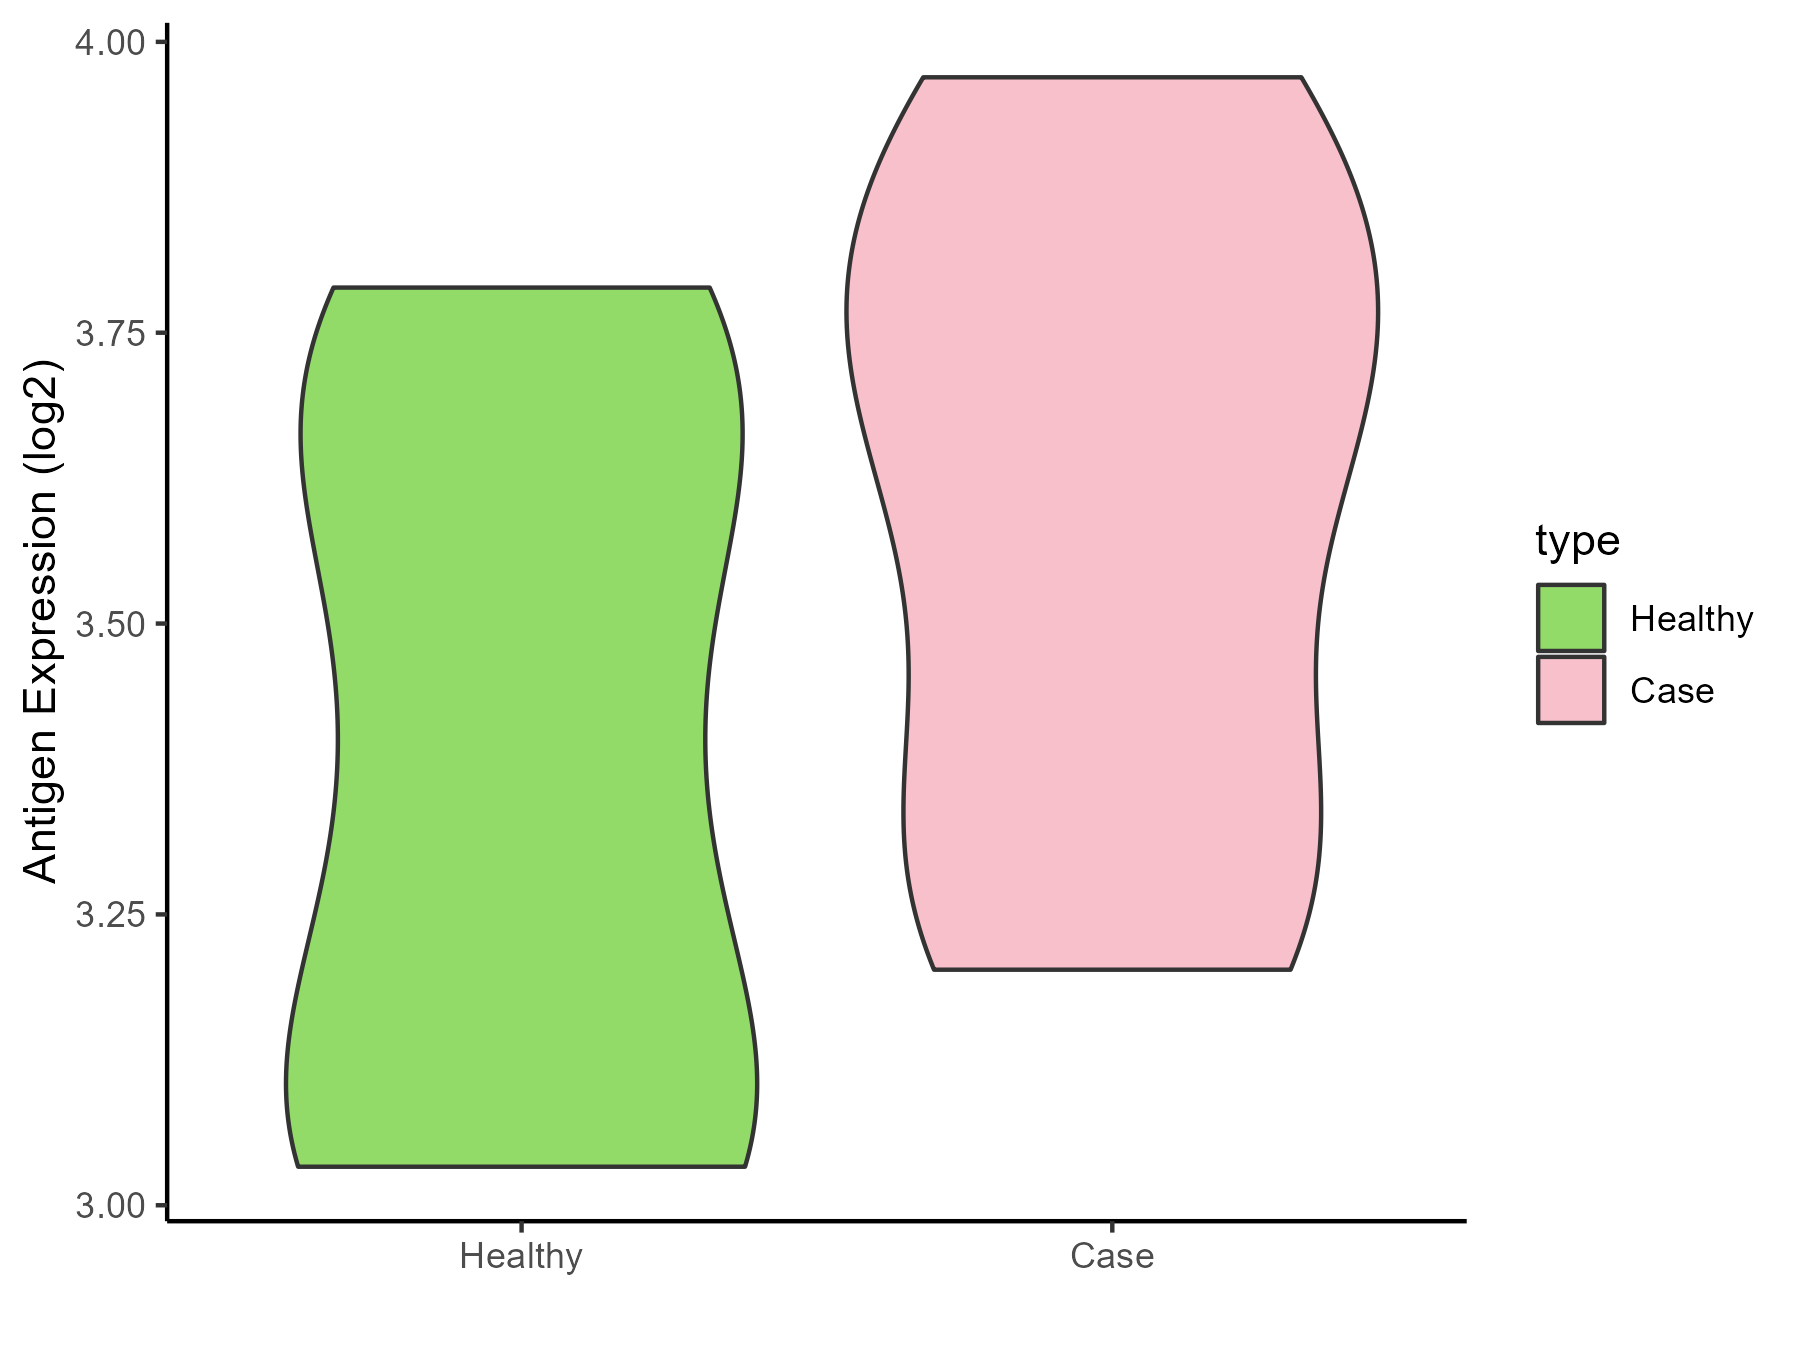
|
Click to View the Clearer Original Diagram |
| Differential expression pattern of antigen in diseases | ||
| The Studied Tissue | Whole blood | |
| The Specific Disease | Batten disease | |
| The Expression Level of Disease Section Compare with the Healthy Individual Tissue | p-value: 0.051539027; Fold-change: 0.098915352; Z-score: 1.441146048 | |
| Disease-specific Antigen Abundances |
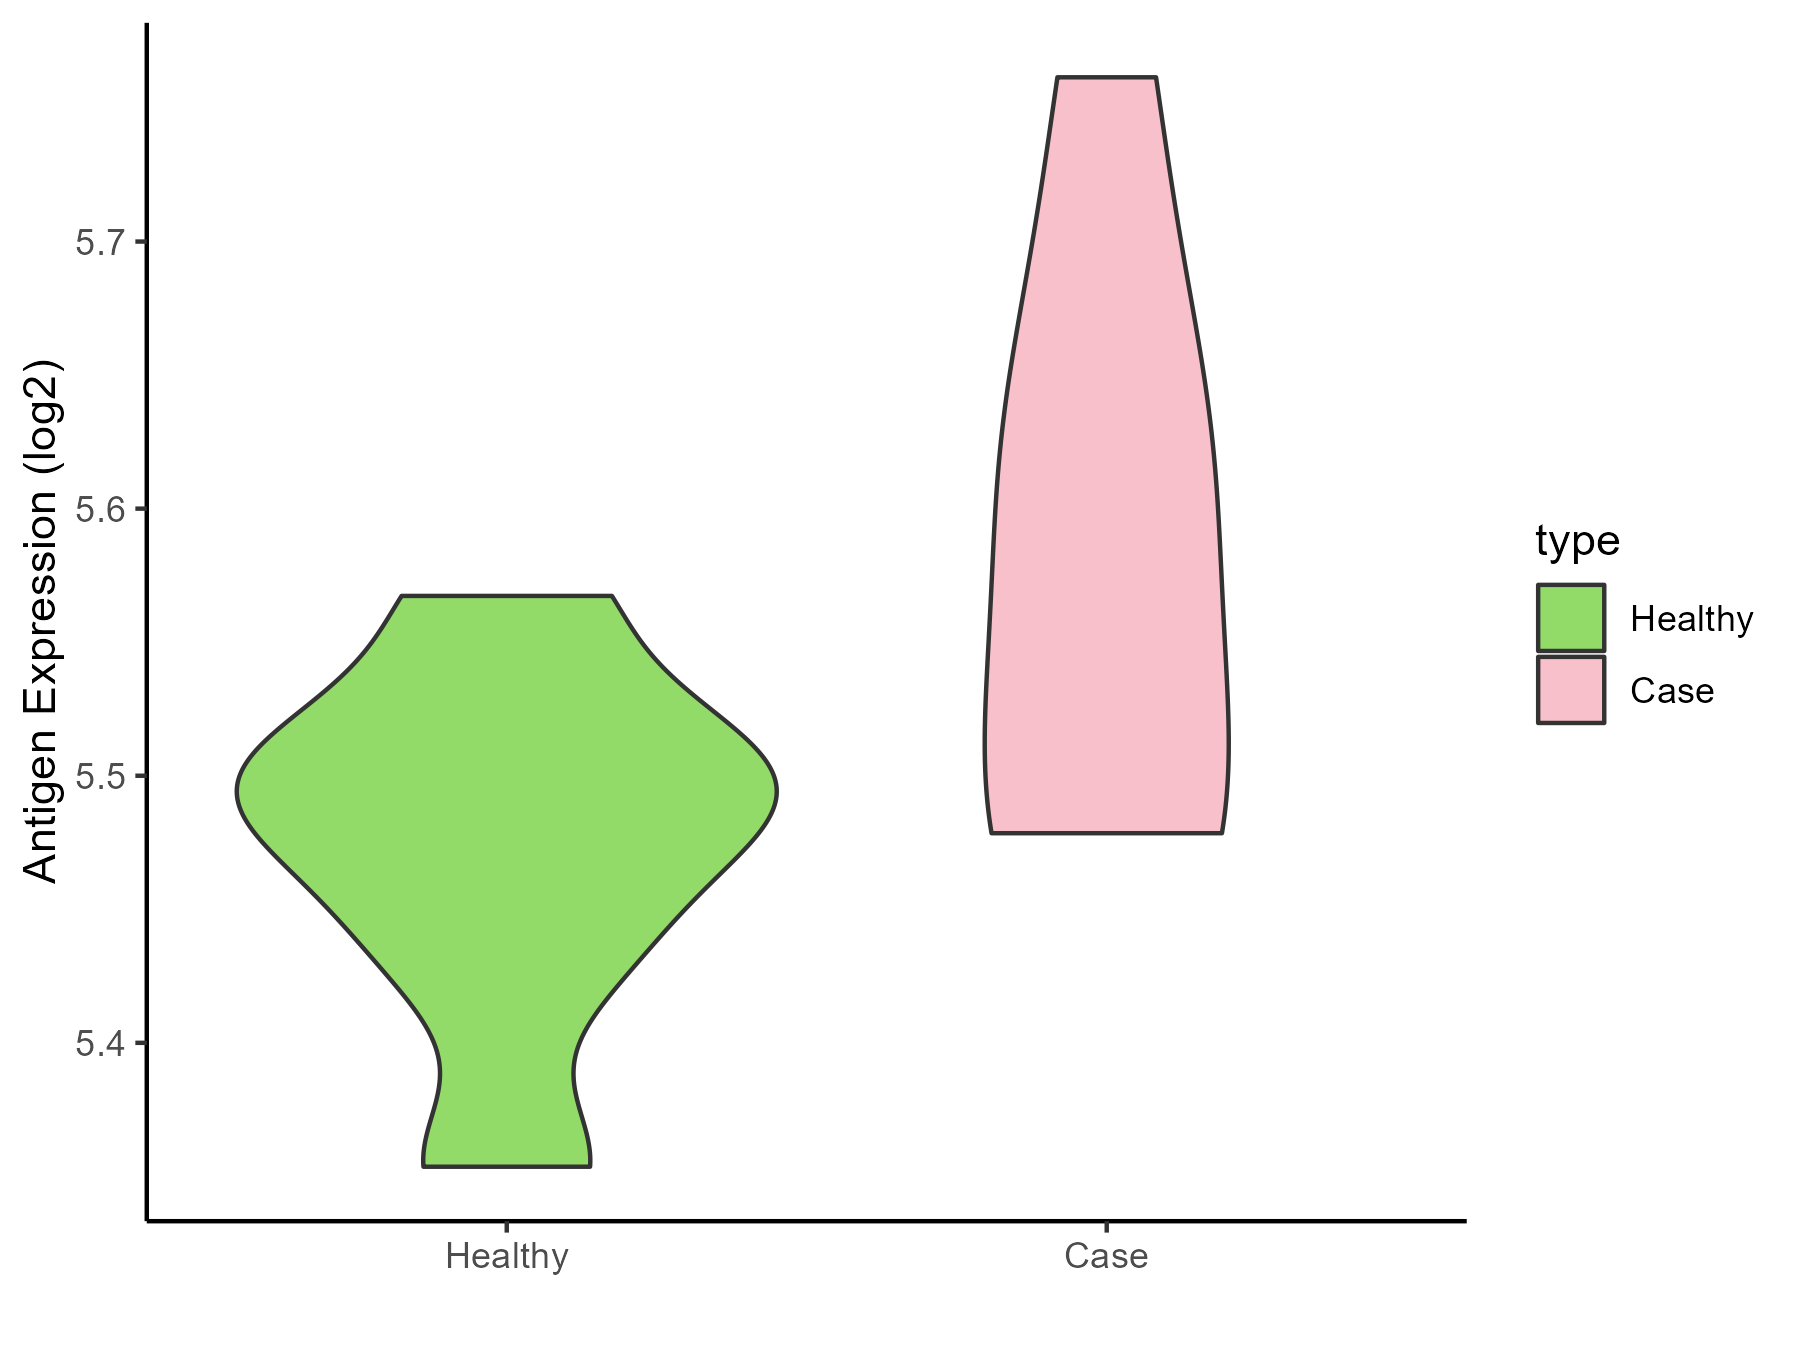
|
Click to View the Clearer Original Diagram |
ICD Disease Classification 6
| Differential expression pattern of antigen in diseases | ||
| The Studied Tissue | Whole blood | |
| The Specific Disease | Autism | |
| The Expression Level of Disease Section Compare with the Healthy Individual Tissue | p-value: 0.058857611; Fold-change: -0.104536145; Z-score: -0.500851731 | |
| Disease-specific Antigen Abundances |
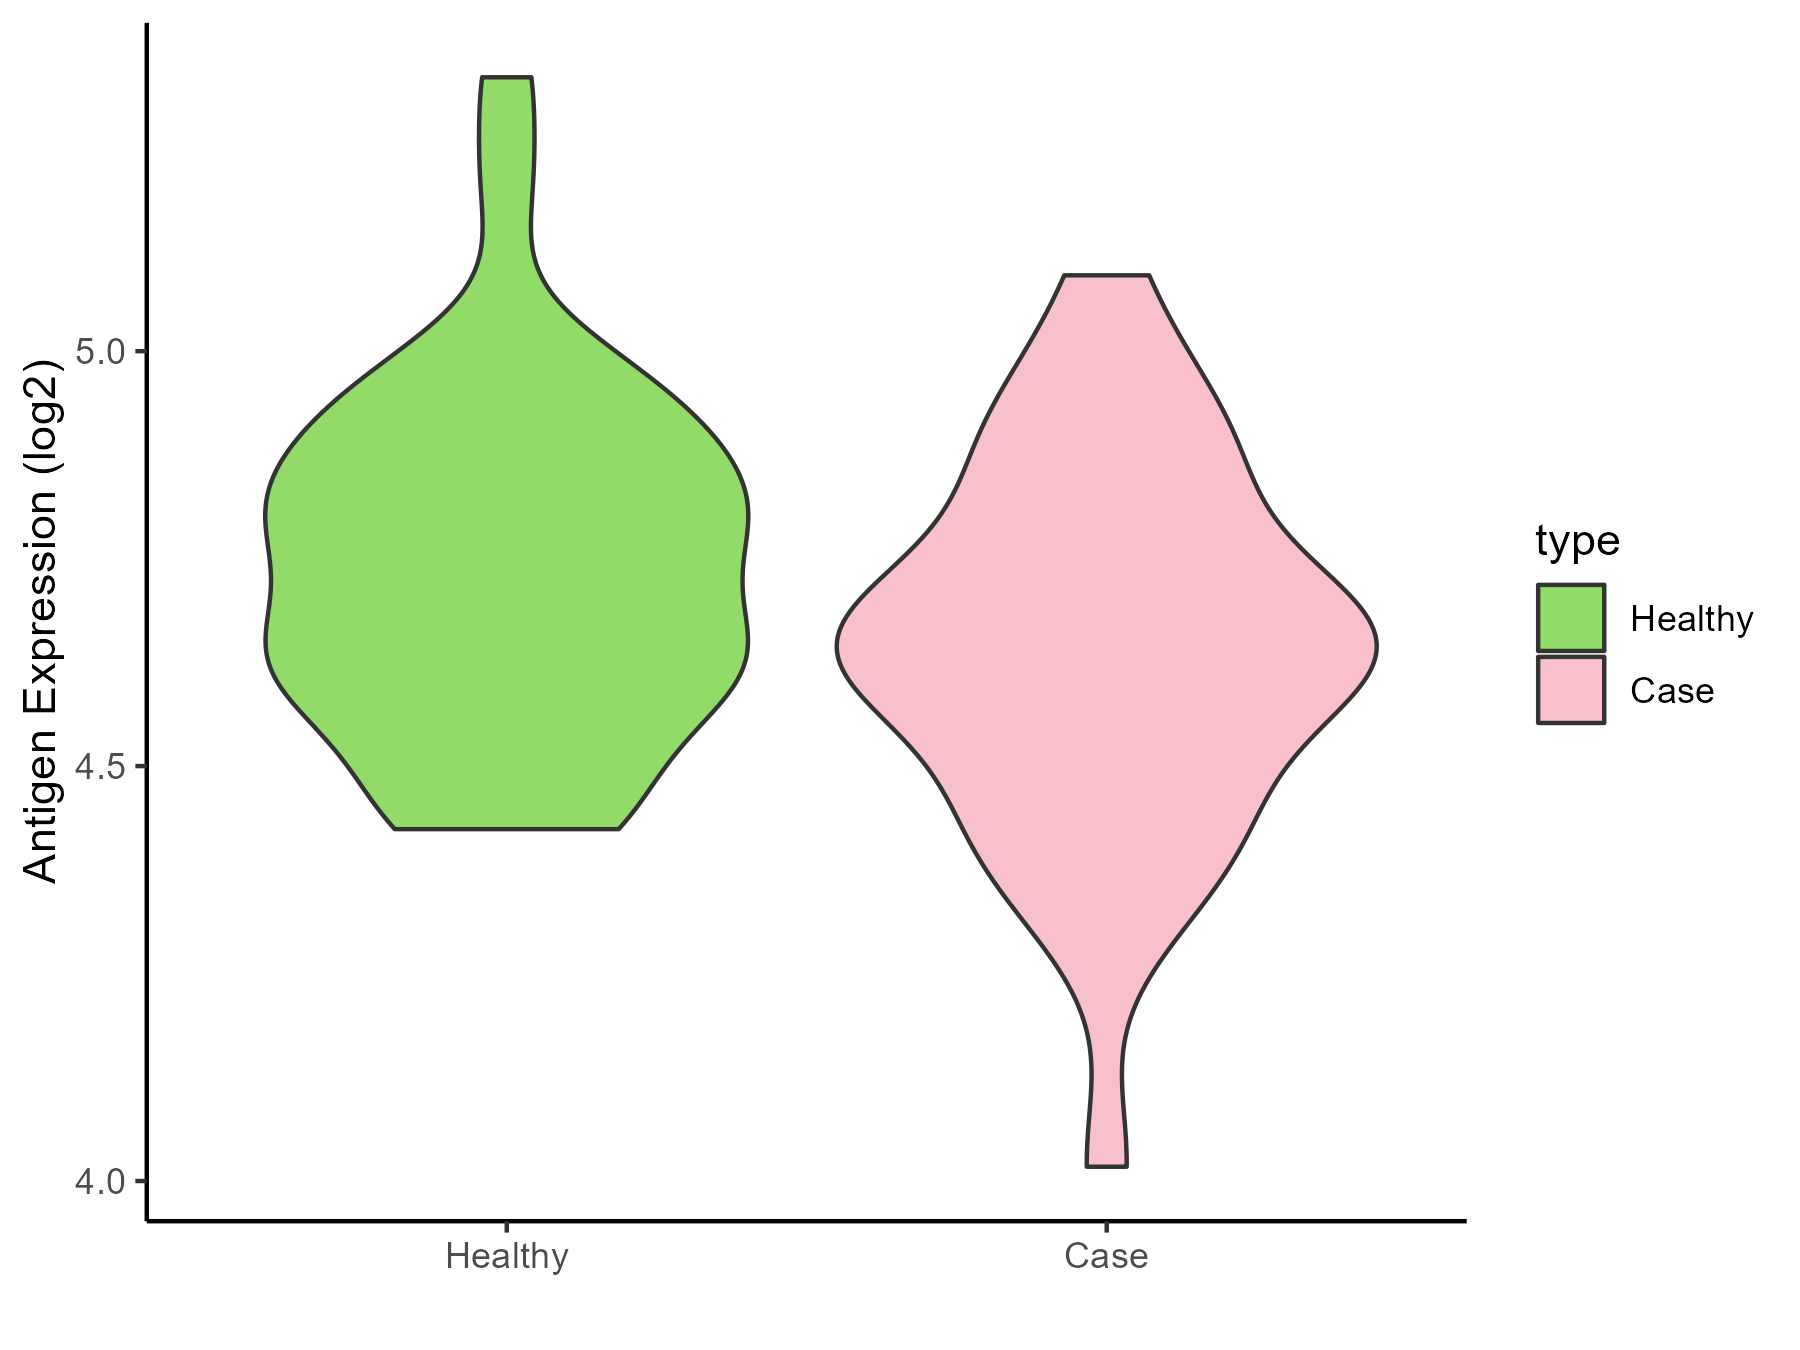
|
Click to View the Clearer Original Diagram |
| Differential expression pattern of antigen in diseases | ||
| The Studied Tissue | Whole blood | |
| The Specific Disease | Anxiety disorder | |
| The Expression Level of Disease Section Compare with the Healthy Individual Tissue | p-value: 0.92299867; Fold-change: -0.020057963; Z-score: -0.099634657 | |
| Disease-specific Antigen Abundances |
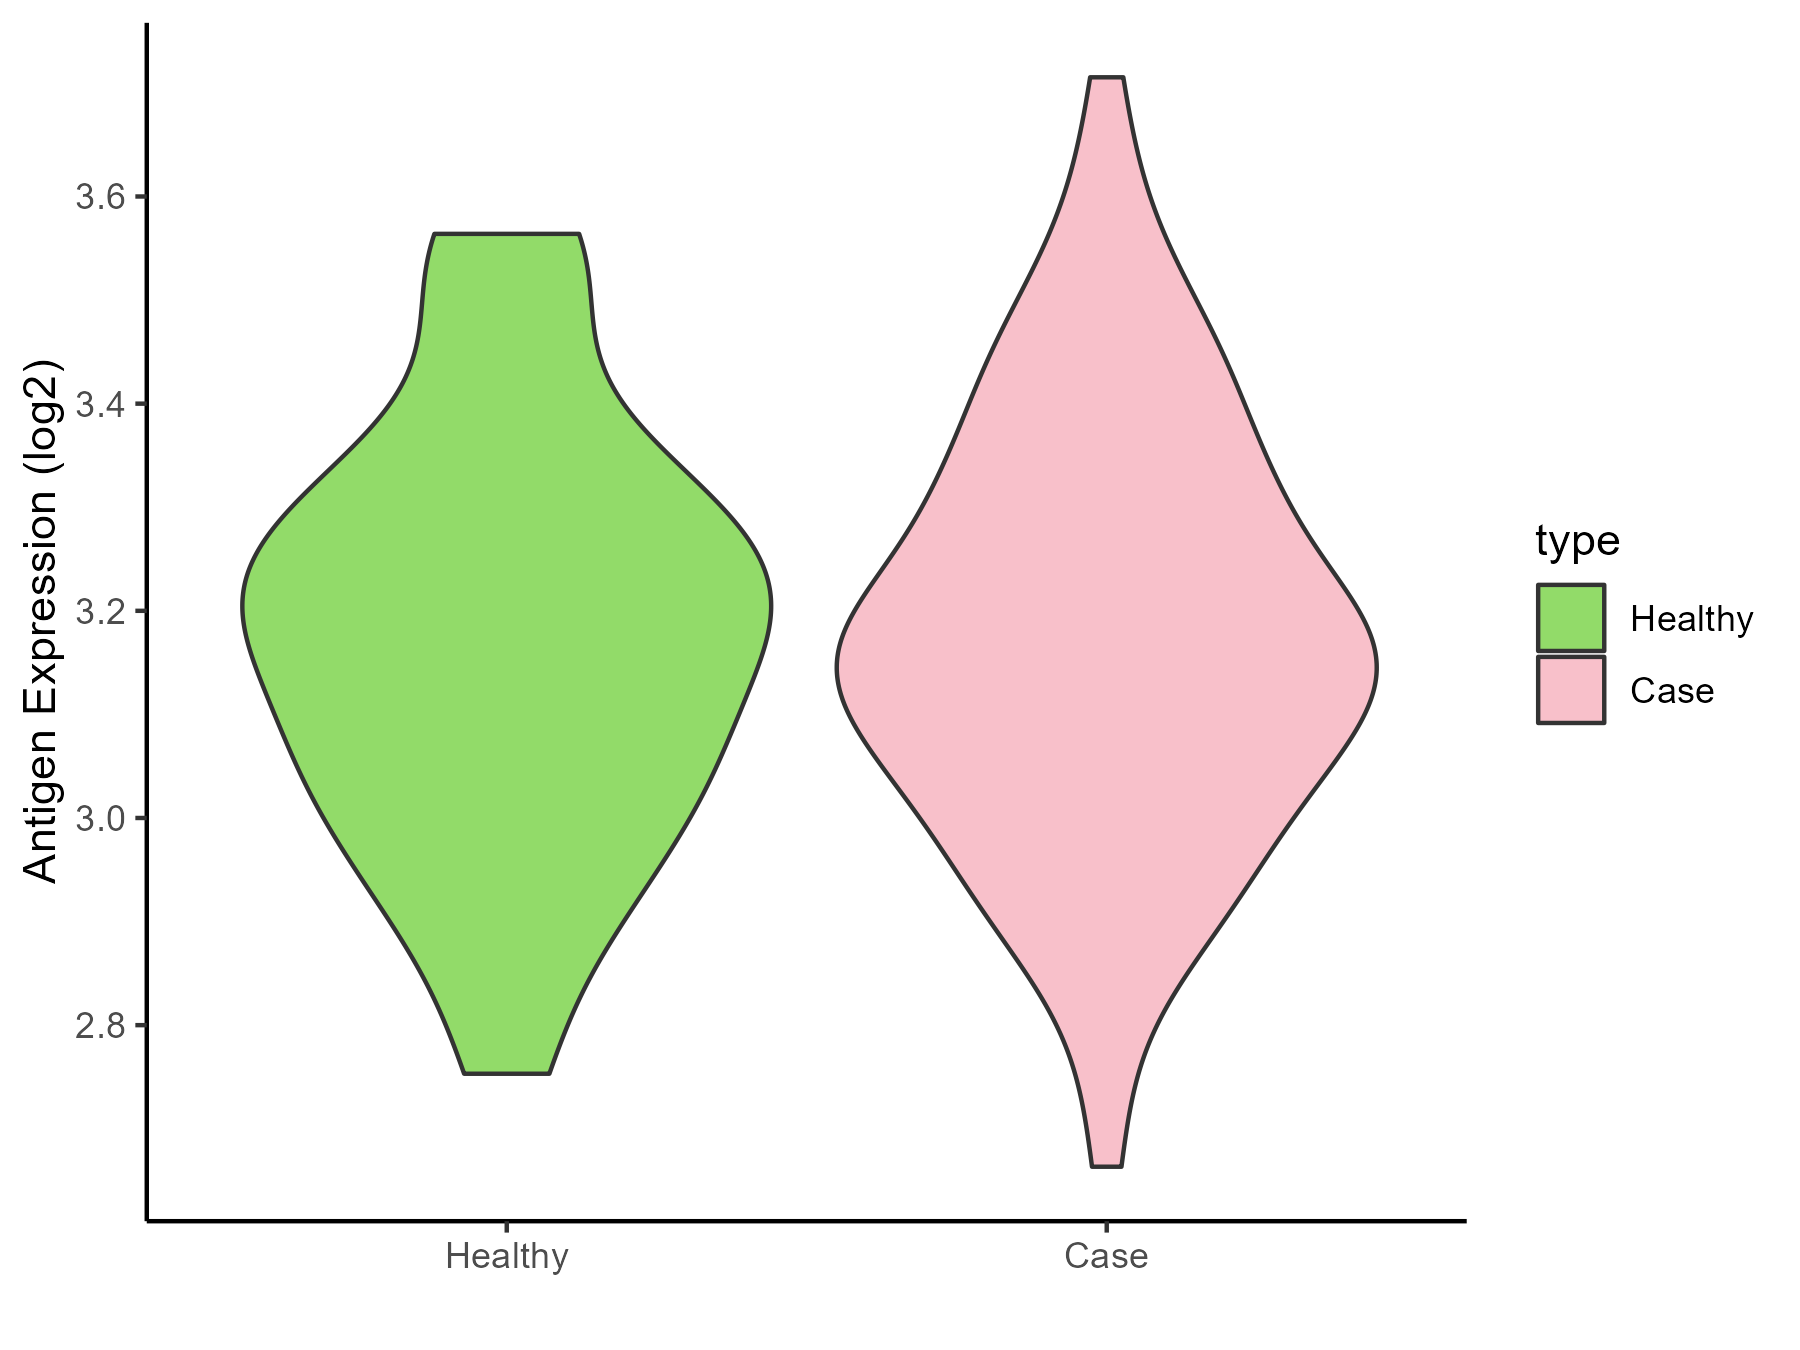
|
Click to View the Clearer Original Diagram |
ICD Disease Classification 8
| Differential expression pattern of antigen in diseases | ||
| The Studied Tissue | Substantia nigra | |
| The Specific Disease | Parkinson disease | |
| The Expression Level of Disease Section Compare with the Healthy Individual Tissue | p-value: 0.892864426; Fold-change: 0.087279758; Z-score: 0.228343572 | |
| Disease-specific Antigen Abundances |
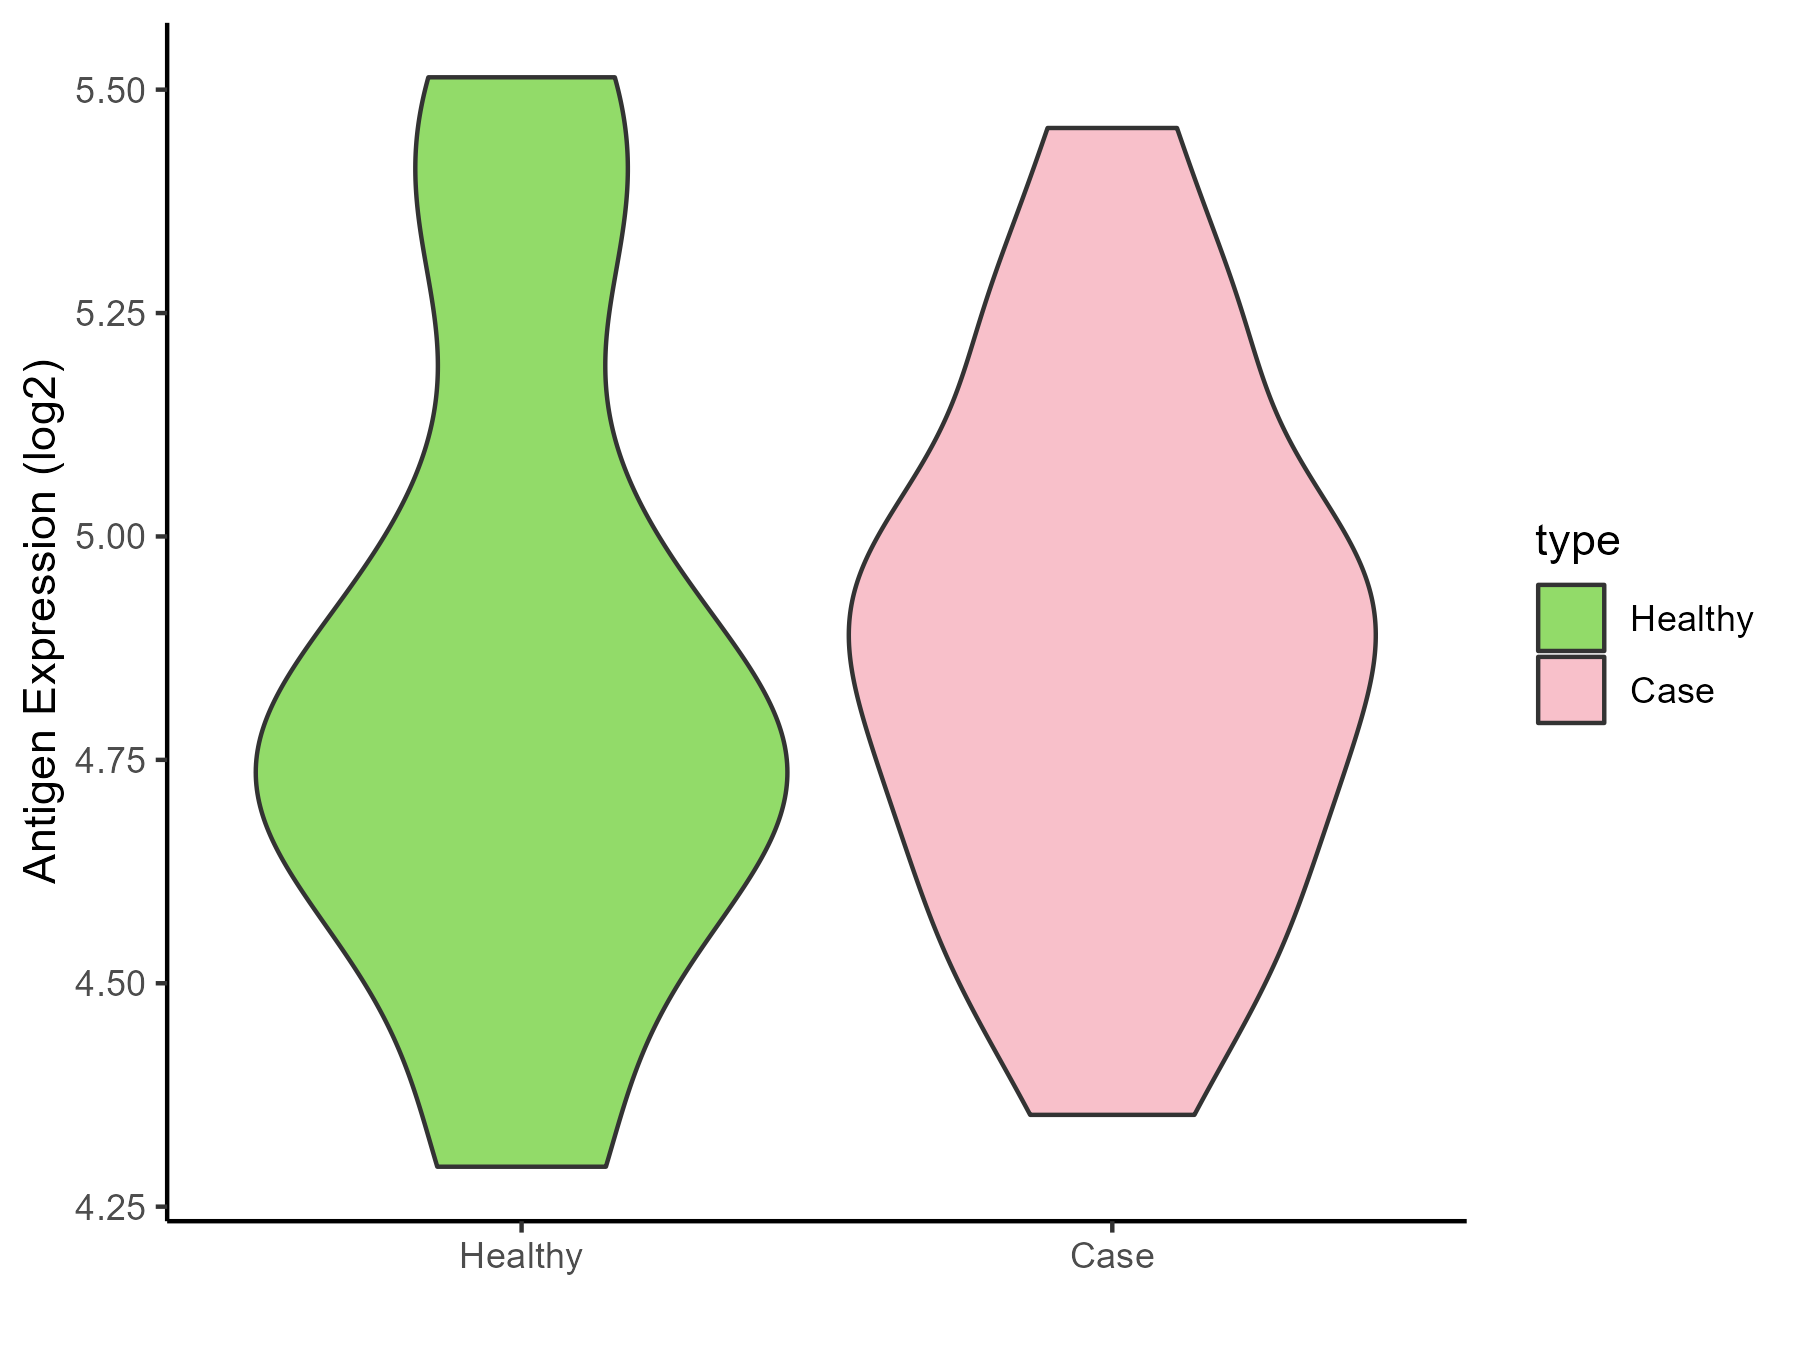
|
Click to View the Clearer Original Diagram |
| Differential expression pattern of antigen in diseases | ||
| The Studied Tissue | Whole blood | |
| The Specific Disease | Huntington disease | |
| The Expression Level of Disease Section Compare with the Healthy Individual Tissue | p-value: 0.007018374; Fold-change: 0.16800984; Z-score: 1.202443013 | |
| Disease-specific Antigen Abundances |
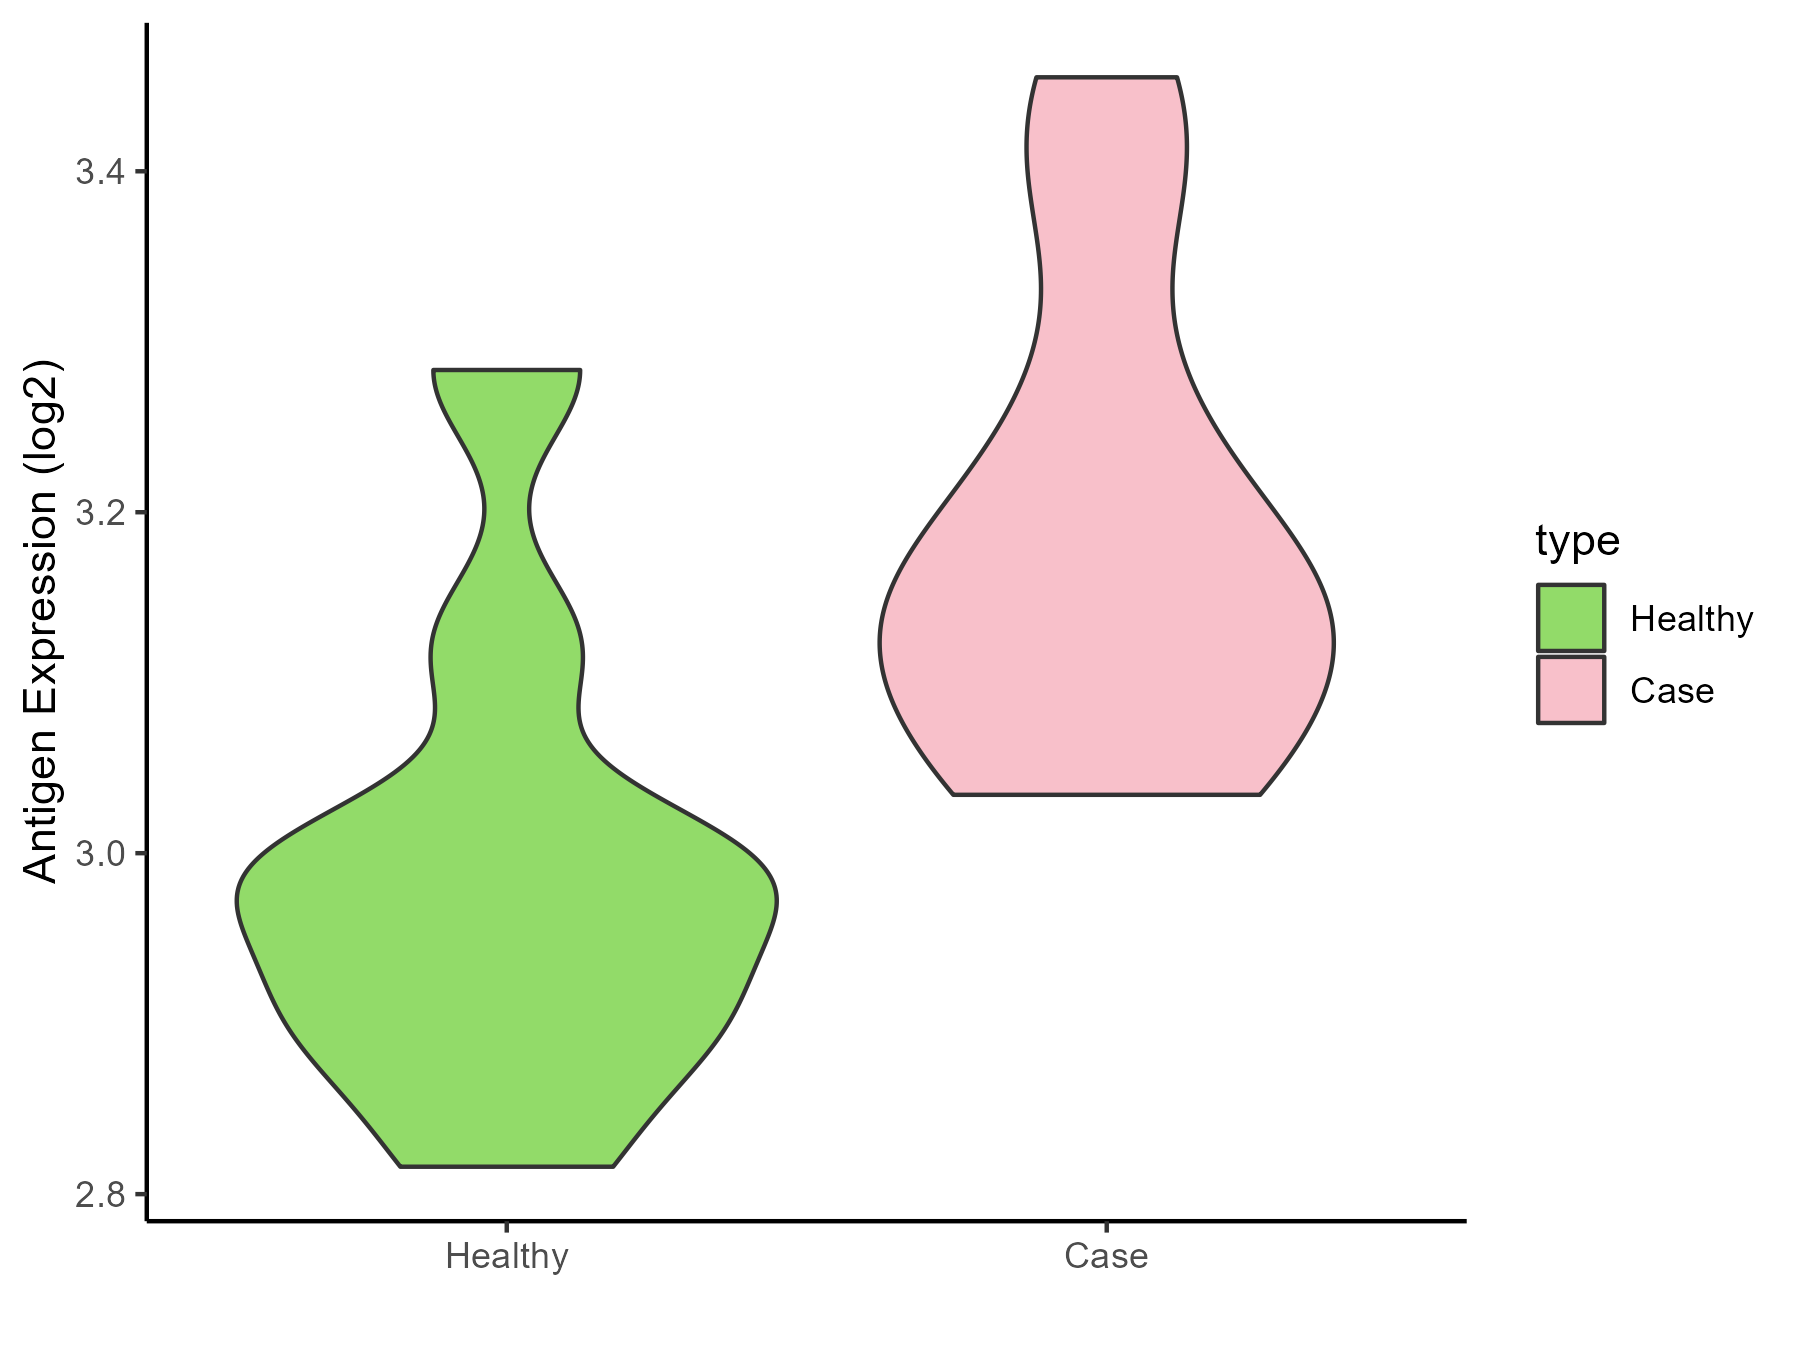
|
Click to View the Clearer Original Diagram |
| Differential expression pattern of antigen in diseases | ||
| The Studied Tissue | Entorhinal cortex | |
| The Specific Disease | Alzheimer disease | |
| The Expression Level of Disease Section Compare with the Healthy Individual Tissue | p-value: 2.67E-05; Fold-change: 0.17669589; Z-score: 0.555604455 | |
| Disease-specific Antigen Abundances |
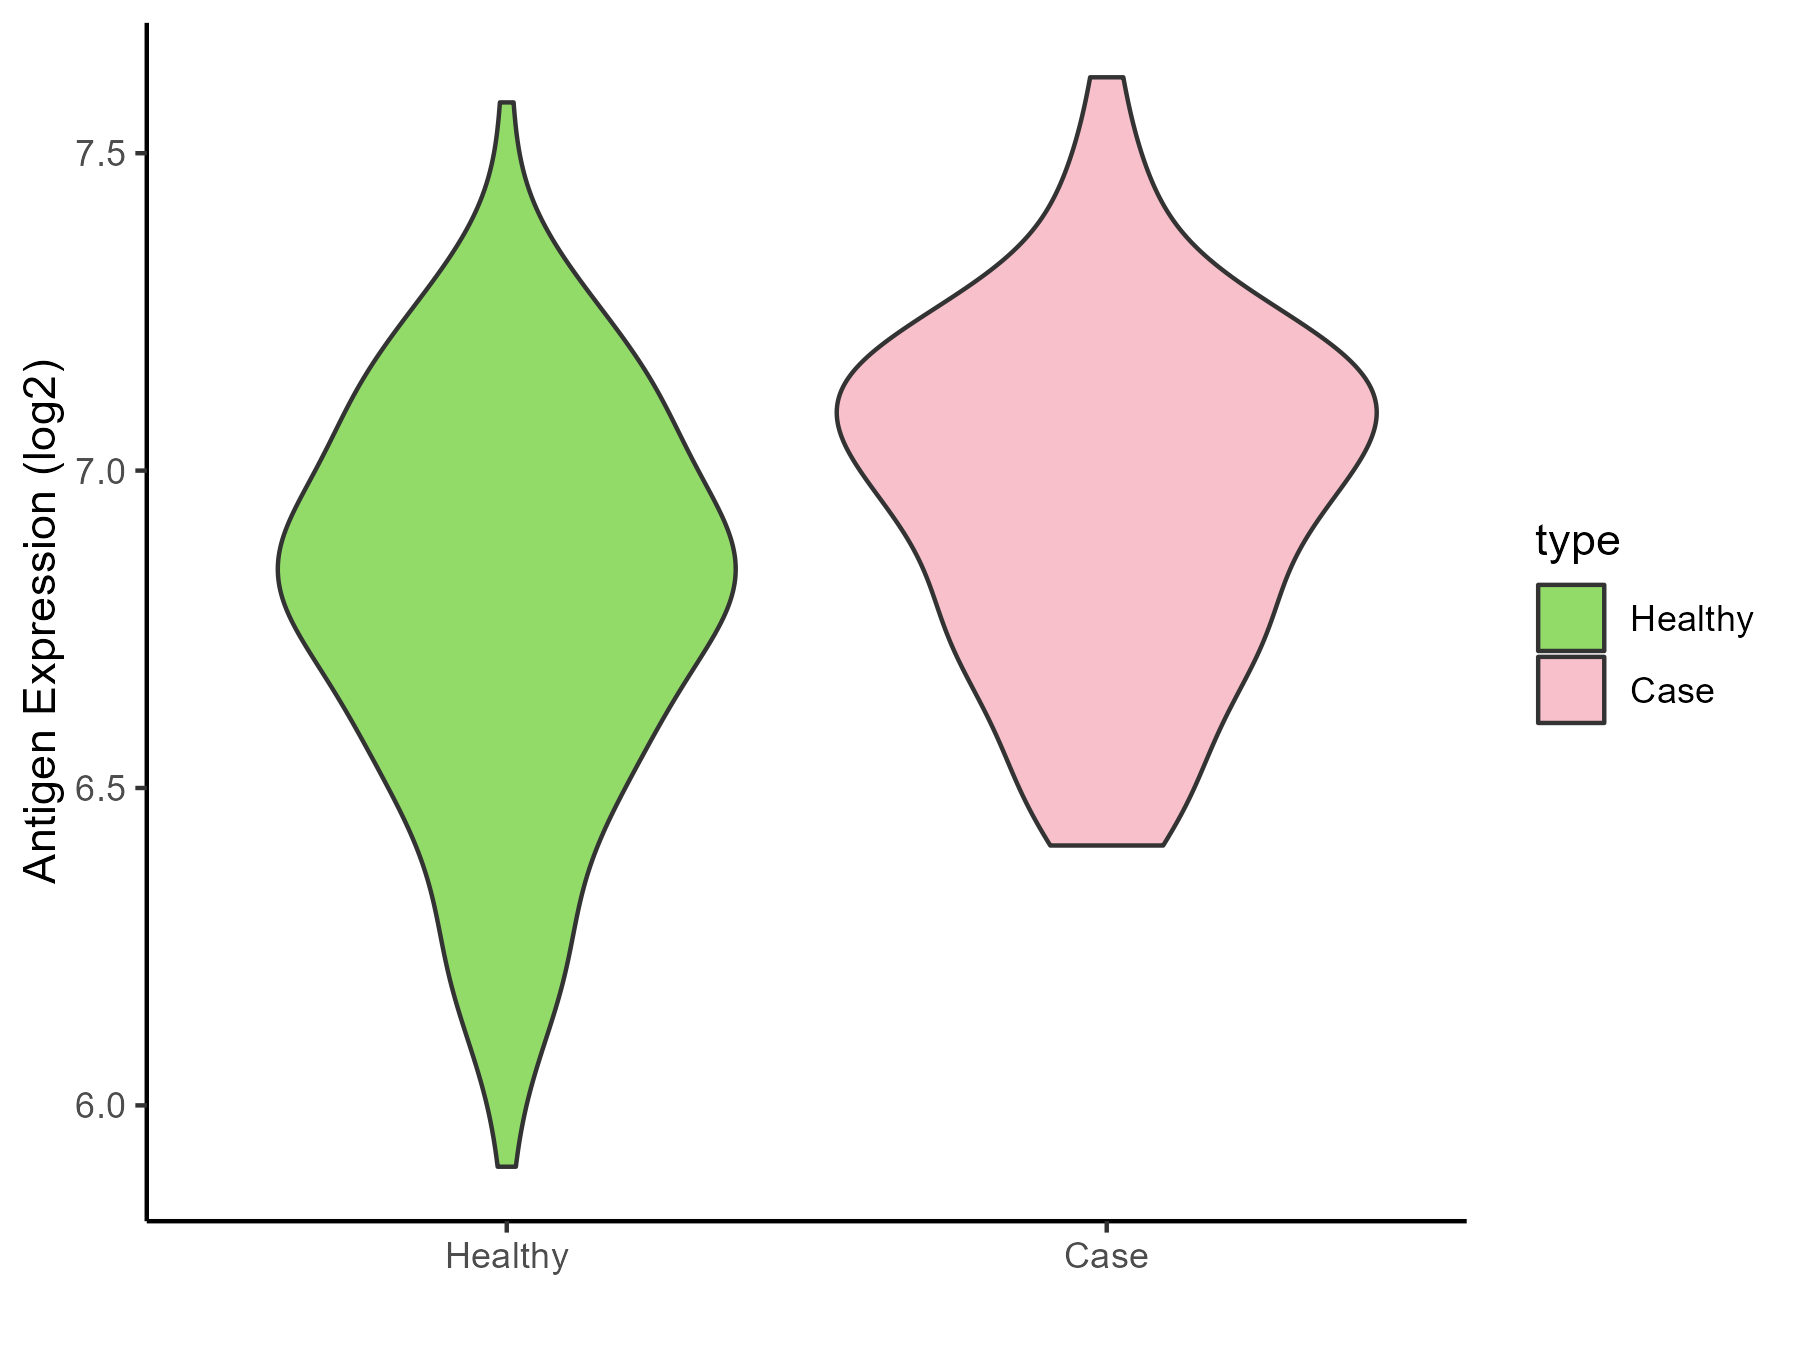
|
Click to View the Clearer Original Diagram |
| Differential expression pattern of antigen in diseases | ||
| The Studied Tissue | Whole blood | |
| The Specific Disease | Seizure | |
| The Expression Level of Disease Section Compare with the Healthy Individual Tissue | p-value: 0.982857988; Fold-change: -0.002190559; Z-score: -0.010466464 | |
| Disease-specific Antigen Abundances |
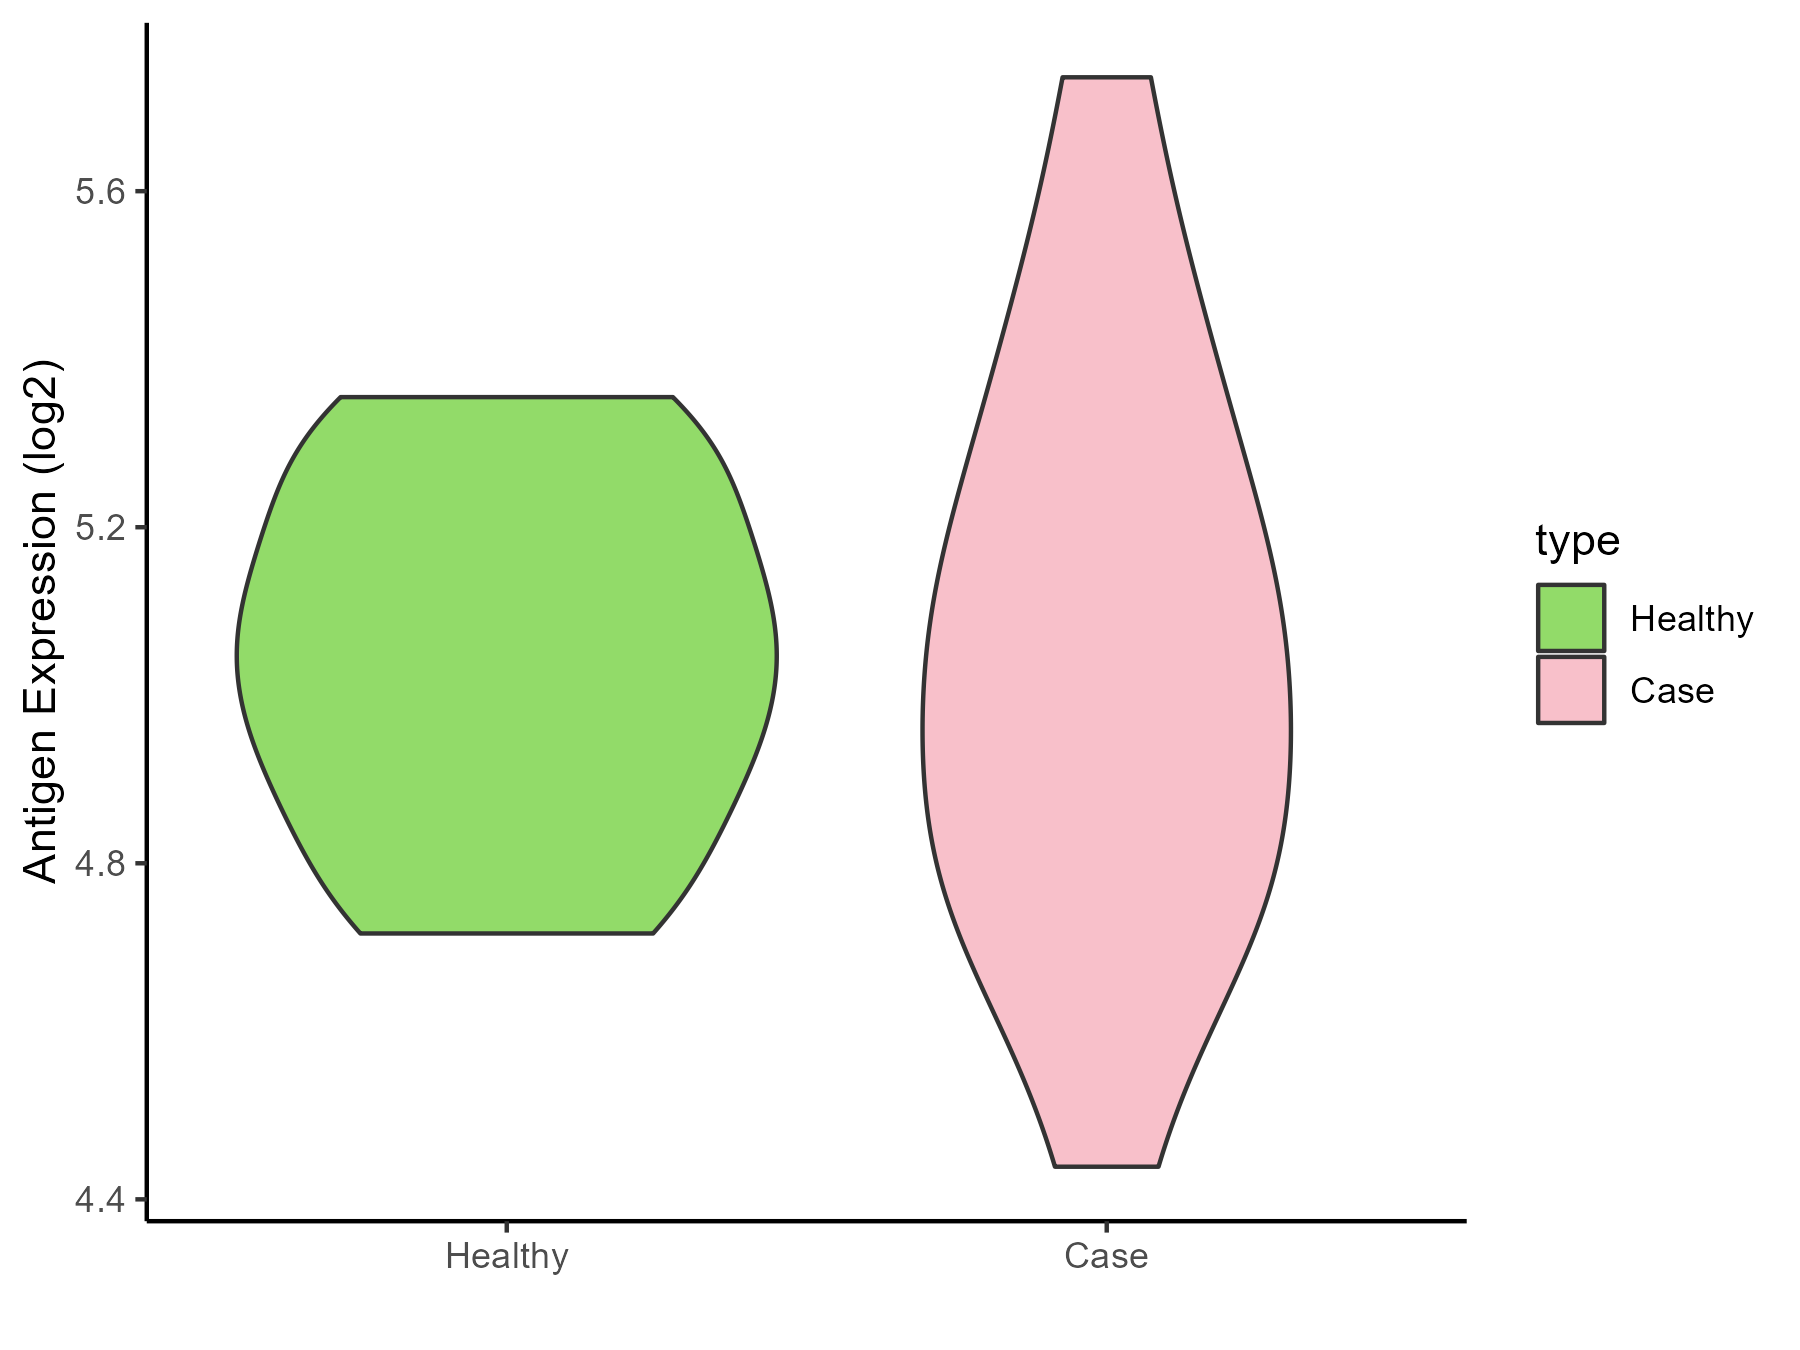
|
Click to View the Clearer Original Diagram |
| Differential expression pattern of antigen in diseases | ||
| The Studied Tissue | Skin | |
| The Specific Disease | Lateral sclerosis | |
| The Expression Level of Disease Section Compare with the Healthy Individual Tissue | p-value: 0.108235245; Fold-change: -0.815041646; Z-score: -1.653864007 | |
| Disease-specific Antigen Abundances |
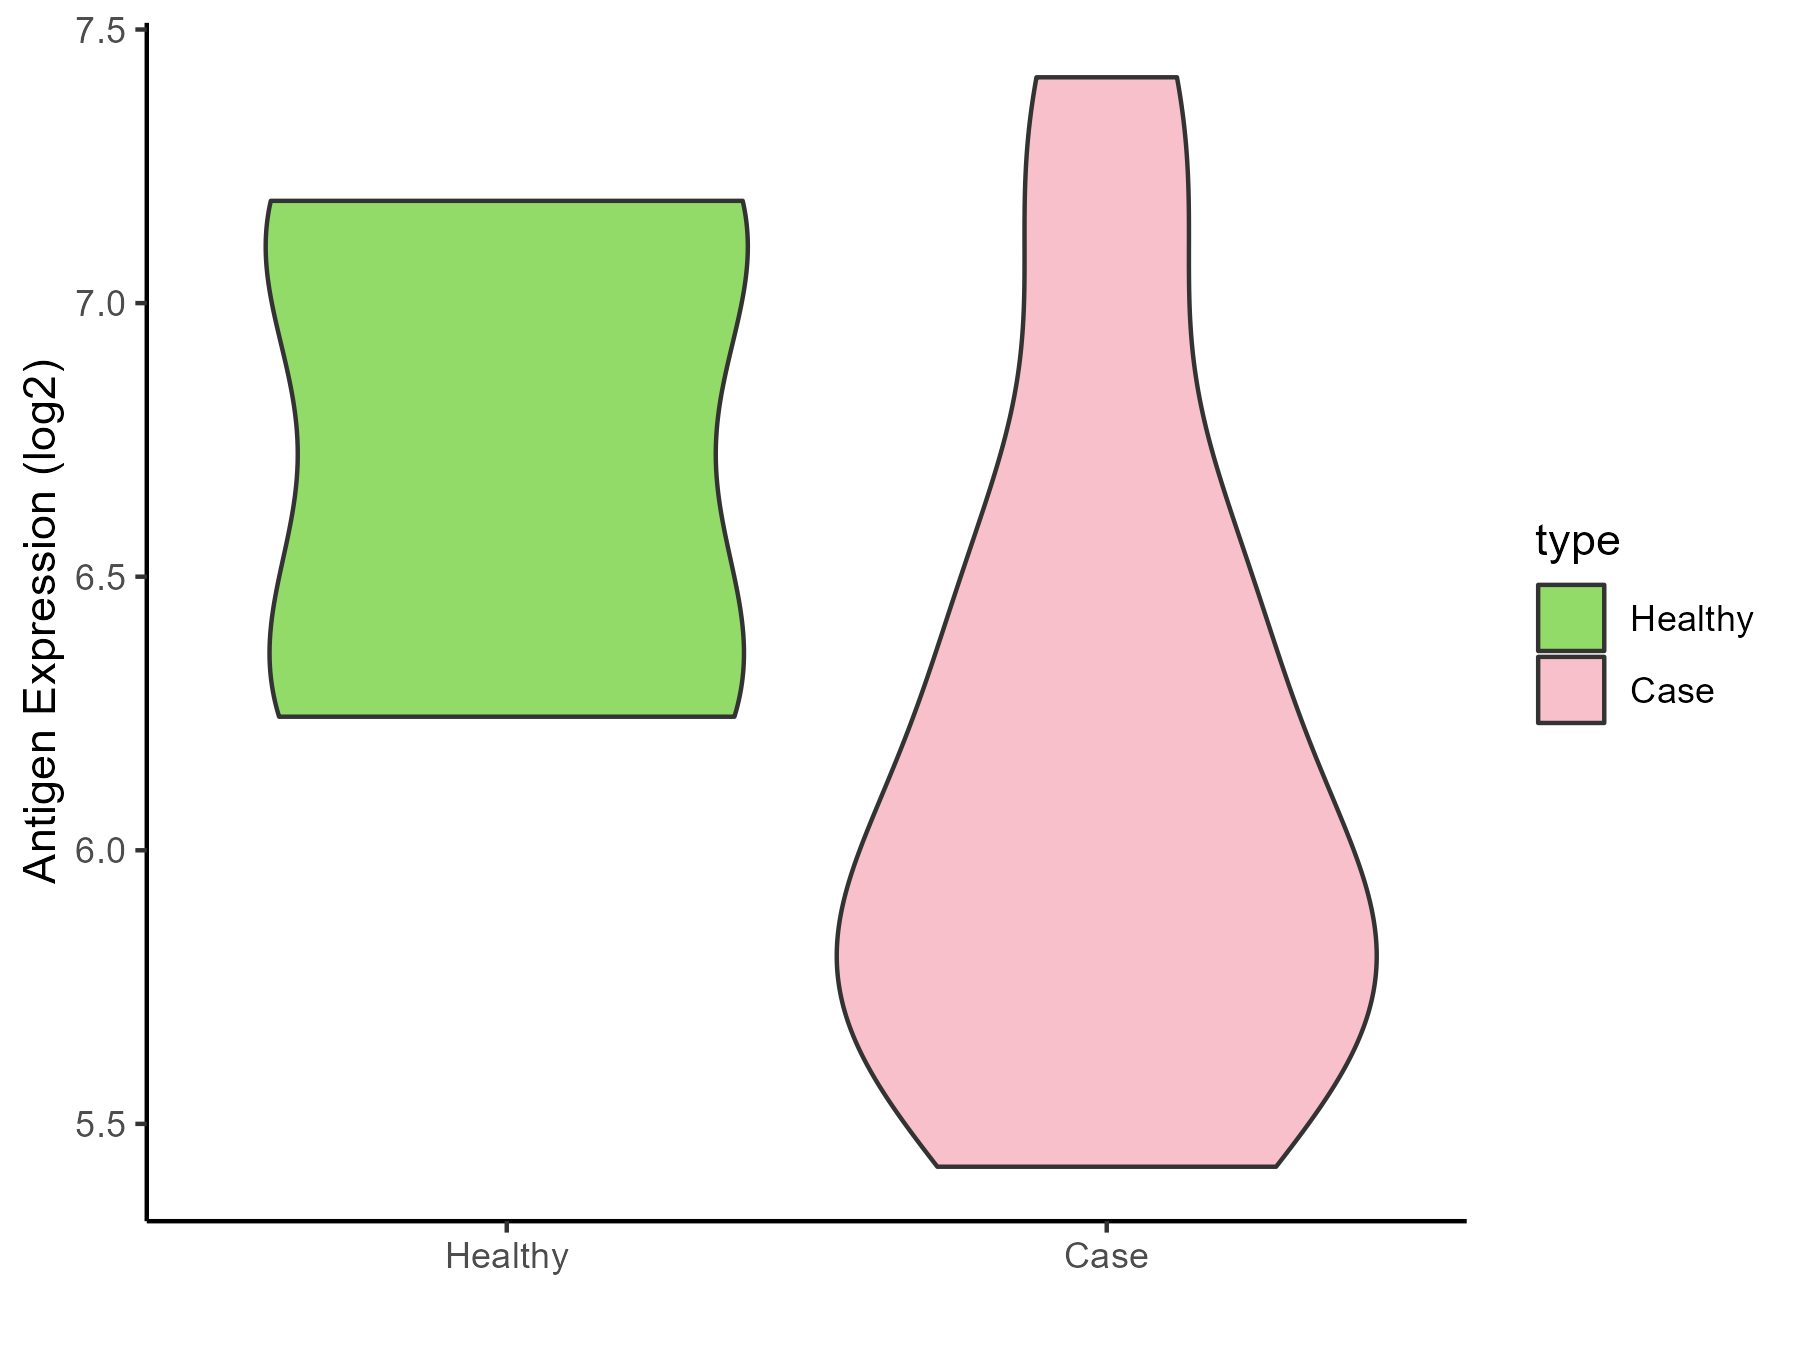
|
Click to View the Clearer Original Diagram |
| The Studied Tissue | Cervical spinal cord | |
| The Specific Disease | Lateral sclerosis | |
| The Expression Level of Disease Section Compare with the Healthy Individual Tissue | p-value: 0.816613059; Fold-change: 0.013862287; Z-score: 0.066052452 | |
| Disease-specific Antigen Abundances |
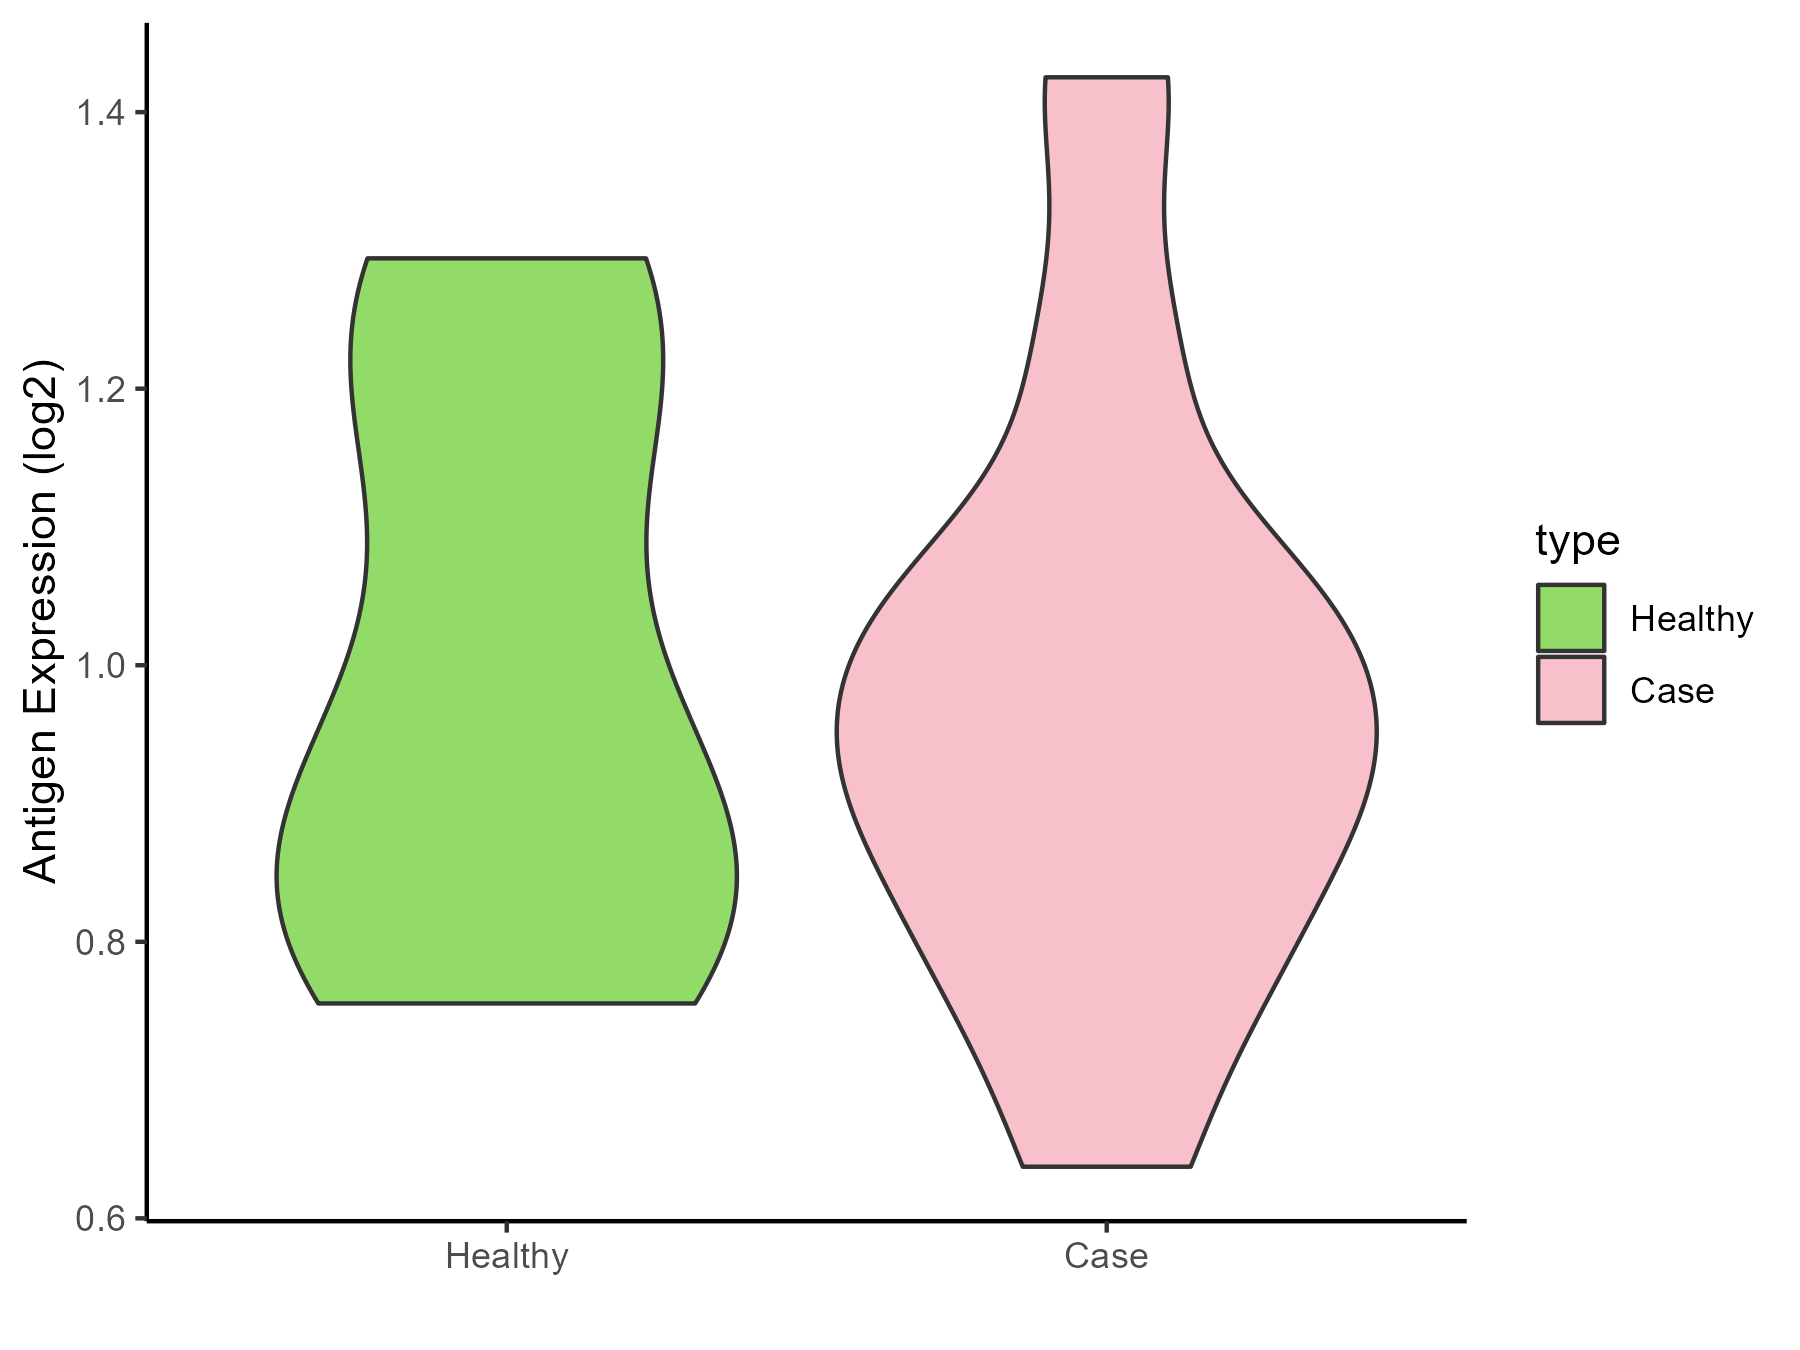
|
Click to View the Clearer Original Diagram |
| Differential expression pattern of antigen in diseases | ||
| The Studied Tissue | Muscle | |
| The Specific Disease | Muscular atrophy | |
| The Expression Level of Disease Section Compare with the Healthy Individual Tissue | p-value: 0.605459319; Fold-change: 0.061419252; Z-score: 0.208202258 | |
| Disease-specific Antigen Abundances |
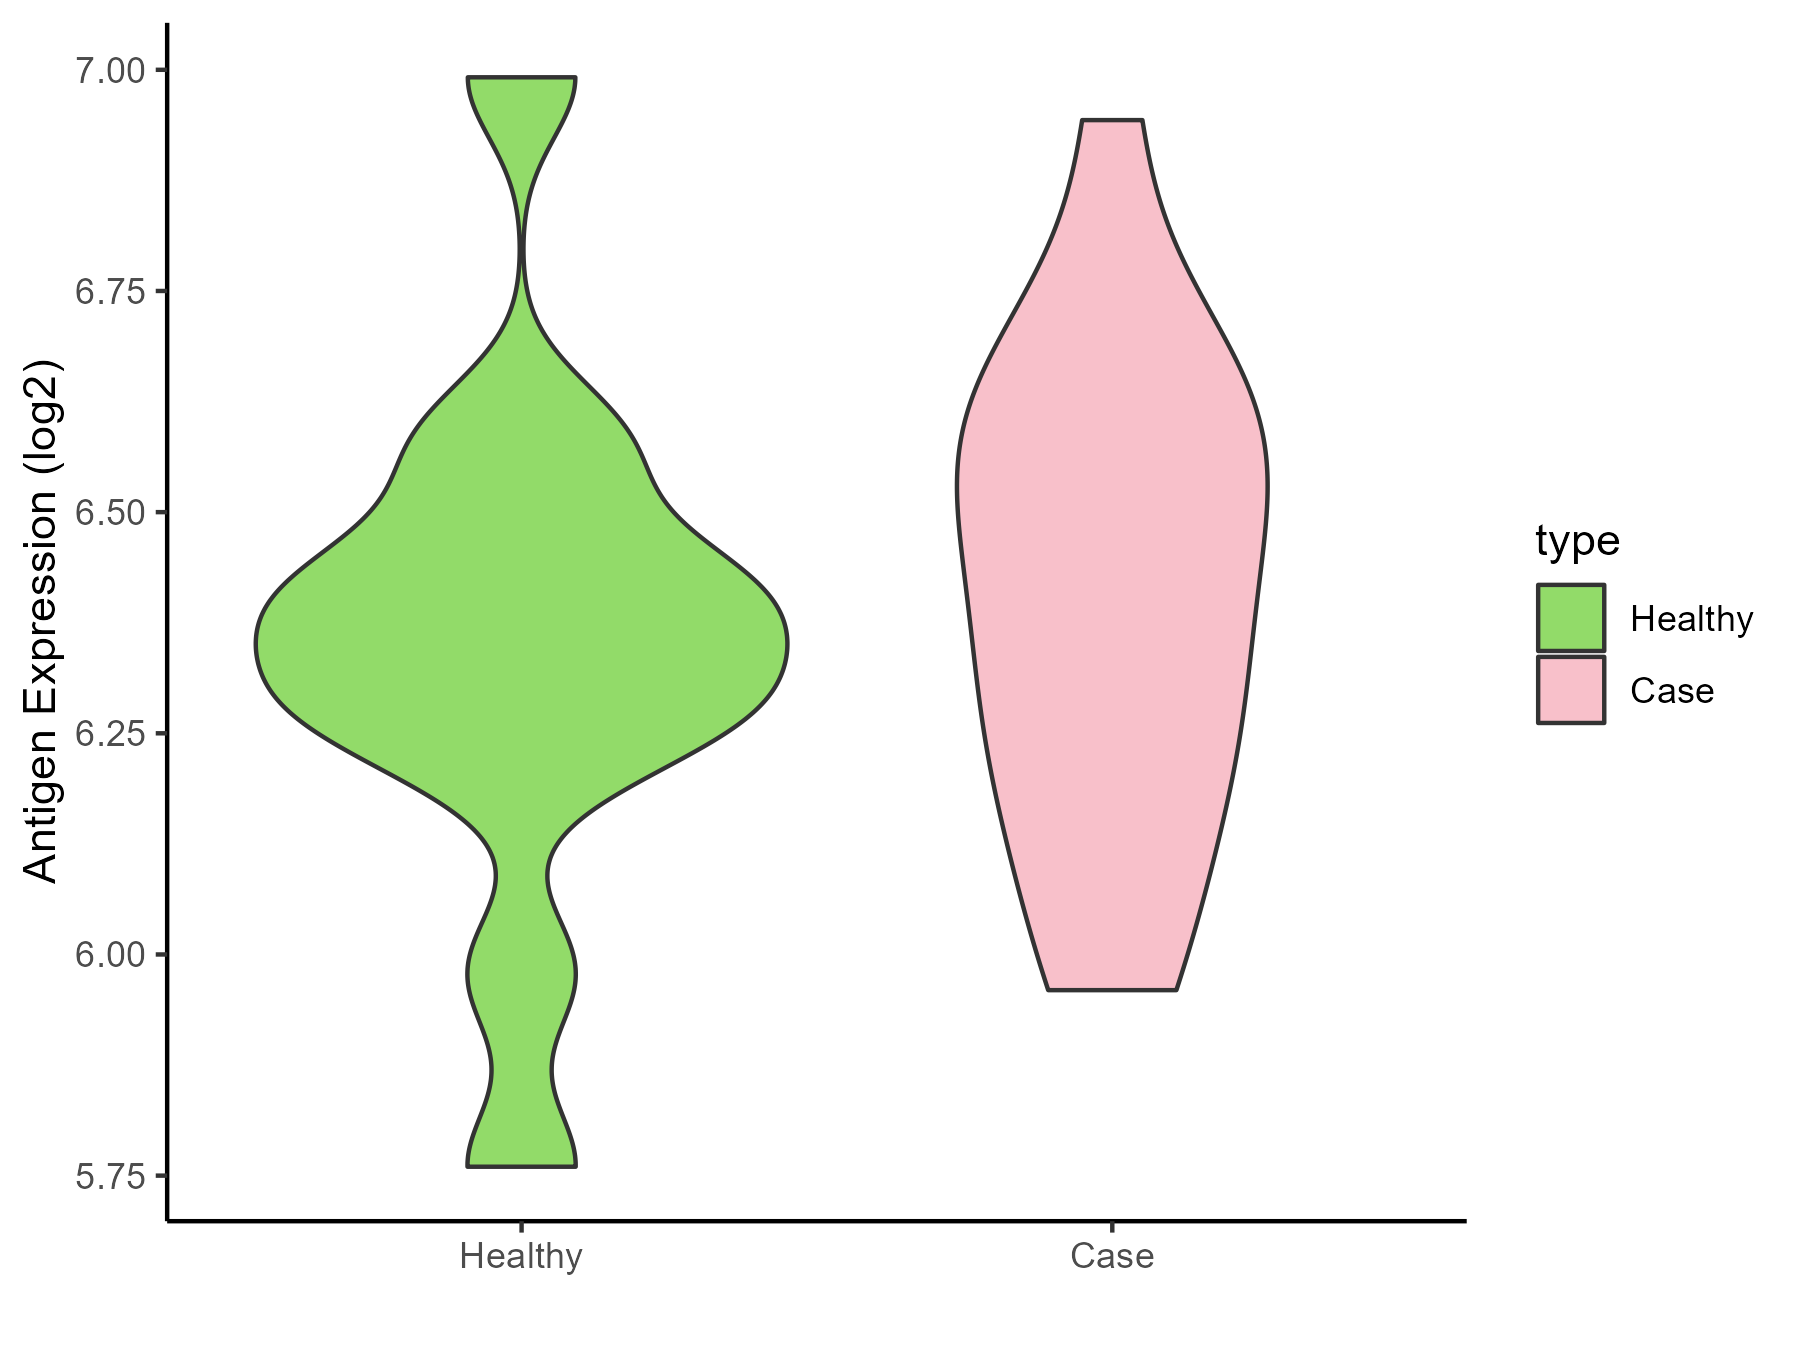
|
Click to View the Clearer Original Diagram |
| Differential expression pattern of antigen in diseases | ||
| The Studied Tissue | Muscle | |
| The Specific Disease | Myopathy | |
| The Expression Level of Disease Section Compare with the Healthy Individual Tissue | p-value: 0.358729957; Fold-change: 0.11474649; Z-score: 0.327795785 | |
| Disease-specific Antigen Abundances |
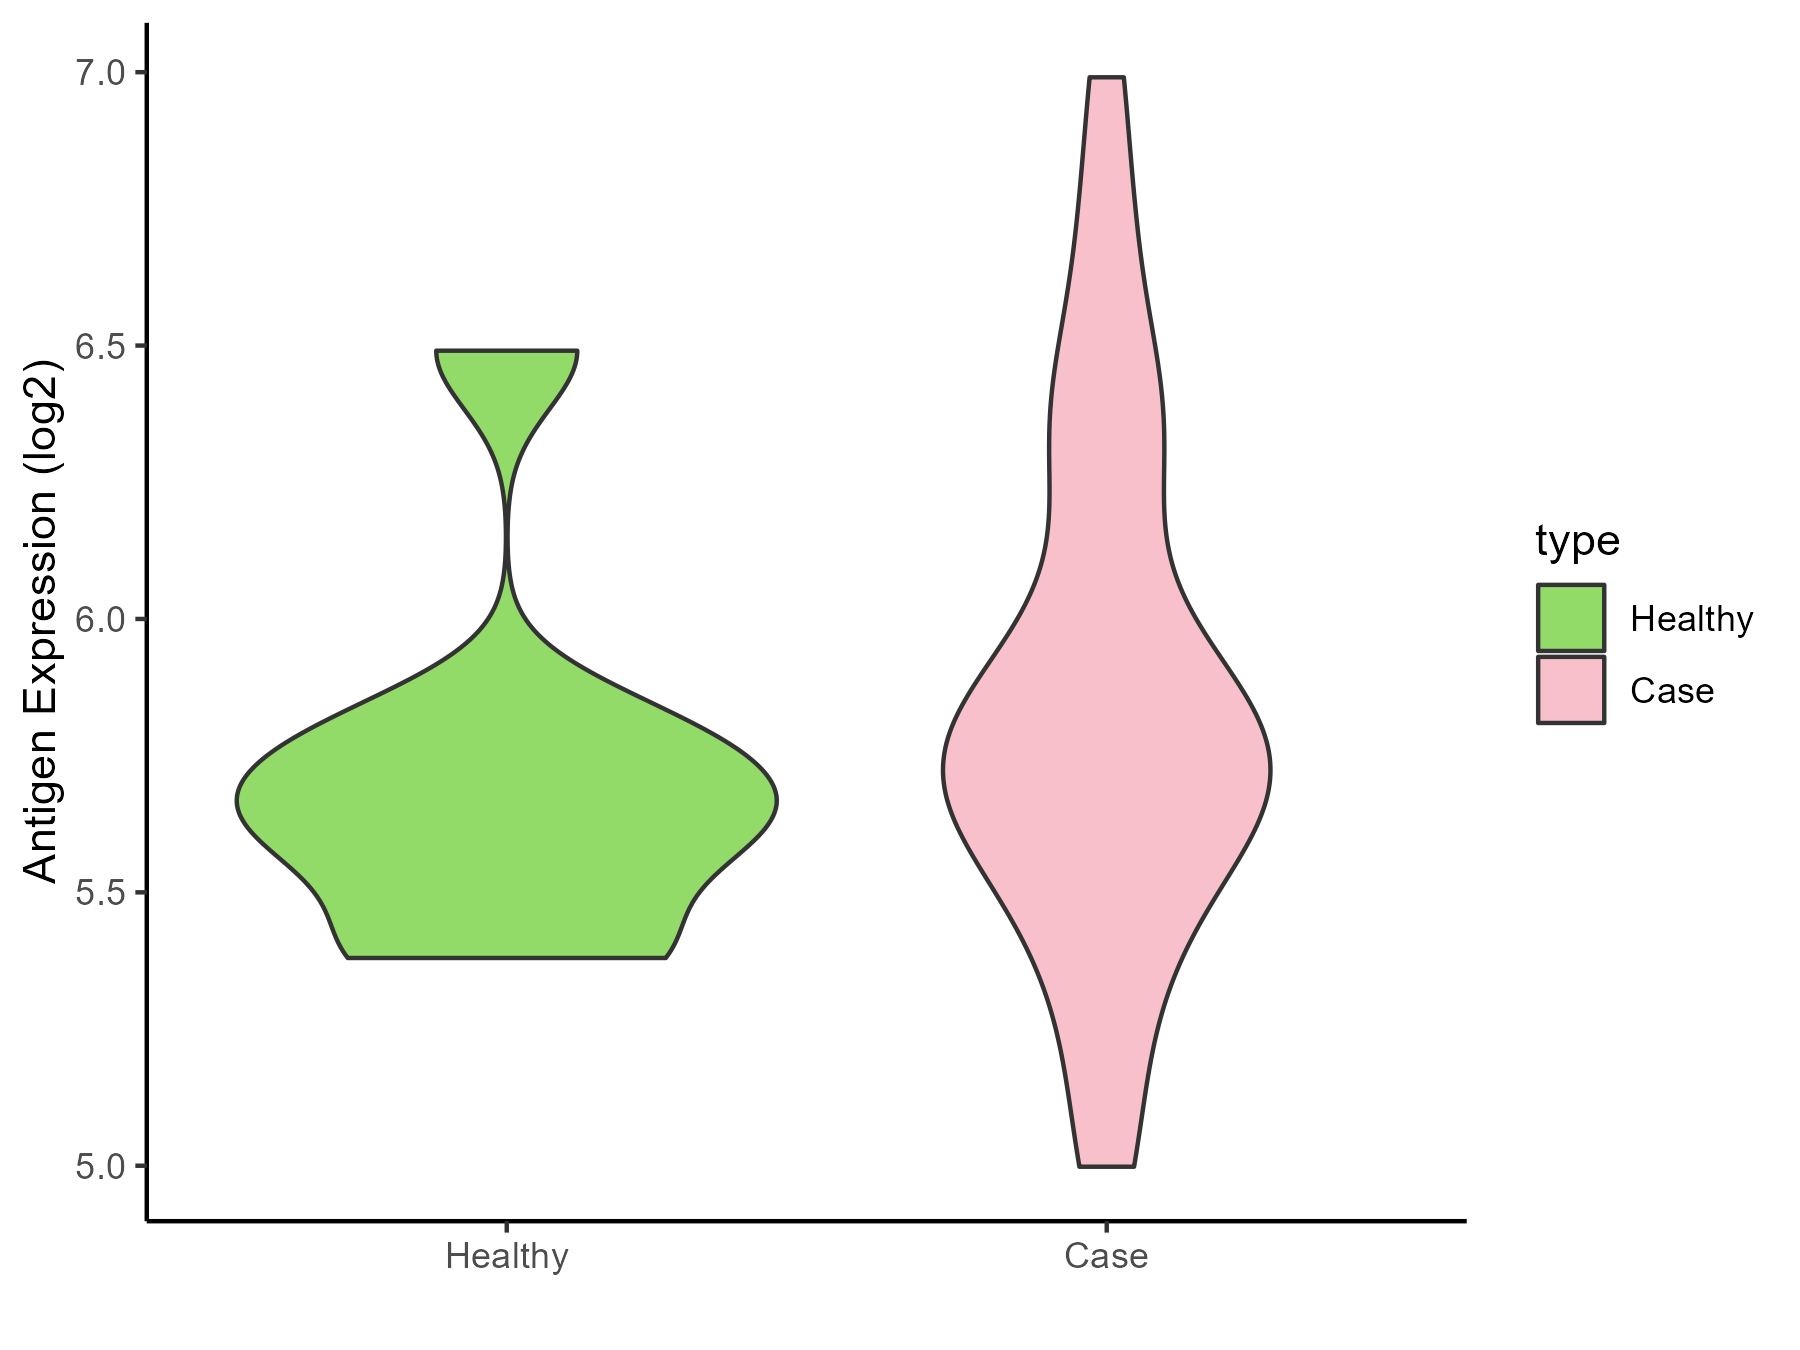
|
Click to View the Clearer Original Diagram |
References
