
Antibody-drug Conjugate Information
General Information of This Antibody-drug Conjugate (ID: DRG0PXQWR)
| ADC Name |
Depatuxizumab mafodotin
|
|||||
|---|---|---|---|---|---|---|
| Synonyms |
depatuxizumab mafodotin; ABT-414; Depatux-M; ABBV-414
Click to Show/Hide
|
|||||
| Organization |
AbbVie (Top20 MNC) (Originator);Life Science Pharmaceuticals (Originator)
|
|||||
| Drug Status |
Phase 3 (discontinued)
|
|||||
| Drug-to-Antibody Ratio |
3.8
|
|||||
| Structure |
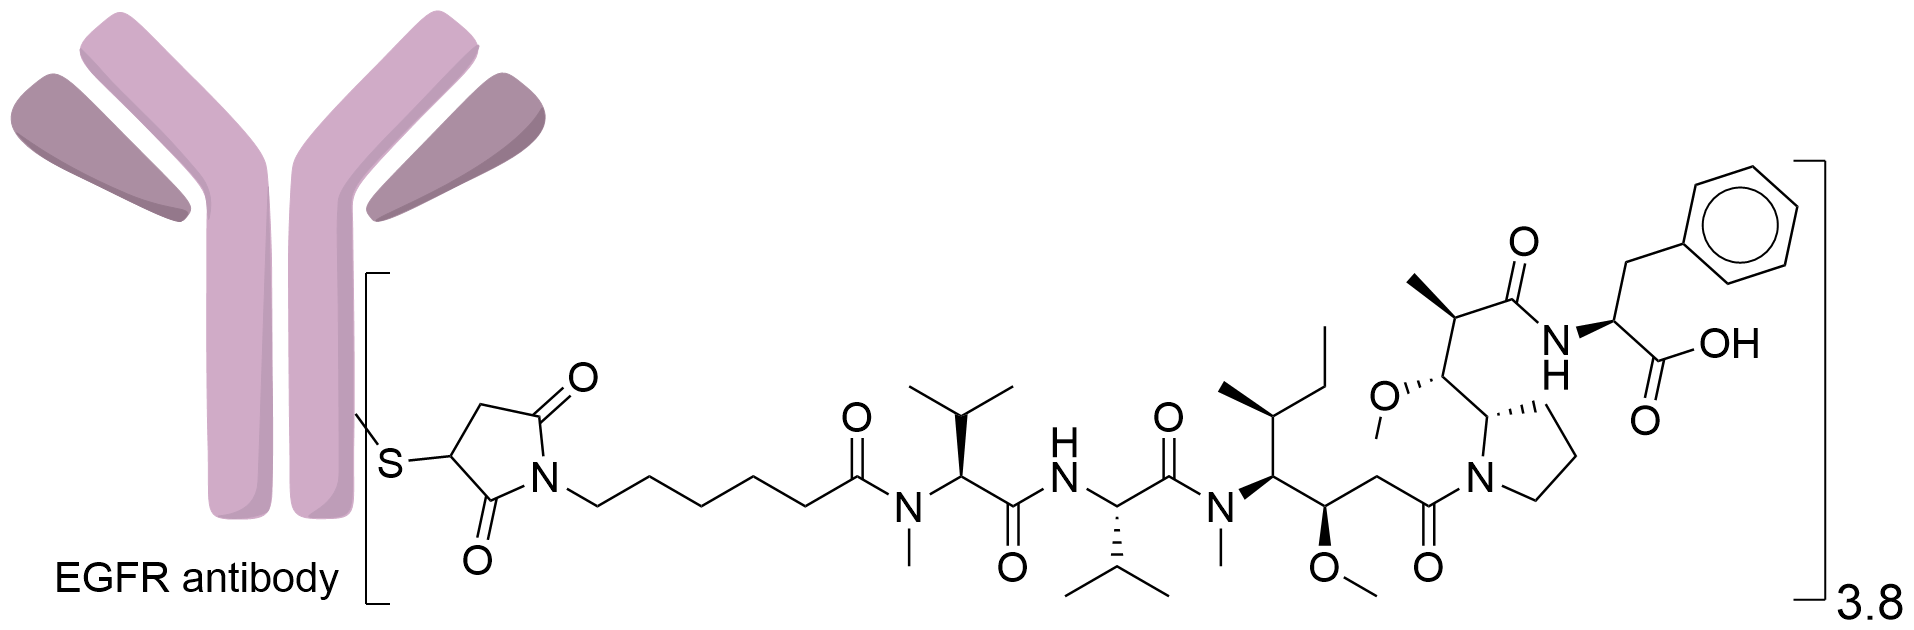
|
|||||
| Antibody Name |
Depatuxizumab
|
Antibody Info | ||||
| Antigen Name |
Epidermal growth factor receptor (EGFR)
|
Antigen Info | ||||
| Payload Name |
Monomethyl auristatin F
|
Payload Info | ||||
| Payload Target |
Microtubule (MT)
|
Target Info | ||||
| Linker Name |
Maleimido-caproyl
|
Linker Info | ||||
| Conjugate Type |
Random Cysteines
|
|||||
| Combination Type |
mafodotin
|
|||||
2027 Update
The disease landscape of This ADC
2027 Update
The clinical trial pipelines of This ADC
| Disease Name | Phase 1 | Phase 2 | Phase 3 | Approved |
|---|---|---|---|---|
| Brain cancer | ||||
| Lung cancer | ||||
| Unspecific solid tumor |
2027 Update
ADC-specific functional property
Bystander Killing Effect
| Bystander Killing Effect | Description | Reference |
|---|---|---|
| no |
Because Cys-mc-MMAF released from Depatux-M lacks potential, toxin levels were not measured in the corresponding conditioned media.
|
[4]
|
2027 Update
General Information of The ADMET Data Related to This ADC
Absorption
| Standard Type | Value | Units | Description | Reference |
|---|---|---|---|---|
| Maximum Observed Concentration (Cmax) | 21.6 | ug/mL |
Geometric mean (Mean, % CV) pharmacokinetic (PK) parameters of depatux-m, total depatux, and Cys-mafodotin following first IV administration of depatux-m at 1 mg/kg.
|
[1] |
| Area Under the Concentration-Time Curve (AUC) | 2.62 | mg·h/mL |
Geometric mean (Mean, % CV) pharmacokinetic (PK) parameters of depatux-m, total depatux, and Cys-mafodotin following first IV administration of depatux-m at 1 mg/kg, AUC 21 days.
|
[1] |
| Area Under the Concentration-Time Curve (AUC) | 3.03 | mg·h/mL |
Geometric mean (Mean, % CV) pharmacokinetic (PK) parameters of depatux-m, total depatux, and Cys-mafodotin following first IV administration of depatux-m at 1 mg/kg, AUC ∞.
|
[1] |
| Maximum Observed Concentration (Cmax) | 50.4 | ug/mL |
Geometric mean (Mean, % CV) pharmacokinetic (PK) parameters of depatux-m, total depatux, and Cys-mafodotin following first IV administration of depatux-m at 2 mg/kg.
|
[1] |
| Area Under the Concentration-Time Curve (AUC) | 7.45 | mg·h/mL |
Geometric mean (Mean, % CV) pharmacokinetic (PK) parameters of depatux-m, total depatux, and Cys-mafodotin following first IV administration of depatux-m at 2 mg/kg, AUC 21 days.
|
[1] |
| Area Under the Concentration-Time Curve (AUC) | 10.1 | mg·h/mL |
Geometric mean (Mean, % CV) pharmacokinetic (PK) parameters of depatux-m, total depatux, and Cys-mafodotin following first IV administration of depatux-m at 2 mg/kg, AUC ∞.
|
[1] |
| Maximum Observed Concentration (Cmax) | 58.3 | ug/mL |
Geometric mean (Mean, % CV) pharmacokinetic (PK) parameters of depatux-m, total depatux, and Cys-mafodotin following first IV administration of depatux-m at 3 mg/kg.
|
[1] |
| Area Under the Concentration-Time Curve (AUC) | 7.79 | mg·h/mL |
Geometric mean (Mean, % CV) pharmacokinetic (PK) parameters of depatux-m, total depatux, and Cys-mafodotin following first IV administration of depatux-m at 3 mg/kg, AUC 21 days.
|
[1] |
| Area Under the Concentration-Time Curve (AUC) | 9.72 | mg·h/mL |
Geometric mean (Mean, % CV) pharmacokinetic (PK) parameters of depatux-m, total depatux, and Cys-mafodotin following first IV administration of depatux-m at 3 mg/kg, AUC ∞.
|
[1] |
| Maximum Observed Concentration (Cmax) | 106 | ug/mL |
Geometric mean (Mean, % CV) pharmacokinetic (PK) parameters of depatux-m, total depatux, and Cys-mafodotin following first IV administration of depatux-m at 4 mg/kg.
|
[1] |
| Area Under the Concentration-Time Curve (AUC) | 13.1 | mg·h/mL |
Geometric mean (Mean, % CV) pharmacokinetic (PK) parameters of depatux-m, total depatux, and Cys-mafodotin following first IV administration of depatux-m at 4 mg/kg, AUC 21 days.
|
[1] |
| Area Under the Concentration-Time Curve (AUC) | 18.1 | mg·h/mL |
Geometric mean (Mean, % CV) pharmacokinetic (PK) parameters of depatux-m, total depatux, and Cys-mafodotin following first IV administration of depatux-m at 4 mg/kg, AUC ∞.
|
[1] |
| Maximum Observed Concentration (Cmax) | 19.6 | ug/mL |
PK parameters of depatux-m after 0.5 mg/kg depatux-m dosing on day 1 of cycle 2
|
[2] |
| Area Under the Concentration-Time Curve (AUC) | 3.52 | mg/h/mL |
PK parameters of depatux-m after 0.5 mg/kg depatux-m dosing on day 1 of cycle 2, AUC 14 days
|
[2] |
| Maximum Observed Concentration (Cmax) | 44.1 | ug/mL |
PK parameters of depatux-m after 1.0 mg/kg depatux-m dosing on day 1 of cycle 2
|
[2] |
| Area Under the Concentration-Time Curve (AUC) | 7.11 | mg/h/mL |
PK parameters of depatux-m after 1.0 mg/kg depatux-m dosing on day 1 of cycle 2, AUC 14 days
|
[2] |
| Maximum Observed Concentration (Cmax) | 51.1 | ug/mL |
PK parameters of depatux-m after 1.25 mg/kg depatux-m dosing on day 1 of cycle 2
|
[2] |
| Area Under the Concentration-Time Curve (AUC) | 9.14 | mg/h/mL |
PK parameters of depatux-m after 1.25 mg/kg depatux-m dosing on day 1 of cycle 2, AUC 14 days
|
[2] |
| Maximum Observed Concentration (Cmax) | 70.5 | ug/mL |
PK parameters of depatux-m after 1.5 mg/kg depatux-m dosing on day 1 of cycle 2
|
[2] |
| Area Under the Concentration-Time Curve (AUC) | 10.2 | mg/h/mL |
PK parameters of depatux-m after 1.5 mg/kg depatux-m dosing on day 1 of cycle 2, AUC 14 days
|
[2] |
Excretion
| Standard Type | Value | Units | Description | Reference |
|---|---|---|---|---|
| Elimination Half-Life (t1/2) | 7.3 | day |
Geometric mean (Mean, % CV) pharmacokinetic (PK) parameters of depatux-m, total depatux, and Cys-mafodotin following first IV administration of depatux-m at 1 mg/kg.
|
[1] |
| Clearance (CL) | 0.363 | mL/h/kg |
Geometric mean (Mean, % CV) pharmacokinetic (PK) parameters of depatux-m, total depatux, and Cys-mafodotin following first IV administration of depatux-m at 1 mg/kg.
|
[1] |
| Elimination Half-Life (t1/2) | 11.1 | day |
Geometric mean (Mean, % CV) pharmacokinetic (PK) parameters of depatux-m, total depatux, and Cys-mafodotin following first IV administration of depatux-m at 2 mg/kg.
|
[1] |
| Clearance (CL) | 0.206 | mL/h/kg |
Geometric mean (Mean, % CV) pharmacokinetic (PK) parameters of depatux-m, total depatux, and Cys-mafodotin following first IV administration of depatux-m at 2 mg/kg.
|
[1] |
| Elimination Half-Life (t1/2) | 8.7 | day |
Geometric mean (Mean, % CV) pharmacokinetic (PK) parameters of depatux-m, total depatux, and Cys-mafodotin following first IV administration of depatux-m at 3 mg/kg.
|
[1] |
| Clearance (CL) | 0.364 | mL/h/kg |
Geometric mean (Mean, % CV) pharmacokinetic (PK) parameters of depatux-m, total depatux, and Cys-mafodotin following first IV administration of depatux-m at 3 mg/kg.
|
[1] |
| Elimination Half-Life (t1/2) | 12 | day |
Geometric mean (Mean, % CV) pharmacokinetic (PK) parameters of depatux-m, total depatux, and Cys-mafodotin following first IV administration of depatux-m at 4 mg/kg.
|
[1] |
| Clearance (CL) | 0.226 | mL/h/kg |
Geometric mean (Mean, % CV) pharmacokinetic (PK) parameters of depatux-m, total depatux, and Cys-mafodotin following first IV administration of depatux-m at 4 mg/kg.
|
[1] |
| Elimination Half-Life (t1/2) | 10.9 | day |
PK parameters of depatux-m after 0.5 mg/kg depatux-m dosing on day 1 of cycle 2
|
[2] |
| Clearance (CL) | 0.143 | mL/h/kg |
PK parameters of depatux-m after 0.5 mg/kg depatux-m dosing on day 1 of cycle 2
|
[2] |
| Elimination Half-Life (t1/2) | 9.2 | day |
PK parameters of depatux-m after 1.0 mg/kg depatux-m dosing on day 1 of cycle 2
|
[2] |
| Clearance (CL) | 0.151 | mL/h/kg |
PK parameters of depatux-m after 1.0 mg/kg depatux-m dosing on day 1 of cycle 2
|
[2] |
| Elimination Half-Life (t1/2) | 11.2 | day |
PK parameters of depatux-m after 1.25 mg/kg depatux-m dosing on day 1 of cycle 2
|
[2] |
| Clearance (CL) | 0.146 | mL/h/kg |
PK parameters of depatux-m after 1.25 mg/kg depatux-m dosing on day 1 of cycle 2
|
[2] |
| Elimination Half-Life (t1/2) | 7.4 | day |
PK parameters of depatux-m after 1.5 mg/kg depatux-m dosing on day 1 of cycle 2
|
[2] |
| Clearance (CL) | 0.154 | mL/h/kg |
PK parameters of depatux-m after 1.5 mg/kg depatux-m dosing on day 1 of cycle 2
|
[2] |
| Clearance (CL) | 0.187 | L/day |
Population Estimates from the Final Individual Model
|
[3] |
General Information of The Activity Data Related to This ADC
Identified from the Human Clinical Data
Revealed Based on the Cell Line Data
Full List of Activity Data of This Antibody-drug Conjugate
Identified from the Human Clinical Data
| Experiment 1 Reporting the Activity Date of This ADC | [5] | ||||
| Efficacy Data | Progression Free Survival |
2.1 months
|
|||
| Patients Enrolled |
Japanese participants with WHO grade III or IV malignant glioma
|
||||
| Administration Dosage |
ABT-414 administered every other weeks monotherapy
|
||||
| Related Clinical Trial | |||||
| NCT Number | NCT02590263 | Clinical Status | PHASE1|||PHASE2 | ||
| Clinical Description | A Non-Randomized, Open-Label, Multi-Center Phase 1/2 Study Evaluating the Safety, Pharmacokinetics and Efficacy of ABT-414 in Japanese Subjects With Malignant Glioma | ||||
| Primary Endpoint |
For all patients in the 2L Depatux-M + CT arm, the 6-month PFS estimate by central review was 25.6% (95% CI 11.4-42.6) with a median PFS of 2.1 months (95% CI 1.9-3.9; Figure 3 A, B). The 6-month OS estimate was 89.7% (95% CI 71.3-96.5), and the median OS was 14.7 months (95% CI 10.7-15.4; Figure 4). ORR, analyzed in patients with at least one measurable disease at baseline, was 21.7% (5/23) by central review with all responses being PR and the median DoR was 5.5 months (95% CI 1.9-NE; Table 6). Seven patients were considered to have 6-month PFS by investigator review, but not by central review.
Click to Show/Hide
|
||||
| Other Endpoint |
Objective Response Rate [Time Frame: At each visit for approximately 1 year], Overall Survival [Time Frame: At each visit for approximately 1 year], Duration of Overall Response [Time Frame: At each visit for approximately 1 year]
|
||||
| Experiment 2 Reporting the Activity Date of This ADC | [5] | ||||
| Efficacy Data | Overall suvival (OS) |
14.7 months
|
|||
| Patients Enrolled |
Japanese participants with WHO grade III or IV malignant glioma
|
||||
| Administration Dosage |
ABT-414 administered every other weeks monotherapy
|
||||
| Related Clinical Trial | |||||
| NCT Number | NCT02590263 | Clinical Status | PHASE1|||PHASE2 | ||
| Clinical Description | A Non-Randomized, Open-Label, Multi-Center Phase 1/2 Study Evaluating the Safety, Pharmacokinetics and Efficacy of ABT-414 in Japanese Subjects With Malignant Glioma | ||||
| Primary Endpoint |
For all patients in the 2L Depatux-M + CT arm, the 6-month PFS estimate by central review was 25.6% (95% CI 11.4-42.6) with a median PFS of 2.1 months (95% CI 1.9-3.9; Figure 3 A, B). The 6-month OS estimate was 89.7% (95% CI 71.3-96.5), and the median OS was 14.7 months (95% CI 10.7-15.4; Figure 4). ORR, analyzed in patients with at least one measurable disease at baseline, was 21.7% (5/23) by central review with all responses being PR and the median DoR was 5.5 months (95% CI 1.9-NE; Table 6). Seven patients were considered to have 6-month PFS by investigator review, but not by central review.
Click to Show/Hide
|
||||
| Other Endpoint |
Objective Response Rate [Time Frame: At each visit for approximately 1 year], Overall Survival [Time Frame: At each visit for approximately 1 year], Duration of Overall Response [Time Frame: At each visit for approximately 1 year]
|
||||
| Experiment 3 Reporting the Activity Date of This ADC | [6] | ||||
| Efficacy Data | Overall suvival (OS) |
15.5 months
|
|||
| Patients Enrolled |
Must have a clinical diagnosis of glioblastoma (GBM).
|
||||
| Administration Dosage |
Depatuxizumab mafodotin is given on Day 1 of Week 1, 3 and 5 along with the standard therapy of TMZ and radiation during the chemoradiation phase. Depatuxizumab mafodotin is given on Day 1 and 15 of each cycle along with TMZ (Days 1-5 of each cycle) per standard of care during the adjuvant phase.
|
||||
| Related Clinical Trial | |||||
| NCT Number | NCT02573324 | Clinical Status | PHASE3 | ||
| Clinical Description | A Randomized, Placebo Controlled Phase 3 Study of ABT-414 With Concurrent Chemoradiation and Adjuvant Temozolomide in Subjects With Newly Diagnosed Glioblastoma (GBM) With Epidermal Growth Factor Receptor (EGFR) Amplification (Intellance1) | ||||
| Primary Endpoint |
Overall Survival (OS) [Time Frame: Overall median duration of follow-up was 15.5 months (range: 0.1, 35.6).]
|
||||
| Other Endpoint |
OS for the O6-methylguaninemethlytransferese (MGMT) Unmethylated Group [Time Frame: Overall median duration of follow-up was 15.5 months (range: 0.1, 35.6).]
|
||||
| Experiment 4 Reporting the Activity Date of This ADC | [5] | ||||
| Efficacy Data | During of response (DoR) |
5.5 months
|
|||
| Patients Enrolled |
Japanese participants with WHO grade III or IV malignant glioma
|
||||
| Administration Dosage |
ABT-414 administered every other weeks monotherapy
|
||||
| Related Clinical Trial | |||||
| NCT Number | NCT02590263 | Clinical Status | PHASE1|||PHASE2 | ||
| Clinical Description | A Non-Randomized, Open-Label, Multi-Center Phase 1/2 Study Evaluating the Safety, Pharmacokinetics and Efficacy of ABT-414 in Japanese Subjects With Malignant Glioma | ||||
| Primary Endpoint |
For all patients in the 2L Depatux-M + CT arm, the 6-month PFS estimate by central review was 25.6% (95% CI 11.4-42.6) with a median PFS of 2.1 months (95% CI 1.9-3.9; Figure 3 A, B). The 6-month OS estimate was 89.7% (95% CI 71.3-96.5), and the median OS was 14.7 months (95% CI 10.7-15.4; Figure 4). ORR, analyzed in patients with at least one measurable disease at baseline, was 21.7% (5/23) by central review with all responses being PR and the median DoR was 5.5 months (95% CI 1.9-NE; Table 6). Seven patients were considered to have 6-month PFS by investigator review, but not by central review.
Click to Show/Hide
|
||||
| Other Endpoint |
Objective Response Rate [Time Frame: At each visit for approximately 1 year], Overall Survival [Time Frame: At each visit for approximately 1 year], Duration of Overall Response [Time Frame: At each visit for approximately 1 year]
|
||||
| Experiment 5 Reporting the Activity Date of This ADC | [7] | ||||
| Patients Enrolled |
Subjects must have a solid tumor type likely to over-express Epidermal Growth Factor Receptor (EGFR) (Phase 1)
|
||||
| Administration Dosage |
Data from patients who received ABT-414 monotherapy at a dose of 1-4 mg/kg once every 3 weeks or 1 or 1.5 mg/kg weekly for 2 out of every 3 weeks (alternate schedule) by intravenous infusion were included in the analysis of triplicate 12-lead ECGs obtained before dosing and through 168 h after dosing.
|
||||
| Related Clinical Trial | |||||
| NCT Number | NCT01741727 | Clinical Status | PHASE1 | ||
| Clinical Description | A Phase 1/2 Study Evaluating the Safety, Pharmacokinetics and Efficacy of ABT-414 in Subjects With Advanced Solid Tumors Likely to Over-Express the Epidermal Growth Factor Receptor (EGFR) | ||||
| Primary Endpoint |
Phase 1 - Safety (Number of subjects with adverse events and/or dose limiting toxicities) [Time Frame: Every 1-3 weeks for an average of 20 weeks]
|
||||
| Other Endpoint |
Phase 2- Safety (Scheduled study visits occurring on average every 3 weeks) [Time Frame: Followed on average every 3 weeks for approximately 20 weeks]
|
||||
| Experiment 6 Reporting the Activity Date of This ADC | [8] | ||||
| Patients Enrolled |
Histologically confirmed de novo (primary) glioblastoma with unequivocal tumor progression or recurrence.
|
||||
| Administration Dosage |
intravenous administration (1.25 mg/kg or 1.0 mg/kg body weight) over 30 to 40 minutes once every 2 weeks until one of the treatment withdrawal criteria was met. The dose was 1.25 mg/kg in the original protocol (Version 1) and Version 2, Amendment 1, and was lowered to 1.0 mg/kg in protocol Version 3, Amendment 2. Pediatric participants: Intravenous administration (1.0 mg/kg body weight for those who were 6 to 17 years old at the date of first dose, or 1.3 mg/kg for those who were 0 to 5 years old) over 30 to 40 minutes or as directed by the guidelines once every 2 weeks until one of the treatment withdrawal criteria was met, for a maximum of one year. If used in combination with temozolomide, depatuxizumab mafodotin was dosed on Day 1 and Day 15 of the TMZ cycle (assuming a standard regimen of 200 mg/m^2/day for 5 days of each 28-day cycle; for other TMZ schedules, timing of the depatuxizumab mafodotin dosing schedule were to be discussed with the medical monitor).
Click to Show/Hide
|
||||
| Related Clinical Trial | |||||
| NCT Number | NCT02343406 | Clinical Status | PHASE2 | ||
| Clinical Description | INTELLANCE-2: ABT-414 Alone or ABT-414 Plus Temozolomide Versus Lomustine or Temozolomide for Recurrent Glioblastoma: A Randomized Phase 2 Study of the EORTC Brain Tumor Group | ||||
| Primary Endpoint |
Overall Survival (OS); Progression-Free Survival (PFS)
|
||||
| Other Endpoint |
Objective Response Rate (ORR); Overall Survival in the Subgroup With Epidermal Growth Factor Receptor (EGFRvIII) Mutation
|
||||
| Experiment 7 Reporting the Activity Date of This ADC | [9] | ||||
| Patients Enrolled |
Newly diagnosed glioblastoma (GBM) histologically proven, World Health Organization (WHO) grade IV GBM or WHO grade IV gliosarcoma
|
||||
| Administration Dosage |
During the Chemoradiation Phase, participants were to receive depatuxizumab mafodotin at 2.0 mg/kg IV infusion over 30 - 40 minutes once every 2 weeks (Day 1 of Weeks 1, 3, and 5 of the 6-week regimen). During the Adjuvant Therapy Phase, participants were to receive depatuxizumab mafodotin at 1.25 mg/kg on Day 1 (± 2 days) and Day 15 (± 2 days) of each 28-day cycle as a 30 - 40 minute infusion for 12 cycles.
Click to Show/Hide
|
||||
| Related Clinical Trial | |||||
| NCT Number | NCT03419403 | Clinical Status | PHASE3 | ||
| Clinical Description | Phase 3b Study for Management of Ocular Side Effects in Subjects With EGFR-amplified Glioblastoma Receiving Depatuxizumab Mafodotin (ABT-414) | ||||
| Primary Endpoint |
Percentage of Participants Who Required a Change in Ocular Side Effect (OSE) Management [Time Frame: Within 8 weeks after the initial dose of depatuxizumab mafodotin]
|
||||
| Other Endpoint |
Maximum Change From Baseline on the Logarithm of the Minimum Angle of Resolution (LogMAR) Scale; Time to Bandage Contact Lens (BCL) Intervention; Number of Participants With Depatuxizumab Mafodotin Dose Modifications Due to Ocular Side Effects (OSE)
|
||||
| Experiment 8 Reporting the Activity Date of This ADC | [10] | ||||
| Patients Enrolled |
Glioblastoma Multiforme (GBM)
|
||||
| Administration Dosage |
ABT-414 will be administered by intravenous infusion
|
||||
| Related Clinical Trial | |||||
| NCT Number | NCT01800695 | Clinical Status | PHASE1 | ||
| Clinical Description | A Phase 1 Study Evaluating the Safety and Pharmacokinetics of ABT-414 for Subjects With Glioblastoma Multiforme | ||||
| Primary Endpoint |
Number and percentage of participants with adverse events
|
||||
| Other Endpoint |
Biomarker EGFR expression, Progression Free Survival, Overall Survival
|
||||
| Experiment 9 Reporting the Activity Date of This ADC | [11] | ||||
| Patients Enrolled |
Participant must have epidermal growth factor receptor (EGFR) amplification or EGFRvIII mutation.
|
||||
| Administration Dosage |
.
|
||||
| Related Clinical Trial | |||||
| NCT Number | NCT03123952 | Clinical Status | N.A. | ||
| Clinical Description | This is an expanded access program (EAP) for eligible participants. This program is designed to provide access to ABT-414 prior to approval by the local regulatory agency. Availability will depend on territory eligibility. Participating sites will be added as they apply for and are approved for the EAP. A medical doctor must decide whether the potential benefit outweighs the risk of receiving an investigational therapy based on the individual patient's medical history and program eligibility criteria. | ||||
| Experiment 10 Reporting the Activity Date of This ADC | [12] | ||||
| Efficacy Data | Median progression-free survival (mPFS) | 8.0 (depatux-m group); 6.3 (placebo group) Months | High EGFR expression (EGFR +++) | ||
| Patients Enrolled |
EGFR-amp newly diagnosed GBM were randomized 1:1 to radiotherapy, temozolomide, and depatux-m/placebo.
|
||||
| Administration Dosage |
Depatux-m was dosed at 2.0 mg/kg during RT, then 1.25 mg/kg thereafter on days 1 and 15/28, 19,21 and allowed to continue until disease progression.
|
||||
| Experiment 11 Reporting the Activity Date of This ADC | [12] | ||||
| Efficacy Data | Median Overall Survival (mOS) | 18.9 (depatux-m group); 18.7(placebo group) Months | High EGFR expression (EGFR +++) | ||
| Patients Enrolled |
EGFR-amp newly diagnosed GBM were randomized 1:1 to radiotherapy, temozolomide, and depatux-m/placebo.
|
||||
| Administration Dosage |
Depatux-m was dosed at 2.0 mg/kg during RT, then 1.25 mg/kg thereafter on days 1 and 15/2819, 21 and allowed to continue until disease progression.
|
||||
Revealed Based on the Cell Line Data
| Experiment 1 Reporting the Activity Date of This ADC | [13] | ||||
| Efficacy Data | Tumor Growth Inhibition value (TGI) | ≈ 87.50% | Positive EGFR expression (EGFR+++/++) | ||
| Method Description |
To establish xenografts, 2 x 10⁶ MSTO-211H cells mixed with 75-uL Matrigel were injected subcutaneously in the right flank of 5 to 6-week-old female BALB/c nu/nu miceFor the MSTO-211H study, mice received either ABT-414, ABBV-221 or ADC control (3 mg/kg) every 4 days.
|
||||
| In Vivo Model | MSTO-211H CDX model | ||||
| In Vitro Model | Pleural biphasic mesothelioma | MSTO-211H cells | CVCL_1430 | ||
| Experiment 2 Reporting the Activity Date of This ADC | [13] | ||||
| Efficacy Data | Half Maximal Inhibitory Concentration (IC50) | 10.00 - 35.00 ug/mL | Positive EGFR expression (EGFR+++/++) | ||
| Method Description |
Cells lines were plated at 1,000-3,000 cells per well in complete growth medium containing 10% FCS in 96-well plates and allowed to adhere overnight.
|
||||
| In Vitro Model | Pleural mesothelioma | NCI-H2052 cells | CVCL_1518 | ||
| Experiment 3 Reporting the Activity Date of This ADC | [13] | ||||
| Efficacy Data | Half Maximal Inhibitory Concentration (IC50) | 10.00 - 35.00 ug/mL | Positive EGFR expression (EGFR+++/++) | ||
| Method Description |
Cells lines were plated at 1,000-3,000 cells per well in complete growth medium containing 10% FCS in 96-well plates and allowed to adhere overnight.
|
||||
| In Vitro Model | Pleural mesothelioma | NCI-H2052 cells | CVCL_1518 | ||
| Experiment 4 Reporting the Activity Date of This ADC | [13] | ||||
| Efficacy Data | Half Maximal Inhibitory Concentration (IC50) | 10.00 - 35.00 ug/mL | Positive EGFR expression (EGFR+++/++) | ||
| Method Description |
Cells lines were plated at 1,000-3,000 cells per well in complete growth medium containing 10% FCS in 96-well plates and allowed to adhere overnight.
|
||||
| In Vitro Model | Pleural mesothelioma | NCI-H28 cells | CVCL_1555 | ||
| Experiment 5 Reporting the Activity Date of This ADC | [13] | ||||
| Efficacy Data | Half Maximal Inhibitory Concentration (IC50) | 10.00 - 35.00 ug/mL | Positive EGFR expression (EGFR+++/++) | ||
| Method Description |
Cells lines were plated at 1,000-3,000 cells per well in complete growth medium containing 10% FCS in 96-well plates and allowed to adhere overnight.
|
||||
| In Vitro Model | Pleural biphasic mesothelioma | MSTO-211H cells | CVCL_1430 | ||
References