
Payload Information
General Information of This Payload (ID: PAY0JCIBW)
| Name |
Mertansine DM1
|
|||||
|---|---|---|---|---|---|---|
| Synonyms |
Mertansine; Maytansinoid DM 1; 139504-50-0; maytansinoid DM1; Mertansine (DM1); N2'-deacetyl-N2'-(3-mercapto-1-oxopropyl)-maytansine; DDZ29HGH0E; DM 1; [(1S,2R,3S,5S,6S,16E,18E,20R,21S)-11-chloro-21-hydroxy-12,20-dimethoxy-2,5,9,16-tetramethyl-8,23-dioxo-4,24-dioxa-9,22-diazatetracyclo[19.3.1.110,14.03,5]hexacosa-10,12,14(26),16,18-pentaen-6-yl] (2S)-2-[methyl(3-sulfanylpropanoyl)amino]propanoate; DM1; Maytansine, N2'-deacetyl-N2'-(3-mercapto-1-oxopropyl)-; N2'-Deacetyl-N2'-(3-mercapto-1-oxopropyl)-maytansine, L-; DM1 [Maytansinoid]; DM 1 [Maytansinoid]; UNII-DDZ29HGH0E; Mertasine; DM1;Maytansinoid; Maytansinoid DM1; MAYTANSINOID DM1 [MI]; CHEMBL4802230; SCHEMBL13558634; CHEBI:82755; MFCD28398157; s6773; CS-5804; DA-48536; HY-19792; J3.653.420F; Q4515649; (1S,2R,3S,5S,6S,16E,18E,20R,21S)-11-chloro-21-hydroxy-12,20-dimethoxy-2,5,9,16-tetramethyl-8,23-dioxo-4,24-dioxa-9,22-diazatetracyclo[19.3.1.1(10,14).0(3,5)]hexacosa-10(26),11,13,16,18-pentaen-6-yl (2S)-2-[methyl(3-sulfanylpropanoyl)amino]propanoate; (3S)-3-O-De[2-(acetylmethylamino)-1-oxopropyl]-3-O-[(2S)-2-(methyl 3-mercaptopropanoylamino)propanoyl]maytansine
Click to Show/Hide
|
|||||
| Target | Microtubule (MT) | |||||
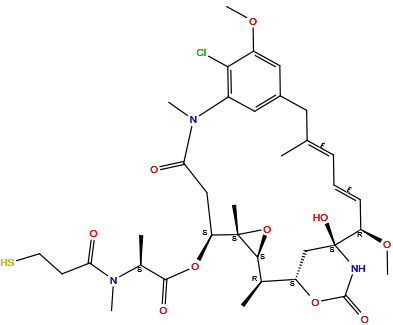
| Structure |
|
|||||
| Formula | C35H48ClN3O10S |
|||||
| Isosmiles | C[C@@H]1[C@@H]2C[C@]([C@@H](/C=C/C=C(/CC3=CC(=C(C(=C3)OC)Cl)N(C(=O)C[C@@H]([C@]4([C@H]1O4)C)OC(=O)[C@H](C)N(C)C(=O)CCS)C)\C)OC)(NC(=O)O2)O |
|||||
| PubChem CID | ||||||
| InChI |
InChI=1S/C35H48ClN3O10S/c1-19-10-9-11-26(46-8)35(44)18-25(47-33(43)37-35)20(2)31-34(4,49-31)27(48-32(42)21(3)38(5)28(40)12-13-50)17-29(41)39(6)23-15-22(14-19)16-24(45-7)30(23)36/h9-11,15-16,20-21,25-27,31,44,50H,12-14,17-18H2,1-8H3,(H,37,43)/b11-9+,19-10+/t20-,21+,25+,26-,27+,31+,34+,35+/m1/s1
|
|||||
| InChIKey |
ANZJBCHSOXCCRQ-FKUXLPTCSA-N
|
|||||
| IUPAC Name |
[(1S,2R,3S,5S,6S,16E,18E,20R,21S)-11-chloro-21-hydroxy-12,20-dimethoxy-2,5,9,16-tetramethyl-8,23-dioxo-4,24-dioxa-9,22-diazatetracyclo[19.3.1.110,14.03,5]hexacosa-10,12,14(26),16,18-pentaen-6-yl] (2S)-2-[methyl(3-sulfanylpropanoyl)amino]propanoate
|
|||||
| Pharmaceutical Properties | Molecule Weight |
738.3 |
Polar area |
158 |
||
Complexity |
1340 |
xlogp Value |
2.2 |
|||
Heavy Count |
50 |
Rot Bonds |
8 |
|||
Hbond acc |
11 |
Hbond Donor |
3 |
|||
Each Antibody-drug Conjugate Related to This Payload
Full Information of The Activity Data of The ADC(s) Related to This Payload
Recombinant anti-HER2 humanized mAb-DM1 [Phase 1]
Identified from the Human Clinical Data
| Experiment 1 Reporting the Activity Date of This ADC | [1] | ||||
| Patients Enrolled |
Key eligibility: Adults (≥18) with progressive advanced sarcoma/prostate/breast/ovarian/pancreatic cancers (ECOG ≤2, life expectancy ≥6 months) post ≥1 prior therapy. Requires ACT Tumor Board recommendation, adequate organ function (ANC ≥1,500/uL, platelets ≥100,000/uL, bilirubin ≤1.5×ULN), and measurable disease. Major exclusions: active secondary malignancies, untreated CNS metastases, uncontrolled comorbidities (NYHA III-IV heart failure, severe infections), pregnancy/breastfeeding, or conditions jeopardizing protocol compliance.
Click to Show/Hide
|
||||
| Administration Dosage |
Administered in monotherapy or in combination with other targeted agents or immunotherapies, chemotherapies, or radiation. Combination treatment plans may include a two-week monotherapy lead-in, followed by a combination treatment regimen. Each ACT study intervention must have an established RP2D determined in a prior clinical trial. Participants undergo a Pre-Treatment Biopsy, plus an On-Treatment Biopsy after two weeks on first dose of study drug (s) and prior to starting Cycle 2, regardless of regimen. Participants continue to receive study agent (s) after the On-Treatment Biopsy, according to the biopsy results and the results of ongoing safety and clinical assessments. Treatment cycles repeat every 21 to 28 days in the absence of disease progression or unacceptable toxicity. Cycles are determined based on the study agent (s). Upon disease progression, participants are given the option to undergo an additional biopsy.
Click to Show/Hide
|
||||
| Related Clinical Trial | |||||
| NCT Number | NCT05238831 | Phase Status | EARLY_PHASE1 | ||
| Clinical Description |
Serial Measurements of Molecular and Architectural Responses to Therapy (SMMART) Trial: Adaptive Clinical Treatment (ACT)
|
||||
| Primary Endpoint |
Primary endpoint evaluates feasibility of ACT therapy implementation, requiring ≥11/15 participants (80%) to initiate recommended regimen within 2 years, with protocol-specified analysis of barriers if threshold unmet.
|
||||
| Other Endpoint |
Secondary objectives assess safety (CTCAE v5.0-graded AEs, discontinuation rates), efficacy (6-month ORR by RECIST 1.1/pseudoprogression criteria), and survival outcomes (PFS, disease-specific survival, OS) through 5-year follow-up using Kaplan-Meier/cumulative incidence methods.
|
||||
| Experiment 2 Reporting the Activity Date of This ADC | [2] | ||||
| Patients Enrolled |
Key eligibility: Adults (≥18) with HER2+ (IHC3+/FISH+) metastatic breast cancer (1-3 prior lines, ECOG 0-1). Exclusions: prior HER2-ADC use, active CNS metastases (except stable treated lesions), uncontrolled effusions/ILD, significant cardiac disease, QTc risks, active infections (HBV/HCV/HIV), or pregnancy. Requires adequate organ function (ANC ≥1.0×10⁹/L, LVEF >50%) and measurable disease (RECIST 1.1).
Click to Show/Hide
|
||||
| Administration Dosage |
FS-1502 Dosage form: lyophilized powder Specification: 30 mg/vial Dose: 2.3 mg/kg, once every 3 weeks, 21 days as a cycle; Method of administration: intravenous drip.
|
||||
| Related Clinical Trial | |||||
| NCT Number | NCT05755048 | Phase Status | PHASE3 | ||
| Clinical Description |
A Multicenter, Open-label, Randomized Controlled Phase III Clinical Study to Compare the Efficacy and Safety of FS-1502 Versus T-DM1 in Patients With HER2-positive Unresectable Locally Advanced or Metastatic Breast Cancer
|
||||
| Primary Endpoint |
Primary endpoint evaluates PFS by independent central review (up to 28 months) in HER2+ metastatic breast cancer patients post-trastuzumab/taxane treatment, defined as time from enrollment to disease progression (≥20% target lesion increase per RECIST 1.1) or death.
|
||||
| Other Endpoint |
Secondary objectives assess OS (time to death), ORR (confirmed CR+PR rates), DCR (CR+PR+SD), CBR (response lasting ≥24 weeks), DOR (response duration), and treatment-emergent AEs (NCI-CTCAE v5.0 graded) over 28 months.
|
||||
| Experiment 3 Reporting the Activity Date of This ADC | [3] | ||||
| Patients Enrolled |
Key eligibility: Adults (≥18) with untreated HER2+ (IHC3+) metastatic breast cancer (ECOG 0-1, LVEF ≥50%), no prior systemic therapy except THP within 6 weeks. Exclusions: prior invasive breast cancer treatment, uncontrolled cardiac/ILD conditions, active infections (unless controlled HIV/HBV/HCV), CYP2C8/3A4 modifiers use, or pregnancy. Requires adequate organ function and stable brain metastases if present.
Click to Show/Hide
|
||||
| Related Clinical Trial | |||||
| NCT Number | NCT06439693 | Phase Status | PHASE2 | ||
| Clinical Description |
A Single-Arm, Phase II Study of Sequential Therapy With Curative Intent in de Novo HER2+ Metastatic Breast Cancer: The SAPPHO Study:
|
||||
| Primary Endpoint |
Primary endpoint evaluates 4-year Disease-Free Survival (DFS4) using Kaplan-Meier method in HER2+ metastatic breast cancer patients, measuring time from registration to disease progression/death/anti-cancer therapy resumption (excluding endocrine therapy), with censoring at last evaluation for progression-free survivors.
|
||||
| Other Endpoint |
Secondary objectives assess median Overall Survival (OS), Objective Response Rate (ORR by RECIST 1.1), Grade 3-5 treatment-related toxicity (CTCAE v5.0), completion rates of sequential therapy parts (A: taxane/trastuzumab/pertuzumab; B: trastuzumab deruxtecan; C: T-DM1/tucatinib; D: trastuzumab/pertuzumab/tucatinib), and DFS4 by Minimal Residual Disease status over 54 months.
Click to Show/Hide
|
||||
| Experiment 4 Reporting the Activity Date of This ADC | [2] | ||||
| Patients Enrolled |
Eligible patients (≥18 years) must have HER2+ disease (IHC3+ or IHC2+/FISH+), 1-3 prior lines (including adjuvant trastuzumab/taxane), ECOG 0-1, LVEF>50%, and adequate organ function. Key exclusions: prior HER2-ADC use, uncontrolled CNS metastases (unless stable ≥6 months post-treatment), QTc prolongation risks, active HBV/HCV/HIV, or unresolved toxicity >CTCAE G1 (except alopecia/stable G2 neuropathy).
Click to Show/Hide
|
||||
| Administration Dosage |
Experimental: FS-1502 Dosage form: lyophilized powder Specification: 30 mg/vial Dose: 2.3 mg/kg, once every 3 weeks, 21 days as a cycle; Method of administration: intravenous drip.
|
||||
| Related Clinical Trial | |||||
| NCT Number | NCT05755048 | Phase Status | PHASE3 | ||
| Clinical Description |
A Multicenter, Open-label, Randomized Controlled Phase III Clinical Study to Compare the Efficacy and Safety of FS-1502 Versus T-DM1 in Patients With HER2-positive Unresectable Locally Advanced or Metastatic Breast Cancer
|
||||
| Primary Endpoint |
The study evaluates PFS by ICR in HER2+ unresectable/metastatic breast cancer patients previously treated with trastuzumab/taxanes over 28 months, with PD defined as ≥20% target lesion increase per RECIST v1.1.
|
||||
| Other Endpoint |
Key efficacy endpoints (OS, ORR, DCR, CBR, DOR) and safety (TEAEs per NCI-CTCAE v5.0) are assessed via ICR/investigator over 28 months, with ORR requiring confirmed CR/PR (CR=target lesion disappearance; PR=≥30% decrease).
|
||||
| Experiment 5 Reporting the Activity Date of This ADC | [4] | ||||
| Patients Enrolled |
Eligible patients (≥18 years) have HER2+ advanced cancers (IHC3+ or IHC2+/FISH+), ECOG 0-1, LVEF>50%, with ≥2 prior anti-HER2 lines. Key exclusions: CNS metastases, recent major surgery/RT (<4 weeks), QTc >470ms, active HBV/HCV/HIV, or unresolved toxicity >CTCAE G1 (except stable G2 alopecia/neuropathy). Tissue confirmation is mandatory for pivotal study participants.
Click to Show/Hide
|
||||
| Administration Dosage |
Phase Ia: Patients enrolled on the 1.2 and 2.0 regimens: FS-1502 monotherapy every 4 weeks with intravenous drip, 28 days as a cycle; Patients enrolled on the 3.0 regimens: starting from the 1.0mg/kg dose group, FS-1502 monotherapy every 3 weeks with intravenous drip, 21 days as a cycle; Phase Ib: FS-1502 monotherapy, the dose and frequency of administration for Stage Ib will be obtained according to Phase Ia (RP2D).
Click to Show/Hide
|
||||
| Related Clinical Trial | |||||
| NCT Number | NCT03944499 | Phase Status | PHASE1 | ||
| Clinical Description |
A Phase I,Multicenter,Open-label,Single-arm Study:A Dose-escalation Phase Evaluating FS1502 in Patients With HER2 Expressed Advanced Solid Tumors,and a Dose-expanded Phase in Patients With Local Advanced or Metastatic,HER2+ Breast Cancer
|
||||
| Primary Endpoint |
The Phase Ia study evaluates DLT (NCI-CTCAE v5.0) and determines MTD/RP2D for FS-1502. ORR (CR/PR per RECIST v1.1) is assessed by IRC in Phase Ib over ~2 years in HER2+ solid tumors with confirmed HER2 expression criteria.
|
||||
| Other Endpoint |
Safety analyses include TEAEs (CTCAE v5.0), SAEs, and treatment discontinuations over ~3 years. Efficacy is measured by PFS (time to progression/death), OS (1-year rate), DOR (CR/PR to progression), and CBR (CR/PR/SD >6 mo). PK parameters (AUC, Cmax, tmax, T1/2, clearance) and anti-drug antibodies are also assessed.
|
||||
B-003 [Phase 2]
Identified from the Human Clinical Data
| Experiment 1 Reporting the Activity Date of This ADC | [5] | ||||
| Patients Enrolled |
Eligible patients (18-75yo females) must have HER2+ metastatic breast cancer refractory to anti-HER2 therapy with ECOG 0-1, adequate organ function, and measurable disease. Key exclusions include recent anti-HER2 therapy (T-DM1/trastuzumab within 3 months), anthracycline overdose (doxorubicin >450mg/m2 equivalent), uncontrolled comorbidities (cardiac dysfunction LVEF<50%, NYHA III-IV, uncontrolled HTN, active bleeding disorders), hepatitis/HIV, symptomatic brain metastases, or lab abnormalities (neutrophils <1.5×10⁹/L, platelets <100×109/L, ALT/AST >2.5×ULN). Pregnancy prevention is mandatory for 6 months post-treatment.
Click to Show/Hide
|
||||
| Administration Dosage |
Usage: Intravenous infusion; Dose escalation stage: doses 0.6, 1.2, 2.4, 3.6, 4.8 mg / kg, 1-6subjects each. Dose expansion stage: 20 subjects are enrolled and take the recommended dose based on the result of dose escalation stage.
|
||||
| Related Clinical Trial | |||||
| NCT Number | NCT03953833 | Phase Status | PHASE1 | ||
| Clinical Description |
Phase I Clinical Trial on the Safety, Tolerability, Pharmacokinetics of B003 in the Treatment of HER2-positive Recurrent or Metastatic Breast Cancer
|
||||
| Primary Endpoint |
The study will determine the MTD of B003 over 2 years by assessing DLTs during the first 21-day cycle, with extensive PK profiling including Tmax, Cmax, t½, MRT, AUC, elimination rate and CL/F. Immunogenicity will track ADA incidence and titers, while efficacy endpoints measure ORR, DCR, DOR and PFS over 14 months per RECIST v1.1 criteria, requiring confirmation of responses at 4 weeks.
Click to Show/Hide
|
||||
| Experiment 2 Reporting the Activity Date of This ADC | [6] | ||||
| Patients Enrolled |
Eligible patients (18-75 years, ECOG 0-1) must have failed standard therapy, measurable lesions, adequate organ function, and controlled toxicities. Exclusion criteria involve recent chemotherapy/radiotherapy, severe comorbidities, active infections, CNS metastases, unresolved ILD, or prior topoisomerase I inhibitors. Strict lab and clinical stability requirements apply.
Click to Show/Hide
|
||||
| Administration Dosage |
BL-B01D1 was administered by intravenous infusion on D1 and D8 in a 3-week cycle.
|
||||
| Related Clinical Trial | |||||
| NCT Number | NCT06042894 | Phase Status | PHASE2 | ||
| Clinical Description |
A Phase II Clinical Trial to Evaluate the Efficacy and Safety of SI-B003 Monotherapy or BL-B01D1+SI-B003 Combination Therapy (BL-B01D1+SI-B003) in Patients With Unresectable Locally Advanced or Recurrent Metastatic HER2 Negative Breast Cancer
|
||||
| Primary Endpoint |
The study evaluates ORR (percentage achieving CR/PR per RECIST 1.1) and RP2D (dose determined by sponsor based on safety, efficacy, PK/PD data) over 24 months in HER2-negative breast cancer patients.
|
||||
| Other Endpoint |
Key endpoints include PFS (time to progression/death), DCR (percentage with CR/PR/SD per RECIST 1.1), DOR (response duration till progression/death), and TEAEs (adverse events during treatment) tracked over 24 months.
|
||||
| Experiment 3 Reporting the Activity Date of This ADC | [7] | ||||
| Patients Enrolled |
Eligible participants include women aged 18-75 with gynecological malignancies, adequate organ function, and measurable lesions per RECIST 1.1. Key exclusions involve prior ADC therapy, recent antineoplastic treatment, severe comorbidities, uncontrolled infections, active CNS metastases, or conditions deemed unsuitable by investigators.
|
||||
| Administration Dosage |
BL-B01D1 was administered by intravenous infusion on D1 and D8 in a 3-week cycle.
|
||||
| Related Clinical Trial | |||||
| NCT Number | NCT05990803 | Phase Status | PHASE2 | ||
| Clinical Description |
A Phase II Clinical Study to Evaluate the Efficacy and Safety of BL-B01D1 Monotherapy, SI-B003 Monotherapy and BL-B01D1+SI-B003 Combination Therapy (BL-B01D1+SI-B003) in Patients With Recurrent or Metastatic Cervical Cancer and Other Gynecological Malignancies
|
||||
| Primary Endpoint |
The primary endpoints include Objective Response Rate (ORR), defined as the percentage of participants achieving complete or partial response per RECIST 1.1, and the Recommended Phase II Dose (RP2D), determined based on safety, tolerability, and efficacy data during dose escalation.
|
||||
| Other Endpoint |
Secondary endpoints comprise Progression-Free Survival (PFS), measuring time from treatment initiation to disease progression or death; Disease Control Rate (DCR), capturing stable disease or better responses; Duration of Response (DOR), tracking sustained responses; and Treatment-Emergent Adverse Events (TEAEs), assessing safety profiles.
|
||||
| Experiment 4 Reporting the Activity Date of This ADC | [8] | ||||
| Patients Enrolled |
Eligible participants (18-75 years) must have locally advanced/metastatic gastrointestinal cancer, measurable lesions (RECIST 1.1), ECOG 0-1, and adequate organ function. Key exclusions: prior topoisomerase I inhibitor ADCs, recent antitumor therapy (4 weeks/5 half-lives), severe cardiac/autoimmune diseases, active infections, uncontrolled effusions, CNS metastases, or conditions compromising trial safety per investigator judgment.
Click to Show/Hide
|
||||
| Administration Dosage |
Administered by intravenous infusion for a cycle of 3 weeks.
|
||||
| Related Clinical Trial | |||||
| NCT Number | NCT06008054 | Phase Status | PHASE2 | ||
| Clinical Description |
A Phase II Clinical Study to Evaluate the Efficacy and Safety of SI-B003 Monotherapy, BL-B01D1+SI-B003 Combination Therapy and BL-B01D1+PD-1 Monoclonal Antibody in Patients With Locally Advanced or Metastatic Esophageal Cancer, Gastric Cancer, Colorectal Cancer and Other Gastrointestinal Tumors
|
||||
| Primary Endpoint |
The primary endpoints are Objective Response Rate (ORR), defined as the proportion of participants achieving complete or partial response per RECIST 1.1, and Recommended Phase II Dose (RP2D), determined by sponsor-investigator consensus based on safety, tolerability, efficacy, pharmacokinetics, and pharmacodynamics data during dose escalation.
|
||||
| Other Endpoint |
Secondary endpoints include Progression-Free Survival (PFS, time from first dose to progression/death), Disease Control Rate (DCR, percentage with CR/PR/SD per RECIST 1.1), Duration of Response (DOR, time from response to progression/death), and Treatment-Emergent Adverse Events (TEAEs, monitoring safety profiles during therapy).
|
||||
| Experiment 5 Reporting the Activity Date of This ADC | [9] | ||||
| Patients Enrolled |
Eligible patients (18-75 years) must have locally advanced/metastatic head and neck squamous cell carcinoma (excluding nasopharyngeal primary), measurable lesions (RECIST 1.1), ECOG ≤1, and adequate organ function. Key exclusions: active CNS metastases, recent anticancer therapy (4 weeks/5 half-lives), uncontrolled hypertension/cardiac conditions, autoimmune diseases, organ transplant history, HIV/HBV/HCV infection, or prior grade ≥3 immune-related adverse events from immunotherapy.
Click to Show/Hide
|
||||
| Related Clinical Trial | |||||
| NCT Number | NCT05668858 | Phase Status | PHASE1|||PHASE2 | ||
| Clinical Description |
Phase Ib/II Clinical Study of SI-B001+SI-B003 Dual-drug No-combination or Combined Chemotherapy in Patients With Locally Advanced or Metastatic Head and Neck Squamous Cell Carcinoma
|
||||
| Primary Endpoint |
The Phase Ib study evaluates dose-limiting toxicity (DLT) and determines the maximum tolerated dose (MTD) and recommended Phase II dose (RP2D) for SI-B001+SI-B003 combination therapy based on safety, efficacy, and pharmacokinetic data. Primary efficacy endpoint is objective response rate (ORR), defined per RECIST 1.1 as complete/partial response rates through 24 months.
Click to Show/Hide
|
||||
| Other Endpoint |
Safety and efficacy outcomes include treatment-emergent adverse events (TEAEs), disease control rate (DCR), duration of response (DOR), and progression-free survival (PFS) across both phases. Pharmacokinetic measures - Cmax, Tmax, half-life (T1/2), AUC, clearance (CL), trough levels (Ctrough) - and immunogenicity (anti-drug/neutralizing antibodies) will be analyzed for both investigational compounds.
Click to Show/Hide
|
||||
| Experiment 6 Reporting the Activity Date of This ADC | [10] | ||||
| Patients Enrolled |
Eligible participants (18-75 years) must have recurrent/metastatic HNSCC (excluding nasopharyngeal) with measurable lesions (RECIST 1.1), ECOG 0-1, and adequate organ function. Key exclusions: prior topoisomerase I inhibitor ADC treatment, recent anticancer therapy (4 weeks/5 half-lives), uncontrolled cardiovascular/autoimmune conditions, active infections, symptomatic CNS metastases/effusions, or positive HIV/HBV/HCV status with high viral loads.
Click to Show/Hide
|
||||
| Administration Dosage |
BL-B01D1 was administered by intravenous infusion on D1, D8, or D1 in 3-week cycles.
|
||||
| Related Clinical Trial | |||||
| NCT Number | NCT06006169 | Phase Status | PHASE2 | ||
| Clinical Description |
A Phase II Clinical Trial to Evaluate the Efficacy and Safety of BL-B01D1 Monotherapy, SI-B003 Monotherapy and BL-B01D1+SI-B003 Combination Therapy (BL-B01D1+SI-B003) in Patients With Recurrent or Metastatic Head and Neck Squamous Cell Carcinoma and Other Solid Tumors
|
||||
| Primary Endpoint |
The primary endpoints evaluate efficacy through Objective Response Rate (ORR) per RECIST 1.1 (complete/partial response rates) and establish the Recommended Phase II Dose (RP2D) based on comprehensive safety, tolerability, and pharmacokinetic data during dose escalation.
|
||||
| Other Endpoint |
Secondary assessments include Progression-Free Survival (time to progression/death), Disease Control Rate (complete/partial response or stable disease), Duration of Response (sustained treatment effect), and Treatment-Emergent Adverse Events monitoring (type/frequency/severity of treatment-related toxicities).
|
||||
| Experiment 7 Reporting the Activity Date of This ADC | [11] | ||||
| Patients Enrolled |
Eligible patients (18-75 years) must have recurrent/metastatic HNSCC (excluding nasopharyngeal origin) with measurable lesions (RECIST 1.1), ECOG ≤1, adequate organ function, and controlled prior treatment toxicities. Key exclusions: active CNS metastases, recent anticancer therapy/immunization (4 weeks), uncontrolled infections/autoimmune diseases, effusions requiring drainage, severe cardiovascular conditions, HIV/HBV/HCV positivity with high viral load, or prior grade ≥3 immune-related adverse events from immunotherapy.
Click to Show/Hide
|
||||
| Related Clinical Trial | |||||
| NCT Number | NCT06668961 | Phase Status | PHASE2 | ||
| Clinical Description |
A Phase II Clinical Study to Evaluate the Safety and Efficacy of SI-B001+SI-B003 Combined With Platinum-based Chemotherapy (SI-B001+SI-B003+ Platinum-based Chemotherapy) as First-line Treatment in Patients With Recurrent or Metastatic Head and Neck Squamous Cell Carcinoma
|
||||
| Primary Endpoint |
The primary endpoint is objective response rate (ORR) assessed per RECIST 1.1 criteria, measuring complete/partial response rates over 24 months in participants receiving SI-B001+SI-B003 combination therapy.
|
||||
| Other Endpoint |
Secondary outcomes include progression-free survival (time to progression/death), disease control rate (complete/partial response or stable disease), duration of response (sustained treatment effect), treatment-emergent adverse events (safety profile), pharmacokinetic parameters (Cmax, Tmax, Ctrough), and immunogenicity assessment (anti-drug antibody frequency/titer).
Click to Show/Hide
|
||||
| Experiment 8 Reporting the Activity Date of This ADC | [12] | ||||
| Patients Enrolled |
Eligible patients (18-75 years, ECOG 0-1) must have locally advanced/metastatic solid tumors (NSCLC, nasopharyngeal carcinoma) with measurable lesions (RECIST v1.1) and adequate organ function. Key exclusions: MET exon 14 skipping mutations (Cohort_A), recent anticancer therapy (4 weeks/5 half-lives), uncontrolled hypertension/infections, active CNS metastases, ≥grade 3 immunotherapy-related toxicities, autoimmune/inflammatory diseases, significant effusions, or HIV/HBV/HCV infections with active viral replication.
Click to Show/Hide
|
||||
| Related Clinical Trial | |||||
| NCT Number | NCT05956587 | Phase Status | PHASE2 | ||
| Clinical Description |
A Phase II Clinical Study to Evaluate the Efficacy and Safety of SI-B003 Monotherapy and BL-B01D1+SI-B003 Combination Therapy in Patients With Locally Advanced or Metastatic Non-small Cell Lung Cancer, Nasopharyngeal Carcinoma and Other Solid Tumors
|
||||
| Primary Endpoint |
The primary endpoints include Objective Response Rate (ORR) per RECIST 1.1 criteria and determination of Recommended Phase II Dose (RP2D) for SI-B003 based on safety, efficacy, pharmacokinetic and pharmacodynamic data during dose escalation, assessed over 24 months.
|
||||
| Other Endpoint |
Secondary endpoints are progression-free survival (time to disease progression/death), disease control rate (complete/partial response or stable disease), duration of response (sustained treatment effect), treatment-emergent adverse events (incidence/severity), all evaluated across the 24-month study period.
|
||||
| Experiment 9 Reporting the Activity Date of This ADC | [13] | ||||
| Patients Enrolled |
Eligible patients (18-75 years, ECOG 0-1) must have extensive-stage small-cell lung cancer (SCLC) confirmed histologically/cytologically, with measurable lesions and adequate organ function. Key exclusions: prior HER3/EGFR antibody therapy, recent anticancer treatment (4 weeks/5 half-lives), uncontrolled hypertension/diabetes, active infections, CNS metastases requiring intervention, autoimmune diseases, or other malignancies within 5 years. Cohort-specific criteria apply for prior therapy lines (Cohort_A: ≥3 lines; Cohort_B: standard therapy failure or treatment-naïve).
Click to Show/Hide
|
||||
| Related Clinical Trial | |||||
| NCT Number | NCT05924841 | Phase Status | PHASE2 | ||
| Clinical Description |
A Phase II Clinical Trial to Evaluate the Efficacy and Safety of BL-B01D1 Monotherapy, SI-B003 Monotherapy and BL-B01D1+SI-B003 Combination Therapy (BL-B01D1+SI-B003) in Patients With Extensive Stage Small Cell Lung Cancer (SCLC)
|
||||
| Primary Endpoint |
The primary outcomes include Objective Response Rate (ORR), defined as the proportion of patients achieving complete or partial response per RECIST 1.1, and Recommended Phase II Dose (RP2D) determination based on safety, efficacy, pharmacokinetic, and pharmacodynamic data from the SI-B003 dose-escalation study, both assessed over 24 months.
|
||||
| Other Endpoint |
Secondary endpoints comprise Progression-Free Survival (time from treatment initiation to disease progression/death), Disease Control Rate (percentage with response/stable disease per RECIST 1.1), Duration of Response (sustained treatment benefit), and Treatment-Emergent Adverse Events (incidence/severity of new/worsened conditions), all evaluated during the 24-month study period.
Click to Show/Hide
|
||||
| Experiment 10 Reporting the Activity Date of This ADC | [14] | ||||
| Patients Enrolled |
Eligible patients (18-75 years, ECOG 0-1) must have histologically confirmed locally advanced/metastatic NSCLC (Phase Ib: driver-negative post-standard therapy; Phase II Cohort_A: untreated driver-negative; Cohort_B: EGFRmut post-TKI failure). Key exclusions: actionable mutations (ALK/MET/ROS1/BRAF/NTRK/RET), uncontrolled CNS metastases, recent immunotherapy with ≥G3 irAE, active infections, autoimmunity, or other malignancies within 5 years. Required: measurable lesions, adequate organ function, and ctDNA testing for EGFR/ALK/MET/ROS1/BRAF/NTRK/RET/HER2/KRAS. PD-L1 testing mandated for Phase II Cohort_A.
Click to Show/Hide
|
||||
| Related Clinical Trial | |||||
| NCT Number | NCT05949606 | Phase Status | PHASE1|||PHASE2 | ||
| Clinical Description |
A Phase Ib/II Clinical Trial to Evaluate the Safety and Efficacy of SI-B001+SI-B003 With or Without Chemotherapy (SI-B001+SI-B003± Chemotherapy) in the Treatment of Locally Advanced or Metastatic Non-small Cell Lung Cancer (NSCLC)
|
||||
| Primary Endpoint |
Phase Ib/II primary endpoints include determining the Recommended Phase II Dose (RP2D) of SI-B001+SI-B003 based on safety, tolerability, efficacy, PK, and PD data. Objective Response Rate (ORR) per RECIST 1.1 assesses confirmed CR/PR rates. Phase Ib evaluates Dose-Limited Toxicity (DLT) incidence/severity via NCI-CTCAE v5.0 and Maximum Tolerated Dose (MTD) or Maximum Administered Dose (MAD) based on DLT rates.
Click to Show/Hide
|
||||
| Other Endpoint |
Secondary endpoints include Treatment-Emergent Adverse Events (TEAEs), Disease Control Rate (DCR), Duration of Response (DOR), and Progression-Free Survival (PFS). Pharmacokinetic parameters (Cmax, Tmax, Ctrough, T1/2, AUC0-t, CL) and immunogenicity (anti-drug/neutralizing antibodies) are also analyzed over 24 months to assess drug exposure and immune response.
Click to Show/Hide
|
||||
| Experiment 11 Reporting the Activity Date of This ADC | [15] | ||||
| Patients Enrolled |
Eligible patients (Phase Ia: ≥18-75 years; Phase Ib: ≥18 years) must have recurrent/metastatic solid tumors (Phase Ib: gastric/GEJ adenocarcinoma post-platinum/anti-PD- (L)1 or mesothelioma), measurable lesions (Phase Ib), ECOG 0-1, and adequate organ function. Key exclusions: symptomatic CNS metastases, recent anticancer therapy (4 weeks/5 half-lives), uncontrolled infections/autoimmunity, HIV/HBV/HCV, QTc prolongation, or anthracycline exposure >360 mg/m2.
Click to Show/Hide
|
||||
| Related Clinical Trial | |||||
| NCT Number | NCT04606472 | Phase Status | PHASE1 | ||
| Clinical Description |
Phase I Clinical Study to Evaluate the Safety, Tolerability, Pharmacokinetic Characteristics and Preliminary Efficacy of SI-B003, a PD-1/CTLA-4 Bispecific Antibody, in Patients With Advanced Solid Tumors
|
||||
| Primary Endpoint |
Phase Ia evaluates Dose-Limiting Toxicity (DLT) and Maximum Tolerated Dose (MTD)/Maximum Administered Dose (MAD) of SI-B003 within 28 days post-dose using NCI-CTCAE v5.0 criteria. Phase Ib determines the Recommended Phase II Dose (RP2D) based on safety, tolerability, efficacy, PK/PD data, while Treatment-Emergent Adverse Events (TEAEs) are monitored over 24 months.
Click to Show/Hide
|
||||
| Other Endpoint |
Pharmacokinetic parameters (Cmax, Tmax, T1/2, AUC0-t, CL, Ctrough) are assessed within 28 days post-dose. Immunogenicity (ADA/NAb incidence/titers), efficacy (ORR, DOR, CBR, PFS, OS per RECIST 1.1), and exploratory endpoints (iORR/iCR/iPR per iRECIST 1.1; PK-efficacy correlations) are evaluated over 24 months.
|
||||
| Experiment 12 Reporting the Activity Date of This ADC | [16] | ||||
| Patients Enrolled |
Eligible patients (≥18-75 years, ECOG 0-1) must have advanced/metastatic solid tumors (urothelial/prostate/renal cancers post-standard therapy failure/intolerance) with measurable lesions (RECIST 1.1). Key exclusions: prior topoisomerase I inhibitor ADC use, recent chemotherapy/radiotherapy (4 weeks/5 half-lives), unstable CVD, active autoimmunity/infections, uncontrolled diabetes/hypertension, CNS metastases (unless stable post-treatment), or serous effusion requiring drainage. Organ function thresholds: Hb ≥90g/L, ANC ≥1.5×10⁹/L, platelets ≥100×109/L, Cr ≤1.5 ULN (Ccr ≥40 mL/min), LVEF ≥50%. HIV/HBV/HCV active infections disqualify.
Click to Show/Hide
|
||||
| Related Clinical Trial | |||||
| NCT Number | NCT05965856 | Phase Status | PHASE2 | ||
| Clinical Description |
A Phase II Clinical Study to Evaluate the Efficacy and Safety of SI-B003 Monotherapy and BL-B01D1+SI-B003 Combination Therapy (BL-B01D1+SI-B003) in Patients With Locally Advanced or Metastatic Urothelial Carcinoma and Other Solid Tumors
|
||||
| Primary Endpoint |
The study evaluates Objective Response Rate (ORR) per RECIST 1.1 (confirmed CR/PR rates) and determines the Recommended Phase II Dose (RP2D) of SI-B003 based on safety, efficacy, PK/PD data, with assessments spanning 24 months.
|
||||
| Other Endpoint |
Key outcomes include Progression-Free Survival (PFS), Disease Control Rate (DCR), Duration of Response (DOR), and Treatment-Emergent Adverse Events (TEAEs). TEAEs-defined as adverse structural/functional changes or pre-existing condition exacerbations-are monitored for type, frequency, and severity over 24 months.
|
||||
| Experiment 13 Reporting the Activity Date of This ADC | [17] | ||||
| Related Clinical Trial | |||||
| NCT Number | NCT03953833 | Phase Status | Phase 1 | ||
| Clinical Description |
Phase 1 clinical trial on the safety, tolerability, pharmacokinetics of B003 in the treatment of HER2-positive recurrent or metastatic breast cancer.
|
||||
SHR-A1201 [Phase 1]
Identified from the Human Clinical Data
| Experiment 1 Reporting the Activity Date of This ADC | [18] | ||||
| Administration Dosage |
There were a total of 4 dose-escalation sequences, 1.2 mg/kg, 2.4 mg/kg, 3.6 mg/kg and 4.8 mg/kg
|
||||
| Related Clinical Trial | |||||
| NCT Number | CTR20191558 | Phase Status | PHASE1 | ||
| Clinical Description |
.
|
||||
| Experiment 2 Reporting the Activity Date of This ADC | [19] | ||||
| Patients Enrolled |
HER2-positive locally advanced or metastatic breast cancer (positivity for HER2 was defined as a score of 2+ in immunohistochemical analysis and a positive result in fluorescence in situ hybridization or a score of 3+ in immunohistochemical analysis), the standard treatment was invalid or there was no effective standard treatment plan, the Eastern Cooperative Oncology Group performance status score was 0-1.
Click to Show/Hide
|
||||
| Administration Dosage |
4 dose-escalation sequences, 1.20 mg/kg, 2.40 mg/kg, 3.60 mg/kg and 4.80 mg/kg, once every 21days, as a 90-min intravenous infusion.
|
||||
Anti-FGFR2/4 mAb-12425 SMCC-DM1 [Investigative]
Discovered Using Patient-derived Xenograft Model
| Experiment 1 Reporting the Activity Date of This ADC | [20] | ||||
| Efficacy Data | Tumor Growth Inhibition value (TGI) | ≈ 9.18% | Positive FGFR2 expression (FGFR2+++/++) | ||
| Method Description |
The total injection volume containing cells in suspension was 200 ul. Mice were enrolled in the first study eight days post implantation with average tumor volume of 208.4 mm3. After being randomly assigned to one of nine groups (n =8/group), mice were administered PBS or a single 5 mg/kg intravenous (i.v,) injection of one antibody drug conjugates.
Click to Show/Hide
|
||||
| In Vivo Model | Breast cancer PDX model | ||||
| Experiment 2 Reporting the Activity Date of This ADC | [20] | ||||
| Efficacy Data | Tumor Growth Inhibition value (TGI) | ≈ 60.63% | Positive FGFR2 expression (FGFR2+++/++) | ||
| Method Description |
The total injection volume containing cells in suspension was 200 ul. Mice were enrolled in the first study eight days post implantation with average tumor volume of 208.4 mm3. After being randomly assigned to one of nine groups (n =8/group), mice were administered PBS or a single 10 mg/kg intravenous (i.v,) injection of one antibody drug conjugates.
Click to Show/Hide
|
||||
| In Vivo Model | Gastric cancer PDX model (PDX: CHGA-010) | ||||
| Experiment 3 Reporting the Activity Date of This ADC | [20] | ||||
| Efficacy Data | Tumor Growth Inhibition value (TGI) | ≈ 73.73% | Positive FGFR2 expression (FGFR2+++/++) | ||
| Method Description |
The total injection volume containing cells in suspension was 200 ul. Mice were enrolled in the first study eight days post implantation with average tumor volume of 208.4 mm3. After being randomly assigned to one of nine groups (n =8/group), mice were administered PBS or a single 10 mg/kg intravenous (i.v, q3w x2) injection of one antibody drug conjugates.
Click to Show/Hide
|
||||
| In Vivo Model | Gastric cancer PDX model (PDX: CHGA-010) | ||||
| Experiment 4 Reporting the Activity Date of This ADC | [20] | ||||
| Efficacy Data | Tumor Growth Inhibition value (TGI) | ≈ 81.30% | Positive FGFR2 expression (FGFR2+++/++) | ||
| Method Description |
The total injection volume containing cells in suspension was 200 ul. Mice were enrolled in the first study eight days post implantation with average tumor volume of 208.4 mm3. After being randomly assigned to one of nine groups (n =8/group), mice were administered PBS or a single 15 mg/kg intravenous (i.v,) injection of one antibody drug conjugates.
Click to Show/Hide
|
||||
| In Vivo Model | Breast cancer PDX model | ||||
Discovered Using Cell Line-derived Xenograft Model
| Experiment 1 Reporting the Activity Date of This ADC | [20] | ||||
| Efficacy Data | Tumor Growth Inhibition value (TGI) | ≈ 52.51% | Positive FGFR2 expression (FGFR2+++/++) | ||
| Method Description |
The total injection volume containing cells in suspension was 200 ul. Mice were enrolled in the first study eight days post implantation with average tumor volume of 208.4 mm3. After being randomly assigned to one of nine groups (n =8/group), mice were administered PBS or a single 10 mg/kg intravenous (i.v,) injection of one antibody drug conjugates.
Click to Show/Hide
|
||||
| In Vivo Model | MFM223 CDX model | ||||
| In Vitro Model | Breast carcinoma | MFM-223 cells | CVCL_1408 | ||
| Experiment 2 Reporting the Activity Date of This ADC | [20] | ||||
| Efficacy Data | Tumor Growth Inhibition value (TGI) | ≈ 63.93% | Positive FGFR2 expression (FGFR2+++/++) | ||
| Method Description |
The total injection volume containing cells in suspension was 200 ul. Mice were enrolled in the first study eight days post implantation with average tumor volume of 171.7 mm3. After being randomly assigned to one of nine groups (n =8/group), mice were administered PBS or a single 5 mg/kg intravenous (i.v,) injection of one antibody drug conjugates.
Click to Show/Hide
|
||||
| In Vivo Model | NCI-H716 CDX model | ||||
| In Vitro Model | Cecum adenocarcinoma | NCI-H716 cells | CVCL_1581 | ||
| Experiment 3 Reporting the Activity Date of This ADC | [20] | ||||
| Efficacy Data | Tumor Growth Inhibition value (TGI) | ≈ 66.08% | Positive FGFR2 expression (FGFR2+++/++) | ||
| Method Description |
The total injection volume containing cells in suspension was 200 ul. Mice were enrolled in the first study eight days post implantation with average tumor volume of 171.7 mm3. After being randomly assigned to one of nine groups (n =8/group), mice were administered PBS or a single 15 mg/kg intravenous (i.v,) injection of one antibody drug conjugates.
Click to Show/Hide
|
||||
| In Vivo Model | NCI-H716 CDX model | ||||
| In Vitro Model | Cecum adenocarcinoma | NCI-H716 cells | CVCL_1581 | ||
| Experiment 4 Reporting the Activity Date of This ADC | [20] | ||||
| Efficacy Data | Tumor Growth Inhibition value (TGI) | ≈ 97.41% | Positive FGFR2 expression (FGFR2+++/++) | ||
| Method Description |
The total injection volume containing cells in suspension was 200 ul. Mice were enrolled in the first study eight days post implantation with average tumor volume of 192.9 mm3. After being randomly assigned to one of nine groups (n =8/group), mice were administered PBS or a single 3 mg/kg intravenous (i.v,) injection of one antibody drug conjugates.
Click to Show/Hide
|
||||
| In Vivo Model | SNU-16 CDX model | ||||
| In Vitro Model | Gastric adenocarcinoma | SNU-16 cells | CVCL_0076 | ||
Revealed Based on the Cell Line Data
| Experiment 1 Reporting the Activity Date of This ADC | [20] | ||||
| Efficacy Data | Half Maximal Inhibitory Concentration (IC50) |
0.1-0.7 nM
|
Positive FGFR2 expression (FGFR2+++/++) | ||
| Method Description |
Cells were counted and seeded in 96 well plates at densities of 2600-3600 cells/well in 100 ul of cell culture medium, A duplicate plate was generated for a day 0 measurement and all plates were incubated in a tissue culture incubator at 37°C with 5% CO2 overnight. Following this incubation, 50 ul/well of Cell titer Glo reagent was added to the day 0 plates, which were then shaken gently for 10 min and the resulting luminescence intensity was measured.
Click to Show/Hide
|
||||
| In Vitro Model | Cecum adenocarcinoma | NCI-H716 cells | CVCL_1581 | ||
| Experiment 2 Reporting the Activity Date of This ADC | [20] | ||||
| Efficacy Data | Half Maximal Inhibitory Concentration (IC50) |
0.15 nM
|
Positive FGFR2 expression (FGFR2+++/++) | ||
| Method Description |
Cells were counted and seeded in 96 well plates at densities of 2600-3600 cells/well in 100 ul of cell culture medium, A duplicate plate was generated for a day 0 measurement and all plates were incubated in a tissue culture incubator at 37°C with 5% CO2 overnight. Following this incubation, 50 ul/well of Cell titer Glo reagent was added to the day 0 plates, which were then shaken gently for 10 min and the resulting luminescence intensity was measured.
Click to Show/Hide
|
||||
| In Vitro Model | Down syndrome | KATO III cells | CVCL_0371 | ||
| Experiment 3 Reporting the Activity Date of This ADC | [20] | ||||
| Efficacy Data | Half Maximal Inhibitory Concentration (IC50) |
0.17 nM
|
Positive FGFR2 expression (FGFR2+++/++) | ||
| Method Description |
Cells were counted and seeded in 96 well plates at densities of 2600-3600 cells/well in 100 ul of cell culture medium, A duplicate plate was generated for a day 0 measurement and all plates were incubated in a tissue culture incubator at 37°C with 5% CO2 overnight. Following this incubation, 50 ul/well of Cell titer Glo reagent was added to the day 0 plates, which were then shaken gently for 10 min and the resulting luminescence intensity was measured.
Click to Show/Hide
|
||||
| In Vitro Model | Breast carcinoma | SUM52PE cells | CVCL_3425 | ||
| Experiment 4 Reporting the Activity Date of This ADC | [20] | ||||
| Efficacy Data | Half Maximal Inhibitory Concentration (IC50) | < 0.2 nM | Positive FGFR2 expression (FGFR2+++/++) | ||
| Method Description |
Cells were counted and seeded in 96 well plates at densities of 2600-3600 cells/well in 100 ul of cell culture medium, A duplicate plate was generated for a day 0 measurement and all plates were incubated in a tissue culture incubator at 37°C with 5% CO2 overnight. Following this incubation, 50 ul/well of Cell titer Glo reagent was added to the day 0 plates, which were then shaken gently for 10 min and the resulting luminescence intensity was measured.
Click to Show/Hide
|
||||
| In Vitro Model | Gastric adenocarcinoma | SNU-16 cells | CVCL_0076 | ||
| Experiment 5 Reporting the Activity Date of This ADC | [20] | ||||
| Efficacy Data | Half Maximal Inhibitory Concentration (IC50) |
1 nM
|
Positive FGFR2 expression (FGFR2+++/++) | ||
| Method Description |
Cells were counted and seeded in 96 well plates at densities of 2600-3600 cells/well in 100 ul of cell culture medium, A duplicate plate was generated for a day 0 measurement and all plates were incubated in a tissue culture incubator at 37°C with 5% CO2 overnight. Following this incubation, 50 ul/well of Cell titer Glo reagent was added to the day 0 plates, which were then shaken gently for 10 min and the resulting luminescence intensity was measured.
Click to Show/Hide
|
||||
| In Vitro Model | Breast carcinoma | MFM-223 cells | CVCL_1408 | ||
| Experiment 6 Reporting the Activity Date of This ADC | [20] | ||||
| Efficacy Data | Half Maximal Inhibitory Concentration (IC50) | > 30 nM | Negative FGFR2 expression (FGFR2-) | ||
| Method Description |
Cells were counted and seeded in 96 well plates at densities of 2600-3600 cells/well in 100 ul of cell culture medium, A duplicate plate was generated for a day 0 measurement and all plates were incubated in a tissue culture incubator at 37°C with 5% CO2 overnight. Following this incubation, 50 ul/well of Cell titer Glo reagent was added to the day 0 plates, which were then shaken gently for 10 min and the resulting luminescence intensity was measured.
Click to Show/Hide
|
||||
| In Vitro Model | Gastric carcinoma | NUGC-3 cells | CVCL_1612 | ||
SNS-622-DM1 [Investigative]
Discovered Using Patient-derived Xenograft Model
| Experiment 1 Reporting the Activity Date of This ADC | [21] | ||||
| Efficacy Data | Tumor Growth Inhibition value (TGI) | ≈ 36.75% | Positive ASPH expression (ASPH +++/++) | ||
| Method Description |
Mice bearing an approximately 100 mm3 tumor xenograft were intravenously injected weekly with 2.5 mg/kg of SNS-622 or SNS-622-DM1, and tumor growth was monitored.
|
||||
| In Vivo Model | Pancreatic ductal adenocarcinoma PDX model | ||||
Discovered Using Cell Line-derived Xenograft Model
| Experiment 1 Reporting the Activity Date of This ADC | [21] | ||||
| Efficacy Data | Tumor Growth Inhibition value (TGI) | ≈ 55.56% | Positive ASPH expression (ASPH +++/++) | ||
| Method Description |
MIA PaCa2-empty vector and MIA-PaCa2-ASPH cell lines generated sc tumors in the NSG mice were treated with SNS-622-DM1 (5 mg/kg. every 7 day) and a non-relevant IgG mAb also conjugated with DM1.
|
||||
| In Vivo Model | MIA PaCa2 CDX model | ||||
| In Vitro Model | Pancreatic ductal adenocarcinoma | MIA PaCa-2 cells | CVCL_0428 | ||
B-B4-DM1 [Investigative]
Discovered Using Patient-derived Xenograft Model
| Experiment 1 Reporting the Activity Date of This ADC | [22] | ||||
| Efficacy Data | Tumor Growth Inhibition value (TGI) | ≈ 87.90% | Positive CD138 expression (CD138+++/++) | ||
| Method Description |
The in vivo antitumor activity of B-B4-DM1 was evaluated in a CD138 positive OPM1 and OPM2 MM cells xenograft models. CB-17 SCID mice were inoculated subcutaneously in the interscapular area with 5x10⁶ OPM1 (A-B) or OPM2 (C-D) MM cells. Animals were treated daily intravenously for 3 consecutive days with either vehicle alone (PBS; n = 5), unconjugated B-B4 (13.3 ug/kg; n = 5), B-B4DM1 (150 ug DM1/kg; n = 5), or control huC242-DM1 (150 ug DM1/kg; n = 5).
Click to Show/Hide
|
||||
| In Vivo Model | Multiple myeloma PDX model (PDX: OPM2) | ||||
| In Vitro Model | Multiple myeloma | Multiple myeloma cells | Homo sapiens | ||
Discovered Using Cell Line-derived Xenograft Model
| Experiment 1 Reporting the Activity Date of This ADC | [22] | ||||
| Efficacy Data | Tumor Growth Inhibition value (TGI) | ≈ 27.30% | Positive CD138 expression (CD138+++/++) | ||
| Method Description |
The in vivo antitumor activity of B-B4-DM1 was evaluated in a CD138 positive OPM1 and OPM2 MM cells xenograft models. CB-17 SCID mice were inoculated subcutaneously in the interscapular area with 5x10⁶ OPM1 (A-B) or OPM2 (C-D) MM cells. Animals were treated daily intravenously for 3 consecutive days with either vehicle alone (PBS; n = 5), unconjugated B-B4 (13.3 ug/kg; n = 5), B-B4DM1 (150 ug DM1/kg; n = 5), or control huC242-DM1 (150 ug DM1/kg; n = 5).
Click to Show/Hide
|
||||
| In Vivo Model | CD138-expressing OPM1 MM cells xenograft model | ||||
| In Vitro Model | Multiple myeloma | Multiple myeloma cells | Homo sapiens | ||
Revealed Based on the Cell Line Data
| Experiment 1 Reporting the Activity Date of This ADC | [22] | ||||
| Efficacy Data | Half Maximal Inhibitory Concentration (IC50) |
25 nM
|
Positive CD138 expression (CD138+++/++) | ||
| Method Description |
The inhibitory activity of B-B4-DM1 against cancer cell growth was compared with B-B4 and DM1 against cancer cell growth in vitro. The cells were treated with B-B4-DM1, B-B4 and DM1 for 96 hours.
|
||||
| In Vitro Model | Plasma cell myeloma | MM1.R cells | CVCL_8794 | ||
C12G1-DM1 [Investigative]
Discovered Using Cell Line-derived Xenograft Model
| Experiment 1 Reporting the Activity Date of This ADC | [23] | ||||
| Efficacy Data | Tumor Growth Inhibition value (TGI) | ≈ 0% | High NECTIN2 expression (NECTIN2+++) | ||
| Method Description |
Treatments c12G1-DM1 at 5 mg/kg every 4th day by intraperitoneal injection.
|
||||
| In Vivo Model | Ovarian cancer CDX model | ||||
| In Vitro Model | Ovarian serous cystadenocarcinoma | SK-OV-3 cells | CVCL_0532 | ||
| Experiment 2 Reporting the Activity Date of This ADC | [23] | ||||
| Efficacy Data | Tumor Growth Inhibition value (TGI) | ≈ 0% | High NECTIN2 expression (NECTIN2+++) | ||
| Method Description |
Treatments c12G1-DM1 at 1 mg/kg every 4th day by intraperitoneal injection.
|
||||
| In Vivo Model | Ovarian cancer CDX model | ||||
| In Vitro Model | Ovarian serous cystadenocarcinoma | SK-OV-3 cells | CVCL_0532 | ||
| Experiment 3 Reporting the Activity Date of This ADC | [23] | ||||
| Efficacy Data | Tumor Growth Inhibition value (TGI) | ≈ 10.40% | High NECTIN2 expression (NECTIN2+++) | ||
| Method Description |
Treatments c12G1-DM1 at 3 mg/kg every 4th day by intraperitoneal injection.
|
||||
| In Vivo Model | Ovarian cancer CDX model | ||||
| In Vitro Model | Ovarian serous cystadenocarcinoma | SK-OV-3 cells | CVCL_0532 | ||
| Experiment 4 Reporting the Activity Date of This ADC | [23] | ||||
| Efficacy Data | Tumor Growth Inhibition value (TGI) | ≈ 11.50% | High NECTIN2 expression (NECTIN2+++) | ||
| Method Description |
Treatments c12G1-DM1 at 1 mg/kg every 4th day by intraperitoneal injection.
|
||||
| In Vivo Model | Ovarian cancer CDX model | ||||
| In Vitro Model | Ovarian cancer | Ovarian cancer cells | Homo sapiens | ||
| Experiment 5 Reporting the Activity Date of This ADC | [23] | ||||
| Efficacy Data | Tumor Growth Inhibition value (TGI) | ≈ 19.60% | High NECTIN2 expression (NECTIN2+++) | ||
| Method Description |
Treatments c12G1-DM1 at 5 mg/kg every 4th day by intraperitoneal injection.
|
||||
| In Vivo Model | Ovarian cancer CDX model | ||||
| In Vitro Model | Ovarian cancer | Ovarian cancer cells | Homo sapiens | ||
| Experiment 6 Reporting the Activity Date of This ADC | [23] | ||||
| Efficacy Data | Tumor Growth Inhibition value (TGI) | ≈ 32.90% | High NECTIN2 expression (NECTIN2+++) | ||
| Method Description |
Treatments c12G1-DM1 at 1 mg/kg every 4th day by intraperitoneal injection.
|
||||
| In Vivo Model | Ovarian cancer CDX model | ||||
| In Vitro Model | Ovarian adenocarcinoma | OV-90 cells | CVCL_3768 | ||
| Experiment 7 Reporting the Activity Date of This ADC | [23] | ||||
| Efficacy Data | Tumor Growth Inhibition value (TGI) | ≈ 46.40% | High NECTIN2 expression (NECTIN2+++) | ||
| Method Description |
Treatments c12G1-DM1 at 3 mg/kg every 4th day by intraperitoneal injection.
|
||||
| In Vivo Model | Ovarian cancer CDX model | ||||
| In Vitro Model | Ovarian cancer | Ovarian cancer cells | Homo sapiens | ||
| Experiment 8 Reporting the Activity Date of This ADC | [23] | ||||
| Efficacy Data | Tumor Growth Inhibition value (TGI) | ≈ 84.40% | High NECTIN2 expression (NECTIN2+++) | ||
| Method Description |
Treatments c12G1-DM1 at 3 mg/kg every 4th day by intraperitoneal injection.
|
||||
| In Vivo Model | Ovarian cancer CDX model | ||||
| In Vitro Model | Ovarian adenocarcinoma | OV-90 cells | CVCL_3768 | ||
| Experiment 9 Reporting the Activity Date of This ADC | [23] | ||||
| Efficacy Data | Tumor Growth Inhibition value (TGI) | ≈ 88.90% | High NECTIN2 expression (NECTIN2+++) | ||
| Method Description |
Treatments c12G1-DM1 at 5 mg/kg every 4th day by intraperitoneal injection.
|
||||
| In Vivo Model | Ovarian cancer CDX model | ||||
| In Vitro Model | Ovarian adenocarcinoma | OV-90 cells | CVCL_3768 | ||
NN2101-DM1 [Investigative]
Discovered Using Cell Line-derived Xenograft Model
| Experiment 1 Reporting the Activity Date of This ADC | [24] | ||||
| Efficacy Data | Tumor Growth Inhibition value (TGI) | ≈ 2.01% | Positive KIT expression (KIT+++/++) | ||
| Method Description |
The animal room had a controlled 12/12-h light/dark cycle (lights on at 06:00 AM), temperature (20±26 °C), and relativehumidity (50±10%). For xenograft assays, mice were anesthetized with isoflurane. Then, cells in 50% Matrigel were subcutaneously transplanted into 5-week-old female C.B-17 severe combined immunodeficiency (SCID) mice. In vivo efficacy studies were initiated when the volume of the tumors reached ~ 200 mm3. Imatinib was formulated in distilled water for oral administration. The mice were intravenously administered NN2101-DM1 three times at the indicated concentrations,2 mg/kg.
Click to Show/Hide
|
||||
| In Vivo Model | GIST xenograft model | ||||
| In Vitro Model | Mast cell leukemia | HMC-1.2 cells | CVCL_H205 | ||
| Experiment 2 Reporting the Activity Date of This ADC | [24] | ||||
| Efficacy Data | Tumor Growth Inhibition value (TGI) | ≈ 12.30% | Positive KIT expression (KIT+++/++) | ||
| Method Description |
The animal room had a controlled 12/12-h light/dark cycle (lights on at 06:00 AM), temperature (20±26 °C), and relativehumidity (50±10%). For xenograft assays, mice were anesthetized with isoflurane. Then, cells in 50% Matrigel were subcutaneously transplanted into 5-week-old female C.B-17 severe combined immunodeficiency (SCID) mice. In vivo efficacy studies were initiated when the volume of the tumors reached ~ 200 mm3. Imatinib was formulated in distilled water for oral administration. The mice were intravenously administered NN2101-DM1 three times at the indicated concentrations,1 mg/kg.
Click to Show/Hide
|
||||
| In Vivo Model | GIST xenograft model | ||||
| In Vitro Model | Gastrointestinal stromal tumor | GIST-T1 cells | CVCL_4976 | ||
| Experiment 3 Reporting the Activity Date of This ADC | [24] | ||||
| Efficacy Data | Tumor Growth Inhibition value (TGI) | ≈ 20.50% | Positive KIT expression (KIT+++/++) | ||
| Method Description |
The animal room had a controlled 12/12-h light/dark cycle (lights on at 06:00 AM), temperature (20±26 °C), and relativehumidity (50±10%). For xenograft assays, mice were anesthetized with isoflurane. Then, cells in 50% Matrigel were subcutaneously transplanted into 5-week-old female C.B-17 severe combined immunodeficiency (SCID) mice. In vivo efficacy studies were initiated when the volume of the tumors reached ~ 200 mm3. Imatinib was formulated in distilled water for oral administration. The mice were intravenously administered NN2101-DM1 three times at the indicated concentrations,3 mg/kg.
Click to Show/Hide
|
||||
| In Vivo Model | SCLC xenograft model | ||||
| In Vitro Model | Lung small cell carcinoma | NCI-H526 cells | CVCL_1569 | ||
| Experiment 4 Reporting the Activity Date of This ADC | [24] | ||||
| Efficacy Data | Tumor Growth Inhibition value (TGI) | ≈ 50.40% | Positive KIT expression (KIT+++/++) | ||
| Method Description |
The animal room had a controlled 12/12-h light/dark cycle (lights on at 06:00 AM), temperature (20±26 °C), and relativehumidity (50±10%). For xenograft assays, mice were anesthetized with isoflurane. Then, cells in 50% Matrigel were subcutaneously transplanted into 5-week-old female C.B-17 severe combined immunodeficiency (SCID) mice. In vivo efficacy studies were initiated when the volume of the tumors reached ~ 200 mm3. Imatinib was formulated in distilled water for oral administration. The mice were intravenously administered NN2101-DM1 three times at the indicated concentrations,1 mg/kg.
Click to Show/Hide
|
||||
| In Vivo Model | GIST xenograft model | ||||
| In Vitro Model | Adult hepatocellular carcinoma | Huh-7 cells | CVCL_0336 | ||
| Experiment 5 Reporting the Activity Date of This ADC | [24] | ||||
| Efficacy Data | Tumor Growth Inhibition value (TGI) | ≈ 61.30% | Positive KIT expression (KIT+++/++) | ||
| Method Description |
The animal room had a controlled 12/12-h light/dark cycle (lights on at 06:00 AM), temperature (20±26 °C), and relativehumidity (50±10%). For xenograft assays, mice were anesthetized with isoflurane. Then, cells in 50% Matrigel were subcutaneously transplanted into 5-week-old female C.B-17 severe combined immunodeficiency (SCID) mice. In vivo efficacy studies were initiated when the volume of the tumors reached ~ 200 mm3. Imatinib was formulated in distilled water for oral administration. The mice were intravenously administered NN2101-DM1 three times at the indicated concentrations,5 mg/kg.
Click to Show/Hide
|
||||
| In Vivo Model | GIST xenograft model | ||||
| In Vitro Model | Mast cell leukemia | HMC-1.2 cells | CVCL_H205 | ||
| Experiment 6 Reporting the Activity Date of This ADC | [24] | ||||
| Efficacy Data | Tumor Growth Inhibition value (TGI) | ≈ 61.30% | Positive KIT expression (KIT+++/++) | ||
| Method Description |
The animal room had a controlled 12/12-h light/dark cycle (lights on at 06:00 AM), temperature (20±26 °C), and relativehumidity (50±10%). For xenograft assays, mice were anesthetized with isoflurane. Then, cells in 50% Matrigel were subcutaneously transplanted into 5-week-old female C.B-17 severe combined immunodeficiency (SCID) mice. In vivo efficacy studies were initiated when the volume of the tumors reached ~ 200 mm3. Imatinib was formulated in distilled water for oral administration. The mice were intravenously administered NN2101-DM1 three times at the indicated concentrations,3.5 mg/kg.
Click to Show/Hide
|
||||
| In Vivo Model | GIST xenograft model | ||||
| In Vitro Model | Mast cell leukemia | HMC-1.2 cells | CVCL_H205 | ||
| Experiment 7 Reporting the Activity Date of This ADC | [24] | ||||
| Efficacy Data | Tumor Growth Inhibition value (TGI) | ≈ 87.90% | Positive KIT expression (KIT+++/++) | ||
| Method Description |
The animal room had a controlled 12/12-h light/dark cycle (lights on at 06:00 AM), temperature (20±26 °C), and relativehumidity (50±10%). For xenograft assays, mice were anesthetized with isoflurane. Then, cells in 50% Matrigel were subcutaneously transplanted into 5-week-old female C.B-17 severe combined immunodeficiency (SCID) mice. In vivo efficacy studies were initiated when the volume of the tumors reached ~ 200 mm3. Imatinib was formulated in distilled water for oral administration. The mice were intravenously administered NN2101-DM1 three times at the indicated concentrations,3 mg/kg.
Click to Show/Hide
|
||||
| In Vivo Model | GIST xenograft model | ||||
| In Vitro Model | Adult hepatocellular carcinoma | Huh-7 cells | CVCL_0336 | ||
| Experiment 8 Reporting the Activity Date of This ADC | [24] | ||||
| Efficacy Data | Tumor Growth Inhibition value (TGI) | ≈ 90.10% | Positive KIT expression (KIT+++/++) | ||
| Method Description |
The animal room had a controlled 12/12-h light/dark cycle (lights on at 06:00 AM), temperature (20±26 °C), and relativehumidity (50±10%). For xenograft assays, mice were anesthetized with isoflurane. Then, cells in 50% Matrigel were subcutaneously transplanted into 5-week-old female C.B-17 severe combined immunodeficiency (SCID) mice. In vivo efficacy studies were initiated when the volume of the tumors reached ~ 200 mm3. Imatinib was formulated in distilled water for oral administration. The mice were intravenously administered NN2101-DM1 three times at the indicated concentrations,3 mg/kg. The mice were intraperitoneally administered Etoposide was prepared in dimethyl sulfoxide, and the solution was diluted in PBS just before administration. The mice were intraperitoneally administered etoposide for 2 cycles (3 mg/kg per day;days 15 and days 1115).
Click to Show/Hide
|
||||
| In Vivo Model | GIST xenograft model | ||||
| In Vitro Model | Gastrointestinal stromal tumor | GIST-T1 cells | CVCL_4976 | ||
| Experiment 9 Reporting the Activity Date of This ADC | [24] | ||||
| Efficacy Data | Tumor Growth Inhibition value (TGI) | ≈ 94.30% | Positive KIT expression (KIT+++/++) | ||
| Method Description |
The animal room had a controlled 12/12-h light/dark cycle (lights on at 06:00 AM), temperature (20±26 °C), and relativehumidity (50±10%). For xenograft assays, mice were anesthetized with isoflurane. Then, cells in 50% Matrigel were subcutaneously transplanted into 5-week-old female C.B-17 severe combined immunodeficiency (SCID) mice. In vivo efficacy studies were initiated when the volume of the tumors reached ~ 200 mm3. Imatinib was formulated in distilled water for oral administration. The mice were intravenously administered NN2101-DM1 three times at the indicated concentrations,3 mg/kg. The mice were intraperitoneally administered Etoposide was prepared in dimethyl sulfoxide, and the solution was diluted in PBS just before administration. The mice were intraperitoneally administered etoposide for 2 cycles (3 mg/kg per day;days 15 and days 1115).
Click to Show/Hide
|
||||
| In Vivo Model | SCLC xenograft model | ||||
| In Vitro Model | Lung small cell carcinoma | NCI-H526 cells | CVCL_1569 | ||
Revealed Based on the Cell Line Data
| Experiment 1 Reporting the Activity Date of This ADC | [24] | ||||
| Efficacy Data | Half Maximal Inhibitory Concentration (IC50) |
0.38 ng/mL
|
Positive KIT expression (KIT+++/++) | ||
| Method Description |
For apoptosis assays, the cells were seeded into 96-well plates and incubated in a humidified CO2 chamber for 16 h. The cells were incubated with vehicle, NN2101-DM1 (1g/mL) for 72 h.
|
||||
| In Vitro Model | Gastrointestinal stromal tumor | GIST-T1 cells | CVCL_4976 | ||
| Experiment 2 Reporting the Activity Date of This ADC | [24] | ||||
| Efficacy Data | Half Maximal Inhibitory Concentration (IC50) |
0.43 ng/mL
|
Positive KIT expression (KIT+++/++) | ||
| Method Description |
For apoptosis assays, the cells were seeded into 96-well plates and incubated in a humidified CO2 chamber for 16 h. The cells were incubated with vehicle, NN2101-DM1 (1g/mL) for 72 h.
|
||||
| In Vitro Model | Gastrointestinal stromal tumor | GIST-430/654 cells | CVCL_7040 | ||
| Experiment 3 Reporting the Activity Date of This ADC | [24] | ||||
| Efficacy Data | Half Maximal Inhibitory Concentration (IC50) |
2.02 ng/mL
|
Positive KIT expression (KIT+++/++) | ||
| Method Description |
For apoptosis assays, the cells were seeded into 96-well plates and incubated in a humidified CO2 chamber for 16 h. The cells were incubated with vehicle, NN2101-DM1 (1g/mL) for 72 h.
|
||||
| In Vitro Model | Gastrointestinal stromal tumor | GIST430 cells | CVCL_7040 | ||
| Experiment 4 Reporting the Activity Date of This ADC | [24] | ||||
| Efficacy Data | Half Maximal Inhibitory Concentration (IC50) |
8.07 ng/mL
|
Positive KIT expression (KIT+++/++) | ||
| Method Description |
For apoptosis assays, the cells were seeded into 96-well plates and incubated in a humidified CO2 chamber for 16 h. The cells were incubated with vehicle, NN2101-DM1 (1g/mL) for 72 h.
|
||||
| In Vitro Model | Lung small cell carcinoma | NCI-H526 cells | CVCL_1569 | ||
| Experiment 5 Reporting the Activity Date of This ADC | [24] | ||||
| Efficacy Data | Half Maximal Inhibitory Concentration (IC50) |
0.77 ug/mL
|
Positive KIT expression (KIT+++/++) | ||
| Method Description |
For apoptosis assays, the cells were seeded into 96-well plates and incubated in a humidified CO2 chamber for 16 h. The cells were incubated with vehicle, NN2101-DM1 (1g/mL) for 72 h.
|
||||
| In Vitro Model | Mast cell leukemia | HMC-1.2 cells | CVCL_H205 | ||
| Experiment 6 Reporting the Activity Date of This ADC | [24] | ||||
| Efficacy Data | Half Maximal Inhibitory Concentration (IC50) |
1.18 ug/mL
|
Positive KIT expression (KIT+++/++) | ||
| Method Description |
For apoptosis assays, the cells were seeded into 96-well plates and incubated in a humidified CO2 chamber for 16 h. The cells were incubated with vehicle, NN2101-DM1 (1g/mL) for 72 h.
|
||||
| In Vitro Model | Lung small cell carcinoma | NCI-H1048 cells | CVCL_1453 | ||
| Experiment 7 Reporting the Activity Date of This ADC | [24] | ||||
| Efficacy Data | Half Maximal Inhibitory Concentration (IC50) |
2.52 ug/mL
|
Positive KIT expression (KIT+++/++) | ||
| Method Description |
For apoptosis assays, the cells were seeded into 96-well plates and incubated in a humidified CO2 chamber for 16 h. The cells were incubated with vehicle, NN2101-DM1 (1g/mL) for 72 h.
|
||||
| In Vitro Model | Ovarian serous adenocarcinoma | Caov-3 cells | CVCL_0201 | ||
| Experiment 8 Reporting the Activity Date of This ADC | [24] | ||||
| Efficacy Data | Half Maximal Inhibitory Concentration (IC50) |
2.54 ug/mL
|
Negative KIT expression (KIT-) | ||
| Method Description |
For apoptosis assays, the cells were seeded into 96-well plates and incubated in a humidified CO2 chamber for 16 h. The cells were incubated with vehicle, NN2101-DM1 (1g/mL) for 72 h.
|
||||
| In Vitro Model | Breast adenocarcinoma | MDA-MB-468 cells | CVCL_0419 | ||
| Experiment 9 Reporting the Activity Date of This ADC | [24] | ||||
| Efficacy Data | Half Maximal Inhibitory Concentration (IC50) |
2.99 ug/mL
|
Negative KIT expression (KIT-) | ||
| Method Description |
For apoptosis assays, the cells were seeded into 96-well plates and incubated in a humidified CO2 chamber for 16 h. The cells were incubated with vehicle, NN2101-DM1 (1g/mL) for 72 h.
|
||||
| In Vitro Model | Breast adenocarcinoma | MDA-MB-453 cells | CVCL_0418 | ||
| Experiment 10 Reporting the Activity Date of This ADC | [24] | ||||
| Efficacy Data | Half Maximal Inhibitory Concentration (IC50) |
3.71 ug/mL
|
Negative KIT expression (KIT-) | ||
| Method Description |
For apoptosis assays, the cells were seeded into 96-well plates and incubated in a humidified CO2 chamber for 16 h. The cells were incubated with vehicle, NN2101-DM1 (1g/mL) for 72 h.
|
||||
| In Vitro Model | Lung squamous cell carcinoma | NCI-H2170 cells | CVCL_1535 | ||
| Experiment 11 Reporting the Activity Date of This ADC | [24] | ||||
| Efficacy Data | Half Maximal Inhibitory Concentration (IC50) |
4.03 ug/mL
|
Positive KIT expression (KIT+++/++) | ||
| Method Description |
For apoptosis assays, the cells were seeded into 96-well plates and incubated in a humidified CO2 chamber for 16 h. The cells were incubated with vehicle, NN2101-DM1 (1g/mL) for 72 h.
|
||||
| In Vitro Model | Ovarian serous adenocarcinoma | OVCAR-3 cells | CVCL_0465 | ||
| Experiment 12 Reporting the Activity Date of This ADC | [24] | ||||
| Efficacy Data | Half Maximal Inhibitory Concentration (IC50) |
4.3 ug/mL
|
Positive KIT expression (KIT+++/++) | ||
| Method Description |
For apoptosis assays, the cells were seeded into 96-well plates and incubated in a humidified CO2 chamber for 16 h. The cells were incubated with vehicle, NN2101-DM1 (1g/mL) for 72 h.
|
||||
| In Vitro Model | Ovarian serous cystadenocarcinoma | SK-OV-3 cells | CVCL_0532 | ||
| Experiment 13 Reporting the Activity Date of This ADC | [24] | ||||
| Efficacy Data | Half Maximal Inhibitory Concentration (IC50) |
5.47 ug/mL
|
Positive KIT expression (KIT+++/++) | ||
| Method Description |
For apoptosis assays, the cells were seeded into 96-well plates and incubated in a humidified CO2 chamber for 16 h. The cells were incubated with vehicle, NN2101-DM1 (1g/mL) for 72 h.
|
||||
| In Vitro Model | Myeloid leukemia with maturation | Kasumi-1 cells | CVCL_0589 | ||
| Experiment 14 Reporting the Activity Date of This ADC | [24] | ||||
| Efficacy Data | Half Maximal Inhibitory Concentration (IC50) |
7.38 ug/mL
|
Positive KIT expression (KIT+++/++) | ||
| Method Description |
For apoptosis assays, the cells were seeded into 96-well plates and incubated in a humidified CO2 chamber for 16 h. The cells were incubated with vehicle, NN2101-DM1 (1g/mL) for 72 h.
|
||||
| In Vitro Model | Esophageal squamous cell carcinoma | TF-1 cells | CVCL_1759 | ||
| Experiment 15 Reporting the Activity Date of This ADC | [24] | ||||
| Efficacy Data | Half Maximal Inhibitory Concentration (IC50) |
11.84 ug/mL
|
Negative KIT expression (KIT-) | ||
| Method Description |
For apoptosis assays, the cells were seeded into 96-well plates and incubated in a humidified CO2 chamber for 16 h. The cells were incubated with vehicle, NN2101-DM1 (1g/mL) for 72 h.
|
||||
| In Vitro Model | Normal | COS-7 cells | CVCL_0224 | ||
| Experiment 16 Reporting the Activity Date of This ADC | [24] | ||||
| Efficacy Data | Half Maximal Inhibitory Concentration (IC50) |
11.95 ug/mL
|
Positive KIT expression (KIT+++/++) | ||
| Method Description |
For apoptosis assays, the cells were seeded into 96-well plates and incubated in a humidified CO2 chamber for 16 h. The cells were incubated with vehicle, NN2101-DM1 (1g/mL) for 72 h.
|
||||
| In Vitro Model | Normal | HUVEC-C cells | CVCL_2959 | ||
| Experiment 17 Reporting the Activity Date of This ADC | [24] | ||||
| Efficacy Data | Half Maximal Inhibitory Concentration (IC50) |
12.47 ug/mL
|
Positive KIT expression (KIT+++/++) | ||
| Method Description |
For apoptosis assays, the cells were seeded into 96-well plates and incubated in a humidified CO2 chamber for 16 h. The cells were incubated with vehicle, NN2101-DM1 (1g/mL) for 72 h.
|
||||
| In Vitro Model | Lung small cell carcinoma | NCI-H889 cells | CVCL_1598 | ||
| Experiment 18 Reporting the Activity Date of This ADC | [24] | ||||
| Efficacy Data | Half Maximal Inhibitory Concentration (IC50) |
17.49 ug/mL
|
Positive KIT expression (KIT+++/++) | ||
| Method Description |
For apoptosis assays, the cells were seeded into 96-well plates and incubated in a humidified CO2 chamber for 16 h. The cells were incubated with vehicle, NN2101-DM1 (1g/mL) for 72 h.
|
||||
| In Vitro Model | Gastrointestinal stromal tumor | GIST48 cells | CVCL_7041 | ||
| Experiment 19 Reporting the Activity Date of This ADC | [24] | ||||
| Efficacy Data | Half Maximal Inhibitory Concentration (IC50) |
17.63 ug/mL
|
Positive KIT expression (KIT+++/++) | ||
| Method Description |
For apoptosis assays, the cells were seeded into 96-well plates and incubated in a humidified CO2 chamber for 16 h. The cells were incubated with vehicle, NN2101-DM1 (1g/mL) for 72 h.
|
||||
| In Vitro Model | Lung small cell carcinoma | Ms-1 cells | CVCL_IQ55 | ||
Anti-FGFR2 mAb-10164 SMCC-DM1 [Investigative]
Discovered Using Cell Line-derived Xenograft Model
| Experiment 1 Reporting the Activity Date of This ADC | [20] | ||||
| Efficacy Data | Tumor Growth Inhibition value (TGI) | ≈ 2.05% | Positive FGFR2 expression (FGFR2+++/++) | ||
| Method Description |
The total injection volume containing cells in suspension was 200 ul. Mice were enrolled in the first study eight days post implantation with average tumor volume of 171.7 mm3. After being randomly assigned to one of nine groups (n =8/group), mice were administered PBS or a single 5 mg/kg intravenous (i.v,) injection of one antibody drug conjugates.
Click to Show/Hide
|
||||
| In Vivo Model | NCI-H716 CDX model | ||||
| In Vitro Model | Cecum adenocarcinoma | NCI-H716 cells | CVCL_1581 | ||
| Experiment 2 Reporting the Activity Date of This ADC | [20] | ||||
| Efficacy Data | Tumor Growth Inhibition value (TGI) | ≈ 57.22% | Positive FGFR2 expression (FGFR2+++/++) | ||
| Method Description |
The total injection volume containing cells in suspension was 200 ul. Mice were enrolled in the first study eight days post implantation with average tumor volume of 171.7 mm3. After being randomly assigned to one of nine groups (n =8/group), mice were administered PBS or a single 15 mg/kg intravenous (i.v,) injection of one antibody drug conjugates.
Click to Show/Hide
|
||||
| In Vivo Model | NCI-H716 CDX model | ||||
| In Vitro Model | Cecum adenocarcinoma | NCI-H716 cells | CVCL_1581 | ||
| Experiment 3 Reporting the Activity Date of This ADC | [20] | ||||
| Efficacy Data | Tumor Growth Inhibition value (TGI) | ≈ 65.68% | Positive FGFR2 expression (FGFR2+++/++) | ||
| Method Description |
The total injection volume containing cells in suspension was 200 ul. Mice were enrolled in the first study eight days post implantation with average tumor volume of 208.4 mm3. After being randomly assigned to one of nine groups (n =8/group), mice were administered PBS or a single 10 mg/kg intravenous (i.v,) injection of one antibody drug conjugates.
Click to Show/Hide
|
||||
| In Vivo Model | MFM223 CDX model | ||||
| In Vitro Model | Breast carcinoma | MFM-223 cells | CVCL_1408 | ||
| Experiment 4 Reporting the Activity Date of This ADC | [20] | ||||
| Efficacy Data | Tumor Growth Inhibition value (TGI) | ≈ 93.61% | Positive FGFR2 expression (FGFR2+++/++) | ||
| Method Description |
The total injection volume containing cells in suspension was 200 ul. Mice were enrolled in the first study eight days post implantation with average tumor volume of 192.9 mm3. After being randomly assigned to one of nine groups (n =8/group), mice were administered PBS or a single 3 mg/kg intravenous (i.v,) injection of one antibody drug conjugates.
Click to Show/Hide
|
||||
| In Vivo Model | SNU-16 CDX model | ||||
| In Vitro Model | Gastric adenocarcinoma | SNU-16 cells | CVCL_0076 | ||
Revealed Based on the Cell Line Data
| Experiment 1 Reporting the Activity Date of This ADC | [20] | ||||
| Efficacy Data | Half Maximal Inhibitory Concentration (IC50) |
0.14 nM
|
Positive FGFR2 expression (FGFR2+++/++) | ||
| Method Description |
Cells were counted and seeded in 96 well plates at densities of 2600-3600 cells/well in 100 ul of cell culture medium, A duplicate plate was generated for a day 0 measurement and all plates were incubated in a tissue culture incubator at 37°C with 5% CO2 overnight. Following this incubation, 50 ul/well of Cell titer Glo reagent was added to the day 0 plates, which were then shaken gently for 10 min and the resulting luminescence intensity was measured.
Click to Show/Hide
|
||||
| In Vitro Model | Breast carcinoma | SUM52PE cells | CVCL_3425 | ||
| Experiment 2 Reporting the Activity Date of This ADC | [20] | ||||
| Efficacy Data | Half Maximal Inhibitory Concentration (IC50) |
0.5 nM
|
Positive FGFR2 expression (FGFR2+++/++) | ||
| Method Description |
Cells were counted and seeded in 96 well plates at densities of 2600-3600 cells/well in 100 ul of cell culture medium, A duplicate plate was generated for a day 0 measurement and all plates were incubated in a tissue culture incubator at 37°C with 5% CO2 overnight. Following this incubation, 50 ul/well of Cell titer Glo reagent was added to the day 0 plates, which were then shaken gently for 10 min and the resulting luminescence intensity was measured.
Click to Show/Hide
|
||||
| In Vitro Model | Gastric adenocarcinoma | SNU-16 cells | CVCL_0076 | ||
| Experiment 3 Reporting the Activity Date of This ADC | [20] | ||||
| Efficacy Data | Half Maximal Inhibitory Concentration (IC50) |
1.6 nM
|
Positive FGFR2 expression (FGFR2+++/++) | ||
| Method Description |
Cells were counted and seeded in 96 well plates at densities of 2600-3600 cells/well in 100 ul of cell culture medium, A duplicate plate was generated for a day 0 measurement and all plates were incubated in a tissue culture incubator at 37°C with 5% CO2 overnight. Following this incubation, 50 ul/well of Cell titer Glo reagent was added to the day 0 plates, which were then shaken gently for 10 min and the resulting luminescence intensity was measured.
Click to Show/Hide
|
||||
| In Vitro Model | Down syndrome | KATO III cells | CVCL_0371 | ||
| Experiment 4 Reporting the Activity Date of This ADC | [20] | ||||
| Efficacy Data | Half Maximal Inhibitory Concentration (IC50) |
1.7 nM
|
Positive FGFR2 expression (FGFR2+++/++) | ||
| Method Description |
Cells were counted and seeded in 96 well plates at densities of 2600-3600 cells/well in 100 ul of cell culture medium, A duplicate plate was generated for a day 0 measurement and all plates were incubated in a tissue culture incubator at 37°C with 5% CO2 overnight. Following this incubation, 50 ul/well of Cell titer Glo reagent was added to the day 0 plates, which were then shaken gently for 10 min and the resulting luminescence intensity was measured.
Click to Show/Hide
|
||||
| In Vitro Model | Cecum adenocarcinoma | NCI-H716 cells | CVCL_1581 | ||
| Experiment 5 Reporting the Activity Date of This ADC | [20] | ||||
| Efficacy Data | Half Maximal Inhibitory Concentration (IC50) |
3.5 nM
|
Positive FGFR2 expression (FGFR2+++/++) | ||
| Method Description |
Cells were counted and seeded in 96 well plates at densities of 2600-3600 cells/well in 100 ul of cell culture medium, A duplicate plate was generated for a day 0 measurement and all plates were incubated in a tissue culture incubator at 37°C with 5% CO2 overnight. Following this incubation, 50 ul/well of Cell titer Glo reagent was added to the day 0 plates, which were then shaken gently for 10 min and the resulting luminescence intensity was measured.
Click to Show/Hide
|
||||
| In Vitro Model | Breast carcinoma | MFM-223 cells | CVCL_1408 | ||
| Experiment 6 Reporting the Activity Date of This ADC | [20] | ||||
| Efficacy Data | Half Maximal Inhibitory Concentration (IC50) | > 30 nM | Negative FGFR2 expression (FGFR2-) | ||
| Method Description |
Cells were counted and seeded in 96 well plates at densities of 2600-3600 cells/well in 100 ul of cell culture medium, A duplicate plate was generated for a day 0 measurement and all plates were incubated in a tissue culture incubator at 37°C with 5% CO2 overnight. Following this incubation, 50 ul/well of Cell titer Glo reagent was added to the day 0 plates, which were then shaken gently for 10 min and the resulting luminescence intensity was measured.
Click to Show/Hide
|
||||
| In Vitro Model | Gastric carcinoma | NUGC-3 cells | CVCL_1612 | ||
2G10 RED-432 maytansine 4 [Investigative]
Discovered Using Cell Line-derived Xenograft Model
| Experiment 1 Reporting the Activity Date of This ADC | [25] | ||||
| Efficacy Data | Tumor Growth Inhibition value (TGI) | ≈ 2.75% | Positive PLAUR expression (PLAUR +++/++) | ||
| Method Description |
To compare the in vivo anti-tumor efficacy of the various ADC constructs, we used MDA-MB-231 xenografts in mice. Animals with tumors of approximately 100 mm3 were treated once a week for four weeks with a 10 mg/kg dose of a variety of DAR 4 ADCs or 2G10 antibody.
|
||||
| In Vivo Model | MDA-MB-231 CDX model | ||||
| In Vitro Model | Breast adenocarcinoma | MDA-MB-231 cells | CVCL_0062 | ||
Revealed Based on the Cell Line Data
| Experiment 1 Reporting the Activity Date of This ADC | [25] | ||||
| Efficacy Data | Half Maximal Inhibitory Concentration (IC50) | > 500 nM | Positive PLAUR expression (PLAUR +++/++) | ||
| Method Description |
MDA-MB-231 cells (0.5x10⁴ cells/well) were seeded in 96-well plates at the density and incubated for 120 h (5 days) with of ADCs or IgG. After 5 days of drug treatment at 37°C with 5% CO2.
|
||||
| In Vitro Model | Breast adenocarcinoma | MDA-MB-231 cells | CVCL_0062 | ||
F105-SPP-DM1 [Investigative]
Discovered Using Cell Line-derived Xenograft Model
| Experiment 1 Reporting the Activity Date of This ADC | [26] | ||||
| Efficacy Data | Tumor Growth Inhibition value (TGI) | ≈ 17.58% | Positive ITGAV expression (ITGAV +++/++) | ||
| Method Description |
The rear flank region of female athymic rats were implanted with 5x10⁶ cells subcutaneously (0.2 ml of25 x106 cells/ml) on the rear flank area. When mean tumor volumes reached to 250 mm3, dosed intravenously (15 mg/kg) on days 17 and 29 after tumor cell injection.
|
||||
| In Vivo Model | A549 CDX model | ||||
| In Vitro Model | Lung adenocarcinoma | A-549 cells | CVCL_0023 | ||
| Experiment 2 Reporting the Activity Date of This ADC | [26] | ||||
| Efficacy Data | Tumor Growth Inhibition value (TGI) | ≈ 20.88% | Positive ITGAV expression (ITGAV +++/++) | ||
| Method Description |
Female athymic rats were inoculated with 5x10⁶ HT29 cells subcutancously on the rear flank area. The animals were stratified into 13 groups, 6 animals per group based on a mean tumor volume for each group of approximately 250 mm3. On the day of grouping (day 7) each group received its initial dosing (175 ug/kg).
|
||||
| In Vivo Model | HT-29 CDX model | ||||
| In Vitro Model | Colon cancer | HT29 cells | CVCL_A8EZ | ||
F105-DM1 [Investigative]
Discovered Using Cell Line-derived Xenograft Model
| Experiment 1 Reporting the Activity Date of This ADC | [26] | ||||
| Efficacy Data | Tumor Growth Inhibition value (TGI) | ≈ 17.58% | Positive ITGAV expression (ITGAV +++/++) | ||
| Method Description |
The rear flank region of female athymic rats were implanted with 5x10⁶ cells subcutaneously (0.2 ml of25 x106 cells/ml) on the rear flank area. When mean tumor volumes reached to 250 mm3, dosed intravenously (15 mg/kg) on days 17 and 29 after tumor cell injection.
|
||||
| In Vivo Model | A549 CDX model | ||||
| In Vitro Model | Lung adenocarcinoma | A-549 cells | CVCL_0023 | ||
Anti-KIT NEG085-SMCC-DM1 [Investigative]
Discovered Using Cell Line-derived Xenograft Model
| Experiment 1 Reporting the Activity Date of This ADC | [27] | ||||
| Efficacy Data | Tumor Growth Inhibition value (TGI) | ≈ 20.12% | Positive KIT expression (KIT+++/++) | ||
| Method Description |
Female SCID-beige mice were implanted subcutaneously with 10,000,000 cells. The total injection volume containingcells in suspension was 200 ul. Mice were enrolled in the study 15 days post implantation withaverage tumor volume of about 120 mm3. All treated groups received a single intravenous dose of2 mg/kg. After being randomly assigned to groups (n = 8/group), mice were administered a single i.v.dose of TBS (5 ml/kg) or ADC (1.25 mg/kg).
Click to Show/Hide
|
||||
| In Vivo Model | GIST430 CDX model | ||||
| In Vitro Model | Gastrointestinal stromal tumor | GIST430 cells | CVCL_7040 | ||
| Experiment 2 Reporting the Activity Date of This ADC | [27] | ||||
| Efficacy Data | Tumor Growth Inhibition value (TGI) | ≈ 32.28% | Positive KIT expression (KIT+++/++) | ||
| Method Description |
Female SCID-beige mice were implanted subcutaneously with 10,000,000 cells. The total injection volume containingcells in suspension was 200 ul. Mice were enrolled in the study 15 days post implantation withaverage tumor volume of about 120 mm3. All treated groups received a single intravenous dose of2 mg/kg. After being randomly assigned to groups (n = 8/group), mice were administered a single i.v.dose of TBS (5 ml/kg) or ADC (1.25 mg/kg).
Click to Show/Hide
|
||||
| In Vivo Model | GIST-T1 CDX model | ||||
| In Vitro Model | Gastrointestinal stromal tumor | GIST-T1 cells | CVCL_4976 | ||
| Experiment 3 Reporting the Activity Date of This ADC | [27] | ||||
| Efficacy Data | Tumor Growth Inhibition value (TGI) | ≈ 39.65% | Positive KIT expression (KIT+++/++) | ||
| Method Description |
Female SCID-beige mice were implanted subcutaneously with 10,000,000 cells. The total injection volume containingcells in suspension was 200 ul. Mice were enrolled in the study 15 days post implantation withaverage tumor volume of about 120 mm3. All treated groups received a single intravenous dose of2 mg/kg. After being randomly assigned to groups (n = 8/group), mice were administered a single i.v.dose of TBS (5 ml/kg) or ADC (2.5 mg/kg).
Click to Show/Hide
|
||||
| In Vivo Model | GIST430 CDX model | ||||
| In Vitro Model | Gastrointestinal stromal tumor | GIST430 cells | CVCL_7040 | ||
| Experiment 4 Reporting the Activity Date of This ADC | [27] | ||||
| Efficacy Data | Tumor Growth Inhibition value (TGI) | ≈ 69.09% | Positive KIT expression (KIT+++/++) | ||
| Method Description |
Female SCID-beige mice were implanted subcutaneously with 10,000,000 cells. The total injection volume containingcells in suspension was 200 ul. Mice were enrolled in the study 15 days post implantation withaverage tumor volume of about 120 mm3. All treated groups received a single intravenous dose of2 mg/kg. After being randomly assigned to groups (n = 8/group), mice were administered a single i.v.dose of TBS (5 ml/kg) or ADC (5 mg/kg).
Click to Show/Hide
|
||||
| In Vivo Model | GIST430 CDX model | ||||
| In Vitro Model | Gastrointestinal stromal tumor | GIST430 cells | CVCL_7040 | ||
| Experiment 5 Reporting the Activity Date of This ADC | [27] | ||||
| Efficacy Data | Tumor Growth Inhibition value (TGI) | ≈ 72% | Positive KIT expression (KIT+++/++) | ||
| Method Description |
Female SCID-beige mice were implanted subcutaneously with 10,000,000 cells. The total injection volume containingcells in suspension was 200 ul. Mice were enrolled in the study 15 days post implantation withaverage tumor volume of about 120 mm3. All treated groups received a single intravenous dose of2 mg/kg. After being randomly assigned to groups (n = 8/group), mice were administered a single i.v.dose of TBS (5 ml/kg) or ADC (0.625 mg/kg).
Click to Show/Hide
|
||||
| In Vivo Model | GIST-T1 CDX model | ||||
| In Vitro Model | Gastrointestinal stromal tumor | GIST-T1 cells | CVCL_4976 | ||
| Experiment 6 Reporting the Activity Date of This ADC | [27] | ||||
| Efficacy Data | Tumor Growth Inhibition value (TGI) | ≈ 75.90% | Positive KIT expression (KIT+++/++) | ||
| Method Description |
Female SCID-beige mice were implanted subcutaneously with 10,000,000 cells. The total injection volume containingcells in suspension was 200 ul. Mice were enrolled in the study 15 days post implantation withaverage tumor volume of about 120 mm3. All treated groups received a single intravenous dose of2 mg/kg. After being randomly assigned to groups (n = 8/group), mice were administered a single i.v.dose of TBS (5 ml/kg) or ADC (2.5 mg/kg).
Click to Show/Hide
|
||||
| In Vivo Model | GIST-T1 CDX model | ||||
| In Vitro Model | Gastrointestinal stromal tumor | GIST-T1 cells | CVCL_4976 | ||
| Experiment 7 Reporting the Activity Date of This ADC | [27] | ||||
| Efficacy Data | Tumor Growth Inhibition value (TGI) | ≈ 77.25% | Positive KIT expression (KIT+++/++) | ||
| Method Description |
Female SCID-beige mice were implanted subcutaneously with 10,000,000 cells. The total injection volume containingcells in suspension was 200 ul. Mice were enrolled in the study 15 days post implantation withaverage tumor volume of about 120 mm3. All treated groups received a single intravenous dose of2 mg/kg. After being randomly assigned to groups (n = 8/group), mice were administered a single i.v.dose of TBS (5 ml/kg) or ADC (5 mg/kg).
Click to Show/Hide
|
||||
| In Vivo Model | GIST-T1 CDX model | ||||
| In Vitro Model | Gastrointestinal stromal tumor | GIST-T1 cells | CVCL_4976 | ||
| Experiment 8 Reporting the Activity Date of This ADC | [27] | ||||
| Efficacy Data | Tumor Growth Inhibition value (TGI) | ≈ 79.31% | Positive KIT expression (KIT+++/++) | ||
| Method Description |
Female SCID-beige mice were implanted subcutaneously with 10,000,000 cells. The total injection volume containingcells in suspension was 200 ul. Mice were enrolled in the study 15 days post implantation withaverage tumor volume of about 120 mm3. All treated groups received a single intravenous dose of2 mg/kg. After being randomly assigned to groups (n = 8/group), mice were administered a single i.v.dose of TBS (5 ml/kg) or ADC (1.25 mg/kg).
Click to Show/Hide
|
||||
| In Vivo Model | NCI-H526 CDX model | ||||
| In Vitro Model | Lung small cell carcinoma | NCI-H526 cells | CVCL_1569 | ||
| Experiment 9 Reporting the Activity Date of This ADC | [27] | ||||
| Efficacy Data | Tumor Growth Inhibition value (TGI) | ≈ 81.81% | Positive KIT expression (KIT+++/++) | ||
| Method Description |
Female SCID-beige mice were implanted subcutaneously with 10,000,000 NCI-H1048 cells. The total injection volume containingcells in suspension was 200 ul. Mice were enrolled in the study 15 days post implantation withaverage tumor volume of about 120 mm3. All treated groups received a single intravenous dose of 2 mg/kg. After being randomly assigned to groups (n = 8/group), mice were administered a single i.v.dose of TBS (5 ml/kg) or ADC (2.0 mg/kg).
Click to Show/Hide
|
||||
| In Vivo Model | NCI-H1048 CDX model | ||||
| In Vitro Model | Lung small cell carcinoma | NCI-H1048 cells | CVCL_1453 | ||
| Experiment 10 Reporting the Activity Date of This ADC | [27] | ||||
| Efficacy Data | Tumor Growth Inhibition value (TGI) | ≈ 95.44% | Positive KIT expression (KIT+++/++) | ||
| Method Description |
Female SCID-beige mice were implanted subcutaneously with 10,000,000 cells. The total injection volume containingcells in suspension was 200 ul. Mice were enrolled in the study 15 days post implantation withaverage tumor volume of about 120 mm3. All treated groups received a single intravenous dose of2 mg/kg. After being randomly assigned to groups (n = 8/group), mice were administered a single i.v.dose of TBS (5 ml/kg) or ADC (2.5 mg/kg).
Click to Show/Hide
|
||||
| In Vivo Model | NCI-H526 CDX model | ||||
| In Vitro Model | Lung small cell carcinoma | NCI-H526 cells | CVCL_1569 | ||
| Experiment 11 Reporting the Activity Date of This ADC | [27] | ||||
| Efficacy Data | Tumor Growth Inhibition value (TGI) | ≈ 99.51% | Positive KIT expression (KIT+++/++) | ||
| Method Description |
Female SCID-beige mice were implanted subcutaneously with 10,000,000 cells. The total injection volume containingcells in suspension was 200 ul. Mice were enrolled in the study 15 days post implantation withaverage tumor volume of about 120 mm3. All treated groups received a single intravenous dose of2 mg/kg. After being randomly assigned to groups (n = 8/group), mice were administered a single i.v.dose of TBS (5 ml/kg) or ADC (5 mg/kg).
Click to Show/Hide
|
||||
| In Vivo Model | NCI-H526 CDX model | ||||
| In Vitro Model | Lung small cell carcinoma | NCI-H526 cells | CVCL_1569 | ||
Revealed Based on the Cell Line Data
| Experiment 1 Reporting the Activity Date of This ADC | [27] | ||||
| Efficacy Data | Max inhibition rate (MIR) |
59%
|
Positive KIT expression (KIT+++/++) | ||
| Method Description |
Cells were cultured in a tissue culture incubator at 37°C with 5% CO2 in culture medium. On the day of the assay, cells were washed twice with PBS, prior to being treated with 0.1% trypsin-EDTA for 5 min and resuspended in the recommended culture medium. Cells were then counted and seeded in 96 well plates at densities of 2,000-10,000 cells/well in 100 ul of cell culture medium.
Click to Show/Hide
|
||||
| In Vitro Model | Gastrointestinal stromal tumor | GIST430 cells | CVCL_7040 | ||
| Experiment 2 Reporting the Activity Date of This ADC | [27] | ||||
| Efficacy Data | Max inhibition rate (MIR) |
71%
|
Positive KIT expression (KIT+++/++) | ||
| Method Description |
Cells were cultured in a tissue culture incubator at 37°C with 5% CO2 in culture medium. On the day of the assay, cells were washed twice with PBS, prior to being treated with 0.1% trypsin-EDTA for 5 min and resuspended in the recommended culture medium. Cells were then counted and seeded in 96 well plates at densities of 2,000-10,000 cells/well in 100 ul of cell culture medium.
Click to Show/Hide
|
||||
| In Vitro Model | Gastrointestinal stromal tumor | GIST882 cells | CVCL_7044 | ||
| Experiment 3 Reporting the Activity Date of This ADC | [27] | ||||
| Efficacy Data | Max inhibition rate (MIR) |
76%
|
Positive KIT expression (KIT+++/++) | ||
| Method Description |
Cells were cultured in a tissue culture incubator at 37°C with 5% CO2 in culture medium. On the day of the assay, cells were washed twice with PBS, prior to being treated with 0.1% trypsin-EDTA for 5 min and resuspended in the recommended culture medium. Cells were then counted and seeded in 96 well plates at densities of 2,000-10,000 cells/well in 100 ul of cell culture medium.
Click to Show/Hide
|
||||
| In Vitro Model | Gastrointestinal stromal tumor | GIST-T1 cells | CVCL_4976 | ||
| Experiment 4 Reporting the Activity Date of This ADC | [27] | ||||
| Efficacy Data | Max inhibition rate (MIR) |
80%
|
Positive KIT expression (KIT+++/++) | ||
| Method Description |
Cells were cultured in a tissue culture incubator at 37°C with 5% CO2 in culture medium. On the day of the assay, cells were washed twice with PBS, prior to being treated with 0.1% trypsin-EDTA for 5 min and resuspended in the recommended culture medium. Cells were then counted and seeded in 96 well plates at densities of 2,000-10,000 cells/well in 100 ul of cell culture medium.
Click to Show/Hide
|
||||
| In Vitro Model | Acute myeloid leukemia | Kasumi-6 cells | CVCL_0614 | ||
| Experiment 5 Reporting the Activity Date of This ADC | [27] | ||||
| Efficacy Data | Max inhibition rate (MIR) |
90%
|
Negative KIT expression (KIT-) | ||
| Method Description |
Cells were cultured in a tissue culture incubator at 37°C with 5% CO2 in culture medium. On the day of the assay, cells were washed twice with PBS, prior to being treated with 0.1% trypsin-EDTA for 5 min and resuspended in the recommended culture medium. Cells were then counted and seeded in 96 well plates at densities of 2,000-10,000 cells/well in 100 ul of cell culture medium.
Click to Show/Hide
|
||||
| In Vitro Model | Breast adenocarcinoma | MDA-MB-453 cells | CVCL_0418 | ||
| Experiment 6 Reporting the Activity Date of This ADC | [27] | ||||
| Efficacy Data | Max inhibition rate (MIR) |
98%
|
Positive KIT expression (KIT+++/++) | ||
| Method Description |
Cells were cultured in a tissue culture incubator at 37°C with 5% CO2 in culture medium. On the day of the assay, cells were washed twice with PBS, prior to being treated with 0.1% trypsin-EDTA for 5 min and resuspended in the recommended culture medium. Cells were then counted and seeded in 96 well plates at densities of 2,000-10,000 cells/well in 100 ul of cell culture medium.
Click to Show/Hide
|
||||
| In Vitro Model | Lung small cell carcinoma | NCI-H1048 cells | CVCL_1453 | ||
| Experiment 7 Reporting the Activity Date of This ADC | [27] | ||||
| Efficacy Data | Max inhibition rate (MIR) |
99%
|
Positive KIT expression (KIT+++/++) | ||
| Method Description |
Cells were cultured in a tissue culture incubator at 37°C with 5% CO2 in culture medium. On the day of the assay, cells were washed twice with PBS, prior to being treated with 0.1% trypsin-EDTA for 5 min and resuspended in the recommended culture medium. Cells were then counted and seeded in 96 well plates at densities of 2,000-10,000 cells/well in 100 ul of cell culture medium.
Click to Show/Hide
|
||||
| In Vitro Model | Myeloid leukemia with maturation | Kasumi-1 cells | CVCL_0589 | ||
| Experiment 8 Reporting the Activity Date of This ADC | [27] | ||||
| Efficacy Data | Max inhibition rate (MIR) |
99%
|
Positive KIT expression (KIT+++/++) | ||
| Method Description |
Cells were cultured in a tissue culture incubator at 37°C with 5% CO2 in culture medium. On the day of the assay, cells were washed twice with PBS, prior to being treated with 0.1% trypsin-EDTA for 5 min and resuspended in the recommended culture medium. Cells were then counted and seeded in 96 well plates at densities of 2,000-10,000 cells/well in 100 ul of cell culture medium.
Click to Show/Hide
|
||||
| In Vitro Model | Lung small cell carcinoma | NCI-H526 cells | CVCL_1569 | ||
| Experiment 9 Reporting the Activity Date of This ADC | [27] | ||||
| Efficacy Data | Half Maximal Inhibitory Concentration (IC50) |
0.01 nM
|
Positive KIT expression (KIT+++/++) | ||
| Method Description |
Cells were cultured in a tissue culture incubator at 37°C with 5% CO2 in culture medium. On the day of the assay, cells were washed twice with PBS, prior to being treated with 0.1% trypsin-EDTA for 5 min and resuspended in the recommended culture medium. Cells were then counted and seeded in 96 well plates at densities of 2,000-10,000 cells/well in 100 ul of cell culture medium.
Click to Show/Hide
|
||||
| In Vitro Model | Gastrointestinal stromal tumor | GIST-T1 cells | CVCL_4976 | ||
| Experiment 10 Reporting the Activity Date of This ADC | [27] | ||||
| Efficacy Data | Half Maximal Inhibitory Concentration (IC50) |
0.03 nM
|
Positive KIT expression (KIT+++/++) | ||
| Method Description |
Cells were cultured in a tissue culture incubator at 37°C with 5% CO2 in culture medium. On the day of the assay, cells were washed twice with PBS, prior to being treated with 0.1% trypsin-EDTA for 5 min and resuspended in the recommended culture medium. Cells were then counted and seeded in 96 well plates at densities of 2,000-10,000 cells/well in 100 ul of cell culture medium.
Click to Show/Hide
|
||||
| In Vitro Model | Lung small cell carcinoma | NCI-H526 cells | CVCL_1569 | ||
| Experiment 11 Reporting the Activity Date of This ADC | [27] | ||||
| Efficacy Data | Half Maximal Inhibitory Concentration (IC50) |
0.04 nM
|
Positive KIT expression (KIT+++/++) | ||
| Method Description |
Cells were cultured in a tissue culture incubator at 37°C with 5% CO2 in culture medium. On the day of the assay, cells were washed twice with PBS, prior to being treated with 0.1% trypsin-EDTA for 5 min and resuspended in the recommended culture medium. Cells were then counted and seeded in 96 well plates at densities of 2,000-10,000 cells/well in 100 ul of cell culture medium.
Click to Show/Hide
|
||||
| In Vitro Model | Gastrointestinal stromal tumor | GIST430 cells | CVCL_7040 | ||
| Experiment 12 Reporting the Activity Date of This ADC | [27] | ||||
| Efficacy Data | Half Maximal Inhibitory Concentration (IC50) |
0.47 nM
|
Positive KIT expression (KIT+++/++) | ||
| Method Description |
Cells were cultured in a tissue culture incubator at 37°C with 5% CO2 in culture medium. On the day of the assay, cells were washed twice with PBS, prior to being treated with 0.1% trypsin-EDTA for 5 min and resuspended in the recommended culture medium. Cells were then counted and seeded in 96 well plates at densities of 2,000-10,000 cells/well in 100 ul of cell culture medium.
Click to Show/Hide
|
||||
| In Vitro Model | Gastrointestinal stromal tumor | GIST882 cells | CVCL_7044 | ||
| Experiment 13 Reporting the Activity Date of This ADC | [27] | ||||
| Efficacy Data | Half Maximal Inhibitory Concentration (IC50) |
0.55 nM
|
Positive KIT expression (KIT+++/++) | ||
| Method Description |
Cells were cultured in a tissue culture incubator at 37°C with 5% CO2 in culture medium. On the day of the assay, cells were washed twice with PBS, prior to being treated with 0.1% trypsin-EDTA for 5 min and resuspended in the recommended culture medium. Cells were then counted and seeded in 96 well plates at densities of 2,000-10,000 cells/well in 100 ul of cell culture medium.
Click to Show/Hide
|
||||
| In Vitro Model | Lung small cell carcinoma | NCI-H1048 cells | CVCL_1453 | ||
| Experiment 14 Reporting the Activity Date of This ADC | [27] | ||||
| Efficacy Data | Half Maximal Inhibitory Concentration (IC50) |
0.64 nM
|
Positive KIT expression (KIT+++/++) | ||
| Method Description |
Cells were cultured in a tissue culture incubator at 37°C with 5% CO2 in culture medium. On the day of the assay, cells were washed twice with PBS, prior to being treated with 0.1% trypsin-EDTA for 5 min and resuspended in the recommended culture medium. Cells were then counted and seeded in 96 well plates at densities of 2,000-10,000 cells/well in 100 ul of cell culture medium.
Click to Show/Hide
|
||||
| In Vitro Model | Acute myeloid leukemia | Kasumi-6 cells | CVCL_0614 | ||
| Experiment 15 Reporting the Activity Date of This ADC | [27] | ||||
| Efficacy Data | Half Maximal Inhibitory Concentration (IC50) |
4.82 nM
|
Positive KIT expression (KIT+++/++) | ||
| Method Description |
Cells were cultured in a tissue culture incubator at 37°C with 5% CO2 in culture medium. On the day of the assay, cells were washed twice with PBS, prior to being treated with 0.1% trypsin-EDTA for 5 min and resuspended in the recommended culture medium. Cells were then counted and seeded in 96 well plates at densities of 2,000-10,000 cells/well in 100 ul of cell culture medium.
Click to Show/Hide
|
||||
| In Vitro Model | Myeloid leukemia with maturation | Kasumi-1 cells | CVCL_0589 | ||
| Experiment 16 Reporting the Activity Date of This ADC | [27] | ||||
| Efficacy Data | Half Maximal Inhibitory Concentration (IC50) |
46.83 nM
|
Negative KIT expression (KIT-) | ||
| Method Description |
Cells were cultured in a tissue culture incubator at 37°C with 5% CO2 in culture medium. On the day of the assay, cells were washed twice with PBS, prior to being treated with 0.1% trypsin-EDTA for 5 min and resuspended in the recommended culture medium. Cells were then counted and seeded in 96 well plates at densities of 2,000-10,000 cells/well in 100 ul of cell culture medium.
Click to Show/Hide
|
||||
| In Vitro Model | Breast adenocarcinoma | MDA-MB-453 cells | CVCL_0418 | ||
HcHAb18-DM1 [Investigative]
Discovered Using Cell Line-derived Xenograft Model
| Experiment 1 Reporting the Activity Date of This ADC | [28] | ||||
| Efficacy Data | Tumor Growth Inhibition value (TGI) | ≈ 23.23% | Positive CD147 expression (CD147 +++/++) | ||
| Method Description |
HcHAb18-DM1 (1 mg/kg, twice a week for 4 weeks) induces efficient tumor cell killing in cell line-derived models of A549 cells with CD147 expression with high expression.
|
||||
| In Vivo Model | A549 CDX model | ||||
| In Vitro Model | Lung adenocarcinoma | A-549 cells | CVCL_0023 | ||
| Experiment 2 Reporting the Activity Date of This ADC | [28] | ||||
| Efficacy Data | Tumor Growth Inhibition value (TGI) | ≈ 23.23% | Positive CD147 expression (CD147 +++/++) | ||
| Method Description |
HcHAb18-DM1 (2 mg/kg, twice a week for 4 weeks) induces efficient tumor cell killing in cell line-derived models of A549 cells with CD147 expression with high expression.
|
||||
| In Vivo Model | A549 CDX model | ||||
| In Vitro Model | Lung adenocarcinoma | A-549 cells | CVCL_0023 | ||
| Experiment 3 Reporting the Activity Date of This ADC | [28] | ||||
| Efficacy Data | Tumor Growth Inhibition value (TGI) | ≈ 38.63% | Positive CD147 expression (CD147 +++/++) | ||
| Method Description |
HcHAb18-DM1 (4 mg/kg, twice a week for 4 weeks) induces efficient tumor cell killing in cell line-derived models of A549 cells with CD147 expression with high expression.
|
||||
| In Vivo Model | A549 CDX model | ||||
| In Vitro Model | Lung adenocarcinoma | A-549 cells | CVCL_0023 | ||
| Experiment 4 Reporting the Activity Date of This ADC | [28] | ||||
| Efficacy Data | Tumor Growth Inhibition value (TGI) | ≈ 56.95% | Positive CD147 expression (CD147 +++/++) | ||
| Method Description |
HcHAb18-DM1 (8 mg/kg, twice a week for 4 weeks) induces efficient tumor cell killing in cell line-derived models of A549 cells with CD147 expression with high expression.
|
||||
| In Vivo Model | A549 CDX model | ||||
| In Vitro Model | Lung adenocarcinoma | A-549 cells | CVCL_0023 | ||
| Experiment 5 Reporting the Activity Date of This ADC | [28] | ||||
| Efficacy Data | Tumor Growth Inhibition value (TGI) | ≈ 89.22% | Positive CD147 expression (CD147 +++/++) | ||
| Method Description |
HcHAb18-DM1 (16 mg/kg, twice a week for 4 weeks) induces efficient tumor cell killing in cell line-derived models of A549 cells with CD147 expression with high expression.
|
||||
| In Vivo Model | A549 CDX model | ||||
| In Vitro Model | Lung adenocarcinoma | A-549 cells | CVCL_0023 | ||
| Experiment 6 Reporting the Activity Date of This ADC | [28] | ||||
| Efficacy Data | Tumor Growth Inhibition value (TGI) | ≈ 94.20% | Positive CD147 expression (CD147 +++/++) | ||
| Method Description |
HcHAb18-DM1 (30 mg/kg, i.v. injection weekly in a total 4 doses) induces efficient tumor cell killing in cell line-derived models of NCI-H226 cells with CD147 expression with high expression.
|
||||
| In Vivo Model | NCI-H226 CDX model | ||||
| In Vitro Model | Pleural epithelioid mesothelioma | NCI-H226 cells | CVCL_1544 | ||
| Experiment 7 Reporting the Activity Date of This ADC | [28] | ||||
| Efficacy Data | Tumor Growth Inhibition value (TGI) | ≈ 95.84% | Positive CD147 expression (CD147 +++/++) | ||
| Method Description |
HcHAb18-DM1 (32 mg/kg, twice a week for 4 weeks) induces efficient tumor cell killing in cell line-derived models of A549 cells with CD147 expression with high expression.
|
||||
| In Vivo Model | A549 CDX model | ||||
| In Vitro Model | Lung adenocarcinoma | A-549 cells | CVCL_0023 | ||
| Experiment 8 Reporting the Activity Date of This ADC | [28] | ||||
| Efficacy Data | Tumor Growth Inhibition value (TGI) | ≈ 97.40% | Positive CD147 expression (CD147 +++/++) | ||
| Method Description |
HcHAb18-DM1 (18 mg/kg, twice a week for 4 weeks) induces efficient tumor cell killing in cell line-derived models of NCI-H460 cells with CD147 expression with high expression.
|
||||
| In Vivo Model | NCI-H460 CDX model | ||||
| In Vitro Model | Lung large cell carcinoma | NCI-H460 cells | CVCL_0459 | ||
Revealed Based on the Cell Line Data
| Experiment 1 Reporting the Activity Date of This ADC | [28] | ||||
| Efficacy Data | Half Maximal Inhibitory Concentration (IC50) |
0.46 ug/mL
|
Positive CD147 expression (CD147 +++/++) | ||
| Method Description |
In vitro efficacy of HcHAb18-DM1 versus HcHAb18 and IgG1-DM1 on six cell lines treated for 72 h.
|
||||
| In Vitro Model | Pleural epithelioid mesothelioma | NCI-H226 cells | CVCL_1544 | ||
| Experiment 2 Reporting the Activity Date of This ADC | [28] | ||||
| Efficacy Data | Half Maximal Inhibitory Concentration (IC50) |
0.77 ug/mL
|
Positive CD147 expression (CD147 +++/++) | ||
| Method Description |
In vitro efficacy of HcHAb18-DM1 versus HcHAb18 and IgG1-DM1 on six cell lines treated for 72 h.
|
||||
| In Vitro Model | Lung large cell carcinoma | NCI-H460 cells | CVCL_0459 | ||
| Experiment 3 Reporting the Activity Date of This ADC | [28] | ||||
| Efficacy Data | Half Maximal Inhibitory Concentration (IC50) |
1.96 ug/mL
|
Positive CD147 expression (CD147 +++/++) | ||
| Method Description |
In vitro efficacy of HcHAb18-DM1 versus HcHAb18 and IgG1-DM1 on six cell lines treated for 72 h.
|
||||
| In Vitro Model | Lung squamous cell carcinoma | NCI-H520 cells | CVCL_1566 | ||
| Experiment 4 Reporting the Activity Date of This ADC | [28] | ||||
| Efficacy Data | Half Maximal Inhibitory Concentration (IC50) |
18.26 ug/mL
|
Positive CD147 expression (CD147 +++/++) | ||
| Method Description |
In vitro efficacy of HcHAb18-DM1 versus HcHAb18 and IgG1-DM1 on six cell lines treated for 72 h.
|
||||
| In Vitro Model | Lung adenocarcinoma | A-549 cells | CVCL_0023 | ||
CNTO95-SPP-DM1 [Investigative]
Discovered Using Cell Line-derived Xenograft Model
| Experiment 1 Reporting the Activity Date of This ADC | [26] | ||||
| Efficacy Data | Tumor Growth Inhibition value (TGI) | ≈ 28.74% | Positive ITGAV expression (ITGAV +++/++) | ||
| Method Description |
On the day of grouping (Day 0), animals were weighed and intravenously injectedwith control ADC at 25 mg/kg. All testand control articles were given in a volume of 1ml/100 gm of body weight. CNTO 364 at 3 mg/kg groups was administered i.v. on a q7dx5 schedule.
|
||||
| In Vivo Model | A375.S2 CDX model | ||||
| In Vitro Model | Amelanotic melanoma | A375.S2 cells | CVCL_0136 | ||
| Experiment 2 Reporting the Activity Date of This ADC | [26] | ||||
| Efficacy Data | Tumor Growth Inhibition value (TGI) | ≈ 44.54% | Positive ITGAV expression (ITGAV +++/++) | ||
| Method Description |
On the day of grouping (Day 0), animals were weighed and intravenously injectedwith control ADC at 25 mg/kg. All testand control articles were given in a volume of 1ml/100 gm of body weight. CNTO 364 at 6 mg/kg groups was administered i.v. on a q7dx5 schedule.
|
||||
| In Vivo Model | A375.S2 CDX model | ||||
| In Vitro Model | Amelanotic melanoma | A375.S2 cells | CVCL_0136 | ||
| Experiment 3 Reporting the Activity Date of This ADC | [26] | ||||
| Efficacy Data | Tumor Growth Inhibition value (TGI) | ≈ 45.81% | Positive ITGAV expression (ITGAV +++/++) | ||
| Method Description |
Female athymic rats were inoculated with 5x10⁶ HT29 cells subcutancously on the rear flank area. The animals were stratified into 13 groups, 6 animals per group based on a mean tumor volume for each group of approximately 250 mm3. On the day of grouping (day 7) each group received its initial dosing (175 ug/kg).
|
||||
| In Vivo Model | HT-29 CDX model | ||||
| In Vitro Model | Colon cancer | HT29 cells | CVCL_A8EZ | ||
| Experiment 4 Reporting the Activity Date of This ADC | [26] | ||||
| Efficacy Data | Tumor Growth Inhibition value (TGI) | ≈ 71.21% | Positive ITGAV expression (ITGAV +++/++) | ||
| Method Description |
Nine-week-old athymic nude rats were subcutaneously inoculated with A375.S2human melanoma cells. ADC (5 mg/kg) andappropriate control compounds were intravenously injected (three injection every other day inthe first week followed by one injection per week for two weeks.
|
||||
| In Vivo Model | A375.S2 CDX model | ||||
| In Vitro Model | Amelanotic melanoma | A375.S2 cells | CVCL_0136 | ||
| Experiment 5 Reporting the Activity Date of This ADC | [26] | ||||
| Efficacy Data | Tumor Growth Inhibition value (TGI) | ≈ 77.15% | Positive ITGAV expression (ITGAV +++/++) | ||
| Method Description |
Nine-week-old athymic nude rats were subcutaneously inoculated with A375.S2human melanoma cells. ADC (10 mg/kg) andappropriate control compounds were intravenously injected (three injection every other day inthe first week followed by one injection per week for two weeks.
|
||||
| In Vivo Model | A375.S2 CDX model | ||||
| In Vitro Model | Amelanotic melanoma | A375.S2 cells | CVCL_0136 | ||
| Experiment 6 Reporting the Activity Date of This ADC | [26] | ||||
| Efficacy Data | Tumor Growth Inhibition value (TGI) | ≈ 87.23% | Positive ITGAV expression (ITGAV +++/++) | ||
| Method Description |
On the day of grouping (Day 0), animals were weighed and intravenously injectedwith control ADC at 25 mg/kg. All testand control articles were given in a volume of 1ml/100 gm of body weight. CNTO 364 at 10 mg/kg groups was administered i.v. on a q7dx5 schedule.
|
||||
| In Vivo Model | A375.S2 CDX model | ||||
| In Vitro Model | Amelanotic melanoma | A375.S2 cells | CVCL_0136 | ||
| Experiment 7 Reporting the Activity Date of This ADC | [26] | ||||
| Efficacy Data | Tumor Growth Inhibition value (TGI) | ≈ 95.10% | Positive ITGAV expression (ITGAV +++/++) | ||
| Method Description |
The rear flank region of female athymic rats were implanted with 5x10⁶ cells subcutaneously (0.2 ml of25 x106 cells/ml) on the rear flank area. When mean tumor volumes reached to 250 mm3, dosed intravenously (15 mg/kg) on days 17 and 29 after tumor cell injection.
|
||||
| In Vivo Model | A549 CDX model | ||||
| In Vitro Model | Lung adenocarcinoma | A-549 cells | CVCL_0023 | ||
| Experiment 8 Reporting the Activity Date of This ADC | [26] | ||||
| Efficacy Data | Tumor Growth Inhibition value (TGI) | ≈ 95.81% | Positive ITGAV expression (ITGAV +++/++) | ||
| Method Description |
On the day of grouping (Day 0), animals were weighed and intravenously injectedwith control ADC at 25 mg/kg. All testand control articles were given in a volume of 1ml/100 gm of body weight. CNTO 364 at 15 mg/kg groups was administered i.v. on a q7dx5 schedule.
|
||||
| In Vivo Model | A375.S2 CDX model | ||||
| In Vitro Model | Amelanotic melanoma | A375.S2 cells | CVCL_0136 | ||
Revealed Based on the Cell Line Data
| Experiment 1 Reporting the Activity Date of This ADC | [26] | ||||
| Efficacy Data | Half Maximal Effective Concentration (EC50) |
1 ug/mL
|
Positive ITGAV expression (ITGAV +++/++) | ||
| Method Description |
Cells were seeded into white 96-well tissue culture plates (5000 cells/well)in culture medium and incubated for 16 hrs. Serial dilutions of immunoconjugates were added toeach appropraite wells (0-20 ug/ml). Tissue culture plates were incubated at 37°C for 96 hrs.
|
||||
| In Vitro Model | Colon cancer | HT29 cells | CVCL_A8EZ | ||
| Experiment 2 Reporting the Activity Date of This ADC | [26] | ||||
| Efficacy Data | Half Maximal Effective Concentration (EC50) |
1.2 ug/mL
|
Positive ITGAV expression (ITGAV +++/++) | ||
| Method Description |
Cells were seeded into white 96-well tissue culture plates (5000 cells/well)in culture medium and incubated for 16 hrs. Serial dilutions of immunoconjugates were added toeach appropraite wells (0-20 ug/ml). Tissue culture plates were incubated at 37°C for 96 hrs.
|
||||
| In Vitro Model | Lung adenocarcinoma | A-549 cells | CVCL_0023 | ||
| Experiment 3 Reporting the Activity Date of This ADC | [26] | ||||
| Efficacy Data | Half Maximal Effective Concentration (EC50) |
0.19 mg/mL
|
Positive ITGAV expression (ITGAV +++/++) | ||
| Method Description |
Cells were harvested, rinsedsuspended in serum free DMEM, and sequentially incubated for 60 minutes on ice with serialdiluted CNTO 95,CNTO 364, CNTO 365 and CNTO 366 and FITC-labeled anti-humanantibody (10 mg/ml).
|
||||
| In Vitro Model | Colon cancer | HT29 cells | CVCL_A8EZ | ||
| Experiment 4 Reporting the Activity Date of This ADC | [26] | ||||
| Efficacy Data | Half Maximal Effective Concentration (EC50) |
0.27 mg/mL
|
Positive ITGAV expression (ITGAV +++/++) | ||
| Method Description |
Cells were harvested, rinsedsuspended in serum free DMEM, and sequentially incubated for 60 minutes on ice with serialdiluted CNTO 95,CNTO 364, CNTO 365 and CNTO 366 and FITC-labeled anti-humanantibody (10 mg/ml).
|
||||
| In Vitro Model | Ovarian endometrioid adenocarcinoma | A2780 cells | CVCL_0134 | ||
| Experiment 5 Reporting the Activity Date of This ADC | [26] | ||||
| Efficacy Data | Half Maximal Effective Concentration (EC50) |
0.27 mg/mL
|
Positive ITGAV expression (ITGAV +++/++) | ||
| Method Description |
Cells were harvested, rinsedsuspended in serum free DMEM, and sequentially incubated for 60 minutes on ice with serialdiluted CNTO 95,CNTO 364, CNTO 365 and CNTO 366 and FITC-labeled anti-humanantibody (10 mg/ml).
|
||||
| In Vitro Model | Lung adenocarcinoma | A-549 cells | CVCL_0023 | ||
CNTO95-DM1 [Investigative]
Discovered Using Cell Line-derived Xenograft Model
| Experiment 1 Reporting the Activity Date of This ADC | [26] | ||||
| Efficacy Data | Tumor Growth Inhibition value (TGI) | ≈ 28.74% | Positive ITGAV expression (ITGAV +++/++) | ||
| Method Description |
On the day of grouping (Day 0), animals were weighed and intravenously injectedwith control ADC at 25 mg/kg. All testand control articles were given in a volume of 1ml/100 gm of body weight. CNTO 364 at 3 mg/kg groups was administered i.v. on a q7dx5 schedule.
|
||||
| In Vivo Model | A375.S2 CDX model | ||||
| In Vitro Model | Amelanotic melanoma | A375.S2 cells | CVCL_0136 | ||
| Experiment 2 Reporting the Activity Date of This ADC | [26] | ||||
| Efficacy Data | Tumor Growth Inhibition value (TGI) | ≈ 44.54% | Positive ITGAV expression (ITGAV +++/++) | ||
| Method Description |
On the day of grouping (Day 0), animals were weighed and intravenously injectedwith control ADC at 25 mg/kg. All testand control articles were given in a volume of 1ml/100 gm of body weight. CNTO 364 at 6 mg/kg groups was administered i.v. on a q7dx5 schedule.
|
||||
| In Vivo Model | A375.S2 CDX model | ||||
| In Vitro Model | Amelanotic melanoma | A375.S2 cells | CVCL_0136 | ||
| Experiment 3 Reporting the Activity Date of This ADC | [26] | ||||
| Efficacy Data | Tumor Growth Inhibition value (TGI) | ≈ 87.23% | Positive ITGAV expression (ITGAV +++/++) | ||
| Method Description |
On the day of grouping (Day 0), animals were weighed and intravenously injectedwith control ADC at 25 mg/kg. All testand control articles were given in a volume of 1ml/100 gm of body weight. CNTO 364 at 10 mg/kg groups was administered i.v. on a q7dx5 schedule.
|
||||
| In Vivo Model | A375.S2 CDX model | ||||
| In Vitro Model | Amelanotic melanoma | A375.S2 cells | CVCL_0136 | ||
| Experiment 4 Reporting the Activity Date of This ADC | [26] | ||||
| Efficacy Data | Tumor Growth Inhibition value (TGI) | ≈ 95.81% | Positive ITGAV expression (ITGAV +++/++) | ||
| Method Description |
On the day of grouping (Day 0), animals were weighed and intravenously injectedwith control ADC at 25 mg/kg. All testand control articles were given in a volume of 1ml/100 gm of body weight. CNTO 364 at 15 mg/kg groups was administered i.v. on a q7dx5 schedule.
|
||||
| In Vivo Model | A375.S2 CDX model | ||||
| In Vitro Model | Amelanotic melanoma | A375.S2 cells | CVCL_0136 | ||
2G10 RED-106 maytansine 4 [Investigative]
Discovered Using Cell Line-derived Xenograft Model
| Experiment 1 Reporting the Activity Date of This ADC | [25] | ||||
| Efficacy Data | Tumor Growth Inhibition value (TGI) | ≈ 30.42% | Positive PLAUR expression (PLAUR +++/++) | ||
| Method Description |
To compare the in vivo anti-tumor efficacy of the various ADC constructs, we used MDA-MB-231 xenografts in mice. Animals with tumors of approximately 100 mm3 were treated once a week for four weeks with a 10 mg/kg dose of a variety of DAR 4 ADCs or 2G10 antibody.
|
||||
| In Vivo Model | MDA-MB-231 CDX model | ||||
| In Vitro Model | Breast adenocarcinoma | MDA-MB-231 cells | CVCL_0062 | ||
Revealed Based on the Cell Line Data
| Experiment 1 Reporting the Activity Date of This ADC | [25] | ||||
| Efficacy Data | Half Maximal Inhibitory Concentration (IC50) | > 500 nM | Positive PLAUR expression (PLAUR +++/++) | ||
| Method Description |
MDA-MB-231 cells (0.5x10⁴ cells/well) were seeded in 96-well plates at the density and incubated for 120 h (5 days) with of ADCs or IgG. After 5 days of drug treatment at 37°C with 5% CO2.
|
||||
| In Vitro Model | Breast adenocarcinoma | MDA-MB-231 cells | CVCL_0062 | ||
Anti-FGFR2/4 mAb-12422 SMCC-DM1 [Investigative]
Discovered Using Cell Line-derived Xenograft Model
| Experiment 1 Reporting the Activity Date of This ADC | [20] | ||||
| Efficacy Data | Tumor Growth Inhibition value (TGI) | ≈ 30.85% | Positive FGFR2 expression (FGFR2+++/++) | ||
| Method Description |
The total injection volume containing cells in suspension was 200 ul. Mice were enrolled in the first study eight days post implantation with average tumor volume of 171.7 mm3. After being randomly assigned to one of nine groups (n =8/group), mice were administered PBS or a single 5 mg/kg intravenous (i.v,) injection of one antibody drug conjugates.
Click to Show/Hide
|
||||
| In Vivo Model | NCI-H716 CDX model | ||||
| In Vitro Model | Cecum adenocarcinoma | NCI-H716 cells | CVCL_1581 | ||
| Experiment 2 Reporting the Activity Date of This ADC | [20] | ||||
| Efficacy Data | Tumor Growth Inhibition value (TGI) | ≈ 35.79% | Positive FGFR2 expression (FGFR2+++/++) | ||
| Method Description |
The total injection volume containing cells in suspension was 200 ul. Mice were enrolled in the first study eight days post implantation with average tumor volume of 171.7 mm3. After being randomly assigned to one of nine groups (n =8/group), mice were administered PBS or a single 15 mg/kg intravenous (i.v,) injection of one antibody drug conjugates.
Click to Show/Hide
|
||||
| In Vivo Model | NCI-H716 CDX model | ||||
| In Vitro Model | Cecum adenocarcinoma | NCI-H716 cells | CVCL_1581 | ||
| Experiment 3 Reporting the Activity Date of This ADC | [20] | ||||
| Efficacy Data | Tumor Growth Inhibition value (TGI) | ≈ 80.52% | Positive FGFR2 expression (FGFR2+++/++) | ||
| Method Description |
The total injection volume containing cells in suspension was 200 ul. Mice were enrolled in the first study eight days post implantation with average tumor volume of 192.9 mm3. After being randomly assigned to one of nine groups (n =8/group), mice were administered PBS or a single 3 mg/kg intravenous (i.v,) injection of one antibody drug conjugates.
Click to Show/Hide
|
||||
| In Vivo Model | SNU-16 CDX model | ||||
| In Vitro Model | Gastric adenocarcinoma | SNU-16 cells | CVCL_0076 | ||
Revealed Based on the Cell Line Data
| Experiment 1 Reporting the Activity Date of This ADC | [20] | ||||
| Efficacy Data | Half Maximal Inhibitory Concentration (IC50) | < 3 nM | Positive FGFR2 expression (FGFR2+++/++) | ||
| Method Description |
Cells were counted and seeded in 96 well plates at densities of 2600-3600 cells/well in 100 ul of cell culture medium, A duplicate plate was generated for a day 0 measurement and all plates were incubated in a tissue culture incubator at 37°C with 5% CO2 overnight. Following this incubation, 50 ul/well of Cell titer Glo reagent was added to the day 0 plates, which were then shaken gently for 10 min and the resulting luminescence intensity was measured.
Click to Show/Hide
|
||||
| In Vitro Model | Down syndrome | KATO III cells | CVCL_0371 | ||
| Experiment 2 Reporting the Activity Date of This ADC | [20] | ||||
| Efficacy Data | Half Maximal Inhibitory Concentration (IC50) | < 3 nM | Positive FGFR2 expression (FGFR2+++/++) | ||
| Method Description |
Cells were counted and seeded in 96 well plates at densities of 2600-3600 cells/well in 100 ul of cell culture medium, A duplicate plate was generated for a day 0 measurement and all plates were incubated in a tissue culture incubator at 37°C with 5% CO2 overnight. Following this incubation, 50 ul/well of Cell titer Glo reagent was added to the day 0 plates, which were then shaken gently for 10 min and the resulting luminescence intensity was measured.
Click to Show/Hide
|
||||
| In Vitro Model | Gastric adenocarcinoma | SNU-16 cells | CVCL_0076 | ||
Mirvetuximab-SPP-DM1 [Investigative]
Discovered Using Cell Line-derived Xenograft Model
| Experiment 1 Reporting the Activity Date of This ADC | [29] | ||||
| Efficacy Data | Tumor Growth Inhibition value (TGI) |
32.17%
|
High FOLR1 expression (FOLR1+++; 4,500,000 FOLR1 molecules/cell) | ||
| Method Description |
Animals with established tumors of about 130 mm3 were treated with intravenous single injection of the M9346A-DM conjugates at 25 02 mg/kg, equivalent to 51 3 g conjugated maytansinoid per kg The conjugates were injected on day 20 after cell inoculation.
|
||||
| In Vivo Model | FRalpha-positive KB CDX model | ||||
| In Vitro Model | Human papillomavirus-related endocervical adenocarcinoma | KB cells | CVCL_0372 | ||
| Experiment 2 Reporting the Activity Date of This ADC | [29] | ||||
| Efficacy Data | Tumor Growth Inhibition value (TGI) |
50%
|
High FOLR1 expression (FOLR1+++; 1,300,000 FOLR1 molecules/cell) | ||
| Method Description |
Animals with established tumors of about 130 mm3 were treated with intravenous single injection of the M9346A-DM conjugates at 25 02 mg/kg, equivalent to 51 3 g conjugated maytansinoid per kg The conjugates were injected on day 7 after cell inoculation.
|
||||
| In Vivo Model | Ovarian carcinoma Igrov-1 CDX model | ||||
| In Vitro Model | Ovarian endometrioid adenocarcinoma | IGROV-1 cells | CVCL_1304 | ||
Revealed Based on the Cell Line Data
| Experiment 1 Reporting the Activity Date of This ADC | [29] | ||||
| Efficacy Data | Half Maximal Inhibitory Concentration (IC50) |
0.11±0.04 nM
|
High FOLR1 expression (FOLR1+++; 4,500,000 FOLR1 molecules/cell) | ||
| Method Description |
Dilutions of conjugates or unconjugated maytansinoid in the appropriate culture medium were added to wells of 96-well flat-bottomed plates containing 1 x10³ cells per well The plates were incubated at 37°C, 6% CO2 for either 5 days (continuos exposure) or for 4 hours followed by 5-day incubation in conjugate-free medium (short exposure). Cell viability was determined by the WST-8 assay in accordance with the manufacturer's protocol, and IC50 were generated using a sigmoidal dose-response (variable slope) nonlinear regression curve fit.
Click to Show/Hide
|
||||
| In Vitro Model | Human papillomavirus-related endocervical adenocarcinoma | KB cells | CVCL_0372 | ||
| Experiment 2 Reporting the Activity Date of This ADC | [29] | ||||
| Efficacy Data | Half Maximal Inhibitory Concentration (IC50) |
0.13±0.08 nM
|
Moderate FOLR1 expression (FOLR1++; 290,000 FOLR1 molecules/cell) | ||
| Method Description |
Dilutions of conjugates or unconjugated maytansinoid in the appropriate culture medium were added to wells of 96-well flat-bottomed plates containing 1 x10³ cells per well The plates were incubated at 37°C, 6% CO2 for either 5 days (continuos exposure) or for 4 hours followed by 5-day incubation in conjugate-free medium (short exposure). Cell viability was determined by the WST-8 assay in accordance with the manufacturer's protocol, and IC50 were generated using a sigmoidal dose-response (variable slope) nonlinear regression curve fit.
Click to Show/Hide
|
||||
| In Vitro Model | Gestational choriocarcinoma | JEG-3 cells | CVCL_0363 | ||
| Experiment 3 Reporting the Activity Date of This ADC | [29] | ||||
| Efficacy Data | Half Maximal Inhibitory Concentration (IC50) |
0.14±0.05 nM
|
High FOLR1 expression (FOLR1+++; 1,300,000 FOLR1 molecules/cell) | ||
| Method Description |
Dilutions of conjugates or unconjugated maytansinoid in the appropriate culture medium were added to wells of 96-well flat-bottomed plates containing 1 x10³ cells per well The plates were incubated at 37°C, 6% CO2 for either 5 days (continuos exposure) or for 4 hours followed by 5-day incubation in conjugate-free medium (short exposure). Cell viability was determined by the WST-8 assay in accordance with the manufacturer's protocol, and IC50 were generated using a sigmoidal dose-response (variable slope) nonlinear regression curve fit.
Click to Show/Hide
|
||||
| In Vitro Model | Ovarian endometrioid adenocarcinoma | IGROV-1 cells | CVCL_1304 | ||
2G10 RED-425 maytansine 4 [Investigative]
Discovered Using Cell Line-derived Xenograft Model
| Experiment 1 Reporting the Activity Date of This ADC | [25] | ||||
| Efficacy Data | Tumor Growth Inhibition value (TGI) | ≈ 38.75% | Positive PLAUR expression (PLAUR +++/++) | ||
| Method Description |
To compare the in vivo anti-tumor efficacy of the various ADC constructs, we used MDA-MB-231 xenografts in mice. Animals with tumors of approximately 100 mm3 were treated once a week for four weeks with a 10 mg/kg dose of a variety of DAR 4 ADCs or 2G10 antibody.
|
||||
| In Vivo Model | MDA-MB-231 CDX model | ||||
| In Vitro Model | Breast adenocarcinoma | MDA-MB-231 cells | CVCL_0062 | ||
Revealed Based on the Cell Line Data
| Experiment 1 Reporting the Activity Date of This ADC | [25] | ||||
| Efficacy Data | Half Maximal Inhibitory Concentration (IC50) |
500 nM
|
Positive PLAUR expression (PLAUR +++/++) | ||
| Method Description |
MDA-MB-231 cells (0.5x10⁴ cells/well) were seeded in 96-well plates at the density and incubated for 120 h (5 days) with of ADCs or IgG. After 5 days of drug treatment at 37°C with 5% CO2.
|
||||
| In Vitro Model | Breast adenocarcinoma | MDA-MB-231 cells | CVCL_0062 | ||
4C9-DM1 [Investigative]
Discovered Using Cell Line-derived Xenograft Model
| Experiment 1 Reporting the Activity Date of This ADC | [30] | ||||
| Efficacy Data | Tumor Growth Inhibition value (TGI) | ≈ 40% | Positive KIT expression (KIT+++/++) | ||
| Method Description |
In vivo efficacy of 4C9-DM1 was examined using mouse models xenotransplanted with NCI-H526, mice with established tumors were randomized into different treatment groups when the tumor volume reached ~200 mm 3. The dose of 4C9-DM1 was 1 mg/kg twice at day 0 and day 7.
|
||||
| In Vivo Model | Small cell lung cancer CDX model | ||||
| In Vitro Model | Small cell lung cancer | Small cell lung cancer cells | Homo sapiens | ||
| Experiment 2 Reporting the Activity Date of This ADC | [30] | ||||
| Efficacy Data | Tumor Growth Inhibition value (TGI) | ≈ 45% | Positive KIT expression (KIT+++/++) | ||
| Method Description |
In vivo efficacy of 4C9-DM1 was examined using mouse models xenotransplanted with NCI-H526, mice with established tumors were randomized into different treatment groups when the tumor volume reached ~200 mm 3. The dose of 4C9-DM1 was 3 mg/kg twice at day 0 and day 7.
|
||||
| In Vivo Model | Small cell lung cancer CDX model | ||||
| In Vitro Model | Small cell lung cancer | Small cell lung cancer cells | Homo sapiens | ||
| Experiment 3 Reporting the Activity Date of This ADC | [30] | ||||
| Efficacy Data | Tumor Growth Inhibition value (TGI) | ≈ 59% | Positive KIT expression (KIT+++/++) | ||
| Method Description |
In vivo efficacy of 4C9-DM1 was examined using mouse models xenotransplanted with NCI-H526, mice with established tumors were randomized into different treatment groups when the tumor volume reached ~200 mm 3. The dose of 4C9-DM1 was 5 mg/kg twice at day 0 and day 7.
|
||||
| In Vivo Model | Small cell lung cancer CDX model | ||||
| In Vitro Model | Small cell lung cancer | Small cell lung cancer cells | Homo sapiens | ||
Revealed Based on the Cell Line Data
| Experiment 1 Reporting the Activity Date of This ADC | [30] | ||||
| Efficacy Data | Half Maximal Inhibitory Concentration (IC50) |
0.16 nM
|
Positive KIT expression (KIT+++/++) | ||
| Method Description |
C-Kit positive or negative SCLC cell lines were seeded into 96-well plates and incubated with 4C9 or 4C9-DM1 in a dose-dependent manner for 35 days.
|
||||
| In Vitro Model | Lung small cell carcinoma | NCI-H526 cells | CVCL_1569 | ||
| Experiment 2 Reporting the Activity Date of This ADC | [30] | ||||
| Efficacy Data | Half Maximal Inhibitory Concentration (IC50) |
0.32 nM
|
Positive KIT expression (KIT+++/++) | ||
| Method Description |
C-Kit positive or negative SCLC cell lines were seeded into 96-well plates and incubated with 4C9 or 4C9-DM1 in a dose-dependent manner for 35 days.
|
||||
| In Vitro Model | Lung small cell carcinoma | NCI-H889 cells | CVCL_1598 | ||
| Experiment 3 Reporting the Activity Date of This ADC | [30] | ||||
| Efficacy Data | Half Maximal Inhibitory Concentration (IC50) |
4.08 nM
|
Positive KIT expression (KIT+++/++) | ||
| Method Description |
C-Kit positive or negative SCLC cell lines were seeded into 96-well plates and incubated with 4C9 or 4C9-DM1 in a dose-dependent manner for 35 days.
|
||||
| In Vitro Model | Lung small cell carcinoma | NCI-H1048 cells | CVCL_1453 | ||
| Experiment 4 Reporting the Activity Date of This ADC | [30] | ||||
| Efficacy Data | Half Maximal Inhibitory Concentration (IC50) |
16.58 nM
|
Negative KIT expression (KIT-) | ||
| Method Description |
C-Kit positive or negative SCLC cell lines were seeded into 96-well plates and incubated with 4C9 or 4C9-DM1 in a dose-dependent manner for 35 days.
|
||||
| In Vitro Model | Lung small cell carcinoma | NCI-H446 cells | CVCL_1562 | ||
| Experiment 5 Reporting the Activity Date of This ADC | [30] | ||||
| Efficacy Data | Half Maximal Inhibitory Concentration (IC50) |
35.5 nM
|
Negative KIT expression (KIT-) | ||
| Method Description |
C-Kit positive or negative SCLC cell lines were seeded into 96-well plates and incubated with 4C9 or 4C9-DM1 in a dose-dependent manner for 35 days.
|
||||
| In Vitro Model | Lung squamous cell carcinoma | NCI-H2170 cells | CVCL_1535 | ||
| Experiment 6 Reporting the Activity Date of This ADC | [30] | ||||
| Efficacy Data | Half Maximal Inhibitory Concentration (IC50) |
47.63 nM
|
Negative KIT expression (KIT-) | ||
| Method Description |
C-Kit positive or negative SCLC cell lines were seeded into 96-well plates and incubated with 4C9 or 4C9-DM1 in a dose-dependent manner for 35 days.
|
||||
| In Vitro Model | Amelanotic melanoma | MDA-MB-435 cells | CVCL_0417 | ||
M9346A-4a-Cxxx-Mal-CX-DM1 [Investigative]
Discovered Using Cell Line-derived Xenograft Model
| Experiment 1 Reporting the Activity Date of This ADC | [31] | ||||
| Efficacy Data | Tumor Growth Inhibition value (TGI) | ≈ 41.22% | Positive FOLR1 expression (FOLR1 +++/++) | ||
| Method Description |
M9346A-4a-Cxxx-Mal-CX-DM1 (200 ug/kg, every seven days x3) induces efficient tumor cell killing in cell line-derived models of KB cells with HER2 expression with high expression.
|
||||
| In Vivo Model | KB CDX model | ||||
| In Vitro Model | Human papillomavirus-related endocervical adenocarcinoma | KB cells | CVCL_0372 | ||
| Experiment 2 Reporting the Activity Date of This ADC | [31] | ||||
| Efficacy Data | Tumor Growth Inhibition value (TGI) | ≈ 99.58% | Positive FOLR1 expression (FOLR1 +++/++) | ||
| Method Description |
M9346A-4a-Cxxx-Mal-CX-DM1 (100 ug/kg, every seven days x3) induces efficient tumor cell killing in cell line-derived models of KB cells with HER2 expression with high expression.
|
||||
| In Vivo Model | KB CDX model | ||||
| In Vitro Model | Human papillomavirus-related endocervical adenocarcinoma | KB cells | CVCL_0372 | ||
Revealed Based on the Cell Line Data
| Experiment 1 Reporting the Activity Date of This ADC | [31] | ||||
| Efficacy Data | Half Maximal Inhibitory Concentration (IC50) |
0.15 nM
|
Positive FOLR1 expression (FOLR1 +++/++) | ||
| Method Description |
Cytotoxic IC50 Values (as a Function of [ADC] and [DM1]) for Various M9346A-CX-DM1 ADCs against FR-Expressing KB Cells in the absence of 1 M unconjugated M9346A antibody.
|
||||
| In Vitro Model | Human papillomavirus-related endocervical adenocarcinoma | KB cells | CVCL_0372 | ||
| Experiment 2 Reporting the Activity Date of This ADC | [31] | ||||
| Efficacy Data | Half Maximal Inhibitory Concentration (IC50) |
5 nM
|
Positive FOLR1 expression (FOLR1 +++/++) | ||
| Method Description |
Cytotoxic IC50 Values (as a Function of [ADC] and [DM1]) for Various M9346A-CX-DM1 ADCs against FOLR1-Expressing KB Cells in the presence of 1 M unconjugated M9346A antibody.
|
||||
| In Vitro Model | Human papillomavirus-related endocervical adenocarcinoma | KB cells | CVCL_0372 | ||
Anti-KIT NEG085-SPP-DM1 [Investigative]
Discovered Using Cell Line-derived Xenograft Model
| Experiment 1 Reporting the Activity Date of This ADC | [27] | ||||
| Efficacy Data | Tumor Growth Inhibition value (TGI) | ≈ 41.55% | Positive KIT expression (KIT+++/++) | ||
| Method Description |
Female SCID-beige mice were implanted subcutaneously with 10,000,000 NCI-H1048 cells. The total injection volume containingcells in suspension was 200 ul. Mice were enrolled in the study 15 days post implantation withaverage tumor volume of about 120 mm3. All treated groups received a single intravenous dose of 2 mg/kg. After being randomly assigned to groups (n = 8/group), mice were administered a single i.v.dose of TBS (5 ml/kg) or ADC (2.5 mg/kg).
Click to Show/Hide
|
||||
| In Vivo Model | NCI-H1048 CDX model | ||||
| In Vitro Model | Lung small cell carcinoma | NCI-H1048 cells | CVCL_1453 | ||
| Experiment 2 Reporting the Activity Date of This ADC | [27] | ||||
| Efficacy Data | Tumor Growth Inhibition value (TGI) | ≈ 87.55% | Positive KIT expression (KIT+++/++) | ||
| Method Description |
Female SCID-beige mice were implanted subcutaneously with 10,000,000 NCI-H1048 cells. The total injection volume containingcells in suspension was 200 ul. Mice were enrolled in the study 15 days post implantation withaverage tumor volume of about 120 mm3. All treated groups received a single intravenous dose of 2 mg/kg. After being randomly assigned to groups (n = 8/group), mice were administered a single i.v.dose of TBS (5 ml/kg) or ADC (5 mg/kg).
Click to Show/Hide
|
||||
| In Vivo Model | NCI-H1048 CDX model | ||||
| In Vitro Model | Lung small cell carcinoma | NCI-H1048 cells | CVCL_1453 | ||
| Experiment 3 Reporting the Activity Date of This ADC | [27] | ||||
| Efficacy Data | Tumor Growth Inhibition value (TGI) | ≈ 91.32% | Positive KIT expression (KIT+++/++) | ||
| Method Description |
Female SCID-beige mice were implanted subcutaneously with 10,000,000 NCI-H1048 cells. The total injection volume containingcells in suspension was 200 ul. Mice were enrolled in the study 15 days post implantation withaverage tumor volume of about 120 mm3. All treated groups received a single intravenous dose of 2 mg/kg. After being randomly assigned to groups (n = 8/group), mice were administered a single i.v.dose of TBS (5 ml/kg) or ADC (10 mg/kg).
Click to Show/Hide
|
||||
| In Vivo Model | NCI-H1048 CDX model | ||||
| In Vitro Model | Lung small cell carcinoma | NCI-H1048 cells | CVCL_1453 | ||
Anti-KIT 20376-SMCC-DM1 [Investigative]
Discovered Using Cell Line-derived Xenograft Model
| Experiment 1 Reporting the Activity Date of This ADC | [27] | ||||
| Efficacy Data | Tumor Growth Inhibition value (TGI) | ≈ 43% | Positive KIT expression (KIT+++/++) | ||
| Method Description |
Female SCID-beige mice were implanted subcutaneously with 10,000,000 NCI-H1048 cells. The total injection volume containingcells in suspension was 200 ul. Mice were enrolled in the study 15 days post implantation withaverage tumor volume of about 120 mm3. All treated groups received a single intravenous dose of 2 mg/kg. After being randomly assigned to groups (n = 8/group), mice were administered a single i.v.dose of TBS (5 ml/kg) or ADC (10 mg/kg).
Click to Show/Hide
|
||||
| In Vivo Model | NCI-H1048 CDX model | ||||
| In Vitro Model | Lung small cell carcinoma | NCI-H1048 cells | CVCL_1453 | ||
| Experiment 2 Reporting the Activity Date of This ADC | [27] | ||||
| Efficacy Data | Tumor Growth Inhibition value (TGI) | ≈ 49% | Positive KIT expression (KIT+++/++) | ||
| Method Description |
Female SCID-beige mice were implanted subcutaneously with 10,000,000 cells. The total injection volume containingcells in suspension was 200 ul. Mice were enrolled in the study 15 days post implantation withaverage tumor volume of about 120 mm3. All treated groups received a single intravenous dose of2 mg/kg. After being randomly assigned to groups (n = 8/group), mice were administered a single i.v.dose of TBS (5 ml/kg) or ADC (0.625 mg/kg).
Click to Show/Hide
|
||||
| In Vivo Model | GIST-T1 CDX model | ||||
| In Vitro Model | Gastrointestinal stromal tumor | GIST-T1 cells | CVCL_4976 | ||
| Experiment 3 Reporting the Activity Date of This ADC | [27] | ||||
| Efficacy Data | Tumor Growth Inhibition value (TGI) | ≈ 91% | Positive KIT expression (KIT+++/++) | ||
| Method Description |
Female SCID-beige mice were implanted subcutaneously with 10,000,000 cells. The total injection volume containingcells in suspension was 200 ul. Mice were enrolled in the study 15 days post implantation withaverage tumor volume of about 120 mm3. All treated groups received a single intravenous dose of2 mg/kg. After being randomly assigned to groups (n = 8/group), mice were administered a single i.v.dose of TBS (5 ml/kg) or ADC (2.5 mg/kg).
Click to Show/Hide
|
||||
| In Vivo Model | GIST-T1 CDX model | ||||
| In Vitro Model | Gastrointestinal stromal tumor | GIST-T1 cells | CVCL_4976 | ||
| Experiment 4 Reporting the Activity Date of This ADC | [27] | ||||
| Efficacy Data | Tumor Growth Inhibition value (TGI) | ≈ 96% | Positive KIT expression (KIT+++/++) | ||
| Method Description |
Female SCID-beige mice were implanted subcutaneously with 10,000,000 cells. The total injection volume containingcells in suspension was 200 ul. Mice were enrolled in the study 15 days post implantation withaverage tumor volume of about 120 mm3. All treated groups received a single intravenous dose of2 mg/kg. After being randomly assigned to groups (n = 8/group), mice were administered a single i.v.dose of TBS (5 ml/kg) or ADC (5 mg/kg).
Click to Show/Hide
|
||||
| In Vivo Model | GIST-T1 CDX model | ||||
| In Vitro Model | Gastrointestinal stromal tumor | GIST-T1 cells | CVCL_4976 | ||
| Experiment 5 Reporting the Activity Date of This ADC | [27] | ||||
| Efficacy Data | Tumor Growth Inhibition value (TGI) | ≈ 97% | Positive KIT expression (KIT+++/++) | ||
| Method Description |
Female SCID-beige mice were implanted subcutaneously with 10,000,000 cells. The total injection volume containingcells in suspension was 200 ul. Mice were enrolled in the study 15 days post implantation withaverage tumor volume of about 120 mm3. All treated groups received a single intravenous dose of2 mg/kg. After being randomly assigned to groups (n = 8/group), mice were administered a single i.v.dose of TBS (5 ml/kg) or ADC (10 mg/kg).
Click to Show/Hide
|
||||
| In Vivo Model | GIST-T1 CDX model | ||||
| In Vitro Model | Gastrointestinal stromal tumor | GIST-T1 cells | CVCL_4976 | ||
Revealed Based on the Cell Line Data
| Experiment 1 Reporting the Activity Date of This ADC | [27] | ||||
| Efficacy Data | Max inhibition rate (MIR) |
54%
|
Positive KIT expression (KIT+++/++) | ||
| Method Description |
Cells were cultured in a tissue culture incubator at 37°C with 5% CO2 in culture medium. On the day of the assay, cells were washed twice with PBS, prior to being treated with 0.1% trypsin-EDTA for 5 min and resuspended in the recommended culture medium. Cells were then counted and seeded in 96 well plates at densities of 2,000-10,000 cells/well in 100 ul of cell culture medium.
Click to Show/Hide
|
||||
| In Vitro Model | Gastrointestinal stromal tumor | GIST430 cells | CVCL_7040 | ||
| Experiment 2 Reporting the Activity Date of This ADC | [27] | ||||
| Efficacy Data | Max inhibition rate (MIR) |
69%
|
Positive KIT expression (KIT+++/++) | ||
| Method Description |
Cells were cultured in a tissue culture incubator at 37°C with 5% CO2 in culture medium. On the day of the assay, cells were washed twice with PBS, prior to being treated with 0.1% trypsin-EDTA for 5 min and resuspended in the recommended culture medium. Cells were then counted and seeded in 96 well plates at densities of 2,000-10,000 cells/well in 100 ul of cell culture medium.
Click to Show/Hide
|
||||
| In Vitro Model | Gastrointestinal stromal tumor | GIST882 cells | CVCL_7044 | ||
| Experiment 3 Reporting the Activity Date of This ADC | [27] | ||||
| Efficacy Data | Max inhibition rate (MIR) |
69%
|
Positive KIT expression (KIT+++/++) | ||
| Method Description |
Cells were cultured in a tissue culture incubator at 37°C with 5% CO2 in culture medium. On the day of the assay, cells were washed twice with PBS, prior to being treated with 0.1% trypsin-EDTA for 5 min and resuspended in the recommended culture medium. Cells were then counted and seeded in 96 well plates at densities of 2,000-10,000 cells/well in 100 ul of cell culture medium.
Click to Show/Hide
|
||||
| In Vitro Model | Gastrointestinal stromal tumor | GIST-T1 cells | CVCL_4976 | ||
| Experiment 4 Reporting the Activity Date of This ADC | [27] | ||||
| Efficacy Data | Max inhibition rate (MIR) |
79%
|
Positive KIT expression (KIT+++/++) | ||
| Method Description |
Cells were cultured in a tissue culture incubator at 37°C with 5% CO2 in culture medium. On the day of the assay, cells were washed twice with PBS, prior to being treated with 0.1% trypsin-EDTA for 5 min and resuspended in the recommended culture medium. Cells were then counted and seeded in 96 well plates at densities of 2,000-10,000 cells/well in 100 ul of cell culture medium.
Click to Show/Hide
|
||||
| In Vitro Model | Acute myeloid leukemia | Kasumi-6 cells | CVCL_0614 | ||
| Experiment 5 Reporting the Activity Date of This ADC | [27] | ||||
| Efficacy Data | Max inhibition rate (MIR) |
95%
|
Negative KIT expression (KIT-) | ||
| Method Description |
Cells were cultured in a tissue culture incubator at 37°C with 5% CO2 in culture medium. On the day of the assay, cells were washed twice with PBS, prior to being treated with 0.1% trypsin-EDTA for 5 min and resuspended in the recommended culture medium. Cells were then counted and seeded in 96 well plates at densities of 2,000-10,000 cells/well in 100 ul of cell culture medium.
Click to Show/Hide
|
||||
| In Vitro Model | Breast adenocarcinoma | MDA-MB-453 cells | CVCL_0418 | ||
| Experiment 6 Reporting the Activity Date of This ADC | [27] | ||||
| Efficacy Data | Max inhibition rate (MIR) |
97%
|
Positive KIT expression (KIT+++/++) | ||
| Method Description |
Cells were cultured in a tissue culture incubator at 37°C with 5% CO2 in culture medium. On the day of the assay, cells were washed twice with PBS, prior to being treated with 0.1% trypsin-EDTA for 5 min and resuspended in the recommended culture medium. Cells were then counted and seeded in 96 well plates at densities of 2,000-10,000 cells/well in 100 ul of cell culture medium.
Click to Show/Hide
|
||||
| In Vitro Model | Lung small cell carcinoma | NCI-H1048 cells | CVCL_1453 | ||
| Experiment 7 Reporting the Activity Date of This ADC | [27] | ||||
| Efficacy Data | Max inhibition rate (MIR) |
99%
|
Positive KIT expression (KIT+++/++) | ||
| Method Description |
Cells were cultured in a tissue culture incubator at 37°C with 5% CO2 in culture medium. On the day of the assay, cells were washed twice with PBS, prior to being treated with 0.1% trypsin-EDTA for 5 min and resuspended in the recommended culture medium. Cells were then counted and seeded in 96 well plates at densities of 2,000-10,000 cells/well in 100 ul of cell culture medium.
Click to Show/Hide
|
||||
| In Vitro Model | Lung small cell carcinoma | NCI-H526 cells | CVCL_1569 | ||
| Experiment 8 Reporting the Activity Date of This ADC | [27] | ||||
| Efficacy Data | Max inhibition rate (MIR) |
100%
|
Positive KIT expression (KIT+++/++) | ||
| Method Description |
Cells were cultured in a tissue culture incubator at 37°C with 5% CO2 in culture medium. On the day of the assay, cells were washed twice with PBS, prior to being treated with 0.1% trypsin-EDTA for 5 min and resuspended in the recommended culture medium. Cells were then counted and seeded in 96 well plates at densities of 2,000-10,000 cells/well in 100 ul of cell culture medium.
Click to Show/Hide
|
||||
| In Vitro Model | Myeloid leukemia with maturation | Kasumi-1 cells | CVCL_0589 | ||
| Experiment 9 Reporting the Activity Date of This ADC | [27] | ||||
| Efficacy Data | Half Maximal Inhibitory Concentration (IC50) |
0.04 nM
|
Positive KIT expression (KIT+++/++) | ||
| Method Description |
Cells were cultured in a tissue culture incubator at 37°C with 5% CO2 in culture medium. On the day of the assay, cells were washed twice with PBS, prior to being treated with 0.1% trypsin-EDTA for 5 min and resuspended in the recommended culture medium. Cells were then counted and seeded in 96 well plates at densities of 2,000-10,000 cells/well in 100 ul of cell culture medium.
Click to Show/Hide
|
||||
| In Vitro Model | Gastrointestinal stromal tumor | GIST430 cells | CVCL_7040 | ||
| Experiment 10 Reporting the Activity Date of This ADC | [27] | ||||
| Efficacy Data | Half Maximal Inhibitory Concentration (IC50) |
0.05 nM
|
Positive KIT expression (KIT+++/++) | ||
| Method Description |
Cells were cultured in a tissue culture incubator at 37°C with 5% CO2 in culture medium. On the day of the assay, cells were washed twice with PBS, prior to being treated with 0.1% trypsin-EDTA for 5 min and resuspended in the recommended culture medium. Cells were then counted and seeded in 96 well plates at densities of 2,000-10,000 cells/well in 100 ul of cell culture medium.
Click to Show/Hide
|
||||
| In Vitro Model | Gastrointestinal stromal tumor | GIST-T1 cells | CVCL_4976 | ||
| Experiment 11 Reporting the Activity Date of This ADC | [27] | ||||
| Efficacy Data | Half Maximal Inhibitory Concentration (IC50) |
0.07 nM
|
Positive KIT expression (KIT+++/++) | ||
| Method Description |
Cells were cultured in a tissue culture incubator at 37°C with 5% CO2 in culture medium. On the day of the assay, cells were washed twice with PBS, prior to being treated with 0.1% trypsin-EDTA for 5 min and resuspended in the recommended culture medium. Cells were then counted and seeded in 96 well plates at densities of 2,000-10,000 cells/well in 100 ul of cell culture medium.
Click to Show/Hide
|
||||
| In Vitro Model | Lung small cell carcinoma | NCI-H526 cells | CVCL_1569 | ||
| Experiment 12 Reporting the Activity Date of This ADC | [27] | ||||
| Efficacy Data | Half Maximal Inhibitory Concentration (IC50) |
1 nM
|
Positive KIT expression (KIT+++/++) | ||
| Method Description |
Cells were cultured in a tissue culture incubator at 37°C with 5% CO2 in culture medium. On the day of the assay, cells were washed twice with PBS, prior to being treated with 0.1% trypsin-EDTA for 5 min and resuspended in the recommended culture medium. Cells were then counted and seeded in 96 well plates at densities of 2,000-10,000 cells/well in 100 ul of cell culture medium.
Click to Show/Hide
|
||||
| In Vitro Model | Gastrointestinal stromal tumor | GIST882 cells | CVCL_7044 | ||
| Experiment 13 Reporting the Activity Date of This ADC | [27] | ||||
| Efficacy Data | Half Maximal Inhibitory Concentration (IC50) |
1.33 nM
|
Positive KIT expression (KIT+++/++) | ||
| Method Description |
Cells were cultured in a tissue culture incubator at 37°C with 5% CO2 in culture medium. On the day of the assay, cells were washed twice with PBS, prior to being treated with 0.1% trypsin-EDTA for 5 min and resuspended in the recommended culture medium. Cells were then counted and seeded in 96 well plates at densities of 2,000-10,000 cells/well in 100 ul of cell culture medium.
Click to Show/Hide
|
||||
| In Vitro Model | Myeloid leukemia with maturation | Kasumi-1 cells | CVCL_0589 | ||
| Experiment 14 Reporting the Activity Date of This ADC | [27] | ||||
| Efficacy Data | Half Maximal Inhibitory Concentration (IC50) |
1.34 nM
|
Positive KIT expression (KIT+++/++) | ||
| Method Description |
Cells were cultured in a tissue culture incubator at 37°C with 5% CO2 in culture medium. On the day of the assay, cells were washed twice with PBS, prior to being treated with 0.1% trypsin-EDTA for 5 min and resuspended in the recommended culture medium. Cells were then counted and seeded in 96 well plates at densities of 2,000-10,000 cells/well in 100 ul of cell culture medium.
Click to Show/Hide
|
||||
| In Vitro Model | Lung small cell carcinoma | NCI-H1048 cells | CVCL_1453 | ||
| Experiment 15 Reporting the Activity Date of This ADC | [27] | ||||
| Efficacy Data | Half Maximal Inhibitory Concentration (IC50) |
1.51 nM
|
Positive KIT expression (KIT+++/++) | ||
| Method Description |
Cells were cultured in a tissue culture incubator at 37°C with 5% CO2 in culture medium. On the day of the assay, cells were washed twice with PBS, prior to being treated with 0.1% trypsin-EDTA for 5 min and resuspended in the recommended culture medium. Cells were then counted and seeded in 96 well plates at densities of 2,000-10,000 cells/well in 100 ul of cell culture medium.
Click to Show/Hide
|
||||
| In Vitro Model | Acute myeloid leukemia | Kasumi-6 cells | CVCL_0614 | ||
| Experiment 16 Reporting the Activity Date of This ADC | [27] | ||||
| Efficacy Data | Half Maximal Inhibitory Concentration (IC50) |
2.69 nM
|
Negative KIT expression (KIT-) | ||
| Method Description |
Cells were cultured in a tissue culture incubator at 37°C with 5% CO2 in culture medium. On the day of the assay, cells were washed twice with PBS, prior to being treated with 0.1% trypsin-EDTA for 5 min and resuspended in the recommended culture medium. Cells were then counted and seeded in 96 well plates at densities of 2,000-10,000 cells/well in 100 ul of cell culture medium.
Click to Show/Hide
|
||||
| In Vitro Model | Breast adenocarcinoma | MDA-MB-453 cells | CVCL_0418 | ||
Anti-KIT NEG087-SMCC-DM1 [Investigative]
Discovered Using Cell Line-derived Xenograft Model
| Experiment 1 Reporting the Activity Date of This ADC | [27] | ||||
| Efficacy Data | Tumor Growth Inhibition value (TGI) | ≈ 44% | Positive KIT expression (KIT+++/++) | ||
| Method Description |
Female SCID-beige mice were implanted subcutaneously with 10,000,000 cells. The total injection volume containingcells in suspension was 200 ul. Mice were enrolled in the study 15 days post implantation withaverage tumor volume of about 120 mm3. All treated groups received a single intravenous dose of2 mg/kg. After being randomly assigned to groups (n = 8/group), mice were administered a single i.v.dose of TBS (5 ml/kg) or ADC (0.625 mg/kg).
Click to Show/Hide
|
||||
| In Vivo Model | GIST-T1 CDX model | ||||
| In Vitro Model | Gastrointestinal stromal tumor | GIST-T1 cells | CVCL_4976 | ||
Revealed Based on the Cell Line Data
| Experiment 1 Reporting the Activity Date of This ADC | [27] | ||||
| Efficacy Data | Max inhibition rate (MIR) |
57%
|
Positive KIT expression (KIT+++/++) | ||
| Method Description |
Cells were cultured in a tissue culture incubator at 37°C with 5% CO2 in culture medium. On the day of the assay, cells were washed twice with PBS, prior to being treated with 0.1% trypsin-EDTA for 5 min and resuspended in the recommended culture medium. Cells were then counted and seeded in 96 well plates at densities of 2,000-10,000 cells/well in 100 ul of cell culture medium.
Click to Show/Hide
|
||||
| In Vitro Model | Gastrointestinal stromal tumor | GIST430 cells | CVCL_7040 | ||
| Experiment 2 Reporting the Activity Date of This ADC | [27] | ||||
| Efficacy Data | Max inhibition rate (MIR) |
70%
|
Positive KIT expression (KIT+++/++) | ||
| Method Description |
Cells were cultured in a tissue culture incubator at 37°C with 5% CO2 in culture medium. On the day of the assay, cells were washed twice with PBS, prior to being treated with 0.1% trypsin-EDTA for 5 min and resuspended in the recommended culture medium. Cells were then counted and seeded in 96 well plates at densities of 2,000-10,000 cells/well in 100 ul of cell culture medium.
Click to Show/Hide
|
||||
| In Vitro Model | Gastrointestinal stromal tumor | GIST882 cells | CVCL_7044 | ||
| Experiment 3 Reporting the Activity Date of This ADC | [27] | ||||
| Efficacy Data | Max inhibition rate (MIR) |
78%
|
Positive KIT expression (KIT+++/++) | ||
| Method Description |
Cells were cultured in a tissue culture incubator at 37°C with 5% CO2 in culture medium. On the day of the assay, cells were washed twice with PBS, prior to being treated with 0.1% trypsin-EDTA for 5 min and resuspended in the recommended culture medium. Cells were then counted and seeded in 96 well plates at densities of 2,000-10,000 cells/well in 100 ul of cell culture medium.
Click to Show/Hide
|
||||
| In Vitro Model | Gastrointestinal stromal tumor | GIST-T1 cells | CVCL_4976 | ||
| Experiment 4 Reporting the Activity Date of This ADC | [27] | ||||
| Efficacy Data | Max inhibition rate (MIR) |
80%
|
Positive KIT expression (KIT+++/++) | ||
| Method Description |
Cells were cultured in a tissue culture incubator at 37°C with 5% CO2 in culture medium. On the day of the assay, cells were washed twice with PBS, prior to being treated with 0.1% trypsin-EDTA for 5 min and resuspended in the recommended culture medium. Cells were then counted and seeded in 96 well plates at densities of 2,000-10,000 cells/well in 100 ul of cell culture medium.
Click to Show/Hide
|
||||
| In Vitro Model | Acute myeloid leukemia | Kasumi-6 cells | CVCL_0614 | ||
| Experiment 5 Reporting the Activity Date of This ADC | [27] | ||||
| Efficacy Data | Max inhibition rate (MIR) |
90%
|
Negative KIT expression (KIT-) | ||
| Method Description |
Cells were cultured in a tissue culture incubator at 37°C with 5% CO2 in culture medium. On the day of the assay, cells were washed twice with PBS, prior to being treated with 0.1% trypsin-EDTA for 5 min and resuspended in the recommended culture medium. Cells were then counted and seeded in 96 well plates at densities of 2,000-10,000 cells/well in 100 ul of cell culture medium.
Click to Show/Hide
|
||||
| In Vitro Model | Breast adenocarcinoma | MDA-MB-453 cells | CVCL_0418 | ||
| Experiment 6 Reporting the Activity Date of This ADC | [27] | ||||
| Efficacy Data | Max inhibition rate (MIR) |
98%
|
Positive KIT expression (KIT+++/++) | ||
| Method Description |
Cells were cultured in a tissue culture incubator at 37°C with 5% CO2 in culture medium. On the day of the assay, cells were washed twice with PBS, prior to being treated with 0.1% trypsin-EDTA for 5 min and resuspended in the recommended culture medium. Cells were then counted and seeded in 96 well plates at densities of 2,000-10,000 cells/well in 100 ul of cell culture medium.
Click to Show/Hide
|
||||
| In Vitro Model | Lung small cell carcinoma | NCI-H1048 cells | CVCL_1453 | ||
| Experiment 7 Reporting the Activity Date of This ADC | [27] | ||||
| Efficacy Data | Max inhibition rate (MIR) |
99%
|
Positive KIT expression (KIT+++/++) | ||
| Method Description |
Cells were cultured in a tissue culture incubator at 37°C with 5% CO2 in culture medium. On the day of the assay, cells were washed twice with PBS, prior to being treated with 0.1% trypsin-EDTA for 5 min and resuspended in the recommended culture medium. Cells were then counted and seeded in 96 well plates at densities of 2,000-10,000 cells/well in 100 ul of cell culture medium.
Click to Show/Hide
|
||||
| In Vitro Model | Myeloid leukemia with maturation | Kasumi-1 cells | CVCL_0589 | ||
| Experiment 8 Reporting the Activity Date of This ADC | [27] | ||||
| Efficacy Data | Max inhibition rate (MIR) |
99%
|
Positive KIT expression (KIT+++/++) | ||
| Method Description |
Cells were cultured in a tissue culture incubator at 37°C with 5% CO2 in culture medium. On the day of the assay, cells were washed twice with PBS, prior to being treated with 0.1% trypsin-EDTA for 5 min and resuspended in the recommended culture medium. Cells were then counted and seeded in 96 well plates at densities of 2,000-10,000 cells/well in 100 ul of cell culture medium.
Click to Show/Hide
|
||||
| In Vitro Model | Lung small cell carcinoma | NCI-H526 cells | CVCL_1569 | ||
| Experiment 9 Reporting the Activity Date of This ADC | [27] | ||||
| Efficacy Data | Half Maximal Inhibitory Concentration (IC50) |
0.01 nM
|
Positive KIT expression (KIT+++/++) | ||
| Method Description |
Cells were cultured in a tissue culture incubator at 37°C with 5% CO2 in culture medium. On the day of the assay, cells were washed twice with PBS, prior to being treated with 0.1% trypsin-EDTA for 5 min and resuspended in the recommended culture medium. Cells were then counted and seeded in 96 well plates at densities of 2,000-10,000 cells/well in 100 ul of cell culture medium.
Click to Show/Hide
|
||||
| In Vitro Model | Gastrointestinal stromal tumor | GIST-T1 cells | CVCL_4976 | ||
| Experiment 10 Reporting the Activity Date of This ADC | [27] | ||||
| Efficacy Data | Half Maximal Inhibitory Concentration (IC50) |
0.03 nM
|
Positive KIT expression (KIT+++/++) | ||
| Method Description |
Cells were cultured in a tissue culture incubator at 37°C with 5% CO2 in culture medium. On the day of the assay, cells were washed twice with PBS, prior to being treated with 0.1% trypsin-EDTA for 5 min and resuspended in the recommended culture medium. Cells were then counted and seeded in 96 well plates at densities of 2,000-10,000 cells/well in 100 ul of cell culture medium.
Click to Show/Hide
|
||||
| In Vitro Model | Lung small cell carcinoma | NCI-H526 cells | CVCL_1569 | ||
| Experiment 11 Reporting the Activity Date of This ADC | [27] | ||||
| Efficacy Data | Half Maximal Inhibitory Concentration (IC50) |
0.05 nM
|
Positive KIT expression (KIT+++/++) | ||
| Method Description |
Cells were cultured in a tissue culture incubator at 37°C with 5% CO2 in culture medium. On the day of the assay, cells were washed twice with PBS, prior to being treated with 0.1% trypsin-EDTA for 5 min and resuspended in the recommended culture medium. Cells were then counted and seeded in 96 well plates at densities of 2,000-10,000 cells/well in 100 ul of cell culture medium.
Click to Show/Hide
|
||||
| In Vitro Model | Gastrointestinal stromal tumor | GIST430 cells | CVCL_7040 | ||
| Experiment 12 Reporting the Activity Date of This ADC | [27] | ||||
| Efficacy Data | Half Maximal Inhibitory Concentration (IC50) |
0.41 nM
|
Positive KIT expression (KIT+++/++) | ||
| Method Description |
Cells were cultured in a tissue culture incubator at 37°C with 5% CO2 in culture medium. On the day of the assay, cells were washed twice with PBS, prior to being treated with 0.1% trypsin-EDTA for 5 min and resuspended in the recommended culture medium. Cells were then counted and seeded in 96 well plates at densities of 2,000-10,000 cells/well in 100 ul of cell culture medium.
Click to Show/Hide
|
||||
| In Vitro Model | Gastrointestinal stromal tumor | GIST882 cells | CVCL_7044 | ||
| Experiment 13 Reporting the Activity Date of This ADC | [27] | ||||
| Efficacy Data | Half Maximal Inhibitory Concentration (IC50) |
1.5 nM
|
Positive KIT expression (KIT+++/++) | ||
| Method Description |
Cells were cultured in a tissue culture incubator at 37°C with 5% CO2 in culture medium. On the day of the assay, cells were washed twice with PBS, prior to being treated with 0.1% trypsin-EDTA for 5 min and resuspended in the recommended culture medium. Cells were then counted and seeded in 96 well plates at densities of 2,000-10,000 cells/well in 100 ul of cell culture medium.
Click to Show/Hide
|
||||
| In Vitro Model | Lung small cell carcinoma | NCI-H1048 cells | CVCL_1453 | ||
| Experiment 14 Reporting the Activity Date of This ADC | [27] | ||||
| Efficacy Data | Half Maximal Inhibitory Concentration (IC50) |
3.24 nM
|
Positive KIT expression (KIT+++/++) | ||
| Method Description |
Cells were cultured in a tissue culture incubator at 37°C with 5% CO2 in culture medium. On the day of the assay, cells were washed twice with PBS, prior to being treated with 0.1% trypsin-EDTA for 5 min and resuspended in the recommended culture medium. Cells were then counted and seeded in 96 well plates at densities of 2,000-10,000 cells/well in 100 ul of cell culture medium.
Click to Show/Hide
|
||||
| In Vitro Model | Acute myeloid leukemia | Kasumi-6 cells | CVCL_0614 | ||
| Experiment 15 Reporting the Activity Date of This ADC | [27] | ||||
| Efficacy Data | Half Maximal Inhibitory Concentration (IC50) |
6.07 nM
|
Positive KIT expression (KIT+++/++) | ||
| Method Description |
Cells were cultured in a tissue culture incubator at 37°C with 5% CO2 in culture medium. On the day of the assay, cells were washed twice with PBS, prior to being treated with 0.1% trypsin-EDTA for 5 min and resuspended in the recommended culture medium. Cells were then counted and seeded in 96 well plates at densities of 2,000-10,000 cells/well in 100 ul of cell culture medium.
Click to Show/Hide
|
||||
| In Vitro Model | Myeloid leukemia with maturation | Kasumi-1 cells | CVCL_0589 | ||
| Experiment 16 Reporting the Activity Date of This ADC | [27] | ||||
| Efficacy Data | Half Maximal Inhibitory Concentration (IC50) |
45.43 nM
|
Negative KIT expression (KIT-) | ||
| Method Description |
Cells were cultured in a tissue culture incubator at 37°C with 5% CO2 in culture medium. On the day of the assay, cells were washed twice with PBS, prior to being treated with 0.1% trypsin-EDTA for 5 min and resuspended in the recommended culture medium. Cells were then counted and seeded in 96 well plates at densities of 2,000-10,000 cells/well in 100 ul of cell culture medium.
Click to Show/Hide
|
||||
| In Vitro Model | Breast adenocarcinoma | MDA-MB-453 cells | CVCL_0418 | ||
Anti-FGFR2 mAb-12433 SMCC-DM1 [Investigative]
Discovered Using Cell Line-derived Xenograft Model
| Experiment 1 Reporting the Activity Date of This ADC | [20] | ||||
| Efficacy Data | Tumor Growth Inhibition value (TGI) | ≈ 44.97% | Positive FGFR2 expression (FGFR2+++/++) | ||
| Method Description |
The total injection volume containing cells in suspension was 200 ul. Mice were enrolled in the first study eight days post implantation with average tumor volume of 208.4 mm3. After being randomly assigned to one of nine groups (n =8/group), mice were administered PBS or a single 10 mg/kg intravenous (i.v,) injection of one antibody drug conjugates.
Click to Show/Hide
|
||||
| In Vivo Model | MFM223 CDX model | ||||
| In Vitro Model | Breast carcinoma | MFM-223 cells | CVCL_1408 | ||
| Experiment 2 Reporting the Activity Date of This ADC | [20] | ||||
| Efficacy Data | Tumor Growth Inhibition value (TGI) | ≈ 91.03% | Positive FGFR2 expression (FGFR2+++/++) | ||
| Method Description |
The total injection volume containing cells in suspension was 200 ul. Mice were enrolled in the first study eight days post implantation with average tumor volume of 192.9 mm3. After being randomly assigned to one of nine groups (n =8/group), mice were administered PBS or a single 3 mg/kg intravenous (i.v,) injection of one antibody drug conjugates.
Click to Show/Hide
|
||||
| In Vivo Model | SNU-16 CDX model | ||||
| In Vitro Model | Gastric adenocarcinoma | SNU-16 cells | CVCL_0076 | ||
| Experiment 3 Reporting the Activity Date of This ADC | [20] | ||||
| Efficacy Data | Tumor Growth Inhibition value (TGI) | ≈ 96.69% | Positive FGFR2 expression (FGFR2+++/++) | ||
| Method Description |
The total injection volume containing cells in suspension was 200 ul. Mice were enrolled in the first study eight days post implantation with average tumor volume of 192.9 mm3. After being randomly assigned to one of nine groups (n =8/group), mice were administered PBS or a single 3 mg/kg intravenous (i.v,) injection of one antibody drug conjugates.
Click to Show/Hide
|
||||
| In Vivo Model | SNU-16 CDX model | ||||
| In Vitro Model | Gastric adenocarcinoma | SNU-16 cells | CVCL_0076 | ||
| Experiment 4 Reporting the Activity Date of This ADC | [20] | ||||
| Efficacy Data | Tumor Growth Inhibition value (TGI) | ≈ 100% | Positive FGFR2 expression (FGFR2+++/++) | ||
| Method Description |
The total injection volume containing cells in suspension was 200 ul. Mice were enrolled in the first study eight days post implantation with average tumor volume of 233 mm3. After being randomly assigned to one of nine groups (n =8/group), mice were administered PBS or a single 15 mg/kg intravenous (i.v,) injection of one antibody drug conjugates.
Click to Show/Hide
|
||||
| In Vivo Model | SNU-16 CDX model | ||||
| In Vitro Model | Gastric adenocarcinoma | SNU-16 cells | CVCL_0076 | ||
Revealed Based on the Cell Line Data
| Experiment 1 Reporting the Activity Date of This ADC | [20] | ||||
| Efficacy Data | Half Maximal Inhibitory Concentration (IC50) |
0.29 nM
|
Positive FGFR2 expression (FGFR2+++/++) | ||
| Method Description |
Cells were counted and seeded in 96 well plates at densities of 2600-3600 cells/well in 100 ul of cell culture medium, A duplicate plate was generated for a day 0 measurement and all plates were incubated in a tissue culture incubator at 37°C with 5% CO2 overnight. Following this incubation, 50 ul/well of Cell titer Glo reagent was added to the day 0 plates, which were then shaken gently for 10 min and the resulting luminescence intensity was measured.
Click to Show/Hide
|
||||
| In Vitro Model | Breast carcinoma | SUM52PE cells | CVCL_3425 | ||
| Experiment 2 Reporting the Activity Date of This ADC | [20] | ||||
| Efficacy Data | Half Maximal Inhibitory Concentration (IC50) | < 3 nM | Positive FGFR2 expression (FGFR2+++/++) | ||
| Method Description |
Cells were counted and seeded in 96 well plates at densities of 2600-3600 cells/well in 100 ul of cell culture medium, A duplicate plate was generated for a day 0 measurement and all plates were incubated in a tissue culture incubator at 37°C with 5% CO2 overnight. Following this incubation, 50 ul/well of Cell titer Glo reagent was added to the day 0 plates, which were then shaken gently for 10 min and the resulting luminescence intensity was measured.
Click to Show/Hide
|
||||
| In Vitro Model | Down syndrome | KATO III cells | CVCL_0371 | ||
| Experiment 3 Reporting the Activity Date of This ADC | [20] | ||||
| Efficacy Data | Half Maximal Inhibitory Concentration (IC50) | < 3 nM | Positive FGFR2 expression (FGFR2+++/++) | ||
| Method Description |
Cells were counted and seeded in 96 well plates at densities of 2600-3600 cells/well in 100 ul of cell culture medium, A duplicate plate was generated for a day 0 measurement and all plates were incubated in a tissue culture incubator at 37°C with 5% CO2 overnight. Following this incubation, 50 ul/well of Cell titer Glo reagent was added to the day 0 plates, which were then shaken gently for 10 min and the resulting luminescence intensity was measured.
Click to Show/Hide
|
||||
| In Vitro Model | Gastric adenocarcinoma | SNU-16 cells | CVCL_0076 | ||
| Experiment 4 Reporting the Activity Date of This ADC | [20] | ||||
| Efficacy Data | Half Maximal Inhibitory Concentration (IC50) |
24 nM
|
Positive FGFR2 expression (FGFR2+++/++) | ||
| Method Description |
Cells were counted and seeded in 96 well plates at densities of 2600-3600 cells/well in 100 ul of cell culture medium, A duplicate plate was generated for a day 0 measurement and all plates were incubated in a tissue culture incubator at 37°C with 5% CO2 overnight. Following this incubation, 50 ul/well of Cell titer Glo reagent was added to the day 0 plates, which were then shaken gently for 10 min and the resulting luminescence intensity was measured.
Click to Show/Hide
|
||||
| In Vitro Model | Breast carcinoma | MFM-223 cells | CVCL_1408 | ||
| Experiment 5 Reporting the Activity Date of This ADC | [20] | ||||
| Efficacy Data | Half Maximal Inhibitory Concentration (IC50) | > 30 nM | Negative FGFR2 expression (FGFR2-) | ||
| Method Description |
Cells were counted and seeded in 96 well plates at densities of 2600-3600 cells/well in 100 ul of cell culture medium, A duplicate plate was generated for a day 0 measurement and all plates were incubated in a tissue culture incubator at 37°C with 5% CO2 overnight. Following this incubation, 50 ul/well of Cell titer Glo reagent was added to the day 0 plates, which were then shaken gently for 10 min and the resulting luminescence intensity was measured.
Click to Show/Hide
|
||||
| In Vitro Model | Gastric carcinoma | NUGC-3 cells | CVCL_1612 | ||
| Experiment 6 Reporting the Activity Date of This ADC | [20] | ||||
| Efficacy Data | Half Maximal Inhibitory Concentration (IC50) | > 30 nM | Positive FGFR2 expression (FGFR2+++/++) | ||
| Method Description |
Cells were counted and seeded in 96 well plates at densities of 2600-3600 cells/well in 100 ul of cell culture medium, A duplicate plate was generated for a day 0 measurement and all plates were incubated in a tissue culture incubator at 37°C with 5% CO2 overnight. Following this incubation, 50 ul/well of Cell titer Glo reagent was added to the day 0 plates, which were then shaken gently for 10 min and the resulting luminescence intensity was measured.
Click to Show/Hide
|
||||
| In Vitro Model | Cecum adenocarcinoma | NCI-H716 cells | CVCL_1581 | ||
Anti-KIT NEG026-SMCC-DM1 [Investigative]
Discovered Using Cell Line-derived Xenograft Model
| Experiment 1 Reporting the Activity Date of This ADC | [27] | ||||
| Efficacy Data | Tumor Growth Inhibition value (TGI) | ≈ 45% | Positive KIT expression (KIT+++/++) | ||
| Method Description |
Female SCID-beige mice were implanted subcutaneously with 10,000,000 cells. The total injection volume containingcells in suspension was 200 ul. Mice were enrolled in the study 15 days post implantation withaverage tumor volume of about 120 mm3. All treated groups received a single intravenous dose of2 mg/kg. After being randomly assigned to groups (n = 8/group), mice were administered a single i.v.dose of TBS (5 ml/kg) or ADC (0.625 mg/kg).
Click to Show/Hide
|
||||
| In Vivo Model | GIST-T1 CDX model | ||||
| In Vitro Model | Gastrointestinal stromal tumor | GIST-T1 cells | CVCL_4976 | ||
TF-mAb-DM1 [Investigative]
Discovered Using Cell Line-derived Xenograft Model
| Experiment 1 Reporting the Activity Date of This ADC | [32] | ||||
| Efficacy Data | Tumor Growth Inhibition value (TGI) | ≈ 48% | Positive TF expression (TF +++) | ||
| Method Description |
Conjugates of the exemplary antibodies were tested using an established xenograft model implanted subcutaneous into SCID mice. Mice were randomized by body weight into treatment groups and treated once post cell inoculation with 3.75 mg/kg, i.v., qw of one of the conjugates listed above or with PBS only.
|
||||
| In Vivo Model | HCC1806 CDX model | ||||
| In Vitro Model | Breast squamous cell carcinoma | HCC1806 cells | CVCL_1258 | ||
| Experiment 2 Reporting the Activity Date of This ADC | [32] | ||||
| Efficacy Data | Tumor Growth Inhibition value (TGI) | ≈ 100% | Positive TF expression (TF +++) | ||
| Method Description |
Conjugates of the exemplary antibodies were tested using an established xenograft model implanted subcutaneous into SCID mice. Mice were randomized by body weight into treatment groups and treated once post cell inoculation with 15 mg/kg, i.v., qw of one of the conjugates listed above or with PBS only.
|
||||
| In Vivo Model | HCC1806 CDX model | ||||
| In Vitro Model | Breast squamous cell carcinoma | HCC1806 cells | CVCL_1258 | ||
Revealed Based on the Cell Line Data
| Experiment 1 Reporting the Activity Date of This ADC | [32] | ||||
| Efficacy Data | Half Maximal Inhibitory Concentration (IC50) |
0.02 nM
|
Positive TF expression (TF +++) | ||
| Method Description |
Cells were plated at about 500 cells per well in a 96-well plate in 100 uL of media. In vitro activity and targeted delivery of ADCs, the isotype-matched negative controls ADCs, and naked antibodies control were assessed in cells.
|
||||
| In Vitro Model | Breast squamous cell carcinoma | HCC1806 cells | CVCL_1258 | ||
| Experiment 2 Reporting the Activity Date of This ADC | [32] | ||||
| Efficacy Data | Half Maximal Inhibitory Concentration (IC50) |
0.04 nM
|
Positive TF expression (TF +++) | ||
| Method Description |
Cells were plated at about 500 cells per well in a 96-well plate in 100 uL of media. In vitro activity and targeted delivery of ADCs, the isotype-matched negative controls ADCs, and naked antibodies control were assessed in cells.
|
||||
| In Vitro Model | Pancreatic ductal adenocarcinoma | BxPC-3 cells | CVCL_0186 | ||
| Experiment 3 Reporting the Activity Date of This ADC | [32] | ||||
| Efficacy Data | Half Maximal Inhibitory Concentration (IC50) |
0.07 nM
|
Positive TF expression (TF +++) | ||
| Method Description |
Cells were plated at about 500 cells per well in a 96-well plate in 100 uL of media. In vitro activity and targeted delivery of ADCs, the isotype-matched negative controls ADCs, and naked antibodies control were assessed in cells.
|
||||
| In Vitro Model | Invasive breast carcinoma | Hs 578T cells | CVCL_0332 | ||
| Experiment 4 Reporting the Activity Date of This ADC | [32] | ||||
| Efficacy Data | Half Maximal Inhibitory Concentration (IC50) |
0.1 nM
|
Positive TF expression (TF +++) | ||
| Method Description |
Cells were plated at about 500 cells per well in a 96-well plate in 100 uL of media. In vitro activity and targeted delivery of ADCs, the isotype-matched negative controls ADCs, and naked antibodies control were assessed in cells.
|
||||
| In Vitro Model | Breast adenocarcinoma | MDA-MB-231 cells | CVCL_0062 | ||
| Experiment 5 Reporting the Activity Date of This ADC | [32] | ||||
| Efficacy Data | Half Maximal Inhibitory Concentration (IC50) |
17.2 nM
|
Positive TF expression (TF +++) | ||
| Method Description |
Cells were plated at about 500 cells per well in a 96-well plate in 100 uL of media. In vitro activity and targeted delivery of ADCs, the isotype-matched negative controls ADCs, and naked antibodies control were assessed in cells.
|
||||
| In Vitro Model | Glioblastoma | U-87MG cells | CVCL_0022 | ||
| Experiment 6 Reporting the Activity Date of This ADC | [32] | ||||
| Efficacy Data | Half Maximal Inhibitory Concentration (IC50) |
25.4 nM
|
Positive TF expression (TF +++) | ||
| Method Description |
Cells were plated at about 500 cells per well in a 96-well plate in 100 uL of media. In vitro activity and targeted delivery of ADCs, the isotype-matched negative controls ADCs, and naked antibodies control were assessed in cells.
|
||||
| In Vitro Model | Lung adenocarcinoma | NCI-H1975 cells | CVCL_1511 | ||
| Experiment 7 Reporting the Activity Date of This ADC | [32] | ||||
| Efficacy Data | Half Maximal Inhibitory Concentration (IC50) | > 100 nM | Positive TF expression (TF +++) | ||
| Method Description |
Cells were plated at about 500 cells per well in a 96-well plate in 100 uL of media. In vitro activity and targeted delivery of ADCs, the isotype-matched negative controls ADCs, and naked antibodies control were assessed in cells.
|
||||
| In Vitro Model | Invasive breast carcinoma | T-47D cells | CVCL_0553 | ||
| Experiment 8 Reporting the Activity Date of This ADC | [32] | ||||
| Efficacy Data | Half Maximal Inhibitory Concentration (IC50) |
100 nM
|
Positive TF expression (TF +++) | ||
| Method Description |
Cells were plated at about 500 cells per well in a 96-well plate in 100 uL of media. In vitro activity and targeted delivery of ADCs, the isotype-matched negative controls ADCs, and naked antibodies control were assessed in cells.
|
||||
| In Vitro Model | Invasive breast carcinoma | MCF-7 cells | CVCL_0031 | ||
| Experiment 9 Reporting the Activity Date of This ADC | [32] | ||||
| Efficacy Data | Half Maximal Inhibitory Concentration (IC50) | > 100 nM | Positive TF expression (TF +++) | ||
| Method Description |
Cells were plated at about 500 cells per well in a 96-well plate in 100 uL of media. In vitro activity and targeted delivery of ADCs, the isotype-matched negative controls ADCs, and naked antibodies control were assessed in cells.
|
||||
| In Vitro Model | Lung adenocarcinoma | A-549 cells | CVCL_0023 | ||
| Experiment 10 Reporting the Activity Date of This ADC | [32] | ||||
| Efficacy Data | Half Maximal Inhibitory Concentration (IC50) | > 100 nM | Positive TF expression (TF +++) | ||
| Method Description |
Cells were plated at about 500 cells per well in a 96-well plate in 100 uL of media. In vitro activity and targeted delivery of ADCs, the isotype-matched negative controls ADCs, and naked antibodies control were assessed in cells.
|
||||
| In Vitro Model | Breast adenocarcinoma | MDA-MB-453 cells | CVCL_0418 | ||
THL4-mpeoDM1 [Investigative]
Discovered Using Cell Line-derived Xenograft Model
| Experiment 1 Reporting the Activity Date of This ADC | [33] | ||||
| Efficacy Data | Tumor Growth Inhibition value (TGI) | ≈ 51.61% | Positive DLL4 expression (DLL4 +++/++) | ||
| Method Description |
Drugs were intravenously (i.v.) administered in total three times on days 1, 4 and 7. 1.5 mg/kg HLmD4 was intravenously administered once every three days for three weeks.
|
||||
| In Vivo Model | A549 CDX model | ||||
| In Vitro Model | Lung adenocarcinoma | A-549 cells | CVCL_0023 | ||
| Experiment 2 Reporting the Activity Date of This ADC | [33] | ||||
| Efficacy Data | Tumor Growth Inhibition value (TGI) | ≈ 57.73% | Positive DLL4 expression (DLL4 +++/++) | ||
| Method Description |
Drugs were intravenously (i.v.) administered in total three times on days 1, 4 and 7. 1.5 mg/kg HLmD4 was intravenously administered once every three days for three weeks.
|
||||
| In Vivo Model | MDA-MB-231 CDX model | ||||
| In Vitro Model | Breast adenocarcinoma | MDA-MB-231 cells | CVCL_0062 | ||
| Experiment 3 Reporting the Activity Date of This ADC | [33] | ||||
| Efficacy Data | Tumor Growth Inhibition value (TGI) | ≈ 80.25% | Positive DLL4 expression (DLL4 +++/++) | ||
| Method Description |
Drugs were intravenously (i.v.) administered in total three times on days 1, 4 and 7. 5 mg/kg HLmD4 was intravenously administered once every three days for three weeks.
|
||||
| In Vivo Model | A549 CDX model | ||||
| In Vitro Model | Lung adenocarcinoma | A-549 cells | CVCL_0023 | ||
| Experiment 4 Reporting the Activity Date of This ADC | [33] | ||||
| Efficacy Data | Tumor Growth Inhibition value (TGI) | ≈ 86.11% | Positive DLL4 expression (DLL4 +++/++) | ||
| Method Description |
Drugs were intravenously (i.v.) administered in total three times on days 1, 4 and 7. 5 mg/kg HLmD4 was intravenously administered once every three days for three weeks.
|
||||
| In Vivo Model | MDA-MB-231 CDX model | ||||
| In Vitro Model | Breast adenocarcinoma | MDA-MB-231 cells | CVCL_0062 | ||
Revealed Based on the Cell Line Data
| Experiment 1 Reporting the Activity Date of This ADC | [33] | ||||
| Efficacy Data | Half Maximal Inhibitory Concentration (IC50) |
37.45 nM
|
Positive DLL4 expression (DLL4 +++/++) | ||
| Method Description |
In vitro cytotoxicity and mechanism of anti-DLL4 ADCs. The cytotoxicity of ADCs was assessed by MTT assay. The percentage of cell inhibition relative to untreated control HUVEC cells was calculated for each drug concentration.
|
||||
| In Vitro Model | Normal | HUVEC-C cells | CVCL_2959 | ||
Mirvetuximab-SMCC-DM1 [Investigative]
Discovered Using Cell Line-derived Xenograft Model
| Experiment 1 Reporting the Activity Date of This ADC | [29] | ||||
| Efficacy Data | Tumor Growth Inhibition value (TGI) |
55.86%
|
High FOLR1 expression (FOLR1+++; 4,500,000 FOLR1 molecules/cell) | ||
| Method Description |
Animals with established tumors of about 130 mm3 were treated with intravenous single injection of the M9346A-DM conjugates at 25 02 mg/kg, equivalent to 51 3 g conjugated maytansinoid per kg The conjugates were injected on day 7 after cell inoculation.
|
||||
| In Vivo Model | FRalpha-positive KB CDX model | ||||
| In Vitro Model | Human papillomavirus-related endocervical adenocarcinoma | KB cells | CVCL_0372 | ||
| Experiment 2 Reporting the Activity Date of This ADC | [29] | ||||
| Efficacy Data | Tumor Growth Inhibition value (TGI) |
99.17%
|
High FOLR1 expression (FOLR1+++; 4,500,000 FOLR1 molecules/cell) | ||
| Method Description |
Five-week-old female CB-17 severe combined immunodeficient (SCID) mice were obtained and quarantined for 7 days prior to study initiation Mice were inoculated subcutaneously with KB cells (1 x10⁷ cells per mouse) resuspended in serum-free culture mediaMice with established KB xenografts were dosed with a single intravenous injection of 200 g of conjugated maytansinoid per kg, equivalent to 102 mg/kg antibody on day 6 after cell inoculationTumor dimensions were measured twice weekly and volume was calculated as (A B2) 05, where A represents the largest and B the perpendicular tumor diameter.
Click to Show/Hide
|
||||
| In Vivo Model | FRalpha-positive KB CDX model | ||||
| In Vitro Model | Human papillomavirus-related endocervical adenocarcinoma | KB cells | CVCL_0372 | ||
Revealed Based on the Cell Line Data
| Experiment 1 Reporting the Activity Date of This ADC | [29] | ||||
| Efficacy Data | Half Maximal Inhibitory Concentration (IC50) |
0.08±0.01 nM
|
High FOLR1 expression (FOLR1+++; 4,500,000 FOLR1 molecules/cell) | ||
| Method Description |
Dilutions of conjugates or unconjugated maytansinoid in the appropriate culture medium were added to wells of 96-well flat-bottomed plates containing 1 x10³ cells per well The plates were incubated at 37°C, 6% CO2 for either 5 days (continuos exposure) or for 4 hours followed by 5-day incubation in conjugate-free medium (short exposure). Cell viability was determined by the WST-8 assay in accordance with the manufacturer's protocol, and IC50 were generated using a sigmoidal dose-response (variable slope) nonlinear regression curve fit.
Click to Show/Hide
|
||||
| In Vitro Model | Human papillomavirus-related endocervical adenocarcinoma | KB cells | CVCL_0372 | ||
| Experiment 2 Reporting the Activity Date of This ADC | [29] | ||||
| Efficacy Data | Half Maximal Inhibitory Concentration (IC50) |
0.10±0.02 nM
|
High FOLR1 expression (FOLR1+++; 4,500,000 FOLR1 molecules/cell) | ||
| Method Description |
Dilutions of conjugates or unconjugated maytansinoid in the appropriate culture medium were added to wells of 96-well flat-bottomed plates containing 1 x10³ cells per well The plates were incubated at 37°C, 6% CO2 for either 5 days (continuos exposure) or for 4 hours followed by 5-day incubation in conjugate-free medium (short exposure). Cell viability was determined by the WST-8 assay in accordance with the manufacturer's protocol, and IC50 were generated using a sigmoidal dose-response (variable slope) nonlinear regression curve fit.
Click to Show/Hide
|
||||
| In Vitro Model | Human papillomavirus-related endocervical adenocarcinoma | KB cells | CVCL_0372 | ||
| Experiment 3 Reporting the Activity Date of This ADC | [29] | ||||
| Efficacy Data | Half Maximal Inhibitory Concentration (IC50) |
7.00±2.00 nM
|
Moderate FOLR1 expression (FOLR1++; 290,000 FOLR1 molecules/cell) | ||
| Method Description |
Dilutions of conjugates or unconjugated maytansinoid in the appropriate culture medium were added to wells of 96-well flat-bottomed plates containing 1 103 cells per well The plates were incubated at 37°C, 6% CO2 for either 5 days (continuos exposure) or for 4 hours followed by 5-day incubation in conjugate-free medium (short exposure) Cell viability was determined by the WST-8 assay in accordance with the manufacturer's protocol, and IC50 were generated using a sigmoidal dose-response (variable slope) nonlinear regression curve fit.
Click to Show/Hide
|
||||
| In Vitro Model | Gestational choriocarcinoma | JEG-3 cells | CVCL_0363 | ||
| Experiment 4 Reporting the Activity Date of This ADC | [29] | ||||
| Efficacy Data | Half Maximal Inhibitory Concentration (IC50) |
20.00±0.70 nM
|
High FOLR1 expression (FOLR1+++; 1,300,000 FOLR1 molecules/cell) | ||
| Method Description |
Dilutions of conjugates or unconjugated maytansinoid in the appropriate culture medium were added to wells of 96-well flat-bottomed plates containing 1 x10³ cells per well The plates were incubated at 37°C, 6% CO2 for either 5 days (continuos exposure) or for 4 hours followed by 5-day incubation in conjugate-free medium (short exposure). Cell viability was determined by the WST-8 assay in accordance with the manufacturer's protocol, and IC50 were generated using a sigmoidal dose-response (variable slope) nonlinear regression curve fit.
Click to Show/Hide
|
||||
| In Vitro Model | Ovarian endometrioid adenocarcinoma | IGROV-1 cells | CVCL_1304 | ||
HuMov19-SMCC-DM1 [Investigative]
Discovered Using Cell Line-derived Xenograft Model
| Experiment 1 Reporting the Activity Date of This ADC | [34] | ||||
| Efficacy Data | Tumor Growth Inhibition value (TGI) | ≈ 56.67% | Positive FOLR1 expression (FOLR1 +++/++) | ||
| Method Description |
Conjugates of the exemplary anti-FOLR1 antibodies were tested using an established xenograft model of KB cells implanted subcutaneous into SCID mice. Mice were randomized by body weight into treatment groups and treated once on day 6 post cell inoculation with 2.5 mg/kg of one of the conjugates listed above or with PBS only.
|
||||
| In Vivo Model | KB CDX model | ||||
| In Vitro Model | Human papillomavirus-related endocervical adenocarcinoma | KB cells | CVCL_0372 | ||
| Experiment 2 Reporting the Activity Date of This ADC | [34] | ||||
| Efficacy Data | Tumor Growth Inhibition value (TGI) | ≈ 89.15% | Positive FOLR1 expression (FOLR1 +++/++) | ||
| Method Description |
Conjugates of the exemplary anti-FOLR1 antibodies were tested using an established xenograft model of KB cells implanted subcutaneous into SCID mice. Mice were randomized by body weight into treatment groups and treated once on day 6 post cell inoculation with 5 mg/kg of one of the conjugates listed above or with PBS only.
|
||||
| In Vivo Model | KB CDX model | ||||
| In Vitro Model | Human papillomavirus-related endocervical adenocarcinoma | KB cells | CVCL_0372 | ||
| Experiment 3 Reporting the Activity Date of This ADC | [34] | ||||
| Efficacy Data | Tumor Growth Inhibition value (TGI) | ≈ 99.52% | Positive FOLR1 expression (FOLR1 +++/++) | ||
| Method Description |
Conjugates of the exemplary anti-FOLR1 antibodies were tested using an established xenograft model of KB cells implanted subcutaneous into SCID mice. Mice were randomized by body weight into treatment groups and treated once on day 6 post cell inoculation with 10 mg/kg of one of the conjugates listed above or with PBS only.
|
||||
| In Vivo Model | KB CDX model | ||||
| In Vitro Model | Human papillomavirus-related endocervical adenocarcinoma | KB cells | CVCL_0372 | ||
| Experiment 4 Reporting the Activity Date of This ADC | [34] | ||||
| Efficacy Data | Half Maximal Inhibitory Concentration (IC50) |
0.1 nM
|
Positive FOLR1 expression (FOLR1 +++/++) | ||
| Method Description |
Conjugate in various concentrations was added to FOLR1-expressing cells in a 96 well plate at 1,000 cells per well in 100 pL in complete RPMI medium.
|
||||
| In Vitro Model | Human papillomavirus-related endocervical adenocarcinoma | KB cells | CVCL_0372 | ||
| Experiment 5 Reporting the Activity Date of This ADC | [34] | ||||
| Efficacy Data | Half Maximal Inhibitory Concentration (IC50) |
0.1 nM
|
Positive FOLR1 expression (FOLR1 +++/++) | ||
| Method Description |
Conjugate in various concentrations was added to FOLR1-expressing cells in a 96 well plate at 1,000 cells per well in 100 pL in complete RPMI medium.
|
||||
| In Vitro Model | Ovarian endometrioid adenocarcinoma | IGROV-1 cells | CVCL_1304 | ||
| Experiment 6 Reporting the Activity Date of This ADC | [34] | ||||
| Efficacy Data | Half Maximal Inhibitory Concentration (IC50) |
0.1 nM
|
Positive FOLR1 expression (FOLR1 +++/++) | ||
| Method Description |
Conjugate in various concentrations was added to FOLR1-expressing cells in a 96 well plate at 1,000 cells per well in 100 pL in complete RPMI medium.
|
||||
| In Vitro Model | Human papillomavirus-related endocervical adenocarcinoma | KB cells | CVCL_0372 | ||
| Experiment 7 Reporting the Activity Date of This ADC | [34] | ||||
| Efficacy Data | Half Maximal Inhibitory Concentration (IC50) |
20 nM
|
Moderate FOLR1 expression (FOLR1 ++) | ||
| Method Description |
Conjugate in various concentrations was added to FOLR1-expressing cells in a 96 well plate at 1,000 cells per well in 100 pL in complete RPMI medium.
|
||||
| In Vitro Model | Gestational choriocarcinoma | JEG-3 cells | CVCL_0363 | ||
Anti-KIT NEG086-SMCC-DM1 [Investigative]
Discovered Using Cell Line-derived Xenograft Model
| Experiment 1 Reporting the Activity Date of This ADC | [27] | ||||
| Efficacy Data | Tumor Growth Inhibition value (TGI) | ≈ 57% | Positive KIT expression (KIT+++/++) | ||
| Method Description |
Female SCID-beige mice were implanted subcutaneously with 10,000,000 cells. The total injection volume containingcells in suspension was 200 ul. Mice were enrolled in the study 15 days post implantation withaverage tumor volume of about 120 mm3. All treated groups received a single intravenous dose of2 mg/kg. After being randomly assigned to groups (n = 8/group), mice were administered a single i.v.dose of TBS (5 ml/kg) or ADC (0.625 mg/kg).
Click to Show/Hide
|
||||
| In Vivo Model | GIST-T1 CDX model | ||||
| In Vitro Model | Gastrointestinal stromal tumor | GIST-T1 cells | CVCL_4976 | ||
| Experiment 2 Reporting the Activity Date of This ADC | [27] | ||||
| Efficacy Data | Tumor Growth Inhibition value (TGI) | ≈ 88.61% | Positive KIT expression (KIT+++/++) | ||
| Method Description |
Female SCID-beige mice were implanted subcutaneously with 10,000,000 NCI-H1048 cells. The total injection volume containingcells in suspension was 200 ul. Mice were enrolled in the study 15 days post implantation withaverage tumor volume of about 120 mm3. All treated groups received a single intravenous dose of 2 mg/kg. After being randomly assigned to groups (n = 8/group), mice were administered a single i.v.dose of TBS (5 ml/kg) or ADC (2.0 mg/kg).
Click to Show/Hide
|
||||
| In Vivo Model | NCI-H1048 CDX model | ||||
| In Vitro Model | Lung small cell carcinoma | NCI-H1048 cells | CVCL_1453 | ||
Revealed Based on the Cell Line Data
| Experiment 1 Reporting the Activity Date of This ADC | [27] | ||||
| Efficacy Data | Max inhibition rate (MIR) |
54%
|
Positive KIT expression (KIT+++/++) | ||
| Method Description |
Cells were cultured in a tissue culture incubator at 37°C with 5% CO2 in culture medium. On the day of the assay, cells were washed twice with PBS, prior to being treated with 0.1% trypsin-EDTA for 5 min and resuspended in the recommended culture medium. Cells were then counted and seeded in 96 well plates at densities of 2,000-10,000 cells/well in 100 ul of cell culture medium.
Click to Show/Hide
|
||||
| In Vitro Model | Gastrointestinal stromal tumor | GIST430 cells | CVCL_7040 | ||
| Experiment 2 Reporting the Activity Date of This ADC | [27] | ||||
| Efficacy Data | Max inhibition rate (MIR) |
69%
|
Positive KIT expression (KIT+++/++) | ||
| Method Description |
Cells were cultured in a tissue culture incubator at 37°C with 5% CO2 in culture medium. On the day of the assay, cells were washed twice with PBS, prior to being treated with 0.1% trypsin-EDTA for 5 min and resuspended in the recommended culture medium. Cells were then counted and seeded in 96 well plates at densities of 2,000-10,000 cells/well in 100 ul of cell culture medium.
Click to Show/Hide
|
||||
| In Vitro Model | Gastrointestinal stromal tumor | GIST882 cells | CVCL_7044 | ||
| Experiment 3 Reporting the Activity Date of This ADC | [27] | ||||
| Efficacy Data | Max inhibition rate (MIR) |
74%
|
Positive KIT expression (KIT+++/++) | ||
| Method Description |
Cells were cultured in a tissue culture incubator at 37°C with 5% CO2 in culture medium. On the day of the assay, cells were washed twice with PBS, prior to being treated with 0.1% trypsin-EDTA for 5 min and resuspended in the recommended culture medium. Cells were then counted and seeded in 96 well plates at densities of 2,000-10,000 cells/well in 100 ul of cell culture medium.
Click to Show/Hide
|
||||
| In Vitro Model | Gastrointestinal stromal tumor | GIST-T1 cells | CVCL_4976 | ||
| Experiment 4 Reporting the Activity Date of This ADC | [27] | ||||
| Efficacy Data | Max inhibition rate (MIR) |
80%
|
Positive KIT expression (KIT+++/++) | ||
| Method Description |
Cells were cultured in a tissue culture incubator at 37°C with 5% CO2 in culture medium. On the day of the assay, cells were washed twice with PBS, prior to being treated with 0.1% trypsin-EDTA for 5 min and resuspended in the recommended culture medium. Cells were then counted and seeded in 96 well plates at densities of 2,000-10,000 cells/well in 100 ul of cell culture medium.
Click to Show/Hide
|
||||
| In Vitro Model | Acute myeloid leukemia | Kasumi-6 cells | CVCL_0614 | ||
| Experiment 5 Reporting the Activity Date of This ADC | [27] | ||||
| Efficacy Data | Max inhibition rate (MIR) |
91%
|
Negative KIT expression (KIT-) | ||
| Method Description |
Cells were cultured in a tissue culture incubator at 37°C with 5% CO2 in culture medium. On the day of the assay, cells were washed twice with PBS, prior to being treated with 0.1% trypsin-EDTA for 5 min and resuspended in the recommended culture medium. Cells were then counted and seeded in 96 well plates at densities of 2,000-10,000 cells/well in 100 ul of cell culture medium.
Click to Show/Hide
|
||||
| In Vitro Model | Breast adenocarcinoma | MDA-MB-453 cells | CVCL_0418 | ||
| Experiment 6 Reporting the Activity Date of This ADC | [27] | ||||
| Efficacy Data | Max inhibition rate (MIR) |
98%
|
Positive KIT expression (KIT+++/++) | ||
| Method Description |
Cells were cultured in a tissue culture incubator at 37°C with 5% CO2 in culture medium. On the day of the assay, cells were washed twice with PBS, prior to being treated with 0.1% trypsin-EDTA for 5 min and resuspended in the recommended culture medium. Cells were then counted and seeded in 96 well plates at densities of 2,000-10,000 cells/well in 100 ul of cell culture medium.
Click to Show/Hide
|
||||
| In Vitro Model | Lung small cell carcinoma | NCI-H1048 cells | CVCL_1453 | ||
| Experiment 7 Reporting the Activity Date of This ADC | [27] | ||||
| Efficacy Data | Max inhibition rate (MIR) |
99%
|
Positive KIT expression (KIT+++/++) | ||
| Method Description |
Cells were cultured in a tissue culture incubator at 37°C with 5% CO2 in culture medium. On the day of the assay, cells were washed twice with PBS, prior to being treated with 0.1% trypsin-EDTA for 5 min and resuspended in the recommended culture medium. Cells were then counted and seeded in 96 well plates at densities of 2,000-10,000 cells/well in 100 ul of cell culture medium.
Click to Show/Hide
|
||||
| In Vitro Model | Myeloid leukemia with maturation | Kasumi-1 cells | CVCL_0589 | ||
| Experiment 8 Reporting the Activity Date of This ADC | [27] | ||||
| Efficacy Data | Max inhibition rate (MIR) |
99%
|
Positive KIT expression (KIT+++/++) | ||
| Method Description |
Cells were cultured in a tissue culture incubator at 37°C with 5% CO2 in culture medium. On the day of the assay, cells were washed twice with PBS, prior to being treated with 0.1% trypsin-EDTA for 5 min and resuspended in the recommended culture medium. Cells were then counted and seeded in 96 well plates at densities of 2,000-10,000 cells/well in 100 ul of cell culture medium.
Click to Show/Hide
|
||||
| In Vitro Model | Lung small cell carcinoma | NCI-H526 cells | CVCL_1569 | ||
| Experiment 9 Reporting the Activity Date of This ADC | [27] | ||||
| Efficacy Data | Half Maximal Inhibitory Concentration (IC50) |
0.01 nM
|
Positive KIT expression (KIT+++/++) | ||
| Method Description |
Cells were cultured in a tissue culture incubator at 37°C with 5% CO2 in culture medium. On the day of the assay, cells were washed twice with PBS, prior to being treated with 0.1% trypsin-EDTA for 5 min and resuspended in the recommended culture medium. Cells were then counted and seeded in 96 well plates at densities of 2,000-10,000 cells/well in 100 ul of cell culture medium.
Click to Show/Hide
|
||||
| In Vitro Model | Gastrointestinal stromal tumor | GIST-T1 cells | CVCL_4976 | ||
| Experiment 10 Reporting the Activity Date of This ADC | [27] | ||||
| Efficacy Data | Half Maximal Inhibitory Concentration (IC50) |
0.03 nM
|
Positive KIT expression (KIT+++/++) | ||
| Method Description |
Cells were cultured in a tissue culture incubator at 37°C with 5% CO2 in culture medium. On the day of the assay, cells were washed twice with PBS, prior to being treated with 0.1% trypsin-EDTA for 5 min and resuspended in the recommended culture medium. Cells were then counted and seeded in 96 well plates at densities of 2,000-10,000 cells/well in 100 ul of cell culture medium.
Click to Show/Hide
|
||||
| In Vitro Model | Lung small cell carcinoma | NCI-H526 cells | CVCL_1569 | ||
| Experiment 11 Reporting the Activity Date of This ADC | [27] | ||||
| Efficacy Data | Half Maximal Inhibitory Concentration (IC50) |
0.06 nM
|
Positive KIT expression (KIT+++/++) | ||
| Method Description |
Cells were cultured in a tissue culture incubator at 37°C with 5% CO2 in culture medium. On the day of the assay, cells were washed twice with PBS, prior to being treated with 0.1% trypsin-EDTA for 5 min and resuspended in the recommended culture medium. Cells were then counted and seeded in 96 well plates at densities of 2,000-10,000 cells/well in 100 ul of cell culture medium.
Click to Show/Hide
|
||||
| In Vitro Model | Gastrointestinal stromal tumor | GIST430 cells | CVCL_7040 | ||
| Experiment 12 Reporting the Activity Date of This ADC | [27] | ||||
| Efficacy Data | Half Maximal Inhibitory Concentration (IC50) |
0.43 nM
|
Positive KIT expression (KIT+++/++) | ||
| Method Description |
Cells were cultured in a tissue culture incubator at 37°C with 5% CO2 in culture medium. On the day of the assay, cells were washed twice with PBS, prior to being treated with 0.1% trypsin-EDTA for 5 min and resuspended in the recommended culture medium. Cells were then counted and seeded in 96 well plates at densities of 2,000-10,000 cells/well in 100 ul of cell culture medium.
Click to Show/Hide
|
||||
| In Vitro Model | Gastrointestinal stromal tumor | GIST882 cells | CVCL_7044 | ||
| Experiment 13 Reporting the Activity Date of This ADC | [27] | ||||
| Efficacy Data | Half Maximal Inhibitory Concentration (IC50) |
0.52 nM
|
Positive KIT expression (KIT+++/++) | ||
| Method Description |
Cells were cultured in a tissue culture incubator at 37°C with 5% CO2 in culture medium. On the day of the assay, cells were washed twice with PBS, prior to being treated with 0.1% trypsin-EDTA for 5 min and resuspended in the recommended culture medium. Cells were then counted and seeded in 96 well plates at densities of 2,000-10,000 cells/well in 100 ul of cell culture medium.
Click to Show/Hide
|
||||
| In Vitro Model | Acute myeloid leukemia | Kasumi-6 cells | CVCL_0614 | ||
| Experiment 14 Reporting the Activity Date of This ADC | [27] | ||||
| Efficacy Data | Half Maximal Inhibitory Concentration (IC50) |
0.83 nM
|
Positive KIT expression (KIT+++/++) | ||
| Method Description |
Cells were cultured in a tissue culture incubator at 37°C with 5% CO2 in culture medium. On the day of the assay, cells were washed twice with PBS, prior to being treated with 0.1% trypsin-EDTA for 5 min and resuspended in the recommended culture medium. Cells were then counted and seeded in 96 well plates at densities of 2,000-10,000 cells/well in 100 ul of cell culture medium.
Click to Show/Hide
|
||||
| In Vitro Model | Lung small cell carcinoma | NCI-H1048 cells | CVCL_1453 | ||
| Experiment 15 Reporting the Activity Date of This ADC | [27] | ||||
| Efficacy Data | Half Maximal Inhibitory Concentration (IC50) |
4.22 nM
|
Positive KIT expression (KIT+++/++) | ||
| Method Description |
Cells were cultured in a tissue culture incubator at 37°C with 5% CO2 in culture medium. On the day of the assay, cells were washed twice with PBS, prior to being treated with 0.1% trypsin-EDTA for 5 min and resuspended in the recommended culture medium. Cells were then counted and seeded in 96 well plates at densities of 2,000-10,000 cells/well in 100 ul of cell culture medium.
Click to Show/Hide
|
||||
| In Vitro Model | Myeloid leukemia with maturation | Kasumi-1 cells | CVCL_0589 | ||
| Experiment 16 Reporting the Activity Date of This ADC | [27] | ||||
| Efficacy Data | Half Maximal Inhibitory Concentration (IC50) |
16.92 nM
|
Negative KIT expression (KIT-) | ||
| Method Description |
Cells were cultured in a tissue culture incubator at 37°C with 5% CO2 in culture medium. On the day of the assay, cells were washed twice with PBS, prior to being treated with 0.1% trypsin-EDTA for 5 min and resuspended in the recommended culture medium. Cells were then counted and seeded in 96 well plates at densities of 2,000-10,000 cells/well in 100 ul of cell culture medium.
Click to Show/Hide
|
||||
| In Vitro Model | Breast adenocarcinoma | MDA-MB-453 cells | CVCL_0418 | ||
Anti-FGFR2/4 mAb-10918 SMCC-DM1 [Investigative]
Discovered Using Cell Line-derived Xenograft Model
| Experiment 1 Reporting the Activity Date of This ADC | [20] | ||||
| Efficacy Data | Tumor Growth Inhibition value (TGI) | ≈ 61.12% | Positive FGFR2 expression (FGFR2+++/++) | ||
| Method Description |
The total injection volume containing cells in suspension was 200 ul. Mice were enrolled in the first study eight days post implantation with average tumor volume of 192.9 mm3. After being randomly assigned to one of nine groups (n =8/group), mice were administered PBS or a single 3 mg/kg intravenous (i.v,) injection of one antibody drug conjugates.
Click to Show/Hide
|
||||
| In Vivo Model | SNU-16 CDX model | ||||
| In Vitro Model | Gastric adenocarcinoma | SNU-16 cells | CVCL_0076 | ||
Revealed Based on the Cell Line Data
| Experiment 1 Reporting the Activity Date of This ADC | [20] | ||||
| Efficacy Data | Half Maximal Inhibitory Concentration (IC50) | < 0.2 nM | Positive FGFR2 expression (FGFR2+++/++) | ||
| Method Description |
Cells were counted and seeded in 96 well plates at densities of 2600-3600 cells/well in 100 ul of cell culture medium, A duplicate plate was generated for a day 0 measurement and all plates were incubated in a tissue culture incubator at 37°C with 5% CO2 overnight. Following this incubation, 50 ul/well of Cell titer Glo reagent was added to the day 0 plates, which were then shaken gently for 10 min and the resulting luminescence intensity was measured.
Click to Show/Hide
|
||||
| In Vitro Model | Gastric adenocarcinoma | SNU-16 cells | CVCL_0076 | ||
| Experiment 2 Reporting the Activity Date of This ADC | [20] | ||||
| Efficacy Data | Half Maximal Inhibitory Concentration (IC50) |
0.61 nM
|
Positive FGFR2 expression (FGFR2+++/++) | ||
| Method Description |
Cells were counted and seeded in 96 well plates at densities of 2600-3600 cells/well in 100 ul of cell culture medium, A duplicate plate was generated for a day 0 measurement and all plates were incubated in a tissue culture incubator at 37°C with 5% CO2 overnight. Following this incubation, 50 ul/well of Cell titer Glo reagent was added to the day 0 plates, which were then shaken gently for 10 min and the resulting luminescence intensity was measured.
Click to Show/Hide
|
||||
| In Vitro Model | Down syndrome | KATO III cells | CVCL_0371 | ||
Anti-FGFR2/4 mAb-11722 SMCC-DM1 [Investigative]
Discovered Using Cell Line-derived Xenograft Model
| Experiment 1 Reporting the Activity Date of This ADC | [20] | ||||
| Efficacy Data | Tumor Growth Inhibition value (TGI) | ≈ 61.76% | Positive FGFR2 expression (FGFR2+++/++) | ||
| Method Description |
The total injection volume containing cells in suspension was 200 ul. Mice were enrolled in the first study eight days post implantation with average tumor volume of 192.9 mm3. After being randomly assigned to one of nine groups (n =8/group), mice were administered PBS or a single 3 mg/kg intravenous (i.v,) injection of one antibody drug conjugates.
Click to Show/Hide
|
||||
| In Vivo Model | SNU-16 CDX model | ||||
| In Vitro Model | Gastric adenocarcinoma | SNU-16 cells | CVCL_0076 | ||
Revealed Based on the Cell Line Data
| Experiment 1 Reporting the Activity Date of This ADC | [20] | ||||
| Efficacy Data | Half Maximal Inhibitory Concentration (IC50) | < 0.2 nM | Positive FGFR2 expression (FGFR2+++/++) | ||
| Method Description |
Cells were counted and seeded in 96 well plates at densities of 2600-3600 cells/well in 100 ul of cell culture medium, A duplicate plate was generated for a day 0 measurement and all plates were incubated in a tissue culture incubator at 37°C with 5% CO2 overnight. Following this incubation, 50 ul/well of Cell titer Glo reagent was added to the day 0 plates, which were then shaken gently for 10 min and the resulting luminescence intensity was measured.
Click to Show/Hide
|
||||
| In Vitro Model | Gastric adenocarcinoma | SNU-16 cells | CVCL_0076 | ||
| Experiment 2 Reporting the Activity Date of This ADC | [20] | ||||
| Efficacy Data | Half Maximal Inhibitory Concentration (IC50) |
0.59 nM
|
Positive FGFR2 expression (FGFR2+++/++) | ||
| Method Description |
Cells were counted and seeded in 96 well plates at densities of 2600-3600 cells/well in 100 ul of cell culture medium, A duplicate plate was generated for a day 0 measurement and all plates were incubated in a tissue culture incubator at 37°C with 5% CO2 overnight. Following this incubation, 50 ul/well of Cell titer Glo reagent was added to the day 0 plates, which were then shaken gently for 10 min and the resulting luminescence intensity was measured.
Click to Show/Hide
|
||||
| In Vitro Model | Down syndrome | KATO III cells | CVCL_0371 | ||
M9346A-4b-Cxxx-Mal-CX-DM1 [Investigative]
Discovered Using Cell Line-derived Xenograft Model
| Experiment 1 Reporting the Activity Date of This ADC | [31] | ||||
| Efficacy Data | Tumor Growth Inhibition value (TGI) | ≈ 62.10% | Positive FOLR1 expression (FOLR1 +++/++) | ||
| Method Description |
M9346A-4b-Cxxx-Mal-CX-DM1 (100 ug/kg, every seven days x3) induces efficient tumor cell killing in cell line-derived models of KB cells with HER2 expression with high expression.
|
||||
| In Vivo Model | KB CDX model | ||||
| In Vitro Model | Human papillomavirus-related endocervical adenocarcinoma | KB cells | CVCL_0372 | ||
| Experiment 2 Reporting the Activity Date of This ADC | [31] | ||||
| Efficacy Data | Tumor Growth Inhibition value (TGI) | ≈ 73.36% | Positive FOLR1 expression (FOLR1 +++/++) | ||
| Method Description |
M9346A-4b-Cxxx-Mal-CX-DM1 (200 ug/kg, every seven days x3) induces efficient tumor cell killing in cell line-derived models of KB cells with HER2 expression with high expression.
|
||||
| In Vivo Model | KB CDX model | ||||
| In Vitro Model | Human papillomavirus-related endocervical adenocarcinoma | KB cells | CVCL_0372 | ||
Revealed Based on the Cell Line Data
| Experiment 1 Reporting the Activity Date of This ADC | [31] | ||||
| Efficacy Data | Half Maximal Inhibitory Concentration (IC50) |
0.2 nM
|
Positive FOLR1 expression (FOLR1 +++/++) | ||
| Method Description |
Cytotoxic IC50 Values (as a Function of [ADC] and [DM1]) for Various M9346A-CX-DM1 ADCs against FR-Expressing KB Cells in the absence of 1 M unconjugated M9346A antibody.
|
||||
| In Vitro Model | Human papillomavirus-related endocervical adenocarcinoma | KB cells | CVCL_0372 | ||
| Experiment 2 Reporting the Activity Date of This ADC | [31] | ||||
| Efficacy Data | Half Maximal Inhibitory Concentration (IC50) |
5 nM
|
Positive FOLR1 expression (FOLR1 +++/++) | ||
| Method Description |
Cytotoxic IC50 Values (as a Function of [ADC] and [DM1]) for Various M9346A-CX-DM1 ADCs against FOLR1-Expressing KB Cells in the presence of 1 M unconjugated M9346A antibody.
|
||||
| In Vitro Model | Human papillomavirus-related endocervical adenocarcinoma | KB cells | CVCL_0372 | ||
Anti-KIT NEG027-SMCC-DM1 [Investigative]
Discovered Using Cell Line-derived Xenograft Model
| Experiment 1 Reporting the Activity Date of This ADC | [27] | ||||
| Efficacy Data | Tumor Growth Inhibition value (TGI) | ≈ 63.65% | Positive KIT expression (KIT+++/++) | ||
| Method Description |
Female SCID-beige mice were implanted subcutaneously with 10,000,000 cells. The total injection volume containingcells in suspension was 200 ul. Mice were enrolled in the study 15 days post implantation withaverage tumor volume of about 120 mm3. All treated groups received a single intravenous dose of2 mg/kg. After being randomly assigned to groups (n = 8/group), mice were administered a single i.v.dose of TBS (5 ml/kg) or ADC (0.625 mg/kg).
Click to Show/Hide
|
||||
| In Vivo Model | GIST-T1 CDX model | ||||
| In Vitro Model | Gastrointestinal stromal tumor | GIST-T1 cells | CVCL_4976 | ||
| Experiment 2 Reporting the Activity Date of This ADC | [27] | ||||
| Efficacy Data | Tumor Growth Inhibition value (TGI) | ≈ 83.95% | Positive KIT expression (KIT+++/++) | ||
| Method Description |
Female SCID-beige mice were implanted subcutaneously with 10,000,000 cells. The total injection volume containingcells in suspension was 200 ul. Mice were enrolled in the study 15 days post implantation withaverage tumor volume of about 120 mm3. All treated groups received a single intravenous dose of2 mg/kg. After being randomly assigned to groups (n = 8/group), mice were administered a single i.v.dose of TBS (5 ml/kg) or ADC (1.25 mg/kg).
Click to Show/Hide
|
||||
| In Vivo Model | GIST-T1 CDX model | ||||
| In Vitro Model | Gastrointestinal stromal tumor | GIST-T1 cells | CVCL_4976 | ||
| Experiment 3 Reporting the Activity Date of This ADC | [27] | ||||
| Efficacy Data | Tumor Growth Inhibition value (TGI) | ≈ 85.25% | Positive KIT expression (KIT+++/++) | ||
| Method Description |
Female SCID-beige mice were implanted subcutaneously with 10,000,000 cells. The total injection volume containingcells in suspension was 200 ul. Mice were enrolled in the study 15 days post implantation withaverage tumor volume of about 120 mm3. All treated groups received a single intravenous dose of2 mg/kg. After being randomly assigned to groups (n = 8/group), mice were administered a single i.v.dose of TBS (5 ml/kg) or ADC (2.5 mg/kg).
Click to Show/Hide
|
||||
| In Vivo Model | GIST-T1 CDX model | ||||
| In Vitro Model | Gastrointestinal stromal tumor | GIST-T1 cells | CVCL_4976 | ||
HuFR1-65-SMCC-DM1 [Investigative]
Discovered Using Cell Line-derived Xenograft Model
| Experiment 1 Reporting the Activity Date of This ADC | [29] | ||||
| Efficacy Data | Tumor Growth Inhibition value (TGI) |
65%
|
High FOLR1 expression (FOLR1+++; 4,500,000 FOLR1 molecules/cell) | ||
| Method Description |
Five-week-old female CB-17 severe combined immunodeficient (SCID) mice were obtained and quarantined for 7 days prior to study initiation Mice were inoculated subcutaneously with KB cells (1 x10⁷ cells per mouse) resuspended in serum-free culture mediaMice with established KB xenografts were dosed with a single intravenous injection of 200 g of conjugated maytansinoid per kg, equivalent to 102 mg/kg antibody on day 6 after cell inoculationTumor dimensions were measured twice weekly and volume was calculated as (A B2) 05, where A represents the largest and B the perpendicular tumor diameter.
Click to Show/Hide
|
||||
| In Vivo Model | FRalpha-positive KB CDX model | ||||
| In Vitro Model | Human papillomavirus-related endocervical adenocarcinoma | KB cells | CVCL_0372 | ||
Revealed Based on the Cell Line Data
| Experiment 1 Reporting the Activity Date of This ADC | [29] | ||||
| Efficacy Data | Half Maximal Inhibitory Concentration (IC50) |
0.08±0.02 nM
|
High FOLR1 expression (FOLR1+++; 4,500,000 FOLR1 molecules/cell) | ||
| Method Description |
Dilutions of conjugates or unconjugated maytansinoid in the appropriate culture medium were added to wells of 96-well flat-bottomed plates containing 1 x10³ cells per well The plates were incubated at 37°C, 6% CO2 for either 5 days (continuos exposure) or for 4 hours followed by 5-day incubation in conjugate-free medium (short exposure). Cell viability was determined by the WST-8 assay in accordance with the manufacturer's protocol, and IC50 were generated using a sigmoidal dose-response (variable slope) nonlinear regression curve fit.
Click to Show/Hide
|
||||
| In Vitro Model | Human papillomavirus-related endocervical adenocarcinoma | KB cells | CVCL_0372 | ||
HuFR1-48-SMCC-DM1 [Investigative]
Discovered Using Cell Line-derived Xenograft Model
| Experiment 1 Reporting the Activity Date of This ADC | [29] | ||||
| Efficacy Data | Tumor Growth Inhibition value (TGI) |
65%
|
High FOLR1 expression (FOLR1+++; 4,500,000 FOLR1 molecules/cell) | ||
| Method Description |
Five-week-old female CB-17 severe combined immunodeficient (SCID) mice were obtained and quarantined for 7 days prior to study initiation Mice were inoculated subcutaneously with KB cells (1 x10⁷ cells per mouse) resuspended in serum-free culture mediaMice with established KB xenografts were dosed with a single intravenous injection of 200 g of conjugated maytansinoid per kg, equivalent to 102 mg/kg antibody on day 6 after cell inoculationTumor dimensions were measured twice weekly and volume was calculated as (A B2) 05, where A represents the largest and B the perpendicular tumor diameter.
Click to Show/Hide
|
||||
| In Vivo Model | FRalpha-positive KB CDX model | ||||
| In Vitro Model | Human papillomavirus-related endocervical adenocarcinoma | KB cells | CVCL_0372 | ||
Revealed Based on the Cell Line Data
| Experiment 1 Reporting the Activity Date of This ADC | [29] | ||||
| Efficacy Data | Half Maximal Inhibitory Concentration (IC50) |
0.07±0.02 nM
|
High FOLR1 expression (FOLR1+++; 4,500,000 FOLR1 molecules/cell) | ||
| Method Description |
Dilutions of conjugates or unconjugated maytansinoid in the appropriate culture medium were added to wells of 96-well flat-bottomed plates containing 1 x10³ cells per well The plates were incubated at 37°C, 6% CO2 for either 5 days (continuos exposure) or for 4 hours followed by 5-day incubation in conjugate-free medium (short exposure). Cell viability was determined by the WST-8 assay in accordance with the manufacturer's protocol, and IC50 were generated using a sigmoidal dose-response (variable slope) nonlinear regression curve fit.
Click to Show/Hide
|
||||
| In Vitro Model | Human papillomavirus-related endocervical adenocarcinoma | KB cells | CVCL_0372 | ||
Anti-FGFR2 mAb-12944 SMCC-DM1 [Investigative]
Discovered Using Cell Line-derived Xenograft Model
| Experiment 1 Reporting the Activity Date of This ADC | [20] | ||||
| Efficacy Data | Tumor Growth Inhibition value (TGI) | ≈ 65.73% | Positive FGFR2 expression (FGFR2+++/++) | ||
| Method Description |
The total injection volume containing cells in suspension was 200 ul. Mice were enrolled in the first study eight days post implantation with average tumor volume of 192.9 mm3. After being randomly assigned to one of nine groups (n =8/group), mice were administered PBS or a single 3 mg/kg intravenous (i.v,) injection of one antibody drug conjugates.
Click to Show/Hide
|
||||
| In Vivo Model | SNU-16 CDX model | ||||
| In Vitro Model | Gastric adenocarcinoma | SNU-16 cells | CVCL_0076 | ||
Revealed Based on the Cell Line Data
| Experiment 1 Reporting the Activity Date of This ADC | [20] | ||||
| Efficacy Data | Half Maximal Inhibitory Concentration (IC50) | < 3 nM | Positive FGFR2 expression (FGFR2+++/++) | ||
| Method Description |
Cells were counted and seeded in 96 well plates at densities of 2600-3600 cells/well in 100 ul of cell culture medium, A duplicate plate was generated for a day 0 measurement and all plates were incubated in a tissue culture incubator at 37°C with 5% CO2 overnight. Following this incubation, 50 ul/well of Cell titer Glo reagent was added to the day 0 plates, which were then shaken gently for 10 min and the resulting luminescence intensity was measured.
Click to Show/Hide
|
||||
| In Vitro Model | Down syndrome | KATO III cells | CVCL_0371 | ||
| Experiment 2 Reporting the Activity Date of This ADC | [20] | ||||
| Efficacy Data | Half Maximal Inhibitory Concentration (IC50) | < 3 nM | Positive FGFR2 expression (FGFR2+++/++) | ||
| Method Description |
Cells were counted and seeded in 96 well plates at densities of 2600-3600 cells/well in 100 ul of cell culture medium, A duplicate plate was generated for a day 0 measurement and all plates were incubated in a tissue culture incubator at 37°C with 5% CO2 overnight. Following this incubation, 50 ul/well of Cell titer Glo reagent was added to the day 0 plates, which were then shaken gently for 10 min and the resulting luminescence intensity was measured.
Click to Show/Hide
|
||||
| In Vitro Model | Gastric adenocarcinoma | SNU-16 cells | CVCL_0076 | ||
Anti-FGFR2 mAb-10846 SMCC-DM1 [Investigative]
Discovered Using Cell Line-derived Xenograft Model
| Experiment 1 Reporting the Activity Date of This ADC | [20] | ||||
| Efficacy Data | Tumor Growth Inhibition value (TGI) | ≈ 71.12% | Positive FGFR2 expression (FGFR2+++/++) | ||
| Method Description |
The total injection volume containing cells in suspension was 200 ul. Mice were enrolled in the first study eight days post implantation with average tumor volume of 192.9 mm3. After being randomly assigned to one of nine groups (n =8/group), mice were administered PBS or a single 3 mg/kg intravenous (i.v,) injection of one antibody drug conjugates.
Click to Show/Hide
|
||||
| In Vivo Model | SNU-16 CDX model | ||||
| In Vitro Model | Gastric adenocarcinoma | SNU-16 cells | CVCL_0076 | ||
Revealed Based on the Cell Line Data
| Experiment 1 Reporting the Activity Date of This ADC | [20] | ||||
| Efficacy Data | Half Maximal Inhibitory Concentration (IC50) | < 0.2 nM | Positive FGFR2 expression (FGFR2+++/++) | ||
| Method Description |
Cells were counted and seeded in 96 well plates at densities of 2600-3600 cells/well in 100 ul of cell culture medium, A duplicate plate was generated for a day 0 measurement and all plates were incubated in a tissue culture incubator at 37°C with 5% CO2 overnight. Following this incubation, 50 ul/well of Cell titer Glo reagent was added to the day 0 plates, which were then shaken gently for 10 min and the resulting luminescence intensity was measured.
Click to Show/Hide
|
||||
| In Vitro Model | Gastric adenocarcinoma | SNU-16 cells | CVCL_0076 | ||
| Experiment 2 Reporting the Activity Date of This ADC | [20] | ||||
| Efficacy Data | Half Maximal Inhibitory Concentration (IC50) |
0.43 nM
|
Positive FGFR2 expression (FGFR2+++/++) | ||
| Method Description |
Cells were counted and seeded in 96 well plates at densities of 2600-3600 cells/well in 100 ul of cell culture medium, A duplicate plate was generated for a day 0 measurement and all plates were incubated in a tissue culture incubator at 37°C with 5% CO2 overnight. Following this incubation, 50 ul/well of Cell titer Glo reagent was added to the day 0 plates, which were then shaken gently for 10 min and the resulting luminescence intensity was measured.
Click to Show/Hide
|
||||
| In Vitro Model | Down syndrome | KATO III cells | CVCL_0371 | ||
Anti-FGFR2/4 mAb-10923 SMCC-DM1 [Investigative]
Discovered Using Cell Line-derived Xenograft Model
| Experiment 1 Reporting the Activity Date of This ADC | [20] | ||||
| Efficacy Data | Tumor Growth Inhibition value (TGI) | ≈ 71.79% | Positive FGFR2 expression (FGFR2+++/++) | ||
| Method Description |
The total injection volume containing cells in suspension was 200 ul. Mice were enrolled in the first study eight days post implantation with average tumor volume of 192.9 mm3. After being randomly assigned to one of nine groups (n =8/group), mice were administered PBS or a single 3 mg/kg intravenous (i.v,) injection of one antibody drug conjugates.
Click to Show/Hide
|
||||
| In Vivo Model | SNU-16 CDX model | ||||
| In Vitro Model | Gastric adenocarcinoma | SNU-16 cells | CVCL_0076 | ||
Revealed Based on the Cell Line Data
| Experiment 1 Reporting the Activity Date of This ADC | [20] | ||||
| Efficacy Data | Half Maximal Inhibitory Concentration (IC50) | < 0.2 nM | Positive FGFR2 expression (FGFR2+++/++) | ||
| Method Description |
Cells were counted and seeded in 96 well plates at densities of 2600-3600 cells/well in 100 ul of cell culture medium, A duplicate plate was generated for a day 0 measurement and all plates were incubated in a tissue culture incubator at 37°C with 5% CO2 overnight. Following this incubation, 50 ul/well of Cell titer Glo reagent was added to the day 0 plates, which were then shaken gently for 10 min and the resulting luminescence intensity was measured.
Click to Show/Hide
|
||||
| In Vitro Model | Gastric adenocarcinoma | SNU-16 cells | CVCL_0076 | ||
| Experiment 2 Reporting the Activity Date of This ADC | [20] | ||||
| Efficacy Data | Half Maximal Inhibitory Concentration (IC50) |
0.45 nM
|
Positive FGFR2 expression (FGFR2+++/++) | ||
| Method Description |
Cells were counted and seeded in 96 well plates at densities of 2600-3600 cells/well in 100 ul of cell culture medium, A duplicate plate was generated for a day 0 measurement and all plates were incubated in a tissue culture incubator at 37°C with 5% CO2 overnight. Following this incubation, 50 ul/well of Cell titer Glo reagent was added to the day 0 plates, which were then shaken gently for 10 min and the resulting luminescence intensity was measured.
Click to Show/Hide
|
||||
| In Vitro Model | Down syndrome | KATO III cells | CVCL_0371 | ||
Anti-FGFR2 mAb-11723 SMCC-DM1 [Investigative]
Discovered Using Cell Line-derived Xenograft Model
| Experiment 1 Reporting the Activity Date of This ADC | [20] | ||||
| Efficacy Data | Tumor Growth Inhibition value (TGI) | ≈ 74.86% | Positive FGFR2 expression (FGFR2+++/++) | ||
| Method Description |
The total injection volume containing cells in suspension was 200 ul. Mice were enrolled in the first study eight days post implantation with average tumor volume of 192.9 mm3. After being randomly assigned to one of nine groups (n =8/group), mice were administered PBS or a single 3 mg/kg intravenous (i.v,) injection of one antibody drug conjugates.
Click to Show/Hide
|
||||
| In Vivo Model | SNU-16 CDX model | ||||
| In Vitro Model | Gastric adenocarcinoma | SNU-16 cells | CVCL_0076 | ||
Revealed Based on the Cell Line Data
| Experiment 1 Reporting the Activity Date of This ADC | [20] | ||||
| Efficacy Data | Half Maximal Inhibitory Concentration (IC50) | < 0.2 nM | Positive FGFR2 expression (FGFR2+++/++) | ||
| Method Description |
Cells were counted and seeded in 96 well plates at densities of 2600-3600 cells/well in 100 ul of cell culture medium, A duplicate plate was generated for a day 0 measurement and all plates were incubated in a tissue culture incubator at 37°C with 5% CO2 overnight. Following this incubation, 50 ul/well of Cell titer Glo reagent was added to the day 0 plates, which were then shaken gently for 10 min and the resulting luminescence intensity was measured.
Click to Show/Hide
|
||||
| In Vitro Model | Gastric adenocarcinoma | SNU-16 cells | CVCL_0076 | ||
| Experiment 2 Reporting the Activity Date of This ADC | [20] | ||||
| Efficacy Data | Half Maximal Inhibitory Concentration (IC50) |
0.91 nM
|
Positive FGFR2 expression (FGFR2+++/++) | ||
| Method Description |
Cells were counted and seeded in 96 well plates at densities of 2600-3600 cells/well in 100 ul of cell culture medium, A duplicate plate was generated for a day 0 measurement and all plates were incubated in a tissue culture incubator at 37°C with 5% CO2 overnight. Following this incubation, 50 ul/well of Cell titer Glo reagent was added to the day 0 plates, which were then shaken gently for 10 min and the resulting luminescence intensity was measured.
Click to Show/Hide
|
||||
| In Vitro Model | Down syndrome | KATO III cells | CVCL_0371 | ||
P38B-DM1 [Investigative]
Discovered Using Cell Line-derived Xenograft Model
| Experiment 1 Reporting the Activity Date of This ADC | [35] | ||||
| Efficacy Data | Tumor Growth Inhibition value (TGI) | ≈ 75% | Positive PDPN expression (PDPN +++/++) | ||
| Method Description |
One day after cell inoculation, 100 mg of antibodies (P38B-DM1, P38B, or normal canine IgG) in 100 mL of PBS were injected into the peritoneal cavity of each mouse. On days 8 and 14, 5 mg/kg P38B-DM1 was injected into each mouse.
|
||||
| In Vivo Model | CHO/dPDPN CDX model | ||||
| In Vitro Model | Melanoma | CHO cells (PDPN expression) | CVCL_0213 | ||
Revealed Based on the Cell Line Data
| Experiment 1 Reporting the Activity Date of This ADC | [35] | ||||
| Efficacy Data | Tumor Growth Inhibition value (TGI) | ≈ 48 ug/mL | Positive PDPN expression (PDPN +++/++) | ||
| Method Description |
0.01-10 mg/mL for 30 minutes, followed by treatment with fluorescein isothiocyanate-conjugated.
|
||||
| In Vitro Model | Breast adenocarcinoma | SK-BR-3 cells | CVCL_0033 | ||
| Experiment 2 Reporting the Activity Date of This ADC | [44] | ||||
| Efficacy Data | Half Maximal Inhibitory Concentration (IC50) |
0.09 nM
|
High HER2 expression (HER2+++) | ||
| Method Description |
0.01-10 mg/mL for 30 minutes, followed by treatment with fluorescein isothiocyanate-conjugated.
|
||||
| In Vitro Model | Breast adenocarcinoma | SK-BR-3 cells | CVCL_0033 | ||
| Experiment 3 Reporting the Activity Date of This ADC | [44] | ||||
| Efficacy Data | Half Maximal Inhibitory Concentration (IC50) |
0.12 nM
|
High HER2 expression (HER2+++) | ||
| Method Description |
0.01-10 mg/mL for 30 minutes, followed by treatment with fluorescein isothiocyanate-conjugated.
|
||||
| In Vitro Model | Breast adenocarcinoma | SK-BR-3 cells | CVCL_0033 | ||
| Experiment 4 Reporting the Activity Date of This ADC | [44] | ||||
| Efficacy Data | Half Maximal Inhibitory Concentration (IC50) |
0.78 nM
|
High HER2 expression (HER2+++) | ||
| Method Description |
0.01-10 mg/mL for 30 minutes, followed by treatment with fluorescein isothiocyanate-conjugated.
|
||||
| In Vitro Model | Breast adenocarcinoma | SK-BR-3 cells | CVCL_0033 | ||
| Experiment 5 Reporting the Activity Date of This ADC | [44] | ||||
| Efficacy Data | Half Maximal Inhibitory Concentration (IC50) |
35 nM
|
High HER2 expression (HER2+++) | ||
| Method Description |
0.01-10 mg/mL for 30 minutes, followed by treatment with fluorescein isothiocyanate-conjugated.
|
||||
| In Vitro Model | Breast adenocarcinoma | SK-BR-3 cells | CVCL_0033 | ||
| Experiment 6 Reporting the Activity Date of This ADC | [44] | ||||
| Efficacy Data | Half Maximal Inhibitory Concentration (IC50) |
97.62 nM
|
Low HER2 expression (HER2+) | ||
| Method Description |
0.01-10 mg/mL for 30 minutes, followed by treatment with fluorescein isothiocyanate-conjugated.
|
||||
| In Vitro Model | Breast adenocarcinoma | SK-BR-3 cells | CVCL_0033 | ||
| Experiment 7 Reporting the Activity Date of This ADC | [44] | ||||
| Efficacy Data | Half Maximal Inhibitory Concentration (IC50) |
110.54 nM
|
Low HER2 expression (HER2+) | ||
| Method Description |
0.01-10 mg/mL for 30 minutes, followed by treatment with fluorescein isothiocyanate-conjugated.
|
||||
| In Vitro Model | Breast adenocarcinoma | SK-BR-3 cells | CVCL_0033 | ||
Anti-FGFR2 mAb-10220 SMCC-DM1 [Investigative]
Discovered Using Cell Line-derived Xenograft Model
| Experiment 1 Reporting the Activity Date of This ADC | [20] | ||||
| Efficacy Data | Tumor Growth Inhibition value (TGI) | ≈ 76.72% | Positive FGFR2 expression (FGFR2+++/++) | ||
| Method Description |
The total injection volume containing cells in suspension was 200 ul. Mice were enrolled in the first study eight days post implantation with average tumor volume of 192.9 mm3. After being randomly assigned to one of nine groups (n =8/group), mice were administered PBS or a single 3 mg/kg intravenous (i.v,) injection of one antibody drug conjugates.
Click to Show/Hide
|
||||
| In Vivo Model | SNU-16 CDX model | ||||
| In Vitro Model | Gastric adenocarcinoma | SNU-16 cells | CVCL_0076 | ||
Revealed Based on the Cell Line Data
| Experiment 1 Reporting the Activity Date of This ADC | [20] | ||||
| Efficacy Data | Half Maximal Inhibitory Concentration (IC50) | < 0.2 nM | Positive FGFR2 expression (FGFR2+++/++) | ||
| Method Description |
Cells were counted and seeded in 96 well plates at densities of 2600-3600 cells/well in 100 ul of cell culture medium, A duplicate plate was generated for a day 0 measurement and all plates were incubated in a tissue culture incubator at 37°C with 5% CO2 overnight. Following this incubation, 50 ul/well of Cell titer Glo reagent was added to the day 0 plates, which were then shaken gently for 10 min and the resulting luminescence intensity was measured.
Click to Show/Hide
|
||||
| In Vitro Model | Gastric adenocarcinoma | SNU-16 cells | CVCL_0076 | ||
| Experiment 2 Reporting the Activity Date of This ADC | [20] | ||||
| Efficacy Data | Half Maximal Inhibitory Concentration (IC50) |
0.33 nM
|
Positive FGFR2 expression (FGFR2+++/++) | ||
| Method Description |
Cells were counted and seeded in 96 well plates at densities of 2600-3600 cells/well in 100 ul of cell culture medium, A duplicate plate was generated for a day 0 measurement and all plates were incubated in a tissue culture incubator at 37°C with 5% CO2 overnight. Following this incubation, 50 ul/well of Cell titer Glo reagent was added to the day 0 plates, which were then shaken gently for 10 min and the resulting luminescence intensity was measured.
Click to Show/Hide
|
||||
| In Vitro Model | Down syndrome | KATO III cells | CVCL_0371 | ||
Anti-KIT NEG024-SMCC-DM1 [Investigative]
Discovered Using Cell Line-derived Xenograft Model
| Experiment 1 Reporting the Activity Date of This ADC | [27] | ||||
| Efficacy Data | Tumor Growth Inhibition value (TGI) | ≈ 77% | Positive KIT expression (KIT+++/++) | ||
| Method Description |
Female SCID-beige mice were implanted subcutaneously with 10,000,000 cells. The total injection volume containingcells in suspension was 200 ul. Mice were enrolled in the study 15 days post implantation withaverage tumor volume of about 120 mm3. All treated groups received a single intravenous dose of2 mg/kg. After being randomly assigned to groups (n = 8/group), mice were administered a single i.v.dose of TBS (5 ml/kg) or ADC (0.625 mg/kg).
Click to Show/Hide
|
||||
| In Vivo Model | GIST-T1 CDX model | ||||
| In Vitro Model | Gastrointestinal stromal tumor | GIST-T1 cells | CVCL_4976 | ||
| Experiment 2 Reporting the Activity Date of This ADC | [27] | ||||
| Efficacy Data | Tumor Growth Inhibition value (TGI) | ≈ 90.01% | Positive KIT expression (KIT+++/++) | ||
| Method Description |
Female SCID-beige mice were implanted subcutaneously with 10,000,000 NCI-H1048 cells. The total injection volume containingcells in suspension was 200 ul. Mice were enrolled in the study 15 days post implantation withaverage tumor volume of about 120 mm3. All treated groups received a single intravenous dose of 2 mg/kg. After being randomly assigned to groups (n = 8/group), mice were administered a single i.v.dose of TBS (5 ml/kg) or ADC (2.0 mg/kg).
Click to Show/Hide
|
||||
| In Vivo Model | NCI-H1048 CDX model | ||||
| In Vitro Model | Lung small cell carcinoma | NCI-H1048 cells | CVCL_1453 | ||
| Experiment 3 Reporting the Activity Date of This ADC | [27] | ||||
| Efficacy Data | Tumor Growth Inhibition value (TGI) | ≈ 99% | Positive KIT expression (KIT+++/++) | ||
| Method Description |
Female SCID-beige mice were implanted subcutaneously with 10,000,000 NCI-H1048 cells. The total injection volume containingcells in suspension was 200 ul. Mice were enrolled in the study 15 days post implantation withaverage tumor volume of about 120 mm3. All treated groups received a single intravenous dose of 2 mg/kg. After being randomly assigned to groups (n = 8/group), mice were administered a single i.v.dose of TBS (5 ml/kg) or ADC (2.5 mg/kg).
Click to Show/Hide
|
||||
| In Vivo Model | NCI-H1048 CDX model | ||||
| In Vitro Model | Lung small cell carcinoma | NCI-H1048 cells | CVCL_1453 | ||
| Experiment 4 Reporting the Activity Date of This ADC | [27] | ||||
| Efficacy Data | Tumor Growth Inhibition value (TGI) | ≈ 100% | Positive KIT expression (KIT+++/++) | ||
| Method Description |
Female SCID-beige mice were implanted subcutaneously with 10,000,000 NCI-H1048 cells. The total injection volume containingcells in suspension was 200 ul. Mice were enrolled in the study 15 days post implantation withaverage tumor volume of about 120 mm3. All treated groups received a single intravenous dose of 2 mg/kg. After being randomly assigned to groups (n = 8/group), mice were administered a single i.v.dose of TBS (5 ml/kg) or ADC (10 mg/kg).
Click to Show/Hide
|
||||
| In Vivo Model | NCI-H1048 CDX model | ||||
| In Vitro Model | Lung small cell carcinoma | NCI-H1048 cells | CVCL_1453 | ||
| Experiment 5 Reporting the Activity Date of This ADC | [27] | ||||
| Efficacy Data | Tumor Growth Inhibition value (TGI) | ≈ 100% | Positive KIT expression (KIT+++/++) | ||
| Method Description |
Female SCID-beige mice were implanted subcutaneously with 10,000,000 NCI-H1048 cells. The total injection volume containingcells in suspension was 200 ul. Mice were enrolled in the study 15 days post implantation withaverage tumor volume of about 120 mm3. All treated groups received a single intravenous dose of 2 mg/kg. After being randomly assigned to groups (n = 8/group), mice were administered a single i.v.dose of TBS (5 ml/kg) or ADC (5 mg/kg).
Click to Show/Hide
|
||||
| In Vivo Model | NCI-H1048 CDX model | ||||
| In Vitro Model | Lung small cell carcinoma | NCI-H1048 cells | CVCL_1453 | ||
Revealed Based on the Cell Line Data
| Experiment 1 Reporting the Activity Date of This ADC | [27] | ||||
| Efficacy Data | Max inhibition rate (MIR) |
53%
|
Positive KIT expression (KIT+++/++) | ||
| Method Description |
Cells were cultured in a tissue culture incubator at 37°C with 5% CO2 in culture medium. On the day of the assay, cells were washed twice with PBS, prior to being treated with 0.1% trypsin-EDTA for 5 min and resuspended in the recommended culture medium. Cells were then counted and seeded in 96 well plates at densities of 2,000-10,000 cells/well in 100 ul of cell culture medium.
Click to Show/Hide
|
||||
| In Vitro Model | Gastrointestinal stromal tumor | GIST430 cells | CVCL_7040 | ||
| Experiment 2 Reporting the Activity Date of This ADC | [27] | ||||
| Efficacy Data | Max inhibition rate (MIR) |
66%
|
Positive KIT expression (KIT+++/++) | ||
| Method Description |
Cells were cultured in a tissue culture incubator at 37°C with 5% CO2 in culture medium. On the day of the assay, cells were washed twice with PBS, prior to being treated with 0.1% trypsin-EDTA for 5 min and resuspended in the recommended culture medium. Cells were then counted and seeded in 96 well plates at densities of 2,000-10,000 cells/well in 100 ul of cell culture medium.
Click to Show/Hide
|
||||
| In Vitro Model | Gastrointestinal stromal tumor | GIST882 cells | CVCL_7044 | ||
| Experiment 3 Reporting the Activity Date of This ADC | [27] | ||||
| Efficacy Data | Max inhibition rate (MIR) |
72%
|
Positive KIT expression (KIT+++/++) | ||
| Method Description |
Cells were cultured in a tissue culture incubator at 37°C with 5% CO2 in culture medium. On the day of the assay, cells were washed twice with PBS, prior to being treated with 0.1% trypsin-EDTA for 5 min and resuspended in the recommended culture medium. Cells were then counted and seeded in 96 well plates at densities of 2,000-10,000 cells/well in 100 ul of cell culture medium.
Click to Show/Hide
|
||||
| In Vitro Model | Gastrointestinal stromal tumor | GIST-T1 cells | CVCL_4976 | ||
| Experiment 4 Reporting the Activity Date of This ADC | [27] | ||||
| Efficacy Data | Max inhibition rate (MIR) |
78%
|
Positive KIT expression (KIT+++/++) | ||
| Method Description |
Cells were cultured in a tissue culture incubator at 37°C with 5% CO2 in culture medium. On the day of the assay, cells were washed twice with PBS, prior to being treated with 0.1% trypsin-EDTA for 5 min and resuspended in the recommended culture medium. Cells were then counted and seeded in 96 well plates at densities of 2,000-10,000 cells/well in 100 ul of cell culture medium.
Click to Show/Hide
|
||||
| In Vitro Model | Acute myeloid leukemia | Kasumi-6 cells | CVCL_0614 | ||
| Experiment 5 Reporting the Activity Date of This ADC | [27] | ||||
| Efficacy Data | Max inhibition rate (MIR) |
92%
|
Negative KIT expression (KIT-) | ||
| Method Description |
Cells were cultured in a tissue culture incubator at 37°C with 5% CO2 in culture medium. On the day of the assay, cells were washed twice with PBS, prior to being treated with 0.1% trypsin-EDTA for 5 min and resuspended in the recommended culture medium. Cells were then counted and seeded in 96 well plates at densities of 2,000-10,000 cells/well in 100 ul of cell culture medium.
Click to Show/Hide
|
||||
| In Vitro Model | Breast adenocarcinoma | MDA-MB-453 cells | CVCL_0418 | ||
| Experiment 6 Reporting the Activity Date of This ADC | [27] | ||||
| Efficacy Data | Max inhibition rate (MIR) |
98%
|
Positive KIT expression (KIT+++/++) | ||
| Method Description |
Cells were cultured in a tissue culture incubator at 37°C with 5% CO2 in culture medium. On the day of the assay, cells were washed twice with PBS, prior to being treated with 0.1% trypsin-EDTA for 5 min and resuspended in the recommended culture medium. Cells were then counted and seeded in 96 well plates at densities of 2,000-10,000 cells/well in 100 ul of cell culture medium.
Click to Show/Hide
|
||||
| In Vitro Model | Lung small cell carcinoma | NCI-H1048 cells | CVCL_1453 | ||
| Experiment 7 Reporting the Activity Date of This ADC | [27] | ||||
| Efficacy Data | Max inhibition rate (MIR) |
99%
|
Positive KIT expression (KIT+++/++) | ||
| Method Description |
Cells were cultured in a tissue culture incubator at 37°C with 5% CO2 in culture medium. On the day of the assay, cells were washed twice with PBS, prior to being treated with 0.1% trypsin-EDTA for 5 min and resuspended in the recommended culture medium. Cells were then counted and seeded in 96 well plates at densities of 2,000-10,000 cells/well in 100 ul of cell culture medium.
Click to Show/Hide
|
||||
| In Vitro Model | Myeloid leukemia with maturation | Kasumi-1 cells | CVCL_0589 | ||
| Experiment 8 Reporting the Activity Date of This ADC | [27] | ||||
| Efficacy Data | Max inhibition rate (MIR) |
99%
|
Positive KIT expression (KIT+++/++) | ||
| Method Description |
Cells were cultured in a tissue culture incubator at 37°C with 5% CO2 in culture medium. On the day of the assay, cells were washed twice with PBS, prior to being treated with 0.1% trypsin-EDTA for 5 min and resuspended in the recommended culture medium. Cells were then counted and seeded in 96 well plates at densities of 2,000-10,000 cells/well in 100 ul of cell culture medium.
Click to Show/Hide
|
||||
| In Vitro Model | Lung small cell carcinoma | NCI-H526 cells | CVCL_1569 | ||
| Experiment 9 Reporting the Activity Date of This ADC | [27] | ||||
| Efficacy Data | Half Maximal Inhibitory Concentration (IC50) |
0.02 nM
|
Positive KIT expression (KIT+++/++) | ||
| Method Description |
Cells were cultured in a tissue culture incubator at 37°C with 5% CO2 in culture medium. On the day of the assay, cells were washed twice with PBS, prior to being treated with 0.1% trypsin-EDTA for 5 min and resuspended in the recommended culture medium. Cells were then counted and seeded in 96 well plates at densities of 2,000-10,000 cells/well in 100 ul of cell culture medium.
Click to Show/Hide
|
||||
| In Vitro Model | Gastrointestinal stromal tumor | GIST-T1 cells | CVCL_4976 | ||
| Experiment 10 Reporting the Activity Date of This ADC | [27] | ||||
| Efficacy Data | Half Maximal Inhibitory Concentration (IC50) |
0.04 nM
|
Positive KIT expression (KIT+++/++) | ||
| Method Description |
Cells were cultured in a tissue culture incubator at 37°C with 5% CO2 in culture medium. On the day of the assay, cells were washed twice with PBS, prior to being treated with 0.1% trypsin-EDTA for 5 min and resuspended in the recommended culture medium. Cells were then counted and seeded in 96 well plates at densities of 2,000-10,000 cells/well in 100 ul of cell culture medium.
Click to Show/Hide
|
||||
| In Vitro Model | Gastrointestinal stromal tumor | GIST430 cells | CVCL_7040 | ||
| Experiment 11 Reporting the Activity Date of This ADC | [27] | ||||
| Efficacy Data | Half Maximal Inhibitory Concentration (IC50) |
0.07 nM
|
Positive KIT expression (KIT+++/++) | ||
| Method Description |
Cells were cultured in a tissue culture incubator at 37°C with 5% CO2 in culture medium. On the day of the assay, cells were washed twice with PBS, prior to being treated with 0.1% trypsin-EDTA for 5 min and resuspended in the recommended culture medium. Cells were then counted and seeded in 96 well plates at densities of 2,000-10,000 cells/well in 100 ul of cell culture medium.
Click to Show/Hide
|
||||
| In Vitro Model | Lung small cell carcinoma | NCI-H526 cells | CVCL_1569 | ||
| Experiment 12 Reporting the Activity Date of This ADC | [27] | ||||
| Efficacy Data | Half Maximal Inhibitory Concentration (IC50) |
0.72 nM
|
Positive KIT expression (KIT+++/++) | ||
| Method Description |
Cells were cultured in a tissue culture incubator at 37°C with 5% CO2 in culture medium. On the day of the assay, cells were washed twice with PBS, prior to being treated with 0.1% trypsin-EDTA for 5 min and resuspended in the recommended culture medium. Cells were then counted and seeded in 96 well plates at densities of 2,000-10,000 cells/well in 100 ul of cell culture medium.
Click to Show/Hide
|
||||
| In Vitro Model | Gastrointestinal stromal tumor | GIST882 cells | CVCL_7044 | ||
| Experiment 13 Reporting the Activity Date of This ADC | [27] | ||||
| Efficacy Data | Half Maximal Inhibitory Concentration (IC50) |
0.74 nM
|
Positive KIT expression (KIT+++/++) | ||
| Method Description |
Cells were cultured in a tissue culture incubator at 37°C with 5% CO2 in culture medium. On the day of the assay, cells were washed twice with PBS, prior to being treated with 0.1% trypsin-EDTA for 5 min and resuspended in the recommended culture medium. Cells were then counted and seeded in 96 well plates at densities of 2,000-10,000 cells/well in 100 ul of cell culture medium.
Click to Show/Hide
|
||||
| In Vitro Model | Lung small cell carcinoma | NCI-H1048 cells | CVCL_1453 | ||
| Experiment 14 Reporting the Activity Date of This ADC | [27] | ||||
| Efficacy Data | Half Maximal Inhibitory Concentration (IC50) |
5.26 nM
|
Positive KIT expression (KIT+++/++) | ||
| Method Description |
Cells were cultured in a tissue culture incubator at 37°C with 5% CO2 in culture medium. On the day of the assay, cells were washed twice with PBS, prior to being treated with 0.1% trypsin-EDTA for 5 min and resuspended in the recommended culture medium. Cells were then counted and seeded in 96 well plates at densities of 2,000-10,000 cells/well in 100 ul of cell culture medium.
Click to Show/Hide
|
||||
| In Vitro Model | Acute myeloid leukemia | Kasumi-6 cells | CVCL_0614 | ||
| Experiment 15 Reporting the Activity Date of This ADC | [27] | ||||
| Efficacy Data | Half Maximal Inhibitory Concentration (IC50) |
8.49 nM
|
Positive KIT expression (KIT+++/++) | ||
| Method Description |
Cells were cultured in a tissue culture incubator at 37°C with 5% CO2 in culture medium. On the day of the assay, cells were washed twice with PBS, prior to being treated with 0.1% trypsin-EDTA for 5 min and resuspended in the recommended culture medium. Cells were then counted and seeded in 96 well plates at densities of 2,000-10,000 cells/well in 100 ul of cell culture medium.
Click to Show/Hide
|
||||
| In Vitro Model | Myeloid leukemia with maturation | Kasumi-1 cells | CVCL_0589 | ||
| Experiment 16 Reporting the Activity Date of This ADC | [27] | ||||
| Efficacy Data | Half Maximal Inhibitory Concentration (IC50) |
22.77 nM
|
Negative KIT expression (KIT-) | ||
| Method Description |
Cells were cultured in a tissue culture incubator at 37°C with 5% CO2 in culture medium. On the day of the assay, cells were washed twice with PBS, prior to being treated with 0.1% trypsin-EDTA for 5 min and resuspended in the recommended culture medium. Cells were then counted and seeded in 96 well plates at densities of 2,000-10,000 cells/well in 100 ul of cell culture medium.
Click to Show/Hide
|
||||
| In Vitro Model | Breast adenocarcinoma | MDA-MB-453 cells | CVCL_0418 | ||
B-B4-SPP-DM1 [Investigative]
Discovered Using Cell Line-derived Xenograft Model
| Experiment 1 Reporting the Activity Date of This ADC | [36] | ||||
| Efficacy Data | Tumor Growth Inhibition value (TGI) | ≈ 77.45% | Positive CD138 expression (CD138 +++/++) | ||
| Method Description |
MOLP-8 cells (1.5x10⁷ cells per mouse) suspended in a 50:50 mixture of serum free media and matrigel were injected subcutaneously in the area under the right shoulder in 100 ul. Nine groups (n=6) were treated with a single intravenous injection of ADCs, each at doses of 250 ug/kg.
|
||||
| In Vivo Model | MOLP-8 CDX model | ||||
| In Vitro Model | Plasma cell myeloma | MOLP-8 cells | CVCL_2124 | ||
Tmab-SPP-DM1 [Investigative]
Discovered Using Cell Line-derived Xenograft Model
| Experiment 1 Reporting the Activity Date of This ADC | [37] | ||||
| Efficacy Data | Tumor Growth Inhibition value (TGI) | ≈ 77.60% | High HER2 expression (HER2+++) | ||
| Method Description |
Mice bearing mammary tumor transplants from the MMTV-HER2 Fo5 line were given a single iv injection (10 mg/kg) of Tmab-SPP-DM1, Tmab-SSNPP-DM3, Tmab-SSNPP-DM4, Tmab-MCC-DM1, or vehicle (n=7 mice per group), and tumor growth was monitored for 25 days.
|
||||
| In Vivo Model | MMTV-HER2 Fo5 CDX model (Trastuzumab resistant) | ||||
| In Vitro Model | Breast cancer | MMTV-HER2 cells | Mus musculus | ||
Revealed Based on the Cell Line Data
| Experiment 1 Reporting the Activity Date of This ADC | [37] | ||||
| Efficacy Data | Half Maximal Inhibitory Concentration (IC50) |
0.22 nM
|
High HER2 expression (HER2+++) | ||
| Method Description |
The effects of trastuzumab and trastuzumab-maytansinoid conjugates on tumor cell viability were assessed using Cell Titer-Glo. Cells were plated in black-walled 96-well plates (20,000 per well for BT-474; 10,000 cells per well for all other lines) and allowed to adhere overnight at 37°C in a humidified atmosphere of 5% CO2. For measurement of apoptosis, BT-474 and SK-BR-3 were exposed to trastuzumab or trastuzumab-DM for 48 h.
Click to Show/Hide
|
||||
| In Vitro Model | Breast adenocarcinoma | SK-BR-3 cells | CVCL_0033 | ||
| Experiment 2 Reporting the Activity Date of This ADC | [37] | ||||
| Efficacy Data | Half Maximal Inhibitory Concentration (IC50) |
4.26 nM
|
High HER2 expression (HER2+++) | ||
| Method Description |
The effects of trastuzumab and trastuzumab-maytansinoid conjugates on tumor cell viability were assessed using Cell Titer-Glo. Cells were plated in black-walled 96-well plates (20,000 per well for BT-474; 10,000 cells per well for all other lines) and allowed to adhere overnight at 37°C in a humidified atmosphere of 5% CO2. For measurement of apoptosis, BT-474 and SK-BR-3 were exposed to trastuzumab or trastuzumab-DM for 48 h.
Click to Show/Hide
|
||||
| In Vitro Model | Invasive breast carcinoma | BT-474 cells | CVCL_0179 | ||
| Experiment 3 Reporting the Activity Date of This ADC | [37] | ||||
| Efficacy Data | Half Maximal Inhibitory Concentration (IC50) |
41.37 nM
|
Negative HER2 expression (HER2-) | ||
| Method Description |
The effects of trastuzumab and trastuzumab-maytansinoid conjugates on tumor cell viability were assessed using Cell Titer-Glo. Cells were plated in black-walled 96-well plates (20,000 per well for BT-474; 10,000 cells per well for all other lines) and allowed to adhere overnight at 37°C in a humidified atmosphere of 5% CO2. Medium was then removed and replaced by fresh culture medium containing different concentrations of trastuzumab, trastuzumab ADC, or free DM1, and the cells incubated for varying periods of time.
Click to Show/Hide
|
||||
| In Vitro Model | Breast adenocarcinoma | MDA-MB-468 cells | CVCL_0419 | ||
| Experiment 4 Reporting the Activity Date of This ADC | [37] | ||||
| Efficacy Data | Half Maximal Inhibitory Concentration (IC50) | > 100 nM | Low HER2 expression (HER2+) | ||
| Method Description |
The effects of trastuzumab and trastuzumab-maytansinoid conjugates on tumor cell viability were assessed using Cell Titer-Glo. Cells were plated in black-walled 96-well plates (20,000 per well for BT-474; 10,000 cells per well for all other lines) and allowed to adhere overnight at 37°C in a humidified atmosphere of 5% CO2. Medium was then removed and replaced by fresh culture medium containing different concentrations of trastuzumab, trastuzumab ADC, or free DM1, and the cells incubated for varying periods of time.
Click to Show/Hide
|
||||
| In Vitro Model | Invasive breast carcinoma | MCF-7 cells | CVCL_0031 | ||
NBT062-SPP-DM1 [Investigative]
Discovered Using Cell Line-derived Xenograft Model
| Experiment 1 Reporting the Activity Date of This ADC | [36] | ||||
| Efficacy Data | Tumor Growth Inhibition value (TGI) | ≈ 77.61% | Positive CD138 expression (CD138 +++/++) | ||
| Method Description |
MOLP-8 cells (1.5x10⁷ cells per mouse) suspended in a 50:50 mixture of serum free media and matrigel were injected subcutaneously in the area under the right shoulder in 100 ul. Nine groups (n=6) were treated with a single intravenous injection of ADCs, each at doses of 250 ug/kg.
|
||||
| In Vivo Model | MOLP-8 CDX model | ||||
| In Vitro Model | Plasma cell myeloma | MOLP-8 cells | CVCL_2124 | ||
| Experiment 2 Reporting the Activity Date of This ADC | [36] | ||||
| Efficacy Data | Tumor Growth Inhibition value (TGI) | ≈ 84.27% | Positive CD138 expression (CD138 +++/++) | ||
| Method Description |
MOLP-8 cells (1.5x10⁷ cells per mouse) suspended in a 50:50 mixture of serum free media and matrigel were injected subcutaneously in the area under the right shoulder in 100 ul. Nine groups (n=6) were treated with a single intravenous injection of ADCs, each at doses of 250 ug/kg.
|
||||
| In Vivo Model | MOLP-8 CDX model | ||||
| In Vitro Model | Plasma cell myeloma | MOLP-8 cells | CVCL_2124 | ||
| Experiment 3 Reporting the Activity Date of This ADC | [36] | ||||
| Efficacy Data | Tumor Growth Inhibition value (TGI) | ≈ 92.11% | Positive CD138 expression (CD138 +++/++) | ||
| Method Description |
MOLP-8 cells (1.5x10⁷ cells per mouse) suspended in a 50:50 mixture of serum free media and matrigel were injected subcutaneously in the area under the right shoulder in 100 ul. Nine groups (n=6) were treated with a single intravenous injection of ADCs, each at doses of 450 ug/kg.
|
||||
| In Vivo Model | MOLP-8 CDX model | ||||
| In Vitro Model | Plasma cell myeloma | MOLP-8 cells | CVCL_2124 | ||
Revealed Based on the Cell Line Data
| Experiment 1 Reporting the Activity Date of This ADC | [36] | ||||
| Efficacy Data | Half Maximal Inhibitory Concentration (IC50) |
1.00-10.00 nM
|
Positive CD138 expression (CD138 +++/++) | ||
| Method Description |
CD138+ MOLP-8 cells were seeded in flat bottom plates at 3000 cells/well. CD138- BJAB control cells were seeded at 1000 cells/weli. The cells were treated with nBT062-SPDB-DM4nBT062-SPP-DM1 or nBT062-SMCC-DM1 at different concentrations for five days.
|
||||
| In Vitro Model | Plasma cell myeloma | MOLP-8 cells | CVCL_2124 | ||
| Experiment 2 Reporting the Activity Date of This ADC | [36] | ||||
| Efficacy Data | Half Maximal Inhibitory Concentration (IC50) | > 100 nM | Negative CD138 expression (CD138 -) | ||
| Method Description |
CD138+ MOLP-8 cells were seeded in flat bottom plates at 3000 cells/well. CD138- BJAB control cells were seeded at 1000 cells/weli. The cells were treated with nBT062-SPDB-DM4nBT062-SPP-DM1 or nBT062-SMCC-DM1 at different concentrations for five days.
|
||||
| In Vitro Model | Burkitt lymphoma | BJAB cells | CVCL_5711 | ||
Anti-FGFR2 mAb-11725 SMCC-DM1 [Investigative]
Discovered Using Cell Line-derived Xenograft Model
| Experiment 1 Reporting the Activity Date of This ADC | [20] | ||||
| Efficacy Data | Tumor Growth Inhibition value (TGI) | ≈ 77.87% | Positive FGFR2 expression (FGFR2+++/++) | ||
| Method Description |
The total injection volume containing cells in suspension was 200 ul. Mice were enrolled in the first study eight days post implantation with average tumor volume of 192.9 mm3. After being randomly assigned to one of nine groups (n =8/group), mice were administered PBS or a single 3 mg/kg intravenous (i.v,) injection of one antibody drug conjugates.
Click to Show/Hide
|
||||
| In Vivo Model | SNU-16 CDX model | ||||
| In Vitro Model | Gastric adenocarcinoma | SNU-16 cells | CVCL_0076 | ||
Revealed Based on the Cell Line Data
| Experiment 1 Reporting the Activity Date of This ADC | [20] | ||||
| Efficacy Data | Half Maximal Inhibitory Concentration (IC50) |
5 nM
|
Positive FGFR2 expression (FGFR2+++/++) | ||
| Method Description |
Cells were counted and seeded in 96 well plates at densities of 2600-3600 cells/well in 100 ul of cell culture medium, A duplicate plate was generated for a day 0 measurement and all plates were incubated in a tissue culture incubator at 37°C with 5% CO2 overnight. Following this incubation, 50 ul/well of Cell titer Glo reagent was added to the day 0 plates, which were then shaken gently for 10 min and the resulting luminescence intensity was measured.
Click to Show/Hide
|
||||
| In Vitro Model | Gastric adenocarcinoma | SNU-16 cells | CVCL_0076 | ||
| Experiment 2 Reporting the Activity Date of This ADC | [20] | ||||
| Efficacy Data | Half Maximal Inhibitory Concentration (IC50) |
5.2 nM
|
Positive FGFR2 expression (FGFR2+++/++) | ||
| Method Description |
Cells were counted and seeded in 96 well plates at densities of 2600-3600 cells/well in 100 ul of cell culture medium, A duplicate plate was generated for a day 0 measurement and all plates were incubated in a tissue culture incubator at 37°C with 5% CO2 overnight. Following this incubation, 50 ul/well of Cell titer Glo reagent was added to the day 0 plates, which were then shaken gently for 10 min and the resulting luminescence intensity was measured.
Click to Show/Hide
|
||||
| In Vitro Model | Down syndrome | KATO III cells | CVCL_0371 | ||
NBT062-SMCC-DM1 [Investigative]
Discovered Using Cell Line-derived Xenograft Model
| Experiment 1 Reporting the Activity Date of This ADC | [36] | ||||
| Efficacy Data | Tumor Growth Inhibition value (TGI) | ≈ 78.02% | Positive CD138 expression (CD138 +++/++) | ||
| Method Description |
MOLP-8 cells (1.5x10⁷ cells per mouse) suspended in a 50:50 mixture of serum free media and matrigel were injected subcutaneously in the area under the right shoulder in 100 ul. Nine groups (n=6) were treated with a single intravenous injection of ADCs, each at doses of 250 ug/kg.
|
||||
| In Vivo Model | MOLP-8 CDX model | ||||
| In Vitro Model | Plasma cell myeloma | MOLP-8 cells | CVCL_2124 | ||
| Experiment 2 Reporting the Activity Date of This ADC | [36] | ||||
| Efficacy Data | Tumor Growth Inhibition value (TGI) | ≈ 93.32% | Positive CD138 expression (CD138 +++/++) | ||
| Method Description |
MOLP-8 cells (1.5x10⁷ cells per mouse) suspended in a 50:50 mixture of serum free media and matrigel were injected subcutaneously in the area under the right shoulder in 100 ul. Nine groups (n=6) were treated with a single intravenous injection of ADCs, each at doses of 250 ug/kg per week (five weeks).
|
||||
| In Vivo Model | MOLP-8 CDX model | ||||
| In Vitro Model | Plasma cell myeloma | MOLP-8 cells | CVCL_2124 | ||
| Experiment 3 Reporting the Activity Date of This ADC | [36] | ||||
| Efficacy Data | Tumor Growth Inhibition value (TGI) | ≈ 94.27% | Positive CD138 expression (CD138 +++/++) | ||
| Method Description |
MOLP-8 cells (1.5x10⁷ cells per mouse) suspended in a 50:50 mixture of serum free media and matrigel were injected subcutaneously in the area under the right shoulder in 100 ul. Nine groups (n=6) were treated with a single intravenous injection of ADCs, each at doses of 450 ug/kg.
|
||||
| In Vivo Model | MOLP-8 CDX model | ||||
| In Vitro Model | Plasma cell myeloma | MOLP-8 cells | CVCL_2124 | ||
Revealed Based on the Cell Line Data
| Experiment 1 Reporting the Activity Date of This ADC | [36] | ||||
| Efficacy Data | Half Maximal Inhibitory Concentration (IC50) |
0.1 nM
|
Positive CD138 expression (CD138 +++/++) | ||
| Method Description |
CD138+ MOLP-8 cells were seeded in flat bottom plates at 3000 cells/well. CD138- BJAB control cells were seeded at 1000 cells/weli. The cells were treated with nBT062-SPDB-DM4nBT062-SPP-DM1 or nBT062-SMCC-DM1 at different concentrations for five days.
|
||||
| In Vitro Model | Plasma cell myeloma | MOLP-8 cells | CVCL_2124 | ||
| Experiment 2 Reporting the Activity Date of This ADC | [36] | ||||
| Efficacy Data | Half Maximal Inhibitory Concentration (IC50) | > 100 nM | Negative CD138 expression (CD138 -) | ||
| Method Description |
CD138+ MOLP-8 cells were seeded in flat bottom plates at 3000 cells/well. CD138- BJAB control cells were seeded at 1000 cells/weli. The cells were treated with nBT062-SPDB-DM4nBT062-SPP-DM1 or nBT062-SMCC-DM1 at different concentrations for five days.
|
||||
| In Vitro Model | Burkitt lymphoma | BJAB cells | CVCL_5711 | ||
Anti-KIT 9P3-SMCC-DM1 [Investigative]
Discovered Using Cell Line-derived Xenograft Model
| Experiment 1 Reporting the Activity Date of This ADC | [27] | ||||
| Efficacy Data | Tumor Growth Inhibition value (TGI) | ≈ 78.93% | Positive KIT expression (KIT+++/++) | ||
| Method Description |
Female SCID-beige mice were implanted subcutaneously with Kasumi-1 cells. Mice were enrolled in the study 15 days post implantation withaverage tumor volume of about 120 mm3. All treated groups received a single intravenous dose of 2 mg/kg. After being randomly assigned to groups (n = 8/group), mice were administered a single i.v.dose of TBS (5 ml/kg) or ADC (10 mg/kg).
Click to Show/Hide
|
||||
| In Vivo Model | Kasumi-1 CDX model | ||||
| In Vitro Model | Myeloid leukemia with maturation | Kasumi-1 cells | CVCL_0589 | ||
| Experiment 2 Reporting the Activity Date of This ADC | [27] | ||||
| Efficacy Data | Tumor Growth Inhibition value (TGI) | ≈ 84.35% | Positive KIT expression (KIT+++/++) | ||
| Method Description |
Female SCID-beige mice were implanted subcutaneously with Kasumi-1 cells. Mice were enrolled in the study 15 days post implantation withaverage tumor volume of about 120 mm3. All treated groups received a single intravenous dose of 2 mg/kg. After being randomly assigned to groups (n = 8/group), mice were administered a single i.v.dose of TBS (5 ml/kg) or ADC (10 mg/kg).
Click to Show/Hide
|
||||
| In Vivo Model | HMC-1 CDX model | ||||
| In Vitro Model | Mast cell leukemia | HMC-1 cells | CVCL_0003 | ||
| Experiment 3 Reporting the Activity Date of This ADC | [27] | ||||
| Efficacy Data | Tumor Growth Inhibition value (TGI) | ≈ 93% | Positive KIT expression (KIT+++/++) | ||
| Method Description |
Female SCID-beige mice were implanted subcutaneously with 10,000,000 cells. The total injection volume containingcells in suspension was 200 ul. Mice were enrolled in the study 15 days post implantation withaverage tumor volume of about 120 mm3. All treated groups received a single intravenous dose of2 mg/kg. After being randomly assigned to groups (n = 8/group), mice were administered a single i.v.dose of TBS (5 ml/kg) or ADC (10 mg/kg).
Click to Show/Hide
|
||||
| In Vivo Model | GIST430 CDX model | ||||
| In Vitro Model | Gastrointestinal stromal tumor | GIST430 cells | CVCL_7040 | ||
| Experiment 4 Reporting the Activity Date of This ADC | [27] | ||||
| Efficacy Data | Tumor Growth Inhibition value (TGI) | ≈ 100% | Positive KIT expression (KIT+++/++) | ||
| Method Description |
Female SCID-beige mice were implanted subcutaneously with 10,000,000 cells. The total injection volume containingcells in suspension was 200 ul. Mice were enrolled in the study 15 days post implantation withaverage tumor volume of about 120 mm3. All treated groups received a single intravenous dose of2 mg/kg. After being randomly assigned to groups (n = 8/group), mice were administered a single i.v.dose of TBS (5 ml/kg) or ADC (10 mg/kg).
Click to Show/Hide
|
||||
| In Vivo Model | GIST-T1 CDX model | ||||
| In Vitro Model | Gastrointestinal stromal tumor | GIST-T1 cells | CVCL_4976 | ||
| Experiment 5 Reporting the Activity Date of This ADC | [27] | ||||
| Efficacy Data | Tumor Growth Inhibition value (TGI) | ≈ 100% | Positive KIT expression (KIT+++/++) | ||
| Method Description |
Female SCID-beige mice were implanted subcutaneously with 10,000,000 cells. The total injection volume containingcells in suspension was 200 ul. Mice were enrolled in the study 15 days post implantation withaverage tumor volume of about 120 mm3. All treated groups received a single intravenous dose of2 mg/kg. After being randomly assigned to groups (n = 8/group), mice were administered a single i.v.dose of TBS (5 ml/kg) or ADC (5 mg/kg).
Click to Show/Hide
|
||||
| In Vivo Model | GIST-T1 CDX model | ||||
| In Vitro Model | Gastrointestinal stromal tumor | GIST-T1 cells | CVCL_4976 | ||
Revealed Based on the Cell Line Data
| Experiment 1 Reporting the Activity Date of This ADC | [27] | ||||
| Efficacy Data | Max inhibition rate (MIR) |
60%
|
Positive KIT expression (KIT+++/++) | ||
| Method Description |
Cells were cultured in a tissue culture incubator at 37°C with 5% CO2 in culture medium. On the day of the assay, cells were washed twice with PBS, prior to being treated with 0.1% trypsin-EDTA for 5 min and resuspended in the recommended culture medium. Cells were then counted and seeded in 96 well plates at densities of 2,000-10,000 cells/well in 100 ul of cell culture medium.
Click to Show/Hide
|
||||
| In Vitro Model | Gastrointestinal stromal tumor | GIST430 cells | CVCL_7040 | ||
| Experiment 2 Reporting the Activity Date of This ADC | [27] | ||||
| Efficacy Data | Max inhibition rate (MIR) |
75%
|
Positive KIT expression (KIT+++/++) | ||
| Method Description |
Cells were cultured in a tissue culture incubator at 37°C with 5% CO2 in culture medium. On the day of the assay, cells were washed twice with PBS, prior to being treated with 0.1% trypsin-EDTA for 5 min and resuspended in the recommended culture medium. Cells were then counted and seeded in 96 well plates at densities of 2,000-10,000 cells/well in 100 ul of cell culture medium.
Click to Show/Hide
|
||||
| In Vitro Model | Gastrointestinal stromal tumor | GIST-T1 cells | CVCL_4976 | ||
| Experiment 3 Reporting the Activity Date of This ADC | [27] | ||||
| Efficacy Data | Max inhibition rate (MIR) |
86%
|
Positive KIT expression (KIT+++/++) | ||
| Method Description |
Cells were cultured in a tissue culture incubator at 37°C with 5% CO2 in culture medium. On the day of the assay, cells were washed twice with PBS, prior to being treated with 0.1% trypsin-EDTA for 5 min and resuspended in the recommended culture medium. Cells were then counted and seeded in 96 well plates at densities of 2,000-10,000 cells/well in 100 ul of cell culture medium.
Click to Show/Hide
|
||||
| In Vitro Model | Lung small cell carcinoma | NCI-H889 cells | CVCL_1598 | ||
| Experiment 4 Reporting the Activity Date of This ADC | [27] | ||||
| Efficacy Data | Max inhibition rate (MIR) |
87%
|
Positive KIT expression (KIT+++/++) | ||
| Method Description |
Cells were cultured in a tissue culture incubator at 37°C with 5% CO2 in culture medium. On the day of the assay, cells were washed twice with PBS, prior to being treated with 0.1% trypsin-EDTA for 5 min and resuspended in the recommended culture medium. Cells were then counted and seeded in 96 well plates at densities of 2,000-10,000 cells/well in 100 ul of cell culture medium.
Click to Show/Hide
|
||||
| In Vitro Model | Lung small cell carcinoma | NCI-H1930 cells | CVCL_1507 | ||
| Experiment 5 Reporting the Activity Date of This ADC | [27] | ||||
| Efficacy Data | Max inhibition rate (MIR) |
91%
|
Positive KIT expression (KIT+++/++) | ||
| Method Description |
Cells were cultured in a tissue culture incubator at 37°C with 5% CO2 in culture medium. On the day of the assay, cells were washed twice with PBS, prior to being treated with 0.1% trypsin-EDTA for 5 min and resuspended in the recommended culture medium. Cells were then counted and seeded in 96 well plates at densities of 2,000-10,000 cells/well in 100 ul of cell culture medium.
Click to Show/Hide
|
||||
| In Vitro Model | Acute megakaryoblastic leukemia | CMK-11-5 cells | CVCL_0217 | ||
| Experiment 6 Reporting the Activity Date of This ADC | [27] | ||||
| Efficacy Data | Max inhibition rate (MIR) |
92%
|
Positive KIT expression (KIT+++/++) | ||
| Method Description |
Cells were cultured in a tissue culture incubator at 37°C with 5% CO2 in culture medium. On the day of the assay, cells were washed twice with PBS, prior to being treated with 0.1% trypsin-EDTA for 5 min and resuspended in the recommended culture medium. Cells were then counted and seeded in 96 well plates at densities of 2,000-10,000 cells/well in 100 ul of cell culture medium.
Click to Show/Hide
|
||||
| In Vitro Model | Acute myeloid leukemia | Kasumi-6 cells | CVCL_0614 | ||
| Experiment 7 Reporting the Activity Date of This ADC | [27] | ||||
| Efficacy Data | Max inhibition rate (MIR) |
95%
|
Positive KIT expression (KIT+++/++) | ||
| Method Description |
Cells were cultured in a tissue culture incubator at 37°C with 5% CO2 in culture medium. On the day of the assay, cells were washed twice with PBS, prior to being treated with 0.1% trypsin-EDTA for 5 min and resuspended in the recommended culture medium. Cells were then counted and seeded in 96 well plates at densities of 2,000-10,000 cells/well in 100 ul of cell culture medium.
Click to Show/Hide
|
||||
| In Vitro Model | Erythroleukemia | HEL 92.1.7 cells | CVCL_2481 | ||
| Experiment 8 Reporting the Activity Date of This ADC | [27] | ||||
| Efficacy Data | Max inhibition rate (MIR) |
98%
|
Positive KIT expression (KIT+++/++) | ||
| Method Description |
Cells were cultured in a tissue culture incubator at 37°C with 5% CO2 in culture medium. On the day of the assay, cells were washed twice with PBS, prior to being treated with 0.1% trypsin-EDTA for 5 min and resuspended in the recommended culture medium. Cells were then counted and seeded in 96 well plates at densities of 2,000-10,000 cells/well in 100 ul of cell culture medium.
Click to Show/Hide
|
||||
| In Vitro Model | Lung small cell carcinoma | NCI-H526 cells | CVCL_1569 | ||
| Experiment 9 Reporting the Activity Date of This ADC | [27] | ||||
| Efficacy Data | Max inhibition rate (MIR) |
99%
|
Positive KIT expression (KIT+++/++) | ||
| Method Description |
Cells were cultured in a tissue culture incubator at 37°C with 5% CO2 in culture medium. On the day of the assay, cells were washed twice with PBS, prior to being treated with 0.1% trypsin-EDTA for 5 min and resuspended in the recommended culture medium. Cells were then counted and seeded in 96 well plates at densities of 2,000-10,000 cells/well in 100 ul of cell culture medium.
Click to Show/Hide
|
||||
| In Vitro Model | Lung small cell carcinoma | NCI-H1048 cells | CVCL_1453 | ||
| Experiment 10 Reporting the Activity Date of This ADC | [27] | ||||
| Efficacy Data | Max inhibition rate (MIR) |
99%
|
Positive KIT expression (KIT+++/++) | ||
| Method Description |
Cells were cultured in a tissue culture incubator at 37°C with 5% CO2 in culture medium. On the day of the assay, cells were washed twice with PBS, prior to being treated with 0.1% trypsin-EDTA for 5 min and resuspended in the recommended culture medium. Cells were then counted and seeded in 96 well plates at densities of 2,000-10,000 cells/well in 100 ul of cell culture medium.
Click to Show/Hide
|
||||
| In Vitro Model | Essential thrombocythemia | UKE-1 cells | CVCL_0104 | ||
| Experiment 11 Reporting the Activity Date of This ADC | [27] | ||||
| Efficacy Data | Max inhibition rate (MIR) |
99%
|
Positive KIT expression (KIT+++/++) | ||
| Method Description |
Cells were cultured in a tissue culture incubator at 37°C with 5% CO2 in culture medium. On the day of the assay, cells were washed twice with PBS, prior to being treated with 0.1% trypsin-EDTA for 5 min and resuspended in the recommended culture medium. Cells were then counted and seeded in 96 well plates at densities of 2,000-10,000 cells/well in 100 ul of cell culture medium.
Click to Show/Hide
|
||||
| In Vitro Model | Adult acute myeloid leukemia | SKNO-1 cells | CVCL_2196 | ||
| Experiment 12 Reporting the Activity Date of This ADC | [27] | ||||
| Efficacy Data | Max inhibition rate (MIR) |
99%
|
Positive KIT expression (KIT+++/++) | ||
| Method Description |
Cells were cultured in a tissue culture incubator at 37°C with 5% CO2 in culture medium. On the day of the assay, cells were washed twice with PBS, prior to being treated with 0.1% trypsin-EDTA for 5 min and resuspended in the recommended culture medium. Cells were then counted and seeded in 96 well plates at densities of 2,000-10,000 cells/well in 100 ul of cell culture medium.
Click to Show/Hide
|
||||
| In Vitro Model | Acute myeloid leukemia | OCI-M1 cells | CVCL_2149 | ||
| Experiment 13 Reporting the Activity Date of This ADC | [27] | ||||
| Efficacy Data | Max inhibition rate (MIR) |
100%
|
Positive KIT expression (KIT+++/++) | ||
| Method Description |
Cells were cultured in a tissue culture incubator at 37°C with 5% CO2 in culture medium. On the day of the assay, cells were washed twice with PBS, prior to being treated with 0.1% trypsin-EDTA for 5 min and resuspended in the recommended culture medium. Cells were then counted and seeded in 96 well plates at densities of 2,000-10,000 cells/well in 100 ul of cell culture medium.
Click to Show/Hide
|
||||
| In Vitro Model | Acute megakaryoblastic leukemia | M-07e cells | CVCL_2106 | ||
| Experiment 14 Reporting the Activity Date of This ADC | [27] | ||||
| Efficacy Data | Max inhibition rate (MIR) |
100%
|
Positive KIT expression (KIT+++/++) | ||
| Method Description |
Cells were cultured in a tissue culture incubator at 37°C with 5% CO2 in culture medium. On the day of the assay, cells were washed twice with PBS, prior to being treated with 0.1% trypsin-EDTA for 5 min and resuspended in the recommended culture medium. Cells were then counted and seeded in 96 well plates at densities of 2,000-10,000 cells/well in 100 ul of cell culture medium.
Click to Show/Hide
|
||||
| In Vitro Model | Myeloid leukemia with maturation | Kasumi-1 cells | CVCL_0589 | ||
| Experiment 15 Reporting the Activity Date of This ADC | [27] | ||||
| Efficacy Data | Half Maximum Growth Inhibitory Concentration (GI50) |
0.02 nM
|
Positive KIT expression (KIT+++/++) | ||
| Method Description |
Cells were cultured in a tissue culture incubator at 37°C with 5% CO2 in culture medium. On the day of the assay, cells were washed twice with PBS, prior to being treated with 0.1% trypsin-EDTA for 5 min and resuspended in the recommended culture medium. Cells were then counted and seeded in 96 well plates at densities of 2,000-10,000 cells/well in 100 ul of cell culture medium.
Click to Show/Hide
|
||||
| In Vitro Model | Gastrointestinal stromal tumor | GIST-T1 cells | CVCL_4976 | ||
| Experiment 16 Reporting the Activity Date of This ADC | [27] | ||||
| Efficacy Data | Half Maximum Growth Inhibitory Concentration (GI50) |
0.05 nM
|
Positive KIT expression (KIT+++/++) | ||
| Method Description |
Cells were cultured in a tissue culture incubator at 37°C with 5% CO2 in culture medium. On the day of the assay, cells were washed twice with PBS, prior to being treated with 0.1% trypsin-EDTA for 5 min and resuspended in the recommended culture medium. Cells were then counted and seeded in 96 well plates at densities of 2,000-10,000 cells/well in 100 ul of cell culture medium.
Click to Show/Hide
|
||||
| In Vitro Model | Lung small cell carcinoma | NCI-H526 cells | CVCL_1569 | ||
| Experiment 17 Reporting the Activity Date of This ADC | [27] | ||||
| Efficacy Data | Half Maximum Growth Inhibitory Concentration (GI50) |
0.05 nM
|
Positive KIT expression (KIT+++/++) | ||
| Method Description |
Cells were cultured in a tissue culture incubator at 37°C with 5% CO2 in culture medium. On the day of the assay, cells were washed twice with PBS, prior to being treated with 0.1% trypsin-EDTA for 5 min and resuspended in the recommended culture medium. Cells were then counted and seeded in 96 well plates at densities of 2,000-10,000 cells/well in 100 ul of cell culture medium.
Click to Show/Hide
|
||||
| In Vitro Model | Acute megakaryoblastic leukemia | CMK-11-5 cells | CVCL_0217 | ||
| Experiment 18 Reporting the Activity Date of This ADC | [27] | ||||
| Efficacy Data | Half Maximum Growth Inhibitory Concentration (GI50) |
0.08 nM
|
Positive KIT expression (KIT+++/++) | ||
| Method Description |
Cells were cultured in a tissue culture incubator at 37°C with 5% CO2 in culture medium. On the day of the assay, cells were washed twice with PBS, prior to being treated with 0.1% trypsin-EDTA for 5 min and resuspended in the recommended culture medium. Cells were then counted and seeded in 96 well plates at densities of 2,000-10,000 cells/well in 100 ul of cell culture medium.
Click to Show/Hide
|
||||
| In Vitro Model | Gastrointestinal stromal tumor | GIST430 cells | CVCL_7040 | ||
| Experiment 19 Reporting the Activity Date of This ADC | [27] | ||||
| Efficacy Data | Half Maximum Growth Inhibitory Concentration (GI50) |
0.08 nM
|
Positive KIT expression (KIT+++/++) | ||
| Method Description |
Cells were cultured in a tissue culture incubator at 37°C with 5% CO2 in culture medium. On the day of the assay, cells were washed twice with PBS, prior to being treated with 0.1% trypsin-EDTA for 5 min and resuspended in the recommended culture medium. Cells were then counted and seeded in 96 well plates at densities of 2,000-10,000 cells/well in 100 ul of cell culture medium.
Click to Show/Hide
|
||||
| In Vitro Model | Acute megakaryoblastic leukemia | M-07e cells | CVCL_2106 | ||
| Experiment 20 Reporting the Activity Date of This ADC | [27] | ||||
| Efficacy Data | Half Maximum Growth Inhibitory Concentration (GI50) |
0.09 nM
|
Positive KIT expression (KIT+++/++) | ||
| Method Description |
Cells were cultured in a tissue culture incubator at 37°C with 5% CO2 in culture medium. On the day of the assay, cells were washed twice with PBS, prior to being treated with 0.1% trypsin-EDTA for 5 min and resuspended in the recommended culture medium. Cells were then counted and seeded in 96 well plates at densities of 2,000-10,000 cells/well in 100 ul of cell culture medium.
Click to Show/Hide
|
||||
| In Vitro Model | Lung small cell carcinoma | NCI-H1930 cells | CVCL_1507 | ||
| Experiment 21 Reporting the Activity Date of This ADC | [27] | ||||
| Efficacy Data | Half Maximum Growth Inhibitory Concentration (GI50) |
0.11 nM
|
Positive KIT expression (KIT+++/++) | ||
| Method Description |
Cells were cultured in a tissue culture incubator at 37°C with 5% CO2 in culture medium. On the day of the assay, cells were washed twice with PBS, prior to being treated with 0.1% trypsin-EDTA for 5 min and resuspended in the recommended culture medium. Cells were then counted and seeded in 96 well plates at densities of 2,000-10,000 cells/well in 100 ul of cell culture medium.
Click to Show/Hide
|
||||
| In Vitro Model | Acute myeloid leukemia | OCI-M1 cells | CVCL_2149 | ||
| Experiment 22 Reporting the Activity Date of This ADC | [27] | ||||
| Efficacy Data | Half Maximum Growth Inhibitory Concentration (GI50) |
0.15 nM
|
Positive KIT expression (KIT+++/++) | ||
| Method Description |
Cells were cultured in a tissue culture incubator at 37°C with 5% CO2 in culture medium. On the day of the assay, cells were washed twice with PBS, prior to being treated with 0.1% trypsin-EDTA for 5 min and resuspended in the recommended culture medium. Cells were then counted and seeded in 96 well plates at densities of 2,000-10,000 cells/well in 100 ul of cell culture medium.
Click to Show/Hide
|
||||
| In Vitro Model | Lung small cell carcinoma | NCI-H889 cells | CVCL_1598 | ||
| Experiment 23 Reporting the Activity Date of This ADC | [27] | ||||
| Efficacy Data | Half Maximum Growth Inhibitory Concentration (GI50) |
0.61 nM
|
Positive KIT expression (KIT+++/++) | ||
| Method Description |
Cells were cultured in a tissue culture incubator at 37°C with 5% CO2 in culture medium. On the day of the assay, cells were washed twice with PBS, prior to being treated with 0.1% trypsin-EDTA for 5 min and resuspended in the recommended culture medium. Cells were then counted and seeded in 96 well plates at densities of 2,000-10,000 cells/well in 100 ul of cell culture medium.
Click to Show/Hide
|
||||
| In Vitro Model | Erythroleukemia | HEL 92.1.7 cells | CVCL_2481 | ||
| Experiment 24 Reporting the Activity Date of This ADC | [27] | ||||
| Efficacy Data | Half Maximum Growth Inhibitory Concentration (GI50) |
1.29 nM
|
Positive KIT expression (KIT+++/++) | ||
| Method Description |
Cells were cultured in a tissue culture incubator at 37°C with 5% CO2 in culture medium. On the day of the assay, cells were washed twice with PBS, prior to being treated with 0.1% trypsin-EDTA for 5 min and resuspended in the recommended culture medium. Cells were then counted and seeded in 96 well plates at densities of 2,000-10,000 cells/well in 100 ul of cell culture medium.
Click to Show/Hide
|
||||
| In Vitro Model | Acute myeloid leukemia | Kasumi-6 cells | CVCL_0614 | ||
| Experiment 25 Reporting the Activity Date of This ADC | [27] | ||||
| Efficacy Data | Half Maximum Growth Inhibitory Concentration (GI50) |
1.8 nM
|
Positive KIT expression (KIT+++/++) | ||
| Method Description |
Cells were cultured in a tissue culture incubator at 37°C with 5% CO2 in culture medium. On the day of the assay, cells were washed twice with PBS, prior to being treated with 0.1% trypsin-EDTA for 5 min and resuspended in the recommended culture medium. Cells were then counted and seeded in 96 well plates at densities of 2,000-10,000 cells/well in 100 ul of cell culture medium.
Click to Show/Hide
|
||||
| In Vitro Model | Essential thrombocythemia | UKE-1 cells | CVCL_0104 | ||
| Experiment 26 Reporting the Activity Date of This ADC | [27] | ||||
| Efficacy Data | Half Maximum Growth Inhibitory Concentration (GI50) |
3.6 nM
|
Positive KIT expression (KIT+++/++) | ||
| Method Description |
Cells were cultured in a tissue culture incubator at 37°C with 5% CO2 in culture medium. On the day of the assay, cells were washed twice with PBS, prior to being treated with 0.1% trypsin-EDTA for 5 min and resuspended in the recommended culture medium. Cells were then counted and seeded in 96 well plates at densities of 2,000-10,000 cells/well in 100 ul of cell culture medium.
Click to Show/Hide
|
||||
| In Vitro Model | Adult acute myeloid leukemia | SKNO-1 cells | CVCL_2196 | ||
| Experiment 27 Reporting the Activity Date of This ADC | [27] | ||||
| Efficacy Data | Half Maximum Growth Inhibitory Concentration (GI50) |
4 nM
|
Positive KIT expression (KIT+++/++) | ||
| Method Description |
Cells were cultured in a tissue culture incubator at 37°C with 5% CO2 in culture medium. On the day of the assay, cells were washed twice with PBS, prior to being treated with 0.1% trypsin-EDTA for 5 min and resuspended in the recommended culture medium. Cells were then counted and seeded in 96 well plates at densities of 2,000-10,000 cells/well in 100 ul of cell culture medium.
Click to Show/Hide
|
||||
| In Vitro Model | Myeloid leukemia with maturation | Kasumi-1 cells | CVCL_0589 | ||
| Experiment 28 Reporting the Activity Date of This ADC | [27] | ||||
| Efficacy Data | Half Maximum Growth Inhibitory Concentration (GI50) |
4.3 nM
|
Positive KIT expression (KIT+++/++) | ||
| Method Description |
Cells were cultured in a tissue culture incubator at 37°C with 5% CO2 in culture medium. On the day of the assay, cells were washed twice with PBS, prior to being treated with 0.1% trypsin-EDTA for 5 min and resuspended in the recommended culture medium. Cells were then counted and seeded in 96 well plates at densities of 2,000-10,000 cells/well in 100 ul of cell culture medium.
Click to Show/Hide
|
||||
| In Vitro Model | Lung small cell carcinoma | NCI-H1048 cells | CVCL_1453 | ||
Anti-FGFR2/4 mAb-12439 SMCC-DM1 [Investigative]
Discovered Using Cell Line-derived Xenograft Model
| Experiment 1 Reporting the Activity Date of This ADC | [20] | ||||
| Efficacy Data | Tumor Growth Inhibition value (TGI) | ≈ 80.60% | Positive FGFR2 expression (FGFR2+++/++) | ||
| Method Description |
The total injection volume containing cells in suspension was 200 ul. Mice were enrolled in the first study eight days post implantation with average tumor volume of 192.9 mm3. After being randomly assigned to one of nine groups (n =8/group), mice were administered PBS or a single 3 mg/kg intravenous (i.v,) injection of one antibody drug conjugates.
Click to Show/Hide
|
||||
| In Vivo Model | SNU-16 CDX model | ||||
| In Vitro Model | Gastric adenocarcinoma | SNU-16 cells | CVCL_0076 | ||
Revealed Based on the Cell Line Data
| Experiment 1 Reporting the Activity Date of This ADC | [20] | ||||
| Efficacy Data | Half Maximal Inhibitory Concentration (IC50) | < 3 nM | Positive FGFR2 expression (FGFR2+++/++) | ||
| Method Description |
Cells were counted and seeded in 96 well plates at densities of 2600-3600 cells/well in 100 ul of cell culture medium, A duplicate plate was generated for a day 0 measurement and all plates were incubated in a tissue culture incubator at 37°C with 5% CO2 overnight. Following this incubation, 50 ul/well of Cell titer Glo reagent was added to the day 0 plates, which were then shaken gently for 10 min and the resulting luminescence intensity was measured.
Click to Show/Hide
|
||||
| In Vitro Model | Down syndrome | KATO III cells | CVCL_0371 | ||
| Experiment 2 Reporting the Activity Date of This ADC | [20] | ||||
| Efficacy Data | Half Maximal Inhibitory Concentration (IC50) | < 3 nM | Positive FGFR2 expression (FGFR2+++/++) | ||
| Method Description |
Cells were counted and seeded in 96 well plates at densities of 2600-3600 cells/well in 100 ul of cell culture medium, A duplicate plate was generated for a day 0 measurement and all plates were incubated in a tissue culture incubator at 37°C with 5% CO2 overnight. Following this incubation, 50 ul/well of Cell titer Glo reagent was added to the day 0 plates, which were then shaken gently for 10 min and the resulting luminescence intensity was measured.
Click to Show/Hide
|
||||
| In Vitro Model | Gastric adenocarcinoma | SNU-16 cells | CVCL_0076 | ||
ADAPT6-ABD-mcDM1 [Investigative]
Discovered Using Cell Line-derived Xenograft Model
| Experiment 1 Reporting the Activity Date of This ADC | [38] | ||||
| Efficacy Data | Tumor Growth Inhibition value (TGI) | ≈ 83.30% | High HER2 expression (HER2+++) | ||
| Method Description |
The SKOV3 xenografts were established in female BALB/c nu/nu mice by subcutaneous implantation of 1 x10⁷ SKOV3 cells in 100 uL of medium in the abdominal region. The therapy started one week after the implantation. The mice were randomized in three groups (n = 910). One group of mice received intravenous (i.v.) injections of 13.3 mg/kg of ADAPT6-ABD-mcDM1 in 100 uL of PBS, the second group of mice received i.v. injections of the same dose of ADAPTNeg-ABD-mcDM1 in 100 uL of PBS, and the third group of mice received i.v. injections of 100 uL of PBS.
Click to Show/Hide
|
||||
| In Vivo Model | ER2-expressing SKOV3 ovarian cancer xenograft model | ||||
| In Vitro Model | Ovarian serous cystadenocarcinoma | SK-OV-3 cells | CVCL_0532 | ||
Revealed Based on the Cell Line Data
| Experiment 1 Reporting the Activity Date of This ADC | [49] | ||||
| Efficacy Data | Half Maximal Inhibitory Concentration (IC50) |
5 nM
|
High HER2 expression (HER2+++) | ||
| Method Description |
The cytotoxic potential of ADAPT6-ABD-mcDM1 was investigated by incubation of dilution series of the conjugate with cell lines having different HER2-expression levels.
|
||||
| In Vitro Model | Breast adenocarcinoma | SK-BR-3 cells | CVCL_0033 | ||
| Experiment 2 Reporting the Activity Date of This ADC | [49] | ||||
| Efficacy Data | Half Maximal Inhibitory Concentration (IC50) |
7 nM
|
High HER2 expression (HER2+++) | ||
| Method Description |
The cytotoxic potential of ADAPT6-ABD-mcDM1 was investigated by incubation of dilution series of the conjugate with cell lines having different HER2-expression levels.
|
||||
| In Vitro Model | Breast adenocarcinoma | AU565 cells | CVCL_1074 | ||
| Experiment 3 Reporting the Activity Date of This ADC | [49] | ||||
| Efficacy Data | Half Maximal Inhibitory Concentration (IC50) |
80 nM
|
High HER2 expression (HER2+++) | ||
| Method Description |
The cytotoxic potential of ADAPT6-ABD-mcDM1 was investigated by incubation of dilution series of the conjugate with cell lines having different HER2-expression levels.
|
||||
| In Vitro Model | Ovarian serous cystadenocarcinoma | SK-OV-3 cells | CVCL_0532 | ||
H3L2-mpeoDM1 [Investigative]
Discovered Using Cell Line-derived Xenograft Model
| Experiment 1 Reporting the Activity Date of This ADC | [33] | ||||
| Efficacy Data | Tumor Growth Inhibition value (TGI) | ≈ 84.38% | Positive DLL4 expression (DLL4 +++/++) | ||
| Method Description |
Drugs were intravenously (i.v.) administered in total three times on days 1, 4 and 7. 5 mg/kg JmD4 was intravenously administered once every three days for three weeks.
|
||||
| In Vivo Model | A549 CDX model | ||||
| In Vitro Model | Lung adenocarcinoma | A-549 cells | CVCL_0023 | ||
| Experiment 2 Reporting the Activity Date of This ADC | [33] | ||||
| Efficacy Data | Tumor Growth Inhibition value (TGI) | ≈ 88.43% | Positive DLL4 expression (DLL4 +++/++) | ||
| Method Description |
Drugs were intravenously (i.v.) administered in total three times on days 1, 4 and 7. 5 mg/kg JmD4 was intravenously administered once every three days for three weeks.
|
||||
| In Vivo Model | MDA-MB-231 CDX model | ||||
| In Vitro Model | Breast adenocarcinoma | MDA-MB-231 cells | CVCL_0062 | ||
Revealed Based on the Cell Line Data
| Experiment 1 Reporting the Activity Date of This ADC | [33] | ||||
| Efficacy Data | Half Maximal Inhibitory Concentration (IC50) |
36.12 nM
|
Positive DLL4 expression (DLL4 +++/++) | ||
| Method Description |
In vitro cytotoxicity and mechanism of anti-DLL4 ADCs. The cytotoxicity of ADCs was assessed by MTT assay. The percentage of cell inhibition relative to untreated control HUVEC cells was calculated for each drug concentration.
|
||||
| In Vitro Model | Normal | HUVEC-C cells | CVCL_2959 | ||
HuFR1-49-SMCC-DM1 [Investigative]
Discovered Using Cell Line-derived Xenograft Model
| Experiment 1 Reporting the Activity Date of This ADC | [29] | ||||
| Efficacy Data | Tumor Growth Inhibition value (TGI) |
85%
|
High FOLR1 expression (FOLR1+++; 4,500,000 FOLR1 molecules/cell) | ||
| Method Description |
Five-week-old female CB-17 severe combined immunodeficient (SCID) mice were obtained and quarantined for 7 days prior to study initiation Mice were inoculated subcutaneously with KB cells (1 x10⁷ cells per mouse) resuspended in serum-free culture mediaMice with established KB xenografts were dosed with a single intravenous injection of 200 g of conjugated maytansinoid per kg, equivalent to 102 mg/kg antibody on day 6 after cell inoculationTumor dimensions were measured twice weekly and volume was calculated as (A B2) 05, where A represents the largest and B the perpendicular tumor diameter.
Click to Show/Hide
|
||||
| In Vivo Model | FRalpha-positive KB CDX model | ||||
| In Vitro Model | Human papillomavirus-related endocervical adenocarcinoma | KB cells | CVCL_0372 | ||
Revealed Based on the Cell Line Data
| Experiment 1 Reporting the Activity Date of This ADC | [29] | ||||
| Efficacy Data | Half Maximal Inhibitory Concentration (IC50) |
0.07±0.01 nM
|
High FOLR1 expression (FOLR1+++; 4,500,000 FOLR1 molecules/cell) | ||
| Method Description |
Dilutions of conjugates or unconjugated maytansinoid in the appropriate culture medium were added to wells of 96-well flat-bottomed plates containing 1 x10³ cells per well The plates were incubated at 37°C, 6% CO2 for either 5 days (continuos exposure) or for 4 hours followed by 5-day incubation in conjugate-free medium (short exposure). Cell viability was determined by the WST-8 assay in accordance with the manufacturer's protocol, and IC50 were generated using a sigmoidal dose-response (variable slope) nonlinear regression curve fit.
Click to Show/Hide
|
||||
| In Vitro Model | Human papillomavirus-related endocervical adenocarcinoma | KB cells | CVCL_0372 | ||
Anti-FGFR2 mAb-12931 SMCC-DM1 [Investigative]
Discovered Using Cell Line-derived Xenograft Model
| Experiment 1 Reporting the Activity Date of This ADC | [20] | ||||
| Efficacy Data | Tumor Growth Inhibition value (TGI) | ≈ 85.56% | Positive FGFR2 expression (FGFR2+++/++) | ||
| Method Description |
The total injection volume containing cells in suspension was 200 ul. Mice were enrolled in the first study eight days post implantation with average tumor volume of 192.9 mm3. After being randomly assigned to one of nine groups (n =8/group), mice were administered PBS or a single 3 mg/kg intravenous (i.v,) injection of one antibody drug conjugates.
Click to Show/Hide
|
||||
| In Vivo Model | SNU-16 CDX model | ||||
| In Vitro Model | Gastric adenocarcinoma | SNU-16 cells | CVCL_0076 | ||
Revealed Based on the Cell Line Data
| Experiment 1 Reporting the Activity Date of This ADC | [20] | ||||
| Efficacy Data | Half Maximal Inhibitory Concentration (IC50) | < 3 nM | Positive FGFR2 expression (FGFR2+++/++) | ||
| Method Description |
Cells were counted and seeded in 96 well plates at densities of 2600-3600 cells/well in 100 ul of cell culture medium, A duplicate plate was generated for a day 0 measurement and all plates were incubated in a tissue culture incubator at 37°C with 5% CO2 overnight. Following this incubation, 50 ul/well of Cell titer Glo reagent was added to the day 0 plates, which were then shaken gently for 10 min and the resulting luminescence intensity was measured.
Click to Show/Hide
|
||||
| In Vitro Model | Down syndrome | KATO III cells | CVCL_0371 | ||
| Experiment 2 Reporting the Activity Date of This ADC | [20] | ||||
| Efficacy Data | Half Maximal Inhibitory Concentration (IC50) | < 3 nM | Positive FGFR2 expression (FGFR2+++/++) | ||
| Method Description |
Cells were counted and seeded in 96 well plates at densities of 2600-3600 cells/well in 100 ul of cell culture medium, A duplicate plate was generated for a day 0 measurement and all plates were incubated in a tissue culture incubator at 37°C with 5% CO2 overnight. Following this incubation, 50 ul/well of Cell titer Glo reagent was added to the day 0 plates, which were then shaken gently for 10 min and the resulting luminescence intensity was measured.
Click to Show/Hide
|
||||
| In Vitro Model | Gastric adenocarcinoma | SNU-16 cells | CVCL_0076 | ||
HuFR1-57-SMCC-DM1 [Investigative]
Discovered Using Cell Line-derived Xenograft Model
| Experiment 1 Reporting the Activity Date of This ADC | [29] | ||||
| Efficacy Data | Tumor Growth Inhibition value (TGI) |
86.67%
|
High FOLR1 expression (FOLR1+++; 4,500,000 FOLR1 molecules/cell) | ||
| Method Description |
Five-week-old female CB-17 severe combined immunodeficient (SCID) mice were obtained and quarantined for 7 days prior to study initiation Mice were inoculated subcutaneously with KB cells (1 x10⁷ cells per mouse) resuspended in serum-free culture mediaMice with established KB xenografts were dosed with a single intravenous injection of 200 g of conjugated maytansinoid per kg, equivalent to 102 mg/kg antibody on day 6 after cell inoculationTumor dimensions were measured twice weekly and volume was calculated as (A B2) 05, where A represents the largest and B the perpendicular tumor diameter.
Click to Show/Hide
|
||||
| In Vivo Model | FRalpha-positive KB CDX model | ||||
| In Vitro Model | Human papillomavirus-related endocervical adenocarcinoma | KB cells | CVCL_0372 | ||
Revealed Based on the Cell Line Data
| Experiment 1 Reporting the Activity Date of This ADC | [29] | ||||
| Efficacy Data | Half Maximal Inhibitory Concentration (IC50) |
0.15±0.02 nM
|
High FOLR1 expression (FOLR1+++; 4,500,000 FOLR1 molecules/cell) | ||
| Method Description |
Dilutions of conjugates or unconjugated maytansinoid in the appropriate culture medium were added to wells of 96-well flat-bottomed plates containing 1 x10³ cells per well The plates were incubated at 37°C, 6% CO2 for either 5 days (continuos exposure) or for 4 hours followed by 5-day incubation in conjugate-free medium (short exposure). Cell viability was determined by the WST-8 assay in accordance with the manufacturer's protocol, and IC50 were generated using a sigmoidal dose-response (variable slope) nonlinear regression curve fit.
Click to Show/Hide
|
||||
| In Vitro Model | Human papillomavirus-related endocervical adenocarcinoma | KB cells | CVCL_0372 | ||
M9346A-CX-DM1 [Investigative]
Discovered Using Cell Line-derived Xenograft Model
| Experiment 1 Reporting the Activity Date of This ADC | [31] | ||||
| Efficacy Data | Tumor Growth Inhibition value (TGI) | ≈ 87.77% | Positive FOLR1 expression (FOLR1 +++/++) | ||
| Method Description |
M9436A-CX-DM1 (200 ug/kg, every seven days x3) induces efficient tumor cell killing in cell line-derived models of KB cells with HER2 expression with high expression.
|
||||
| In Vivo Model | KB CDX model | ||||
| In Vitro Model | Human papillomavirus-related endocervical adenocarcinoma | KB cells | CVCL_0372 | ||
| Experiment 2 Reporting the Activity Date of This ADC | [31] | ||||
| Efficacy Data | Tumor Growth Inhibition value (TGI) | ≈ 88.30% | Positive FOLR1 expression (FOLR1 +++/++) | ||
| Method Description |
M9436A-CX-DM1 (100 ug/kg, every seven days x3) induces efficient tumor cell killing in cell line-derived models of KB cells with HER2 expression with high expression.
|
||||
| In Vivo Model | KB CDX model | ||||
| In Vitro Model | Human papillomavirus-related endocervical adenocarcinoma | KB cells | CVCL_0372 | ||
Revealed Based on the Cell Line Data
| Experiment 1 Reporting the Activity Date of This ADC | [31] | ||||
| Efficacy Data | Half Maximal Inhibitory Concentration (IC50) |
0.07 nM
|
Positive FOLR1 expression (FOLR1 +++/++) | ||
| Method Description |
Cytotoxic IC50 Values (as a Function of [ADC] and [DM1]) for Various M9346A-CX-DM1 ADCs against FR-Expressing KB Cells in the absence of 1 M unconjugated M9346A antibody.
|
||||
| In Vitro Model | Human papillomavirus-related endocervical adenocarcinoma | KB cells | CVCL_0372 | ||
| Experiment 2 Reporting the Activity Date of This ADC | [31] | ||||
| Efficacy Data | Half Maximal Inhibitory Concentration (IC50) |
8 nM
|
Positive FOLR1 expression (FOLR1 +++/++) | ||
| Method Description |
Cytotoxic IC50 Values (as a Function of [ADC] and [DM1]) for Various M9346A-CX-DM1 ADCs against FOLR1-Expressing KB Cells in the presence of 1 M unconjugated M9346A antibody.
|
||||
| In Vitro Model | Human papillomavirus-related endocervical adenocarcinoma | KB cells | CVCL_0372 | ||
Anti-FGFR2 mAb-12947 SMCC-DM1 [Investigative]
Discovered Using Cell Line-derived Xenograft Model
| Experiment 1 Reporting the Activity Date of This ADC | [20] | ||||
| Efficacy Data | Tumor Growth Inhibition value (TGI) | ≈ 90.66% | Positive FGFR2 expression (FGFR2+++/++) | ||
| Method Description |
The total injection volume containing cells in suspension was 200 ul. Mice were enrolled in the first study eight days post implantation with average tumor volume of 192.9 mm3. After being randomly assigned to one of nine groups (n =8/group), mice were administered PBS or a single 3 mg/kg intravenous (i.v,) injection of one antibody drug conjugates.
Click to Show/Hide
|
||||
| In Vivo Model | SNU-16 CDX model | ||||
| In Vitro Model | Gastric adenocarcinoma | SNU-16 cells | CVCL_0076 | ||
Revealed Based on the Cell Line Data
| Experiment 1 Reporting the Activity Date of This ADC | [20] | ||||
| Efficacy Data | Half Maximal Inhibitory Concentration (IC50) | < 3 nM | Positive FGFR2 expression (FGFR2+++/++) | ||
| Method Description |
Cells were counted and seeded in 96 well plates at densities of 2600-3600 cells/well in 100 ul of cell culture medium, A duplicate plate was generated for a day 0 measurement and all plates were incubated in a tissue culture incubator at 37°C with 5% CO2 overnight. Following this incubation, 50 ul/well of Cell titer Glo reagent was added to the day 0 plates, which were then shaken gently for 10 min and the resulting luminescence intensity was measured.
Click to Show/Hide
|
||||
| In Vitro Model | Down syndrome | KATO III cells | CVCL_0371 | ||
| Experiment 2 Reporting the Activity Date of This ADC | [20] | ||||
| Efficacy Data | Half Maximal Inhibitory Concentration (IC50) | < 3 nM | Positive FGFR2 expression (FGFR2+++/++) | ||
| Method Description |
Cells were counted and seeded in 96 well plates at densities of 2600-3600 cells/well in 100 ul of cell culture medium, A duplicate plate was generated for a day 0 measurement and all plates were incubated in a tissue culture incubator at 37°C with 5% CO2 overnight. Following this incubation, 50 ul/well of Cell titer Glo reagent was added to the day 0 plates, which were then shaken gently for 10 min and the resulting luminescence intensity was measured.
Click to Show/Hide
|
||||
| In Vitro Model | Gastric adenocarcinoma | SNU-16 cells | CVCL_0076 | ||
HuMov19-SPP-DM1 [Investigative]
Discovered Using Cell Line-derived Xenograft Model
| Experiment 1 Reporting the Activity Date of This ADC | [34] | ||||
| Efficacy Data | Tumor Growth Inhibition value (TGI) | ≈ 90.72% | Positive FOLR1 expression (FOLR1 +++/++) | ||
| Method Description |
Conjugates of the exemplary anti-FOLR1 antibodies were tested using an established xenograft model of KB cells implanted subcutaneous into SCID mice. Mice were randomized by body weight into treatment groups and treated once on day 6 post cell inoculation with 2.5 mg/kg of one of the conjugates listed above or with PBS only.
|
||||
| In Vivo Model | KB CDX model | ||||
| In Vitro Model | Human papillomavirus-related endocervical adenocarcinoma | KB cells | CVCL_0372 | ||
| Experiment 2 Reporting the Activity Date of This ADC | [34] | ||||
| Efficacy Data | Tumor Growth Inhibition value (TGI) | ≈ 94.09% | Positive FOLR1 expression (FOLR1 +++/++) | ||
| Method Description |
Conjugates of the exemplary anti-FOLR1 antibodies were tested using an established xenograft model of KB cells implanted subcutaneous into SCID mice. Mice were randomized by body weight into treatment groups and treated once on day 6 post cell inoculation with 5 mg/kg of one of the conjugates listed above or with PBS only.
|
||||
| In Vivo Model | KB CDX model | ||||
| In Vitro Model | Human papillomavirus-related endocervical adenocarcinoma | KB cells | CVCL_0372 | ||
| Experiment 3 Reporting the Activity Date of This ADC | [34] | ||||
| Efficacy Data | Half Maximal Inhibitory Concentration (IC50) |
0.1 nM
|
Positive FOLR1 expression (FOLR1 +++/++) | ||
| Method Description |
Conjugate in various concentrations was added to FOLR1-expressing cells in a 96 well plate at 1,000 cells per well in 100 pL in complete RPMI medium.
|
||||
| In Vitro Model | Ovarian endometrioid adenocarcinoma | IGROV-1 cells | CVCL_1304 | ||
| Experiment 4 Reporting the Activity Date of This ADC | [34] | ||||
| Efficacy Data | Half Maximal Inhibitory Concentration (IC50) |
0.1 nM
|
Positive FOLR1 expression (FOLR1 +++/++) | ||
| Method Description |
Conjugate in various concentrations was added to FOLR1-expressing cells in a 96 well plate at 1,000 cells per well in 100 pL in complete RPMI medium.
|
||||
| In Vitro Model | Human papillomavirus-related endocervical adenocarcinoma | KB cells | CVCL_0372 | ||
| Experiment 5 Reporting the Activity Date of This ADC | [34] | ||||
| Efficacy Data | Half Maximal Inhibitory Concentration (IC50) |
0.2 nM
|
Moderate FOLR1 expression (FOLR1 ++) | ||
| Method Description |
Conjugate in various concentrations was added to FOLR1-expressing cells in a 96 well plate at 1,000 cells per well in 100 pL in complete RPMI medium.
|
||||
| In Vitro Model | Gestational choriocarcinoma | JEG-3 cells | CVCL_0363 | ||
M9346A-SPP-DM1 [Investigative]
Discovered Using Cell Line-derived Xenograft Model
| Experiment 1 Reporting the Activity Date of This ADC | [34] | ||||
| Efficacy Data | Tumor Growth Inhibition value (TGI) | ≈ 90.98% | Positive FOLR1 expression (FOLR1 +++/++) | ||
| Method Description |
Conjugates of the exemplary anti-FOLR1 antibodies were tested using an established xenograft model of OVCAR-3 cells implanted subcutaneous into SCID mice. Mice were randomized by body weight into treatment groups and treated once post cell inoculation with 5 mg/kg of one of the conjugates listed above or with PBS only.
|
||||
| In Vivo Model | OVCAR-3 CDX model | ||||
| In Vitro Model | Ovarian serous adenocarcinoma | OVCAR-3 cells | CVCL_0465 | ||
MuDS6-DM1 [Investigative]
Discovered Using Cell Line-derived Xenograft Model
| Experiment 1 Reporting the Activity Date of This ADC | [39] | ||||
| Efficacy Data | Tumor Growth Inhibition value (TGI) | ≈ 94.50% | Positive CA6 expression (CA6 +++/++) | ||
| Method Description |
To demonstrate the in vivo activity of the muDS6-DM1 conjugate,human tumor xenografts were established in SCID mice.A subcutaneous model of the human pancreatic cancer cell-line HPAC was developed. The dose was 27.7 mg/kg qw x2.
|
||||
| In Vivo Model | HPAC CDX model | ||||
| In Vitro Model | Pancreatic adenocarcinoma | HPAC cells | CVCL_3517 | ||
| Experiment 2 Reporting the Activity Date of This ADC | [39] | ||||
| Efficacy Data | Tumor Growth Inhibition value (TGI) | ≈ 100% | Positive CA6 expression (CA6 +++/++) | ||
| Method Description |
To demonstrate the in vivo activity of the muDS6-DM1 conjugate,human tumor xenografts were established in SCID mice.A subcutaneous model of the human cervical cancer cell-line HeLa was developed. The dose was 27.7 mg/kg qw x2.
|
||||
| In Vivo Model | HeLa CDX model | ||||
| In Vitro Model | Endocervical adenocarcinoma | HeLa cells | CVCL_0030 | ||
| Experiment 3 Reporting the Activity Date of This ADC | [39] | ||||
| Efficacy Data | Tumor Growth Inhibition value (TGI) | ≈ 100% | Positive CA6 expression (CA6 +++/++) | ||
| Method Description |
To demonstrate the in vivo activity of the muDS6-DM1 conjugate,human tumor xenografts were established in SCID mice.A subcutaneous model of the human ovarian cancer cell-line TOV-21G was developed. The dose was 27.7 mg/kg qw x2.
|
||||
| In Vivo Model | TOV-21G CDX model | ||||
| In Vitro Model | Ovarian clear cell adenocarcinoma | TOV-21G cells | CVCL_3613 | ||
| Experiment 4 Reporting the Activity Date of This ADC | [39] | ||||
| Efficacy Data | Tumor Growth Inhibition value (TGI) | ≈ 100% | Positive CA6 expression (CA6 +++/++) | ||
| Method Description |
To demonstrate the in vivo activity of the muDS6-DM1 conjugate,human tumor xenografts were established inSCID mice.A subcutaneous model of the human cervicalcarcinoma cell-line KB was developed. The dose was 27.7 mg/kg qw x2.
|
||||
| In Vivo Model | OVCAR-5 CDX model | ||||
| In Vitro Model | Ovarian serous adenocarcinoma | OVCAR-5 cells | CVCL_1628 | ||
| Experiment 5 Reporting the Activity Date of This ADC | [39] | ||||
| Efficacy Data | Tumor Growth Inhibition value (TGI) | ≈ 100% | Positive CA6 expression (CA6 +++/++) | ||
| Method Description |
To demonstrate the in vivo activity of the muDS6-DM1 conjugate,human tumor xenografts were established inSCID mice.A subcutaneous model of the human cervicalcarcinoma cell-line KB was developed. The dose was 250 ug/kg every day for 5 days.
|
||||
| In Vivo Model | KB CDX model | ||||
| In Vitro Model | Human papillomavirus-related endocervical adenocarcinoma | KB cells | CVCL_0372 | ||
| Experiment 6 Reporting the Activity Date of This ADC | [39] | ||||
| Efficacy Data | Tumor Growth Inhibition value (TGI) | ≈ 100% | Positive CA6 expression (CA6 +++/++) | ||
| Method Description |
To demonstrate the in vivo activity of the muDS6-DM1 conjugate,human tumor xenografts were established inSCID mice.A subcutaneous model of the human cervicalcarcinoma cell-line KB was developed. The dose was 150 ug/kg every day for 5 days.
|
||||
| In Vivo Model | KB CDX model | ||||
| In Vitro Model | Human papillomavirus-related endocervical adenocarcinoma | KB cells | CVCL_0372 | ||
Revealed Based on the Cell Line Data
| Experiment 1 Reporting the Activity Date of This ADC | [39] | ||||
| Efficacy Data | Half Maximal Inhibitory Concentration (IC50) |
0.1 nM
|
Positive CA6 expression (CA6 +++/++) | ||
| Method Description |
Clonogenic assays were conducted where cells (1000-2500 cells/well) were plated on6-well plates in 2 ml of conjugate diluted in culture media.The cells were continuously exposed to the conjugate at concentrations,generally between 3x10-11M toseveral 3x10⁻⁹ M,and were incubated in a 37°C,6% CO2, humidified chamber for 5-9 days.
Click to Show/Hide
|
||||
| In Vitro Model | Ductal carcinoma | BT-483 cells | CVCL_2319 | ||
| Experiment 2 Reporting the Activity Date of This ADC | [39] | ||||
| Efficacy Data | Half Maximal Inhibitory Concentration (IC50) |
0.45 nM
|
Positive CA6 expression (CA6 +++/++) | ||
| Method Description |
In the MTT assay, cells were seeded in 96-well plates ata density of 1000-5000 cells/well. The cells were plated with serial dilutions of either naked muDS6 or muDS6-DM1 immunoconjugate in 200 pl of culture media. The cells and antibody/conjugate mixtures were then incubated for 2-7 d, at which time cellviability was assessed by an MTT assay.
|
||||
| In Vitro Model | Invasive breast carcinoma | ZR-75-1 cells | CVCL_0588 | ||
| Experiment 3 Reporting the Activity Date of This ADC | [39] | ||||
| Efficacy Data | Half Maximal Inhibitory Concentration (IC50) |
0.46 nM
|
Positive CA6 expression (CA6 +++/++) | ||
| Method Description |
Clonogenic assays were conducted where cells (1000-2500 cells/well) were plated on6-well plates in 2 ml of conjugate diluted in culture media.The cells were continuously exposed to the conjugate at concentrations,generally between 3x10-11M toseveral 3x10⁻⁹ M,and were incubated in a 37°C,6% CO2, humidified chamber for 5-9 days.
Click to Show/Hide
|
||||
| In Vitro Model | Endocervical adenocarcinoma | WISH cells | CVCL_1909 | ||
| Experiment 4 Reporting the Activity Date of This ADC | [39] | ||||
| Efficacy Data | Half Maximal Inhibitory Concentration (IC50) |
0.67 nM
|
Positive CA6 expression (CA6 +++/++) | ||
| Method Description |
In the MTT assay, cells were seeded in 96-well plates ata density of 1000-5000 cells/well. The cells were plated with serial dilutions of either naked muDS6 or muDS6-DM1 immunoconjugate in 200 pl of culture media. The cells and antibody/conjugate mixtures were then incubated for 2-7 d, at which time cellviability was assessed by an MTT assay.
|
||||
| In Vitro Model | Endocervical adenocarcinoma | WISH cells | CVCL_1909 | ||
| Experiment 5 Reporting the Activity Date of This ADC | [39] | ||||
| Efficacy Data | Half Maximal Inhibitory Concentration (IC50) |
0.8 nM
|
Positive CA6 expression (CA6 +++/++) | ||
| Method Description |
Clonogenic assays were conducted where cells (1000-2500 cells/well) were plated on6-well plates in 2 ml of conjugate diluted in culture media.The cells were continuously exposed to the conjugate at concentrations,generally between 3x10-11M toseveral 3x10⁻⁹ M,and were incubated in a 37°C,6% CO2, humidified chamber for 5-9 days.
Click to Show/Hide
|
||||
| In Vitro Model | Ovarian serous adenocarcinoma | Caov-3 cells | CVCL_0201 | ||
| Experiment 6 Reporting the Activity Date of This ADC | [39] | ||||
| Efficacy Data | Half Maximal Inhibitory Concentration (IC50) |
1.4 nM
|
Positive CA6 expression (CA6 +++/++) | ||
| Method Description |
Clonogenic assays were conducted where cells (1000-2500 cells/well) were plated on6-well plates in 2 ml of conjugate diluted in culture media.The cells were continuously exposed to the conjugate at concentrations,generally between 3x10-11M toseveral 3x10⁻⁹ M,and were incubated in a 37°C,6% CO2, humidified chamber for 5-9 days.
Click to Show/Hide
|
||||
| In Vitro Model | Human papillomavirus-related endocervical adenocarcinoma | KB cells | CVCL_0372 | ||
| Experiment 7 Reporting the Activity Date of This ADC | [39] | ||||
| Efficacy Data | Half Maximal Inhibitory Concentration (IC50) |
1.61 nM
|
Positive CA6 expression (CA6 +++/++) | ||
| Method Description |
In the MTT assay, cells were seeded in 96-well plates ata density of 1000-5000 cells/well. The cells were plated with serial dilutions of either naked muDS6 or muDS6-DM1 immunoconjugate in 200 pl of culture media. The cells and antibody/conjugate mixtures were then incubated for 2-7 d, at which time cellviability was assessed by an MTT assay.
|
||||
| In Vitro Model | Ovarian serous adenocarcinoma | Caov-3 cells | CVCL_0201 | ||
| Experiment 8 Reporting the Activity Date of This ADC | [39] | ||||
| Efficacy Data | Half Maximal Inhibitory Concentration (IC50) |
1.8 nM
|
Positive CA6 expression (CA6 +++/++) | ||
| Method Description |
Clonogenic assays were conducted where cells (1000-2500 cells/well) were plated on6-well plates in 2 ml of conjugate diluted in culture media.The cells were continuously exposed to the conjugate at concentrations,generally between 3x10-11M toseveral 3x10⁻⁹ M,and were incubated in a 37°C,6% CO2, humidified chamber for 5-9 days.
Click to Show/Hide
|
||||
| In Vitro Model | Pancreatic adenocarcinoma | HPAC cells | CVCL_3517 | ||
| Experiment 9 Reporting the Activity Date of This ADC | [39] | ||||
| Efficacy Data | Half Maximal Inhibitory Concentration (IC50) |
1.8 nM
|
Positive CA6 expression (CA6 +++/++) | ||
| Method Description |
Clonogenic assays were conducted where cells (1000-2500 cells/well) were plated on6-well plates in 2 ml of conjugate diluted in culture media.The cells were continuously exposed to the conjugate at concentrations,generally between 3x10-11M toseveral 3x10⁻⁹ M,and were incubated in a 37°C,6% CO2, humidified chamber for 5-9 days.
Click to Show/Hide
|
||||
| In Vitro Model | Endocervical adenocarcinoma | HeLa cells | CVCL_0030 | ||
| Experiment 10 Reporting the Activity Date of This ADC | [39] | ||||
| Efficacy Data | Half Maximal Inhibitory Concentration (IC50) |
1.84 nM
|
Positive CA6 expression (CA6 +++/++) | ||
| Method Description |
In the MTT assay, cells were seeded in 96-well plates ata density of 1000-5000 cells/well. The cells were plated with serial dilutions of either naked muDS6 or muDS6-DM1 immunoconjugate in 200 pl of culture media. The cells and antibody/conjugate mixtures were then incubated for 2-7 d, at which time cellviability was assessed by an MTT assay.
|
||||
| In Vitro Model | Pancreatic adenocarcinoma | HPAC cells | CVCL_3517 | ||
| Experiment 11 Reporting the Activity Date of This ADC | [39] | ||||
| Efficacy Data | Half Maximal Inhibitory Concentration (IC50) |
2 nM
|
Positive CA6 expression (CA6 +++/++) | ||
| Method Description |
Clonogenic assays were conducted where cells (1000-2500 cells/well) were plated on6-well plates in 2 ml of conjugate diluted in culture media.The cells were continuously exposed to the conjugate at concentrations,generally between 3x10-11M toseveral 3x10⁻⁹ M,and were incubated in a 37°C,6% CO2, humidified chamber for 5-9 days.
Click to Show/Hide
|
||||
| In Vitro Model | Ovarian clear cell adenocarcinoma | TOV-21G cells | CVCL_3613 | ||
| Experiment 12 Reporting the Activity Date of This ADC | [39] | ||||
| Efficacy Data | Half Maximal Inhibitory Concentration (IC50) | > 3 nM | Positive CA6 expression (CA6 +++/++) | ||
| Method Description |
Clonogenic assays were conducted where cells (1000-2500 cells/well) were plated on6-well plates in 2 ml of conjugate diluted in culture media.The cells were continuously exposed to the conjugate at concentrations,generally between 3x10-11M toseveral 3x10⁻⁹ M,and were incubated in a 37°C,6% CO2, humidified chamber for 5-9 days.
Click to Show/Hide
|
||||
| In Vitro Model | Invasive breast carcinoma | ZR-75-1 cells | CVCL_0588 | ||
| Experiment 13 Reporting the Activity Date of This ADC | [39] | ||||
| Efficacy Data | Half Maximal Inhibitory Concentration (IC50) | > 3 nM | Positive CA6 expression (CA6 +++/++) | ||
| Method Description |
Clonogenic assays were conducted where cells (1000-2500 cells/well) were plated on6-well plates in 2 ml of conjugate diluted in culture media.The cells were continuously exposed to the conjugate at concentrations,generally between 3x10-11M toseveral 3x10⁻⁹ M,and were incubated in a 37°C,6% CO2, humidified chamber for 5-9 days.
Click to Show/Hide
|
||||
| In Vitro Model | Invasive breast carcinoma | T-47D cells | CVCL_0553 | ||
| Experiment 14 Reporting the Activity Date of This ADC | [39] | ||||
| Efficacy Data | Half Maximal Inhibitory Concentration (IC50) | > 3 nM | Positive CA6 expression (CA6 +++/++) | ||
| Method Description |
Clonogenic assays were conducted where cells (1000-2500 cells/well) were plated on6-well plates in 2 ml of conjugate diluted in culture media.The cells were continuously exposed to the conjugate at concentrations,generally between 3x10-11M toseveral 3x10⁻⁹ M,and were incubated in a 37°C,6% CO2, humidified chamber for 5-9 days.
Click to Show/Hide
|
||||
| In Vitro Model | Ovarian serous adenocarcinoma | OVCAR-5 cells | CVCL_1628 | ||
| Experiment 15 Reporting the Activity Date of This ADC | [39] | ||||
| Efficacy Data | Half Maximal Inhibitory Concentration (IC50) | > 3 nM | Positive CA6 expression (CA6 +++/++) | ||
| Method Description |
Clonogenic assays were conducted where cells (1000-2500 cells/well) were plated on6-well plates in 2 ml of conjugate diluted in culture media.The cells were continuously exposed to the conjugate at concentrations,generally between 3x10-11M toseveral 3x10⁻⁹ M,and were incubated in a 37°C,6% CO2, humidified chamber for 5-9 days.
Click to Show/Hide
|
||||
| In Vitro Model | Pancreatic adenocarcinoma | Hs 766T cells | CVCL_0334 | ||
| Experiment 16 Reporting the Activity Date of This ADC | [39] | ||||
| Efficacy Data | Half Maximal Inhibitory Concentration (IC50) | > 3 nM | Positive CA6 expression (CA6 +++/++) | ||
| Method Description |
Clonogenic assays were conducted where cells (1000-2500 cells/well) were plated on6-well plates in 2 ml of conjugate diluted in culture media.The cells were continuously exposed to the conjugate at concentrations,generally between 3x10-11M toseveral 3x10⁻⁹ M,and were incubated in a 37°C,6% CO2, humidified chamber for 5-9 days.
Click to Show/Hide
|
||||
| In Vitro Model | Pancreatic ductal adenocarcinoma | HPAF-II cells | CVCL_0313 | ||
| Experiment 17 Reporting the Activity Date of This ADC | [39] | ||||
| Efficacy Data | Half Maximal Inhibitory Concentration (IC50) | > 3 nM | Positive CA6 expression (CA6 +++/++) | ||
| Method Description |
Clonogenic assays were conducted where cells (1000-2500 cells/well) were plated on6-well plates in 2 ml of conjugate diluted in culture media.The cells were continuously exposed to the conjugate at concentrations,generally between 3x10-11M toseveral 3x10⁻⁹ M,and were incubated in a 37°C,6% CO2, humidified chamber for 5-9 days.
Click to Show/Hide
|
||||
| In Vitro Model | High grade ovarian serous adenocarcinoma | Caov-4 cells | CVCL_0202 | ||
| Experiment 18 Reporting the Activity Date of This ADC | [39] | ||||
| Efficacy Data | Half Maximal Inhibitory Concentration (IC50) | > 3 nM | Positive CA6 expression (CA6 +++/++) | ||
| Method Description |
Clonogenic assays were conducted where cells (1000-2500 cells/well) were plated on6-well plates in 2 ml of conjugate diluted in culture media.The cells were continuously exposed to the conjugate at concentrations,generally between 3x10-11M toseveral 3x10⁻⁹ M,and were incubated in a 37°C,6% CO2, humidified chamber for 5-9 days.
Click to Show/Hide
|
||||
| In Vitro Model | Invasive breast carcinoma of no special type | BT-20 cells | CVCL_0178 | ||
| Experiment 19 Reporting the Activity Date of This ADC | [39] | ||||
| Efficacy Data | Half Maximal Inhibitory Concentration (IC50) |
3.01 nM
|
Positive CA6 expression (CA6 +++/++) | ||
| Method Description |
In the MTT assay, cells were seeded in 96-well plates ata density of 1000-5000 cells/well. The cells were plated with serial dilutions of either naked muDS6 or muDS6-DM1 immunoconjugate in 200 pl of culture media. The cells and antibody/conjugate mixtures were then incubated for 2-7 d, at which time cellviability was assessed by an MTT assay.
|
||||
| In Vitro Model | Human papillomavirus-related endocervical adenocarcinoma | KB cells | CVCL_0372 | ||
| Experiment 20 Reporting the Activity Date of This ADC | [39] | ||||
| Efficacy Data | Half Maximal Inhibitory Concentration (IC50) |
6.88 nM
|
Positive CA6 expression (CA6 +++/++) | ||
| Method Description |
In the MTT assay, cells were seeded in 96-well plates ata density of 1000-5000 cells/well. The cells were plated with serial dilutions of either naked muDS6 or muDS6-DM1 immunoconjugate in 200 pl of culture media. The cells and antibody/conjugate mixtures were then incubated for 2-7 d, at which time cellviability was assessed by an MTT assay.
|
||||
| In Vitro Model | Ovarian clear cell adenocarcinoma | TOV-21G cells | CVCL_3613 | ||
| Experiment 21 Reporting the Activity Date of This ADC | [39] | ||||
| Efficacy Data | Half Maximal Inhibitory Concentration (IC50) |
10 nM
|
Positive CA6 expression (CA6 +++/++) | ||
| Method Description |
In the MTT assay, cells were seeded in 96-well plates ata density of 1000-5000 cells/well. The cells were plated with serial dilutions of either naked muDS6 or muDS6-DM1 immunoconjugate in 200 pl of culture media. The cells and antibody/conjugate mixtures were then incubated for 2-7 d, at which time cellviability was assessed by an MTT assay.
|
||||
| In Vitro Model | Pancreatic ductal adenocarcinoma | HPAF-II cells | CVCL_0313 | ||
| Experiment 22 Reporting the Activity Date of This ADC | [39] | ||||
| Efficacy Data | Half Maximal Inhibitory Concentration (IC50) |
14.4 nM
|
Positive CA6 expression (CA6 +++/++) | ||
| Method Description |
In the MTT assay, cells were seeded in 96-well plates ata density of 1000-5000 cells/well. The cells were plated with serial dilutions of either naked muDS6 or muDS6-DM1 immunoconjugate in 200 pl of culture media. The cells and antibody/conjugate mixtures were then incubated for 2-7 d, at which time cellviability was assessed by an MTT assay.
|
||||
| In Vitro Model | Invasive breast carcinoma of no special type | BT-20 cells | CVCL_0178 | ||
| Experiment 23 Reporting the Activity Date of This ADC | [39] | ||||
| Efficacy Data | Half Maximal Inhibitory Concentration (IC50) | > 30 nM | Positive CA6 expression (CA6 +++/++) | ||
| Method Description |
In the MTT assay, cells were seeded in 96-well plates ata density of 1000-5000 cells/well. The cells were plated with serial dilutions of either naked muDS6 or muDS6-DM1 immunoconjugate in 200 pl of culture media. The cells and antibody/conjugate mixtures were then incubated for 2-7 d, at which time cellviability was assessed by an MTT assay.
|
||||
| In Vitro Model | Invasive breast carcinoma | T-47D cells | CVCL_0553 | ||
| Experiment 24 Reporting the Activity Date of This ADC | [39] | ||||
| Efficacy Data | Half Maximal Inhibitory Concentration (IC50) | > 30 nM | Positive CA6 expression (CA6 +++/++) | ||
| Method Description |
In the MTT assay, cells were seeded in 96-well plates ata density of 1000-5000 cells/well. The cells were plated with serial dilutions of either naked muDS6 or muDS6-DM1 immunoconjugate in 200 pl of culture media. The cells and antibody/conjugate mixtures were then incubated for 2-7 d, at which time cellviability was assessed by an MTT assay.
|
||||
| In Vitro Model | Endocervical adenocarcinoma | HeLa cells | CVCL_0030 | ||
| Experiment 25 Reporting the Activity Date of This ADC | [39] | ||||
| Efficacy Data | Half Maximal Inhibitory Concentration (IC50) | > 30 nM | Positive CA6 expression (CA6 +++/++) | ||
| Method Description |
In the MTT assay, cells were seeded in 96-well plates ata density of 1000-5000 cells/well. The cells were plated with serial dilutions of either naked muDS6 or muDS6-DM1 immunoconjugate in 200 pl of culture media. The cells and antibody/conjugate mixtures were then incubated for 2-7 d, at which time cellviability was assessed by an MTT assay.
|
||||
| In Vitro Model | High grade ovarian serous adenocarcinoma | Caov-4 cells | CVCL_0202 | ||
| Experiment 26 Reporting the Activity Date of This ADC | [39] | ||||
| Efficacy Data | Half Maximal Inhibitory Concentration (IC50) | > 30 nM | Positive CA6 expression (CA6 +++/++) | ||
| Method Description |
In the MTT assay, cells were seeded in 96-well plates ata density of 1000-5000 cells/well. The cells were plated with serial dilutions of either naked muDS6 or muDS6-DM1 immunoconjugate in 200 pl of culture media. The cells and antibody/conjugate mixtures were then incubated for 2-7 d, at which time cellviability was assessed by an MTT assay.
|
||||
| In Vitro Model | Ductal carcinoma | BT-483 cells | CVCL_2319 | ||
| Experiment 27 Reporting the Activity Date of This ADC | [39] | ||||
| Efficacy Data | Half Maximal Inhibitory Concentration (IC50) |
32 nM
|
Positive CA6 expression (CA6 +++/++) | ||
| Method Description |
In the MTT assay, cells were seeded in 96-well plates ata density of 1000-5000 cells/well. The cells were plated with serial dilutions of either naked muDS6 or muDS6-DM1 immunoconjugate in 200 pl of culture media. The cells and antibody/conjugate mixtures were then incubated for 2-7 d, at which time cellviability was assessed by an MTT assay.
|
||||
| In Vitro Model | Pancreatic adenocarcinoma | Hs 766T cells | CVCL_0334 | ||
| Experiment 28 Reporting the Activity Date of This ADC | [39] | ||||
| Efficacy Data | Half Maximal Inhibitory Concentration (IC50) |
846 nM
|
Positive CA6 expression (CA6 +++/++) | ||
| Method Description |
In the MTT assay, cells were seeded in 96-well plates ata density of 1000-5000 cells/well. The cells were plated with serial dilutions of either naked muDS6 or muDS6-DM1 immunoconjugate in 200 pl of culture media. The cells and antibody/conjugate mixtures were then incubated for 2-7 d, at which time cellviability was assessed by an MTT assay.
|
||||
| In Vitro Model | Ovarian serous adenocarcinoma | OVCAR-5 cells | CVCL_1628 | ||
M9346A-SMCC-DM1 [Investigative]
Discovered Using Cell Line-derived Xenograft Model
| Experiment 1 Reporting the Activity Date of This ADC | [34] | ||||
| Efficacy Data | Tumor Growth Inhibition value (TGI) | ≈ 100% | Positive FOLR1 expression (FOLR1 +++/++) | ||
| Method Description |
Conjugates of the exemplary anti-FOLR1 antibodies were tested using an established xenograft model of OVCAR-3 cells implanted subcutaneous into SCID mice. Mice were randomized by body weight into treatment groups and treated once post cell inoculation with 10 mg/kg of one of the conjugates listed above or with PBS only.
|
||||
| In Vivo Model | OVCAR-3 CDX model | ||||
| In Vitro Model | Ovarian serous adenocarcinoma | OVCAR-3 cells | CVCL_0465 | ||
CAC10-Gly5-MAY [Investigative]
Discovered Using Cell Line-derived Xenograft Model
| Experiment 1 Reporting the Activity Date of This ADC | [40] | ||||
| Efficacy Data | Tumor Growth Inhibition value (TGI) | ≈ 100% | High CD30 expression (CD30+++) | ||
| Method Description |
CD30 Karpas-299 cells were either transplanted subcutaneously into NSG, or into CB17.SCID mice. Mice were treated intravenously 3 times weekly with 1 mg/kg preparations, beginning one day post randomization, when the tumors had reached a size ranging between 100 and 150 mm3.
|
||||
| In Vivo Model | Non-Hodgkin's lymphoma CDX model | ||||
| In Vitro Model | ALK-positive anaplastic large cell lymphoma | Karpas-299 cells | CVCL_1324 | ||
| Experiment 2 Reporting the Activity Date of This ADC | [40] | ||||
| Efficacy Data | Tumor Growth Inhibition value (TGI) | ≈ 100% | High CD30 expression (CD30+++) | ||
| Method Description |
CD30 Karpas-299 cells were either transplanted subcutaneously into NSG, or into CB17.SCID mice. Mice were treated intravenously 3 times weekly with 10 mg/kg ADC preparations, beginning one day post randomization, when the tumors had reached a size ranging between 100 and 150 mm3.
|
||||
| In Vivo Model | Non-Hodgkin's lymphoma CDX model | ||||
| In Vitro Model | ALK-positive anaplastic large cell lymphoma | Karpas-299 cells | CVCL_1324 | ||
Revealed Based on the Cell Line Data
| Experiment 1 Reporting the Activity Date of This ADC | [40] | ||||
| Efficacy Data | Half Maximal Inhibitory Concentration (IC50) |
4.7 ng/mL
|
High CD30 expression (CD30+++) | ||
| Method Description |
Briefly, cells were plated on 96-well plates in 75 uL growth medium and grown at 37°C in a humidified incubator in a 7.5% CO2 atmosphere. After one day incubation, 25 uL of 3.5-fold serial dilutions of each ADC in growth medium were added, typically resulting in final ADC concentrations from 20 ug/mL to 0.02 ng/mL.
|
||||
| In Vitro Model | ALK-positive anaplastic large cell lymphoma | Karpas-299 cells | CVCL_1324 | ||
Trastuzumab-AJICAP-maytansinoid [Investigative]
Discovered Using Cell Line-derived Xenograft Model
| Experiment 1 Reporting the Activity Date of This ADC | [41] | ||||
| Efficacy Data | Minimal Effective Dose (MED) | < 5 mg/kg | High HER2 expression (HER2+++) | ||
| Method Description |
Following the acclimatization period (1 week), the animals were stratified by body weight and randomly assigned to the following group: three trastuzumab-AJICAP-maytansinoid groups, treated with 20 mg/kg, 60 mg/kg, and 120 mg/kg. Each group consisted of five animals for blood chemistry test as well as five animals for clinical signs and body weight measurements.
Click to Show/Hide
|
||||
| In Vivo Model | Gastric cancer CDX model | ||||
| In Vitro Model | Gastric tubular adenocarcinoma | NCI-N87 cells | CVCL_1603 | ||
| Experiment 2 Reporting the Activity Date of This ADC | [41] | ||||
| Efficacy Data | Maximum Tolerated Dose (MTD) | > 120 mg/kg | High HER2 expression (HER2+++) | ||
| Method Description |
Following the acclimatization period (1 week), the animals were stratified by body weight and randomly assigned to the following group: three trastuzumab-AJICAP-maytansinoid groups, treated with 20 mg/kg, 60 mg/kg, and 120 mg/kg. Each group consisted of five animals for blood chemistry test as well as five animals for clinical signs and body weight measurements.
Click to Show/Hide
|
||||
| In Vivo Model | Gastric cancer CDX model | ||||
| In Vitro Model | Gastric tubular adenocarcinoma | NCI-N87 cells | CVCL_1603 | ||
FR1-48-SMCC-DM1 [Investigative]
Discovered Using Cell Line-derived Xenograft Model
| Experiment 1 Reporting the Activity Date of This ADC | [34] | ||||
| Efficacy Data | Half Maximal Inhibitory Concentration (IC50) |
0.05 nM
|
Positive FOLR1 expression (FOLR1 +++/++) | ||
| Method Description |
Conjugate in various concentrations was added to FOLR1-expressing cells in a 96 well plate at 1,000 cells per well in 100 pL in complete RPMI medium.
|
||||
| In Vitro Model | Human papillomavirus-related endocervical adenocarcinoma | KB cells | CVCL_0372 | ||
FR1-65-SMCC-DM1 [Investigative]
Discovered Using Cell Line-derived Xenograft Model
| Experiment 1 Reporting the Activity Date of This ADC | [34] | ||||
| Efficacy Data | Half Maximal Inhibitory Concentration (IC50) |
0.1 nM
|
Positive FOLR1 expression (FOLR1 +++/++) | ||
| Method Description |
Conjugate in various concentrations was added to FOLR1-expressing cells in a 96 well plate at 1,000 cells per well in 100 pL in complete RPMI medium.
|
||||
| In Vitro Model | Human papillomavirus-related endocervical adenocarcinoma | KB cells | CVCL_0372 | ||
FR1-57-SMCC-DM1 [Investigative]
Discovered Using Cell Line-derived Xenograft Model
| Experiment 1 Reporting the Activity Date of This ADC | [34] | ||||
| Efficacy Data | Half Maximal Inhibitory Concentration (IC50) |
0.1 nM
|
Positive FOLR1 expression (FOLR1 +++/++) | ||
| Method Description |
Conjugate in various concentrations was added to FOLR1-expressing cells in a 96 well plate at 1,000 cells per well in 100 pL in complete RPMI medium.
|
||||
| In Vitro Model | Human papillomavirus-related endocervical adenocarcinoma | KB cells | CVCL_0372 | ||
FR1-49-SMCC-DM1 [Investigative]
Discovered Using Cell Line-derived Xenograft Model
| Experiment 1 Reporting the Activity Date of This ADC | [34] | ||||
| Efficacy Data | Half Maximal Inhibitory Concentration (IC50) |
0.1 nM
|
Positive FOLR1 expression (FOLR1 +++/++) | ||
| Method Description |
Conjugate in various concentrations was added to FOLR1-expressing cells in a 96 well plate at 1,000 cells per well in 100 pL in complete RPMI medium.
|
||||
| In Vitro Model | Human papillomavirus-related endocervical adenocarcinoma | KB cells | CVCL_0372 | ||
Anti-KIT 9P3-CX1-1-DM1 [Investigative]
Revealed Based on the Cell Line Data
| Experiment 1 Reporting the Activity Date of This ADC | [27] | ||||
| Efficacy Data | Max inhibition rate (MIR) |
95 nM
|
Positive KIT expression (KIT+++/++) | ||
| Method Description |
Cells were cultured in a tissue culture incubator at 37°C with 5% CO2 in culture medium. On the day of the assay, cells were washed twice with PBS, prior to being treated with 0.1% trypsin-EDTA for 5 min and resuspended in the recommended culture medium. Cells were then counted and seeded in 96 well plates at densities of 2,000-10,000 cells/well in 100 ul of cell culture medium.
Click to Show/Hide
|
||||
| In Vitro Model | Erythroleukemia | HEL 92.1.7 cells | CVCL_2481 | ||
| Experiment 2 Reporting the Activity Date of This ADC | [27] | ||||
| Efficacy Data | Max inhibition rate (MIR) |
55%
|
Positive KIT expression (KIT+++/++) | ||
| Method Description |
Cells were cultured in a tissue culture incubator at 37°C with 5% CO2 in culture medium. On the day of the assay, cells were washed twice with PBS, prior to being treated with 0.1% trypsin-EDTA for 5 min and resuspended in the recommended culture medium. Cells were then counted and seeded in 96 well plates at densities of 2,000-10,000 cells/well in 100 ul of cell culture medium.
Click to Show/Hide
|
||||
| In Vitro Model | Gastrointestinal stromal tumor | GIST430 cells | CVCL_7040 | ||
| Experiment 3 Reporting the Activity Date of This ADC | [27] | ||||
| Efficacy Data | Max inhibition rate (MIR) |
100%
|
Positive KIT expression (KIT+++/++) | ||
| Method Description |
Cells were cultured in a tissue culture incubator at 37°C with 5% CO2 in culture medium. On the day of the assay, cells were washed twice with PBS, prior to being treated with 0.1% trypsin-EDTA for 5 min and resuspended in the recommended culture medium. Cells were then counted and seeded in 96 well plates at densities of 2,000-10,000 cells/well in 100 ul of cell culture medium.
Click to Show/Hide
|
||||
| In Vitro Model | Lung small cell carcinoma | NCI-H1048 cells | CVCL_1453 | ||
| Experiment 4 Reporting the Activity Date of This ADC | [27] | ||||
| Efficacy Data | Max inhibition rate (MIR) |
100%
|
Positive KIT expression (KIT+++/++) | ||
| Method Description |
Cells were cultured in a tissue culture incubator at 37°C with 5% CO2 in culture medium. On the day of the assay, cells were washed twice with PBS, prior to being treated with 0.1% trypsin-EDTA for 5 min and resuspended in the recommended culture medium. Cells were then counted and seeded in 96 well plates at densities of 2,000-10,000 cells/well in 100 ul of cell culture medium.
Click to Show/Hide
|
||||
| In Vitro Model | Adult acute myeloid leukemia | SKNO-1 cells | CVCL_2196 | ||
| Experiment 5 Reporting the Activity Date of This ADC | [27] | ||||
| Efficacy Data | Max inhibition rate (MIR) |
100%
|
Positive KIT expression (KIT+++/++) | ||
| Method Description |
Cells were cultured in a tissue culture incubator at 37°C with 5% CO2 in culture medium. On the day of the assay, cells were washed twice with PBS, prior to being treated with 0.1% trypsin-EDTA for 5 min and resuspended in the recommended culture medium. Cells were then counted and seeded in 96 well plates at densities of 2,000-10,000 cells/well in 100 ul of cell culture medium.
Click to Show/Hide
|
||||
| In Vitro Model | Myeloid leukemia with maturation | Kasumi-1 cells | CVCL_0589 | ||
| Experiment 6 Reporting the Activity Date of This ADC | [27] | ||||
| Efficacy Data | Half Maximum Growth Inhibitory Concentration (GI50) |
0.02 nM
|
Positive KIT expression (KIT+++/++) | ||
| Method Description |
Cells were cultured in a tissue culture incubator at 37°C with 5% CO2 in culture medium. On the day of the assay, cells were washed twice with PBS, prior to being treated with 0.1% trypsin-EDTA for 5 min and resuspended in the recommended culture medium. Cells were then counted and seeded in 96 well plates at densities of 2,000-10,000 cells/well in 100 ul of cell culture medium.
Click to Show/Hide
|
||||
| In Vitro Model | Myeloid leukemia with maturation | Kasumi-1 cells | CVCL_0589 | ||
| Experiment 7 Reporting the Activity Date of This ADC | [27] | ||||
| Efficacy Data | Half Maximum Growth Inhibitory Concentration (GI50) |
0.04 nM
|
Positive KIT expression (KIT+++/++) | ||
| Method Description |
Cells were cultured in a tissue culture incubator at 37°C with 5% CO2 in culture medium. On the day of the assay, cells were washed twice with PBS, prior to being treated with 0.1% trypsin-EDTA for 5 min and resuspended in the recommended culture medium. Cells were then counted and seeded in 96 well plates at densities of 2,000-10,000 cells/well in 100 ul of cell culture medium.
Click to Show/Hide
|
||||
| In Vitro Model | Gastrointestinal stromal tumor | GIST430 cells | CVCL_7040 | ||
| Experiment 8 Reporting the Activity Date of This ADC | [27] | ||||
| Efficacy Data | Half Maximum Growth Inhibitory Concentration (GI50) |
1.45 nM
|
Positive KIT expression (KIT+++/++) | ||
| Method Description |
Cells were cultured in a tissue culture incubator at 37°C with 5% CO2 in culture medium. On the day of the assay, cells were washed twice with PBS, prior to being treated with 0.1% trypsin-EDTA for 5 min and resuspended in the recommended culture medium. Cells were then counted and seeded in 96 well plates at densities of 2,000-10,000 cells/well in 100 ul of cell culture medium.
Click to Show/Hide
|
||||
| In Vitro Model | Lung small cell carcinoma | NCI-H1048 cells | CVCL_1453 | ||
| Experiment 9 Reporting the Activity Date of This ADC | [27] | ||||
| Efficacy Data | Half Maximum Growth Inhibitory Concentration (GI50) |
5.2 nM
|
Positive KIT expression (KIT+++/++) | ||
| Method Description |
Cells were cultured in a tissue culture incubator at 37°C with 5% CO2 in culture medium. On the day of the assay, cells were washed twice with PBS, prior to being treated with 0.1% trypsin-EDTA for 5 min and resuspended in the recommended culture medium. Cells were then counted and seeded in 96 well plates at densities of 2,000-10,000 cells/well in 100 ul of cell culture medium.
Click to Show/Hide
|
||||
| In Vitro Model | Adult acute myeloid leukemia | SKNO-1 cells | CVCL_2196 | ||
| Experiment 10 Reporting the Activity Date of This ADC | [27] | ||||
| Efficacy Data | Half Maximum Growth Inhibitory Concentration (GI50) |
7.6 nM
|
Positive KIT expression (KIT+++/++) | ||
| Method Description |
Cells were cultured in a tissue culture incubator at 37°C with 5% CO2 in culture medium. On the day of the assay, cells were washed twice with PBS, prior to being treated with 0.1% trypsin-EDTA for 5 min and resuspended in the recommended culture medium. Cells were then counted and seeded in 96 well plates at densities of 2,000-10,000 cells/well in 100 ul of cell culture medium.
Click to Show/Hide
|
||||
| In Vitro Model | Erythroleukemia | HEL 92.1.7 cells | CVCL_2481 | ||
T-DM1-2.6 [Investigative]
Revealed Based on the Cell Line Data
| Experiment 1 Reporting the Activity Date of This ADC | [42] | ||||
| Efficacy Data | Half Maximal Inhibitory Concentration (IC50) |
0.04 nM
|
Positive HER2 expression (HER2+++/++) | ||
| Method Description |
Cells were cultured in a 10% fetal bovine serum (FBS)-containing RPMI 1640 medium and were planted into 96-well plates with 6000 cells per well. The plates were incubated overnight at 37°C in a 5% CO2 cell incubator.
|
||||
| In Vitro Model | Breast adenocarcinoma | SK-BR-3 cells | CVCL_0033 | ||
| Experiment 2 Reporting the Activity Date of This ADC | [42] | ||||
| Efficacy Data | Half Maximal Inhibitory Concentration (IC50) |
1.05 nM
|
Positive HER2 expression (HER2+++/++) | ||
| Method Description |
Cells were cultured in a 10% fetal bovine serum (FBS)-containing RPMI 1640 medium and were planted into 96-well plates with 6000 cells per well. The plates were incubated overnight at 37°C in a 5% CO2 cell incubator.
|
||||
| In Vitro Model | Gastric tubular adenocarcinoma | NCI-N87 cells | CVCL_1603 | ||
| Experiment 3 Reporting the Activity Date of This ADC | [42] | ||||
| Efficacy Data | Half Maximal Inhibitory Concentration (IC50) | > 66 nM | Negative HER2 expression (HER2 -) | ||
| Method Description |
Cells were cultured in a 10% fetal bovine serum (FBS)-containing RPMI 1640 medium and were planted into 96-well plates with 6000 cells per well. The plates were incubated overnight at 37°C in a 5% CO2 cell incubator.
|
||||
| In Vitro Model | Breast adenocarcinoma | MDA-MB-231 cells | CVCL_0062 | ||
H32-DM1_3.8 [Investigative]
Revealed Based on the Cell Line Data
| Experiment 1 Reporting the Activity Date of This ADC | [43] | ||||
| Efficacy Data | Half Maximal Inhibitory Concentration (IC50) |
0.05 nM
|
High HER2 expression (HER2 +++) | ||
| Method Description |
To determine the IC50 values of the ADCs, different concentrations of each conjugate was directly added to the culture medium. After the cells were cultured for 3 days at 37°C, the number of viable cells was quantified by using the WST- reagent, and the absorbance was measured at OD450.
|
||||
| In Vitro Model | Breast adenocarcinoma | SK-BR-3 cells | CVCL_0033 | ||
| Experiment 2 Reporting the Activity Date of This ADC | [43] | ||||
| Efficacy Data | Half Maximal Inhibitory Concentration (IC50) |
0.54 nM
|
High HER2 expression (HER2 +++) | ||
| Method Description |
To determine the IC50 values of the ADCs, different concentrations of each conjugate was directly added to the culture medium. After the cells were cultured for 3 days at 37°C, the number of viable cells was quantified by using the WST- reagent, and the absorbance was measured at OD450.
|
||||
| In Vitro Model | Invasive breast carcinoma | BT-474 cells | CVCL_0179 | ||
| Experiment 3 Reporting the Activity Date of This ADC | [43] | ||||
| Efficacy Data | Half Maximal Inhibitory Concentration (IC50) |
0.76 nM
|
High HER2 expression (HER2 +++) | ||
| Method Description |
To determine the IC50 values of the ADCs, different concentrations of each conjugate was directly added to the culture medium. After the cells were cultured for 3 days at 37°C, the number of viable cells was quantified by using the WST- reagent, and the absorbance was measured at OD450.
|
||||
| In Vitro Model | Gastric tubular adenocarcinoma | NCI-N87 cells | CVCL_1603 | ||
H32-DM1_3.3 [Investigative]
Revealed Based on the Cell Line Data
| Experiment 1 Reporting the Activity Date of This ADC | [43] | ||||
| Efficacy Data | Half Maximal Inhibitory Concentration (IC50) |
0.05 nM
|
High HER2 expression (HER2 +++) | ||
| Method Description |
To determine the IC50 values of the ADCs, different concentrations of each conjugate was directly added to the culture medium. After the cells were cultured for 3 days at 37°C, the number of viable cells was quantified by using the WST- reagent, and the absorbance was measured at OD450.
|
||||
| In Vitro Model | Breast adenocarcinoma | SK-BR-3 cells | CVCL_0033 | ||
| Experiment 2 Reporting the Activity Date of This ADC | [43] | ||||
| Efficacy Data | Half Maximal Inhibitory Concentration (IC50) |
0.65 nM
|
High HER2 expression (HER2 +++) | ||
| Method Description |
To determine the IC50 values of the ADCs, different concentrations of each conjugate was directly added to the culture medium. After the cells were cultured for 3 days at 37°C, the number of viable cells was quantified by using the WST- reagent, and the absorbance was measured at OD450.
|
||||
| In Vitro Model | Invasive breast carcinoma | BT-474 cells | CVCL_0179 | ||
| Experiment 3 Reporting the Activity Date of This ADC | [43] | ||||
| Efficacy Data | Half Maximal Inhibitory Concentration (IC50) |
0.65 nM
|
High HER2 expression (HER2 +++) | ||
| Method Description |
To determine the IC50 values of the ADCs, different concentrations of each conjugate was directly added to the culture medium. After the cells were cultured for 3 days at 37°C, the number of viable cells was quantified by using the WST- reagent, and the absorbance was measured at OD450.
|
||||
| In Vitro Model | Gastric tubular adenocarcinoma | NCI-N87 cells | CVCL_1603 | ||
H32-DM1_3.7 [Investigative]
Revealed Based on the Cell Line Data
| Experiment 1 Reporting the Activity Date of This ADC | [43] | ||||
| Efficacy Data | Half Maximal Inhibitory Concentration (IC50) |
0.06 nM
|
High HER2 expression (HER2 +++) | ||
| Method Description |
To determine the IC50 values of the ADCs, different concentrations of each conjugate was directly added to the culture medium. After the cells were cultured for 3 days at 37°C, the number of viable cells was quantified by using the WST- reagent, and the absorbance was measured at OD450.
|
||||
| In Vitro Model | Breast adenocarcinoma | SK-BR-3 cells | CVCL_0033 | ||
| Experiment 2 Reporting the Activity Date of This ADC | [43] | ||||
| Efficacy Data | Half Maximal Inhibitory Concentration (IC50) |
0.75 nM
|
High HER2 expression (HER2 +++) | ||
| Method Description |
To determine the IC50 values of the ADCs, different concentrations of each conjugate was directly added to the culture medium. After the cells were cultured for 3 days at 37°C, the number of viable cells was quantified by using the WST- reagent, and the absorbance was measured at OD450.
|
||||
| In Vitro Model | Gastric tubular adenocarcinoma | NCI-N87 cells | CVCL_1603 | ||
| Experiment 3 Reporting the Activity Date of This ADC | [43] | ||||
| Efficacy Data | Half Maximal Inhibitory Concentration (IC50) |
0.79 nM
|
High HER2 expression (HER2 +++) | ||
| Method Description |
To determine the IC50 values of the ADCs, different concentrations of each conjugate was directly added to the culture medium. After the cells were cultured for 3 days at 37°C, the number of viable cells was quantified by using the WST- reagent, and the absorbance was measured at OD450.
|
||||
| In Vitro Model | Invasive breast carcinoma | BT-474 cells | CVCL_0179 | ||
H32-DM1_3.0 [Investigative]
Revealed Based on the Cell Line Data
| Experiment 1 Reporting the Activity Date of This ADC | [43] | ||||
| Efficacy Data | Half Maximal Inhibitory Concentration (IC50) |
0.08 nM
|
High HER2 expression (HER2 +++) | ||
| Method Description |
To determine the IC50 values of the ADCs, different concentrations of each conjugate was directly added to the culture medium. After the cells were cultured for 3 days at 37°C, the number of viable cells was quantified by using the WST- reagent, and the absorbance was measured at OD450.
|
||||
| In Vitro Model | Breast adenocarcinoma | SK-BR-3 cells | CVCL_0033 | ||
| Experiment 2 Reporting the Activity Date of This ADC | [43] | ||||
| Efficacy Data | Half Maximal Inhibitory Concentration (IC50) |
0.77 nM
|
High HER2 expression (HER2 +++) | ||
| Method Description |
To determine the IC50 values of the ADCs, different concentrations of each conjugate was directly added to the culture medium. After the cells were cultured for 3 days at 37°C, the number of viable cells was quantified by using the WST- reagent, and the absorbance was measured at OD450.
|
||||
| In Vitro Model | Invasive breast carcinoma | BT-474 cells | CVCL_0179 | ||
| Experiment 3 Reporting the Activity Date of This ADC | [43] | ||||
| Efficacy Data | Half Maximal Inhibitory Concentration (IC50) |
0.84 nM
|
High HER2 expression (HER2 +++) | ||
| Method Description |
To determine the IC50 values of the ADCs, different concentrations of each conjugate was directly added to the culture medium. After the cells were cultured for 3 days at 37°C, the number of viable cells was quantified by using the WST- reagent, and the absorbance was measured at OD450.
|
||||
| In Vitro Model | Gastric tubular adenocarcinoma | NCI-N87 cells | CVCL_1603 | ||
HuMov19-PEG4-Mal-DM1 [Investigative]
Revealed Based on the Cell Line Data
| Experiment 1 Reporting the Activity Date of This ADC | [34] | ||||
| Efficacy Data | Half Maximal Inhibitory Concentration (IC50) |
0.1 nM
|
Positive FOLR1 expression (FOLR1 +++/++) | ||
| Method Description |
A PEG4-mal-DM4 conjugate in various concentrations was added to FOLR1-expressing KB cells in a 96 well plate at 1,000 cells per well in 100 pL in complete RPMI medium.
|
||||
| In Vitro Model | Human papillomavirus-related endocervical adenocarcinoma | KB cells | CVCL_0372 | ||
| Experiment 2 Reporting the Activity Date of This ADC | [34] | ||||
| Efficacy Data | Half Maximal Inhibitory Concentration (IC50) |
0.1 nM
|
Positive FOLR1 expression (FOLR1 +++/++) | ||
| Method Description |
A PEG4-mal-DM4 conjugate in various concentrations was added to FOLR1-expressing KB cells in a 96 well plate at 1,000 cells per well in 100 pL in complete RPMI medium.
|
||||
| In Vitro Model | Human papillomavirus-related endocervical adenocarcinoma | KB cells | CVCL_0372 | ||
M9346A-4d-Cxxx-Mal-CX-DM1 [Investigative]
Revealed Based on the Cell Line Data
| Experiment 1 Reporting the Activity Date of This ADC | [31] | ||||
| Efficacy Data | Half Maximal Inhibitory Concentration (IC50) |
0.15 nM
|
Positive FOLR1 expression (FOLR1 +++/++) | ||
| Method Description |
Cytotoxic IC50 Values (as a Function of [ADC] and [DM1]) for Various M9346A-CX-DM1 ADCs against FR-Expressing KB Cells in the absence of 1 M unconjugated M9346A antibody.
|
||||
| In Vitro Model | Human papillomavirus-related endocervical adenocarcinoma | KB cells | CVCL_0372 | ||
| Experiment 2 Reporting the Activity Date of This ADC | [31] | ||||
| Efficacy Data | Half Maximal Inhibitory Concentration (IC50) |
5 nM
|
Positive FOLR1 expression (FOLR1 +++/++) | ||
| Method Description |
Cytotoxic IC50 Values (as a Function of [ADC] and [DM1]) for Various M9346A-CX-DM1 ADCs against FOLR1-Expressing KB Cells in the presence of 1 M unconjugated M9346A antibody.
|
||||
| In Vitro Model | Human papillomavirus-related endocervical adenocarcinoma | KB cells | CVCL_0372 | ||
M9346A-4c-Cxxx-Mal-CX-DM1 [Investigative]
Revealed Based on the Cell Line Data
| Experiment 1 Reporting the Activity Date of This ADC | [31] | ||||
| Efficacy Data | Half Maximal Inhibitory Concentration (IC50) |
0.15 nM
|
Positive FOLR1 expression (FOLR1 +++/++) | ||
| Method Description |
Cytotoxic IC50 Values (as a Function of [ADC] and [DM1]) for Various M9346A-CX-DM1 ADCs against FR-Expressing KB Cells in the absence of 1 M unconjugated M9346A antibody.
|
||||
| In Vitro Model | Human papillomavirus-related endocervical adenocarcinoma | KB cells | CVCL_0372 | ||
| Experiment 2 Reporting the Activity Date of This ADC | [31] | ||||
| Efficacy Data | Half Maximal Inhibitory Concentration (IC50) |
5 nM
|
Positive FOLR1 expression (FOLR1 +++/++) | ||
| Method Description |
Cytotoxic IC50 Values (as a Function of [ADC] and [DM1]) for Various M9346A-CX-DM1 ADCs against FOLR1-Expressing KB Cells in the presence of 1 M unconjugated M9346A antibody.
|
||||
| In Vitro Model | Human papillomavirus-related endocervical adenocarcinoma | KB cells | CVCL_0372 | ||
5E3-emtansine [Investigative]
Revealed Based on the Cell Line Data
| Experiment 1 Reporting the Activity Date of This ADC | [45] | ||||
| Efficacy Data | Half Maximal Inhibitory Concentration (IC50) |
0.21 nM
|
Positive SEMA4A expression (SEMA4A +++/++) | ||
| Method Description |
Cells were seeded at 5000 per well in a 96-well plate in complete RPMI 1640. Antibody-ZAP complexes (Advanced Targeting Systems; produced according to manufacturer's instructions) or ADCs were added to the cells and plates incubated for 72 hours and 5% carbon dioxide.
|
||||
| In Vitro Model | Plasma cell myeloma | MM1.S cells | CVCL_8792 | ||
| Experiment 2 Reporting the Activity Date of This ADC | [45] | ||||
| Efficacy Data | Half Maximal Inhibitory Concentration (IC50) |
0.42 nM
|
Positive SEMA4A expression (SEMA4A +++/++) | ||
| Method Description |
Cells were seeded at 5000 per well in a 96-well plate in complete RPMI 1640. Antibody-ZAP complexes (Advanced Targeting Systems; produced according to manufacturer's instructions) or ADCs were added to the cells and plates incubated for 72 hours and 5% carbon dioxide.
|
||||
| In Vitro Model | Plasma cell myeloma | NCI-H929 cells | CVCL_1600 | ||
| Experiment 3 Reporting the Activity Date of This ADC | [45] | ||||
| Efficacy Data | Half Maximal Inhibitory Concentration (IC50) |
1.3 nM
|
Positive SEMA4A expression (SEMA4A +++/++) | ||
| Method Description |
Cells were seeded at 5000 per well in a 96-well plate in complete RPMI 1640. Antibody-ZAP complexes (Advanced Targeting Systems; produced according to manufacturer's instructions) or ADCs were added to the cells and plates incubated for 72 hours and 5% carbon dioxide.
|
||||
| In Vitro Model | Plasma cell myeloma | INA-6 cells | CVCL_5209 | ||
| Experiment 4 Reporting the Activity Date of This ADC | [45] | ||||
| Efficacy Data | Half Maximal Inhibitory Concentration (IC50) |
1.8 nM
|
Positive SEMA4A expression (SEMA4A +++/++) | ||
| Method Description |
Cells were seeded at 5000 per well in a 96-well plate in complete RPMI 1640. Antibody-ZAP complexes (Advanced Targeting Systems; produced according to manufacturer's instructions) or ADCs were added to the cells and plates incubated for 72 hours and 5% carbon dioxide.
|
||||
| In Vitro Model | Plasma cell myeloma | OCI-My7 cells | CVCL_E333 | ||
| Experiment 5 Reporting the Activity Date of This ADC | [45] | ||||
| Efficacy Data | Half Maximal Inhibitory Concentration (IC50) |
9.9 nM
|
Positive SEMA4A expression (SEMA4A +++/++) | ||
| Method Description |
Cells were seeded at 5000 per well in a 96-well plate in complete RPMI 1640. Antibody-ZAP complexes (Advanced Targeting Systems; produced according to manufacturer's instructions) or ADCs were added to the cells and plates incubated for 72 hours and 5% carbon dioxide.
|
||||
| In Vitro Model | Plasma cell myeloma | OCI-My5 cells | CVCL_E332 | ||
| Experiment 6 Reporting the Activity Date of This ADC | [45] | ||||
| Efficacy Data | Half Maximal Inhibitory Concentration (IC50) |
12.9 nM
|
Positive SEMA4A expression (SEMA4A +++/++) | ||
| Method Description |
Cells were seeded at 5000 per well in a 96-well plate in complete RPMI 1640. Antibody-ZAP complexes (Advanced Targeting Systems; produced according to manufacturer's instructions) or ADCs were added to the cells and plates incubated for 72 hours and 5% carbon dioxide.
|
||||
| In Vitro Model | Plasma cell myeloma | KMS-12-BM cells | CVCL_1334 | ||
| Experiment 7 Reporting the Activity Date of This ADC | [45] | ||||
| Efficacy Data | Half Maximal Inhibitory Concentration (IC50) |
16.9 nM
|
Positive SEMA4A expression (SEMA4A +++/++) | ||
| Method Description |
Cells were seeded at 5000 per well in a 96-well plate in complete RPMI 1640. Antibody-ZAP complexes (Advanced Targeting Systems; produced according to manufacturer's instructions) or ADCs were added to the cells and plates incubated for 72 hours and 5% carbon dioxide.
|
||||
| In Vitro Model | Multiple myeloma | SK-MM-1 cells | CVCL_A478 | ||
| Experiment 8 Reporting the Activity Date of This ADC | [45] | ||||
| Efficacy Data | Half Maximal Inhibitory Concentration (IC50) |
35.3 nM
|
Positive SEMA4A expression (SEMA4A +++/++) | ||
| Method Description |
Cells were seeded at 5000 per well in a 96-well plate in complete RPMI 1640. Antibody-ZAP complexes (Advanced Targeting Systems; produced according to manufacturer's instructions) or ADCs were added to the cells and plates incubated for 72 hours and 5% carbon dioxide.
|
||||
| In Vitro Model | Plasma cell myeloma | OPM-2 cells | CVCL_1625 | ||
| Experiment 9 Reporting the Activity Date of This ADC | [45] | ||||
| Efficacy Data | Half Maximal Inhibitory Concentration (IC50) |
37 nM
|
Positive SEMA4A expression (SEMA4A +++/++) | ||
| Method Description |
Cells were seeded at 5000 per well in a 96-well plate in complete RPMI 1640. Antibody-ZAP complexes (Advanced Targeting Systems; produced according to manufacturer's instructions) or ADCs were added to the cells and plates incubated for 72 hours and 5% carbon dioxide.
|
||||
| In Vitro Model | Plasma cell myeloma | JIM3 cells | CVCL_2533 | ||
| Experiment 10 Reporting the Activity Date of This ADC | [45] | ||||
| Efficacy Data | Half Maximal Inhibitory Concentration (IC50) |
39.6 nM
|
Positive SEMA4A expression (SEMA4A +++/++) | ||
| Method Description |
Cells were seeded at 5000 per well in a 96-well plate in complete RPMI 1640. Antibody-ZAP complexes (Advanced Targeting Systems; produced according to manufacturer's instructions) or ADCs were added to the cells and plates incubated for 72 hours and 5% carbon dioxide.
|
||||
| In Vitro Model | Plasma cell myeloma | LP-1 cells | CVCL_0012 | ||
EGFRvIII-MCC-DM1 [Investigative]
Revealed Based on the Cell Line Data
| Experiment 1 Reporting the Activity Date of This ADC | [46] | ||||
| Efficacy Data | Half Maximal Inhibitory Concentration (IC50) |
0.4 nM
|
Positive EGFR vIII expression (EGFR vIII+++/++) | ||
| Method Description |
Cells were seeded in PDL-coated 96 well plates at 375 for MMT/hEGFRvIII, 1500 for U251/hEGFRvIII, 2000 for HEK293/hEGFRvIII, or 3000 for C4-2, PC3, and T47D cells per well in complete growth media and grown overnight.
|
||||
| In Vitro Model | Normal | HEK293 cells | CVCL_0045 | ||
| Experiment 2 Reporting the Activity Date of This ADC | [46] | ||||
| Efficacy Data | Half Maximal Inhibitory Concentration (IC50) |
3 nM
|
Positive EGFR vIII expression (EGFR vIII+++/++) | ||
| Method Description |
Cells were seeded in PDL-coated 96 well plates at 375 for MMT/hEGFRvIII, 1500 for U251/hEGFRvIII, 2000 for HEK293/hEGFRvIII, or 3000 for C4-2, PC3, and T47D cells per well in complete growth media and grown overnight.
|
||||
| In Vitro Model | Astrocytoma | U-251MG cells | CVCL_0021 | ||
| Experiment 3 Reporting the Activity Date of This ADC | [46] | ||||
| Efficacy Data | Half Maximal Inhibitory Concentration (IC50) |
10 nM
|
Positive EGFR vIII expression (EGFR vIII+++/++) | ||
| Method Description |
Cells were seeded in PDL-coated 96 well plates at 375 for MMT/hEGFRvIII, 1500 for U251/hEGFRvIII, 2000 for HEK293/hEGFRvIII, or 3000 for C4-2, PC3, and T47D cells per well in complete growth media and grown overnight.
|
||||
| In Vitro Model | Malignant neoplasms of the mouse mammary gland | MMT-060562 cells | CVCL_4241 | ||
Cet-DM1 [Investigative]
Revealed Based on the Cell Line Data
| Experiment 1 Reporting the Activity Date of This ADC | [47] | ||||
| Efficacy Data | Half Maximal Inhibitory Concentration (IC50) |
0.85 nM
|
High EGFR expression (EGFR+++/++) | ||
| Method Description |
HCC1954 cells (20,000) were plated in 150 mm dishes and treated with 1 nM T-DM1 (media replaced weekly). Resistant HCC1954 T-DM1R clones (HCC-TDM1R#) were obtained by single-cell cloning and continuously cultured in the presence of 1 nM T-DM1 for a total period of 5 months.
|
||||
| In Vivo Model | HCC1954/TDR CDX model (CDX: C#19) | ||||
| In Vitro Model | Breast ductal carcinoma | HCC1954 T-DM1R (T-DM1 resistance) cells | CVCL_1259 | ||
| Experiment 2 Reporting the Activity Date of This ADC | [47] | ||||
| Efficacy Data | Half Maximal Inhibitory Concentration (IC50) |
0.85 nM
|
High EGFR expression (EGFR+++/++) | ||
| Method Description |
HCC1954 cells (20,000) were plated in 150 mm dishes and treated with 1 nM T-DM1 (media replaced weekly). Resistant HCC1954 T-DM1R clones (HCC-TDM1R#) were obtained by single-cell cloning and continuously cultured in the presence of 1 nM T-DM1 for a total period of 5 months.
|
||||
| In Vivo Model | HCC1954/TDR CDX model (CDX: C#10) | ||||
| In Vitro Model | Breast ductal carcinoma | HCC1954 T-DM1R (T-DM1 resistance) cells | CVCL_1259 | ||
| Experiment 3 Reporting the Activity Date of This ADC | [47] | ||||
| Efficacy Data | Half Maximal Inhibitory Concentration (IC50) |
1.41 nM
|
High EGFR expression (EGFR+++/++) | ||
| Method Description |
HCC1954 cells (20,000) were plated in 150 mm dishes and treated with 1 nM T-DM1 (media replaced weekly). Resistant HCC1954 T-DM1R clones (HCC-TDM1R#) were obtained by single-cell cloning and continuously cultured in the presence of 1 nM T-DM1 for a total period of 5 months.
|
||||
| In Vitro Model | Breast ductal carcinoma | HCC1954 cells | CVCL_1259 | ||
| Experiment 4 Reporting the Activity Date of This ADC | [47] | ||||
| Efficacy Data | Half Maximal Inhibitory Concentration (IC50) |
3.52 nM
|
High EGFR expression (EGFR+++/++) | ||
| Method Description |
HCC1954 cells (20,000) were plated in 150 mm dishes and treated with 1 nM T-DM1 (media replaced weekly). Resistant HCC1954 T-DM1R clones (HCC-TDM1R#) were obtained by single-cell cloning and continuously cultured in the presence of 1 nM T-DM1 for a total period of 5 months.
|
||||
| In Vivo Model | HCC1954/TDR CDX model (CDX: C#20) | ||||
| In Vitro Model | Breast ductal carcinoma | HCC1954 T-DM1R (T-DM1 resistance) cells | CVCL_1259 | ||
| Experiment 5 Reporting the Activity Date of This ADC | [47] | ||||
| Efficacy Data | Half Maximal Inhibitory Concentration (IC50) |
7.68 nM
|
High EGFR expression (EGFR+++/++) | ||
| Method Description |
HCC1954 cells (20,000) were plated in 150 mm dishes and treated with 1 nM T-DM1 (media replaced weekly). Resistant HCC1954 T-DM1R clones (HCC-TDM1R#) were obtained by single-cell cloning and continuously cultured in the presence of 1 nM T-DM1 for a total period of 5 months.
|
||||
| In Vivo Model | HCC1954/TDR CDX model (CDX: C#29) | ||||
| In Vitro Model | Breast ductal carcinoma | HCC1954 T-DM1R (T-DM1 resistance) cells | CVCL_1259 | ||
HuFR1-21-PEG4-Mal-DM1 [Investigative]
Revealed Based on the Cell Line Data
| Experiment 1 Reporting the Activity Date of This ADC | [34] | ||||
| Efficacy Data | Half Maximal Inhibitory Concentration (IC50) |
1.00-10.00 nM
|
Positive FOLR1 expression (FOLR1 +++/++) | ||
| Method Description |
A PEG4-mal-DM4 conjugate in various concentrations was added to FOLR1-expressing KB cells in a 96 well plate at 1,000 cells per well in 100 pL in complete RPMI medium. Antibodies and conjugates were diluted into complete RPMI medium using 3-fold dilution seriesand 100 pL were added per well.
|
||||
| In Vitro Model | Human papillomavirus-related endocervical adenocarcinoma | KB cells | CVCL_0372 | ||
| Experiment 2 Reporting the Activity Date of This ADC | [34] | ||||
| Efficacy Data | Half Maximal Inhibitory Concentration (IC50) |
1.00-10.00 nM
|
Positive FOLR1 expression (FOLR1 +++/++) | ||
| Method Description |
A PEG4-mal-DM4 conjugate in various concentrations was added to FOLR1-expressing KB cells in a 96 well plate at 1,000 cells per well in 100 pL in complete RPMI medium. Antibodies and conjugates were diluted into complete RPMI medium using 3-fold dilution seriesand 100 pL were added per well.
|
||||
| In Vitro Model | Human papillomavirus-related endocervical adenocarcinoma | KB cells | CVCL_0372 | ||
ICAM1-DM1 ADC [Clinical candidate]
Revealed Based on the Cell Line Data
| Experiment 1 Reporting the Activity Date of This ADC | [48] | ||||
| Efficacy Data | Half Maximal Inhibitory Concentration (IC50) |
4 nM
|
Positive ICAM1 expression (ICAM1+++/++) | ||
| Method Description |
Cells were plated in 96-well tissue culture plates (SigmaAldrich) 1 day before treatment, serum-starved, and treated with serially diluted Tras-Me-PRX (10 mg/mL antibody) for 24 h.
|
||||
| In Vitro Model | Pancreatic ductal adenocarcinoma | BxPC-3 cells | CVCL_0186 | ||
| Experiment 2 Reporting the Activity Date of This ADC | [48] | ||||
| Efficacy Data | Half Maximal Inhibitory Concentration (IC50) |
9.8 nM
|
Positive ICAM1 expression (ICAM1+++/++) | ||
| Method Description |
Cells were plated in 96-well tissue culture plates (SigmaAldrich) 1 day before treatment, serum-starved, and treated with serially diluted Tras-Me-PRX (10 mg/mL antibody) for 24 h.
|
||||
| In Vitro Model | Pancreatic ductal adenocarcinoma | PANC-1 cells | CVCL_0480 | ||
| Experiment 3 Reporting the Activity Date of This ADC | [48] | ||||
| Efficacy Data | Half Maximal Inhibitory Concentration (IC50) | > 100 nM | Positive ICAM1 expression (ICAM1+++/++) | ||
| Method Description |
Cells were plated in 96-well tissue culture plates (SigmaAldrich) 1 day before treatment, serum-starved, and treated with serially diluted Tras-Me-PRX (10 mg/mL antibody) for 24 h.
|
||||
| In Vitro Model | Normal | hTERT-HPNE cells | CVCL_C466 | ||
40H3-SMCC-DM1 [Investigative]
Revealed Based on the Cell Line Data
| Experiment 1 Reporting the Activity Date of This ADC | [50] | ||||
| Efficacy Data | Half Maximal Inhibitory Concentration (IC50) |
6.65 nM
|
High EGFR expression (EGFR+++) | ||
| Method Description |
1 x10⁴ cells per well in a volume of 100 ul were plated in 96-well tissue culture plates. After 24 h, ADCs were added at the indicated concentrations. After 72 h, the medium was removed and the viability was determined using the CellTiter-Glo luminescent cell viability assay kit.
|
||||
| In Vitro Model | Breast adenocarcinoma | MDA-MB-468 cells | CVCL_0419 | ||
| Experiment 2 Reporting the Activity Date of This ADC | [50] | ||||
| Efficacy Data | Half Maximal Inhibitory Concentration (IC50) |
89.6 nM
|
High EGFR expression (EGFR+++) | ||
| Method Description |
1 x10⁴ cells per well in a volume of 100 ul were plated in 96-well tissue culture plates. After 24 h, ADCs were added at the indicated concentrations. After 72 h, the medium was removed and the viability was determined using the CellTiter-Glo luminescent cell viability assay kit.
|
||||
| In Vitro Model | Skin squamous cell carcinoma | A431 cells | CVCL_0037 | ||
| Experiment 3 Reporting the Activity Date of This ADC | [50] | ||||
| Efficacy Data | Half Maximal Inhibitory Concentration (IC50) | > 100 nM | Negative EGFR expression (EGFR-) | ||
| Method Description |
1 x10⁴ cells per well in a volume of 100 ul were plated in 96-well tissue culture plates. After 24 h, ADCs were added at the indicated concentrations. After 72 h, the medium was removed and the viability was determined using the CellTiter-Glo luminescent cell viability assay kit.
|
||||
| In Vitro Model | Breast adenocarcinoma | MDA-MB-231 cells | CVCL_0062 | ||
| Experiment 4 Reporting the Activity Date of This ADC | [50] | ||||
| Efficacy Data | Half Maximal Inhibitory Concentration (IC50) | > 100 nM | Moderate EGFR expression (EGFR++) | ||
| Method Description |
1 x10⁴ cells per well in a volume of 100 ul were plated in 96-well tissue culture plates. After 24 h, ADCs were added at the indicated concentrations. After 72 h, the medium was removed and the viability was determined using the CellTiter-Glo luminescent cell viability assay kit.
|
||||
| In Vitro Model | Invasive breast carcinoma of no special type | BT-20 cells | CVCL_0178 | ||
Ch735-Py-DM1 [Investigative]
Revealed Based on the Cell Line Data
| Experiment 1 Reporting the Activity Date of This ADC | [51] | ||||
| Efficacy Data | Half Maximal Inhibitory Concentration (IC50) |
50 nM
|
Positive polySia expression (polySia +++/++) | ||
| Method Description |
Cells were plated at 5,000, 2,500, and 2,500 cells/well, respectively, and allowed to rest for 24 h. Five-fold serial dilutions of the antibodies were added starting at 150 nM and incubated for 72-144 h.
|
||||
| In Vitro Model | Bone marrow neuroblastoma | SH-SY5Y cells | CVCL_0019 | ||
| Experiment 2 Reporting the Activity Date of This ADC | [51] | ||||
| Efficacy Data | Half Maximal Inhibitory Concentration (IC50) | > 100 nM | Negative polySia expression (polySia -) | ||
| Method Description |
Cells were plated at 5,000, 2,500, and 2,500 cells/well, respectively, and allowed to rest for 24 h. Five-fold serial dilutions of the antibodies were added starting at 150 nM and incubated for 72-144 h.
|
||||
| In Vitro Model | Invasive breast carcinoma | MCF-7 cells | CVCL_0031 | ||
T-Py-DM1 [Investigative]
Revealed Based on the Cell Line Data
| Experiment 1 Reporting the Activity Date of This ADC | [51] | ||||
| Efficacy Data | Half Maximal Inhibitory Concentration (IC50) | > 100 nM | Negative HER2 expression (HER2 -) | ||
| Method Description |
Cells were plated at 5,000, 2,500, and 2,500 cells/well, respectively, and allowed to rest for 24 h. Five-fold serial dilutions of the antibodies were added starting at 150 nM and incubated for 72-144 h.
|
||||
| In Vitro Model | Bone marrow neuroblastoma | SH-SY5Y cells | CVCL_0019 | ||
| Experiment 2 Reporting the Activity Date of This ADC | [51] | ||||
| Efficacy Data | Half Maximal Inhibitory Concentration (IC50) |
144 nM
|
Positive HER2 expression (HER2 +++/++) | ||
| Method Description |
Cells were plated at 5,000, 2,500, and 2,500 cells/well, respectively, and allowed to rest for 24 h. Five-fold serial dilutions of the antibodies were added starting at 150 nM and incubated for 72-144 h.
|
||||
| In Vitro Model | Ovarian serous cystadenocarcinoma | SK-OV-3 cells | CVCL_0532 | ||
2G10 RED-106 maytansine 2 [Investigative]
Revealed Based on the Cell Line Data
| Experiment 1 Reporting the Activity Date of This ADC | [25] | ||||
| Efficacy Data | Half Maximal Inhibitory Concentration (IC50) | > 500 nM | Positive PLAUR expression (PLAUR +++/++) | ||
| Method Description |
MDA-MB-231 cells (0.5x10⁴ cells/well) were seeded in 96-well plates at the density and incubated for 120 h (5 days) with of ADCs or IgG. After 5 days of drug treatment at 37°C with 5% CO2.
|
||||
| In Vitro Model | Breast adenocarcinoma | MDA-MB-231 cells | CVCL_0062 | ||
Tras-Gly5-May [Investigative]
Revealed Based on the Cell Line Data
| Experiment 1 Reporting the Activity Date of This ADC | [40] | ||||
| Efficacy Data | Half Maximal Inhibitory Concentration (IC50) |
18 ng/mL
|
High HER2 expression (HER2+++; 694,000 HER2 molecules/cell) | ||
| Method Description |
Briefly, cells were plated on 96-well plates in 75 uL growth medium and grown at 37°C in a humidified incubator in a 7.5% CO2 atmosphere. After one day incubation, 25 uL of 3.5-fold serial dilutions of each ADC in growth medium were added, typically resulting in final ADC concentrations from 20 ug/mL to 0.02 ng/mL.
|
||||
| In Vitro Model | Breast adenocarcinoma | SK-BR-3 cells | CVCL_0033 | ||
| Experiment 2 Reporting the Activity Date of This ADC | [40] | ||||
| Efficacy Data | Half Maximal Inhibitory Concentration (IC50) | > 110 ng/mL | Moderate HER2 expression (HER2++; 32,000 HER2 molecules/cell) | ||
| Method Description |
Briefly, cells were plated on 96-well plates in 75 uL growth medium and grown at 37°C in a humidified incubator in a 7.5% CO2 atmosphere. After one day incubation, 25 uL of 3.5-fold serial dilutions of each ADC in growth medium were added, typically resulting in final ADC concentrations from 20 ug/mL to 0.02 ng/mL.
|
||||
| In Vitro Model | Breast adenocarcinoma | SK-BR-3 cells | CVCL_0033 | ||
T-FcBP-DM1 [Investigative]
Revealed Based on the Cell Line Data
| Experiment 1 Reporting the Activity Date of This ADC | [52] | ||||
| Efficacy Data | Half Maximal Inhibitory Concentration (IC50) |
81.64 ng/mL
|
Positive HER2 expression (HER2 +++/++) | ||
| Method Description |
Cells were seeded at 5000 per well in a 96-well plate in complete RPMI 1640. Antibody-ZAP complexes (Advanced Targeting Systems; produced according to manufacturer's instructions) or ADCs were added to the cells and plates incubated for 72 hours and 5% carbon dioxide.
|
||||
| In Vitro Model | Gastric tubular adenocarcinoma | NCI-N87 cells | CVCL_1603 | ||
| Experiment 2 Reporting the Activity Date of This ADC | [52] | ||||
| Efficacy Data | Half Maximal Inhibitory Concentration (IC50) | > 800 ng/mL | Negative HER2 expression (HER2 -) | ||
| Method Description |
Cells were seeded at 5000 per well in a 96-well plate in complete RPMI 1640. Antibody-ZAP complexes (Advanced Targeting Systems; produced according to manufacturer's instructions) or ADCs were added to the cells and plates incubated for 72 hours and 5% carbon dioxide.
|
||||
| In Vitro Model | Breast adenocarcinoma | MDA-MB-231 cells | CVCL_0062 | ||
GABRP Ab-DM1 ADC [Investigative]
Revealed Based on the Cell Line Data
| Experiment 1 Reporting the Activity Date of This ADC | [53] | ||||
| Efficacy Data | Half Maximal Inhibitory Concentration (IC50) |
100 - 500 ng/mL
|
Positive GABRP expression (GABRP+++/++) | ||
| Method Description |
Cells were plated at 2000 cells/well in triplicate in 96-well plates and exposed to GABRP Ab-DM1 ADC and control IgG-DM1 for 3 days.
|
||||
| In Vitro Model | Breast adenocarcinoma | SK-BR-3 cells | CVCL_0033 | ||
| Experiment 2 Reporting the Activity Date of This ADC | [53] | ||||
| Efficacy Data | Half Maximal Inhibitory Concentration (IC50) |
100 - 500 ng/mL
|
Positive GABRP expression (GABRP+++/++) | ||
| Method Description |
Cells were plated at 2000 cells/well in triplicate in 96-well plates and exposed to GABRP Ab-DM1 ADC and control IgG-DM1 for 3 days.
|
||||
| In Vitro Model | Breast adenocarcinoma | MDA-MB-468 cells | CVCL_0419 | ||
| Experiment 3 Reporting the Activity Date of This ADC | [53] | ||||
| Efficacy Data | Half Maximal Inhibitory Concentration (IC50) | > 500 ng/mL | Positive GABRP expression (GABRP+++/++) | ||
| Method Description |
Cells were plated at 2000 cells/well in triplicate in 96-well plates and exposed to GABRP Ab-DM1 ADC and control IgG-DM1 for 3 days.
|
||||
| In Vitro Model | Invasive breast carcinoma | BT-474 cells | CVCL_0179 | ||
| Experiment 4 Reporting the Activity Date of This ADC | [53] | ||||
| Efficacy Data | Half Maximal Inhibitory Concentration (IC50) | > 500 ng/mL | Positive GABRP expression (GABRP+++/++) | ||
| Method Description |
Cells were plated at 2000 cells/well in triplicate in 96-well plates and exposed to GABRP Ab-DM1 ADC and control IgG-DM1 for 3 days.
|
||||
| In Vitro Model | Breast adenocarcinoma | MDA-MB-231 cells | CVCL_0062 | ||
| Experiment 5 Reporting the Activity Date of This ADC | [53] | ||||
| Efficacy Data | Half Maximal Inhibitory Concentration (IC50) | > 500 ng/mL | Positive GABRP expression (GABRP+++/++) | ||
| Method Description |
Cells were plated at 2000 cells/well in triplicate in 96-well plates and exposed to GABRP Ab-DM1 ADC and control IgG-DM1 for 3 days.
|
||||
| In Vitro Model | Breast ductal carcinoma | HCC1143 cells | CVCL_1245 | ||
IMGN529 [Investigative]
Discovered Using Cell Line-derived Xenograft Model
| Experiment 1 Reporting the Activity Date of This ADC | [54] | ||||
| Efficacy Data | Tumor Growth lnhibition value (TGl) | < 20% | Positive CD37 expression (CD37+++/++) | ||
| Method Description |
CD37-positive human diffuse large B-cell lymphoma cell line OCI-LY7 (DSMZ) was subcutaneously inoculated at a dose of 1x10⁷ cells to the right flank region of each five or six-week-old female SCID mouse (Day 0). On Day 10, the mice were randomly grouped. On the day of grouping, the antibodydrug conjugates IMGN529 was intravenously administered at a dose of 3 mg/kg to the tail of each mouse. An antibody-drug conjugate (hmAb-IgG1-DXd) produced using human IgG was administered as a negative control at a dose of 3 mg/kg in the same manner as above. The long diameter and short diameter of the inoculated tumor were measured twice a week using electronic digital calipers, and the volume of the tumor was then calculated.
Click to Show/Hide
|
||||
| In Vivo Model | OCI-LY7 (DSMZ) female SCID mouse model | ||||
| Experiment 2 Reporting the Activity Date of This ADC | [54] | ||||
| Efficacy Data | Tumor Growth lnhibition value (TGl) | < 20% | Positive CD37 expression (CD37+++/++) | ||
| Method Description |
CD37-positive human diffuse large B-cell lymphoma cell line WSU-DLCL2 (DSMZ) was subcutaneously inoculated at a dose of 1x10⁷ cells to the right flank region of each five or six-week-old female SCID mouse (Day 0). On Day 8, the mice were randomly grouped. On the day of grouping, the antibodydrug conjugates IMGN529 was intravenously administered at a dose of 3 mg/kg to the tail of each mouse. An antibody-drug conjugate (hmAb-IgG1-DXd) produced using human IgG was administered as a negative control at a dose of 3 mg/kg in the same manner as above. The long diameter and short diameter of the inoculated tumor were measured twice a week using electronic digital calipers, and the volume of the tumor was then calculated.
Click to Show/Hide
|
||||
| In Vivo Model | WSU-DLCL2 (DSMZ) female SCID mouse model | ||||
| Experiment 3 Reporting the Activity Date of This ADC | [54] | ||||
| Efficacy Data | Tumor Growth lnhibition value (TGl) | < 20% | Positive CD37 expression (CD37+++/++) | ||
| Method Description |
CD37-positive human diffuse large B-cell lymphoma cell line NU-DUL-1 (DSMZ) was subcutaneously inoculated at a dose of 1x10⁷ cells to the right flank region of each five or six-week-old female SCID mouse (Day 0). On Day 14, the mice were randomly grouped. On the day of grouping, the antibodydrug conjugates IMGN529 was intravenously administered at a dose of 3 mg/kg to the tail of each mouse. An antibody-drug conjugate (hmAb-IgG1-DXd) produced using human IgG was administered as a negative control at a dose of 3 mg/kg in the same manner as above. The long diameter and short diameter of the inoculated tumor were measured twice a week using electronic digital calipers, and the volume of the tumor was then calculated.
Click to Show/Hide
|
||||
| In Vivo Model | NU-DUL-1 (DSMZ) female SCID mouse model | ||||
| Experiment 4 Reporting the Activity Date of This ADC | [54] | ||||
| Efficacy Data | Tumor Growth lnhibition value (TGl) | ≈ 20% | Positive CD37 expression (CD37+++/++) | ||
| Method Description |
CD37- positive human follicular lymphoma cell line DOHH-2 (DSMZ) was subcutaneously inoculated at a dose of 1x10⁶ cells to the right flank region of each female SCID mouse (Day 0). On Day 21, the mice were randomly grouped. On the day of grouping, IMGN529 was intravenously administered to the tail of each mouse at 3 mg/kg.
|
||||
| In Vivo Model | DOHH-2 (DSMZ) female SCID mouse model | ||||
| Experiment 5 Reporting the Activity Date of This ADC | [54] | ||||
| Efficacy Data | Tumor Growth lnhibition value (TGl) | < 30% | Positive CD37 expression (CD37+++/++) | ||
| Method Description |
CD37-positive human diffuse large B-cell lymphoma cell line SU-DHL-8 (ATCC) was subcutaneously inoculated at a dose of 5x10⁶ cells to the right flank region of each five or six-week-old female SCID mouse (Day 0). On Day 16, the mice were randomly grouped. On the day of grouping, the antibodydrug conjugates IMGN529 was intravenously administered at a dose of 10 mg/kg to the tail of each mouse. An antibody-drug conjugate (hmAb-IgG1-DXd) produced using human IgG was administered as a negative control at a dose of 3 mg/kg in the same manner as above. The long diameter and short diameter of the inoculated tumor were measured twice a week using electronic digital calipers, and the volume of the tumor was then calculated.
Click to Show/Hide
|
||||
| In Vivo Model | SU-DHL-8 (ATCC) female SCID mouse model | ||||
| Experiment 6 Reporting the Activity Date of This ADC | [54] | ||||
| Efficacy Data | Tumor Growth lnhibition value (TGl) | < 30% | Positive CD37 expression (CD37+++/++) | ||
| Method Description |
CD37- positive human chronic lymphocytic leukemia cell line JVM-3 (DSMZ) was subcutaneously inoculated at a dose of 3x10⁶ cells to the right flank region of each female SCID mouse (Day 0). On Day 13, the mice were randomly grouped. On the day of grouping, each antibody-drug conjugate was intravenously administered to the tail of each mouse.
|
||||
| In Vivo Model | JVM-3 (DSMZ) female SCID mouse model | ||||
WBP319-BMK4.uIgG1k-DM1 [Investigative]
Discovered Using Cell Line-derived Xenograft Model
| Experiment 1 Reporting the Activity Date of This ADC | [55] | ||||
| Efficacy Data | Tumor Growth lnhibition value (TGl) |
40.91%
|
|||
| Method Description |
Cell line-derived xenograft models were established in SCID-17B female mice, by subcutaneous injection of 1x10⁷ (HCC-70) tumor cells, and treatmen with 1mg/kg ADC (single dosee) after tumor volume about 230mm3. Determined tumor volume after the experiment, measured at day 34.
|
||||
| In Vivo Model | HCC70 breast tumor model | ||||
| Experiment 2 Reporting the Activity Date of This ADC | [55] | ||||
| Efficacy Data | Tumor Growth Inhibition value (TGI) |
42.69%
|
|||
| Method Description |
Cell line-derived xenograft models were established in SCID-17B female mice, by subcutaneous injection of 1x10⁷ (HCC-70) tumor cells, and treatmen with 0.5mg/kg ADC (single dosee) after tumor volume about 242mm3. Determined tumor volume after the experiment, measured at day 36.
|
||||
| In Vivo Model | HCC70 breast tumor model | ||||
Revealed Based on the Cell Line Data
| Experiment 1 Reporting the Activity Date of This ADC | [55] | ||||
| Efficacy Data | Half Maximal inhibitory Concentration (lC50) |
0.15 nM
|
|||
| Method Description |
4000cells/well for HCC-1954 (50 uL) of cells from each cell line were seeded onto 96-well clear bottom black plates. The cells were cultured overnight at 37°C in a humidified 5% CO2 incubator before adding the ADC, The plates were returned to the incubator for 5 days . 50 uL of CellTiter Glo solution was added to each well and incubated atroom temperature with gentle shaking for 10 minutes.
Click to Show/Hide
|
||||
| In Vitro Model | Breast ductal carcinoma | HCC-1954 cells | CVCL_1259 | ||
| Experiment 2 Reporting the Activity Date of This ADC | [55] | ||||
| Efficacy Data | Half Maximal inhibitory Concentration (lC50) |
0.8 nM
|
|||
| Method Description |
6000 cells/well for HCC-70 (50 uL) of cells from each cell line were seeded onto 96-well clear bottom black plates. The cells were cultured overnight at 37°C in a humidified 5% CO2 incubator before adding the ADC, The plates were returned to the incubator for 5 days . 50 uL of CellTiter Glo solution was added to each well and incubated atroom temperature with gentle shaking for 10 minutes.
Click to Show/Hide
|
||||
| In Vitro Model | Breast ductal carcinoma | HCC-70 cells | CVCL_1270 | ||
| Experiment 3 Reporting the Activity Date of This ADC | [55] | ||||
| Efficacy Data | Half Maximal inhibitory Concentration (lC50) |
1.14 nM
|
|||
| Method Description |
2000 cells/well for NCI-H1650 (50 uL) of cells from each cell line were seeded onto 96-well clear bottom black plates. The cells were cultured overnight at 37°C in a humidified 5% CO2 incubator before adding the ADC, The plates were returned to the incubator for 5 days . 50 uL of CellTiter Glo solution was added to each well and incubated atroom temperature with gentle shaking for 10 minutes.
Click to Show/Hide
|
||||
| In Vitro Model | Lung adenocarcinoma | NCI-H1650 cells | CVCL_1483 | ||
| Experiment 4 Reporting the Activity Date of This ADC | [55] | ||||
| Efficacy Data | Half Maximal inhibitory Concentration (lC50) | > 10 nM | |||
| Method Description |
5000cells/well for HT-29 (50 uL) of cells from each cell line were seeded onto 96-well clear bottom black plates. The cells were cultured overnight at 37°C in a humidified 5% CO2 incubator before adding the ADC, The plates were returned to the incubator for 5 days . 50 uL of CellTiter Glo solution was added to each well and incubated atroom temperature with gentle shaking for 10 minutes.
Click to Show/Hide
|
||||
| In Vitro Model | Colon adenocarcinoma | HT-29 cells | CVCL_0320 | ||
| Experiment 5 Reporting the Activity Date of This ADC | [55] | ||||
| Efficacy Data | Half Maximal inhibitory Concentration (lC50) | > 10 nM | |||
| Method Description |
800 cells/well for A549 (50 uL) of cells from each cell line were seeded onto 96-well clear bottom black plates. The cells were cultured overnight at 37°C in a humidified 5% CO2 incubator before adding the ADC, The plates were returned to the incubator for 5 days . 50 uL of CellTiter Glo solution was added to each well and incubated atroom temperature with gentle shaking for 10 minutes.
Click to Show/Hide
|
||||
| In Vitro Model | Lung adenocarcinoma | A549 cells | CVCL_0023 | ||
| Experiment 6 Reporting the Activity Date of This ADC | [55] | ||||
| Efficacy Data | Half Maximal inhibitory Concentration (lC50) | > 10 nM | |||
| Method Description |
5000 cells/well for MDA-MB-453 (50 uL) of cells from each cell line were seeded onto 96-well clear bottom black plates. The cells were cultured overnight at 37°C in a humidified 5% CO2 incubator before adding the ADC, The plates were returned to the incubator for 5 days . 50 uL of CellTiter Glo solution was added to each well and incubated atroom temperature with gentle shaking for 10 minutes.
Click to Show/Hide
|
||||
| In Vitro Model | Breast adenocarcinoma | MDA-MB-453 cells | CVCL_0418 | ||
| Experiment 7 Reporting the Activity Date of This ADC | [55] | ||||
| Efficacy Data | Half Maximal Effective Concentration (EC50) |
0.019 nM
|
|||
| Method Description |
For HCC-1954 cells,cells were washed with 100uL,1% BSA1xPBS resuspended in PE conjugated Goatanti-human IgG Fc 1:150 dilutedin 1% BSA1xPBS for 1 hour at 4°C in thedark. Cells were then washed one time as described aboveand resuspended in 1% BSA/1xPBS for 2 hours at 37°C. Supernatants were discarded and 100 uL/wellquench buffer (0.1 M glycine, 0.15 M NaCl, adjust pH to2.5) were added and incubated at 4°C. for 5 min. Cells werethen washed one time as described above and resuspended in Hoechst 33342 1:5000 diluted in DPBS for 15 min at room tem-perature.Afer washed with DPBS one time as described above, cells were resuspended in 4%%PFA and stored at 4°C.
Click to Show/Hide
|
||||
| In Vitro Model | Breast ductal carcinoma | HCC-1954 cells | CVCL_1259 | ||
| Experiment 8 Reporting the Activity Date of This ADC | [55] | ||||
| Efficacy Data | Half Maximal Effective Concentration (EC50) |
0.57 nM
|
|||
| Method Description |
For NCI-H1650 cells,cells were washed with 100uL,1% BSA/1xPBS resuspended in Alexa647 conjugatedGoat anti-human IgG Fc 1:500 diluted in 1% BSA/1xPBS for 1 hour at 4°C. inthe dark.Cells were then washed one time as describedabove and resuspended in 1% BSA/1xPBS for 2hours at 37°C. Supernatants were discarded and cells wereresuspended in Hoechst 33342 1:5000diluted in DPBS for 15 min atroom temperature.After washed with DPBS one time as described above,100 uL/well quench buffer (0.1 M glycine, 0.15 M NaCl, adjust pH to2.5)were added and incubated at 4°C.for 5 min. Afterwashing for once with 1% BSA/1xPBS, cellswere resuspended in 4% PFA and stored at 4°C
Click to Show/Hide
|
||||
| In Vitro Model | Lung adenocarcinoma | NCI-H1650 cells | CVCL_1483 | ||
Mehozumab-DM1 [Investigative]
Discovered Using Cell Line-derived Xenograft Model
| Experiment 1 Reporting the Activity Date of This ADC | [56] | ||||
| Efficacy Data | Tumor Growth lnhibition value (TGl) |
87.39%
|
|||
| Method Description |
When the tumor diameter reached 1.00 cm, qualified cynomolgus monkey liver cancer models were selected and randomly divided into an ADC intravenous injection 0.2 mg kg-1 group (n = 3), an ADC intravenous injection 1.0 mg kg-1 group (n = 3), and a physiological saline control group (n = 2). The ADC was administered once a week for 8 weeks. Tumor volumes were observed by ultrasound scans, and Figure 3C shows representative photos of ultrasound scans before and after the 8-week ADC treatment,0.2 mg/kg.
Click to Show/Hide
|
||||
| In Vivo Model | CRISPR-Mediated Cynomolgus Monkey Liver Cancer Model | ||||
| Experiment 2 Reporting the Activity Date of This ADC | [56] | ||||
| Efficacy Data | Tumor Growth lnhibition value (TGl) |
91.11%
|
|||
| Method Description |
When the tumor diameter reached 1.00 cm, qualified cynomolgus monkey liver cancer models were selected and randomly divided into an ADC intravenous injection 0.2 mg kg-1 group (n = 3), an ADC intravenous injection 1.0 mg kg-1 group (n = 3), and a physiological saline control group (n = 2). The ADC was administered once a week for 8 weeks. Tumor volumes were observed by ultrasound scans, and Figure 3C shows representative photos of ultrasound scans before and after the 8-week ADC treatment,1 mg/kg.
Click to Show/Hide
|
||||
| In Vivo Model | CRISPR-Mediated Cynomolgus Monkey Liver Cancer Model | ||||
Revealed Based on the Cell Line Data
| Experiment 1 Reporting the Activity Date of This ADC | [56] | ||||
| Efficacy Data | Half Maximal inhibitory Concentration (lC50) |
35.97 nM
|
High CD147 expression (CD147 +++) | ||
| Method Description |
Human HCC cell lines HCC-LM3, MHCC97-H, and Huh-7 were seeded in 96-well plates (3000 cells per well). After the cells had adhered to the walls, different concentration gradients of Mehozumab-DM1 diluent, Mehozumab diluent, and IgG were added, and the cells were cultured in a 37 °C incubator under 5% CO2 for 72 h. ThenCCK8 (cat#: C005; Topscience Biology) was used to determine cell viability. Per the manufacturer's instructions, 10 uL of CCK8 reagent was added to each well followed by incubation for 1 h. The absorbance was measured at 450 nm, and used to calculate the corresponding IC50 value using GraphPad Prism v8.0 software (GraphPad Software Inc., San Diego, CA).
Click to Show/Hide
|
||||
| In Vitro Model | Adult hepatocellular carcinoma | HCC-LM3 cells | CVCL_6832 | ||
| Experiment 2 Reporting the Activity Date of This ADC | [56] | ||||
| Efficacy Data | Half Maximal inhibitory Concentration (lC50) |
83.07 nM
|
High CD147 expression (CD147 +++) | ||
| Method Description |
Human HCC cell lines HCC-LM3, MHCC97-H, and Huh-7 were seeded in 96-well plates (3000 cells per well). After the cells had adhered to the walls, different concentration gradients of Mehozumab-DM1 diluent, Mehozumab diluent, and IgG were added, and the cells were cultured in a 37 °C incubator under 5% CO2 for 72 h. ThenCCK8 (cat#: C005; Topscience Biology) was used to determine cell viability. Per the manufacturer's instructions, 10 uL of CCK8 reagent was added to each well followed by incubation for 1 h. The absorbance was measured at 450 nm, and used to calculate the corresponding IC50 value using GraphPad Prism v8.0 software (GraphPad Software Inc., San Diego, CA).
Click to Show/Hide
|
||||
| In Vitro Model | Adult hepatocellular carcinoma | MHCC97-H cells | CVCL_E3I0 | ||
| Experiment 3 Reporting the Activity Date of This ADC | [56] | ||||
| Efficacy Data | Half Maximal inhibitory Concentration (lC50) |
367.1 nM
|
Moderate CD147 expression (CD147++) | ||
| Method Description |
Human HCC cell lines HCC-LM3, MHCC97-H, and Huh-7 were seeded in 96-well plates (3000 cells per well). After the cells had adhered to the walls, different concentration gradients of Mehozumab-DM1 diluent, Mehozumab diluent, and IgG were added, and the cells were cultured in a 37 °C incubator under 5% CO2 for 72 h. ThenCCK8 (cat#: C005; Topscience Biology) was used to determine cell viability. Per the manufacturer's instructions, 10 uL of CCK8 reagent was added to each well followed by incubation for 1 h. The absorbance was measured at 450 nm, and used to calculate the corresponding IC50 value using GraphPad Prism v8.0 software (GraphPad Software Inc., San Diego, CA).
Click to Show/Hide
|
||||
| In Vitro Model | Adult hepatocellular carcinoma | Huh-7 cells | CVCL_0336 | ||
38850783 ADC 3 [Investigative]
Revealed Based on the Cell Line Data
| Experiment 1 Reporting the Activity Date of This ADC | [57] | ||||
| Efficacy Data | Ninety Percent Inhibitory Concentration (IC90) |
0.11- 0.28 ng/mL
|
Negative HER2 expression (HER2-) | ||
| Method Description |
We added 100 uL of media containing the drug to be tested (drug by concentration + 1 % FBS). We added PBS to surrounding wells to prevent evaporation. we cultivate in conditions of 37°C and 5 % CO2 according to the set time (Payload: initial observation and observes 48hr, 72hr, and 96hr culture conditions to select appropriate culture conditions). For Antibody and ADC, we selected appropriate culture conditions by observing culture conditions for 96hr, 120hr, and 144hr. In the case of 120hr and 144hr incubation conditions, we added additional media after 72hr incubation (The concentration of the drug is set to 3 below and 3 above based on the IC50 value used as a reference). Positive control usually uses etoposide 10 uM or 24 uM, and negative control uses DMSO with same concentration of drug and a positive control with SN38 or etoposide for validating the assay system (data not shown).
Click to Show/Hide
|
||||
| In Vitro Model | Breast ductal carcinoma | HCC1937 cells | CVCL_0290 | ||
| Experiment 2 Reporting the Activity Date of This ADC | [57] | ||||
| Efficacy Data | Ninety Percent Inhibitory Concentration (IC90) |
0.27- 0.38 ng/mL
|
High HER2 expression (HER2 +++) | ||
| Method Description |
We added 100 uL of media containing the drug to be tested (drug by concentration + 1 % FBS). We added PBS to surrounding wells to prevent evaporation. we cultivate in conditions of 37°C and 5 % CO2 according to the set time (Payload: initial observation and observes 48hr, 72hr, and 96hr culture conditions to select appropriate culture conditions). For Antibody and ADC, we selected appropriate culture conditions by observing culture conditions for 96hr, 120hr, and 144hr. In the case of 120hr and 144hr incubation conditions, we added additional media after 72hr incubation (The concentration of the drug is set to 3 below and 3 above based on the IC50 value used as a reference). Positive control usually uses etoposide 10 uM or 24 uM, and negative control uses DMSO with same concentration of drug and a positive control with SN38 or etoposide for validating the assay system (data not shown).
Click to Show/Hide
|
||||
| In Vitro Model | Breast adenocarcinoma | SK-BR-3 cells | CVCL_0033 | ||
| Experiment 3 Reporting the Activity Date of This ADC | [57] | ||||
| Efficacy Data | Half Maximal inhibitory Concentration (lC50) |
0.18 ng/mL
|
Negative HER2 expression (HER2-) | ||
| Method Description |
We added 100 uL of media containing the drug to be tested (drug by concentration + 1 % FBS). We added PBS to surrounding wells to prevent evaporation. we cultivate in conditions of 37°C and 5 % CO2 according to the set time (Payload: initial observation and observes 48hr, 72hr, and 96hr culture conditions to select appropriate culture conditions). For Antibody and ADC, we selected appropriate culture conditions by observing culture conditions for 96hr, 120hr, and 144hr. In the case of 120hr and 144hr incubation conditions, we added additional media after 72hr incubation (The concentration of the drug is set to 3 below and 3 above based on the IC50 value used as a reference). Positive control usually uses etoposide 10 uM or 24 uM, and negative control uses DMSO with same concentration of drug and a positive control with SN38 or etoposide for validating the assay system (data not shown).
Click to Show/Hide
|
||||
| In Vitro Model | Breast ductal carcinoma | HCC1937 cells | CVCL_0290 | ||
| Experiment 4 Reporting the Activity Date of This ADC | [57] | ||||
| Efficacy Data | Half Maximal inhibitory Concentration (lC50) |
0.32 ng/mL
|
High HER2 expression (HER2 +++) | ||
| Method Description |
We added 100 uL of media containing the drug to be tested (drug by concentration + 1 % FBS). We added PBS to surrounding wells to prevent evaporation. we cultivate in conditions of 37°C and 5 % CO2 according to the set time (Payload: initial observation and observes 48hr, 72hr, and 96hr culture conditions to select appropriate culture conditions). For Antibody and ADC, we selected appropriate culture conditions by observing culture conditions for 96hr, 120hr, and 144hr. In the case of 120hr and 144hr incubation conditions, we added additional media after 72hr incubation (The concentration of the drug is set to 3 below and 3 above based on the IC50 value used as a reference). Positive control usually uses etoposide 10 uM or 24 uM, and negative control uses DMSO with same concentration of drug and a positive control with SN38 or etoposide for validating the assay system (data not shown).
Click to Show/Hide
|
||||
| In Vitro Model | Breast adenocarcinoma | SK-BR-3 cells | CVCL_0033 | ||
38850783 ADC 2 [Investigative]
Revealed Based on the Cell Line Data
| Experiment 1 Reporting the Activity Date of This ADC | [57] | ||||
| Efficacy Data | Ninety Percent Inhibitory Concentration (IC90) |
0.17- 0.55 ng/mL
|
Negative HER2 expression (HER2-) | ||
| Method Description |
We added 100 uL of media containing the drug to be tested (drug by concentration + 1 % FBS). We added PBS to surrounding wells to prevent evaporation. we cultivate in conditions of 37°C and 5 % CO2 according to the set time (Payload: initial observation and observes 48hr, 72hr, and 96hr culture conditions to select appropriate culture conditions). For Antibody and ADC, we selected appropriate culture conditions by observing culture conditions for 96hr, 120hr, and 144hr. In the case of 120hr and 144hr incubation conditions, we added additional media after 72hr incubation (The concentration of the drug is set to 3 below and 3 above based on the IC50 value used as a reference). Positive control usually uses etoposide 10 uM or 24 uM, and negative control uses DMSO with same concentration of drug and a positive control with SN38 or etoposide for validating the assay system (data not shown).
Click to Show/Hide
|
||||
| In Vitro Model | Breast ductal carcinoma | HCC1937 cells | CVCL_0290 | ||
| Experiment 2 Reporting the Activity Date of This ADC | [57] | ||||
| Efficacy Data | Ninety Percent Inhibitory Concentration (IC90) |
0.19- 0.31 ng/mL
|
High HER2 expression (HER2 +++) | ||
| Method Description |
We added 100 uL of media containing the drug to be tested (drug by concentration + 1 % FBS). We added PBS to surrounding wells to prevent evaporation. we cultivate in conditions of 37°C and 5 % CO2 according to the set time (Payload: initial observation and observes 48hr, 72hr, and 96hr culture conditions to select appropriate culture conditions). For Antibody and ADC, we selected appropriate culture conditions by observing culture conditions for 96hr, 120hr, and 144hr. In the case of 120hr and 144hr incubation conditions, we added additional media after 72hr incubation (The concentration of the drug is set to 3 below and 3 above based on the IC50 value used as a reference). Positive control usually uses etoposide 10 uM or 24 uM, and negative control uses DMSO with same concentration of drug and a positive control with SN38 or etoposide for validating the assay system (data not shown).
Click to Show/Hide
|
||||
| In Vitro Model | Breast adenocarcinoma | SK-BR-3 cells | CVCL_0033 | ||
| Experiment 3 Reporting the Activity Date of This ADC | [57] | ||||
| Efficacy Data | Half Maximal inhibitory Concentration (lC50) |
0.24 ng/mL
|
High HER2 expression (HER2 +++) | ||
| Method Description |
We added 100 uL of media containing the drug to be tested (drug by concentration + 1 % FBS). We added PBS to surrounding wells to prevent evaporation. we cultivate in conditions of 37°C and 5 % CO2 according to the set time (Payload: initial observation and observes 48hr, 72hr, and 96hr culture conditions to select appropriate culture conditions). For Antibody and ADC, we selected appropriate culture conditions by observing culture conditions for 96hr, 120hr, and 144hr. In the case of 120hr and 144hr incubation conditions, we added additional media after 72hr incubation (The concentration of the drug is set to 3 below and 3 above based on the IC50 value used as a reference). Positive control usually uses etoposide 10 uM or 24 uM, and negative control uses DMSO with same concentration of drug and a positive control with SN38 or etoposide for validating the assay system (data not shown).
Click to Show/Hide
|
||||
| In Vitro Model | Breast adenocarcinoma | SK-BR-3 cells | CVCL_0033 | ||
| Experiment 4 Reporting the Activity Date of This ADC | [57] | ||||
| Efficacy Data | Half Maximal inhibitory Concentration (lC50) |
0.31 ng/mL
|
Negative HER2 expression (HER2-) | ||
| Method Description |
We added 100 uL of media containing the drug to be tested (drug by concentration + 1 % FBS). We added PBS to surrounding wells to prevent evaporation. we cultivate in conditions of 37°C and 5 % CO2 according to the set time (Payload: initial observation and observes 48hr, 72hr, and 96hr culture conditions to select appropriate culture conditions). For Antibody and ADC, we selected appropriate culture conditions by observing culture conditions for 96hr, 120hr, and 144hr. In the case of 120hr and 144hr incubation conditions, we added additional media after 72hr incubation (The concentration of the drug is set to 3 below and 3 above based on the IC50 value used as a reference). Positive control usually uses etoposide 10 uM or 24 uM, and negative control uses DMSO with same concentration of drug and a positive control with SN38 or etoposide for validating the assay system (data not shown).
Click to Show/Hide
|
||||
| In Vitro Model | Breast ductal carcinoma | HCC1937 cells | CVCL_0290 | ||
38850783 ADC 4 [Investigative]
Revealed Based on the Cell Line Data
| Experiment 1 Reporting the Activity Date of This ADC | [57] | ||||
| Efficacy Data | Ninety Percent Inhibitory Concentration (IC90) |
0.86- 1.28 ng/mL
|
High HER2 expression (HER2 +++) | ||
| Method Description |
We added 100 uL of media containing the drug to be tested (drug by concentration + 1 % FBS). We added PBS to surrounding wells to prevent evaporation. we cultivate in conditions of 37°C and 5 % CO2 according to the set time (Payload: initial observation and observes 48hr, 72hr, and 96hr culture conditions to select appropriate culture conditions). For Antibody and ADC, we selected appropriate culture conditions by observing culture conditions for 96hr, 120hr, and 144hr. In the case of 120hr and 144hr incubation conditions, we added additional media after 72hr incubation (The concentration of the drug is set to 3 below and 3 above based on the IC50 value used as a reference). Positive control usually uses etoposide 10 uM or 24 uM, and negative control uses DMSO with same concentration of drug and a positive control with SN38 or etoposide for validating the assay system (data not shown).
Click to Show/Hide
|
||||
| In Vitro Model | Breast adenocarcinoma | SK-BR-3 cells | CVCL_0033 | ||
| Experiment 2 Reporting the Activity Date of This ADC | [57] | ||||
| Efficacy Data | Ninety Percent Inhibitory Concentration (IC90) |
1.46- 2.69 ng/mL
|
Negative HER2 expression (HER2-) | ||
| Method Description |
We added 100 uL of media containing the drug to be tested (drug by concentration + 1 % FBS). We added PBS to surrounding wells to prevent evaporation. we cultivate in conditions of 37°C and 5 % CO2 according to the set time (Payload: initial observation and observes 48hr, 72hr, and 96hr culture conditions to select appropriate culture conditions). For Antibody and ADC, we selected appropriate culture conditions by observing culture conditions for 96hr, 120hr, and 144hr. In the case of 120hr and 144hr incubation conditions, we added additional media after 72hr incubation (The concentration of the drug is set to 3 below and 3 above based on the IC50 value used as a reference). Positive control usually uses etoposide 10 uM or 24 uM, and negative control uses DMSO with same concentration of drug and a positive control with SN38 or etoposide for validating the assay system (data not shown).
Click to Show/Hide
|
||||
| In Vitro Model | Breast ductal carcinoma | HCC1937 cells | CVCL_0290 | ||
| Experiment 3 Reporting the Activity Date of This ADC | [57] | ||||
| Efficacy Data | Half Maximal inhibitory Concentration (lC50) |
1.05 ng/mL
|
High HER2 expression (HER2 +++) | ||
| Method Description |
We added 100 uL of media containing the drug to be tested (drug by concentration + 1 % FBS). We added PBS to surrounding wells to prevent evaporation. we cultivate in conditions of 37°C and 5 % CO2 according to the set time (Payload: initial observation and observes 48hr, 72hr, and 96hr culture conditions to select appropriate culture conditions). For Antibody and ADC, we selected appropriate culture conditions by observing culture conditions for 96hr, 120hr, and 144hr. In the case of 120hr and 144hr incubation conditions, we added additional media after 72hr incubation (The concentration of the drug is set to 3 below and 3 above based on the IC50 value used as a reference). Positive control usually uses etoposide 10 uM or 24 uM, and negative control uses DMSO with same concentration of drug and a positive control with SN38 or etoposide for validating the assay system (data not shown).
Click to Show/Hide
|
||||
| In Vitro Model | Breast adenocarcinoma | SK-BR-3 cells | CVCL_0033 | ||
| Experiment 4 Reporting the Activity Date of This ADC | [57] | ||||
| Efficacy Data | Half Maximal inhibitory Concentration (lC50) |
1.98 ng/mL
|
Negative HER2 expression (HER2-) | ||
| Method Description |
We added 100 uL of media containing the drug to be tested (drug by concentration + 1 % FBS). We added PBS to surrounding wells to prevent evaporation. we cultivate in conditions of 37°C and 5 % CO2 according to the set time (Payload: initial observation and observes 48hr, 72hr, and 96hr culture conditions to select appropriate culture conditions). For Antibody and ADC, we selected appropriate culture conditions by observing culture conditions for 96hr, 120hr, and 144hr. In the case of 120hr and 144hr incubation conditions, we added additional media after 72hr incubation (The concentration of the drug is set to 3 below and 3 above based on the IC50 value used as a reference). Positive control usually uses etoposide 10 uM or 24 uM, and negative control uses DMSO with same concentration of drug and a positive control with SN38 or etoposide for validating the assay system (data not shown).
Click to Show/Hide
|
||||
| In Vitro Model | Breast ductal carcinoma | HCC1937 cells | CVCL_0290 | ||
Trastuzumab-Qtag2-DM1 [Investigative]
Revealed Based on the Cell Line Data
| Experiment 1 Reporting the Activity Date of This ADC | [58] | ||||
| Efficacy Data | Half Maximal inhibitory Concentration (lC50) |
0.163۪.07 nM
|
Positive HER2 expression (HER2+++/++) | ||
| Method Description |
In vitro cytotoxicity of CovADC-DM1 and CovADC-MMAE was compared to T-DM1 (Kadcyla, Roche, France) on BT-474 and SKBR3 Her2-positive breast cancer cell lines, MDA-MB-231 Her2-negative cell line was included in the assay to confirm target selectivity. All cell lines were obtained from ATCC and cultured in DMEM supplemented with 10% FBS, 100 U/ml penicillin/streptomycin and 2 mM l-glutamine (Life technologies, France). Cells were maintained at 37 °C with 5% CO2 atmosphere. Optimal cell density of each cell lines was determined by IncuCyte S3 live-cell analysis system (Essence BioScience, UK). Cells were plated (SKBR3 and BT-474: 5000 cells per well, MDA-MB-231: 1,250 cells per well) on 96-well plates. Following the incubation for 24 h, cell culture medium was removed and serial dilutions of ADCs and free unconjugated drugs were added in triplicates. After 3 days incubation cytotoxicity was evaluated by sulforhodamine B assay (SRB assay kit, Sigma, France) based on the measurement of cellular protein content according to the manufacturer's instructions. Briefly, cells were fixed with 50% (wt/vol) TriChloroacetic Acid (TCA) at 4 °C (30 ul/well, final concentration 11.5%) for 1 h. After washing with dH2O cells were stained with 100 ul of 0.04% (wt/vol) SRB solution for 30 min and subsequently washed with 1% (vol/vol) acetic acid to remove unbound stain. Cellular protein bound dye was solubilized in 200 ul of 10 mM Tris base solution (pH 10.5) and the absorption was measured at 510 nm (Microplate reader, Tecan, Switzerland). The raw data was processed using GraphPad Prism 7.0 (GraphPad Software, San Diego, USA). Error bars in graphs represent SEM of two measurements.
Click to Show/Hide
|
||||
| In Vitro Model | Breast adenocarcinoma | SK-BR-3 cells | CVCL_0033 | ||
| Experiment 2 Reporting the Activity Date of This ADC | [58] | ||||
| Efficacy Data | Half Maximal inhibitory Concentration (lC50) |
0.65䔮.21 nM
|
Positive HER2 expression (HER2+++/++) | ||
| Method Description |
In vitro cytotoxicity of CovADC-DM1 and CovADC-MMAE was compared to T-DM1 (Kadcyla, Roche, France) on BT-474 and SKBR3 Her2-positive breast cancer cell lines, MDA-MB-231 Her2-negative cell line was included in the assay to confirm target selectivity. All cell lines were obtained from ATCC and cultured in DMEM supplemented with 10% FBS, 100 U/ml penicillin/streptomycin and 2 mM l-glutamine (Life technologies, France). Cells were maintained at 37 °C with 5% CO2 atmosphere. Optimal cell density of each cell lines was determined by IncuCyte S3 live-cell analysis system (Essence BioScience, UK). Cells were plated (SKBR3 and BT-474: 5000 cells per well, MDA-MB-231: 1,250 cells per well) on 96-well plates. Following the incubation for 24 h, cell culture medium was removed and serial dilutions of ADCs and free unconjugated drugs were added in triplicates. After 3 days incubation cytotoxicity was evaluated by sulforhodamine B assay (SRB assay kit, Sigma, France) based on the measurement of cellular protein content according to the manufacturer's instructions. Briefly, cells were fixed with 50% (wt/vol) TriChloroacetic Acid (TCA) at 4 °C (30 ul/well, final concentration 11.5%) for 1 h. After washing with dH2O cells were stained with 100 ul of 0.04% (wt/vol) SRB solution for 30 min and subsequently washed with 1% (vol/vol) acetic acid to remove unbound stain. Cellular protein bound dye was solubilized in 200 ul of 10 mM Tris base solution (pH 10.5) and the absorption was measured at 510 nm (Microplate reader, Tecan, Switzerland). The raw data was processed using GraphPad Prism 7.0 (GraphPad Software, San Diego, USA). Error bars in graphs represent SEM of two measurements.
Click to Show/Hide
|
||||
| In Vitro Model | Invasive breast carcinoma | BT-474 cells | CVCL_0179 | ||
| Experiment 3 Reporting the Activity Date of This ADC | [58] | ||||
| Efficacy Data | Half Maximal inhibitory Concentration (lC50) | > 10 nM | Negative HER2 expression (HER2-) | ||
| Method Description |
In vitro cytotoxicity of CovADC-DM1 and CovADC-MMAE was compared to T-DM1 (Kadcyla, Roche, France) on BT-474 and SKBR3 Her2-positive breast cancer cell lines, MDA-MB-231 Her2-negative cell line was included in the assay to confirm target selectivity. All cell lines were obtained from ATCC and cultured in DMEM supplemented with 10% FBS, 100 U/ml penicillin/streptomycin and 2 mM l-glutamine (Life technologies, France). Cells were maintained at 37 °C with 5% CO2 atmosphere. Optimal cell density of each cell lines was determined by IncuCyte S3 live-cell analysis system (Essence BioScience, UK). Cells were plated (SKBR3 and BT-474: 5000 cells per well, MDA-MB-231: 1,250 cells per well) on 96-well plates. Following the incubation for 24 h, cell culture medium was removed and serial dilutions of ADCs and free unconjugated drugs were added in triplicates. After 3 days incubation cytotoxicity was evaluated by sulforhodamine B assay (SRB assay kit, Sigma, France) based on the measurement of cellular protein content according to the manufacturer's instructions. Briefly, cells were fixed with 50% (wt/vol) TriChloroacetic Acid (TCA) at 4 °C (30 ul/well, final concentration 11.5%) for 1 h. After washing with dH2O cells were stained with 100 ul of 0.04% (wt/vol) SRB solution for 30 min and subsequently washed with 1% (vol/vol) acetic acid to remove unbound stain. Cellular protein bound dye was solubilized in 200 ul of 10 mM Tris base solution (pH 10.5) and the absorption was measured at 510 nm (Microplate reader, Tecan, Switzerland). The raw data was processed using GraphPad Prism 7.0 (GraphPad Software, San Diego, USA). Error bars in graphs represent SEM of two measurements.
Click to Show/Hide
|
||||
| In Vitro Model | Breast adenocarcinoma | MDA-MB-231 cells | CVCL_0062 | ||
US20230256114A1 ADC (DAR4) 1 [Investigative]
Revealed Based on the Cell Line Data
| Experiment 1 Reporting the Activity Date of This ADC | [59] | ||||
| Efficacy Data | Half Maximal inhibitory Concentration (lC50) |
0.49 nM
|
Positive TROP2 expression (TROP2+++/++) | ||
| Method Description |
Table 3 summarizes the results from in vitro cytotoxicity assays in which ADCs containing various DM1 derivative payload at different DARs were tested.
|
||||
| In Vitro Model | Gastric tubular adenocarcinoma | NCI-N87 cells | CVCL_1603 | ||
| Experiment 2 Reporting the Activity Date of This ADC | [59] | ||||
| Efficacy Data | Half Maximal inhibitory Concentration (lC50) |
0.51 nM
|
High TROP2 expression (TROP2 +++) | ||
| Method Description |
Table 3 summarizes the results from in vitro cytotoxicity assays in which ADCs containing various DM1 derivative payload at different DARs were tested.
|
||||
| In Vitro Model | Pancreatic ductal adenocarcinoma | BxPC-3 cells | CVCL_0186 | ||
| Experiment 3 Reporting the Activity Date of This ADC | [59] | ||||
| Efficacy Data | Half Maximal inhibitory Concentration (lC50) |
0.54 nM
|
Moderate TROP2 expression (TROP2++) | ||
| Method Description |
Table 3 summarizes the results from in vitro cytotoxicity assays in which ADCs containing various DM1 derivative payload at different DARs were tested.
|
||||
| In Vitro Model | Breast adenocarcinoma | MDA-MB-468 cells | CVCL_0419 | ||
| Experiment 4 Reporting the Activity Date of This ADC | [59] | ||||
| Efficacy Data | Half Maximal inhibitory Concentration (lC50) |
0.68 nM
|
Low TROP2 expression (TROP2+) | ||
| Method Description |
Table 3 summarizes the results from in vitro cytotoxicity assays in which ADCs containing various DM1 derivative payload at different DARs were tested.
|
||||
| In Vitro Model | Colon adenocarcinoma | Colo205 cells | CVCL_0218 | ||
| Experiment 5 Reporting the Activity Date of This ADC | [59] | ||||
| Efficacy Data | Half Maximal inhibitory Concentration (lC50) |
1.01 nM
|
High TROP2 expression (TROP2 +++) | ||
| Method Description |
Table 3 summarizes the results from in vitro cytotoxicity assays in which ADCs containing various DM1 derivative payload at different DARs were tested.
|
||||
| In Vitro Model | Pancreatic ductal adenocarcinoma | BxPC-3 cells | CVCL_0186 | ||
| Experiment 6 Reporting the Activity Date of This ADC | [59] | ||||
| Efficacy Data | Half Maximal inhibitory Concentration (lC50) |
2.88 nM
|
Positive TROP2 expression (TROP2+++/++) | ||
| Method Description |
Table 3 summarizes the results from in vitro cytotoxicity assays in which ADCs containing various DM1 derivative payload at different DARs were tested.
|
||||
| In Vitro Model | Gastric tubular adenocarcinoma | NCI-N87 cells | CVCL_1603 | ||
| Experiment 7 Reporting the Activity Date of This ADC | [59] | ||||
| Efficacy Data | Half Maximal inhibitory Concentration (lC50) |
4.88 nM
|
Moderate TROP2 expression (TROP2++) | ||
| Method Description |
Table 3 summarizes the results from in vitro cytotoxicity assays in which ADCs containing various DM1 derivative payload at different DARs were tested.
|
||||
| In Vitro Model | Breast adenocarcinoma | MDA-MB-468 cells | CVCL_0419 | ||
| Experiment 8 Reporting the Activity Date of This ADC | [59] | ||||
| Efficacy Data | Half Maximal inhibitory Concentration (lC50) |
56.42 nM
|
Low TROP2 expression (TROP2+) | ||
| Method Description |
Table 3 summarizes the results from in vitro cytotoxicity assays in which ADCs containing various DM1 derivative payload at different DARs were tested.
|
||||
| In Vitro Model | Colon adenocarcinoma | Colo205 cells | CVCL_0218 | ||
| Experiment 9 Reporting the Activity Date of This ADC | [59] | ||||
| Efficacy Data | Half Maximal inhibitory Concentration (lC50) | > 100 nM | Negative TROP2 expression (TROP2-) | ||
| Method Description |
Table 3 summarizes the results from in vitro cytotoxicity assays in which ADCs containing various DM1 derivative payload at different DARs were tested.
|
||||
| In Vitro Model | Lung adenocarcinoma | A549 cells | CVCL_0023 | ||
| Experiment 10 Reporting the Activity Date of This ADC | [59] | ||||
| Efficacy Data | Half Maximal inhibitory Concentration (lC50) | > 100 nM | Negative TROP2 expression (TROP2-) | ||
| Method Description |
Table 3 summarizes the results from in vitro cytotoxicity assays in which ADCs containing various DM1 derivative payload at different DARs were tested.
|
||||
| In Vitro Model | Breast adenocarcinoma | MDA-MB-231 cells | CVCL_0062 | ||
| Experiment 11 Reporting the Activity Date of This ADC | [59] | ||||
| Efficacy Data | Half Maximal inhibitory Concentration (lC50) | > 100 nM | Negative TROP2 expression (TROP2-) | ||
| Method Description |
Table 3 summarizes the results from in vitro cytotoxicity assays in which ADCs containing various DM1 derivative payload at different DARs were tested.
|
||||
| In Vitro Model | Lung adenocarcinoma | A549 cells | CVCL_0023 | ||
| Experiment 12 Reporting the Activity Date of This ADC | [59] | ||||
| Efficacy Data | Half Maximal inhibitory Concentration (lC50) | > 100 nM | Negative TROP2 expression (TROP2-) | ||
| Method Description |
Table 3 summarizes the results from in vitro cytotoxicity assays in which ADCs containing various DM1 derivative payload at different DARs were tested.
|
||||
| In Vitro Model | Breast adenocarcinoma | MDA-MB-231 cells | CVCL_0062 | ||
MORAb-003 ADC8 [Investigative]
Revealed Based on the Cell Line Data
| Experiment 1 Reporting the Activity Date of This ADC | [60] | ||||
| Efficacy Data | Half Maximal inhibitory Concentration (lC50) | > 100 nM | High FRA expression (FRA +++) | ||
| Method Description |
Use crystal violet analysis to evaluate the in vitro efficacy of the prepared ADCs. Initially screen all MORAb003 ADCs on IGROV1 (FRi (+++)) and SJSA - 1 (FReg (-)) cells.
|
||||
| In Vitro Model | Osteosarcoma | SJSA-1 cells | CVCL_1697 | ||
MORAb-003 ADC11 [Investigative]
Revealed Based on the Cell Line Data
| Experiment 1 Reporting the Activity Date of This ADC | [60] | ||||
| Efficacy Data | Half Maximal inhibitory Concentration (lC50) |
132 nM
|
High FRA expression (FRA +++) | ||
| Method Description |
Use crystal violet analysis to evaluate the in vitro efficacy of the prepared ADCs. Initially screen all MORAb003 ADCs on IGROV1 (FRi (+++)) and SJSA - 1 (FReg (-)) cells.
|
||||
| In Vitro Model | Osteosarcoma | SJSA-1 cells | CVCL_1697 | ||
IN202417078684A+ADC2 [Investigative]
Revealed Based on the Cell Line Data
| Experiment 1 Reporting the Activity Date of This ADC | [61] | ||||
| Efficacy Data | Half Maximal inhibitory Concentration (lC50) |
30 ng/ml
|
|||
| Method Description |
The cytotoxicity of ADC against cell lines was evaluated by cell viability test with CellTiter-Glo 2.0 luminescence method.
|
||||
EDB-L19-diS-DM1 [Investigative]
Revealed Based on the Cell Line Data
| Experiment 1 Reporting the Activity Date of This ADC | [62] | ||||
| Efficacy Data | Half Maximal inhibitory Concentration (lC50) |
237 ng/mL
|
Negative EDB expression (EDB-) | ||
| Method Description |
Calculated using four-parameter logistic model #203 with XLfit v4.2 (IDBS)
|
||||
| In Vitro Model | Colon cancer | HT29 cells | CVCL_A8EZ | ||
| Experiment 2 Reporting the Activity Date of This ADC | [62] | ||||
| Efficacy Data | Half Maximal inhibitory Concentration (lC50) |
268 ng/mL
|
Positive EDB expression (EDB+++/++) | ||
| Method Description |
Calculated using four-parameter logistic model #203 with XLfit v4.2 (IDBS)
|
||||
| In Vitro Model | Normal | WI38-VA13 cells | CVCL_2759 | ||
IN202417078684A+ADC1 [Investigative]
Revealed Based on the Cell Line Data
| Experiment 1 Reporting the Activity Date of This ADC | [61] | ||||
| Efficacy Data | Half Maximal inhibitory Concentration (lC50) |
240 ng/ml
|
|||
| Method Description |
The cytotoxicity of ADC against cell lines was evaluated by cell viability test with CellTiter-Glo 2.0 luminescence method.
|
||||
IN202417078684A+ADC3 [Investigative]
Revealed Based on the Cell Line Data
| Experiment 1 Reporting the Activity Date of This ADC | [61] | ||||
| Efficacy Data | Half Maximal inhibitory Concentration (lC50) |
311 ng/ml
|
|||
| Method Description |
The cytotoxicity of ADC against cell lines was evaluated by cell viability test with CellTiter-Glo 2.0 luminescence method.
|
||||
IN202417078684A+ADC4 [Investigative]
Revealed Based on the Cell Line Data
| Experiment 1 Reporting the Activity Date of This ADC | [61] | ||||
| Efficacy Data | Half Maximal inhibitory Concentration (lC50) |
2378 ng/ml
|
|||
| Method Description |
The cytotoxicity of ADC against cell lines was evaluated by cell viability test with CellTiter-Glo 2.0 luminescence method.
|
||||
| Experiment 2 Reporting the Activity Date of This ADC | [61] | ||||
| Efficacy Data | Half Maximal inhibitory Concentration (lC50) |
4928 ng/ml
|
|||
| Method Description |
The cytotoxicity of ADC against cell lines was evaluated by cell viability test with CellTiter-Glo 2.0 luminescence method.
|
||||
WO2024181570A1 ADC1 [Investigative]
Revealed Based on the Cell Line Data
| Experiment 1 Reporting the Activity Date of This ADC | [63] | ||||
| Efficacy Data | Half Maximal inhibitory Concentration (lC50) |
7996 ng/mL
|
Negative CD138 expression (CD138-) | ||
| Method Description |
1000 cells/well of Jurkat in 96 well, 37 °C for 5 days.
|
||||
| In Vitro Model | T acute lymphoblastic leukemia | Jurkat cells | CVCL_0065 | ||
| Experiment 2 Reporting the Activity Date of This ADC | [63] | ||||
| Efficacy Data | Half Maximal inhibitory Concentration (lC50) |
8385 ng/mL
|
Positive CD138 expression (CD138+++/++) | ||
| Method Description |
1000 cells/well of Capan-1 in 96 well, 37 °C for 5 days.
|
||||
| In Vitro Model | Pancreatic ductal adenocarcinoma | Capan-1 cells | CVCL_0237 | ||
16A5-MCC-DM1 [Phase 1]
Discovered Using Cell Line-derived Xenograft Model
| Experiment 1 Reporting the Activity Date of This ADC | [64] | ||||
| Efficacy Data | Tumor Growth Inhibition value (TGI) | ≈ 59.90% | High CD205 expression (CD205+++; IHC 3+) | ||
| Method Description |
The antitumor activity of the ADCs was then evaluated in solid and hematologic mouse xenograft models. A total of 5x10⁶-2x10⁷ cells with or without Matrigel, were injected subcutaneously into the flanks of mice. The treatments were started when average tumor volume reached 88-300 mm3. Animals were randomly assigned into groups (6 mice/group), and treated with MEN1309/OBT076 intravenously once weekly for 2 consecutive weeks, 10 mg/kg.
Click to Show/Hide
|
||||
| In Vivo Model | Diffuse Large B-Cell Lymphoma CDX model | ||||
| In Vitro Model | EBV-related Burkitt lymphoma | Raji cells | CVCL_0511 | ||
| Experiment 2 Reporting the Activity Date of This ADC | [64] | ||||
| Efficacy Data | Tumor Growth Inhibition value (TGI) | ≈ 77.10% | High CD205 expression (CD205+++; IHC 3+) | ||
| Method Description |
The antitumor activity of the ADCs was then evaluated in solid and hematologic mouse xenograft models. A total of 5x10⁶-2x10⁷ cells with or without Matrigel, were injected subcutaneously into the flanks of mice. The treatments were started when average tumor volume reached 88-300 mm3. Animals were randomly assigned into groups (6 mice/group), and treated with MEN1309/OBT076 intravenously with a single dose, 10 mg/kg.
Click to Show/Hide
|
||||
| In Vivo Model | Pancreas cancer CDX model | ||||
| In Vitro Model | Pancreatic cancer | Pancreatic cancer cells | Homo sapiens | ||
References