
Antibody-drug Conjugate Information
General Information of This Antibody-drug Conjugate (ID: DRG0CYMEB)
| ADC Name |
Trastuzumab emtansine
|
|||||
|---|---|---|---|---|---|---|
| Brand Name |
Kadcyla
|
|||||
| Synonyms |
trastuzumab emtansine; ado-trastuzumab emtansine; Kadcyla; RG3502; RO5304020; T-DM1; trastuzumab-DM1; trastuzumab-MCC-DM1; trastuzumab-emtansine; RG3502-10
Click to Show/Hide
|
|||||
| Organization |
ImmunoGen (Top20 MNC) (Originator);Genentech (Top20 MNC)
|
|||||
| Drug Status |
Approved in 2013
|
|||||
| Drug-to-Antibody Ratio |
3.5
|
|||||
| Structure |
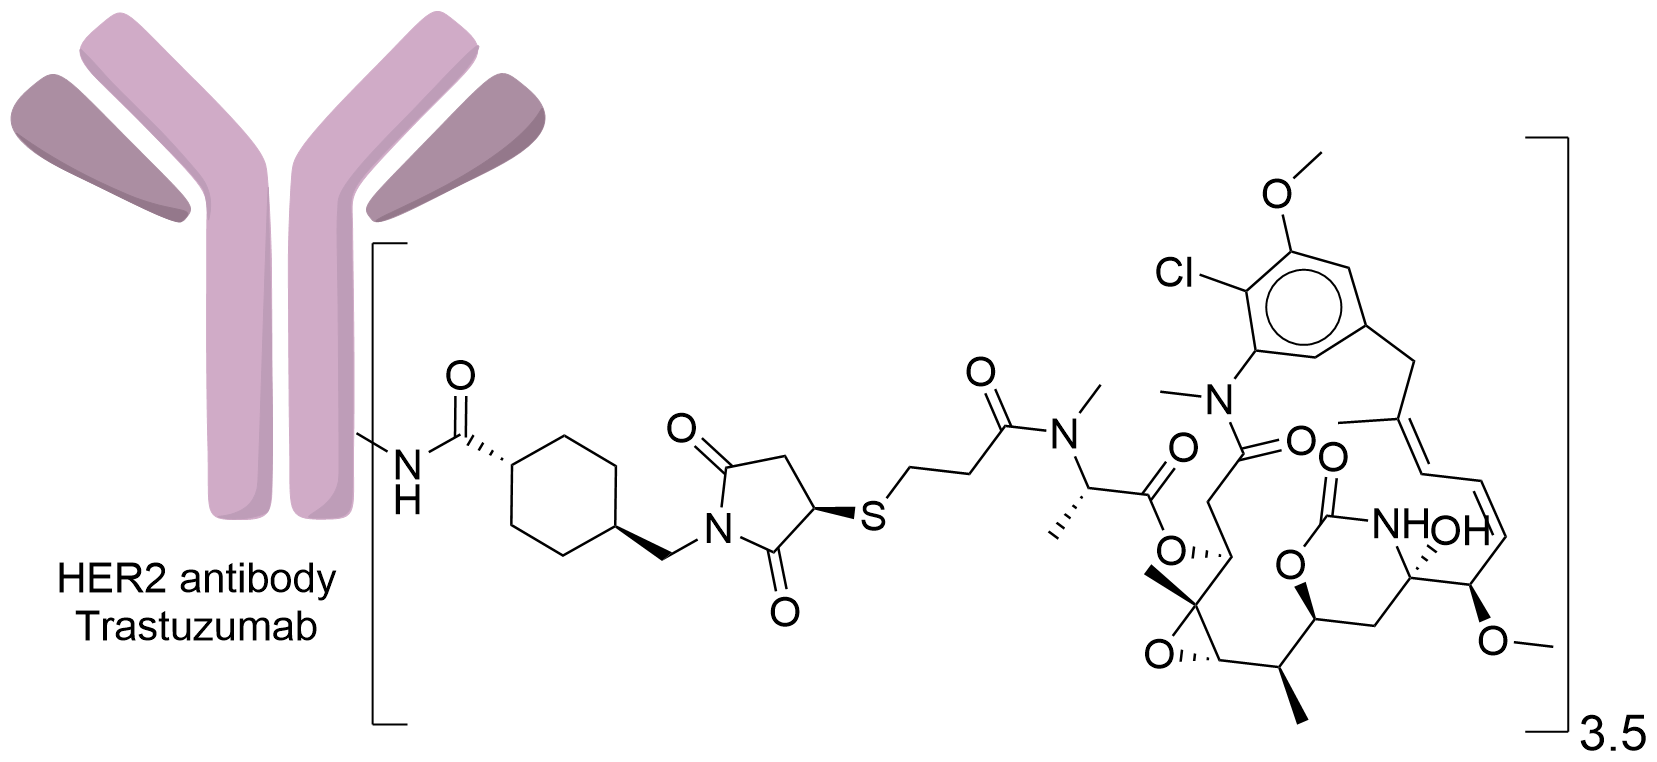
|
|||||
| Antibody Name |
Trastuzumab
|
Antibody Info | ||||
| Antigen Name |
Receptor tyrosine-protein kinase erbB-2 (HER2)
|
Antigen Info | ||||
| Payload Name |
DM1
|
Payload Info | ||||
| Payload Target |
Microtubule (MT)
|
Target Info | ||||
| Linker Name |
Succinimidyl-4-(N-maleimidomethyl)cyclohexane-1-carboxylate (SMCC)
|
Linker Info | ||||
| Conjugate Type |
Random Lysines
|
|||||
| Combination Type |
emtansine
|
|||||
| Special Approval(s) |
Breakthrough therapy (FDA); Fast track (FDA); Priority review (NMPA)
|
|||||
2027 Update
The disease landscape of This ADC
2027 Update
The clinical trial pipelines of This ADC
| Disease Name | Phase 1 | Phase 2 | Phase 3 | Approved | |||||||||||||||||||||||||||||||
|---|---|---|---|---|---|---|---|---|---|---|---|---|---|---|---|---|---|---|---|---|---|---|---|---|---|---|---|---|---|---|---|---|---|---|---|
| Unspecific non-hodgkin lymphoma | |||||||||||||||||||||||||||||||||||
| Multiple myeloma | |||||||||||||||||||||||||||||||||||
| Unspecific hematological malignancies | |||||||||||||||||||||||||||||||||||
| Oral cavity cancer | |||||||||||||||||||||||||||||||||||
| Gastric cancer | |||||||||||||||||||||||||||||||||||
| Colorectal cancer | |||||||||||||||||||||||||||||||||||
| Pancreatic cancer | |||||||||||||||||||||||||||||||||||
| Liver cancer | |||||||||||||||||||||||||||||||||||
| Biliary tract cancer | |||||||||||||||||||||||||||||||||||
| Lung cancer | |||||||||||||||||||||||||||||||||||
| Breast cancer |
19 Trials
|
10 Trials
|
|||||||||||||||||||||||||||||||||
| Penile cancer | |||||||||||||||||||||||||||||||||||
| Urothelial cancer | |||||||||||||||||||||||||||||||||||
| Extramammary paget's disease | |||||||||||||||||||||||||||||||||||
| Unspecific solid tumor |
7 Trials
|
2027 Update
ADC-specific functional property
Bystander Killing Effect
| Bystander Killing Effect | Description | Reference |
|---|---|---|
| no | Undisclosed |
[1]
|
2027 Update
General Information of The ADMET Data Related to This ADC
Absorption
| Standard Type | Value | Units | Description | Reference |
|---|---|---|---|---|
| Maximum Observed Concentration (Cmax) | 83.4 | ug/mL |
The maximum concentrations (Cmax) of trastuzumab emtansine was observed close to the end of infusion, with mean values of 83.4 ug/ mL.
|
[1] |
| Area Under the Concentration-Time Curve (AUC) | 14.5 | day·ug/mL |
After every-3-week (q3w) dosing, the AUC (0.3mg/kg, n=3) of T-DM1 is 14.5 day·ug/mL.
|
[1] |
| Maximum Observed Concentration (Cmax) | 35.3 | ug/mL |
Pharmacokinetic parameters of T-DM1, total trastuzumab and DM1 in Cycle 1, 1.8mg/kg (Dose), N=1
|
[5] |
| Maximum Observed Concentration (Cmax) | 43.4 | ug/mL |
Pharmacokinetic parameters of T-DM1, total trastuzumab and DM1 in Cycle 1, 2.4 mg/kg (Dose), N=4
|
[5] |
| Maximum Observed Concentration (Cmax) | 82 | ug/mL |
Pharmacokinetic parameters of T-DM1, total trastuzumab and DM1 in Cycle 1, 3.6 mg/kg (Dose), N=5
|
[5] |
| Area Under the Concentration-Time Curve (AUC) | 139 | day·ug/mL |
Pharmacokinetic parameters of T-DM1, total trastuzumab and DM1 in Cycle 1, 1.8mg/kg (Dose), N=1,area under the serum concentration-time curve from time zero to the last measurable concentration
|
[5] |
| Area Under the Concentration-Time Curve (AUC) | 203 | day·ug/mL |
Pharmacokinetic parameters of T-DM1, total trastuzumab and DM1 in Cycle 1, 2.4 mg/kg (Dose), N=4, area under the serum concentration-time curve from time zero to the last measurable concentration
|
[5] |
| Area Under the Concentration-Time Curve (AUC) | 338 | day·ug/mL |
Pharmacokinetic parameters of T-DM1, total trastuzumab and DM1 in Cycle 1, 3.6 mg/kg (Dose), N=5, area under the serum concentration-time curve from time zero to the last measurable concentration
|
[5] |
| Area Under the Concentration-Time Curve (AUC) | 141 | day·ug/mL |
Pharmacokinetic parameters of T-DM1, total trastuzumab and DM1 in Cycle 1, 1.8mg/kg (Dose), N=1, area under the serum concentration-time curve from time zero extrapolated to infinity
|
[5] |
| Area Under the Concentration-Time Curve (AUC) | 204 | day·ug/mL |
Pharmacokinetic parameters of T-DM1, total trastuzumab and DM1 in Cycle 1, 2.4 mg/kg (Dose), N=4, area under the serum concentration-time curve from time zero extrapolated to infinity
|
[5] |
| Area Under the Concentration-Time Curve (AUC) | 346 | day·ug/mL |
Pharmacokinetic parameters of T-DM1, total trastuzumab and DM1 in Cycle 1, 3.6 mg/kg (Dose), N=5, area under the serum concentration-time curve from time zero extrapolated to infinity
|
[5] |
| Area Under the Concentration-Time Curve (AUC) | 367.2 | day·ug/mL |
On steady-state T-DM1 exposure after repeated dosing of 3.6 mg/kg by 0.5-h IV infusion q3w, Age<65
|
[3] |
| Maximum Observed Concentration (Cmax) | 80.67 | ug/mL |
On steady-state T-DM1 exposure after repeated dosing of 3.6 mg/kg by 0.5-h IV infusion q3w, Age<65
|
[3] |
| Area Under the Concentration-Time Curve (AUC) | 367 | day·ug/mL |
On steady-state T-DM1 exposure after repeated dosing of 3.6 mg/kg by 0.5-h IV infusion q3w, Age 65-75 years
|
[3] |
| Maximum Observed Concentration (Cmax) | 81.47 | ug/mL |
On steady-state T-DM1 exposure after repeated dosing of 3.6 mg/kg by 0.5-h IV infusion q3w, Age 65-75 years
|
[3] |
| Area Under the Concentration-Time Curve (AUC) | 370.2 | day·ug/mL |
On steady-state T-DM1 exposure after repeated dosing of 3.6 mg/kg by 0.5-h IV infusion q3w, Age >75 years
|
[3] |
| Maximum Observed Concentration (Cmax) | 80.36 | ug/mL |
On steady-state T-DM1 exposure after repeated dosing of 3.6 mg/kg by 0.5-h IV infusion q3w, Age >75 years
|
[3] |
| Area Under the Concentration-Time Curve (AUC) | 369.8 | day·ug/mL |
On steady-state T-DM1 exposure after repeated dosing of 3.6 mg/kg by 0.5-h IV infusion q3w, Non-Asian
|
[3] |
| Maximum Observed Concentration (Cmax) | 81.03 | ug/mL |
On steady-state T-DM1 exposure after repeated dosing of 3.6 mg/kg by 0.5-h IV infusion q3w, Non-Asian
|
[3] |
| Area Under the Concentration-Time Curve (AUC) | 346.1 | day·ug/mL |
On steady-state T-DM1 exposure after repeated dosing of 3.6 mg/kg by 0.5-h IV infusion q3w, Asian
|
[3] |
| Maximum Observed Concentration (Cmax) | 78.53 | ug/mL |
On steady-state T-DM1 exposure after repeated dosing of 3.6 mg/kg by 0.5-h IV infusion q3w, Asian
|
[3] |
| Area Under the Concentration-Time Curve (AUC) | 365.8 | day·ug/mL |
On steady-state T-DM1 exposure after repeated dosing of 3.6 mg/kg by 0.5-h IV infusion q3w, US
|
[3] |
| Maximum Observed Concentration (Cmax) | 79.81 | ug/mL |
On steady-state T-DM1 exposure after repeated dosing of 3.6 mg/kg by 0.5-h IV infusion q3w, US
|
[3] |
| Area Under the Concentration-Time Curve (AUC) | 375.2 | day·ug/mL |
On steady-state T-DM1 exposure after repeated dosing of 3.6 mg/kg by 0.5-h IV infusion q3w, Western Europe
|
[3] |
| Maximum Observed Concentration (Cmax) | 83.79 | ug/mL |
On steady-state T-DM1 exposure after repeated dosing of 3.6 mg/kg by 0.5-h IV infusion q3w, Western Europe
|
[3] |
| Area Under the Concentration-Time Curve (AUC) | 351 | day·ug/mL |
On steady-state T-DM1 exposure after repeated dosing of 3.6 mg/kg by 0.5-h IV infusion q3w, Asia
|
[3] |
| Maximum Observed Concentration (Cmax) | 78.11 | ug/mL |
On steady-state T-DM1 exposure after repeated dosing of 3.6 mg/kg by 0.5-h IV infusion q3w, Asia
|
[3] |
| Area Under the Concentration-Time Curve (AUC) | 372.6 | day·ug/mL |
On steady-state T-DM1 exposure after repeated dosing of 3.6 mg/kg by 0.5-h IV infusion q3w, Other
|
[3] |
| Maximum Observed Concentration (Cmax) | 82.15 | ug/mL |
On steady-state T-DM1 exposure after repeated dosing of 3.6 mg/kg by 0.5-h IV infusion q3w, Other
|
[3] |
| Area Under the Concentration-Time Curve (AUC) | 391.6 | day·ug/mL |
On steady-state T-DM1 exposure after repeated dosing of 3.6 mg/kg by 0.5-h IV infusion q3w, Normal Renal function
|
[3] |
| Maximum Observed Concentration (Cmax) | 85.45 | ug/mL |
On steady-state T-DM1 exposure after repeated dosing of 3.6 mg/kg by 0.5-h IV infusion q3w, Normal Renal function
|
[3] |
| Area Under the Concentration-Time Curve (AUC) | 360.1 | day·ug/mL |
On steady-state T-DM1 exposure after repeated dosing of 3.6 mg/kg by 0.5-h IV infusion q3w, mild impairment Renal function
|
[3] |
| Maximum Observed Concentration (Cmax) | 79.6 | ug/mL |
On steady-state T-DM1 exposure after repeated dosing of 3.6 mg/kg by 0.5-h IV infusion q3w, mild impairment Renal function
|
[3] |
| Area Under the Concentration-Time Curve (AUC) | 350.2 | day·ug/mL |
On steady-state T-DM1 exposure after repeated dosing of 3.6 mg/kg by 0.5-h IV infusion q3w, Moderate mpairment Renal function
|
[3] |
| Maximum Observed Concentration (Cmax) | 77.65 | ug/mL |
On steady-state T-DM1 exposure after repeated dosing of 3.6 mg/kg by 0.5-h IV infusion q3w, Moderate mpairment Renal function
|
[3] |
| Area Under the Concentration-Time Curve (AUC) | 375.5 | day·ug/mL |
On steady-state T-DM1 exposure after repeated dosing of 3.6 mg/kg by 0.5-h IV infusion q3w, Severe mpairment Renal function
|
[3] |
| Maximum Observed Concentration (Cmax) | 78.08 | ug/mL |
On steady-state T-DM1 exposure after repeated dosing of 3.6 mg/kg by 0.5-h IV infusion q3w, Severe mpairment Renal function
|
[3] |
| Maximum Observed Concentration (Cmax) | 80.9±15.5 | ug/mL |
A Phase I Pharmacokinetic Study of Trastuzumab Emtansine (T-DM1) in Patients with Human Epidermal Growth Factor Receptor 2-Positive Metastatic Breast Cancer and Normal Hepatic Function, Mean pharmacokinetic parameters for T-DM1 at cycles 1.
Click to Show/Hide
|
[6] |
| Maximum Observed Concentration (Cmax) | 75.6±16.3 | ug/mL |
A Phase I Pharmacokinetic Study of Trastuzumab Emtansine (T-DM1) in Patients with Human Epidermal Growth Factor Receptor 2-Positive Metastatic Breast Cancer and Mild Hepatic Function, Mean pharmacokinetic parameters for T-DM1 at cycles 1.
Click to Show/Hide
|
[6] |
| Maximum Observed Concentration (Cmax) | 60.9±12.8 | ug/mL |
A Phase I Pharmacokinetic Study of Trastuzumab Emtansine (T-DM1) in Patients with Human Epidermal Growth Factor Receptor 2-Positive Metastatic Breast Cancer and Moderate Hepatic Function, Mean pharmacokinetic parameters for T-DM1 at cycles 1.
Click to Show/Hide
|
[6] |
| Area Under the Concentration-Time Curve (AUC) | 377±88.5 | day·ug/mL |
A Phase I Pharmacokinetic Study of Trastuzumab Emtansine (T-DM1) in Patients with Human Epidermal Growth Factor Receptor 2-Positive Metastatic Breast Cancer and Normal Hepatic Function, Mean pharmacokinetic parameters for T-DM1 at cycles 1.
Click to Show/Hide
|
[6] |
| Area Under the Concentration-Time Curve (AUC) | 232±96.1 | day·ug/mL |
A Phase I Pharmacokinetic Study of Trastuzumab Emtansine (T-DM1) in Patients with Human Epidermal Growth Factor Receptor 2-Positive Metastatic Breast Cancer and Mild Hepatic Function, Mean pharmacokinetic parameters for T-DM1 at cycles 1.
Click to Show/Hide
|
[6] |
| Area Under the Concentration-Time Curve (AUC) | 126±67.9 | day·ug/mL |
A Phase I Pharmacokinetic Study of Trastuzumab Emtansine (T-DM1) in Patients with Human Epidermal Growth Factor Receptor 2-Positive Metastatic Breast Cancer and Moderate Hepatic Function, Mean pharmacokinetic parameters for T-DM1 at cycles 1.
Click to Show/Hide
|
[6] |
| Maximum Observed Concentration (Cmax) | 77.9±27 | ug/mL |
A Phase I Pharmacokinetic Study of Trastuzumab Emtansine (T-DM1) in Patients with Human Epidermal Growth Factor Receptor 2-Positive Metastatic Breast Cancer and Normal Hepatic Function, Mean pharmacokinetic parameters for T-DM1 at cycles 3.
Click to Show/Hide
|
[6] |
| Maximum Observed Concentration (Cmax) | 71±25.5 | ug/mL |
A Phase I Pharmacokinetic Study of Trastuzumab Emtansine (T-DM1) in Patients with Human Epidermal Growth Factor Receptor 2-Positive Metastatic Breast Cancer and Mild Hepatic Function, Mean pharmacokinetic parameters for T-DM1 at cycles 3.
Click to Show/Hide
|
[6] |
| Maximum Observed Concentration (Cmax) | 66.5±4.3 | ug/mL |
A Phase I Pharmacokinetic Study of Trastuzumab Emtansine (T-DM1) in Patients with Human Epidermal Growth Factor Receptor 2-Positive Metastatic Breast Cancer and Moderate Hepatic Function, Mean pharmacokinetic parameters for T-DM1 at cycles 3.
Click to Show/Hide
|
[6] |
| Area Under the Concentration-Time Curve (AUC) | 488±146 | day·ug/mL |
A Phase I Pharmacokinetic Study of Trastuzumab Emtansine (T-DM1) in Patients with Human Epidermal Growth Factor Receptor 2-Positive Metastatic Breast Cancer and Normal Hepatic Function, Mean pharmacokinetic parameters for T-DM1 at cycles 3.
Click to Show/Hide
|
[6] |
| Area Under the Concentration-Time Curve (AUC) | 418±164 | day·ug/mL |
A Phase I Pharmacokinetic Study of Trastuzumab Emtansine (T-DM1) in Patients with Human Epidermal Growth Factor Receptor 2-Positive Metastatic Breast Cancer and Mild Hepatic Function, Mean pharmacokinetic parameters for T-DM1 at cycles 3.
Click to Show/Hide
|
[6] |
| Area Under the Concentration-Time Curve (AUC) | 328 | day·ug/mL |
A Phase I Pharmacokinetic Study of Trastuzumab Emtansine (T-DM1) in Patients with Human Epidermal Growth Factor Receptor 2-Positive Metastatic Breast Cancer and Moderate Hepatic Function, Mean pharmacokinetic parameters for T-DM1 at cycles 3.
Click to Show/Hide
|
[6] |
Distribution
| Standard Type | Value | Units | Description | Reference |
|---|---|---|---|---|
| Volume of Distribution (Vd) | 3.13 | L |
The central volume of distribution of trastuzumab emtansine was 3.13 L
|
[1] |
| Volume of Distribution (Vd) | 3.21 | L |
Final model estimates for the volume of distribution of T-DM1 (VTDM) were relatively low, similar to average adult plasma volume.
|
[2] |
| Volume of Distribution (Vd) | 11 | mL |
A Mechanistic Pharmacokinetic Model Elucidating the Disposition of Trastuzumab Emtansine (T-DM1), an Antibody-Drug Conjugate (ADC) for Treatment of Metastatic Breast Cancer, Mechanistic T-DM1 PK Model Parameter Estimates, Rat Central volume
Click to Show/Hide
|
[4] |
| Clearance (CL) | 49 | mL/day |
A Mechanistic Pharmacokinetic Model Elucidating the Disposition of Trastuzumab Emtansine (T-DM1), an Antibody-Drug Conjugate (ADC) for Treatment of Metastatic Breast Cancer, Mechanistic T-DM1 PK Model Parameter Estimates, Rat Distributional clearance 2
Click to Show/Hide
|
[4] |
| Volume of Distribution (Vd) | 3.44 | mL |
A Mechanistic Pharmacokinetic Model Elucidating the Disposition of Trastuzumab Emtansine (T-DM1), an Antibody-Drug Conjugate (ADC) for Treatment of Metastatic Breast Cancer, Mechanistic T-DM1 PK Model Parameter Estimates, Rat Peripheral volume 2
Click to Show/Hide
|
[4] |
| Clearance (CL) | 12 | mL/day |
A Mechanistic Pharmacokinetic Model Elucidating the Disposition of Trastuzumab Emtansine (T-DM1), an Antibody-Drug Conjugate (ADC) for Treatment of Metastatic Breast Cancer, Mechanistic T-DM1 PK Model Parameter Estimates, Rat Distributional clearance 3
Click to Show/Hide
|
[4] |
| Volume of Distribution (Vd) | 148 | mL |
A Mechanistic Pharmacokinetic Model Elucidating the Disposition of Trastuzumab Emtansine (T-DM1), an Antibody-Drug Conjugate (ADC) for Treatment of Metastatic Breast Cancer, Mechanistic T-DM1 PK Model Parameter Estimates, Cynomolgus monkey Central volume
Click to Show/Hide
|
[4] |
| Clearance (CL) | 25.5 | mL/day |
A Mechanistic Pharmacokinetic Model Elucidating the Disposition of Trastuzumab Emtansine (T-DM1), an Antibody-Drug Conjugate (ADC) for Treatment of Metastatic Breast Cancer, Mechanistic T-DM1 PK Model Parameter Estimates, Cynomolgus monkey Distributional clearance 2
Click to Show/Hide
|
[4] |
| Volume of Distribution (Vd) | 57.2 | mL |
A Mechanistic Pharmacokinetic Model Elucidating the Disposition of Trastuzumab Emtansine (T-DM1), an Antibody-Drug Conjugate (ADC) for Treatment of Metastatic Breast Cancer, Mechanistic T-DM1 PK Model Parameter Estimates, Cynomolgus monkey Peripheral volume 2
Click to Show/Hide
|
[4] |
| Clearance (CL) | 81.2 | mL/day |
A Mechanistic Pharmacokinetic Model Elucidating the Disposition of Trastuzumab Emtansine (T-DM1), an Antibody-Drug Conjugate (ADC) for Treatment of Metastatic Breast Cancer, Mechanistic T-DM1 PK Model Parameter Estimates, Cynomolgus monkey Distributional clearance 3
Click to Show/Hide
|
[4] |
| Volume of Distribution (Vd) | 10.7 | mL |
A Mechanistic Pharmacokinetic Model Elucidating the Disposition of Trastuzumab Emtansine (T-DM1), an Antibody-Drug Conjugate (ADC) for Treatment of Metastatic Breast Cancer, Reduced T-DM1 PK Model Parameter Estimates Estimates, Rat Central volume
Click to Show/Hide
|
[4] |
| Clearance (CL) | 59.7 | mL/day |
A Mechanistic Pharmacokinetic Model Elucidating the Disposition of Trastuzumab Emtansine (T-DM1), an Antibody-Drug Conjugate (ADC) for Treatment of Metastatic Breast Cancer, Reduced T-DM1 PK Model Parameter Estimates Estimates, Rat Distributional clearance 2
Click to Show/Hide
|
[4] |
| Volume of Distribution (Vd) | 2.52 | mL |
A Mechanistic Pharmacokinetic Model Elucidating the Disposition of Trastuzumab Emtansine (T-DM1), an Antibody-Drug Conjugate (ADC) for Treatment of Metastatic Breast Cancer, Reduced T-DM1 PK Model Parameter Estimates Estimates, Rat Peripheral volume 2
Click to Show/Hide
|
[4] |
| Clearance (CL) | 13.9 | mL/day |
A Mechanistic Pharmacokinetic Model Elucidating the Disposition of Trastuzumab Emtansine (T-DM1), an Antibody-Drug Conjugate (ADC) for Treatment of Metastatic Breast Cancer, Reduced T-DM1 PK Model Parameter Estimates Estimates, Rat Distributional clearance 3
Click to Show/Hide
|
[4] |
| Volume of Distribution (Vd) | 154 | mL |
A Mechanistic Pharmacokinetic Model Elucidating the Disposition of Trastuzumab Emtansine (T-DM1), an Antibody-Drug Conjugate (ADC) for Treatment of Metastatic Breast Cancer, Reduced T-DM1 PK Model Parameter Estimates Estimates, Cynomolgus monkey Central volume
Click to Show/Hide
|
[4] |
| Clearance (CL) | 56.8 | mL/day |
A Mechanistic Pharmacokinetic Model Elucidating the Disposition of Trastuzumab Emtansine (T-DM1), an Antibody-Drug Conjugate (ADC) for Treatment of Metastatic Breast Cancer, Reduced T-DM1 PK Model Parameter Estimates Estimates, Cynomolgus monkey Distributional clearance 2
Click to Show/Hide
|
[4] |
| Volume of Distribution (Vd) | 50 | mL |
A Mechanistic Pharmacokinetic Model Elucidating the Disposition of Trastuzumab Emtansine (T-DM1), an Antibody-Drug Conjugate (ADC) for Treatment of Metastatic Breast Cancer, Reduced T-DM1 PK Model Parameter Estimates Estimates, Cynomolgus monkey Peripheral volume 2
Click to Show/Hide
|
[4] |
| Clearance (CL) | 60.4 | mL/day |
A Mechanistic Pharmacokinetic Model Elucidating the Disposition of Trastuzumab Emtansine (T-DM1), an Antibody-Drug Conjugate (ADC) for Treatment of Metastatic Breast Cancer, Reduced T-DM1 PK Model Parameter Estimates Estimates, Cynomolgus monkey Distributional clearance 3
Click to Show/Hide
|
[4] |
| Volume of Distribution (Vd) | 57.1 | mL/kg |
Pharmacokinetic parameters of T-DM1, total trastuzumab and DM1 in Cycle 1, 1.8mg/kg (Dose), N=1, volume of distribution, steady state
|
[5] |
| Volume of Distribution (Vd) | 67.6 | mL/kg |
Pharmacokinetic parameters of T-DM1, total trastuzumab and DM1 in Cycle 1, 2.4 mg/kg (Dose), N=4, volume of distribution, steady state
|
[5] |
| Volume of Distribution (Vd) | 59.1 | mL/kg |
Pharmacokinetic parameters of T-DM1, total trastuzumab and DM1 in Cycle 1, 3.6 mg/kg (Dose), N=5, volume of distribution, steady state
|
[5] |
| Volume of Distribution (Vd) | 52.1±9.61 | mL/kg |
A Phase I Pharmacokinetic Study of Trastuzumab Emtansine (T-DM1) in Patients with Human Epidermal Growth Factor Receptor 2-Positive Metastatic Breast Cancer and Normal Hepatic Function, Mean pharmacokinetic parameters for T-DM1 at cycles 1.
Click to Show/Hide
|
[6] |
| Volume of Distribution (Vd) | 53.5±10.7 | mL/kg |
A Phase I Pharmacokinetic Study of Trastuzumab Emtansine (T-DM1) in Patients with Human Epidermal Growth Factor Receptor 2-Positive Metastatic Breast Cancer and Mild Hepatic Function, Mean pharmacokinetic parameters for T-DM1 at cycles 1.
Click to Show/Hide
|
[6] |
| Volume of Distribution (Vd) | 78.4±42.9 | mL/kg |
A Phase I Pharmacokinetic Study of Trastuzumab Emtansine (T-DM1) in Patients with Human Epidermal Growth Factor Receptor 2-Positive Metastatic Breast Cancer and Moderate Hepatic Function, Mean pharmacokinetic parameters for T-DM1 at cycles 1.
Click to Show/Hide
|
[6] |
| Volume of Distribution (Vd) | 40.5±30.1 | mL/kg |
A Phase I Pharmacokinetic Study of Trastuzumab Emtansine (T-DM1) in Patients with Human Epidermal Growth Factor Receptor 2-Positive Metastatic Breast Cancer and Normal Hepatic Function, Mean pharmacokinetic parameters for T-DM1 at cycles 3.
Click to Show/Hide
|
[6] |
| Volume of Distribution (Vd) | 36.2±31.3 | mL/kg |
A Phase I Pharmacokinetic Study of Trastuzumab Emtansine (T-DM1) in Patients with Human Epidermal Growth Factor Receptor 2-Positive Metastatic Breast Cancer and Mild Hepatic Function, Mean pharmacokinetic parameters for T-DM1 at cycles 3.
Click to Show/Hide
|
[6] |
| Volume of Distribution (Vd) | 20.4 | mL/kg |
A Phase I Pharmacokinetic Study of Trastuzumab Emtansine (T-DM1) in Patients with Human Epidermal Growth Factor Receptor 2-Positive Metastatic Breast Cancer and Moderate Hepatic Function, Mean pharmacokinetic parameters for T-DM1 at cycles 3.
Click to Show/Hide
|
[6] |
| Clearance (CL) | 0.737 | L/day |
An Integrated Multiple-Analyte Pharmacokinetic Model to Characterize Trastuzumab Emtansine (T-DM1) Clearance Pathways and to Evaluate Reduced Pharmacokinetic Sampling in Patients with HER2-Positive Metastatic Breast Cancer, T-DM1 distributional clearance
Click to Show/Hide
|
[7] |
| Volume of Distribution (Vd) | 3.37 | L |
An Integrated Multiple-Analyte Pharmacokinetic Model to Characterize Trastuzumab Emtansine (T-DM1) Clearance Pathways and to Evaluate Reduced Pharmacokinetic Sampling in Patients with HER2-Positive Metastatic Breast Cancer, Central volume of distribution
Click to Show/Hide
|
[7] |
| Volume of Distribution (Vd) | 0.974 | L |
An Integrated Multiple-Analyte Pharmacokinetic Model to Characterize Trastuzumab Emtansine (T-DM1) Clearance Pathways and to Evaluate Reduced Pharmacokinetic Sampling in Patients with HER2-Positive Metastatic Breast Cancer, T-DM1 peripheral volume of distribution
Click to Show/Hide
|
[7] |
Metabolism
| Description | Reference |
|---|---|
|
Trastuzumab emtansine undergoes lysosomal degradation to MCC-DM1, Lys-MCC-DM1, and DM1. All of these products are detected at low levels in the plasma. DM1 undergoes further degradation by CYP3A4 and CYP3A5, but DM1 does not induce or inhibit any of the CYP450 enzymes.
Click to Show/Hide
|
Excretion
| Standard Type | Value | Units | Description | Reference |
|---|---|---|---|---|
| Elimination Half-Life (t1/2) | 4 | days |
Trastuzumab emtansine has a long half life of about 4 days.
|
[1] |
| Clearance (CL) | 0.68 | L/day |
After IV infusion, trastuzumab emtansine has a clearance of 0.68 L/day.
|
[1] |
| Clearance (CL) | 0.0618 | L/h |
Noncompartmental analysis showed concentration-dependent clearance for T-DM1 (0.3 mg/kg). Administered to phase I patients in once-every-3-weeks and once-weekly regimens.
|
[2] |
| Clearance (CL) | 0.0232 | L/h |
Noncompartmental analysis showed concentration-dependent clearance for T-DM1 (4.8 mg/kg). Administered to phase I patients in once-every-3-weeks and once-weekly regimens.
|
[2] |
| Elimination Half-Life (t1/2) | 4 | days |
Terminal half-life in phase II and III studies (3.6 mg/kg q3w).
|
[3] |
| Clearance (CL) | 2.42 | mL/day |
A Mechanistic Pharmacokinetic Model Elucidating the Disposition of Trastuzumab Emtansine (T-DM1), an Antibody-Drug Conjugate (ADC) for Treatment of Metastatic Breast Cancer, Mechanistic T-DM1 PK Model Parameter Estimates, Rat Total trastuzumab clearance
Click to Show/Hide
|
[4] |
| Elimination Half-Life (t1/2) | 16.7 | mL |
A Mechanistic Pharmacokinetic Model Elucidating the Disposition of Trastuzumab Emtansine (T-DM1), an Antibody-Drug Conjugate (ADC) for Treatment of Metastatic Breast Cancer, Mechanistic T-DM1 PK Model Parameter Estimates, Rat Peripheral volume 3
Click to Show/Hide
|
[4] |
| Clearance (CL) | 17.4 | mL/day |
A Mechanistic Pharmacokinetic Model Elucidating the Disposition of Trastuzumab Emtansine (T-DM1), an Antibody-Drug Conjugate (ADC) for Treatment of Metastatic Breast Cancer, Mechanistic T-DM1 PK Model Parameter Estimates, Cynomolgus monkey Total trastuzumab clearance
Click to Show/Hide
|
[4] |
| Elimination Half-Life (t1/2) | 127 | mL |
A Mechanistic Pharmacokinetic Model Elucidating the Disposition of Trastuzumab Emtansine (T-DM1), an Antibody-Drug Conjugate (ADC) for Treatment of Metastatic Breast Cancer, Mechanistic T-DM1 PK Model Parameter Estimates, Cynomolgus monkey Peripheral volume 3
Click to Show/Hide
|
[4] |
| Clearance (CL) | 2.37 | mL/day |
A Mechanistic Pharmacokinetic Model Elucidating the Disposition of Trastuzumab Emtansine (T-DM1), an Antibody-Drug Conjugate (ADC) for Treatment of Metastatic Breast Cancer, Reduced T-DM1 PK Model Parameter Estimates Estimates, Rat Total trastuzumab clearance
Click to Show/Hide
|
[4] |
| Elimination Half-Life (t1/2) | 15.5 | mL |
A Mechanistic Pharmacokinetic Model Elucidating the Disposition of Trastuzumab Emtansine (T-DM1), an Antibody-Drug Conjugate (ADC) for Treatment of Metastatic Breast Cancer, Reduced T-DM1 PK Model Parameter Estimates Estimates, Rat Peripheral volume 3
Click to Show/Hide
|
[4] |
| Clearance (CL) | 19.9 | mL/day |
A Mechanistic Pharmacokinetic Model Elucidating the Disposition of Trastuzumab Emtansine (T-DM1), an Antibody-Drug Conjugate (ADC) for Treatment of Metastatic Breast Cancer, Reduced T-DM1 PK Model Parameter Estimates Estimates, Cynomolgus monkey Total trastuzumab clearance
Click to Show/Hide
|
[4] |
| Elimination Half-Life (t1/2) | 84.7 | mL |
A Mechanistic Pharmacokinetic Model Elucidating the Disposition of Trastuzumab Emtansine (T-DM1), an Antibody-Drug Conjugate (ADC) for Treatment of Metastatic Breast Cancer, Reduced T-DM1 PK Model Parameter Estimates Estimates, Cynomolgus monkey Peripheral volume 3
Click to Show/Hide
|
[4] |
| Elimination Half-Life (t1/2) | 2.39 | day |
Pharmacokinetic parameters of T-DM1, total trastuzumab and DM1 in Cycle 1, 1.8mg/kg (Dose), N=1
|
[5] |
| Elimination Half-Life (t1/2) | 2.88 | day |
Pharmacokinetic parameters of T-DM1, total trastuzumab and DM1 in Cycle 1, 2.4 mg/kg (Dose), N=4
|
[5] |
| Elimination Half-Life (t1/2) | 3.74 | day |
Pharmacokinetic parameters of T-DM1, total trastuzumab and DM1 in Cycle 1, 3.6 mg/kg (Dose), N=5
|
[5] |
| Clearance (CL) | 12.9 | mL/day/kg |
Pharmacokinetic parameters of T-DM1, total trastuzumab and DM1 in Cycle 1, 1.8mg/kg (Dose), N=1, volume of distribution, steady state
|
[5] |
| Clearance (CL) | 13.4 | mL/day/kg |
Pharmacokinetic parameters of T-DM1, total trastuzumab and DM1 in Cycle 1, 2.4 mg/kg (Dose), N=4, volume of distribution, steady state
|
[5] |
| Clearance (CL) | 10.6 | mL/day/kg |
Pharmacokinetic parameters of T-DM1, total trastuzumab and DM1 in Cycle 1, 3.6 mg/kg (Dose), N=5, volume of distribution, steady state
|
[5] |
| Elimination Half-Life (t1/2) | 3.32±0.678 | day |
A Phase I Pharmacokinetic Study of Trastuzumab Emtansine (T-DM1) in Patients with Human Epidermal Growth Factor Receptor 2-Positive Metastatic Breast Cancer and Normal Hepatic Function, Mean pharmacokinetic parameters for T-DM1 at cycles 1.
Click to Show/Hide
|
[6] |
| Elimination Half-Life (t1/2) | 2.23±0.782 | day |
A Phase I Pharmacokinetic Study of Trastuzumab Emtansine (T-DM1) in Patients with Human Epidermal Growth Factor Receptor 2-Positive Metastatic Breast Cancer and Mild Hepatic Function, Mean pharmacokinetic parameters for T-DM1 at cycles 1.
Click to Show/Hide
|
[6] |
| Elimination Half-Life (t1/2) | 2.57±1.65 | day |
A Phase I Pharmacokinetic Study of Trastuzumab Emtansine (T-DM1) in Patients with Human Epidermal Growth Factor Receptor 2-Positive Metastatic Breast Cancer and Moderate Hepatic Function, Mean pharmacokinetic parameters for T-DM1 at cycles 1.
Click to Show/Hide
|
[6] |
| Clearance (CL) | 9.94±2.1 | mL/day/kg |
A Phase I Pharmacokinetic Study of Trastuzumab Emtansine (T-DM1) in Patients with Human Epidermal Growth Factor Receptor 2-Positive Metastatic Breast Cancer and Normal Hepatic Function, Mean pharmacokinetic parameters for T-DM1 at cycles 1.
Click to Show/Hide
|
[6] |
| Clearance (CL) | 18.2±7.93 | mL/day/kg |
A Phase I Pharmacokinetic Study of Trastuzumab Emtansine (T-DM1) in Patients with Human Epidermal Growth Factor Receptor 2-Positive Metastatic Breast Cancer and Mild Hepatic Function, Mean pharmacokinetic parameters for T-DM1 at cycles 1.
Click to Show/Hide
|
[6] |
| Clearance (CL) | 39.7±26.2 | mL/day/kg |
A Phase I Pharmacokinetic Study of Trastuzumab Emtansine (T-DM1) in Patients with Human Epidermal Growth Factor Receptor 2-Positive Metastatic Breast Cancer and Moderate Hepatic Function, Mean pharmacokinetic parameters for T-DM1 at cycles 1.
Click to Show/Hide
|
[6] |
| Elimination Half-Life (t1/2) | 3.82±0.698 | day |
A Phase I Pharmacokinetic Study of Trastuzumab Emtansine (T-DM1) in Patients with Human Epidermal Growth Factor Receptor 2-Positive Metastatic Breast Cancer and Normal Hepatic Function, Mean pharmacokinetic parameters for T-DM1 at cycles 3.
Click to Show/Hide
|
[6] |
| Elimination Half-Life (t1/2) | 3.23±0.856 | day |
A Phase I Pharmacokinetic Study of Trastuzumab Emtansine (T-DM1) in Patients with Human Epidermal Growth Factor Receptor 2-Positive Metastatic Breast Cancer and Mild Hepatic Function, Mean pharmacokinetic parameters for T-DM1 at cycles 3.
Click to Show/Hide
|
[6] |
| Elimination Half-Life (t1/2) | 2.67 | day |
A Phase I Pharmacokinetic Study of Trastuzumab Emtansine (T-DM1) in Patients with Human Epidermal Growth Factor Receptor 2-Positive Metastatic Breast Cancer and Moderate Hepatic Function, Mean pharmacokinetic parameters for T-DM1 at cycles 3.
Click to Show/Hide
|
[6] |
| Clearance (CL) | 8.16±3.27 | mL/day/kg |
A Phase I Pharmacokinetic Study of Trastuzumab Emtansine (T-DM1) in Patients with Human Epidermal Growth Factor Receptor 2-Positive Metastatic Breast Cancer and Normal Hepatic Function, Mean pharmacokinetic parameters for T-DM1 at cycles 3.
Click to Show/Hide
|
[6] |
| Clearance (CL) | 9.74±3.62 | mL/day/kg |
A Phase I Pharmacokinetic Study of Trastuzumab Emtansine (T-DM1) in Patients with Human Epidermal Growth Factor Receptor 2-Positive Metastatic Breast Cancer and Mild Hepatic Function, Mean pharmacokinetic parameters for T-DM1 at cycles 3.
Click to Show/Hide
|
[6] |
| Clearance (CL) | 8.99 | mL/day/kg |
A Phase I Pharmacokinetic Study of Trastuzumab Emtansine (T-DM1) in Patients with Human Epidermal Growth Factor Receptor 2-Positive Metastatic Breast Cancer and Moderate Hepatic Function, Mean pharmacokinetic parameters for T-DM1 at cycles 3.
Click to Show/Hide
|
[6] |
| Clearance (CL) | 0.403 | L/day |
An Integrated Multiple-Analyte Pharmacokinetic Model to Characterize Trastuzumab Emtansine (T-DM1) Clearance Pathways and to Evaluate Reduced Pharmacokinetic Sampling in Patients with HER2-Positive Metastatic Breast Cancer, T-DM1 deconjugation clearance
Click to Show/Hide
|
[7] |
| Clearance (CL) | 0.305 | L/day |
An Integrated Multiple-Analyte Pharmacokinetic Model to Characterize Trastuzumab Emtansine (T-DM1) Clearance Pathways and to Evaluate Reduced Pharmacokinetic Sampling in Patients with HER2-Positive Metastatic Breast Cancer, T-DM1 proteolytic degradation clearance
Click to Show/Hide
|
[7] |
Toxicity
| Description | Reference |
|---|---|
|
The FDA label includes a black box warning of serious side effects such as hepatotoxicity, embryo-fetal toxicity, and cardiac toxicity.
|
General Information of The Activity Data Related to This ADC
Identified from the Human Clinical Data
Discovered Using Patient-derived Xenograft Model
Discovered Using Cell Line-derived Xenograft Model
Obtained from the Model Organism Data
| Standard Type | Value | Units | Animal Model (No. of PDX) |
|---|---|---|---|
| Tumor Growth Inhibition value (TGI) |
≈ 94.98
|
%
|
Breast cancer model MMTV-HER2 Fo5
|
Revealed Based on the Cell Line Data
Full List of Activity Data of This Antibody-drug Conjugate
Identified from the Human Clinical Data
| Experiment 1 Reporting the Activity Date of This ADC | [8] | ||||
| Efficacy Data | Objective Response Rate (ORR) | 21.40% | Positive HER2 expression (HER2 +++/++) | ||
| Patients Enrolled |
Untreated, asymptomatic BM or controlled brain disease treated with radiotherapy >14 days before enrollment; had received prior HER2-targeted therapy and chemotherapy; and had progressed on or after their most recent treatment of advanced breast cancer.
|
||||
| Administration Dosage |
3.6 mg/kg intravenously every 3 weeks.
|
||||
| Related Clinical Trial | |||||
| NCT Number | NCT01702571 | Clinical Status | Phase 3 | ||
| Clinical Description | A two-cohort, open-label, multicenter study of trastuzumab emtansine (T-DM1) in HER2-positive locally advanced or metastatic breast cancer patients who have received prior anti-HER2 and chemotherapy-based treatment. | ||||
| Primary Endpoint |
Objective response rate=21.40% (95% CI 14.60-29.60), clinical benefit rate=42.90% (95% CI 34.10-52.00).
|
||||
| Other Endpoint |
Median PFS=5.50 months (95% CI, 5.30-5.60), overall survival =18.90 months (95% CI, 17.10-21.30).
|
||||
| Experiment 2 Reporting the Activity Date of This ADC | [9] | ||||
| Efficacy Data | Objective Response Rate (ORR) | 5.10% | Positive HER2 expression (HER2+++/++) | ||
| Patients Enrolled |
HER2 positive advanced urothelial bladder cancer or pancreatic cancer/cholangiocarcinoma
|
||||
| Administration Dosage |
Received singleagent TDM1 2.4 mg/kg once weekly (qw) or 3.6 mg/kg every 3 weeks (q3w).
|
||||
| Related Clinical Trial | |||||
| NCT Number | NCT02999672 | Clinical Status | Phase 2 | ||
| Clinical Description | A study to determine best tumor response with trastuzumab emtansine in human epidermal growth factor receptor 2 (HER2) overexpressing solid tumors (KAMELEON). | ||||
| Primary Endpoint |
BOR, Urothelial bladder cancer (n=13); PR N=5 (38.46%);SD N=1 (7.7%);PD N=6 (46.2%);NE N=1 (7.69%). Pancreatic cancer/cholangiocarcinoma (n=7) PR N=1 (14.29%);SD N=3 (42.86%);PD N=2 (28.57%); NE N=1 (14.29%).
|
||||
| Other Endpoint |
PFS, Urothelial bladder cancer (n=13), Median PFS, months (95% CI) 2.20 (1.18-4.30), Median OS, months (95% CI) 7.03 (3.75-NE). Pancreatic cancer/cholangiocarcinoma (n=7), Median PFS, months (95% CI) 2.58 (1.31-9.99), Median OS, months (95% CI) NE (1.45-NE).
|
||||
| Experiment 3 Reporting the Activity Date of This ADC | [10] | ||||
| Efficacy Data | Objective Response Rate (ORR) |
5.60%
|
|||
| Patients Enrolled |
38 patients were enrolled and 36 included in efficacy analysis.Patients were treated with the standard intravenous dosing of T- DM1, that is 3.6mg/kg every 3 weeks for a 21-day cycle.
|
||||
| Administration Dosage |
3.6 mg/kg every 3 weeks for a 21-day cycle, until toxicity or progression.
|
||||
| Related Clinical Trial | |||||
| NCT Number | NCT02465060 | Clinical Status | Phase 2 | ||
| Clinical Description | Targeted therapy directed by genetic testing in treating patients with advanced refractory solid tumors, lymphomas, or multiple myeloma (the MATCH screening trial). | ||||
| Primary Endpoint |
ORR was 2/36 (5.56%) with 90% confidence interval (90% CI, 1.00% to 16.50%)
|
||||
| Other Endpoint |
PFS=23.60%.
|
||||
| Experiment 4 Reporting the Activity Date of This ADC | [11] | ||||
| Efficacy Data | Objective Response Rate (ORR) | 45% | Positive HER2 expression (HER2 +++/++) | ||
| Patients Enrolled |
An Eastern Cooperative Oncology Group performance status of 0 or 1 and centrally confirmed, measurable, HER2-positive advanced breast cancer previously treated with trastuzumab and a taxane.
|
||||
| Administration Dosage |
3.6 mg/kg ( trastuzumab emtansine) and 1200 mg (Atezolizumab) intravenously every 3 weeks.
|
||||
| Related Clinical Trial | |||||
| NCT Number | NCT02924883 | Clinical Status | Phase 2 | ||
| Clinical Description | A randomized, multicenter, double-blind, placebo-controlled phase II study of the efficacy and safety of trastuzumab emtansine in combination with atezolizumab or atezolizumab-placebo in patients with HER2-positive locally advanced or metastatic breast cancer who have received prior trastuzumab and taxane based therapy. | ||||
| Primary Endpoint |
Median PFS=8.20 months (95% CI 5.80-10.70).
|
||||
| Other Endpoint |
Median overall survival was not estimable (95% CI NE-NE); Objective response rate=45.00% (95% CI 28.06-50.30).
|
||||
| Experiment 5 Reporting the Activity Date of This ADC | [12] | ||||
| Efficacy Data | Objective Response Rate (ORR) | 20% | High HER2 expression (HER2+++) | ||
| Patients Enrolled |
HER2-positive, metastatic breast cancer previously treated with taxane, trastuzumab, and pertuzumab, and were T-DM1-nave.
|
||||
| Administration Dosage |
The study consisted of a dose de-escalation (dose-finding) cohort, followed by an expansion cohort at the recommended phase II dose (RP2D), T-DM1 3.60 mg/kg intravenously every 21 days, and pembrolizumab 200mg intravenously every 21 days, if one or fewer DLTs were noted in the first six patients at that dose level, it would be declared the RP2D.
|
||||
| Related Clinical Trial | |||||
| NCT Number | NCT03032107 | Clinical Status | Phase 1b | ||
| Clinical Description | A phase 1b study of pembrolizumab in combination with trastuzumab-dm1 in metastatic HER2-positive breast cancer. | ||||
| Primary Endpoint |
OrR=20.00% (95% CI 5.70%-43.70%), and median PFS=9.60 months (95%CI 2.80-16.00 months).
|
||||
| Other Endpoint |
There were no dose-limiting toxicities. The RP2D was 3.60 mg/kg T-DM1 plus 200 mg pembrolizumab every 21 days.
|
||||
| Experiment 6 Reporting the Activity Date of This ADC | [13] | ||||
| Patients Enrolled |
Newly diagnosed, HER2-positive, nonmetastatic, histologically confirmed, operable primary invasive breast carcinoma.
|
||||
| Administration Dosage |
T-DM1 was dosed at 3.60 mg/kg once every 3 weeks. Trastuzumab was dosed at 6 mg/kg once every 3 weeks after an 8 mg/kg loading dose and started concurrently with the taxane. Pertuzumab was dosed at 420 mg once every 3 weeks after an 840 mg loading dose and administered concurrently with T-DM1 or trastuzumab-plus-taxane. An interval of 3 weeks from the last dose of anthracycline to initiation of HER2-targeted therapy was required. After the taxane-concurrent phase in the trastuzumab-containing arm, trastuzumab-plus-pertuzumab was continued for 1 year. In the T-DM1containing arm, T-DM1-plus-pertuzumab was continued for 1 year.
Click to Show/Hide
|
||||
| Related Clinical Trial | |||||
| NCT Number | NCT01966471 | Clinical Status | Phase 3 | ||
| Clinical Description | A randomized, multicenter, open-label, phase 3 trial comparing trastuzumab plus pertuzumab plus a taxane following anthracyclines versus trastuzumab emtansine plus pertuzumab following anthracyclines as adjuvant therapy in patients with operable HER2-positive primary breast cancer. | ||||
| Primary Endpoint |
82 (9.90%) IDFS events had occurred in the AC-THP arm and 80 (9.60%) had occurred in the AC-KP arm.
|
||||
| Other Endpoint |
3-year IDFS rates were 94.10% (95% CI, 92.50 to 95.70) with AC-THP and 92.80% (95% CI, 91.00 to 94.50) with AC-KP.
|
||||
Discovered Using Patient-derived Xenograft Model
| Experiment 1 Reporting the Activity Date of This ADC | [14] | ||||
| Efficacy Data | Tumor Growth Inhibition value (TGI) | ≈ 1.10% | Low HER2 expression (HER2+) | ||
| Method Description |
The antitumor activity of T-DM1 was evaluated in various patient-derived xenograft models with different HER2 expression levels. Each cell suspension or tumor fragment was inoculated subcutaneously into specific pathogen-free female nude mice.The tumor-bearing mice were randomized into treatment and control groups based on the tumor volumes, and dosing was initiated on day 0. In this group, 10 mg/kg T-DM1 was i.v. to the tumor-bearing mice.
Click to Show/Hide
|
||||
| In Vivo Model | Breast cancer PDX model (PDX: ST565) | ||||
| Experiment 2 Reporting the Activity Date of This ADC | [14] | ||||
| Efficacy Data | Tumor Growth Inhibition value (TGI) | ≈ 19.20% | Low HER2 expression (HER2+) | ||
| Method Description |
The antitumor activity of T-DM1 was evaluated in various patient-derived xenograft models with different HER2 expression levels. Each cell suspension or tumor fragment was inoculated subcutaneously into specific pathogen-free female nude mice.The tumor-bearing mice were randomized into treatment and control groups based on the tumor volumes, and dosing was initiated on day 0. In this group, 10 mg/kg T-DM1 was i.v. to the tumor-bearing mice.
Click to Show/Hide
|
||||
| In Vivo Model | Breast cancer PDX model (PDX: ST313) | ||||
| Experiment 3 Reporting the Activity Date of This ADC | [14] | ||||
| Efficacy Data | Tumor Growth Inhibition value (TGI) | ≈ 37.60% | High HER2 expression (HER2+++) | ||
| Method Description |
The antitumor activity of T-DM1 was evaluated in various patient-derived xenograft models with different HER2 expression levels. Each cell suspension or tumor fragment was inoculated subcutaneously into specific pathogen-free female nude mice.The tumor-bearing mice were randomized into treatment and control groups based on the tumor volumes, and dosing was initiated on day 0. In this group, 10 mg/kg T-DM1 was i.v. to the tumor-bearing mice.
Click to Show/Hide
|
||||
| In Vivo Model | Gastric cancer PDX model (PDX model: NIBIO G016) | ||||
| Experiment 4 Reporting the Activity Date of This ADC | [14] | ||||
| Efficacy Data | Tumor Growth Inhibition value (TGI) | ≈ 85.20% | Moderate HER2 expression (HER2++) | ||
| Method Description |
The antitumor activity of T-DM1 was evaluated in various patient-derived xenograft models with different HER2 expression levels. Each cell suspension or tumor fragment was inoculated subcutaneously into specific pathogen-free female nude mice.The tumor-bearing mice were randomized into treatment and control groups based on the tumor volumes, and dosing was initiated on day 0. In this group, 10 mg/kg T-DM1 was i.v. to the tumor-bearing mice.
Click to Show/Hide
|
||||
| In Vivo Model | Breast cancer PDX model (PDX: ST225) | ||||
| Experiment 5 Reporting the Activity Date of This ADC | [15] | ||||
| Efficacy Data | Tumor Growth Inhibition value (TGI) | ≈ 90.40% | Positive HER2 expression (HER2+++/++) | ||
| Method Description |
T-DM1 (Genentech) was administered i.p. at 10 mg/kg once per week.
|
||||
| In Vivo Model | Breast cancer PDX model (PDX: PDX12) | ||||
Discovered Using Cell Line-derived Xenograft Model
| Experiment 1 Reporting the Activity Date of This ADC | [14] | ||||
| Efficacy Data | Tumor Growth Inhibition value (TGI) | ≈ 7.10% | Low HER2 expression (HER2+) | ||
| Method Description |
The antitumor activity of T-DM1 was evaluated in various mice xenograft models with different HER2 expression levels; CFPAC-1 (low-expression). Each cell suspension or tumor fragment was inoculated subcutaneously into specific pathogen-free female nude mice.The tumor-bearing mice were randomized into treatment and control groups based on the tumor volumes, and dosing was initiated on day 0. In this group, 10 mg/kg T-DM1 was i.v. to the tumor-bearing mice.
Click to Show/Hide
|
||||
| In Vivo Model | CFPAC-1 cell line xenograft model | ||||
| In Vitro Model | Cystic fibrosis | CFPAC-1 cells | CVCL_1119 | ||
| Experiment 2 Reporting the Activity Date of This ADC | [16] | ||||
| Efficacy Data | Tumor Growth Inhibition value (TGI) | ≈ 15.50% | High HER2 expression (HER2+++) | ||
| Method Description |
The activity of trastuzumab-MCC-DM1 was further investigated in trastuzumab-insensitive mouse xenograft model. After transplantation of MMTV-HER2 Fo5 mammary tumor explants, tumor-bearing nude mice (n = 8 mice per group) were treated once every 3 weeks with 1 mg/kg trastuzmab-MCC-DM1.
|
||||
| In Vivo Model | MMTV-HER2 Fo5 CDX model (Trastuzumab resistant) | ||||
| In Vitro Model | Breast cancer | MMTV-HER2 cells | Mus musculus | ||
| Experiment 3 Reporting the Activity Date of This ADC | [16] | ||||
| Efficacy Data | Tumor Growth Inhibition value (TGI) | ≈ 27.10% | High HER2 expression (HER2+++) | ||
| Method Description |
Naive female beige nude XID mice were inoculated in the mammary fat pad with 20 million tumor cells suspended in 50% phenol redfree Matrigel mixed with culture medium. All animals were randomly assigned into treatment groups, such that the mean tumor volume for each group was 100 to 200 mm3. Nude mice with established tumors were dosed i.v. with Tmab-MCC-DM1 0.3 mg/kg for a total of three injections.
Click to Show/Hide
|
||||
| In Vivo Model | Trastuzumab-resistant breast cancer CDX model | ||||
| In Vitro Model | Invasive breast carcinoma of no special type | BT-474 EEI cells | CVCL_AR96 | ||
| Experiment 4 Reporting the Activity Date of This ADC | [14] | ||||
| Efficacy Data | Tumor Growth Inhibition value (TGI) | ≈ 31.70% | Low HER2 expression (HER2+) | ||
| Method Description |
The antitumor activity of T-DM1 was evaluated in various mice xenograft models with different HER2 expression levels; Capan-1 (weak positive). Each cell suspension or tumor fragment was inoculated subcutaneously into specific pathogen-free female nude mice.The tumor-bearing mice were randomized into treatment and control groups based on the tumor volumes, and dosing was initiated on day 0. In this group, 10 mg/kg T-DM1 was i.v. to the tumor-bearing mice.
Click to Show/Hide
|
||||
| In Vivo Model | Capan-1 cell line xenograft model | ||||
| In Vitro Model | Pancreatic ductal adenocarcinoma | Capan-1 cells | CVCL_0237 | ||
| Experiment 5 Reporting the Activity Date of This ADC | [14] | ||||
| Efficacy Data | Tumor Growth Inhibition value (TGI) | ≈ 33.10% | Negative HER2 expression (HER2-) | ||
| Method Description |
The antitumor activity of T-DM1 was evaluated in various mice xenograft models with different HER2 expression levels; GCIY (negative). Each cell suspension or tumor fragment was inoculated subcutaneously into specific pathogen-free female nude mice.The tumor-bearing mice were randomized into treatment and control groups based on the tumor volumes, and dosing was initiated on day 0. In this group, 10 mg/kg T-DM1 was i.v. to the tumor-bearing mice.
Click to Show/Hide
|
||||
| In Vivo Model | GCIY cell line xenograft model | ||||
| In Vitro Model | Gastric adenocarcinoma | GCIY cells | CVCL_1228 | ||
| Experiment 6 Reporting the Activity Date of This ADC | [17] | ||||
| Efficacy Data | Tumor Growth Inhibition value (TGI) | ≈ 36% | Positive HER2 expression (HER2+++/++) | ||
| Method Description |
Subcutaneous injection of 100,000 cells mixed in 200 mL PBS solution was performed. Two weeks after tumour cell injection, mice were treated with trastuzumab, cetuximab or T-DM1 at a dose of 300 mg/kg via IP injection.
|
||||
| In Vivo Model | SW48 CDX model | ||||
| In Vitro Model | Colon adenocarcinoma | SW48 cells | CVCL_1724 | ||
| Experiment 7 Reporting the Activity Date of This ADC | [17] | ||||
| Efficacy Data | Tumor Growth Inhibition value (TGI) | ≈ 36% | Low HER2 expression (HER2 +) | ||
| Method Description |
SW48, HT-29 and LS174T cells were injected into null mice subcutaneously, followed by treatment with cetuximab, trastuzumab and T-DM1. Two weeks after tumour cell injection, mice were treated with trastuzumab, cetuximab or T-DM1 at a dose of 300 mg/kg via IP injection.
|
||||
| In Vivo Model | SW48 CDX model | ||||
| In Vitro Model | Colon adenocarcinoma | SW48 cells | CVCL_1724 | ||
| Experiment 8 Reporting the Activity Date of This ADC | [18] | ||||
| Efficacy Data | Tumor Growth Inhibition value (TGI) | ≈ 42% | Low HER2 expression (HER2+) | ||
| Method Description |
Subcutaneous injection of 100,000 cells mixed in 200 mL PBS solution was performed. Two weeks after tumour cell injection, mice were treated with trastuzumab, cetuximab or T-DM1 (30 mg/kg, once per week i.p.) for 8 weeks.
|
||||
| In Vivo Model | 11-18 CDX model | ||||
| In Vitro Model | Lung adenocarcinoma | 11-18 cells | CVCL_6659 | ||
| Experiment 9 Reporting the Activity Date of This ADC | [18] | ||||
| Efficacy Data | Tumor Growth Inhibition value (TGI) | ≈ 42% | Low HER2 expression (HER2 +) | ||
| Method Description |
11-18 cells (4,000,000 ) and HCC827 cells (2,000,000 ) were injected subcutaneously into the backs on both sides of the mice. T-DM1 (30 mg/kg, once per week i.p.) for 8 weeks.
|
||||
| In Vivo Model | 11-18 CDX model | ||||
| In Vitro Model | Lung adenocarcinoma | 11-18 cells | CVCL_6659 | ||
| Experiment 10 Reporting the Activity Date of This ADC | [19] | ||||
| Efficacy Data | Tumor Growth Inhibition value (TGI) | ≈ 43.30% | Positive HER2 expression (HER2 +++/++) | ||
| Method Description |
Trastuzumab-emtansine (3 mg/kg, every seven days 4) induces efficient tumor cell killing in cell line-derived models of BT-474/R1-7 cells with HER2 expression with high expression.
|
||||
| In Vivo Model | BT-474 CDX model (T-DM1 resistant) | ||||
| In Vitro Model | Invasive breast carcinoma | BT-474 cells (Trastuzumab emtansine resistant) | CVCL_0179 | ||
| Experiment 11 Reporting the Activity Date of This ADC | [19] | ||||
| Efficacy Data | Tumor Growth Inhibition value (TGI) | ≈ 45% | Positive HER2 expression (HER2 +++/++) | ||
| Method Description |
Trastuzumab-emtansine (3 m ug/kg, every seven days x3) induces efficient tumor cell killing in cell line-derived models of SK-OV-3 cells with HER2 expression with high expression.
|
||||
| In Vivo Model | SK-OV-3 CDX model (Expressing YES1 Y537F) | ||||
| In Vitro Model | Ovarian serous cystadenocarcinoma | SK-OV-3 cells (YES1 Y537F expression) | CVCL_0532 | ||
| Experiment 12 Reporting the Activity Date of This ADC | [16] | ||||
| Efficacy Data | Tumor Growth Inhibition value (TGI) | ≈ 45.50% | High HER2 expression (HER2+++) | ||
| Method Description |
Naive female beige nude XID mice were inoculated in the mammary fat pad with 20 million tumor cells suspended in 50% phenol redfree Matrigel mixed with culture medium. All animals were randomly assigned into treatment groups, such that the mean tumor volume for each group was 100 to 200 mm3. Nude mice with established tumors were dosed i.v. with Tmab-MCC-DM1 1 mg/kg for a total of three injections.
Click to Show/Hide
|
||||
| In Vivo Model | Trastuzumab-resistant breast cancer CDX model | ||||
| In Vitro Model | Invasive breast carcinoma of no special type | BT-474 EEI cells | CVCL_AR96 | ||
| Experiment 13 Reporting the Activity Date of This ADC | [16] | ||||
| Efficacy Data | Tumor Growth Inhibition value (TGI) | ≈ 46.20% | High HER2 expression (HER2+++) | ||
| Method Description |
The activity of trastuzumab-MCC-DM1 was further investigated in trastuzumab-insensitive mouse xenograft model. After transplantation of MMTV-HER2 Fo5 mammary tumor explants, tumor-bearing nude mice (n = 8 mice per group) were treated once every 3 weeks with 3 mg/kg trastuzmab-MCC-DM1.
|
||||
| In Vivo Model | MMTV-HER2 Fo5 CDX model (Trastuzumab resistant) | ||||
| In Vitro Model | Breast cancer | MMTV-HER2 cells | Mus musculus | ||
| Experiment 14 Reporting the Activity Date of This ADC | [17] | ||||
| Efficacy Data | Tumor Growth Inhibition value (TGI) | ≈ 55% | Positive HER2 expression (HER2+++/++) | ||
| Method Description |
Subcutaneous injection of 100,000 cells mixed in 200 mL PBS solution was performed. Two weeks after tumour cell injection, mice were treated with trastuzumab, cetuximab or T-DM1 at a dose of 300 mg/kg via IP injection.
|
||||
| In Vivo Model | HT-29 CDX model | ||||
| In Vitro Model | Colon adenocarcinoma | HT-29 cells | CVCL_0320 | ||
| Experiment 15 Reporting the Activity Date of This ADC | [17] | ||||
| Efficacy Data | Tumor Growth Inhibition value (TGI) | ≈ 55% | Moderate HER2 expression (HER2 ++) | ||
| Method Description |
SW48, HT-29 and LS174T cells were injected into null mice subcutaneously, followed by treatment with cetuximab, trastuzumab and T-DM1. Two weeks after tumour cell injection, mice were treated with trastuzumab, cetuximab or T-DM1 at a dose of 300 mg/kg via IP injection.
|
||||
| In Vivo Model | HT-29 CDX model | ||||
| In Vitro Model | Colon adenocarcinoma | HT-29 cells | CVCL_0320 | ||
| Experiment 16 Reporting the Activity Date of This ADC | [14] | ||||
| Efficacy Data | Tumor Growth Inhibition value (TGI) | ≈ 58.50% | Moderate HER2 expression (HER2++) | ||
| Method Description |
The antitumor activity of T-DM1 was evaluated in various mice xenograft models with different HER2 expression levels; JIMT-1 (moderate positive). Each cell suspension or tumor fragment was inoculated subcutaneously into specific pathogen-free female nude mice.The tumor-bearing mice were randomized into treatment and control groups based on the tumor volumes, and dosing was initiated on day 0. In this group, 10 mg/kg T-DM1 was i.v. to the tumor-bearing mice.
Click to Show/Hide
|
||||
| In Vivo Model | JIMT-1 cell line xenograft model | ||||
| In Vitro Model | Breast ductal carcinoma | JIMT-1 cells | CVCL_2077 | ||
| Experiment 17 Reporting the Activity Date of This ADC | [16] | ||||
| Efficacy Data | Tumor Growth Inhibition value (TGI) | ≈ 58.70% | High HER2 expression (HER2+++) | ||
| Method Description |
Naive female beige nude XID mice were inoculated in the mammary fat pad with 20 million tumor cells suspended in 50% phenol redfree Matrigel mixed with culture medium. All animals were randomly assigned into treatment groups, such that the mean tumor volume for each group was 100 to 200 mm3. Nude mice with established tumors were dosed i.v. with Tmab-MCC-DM1 3 mg/kg for a total of three injections.
Click to Show/Hide
|
||||
| In Vivo Model | Trastuzumab-resistant breast cancer CDX model | ||||
| In Vitro Model | Invasive breast carcinoma of no special type | BT-474 EEI cells | CVCL_AR96 | ||
| Experiment 18 Reporting the Activity Date of This ADC | [18] | ||||
| Efficacy Data | Tumor Growth Inhibition value (TGI) | ≈ 63% | Positive HER2 expression (HER2+++/++) | ||
| Method Description |
Subcutaneous injection of 100,000 cells mixed in 200 mL PBS solution was performed. Two weeks after tumour cell injection, mice were treated with trastuzumab, cetuximab or T-DM1 (30 mg/kg, once per week i.p.) for 8 weeks.
|
||||
| In Vivo Model | H3255 CDX model | ||||
| In Vitro Model | Lung adenocarcinoma | NCI-H3255 cells | CVCL_6831 | ||
| Experiment 19 Reporting the Activity Date of This ADC | [18] | ||||
| Efficacy Data | Tumor Growth Inhibition value (TGI) | ≈ 63% | High HER2 expression (HER2 +++) | ||
| Method Description |
T-DM1 (30 mg/kg, once per week i.p.) for 8 weeks,.
|
||||
| In Vivo Model | H3255 CDX model | ||||
| In Vitro Model | Lung adenocarcinoma | NCI-H3255 cells | CVCL_6831 | ||
| Experiment 20 Reporting the Activity Date of This ADC | [17] | ||||
| Efficacy Data | Tumor Growth Inhibition value (TGI) | ≈ 63.30% | High HER2 expression (HER2 +++) | ||
| Method Description |
SW48, HT-29 and LS174T cells were injected into null mice subcutaneously, followed by treatment with cetuximab, trastuzumab and T-DM1. Two weeks after tumour cell injection, mice were treated with trastuzumab, cetuximab or T-DM1 at a dose of 300 mg/kg via IP injection.
|
||||
| In Vivo Model | LS174T CDX model | ||||
| In Vitro Model | Colon adenocarcinoma | LS174T cells | CVCL_1384 | ||
| Experiment 21 Reporting the Activity Date of This ADC | [18] | ||||
| Efficacy Data | Tumor Growth Inhibition value (TGI) | ≈ 66.70% | Low HER2 expression (HER2+) | ||
| Method Description |
Subcutaneous injection of 100,000 cells mixed in 200 mL PBS solution was performed. Two weeks after tumour cell injection, mice were treated with trastuzumab, cetuximab or T-DM1 (30 mg/kg, once per week i.p.) for 8 weeks.
|
||||
| In Vivo Model | HCC827 CDX model | ||||
| In Vitro Model | Lung adenocarcinoma | HCC827 cells | CVCL_2063 | ||
| Experiment 22 Reporting the Activity Date of This ADC | [16] | ||||
| Efficacy Data | Tumor Growth Inhibition value (TGI) | ≈ 74% | High HER2 expression (HER2+++) | ||
| Method Description |
The activity of trastuzumab-MCC-DM1 was further investigated in trastuzumab-insensitive mouse xenograft model. After transplantation of MMTV-HER2 Fo5 mammary tumor explants, tumor-bearing nude mice (n = 8 mice per group) were treated once every 3 weeks with 10 mg/kg trastuzmab-MCC-DM1.
|
||||
| In Vivo Model | MMTV-HER2 Fo5 CDX model (Trastuzumab resistant) | ||||
| In Vitro Model | Breast cancer | MMTV-HER2 cells | Mus musculus | ||
| Experiment 23 Reporting the Activity Date of This ADC | [20] | ||||
| Efficacy Data | Tumor Growth Inhibition value (TGI) | ≈ 76.54% | Positive HER2 expression (HER2+++/++) | ||
| Method Description |
Inoculate 150 mice with KPL-4 cells at 3 million cells/mouse suspended in HBSS/matrigel, in the thoracic mammary fat pad at a volume of 0.2 ml. When tumors have reached a mean tumor volume of 100-250 mm3, they will be grouped out into 10 groups of 8-10 mice each. A single treatment will be administered intravenously (1 mg/kg) via the tail vein on Day 0.
Click to Show/Hide
|
||||
| In Vivo Model | KPL-4 CDX model | ||||
| In Vitro Model | Breast inflammatory carcinoma | KPL-4 cells | CVCL_5310 | ||
| Experiment 24 Reporting the Activity Date of This ADC | [20] | ||||
| Efficacy Data | Tumor Growth Inhibition value (TGI) | ≈ 82.90% | Positive HER2 expression (HER2+++/++) | ||
| Method Description |
Inoculate 150 mice with KPL-4 cells at 3 million cells/mouse suspended in HBSS/matrigel, in the thoracic mammary fat pad at a volume of 0.2 ml. When tumors have reached a mean tumor volume of 100-250 mm3, they will be grouped out into 10 groups of 8-10 mice each. A single treatment will be administered intravenously (ADC-211, 1 mg/kg plus ADC-106, 5 mg/kg) via the tail vein on Day 0.
Click to Show/Hide
|
||||
| In Vivo Model | KPL-4 CDX model | ||||
| In Vitro Model | Breast inflammatory carcinoma | KPL-4 cells | CVCL_5310 | ||
| Experiment 25 Reporting the Activity Date of This ADC | [16] | ||||
| Efficacy Data | Tumor Growth Inhibition value (TGI) | ≈ 83.90% | High HER2 expression (HER2+++) | ||
| Method Description |
Mice bearing mammary tumor transplants from the MMTV-HER2 Fo5 line were given a single iv injection (10 mg/kg) of Tmab-SPP-DM1, Tmab-SSNPP-DM3, Tmab-SSNPP-DM4, Tmab-MCC-DM1, or vehicle (n=7 mice per group), and tumor growth was monitored for 25 days.
|
||||
| In Vivo Model | MMTV-HER2 Fo5 CDX model (Trastuzumab resistant) | ||||
| In Vitro Model | Breast cancer | MMTV-HER2 cells | Mus musculus | ||
| Experiment 26 Reporting the Activity Date of This ADC | [20] | ||||
| Efficacy Data | Tumor Growth Inhibition value (TGI) | ≈ 84.39% | Positive HER2 expression (HER2+++/++) | ||
| Method Description |
Inoculate 150 mice with KPL-4 cells at 3 million cells/mouse suspended in HBSS/matrigel, in the thoracic mammary fat pad at a volume of 0.2 ml. When tumors have reached a mean tumor volume of 100-250 mm3, they will be grouped out into 10 groups of 8-10 mice each. A single treatment will be administered intravenously (ADC-211, 1 mg/kg plus ADC-106, 1 mg/kg) via the tail vein on Day 0.
Click to Show/Hide
|
||||
| In Vivo Model | KPL-4 CDX model | ||||
| In Vitro Model | Breast inflammatory carcinoma | KPL-4 cells | CVCL_5310 | ||
| Experiment 27 Reporting the Activity Date of This ADC | [16] | ||||
| Efficacy Data | Tumor Growth Inhibition value (TGI) | ≈ 88.70% | High HER2 expression (HER2+++) | ||
| Method Description |
The activity of trastuzumab-MCC-DM1 was further investigated in trastuzumab-insensitive mouse xenograft model. After transplantation of MMTV-HER2 Fo5 mammary tumor explants, tumor-bearing nude mice (n = 8 mice per group) were treated once every 3 weeks with 15 mg/kg trastuzmab-MCC-DM1.
|
||||
| In Vivo Model | MMTV-HER2 Fo5 CDX model (Trastuzumab resistant) | ||||
| In Vitro Model | Breast cancer | MMTV-HER2 cells | Mus musculus | ||
| Experiment 28 Reporting the Activity Date of This ADC | [16] | ||||
| Efficacy Data | Tumor Growth Inhibition value (TGI) | ≈ 90.10% | High HER2 expression (HER2+++) | ||
| Method Description |
The activity of trastuzumab-MCC-DM1 was further investigated in trastuzumab-insensitive mouse xenograft model. After transplantation of MMTV-HER2 Fo5 mammary tumor explants, tumor-bearing nude mice (n = 8 mice per group) were treated once every 3 weeks with 30 mg/kg trastuzmab-MCC-DM1.
|
||||
| In Vivo Model | MMTV-HER2 Fo5 CDX model (Trastuzumab resistant) | ||||
| In Vitro Model | Breast cancer | MMTV-HER2 cells | Mus musculus | ||
| Experiment 29 Reporting the Activity Date of This ADC | [16] | ||||
| Efficacy Data | Tumor Growth Inhibition value (TGI) | ≈ 90.70% | High HER2 expression (HER2+++) | ||
| Method Description |
Naive female beige nude XID mice were inoculated in the mammary fat pad with 20 million tumor cells suspended in 50% phenol redfree Matrigel mixed with culture medium. All animals were randomly assigned into treatment groups, such that the mean tumor volume for each group was 100 to 200 mm3. Nude mice with established tumors were dosed i.v. with Tmab-MCC-DM1 10 mg/kg for a total of three injections.
Click to Show/Hide
|
||||
| In Vivo Model | Trastuzumab-resistant breast cancer CDX model | ||||
| In Vitro Model | Invasive breast carcinoma of no special type | BT-474 EEI cells | CVCL_AR96 | ||
| Experiment 30 Reporting the Activity Date of This ADC | [16] | ||||
| Efficacy Data | Tumor Growth Inhibition value (TGI) | ≈ 92.30% | High HER2 expression (HER2+++) | ||
| Method Description |
KPL-4 human breast tumor cells were inoculated (3 million cells per mouse, in Matrigel) into the mammary fat pads of SCID beige mice. All animals were randomly assigned into treatment groups, such that the mean tumor volume for each group was 100 to 200 mm3. Trastuzumab-maytansinoid conjugates were given by single 15 mg/kg iv injection.
|
||||
| In Vivo Model | Breast cancer CDX model | ||||
| In Vitro Model | Breast inflammatory carcinoma | KPL-4 cells | CVCL_5310 | ||
| Experiment 31 Reporting the Activity Date of This ADC | [16] | ||||
| Efficacy Data | Tumor Growth Inhibition value (TGI) | ≈ 98.70% | High HER2 expression (HER2+++) | ||
| Method Description |
Naive female beige nude XID mice were inoculated in the mammary fat pad with 20 million tumor cells suspended in 50% phenol redfree Matrigel mixed with culture medium. All animals were randomly assigned into treatment groups, such that the mean tumor volume for each group was 100 to 200 mm3. Nude mice with established tumors were dosed i.v. with Tmab-MCC-DM1 15 mg/kg for a total of three injections.
Click to Show/Hide
|
||||
| In Vivo Model | Trastuzumab-resistant breast cancer CDX model | ||||
| In Vitro Model | Invasive breast carcinoma of no special type | BT-474 EEI cells | CVCL_AR96 | ||
| Experiment 32 Reporting the Activity Date of This ADC | [14] | ||||
| Efficacy Data | Tumor Growth Inhibition value (TGI) | ≈ 99.40% | High HER2 expression (HER2+++) | ||
| Method Description |
The antitumor activity of T-DM1 was evaluated in various mice xenograft models with different HER2 expression levels; KPL-4 (strong positive). Each cell suspension or tumor fragment was inoculated subcutaneously into specific pathogen-free female nude mice.The tumor-bearing mice were randomized into treatment and control groups based on the tumor volumes, and dosing was initiated on day 0. In this group, 10 mg/kg T-DM1 was i.v. to the tumor-bearing mice.
Click to Show/Hide
|
||||
| In Vivo Model | KPL-4 cell line xenograft model | ||||
| In Vitro Model | Breast inflammatory carcinoma | KPL-4 cells | CVCL_5310 | ||
| Experiment 33 Reporting the Activity Date of This ADC | [21] | ||||
| Efficacy Data | Tumor Growth Inhibition value (TGI) | ≈ 100% | High HER2 expression (HER2+++) | ||
| Method Description |
Mice were inoculated subcutaneously in the right flank with either 5x10⁶ cells/mouse of BTC cell line KKU-100, mice were randomized to the control group or treatment with T-DM1 20 mg/kg groups.
|
||||
| In Vivo Model | KMCH-1 CDX model | ||||
| In Vitro Model | Combined hepatocellular carcinoma and cholangiocarcinoma | KMCH-1 cells | CVCL_7970 | ||
| Experiment 34 Reporting the Activity Date of This ADC | [22] | ||||
| Efficacy Data | Tumor Growth Inhibition value (TGI) | ≈ 100% | Positive HER2 expression (HER2 +++/++) | ||
| Method Description |
HER2-positive HCC1954 cells were either treated with vehicle (control) or T-DM1 for 5 days, trypsinized, washed in PBS and sorted by flow cytometry based on the surface ROR1 expression. ROR1- and ROR1+ or unfractionated cells were injected into the subcutaneous site of 6-8-week old Nu/J mice (n=3/group).
|
||||
| In Vivo Model | HCC1954 CDX model | ||||
| In Vitro Model | Breast ductal carcinoma | HCC1954 cells | CVCL_1259 | ||
| Experiment 35 Reporting the Activity Date of This ADC | [23] | ||||
| Efficacy Data | Minimal Effective Dose (MED) | < 5 mg/kg | Moderate HER2 expression (HER2++) | ||
| Method Description |
Following the acclimatization period (1 week), the animals were stratified by body weight and randomly assigned to the following group: two T-DM1 groups, treated with 20 mg/kg and 60 mg/kg. Each group consisted of five animals for blood chemistry test as well as five animals for clinical signs and body weight measurements.
|
||||
| In Vivo Model | Gastric cancer CDX model | ||||
| In Vitro Model | Gastric tubular adenocarcinoma | NCI-N87 cells | CVCL_1603 | ||
| Experiment 36 Reporting the Activity Date of This ADC | [23] | ||||
| Efficacy Data | Maximum Tolerated Dose (MTD) | > 20 mg/kg | High HER2 expression (HER2+++) | ||
| Method Description |
Following the acclimatization period (1 week), the animals were stratified by body weight and randomly assigned to the following group: two T-DM1 groups, treated with 20 mg/kg and 60 mg/kg. Each group consisted of five animals for blood chemistry test as well as five animals for clinical signs and body weight measurements.
|
||||
| In Vivo Model | Gastric cancer CDX model | ||||
| In Vitro Model | Gastric tubular adenocarcinoma | NCI-N87 cells | CVCL_1603 | ||
Obtained from the Model Organism Data
| Experiment 1 Reporting the Activity Date of This ADC | [24] | ||||
| Efficacy Data | Tumor Growth Inhibition value (TGI) | ≈ 94.98% | High HER2 expression (HER2 +++) | ||
| Method Description |
An allograft was propagated from the Fo5 mmty transgenic mouse which does not respond to.or responds poorly to HERCEPTIN therapy. Subjects were treated once with ADC (10 mg/kg); and placebo PBS buffer control (Vehicle) andmonitored over 3 weeks.
|
||||
| In Vivo Model | Breast cancer model MMTV-HER2 Fo5 | ||||
Revealed Based on the Cell Line Data
| Experiment 1 Reporting the Activity Date of This ADC | [25] | ||||
| Efficacy Data | Half Maximal Inhibitory Concentration (IC50) | 0.04 nM | High HER2 expression (HER2 +++) | ||
| Method Description |
With OHPAS ADCs 1-4 , we first performed cell-based MTT assays against a series of HER2 positive/negative cell lines using the commercially available HER2 ADC, T-DM1 (average DAR 3.5), which we purchased as a positive control.
|
||||
| In Vitro Model | Breast adenocarcinoma | SK-BR-3 cells | CVCL_0033 | ||
| Experiment 2 Reporting the Activity Date of This ADC | [25] | ||||
| Efficacy Data | Half Maximal Inhibitory Concentration (IC50) | 0.14 nM | High HER2 expression (HER2 +++) | ||
| Method Description |
With OHPAS ADCs 1-4 , we first performed cell-based MTT assays against a series of HER2 positive/negative cell lines using the commercially available HER2 ADC, T-DM1 (average DAR 3.5), which we purchased as a positive control.
|
||||
| In Vitro Model | Ovarian serous cystadenocarcinoma | SK-OV-3 cells | CVCL_0532 | ||
| Experiment 3 Reporting the Activity Date of This ADC | [26] | ||||
| Efficacy Data | Half Maximal Inhibitory Concentration (IC50) | 0.24 nM | High HER2 expression (HER2 +++) | ||
| Method Description |
To determine the IC50 values of the ADCs, different concentrations of each conjugate was directly added to the culture medium. After the cells were cultured for 3 days at 37°C, the number of viable cells was quantified by using the WST- reagent, and the absorbance was measured at OD450.
|
||||
| In Vitro Model | Breast adenocarcinoma | SK-BR-3 cells | CVCL_0033 | ||
| Experiment 4 Reporting the Activity Date of This ADC | [16] | ||||
| Efficacy Data | Half Maximal Inhibitory Concentration (IC50) | 0.24 nM | Low HER2 expression (HER2+; IHC 1+) | ||
| Method Description |
The effects of trastuzumab and trastuzumab-maytansinoid conjugates on tumor cell viability were assessed using Cell Titer-Glo. Cells were plated in black-walled 96-well plates (20,000 per well for BT-474; 10,000 cells per well for all other lines) and allowed to adhere overnight at 37°C in a humidified atmosphere of 5% CO2. For measurement of apoptosis, BT-474 and SK-BR-3 were exposed to trastuzumab or trastuzumab-DM for 48 h.
Click to Show/Hide
|
||||
| In Vitro Model | Breast adenocarcinoma | SK-BR-3 cells | CVCL_0033 | ||
| Experiment 5 Reporting the Activity Date of This ADC | [25] | ||||
| Efficacy Data | Half Maximal Inhibitory Concentration (IC50) | 0.26 nM | High HER2 expression (HER2 +++) | ||
| Method Description |
With OHPAS ADCs 1-4 , we first performed cell-based MTT assays against a series of HER2 positive/negative cell lines using the commercially available HER2 ADC, T-DM1 (average DAR 3.5), which we purchased as a positive control.
|
||||
| In Vitro Model | Gastric tubular adenocarcinoma | NCI-N87 cells | CVCL_1603 | ||
| Experiment 6 Reporting the Activity Date of This ADC | [26] | ||||
| Efficacy Data | Half Maximal Inhibitory Concentration (IC50) | 1.57 nM | High HER2 expression (HER2 +++) | ||
| Method Description |
To determine the IC50 values of the ADCs, different concentrations of each conjugate was directly added to the culture medium. After the cells were cultured for 3 days at 37°C, the number of viable cells was quantified by using the WST- reagent, and the absorbance was measured at OD450.
|
||||
| In Vitro Model | Gastric tubular adenocarcinoma | NCI-N87 cells | CVCL_1603 | ||
| Experiment 7 Reporting the Activity Date of This ADC | [25] | ||||
| Efficacy Data | Half Maximal Inhibitory Concentration (IC50) | 1.76 nM | Moderate HER2 expression (HER2 ++) | ||
| Method Description |
With OHPAS ADCs 1-4 , we first performed cell-based MTT assays against a series of HER2 positive/negative cell lines using the commercially available HER2 ADC, T-DM1 (average DAR 3.5), which we purchased as a positive control.
|
||||
| In Vitro Model | Breast ductal carcinoma | JIMT-1 cells | CVCL_2077 | ||
| Experiment 8 Reporting the Activity Date of This ADC | [16] | ||||
| Efficacy Data | Half Maximal Inhibitory Concentration (IC50) |
2.71 nM
|
|||
| Method Description |
The effects of trastuzumab and trastuzumab-maytansinoid conjugates on tumor cell viability were assessed using Cell Titer-Glo. Cells were plated in black-walled 96-well plates (20,000 per well for BT-474; 10,000 cells per well for all other lines) and allowed to adhere overnight at 37°C in a humidified atmosphere of 5% CO2. For measurement of apoptosis, BT-474 and SK-BR-3 were exposed to trastuzumab or trastuzumab-DM for 48 h.
Click to Show/Hide
|
||||
| In Vitro Model | Invasive breast carcinoma | BT-474 cells | CVCL_0179 | ||
| Experiment 9 Reporting the Activity Date of This ADC | [26] | ||||
| Efficacy Data | Half Maximal Inhibitory Concentration (IC50) | 5.89 nM | High HER2 expression (HER2 +++) | ||
| Method Description |
To determine the IC50 values of the ADCs, different concentrations of each conjugate was directly added to the culture medium. After the cells were cultured for 3 days at 37°C, the number of viable cells was quantified by using the WST- reagent, and the absorbance was measured at OD450.
|
||||
| In Vitro Model | Invasive breast carcinoma | BT-474 cells | CVCL_0179 | ||
| Experiment 10 Reporting the Activity Date of This ADC | [27] | ||||
| Efficacy Data | Half Maximal Inhibitory Concentration (IC50) | 6.4 nM | Positive HER2 expression (HER2 +++/++) | ||
| Method Description |
ADCs 21-23 was performed on HCC827 and NCI-H2228 cells. cells (5 x 10³ cells/well) were cultured in 96-well plates with 100 uL complete medium, and 24 h later the cells were treated in triplicate with varying concentrations of ADCs for 72 h.
|
||||
| In Vitro Model | Breast adenocarcinoma | SK-BR-3 cells | CVCL_0033 | ||
| Experiment 11 Reporting the Activity Date of This ADC | [16] | ||||
| Efficacy Data | Half Maximal Inhibitory Concentration (IC50) | 18.37 nM | Low HER2 expression (HER2+; IHC 1+) | ||
| Method Description |
The effects of trastuzumab and trastuzumab-maytansinoid conjugates on tumor cell viability were assessed using Cell Titer-Glo. Cells were plated in black-walled 96-well plates (20,000 per well for BT-474; 10,000 cells per well for all other lines) and allowed to adhere overnight at 37°C in a humidified atmosphere of 5% CO2. Medium was then removed and replaced by fresh culture medium containing different concentrations of trastuzumab, trastuzumab ADC, or free DM1, and the cells incubated for varying periods of time.
Click to Show/Hide
|
||||
| In Vitro Model | Breast adenocarcinoma | MDA-MB-468 cells | CVCL_0419 | ||
| Experiment 12 Reporting the Activity Date of This ADC | [25] | ||||
| Efficacy Data | Half Maximal Inhibitory Concentration (IC50) | > 50 nM | Negative HER2 expression (HER2 -) | ||
| Method Description |
With OHPAS ADCs 1-4 , we first performed cell-based MTT assays against a series of HER2 positive/negative cell lines using the commercially available HER2 ADC, T-DM1 (average DAR 3.5), which we purchased as a positive control.
|
||||
| In Vitro Model | Invasive breast carcinoma | MCF-7 cells | CVCL_0031 | ||
| Experiment 13 Reporting the Activity Date of This ADC | [16] | ||||
| Efficacy Data | Half Maximal Inhibitory Concentration (IC50) | > 100 nM | Negative HER2 expression (HER2 -) | ||
| Method Description |
The effects of trastuzumab and trastuzumab-maytansinoid conjugates on tumor cell viability were assessed using Cell Titer-Glo. Cells were plated in black-walled 96-well plates (20,000 per well for BT-474; 10,000 cells per well for all other lines) and allowed to adhere overnight at 37°C in a humidified atmosphere of 5% CO2. Medium was then removed and replaced by fresh culture medium containing different concentrations of trastuzumab, trastuzumab ADC, or free DM1, and the cells incubated for varying periods of time.
Click to Show/Hide
|
||||
| In Vitro Model | Invasive breast carcinoma | MCF-7 cells | CVCL_0031 | ||
| Experiment 14 Reporting the Activity Date of This ADC | [27] | ||||
| Efficacy Data | Half Maximal Inhibitory Concentration (IC50) | 220 nM | Negative HER2 expression (HER2 -) | ||
| Method Description |
ADCs 21-23 was performed on HCC827 and NCI-H2228 cells. cells (5 x 10³ cells/well) were cultured in 96-well plates with 100 uL complete medium, and 24 h later the cells were treated in triplicate with varying concentrations of ADCs for 72 h.
|
||||
| In Vitro Model | Breast adenocarcinoma | MDA-MB-468 cells | CVCL_0419 | ||
| Experiment 15 Reporting the Activity Date of This ADC | [27] | ||||
| Efficacy Data | Half Maximal Inhibitory Concentration (IC50) | 317 nM | Negative HER2 expression (HER2 -) | ||
| Method Description |
ADCs 21-23 was performed on HCC827 and NCI-H2228 cells. cells (5 x 10³ cells/well) were cultured in 96-well plates with 100 uL complete medium, and 24 h later the cells were treated in triplicate with varying concentrations of ADCs for 72 h.
|
||||
| In Vitro Model | Lung adenocarcinoma | HCC827 cells | CVCL_2063 | ||
| Experiment 16 Reporting the Activity Date of This ADC | [27] | ||||
| Efficacy Data | Half Maximal Inhibitory Concentration (IC50) | > 500 nM | Negative HER2 expression (HER2 -) | ||
| Method Description |
ADCs 21-23 was performed on HCC827 and NCI-H2228 cells. cells (5 x 10³ cells/well) were cultured in 96-well plates with 100 uL complete medium, and 24 h later the cells were treated in triplicate with varying concentrations of ADCs for 72 h.
|
||||
| In Vitro Model | Invasive breast carcinoma | MCF-7 cells | CVCL_0031 | ||
| Experiment 17 Reporting the Activity Date of This ADC | [24] | ||||
| Efficacy Data | Half Maximal Inhibitory Concentration (IC50) | 8.00-15.00 ng/mL | High HER2 expression (HER2+++) | ||
| Method Description |
Exposing mammalian cells having HER2 receptors to ADC in a cell culture medium; culturing the cells for a period from about 6 hours to about 5 days; and measuring cell viability Cell-based in vitro assays were used to measure viability, cytotoxicity, and induction of apoptosis of the ADC of the invention.
|
||||
| In Vitro Model | Breast adenocarcinoma | SK-BR-3 cells | CVCL_0033 | ||
| Experiment 18 Reporting the Activity Date of This ADC | [16] | ||||
| Efficacy Data | Half Maximal Inhibitory Concentration (IC50) | 0 ug/mL | Negative HER2 expression (HER2-) | ||
| Method Description |
The effects of trastuzumab and trastuzumab-maytansinoid conjugates on tumor cell viability were assessed using Cell Titer-Glo. Cells were plated in black-walled 96-well plates (20,000 per well for BT-474; 10,000 cells per well for all other lines) and allowed to adhere overnight at 37°C in a humidified atmosphere of 5% CO2. Medium was then removed and replaced by fresh culture medium containing different concentrations of trastuzumab, trastuzumab ADC, or free DM1, and the cells incubated for varying periods of time.
Click to Show/Hide
|
||||
| In Vitro Model | Invasive breast carcinoma of no special type | BT-474 EEI cells | CVCL_AR96 | ||
| Experiment 19 Reporting the Activity Date of This ADC | [16] | ||||
| Efficacy Data | Half Maximal Inhibitory Concentration (IC50) | 0.01 ug/mL | Positive HER2 expression (HER2+++/++; HER2 MFI=95.7) | ||
| Method Description |
The effects of trastuzumab and trastuzumab-maytansinoid conjugates on tumor cell viability were assessed using Cell Titer-Glo. Cells were plated in black-walled 96-well plates (20,000 per well for BT-474; 10,000 cells per well for all other lines) and allowed to adhere overnight at 37°C in a humidified atmosphere of 5% CO2. Medium was then removed and replaced by fresh culture medium containing different concentrations of trastuzumab, trastuzumab ADC, or free DM1, and the cells incubated for varying periods of time.
Click to Show/Hide
|
||||
| In Vitro Model | Ovarian serous cystadenocarcinoma | SK-OV-3 cells | CVCL_0532 | ||
| Experiment 20 Reporting the Activity Date of This ADC | [16] | ||||
| Efficacy Data | Half Maximal Inhibitory Concentration (IC50) | 0.01 ug/mL | Moderate HER2 expression (HER2++; IHC 2+) | ||
| Method Description |
The effects of trastuzumab and trastuzumab-maytansinoid conjugates on tumor cell viability were assessed using Cell Titer-Glo. Cells were plated in black-walled 96-well plates (20,000 per well for BT-474; 10,000 cells per well for all other lines) and allowed to adhere overnight at 37°C in a humidified atmosphere of 5% CO2. Medium was then removed and replaced by fresh culture medium containing different concentrations of trastuzumab, trastuzumab ADC, or free DM1, and the cells incubated for varying periods of time.
Click to Show/Hide
|
||||
| In Vitro Model | Breast inflammatory carcinoma | KPL-4 cells | CVCL_5310 | ||
| Experiment 21 Reporting the Activity Date of This ADC | [16] | ||||
| Efficacy Data | Half Maximal Inhibitory Concentration (IC50) | 0.03 ug/mL | High HER2 expression (HER2+++) | ||
| Method Description |
The effects of trastuzumab and trastuzumab-maytansinoid conjugates on tumor cell viability were assessed using Cell Titer-Glo. Cells were plated in black-walled 96-well plates (20,000 per well for BT-474; 10,000 cells per well for all other lines) and allowed to adhere overnight at 37°C in a humidified atmosphere of 5% CO2. Medium was then removed and replaced by fresh culture medium containing different concentrations of trastuzumab, trastuzumab ADC, or free DM1, and the cells incubated for varying periods of time.
Click to Show/Hide
|
||||
| In Vitro Model | Breast ductal carcinoma | HCC1954 cells | CVCL_1259 | ||
| Experiment 22 Reporting the Activity Date of This ADC | [16] | ||||
| Efficacy Data | Half Maximal Inhibitory Concentration (IC50) | 0.06 ug/mL | High HER2 expression (HER2+++) | ||
| Method Description |
The effects of trastuzumab and trastuzumab-maytansinoid conjugates on tumor cell viability were assessed using Cell Titer-Glo. Cells were plated in black-walled 96-well plates (20,000 per well for BT-474; 10,000 cells per well for all other lines) and allowed to adhere overnight at 37°C in a humidified atmosphere of 5% CO2. Medium was then removed and replaced by fresh culture medium containing different concentrations of trastuzumab, trastuzumab ADC, or free DM1, and the cells incubated for varying periods of time.
Click to Show/Hide
|
||||
| In Vitro Model | Lung adenocarcinoma | Calu-3 cells | CVCL_0609 | ||
| Experiment 23 Reporting the Activity Date of This ADC | [16] | ||||
| Efficacy Data | Half Maximal Inhibitory Concentration (IC50) | 0.27 ug/mL | Low HER2 expression (HER2+) | ||
| Method Description |
The effects of trastuzumab and trastuzumab-maytansinoid conjugates on tumor cell viability were assessed using Cell Titer-Glo. Cells were plated in black-walled 96-well plates (20,000 per well for BT-474; 10,000 cells per well for all other lines) and allowed to adhere overnight at 37°C in a humidified atmosphere of 5% CO2. Medium was then removed and replaced by fresh culture medium containing different concentrations of trastuzumab, trastuzumab ADC, or free DM1, and the cells incubated for varying periods of time.
Click to Show/Hide
|
||||
| In Vitro Model | Gastric tubular adenocarcinoma | MKN7 cells | CVCL_1417 | ||
References