
Antibody-drug Conjugate Information
General Information of This Antibody-drug Conjugate (ID: DRG0DIWSF)
| ADC Name |
Cantuzumab mertansine
|
|||||
|---|---|---|---|---|---|---|
| Synonyms |
cantuzumab mertansine; SB-408075; huC242-DM1; huC242-SPP-DM1
Click to Show/Hide
|
|||||
| Organization |
ImmunoGen (Top20 MNC) (Originator);SmithKline Beecham (Top20 MNC)
|
|||||
| Drug Status |
Phase 1 (discontinued)
|
|||||
| Drug-to-Antibody Ratio |
3 to 4
|
|||||
| Structure |
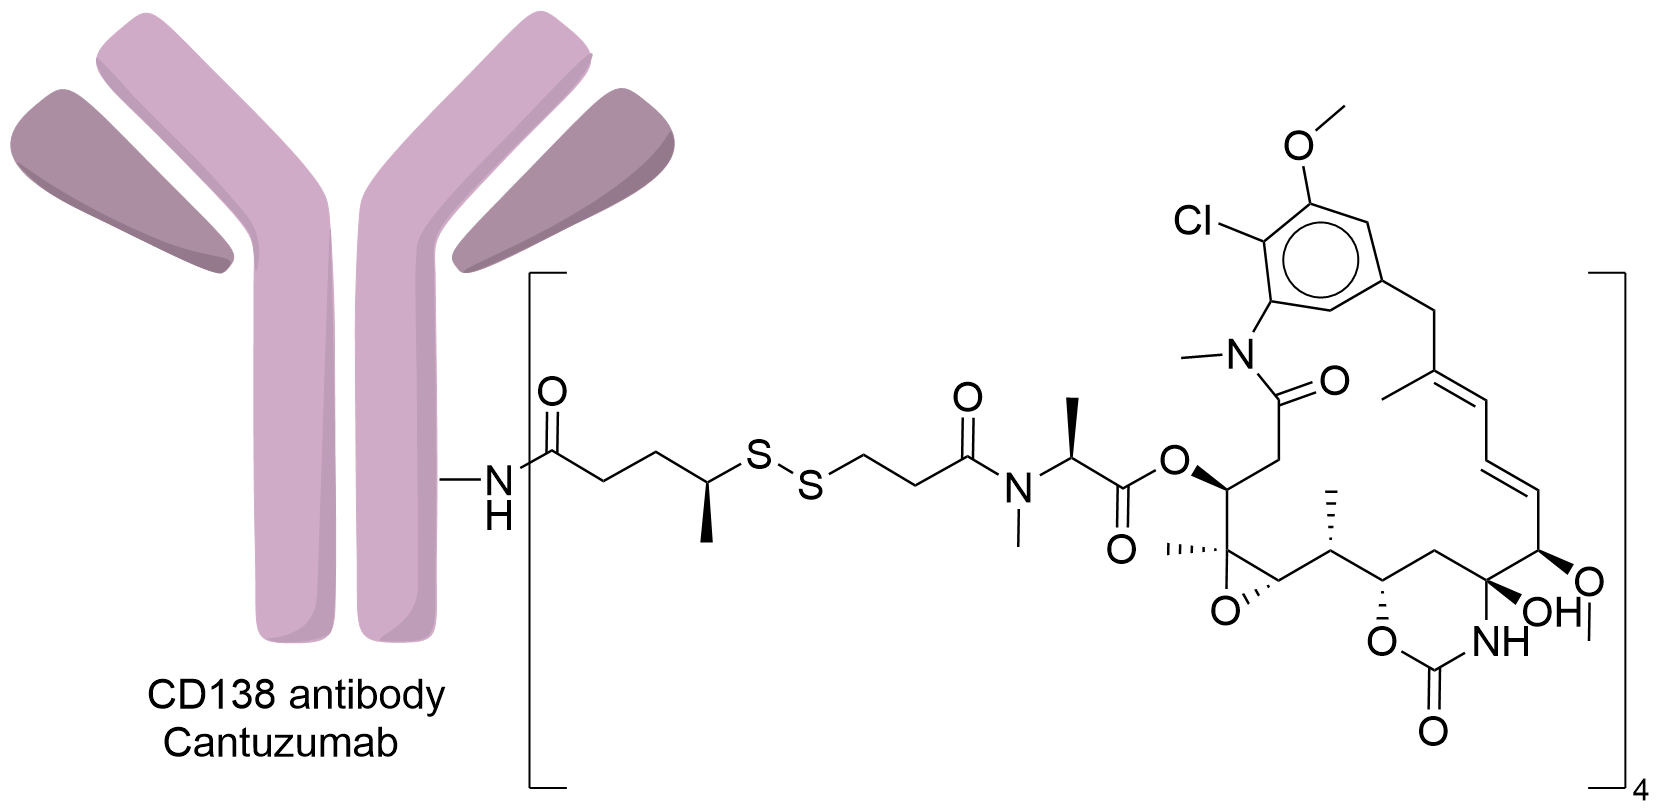
|
|||||
| Antibody Name |
Cantuzumab
|
Antibody Info | ||||
| Antigen Name |
Mucin-1 (MUC1)
|
Antigen Info | ||||
| Payload Name |
DM1
|
Payload Info | ||||
| Payload Target |
Microtubule (MT)
|
Target Info | ||||
| Linker Name |
N-succinimidyl 4-(2-pyridyldithio) pentanoate (SPP)
|
Linker Info | ||||
| Conjugate Type |
Random Lysines
|
|||||
| Combination Type |
mertansine
|
|||||
2027 Update
The disease landscape of This ADC
2027 Update
The clinical trial pipelines of This ADC
2027 Update
General Information of The ADMET Data Related to This ADC
Absorption
| Standard Type | Value | Units | Description | Reference |
|---|---|---|---|---|
| Area Under the Concentration-Time Curve (AUC) | 216 | mg·h/L |
Patients received a total of 280 weekly infusions of huC242-DM1 at 40 mg/m2.
|
[2] |
| Maximum Observed Concentration (Cmax) | 10.7 | mg/L |
Patients received a total of 280 weekly infusions of huC242-DM1 at 40 mg/m2.
|
[2] |
| Area Under the Concentration-Time Curve (AUC) | 927 | mg·h/L |
Patients received a total of 280 weekly infusions of huC242-DM1 at 60 mg/m2.
|
[2] |
| Maximum Observed Concentration (Cmax) | 34 | mg/L |
Patients received a total of 280 weekly infusions of huC242-DM1 at 60 mg/m2.
|
[2] |
| Area Under the Concentration-Time Curve (AUC) | 1582 | mg·h/L |
Patients received a total of 280 weekly infusions of huC242-DM1 at 80 mg/m2.
|
[2] |
| Maximum Observed Concentration (Cmax) | 43.5 | mg/L |
Patients received a total of 280 weekly infusions of huC242-DM1 at 80 mg/m2.
|
[2] |
| Area Under the Concentration-Time Curve (AUC) | 1987 | mg·h/L |
Patients received a total of 280 weekly infusions of huC242-DM1 at 96 mg/m2.
|
[2] |
| Maximum Observed Concentration (Cmax) | 51.22 | mg/L |
Patients received a total of 280 weekly infusions of huC242-DM1 at 96 mg/m2.
|
[2] |
| Area Under the Concentration-Time Curve (AUC) | 2650 | mg·h/L |
Patients received a total of 280 weekly infusions of huC242-DM1 at 115 mg/m2.
|
[2] |
| Maximum Observed Concentration (Cmax) | 73.5 | mg/L |
Patients received a total of 280 weekly infusions of huC242-DM1 at 115 mg/m2.
|
[2] |
| Area Under the Concentration-Time Curve (AUC) | 3463 | mg·h/L |
Patients received a total of 280 weekly infusions of huC242-DM1 at 138 mg/m2.
|
[2] |
| Maximum Observed Concentration (Cmax) | 80.8 | mg/L |
Patients received a total of 280 weekly infusions of huC242-DM1 at 138 mg/m2.
|
[2] |
Distribution
| Standard Type | Value | Units | Description | Reference |
|---|---|---|---|---|
| Volume of Distribution (Vd) | 5.35 | L |
Patients received a total of 280 weekly infusions of huC242-DM1 at 40 mg/m2.
|
[2] |
| Volume of Distribution (Vd) | 4.04 | L |
Patients received a total of 280 weekly infusions of huC242-DM1 at 60 mg/m2.
|
[2] |
| Volume of Distribution (Vd) | 5.53 | L |
Patients received a total of 280 weekly infusions of huC242-DM1 at 80 mg/m2.
|
[2] |
| Volume of Distribution (Vd) | 4.85 | L |
Patients received a total of 280 weekly infusions of huC242-DM1 at 96 mg/m2.
|
[2] |
| Volume of Distribution (Vd) | 4.06 | L |
Patients received a total of 280 weekly infusions of huC242-DM1 at 115 mg/m2.
|
[2] |
| Volume of Distribution (Vd) | 4.58 | L |
Patients received a total of 280 weekly infusions of huC242-DM1 at 138 mg/m2.
|
[2] |
Excretion
| Standard Type | Value | Units | Description | Reference |
|---|---|---|---|---|
| Clearance (CL) | 39.5 | mL/h/m2 |
Thirty-seven patients received 110 courses of cantuzumab mertansine at doses ranging from 22 to 295 mg/m2.
|
[1] |
| Elimination Half-Life (t1/2) | 41.1 | h |
Thirty-seven patients received 110 courses of cantuzumab mertansine at doses ranging from 22 to 295 mg/m2.
|
[1] |
| Elimination Half-Life (t1/2) | 13 | h |
Patients received a total of 280 weekly infusions of huC242-DM1 at 40 mg/m2.
|
[2] |
| Elimination Half-Life (t1/2) | 22 | h |
Patients received a total of 280 weekly infusions of huC242-DM1 at 60 mg/m2.
|
[2] |
| Elimination Half-Life (t1/2) | 39 | h |
Patients received a total of 280 weekly infusions of huC242-DM1 at 80 mg/m2.
|
[2] |
| Elimination Half-Life (t1/2) | 37 | h |
Patients received a total of 280 weekly infusions of huC242-DM1 at 96 mg/m2.
|
[2] |
| Elimination Half-Life (t1/2) | 40 | h |
Patients received a total of 280 weekly infusions of huC242-DM1 at 115 mg/m2.
|
[2] |
| Elimination Half-Life (t1/2) | 41 | h |
Patients received a total of 280 weekly infusions of huC242-DM1 at 138 mg/m2.
|
[2] |
General Information of The Activity Data Related to This ADC
Identified from the Human Clinical Data
Full List of Activity Data of This Antibody-drug Conjugate
Identified from the Human Clinical Data
| Experiment 1 Reporting the Activity Date of This ADC | [3] | ||||
| Efficacy Data | Objective Response Rate (ORR) |
0%
|
|||
| Patients Enrolled |
Histological documentation of advanced or metastatic epithelial solid tumor which were likely to express the CanAg antigen, that were refractory or resistant to standard chemotherapy, or for which no effective standard therapy exists.
|
||||
| Administration Dosage |
IV infusion at an initial dose of 30 mg/m2, three times per week for three consecutive weeks for a total of nine doses.
|
||||
| Experiment 2 Reporting the Activity Date of This ADC | [4] | ||||
| Patients Enrolled |
Solid malignancies refractory to standard therapy or for whom no standard therapy existed.
|
||||
| Administration Dosage |
IV cantuzumab mertansine was administered at a rate of 1 mg/min for 30 minutes and then increased to 3 mg/min if hypersensitivity phenomena were not observed. Treatment courses were repeated every 3 weeks.
|
||||
References