
Payload Information
General Information of This Payload (ID: PAY0LZRXU)
| Name |
SG3199
|
|||||
|---|---|---|---|---|---|---|
| Synonyms |
SG3199; 1595275-71-0; SCHEMBL15686377; EX-A6229; MS-30463; HY-101161; CS-0020928
Click to Show/Hide
|
|||||
| Target | Human Deoxyribonucleic acid (hDNA) | |||||
| Structure |
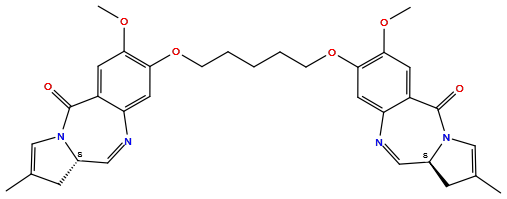
|
|||||
| Formula | C33H36N4O6 |
|||||
| Isosmiles | CC1=CN2[C@@H](C1)C=NC3=CC(=C(C=C3C2=O)OC)OCCCCCOC4=C(C=C5C(=C4)N=C[C@@H]6CC(=CN6C5=O)C)OC |
|||||
| PubChem CID | ||||||
| InChI |
InChI=1S/C33H36N4O6/c1-20-10-22-16-34-26-14-30(28(40-3)12-24(26)32(38)36(22)18-20)42-8-6-5-7-9-43-31-15-27-25(13-29(31)41-4)33(39)37-19-21(2)11-23(37)17-35-27/h12-19,22-23H,5-11H2,1-4H3/t22-,23-/m0/s1
|
|||||
| InChIKey |
YMTZZJOPSATRTO-GOTSBHOMSA-N
|
|||||
| IUPAC Name |
(6aS)-3-[5-[[(6aS)-2-methoxy-8-methyl-11-oxo-6a,7-dihydropyrrolo[2,1-c][1,4]benzodiazepin-3-yl]oxy]pentoxy]-2-methoxy-8-methyl-6a,7-dihydropyrrolo[2,1-c][1,4]benzodiazepin-11-one
|
|||||
| Pharmaceutical Properties | Molecule Weight |
584.7 |
Polar area |
102 |
||
Complexity |
1080 |
xlogp Value |
2.8 |
|||
Heavy Count |
43 |
Rot Bonds |
10 |
|||
Hbond acc |
8 |
Hbond Donor |
0 |
|||
The activity data of This Payload
| Standard Type | Value | Units | Cell line | Disease Model | Cell line ID | Reference |
|---|---|---|---|---|---|---|
| Half Maximal Inhibitory Concentration (IC50) | 0.79 | pM |
EoL-1 cells
|
Chronic eosinophilic leukemia
|
[1] | |
| Half Maximal Inhibitory Concentration (IC50) | 12.11 | pM |
SU-DHL-1 cells
|
Anaplastic large cell lymphoma
|
[1] | |
| Half Maximal Inhibitory Concentration (IC50) | 12.98 | pM |
HuT 78 cells
|
T lymphocytic leukemia
|
[1] | |
| Half Maximal Inhibitory Concentration (IC50) | 14.8 | pM |
L-540 cells
|
Hodgkin lymphoma
|
[1] | |
| Half Maximal Inhibitory Concentration (IC50) | 150 | pM |
K562 cells
|
Chronic myeloid leukemia
|
[2] | |
| Half Maximal Inhibitory Concentration (IC50) | 158.6 | pM |
HDLM-2 cells
|
Hodgkin lymphoma
|
[1] | |
| Half Maximal Inhibitory Concentration (IC50) | 18.11 | pM |
Daudi cells
|
Burkitt lymphoma
|
[1] | |
| Half Maximal Inhibitory Concentration (IC50) | 18.49 | pM |
Karpas-299 cells
|
ALK-positive anaplastic large cell lymphoma
|
[1] | |
| Half Maximal Inhibitory Concentration (IC50) | 20 | pM |
NCI-N87 cells
|
Gastric tubular adenocarcinoma
|
[2] | |
| Half Maximal Inhibitory Concentration (IC50) | 320 | pM |
SK-BR-3 cells
|
Breast adenocarcinoma
|
[2] | |
| Half Maximal Inhibitory Concentration (IC50) | 5.83 | pM |
Ramos cells
|
Burkitt lymphoma
|
[1] | |
| Half Maximal Inhibitory Concentration (IC50) | 0.033 | nM |
SW48 cells
|
Colon adenocarcinoma
|
[3] | |
| Half Maximal Inhibitory Concentration (IC50) | 0.3 | nM |
LIM1215 cells
|
Colon adenocarcinoma
|
[3] | |
| Half Maximal Inhibitory Concentration (IC50) | 0.92 | nM |
SW620 cells
|
Colon adenocarcinoma
|
[3] | |
| Half Maximal Inhibitory Concentration (IC50) | 1 | nM |
BT-474 cells
|
Invasive breast carcinoma
|
[2] | |
| Half Maximal Inhibitory Concentration (IC50) | 110.5 | nM |
MDA-MB-231 cells
|
Breast adenocarcinoma
|
[4] | |
| Half Maximal Inhibitory Concentration (IC50) | 174.1 | nM |
MDA-MB-468 cells
|
Breast adenocarcinoma
|
[4] | |
| Half Maximal Inhibitory Concentration (IC50) | 19.06 | nM |
SK-LU-1 cells
|
Lung adenocarcinoma
|
[4] | |
| Half Maximal Inhibitory Concentration (IC50) | 22.79 | nM |
A-172 cells
|
Glioblastoma
|
[4] | |
| Half Maximal Inhibitory Concentration (IC50) | 57.63 | nM |
SN12C cells
|
Renal cell carcinoma
|
[4] | |
| Half Maximal Inhibitory Concentration (IC50) | 60.6 | nM |
PANC-1 cells
|
Pancreatic ductal adenocarcinoma
|
[4] | |
| Half Maximal Inhibitory Concentration (IC50) | 62.59 | nM |
SK-OV-3 cells
|
Ovarian serous cystadenocarcinoma
|
[4] | |
| Half Maximal Inhibitory Concentration (IC50) | 88.8 | nM |
NCI-H1299 cells
|
Lung large cell carcinoma
|
[4] | |
| Half Maximal Inhibitory Concentration (IC50) | 9.18 | nM |
Karpas-299 cells
|
ALK-positive anaplastic large cell lymphoma
|
[4] |
Each Antibody-drug Conjugate Related to This Payload
Full Information of The Activity Data of The ADC(s) Related to This Payload
Anti-BCMA R347-SG3249 [Investigative]
Discovered Using Cell Line-derived Xenograft Model
| Experiment 1 Reporting the Activity Date of This ADC | [5] | ||||
| Efficacy Data | Tumor Growth Inhibition value (TGI) | ≈ 16.02% | Moderate BCMA expression (BCMA++) | ||
| Method Description |
Mice were treated with either a single intravenous dose of ADCs at 1 mg/kg, or dosed intravenously with J6M0-mc-MMAF ADC weekly at a dose of 1 mg/kg for 3 weeks. Control mice were left untreated.
|
||||
| In Vivo Model | JJN-3 CDX model | ||||
| In Vitro Model | Plasma cell myeloma | JJN-3 cells | CVCL_2078 | ||
Trastuzumab-Flexmab-SG3710 [Investigative]
Discovered Using Cell Line-derived Xenograft Model
| Experiment 1 Reporting the Activity Date of This ADC | [6] | ||||
| Efficacy Data | Tumor Growth Inhibition value (TGI) | ≈ 82.20% | Low HER2 expression (HER2+) | ||
| Method Description |
The in vivo efficacy of trastuzumab-Flexmab-SG3710 was investigated after single-dose injections (0.30 mg/kg) in female athymic mice bearing NCI-N87 HER2-positive subcutaneous xenografts. NCI-N87 cells (5 x10⁶) in 50% Matrigel were inoculated subcutaneously into 46 week-old female athymic nude mice. Five mice per group were dosed intravenously five days after their tumors reached a volume of 200 mm3.
Click to Show/Hide
|
||||
| In Vitro Model | Gastric tubular adenocarcinoma | NCI-N87 cells | CVCL_1603 | ||
| Experiment 2 Reporting the Activity Date of This ADC | [6] | ||||
| Efficacy Data | Tumor Growth Inhibition value (TGI) | ≈ 92.20% | Low HER2 expression (HER2+) | ||
| Method Description |
The in vivo efficacy of trastuzumab-Flexmab-SG3710 was investigated after single-dose injections (0.6 mg/kg) in female athymic mice bearing NCI-N87 HER2-positive subcutaneous xenografts. NCI-N87 cells (5 x10⁶) in 50% Matrigel were inoculated subcutaneously into 46 week-old female athymic nude mice. Five mice per group were dosed intravenously five days after their tumors reached a volume of 200 mm3.
Click to Show/Hide
|
||||
| In Vitro Model | Gastric tubular adenocarcinoma | NCI-N87 cells | CVCL_1603 | ||
| Experiment 3 Reporting the Activity Date of This ADC | [6] | ||||
| Efficacy Data | Tumor Growth Inhibition value (TGI) | ≈ 92.80% | Low HER2 expression (HER2+) | ||
| Method Description |
The in vivo efficacy of trastuzumab-Flexmab-SG3710 and trastuzumab-C239i-SG3249 ADCs was investigated after single-dose injections (1 mg/kg) in female athymic mice bearing NCI-N87 HER2-positive subcutaneous xenografts,and tumor growth was monitored for 85 days. NCI-N87 cells (5 x10⁶) in 50% Matrigel were inoculated subcutaneously into 46 week-old female athymic nude mice. Five mice per group were dosed intravenously five days after their tumors reached a volume of 200 mm3.
Click to Show/Hide
|
||||
| In Vitro Model | Gastric tubular adenocarcinoma | NCI-N87 cells | CVCL_1603 | ||
Revealed Based on the Cell Line Data
| Experiment 1 Reporting the Activity Date of This ADC | [6] | ||||
| Efficacy Data | Half Maximal Inhibitory Concentration (IC50) |
35.5 pM
|
Low HER2 expression (HER2+) | ||
| Method Description |
The cytotoxic effect of Trastuzumab-Flexmab-SG3710 was assessed in cell viability assays for a diverse panel of human solid tumor cell lines representing breast and gastric cancers. The potency of trastuzumab-Flexmab-SG3710 was assessed on the SKBR-3 cell line after five days of incubation.
|
||||
| In Vitro Model | Breast adenocarcinoma | SK-BR-3 cells | CVCL_0033 | ||
Trastuzumab-C239I-SG3249 [Investigative]
Discovered Using Cell Line-derived Xenograft Model
| Experiment 1 Reporting the Activity Date of This ADC | [6] | ||||
| Efficacy Data | Tumor Growth Inhibition value (TGI) | ≈ 94% | Low HER2 expression (HER2+) | ||
| Method Description |
The in vivo efficacy of trastuzumab-C239i-SG3249 was investigated after single-dose injections (0.30 mg/kg) in female athymic mice bearing NCI-N87 HER2-positive subcutaneous xenografts. NCI-N87 cells (5 x10⁶) in 50% Matrigel were inoculated subcutaneously into 46 week-old female athymic nude mice. Five mice per group were dosed intravenously five days after their tumors reached a volume of 200 mm3.
Click to Show/Hide
|
||||
| In Vitro Model | Gastric tubular adenocarcinoma | NCI-N87 cells | CVCL_1603 | ||
| Experiment 2 Reporting the Activity Date of This ADC | [6] | ||||
| Efficacy Data | Tumor Growth Inhibition value (TGI) | ≈ 94.20% | Low HER2 expression (HER2+) | ||
| Method Description |
The in vivo efficacy of trastuzumab-Flexmab-SG3710 and trastuzumab-C239i-SG3249 ADCs was investigated after single-dose injections (1 mg/kg) in female athymic mice bearing NCI-N87 HER2-positive subcutaneous xenografts,and tumor growth was monitored for 85 days. NCI-N87 cells (5 x10⁶) in 50% Matrigel were inoculated subcutaneously into 46 week-old female athymic nude mice. Five mice per group were dosed intravenously five days after their tumors reached a volume of 200 mm3.
Click to Show/Hide
|
||||
| In Vitro Model | Gastric tubular adenocarcinoma | NCI-N87 cells | CVCL_1603 | ||
Revealed Based on the Cell Line Data
| Experiment 1 Reporting the Activity Date of This ADC | [6] | ||||
| Efficacy Data | Half Maximal Inhibitory Concentration (IC50) |
14.4 pM
|
Low HER2 expression (HER2+) | ||
| Method Description |
The cytotoxic effect of Trastuzumab-C239i-SG32490 was assessed in cell viability assays for a diverse panel of human solid tumor cell lines representing breast and gastric cancers. The potency of trastuzumab-Flexmab-SG3710 was assessed on the SKBR-3 cell line after five days of incubation.
|
||||
| In Vitro Model | Breast adenocarcinoma | SK-BR-3 cells | CVCL_0033 | ||
Anti-BCMA I09-SG3249 [Investigative]
Discovered Using Cell Line-derived Xenograft Model
| Experiment 1 Reporting the Activity Date of This ADC | [5] | ||||
| Efficacy Data | Tumor Growth Inhibition value (TGI) | ≈ 94.55% | High BCMA expression (BCMA+++) | ||
| Method Description |
Mice were treated with either a single intravenous dose of the ADCs at 0.3 mg/kg or dosed intravenously with J6M0-mc-MMAFweekly at a dose of 0.3 mg/kg for 2 weeks.
|
||||
| In Vivo Model | NCI-H929 CDX model | ||||
| In Vitro Model | Plasma cell myeloma | NCI-H929 cells | CVCL_1600 | ||
| Experiment 2 Reporting the Activity Date of This ADC | [5] | ||||
| Efficacy Data | Tumor Growth Inhibition value (TGI) | ≈ 95.16% | Moderate BCMA expression (BCMA++) | ||
| Method Description |
Mice were treated with either a single intravenous dose of ADCs at 1 mg/kg, or dosed intravenously with J6M0-mc-MMAF ADC weekly at a dose of 1 mg/kg for 3 weeks. Control mice were left untreated.
|
||||
| In Vivo Model | JJN-3 CDX model | ||||
| In Vitro Model | Plasma cell myeloma | JJN-3 cells | CVCL_2078 | ||
| Experiment 3 Reporting the Activity Date of This ADC | [5] | ||||
| Efficacy Data | Tumor Growth Inhibition value (TGI) | ≈ 96.37% | Moderate BCMA expression (BCMA++) | ||
| Method Description |
Mice were treated with either a single intravenous dose of ADCs at 1 mg/kg, or dosed intravenously with J6M0-mc-MMAF ADC weekly at a dose of 1 mg/kg for 4 weeks. Control mice were left untreated.
|
||||
| In Vivo Model | MM.1S CDX model | ||||
| In Vitro Model | Plasma cell myeloma | MM1.S cells | CVCL_8792 | ||
Revealed Based on the Cell Line Data
| Experiment 1 Reporting the Activity Date of This ADC | [5] | ||||
| Efficacy Data | Half Maximal Inhibitory Concentration (IC50) |
2.81 nM
|
Moderate BCMA expression (BCMA++) | ||
| Method Description |
The ability of the ADCs to kill multiple myeloma cells in vitro inthe presence of soluble BCMA (sBCMA, 0 ng/ml) as compared to the 09-SG3249 ADC was evaluated in MM.1S cells, except that tested cell lines also were treated with BCMA-containing conditioned media collected from Ad293 cells expressing human BCMA.
|
||||
| In Vitro Model | Plasma cell myeloma | MM1.S cells | CVCL_8792 | ||
| Experiment 2 Reporting the Activity Date of This ADC | [5] | ||||
| Efficacy Data | Half Maximal Inhibitory Concentration (IC50) |
5.55 nM
|
Moderate BCMA expression (BCMA++) | ||
| Method Description |
The ability of the ADCs to kill multiple myeloma cells in vitro inthe presence of soluble BCMA (sBCMA, 270 ng/ml) as compared to the 09-SG3249 ADC was evaluated in MM.1S cells, except that tested cell lines also were treated with BCMA-containing conditioned media collected from Ad293 cells expressing human BCMA.
|
||||
| In Vitro Model | Plasma cell myeloma | MM1.S cells | CVCL_8792 | ||
| Experiment 3 Reporting the Activity Date of This ADC | [5] | ||||
| Efficacy Data | Half Maximal Inhibitory Concentration (IC50) |
7.79 nM
|
Moderate BCMA expression (BCMA++) | ||
| Method Description |
The ability of the ADCs to kill multiple myeloma cells in vitro inthe presence of soluble BCMA (sBCMA, 75 ng/ml) as compared to the 09-SG3249 ADC was evaluated in MM.1S cells, except that tested cell lines also were treated with BCMA-containing conditioned media collected from Ad293 cells expressing human BCMA.
|
||||
| In Vitro Model | Plasma cell myeloma | MM1.S cells | CVCL_8792 | ||
| Experiment 4 Reporting the Activity Date of This ADC | [5] | ||||
| Efficacy Data | Half Maximal Inhibitory Concentration (IC50) |
16.16 nM
|
Moderate BCMA expression (BCMA++) | ||
| Method Description |
The ability of the ADCs to kill multiple myeloma cells in vitro inthe presence of soluble BCMA (sBCMA, 720 ng/ml) as compared to the 09-SG3249 ADC was evaluated in MM.1S cells, except that tested cell lines also were treated with BCMA-containing conditioned media collected from Ad293 cells expressing human BCMA.
|
||||
| In Vitro Model | Plasma cell myeloma | MM1.S cells | CVCL_8792 | ||
Anti-BCMA L15-SG3249 [Investigative]
Discovered Using Cell Line-derived Xenograft Model
| Experiment 1 Reporting the Activity Date of This ADC | [5] | ||||
| Efficacy Data | Tumor Growth Inhibition value (TGI) | ≈ 95.16% | Moderate BCMA expression (BCMA++) | ||
| Method Description |
Mice were treated with either a single intravenous dose of ADCs at 1 mg/kg, or dosed intravenously with J6M0-mc-MMAF ADC weekly at a dose of 1 mg/kg for 3 weeks. Control mice were left untreated.
|
||||
| In Vivo Model | JJN-3 CDX model | ||||
| In Vitro Model | Plasma cell myeloma | JJN-3 cells | CVCL_2078 | ||
| Experiment 2 Reporting the Activity Date of This ADC | [5] | ||||
| Efficacy Data | Tumor Growth Inhibition value (TGI) | ≈ 96.37% | Moderate BCMA expression (BCMA++) | ||
| Method Description |
Mice were treated with either a single intravenous dose of ADCs at 1 mg/kg, or dosed intravenously with J6M0-mc-MMAF ADC weekly at a dose of 1 mg/kg for 4 weeks. Control mice were left untreated.
|
||||
| In Vivo Model | MM.1S CDX model | ||||
| In Vitro Model | Plasma cell myeloma | MM1.S cells | CVCL_8792 | ||
| Experiment 3 Reporting the Activity Date of This ADC | [5] | ||||
| Efficacy Data | Tumor Growth Inhibition value (TGI) | ≈ 97.35% | High BCMA expression (BCMA+++) | ||
| Method Description |
Mice were treated with either a single intravenous dose of the ADCs at 0.3 mg/kg or dosed intravenously with J6M0-mc-MMAFweekly at a dose of 0.3 mg/kg for 2 weeks.
|
||||
| In Vivo Model | NCI-H929 CDX model | ||||
| In Vitro Model | Plasma cell myeloma | NCI-H929 cells | CVCL_1600 | ||
Anti-BCMA 15B2WT-SG3249 [Investigative]
Discovered Using Cell Line-derived Xenograft Model
| Experiment 1 Reporting the Activity Date of This ADC | [5] | ||||
| Efficacy Data | Tumor Growth Inhibition value (TGI) | ≈ 95.59% | High BCMA expression (BCMA+++) | ||
| Method Description |
Mice were treated with either a single intravenous dose of the ADCs at 0.3 mg/kg or dosed intravenously with J6M0-mc-MMAFweekly at a dose of 0.3 mg/kg for 2 weeks.
|
||||
| In Vivo Model | NCI-H929 CDX model | ||||
| In Vitro Model | Plasma cell myeloma | NCI-H929 cells | CVCL_1600 | ||
Anti-BCMA 15B2GL-SG3249 [Investigative]
Discovered Using Cell Line-derived Xenograft Model
| Experiment 1 Reporting the Activity Date of This ADC | [5] | ||||
| Efficacy Data | Tumor Growth Inhibition value (TGI) | ≈ 96.37% | Moderate BCMA expression (BCMA++) | ||
| Method Description |
Mice were treated with either a single intravenous dose of ADCs at 1 mg/kg, or dosed intravenously with J6M0-mc-MMAF ADC weekly at a dose of 1 mg/kg for 4 weeks. Control mice were left untreated.
|
||||
| In Vivo Model | MM.1S CDX model | ||||
| In Vitro Model | Plasma cell myeloma | MM1.S cells | CVCL_8792 | ||
| Experiment 2 Reporting the Activity Date of This ADC | [5] | ||||
| Efficacy Data | Tumor Growth Inhibition value (TGI) | ≈ 98.73% | High BCMA expression (BCMA+++) | ||
| Method Description |
Mice were treated with either a single intravenous dose of ADCs at 1 mg/kg, or dosed intravenously with J6M0-mc-MMAF ADC weekly at a dose of 3 mg/kg for 4 weeks. Control mice were left untreated.
|
||||
| In Vivo Model | MM.1R CDX model | ||||
| In Vitro Model | Plasma cell myeloma | MM1.R cells | CVCL_8794 | ||
Revealed Based on the Cell Line Data
| Experiment 1 Reporting the Activity Date of This ADC | [5] | ||||
| Efficacy Data | Half Maximal Inhibitory Concentration (IC50) |
5.99 nM
|
High BCMA expression (BCMA+++) | ||
| Method Description |
Treatments were then serially diluted 1:3 in RPMI+10% FBS. 20uL of this series was added to the cells in duplicate, resulting in a 12-point dose curve of antibody-drug conjugate and media-only controls also were included. Plates were incubated at 37°C, 5% CO for 9 hours.
|
||||
| In Vitro Model | Plasma cell myeloma | NCI-H929 cells | CVCL_1600 | ||
| Experiment 2 Reporting the Activity Date of This ADC | [5] | ||||
| Efficacy Data | Half Maximal Inhibitory Concentration (IC50) |
8.64 nM
|
High BCMA expression (BCMA+++) | ||
| Method Description |
Treatments were then serially diluted 1:3 in RPMI+10% FBS. 20uL of this series was added to the cells in duplicate, resulting in a 12-point dose curve of antibody-drug conjugate and media-only controls also were included. Plates were incubated at 37°C, 5% CO for 9 hours.
|
||||
| In Vitro Model | Plasma cell myeloma | MM1.R cells | CVCL_8794 | ||
| Experiment 3 Reporting the Activity Date of This ADC | [5] | ||||
| Efficacy Data | Half Maximal Inhibitory Concentration (IC50) |
14.47 nM
|
Moderate BCMA expression (BCMA++) | ||
| Method Description |
The ability of the ADCs to kill multiple myeloma cells in vitro inthe presence of soluble BCMA (sBCMA, 0 ng/ml) as compared to the 09-SG3249 ADC was evaluated in MM.1S cells, except that tested cell lines also were treated with BCMA-containing conditioned media collected from Ad293 cells expressing human BCMA.
|
||||
| In Vitro Model | Plasma cell myeloma | MM1.S cells | CVCL_8792 | ||
| Experiment 4 Reporting the Activity Date of This ADC | [5] | ||||
| Efficacy Data | Half Maximal Inhibitory Concentration (IC50) |
16.09 nM
|
Moderate BCMA expression (BCMA++) | ||
| Method Description |
The ability of the ADCs to kill multiple myeloma cells in vitro inthe presence of soluble BCMA (sBCMA, 75 ng/ml) as compared to the 09-SG3249 ADC was evaluated in MM.1S cells, except that tested cell lines also were treated with BCMA-containing conditioned media collected from Ad293 cells expressing human BCMA.
|
||||
| In Vitro Model | Plasma cell myeloma | MM1.S cells | CVCL_8792 | ||
| Experiment 5 Reporting the Activity Date of This ADC | [5] | ||||
| Efficacy Data | Half Maximal Inhibitory Concentration (IC50) |
16.8 nM
|
Moderate BCMA expression (BCMA++) | ||
| Method Description |
Treatments were then serially diluted 1:3 in RPMI+10% FBS. 20uL of this series was added to the cells in duplicate, resulting in a 12-point dose curve of antibody-drug conjugate and media-only controls also were included. Plates were incubated at 37°C, 5% CO for 9 hours.
|
||||
| In Vitro Model | Plasma cell myeloma | MM1.S cells | CVCL_8792 | ||
| Experiment 6 Reporting the Activity Date of This ADC | [5] | ||||
| Efficacy Data | Half Maximal Inhibitory Concentration (IC50) |
22.86 nM
|
Moderate BCMA expression (BCMA++) | ||
| Method Description |
The ability of the ADCs to kill multiple myeloma cells in vitro inthe presence of soluble BCMA (sBCMA, 270 ng/ml) as compared to the 09-SG3249 ADC was evaluated in MM.1S cells, except that tested cell lines also were treated with BCMA-containing conditioned media collected from Ad293 cells expressing human BCMA.
|
||||
| In Vitro Model | Plasma cell myeloma | MM1.S cells | CVCL_8792 | ||
| Experiment 7 Reporting the Activity Date of This ADC | [5] | ||||
| Efficacy Data | Half Maximal Inhibitory Concentration (IC50) |
29.12 nM
|
Moderate BCMA expression (BCMA++) | ||
| Method Description |
The ability of the ADCs to kill multiple myeloma cells in vitro inthe presence of soluble BCMA (sBCMA, 720 ng/ml) as compared to the 09-SG3249 ADC was evaluated in MM.1S cells, except that tested cell lines also were treated with BCMA-containing conditioned media collected from Ad293 cells expressing human BCMA.
|
||||
| In Vitro Model | Plasma cell myeloma | MM1.S cells | CVCL_8792 | ||
| Experiment 8 Reporting the Activity Date of This ADC | [5] | ||||
| Efficacy Data | Half Maximal Inhibitory Concentration (IC50) |
31.4 nM
|
Low BCMA expression (BCMA+) | ||
| Method Description |
Treatments were then serially diluted 1:3 in RPMI+10% FBS. 20uL of this series was added to the cells in duplicate, resulting in a 12-point dose curve of antibody-drug conjugate and media-only controls also were included. Plates were incubated at 37°C, 5% CO for 9 hours.
|
||||
| In Vitro Model | Plasma cell myeloma | L-363 cells | CVCL_1357 | ||
| Experiment 9 Reporting the Activity Date of This ADC | [5] | ||||
| Efficacy Data | Half Maximal Inhibitory Concentration (IC50) |
36.28 nM
|
Moderate BCMA expression (BCMA++) | ||
| Method Description |
Treatments were then serially diluted 1:3 in RPMI+10% FBS. 20uL of this series was added to the cells in duplicate, resulting in a 12-point dose curve of antibody-drug conjugate and media-only controls also were included. Plates were incubated at 37°C, 5% CO for 9 hours.
|
||||
| In Vitro Model | Plasma cell myeloma | JJN-3 cells | CVCL_2078 | ||
| Experiment 10 Reporting the Activity Date of This ADC | [5] | ||||
| Efficacy Data | Half Maximal Inhibitory Concentration (IC50) |
39 nM
|
Moderate BCMA expression (BCMA++) | ||
| Method Description |
Treatments were then serially diluted 1:3 in RPMI+10% FBS. 20uL of this series was added to the cells in duplicate, resulting in a 12-point dose curve of antibody-drug conjugate and media-only controls also were included. Plates were incubated at 37°C, 5% CO for 9 hours.
|
||||
| In Vitro Model | Plasma cell myeloma | U266B1 cells | CVCL_0566 | ||
| Experiment 11 Reporting the Activity Date of This ADC | [5] | ||||
| Efficacy Data | Half Maximal Inhibitory Concentration (IC50) |
153 nM
|
High BCMA expression (BCMA+++) | ||
| Method Description |
Treatments were then serially diluted 1:3 in RPMI+10% FBS. 20uL of this series was added to the cells in duplicate, resulting in a 12-point dose curve of antibody-drug conjugate and media-only controls also were included. Plates were incubated at 37°C, 5% CO for 9 hours.
|
||||
| In Vitro Model | Plasma cell myeloma | EJM cells | CVCL_2030 | ||
| Experiment 12 Reporting the Activity Date of This ADC | [5] | ||||
| Efficacy Data | Half Maximal Inhibitory Concentration (IC50) |
201 nM
|
Moderate BCMA expression (BCMA++) | ||
| Method Description |
Treatments were then serially diluted 1:3 in RPMI+10% FBS. 20uL of this series was added to the cells in duplicate, resulting in a 12-point dose curve of antibody-drug conjugate and media-only controls also were included. Plates were incubated at 37°C, 5% CO for 9 hours.
|
||||
| In Vitro Model | Plasma cell myeloma | OPM-2 cells | CVCL_1625 | ||
| Experiment 13 Reporting the Activity Date of This ADC | [5] | ||||
| Efficacy Data | Half Maximal Inhibitory Concentration (IC50) | > 500 nM | Negative BCMA expression (BCMA-) | ||
| Method Description |
Treatments were then serially diluted 1:3 in RPMI+10% FBS. 20uL of this series was added to the cells in duplicate, resulting in a 12-point dose curve of antibody-drug conjugate and media-only controls also were included. Plates were incubated at 37°C, 5% CO for 9 hours.
|
||||
| In Vitro Model | T acute lymphoblastic leukemia | Jurkat cells | CVCL_0065 | ||
| Experiment 14 Reporting the Activity Date of This ADC | [5] | ||||
| Efficacy Data | Half Maximal Inhibitory Concentration (IC50) | > 500 nM | Negative BCMA expression (BCMA-) | ||
| Method Description |
Treatments were then serially diluted 1:3 in RPMI+10% FBS. 20uL of this series was added to the cells in duplicate, resulting in a 12-point dose curve of antibody-drug conjugate and media-only controls also were included. Plates were incubated at 37°C, 5% CO for 9 hours.
|
||||
| In Vitro Model | EBV-related Burkitt lymphoma | Raji cells | CVCL_0511 | ||
ChDAB4-SG3249 [Investigative]
Discovered Using Cell Line-derived Xenograft Model
| Experiment 1 Reporting the Activity Date of This ADC | [7] | ||||
| Efficacy Data | Tumor Growth Inhibition value (TGI) | ≈ 96.50% | Positive La/SSB expression (La/SSB +++/++) | ||
| Method Description |
ChDAB4-SG3249 (3 mg/kg, the day after chemotherapy (Day 3)) induces efficient tumor cell killing in cell line-derived models of Lewis lung carcinoma cell with HER3 expression with high expression.
|
||||
| In Vivo Model | LL2 CDX model | ||||
| In Vitro Model | Normal | LL2 cells | CVCL_C4MM | ||
HER-SG3249 [Investigative]
Revealed Based on the Cell Line Data
| Experiment 1 Reporting the Activity Date of This ADC | [2] | ||||
| Efficacy Data | Half Maximum Growth Inhibitory Concentration (GI50) |
1.74 ng/mL
|
Low HER2 expression (HER2+) | ||
| Method Description |
The cytotoxic effect of Her-SG3249 was assessed in cell viability assays for breast cancer. The potency of Her-SG3249 was assessed on the SKBR-3 cell line. Process aggregation assessed by SEC.
|
||||
| In Vitro Model | Breast adenocarcinoma | SK-BR-3 cells | CVCL_0033 | ||
Site-specific HER-SG3249 [Investigative]
Revealed Based on the Cell Line Data
| Experiment 1 Reporting the Activity Date of This ADC | [2] | ||||
| Efficacy Data | Half Maximum Growth Inhibitory Concentration (GI50) |
2.62 ng/mL
|
Low HER2 expression (HER2+) | ||
| Method Description |
The cytotoxic effect of site-specific Her-SG3249 was assessed in cell viability assays for breast cancer. The potency of site-specific Her-SG3249 was assessed on the SKBR-3 cell line. Process aggregation assessed by SEC.
|
||||
| In Vitro Model | Breast adenocarcinoma | SK-BR-3 cells | CVCL_0033 | ||
SC16.103-DL5 [Investigative]
Revealed Based on the Cell Line Data
| Experiment 1 Reporting the Activity Date of This ADC | [8] | ||||
| Efficacy Data | Half Maximal Inhibitory Concentration (IC50) |
0.13 nM
|
Positive CD276 expression (CD276 +++/++) | ||
| Method Description |
The anti-tumor activity of these ADCs was tested in cytotoxicity assaysusing the HCC38 cell line. IC50 values were determined by quantitating viable cells using a CellTiter-Glo luminescent assay.
|
||||
| In Vitro Model | Breast ductal carcinoma | HCC38 cells | CVCL_1267 | ||
40H3-Tesirine [Investigative]
Revealed Based on the Cell Line Data
| Experiment 1 Reporting the Activity Date of This ADC | [9] | ||||
| Efficacy Data | Half Maximal Inhibitory Concentration (IC50) |
0.31 nM
|
High EGFR expression (EGFR+++) | ||
| Method Description |
1 x10⁴ cells per well in a volume of 100 ul were plated in 96-well tissue culture plates. After 24 h, ADCs were added at the indicated concentrations. After 72 h, the medium was removed and the viability was determined using the CellTiter-Glo luminescent cell viability assay kit.
|
||||
| In Vitro Model | Breast adenocarcinoma | MDA-MB-468 cells | CVCL_0419 | ||
| Experiment 2 Reporting the Activity Date of This ADC | [9] | ||||
| Efficacy Data | Half Maximal Inhibitory Concentration (IC50) |
1.85 nM
|
High EGFR expression (EGFR+++) | ||
| Method Description |
1 x10⁴ cells per well in a volume of 100 ul were plated in 96-well tissue culture plates. After 24 h, ADCs were added at the indicated concentrations. After 72 h, the medium was removed and the viability was determined using the CellTiter-Glo luminescent cell viability assay kit.
|
||||
| In Vitro Model | Skin squamous cell carcinoma | A431 cells | CVCL_0037 | ||
| Experiment 3 Reporting the Activity Date of This ADC | [9] | ||||
| Efficacy Data | Half Maximal Inhibitory Concentration (IC50) |
9.07 nM
|
Moderate EGFR expression (EGFR++) | ||
| Method Description |
1 x10⁴ cells per well in a volume of 100 ul were plated in 96-well tissue culture plates. After 24 h, ADCs were added at the indicated concentrations. After 72 h, the medium was removed and the viability was determined using the CellTiter-Glo luminescent cell viability assay kit.
|
||||
| In Vitro Model | Invasive breast carcinoma of no special type | BT-20 cells | CVCL_0178 | ||
| Experiment 4 Reporting the Activity Date of This ADC | [9] | ||||
| Efficacy Data | Half Maximal Inhibitory Concentration (IC50) | > 100 nM | Negative EGFR expression (EGFR-) | ||
| Method Description |
1 x10⁴ cells per well in a volume of 100 ul were plated in 96-well tissue culture plates. After 24 h, ADCs were added at the indicated concentrations. After 72 h, the medium was removed and the viability was determined using the CellTiter-Glo luminescent cell viability assay kit.
|
||||
| In Vitro Model | Breast adenocarcinoma | MDA-MB-231 cells | CVCL_0062 | ||
Anti-BCMA J6M0-SG3249 [Investigative]
Revealed Based on the Cell Line Data
| Experiment 1 Reporting the Activity Date of This ADC | [5] | ||||
| Efficacy Data | Half Maximal Inhibitory Concentration (IC50) |
4.82 nM
|
Moderate BCMA expression (BCMA++) | ||
| Method Description |
The ability of the ADCs to kill multiple myeloma cells in vitro inthe presence of soluble BCMA (sBCMA, 0 ng/ml) as compared to the 09-SG3249 ADC was evaluated in MM.1S cells, except that tested cell lines also were treated with BCMA-containing conditioned media collected from Ad293 cells expressing human BCMA.
|
||||
| In Vitro Model | Plasma cell myeloma | MM1.S cells | CVCL_8792 | ||
| Experiment 2 Reporting the Activity Date of This ADC | [5] | ||||
| Efficacy Data | Half Maximal Inhibitory Concentration (IC50) |
12.83 nM
|
Moderate BCMA expression (BCMA++) | ||
| Method Description |
The ability of the ADCs to kill multiple myeloma cells in vitro inthe presence of soluble BCMA (sBCMA, 75 ng/ml) as compared to the 09-SG3249 ADC was evaluated in MM.1S cells, except that tested cell lines also were treated with BCMA-containing conditioned media collected from Ad293 cells expressing human BCMA.
|
||||
| In Vitro Model | Plasma cell myeloma | MM1.S cells | CVCL_8792 | ||
| Experiment 3 Reporting the Activity Date of This ADC | [5] | ||||
| Efficacy Data | Half Maximal Inhibitory Concentration (IC50) |
32.26 nM
|
Moderate BCMA expression (BCMA++) | ||
| Method Description |
The ability of the ADCs to kill multiple myeloma cells in vitro inthe presence of soluble BCMA (sBCMA, 270 ng/ml) as compared to the 09-SG3249 ADC was evaluated in MM.1S cells, except that tested cell lines also were treated with BCMA-containing conditioned media collected from Ad293 cells expressing human BCMA.
|
||||
| In Vitro Model | Plasma cell myeloma | MM1.S cells | CVCL_8792 | ||
| Experiment 4 Reporting the Activity Date of This ADC | [5] | ||||
| Efficacy Data | Half Maximal Inhibitory Concentration (IC50) |
92.92 nM
|
Moderate BCMA expression (BCMA++) | ||
| Method Description |
The ability of the ADCs to kill multiple myeloma cells in vitro inthe presence of soluble BCMA (sBCMA, 720 ng/ml) as compared to the 09-SG3249 ADC was evaluated in MM.1S cells, except that tested cell lines also were treated with BCMA-containing conditioned media collected from Ad293 cells expressing human BCMA.
|
||||
| In Vitro Model | Plasma cell myeloma | MM1.S cells | CVCL_8792 | ||
Isotype-SG3249 [Investigative]
Revealed Based on the Cell Line Data
| Experiment 1 Reporting the Activity Date of This ADC | [10] | ||||
| Efficacy Data | Half Maximal inhibitory Concentration (lC50) |
214.4 pM
|
Positive CD45 expression (CD45+++/++) | ||
| Method Description |
Cells at 0.5 × 10⁵/mL were cultured for 5 days in mAb or ADC or medium (in triplicate wells) in wells of flat-bottom 96-well plates. PrestoBlue Cell Viability reagent (Thermo Fisher Scientific) was added and incubated for 1.5 h. Fluorescence intensity from each well was detected using a FLUOstar OPTIMA microplate reader (BMG Labtech, Aylesbury, UK) using excitation filter of 560-10 and emission filter of 590-10, and gain at 1,500. Data were plotted using GraphPad Prism software, and sigmoid dose-response non-linear regression was carried out to determine IC50 values.
Click to Show/Hide
|
||||
| In Vitro Model | Acute erythroid leukemia | OCIM1 cells | CVCL_2149 | ||
| Experiment 2 Reporting the Activity Date of This ADC | [10] | ||||
| Efficacy Data | Half Maximal inhibitory Concentration (lC50) |
309.6 pM
|
Positive CD45 expression (CD45+++/++) | ||
| Method Description |
Cells at 0.5 × 10⁵/mL were cultured for 5 days in mAb or ADC or medium (in triplicate wells) in wells of flat-bottom 96-well plates. PrestoBlue Cell Viability reagent (Thermo Fisher Scientific) was added and incubated for 1.5 h. Fluorescence intensity from each well was detected using a FLUOstar OPTIMA microplate reader (BMG Labtech, Aylesbury, UK) using excitation filter of 560-10 and emission filter of 590-10, and gain at 1,500. Data were plotted using GraphPad Prism software, and sigmoid dose-response non-linear regression was carried out to determine IC50 values.
Click to Show/Hide
|
||||
| In Vitro Model | T acute lymphoblastic leukemia | Jurkat cells | CVCL_0065 | ||
| Experiment 3 Reporting the Activity Date of This ADC | [10] | ||||
| Efficacy Data | Half Maximal inhibitory Concentration (lC50) | > 6000 pM | Negative CD45 expression (CD45-) | ||
| Method Description |
Cells at 0.5 × 10⁵/mL were cultured for 5 days in mAb or ADC or medium (in triplicate wells) in wells of flat-bottom 96-well plates. PrestoBlue Cell Viability reagent (Thermo Fisher Scientific) was added and incubated for 1.5 h. Fluorescence intensity from each well was detected using a FLUOstar OPTIMA microplate reader (BMG Labtech, Aylesbury, UK) using excitation filter of 560-10 and emission filter of 590-10, and gain at 1,500. Data were plotted using GraphPad Prism software, and sigmoid dose-response non-linear regression was carried out to determine IC50 values.
Click to Show/Hide
|
||||
| In Vitro Model | Normal | 293T cells | CVCL_0063 | ||
Isotype-SG3376 [Investigative]
Revealed Based on the Cell Line Data
| Experiment 1 Reporting the Activity Date of This ADC | [10] | ||||
| Efficacy Data | Half Maximal inhibitory Concentration (lC50) |
2288.3 pM
|
Positive CD45 expression (CD45+++/++) | ||
| Method Description |
Cells at 0.5 × 10⁵/mL were cultured for 5 days in mAb or ADC or medium (in triplicate wells) in wells of flat-bottom 96-well plates. PrestoBlue Cell Viability reagent (Thermo Fisher Scientific) was added and incubated for 1.5 h. Fluorescence intensity from each well was detected using a FLUOstar OPTIMA microplate reader (BMG Labtech, Aylesbury, UK) using excitation filter of 560-10 and emission filter of 590-10, and gain at 1,500. Data were plotted using GraphPad Prism software, and sigmoid dose-response non-linear regression was carried out to determine IC50 values.
Click to Show/Hide
|
||||
| In Vitro Model | Acute erythroid leukemia | OCIM1 cells | CVCL_2149 | ||
| Experiment 2 Reporting the Activity Date of This ADC | [10] | ||||
| Efficacy Data | Half Maximal inhibitory Concentration (lC50) |
3399.8 pM
|
Positive CD45 expression (CD45+++/++) | ||
| Method Description |
Cells at 0.5 × 10⁵/mL were cultured for 5 days in mAb or ADC or medium (in triplicate wells) in wells of flat-bottom 96-well plates. PrestoBlue Cell Viability reagent (Thermo Fisher Scientific) was added and incubated for 1.5 h. Fluorescence intensity from each well was detected using a FLUOstar OPTIMA microplate reader (BMG Labtech, Aylesbury, UK) using excitation filter of 560-10 and emission filter of 590-10, and gain at 1,500. Data were plotted using GraphPad Prism software, and sigmoid dose-response non-linear regression was carried out to determine IC50 values.
Click to Show/Hide
|
||||
| In Vitro Model | T acute lymphoblastic leukemia | Jurkat cells | CVCL_0065 | ||
| Experiment 3 Reporting the Activity Date of This ADC | [10] | ||||
| Efficacy Data | Half Maximal inhibitory Concentration (lC50) | > 6000 pM | Negative CD45 expression (CD45-) | ||
| Method Description |
Cells at 0.5 × 10⁵/mL were cultured for 5 days in mAb or ADC or medium (in triplicate wells) in wells of flat-bottom 96-well plates. PrestoBlue Cell Viability reagent (Thermo Fisher Scientific) was added and incubated for 1.5 h. Fluorescence intensity from each well was detected using a FLUOstar OPTIMA microplate reader (BMG Labtech, Aylesbury, UK) using excitation filter of 560-10 and emission filter of 590-10, and gain at 1,500. Data were plotted using GraphPad Prism software, and sigmoid dose-response non-linear regression was carried out to determine IC50 values.
Click to Show/Hide
|
||||
| In Vitro Model | Normal | 293T cells | CVCL_0063 | ||
anti-TRBC1-SG3249 [Investigative]
Revealed Based on the Cell Line Data
| Experiment 1 Reporting the Activity Date of This ADC | [11] | ||||
| Efficacy Data | Half Maximal inhibitory Concentration (lC50) |
0.006 nM
|
|||
| Method Description |
IC50 Values (nM) of anti-TRBC1-SG3199 in T-cell cancer cell lines in CML-T1 TRBC1
|
||||
| In Vitro Model | Chronic myelogenous leukemia, BCR-ABL1 positive, Chronic myeloid leukemia | CML-T1 TRBC1 cells | CVCL_1126 | ||
| Experiment 2 Reporting the Activity Date of This ADC | [11] | ||||
| Efficacy Data | Half Maximal inhibitory Concentration (lC50) |
0.009 nM
|
|||
| Method Description |
IC50 Values (nM) of anti-TRBC1-SG3199 in T-cell cancer cell lines in HPB-ALL TRBC2
|
||||
| In Vitro Model | Childhood T acute lymphoblastic leukemia, Precursor T-cell acute lymphoblastic leukemia | HPB-ALL TRBC2 cells | CVCL_1820 | ||
| Experiment 3 Reporting the Activity Date of This ADC | [11] | ||||
| Efficacy Data | Half Maximal inhibitory Concentration (lC50) |
0.012 nM
|
|||
| Method Description |
IC50 Values (nM) of anti-TRBC1-SG3199 in T-cell cancer cell lines in SUP-T1 TRBC1
|
||||
| In Vitro Model | Childhood T lymphoblastic lymphoma, T-cell non-Hodgkin lymphoma | SUP-T1 TRBC1 cells | CVCL_1714 | ||
| Experiment 4 Reporting the Activity Date of This ADC | [11] | ||||
| Efficacy Data | Half Maximal inhibitory Concentration (lC50) |
0.014 nM
|
|||
| Method Description |
IC50 Values (nM) of anti-TRBC1-SG3199 in T-cell cancer cell lines in Jurkat TCR-KO
|
||||
| In Vitro Model | Childhood T acute lymphoblastic leukemia, Precursor T-cell acute lymphoblastic leukemia | Jurkat TCR-KO cells | CVCL_0065 | ||
| Experiment 5 Reporting the Activity Date of This ADC | [11] | ||||
| Efficacy Data | Half Maximal inhibitory Concentration (lC50) |
0.016 nM
|
|||
| Method Description |
IC50 Values (nM) of anti-TRBC1-SG3199 in T-cell cancer cell lines in H9 TRBC1
|
||||
| In Vitro Model | Sezary syndrome | H9 TRBC1 cells | CVCL_1240 | ||
| Experiment 6 Reporting the Activity Date of This ADC | [11] | ||||
| Efficacy Data | Half Maximal inhibitory Concentration (lC50) |
0.016 nM
|
|||
| Method Description |
IC50 Values (nM) of anti-TRBC1-SG3199 in T-cell cancer cell lines in HPB-ALL TRBC1
|
||||
| In Vitro Model | Childhood T acute lymphoblastic leukemia, Precursor T-cell acute lymphoblastic leukemia | HPB-ALL TRBC1 cells | CVCL_1820 | ||
| Experiment 7 Reporting the Activity Date of This ADC | [11] | ||||
| Efficacy Data | Half Maximal inhibitory Concentration (lC50) |
0.025 nM
|
|||
| Method Description |
IC50 Values (nM) of anti-TRBC1-SG3199 in T-cell cancer cell lines in Jurkat TRBC1
|
||||
| In Vitro Model | Childhood T acute lymphoblastic leukemia, Precursor T-cell acute lymphoblastic leukemia | Jurkat TRBC1 cells | CVCL_0065 | ||
| Experiment 8 Reporting the Activity Date of This ADC | [11] | ||||
| Efficacy Data | Half Maximal inhibitory Concentration (lC50) |
0.03 nM
|
|||
| Method Description |
IC50 Values (nM) of anti-TRBC1-SG3199 in T-cell cancer cell lines in Jurkat TRBC2
|
||||
| In Vitro Model | Childhood T acute lymphoblastic leukemia, Precursor T-cell acute lymphoblastic leukemia | Jurkat TRBC2 cells | CVCL_0065 | ||
anti TRBC1-SG3249 [Investigative]
Revealed Based on the Cell Line Data
| Experiment 1 Reporting the Activity Date of This ADC | [12] | ||||
| Efficacy Data | Half Maximal inhibitory Concentration (lC50) |
4.3 ng/mL
|
Positive TRBC1 expression (TRBC1+++/++) | ||
| Method Description |
A total of 1 × 10⁴ T cell cancer cells or the normal human T cells was suspended in 200 ul of RPMI-1640 medium supplemented with 10% FBS and 1% penicillin-streptomycin in 96-well flat-bottom tissue culture-treated plates. The following drugs were resuspended in DMSO solution to make a 10 mM stock solution; exatecan mesylate (MedChemExpress HY-13631A), DM1 (MedChemExpress HY-19792), SN38 (MedChemExpress HY-13704), MMAE (MedChemExpress HY-15162), SG3199 (MedChemExpress HY-101161). The drugs were added to the target cells at the concentrations specified in the text for 5 days at 37 °C. For luciferase-expressing cells, cell viability was assayed using the ONE-Glo luciferase assay (E6110, Promega) according to the manufacturer's instructions. Luminescence data were collected using the Synergy H1 microplate reader and analysed with the Biotek Gen5 software. Viability was calculated as the ratio of the luminescence signal to the no antibody or control antibody condition: (antibody well luminescence)/ (no antibody or control antibody well luminescence).
Click to Show/Hide
|
||||
| In Vitro Model | Sezary syndrome | H9 cells | CVCL_1240 | ||
| Experiment 2 Reporting the Activity Date of This ADC | [12] | ||||
| Efficacy Data | Half Maximal inhibitory Concentration (lC50) |
7.6 ng/mL
|
Positive TRBC1 expression (TRBC1+++/++) | ||
| Method Description |
A total of 1 × 10⁴ T cell cancer cells or the normal human T cells was suspended in 200 ul of RPMI-1640 medium supplemented with 10% FBS and 1% penicillin-streptomycin in 96-well flat-bottom tissue culture-treated plates. The following drugs were resuspended in DMSO solution to make a 10 mM stock solution; exatecan mesylate (MedChemExpress HY-13631A), DM1 (MedChemExpress HY-19792), SN38 (MedChemExpress HY-13704), MMAE (MedChemExpress HY-15162), SG3199 (MedChemExpress HY-101161). The drugs were added to the target cells at the concentrations specified in the text for 5 days at 37 °C. For luciferase-expressing cells, cell viability was assayed using the ONE-Glo luciferase assay (E6110, Promega) according to the manufacturer's instructions. Luminescence data were collected using the Synergy H1 microplate reader and analysed with the Biotek Gen5 software. Viability was calculated as the ratio of the luminescence signal to the no antibody or control antibody condition: (antibody well luminescence)/ (no antibody or control antibody well luminescence).
Click to Show/Hide
|
||||
| In Vitro Model | T acute lymphoblastic leukemia | Jurkat cells | CVCL_0065 | ||
KM8047-SG3249 [Investigative]
Revealed Based on the Cell Line Data
| Experiment 1 Reporting the Activity Date of This ADC | [13] | ||||
| Efficacy Data | Half Maximal inhibitory Concentration (lC50) |
495.3 ng/mL
|
High TIM-3 expression (TIM-3 +++) | ||
| Method Description |
EoL-1, EoL-1/hTIM-3 and Kasumi-3 cells were incubated with increasing concentrations of KK2845 or KM8047-SG3249 in RPMI1640 medium supplemented with 10 vol% (for EoL-1 and EoL-1/hTIM-3 cells) or 20 vol% (for Kasumi-3 cells) heat-inactivated fetal bovine serum, 20 vol% heat-inactivated human serum (Sigma), and a mixture of 100 U/mL penicillin and 100 ug/mL streptomycin at 37 °C for 4 days. After incubation, the cells were treated with Cell Counting Kit-8 (CCK-8, Dojindo Laboratories), and the absorbance was measured using a Multiskan Ascent device (Thermo Fisher Scientific, Ascent Software: version 2.6). Primary AML cells were incubated with increasing concentrations of KM8047-SG3249, KK2845, or CD33-ADC in IMDM medium (Thermo Fisher Scientific) supplemented with 20 vol% heat-inactivated human serum, a mixture of 100 U/mL penicillin and 100 ug/mL streptomycin, 25 ng/mL hIL-3 (Miltenyi Biotec), 25 ng/mL hSCF (Peprotech), 25 ng/mL hGM-CSF (R&D), and 25 ng/mL hG-CSF (R&D) at 37 °C for 4 days. After incubation, the cells were stained by anti-CD45 antibody-FITC (BD Pharmingen, HI30 clone), anti-CD34 antibody-APC (BD Bioscience, 8G12 clone), anti-CD38 antibody-BV421 (BD Bioscience, HIT2 clone) and 7-amino-actinomycin D (7-AAD, Bio-Rad Laboratories). The number of viable cells in the CD34+ fraction, CD34+CD38- fraction, or CD34- fraction in primary AML cells was counted by flow cytometry (FACSVerse, software program: BD FACSUITE-V1.0.5).
Click to Show/Hide
|
||||
| In Vitro Model | Chronic eosinophilic leukemia, not otherwise specified,Chronic eosinophilic leukemia | EoL-1/hTIM-3 cells | CVCL_0258 | ||
| Experiment 2 Reporting the Activity Date of This ADC | [13] | ||||
| Efficacy Data | Half Maximal inhibitory Concentration (lC50) |
640.8 ng/mL
|
Low TIM-3 expression (TIM-3+) | ||
| Method Description |
EoL-1, EoL-1/hTIM-3 and Kasumi-3 cells were incubated with increasing concentrations of KK2845 or KM8047-SG3249 in RPMI1640 medium supplemented with 10 vol% (for EoL-1 and EoL-1/hTIM-3 cells) or 20 vol% (for Kasumi-3 cells) heat-inactivated fetal bovine serum, 20 vol% heat-inactivated human serum (Sigma), and a mixture of 100 U/mL penicillin and 100 ug/mL streptomycin at 37 °C for 4 days. After incubation, the cells were treated with Cell Counting Kit-8 (CCK-8, Dojindo Laboratories), and the absorbance was measured using a Multiskan Ascent device (Thermo Fisher Scientific, Ascent Software: version 2.6). Primary AML cells were incubated with increasing concentrations of KM8047-SG3249, KK2845, or CD33-ADC in IMDM medium (Thermo Fisher Scientific) supplemented with 20 vol% heat-inactivated human serum, a mixture of 100 U/mL penicillin and 100 ug/mL streptomycin, 25 ng/mL hIL-3 (Miltenyi Biotec), 25 ng/mL hSCF (Peprotech), 25 ng/mL hGM-CSF (R&D), and 25 ng/mL hG-CSF (R&D) at 37 °C for 4 days. After incubation, the cells were stained by anti-CD45 antibody-FITC (BD Pharmingen, HI30 clone), anti-CD34 antibody-APC (BD Bioscience, 8G12 clone), anti-CD38 antibody-BV421 (BD Bioscience, HIT2 clone) and 7-amino-actinomycin D (7-AAD, Bio-Rad Laboratories). The number of viable cells in the CD34+ fraction, CD34+CD38- fraction, or CD34- fraction in primary AML cells was counted by flow cytometry (FACSVerse, software program: BD FACSUITE-V1.0.5).
Click to Show/Hide
|
||||
| In Vitro Model | Chronic eosinophilic leukemia | EoL-1 cells | CVCL_0258 | ||
| Experiment 3 Reporting the Activity Date of This ADC | [13] | ||||
| Efficacy Data | Half Maximal inhibitory Concentration (lC50) |
1576.3 ng/mL
|
Low TIM-3 expression (TIM-3+) | ||
| Method Description |
EoL-1, EoL-1/hTIM-3 and Kasumi-3 cells were incubated with increasing concentrations of KK2845 or KM8047-SG3249 in RPMI1640 medium supplemented with 10 vol% (for EoL-1 and EoL-1/hTIM-3 cells) or 20 vol% (for Kasumi-3 cells) heat-inactivated fetal bovine serum, 20 vol% heat-inactivated human serum (Sigma), and a mixture of 100 U/mL penicillin and 100 ug/mL streptomycin at 37 °C for 4 days. After incubation, the cells were treated with Cell Counting Kit-8 (CCK-8, Dojindo Laboratories), and the absorbance was measured using a Multiskan Ascent device (Thermo Fisher Scientific, Ascent Software: version 2.6). Primary AML cells were incubated with increasing concentrations of KM8047-SG3249, KK2845, or CD33-ADC in IMDM medium (Thermo Fisher Scientific) supplemented with 20 vol% heat-inactivated human serum, a mixture of 100 U/mL penicillin and 100 ug/mL streptomycin, 25 ng/mL hIL-3 (Miltenyi Biotec), 25 ng/mL hSCF (Peprotech), 25 ng/mL hGM-CSF (R&D), and 25 ng/mL hG-CSF (R&D) at 37 °C for 4 days. After incubation, the cells were stained by anti-CD45 antibody-FITC (BD Pharmingen, HI30 clone), anti-CD34 antibody-APC (BD Bioscience, 8G12 clone), anti-CD38 antibody-BV421 (BD Bioscience, HIT2 clone) and 7-amino-actinomycin D (7-AAD, Bio-Rad Laboratories). The number of viable cells in the CD34+ fraction, CD34+CD38- fraction, or CD34- fraction in primary AML cells was counted by flow cytometry (FACSVerse, software program: BD FACSUITE-V1.0.5).
Click to Show/Hide
|
||||
| In Vitro Model | Adult acute myeloid leukemia | Kasumi-3 cells | CVCL_0612 | ||
CD117-ADC [Investigative]
Revealed Based on the Cell Line Data
| Experiment 1 Reporting the Activity Date of This ADC | [14] | ||||
| Efficacy Data | Half Maximal Effective Concentration (EC50) |
0.0265 nM
|
Positive CD34 expression ( CD34+++/++) | ||
| Method Description |
Primary human CD34+ cells were purchased from STEMCELL technologies (Vancouver, BC, Canada). The cells were obtained using Institutional Review Board (IRB)-approved consent forms and protocols. The steady-state human bone marrow CD34+ cells (3 donors, STEMCELL technologies) or purified mobilized CD34+ cells from two healthy rhesus macaques were cultured (2500 cells/well in 384-well plate) in serum-free StemSpan SFEM media (45 ul, STEMCELL Technologies) supplemented with 100 ng/ml each of Interleukin 6 (IL-6), fms-related tyrosine kinase 3 ligand (FLT3L), and thrombopoietin (TPO). Escalating doses of CD117-ADC as well as IgG isotype control-conjugated ADC were added (5 ul ADC added to 45 ul cells). After 6 days of culture, the number of viable CD34 + CD90+ cells were evaluated by flow cytometry using 7-Aminoactinomycin D (7-AAD as a viability marker, Biolegend, San Diego, CA, USA), CD34 BV785 (clone 561, BioLegend), and CD90 APC (Clone 5E10, BioLegend) detection antibodies. Cells were acquired on a BD Celesta Instrument and analyzed with FloJo. The EC50 and EC90 values were calculated with GraphPad Prism software.
Click to Show/Hide
|
||||
| In Vitro Model | Normal | Rhesus CD34+ cells | Macaca mulatta | ||
| Experiment 2 Reporting the Activity Date of This ADC | [14] | ||||
| Efficacy Data | Half Maximal Effective Concentration (EC50) |
0.0521 nM
|
Positive CD34 expression ( CD34+++/++) | ||
| Method Description |
Primary human CD34+ cells were purchased from STEMCELL technologies (Vancouver, BC, Canada). The cells were obtained using Institutional Review Board (IRB)-approved consent forms and protocols. The steady-state human bone marrow CD34+ cells (3 donors, STEMCELL technologies) or purified mobilized CD34+ cells from two healthy rhesus macaques were cultured (2500 cells/well in 384-well plate) in serum-free StemSpan SFEM media (45 ul, STEMCELL Technologies) supplemented with 100 ng/ml each of Interleukin 6 (IL-6), fms-related tyrosine kinase 3 ligand (FLT3L), and thrombopoietin (TPO). Escalating doses of CD117-ADC as well as IgG isotype control-conjugated ADC were added (5 ul ADC added to 45 ul cells). After 6 days of culture, the number of viable CD34 + CD90+ cells were evaluated by flow cytometry using 7-Aminoactinomycin D (7-AAD as a viability marker, Biolegend, San Diego, CA, USA), CD34 BV785 (clone 561, BioLegend), and CD90 APC (Clone 5E10, BioLegend) detection antibodies. Cells were acquired on a BD Celesta Instrument and analyzed with FloJo. The EC50 and EC90 values were calculated with GraphPad Prism software.
Click to Show/Hide
|
||||
| In Vitro Model | . | Human CD34+ cells | Homo sapiens | ||
References