
Antibody-drug Conjugate Information
General Information of This Antibody-drug Conjugate (ID: DRG0ZQLZD)
| ADC Name |
MT-8633
|
|||||
|---|---|---|---|---|---|---|
| Synonyms |
MT-8633; TR1801-ADC
Click to Show/Hide
|
|||||
| Organization |
Tanabe Pharma Corporation (Originator)
|
|||||
| Drug Status |
Phase 1 (discontinued)
|
|||||
| Drug-to-Antibody Ratio |
2
|
|||||
| Structure |
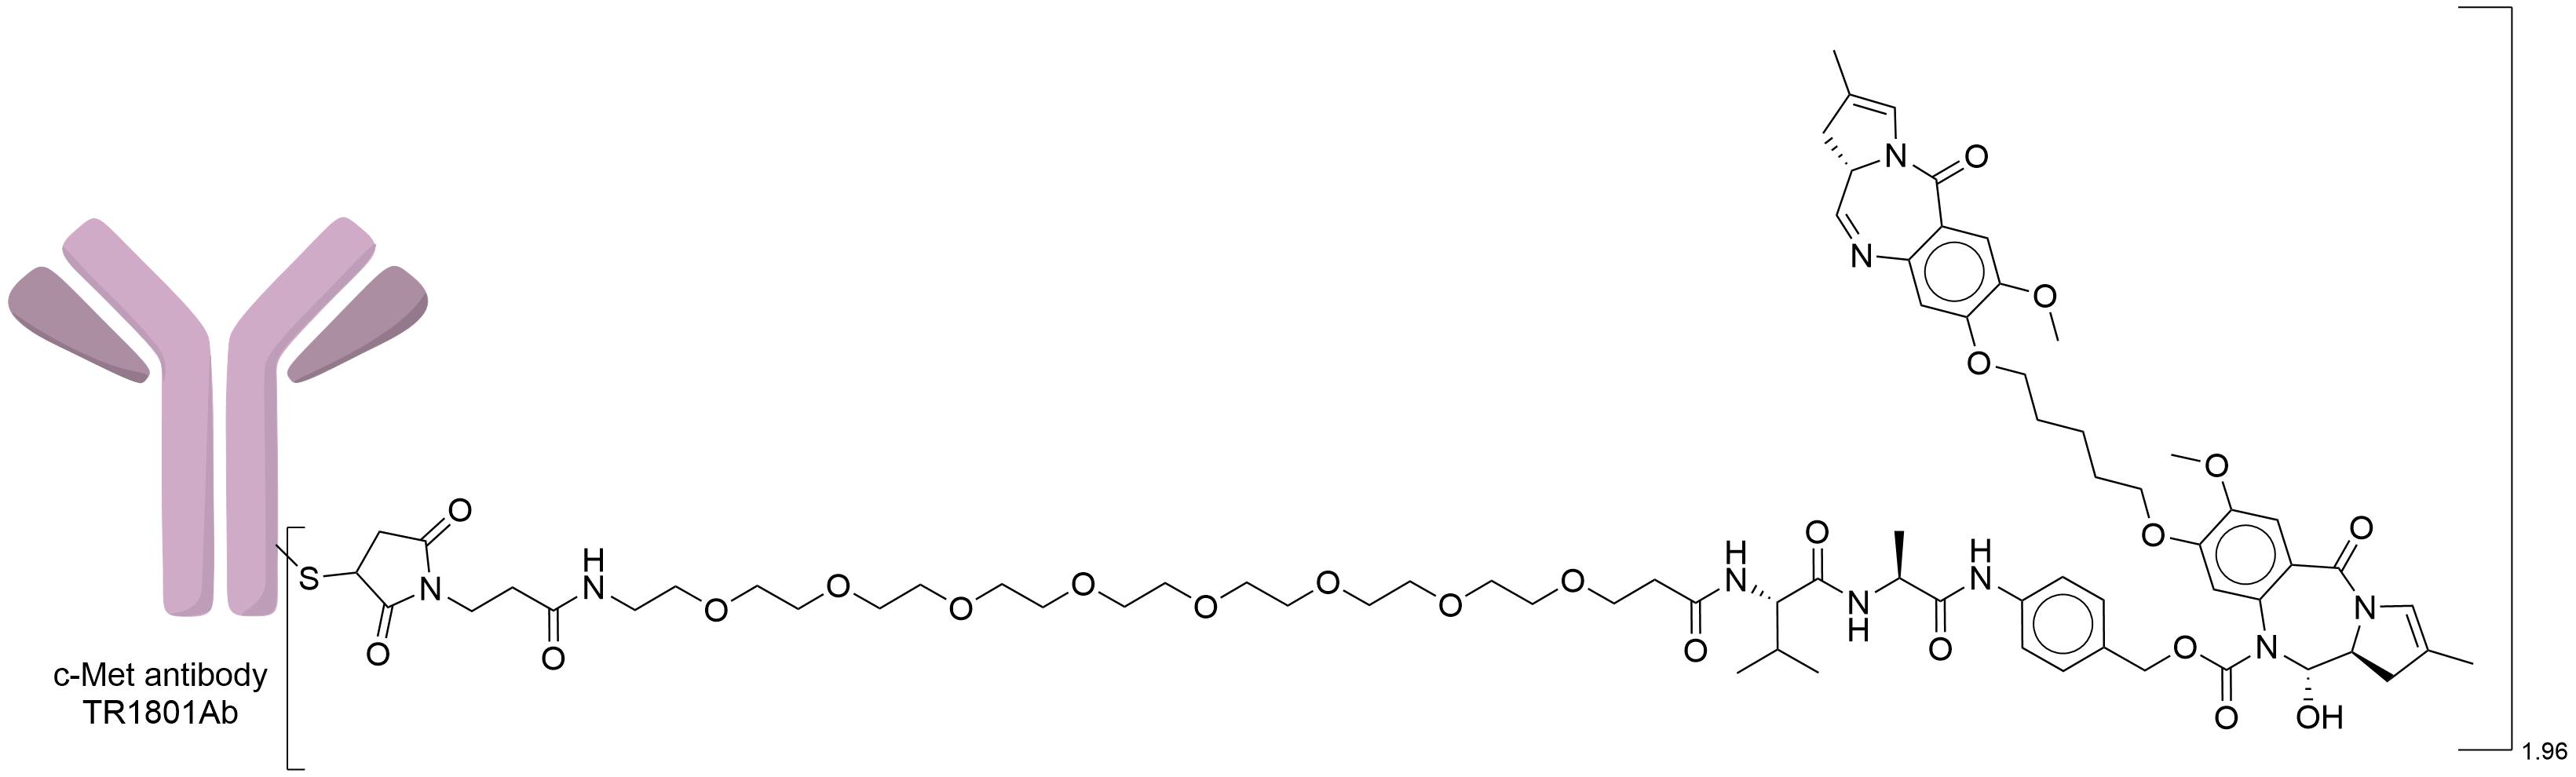
|
|||||
| Antibody Name |
HD12
|
Antibody Info | ||||
| Antigen Name |
Hepatocyte growth factor receptor (MET)
|
Antigen Info | ||||
| Payload Name |
SG3199 (SC-DR002)
|
Payload Info | ||||
| Payload Target |
Human deoxyribonucleic acid (hDNA)
|
Target Info | ||||
| Linker Name |
Mal-PEG8-Val-Ala-PABC
|
Linker Info | ||||
| Conjugate Type |
Reactive Cysteines
|
|||||
| Combination Type |
tesirine
|
|||||
2027 Update
The disease landscape of This ADC
2027 Update
The clinical trial pipelines of This ADC
2027 Update
General Information of The ADMET Data Related to This ADC
Absorption
| Standard Type | Value | Units | Description | Reference |
|---|---|---|---|---|
| Maximum Observed Concentration (Cmax) | 23.51 | ug/mL |
2 Different PK ELISA methods (1 mg/kg ADC) were used to measure the serum concentrations and analyze the circulating half-life and deconjugation of TR1801-ADC.
|
[1] |
| Area Under the Concentration-Time Curve (AUC) | 3499.67 | ug·h/mL |
2 Different PK ELISA methods (1 mg/kg ADC) were used to measure the serum concentrations and analyze the circulating half-life and deconjugation of TR1801-ADC, AUClast.
|
[1] |
Excretion
| Standard Type | Value | Units | Description | Reference |
|---|---|---|---|---|
| Elimination Half-Life (t1/2) | 306 | h |
2 Different PK ELISA methods (1 mg/kg ADC) were used to measure the serum concentrations and analyze the circulating half-life and deconjugation of TR1801-ADC.
|
[1] |
| Clearance (CL) | 0.196 | mL/h/kg |
2 Different PK ELISA methods (1 mg/kg ADC) were used to measure the serum concentrations and analyze the circulating half-life and deconjugation of TR1801-ADC.
|
[1] |
General Information of The Activity Data Related to This ADC
Identified from the Human Clinical Data
Discovered Using Patient-derived Xenograft Model
Revealed Based on the Cell Line Data
Full List of Activity Data of This Antibody-drug Conjugate
Identified from the Human Clinical Data
| Experiment 1 Reporting the Activity Date of This ADC | [2] | ||||
| Related Clinical Trial | |||||
| NCT Number | NCT03859752 | Clinical Status | Phase 1 | ||
| Clinical Description | A phase 1, open label, first-in-human study of TR1801-ADC, an antibody drug conjugate (ADC), in patients with select solid tumors expressing c-met. | ||||
Discovered Using Patient-derived Xenograft Model
| Experiment 1 Reporting the Activity Date of This ADC | [3] | ||||
| Efficacy Data | Tumor Growth Inhibition value (TGI) | ≈ 1.02% | High MET expression (MET+++) | ||
| Method Description |
Each mouse was subcutaneously inoculated at the right flank with a 23 mm (diameter) tumor piece of one of the tested PDX models. Mice were randomly grouped into six groups (n = 10 animals) according to the tumor size average of 200 mm3.A single dose of test articles was administered intravenously into the tail vein at the dose concentrations indicated. TR1801-ADC 0.125 mg/kg.
Click to Show/Hide
|
||||
| In Vivo Model | Colorectal cancer PDX model (PDX: CR3150) | ||||
| Experiment 2 Reporting the Activity Date of This ADC | [3] | ||||
| Efficacy Data | Tumor Growth Inhibition value (TGI) | ≈ 30.20% | High MET expression (MET+++) | ||
| Method Description |
Each mouse was subcutaneously inoculated at the right flank with a 23 mm (diameter) tumor piece of one of the tested PDX models. Mice were randomly grouped into six groups (n = 10 animals) according to the tumor size average of 200 mm3.A single dose of test articles was administered intravenously into the tail vein at the dose concentrations indicated. TR1801-ADC 0.125 mg/kg.
Click to Show/Hide
|
||||
| In Vivo Model | Head and neck squamous cell carcinoma PDX model (PDX: HN0635) | ||||
| Experiment 3 Reporting the Activity Date of This ADC | [3] | ||||
| Efficacy Data | Tumor Growth Inhibition value (TGI) | ≈ 30.40% | Moderate MET expression (MET++) | ||
| Method Description |
Each mouse was subcutaneously inoculated at the right flank with a 23 mm (diameter) tumor piece of one of the tested PDX models. Mice were randomly grouped into six groups (n = 10 animals) according to the tumor size average of 200 mm3.A single dose of test articles was administered intravenously into the tail vein at the dose concentrations indicated. TR1801-ADC 0.125 mg/kg.
Click to Show/Hide
|
||||
| In Vivo Model | Head and neck squamous cell carcinoma PDX model (PDX: HN0696) | ||||
| Experiment 4 Reporting the Activity Date of This ADC | [3] | ||||
| Efficacy Data | Tumor Growth Inhibition value (TGI) | ≈ 34.80% | Moderate MET expression (MET++) | ||
| Method Description |
Each mouse was subcutaneously inoculated at the right flank with a 23 mm (diameter) tumor piece of one of the tested PDX models. Mice were randomly grouped into six groups (n = 10 animals) according to the tumor size average of 200 mm3.A single dose of test articles was administered intravenously into the tail vein at the dose concentrations indicated. TR1801-ADC 0.25 mg/kg.
Click to Show/Hide
|
||||
| In Vivo Model | Colorectal cancer PDX model (PDX: CR0126) | ||||
| Experiment 5 Reporting the Activity Date of This ADC | [3] | ||||
| Efficacy Data | Tumor Growth Inhibition value (TGI) | ≈ 35.40% | Moderate MET expression (MET++) | ||
| Method Description |
Each mouse was subcutaneously inoculated at the right flank with a 23 mm (diameter) tumor piece of one of the tested PDX models. Mice were randomly grouped into six groups (n = 10 animals) according to the tumor size average of 200 mm3.A single dose of test articles was administered intravenously into the tail vein at the dose concentrations indicated. TR1801-ADC 0.125 mg/kg.
Click to Show/Hide
|
||||
| In Vivo Model | Head and neck squamous cell carcinoma PDX model (PDX: HN3533) | ||||
| Experiment 6 Reporting the Activity Date of This ADC | [3] | ||||
| Efficacy Data | Tumor Growth Inhibition value (TGI) | ≈ 37.50% | Moderate MET expression (MET++) | ||
| Method Description |
Each mouse was subcutaneously inoculated at the right flank with a 23 mm (diameter) tumor piece of one of the tested PDX models. Mice were randomly grouped into six groups (n = 10 animals) according to the tumor size average of 200 mm3.A single dose of test articles was administered intravenously into the tail vein at the dose concentrations indicated. TR1801-ADC 0.25 mg/kg.
Click to Show/Hide
|
||||
| In Vivo Model | Colorectal cancer PDX model (PDX: CR3150) | ||||
| Experiment 7 Reporting the Activity Date of This ADC | [3] | ||||
| Efficacy Data | Tumor Growth Inhibition value (TGI) | ≈ 44.60% | High MET expression (MET+++) | ||
| Method Description |
Each mouse was subcutaneously inoculated at the right flank with a 23 mm (diameter) tumor piece of one of the tested PDX models. Mice were randomly grouped into six groups (n = 10 animals) according to the tumor size average of 200 mm3.A single dose of test articles was administered intravenously into the tail vein at the dose concentrations indicated. TR1801-ADC 0.5 mg/kg.
Click to Show/Hide
|
||||
| In Vivo Model | Colorectal cancer PDX model (PDX: CR0126) | ||||
| Experiment 8 Reporting the Activity Date of This ADC | [3] | ||||
| Efficacy Data | Tumor Growth Inhibition value (TGI) | ≈ 45.70% | Negative MET expression (MET-) | ||
| Method Description |
Each mouse was subcutaneously inoculated at the right flank with a 23 mm (diameter) tumor piece of one of the tested PDX models. Mice were randomly grouped into six groups (n = 10 animals) according to the tumor size average of 200 mm3.A single dose of test articles was administered intravenously into the tail vein at the dose concentrations indicated. TR1801-ADC 0.25 mg/kg.
Click to Show/Hide
|
||||
| In Vivo Model | Head and neck squamous cell carcinoma PDX model (PDX: HN0696) | ||||
| Experiment 9 Reporting the Activity Date of This ADC | [3] | ||||
| Efficacy Data | Tumor Growth Inhibition value (TGI) | ≈ 45.70% | Moderate MET expression (MET++) | ||
| Method Description |
Each mouse was subcutaneously inoculated at the right flank with a 23 mm (diameter) tumor piece of one of the tested PDX models. Mice were randomly grouped into six groups (n = 10 animals) according to the tumor size average of 200 mm3.A single dose of test articles was administered intravenously into the tail vein at the dose concentrations indicated. TR1801-ADC 0.25 mg/kg.
Click to Show/Hide
|
||||
| In Vivo Model | Head and neck squamous cell carcinoma PDX model (PDX: HN3533) | ||||
| Experiment 10 Reporting the Activity Date of This ADC | [3] | ||||
| Efficacy Data | Tumor Growth Inhibition value (TGI) | ≈ 47.30% | High MET expression (MET+++) | ||
| Method Description |
Each mouse was subcutaneously inoculated at the right flank with a 23 mm (diameter) tumor piece of one of the tested PDX models. Mice were randomly grouped into six groups (n = 10 animals) according to the tumor size average of 200 mm3.A single dose of test articles was administered intravenously into the tail vein at the dose concentrations indicated. TR1801-ADC 0.25 mg/kg.
Click to Show/Hide
|
||||
| In Vivo Model | Head and neck squamous cell carcinoma PDX model (PDX: HN0635) | ||||
| Experiment 11 Reporting the Activity Date of This ADC | [3] | ||||
| Efficacy Data | Tumor Growth Inhibition value (TGI) | ≈ 53.20% | Moderate MET expression (MET++) | ||
| Method Description |
Each mouse was subcutaneously inoculated at the right flank with a 23 mm (diameter) tumor piece of one of the tested PDX models. Mice were randomly grouped into six groups (n = 10 animals) according to the tumor size average of 200 mm3.A single dose of test articles was administered intravenously into the tail vein at the dose concentrations indicated. TR1801-ADC 0.5 mg/kg.
Click to Show/Hide
|
||||
| In Vivo Model | Head and neck squamous cell carcinoma PDX model (PDX: HN0635) | ||||
| Experiment 12 Reporting the Activity Date of This ADC | [3] | ||||
| Efficacy Data | Tumor Growth Inhibition value (TGI) | ≈ 59.10% | High MET expression (MET+++) | ||
| Method Description |
Each mouse was subcutaneously inoculated at the right flank with a 23 mm (diameter) tumor piece of one of the tested PDX models. Mice were randomly grouped into six groups (n = 10 animals) according to the tumor size average of 200 mm3.A single dose of test articles was administered intravenously into the tail vein at the dose concentrations indicated. TR1801-ADC 0.5 mg/kg.
Click to Show/Hide
|
||||
| In Vivo Model | Head and neck squamous cell carcinoma PDX model (PDX: HN3533) | ||||
| Experiment 13 Reporting the Activity Date of This ADC | [3] | ||||
| Efficacy Data | Tumor Growth Inhibition value (TGI) | ≈ 60.40% | High MET expression (MET+++) | ||
| Method Description |
Each mouse was subcutaneously inoculated at the right flank with a 23 mm (diameter) tumor piece of one of the tested PDX models. Mice were randomly grouped into six groups (n = 10 animals) according to the tumor size average of 200 mm3.A single dose of test articles was administered intravenously into the tail vein at the dose concentrations indicated. TR1801-ADC 0.5 mg/kg.
Click to Show/Hide
|
||||
| In Vivo Model | Head and neck squamous cell carcinoma PDX model (PDX: HN0696) | ||||
| Experiment 14 Reporting the Activity Date of This ADC | [3] | ||||
| Efficacy Data | Tumor Growth Inhibition value (TGI) | ≈ 70.30% | High MET expression (MET+++; IHC H-score=300) | ||
| Method Description |
Each mouse was subcutaneously inoculated at the right flank with a 23 mm (diameter) tumor piece of one of the tested PDX models. Mice were randomly grouped into six groups (n = 10 animals) according to the tumor size average of 200 mm3.A single dose of test articles was administered intravenously into the tail vein at the dose concentrations indicated. TR1801-ADC 0.5 mg/kg.
Click to Show/Hide
|
||||
| In Vivo Model | Colorectal cancer PDX model (PDX: CR3150) | ||||
| Experiment 15 Reporting the Activity Date of This ADC | [3] | ||||
| Efficacy Data | Tumor Growth Inhibition value (TGI) | ≈ 70.80% | High MET expression (MET+++; IHC H-score=295) | ||
| Method Description |
Each mouse was subcutaneously inoculated at the right flank with a 23 mm (diameter) tumor piece of one of the tested PDX models. Mice were randomly grouped into six groups (n = 10 animals) according to the tumor size average of 200 mm3.A single dose of test articles was administered intravenously into the tail vein at the dose concentrations indicated. TR1801-ADC 1 mg/kg.
Click to Show/Hide
|
||||
| In Vivo Model | Head and neck squamous cell carcinoma PDX model (PDX: HN0635) | ||||
| Experiment 16 Reporting the Activity Date of This ADC | [3] | ||||
| Efficacy Data | Tumor Growth Inhibition value (TGI) | ≈ 70.90% | Moderate MET expression (MET++; IHC H-score=173) | ||
| Method Description |
Each mouse was subcutaneously inoculated at the right flank with a 23 mm (diameter) tumor piece of one of the tested PDX models. Mice were randomly grouped into six groups (n = 10 animals) according to the tumor size average of 200 mm3.A single dose of test articles was administered intravenously into the tail vein at the dose concentrations indicated. TR1801-ADC 1 mg/kg.
Click to Show/Hide
|
||||
| In Vivo Model | Colorectal cancer PDX model (PDX: CR0126) | ||||
| Experiment 17 Reporting the Activity Date of This ADC | [3] | ||||
| Efficacy Data | Tumor Growth Inhibition value (TGI) | ≈ 76.50% | Moderate MET expression (MET++; IHC H-score=130) | ||
| Method Description |
Each mouse was subcutaneously inoculated at the right flank with a 23 mm (diameter) tumor piece of one of the tested PDX models. Mice were randomly grouped into six groups (n = 10 animals) according to the tumor size average of 200 mm3.A single dose of test articles was administered intravenously into the tail vein at the dose concentrations indicated. TR1801-ADC 1 mg/kg.
Click to Show/Hide
|
||||
| In Vivo Model | Head and neck squamous cell carcinoma PDX model (PDX: HN0696) | ||||
| Experiment 18 Reporting the Activity Date of This ADC | [3] | ||||
| Efficacy Data | Tumor Growth Inhibition value (TGI) | ≈ 79.40% | Moderate MET expression (MET++; IHC H-score=180) | ||
| Method Description |
Each mouse was subcutaneously inoculated at the right flank with a 23 mm (diameter) tumor piece of one of the tested PDX models. Mice were randomly grouped into six groups (n = 10 animals) according to the tumor size average of 200 mm3.A single dose of test articles was administered intravenously into the tail vein at the dose concentrations indicated. TR1801-ADC 0.125 mg/kg.
Click to Show/Hide
|
||||
| In Vivo Model | Gastric cancer PDX models (PDX: GA0152) | ||||
| Experiment 19 Reporting the Activity Date of This ADC | [3] | ||||
| Efficacy Data | Tumor Growth Inhibition value (TGI) | ≈ 80.50% | Moderate MET expression (MET++; IHC H-score=190) | ||
| Method Description |
Each mouse was subcutaneously inoculated at the right flank with a 23 mm (diameter) tumor piece of one of the tested PDX models. Mice were randomly grouped into six groups (n = 10 animals) according to the tumor size average of 200 mm3.A single dose of test articles was administered intravenously into the tail vein at the dose concentrations indicated. TR1801-ADC 1 mg/kg.
Click to Show/Hide
|
||||
| In Vivo Model | Head and neck squamous cell carcinoma PDX model (PDX: HN3533) | ||||
| Experiment 20 Reporting the Activity Date of This ADC | [3] | ||||
| Efficacy Data | Tumor Growth Inhibition value (TGI) | ≈ 80.90% | High MET expression (MET+++; IHC H-score=300) | ||
| Method Description |
Each mouse was subcutaneously inoculated at the right flank with a 23 mm (diameter) tumor piece of one of the tested PDX models. Mice were randomly grouped into six groups (n = 10 animals) according to the tumor size average of 200 mm3.A single dose of test articles was administered intravenously into the tail vein at the dose concentrations indicated. TR1801-ADC 0.125 mg/kg.
Click to Show/Hide
|
||||
| In Vivo Model | Colorectal cancer PDX model (PDX: CR0126) | ||||
| Experiment 21 Reporting the Activity Date of This ADC | [3] | ||||
| Efficacy Data | Tumor Growth Inhibition value (TGI) | ≈ 81.40% | High MET expression (MET+++; IHC H-score=300) | ||
| Method Description |
Each mouse was subcutaneously inoculated at the right flank with a 23 mm (diameter) tumor piece of one of the tested PDX models. Mice were randomly grouped into six groups (n = 10 animals) according to the tumor size average of 200 mm3.A single dose of test articles was administered intravenously into the tail vein at the dose concentrations indicated. TR1801-ADC 0.125 mg/kg.
Click to Show/Hide
|
||||
| In Vivo Model | Gastric cancer PDX models (PDX: GA3121) | ||||
| Experiment 22 Reporting the Activity Date of This ADC | [3] | ||||
| Efficacy Data | Tumor Growth Inhibition value (TGI) | ≈ 89.20% | Moderate MET expression (MET++; IHC H-score=190) | ||
| Method Description |
Each mouse was subcutaneously inoculated at the right flank with a 23 mm (diameter) tumor piece of one of the tested PDX models. Mice were randomly grouped into six groups (n = 10 animals) according to the tumor size average of 200 mm3.A single dose of test articles was administered intravenously into the tail vein at the dose concentrations indicated. TR1801-ADC 0.25 mg/kg.
Click to Show/Hide
|
||||
| In Vivo Model | Gastric cancer PDX models (PDX: GA0152) | ||||
| Experiment 23 Reporting the Activity Date of This ADC | [3] | ||||
| Efficacy Data | Tumor Growth Inhibition value (TGI) | ≈ 95.10% | High MET expression (MET+++; IHC H-score=300) | ||
| Method Description |
Each mouse was subcutaneously inoculated at the right flank with a 23 mm (diameter) tumor piece of one of the tested PDX models. Mice were randomly grouped into six groups (n = 10 animals) according to the tumor size average of 200 mm3.A single dose of test articles was administered intravenously into the tail vein at the dose concentrations indicated. TR1801-ADC 1 mg/kg.
Click to Show/Hide
|
||||
| In Vivo Model | Colorectal cancer PDX model (PDX: CR3150) | ||||
| Experiment 24 Reporting the Activity Date of This ADC | [3] | ||||
| Efficacy Data | Tumor Growth Inhibition value (TGI) | ≈ 96.30% | Moderate MET expression (MET++; IHC H-score=180) | ||
| Method Description |
Each mouse was subcutaneously inoculated at the right flank with a 23 mm (diameter) tumor piece of one of the tested PDX models. Mice were randomly grouped into six groups (n = 10 animals) according to the tumor size average of 200 mm3.A single dose of test articles was administered intravenously into the tail vein at the dose concentrations indicated. TR1801-ADC 0.25 mg/kg.
Click to Show/Hide
|
||||
| In Vivo Model | Gastric cancer PDX models (PDX: GA3121) | ||||
| Experiment 25 Reporting the Activity Date of This ADC | [3] | ||||
| Efficacy Data | Tumor Growth Inhibition value (TGI) | ≈ 97.60% | Moderate MET expression (MET++; IHC H-score=130) | ||
| Method Description |
Each mouse was subcutaneously inoculated at the right flank with a 23 mm (diameter) tumor piece of one of the tested PDX models. Mice were randomly grouped into six groups (n = 10 animals) according to the tumor size average of 200 mm3.A single dose of test articles was administered intravenously into the tail vein at the dose concentrations indicated. TR1801-ADC 0.5 mg/kg.
Click to Show/Hide
|
||||
| In Vivo Model | Gastric cancer PDX models (PDX: GA0152) | ||||
| Experiment 26 Reporting the Activity Date of This ADC | [3] | ||||
| Efficacy Data | Tumor Growth Inhibition value (TGI) | ≈ 99.10% | Moderate MET expression (MET++; IHC H-score=130) | ||
| Method Description |
Each mouse was subcutaneously inoculated at the right flank with a 23 mm (diameter) tumor piece of one of the tested PDX models. Mice were randomly grouped into six groups (n = 10 animals) according to the tumor size average of 200 mm3.A single dose of test articles was administered intravenously into the tail vein at the dose concentrations indicated. TR1801-ADC 0.5 mg/kg.
Click to Show/Hide
|
||||
| In Vivo Model | Gastric cancer PDX models (PDX: GA3121) | ||||
| Experiment 27 Reporting the Activity Date of This ADC | [3] | ||||
| Efficacy Data | Tumor Growth Inhibition value (TGI) | ≈ 100% | Moderate MET expression (MET++) | ||
| Method Description |
Each mouse was subcutaneously inoculated at the right flank with a 23 mm (diameter) tumor piece of one of the tested PDX models. Mice were randomly grouped into six groups (n = 10 animals) according to the tumor size average of 200 mm3.A single dose of test articles was administered intravenously into the tail vein at the dose concentrations indicated. TR1801-ADC 1 mg/kg.
Click to Show/Hide
|
||||
| In Vivo Model | Gastric cancer PDX models (PDX: GA0152) | ||||
| Experiment 28 Reporting the Activity Date of This ADC | [3] | ||||
| Efficacy Data | Tumor Growth Inhibition value (TGI) | ≈ 100% | Moderate MET expression (MET++) | ||
| Method Description |
Each mouse was subcutaneously inoculated at the right flank with a 23 mm (diameter) tumor piece of one of the tested PDX models. Mice were randomly grouped into six groups (n = 10 animals) according to the tumor size average of 200 mm3.A single dose of test articles was administered intravenously into the tail vein at the dose concentrations indicated. TR1801-ADC 1 mg/kg.
Click to Show/Hide
|
||||
| In Vivo Model | Gastric cancer PDX models (PDX: GA3121) | ||||
Revealed Based on the Cell Line Data
| Experiment 1 Reporting the Activity Date of This ADC | [3] | ||||
| Efficacy Data | Maximum inhibition efficiency (MIE) | 68.30% | High MET expression (MET+++; IHC H-score=300) | ||
| Method Description |
Cell viability was determined by measuring the luminescence after adding the CellTiter-Glo 2.0 reagent. Cancer cells were seeded overnight in growth media and incubated at 37°C, 5% CO2,and 95% humidity. starting with concentrations of 100 nM for ADCs for free drug. Cells were exposed to test articlesfor 5 days.
|
||||
| In Vitro Model | Pharyngeal squamous cell carcinoma | Detroit 562 cells | CVCL_1171 | ||
| Experiment 2 Reporting the Activity Date of This ADC | [3] | ||||
| Efficacy Data | Maximum inhibition efficiency (MIE) | 88.80% | Moderate MET expression (MET++; IHC H-score=190) | ||
| Method Description |
Cell viability was determined by measuring the luminescence after adding the CellTiter-Glo 2.0 reagent. Cancer cells were seeded overnight in growth media and incubated at 37°C, 5% CO2,and 95% humidity. starting with concentrations of 100 nM for ADCs for free drug. Cells were exposed to test articlesfor 5 days.
|
||||
| In Vitro Model | Lung adenocarcinoma | NCI-H1573 cells | CVCL_1478 | ||
| Experiment 3 Reporting the Activity Date of This ADC | [3] | ||||
| Efficacy Data | Maximum inhibition efficiency (MIE) | 90.50% | High MET expression (MET+++; IHC H-score=295) | ||
| Method Description |
Cell viability was determined by measuring the luminescence after adding the CellTiter-Glo 2.0 reagent. Cancer cells were seeded overnight in growth media and incubated at 37°C, 5% CO2,and 95% humidity. starting with concentrations of 100 nM for ADCs for free drug. Cells were exposed to test articlesfor 5 days.
|
||||
| In Vitro Model | Gastric adenocarcinoma | SNU-16 cells | CVCL_0076 | ||
| Experiment 4 Reporting the Activity Date of This ADC | [3] | ||||
| Efficacy Data | Maximum inhibition efficiency (MIE) | 92.40% | Moderate MET expression (MET++; IHC H-score=190) | ||
| Method Description |
Cell viability was determined by measuring the luminescence after adding the CellTiter-Glo 2.0 reagent. Cancer cells were seeded overnight in growth media and incubated at 37°C, 5% CO2,and 95% humidity. starting with concentrations of 100 nM for ADCs for free drug. Cells were exposed to test articlesfor 5 days.
|
||||
| In Vitro Model | Colon adenocarcinoma | SW480 cells | CVCL_0546 | ||
| Experiment 5 Reporting the Activity Date of This ADC | [3] | ||||
| Efficacy Data | Maximum inhibition efficiency (MIE) | 92.90% | Moderate MET expression (MET++; IHC H-score=180) | ||
| Method Description |
Cell viability was determined by measuring the luminescence after adding the CellTiter-Glo 2.0 reagent. Cancer cells were seeded overnight in growth media and incubated at 37°C, 5% CO2,and 95% humidity. starting with concentrations of 100 nM for ADCs for free drug. Cells were exposed to test articlesfor 5 days.
|
||||
| In Vitro Model | Colon adenocarcinoma | SW1417 cells | CVCL_1717 | ||
| Experiment 6 Reporting the Activity Date of This ADC | [3] | ||||
| Efficacy Data | Maximum inhibition efficiency (MIE) | 95.20% | Moderate MET expression (MET++; IHC H-score=173) | ||
| Method Description |
Cell viability was determined by measuring the luminescence after adding the CellTiter-Glo 2.0 reagent. Cancer cells were seeded overnight in growth media and incubated at 37°C, 5% CO2,and 95% humidity. starting with concentrations of 100 nM for ADCs for free drug. Cells were exposed to test articlesfor 5 days.
|
||||
| In Vitro Model | Lung papillary adenocarcinoma | NCI-H441 cells | CVCL_1561 | ||
| Experiment 7 Reporting the Activity Date of This ADC | [3] | ||||
| Efficacy Data | Maximum inhibition efficiency (MIE) | 95.50% | Moderate MET expression (MET++; IHC H-score=180) | ||
| Method Description |
Cell viability was determined by measuring the luminescence after adding the CellTiter-Glo 2.0 reagent. Cancer cells were seeded overnight in growth media and incubated at 37°C, 5% CO2,and 95% humidity. starting with concentrations of 100 nM for ADCs for free drug. Cells were exposed to test articlesfor 5 days.
|
||||
| In Vitro Model | Lung adenocarcinoma | NCI-H1373 cells | CVCL_1465 | ||
| Experiment 8 Reporting the Activity Date of This ADC | [3] | ||||
| Efficacy Data | Maximum inhibition efficiency (MIE) | 97.40% | Moderate MET expression (MET++; IHC H-score=173) | ||
| Method Description |
Cell viability was determined by measuring the luminescence after adding the CellTiter-Glo 2.0 reagent. Cancer cells were seeded overnight in growth media and incubated at 37°C, 5% CO2,and 95% humidity. starting with concentrations of 100 nM for ADCs for free drug. Cells were exposed to test articlesfor 5 days.
|
||||
| In Vitro Model | Gastric adenocarcinoma | SNU-1 cells | CVCL_0099 | ||
| Experiment 9 Reporting the Activity Date of This ADC | [3] | ||||
| Efficacy Data | Maximum inhibition efficiency (MIE) | 97.50% | High MET expression (MET+++; IHC H-score=300) | ||
| Method Description |
Cell viability was determined by measuring the luminescence after adding the CellTiter-Glo 2.0 reagent. Cancer cells were seeded overnight in growth media and incubated at 37°C, 5% CO2,and 95% humidity. starting with concentrations of 100 nM for ADCs for free drug. Cells were exposed to test articlesfor 5 days.
|
||||
| In Vitro Model | Gastric adenocarcinoma | SNU-5 cells | CVCL_0078 | ||
| Experiment 10 Reporting the Activity Date of This ADC | [3] | ||||
| Efficacy Data | Maximum inhibition efficiency (MIE) | 97.60% | Moderate MET expression (MET++; IHC H-score=130) | ||
| Method Description |
Cell viability was determined by measuring the luminescence after adding the CellTiter-Glo 2.0 reagent. Cancer cells were seeded overnight in growth media and incubated at 37°C, 5% CO2,and 95% humidity. starting with concentrations of 100 nM for ADCs for free drug. Cells were exposed to test articlesfor 5 days.
|
||||
| In Vitro Model | Lung adenocarcinoma | NCI-H1975 cells | CVCL_1511 | ||
| Experiment 11 Reporting the Activity Date of This ADC | [3] | ||||
| Efficacy Data | Maximum inhibition efficiency (MIE) | 97.80% | High MET expression (MET+++; IHC H-score=295) | ||
| Method Description |
Cell viability was determined by measuring the luminescence after adding the CellTiter-Glo 2.0 reagent. Cancer cells were seeded overnight in growth media and incubated at 37°C, 5% CO2,and 95% humidity. starting with concentrations of 100 nM for ADCs for free drug. Cells were exposed to test articlesfor 5 days.
|
||||
| In Vitro Model | Gastric adenocarcinoma | MKN45 cells | CVCL_0434 | ||
| Experiment 12 Reporting the Activity Date of This ADC | [3] | ||||
| Efficacy Data | Maximum inhibition efficiency (MIE) | 98.10% | Moderate MET expression (MET++; IHC H-score=173) | ||
| Method Description |
Cell viability was determined by measuring the luminescence after adding the CellTiter-Glo 2.0 reagent. Cancer cells were seeded overnight in growth media and incubated at 37°C, 5% CO2,and 95% humidity. starting with concentrations of 100 nM for ADCs for free drug. Cells were exposed to test articlesfor 5 days.
|
||||
| In Vitro Model | Hypopharyngeal squamous cell carcinoma | FaDu cells | CVCL_1218 | ||
| Experiment 13 Reporting the Activity Date of This ADC | [3] | ||||
| Efficacy Data | Maximum inhibition efficiency (MIE) | 98.90% | High MET expression (MET+++; IHC H-score=295) | ||
| Method Description |
Cell viability was determined by measuring the luminescence after adding the CellTiter-Glo 2.0 reagent. Cancer cells were seeded overnight in growth media and incubated at 37°C, 5% CO2,and 95% humidity. starting with concentrations of 100 nM for ADCs for free drug. Cells were exposed to test articlesfor 5 days.
|
||||
| In Vitro Model | Colon carcinoma | HCT 116 cells | CVCL_0291 | ||
| Experiment 14 Reporting the Activity Date of This ADC | [3] | ||||
| Efficacy Data | Maximum inhibition efficiency (MIE) | 99.10% | High MET expression (MET+++; IHC H-score=300) | ||
| Method Description |
Cell viability was determined by measuring the luminescence after adding the CellTiter-Glo 2.0 reagent. Cancer cells were seeded overnight in growth media and incubated at 37°C, 5% CO2,and 95% humidity. starting with concentrations of 100 nM for ADCs for free drug. Cells were exposed to test articlesfor 5 days.
|
||||
| In Vitro Model | Cecum adenocarcinoma | NCI-H747 cells | CVCL_1587 | ||
| Experiment 15 Reporting the Activity Date of This ADC | [3] | ||||
| Efficacy Data | Maximum inhibition efficiency (MIE) | 99.30% | High MET expression (MET+++; IHC H-score=300) | ||
| Method Description |
Cell viability was determined by measuring the luminescence after adding the CellTiter-Glo 2.0 reagent. Cancer cells were seeded overnight in growth media and incubated at 37°C, 5% CO2,and 95% humidity. starting with concentrations of 100 nM for ADCs for free drug. Cells were exposed to test articlesfor 5 days.
|
||||
| In Vitro Model | Gastric adenocarcinoma | SNU-620 cells | CVCL_5079 | ||
| Experiment 16 Reporting the Activity Date of This ADC | [3] | ||||
| Efficacy Data | Half Maximal Inhibitory Concentration (IC50) | 4.2 pM | Moderate MET expression (MET++; IHC H-score=173) | ||
| Method Description |
Cell viability was determined by measuring the luminescence after adding the CellTiter-Glo 2.0 reagent. Cancer cells were seeded overnight in growth media and incubated at 37°C, 5% CO2,and 95% humidity. starting with concentrations of 100 nM for ADCs for free drug. Cells were exposed to test articlesfor 5 days.
|
||||
| In Vitro Model | Lung papillary adenocarcinoma | NCI-H441 cells | CVCL_1561 | ||
| Experiment 17 Reporting the Activity Date of This ADC | [3] | ||||
| Efficacy Data | Half Maximal Inhibitory Concentration (IC50) | 15.6 pM | High MET expression (MET+++; IHC H-score=300) | ||
| Method Description |
Cell viability was determined by measuring the luminescence after adding the CellTiter-Glo 2.0 reagent. Cancer cells were seeded overnight in growth media and incubated at 37°C, 5% CO2,and 95% humidity. starting with concentrations of 100 nM for ADCs for free drug. Cells were exposed to test articlesfor 5 days.
|
||||
| In Vitro Model | Gastric adenocarcinoma | SNU-5 cells | CVCL_0078 | ||
| Experiment 18 Reporting the Activity Date of This ADC | [3] | ||||
| Efficacy Data | Half Maximal Inhibitory Concentration (IC50) | 15.8 pM | High MET expression (MET+++; IHC H-score=295) | ||
| Method Description |
Cell viability was determined by measuring the luminescence after adding the CellTiter-Glo 2.0 reagent. Cancer cells were seeded overnight in growth media and incubated at 37°C, 5% CO2,and 95% humidity. starting with concentrations of 100 nM for ADCs for free drug. Cells were exposed to test articlesfor 5 days.
|
||||
| In Vitro Model | Gastric adenocarcinoma | MKN45 cells | CVCL_0434 | ||
| Experiment 19 Reporting the Activity Date of This ADC | [3] | ||||
| Efficacy Data | Half Maximal Inhibitory Concentration (IC50) | 190.2 pM | High MET expression (MET+++; IHC H-score=295) | ||
| Method Description |
Cell viability was determined by measuring the luminescence after adding the CellTiter-Glo 2.0 reagent. Cancer cells were seeded overnight in growth media and incubated at 37°C, 5% CO2,and 95% humidity. starting with concentrations of 100 nM for ADCs for free drug. Cells were exposed to test articlesfor 5 days.
|
||||
| In Vitro Model | Colon carcinoma | HCT 116 cells | CVCL_0291 | ||
| Experiment 20 Reporting the Activity Date of This ADC | [3] | ||||
| Efficacy Data | Half Maximal Inhibitory Concentration (IC50) | 197.9 pM | High MET expression (MET+++; IHC H-score=300) | ||
| Method Description |
Cell viability was determined by measuring the luminescence after adding the CellTiter-Glo 2.0 reagent. Cancer cells were seeded overnight in growth media and incubated at 37°C, 5% CO2,and 95% humidity. starting with concentrations of 100 nM for ADCs for free drug. Cells were exposed to test articlesfor 5 days.
|
||||
| In Vitro Model | Gastric adenocarcinoma | SNU-620 cells | CVCL_5079 | ||
| Experiment 21 Reporting the Activity Date of This ADC | [3] | ||||
| Efficacy Data | Half Maximal Inhibitory Concentration (IC50) | 327.5 pM | Moderate MET expression (MET++; IHC H-score=173) | ||
| Method Description |
Cell viability was determined by measuring the luminescence after adding the CellTiter-Glo 2.0 reagent. Cancer cells were seeded overnight in growth media and incubated at 37°C, 5% CO2,and 95% humidity. starting with concentrations of 100 nM for ADCs for free drug. Cells were exposed to test articlesfor 5 days.
|
||||
| In Vitro Model | Hypopharyngeal squamous cell carcinoma | FaDu cells | CVCL_1218 | ||
| Experiment 22 Reporting the Activity Date of This ADC | [3] | ||||
| Efficacy Data | Half Maximal Inhibitory Concentration (IC50) | 346.4 pM | Moderate MET expression (MET++; IHC H-score=130) | ||
| Method Description |
Cell viability was determined by measuring the luminescence after adding the CellTiter-Glo 2.0 reagent. Cancer cells were seeded overnight in growth media and incubated at 37°C, 5% CO2,and 95% humidity. starting with concentrations of 100 nM for ADCs for free drug. Cells were exposed to test articlesfor 5 days.
|
||||
| In Vitro Model | Lung adenocarcinoma | NCI-H1975 cells | CVCL_1511 | ||
| Experiment 23 Reporting the Activity Date of This ADC | [3] | ||||
| Efficacy Data | Half Maximal Inhibitory Concentration (IC50) | 1380 pM | Moderate MET expression (MET++; IHC H-score=190) | ||
| Method Description |
Cell viability was determined by measuring the luminescence after adding the CellTiter-Glo 2.0 reagent. Cancer cells were seeded overnight in growth media and incubated at 37°C, 5% CO2,and 95% humidity. starting with concentrations of 100 nM for ADCs for free drug. Cells were exposed to test articlesfor 5 days.
|
||||
| In Vitro Model | Colon adenocarcinoma | SW480 cells | CVCL_0546 | ||
| Experiment 24 Reporting the Activity Date of This ADC | [3] | ||||
| Efficacy Data | Half Maximal Inhibitory Concentration (IC50) | 2272.7 pM | Moderate MET expression (MET++; IHC H-score=180) | ||
| Method Description |
Cell viability was determined by measuring the luminescence after adding the CellTiter-Glo 2.0 reagent. Cancer cells were seeded overnight in growth media and incubated at 37°C, 5% CO2,and 95% humidity. starting with concentrations of 100 nM for ADCs for free drug. Cells were exposed to test articlesfor 5 days.
|
||||
| In Vitro Model | Lung adenocarcinoma | NCI-H1373 cells | CVCL_1465 | ||
| Experiment 25 Reporting the Activity Date of This ADC | [3] | ||||
| Efficacy Data | Half Maximal Inhibitory Concentration (IC50) | 3230 pM | High MET expression (MET+++; IHC H-score=300) | ||
| Method Description |
Cell viability was determined by measuring the luminescence after adding the CellTiter-Glo 2.0 reagent. Cancer cells were seeded overnight in growth media and incubated at 37°C, 5% CO2,and 95% humidity. starting with concentrations of 100 nM for ADCs for free drug. Cells were exposed to test articlesfor 5 days.
|
||||
| In Vitro Model | Cecum adenocarcinoma | NCI-H747 cells | CVCL_1587 | ||
| Experiment 26 Reporting the Activity Date of This ADC | [3] | ||||
| Efficacy Data | Half Maximal Inhibitory Concentration (IC50) | 3494 pM | Moderate MET expression (MET++; IHC H-score=180) | ||
| Method Description |
Cell viability was determined by measuring the luminescence after adding the CellTiter-Glo 2.0 reagent. Cancer cells were seeded overnight in growth media and incubated at 37°C, 5% CO2,and 95% humidity. starting with concentrations of 100 nM for ADCs for free drug. Cells were exposed to test articlesfor 5 days.
|
||||
| In Vitro Model | Colon adenocarcinoma | SW1417 cells | CVCL_1717 | ||
| Experiment 27 Reporting the Activity Date of This ADC | [3] | ||||
| Efficacy Data | Half Maximal Inhibitory Concentration (IC50) | 4664 pM | High MET expression (MET+++; IHC H-score=295) | ||
| Method Description |
Cell viability was determined by measuring the luminescence after adding the CellTiter-Glo 2.0 reagent. Cancer cells were seeded overnight in growth media and incubated at 37°C, 5% CO2,and 95% humidity. starting with concentrations of 100 nM for ADCs for free drug. Cells were exposed to test articlesfor 5 days.
|
||||
| In Vitro Model | Gastric adenocarcinoma | SNU-16 cells | CVCL_0076 | ||
| Experiment 28 Reporting the Activity Date of This ADC | [3] | ||||
| Efficacy Data | Half Maximal Inhibitory Concentration (IC50) | 11.03 nM | High MET expression (MET+++; IHC H-score=300) | ||
| Method Description |
Cell viability was determined by measuring the luminescence after adding the CellTiter-Glo 2.0 reagent. Cancer cells were seeded overnight in growth media and incubated at 37°C, 5% CO2,and 95% humidity. starting with concentrations of 100 nM for ADCs for free drug. Cells were exposed to test articlesfor 5 days.
|
||||
| In Vitro Model | Pharyngeal squamous cell carcinoma | Detroit 562 cells | CVCL_1171 | ||
| Experiment 29 Reporting the Activity Date of This ADC | [3] | ||||
| Efficacy Data | Half Maximal Inhibitory Concentration (IC50) | 13.44 nM | Moderate MET expression (MET++; IHC H-score=190) | ||
| Method Description |
Cell viability was determined by measuring the luminescence after adding the CellTiter-Glo 2.0 reagent. Cancer cells were seeded overnight in growth media and incubated at 37°C, 5% CO2,and 95% humidity. starting with concentrations of 100 nM for ADCs for free drug. Cells were exposed to test articlesfor 5 days.
|
||||
| In Vitro Model | Lung adenocarcinoma | NCI-H1573 cells | CVCL_1478 | ||
| Experiment 30 Reporting the Activity Date of This ADC | [3] | ||||
| Efficacy Data | Half Maximal Inhibitory Concentration (IC50) | 24.37 nM | Moderate MET expression (MET++; IHC H-score=173) | ||
| Method Description |
Cell viability was determined by measuring the luminescence after adding the CellTiter-Glo 2.0 reagent. Cancer cells were seeded overnight in growth media and incubated at 37°C, 5% CO2,and 95% humidity. starting with concentrations of 100 nM for ADCs for free drug. Cells were exposed to test articlesfor 5 days.
|
||||
| In Vitro Model | Gastric adenocarcinoma | SNU-1 cells | CVCL_0099 | ||
References