Antigen Information
General Information of This Antigen
| Antigen ID | TAR0OVWVF |
|||||
|---|---|---|---|---|---|---|
| Antigen Name | Myeloid cell surface antigen CD33 (CD33) |
|||||
| Gene Name | CD33 |
|||||
| Gene ID | ||||||
| Synonym | SIGLEC3; Sialic acid-binding Ig-like lectin 3;gp67;CD_antigen=CD33 |
|||||
| Sequence |
MPLLLLLPLLWAGALAMDPNFWLQVQESVTVQEGLCVLVPCTFFHPIPYYDKNSPVHGYW
FREGAIISRDSPVATNKLDQEVQEETQGRFRLLGDPSRNNCSLSIVDARRRDNGSYFFRM ERGSTKYSYKSPQLSVHVTDLTHRPKILIPGTLEPGHSKNLTCSVSWACEQGTPPIFSWL SAAPTSLGPRTTHSSVLIITPRPQDHGTNLTCQVKFAGAGVTTERTIQLNVTYVPQNPTT GIFPGDGSGKQETRAGVVHGAIGGAGVTALLALCLCLIFFIVKTHRRKAARTAVGRNDTH PTTGSASPKHQKKSKLHGPTETSSCSGAAPTVEMDEELHYASLNFHGMNPSKDTSTEYSE VRTQ Click to Show/Hide
|
|||||
| Family | Immunoglobulin family |
|||||
| Function |
Sialic-acid-binding immunoglobulin-like lectin (Siglec) that plays a role in mediating cell-cell interactions and in maintaining immune cells in a resting state. Preferentially recognizes and binds alpha-2,3- and more avidly alpha-2,6-linked sialic acid-bearing glycans. Upon engagement of ligands such as C1q or syalylated glycoproteins, two immunoreceptor tyrosine-based inhibitory motifs (ITIMs) located in CD33 cytoplasmic tail are phosphorylated by Src-like kinases such as LCK. These phosphorylations provide docking sites for the recruitment and activation of protein-tyrosine phosphatases PTPN6/SHP-1 and PTPN11/SHP- 2. In turn, these phosphatases regulate downstream pathways through dephosphorylation of signaling molecules. One of the repressive effect of CD33 on monocyte activation requires phosphoinositide 3-kinase/PI3K.
Click to Show/Hide
|
|||||
| Uniprot Entry | ||||||
| HGNC ID | ||||||
| KEGG ID | ||||||
Each Antibody-drug Conjuate AND It's Component Related to This Antigen
Full List of The ADC Related to This Antigen
A recombinant humanized anti-CD33 monoclonal antibody
| ADC Info | ADC Name | Payload | Target | Linker | Ref |
|---|---|---|---|---|---|
DXC-007 |
Tubulysin B analog Tub255 |
Microtubule (MT) |
Undisclosed |
Anti-CD3 single-chain Fv
| ADC Info | ADC Name | Payload | Target | Linker | Ref |
|---|---|---|---|---|---|
DT390 anti-CD3sFv immunotoxin |
DT390 |
Eukaryotic elongation factor 2 (EEF2) |
Undisclosed |
[1] |
Anti-CD33 AB1
| ADC Info | ADC Name | Payload | Target | Linker | Ref |
|---|---|---|---|---|---|
Anti-CD33 AB1 Compound (Ia) |
NeoDegrader P1 |
Protein cereblon (CRBN) |
Anti-CD33 AB1 Compound (Ia) linker |
[2] | |
Anti-CD33 AB1 Compound (Ib) |
NeoDegrader P1 |
Protein cereblon (CRBN) |
Anti-CD33 AB1 Compound (Ib) linker |
[2] | |
Anti-CD33 AB1 Compound (Ic) |
NeoDegrader P1 |
Protein cereblon (CRBN) |
Anti-CD33 AB1 Compound (Ic) linker |
[2] | |
Anti-CD33 AB1 Compound (Id) |
NeoDegrader P1 |
Protein cereblon (CRBN) |
Anti-CD33 AB1 Compound (Id) linker |
[2] | |
Anti-CD33 AB1 Compound (Ie) |
NeoDegrader P1 |
Protein cereblon (CRBN) |
Anti-CD33 AB1 Compound (Ie) linker |
[2] | |
Anti-CD33 AB1 Compound (If) |
NeoDegrader P6 |
Protein cereblon (CRBN) |
Anti-CD33 AB1 Compound (If) linker |
[2] | |
Anti-CD33 AB1 Compound (Ig) |
NeoDegrader P2 |
Protein cereblon (CRBN) |
Anti-CD33 AB1 Compound (Ig) linker |
[2] | |
Anti-CD33 AB1 Compound (Ih) |
NeoDegrader P1 |
Protein cereblon (CRBN) |
Anti-CD33 AB1 Compound (Ih) linker |
[2] | |
Anti-CD33 AB1 Compound (Ii) |
NeoDegrader P1 |
Protein cereblon (CRBN) |
Anti-CD33 AB1 Compound (Ii) linker |
[2] | |
Anti-CD33 AB1 Compound (Ij) |
NeoDegrader P1 |
Protein cereblon (CRBN) |
Anti-CD33 AB1 Compound (Ij) linker |
[2] | |
Anti-CD33 AB1 Compound (Ik) |
NeoDegrader P14 |
Protein cereblon (CRBN) |
Anti-CD33 AB1 Compound (Ik) linker |
[2] | |
Anti-CD33 AB1 Compound (Il) |
NeoDegrader P14 |
Protein cereblon (CRBN) |
Anti-CD33 AB1 Compound (Il) linker |
[2] | |
Anti-CD33 AB1 Compound (Im) |
NeoDegrader P14 |
Protein cereblon (CRBN) |
Anti-CD33 AB1 Compound (Im) linker |
[2] |
Anti-CD33 Anti-ody 11A1
| ADC Info | ADC Name | Payload | Target | Linker | Ref |
|---|---|---|---|---|---|
CD33-CPI dimer ADC |
Bicyclopentyl-seco-CBI-dimer |
Human Deoxyribonucleic acid (hDNA) |
AcLys-Val-Cit-PABC-DMAE |
[3] |
Anti-CD33 mAb 15G15.33
| ADC Info | ADC Name | Payload | Target | Linker | Ref |
|---|---|---|---|---|---|
CD33 PNU ADC2-2 |
CD33 PNU ADC2-2 payload |
Undisclosed |
CD33 PNU ADC2-2 linker |
[4] | |
CD33 PNU ADC3-2 |
CD33 PNU ADC3-2 payload |
Undisclosed |
CD33 PNU ADC3-2 linker |
[4] | |
CD33 PNU ADC4-2 |
CD33 PNU ADC4-2 payload |
Undisclosed |
CD33 PNU ADC4-2 linker |
[4] | |
CD33-PNU-LD1 |
CD33-PNU-LD1 payload |
Undisclosed |
CD33-PNU-LD1 linker |
[4] | |
CD33-PNU-LD5 |
CD33-PNU-LD5 payload |
Undisclosed |
CD33-PNU-LD5 linker |
[4] | |
CD33-PNU-LD6 |
CD33-PNU-LD6 payload |
Undisclosed |
CD33-PNU-LD6 linker |
[4] | |
CD33-PNU-LD7 |
CD33-PNU-LD7 payload |
Undisclosed |
CD33-PNU-LD7 linker |
[4] |
Anti-CD33 mAb humanized 2H12
| ADC Info | ADC Name | Payload | Target | Linker | Ref |
|---|---|---|---|---|---|
h2H12-Compound 1 |
h2H12-compound 1 payload |
Undisclosed |
h2H12-compound 1 linker |
[5] | |
h2H12-Compound 2 |
h2H12-compound 2 payload |
Undisclosed |
h2H12-compound 2 linker |
[5] | |
h2H12-Compound 3 |
h2H12-compound 3 payload |
Undisclosed |
h2H12-compound 3 linker |
[5] |
Anti-CD33 mAb huMy9-6
| ADC Info | ADC Name | Payload | Target | Linker | Ref |
|---|---|---|---|---|---|
AVE-9633 |
Mertansine DM4 |
Microtubule (MT) |
N-succinimidyl 4-(2-pyridyldithio) butanoate (SPDB) |
[6] |
Anti-CD33 mAb murine 2H12
| ADC Info | ADC Name | Payload | Target | Linker | Ref |
|---|---|---|---|---|---|
m2H12-Compound 1 |
m2H12-compound 1 payload |
Undisclosed |
m2H12-compound 1 linker |
[5] | |
m2H12-Compound 2 |
m2H12-compound 2 payload |
Undisclosed |
m2H12-compound 2 linker |
[5] | |
m2H12-Compound 3 |
m2H12-compound 3 payload |
Undisclosed |
m2H12-compound 3 linker |
[5] |
Anti-CD33AB
| ADC Info | ADC Name | Payload | Target | Linker | Ref |
|---|---|---|---|---|---|
Anti-CD33AB-Compound (Ia) |
NeoDegrader P1 |
Protein cereblon (CRBN) |
Anti-CD33AB-Compound (Ia) linker |
[7] | |
Anti-CD33AB-Compound (Ib) |
NeoDegrader P1 |
Protein cereblon (CRBN) |
Anti-CD33AB-Compound (Ib) linker |
[7] | |
Anti-CD33AB-Compound (Ic) |
NeoDegrader P1 |
Protein cereblon (CRBN) |
Anti-CD33AB-Compound (Ic) linker |
[7] | |
Anti-CD33AB-Compound (Ie) |
NeoDegrader P1 |
Protein cereblon (CRBN) |
Anti-CD33AB-Compound (Ie) linker |
[7] | |
Anti-CD33AB-Compound (Ih) |
NeoDegrader P1 |
Protein cereblon (CRBN) |
Anti-CD33AB-Compound (Ih) linker |
[7] |
CD33-A Anti-ody
| ADC Info | ADC Name | Payload | Target | Linker | Ref |
|---|---|---|---|---|---|
CD33-A Antibody-Compound (Ie) |
CD33-A Antibody-Compound (Ie) payload |
Undisclosed |
CD33-A Antibody-Compound (Ie) linker |
[8] | |
CD33-A Antibody-Compound (Ii) |
CD33-A Antibody-Compound (Ii) payload |
Undisclosed |
CD33-A Antibody-Compound (Ii) linker |
[8] | |
CD33-A Antibody-Compound (X) |
CD33-A Antibody-Compound (X) payload |
Undisclosed |
CD33-A Antibody-Compound (X) linker |
[8] | |
CD33-A Antibody-Compound (XI) |
CD33-A Antibody-Compound (XI) payload |
Undisclosed |
CD33-A Antibody-Compound (XI) linker |
[8] | |
CD33-A Antibody-Compound (XIV) |
CD33-A Antibody-Compound (XIV) payload |
Undisclosed |
CD33-A Antibody-Compound (XIV) linker |
[8] | |
CD33-A Antibody-Compound (XIX) |
CD33-A Antibody-Compound (XIX) payload |
Undisclosed |
CD33-A Antibody-Compound (XIX) linker |
[8] | |
CD33-A Antibody-Compound (XL) |
CD33-A Antibody-Compound (XL) payload |
Undisclosed |
CD33-A Antibody-Compound (XL) linker |
[8] | |
CD33-A Antibody-Compound (XLI) |
CD33-A Antibody-Compound (XLI) payload |
Undisclosed |
CD33-A Antibody-Compound (XLI) linker |
[8] | |
CD33-A Antibody-Compound (XLII) |
CD33-A Antibody-Compound (XLII) payload |
Undisclosed |
CD33-A Antibody-Compound (XLII) linker |
[8] | |
CD33-A Antibody-Compound (XLIII) |
CD33-A Antibody-Compound (XLIII) payload |
Undisclosed |
CD33-A Antibody-Compound (XLIII) linker |
[8] | |
CD33-A Antibody-Compound (XV) |
CD33-A Antibody-Compound (XV) payload |
Undisclosed |
CD33-A Antibody-Compound (XV) linker |
[8] | |
CD33-A Antibody-Compound (XVI) |
CD33-A Antibody-Compound (XIX) payload |
Undisclosed |
CD33-A Antibody-Compound (XIX) linker |
[8] | |
CD33-A Antibody-Compound (XVIII) |
CD33-A Antibody-Compound (XVIII) payload |
Undisclosed |
CD33-A Antibody-Compound (XVIII) linker |
[8] |
CD33-B Anti-ody
| ADC Info | ADC Name | Payload | Target | Linker | Ref |
|---|---|---|---|---|---|
CD33-B Antibody-Compound (Ie) |
CD33-B Antibody-Compound (Ie) payload |
Undisclosed |
CD33-B Antibody-Compound (Ie) linker |
[8] | |
CD33-B Antibody-Compound (Ii) |
CD33-B Antibody-Compound (Ii) payload |
Undisclosed |
CD33-B Antibody-Compound (Ii) linker |
[8] | |
CD33-B Antibody-Compound (X) |
CD33-B Antibody-Compound (X) payload |
Undisclosed |
CD33-B Antibody-Compound (X) linker |
[8] | |
CD33-B Antibody-Compound (XI) |
CD33-B Antibody-Compound (XI) payload |
Undisclosed |
CD33-B Antibody-Compound (XI) linker |
[8] | |
CD33-B Antibody-Compound (XIV) |
CD33-B Antibody-Compound (XIV) payload |
Undisclosed |
CD33-B Antibody-Compound (XIV) linker |
[8] | |
CD33-B Antibody-Compound (XIX) |
CD33-B Antibody-Compound (XIX) payload |
Undisclosed |
CD33-B Antibody-Compound (XIX) linker |
[8] | |
CD33-B Antibody-Compound (XL) |
CD33-B Antibody-Compound (XL) payload |
Undisclosed |
CD33-B Antibody-Compound (XL) linker |
[8] | |
CD33-B Antibody-Compound (XLI) |
CD33-B Antibody-Compound (XLI) payload |
Undisclosed |
CD33-B Antibody-Compound (XLI) linker |
[8] | |
CD33-B Antibody-Compound (XLII) |
CD33-B Antibody-Compound (XLII) payload |
Undisclosed |
CD33-B Antibody-Compound (XLII) linker |
[8] | |
CD33-B Antibody-Compound (XLIII) |
CD33-B Antibody-Compound (XLIII) payload |
Undisclosed |
CD33-B Antibody-Compound (XLIII) linker |
[8] | |
CD33-B Antibody-Compound (XV) |
CD33-B Antibody-Compound (XV) payload |
Undisclosed |
CD33-B Antibody-Compound (XV) linker |
[8] | |
CD33-B Antibody-Compound (XVI) |
CD33-B Antibody-Compound (XIX) payload |
Undisclosed |
CD33-B Antibody-Compound (XIX) linker |
[8] | |
CD33-B Antibody-Compound (XVIII) |
CD33-B Antibody-Compound (XVIII) payload |
Undisclosed |
CD33-B Antibody-Compound (XVIII) linker |
[8] |
CD33-C Anti-ody
| ADC Info | ADC Name | Payload | Target | Linker | Ref |
|---|---|---|---|---|---|
CD33-C Antibody-Compound (Ie) |
CD33-C Antibody-Compound (Ie) payload |
Undisclosed |
CD33-C Antibody-Compound (Ie) linker |
[8] | |
CD33-C Antibody-Compound (Ii) |
CD33-C Antibody-Compound (Ii) payload |
Undisclosed |
CD33-C Antibody-Compound (Ii) linker |
[8] | |
CD33-C Antibody-Compound (X) |
CD33-C Antibody-Compound (X) payload |
Undisclosed |
CD33-C Antibody-Compound (X) linker |
[8] | |
CD33-C Antibody-Compound (XI) |
CD33-C Antibody-Compound (XI) payload |
Undisclosed |
CD33-C Antibody-Compound (XI) linker |
[8] | |
CD33-C Antibody-Compound (XIV) |
CD33-C Antibody-Compound (XIV) payload |
Undisclosed |
CD33-C Antibody-Compound (XIV) linker |
[8] | |
CD33-C Antibody-Compound (XIX) |
CD33-C Antibody-Compound (XIX) payload |
Undisclosed |
CD33-C Antibody-Compound (XIX) linker |
[8] | |
CD33-C Antibody-Compound (XL) |
CD33-C Antibody-Compound (XL) payload |
Undisclosed |
CD33-C Antibody-Compound (XL) linker |
[8] | |
CD33-C Antibody-Compound (XLI) |
CD33-C Antibody-Compound (XLI) payload |
Undisclosed |
CD33-C Antibody-Compound (XLI) linker |
[8] | |
CD33-C Antibody-Compound (XLII) |
CD33-C Antibody-Compound (XLII) payload |
Undisclosed |
CD33-C Antibody-Compound (XLII) linker |
[8] | |
CD33-C Antibody-Compound (XLIII) |
CD33-C Antibody-Compound (XLIII) payload |
Undisclosed |
CD33-C Antibody-Compound (XLIII) linker |
[8] | |
CD33-C Antibody-Compound (XV) |
CD33-C Antibody-Compound (XV) payload |
Undisclosed |
CD33-C Antibody-Compound (XV) linker |
[8] | |
CD33-C Antibody-Compound (XVI) |
CD33-C Antibody-Compound (XIX) payload |
Undisclosed |
CD33-C Antibody-Compound (XIX) linker |
[8] | |
CD33-C Antibody-Compound (XVIII) |
CD33-C Antibody-Compound (XVIII) payload |
Undisclosed |
CD33-C Antibody-Compound (XVIII) linker |
[8] |
CD33-D Anti-ody
| ADC Info | ADC Name | Payload | Target | Linker | Ref |
|---|---|---|---|---|---|
CD33-D Antibody-Compound (Ie) |
CD33-D Antibody-Compound (Ie) payload |
Undisclosed |
CD33-D Antibody-Compound (Ie) linker |
[8] | |
CD33-D Antibody-Compound (Ii) |
CD33-D Antibody-Compound (Ii) payload |
Undisclosed |
CD33-D Antibody-Compound (Ii) linker |
[8] | |
CD33-D Antibody-Compound (X) |
CD33-D Antibody-Compound (X) payload |
Undisclosed |
CD33-D Antibody-Compound (X) linker |
[8] | |
CD33-D Antibody-Compound (XI) |
CD33-D Antibody-Compound (XI) payload |
Undisclosed |
CD33-D Antibody-Compound (XI) linker |
[8] | |
CD33-D Antibody-Compound (XIV) |
CD33-D Antibody-Compound (XIV) payload |
Undisclosed |
CD33-D Antibody-Compound (XIV) linker |
[8] | |
CD33-D Antibody-Compound (XIX) |
CD33-D Antibody-Compound (XIX) payload |
Undisclosed |
CD33-D Antibody-Compound (XIX) linker |
[8] | |
CD33-D Antibody-Compound (XL) |
CD33-D Antibody-Compound (XL) payload |
Undisclosed |
CD33-D Antibody-Compound (XL) linker |
[8] | |
CD33-D Antibody-Compound (XLI) |
CD33-D Antibody-Compound (XLI) payload |
Undisclosed |
CD33-D Antibody-Compound (XLI) linker |
[8] | |
CD33-D Antibody-Compound (XLII) |
CD33-D Antibody-Compound (XLII) payload |
Undisclosed |
CD33-D Antibody-Compound (XLII) linker |
[8] | |
CD33-D Antibody-Compound (XLIII) |
CD33-D Antibody-Compound (XLIII) payload |
Undisclosed |
CD33-D Antibody-Compound (XLIII) linker |
[8] | |
CD33-D Antibody-Compound (XV) |
CD33-D Antibody-Compound (XV) payload |
Undisclosed |
CD33-D Antibody-Compound (XV) linker |
[8] | |
CD33-D Antibody-Compound (XVI) |
CD33-D Antibody-Compound (XIX) payload |
Undisclosed |
CD33-D Antibody-Compound (XIX) linker |
[8] | |
CD33-D Antibody-Compound (XVIII) |
CD33-D Antibody-Compound (XVIII) payload |
Undisclosed |
CD33-D Antibody-Compound (XVIII) linker |
[8] |
CN105828840B_ADC-125 antibody
| ADC Info | ADC Name | Payload | Target | Linker | Ref |
|---|---|---|---|---|---|
CN105828840B ADC-125 |
CN105828840B_ADC-125 payload |
Undisclosed |
CN105828840B_ADC-125 linker |
[9] |
CN105828840B_ADC-127 antibody
| ADC Info | ADC Name | Payload | Target | Linker | Ref |
|---|---|---|---|---|---|
CN105828840B ADC-127 |
CN105828840B_ADC-127 payload |
Undisclosed |
CN105828840B_ADC-127 linker |
[9] |
CN105828840B_ADC-129 antibody
| ADC Info | ADC Name | Payload | Target | Linker | Ref |
|---|---|---|---|---|---|
CN105828840B ADC-129 |
CN105828840B_ADC-129 payload |
Undisclosed |
CN105828840B_ADC-129 linker |
[9] |
CN105828840B_ADC-131 antibody
| ADC Info | ADC Name | Payload | Target | Linker | Ref |
|---|---|---|---|---|---|
CN105828840B ADC-131 |
CN105828840B_ADC-131 payload |
Undisclosed |
CN105828840B_ADC-131 linker |
[9] |
CN105828840B_ADC-133 antibody
| ADC Info | ADC Name | Payload | Target | Linker | Ref |
|---|---|---|---|---|---|
CN105828840B ADC-133 |
CN105828840B_ADC-133 payload |
Undisclosed |
CN105828840B_ADC-133 linker |
[9] |
CN105828840B_ADC-137 antibody
| ADC Info | ADC Name | Payload | Target | Linker | Ref |
|---|---|---|---|---|---|
CN105828840B ADC-137 |
CN105828840B_ADC-137 payload |
Undisclosed |
CN105828840B_ADC-137 linker |
[9] |
CN105828840B_ADC-138 antibody
| ADC Info | ADC Name | Payload | Target | Linker | Ref |
|---|---|---|---|---|---|
CN105828840B ADC-138 |
CN105828840B_ADC-138 payload |
Undisclosed |
CN105828840B_ADC-138 linker |
[9] |
CN105828840B_ADC-139 antibody
| ADC Info | ADC Name | Payload | Target | Linker | Ref |
|---|---|---|---|---|---|
CN105828840B ADC-139 |
CN105828840B_ADC-139 payload |
Undisclosed |
CN105828840B_ADC-139 linker |
[9] |
Gemtuzumab
| ADC Info | ADC Name | Payload | Target | Linker | Ref |
|---|---|---|---|---|---|
Gemtuzumab ozogamicin |
N-acetyl-gamma-calicheamicin |
Human Deoxyribonucleic acid (hDNA) |
AcButDMH |
[10] | |
BL-M11D1 |
Camptothecin analogue ED04 |
DNA topoisomerase 1 (TOP1) |
Gly-Mal-Gly-Gly-Phe-Gly |
[11] | |
Gemtuzumab-Compound (Ie) |
NeoDegrader P1 |
Protein cereblon (CRBN) |
Gemtuzumab-Compound (Ie) linker |
[7] | |
Gemtuzumab-Compound (Ie) |
Gemtuzumab-Compound (Ie) payload |
Undisclosed |
Gemtuzumab-Compound (Ie) linker |
[8] | |
Gemtuzumab-ADC-24-1 |
Gemtuzumab-ADC-24-1 payload |
Undisclosed |
Gemtuzumab-ADC-24-1 linker |
[12] | |
Gemtuzumab-ADC-24-10 |
Gemtuzumab-ADC-24-10 payload |
Undisclosed |
Gemtuzumab-ADC-24-10 linker |
[12] | |
Gemtuzumab-ADC-24-11 |
Gemtuzumab-ADC-24-11 payload |
Undisclosed |
Gemtuzumab-ADC-24-11 linker |
[12] | |
Gemtuzumab-ADC-24-12 |
Gemtuzumab-ADC-24-12 payload |
Undisclosed |
Gemtuzumab-ADC-24-12 linker |
[12] | |
Gemtuzumab-ADC-24-13 |
Gemtuzumab-ADC-24-13 payload |
Undisclosed |
Gemtuzumab-ADC-24-13 linker |
[12] | |
Gemtuzumab-ADC-24-2 |
Gemtuzumab-ADC-24-2 payload |
Undisclosed |
Gemtuzumab-ADC-24-2 linker |
[12] | |
Gemtuzumab-ADC-24-3 |
Gemtuzumab-ADC-24-3 payload |
Undisclosed |
Gemtuzumab-ADC-24-3 linker |
[12] | |
Gemtuzumab-ADC-24-4 |
Gemtuzumab-ADC-24-4 payload |
Undisclosed |
Gemtuzumab-ADC-24-4 linker |
[12] | |
Gemtuzumab-ADC-24-5 |
Gemtuzumab-ADC-24-5 payload |
Undisclosed |
Gemtuzumab-ADC-24-5 linker |
[12] | |
Gemtuzumab-ADC-24-6 |
Gemtuzumab-ADC-24-6 payload |
Undisclosed |
Gemtuzumab-ADC-24-6 linker |
[12] | |
Gemtuzumab-ADC-24-7 |
Gemtuzumab-ADC-24-7 payload |
Undisclosed |
Gemtuzumab-ADC-24-7 linker |
[12] | |
Gemtuzumab-ADC-24-8 |
Gemtuzumab-ADC-24-8 payload |
Undisclosed |
Gemtuzumab-ADC-24-8 linker |
[12] | |
Gemtuzumab-ADC-24-9 |
Gemtuzumab-ADC-24-9 payload |
Undisclosed |
Gemtuzumab-ADC-24-9 linker |
[12] | |
Gemtuzumab-Compound (Ia) |
NeoDegrader P1 |
Protein cereblon (CRBN) |
Gemtuzumab-Compound (Ia) linker |
[7] | |
Gemtuzumab-Compound (Ib) |
NeoDegrader P1 |
Protein cereblon (CRBN) |
Gemtuzumab-Compound (Ib) linker |
[7] | |
Gemtuzumab-Compound (Ic) |
NeoDegrader P1 |
Protein cereblon (CRBN) |
Gemtuzumab-Compound (Ic) linker |
[7] | |
Gemtuzumab-Compound (Ih) |
NeoDegrader P1 |
Protein cereblon (CRBN) |
Gemtuzumab-Compound (Ih) linker |
[7] | |
Gemtuzumab-Compound (Ii) |
Gemtuzumab-Compound (Ii) payload |
Undisclosed |
Gemtuzumab-Compound (Ii) linker |
[8] | |
Gemtuzumab-Compound (X) |
Gemtuzumab-Compound (X) payload |
Undisclosed |
Gemtuzumab-Compound (X) linker |
[8] | |
Gemtuzumab-Compound (XI) |
Gemtuzumab-Compound (XI) payload |
Undisclosed |
Gemtuzumab-Compound (XI) linker |
[8] | |
Gemtuzumab-Compound (XIV) |
Gemtuzumab-Compound (XIV) payload |
Undisclosed |
Gemtuzumab-Compound (XIV) linker |
[8] | |
Gemtuzumab-Compound (XIX) |
Gemtuzumab-Compound (XIX) payload |
Undisclosed |
Gemtuzumab-Compound (XIX) linker |
[8] | |
Gemtuzumab-Compound (XL) |
Gemtuzumab-Compound (XL) payload |
Undisclosed |
Gemtuzumab-Compound (XL) linker |
[8] | |
Gemtuzumab-Compound (XLI) |
Gemtuzumab-Compound (XLI) payload |
Undisclosed |
Gemtuzumab-Compound (XLI) linker |
[8] | |
Gemtuzumab-Compound (XLII) |
Gemtuzumab-Compound (XLII) payload |
Undisclosed |
Gemtuzumab-Compound (XLII) linker |
[8] | |
Gemtuzumab-Compound (XLIII) |
Gemtuzumab-Compound (XLIII) payload |
Undisclosed |
Gemtuzumab-Compound (XLIII) linker |
[8] | |
Gemtuzumab-Compound (XV) |
Gemtuzumab-Compound (XV) payload |
Undisclosed |
Gemtuzumab-Compound (XV) linker |
[8] | |
Gemtuzumab-Compound (XVI) |
Gemtuzumab-Compound (XIX) payload |
Undisclosed |
Gemtuzumab-Compound (XIX) linker |
[8] | |
Gemtuzumab-Compound (XVIII) |
Gemtuzumab-Compound (XVIII) payload |
Undisclosed |
Gemtuzumab-Compound (XVIII) linker |
[8] | |
Gemtuzumab-Compound 17 |
Mertansine DM4 |
Microtubule (MT) |
Gemtuzumab-Compound 17 linker |
[13] | |
Gemtuzumab-Compound 25 |
Monomethyl auristatin E |
Microtubule (MT) |
Gemtuzumab-Compound 25 linker |
[13] | |
Gemtuzumab-Compound 31 |
Auristatin 0101 |
Microtubule (MT) |
Gemtuzumab-Compound 31 linker |
[13] | |
Gemtuzumab-Compound 36 |
Monomethyl auristatin E |
Microtubule (MT) |
Gemtuzumab-Compound 36 linker |
[13] | |
Gemtuzumab-Compound 43 |
PBD dimer |
Human Deoxyribonucleic acid (hDNA) |
Gemtuzumab-Compound 43 linker |
[13] | |
Gemtuzumab-Compound 49 |
PBD dimer |
Human Deoxyribonucleic acid (hDNA) |
Gemtuzumab-Compound 49 linker |
[13] | |
Gemtuzumab-Compound 55 |
Mertansine DM1 |
Microtubule (MT) |
Gemtuzumab-Compound 55 linker |
[13] | |
Gemtuzumab-Compound 59 |
Mertansine DM4 |
Microtubule (MT) |
Gemtuzumab-Compound 59 linker |
[13] | |
Gemtuzumab-Compound 64 |
Monomethyl auristatin E |
Microtubule (MT) |
Gemtuzumab-Compound 64 linker |
[13] | |
Gemtuzumab-Compound 69 |
Monomethyl auristatin E |
Microtubule (MT) |
Gemtuzumab-Compound 69 linker |
[13] | |
Gemtuzumab-Compound 74 |
PBD dimer |
Human Deoxyribonucleic acid (hDNA) |
Gemtuzumab-Compound 74 linker |
[13] | |
Gemtuzumab-Compound 75 |
Monomethyl auristatin E |
Microtubule (MT) |
Gemtuzumab-Compound 75 linker |
[13] | |
Gemtuzumab-Compound 76 |
Monomethyl auristatin E |
Microtubule (MT) |
Gemtuzumab-Compound 76 linker |
[13] | |
Gemtuzumab-Compound 77 |
Mertansine DM1 |
Microtubule (MT) |
Gemtuzumab-Compound 77 linker |
[13] | |
Gemtuzumab-Compound 78 |
Auristatin 0101 |
Microtubule (MT) |
Gemtuzumab-Compound 78 linker |
[13] | |
Gemtuzumab-Compound 79 |
Auristatin 0101 |
Microtubule (MT) |
Gemtuzumab-Compound 79 linker |
[13] | |
Gemtuzumab-Compound 80 |
Mertansine DM4 |
Microtubule (MT) |
Gemtuzumab-Compound 80 linker |
[13] | |
Gemtuzumab-Compound 9 |
Mertansine DM1 |
Microtubule (MT) |
Gemtuzumab-Compound 9 linker |
[13] |
huMy9-6 IgG1
| ADC Info | ADC Name | Payload | Target | Linker | Ref |
|---|---|---|---|---|---|
huMy9-6 IgG1-Compound (la) DAR 1.9 |
NeoDegrader P1 |
Protein cereblon (CRBN) |
huMy9-6 IgG1-Compound (la) DAR 1.9 linker |
[14] | |
huMy9-6IgG1-Compound (la) DAR 8 |
NeoDegrader P1 |
Protein cereblon (CRBN) |
huMy9-6IgG1-Compound (la) DAR 8 linker |
[14] | |
huMy9-6IgG1-Compound (la) DAR3.9 |
NeoDegrader P1 |
Protein cereblon (CRBN) |
huMy9-6IgG1-Compound (la) DAR3.9 linker |
[14] | |
huMy9-6IgG1-Compound (ld) DAR 8 |
NeoDegrader P1 |
Protein cereblon (CRBN) |
huMy9-6IgG1-Compound (ld) DAR 8 linker |
[14] | |
huMy9-6IgG1-Compound(la) DAR 5.5 |
NeoDegrader P1 |
Protein cereblon (CRBN) |
huMy9-6IgG1-Compound(la) DAR 5.5 linker |
[14] |
huMy9-6-IgG4-S228P
| ADC Info | ADC Name | Payload | Target | Linker | Ref |
|---|---|---|---|---|---|
huMy9-6-IgG4-S228P-Compound (Ia) |
NeoDegrader P1 |
Protein cereblon (CRBN) |
huMy9-6-IgG4-S228P-Compound (Ia) linker |
[7] | |
huMy9-6-IgG4-S228P-Compound (Ib) |
NeoDegrader P1 |
Protein cereblon (CRBN) |
huMy9-6-IgG4-S228P-Compound (Ib) linker |
[7] | |
huMy9-6-IgG4-S228P-Compound (Ic) |
NeoDegrader P1 |
Protein cereblon (CRBN) |
huMy9-6-IgG4-S228P-Compound (Ic) linker |
[7] | |
huMy9-6-IgG4-S228P-Compound (Ie) |
NeoDegrader P1 |
Protein cereblon (CRBN) |
huMy9-6-IgG4-S228P-Compound (Ie) linker |
[7] | |
huMy9-6-IgG4-S228P-Compound (Ih) |
NeoDegrader P1 |
Protein cereblon (CRBN) |
huMy9-6-IgG4-S228P-Compound (Ih) linker |
[7] |
Lintuzumab
| ADC Info | ADC Name | Payload | Target | Linker | Ref |
|---|---|---|---|---|---|
Lintuzumab Ac-225 |
AC225 |
Human Deoxyribonucleic acid (hDNA) |
DOTA-P-toluene isothiocyanate |
[15] | |
Lintuzumab IgG1-Compound (la) DAR 8 |
NeoDegrader P1 |
Protein cereblon (CRBN) |
Lintuzumab IgG1-Compound (la) DAR 8 linker |
[14] | |
Lintuzumab IgG1-Compound (ld) DAR 8 |
NeoDegrader P1 |
Protein cereblon (CRBN) |
Lintuzumab IgG1-Compound (ld) DAR 8 linker |
[14] |
OR000213
| ADC Info | ADC Name | Payload | Target | Linker | Ref |
|---|---|---|---|---|---|
OR000213-Compound (Ia) |
NeoDegrader P1 |
Protein cereblon (CRBN) |
OR000213-Compound (Ia) linker |
[14] | |
OR000213-Compound (la) DAR 1.2 |
NeoDegrader P1 |
Protein cereblon (CRBN) |
OR000213-Compound (la) DAR 1.2 linker |
[14] | |
OR000213-Compound(la) DAR 1.8 |
NeoDegrader P1 |
Protein cereblon (CRBN) |
OR000213-Compound(la) DAR 1.8 linker |
[14] | |
OR000213-Compound(la) DAR 2.3 |
NeoDegrader P1 |
Protein cereblon (CRBN) |
OR000213-Compound(la) DAR 2.3 linker |
[14] | |
OR000213-Compound(la) DAR 8 |
NeoDegrader P1 |
Protein cereblon (CRBN) |
OR000213-Compound(la) DAR 8 linker |
[14] |
OR000283
| ADC Info | ADC Name | Payload | Target | Linker | Ref |
|---|---|---|---|---|---|
ORM-6151 |
SMol006 |
Eukaryotic peptide chain release factor GTP-binding subunit ERF3A (GSPT1) |
#NAME? |
Thio hu Anti-CD33 GM15.33 HC A118C
| ADC Info | ADC Name | Payload | Target | Linker | Ref |
|---|---|---|---|---|---|
WO2014159981A2 ADC-203 |
WO2014159981A2_ADC-203 payload |
Undisclosed |
WO2014159981A2_ADC-203 linker |
[16] | |
WO2014159981A2 ADC-213 |
WO2014159981A2_ADC-213 payload |
Undisclosed |
WO2014159981A2_ADC-213 linker |
[16] | |
WO2014159981A2 ADC-222 |
WO2014159981A2_ADC-222 payload |
Undisclosed |
WO2014159981A2_ADC-222 linker |
[16] | |
WO2014159981A2 ADC-CD33-24 |
WO2014159981A2_ADC-CD33-24 payload |
Undisclosed |
WO2014159981A2_ADC-CD33-24 linker |
[16] | |
WO2014159981A2 ADC-CD33-25 |
WO2014159981A2_ADC-CD33-25 payload |
Undisclosed |
WO2014159981A2_ADC-CD33-25 linker |
[16] | |
WO2014159981A2 ADC-CD33-33 |
WO2014159981A2_ADC-CD33-33 payload |
Undisclosed |
WO2014159981A2_ADC-CD33-33 linker |
[16] | |
WO2014159981A2 ADC-CD33-37 |
WO2014159981A2_ADC-CD33-37 payload |
Undisclosed |
WO2014159981A2_ADC-CD33-37 linker |
[16] | |
WO2014159981A2 ADC-CD33-41 |
WO2014159981A2_ADC-CD33-41 payload |
Undisclosed |
WO2014159981A2_ADC-CD33-41 linker |
[16] | |
WO2014159981A2 ADC-CD33-44 |
WO2014159981A2_ADC-CD33-44 payload |
Undisclosed |
WO2014159981A2_ADC-CD33-44 linker |
[16] |
Vadastuximab
| ADC Info | ADC Name | Payload | Target | Linker | Ref |
|---|---|---|---|---|---|
Vadastuximab talirine |
SGD-1882 |
Human Deoxyribonucleic acid (hDNA) |
Mc-Val-Ala |
[17] |
Z4681A
| ADC Info | ADC Name | Payload | Target | Linker | Ref |
|---|---|---|---|---|---|
IMGN-779 |
DGN462 |
Human Deoxyribonucleic acid (hDNA) |
Sulfo-SPDB |
[18] |
undisclosed
| ADC Info | ADC Name | Payload | Target | Linker | Ref |
|---|---|---|---|---|---|
ABBV-787 |
BET degrader |
BET |
undisclosed |
Undisclosed
| ADC Info | ADC Name | Payload | Target | Linker | Ref |
|---|---|---|---|---|---|
Anti-CD3 single-chain immunotoxin |
DT390-scFvUCHT1 |
Undisclosed |
Undisclosed |
[19] | |
Anti-CD33 next-generation DNA-targeting payload ADC (Pfizer) |
Undisclosed |
Undisclosed |
Undisclosed |
[20] | |
Indolino-benzodiazepine antibody drug conjugate |
Undisclosed |
Undisclosed |
Undisclosed |
[21] |
Tissue/Disease specific Abundances of This Antigen
Tissue specific Abundances of This Antigen
ICD Disease Classification 01
| Differential expression pattern of antigen in diseases | ||
| The Studied Tissue | Gingival | |
| The Specific Disease | Bacterial infection of gingival | |
| The Expression Level of Disease Section Compare with the Healthy Individual Tissue | p-value: 3.26E-10; Fold-change: 0.314079456; Z-score: 0.967657543 | |
| Disease-specific Antigen Abundances |
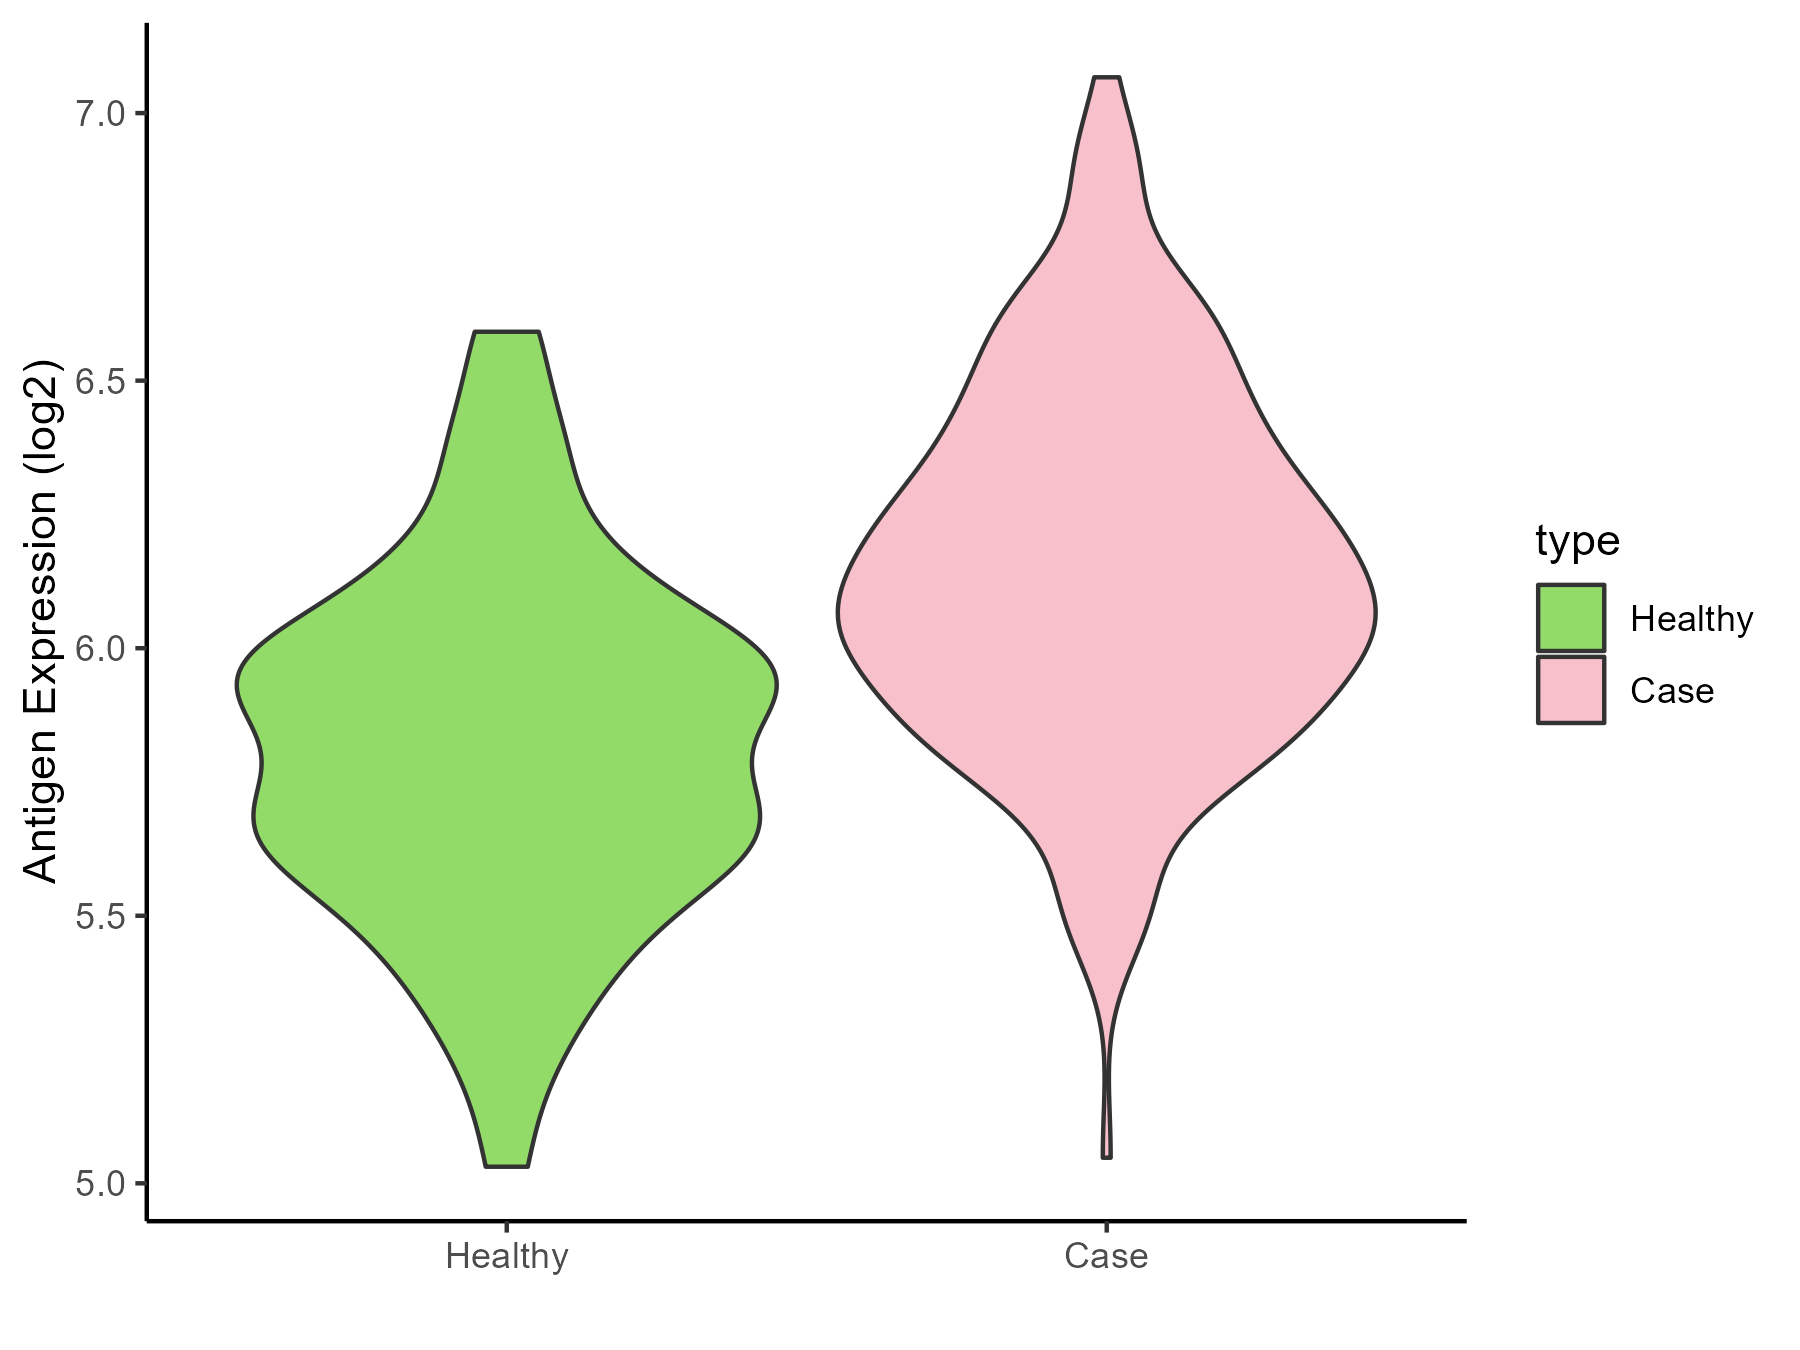
|
Click to View the Clearer Original Diagram |
ICD Disease Classification 02
| Differential expression pattern of antigen in diseases | ||
| The Studied Tissue | Brainstem | |
| The Specific Disease | Glioma | |
| The Expression Level of Disease Section Compare with the Healthy Individual Tissue | p-value: 0.441339172; Fold-change: -0.914552317; Z-score: -1.02637046 | |
| Disease-specific Antigen Abundances |
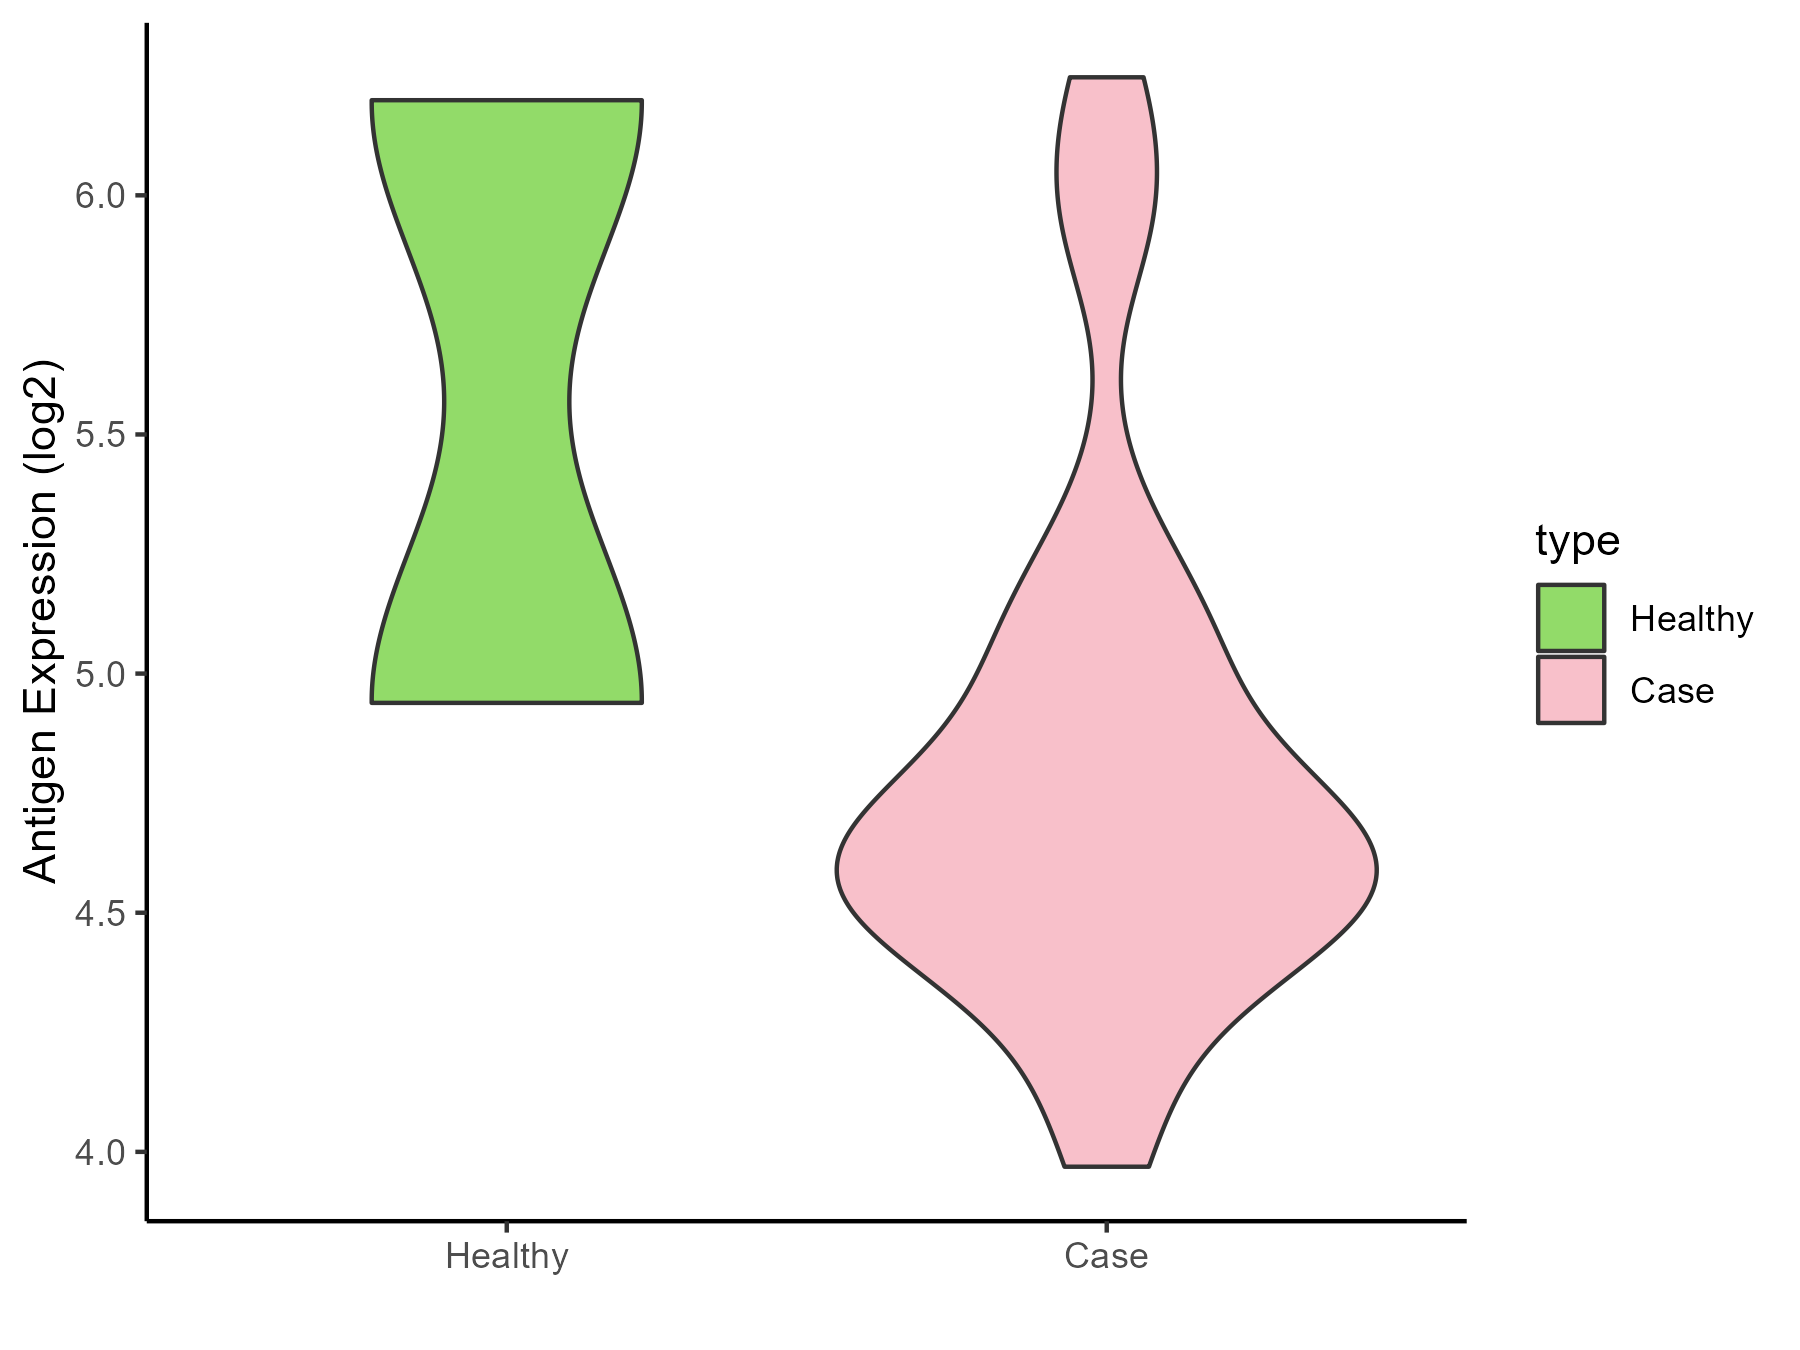
|
Click to View the Clearer Original Diagram |
| The Studied Tissue | White matter | |
| The Specific Disease | Glioma | |
| The Expression Level of Disease Section Compare with the Healthy Individual Tissue | p-value: 0.180863381; Fold-change: 0.762904172; Z-score: 0.7480412 | |
| Disease-specific Antigen Abundances |
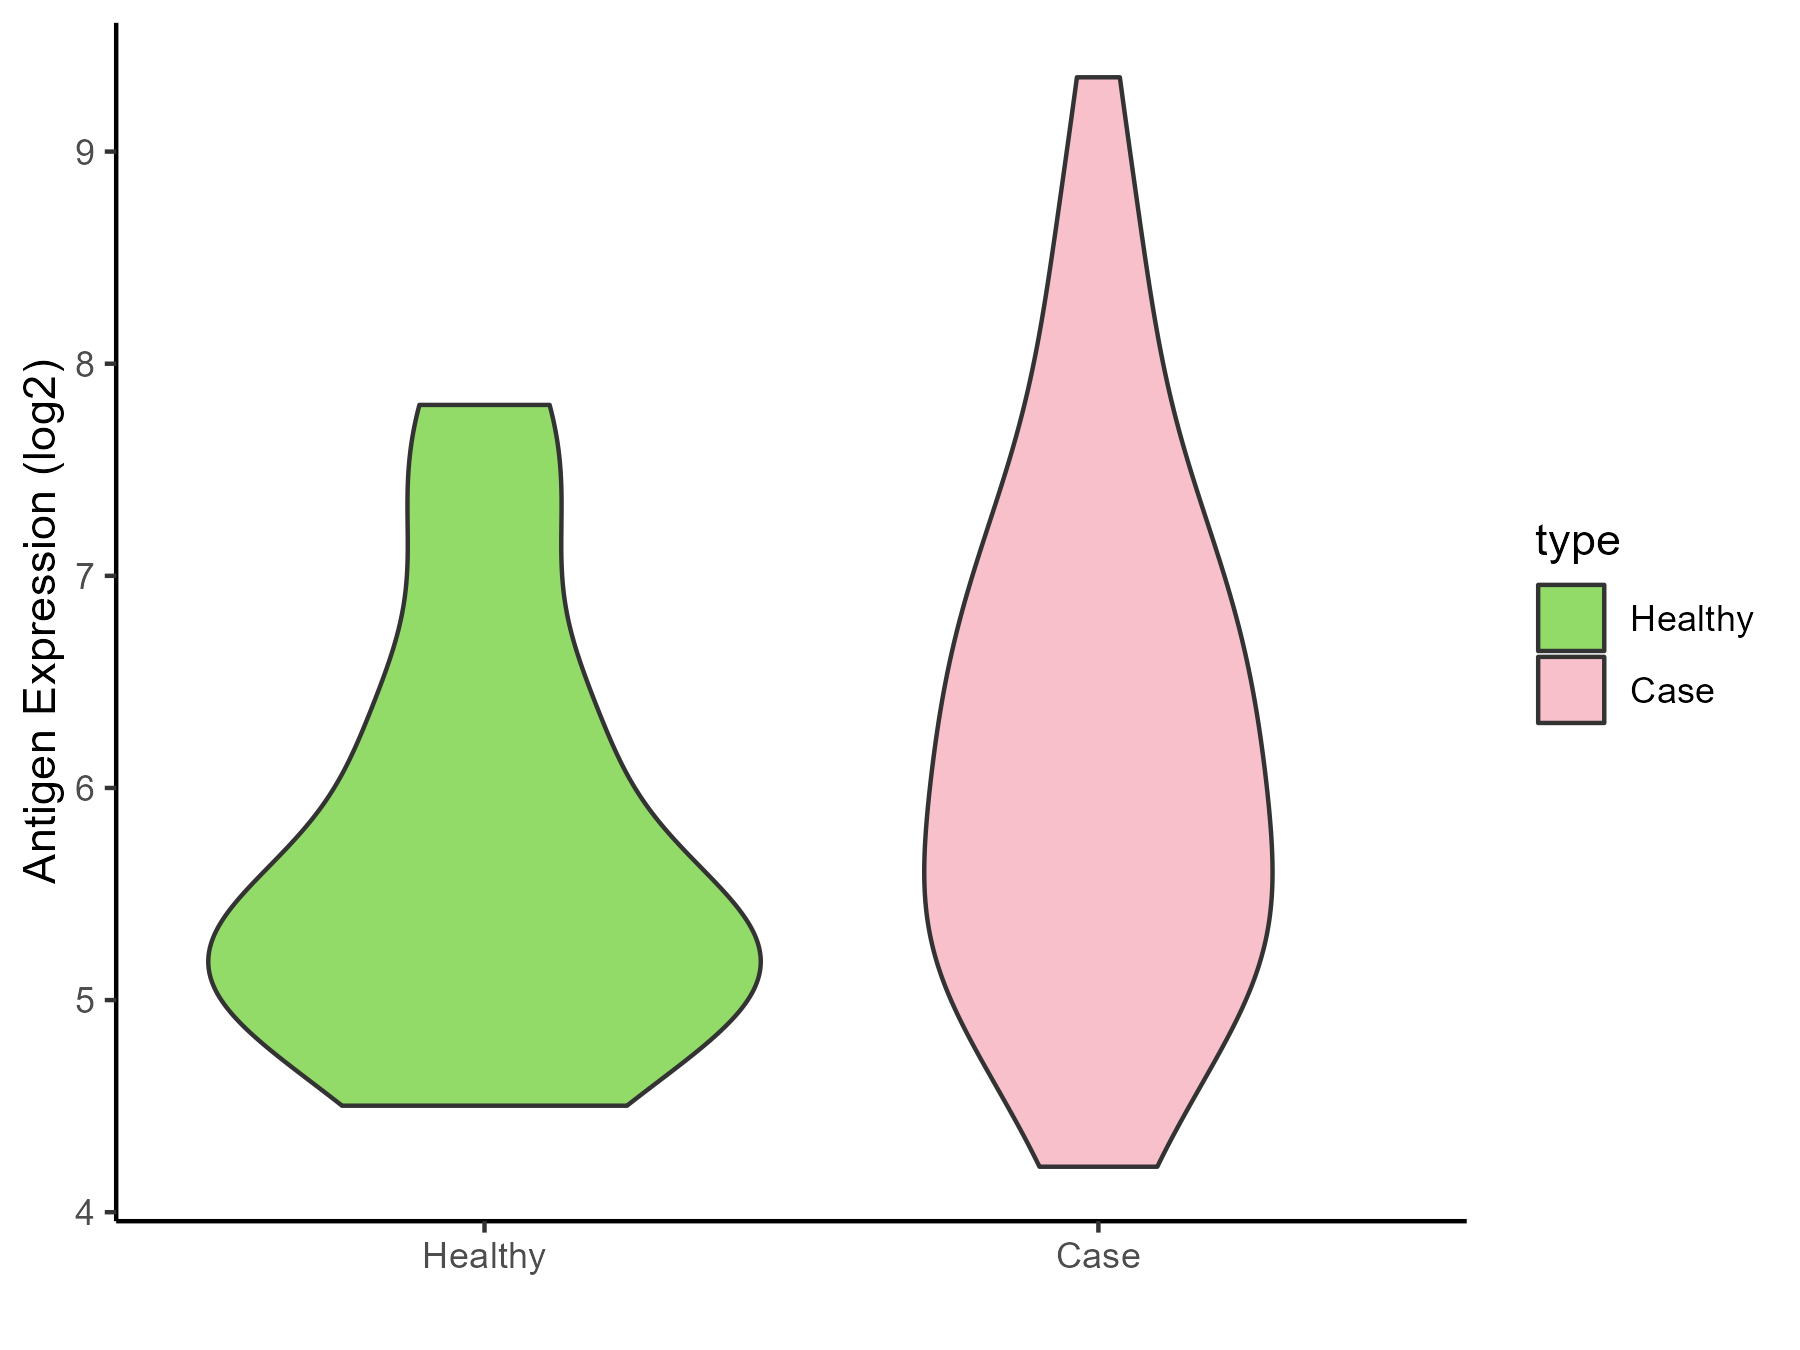
|
Click to View the Clearer Original Diagram |
| The Studied Tissue | Brainstem | |
| The Specific Disease | Neuroectodermal tumor | |
| The Expression Level of Disease Section Compare with the Healthy Individual Tissue | p-value: 8.17E-07; Fold-change: -1.076597336; Z-score: -3.224803207 | |
| Disease-specific Antigen Abundances |
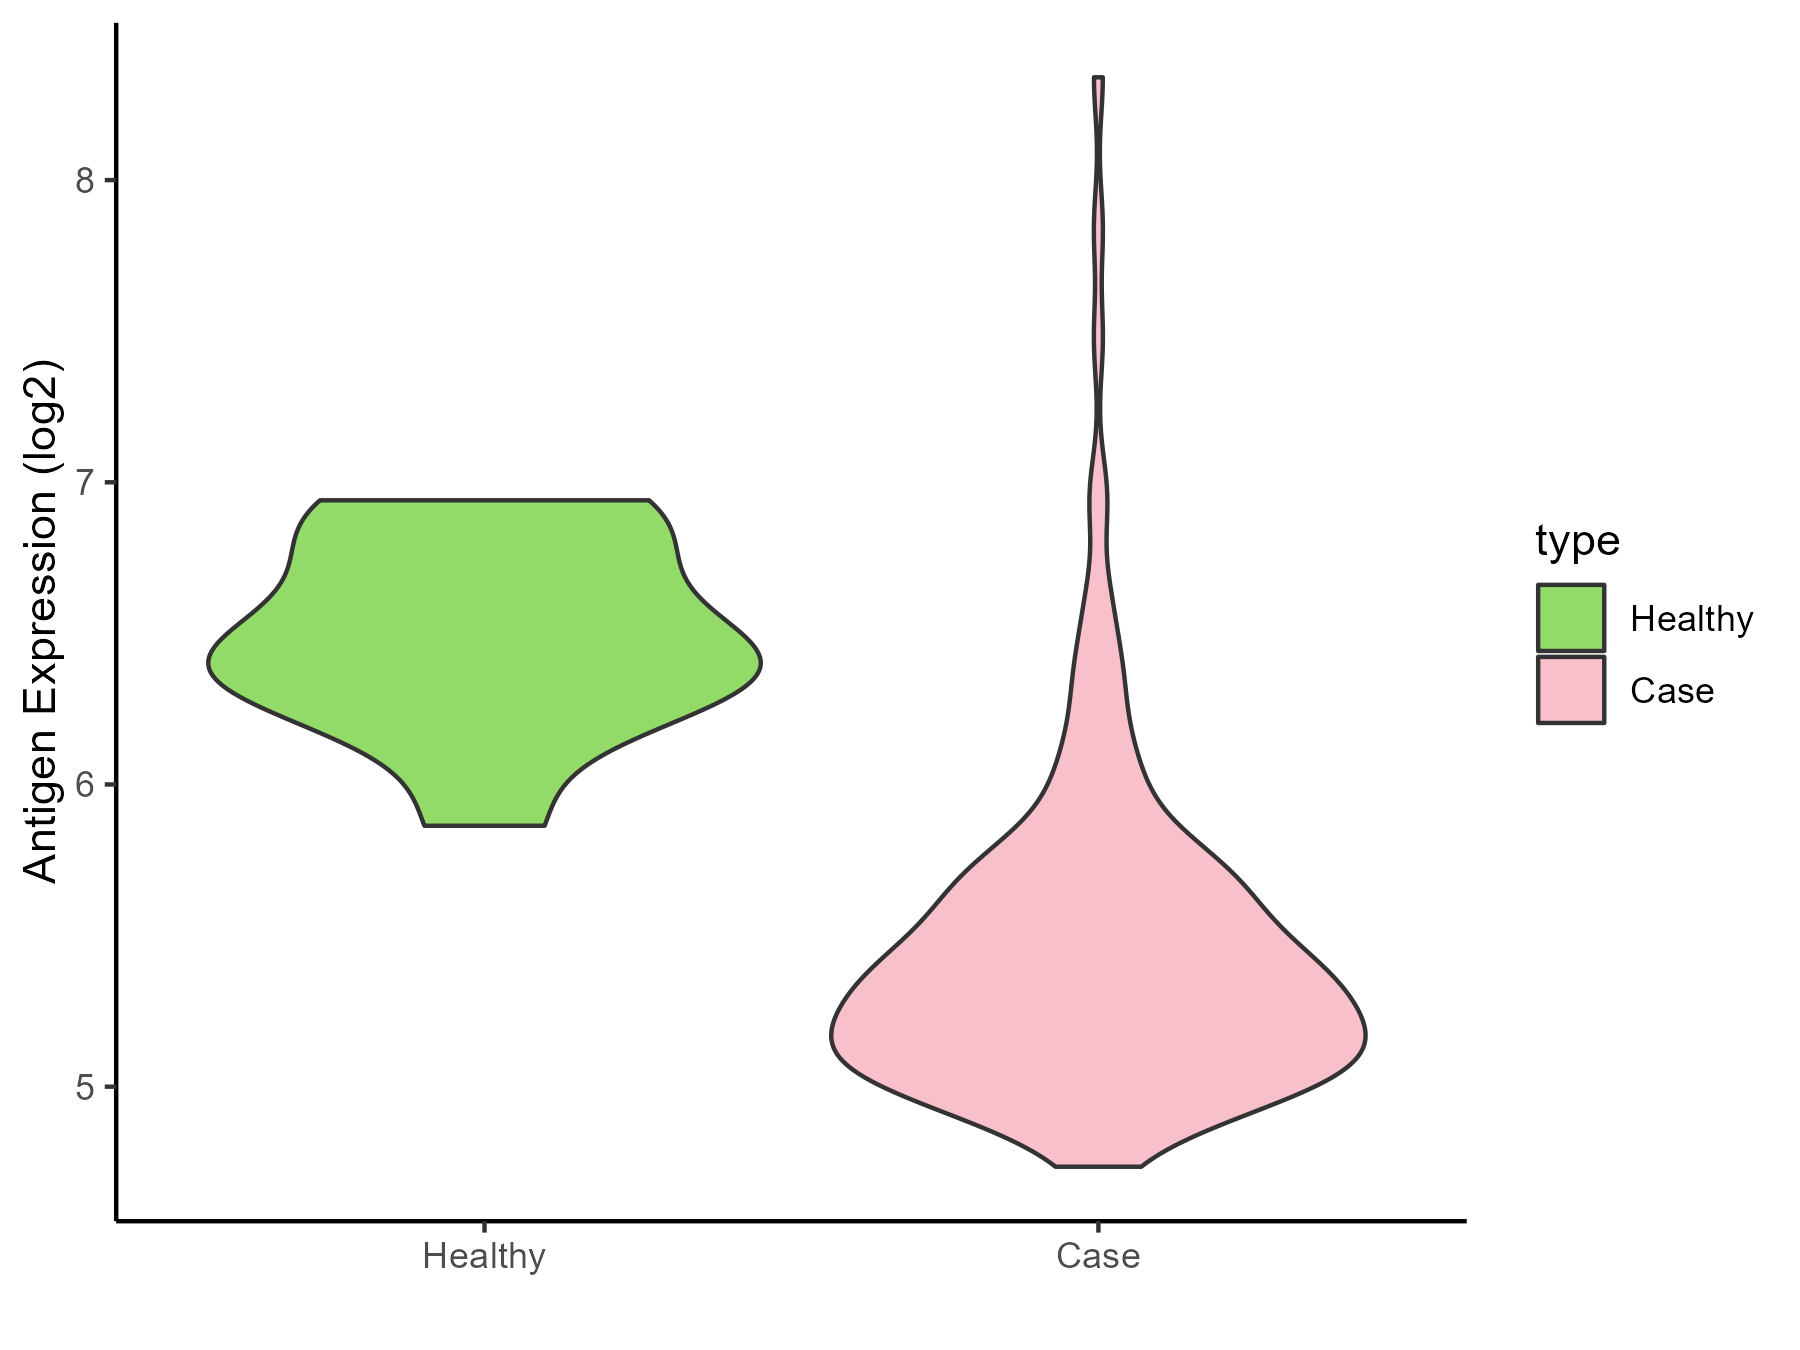
|
Click to View the Clearer Original Diagram |
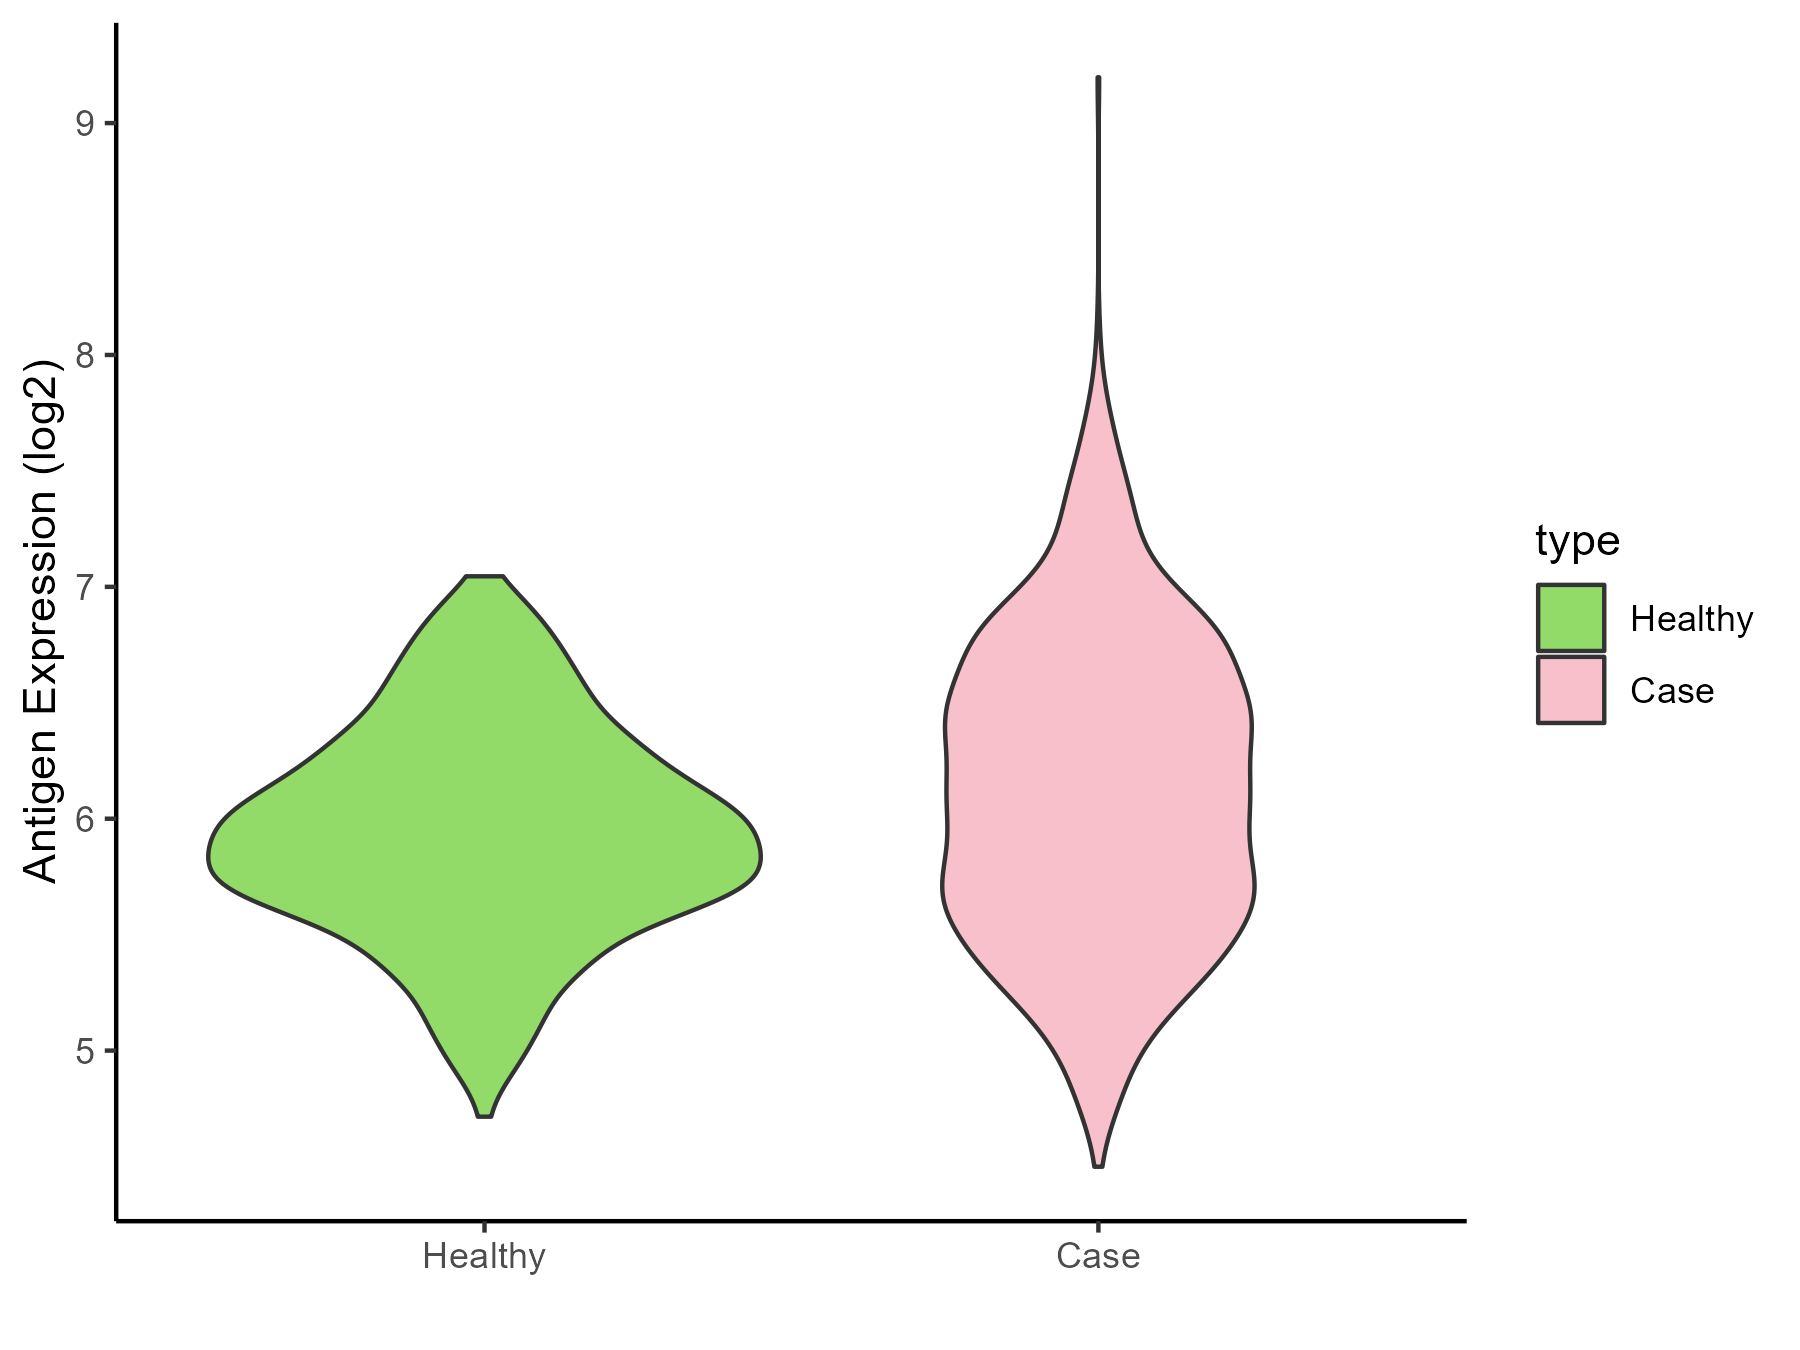
| The Studied Tissue | Nervous | |
| The Specific Disease | Brain cancer | |
| The Expression Level of Disease Section Compare with the Healthy Individual Tissue | p-value: 1.10E-09; Fold-change: 0.201035326; Z-score: 0.442817729 | |
| Disease-specific Antigen Abundances |
|
Click to View the Clearer Original Diagram |
| Differential expression pattern of antigen in diseases | ||
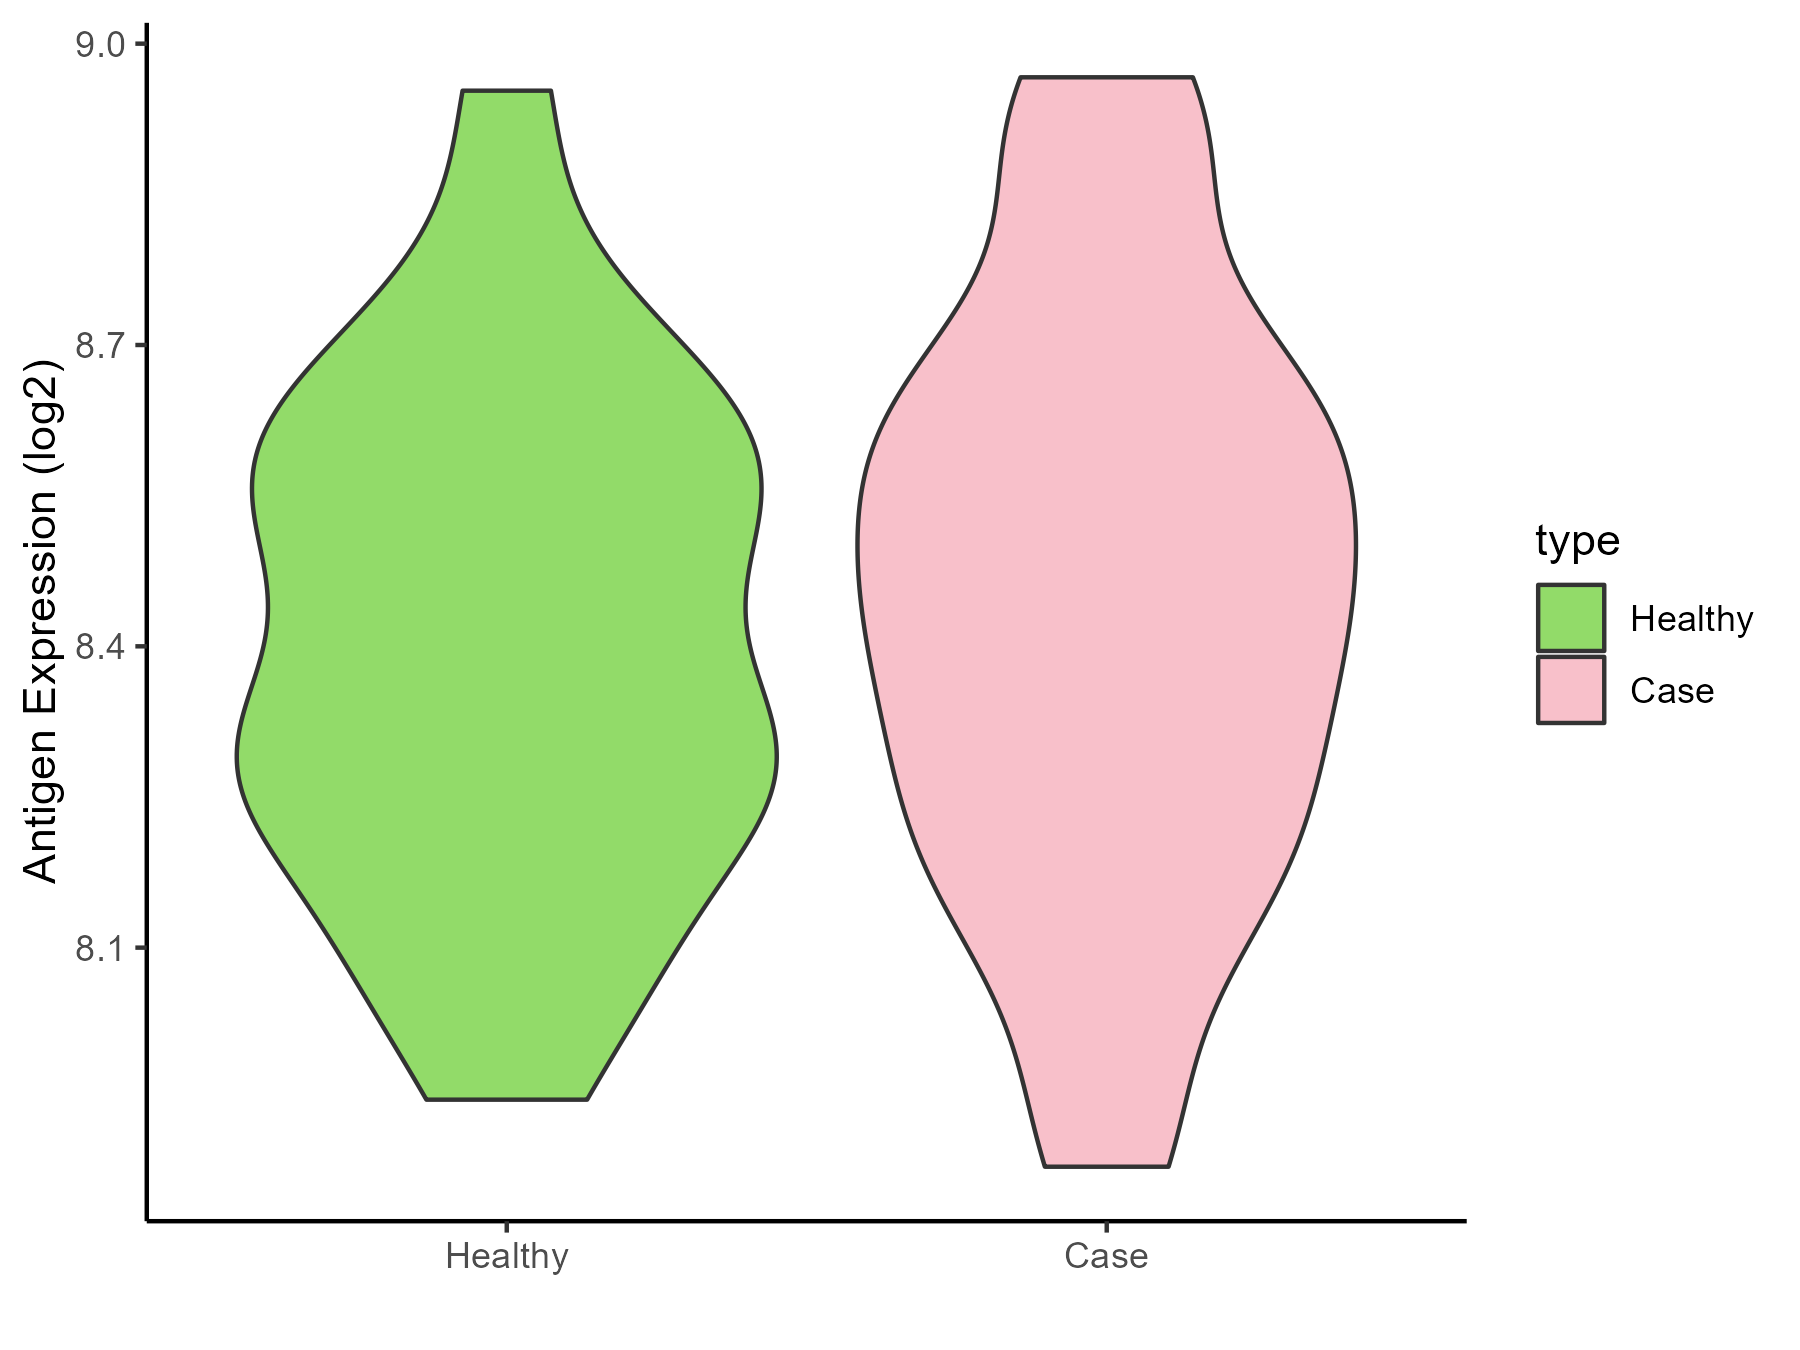
| The Studied Tissue | Whole blood | |
| The Specific Disease | Polycythemia vera | |
| The Expression Level of Disease Section Compare with the Healthy Individual Tissue | p-value: 0.469079159; Fold-change: 0.064429883; Z-score: 0.257024289 | |
| Disease-specific Antigen Abundances |
|
Click to View the Clearer Original Diagram |
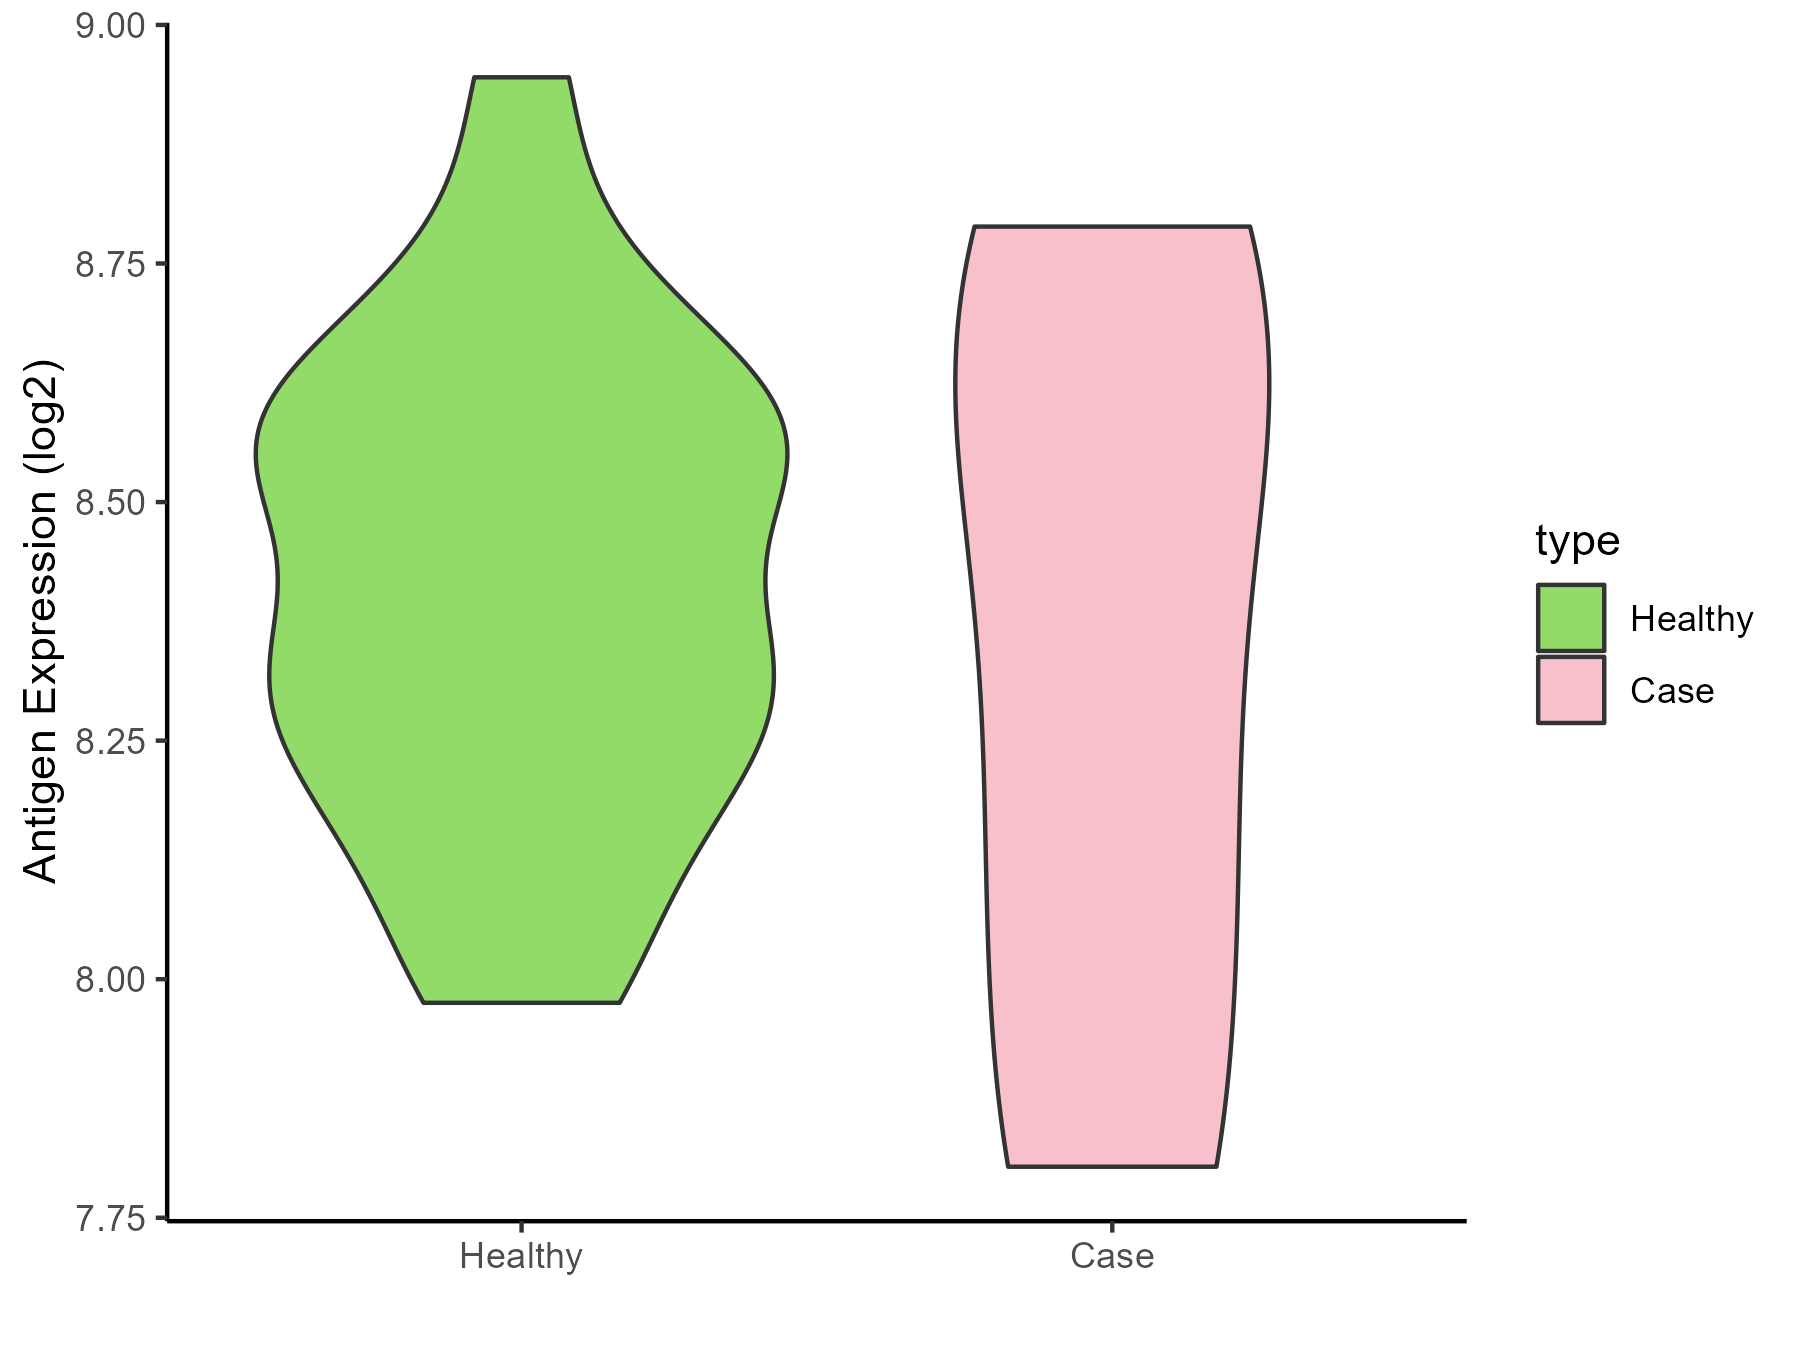
| The Studied Tissue | Whole blood | |
| The Specific Disease | Myelofibrosis | |
| The Expression Level of Disease Section Compare with the Healthy Individual Tissue | p-value: 0.618066778; Fold-change: -0.013498748; Z-score: -0.053843665 | |
| Disease-specific Antigen Abundances |
|
Click to View the Clearer Original Diagram |
| Differential expression pattern of antigen in diseases | ||
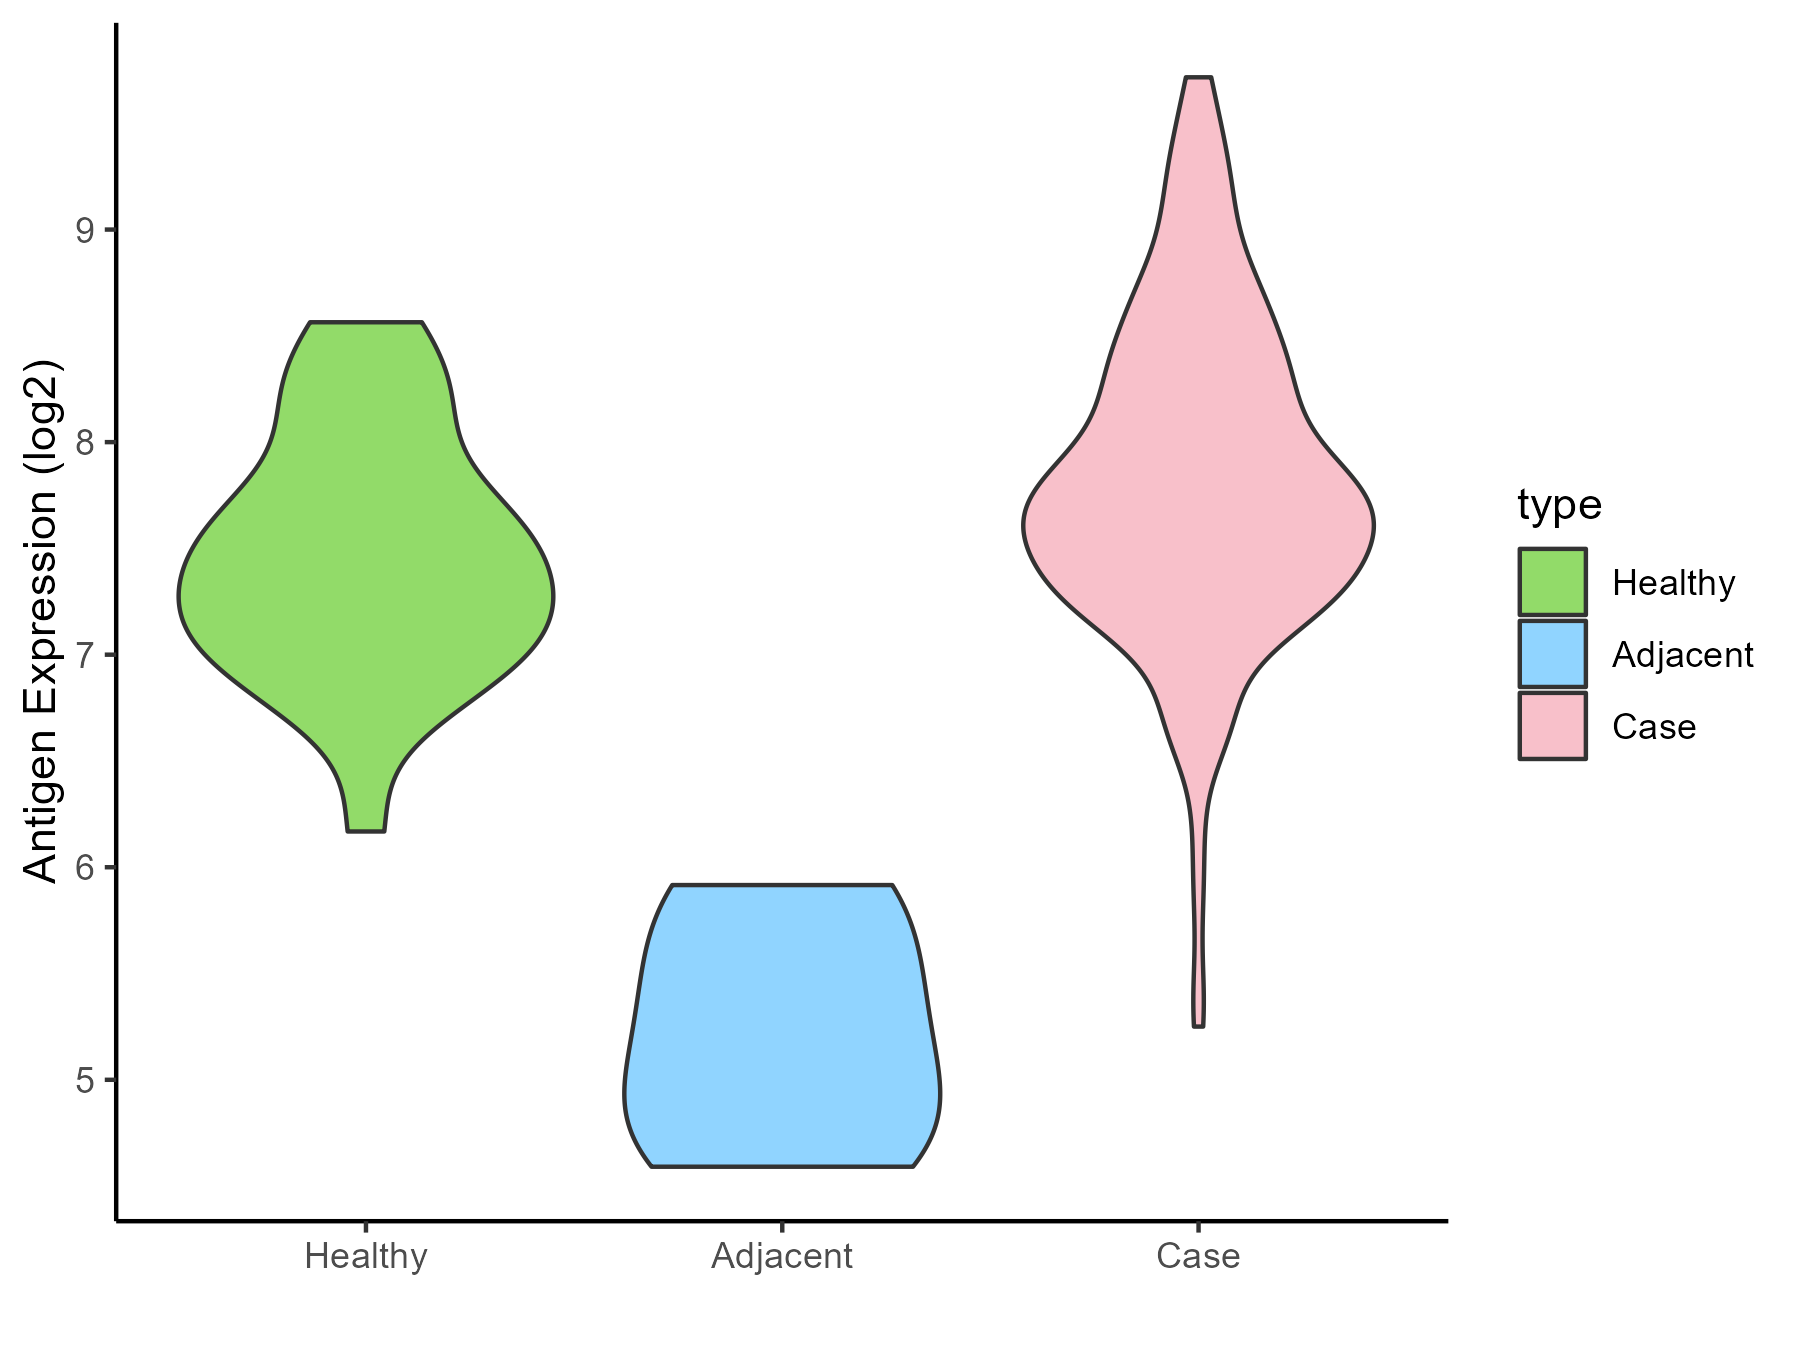
| The Studied Tissue | Bone marrow | |
| The Specific Disease | Myelodysplastic syndromes | |
| The Expression Level of Disease Section Compare with the Healthy Individual Tissue | p-value: 0.005032218; Fold-change: 0.274846965; Z-score: 0.473298153 | |
| The Expression Level of Disease Section Compare with the Adjacent Tissue | p-value: 0.00248525; Fold-change: 2.525576797; Z-score: 4.370846507 | |
| Disease-specific Antigen Abundances |
|
Click to View the Clearer Original Diagram |
| Differential expression pattern of antigen in diseases | ||
| The Studied Tissue | Tonsil | |
| The Specific Disease | Lymphoma | |
| The Expression Level of Disease Section Compare with the Healthy Individual Tissue | p-value: 0.299288387; Fold-change: 0.057204909; Z-score: 0.644644301 | |
| Disease-specific Antigen Abundances |

|
Click to View the Clearer Original Diagram |
| Differential expression pattern of antigen in diseases | ||
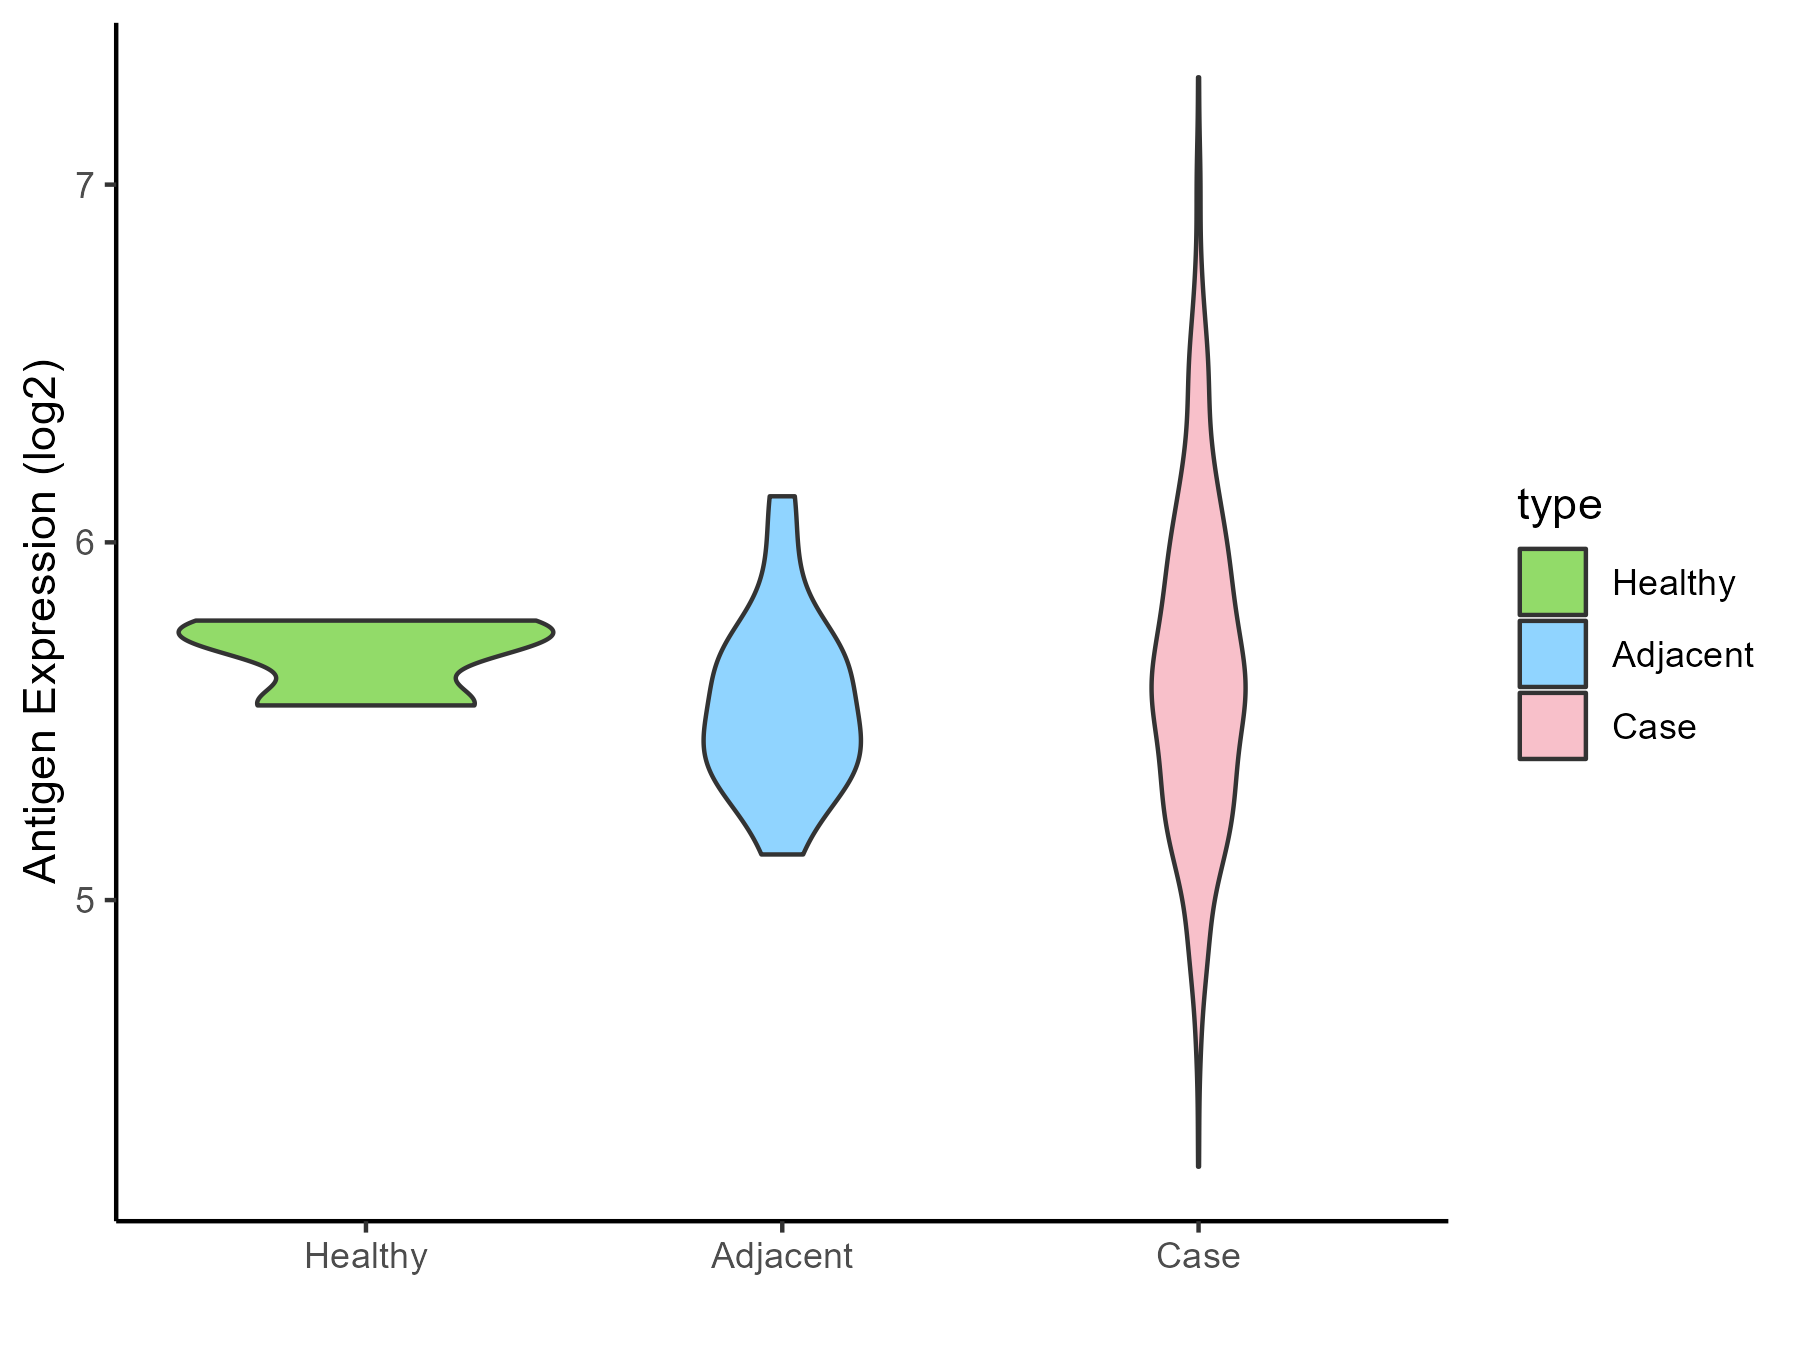
| The Studied Tissue | Gastric | |
| The Specific Disease | Gastric cancer | |
| The Expression Level of Disease Section Compare with the Healthy Individual Tissue | p-value: 0.679929424; Fold-change: -0.105642199; Z-score: -0.860748877 | |
| The Expression Level of Disease Section Compare with the Adjacent Tissue | p-value: 0.126549121; Fold-change: 0.121986318; Z-score: 0.491885589 | |
| Disease-specific Antigen Abundances |
|
Click to View the Clearer Original Diagram |
| Differential expression pattern of antigen in diseases | ||
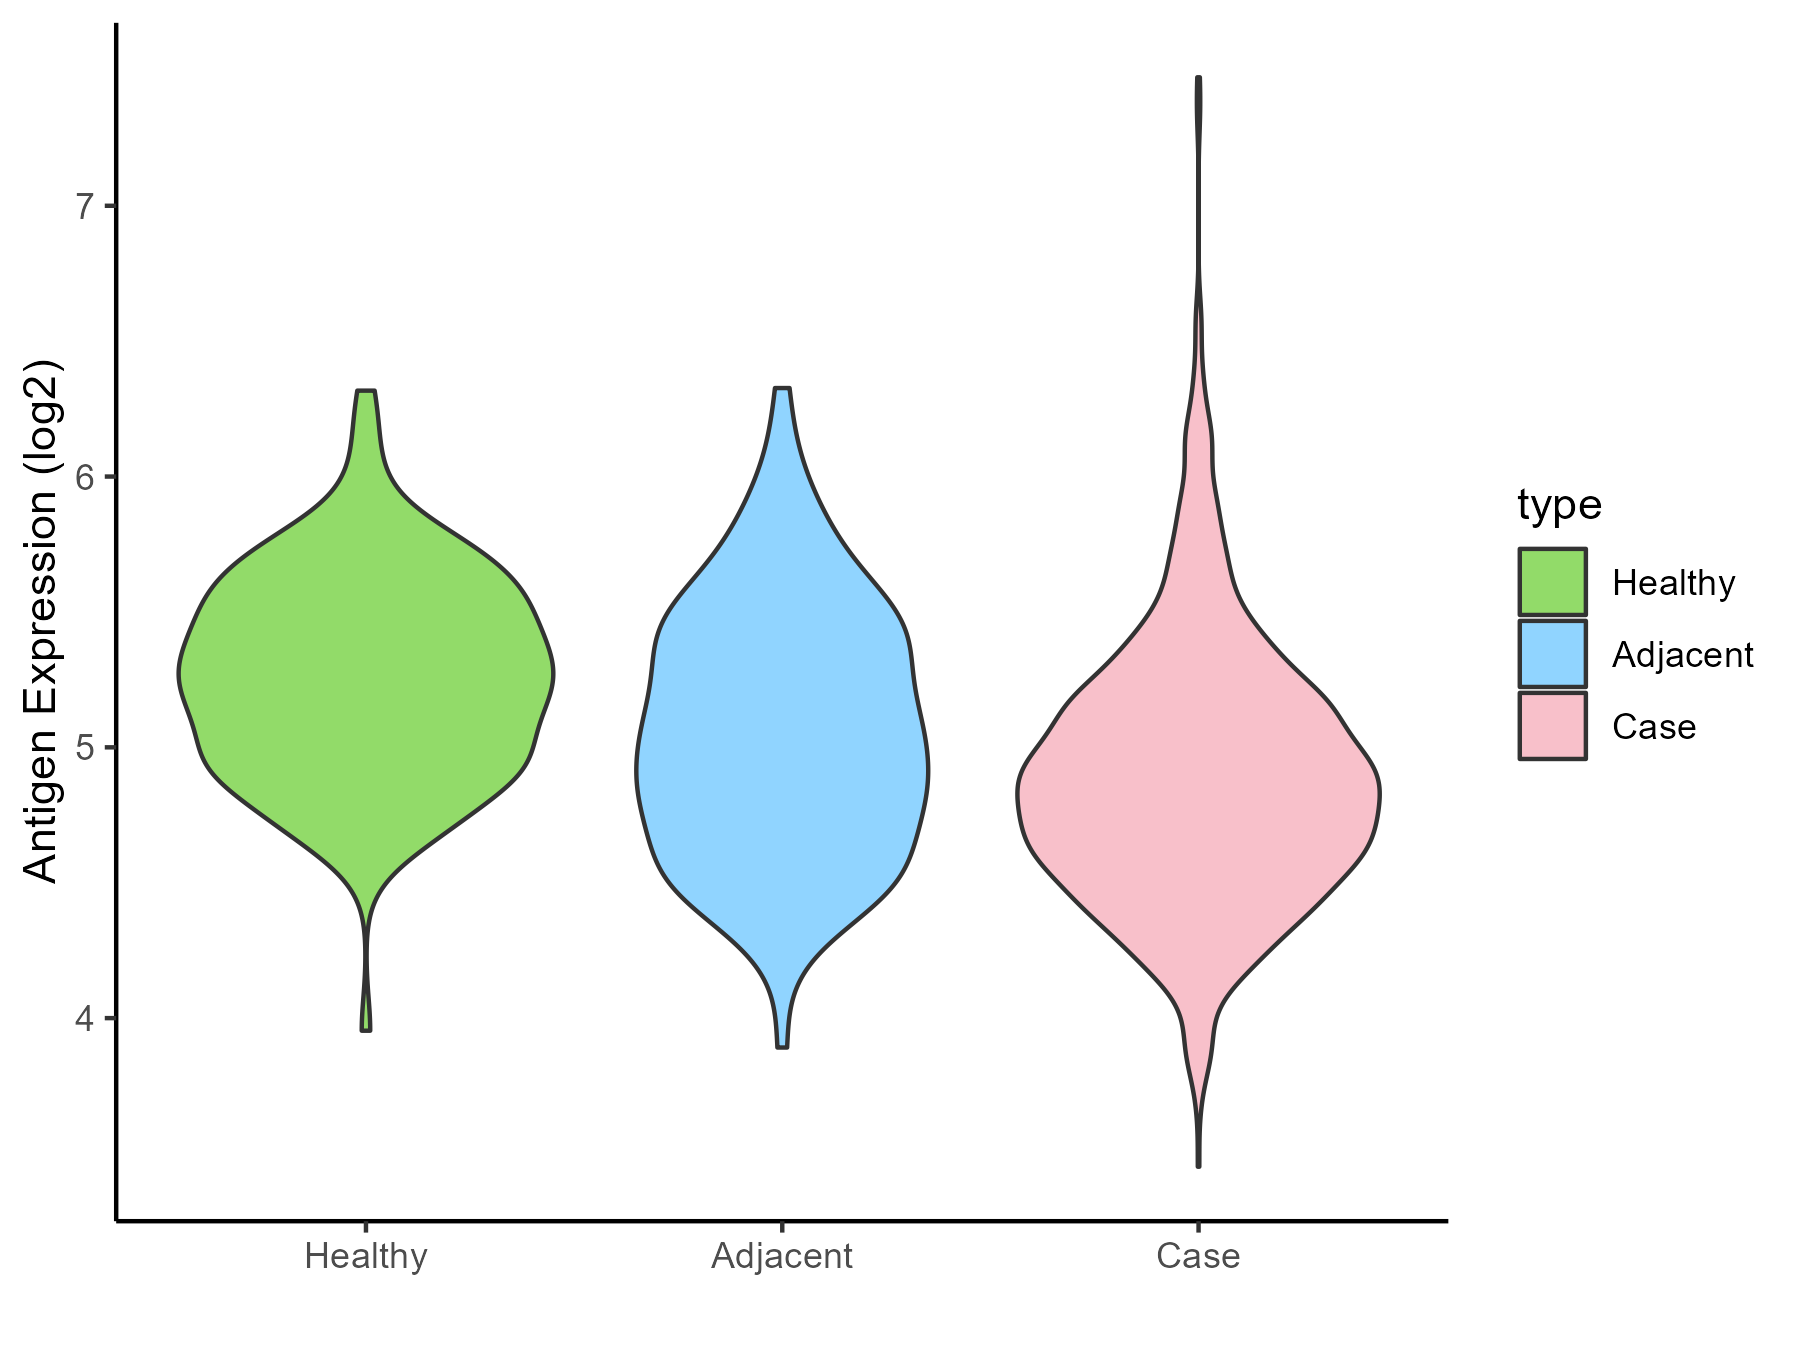
| The Studied Tissue | Colon | |
| The Specific Disease | Colon cancer | |
| The Expression Level of Disease Section Compare with the Healthy Individual Tissue | p-value: 2.59E-23; Fold-change: -0.405560115; Z-score: -1.087128152 | |
| The Expression Level of Disease Section Compare with the Adjacent Tissue | p-value: 0.000148858; Fold-change: -0.187354456; Z-score: -0.405174272 | |
| Disease-specific Antigen Abundances |
|
Click to View the Clearer Original Diagram |
| Differential expression pattern of antigen in diseases | ||
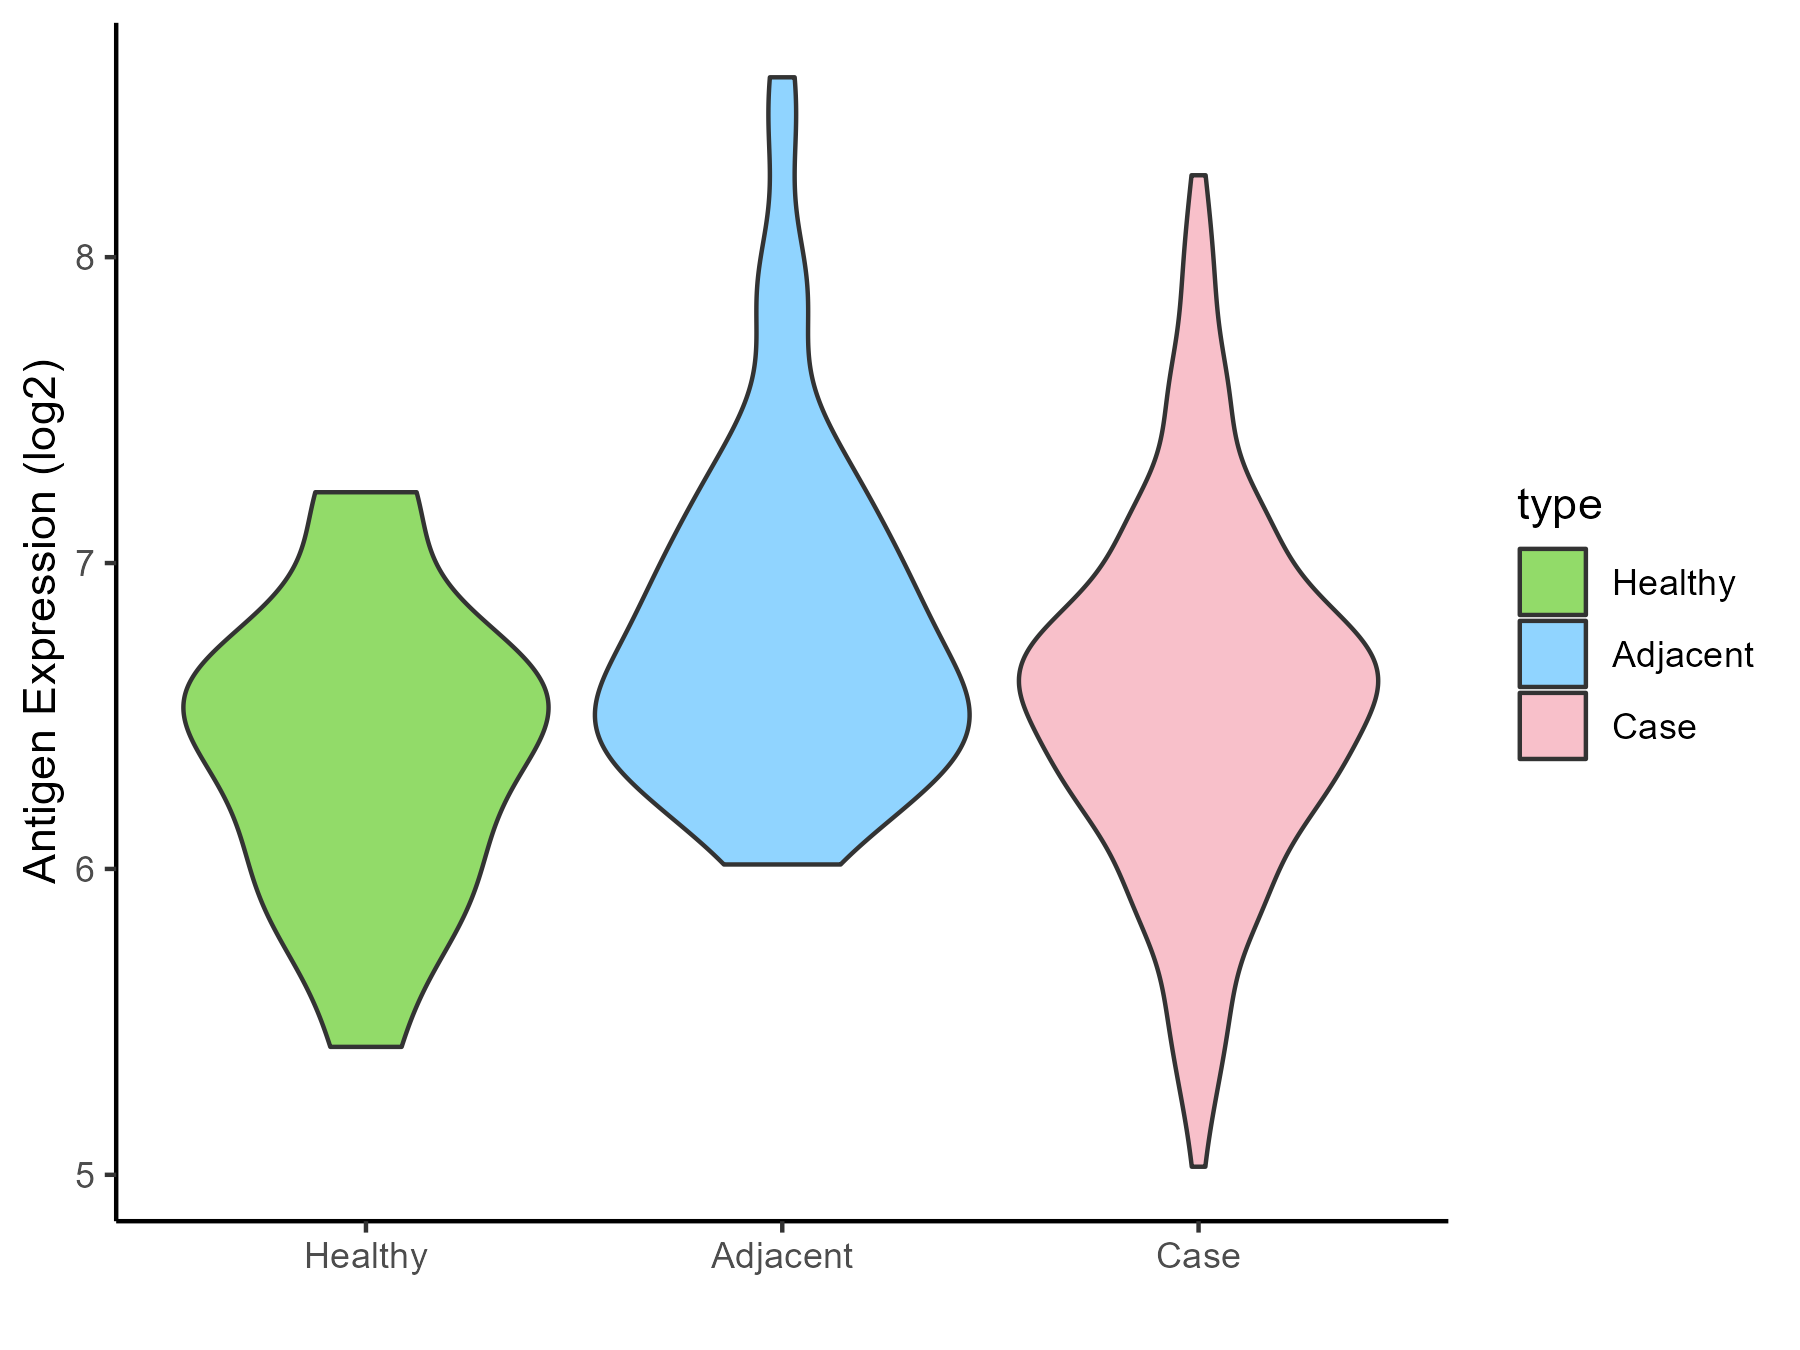
| The Studied Tissue | Pancreas | |
| The Specific Disease | Pancreatic cancer | |
| The Expression Level of Disease Section Compare with the Healthy Individual Tissue | p-value: 0.173733362; Fold-change: 0.087089785; Z-score: 0.180005426 | |
| The Expression Level of Disease Section Compare with the Adjacent Tissue | p-value: 0.006464504; Fold-change: -0.067088655; Z-score: -0.121367895 | |
| Disease-specific Antigen Abundances |
|
Click to View the Clearer Original Diagram |
| Differential expression pattern of antigen in diseases | ||
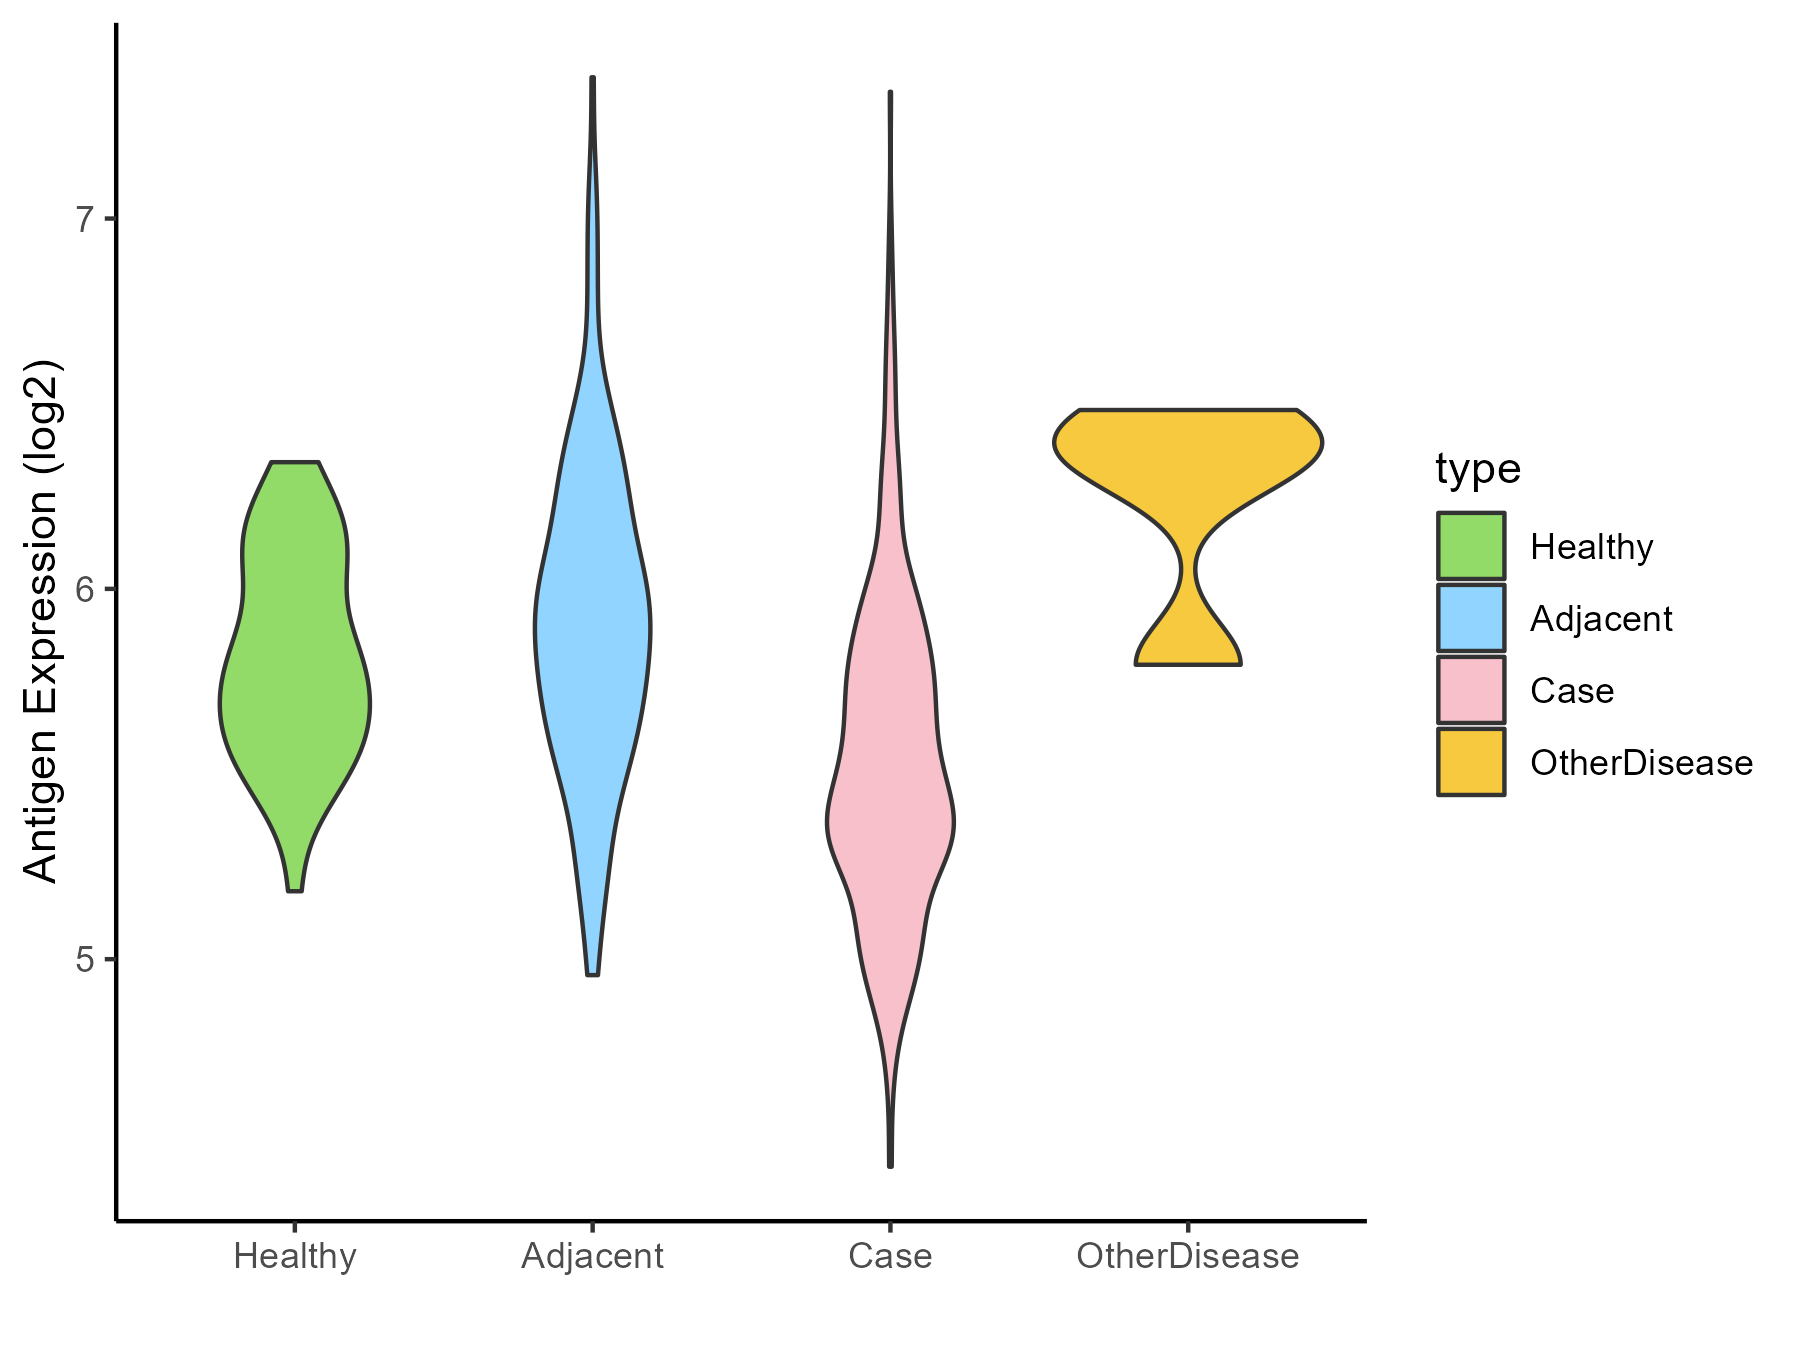
| The Studied Tissue | Liver | |
| The Specific Disease | Liver cancer | |
| The Expression Level of Disease Section Compare with the Healthy Individual Tissue | p-value: 1.62E-07; Fold-change: -0.320302205; Z-score: -1.141620863 | |
| The Expression Level of Disease Section Compare with the Adjacent Tissue | p-value: 6.43E-21; Fold-change: -0.427116203; Z-score: -1.00109189 | |
| The Expression Level of Disease Section Compare with the Other Disease Section | p-value: 0.018025535; Fold-change: -0.878958673; Z-score: -2.846802965 | |
| Disease-specific Antigen Abundances |
|
Click to View the Clearer Original Diagram |
| Differential expression pattern of antigen in diseases | ||
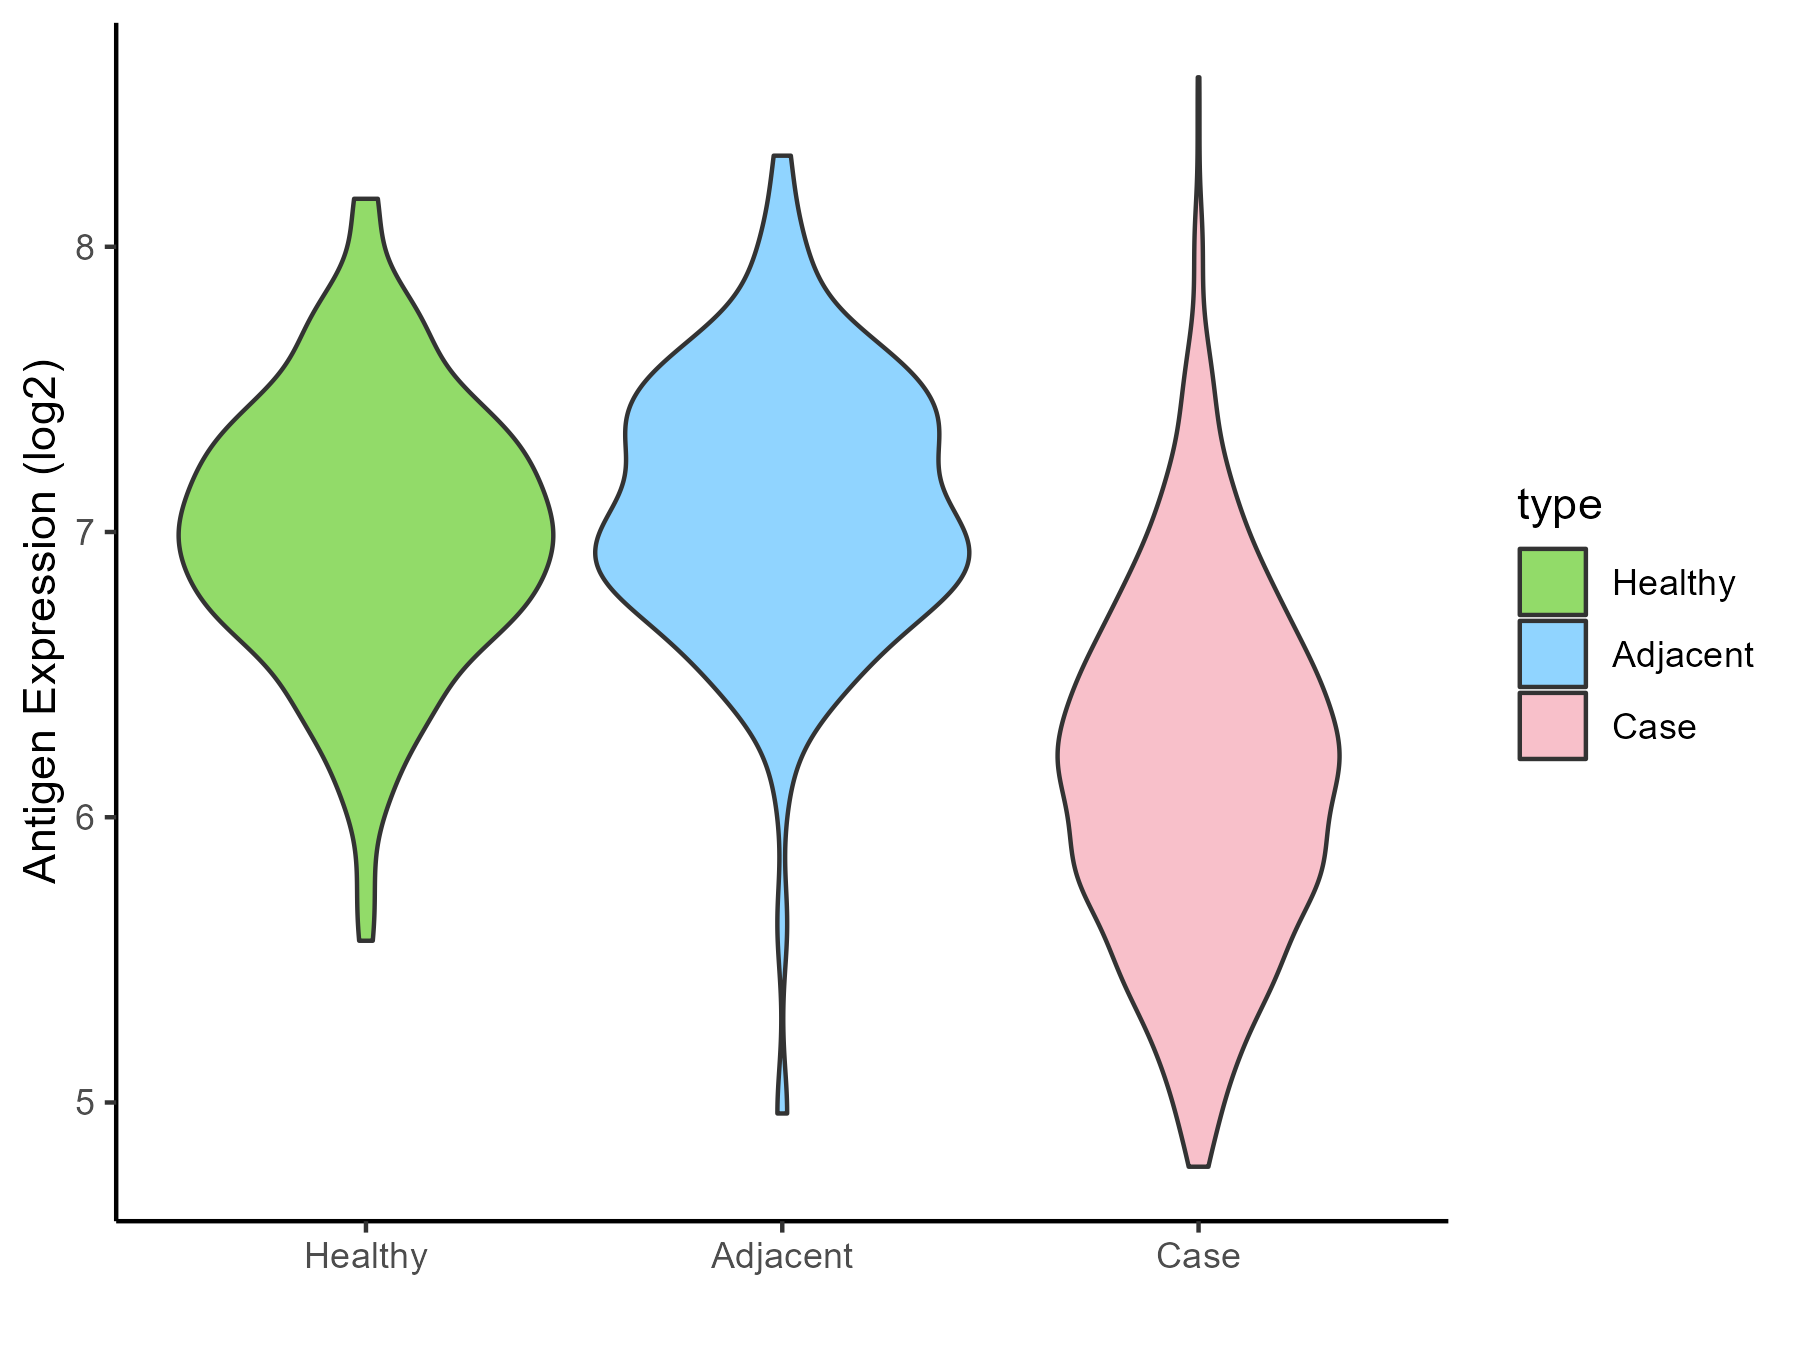
| The Studied Tissue | Lung | |
| The Specific Disease | Lung cancer | |
| The Expression Level of Disease Section Compare with the Healthy Individual Tissue | p-value: 1.51E-60; Fold-change: -0.83185502; Z-score: -1.789528367 | |
| The Expression Level of Disease Section Compare with the Adjacent Tissue | p-value: 3.09E-42; Fold-change: -0.900503762; Z-score: -1.868569621 | |
| Disease-specific Antigen Abundances |
|
Click to View the Clearer Original Diagram |
| Differential expression pattern of antigen in diseases | ||
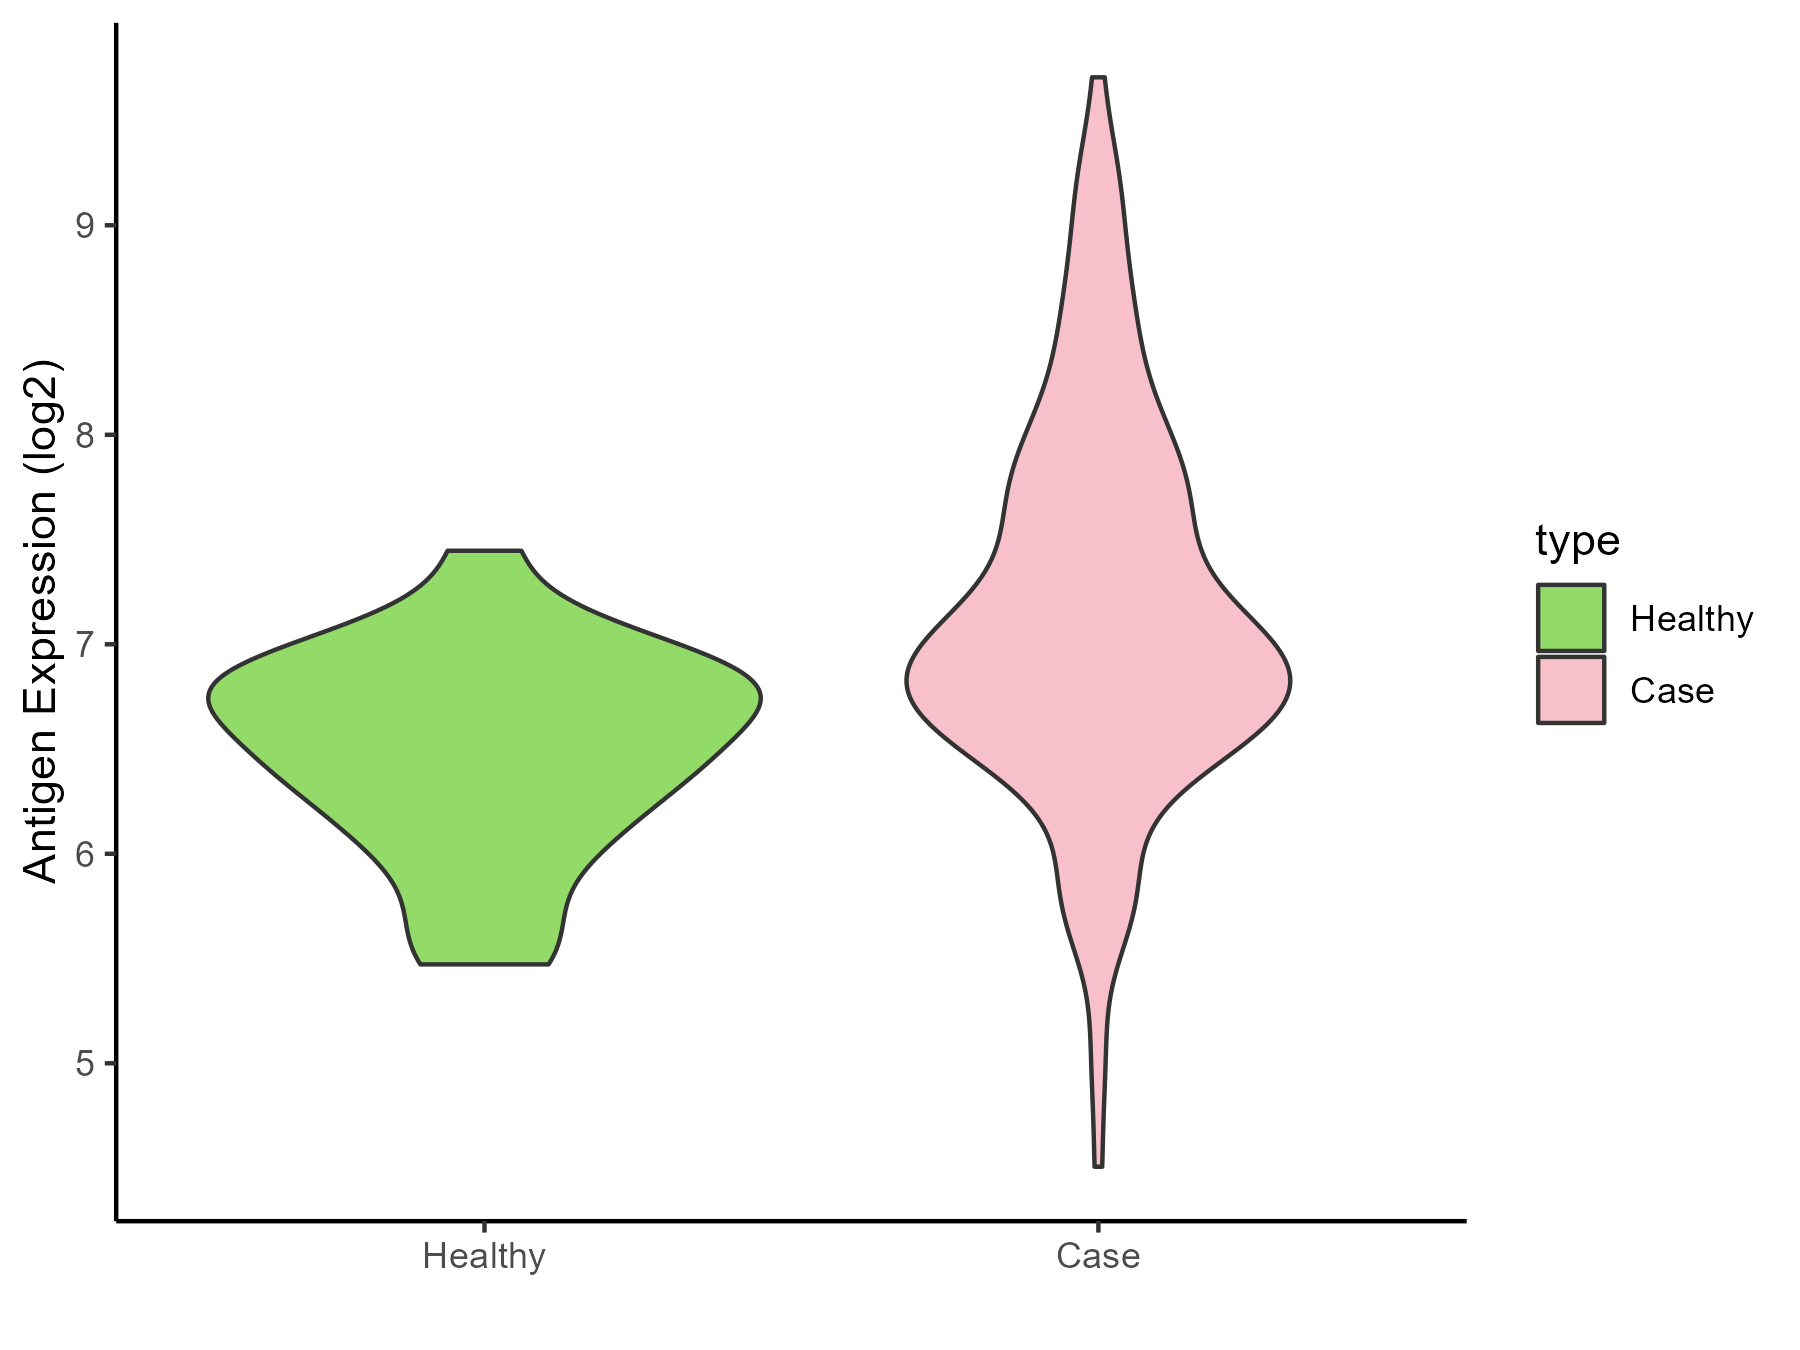
| The Studied Tissue | Skin | |
| The Specific Disease | Melanoma | |
| The Expression Level of Disease Section Compare with the Healthy Individual Tissue | p-value: 3.07E-06; Fold-change: 0.460094625; Z-score: 0.934589322 | |
| Disease-specific Antigen Abundances |
|
Click to View the Clearer Original Diagram |
| Differential expression pattern of antigen in diseases | ||
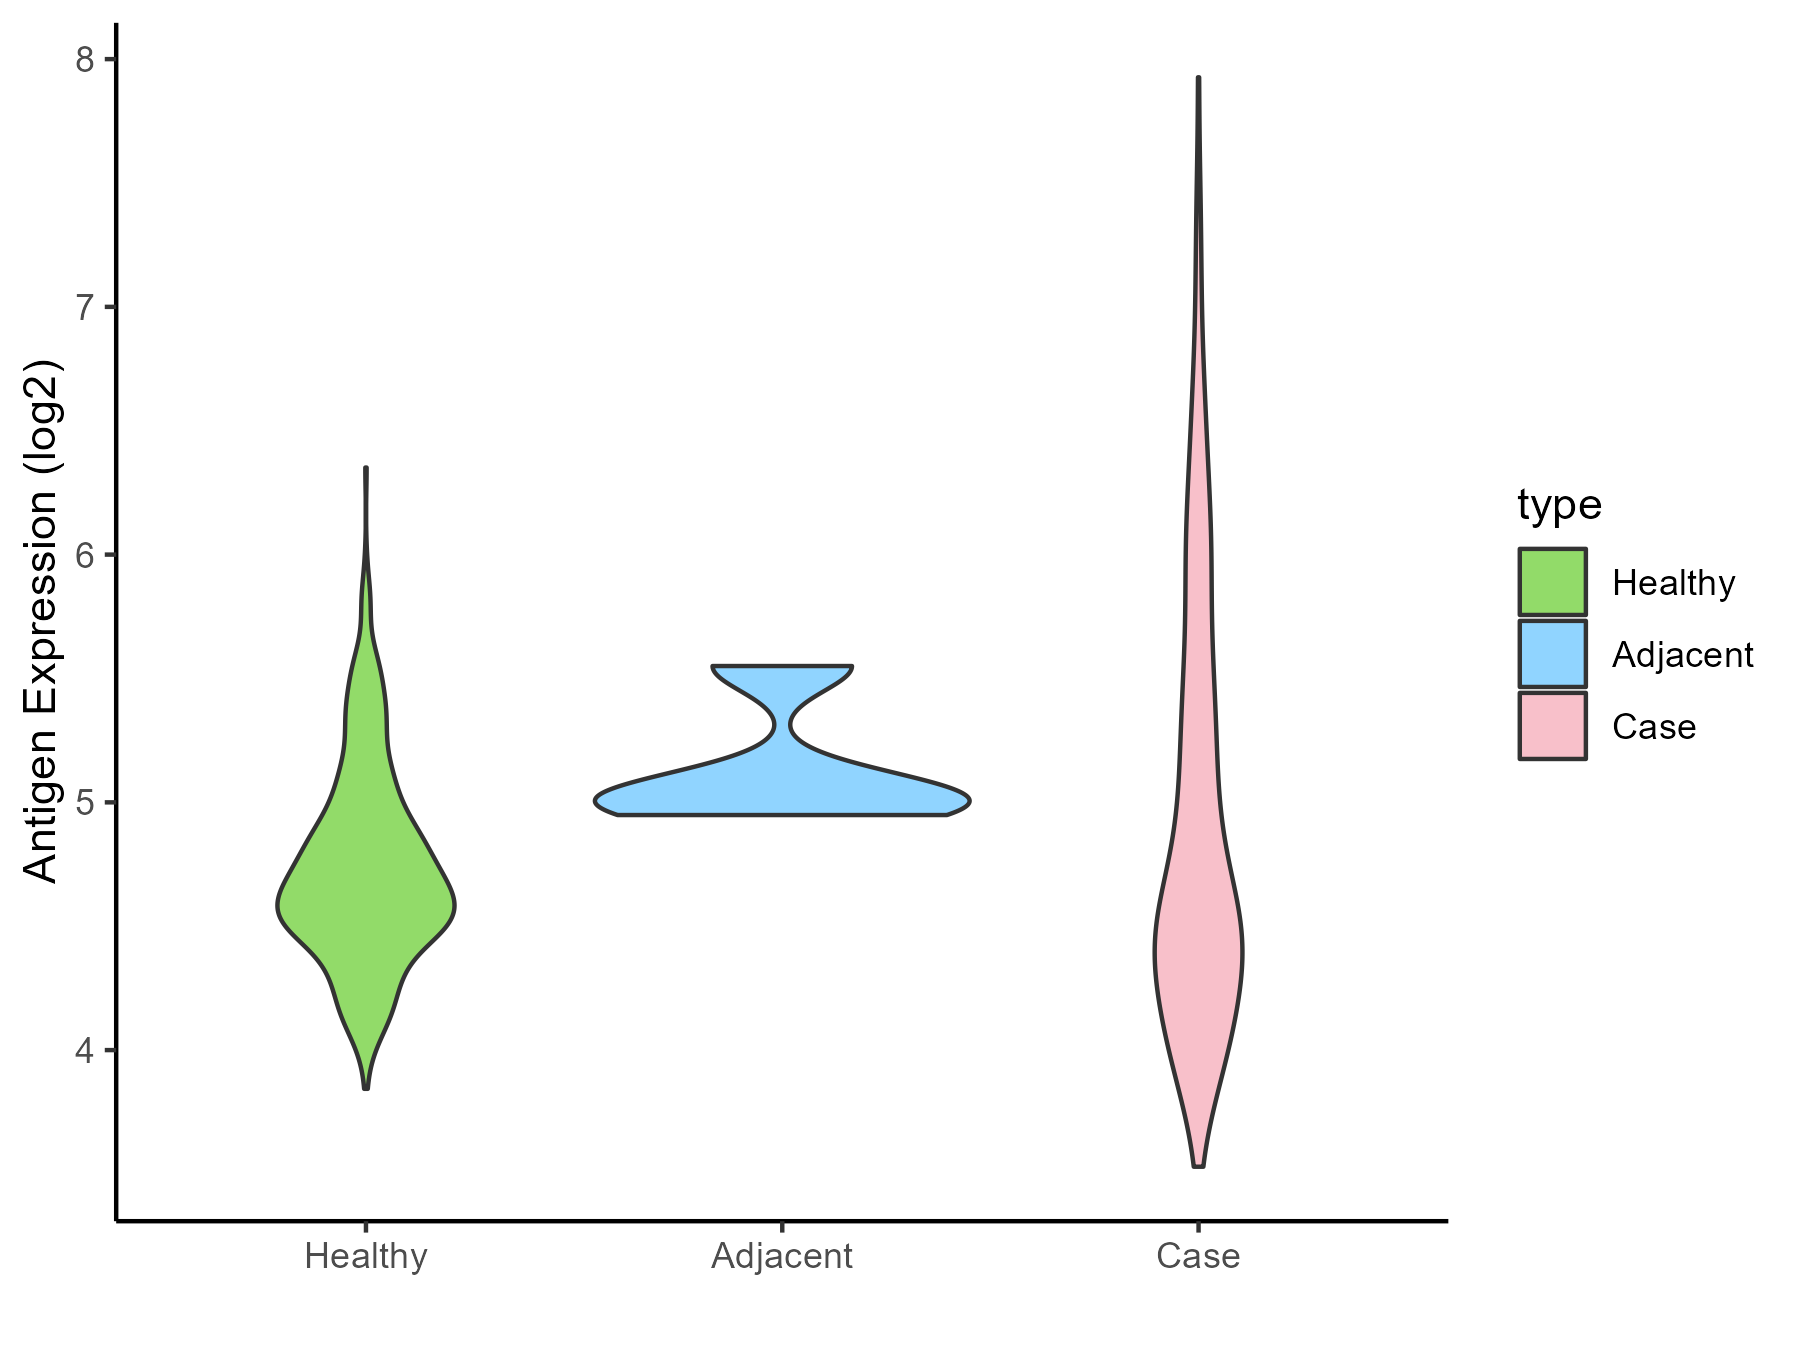
| The Studied Tissue | Muscle | |
| The Specific Disease | Sarcoma | |
| The Expression Level of Disease Section Compare with the Healthy Individual Tissue | p-value: 6.04E-06; Fold-change: -0.053665412; Z-score: -0.136514096 | |
| The Expression Level of Disease Section Compare with the Adjacent Tissue | p-value: 0.202795601; Fold-change: -0.426680525; Z-score: -1.545086404 | |
| Disease-specific Antigen Abundances |
|
Click to View the Clearer Original Diagram |
| Differential expression pattern of antigen in diseases | ||
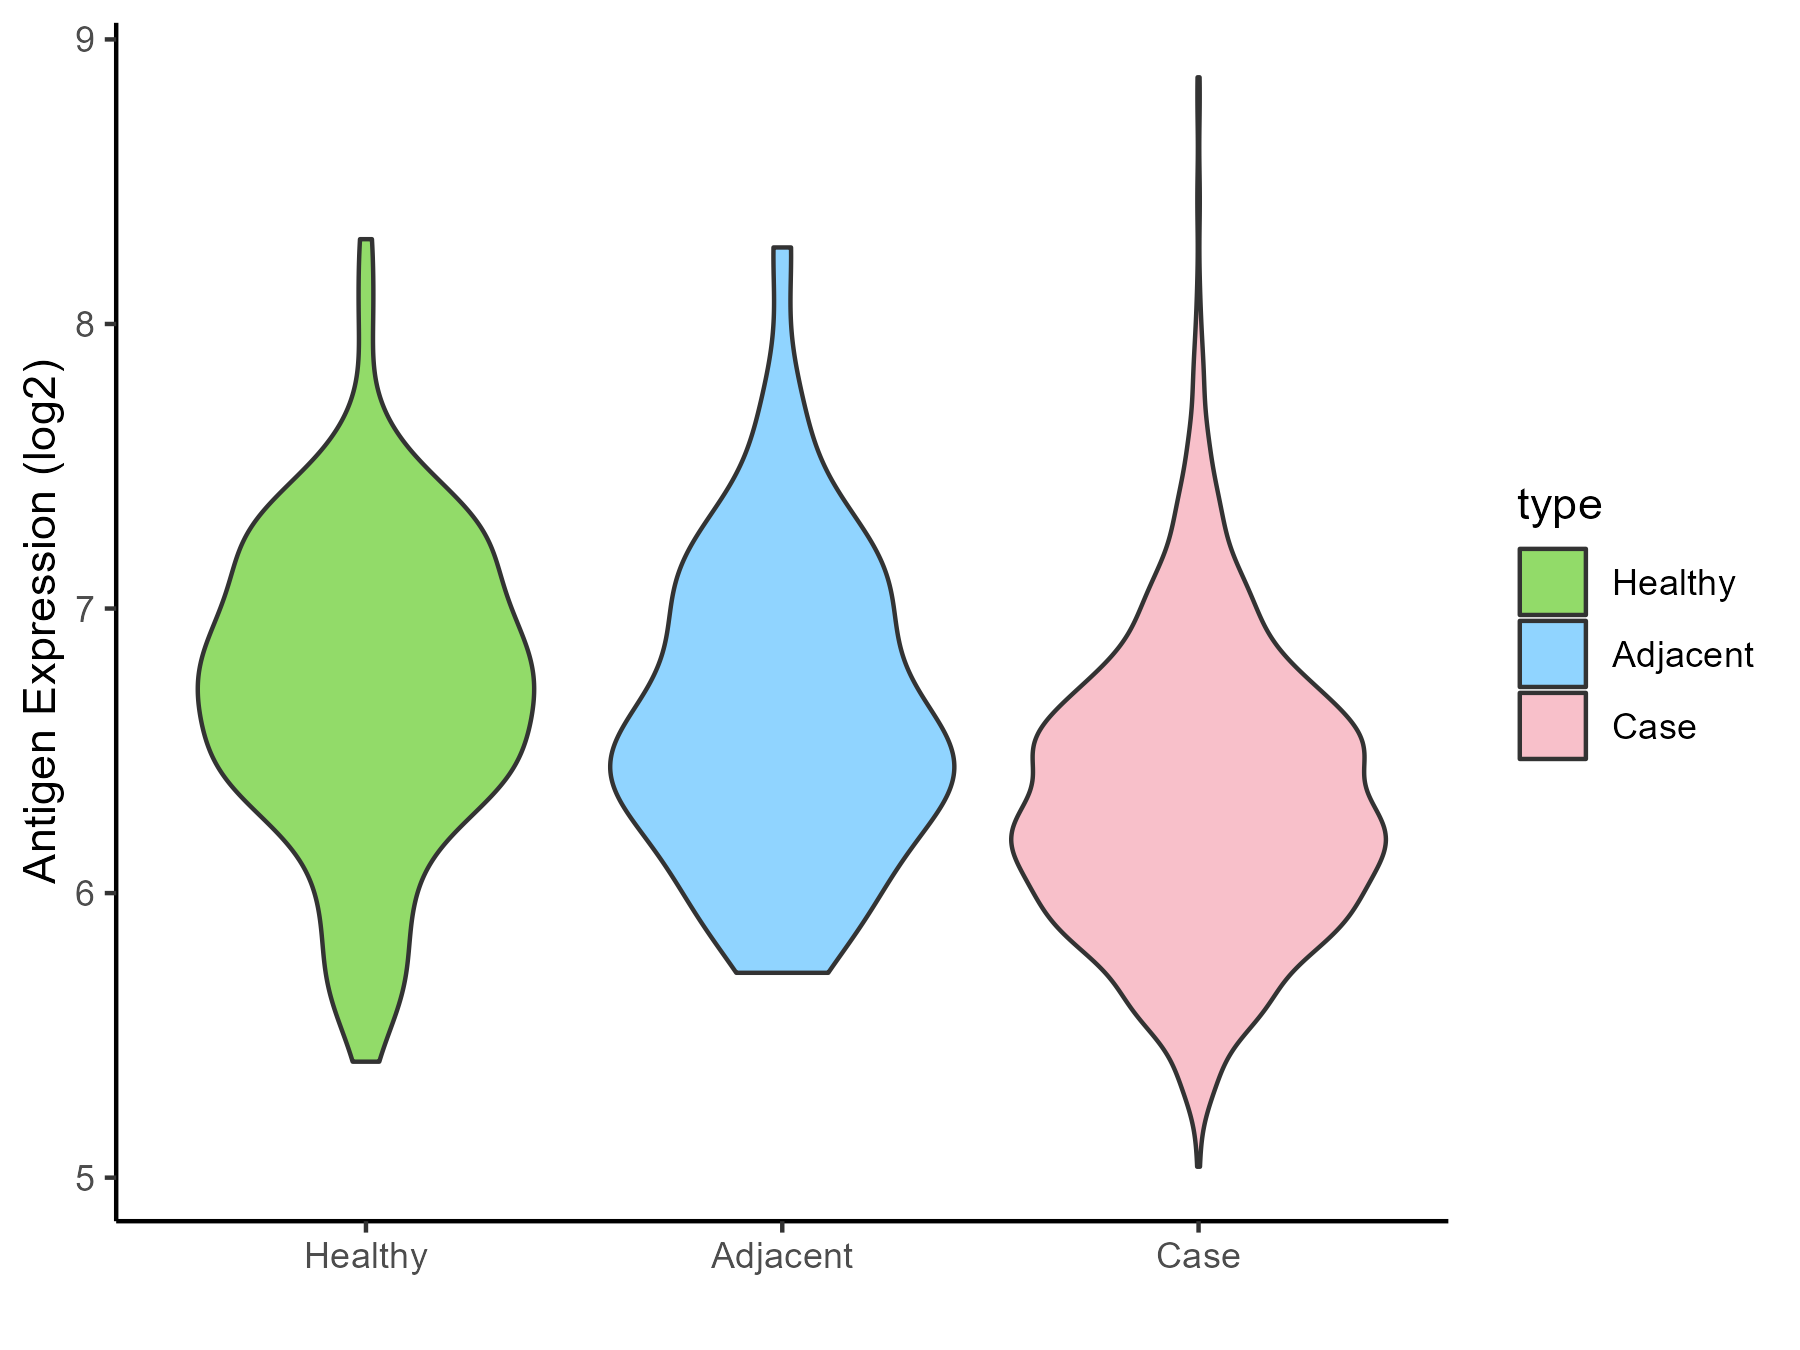
| The Studied Tissue | Breast | |
| The Specific Disease | Breast cancer | |
| The Expression Level of Disease Section Compare with the Healthy Individual Tissue | p-value: 1.72E-25; Fold-change: -0.440436203; Z-score: -0.841835421 | |
| The Expression Level of Disease Section Compare with the Adjacent Tissue | p-value: 0.000180606; Fold-change: -0.268569442; Z-score: -0.504266611 | |
| Disease-specific Antigen Abundances |
|
Click to View the Clearer Original Diagram |
| Differential expression pattern of antigen in diseases | ||
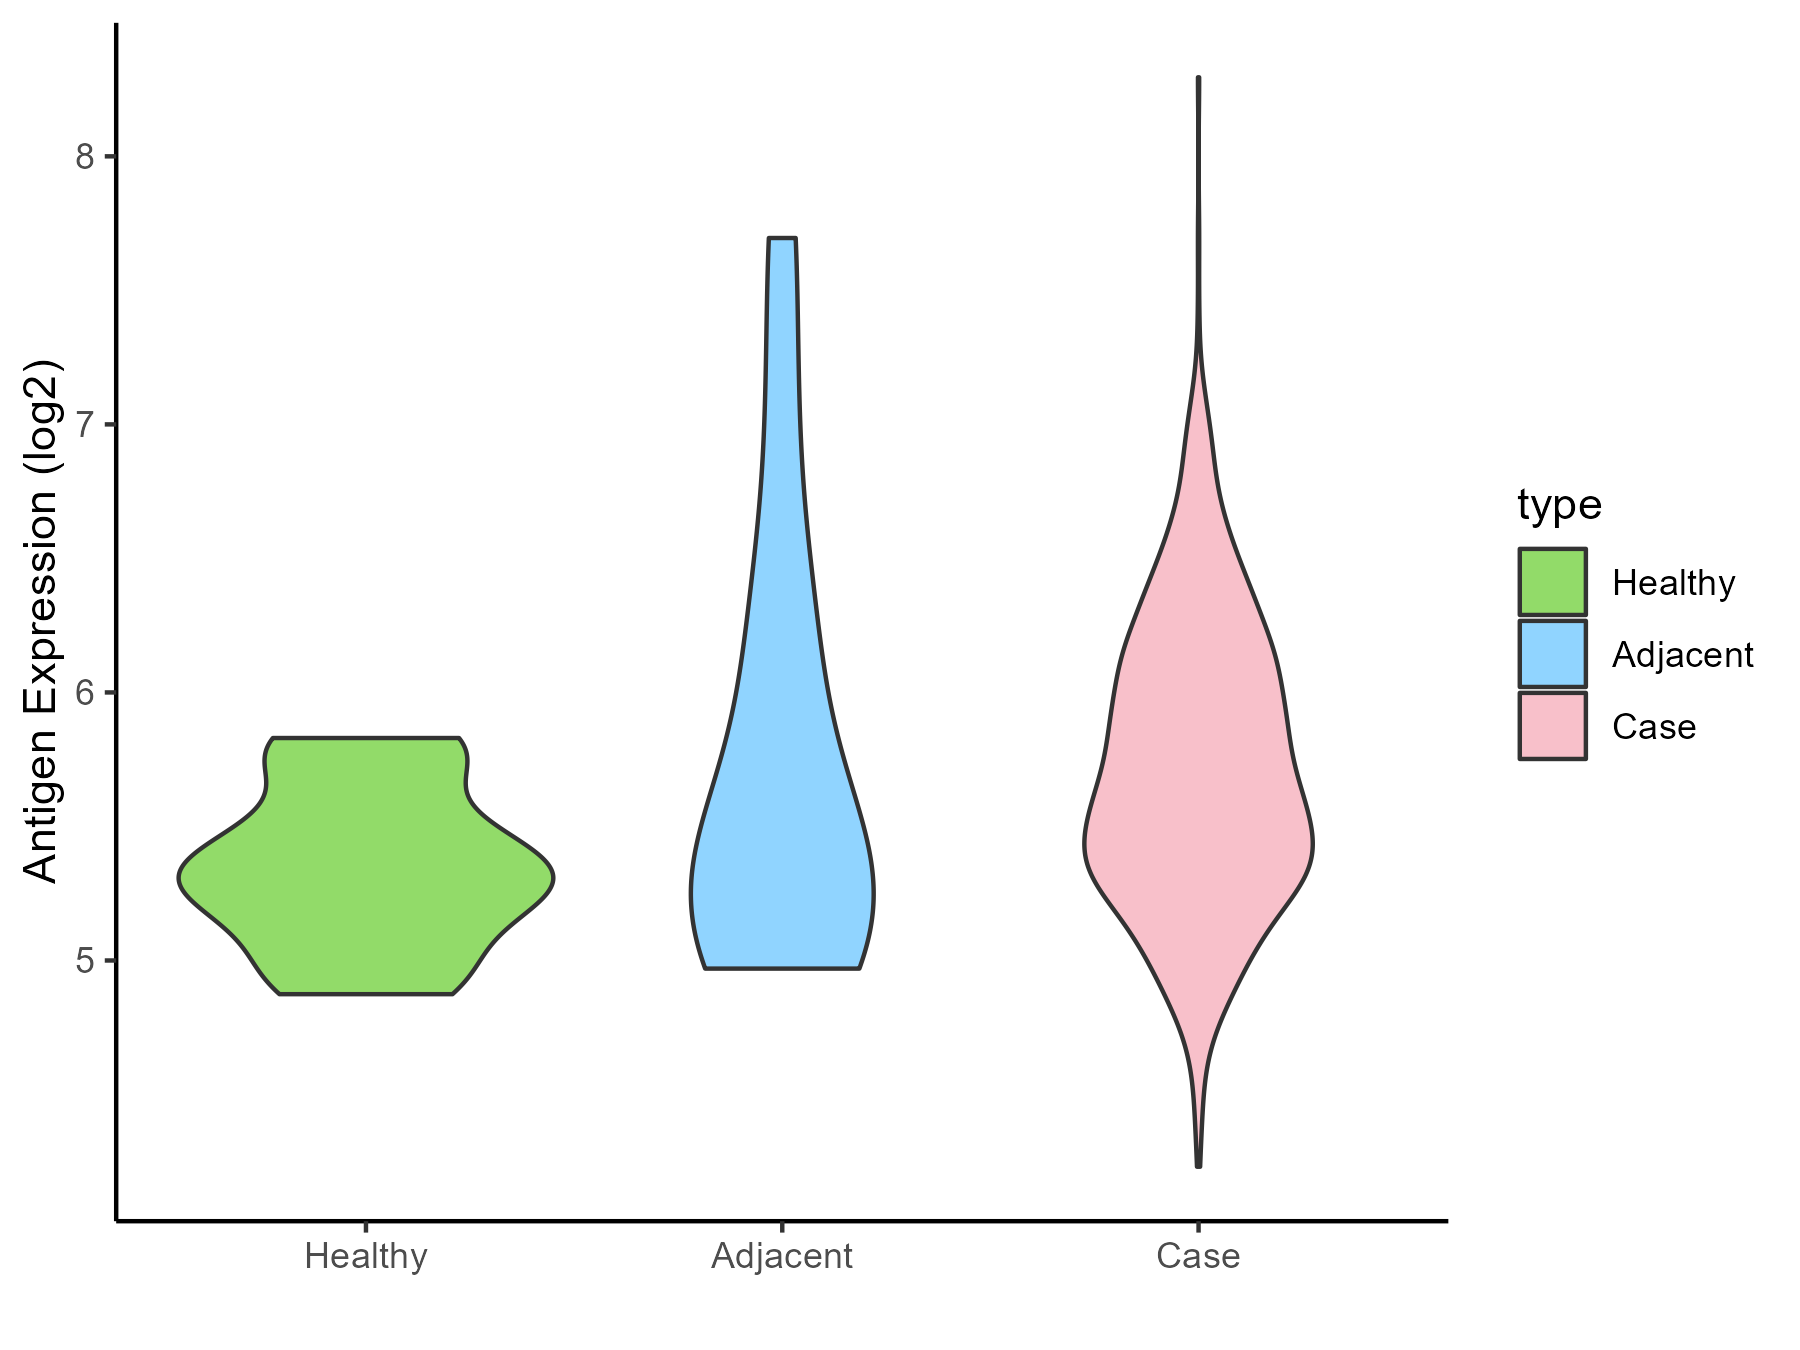
| The Studied Tissue | Ovarian | |
| The Specific Disease | Ovarian cancer | |
| The Expression Level of Disease Section Compare with the Healthy Individual Tissue | p-value: 0.007614477; Fold-change: 0.364277838; Z-score: 1.141354714 | |
| The Expression Level of Disease Section Compare with the Adjacent Tissue | p-value: 0.993340092; Fold-change: 0.23098312; Z-score: 0.280021302 | |
| Disease-specific Antigen Abundances |
|
Click to View the Clearer Original Diagram |
| Differential expression pattern of antigen in diseases | ||
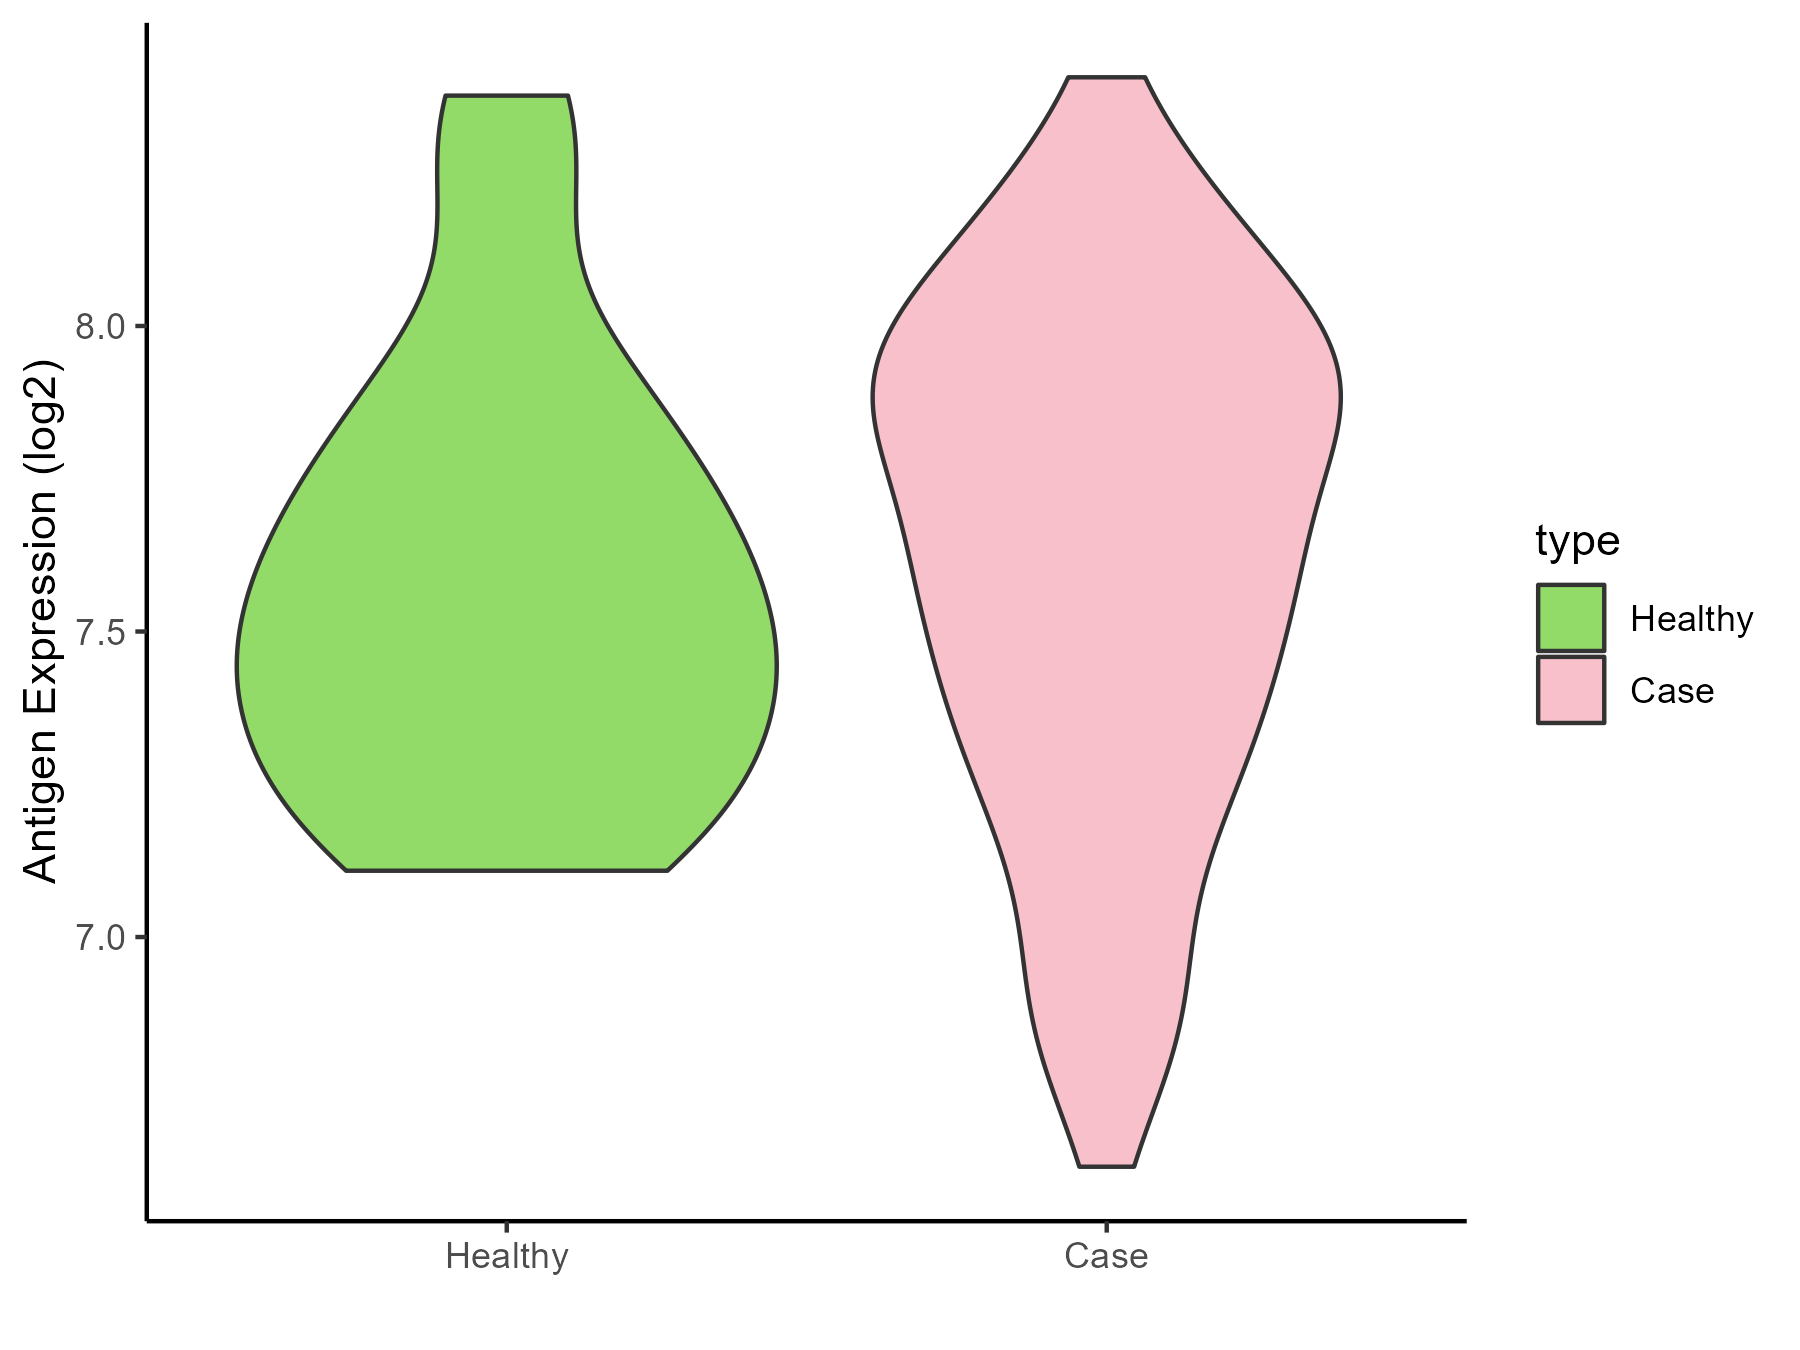
| The Studied Tissue | Cervical | |
| The Specific Disease | Cervical cancer | |
| The Expression Level of Disease Section Compare with the Healthy Individual Tissue | p-value: 0.662419235; Fold-change: 0.127586991; Z-score: 0.353301097 | |
| Disease-specific Antigen Abundances |
|
Click to View the Clearer Original Diagram |
| Differential expression pattern of antigen in diseases | ||
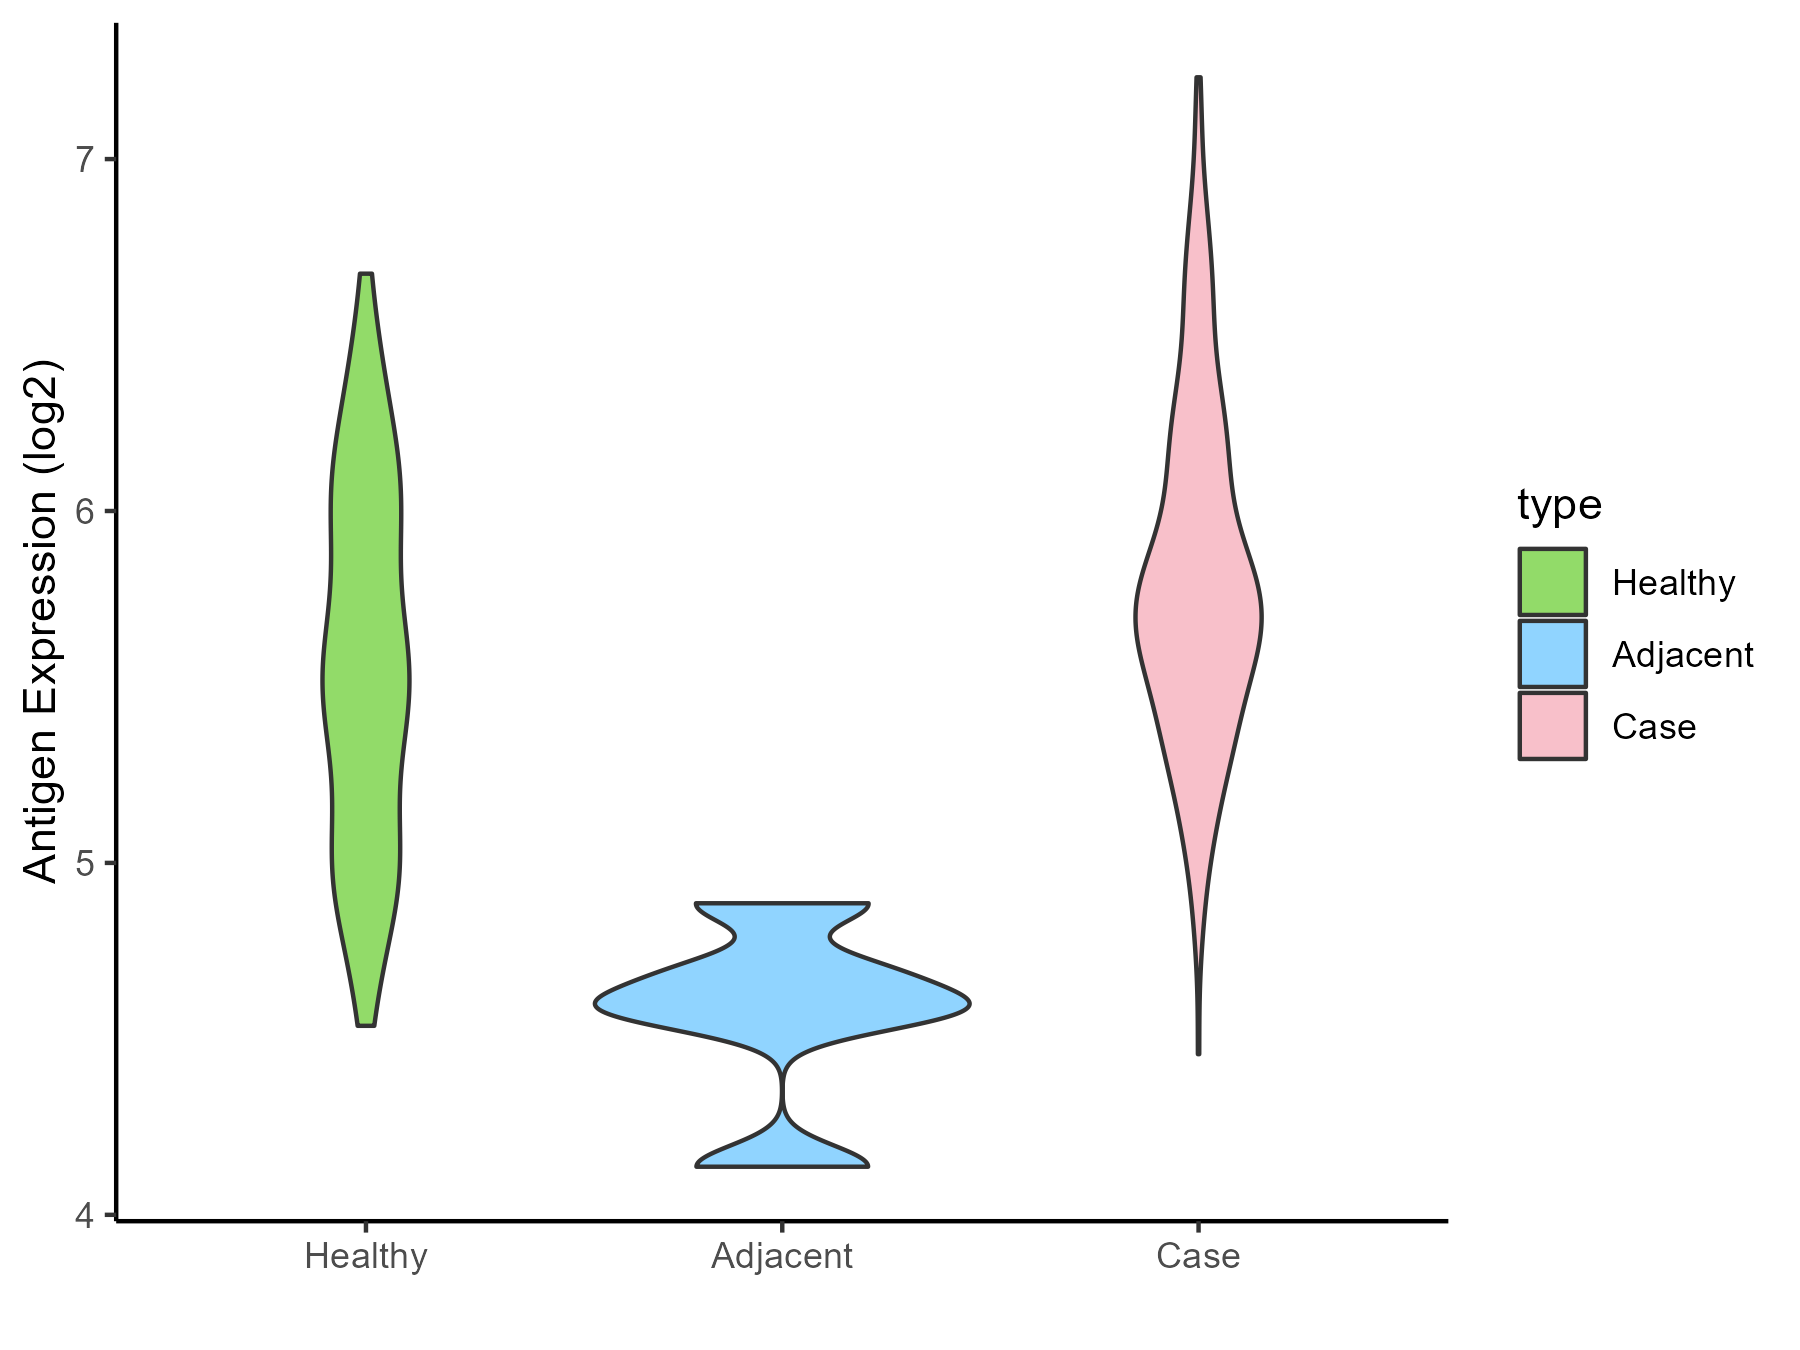
| The Studied Tissue | Endometrium | |
| The Specific Disease | Uterine cancer | |
| The Expression Level of Disease Section Compare with the Healthy Individual Tissue | p-value: 9.35E-06; Fold-change: 0.17878966; Z-score: 0.346728765 | |
| The Expression Level of Disease Section Compare with the Adjacent Tissue | p-value: 0.000385379; Fold-change: 1.141969968; Z-score: 4.151064208 | |
| Disease-specific Antigen Abundances |
|
Click to View the Clearer Original Diagram |
| Differential expression pattern of antigen in diseases | ||
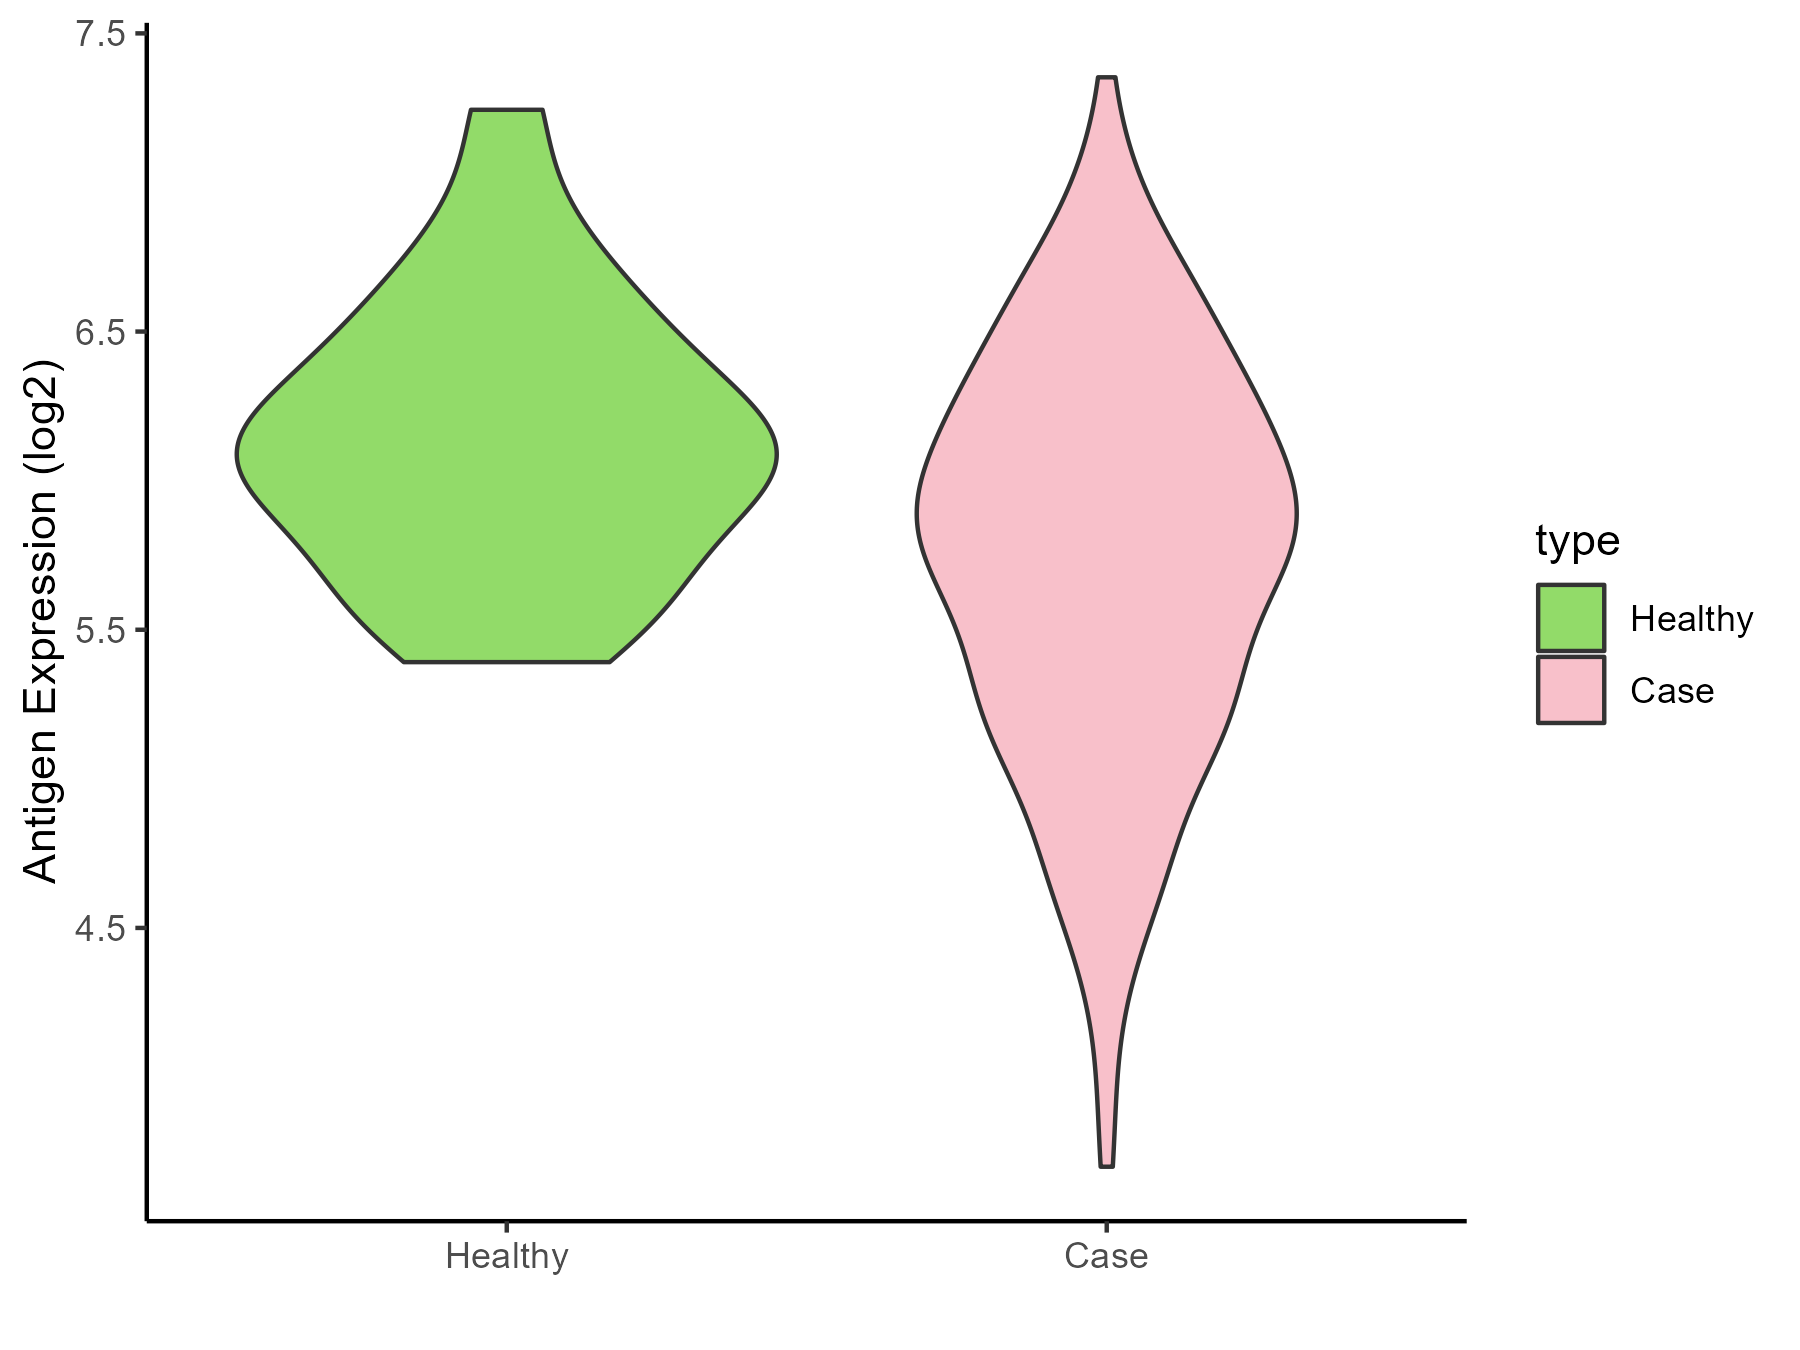
| The Studied Tissue | Prostate | |
| The Specific Disease | Prostate cancer | |
| The Expression Level of Disease Section Compare with the Healthy Individual Tissue | p-value: 0.001524126; Fold-change: -0.259230041; Z-score: -0.556985699 | |
| Disease-specific Antigen Abundances |
|
Click to View the Clearer Original Diagram |
| Differential expression pattern of antigen in diseases | ||
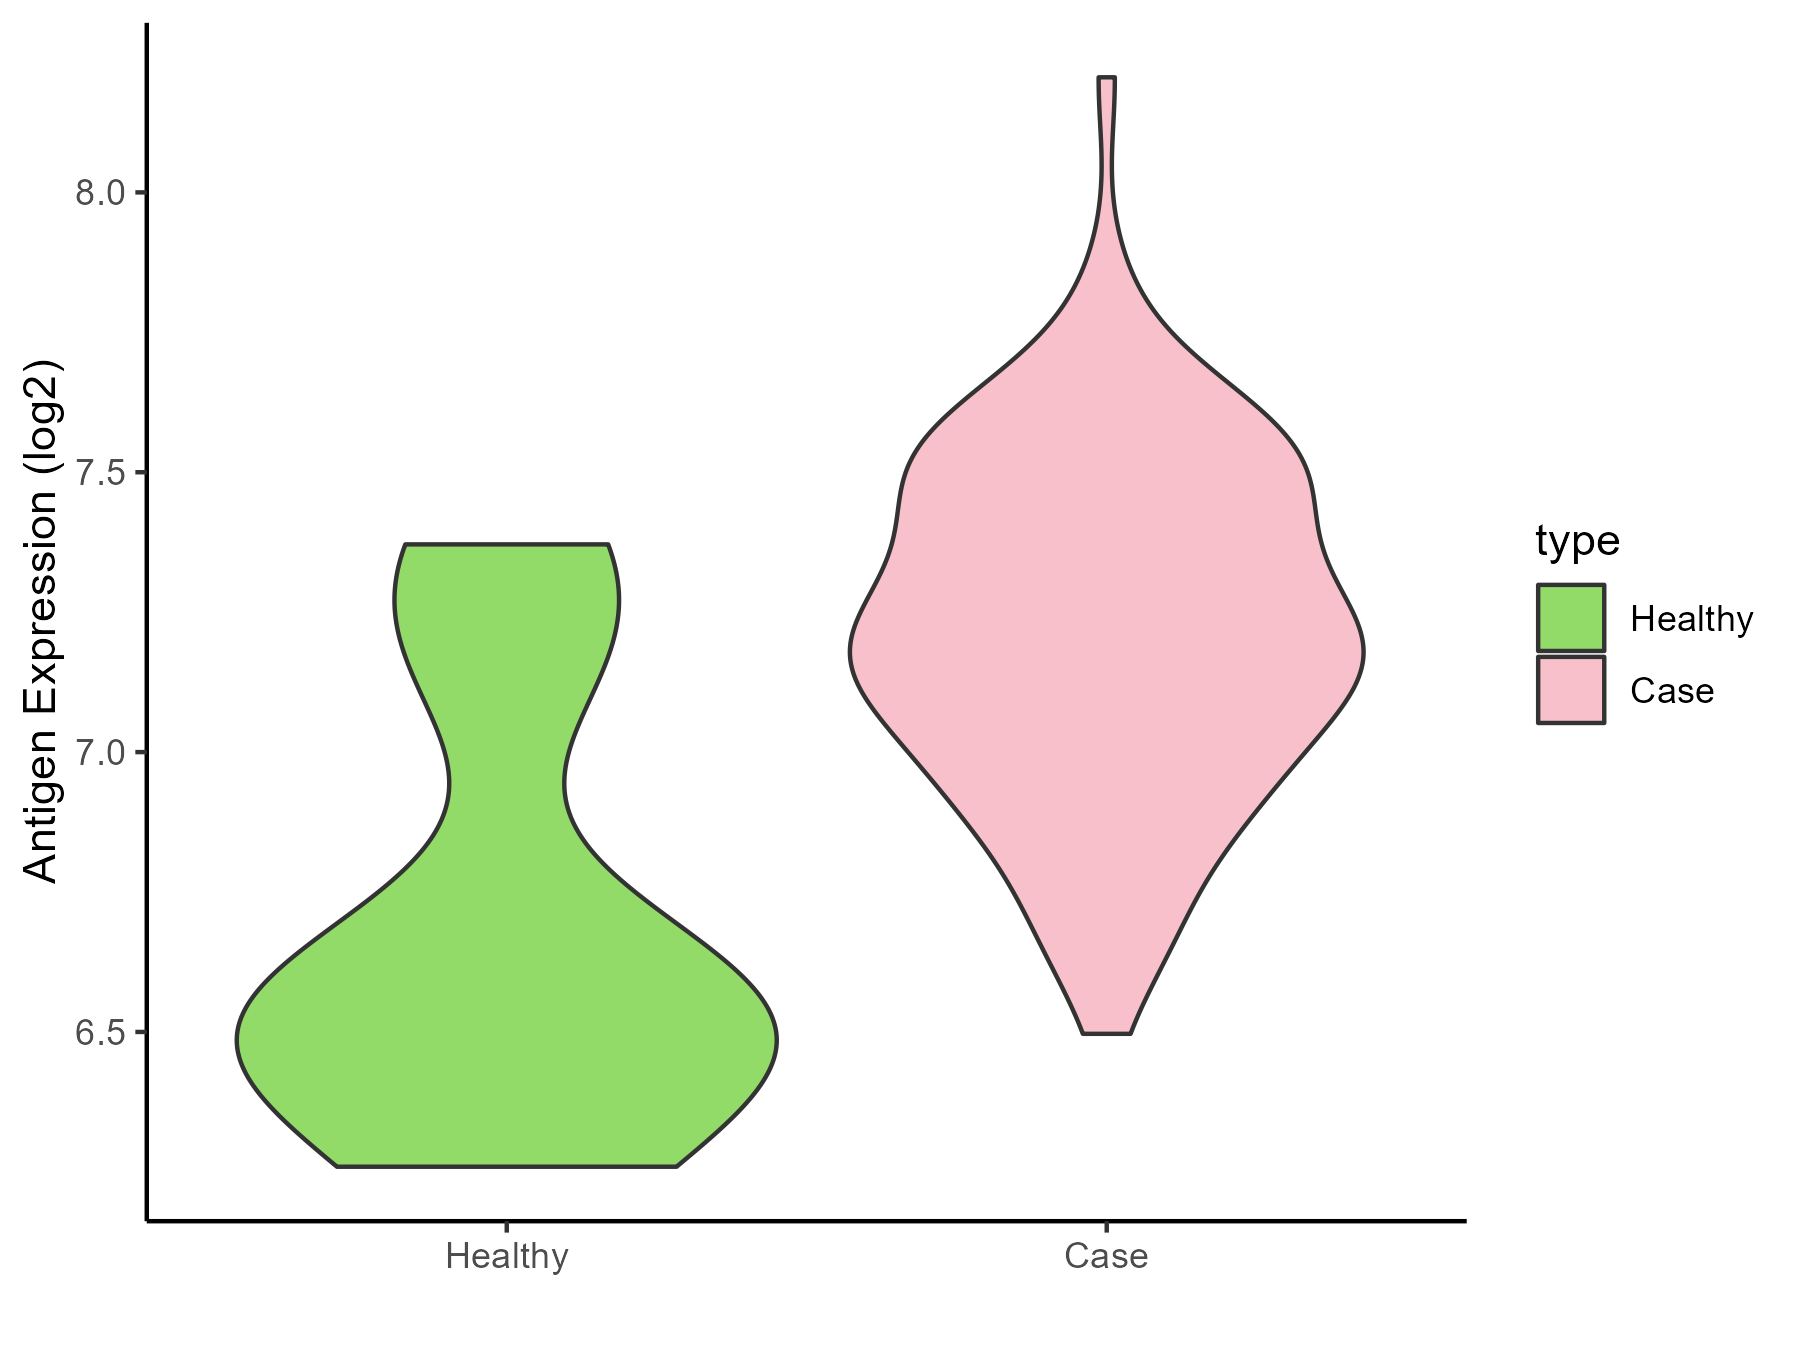
| The Studied Tissue | Bladder | |
| The Specific Disease | Bladder cancer | |
| The Expression Level of Disease Section Compare with the Healthy Individual Tissue | p-value: 0.014101812; Fold-change: 0.644972919; Z-score: 1.560094129 | |
| Disease-specific Antigen Abundances |
|
Click to View the Clearer Original Diagram |
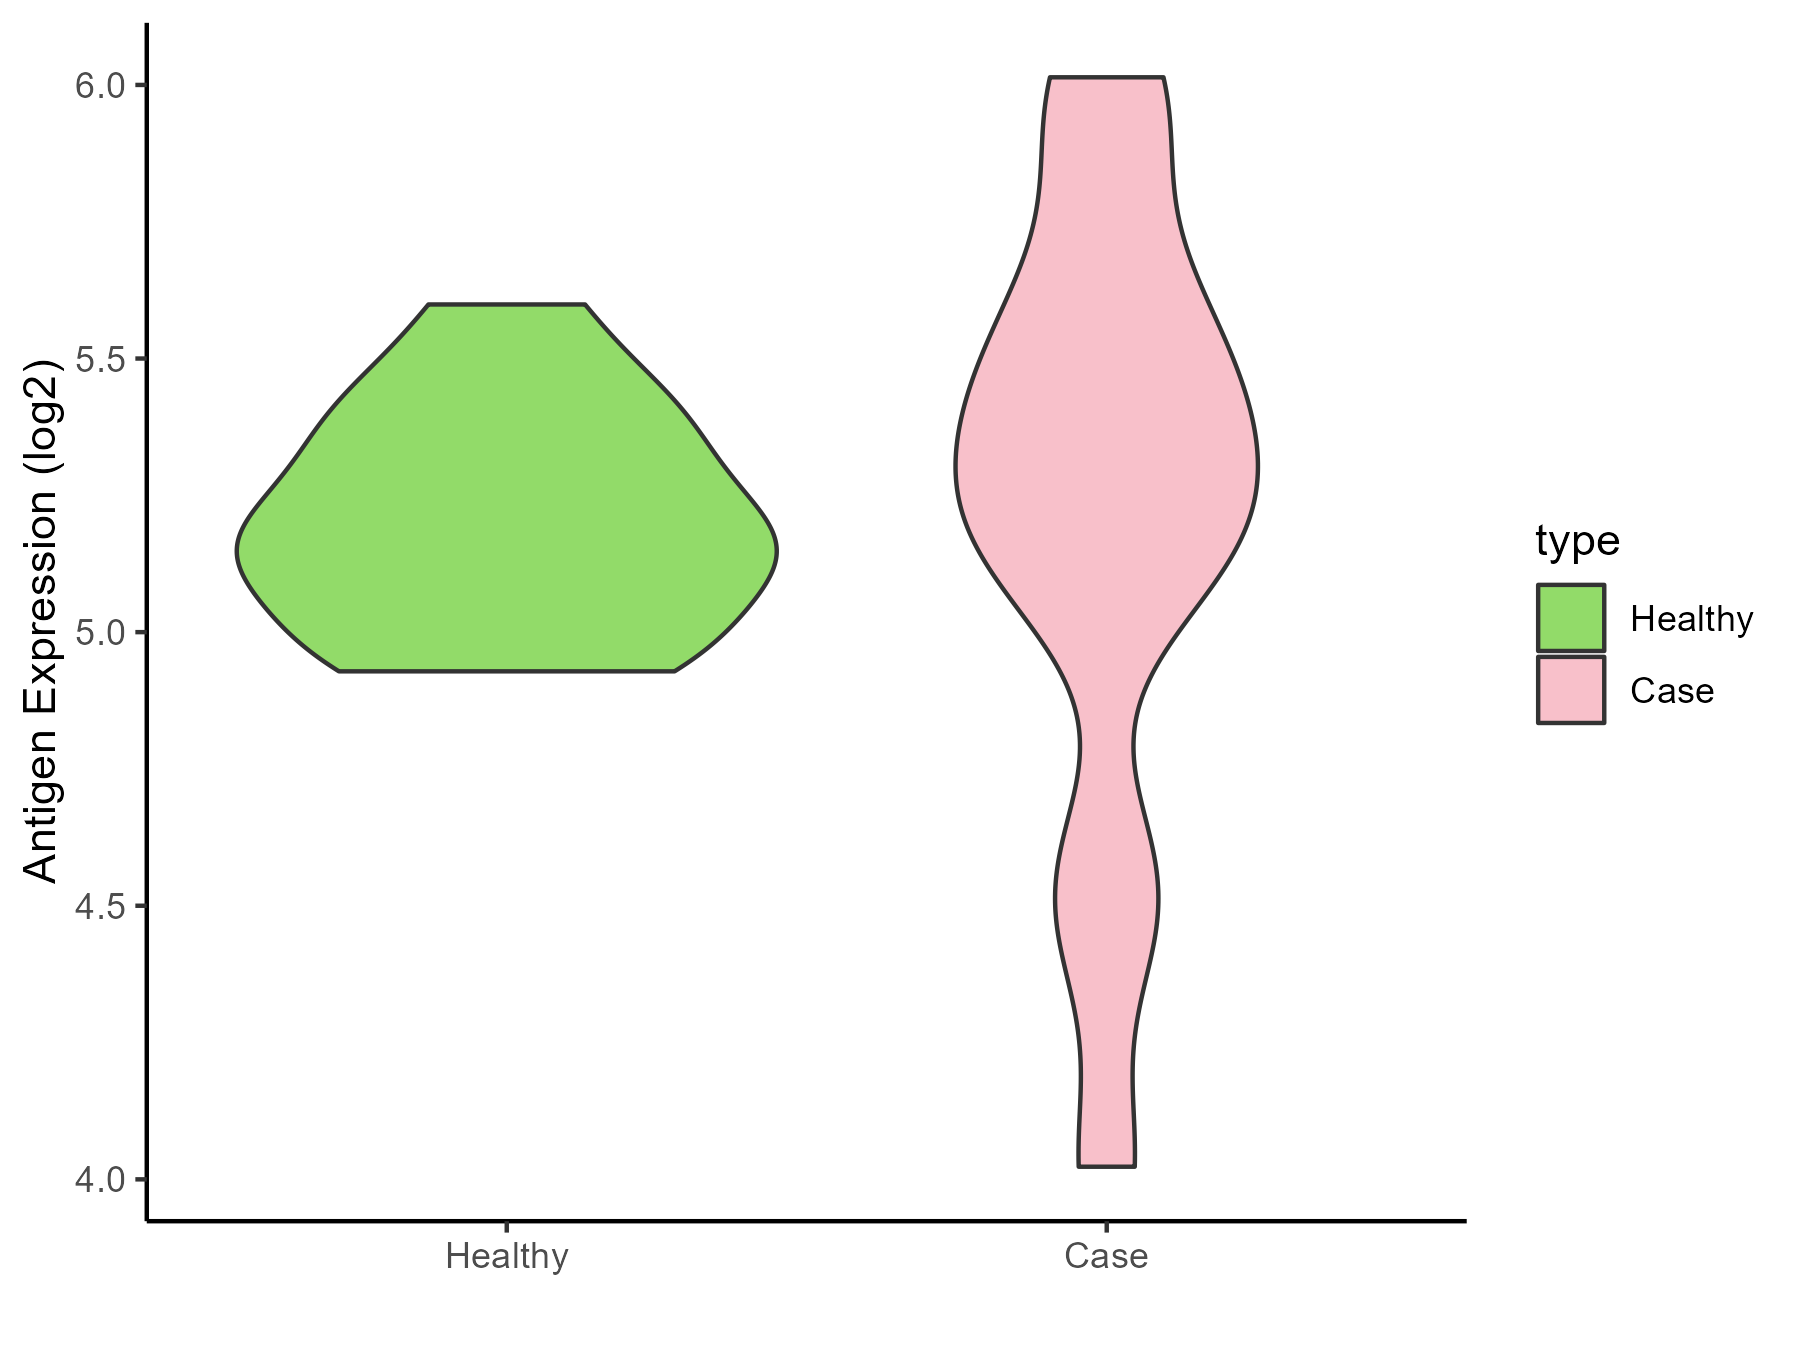
| Differential expression pattern of antigen in diseases | ||
| The Studied Tissue | Uvea | |
| The Specific Disease | Retinoblastoma tumor | |
| The Expression Level of Disease Section Compare with the Healthy Individual Tissue | p-value: 0.918295356; Fold-change: 0.126952925; Z-score: 0.614512512 | |
| Disease-specific Antigen Abundances |
|
Click to View the Clearer Original Diagram |
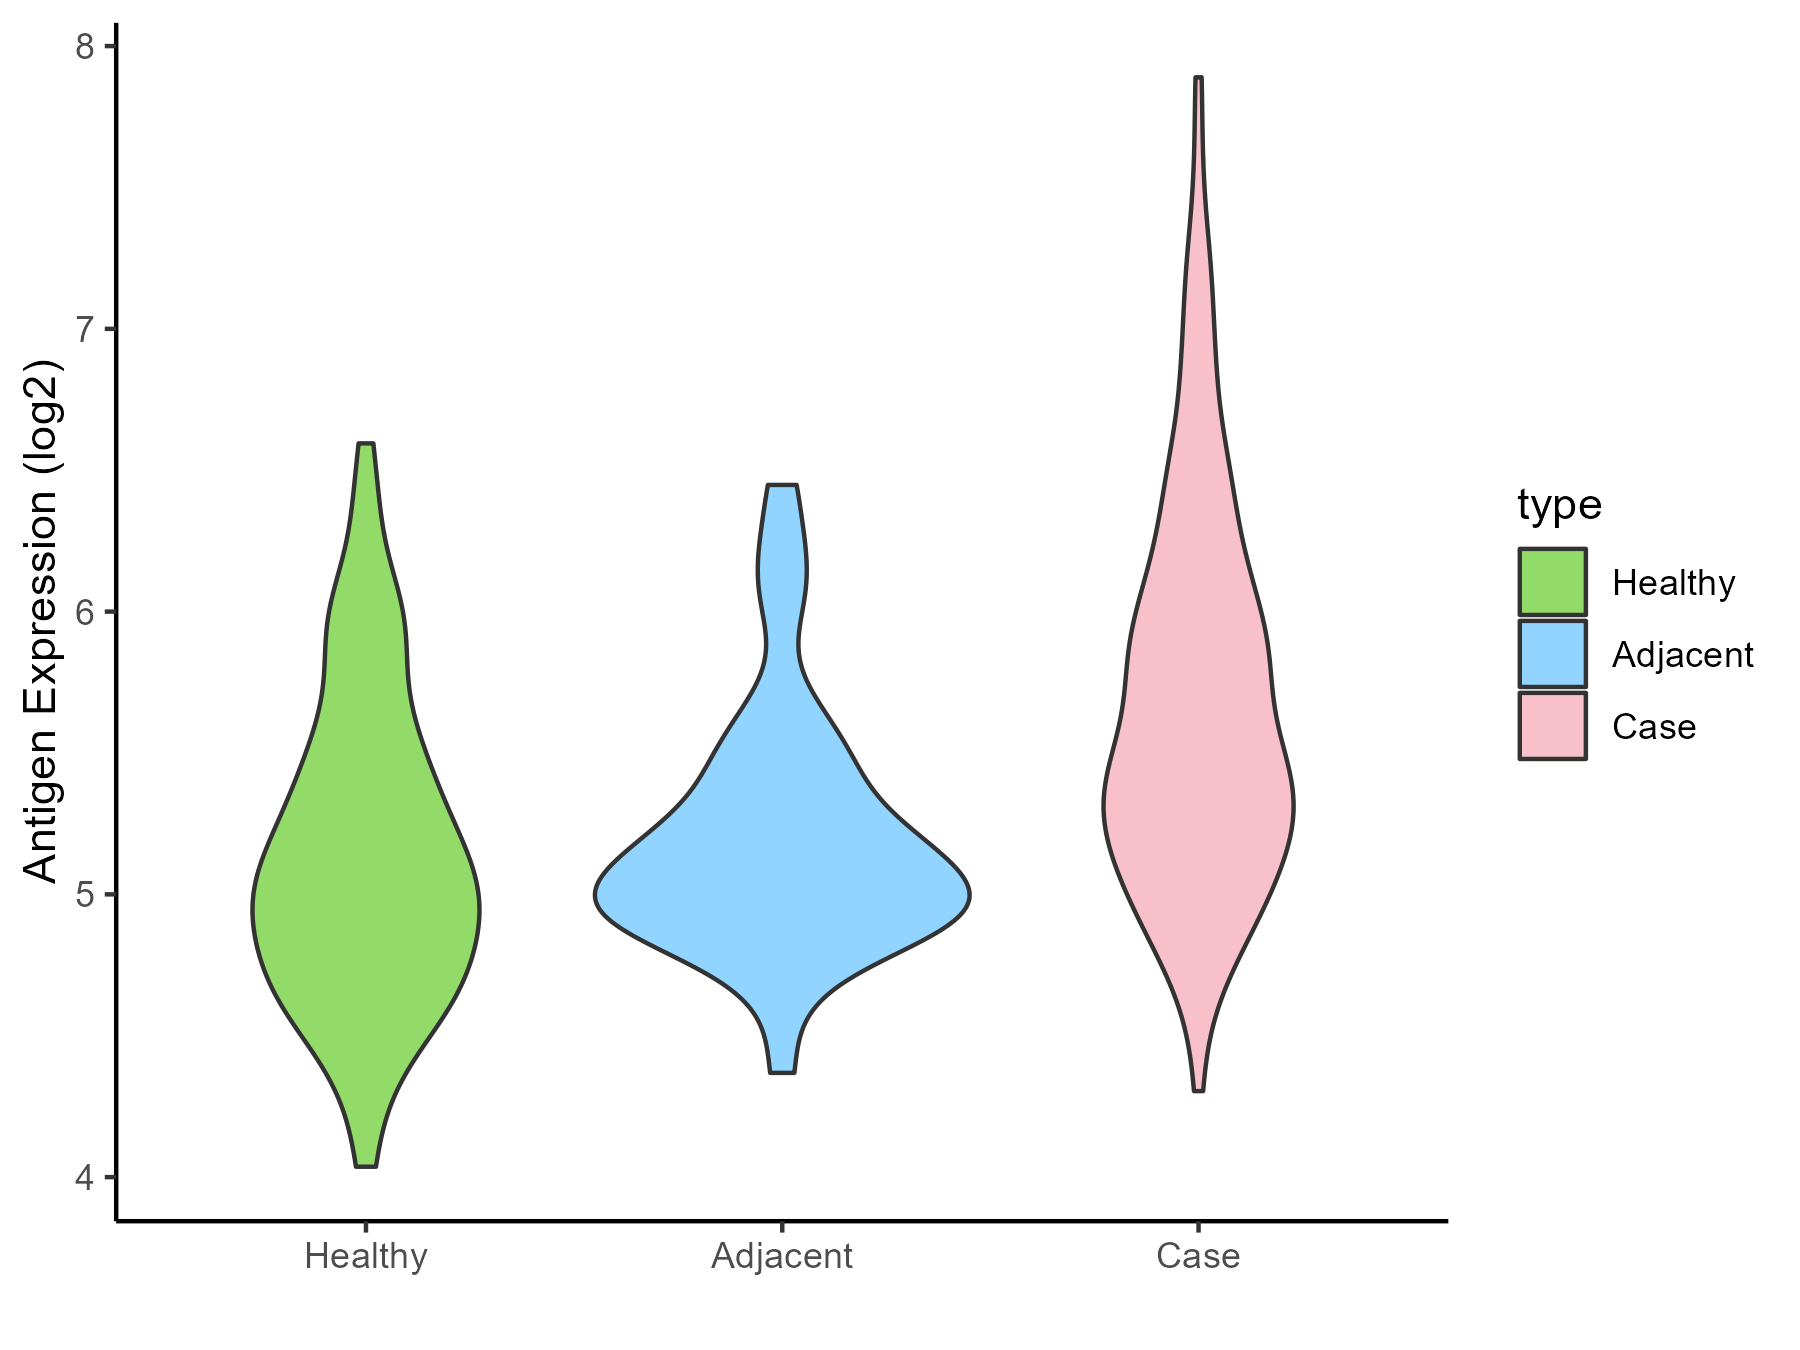
| Differential expression pattern of antigen in diseases | ||
| The Studied Tissue | Thyroid | |
| The Specific Disease | Thyroid cancer | |
| The Expression Level of Disease Section Compare with the Healthy Individual Tissue | p-value: 1.79E-14; Fold-change: 0.501286506; Z-score: 0.93895949 | |
| The Expression Level of Disease Section Compare with the Adjacent Tissue | p-value: 3.24E-08; Fold-change: 0.472078505; Z-score: 1.09799793 | |
| Disease-specific Antigen Abundances |
|
Click to View the Clearer Original Diagram |
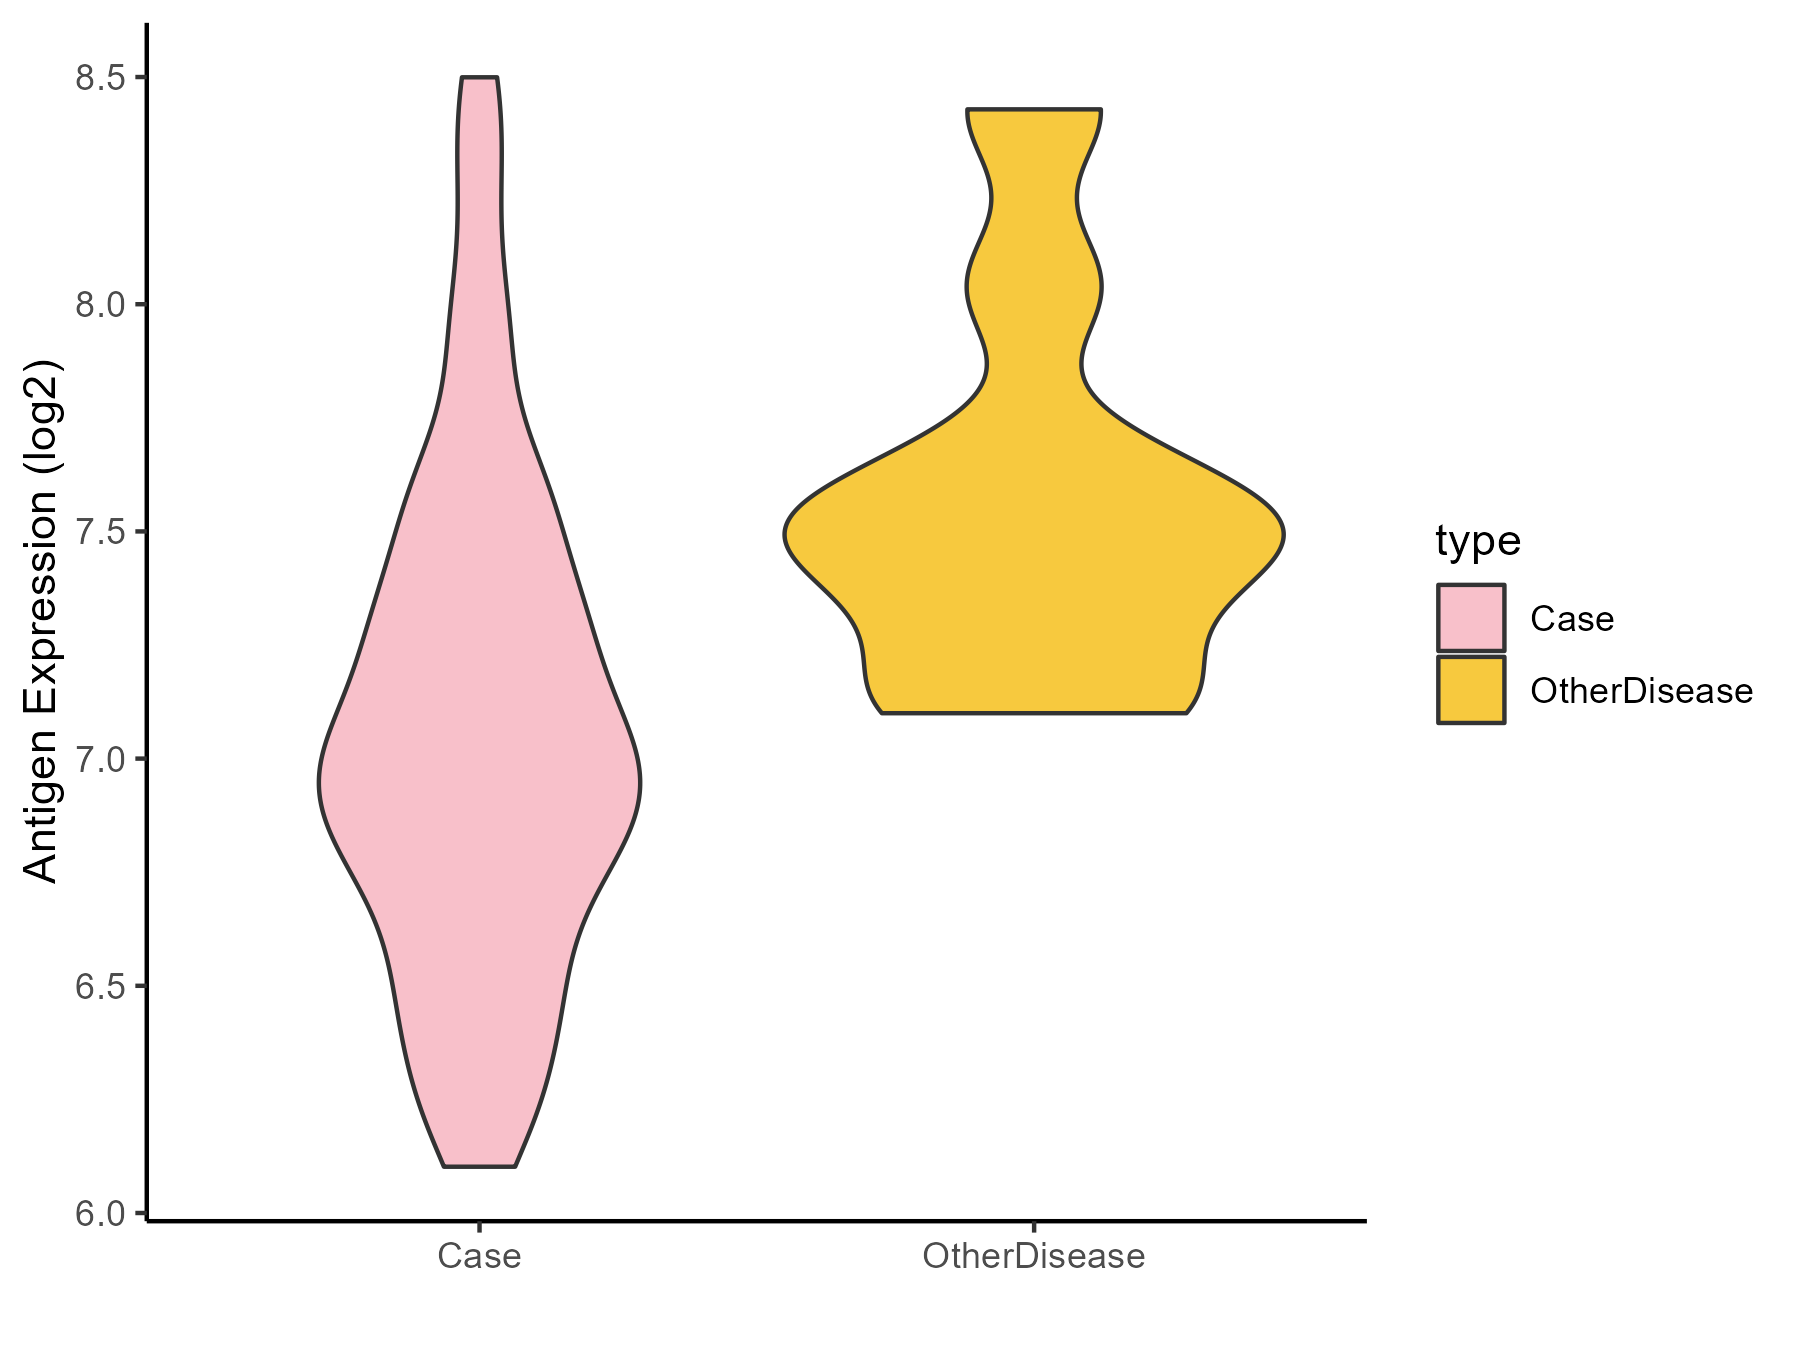
| Differential expression pattern of antigen in diseases | ||
| The Studied Tissue | Adrenal cortex | |
| The Specific Disease | Adrenocortical carcinoma | |
| The Expression Level of Disease Section Compare with the Other Disease Section | p-value: 0.000102759; Fold-change: -0.500527347; Z-score: -1.201934807 | |
| Disease-specific Antigen Abundances |
|
Click to View the Clearer Original Diagram |
| Differential expression pattern of antigen in diseases | ||
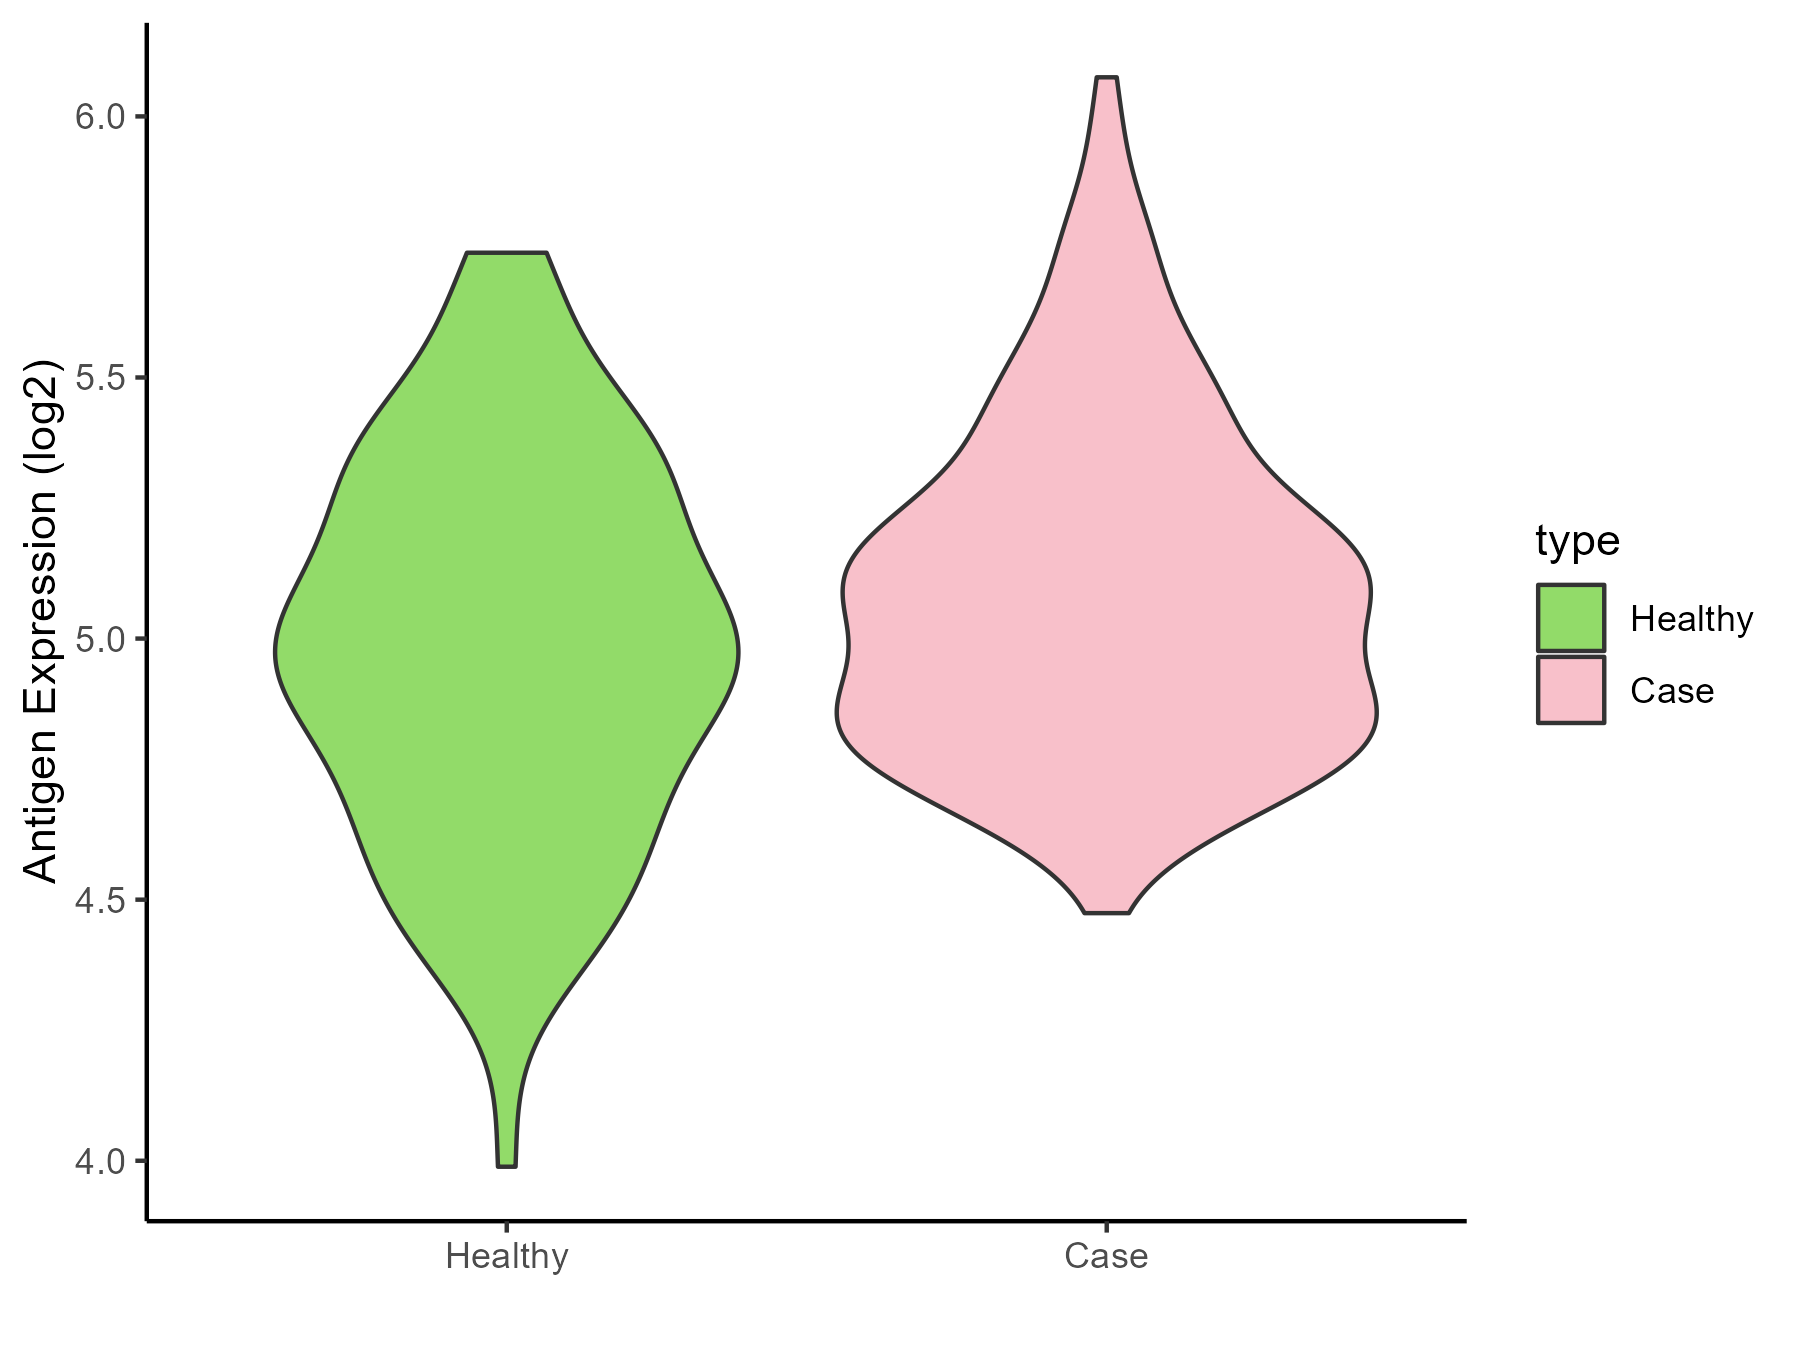
| The Studied Tissue | Head and neck | |
| The Specific Disease | Head and neck cancer | |
| The Expression Level of Disease Section Compare with the Healthy Individual Tissue | p-value: 0.015539225; Fold-change: 0.082093261; Z-score: 0.225591286 | |
| Disease-specific Antigen Abundances |
|
Click to View the Clearer Original Diagram |
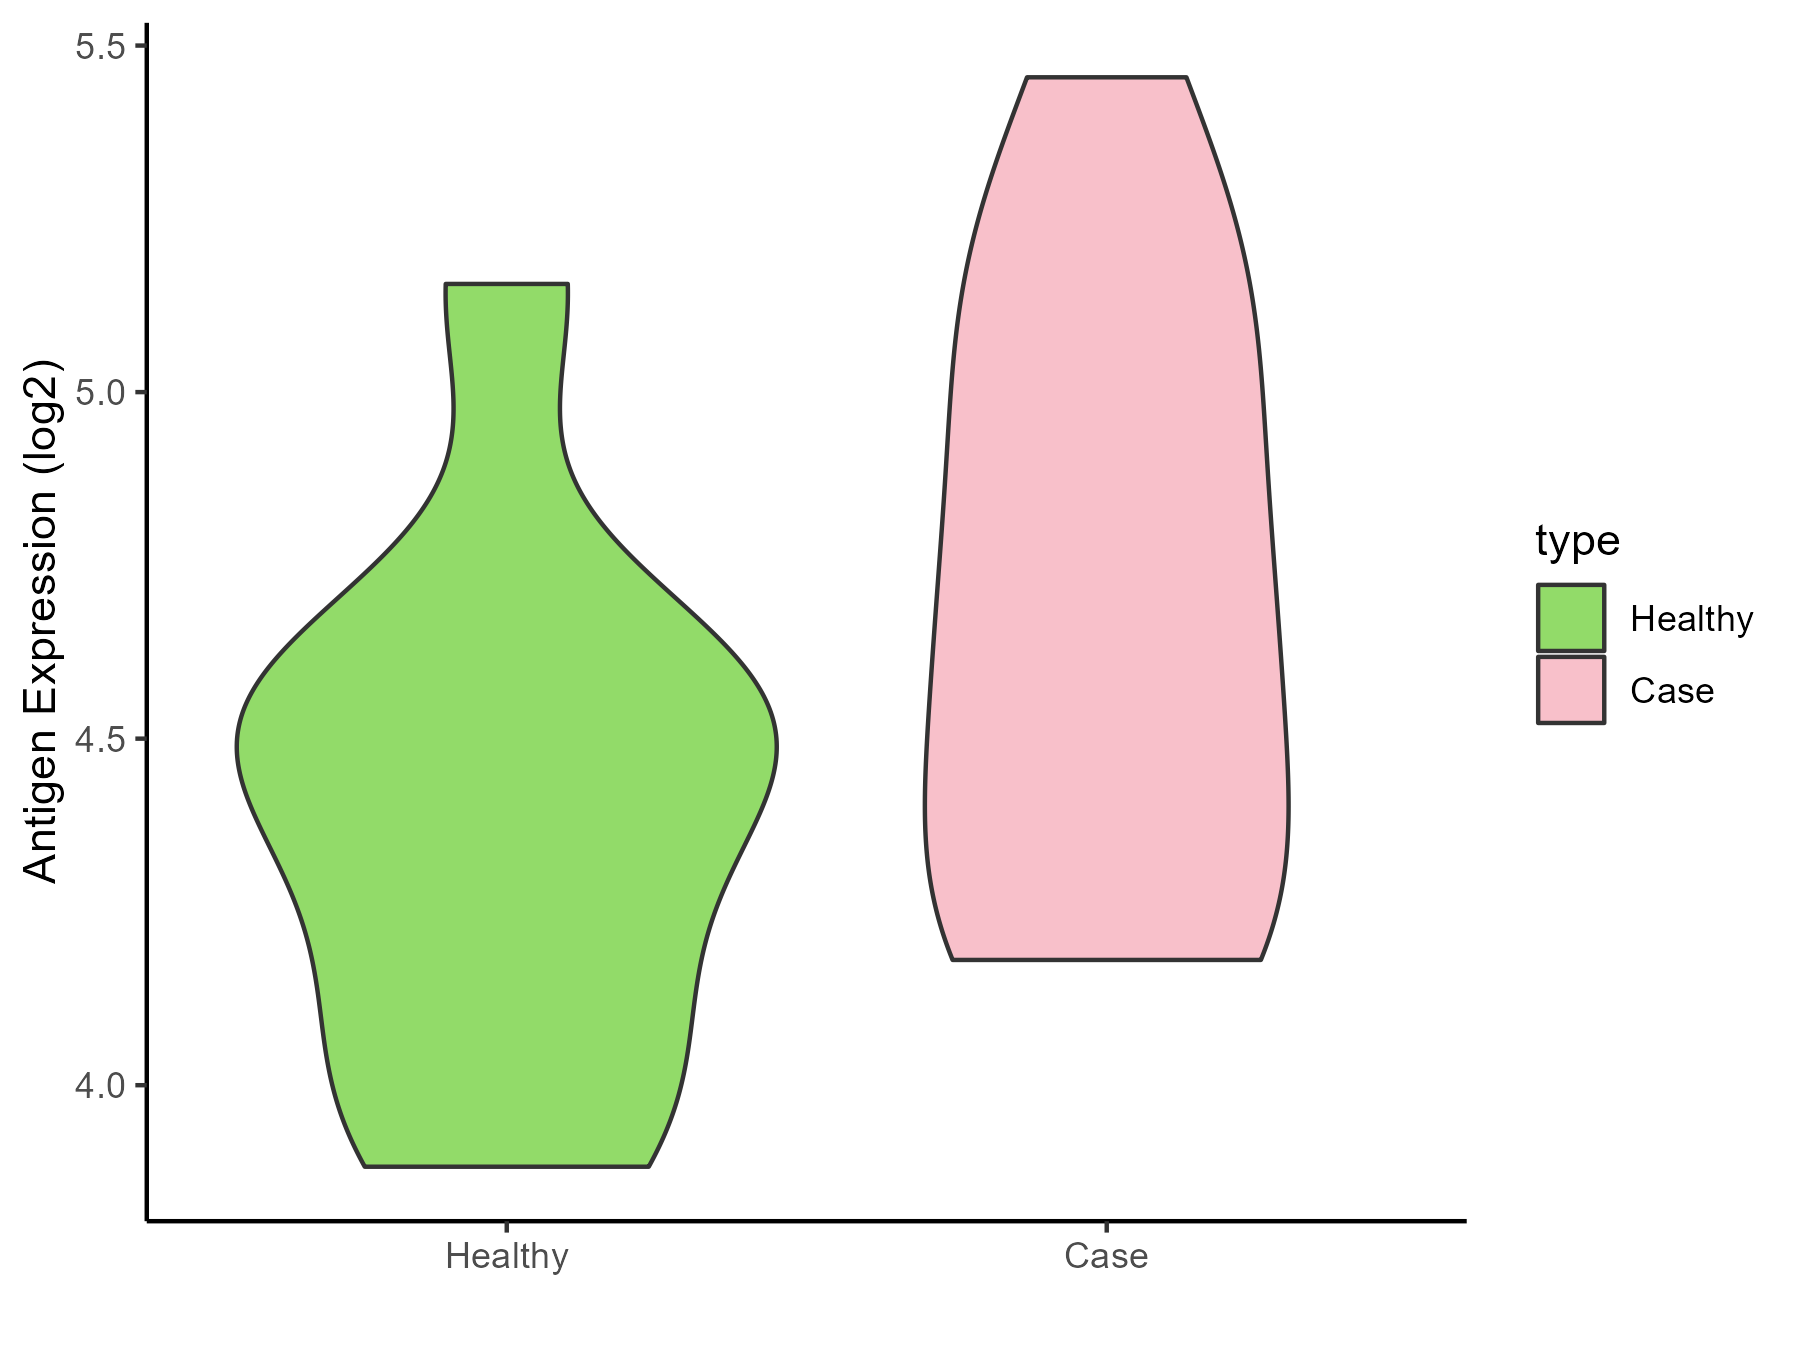
| Differential expression pattern of antigen in diseases | ||
| The Studied Tissue | Pituitary | |
| The Specific Disease | Pituitary gonadotrope tumor | |
| The Expression Level of Disease Section Compare with the Healthy Individual Tissue | p-value: 0.086632812; Fold-change: 0.225369857; Z-score: 0.584566427 | |
| Disease-specific Antigen Abundances |
|
Click to View the Clearer Original Diagram |
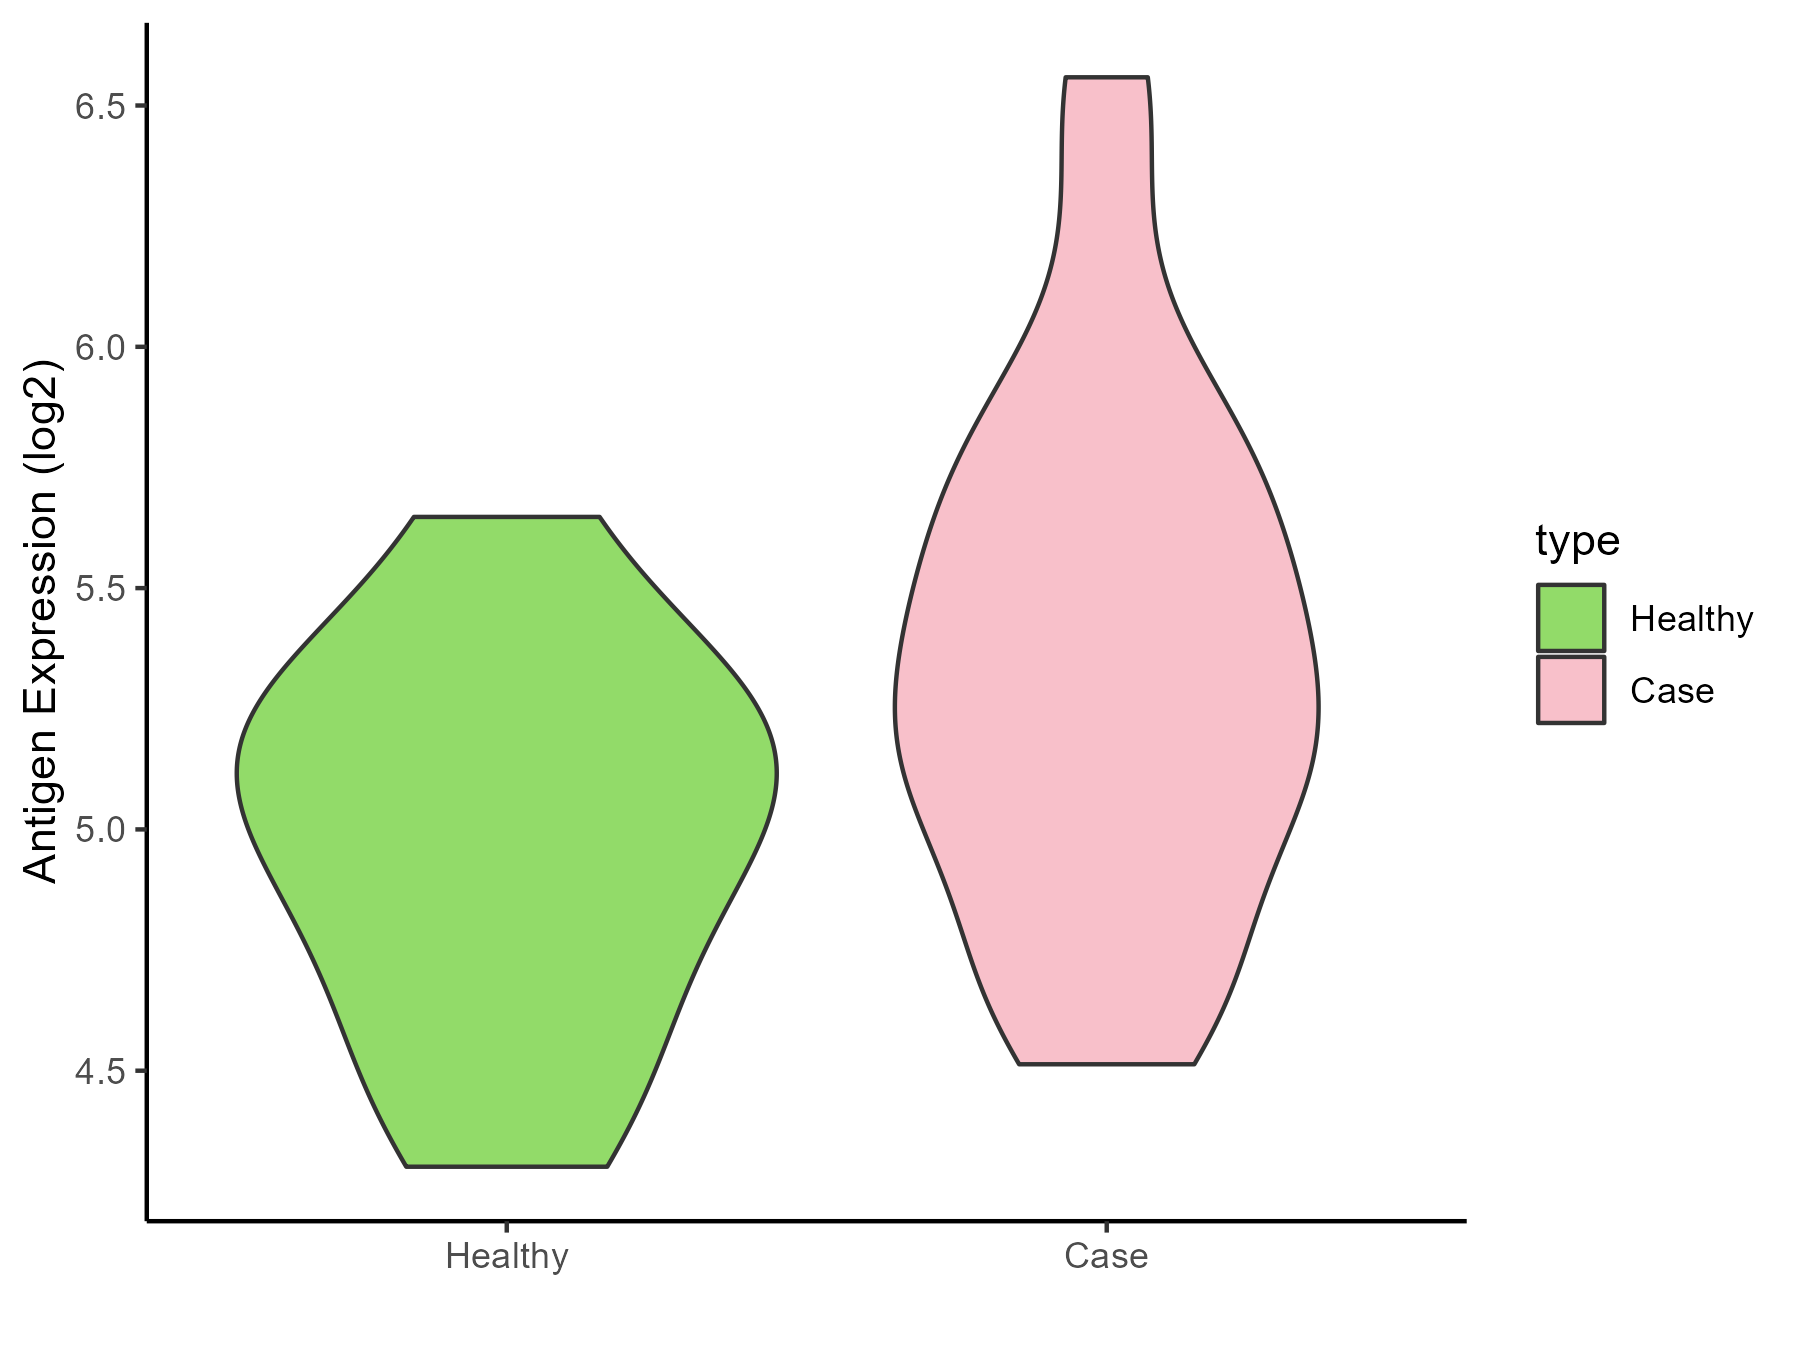
| The Studied Tissue | Pituitary | |
| The Specific Disease | Pituitary cancer | |
| The Expression Level of Disease Section Compare with the Healthy Individual Tissue | p-value: 0.02381192; Fold-change: 0.268399573; Z-score: 0.674493064 | |
| Disease-specific Antigen Abundances |
|
Click to View the Clearer Original Diagram |
ICD Disease Classification 03
| Differential expression pattern of antigen in diseases | ||
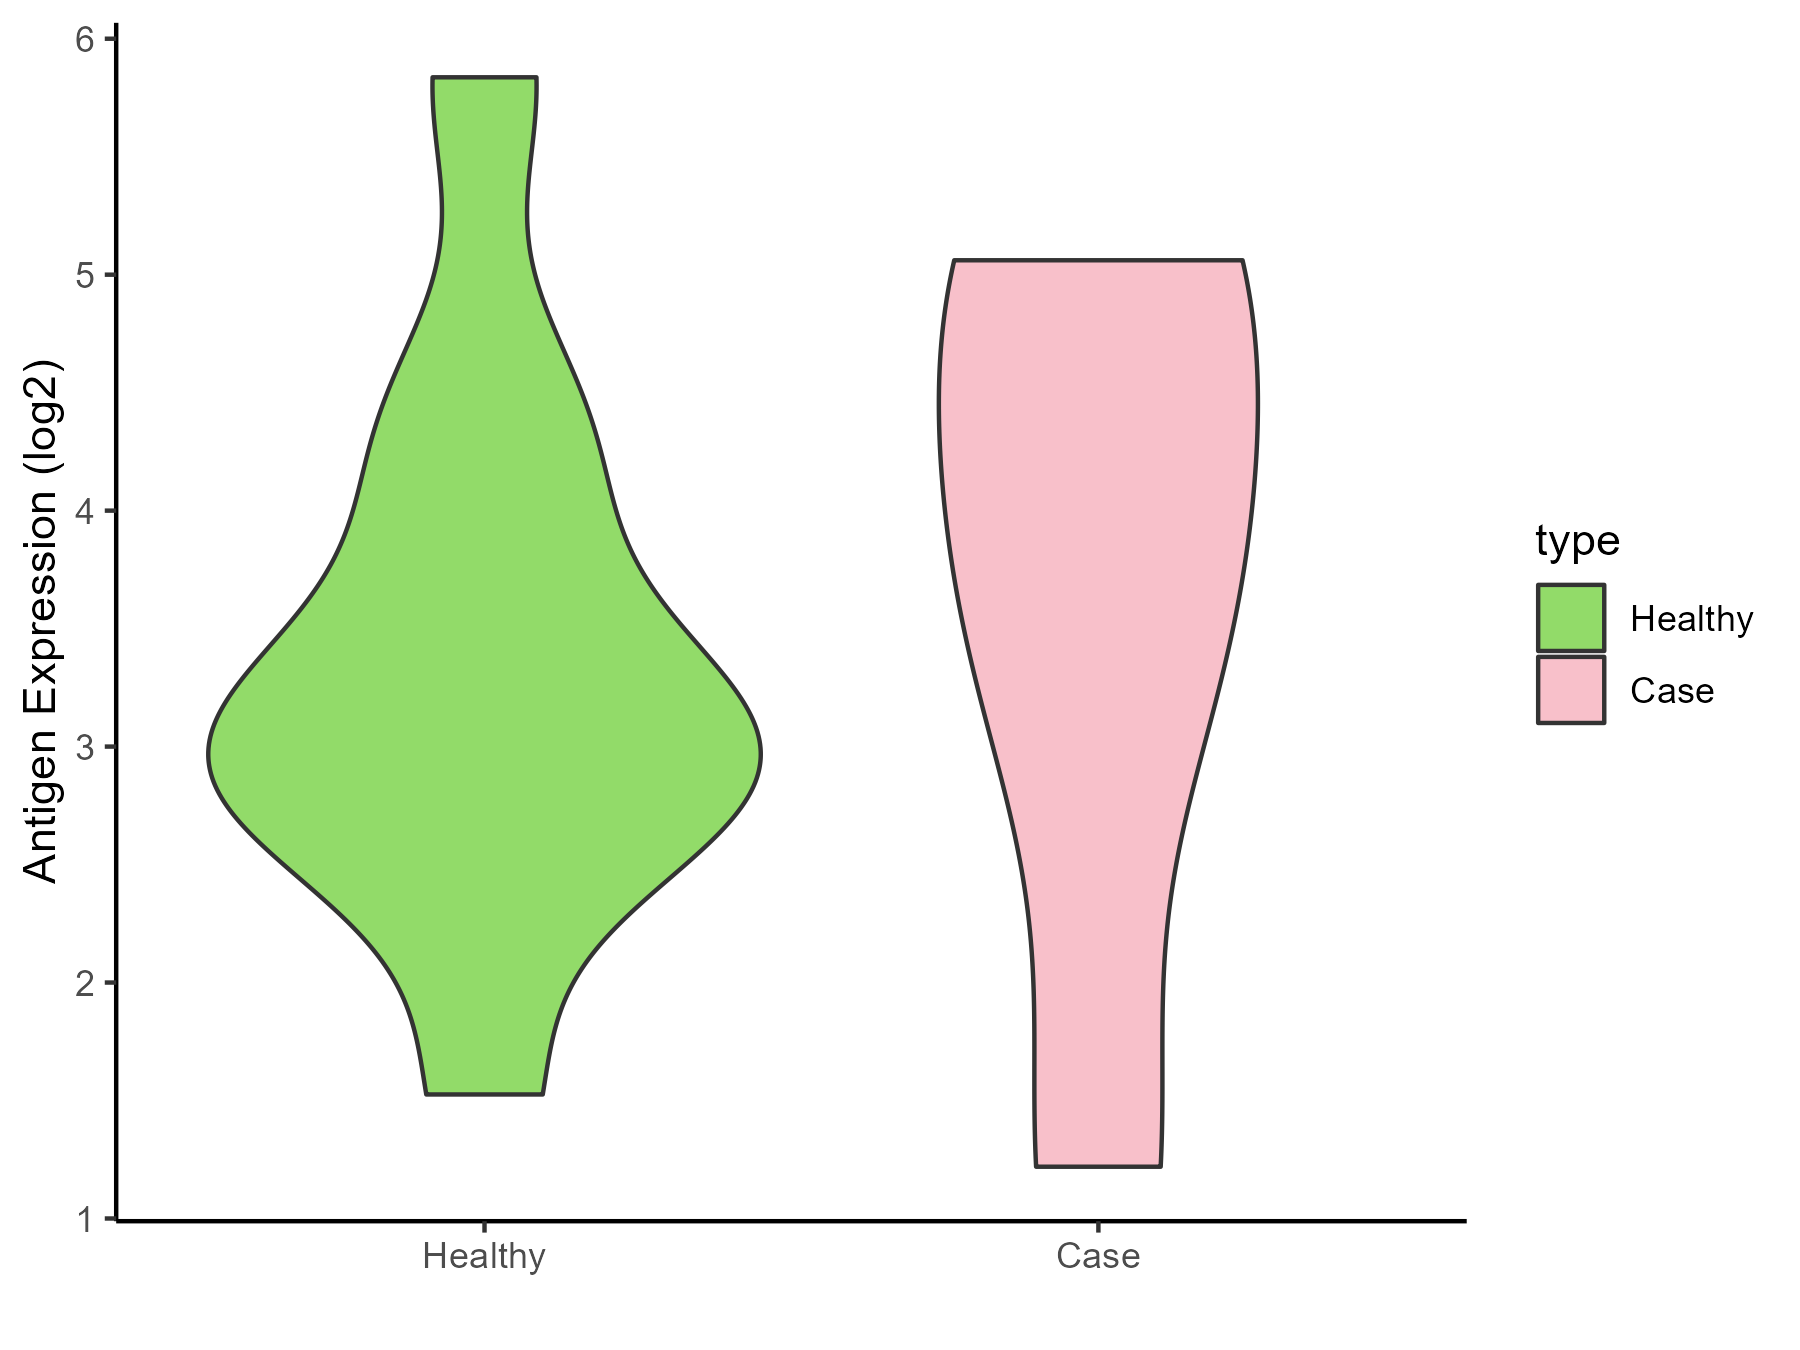
| The Studied Tissue | Whole blood | |
| The Specific Disease | Thrombocytopenia | |
| The Expression Level of Disease Section Compare with the Healthy Individual Tissue | p-value: 0.718650921; Fold-change: 0.767065908; Z-score: 0.650054885 | |
| Disease-specific Antigen Abundances |
|
Click to View the Clearer Original Diagram |
ICD Disease Classification 04
| Differential expression pattern of antigen in diseases | ||
| The Studied Tissue | Whole blood | |
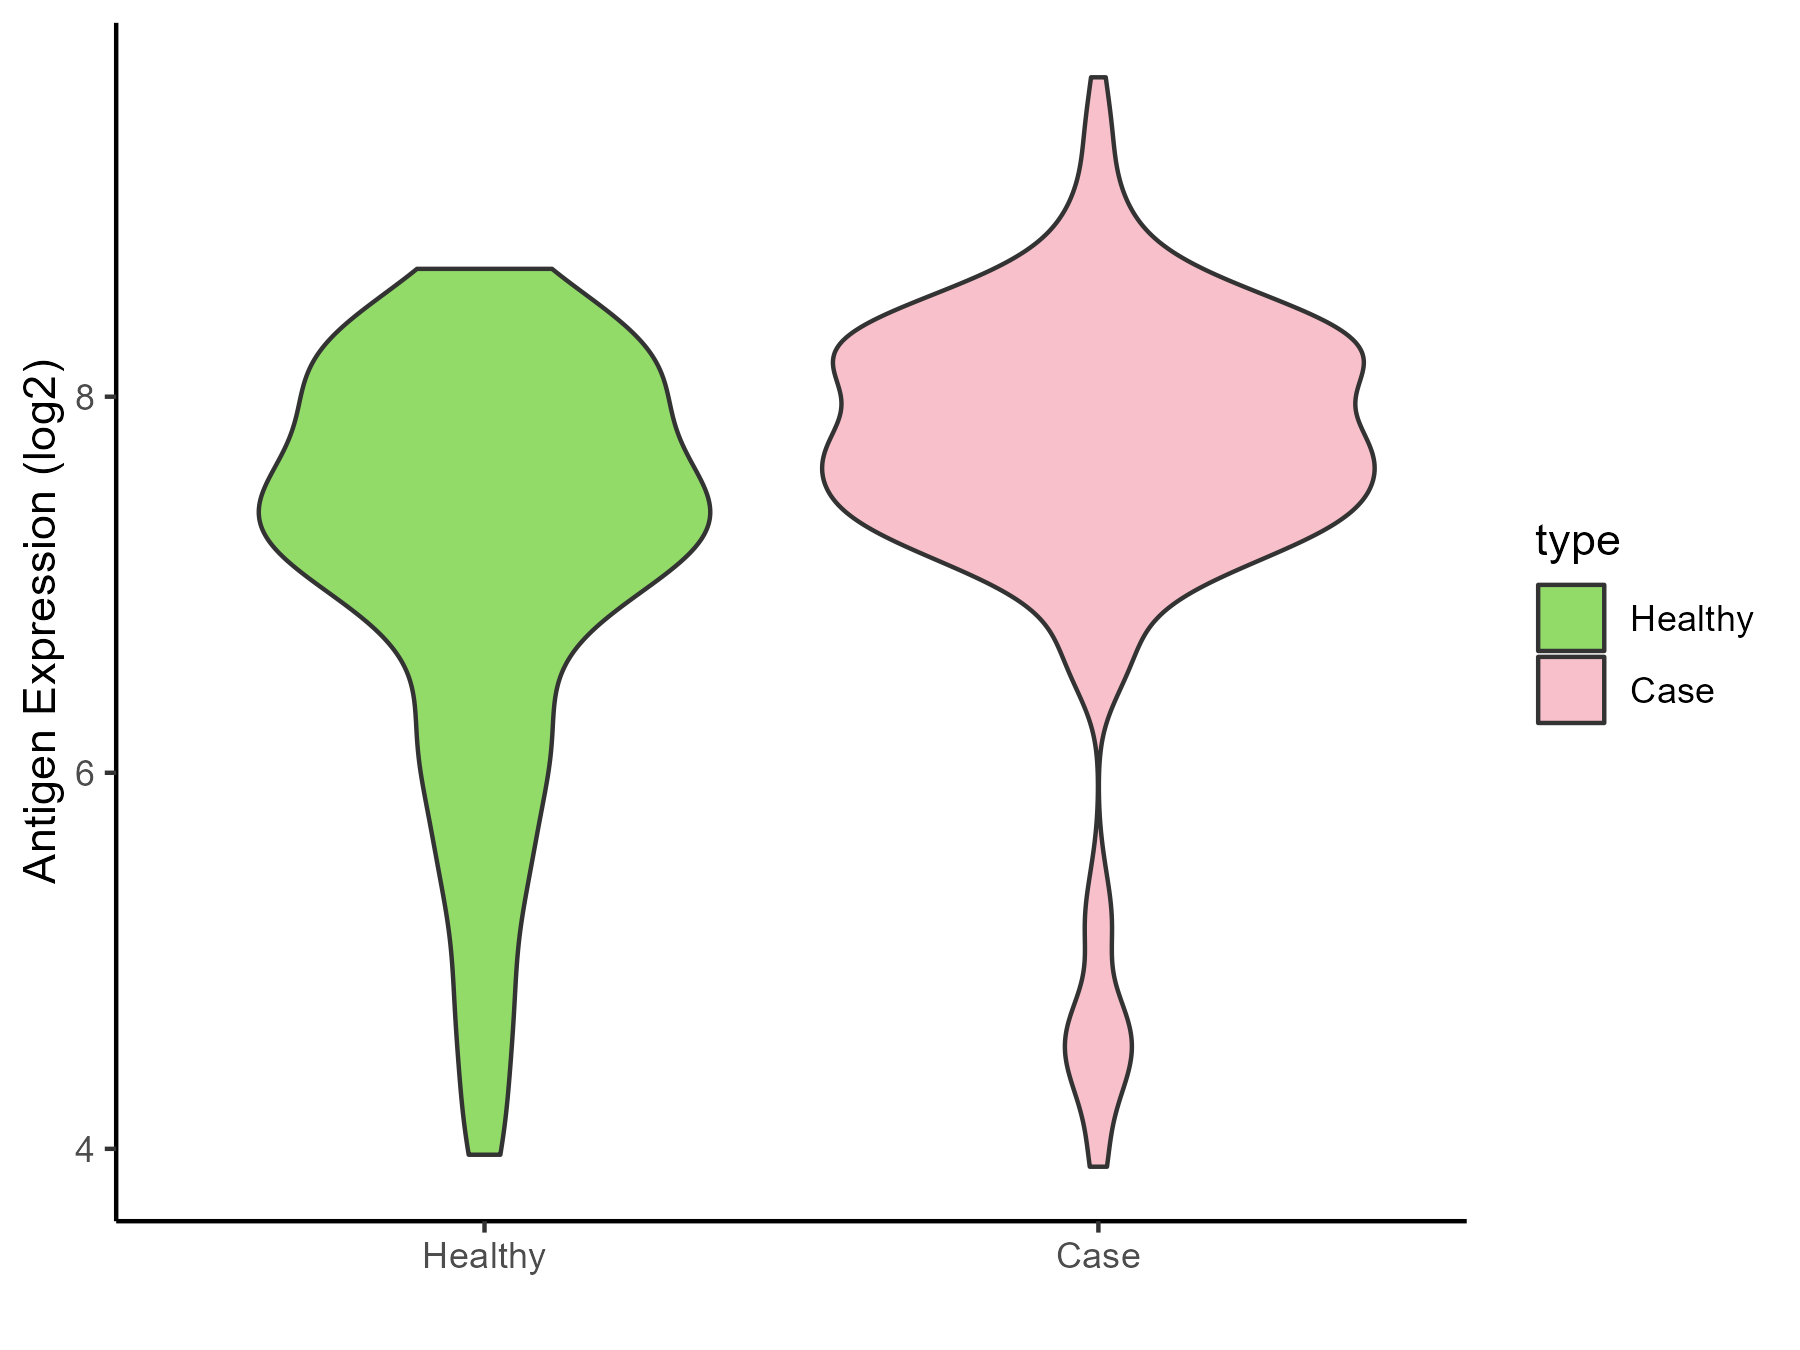
| The Specific Disease | Lupus erythematosus | |
| The Expression Level of Disease Section Compare with the Healthy Individual Tissue | p-value: 3.88E-05; Fold-change: 0.36080115; Z-score: 0.334396514 | |
| Disease-specific Antigen Abundances |
|
Click to View the Clearer Original Diagram |
| Differential expression pattern of antigen in diseases | ||
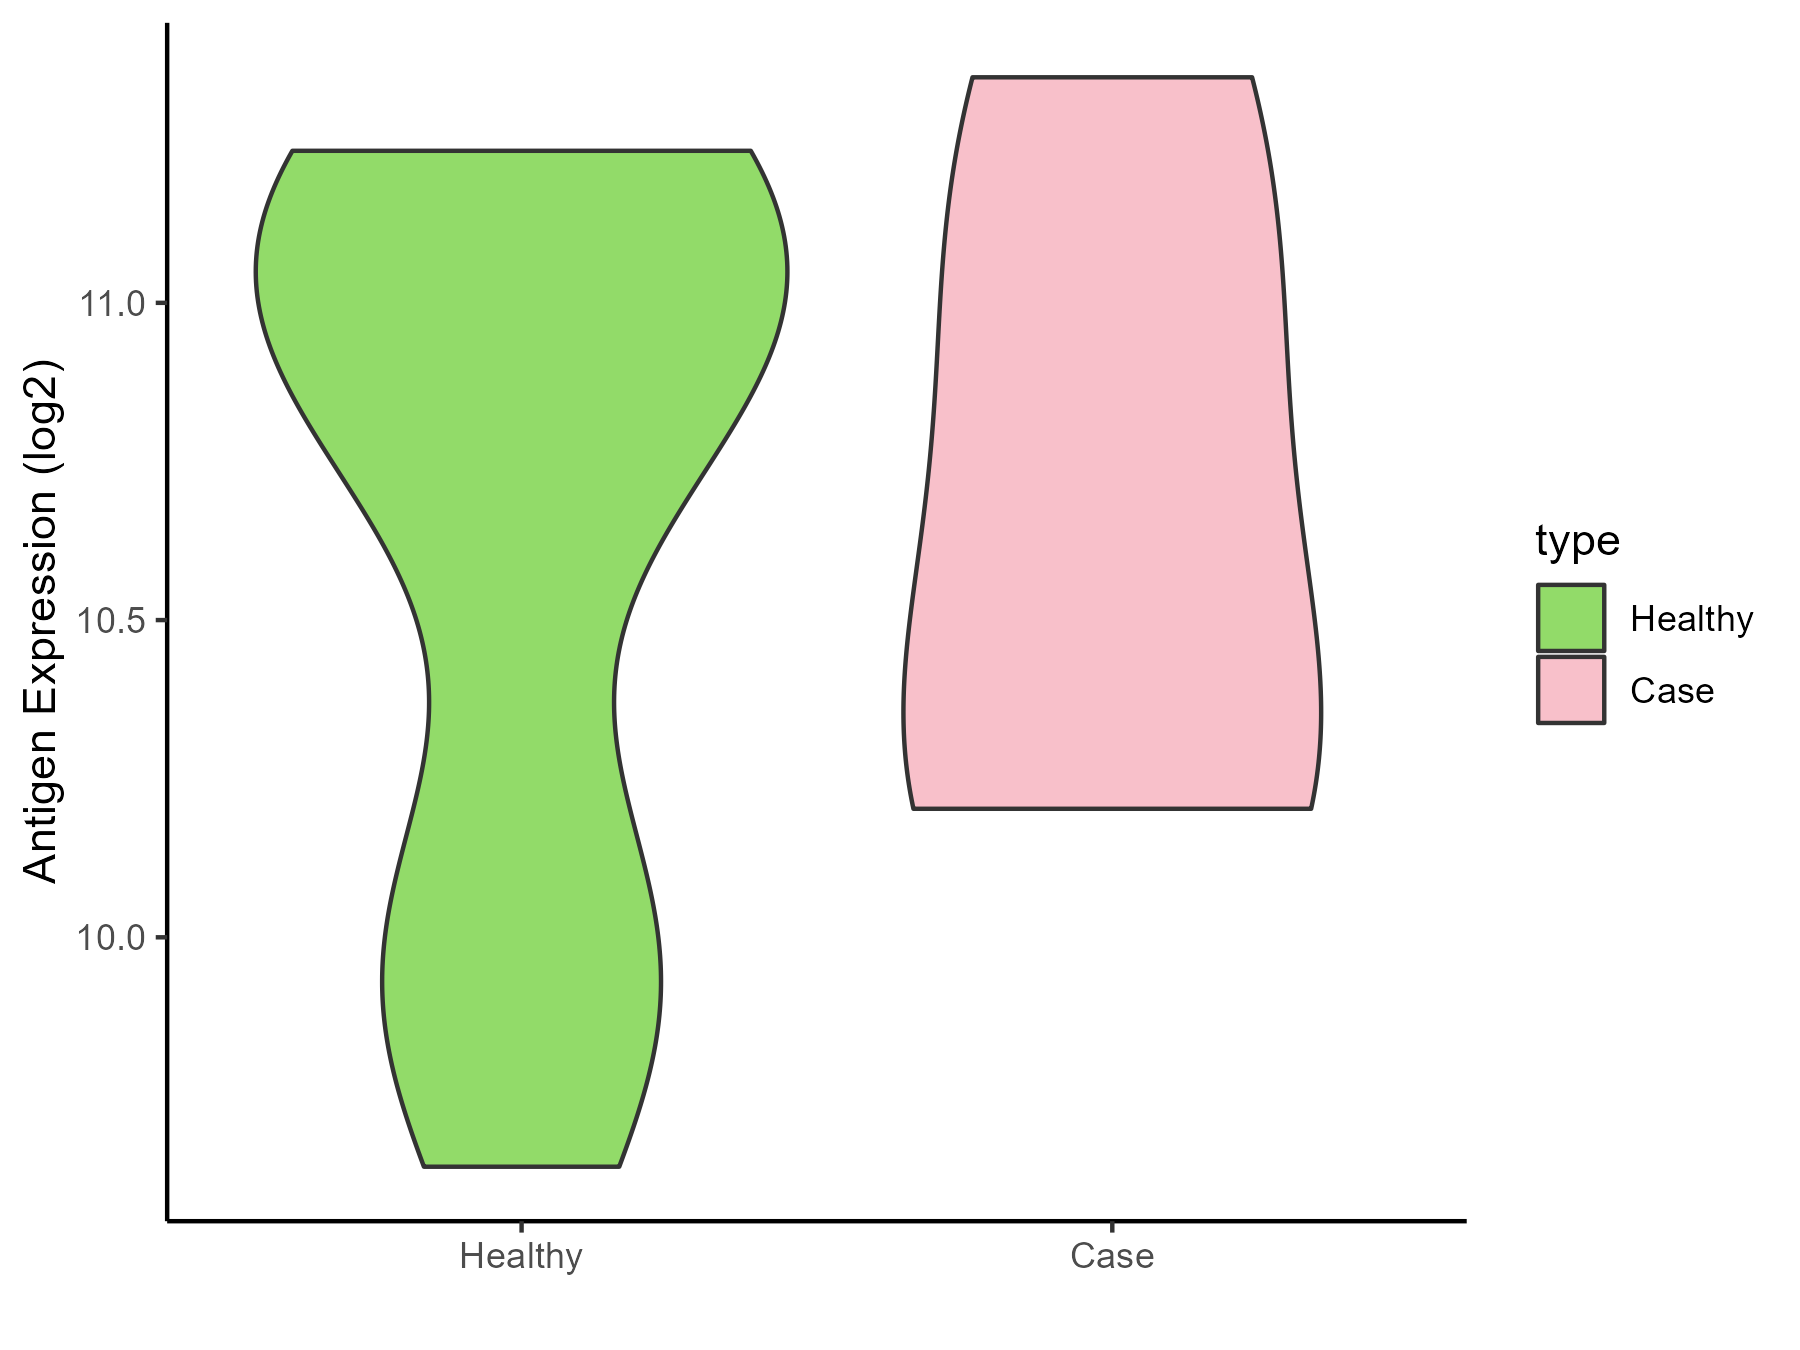
| The Studied Tissue | Peripheral monocyte | |
| The Specific Disease | Autoimmune uveitis | |
| The Expression Level of Disease Section Compare with the Healthy Individual Tissue | p-value: 0.937023062; Fold-change: -0.250066957; Z-score: -0.432742027 | |
| Disease-specific Antigen Abundances |
|
Click to View the Clearer Original Diagram |
ICD Disease Classification 05
| Differential expression pattern of antigen in diseases | ||
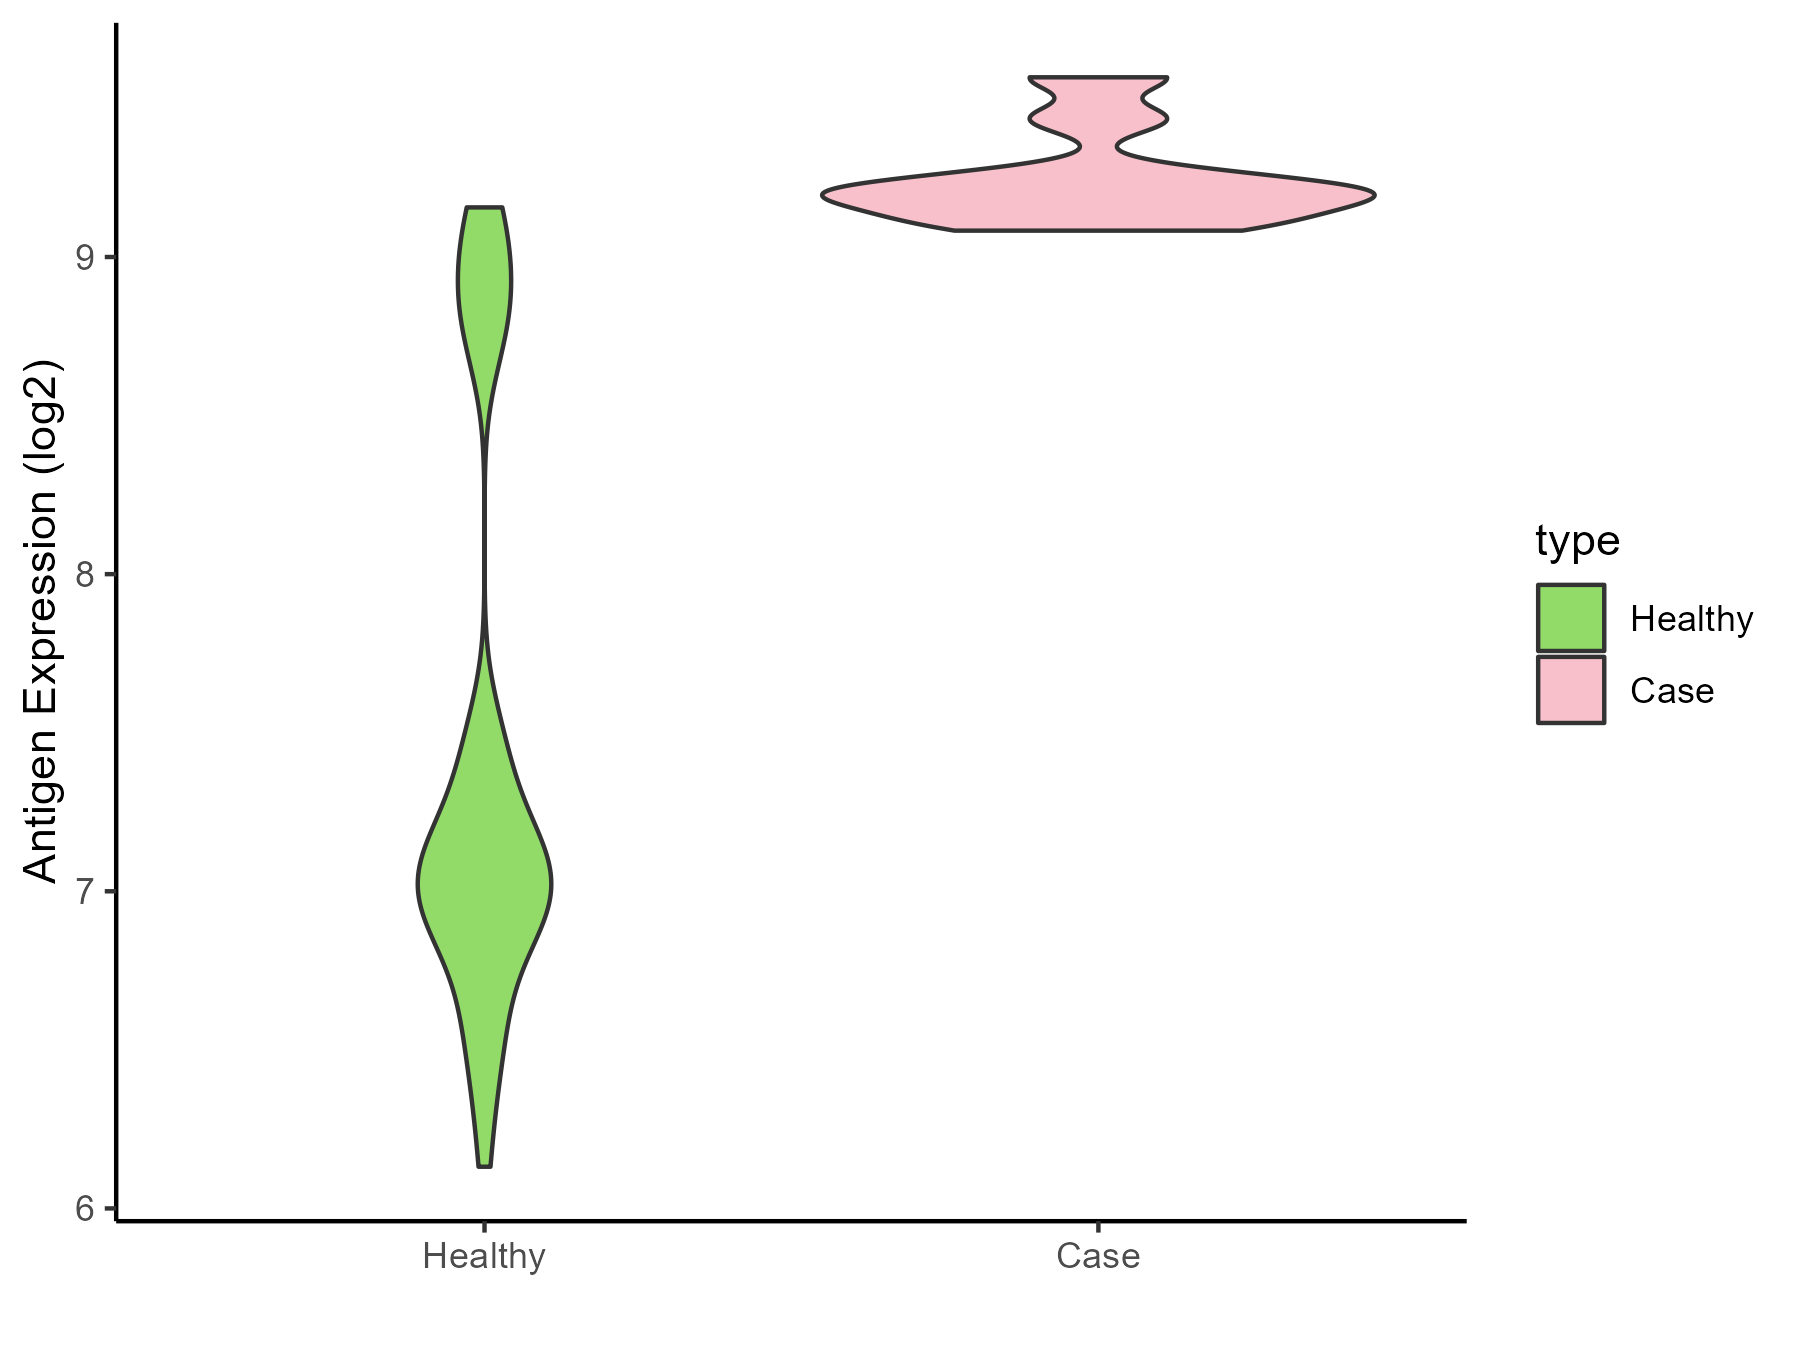
| The Studied Tissue | Whole blood | |
| The Specific Disease | Familial hypercholesterolemia | |
| The Expression Level of Disease Section Compare with the Healthy Individual Tissue | p-value: 1.34E-20; Fold-change: 2.121685605; Z-score: 2.391979147 | |
| Disease-specific Antigen Abundances |
|
Click to View the Clearer Original Diagram |
ICD Disease Classification 06
| Differential expression pattern of antigen in diseases | ||
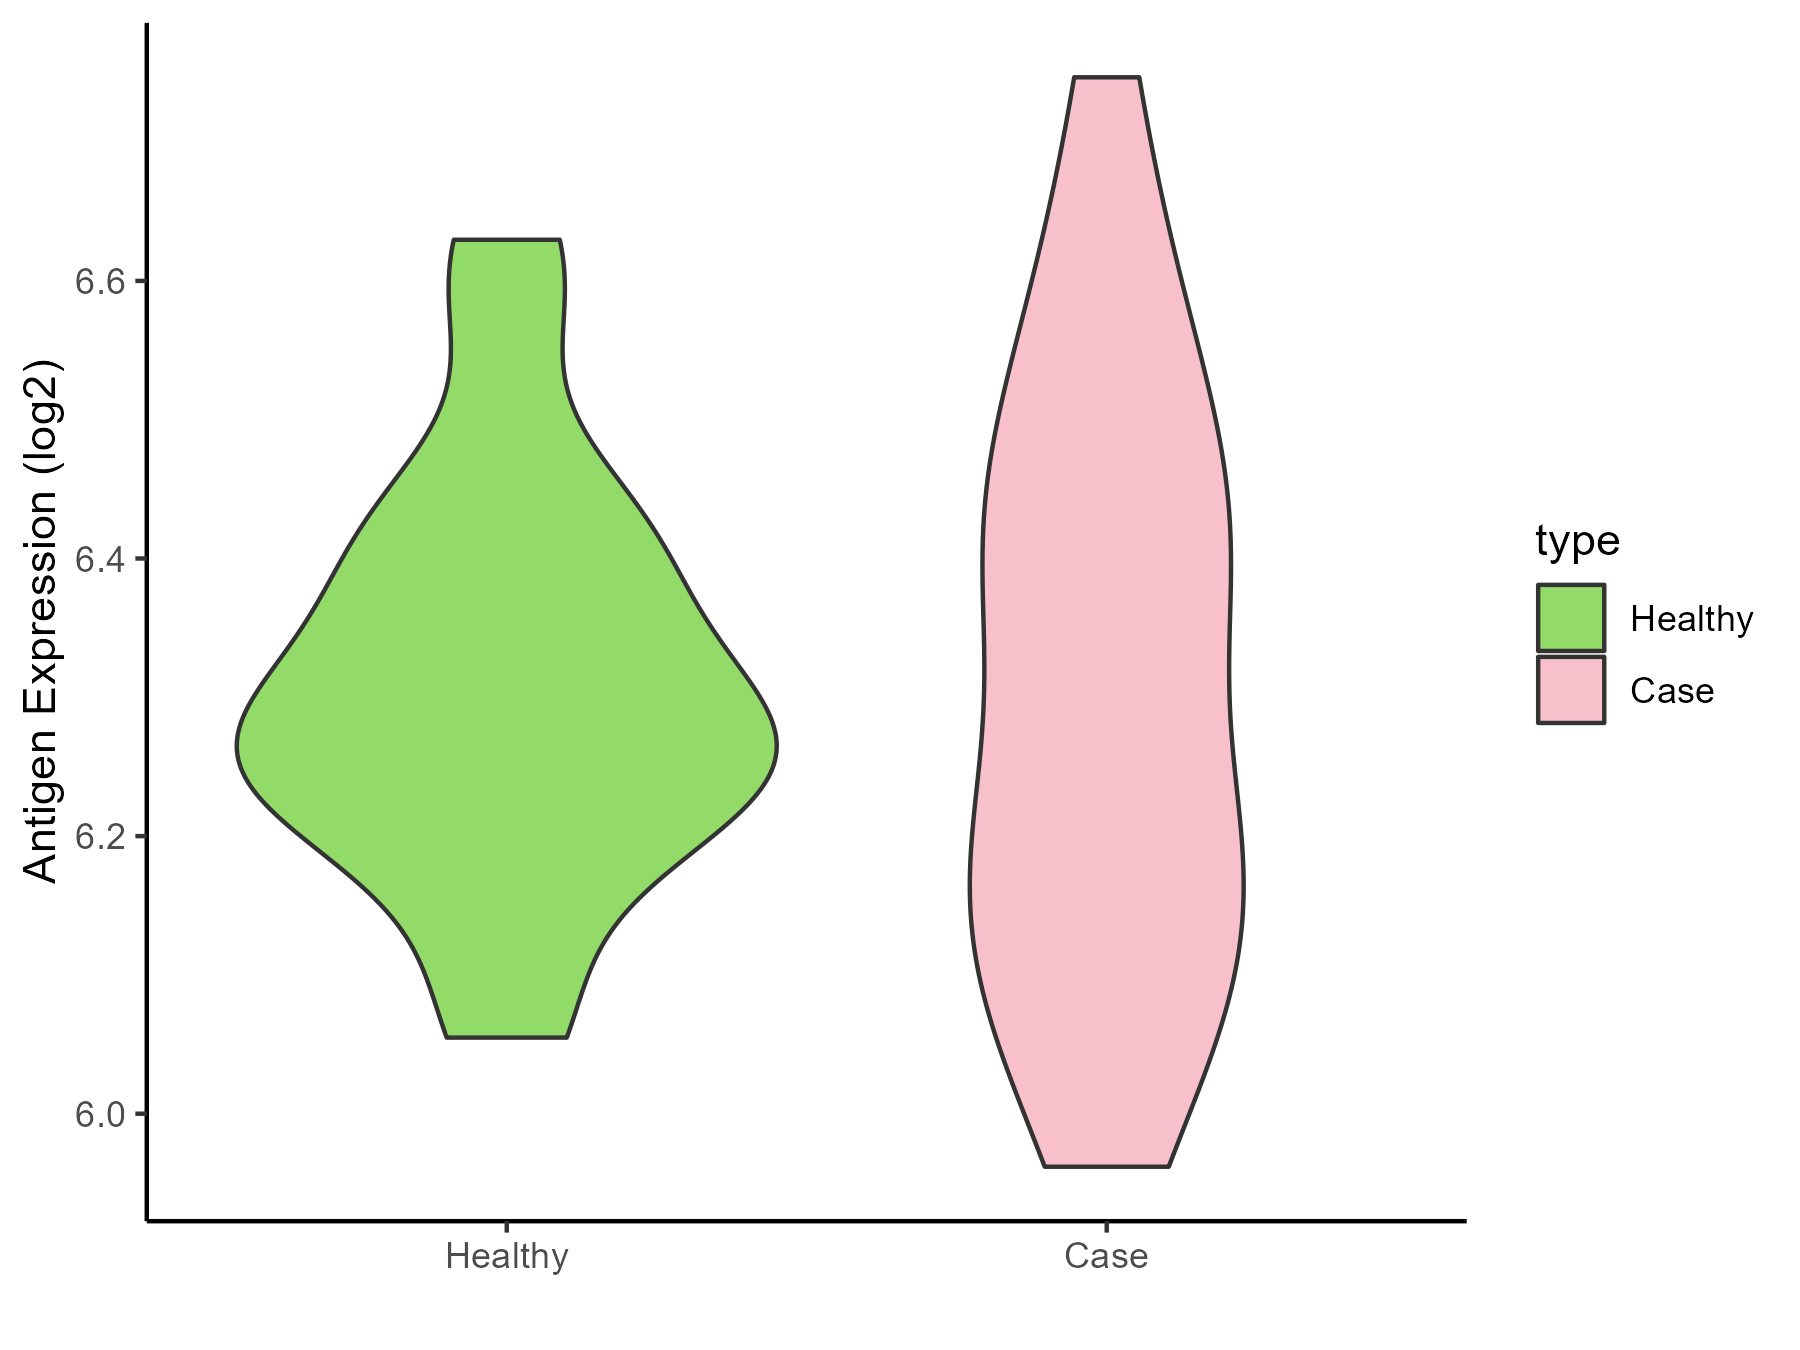
| The Studied Tissue | Superior temporal cortex | |
| The Specific Disease | Schizophrenia | |
| The Expression Level of Disease Section Compare with the Healthy Individual Tissue | p-value: 0.958337312; Fold-change: 0.01138344; Z-score: 0.077847602 | |
| Disease-specific Antigen Abundances |
|
Click to View the Clearer Original Diagram |
ICD Disease Classification 08
| Differential expression pattern of antigen in diseases | ||
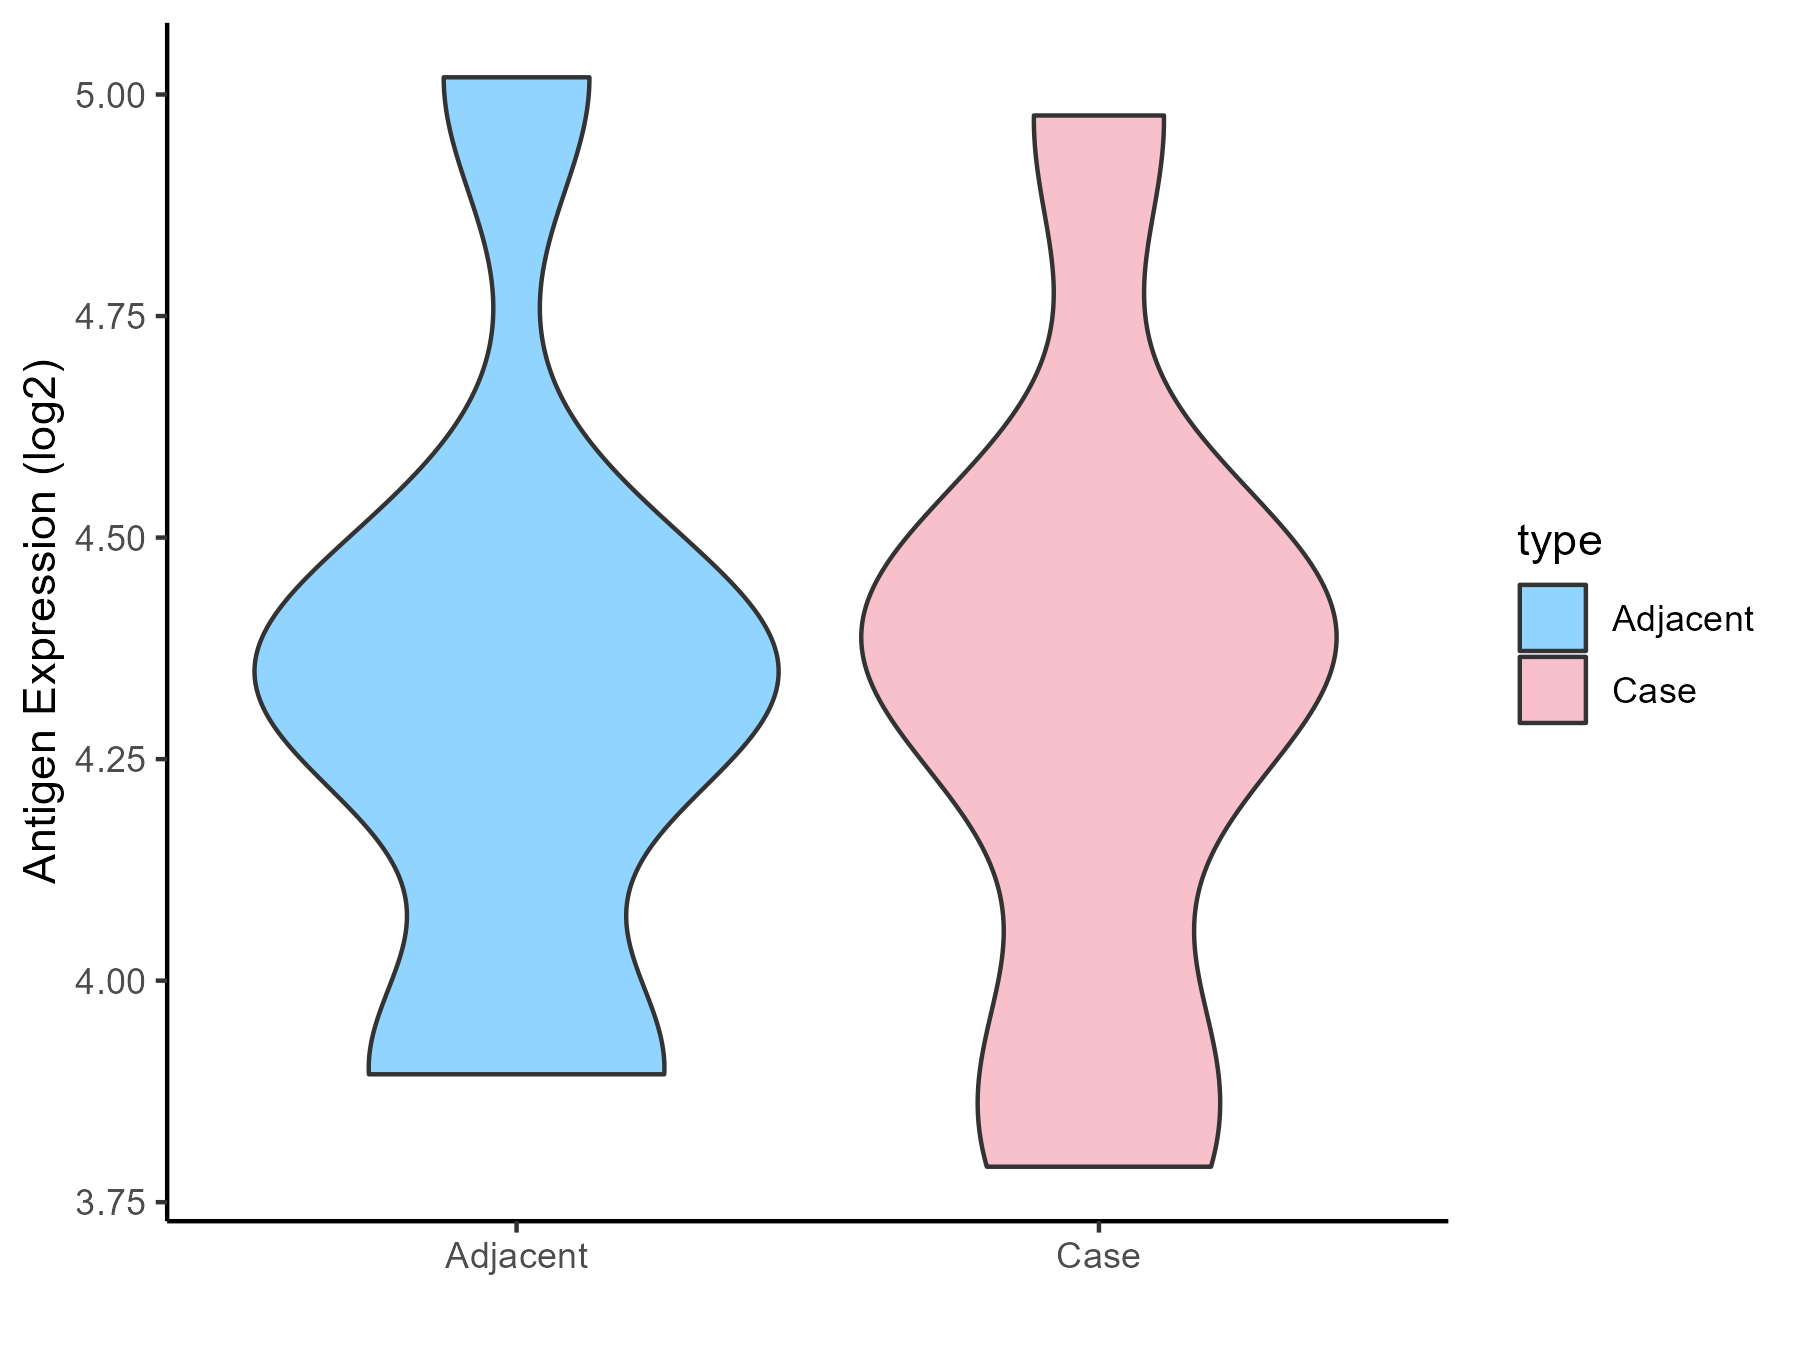
| The Studied Tissue | Spinal cord | |
| The Specific Disease | Multiple sclerosis | |
| The Expression Level of Disease Section Compare with the Adjacent Tissue | p-value: 0.986538874; Fold-change: 0.042341534; Z-score: 0.110856344 | |
| Disease-specific Antigen Abundances |
|
Click to View the Clearer Original Diagram |
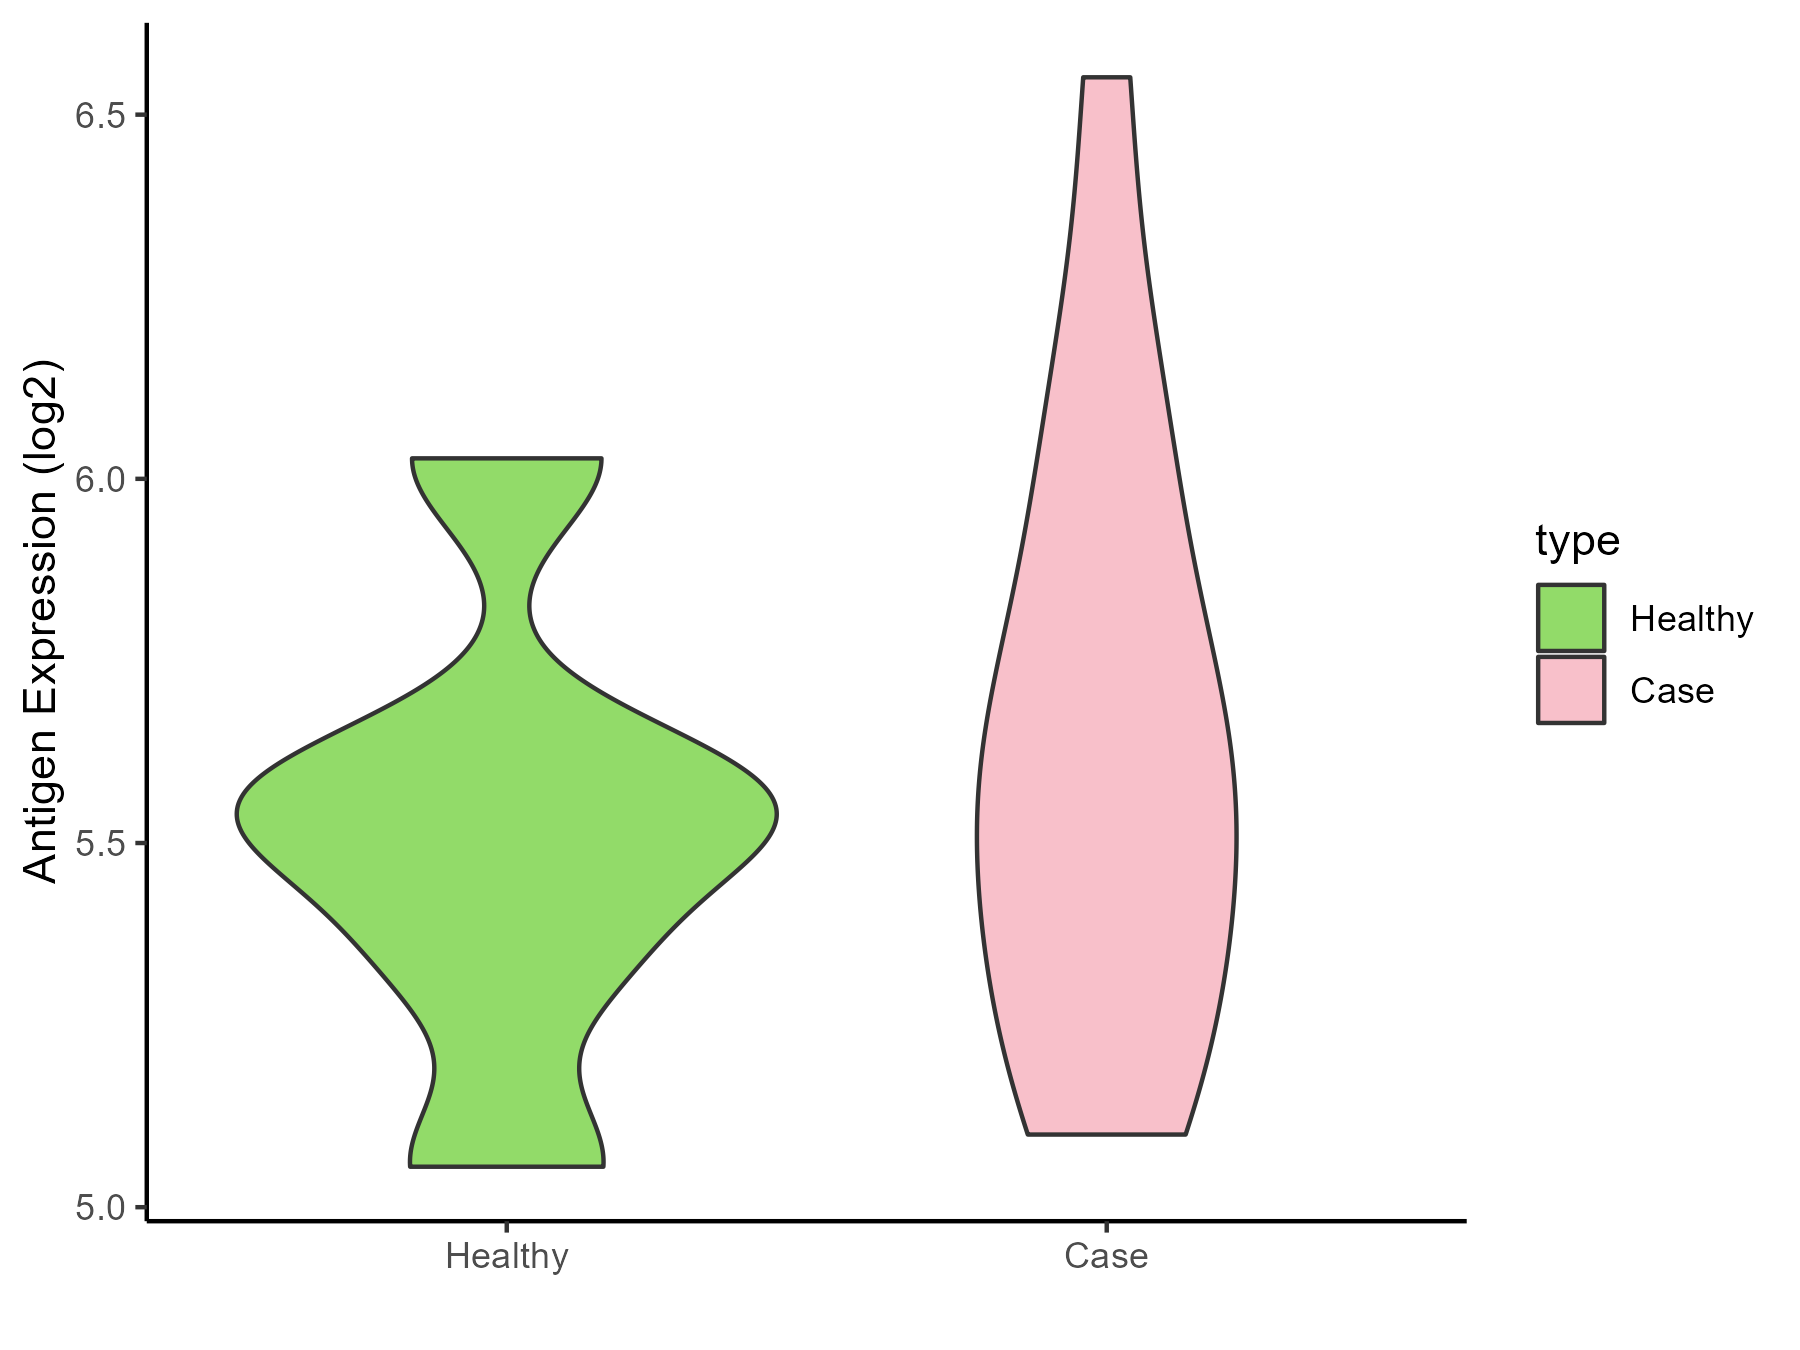
| The Studied Tissue | Plasmacytoid dendritic cells | |
| The Specific Disease | Multiple sclerosis | |
| The Expression Level of Disease Section Compare with the Healthy Individual Tissue | p-value: 0.468956229; Fold-change: 0.048998569; Z-score: 0.152568927 | |
| Disease-specific Antigen Abundances |
|
Click to View the Clearer Original Diagram |
| Differential expression pattern of antigen in diseases | ||
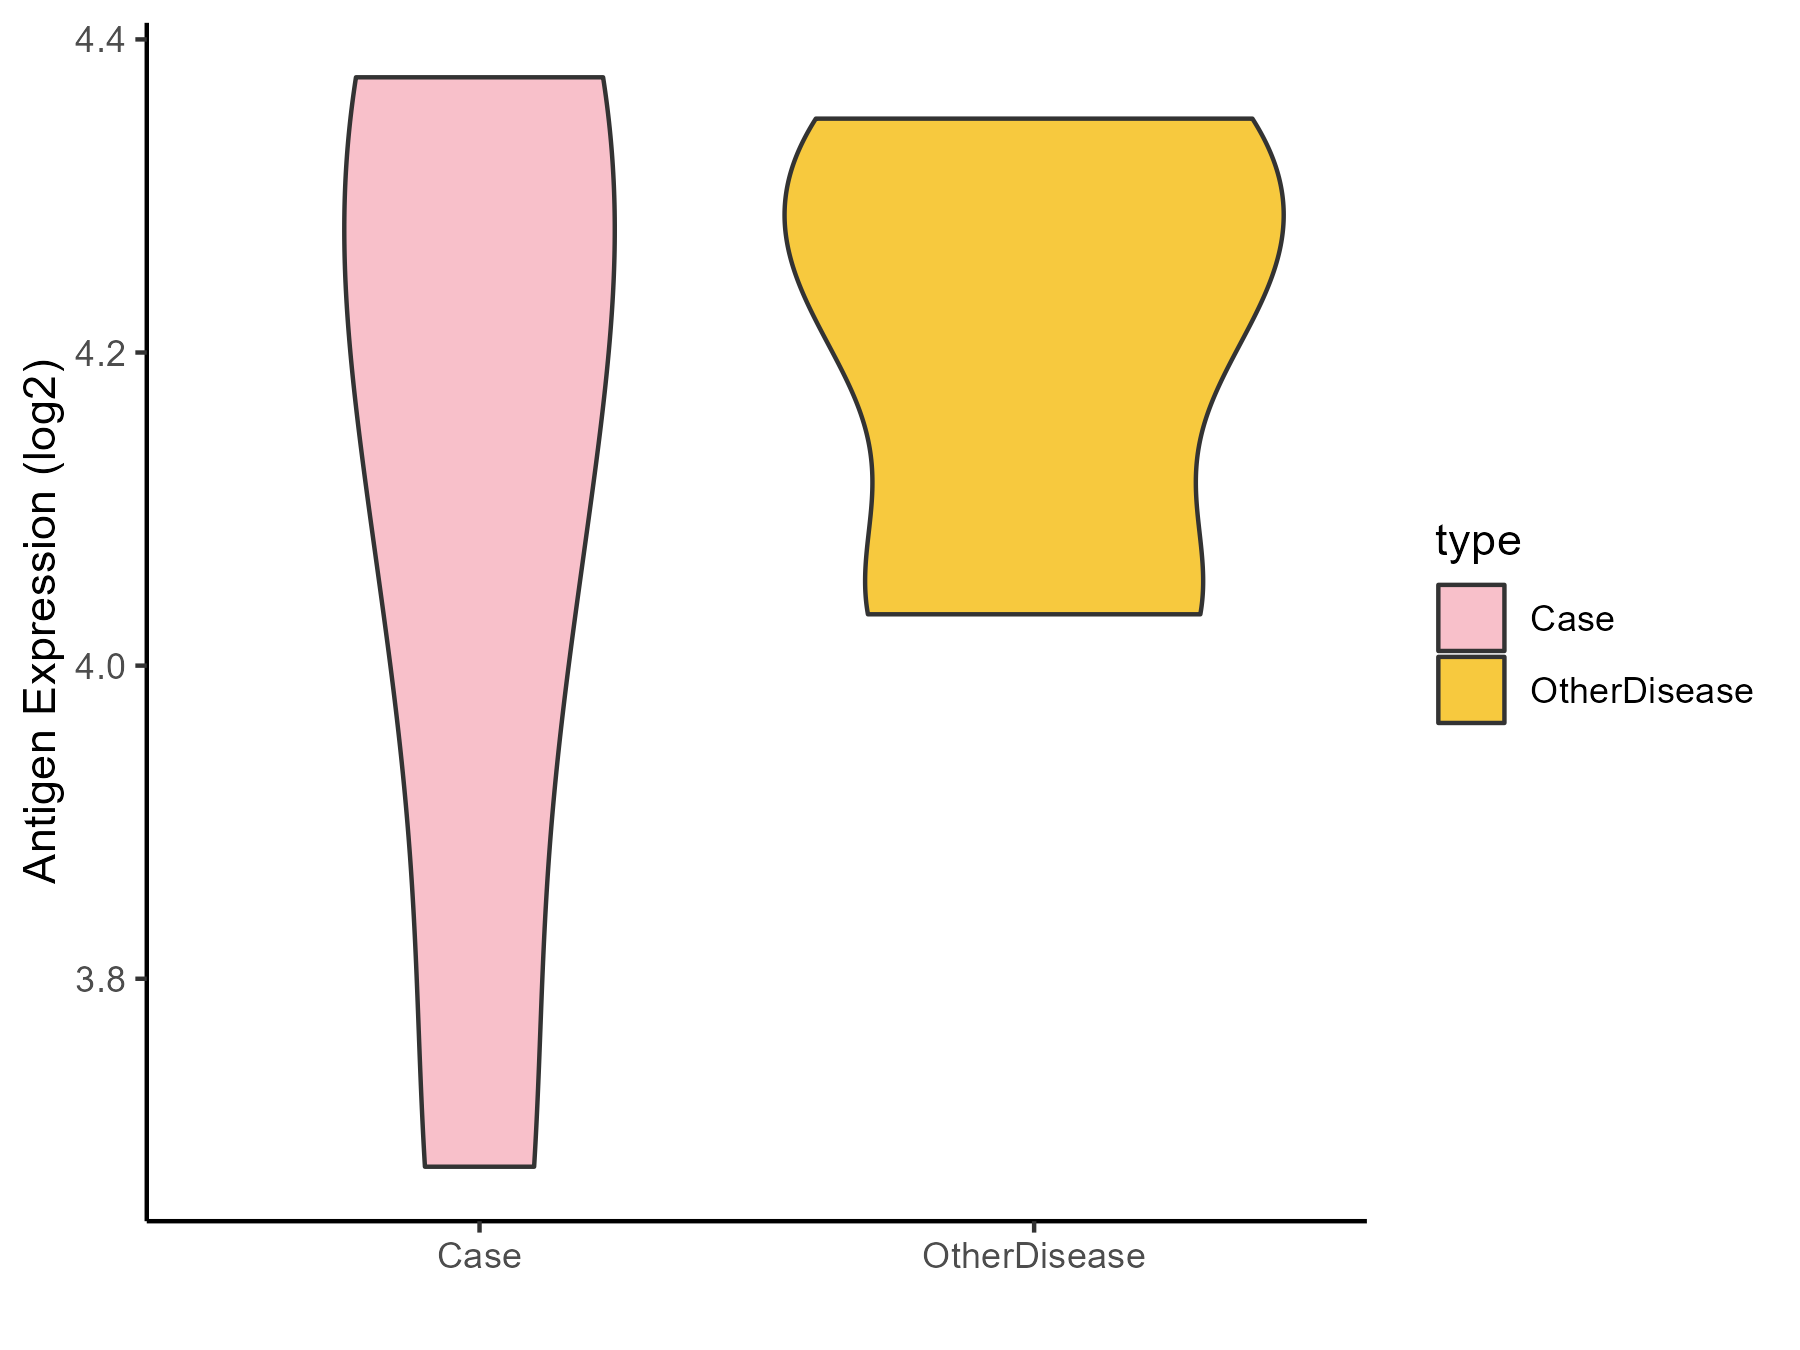
| The Studied Tissue | Peritumoral cortex | |
| The Specific Disease | Epilepsy | |
| The Expression Level of Disease Section Compare with the Other Disease Section | p-value: 0.625943549; Fold-change: -0.04181638; Z-score: -0.261087131 | |
| Disease-specific Antigen Abundances |
|
Click to View the Clearer Original Diagram |
| Differential expression pattern of antigen in diseases | ||
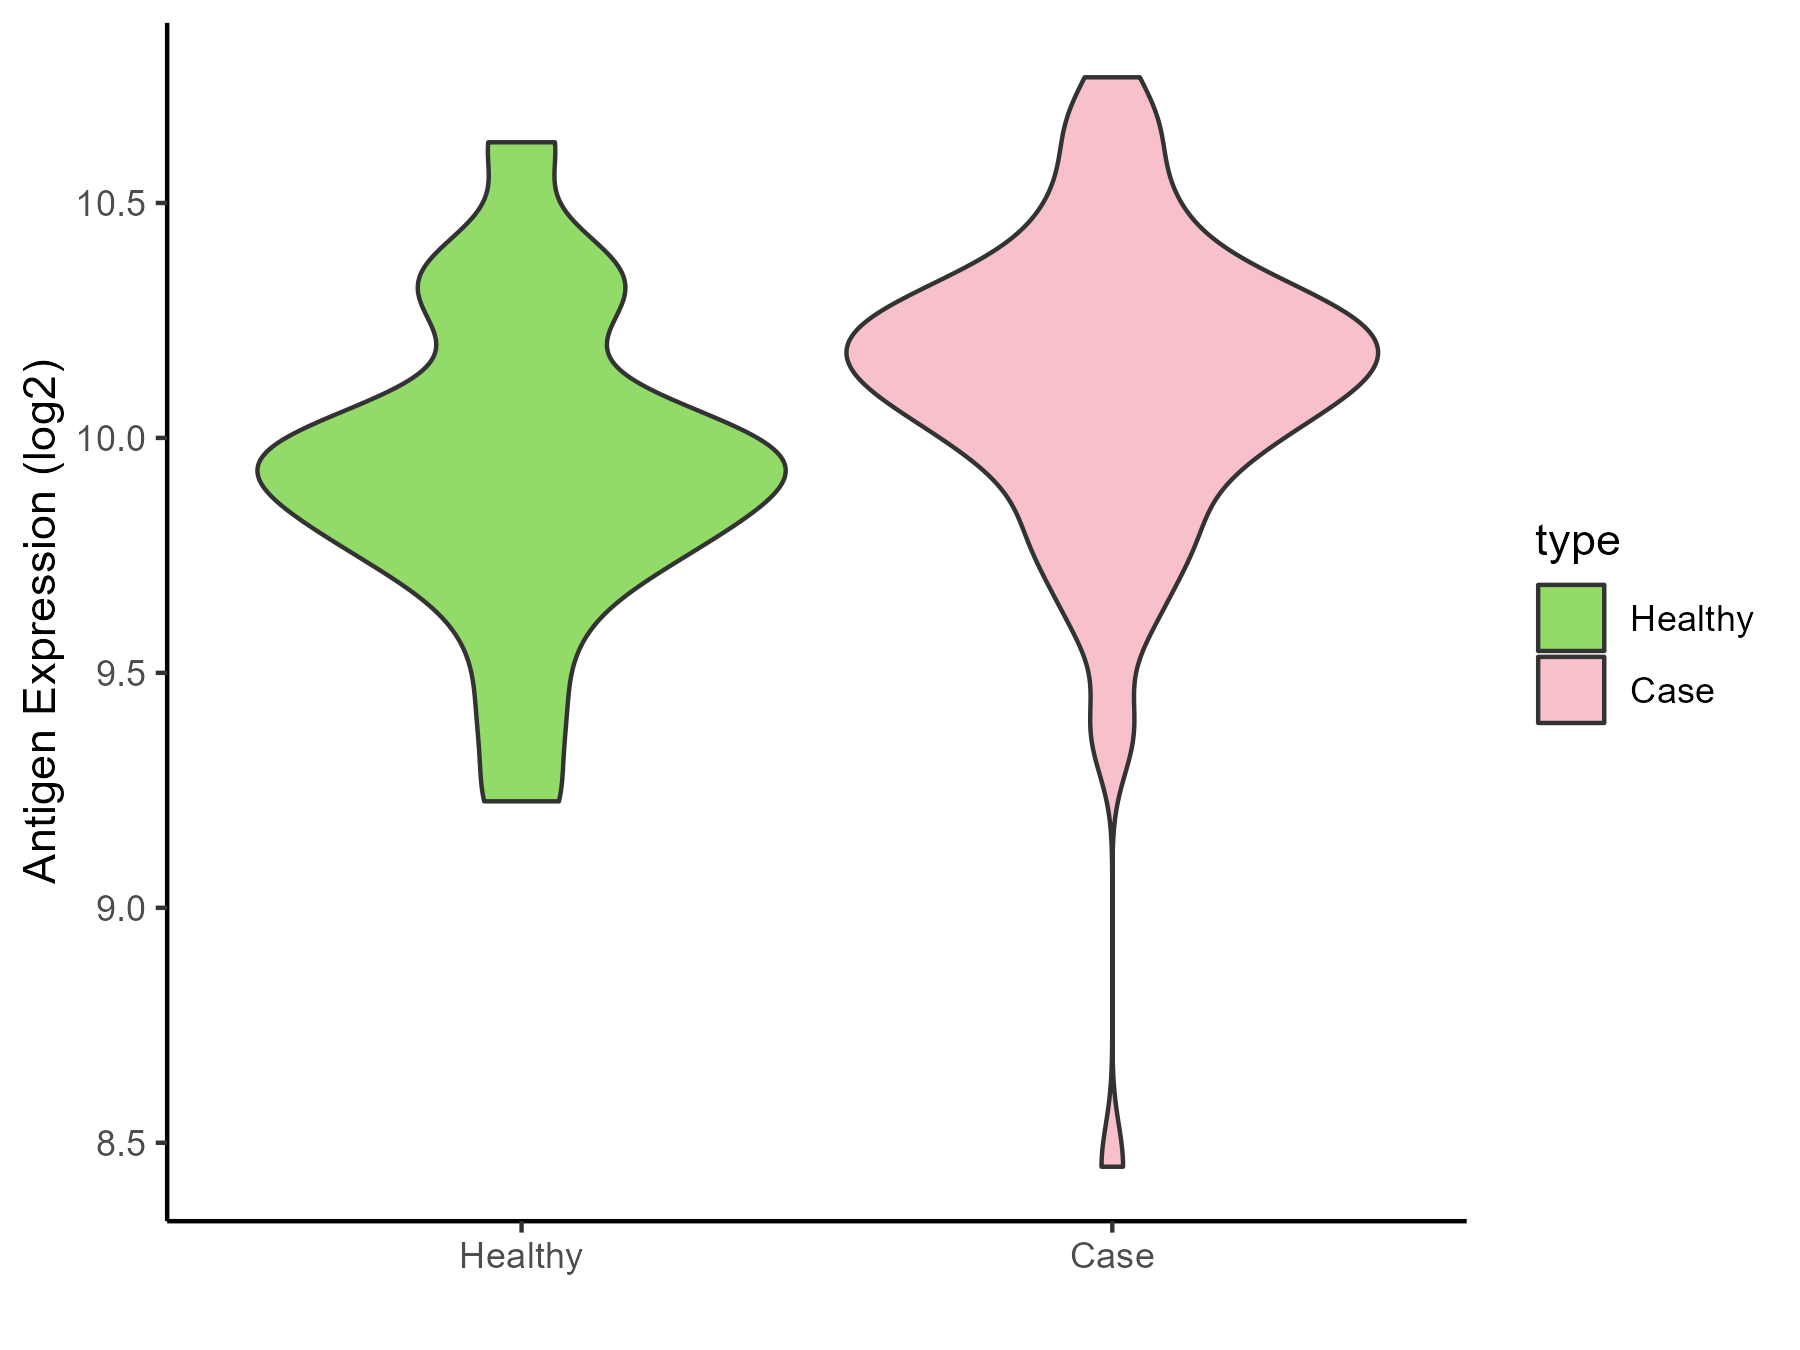
| The Studied Tissue | Whole blood | |
| The Specific Disease | Cardioembolic Stroke | |
| The Expression Level of Disease Section Compare with the Healthy Individual Tissue | p-value: 0.0584731; Fold-change: 0.209233691; Z-score: 0.639818138 | |
| Disease-specific Antigen Abundances |
|
Click to View the Clearer Original Diagram |
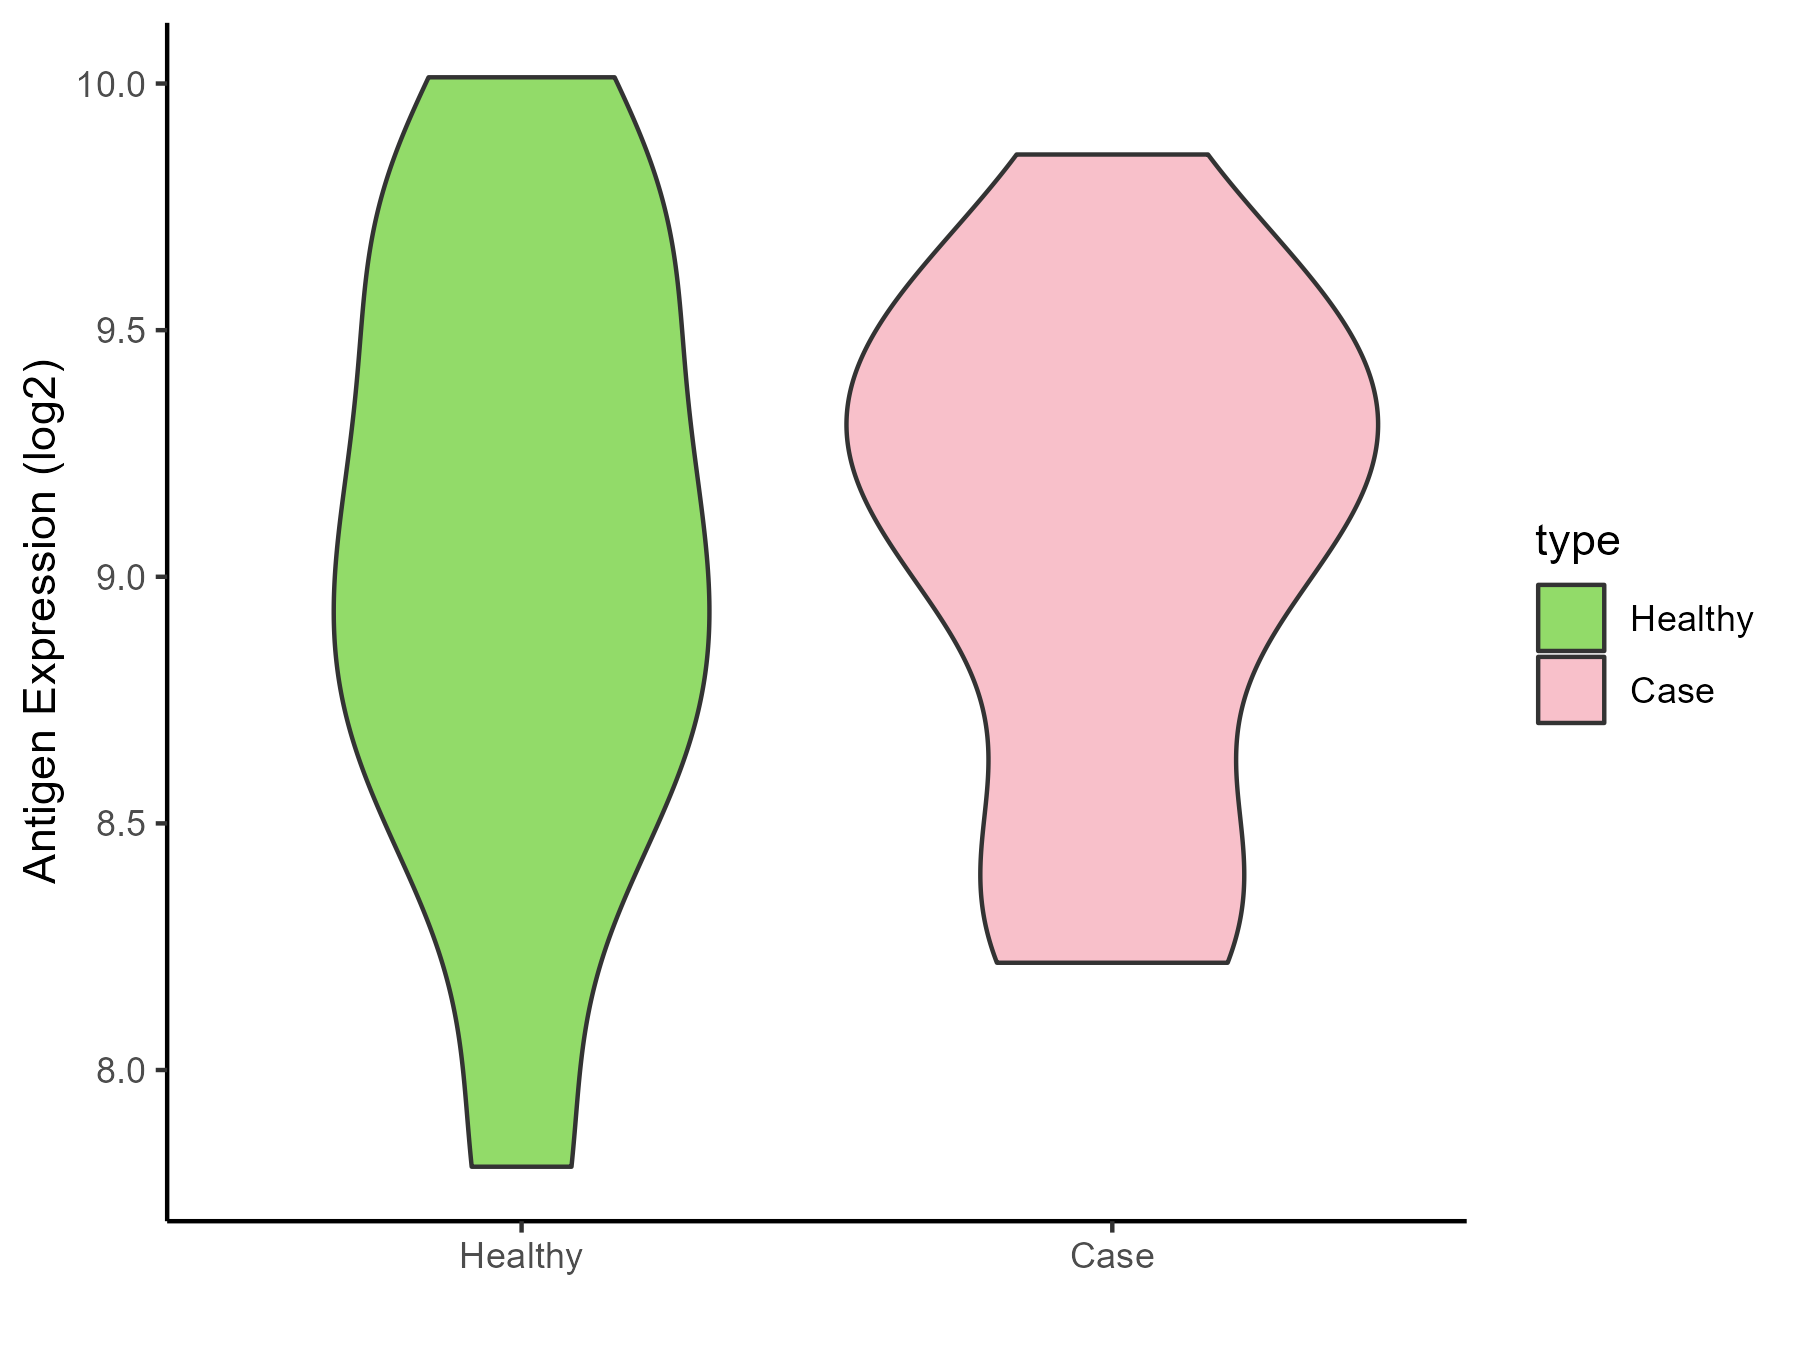
| The Studied Tissue | Peripheral blood | |
| The Specific Disease | Ischemic stroke | |
| The Expression Level of Disease Section Compare with the Healthy Individual Tissue | p-value: 0.870881278; Fold-change: 0.080148211; Z-score: 0.127663846 | |
| Disease-specific Antigen Abundances |
|
Click to View the Clearer Original Diagram |
ICD Disease Classification 1
| Differential expression pattern of antigen in diseases | ||
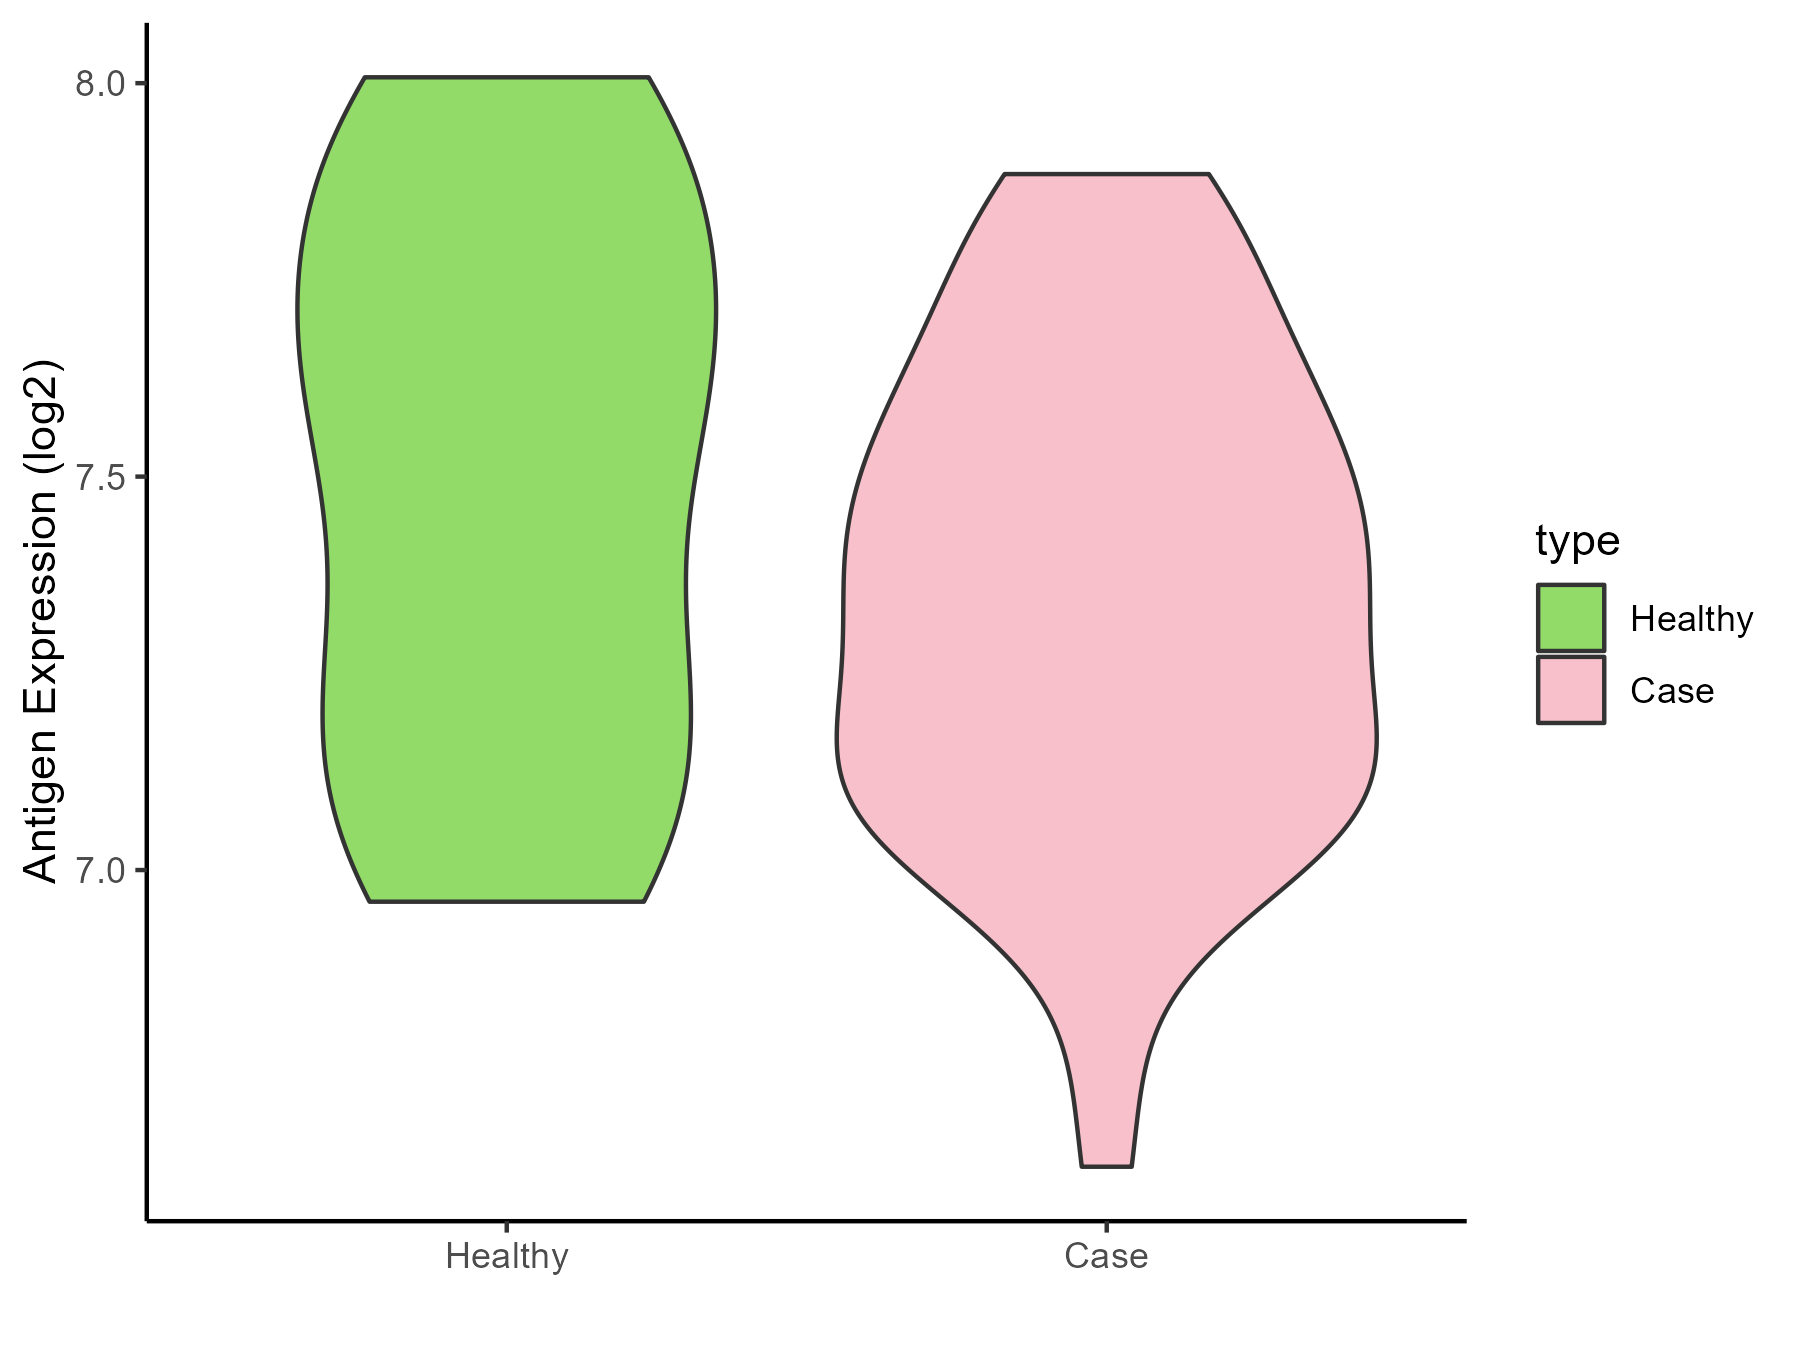
| The Studied Tissue | White matter | |
| The Specific Disease | HIV | |
| The Expression Level of Disease Section Compare with the Healthy Individual Tissue | p-value: 0.177700734; Fold-change: -0.216048472; Z-score: -0.59929453 | |
| Disease-specific Antigen Abundances |
|
Click to View the Clearer Original Diagram |
| Differential expression pattern of antigen in diseases | ||
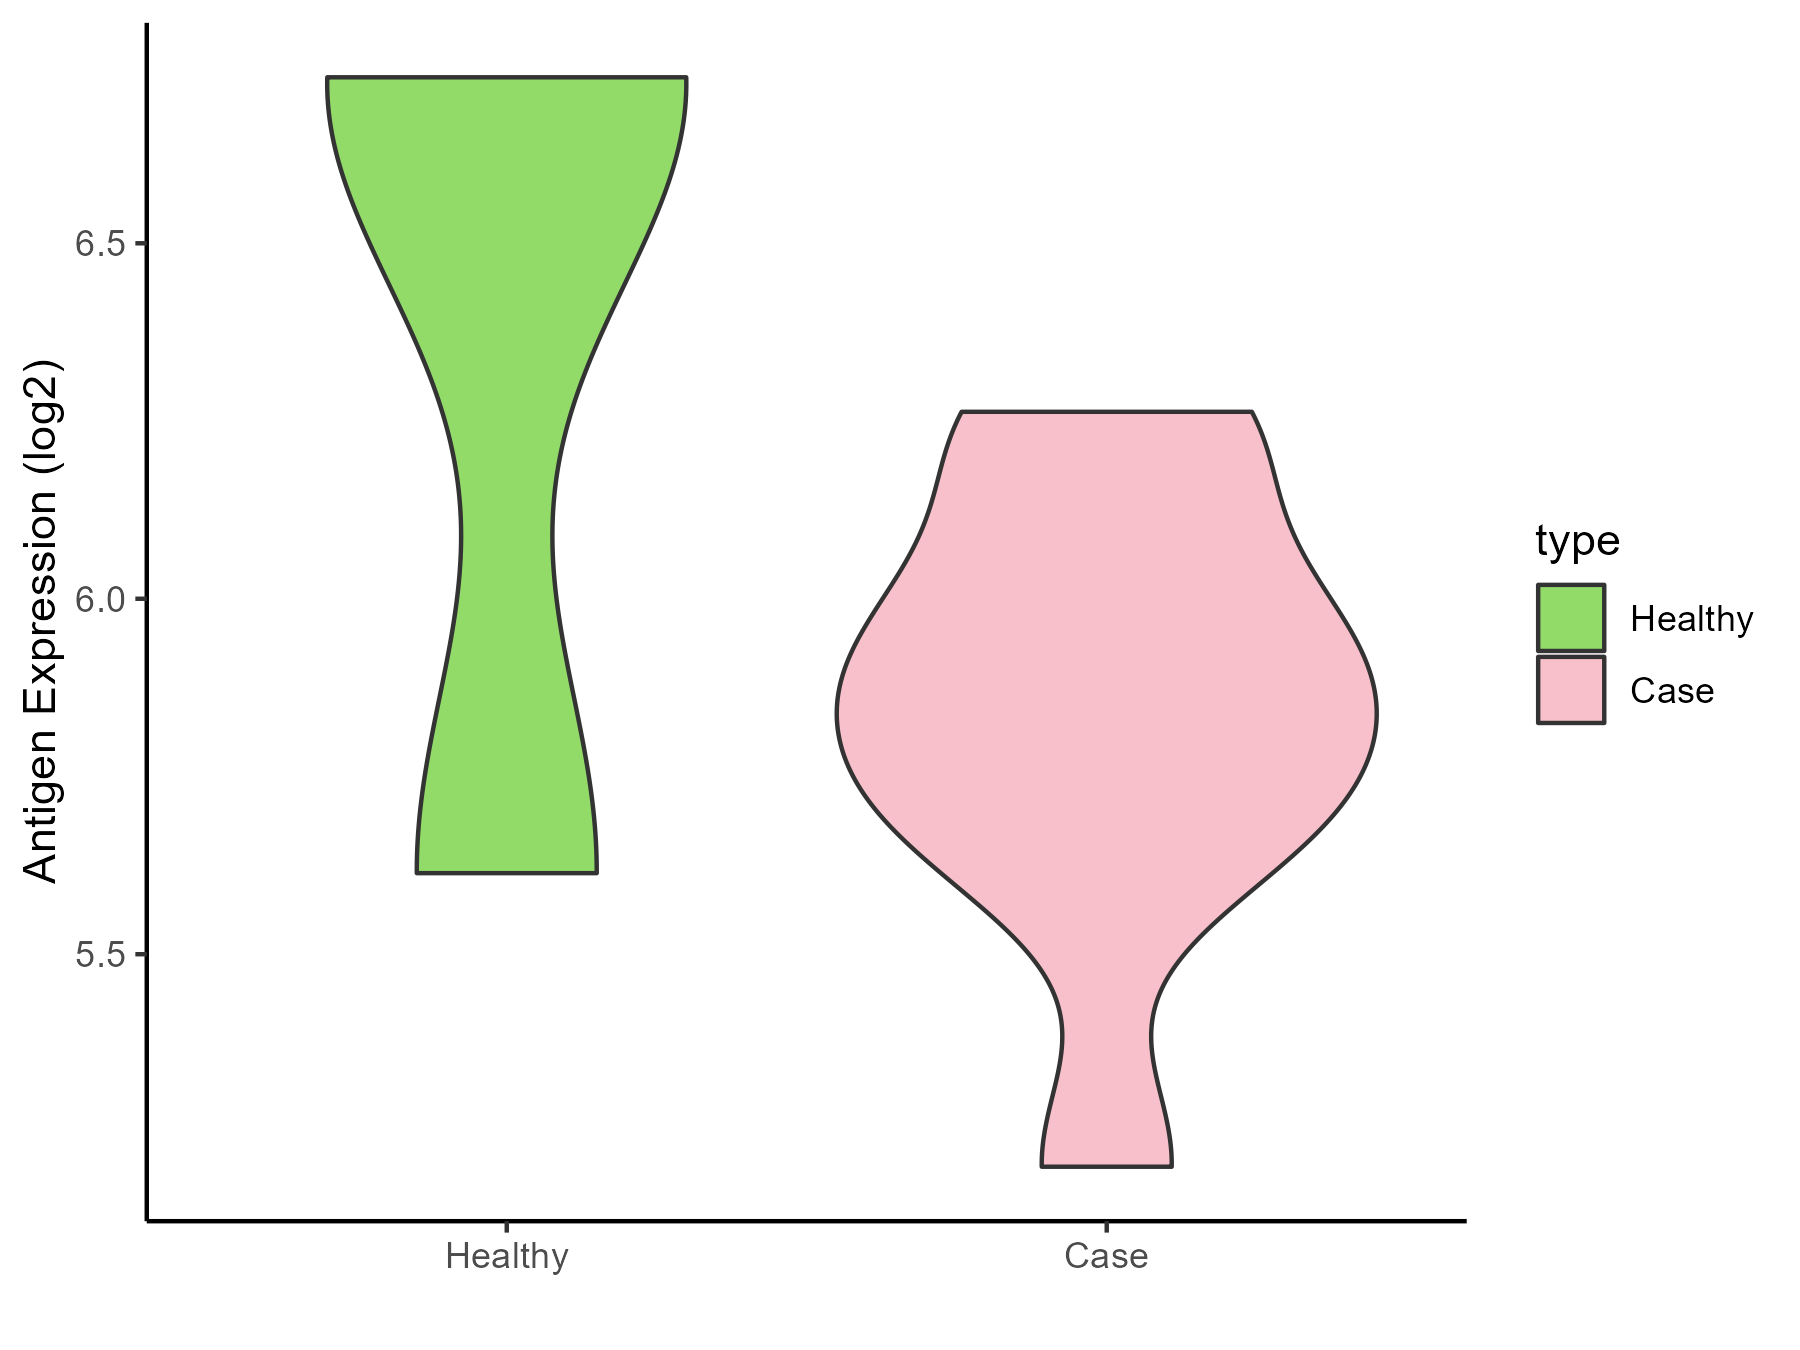
| The Studied Tissue | Whole blood | |
| The Specific Disease | Influenza | |
| The Expression Level of Disease Section Compare with the Healthy Individual Tissue | p-value: 0.303628012; Fold-change: -0.81322717; Z-score: -1.267394826 | |
| Disease-specific Antigen Abundances |
|
Click to View the Clearer Original Diagram |
| Differential expression pattern of antigen in diseases | ||
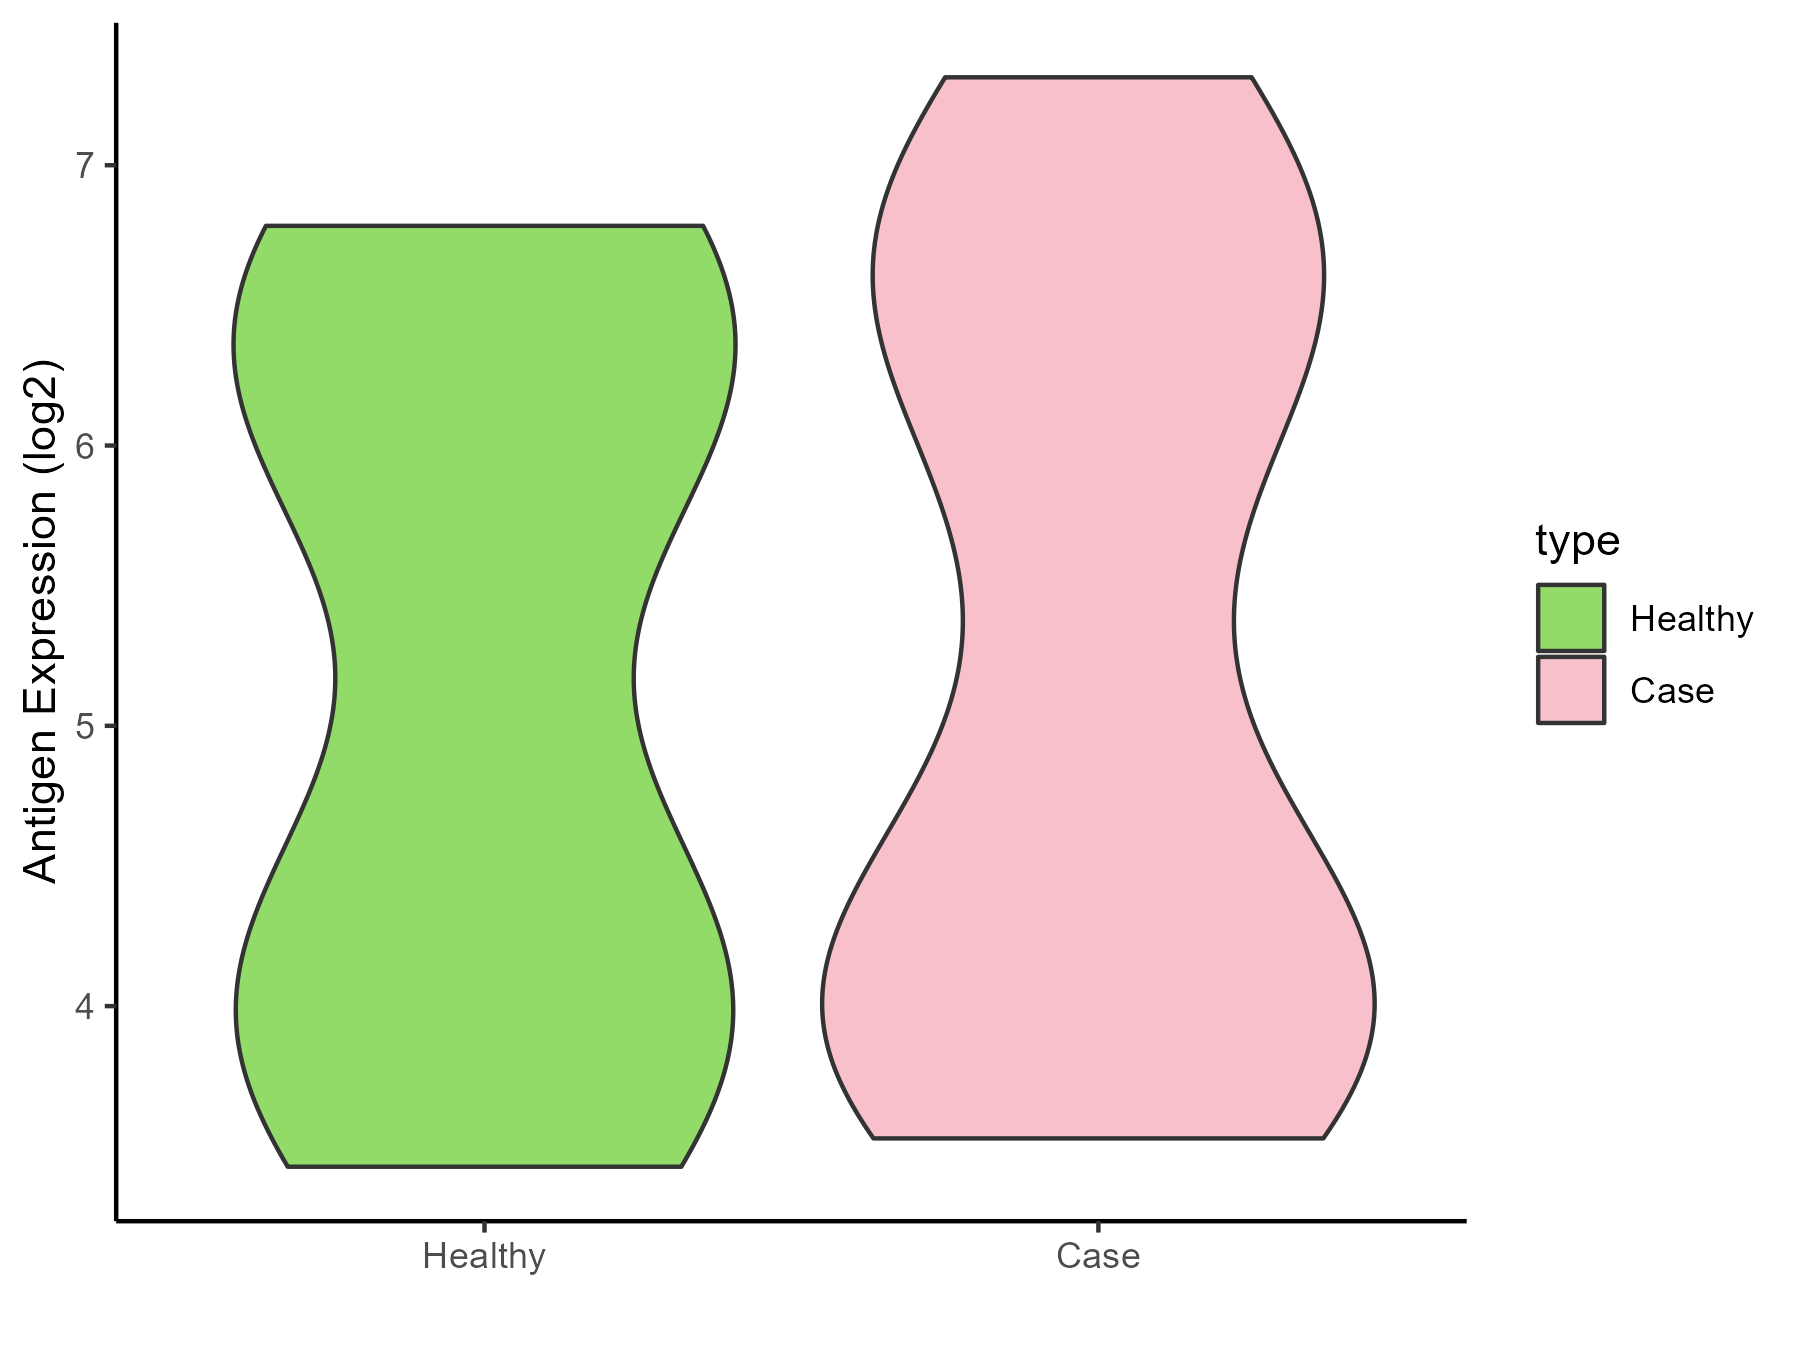
| The Studied Tissue | Whole blood | |
| The Specific Disease | Chronic hepatitis C | |
| The Expression Level of Disease Section Compare with the Healthy Individual Tissue | p-value: 0.903895373; Fold-change: -0.191715574; Z-score: -0.145725562 | |
| Disease-specific Antigen Abundances |
|
Click to View the Clearer Original Diagram |
| Differential expression pattern of antigen in diseases | ||
| The Studied Tissue | Whole blood | |
| The Specific Disease | Sepsis | |
| The Expression Level of Disease Section Compare with the Healthy Individual Tissue | p-value: 4.68E-09; Fold-change: 0.636912074; Z-score: 1.209749128 | |
| Disease-specific Antigen Abundances |
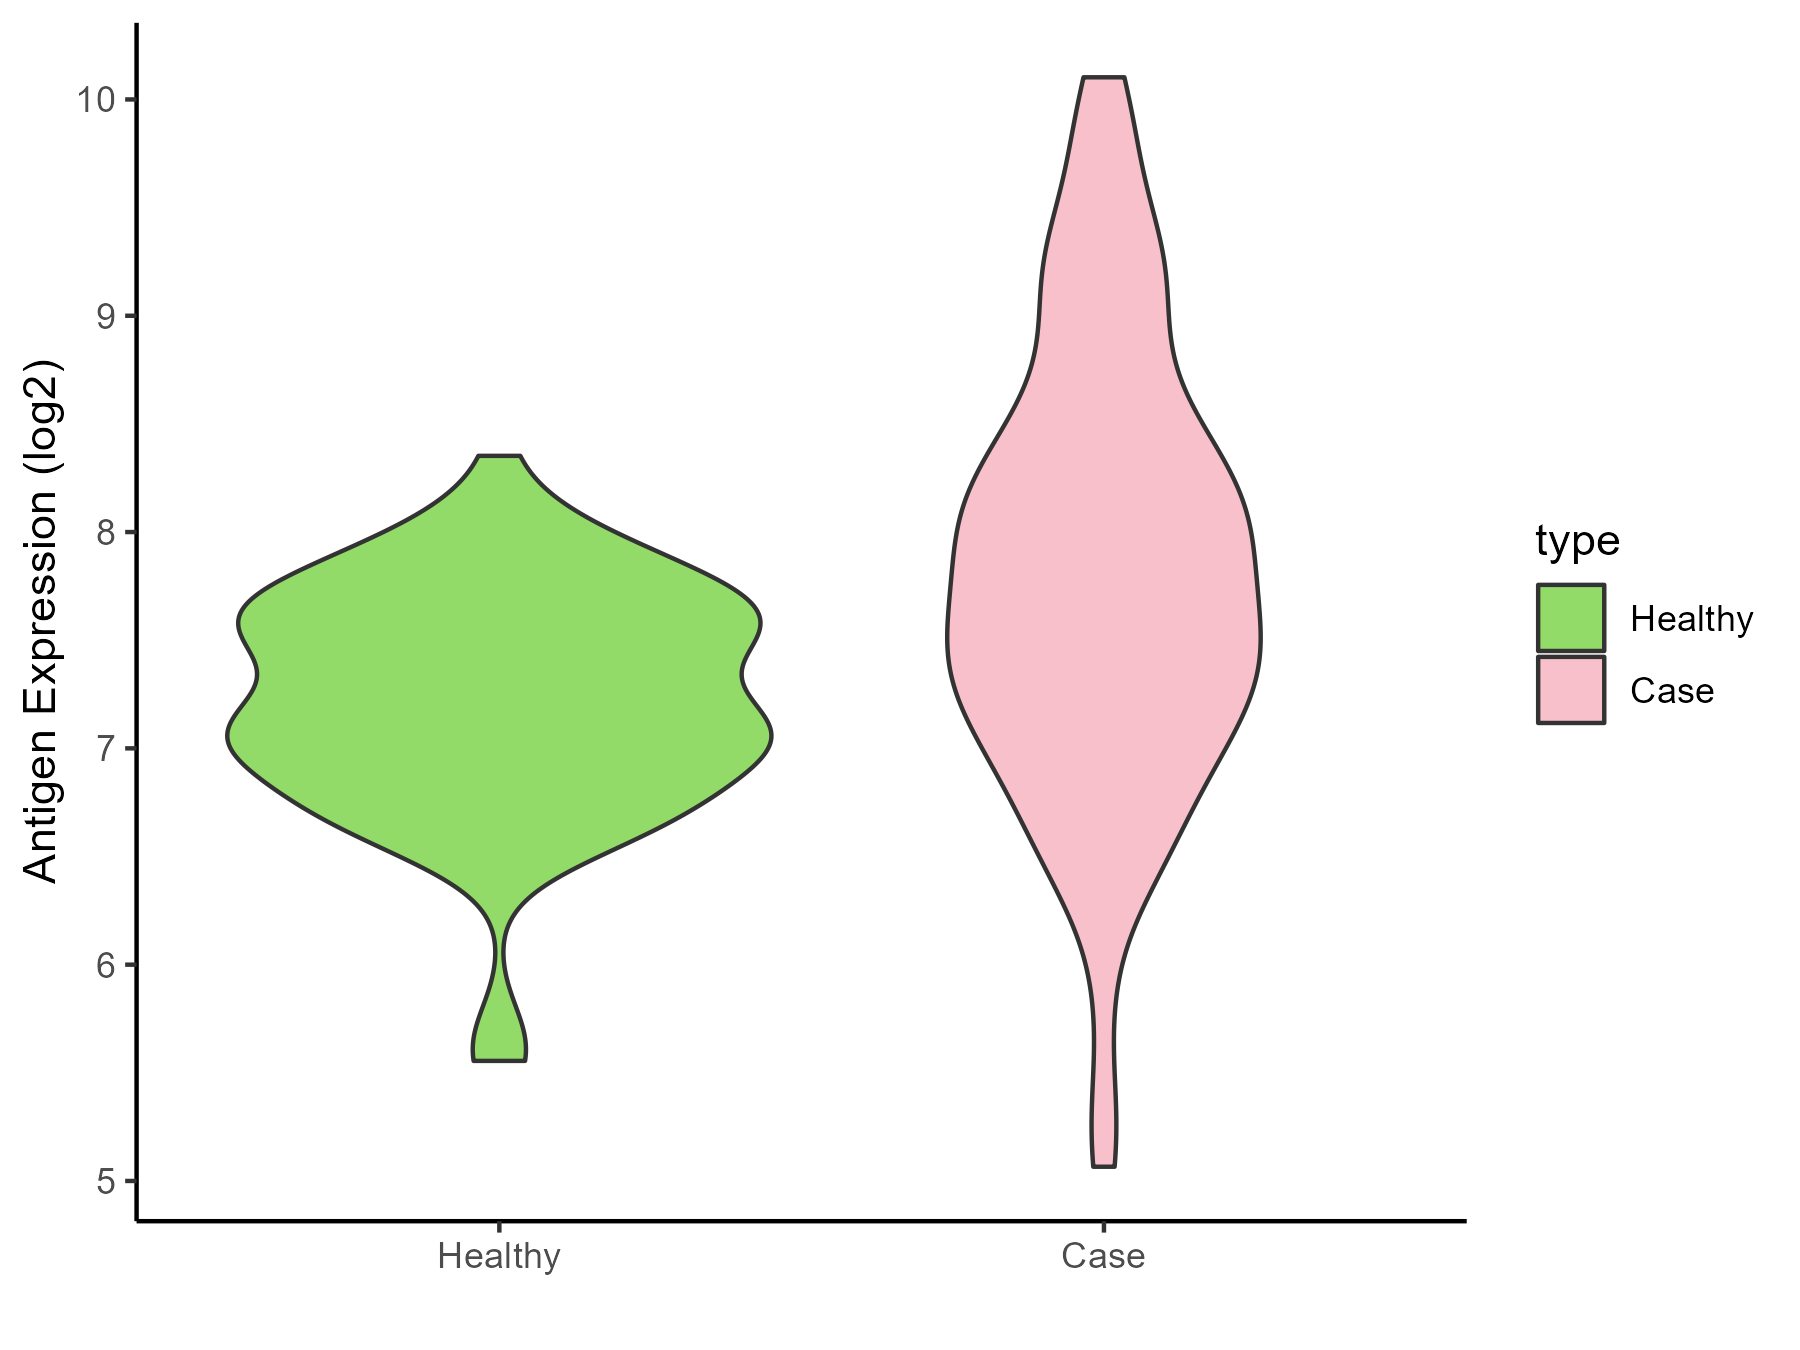
|
Click to View the Clearer Original Diagram |
| Differential expression pattern of antigen in diseases | ||
| The Studied Tissue | Whole blood | |
| The Specific Disease | Septic shock | |
| The Expression Level of Disease Section Compare with the Healthy Individual Tissue | p-value: 7.50E-10; Fold-change: 0.291187012; Z-score: 0.761624551 | |
| Disease-specific Antigen Abundances |
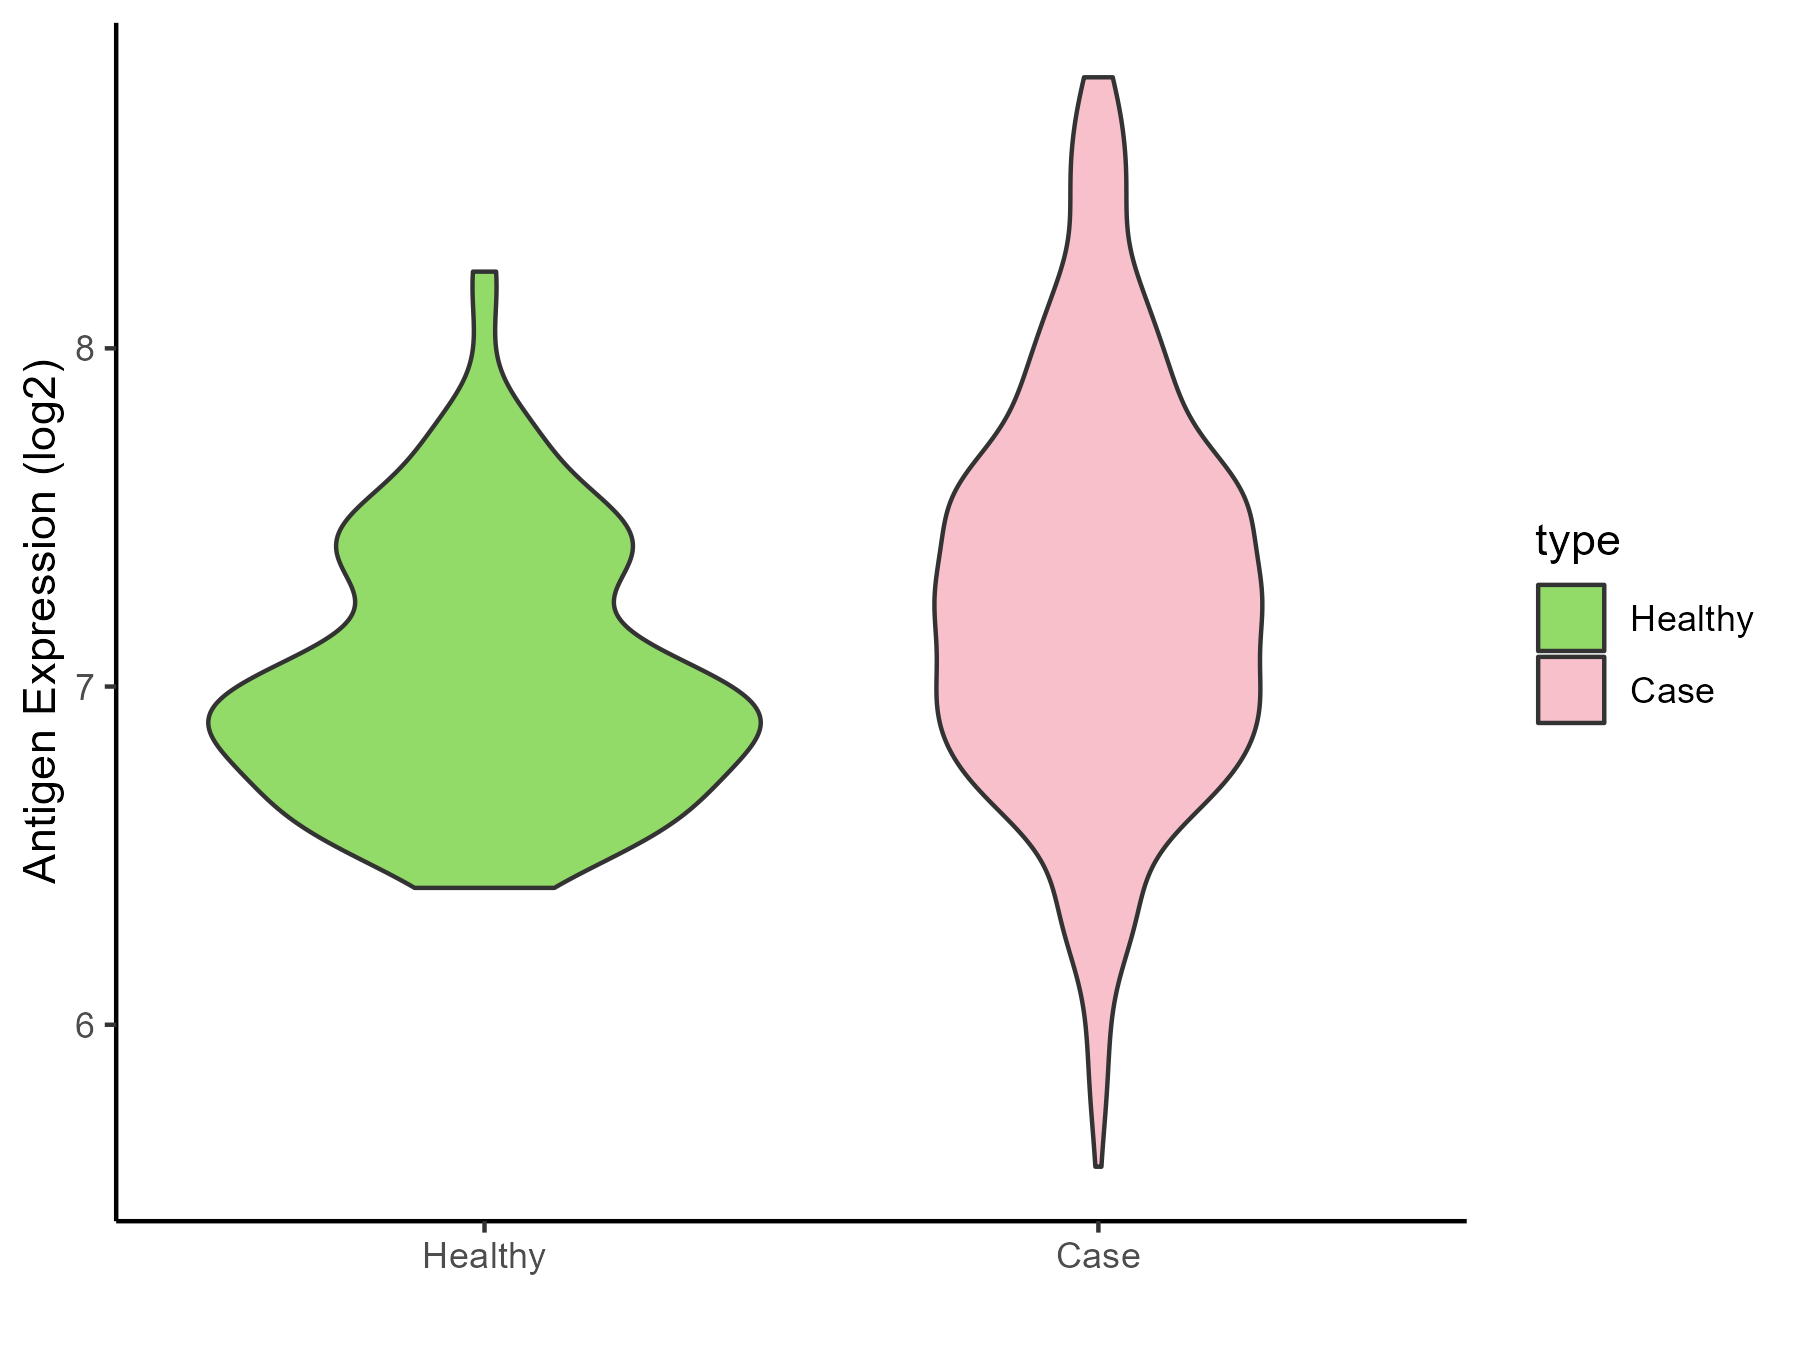
|
Click to View the Clearer Original Diagram |
| Differential expression pattern of antigen in diseases | ||
| The Studied Tissue | Peripheral blood | |
| The Specific Disease | Pediatric respiratory syncytial virus infection | |
| The Expression Level of Disease Section Compare with the Healthy Individual Tissue | p-value: 0.000581663; Fold-change: 0.630986525; Z-score: 0.987018973 | |
| Disease-specific Antigen Abundances |
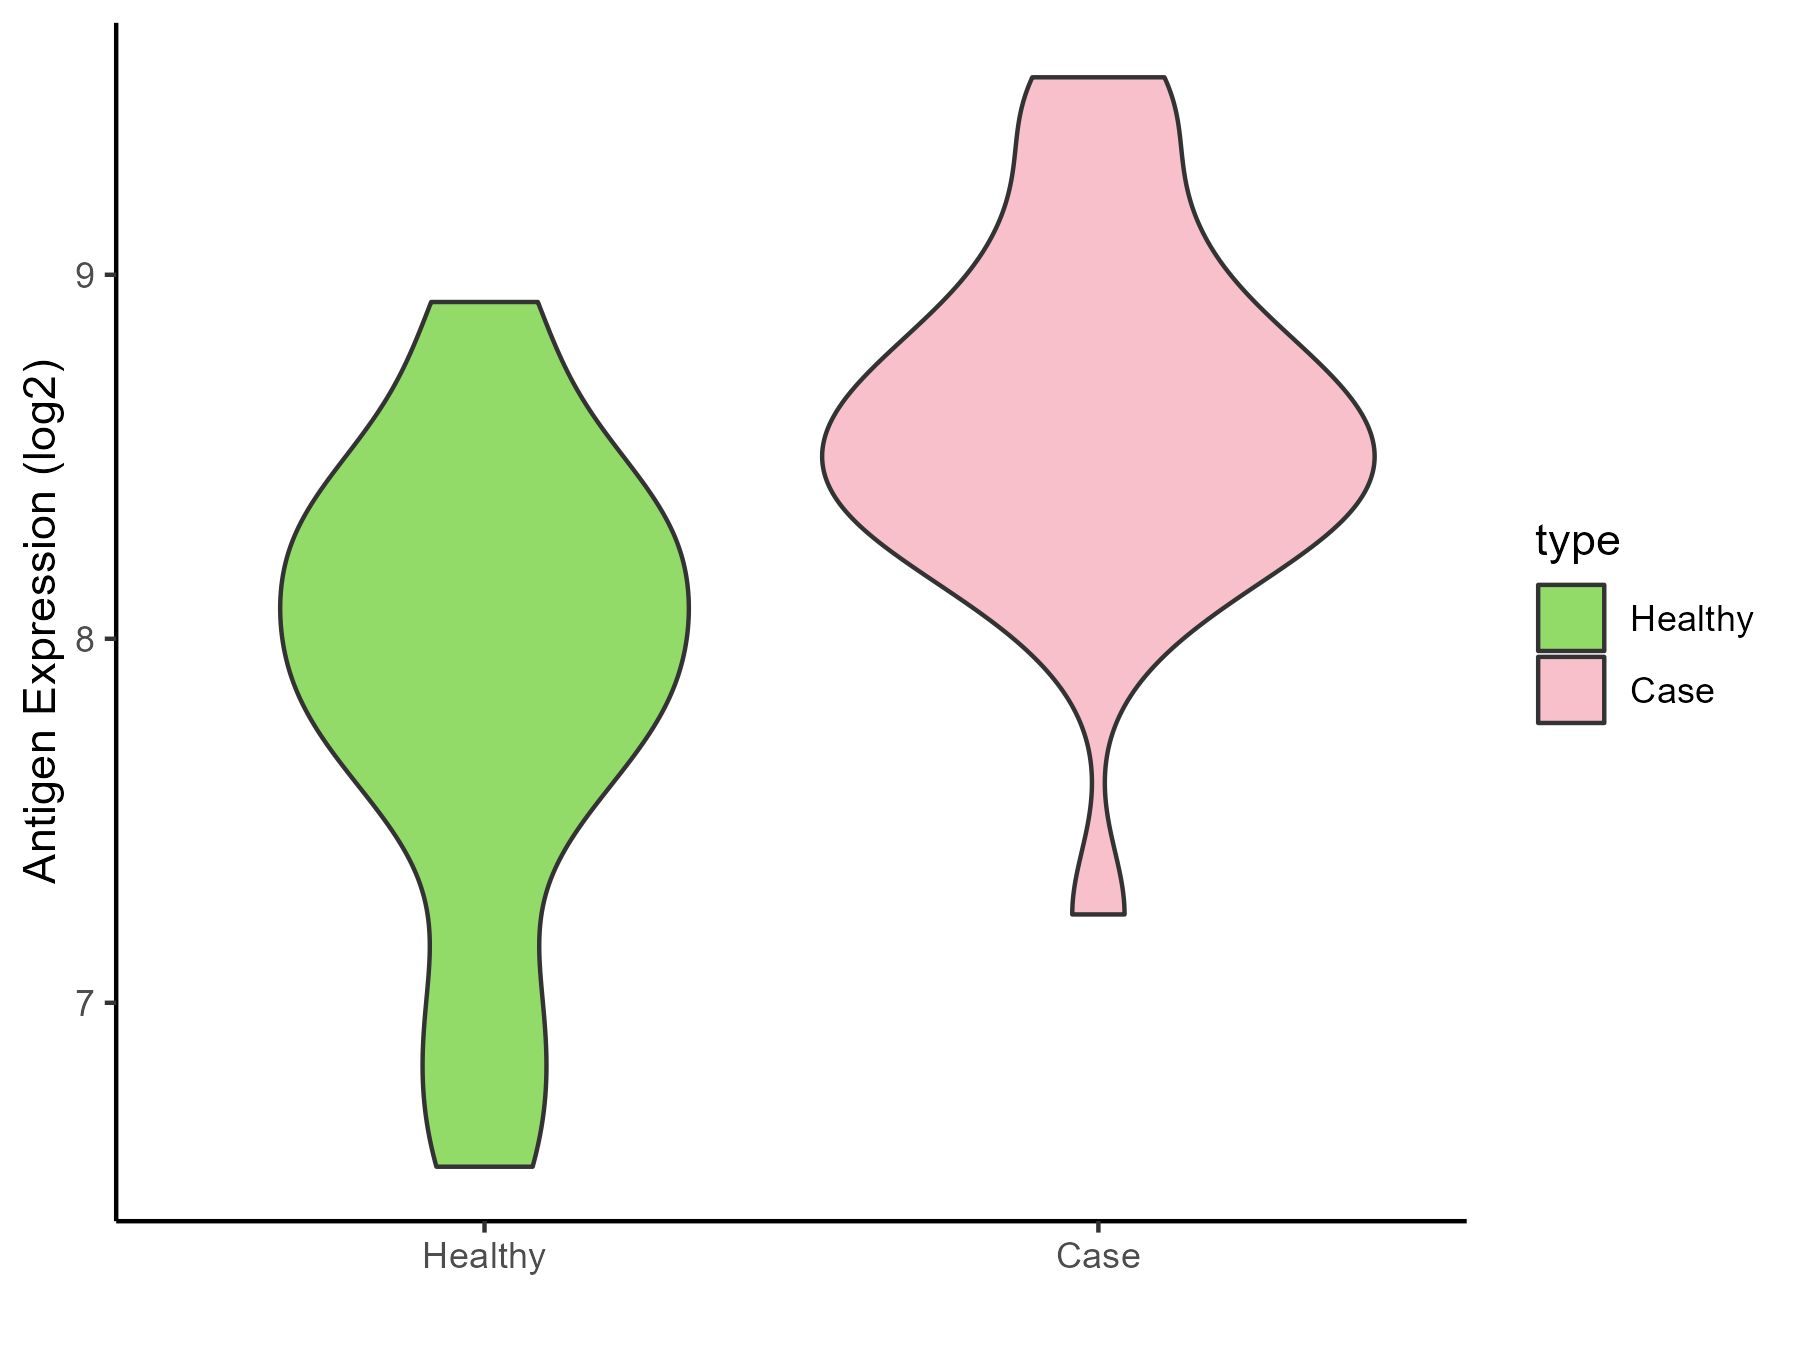
|
Click to View the Clearer Original Diagram |
ICD Disease Classification 11
| Differential expression pattern of antigen in diseases | ||
| The Studied Tissue | Peripheral blood | |
| The Specific Disease | Essential hypertension | |
| The Expression Level of Disease Section Compare with the Healthy Individual Tissue | p-value: 0.347790822; Fold-change: -0.378363304; Z-score: -1.478267891 | |
| Disease-specific Antigen Abundances |
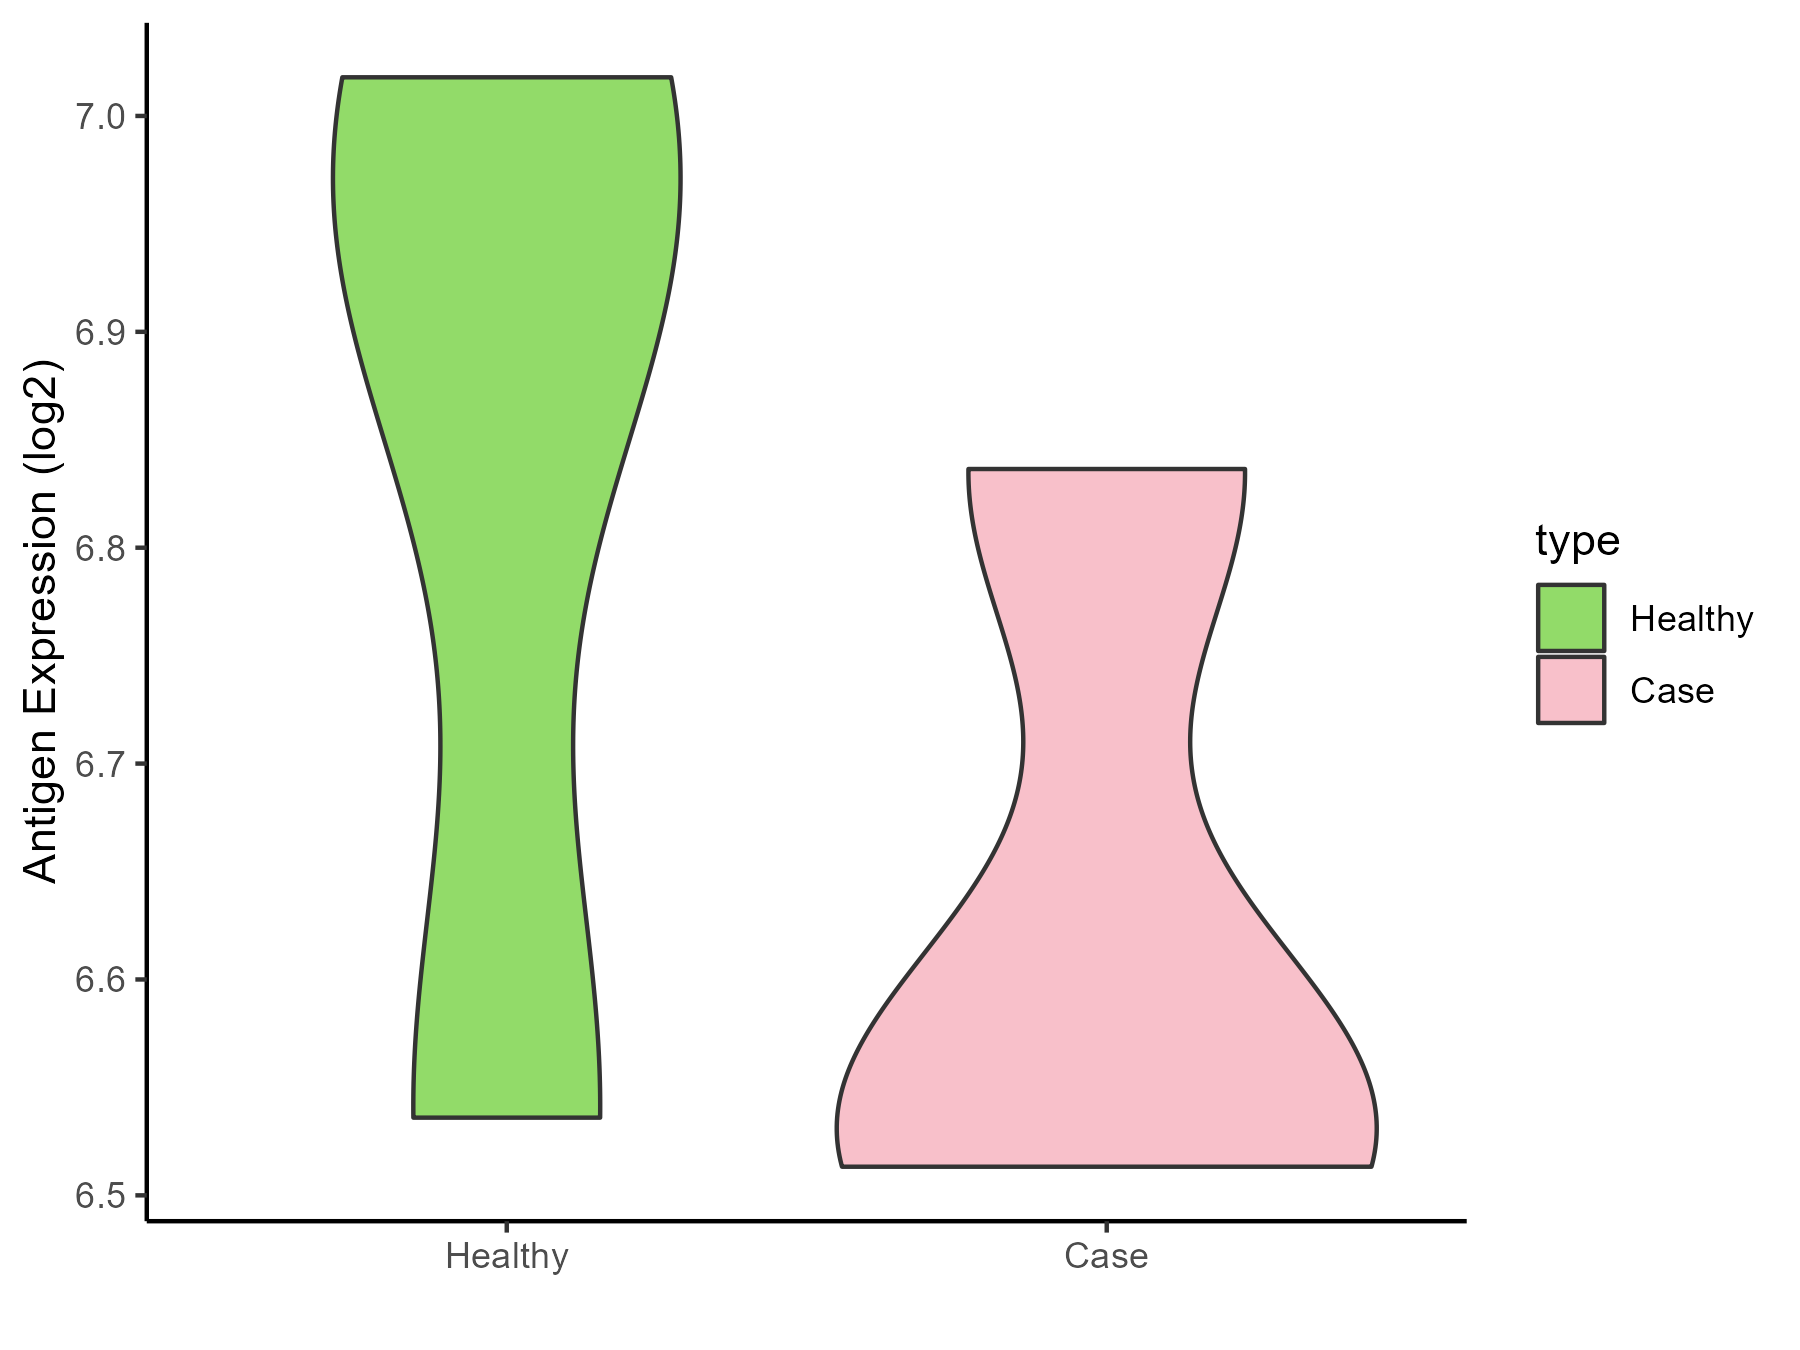
|
Click to View the Clearer Original Diagram |
| Differential expression pattern of antigen in diseases | ||
| The Studied Tissue | Peripheral blood | |
| The Specific Disease | Myocardial infarction | |
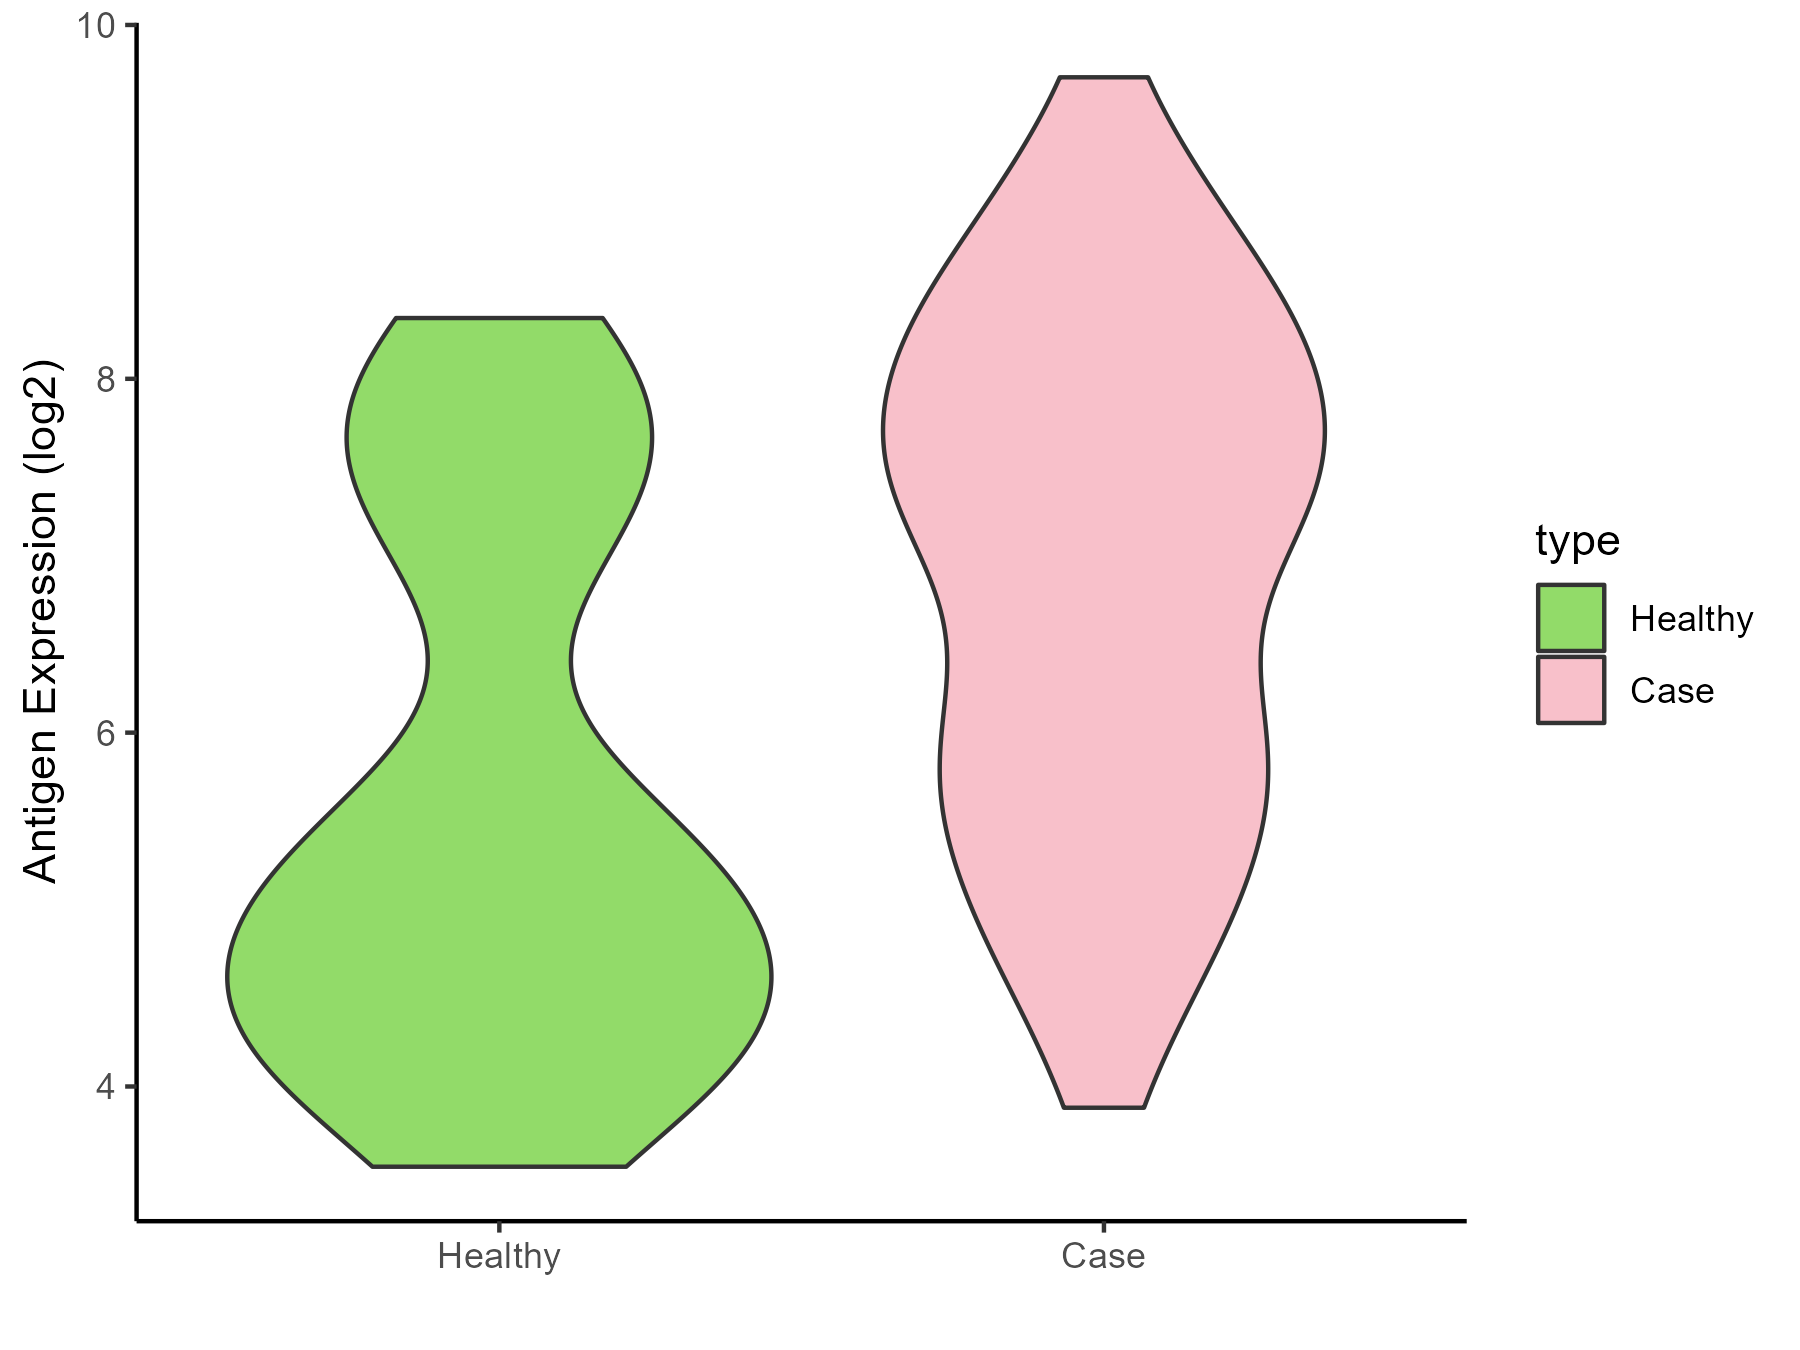
| The Expression Level of Disease Section Compare with the Healthy Individual Tissue | p-value: 2.68E-06; Fold-change: 1.962352418; Z-score: 1.293439159 | |
| Disease-specific Antigen Abundances |
|
Click to View the Clearer Original Diagram |
| Differential expression pattern of antigen in diseases | ||
| The Studied Tissue | Peripheral blood | |
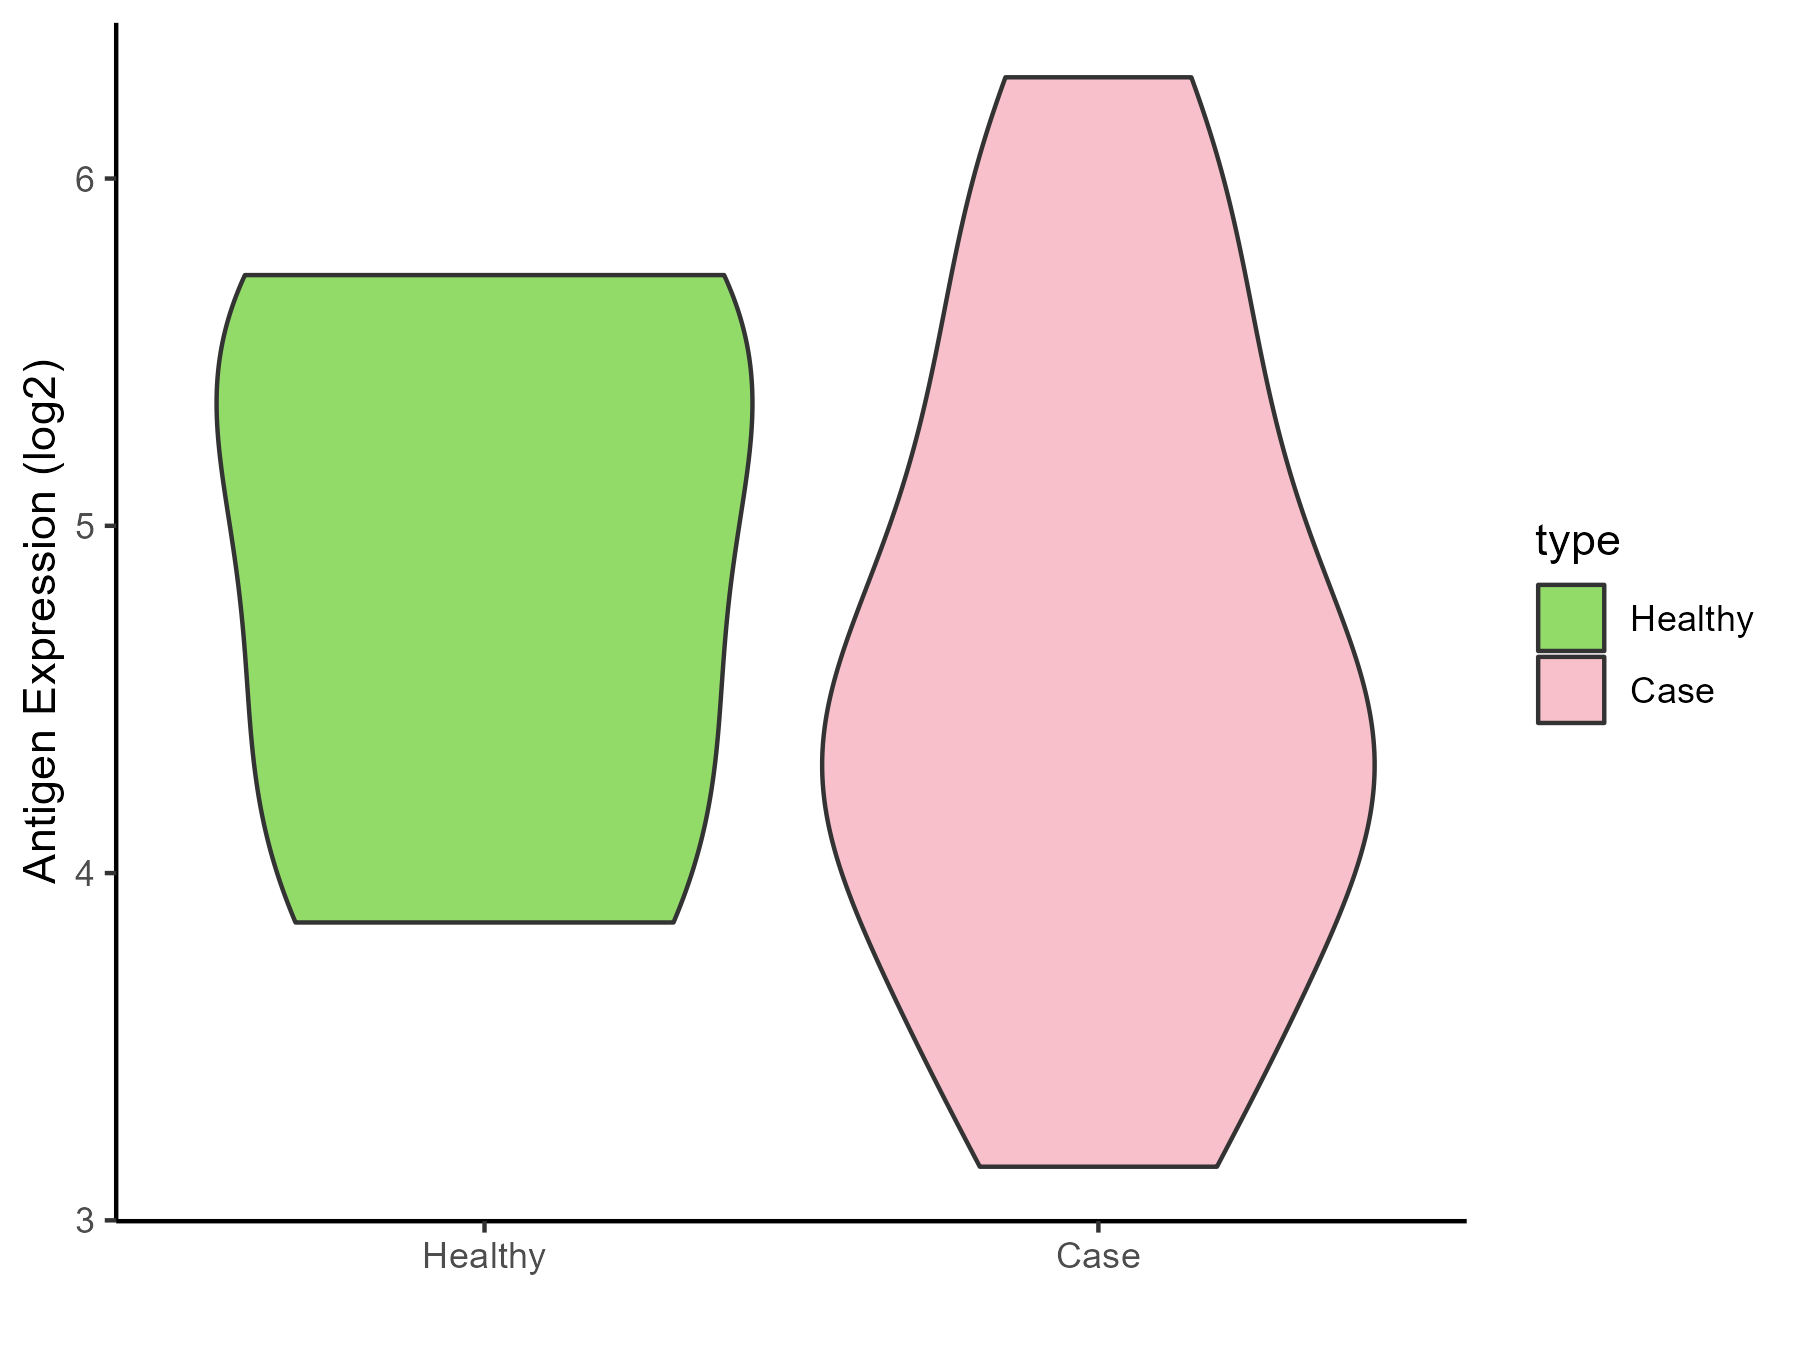
| The Specific Disease | Coronary artery disease | |
| The Expression Level of Disease Section Compare with the Healthy Individual Tissue | p-value: 0.583674353; Fold-change: -0.509297141; Z-score: -0.603169062 | |
| Disease-specific Antigen Abundances |
|
Click to View the Clearer Original Diagram |
| Differential expression pattern of antigen in diseases | ||
| The Studied Tissue | Calcified aortic valve | |
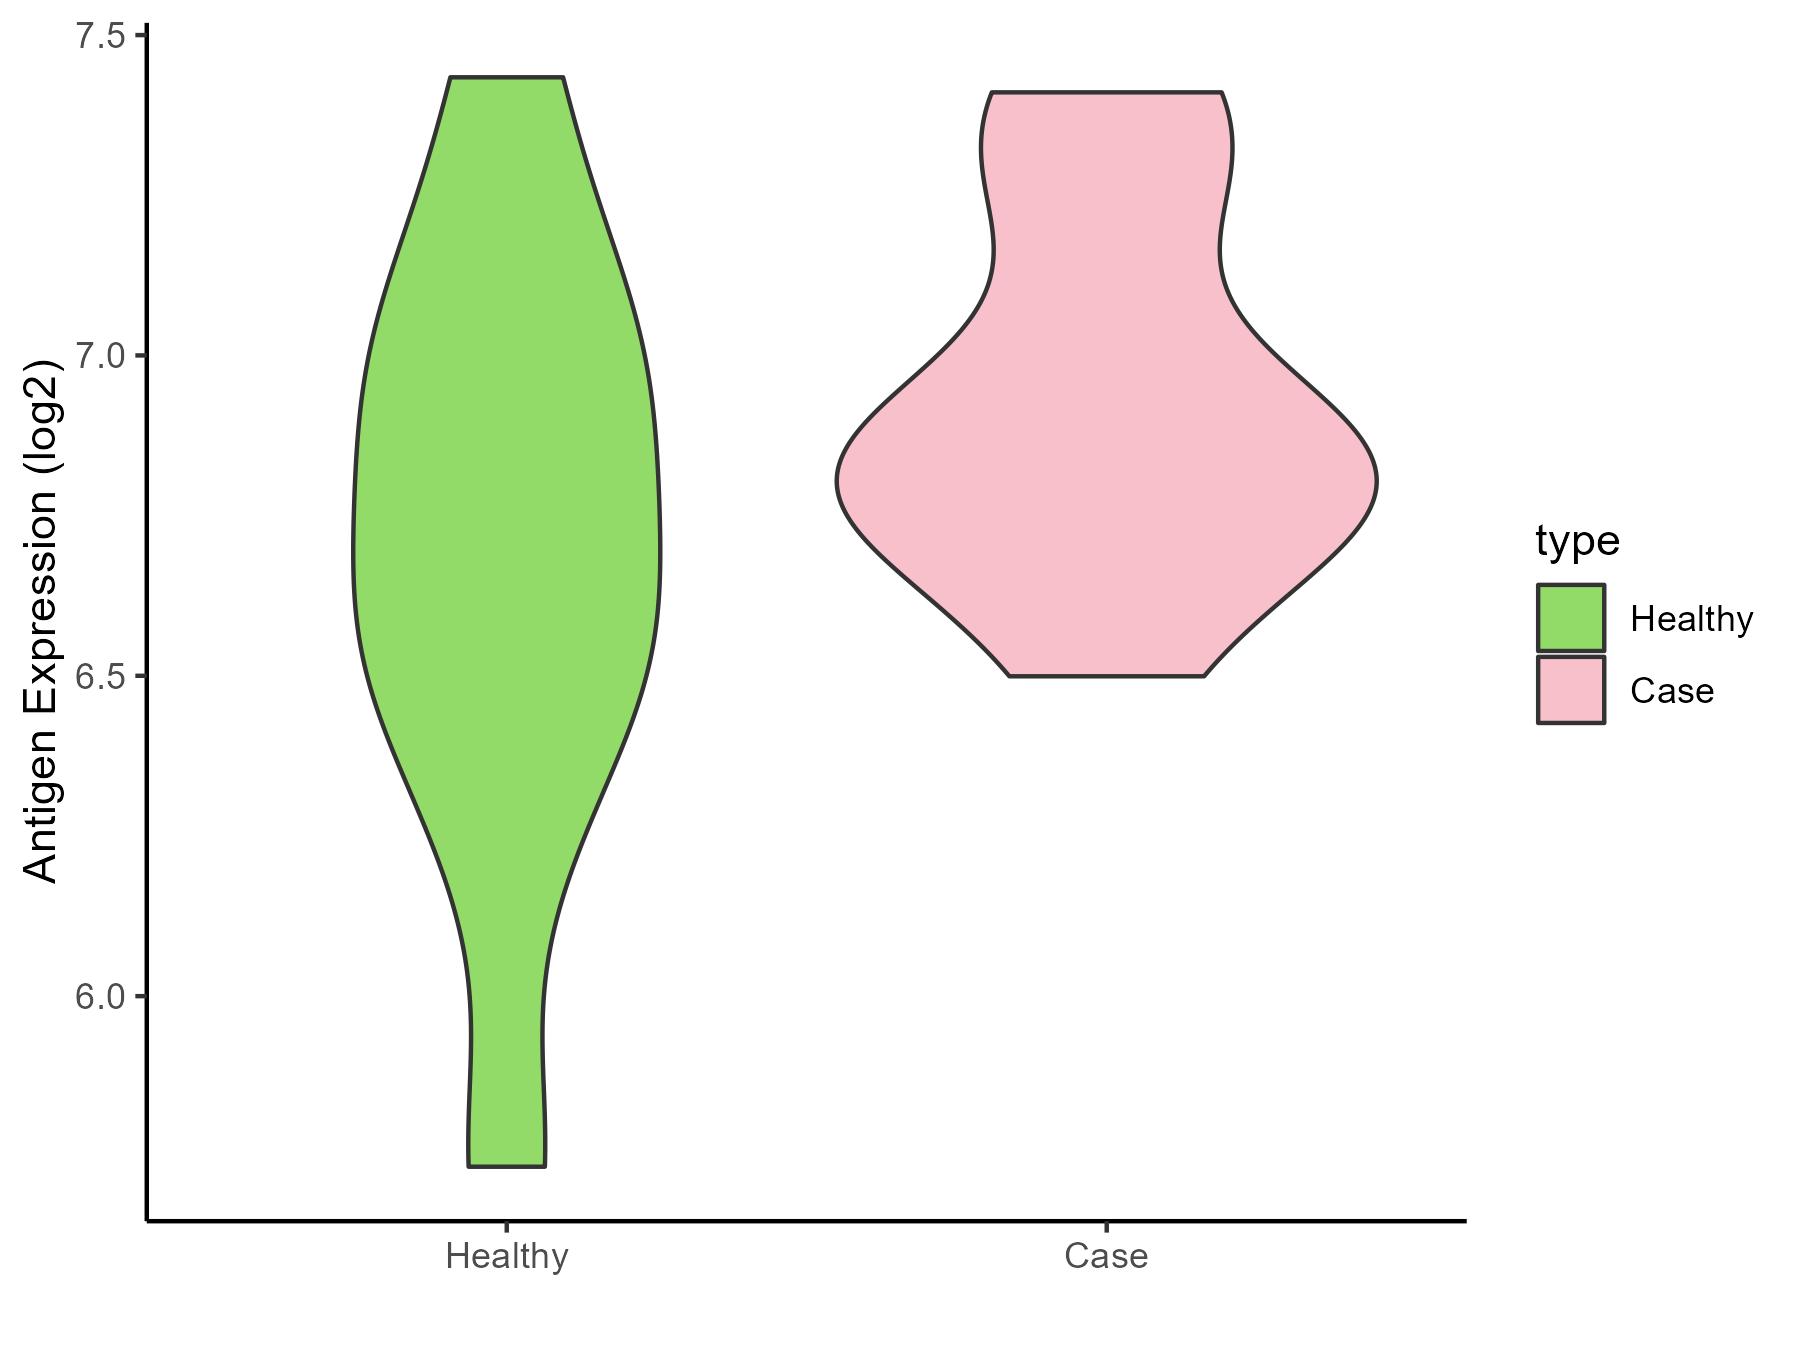
| The Specific Disease | Aortic stenosis | |
| The Expression Level of Disease Section Compare with the Healthy Individual Tissue | p-value: 0.198541107; Fold-change: 0.118402841; Z-score: 0.244926255 | |
| Disease-specific Antigen Abundances |
|
Click to View the Clearer Original Diagram |
| Differential expression pattern of antigen in diseases | ||
| The Studied Tissue | Peripheral blood | |
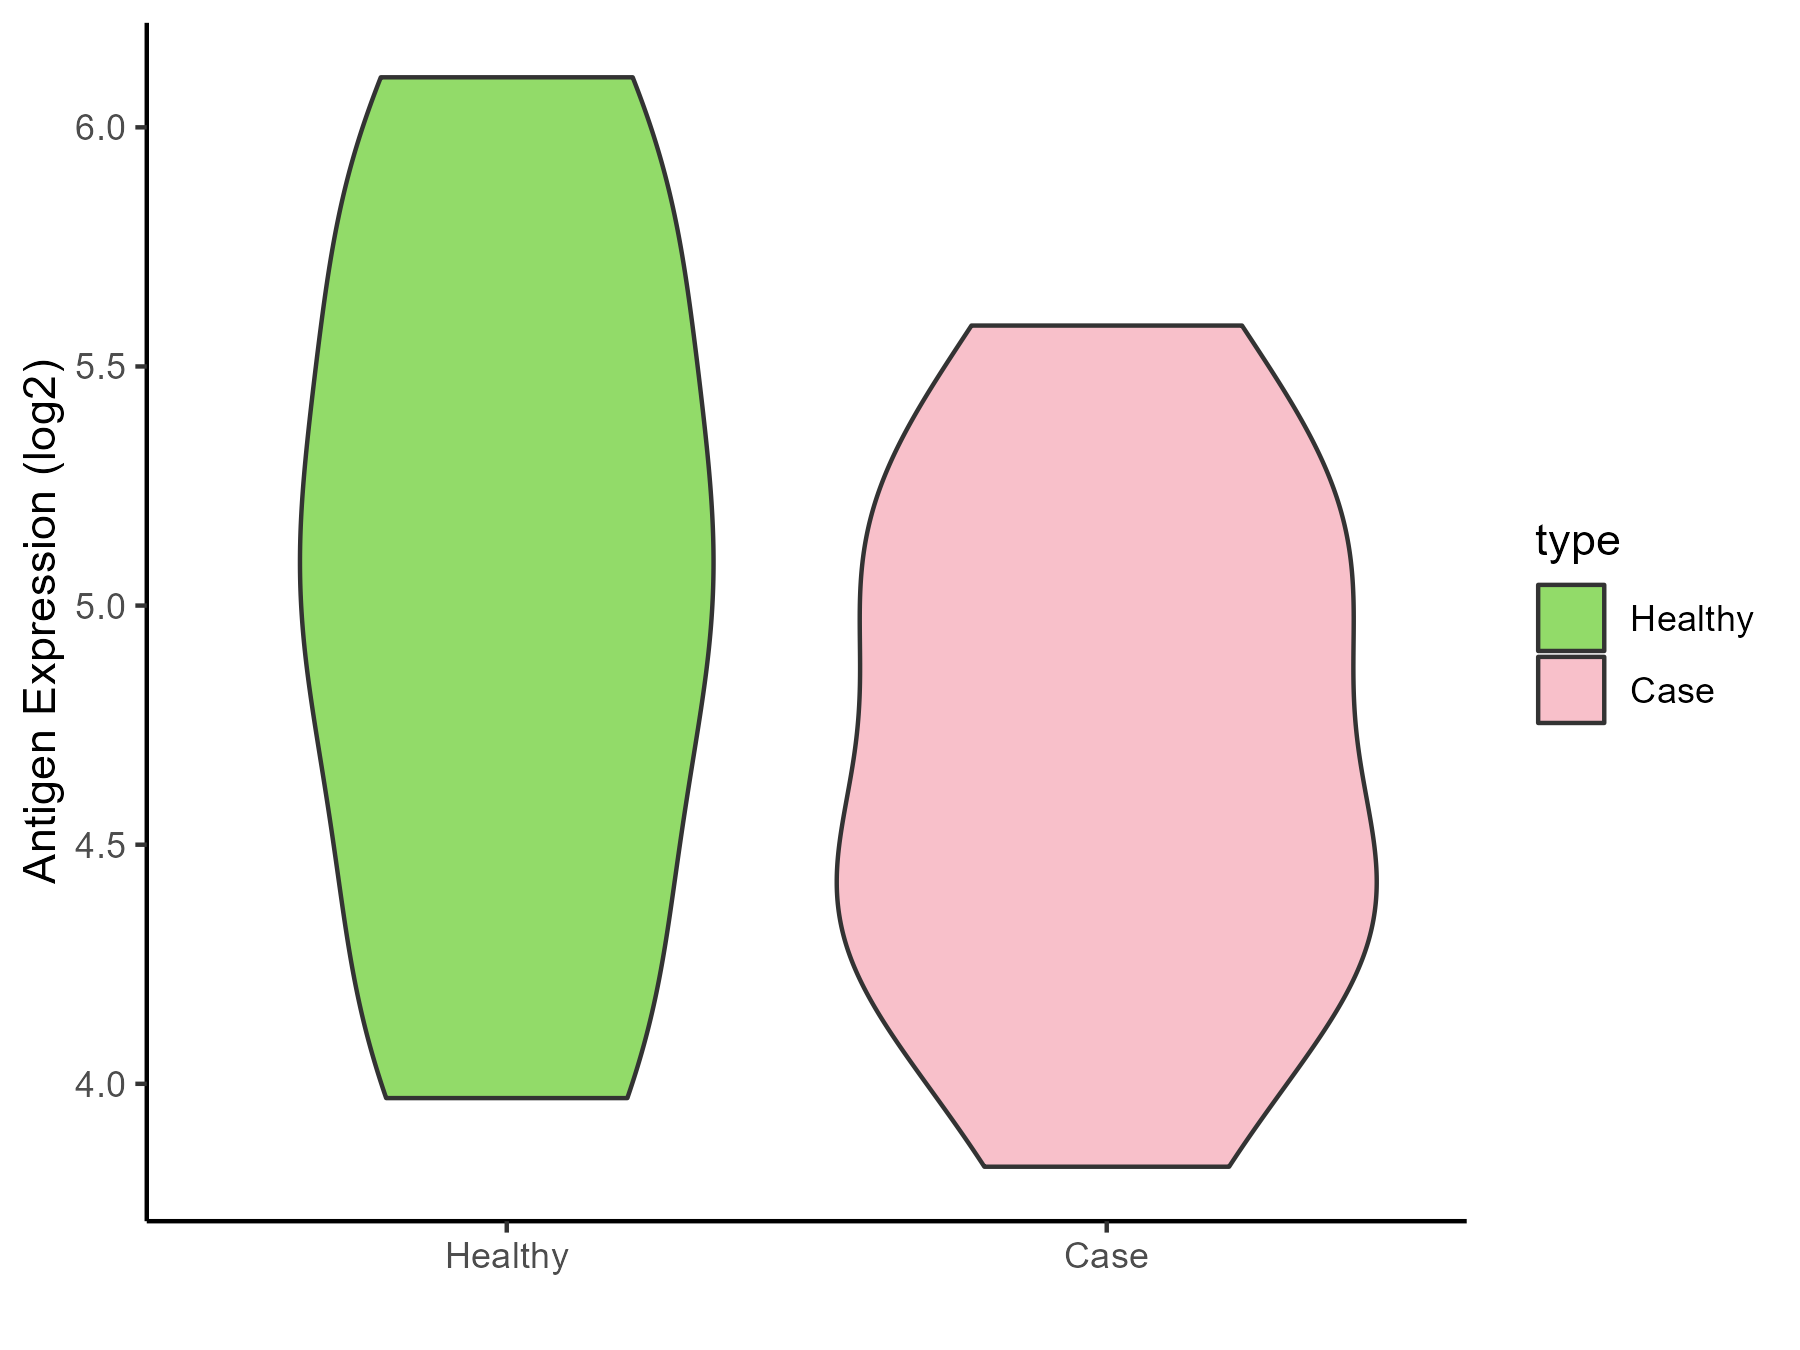
| The Specific Disease | Arteriosclerosis | |
| The Expression Level of Disease Section Compare with the Healthy Individual Tissue | p-value: 0.225430737; Fold-change: -0.348426988; Z-score: -0.486868254 | |
| Disease-specific Antigen Abundances |
|
Click to View the Clearer Original Diagram |
| Differential expression pattern of antigen in diseases | ||
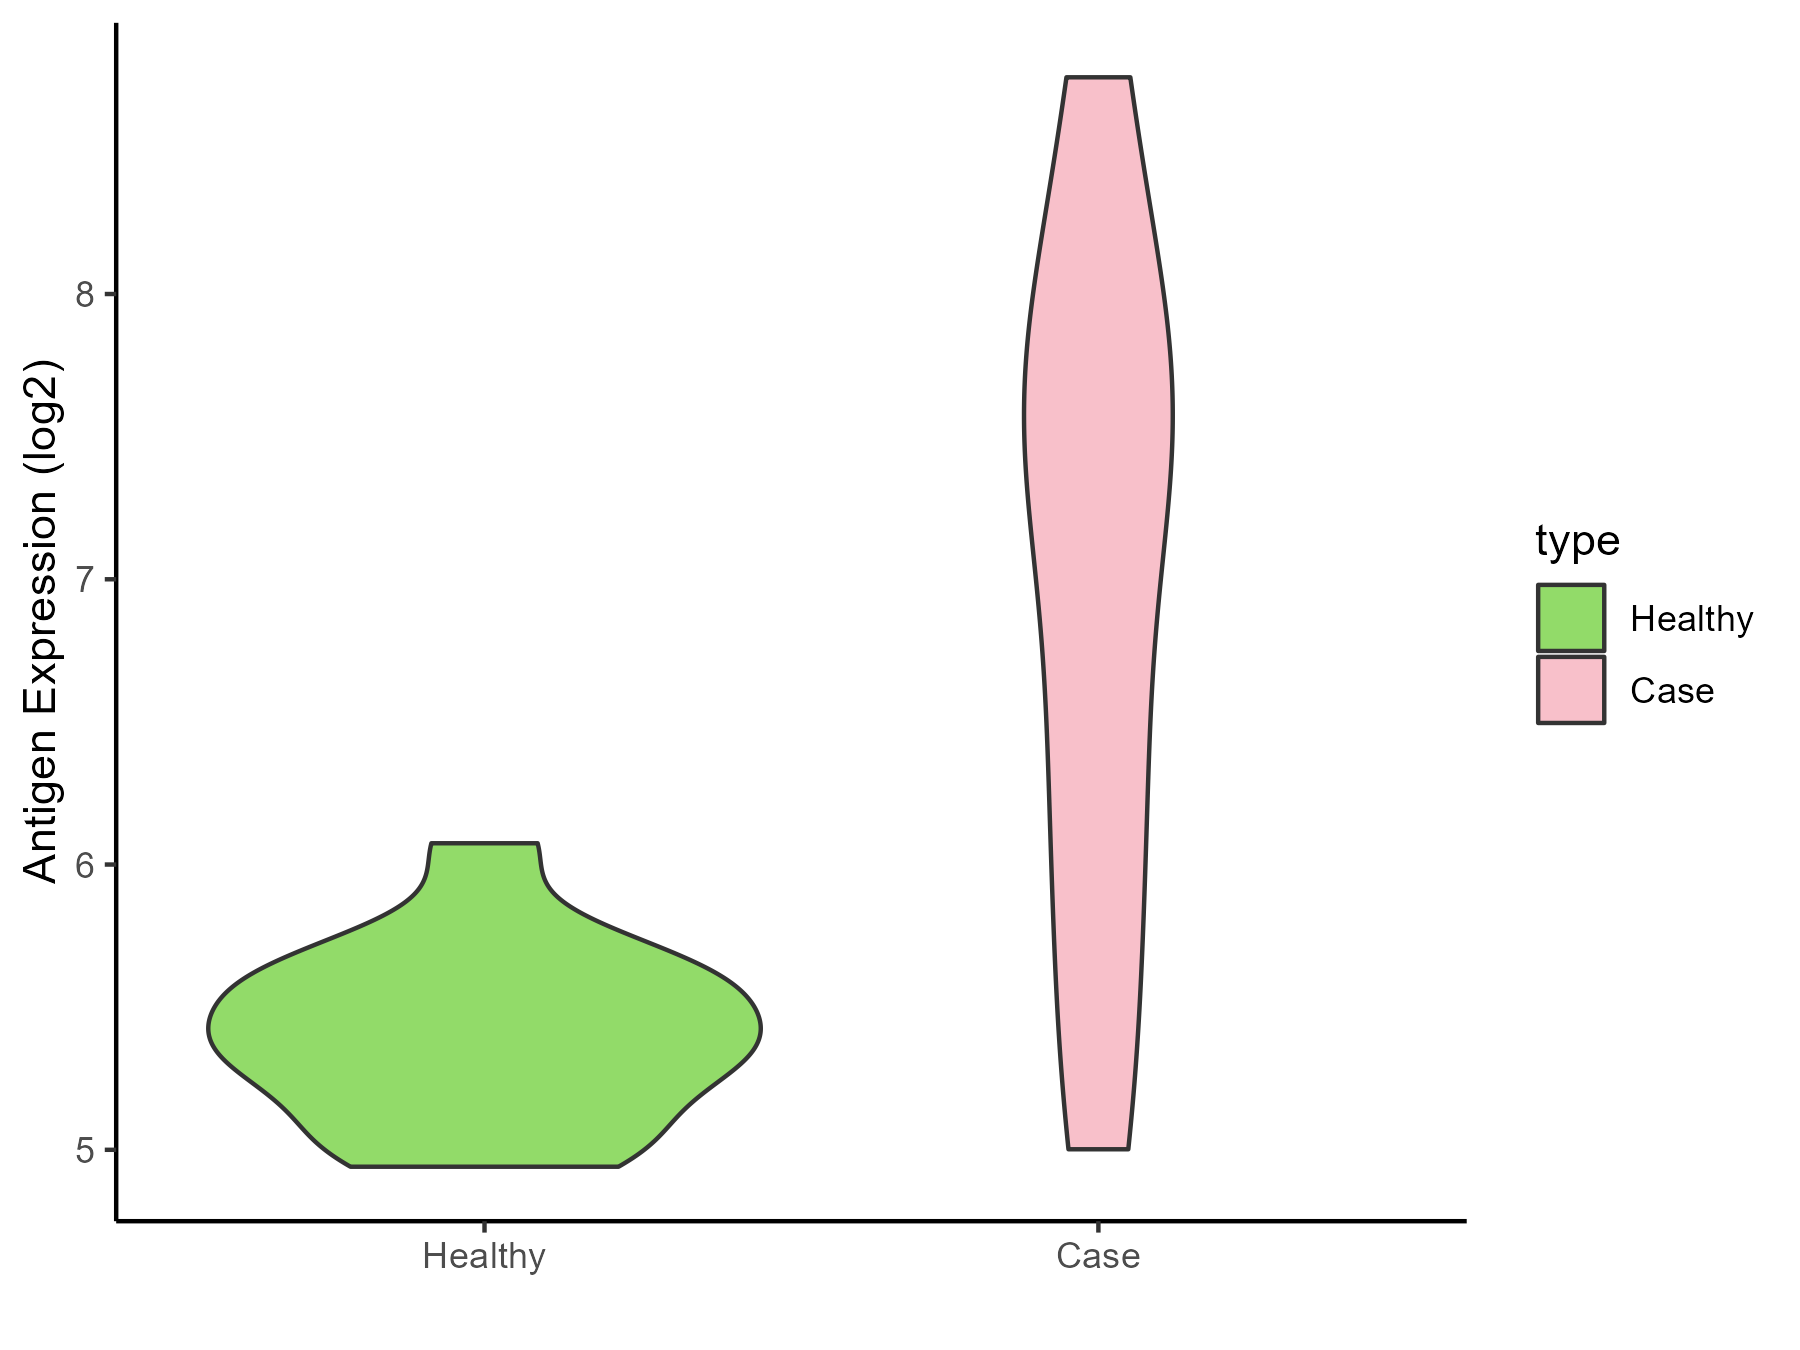
| The Studied Tissue | Intracranial artery | |
| The Specific Disease | Aneurysm | |
| The Expression Level of Disease Section Compare with the Healthy Individual Tissue | p-value: 0.000191659; Fold-change: 1.984458229; Z-score: 6.291293316 | |
| Disease-specific Antigen Abundances |
|
Click to View the Clearer Original Diagram |
ICD Disease Classification 12
| Differential expression pattern of antigen in diseases | ||
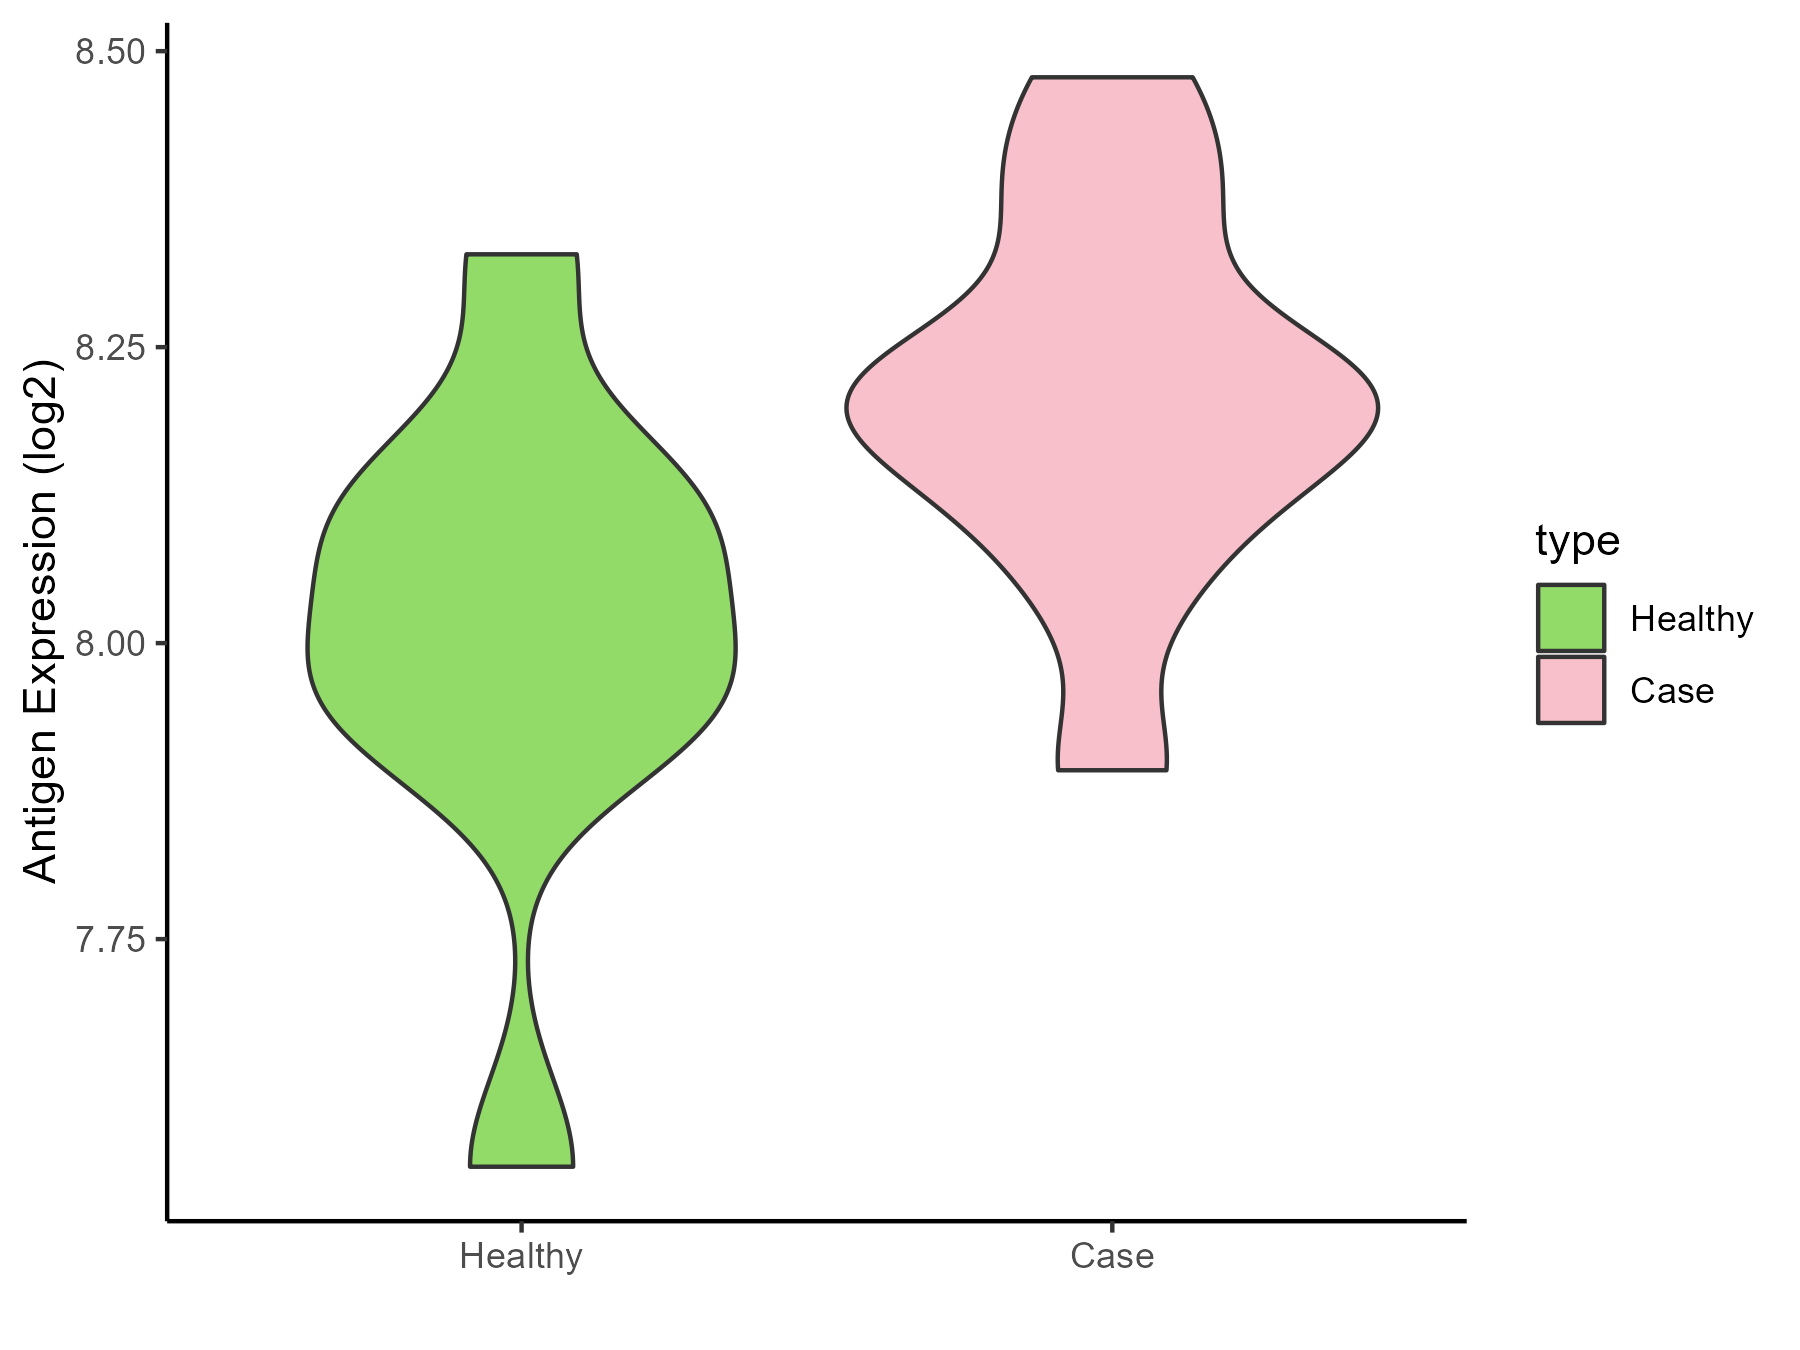
| The Studied Tissue | Peripheral blood | |
| The Specific Disease | Immunodeficiency | |
| The Expression Level of Disease Section Compare with the Healthy Individual Tissue | p-value: 0.034531453; Fold-change: 0.192794352; Z-score: 0.915632303 | |
| Disease-specific Antigen Abundances |
|
Click to View the Clearer Original Diagram |
| Differential expression pattern of antigen in diseases | ||
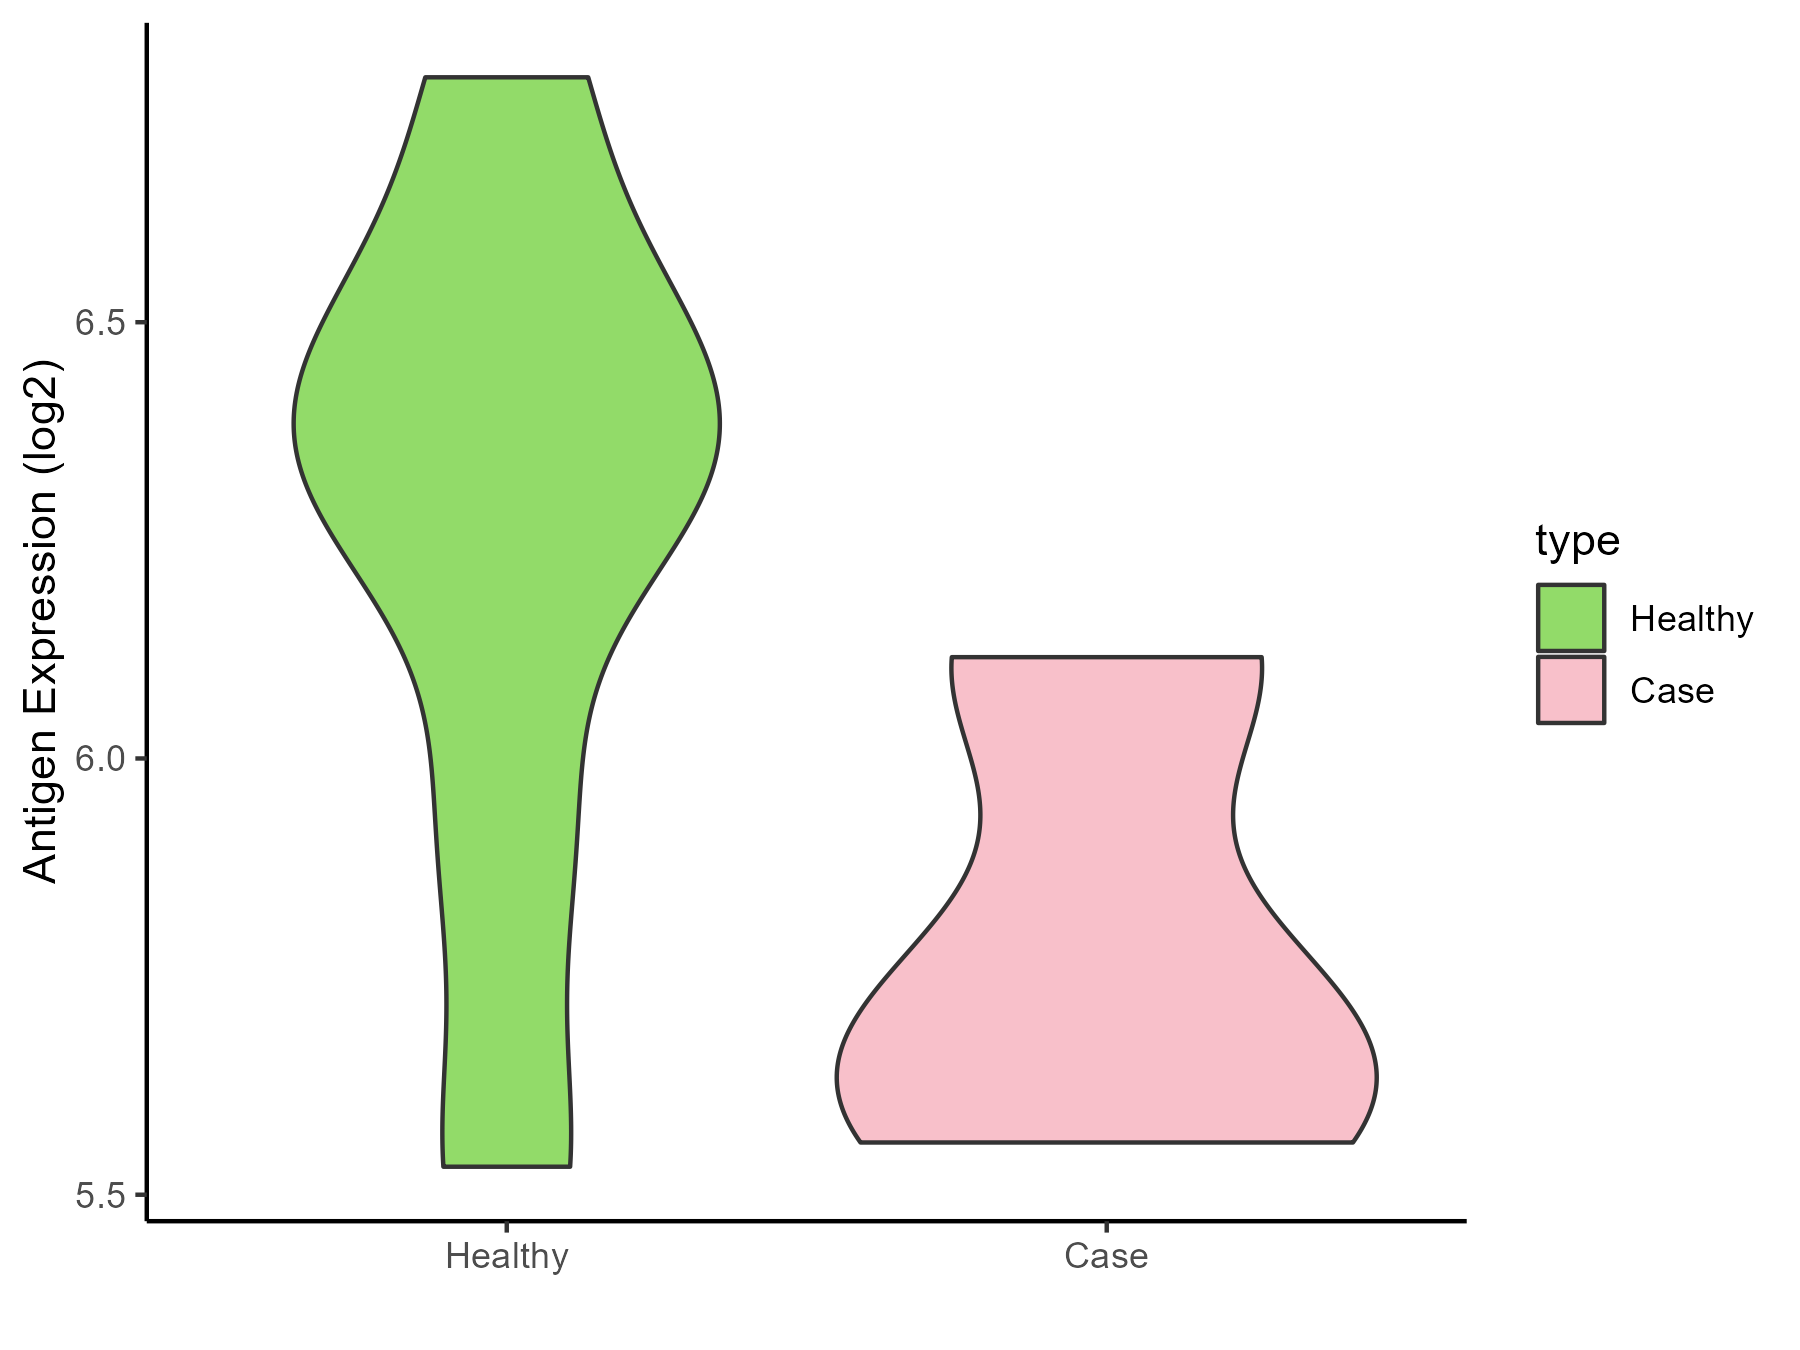
| The Studied Tissue | Hyperplastic tonsil | |
| The Specific Disease | Apnea | |
| The Expression Level of Disease Section Compare with the Healthy Individual Tissue | p-value: 0.094137721; Fold-change: -0.627093509; Z-score: -1.527167331 | |
| Disease-specific Antigen Abundances |
|
Click to View the Clearer Original Diagram |
| Differential expression pattern of antigen in diseases | ||
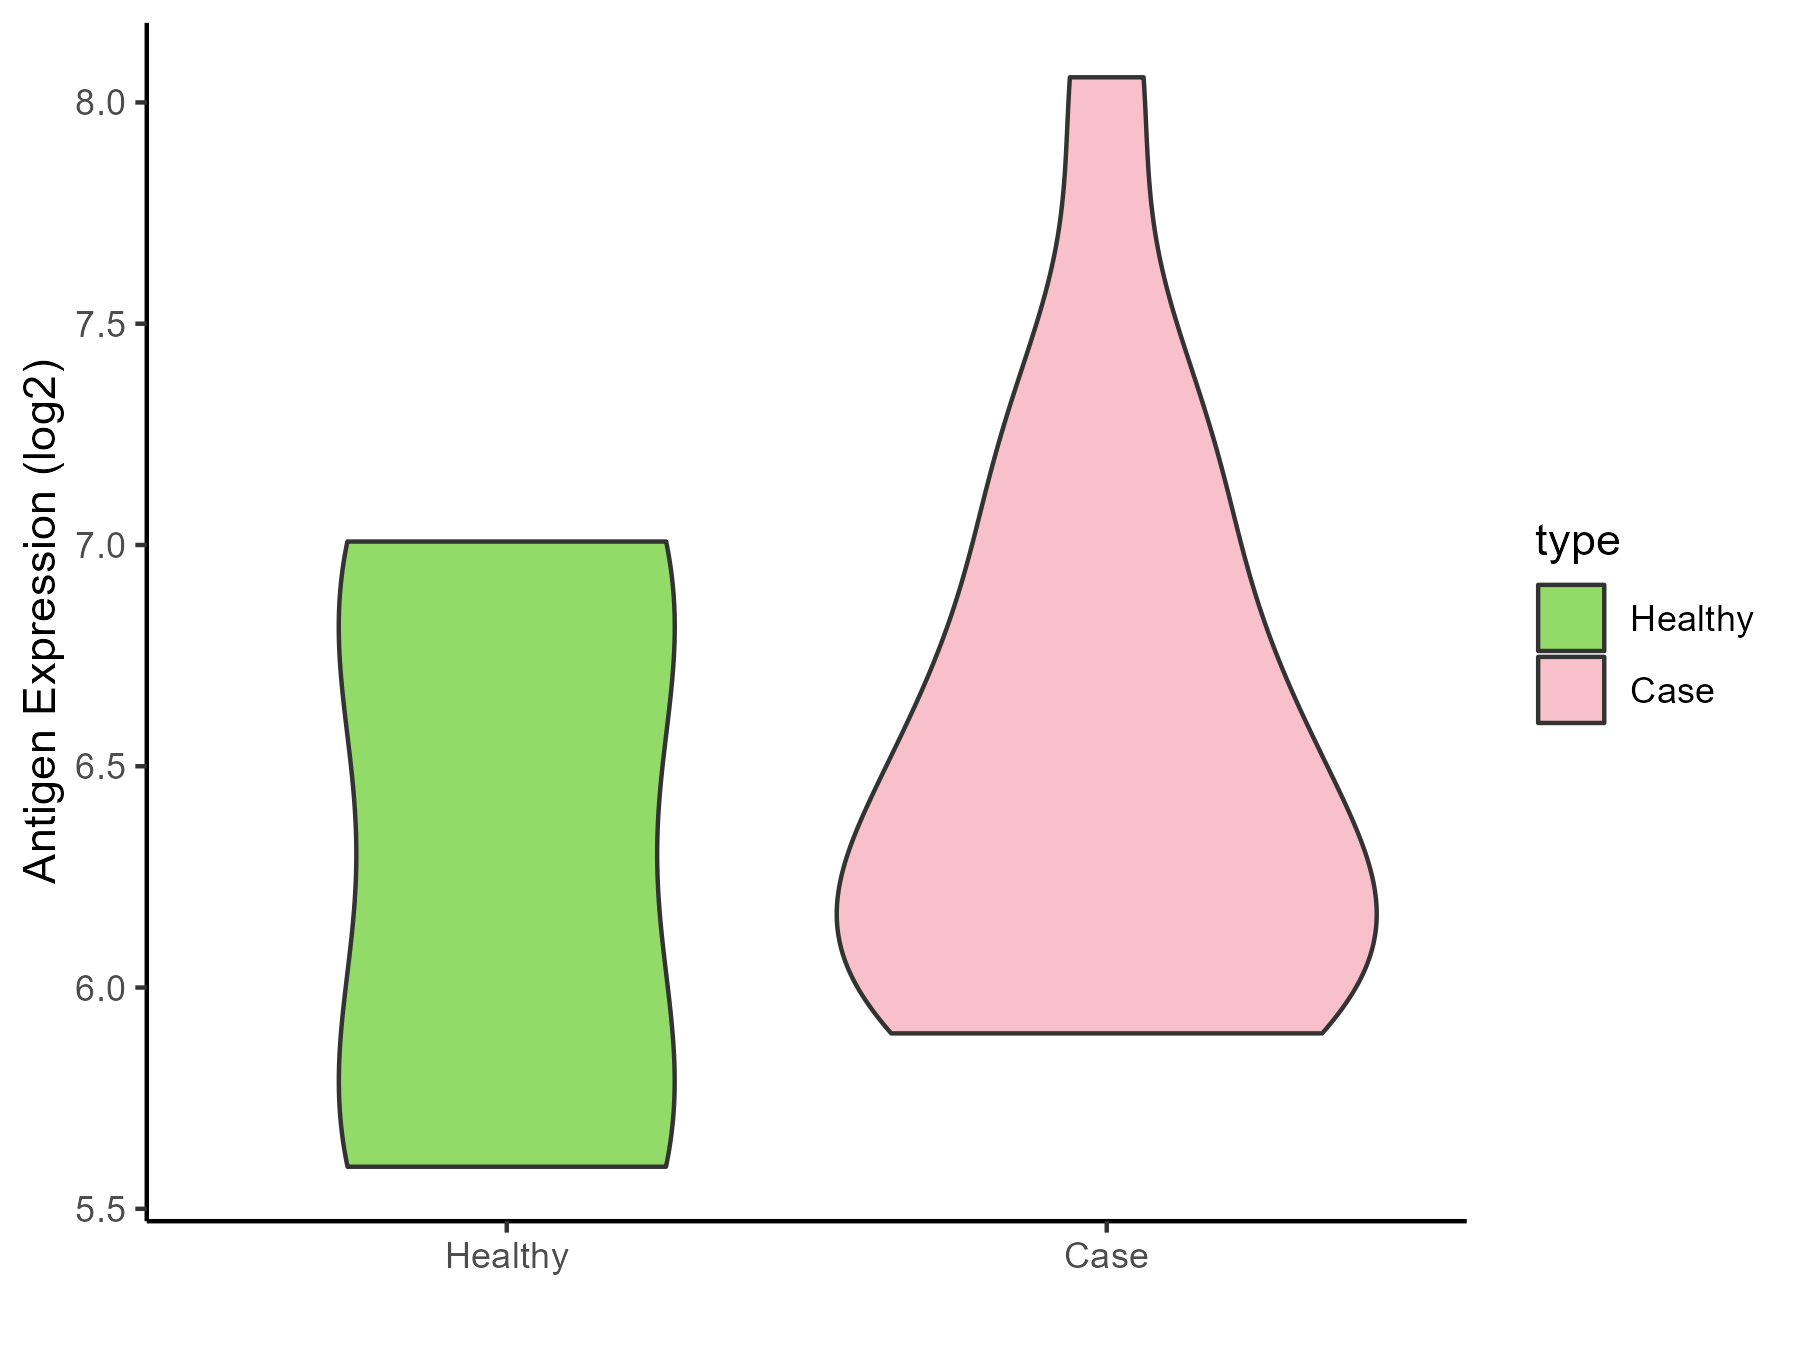
| The Studied Tissue | Peripheral blood | |
| The Specific Disease | Olive pollen allergy | |
| The Expression Level of Disease Section Compare with the Healthy Individual Tissue | p-value: 0.552079576; Fold-change: 0.124780952; Z-score: 0.177095818 | |
| Disease-specific Antigen Abundances |
|
Click to View the Clearer Original Diagram |
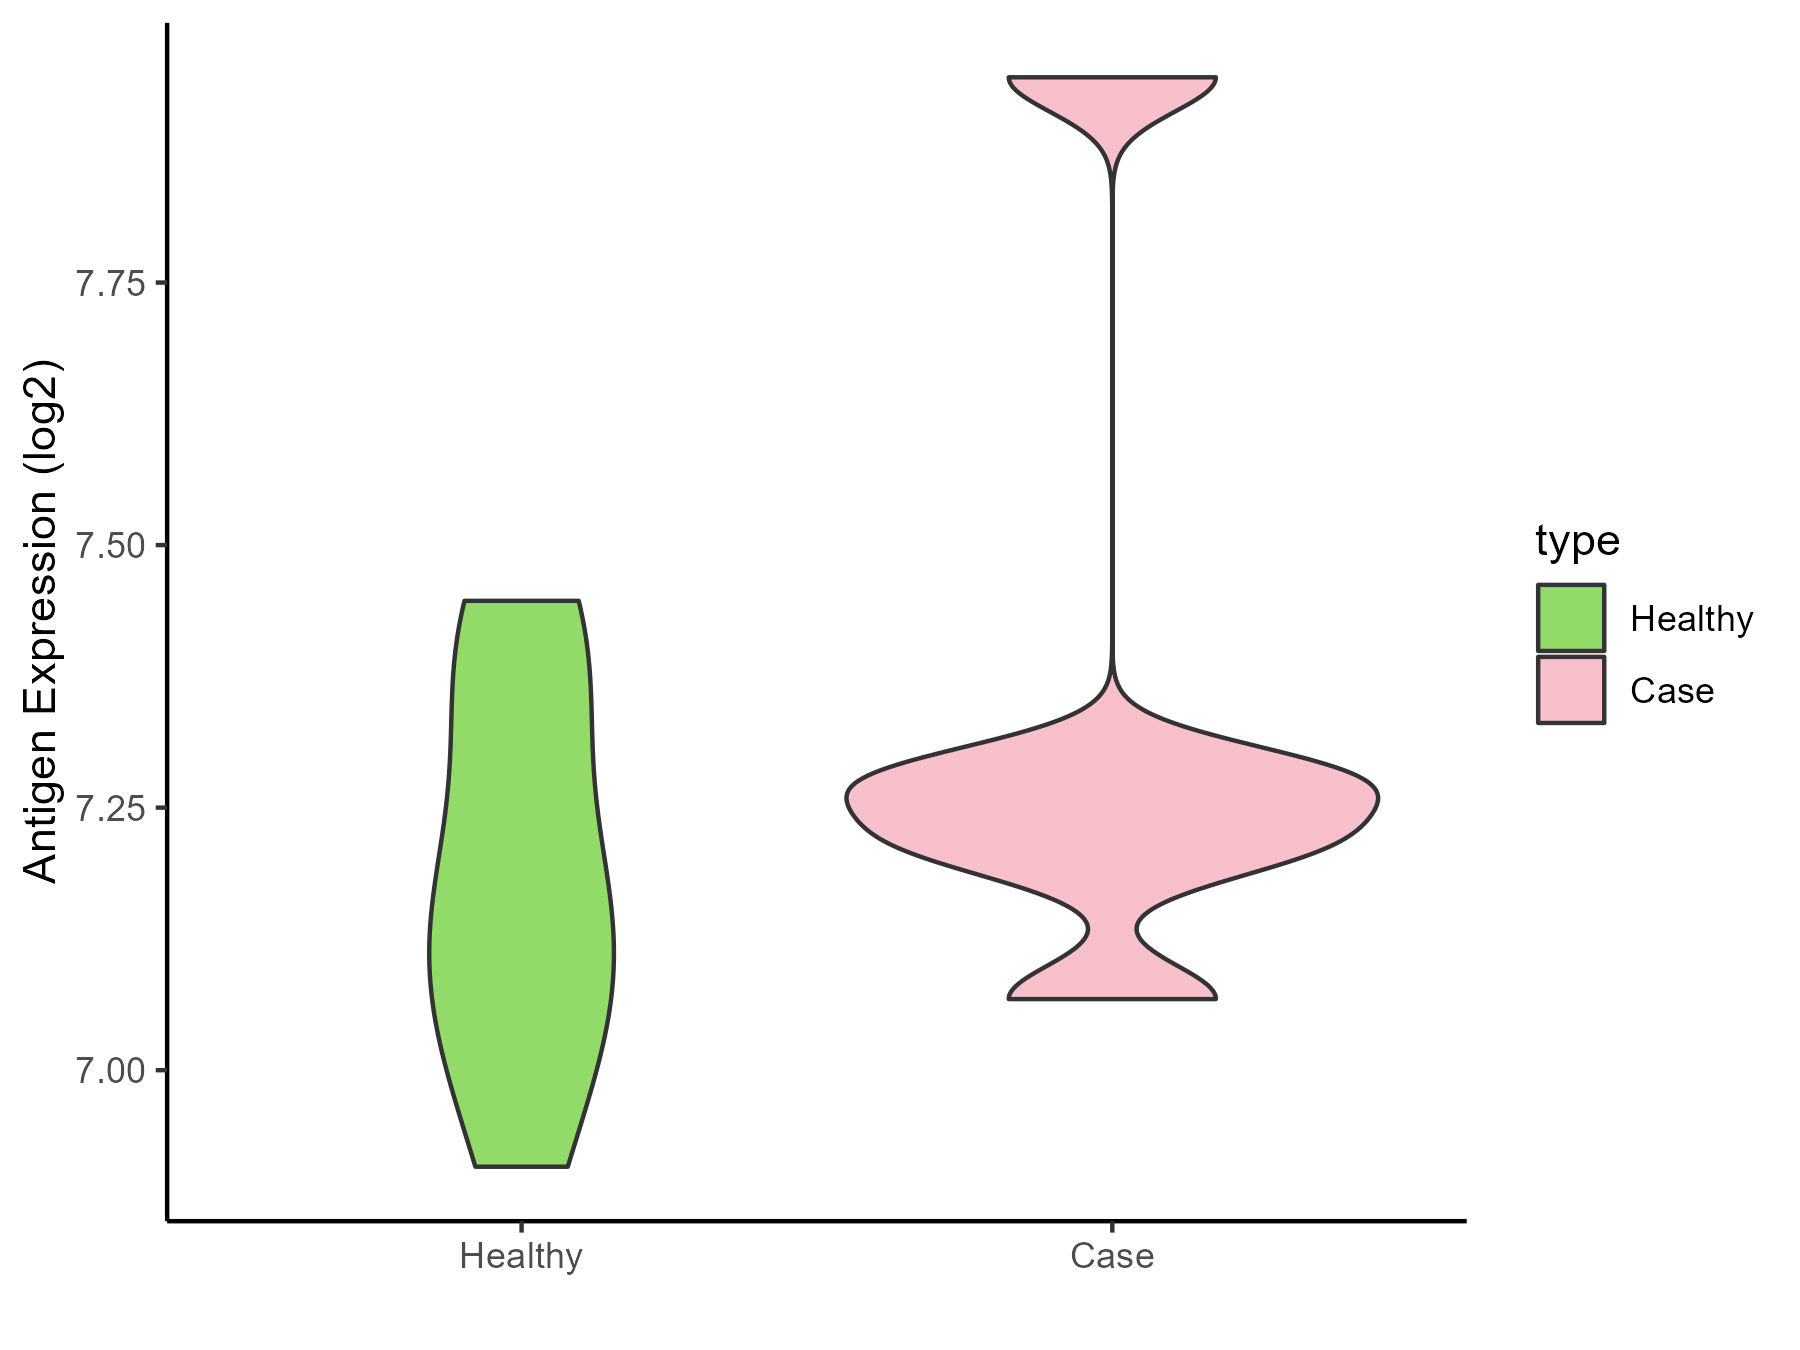
| Differential expression pattern of antigen in diseases | ||
| The Studied Tissue | Sinus mucosa | |
| The Specific Disease | Chronic rhinosinusitis | |
| The Expression Level of Disease Section Compare with the Healthy Individual Tissue | p-value: 0.323199955; Fold-change: 0.070855343; Z-score: 0.385694446 | |
| Disease-specific Antigen Abundances |
|
Click to View the Clearer Original Diagram |
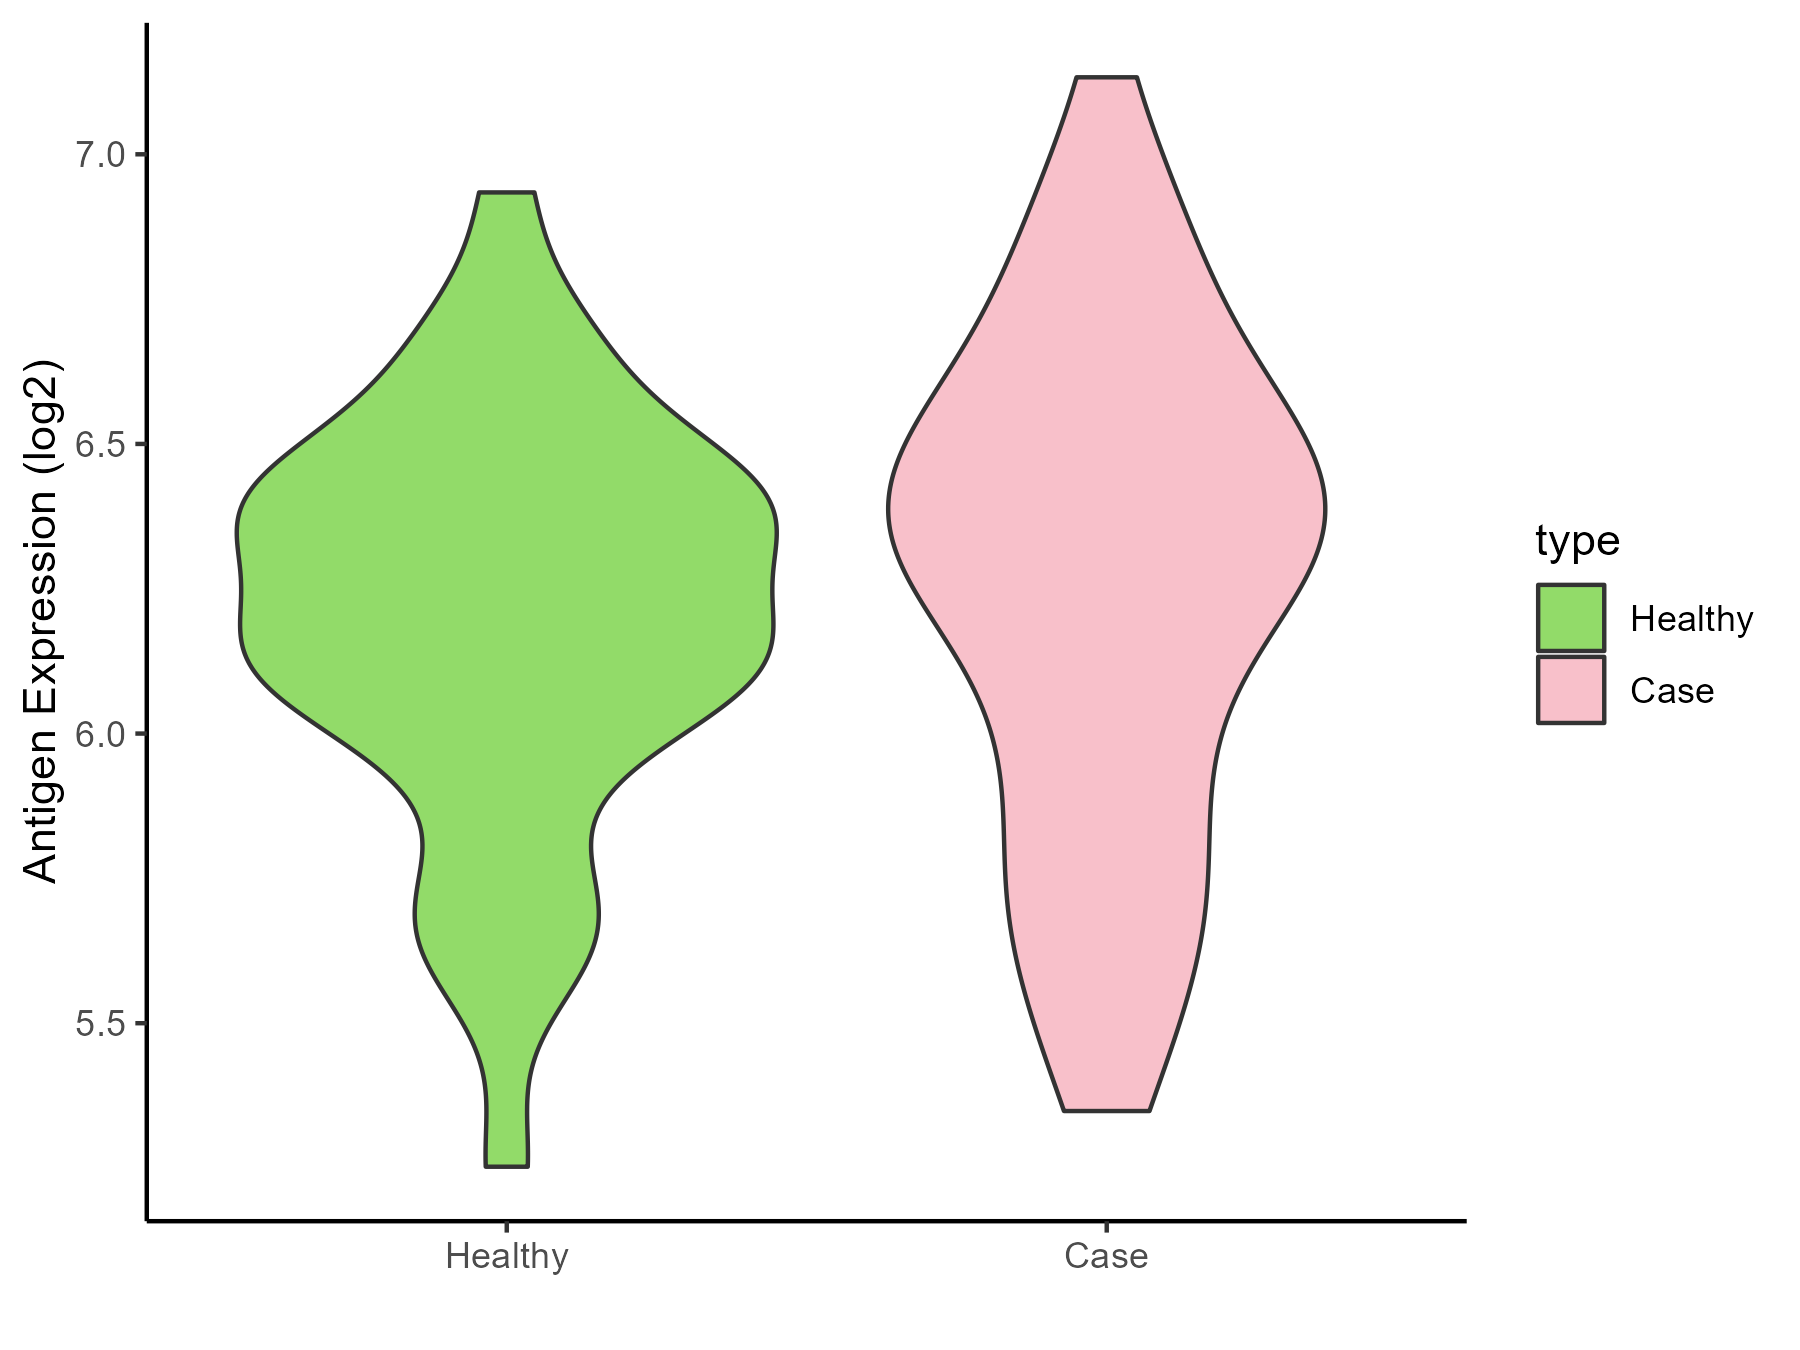
| Differential expression pattern of antigen in diseases | ||
| The Studied Tissue | Lung | |
| The Specific Disease | Chronic obstructive pulmonary disease | |
| The Expression Level of Disease Section Compare with the Healthy Individual Tissue | p-value: 0.501652959; Fold-change: 0.125205304; Z-score: 0.35686632 | |
| Disease-specific Antigen Abundances |
|
Click to View the Clearer Original Diagram |
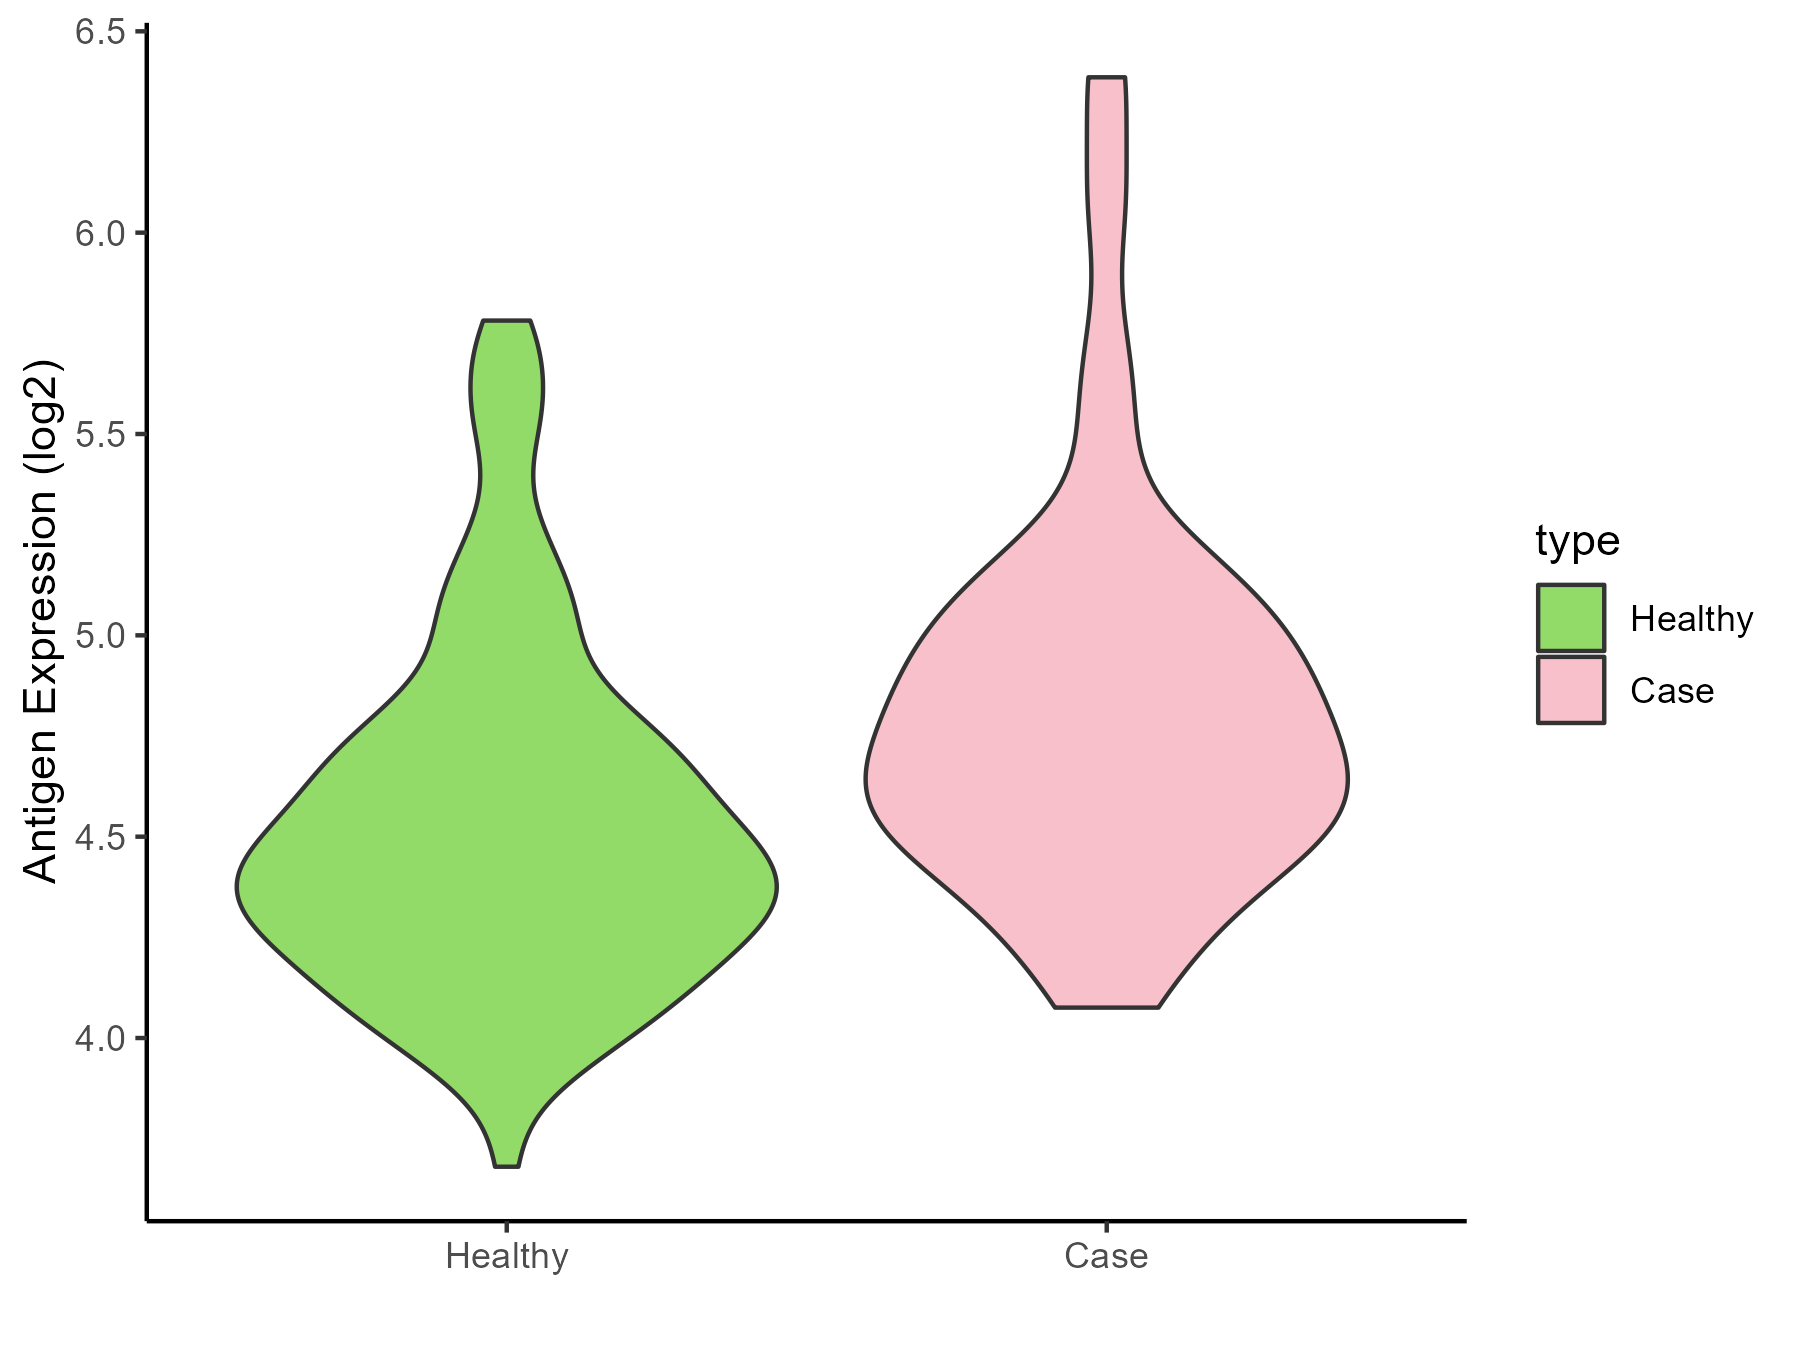
| The Studied Tissue | Small airway epithelium | |
| The Specific Disease | Chronic obstructive pulmonary disease | |
| The Expression Level of Disease Section Compare with the Healthy Individual Tissue | p-value: 0.001156722; Fold-change: 0.285090157; Z-score: 0.668389474 | |
| Disease-specific Antigen Abundances |
|
Click to View the Clearer Original Diagram |
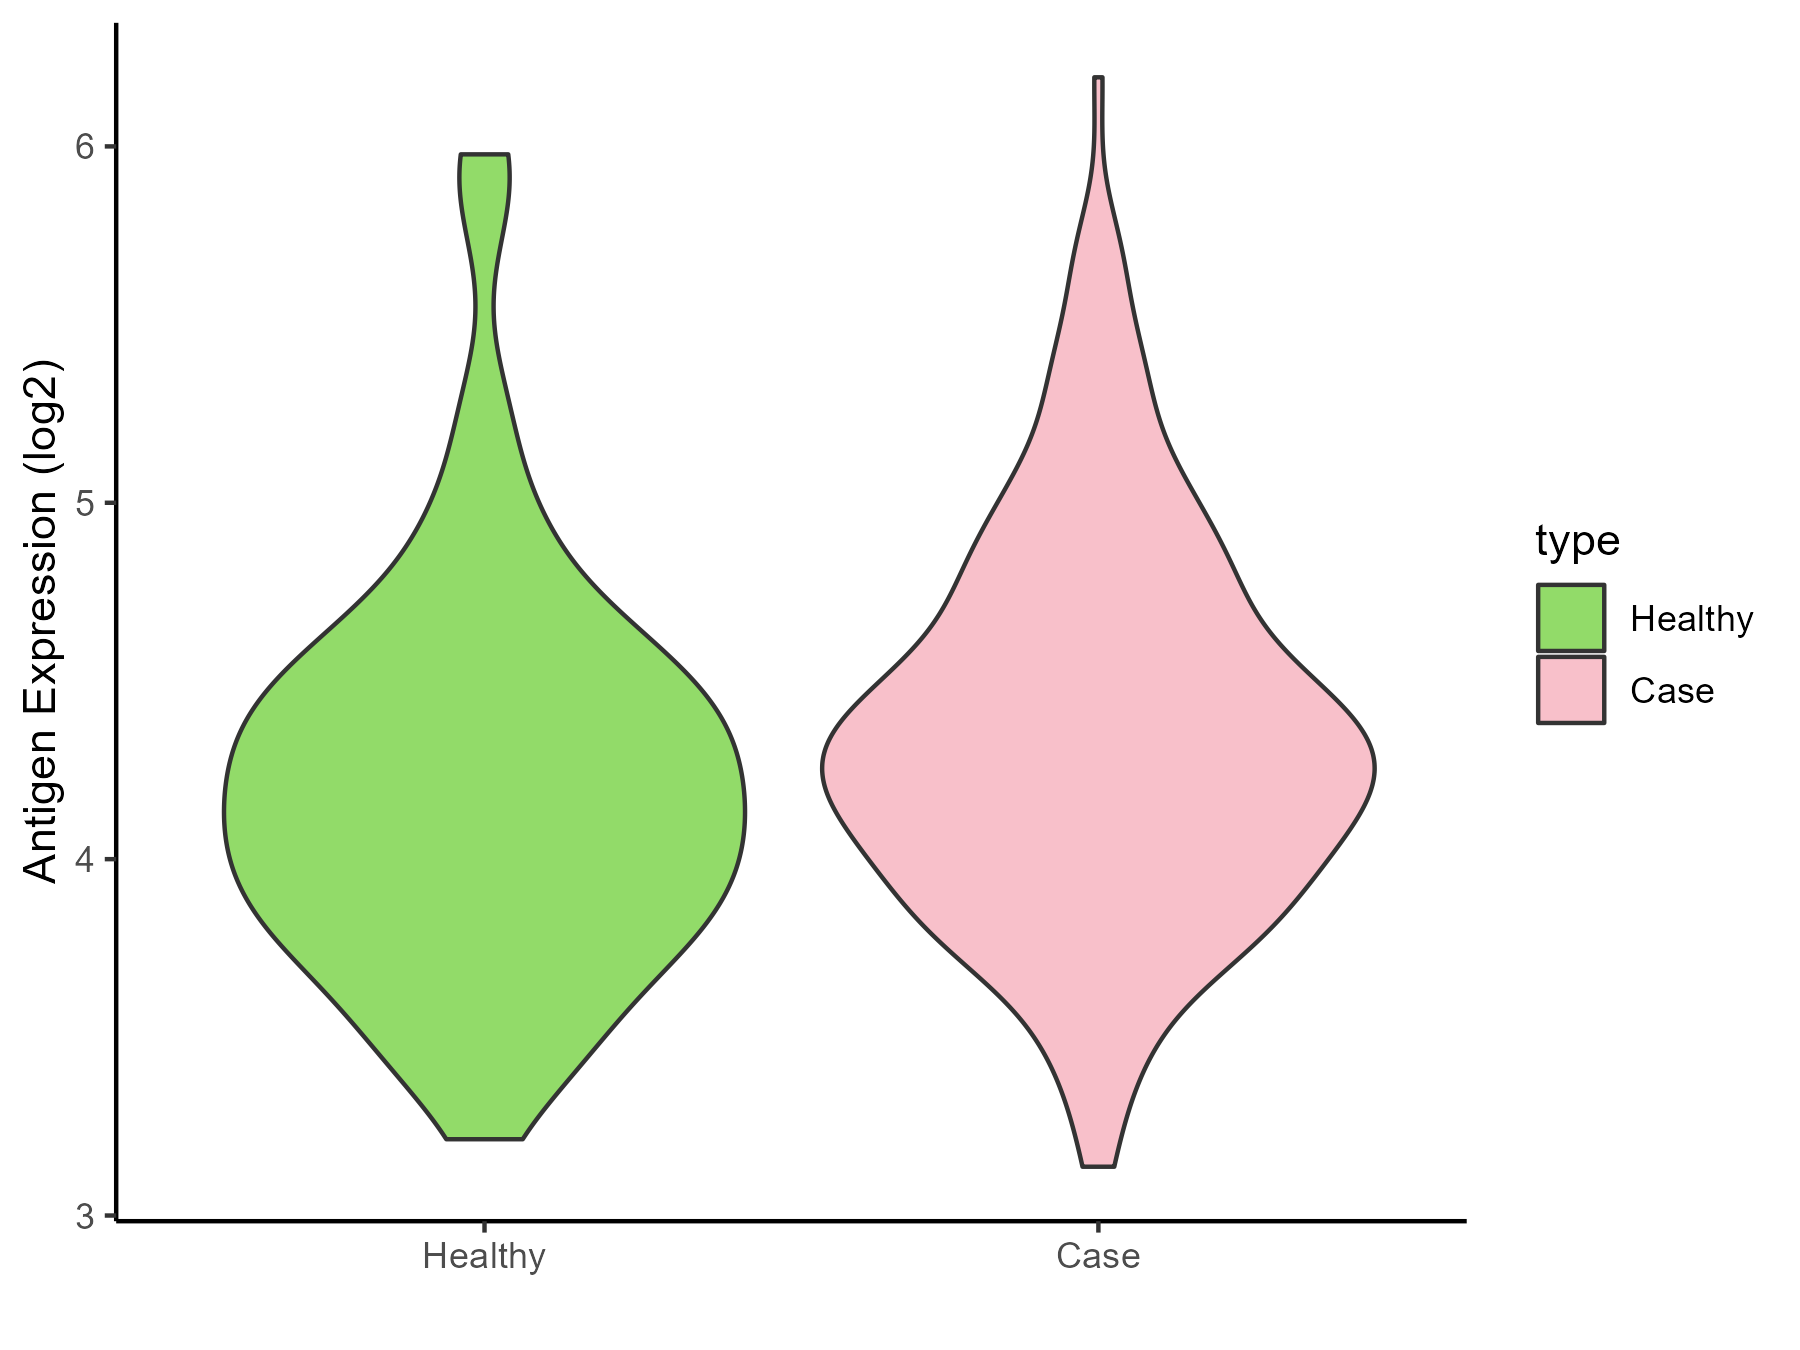
| Differential expression pattern of antigen in diseases | ||
| The Studied Tissue | Nasal and bronchial airway | |
| The Specific Disease | Asthma | |
| The Expression Level of Disease Section Compare with the Healthy Individual Tissue | p-value: 0.029596081; Fold-change: 0.140940948; Z-score: 0.258794314 | |
| Disease-specific Antigen Abundances |
|
Click to View the Clearer Original Diagram |
| Differential expression pattern of antigen in diseases | ||
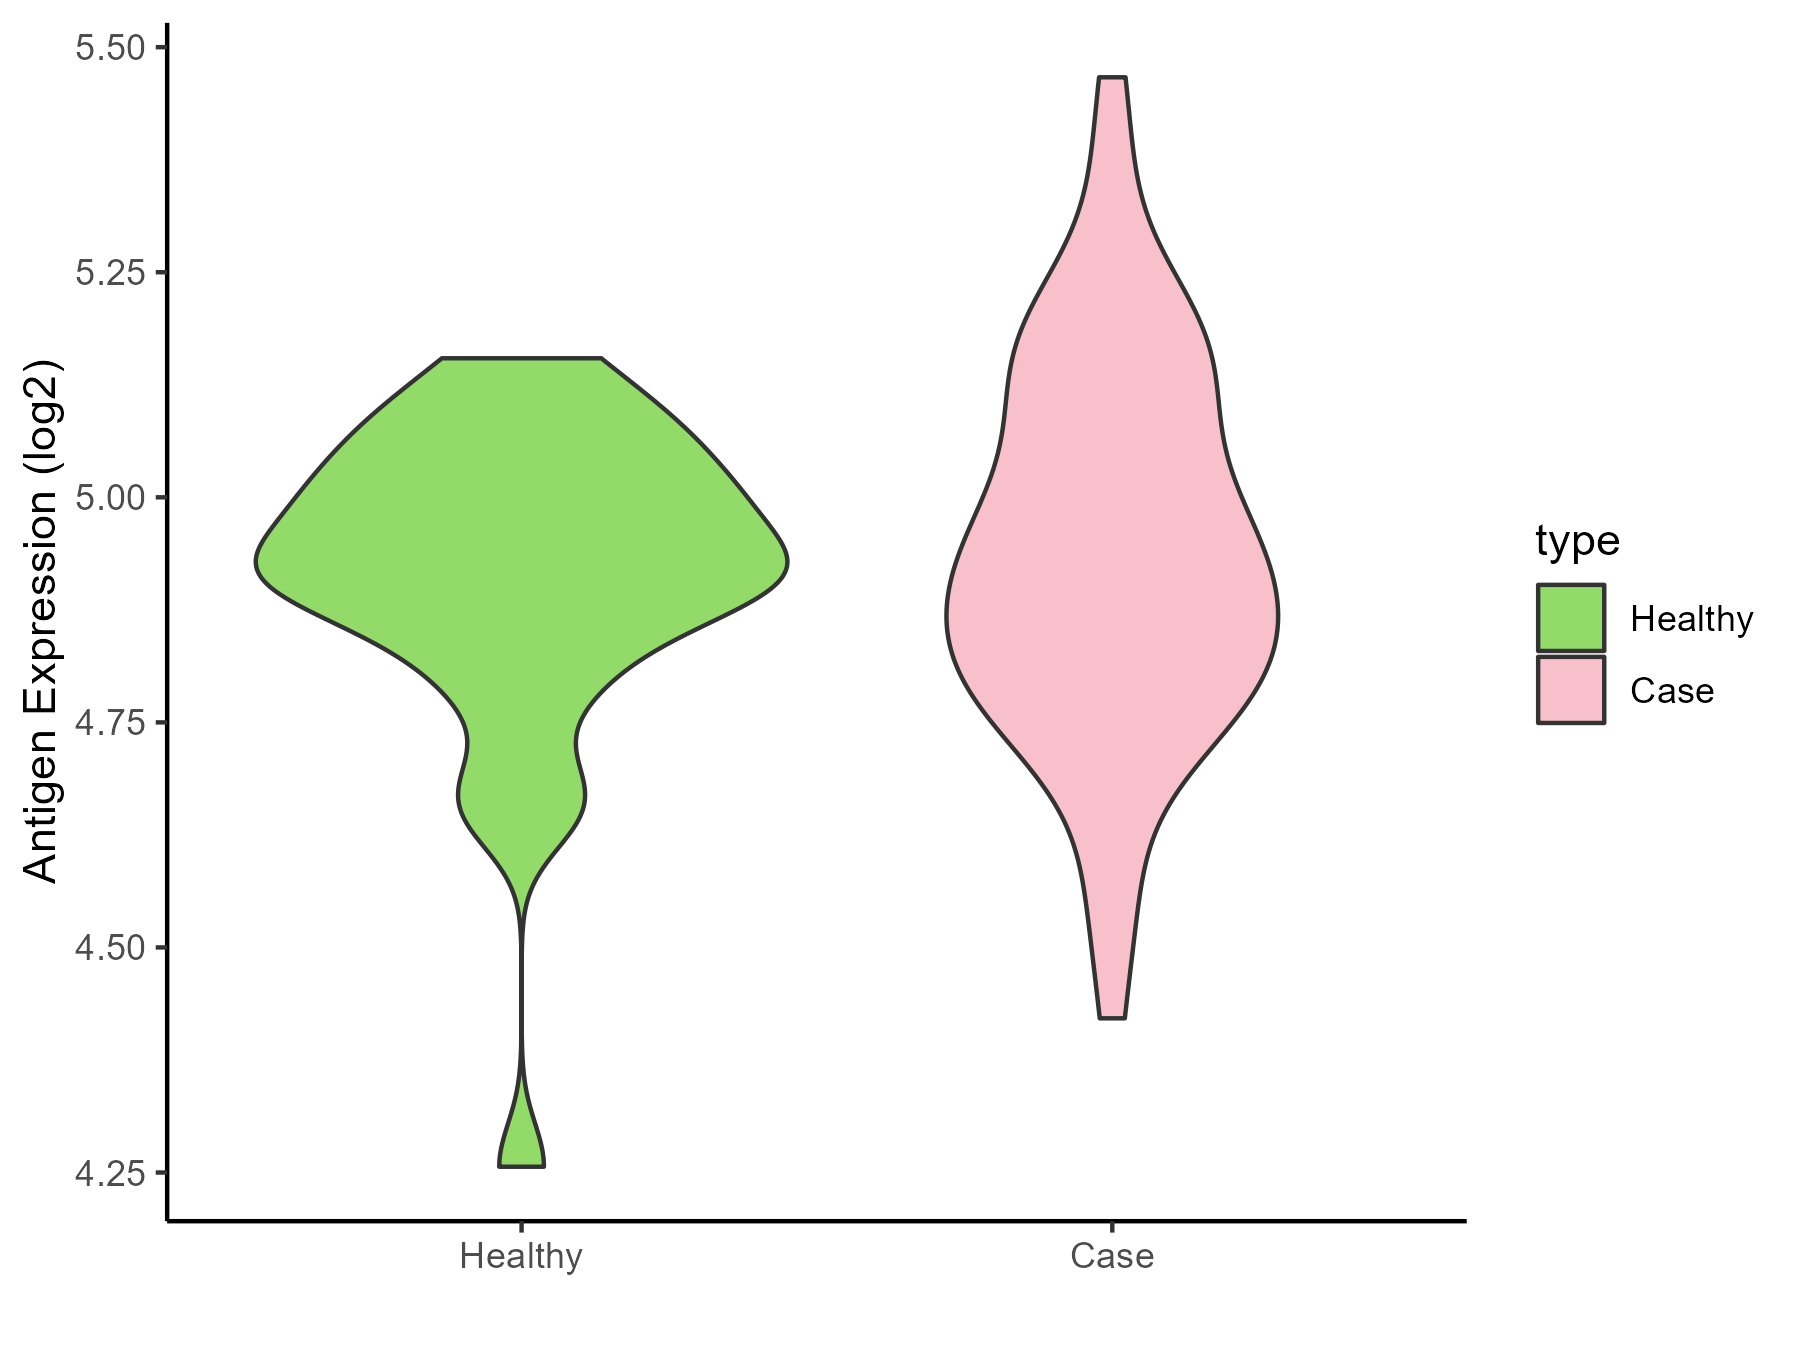
| The Studied Tissue | Nasal Epithelium | |
| The Specific Disease | Human rhinovirus infection | |
| The Expression Level of Disease Section Compare with the Healthy Individual Tissue | p-value: 0.526069144; Fold-change: -0.009131304; Z-score: -0.05167995 | |
| Disease-specific Antigen Abundances |
|
Click to View the Clearer Original Diagram |
| Differential expression pattern of antigen in diseases | ||
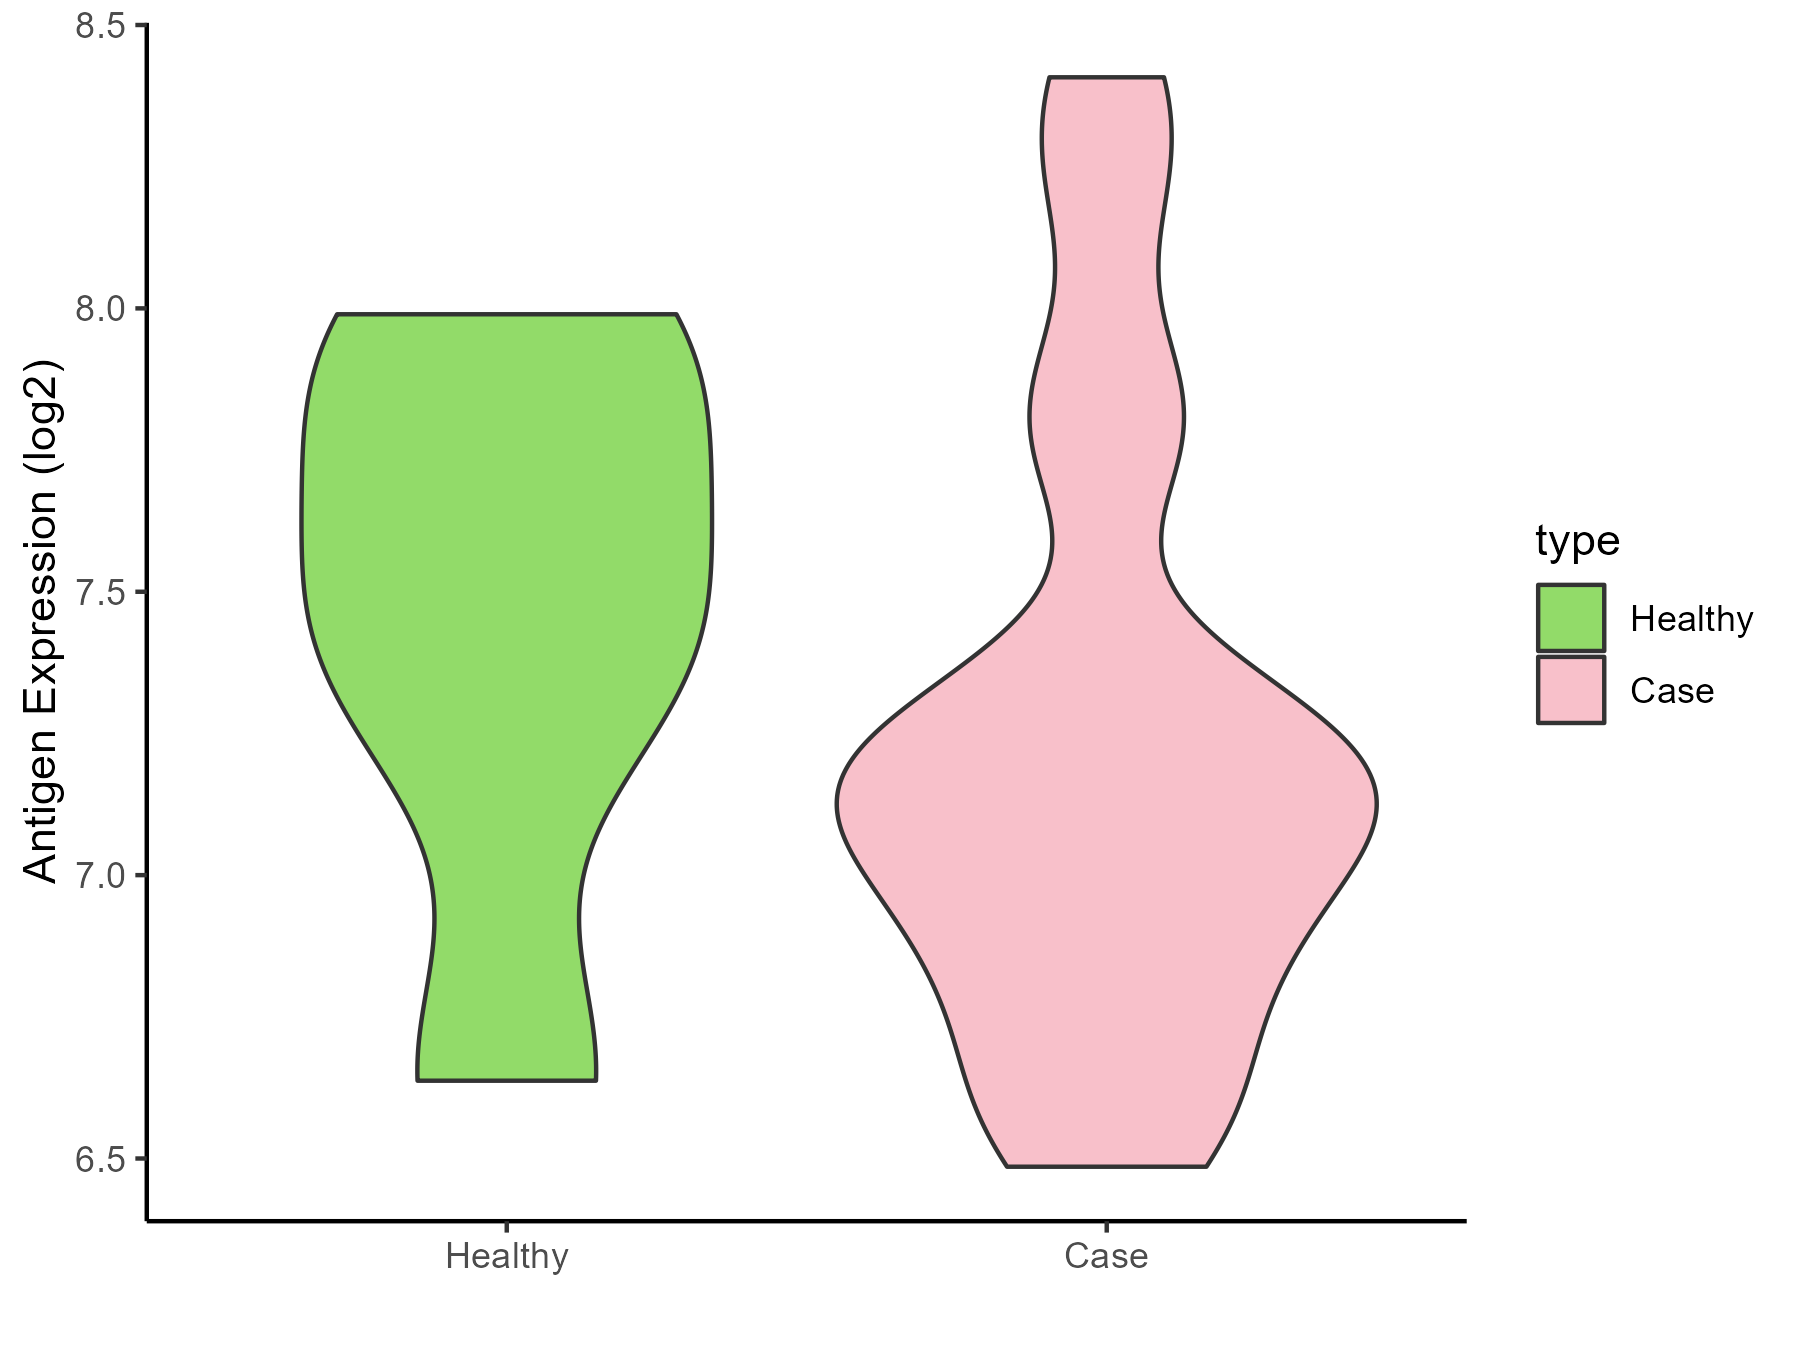
| The Studied Tissue | Lung | |
| The Specific Disease | Idiopathic pulmonary fibrosis | |
| The Expression Level of Disease Section Compare with the Healthy Individual Tissue | p-value: 0.435304189; Fold-change: -0.344971216; Z-score: -0.654748974 | |
| Disease-specific Antigen Abundances |
|
Click to View the Clearer Original Diagram |
ICD Disease Classification 13
| Differential expression pattern of antigen in diseases | ||
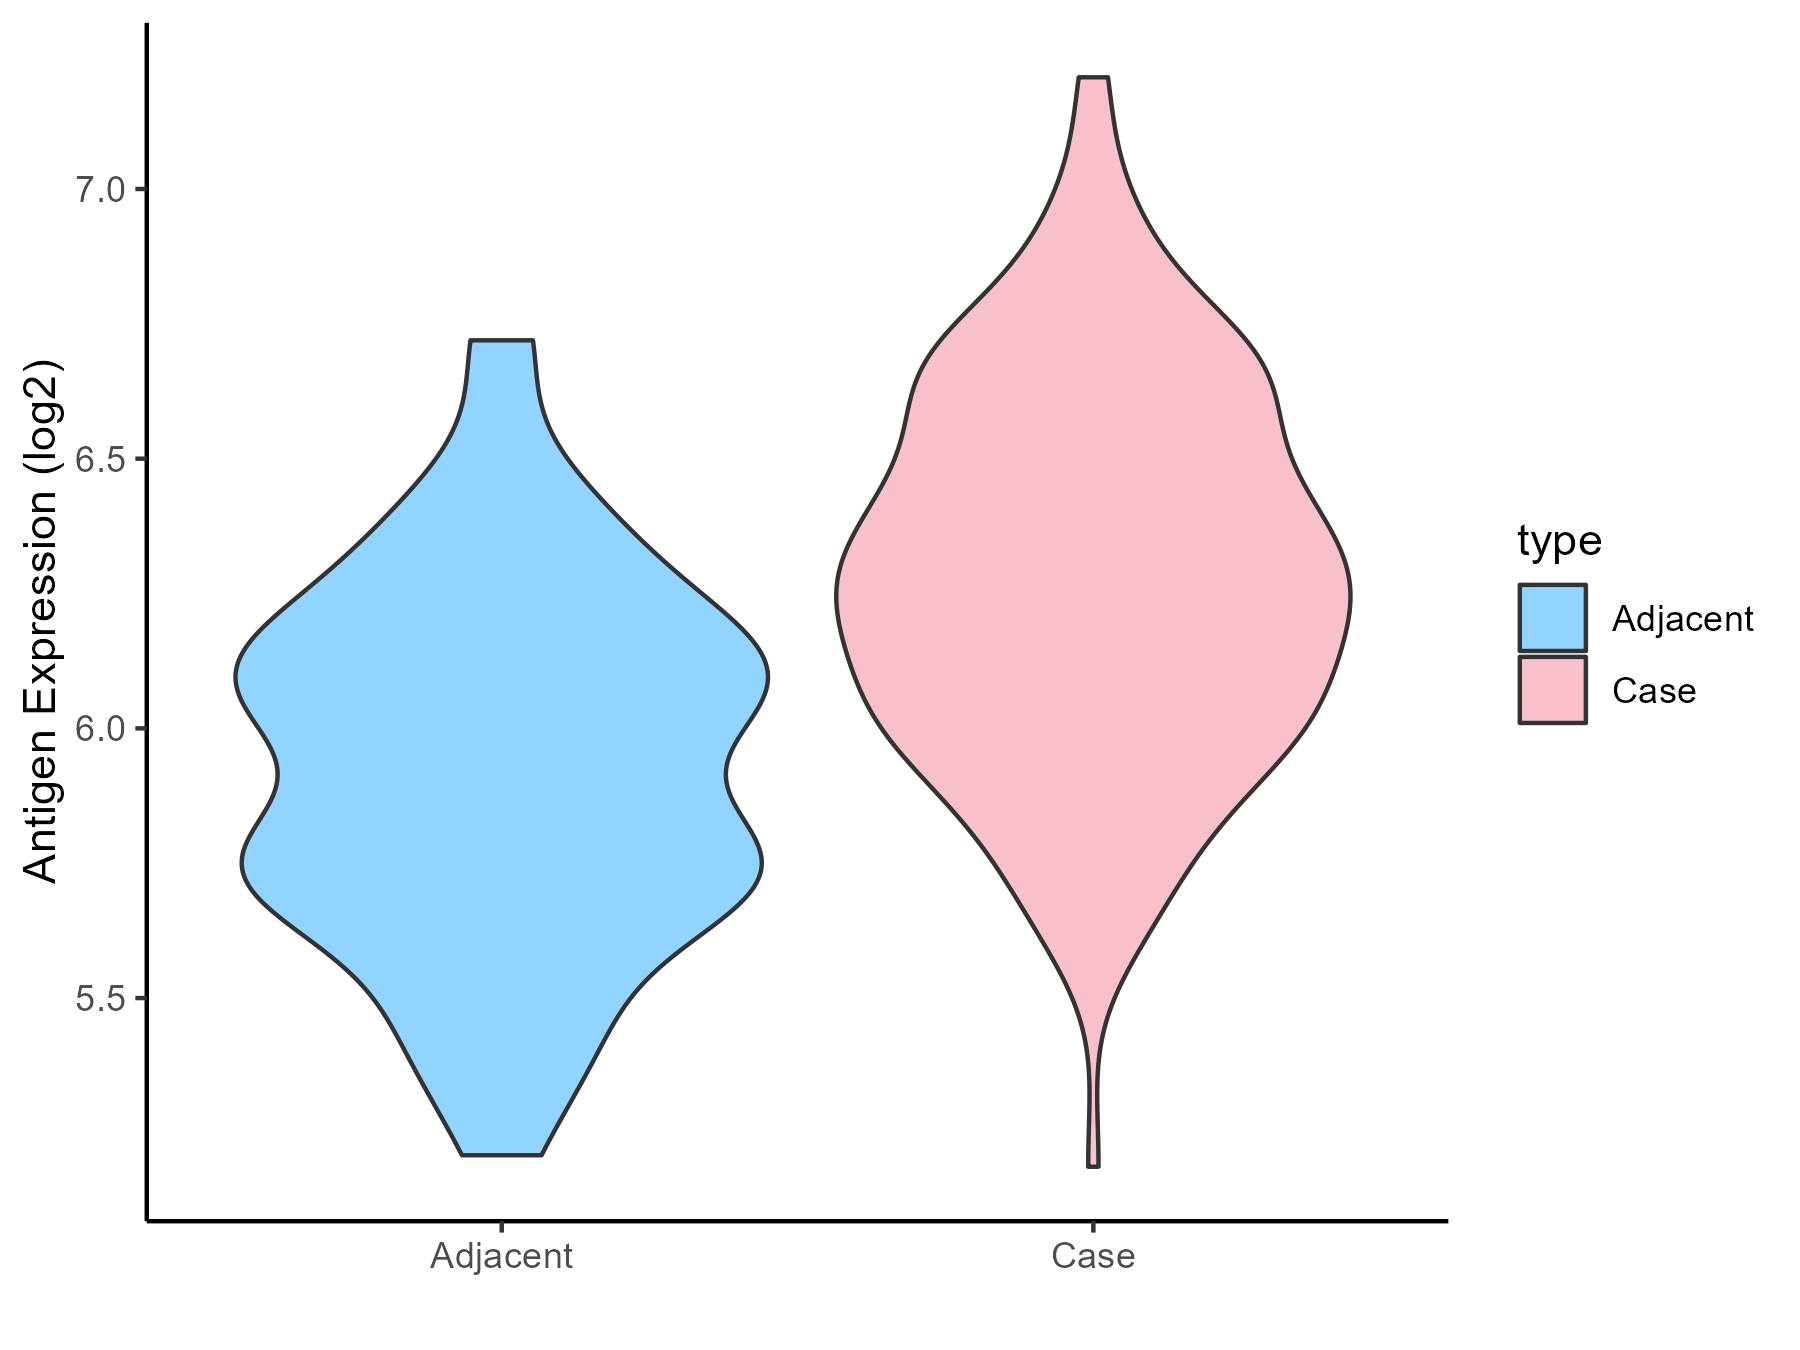
| The Studied Tissue | Gingival | |
| The Specific Disease | Periodontal disease | |
| The Expression Level of Disease Section Compare with the Adjacent Tissue | p-value: 1.10E-09; Fold-change: 0.319052996; Z-score: 0.947702695 | |
| Disease-specific Antigen Abundances |
|
Click to View the Clearer Original Diagram |
| Differential expression pattern of antigen in diseases | ||
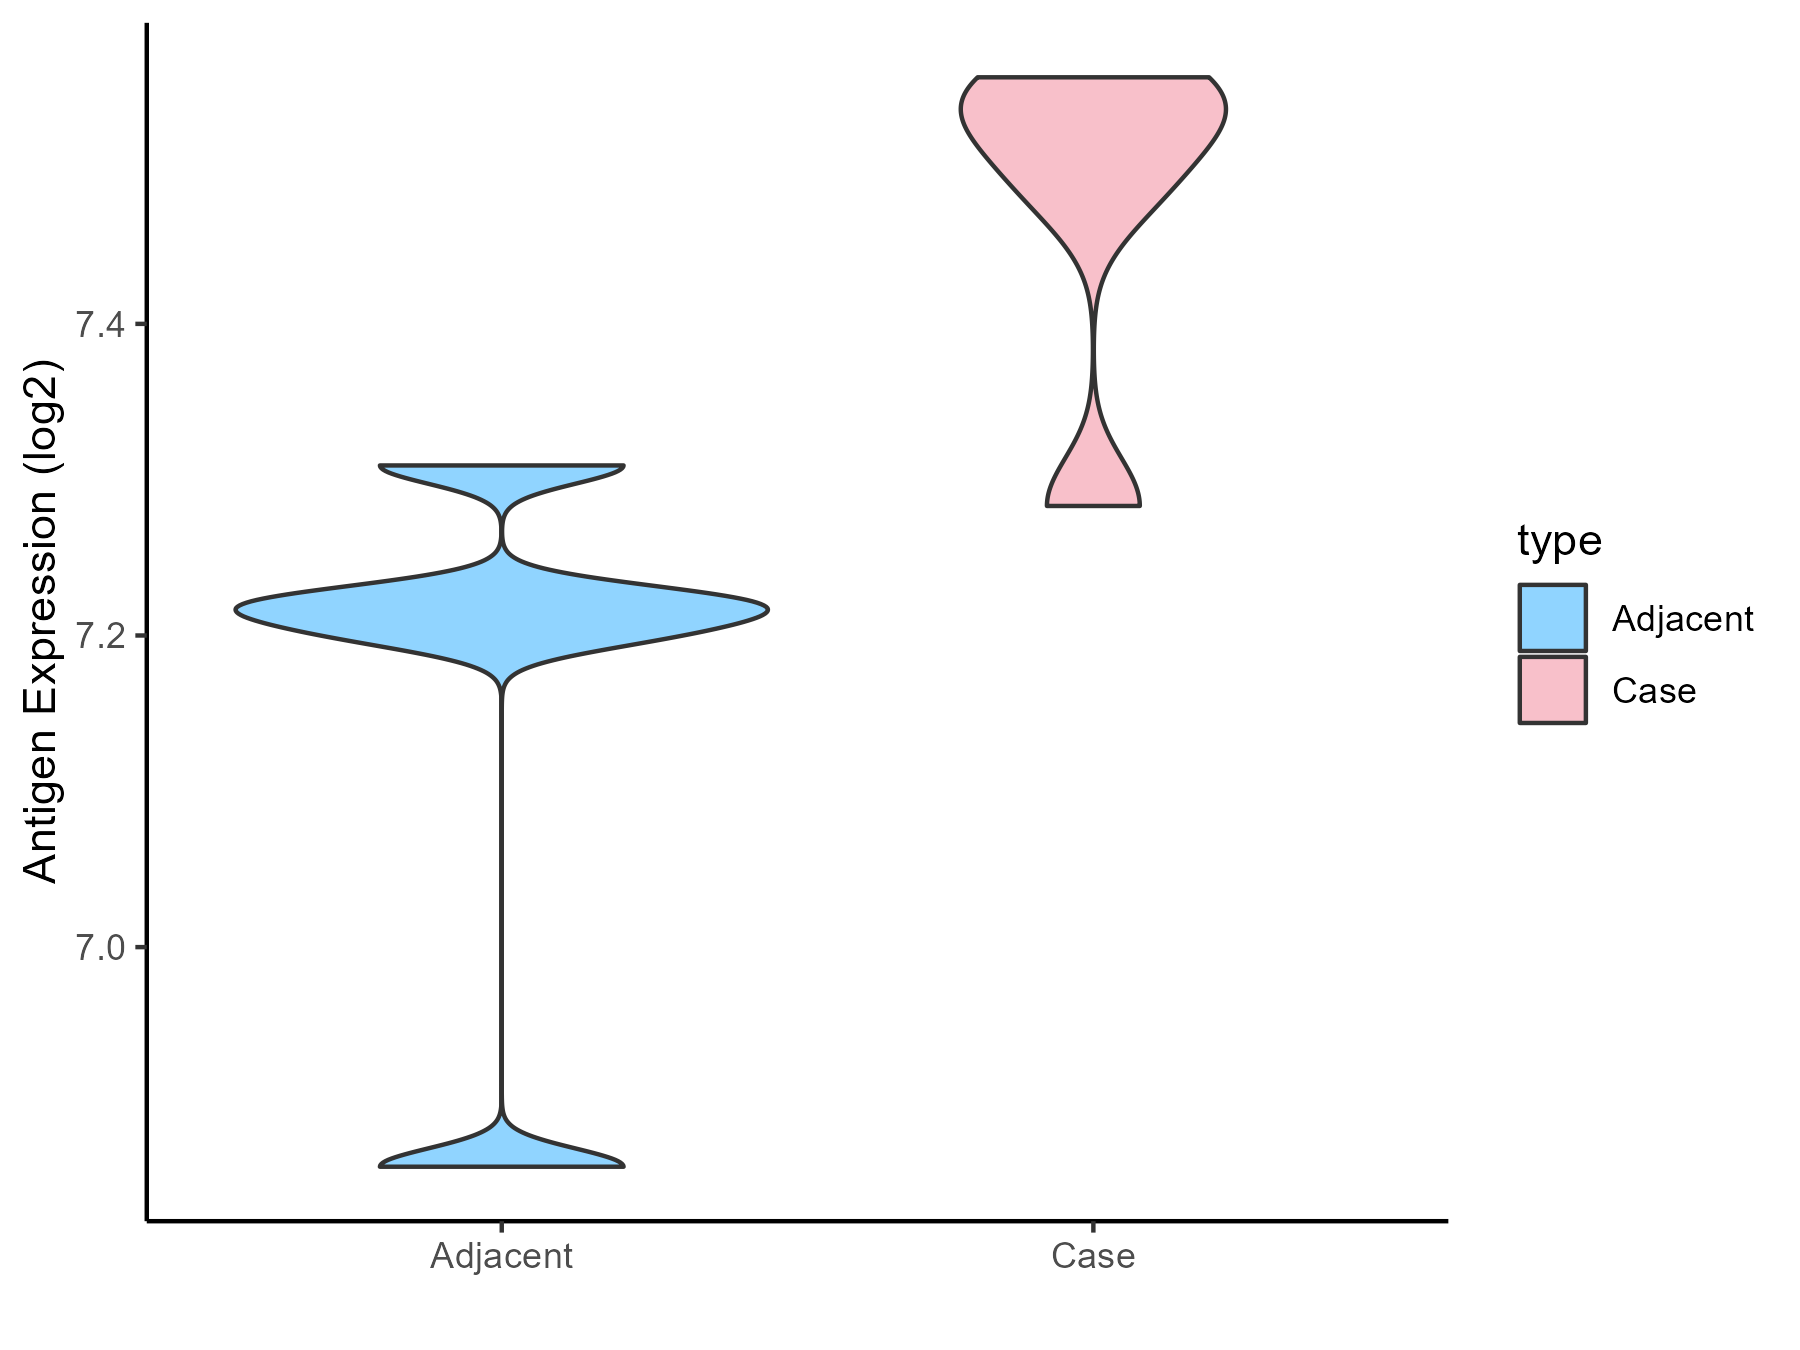
| The Studied Tissue | Gastric antrum | |
| The Specific Disease | Eosinophilic gastritis | |
| The Expression Level of Disease Section Compare with the Adjacent Tissue | p-value: 0.01163384; Fold-change: 0.306033263; Z-score: 1.754566473 | |
| Disease-specific Antigen Abundances |
|
Click to View the Clearer Original Diagram |
| Differential expression pattern of antigen in diseases | ||
| The Studied Tissue | Liver | |
| The Specific Disease | Liver failure | |
| The Expression Level of Disease Section Compare with the Healthy Individual Tissue | p-value: 1.78E-05; Fold-change: 0.916416539; Z-score: 3.060484344 | |
| Disease-specific Antigen Abundances |
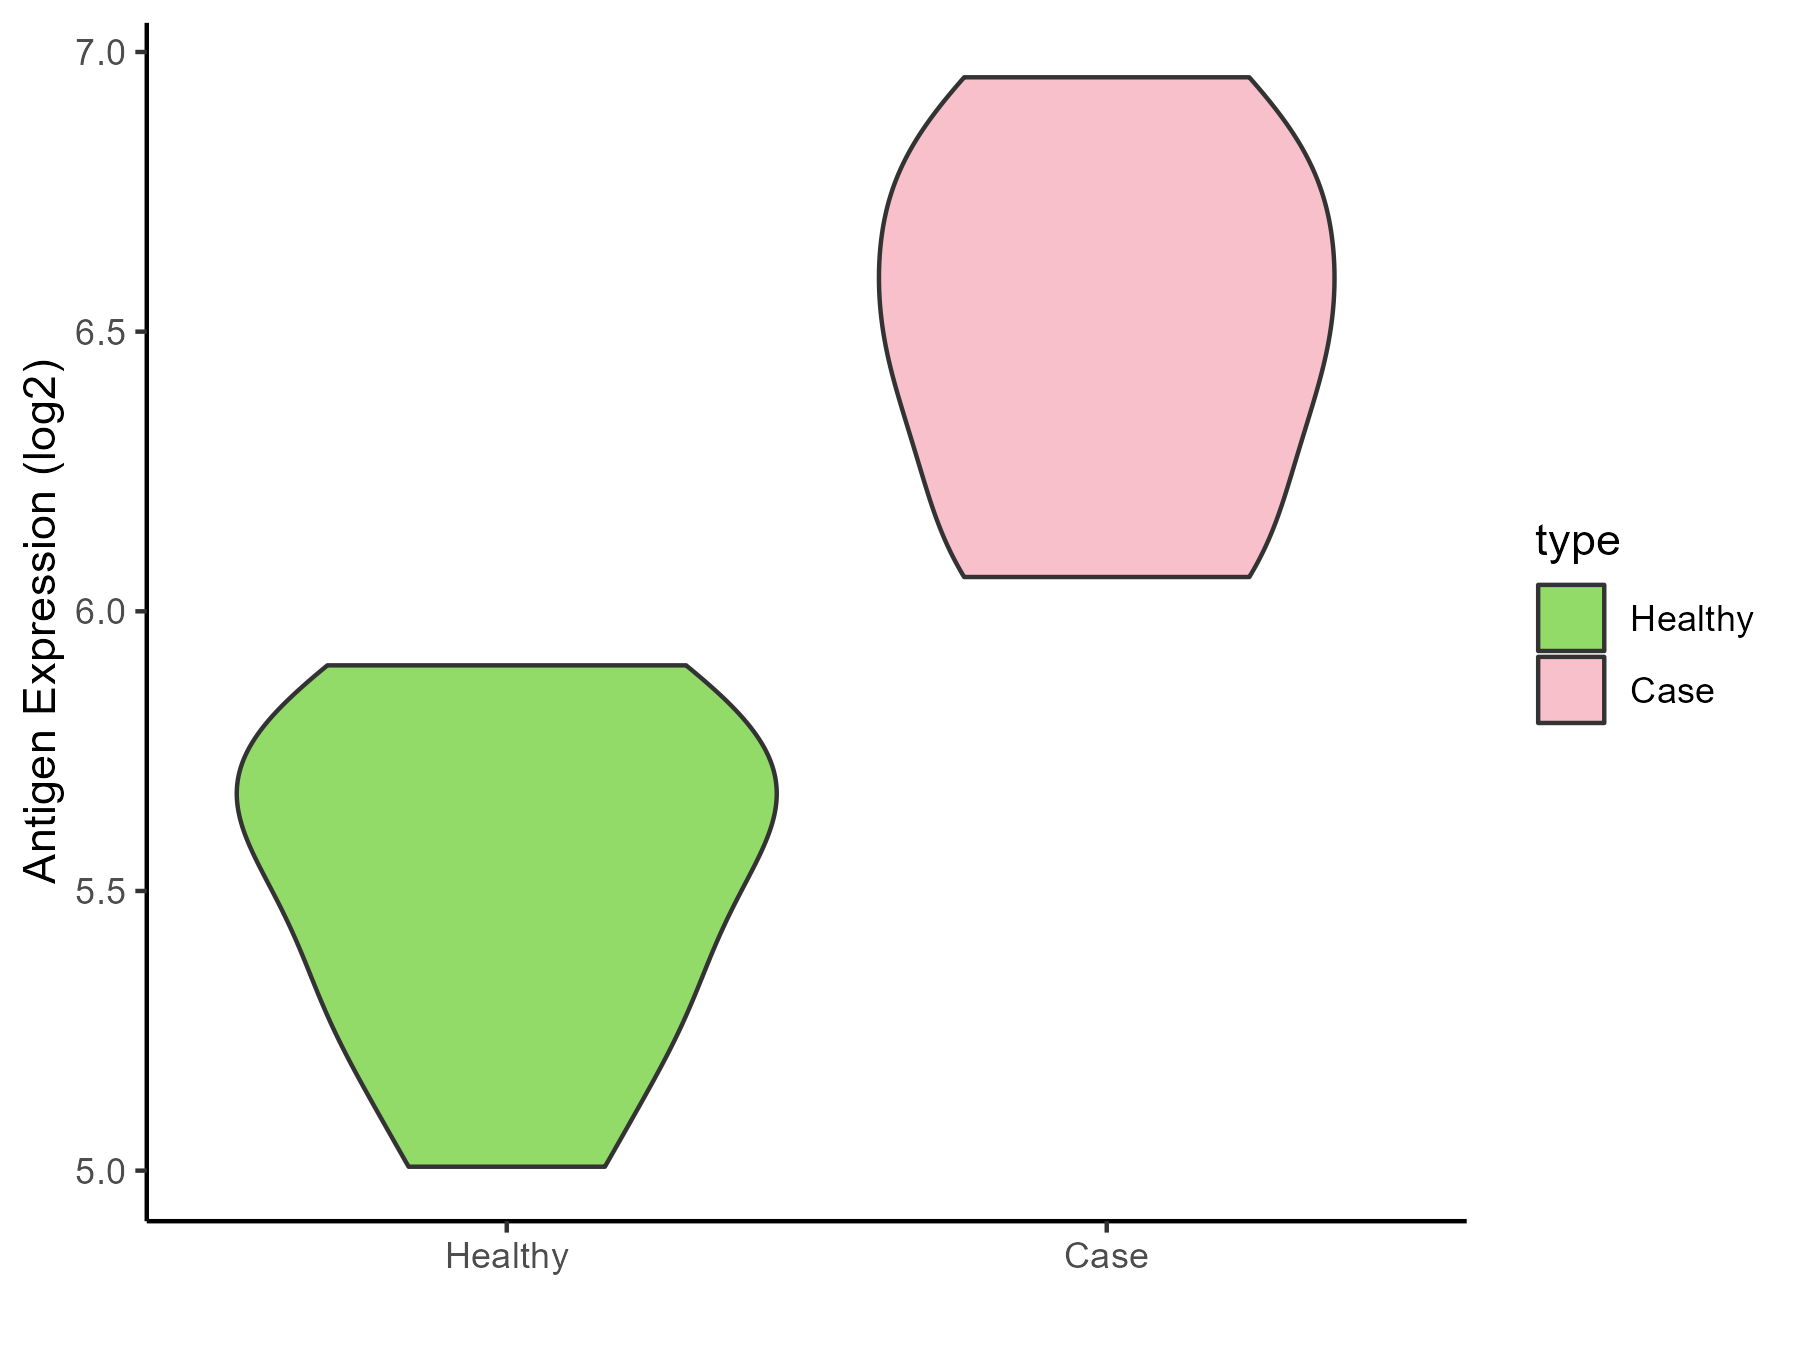
|
Click to View the Clearer Original Diagram |
| Differential expression pattern of antigen in diseases | ||
| The Studied Tissue | Colon mucosal | |
| The Specific Disease | Ulcerative colitis | |
| The Expression Level of Disease Section Compare with the Adjacent Tissue | p-value: 0.523662864; Fold-change: 0.038189907; Z-score: 0.168699999 | |
| Disease-specific Antigen Abundances |
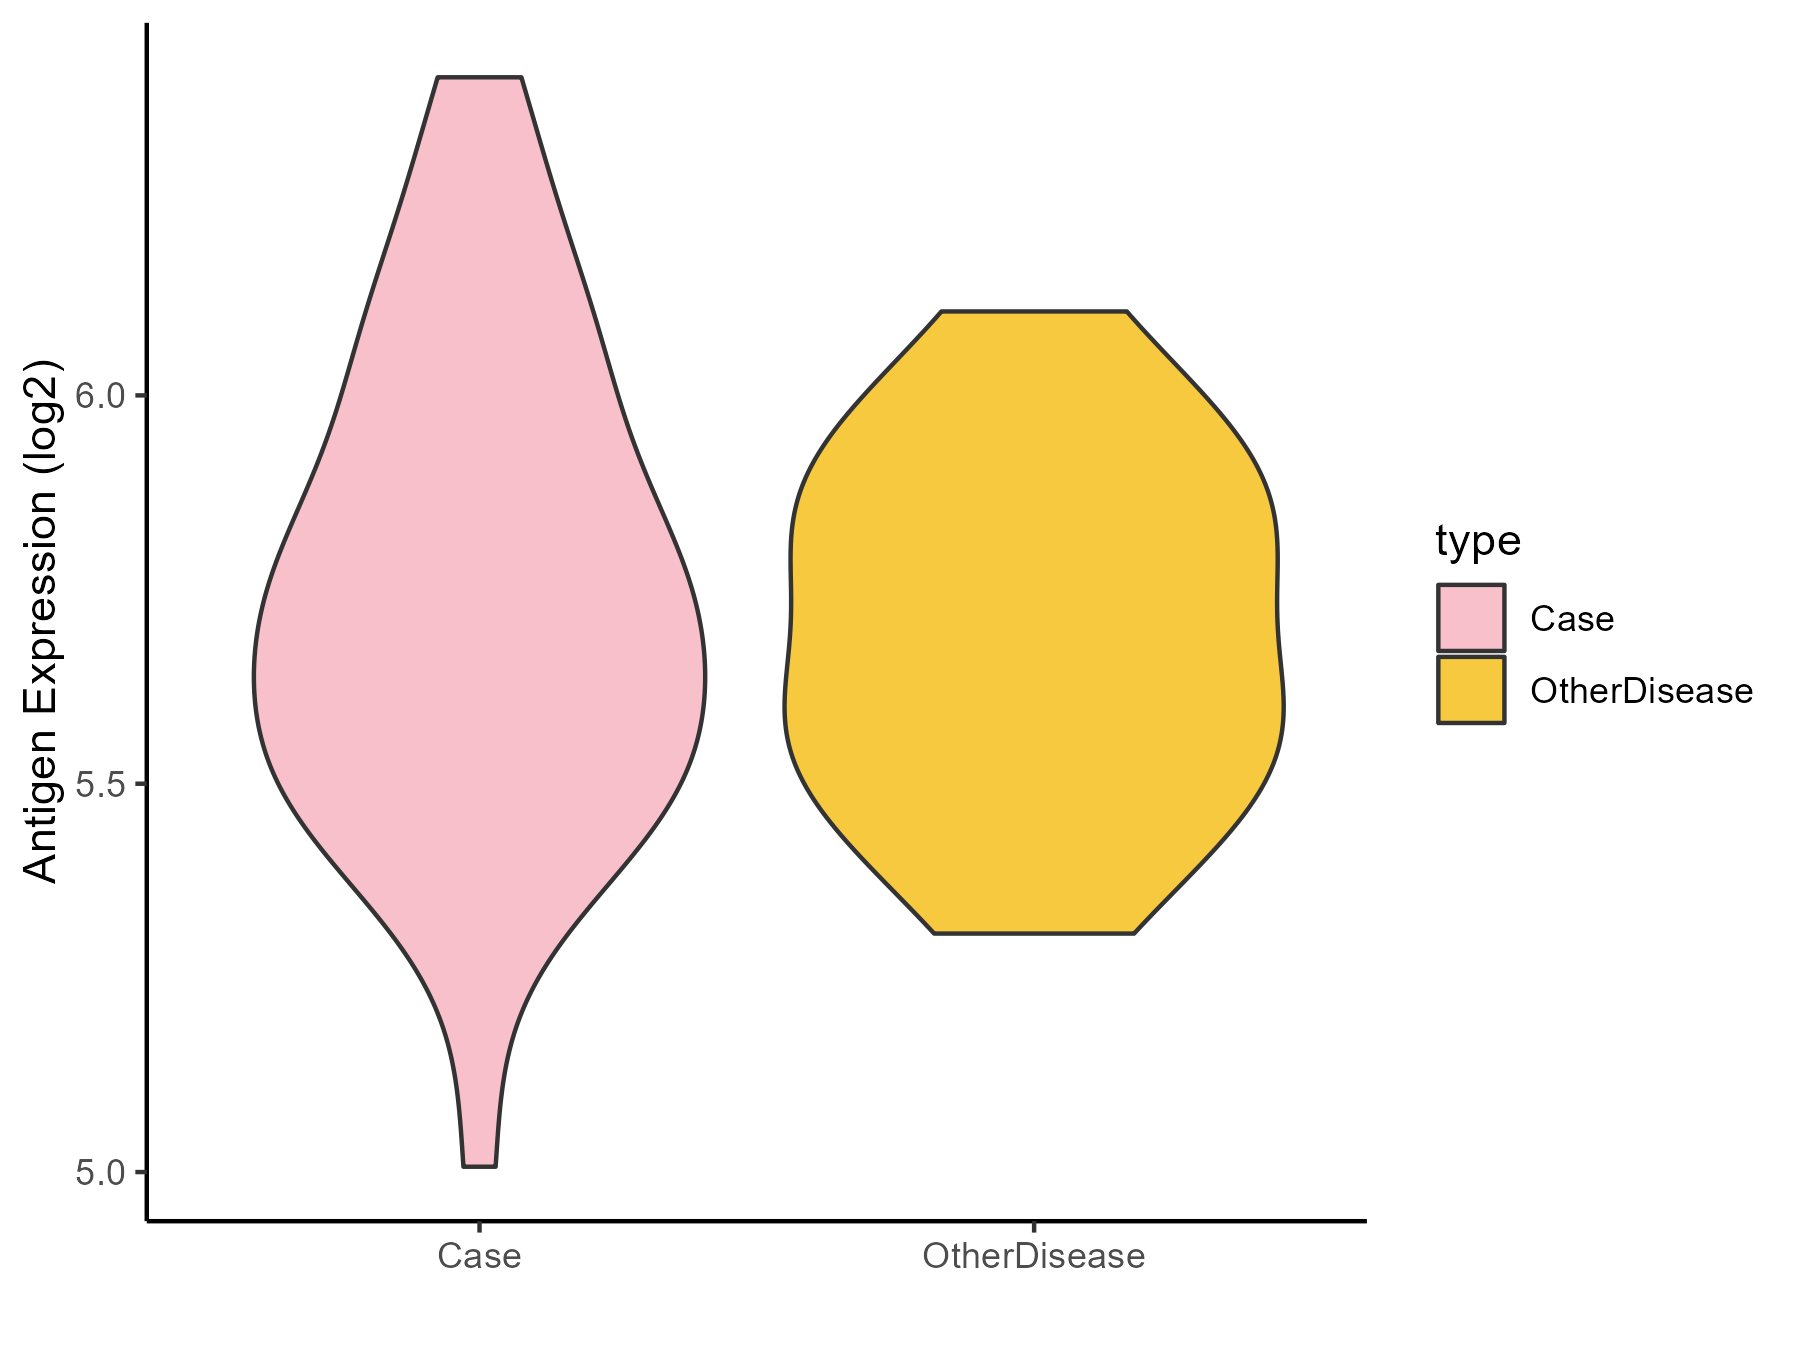
|
Click to View the Clearer Original Diagram |
| Differential expression pattern of antigen in diseases | ||
| The Studied Tissue | Rectal colon | |
| The Specific Disease | Irritable bowel syndrome | |
| The Expression Level of Disease Section Compare with the Healthy Individual Tissue | p-value: 0.305439412; Fold-change: -0.074529581; Z-score: -0.128472556 | |
| Disease-specific Antigen Abundances |
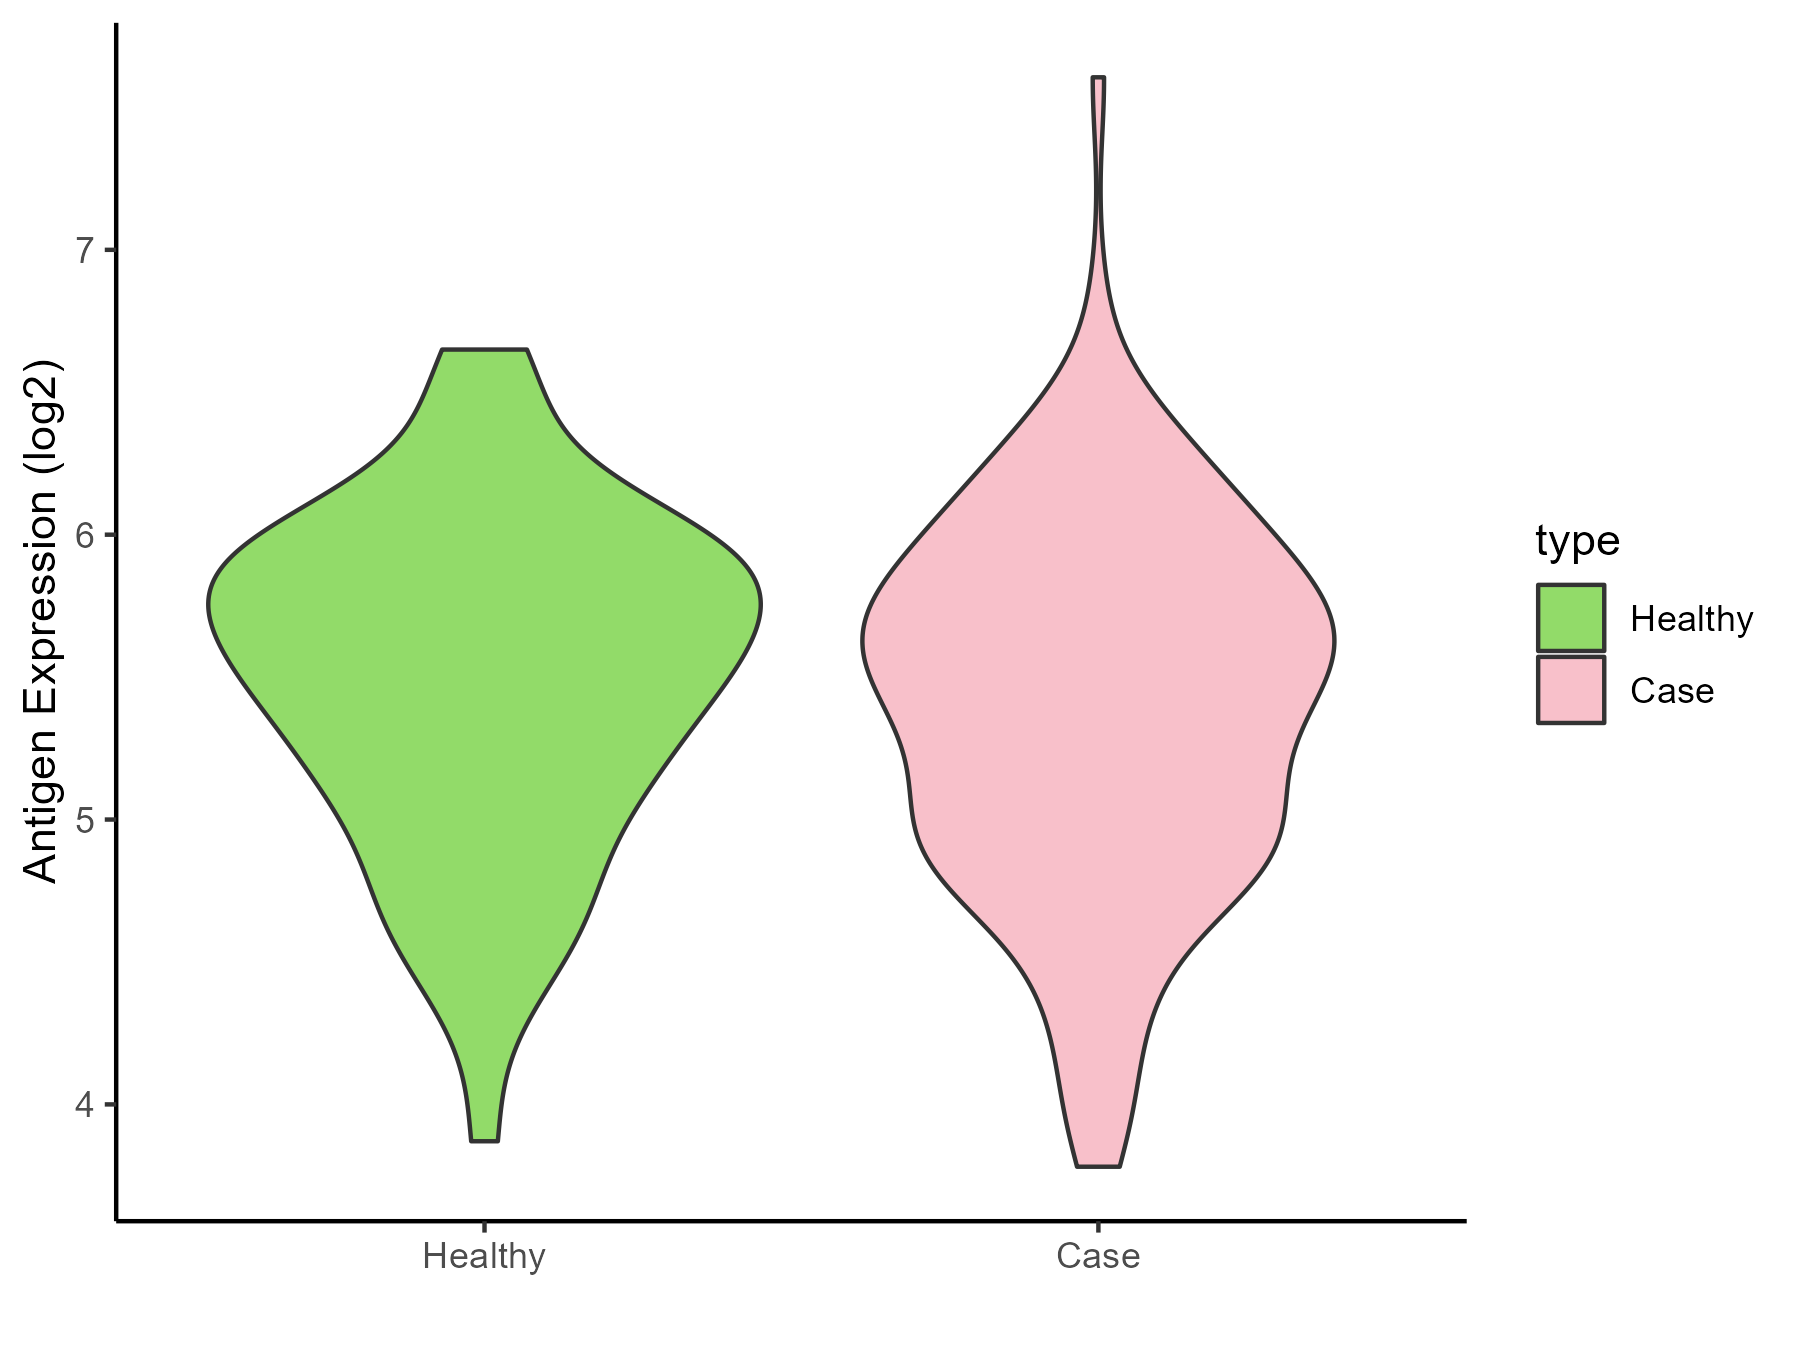
|
Click to View the Clearer Original Diagram |
ICD Disease Classification 14
| Differential expression pattern of antigen in diseases | ||
| The Studied Tissue | Skin | |
| The Specific Disease | Atopic dermatitis | |
| The Expression Level of Disease Section Compare with the Healthy Individual Tissue | p-value: 0.142028625; Fold-change: 0.04098346; Z-score: 0.177652971 | |
| Disease-specific Antigen Abundances |
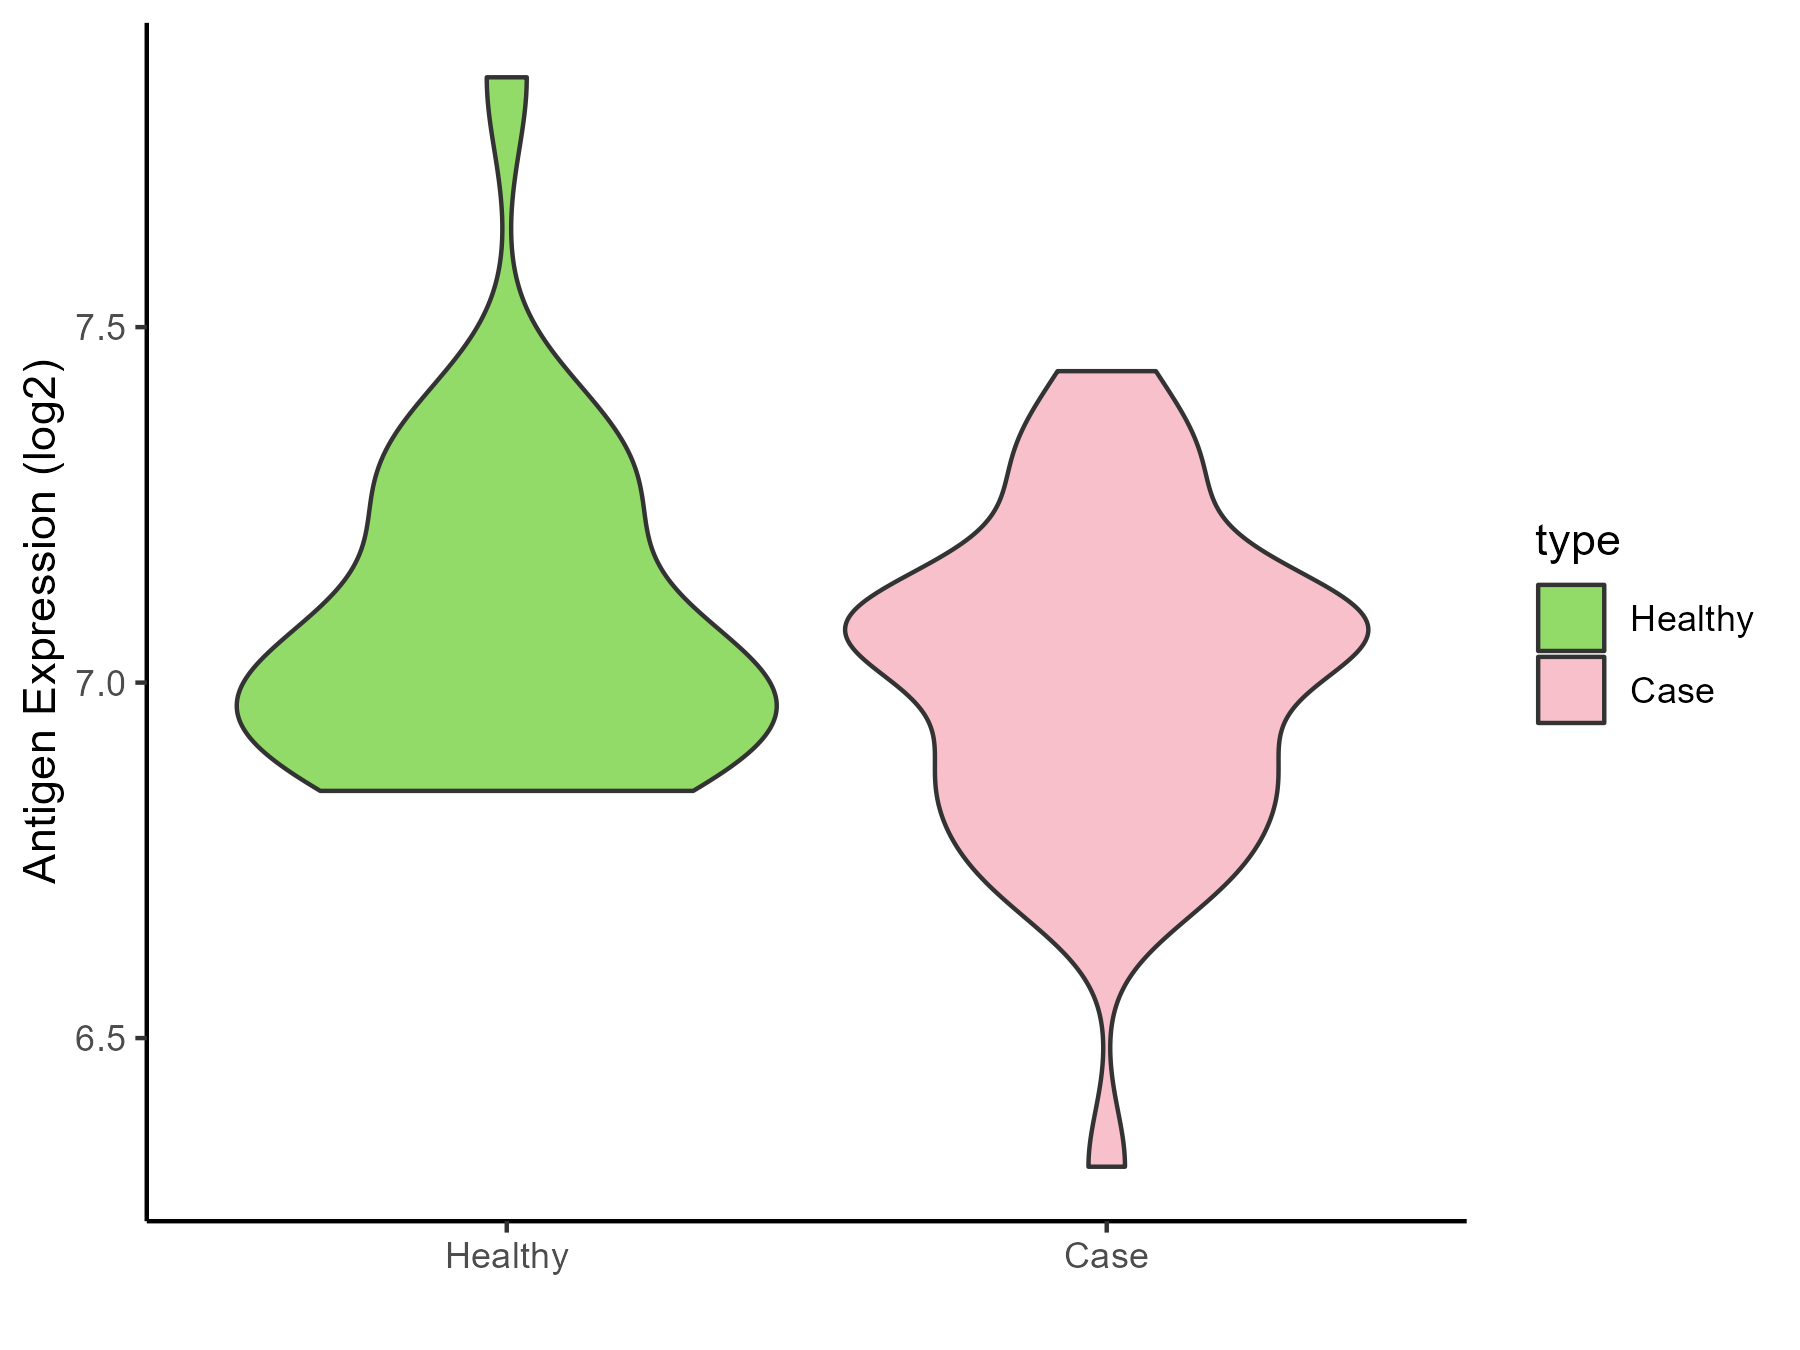
|
Click to View the Clearer Original Diagram |
| Differential expression pattern of antigen in diseases | ||
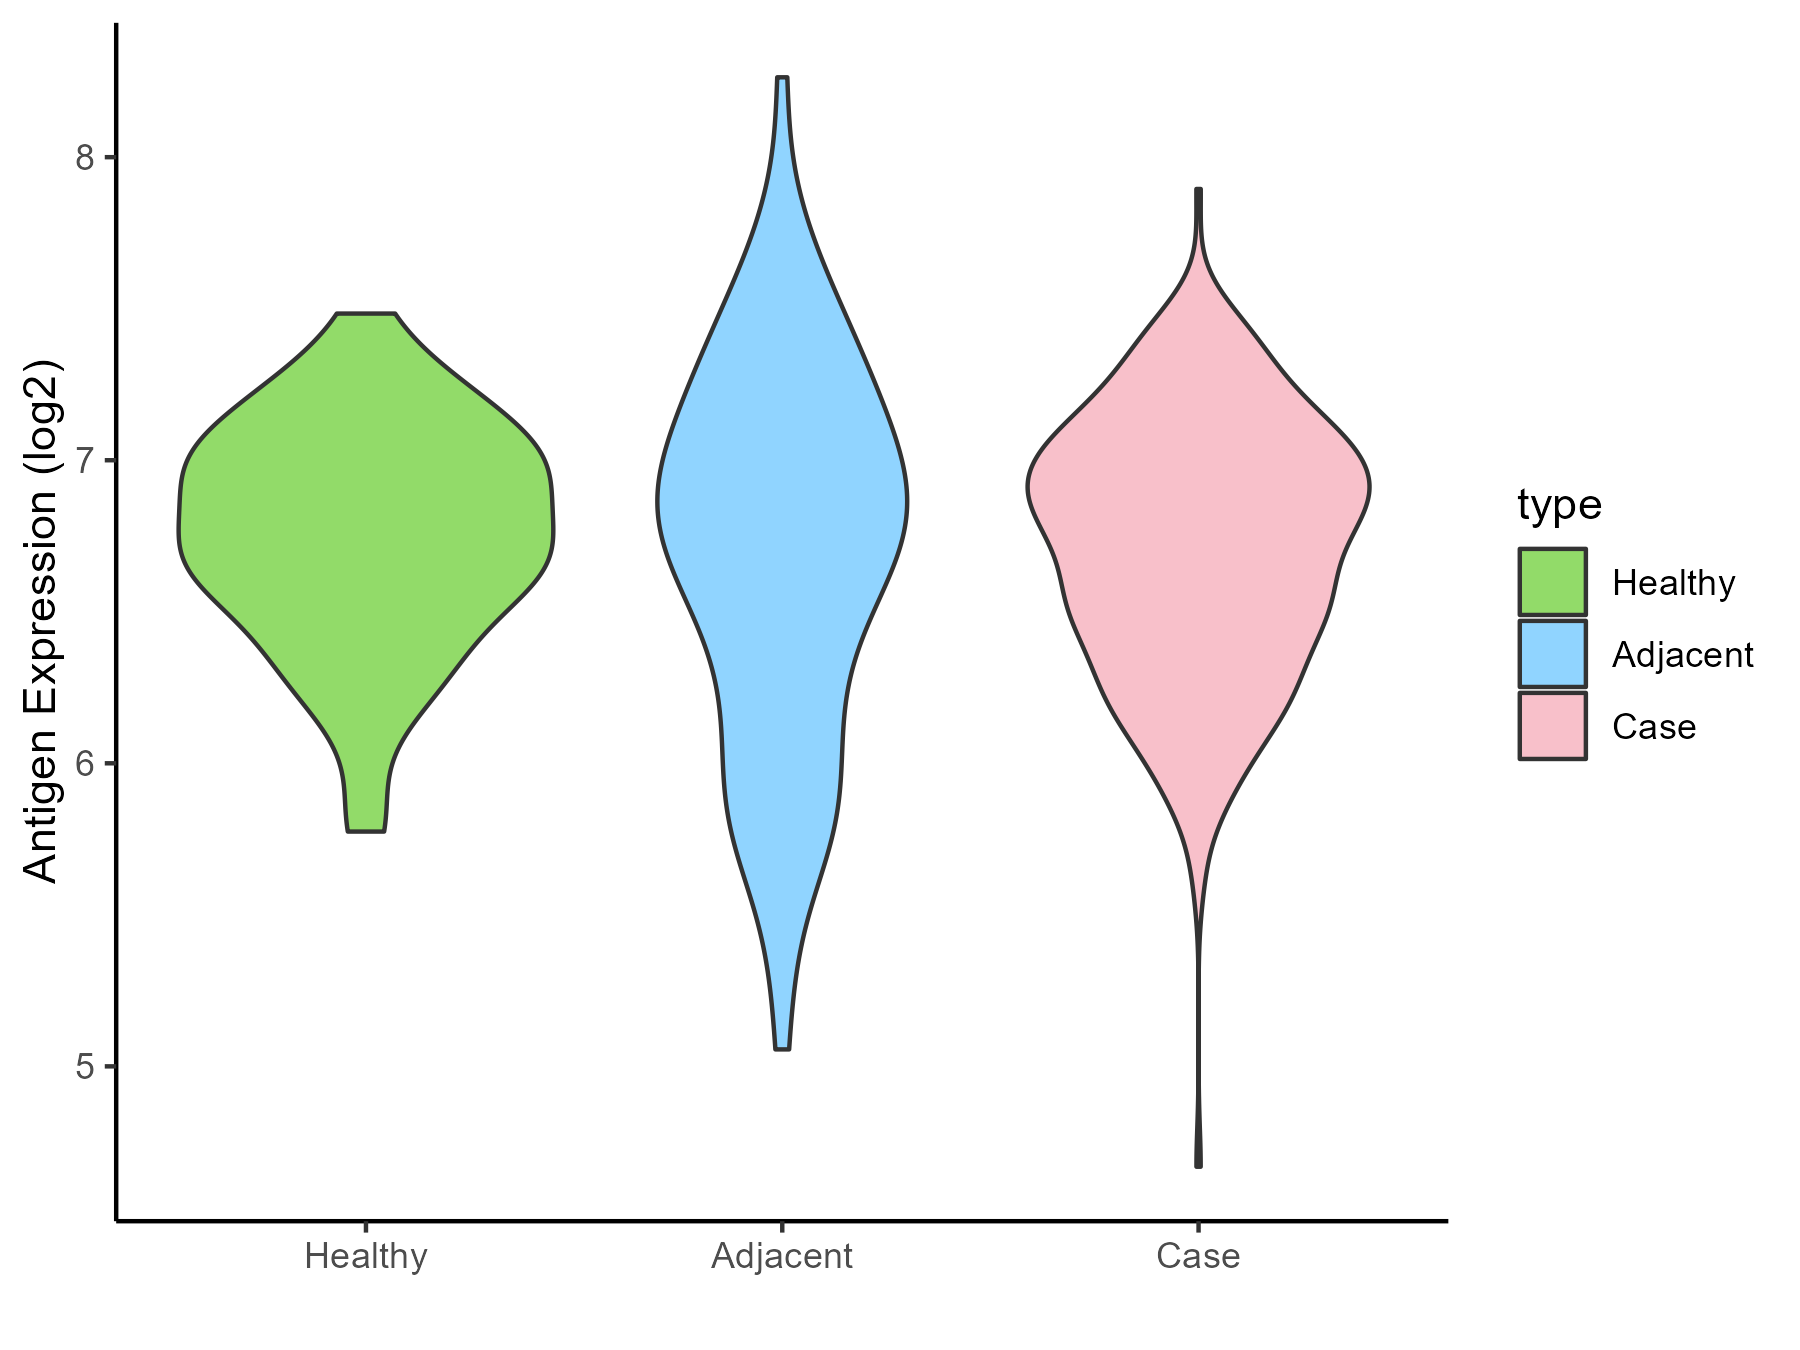
| The Studied Tissue | Skin | |
| The Specific Disease | Psoriasis | |
| The Expression Level of Disease Section Compare with the Healthy Individual Tissue | p-value: 0.366942433; Fold-change: -0.004048089; Z-score: -0.011018346 | |
| The Expression Level of Disease Section Compare with the Adjacent Tissue | p-value: 0.862039448; Fold-change: -0.020452782; Z-score: -0.032811122 | |
| Disease-specific Antigen Abundances |
|
Click to View the Clearer Original Diagram |
| Differential expression pattern of antigen in diseases | ||
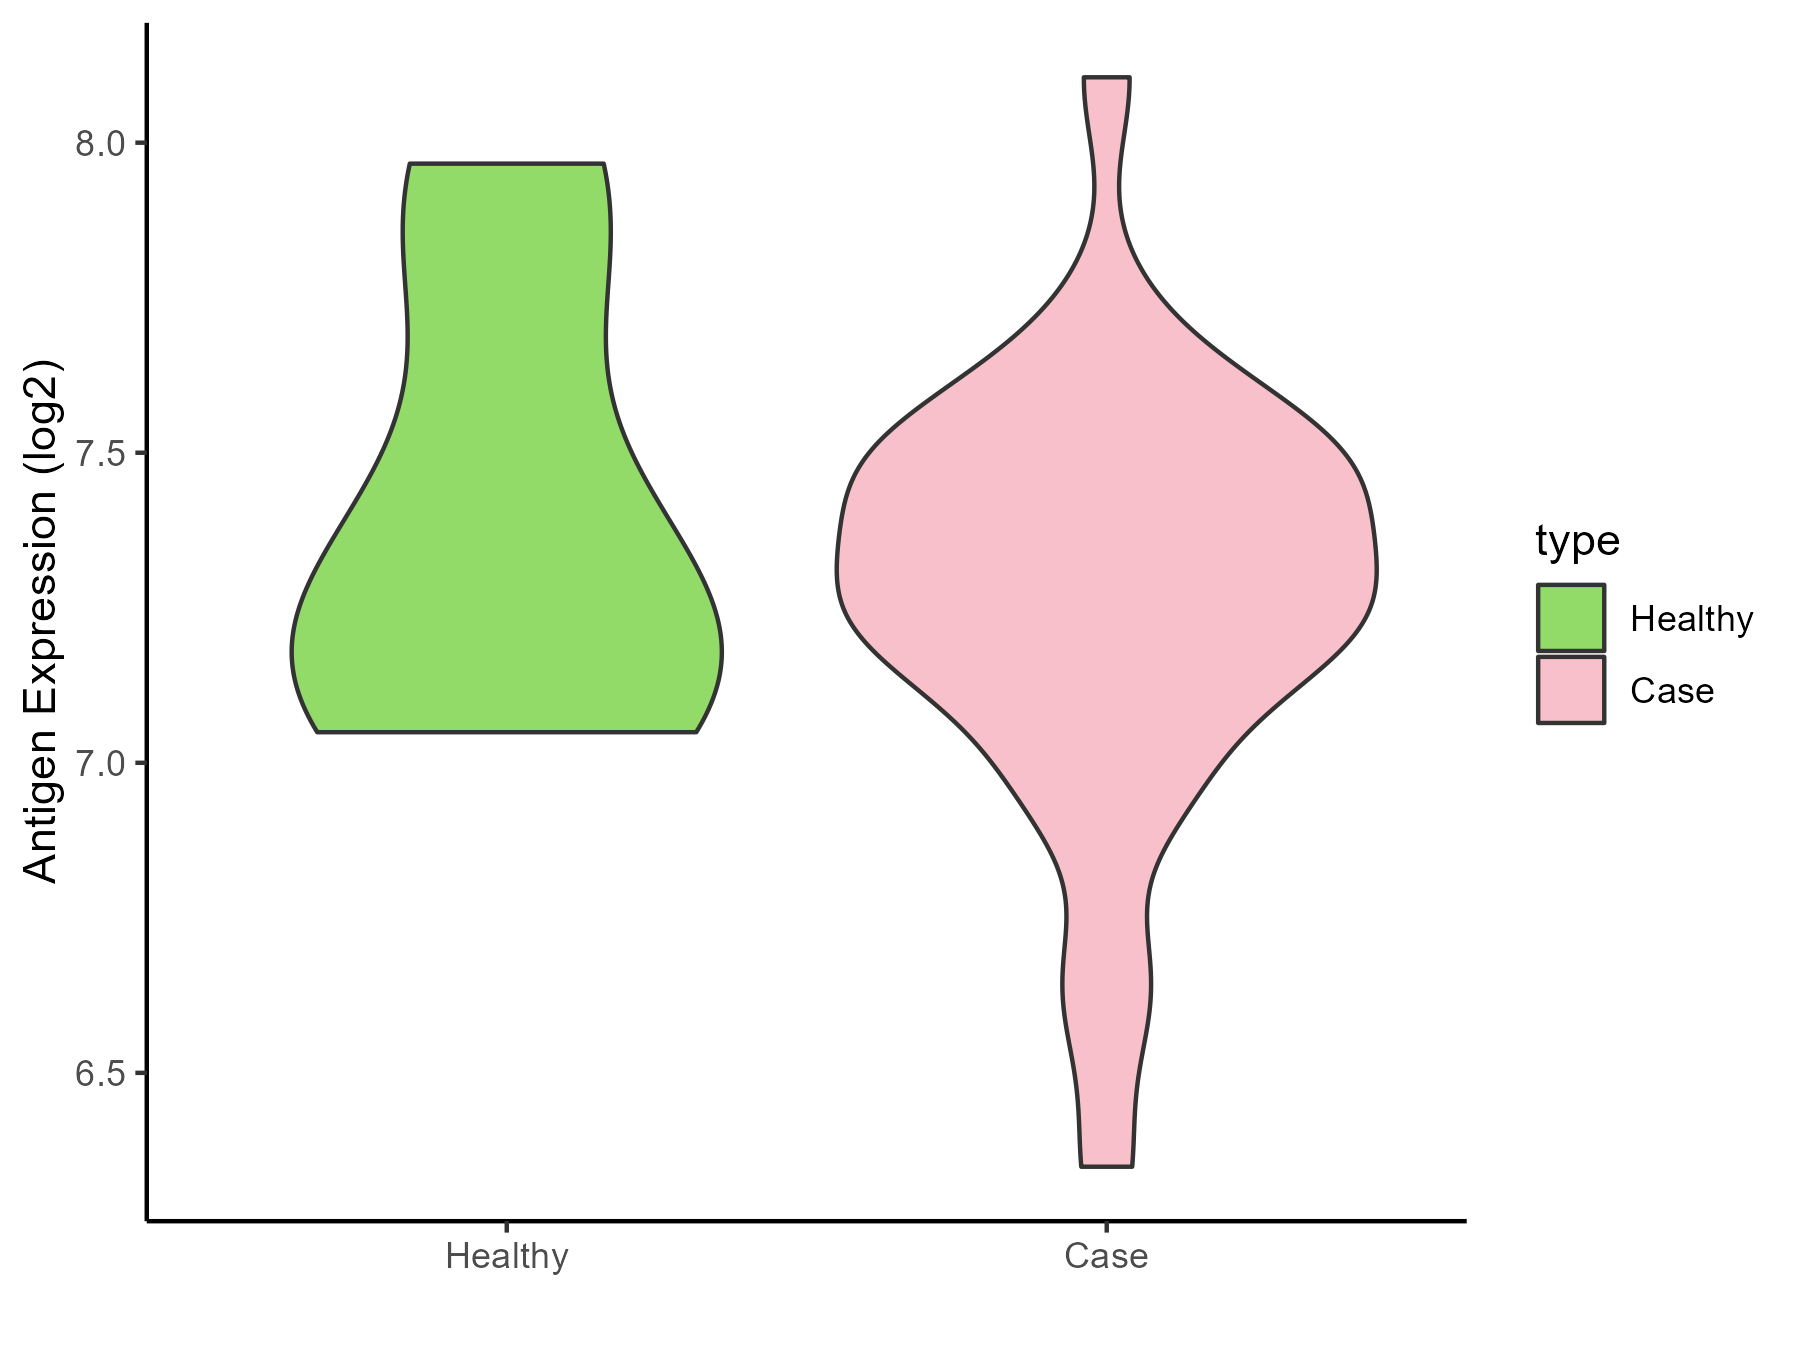
| The Studied Tissue | Skin | |
| The Specific Disease | Vitiligo | |
| The Expression Level of Disease Section Compare with the Healthy Individual Tissue | p-value: 0.425668184; Fold-change: 0.117595118; Z-score: 0.318361808 | |
| Disease-specific Antigen Abundances |
|
Click to View the Clearer Original Diagram |
| Differential expression pattern of antigen in diseases | ||
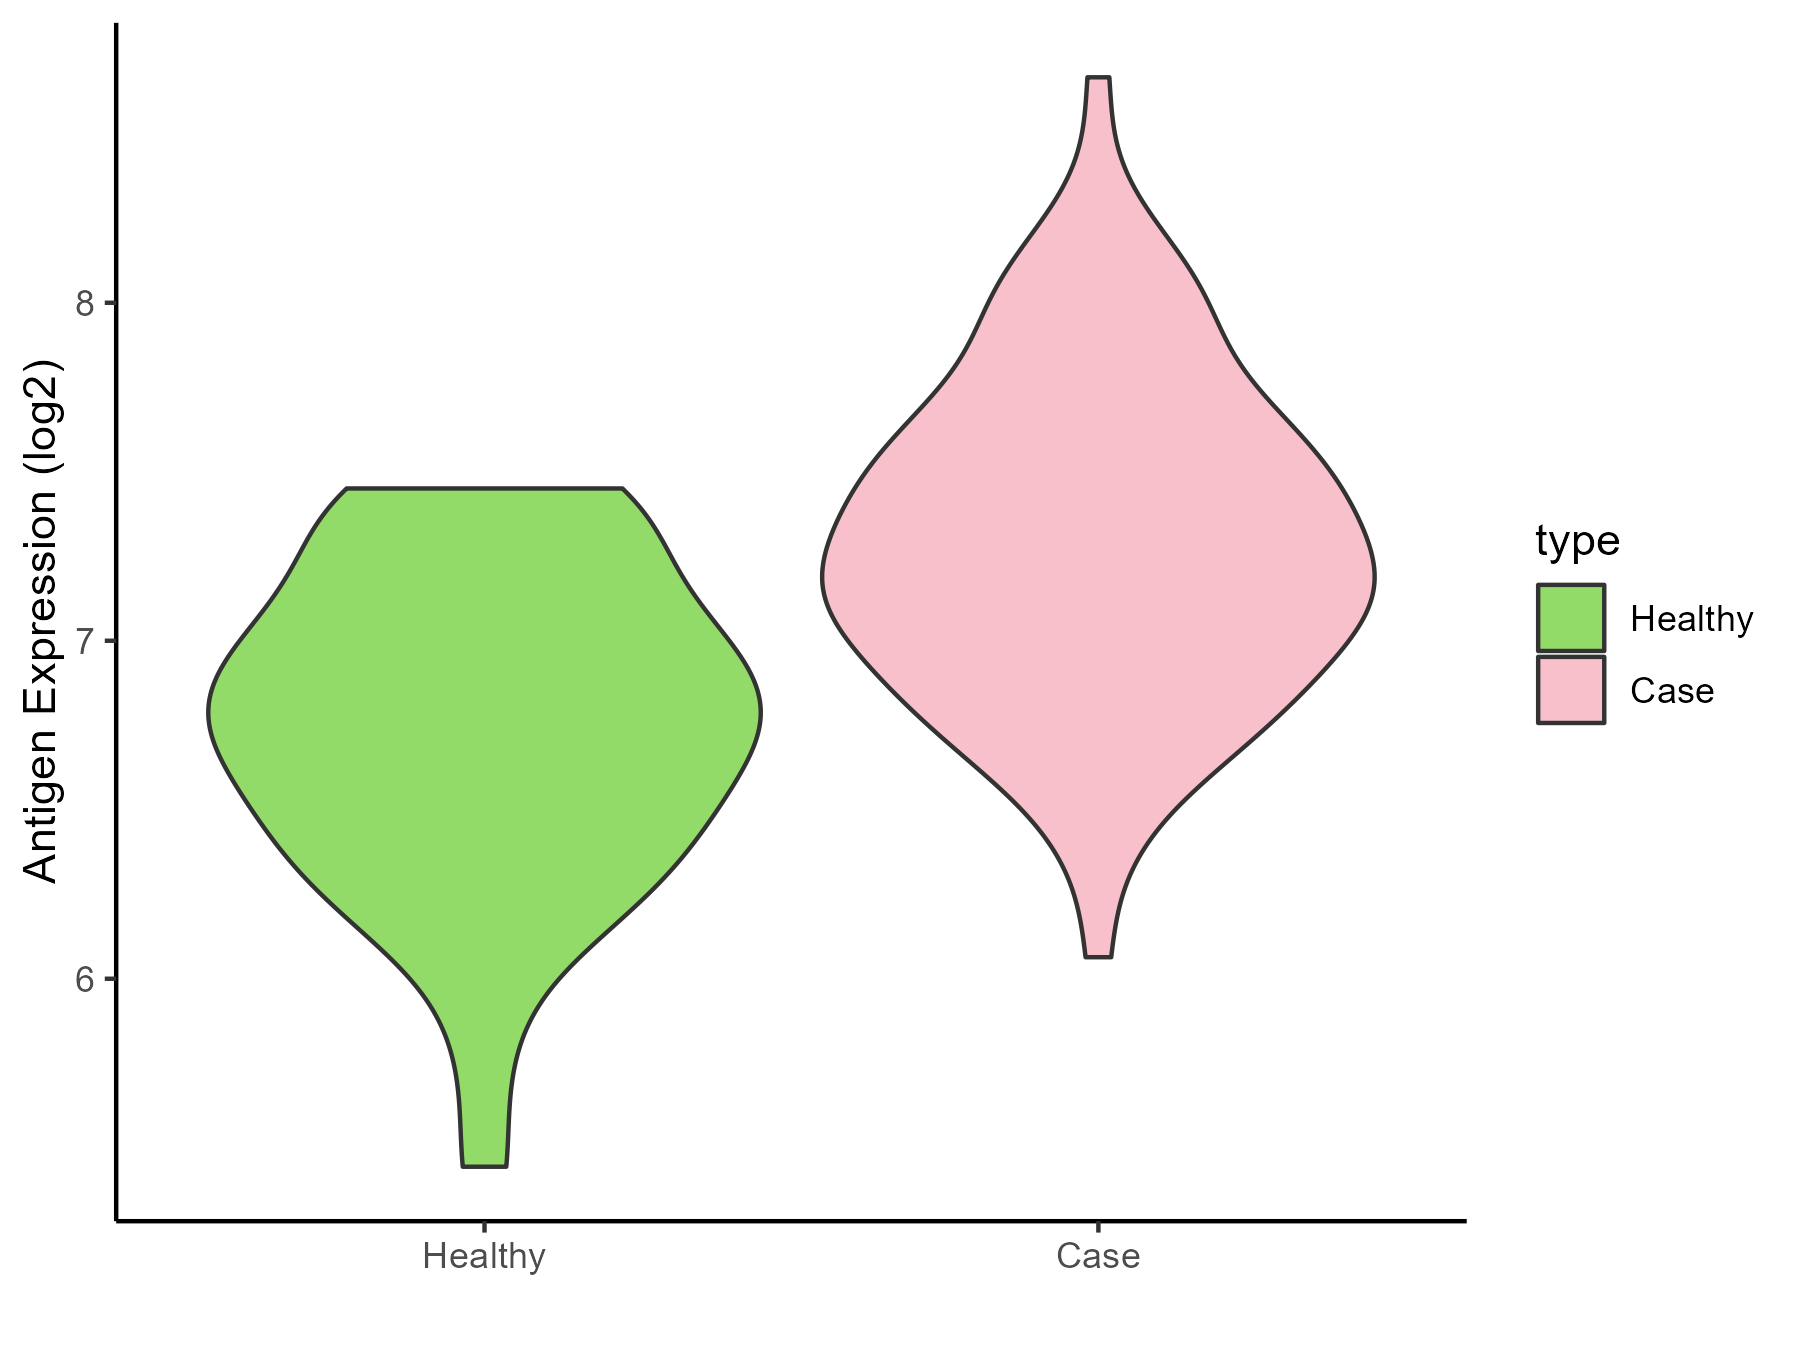
| The Studied Tissue | Skin from scalp | |
| The Specific Disease | Alopecia | |
| The Expression Level of Disease Section Compare with the Healthy Individual Tissue | p-value: 9.50E-08; Fold-change: 0.465120604; Z-score: 0.987329288 | |
| Disease-specific Antigen Abundances |
|
Click to View the Clearer Original Diagram |
| Differential expression pattern of antigen in diseases | ||
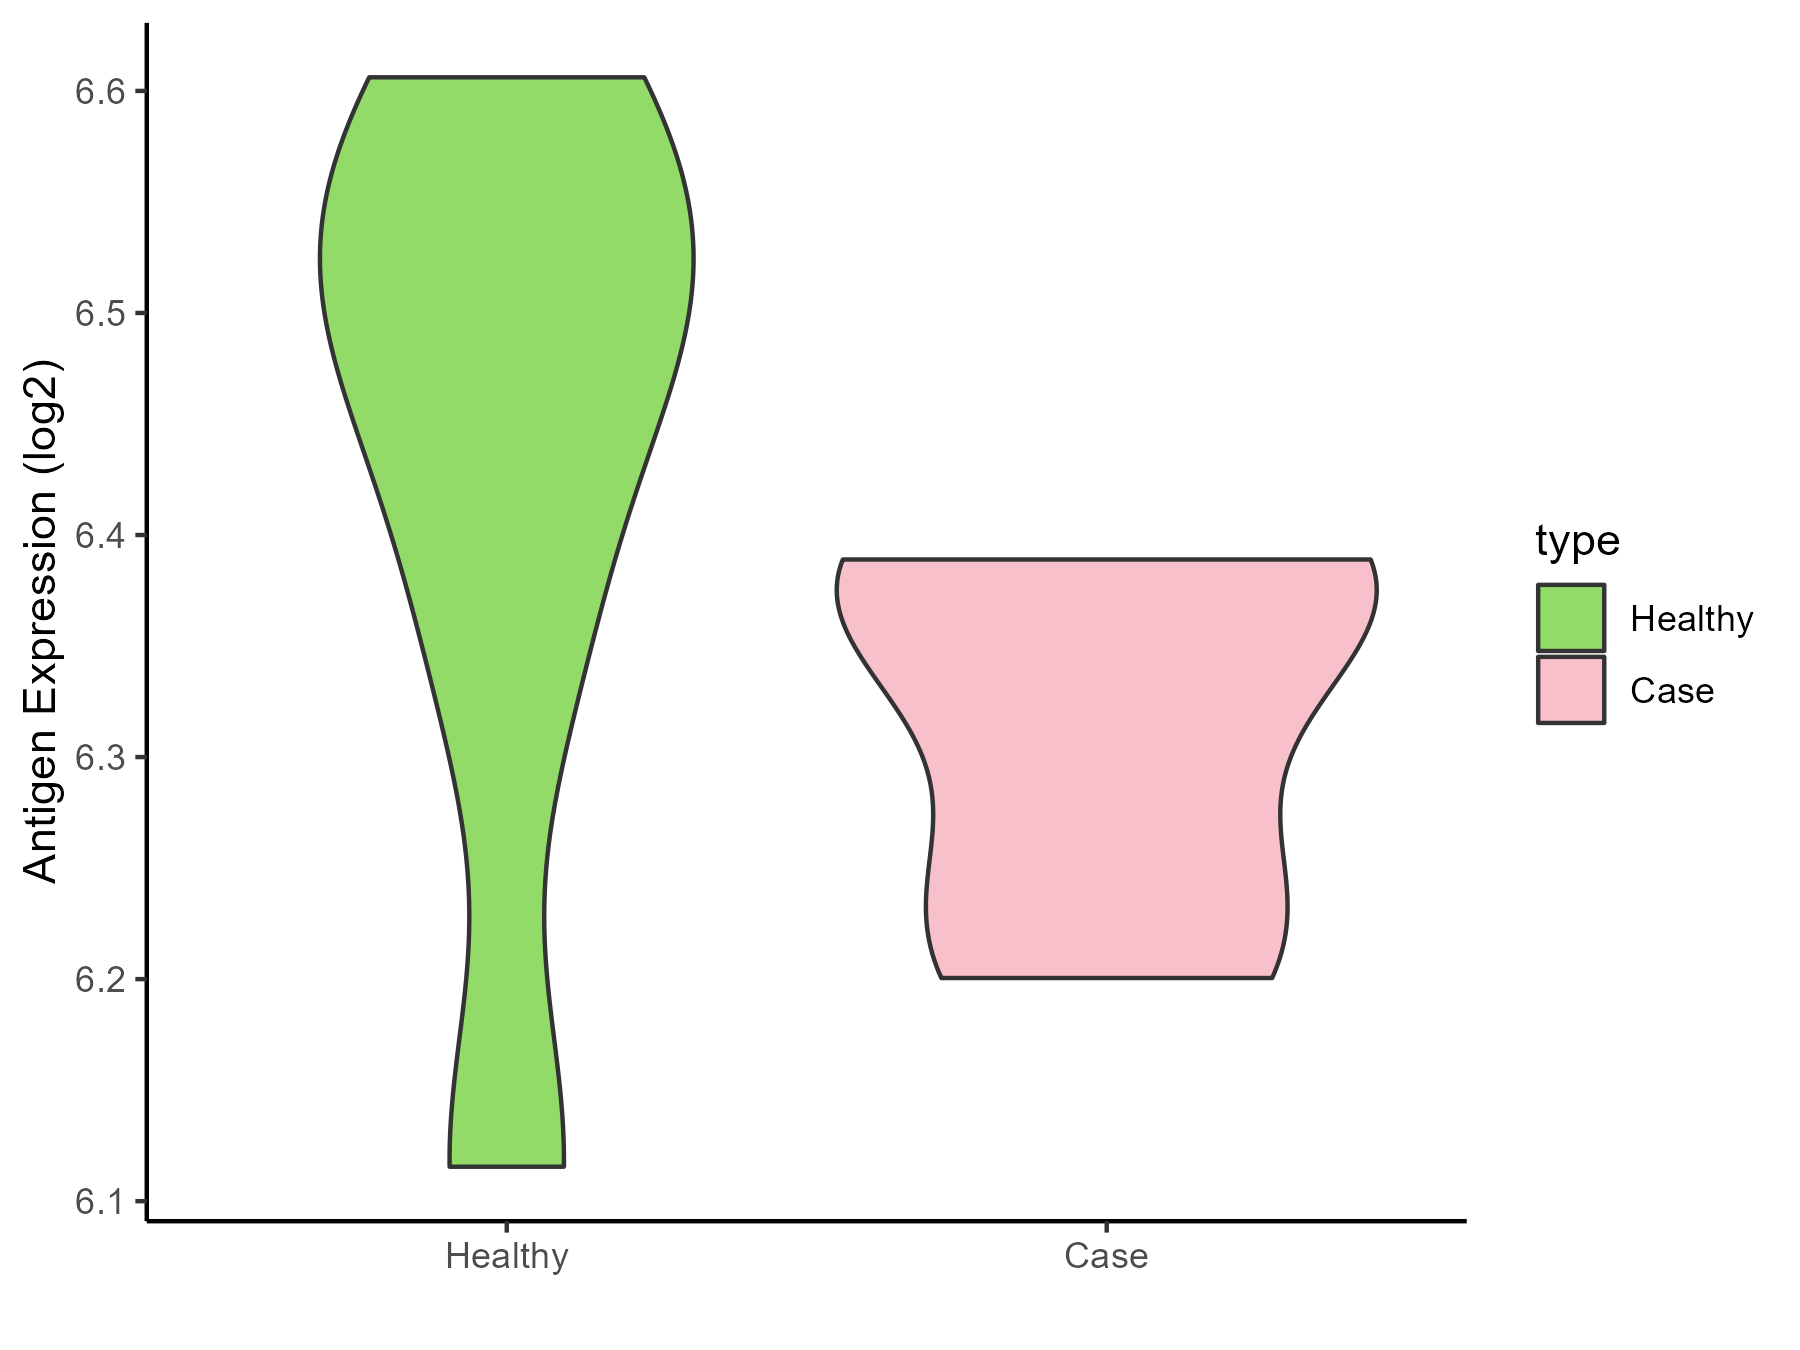
| The Studied Tissue | Skin | |
| The Specific Disease | Sensitive skin | |
| The Expression Level of Disease Section Compare with the Healthy Individual Tissue | p-value: 0.197643027; Fold-change: -0.127875012; Z-score: -0.716701682 | |
| Disease-specific Antigen Abundances |
|
Click to View the Clearer Original Diagram |
ICD Disease Classification 15
| Differential expression pattern of antigen in diseases | ||
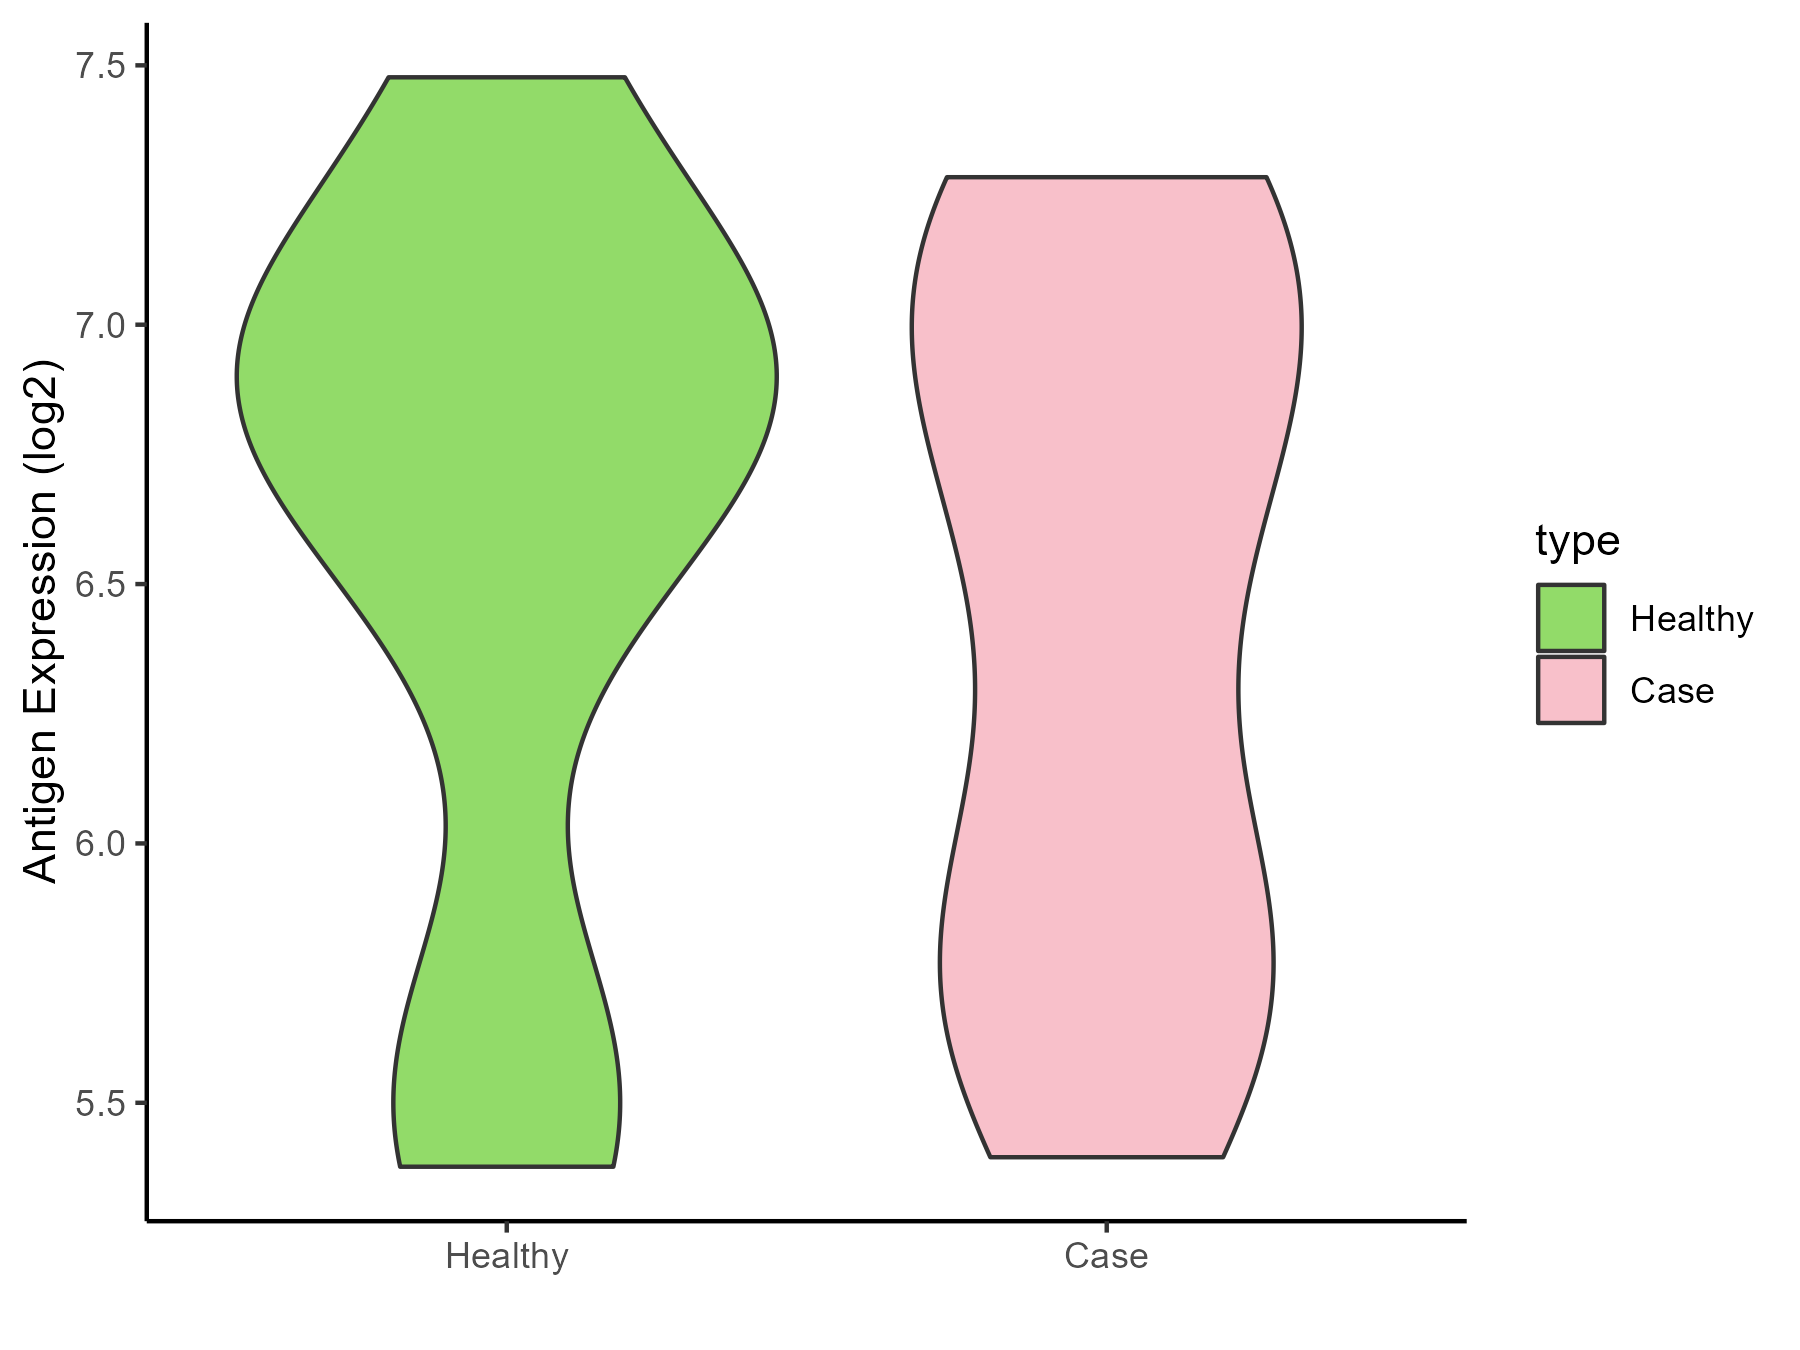
| The Studied Tissue | Synovial | |
| The Specific Disease | Osteoarthritis | |
| The Expression Level of Disease Section Compare with the Healthy Individual Tissue | p-value: 0.637926359; Fold-change: -0.208317428; Z-score: -0.287045384 | |
| Disease-specific Antigen Abundances |
|
Click to View the Clearer Original Diagram |
| Differential expression pattern of antigen in diseases | ||
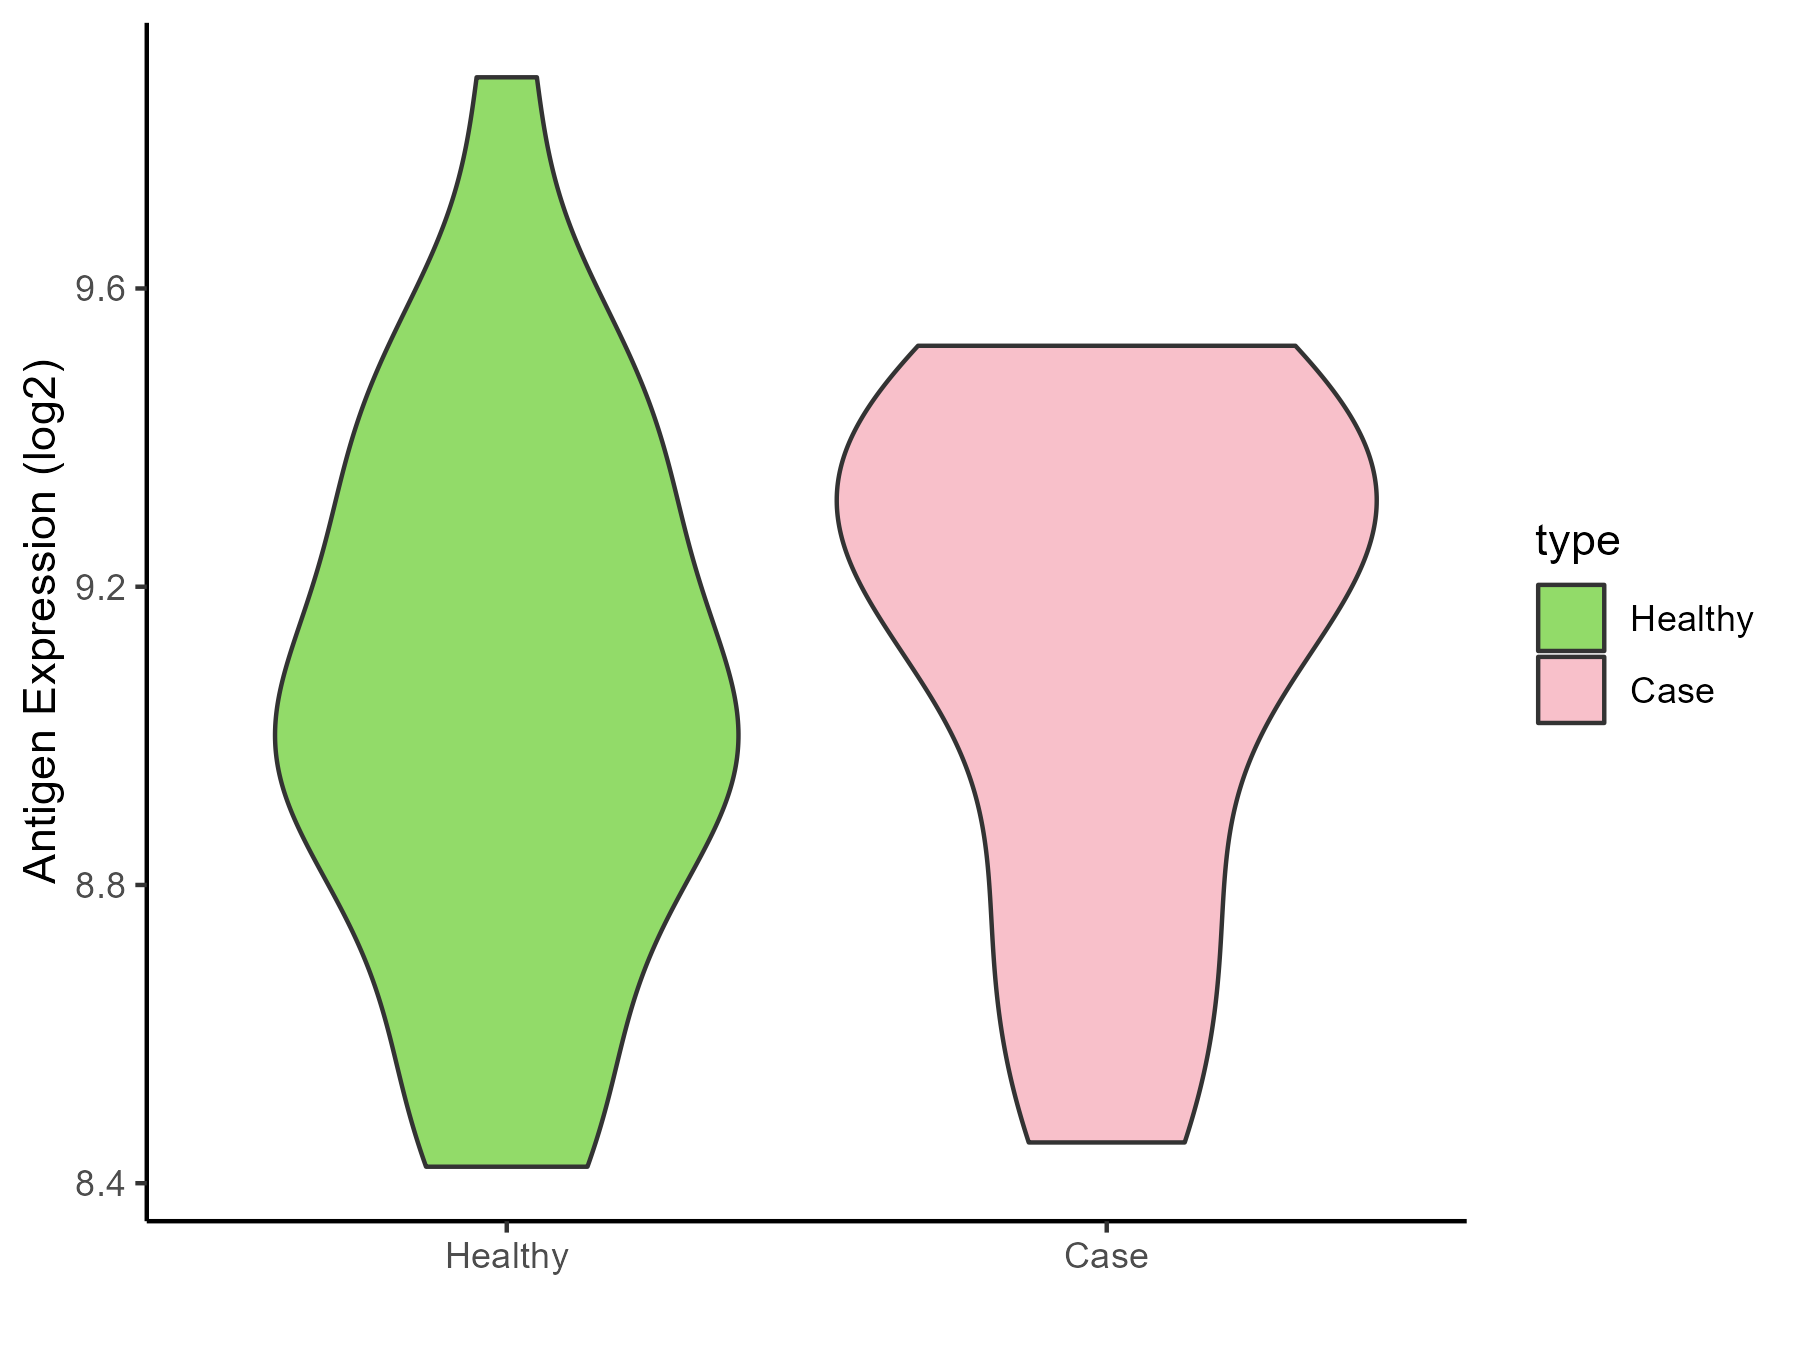
| The Studied Tissue | Peripheral blood | |
| The Specific Disease | Arthropathy | |
| The Expression Level of Disease Section Compare with the Healthy Individual Tissue | p-value: 0.580653846; Fold-change: 0.202823213; Z-score: 0.547663349 | |
| Disease-specific Antigen Abundances |
|
Click to View the Clearer Original Diagram |
| Differential expression pattern of antigen in diseases | ||
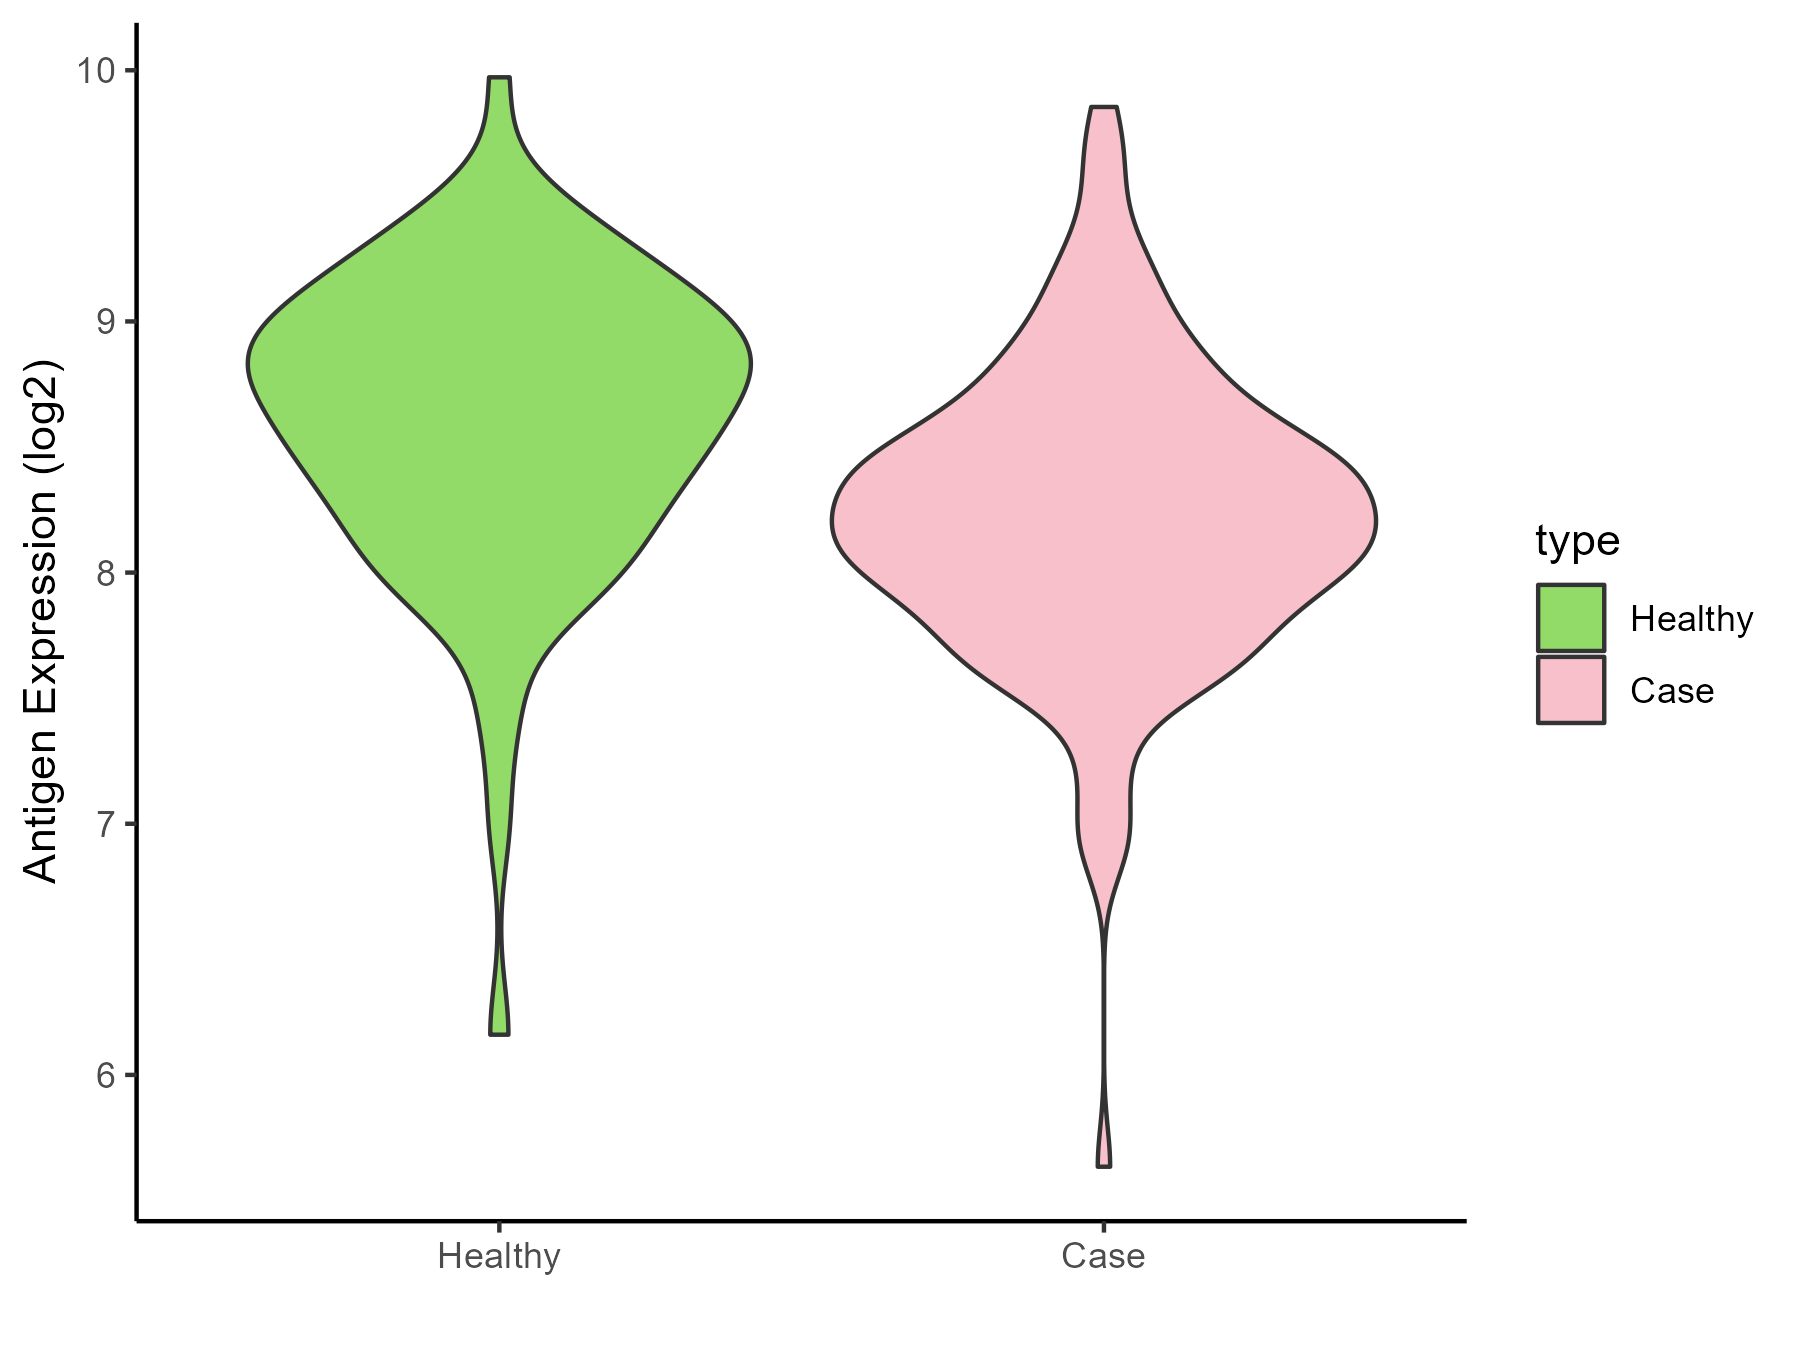
| The Studied Tissue | Peripheral blood | |
| The Specific Disease | Arthritis | |
| The Expression Level of Disease Section Compare with the Healthy Individual Tissue | p-value: 1.58E-05; Fold-change: -0.462018144; Z-score: -0.771849359 | |
| Disease-specific Antigen Abundances |
|
Click to View the Clearer Original Diagram |
| Differential expression pattern of antigen in diseases | ||
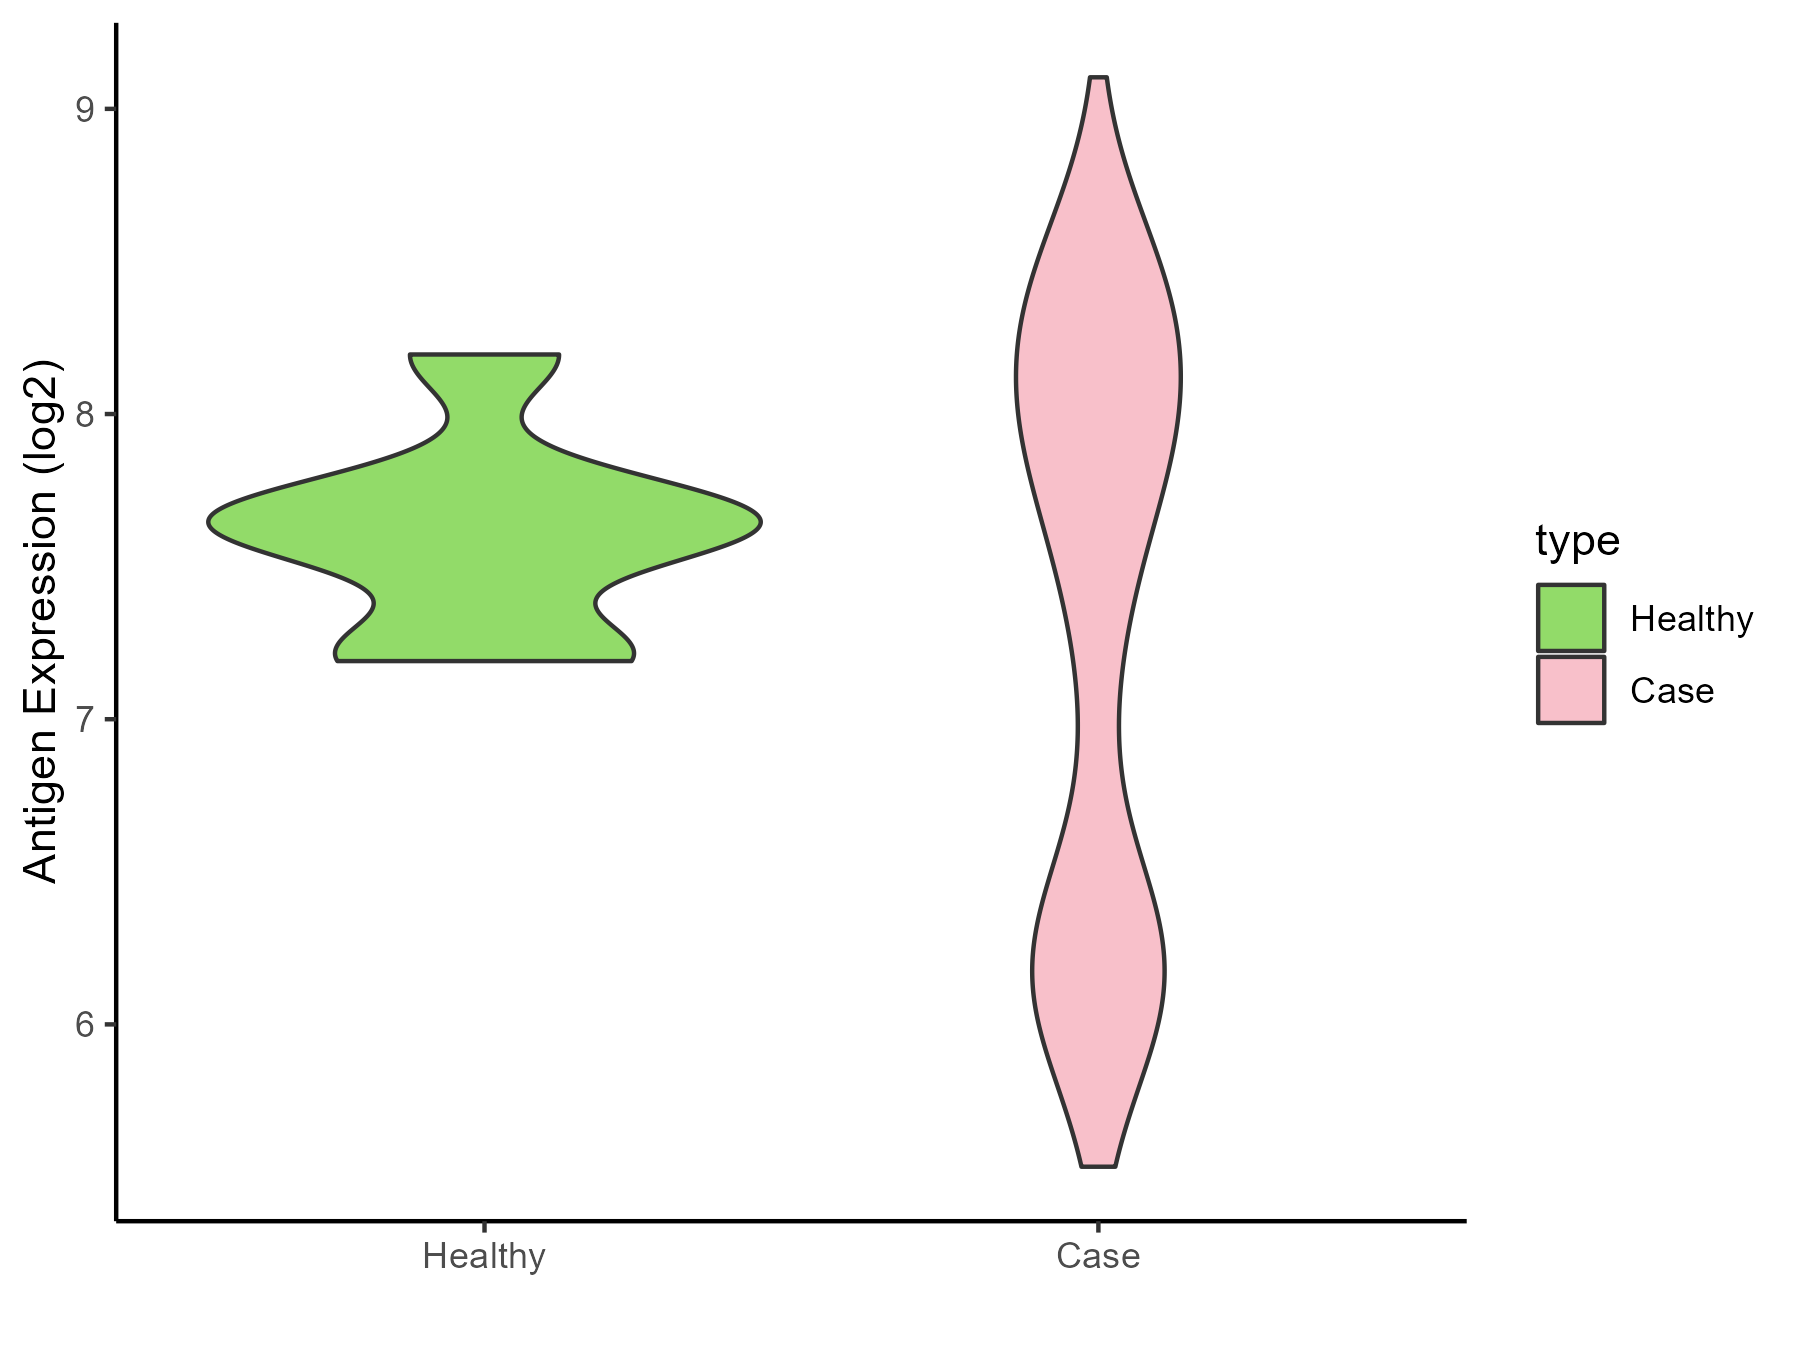
| The Studied Tissue | Synovial | |
| The Specific Disease | Rheumatoid arthritis | |
| The Expression Level of Disease Section Compare with the Healthy Individual Tissue | p-value: 0.106059668; Fold-change: 0.078441557; Z-score: 0.233003991 | |
| Disease-specific Antigen Abundances |
|
Click to View the Clearer Original Diagram |
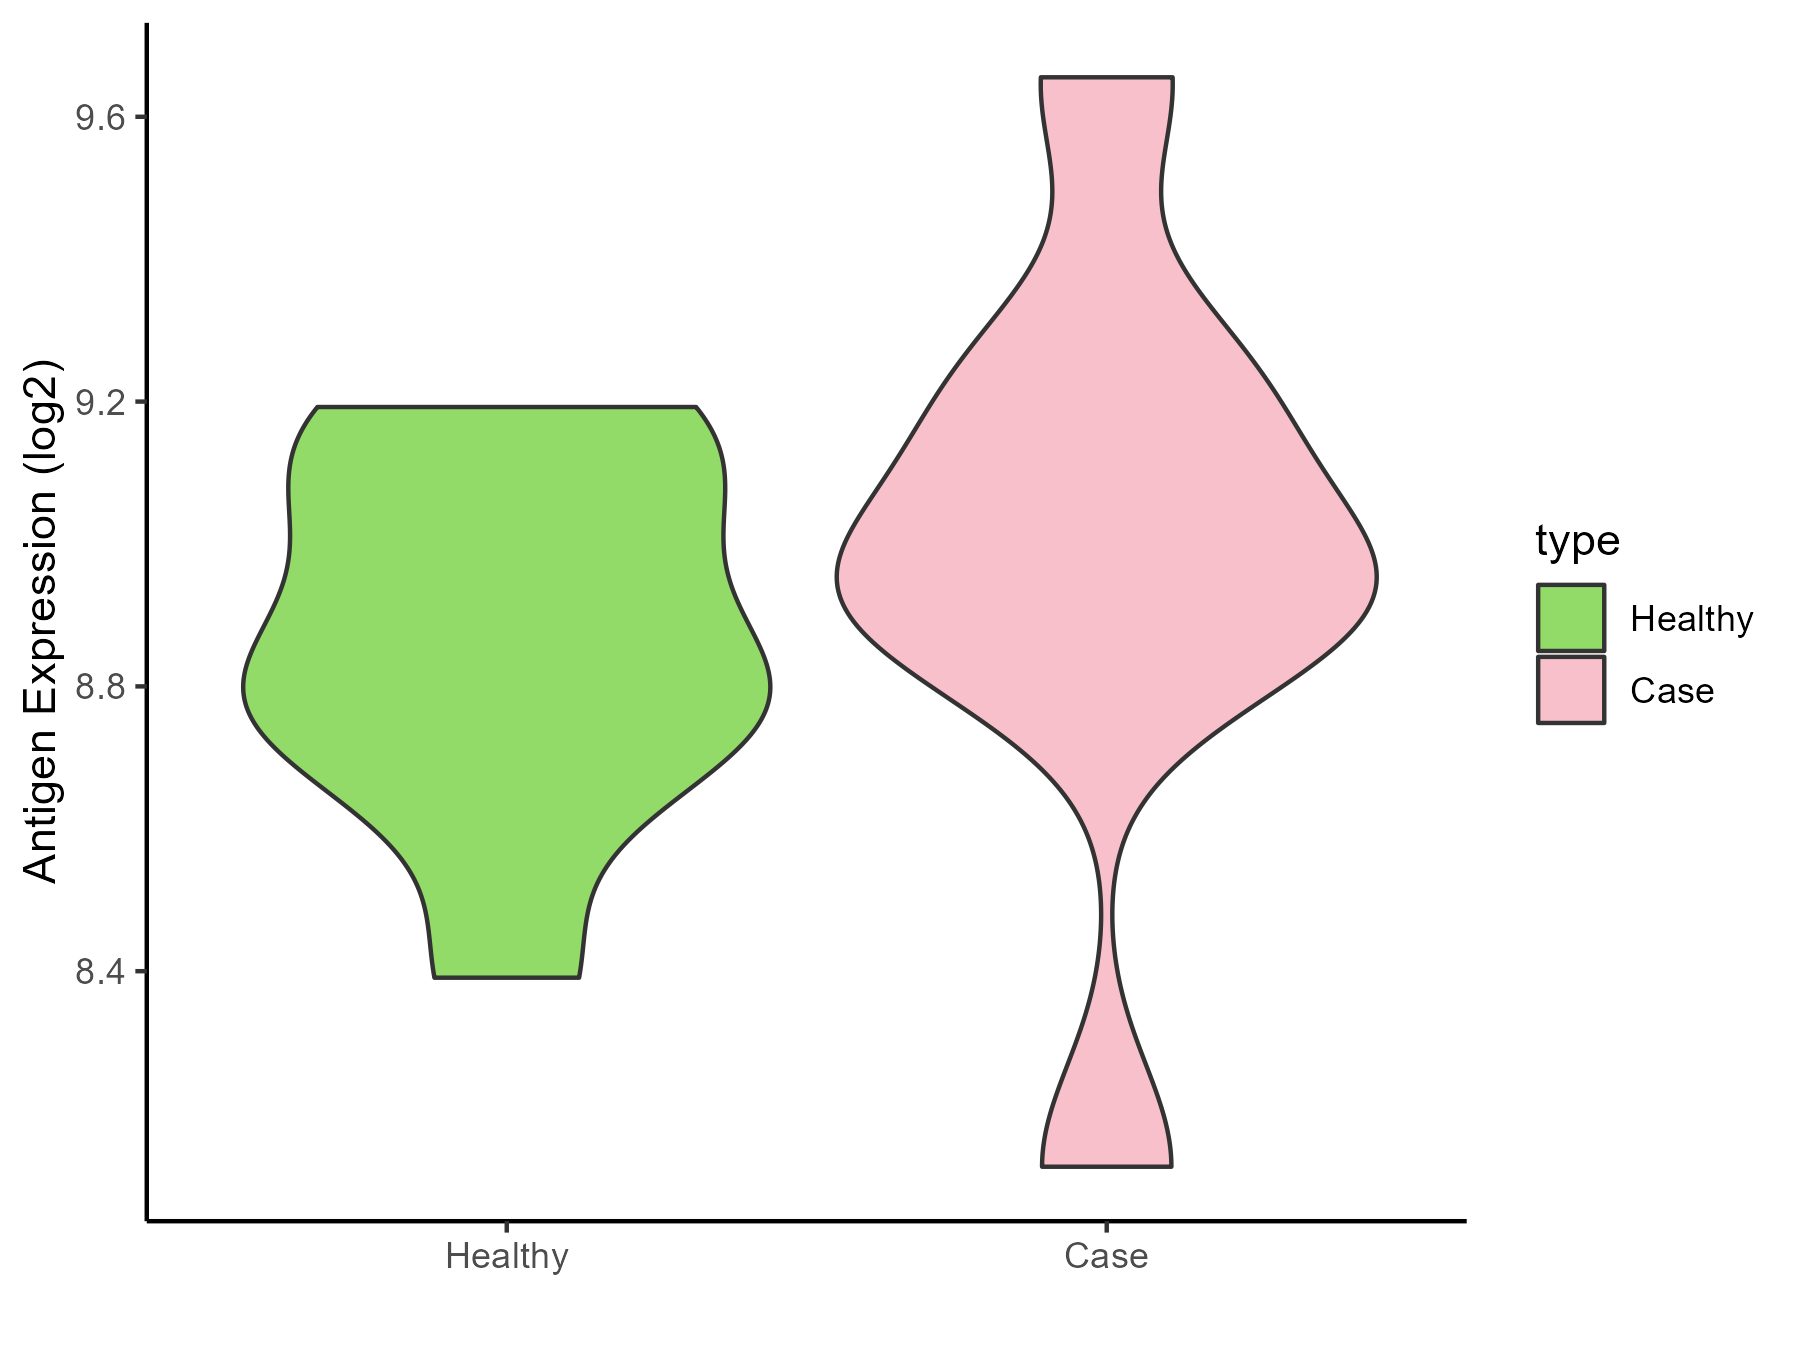
| Differential expression pattern of antigen in diseases | ||
| The Studied Tissue | Pheripheral blood | |
| The Specific Disease | Ankylosing spondylitis | |
| The Expression Level of Disease Section Compare with the Healthy Individual Tissue | p-value: 0.527836155; Fold-change: 0.141339503; Z-score: 0.540705884 | |
| Disease-specific Antigen Abundances |
|
Click to View the Clearer Original Diagram |
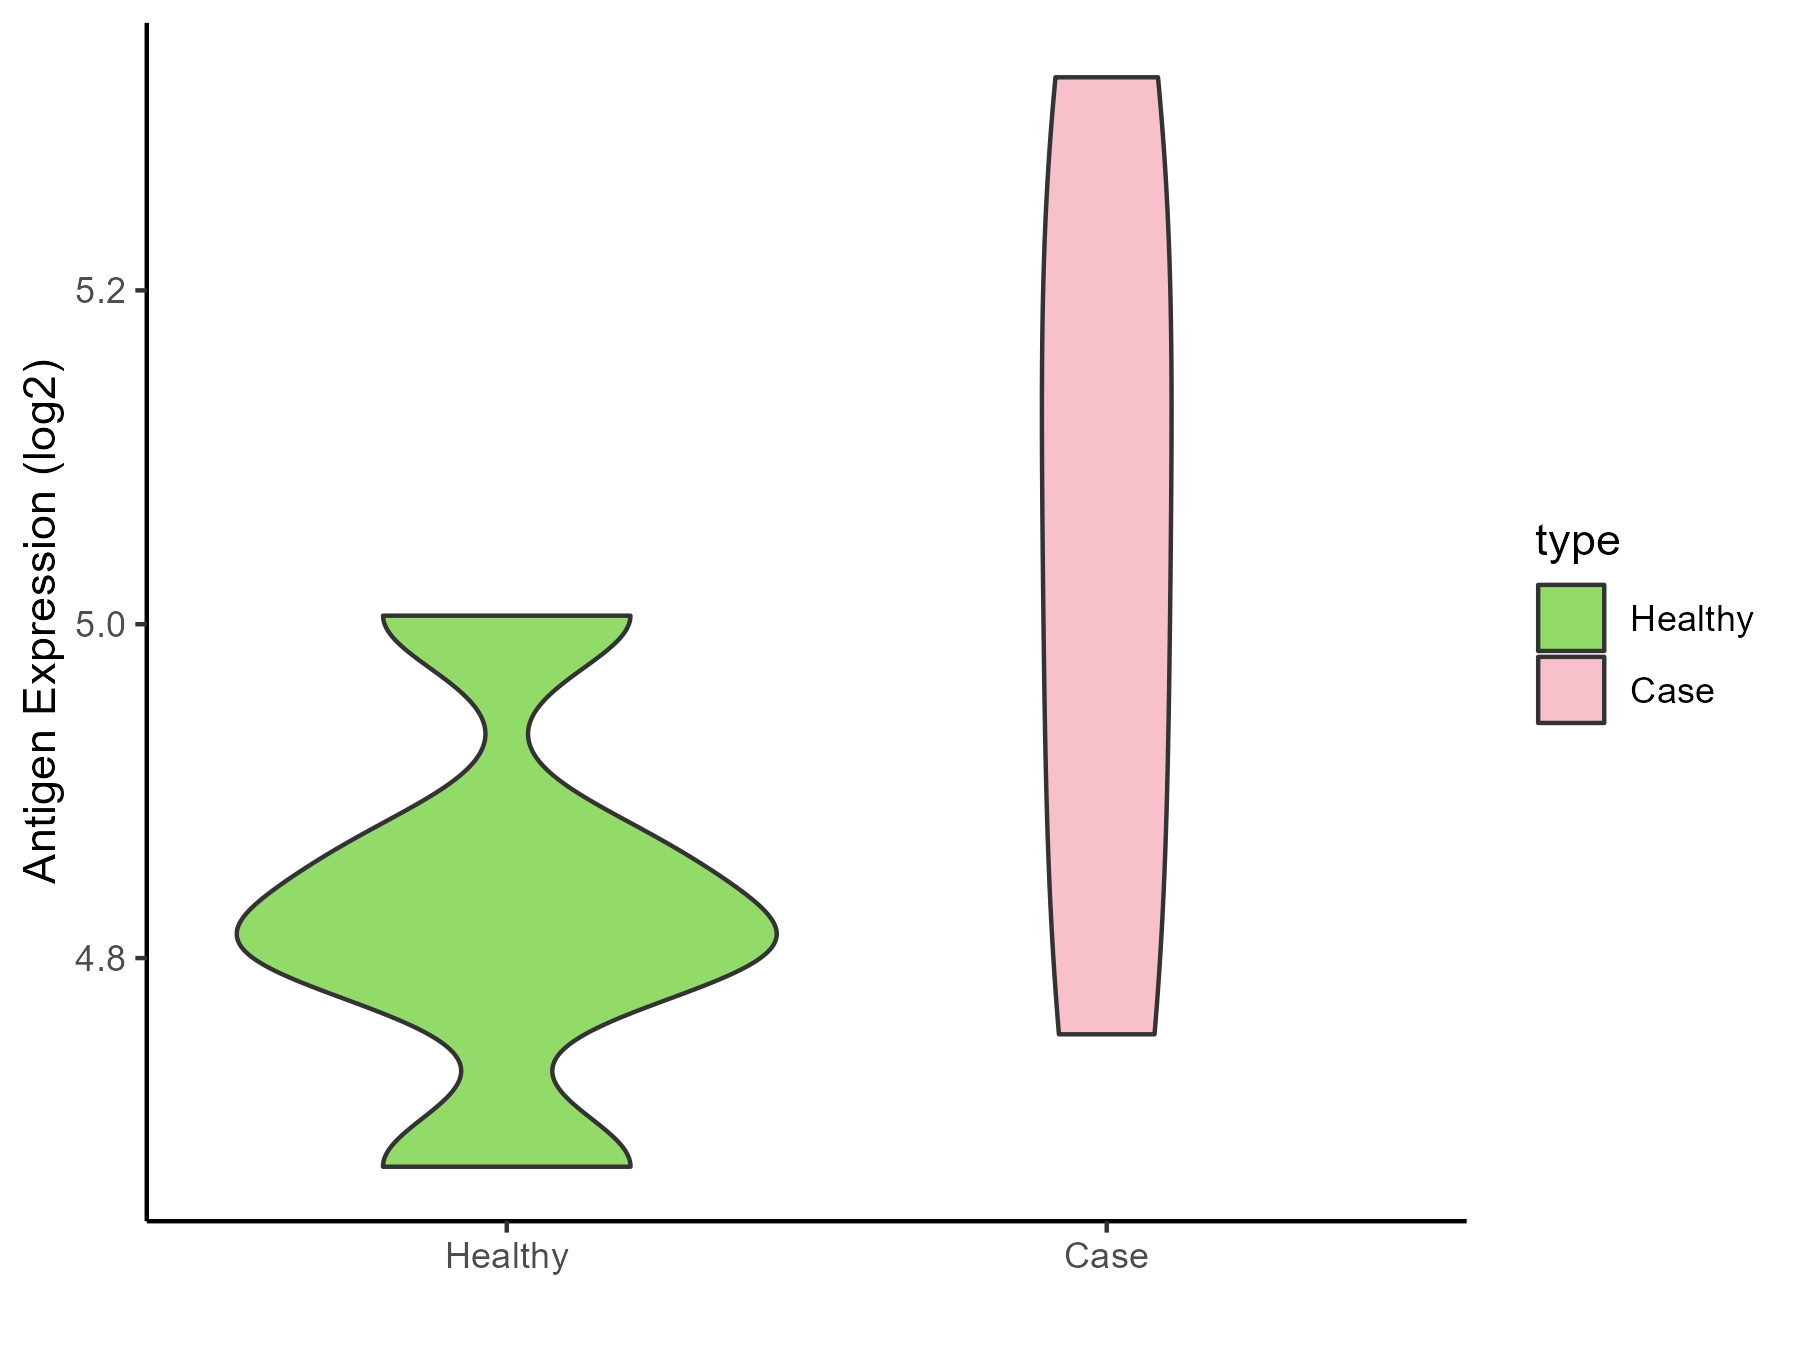
| Differential expression pattern of antigen in diseases | ||
| The Studied Tissue | Bone marrow | |
| The Specific Disease | Osteoporosis | |
| The Expression Level of Disease Section Compare with the Healthy Individual Tissue | p-value: 0.18224516; Fold-change: 0.238759471; Z-score: 1.998325639 | |
| Disease-specific Antigen Abundances |
|
Click to View the Clearer Original Diagram |
ICD Disease Classification 16
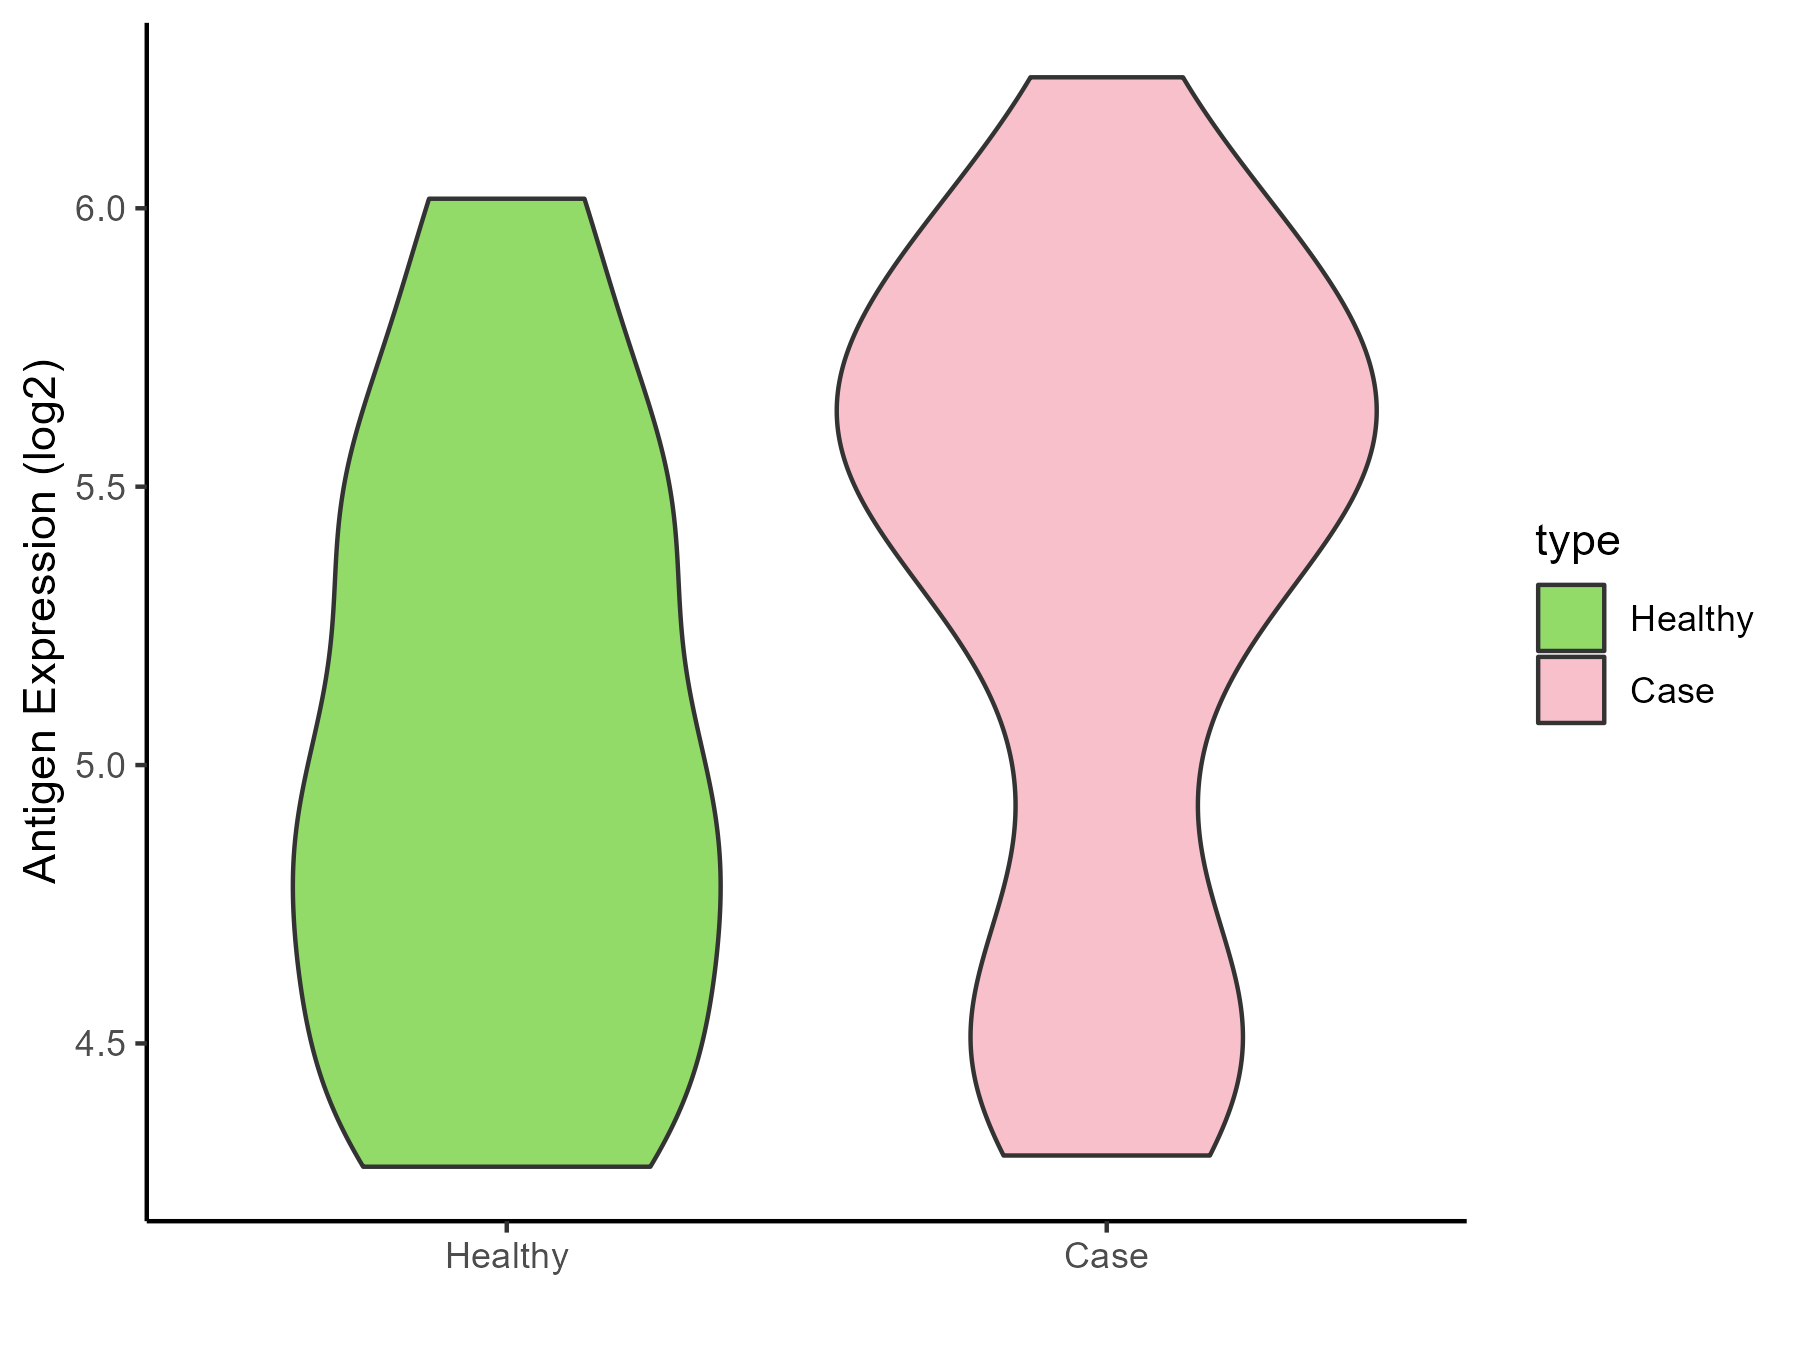
| Differential expression pattern of antigen in diseases | ||
| The Studied Tissue | Endometrium | |
| The Specific Disease | Endometriosis | |
| The Expression Level of Disease Section Compare with the Healthy Individual Tissue | p-value: 0.030942268; Fold-change: 0.571418904; Z-score: 1.063010396 | |
| Disease-specific Antigen Abundances |
|
Click to View the Clearer Original Diagram |
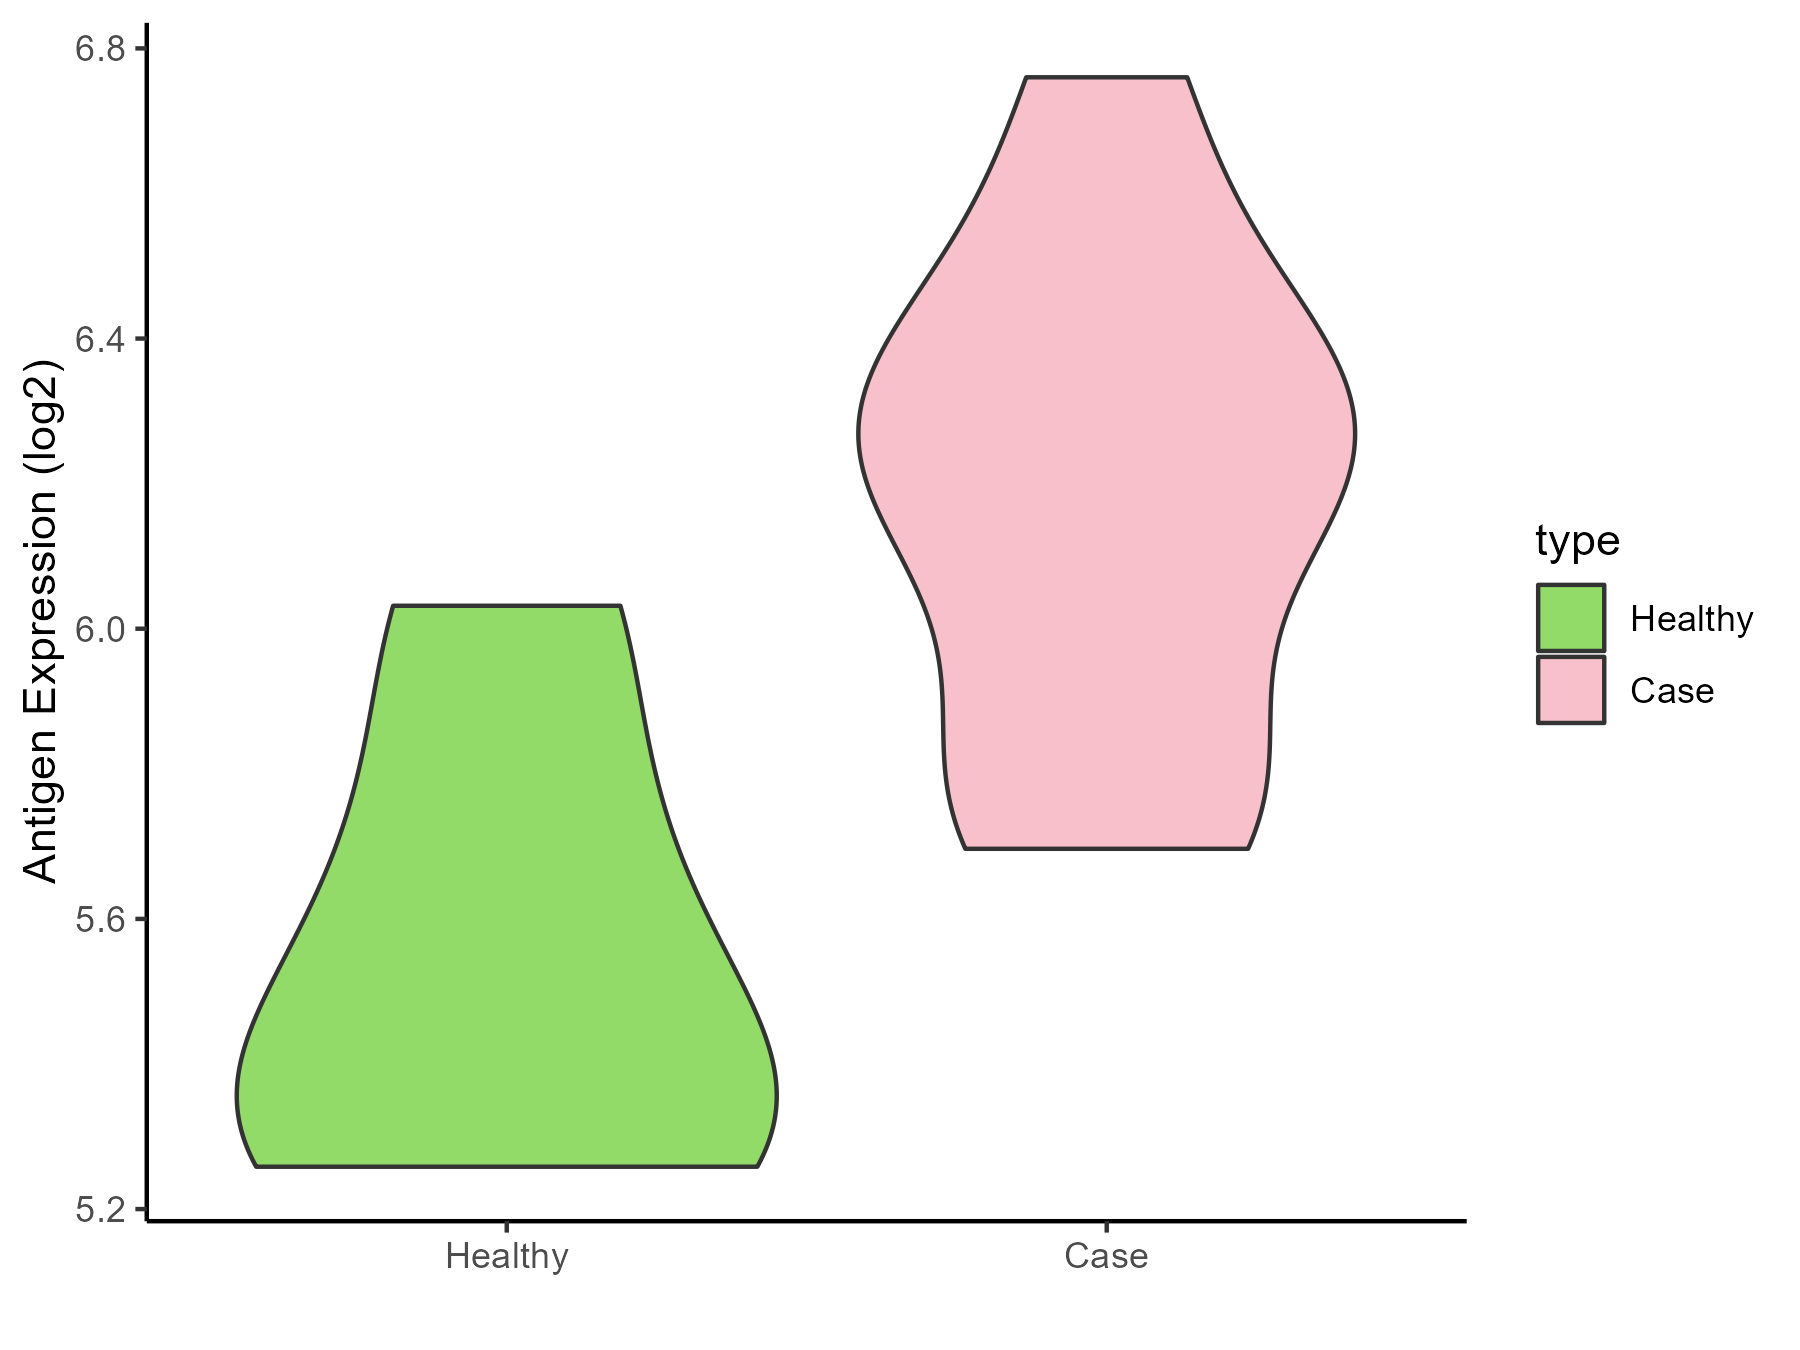
| Differential expression pattern of antigen in diseases | ||
| The Studied Tissue | Bladder | |
| The Specific Disease | Interstitial cystitis | |
| The Expression Level of Disease Section Compare with the Healthy Individual Tissue | p-value: 0.007035565; Fold-change: 0.793054524; Z-score: 2.432108711 | |
| Disease-specific Antigen Abundances |
|
Click to View the Clearer Original Diagram |
ICD Disease Classification 19
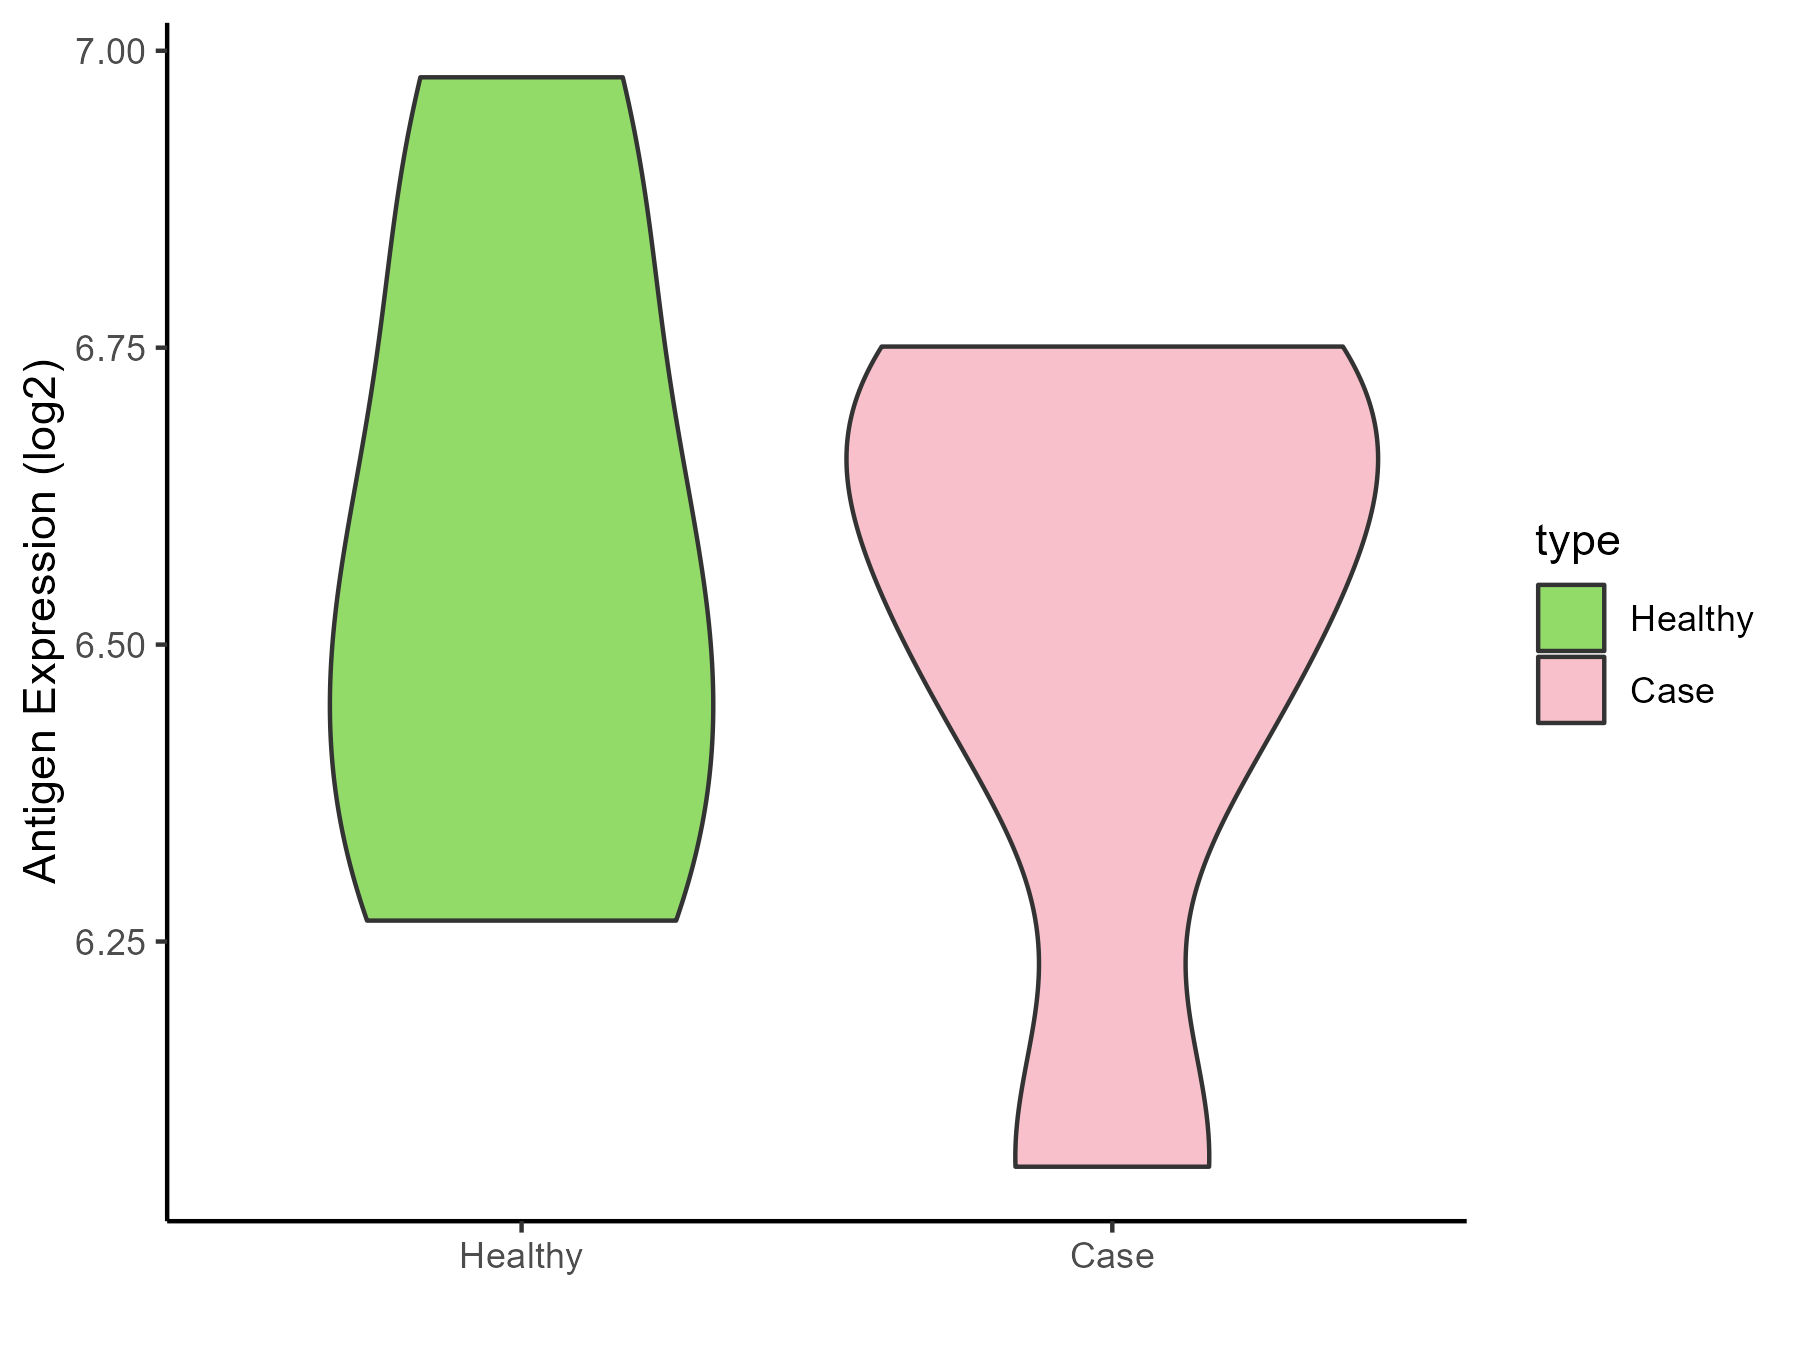
| Differential expression pattern of antigen in diseases | ||
| The Studied Tissue | Myometrium | |
| The Specific Disease | Preterm birth | |
| The Expression Level of Disease Section Compare with the Healthy Individual Tissue | p-value: 0.700993885; Fold-change: 0.042213977; Z-score: 0.152824355 | |
| Disease-specific Antigen Abundances |
|
Click to View the Clearer Original Diagram |
ICD Disease Classification 2
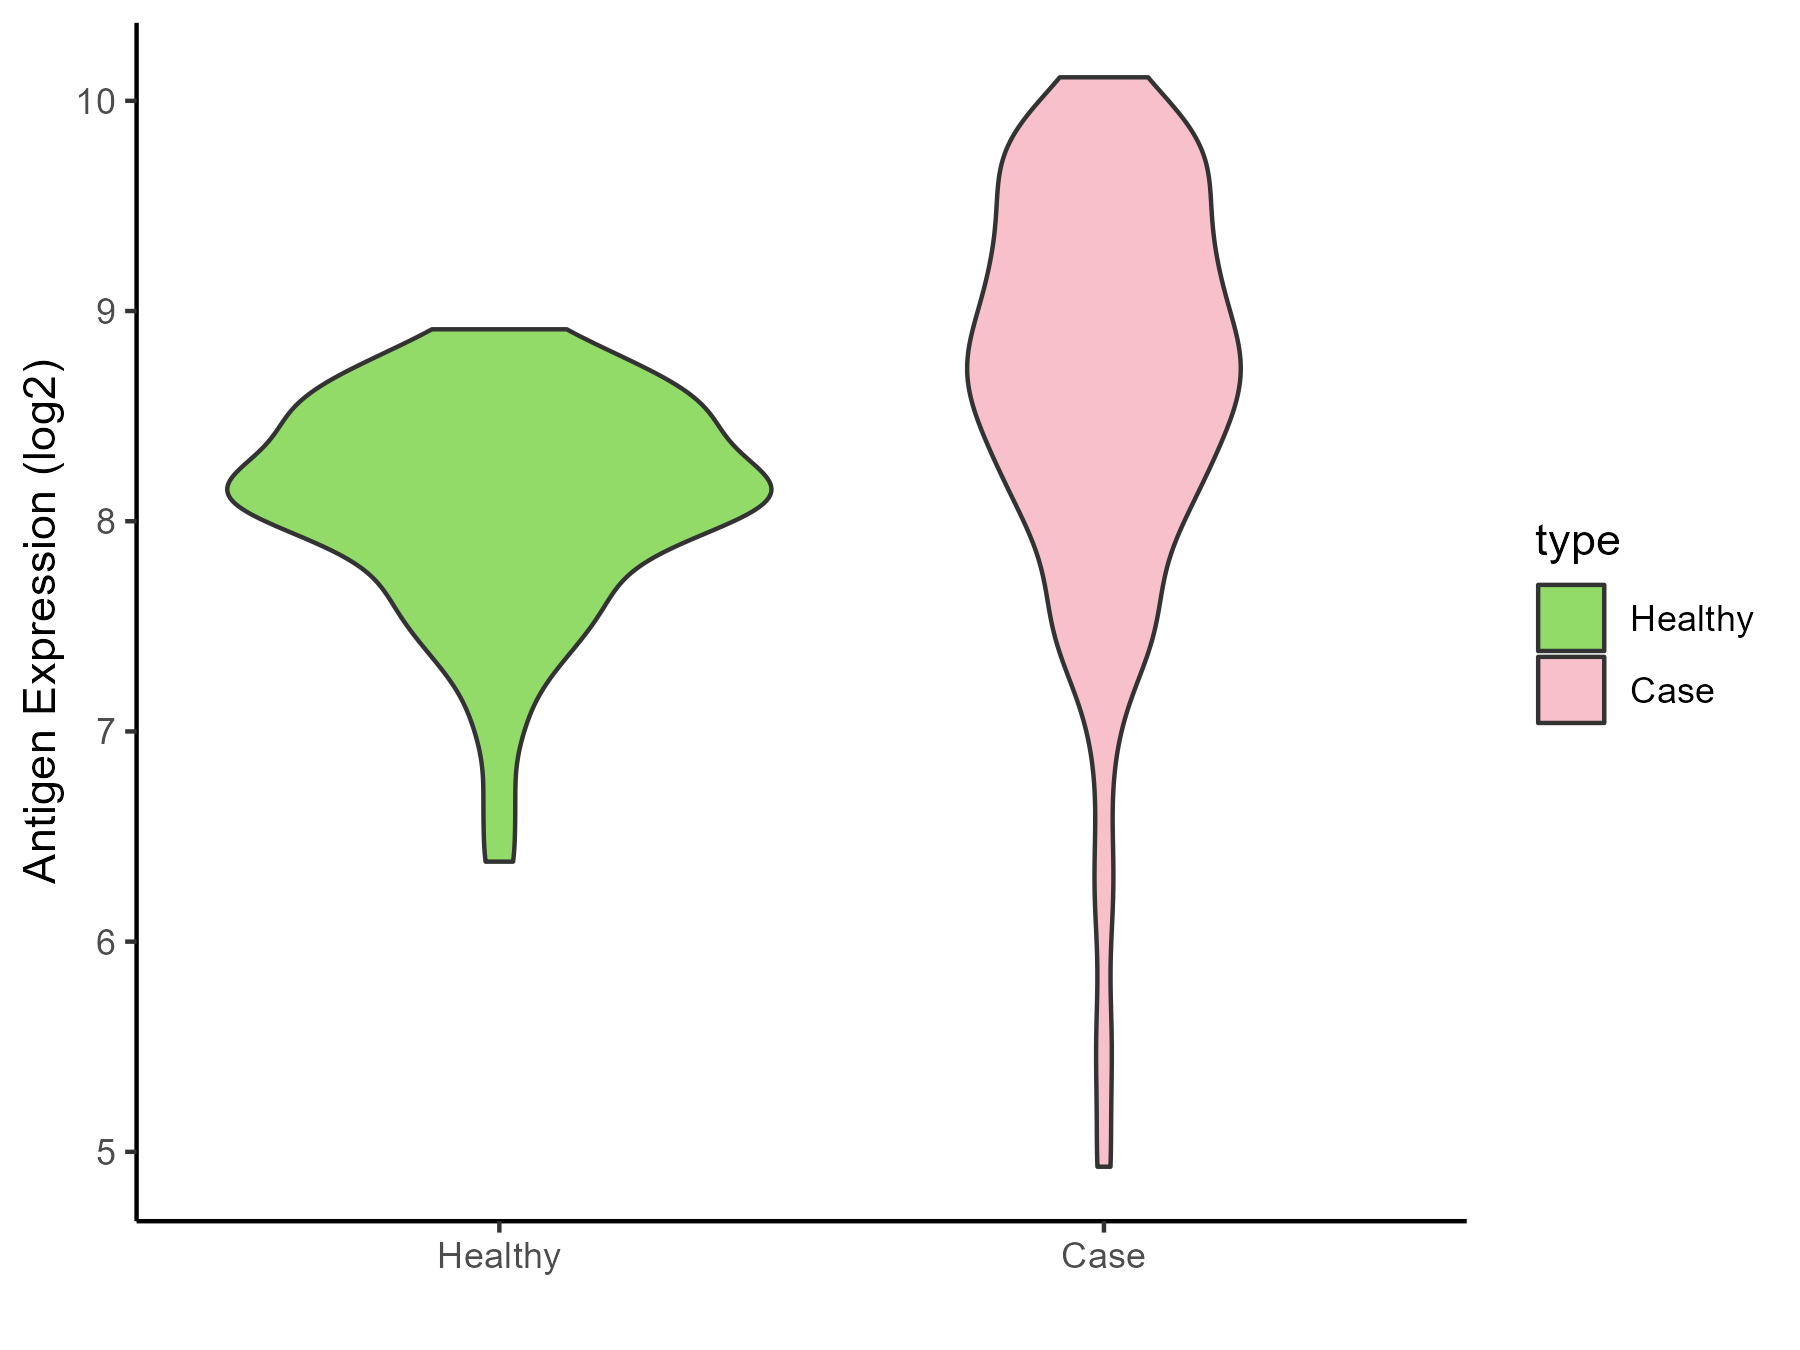
| Differential expression pattern of antigen in diseases | ||
| The Studied Tissue | Bone marrow | |
| The Specific Disease | Acute myelocytic leukemia | |
| The Expression Level of Disease Section Compare with the Healthy Individual Tissue | p-value: 5.37E-13; Fold-change: 0.57838886; Z-score: 1.127366157 | |
| Disease-specific Antigen Abundances |
|
Click to View the Clearer Original Diagram |
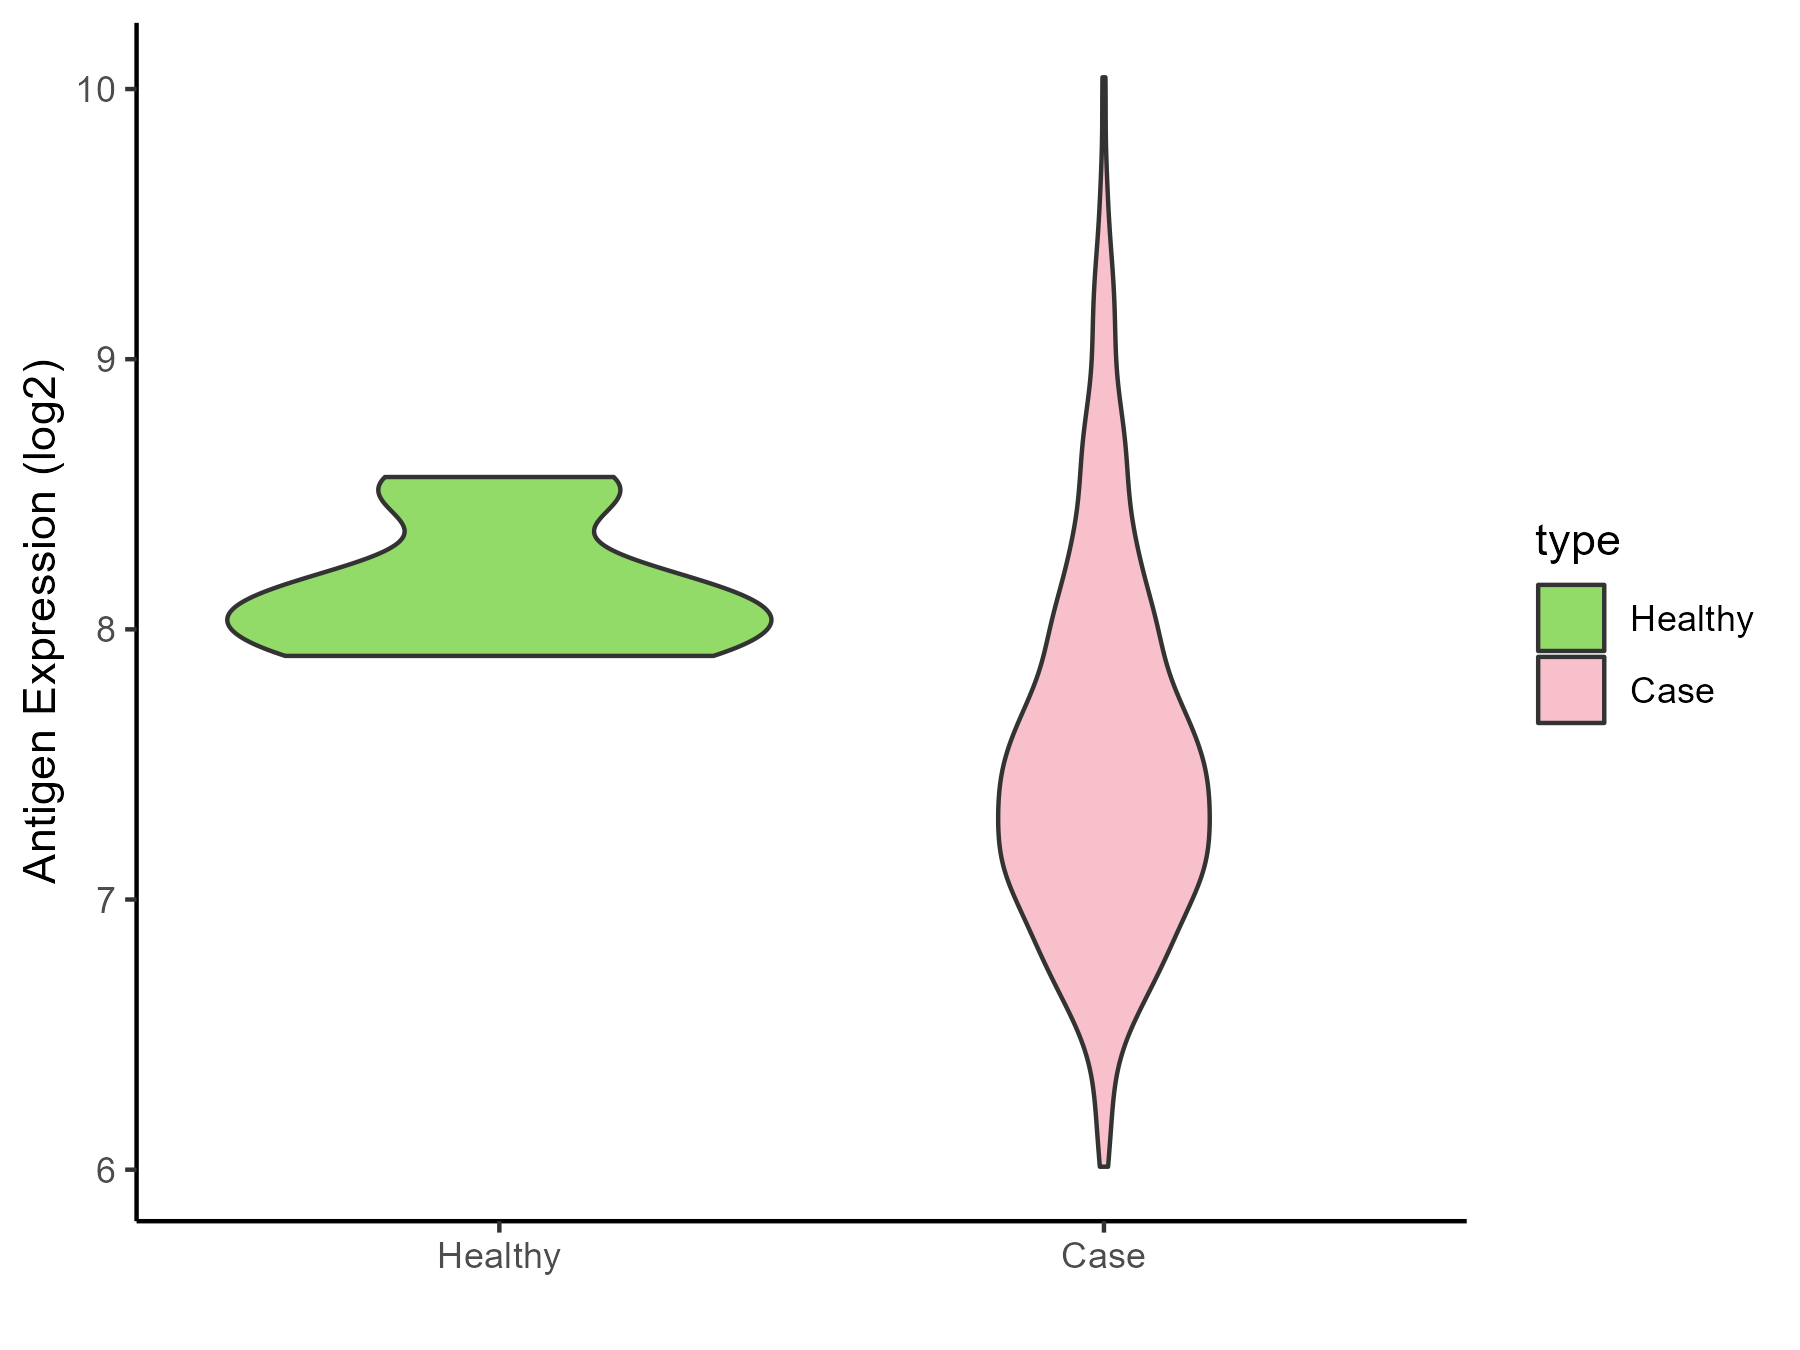
| Differential expression pattern of antigen in diseases | ||
| The Studied Tissue | Bone marrow | |
| The Specific Disease | Myeloma | |
| The Expression Level of Disease Section Compare with the Healthy Individual Tissue | p-value: 0.000152943; Fold-change: -0.671722137; Z-score: -2.698853852 | |
| Disease-specific Antigen Abundances |
|
Click to View the Clearer Original Diagram |
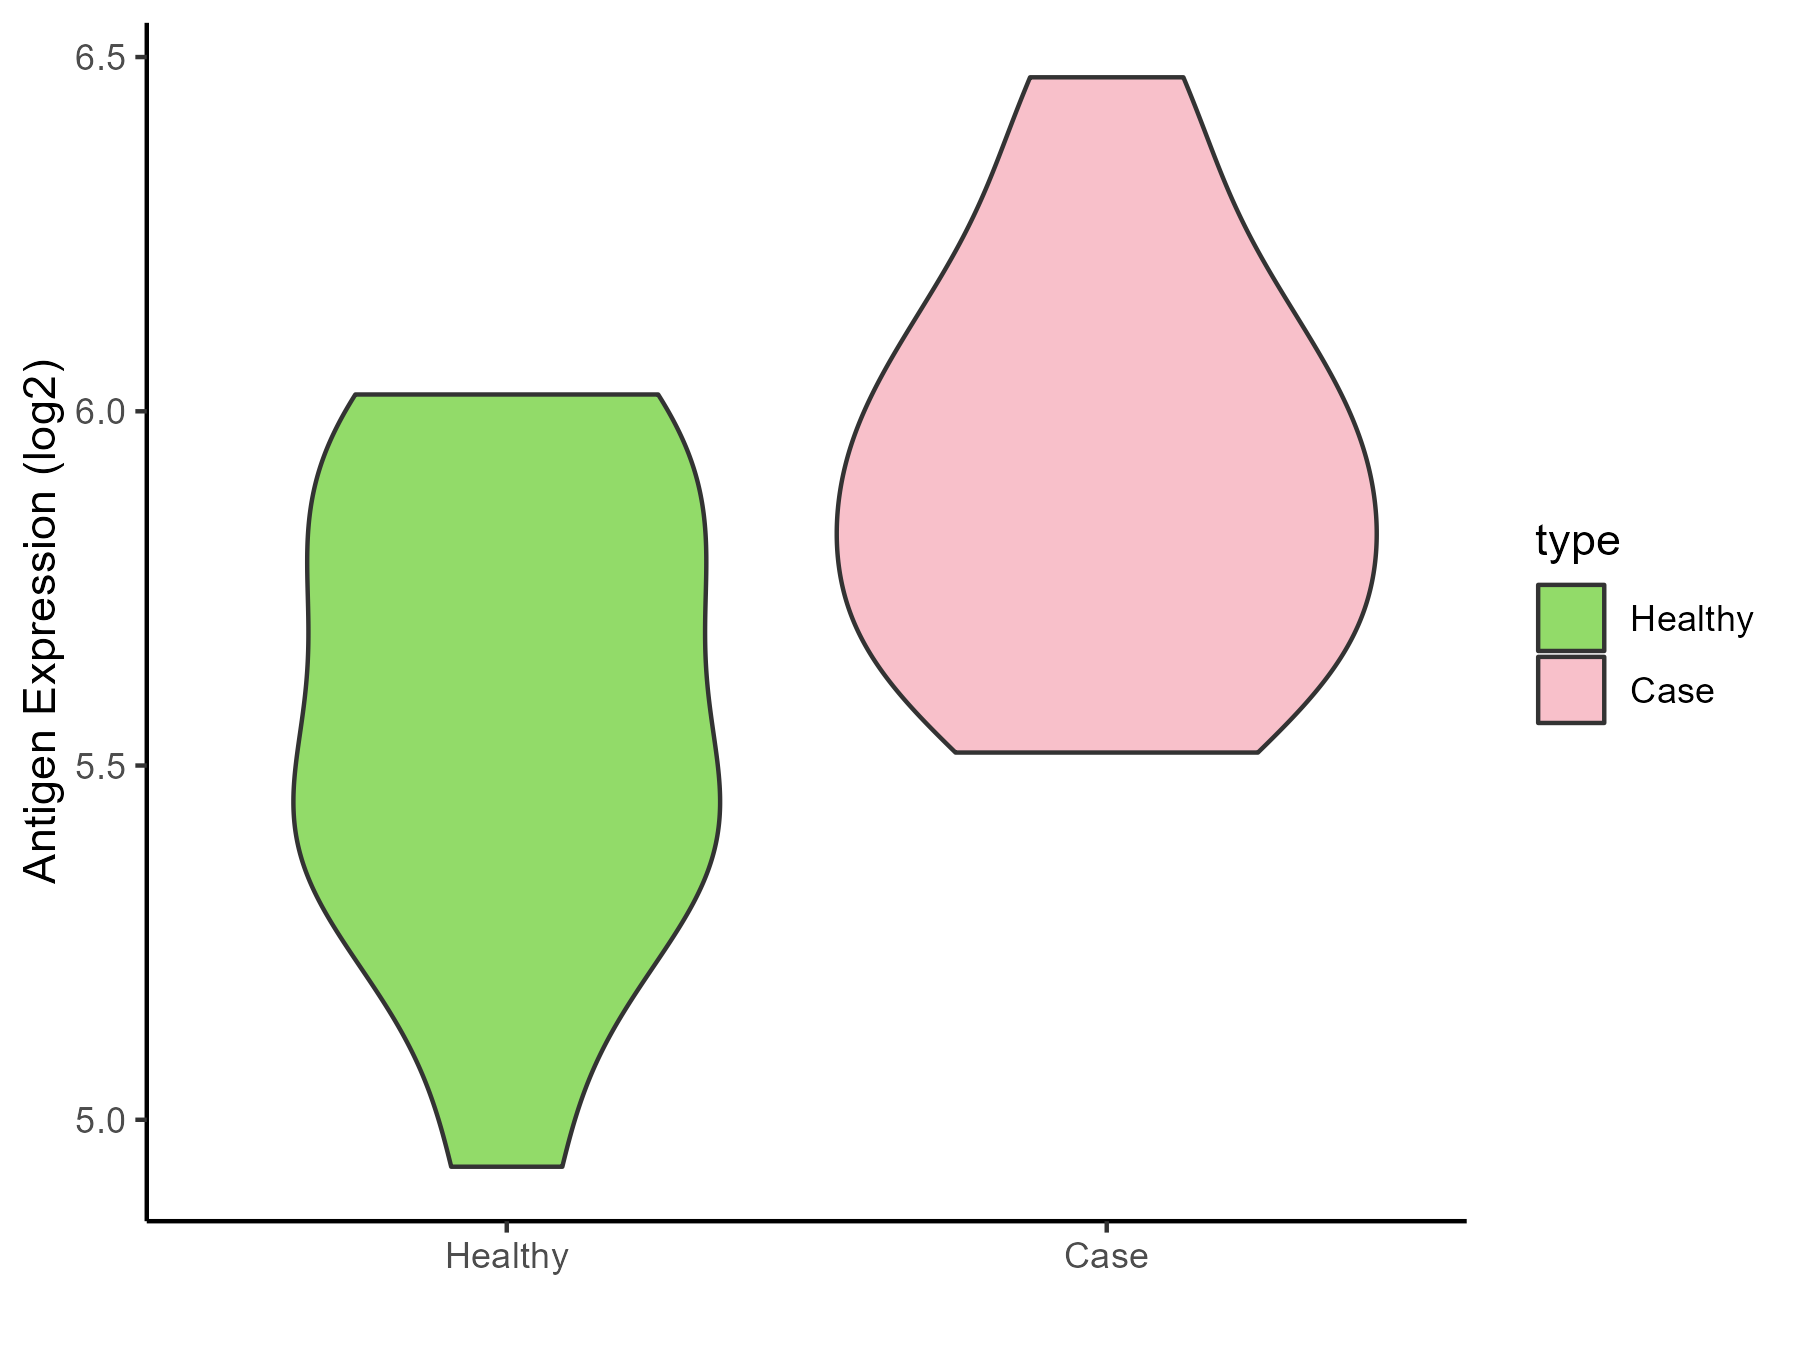
| The Studied Tissue | Peripheral blood | |
| The Specific Disease | Myeloma | |
| The Expression Level of Disease Section Compare with the Healthy Individual Tissue | p-value: 0.010566745; Fold-change: 0.35466069; Z-score: 1.065258007 | |
| Disease-specific Antigen Abundances |
|
Click to View the Clearer Original Diagram |
| Differential expression pattern of antigen in diseases | ||
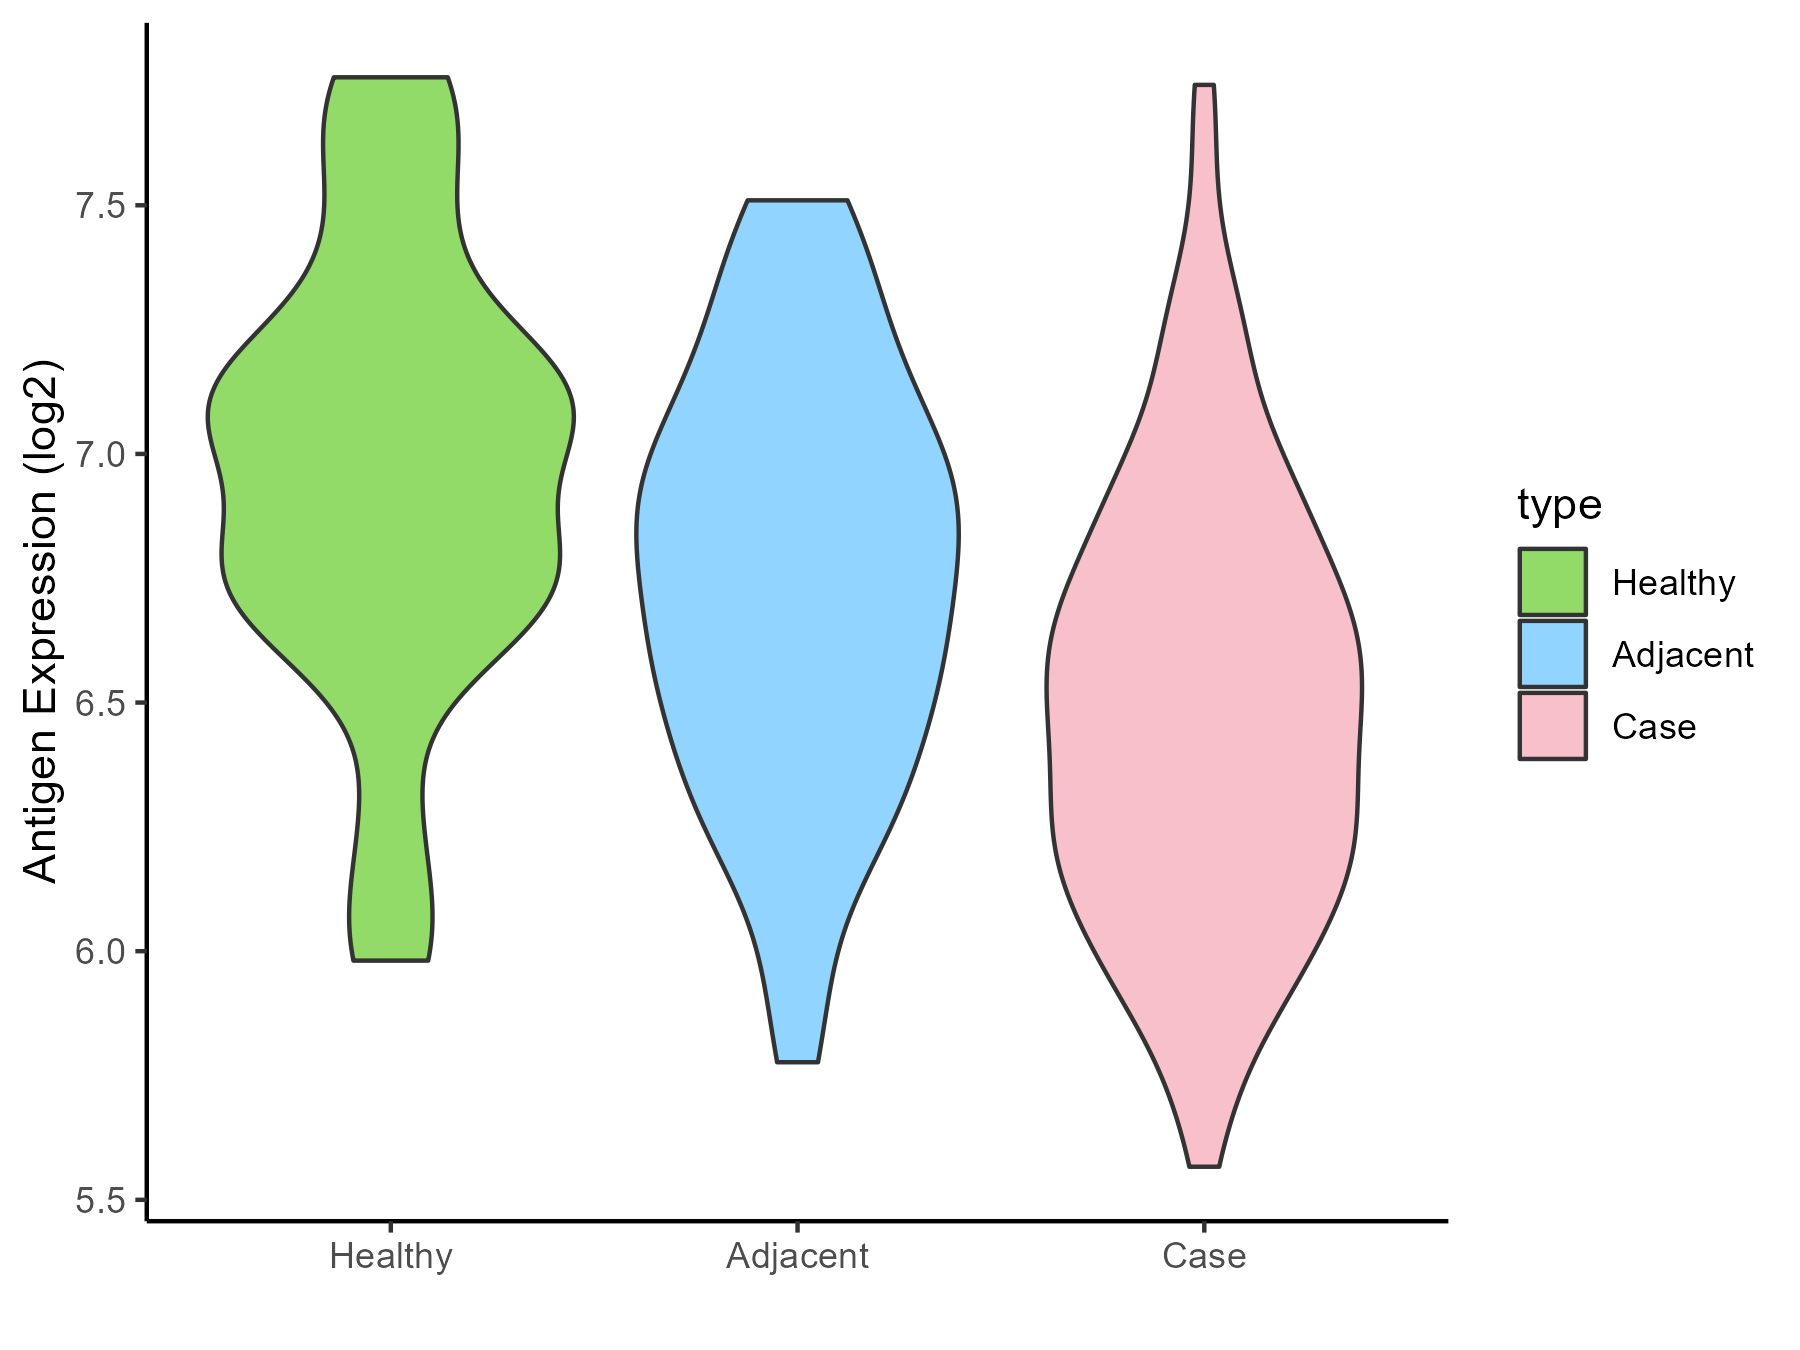
| The Studied Tissue | Oral | |
| The Specific Disease | Oral cancer | |
| The Expression Level of Disease Section Compare with the Healthy Individual Tissue | p-value: 1.40E-05; Fold-change: -0.547724744; Z-score: -1.222603733 | |
| The Expression Level of Disease Section Compare with the Adjacent Tissue | p-value: 7.10E-06; Fold-change: -0.28396826; Z-score: -0.682661074 | |
| Disease-specific Antigen Abundances |
|
Click to View the Clearer Original Diagram |
| Differential expression pattern of antigen in diseases | ||
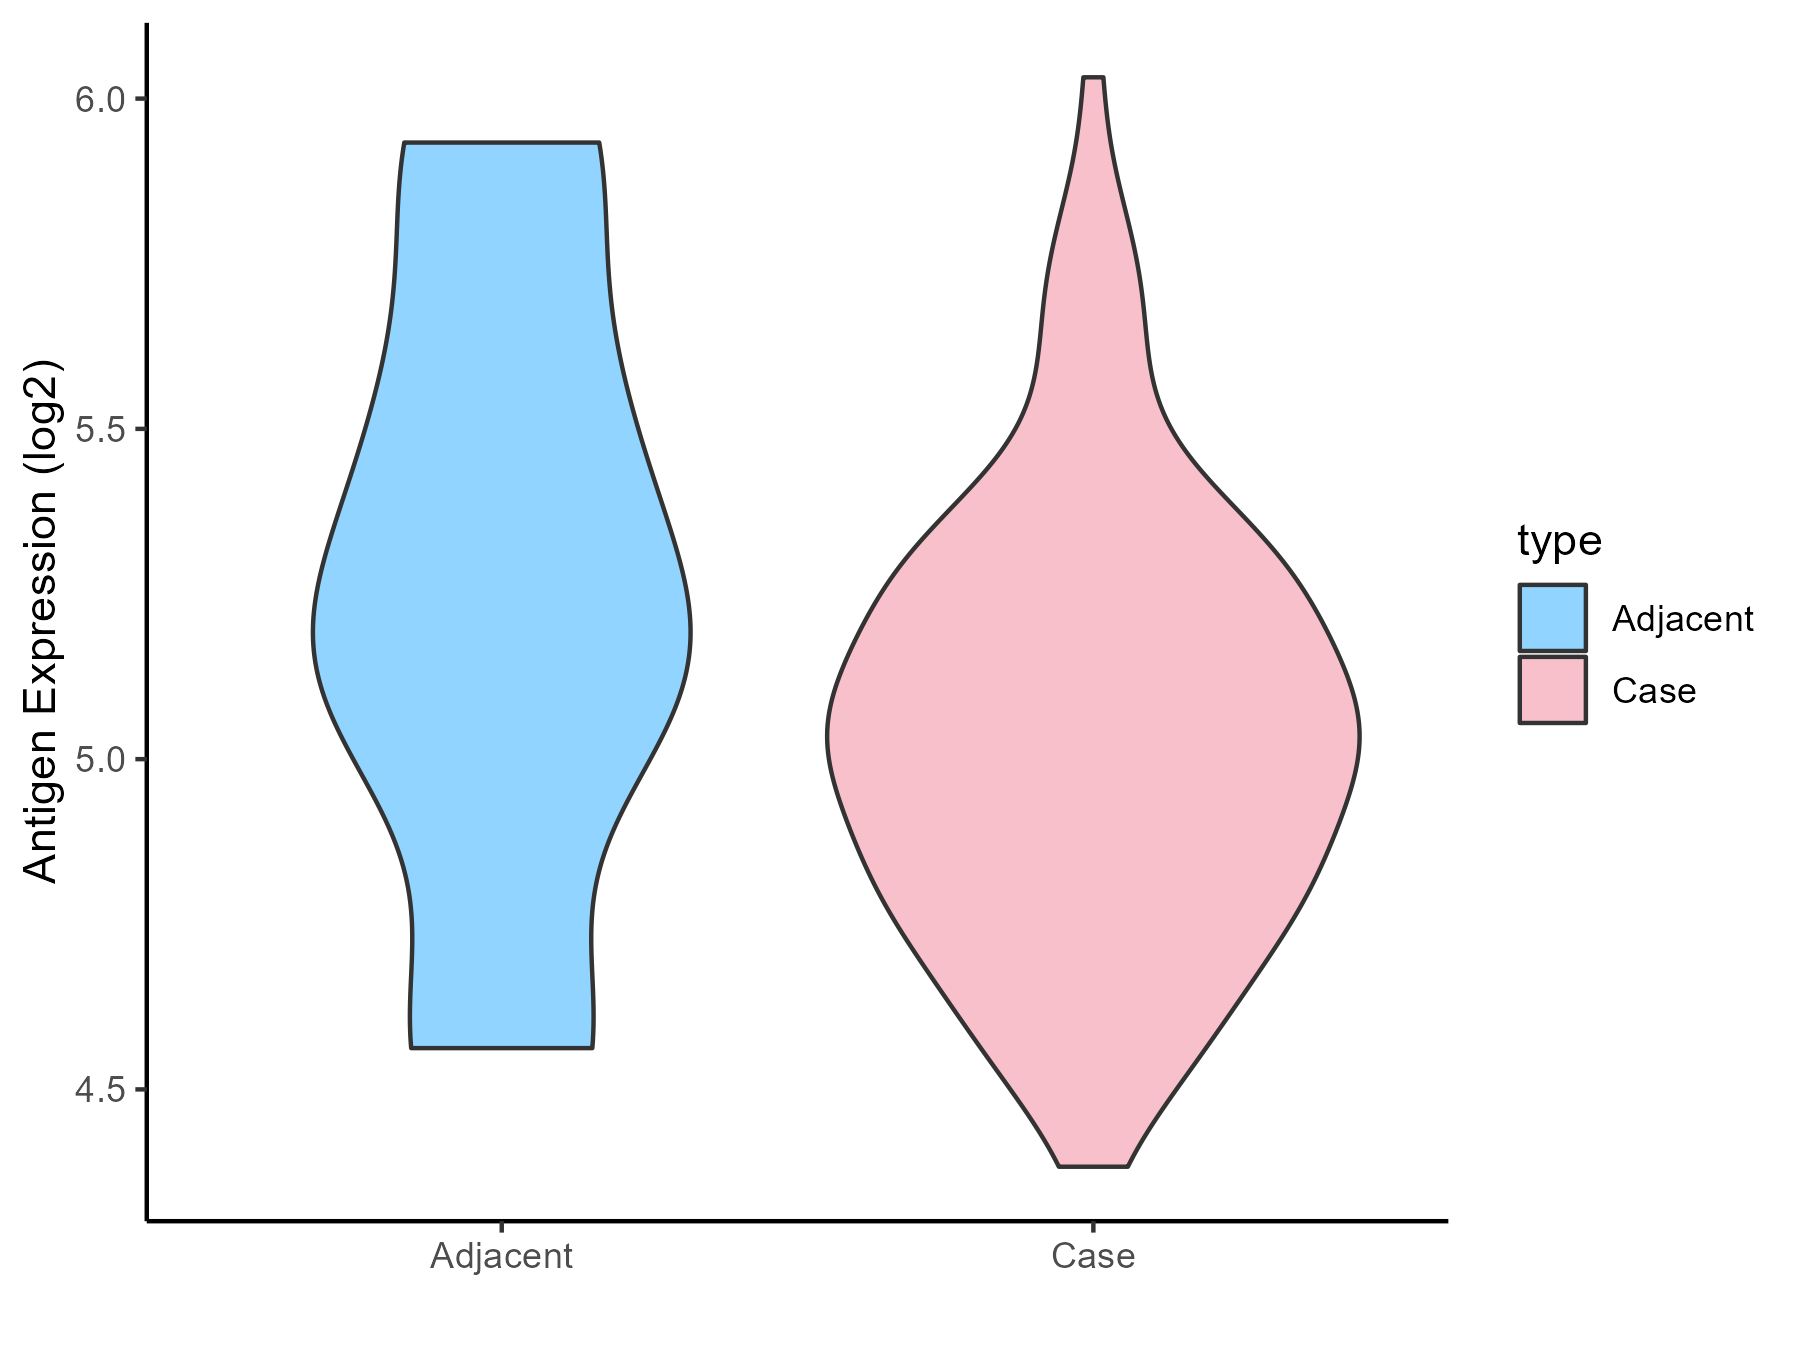
| The Studied Tissue | Esophagus | |
| The Specific Disease | Esophagal cancer | |
| The Expression Level of Disease Section Compare with the Adjacent Tissue | p-value: 0.413250384; Fold-change: -0.157927965; Z-score: -0.309874236 | |
| Disease-specific Antigen Abundances |
|
Click to View the Clearer Original Diagram |
| Differential expression pattern of antigen in diseases | ||
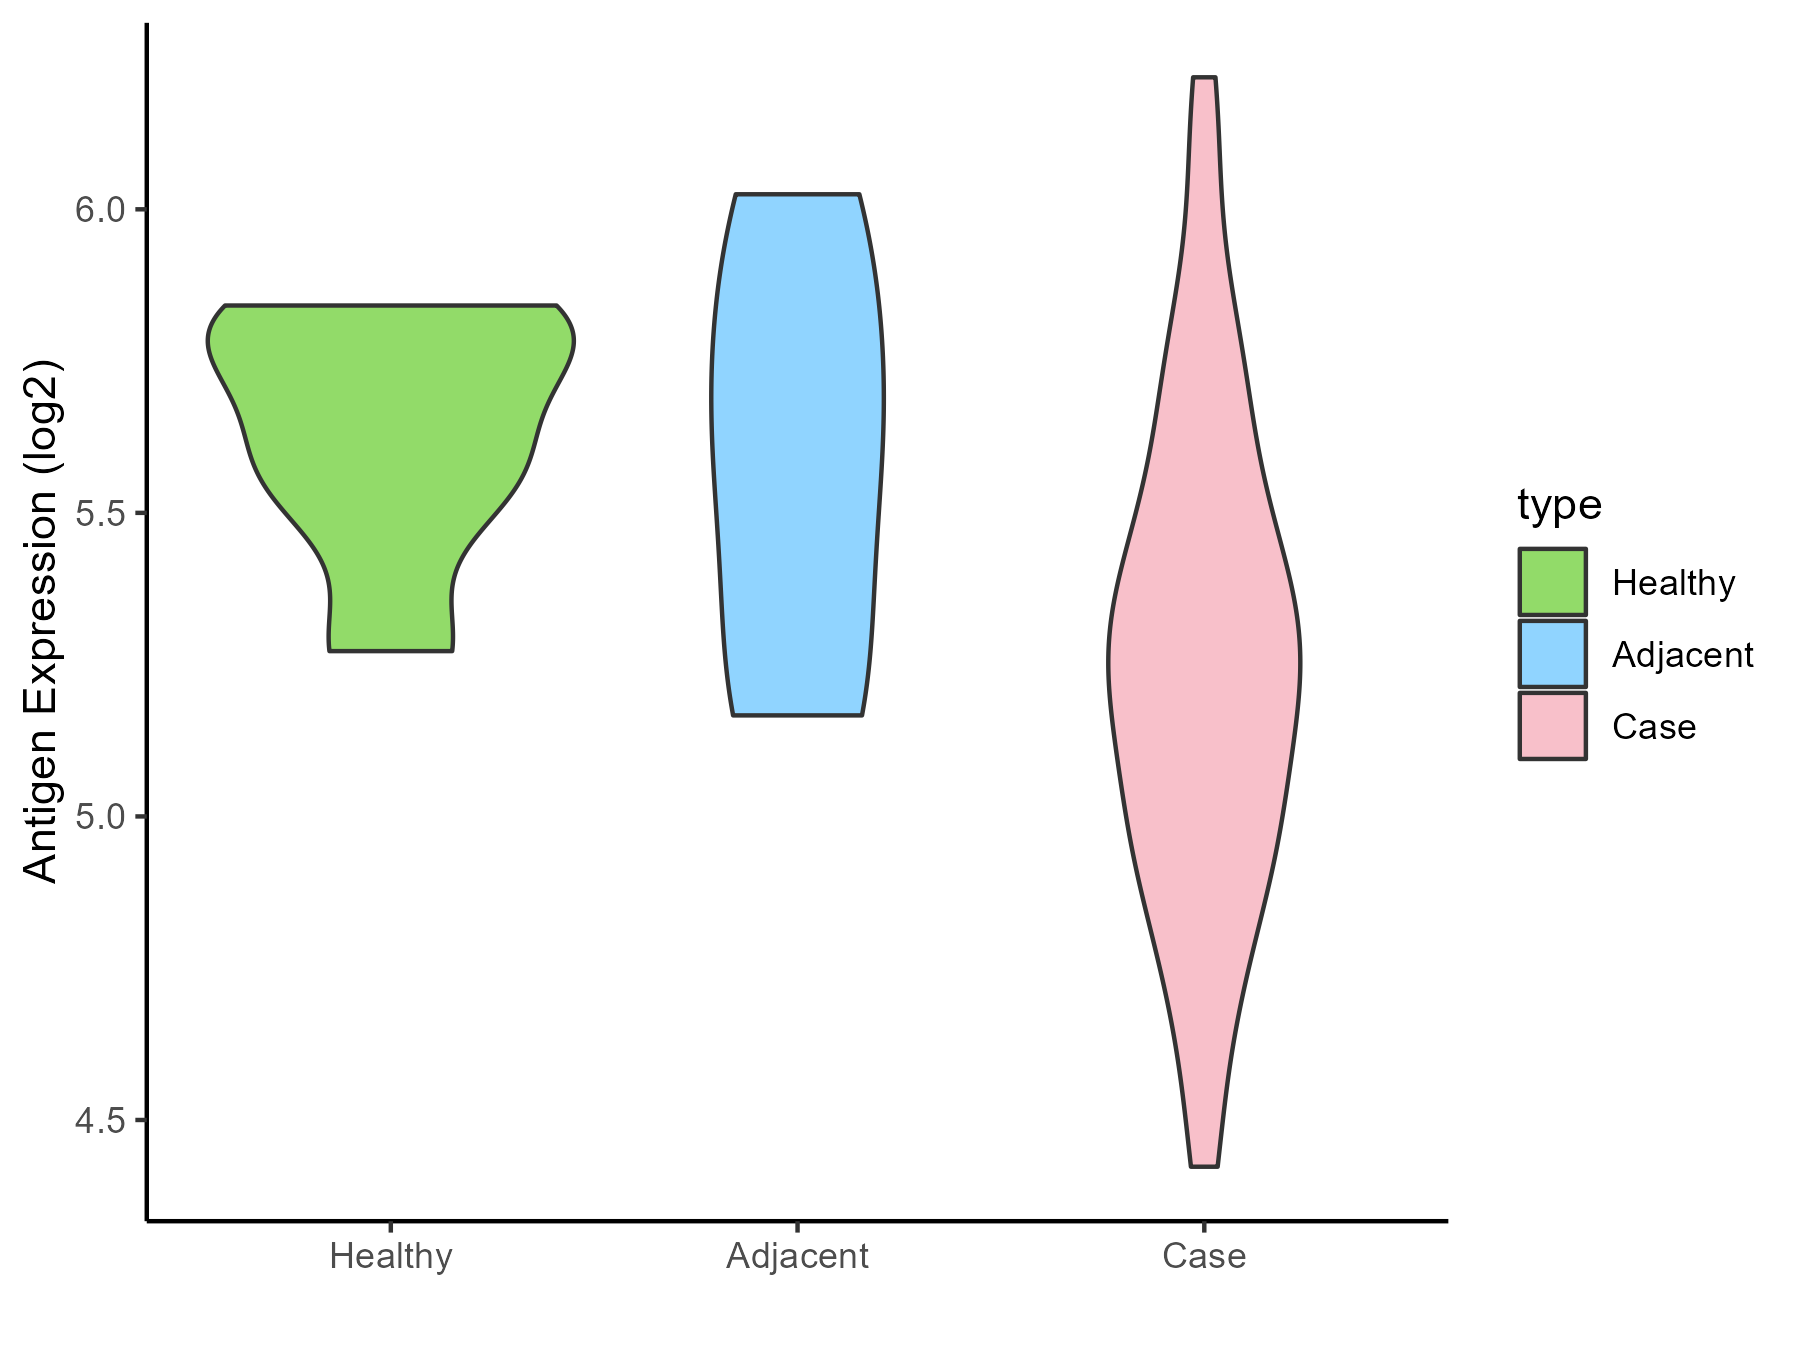
| The Studied Tissue | Rectal colon | |
| The Specific Disease | Rectal cancer | |
| The Expression Level of Disease Section Compare with the Healthy Individual Tissue | p-value: 0.005266742; Fold-change: -0.421946902; Z-score: -1.967270713 | |
| The Expression Level of Disease Section Compare with the Adjacent Tissue | p-value: 0.063321675; Fold-change: -0.344401376; Z-score: -1.007799157 | |
| Disease-specific Antigen Abundances |
|
Click to View the Clearer Original Diagram |
| Differential expression pattern of antigen in diseases | ||
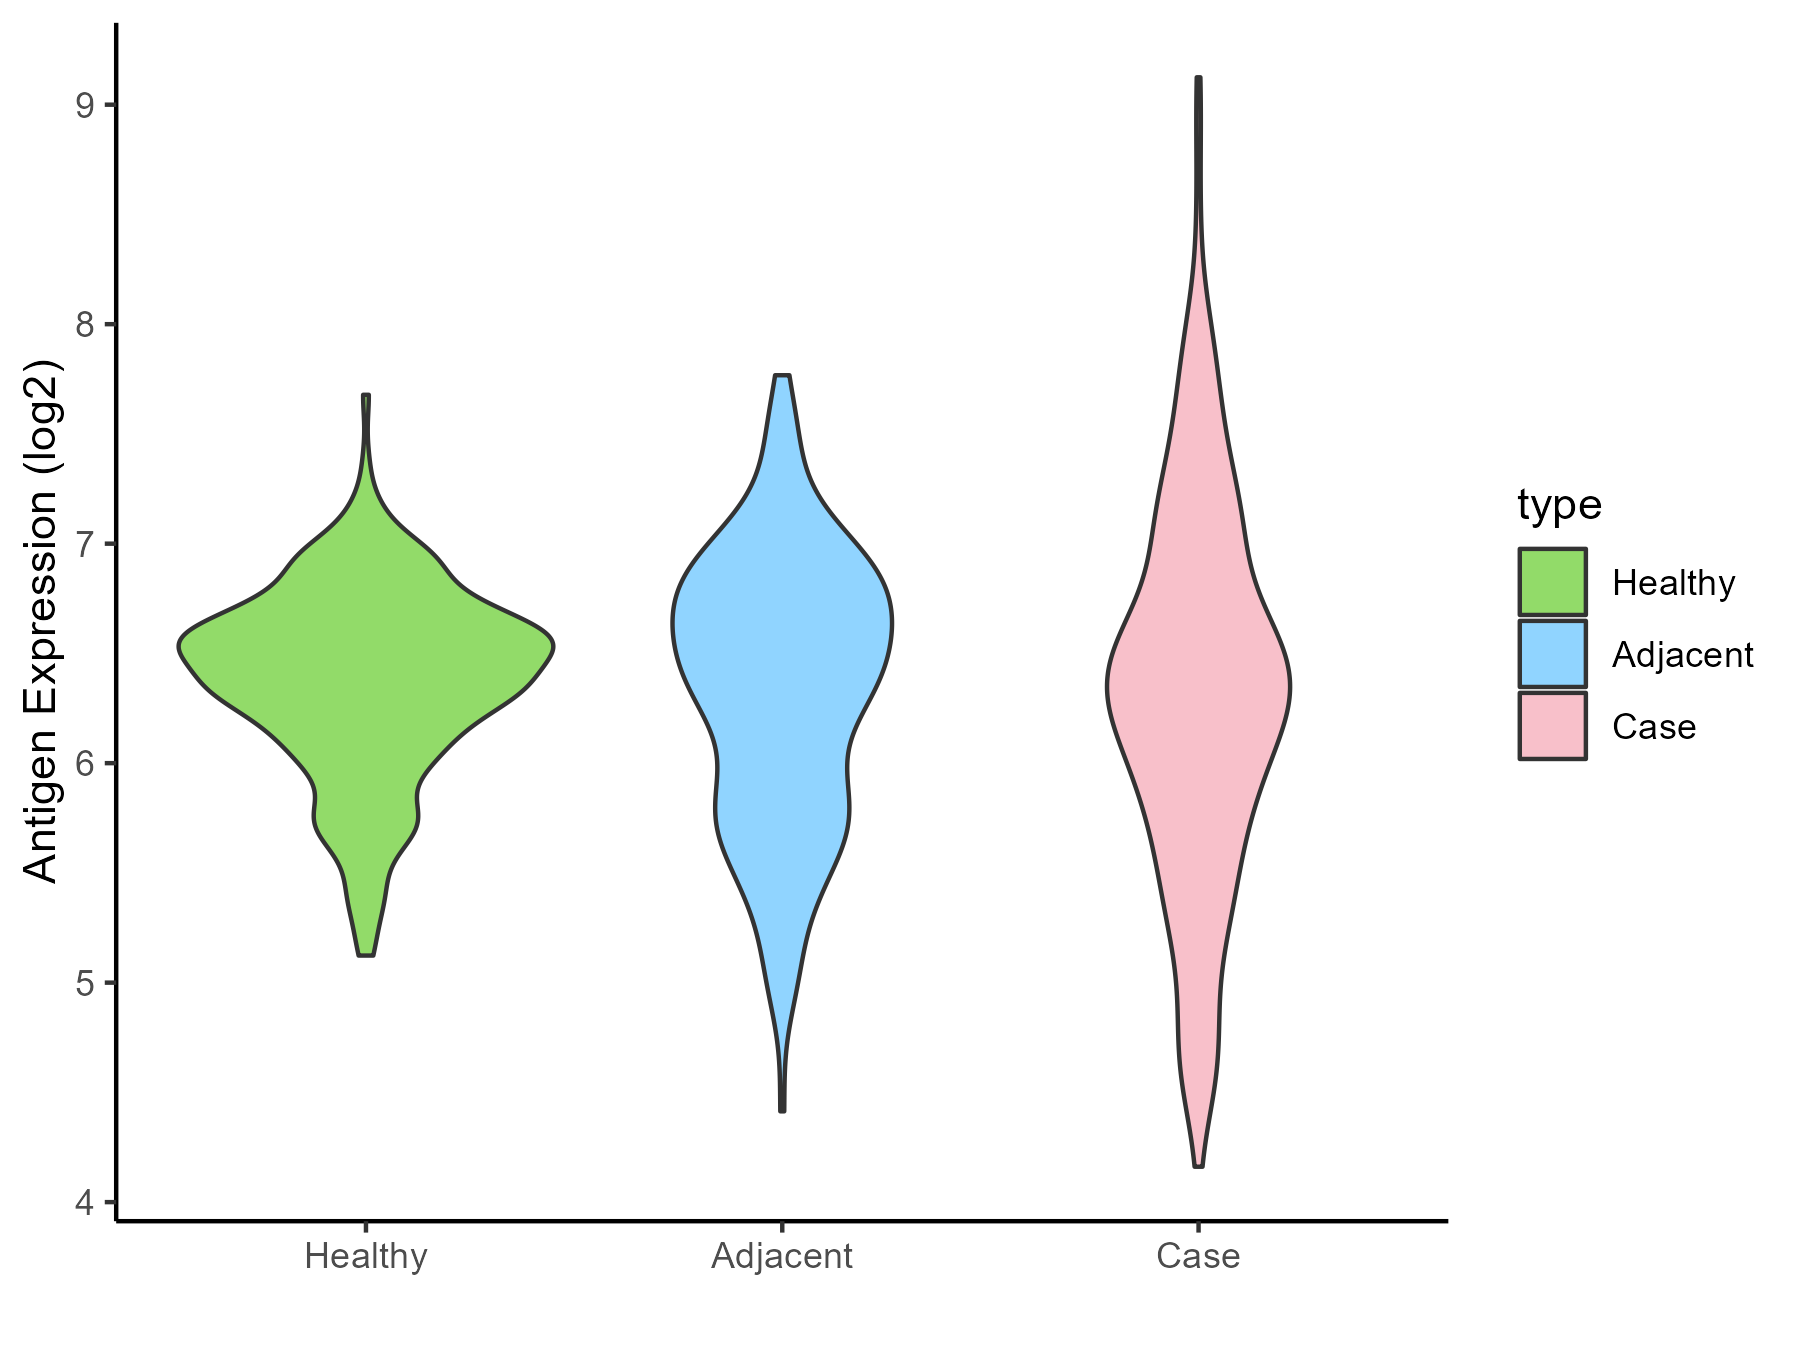
| The Studied Tissue | Skin | |
| The Specific Disease | Skin cancer | |
| The Expression Level of Disease Section Compare with the Healthy Individual Tissue | p-value: 0.210388107; Fold-change: -0.106575748; Z-score: -0.251262101 | |
| The Expression Level of Disease Section Compare with the Adjacent Tissue | p-value: 0.740294482; Fold-change: -0.091853784; Z-score: -0.148374003 | |
| Disease-specific Antigen Abundances |
|
Click to View the Clearer Original Diagram |
| Differential expression pattern of antigen in diseases | ||
| The Studied Tissue | Kidney | |
| The Specific Disease | Renal cancer | |
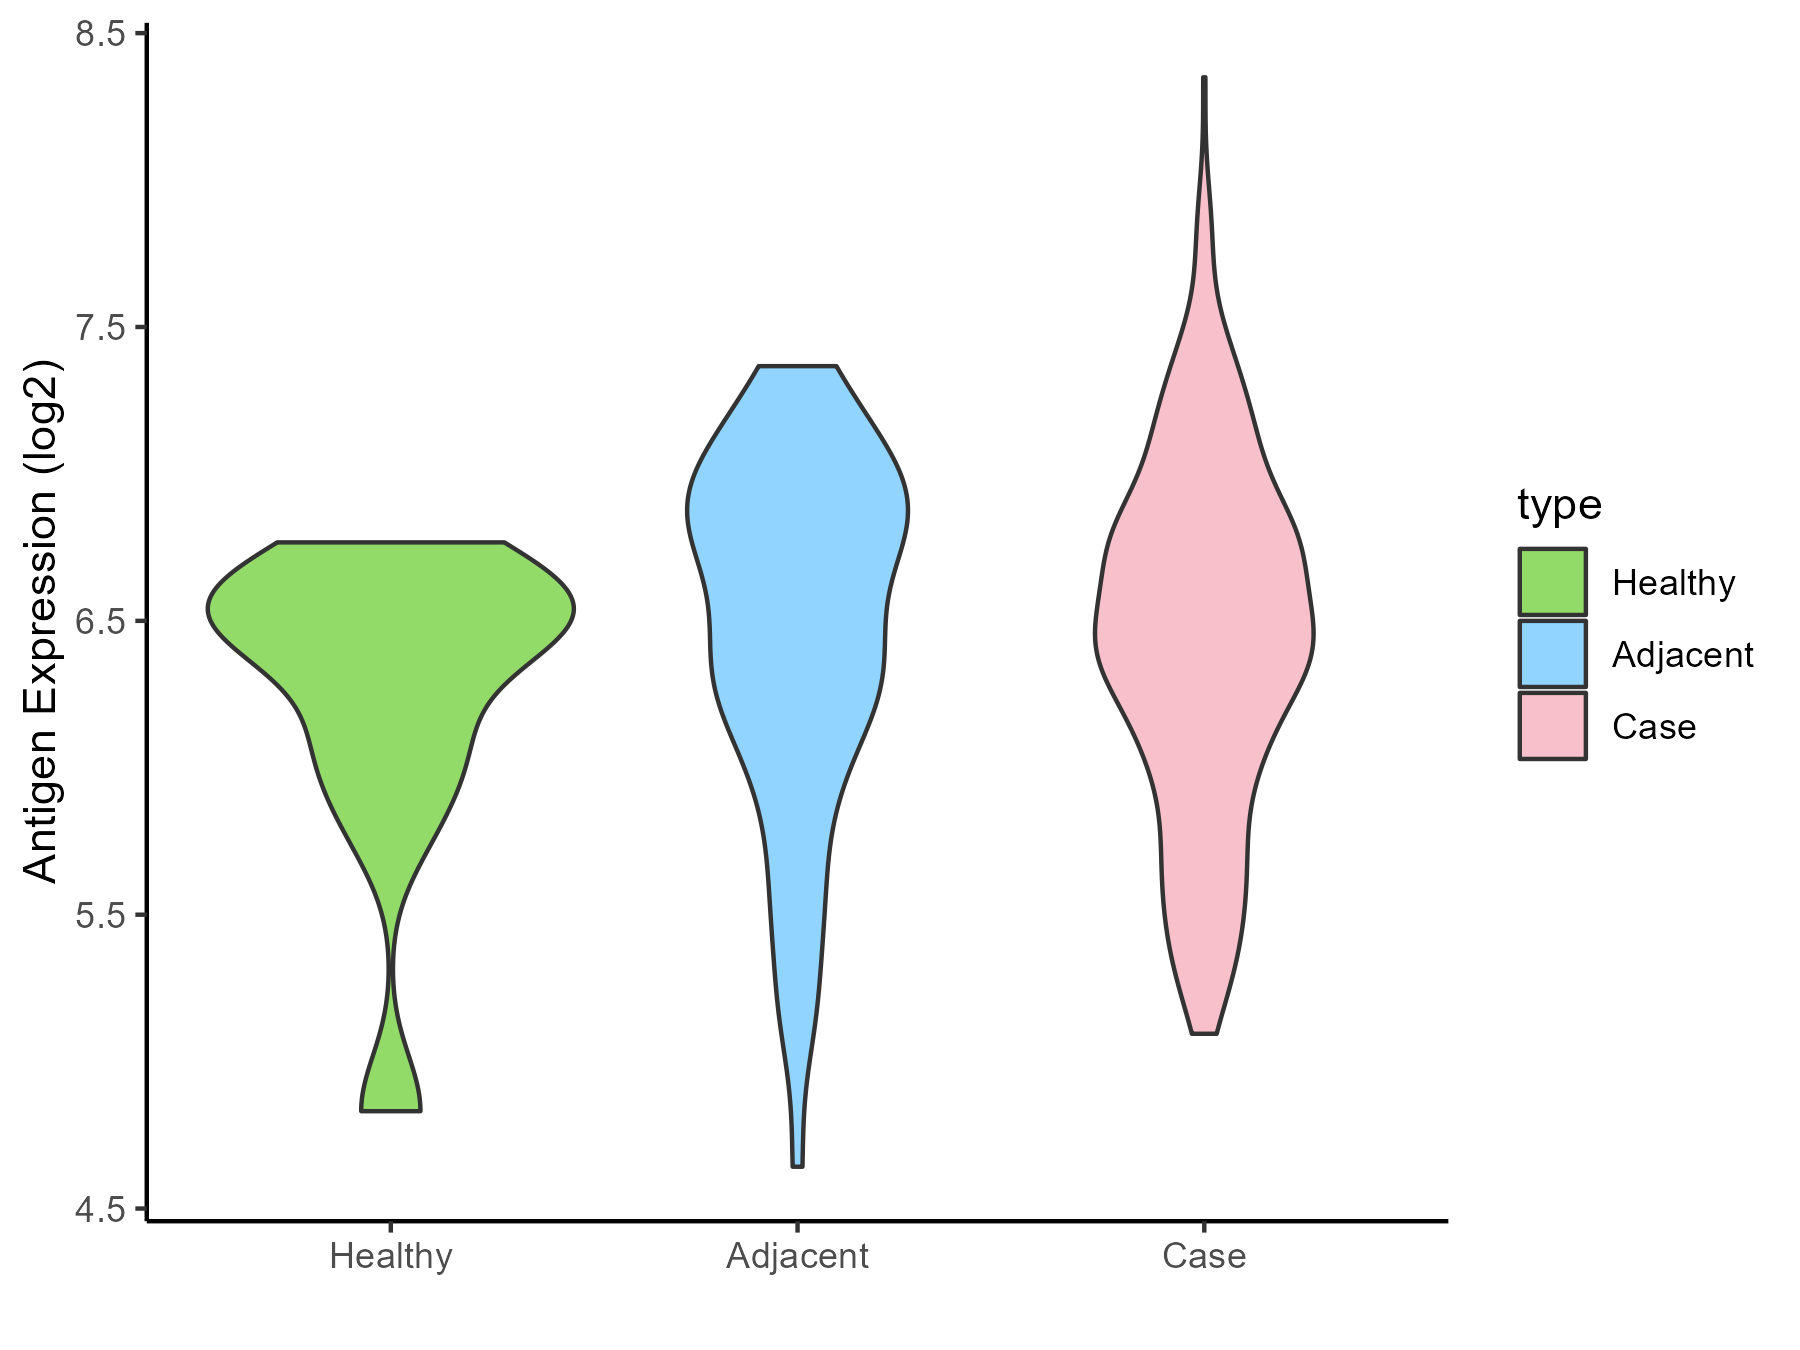
| The Expression Level of Disease Section Compare with the Healthy Individual Tissue | p-value: 0.270880571; Fold-change: -0.045654989; Z-score: -0.082611294 | |
| The Expression Level of Disease Section Compare with the Adjacent Tissue | p-value: 0.754938692; Fold-change: -0.122394645; Z-score: -0.201778286 | |
| Disease-specific Antigen Abundances |
|
Click to View the Clearer Original Diagram |
| Differential expression pattern of antigen in diseases | ||
| The Studied Tissue | Urothelium | |
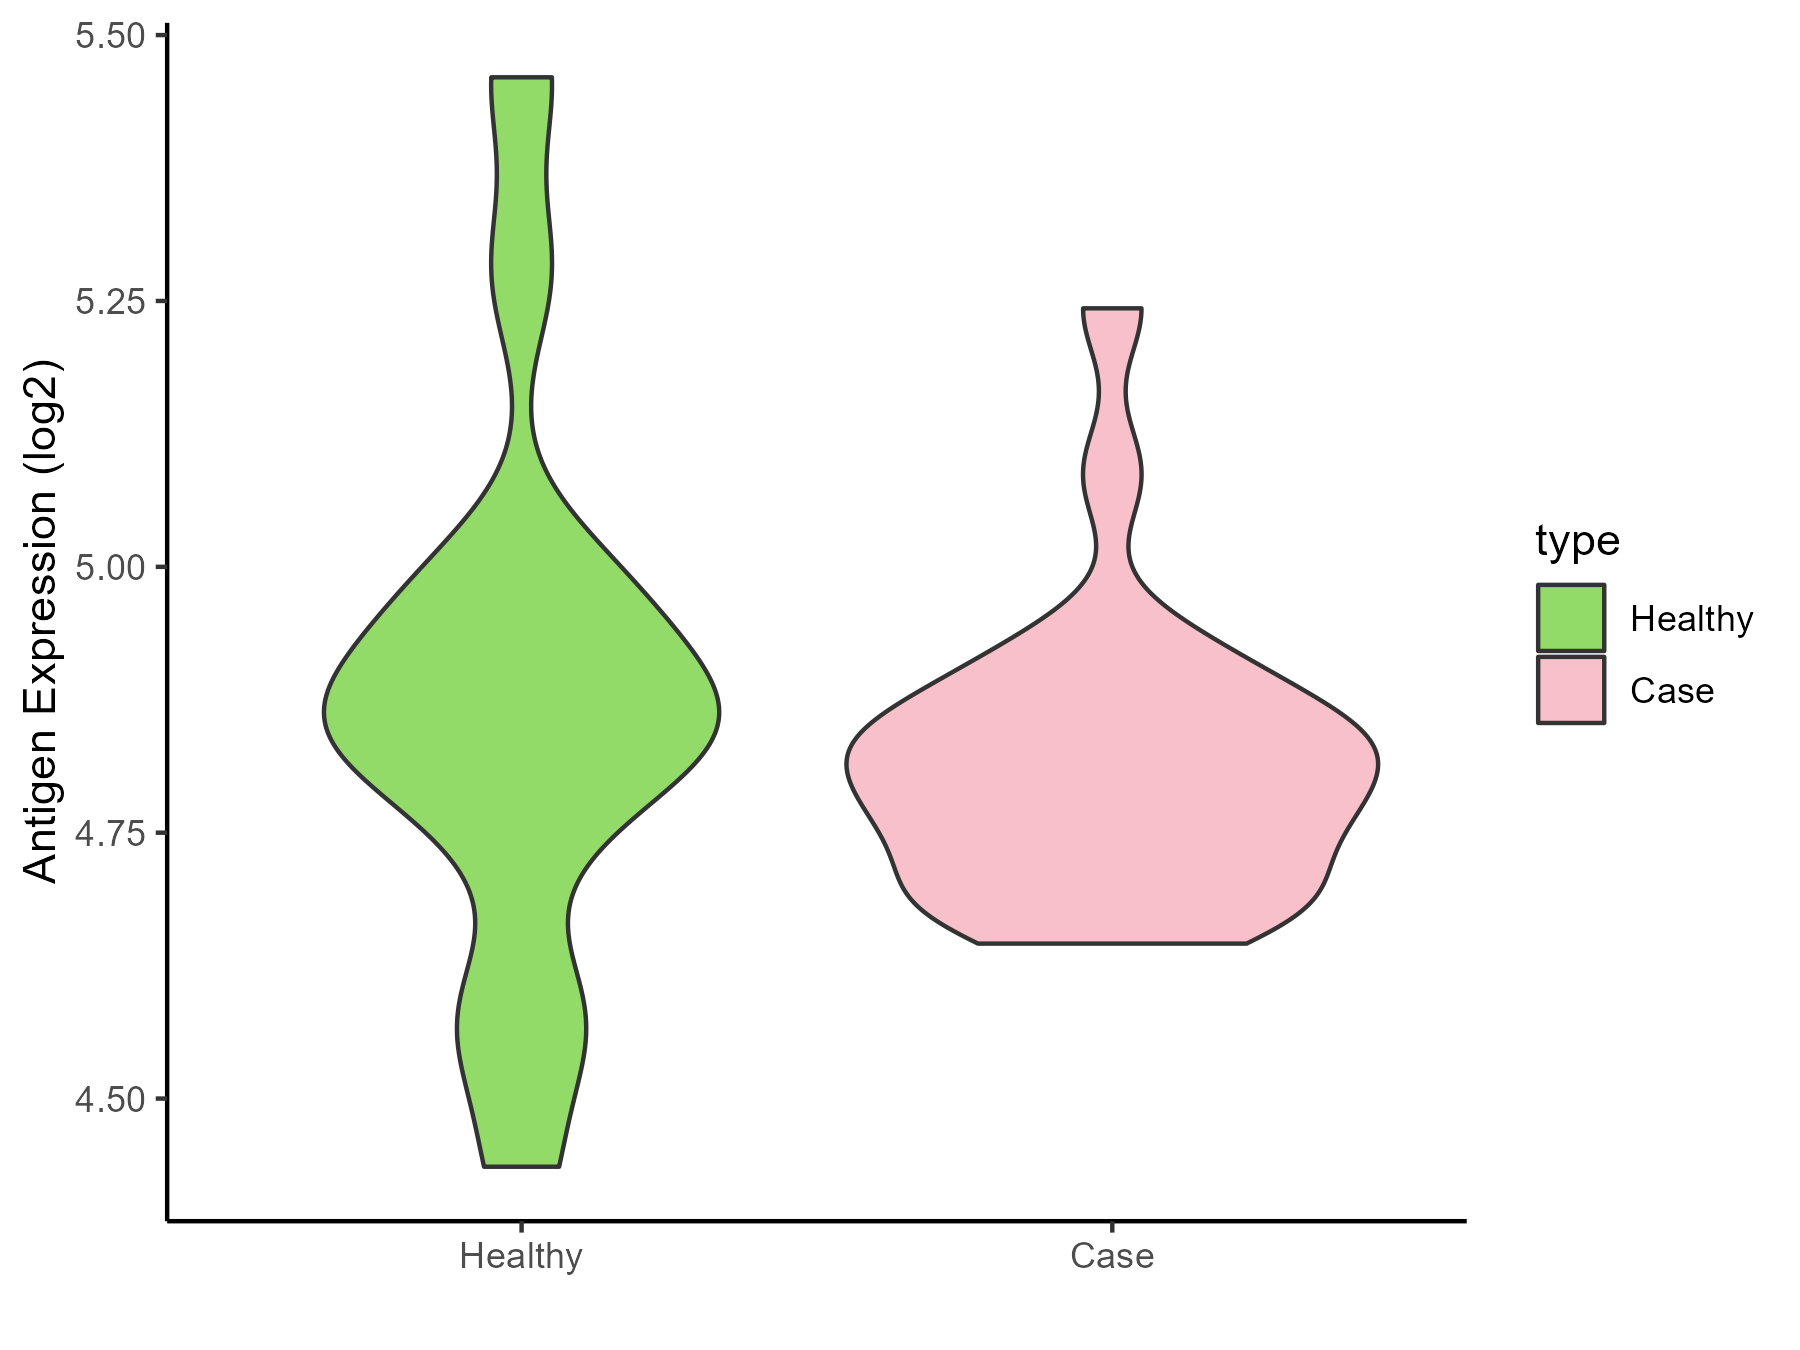
| The Specific Disease | Ureter cancer | |
| The Expression Level of Disease Section Compare with the Healthy Individual Tissue | p-value: 0.455764886; Fold-change: -0.035274765; Z-score: -0.136527818 | |
| Disease-specific Antigen Abundances |
|
Click to View the Clearer Original Diagram |
ICD Disease Classification 20
| Differential expression pattern of antigen in diseases | ||
| The Studied Tissue | Adipose | |
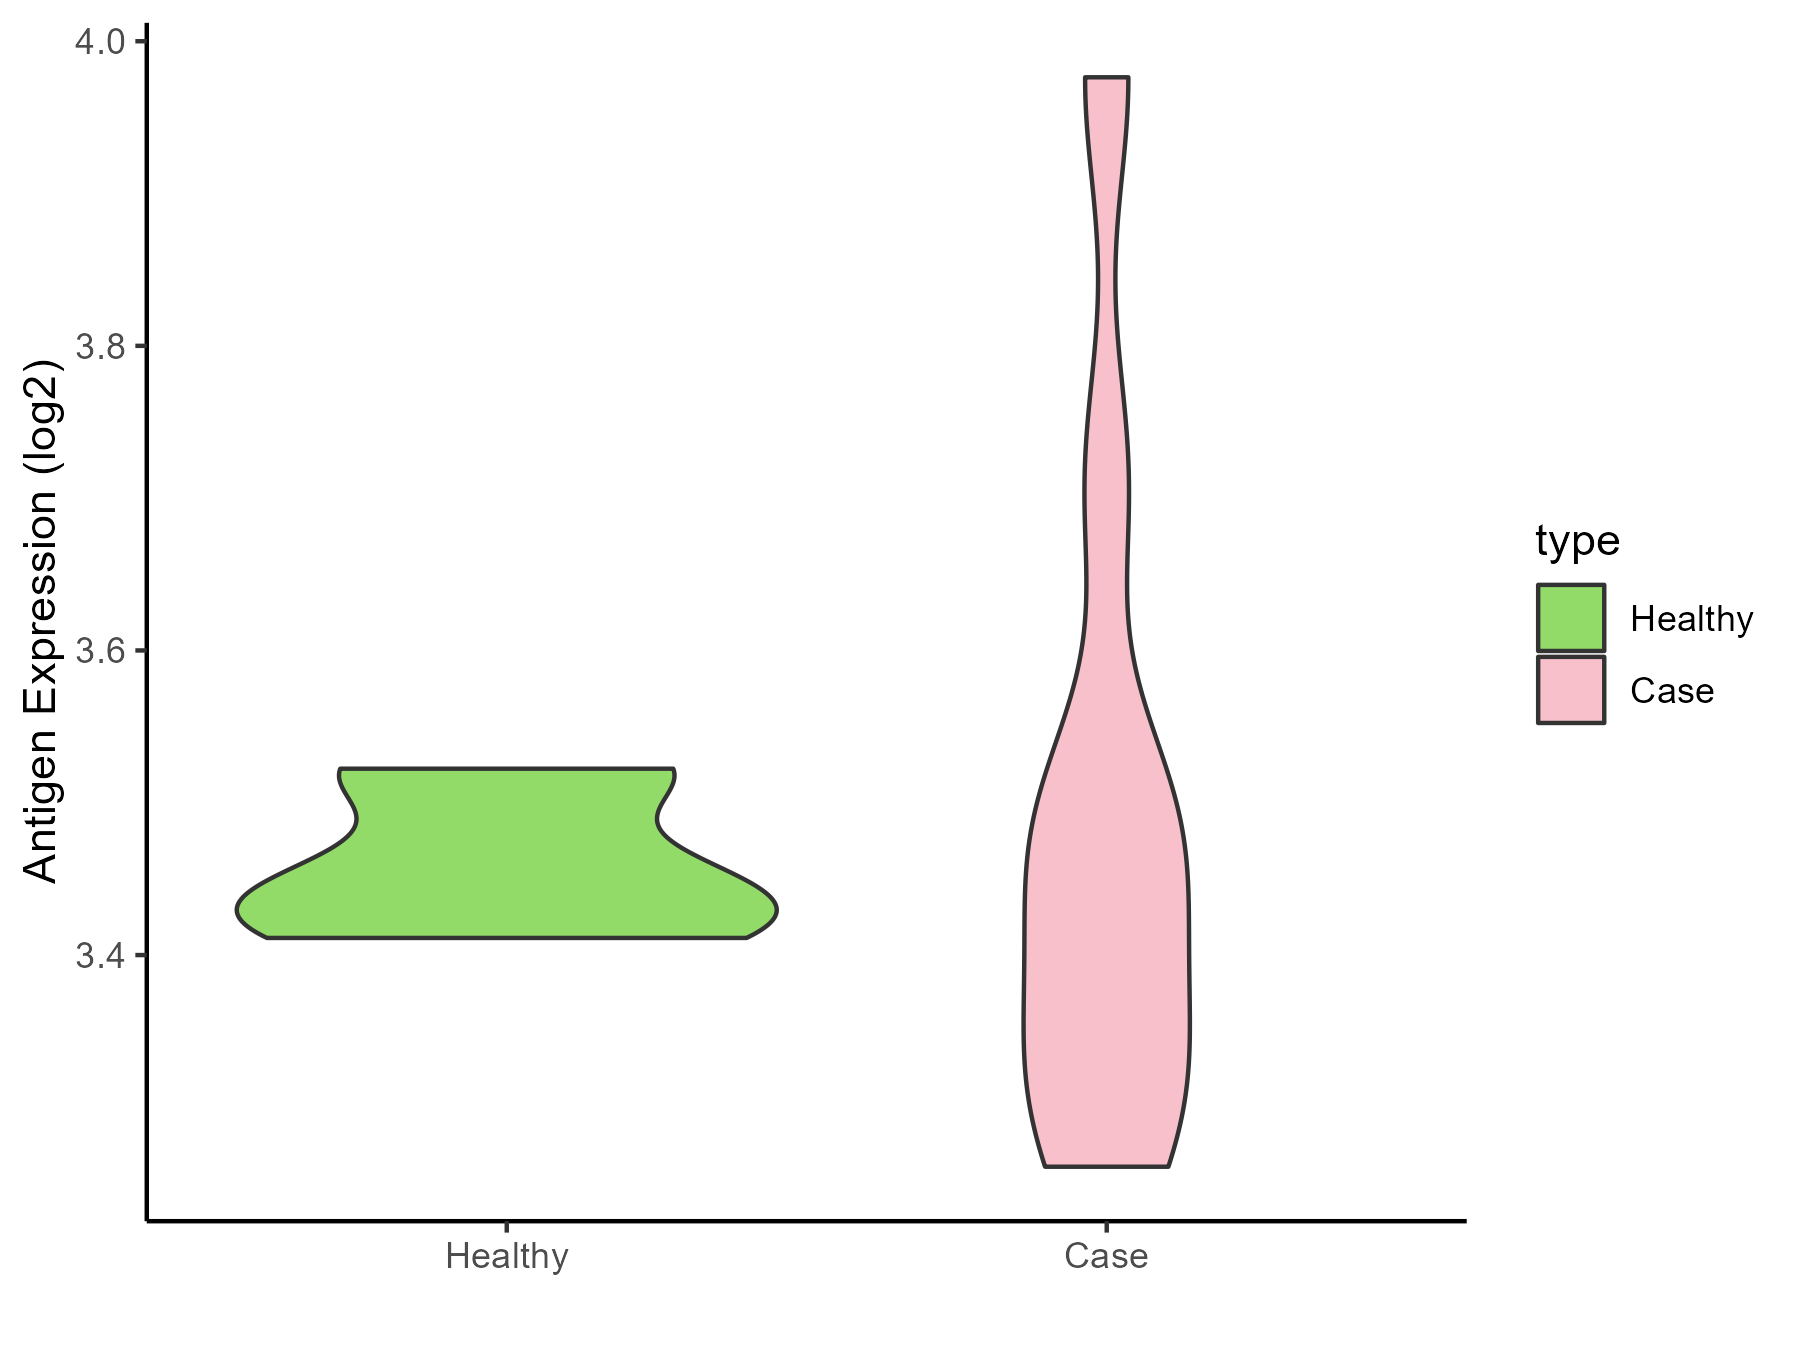
| The Specific Disease | Simpson golabi behmel syndrome | |
| The Expression Level of Disease Section Compare with the Healthy Individual Tissue | p-value: 0.735189755; Fold-change: 0.020706147; Z-score: 0.364680473 | |
| Disease-specific Antigen Abundances |
|
Click to View the Clearer Original Diagram |
| Differential expression pattern of antigen in diseases | ||
| The Studied Tissue | Perituberal | |
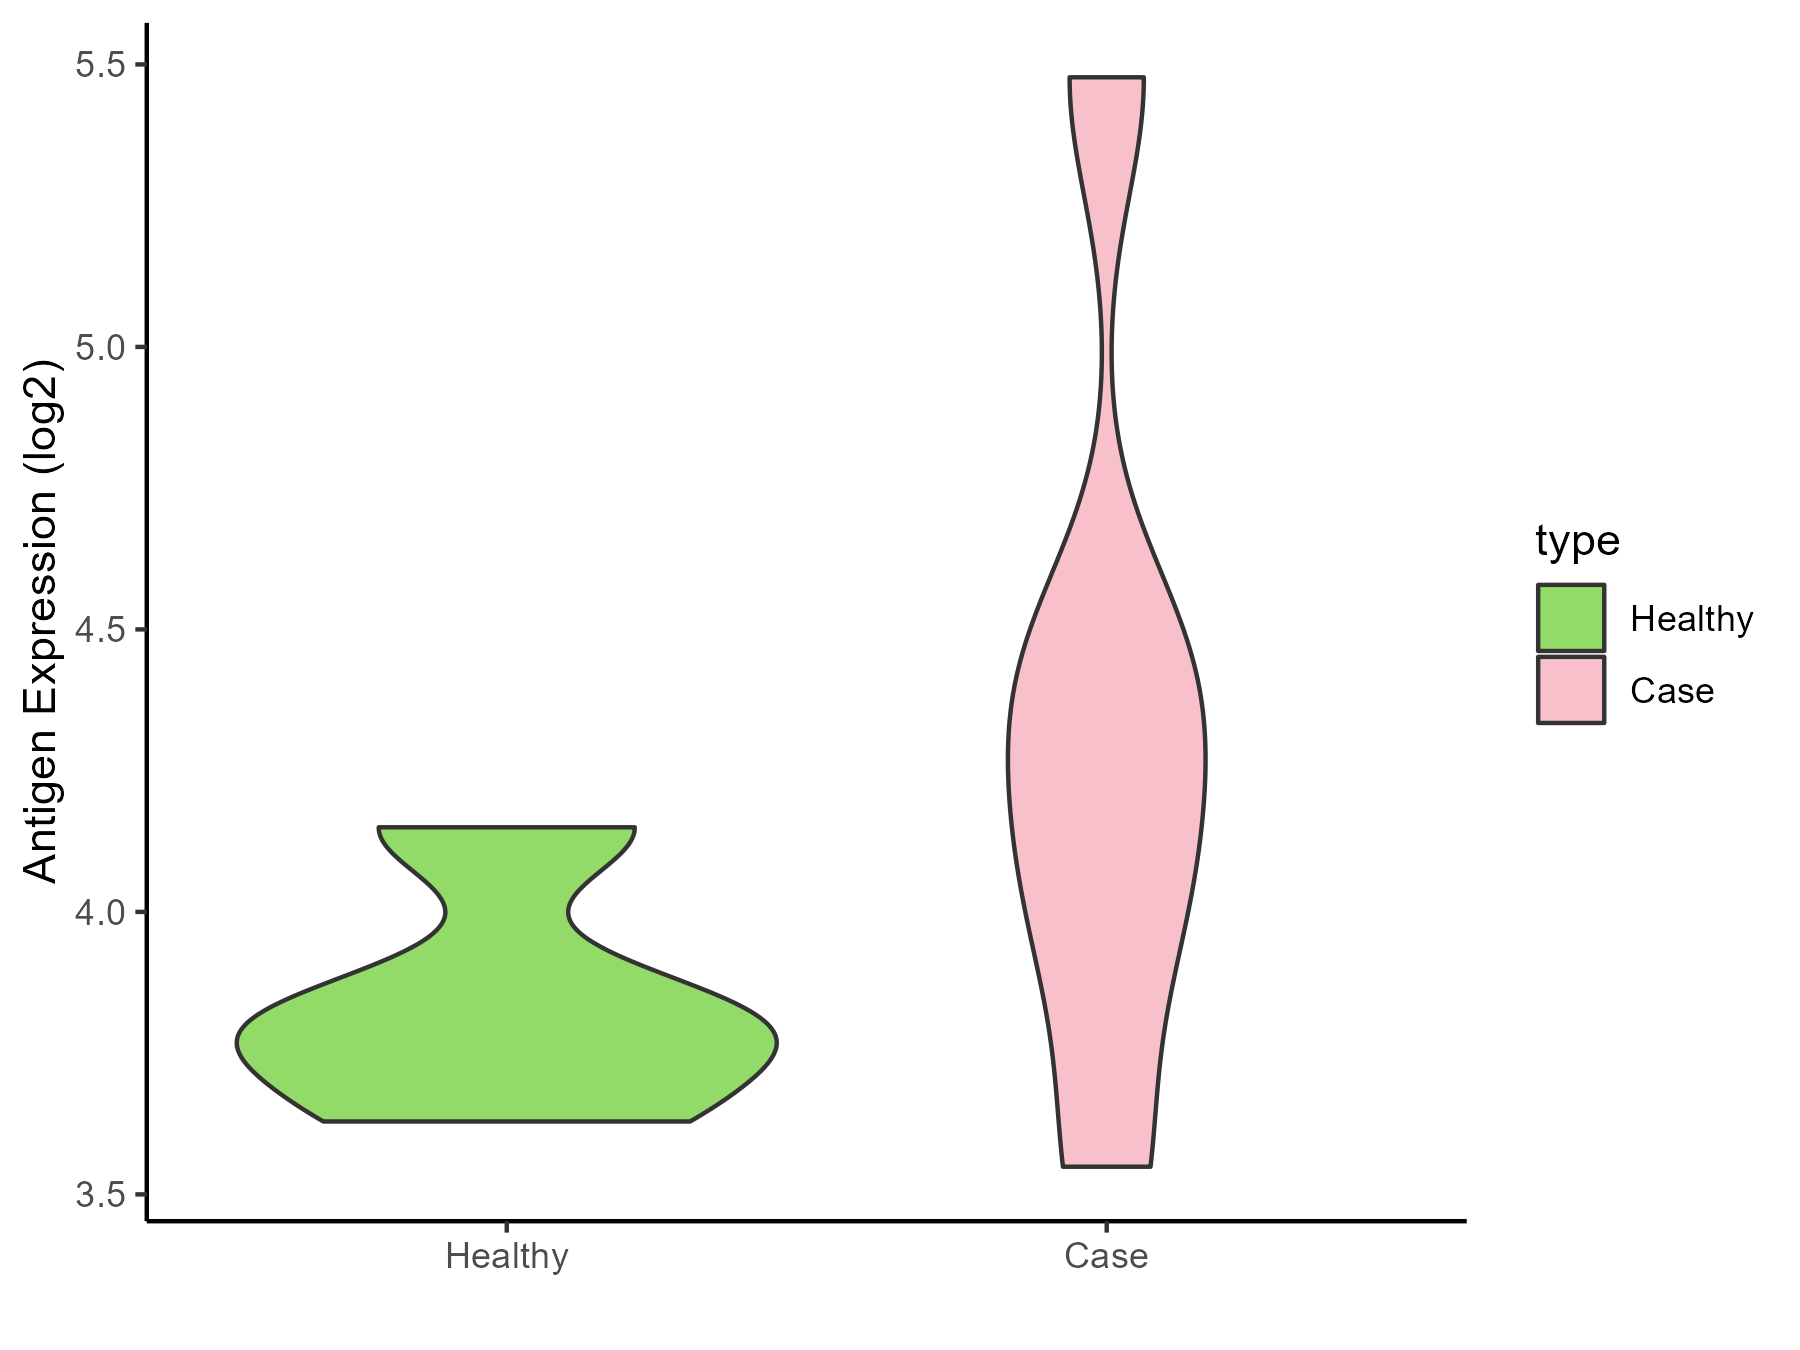
| The Specific Disease | Tuberous sclerosis complex | |
| The Expression Level of Disease Section Compare with the Healthy Individual Tissue | p-value: 0.140997087; Fold-change: 0.453892881; Z-score: 2.05453469 | |
| Disease-specific Antigen Abundances |
|
Click to View the Clearer Original Diagram |
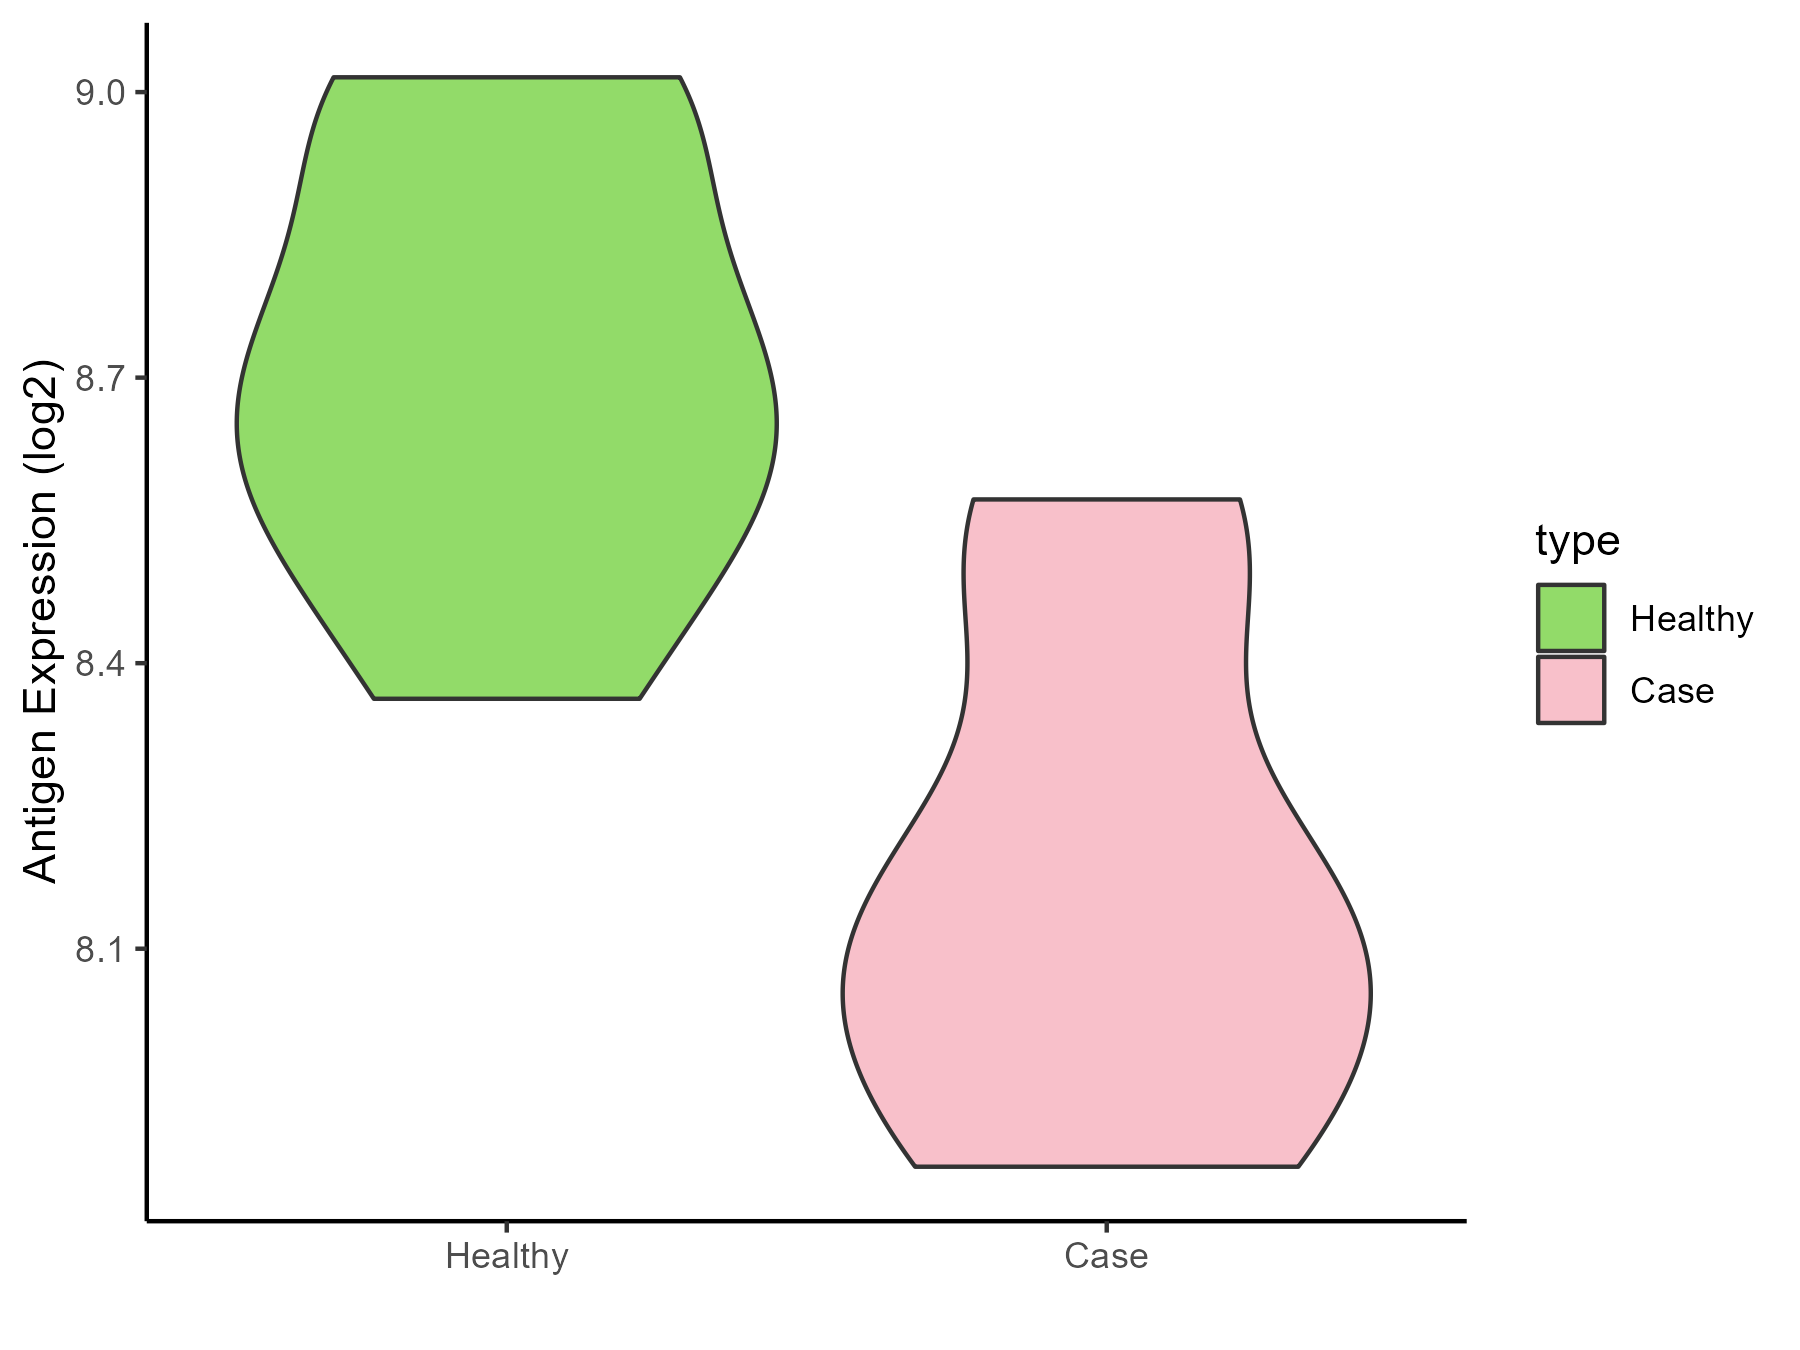
ICD Disease Classification 3
| Differential expression pattern of antigen in diseases | ||
| The Studied Tissue | Bone marrow | |
| The Specific Disease | Anemia | |
| The Expression Level of Disease Section Compare with the Healthy Individual Tissue | p-value: 0.001902367; Fold-change: -0.589888143; Z-score: -2.53068542 | |
| Disease-specific Antigen Abundances |
|
Click to View the Clearer Original Diagram |
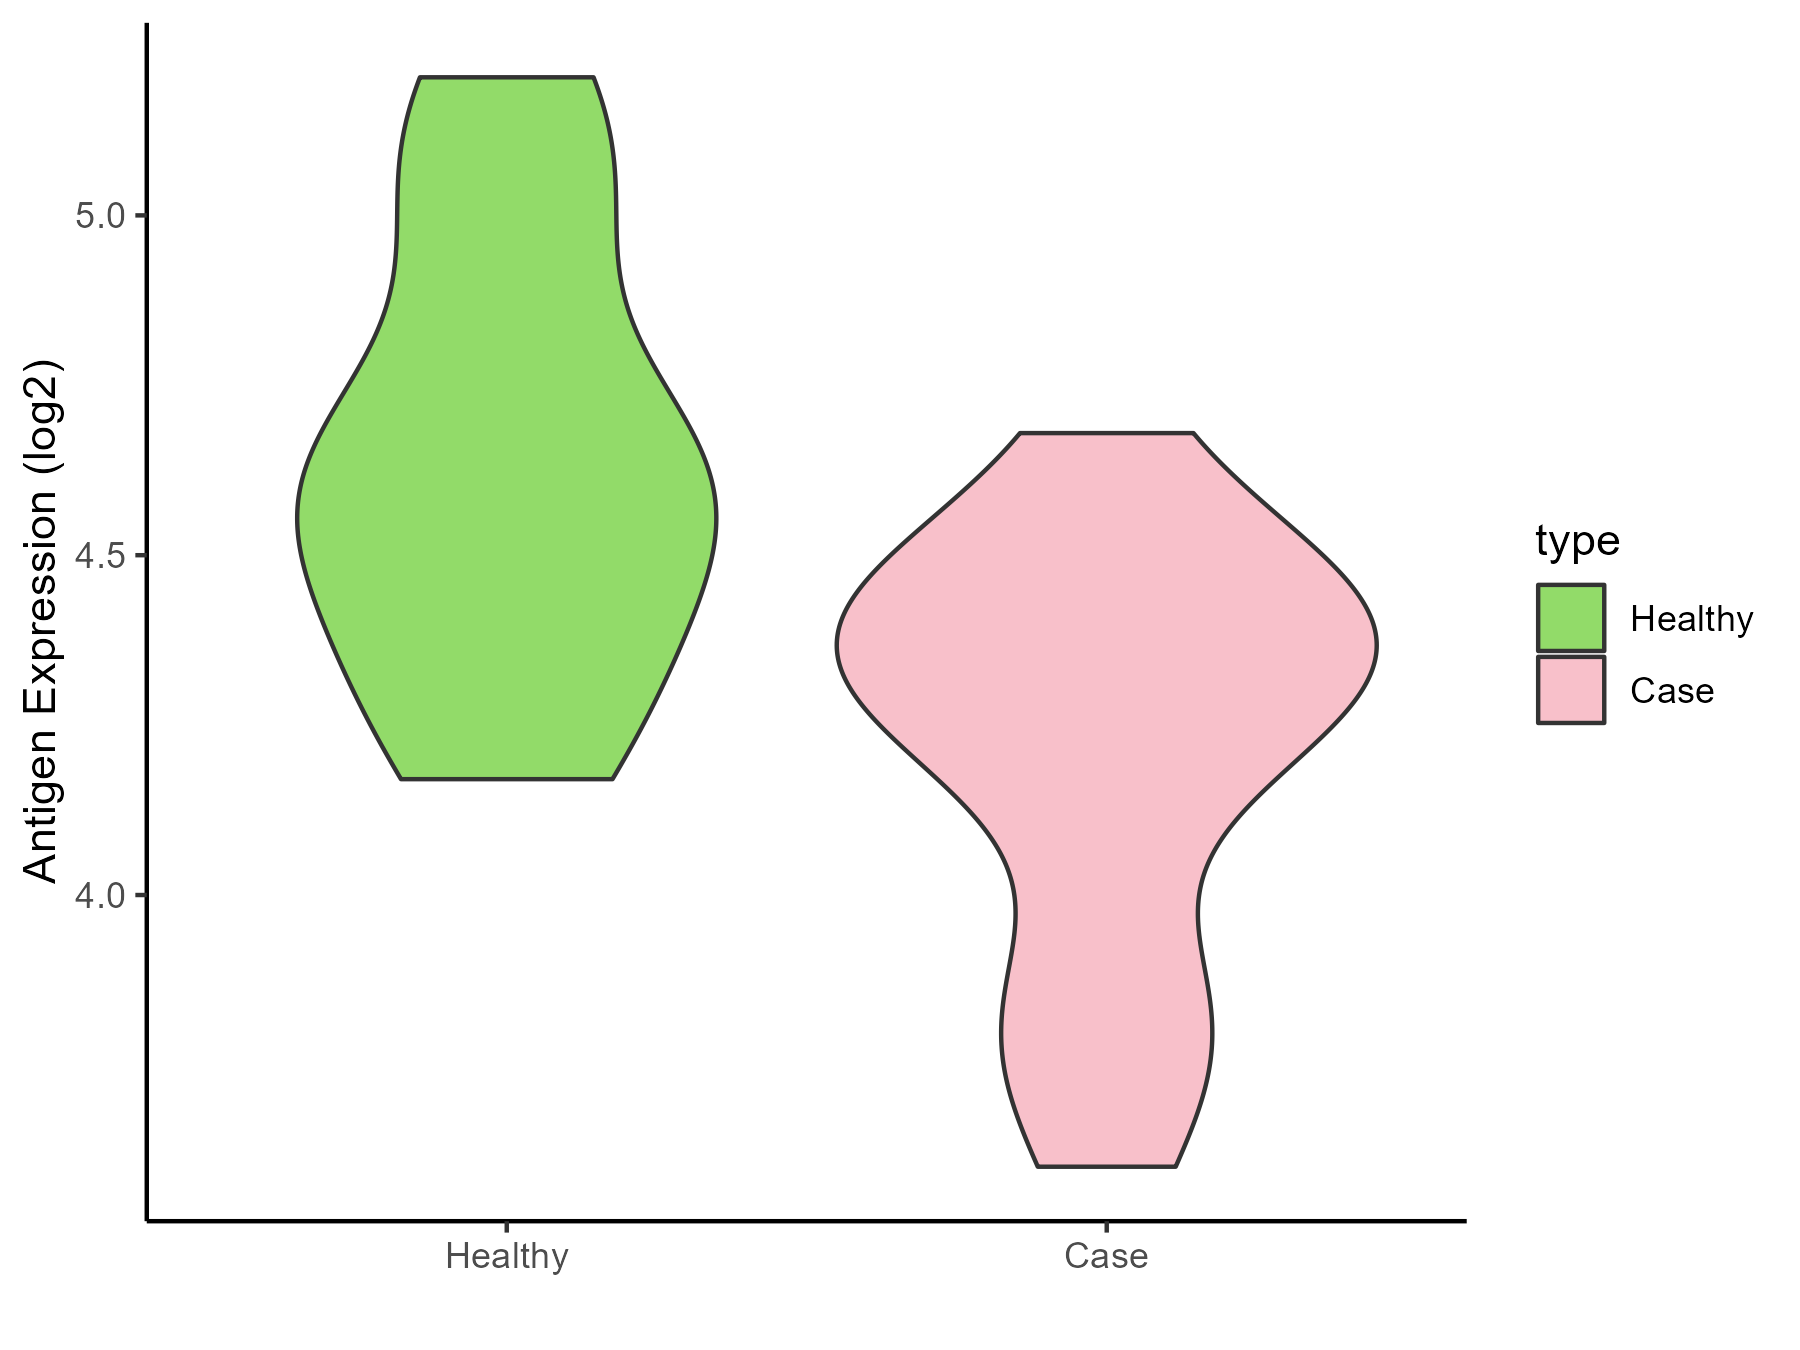
| Differential expression pattern of antigen in diseases | ||
| The Studied Tissue | Peripheral blood | |
| The Specific Disease | Sickle cell disease | |
| The Expression Level of Disease Section Compare with the Healthy Individual Tissue | p-value: 0.00336045; Fold-change: -0.284358768; Z-score: -0.858139656 | |
| Disease-specific Antigen Abundances |
|
Click to View the Clearer Original Diagram |
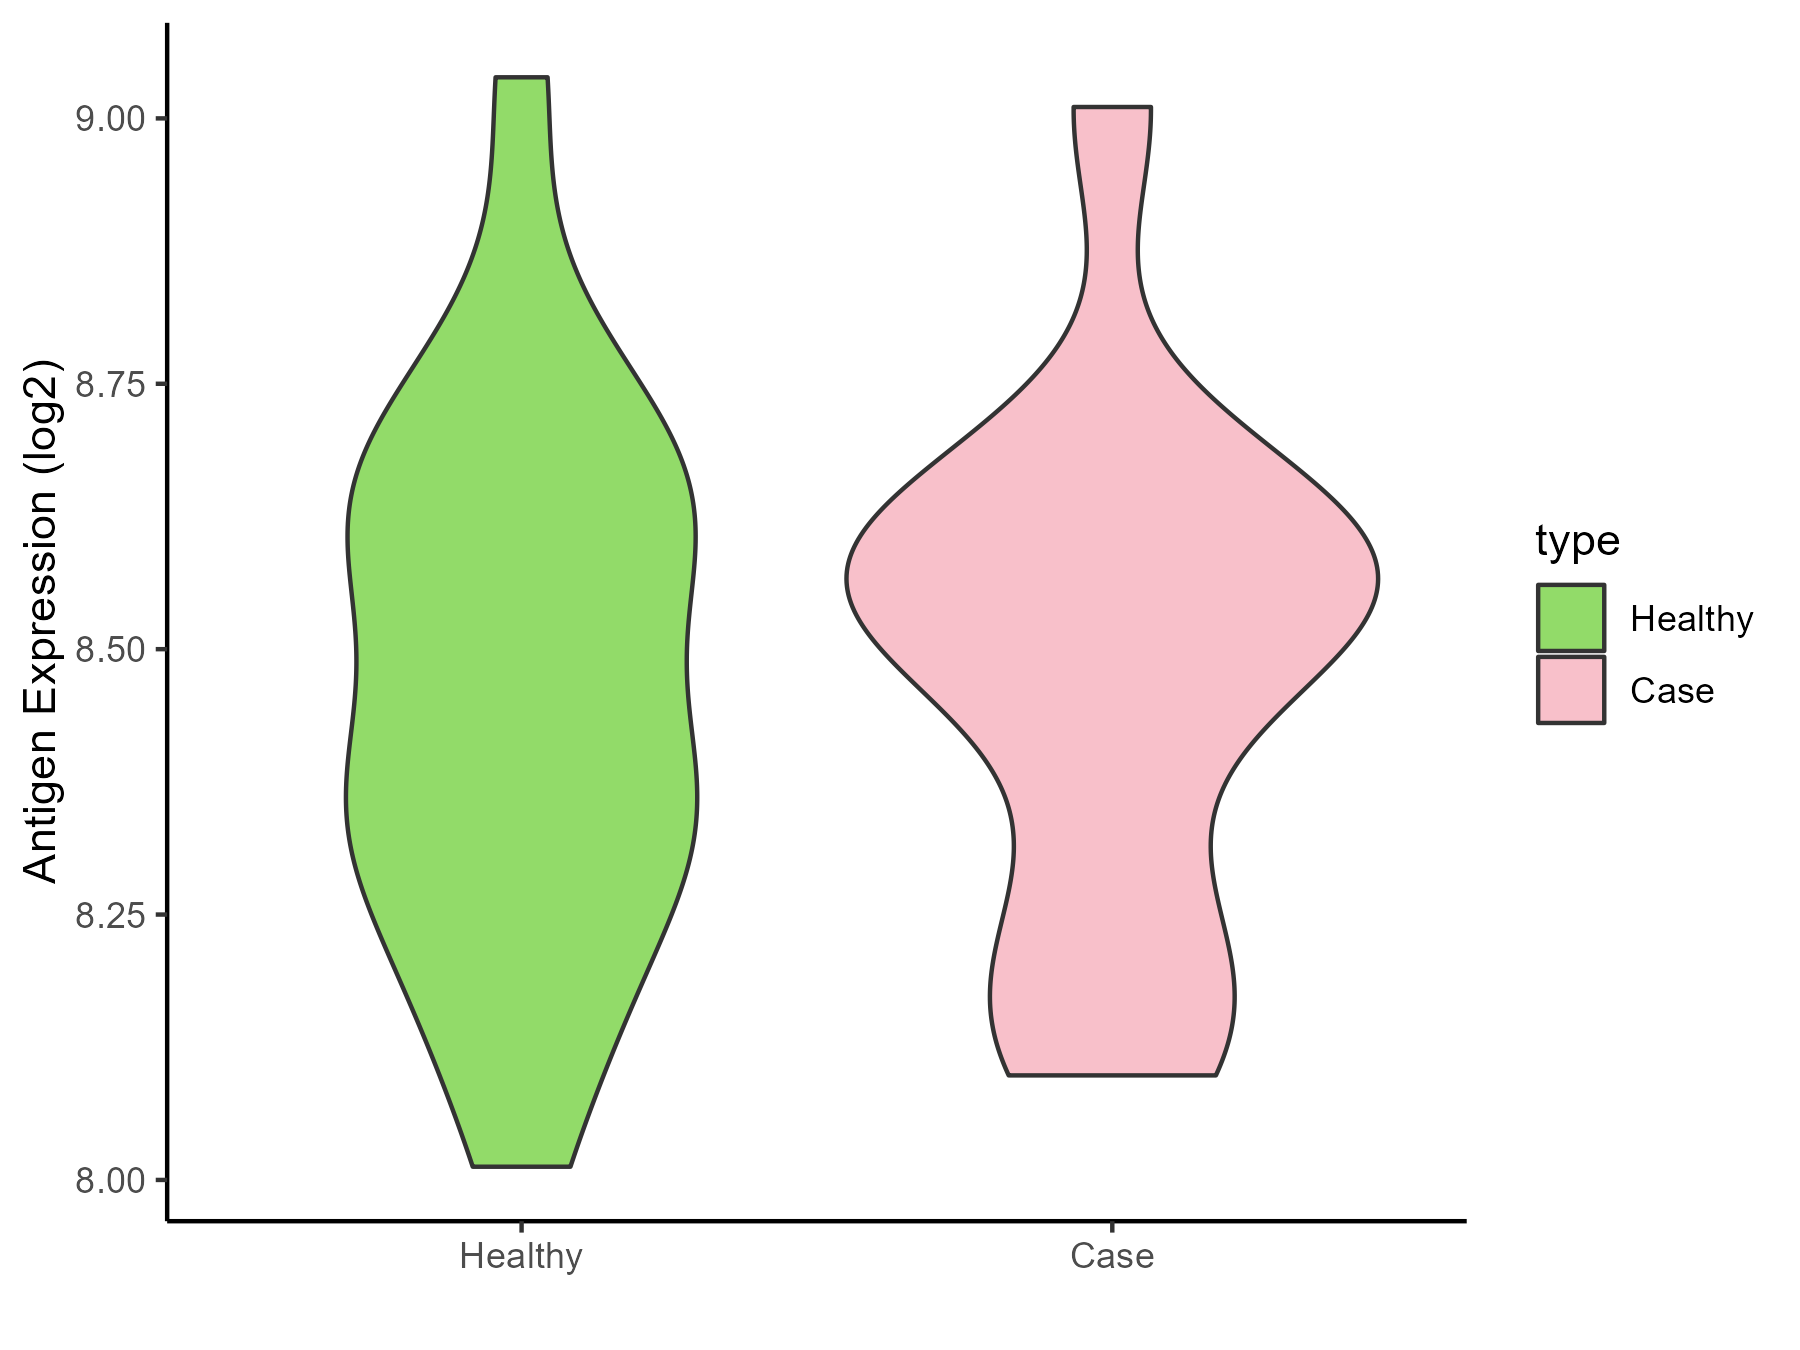
| Differential expression pattern of antigen in diseases | ||
| The Studied Tissue | Whole blood | |
| The Specific Disease | Thrombocythemia | |
| The Expression Level of Disease Section Compare with the Healthy Individual Tissue | p-value: 0.833188041; Fold-change: 0.080199007; Z-score: 0.323857435 | |
| Disease-specific Antigen Abundances |
|
Click to View the Clearer Original Diagram |
ICD Disease Classification 4
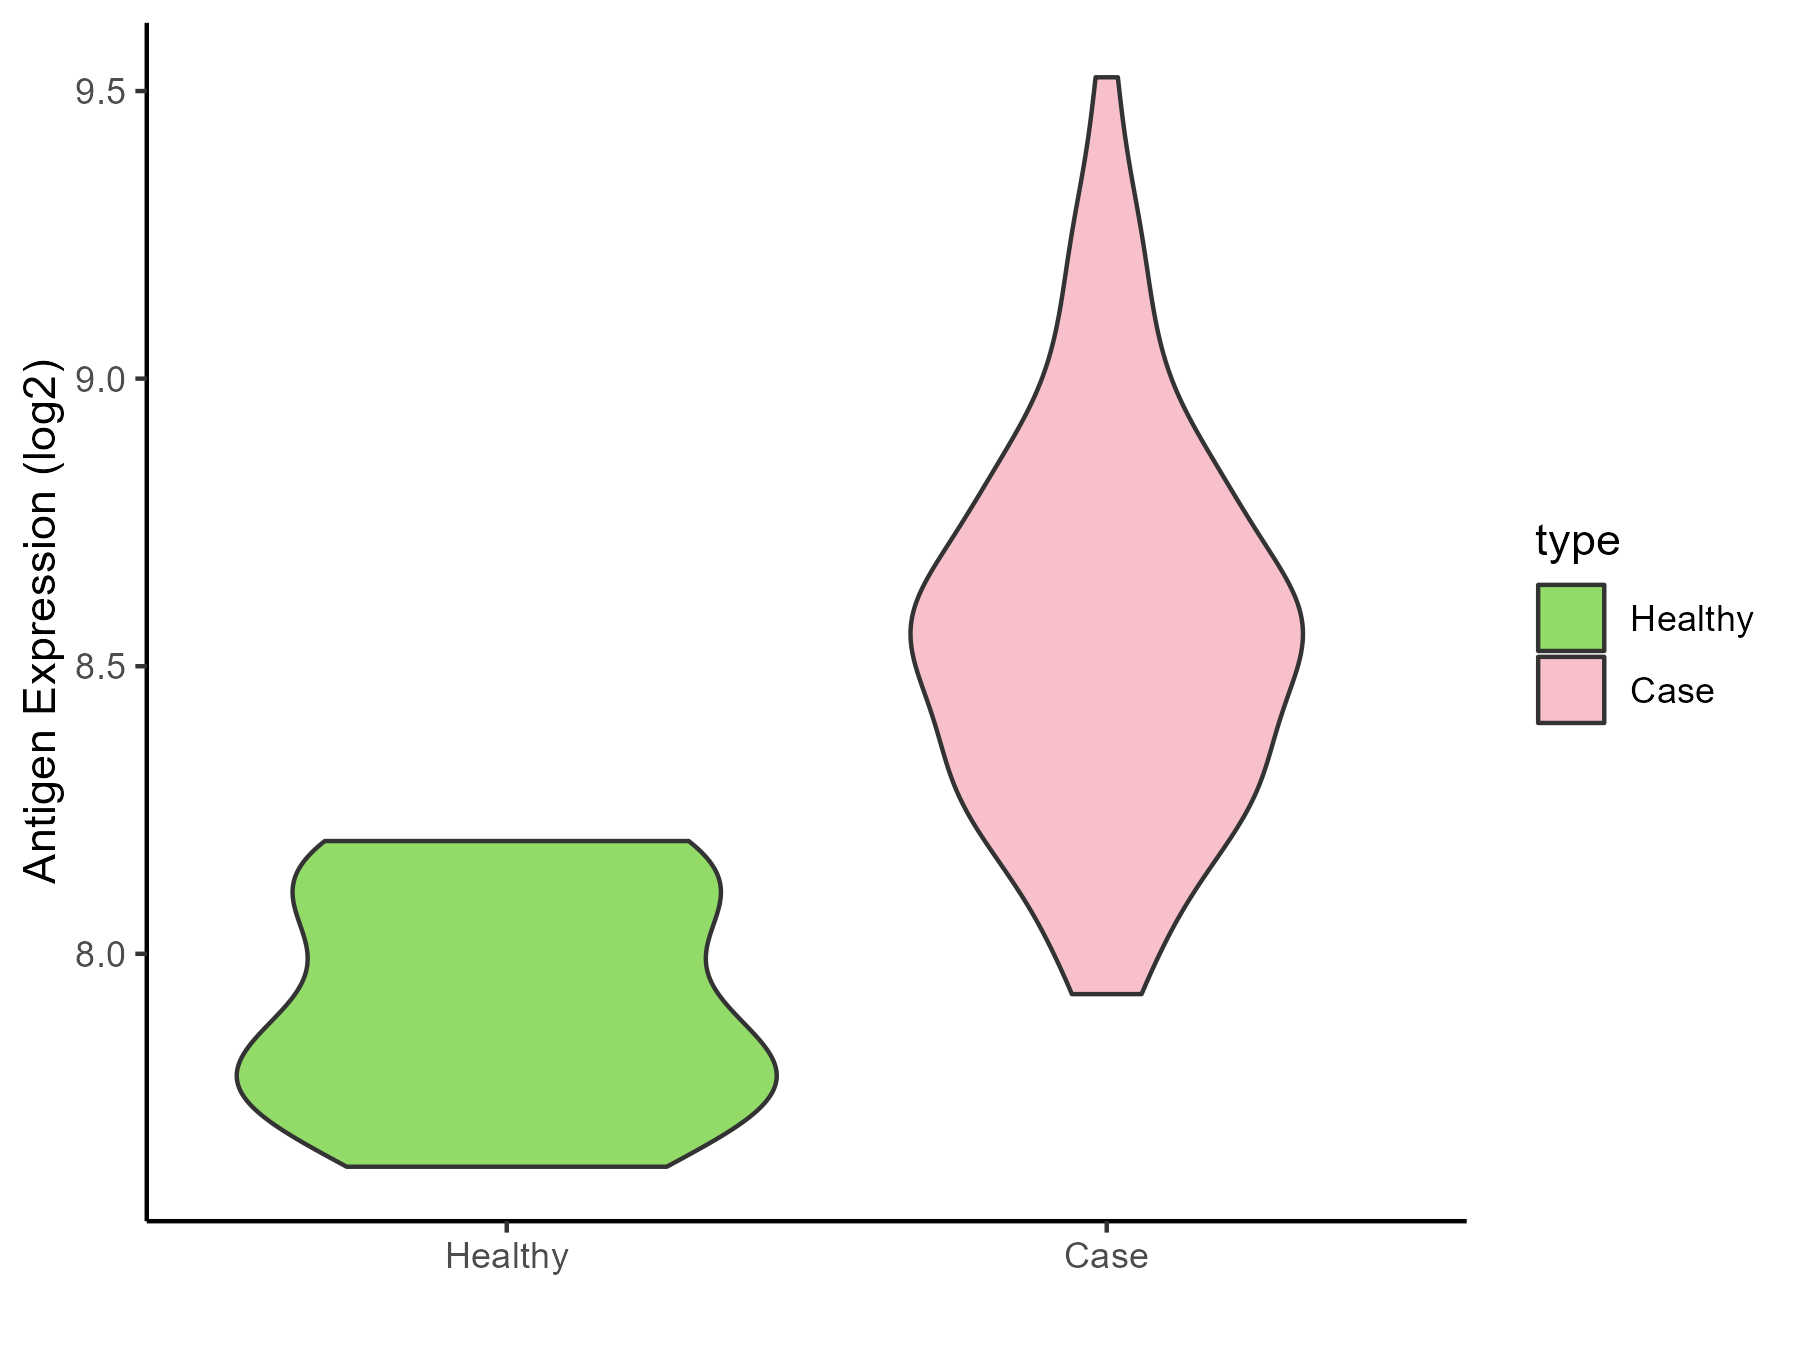
| Differential expression pattern of antigen in diseases | ||
| The Studied Tissue | Whole blood | |
| The Specific Disease | Scleroderma | |
| The Expression Level of Disease Section Compare with the Healthy Individual Tissue | p-value: 1.24E-06; Fold-change: 0.70516659; Z-score: 3.485711917 | |
| Disease-specific Antigen Abundances |
|
Click to View the Clearer Original Diagram |
| Differential expression pattern of antigen in diseases | ||
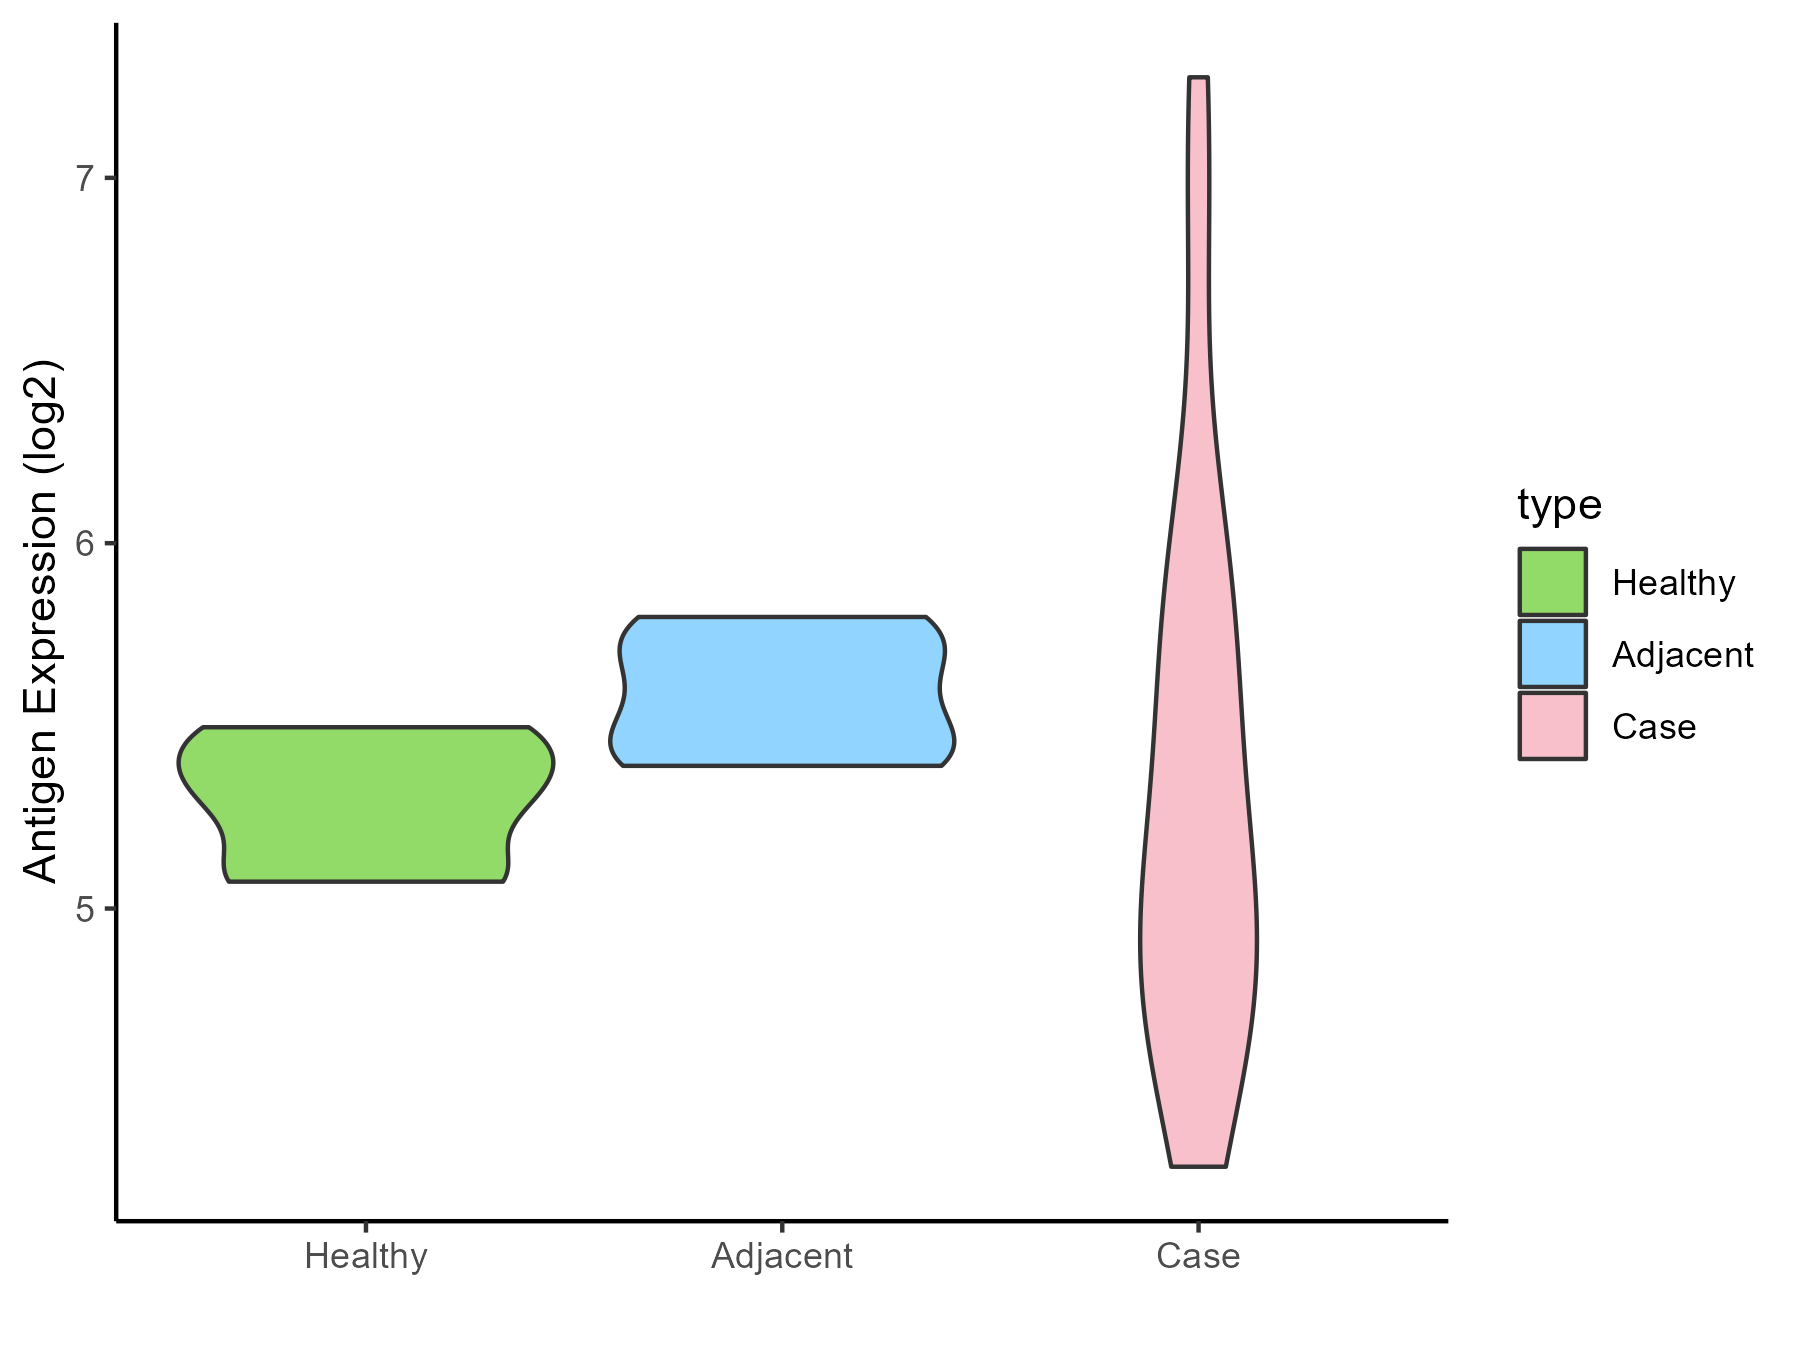
| The Studied Tissue | Salivary gland | |
| The Specific Disease | Sjogren syndrome | |
| The Expression Level of Disease Section Compare with the Healthy Individual Tissue | p-value: 0.796627955; Fold-change: -0.16987837; Z-score: -0.800097991 | |
| The Expression Level of Disease Section Compare with the Adjacent Tissue | p-value: 0.27282997; Fold-change: -0.424638245; Z-score: -2.207554488 | |
| Disease-specific Antigen Abundances |
|
Click to View the Clearer Original Diagram |
| Differential expression pattern of antigen in diseases | ||
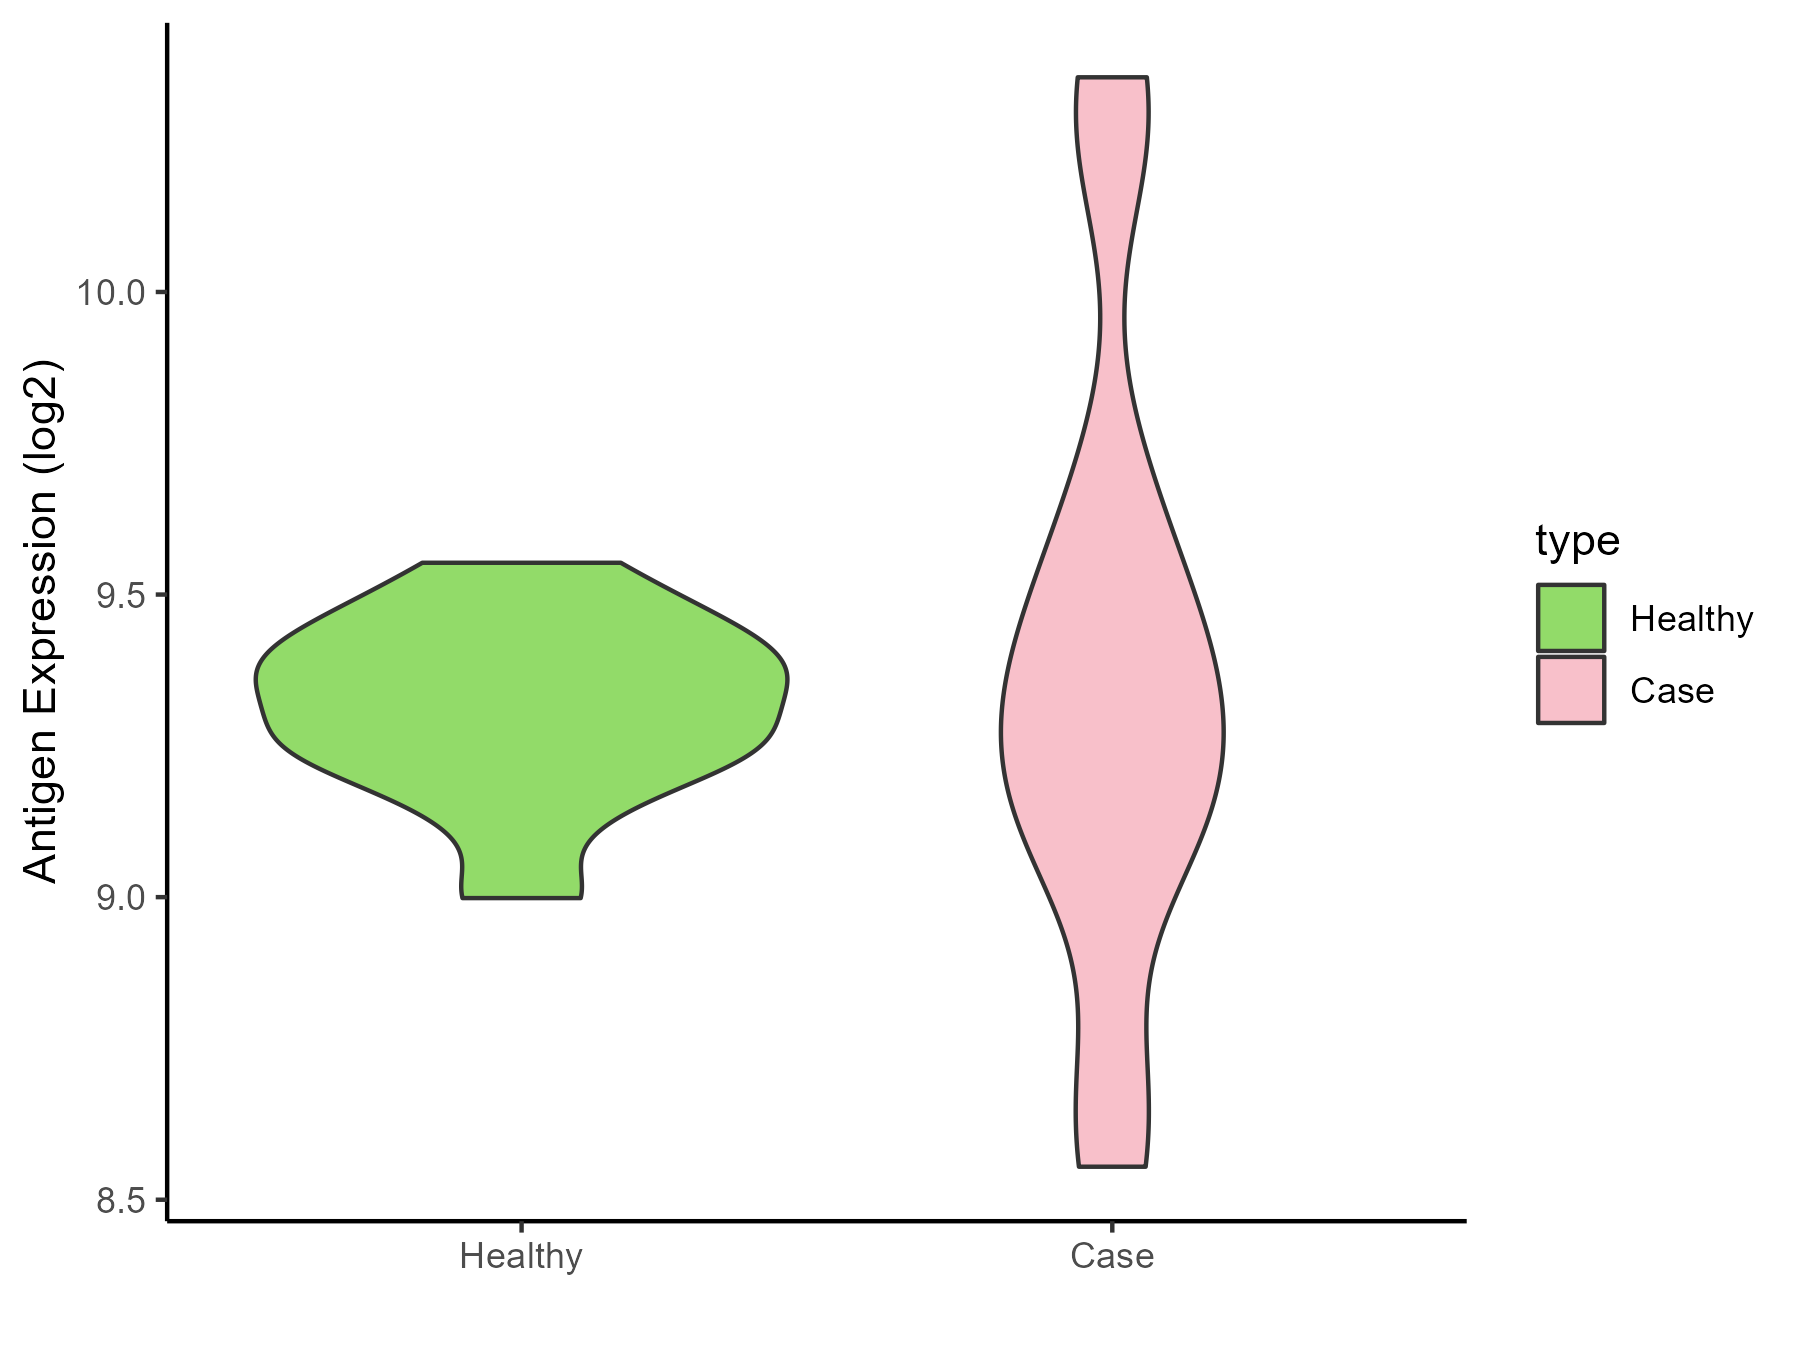
| The Studied Tissue | Peripheral blood | |
| The Specific Disease | Behcet disease | |
| The Expression Level of Disease Section Compare with the Healthy Individual Tissue | p-value: 0.747497743; Fold-change: -0.031984089; Z-score: -0.210344612 | |
| Disease-specific Antigen Abundances |
|
Click to View the Clearer Original Diagram |
| Differential expression pattern of antigen in diseases | ||
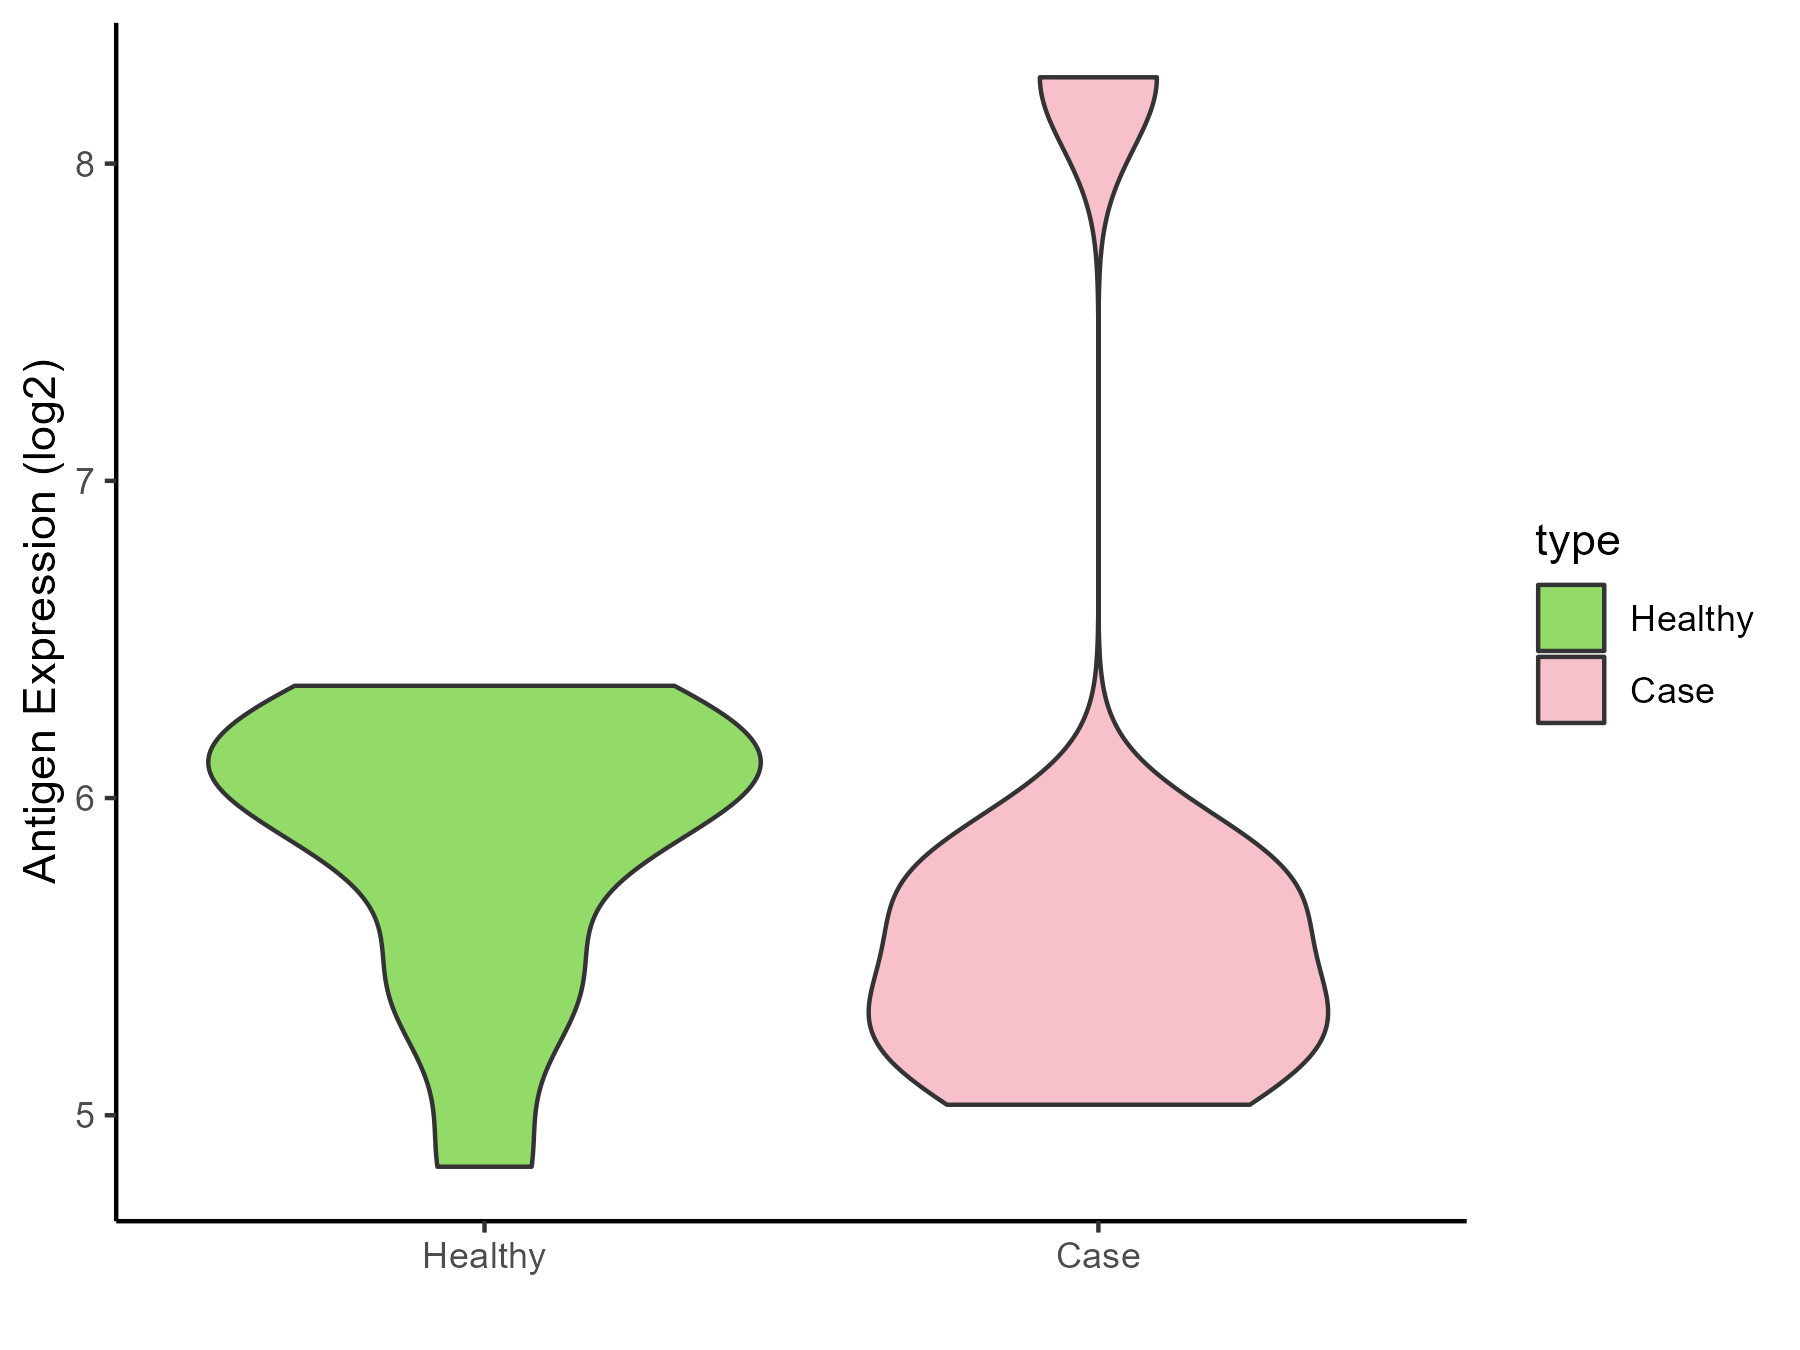
| The Studied Tissue | Whole blood | |
| The Specific Disease | Autosomal dominant monocytopenia | |
| The Expression Level of Disease Section Compare with the Healthy Individual Tissue | p-value: 0.872599884; Fold-change: -0.517961608; Z-score: -1.106310275 | |
| Disease-specific Antigen Abundances |
|
Click to View the Clearer Original Diagram |
ICD Disease Classification 5
| Differential expression pattern of antigen in diseases | ||
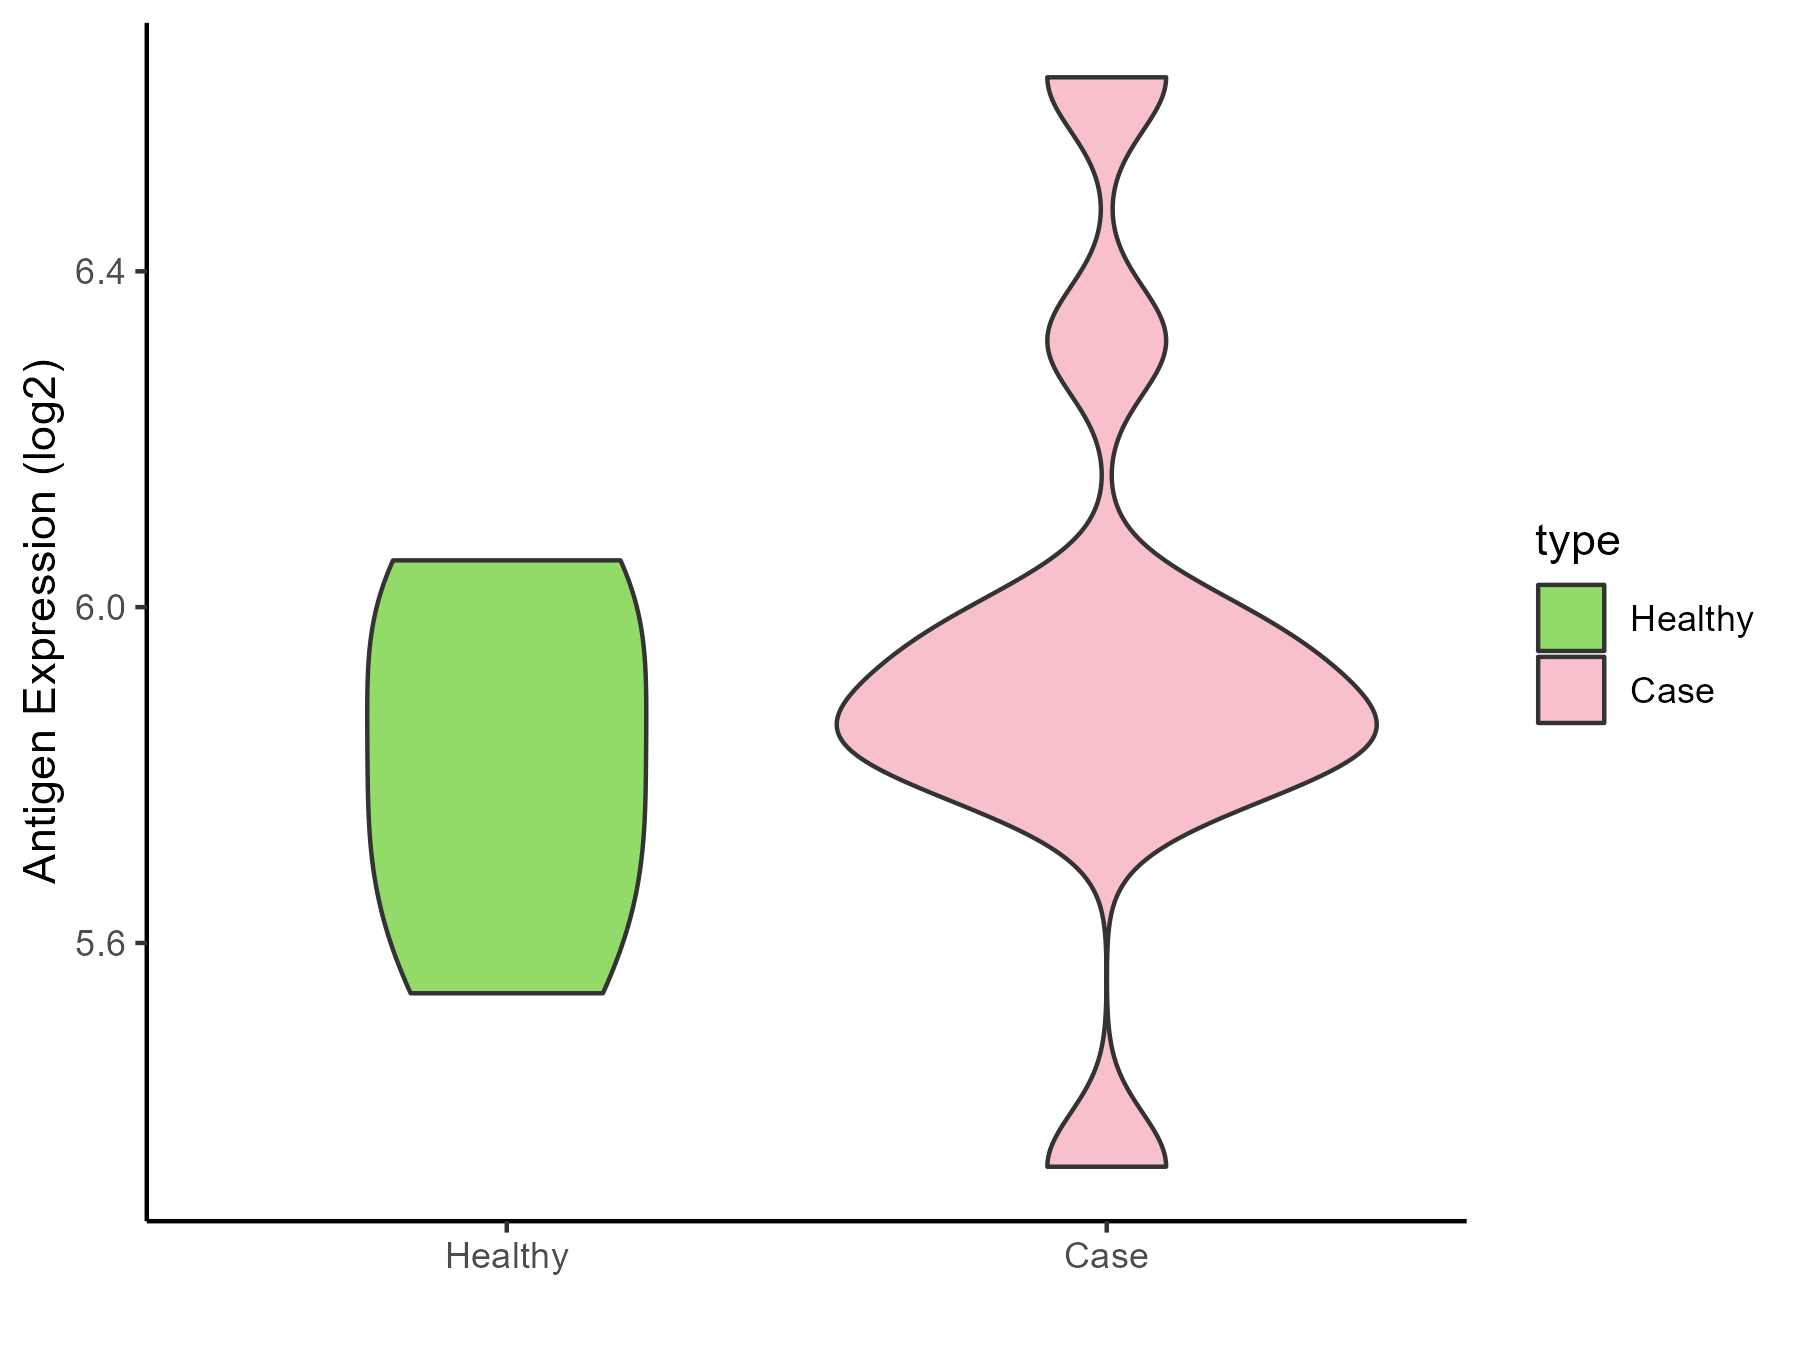
| The Studied Tissue | Liver | |
| The Specific Disease | Type 2 diabetes | |
| The Expression Level of Disease Section Compare with the Healthy Individual Tissue | p-value: 0.366805522; Fold-change: 0.078597672; Z-score: 0.375969453 | |
| Disease-specific Antigen Abundances |
|
Click to View the Clearer Original Diagram |
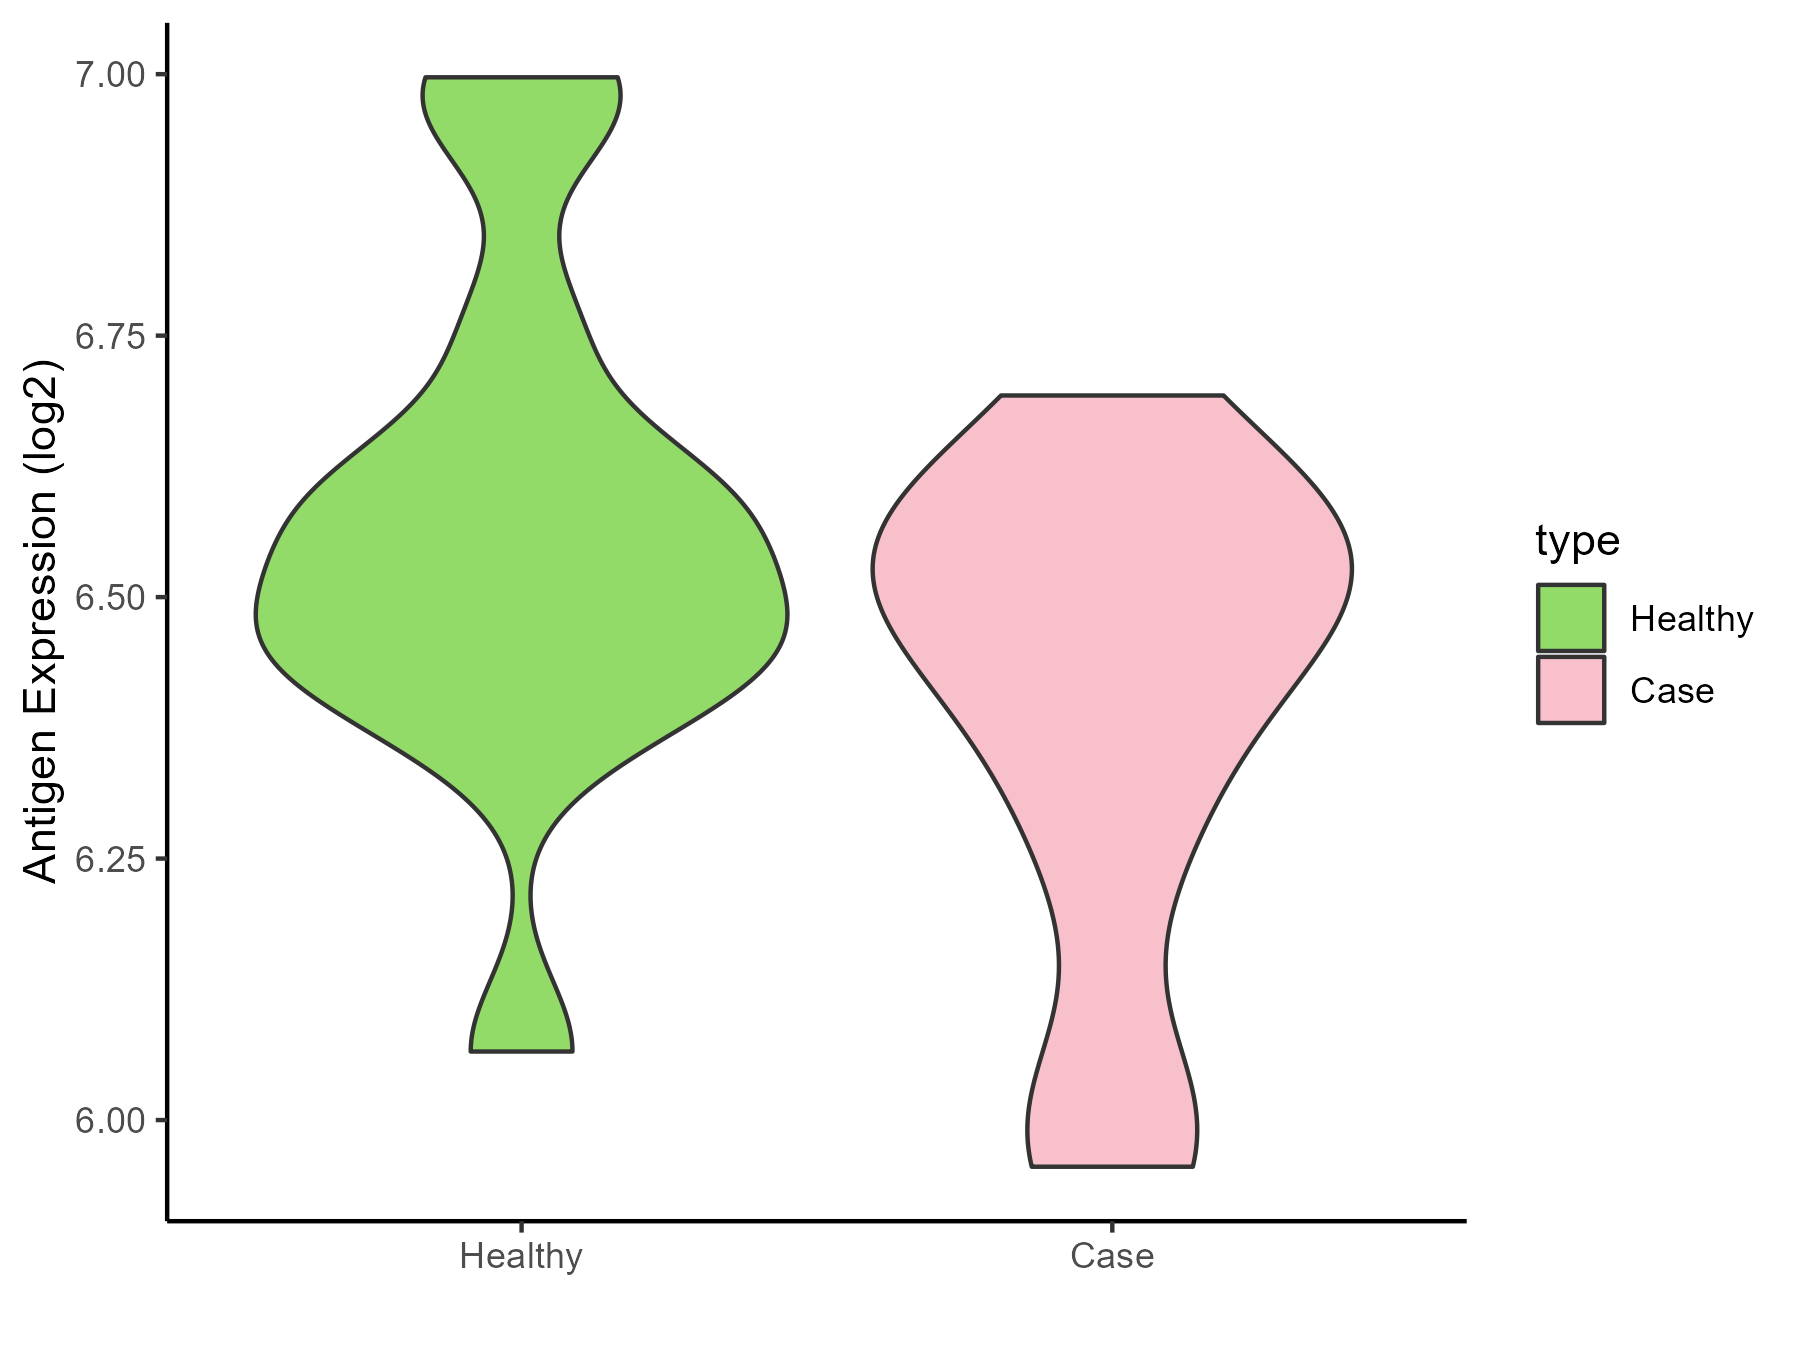
| Differential expression pattern of antigen in diseases | ||
| The Studied Tissue | Vastus lateralis muscle | |
| The Specific Disease | Polycystic ovary syndrome | |
| The Expression Level of Disease Section Compare with the Healthy Individual Tissue | p-value: 0.07538816; Fold-change: -0.051550865; Z-score: -0.209863343 | |
| Disease-specific Antigen Abundances |
|
Click to View the Clearer Original Diagram |
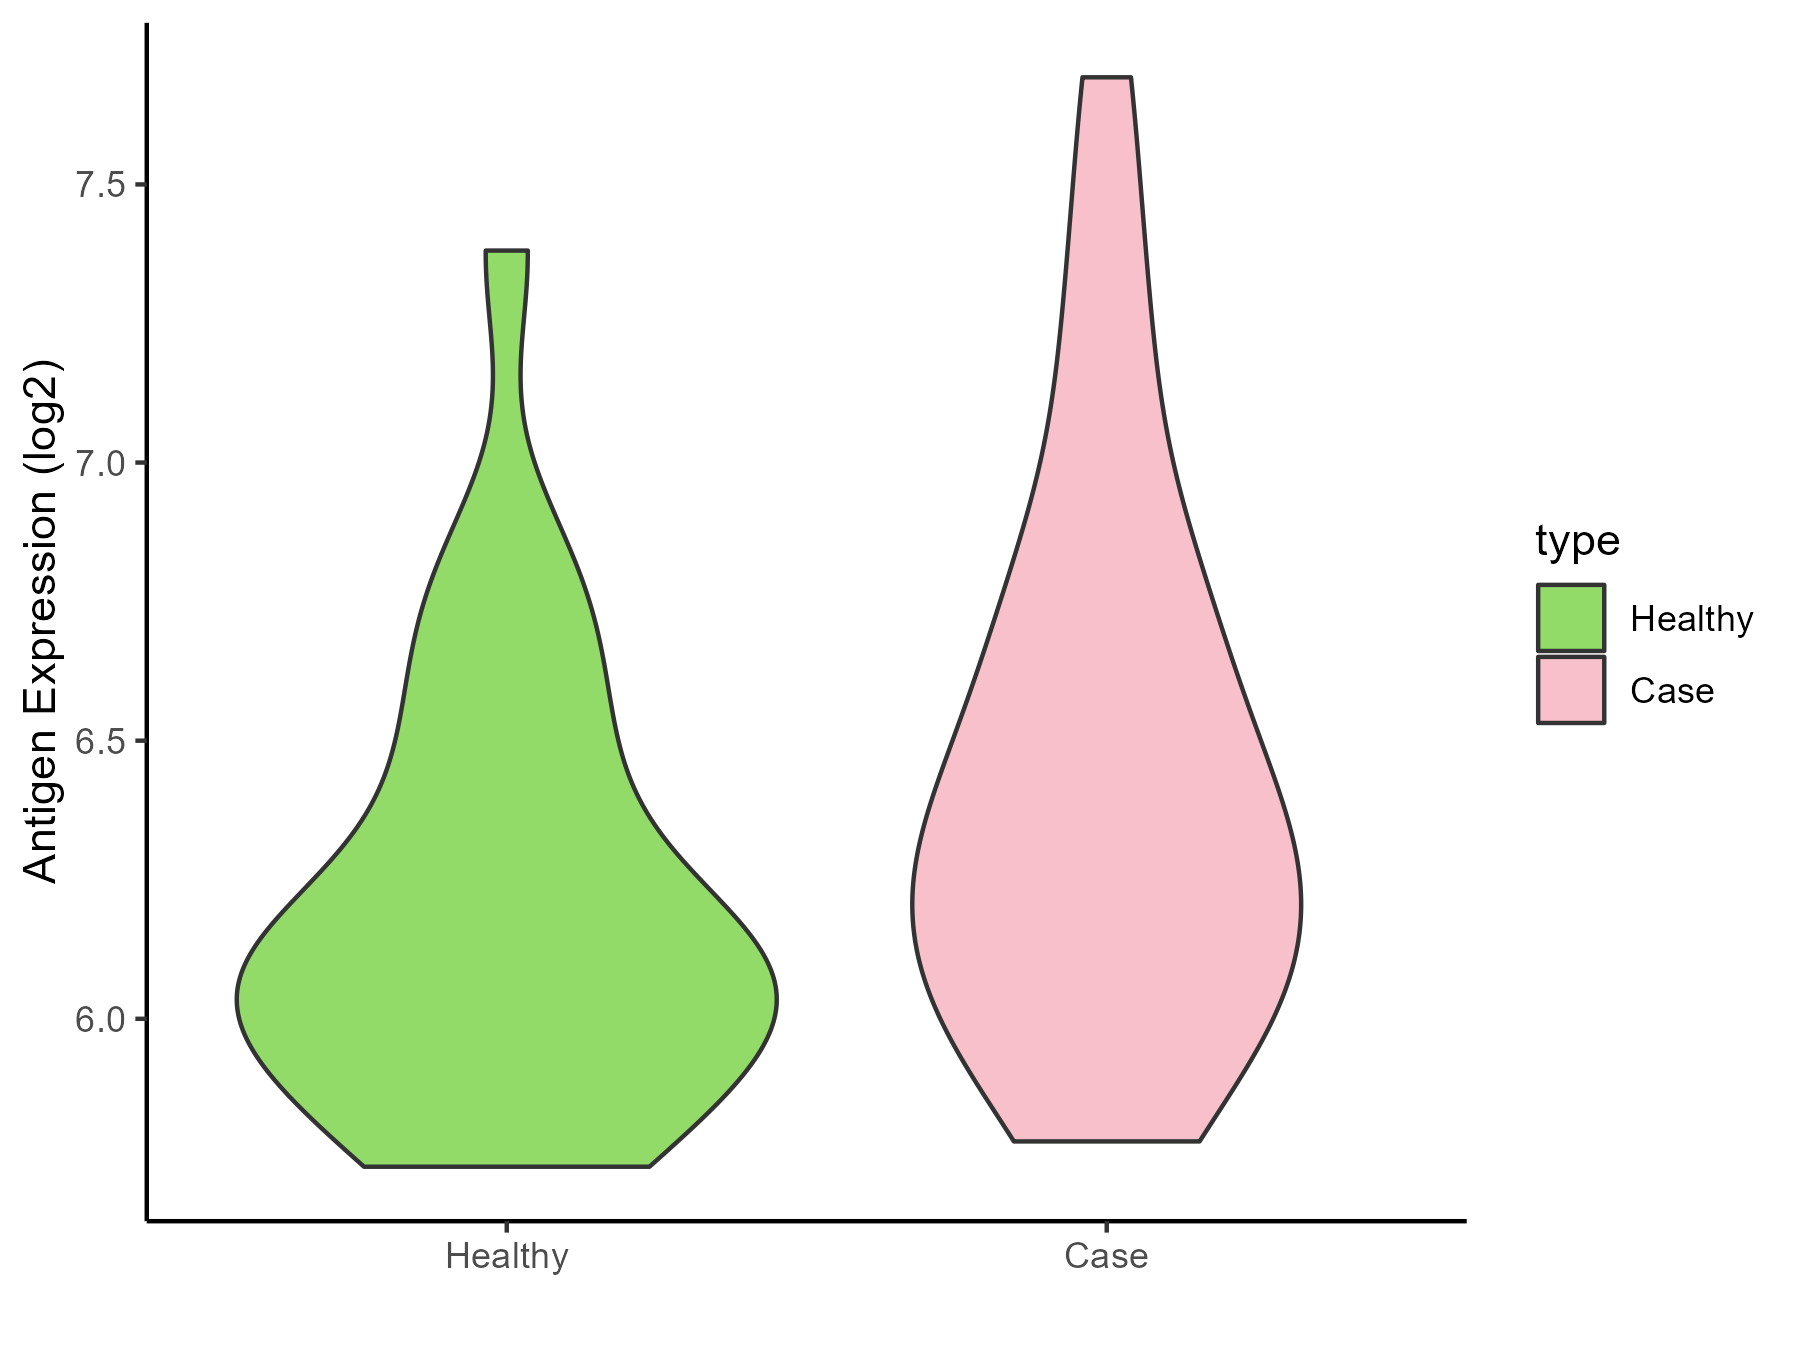
| Differential expression pattern of antigen in diseases | ||
| The Studied Tissue | Subcutaneous Adipose | |
| The Specific Disease | Obesity | |
| The Expression Level of Disease Section Compare with the Healthy Individual Tissue | p-value: 0.064495664; Fold-change: 0.22036411; Z-score: 0.558817231 | |
| Disease-specific Antigen Abundances |
|
Click to View the Clearer Original Diagram |
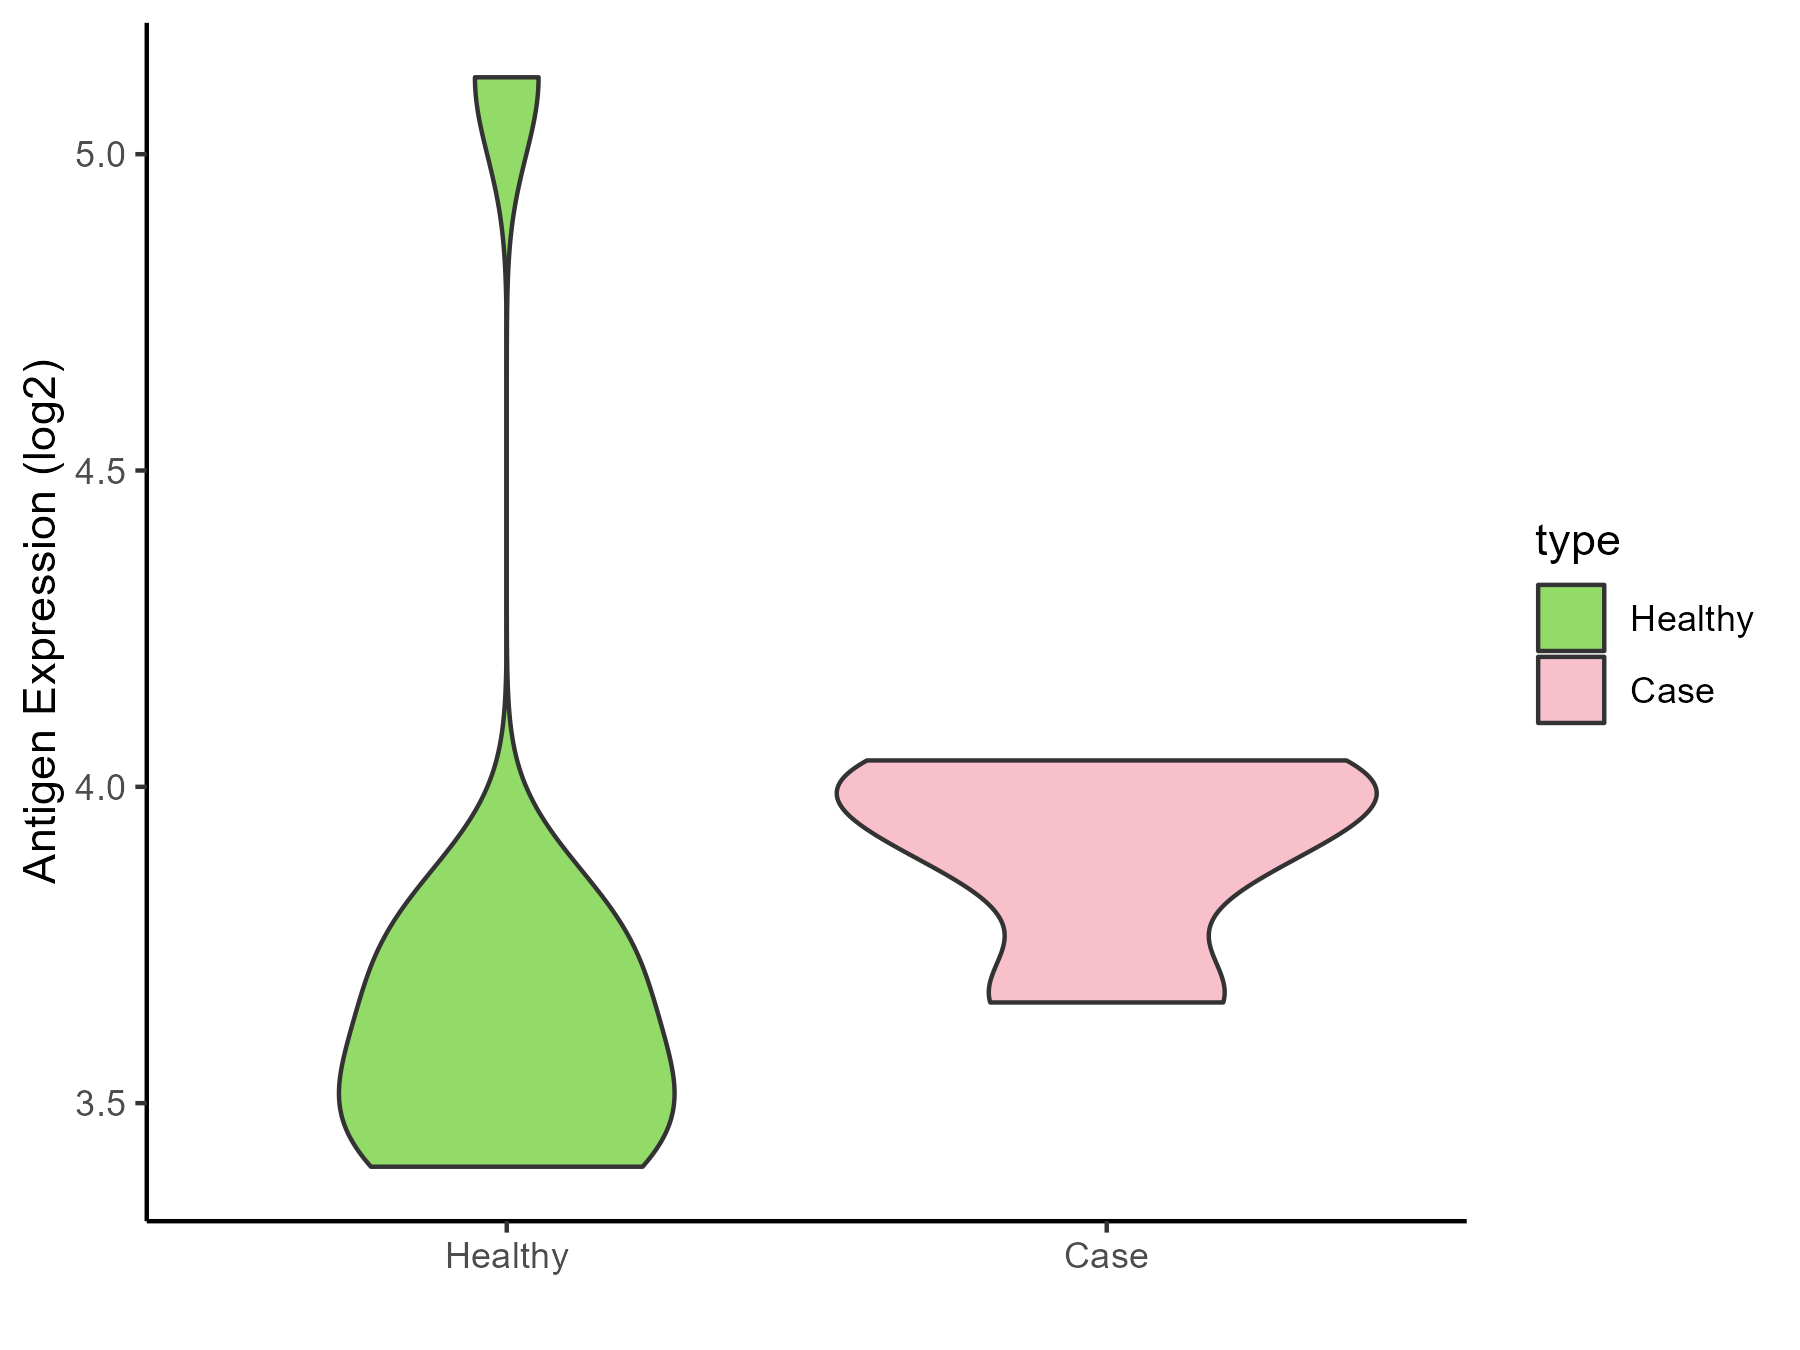
| Differential expression pattern of antigen in diseases | ||
| The Studied Tissue | Biceps muscle | |
| The Specific Disease | Pompe disease | |
| The Expression Level of Disease Section Compare with the Healthy Individual Tissue | p-value: 0.370738287; Fold-change: 0.351315418; Z-score: 0.692188494 | |
| Disease-specific Antigen Abundances |
|
Click to View the Clearer Original Diagram |
| Differential expression pattern of antigen in diseases | ||
| The Studied Tissue | Whole blood | |
| The Specific Disease | Batten disease | |
| The Expression Level of Disease Section Compare with the Healthy Individual Tissue | p-value: 0.842277404; Fold-change: 0.228699903; Z-score: 0.488252521 | |
| Disease-specific Antigen Abundances |
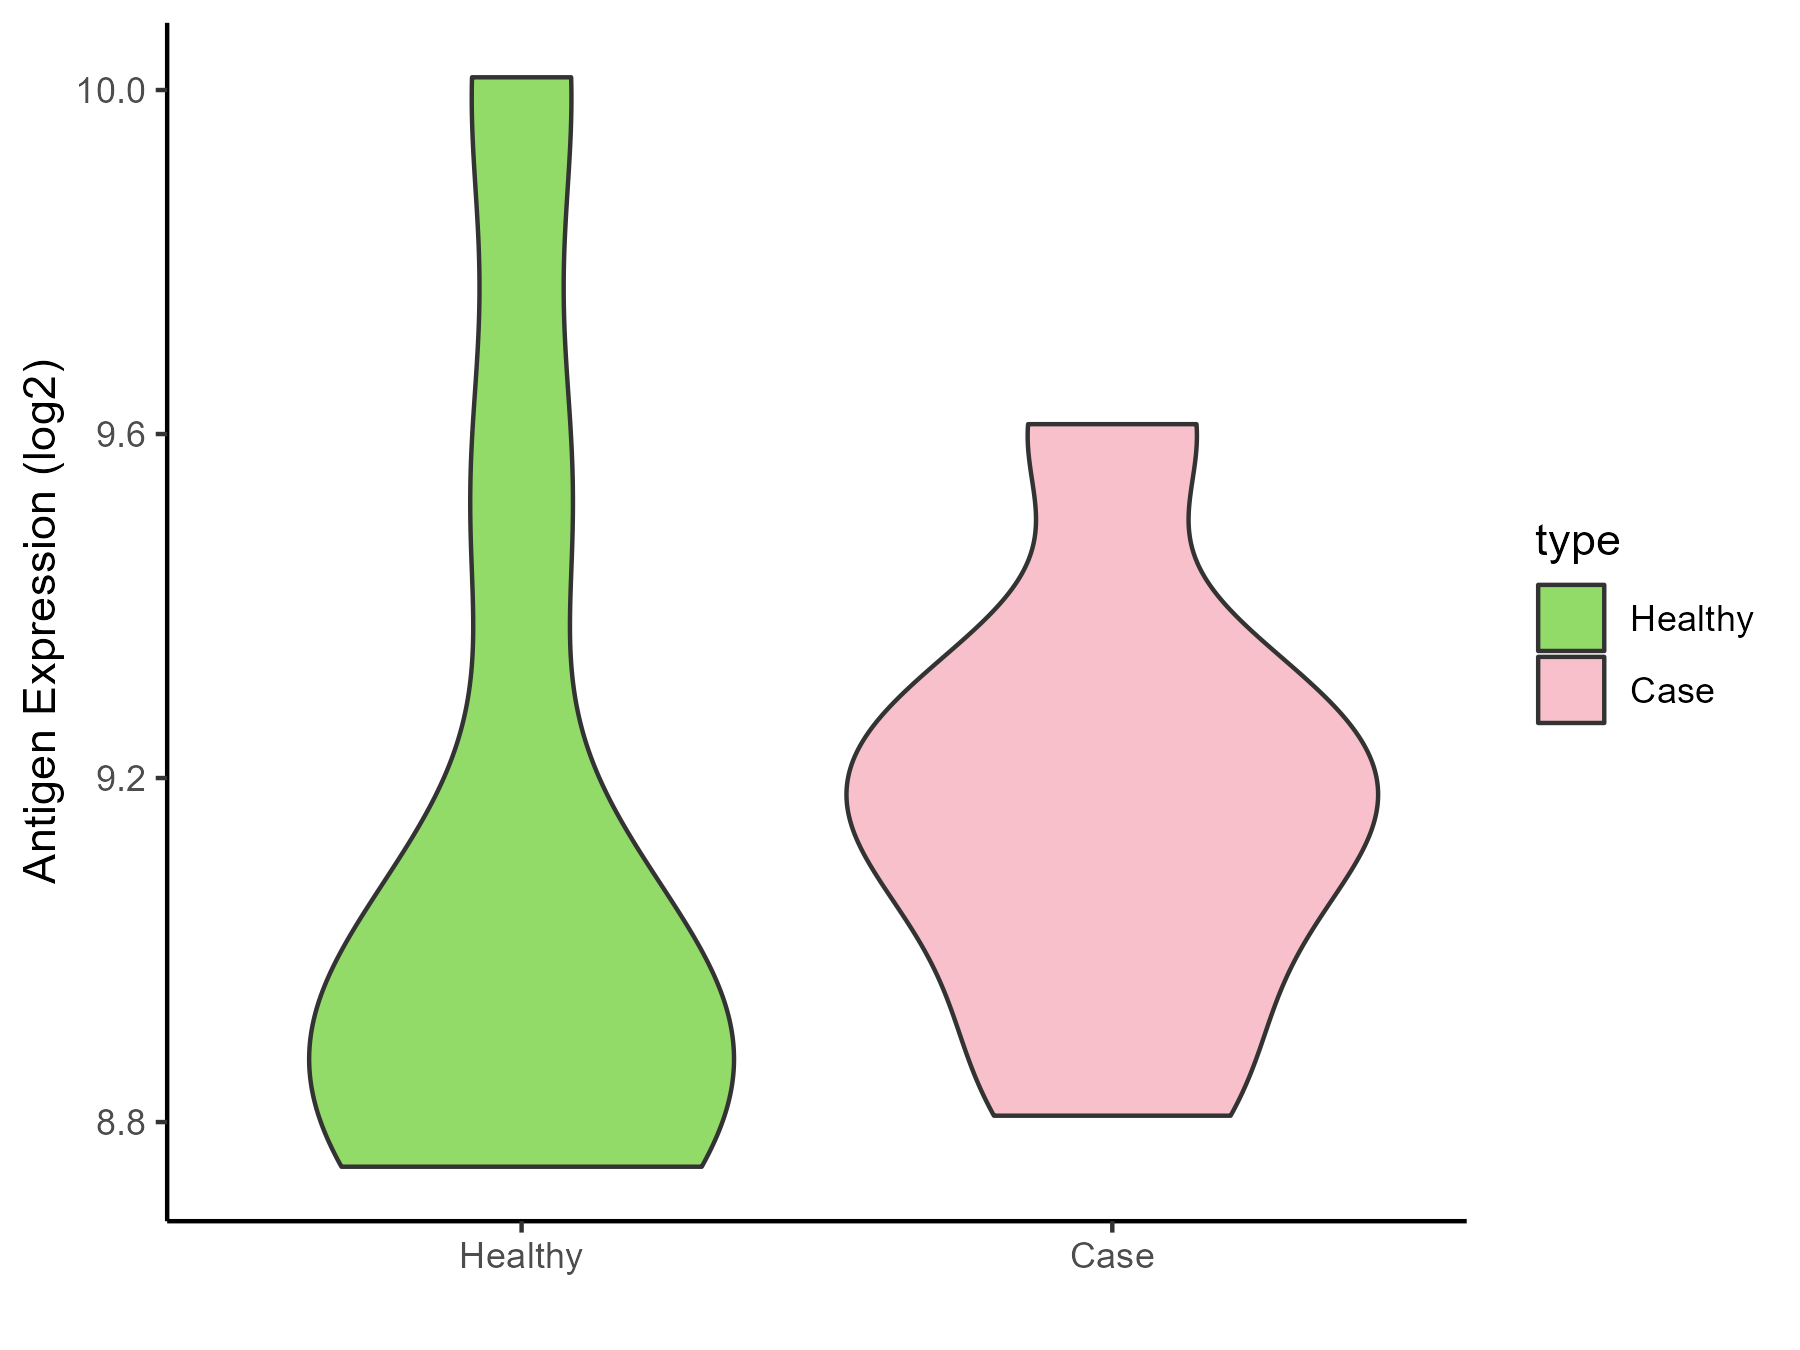
|
Click to View the Clearer Original Diagram |
ICD Disease Classification 6
| Differential expression pattern of antigen in diseases | ||
| The Studied Tissue | Whole blood | |
| The Specific Disease | Autism | |
| The Expression Level of Disease Section Compare with the Healthy Individual Tissue | p-value: 0.05576914; Fold-change: 0.199703514; Z-score: 0.773797754 | |
| Disease-specific Antigen Abundances |
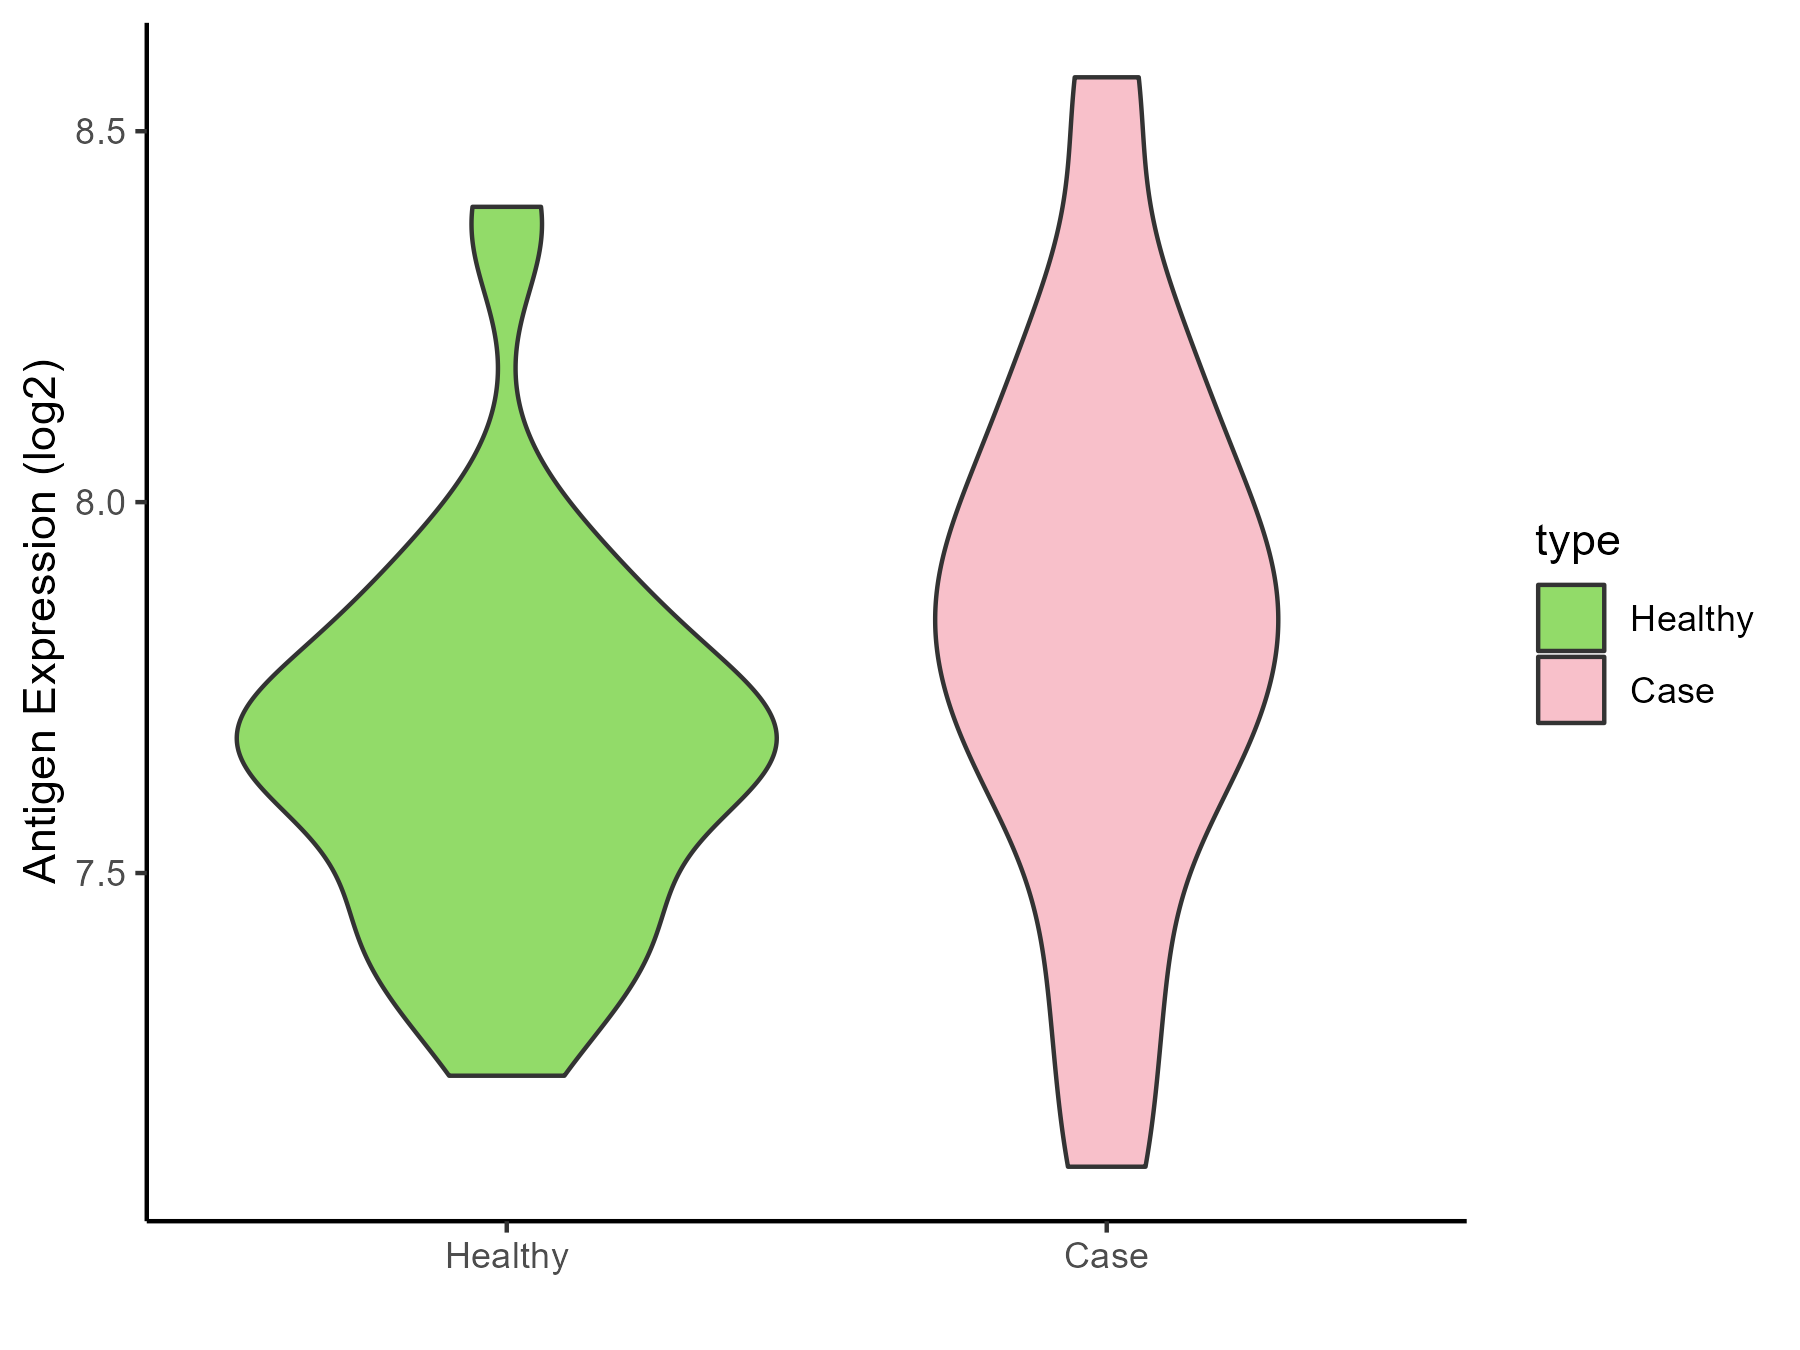
|
Click to View the Clearer Original Diagram |
| Differential expression pattern of antigen in diseases | ||
| The Studied Tissue | Whole blood | |
| The Specific Disease | Anxiety disorder | |
| The Expression Level of Disease Section Compare with the Healthy Individual Tissue | p-value: 0.85430777; Fold-change: -0.041875909; Z-score: -0.07451898 | |
| Disease-specific Antigen Abundances |
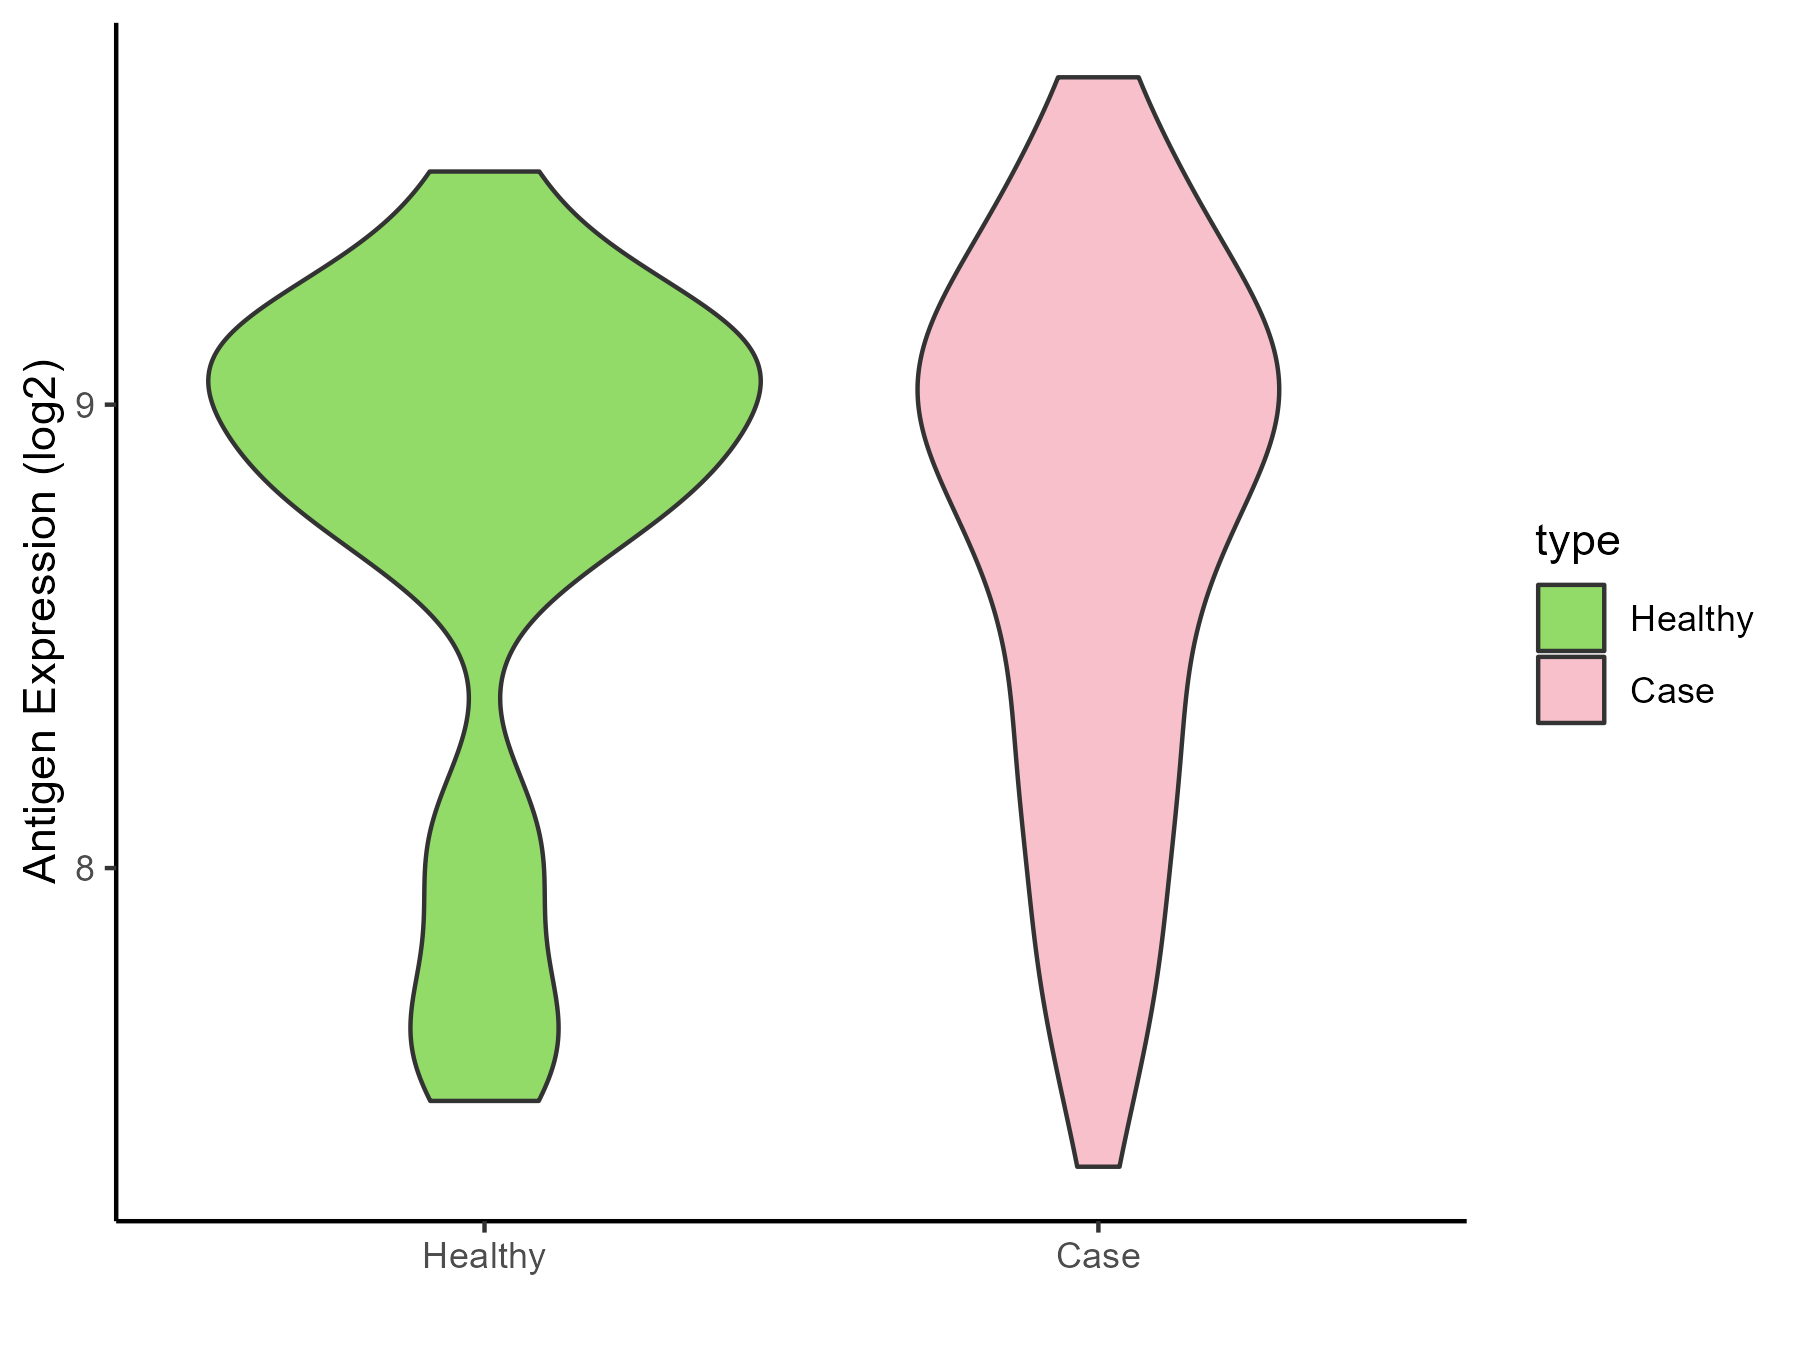
|
Click to View the Clearer Original Diagram |
ICD Disease Classification 8
| Differential expression pattern of antigen in diseases | ||
| The Studied Tissue | Substantia nigra | |
| The Specific Disease | Parkinson disease | |
| The Expression Level of Disease Section Compare with the Healthy Individual Tissue | p-value: 0.289713071; Fold-change: 0.242993091; Z-score: 0.864862175 | |
| Disease-specific Antigen Abundances |
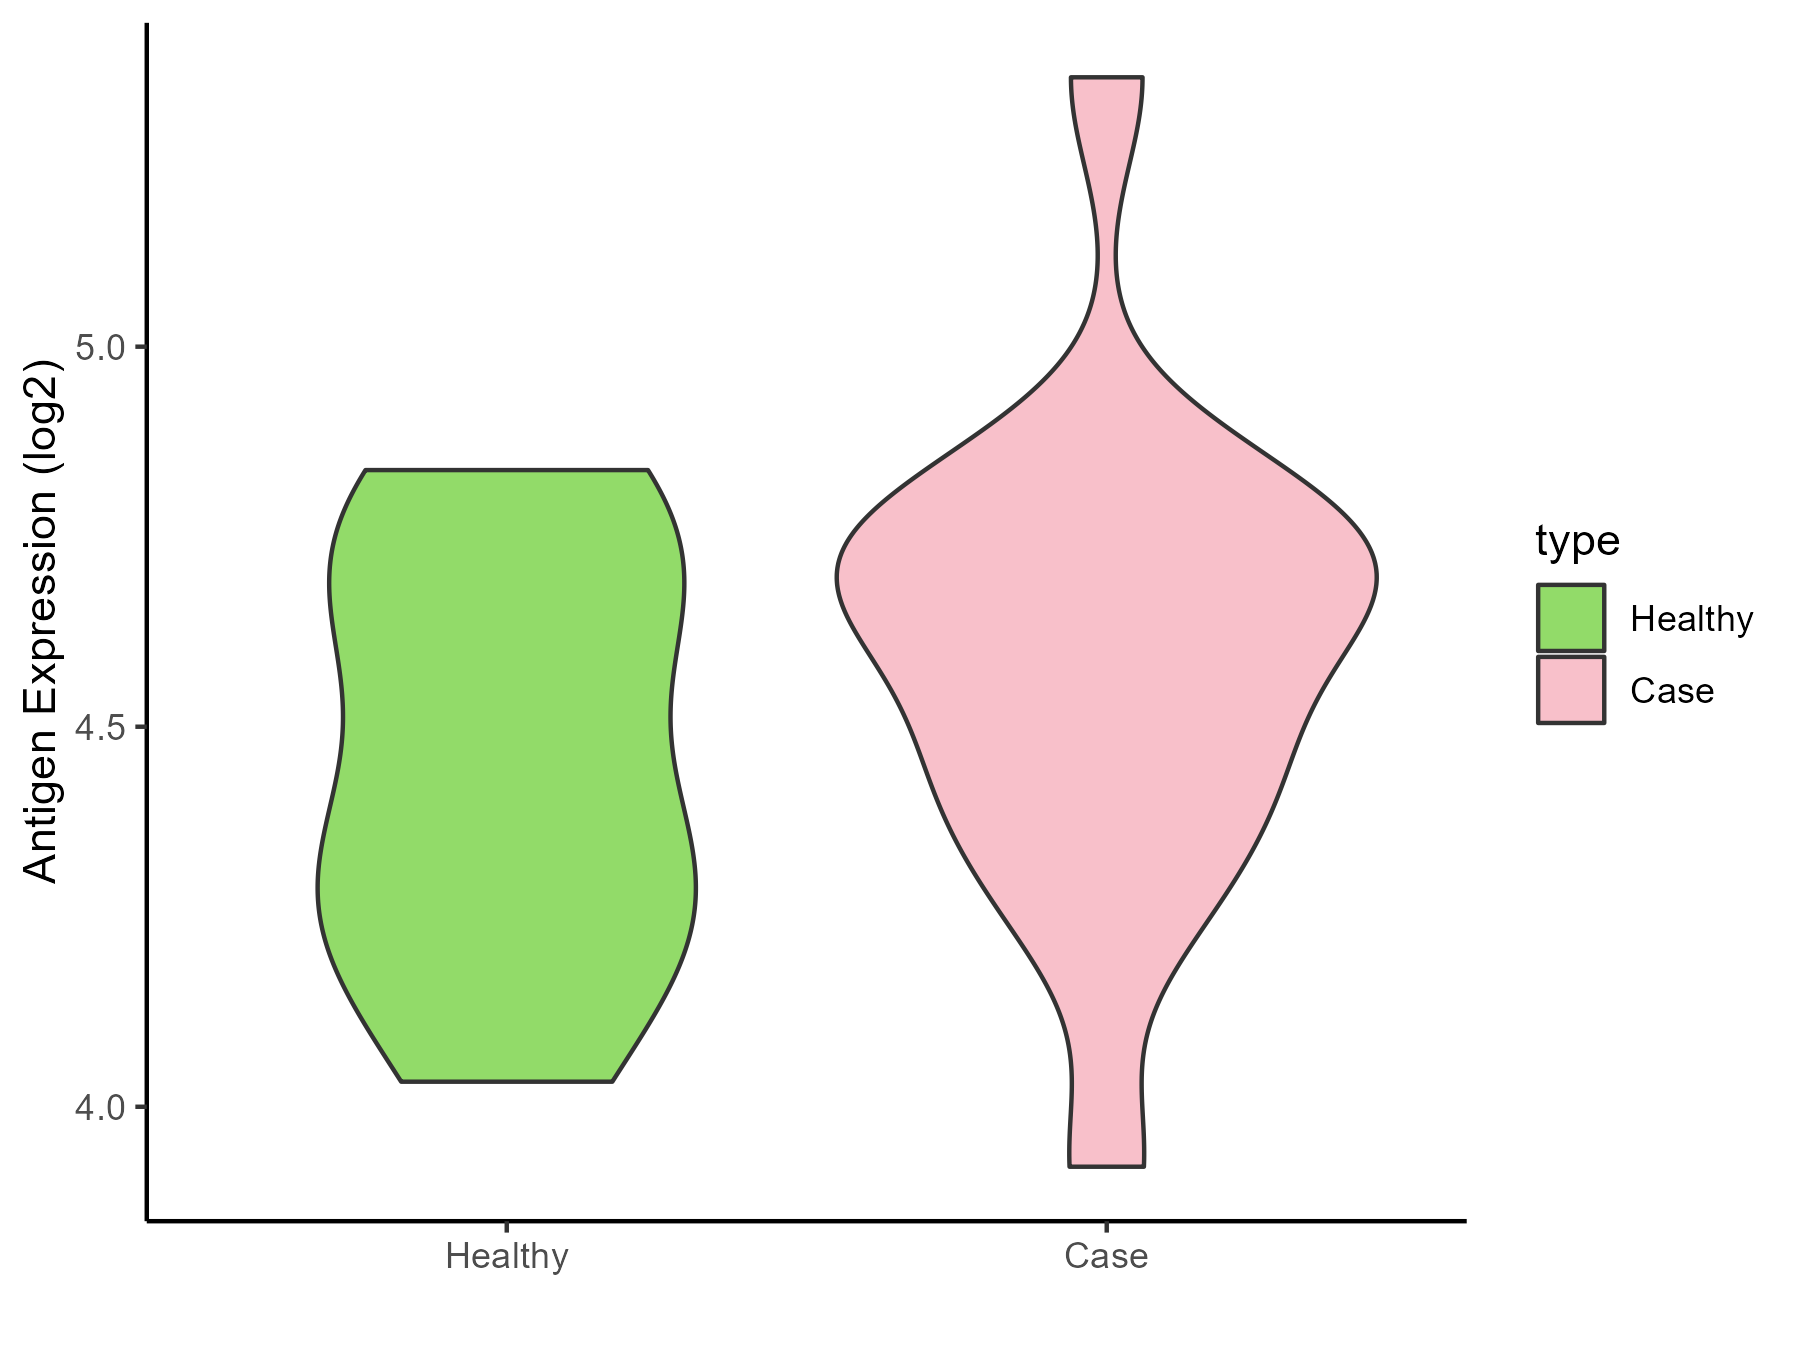
|
Click to View the Clearer Original Diagram |
| Differential expression pattern of antigen in diseases | ||
| The Studied Tissue | Whole blood | |
| The Specific Disease | Huntington disease | |
| The Expression Level of Disease Section Compare with the Healthy Individual Tissue | p-value: 0.208986759; Fold-change: 0.034855435; Z-score: 0.035463569 | |
| Disease-specific Antigen Abundances |
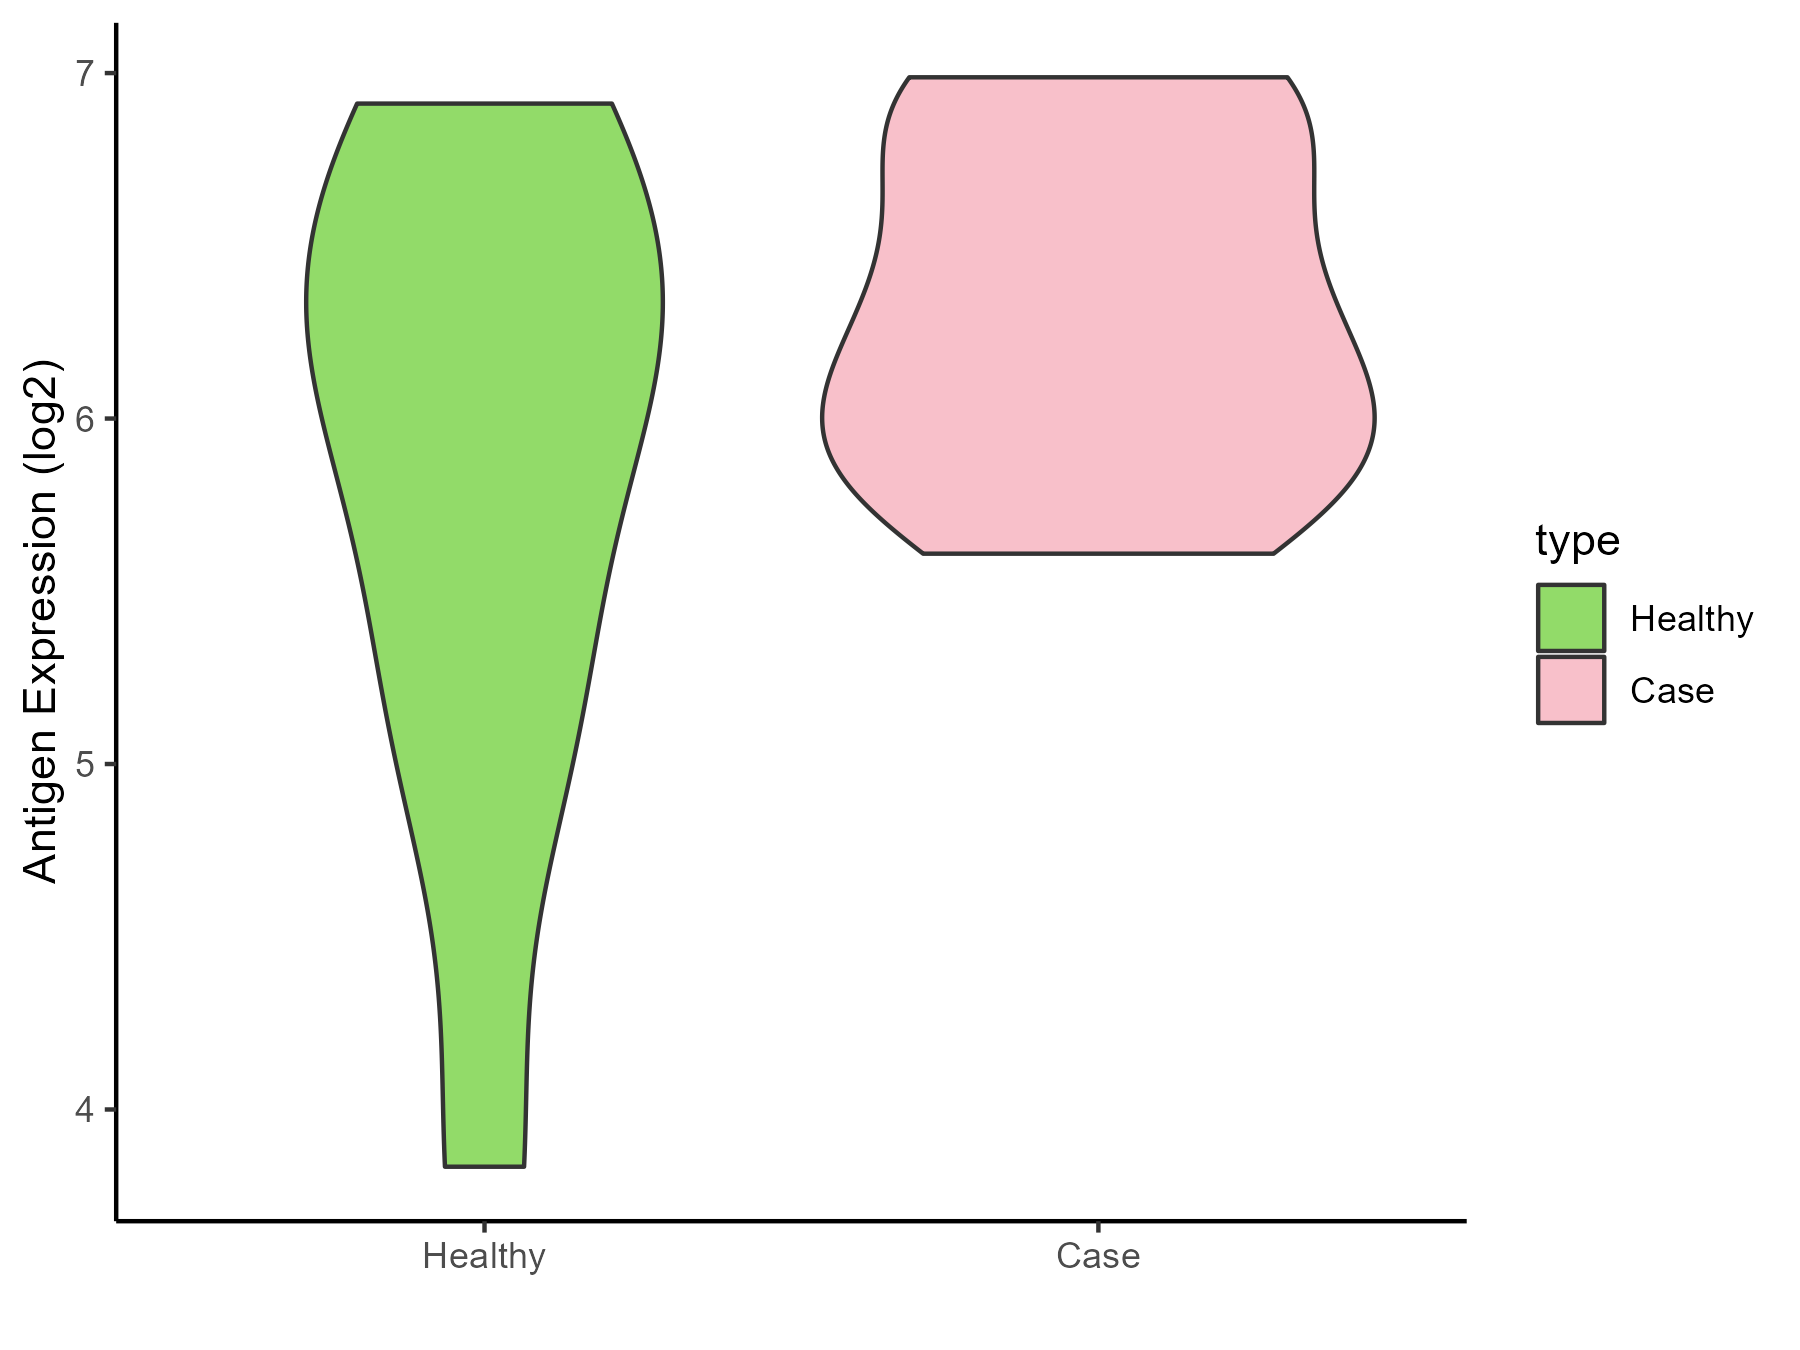
|
Click to View the Clearer Original Diagram |
| Differential expression pattern of antigen in diseases | ||
| The Studied Tissue | Entorhinal cortex | |
| The Specific Disease | Alzheimer disease | |
| The Expression Level of Disease Section Compare with the Healthy Individual Tissue | p-value: 0.000371885; Fold-change: 0.166589772; Z-score: 0.696762092 | |
| Disease-specific Antigen Abundances |
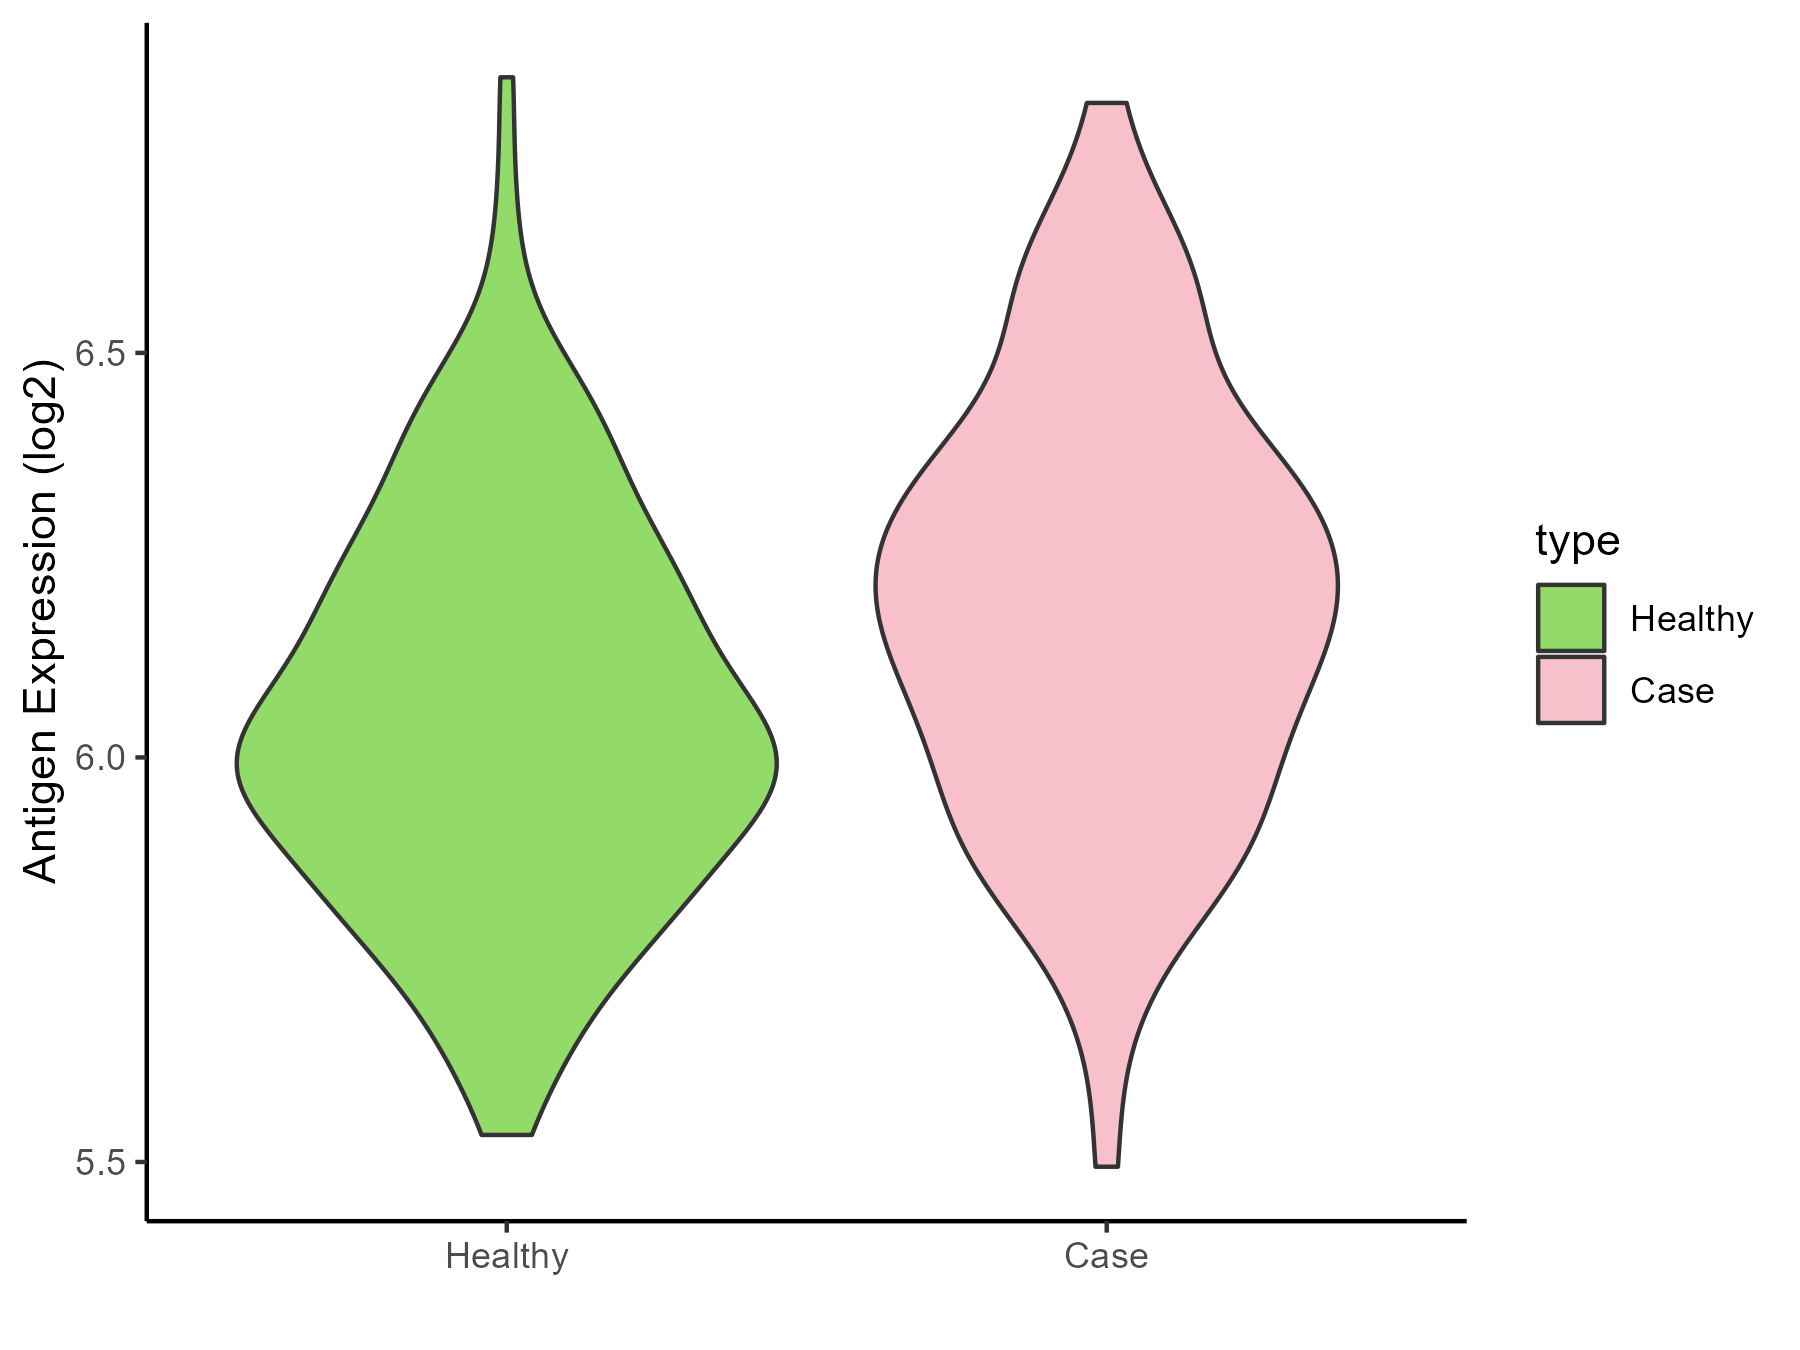
|
Click to View the Clearer Original Diagram |
| Differential expression pattern of antigen in diseases | ||
| The Studied Tissue | Whole blood | |
| The Specific Disease | Seizure | |
| The Expression Level of Disease Section Compare with the Healthy Individual Tissue | p-value: 0.150927103; Fold-change: -0.070248431; Z-score: -0.174518656 | |
| Disease-specific Antigen Abundances |
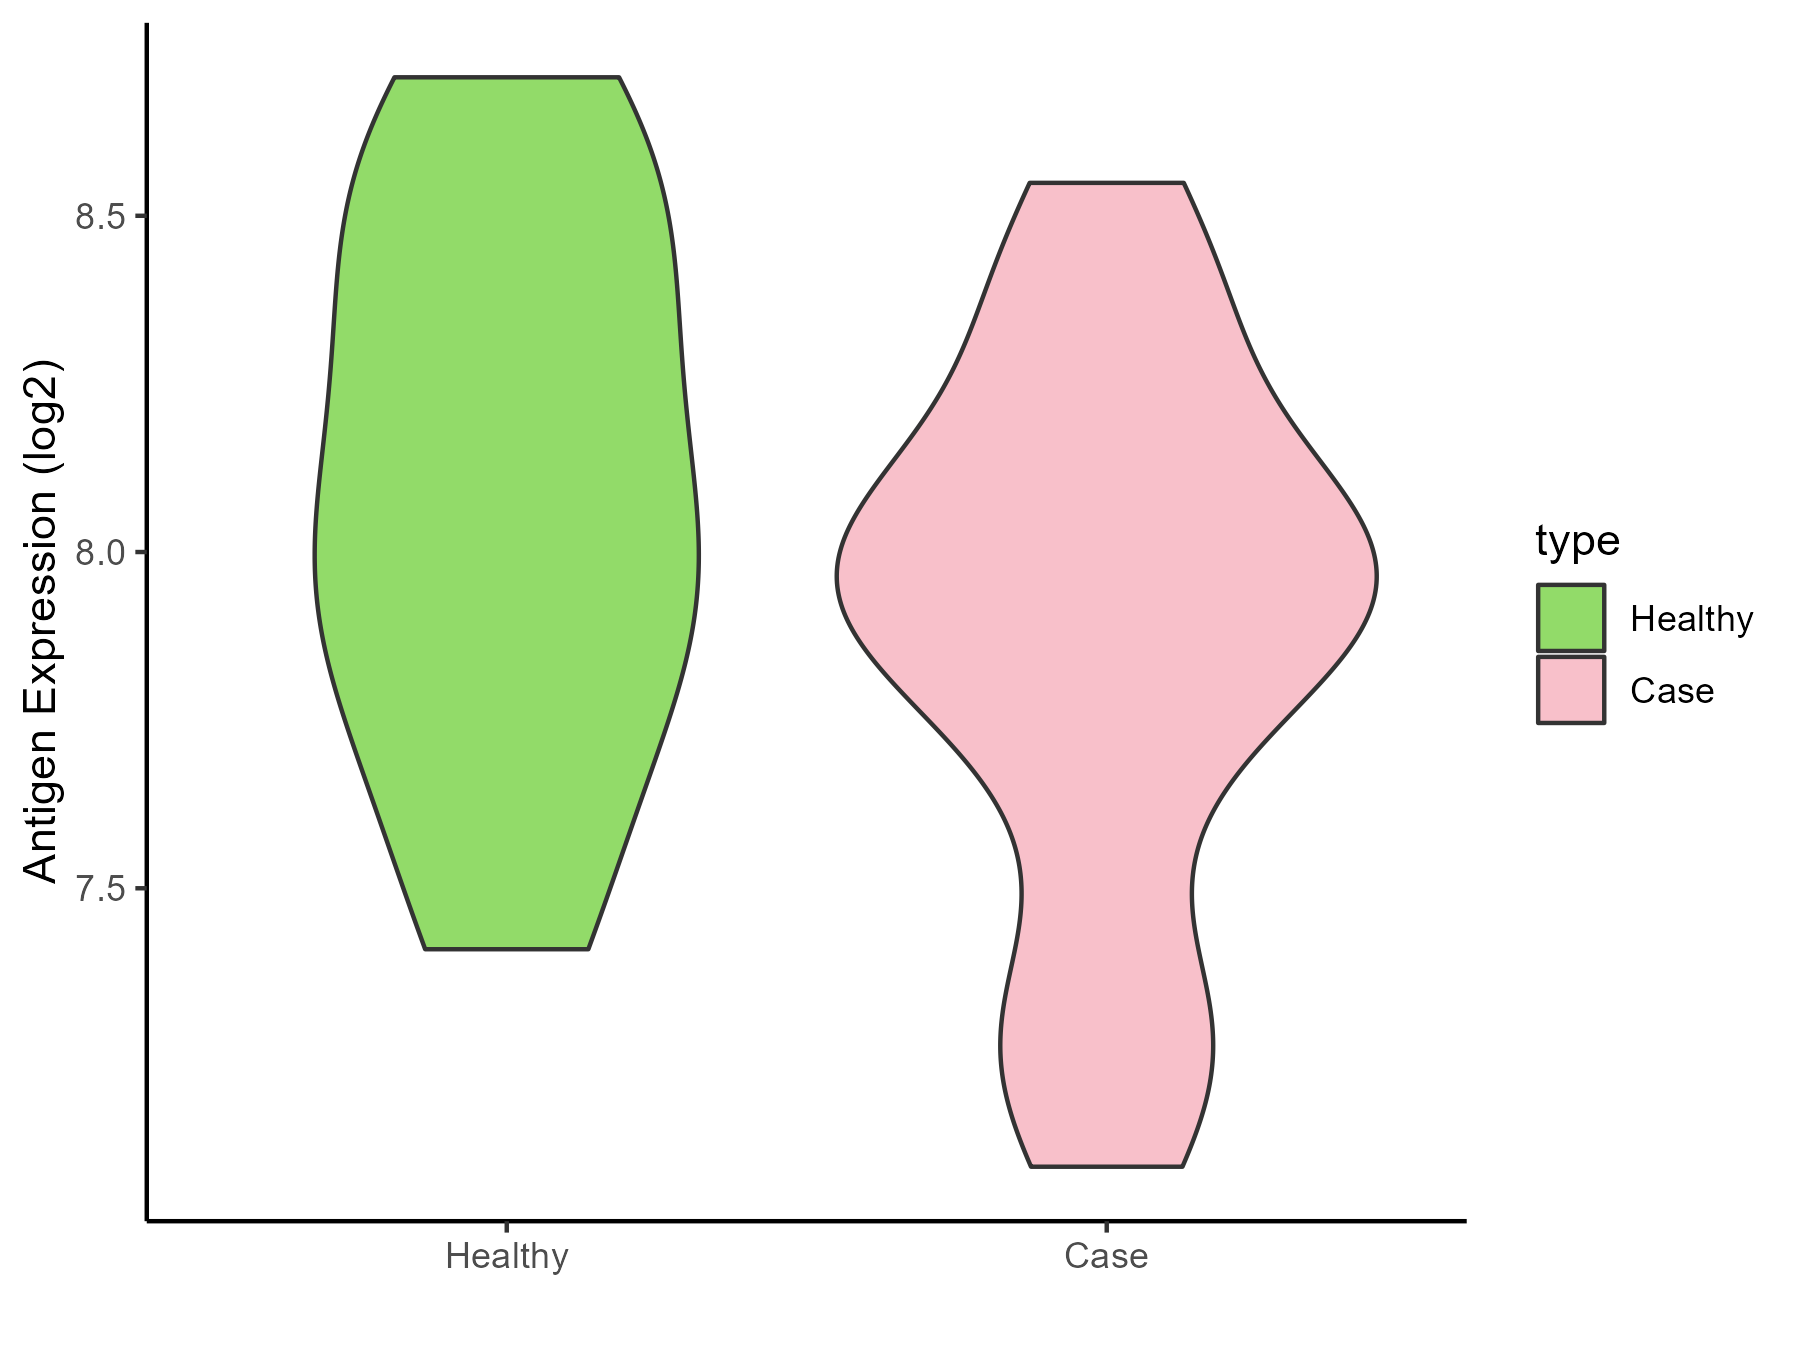
|
Click to View the Clearer Original Diagram |
| Differential expression pattern of antigen in diseases | ||
| The Studied Tissue | Skin | |
| The Specific Disease | Lateral sclerosis | |
| The Expression Level of Disease Section Compare with the Healthy Individual Tissue | p-value: 0.517045504; Fold-change: -0.086309829; Z-score: -0.856007291 | |
| Disease-specific Antigen Abundances |
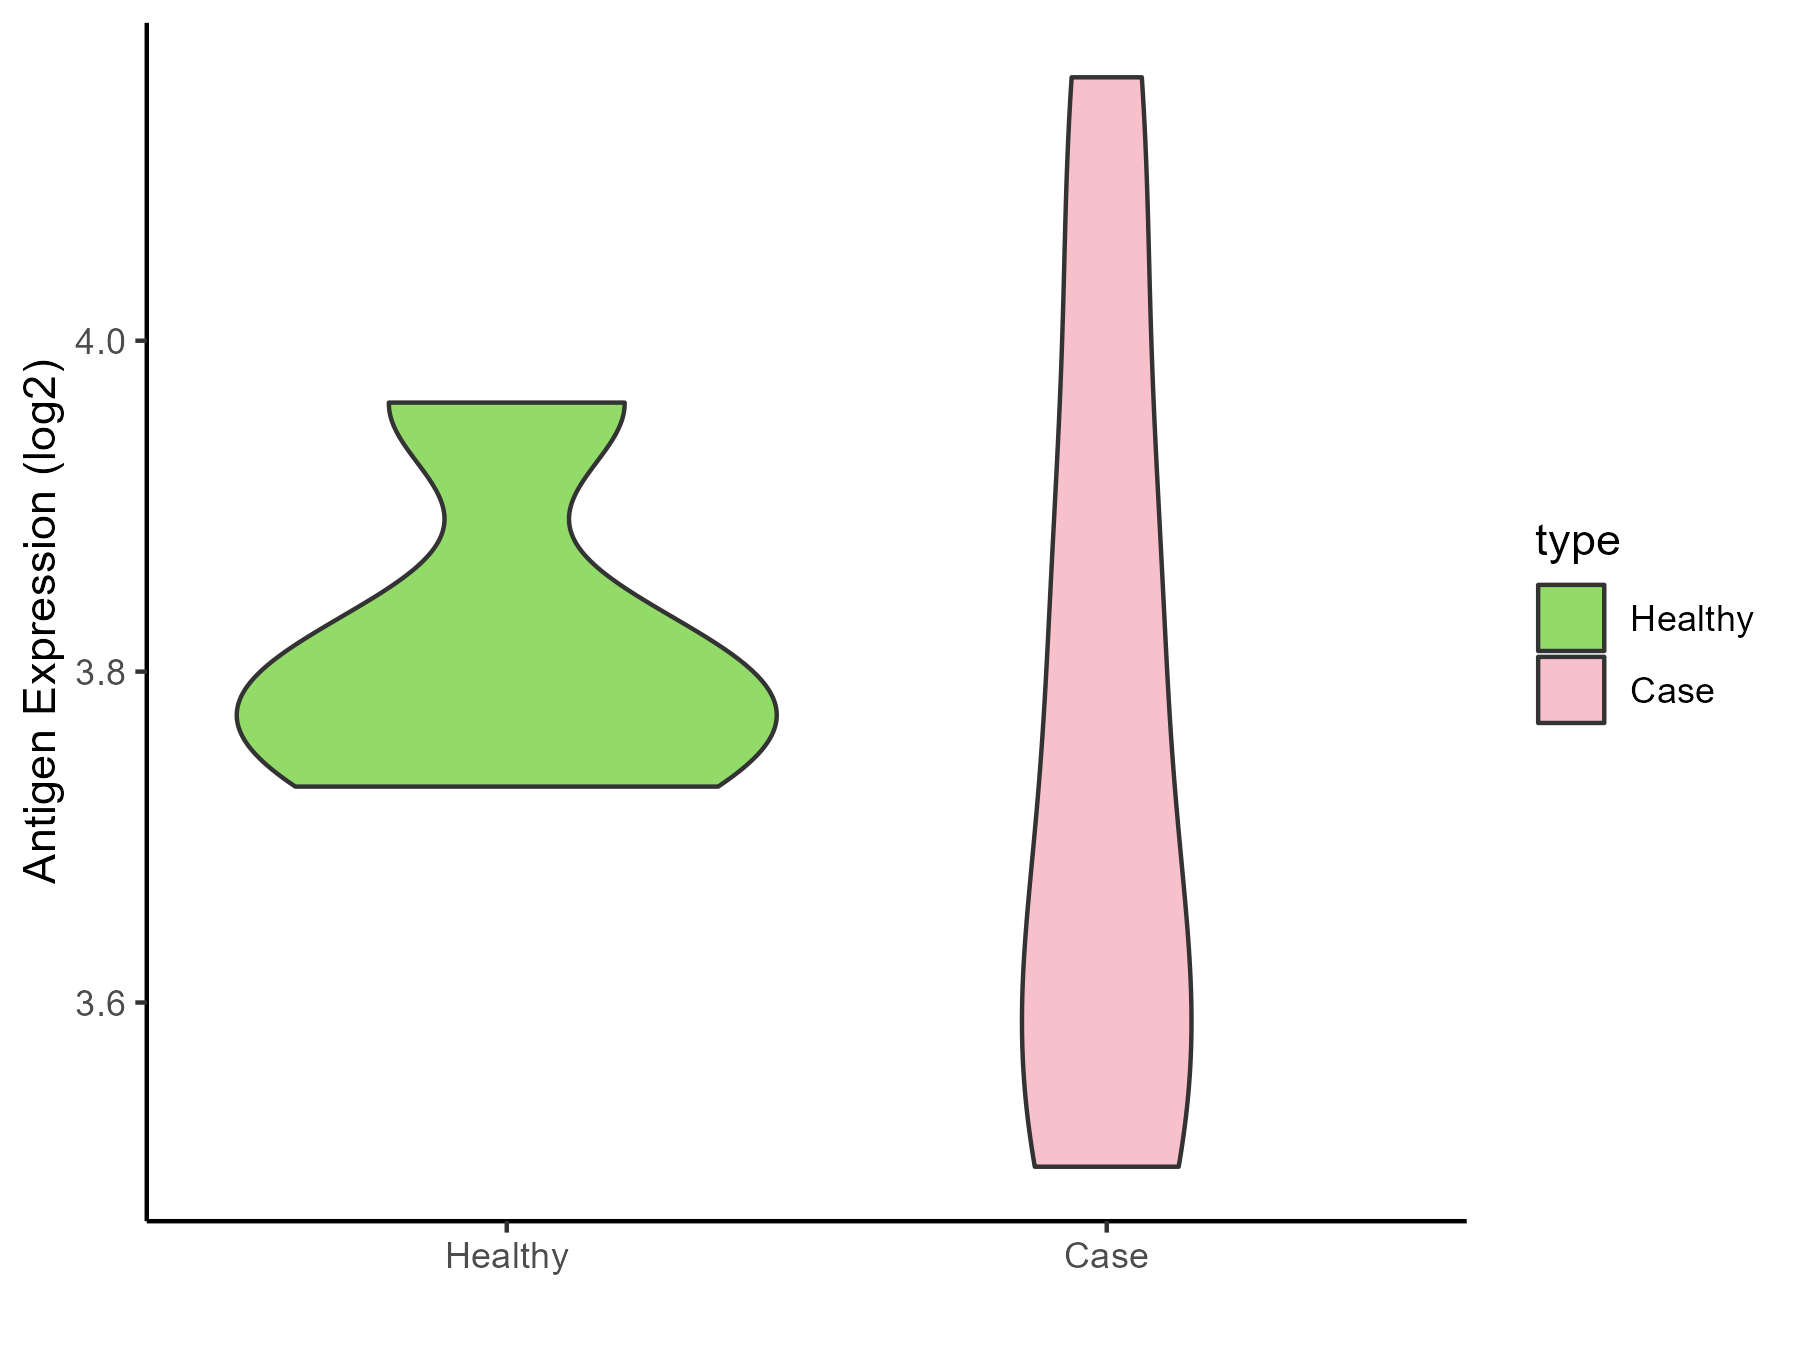
|
Click to View the Clearer Original Diagram |
| The Studied Tissue | Cervical spinal cord | |
| The Specific Disease | Lateral sclerosis | |
| The Expression Level of Disease Section Compare with the Healthy Individual Tissue | p-value: 0.257972331; Fold-change: 0.247575329; Z-score: 0.661822032 | |
| Disease-specific Antigen Abundances |
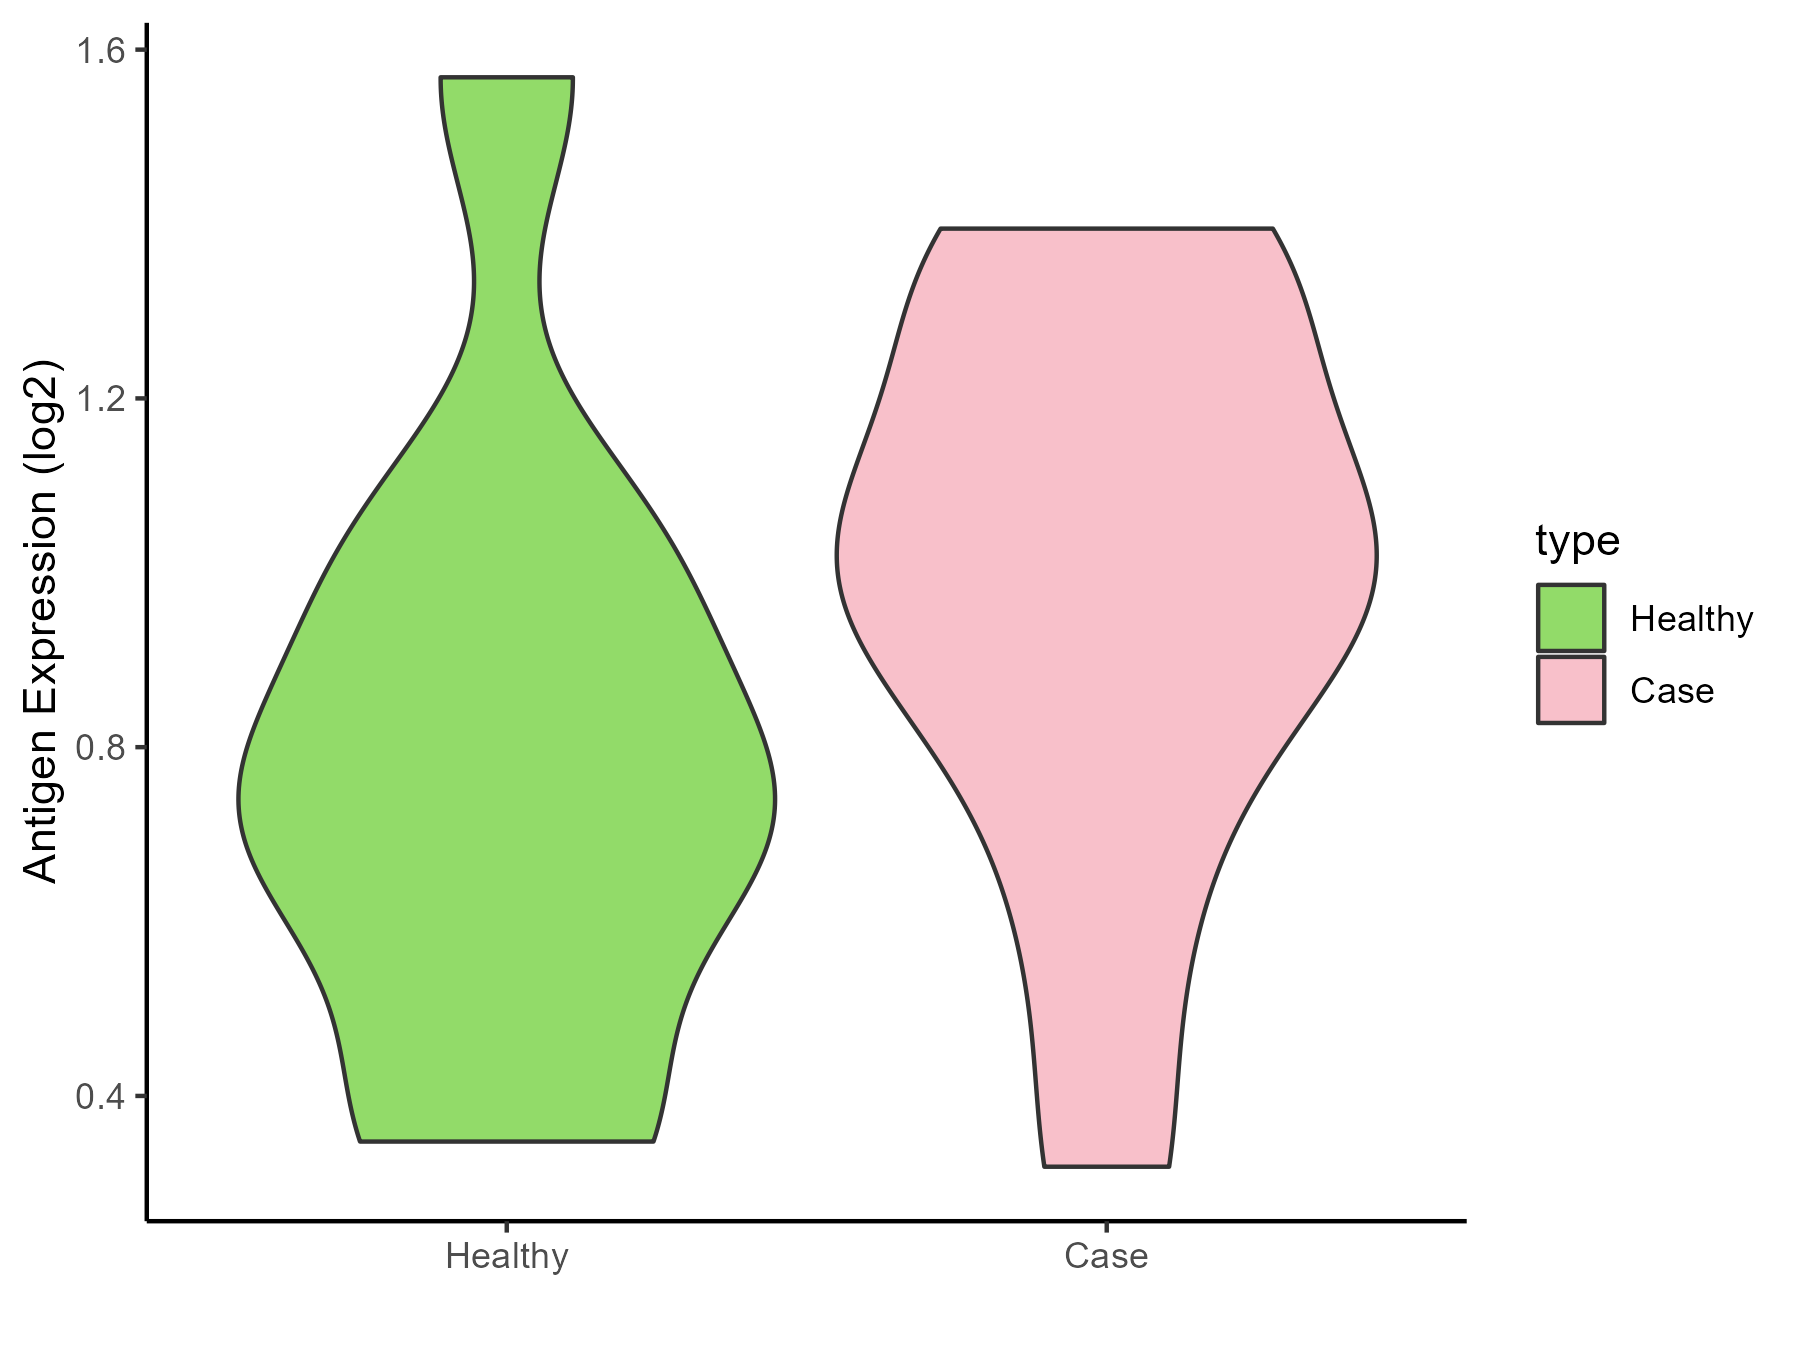
|
Click to View the Clearer Original Diagram |
| Differential expression pattern of antigen in diseases | ||
| The Studied Tissue | Muscle | |
| The Specific Disease | Muscular atrophy | |
| The Expression Level of Disease Section Compare with the Healthy Individual Tissue | p-value: 1.74E-05; Fold-change: 0.737121504; Z-score: 1.985971501 | |
| Disease-specific Antigen Abundances |
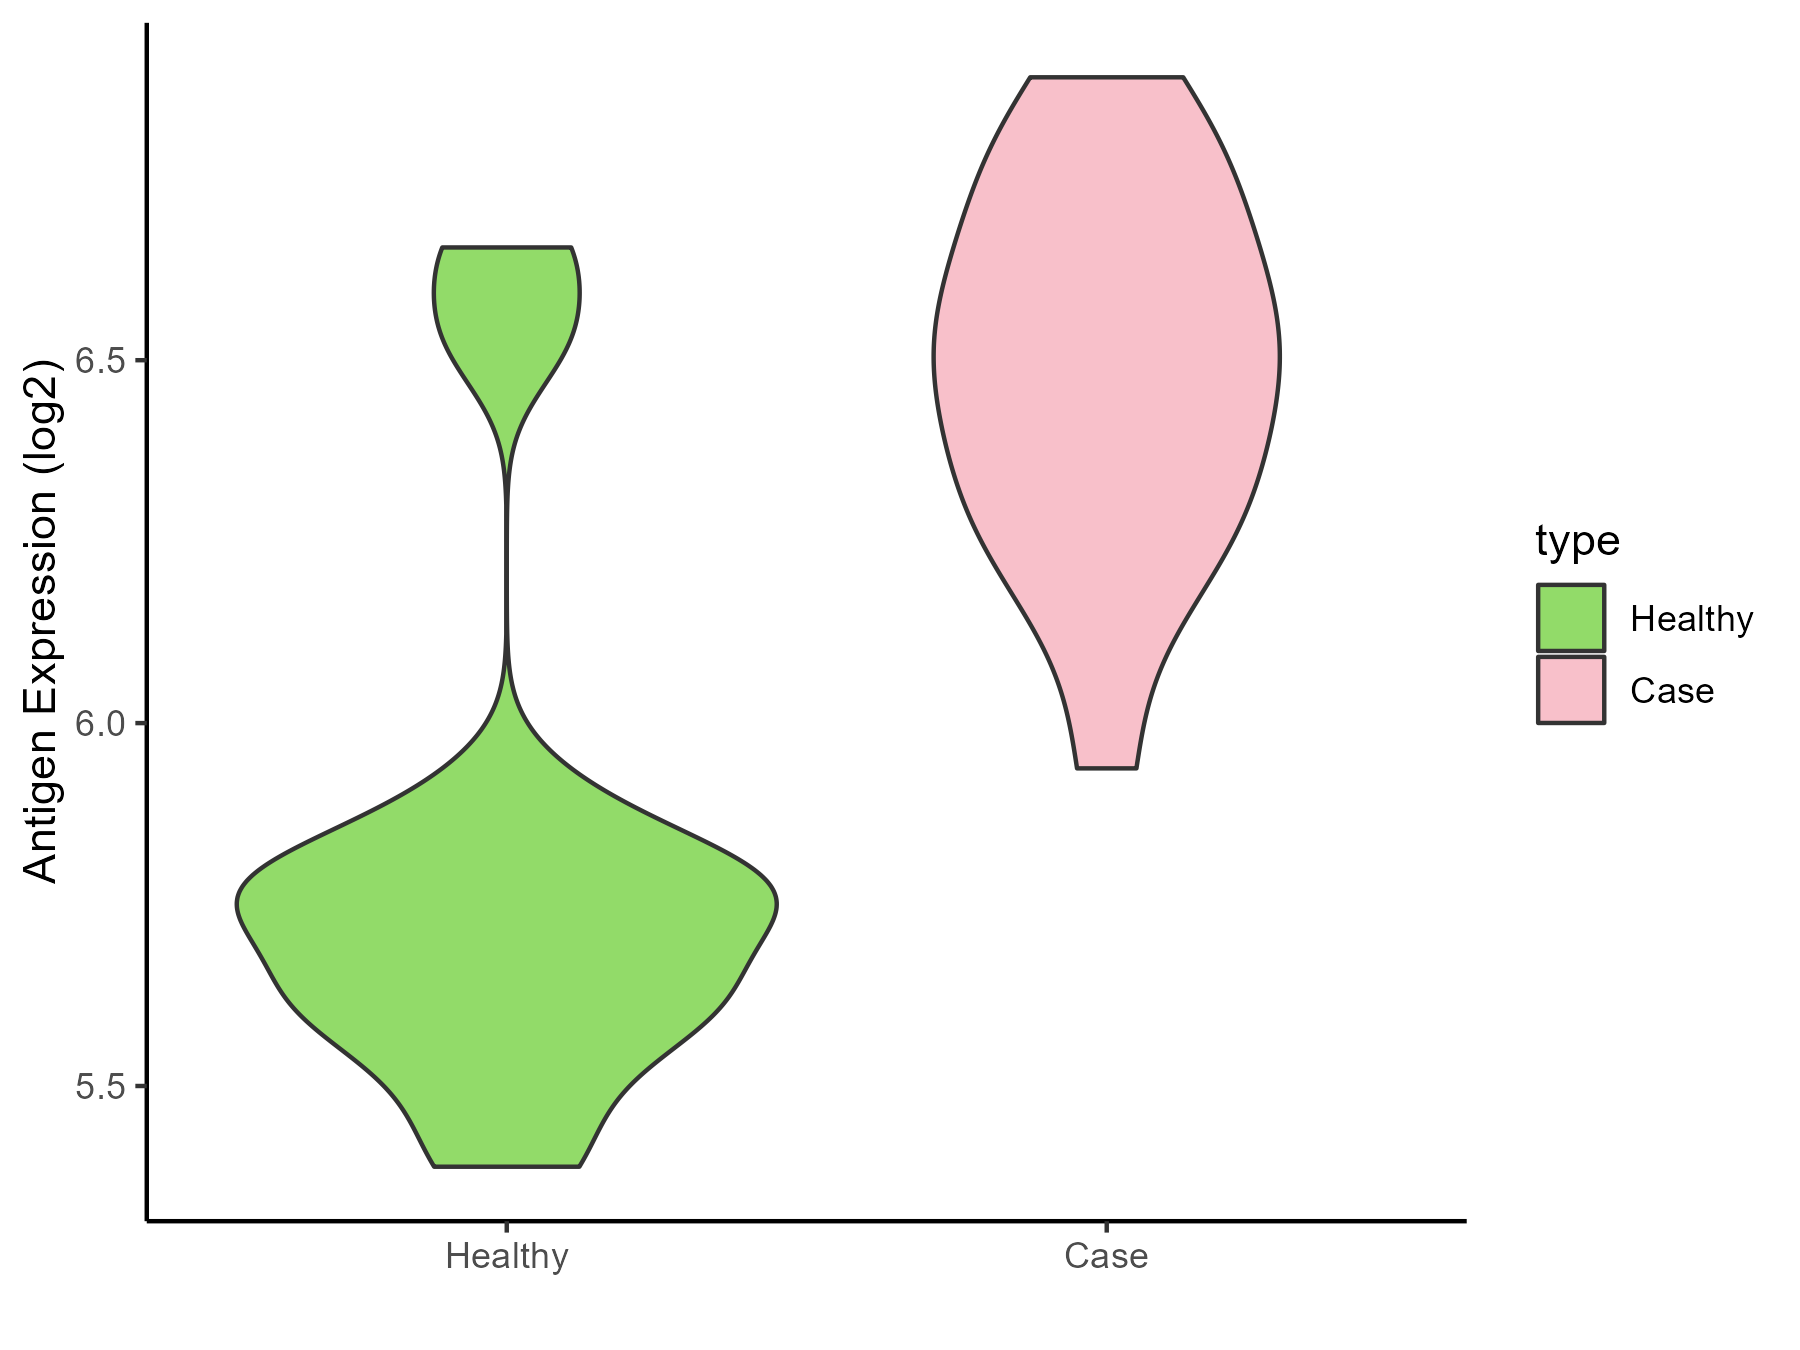
|
Click to View the Clearer Original Diagram |
| Differential expression pattern of antigen in diseases | ||
| The Studied Tissue | Muscle | |
| The Specific Disease | Myopathy | |
| The Expression Level of Disease Section Compare with the Healthy Individual Tissue | p-value: 0.036314172; Fold-change: 0.40964765; Z-score: 1.253429377 | |
| Disease-specific Antigen Abundances |
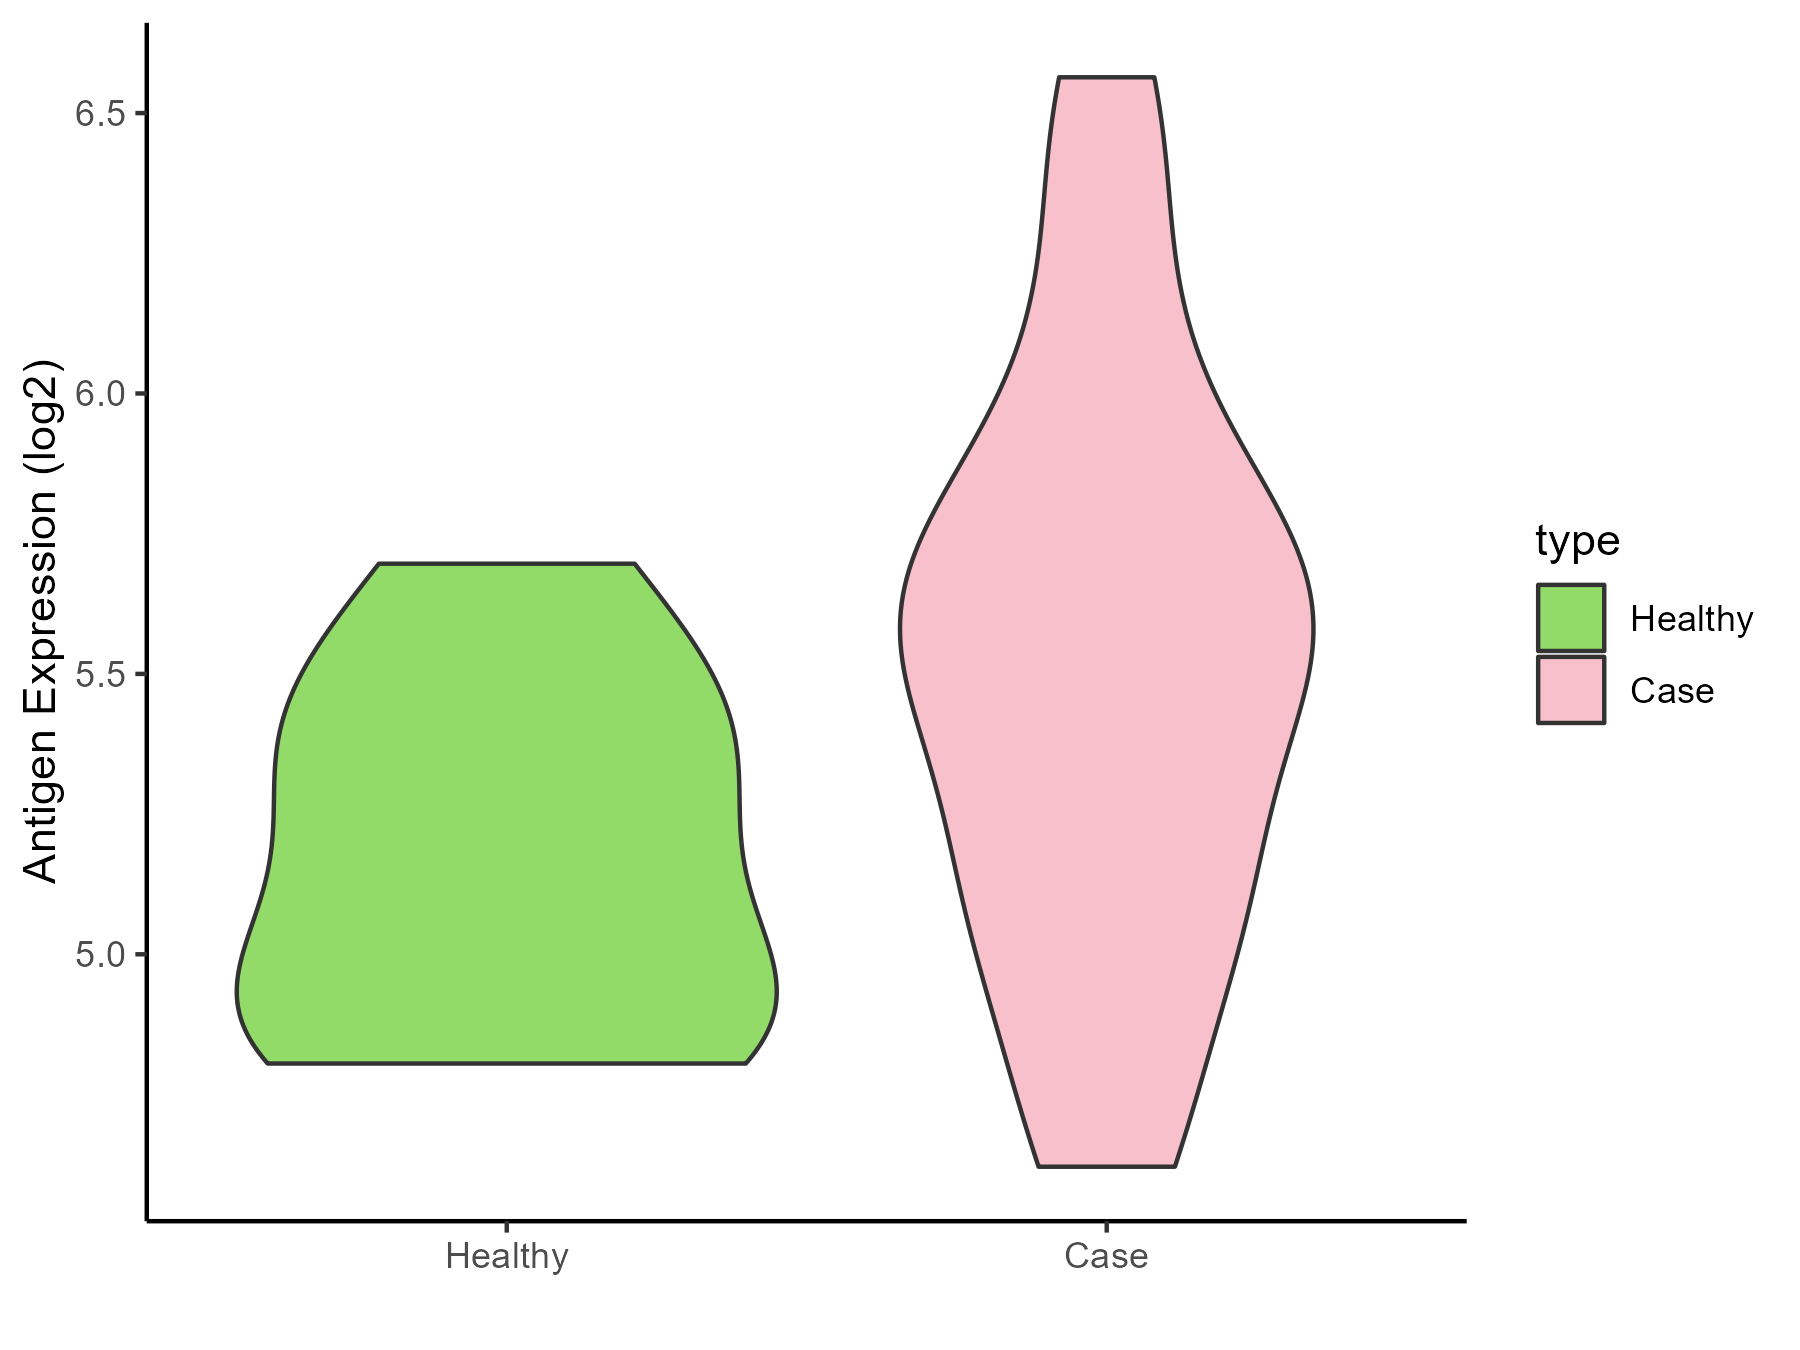
|
Click to View the Clearer Original Diagram |
References
