
Antibody-drug Conjugate Information
General Information of This Antibody-drug Conjugate (ADC)
| ADC ID |
DRG0JOHND
|
|||||
|---|---|---|---|---|---|---|
| ADC Name |
Gemtuzumab ozogamicin
|
|||||
| Brand Name |
Mylotarg
|
|||||
| Synonyms |
gemtuzumab ozogamicin; Mylotarg; gemtuzumab; gemtuzumab ozogamycin; CMA-676; CDP-771; hP67.6
Click to Show/Hide
|
|||||
| Organization |
Celltech (Originator) (No Rights);Wyeth (Top20 MNC)
|
|||||
| Drug Status |
Approved in 2000 (withdrawn in 2010, approved again in 2017)
|
|||||
| Drug-to-Antibody Ratio |
2~3
|
|||||
| Structure |
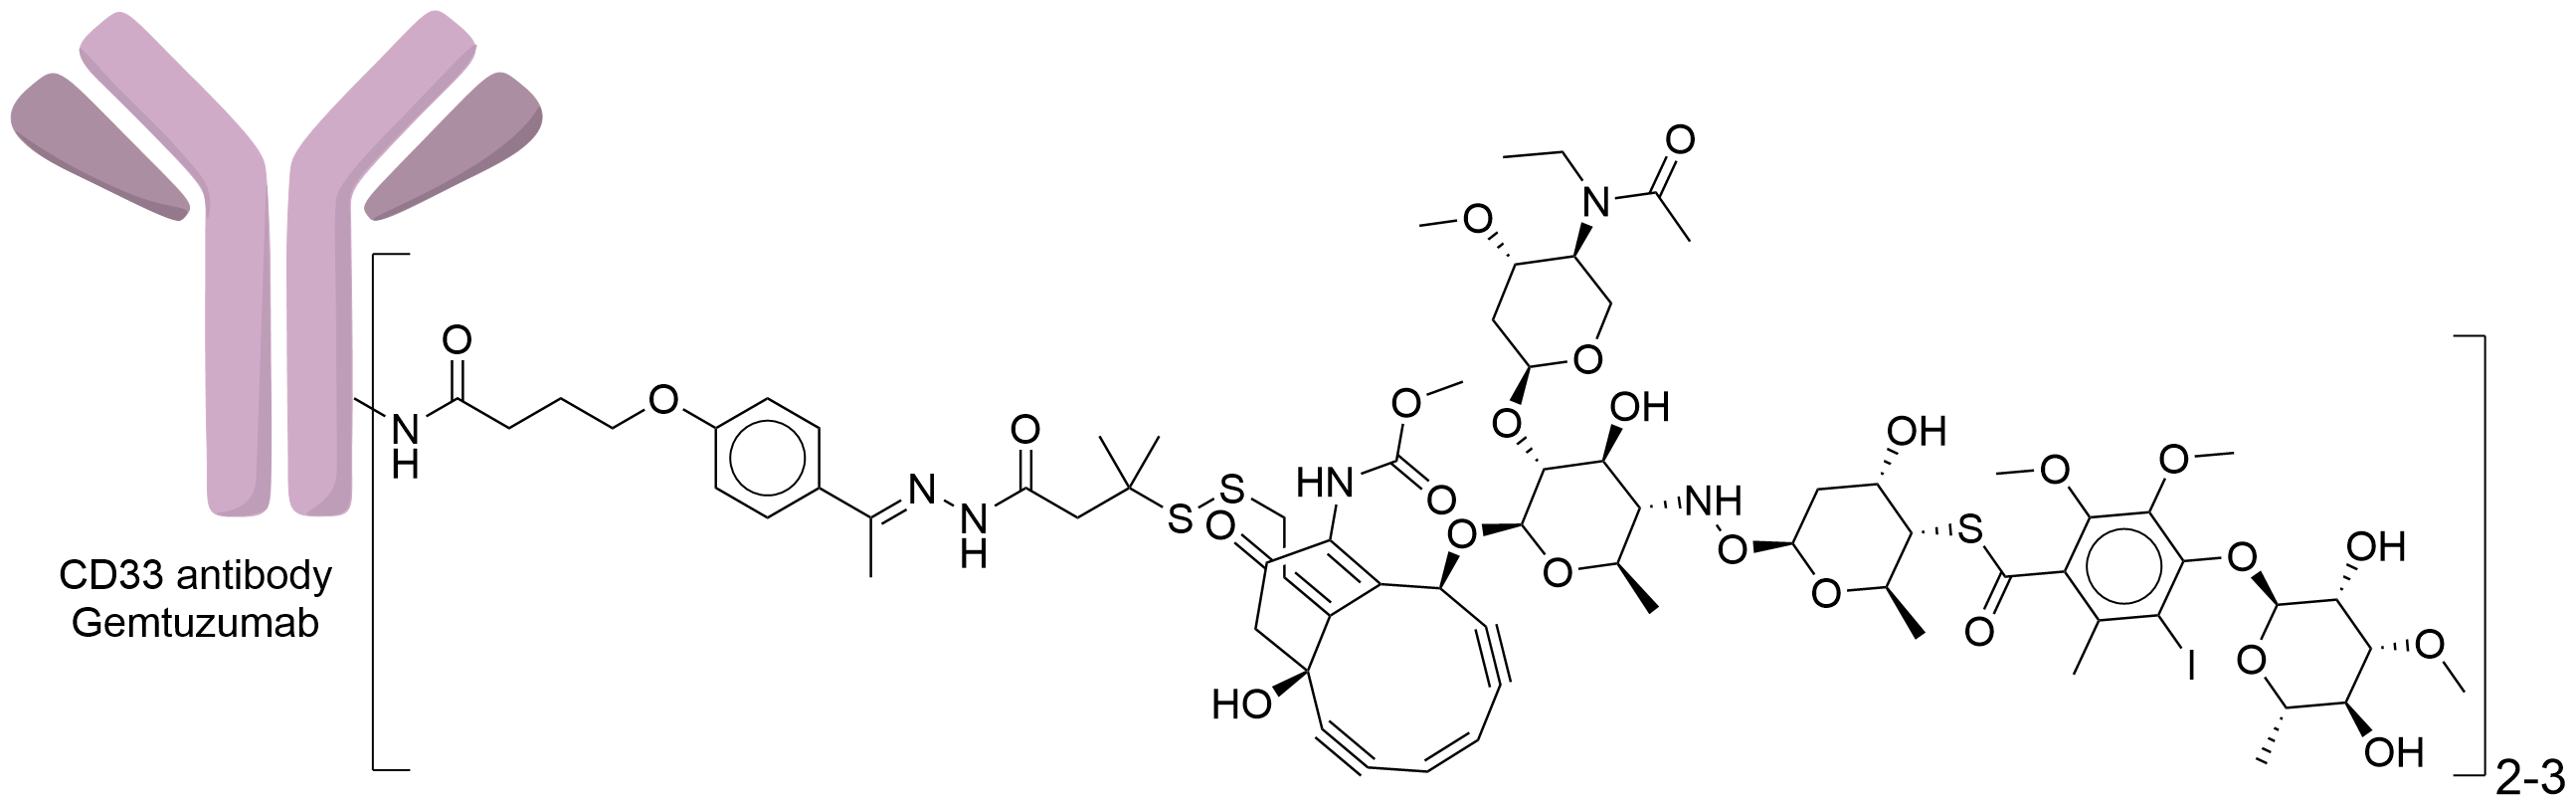
|
|||||
| Antibody Name |
Gemtuzumab
|
Antibody Info | ||||
| Antigen Name |
Myeloid cell surface antigen CD33 (CD33)
|
Antigen Info | ||||
| Payload Name |
N-acetyl-gamma-calicheamicin
|
Payload Info | ||||
| Therapeutic Target |
Human deoxyribonucleic acid (hDNA)
|
Target Info | ||||
| Linker Name |
AcButDMH
|
Linker Info | ||||
| Conjugate Type |
Random Lysines
|
|||||
| Combination Type |
ozogamicin
|
|||||
| Absorption |
In pediatric patients (9 mg/m2), the peak plasma concentration (Cmax) was approximately 3.47±1.04 (mg/L) with the AUC of 136 ±107 (mg x h/L).
|
|||||
| Distribution |
The volume of distribution at steady state (Vss) was approximately 6.5±5.5 L in pediatric patients receiving a dose level of 9mg/m2.
|
|||||
| Metabolism |
Metabolic studies indicate hydrolytic release of the calicheamicin derivative from gemtuzumab ozogamicin. The drug is most likely removed by opsonization via the reticuloendothelial system. In pediatric patients receiving a dose level of 9mg/m2, the half life was approximately 64±44 h after the first dose.
|
|||||
| Toxicity |
Hepatotoxicity, including severe or fatal hepatic veno-occlusive disease (VOD), also known as sinusoidal obstruction syndrome (SOS), has been reported in association with the use of MYLOTARG as a single agent, and as part of a combination chemotherapy regimen.
|
|||||
| Special Approval(s) |
Accelerated approval (FDA); Orphan drug (FDA); Orphan drug (EMA)
|
|||||
The indication landscape of This ADC(2027 Update)
The clinical trial pipeline of This ADC(2027 Update)
| Indication | Phase 1 | Phase 1/2 | Phase 2 | Phase 2/3 | Phase 3 | New Drug Application | Approved | |||||||||||||||||||||||
|---|---|---|---|---|---|---|---|---|---|---|---|---|---|---|---|---|---|---|---|---|---|---|---|---|---|---|---|---|---|---|
| Acute lymphoblastic leukemia |
1 Trials
|
|||||||||||||||||||||||||||||
| Acute myeloid leukaemia |
1 Trials
|
8 Trials
|
2 Trials
|
8 Trials
|
|
|||||||||||||||||||||||||
| Chronic myeloid leukemia |
1 Trials
|
|||||||||||||||||||||||||||||
| Coronavirus disease 2019 |
1 Trials
|
|||||||||||||||||||||||||||||
| Haemophagocytic lymphohistiocytosis |
2 Trials
|
|||||||||||||||||||||||||||||
| Macrophage activation syndrome |
2 Trials
|
|||||||||||||||||||||||||||||
| Myelodysplastic syndrome |
1 Trials
|
1 Trials
|
1 Trials
|
|||||||||||||||||||||||||||
| Unspecific solid tumor |
2 Trials
|
ADC-specific functional property(2027 Update)
Bystander Killing Effect
| Bystander Killing Effect | Description | Reference |
|---|---|---|
| no | Undisclosed |
[1]
|
General Information of The ADMET Data Related to This ADC(2027 Update)
Absorption
| Standard Type | Value | Units | Description | Reference |
|---|---|---|---|---|
| Area Under the Concentration-Time Curve (AUC) | 132±136 | h/liter |
After i.v. administration of the 9 mg/m2 dose,Corresponding AUCs were 132±136 and 243±198 mg h/liter for dose periods 1 and 2, respectively.
|
[1] |
| Maximum Observed Concentration (Cmax) | 2.86 | mg/L |
Summary of hP67.6 Pharmacokinetic Parameters in Patients Receiving 9 mg/m2 Intravenous Infusion Doses of Gemtuzumab Ozogamicin, Dose period 1 (n=59).
|
[2] |
| Area Under the Concentration-Time Curve (AUC) | 123 | mg*h/L |
Summary of hP67.6 Pharmacokinetic Parameters in Patients Receiving 9 mg/m2 Intravenous Infusion Doses of Gemtuzumab Ozogamicin, Dose period 1 (n=59).
|
[2] |
| Maximum Observed Concentration (Cmax) | 3.67 | mg/L |
Summary of hP67.6 Pharmacokinetic Parameters in Patients Receiving 9 mg/m2 Intravenous Infusion Doses of Gemtuzumab Ozogamicin, Dose period 2 (n=49).
|
[2] |
| Area Under the Concentration-Time Curve (AUC) | 239 | mg*h/L |
Summary of hP67.6 Pharmacokinetic Parameters in Patients Receiving 9 mg/m2 Intravenous Infusion Doses of Gemtuzumab Ozogamicin, Dose period 2 (n=49).
|
[2] |
| Maximum Observed Concentration (Cmax) | 1.70±1.12 | mg/L |
6 Mg/m2, first dose, Administered in AML patients in first relapse,period 1.
|
[3] |
| Area Under the Concentration-Time Curve (AUC) | 48.8±47.6 | mg*h/L |
6 Mg/m2, first dose, Administered in AML patients in first relapse,period 1.
|
[3] |
| Maximum Observed Concentration (Cmax) | 1.94±1.09 | mg/L |
6 Mg/m2, first dose, Administered in AML patients in first relapse,period 2.
|
[3] |
| Area Under the Concentration-Time Curve (AUC) | 79.7±66.2 | mg*h/L |
6 Mg/m2, first dose, Administered in AML patients in first relapse,period 2.
|
[3] |
| Maximum Observed Concentration (Cmax) | 3.11 | mg/L |
7.5 Mg/m2, first dose, Administered in AML patients in first relapse,period 1.
|
[3] |
| Area Under the Concentration-Time Curve (AUC) | 112 | mg*h/L |
7.5 Mg/m2, first dose, Administered in AML patients in first relapse,period 1.
|
[3] |
| Maximum Observed Concentration (Cmax) | 3 | mg/L |
7.5 Mg/m2, first dose, Administered in AML patients in first relapse,period 2.
|
[3] |
| Area Under the Concentration-Time Curve (AUC) | 153 | mg*h/L |
7.5 Mg/m2, first dose, Administered in AML patients in first relapse,period 2.
|
[3] |
| Maximum Observed Concentration (Cmax) | 3.47±1.04 | mg/L |
9 Mg/m2, first dose, Administered in AML patients in first relapse,period 1.
|
[3] |
| Area Under the Concentration-Time Curve (AUC) | 136±107 | mg*h/L |
9 Mg/m2, first dose, Administered in AML patients in first relapse,period 1.
|
[3] |
| Maximum Observed Concentration (Cmax) | 4.68±2.18 | mg/L |
9 Mg/m2, first dose, Administered in AML patients in first relapse,period 2.
|
[3] |
| Area Under the Concentration-Time Curve (AUC) | 241±157 | mg*h/L |
9 Mg/m2, first dose, Administered in AML patients in first relapse,period 2.
|
[3] |
| Maximum Observed Concentration (Cmax) | 1.58±1.16 | mg/L |
6 Mg/m2, first dose, Administered in Infants (0-2 years) AML patients in first relapse,period 2.
|
[3] |
| Area Under the Concentration-Time Curve (AUC) | 46.2±54.5 | mg*h/L |
6 Mg/m2, first dose, Administered in Infants (0-2 years) AML patients in first relapse,period 2.
|
[3] |
| Maximum Observed Concentration (Cmax) | 2.14±1.66 | mg/L |
6 Mg/m2, first dose, Administered in Children (3-11 years) AML patients in first relapse,period 2.
|
[3] |
| Area Under the Concentration-Time Curve (AUC) | 41.1±48 | mg*h/L |
6 Mg/m2, first dose, Administered in Children (3-11 years) AML patients in first relapse,period 2.
|
[3] |
| Maximum Observed Concentration (Cmax) | 1.49±0.8 | mg/L |
6 Mg/m2, first dose, Administered in Adolescents (12-16 years) AML patients in first relapse,period 2.
|
[3] |
| Area Under the Concentration-Time Curve (AUC) | 54.3±51.9 | mg*h/L |
6 Mg/m2, first dose, Administered in Adolescents (12-16 years) AML patients in first relapse,period 2.
|
[3] |
| Maximum Observed Concentration (Cmax) | 3.11±0.55 | mg/L |
7.5 Mg/m2, first dose, Administered in Adolescents (12-16 years) AML patients in first relapse,period 2.
|
[3] |
| Area Under the Concentration-Time Curve (AUC) | 113±37.7 | mg*h/L |
7.5 Mg/m2, first dose, Administered in Adolescents (12-16 years) AML patients in first relapse,period 2.
|
[3] |
| Maximum Observed Concentration (Cmax) | 3.54±0.83 | mg/L |
9 Mg/m2, first dose, Administered in Infants (0-2 years) AML patients in first relapse,period 2.
|
[3] |
| Area Under the Concentration-Time Curve (AUC) | 134±36.7 | mg*h/L |
9 Mg/m2, first dose, Administered in Infants (0-2 years) AML patients in first relapse,period 2.
|
[3] |
| Maximum Observed Concentration (Cmax) | 3.76±1 | mg/L |
9 Mg/m2, first dose, Administered in Children (3-11 years) AML patients in first relapse,period 2.
|
[3] |
| Area Under the Concentration-Time Curve (AUC) | 184±163 | mg*h/L |
9 Mg/m2, first dose, Administered in Children (3-11 years) AML patients in first relapse,period 2.
|
[3] |
| Maximum Observed Concentration (Cmax) | 3.24±1.19 | mg/L |
9 Mg/m2, first dose, Administered in Adolescents (12-16 years) AML patients in first relapse,period 2.
|
[3] |
| Area Under the Concentration-Time Curve (AUC) | 102±59.6 | mg*h/L |
9 Mg/m2, first dose, Administered in Adolescents (12-16 years) AML patients in first relapse,period 2.
|
[3] |
| Maximum Observed Concentration (Cmax) | 5.86±1.35 | mg/L |
9 Mg/m2, first dose, Administered in Adults AML patients in first relapse,period 2.
|
[3] |
| Area Under the Concentration-Time Curve (AUC) | 123±105 | mg*h/L |
9 Mg/m2, first dose, Administered in Adults AML patients in first relapse,period 2.
|
[3] |
| Maximum Observed Concentration (Cmax) | 2.99±1.63 | mg/L |
HP67.6 Pharmacokinetics for the First Dose Period of Patients by Men (n=29)
|
[4] |
| Area Under the Concentration-Time Curve (AUC) | 137±124 | mg*h/L |
HP67.6 Pharmacokinetics for the First Dose Period of Patients by Men (n=29)
|
[4] |
| Maximum Observed Concentration (Cmax) | 2.72±0.98 | mg/L |
HP67.6 Pharmacokinetics for the First Dose Period of Patients by Women (n=29)
|
[4] |
| Area Under the Concentration-Time Curve (AUC) | 110±82 | mg*h/L |
HP67.6 Pharmacokinetics for the First Dose Period of Patients by Women (n=29)
|
[4] |
| Maximum Observed Concentration (Cmax) | 3.03±1.36 | mg/L |
HP67.6 Pharmacokinetics for the First Dose Period of Patients by Age<60 yrs (n=34)
|
[4] |
| Area Under the Concentration-Time Curve (AUC) | 129±91 | mg*h/L |
HP67.6 Pharmacokinetics for the First Dose Period of Patients by Age<60 yrs (n=34)
|
[4] |
| Maximum Observed Concentration (Cmax) | 2.61±1.31 | mg/L |
HP67.6 Pharmacokinetics for the First Dose Period of Patients by Aged≥60 yrs (n=24)
|
[4] |
| Area Under the Concentration-Time Curve (AUC) | 115±125 | mg*h/L |
HP67.6 Pharmacokinetics for the First Dose Period of Patients by Aged≥60 yrs (n=24)
|
[4] |
| Maximum Observed Concentration (Cmax) | 2.86±1.35 | mg/L |
HP67.6 Pharmacokinetics for the First Dose Period of Patients by All patients
|
[4] |
| Area Under the Concentration-Time Curve (AUC) | 123±105 | mg*h/L |
HP67.6 Pharmacokinetics for the First Dose Period of Patients by All patients
|
[4] |
| Maximum Observed Concentration (Cmax) | 1.4 | mg/L |
Pediatric Patients (6 mg/m2)
|
[5] |
| Area Under the Concentration-Time Curve (AUC) | 48.5 | mg*h/L |
Pediatric Patients (6 mg/m2)
|
[5] |
Distribution
| Standard Type | Value | Units | Description | Reference |
|---|---|---|---|---|
| Area Under the Concentration-Time Curve (AUC) | 132±136 | h/liter |
After i.v. administration of the 9 mg/m2 dose,Corresponding AUCs were 132±136 and 243±198 mg h/liter for dose periods 1 and 2, respectively.
|
[1] |
| Area Under the Concentration-Time Curve (AUC) | 123 | mg*h/L |
Summary of hP67.6 Pharmacokinetic Parameters in Patients Receiving 9 mg/m2 Intravenous Infusion Doses of Gemtuzumab Ozogamicin, Dose period 1 (n=59).
|
[2] |
| Volume of Distribution (Vd) | 20.95 | L |
Summary of hP67.6 Pharmacokinetic Parameters in Patients Receiving 9 mg/m2 Intravenous Infusion Doses of Gemtuzumab Ozogamicin, Dose period 1 (n=59).
|
[2] |
| Area Under the Concentration-Time Curve (AUC) | 239 | mg*h/L |
Summary of hP67.6 Pharmacokinetic Parameters in Patients Receiving 9 mg/m2 Intravenous Infusion Doses of Gemtuzumab Ozogamicin, Dose period 2 (n=49).
|
[2] |
| Volume of Distribution (Vd) | 9.92 | L |
Summary of hP67.6 Pharmacokinetic Parameters in Patients Receiving 9 mg/m2 Intravenous Infusion Doses of Gemtuzumab Ozogamicin, Dose period 2 (n=49).
|
[2] |
| Area Under the Concentration-Time Curve (AUC) | 48.8±47.6 | mg*h/L |
6 Mg/m2, first dose, Administered in AML patients in first relapse,period 1.
|
[3] |
| Volume of Distribution (Vd) | 13.7±14.0 | L |
6 Mg/m2, first dose, Administered in AML patients in first relapse,period 1.
|
[3] |
| Area Under the Concentration-Time Curve (AUC) | 79.7±66.2 | mg*h/L |
6 Mg/m2, first dose, Administered in AML patients in first relapse,period 2.
|
[3] |
| Volume of Distribution (Vd) | 12.5±13.1 | L |
6 Mg/m2, first dose, Administered in AML patients in first relapse,period 2.
|
[3] |
| Area Under the Concentration-Time Curve (AUC) | 112 | mg*h/L |
7.5 Mg/m2, first dose, Administered in AML patients in first relapse,period 1.
|
[3] |
| Volume of Distribution (Vd) | 6.3 | L |
7.5 Mg/m2, first dose, Administered in AML patients in first relapse,period 1.
|
[3] |
| Area Under the Concentration-Time Curve (AUC) | 153 | mg*h/L |
7.5 Mg/m2, first dose, Administered in AML patients in first relapse,period 2.
|
[3] |
| Volume of Distribution (Vd) | 14.5 | L |
7.5 Mg/m2, first dose, Administered in AML patients in first relapse,period 2.
|
[3] |
| Area Under the Concentration-Time Curve (AUC) | 136±107 | mg*h/L |
9 Mg/m2, first dose, Administered in AML patients in first relapse,period 1.
|
[3] |
| Volume of Distribution (Vd) | 6.5±5.5 | L |
9 Mg/m2, first dose, Administered in AML patients in first relapse,period 1.
|
[3] |
| Area Under the Concentration-Time Curve (AUC) | 241±157 | mg*h/L |
9 Mg/m2, first dose, Administered in AML patients in first relapse,period 2.
|
[3] |
| Volume of Distribution (Vd) | 3.9±2.1 | L |
9 Mg/m2, first dose, Administered in AML patients in first relapse,period 2.
|
[3] |
| Area Under the Concentration-Time Curve (AUC) | 46.2±54.5 | mg*h/L |
6 Mg/m2, first dose, Administered in Infants (0-2 years) AML patients in first relapse,period 2.
|
[3] |
| Volume of Distribution (Vd) | 2.3±1.2 | L |
6 Mg/m2, first dose, Administered in Infants (0-2 years) AML patients in first relapse,period 2.
|
[3] |
| Volume of Distribution (Vd) | 0.19±0.1 | L/kg |
6 Mg/m2, first dose, Administered in Infants (0-2 years) AML patients in first relapse,period 2.
|
[3] |
| Area Under the Concentration-Time Curve (AUC) | 41.1±48 | mg*h/L |
6 Mg/m2, first dose, Administered in Children (3-11 years) AML patients in first relapse,period 2.
|
[3] |
| Volume of Distribution (Vd) | 11.2±11.8 | L |
6 Mg/m2, first dose, Administered in Children (3-11 years) AML patients in first relapse,period 2.
|
[3] |
| Volume of Distribution (Vd) | 0.48±0.51 | L/kg |
6 Mg/m2, first dose, Administered in Children (3-11 years) AML patients in first relapse,period 2.
|
[3] |
| Area Under the Concentration-Time Curve (AUC) | 54.3±51.9 | mg*h/L |
6 Mg/m2, first dose, Administered in Adolescents (12-16 years) AML patients in first relapse,period 2.
|
[3] |
| Volume of Distribution (Vd) | 20.1±15.5 | L |
6 Mg/m2, first dose, Administered in Adolescents (12-16 years) AML patients in first relapse,period 2.
|
[3] |
| Volume of Distribution (Vd) | 0.36±0.28 | L/kg |
6 Mg/m2, first dose, Administered in Adolescents (12-16 years) AML patients in first relapse,period 2.
|
[3] |
| Area Under the Concentration-Time Curve (AUC) | 113±37.7 | mg*h/L |
7.5 Mg/m2, first dose, Administered in Adolescents (12-16 years) AML patients in first relapse,period 2.
|
[3] |
| Volume of Distribution (Vd) | 6.3±2.5 | L |
7.5 Mg/m2, first dose, Administered in Adolescents (12-16 years) AML patients in first relapse,period 2.
|
[3] |
| Volume of Distribution (Vd) | 0.11±0.04 | L/kg |
7.5 Mg/m2, first dose, Administered in Adolescents (12-16 years) AML patients in first relapse,period 2.
|
[3] |
| Area Under the Concentration-Time Curve (AUC) | 134±36.7 | mg*h/L |
9 Mg/m2, first dose, Administered in Infants (0-2 years) AML patients in first relapse,period 2.
|
[3] |
| Volume of Distribution (Vd) | 2.9±2.7 | L |
9 Mg/m2, first dose, Administered in Infants (0-2 years) AML patients in first relapse,period 2.
|
[3] |
| Volume of Distribution (Vd) | 0.24±0.22 | L/kg |
9 Mg/m2, first dose, Administered in Infants (0-2 years) AML patients in first relapse,period 2.
|
[3] |
| Area Under the Concentration-Time Curve (AUC) | 184±163 | mg*h/L |
9 Mg/m2, first dose, Administered in Children (3-11 years) AML patients in first relapse,period 2.
|
[3] |
| Volume of Distribution (Vd) | 3.9±1.6 | L |
9 Mg/m2, first dose, Administered in Children (3-11 years) AML patients in first relapse,period 2.
|
[3] |
| Volume of Distribution (Vd) | 0.17±0.07 | L/kg |
9 Mg/m2, first dose, Administered in Children (3-11 years) AML patients in first relapse,period 2.
|
[3] |
| Area Under the Concentration-Time Curve (AUC) | 102±59.6 | mg*h/L |
9 Mg/m2, first dose, Administered in Adolescents (12-16 years) AML patients in first relapse,period 2.
|
[3] |
| Volume of Distribution (Vd) | 9.4±6.6 | L |
9 Mg/m2, first dose, Administered in Adolescents (12-16 years) AML patients in first relapse,period 2.
|
[3] |
| Volume of Distribution (Vd) | 0.17±0.12 | L/kg |
9 Mg/m2, first dose, Administered in Adolescents (12-16 years) AML patients in first relapse,period 2.
|
[3] |
| Area Under the Concentration-Time Curve (AUC) | 123±105 | mg*h/L |
9 Mg/m2, first dose, Administered in Adults AML patients in first relapse,period 2.
|
[3] |
| Volume of Distribution (Vd) | 20.9±21.5 | L |
9 Mg/m2, first dose, Administered in Adults AML patients in first relapse,period 2.
|
[3] |
| Volume of Distribution (Vd) | 0.3±0.31 | L/kg |
9 Mg/m2, first dose, Administered in Adults AML patients in first relapse,period 2.
|
[3] |
| Area Under the Concentration-Time Curve (AUC) | 137±124 | mg*h/L |
HP67.6 Pharmacokinetics for the First Dose Period of Patients by Men (n=29)
|
[4] |
| Volume of Distribution (Vd) | 20±20.8 | L |
HP67.6 Pharmacokinetics for the First Dose Period of Patients by Men (n=29)
|
[4] |
| Area Under the Concentration-Time Curve (AUC) | 110±82 | mg*h/L |
HP67.6 Pharmacokinetics for the First Dose Period of Patients by Women (n=29)
|
[4] |
| Volume of Distribution (Vd) | 21.9±22.6 | L |
HP67.6 Pharmacokinetics for the First Dose Period of Patients by Women (n=29)
|
[4] |
| Area Under the Concentration-Time Curve (AUC) | 129±91 | mg*h/L |
HP67.6 Pharmacokinetics for the First Dose Period of Patients by Age<60 yrs (n=34)
|
[4] |
| Volume of Distribution (Vd) | 19.2±19 | L |
HP67.6 Pharmacokinetics for the First Dose Period of Patients by Age<60 yrs (n=34)
|
[4] |
| Area Under the Concentration-Time Curve (AUC) | 115±125 | mg*h/L |
HP67.6 Pharmacokinetics for the First Dose Period of Patients by Aged≥60 yrs (n=24)
|
[4] |
| Volume of Distribution (Vd) | 23.4±24.9 | L |
HP67.6 Pharmacokinetics for the First Dose Period of Patients by Aged≥60 yrs (n=24)
|
[4] |
| Area Under the Concentration-Time Curve (AUC) | 123±105 | mg*h/L |
HP67.6 Pharmacokinetics for the First Dose Period of Patients by All patients
|
[4] |
| Volume of Distribution (Vd) | 20.9±21.5 | L |
HP67.6 Pharmacokinetics for the First Dose Period of Patients by All patients
|
[4] |
| Area Under the Concentration-Time Curve (AUC) | 48.5 | mg*h/L |
Pediatric Patients (6 mg/m2)
|
[5] |
| Volume of Distribution (Vd) | 6.37 | L |
Population Pharmacokinetic Modeling of Gemtuzumab Ozogamicin in Adult Patients with Acute Myeloid Leukemia,volume of distribution in central compartment
|
[6] |
| Volume of Distribution (Vd) | 8.58 | L |
Population Pharmacokinetic Modeling of Gemtuzumab Ozogamicin in Adult Patients with Acute Myeloid Leukemia,volume of distribution in peripheral compartment
|
[6] |
Metabolism
| Standard Type | Value | Units | Description | Reference |
|---|---|---|---|---|
| Area Under the Concentration-Time Curve (AUC) | 132±136 | h/liter |
After i.v. administration of the 9 mg/m2 dose,Corresponding AUCs were 132±136 and 243±198 mg h/liter for dose periods 1 and 2, respectively.
|
[1] |
| Area Under the Concentration-Time Curve (AUC) | 123 | mg*h/L |
Summary of hP67.6 Pharmacokinetic Parameters in Patients Receiving 9 mg/m2 Intravenous Infusion Doses of Gemtuzumab Ozogamicin, Dose period 1 (n=59).
|
[2] |
| Area Under the Concentration-Time Curve (AUC) | 239 | mg*h/L |
Summary of hP67.6 Pharmacokinetic Parameters in Patients Receiving 9 mg/m2 Intravenous Infusion Doses of Gemtuzumab Ozogamicin, Dose period 2 (n=49).
|
[2] |
| Area Under the Concentration-Time Curve (AUC) | 48.8±47.6 | mg*h/L |
6 Mg/m2, first dose, Administered in AML patients in first relapse,period 1.
|
[3] |
| Area Under the Concentration-Time Curve (AUC) | 79.7±66.2 | mg*h/L |
6 Mg/m2, first dose, Administered in AML patients in first relapse,period 2.
|
[3] |
| Area Under the Concentration-Time Curve (AUC) | 112 | mg*h/L |
7.5 Mg/m2, first dose, Administered in AML patients in first relapse,period 1.
|
[3] |
| Area Under the Concentration-Time Curve (AUC) | 153 | mg*h/L |
7.5 Mg/m2, first dose, Administered in AML patients in first relapse,period 2.
|
[3] |
| Area Under the Concentration-Time Curve (AUC) | 136±107 | mg*h/L |
9 Mg/m2, first dose, Administered in AML patients in first relapse,period 1.
|
[3] |
| Area Under the Concentration-Time Curve (AUC) | 241±157 | mg*h/L |
9 Mg/m2, first dose, Administered in AML patients in first relapse,period 2.
|
[3] |
| Area Under the Concentration-Time Curve (AUC) | 46.2±54.5 | mg*h/L |
6 Mg/m2, first dose, Administered in Infants (0-2 years) AML patients in first relapse,period 2.
|
[3] |
| Area Under the Concentration-Time Curve (AUC) | 41.1±48 | mg*h/L |
6 Mg/m2, first dose, Administered in Children (3-11 years) AML patients in first relapse,period 2.
|
[3] |
| Area Under the Concentration-Time Curve (AUC) | 54.3±51.9 | mg*h/L |
6 Mg/m2, first dose, Administered in Adolescents (12-16 years) AML patients in first relapse,period 2.
|
[3] |
| Area Under the Concentration-Time Curve (AUC) | 113±37.7 | mg*h/L |
7.5 Mg/m2, first dose, Administered in Adolescents (12-16 years) AML patients in first relapse,period 2.
|
[3] |
| Area Under the Concentration-Time Curve (AUC) | 134±36.7 | mg*h/L |
9 Mg/m2, first dose, Administered in Infants (0-2 years) AML patients in first relapse,period 2.
|
[3] |
| Area Under the Concentration-Time Curve (AUC) | 184±163 | mg*h/L |
9 Mg/m2, first dose, Administered in Children (3-11 years) AML patients in first relapse,period 2.
|
[3] |
| Area Under the Concentration-Time Curve (AUC) | 102±59.6 | mg*h/L |
9 Mg/m2, first dose, Administered in Adolescents (12-16 years) AML patients in first relapse,period 2.
|
[3] |
| Area Under the Concentration-Time Curve (AUC) | 123±105 | mg*h/L |
9 Mg/m2, first dose, Administered in Adults AML patients in first relapse,period 2.
|
[3] |
| Area Under the Concentration-Time Curve (AUC) | 137±124 | mg*h/L |
HP67.6 Pharmacokinetics for the First Dose Period of Patients by Men (n=29)
|
[4] |
| Area Under the Concentration-Time Curve (AUC) | 110±82 | mg*h/L |
HP67.6 Pharmacokinetics for the First Dose Period of Patients by Women (n=29)
|
[4] |
| Area Under the Concentration-Time Curve (AUC) | 129±91 | mg*h/L |
HP67.6 Pharmacokinetics for the First Dose Period of Patients by Age<60 yrs (n=34)
|
[4] |
| Area Under the Concentration-Time Curve (AUC) | 115±125 | mg*h/L |
HP67.6 Pharmacokinetics for the First Dose Period of Patients by Aged≥60 yrs (n=24)
|
[4] |
| Area Under the Concentration-Time Curve (AUC) | 123±105 | mg*h/L |
HP67.6 Pharmacokinetics for the First Dose Period of Patients by All patients
|
[4] |
| Area Under the Concentration-Time Curve (AUC) | 48.5 | mg*h/L |
Pediatric Patients (6 mg/m2)
|
[5] |
Excretion
| Standard Type | Value | Units | Description | Reference |
|---|---|---|---|---|
| Area Under the Concentration-Time Curve (AUC) | 132±136 | h/liter |
After i.v. administration of the 9 mg/m2 dose,Corresponding AUCs were 132±136 and 243±198 mg h/liter for dose periods 1 and 2, respectively.
|
[1] |
| Clearance (CL) | 0.12±0.15 | L/h/m2 |
The mean clearance rate was approximately 0.12±0.15 L/h/m2 in pediatric patients receiving a dose level of 9mg/m2
|
[1] |
| Elimination Half-Life (t1/2) | 64±44 | h |
In pediatric patients receiving a dose level of 9mg/m2 , the half life was approximately 64±44 h after the first dose
|
[1] |
| Elimination Half-Life (t1/2) | 72.4 | h |
Summary of hP67.6 Pharmacokinetic Parameters in Patients Receiving 9 mg/m2 Intravenous Infusion Doses of Gemtuzumab Ozogamicin, Dose period 1 (n=59).
|
[2] |
| Area Under the Concentration-Time Curve (AUC) | 123 | mg*h/L |
Summary of hP67.6 Pharmacokinetic Parameters in Patients Receiving 9 mg/m2 Intravenous Infusion Doses of Gemtuzumab Ozogamicin, Dose period 1 (n=59).
|
[2] |
| Clearance (CL) | 0.265 | L/h |
Summary of hP67.6 Pharmacokinetic Parameters in Patients Receiving 9 mg/m2 Intravenous Infusion Doses of Gemtuzumab Ozogamicin, Dose period 1 (n=59).
|
[2] |
| Elimination Half-Life (t1/2) | 93.7 | h |
Summary of hP67.6 Pharmacokinetic Parameters in Patients Receiving 9 mg/m2 Intravenous Infusion Doses of Gemtuzumab Ozogamicin, Dose period 2 (n=49).
|
[2] |
| Area Under the Concentration-Time Curve (AUC) | 239 | mg*h/L |
Summary of hP67.6 Pharmacokinetic Parameters in Patients Receiving 9 mg/m2 Intravenous Infusion Doses of Gemtuzumab Ozogamicin, Dose period 2 (n=49).
|
[2] |
| Clearance (CL) | 0.132 | L/h |
Summary of hP67.6 Pharmacokinetic Parameters in Patients Receiving 9 mg/m2 Intravenous Infusion Doses of Gemtuzumab Ozogamicin, Dose period 2 (n=49).
|
[2] |
| Elimination Half-Life (t1/2) | 43.1±22.7 | h |
6 Mg/m2, first dose, Administered in AML patients in first relapse,period 1.
|
[3] |
| Area Under the Concentration-Time Curve (AUC) | 48.8±47.6 | mg*h/L |
6 Mg/m2, first dose, Administered in AML patients in first relapse,period 1.
|
[3] |
| Clearance (CL) | 0.61±1.34 | L/h |
6 Mg/m2, first dose, Administered in AML patients in first relapse,period 1.
|
[3] |
| Clearance (CL) | 0.48±0.94 | L/h/m2 |
6 Mg/m2, first dose, Administered in AML patients in first relapse,period 1.
|
[3] |
| Elimination Half-Life (t1/2) | 49.4±25.6 | h |
6 Mg/m2, first dose, Administered in AML patients in first relapse,period 2.
|
[3] |
| Area Under the Concentration-Time Curve (AUC) | 79.7±66.2 | mg*h/L |
6 Mg/m2, first dose, Administered in AML patients in first relapse,period 2.
|
[3] |
| Clearance (CL) | 0.32±0.49 | L/h |
6 Mg/m2, first dose, Administered in AML patients in first relapse,period 2.
|
[3] |
| Clearance (CL) | 0.25±0.35 | L/h/m2 |
6 Mg/m2, first dose, Administered in AML patients in first relapse,period 2.
|
[3] |
| Elimination Half-Life (t1/2) | 40 | h |
7.5 Mg/m2, first dose, Administered in AML patients in first relapse,period 1.
|
[3] |
| Area Under the Concentration-Time Curve (AUC) | 112 | mg*h/L |
7.5 Mg/m2, first dose, Administered in AML patients in first relapse,period 1.
|
[3] |
| Clearance (CL) | 0.12 | L/h |
7.5 Mg/m2, first dose, Administered in AML patients in first relapse,period 1.
|
[3] |
| Clearance (CL) | 0.07 | L/h/m2 |
7.5 Mg/m2, first dose, Administered in AML patients in first relapse,period 1.
|
[3] |
| Elimination Half-Life (t1/2) | 33.4 | h |
7.5 Mg/m2, first dose, Administered in AML patients in first relapse,period 2.
|
[3] |
| Area Under the Concentration-Time Curve (AUC) | 153 | mg*h/L |
7.5 Mg/m2, first dose, Administered in AML patients in first relapse,period 2.
|
[3] |
| Clearance (CL) | 0.09 | L/h |
7.5 Mg/m2, first dose, Administered in AML patients in first relapse,period 2.
|
[3] |
| Clearance (CL) | 0.05 | L/h/m2 |
7.5 Mg/m2, first dose, Administered in AML patients in first relapse,period 2.
|
[3] |
| Elimination Half-Life (t1/2) | 63.7±44.3 | h |
9 Mg/m2, first dose, Administered in AML patients in first relapse,period 1.
|
[3] |
| Area Under the Concentration-Time Curve (AUC) | 136±107 | mg*h/L |
9 Mg/m2, first dose, Administered in AML patients in first relapse,period 1.
|
[3] |
| Clearance (CL) | 0.16±0.23 | L/h |
9 Mg/m2, first dose, Administered in AML patients in first relapse,period 1.
|
[3] |
| Clearance (CL) | 0.12±0.15 | L/h/m2 |
9 Mg/m2, first dose, Administered in AML patients in first relapse,period 1.
|
[3] |
| Elimination Half-Life (t1/2) | 57.8±33.4 | h |
9 Mg/m2, first dose, Administered in AML patients in first relapse,period 2.
|
[3] |
| Area Under the Concentration-Time Curve (AUC) | 241±157 | mg*h/L |
9 Mg/m2, first dose, Administered in AML patients in first relapse,period 2.
|
[3] |
| Clearance (CL) | 0.21±0.45 | L/h |
9 Mg/m2, first dose, Administered in AML patients in first relapse,period 2.
|
[3] |
| Clearance (CL) | 0.16±0.34 | L/h/m2 |
9 Mg/m2, first dose, Administered in AML patients in first relapse,period 2.
|
[3] |
| Elimination Half-Life (t1/2) | 30.6±8.9 | h |
6 Mg/m2, first dose, Administered in Infants (0-2 years) AML patients in first relapse,period 2.
|
[3] |
| Area Under the Concentration-Time Curve (AUC) | 46.2±54.5 | mg*h/L |
6 Mg/m2, first dose, Administered in Infants (0-2 years) AML patients in first relapse,period 2.
|
[3] |
| Clearance (CL) | 0.16±0.16 | L/h |
6 Mg/m2, first dose, Administered in Infants (0-2 years) AML patients in first relapse,period 2.
|
[3] |
| Clearance (CL) | 0.29±0.30 | L/h/m2 |
6 Mg/m2, first dose, Administered in Infants (0-2 years) AML patients in first relapse,period 2.
|
[3] |
| Elimination Half-Life (t1/2) | 32.9±18.2 | h |
6 Mg/m2, first dose, Administered in Children (3-11 years) AML patients in first relapse,period 2.
|
[3] |
| Area Under the Concentration-Time Curve (AUC) | 41.1±48 | mg*h/L |
6 Mg/m2, first dose, Administered in Children (3-11 years) AML patients in first relapse,period 2.
|
[3] |
| Clearance (CL) | 0.27±0.22 | L/h |
6 Mg/m2, first dose, Administered in Children (3-11 years) AML patients in first relapse,period 2.
|
[3] |
| Clearance (CL) | 0.29±0.18 | L/h/m2 |
6 Mg/m2, first dose, Administered in Children (3-11 years) AML patients in first relapse,period 2.
|
[3] |
| Elimination Half-Life (t1/2) | 52.5±25 | h |
6 Mg/m2, first dose, Administered in Adolescents (12-16 years) AML patients in first relapse,period 2.
|
[3] |
| Area Under the Concentration-Time Curve (AUC) | 54.3±51.9 | mg*h/L |
6 Mg/m2, first dose, Administered in Adolescents (12-16 years) AML patients in first relapse,period 2.
|
[3] |
| Clearance (CL) | 0.99±1.87 | L/h |
6 Mg/m2, first dose, Administered in Adolescents (12-16 years) AML patients in first relapse,period 2.
|
[3] |
| Clearance (CL) | 0.68±1.34 | L/h/m2 |
6 Mg/m2, first dose, Administered in Adolescents (12-16 years) AML patients in first relapse,period 2.
|
[3] |
| Elimination Half-Life (t1/2) | 40±7.4 | h |
7.5 Mg/m2, first dose, Administered in Adolescents (12-16 years) AML patients in first relapse,period 2.
|
[3] |
| Area Under the Concentration-Time Curve (AUC) | 113±37.7 | mg*h/L |
7.5 Mg/m2, first dose, Administered in Adolescents (12-16 years) AML patients in first relapse,period 2.
|
[3] |
| Clearance (CL) | 0.12±0.06 | L/h |
7.5 Mg/m2, first dose, Administered in Adolescents (12-16 years) AML patients in first relapse,period 2.
|
[3] |
| Clearance (CL) | 0.07±0.02 | L/h/m2 |
7.5 Mg/m2, first dose, Administered in Adolescents (12-16 years) AML patients in first relapse,period 2.
|
[3] |
| Elimination Half-Life (t1/2) | 113±108 | h |
9 Mg/m2, first dose, Administered in Infants (0-2 years) AML patients in first relapse,period 2.
|
[3] |
| Area Under the Concentration-Time Curve (AUC) | 134±36.7 | mg*h/L |
9 Mg/m2, first dose, Administered in Infants (0-2 years) AML patients in first relapse,period 2.
|
[3] |
| Clearance (CL) | 0.03±0.02 | L/h |
9 Mg/m2, first dose, Administered in Infants (0-2 years) AML patients in first relapse,period 2.
|
[3] |
| Clearance (CL) | 0.05±0.02 | L/h/m2 |
9 Mg/m2, first dose, Administered in Infants (0-2 years) AML patients in first relapse,period 2.
|
[3] |
| Elimination Half-Life (t1/2) | 45.6±30.8 | h |
9 Mg/m2, first dose, Administered in Children (3-11 years) AML patients in first relapse,period 2.
|
[3] |
| Area Under the Concentration-Time Curve (AUC) | 184±163 | mg*h/L |
9 Mg/m2, first dose, Administered in Children (3-11 years) AML patients in first relapse,period 2.
|
[3] |
| Clearance (CL) | 0.06±0.03 | L/h |
9 Mg/m2, first dose, Administered in Children (3-11 years) AML patients in first relapse,period 2.
|
[3] |
| Clearance (CL) | 0.08±0.05 | L/h/m2 |
9 Mg/m2, first dose, Administered in Children (3-11 years) AML patients in first relapse,period 2.
|
[3] |
| Elimination Half-Life (t1/2) | 62±16.5 | h |
9 Mg/m2, first dose, Administered in Adolescents (12-16 years) AML patients in first relapse,period 2.
|
[3] |
| Area Under the Concentration-Time Curve (AUC) | 102±59.6 | mg*h/L |
9 Mg/m2, first dose, Administered in Adolescents (12-16 years) AML patients in first relapse,period 2.
|
[3] |
| Clearance (CL) | 0.26±0.3 | L/h |
9 Mg/m2, first dose, Administered in Adolescents (12-16 years) AML patients in first relapse,period 2.
|
[3] |
| Clearance (CL) | 0.17±0.21 | L/h/m2 |
9 Mg/m2, first dose, Administered in Adolescents (12-16 years) AML patients in first relapse,period 2.
|
[3] |
| Elimination Half-Life (t1/2) | 72.4±42.0 | h |
9 Mg/m2, first dose, Administered in Adults AML patients in first relapse,period 2.
|
[3] |
| Area Under the Concentration-Time Curve (AUC) | 123±105 | mg*h/L |
9 Mg/m2, first dose, Administered in Adults AML patients in first relapse,period 2.
|
[3] |
| Clearance (CL) | 0.27±0.23 | L/h |
9 Mg/m2, first dose, Administered in Adults AML patients in first relapse,period 2.
|
[3] |
| Clearance (CL) | 0.15±0.13 | L/h/m2 |
9 Mg/m2, first dose, Administered in Adults AML patients in first relapse,period 2.
|
[3] |
| Elimination Half-Life (t1/2) | 66.8±39.4 | h |
HP67.6 Pharmacokinetics for the First Dose Period of Patients by Men (n=29)
|
[4] |
| Area Under the Concentration-Time Curve (AUC) | 137±124 | mg*h/L |
HP67.6 Pharmacokinetics for the First Dose Period of Patients by Men (n=29)
|
[4] |
| Clearance (CL) | 0.254±0.229 | L/h |
HP67.6 Pharmacokinetics for the First Dose Period of Patients by Men (n=29)
|
[4] |
| Elimination Half-Life (t1/2) | 77.9±44.5 | h |
HP67.6 Pharmacokinetics for the First Dose Period of Patients by Women (n=29)
|
[4] |
| Area Under the Concentration-Time Curve (AUC) | 110±82 | mg*h/L |
HP67.6 Pharmacokinetics for the First Dose Period of Patients by Women (n=29)
|
[4] |
| Clearance (CL) | 0.288±0.232 | L/h |
HP67.6 Pharmacokinetics for the First Dose Period of Patients by Women (n=29)
|
[4] |
| Elimination Half-Life (t1/2) | 74.1±47.7 | h |
HP67.6 Pharmacokinetics for the First Dose Period of Patients by Age<60 yrs (n=34)
|
[4] |
| Area Under the Concentration-Time Curve (AUC) | 129±91 | mg*h/L |
HP67.6 Pharmacokinetics for the First Dose Period of Patients by Age<60 yrs (n=34)
|
[4] |
| Clearance (CL) | 0.239±0.207 | L/h |
HP67.6 Pharmacokinetics for the First Dose Period of Patients by Age<60 yrs (n=34)
|
[4] |
| Elimination Half-Life (t1/2) | 69.8±33.1 | h |
HP67.6 Pharmacokinetics for the First Dose Period of Patients by Aged≥60 yrs (n=24)
|
[4] |
| Area Under the Concentration-Time Curve (AUC) | 115±125 | mg*h/L |
HP67.6 Pharmacokinetics for the First Dose Period of Patients by Aged≥60 yrs (n=24)
|
[4] |
| Clearance (CL) | 0.304±0.258 | L/h |
HP67.6 Pharmacokinetics for the First Dose Period of Patients by Aged≥60 yrs (n=24)
|
[4] |
| Elimination Half-Life (t1/2) | 72.4±42.0 | h |
HP67.6 Pharmacokinetics for the First Dose Period of Patients by All patients
|
[4] |
| Area Under the Concentration-Time Curve (AUC) | 123±105 | mg*h/L |
HP67.6 Pharmacokinetics for the First Dose Period of Patients by All patients
|
[4] |
| Clearance (CL) | 0.265±0.229 | L/h |
HP67.6 Pharmacokinetics for the First Dose Period of Patients by All patients
|
[4] |
| Area Under the Concentration-Time Curve (AUC) | 48.5 | mg*h/L |
Pediatric Patients (6 mg/m2)
|
[5] |
| Clearance (CL) | 0.296 | L/h |
Pediatric Patients (6 mg/m2)
|
[5] |
| Elimination Half-Life (t1/2) | 51.6 | h |
Pediatric Patients (6 mg/m2)
|
[5] |
| Clearance (CL) | 0.353 | L/h |
Adult Patients (9 mg/m2)
|
[5] |
| Elimination Half-Life (t1/2) | 66.5 | h |
Adult Patients (9 mg/m2)
|
[5] |
| Clearance (CL) | 0.117 | L/h |
Population Pharmacokinetic Modeling of Gemtuzumab Ozogamicin in Adult Patients with Acute Myeloid Leukemia, linear clearance
|
[6] |
| Clearance (CL) | 0.0861 | L/h |
Population Pharmacokinetic Modeling of Gemtuzumab Ozogamicin in Adult Patients with Acute Myeloid Leukemia, intercompartmental clearance
|
[6] |
| Clearance (CL) | 2.75 | L/h |
Population Pharmacokinetic Modeling of Gemtuzumab Ozogamicin in Adult Patients with Acute Myeloid Leukemia, clearance associated with CLt, CLt time-dependent clearance
|
[6] |
General Information of The Activity Data Related to This ADC
Identified from the Human Clinical Data
Discovered Using Cell Line-derived Xenograft Model
| Standard Type | Value | Units | Cell Line | Disease Model |
|---|---|---|---|---|
| Tumor Growth Inhibition value (TGI) |
≈ 13.81
|
%
|
MV4-11 cells
|
Childhood acute monocytic leukemia
|
Revealed Based on the Cell Line Data
Full List of Activity Data of This Antibody-drug Conjugate
Identified from the Human Clinical Data
| Experiment 1 Reporting the Activity Date of This ADC | [7] | ||||
| Efficacy Data | Two-year Overall Survival (OS) |
69.00 (standard group); 73.00 (gemtuzumab ozogamicin group) %
|
|||
| Patients Enrolled |
Eligible participants were 18 years or older and had newly diagnosed NPM1-mutated acute myeloid leukaemia and an Eastern Cooperative Oncology Group performance status of 0-2.
|
||||
| Administration Dosage |
Participants received two cycles of induction therapy plus all-trans retinoic acid (ATRA) followed by three consolidation cycles of high-dose cytarabine and ATRA, without or with gemtuzumab ozogamicin (3 mg/m2 i.v.on day 1 of induction cycles 1 and 2, and consolidation cycle 1).
|
||||
| Related Clinical Trial | |||||
| NCT Number | NCT00893399 | Clinical Status | Phase 3 | ||
| Clinical Description | Phase III study of chemotherapy in combination with atra with or without gemtuzumab ozogamicin in patients with acute myeloid leukemia and npm1 gene mutation. | ||||
| Primary Endpoint |
Short-term event-free survival at 6-month follow-up, 53.00% in the standard group and 58.00% in the gemtuzumab ozogamicin group.
|
||||
| Other Endpoint |
CRi rates, n=267 (90%) in the standard group vs n=251 (86%) in the gemtuzumab ozogamicin group.
|
||||
| Experiment 2 Reporting the Activity Date of This ADC | [8] | ||||
| Efficacy Data | Objective Response Rate (ORR) | 85% | Positive CD33 expression (CD33+++/++) | ||
| Patients Enrolled |
Previously untreated primary or secondary acute myeloid leukemia (with bone marrow blasts 20%), express CD33 on blast cells.
|
||||
| Administration Dosage |
3 mg/sqm single dose on day 6.
|
||||
| Related Clinical Trial | |||||
| NCT Number | NCT00909168 | Clinical Status | Phase 3 | ||
| Clinical Description | Induction, consolidation and intensification therapy for patients younger than 66 years with previously untreated CD33 positive acute myeloid leukemia (AML) (MYFLAI07). | ||||
| Primary Endpoint |
Objective response rate=85.00%, comprising 82.00% complete responses and 3.00% partial responses.
|
||||
| Other Endpoint |
median DFS=61 months, median OS=63 months.
|
||||
Discovered Using Cell Line-derived Xenograft Model
| Experiment 1 Reporting the Activity Date of This ADC | [9] | ||||
| Efficacy Data | Tumor Growth Inhibition value (TGI) | ≈ 13.81% | Positive CD33 expression (CD33+++/++) | ||
| Method Description |
Subcutaneous tumor model MV4-11 human acute myelocytic leukemia cells (1x10 cells in 0.1 mL) were subcutaneously inoculated into the right flank of female athymic nude mice. Mice were treated with ADCs (iv, 0.1 mg/kg x 1) when tumors reached 150 mm3 and mouse body weight were measured twice per week.
|
||||
| In Vivo Model | MV411 CDX model | ||||
| In Vitro Model | Childhood acute monocytic leukemia | MV4-11 cells | CVCL_0064 | ||
Revealed Based on the Cell Line Data
| Experiment 1 Reporting the Activity Date of This ADC | [9] | ||||
| Efficacy Data | Half Maximal Inhibitory Concentration (IC50) | 20 pM | Positive CD33 expression (CD33+++/++) | ||
| Method Description |
The cells, at a predetermined concentration, were plated into 96 well plates, and, after overnight incubation at 37°C/5% CO2, serial dilutions of each test article (TA) were added to the cells. Cells were incubated with test articles for 72 hours. and viability was detected with CellTiter-Gloreagent.
|
||||
| In Vitro Model | Acute myeloid leukemia | ML-2 cells | CVCL_1418 | ||
| Experiment 2 Reporting the Activity Date of This ADC | [9] | ||||
| Efficacy Data | Half Maximal Inhibitory Concentration (IC50) | 30 pM | Positive CD33 expression (CD33+++/++) | ||
| Method Description |
The cells, at a predetermined concentration, were plated into 96 well plates, and, after overnight incubation at 37°C/5% CO2, serial dilutions of each test article (TA) were added to the cells. Cells were incubated with test articles for 72 hours. and viability was detected with CellTiter-Gloreagent.
|
||||
| In Vitro Model | Chronic eosinophilic leukemia | EoL-1 cells | CVCL_0258 | ||
| Experiment 3 Reporting the Activity Date of This ADC | [9] | ||||
| Efficacy Data | Half Maximal Inhibitory Concentration (IC50) | 30 pM | Positive CD33 expression (CD33+++/++) | ||
| Method Description |
The cells, at a predetermined concentration, were plated into 96 well plates, and, after overnight incubation at 37°C/5% CO2, serial dilutions of each test article (TA) were added to the cells. Cells were incubated with test articles for 72 hours. and viability was detected with CellTiter-Gloreagent.
|
||||
| In Vitro Model | Adult acute myeloid leukemia | MOLM-13 cells | CVCL_2119 | ||
| Experiment 4 Reporting the Activity Date of This ADC | [9] | ||||
| Efficacy Data | Half Maximal Inhibitory Concentration (IC50) | 40 pM | Positive CD33 expression (CD33+++/++) | ||
| Method Description |
The cells, at a predetermined concentration, were plated into 96 well plates, and, after overnight incubation at 37°C/5% CO2, serial dilutions of each test article (TA) were added to the cells. Cells were incubated with test articles for 72 hours. and viability was detected with CellTiter-Gloreagent.
|
||||
| In Vitro Model | Adult acute myeloid leukemia | SKNO-1 cells | CVCL_2196 | ||
| Experiment 5 Reporting the Activity Date of This ADC | [9] | ||||
| Efficacy Data | Half Maximal Inhibitory Concentration (IC50) | 70 pM | Positive CD33 expression (CD33+++/++) | ||
| Method Description |
The cells, at a predetermined concentration, were plated into 96 well plates, and, after overnight incubation at 37°C/5% CO2, serial dilutions of each test article (TA) were added to the cells. Cells were incubated with test articles for 72 hours. and viability was detected with CellTiter-Gloreagent.
|
||||
| In Vitro Model | Childhood acute monocytic leukemia | MV4-11 cells | CVCL_0064 | ||
| Experiment 6 Reporting the Activity Date of This ADC | [9] | ||||
| Efficacy Data | Half Maximal Inhibitory Concentration (IC50) | 90 pM | Positive CD33 expression (CD33+++/++) | ||
| Method Description |
The cells, at a predetermined concentration, were plated into 96 well plates, and, after overnight incubation at 37°C/5% CO2, serial dilutions of each test article (TA) were added to the cells. Cells were incubated with test articles for 72 hours. and viability was detected with CellTiter-Gloreagent.
|
||||
| In Vitro Model | Adult acute myeloid leukemia | OCI-AML-1 cells | CVCL_5228 | ||
| Experiment 7 Reporting the Activity Date of This ADC | [9] | ||||
| Efficacy Data | Half Maximal Inhibitory Concentration (IC50) | 90 pM | Positive CD33 expression (CD33+++/++) | ||
| Method Description |
The cells, at a predetermined concentration, were plated into 96 well plates, and, after overnight incubation at 37°C/5% CO2, serial dilutions of each test article (TA) were added to the cells. Cells were incubated with test articles for 72 hours. and viability was detected with CellTiter-Gloreagent.
|
||||
| In Vitro Model | Adult acute myeloid leukemia | HL-60 cells | CVCL_0002 | ||
| Experiment 8 Reporting the Activity Date of This ADC | [9] | ||||
| Efficacy Data | Half Maximal Inhibitory Concentration (IC50) | 0.1 nM | Positive CD33 expression (CD33+++/++) | ||
| Method Description |
The cells, at a predetermined concentration, were plated into 96 well plates, and, after overnight incubation at 37°C/5% CO2, serial dilutions of each test article (TA) were added to the cells. Cells were incubated with test articles for 72 hours. and viability was detected with CellTiter-Gloreagent.
|
||||
| In Vitro Model | Acute myeloid leukemia | Kasumi-6 cells | CVCL_0614 | ||
| Experiment 9 Reporting the Activity Date of This ADC | [9] | ||||
| Efficacy Data | Half Maximal Inhibitory Concentration (IC50) | 0.1 nM | Positive CD33 expression (CD33+++/++) | ||
| Method Description |
The cells, at a predetermined concentration, were plated into 96 well plates, and, after overnight incubation at 37°C/5% CO2, serial dilutions of each test article (TA) were added to the cells. Cells were incubated with test articles for 72 hours. and viability was detected with CellTiter-Gloreagent.
|
||||
| In Vitro Model | Acute myeloid leukemia | AML-193 cells | CVCL_1071 | ||
| Experiment 10 Reporting the Activity Date of This ADC | [9] | ||||
| Efficacy Data | Half Maximal Inhibitory Concentration (IC50) | 0.1 nM | Positive CD33 expression (CD33+++/++) | ||
| Method Description |
The cells, at a predetermined concentration, were plated into 96 well plates, and, after overnight incubation at 37°C/5% CO2, serial dilutions of each test article (TA) were added to the cells. Cells were incubated with test articles for 72 hours. and viability was detected with CellTiter-Gloreagent.
|
||||
| In Vitro Model | Acute myeloid leukemia | OCI-AML-4 cells | CVCL_5224 | ||
| Experiment 11 Reporting the Activity Date of This ADC | [9] | ||||
| Efficacy Data | Half Maximal Inhibitory Concentration (IC50) | > 0.41 nM | Negative CD33 expression (CD33-) | ||
| Method Description |
The cells, at a predetermined concentration, were plated into 96 well plates, and, after overnight incubation at 37°C/5% CO2, serial dilutions of each test article (TA) were added to the cells. Cells were incubated with test articles for 72 hours. and viability was detected with CellTiter-Gloreagent.
|
||||
| In Vitro Model | Leukemia | KOPN-8 cells | CVCL_1866 | ||
| Experiment 12 Reporting the Activity Date of This ADC | [9] | ||||
| Efficacy Data | Half Maximal Inhibitory Concentration (IC50) | 0.43 nM | Negative CD33 expression (CD33-) | ||
| Method Description |
The cells, at a predetermined concentration, were plated into 96 well plates, and, after overnight incubation at 37°C/5% CO2, serial dilutions of each test article (TA) were added to the cells. Cells were incubated with test articles for 72 hours. and viability was detected with CellTiter-Gloreagent.
|
||||
| In Vitro Model | Adult T acute lymphoblastic leukemia | MOLT-4 cells | CVCL_0013 | ||
| Experiment 13 Reporting the Activity Date of This ADC | [9] | ||||
| Efficacy Data | Half Maximal Inhibitory Concentration (IC50) | 0.45 nM | Negative CD33 expression (CD33-) | ||
| Method Description |
The cells, at a predetermined concentration, were plated into 96 well plates, and, after overnight incubation at 37°C/5% CO2, serial dilutions of each test article (TA) were added to the cells. Cells were incubated with test articles for 72 hours. and viability was detected with CellTiter-Gloreagent.
|
||||
| In Vitro Model | Acute myeloid leukemia | SKM-1 cells | CVCL_0098 | ||
| Experiment 14 Reporting the Activity Date of This ADC | [9] | ||||
| Efficacy Data | Half Maximal Inhibitory Concentration (IC50) | 0.52 nM | Positive CD33 expression (CD33+++/++) | ||
| Method Description |
The cells, at a predetermined concentration, were plated into 96 well plates, and, after overnight incubation at 37°C/5% CO2, serial dilutions of each test article (TA) were added to the cells. Cells were incubated with test articles for 72 hours. and viability was detected with CellTiter-Gloreagent.
|
||||
| In Vitro Model | Acute myeloid leukemia | HNT-34 cells | CVCL_2071 | ||
| Experiment 15 Reporting the Activity Date of This ADC | [9] | ||||
| Efficacy Data | Half Maximal Inhibitory Concentration (IC50) | 0.56 nM | Negative CD33 expression (CD33-) | ||
| Method Description |
The cells, at a predetermined concentration, were plated into 96 well plates, and, after overnight incubation at 37°C/5% CO2, serial dilutions of each test article (TA) were added to the cells. Cells were incubated with test articles for 72 hours. and viability was detected with CellTiter-Gloreagent.
|
||||
| In Vitro Model | Adult B acute lymphoblastic leukemia | RS4;11 cells | CVCL_0093 | ||
| Experiment 16 Reporting the Activity Date of This ADC | [9] | ||||
| Efficacy Data | Half Maximal Inhibitory Concentration (IC50) | 0.58 nM | Negative CD33 expression (CD33-) | ||
| Method Description |
The cells, at a predetermined concentration, were plated into 96 well plates, and, after overnight incubation at 37°C/5% CO2, serial dilutions of each test article (TA) were added to the cells. Cells were incubated with test articles for 72 hours. and viability was detected with CellTiter-Gloreagent.
|
||||
| In Vitro Model | B acute lymphoblastic leukemia | Reh cells | CVCL_1650 | ||
| Experiment 17 Reporting the Activity Date of This ADC | [9] | ||||
| Efficacy Data | Half Maximal Inhibitory Concentration (IC50) | 1.47 nM | Negative CD33 expression (CD33-) | ||
| Method Description |
The cells, at a predetermined concentration, were plated into 96 well plates, and, after overnight incubation at 37°C/5% CO2, serial dilutions of each test article (TA) were added to the cells. Cells were incubated with test articles for 72 hours. and viability was detected with CellTiter-Gloreagent.
|
||||
| In Vitro Model | B acute lymphoblastic leukemia | LC4-1 cells | CVCL_1374 | ||
| Experiment 18 Reporting the Activity Date of This ADC | [9] | ||||
| Efficacy Data | Half Maximal Inhibitory Concentration (IC50) | 1.78 nM | Negative CD33 expression (CD33-) | ||
| Method Description |
The cells, at a predetermined concentration, were plated into 96 well plates, and, after overnight incubation at 37°C/5% CO2, serial dilutions of each test article (TA) were added to the cells. Cells were incubated with test articles for 72 hours. and viability was detected with CellTiter-Gloreagent.
|
||||
| In Vitro Model | B-lymphoblastic leukemia | SUP-B15 cells | CVCL_0103 | ||
| Experiment 19 Reporting the Activity Date of This ADC | [9] | ||||
| Efficacy Data | Half Maximal Inhibitory Concentration (IC50) | 2.57 nM | Negative CD33 expression (CD33-) | ||
| Method Description |
The cells, at a predetermined concentration, were plated into 96 well plates, and, after overnight incubation at 37°C/5% CO2, serial dilutions of each test article (TA) were added to the cells. Cells were incubated with test articles for 72 hours. and viability was detected with CellTiter-Gloreagent.
|
||||
| In Vitro Model | Childhood acute monocytic leukemia | THP-1 cells | CVCL_0006 | ||
| Experiment 20 Reporting the Activity Date of This ADC | [9] | ||||
| Efficacy Data | Half Maximal Inhibitory Concentration (IC50) | 2.92 nM | Negative CD33 expression (CD33-) | ||
| Method Description |
The cells, at a predetermined concentration, were plated into 96 well plates, and, after overnight incubation at 37°C/5% CO2, serial dilutions of each test article (TA) were added to the cells. Cells were incubated with test articles for 72 hours. and viability was detected with CellTiter-Gloreagent.
|
||||
| In Vitro Model | T acute lymphoblastic leukemia | TALL-1 cells | CVCL_1736 | ||
| Experiment 21 Reporting the Activity Date of This ADC | [9] | ||||
| Efficacy Data | Half Maximal Inhibitory Concentration (IC50) | 3.31 nM | Negative CD33 expression (CD33-) | ||
| Method Description |
The cells, at a predetermined concentration, were plated into 96 well plates, and, after overnight incubation at 37°C/5% CO2, serial dilutions of each test article (TA) were added to the cells. Cells were incubated with test articles for 72 hours. and viability was detected with CellTiter-Gloreagent.
|
||||
| In Vitro Model | Adult T acute lymphoblastic leukemia | LOUCY cells | CVCL_1380 | ||
| Experiment 22 Reporting the Activity Date of This ADC | [9] | ||||
| Efficacy Data | Half Maximal Inhibitory Concentration (IC50) | 8.02 nM | Negative CD33 expression (CD33-) | ||
| Method Description |
The cells, at a predetermined concentration, were plated into 96 well plates, and, after overnight incubation at 37°C/5% CO2, serial dilutions of each test article (TA) were added to the cells. Cells were incubated with test articles for 72 hours. and viability was detected with CellTiter-Gloreagent.
|
||||
| In Vitro Model | Childhood B acute lymphoblastic leukemia | NALM-16 cells | CVCL_1834 | ||
| Experiment 23 Reporting the Activity Date of This ADC | [9] | ||||
| Efficacy Data | Half Maximal Inhibitory Concentration (IC50) | 8.03 nM | Negative CD33 expression (CD33-) | ||
| Method Description |
The cells, at a predetermined concentration, were plated into 96 well plates, and, after overnight incubation at 37°C/5% CO2, serial dilutions of each test article (TA) were added to the cells. Cells were incubated with test articles for 72 hours. and viability was detected with CellTiter-Gloreagent.
|
||||
| In Vitro Model | T acute lymphoblastic leukemia | ATN-1 cells | CVCL_1073 | ||
| Experiment 24 Reporting the Activity Date of This ADC | [9] | ||||
| Efficacy Data | Half Maximal Inhibitory Concentration (IC50) | 8.56 nM | Negative CD33 expression (CD33-) | ||
| Method Description |
The cells, at a predetermined concentration, were plated into 96 well plates, and, after overnight incubation at 37°C/5% CO2, serial dilutions of each test article (TA) were added to the cells. Cells were incubated with test articles for 72 hours. and viability was detected with CellTiter-Gloreagent.
|
||||
| In Vitro Model | T acute lymphoblastic leukemia | CCRF-CEM cells | CVCL_0207 | ||
| Experiment 25 Reporting the Activity Date of This ADC | [9] | ||||
| Efficacy Data | Half Maximal Inhibitory Concentration (IC50) | 8.61 nM | Negative CD33 expression (CD33-) | ||
| Method Description |
The cells, at a predetermined concentration, were plated into 96 well plates, and, after overnight incubation at 37°C/5% CO2, serial dilutions of each test article (TA) were added to the cells. Cells were incubated with test articles for 72 hours. and viability was detected with CellTiter-Gloreagent.
|
||||
| In Vitro Model | T lymphoblastic lymphoma | SUP-T1 cells | CVCL_1714 | ||
| Experiment 26 Reporting the Activity Date of This ADC | [9] | ||||
| Efficacy Data | Half Maximal Inhibitory Concentration (IC50) | 8.91 nM | Negative CD33 expression (CD33-) | ||
| Method Description |
The cells, at a predetermined concentration, were plated into 96 well plates, and, after overnight incubation at 37°C/5% CO2, serial dilutions of each test article (TA) were added to the cells. Cells were incubated with test articles for 72 hours. and viability was detected with CellTiter-Gloreagent.
|
||||
| In Vitro Model | Leukemia | ARH-77 cells | CVCL_1072 | ||
| Experiment 27 Reporting the Activity Date of This ADC | [9] | ||||
| Efficacy Data | Half Maximal Inhibitory Concentration (IC50) | 10.2 nM | Negative CD33 expression (CD33-) | ||
| Method Description |
The cells, at a predetermined concentration, were plated into 96 well plates, and, after overnight incubation at 37°C/5% CO2, serial dilutions of each test article (TA) were added to the cells. Cells were incubated with test articles for 72 hours. and viability was detected with CellTiter-Gloreagent.
|
||||
| In Vitro Model | Leukemia | Jurkat E6.1 cells | CVCL_0367 | ||
| Experiment 28 Reporting the Activity Date of This ADC | [9] | ||||
| Efficacy Data | Half Maximal Inhibitory Concentration (IC50) | > 20 nM | Negative CD33 expression (CD33-) | ||
| Method Description |
The cells, at a predetermined concentration, were plated into 96 well plates, and, after overnight incubation at 37°C/5% CO2, serial dilutions of each test article (TA) were added to the cells. Cells were incubated with test articles for 72 hours. and viability was detected with CellTiter-Gloreagent.
|
||||
| In Vitro Model | Acute myeloid leukemia | GDM-1 cells | CVCL_1230 | ||
| Experiment 29 Reporting the Activity Date of This ADC | [9] | ||||
| Efficacy Data | Half Maximal Inhibitory Concentration (IC50) | > 20 nM | Negative CD33 expression (CD33-) | ||
| Method Description |
The cells, at a predetermined concentration, were plated into 96 well plates, and, after overnight incubation at 37°C/5% CO2, serial dilutions of each test article (TA) were added to the cells. Cells were incubated with test articles for 72 hours. and viability was detected with CellTiter-Gloreagent.
|
||||
| In Vitro Model | Acute erythroid leukemia | TF-1a cells | CVCL_3608 | ||
| Experiment 30 Reporting the Activity Date of This ADC | [9] | ||||
| Efficacy Data | Half Maximal Inhibitory Concentration (IC50) | > 20 nM | Negative CD33 expression (CD33-) | ||
| Method Description |
The cells, at a predetermined concentration, were plated into 96 well plates, and, after overnight incubation at 37°C/5% CO2, serial dilutions of each test article (TA) were added to the cells. Cells were incubated with test articles for 72 hours. and viability was detected with CellTiter-Gloreagent.
|
||||
| In Vitro Model | Chronic myeloid leukemia | KU812 cells | CVCL_0379 | ||
| Experiment 31 Reporting the Activity Date of This ADC | [9] | ||||
| Efficacy Data | Half Maximal Inhibitory Concentration (IC50) | > 20 nM | Negative CD33 expression (CD33-) | ||
| Method Description |
The cells, at a predetermined concentration, were plated into 96 well plates, and, after overnight incubation at 37°C/5% CO2, serial dilutions of each test article (TA) were added to the cells. Cells were incubated with test articles for 72 hours. and viability was detected with CellTiter-Gloreagent.
|
||||
| In Vitro Model | Acute megakaryoblastic leukemia | CMK-11-5 cells | CVCL_0217 | ||
| Experiment 32 Reporting the Activity Date of This ADC | [9] | ||||
| Efficacy Data | Half Maximal Inhibitory Concentration (IC50) | > 20 nM | Positive CD33 expression (CD33+++/++) | ||
| Method Description |
The cells, at a predetermined concentration, were plated into 96 well plates, and, after overnight incubation at 37°C/5% CO2, serial dilutions of each test article (TA) were added to the cells. Cells were incubated with test articles for 72 hours. and viability was detected with CellTiter-Gloreagent.
|
||||
| In Vitro Model | Adult acute myeloid leukemia | PLB-985 cells | CVCL_2162 | ||
| Experiment 33 Reporting the Activity Date of This ADC | [9] | ||||
| Efficacy Data | Half Maximal Inhibitory Concentration (IC50) | > 20 nM | Positive CD33 expression (CD33+++/++) | ||
| Method Description |
The cells, at a predetermined concentration, were plated into 96 well plates, and, after overnight incubation at 37°C/5% CO2, serial dilutions of each test article (TA) were added to the cells. Cells were incubated with test articles for 72 hours. and viability was detected with CellTiter-Gloreagent.
|
||||
| In Vitro Model | Acute myeloid leukemia | OCI-M1 cells | CVCL_2149 | ||
| Experiment 34 Reporting the Activity Date of This ADC | [9] | ||||
| Efficacy Data | Half Maximal Inhibitory Concentration (IC50) | > 20 nM | Positive CD33 expression (CD33+++/++) | ||
| Method Description |
The cells, at a predetermined concentration, were plated into 96 well plates, and, after overnight incubation at 37°C/5% CO2, serial dilutions of each test article (TA) were added to the cells. Cells were incubated with test articles for 72 hours. and viability was detected with CellTiter-Gloreagent.
|
||||
| In Vitro Model | Myeloid leukemia with maturation | Kasumi-1 cells | CVCL_0589 | ||
| Experiment 35 Reporting the Activity Date of This ADC | [9] | ||||
| Efficacy Data | Half Maximal Inhibitory Concentration (IC50) | > 20 nM | Positive CD33 expression (CD33+++/++) | ||
| Method Description |
The cells, at a predetermined concentration, were plated into 96 well plates, and, after overnight incubation at 37°C/5% CO2, serial dilutions of each test article (TA) were added to the cells. Cells were incubated with test articles for 72 hours. and viability was detected with CellTiter-Gloreagent.
|
||||
| In Vitro Model | Acute monocytic leukemia | NOMO-1 cells | CVCL_1609 | ||
| Experiment 36 Reporting the Activity Date of This ADC | [9] | ||||
| Efficacy Data | Half Maximal Inhibitory Concentration (IC50) | > 20 nM | Positive CD33 expression (CD33+++/++) | ||
| Method Description |
The cells, at a predetermined concentration, were plated into 96 well plates, and, after overnight incubation at 37°C/5% CO2, serial dilutions of each test article (TA) were added to the cells. Cells were incubated with test articles for 72 hours. and viability was detected with CellTiter-Gloreagent.
|
||||
| In Vitro Model | Leukemia | KG-1a cells | CVCL_1824 | ||
| Experiment 37 Reporting the Activity Date of This ADC | [9] | ||||
| Efficacy Data | Half Maximal Inhibitory Concentration (IC50) | > 20 nM | Positive CD33 expression (CD33+++/++) | ||
| Method Description |
The cells, at a predetermined concentration, were plated into 96 well plates, and, after overnight incubation at 37°C/5% CO2, serial dilutions of each test article (TA) were added to the cells. Cells were incubated with test articles for 72 hours. and viability was detected with CellTiter-Gloreagent.
|
||||
| In Vitro Model | Adult acute myeloid leukemia | Kasumi-3 cells | CVCL_0612 | ||
| Experiment 38 Reporting the Activity Date of This ADC | [9] | ||||
| Efficacy Data | Half Maximal Inhibitory Concentration (IC50) | > 20 nM | Positive CD33 expression (CD33+++/++) | ||
| Method Description |
The cells, at a predetermined concentration, were plated into 96 well plates, and, after overnight incubation at 37°C/5% CO2, serial dilutions of each test article (TA) were added to the cells. Cells were incubated with test articles for 72 hours. and viability was detected with CellTiter-Gloreagent.
|
||||
| In Vitro Model | Acute myeloid leukemia | AML-193 cells | CVCL_1071 | ||
| Experiment 39 Reporting the Activity Date of This ADC | [9] | ||||
| Efficacy Data | Half Maximal Inhibitory Concentration (IC50) | > 20 nM | Positive CD33 expression (CD33+++/++) | ||
| Method Description |
The cells, at a predetermined concentration, were plated into 96 well plates, and, after overnight incubation at 37°C/5% CO2, serial dilutions of each test article (TA) were added to the cells. Cells were incubated with test articles for 72 hours. and viability was detected with CellTiter-Gloreagent.
|
||||
| In Vitro Model | Acute myeloid leukemia | Kasumi-6 cells | CVCL_0614 | ||
| Experiment 40 Reporting the Activity Date of This ADC | [9] | ||||
| Efficacy Data | Half Maximal Inhibitory Concentration (IC50) | > 20 nM | Positive CD33 expression (CD33+++/++) | ||
| Method Description |
The cells, at a predetermined concentration, were plated into 96 well plates, and, after overnight incubation at 37°C/5% CO2, serial dilutions of each test article (TA) were added to the cells. Cells were incubated with test articles for 72 hours. and viability was detected with CellTiter-Gloreagent.
|
||||
| In Vitro Model | Myelodysplastic syndrome | F-36P cells | CVCL_2037 | ||
References