Antigen Information
General Information of This Antigen
| Antigen ID | TAR0EBTXG |
|||||
|---|---|---|---|---|---|---|
| Antigen Name | B-lymphocyte antigen CD19 (CD19) |
|||||
| Gene Name | CD19 |
|||||
| Gene ID | ||||||
| Synonym | B-lymphocyte surface antigen B4; Differentiation antigen CD19;T-cell surface antigen Leu-12;CD_antigen=CD19 |
|||||
| Sequence |
MPPPRLLFFLLFLTPMEVRPEEPLVVKVEEGDNAVLQCLKGTSDGPTQQLTWSRESPLKP
FLKLSLGLPGLGIHMRPLAIWLFIFNVSQQMGGFYLCQPGPPSEKAWQPGWTVNVEGSGE LFRWNVSDLGGLGCGLKNRSSEGPSSPSGKLMSPKLYVWAKDRPEIWEGEPPCLPPRDSL NQSLSQDLTMAPGSTLWLSCGVPPDSVSRGPLSWTHVHPKGPKSLLSLELKDDRPARDMW VMETGLLLPRATAQDAGKYYCHRGNLTMSFHLEITARPVLWHWLLRTGGWKVSAVTLAYL IFCLCSLVGILHLQRALVLRRKRKRMTDPTRRFFKVTPPPGSGPQNQYGNVLSLPTPTSG LGRAQRWAAGLGGTAPSYGNPSSDVQADGALGSRSPPGVGPEEEEGEGYEEPDSEEDSEF YENDSNLGQDQLSQDGSGYENPEDEPLGPEDEDSFSNAESYENEDEELTQPVARTMDFLS PHGSAWDPSREATSLGSQSYEDMRGILYAAPQLRSIRGQPGPNHEEDADSYENMDNPDGP DPAWGGGGRMGTWSTR Click to Show/Hide
|
|||||
| Function |
Functions as coreceptor for the B-cell antigen receptor complex (BCR) on B-lymphocytes. Decreases the threshold for activation of downstream signaling pathways and for triggering B-cell responses to antigens. Activates signaling pathways that lead to the activation of phosphatidylinositol 3-kinase and the mobilization of intracellular Ca(2+) stores. Is not required for early steps during B cell differentiation in the blood marrow. Required for normal differentiation of B-1 cells. Required for normal B cell differentiation and proliferation in response to antigen challenges. Required for normal levels of serum immunoglobulins, and for production of high-affinity antibodies in response to antigen challenge.
Click to Show/Hide
|
|||||
| Uniprot Entry | ||||||
| HGNC ID | ||||||
| KEGG ID | ||||||
Each Antibody-drug Conjuate AND It's Component Related to This Antigen
Full List of The ADC Related to This Antigen
AFM-11
| ADC Info | ADC Name | Payload | Target | Linker | Ref |
|---|---|---|---|---|---|
AFM-11-2i |
Monomethyl auristatin F |
Microtubule (MT) |
AFM-11-2i linker |
[1] | |
AFM-11-3i |
Monomethyl auristatin F |
Microtubule (MT) |
AFM-11-3i linker |
[1] | |
AFM-11-4i |
Monomethyl auristatin F |
Microtubule (MT) |
AFM-11-4i linker |
[1] | |
AFM-11-6e |
Monomethyl auristatin E |
Microtubule (MT) |
AFM-11-6e linker |
[1] | |
AFM-11-amanitin |
Alpha-amanitin |
DNA-directed RNA polymerase II subunit RPB2 (POLR2B); DNA-directed RNA polymerase III subunit RPC7 (POLR3G) |
AFM-11-amanitin linker |
[1] |
AFM-12
| ADC Info | ADC Name | Payload | Target | Linker | Ref |
|---|---|---|---|---|---|
AFM-12-2i |
Monomethyl auristatin F |
Microtubule (MT) |
AFM-12-2i linker |
[1] | |
AFM-12-3i |
Monomethyl auristatin F |
Microtubule (MT) |
AFM-12-3i linker |
[1] | |
AFM-12-4i |
Monomethyl auristatin F |
Microtubule (MT) |
AFM-12-4i linker |
[1] | |
AFM-12-6e |
Monomethyl auristatin E |
Microtubule (MT) |
AFM-12-6e linker |
[1] | |
AFM-12-amanitin |
Alpha-amanitin |
DNA-directed RNA polymerase II subunit RPB2 (POLR2B); DNA-directed RNA polymerase III subunit RPC7 (POLR3G) |
AFM-12-amanitin linker |
[1] |
Anti-CD19 ABBV319 IgG1 mAb
| ADC Info | ADC Name | Payload | Target | Linker | Ref |
|---|---|---|---|---|---|
ABBV-319 |
Proprietary GRM agonist |
Glucocorticoid receptor (NR3C1) |
Formyl-Ala-Ala |
[2] |
Anti-CD19 mAb B4
| ADC Info | ADC Name | Payload | Target | Linker | Ref |
|---|---|---|---|---|---|
B4-SMCC-DC4 |
Phosphate prodrugs 40 (DC4) |
Human Deoxyribonucleic acid (hDNA) |
Succinimidyl-4-(N-maleimidomethyl)cyclohexane-1-carboxylate (SMCC) |
[3] | |
B4-SPP-DC1 |
DC1 |
Human Deoxyribonucleic acid (hDNA) |
N-succinimidyl 4-(2-pyridyldithio) pentanoate (SPP) |
[3] | |
B4-SPP-DC4 |
Phosphate prodrugs 40 (DC4) |
Human Deoxyribonucleic acid (hDNA) |
N-succinimidyl 4-(2-pyridyldithio) pentanoate (SPP) |
[3] | |
B4-SPP-DC44 |
DC44 |
Human Deoxyribonucleic acid (hDNA) |
N-succinimidyl 4-(2-pyridyldithio) pentanoate (SPP) |
[3] |
Anti-CD19 mAb DI-B4
| ADC Info | ADC Name | Payload | Target | Linker | Ref |
|---|---|---|---|---|---|
LCB14-0648 |
Monomethyl auristatin F |
Microtubule (MT) |
LCB14-0648 linker |
[1] | |
LCB14-0663 |
Monomethyl auristatin F |
Microtubule (MT) |
LCB14-0663 linker |
[1] | |
LCB14-0664 |
Monomethyl auristatin F |
Microtubule (MT) |
LCB14-0664 linker |
[1] | |
LCB14-6e |
Monomethyl auristatin E |
Microtubule (MT) |
LCB14-6e linker |
[1] | |
LCB14-alpha-amanitin |
Alpha-amanitin |
DNA-directed RNA polymerase II subunit RPB2 (POLR2B); DNA-directed RNA polymerase III subunit RPC7 (POLR3G) |
LCB14-alpha-amanitin linker |
[1] | |
WO2017089890A1 ADC67 |
Monomethyl auristatin F |
Microtubule (MT) |
WO2017089890A1_ADC67 linker |
[4] | |
WO2017089890A1 ADC68 |
Monomethyl auristatin E |
Microtubule (MT) |
WO2017089890A1_ADC68 linker |
[4] | |
WO2017089890A1 ADC69 |
Monomethyl auristatin F |
Microtubule (MT) |
WO2017089890A1_ADC69 linker |
[4] | |
WO2017089895A1 ADC67 |
Monomethyl auristatin F |
Microtubule (MT) |
WO2017089895A1_ADC67 linker |
[5] | |
WO2017089895A1 ADC68 |
Monomethyl auristatin E |
Microtubule (MT) |
WO2017089895A1_ADC68 linker |
[5] | |
WO2017089895A1 ADC69 |
Monomethyl auristatin F |
Microtubule (MT) |
WO2017089895A1_ADC69 linker |
[5] |
Anti-CD19 mAb hA19
| ADC Info | ADC Name | Payload | Target | Linker | Ref |
|---|---|---|---|---|---|
HA19-SN38 antibody-drug conjugate |
Active metabolite of irinotecan SN38 |
DNA topoisomerase 1 (TOP1) |
CL2A |
[6] |
Anti-CD19 mAb hBU12
| ADC Info | ADC Name | Payload | Target | Linker | Ref |
|---|---|---|---|---|---|
hBU12-mc-MMAF |
Monomethyl auristatin F |
Microtubule (MT) |
Mc-Val-Cit-PABC |
[7] |
Anti-CD19 mAb hBU12ec
| ADC Info | ADC Name | Payload | Target | Linker | Ref |
|---|---|---|---|---|---|
SGN-CD19B |
SGD-1882 |
Human Deoxyribonucleic acid (hDNA) |
Mc-Val-Ala |
[8] |
cHD37
| ADC Info | ADC Name | Payload | Target | Linker | Ref |
|---|---|---|---|---|---|
cHD37-2i |
Monomethyl auristatin F |
Microtubule (MT) |
cHD37-2i linker |
[1] | |
cHD37-3i |
Monomethyl auristatin F |
Microtubule (MT) |
cHD37-3i linker |
[1] | |
cHD37-4i |
Monomethyl auristatin F |
Microtubule (MT) |
cHD37-4i linker |
[1] | |
cHD37-6e |
Monomethyl auristatin E |
Microtubule (MT) |
cHD37-6e linker |
[1] | |
cHD37-amanitin |
Alpha-amanitin |
DNA-directed RNA polymerase II subunit RPB2 (POLR2B); DNA-directed RNA polymerase III subunit RPC7 (POLR3G) |
cHD37-amanitin linker |
[1] |
Coltuximab
| ADC Info | ADC Name | Payload | Target | Linker | Ref |
|---|---|---|---|---|---|
Coltuximab ravtansine |
Mertansine DM4 |
Microtubule (MT) |
N-succinimidyl 4-(2-pyridyldithio) butanoate (SPDB) |
[9] |
Denintuzumab
| ADC Info | ADC Name | Payload | Target | Linker | Ref |
|---|---|---|---|---|---|
SGN-CD19A |
Monomethyl auristatin F |
Microtubule (MT) |
Maleimido-caproyl |
[10] | |
Denintuzumab-2i |
Monomethyl auristatin F |
Microtubule (MT) |
Denintuzumab-2i linker |
[1] | |
Denintuzumab-3i |
Monomethyl auristatin F |
Microtubule (MT) |
Denintuzumab-3i linker |
[1] | |
Denintuzumab-4i |
Monomethyl auristatin F |
Microtubule (MT) |
Denintuzumab-4i linker |
[1] | |
Denintuzumab-6e |
Monomethyl auristatin E |
Microtubule (MT) |
Denintuzumab-6e linker |
[1] | |
Denintuzumab-amanitin |
Alpha-amanitin |
DNA-directed RNA polymerase II subunit RPB2 (POLR2B); DNA-directed RNA polymerase III subunit RPC7 (POLR3G) |
Denintuzumab-amanitin linker |
[1] | |
hBU12-1 MMAE DAR4 |
Monomethyl auristatin E |
Microtubule (MT) |
Phe-Dpr-MA |
[11] | |
hBU12-1 MMAE DAR8 |
Monomethyl auristatin E |
Microtubule (MT) |
Phe-Dpr-MA |
[11] | |
hBU12-1 MMAF |
Monomethyl auristatin F |
Microtubule (MT) |
Phe-Dpr-MA |
[11] | |
hBU12-10 MMAE |
Monomethyl auristatin E |
Microtubule (MT) |
Thr-Glu-EDA-MDpr |
[11] | |
hBU12-10 MMAF |
Monomethyl auristatin F |
Microtubule (MT) |
Thr-Glu-EDA-MDpr |
[11] | |
hBU12-11 MMAE |
Monomethyl auristatin E |
Microtubule (MT) |
Phe-Ile-EDA-MDpr |
[11] | |
hBU12-11 MMAE DAR8 |
Monomethyl auristatin E |
Microtubule (MT) |
Phe-Ile-EDA-MDpr |
[11] | |
hBU12-11 MMAF |
Monomethyl auristatin F |
Microtubule (MT) |
Phe-Ile-EDA-MDpr |
[11] | |
hBU12-12 MMAE DAR4 |
Monomethyl auristatin E |
Microtubule (MT) |
Thr-Ile-EDA-MDpr |
[11] | |
hBU12-12 MMAE DAR8 |
Monomethyl auristatin E |
Microtubule (MT) |
Thr-Ile-EDA-MDpr |
[11] | |
hBU12-12 MMAF |
Monomethyl auristatin F |
Microtubule (MT) |
Thr-Ile-EDA-MDpr |
[11] | |
hBU12-13 MMAE DAR4 |
Monomethyl auristatin E |
Microtubule (MT) |
Thiazole-Glu-EDA-MDpr |
[11] | |
hBU12-13 MMAE DAR8 |
Monomethyl auristatin E |
Microtubule (MT) |
Thiazole-Glu-EDA-MDpr |
[11] | |
hBU12-13 MMAF |
Monomethyl auristatin F |
Microtubule (MT) |
Thiazole-Glu-EDA-MDpr |
[11] | |
hBU12-14 MMAE |
Monomethyl auristatin E |
Microtubule (MT) |
Asp-Ala-Lys-MDpr |
[11] | |
hBU12-14 MMAF |
Monomethyl auristatin F |
Microtubule (MT) |
Asp-Ala-Lys-MDpr |
[11] | |
hBU12-15 MMAE |
Monomethyl auristatin E |
Microtubule (MT) |
Glu-Ala-Lys-MDpr |
[11] | |
hBU12-15 MMAF |
Monomethyl auristatin F |
Microtubule (MT) |
Glu-Ala-Lys-MDpr |
[11] | |
hBU12-16 MMAE |
Monomethyl auristatin E |
Microtubule (MT) |
PhosphoThr-Ala-Lys-MDpr |
[11] | |
hBU12-16 MMAF |
Monomethyl auristatin F |
Microtubule (MT) |
PhosphoThr-Ala-Lys-MDpr |
[11] | |
hBU12-17 MMAE |
Monomethyl auristatin E |
Microtubule (MT) |
Asn-AlaGlu-Dpr-MDpr |
[11] | |
hBU12-17 MMAE DAR4 |
Monomethyl auristatin E |
Microtubule (MT) |
Asn-AlaGlu-Dpr-MDpr |
[11] | |
hBU12-17 MMAF |
Monomethyl auristatin F |
Microtubule (MT) |
Asn-AlaGlu-Dpr-MDpr |
[11] | |
hBU12-18 MMAE |
Monomethyl auristatin E |
Microtubule (MT) |
Glu-Ala-Glu-Dpr-MDpr |
[11] | |
hBU12-18 MMAF |
Monomethyl auristatin F |
Microtubule (MT) |
Glu-Ala-Glu-Dpr-MDpr |
[11] | |
hBU12-19 MMAE |
Monomethyl auristatin E |
Microtubule (MT) |
Asp-AlaGlu-Dpr-MDpr |
[11] | |
hBU12-19 MMAF |
Monomethyl auristatin F |
Microtubule (MT) |
Asp-AlaGlu-Dpr-MDpr |
[11] | |
hBU12-2 MMAE DAR4 |
Monomethyl auristatin E |
Microtubule (MT) |
Phe-Glu-Dpr-MA |
[11] | |
hBU12-2 MMAE DAR8 |
Monomethyl auristatin E |
Microtubule (MT) |
Phe-Glu-Dpr-MA |
[11] | |
hBU12-2 MMAF |
Monomethyl auristatin F |
Microtubule (MT) |
Phe-Glu-Dpr-MA |
[11] | |
hBU12-20 MMAE |
Monomethyl auristatin E |
Microtubule (MT) |
Glu-Ala-Glu-Dpr-MDpr |
[11] | |
hBU12-20 MMAE DAR4 |
Monomethyl auristatin E |
Microtubule (MT) |
Glu-Ala-Glu-Dpr-MDpr |
[11] | |
hBU12-20 MMAF |
Monomethyl auristatin F |
Microtubule (MT) |
Glu-Ala-Glu-Dpr-MDpr |
[11] | |
hBU12-21 MMAE |
Monomethyl auristatin E |
Microtubule (MT) |
hSer-Ala-Glu-Dpr-MDpr |
[11] | |
hBU12-21 MMAF |
Monomethyl auristatin F |
Microtubule (MT) |
hSer-Ala-Glu-Dpr-MDpr |
[11] | |
hBU12-22 MMAE |
Monomethyl auristatin E |
Microtubule (MT) |
ValoH-AlaGlu-Dpr-MDpr |
[11] | |
hBU12-22 MMAF |
Monomethyl auristatin F |
Microtubule (MT) |
ValoH-AlaGlu-Dpr-MDpr |
[11] | |
hBU12-23 MMAE |
Monomethyl auristatin E |
Microtubule (MT) |
PhosphoThr-Ala-Glu-Dpr-MDpr |
[11] | |
hBU12-23 MMAF |
Monomethyl auristatin F |
Microtubule (MT) |
PhosphoThr-Ala-Glu-Dpr-MDpr |
[11] | |
hBU12-24 MMAE |
Monomethyl auristatin E |
Microtubule (MT) |
Pyrazole-Glu-Dpr-MDpr |
[11] | |
hBU12-24 MMAE DAR4 |
Monomethyl auristatin E |
Microtubule (MT) |
Pyrazole-Glu-Dpr-MDpr |
[11] | |
hBU12-24 MMAF |
Monomethyl auristatin F |
Microtubule (MT) |
Pyrazole-Glu-Dpr-MDpr |
[11] | |
hBU12-25 MMAE |
Monomethyl auristatin E |
Microtubule (MT) |
Triazole-Glu-Dpr-MDpr |
[11] | |
hBU12-25 MMAF |
Monomethyl auristatin F |
Microtubule (MT) |
Triazole-Glu-Dpr-MDpr |
[11] | |
hBU12-26 MMAE |
Monomethyl auristatin E |
Microtubule (MT) |
Asn-Glu-Dpr-MDpr |
[11] | |
hBU12-26 MMAF |
Monomethyl auristatin F |
Microtubule (MT) |
Asn-Glu-Dpr-MDpr |
[11] | |
hBU12-27 MMAE |
Monomethyl auristatin E |
Microtubule (MT) |
Asp-Glu-Dpr-MDpr |
[11] | |
hBU12-27 MMAF |
Monomethyl auristatin F |
Microtubule (MT) |
Asp-Glu-Dpr-MDpr |
[11] | |
hBU12-28 MMAE |
Monomethyl auristatin E |
Microtubule (MT) |
Fur-Glu-Dpr-MDpr |
[11] | |
hBU12-28 MMAF |
Monomethyl auristatin F |
Microtubule (MT) |
Fur-Glu-Dpr-MDpr |
[11] | |
hBU12-29 MMAE |
Monomethyl auristatin E |
Microtubule (MT) |
ValOH-Glu-Dpr-MDpr |
[11] | |
hBU12-29 MMAE DAR4 |
Monomethyl auristatin E |
Microtubule (MT) |
ValOH-Glu-Dpr-MDpr |
[11] | |
hBU12-29 MMAF |
Monomethyl auristatin F |
Microtubule (MT) |
ValOH-Glu-Dpr-MDpr |
[11] | |
hBU12-3 MMAE DAR4 |
Monomethyl auristatin E |
Microtubule (MT) |
Thr-Dpr-MA |
[11] | |
hBU12-3 MMAE DAR8 |
Monomethyl auristatin E |
Microtubule (MT) |
Thr-Dpr-MA |
[11] | |
hBU12-3 MMAF |
Monomethyl auristatin F |
Microtubule (MT) |
Thr-Dpr-MA |
[11] | |
hBU12-30 MMAE |
Monomethyl auristatin E |
Microtubule (MT) |
Ser-Glu-Dpr-MDpr |
[11] | |
hBU12-30 MMAF |
Monomethyl auristatin F |
Microtubule (MT) |
Ser-Glu-Dpr-MDpr |
[11] | |
hBU12-31 MMAE |
Monomethyl auristatin E |
Microtubule (MT) |
hSer-Glu-Dpr-MDpr |
[11] | |
hBU12-31 MMAF |
Monomethyl auristatin F |
Microtubule (MT) |
hSer-Glu-Dpr-MDpr |
[11] | |
hBU12-32 MMAE |
Monomethyl auristatin E |
Microtubule (MT) |
Thr-IleLeu-Dpr-MDpr |
[11] | |
hBU12-32 MMAF |
Monomethyl auristatin F |
Microtubule (MT) |
Thr-IleLeu-Dpr-MDpr |
[11] | |
hBU12-33 MMAE |
Monomethyl auristatin E |
Microtubule (MT) |
Phe-Ile-Leu-Dpr-MDpr |
[11] | |
hBU12-33 MMAF |
Monomethyl auristatin F |
Microtubule (MT) |
Phe-Ile-Leu-Dpr-MDpr |
[11] | |
hBU12-34 MMAE |
Monomethyl auristatin E |
Microtubule (MT) |
Glu-Phe-Leu-Dpr-MDpr |
[11] | |
hBU12-34 MMAF |
Monomethyl auristatin F |
Microtubule (MT) |
Glu-Phe-Leu-Dpr-MDpr |
[11] | |
hBU12-35 MMAE |
Monomethyl auristatin E |
Microtubule (MT) |
Thr-LeuPhe-Dpr-MDpr |
[11] | |
hBU12-35 MMAF |
Monomethyl auristatin F |
Microtubule (MT) |
Thr-LeuPhe-Dpr-MDpr |
[11] | |
hBU12-36 MMAE |
Monomethyl auristatin E |
Microtubule (MT) |
Phe-Leu-Phe-Dpr-MDpr |
[11] | |
hBU12-36 MMAF |
Monomethyl auristatin F |
Microtubule (MT) |
Phe-Leu-Phe-Dpr-MDpr |
[11] | |
hBU12-37 MMAE |
Monomethyl auristatin E |
Microtubule (MT) |
Glu-Phe-Phe-Dpr-MDpr |
[11] | |
hBU12-37 MMAF |
Monomethyl auristatin F |
Microtubule (MT) |
Glu-Phe-Phe-Dpr-MDpr |
[11] | |
hBU12-38 MMAE |
Monomethyl auristatin E |
Microtubule (MT) |
Thr-LysAla-Dpr-MDpr |
[11] | |
hBU12-38 MMAF |
Monomethyl auristatin F |
Microtubule (MT) |
Thr-LysAla-Dpr-MDpr |
[11] | |
hBU12-39 MMAE |
Monomethyl auristatin E |
Microtubule (MT) |
Thr-Lys-Dpr-MDpr |
[11] | |
hBU12-39 MMAF |
Monomethyl auristatin F |
Microtubule (MT) |
Thr-Lys-Dpr-MDpr |
[11] | |
hBU12-4 MMAE DAR4 |
Monomethyl auristatin E |
Microtubule (MT) |
Thr-Glu-Dpr-MA |
[11] | |
hBU12-4 MMAE DAR8 |
Monomethyl auristatin E |
Microtubule (MT) |
Thr-Glu-Dpr-MA |
[11] | |
hBU12-4 MMAF |
Monomethyl auristatin F |
Microtubule (MT) |
Thr-Glu-Dpr-MA |
[11] | |
hBU12-5 MMAE DAR4 |
Monomethyl auristatin E |
Microtubule (MT) |
Phe-Glu-Dpr-MDpr |
[11] | |
hBU12-5 MMAE DAR8 |
Monomethyl auristatin E |
Microtubule (MT) |
Phe-Glu-Dpr-MDpr |
[11] | |
hBU12-5 MMAF |
Monomethyl auristatin F |
Microtubule (MT) |
Phe-Glu-Dpr-MDpr |
[11] | |
hBU12-6 MMAE DAR4 |
Monomethyl auristatin E |
Microtubule (MT) |
Thr-Glu-Dpr-MDpr |
[11] | |
hBU12-6 MMAE DAR8 |
Monomethyl auristatin E |
Microtubule (MT) |
Thr-Glu-Dpr-MDpr |
[11] | |
hBU12-6 MMAF |
Monomethyl auristatin F |
Microtubule (MT) |
Thr-Glu-Dpr-MDpr |
[11] | |
hBU12-7 MMAE DAR4 |
Monomethyl auristatin E |
Microtubule (MT) |
Thr-Glu-Lys-MDpr |
[11] | |
hBU12-7 MMAE DAR8 |
Monomethyl auristatin E |
Microtubule (MT) |
Thr-Glu-Lys-MDpr |
[11] | |
hBU12-7 MMAF |
Monomethyl auristatin F |
Microtubule (MT) |
Thr-Glu-Lys-MDpr |
[11] | |
hBU12-8 MMAE |
Monomethyl auristatin E |
Microtubule (MT) |
Thiazole-Glu-Lys-MDpr |
[11] | |
hBU12-8 MMAF |
Monomethyl auristatin F |
Microtubule (MT) |
Thiazole-Glu-Lys-MDpr |
[11] | |
hBU12-9 MMAE |
Monomethyl auristatin E |
Microtubule (MT) |
Phe-Glu-EDA-MDpr |
[11] | |
hBU12-9 MMAF |
Monomethyl auristatin F |
Microtubule (MT) |
Phe-Glu-EDA-MDpr |
[11] | |
hBU12-MC-vc-PABC-MMAF DAR8 |
Monomethyl auristatin E |
Microtubule (MT) |
Mc-Val-Cit-PABC |
[11] |
DI-B4-(LC)-GGGGGGG-CVIM
| ADC Info | ADC Name | Payload | Target | Linker | Ref |
|---|---|---|---|---|---|
Anti-CD19(LC)-G7VIM-2i |
Monomethyl auristatin F |
Microtubule (MT) |
Anti-CD19(LC)-G7VIM-2i linker |
[1] | |
Anti-CD19(LC)-G7VIM-3i |
Monomethyl auristatin F |
Microtubule (MT) |
Anti-CD19(LC)-G7VIM-3i linker |
[1] | |
Anti-CD19(LC)-G7VIM-4i |
Monomethyl auristatin F |
Microtubule (MT) |
Anti-CD19(LC)-G7VIM-4i linker |
[1] | |
Anti-CD19(LC)-G7VIM-6e |
Monomethyl auristatin E |
Microtubule (MT) |
Anti-CD19(LC)-G7VIM-6e linker |
[1] | |
Anti-CD19(LC)-G7VIM-amanitin |
Alpha-amanitin |
DNA-directed RNA polymerase II subunit RPB2 (POLR2B); DNA-directed RNA polymerase III subunit RPC7 (POLR3G) |
Anti-CD19(LC)-G7VIM-amanitin linker |
[1] |
GBR401
| ADC Info | ADC Name | Payload | Target | Linker | Ref |
|---|---|---|---|---|---|
GBR401-2i |
Monomethyl auristatin F |
Microtubule (MT) |
GBR401-2i linker |
[1] | |
GBR401-3i |
Monomethyl auristatin F |
Microtubule (MT) |
GBR401-3i linker |
[1] | |
GBR401-4i |
Monomethyl auristatin F |
Microtubule (MT) |
GBR401-4i linker |
[1] | |
GBR401-6e |
Monomethyl auristatin E |
Microtubule (MT) |
GBR401-6e linker |
[1] | |
GBR401-amanitin |
Alpha-amanitin |
DNA-directed RNA polymerase II subunit RPB2 (POLR2B); DNA-directed RNA polymerase III subunit RPC7 (POLR3G) |
GBR401-amanitin linker |
[1] |
Inebilizumab
| ADC Info | ADC Name | Payload | Target | Linker | Ref |
|---|---|---|---|---|---|
Inebilizumab-2i |
Monomethyl auristatin F |
Microtubule (MT) |
Inebilizumab-2i linker |
[1] | |
Inebilizumab-3i |
Monomethyl auristatin F |
Microtubule (MT) |
Inebilizumab-3i linker |
[1] | |
Inebilizumab-4i |
Monomethyl auristatin F |
Microtubule (MT) |
Inebilizumab-4i linker |
[1] | |
Inebilizumab-6e |
Monomethyl auristatin E |
Microtubule (MT) |
Inebilizumab-6e linker |
[1] | |
Inebilizumab-amanitin |
Alpha-amanitin |
DNA-directed RNA polymerase II subunit RPB2 (POLR2B); DNA-directed RNA polymerase III subunit RPC7 (POLR3G) |
Inebilizumab-amanitin linker |
[1] |
Loncastuximab
| ADC Info | ADC Name | Payload | Target | Linker | Ref |
|---|---|---|---|---|---|
Loncastuximab tesirine |
SG3199 |
Human Deoxyribonucleic acid (hDNA) |
Mal-PEG8-Val-Ala-PABC |
[12] |
MDX-1342
| ADC Info | ADC Name | Payload | Target | Linker | Ref |
|---|---|---|---|---|---|
MDX-1342-2i |
Monomethyl auristatin F |
Microtubule (MT) |
MDX-1342-2i linker |
[1] | |
MDX-1342-3i |
Monomethyl auristatin F |
Microtubule (MT) |
MDX-1342-3i linker |
[1] | |
MDX-1342-4i |
Monomethyl auristatin F |
Microtubule (MT) |
MDX-1342-4i linker |
[1] | |
MDX-1342-6e |
Monomethyl auristatin E |
Microtubule (MT) |
MDX-1342-6e linker |
[1] | |
MDX-1342-amanitin |
Alpha-amanitin |
DNA-directed RNA polymerase II subunit RPB2 (POLR2B); DNA-directed RNA polymerase III subunit RPC7 (POLR3G) |
MDX-1342-amanitin linker |
[1] |
MDX-1435
| ADC Info | ADC Name | Payload | Target | Linker | Ref |
|---|---|---|---|---|---|
MDX-1435-2i |
Monomethyl auristatin F |
Microtubule (MT) |
MDX-1435-2i linker |
[1] | |
MDX-1435-3i |
Monomethyl auristatin F |
Microtubule (MT) |
MDX-1435-3i linker |
[1] | |
MDX-1435-4i |
Monomethyl auristatin F |
Microtubule (MT) |
MDX-1435-4i linker |
[1] | |
MDX-1435-6e |
Monomethyl auristatin E |
Microtubule (MT) |
MDX-1435-6e linker |
[1] | |
MDX-1435-amanitin |
Alpha-amanitin |
DNA-directed RNA polymerase II subunit RPB2 (POLR2B); DNA-directed RNA polymerase III subunit RPC7 (POLR3G) |
MDX-1435-amanitin linker |
[1] |
Obexelimab
| ADC Info | ADC Name | Payload | Target | Linker | Ref |
|---|---|---|---|---|---|
Obexelimab-2i |
Monomethyl auristatin F |
Microtubule (MT) |
Obexelimab-2i linker |
[1] | |
Obexelimab-3i |
Monomethyl auristatin F |
Microtubule (MT) |
Obexelimab-3i linker |
[1] | |
Obexelimab-4i |
Monomethyl auristatin F |
Microtubule (MT) |
Obexelimab-4i linker |
[1] | |
Obexelimab-6e |
Monomethyl auristatin E |
Microtubule (MT) |
Obexelimab-6e linker |
[1] | |
Obexelimab-amanitin |
Alpha-amanitin |
DNA-directed RNA polymerase II subunit RPB2 (POLR2B); DNA-directed RNA polymerase III subunit RPC7 (POLR3G) |
Obexelimab-amanitin linker |
[1] |
RC58
| ADC Info | ADC Name | Payload | Target | Linker | Ref |
|---|---|---|---|---|---|
RC58-ADC-1 |
Dumycin-7 |
Human Deoxyribonucleic acid (hDNA) |
Bis-bromine linker-PEG4-Asn-Ala-ethylenediamine |
[13] | |
RC58-ADC-2 |
Duostain 3 |
Undisclosed |
Bis-bromine linker-PEG2-VC-PAB |
[13] | |
RC58-ADC-3 |
Duostain 3 |
Undisclosed |
Bis-bromine linker-mono-glycine-PEG12-PAB |
[13] |
Tafasitamab
| ADC Info | ADC Name | Payload | Target | Linker | Ref |
|---|---|---|---|---|---|
Tafasitamab-2i |
Monomethyl auristatin F |
Microtubule (MT) |
Tafasitamab-2i linker |
[1] | |
Tafasitamab-3i |
Monomethyl auristatin F |
Microtubule (MT) |
Tafasitamab-3i linker |
[1] | |
Tafasitamab-4i |
Monomethyl auristatin F |
Microtubule (MT) |
Tafasitamab-4i linker |
[1] | |
Tafasitamab-6e |
Monomethyl auristatin E |
Microtubule (MT) |
Tafasitamab-6e linker |
[1] | |
Tafasitamab-amanitin |
Alpha-amanitin |
DNA-directed RNA polymerase II subunit RPB2 (POLR2B); DNA-directed RNA polymerase III subunit RPC7 (POLR3G) |
Tafasitamab-amanitin linker |
[1] |
Undisclosed
| ADC Info | ADC Name | Payload | Target | Linker | Ref |
|---|---|---|---|---|---|
IKS-03 |
Pyrrolobenzo diazepine prodrug |
Human Deoxyribonucleic acid (hDNA) |
Tumor-cleavable linker |
[14] | |
Monoclonal antibody B43-genistein-conjugate |
Genistein |
Pro-epidermal growth factor (EGF) |
Undisclosed |
[15] | |
Anti-B4 monoclonal antibody-DC1 conjugate |
DC1 |
Human Deoxyribonucleic acid (hDNA) |
Undisclosed |
[16] | |
CD19-ATAC |
HDP 30.2115 |
DNA-directed RNA polymerase II subunit RPB2 (POLR2B); DNA-directed RNA polymerase III subunit RPC7 (POLR3G) |
Mal-Val-Ala-PAB |
[17] | |
CO-1008 |
Undisclosed |
Undisclosed |
Undisclosed |
[18] | |
HuB4-DGN462 |
DGN462 |
Human Deoxyribonucleic acid (hDNA) |
Sulfo-SPDB |
[19] | |
NI-2201 |
Undisclosed |
Undisclosed |
Undisclosed |
[20] | |
NV102 |
Doxorubicin |
DNA topoisomerase 2-alpha (TOP2A) |
Undisclosed |
[21] | |
LCB-73 |
Undisclosed |
Undisclosed |
Undisclosed |
[22] | |
Anti-CD19 monoclonal antibody-liposomal sodium butyrate conjugate |
Sodium butyrate |
Histone deacetylase 1 (HDAC1) |
Undisclosed |
[23] | |
TE-1522 |
Undisclosed |
Undisclosed |
Undisclosed |
[24] |
Tissue/Disease specific Abundances of This Antigen
Tissue specific Abundances of This Antigen
ICD Disease Classification 01
| Differential expression pattern of antigen in diseases | ||
| The Studied Tissue | Gingival | |
| The Specific Disease | Bacterial infection of gingival | |
| The Expression Level of Disease Section Compare with the Healthy Individual Tissue | p-value: 7.16E-25; Fold-change: 1.410147221; Z-score: 2.228067582 | |
| Disease-specific Antigen Abundances |
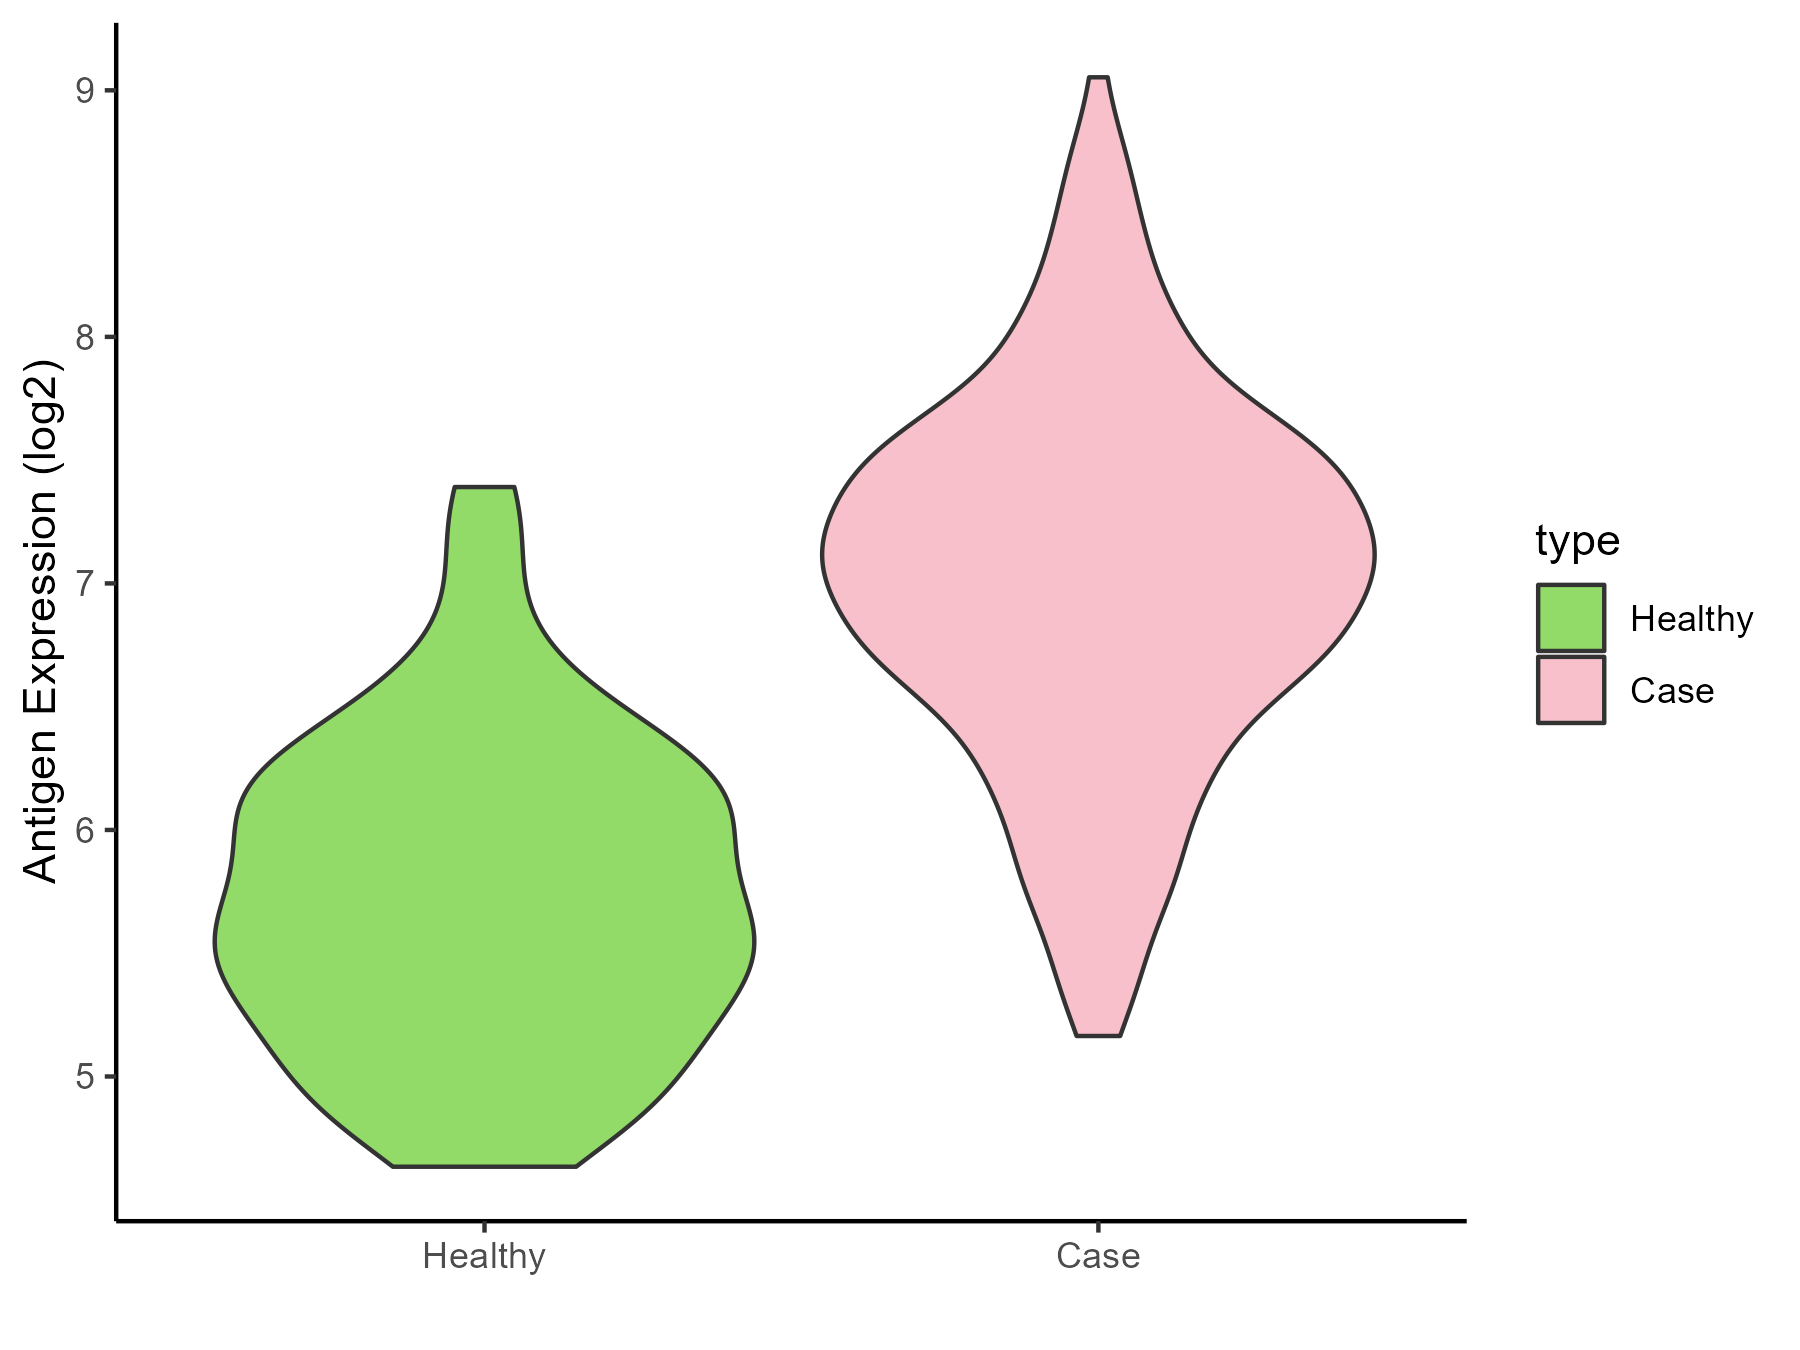
|
Click to View the Clearer Original Diagram |
ICD Disease Classification 02
| Differential expression pattern of antigen in diseases | ||
| The Studied Tissue | Brainstem | |
| The Specific Disease | Glioma | |
| The Expression Level of Disease Section Compare with the Healthy Individual Tissue | p-value: 0.293573004; Fold-change: -0.226021531; Z-score: -1.290021358 | |
| Disease-specific Antigen Abundances |
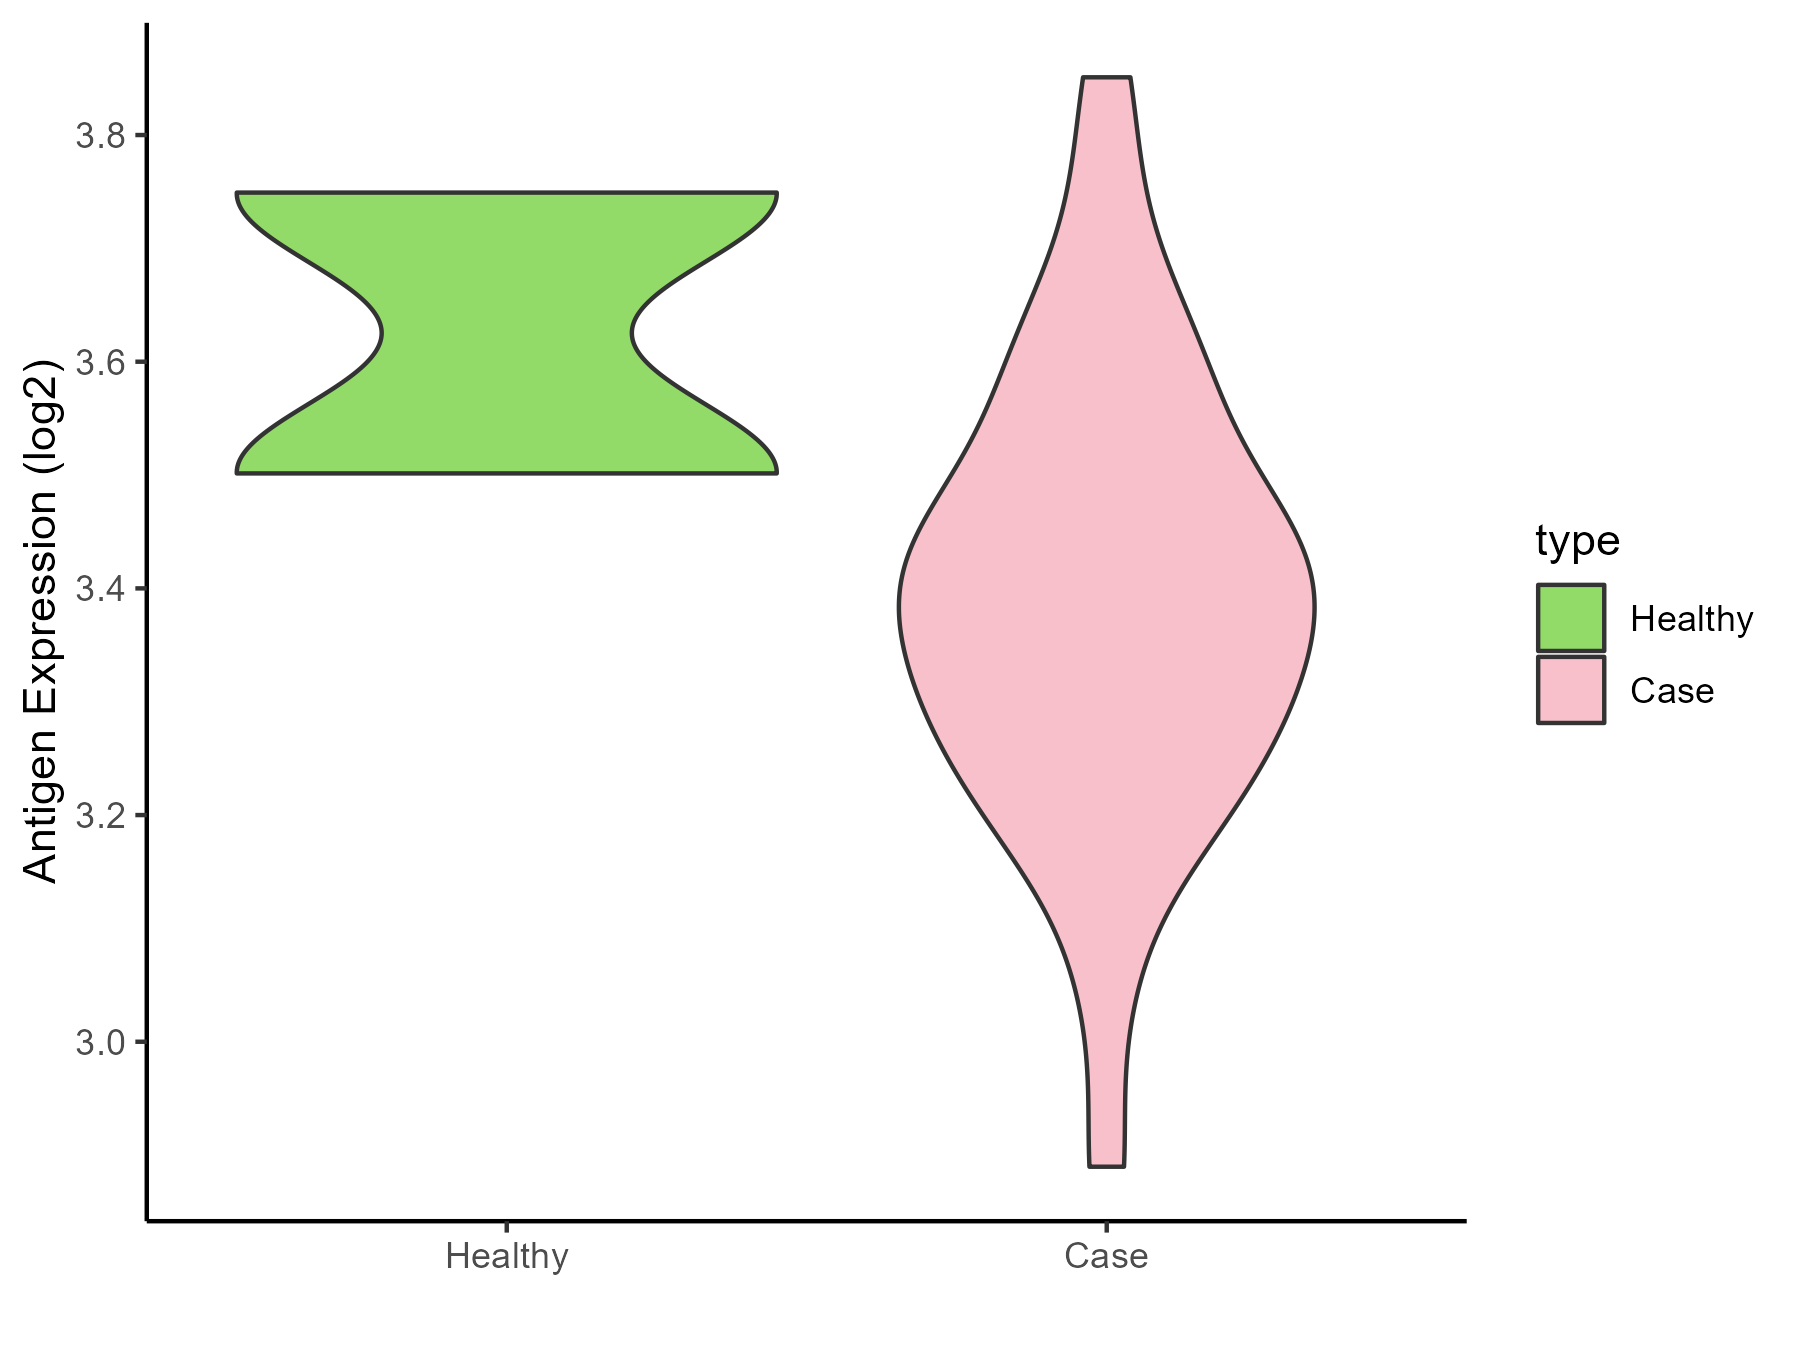
|
Click to View the Clearer Original Diagram |
| The Studied Tissue | White matter | |
| The Specific Disease | Glioma | |
| The Expression Level of Disease Section Compare with the Healthy Individual Tissue | p-value: 0.000258934; Fold-change: -0.608737311; Z-score: -1.438800272 | |
| Disease-specific Antigen Abundances |
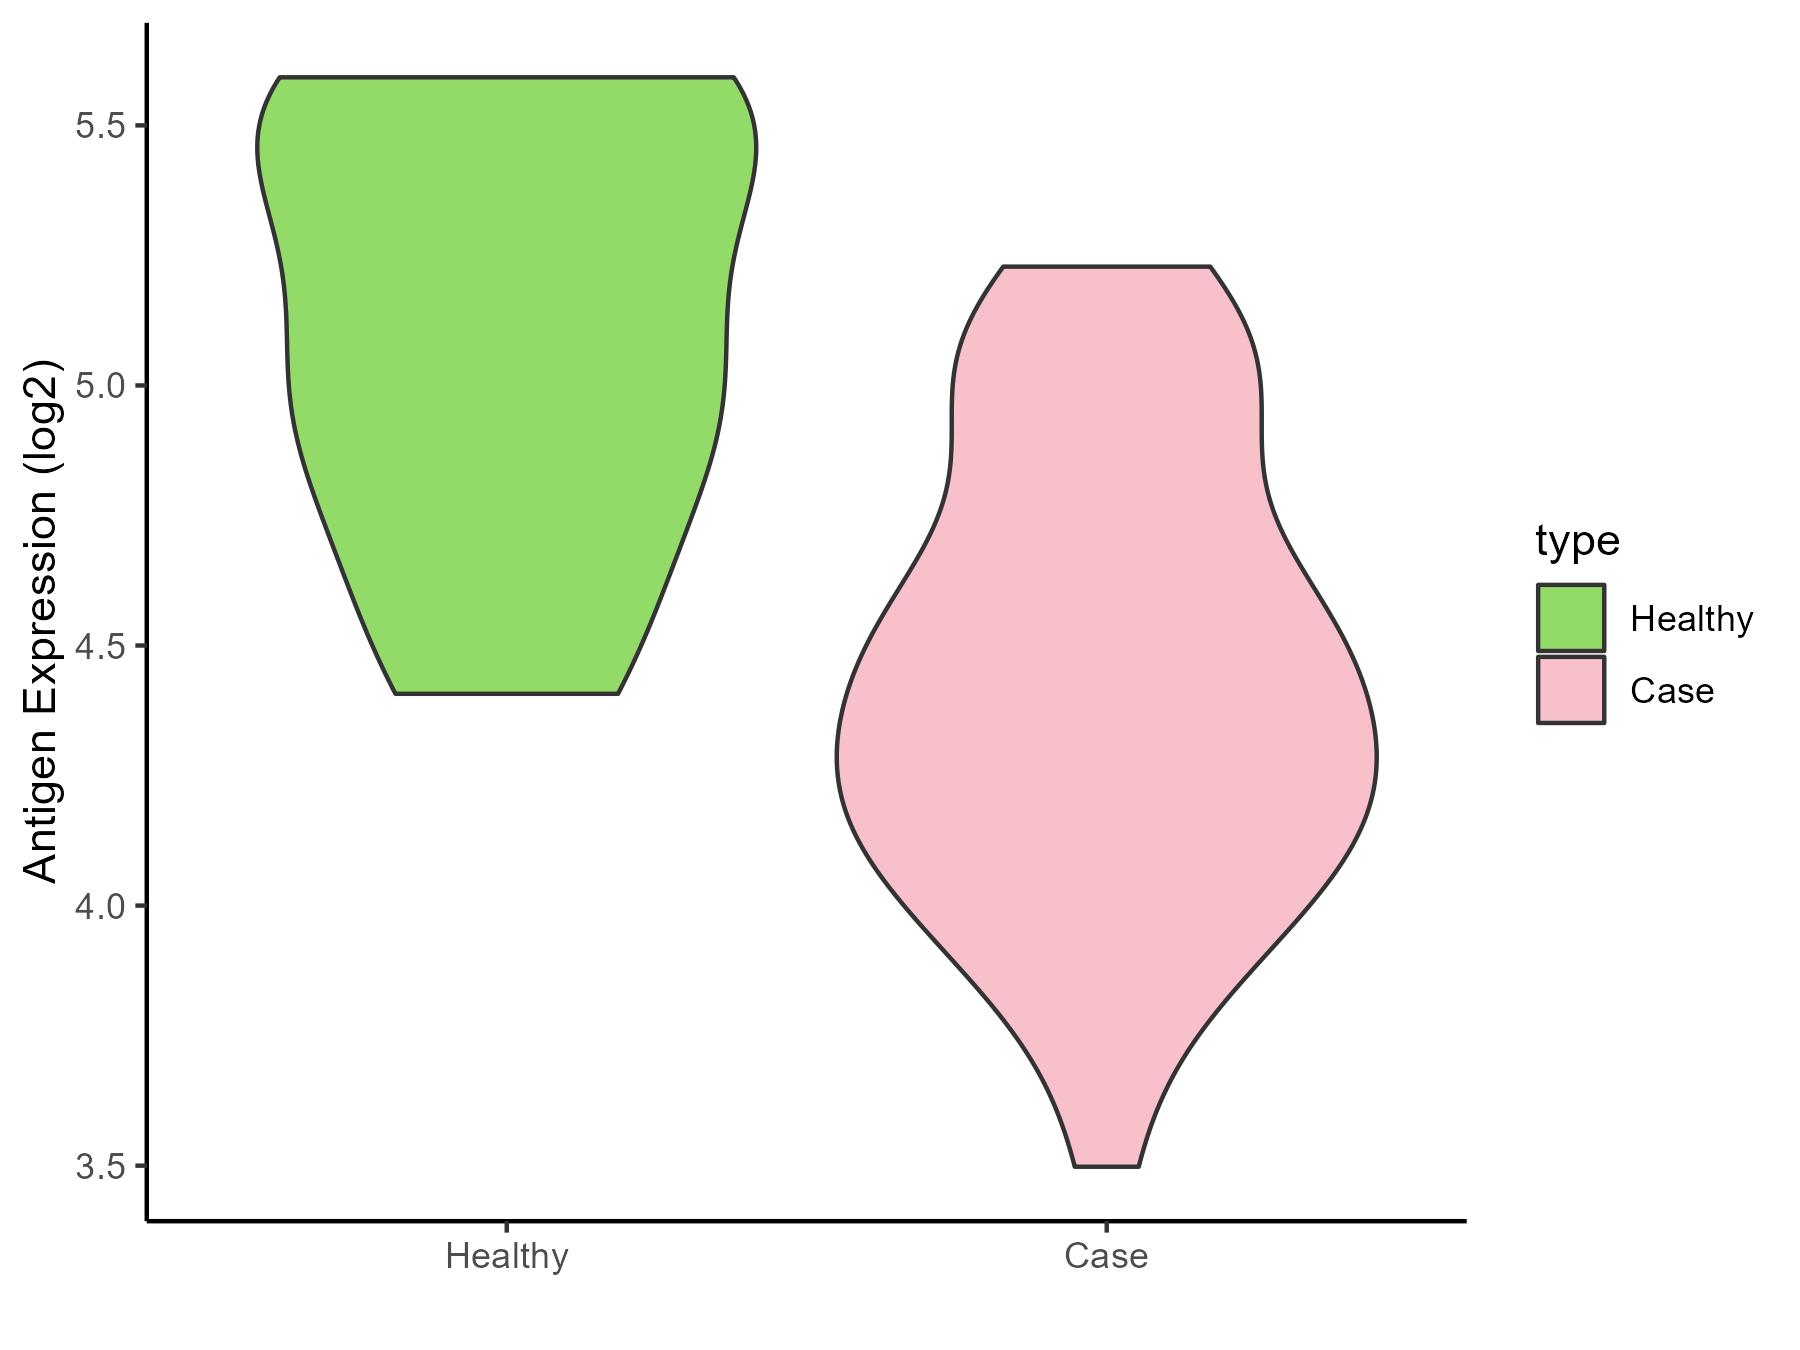
|
Click to View the Clearer Original Diagram |
| The Studied Tissue | Brainstem | |
| The Specific Disease | Neuroectodermal tumor | |
| The Expression Level of Disease Section Compare with the Healthy Individual Tissue | p-value: 0.002467981; Fold-change: -1.046382672; Z-score: -1.693610121 | |
| Disease-specific Antigen Abundances |
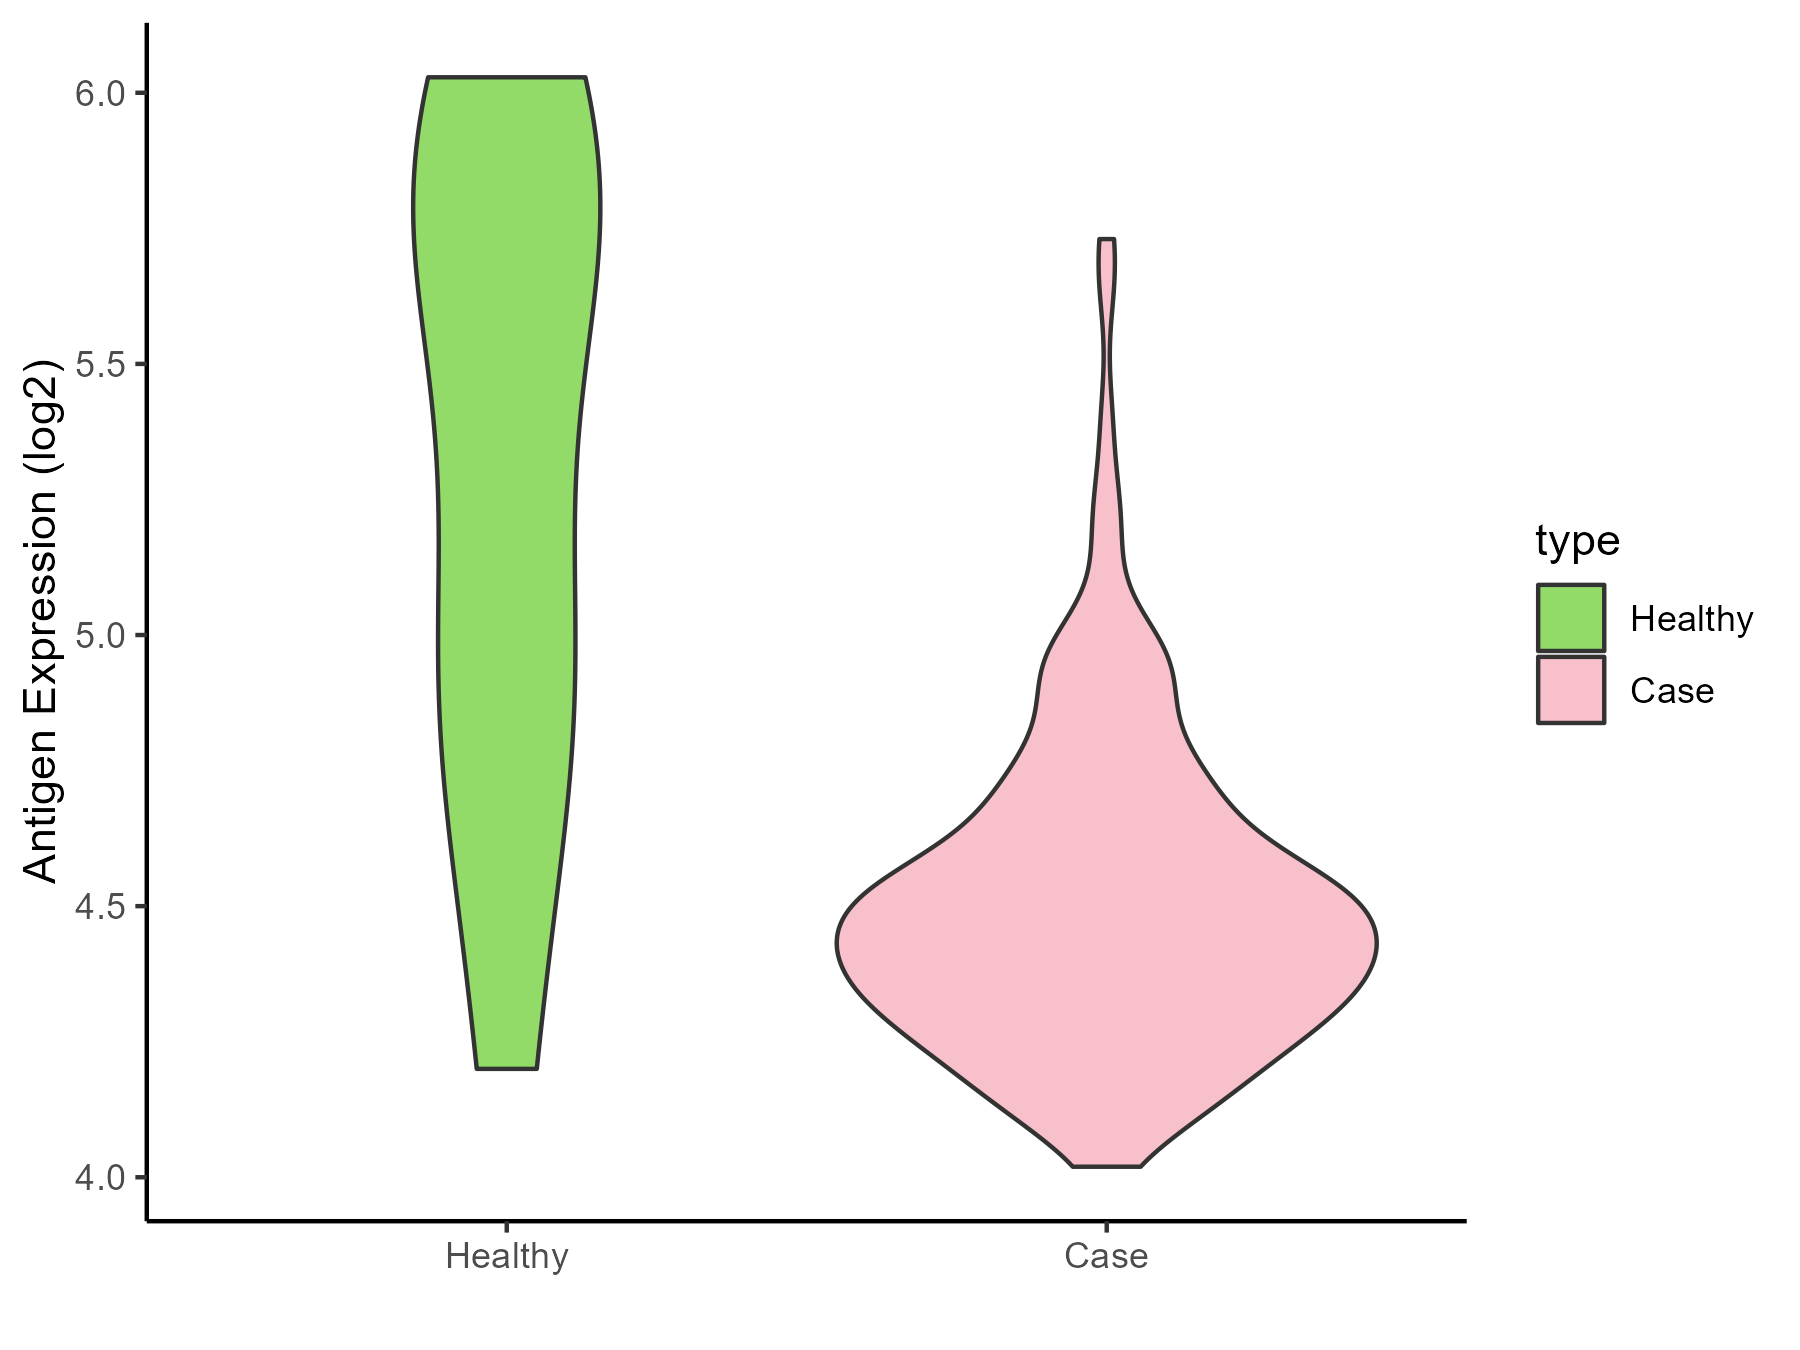
|
Click to View the Clearer Original Diagram |
| The Studied Tissue | Nervous | |
| The Specific Disease | Brain cancer | |
| The Expression Level of Disease Section Compare with the Healthy Individual Tissue | p-value: 3.99E-06; Fold-change: -0.06162536; Z-score: -0.18087815 | |
| Disease-specific Antigen Abundances |
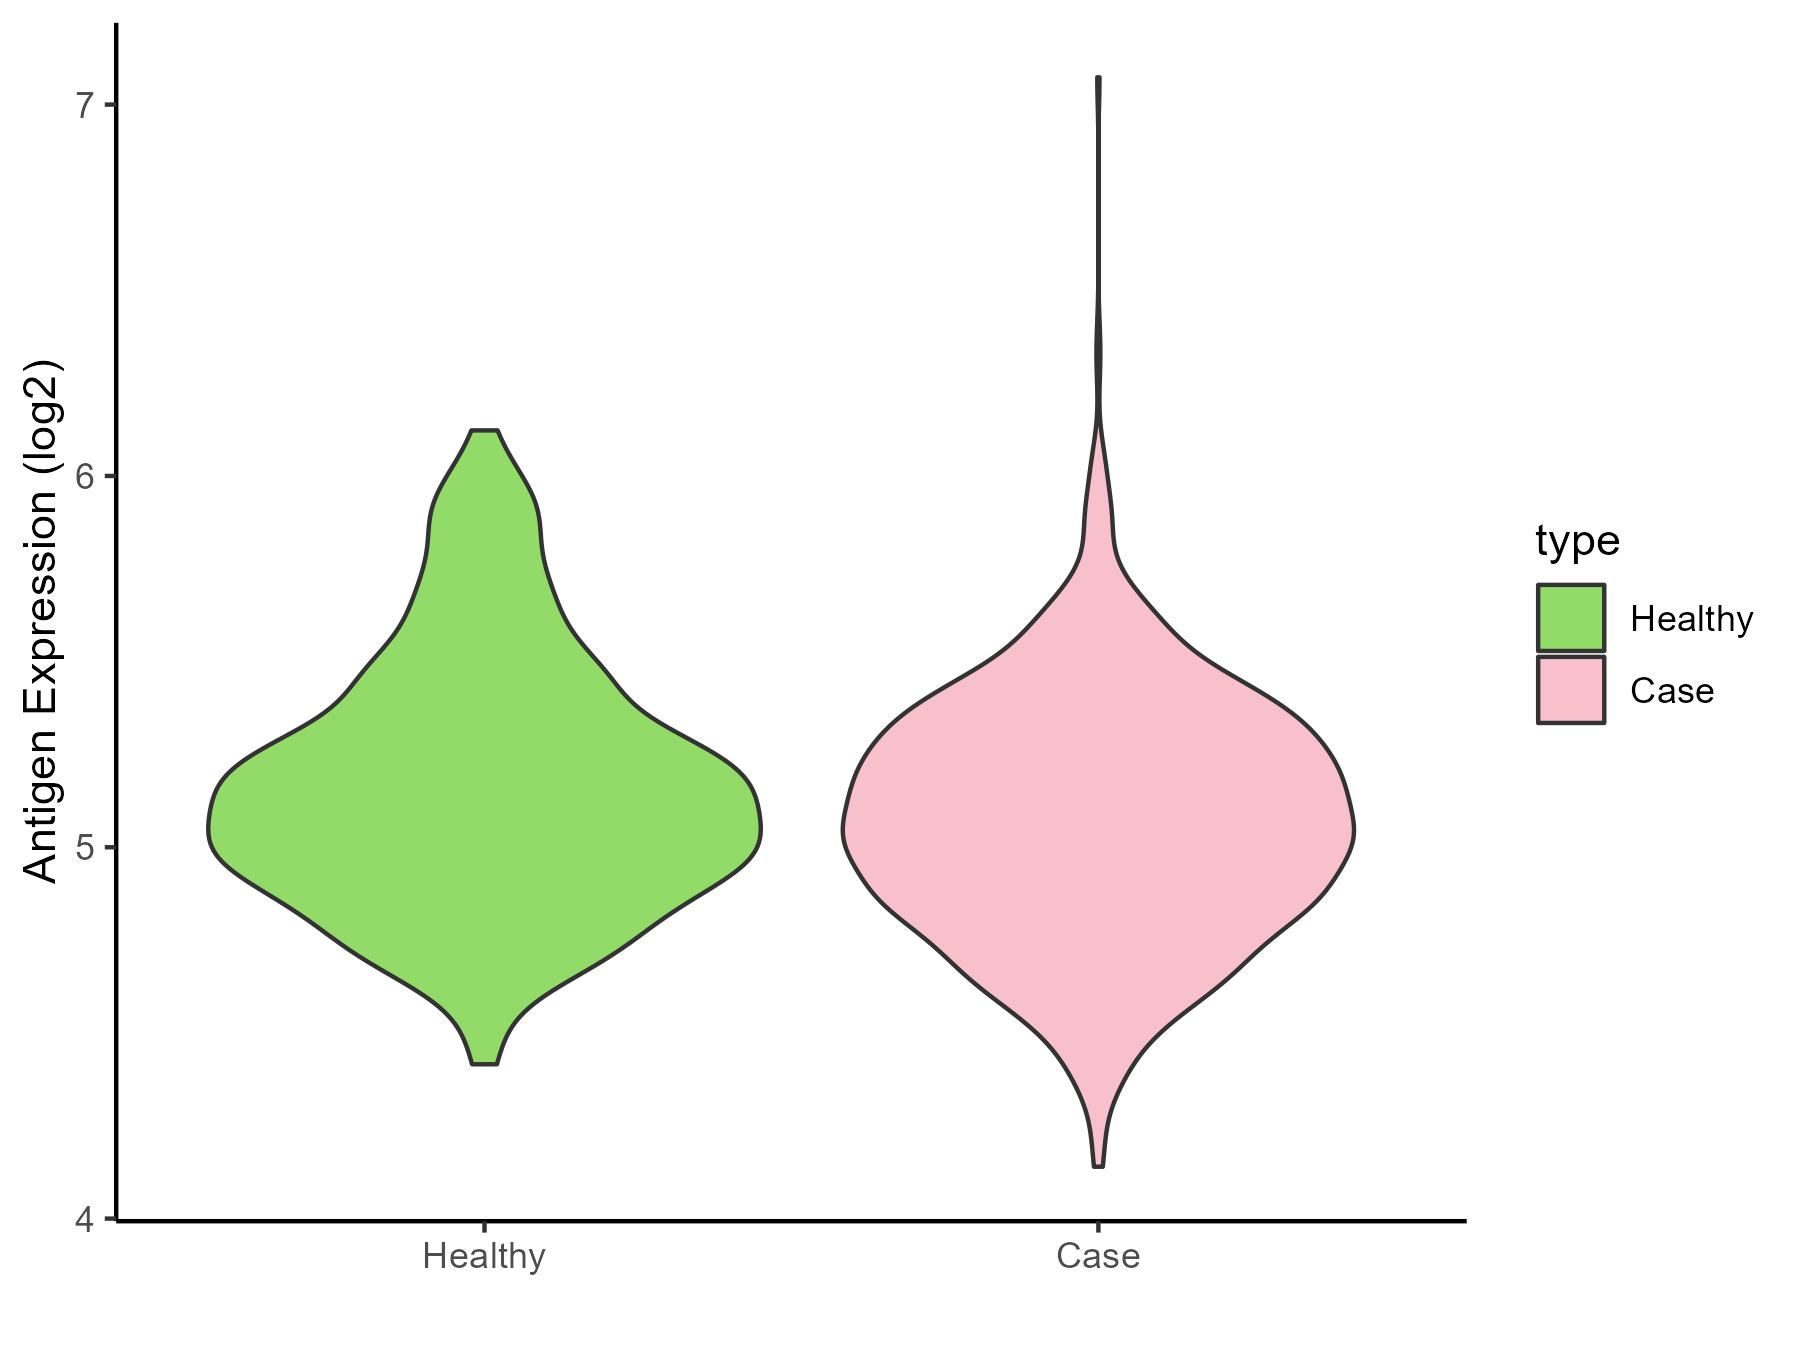
|
Click to View the Clearer Original Diagram |
| Differential expression pattern of antigen in diseases | ||
| The Studied Tissue | Whole blood | |
| The Specific Disease | Polycythemia vera | |
| The Expression Level of Disease Section Compare with the Healthy Individual Tissue | p-value: 4.09E-06; Fold-change: -0.343323727; Z-score: -1.41808629 | |
| Disease-specific Antigen Abundances |
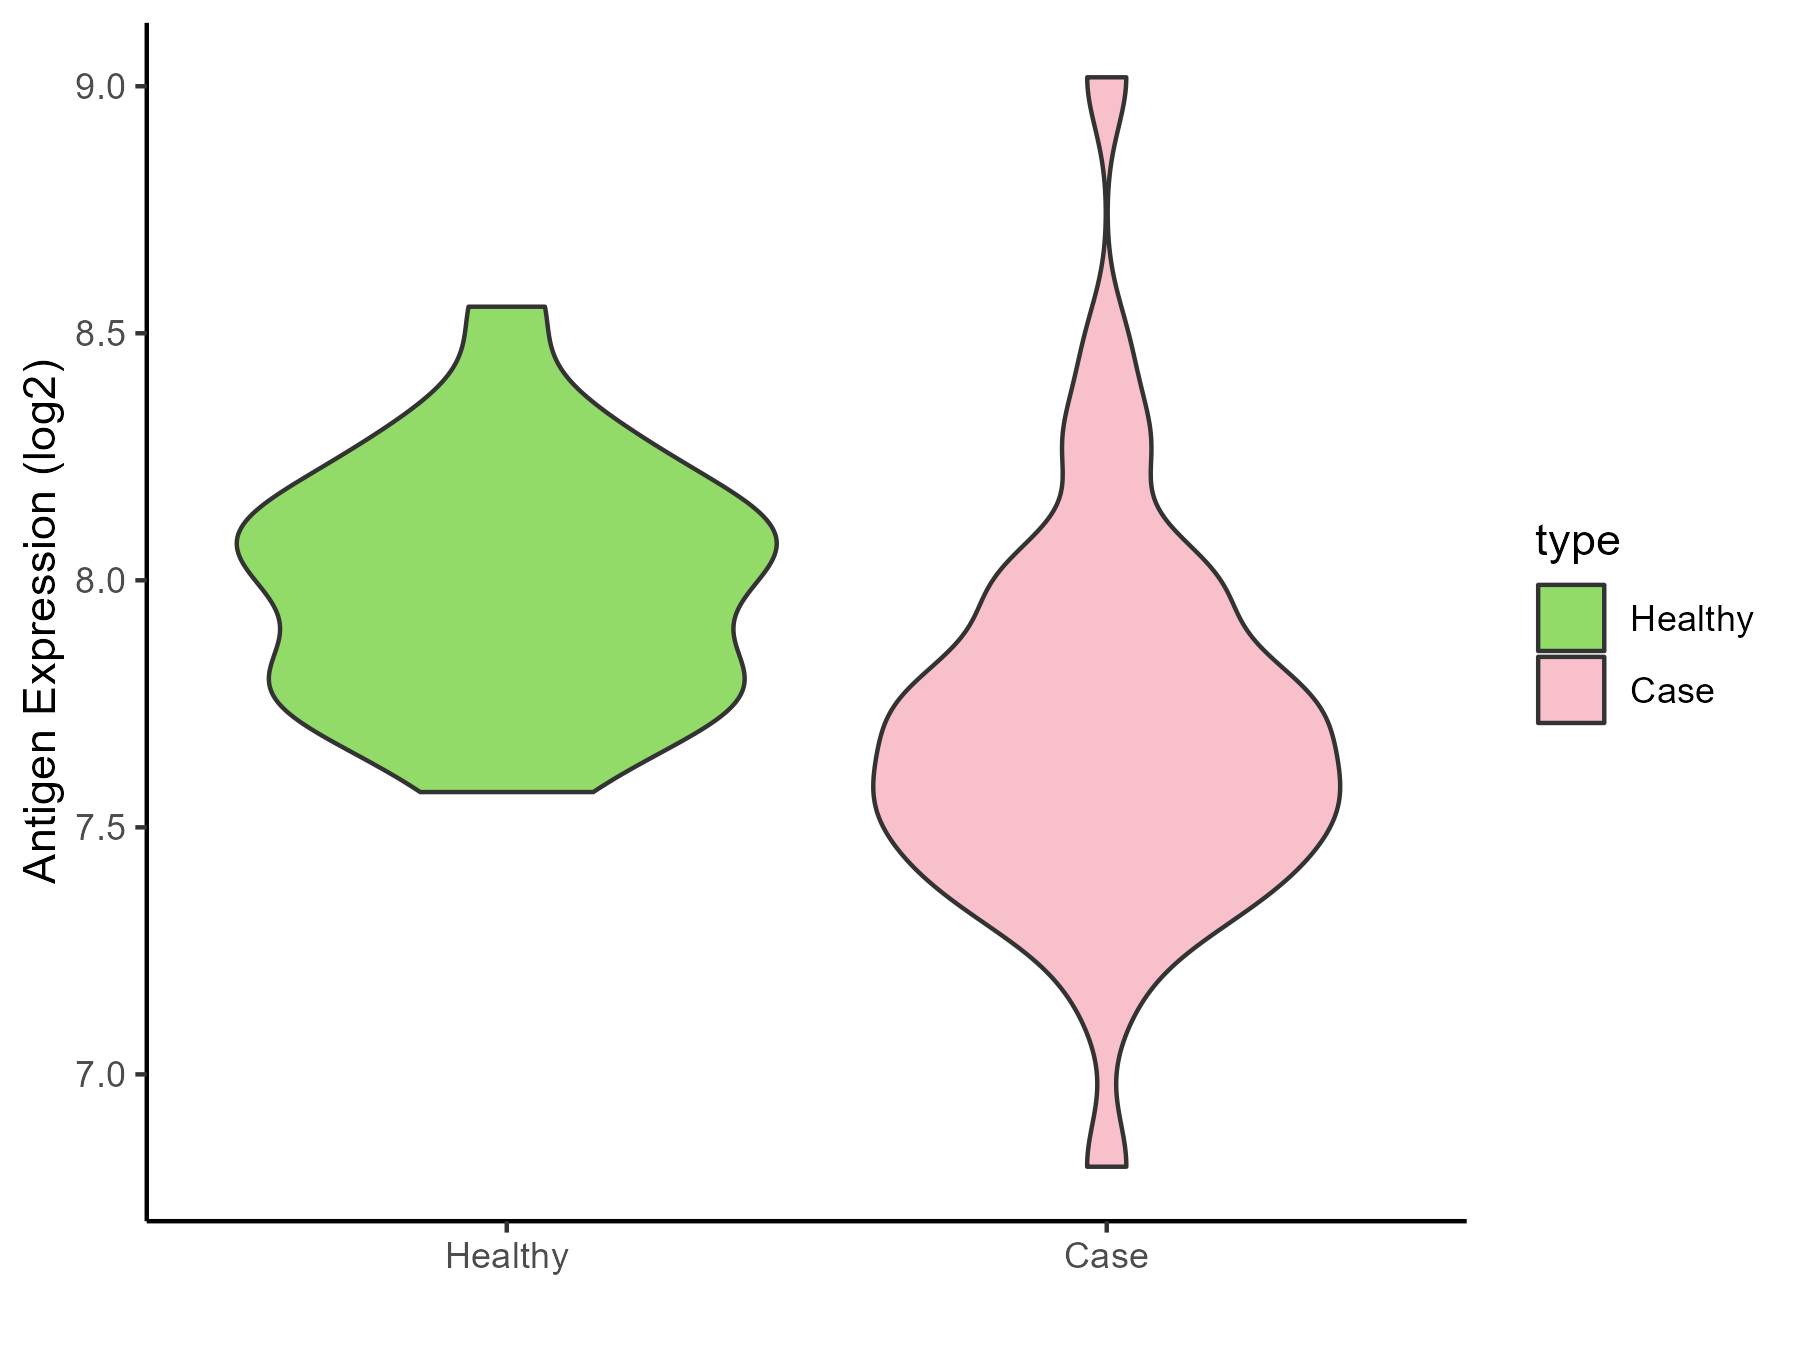
|
Click to View the Clearer Original Diagram |
| The Studied Tissue | Whole blood | |
| The Specific Disease | Myelofibrosis | |
| The Expression Level of Disease Section Compare with the Healthy Individual Tissue | p-value: 0.002728065; Fold-change: -0.542599714; Z-score: -2.179433787 | |
| Disease-specific Antigen Abundances |
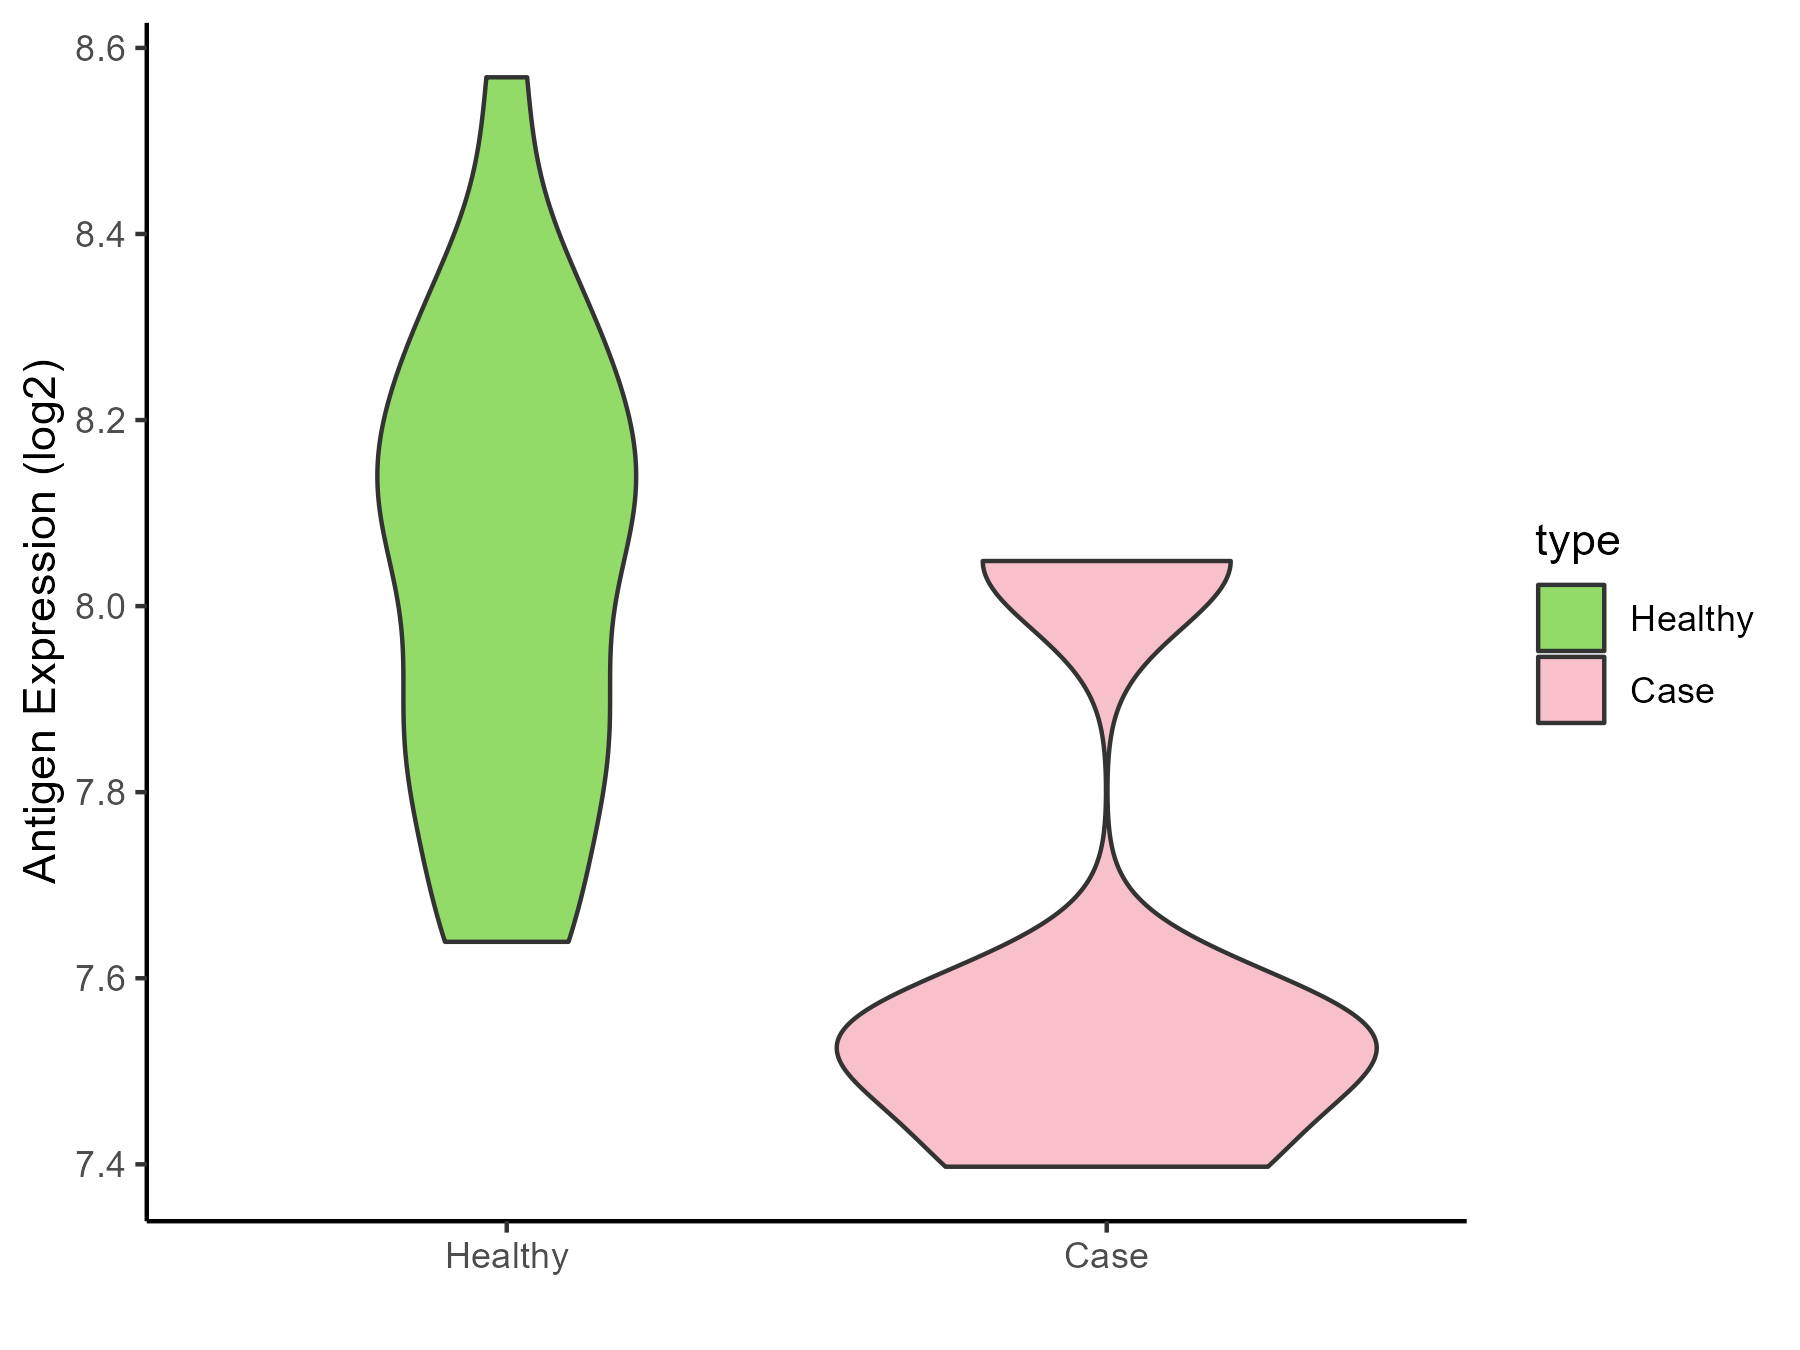
|
Click to View the Clearer Original Diagram |
| Differential expression pattern of antigen in diseases | ||
| The Studied Tissue | Bone marrow | |
| The Specific Disease | Myelodysplastic syndromes | |
| The Expression Level of Disease Section Compare with the Healthy Individual Tissue | p-value: 6.74E-16; Fold-change: -2.029114238; Z-score: -3.154547976 | |
| The Expression Level of Disease Section Compare with the Adjacent Tissue | p-value: 0.103656715; Fold-change: -1.872357634; Z-score: -1.393804248 | |
| Disease-specific Antigen Abundances |
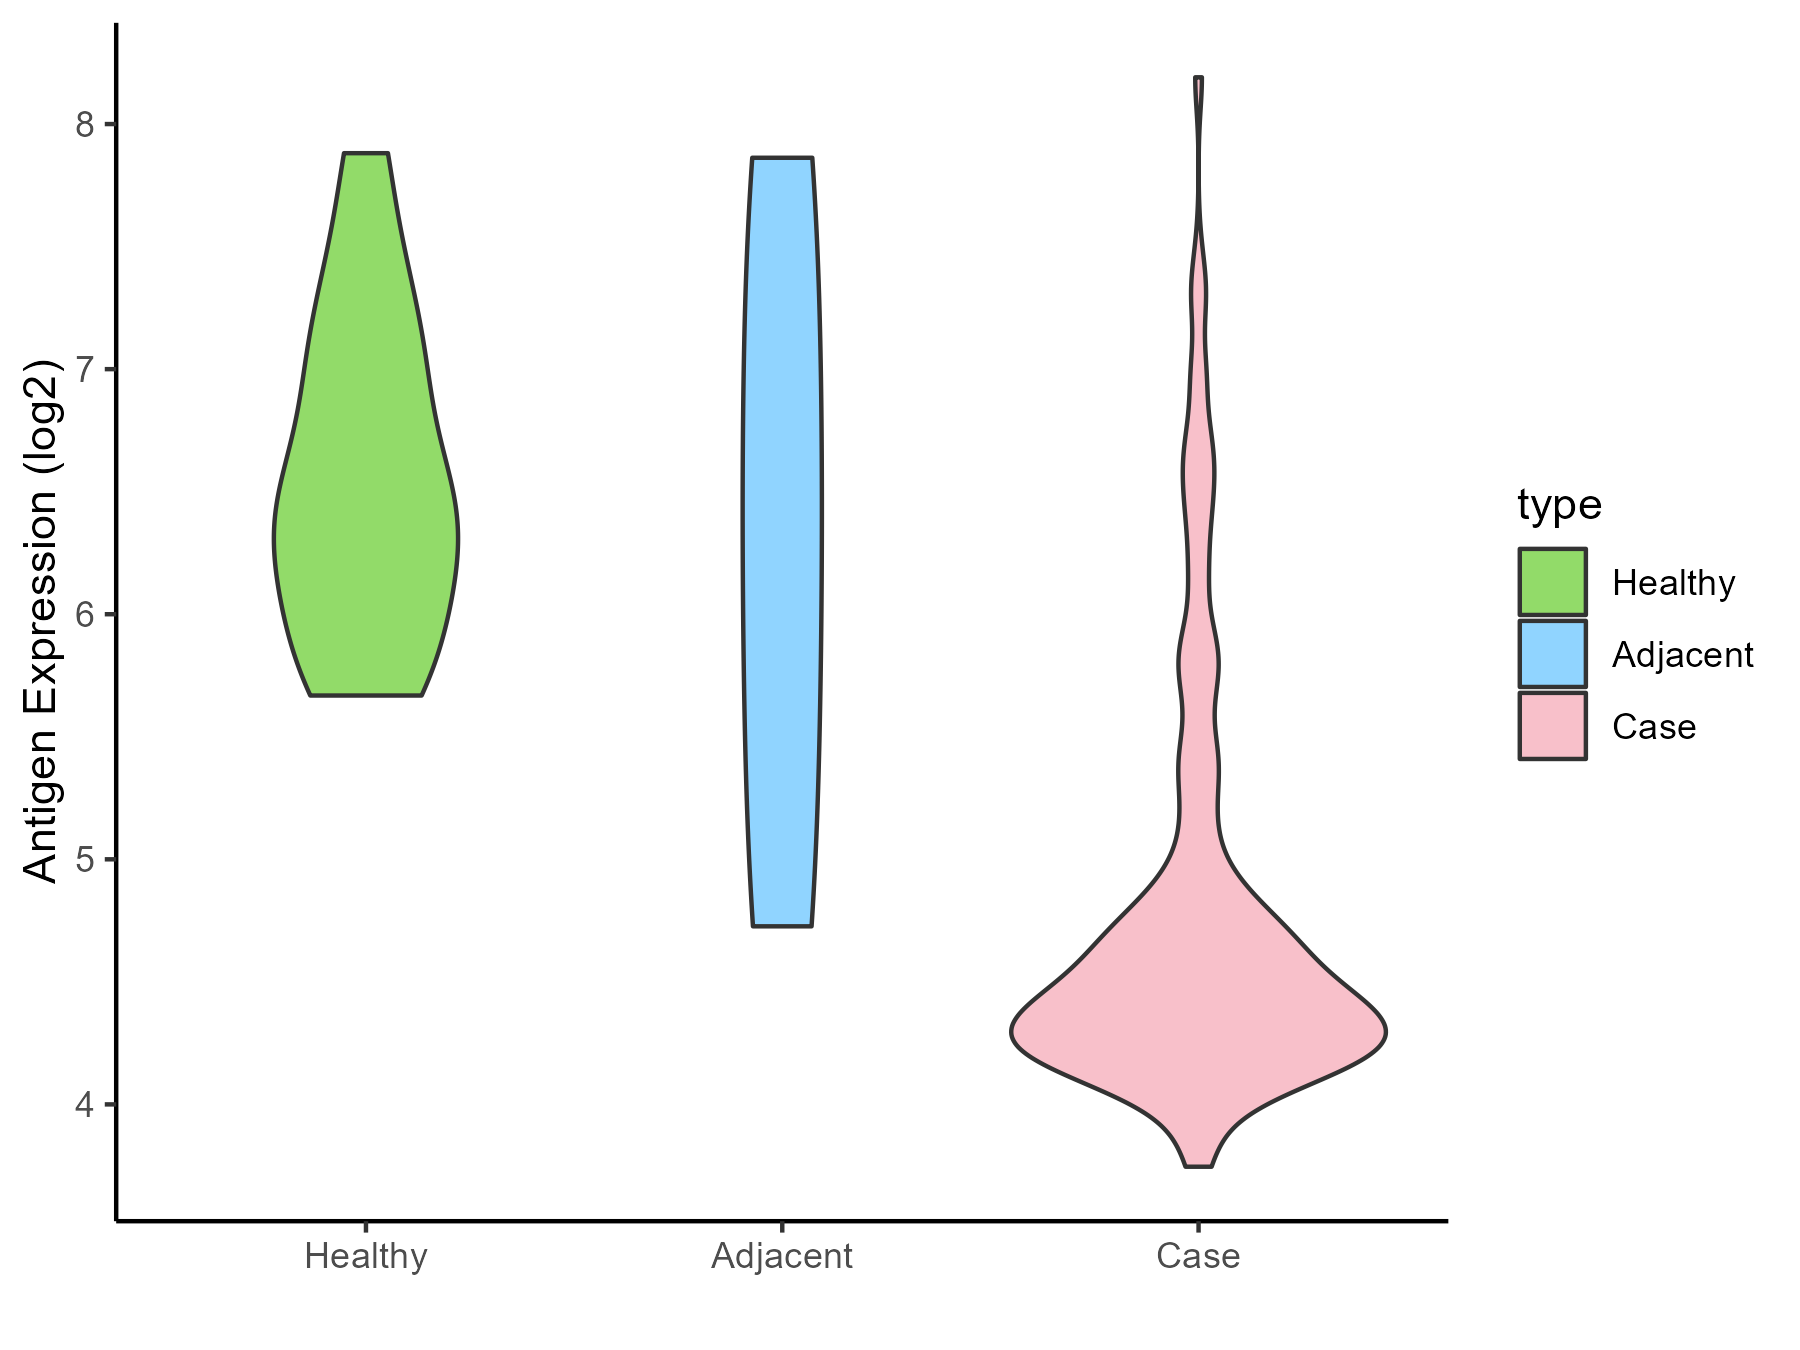
|
Click to View the Clearer Original Diagram |
| Differential expression pattern of antigen in diseases | ||
| The Studied Tissue | Tonsil | |
| The Specific Disease | Lymphoma | |
| The Expression Level of Disease Section Compare with the Healthy Individual Tissue | p-value: 0.597531584; Fold-change: 0.047577441; Z-score: 0.132440793 | |
| Disease-specific Antigen Abundances |
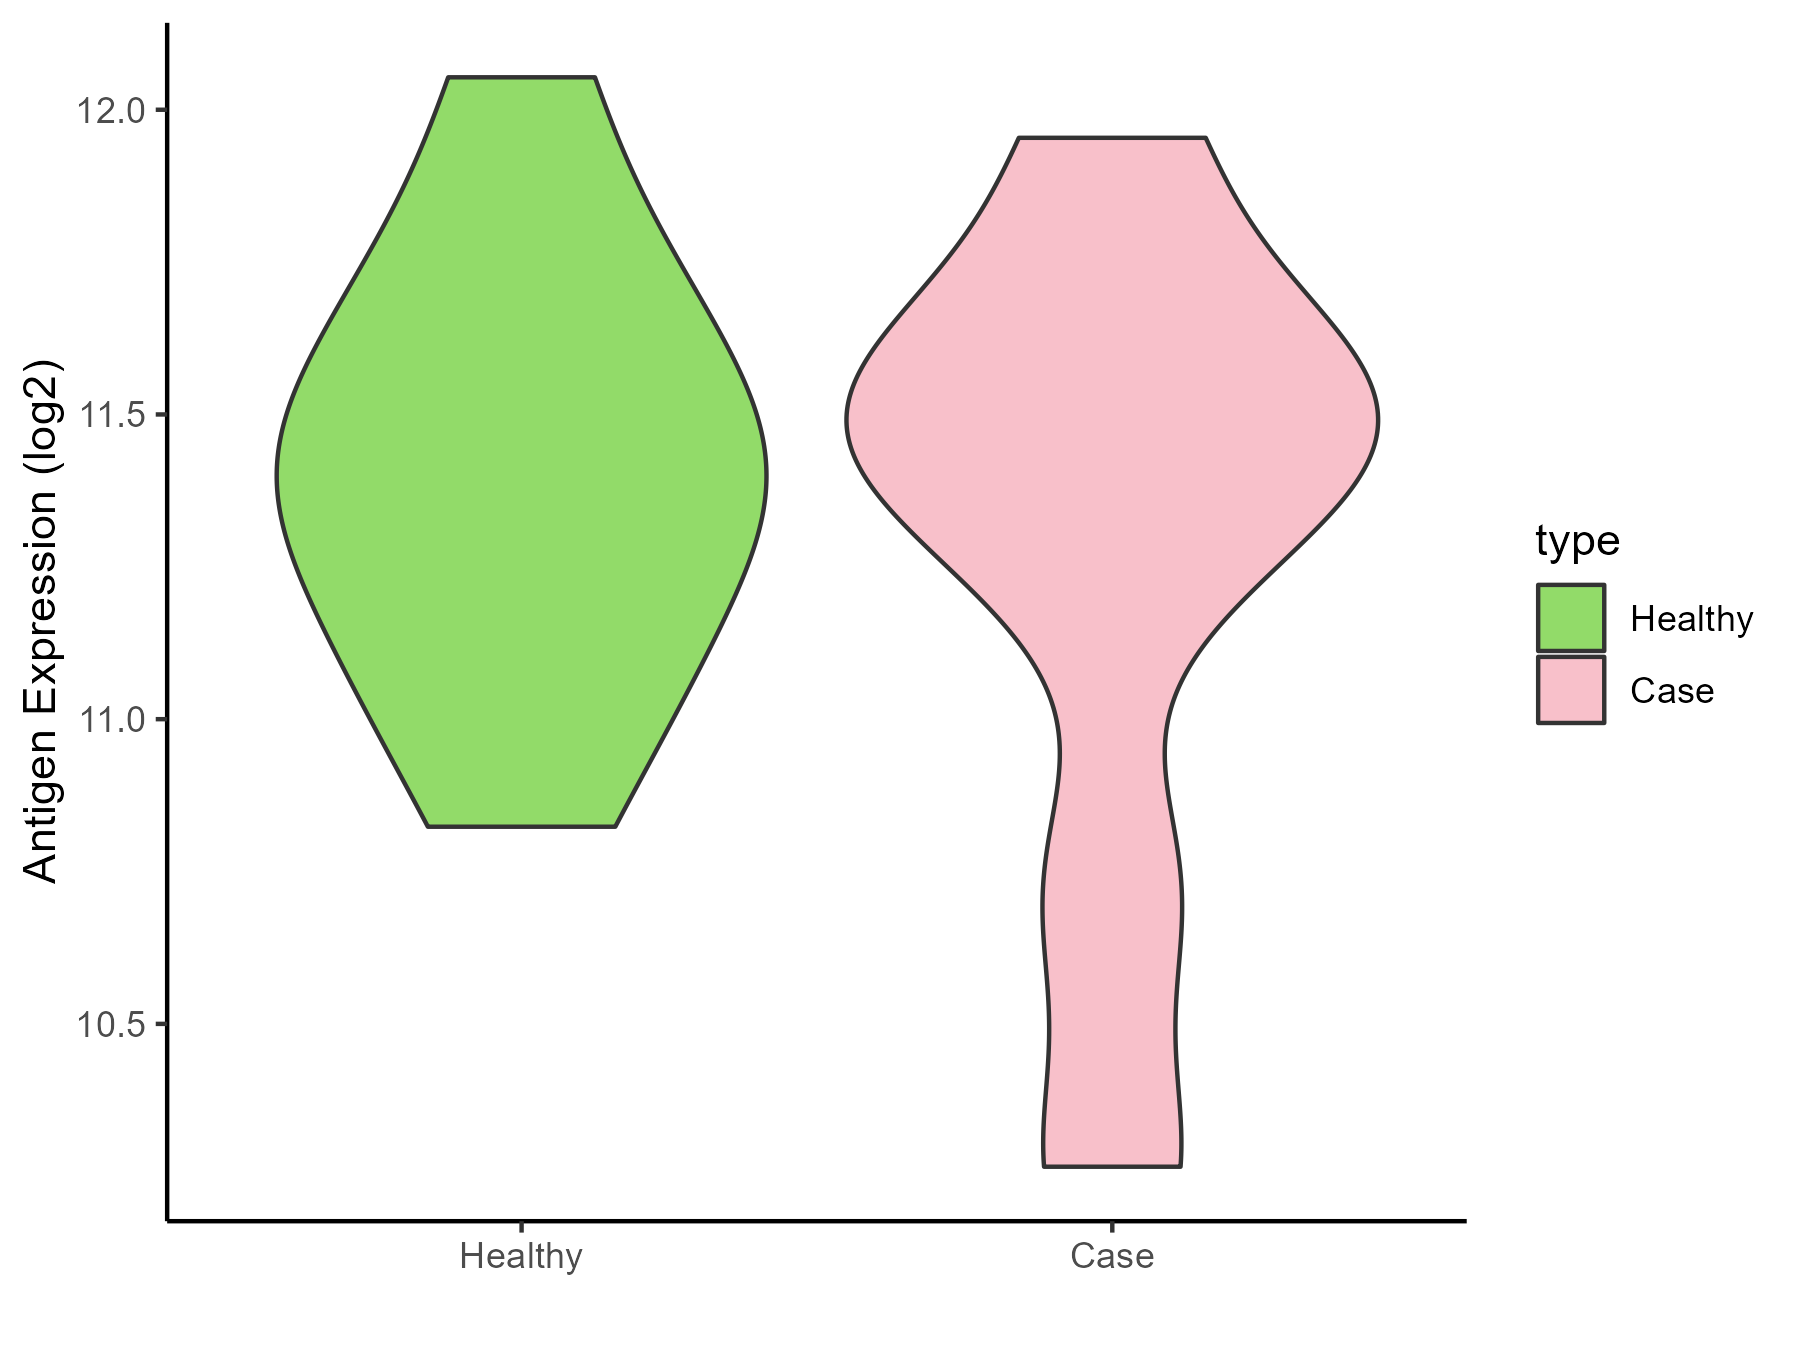
|
Click to View the Clearer Original Diagram |
| Differential expression pattern of antigen in diseases | ||
| The Studied Tissue | Gastric | |
| The Specific Disease | Gastric cancer | |
| The Expression Level of Disease Section Compare with the Healthy Individual Tissue | p-value: 0.35676261; Fold-change: -0.647084127; Z-score: -0.760166801 | |
| The Expression Level of Disease Section Compare with the Adjacent Tissue | p-value: 0.016729513; Fold-change: -0.99175493; Z-score: -0.787439603 | |
| Disease-specific Antigen Abundances |
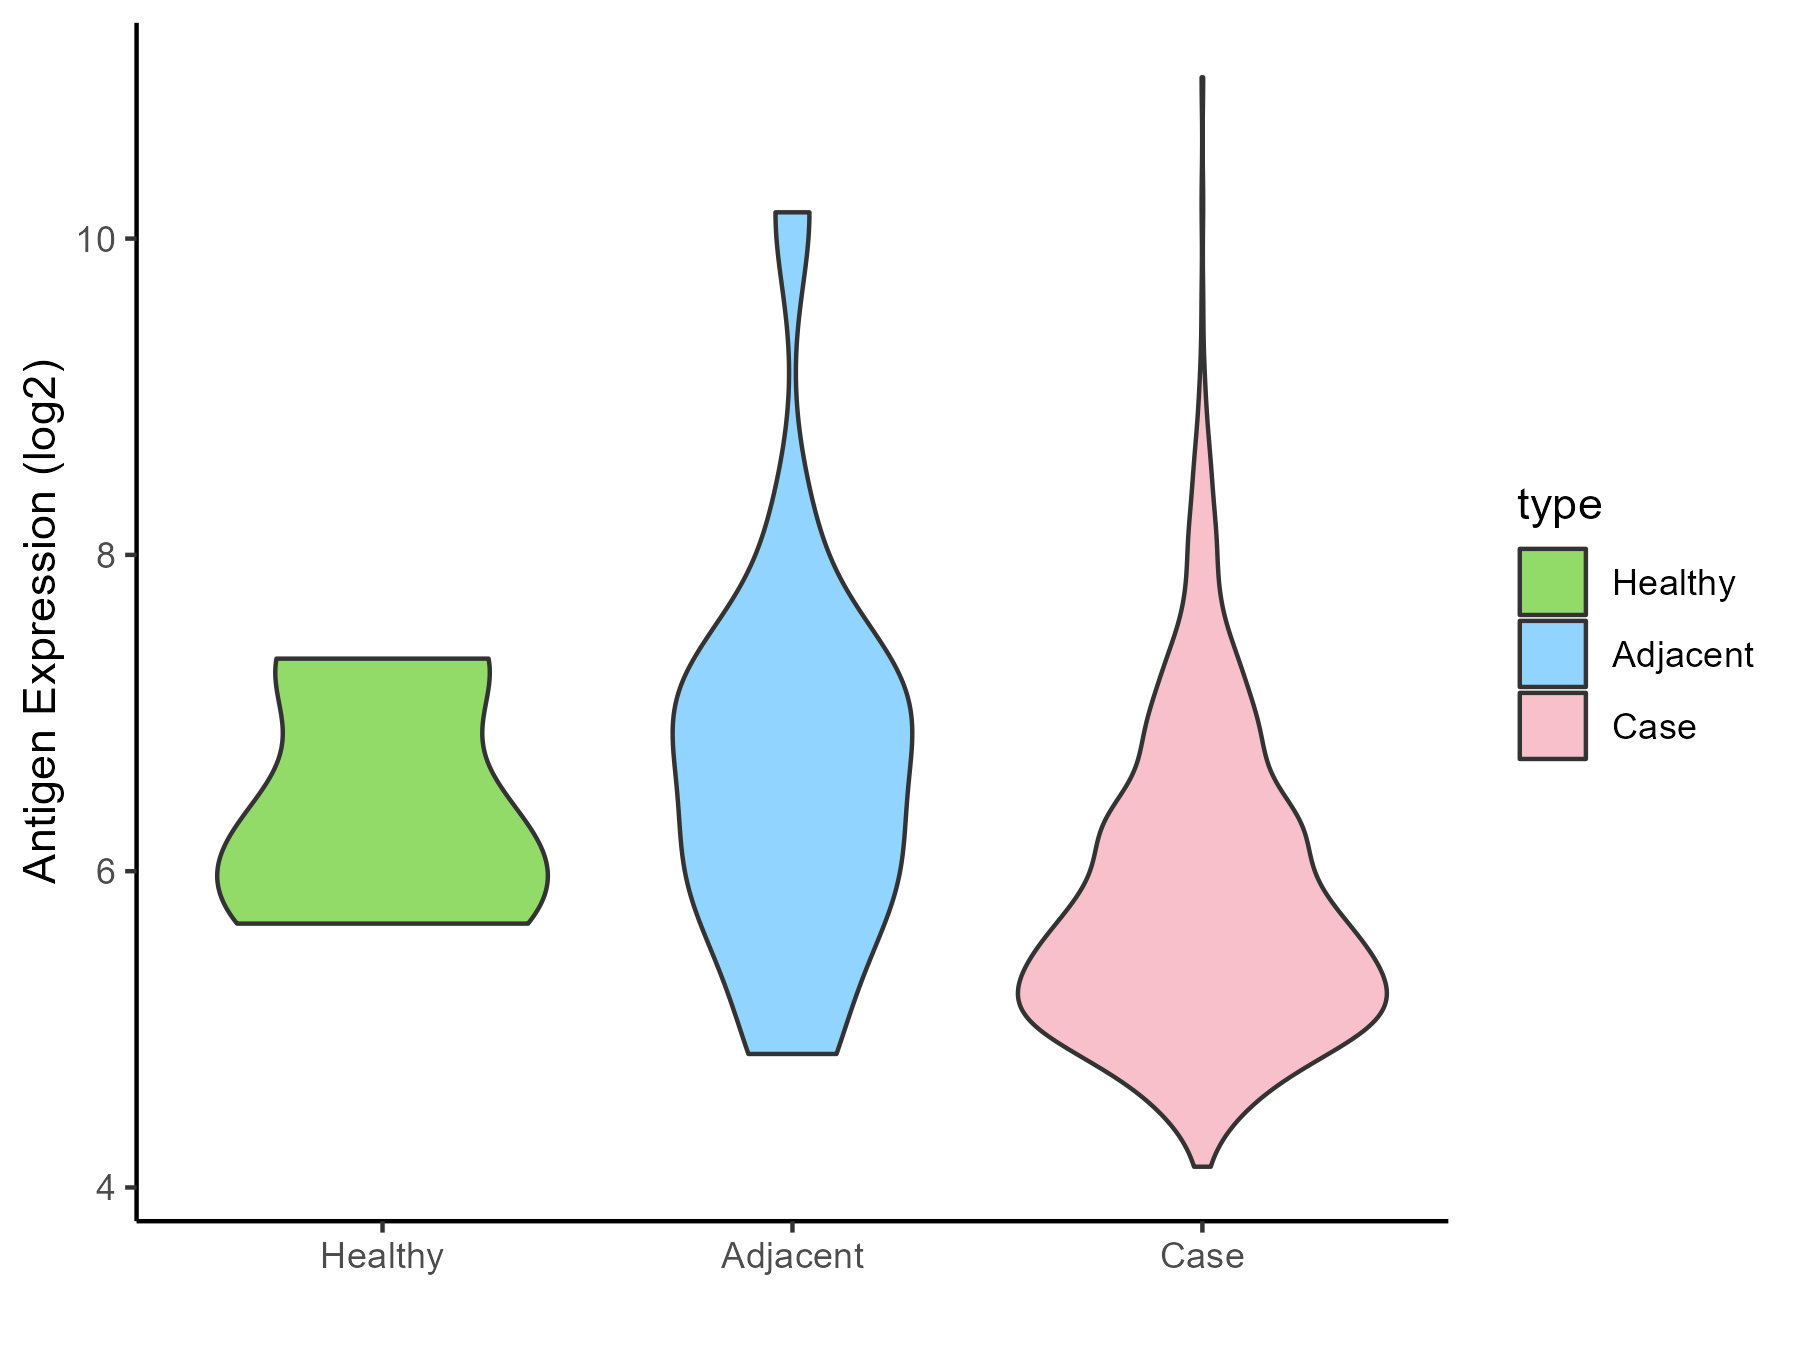
|
Click to View the Clearer Original Diagram |
| Differential expression pattern of antigen in diseases | ||
| The Studied Tissue | Colon | |
| The Specific Disease | Colon cancer | |
| The Expression Level of Disease Section Compare with the Healthy Individual Tissue | p-value: 1.09E-27; Fold-change: -0.772796476; Z-score: -1.01995821 | |
| The Expression Level of Disease Section Compare with the Adjacent Tissue | p-value: 4.47E-12; Fold-change: -0.477047033; Z-score: -0.601726604 | |
| Disease-specific Antigen Abundances |
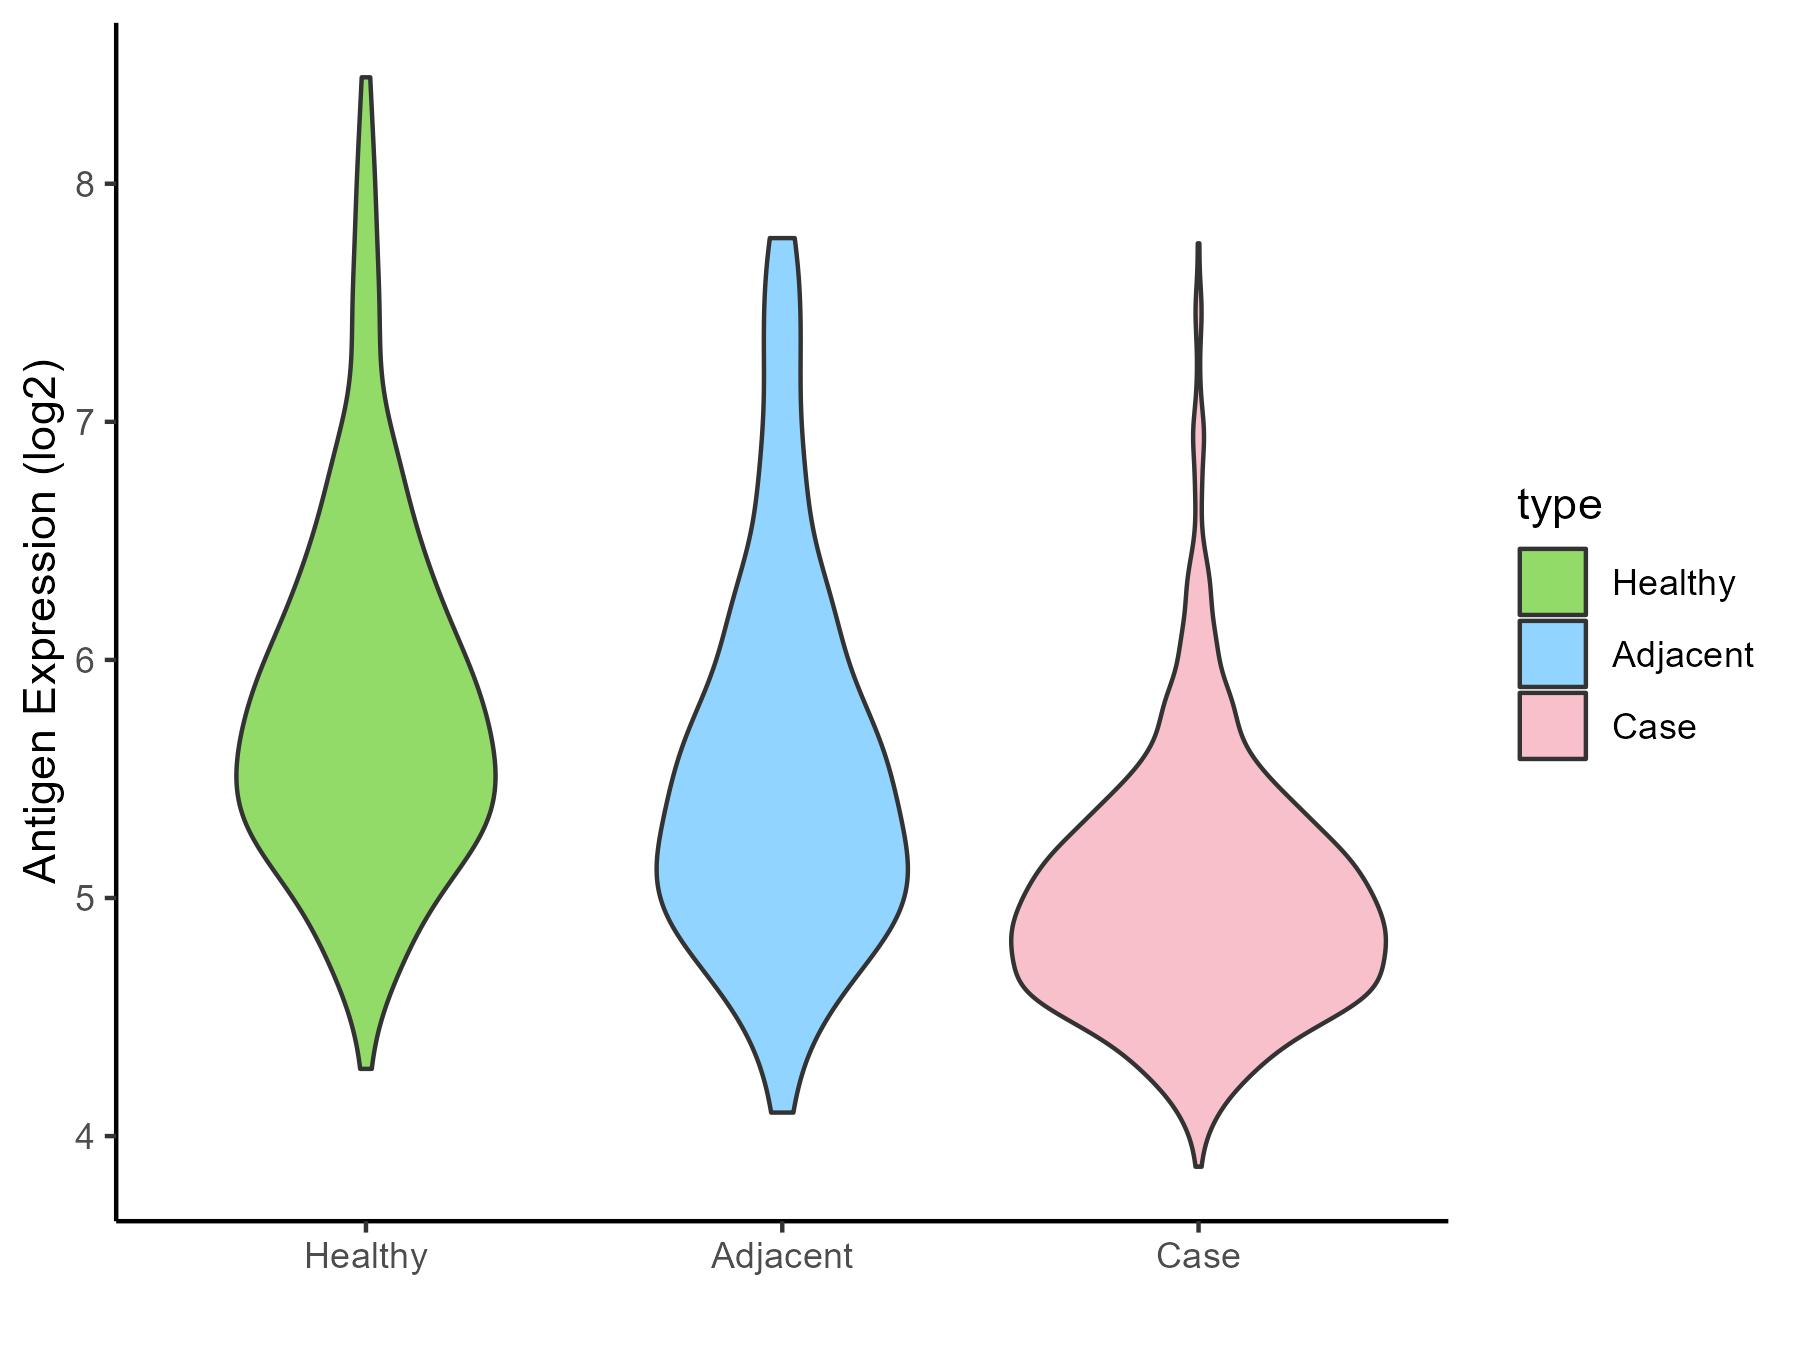
|
Click to View the Clearer Original Diagram |
| Differential expression pattern of antigen in diseases | ||
| The Studied Tissue | Pancreas | |
| The Specific Disease | Pancreatic cancer | |
| The Expression Level of Disease Section Compare with the Healthy Individual Tissue | p-value: 0.542182361; Fold-change: 0.081496426; Z-score: 0.044171098 | |
| The Expression Level of Disease Section Compare with the Adjacent Tissue | p-value: 0.14099629; Fold-change: -0.139788941; Z-score: -0.106042092 | |
| Disease-specific Antigen Abundances |
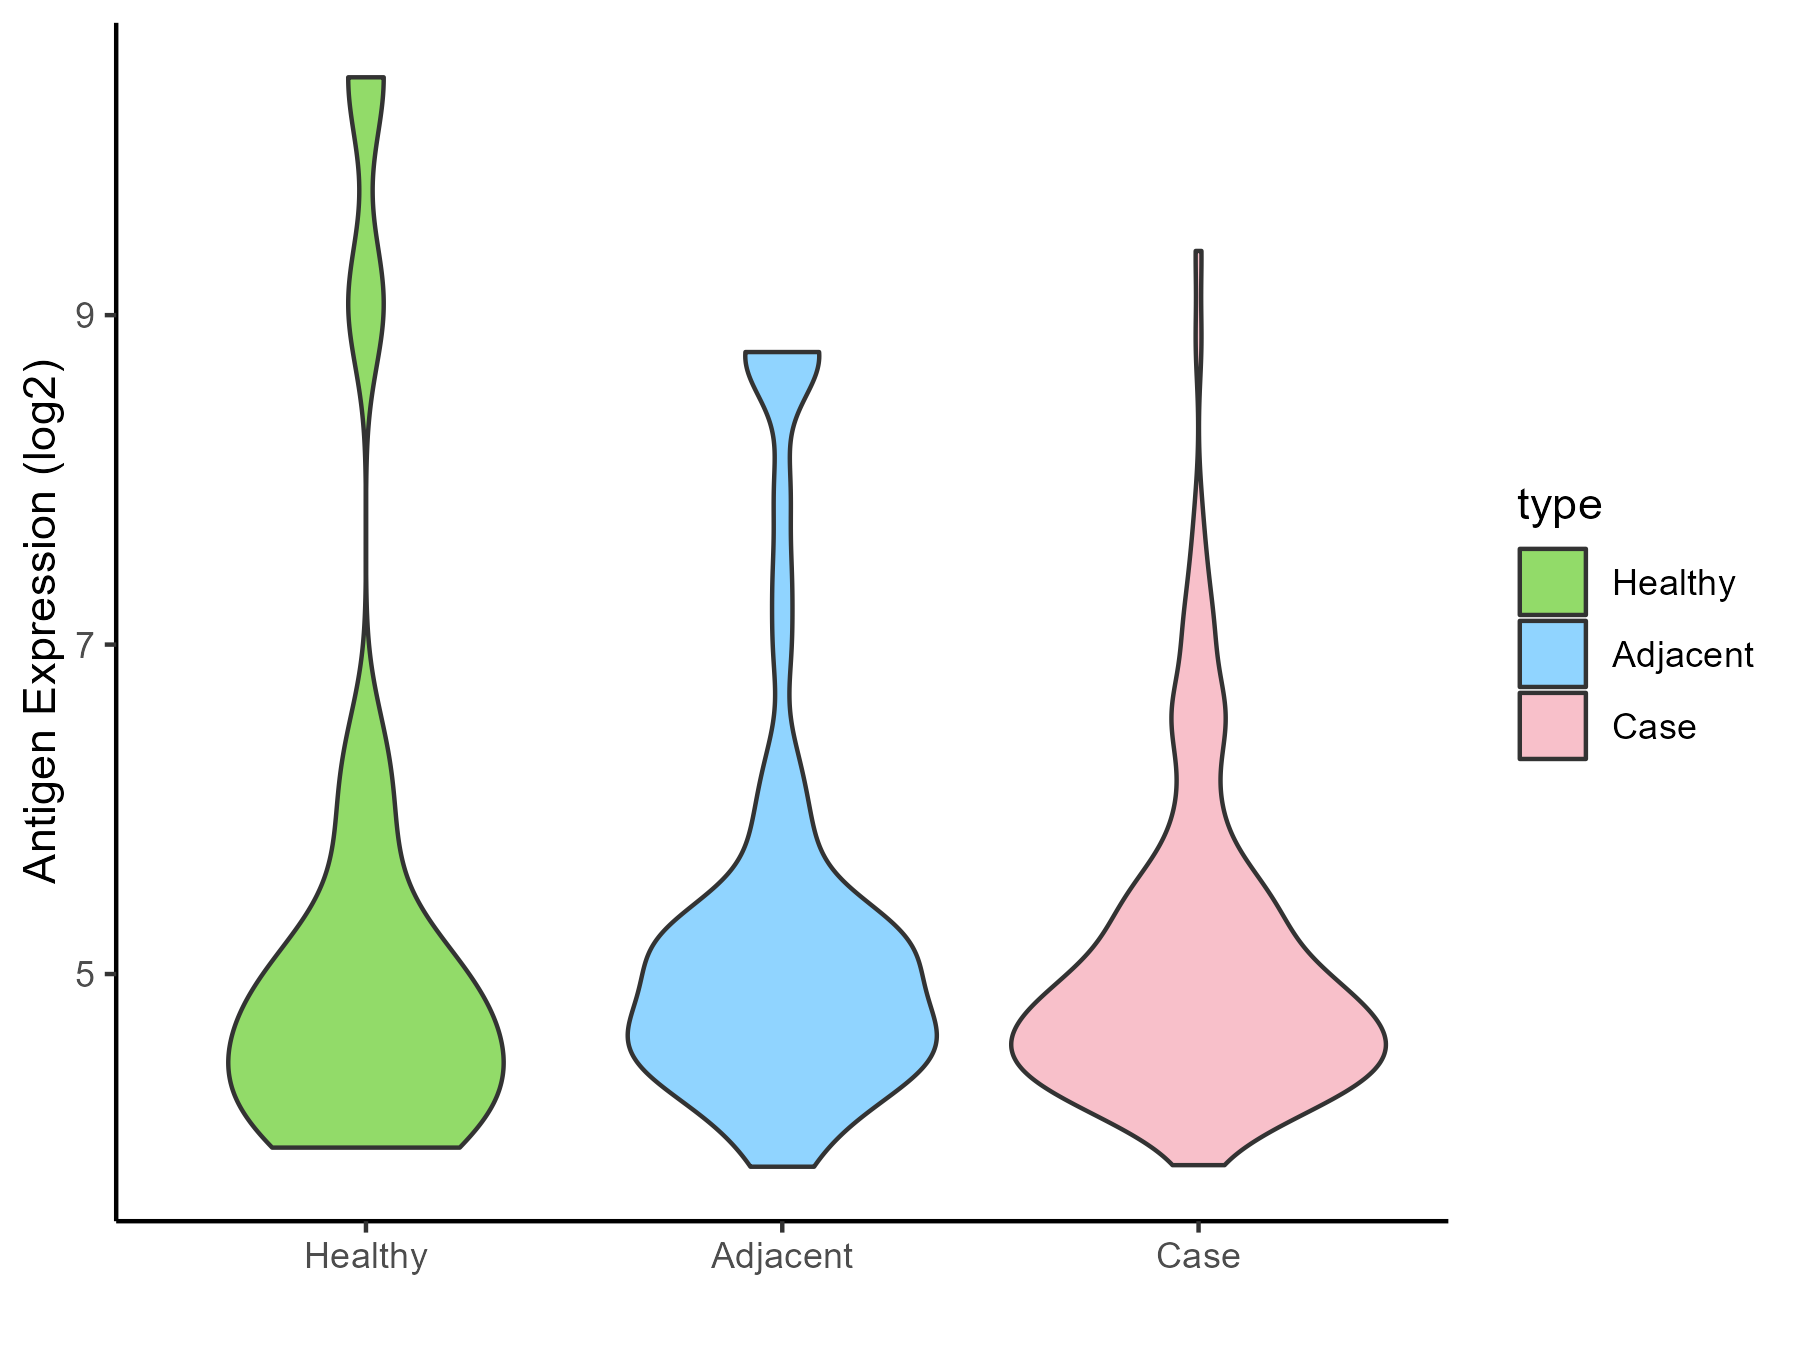
|
Click to View the Clearer Original Diagram |
| Differential expression pattern of antigen in diseases | ||
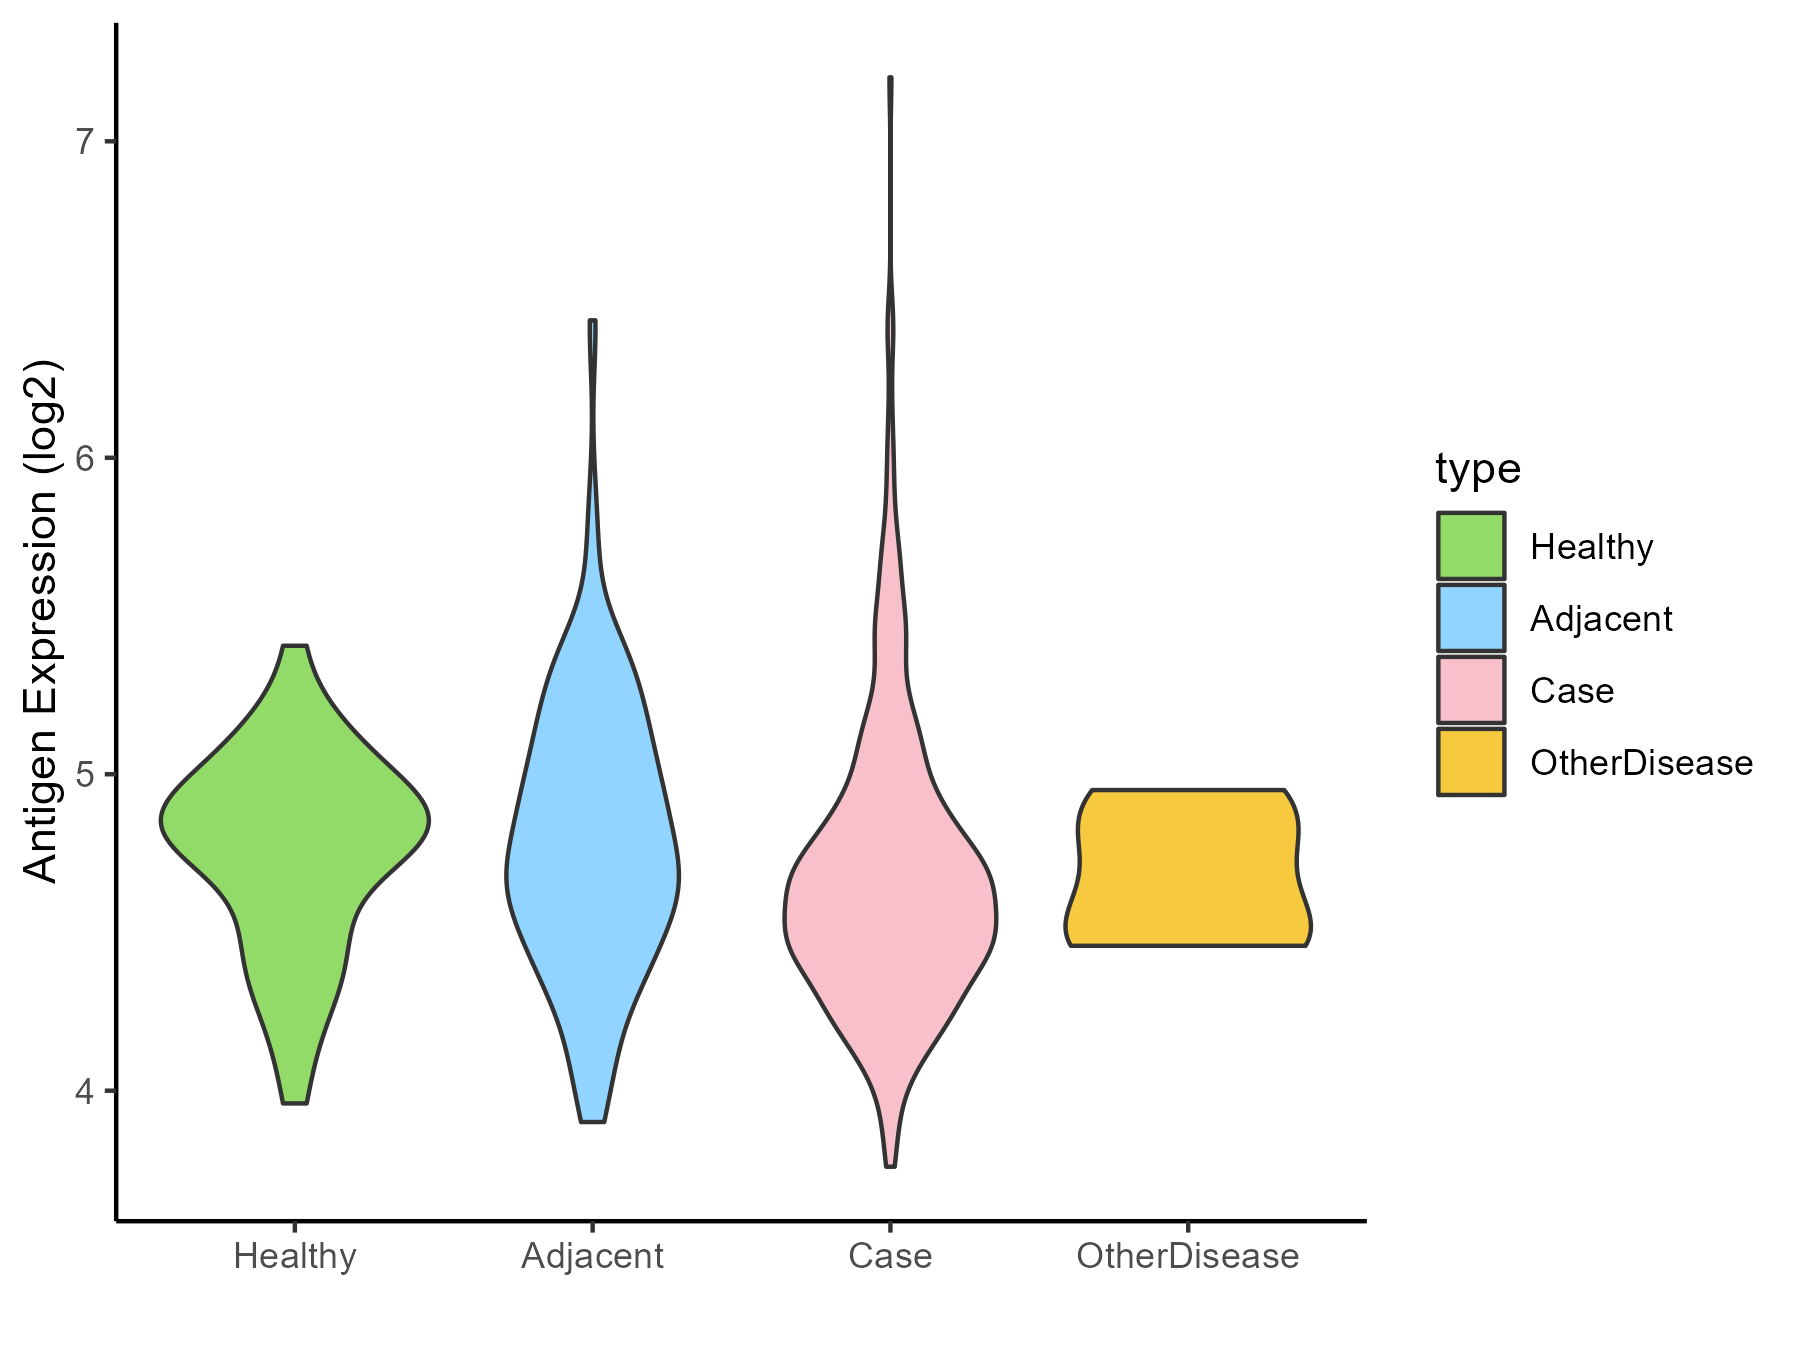
| The Studied Tissue | Liver | |
| The Specific Disease | Liver cancer | |
| The Expression Level of Disease Section Compare with the Healthy Individual Tissue | p-value: 0.177967209; Fold-change: -0.21540781; Z-score: -0.693039757 | |
| The Expression Level of Disease Section Compare with the Adjacent Tissue | p-value: 0.003655998; Fold-change: -0.150391206; Z-score: -0.349341419 | |
| The Expression Level of Disease Section Compare with the Other Disease Section | p-value: 0.980096618; Fold-change: -0.040088022; Z-score: -0.168969846 | |
| Disease-specific Antigen Abundances |
|
Click to View the Clearer Original Diagram |
| Differential expression pattern of antigen in diseases | ||
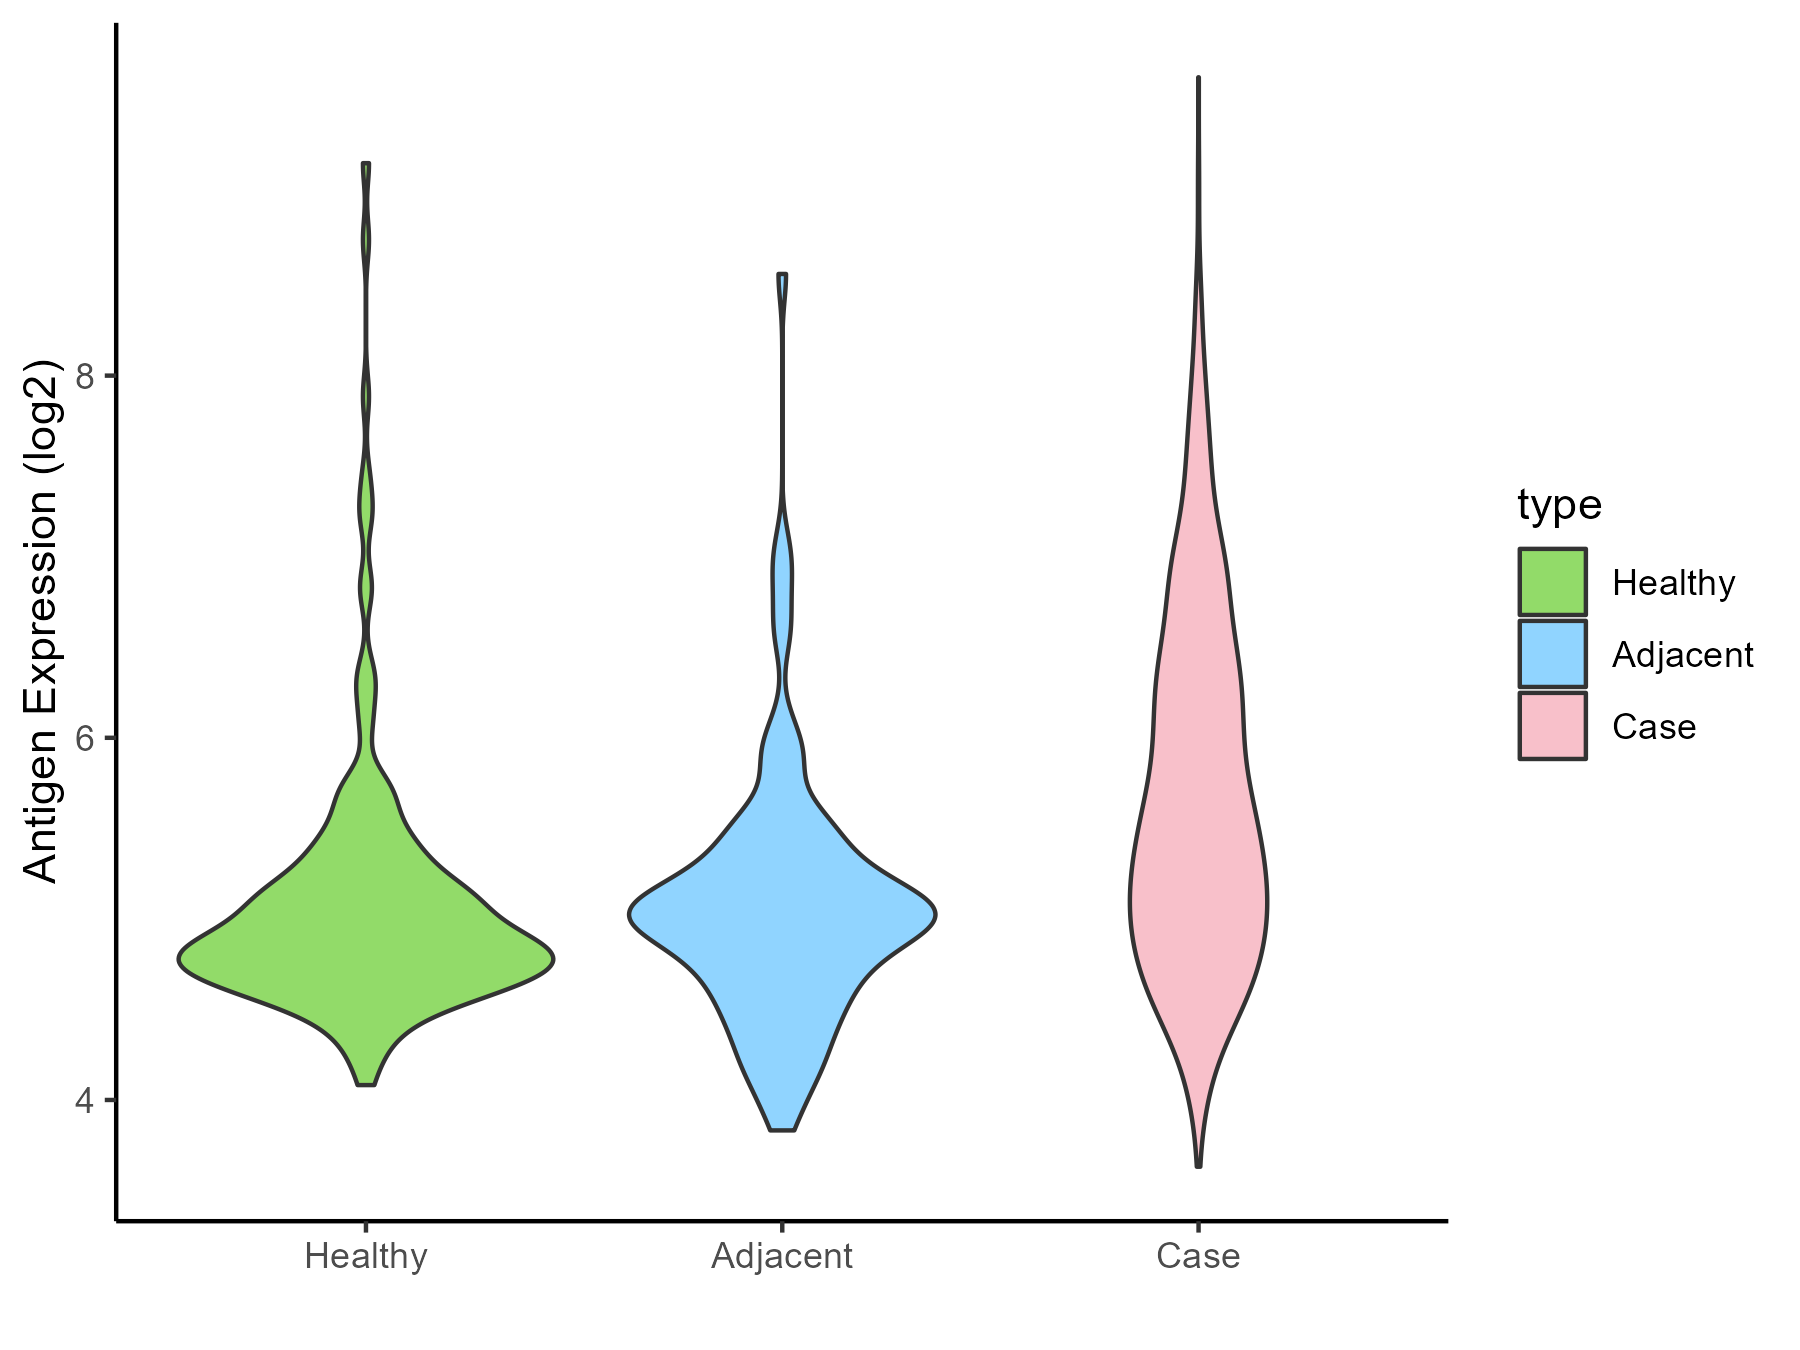
| The Studied Tissue | Lung | |
| The Specific Disease | Lung cancer | |
| The Expression Level of Disease Section Compare with the Healthy Individual Tissue | p-value: 8.00E-21; Fold-change: 0.617730858; Z-score: 0.869906041 | |
| The Expression Level of Disease Section Compare with the Adjacent Tissue | p-value: 4.07E-16; Fold-change: 0.487655803; Z-score: 0.718725508 | |
| Disease-specific Antigen Abundances |
|
Click to View the Clearer Original Diagram |
| Differential expression pattern of antigen in diseases | ||
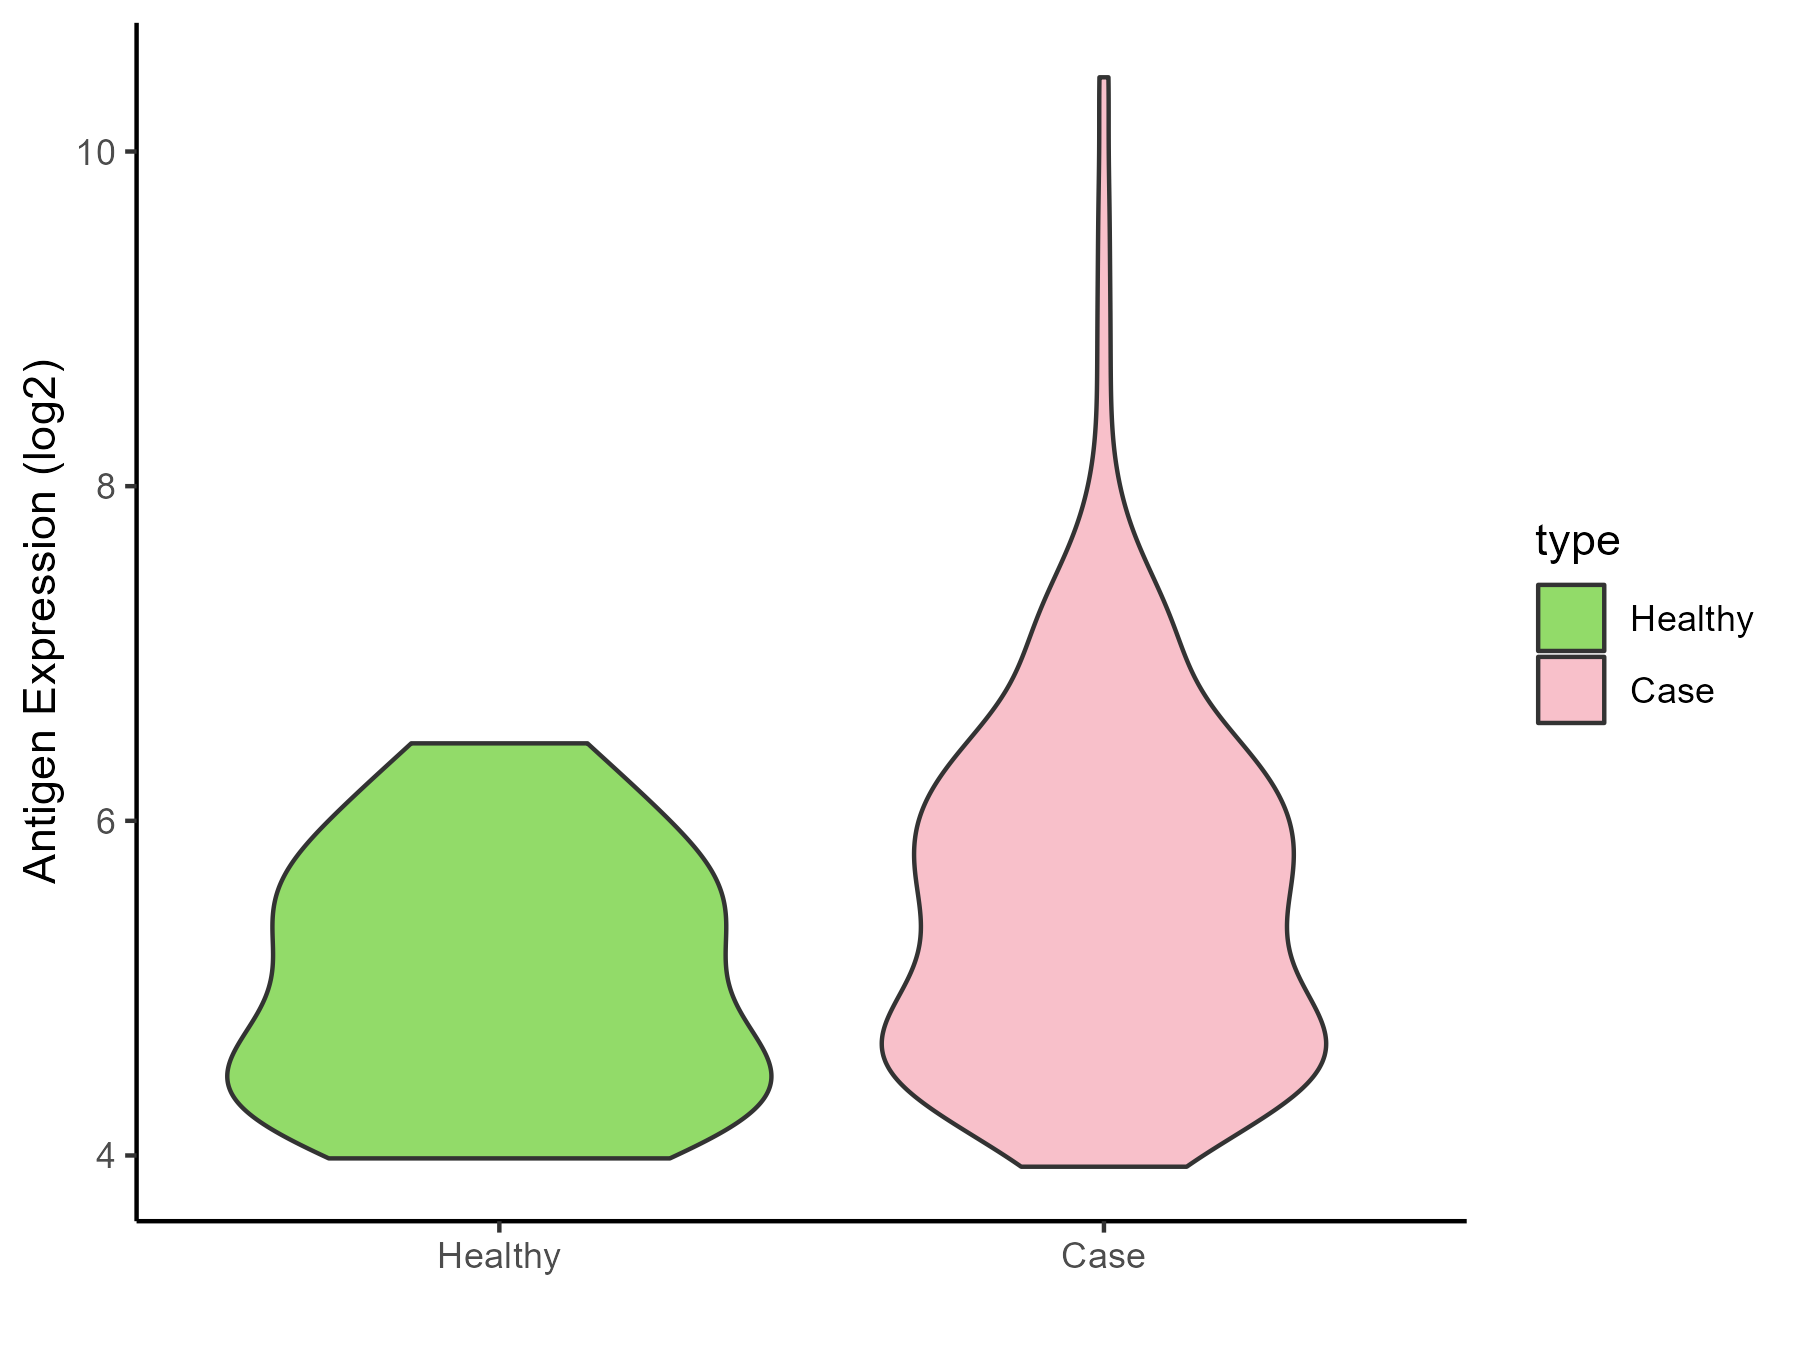
| The Studied Tissue | Skin | |
| The Specific Disease | Melanoma | |
| The Expression Level of Disease Section Compare with the Healthy Individual Tissue | p-value: 0.005519727; Fold-change: 0.518951495; Z-score: 0.700209979 | |
| Disease-specific Antigen Abundances |
|
Click to View the Clearer Original Diagram |
| Differential expression pattern of antigen in diseases | ||
| The Studied Tissue | Muscle | |
| The Specific Disease | Sarcoma | |
| The Expression Level of Disease Section Compare with the Healthy Individual Tissue | p-value: 3.72E-29; Fold-change: -0.362071583; Z-score: -1.278107683 | |
| The Expression Level of Disease Section Compare with the Adjacent Tissue | p-value: 0.038138187; Fold-change: -0.596862307; Z-score: -2.325438952 | |
| Disease-specific Antigen Abundances |

|
Click to View the Clearer Original Diagram |
| Differential expression pattern of antigen in diseases | ||
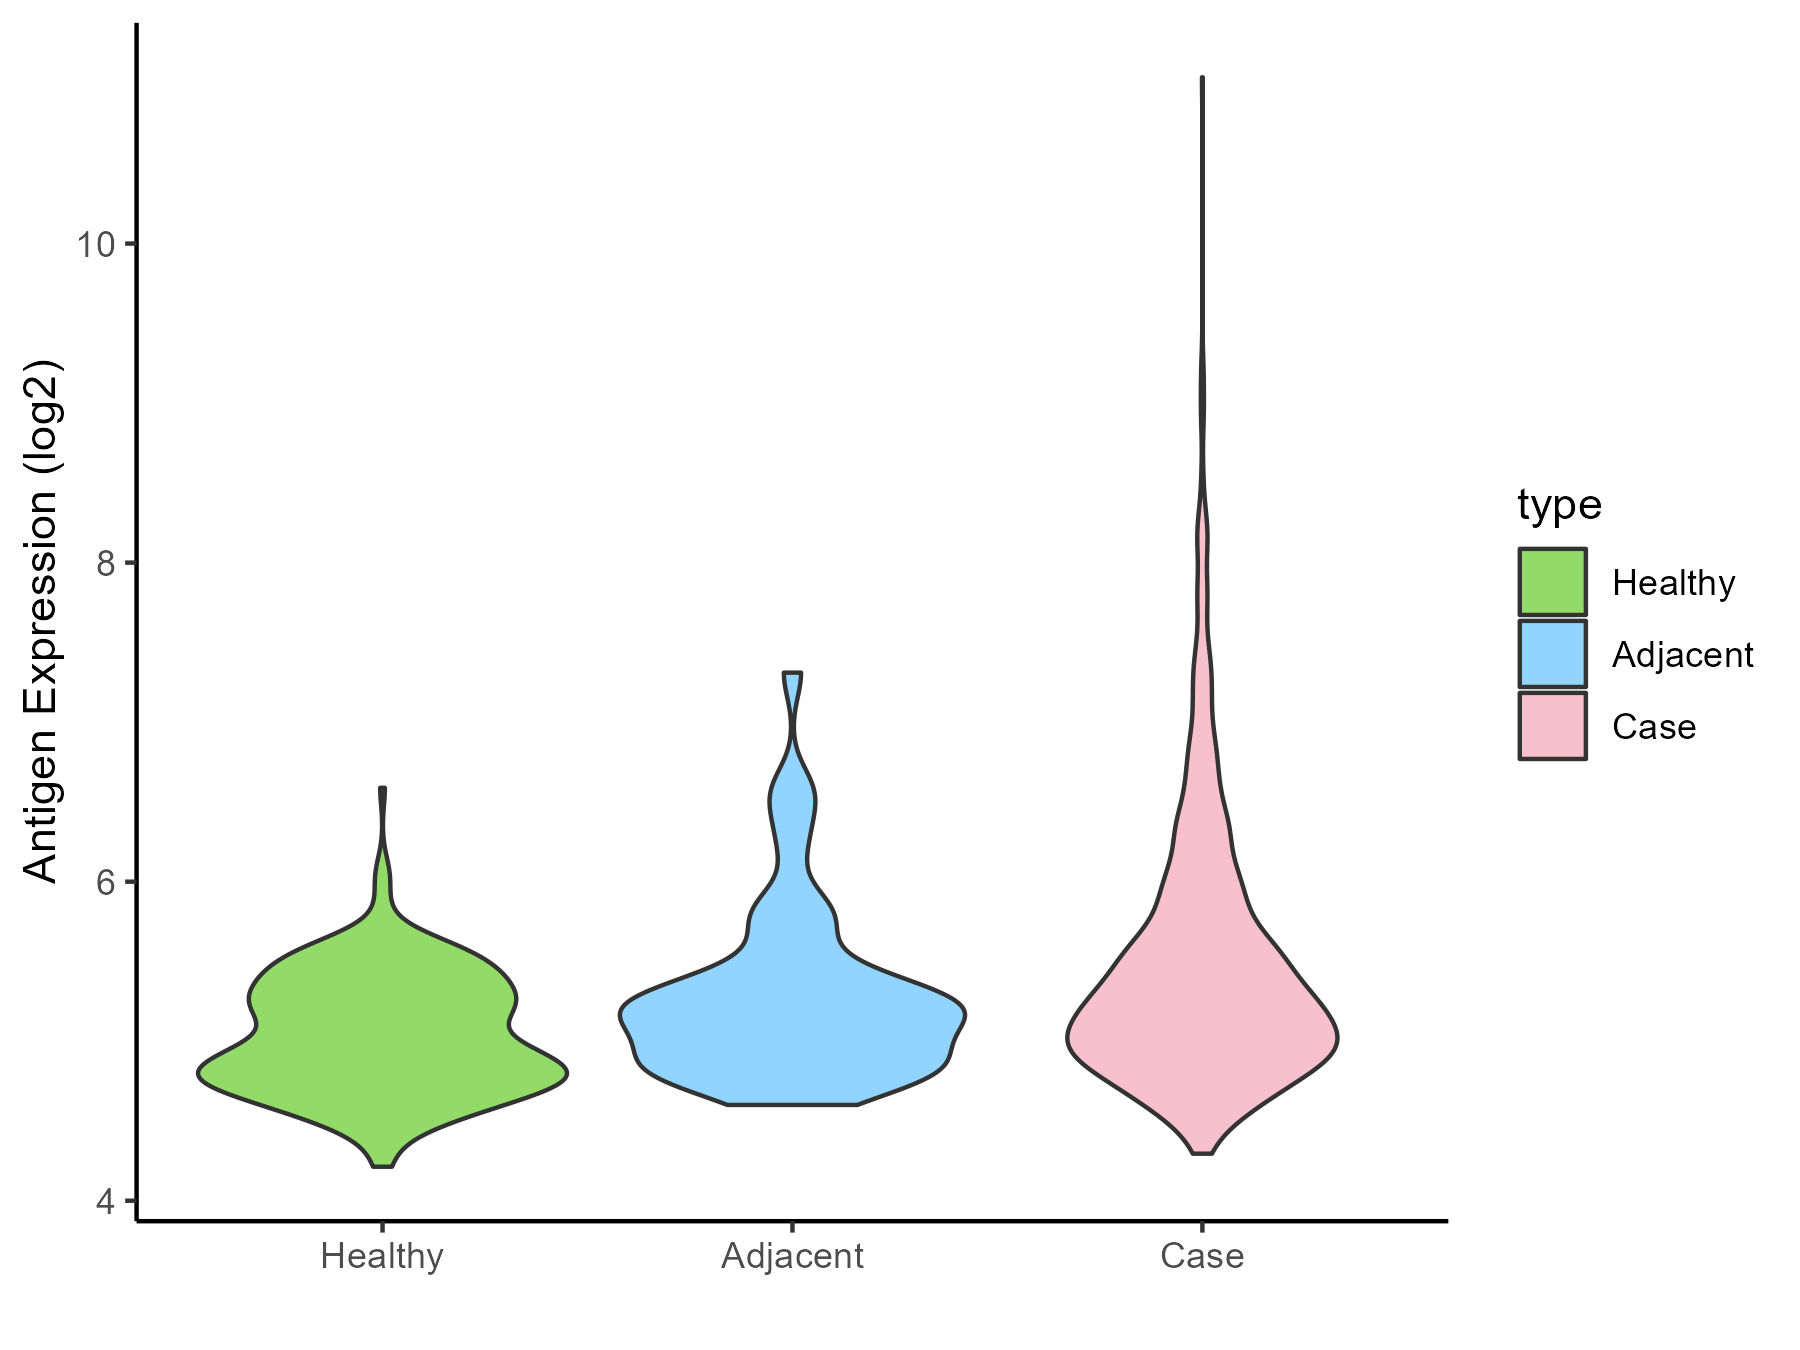
| The Studied Tissue | Breast | |
| The Specific Disease | Breast cancer | |
| The Expression Level of Disease Section Compare with the Healthy Individual Tissue | p-value: 6.86E-38; Fold-change: 0.268944309; Z-score: 0.723584436 | |
| The Expression Level of Disease Section Compare with the Adjacent Tissue | p-value: 0.016287387; Fold-change: 0.046542313; Z-score: 0.084502389 | |
| Disease-specific Antigen Abundances |
|
Click to View the Clearer Original Diagram |
| Differential expression pattern of antigen in diseases | ||
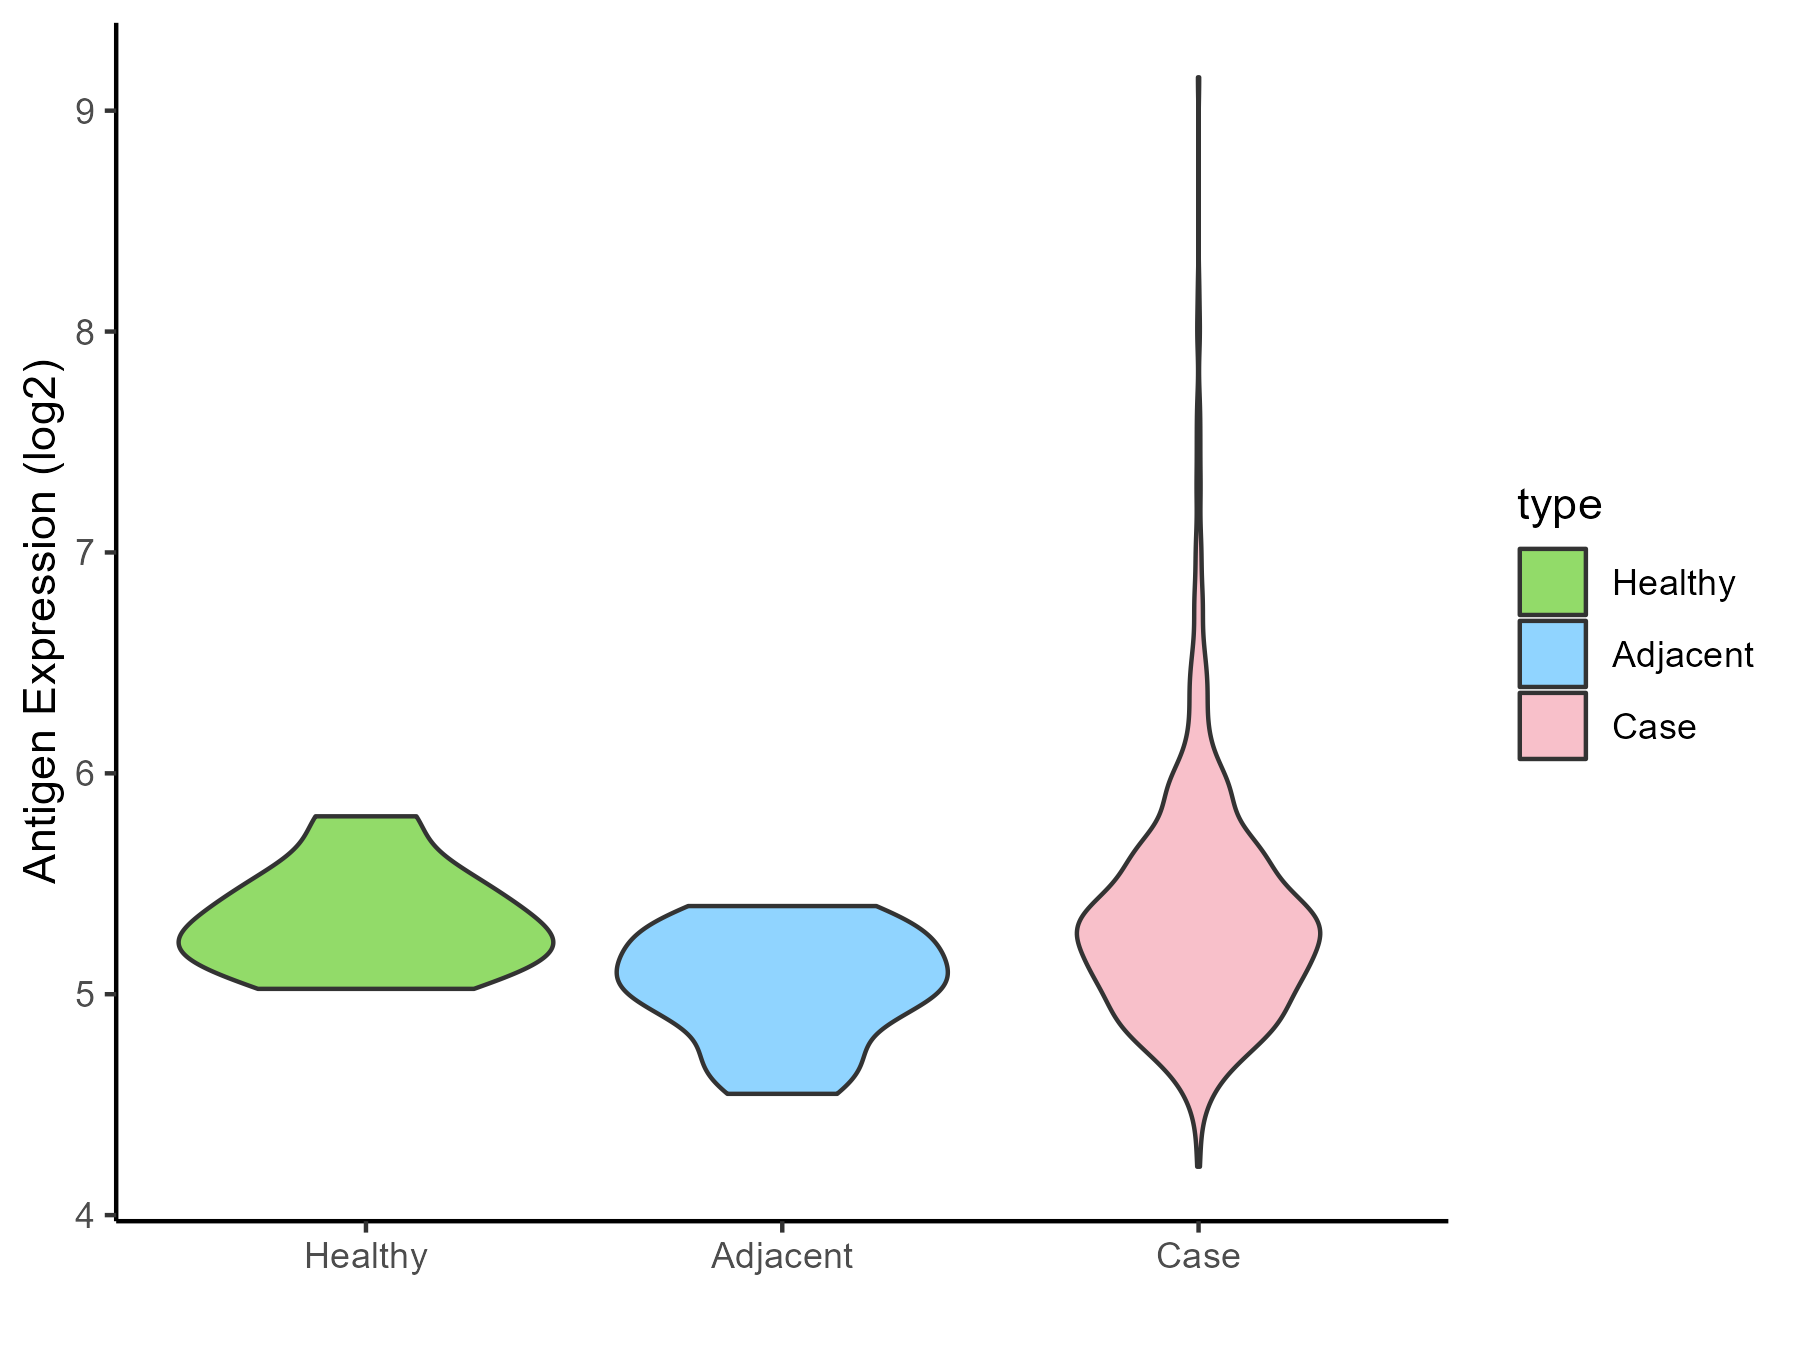
| The Studied Tissue | Ovarian | |
| The Specific Disease | Ovarian cancer | |
| The Expression Level of Disease Section Compare with the Healthy Individual Tissue | p-value: 0.863374041; Fold-change: 0.000213001; Z-score: 0.000876527 | |
| The Expression Level of Disease Section Compare with the Adjacent Tissue | p-value: 0.000430241; Fold-change: 0.236464292; Z-score: 0.918868947 | |
| Disease-specific Antigen Abundances |
|
Click to View the Clearer Original Diagram |
| Differential expression pattern of antigen in diseases | ||
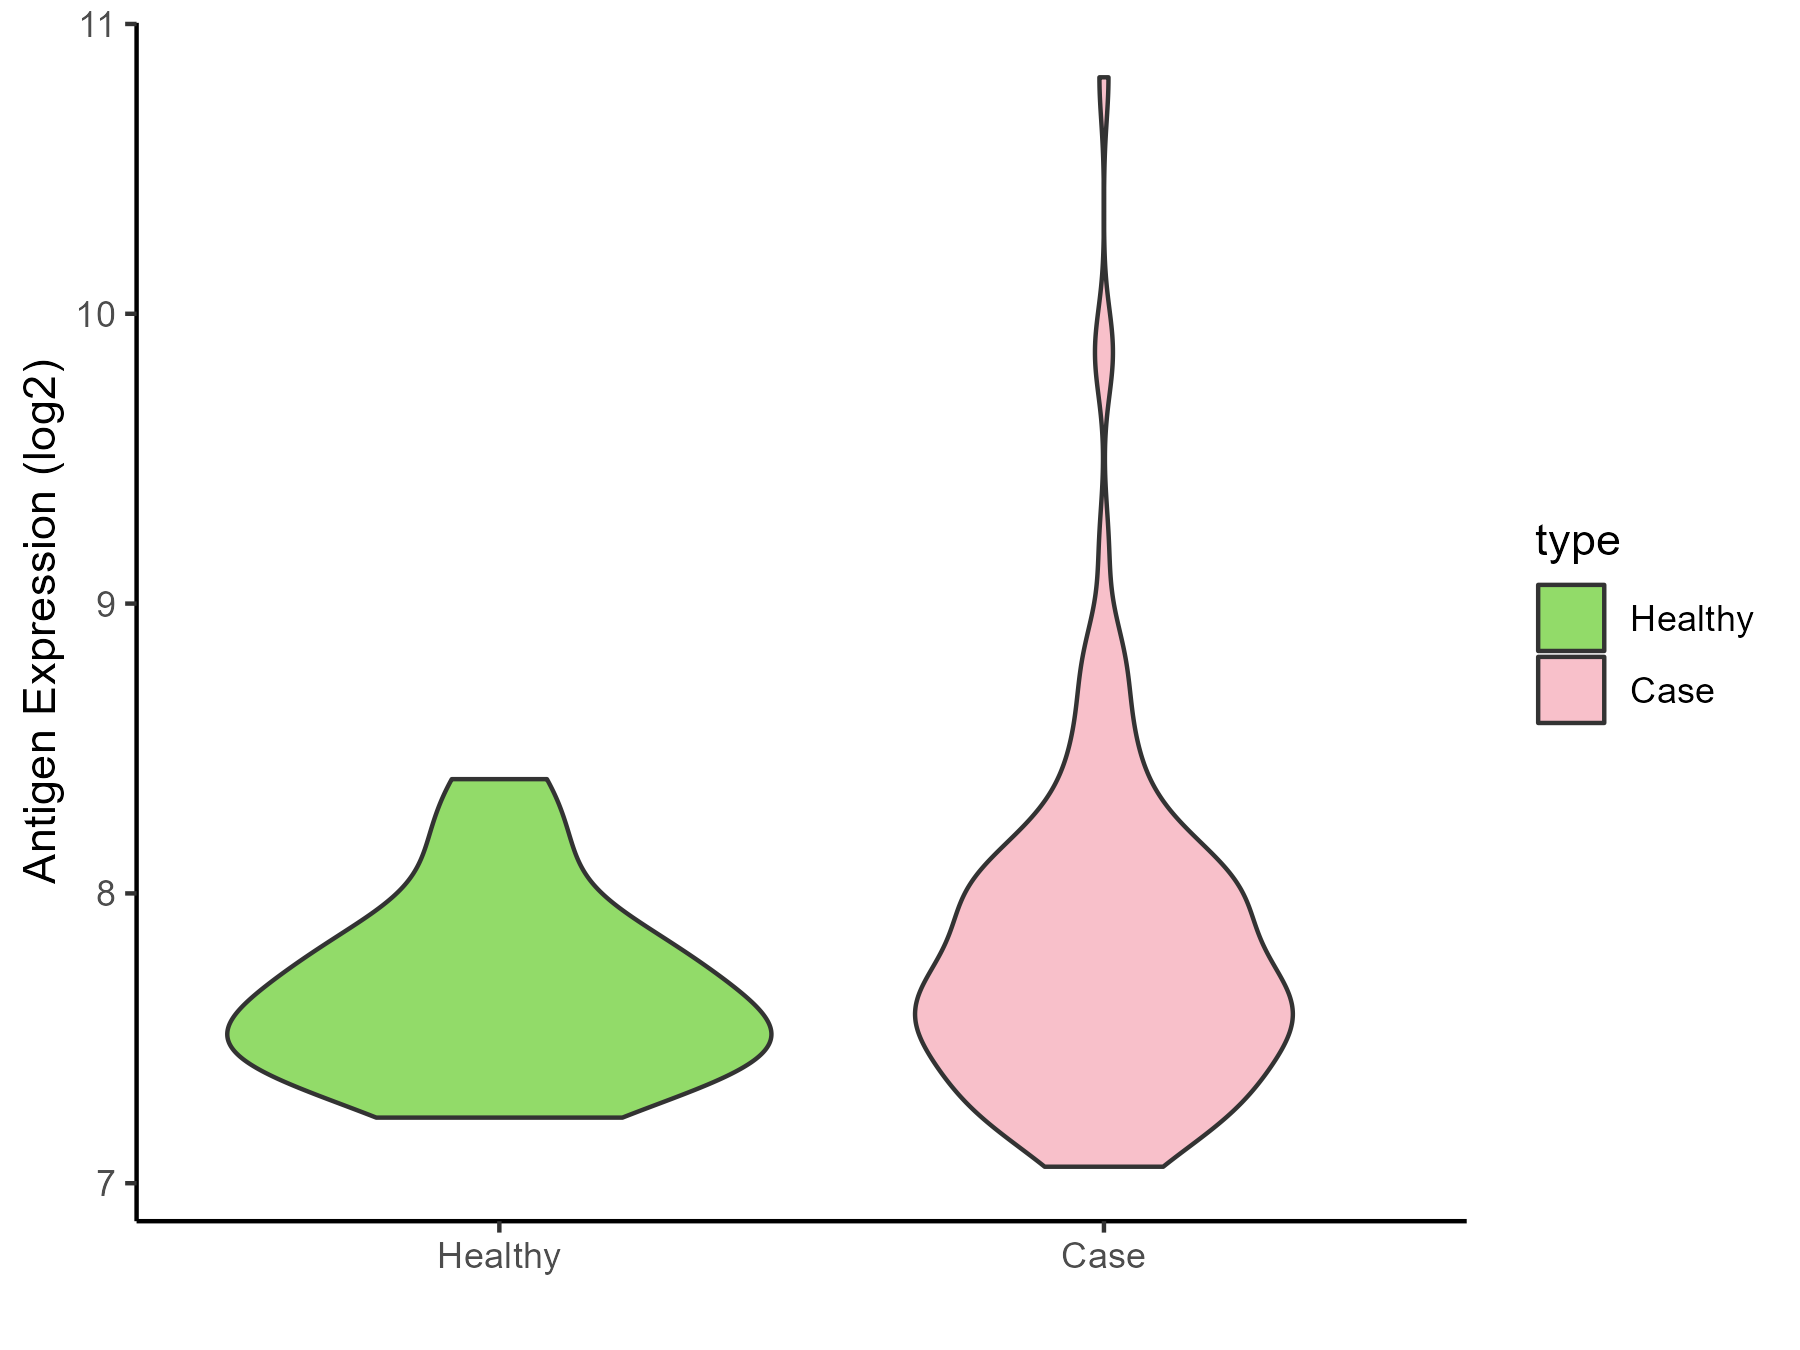
| The Studied Tissue | Cervical | |
| The Specific Disease | Cervical cancer | |
| The Expression Level of Disease Section Compare with the Healthy Individual Tissue | p-value: 0.125139618; Fold-change: 0.107389446; Z-score: 0.342270949 | |
| Disease-specific Antigen Abundances |
|
Click to View the Clearer Original Diagram |
| Differential expression pattern of antigen in diseases | ||
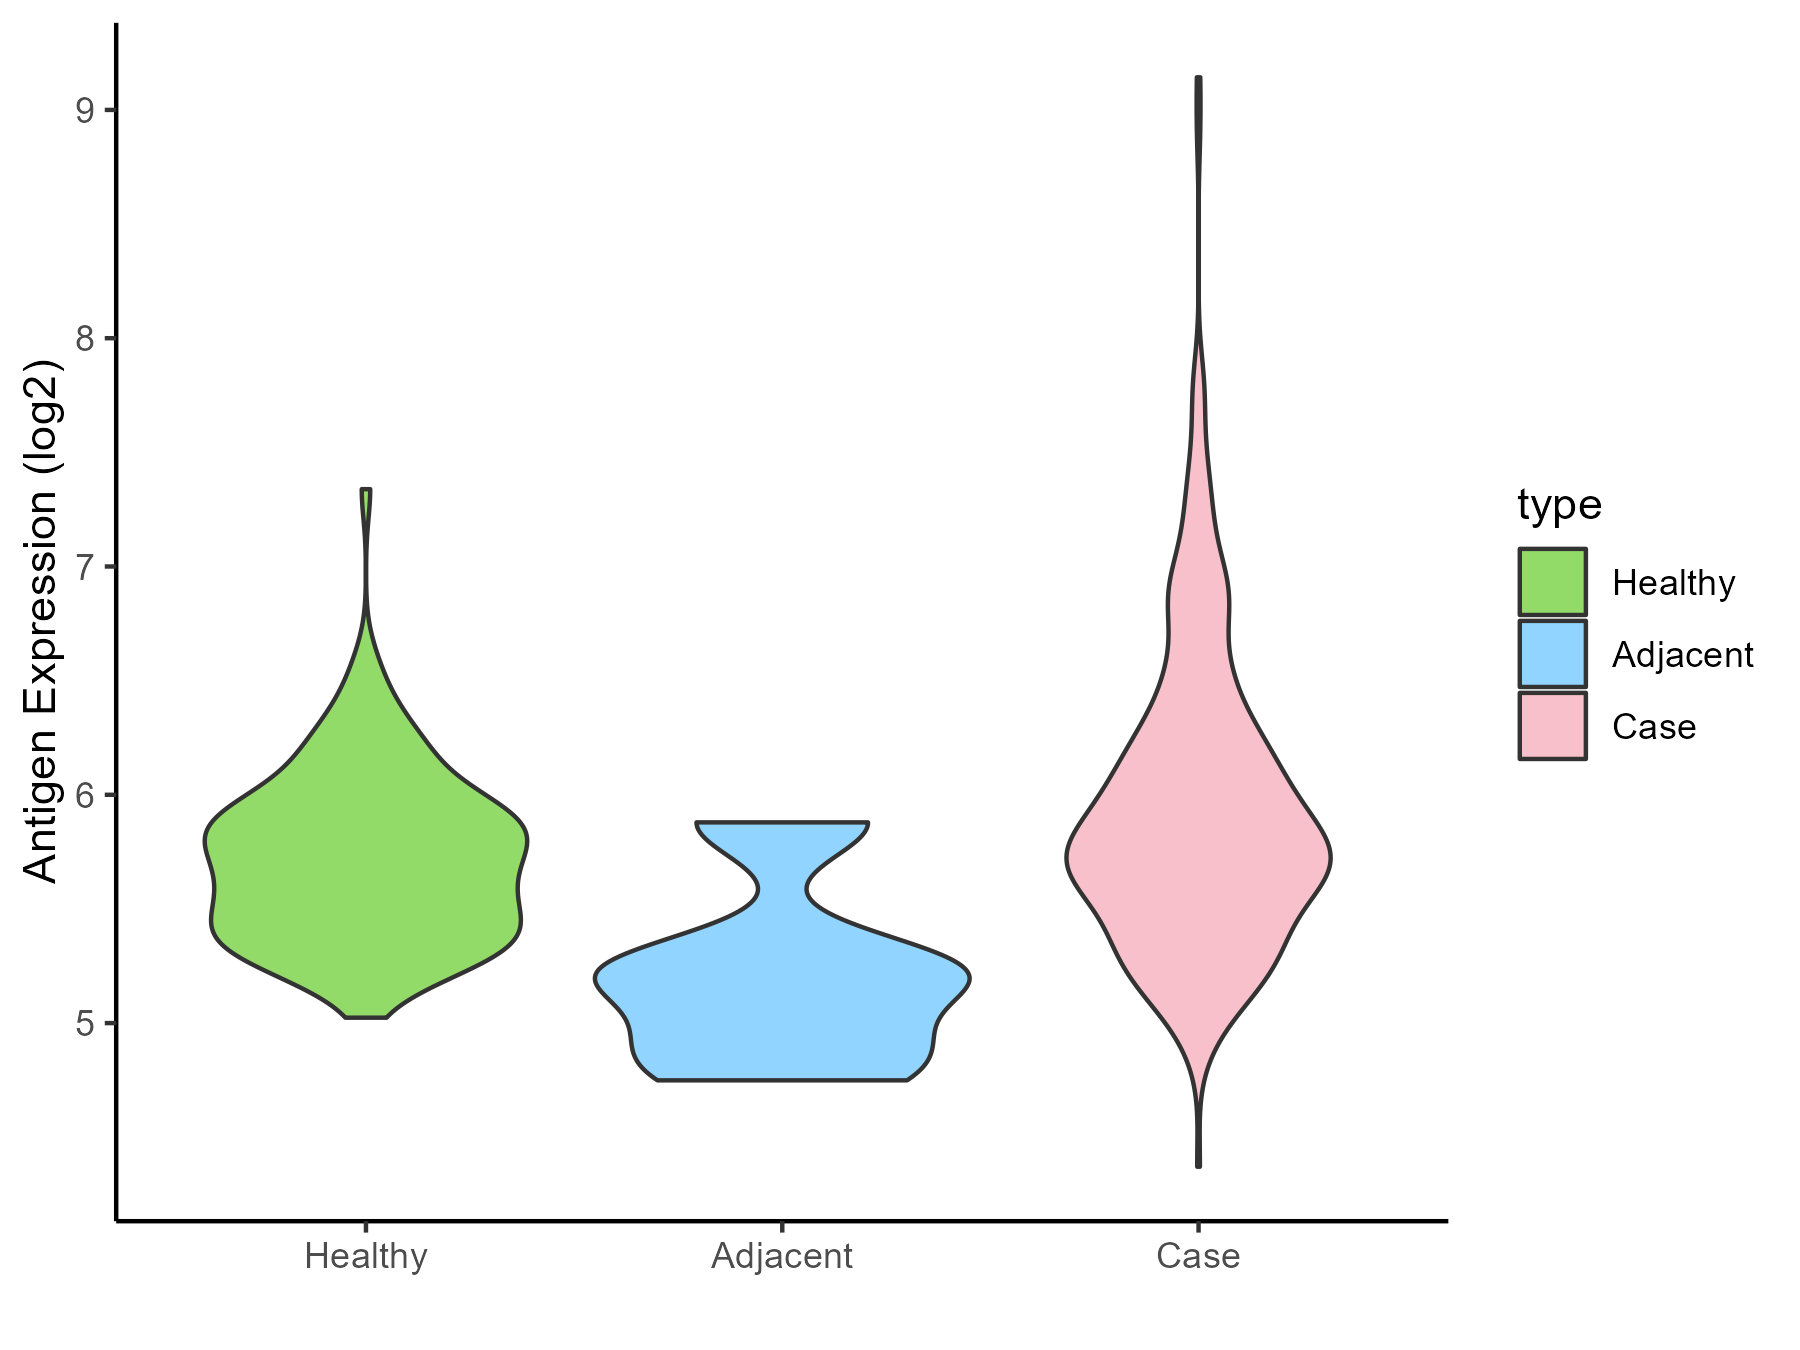
| The Studied Tissue | Endometrium | |
| The Specific Disease | Uterine cancer | |
| The Expression Level of Disease Section Compare with the Healthy Individual Tissue | p-value: 2.32E-05; Fold-change: 0.082716018; Z-score: 0.224919992 | |
| The Expression Level of Disease Section Compare with the Adjacent Tissue | p-value: 0.018240837; Fold-change: 0.585182031; Z-score: 1.366454093 | |
| Disease-specific Antigen Abundances |
|
Click to View the Clearer Original Diagram |
| Differential expression pattern of antigen in diseases | ||
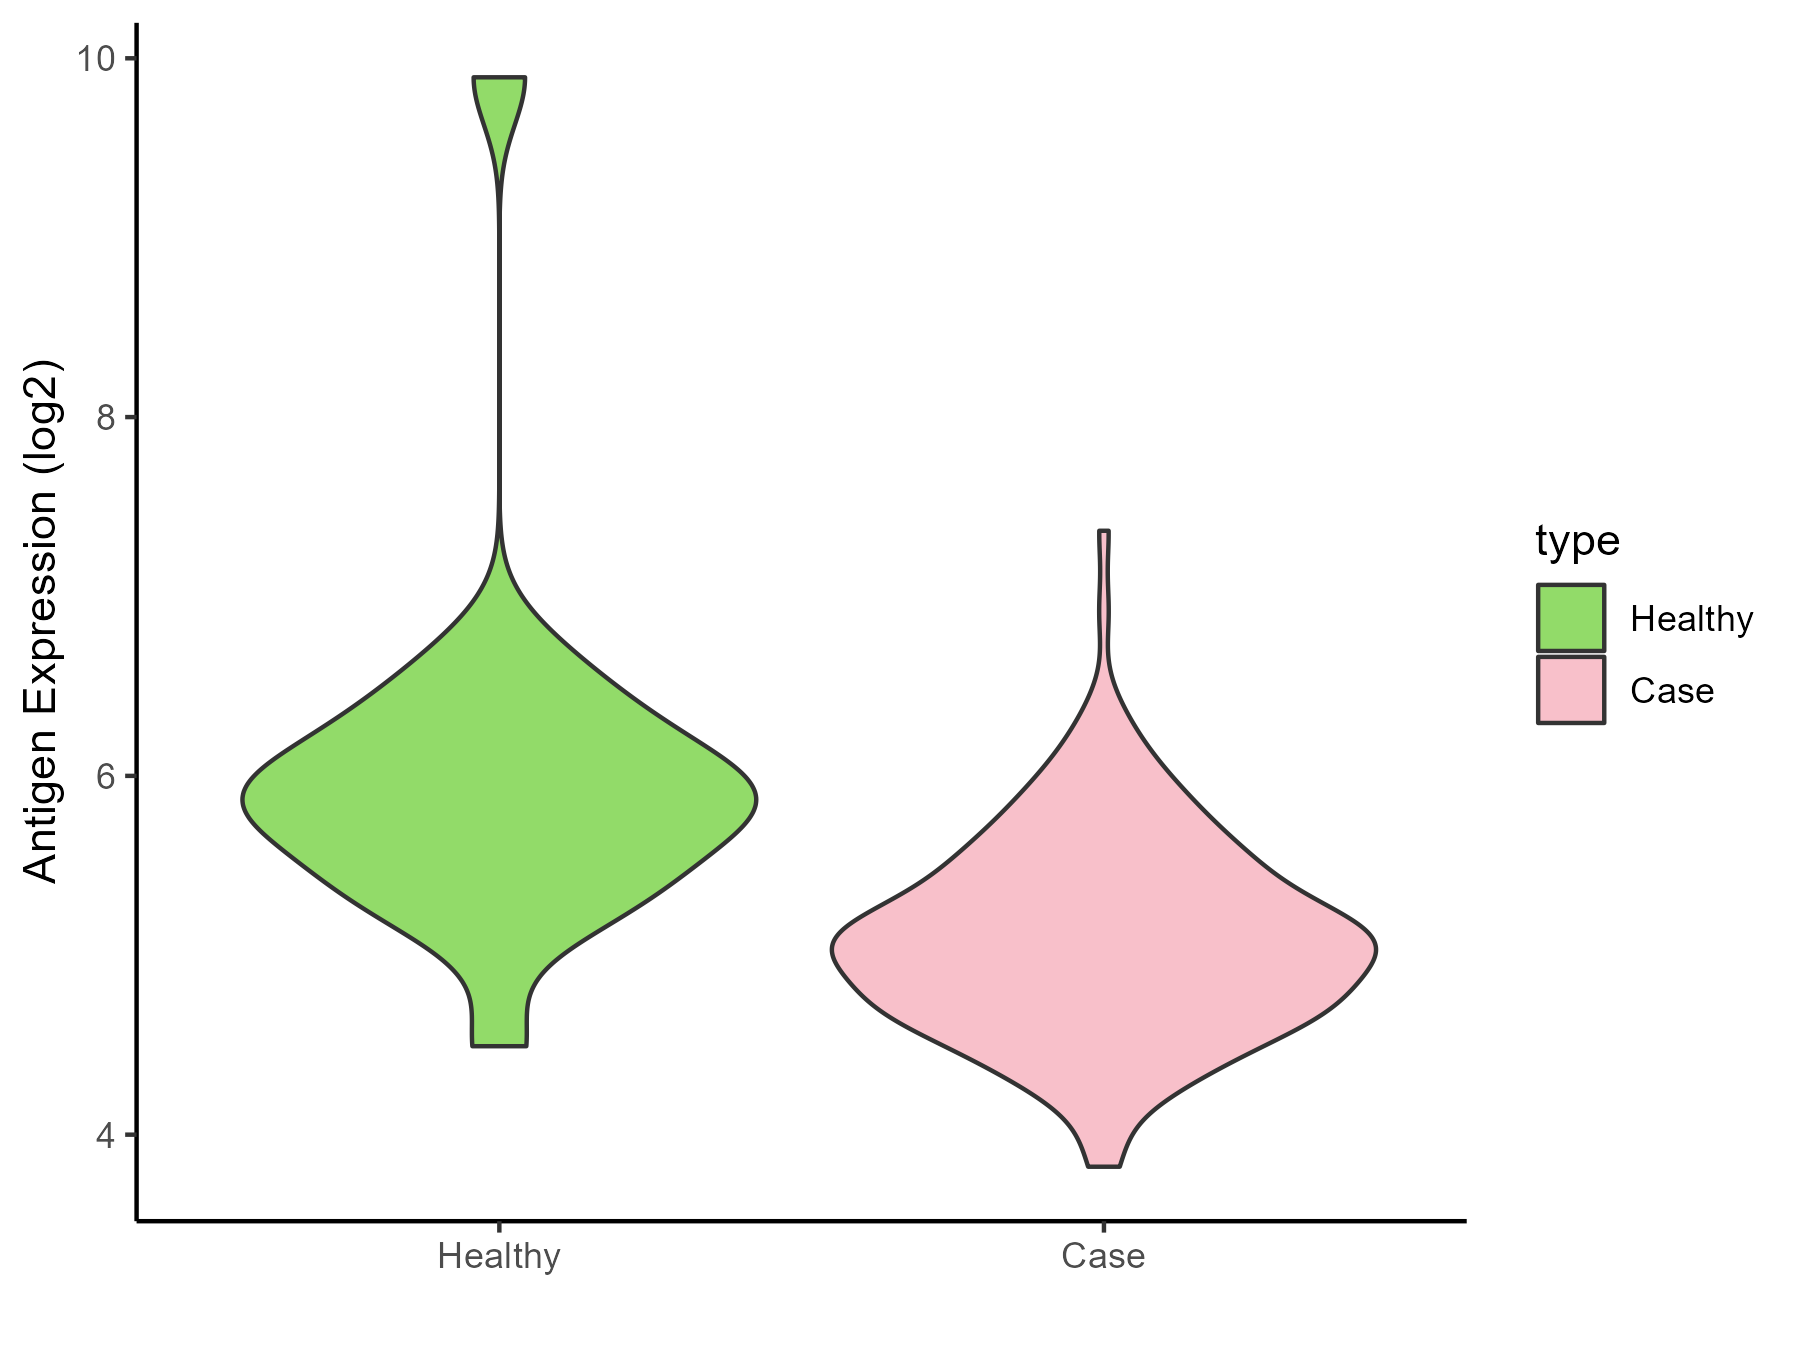
| The Studied Tissue | Prostate | |
| The Specific Disease | Prostate cancer | |
| The Expression Level of Disease Section Compare with the Healthy Individual Tissue | p-value: 0.000643964; Fold-change: -0.840331812; Z-score: -0.820421863 | |
| Disease-specific Antigen Abundances |
|
Click to View the Clearer Original Diagram |
| Differential expression pattern of antigen in diseases | ||
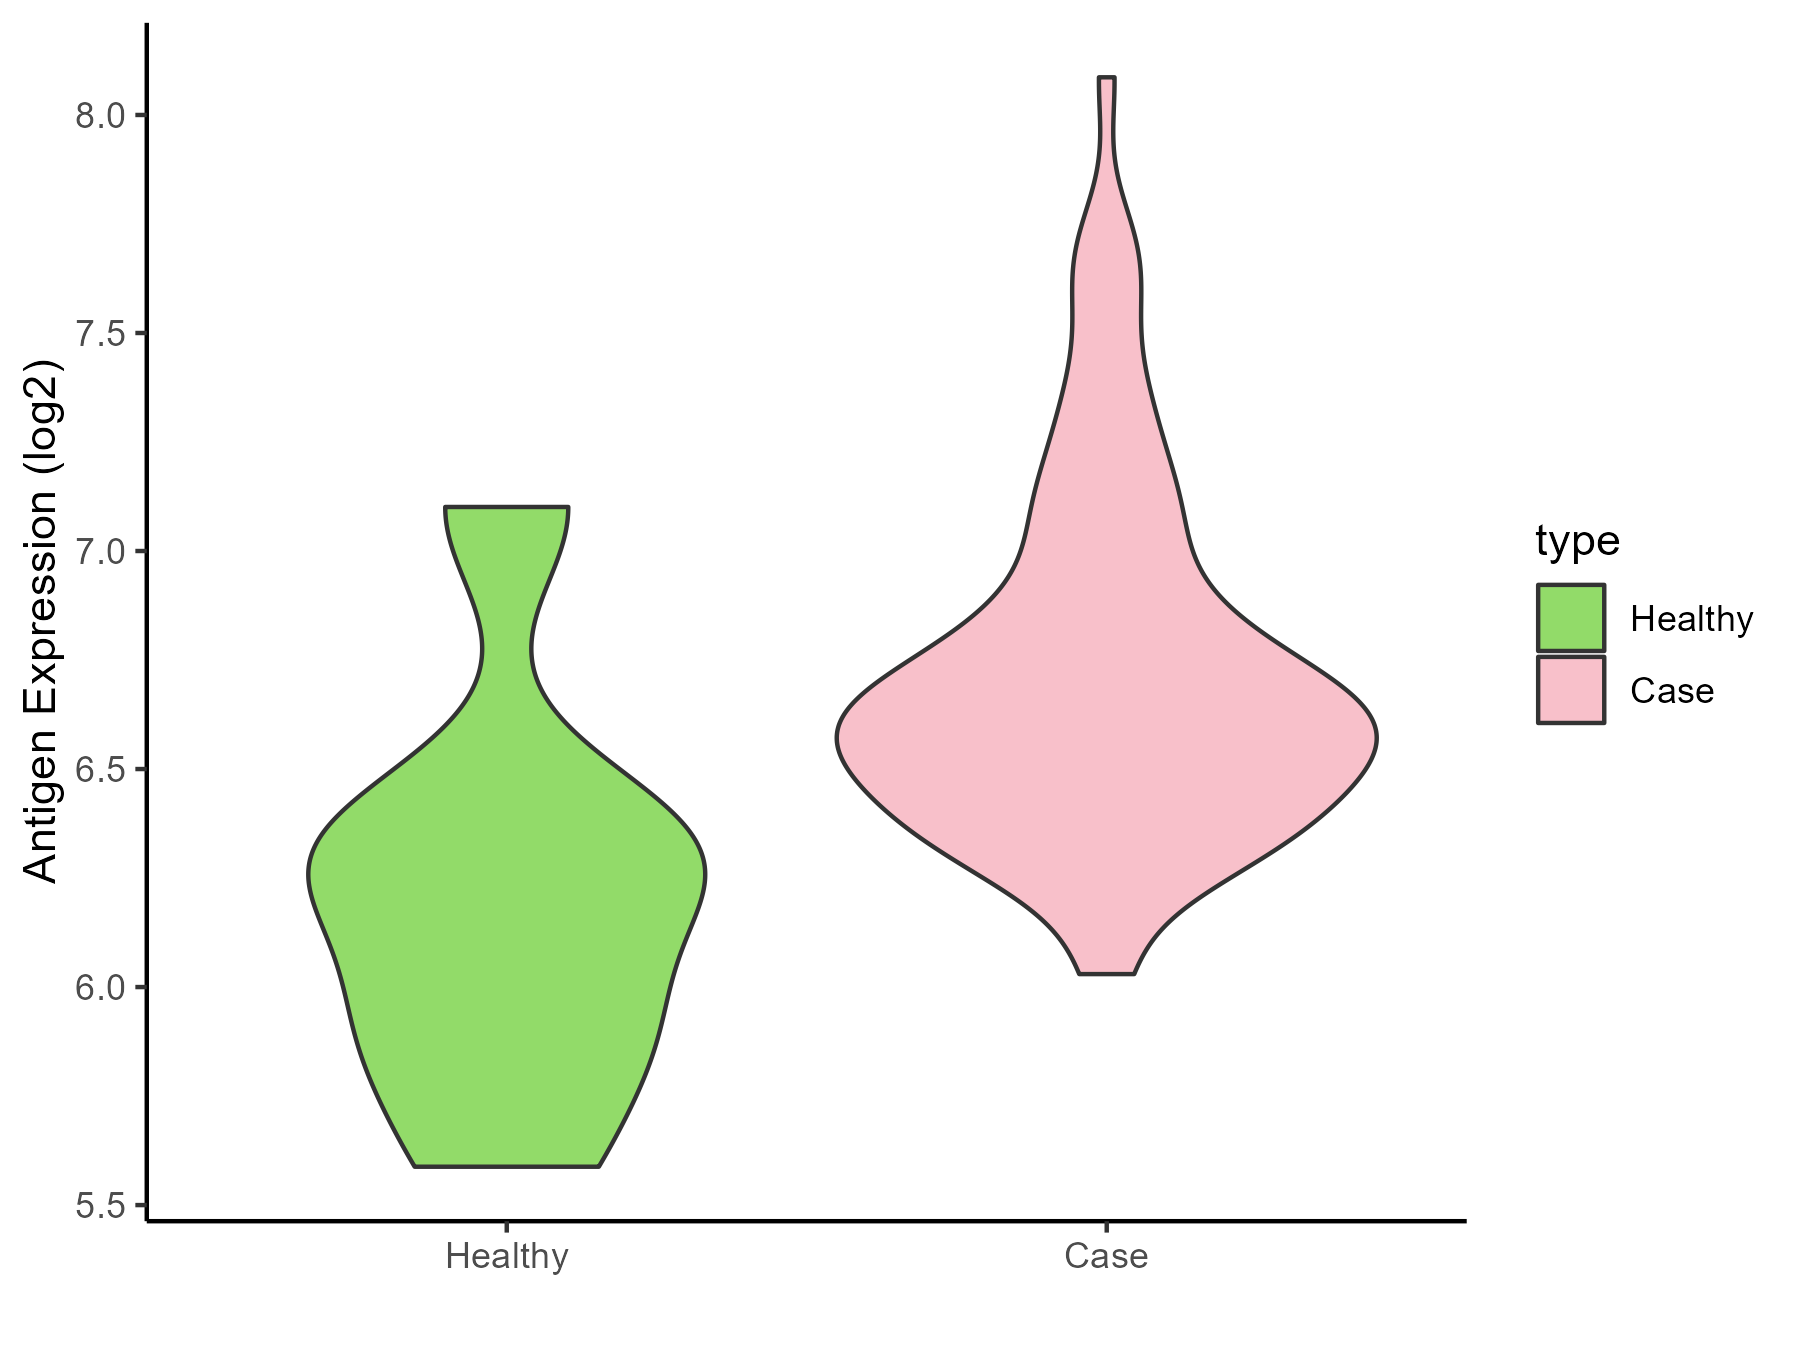
| The Studied Tissue | Bladder | |
| The Specific Disease | Bladder cancer | |
| The Expression Level of Disease Section Compare with the Healthy Individual Tissue | p-value: 0.031512276; Fold-change: 0.357477486; Z-score: 0.740050348 | |
| Disease-specific Antigen Abundances |
|
Click to View the Clearer Original Diagram |
| Differential expression pattern of antigen in diseases | ||
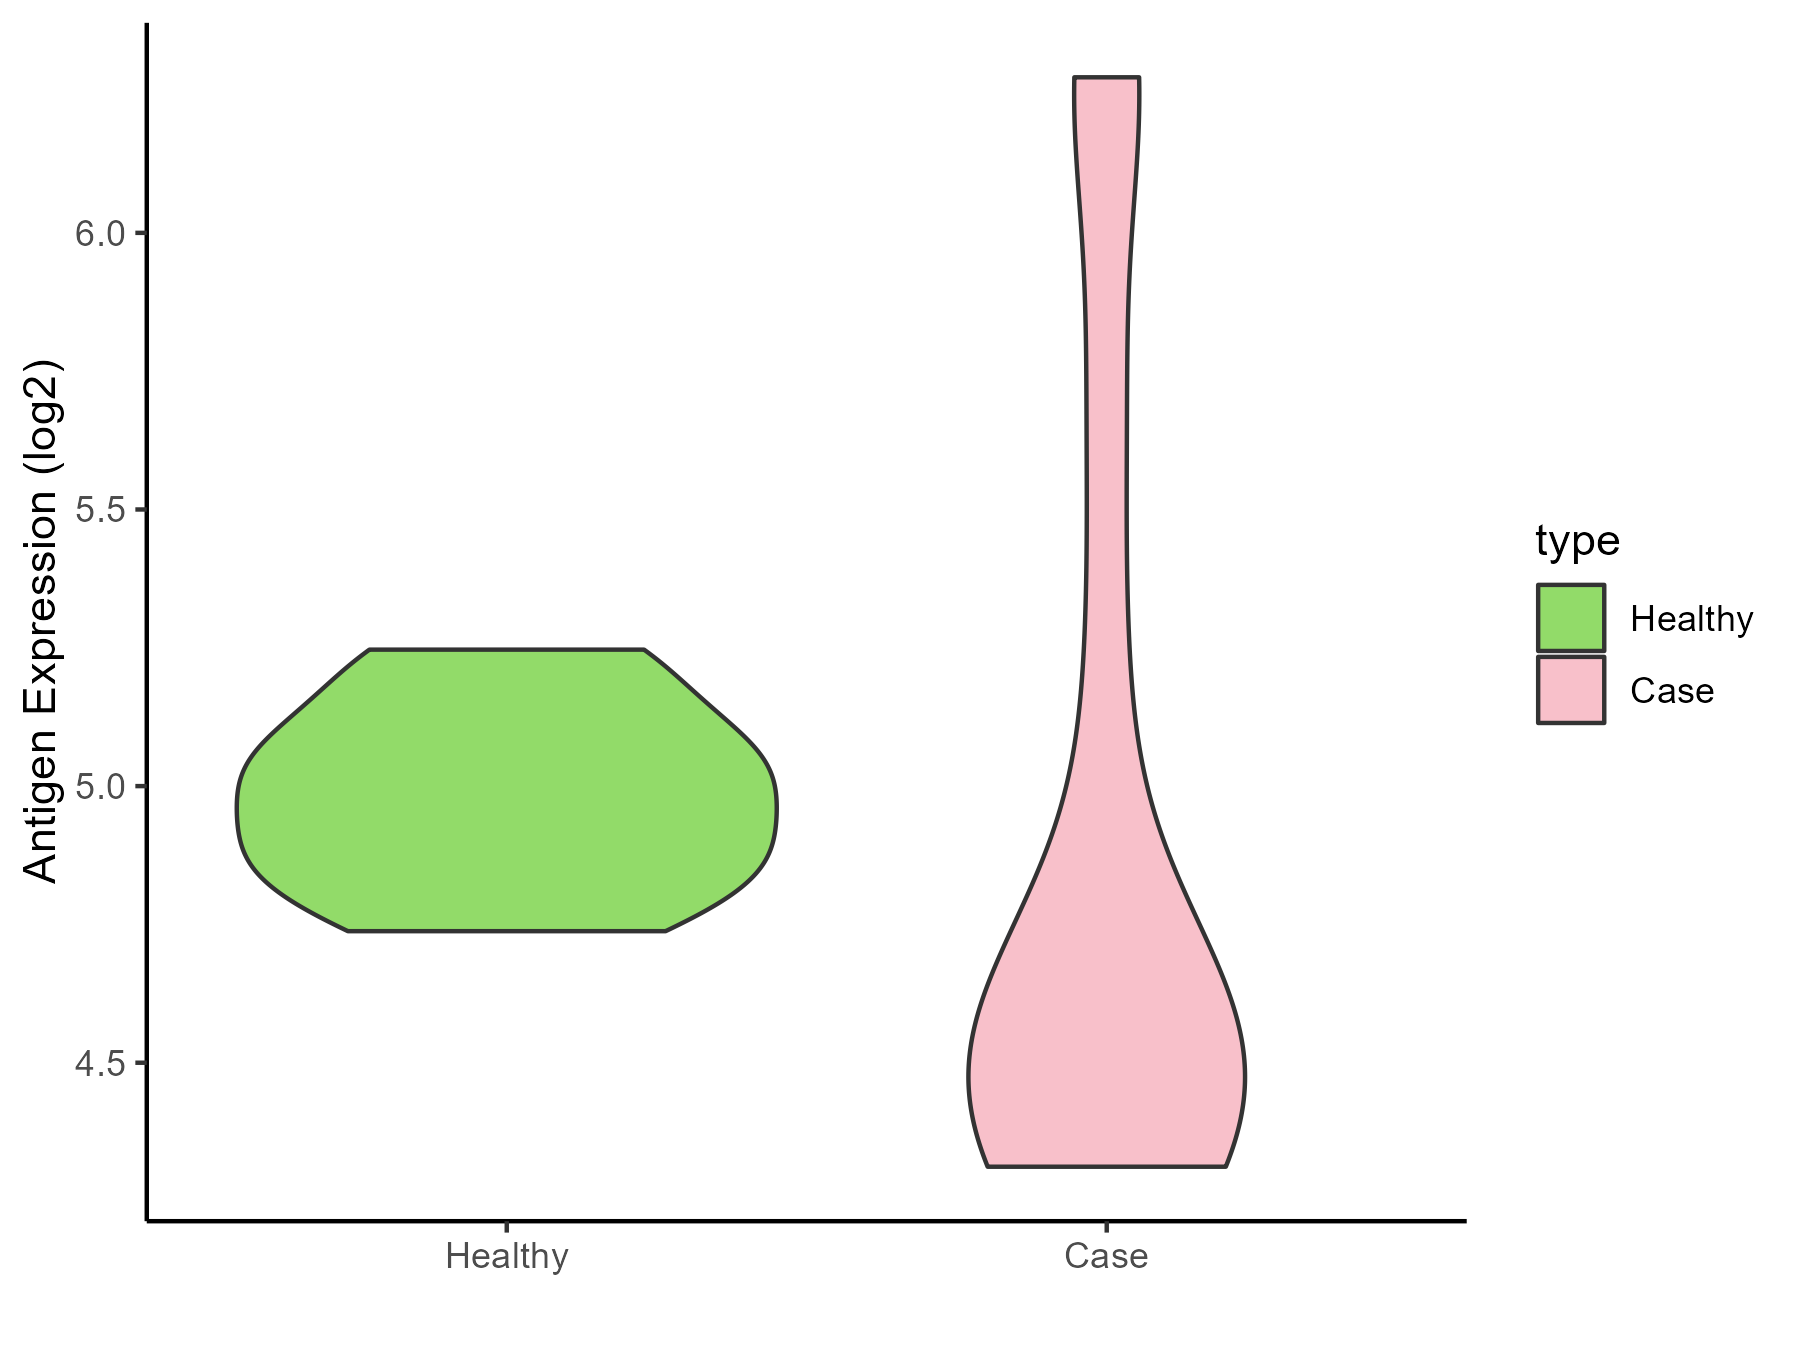
| The Studied Tissue | Uvea | |
| The Specific Disease | Retinoblastoma tumor | |
| The Expression Level of Disease Section Compare with the Healthy Individual Tissue | p-value: 0.567686869; Fold-change: -0.422983557; Z-score: -2.53900995 | |
| Disease-specific Antigen Abundances |
|
Click to View the Clearer Original Diagram |
| Differential expression pattern of antigen in diseases | ||
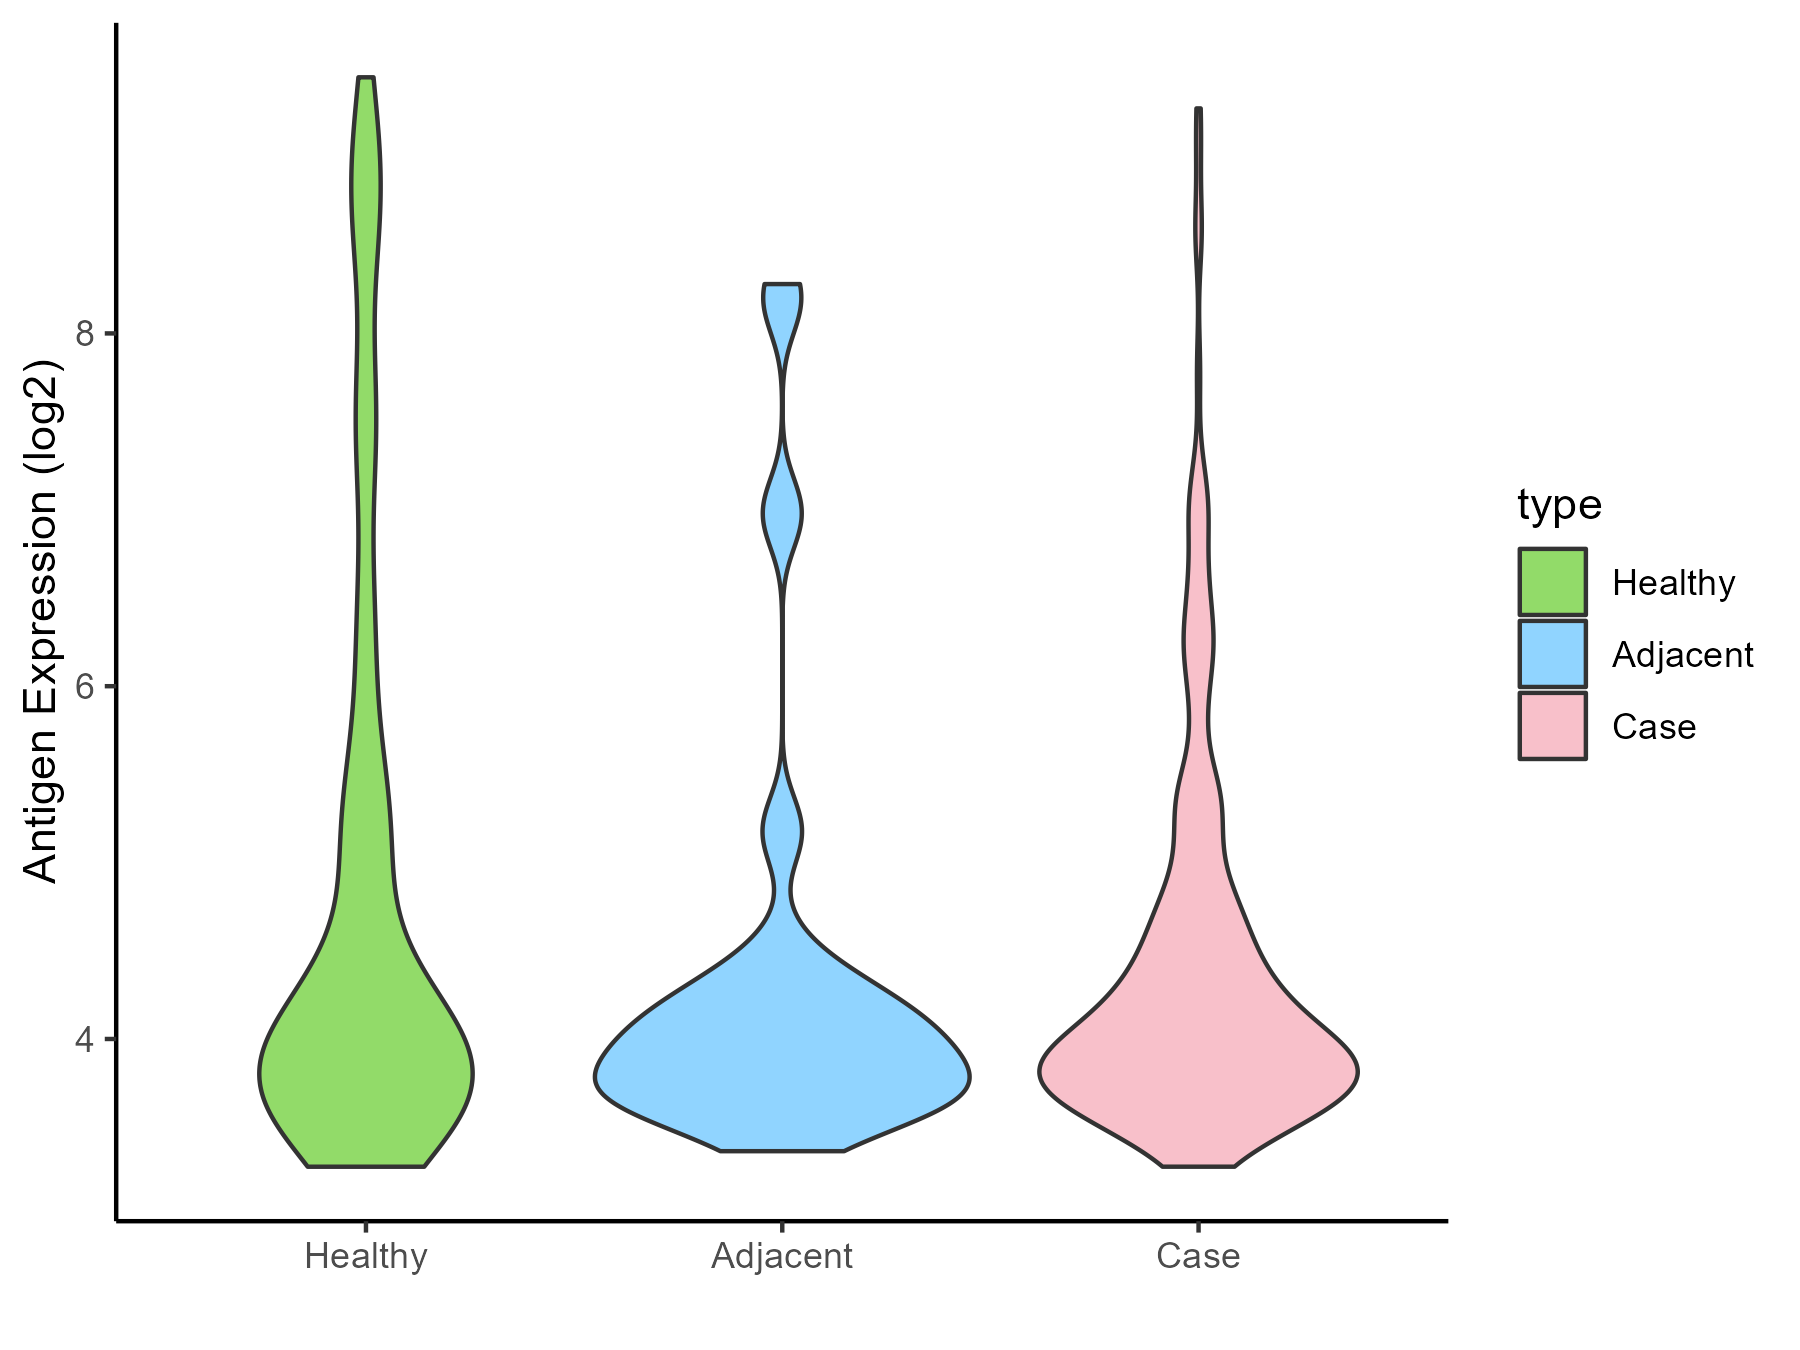
| The Studied Tissue | Thyroid | |
| The Specific Disease | Thyroid cancer | |
| The Expression Level of Disease Section Compare with the Healthy Individual Tissue | p-value: 0.018221177; Fold-change: 0.030367127; Z-score: 0.017986172 | |
| The Expression Level of Disease Section Compare with the Adjacent Tissue | p-value: 0.684669247; Fold-change: 0.064745747; Z-score: 0.055214027 | |
| Disease-specific Antigen Abundances |
|
Click to View the Clearer Original Diagram |
| Differential expression pattern of antigen in diseases | ||
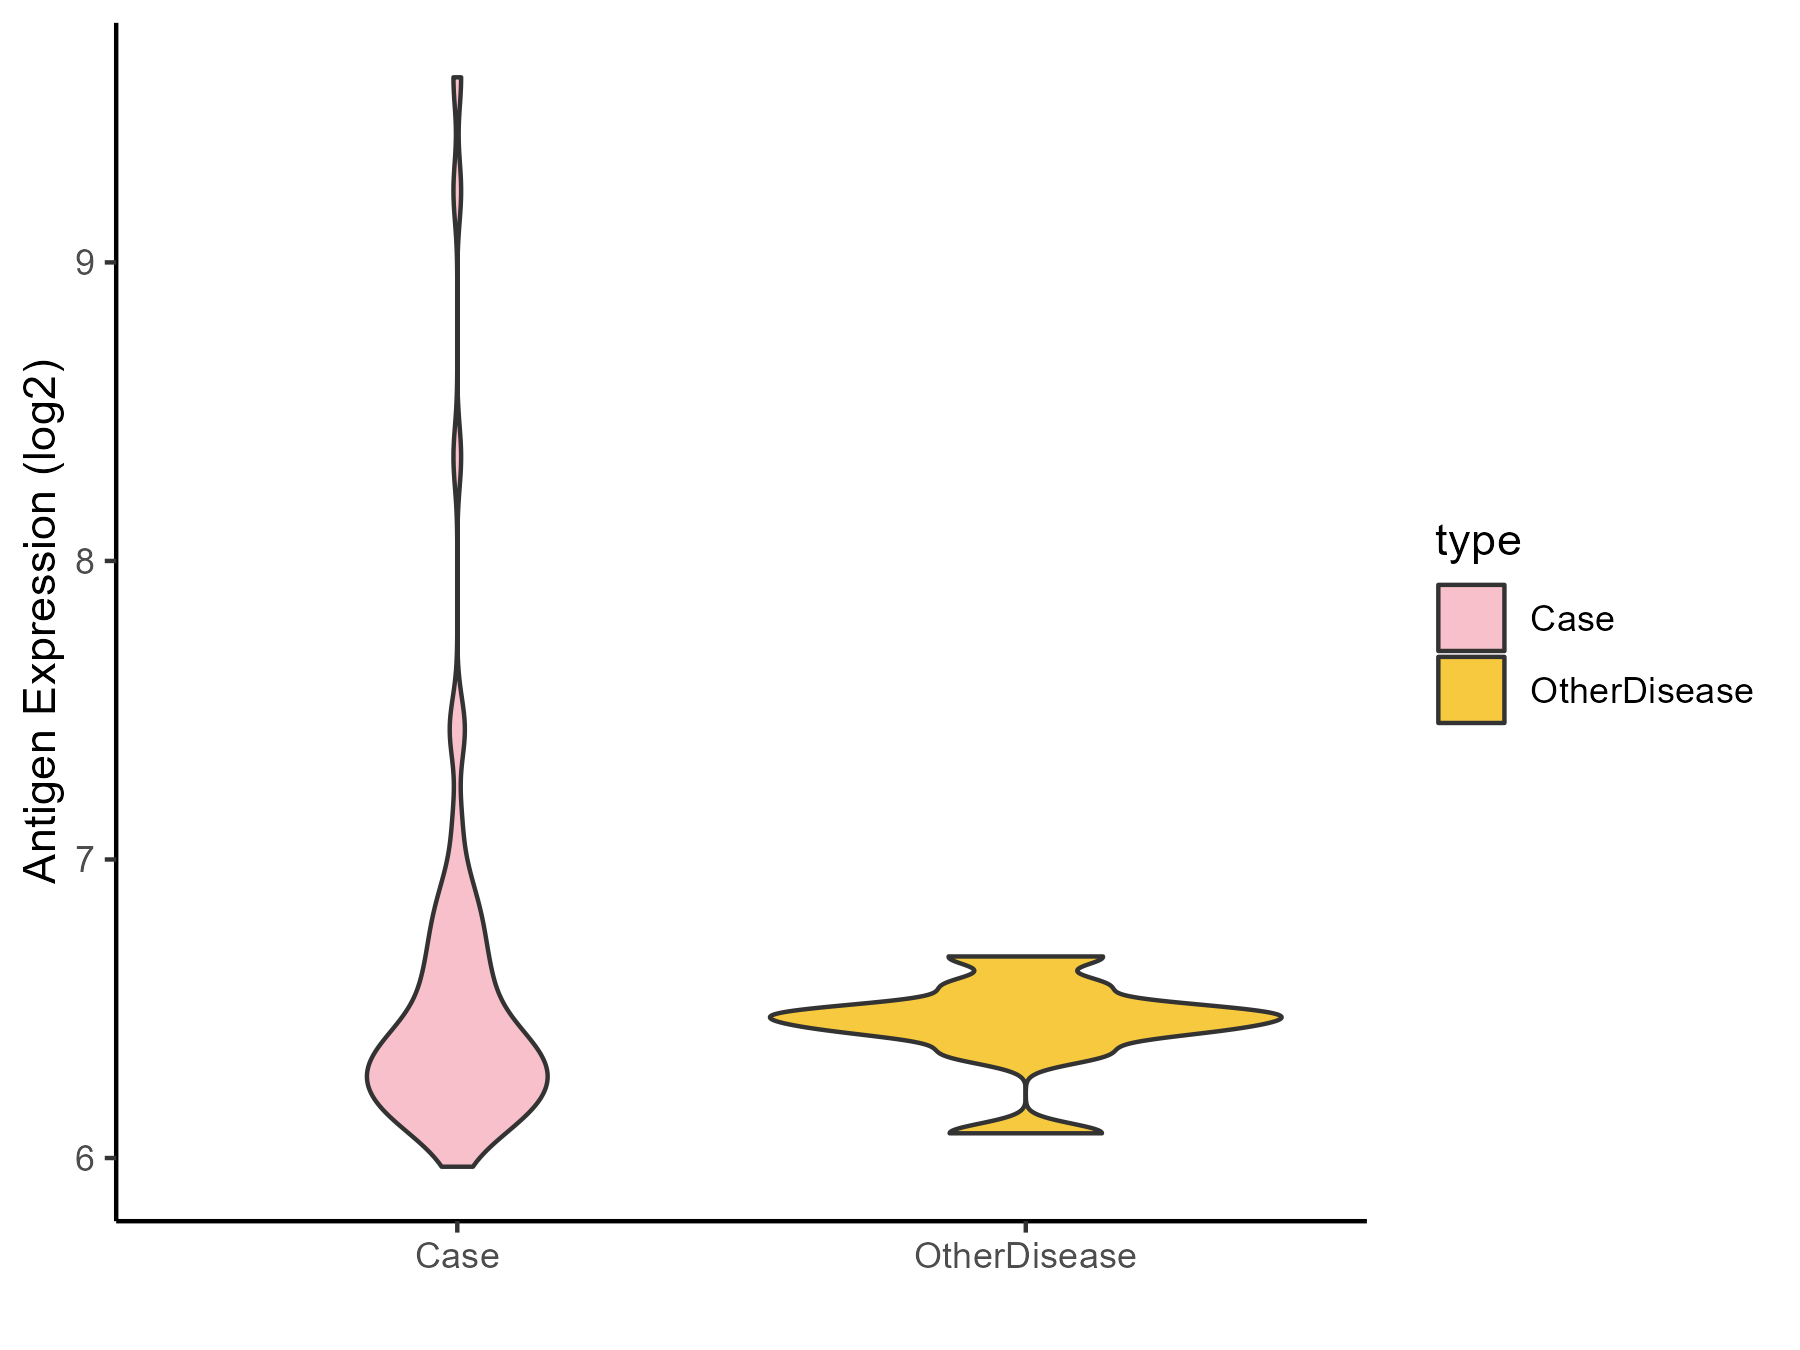
| The Studied Tissue | Adrenal cortex | |
| The Specific Disease | Adrenocortical carcinoma | |
| The Expression Level of Disease Section Compare with the Other Disease Section | p-value: 0.074839655; Fold-change: -0.121720122; Z-score: -0.75919934 | |
| Disease-specific Antigen Abundances |
|
Click to View the Clearer Original Diagram |
| Differential expression pattern of antigen in diseases | ||
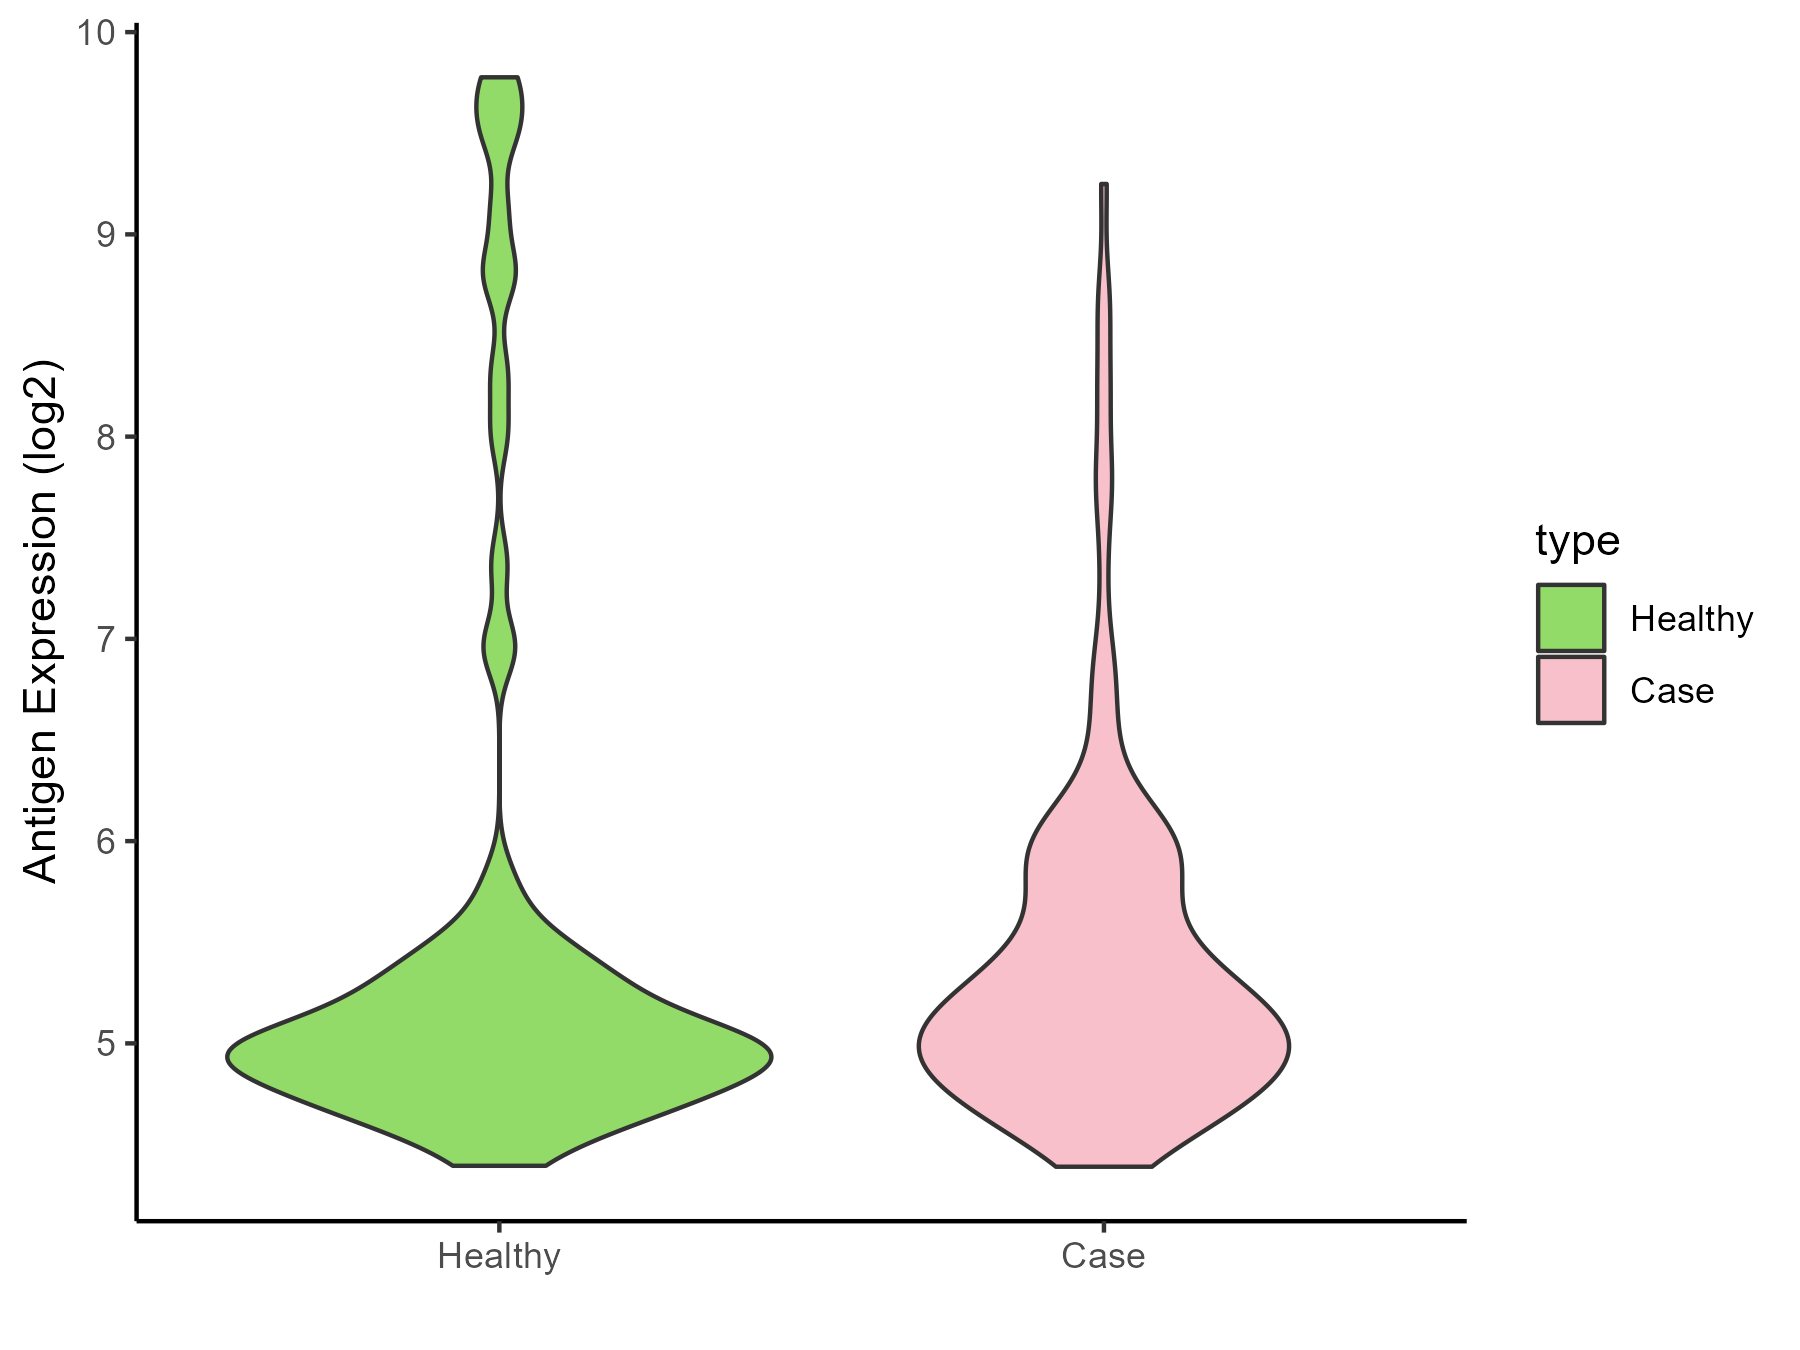
| The Studied Tissue | Head and neck | |
| The Specific Disease | Head and neck cancer | |
| The Expression Level of Disease Section Compare with the Healthy Individual Tissue | p-value: 0.631008965; Fold-change: 0.140762475; Z-score: 0.105447589 | |
| Disease-specific Antigen Abundances |
|
Click to View the Clearer Original Diagram |
| Differential expression pattern of antigen in diseases | ||
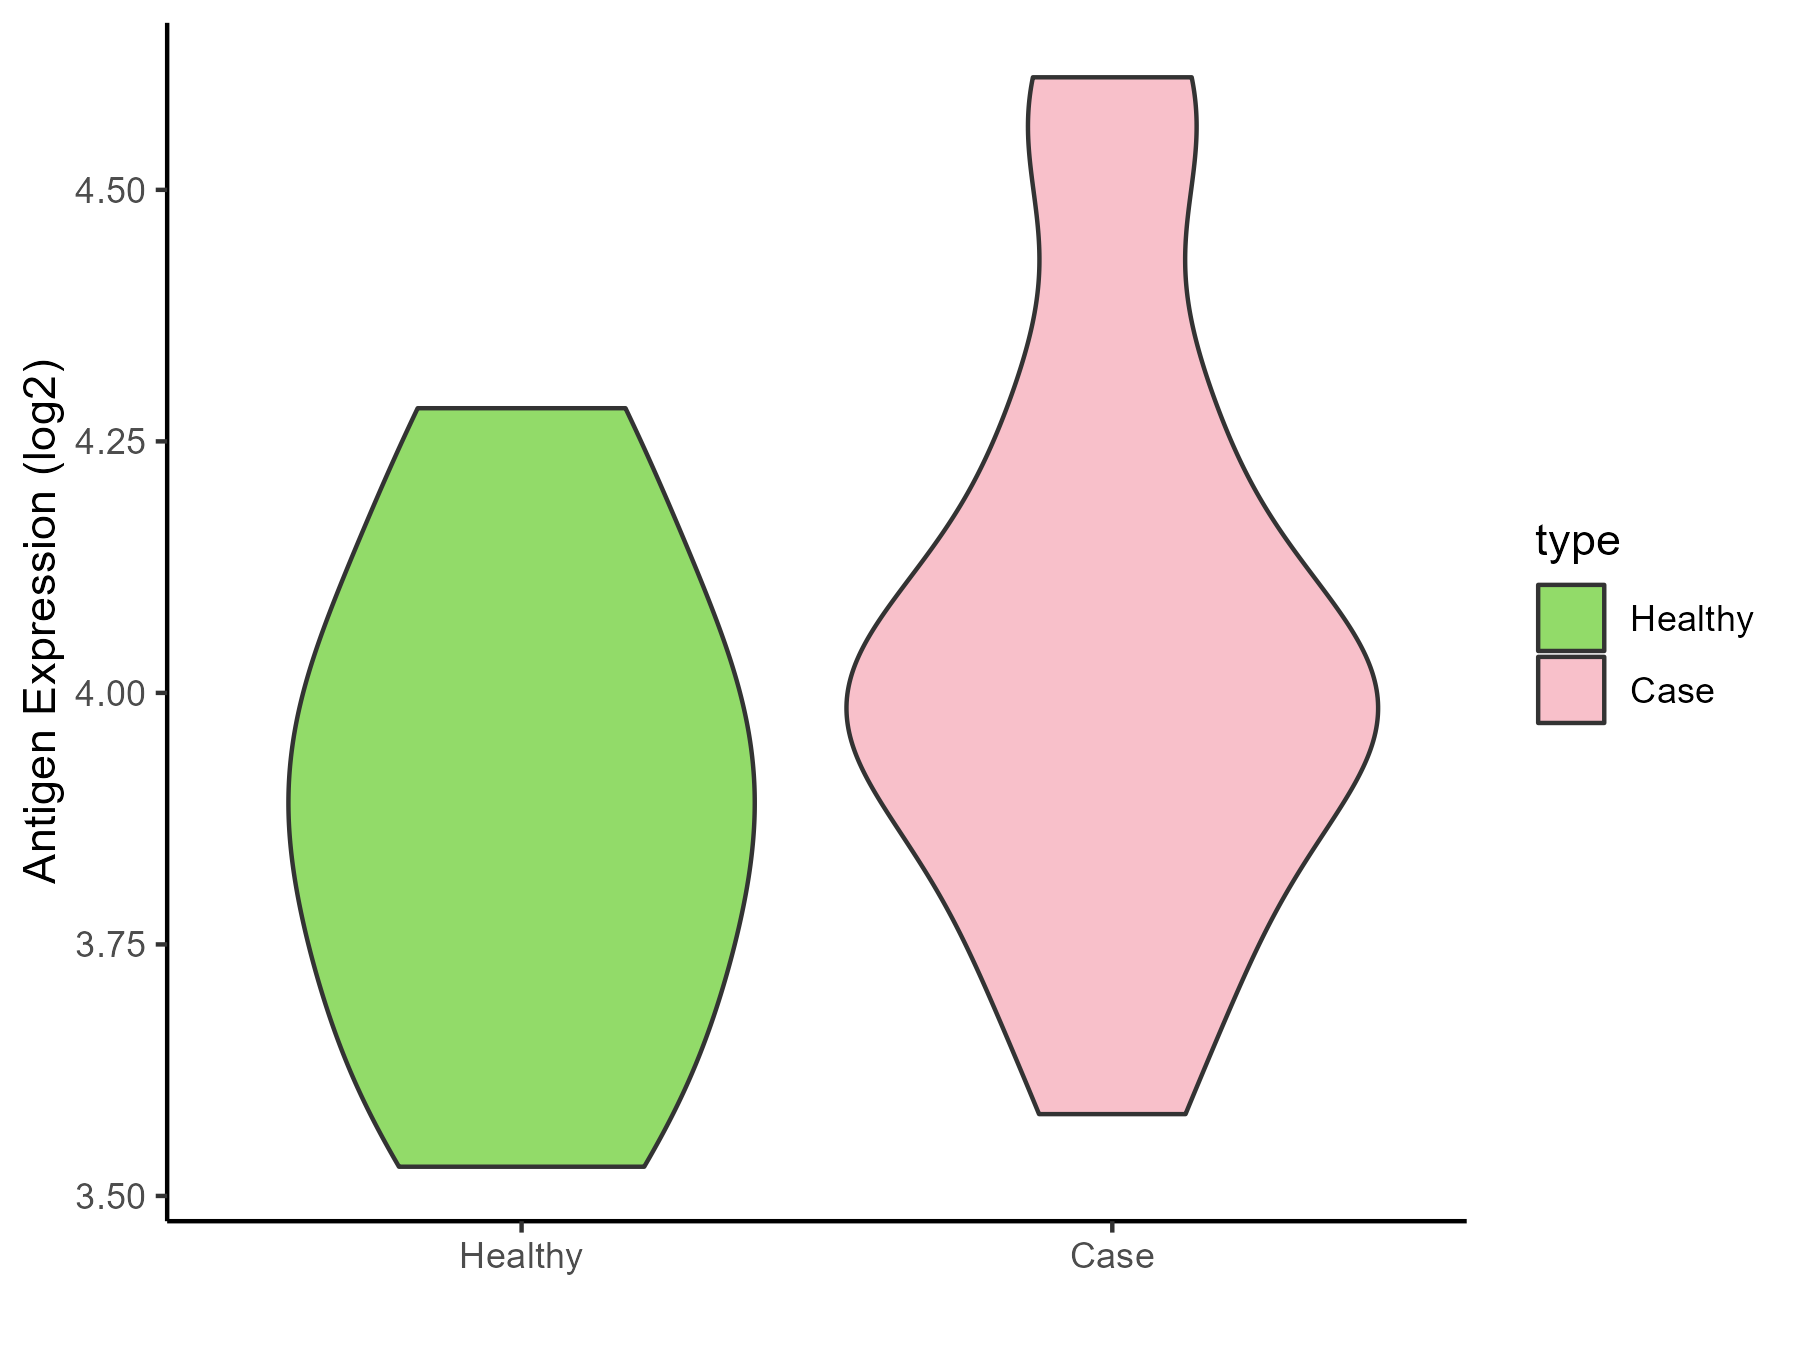
| The Studied Tissue | Pituitary | |
| The Specific Disease | Pituitary gonadotrope tumor | |
| The Expression Level of Disease Section Compare with the Healthy Individual Tissue | p-value: 0.172801108; Fold-change: 0.142846221; Z-score: 0.588452776 | |
| Disease-specific Antigen Abundances |
|
Click to View the Clearer Original Diagram |
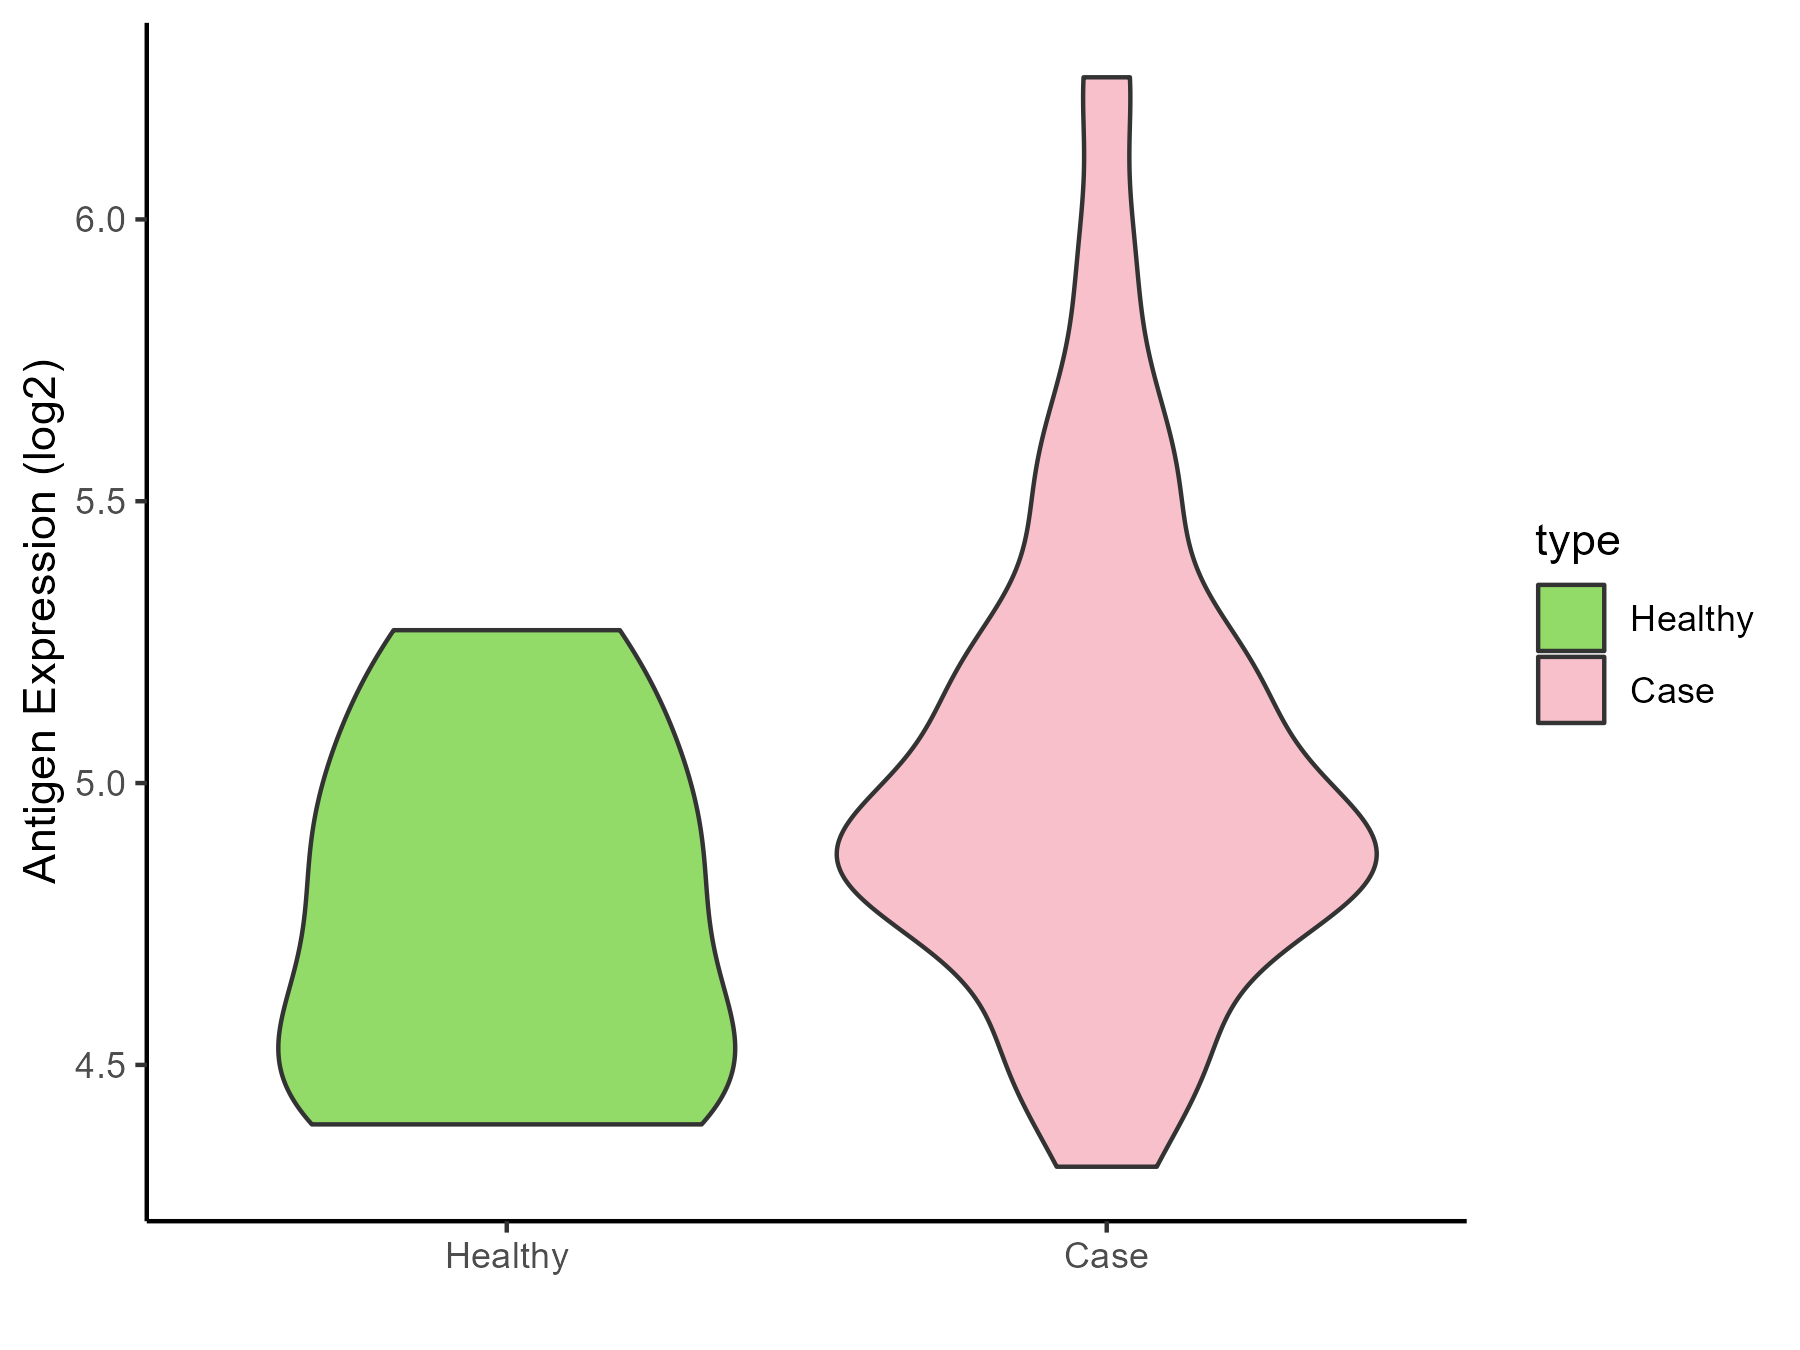
| The Studied Tissue | Pituitary | |
| The Specific Disease | Pituitary cancer | |
| The Expression Level of Disease Section Compare with the Healthy Individual Tissue | p-value: 0.036142011; Fold-change: 0.1391758; Z-score: 0.44683408 | |
| Disease-specific Antigen Abundances |
|
Click to View the Clearer Original Diagram |
ICD Disease Classification 03
| Differential expression pattern of antigen in diseases | ||
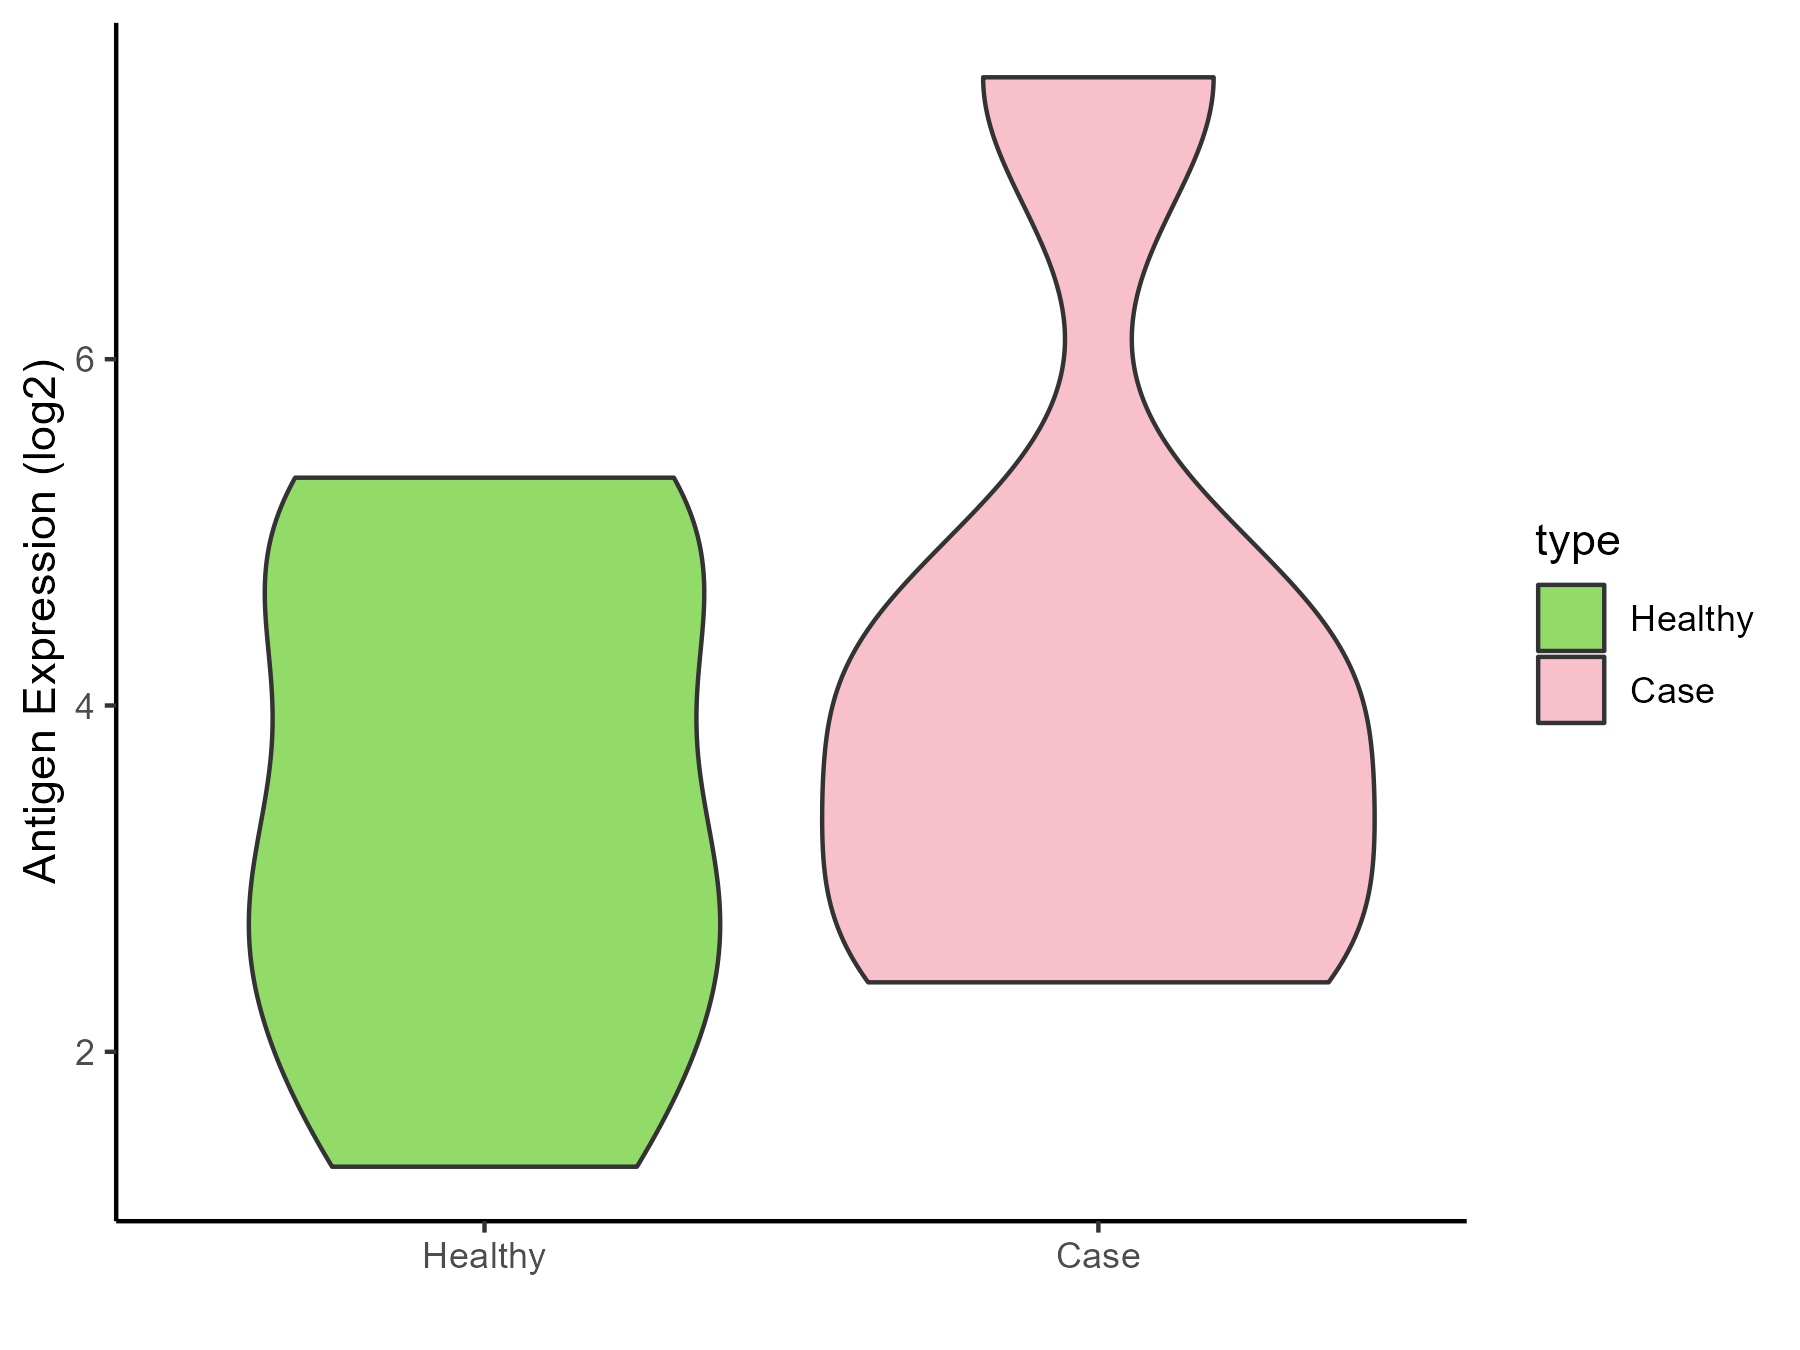
| The Studied Tissue | Whole blood | |
| The Specific Disease | Thrombocytopenia | |
| The Expression Level of Disease Section Compare with the Healthy Individual Tissue | p-value: 0.44559903; Fold-change: 0.727544422; Z-score: 0.495745543 | |
| Disease-specific Antigen Abundances |
|
Click to View the Clearer Original Diagram |
ICD Disease Classification 04
| Differential expression pattern of antigen in diseases | ||
| The Studied Tissue | Whole blood | |
| The Specific Disease | Lupus erythematosus | |
| The Expression Level of Disease Section Compare with the Healthy Individual Tissue | p-value: 0.021959257; Fold-change: -0.280993795; Z-score: -0.223740041 | |
| Disease-specific Antigen Abundances |
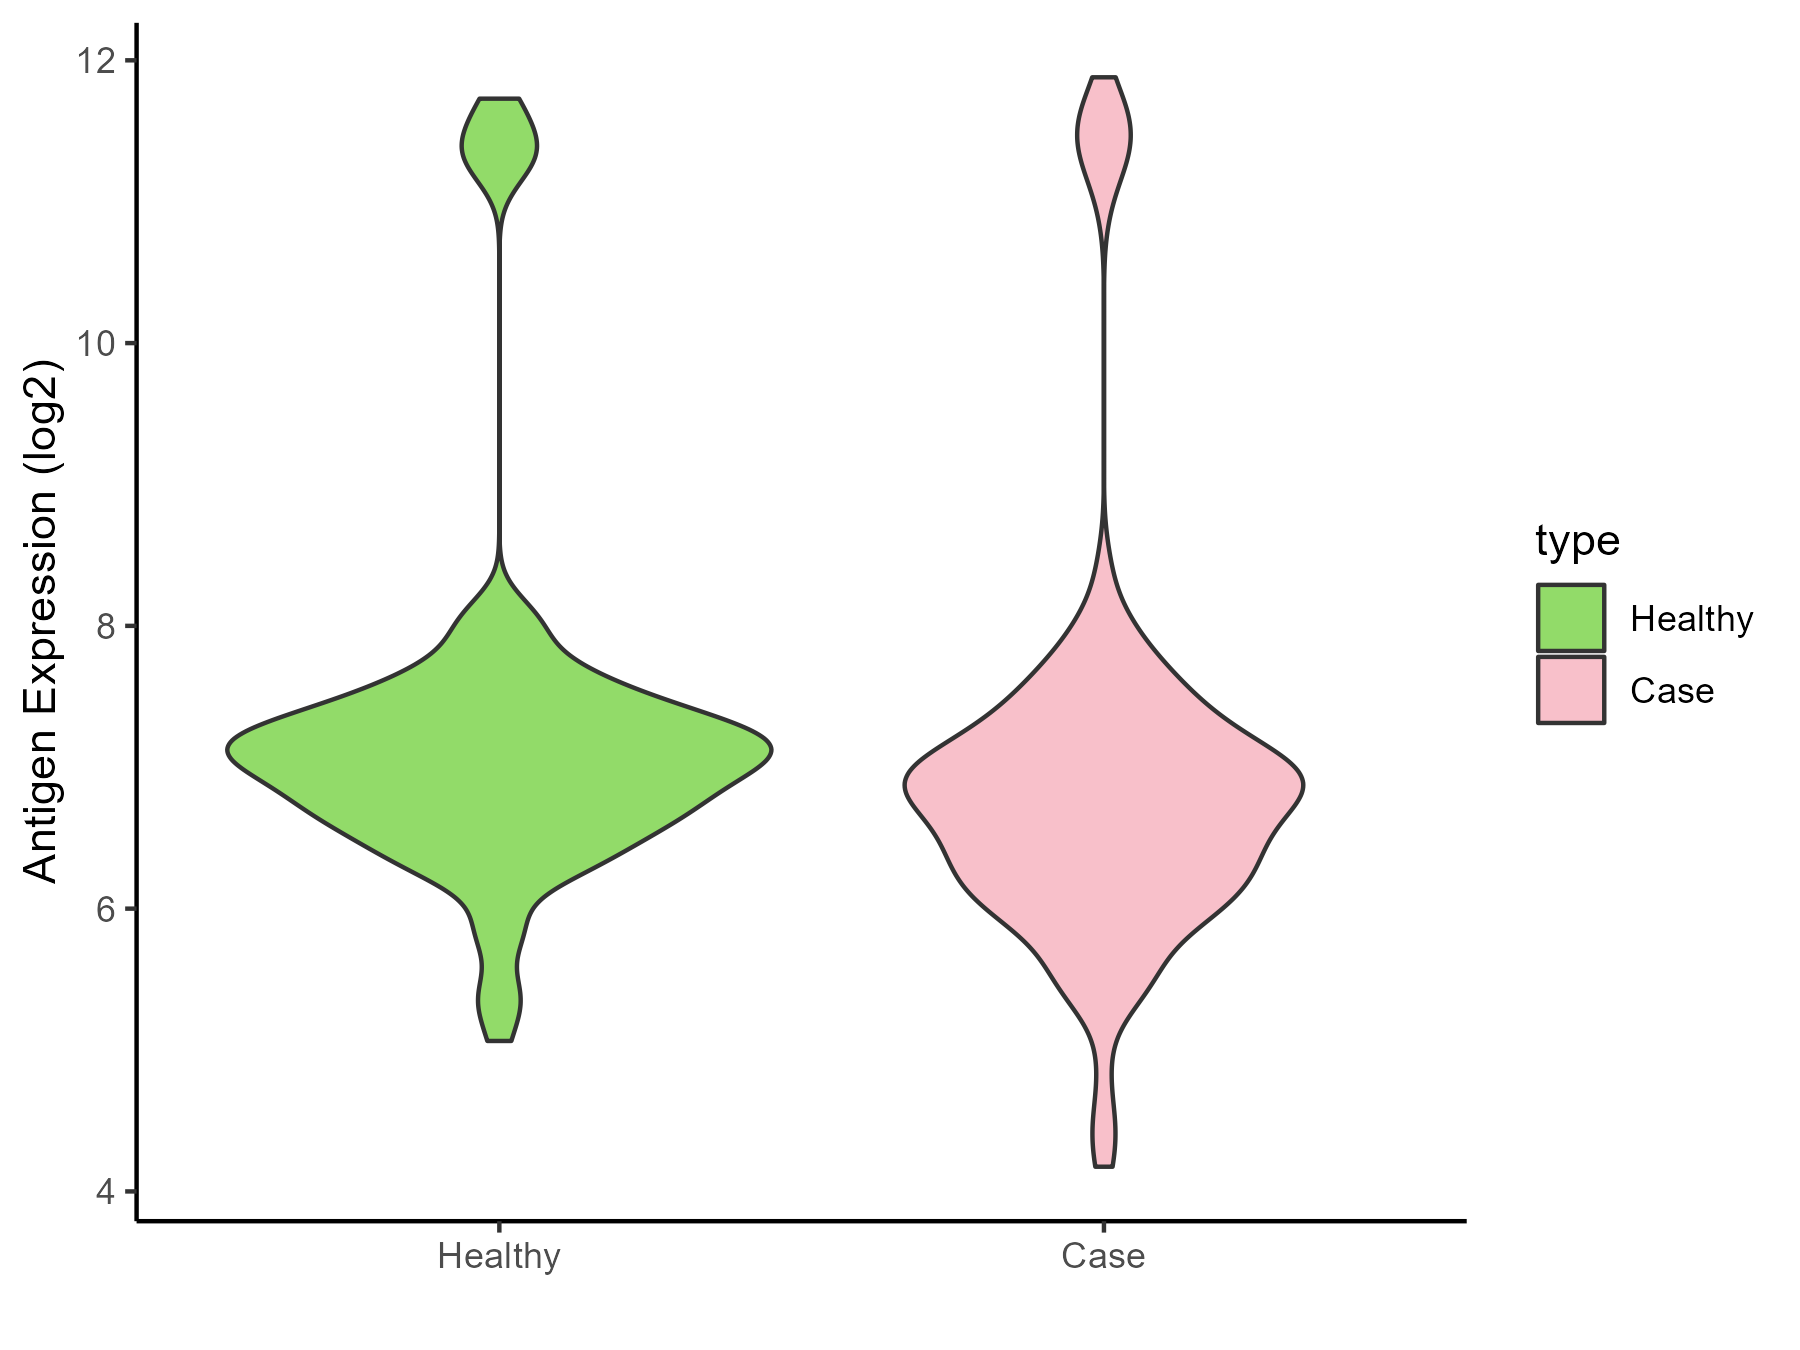
|
Click to View the Clearer Original Diagram |
| Differential expression pattern of antigen in diseases | ||
| The Studied Tissue | Peripheral monocyte | |
| The Specific Disease | Autoimmune uveitis | |
| The Expression Level of Disease Section Compare with the Healthy Individual Tissue | p-value: 0.849165417; Fold-change: 0.009913974; Z-score: 0.077679582 | |
| Disease-specific Antigen Abundances |
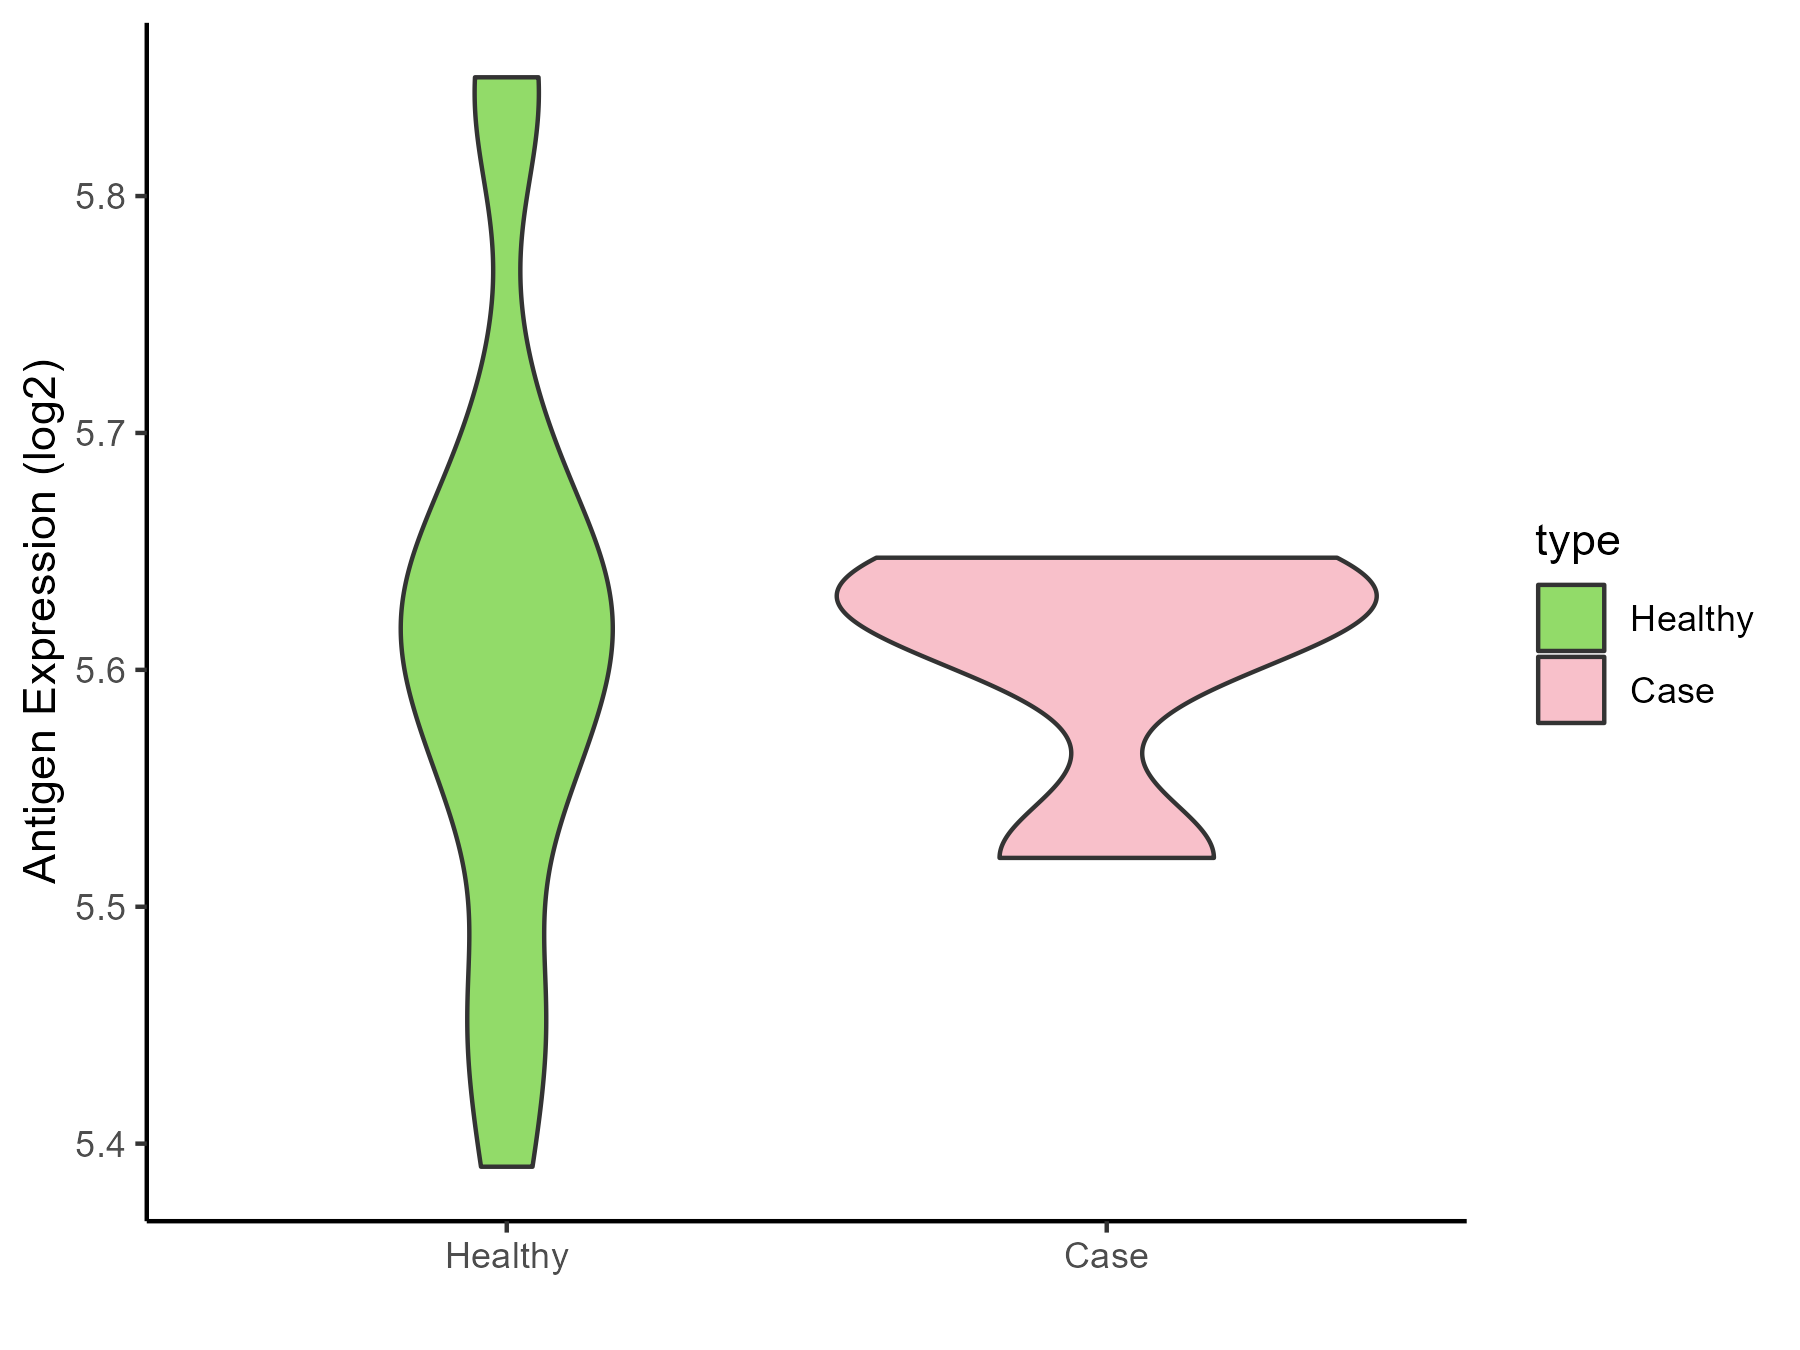
|
Click to View the Clearer Original Diagram |
ICD Disease Classification 05
| Differential expression pattern of antigen in diseases | ||
| The Studied Tissue | Whole blood | |
| The Specific Disease | Familial hypercholesterolemia | |
| The Expression Level of Disease Section Compare with the Healthy Individual Tissue | p-value: 0.000212844; Fold-change: -0.758172162; Z-score: -1.43849846 | |
| Disease-specific Antigen Abundances |
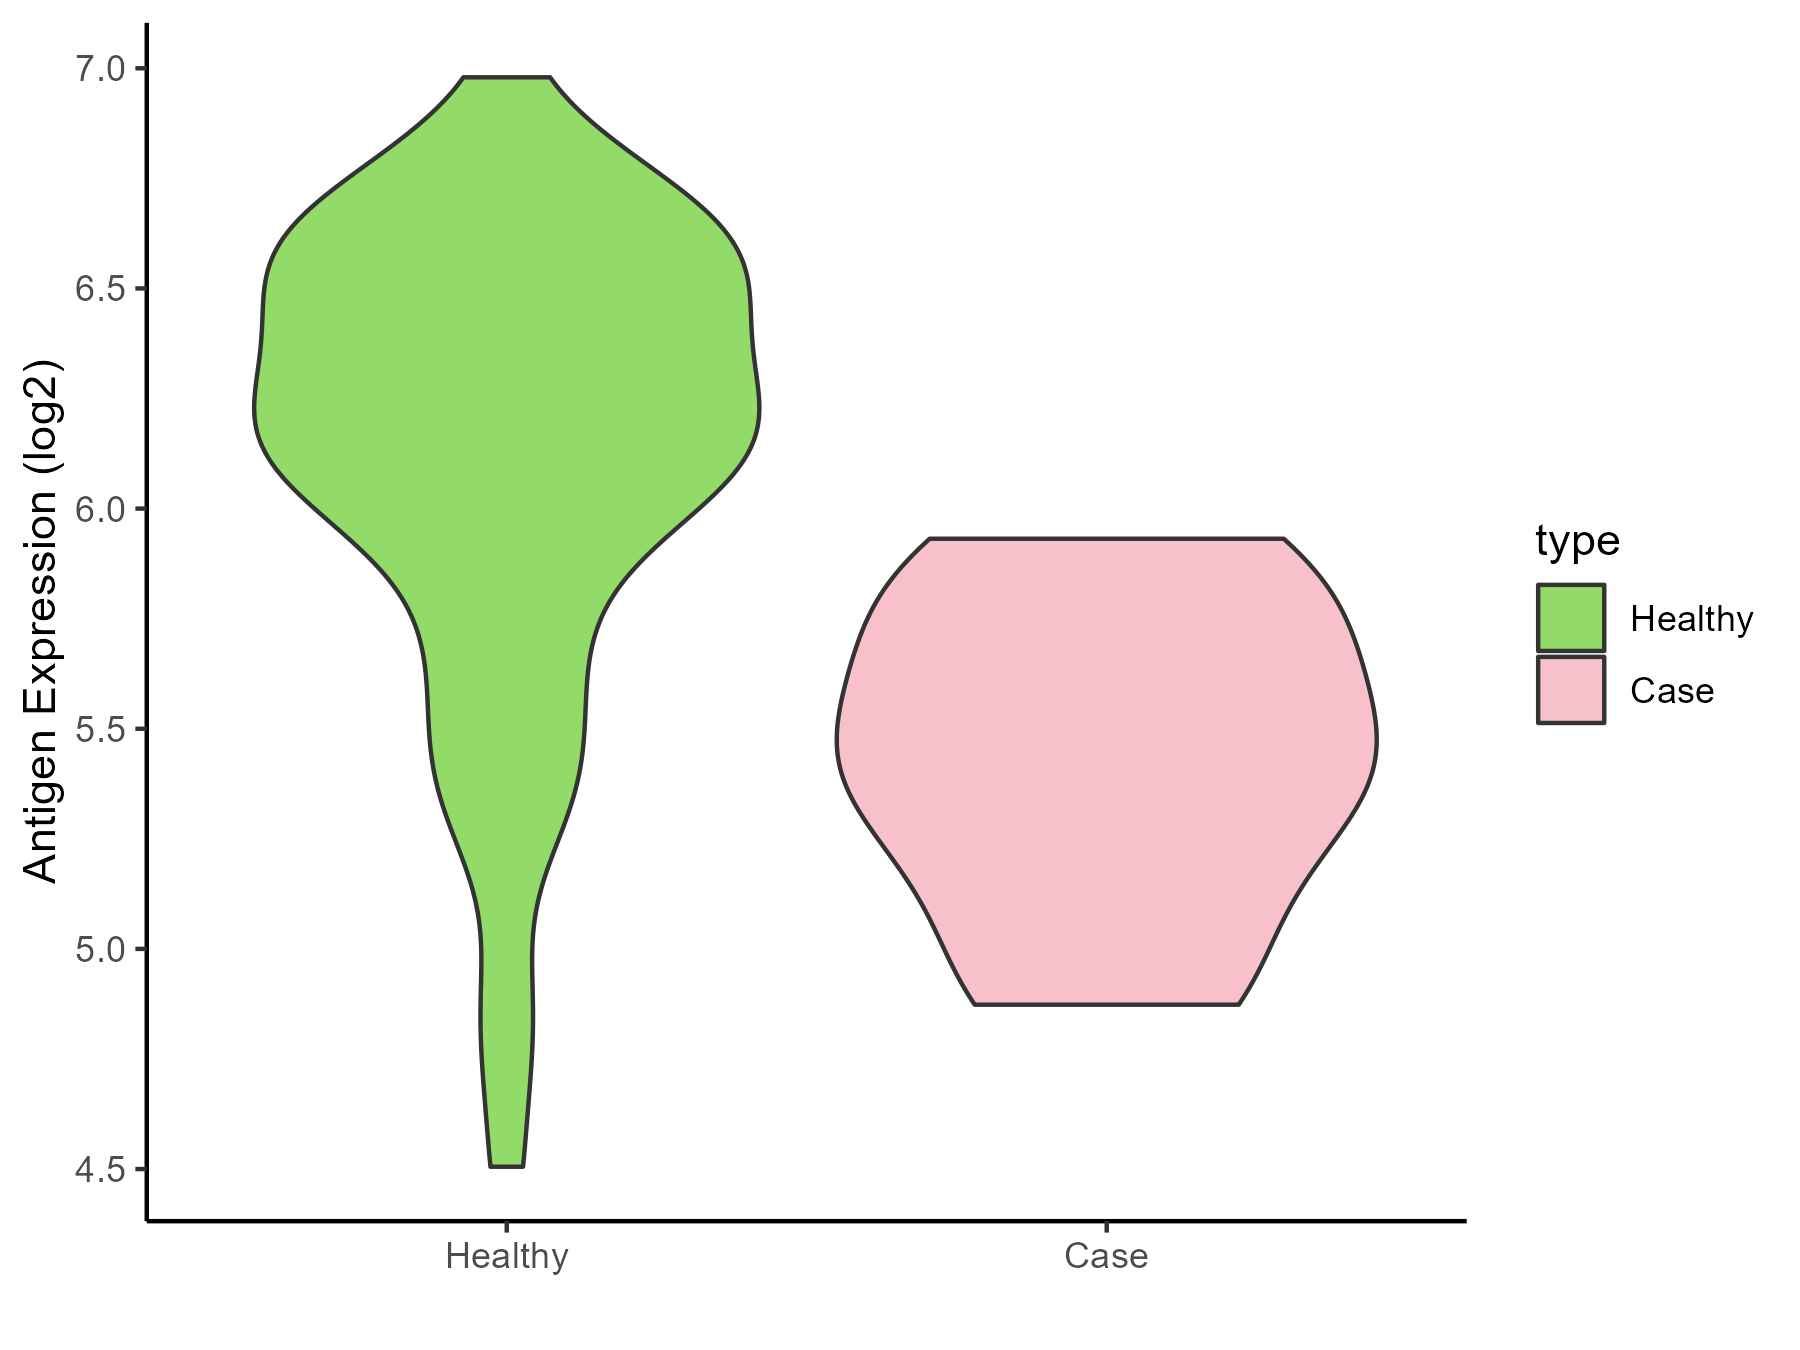
|
Click to View the Clearer Original Diagram |
ICD Disease Classification 06
| Differential expression pattern of antigen in diseases | ||
| The Studied Tissue | Superior temporal cortex | |
| The Specific Disease | Schizophrenia | |
| The Expression Level of Disease Section Compare with the Healthy Individual Tissue | p-value: 0.798444383; Fold-change: -0.007052483; Z-score: -0.032304068 | |
| Disease-specific Antigen Abundances |
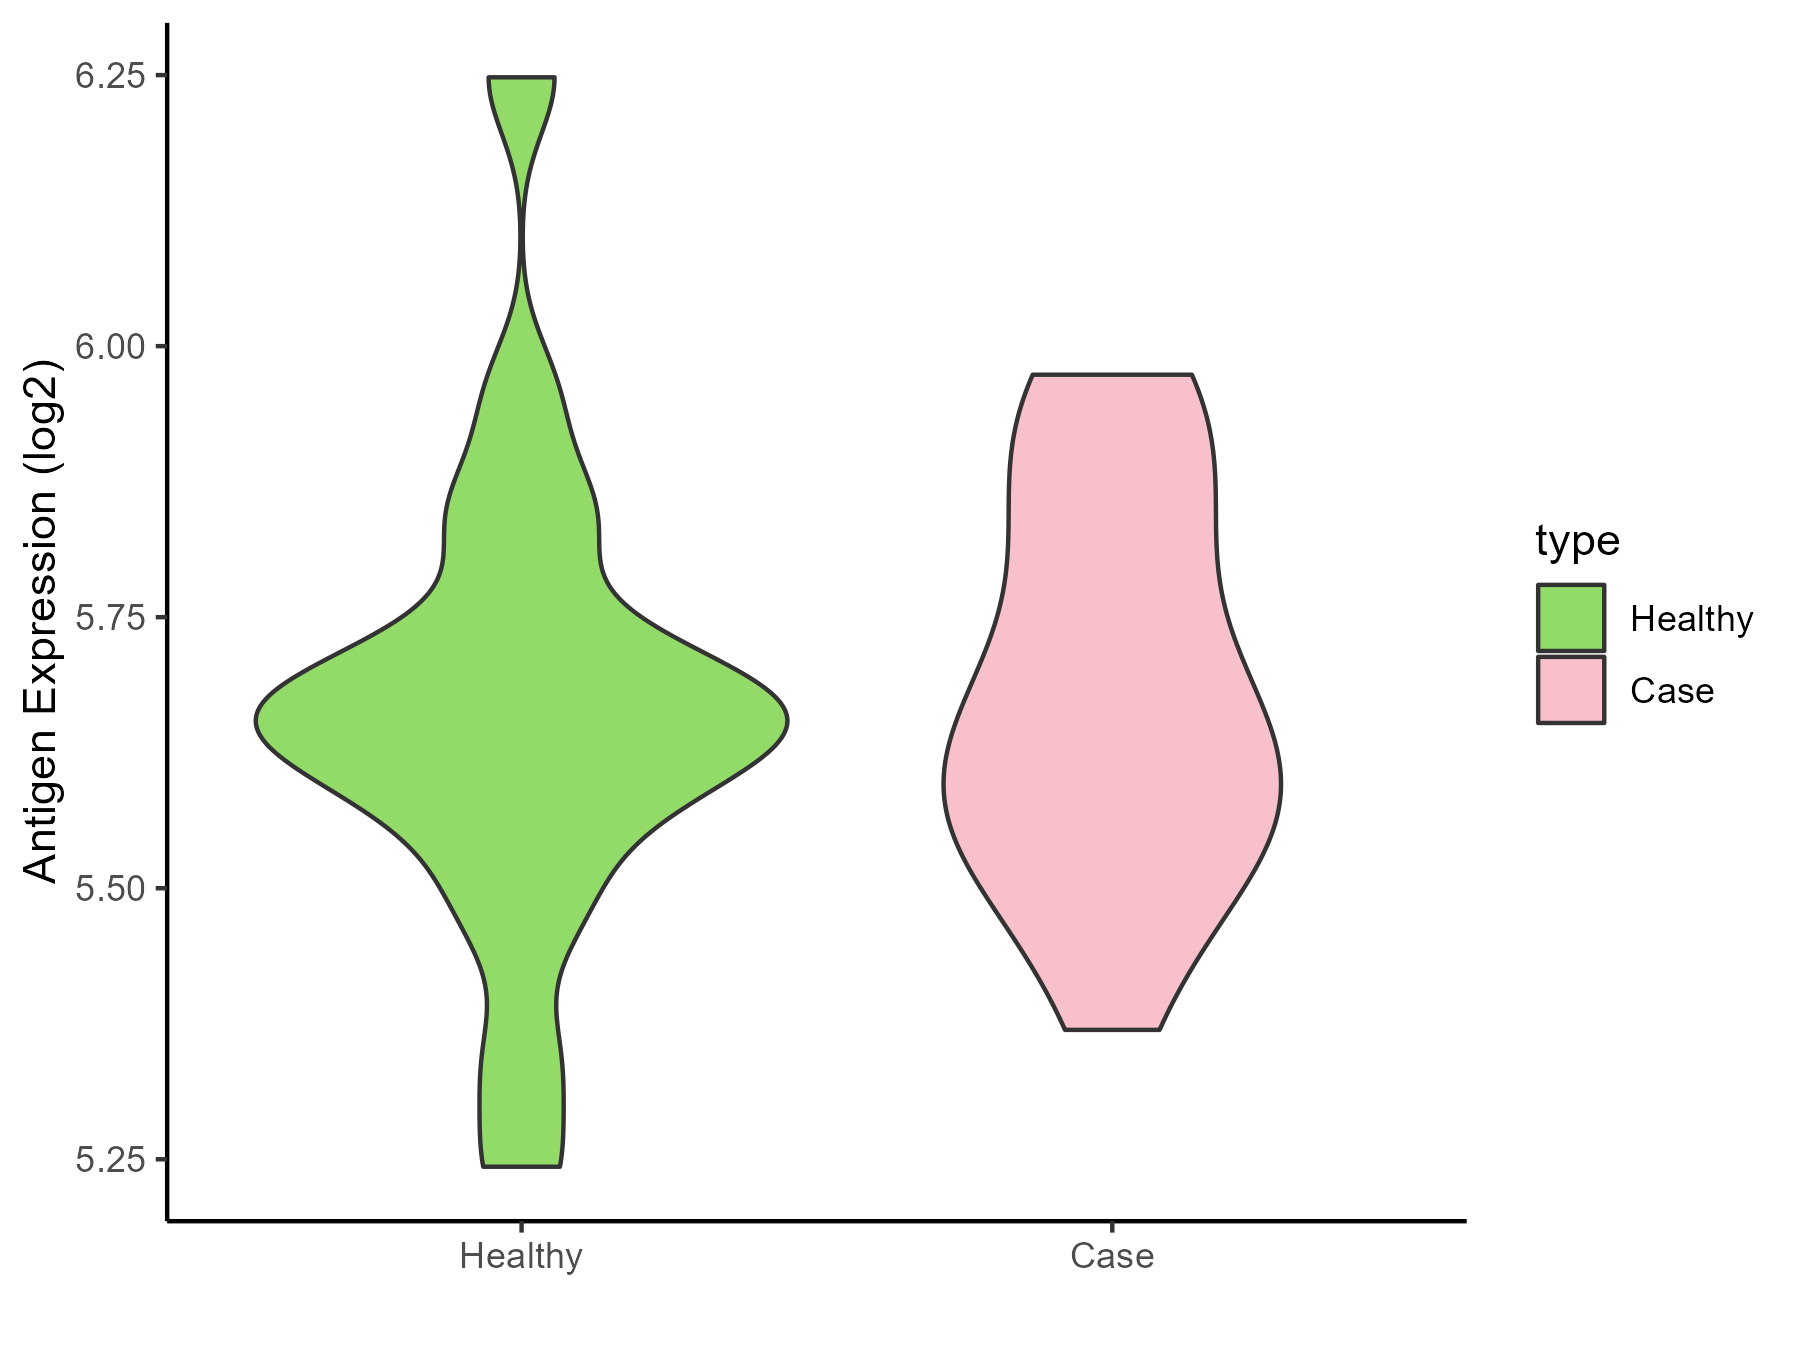
|
Click to View the Clearer Original Diagram |
ICD Disease Classification 08
| Differential expression pattern of antigen in diseases | ||
| The Studied Tissue | Spinal cord | |
| The Specific Disease | Multiple sclerosis | |
| The Expression Level of Disease Section Compare with the Adjacent Tissue | p-value: 0.460708469; Fold-change: 0.082345968; Z-score: 0.793464718 | |
| Disease-specific Antigen Abundances |
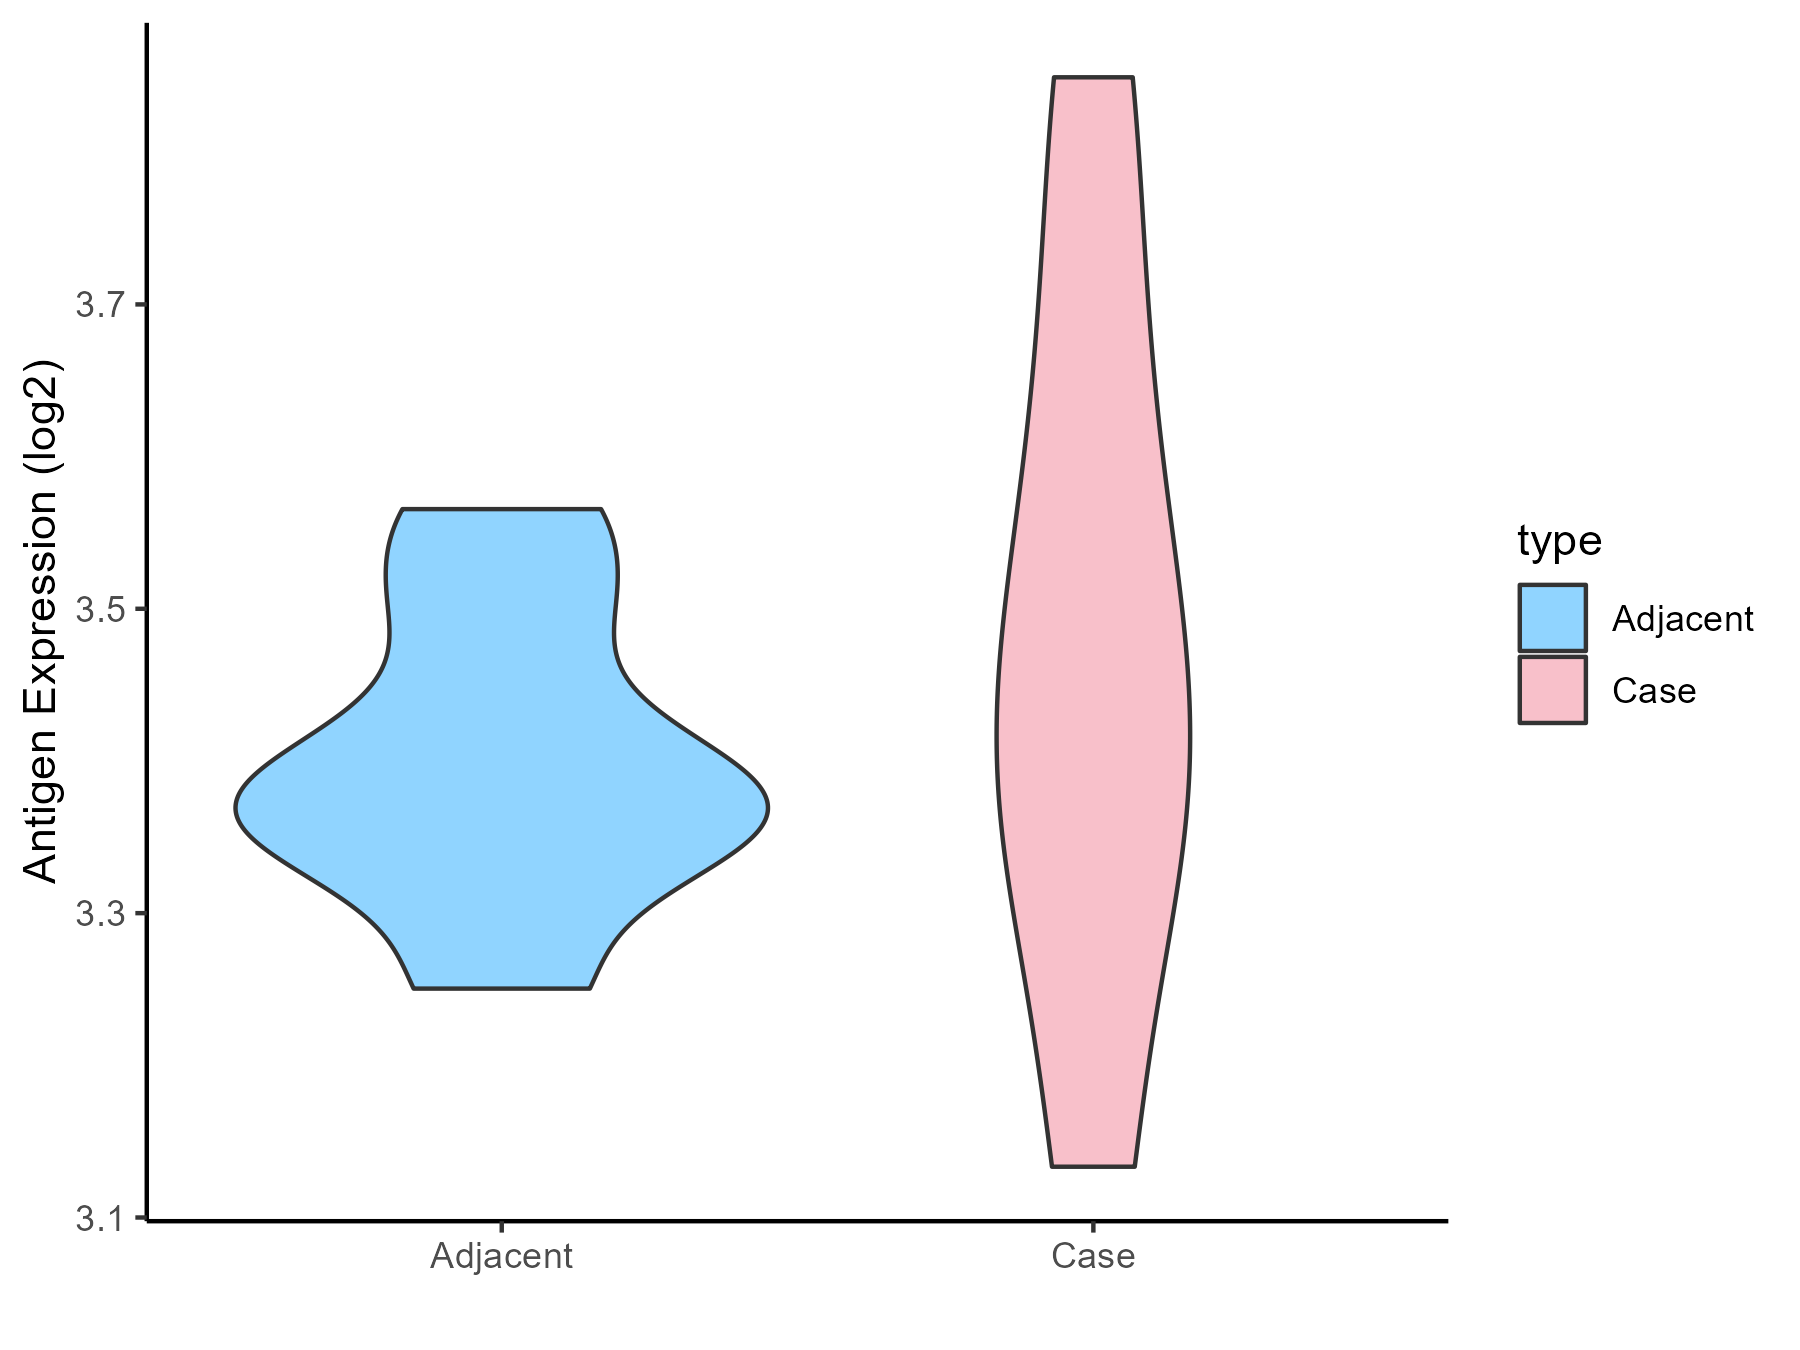
|
Click to View the Clearer Original Diagram |
| The Studied Tissue | Plasmacytoid dendritic cells | |
| The Specific Disease | Multiple sclerosis | |
| The Expression Level of Disease Section Compare with the Healthy Individual Tissue | p-value: 0.330847637; Fold-change: -0.107639501; Z-score: -0.185123903 | |
| Disease-specific Antigen Abundances |
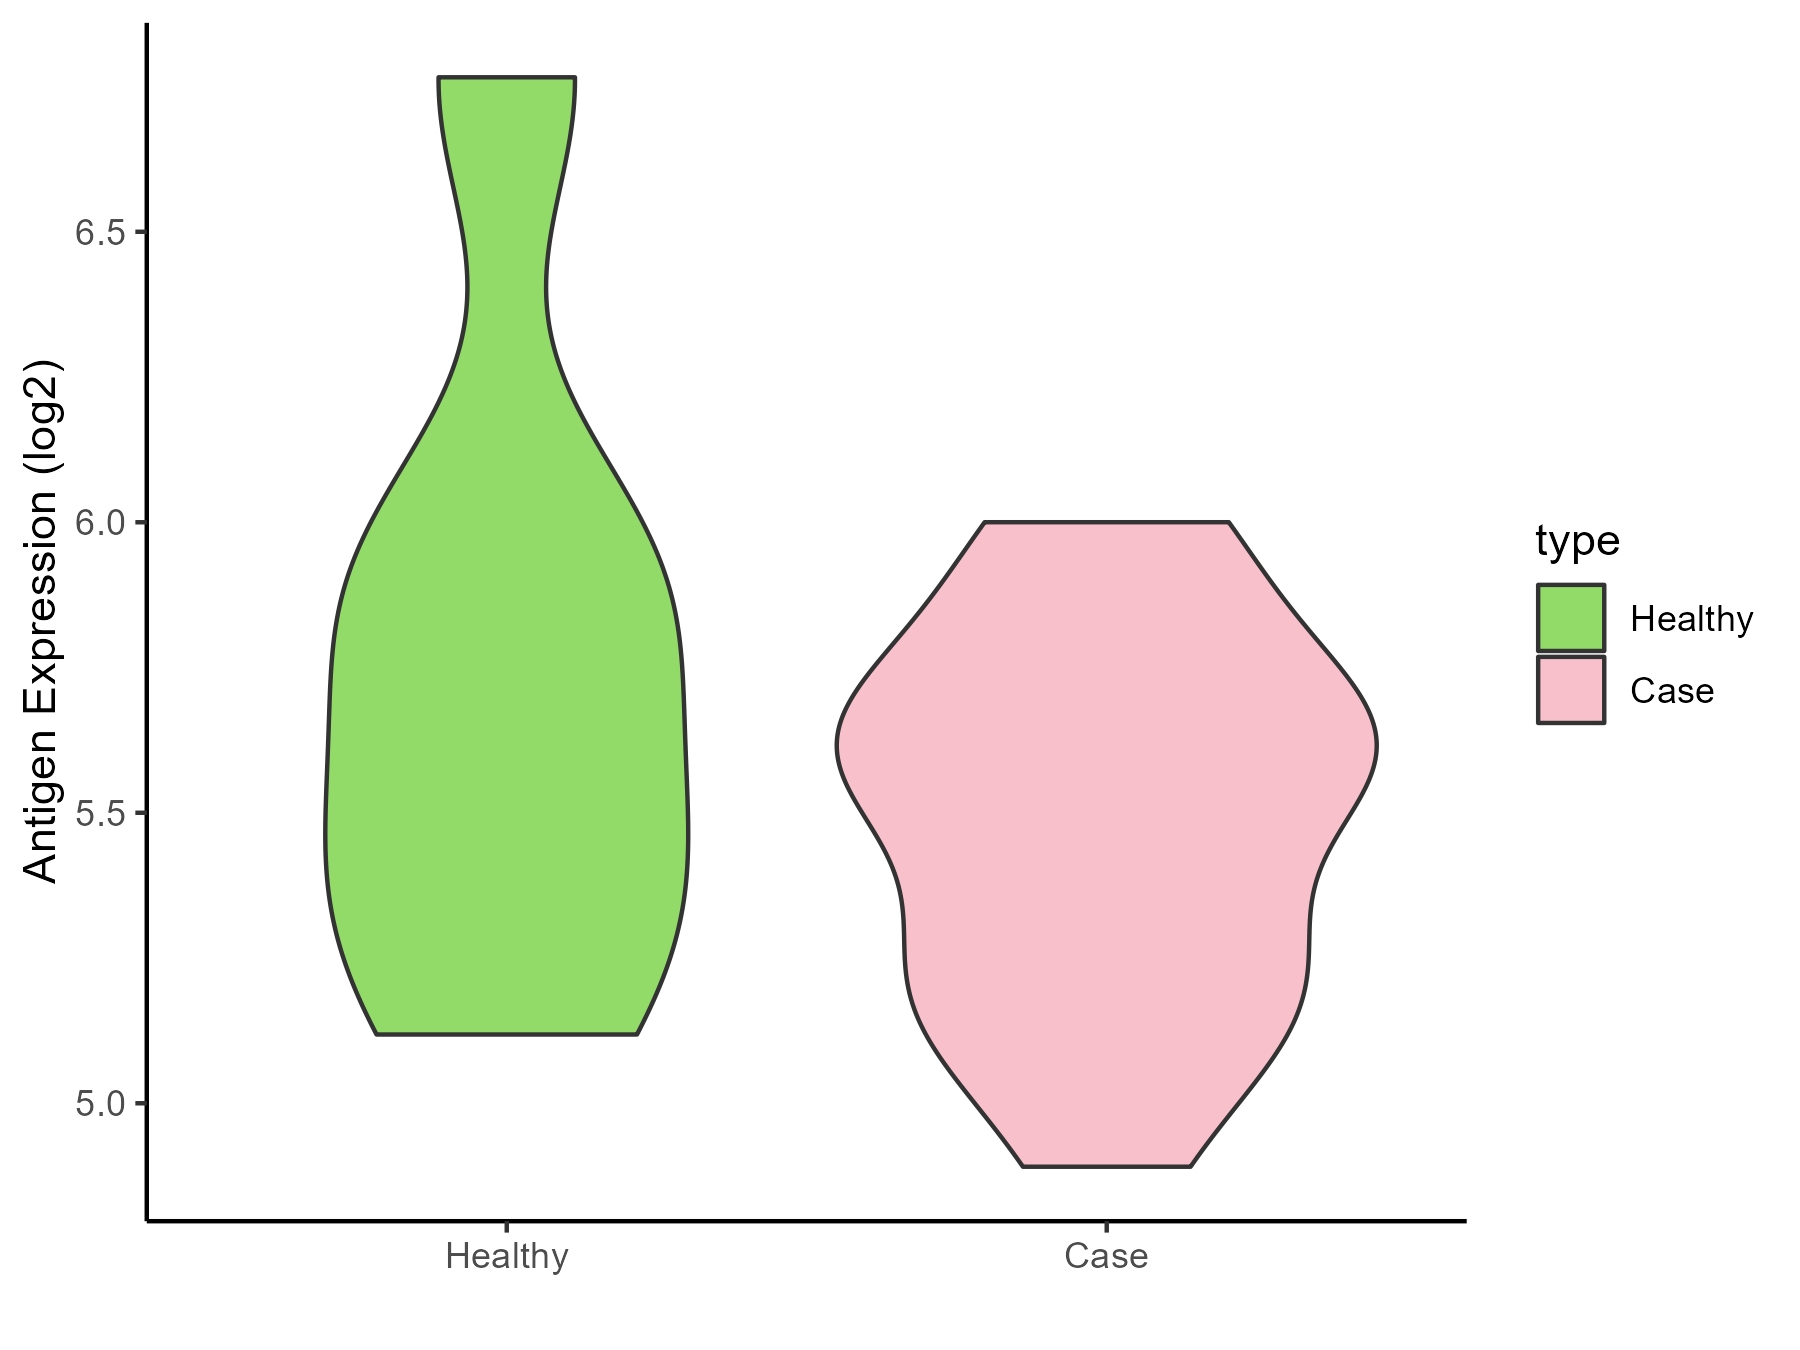
|
Click to View the Clearer Original Diagram |
| Differential expression pattern of antigen in diseases | ||
| The Studied Tissue | Peritumoral cortex | |
| The Specific Disease | Epilepsy | |
| The Expression Level of Disease Section Compare with the Other Disease Section | p-value: 0.302687519; Fold-change: -0.03575179; Z-score: -0.177501537 | |
| Disease-specific Antigen Abundances |
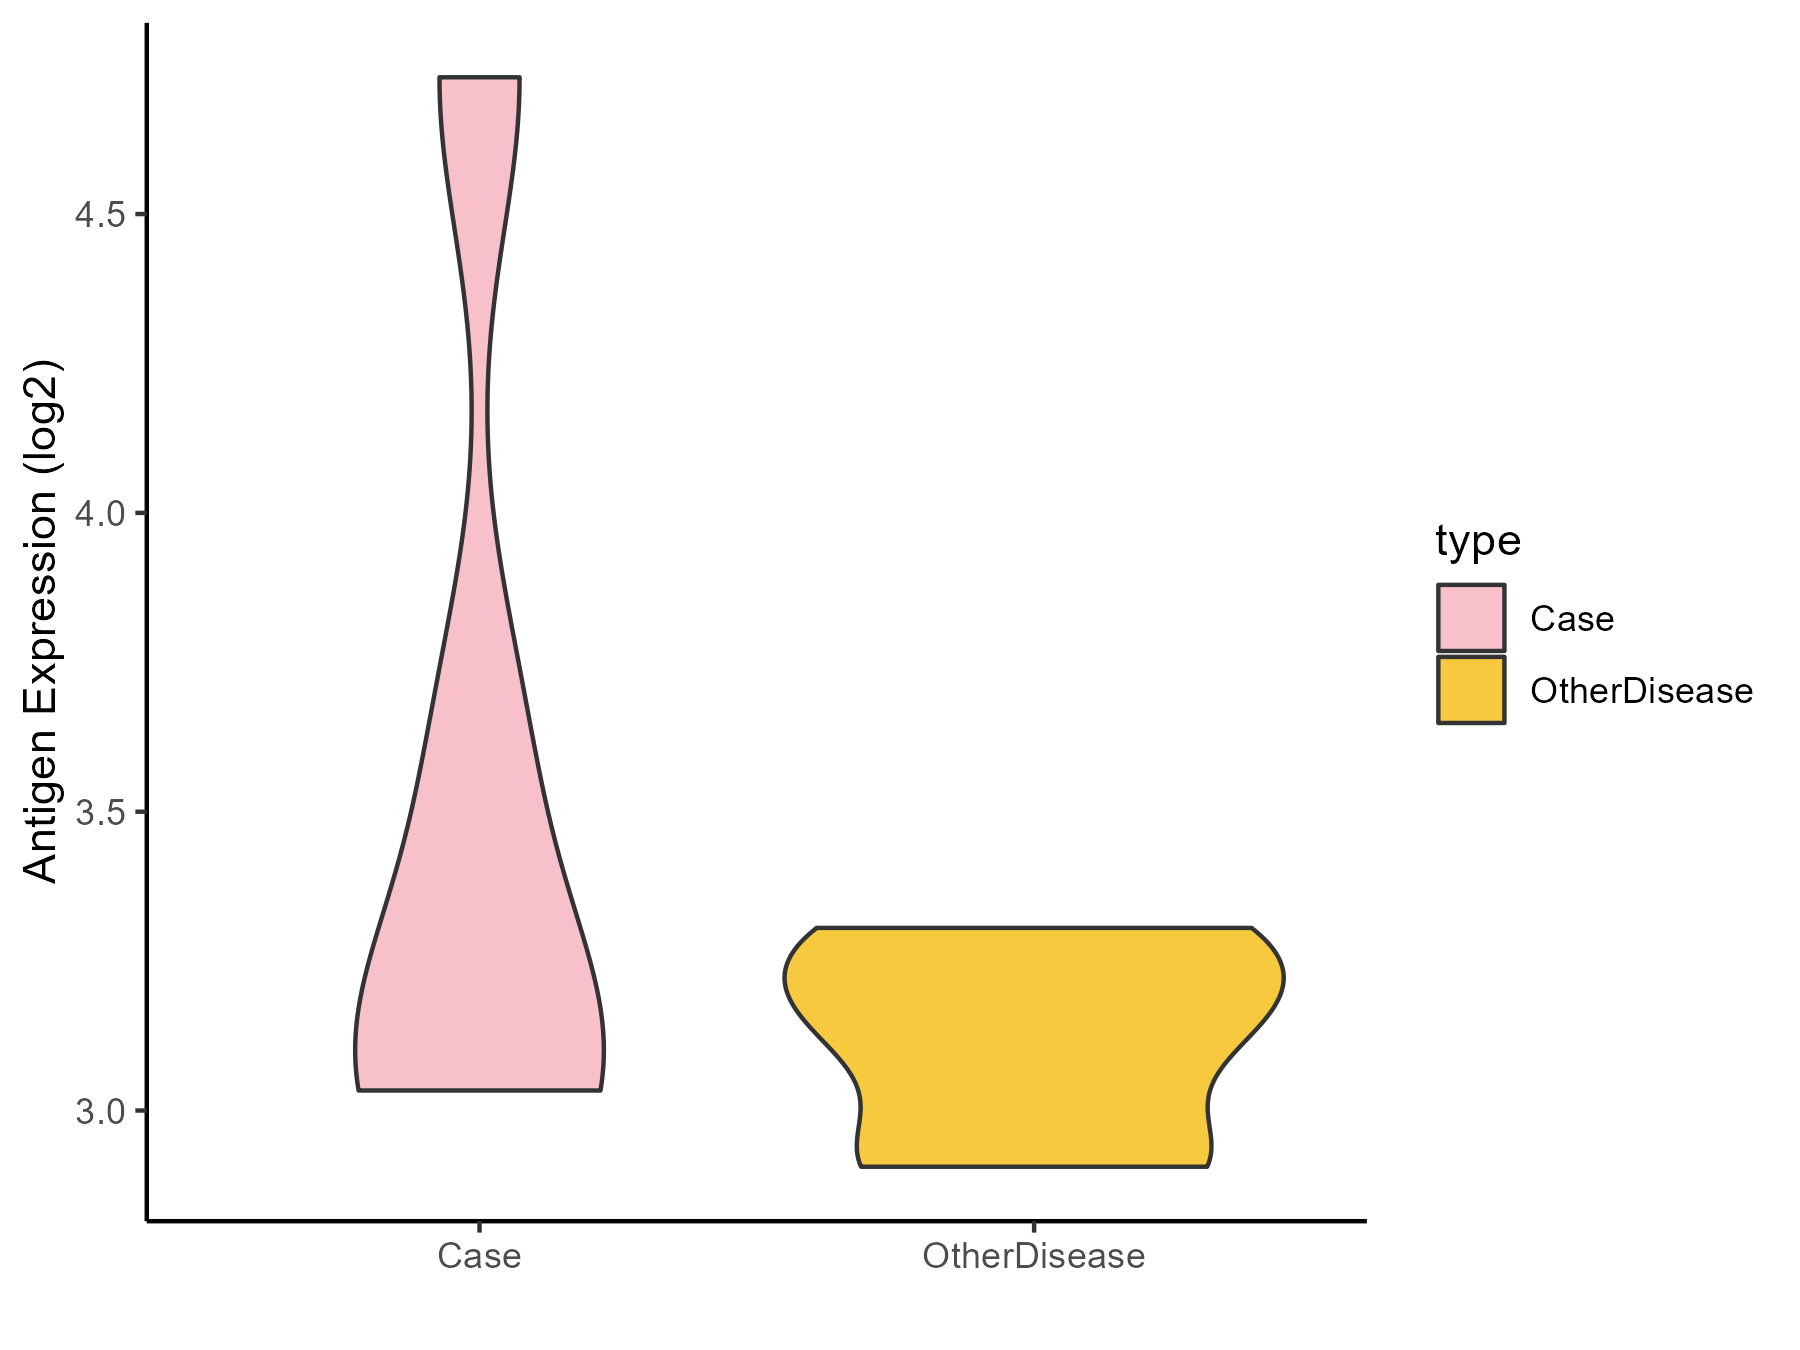
|
Click to View the Clearer Original Diagram |
| Differential expression pattern of antigen in diseases | ||
| The Studied Tissue | Whole blood | |
| The Specific Disease | Cardioembolic Stroke | |
| The Expression Level of Disease Section Compare with the Healthy Individual Tissue | p-value: 4.87E-09; Fold-change: -1.202761109; Z-score: -2.014806056 | |
| Disease-specific Antigen Abundances |
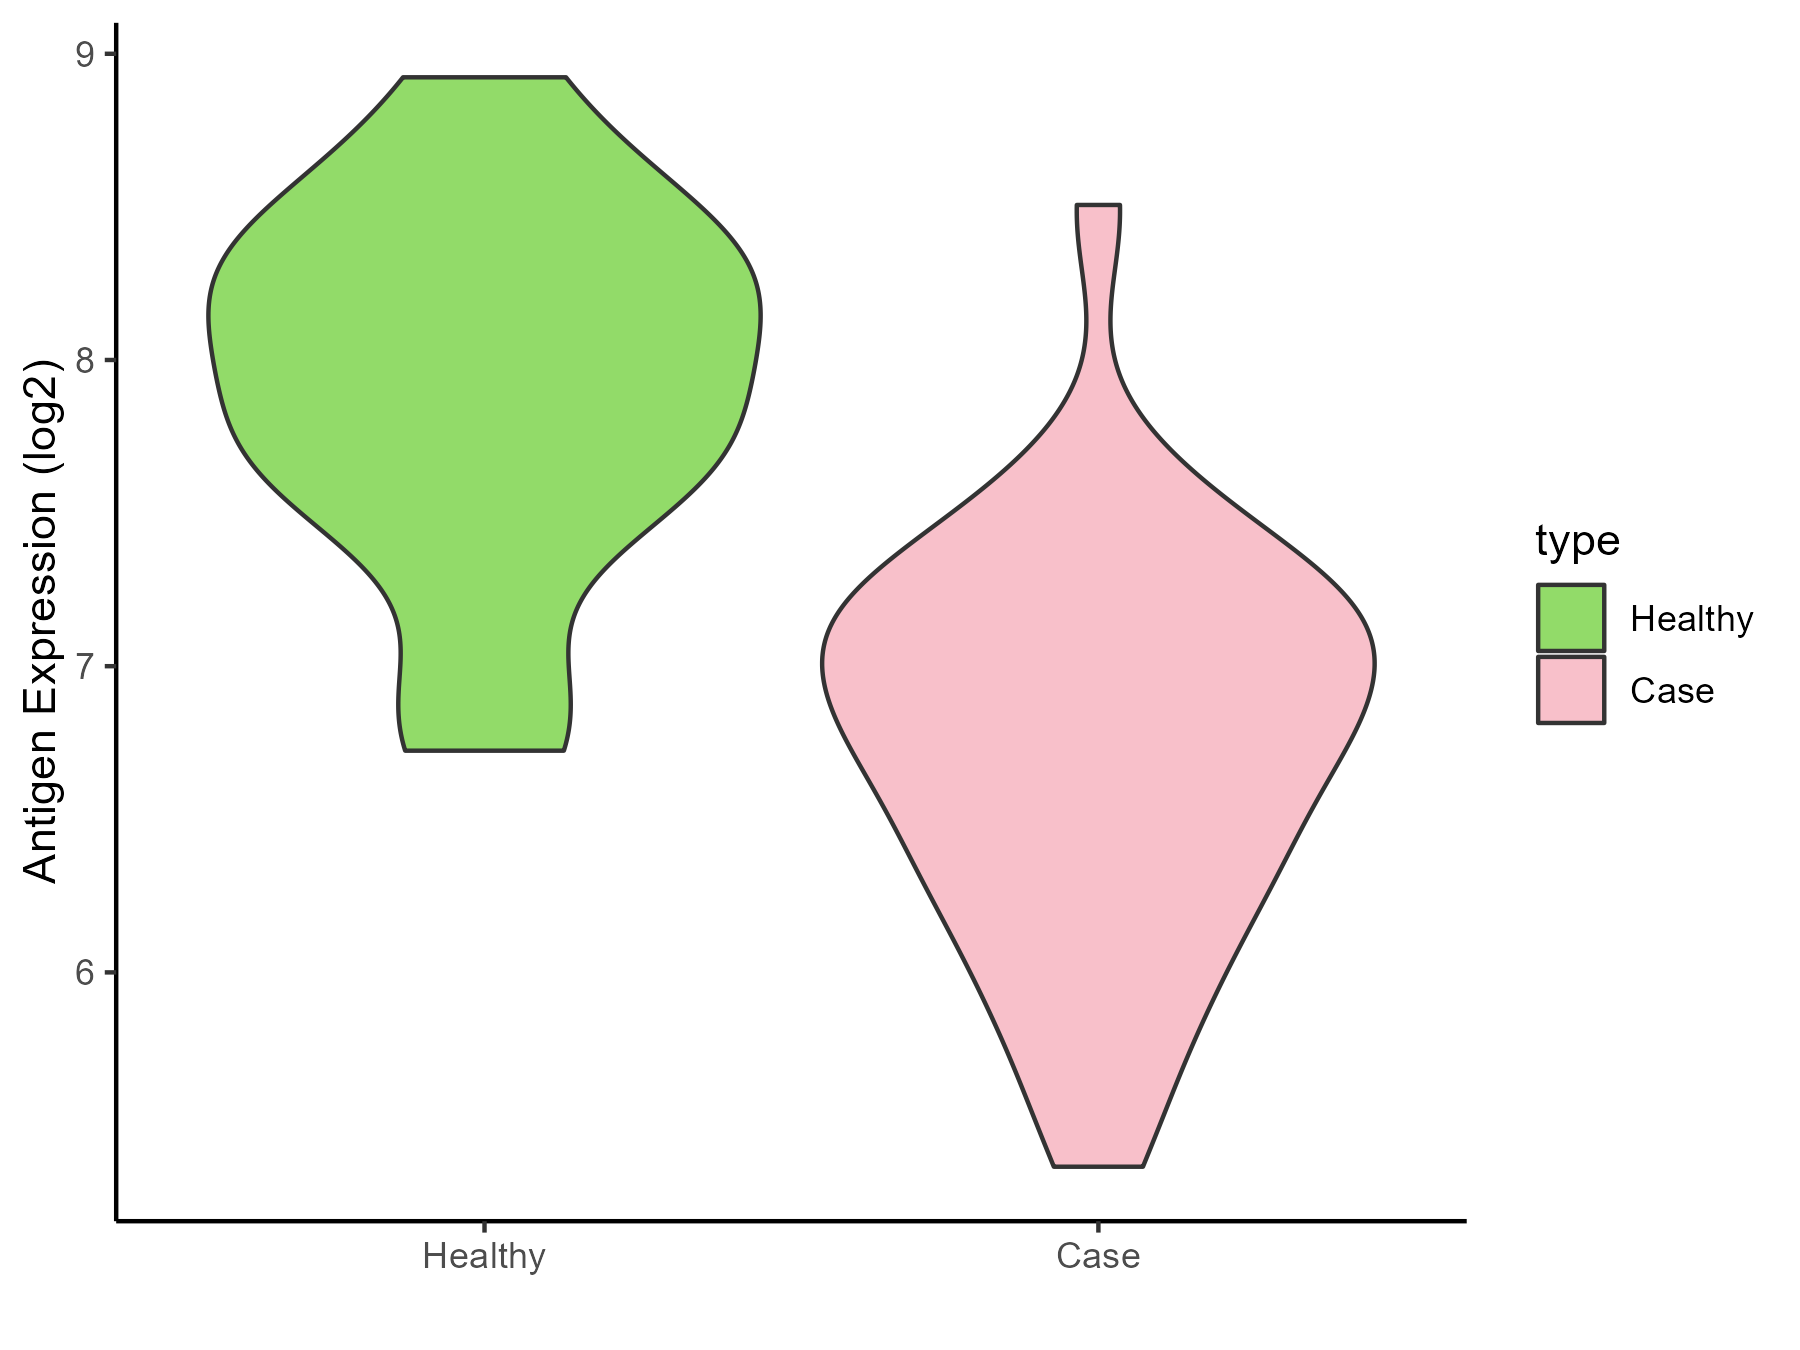
|
Click to View the Clearer Original Diagram |
| The Studied Tissue | Peripheral blood | |
| The Specific Disease | Ischemic stroke | |
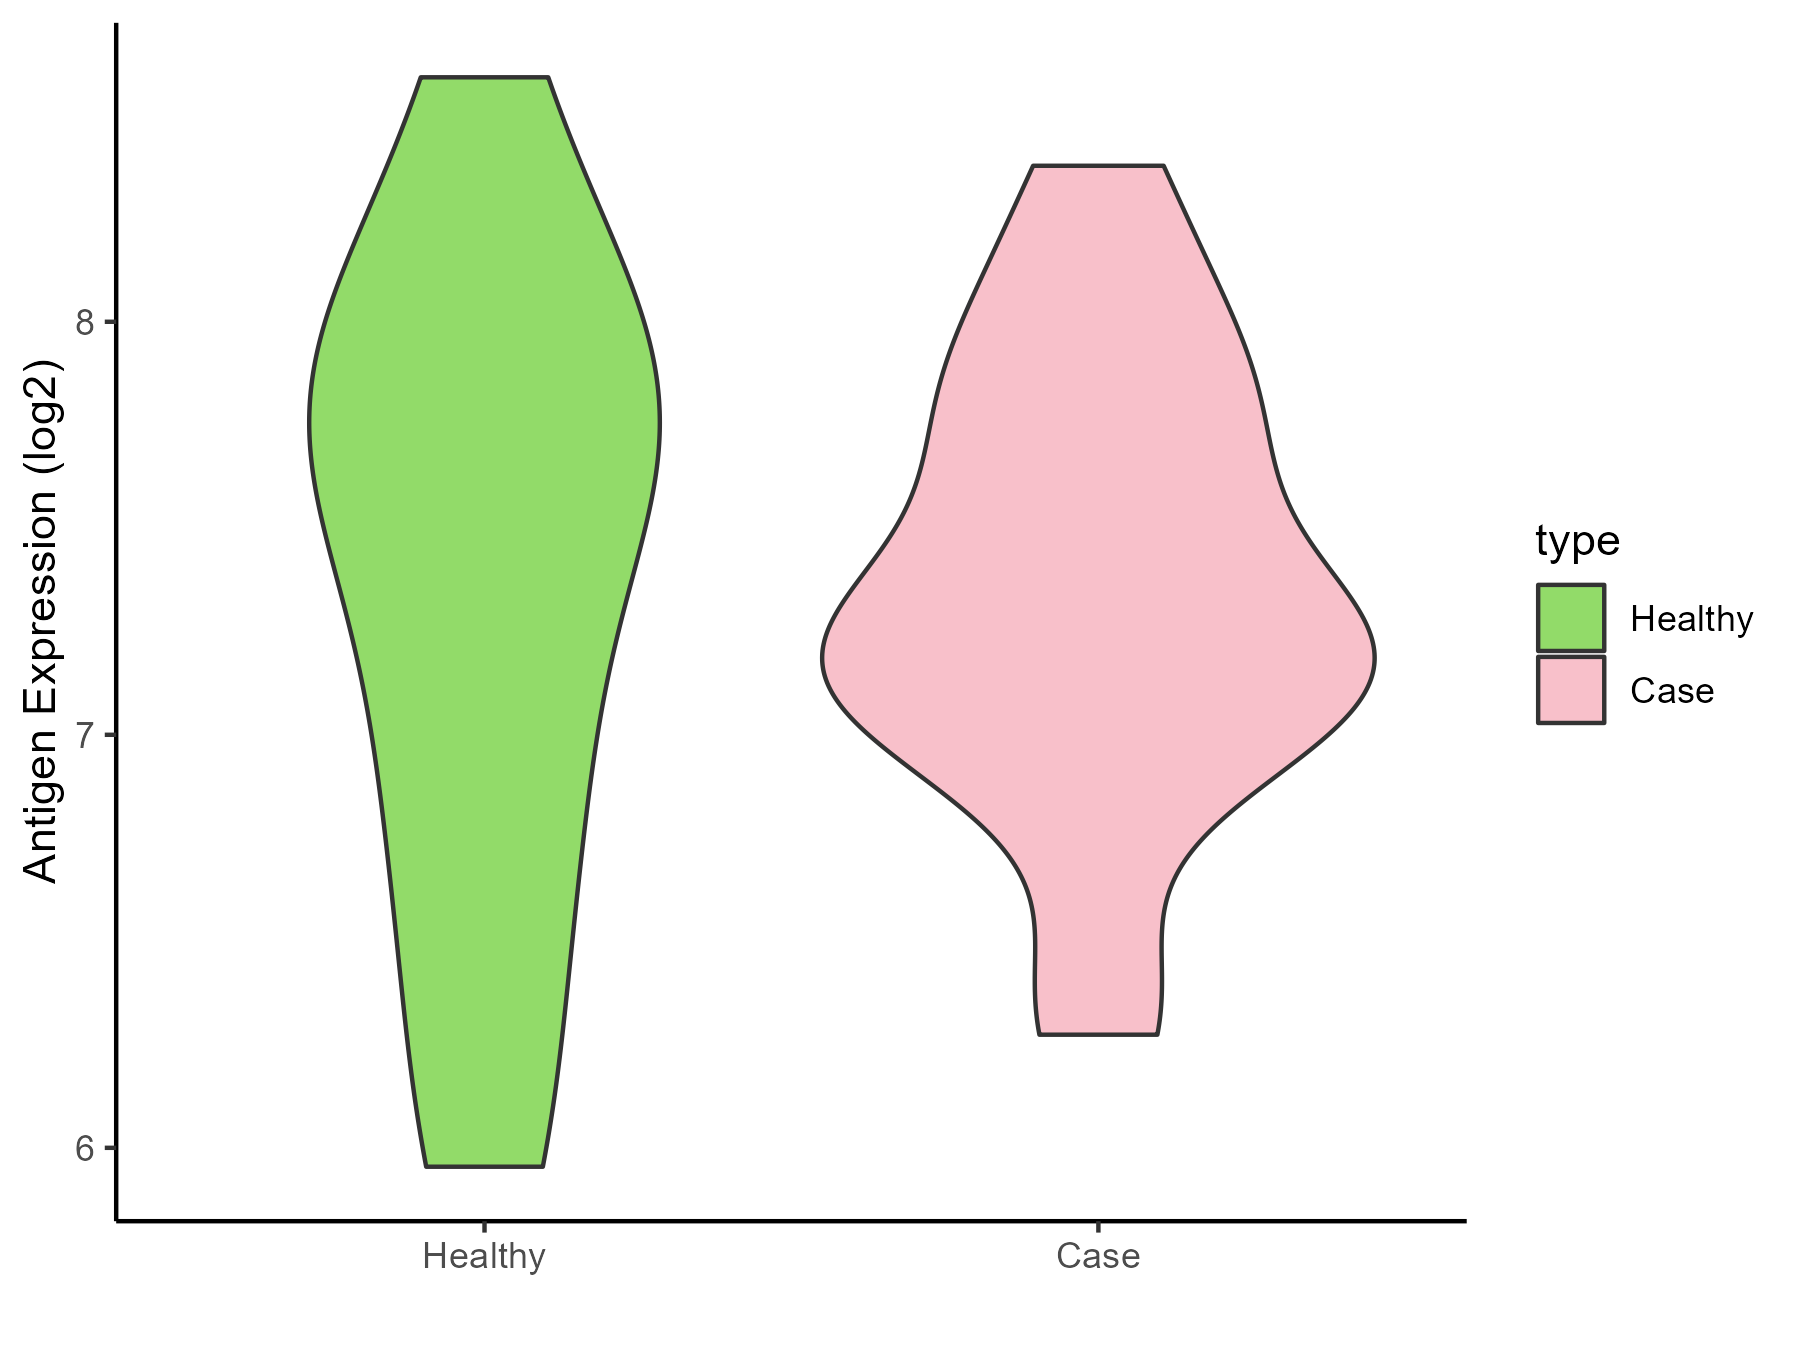
| The Expression Level of Disease Section Compare with the Healthy Individual Tissue | p-value: 0.950168363; Fold-change: -0.33389947; Z-score: -0.432496316 | |
| Disease-specific Antigen Abundances |
|
Click to View the Clearer Original Diagram |
ICD Disease Classification 1
| Differential expression pattern of antigen in diseases | ||
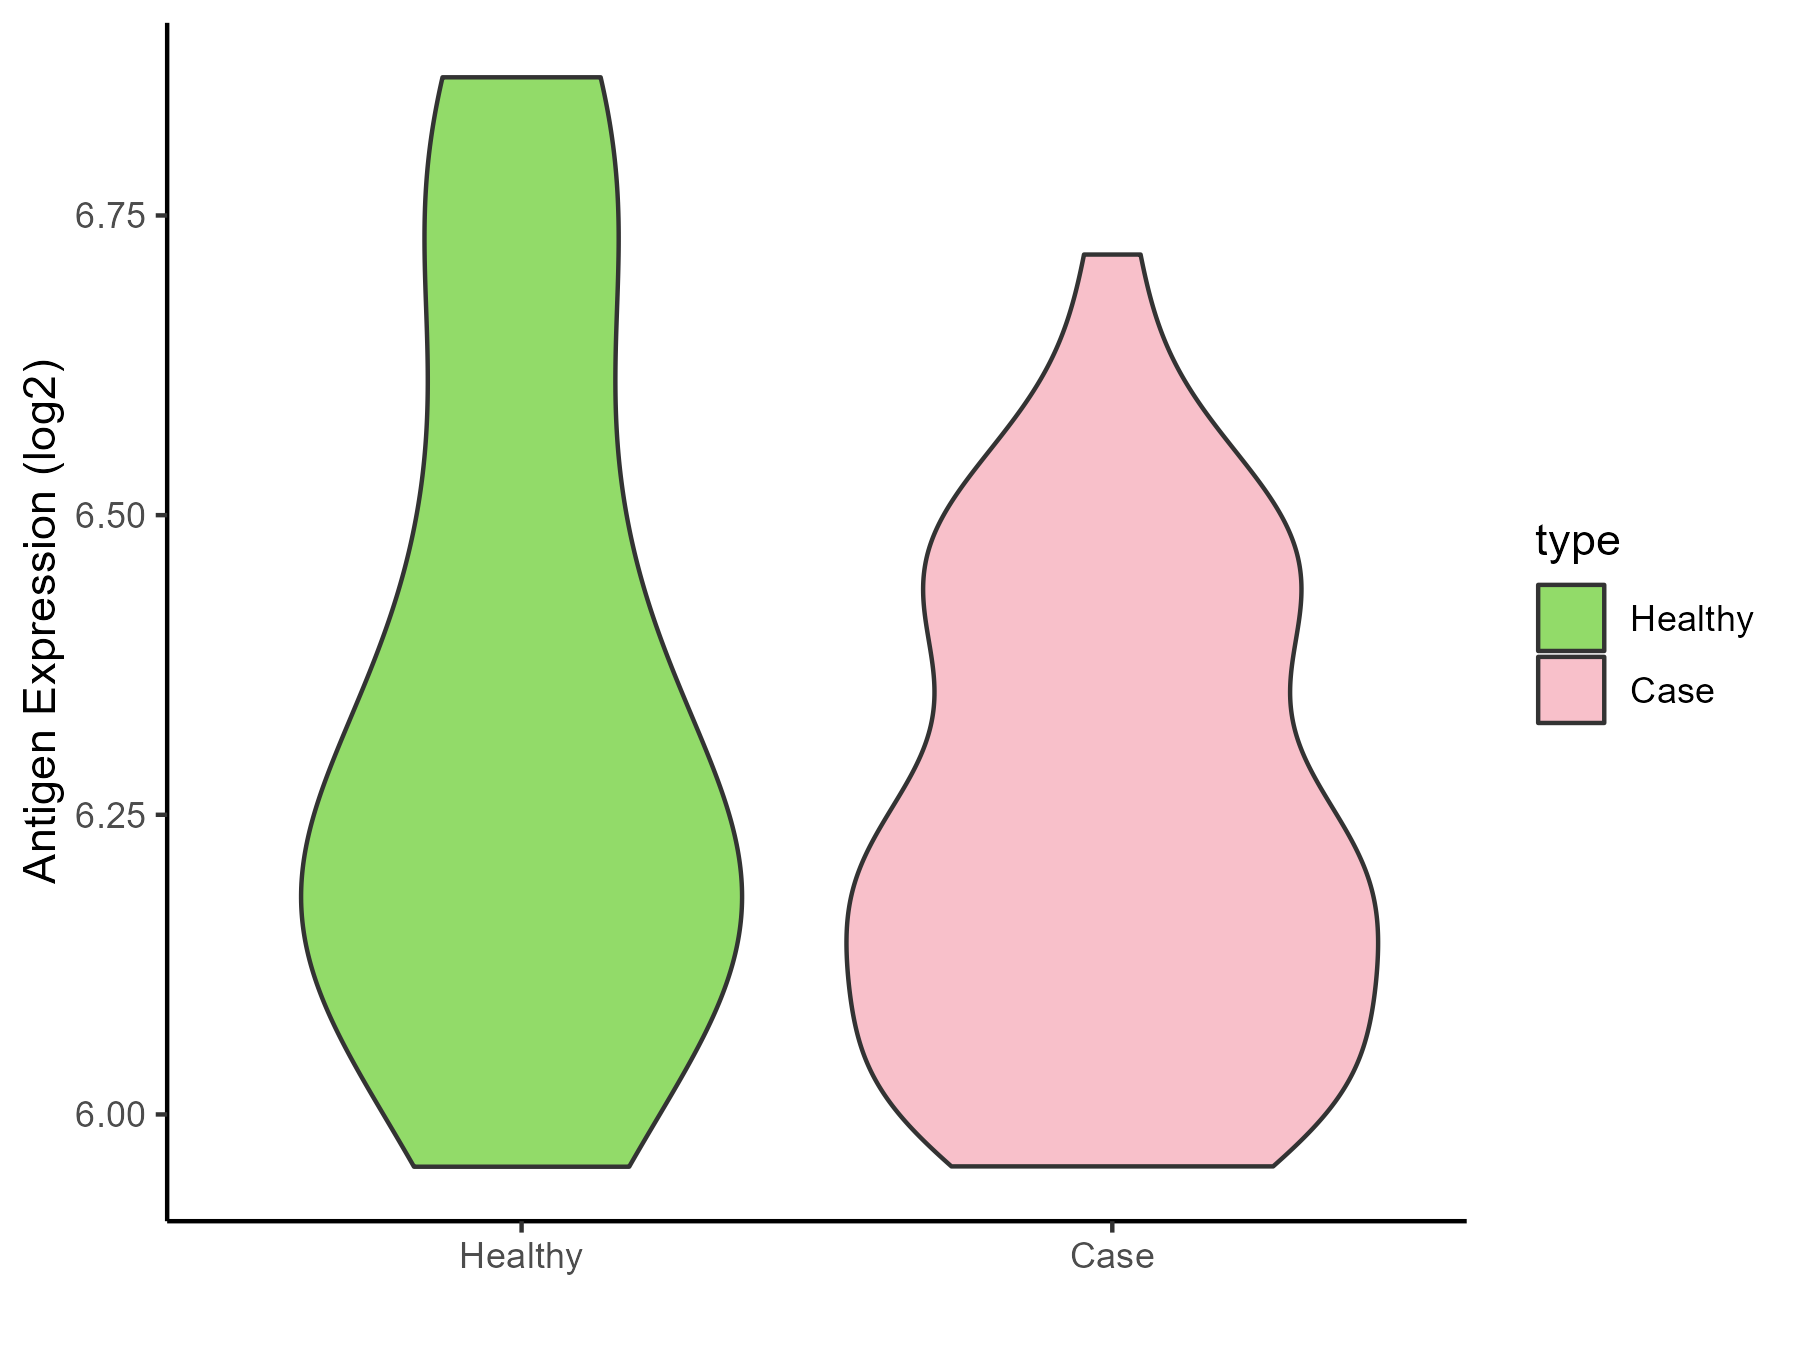
| The Studied Tissue | White matter | |
| The Specific Disease | HIV | |
| The Expression Level of Disease Section Compare with the Healthy Individual Tissue | p-value: 0.187793631; Fold-change: -0.026251958; Z-score: -0.091497819 | |
| Disease-specific Antigen Abundances |
|
Click to View the Clearer Original Diagram |
| Differential expression pattern of antigen in diseases | ||
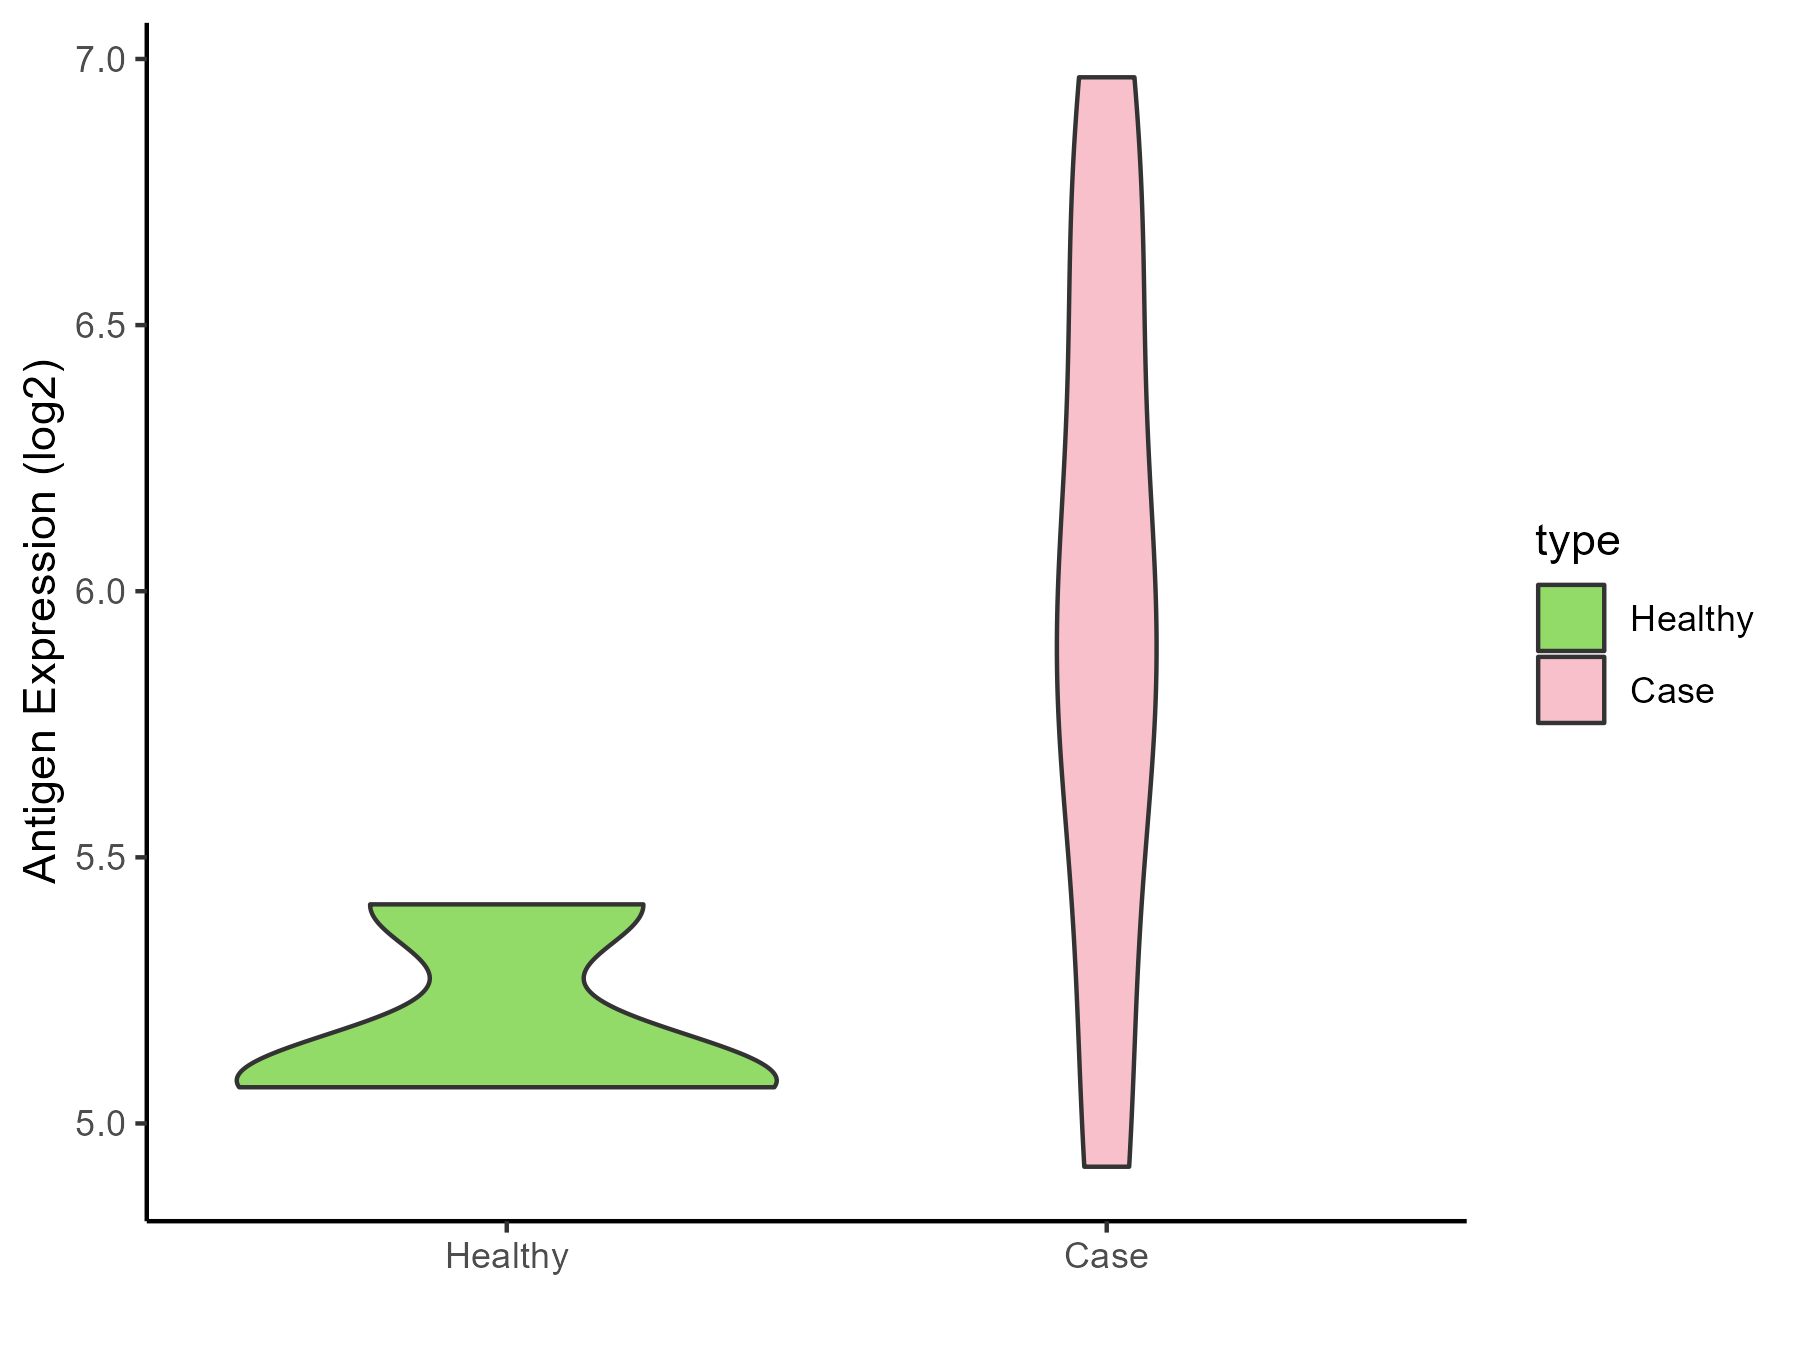
| The Studied Tissue | Whole blood | |
| The Specific Disease | Influenza | |
| The Expression Level of Disease Section Compare with the Healthy Individual Tissue | p-value: 0.010508608; Fold-change: 0.78631082; Z-score: 4.103354421 | |
| Disease-specific Antigen Abundances |
|
Click to View the Clearer Original Diagram |
| Differential expression pattern of antigen in diseases | ||
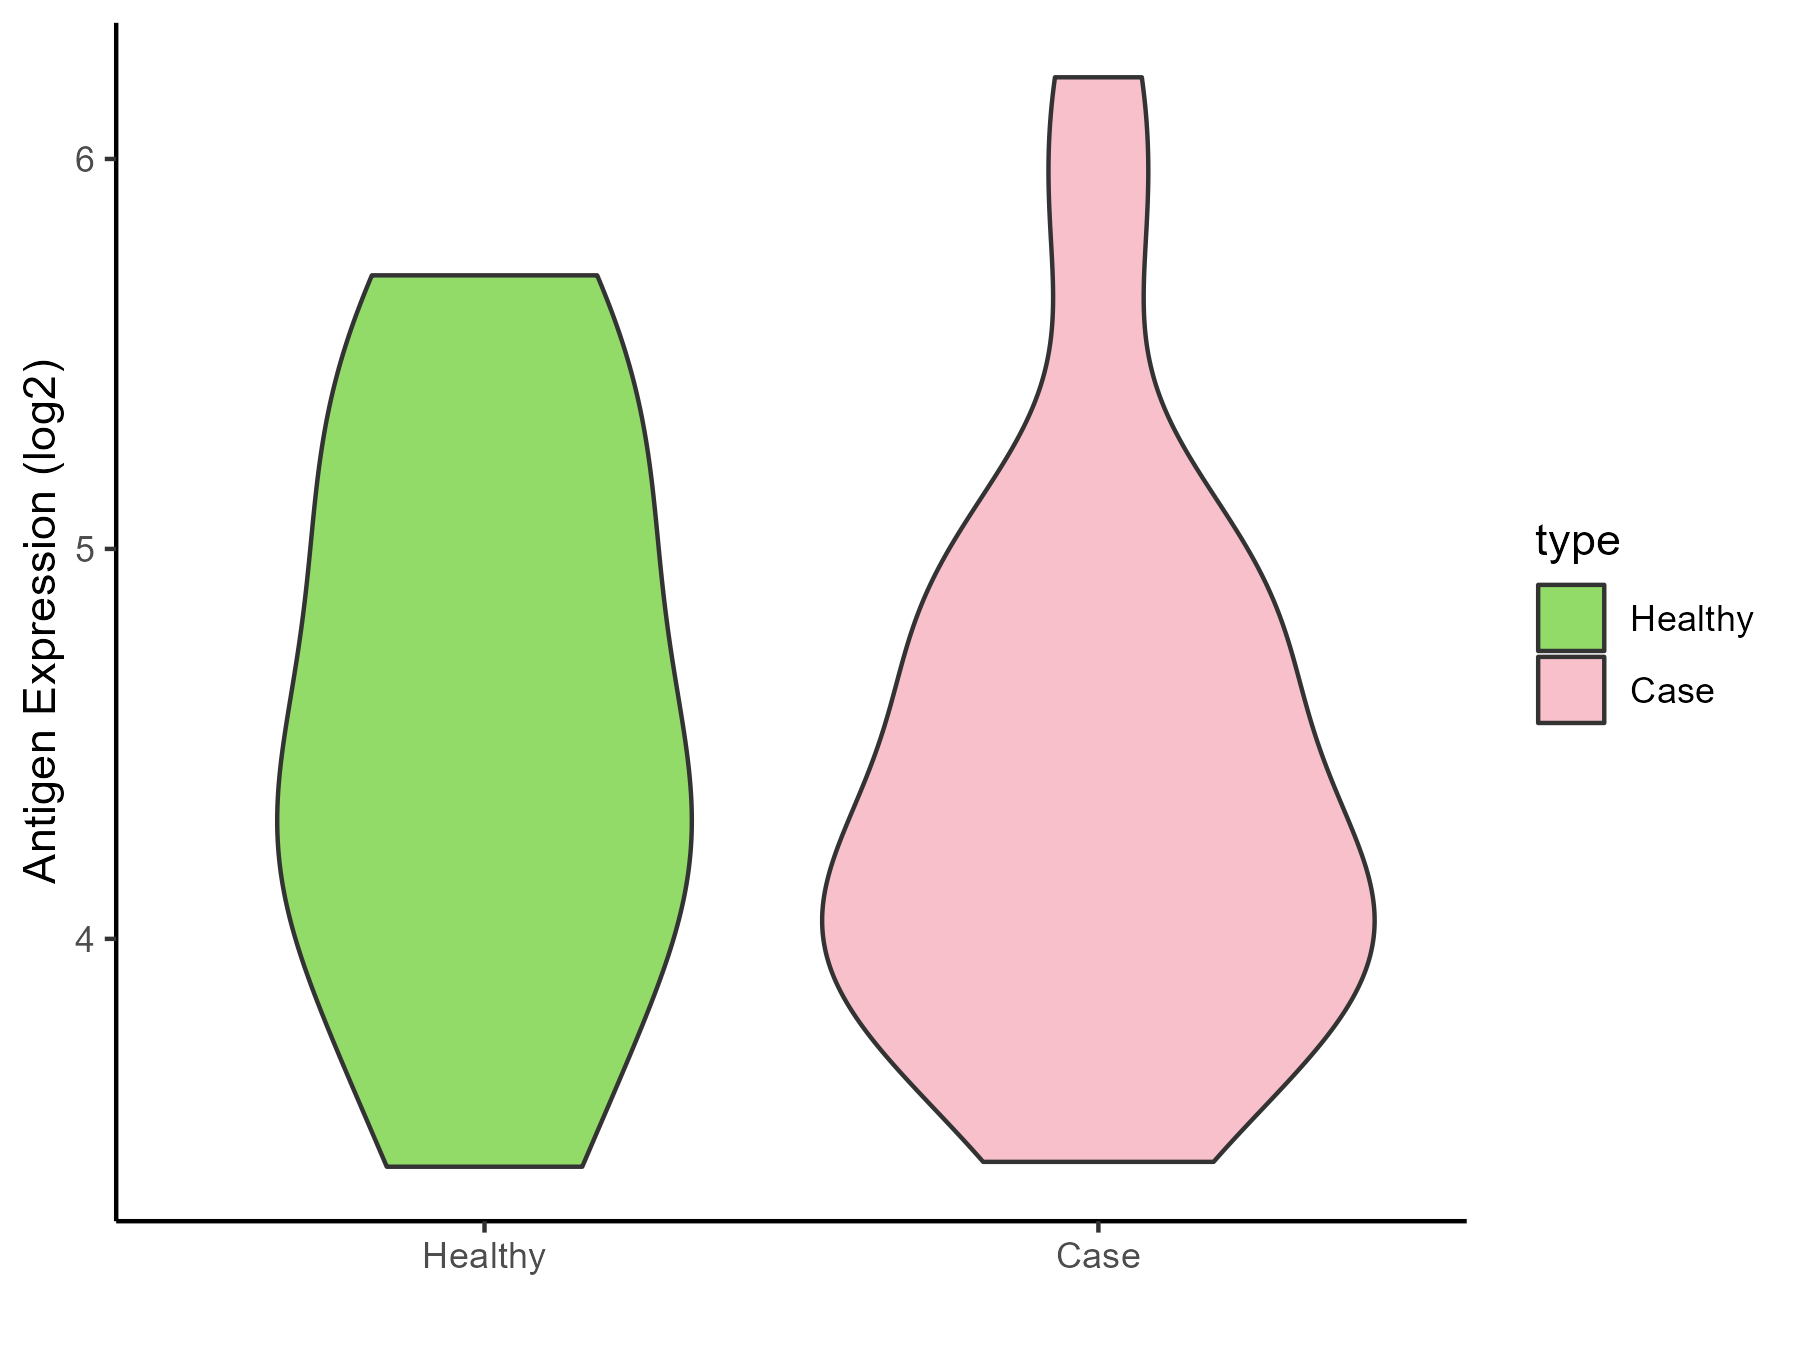
| The Studied Tissue | Whole blood | |
| The Specific Disease | Chronic hepatitis C | |
| The Expression Level of Disease Section Compare with the Healthy Individual Tissue | p-value: 0.632975184; Fold-change: -0.347636404; Z-score: -0.468850856 | |
| Disease-specific Antigen Abundances |
|
Click to View the Clearer Original Diagram |
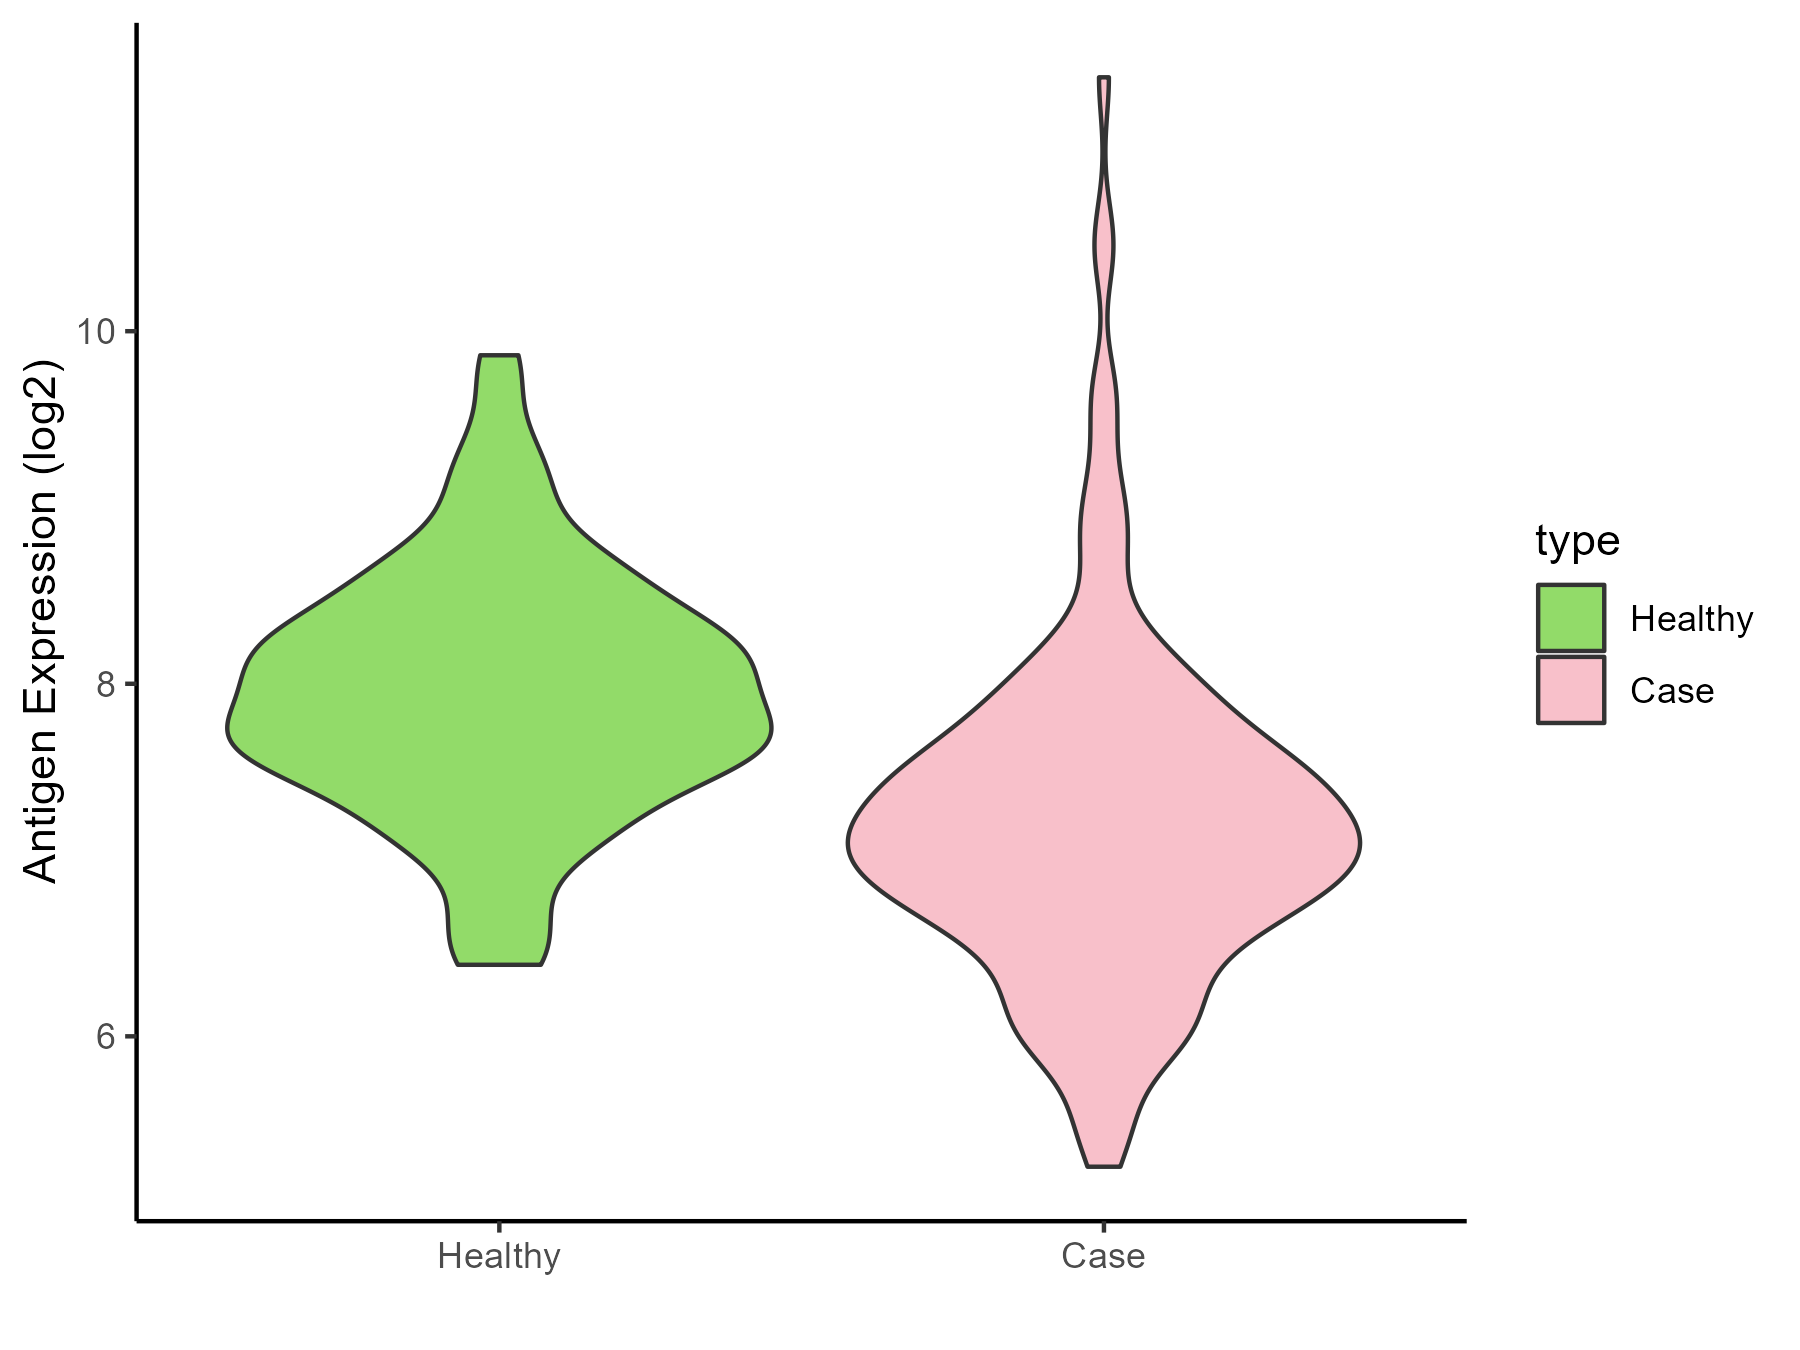
| Differential expression pattern of antigen in diseases | ||
| The Studied Tissue | Whole blood | |
| The Specific Disease | Sepsis | |
| The Expression Level of Disease Section Compare with the Healthy Individual Tissue | p-value: 4.58E-11; Fold-change: -0.790430064; Z-score: -1.124258106 | |
| Disease-specific Antigen Abundances |
|
Click to View the Clearer Original Diagram |
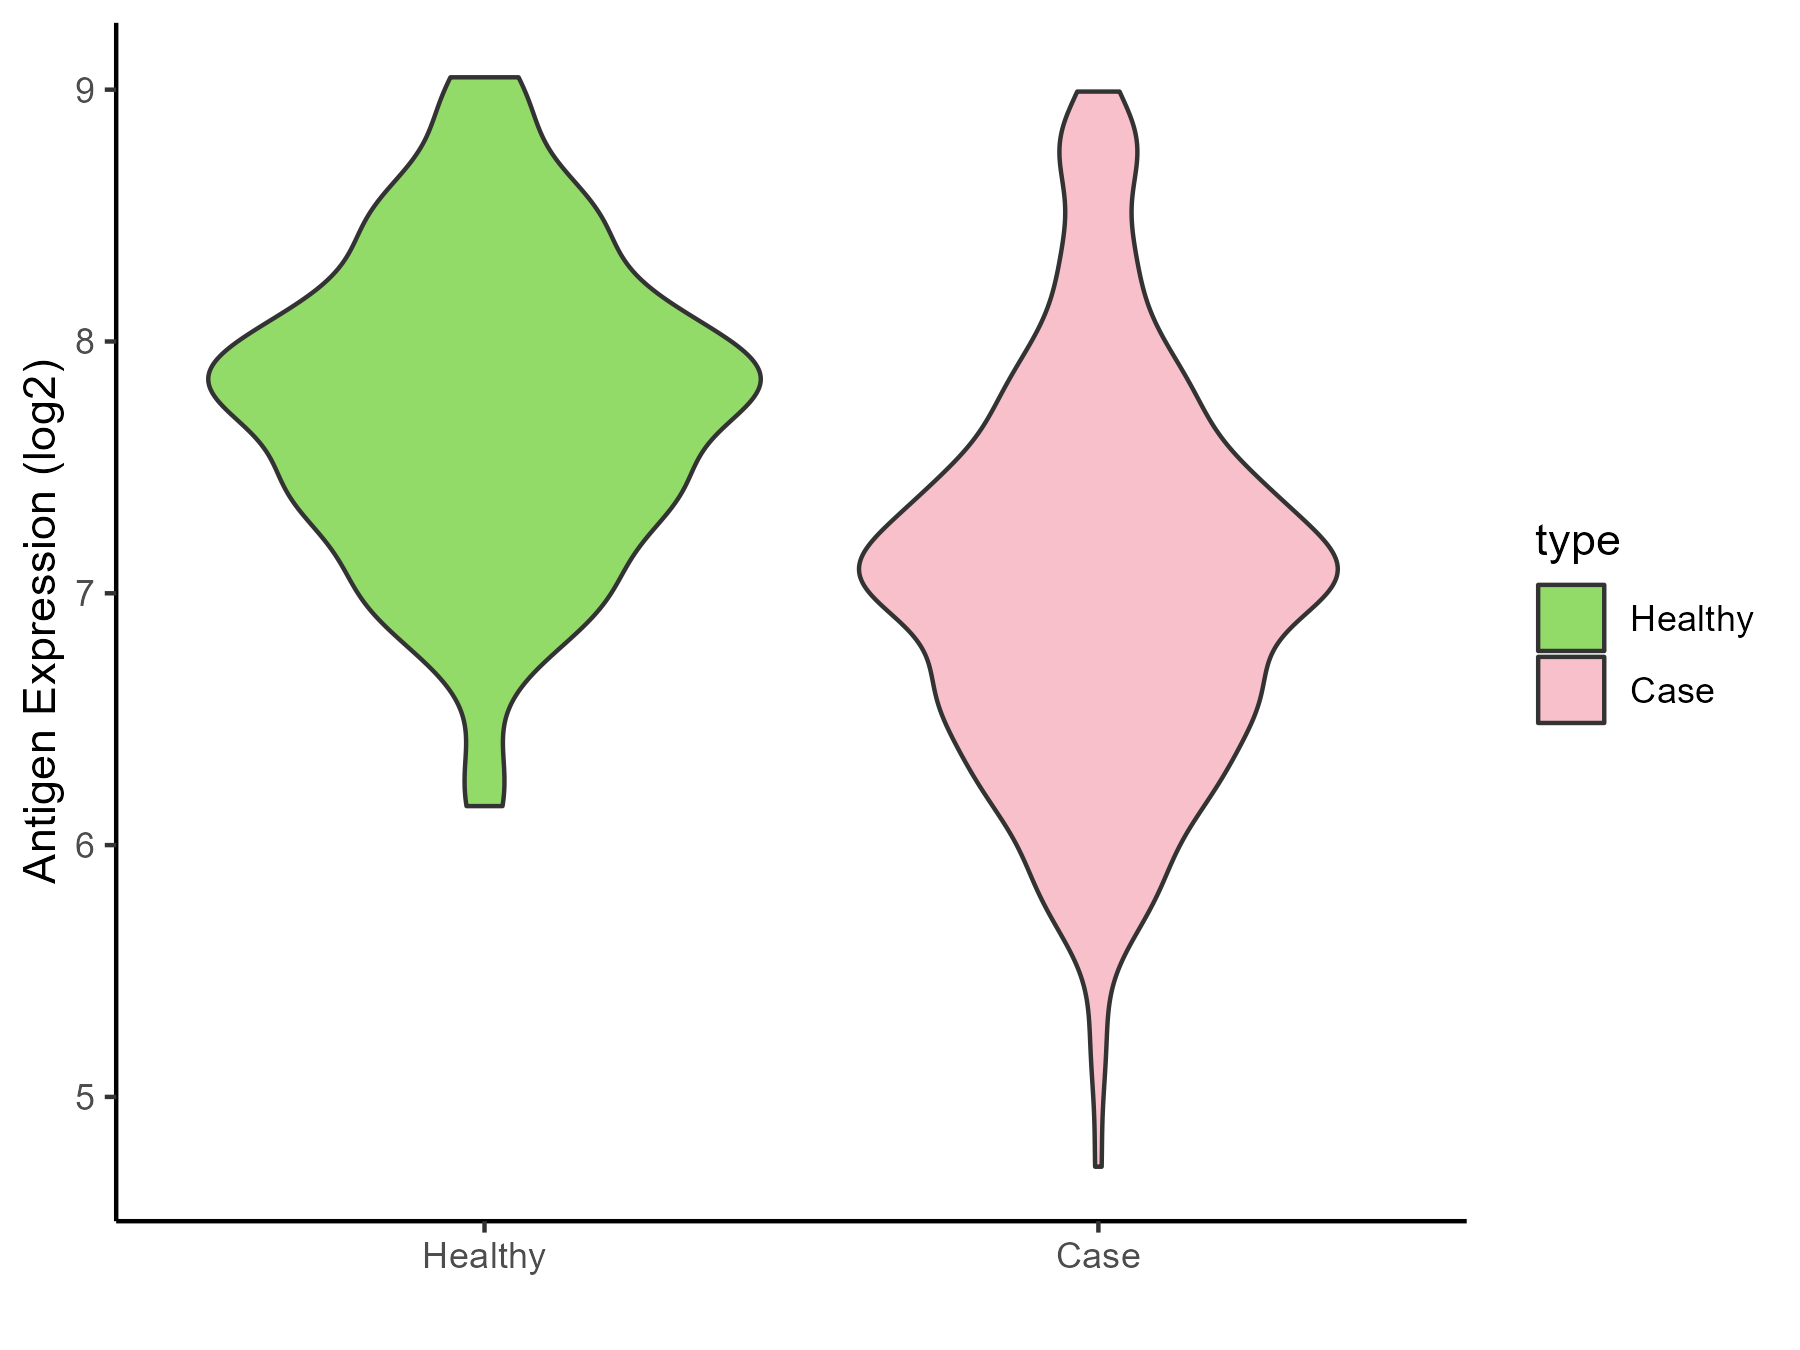
| Differential expression pattern of antigen in diseases | ||
| The Studied Tissue | Whole blood | |
| The Specific Disease | Septic shock | |
| The Expression Level of Disease Section Compare with the Healthy Individual Tissue | p-value: 4.29E-29; Fold-change: -0.746671047; Z-score: -1.263006838 | |
| Disease-specific Antigen Abundances |
|
Click to View the Clearer Original Diagram |
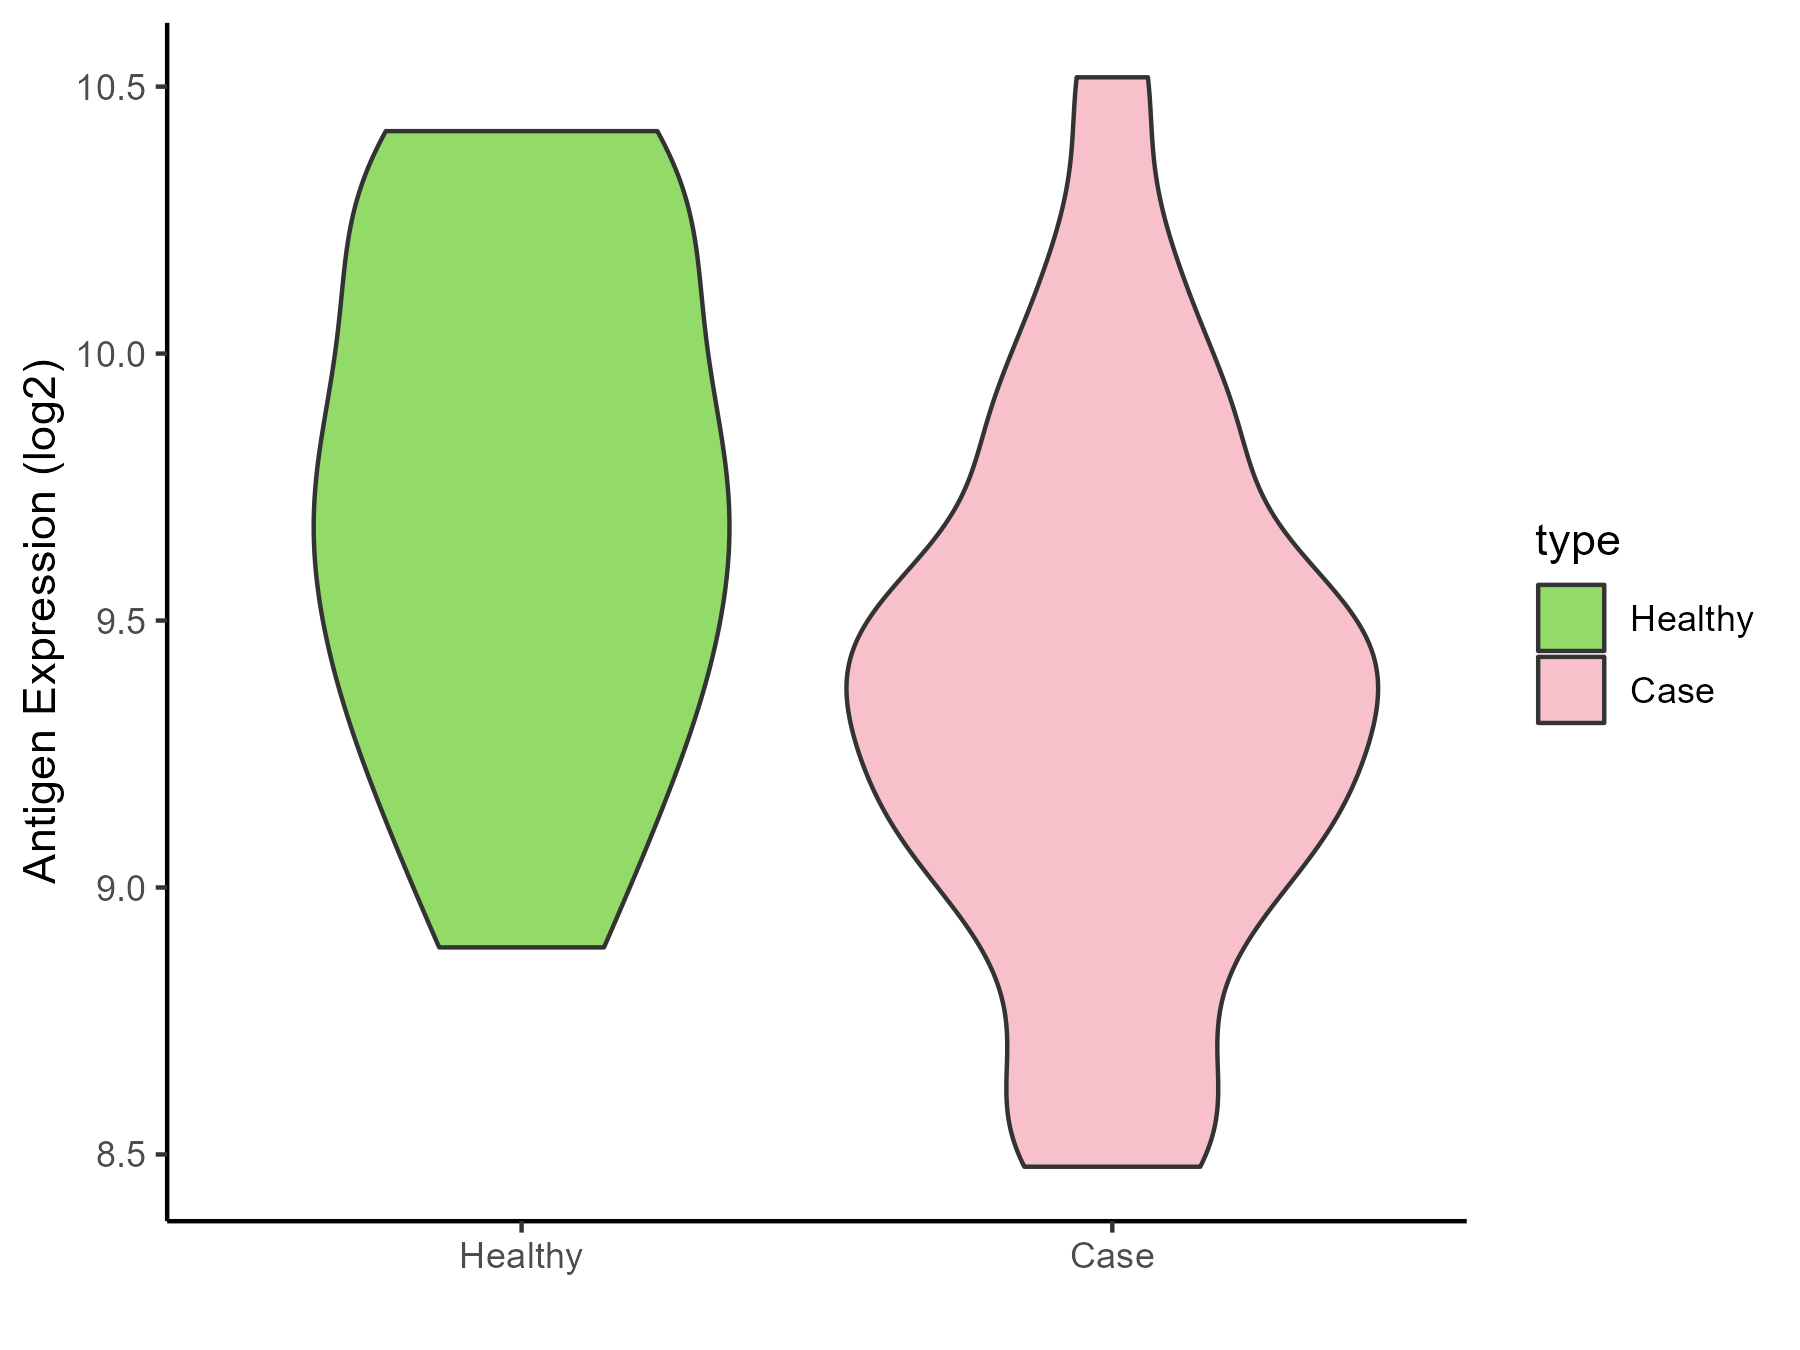
| Differential expression pattern of antigen in diseases | ||
| The Studied Tissue | Peripheral blood | |
| The Specific Disease | Pediatric respiratory syncytial virus infection | |
| The Expression Level of Disease Section Compare with the Healthy Individual Tissue | p-value: 0.024137949; Fold-change: -0.350831575; Z-score: -0.735351427 | |
| Disease-specific Antigen Abundances |
|
Click to View the Clearer Original Diagram |
ICD Disease Classification 11
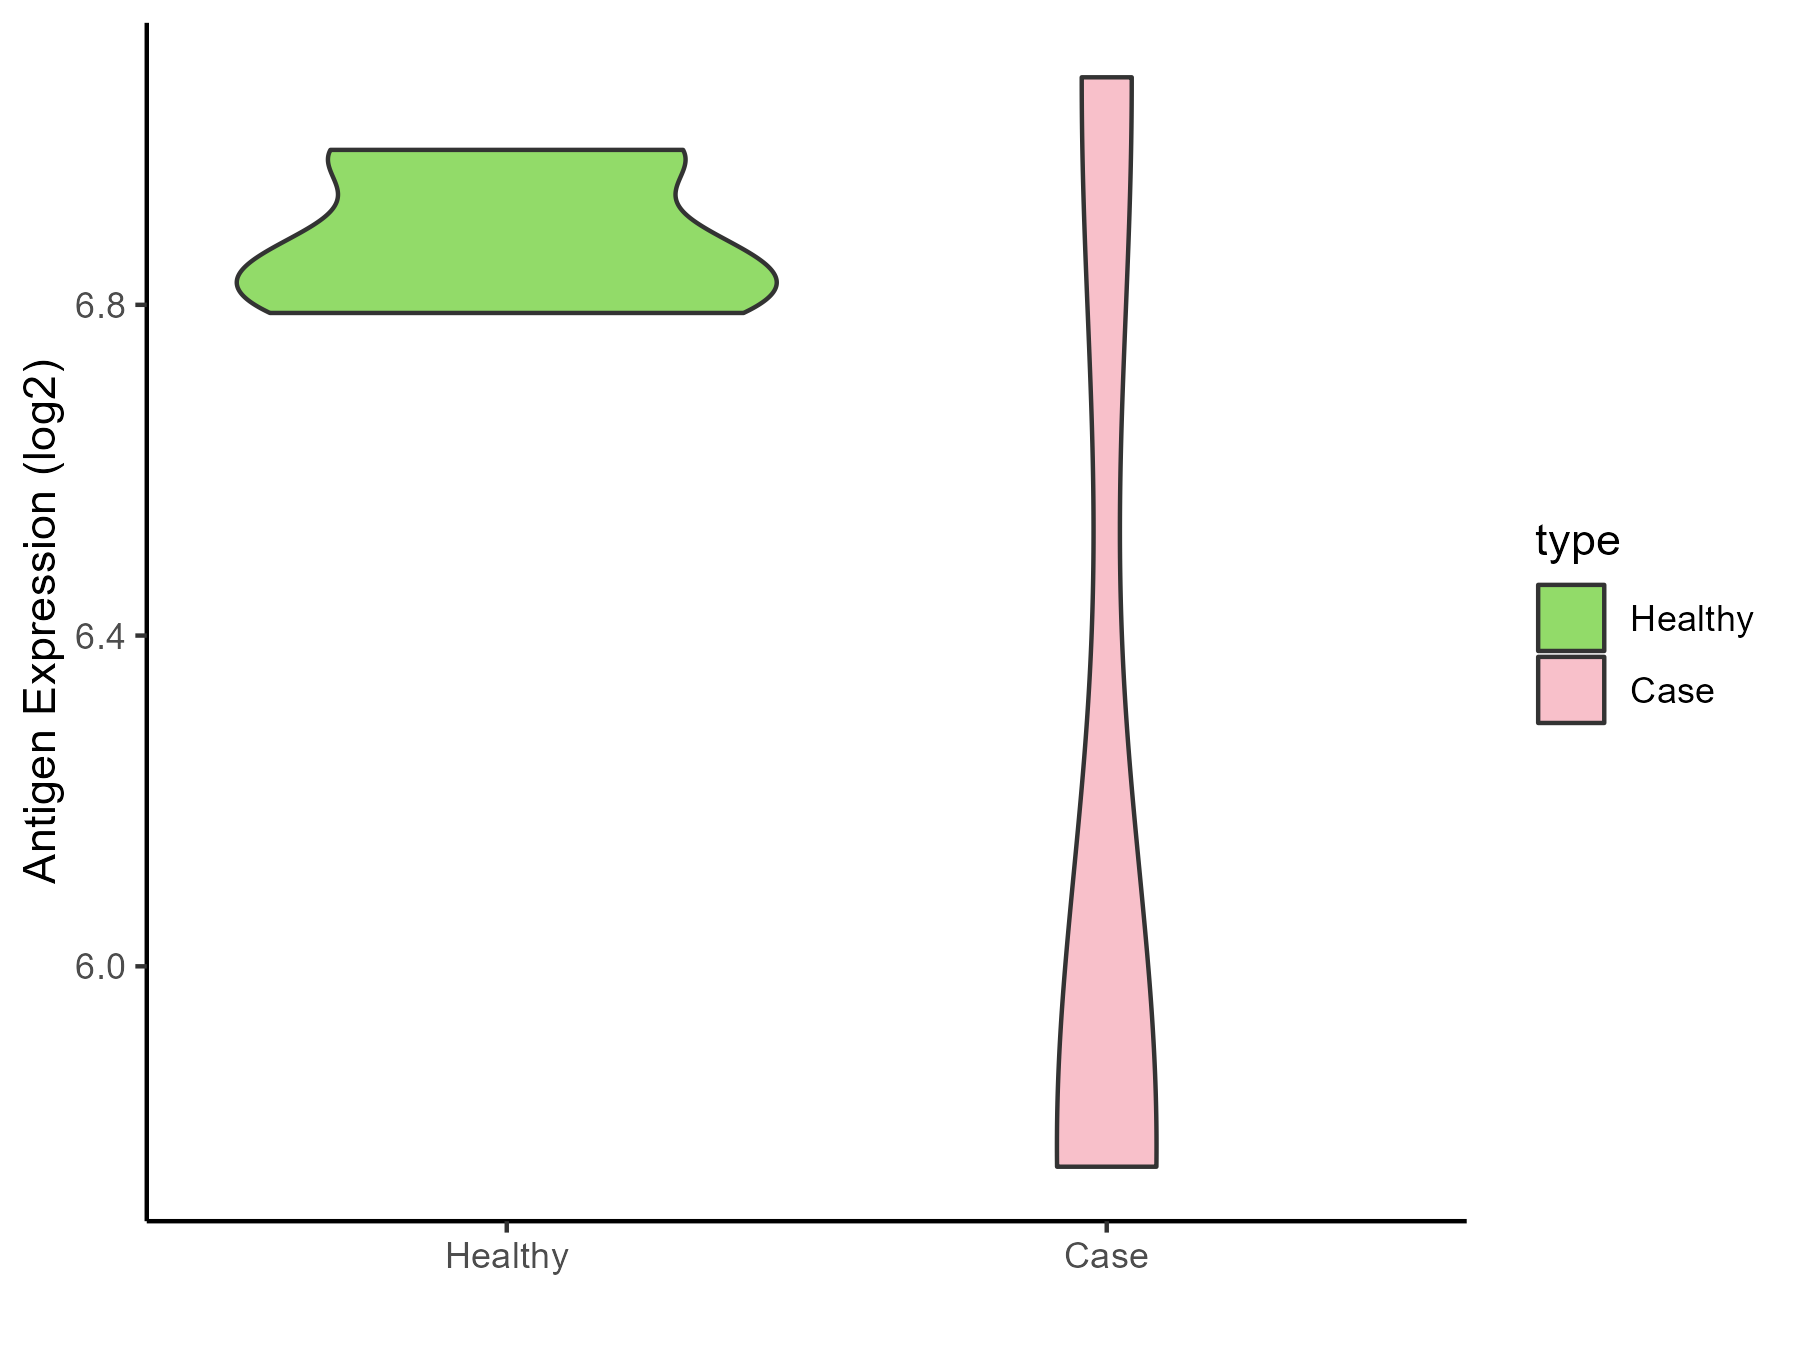
| Differential expression pattern of antigen in diseases | ||
| The Studied Tissue | Peripheral blood | |
| The Specific Disease | Essential hypertension | |
| The Expression Level of Disease Section Compare with the Healthy Individual Tissue | p-value: 0.261228119; Fold-change: -1.054481209; Z-score: -10.54689768 | |
| Disease-specific Antigen Abundances |
|
Click to View the Clearer Original Diagram |
| Differential expression pattern of antigen in diseases | ||
| The Studied Tissue | Peripheral blood | |
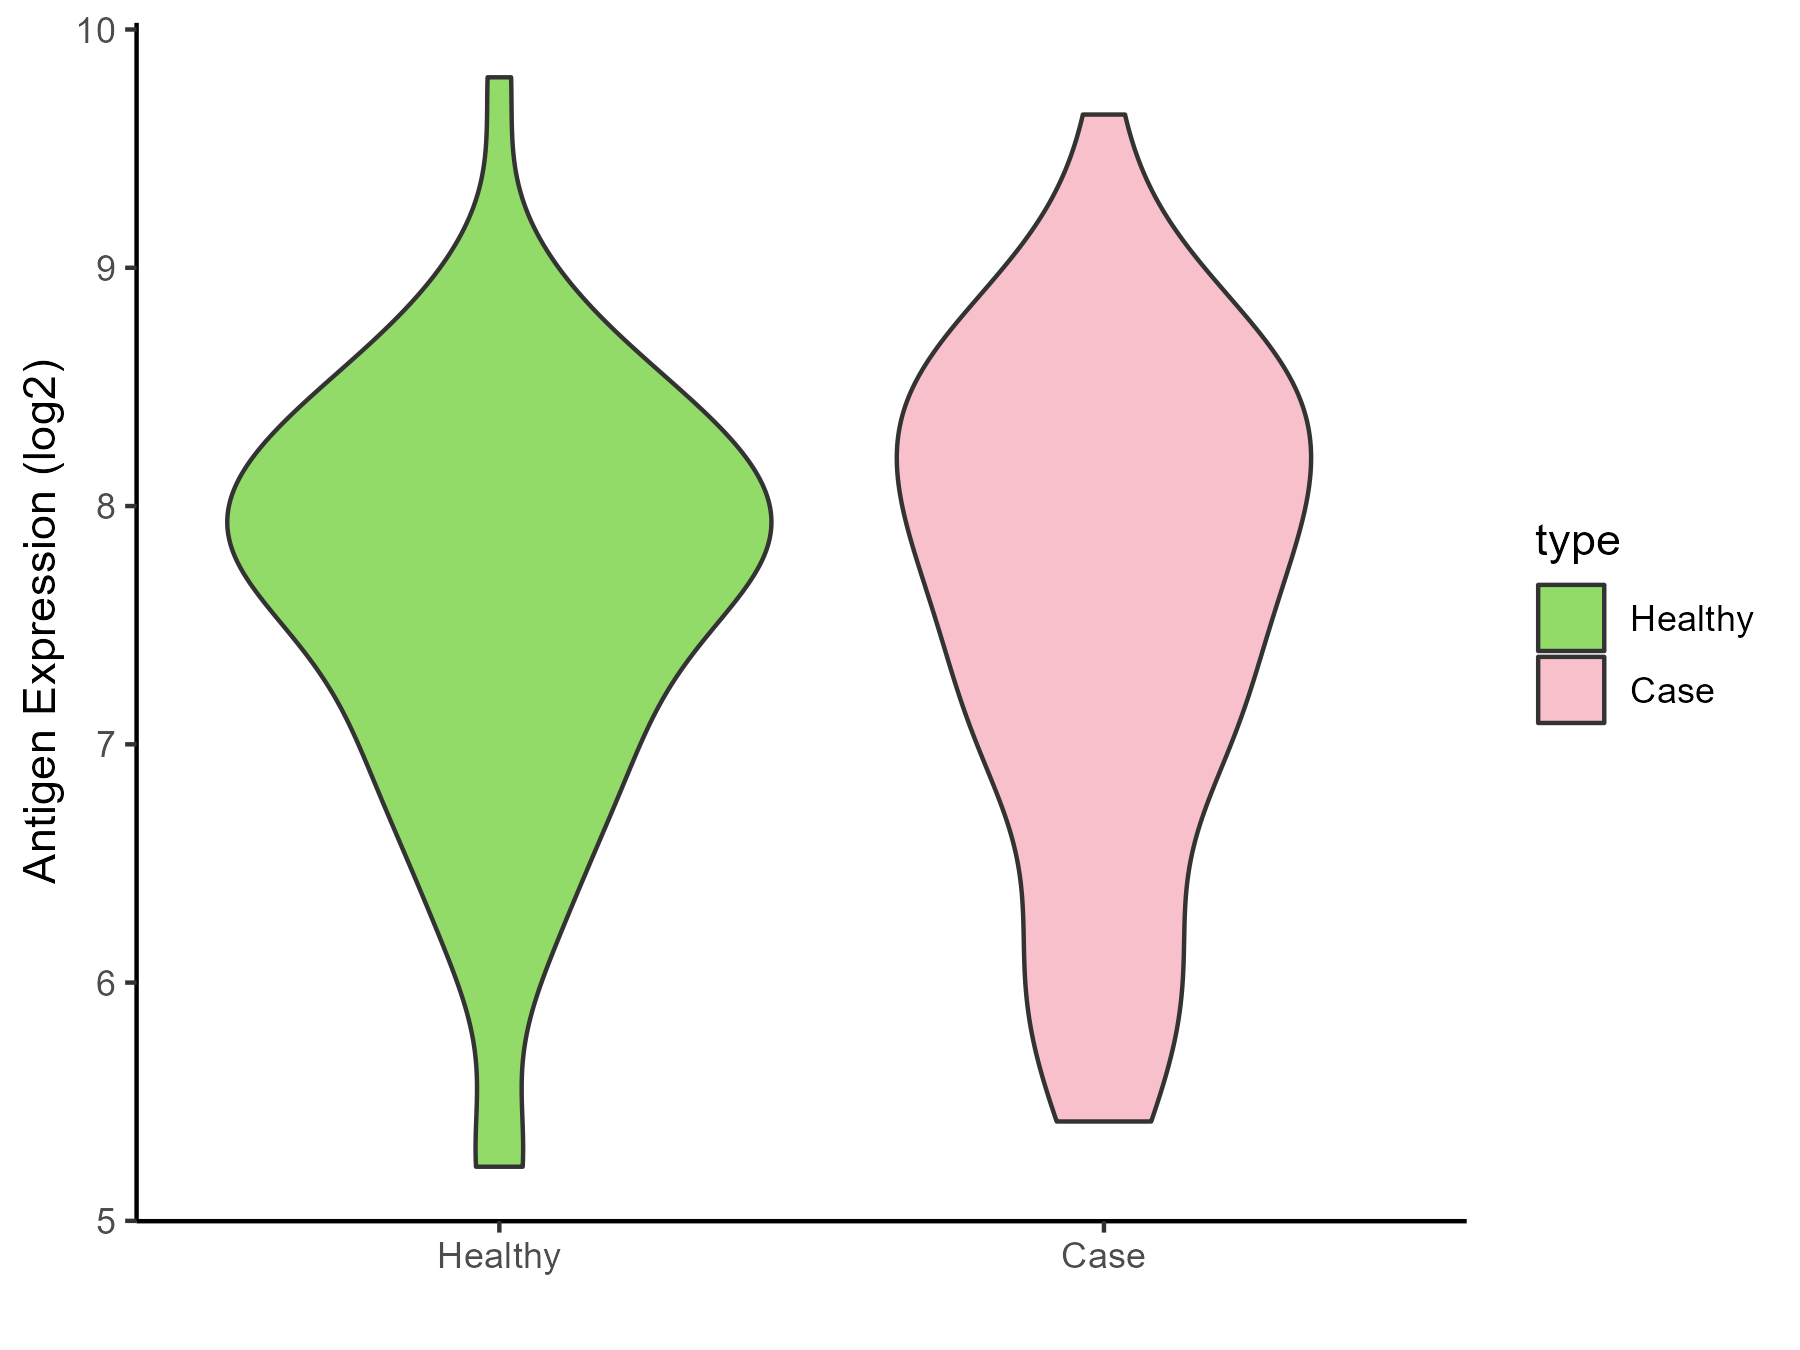
| The Specific Disease | Myocardial infarction | |
| The Expression Level of Disease Section Compare with the Healthy Individual Tissue | p-value: 0.844663494; Fold-change: 0.056164438; Z-score: 0.064037889 | |
| Disease-specific Antigen Abundances |
|
Click to View the Clearer Original Diagram |
| Differential expression pattern of antigen in diseases | ||
| The Studied Tissue | Peripheral blood | |
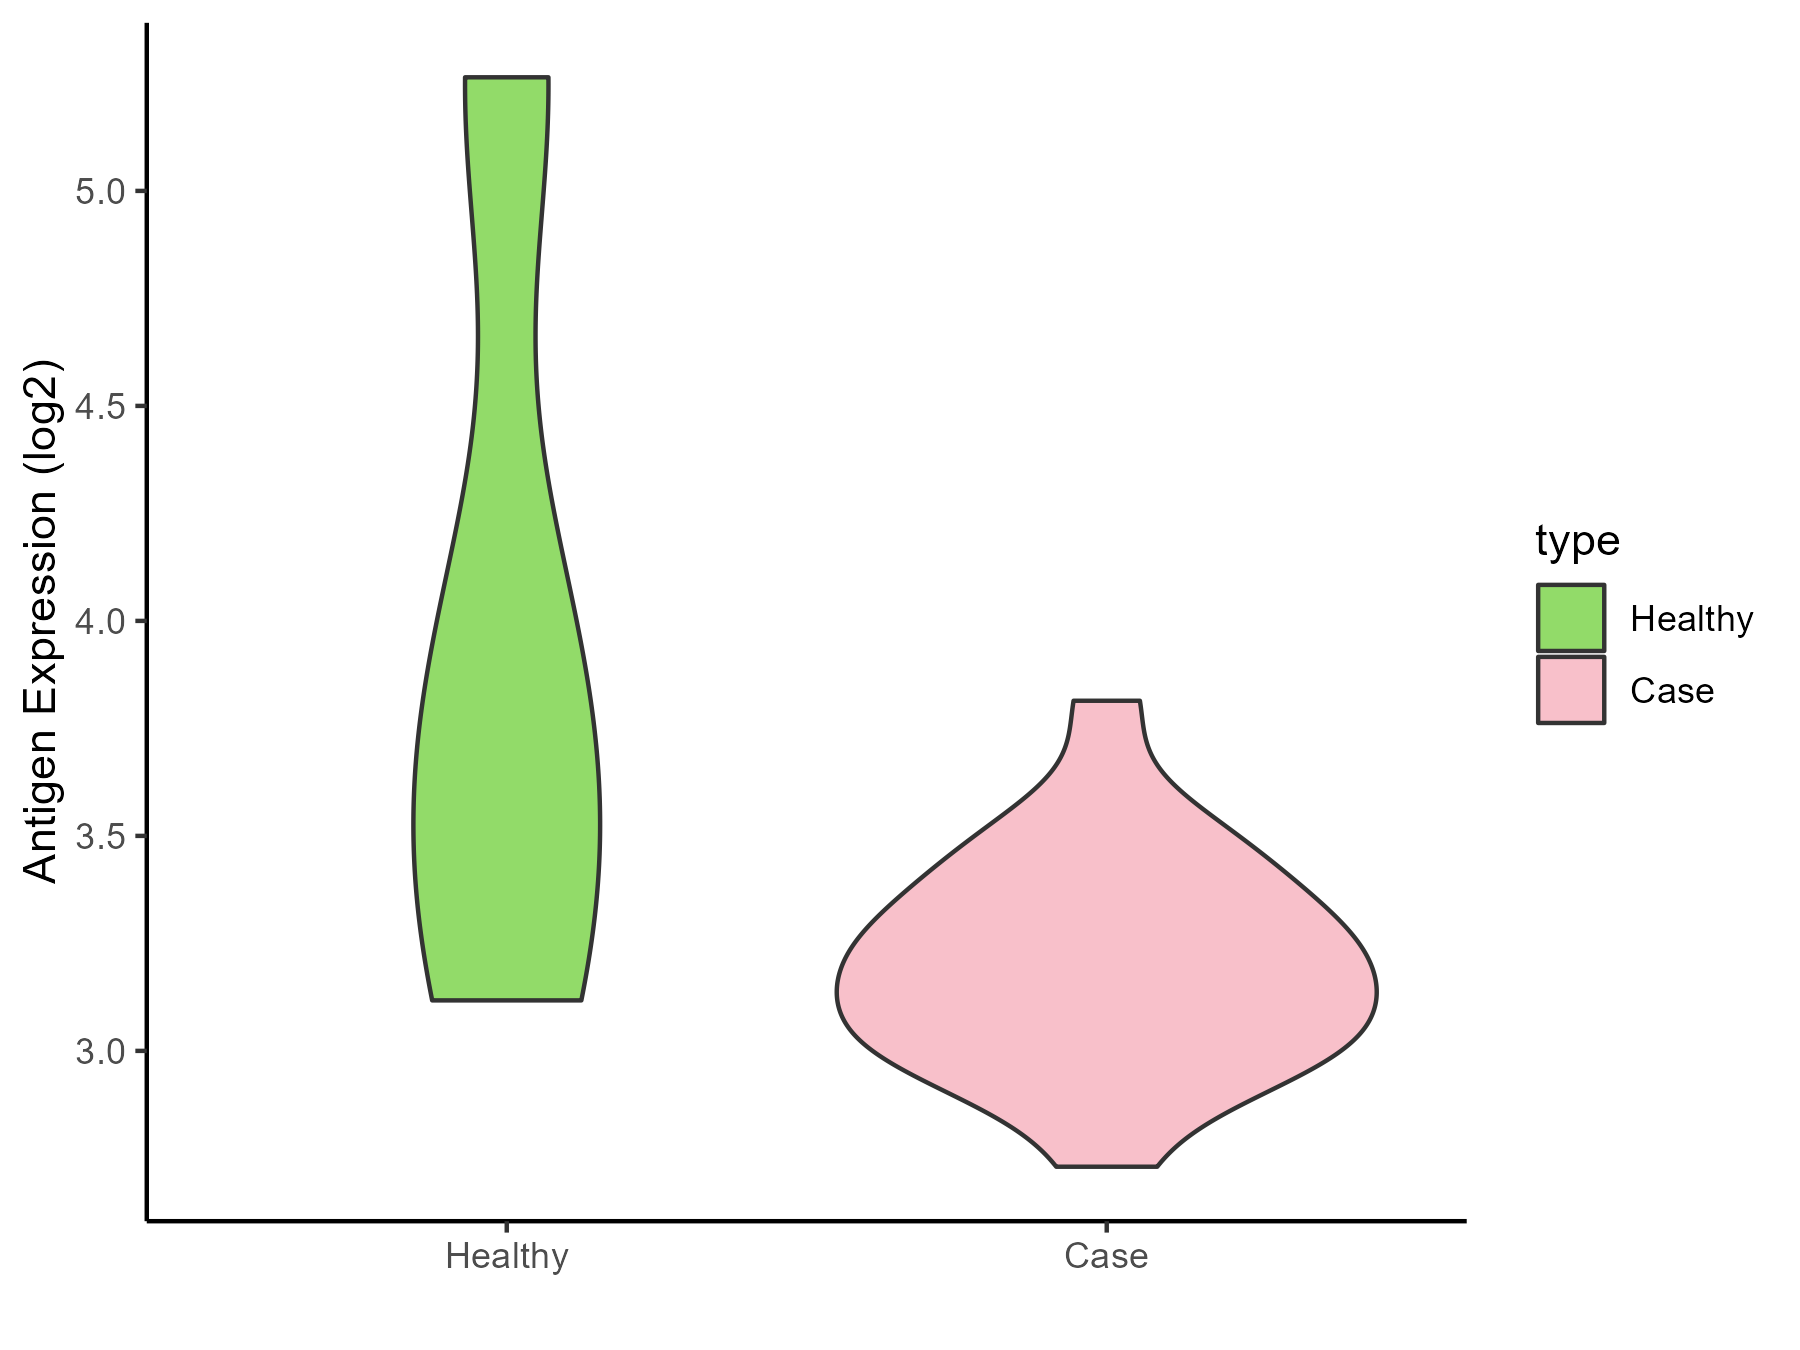
| The Specific Disease | Coronary artery disease | |
| The Expression Level of Disease Section Compare with the Healthy Individual Tissue | p-value: 0.200945483; Fold-change: -0.558090581; Z-score: -0.599421927 | |
| Disease-specific Antigen Abundances |
|
Click to View the Clearer Original Diagram |
| Differential expression pattern of antigen in diseases | ||
| The Studied Tissue | Calcified aortic valve | |
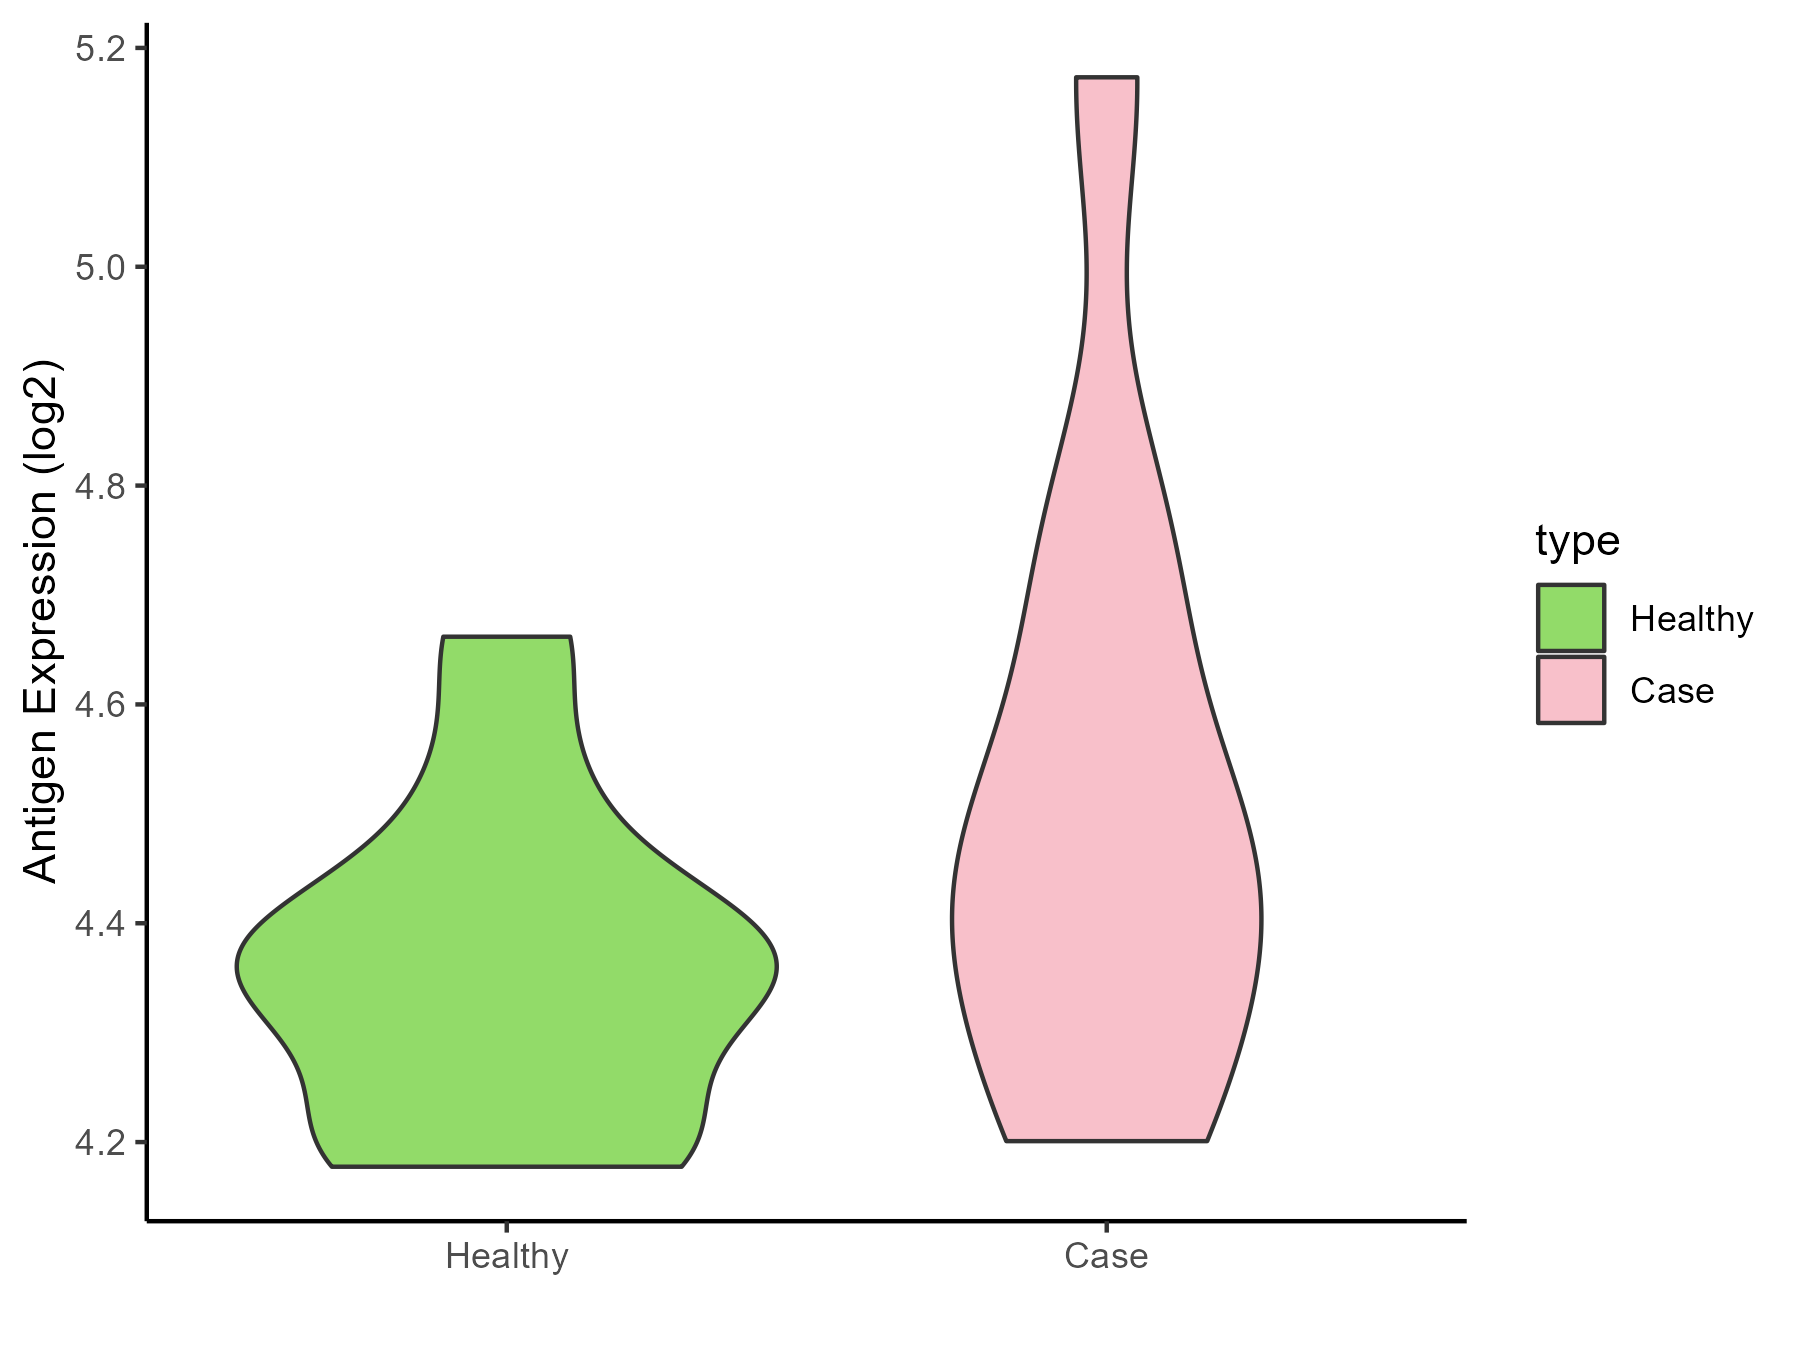
| The Specific Disease | Aortic stenosis | |
| The Expression Level of Disease Section Compare with the Healthy Individual Tissue | p-value: 0.149694747; Fold-change: 0.087459823; Z-score: 0.578139416 | |
| Disease-specific Antigen Abundances |
|
Click to View the Clearer Original Diagram |
| Differential expression pattern of antigen in diseases | ||
| The Studied Tissue | Peripheral blood | |
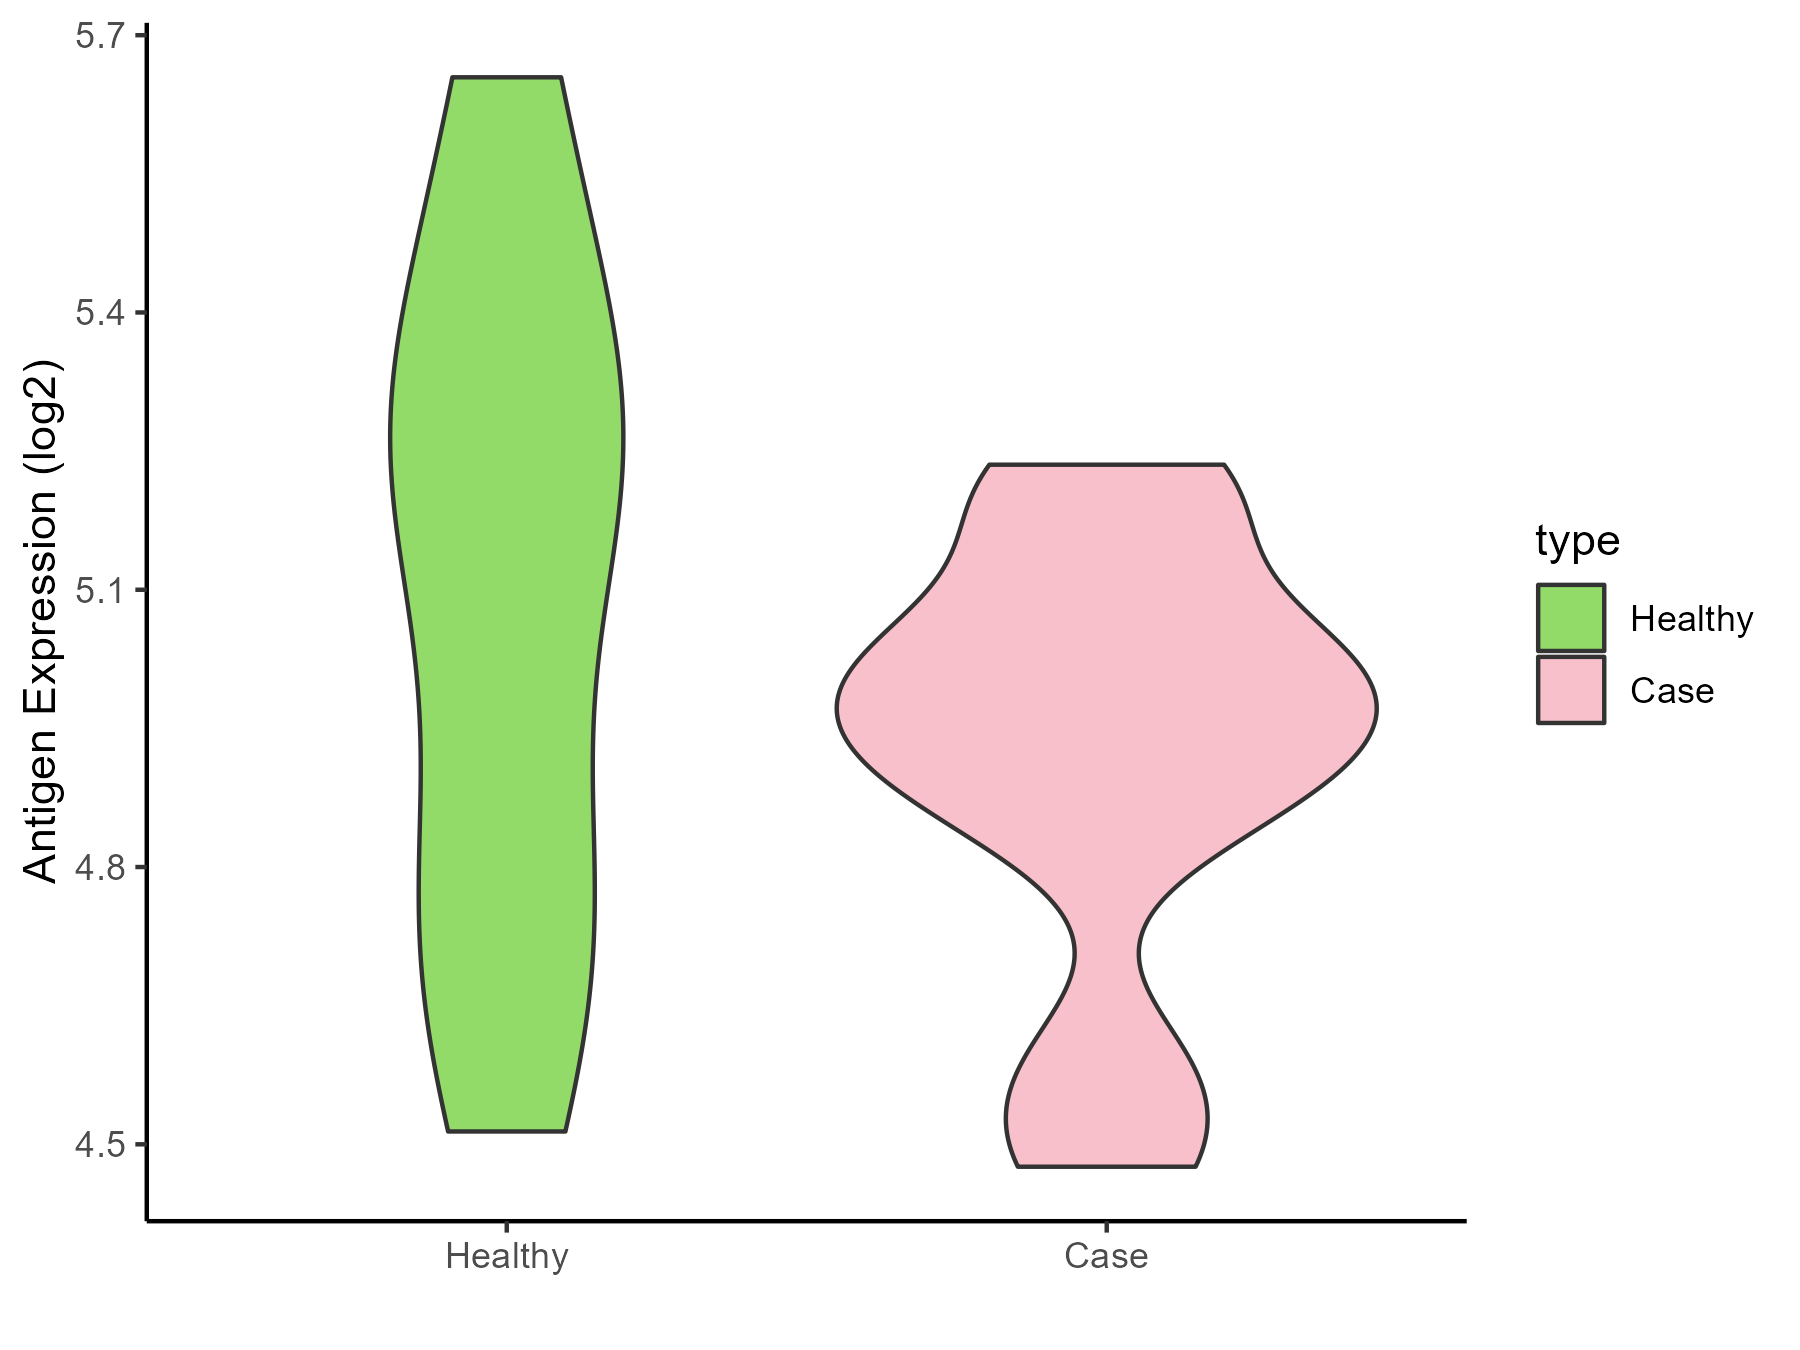
| The Specific Disease | Arteriosclerosis | |
| The Expression Level of Disease Section Compare with the Healthy Individual Tissue | p-value: 0.205250995; Fold-change: -0.255802212; Z-score: -0.701870618 | |
| Disease-specific Antigen Abundances |
|
Click to View the Clearer Original Diagram |
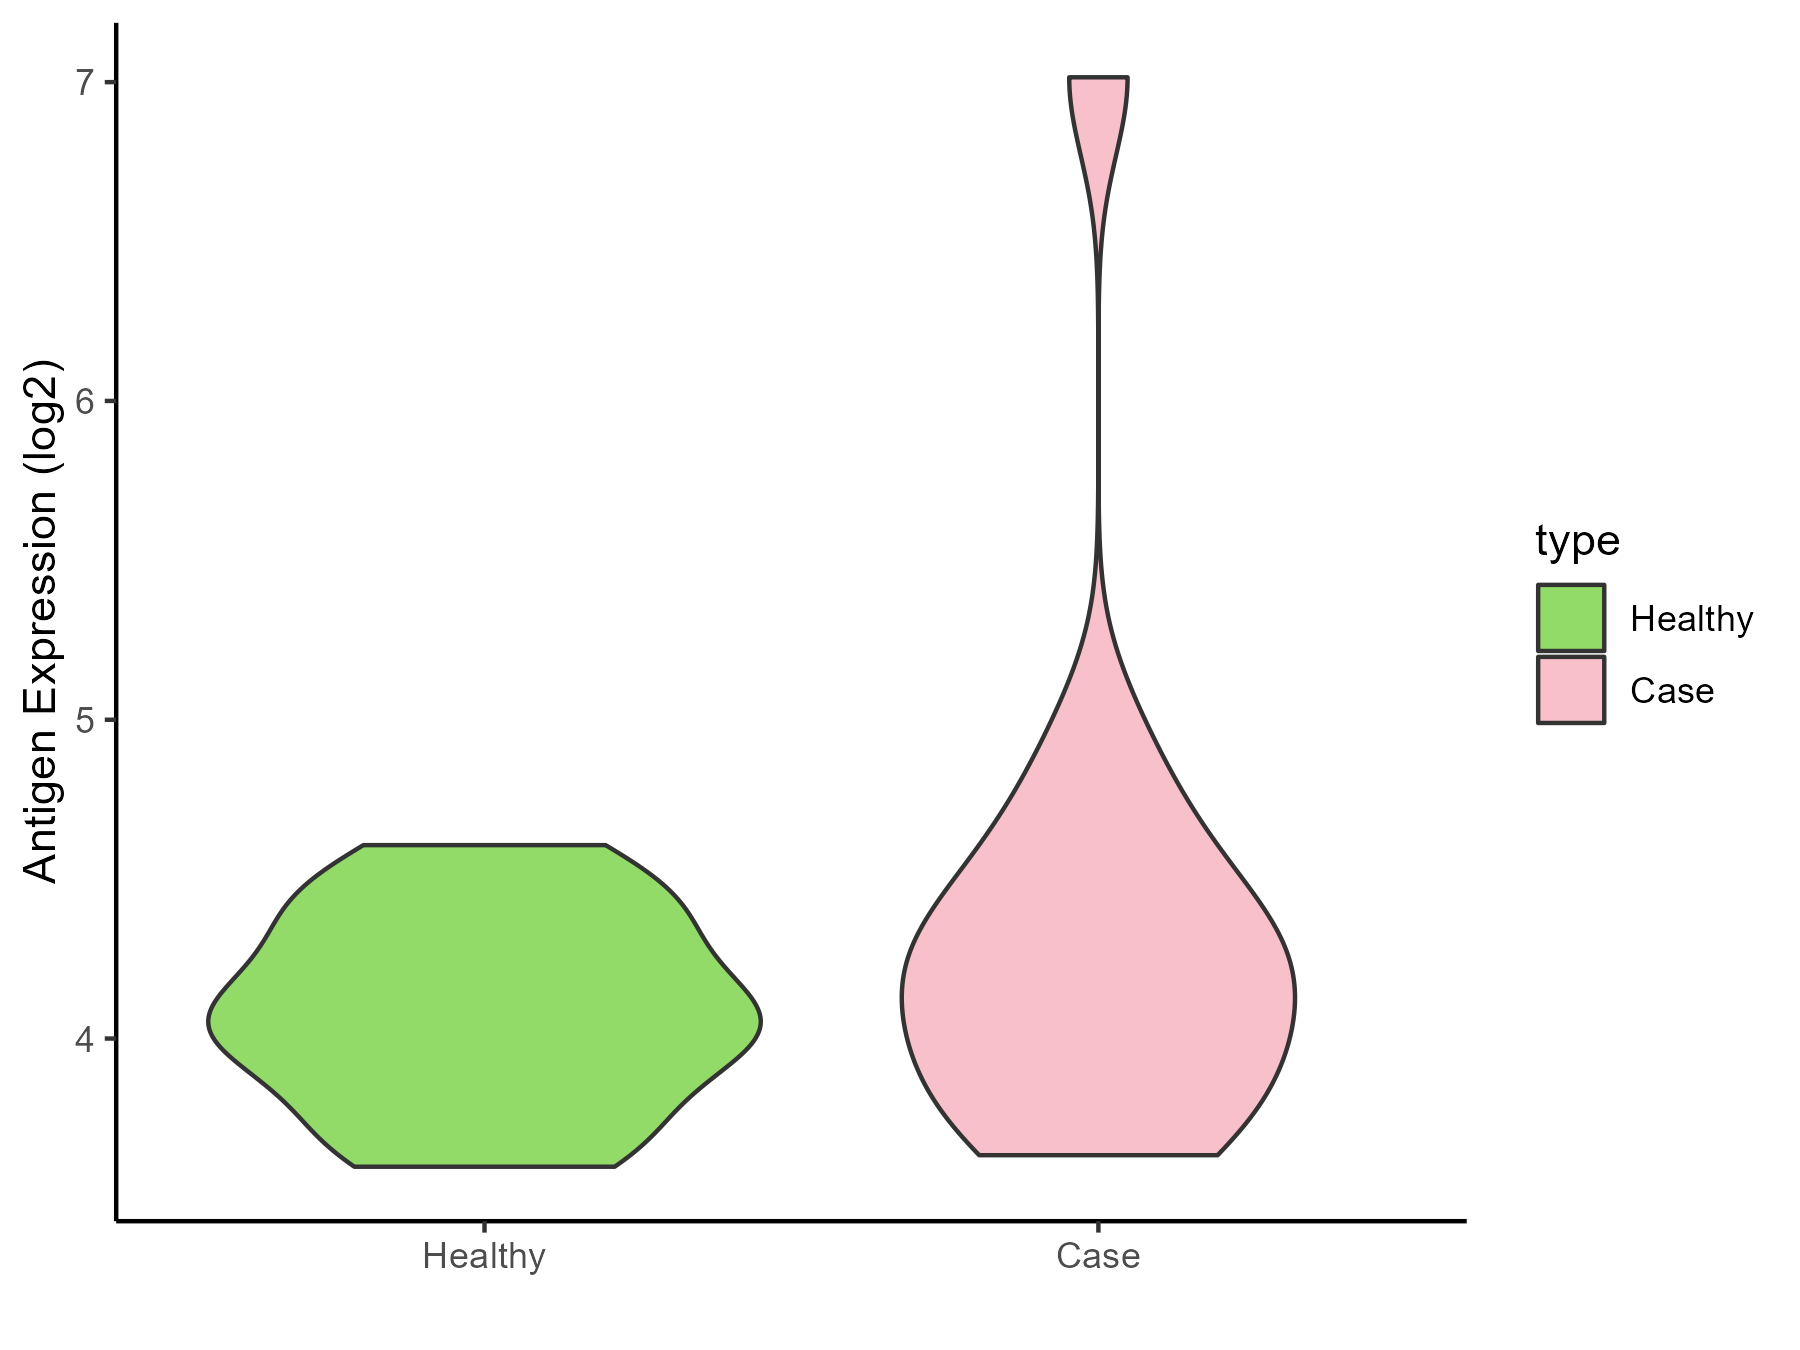
| Differential expression pattern of antigen in diseases | ||
| The Studied Tissue | Intracranial artery | |
| The Specific Disease | Aneurysm | |
| The Expression Level of Disease Section Compare with the Healthy Individual Tissue | p-value: 0.255524704; Fold-change: 0.218279118; Z-score: 0.701359308 | |
| Disease-specific Antigen Abundances |
|
Click to View the Clearer Original Diagram |
ICD Disease Classification 12
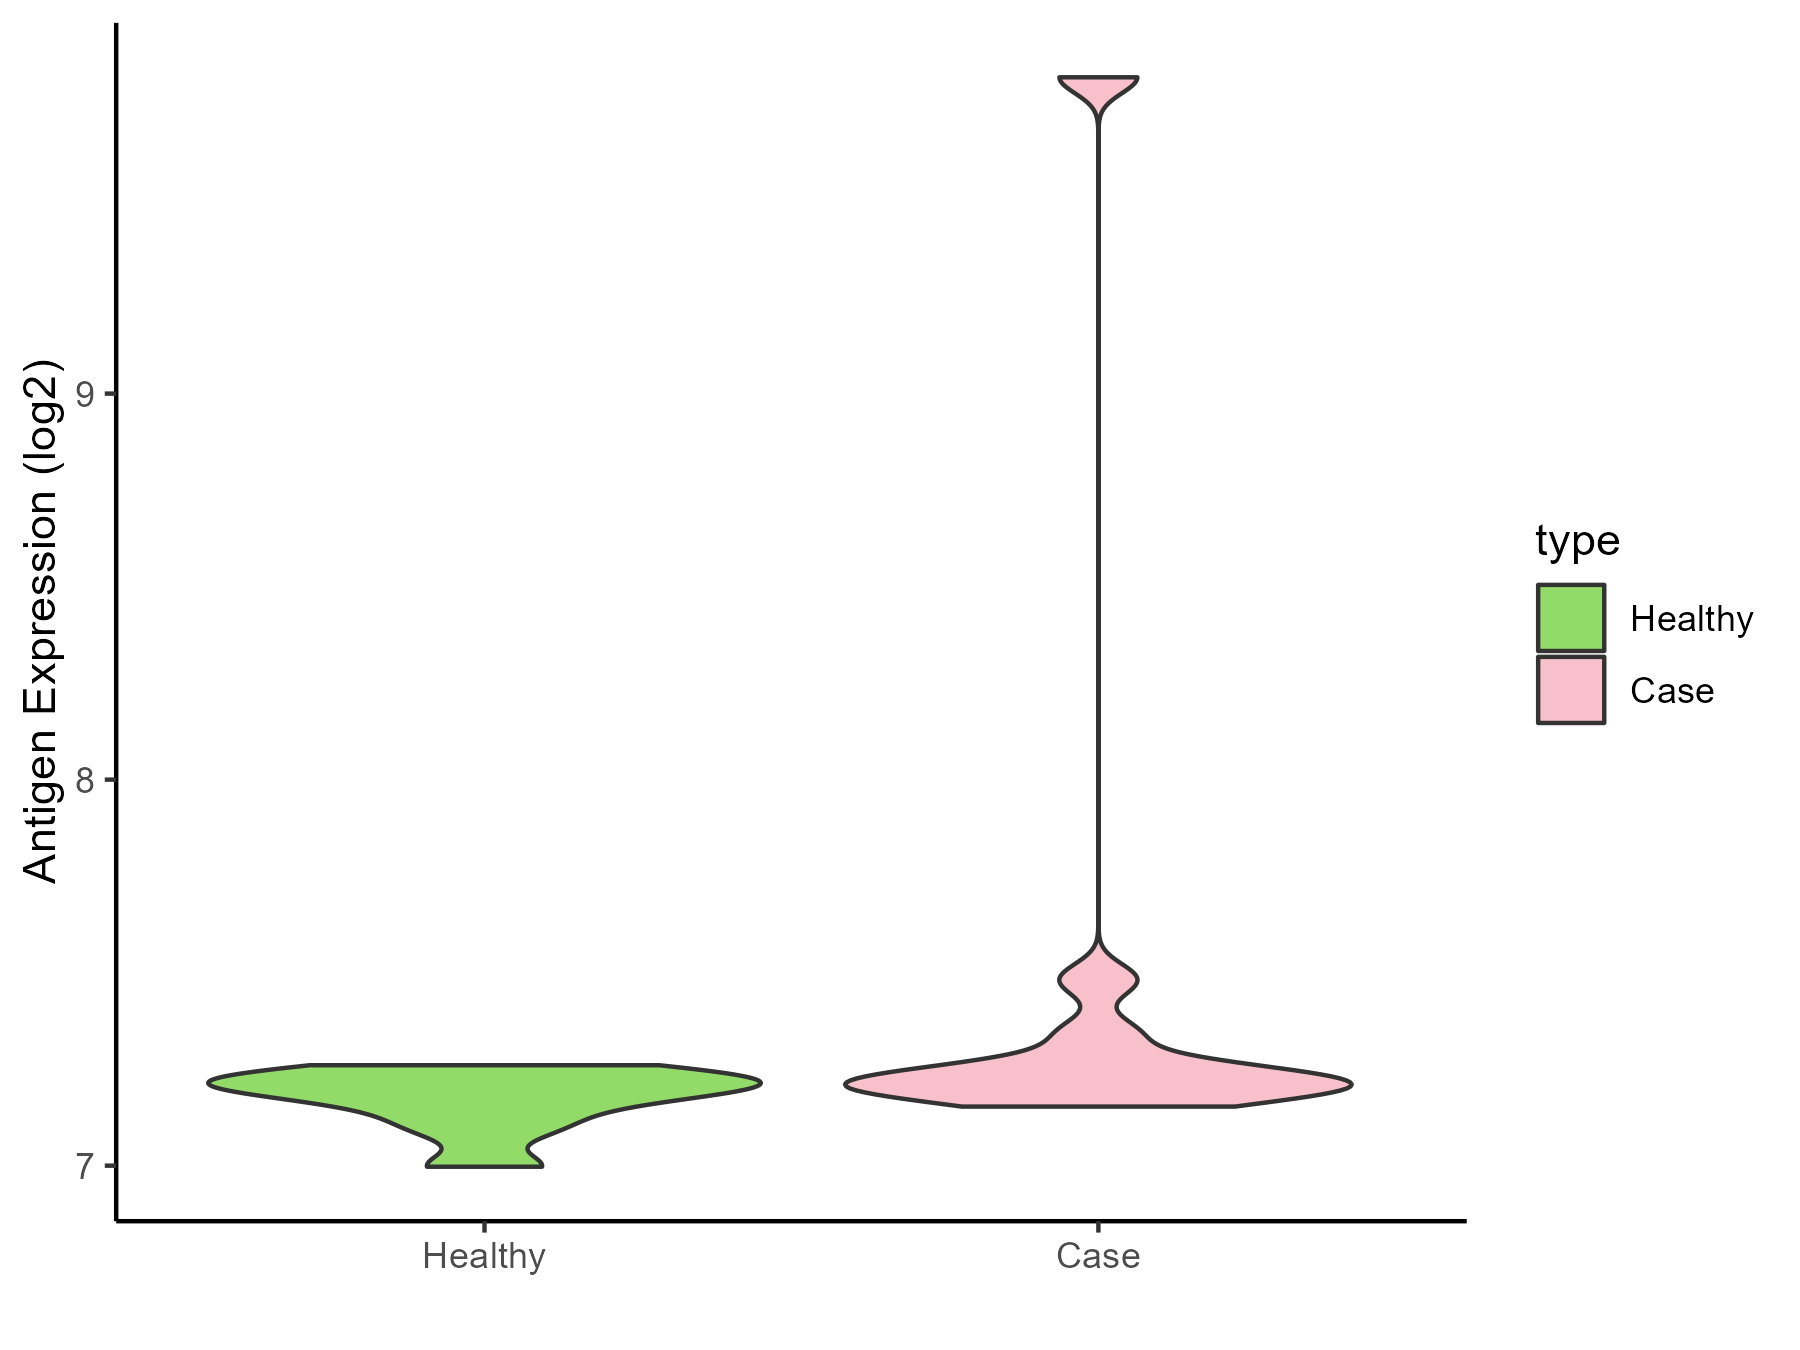
| Differential expression pattern of antigen in diseases | ||
| The Studied Tissue | Peripheral blood | |
| The Specific Disease | Immunodeficiency | |
| The Expression Level of Disease Section Compare with the Healthy Individual Tissue | p-value: 0.219754714; Fold-change: 0.028692585; Z-score: 0.346913397 | |
| Disease-specific Antigen Abundances |
|
Click to View the Clearer Original Diagram |
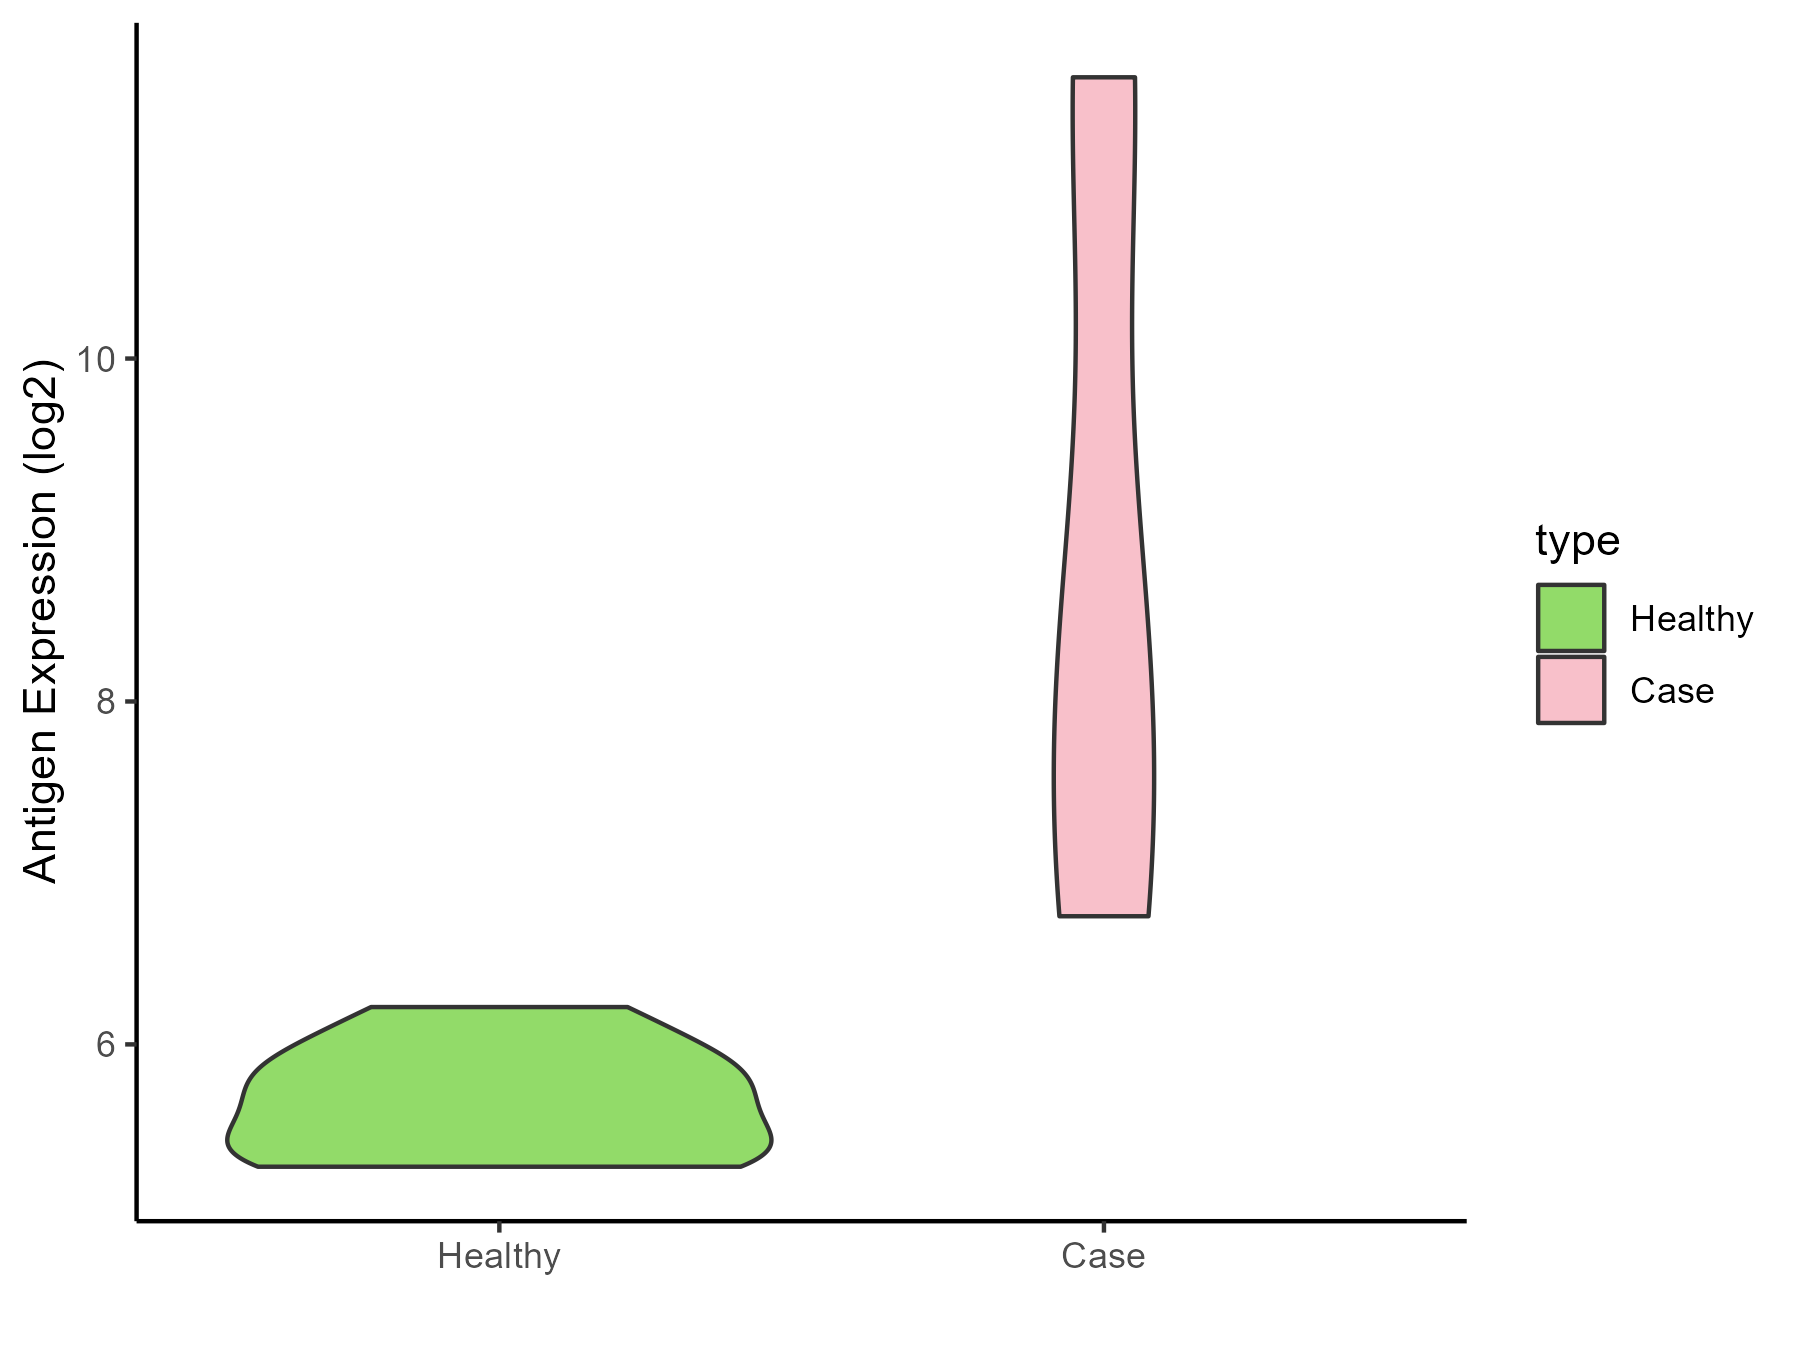
| Differential expression pattern of antigen in diseases | ||
| The Studied Tissue | Hyperplastic tonsil | |
| The Specific Disease | Apnea | |
| The Expression Level of Disease Section Compare with the Healthy Individual Tissue | p-value: 0.153197207; Fold-change: 2.635954591; Z-score: 7.589246911 | |
| Disease-specific Antigen Abundances |
|
Click to View the Clearer Original Diagram |
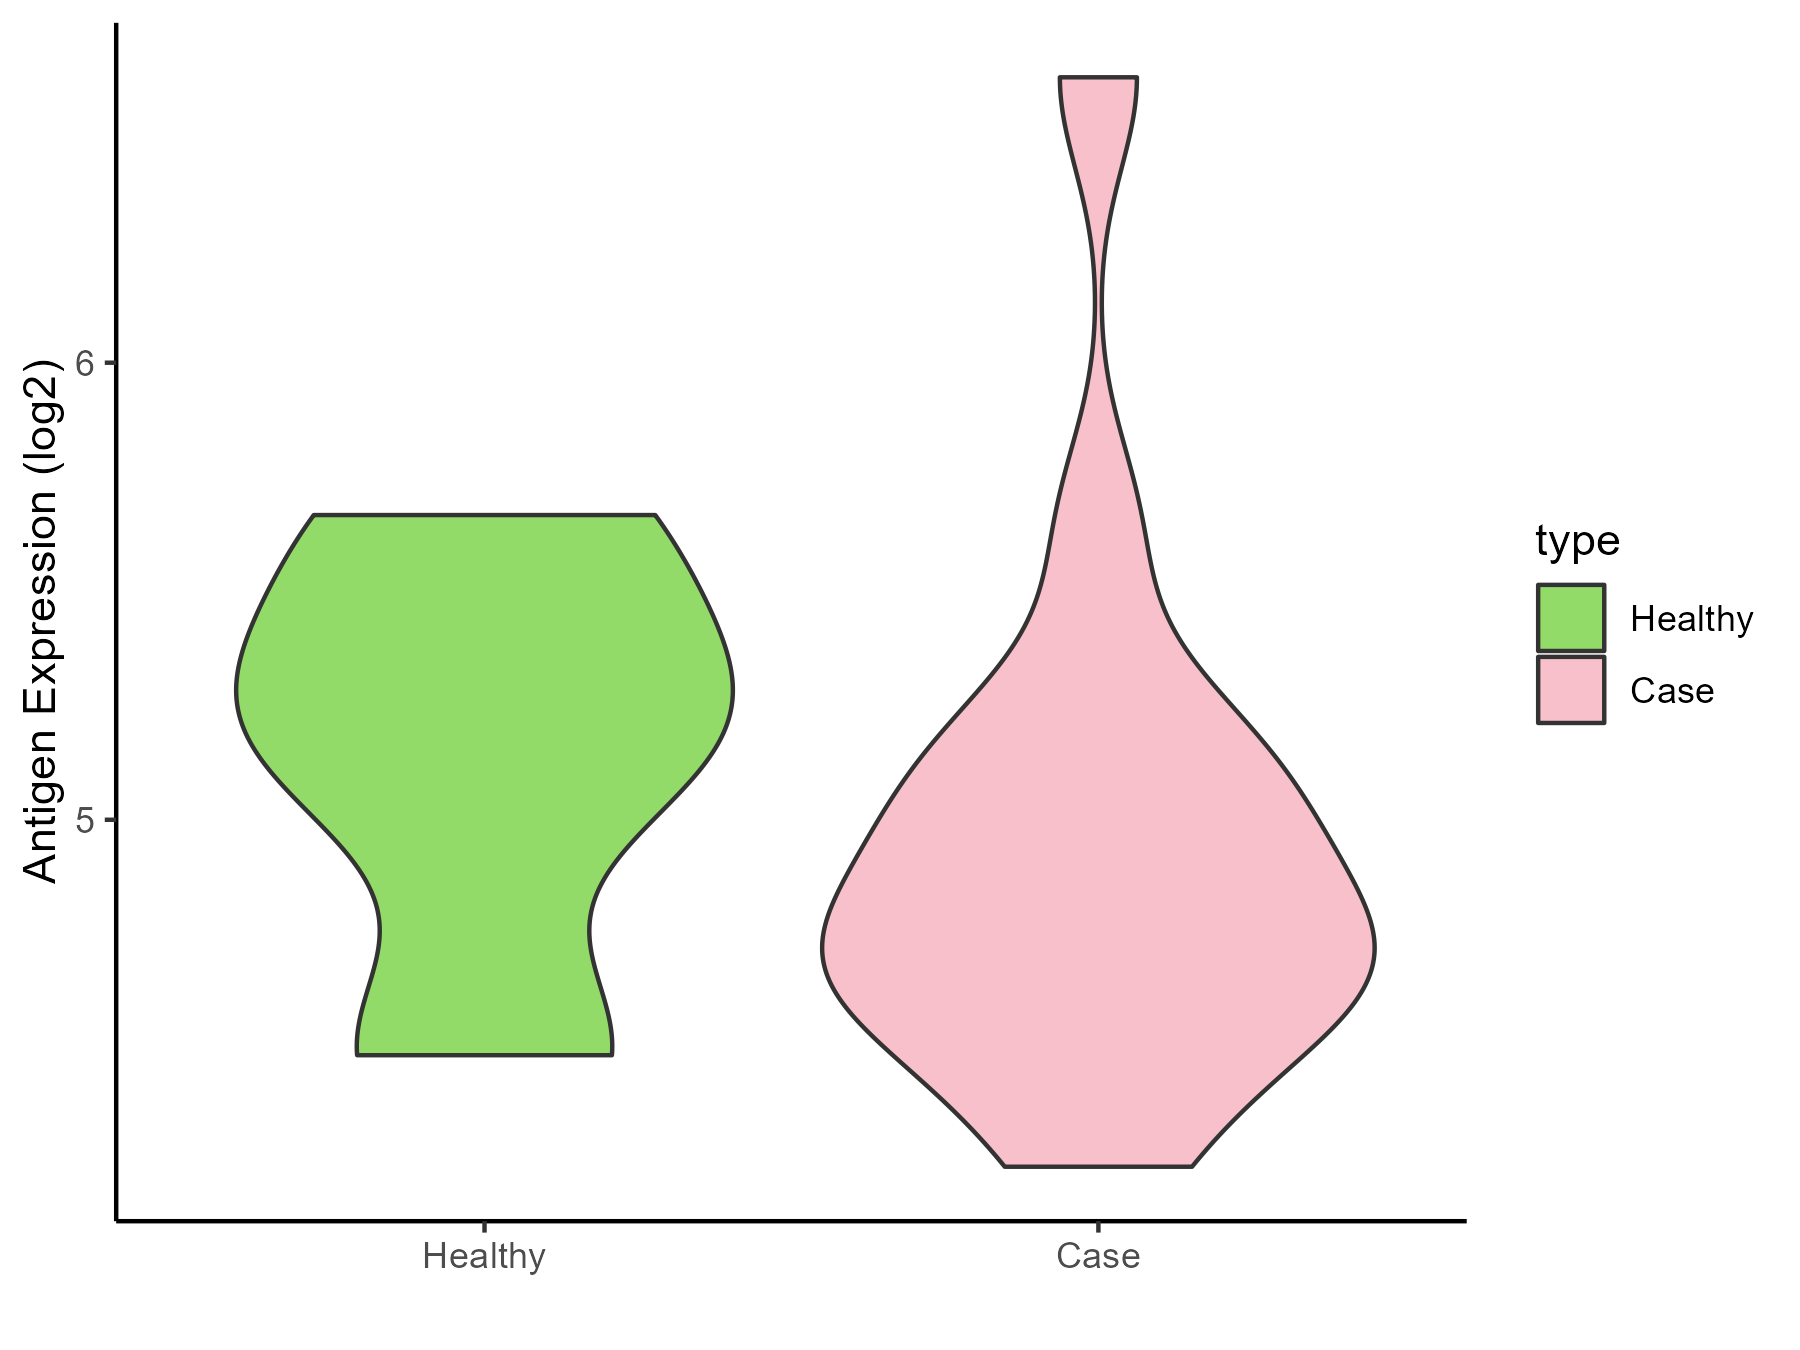
| Differential expression pattern of antigen in diseases | ||
| The Studied Tissue | Peripheral blood | |
| The Specific Disease | Olive pollen allergy | |
| The Expression Level of Disease Section Compare with the Healthy Individual Tissue | p-value: 0.529858726; Fold-change: -0.460972039; Z-score: -0.928468608 | |
| Disease-specific Antigen Abundances |
|
Click to View the Clearer Original Diagram |
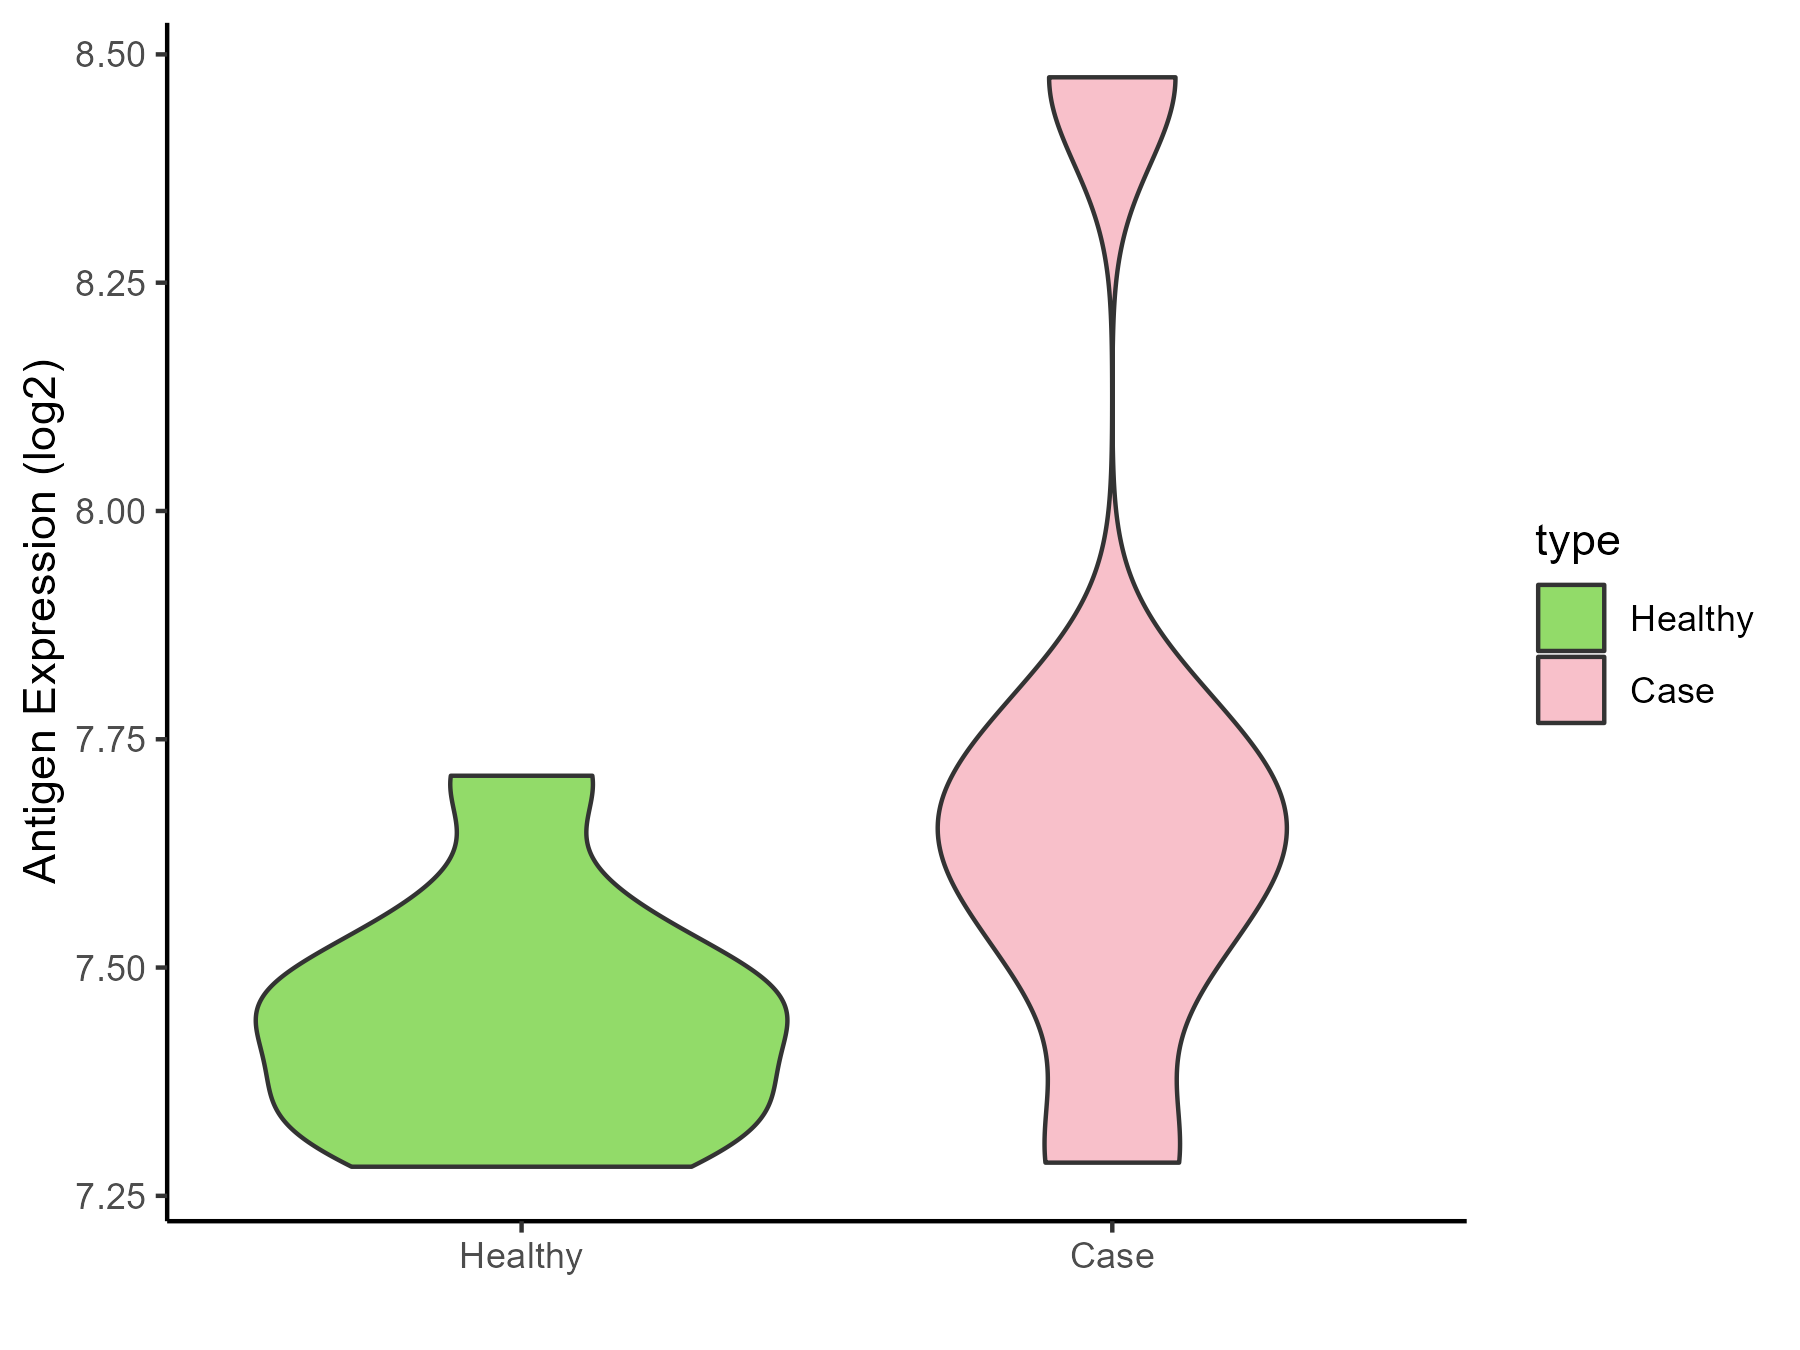
| Differential expression pattern of antigen in diseases | ||
| The Studied Tissue | Sinus mucosa | |
| The Specific Disease | Chronic rhinosinusitis | |
| The Expression Level of Disease Section Compare with the Healthy Individual Tissue | p-value: 0.156561014; Fold-change: 0.199657374; Z-score: 1.512898194 | |
| Disease-specific Antigen Abundances |
|
Click to View the Clearer Original Diagram |
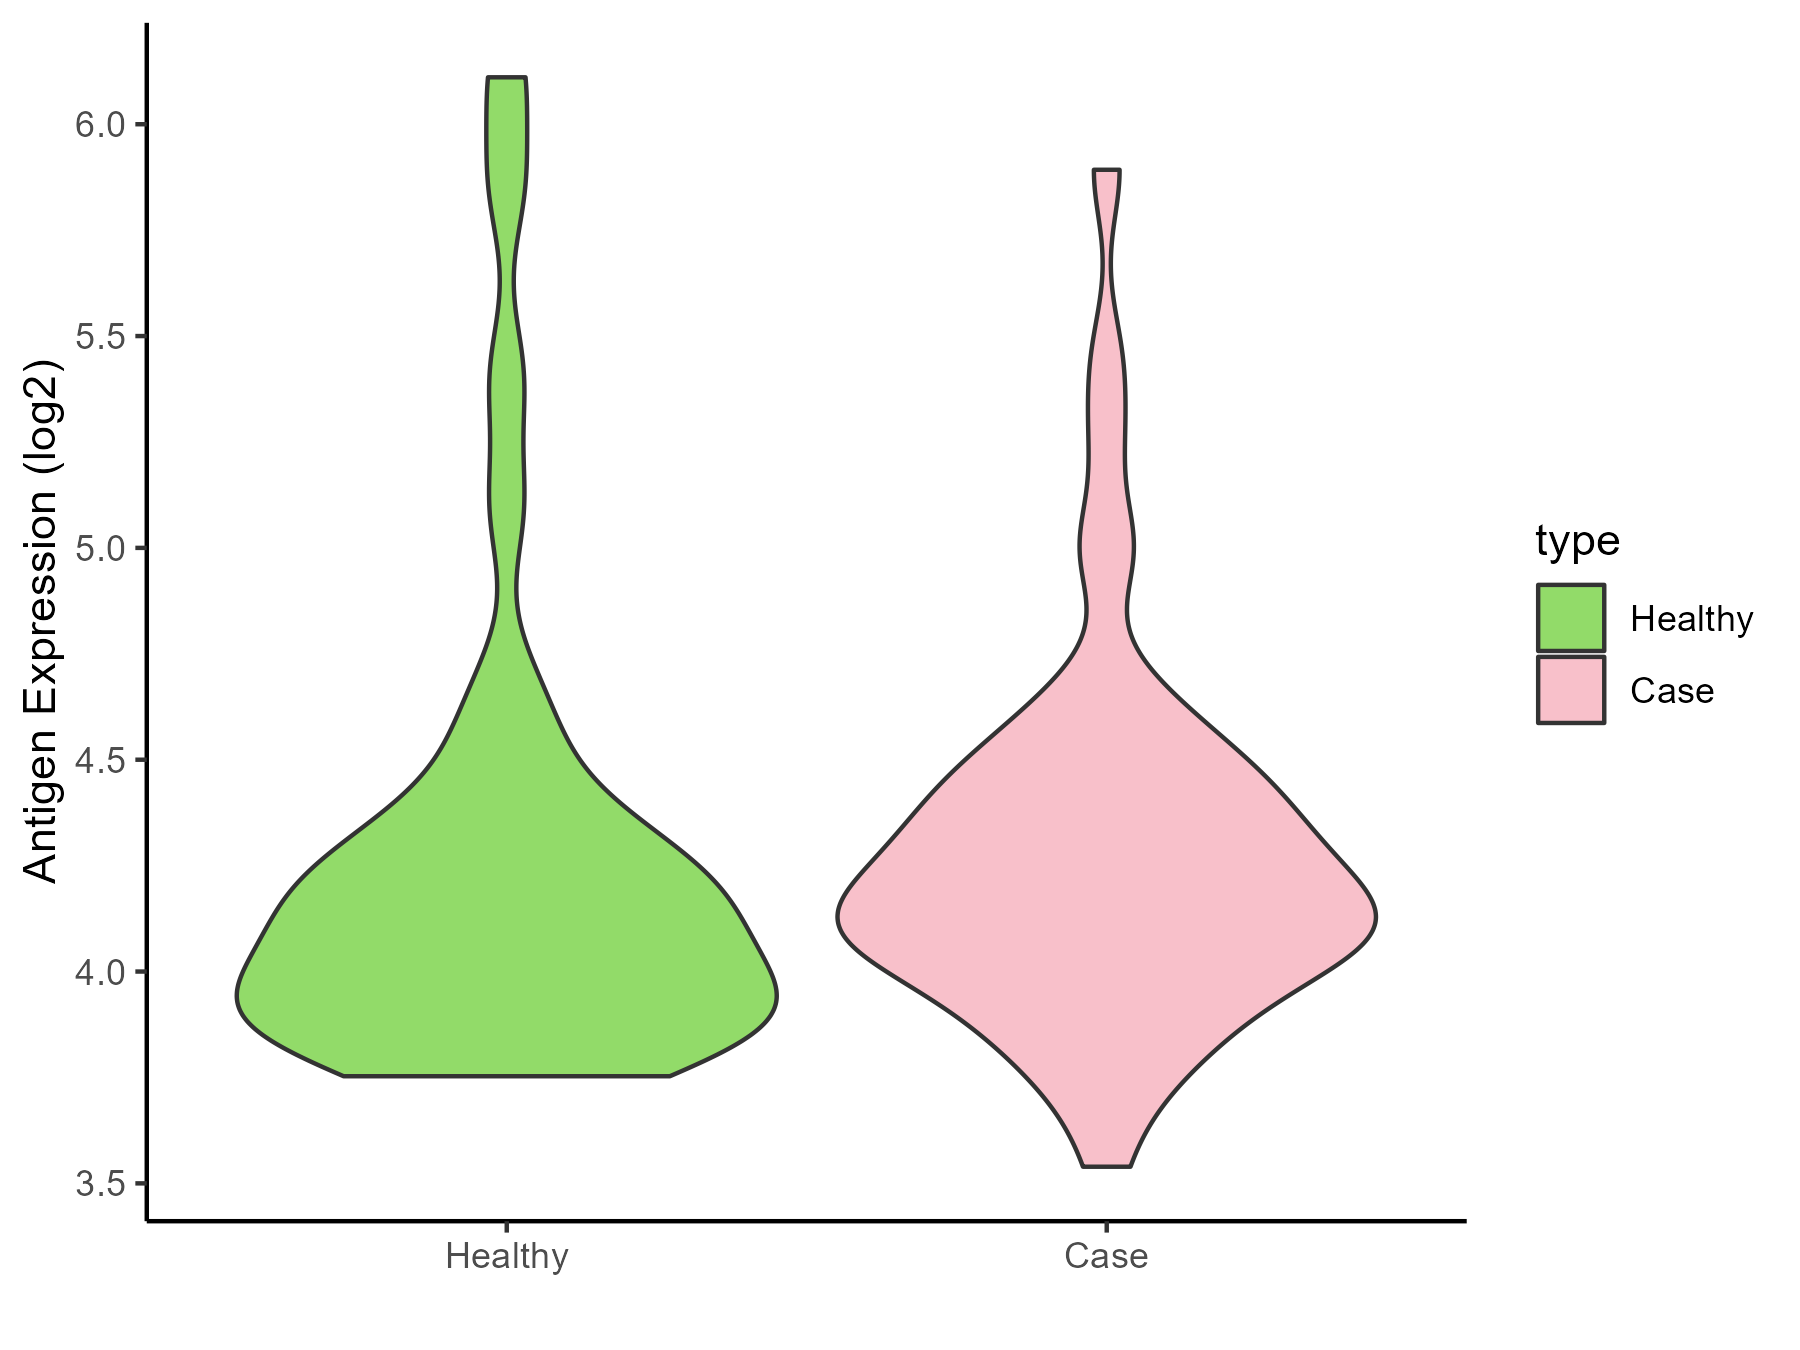
| Differential expression pattern of antigen in diseases | ||
| The Studied Tissue | Lung | |
| The Specific Disease | Chronic obstructive pulmonary disease | |
| The Expression Level of Disease Section Compare with the Healthy Individual Tissue | p-value: 0.741936726; Fold-change: 0.090273878; Z-score: 0.166244675 | |
| Disease-specific Antigen Abundances |
|
Click to View the Clearer Original Diagram |
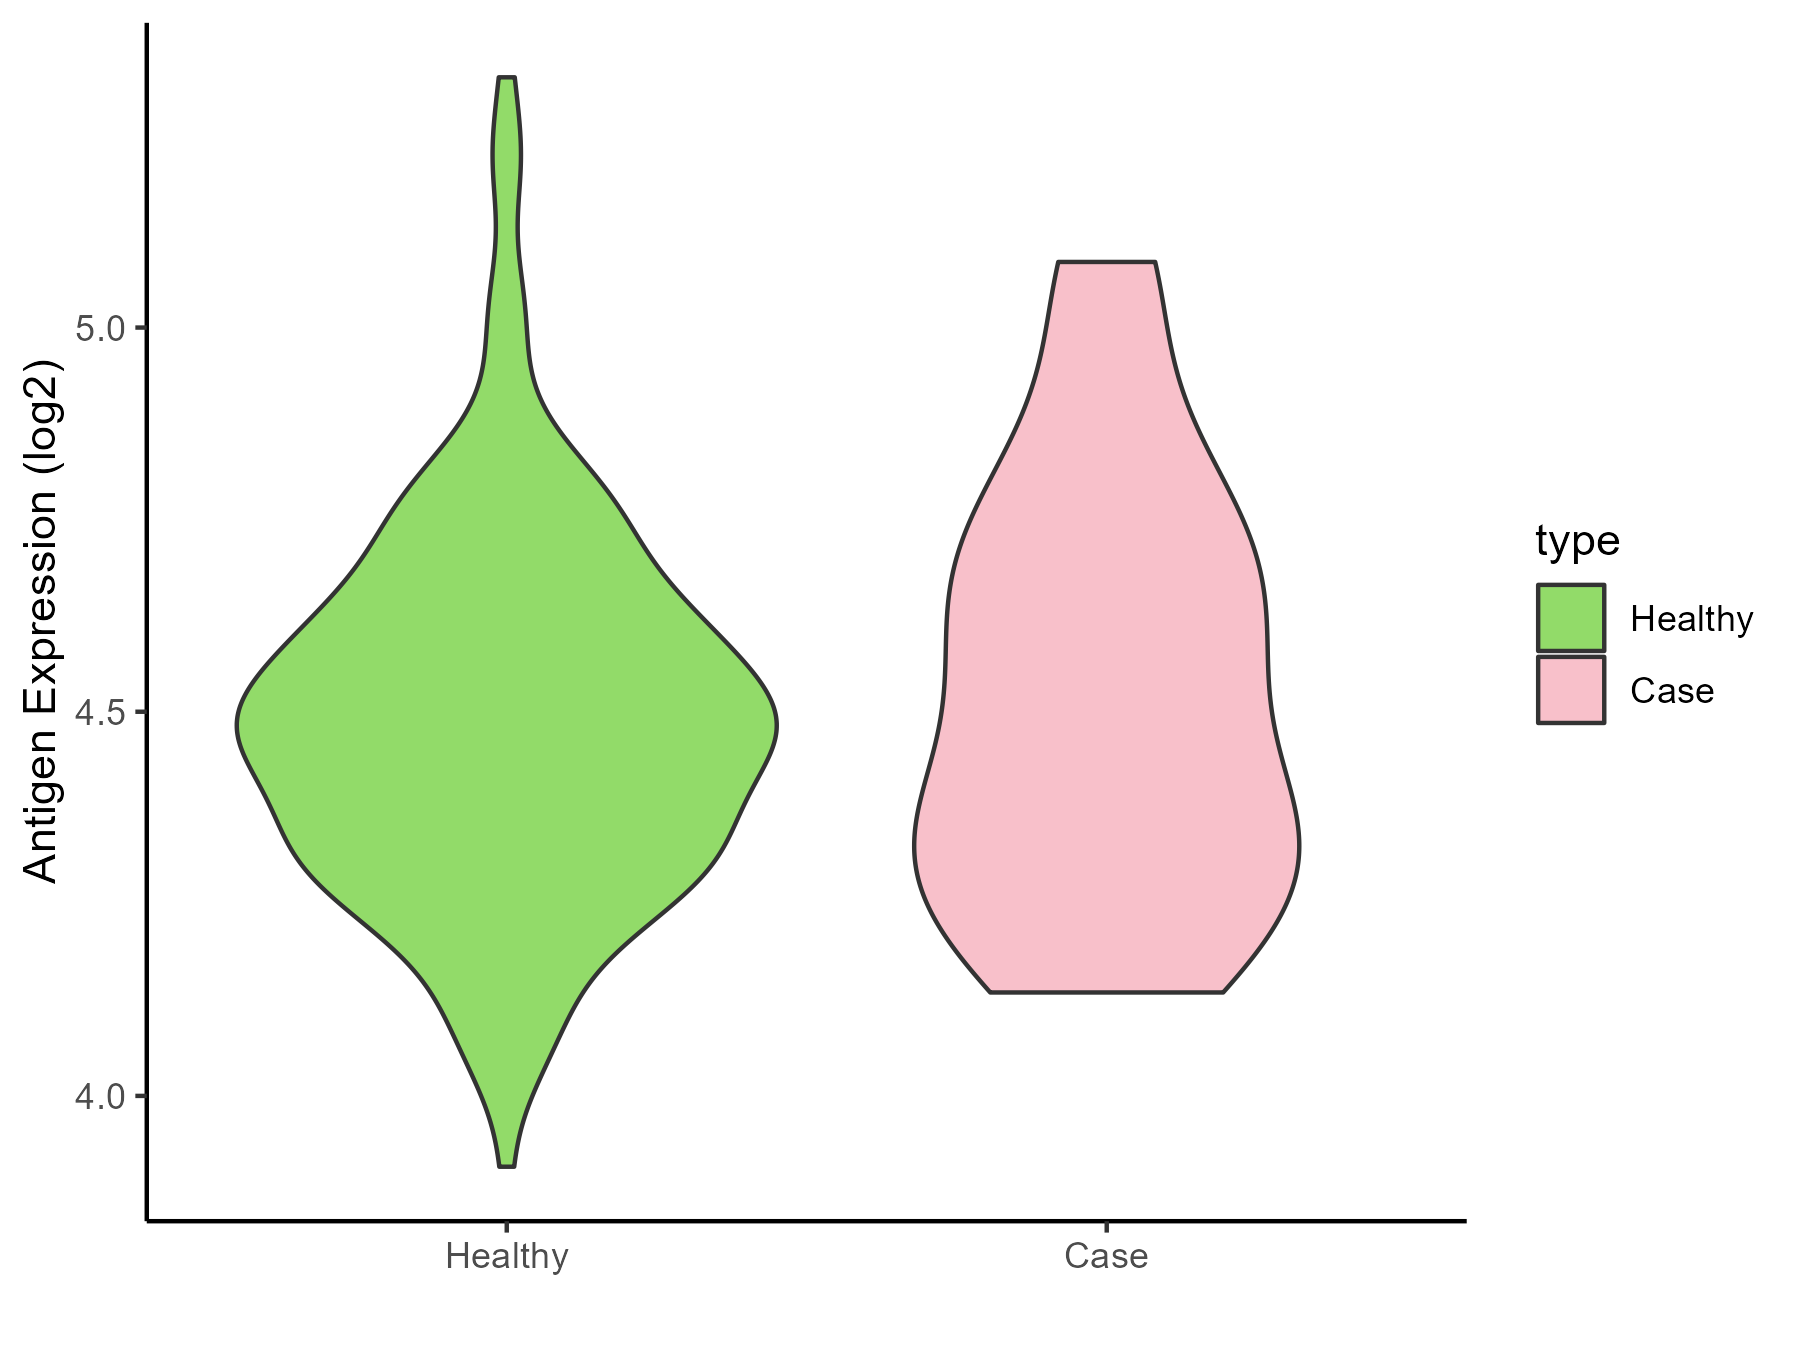
| The Studied Tissue | Small airway epithelium | |
| The Specific Disease | Chronic obstructive pulmonary disease | |
| The Expression Level of Disease Section Compare with the Healthy Individual Tissue | p-value: 0.520452716; Fold-change: 0.032009978; Z-score: 0.136440017 | |
| Disease-specific Antigen Abundances |
|
Click to View the Clearer Original Diagram |
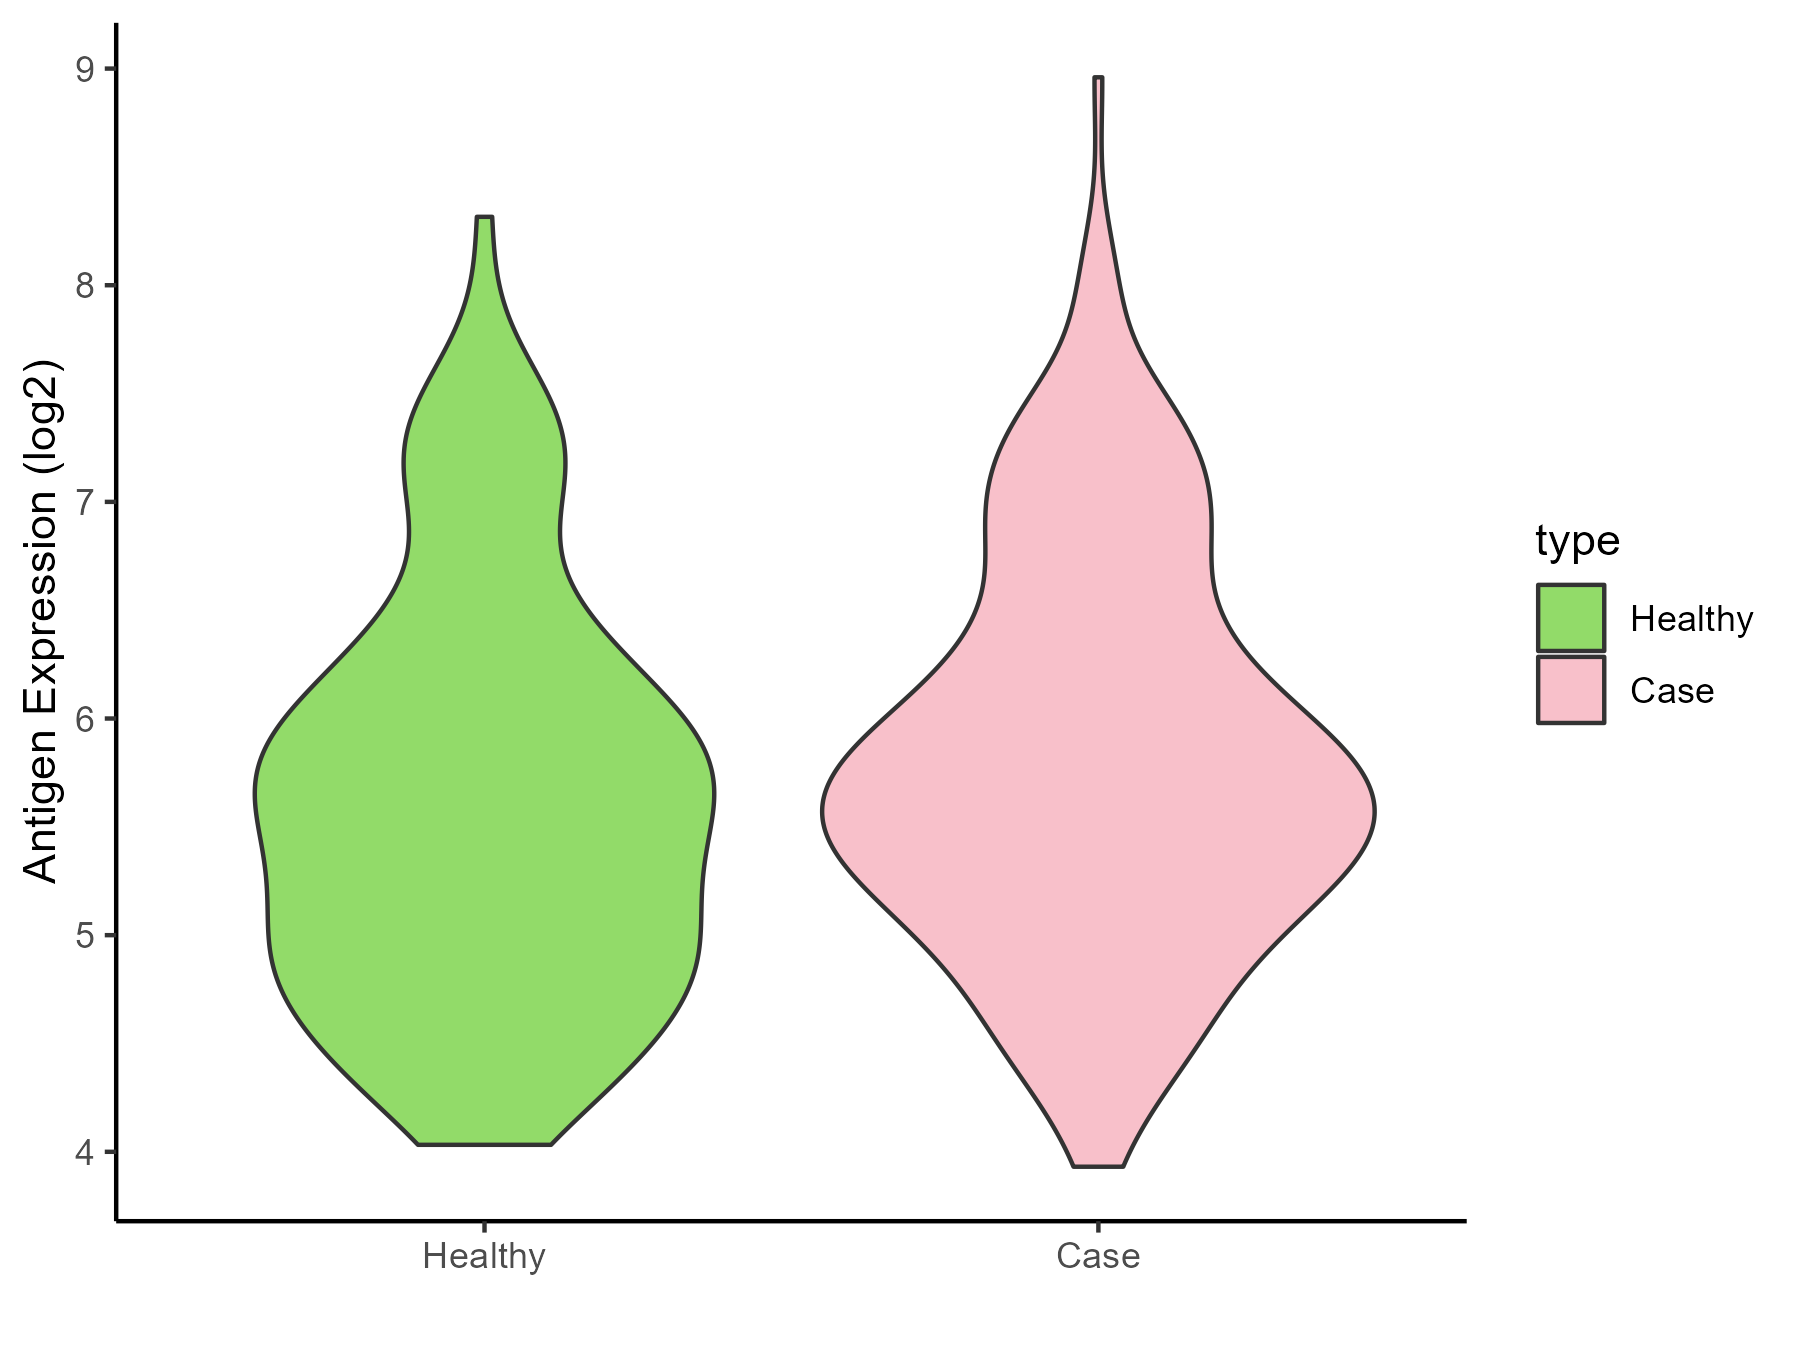
| Differential expression pattern of antigen in diseases | ||
| The Studied Tissue | Nasal and bronchial airway | |
| The Specific Disease | Asthma | |
| The Expression Level of Disease Section Compare with the Healthy Individual Tissue | p-value: 0.049596063; Fold-change: 0.166926113; Z-score: 0.179644725 | |
| Disease-specific Antigen Abundances |
|
Click to View the Clearer Original Diagram |
| Differential expression pattern of antigen in diseases | ||
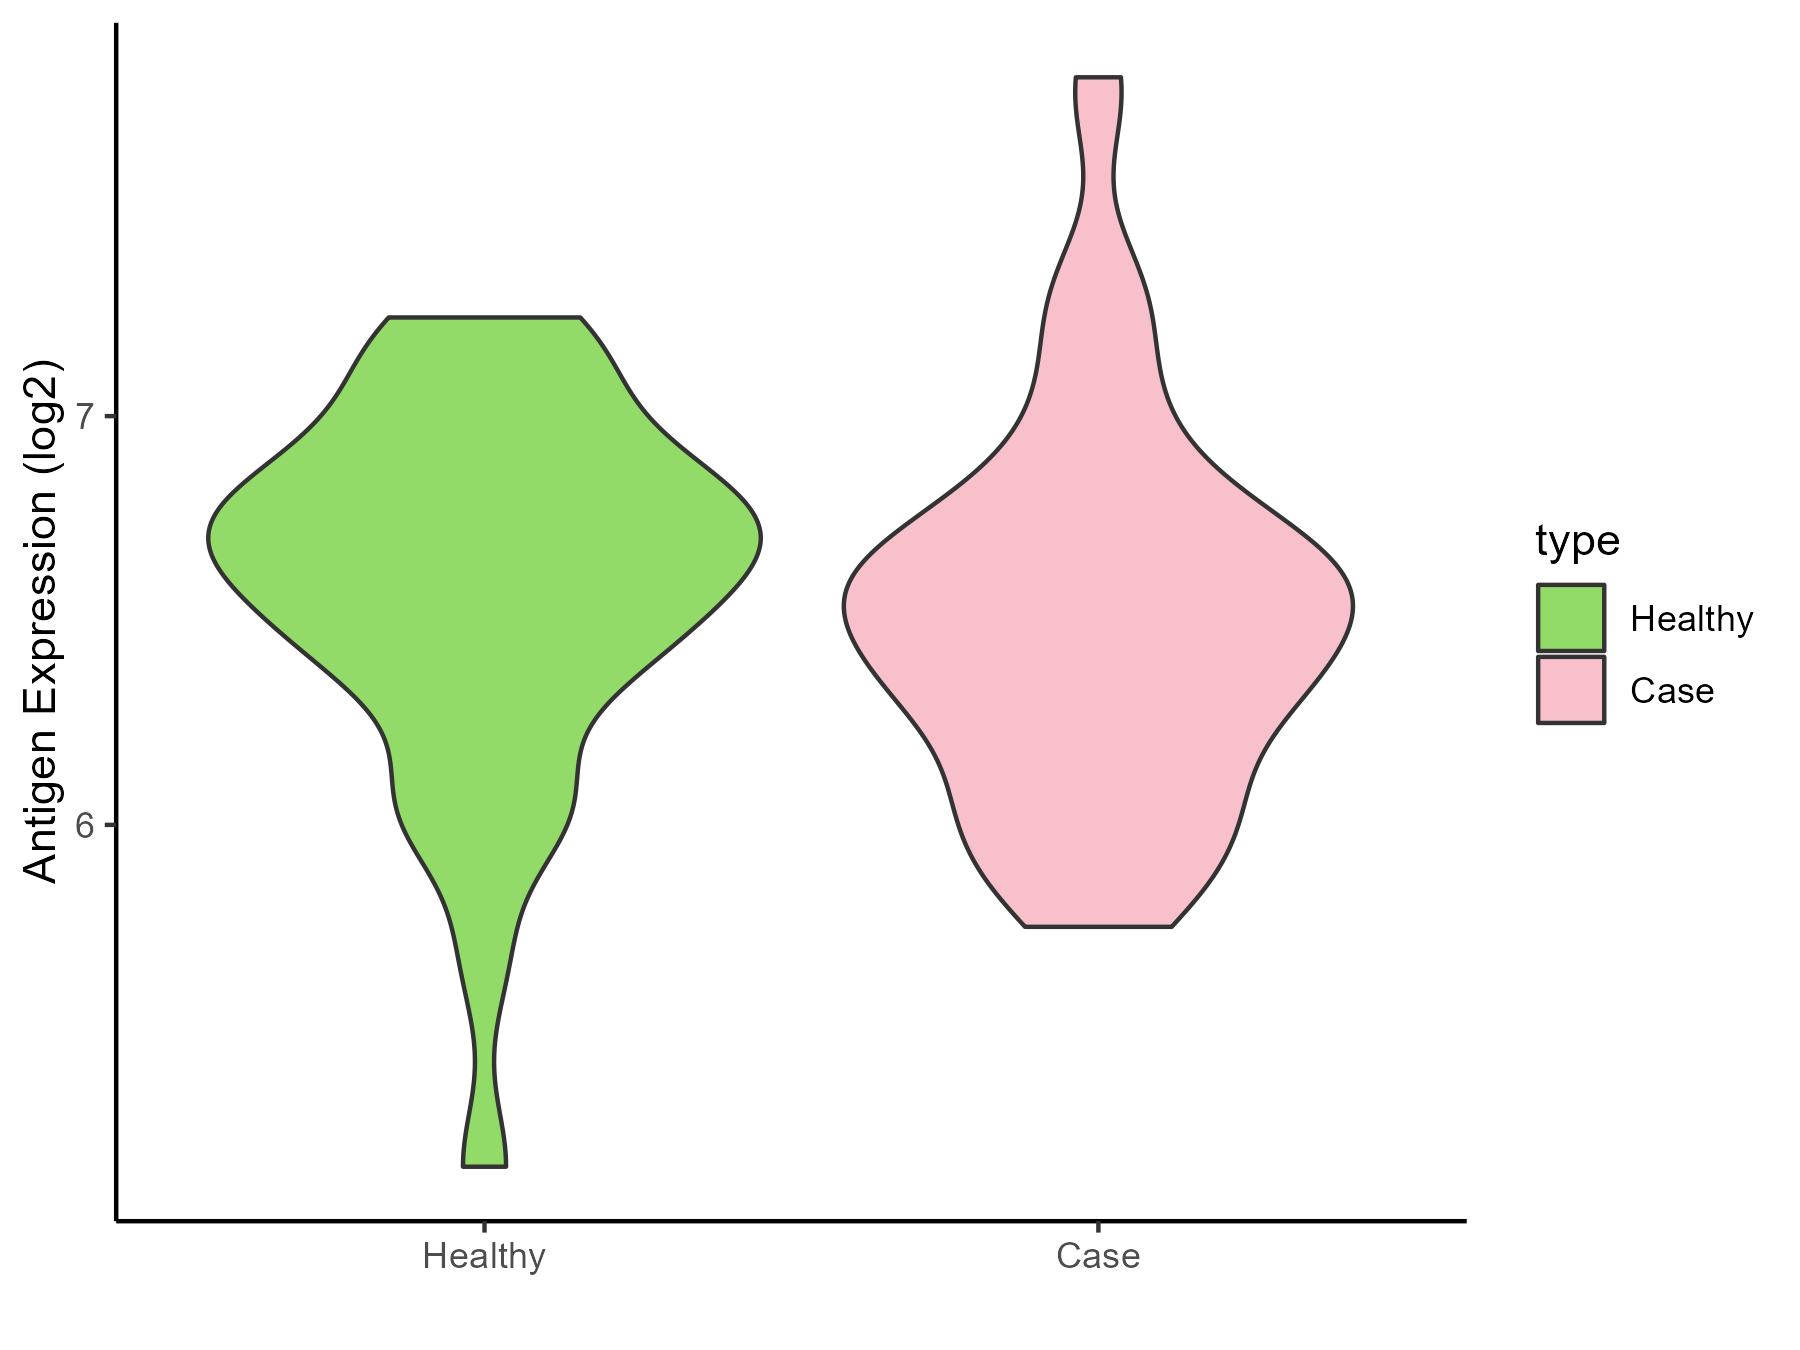
| The Studied Tissue | Nasal Epithelium | |
| The Specific Disease | Human rhinovirus infection | |
| The Expression Level of Disease Section Compare with the Healthy Individual Tissue | p-value: 0.466133351; Fold-change: -0.140115629; Z-score: -0.306750224 | |
| Disease-specific Antigen Abundances |
|
Click to View the Clearer Original Diagram |
| Differential expression pattern of antigen in diseases | ||
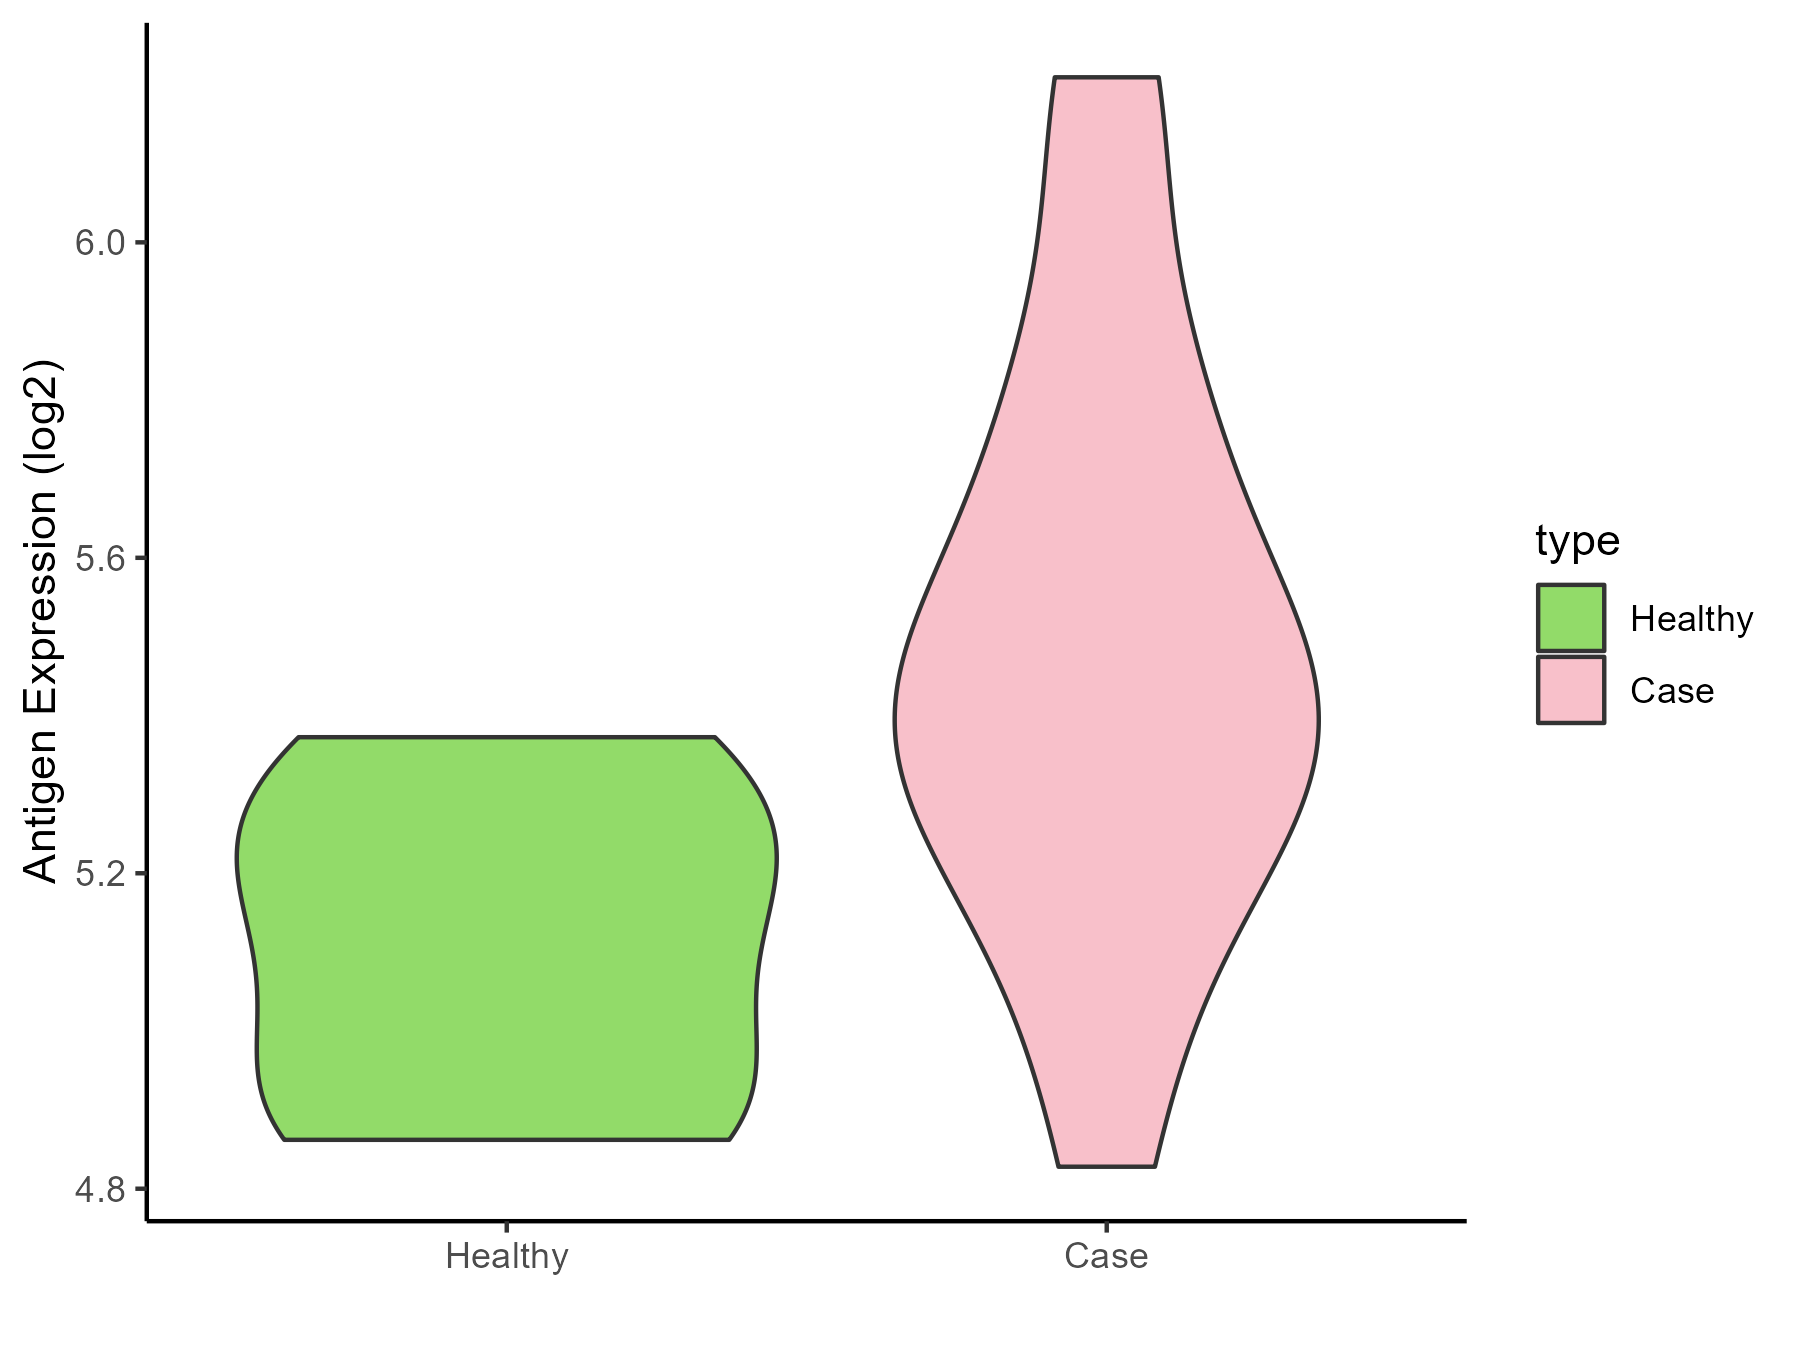
| The Studied Tissue | Lung | |
| The Specific Disease | Idiopathic pulmonary fibrosis | |
| The Expression Level of Disease Section Compare with the Healthy Individual Tissue | p-value: 0.014384669; Fold-change: 0.289016178; Z-score: 1.340521578 | |
| Disease-specific Antigen Abundances |
|
Click to View the Clearer Original Diagram |
ICD Disease Classification 13
| Differential expression pattern of antigen in diseases | ||
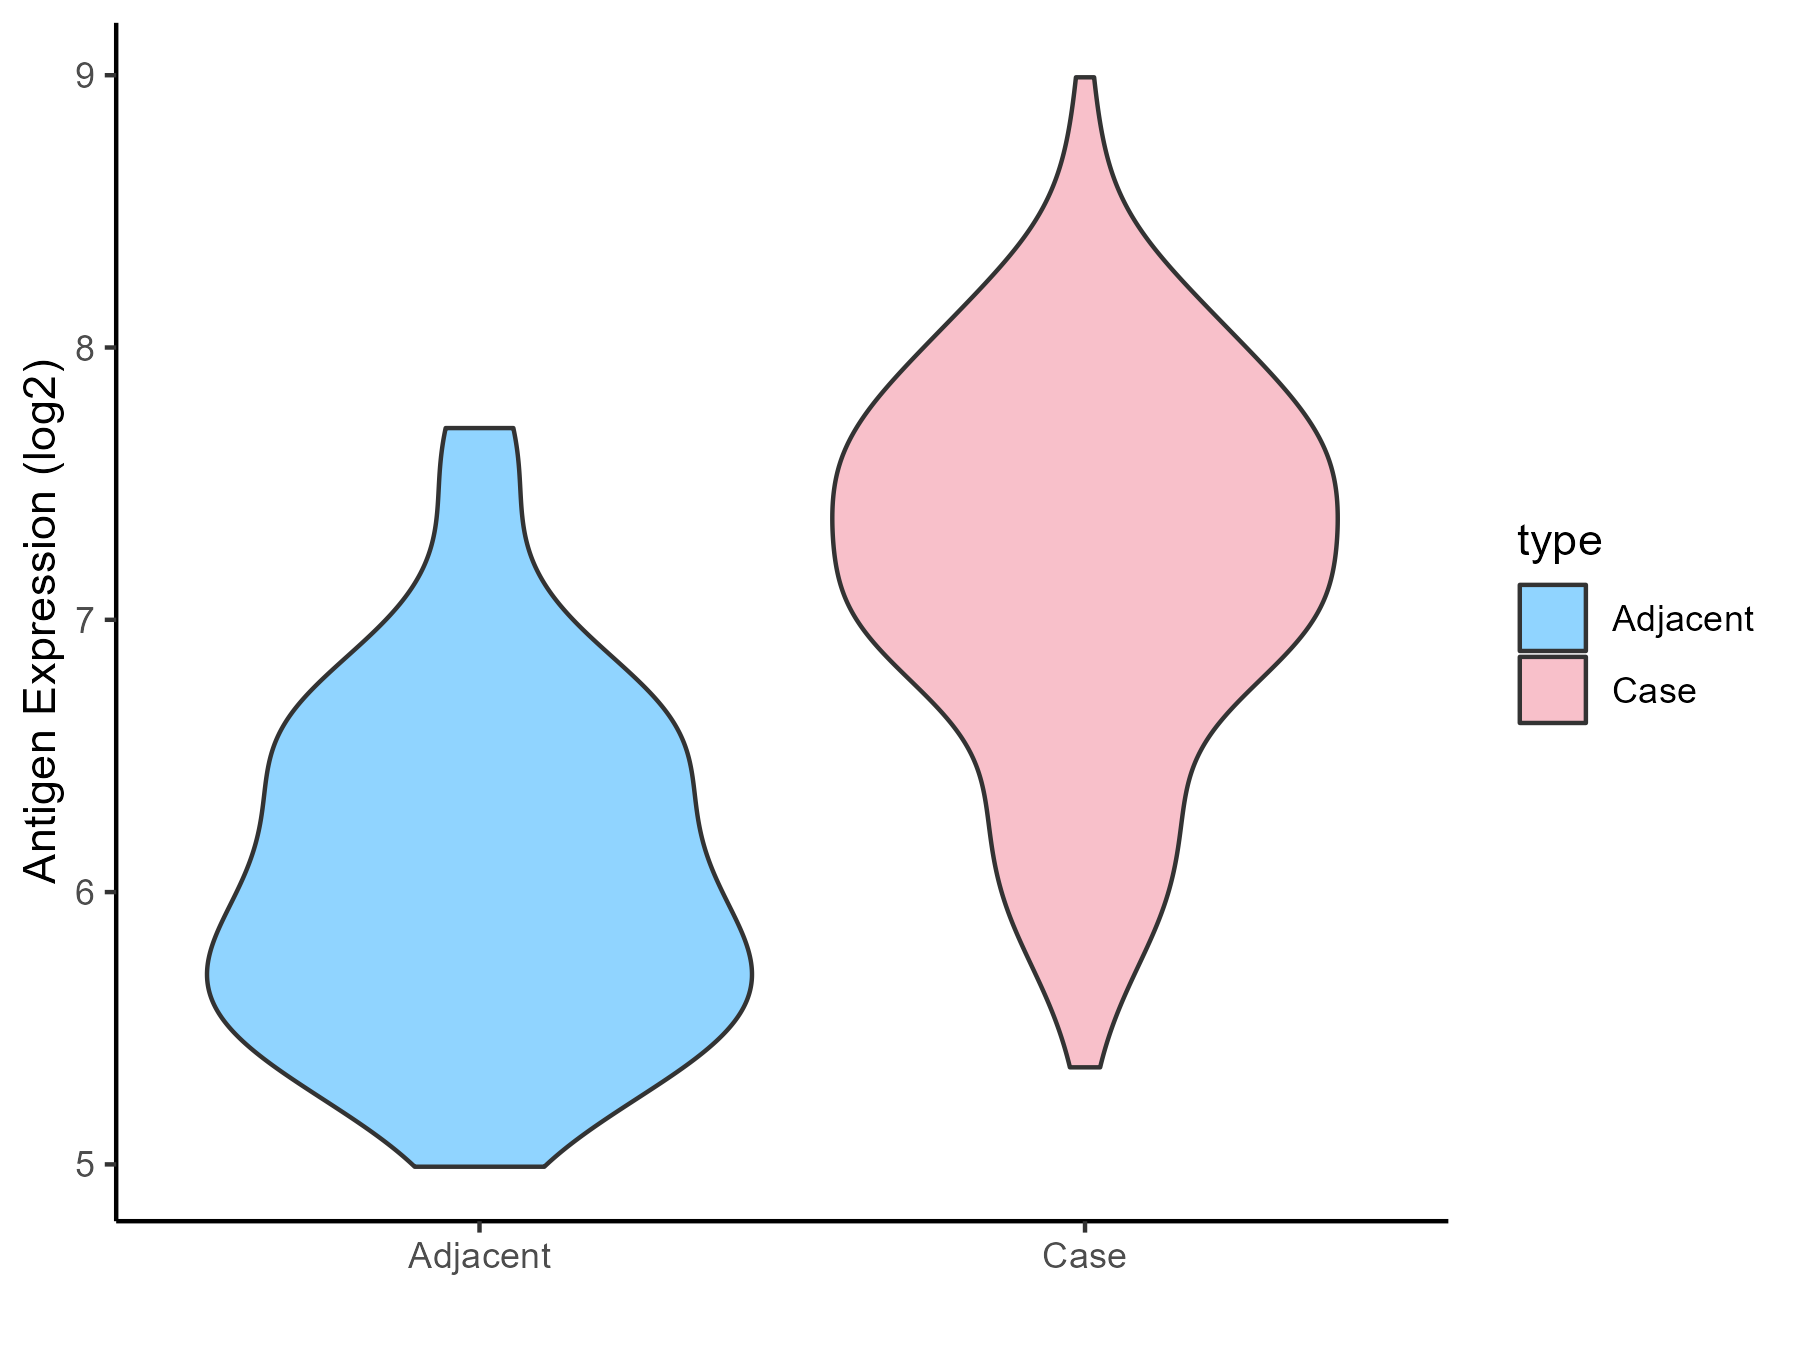
| The Studied Tissue | Gingival | |
| The Specific Disease | Periodontal disease | |
| The Expression Level of Disease Section Compare with the Adjacent Tissue | p-value: 1.31E-19; Fold-change: 1.256173632; Z-score: 1.99635053 | |
| Disease-specific Antigen Abundances |
|
Click to View the Clearer Original Diagram |
| Differential expression pattern of antigen in diseases | ||
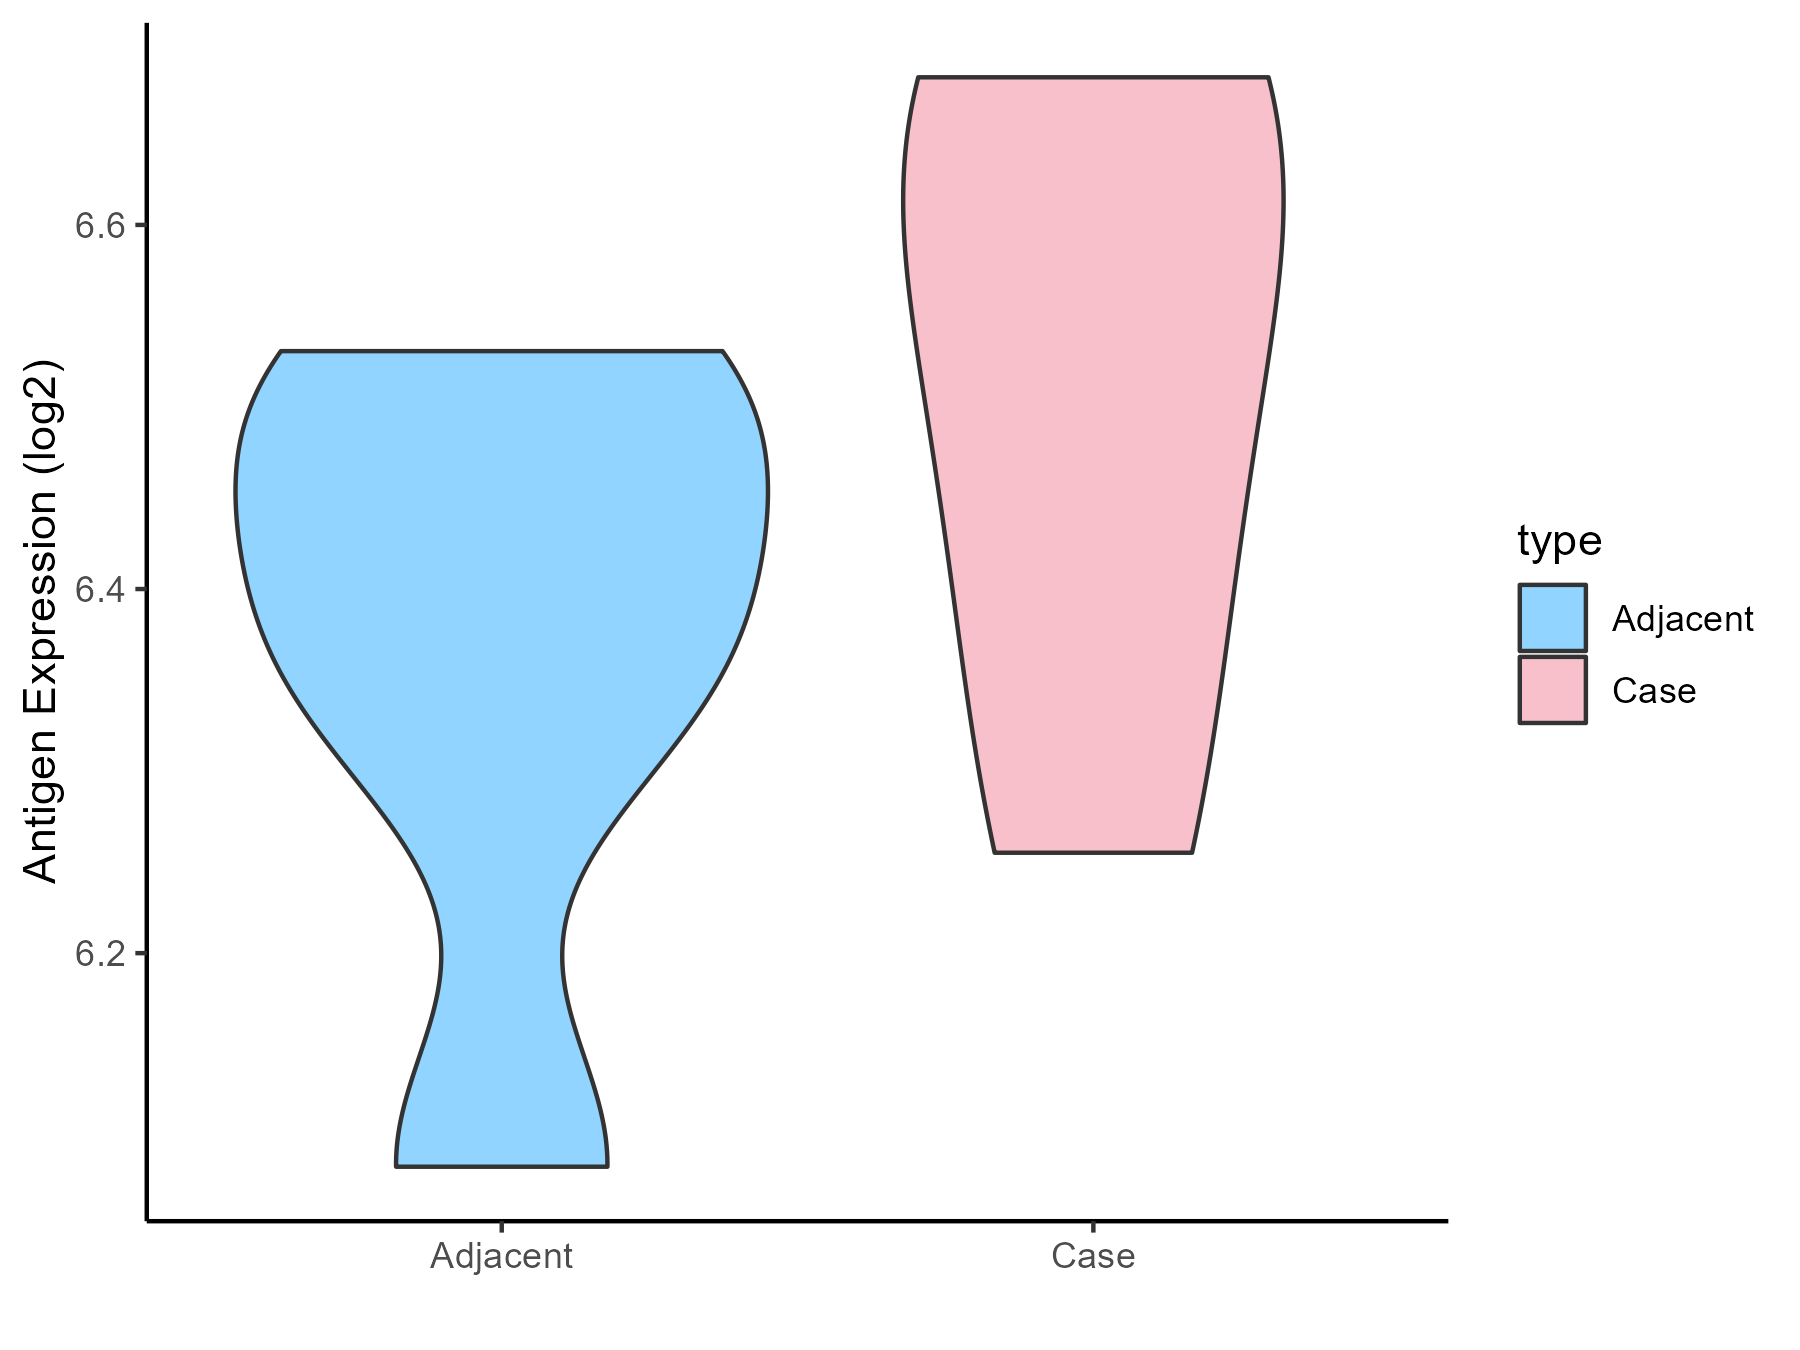
| The Studied Tissue | Gastric antrum | |
| The Specific Disease | Eosinophilic gastritis | |
| The Expression Level of Disease Section Compare with the Adjacent Tissue | p-value: 0.225972021; Fold-change: 0.146139245; Z-score: 0.828675724 | |
| Disease-specific Antigen Abundances |
|
Click to View the Clearer Original Diagram |
| Differential expression pattern of antigen in diseases | ||
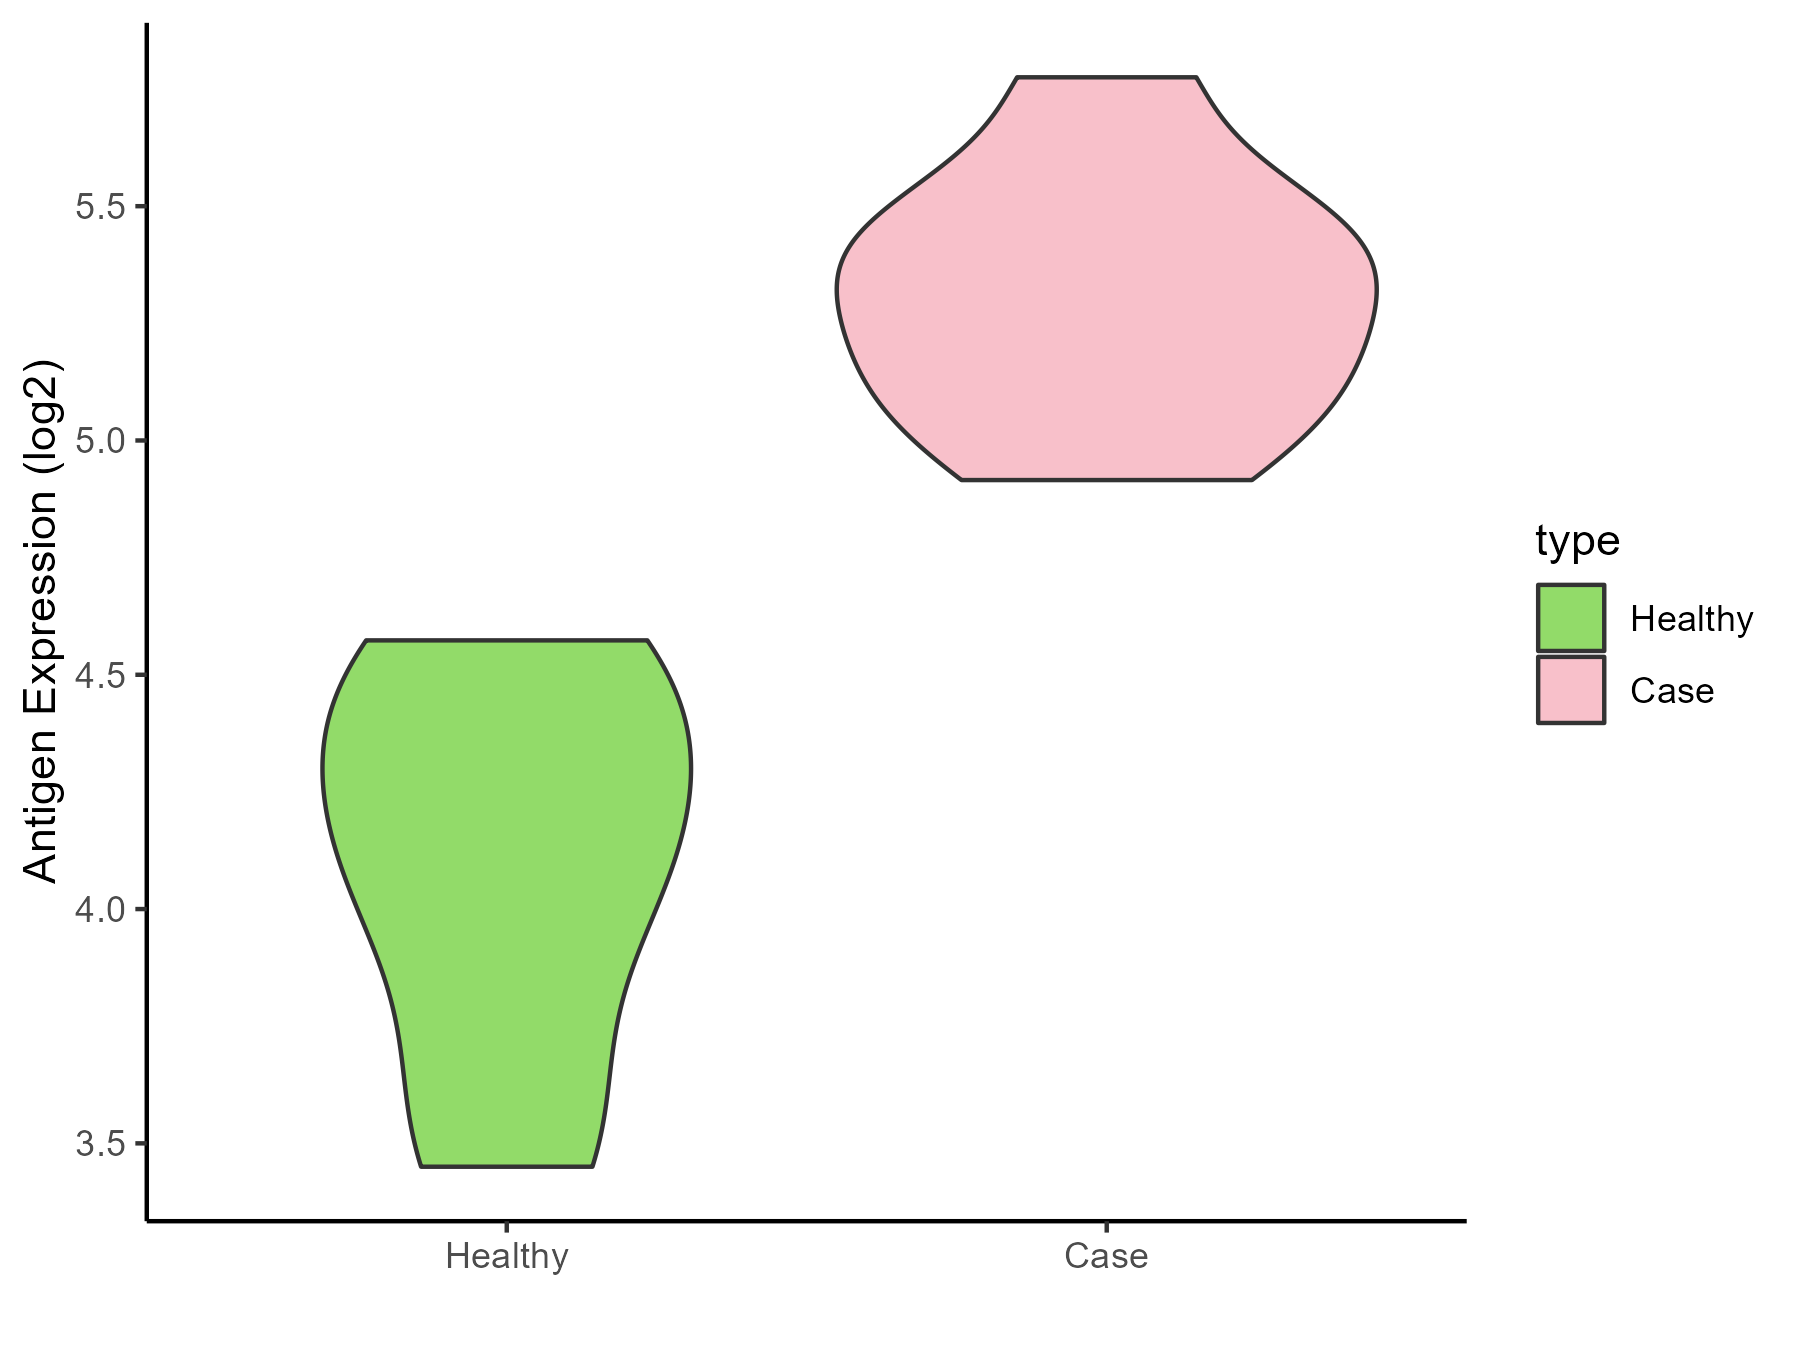
| The Studied Tissue | Liver | |
| The Specific Disease | Liver failure | |
| The Expression Level of Disease Section Compare with the Healthy Individual Tissue | p-value: 1.37E-05; Fold-change: 1.163260039; Z-score: 2.855390447 | |
| Disease-specific Antigen Abundances |
|
Click to View the Clearer Original Diagram |
| Differential expression pattern of antigen in diseases | ||
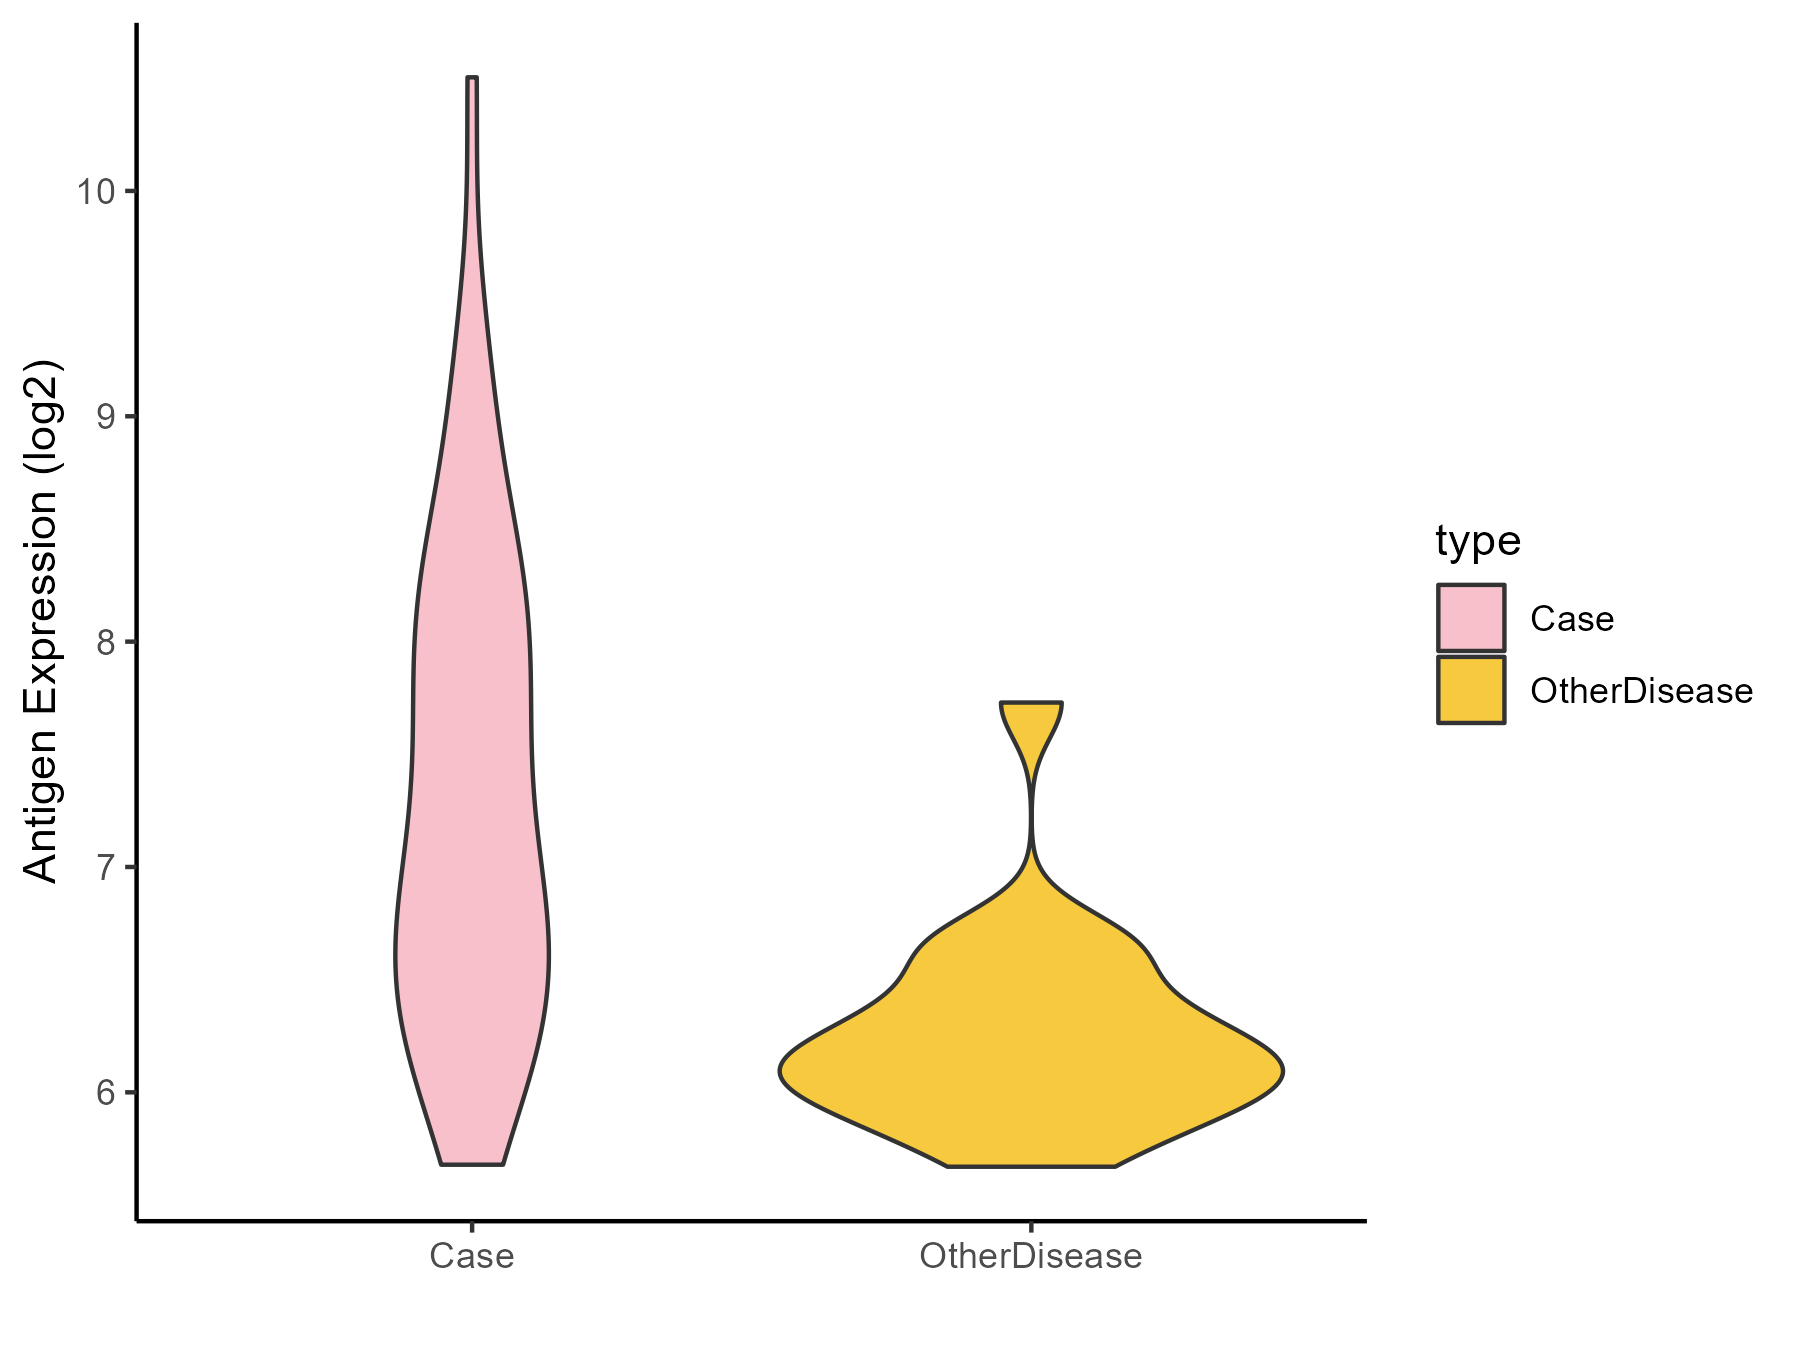
| The Studied Tissue | Colon mucosal | |
| The Specific Disease | Ulcerative colitis | |
| The Expression Level of Disease Section Compare with the Adjacent Tissue | p-value: 7.85E-07; Fold-change: 0.941311897; Z-score: 2.017070851 | |
| Disease-specific Antigen Abundances |
|
Click to View the Clearer Original Diagram |
| Differential expression pattern of antigen in diseases | ||
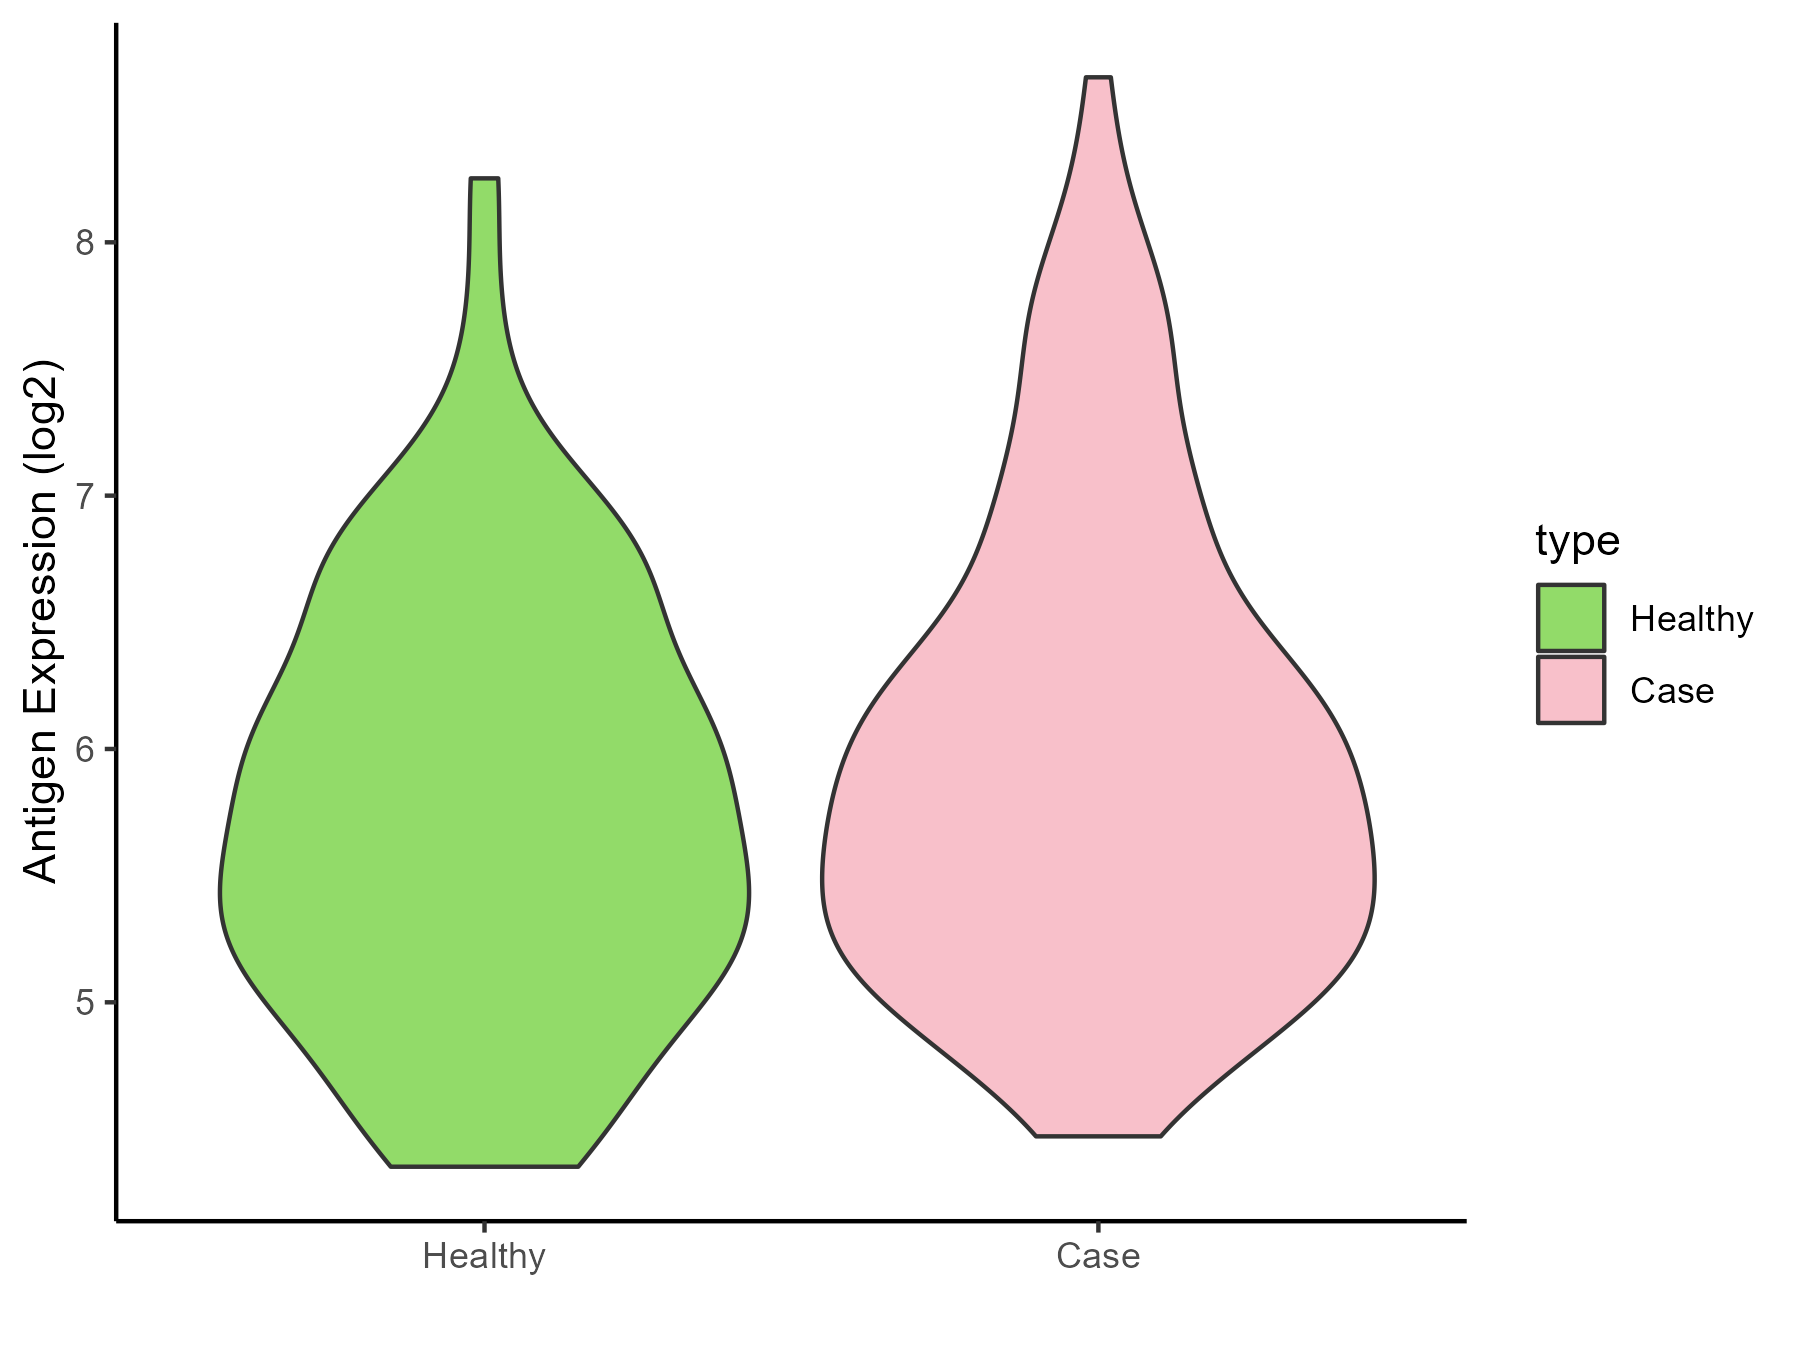
| The Studied Tissue | Rectal colon | |
| The Specific Disease | Irritable bowel syndrome | |
| The Expression Level of Disease Section Compare with the Healthy Individual Tissue | p-value: 0.100570905; Fold-change: 0.083680268; Z-score: 0.099594296 | |
| Disease-specific Antigen Abundances |
|
Click to View the Clearer Original Diagram |
ICD Disease Classification 14
| Differential expression pattern of antigen in diseases | ||
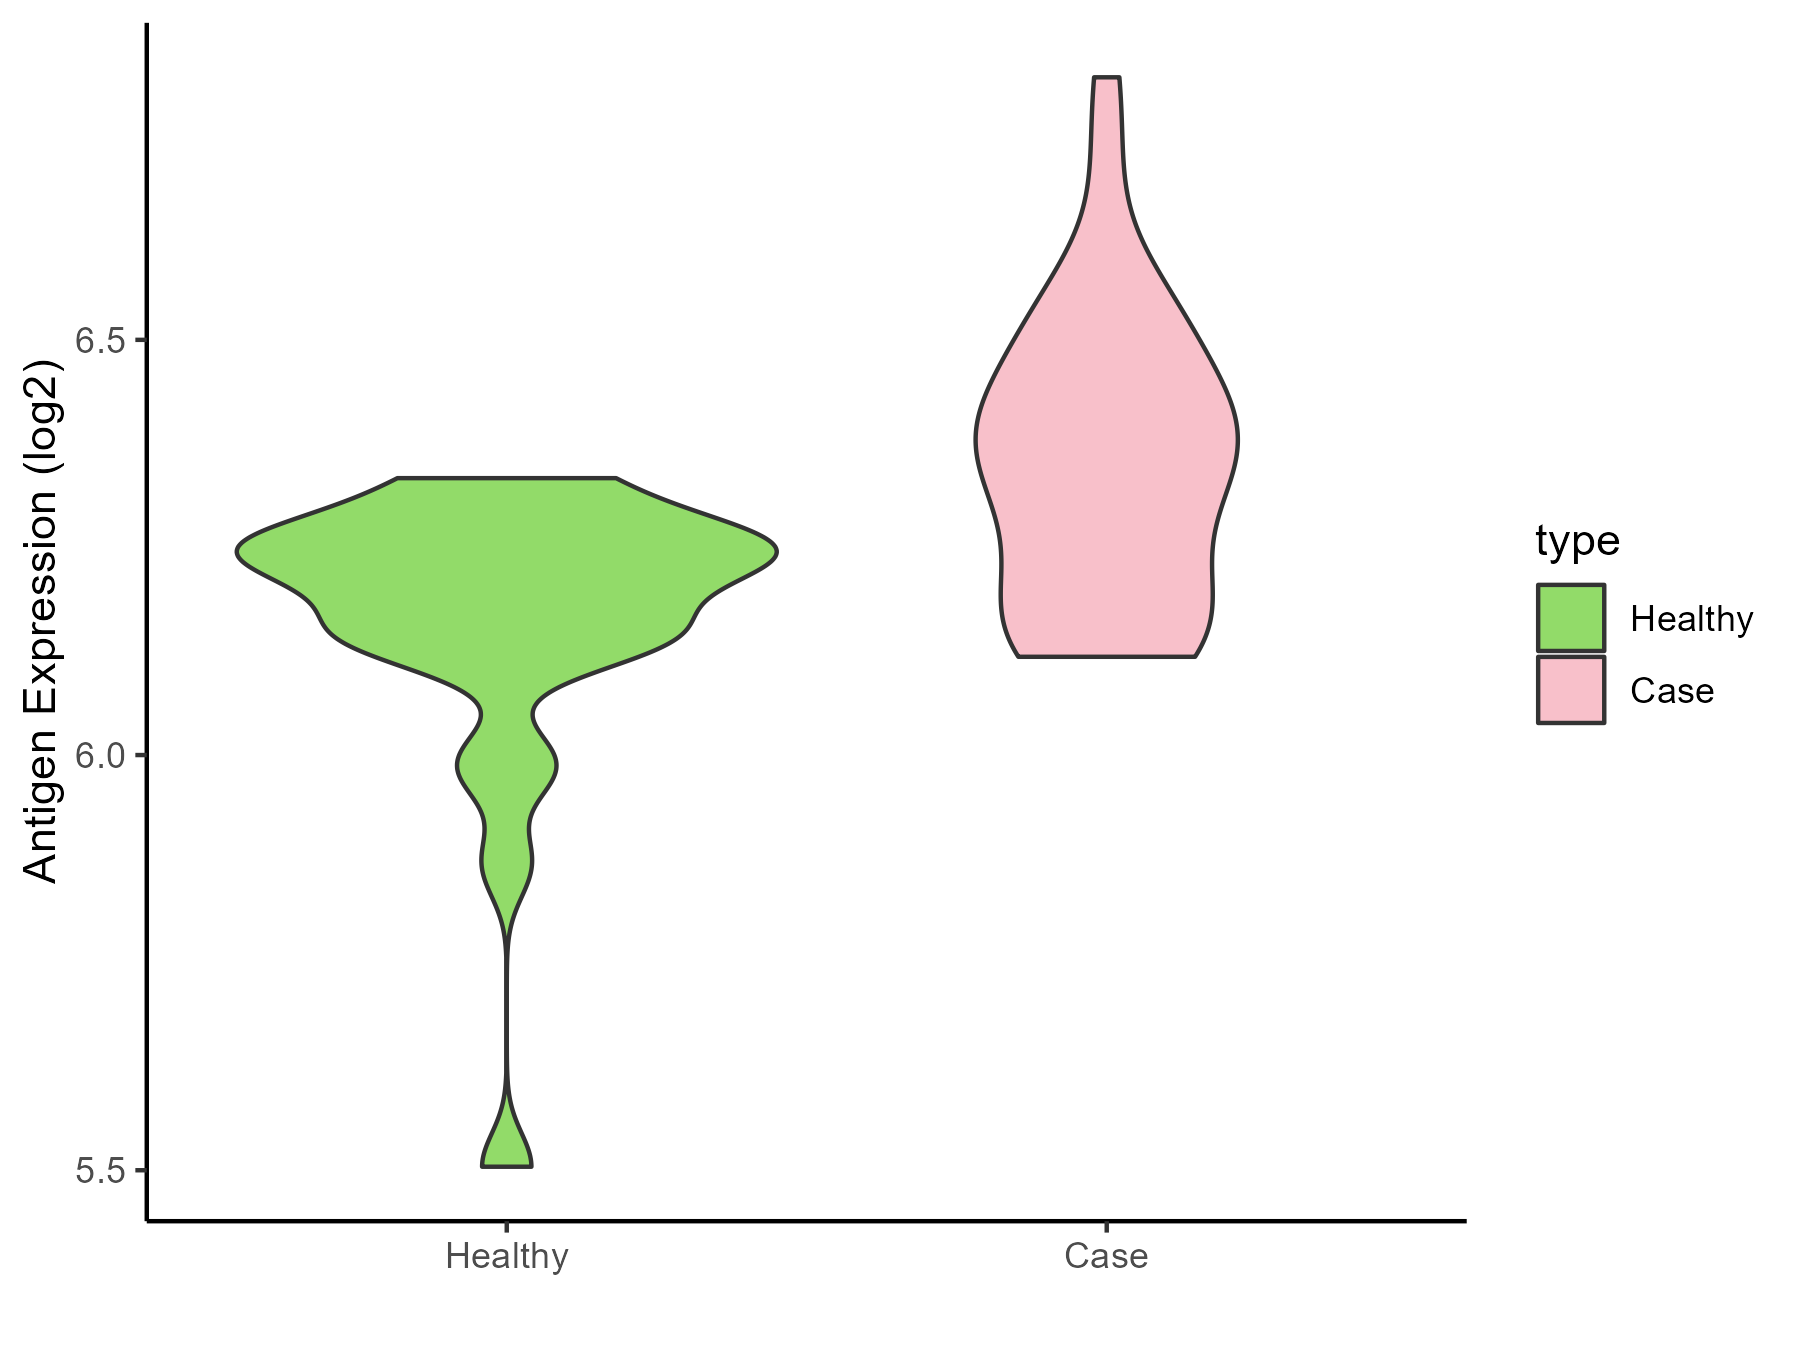
| The Studied Tissue | Skin | |
| The Specific Disease | Atopic dermatitis | |
| The Expression Level of Disease Section Compare with the Healthy Individual Tissue | p-value: 0.000175039; Fold-change: 0.14314738; Z-score: 0.807939772 | |
| Disease-specific Antigen Abundances |
|
Click to View the Clearer Original Diagram |
| Differential expression pattern of antigen in diseases | ||
| The Studied Tissue | Skin | |
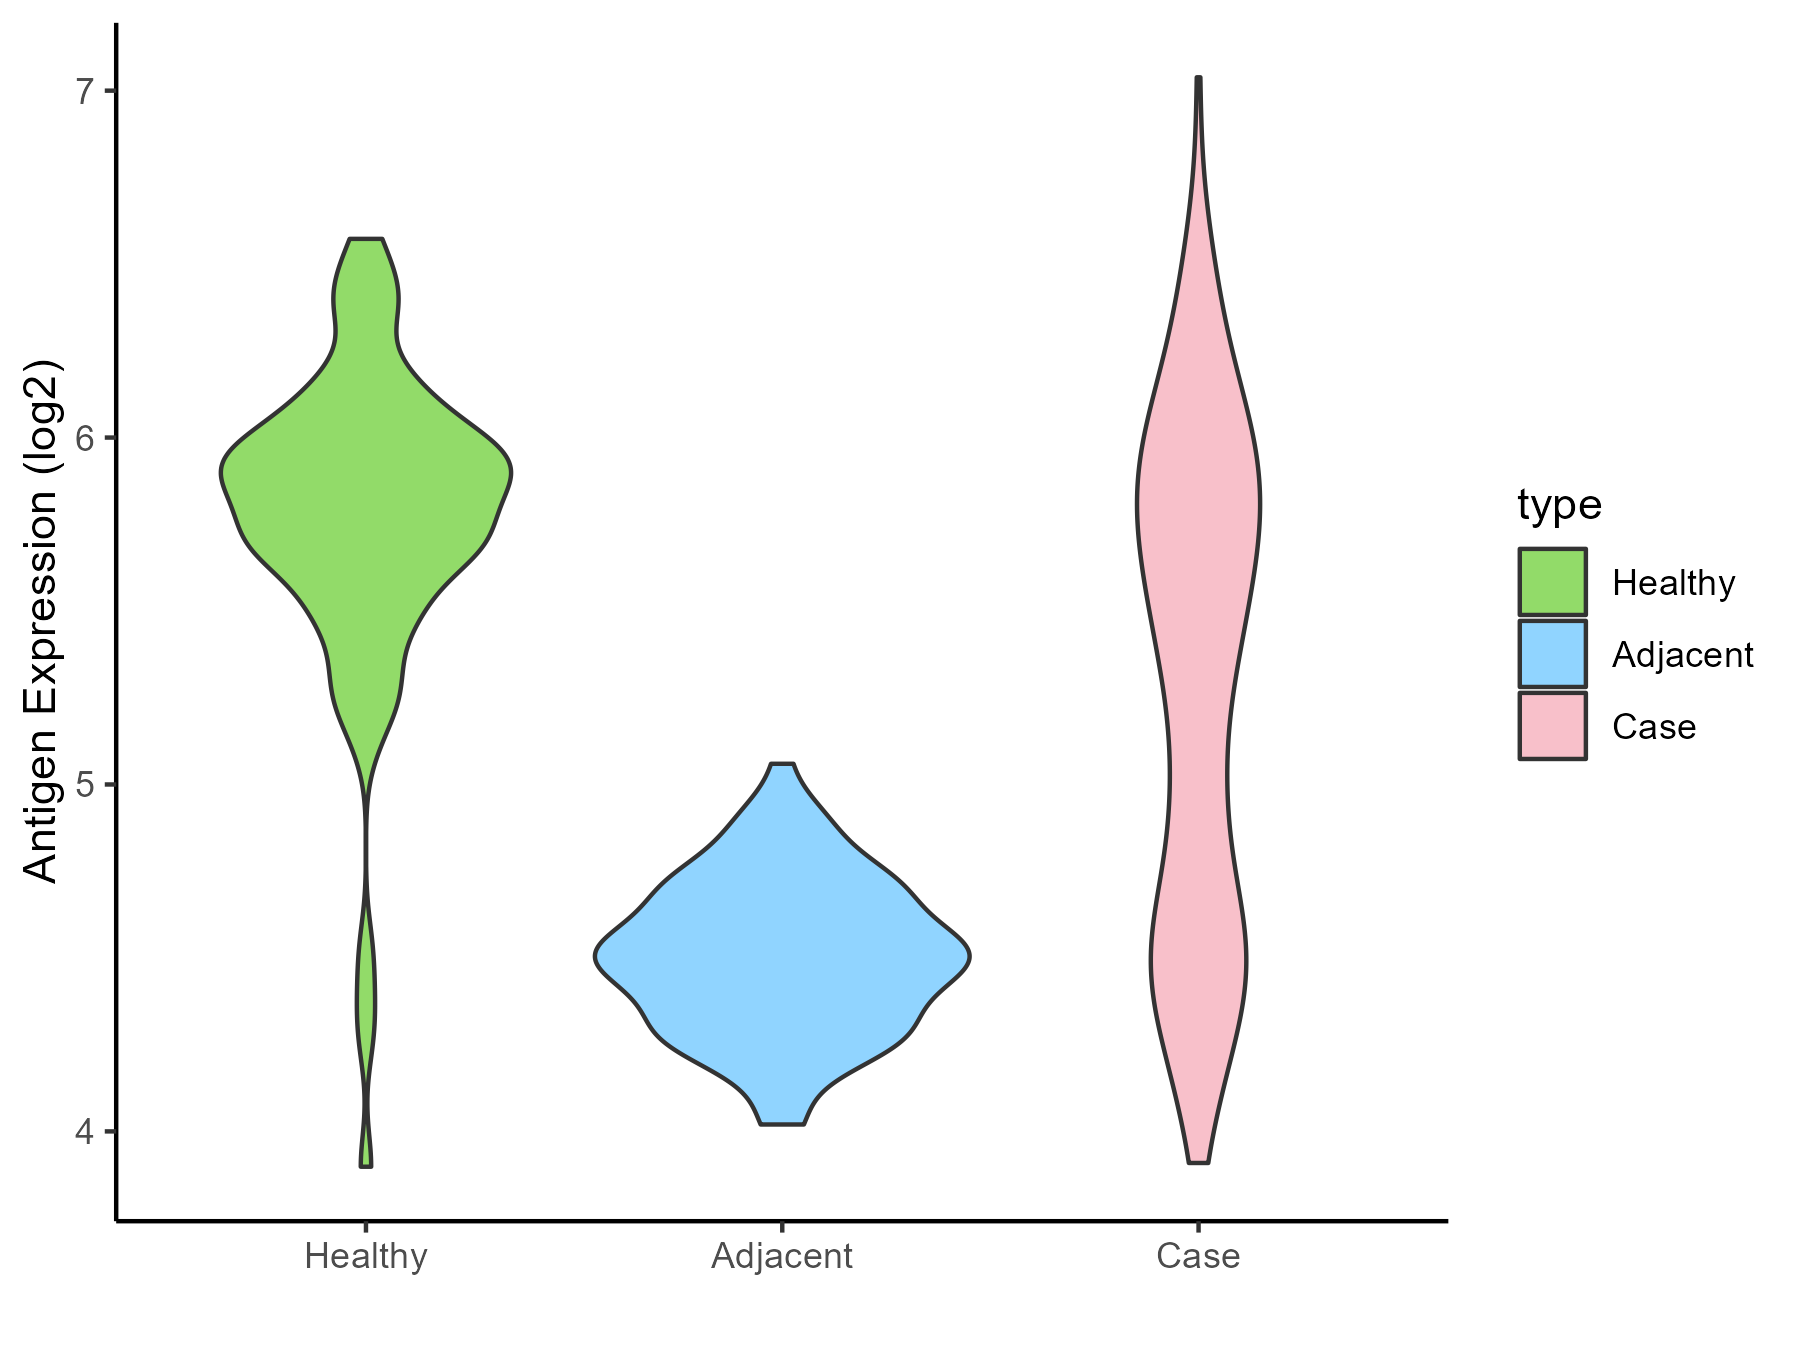
| The Specific Disease | Psoriasis | |
| The Expression Level of Disease Section Compare with the Healthy Individual Tissue | p-value: 5.13E-11; Fold-change: -0.366465387; Z-score: -0.814733281 | |
| The Expression Level of Disease Section Compare with the Adjacent Tissue | p-value: 6.93E-47; Fold-change: 0.950053141; Z-score: 4.350653401 | |
| Disease-specific Antigen Abundances |
|
Click to View the Clearer Original Diagram |
| Differential expression pattern of antigen in diseases | ||
| The Studied Tissue | Skin | |
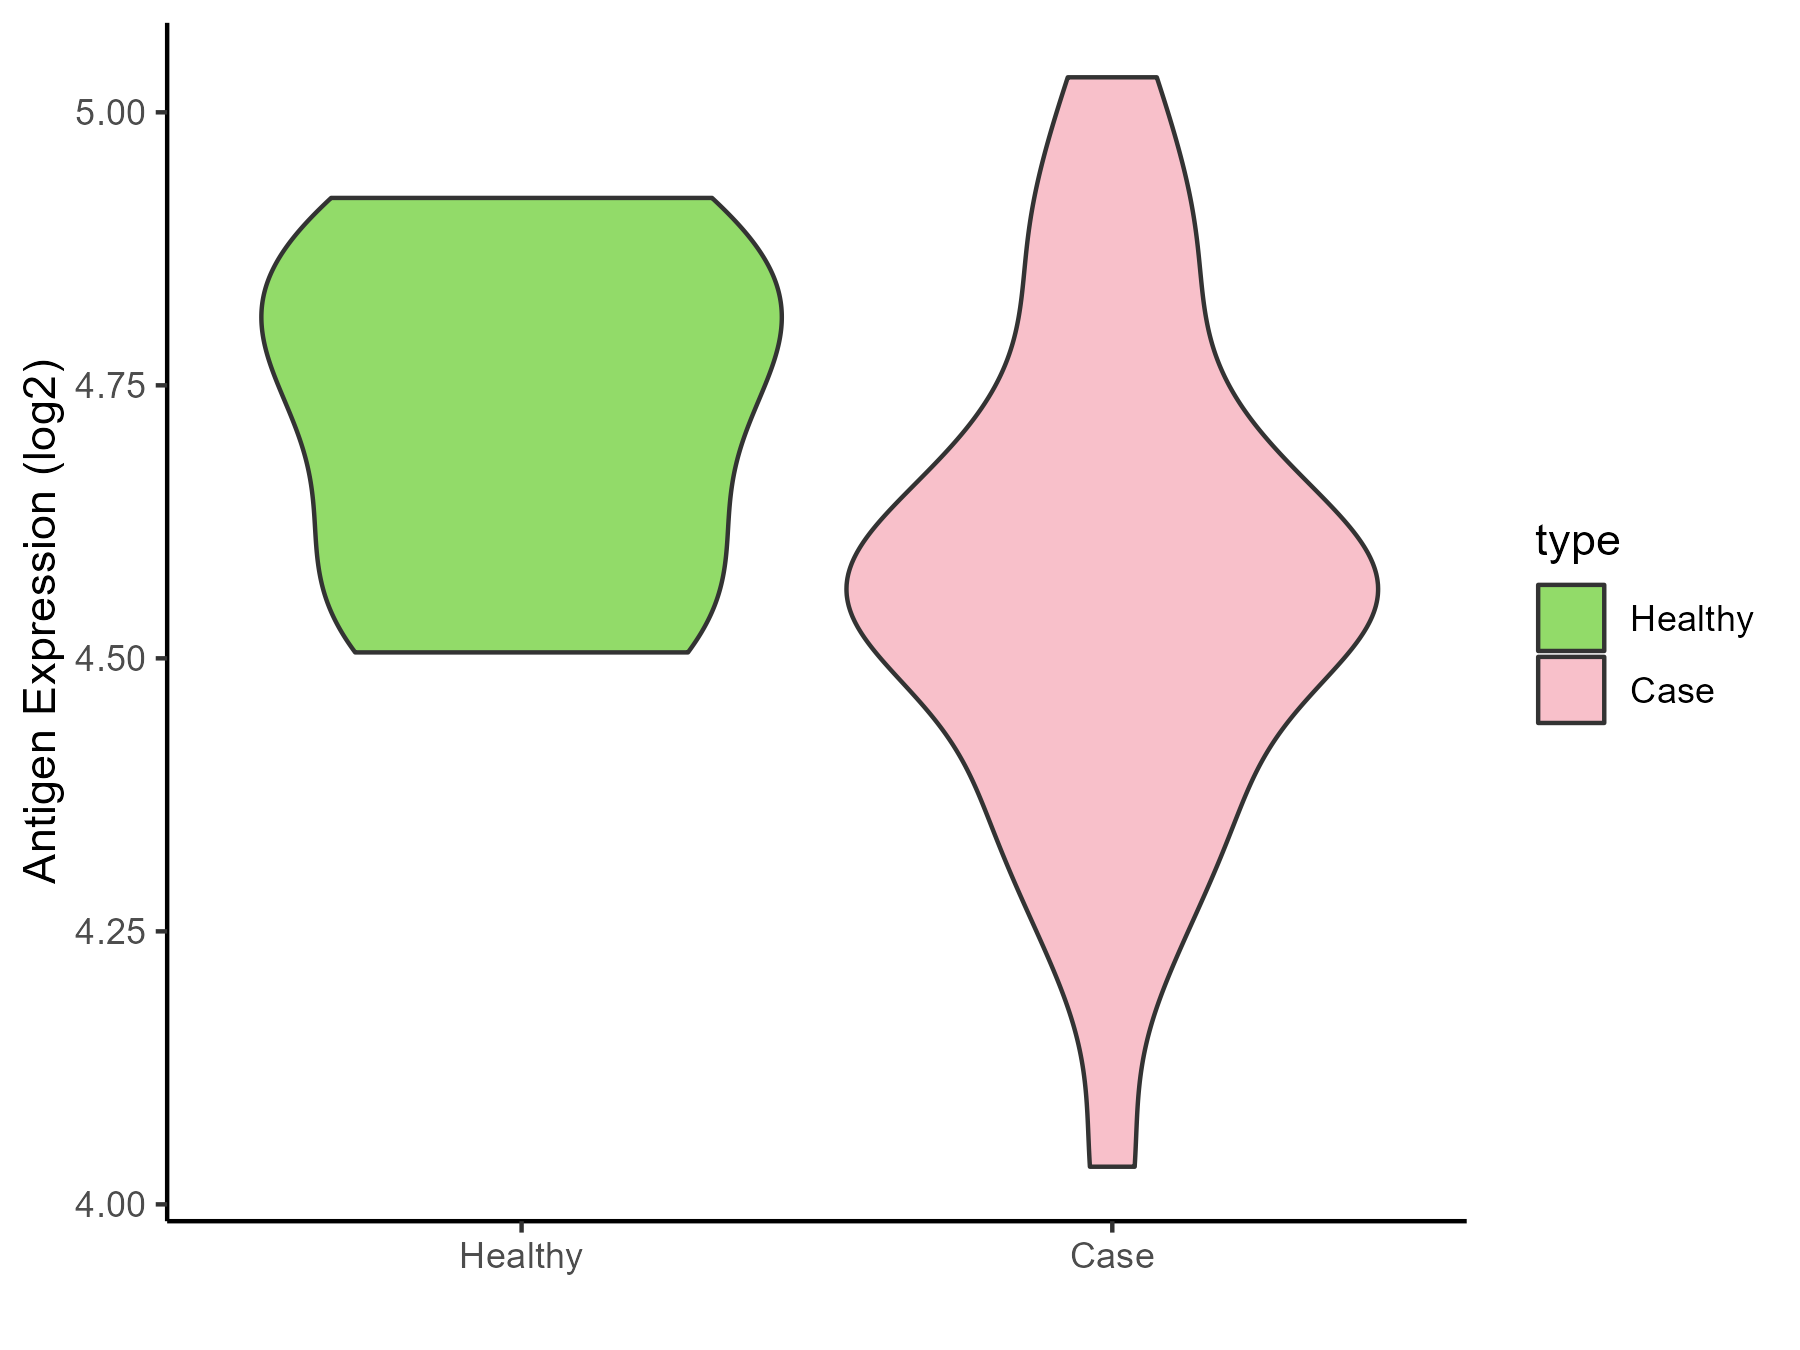
| The Specific Disease | Vitiligo | |
| The Expression Level of Disease Section Compare with the Healthy Individual Tissue | p-value: 0.054711153; Fold-change: -0.210765078; Z-score: -1.337694455 | |
| Disease-specific Antigen Abundances |
|
Click to View the Clearer Original Diagram |
| Differential expression pattern of antigen in diseases | ||
| The Studied Tissue | Skin from scalp | |
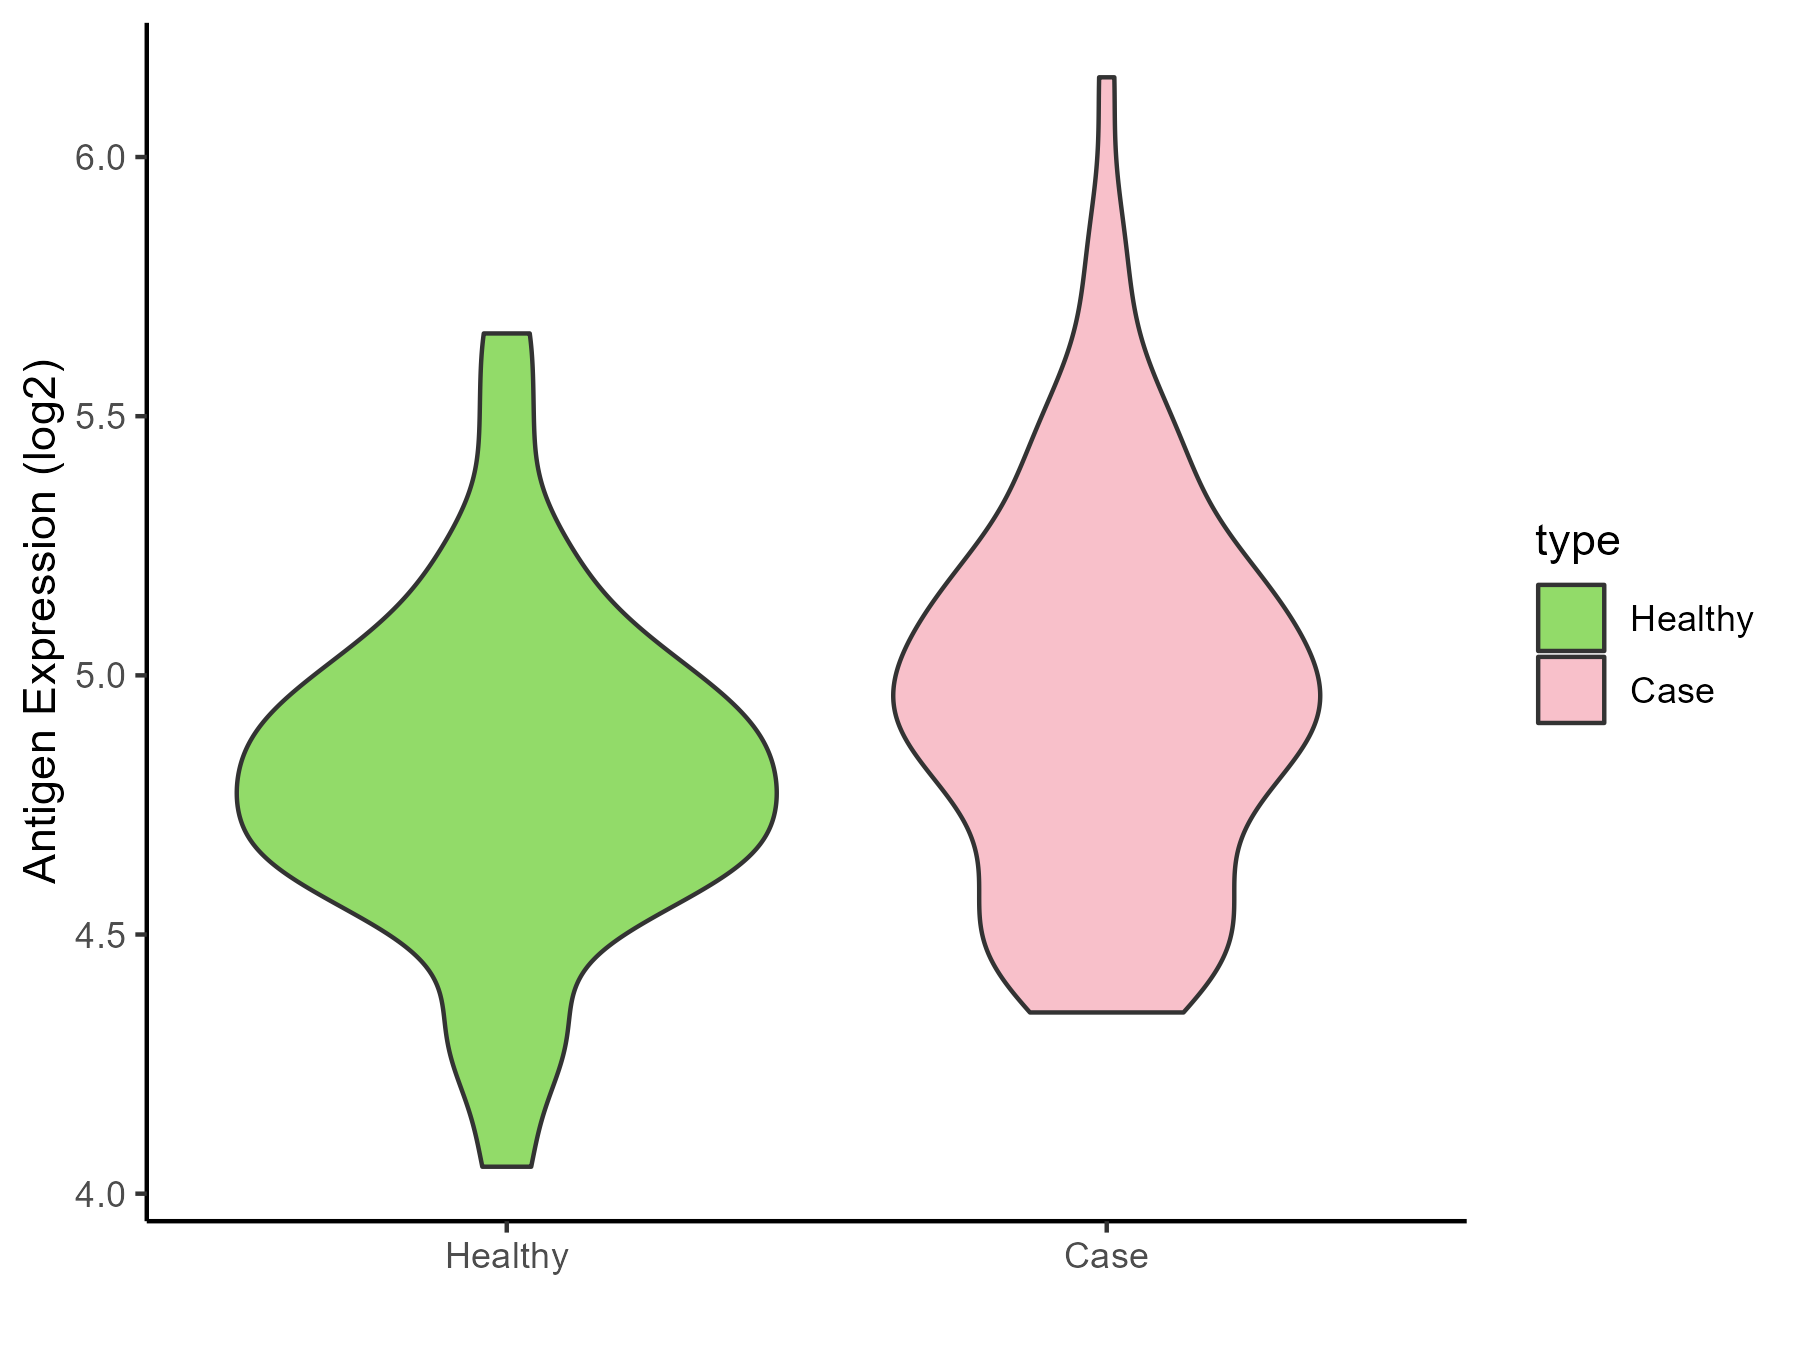
| The Specific Disease | Alopecia | |
| The Expression Level of Disease Section Compare with the Healthy Individual Tissue | p-value: 0.019224825; Fold-change: 0.148908678; Z-score: 0.465552236 | |
| Disease-specific Antigen Abundances |
|
Click to View the Clearer Original Diagram |
| Differential expression pattern of antigen in diseases | ||
| The Studied Tissue | Skin | |
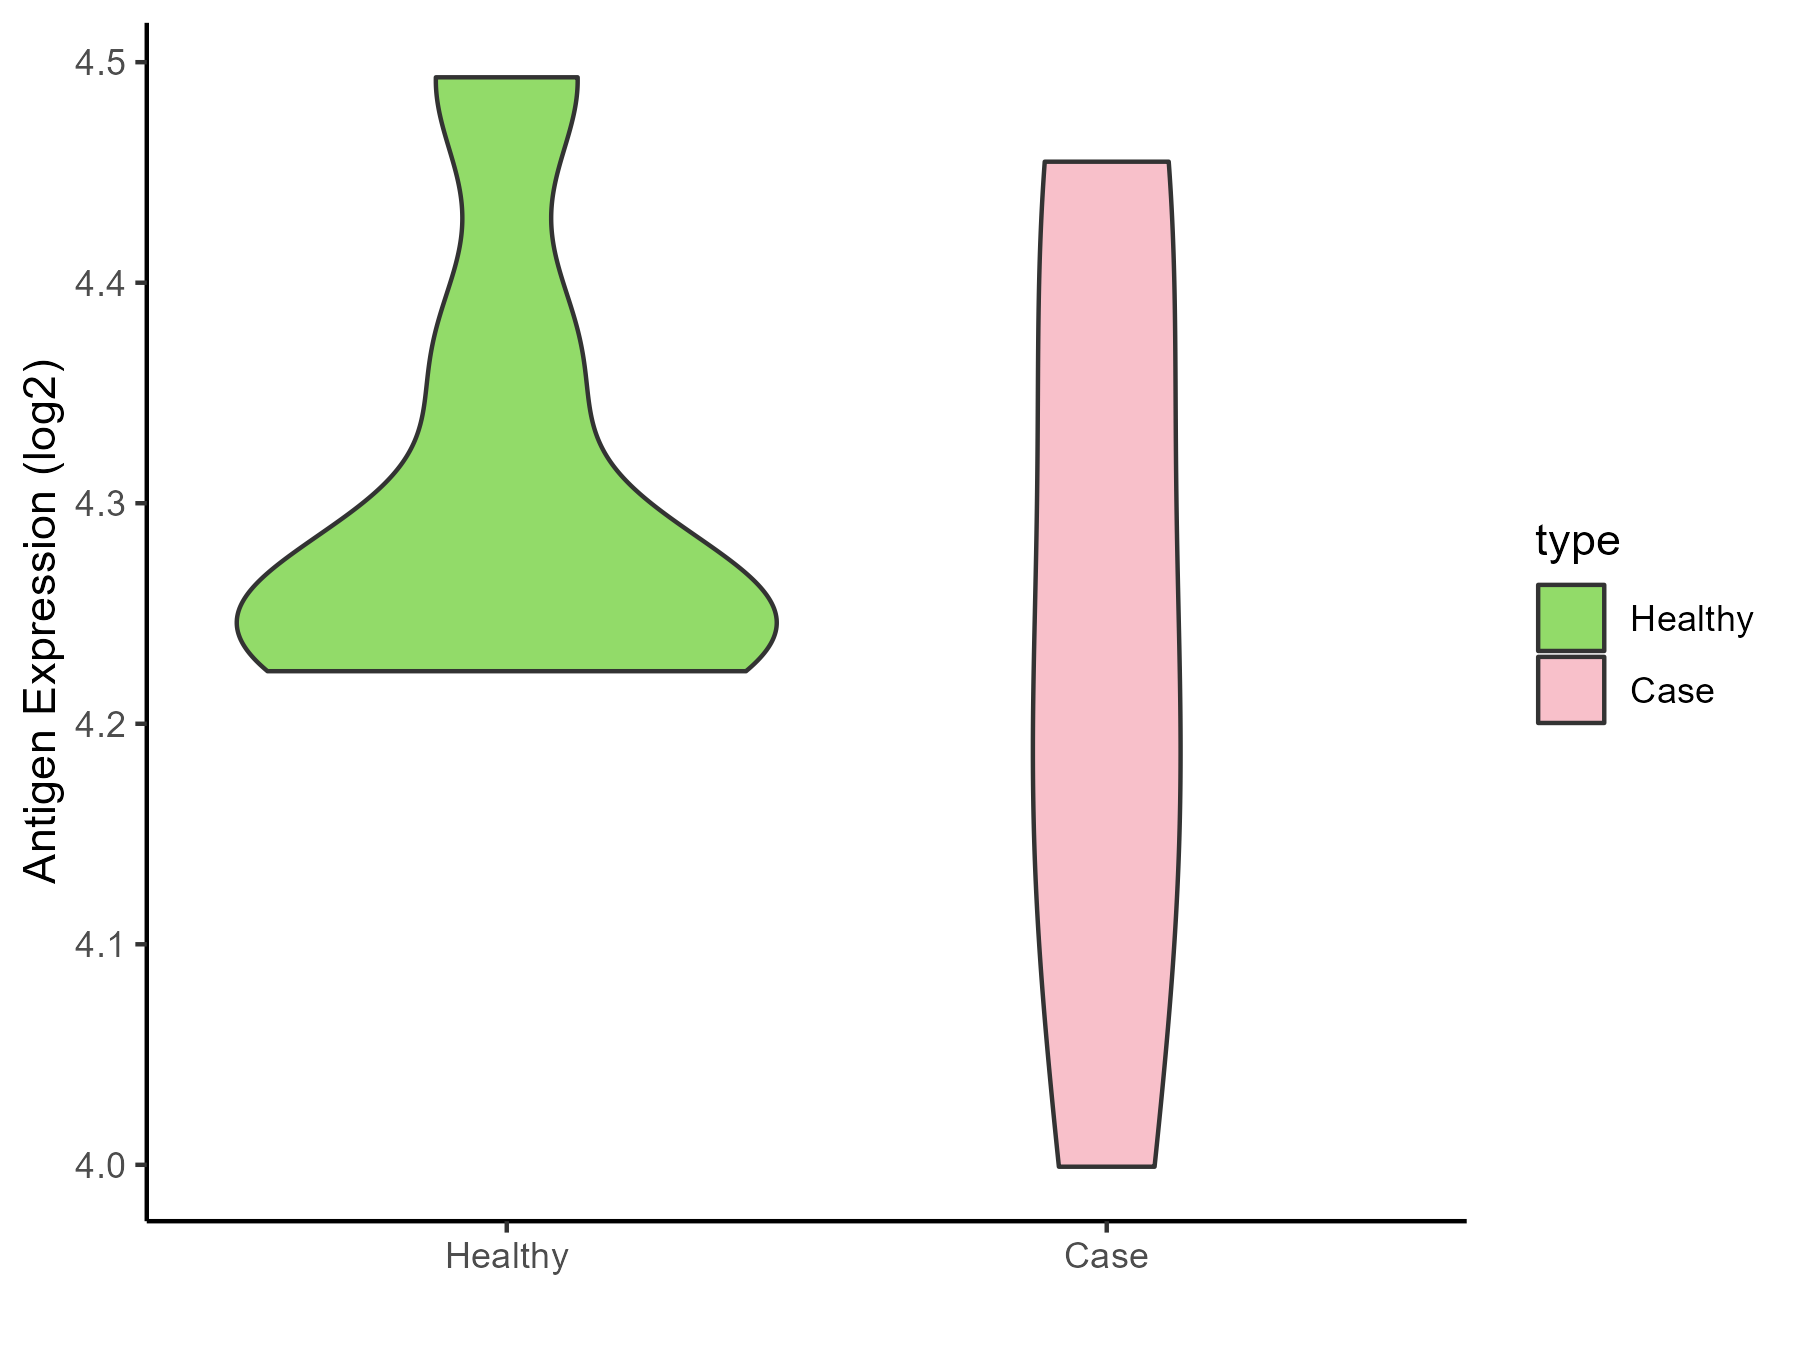
| The Specific Disease | Sensitive skin | |
| The Expression Level of Disease Section Compare with the Healthy Individual Tissue | p-value: 0.561991309; Fold-change: -0.052672575; Z-score: -0.505945982 | |
| Disease-specific Antigen Abundances |
|
Click to View the Clearer Original Diagram |
ICD Disease Classification 15
| Differential expression pattern of antigen in diseases | ||
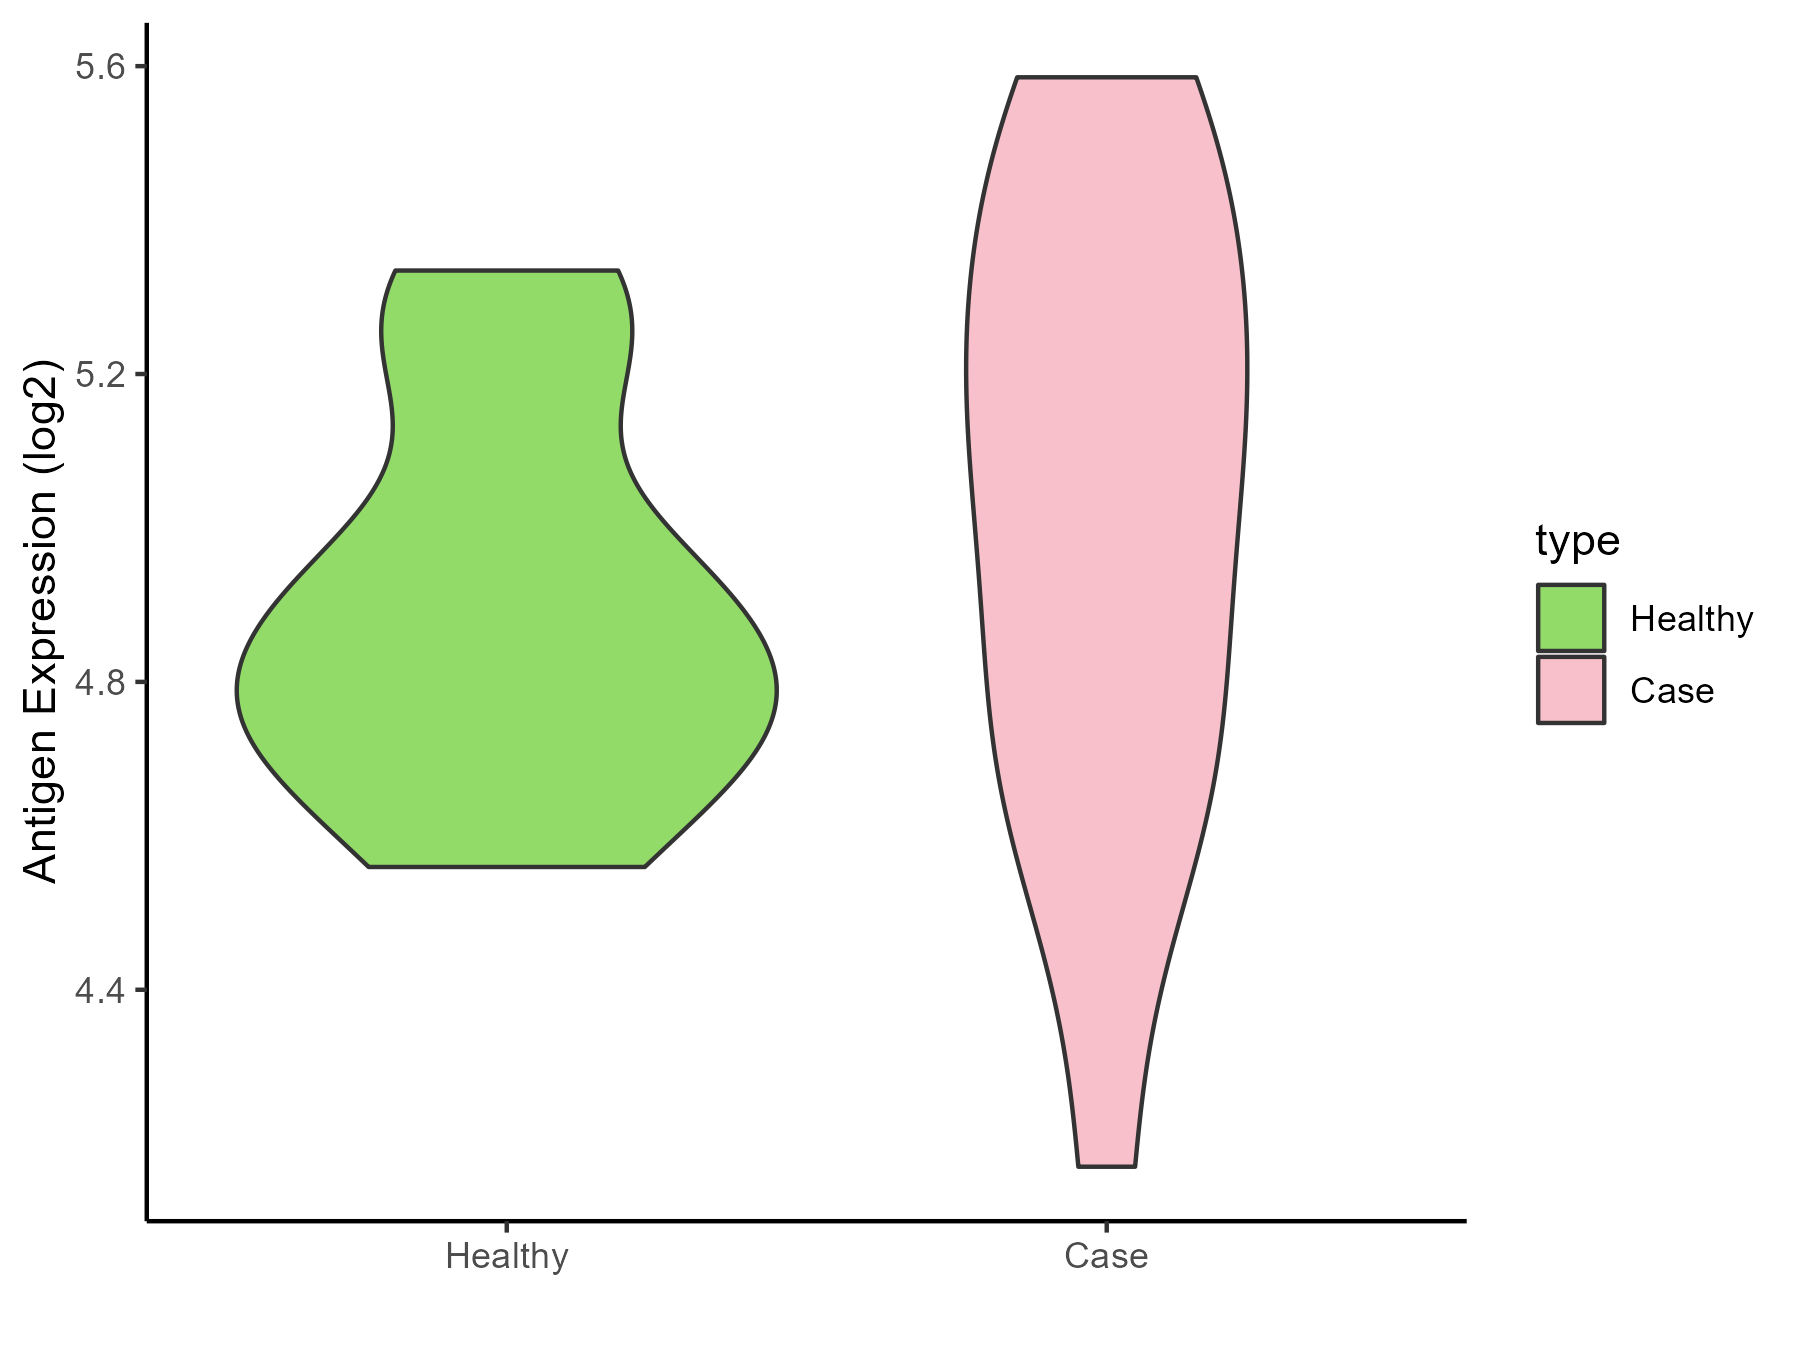
| The Studied Tissue | Synovial | |
| The Specific Disease | Osteoarthritis | |
| The Expression Level of Disease Section Compare with the Healthy Individual Tissue | p-value: 0.387810634; Fold-change: 0.27729675; Z-score: 1.059911864 | |
| Disease-specific Antigen Abundances |
|
Click to View the Clearer Original Diagram |
| Differential expression pattern of antigen in diseases | ||
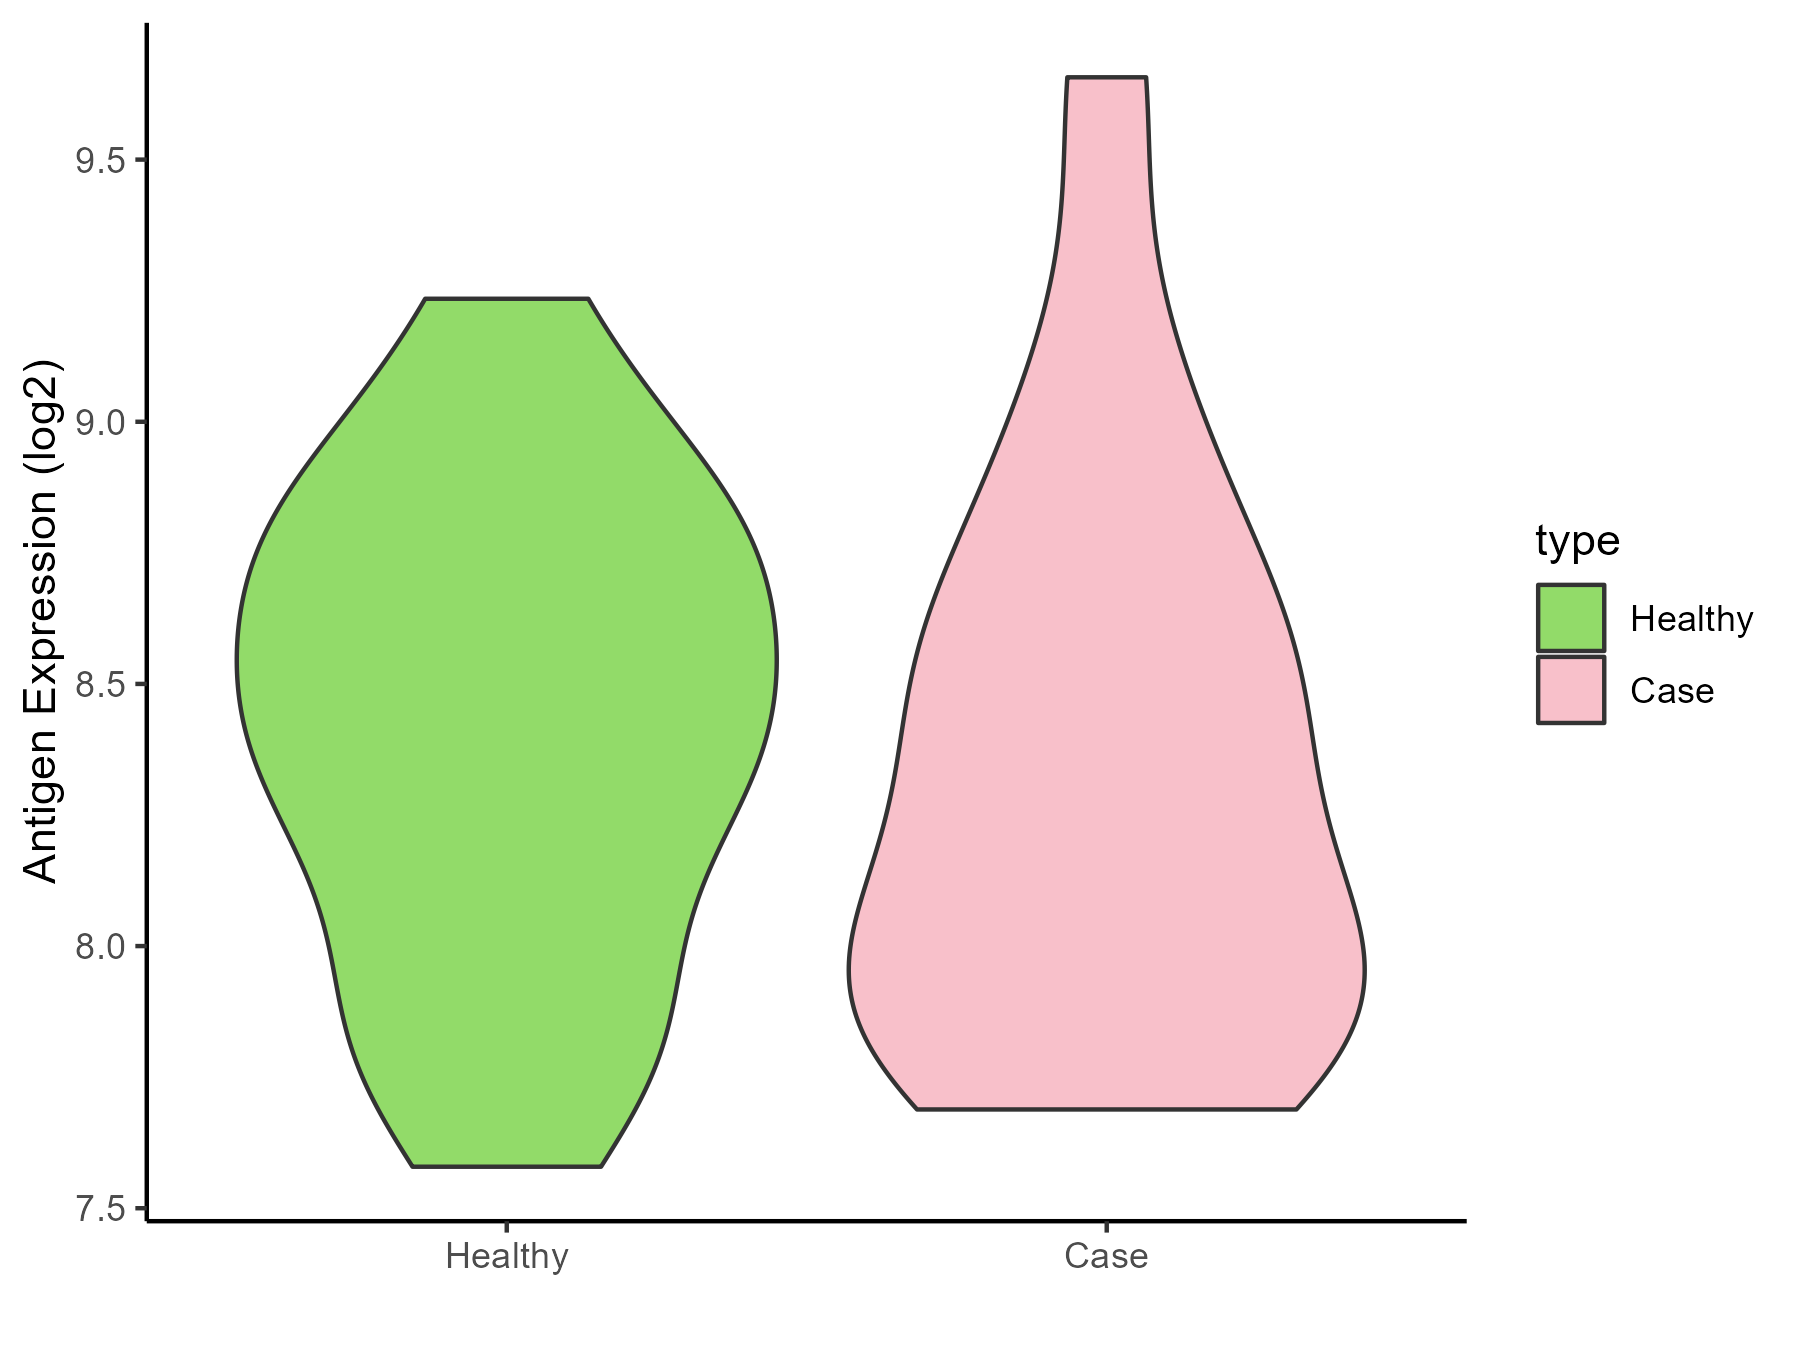
| The Studied Tissue | Peripheral blood | |
| The Specific Disease | Arthropathy | |
| The Expression Level of Disease Section Compare with the Healthy Individual Tissue | p-value: 0.648829517; Fold-change: -0.163947961; Z-score: -0.360892597 | |
| Disease-specific Antigen Abundances |
|
Click to View the Clearer Original Diagram |
| Differential expression pattern of antigen in diseases | ||
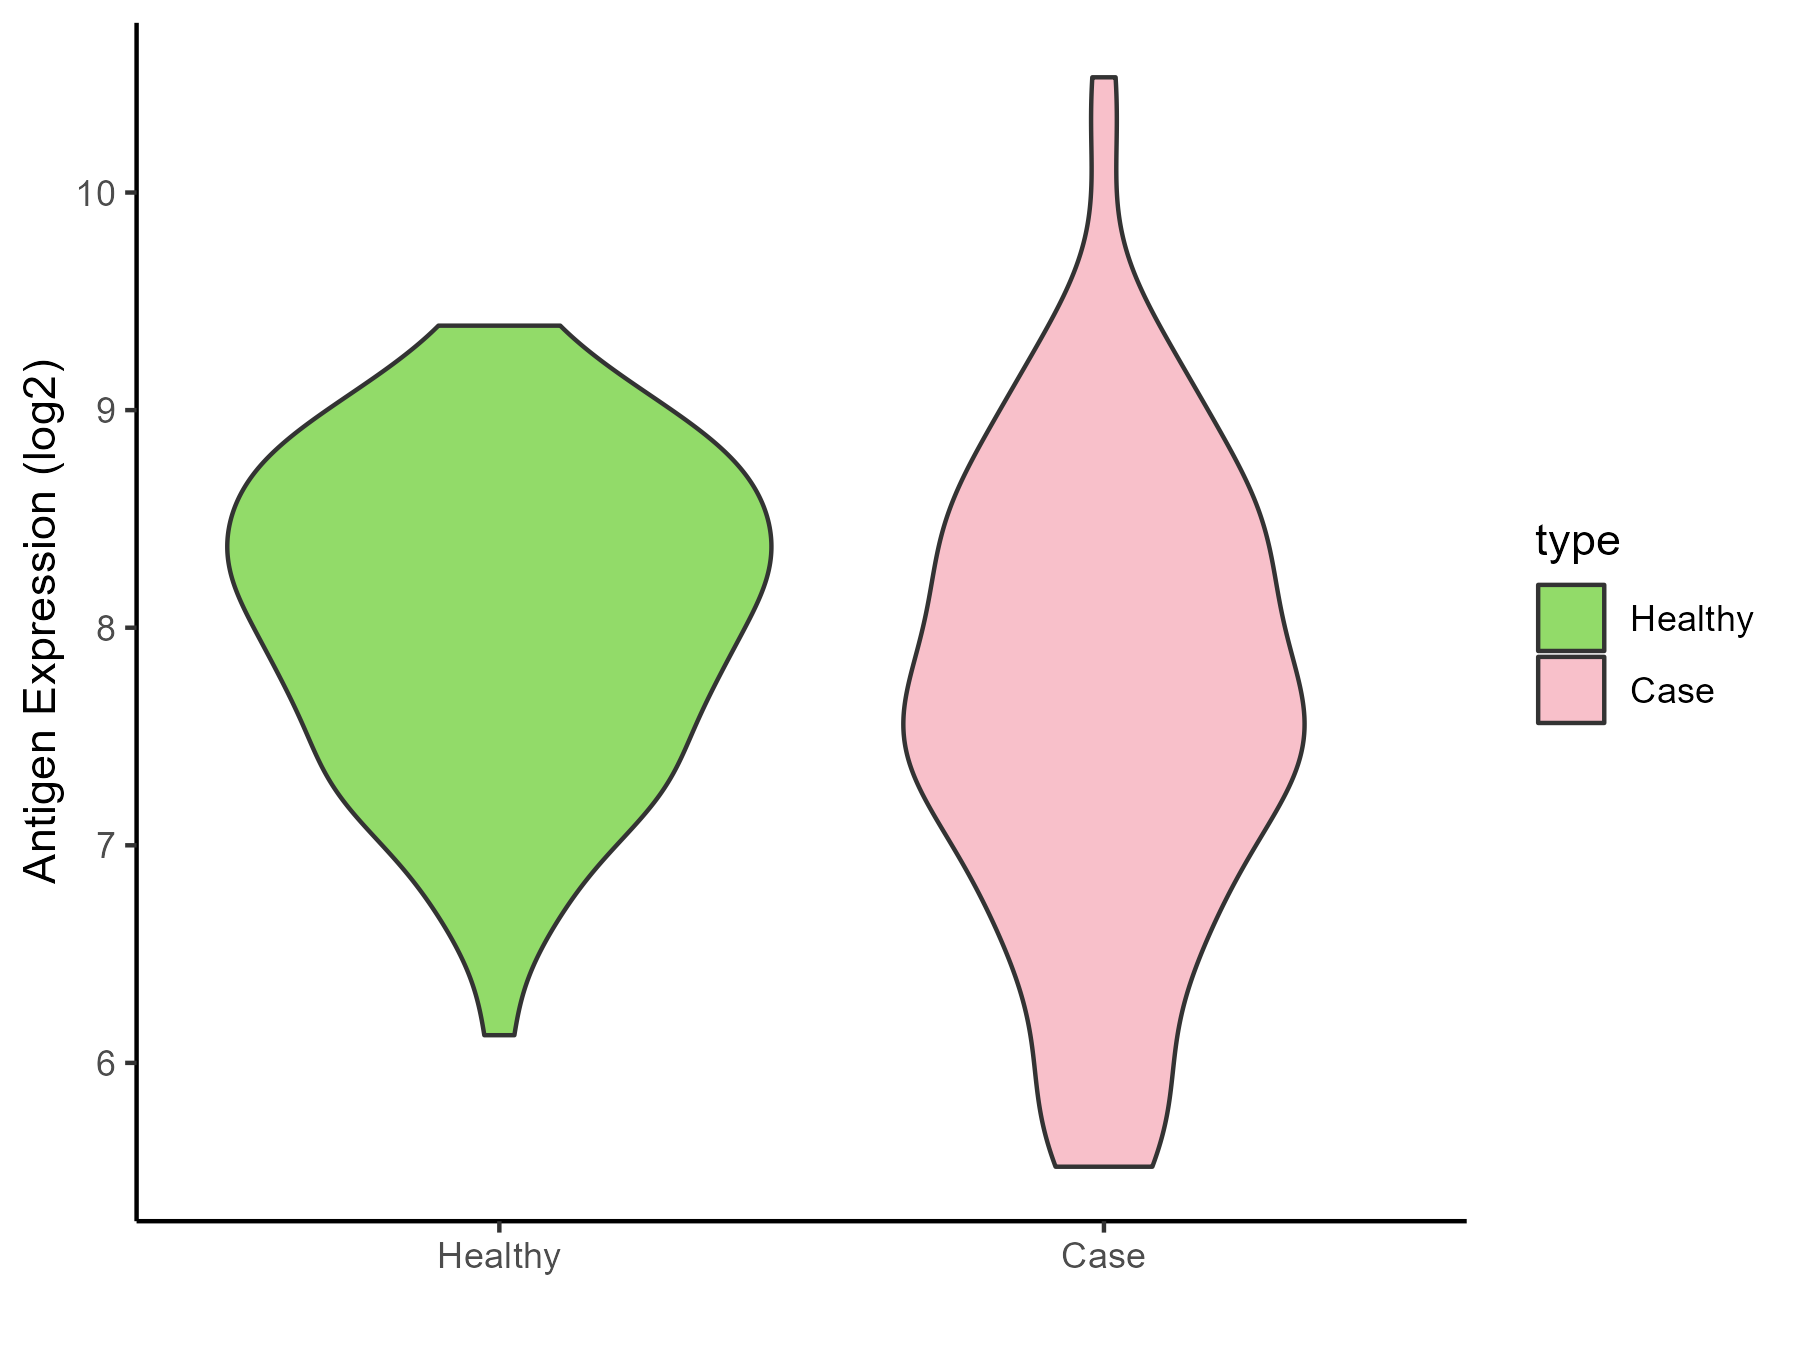
| The Studied Tissue | Peripheral blood | |
| The Specific Disease | Arthritis | |
| The Expression Level of Disease Section Compare with the Healthy Individual Tissue | p-value: 0.000964258; Fold-change: -0.547763174; Z-score: -0.764909816 | |
| Disease-specific Antigen Abundances |
|
Click to View the Clearer Original Diagram |
| Differential expression pattern of antigen in diseases | ||
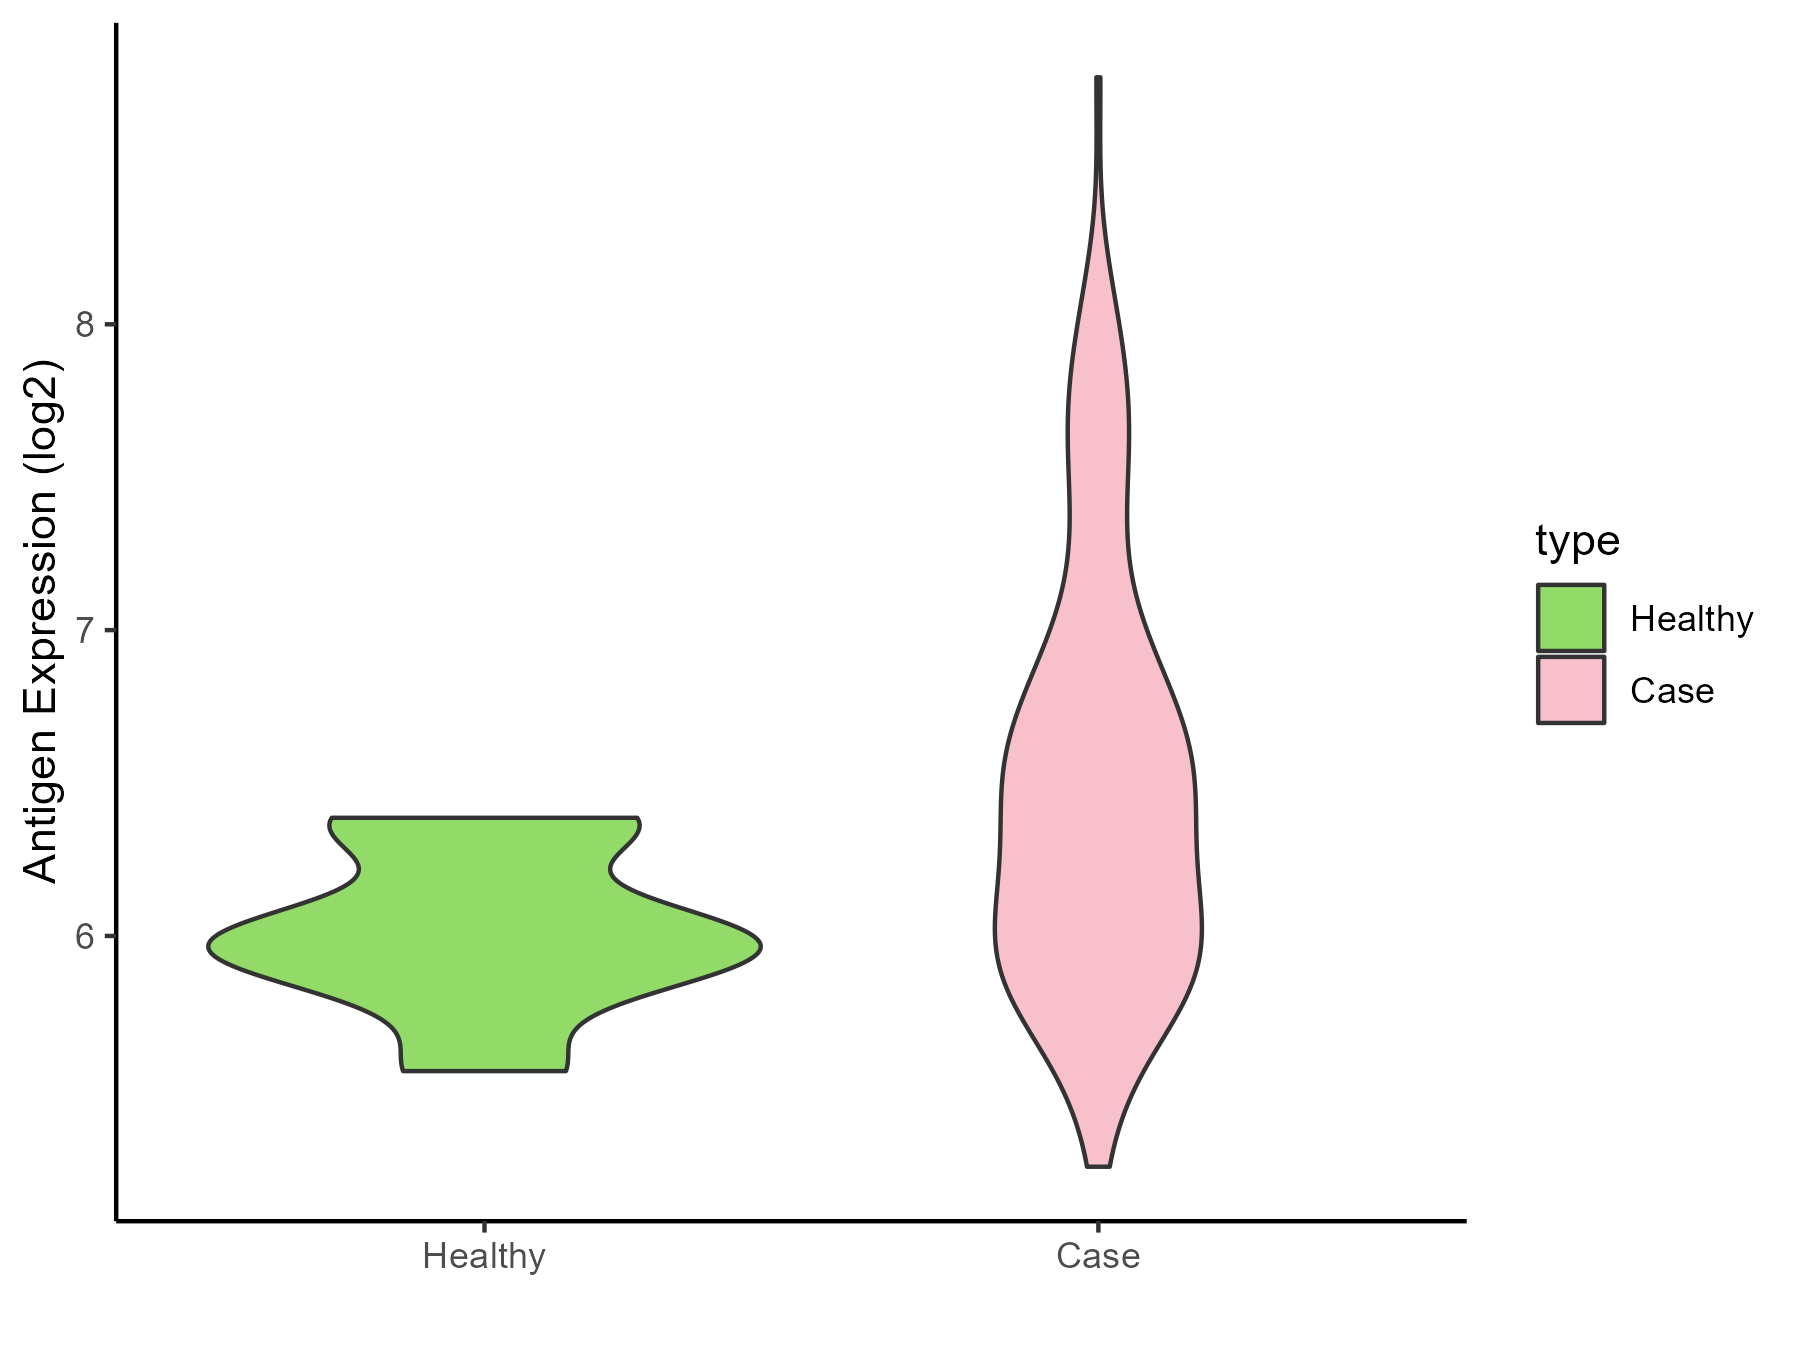
| The Studied Tissue | Synovial | |
| The Specific Disease | Rheumatoid arthritis | |
| The Expression Level of Disease Section Compare with the Healthy Individual Tissue | p-value: 0.002878413; Fold-change: 0.427047639; Z-score: 1.495429157 | |
| Disease-specific Antigen Abundances |
|
Click to View the Clearer Original Diagram |
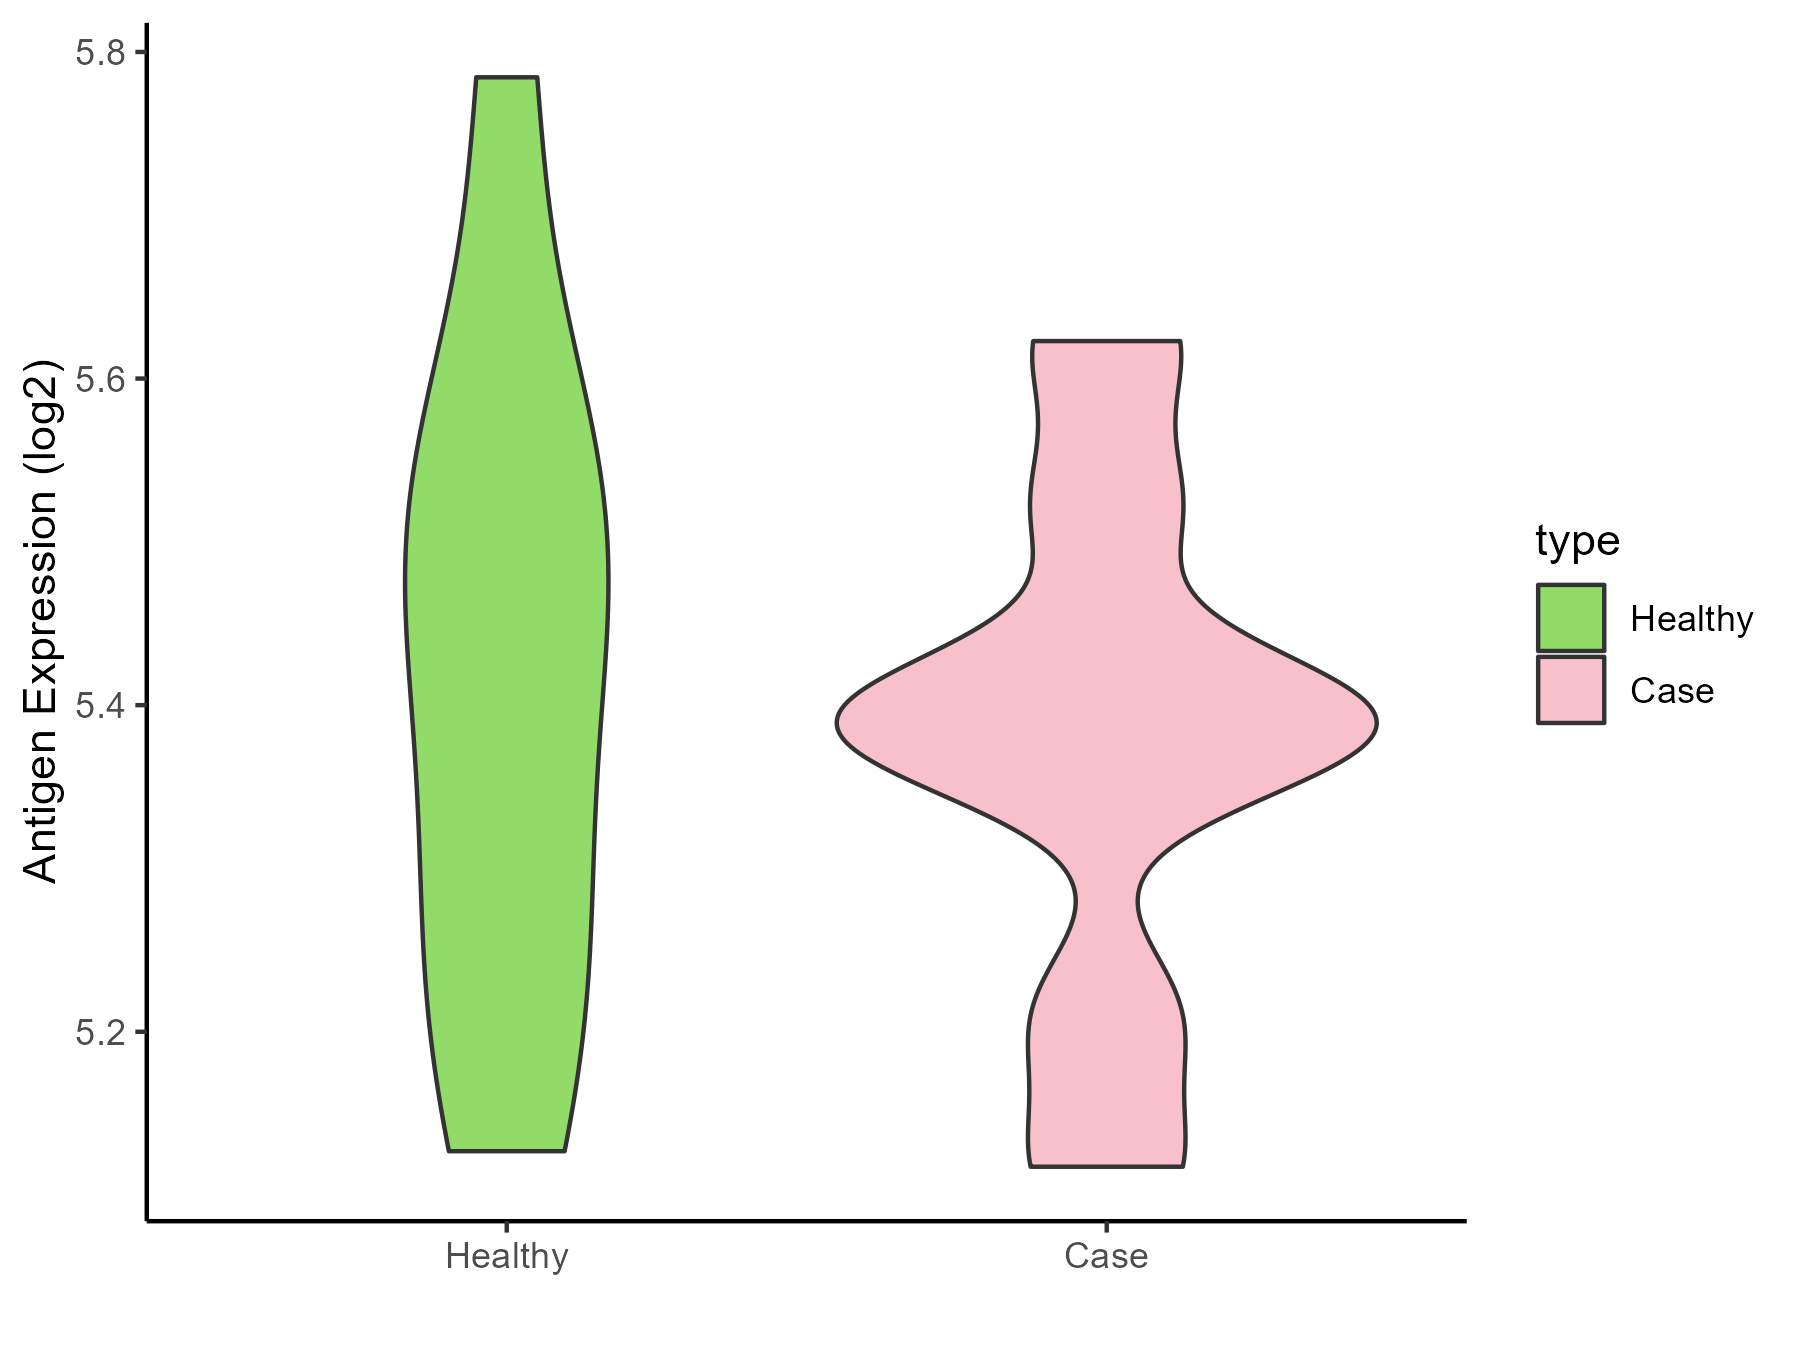
| Differential expression pattern of antigen in diseases | ||
| The Studied Tissue | Pheripheral blood | |
| The Specific Disease | Ankylosing spondylitis | |
| The Expression Level of Disease Section Compare with the Healthy Individual Tissue | p-value: 0.656121196; Fold-change: -0.071303866; Z-score: -0.347040994 | |
| Disease-specific Antigen Abundances |
|
Click to View the Clearer Original Diagram |
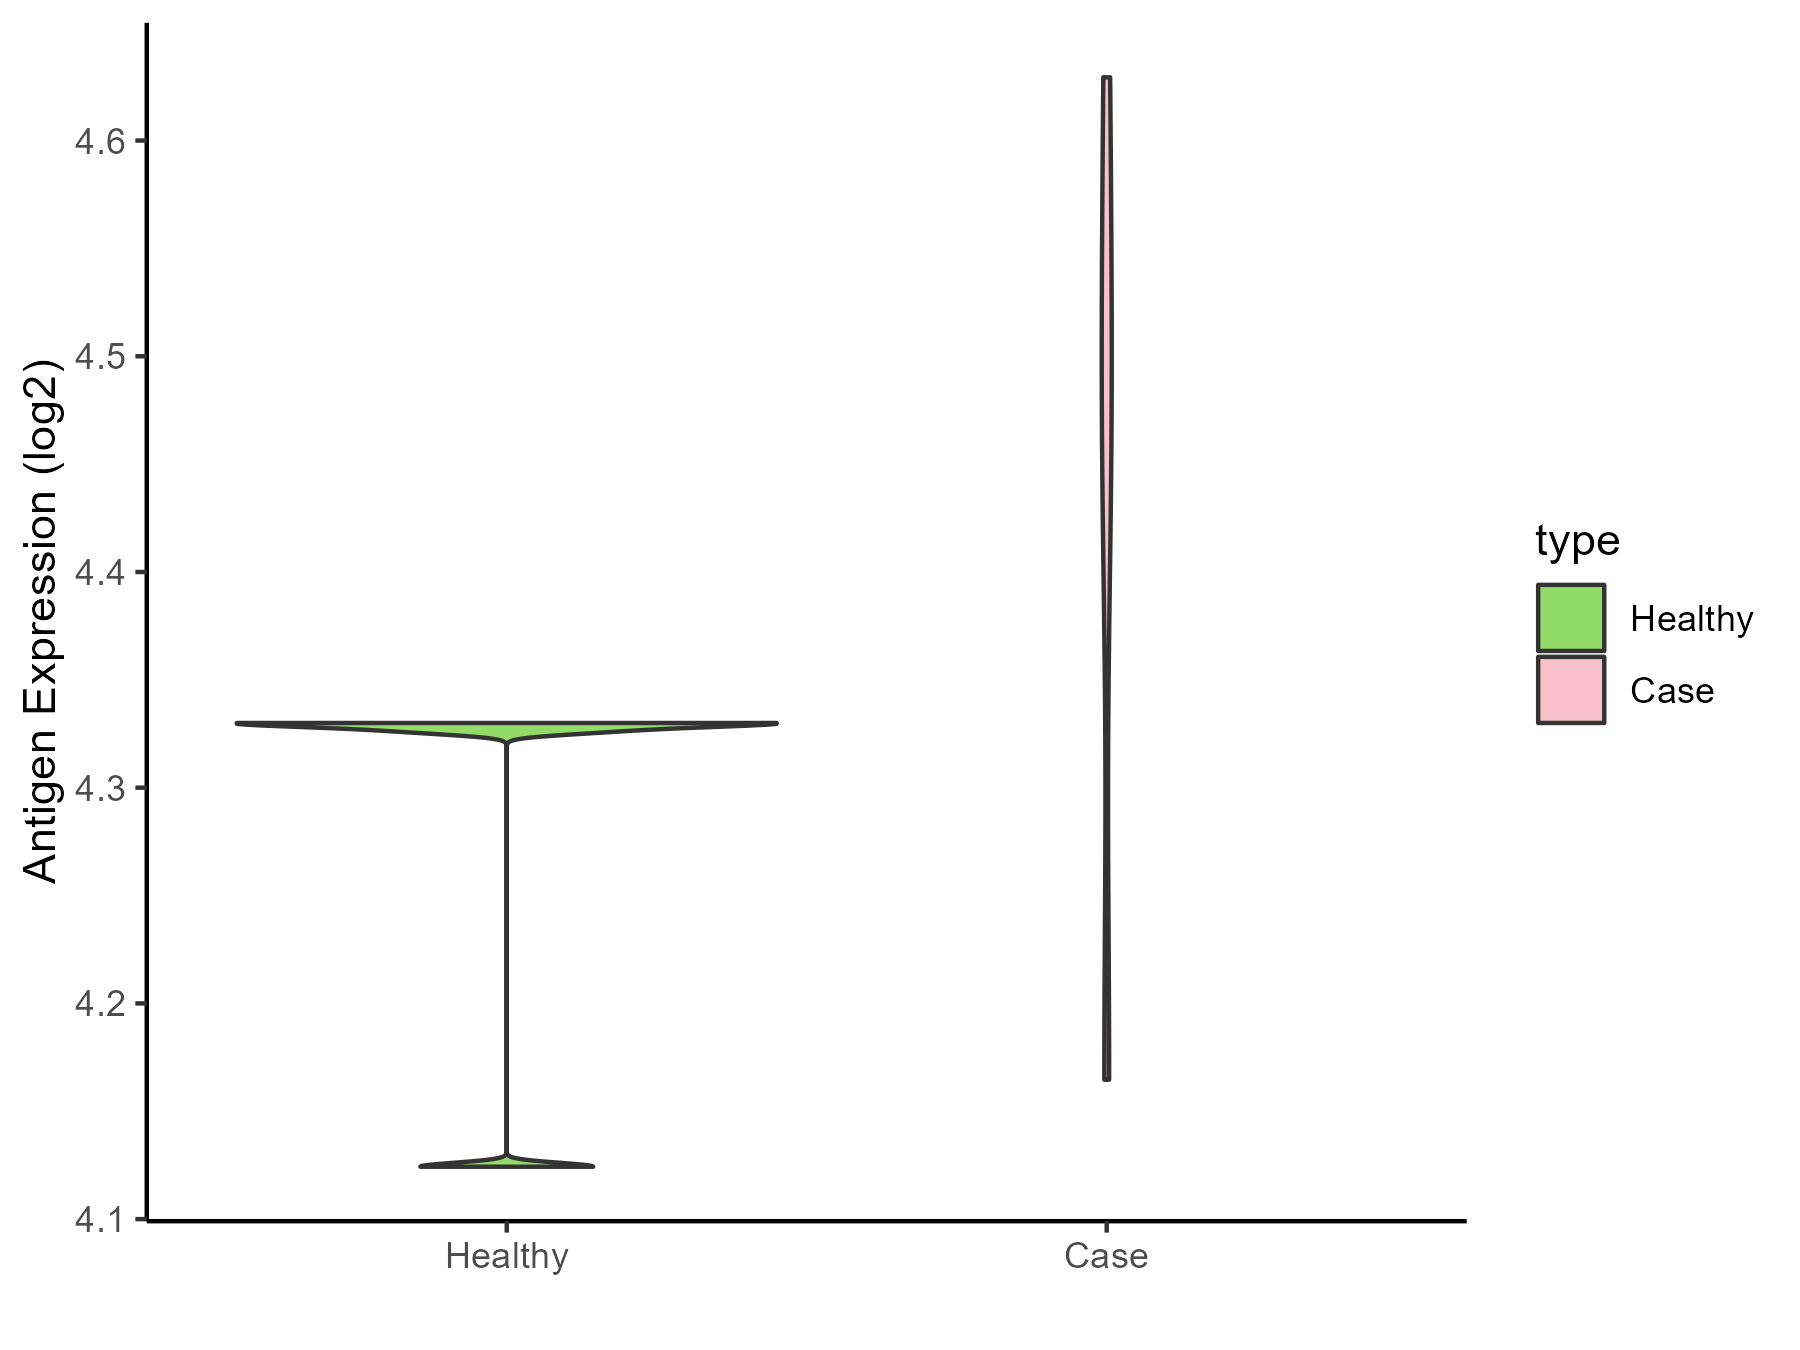
| Differential expression pattern of antigen in diseases | ||
| The Studied Tissue | Bone marrow | |
| The Specific Disease | Osteoporosis | |
| The Expression Level of Disease Section Compare with the Healthy Individual Tissue | p-value: 0.23620727; Fold-change: 0.145547186; Z-score: 1.589141961 | |
| Disease-specific Antigen Abundances |
|
Click to View the Clearer Original Diagram |
ICD Disease Classification 16
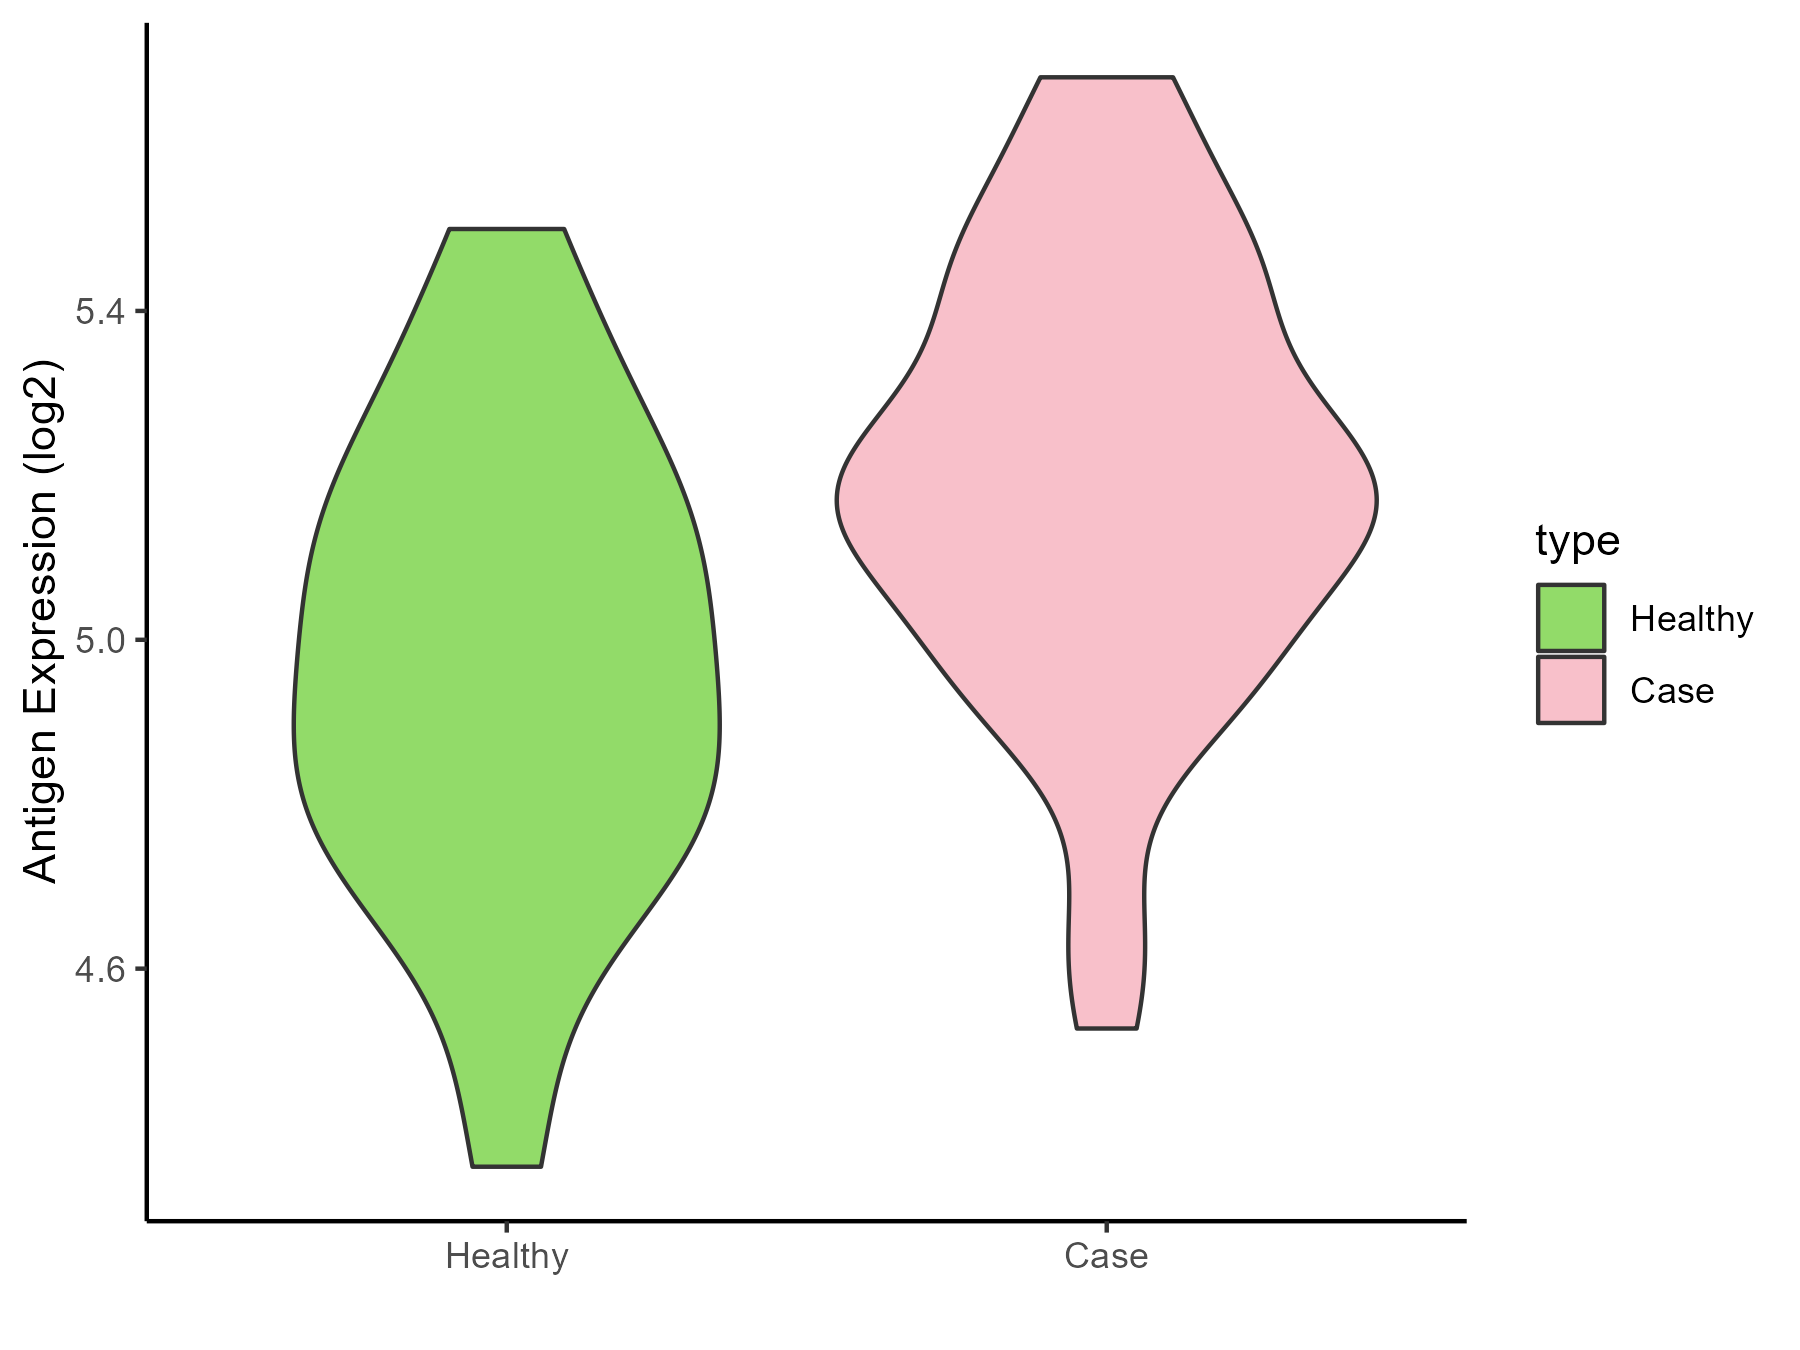
| Differential expression pattern of antigen in diseases | ||
| The Studied Tissue | Endometrium | |
| The Specific Disease | Endometriosis | |
| The Expression Level of Disease Section Compare with the Healthy Individual Tissue | p-value: 0.001386995; Fold-change: 0.216908021; Z-score: 0.780090592 | |
| Disease-specific Antigen Abundances |
|
Click to View the Clearer Original Diagram |
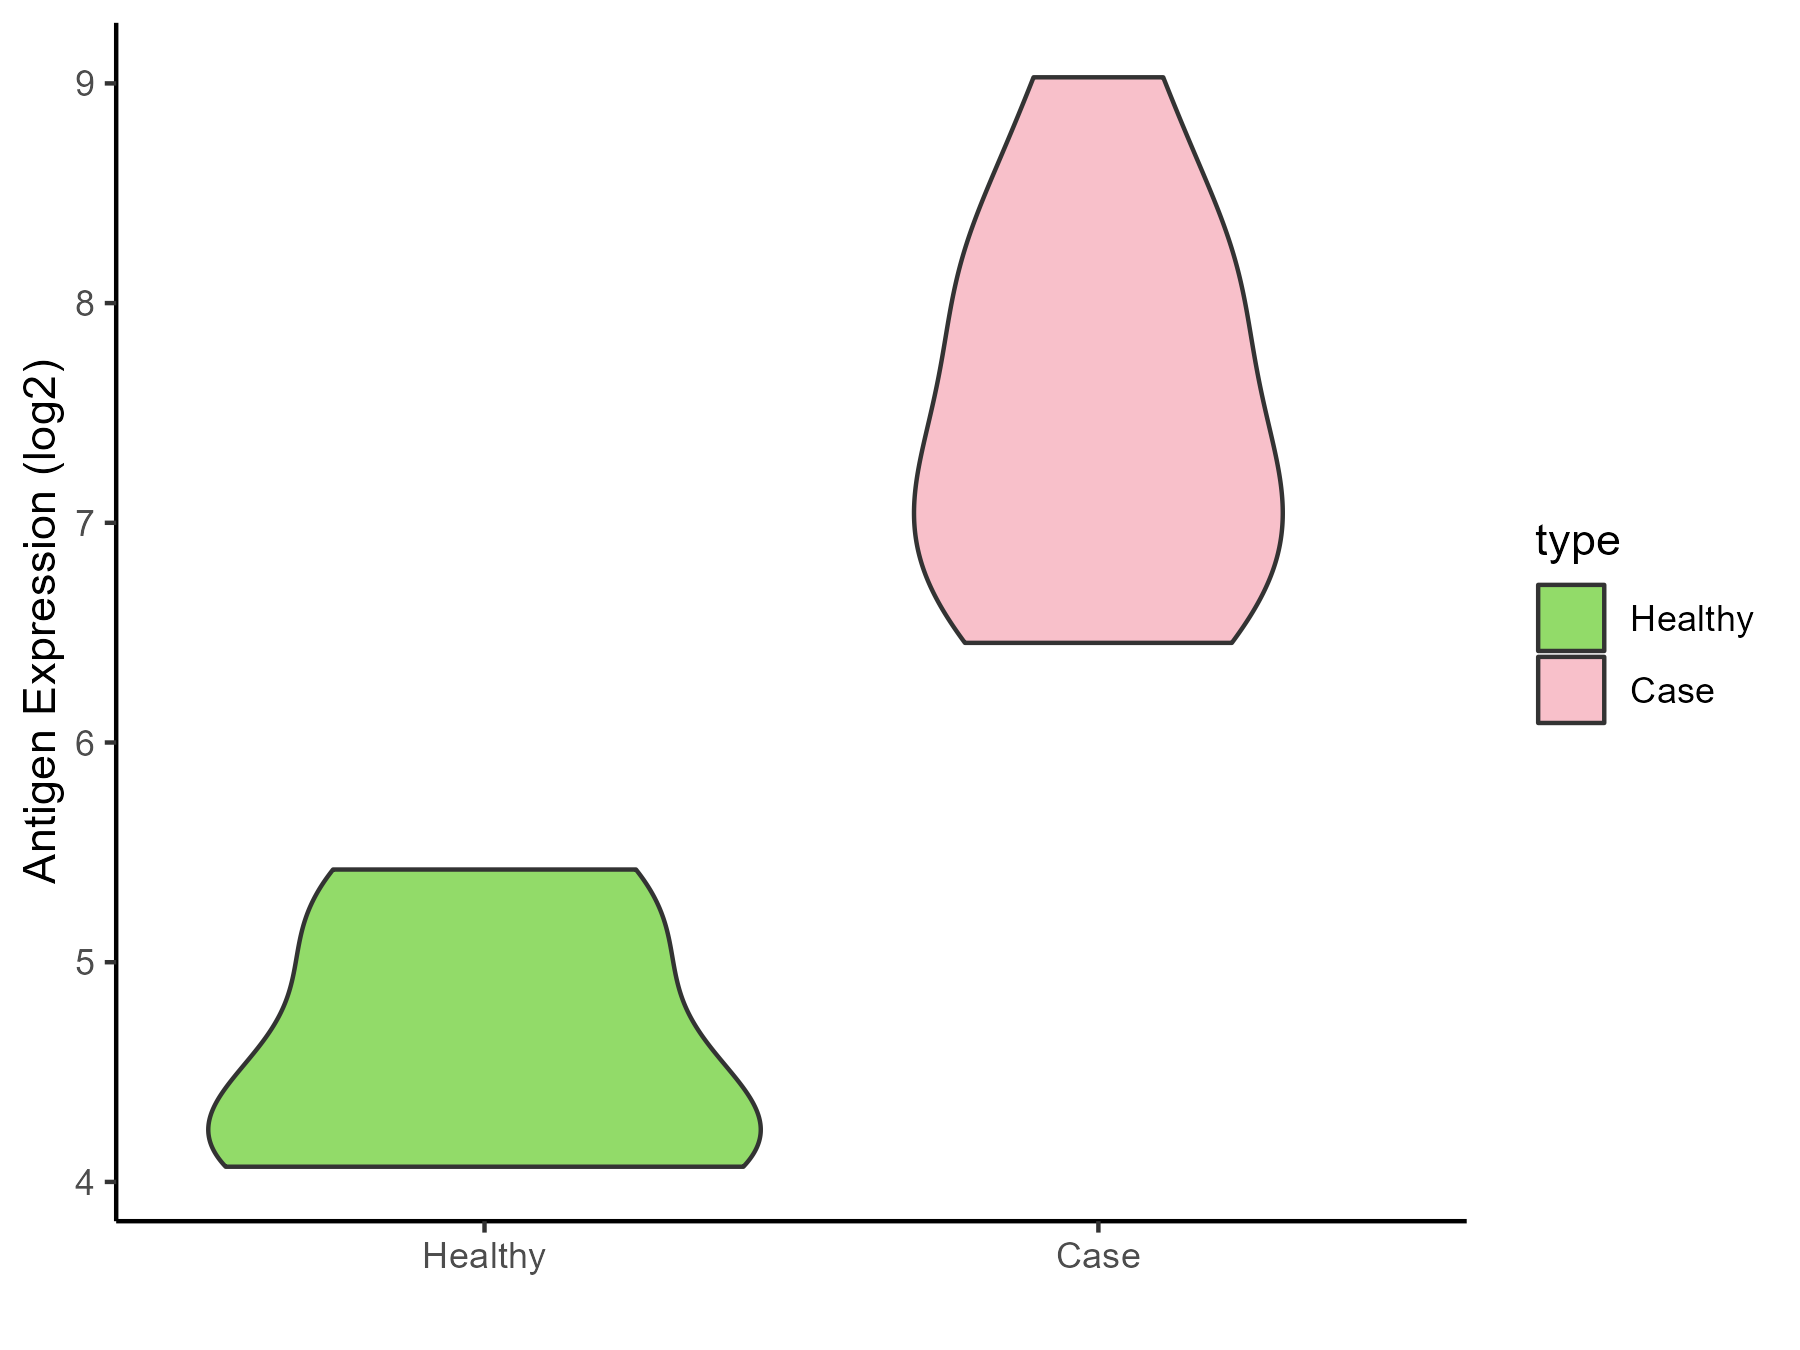
| Differential expression pattern of antigen in diseases | ||
| The Studied Tissue | Bladder | |
| The Specific Disease | Interstitial cystitis | |
| The Expression Level of Disease Section Compare with the Healthy Individual Tissue | p-value: 7.97E-06; Fold-change: 2.942662131; Z-score: 4.981091248 | |
| Disease-specific Antigen Abundances |
|
Click to View the Clearer Original Diagram |
ICD Disease Classification 19
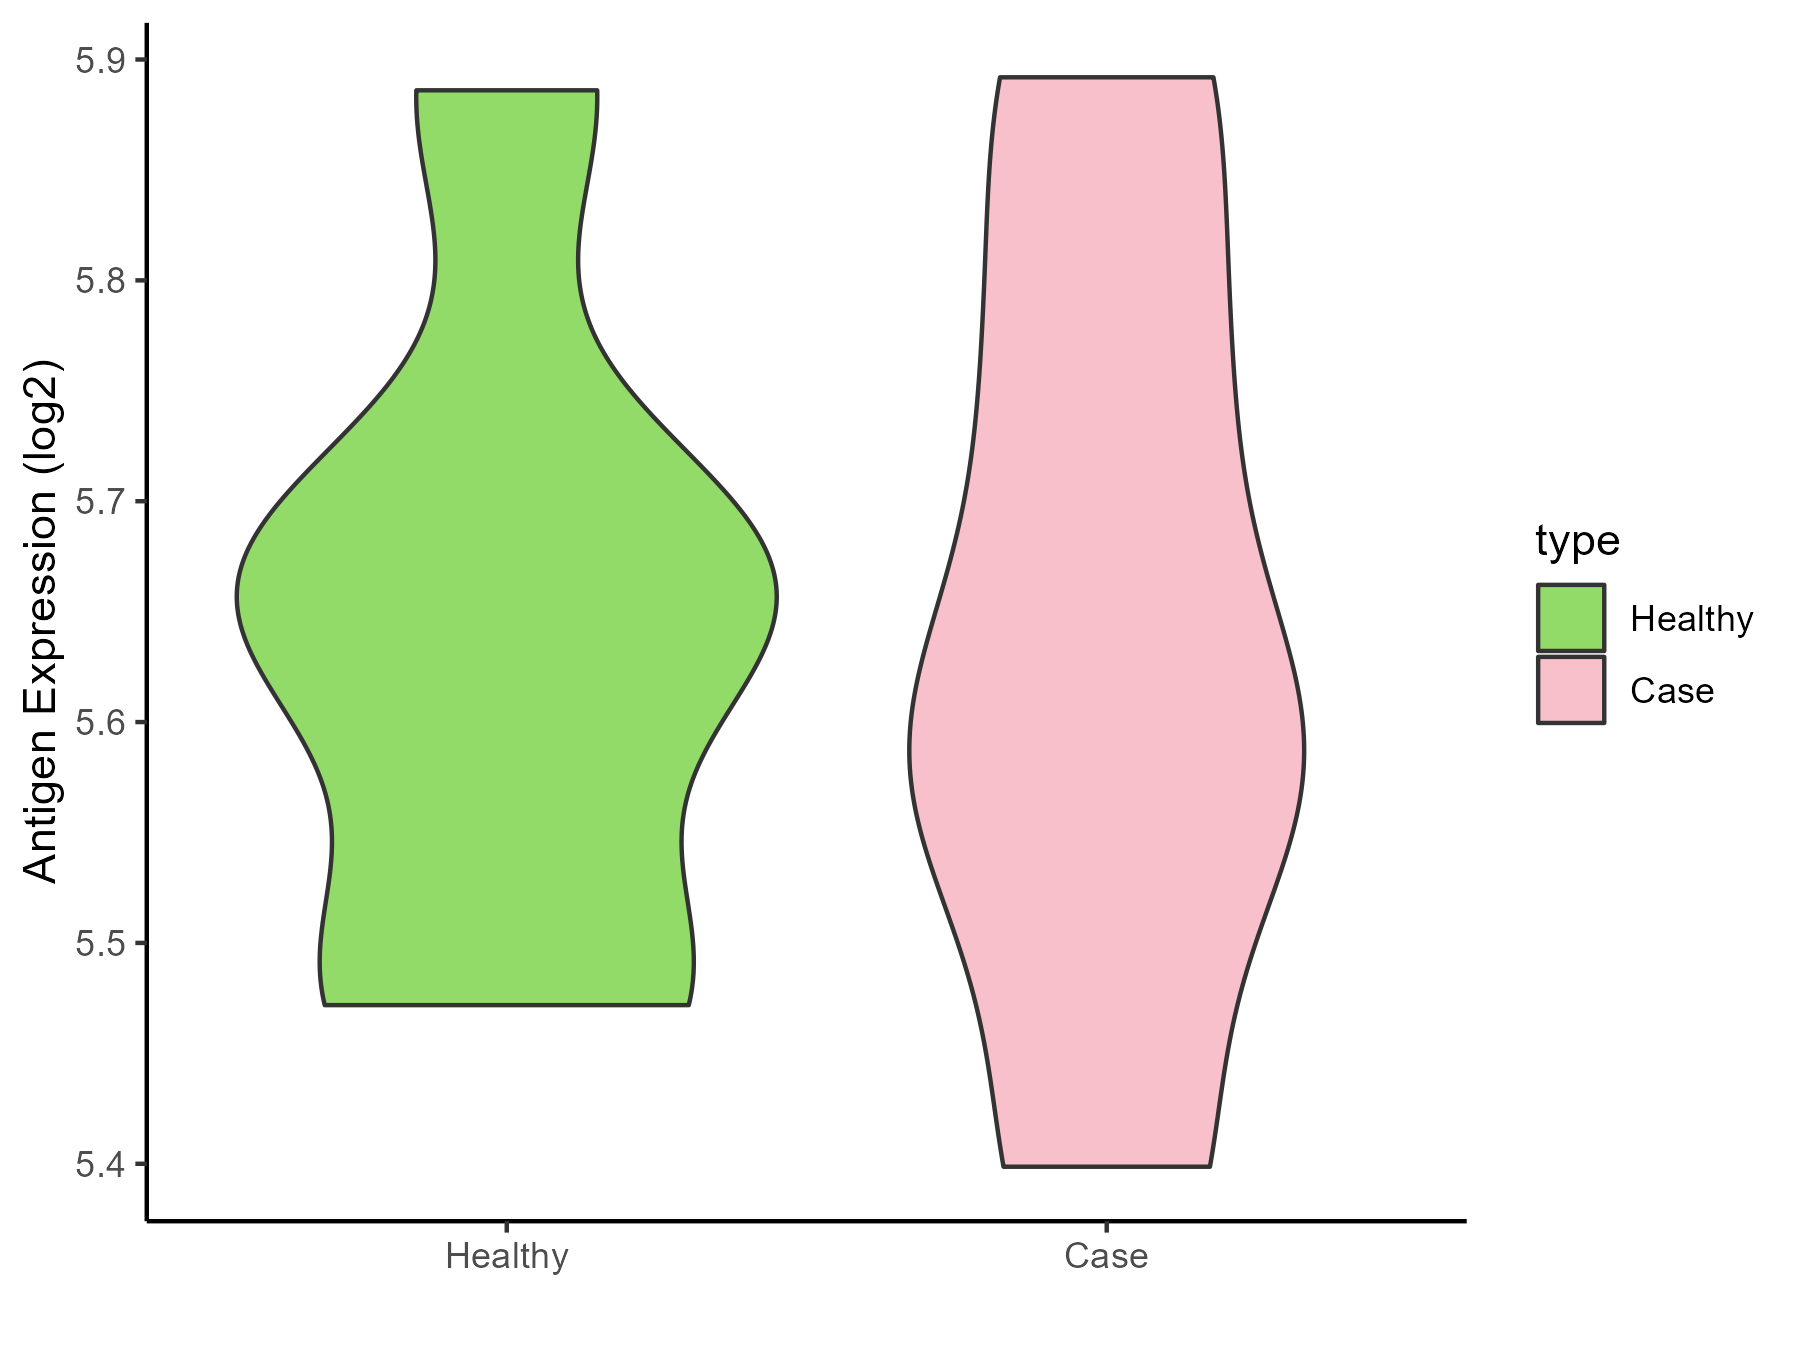
| Differential expression pattern of antigen in diseases | ||
| The Studied Tissue | Myometrium | |
| The Specific Disease | Preterm birth | |
| The Expression Level of Disease Section Compare with the Healthy Individual Tissue | p-value: 0.985559691; Fold-change: -0.07000865; Z-score: -0.464279952 | |
| Disease-specific Antigen Abundances |
|
Click to View the Clearer Original Diagram |
ICD Disease Classification 2
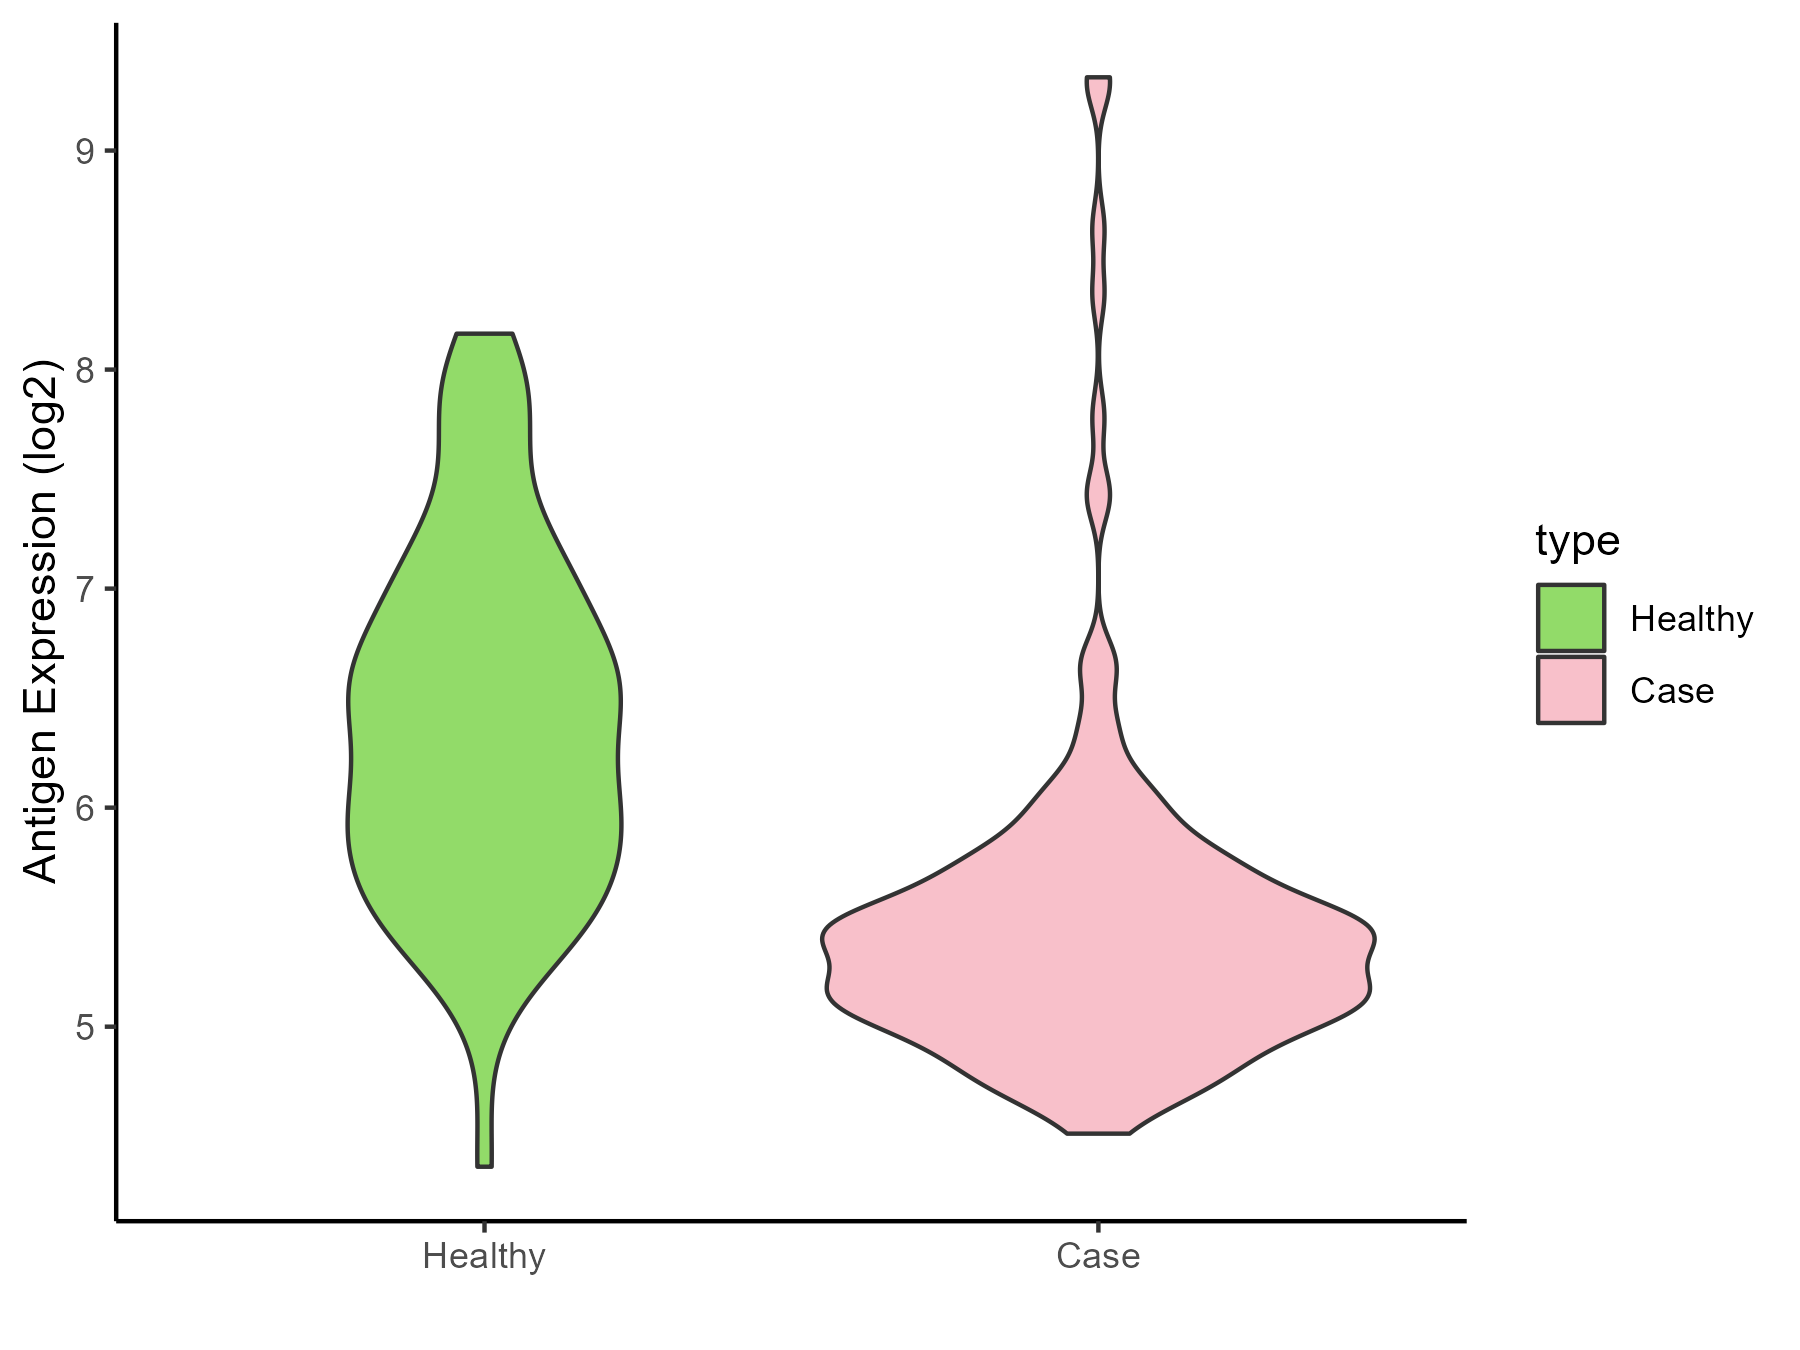
| Differential expression pattern of antigen in diseases | ||
| The Studied Tissue | Bone marrow | |
| The Specific Disease | Acute myelocytic leukemia | |
| The Expression Level of Disease Section Compare with the Healthy Individual Tissue | p-value: 2.33E-24; Fold-change: -1.060235455; Z-score: -1.328624264 | |
| Disease-specific Antigen Abundances |
|
Click to View the Clearer Original Diagram |
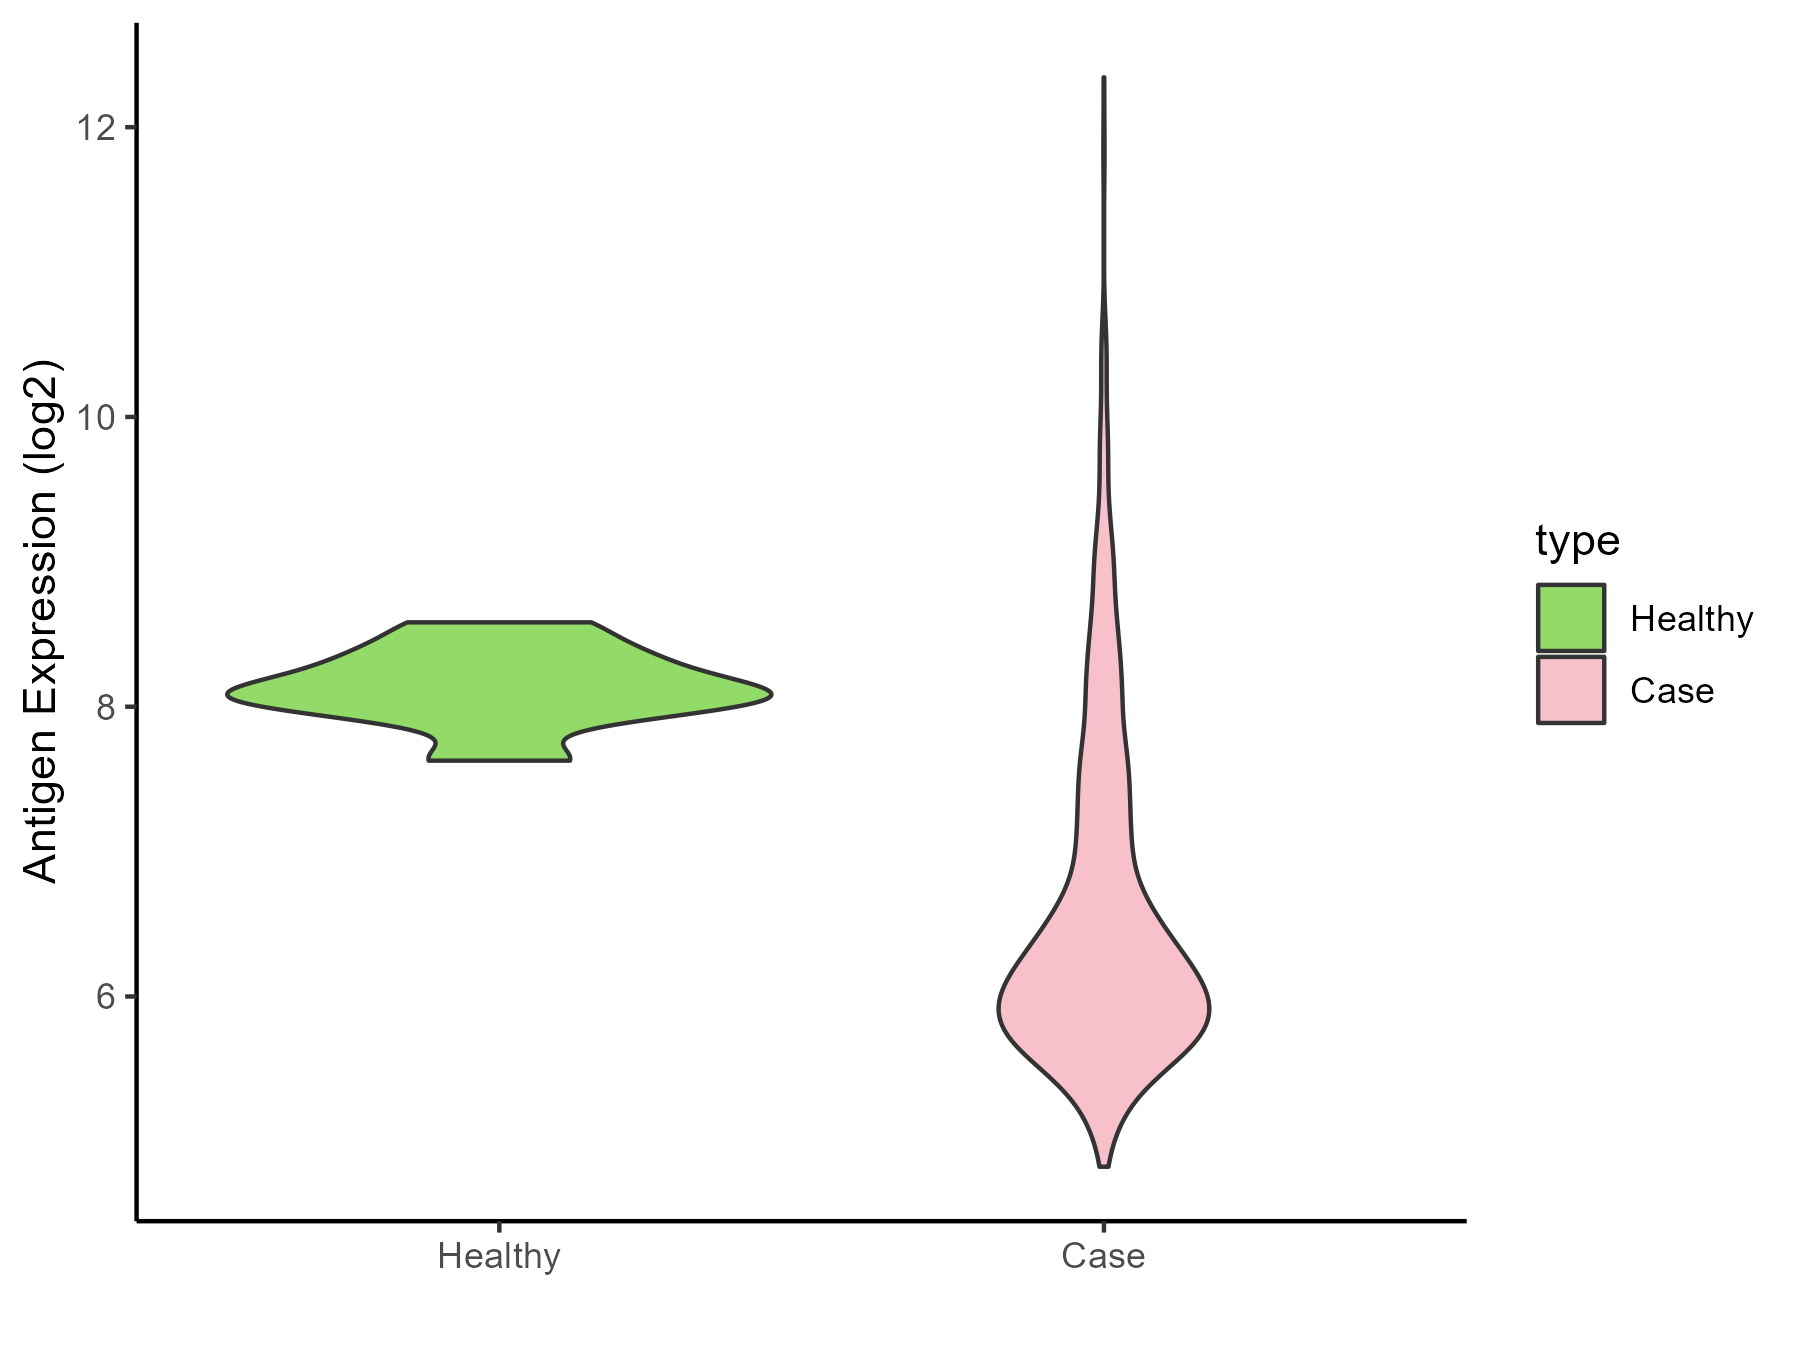
| Differential expression pattern of antigen in diseases | ||
| The Studied Tissue | Bone marrow | |
| The Specific Disease | Myeloma | |
| The Expression Level of Disease Section Compare with the Healthy Individual Tissue | p-value: 2.33E-07; Fold-change: -1.903622593; Z-score: -6.638832944 | |
| Disease-specific Antigen Abundances |
|
Click to View the Clearer Original Diagram |
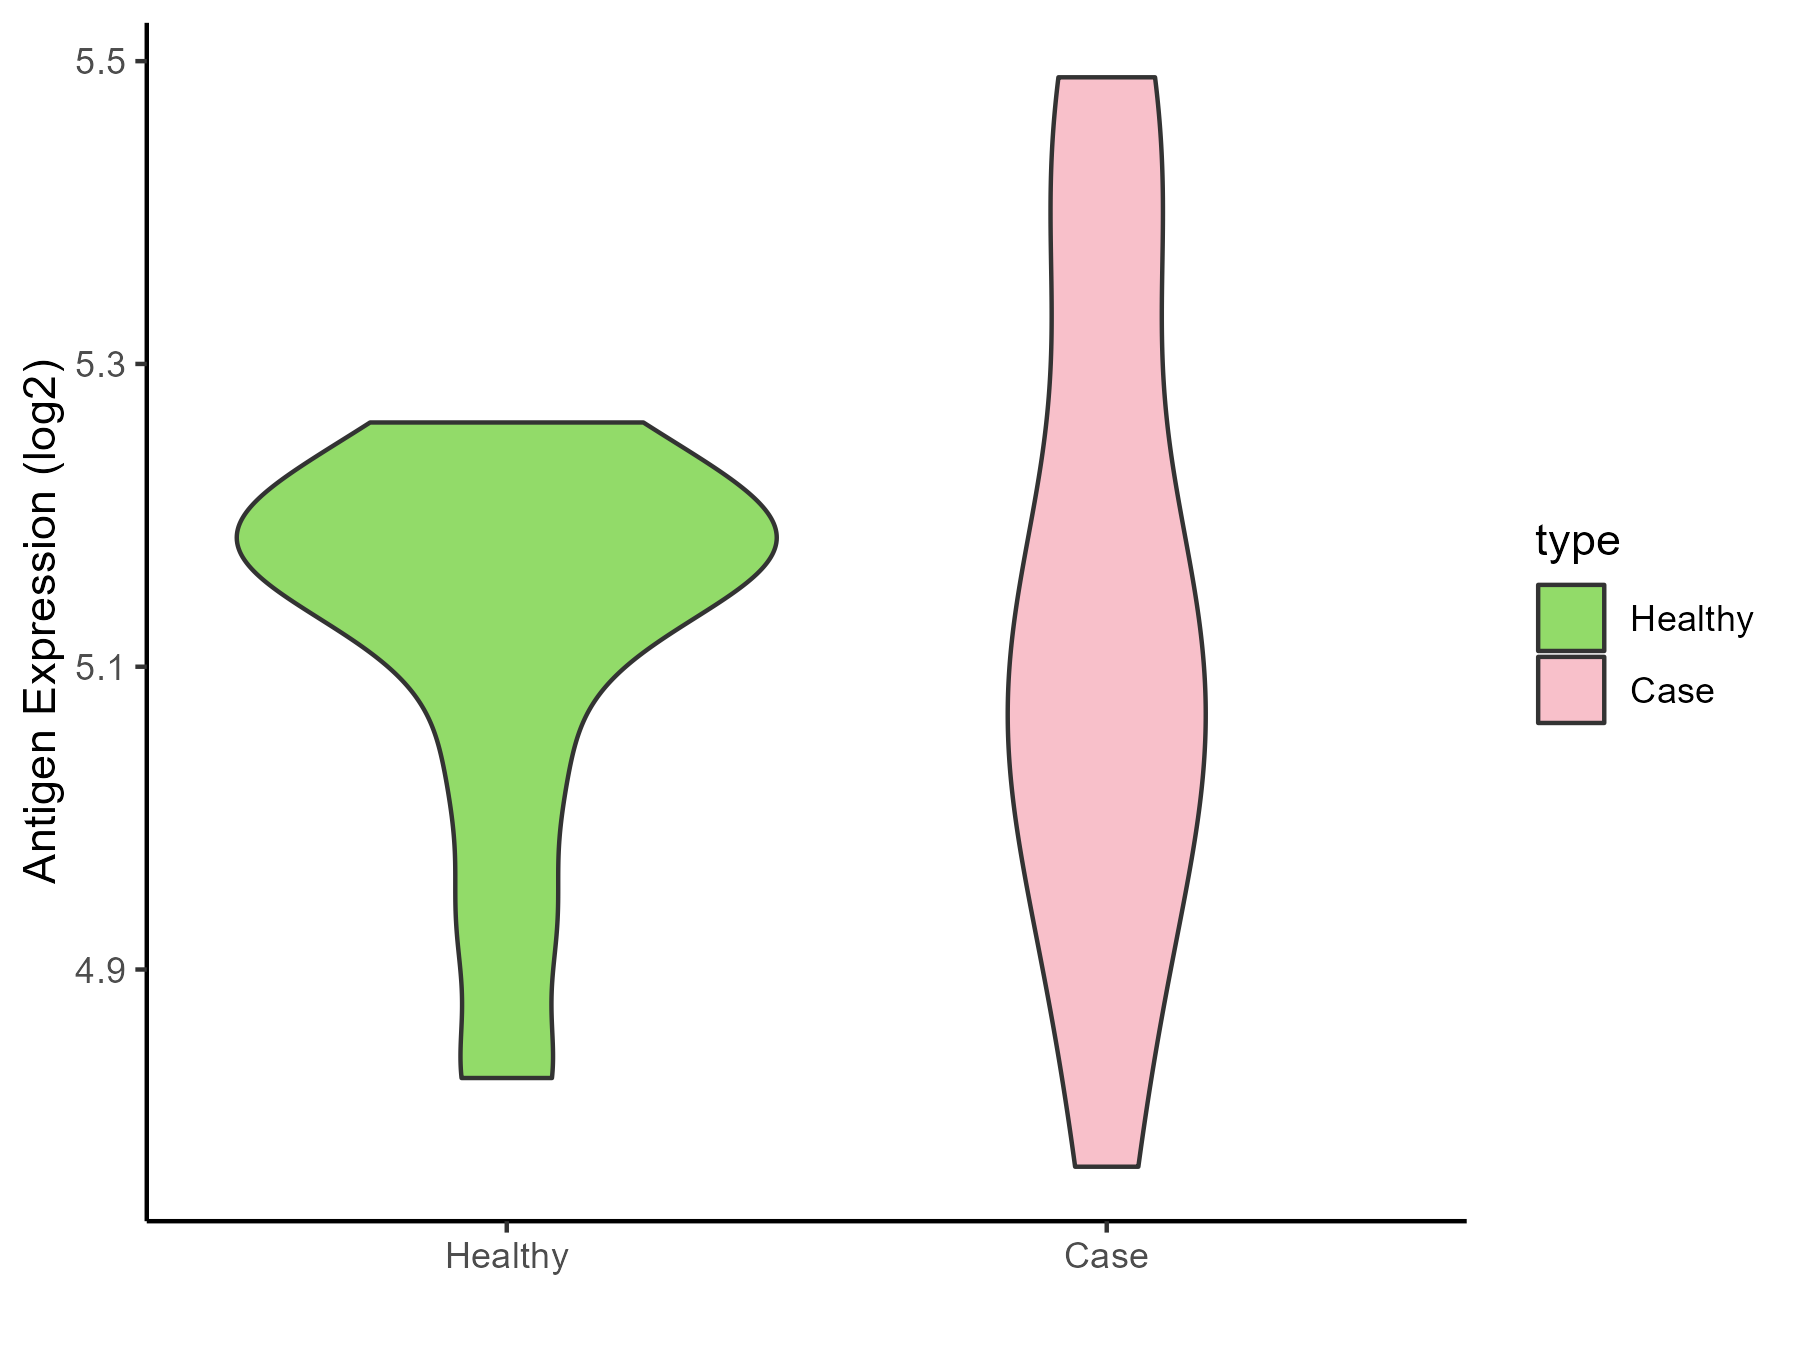
| The Studied Tissue | Peripheral blood | |
| The Specific Disease | Myeloma | |
| The Expression Level of Disease Section Compare with the Healthy Individual Tissue | p-value: 0.769255144; Fold-change: -0.064173239; Z-score: -0.492409928 | |
| Disease-specific Antigen Abundances |
|
Click to View the Clearer Original Diagram |
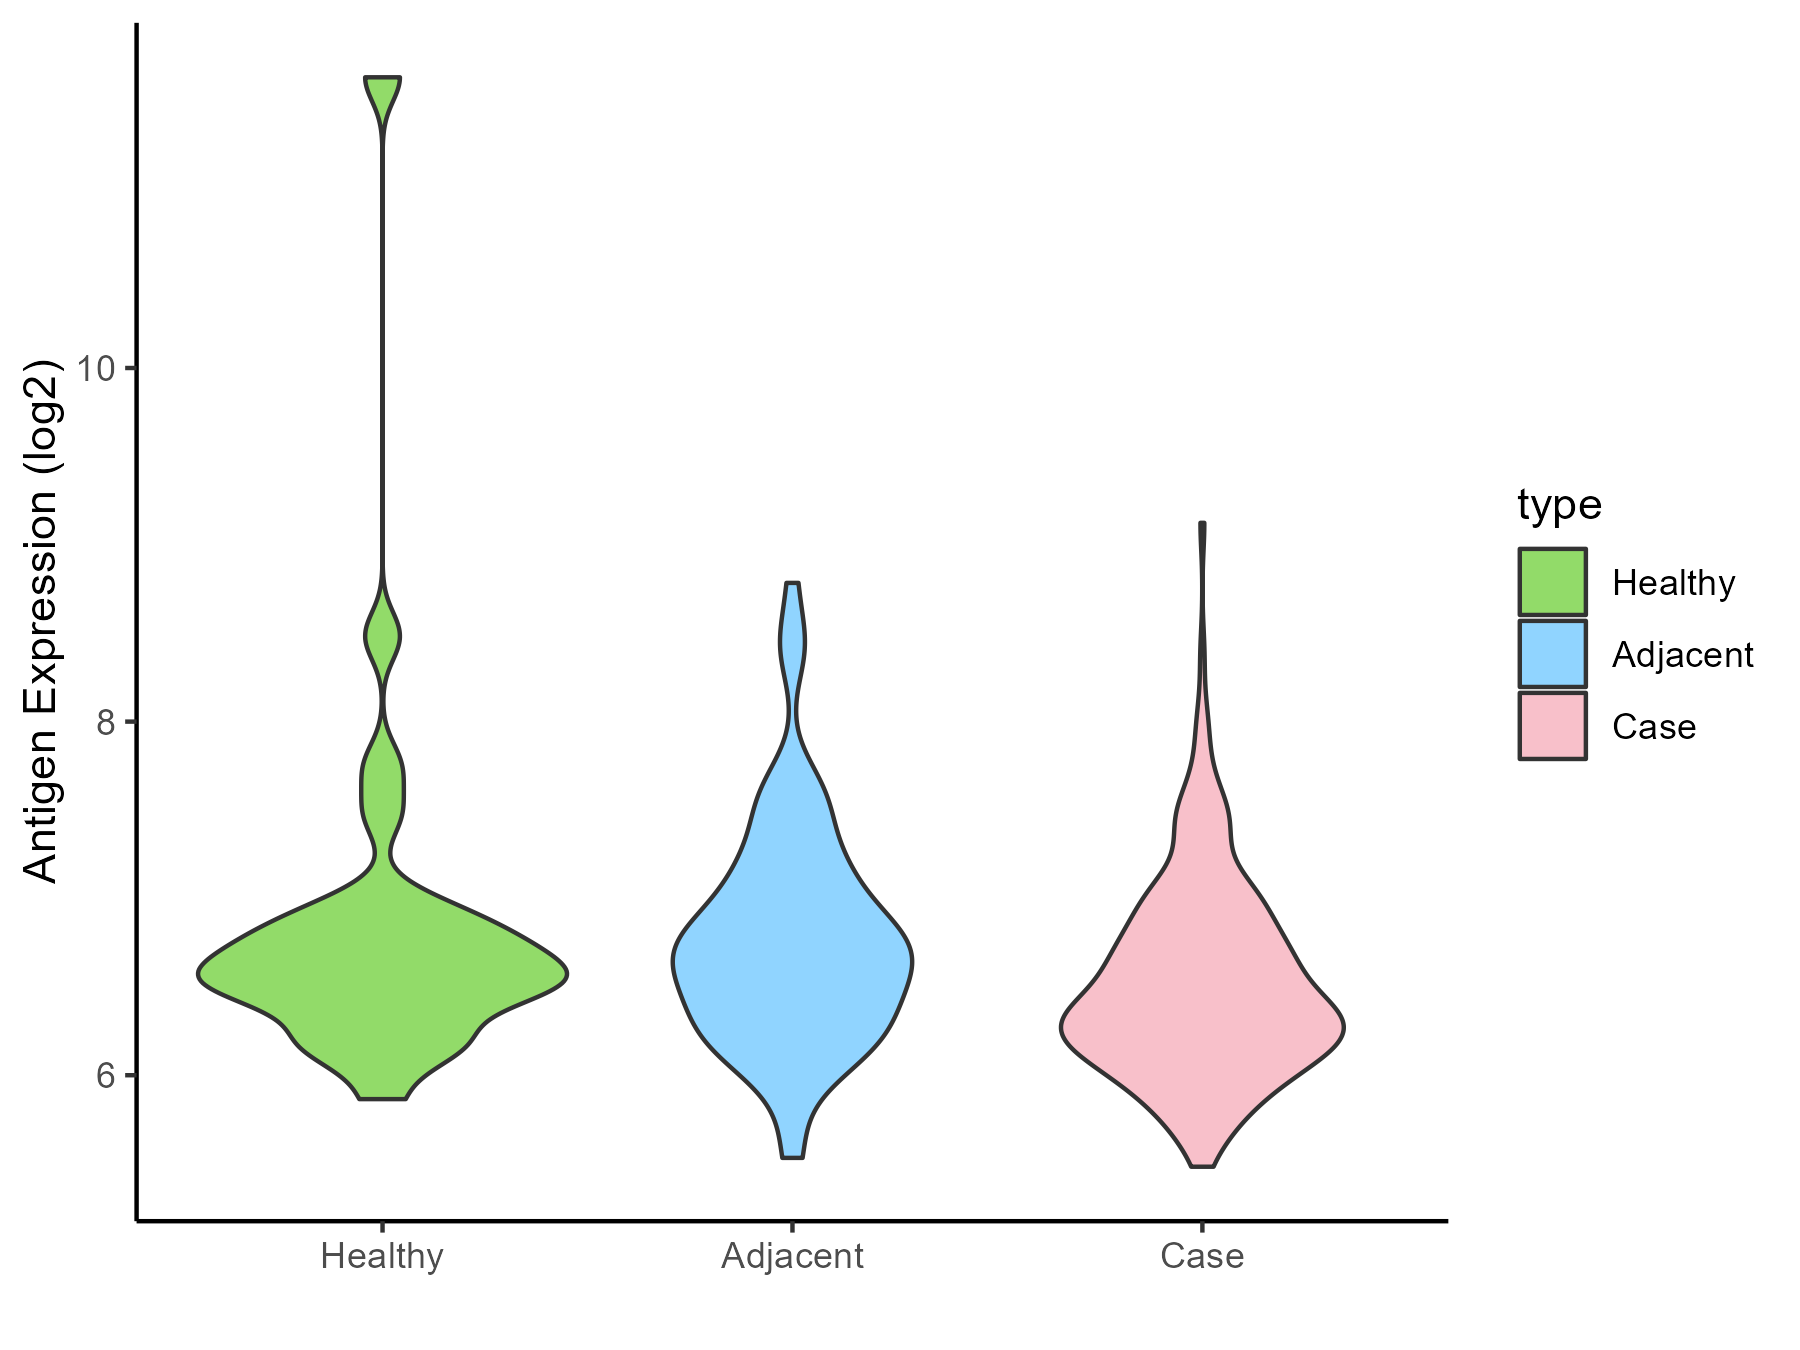
| Differential expression pattern of antigen in diseases | ||
| The Studied Tissue | Oral | |
| The Specific Disease | Oral cancer | |
| The Expression Level of Disease Section Compare with the Healthy Individual Tissue | p-value: 0.10880601; Fold-change: -0.17621574; Z-score: -0.161392812 | |
| The Expression Level of Disease Section Compare with the Adjacent Tissue | p-value: 0.001971873; Fold-change: -0.286337053; Z-score: -0.465272225 | |
| Disease-specific Antigen Abundances |
|
Click to View the Clearer Original Diagram |
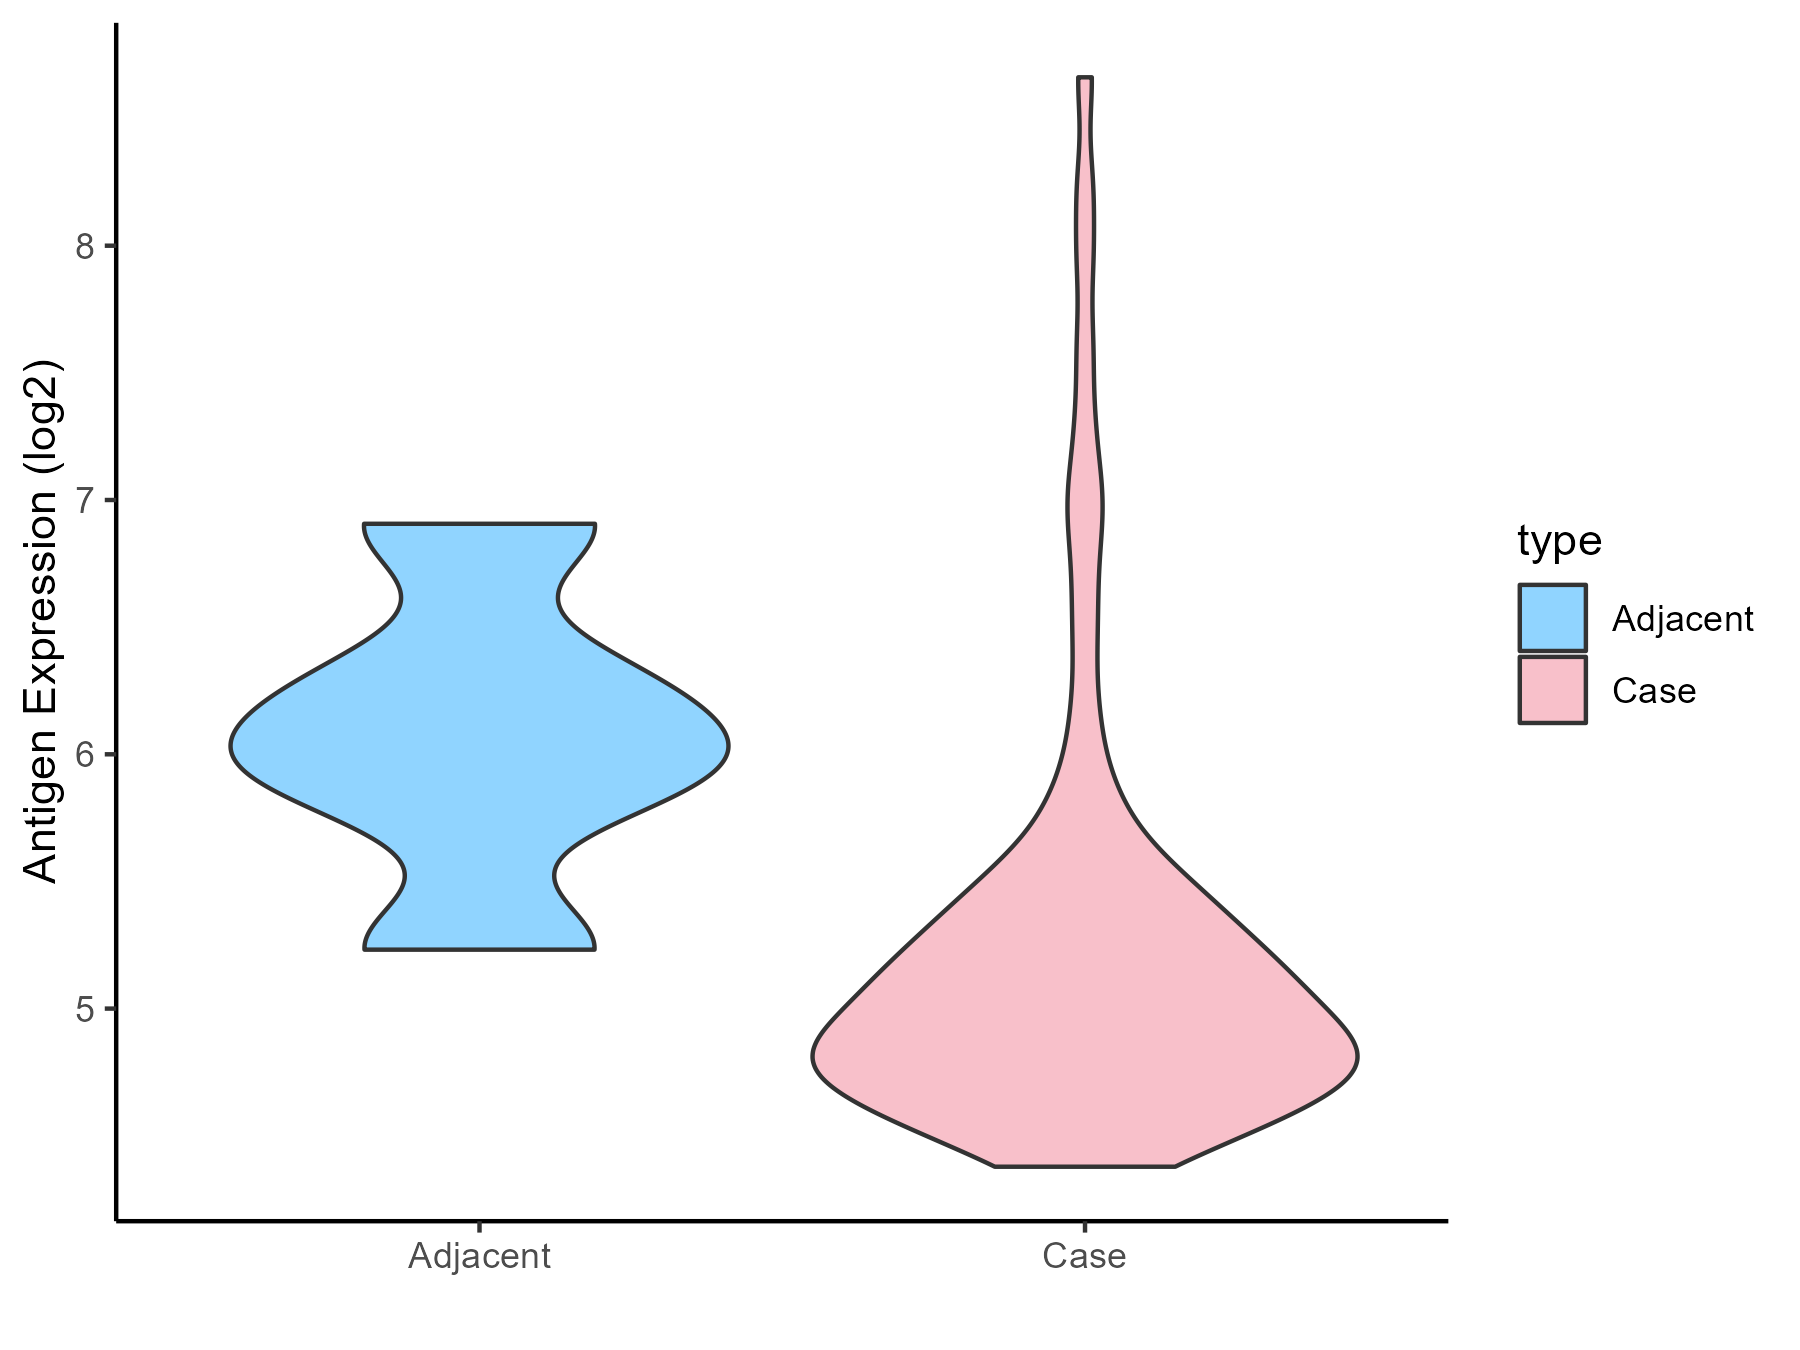
| Differential expression pattern of antigen in diseases | ||
| The Studied Tissue | Esophagus | |
| The Specific Disease | Esophagal cancer | |
| The Expression Level of Disease Section Compare with the Adjacent Tissue | p-value: 0.0321341; Fold-change: -1.054852221; Z-score: -1.726404061 | |
| Disease-specific Antigen Abundances |
|
Click to View the Clearer Original Diagram |
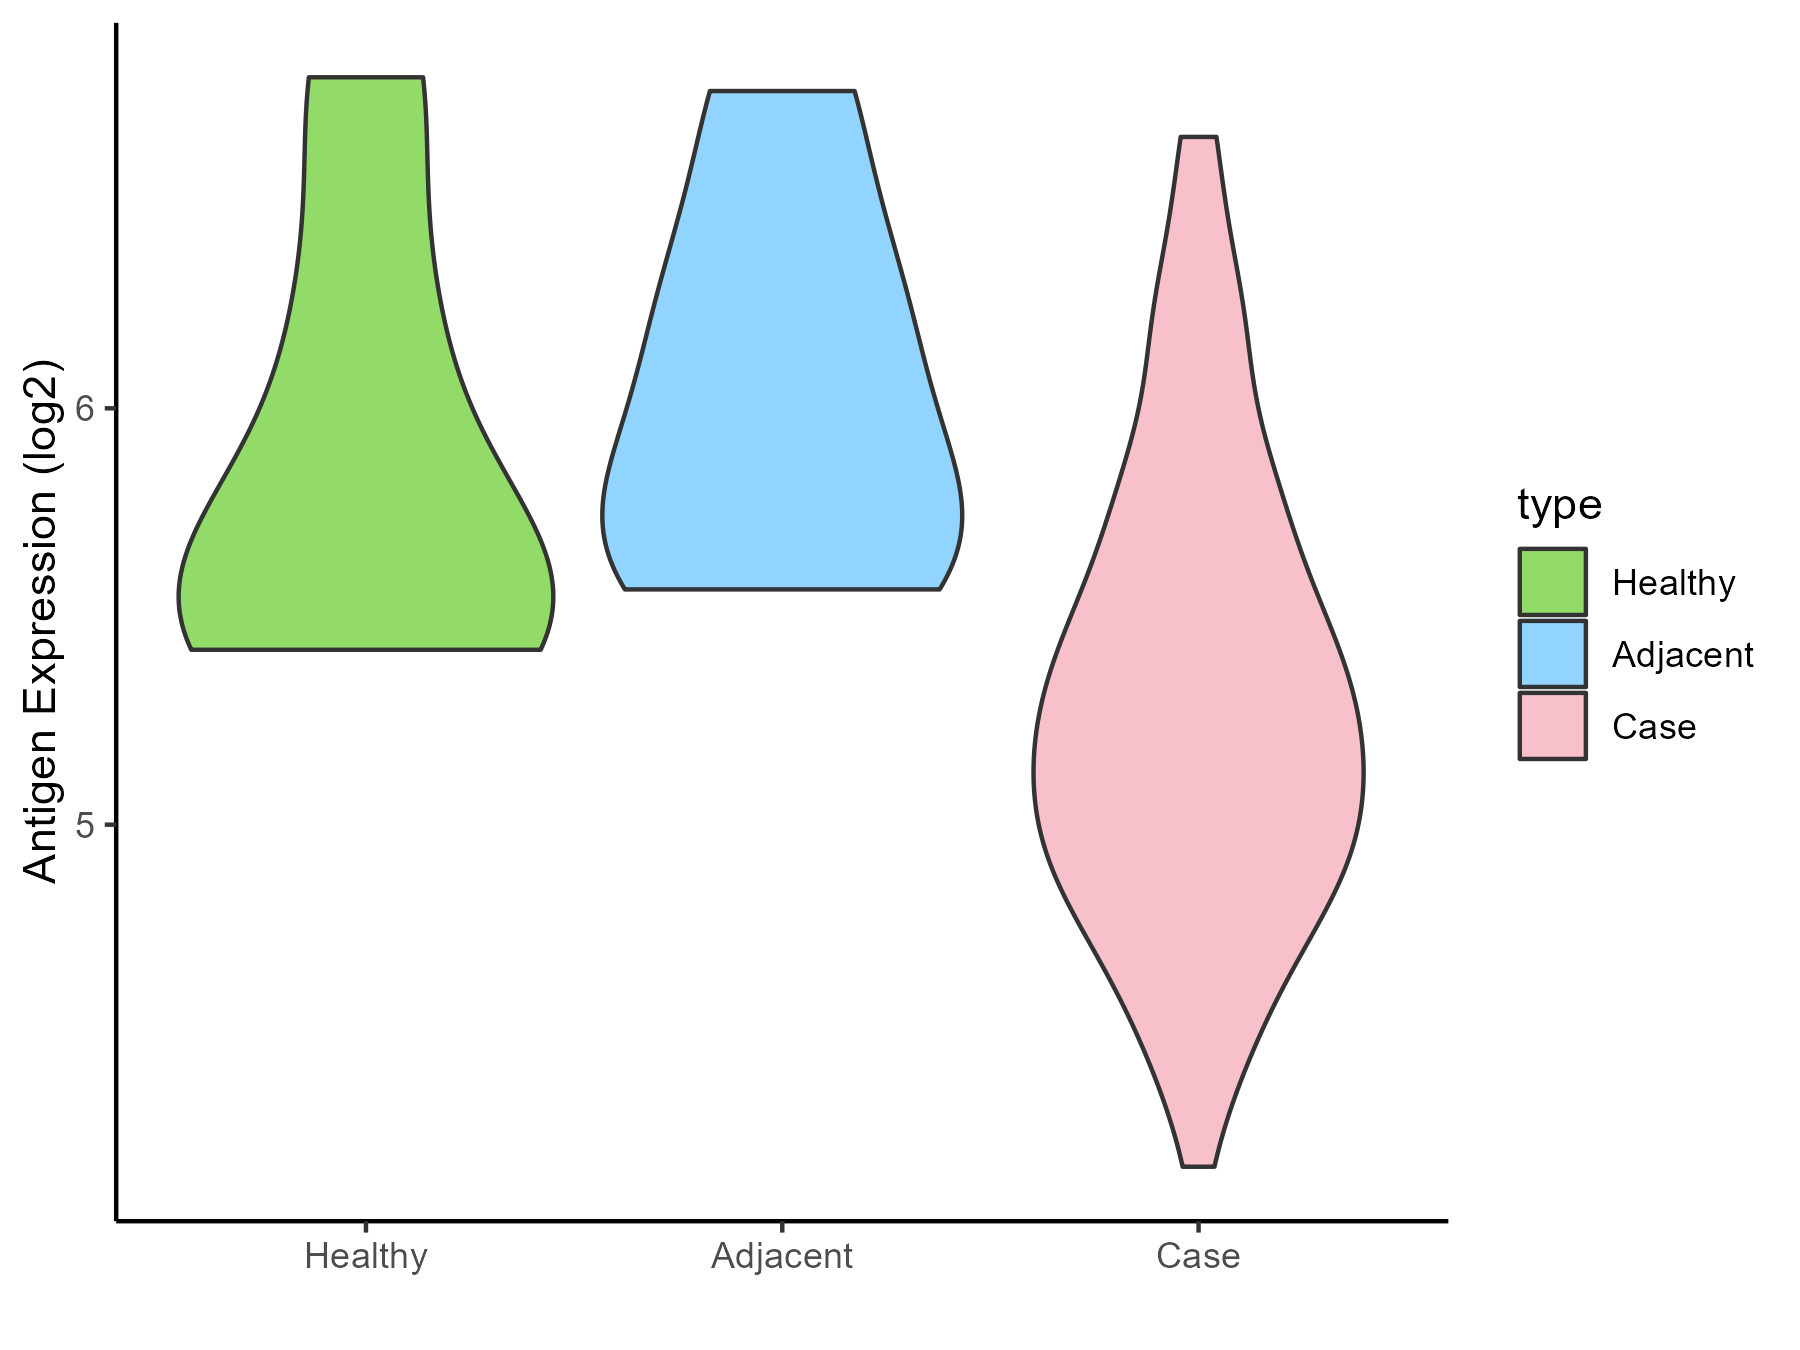
| Differential expression pattern of antigen in diseases | ||
| The Studied Tissue | Rectal colon | |
| The Specific Disease | Rectal cancer | |
| The Expression Level of Disease Section Compare with the Healthy Individual Tissue | p-value: 0.053092761; Fold-change: -0.425775827; Z-score: -0.784271069 | |
| The Expression Level of Disease Section Compare with the Adjacent Tissue | p-value: 0.010037528; Fold-change: -0.702635773; Z-score: -1.536322361 | |
| Disease-specific Antigen Abundances |
|
Click to View the Clearer Original Diagram |
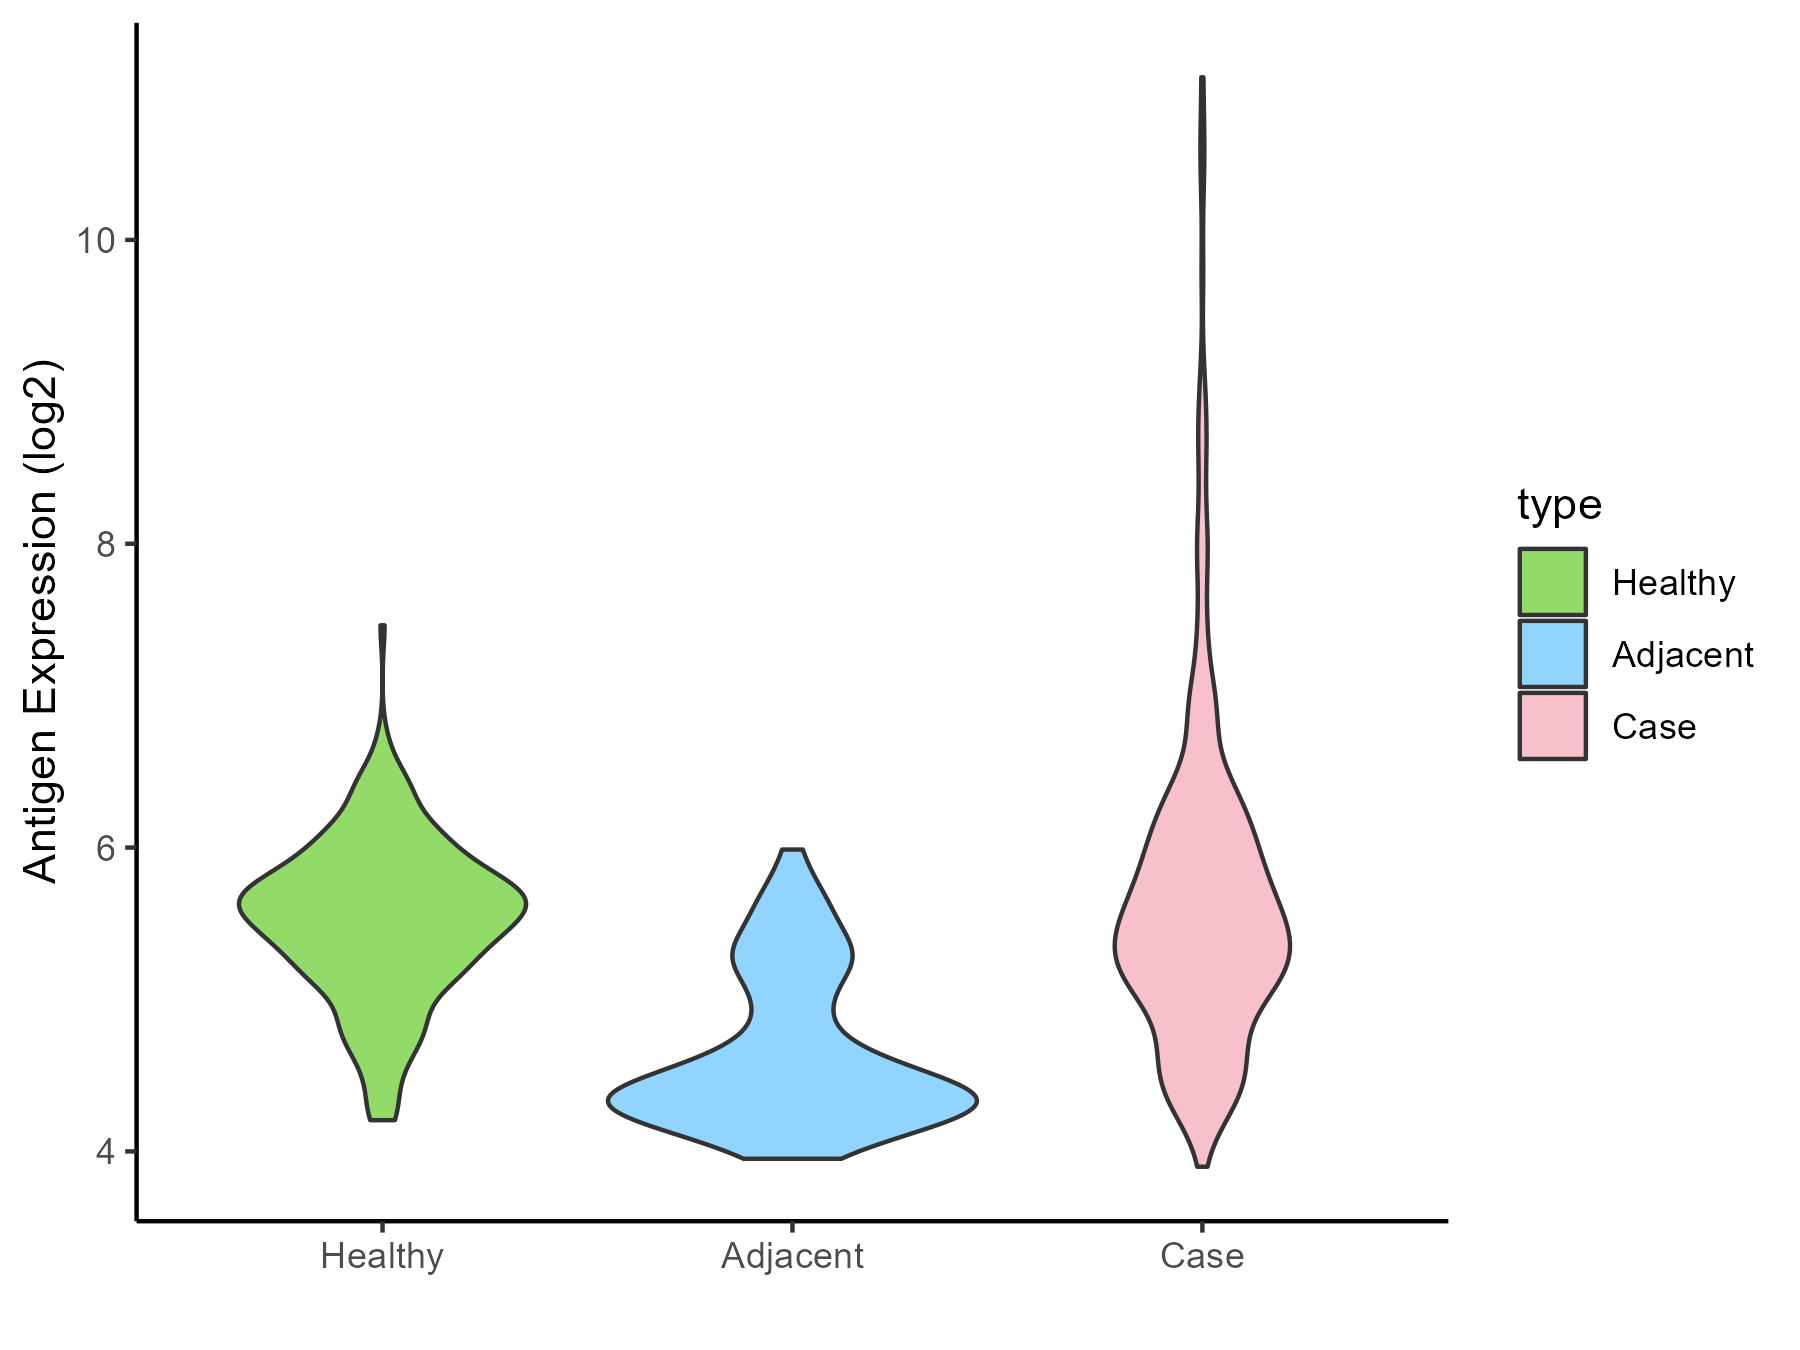
| Differential expression pattern of antigen in diseases | ||
| The Studied Tissue | Skin | |
| The Specific Disease | Skin cancer | |
| The Expression Level of Disease Section Compare with the Healthy Individual Tissue | p-value: 0.030733062; Fold-change: -0.074759144; Z-score: -0.144028895 | |
| The Expression Level of Disease Section Compare with the Adjacent Tissue | p-value: 9.43E-44; Fold-change: 1.059179166; Z-score: 2.076173698 | |
| Disease-specific Antigen Abundances |
|
Click to View the Clearer Original Diagram |
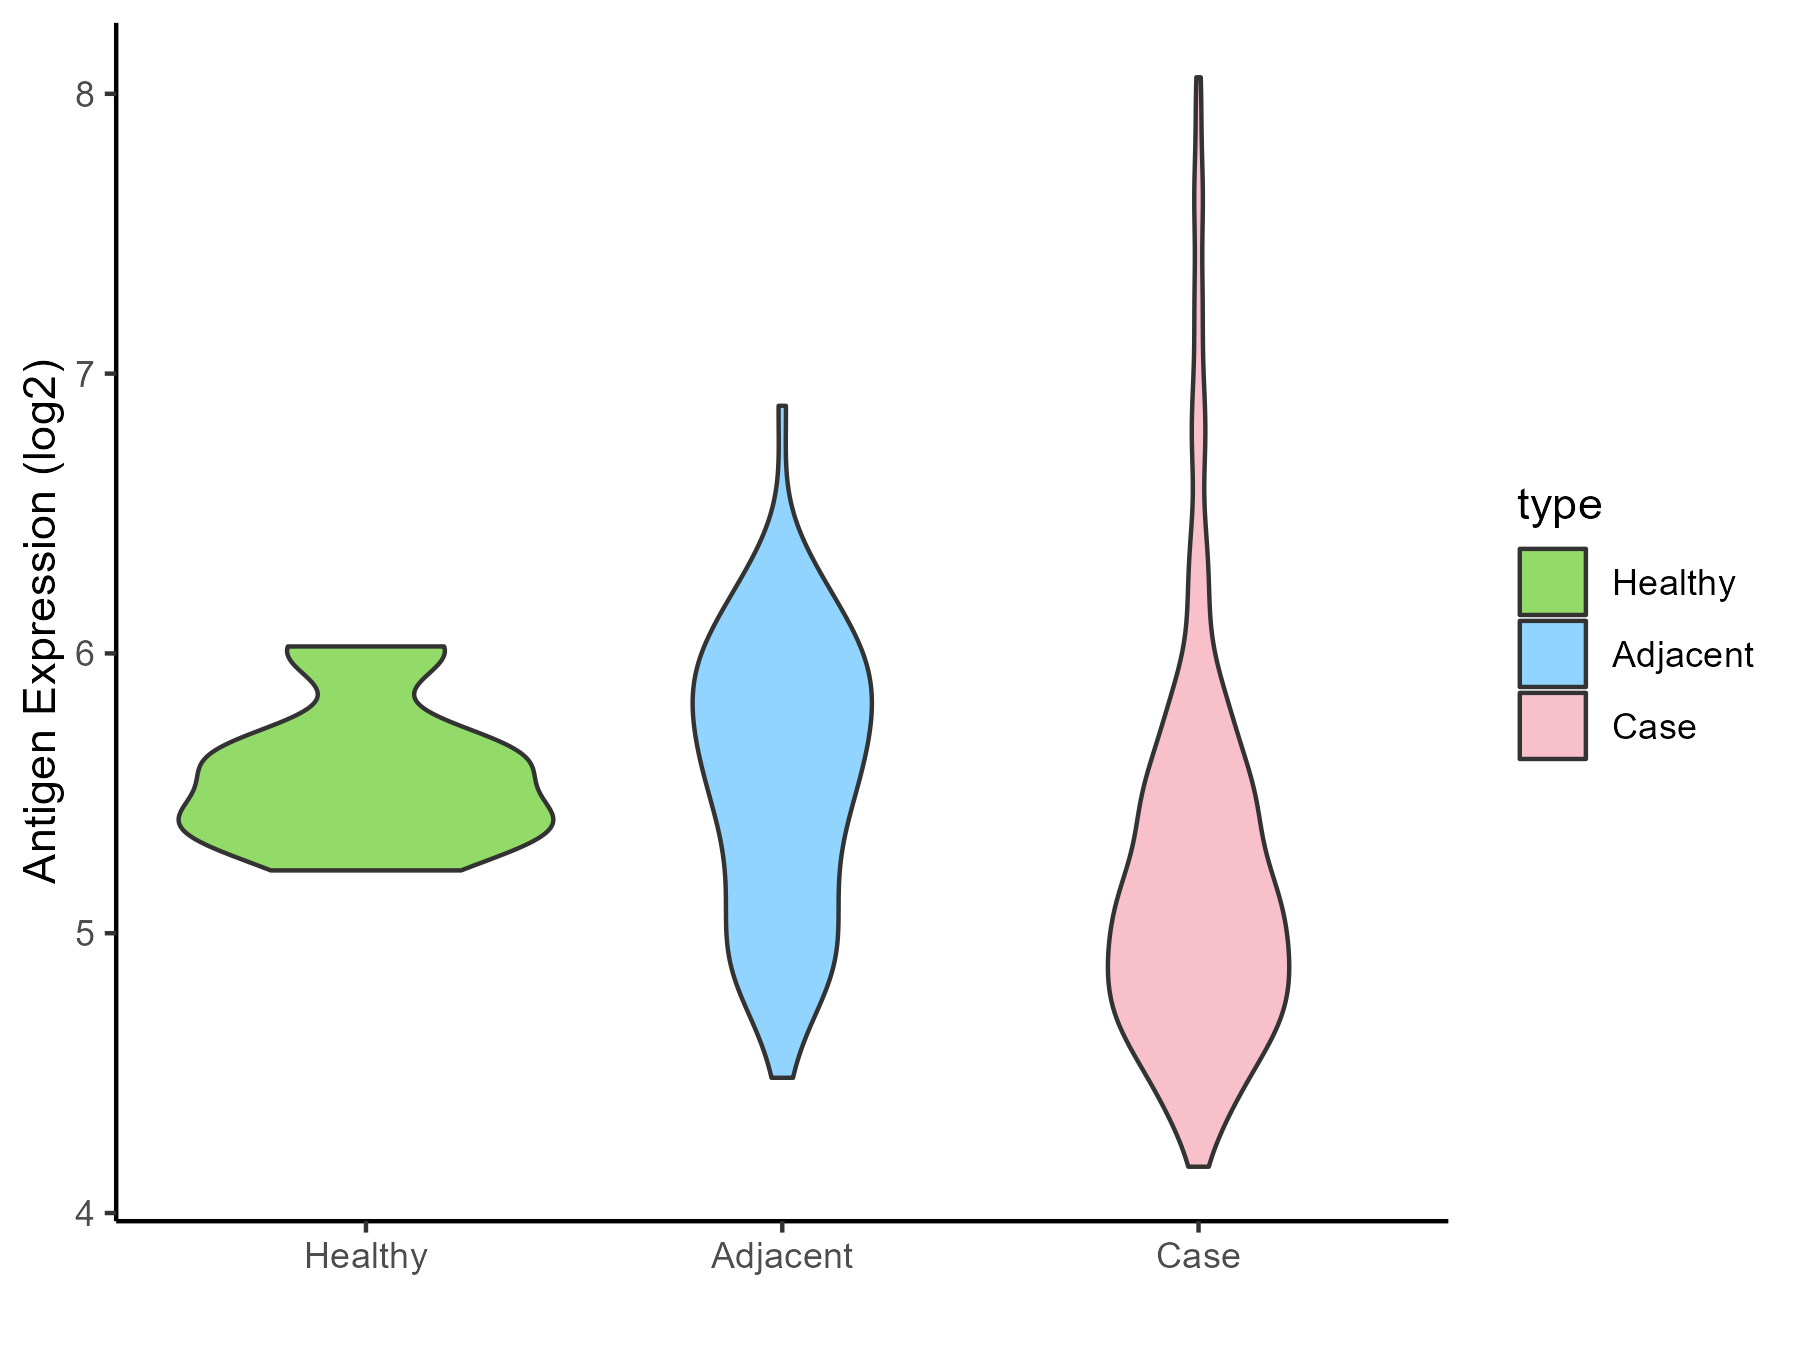
| Differential expression pattern of antigen in diseases | ||
| The Studied Tissue | Kidney | |
| The Specific Disease | Renal cancer | |
| The Expression Level of Disease Section Compare with the Healthy Individual Tissue | p-value: 0.00127383; Fold-change: -0.470668701; Z-score: -1.818670547 | |
| The Expression Level of Disease Section Compare with the Adjacent Tissue | p-value: 2.53E-06; Fold-change: -0.54615426; Z-score: -1.113810358 | |
| Disease-specific Antigen Abundances |
|
Click to View the Clearer Original Diagram |
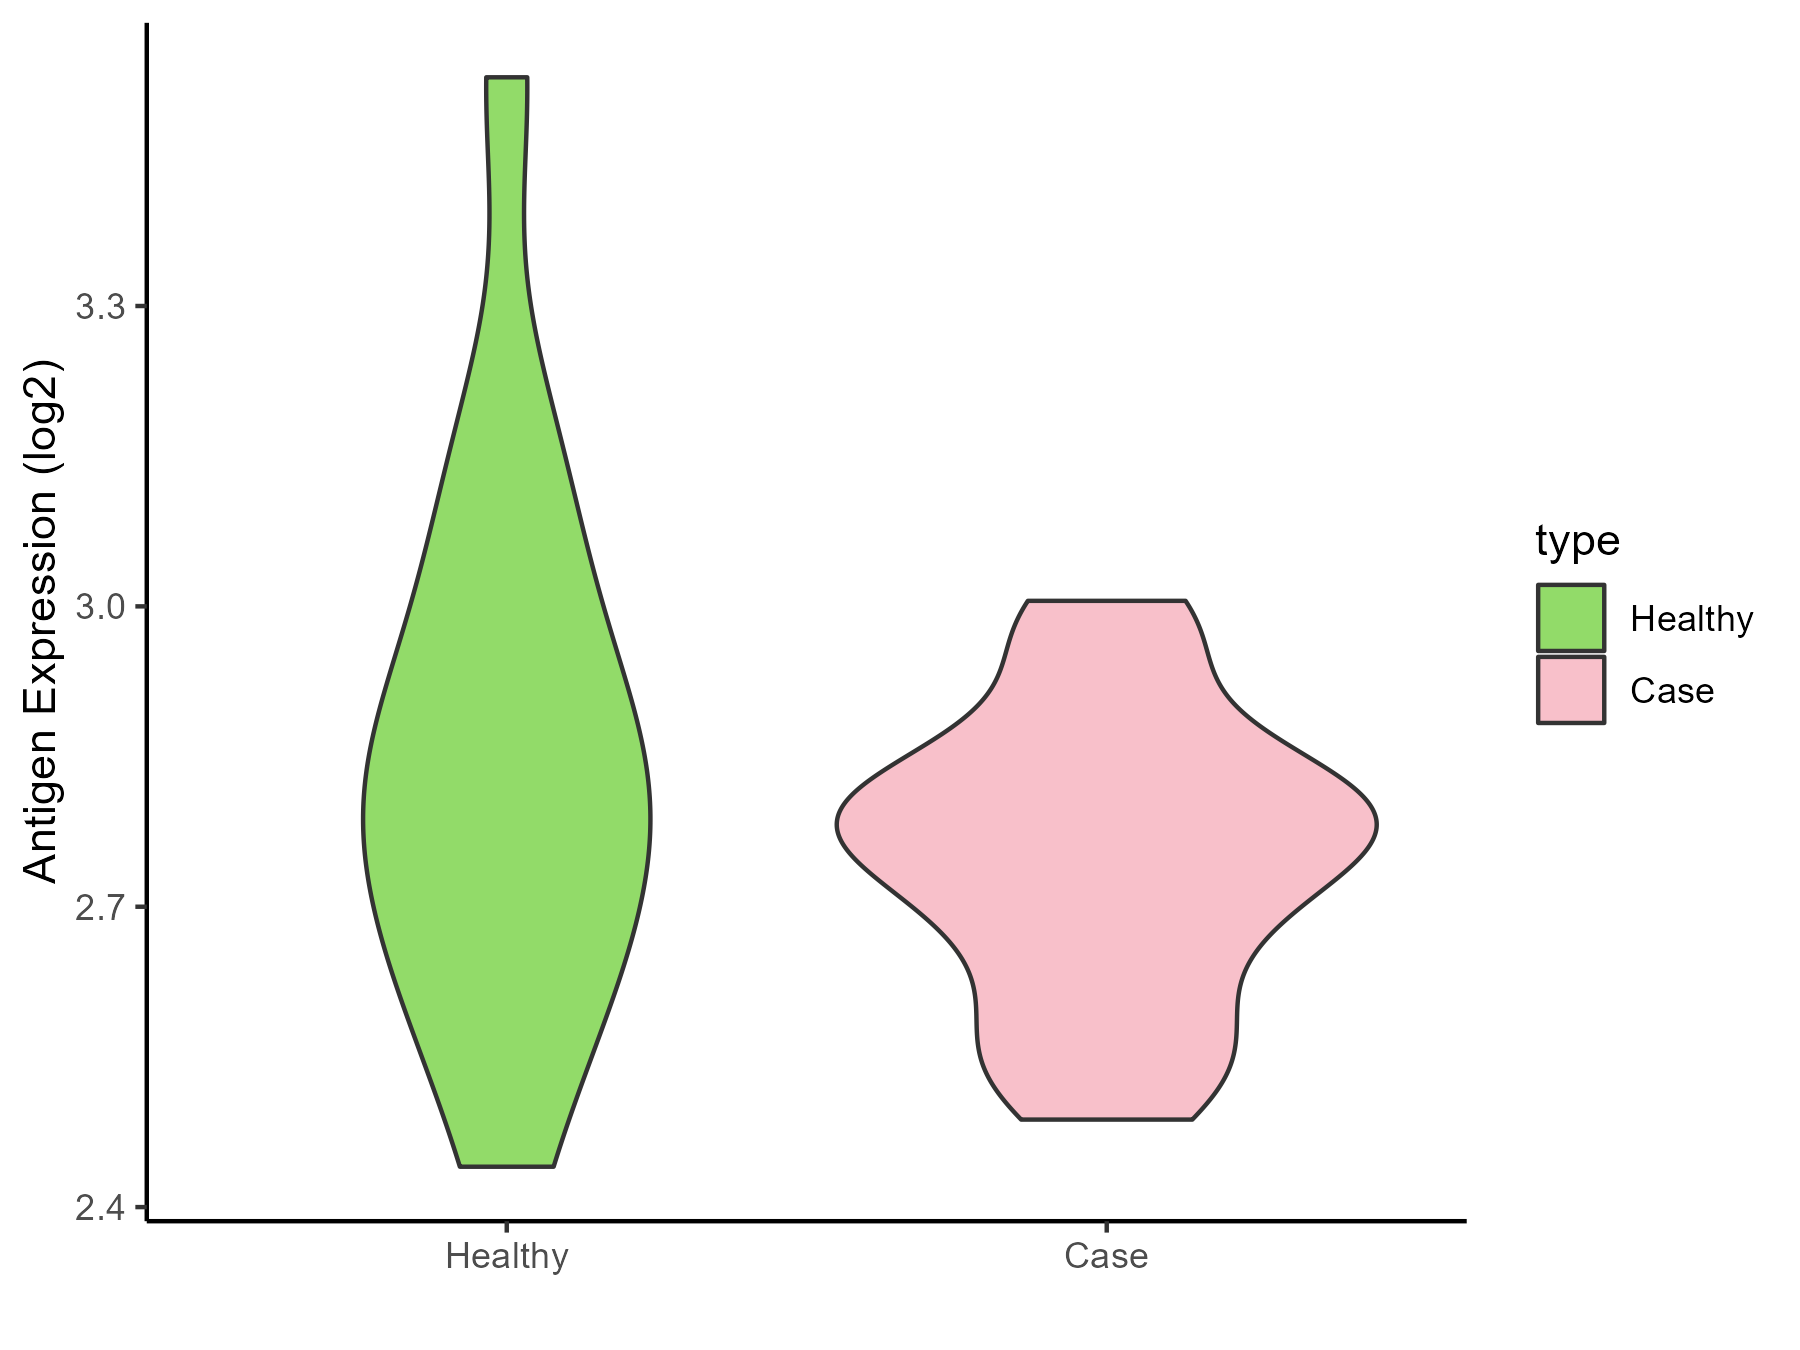
| Differential expression pattern of antigen in diseases | ||
| The Studied Tissue | Urothelium | |
| The Specific Disease | Ureter cancer | |
| The Expression Level of Disease Section Compare with the Healthy Individual Tissue | p-value: 0.17265883; Fold-change: -0.051406948; Z-score: -0.187640742 | |
| Disease-specific Antigen Abundances |
|
Click to View the Clearer Original Diagram |
ICD Disease Classification 20
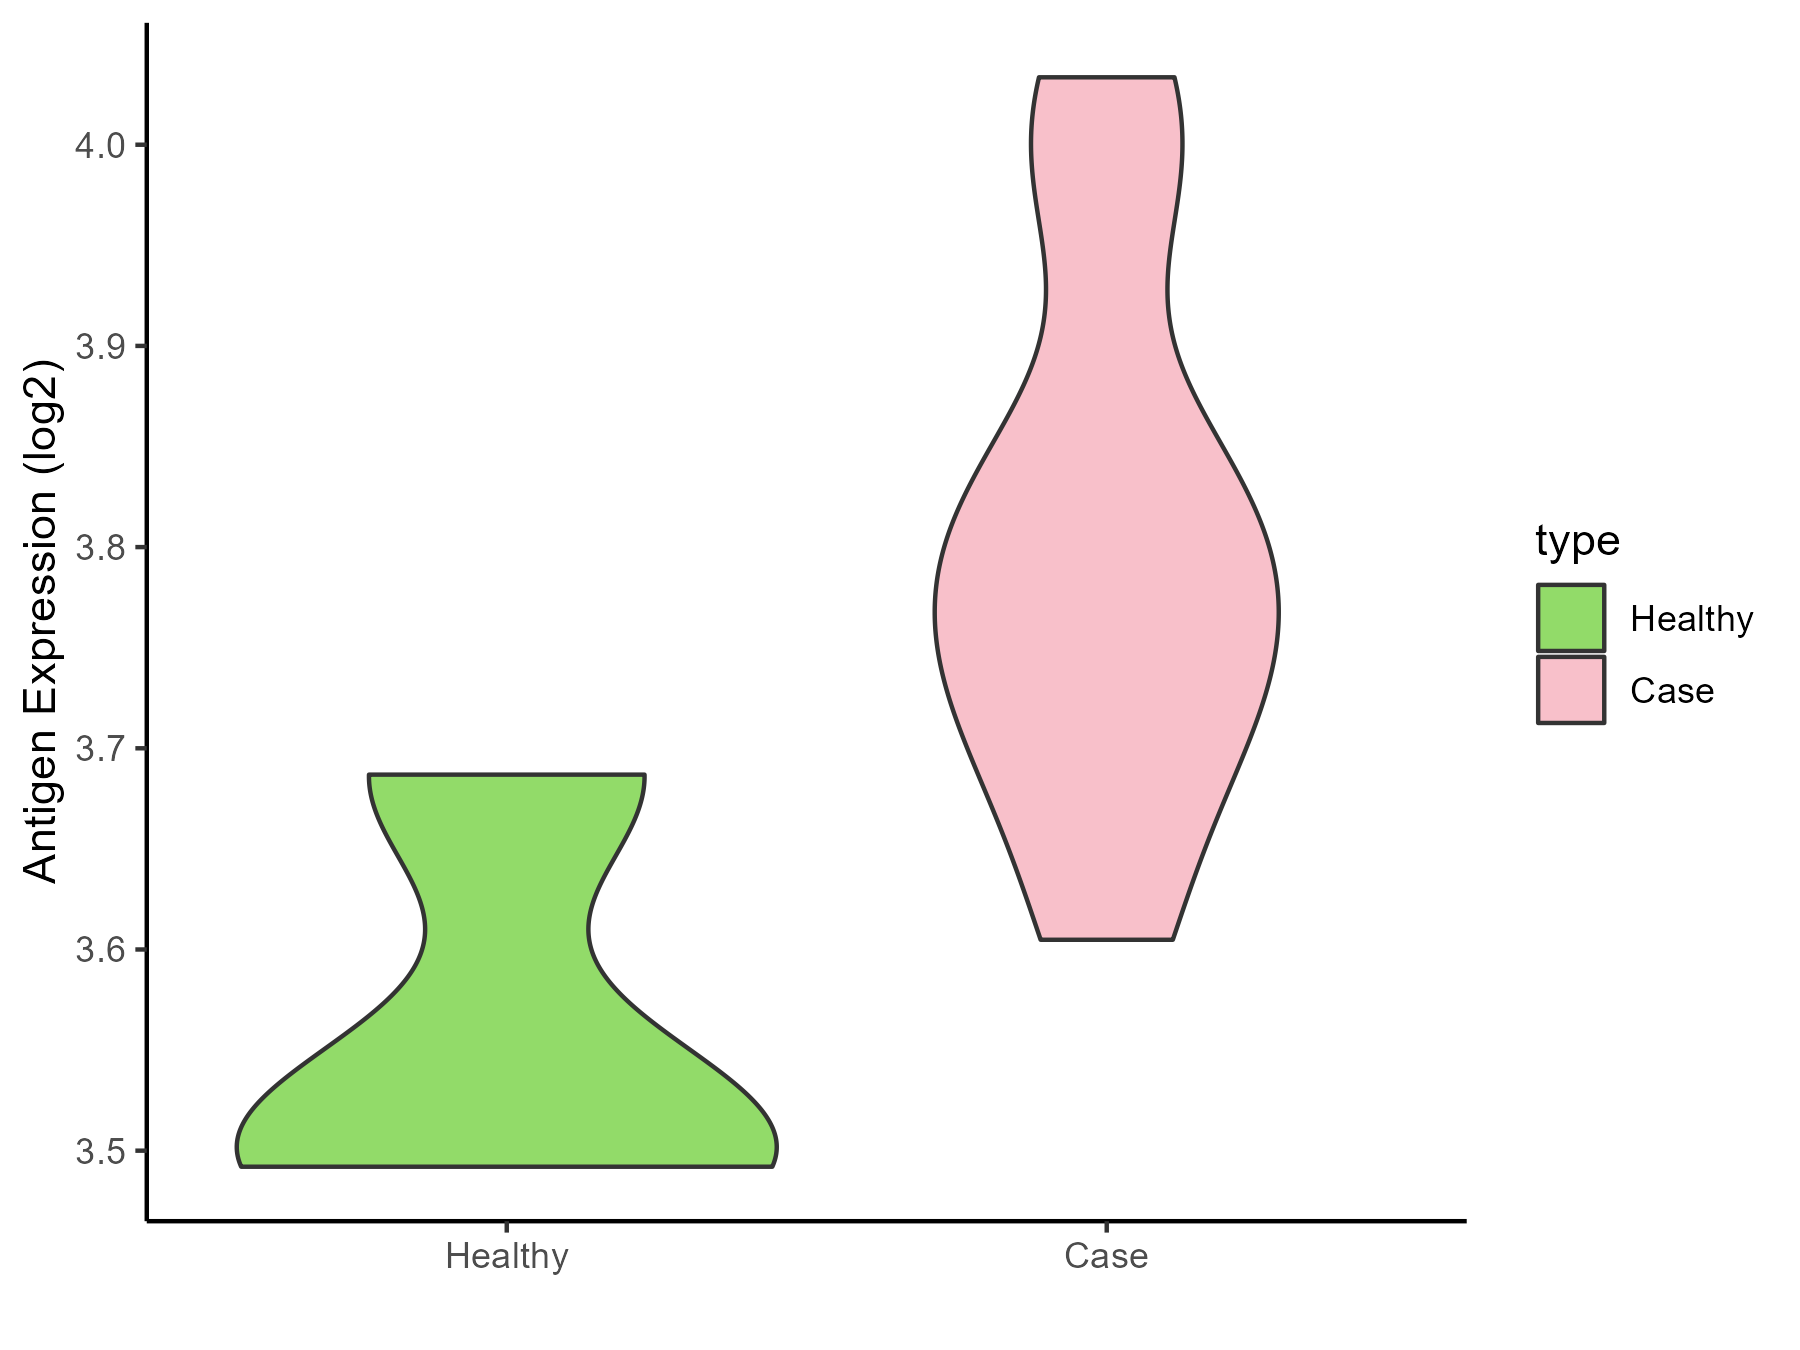
| Differential expression pattern of antigen in diseases | ||
| The Studied Tissue | Adipose | |
| The Specific Disease | Simpson golabi behmel syndrome | |
| The Expression Level of Disease Section Compare with the Healthy Individual Tissue | p-value: 0.031836224; Fold-change: 0.25959497; Z-score: 2.416902672 | |
| Disease-specific Antigen Abundances |
|
Click to View the Clearer Original Diagram |
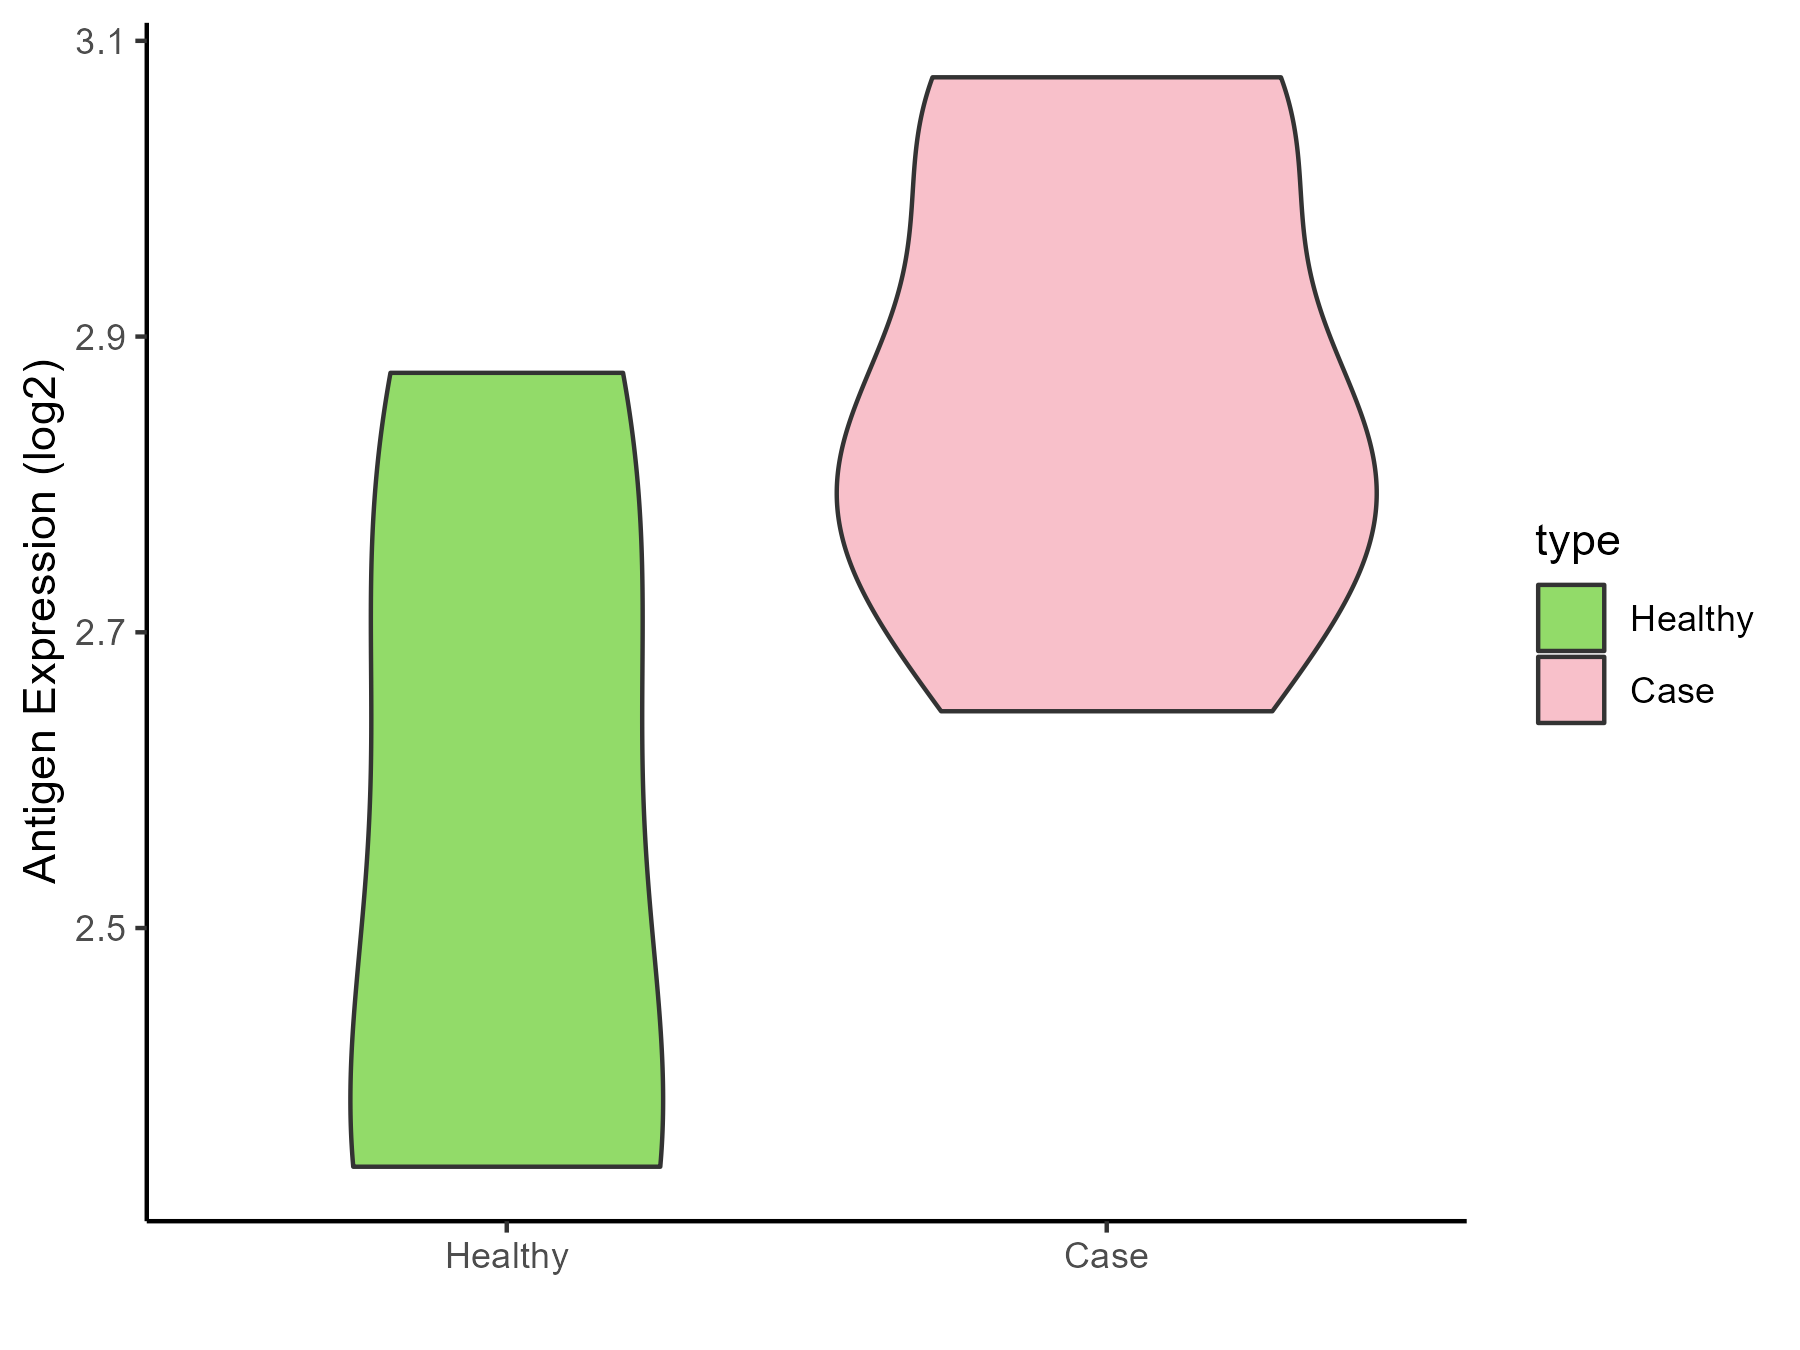
| Differential expression pattern of antigen in diseases | ||
| The Studied Tissue | Perituberal | |
| The Specific Disease | Tuberous sclerosis complex | |
| The Expression Level of Disease Section Compare with the Healthy Individual Tissue | p-value: 0.106084597; Fold-change: 0.313503327; Z-score: 1.170497322 | |
| Disease-specific Antigen Abundances |
|
Click to View the Clearer Original Diagram |
ICD Disease Classification 3
| Differential expression pattern of antigen in diseases | ||
| The Studied Tissue | Bone marrow | |
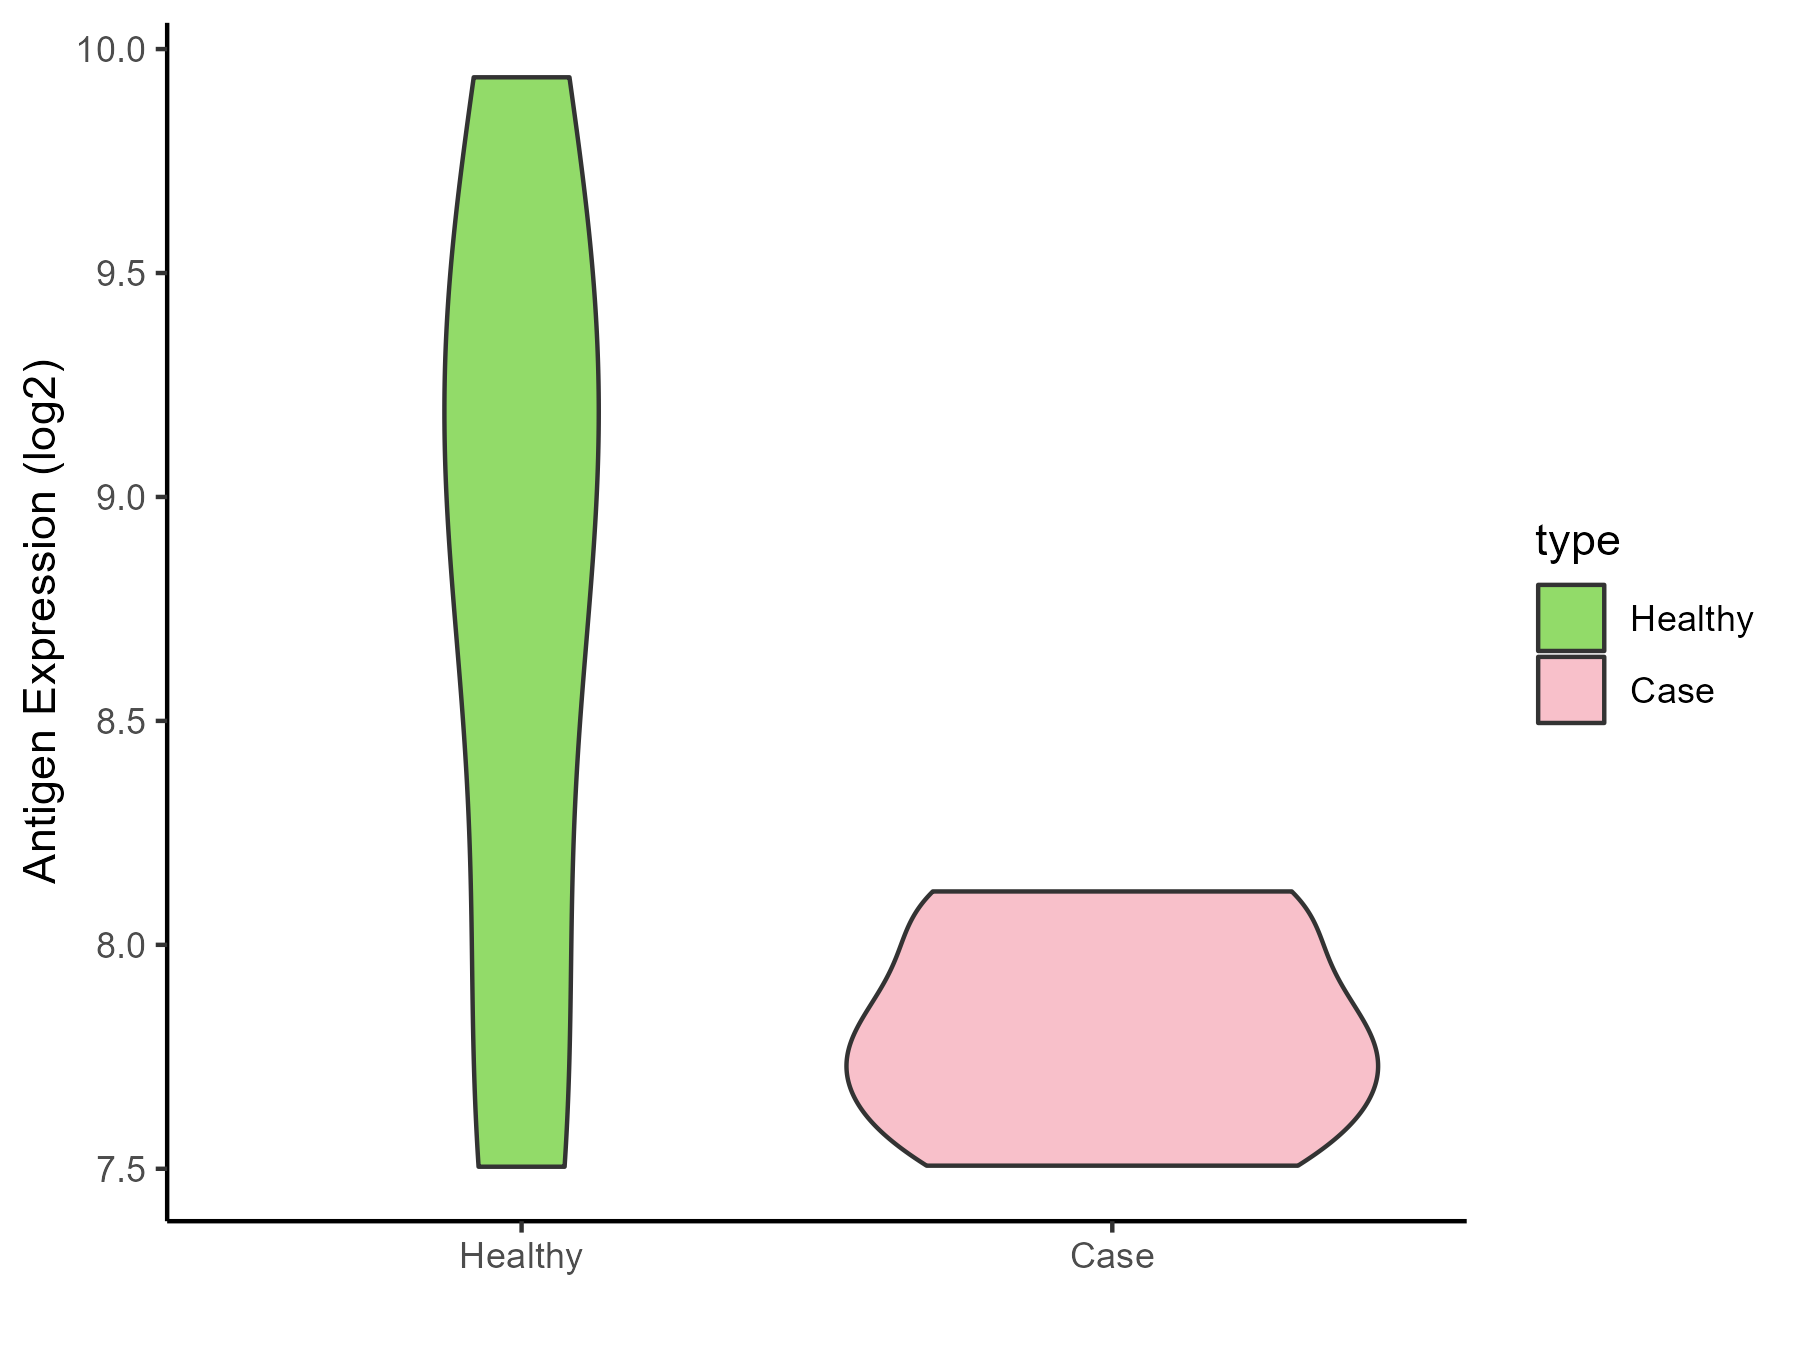
| The Specific Disease | Anemia | |
| The Expression Level of Disease Section Compare with the Healthy Individual Tissue | p-value: 0.029467644; Fold-change: -1.215320629; Z-score: -1.360636451 | |
| Disease-specific Antigen Abundances |
|
Click to View the Clearer Original Diagram |
| Differential expression pattern of antigen in diseases | ||
| The Studied Tissue | Peripheral blood | |
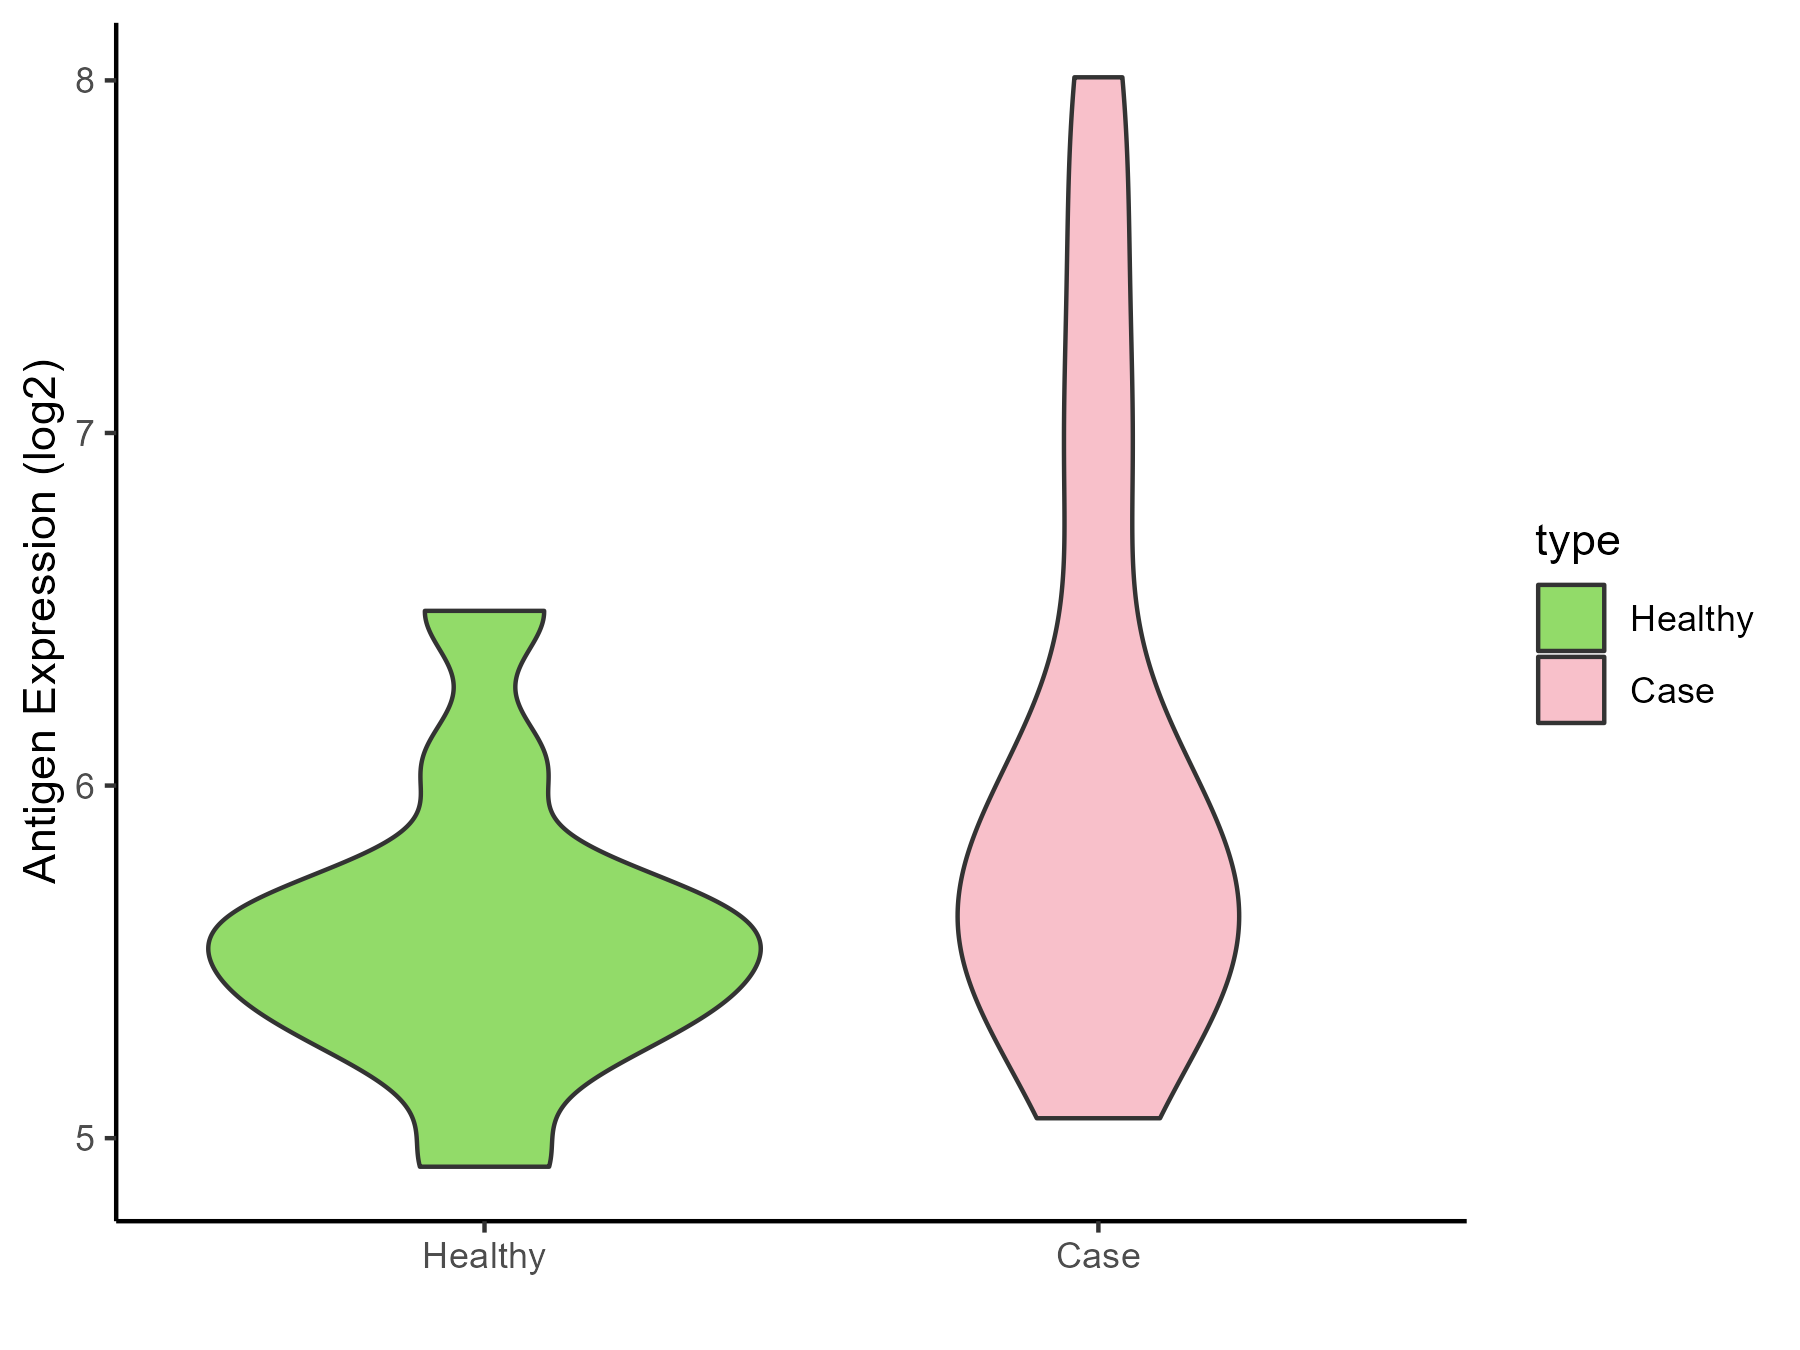
| The Specific Disease | Sickle cell disease | |
| The Expression Level of Disease Section Compare with the Healthy Individual Tissue | p-value: 0.064895305; Fold-change: 0.169353682; Z-score: 0.401719603 | |
| Disease-specific Antigen Abundances |
|
Click to View the Clearer Original Diagram |
| Differential expression pattern of antigen in diseases | ||
| The Studied Tissue | Whole blood | |
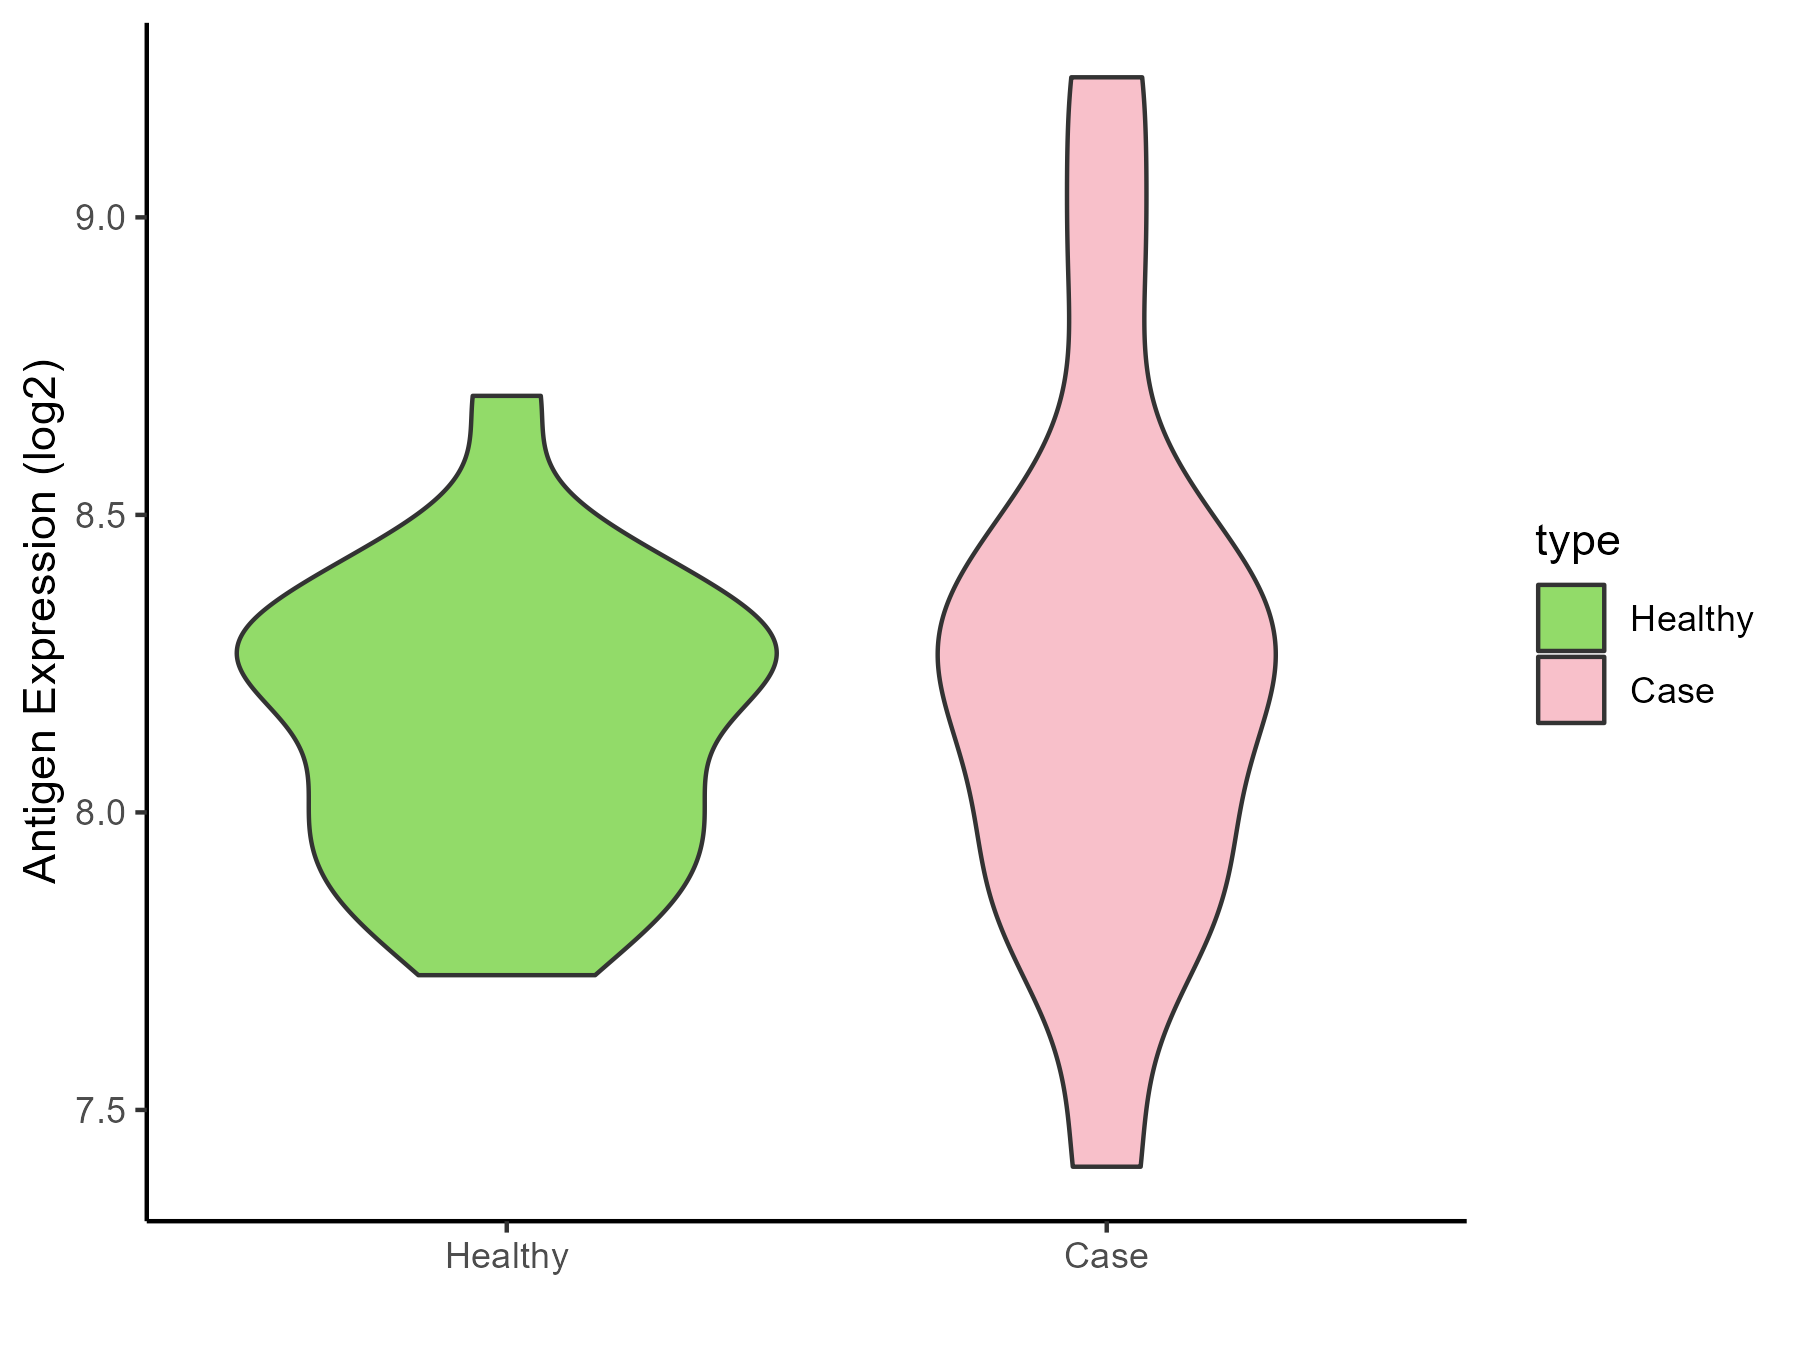
| The Specific Disease | Thrombocythemia | |
| The Expression Level of Disease Section Compare with the Healthy Individual Tissue | p-value: 0.393586267; Fold-change: 0.042927355; Z-score: 0.178131279 | |
| Disease-specific Antigen Abundances |
|
Click to View the Clearer Original Diagram |
ICD Disease Classification 4
| Differential expression pattern of antigen in diseases | ||
| The Studied Tissue | Whole blood | |
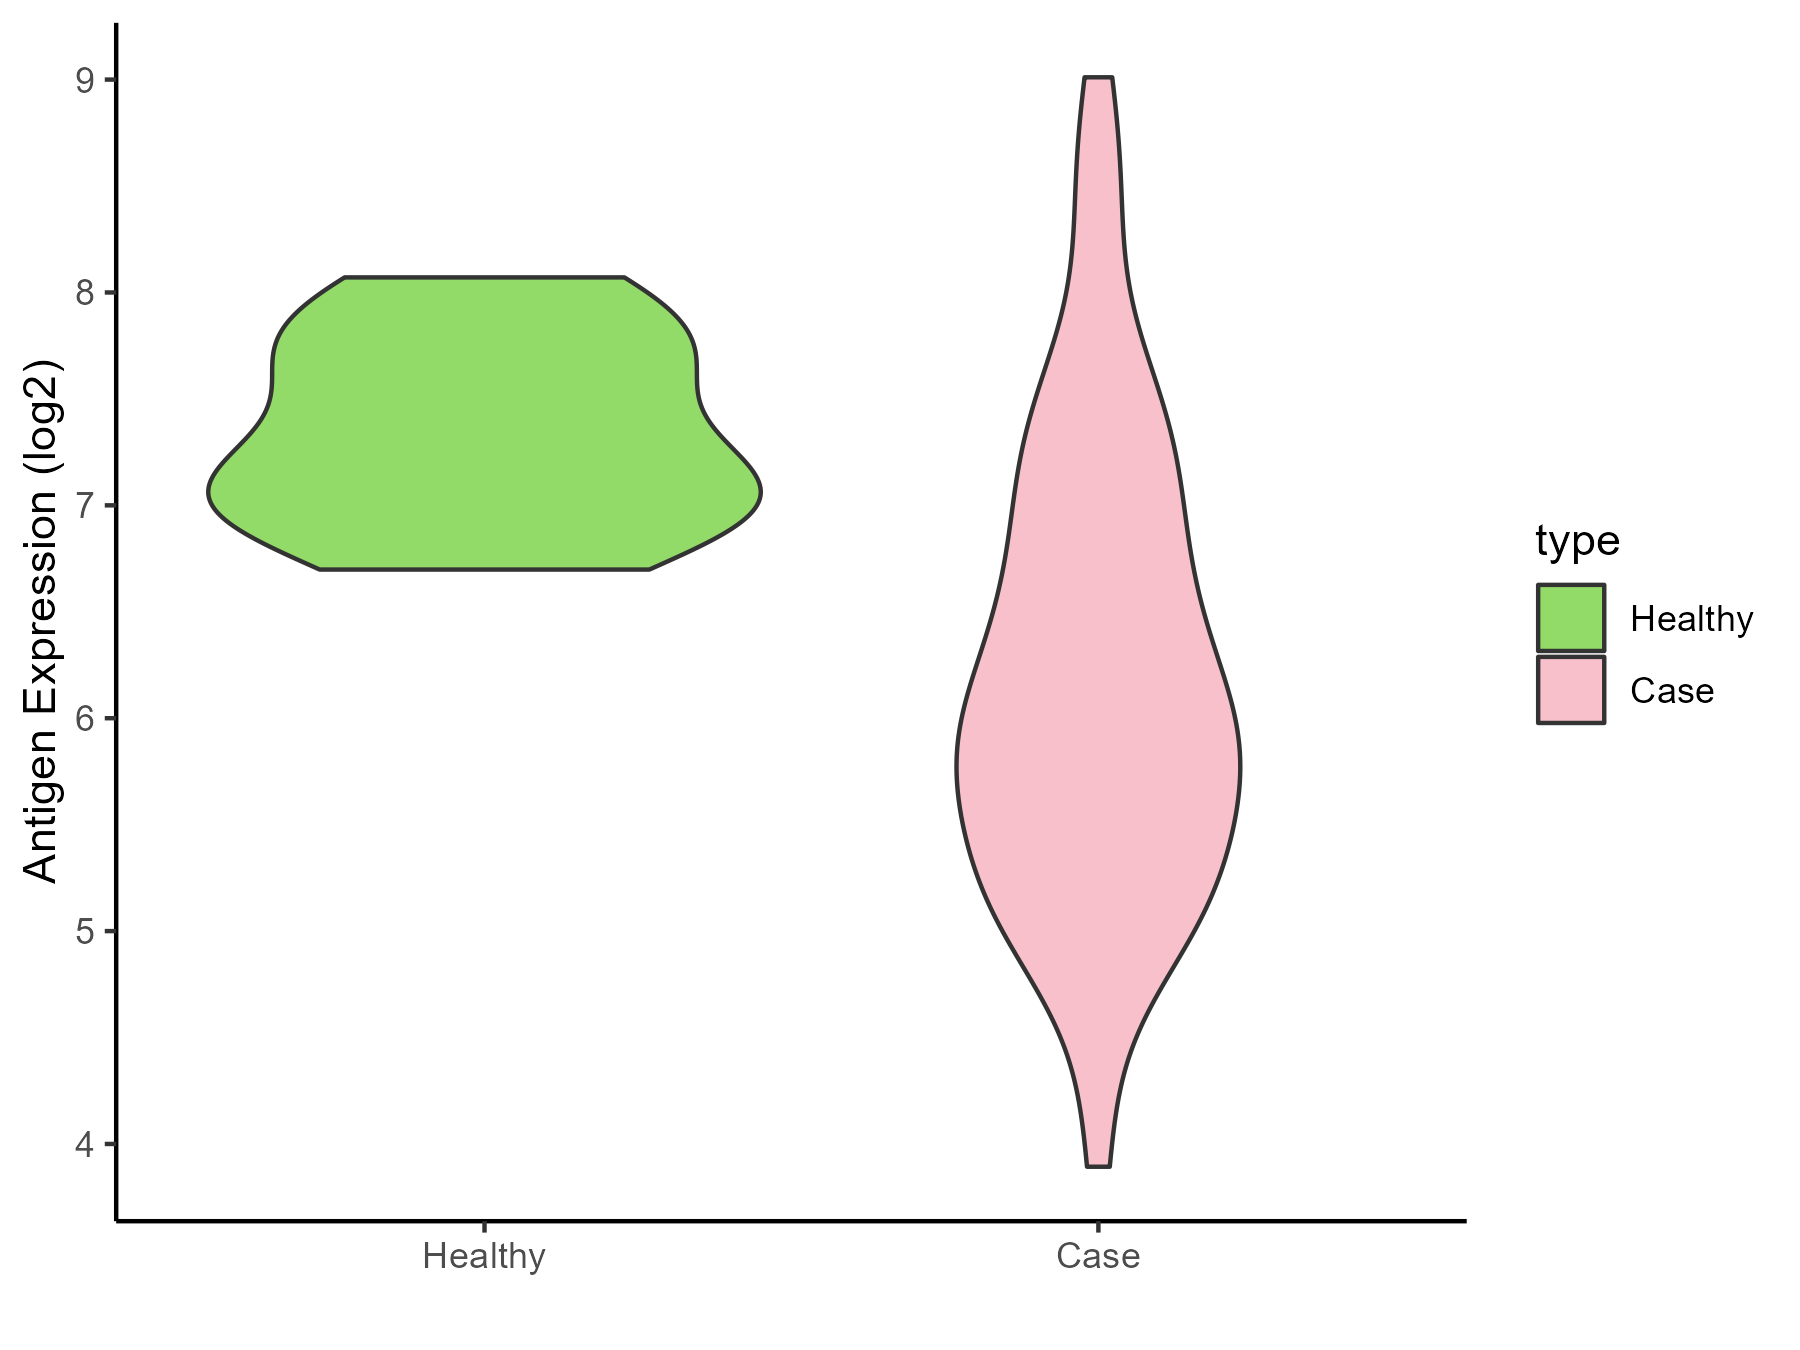
| The Specific Disease | Scleroderma | |
| The Expression Level of Disease Section Compare with the Healthy Individual Tissue | p-value: 9.92E-06; Fold-change: -1.221193588; Z-score: -2.647070825 | |
| Disease-specific Antigen Abundances |
|
Click to View the Clearer Original Diagram |
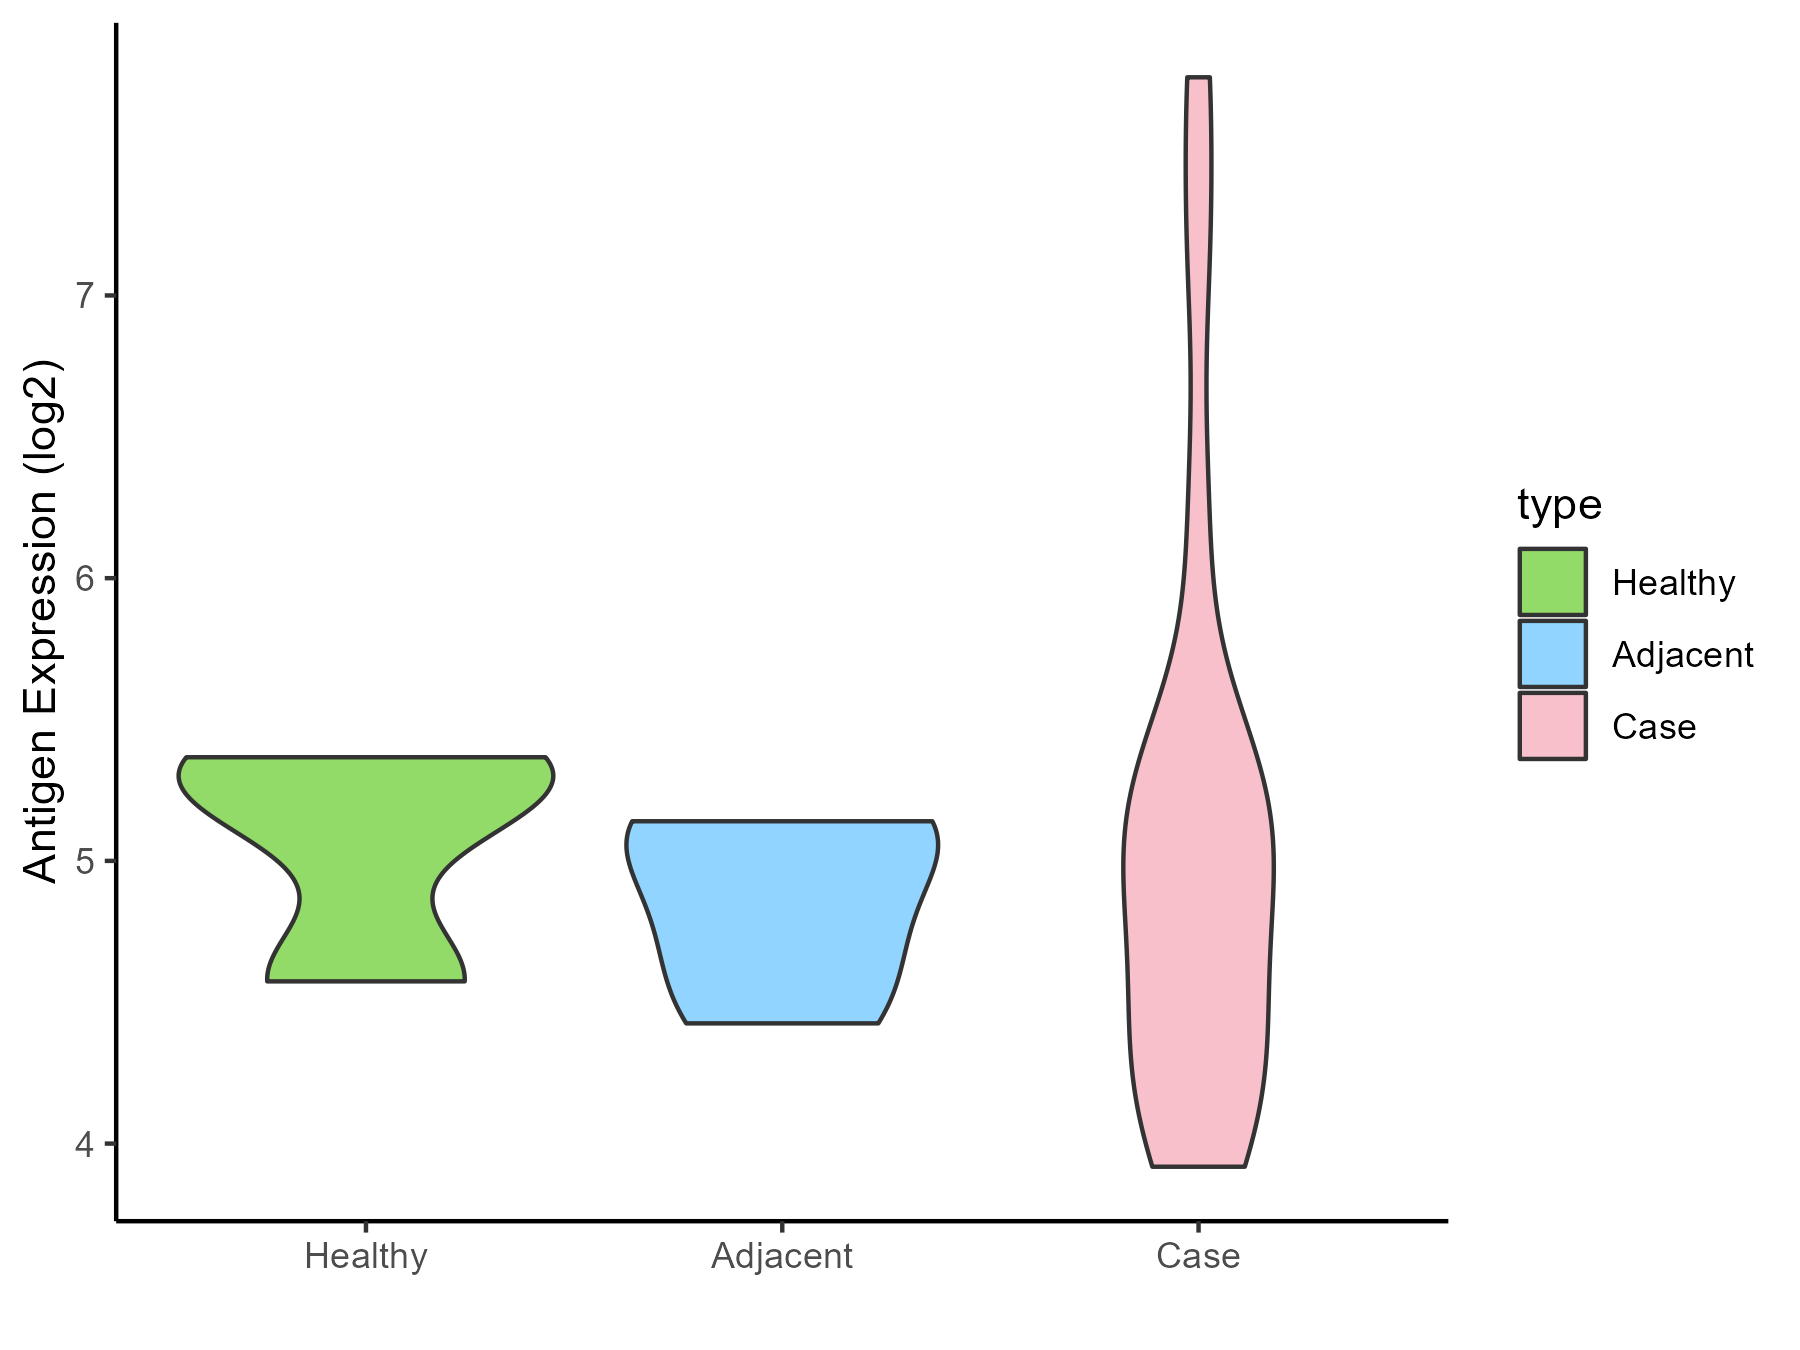
| Differential expression pattern of antigen in diseases | ||
| The Studied Tissue | Salivary gland | |
| The Specific Disease | Sjogren syndrome | |
| The Expression Level of Disease Section Compare with the Healthy Individual Tissue | p-value: 0.973418287; Fold-change: -0.305795082; Z-score: -0.718821281 | |
| The Expression Level of Disease Section Compare with the Adjacent Tissue | p-value: 0.472074041; Fold-change: 0.001470757; Z-score: 0.00429712 | |
| Disease-specific Antigen Abundances |
|
Click to View the Clearer Original Diagram |
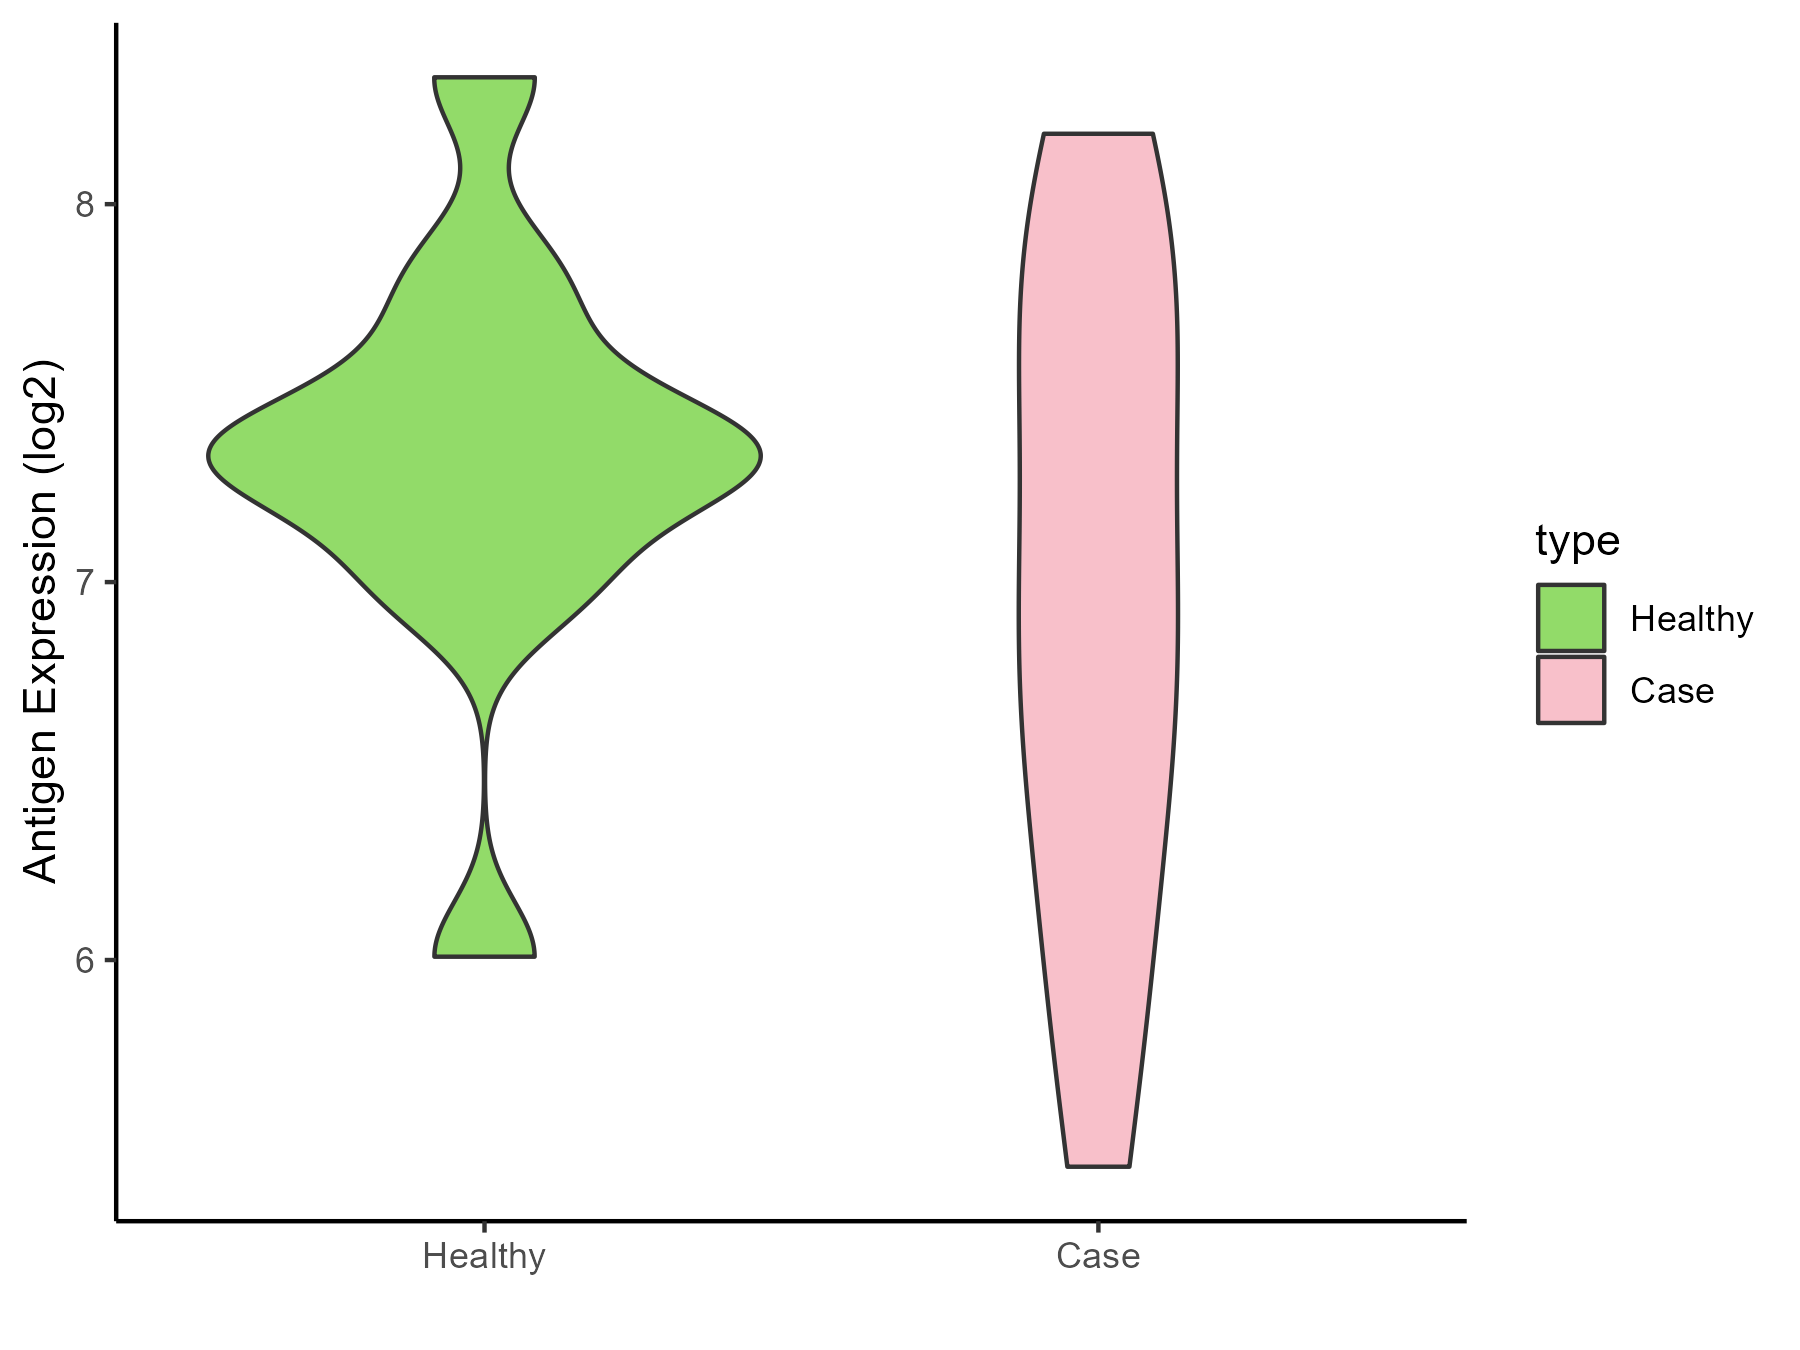
| Differential expression pattern of antigen in diseases | ||
| The Studied Tissue | Peripheral blood | |
| The Specific Disease | Behcet disease | |
| The Expression Level of Disease Section Compare with the Healthy Individual Tissue | p-value: 0.237639419; Fold-change: -0.380216791; Z-score: -0.68393196 | |
| Disease-specific Antigen Abundances |
|
Click to View the Clearer Original Diagram |
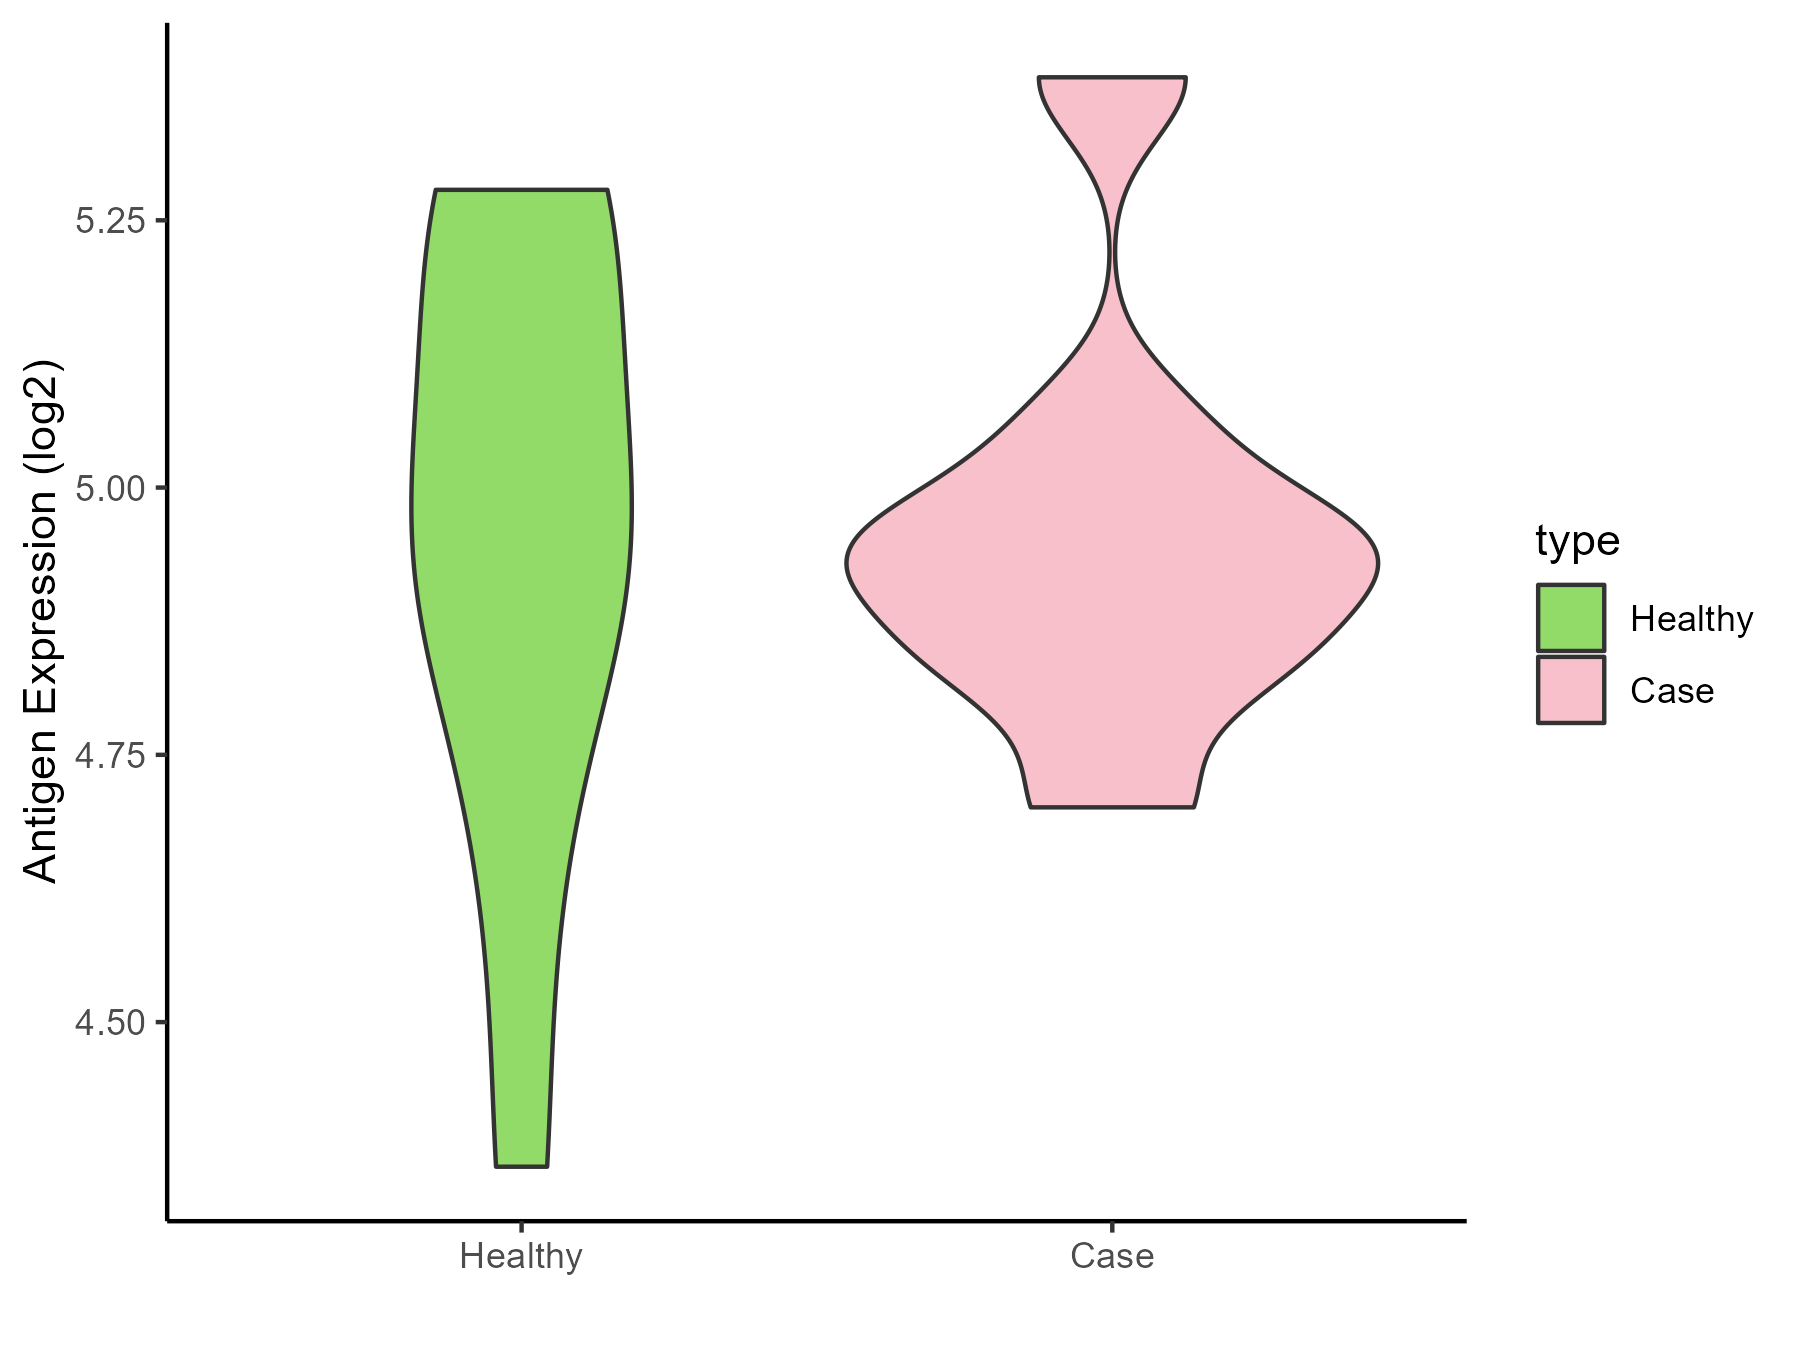
| Differential expression pattern of antigen in diseases | ||
| The Studied Tissue | Whole blood | |
| The Specific Disease | Autosomal dominant monocytopenia | |
| The Expression Level of Disease Section Compare with the Healthy Individual Tissue | p-value: 0.97312428; Fold-change: -0.014543534; Z-score: -0.050524802 | |
| Disease-specific Antigen Abundances |
|
Click to View the Clearer Original Diagram |
ICD Disease Classification 5
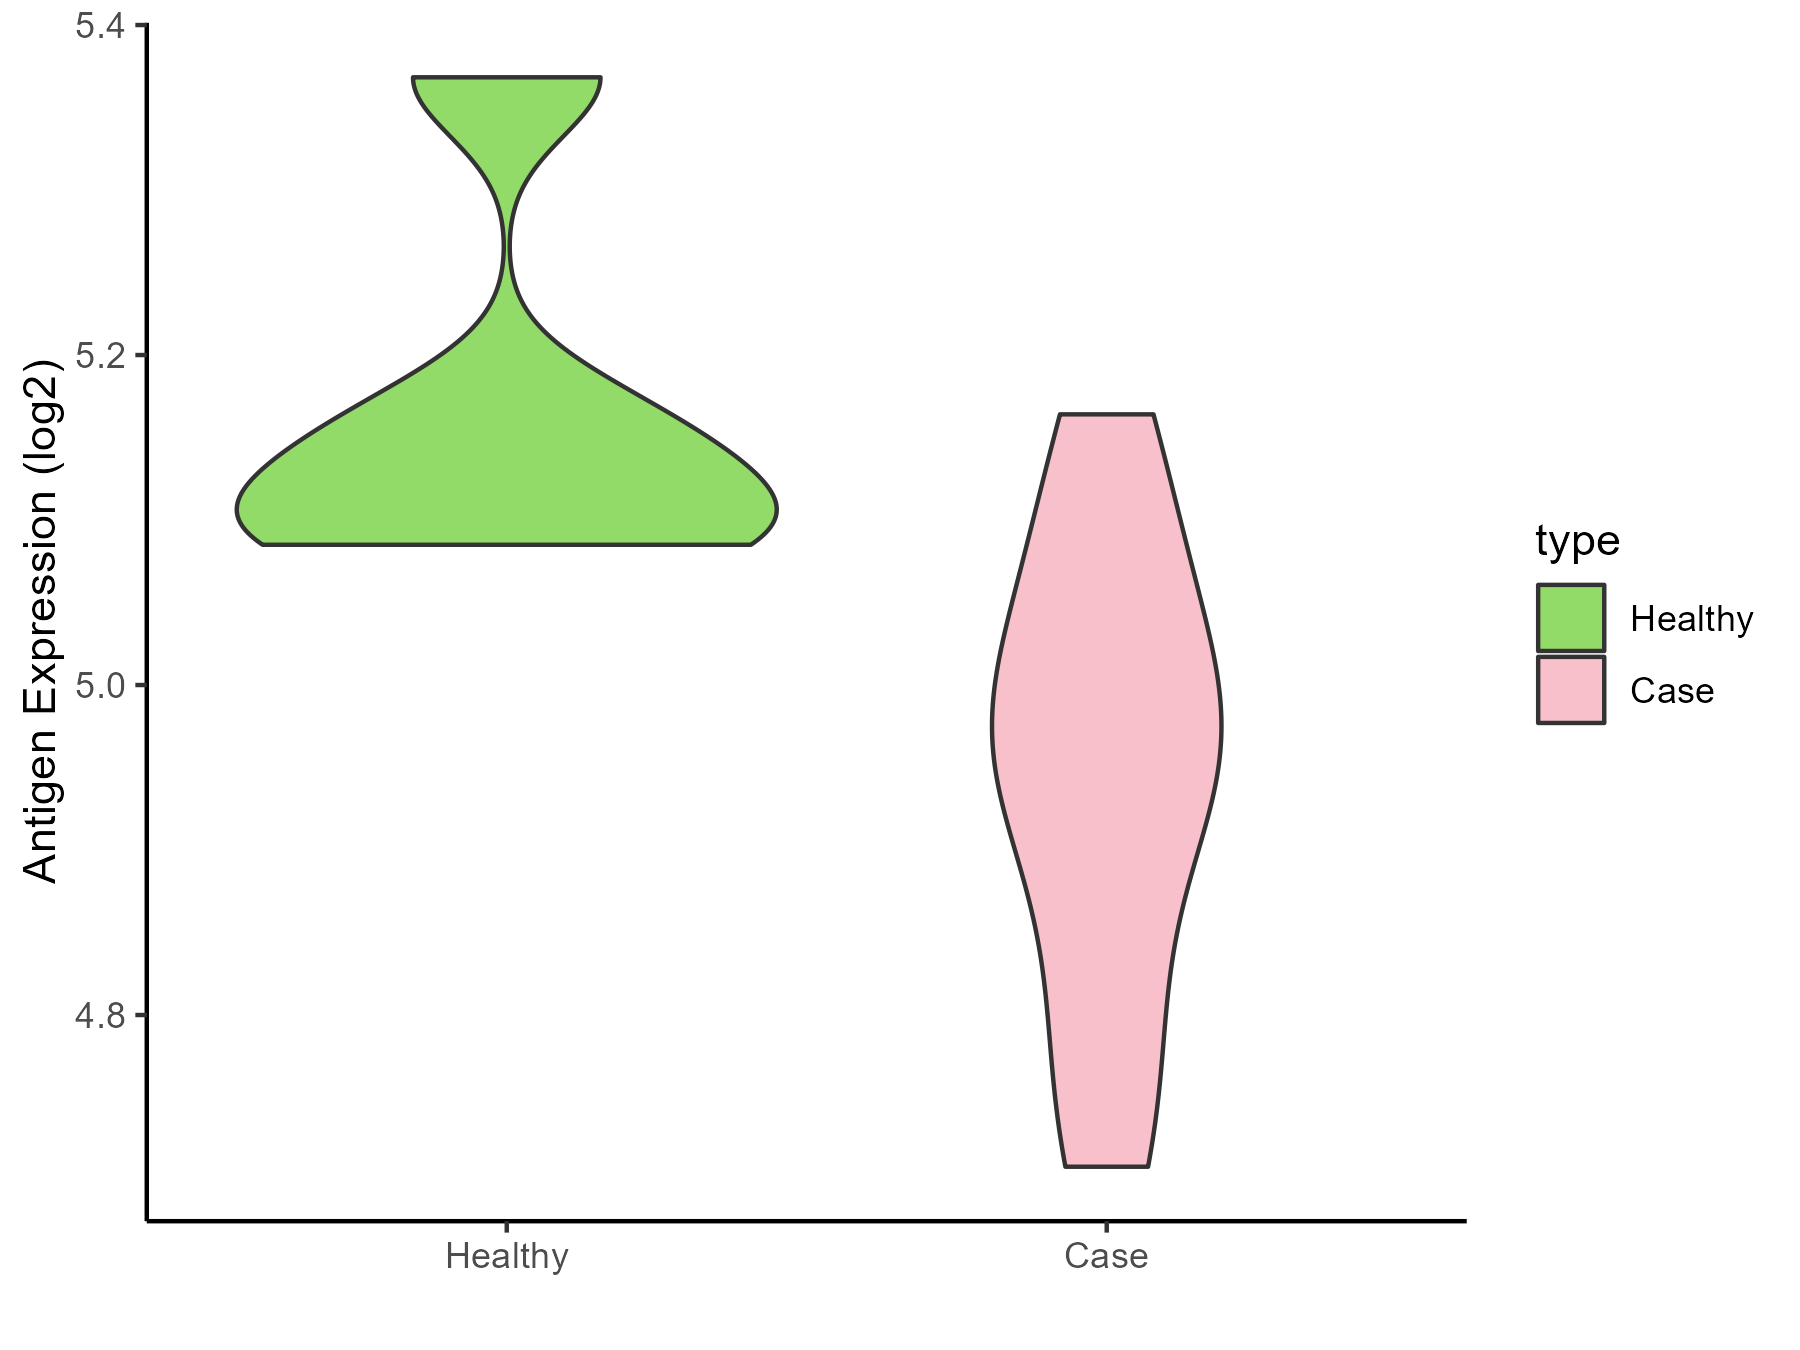
| Differential expression pattern of antigen in diseases | ||
| The Studied Tissue | Liver | |
| The Specific Disease | Type 2 diabetes | |
| The Expression Level of Disease Section Compare with the Healthy Individual Tissue | p-value: 0.010689341; Fold-change: -0.162202779; Z-score: -1.38390897 | |
| Disease-specific Antigen Abundances |
|
Click to View the Clearer Original Diagram |
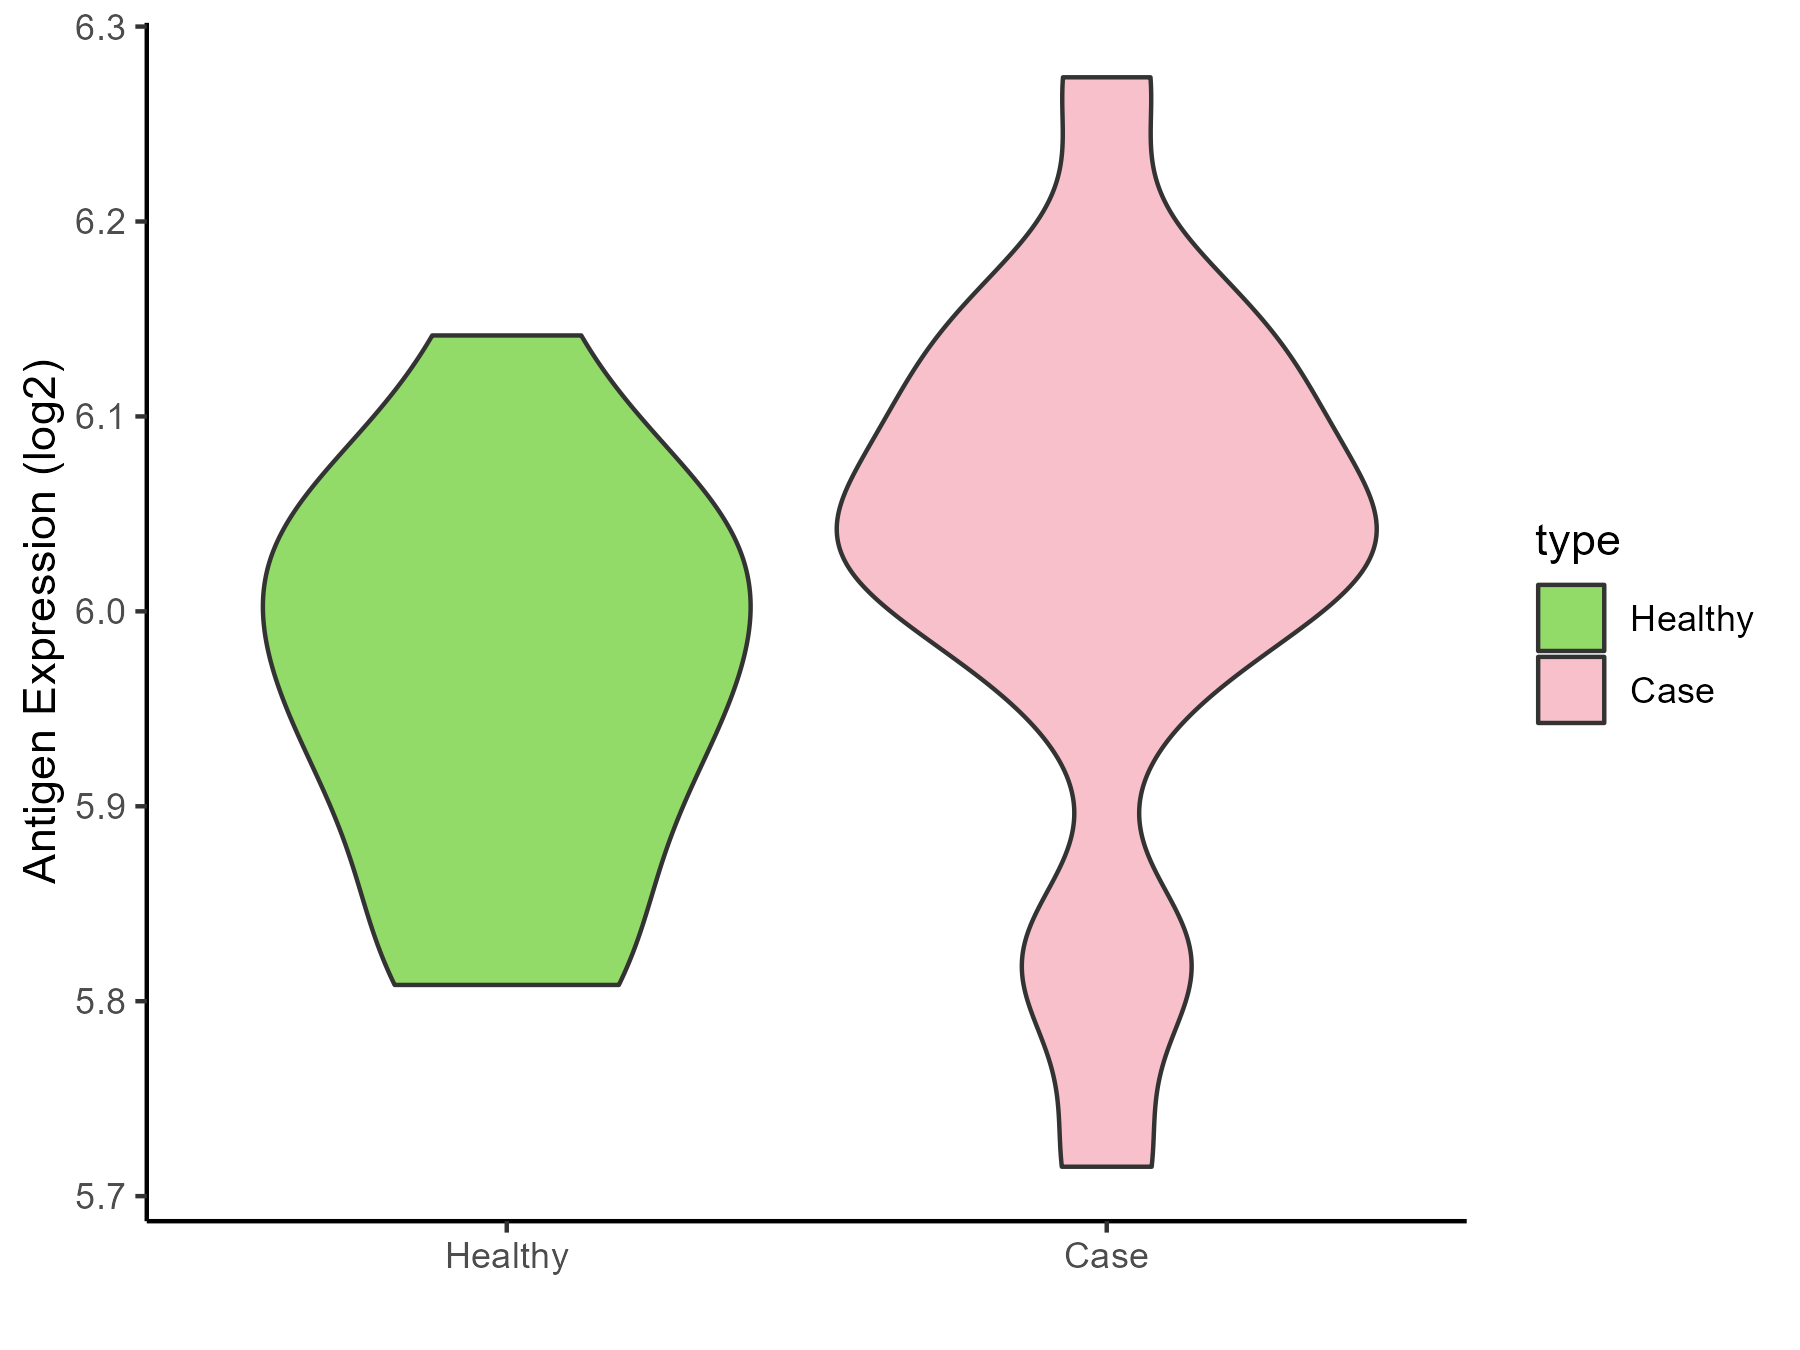
| Differential expression pattern of antigen in diseases | ||
| The Studied Tissue | Vastus lateralis muscle | |
| The Specific Disease | Polycystic ovary syndrome | |
| The Expression Level of Disease Section Compare with the Healthy Individual Tissue | p-value: 0.212762766; Fold-change: 0.085840461; Z-score: 0.858272868 | |
| Disease-specific Antigen Abundances |
|
Click to View the Clearer Original Diagram |
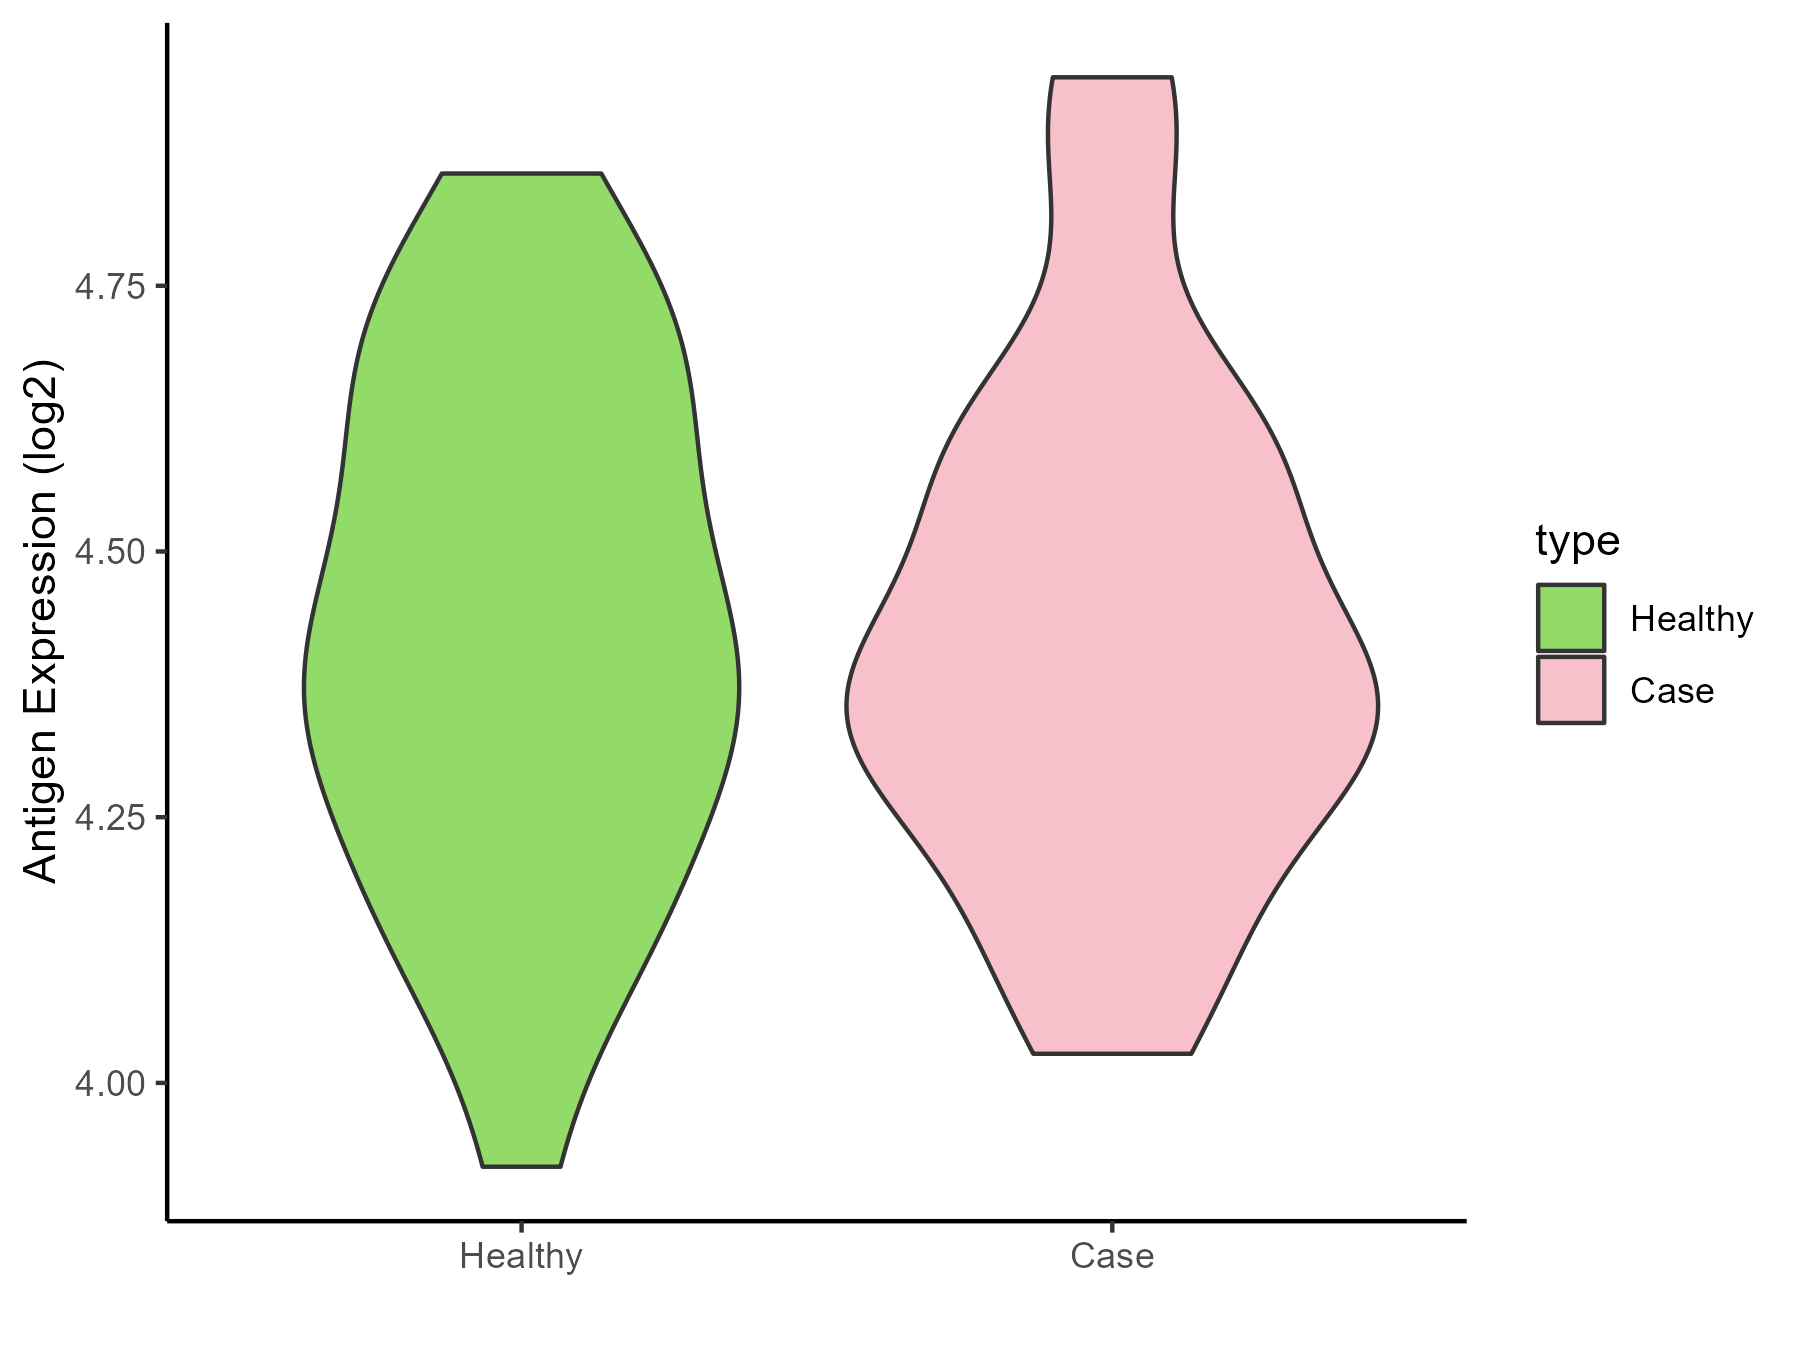
| Differential expression pattern of antigen in diseases | ||
| The Studied Tissue | Subcutaneous Adipose | |
| The Specific Disease | Obesity | |
| The Expression Level of Disease Section Compare with the Healthy Individual Tissue | p-value: 0.984325688; Fold-change: -0.048450065; Z-score: -0.200569127 | |
| Disease-specific Antigen Abundances |
|
Click to View the Clearer Original Diagram |
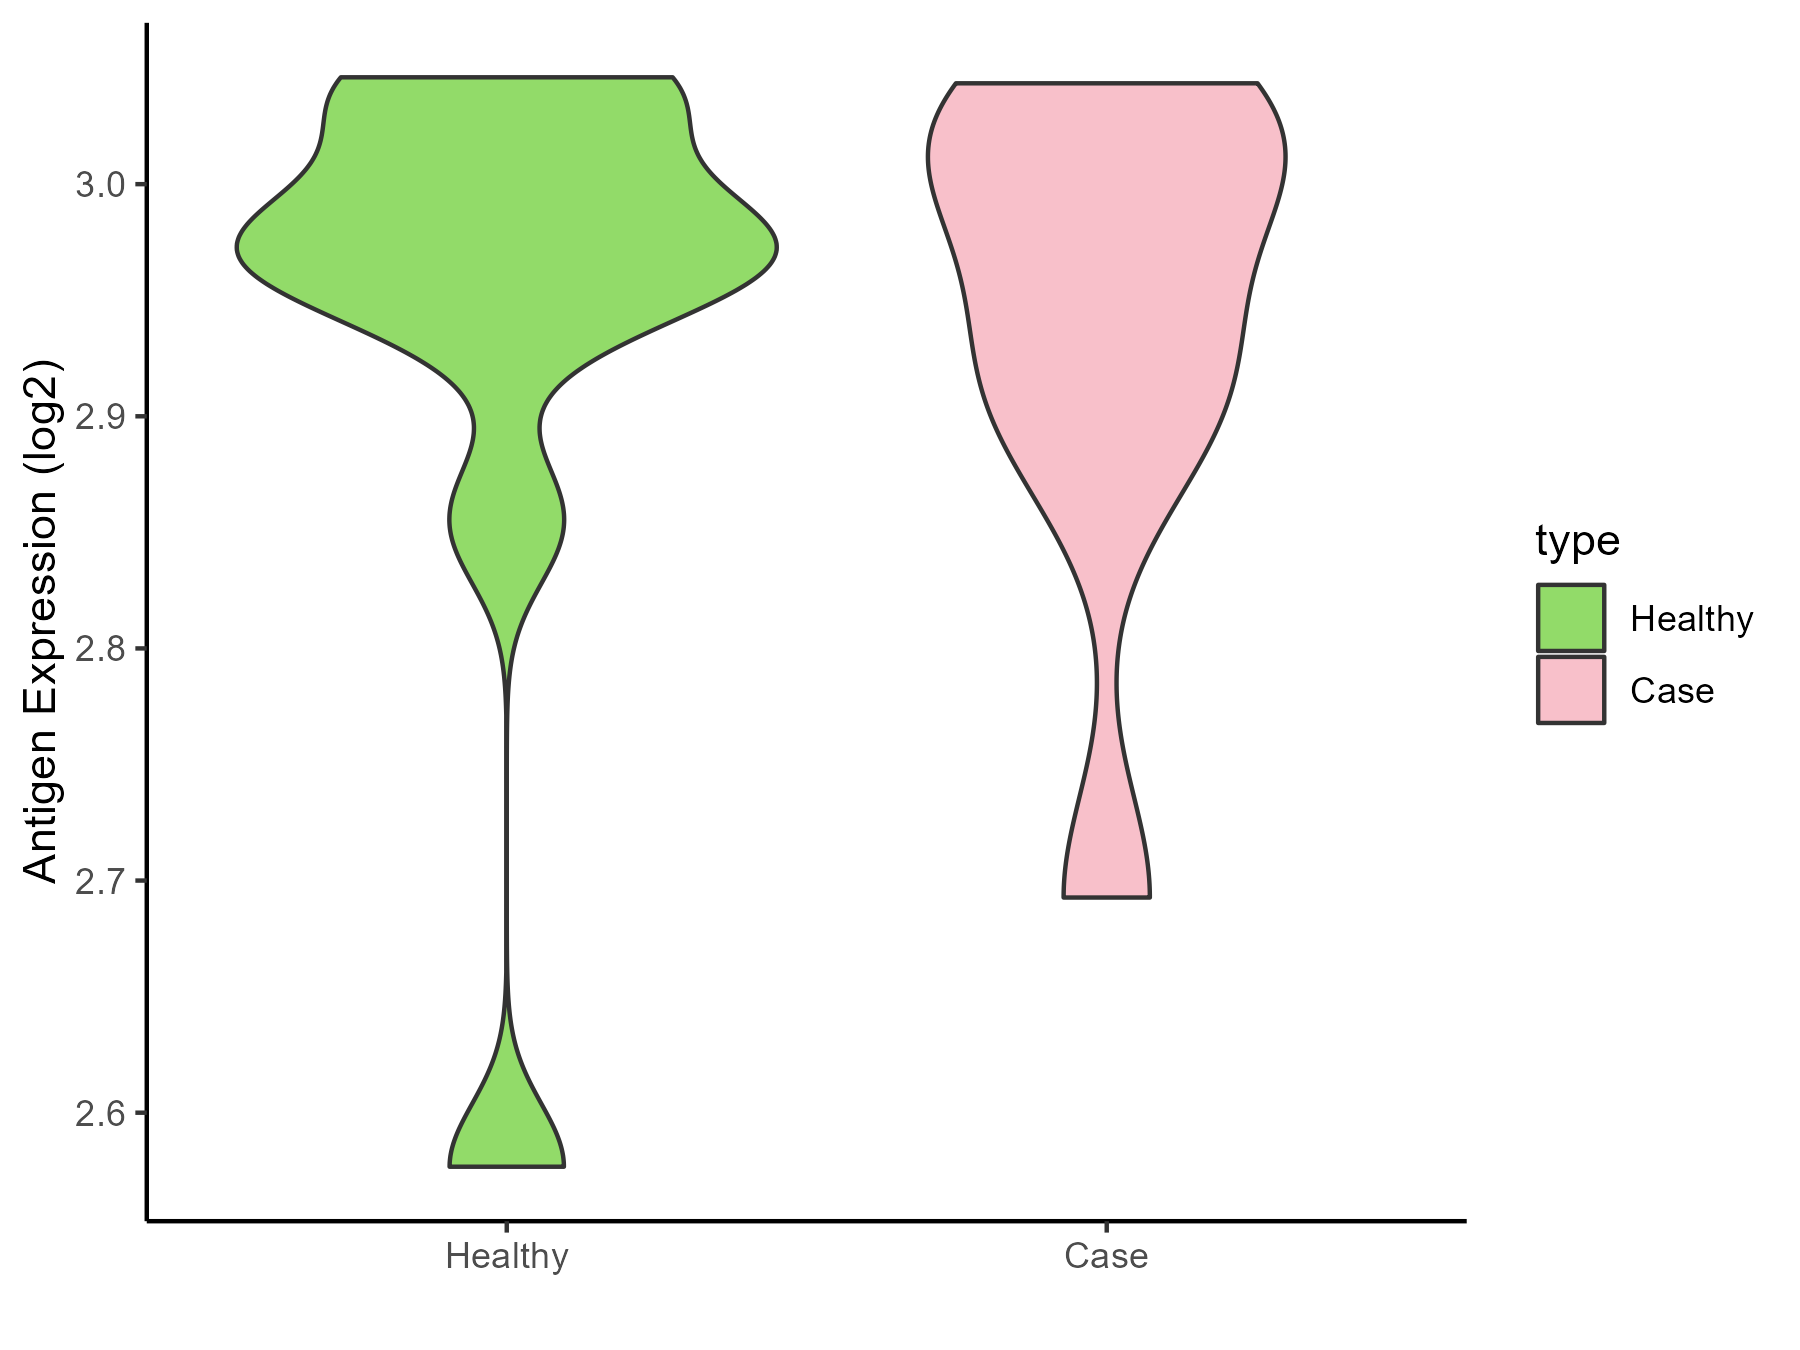
| Differential expression pattern of antigen in diseases | ||
| The Studied Tissue | Biceps muscle | |
| The Specific Disease | Pompe disease | |
| The Expression Level of Disease Section Compare with the Healthy Individual Tissue | p-value: 0.994712465; Fold-change: -0.002854789; Z-score: -0.02053996 | |
| Disease-specific Antigen Abundances |
|
Click to View the Clearer Original Diagram |
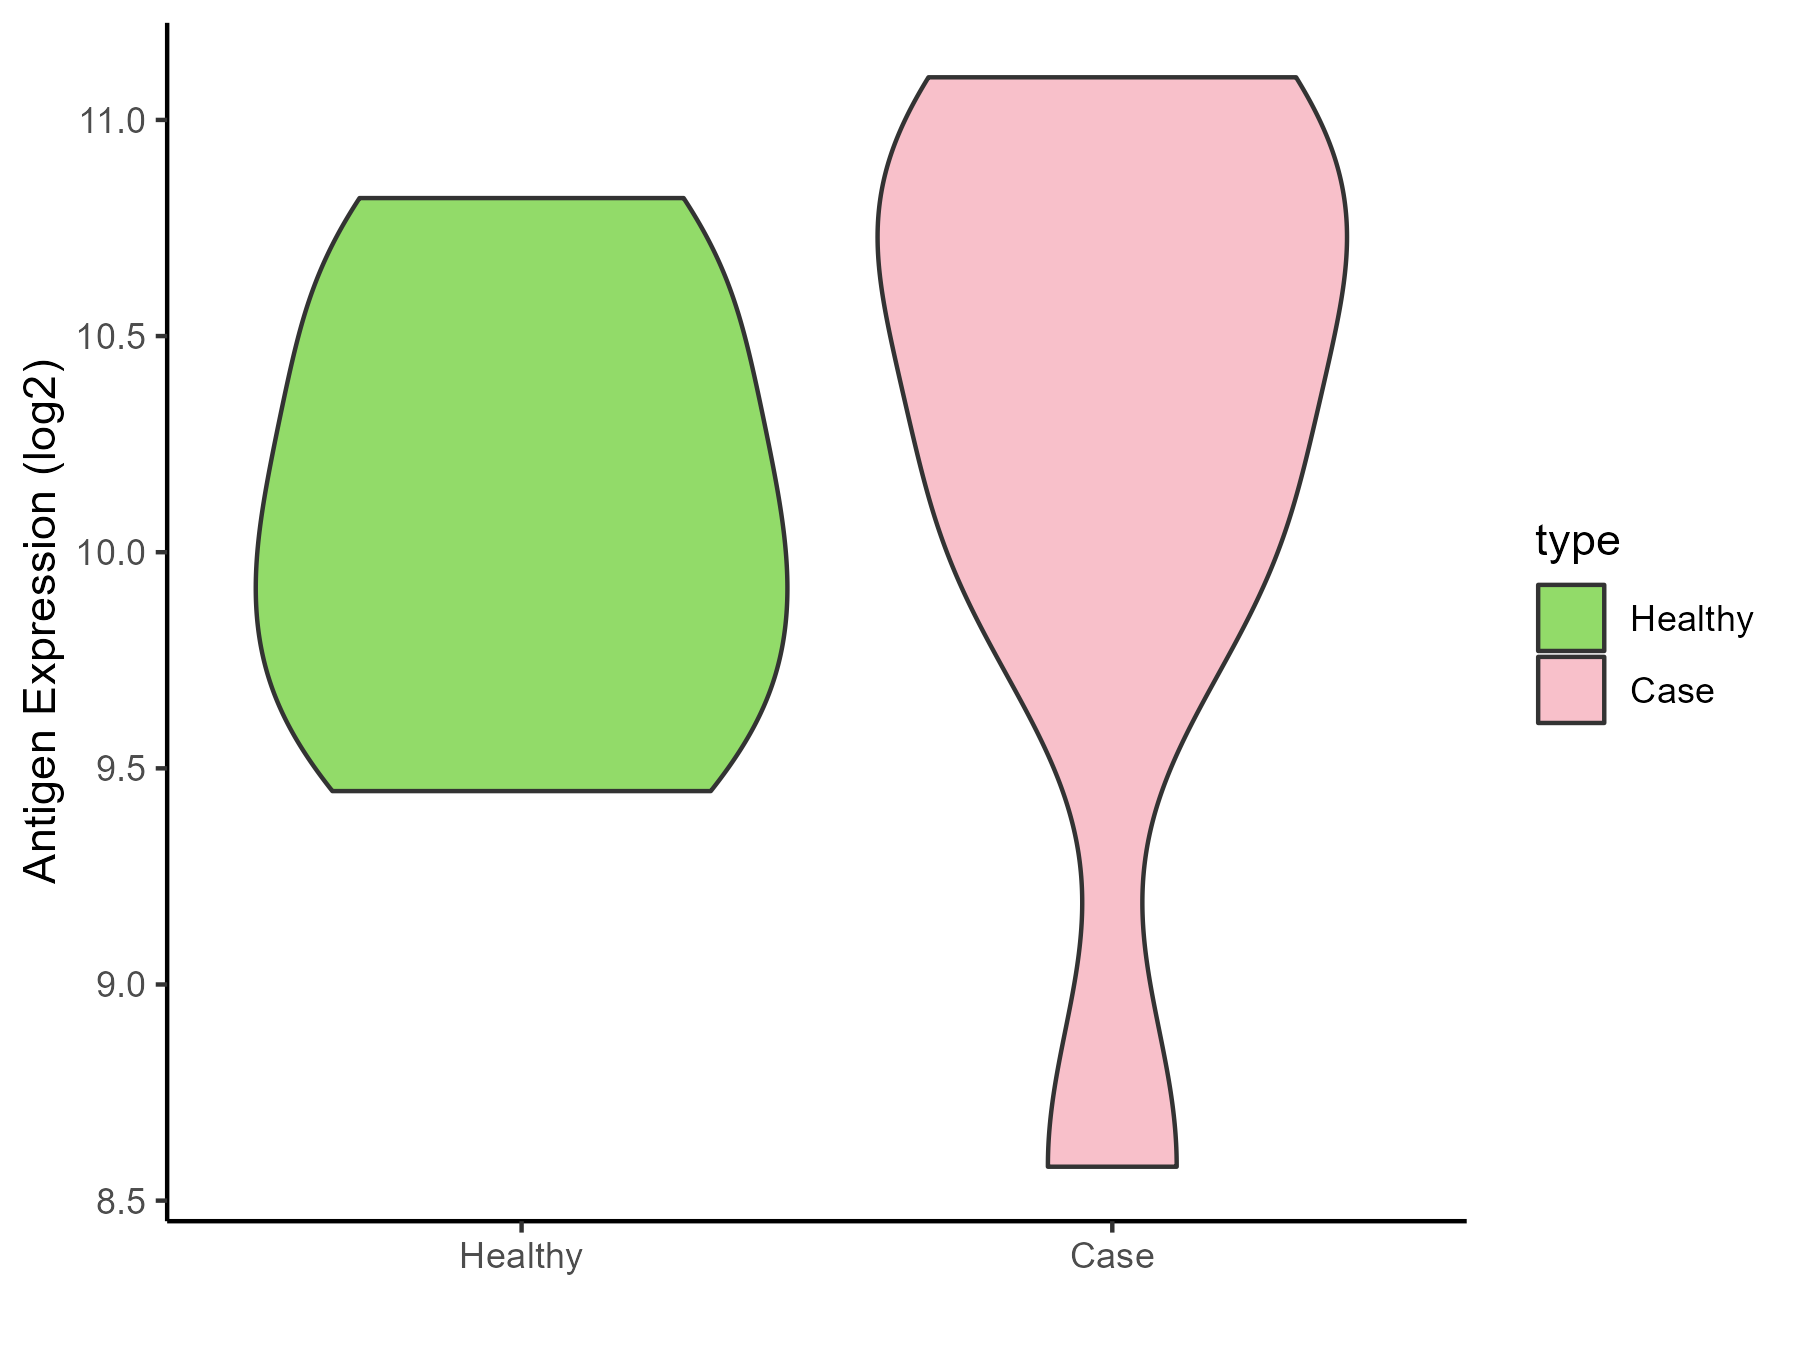
| Differential expression pattern of antigen in diseases | ||
| The Studied Tissue | Whole blood | |
| The Specific Disease | Batten disease | |
| The Expression Level of Disease Section Compare with the Healthy Individual Tissue | p-value: 0.668725266; Fold-change: 0.4919918; Z-score: 0.978187271 | |
| Disease-specific Antigen Abundances |
|
Click to View the Clearer Original Diagram |
ICD Disease Classification 6
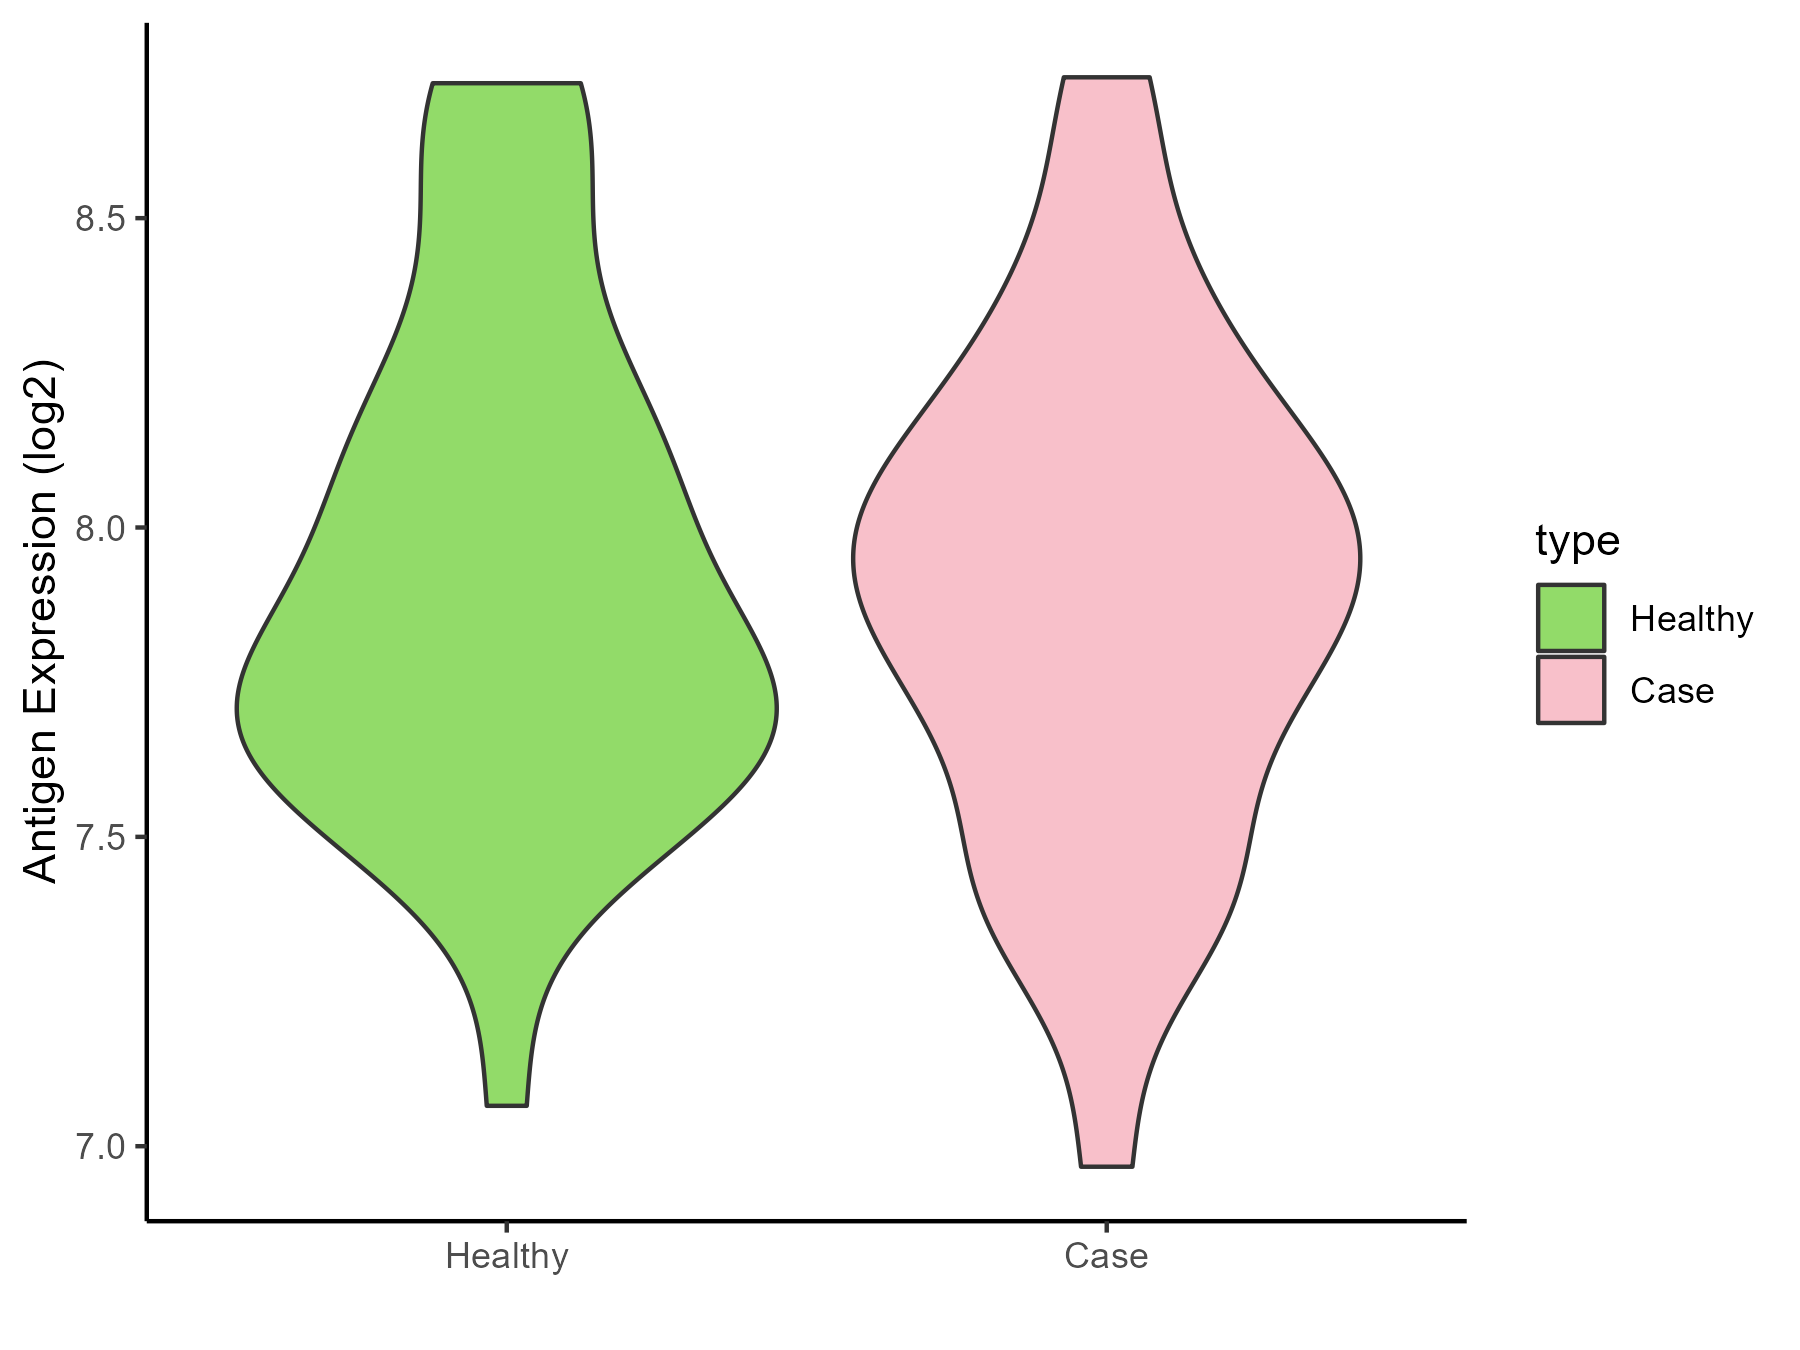
| Differential expression pattern of antigen in diseases | ||
| The Studied Tissue | Whole blood | |
| The Specific Disease | Autism | |
| The Expression Level of Disease Section Compare with the Healthy Individual Tissue | p-value: 0.670266727; Fold-change: 0.075676469; Z-score: 0.189895766 | |
| Disease-specific Antigen Abundances |
|
Click to View the Clearer Original Diagram |
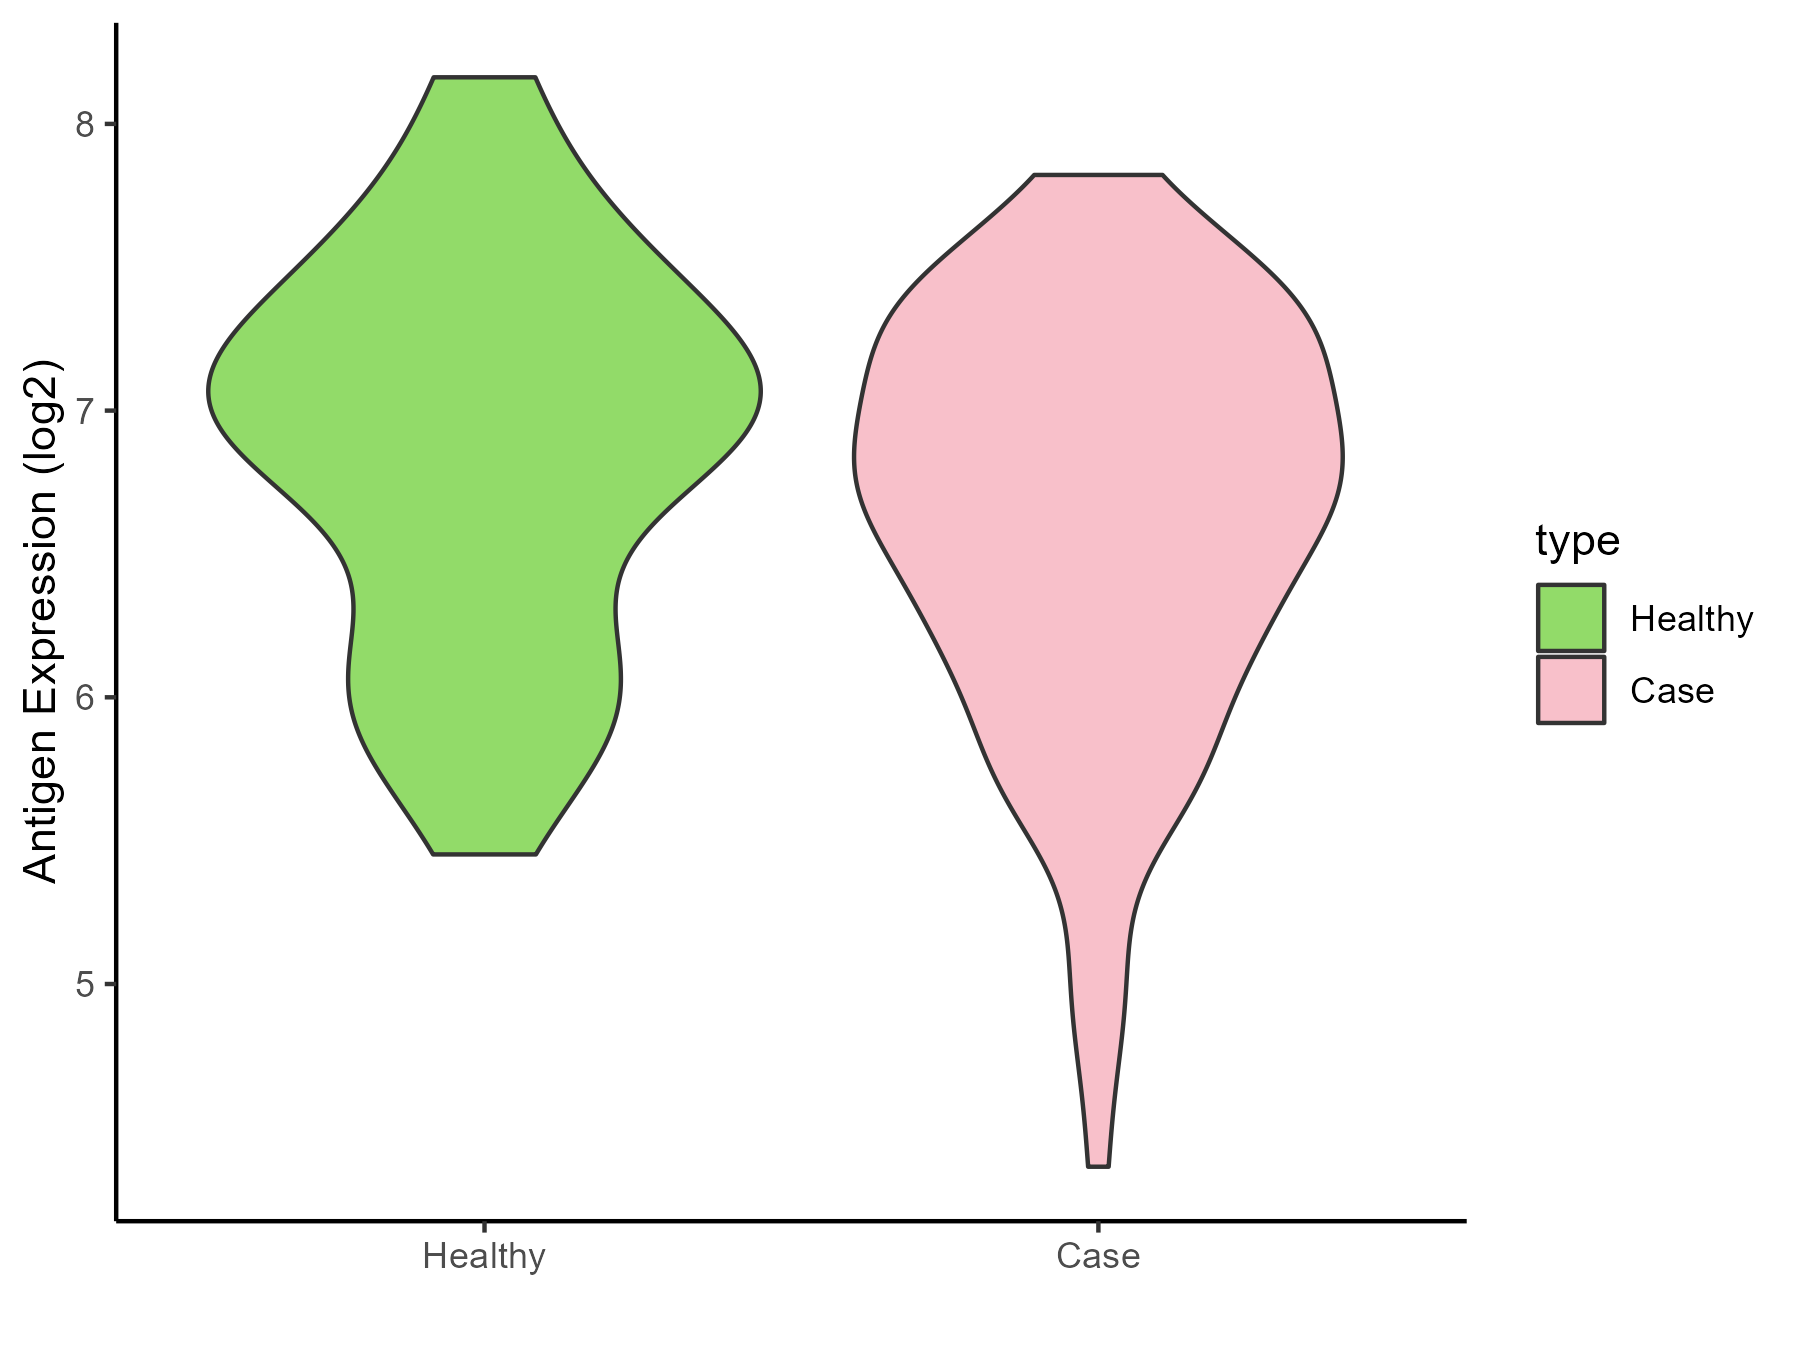
| Differential expression pattern of antigen in diseases | ||
| The Studied Tissue | Whole blood | |
| The Specific Disease | Anxiety disorder | |
| The Expression Level of Disease Section Compare with the Healthy Individual Tissue | p-value: 0.060500552; Fold-change: -0.238045973; Z-score: -0.352929582 | |
| Disease-specific Antigen Abundances |
|
Click to View the Clearer Original Diagram |
ICD Disease Classification 8
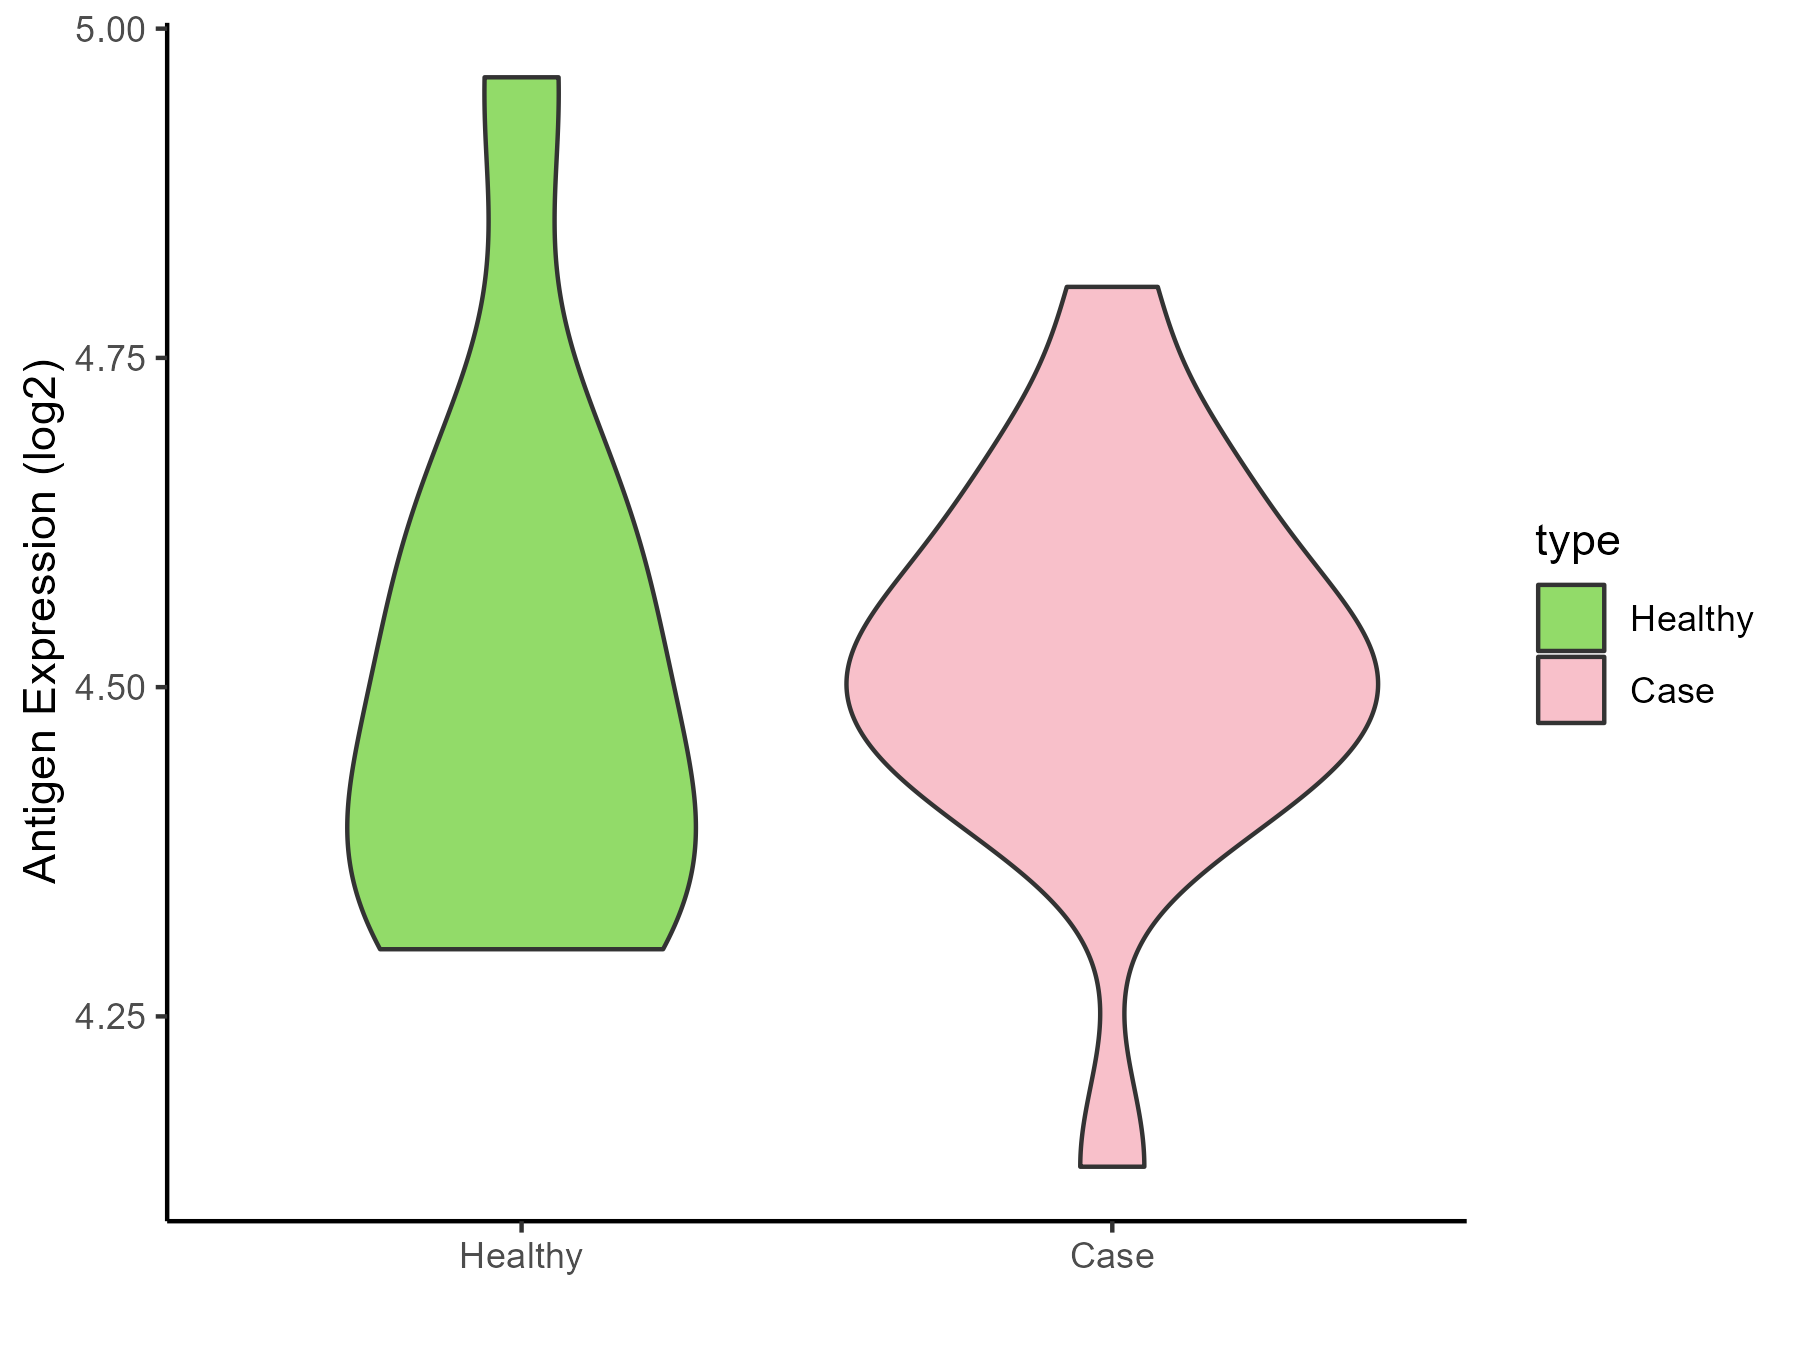
| Differential expression pattern of antigen in diseases | ||
| The Studied Tissue | Substantia nigra | |
| The Specific Disease | Parkinson disease | |
| The Expression Level of Disease Section Compare with the Healthy Individual Tissue | p-value: 0.934625426; Fold-change: 0.039980775; Z-score: 0.189953988 | |
| Disease-specific Antigen Abundances |
|
Click to View the Clearer Original Diagram |
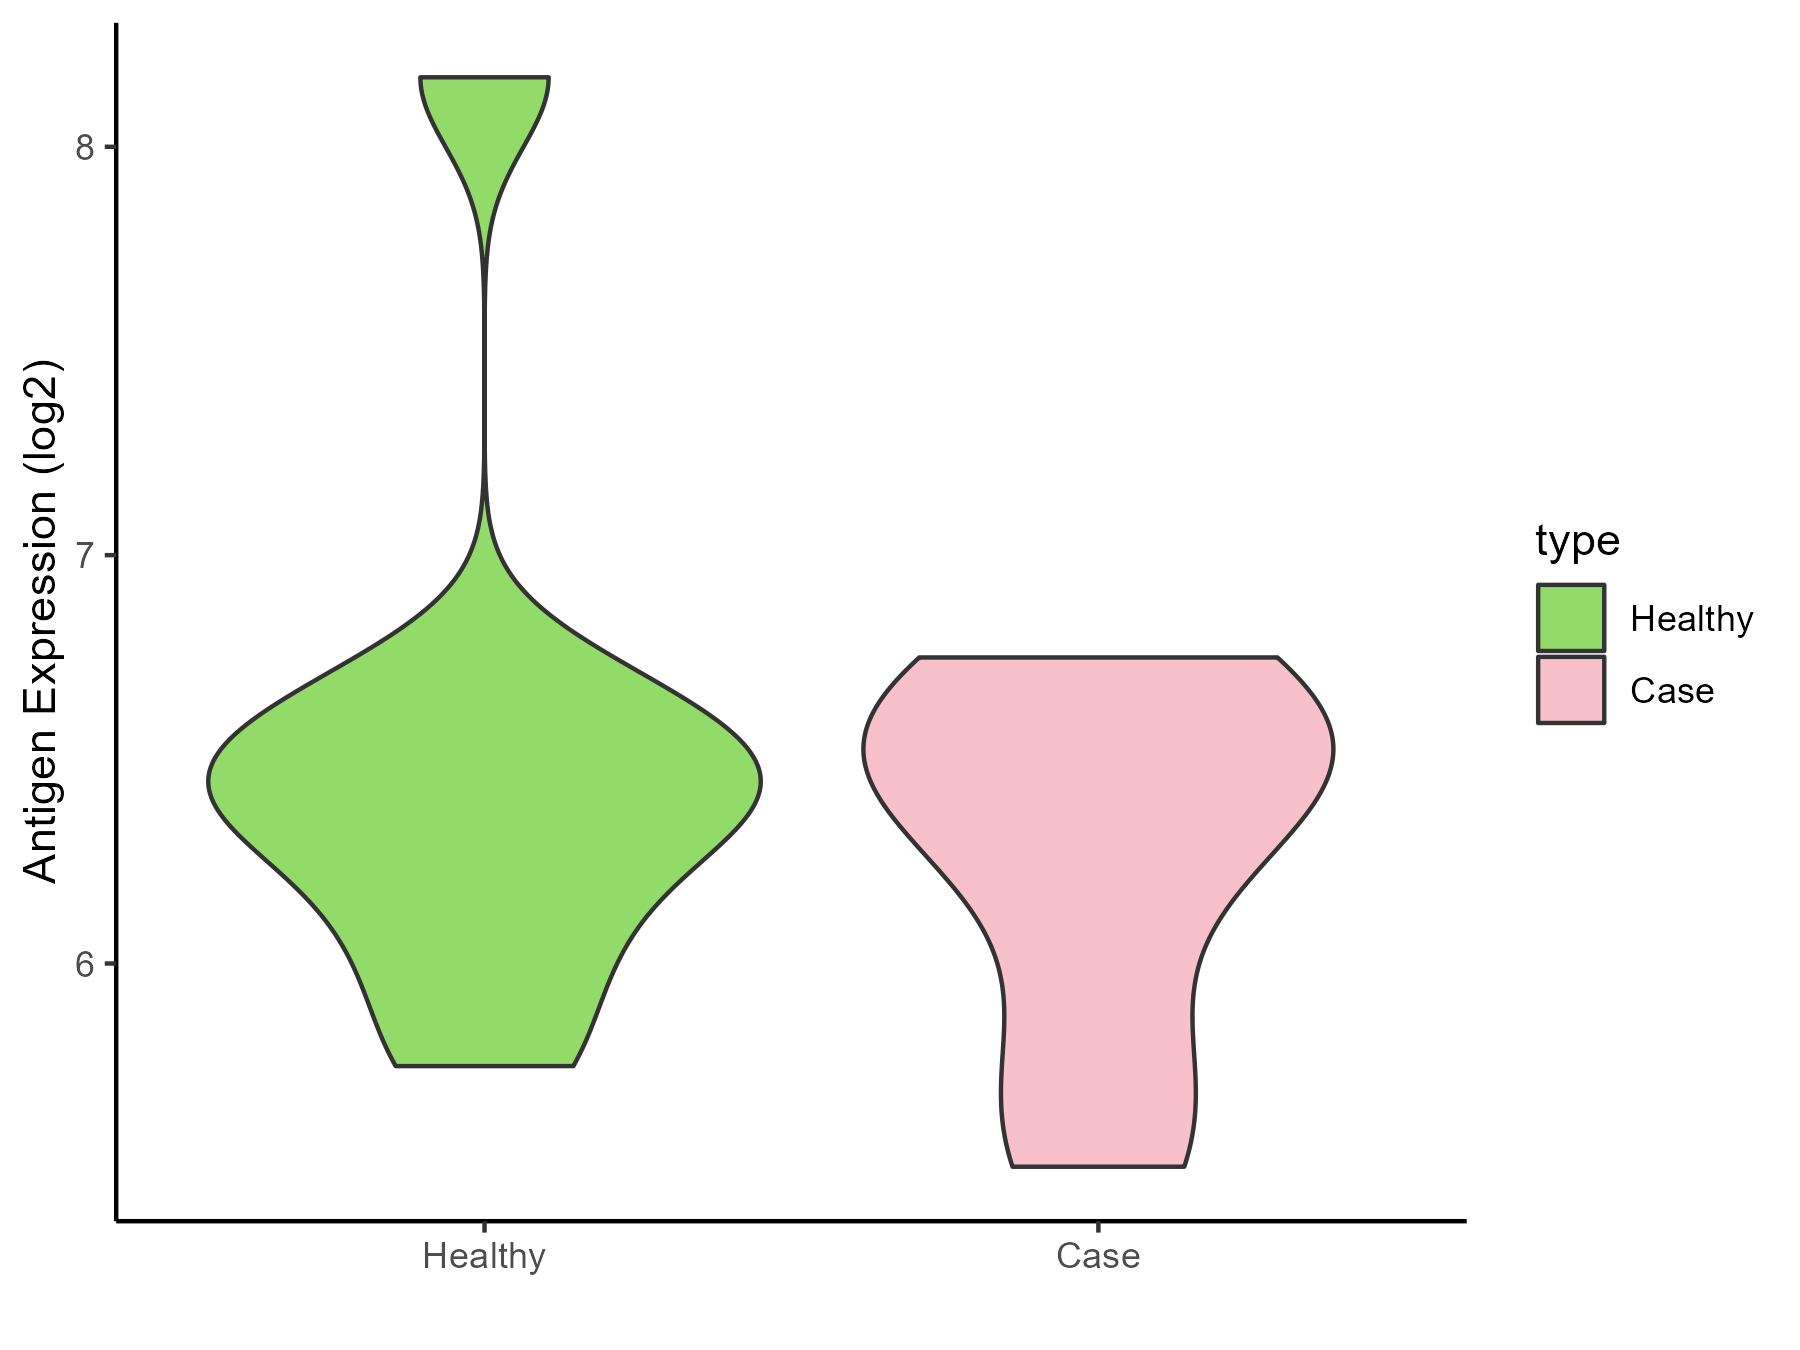
| Differential expression pattern of antigen in diseases | ||
| The Studied Tissue | Whole blood | |
| The Specific Disease | Huntington disease | |
| The Expression Level of Disease Section Compare with the Healthy Individual Tissue | p-value: 0.387594552; Fold-change: 0.045250742; Z-score: 0.065909399 | |
| Disease-specific Antigen Abundances |
|
Click to View the Clearer Original Diagram |
| Differential expression pattern of antigen in diseases | ||
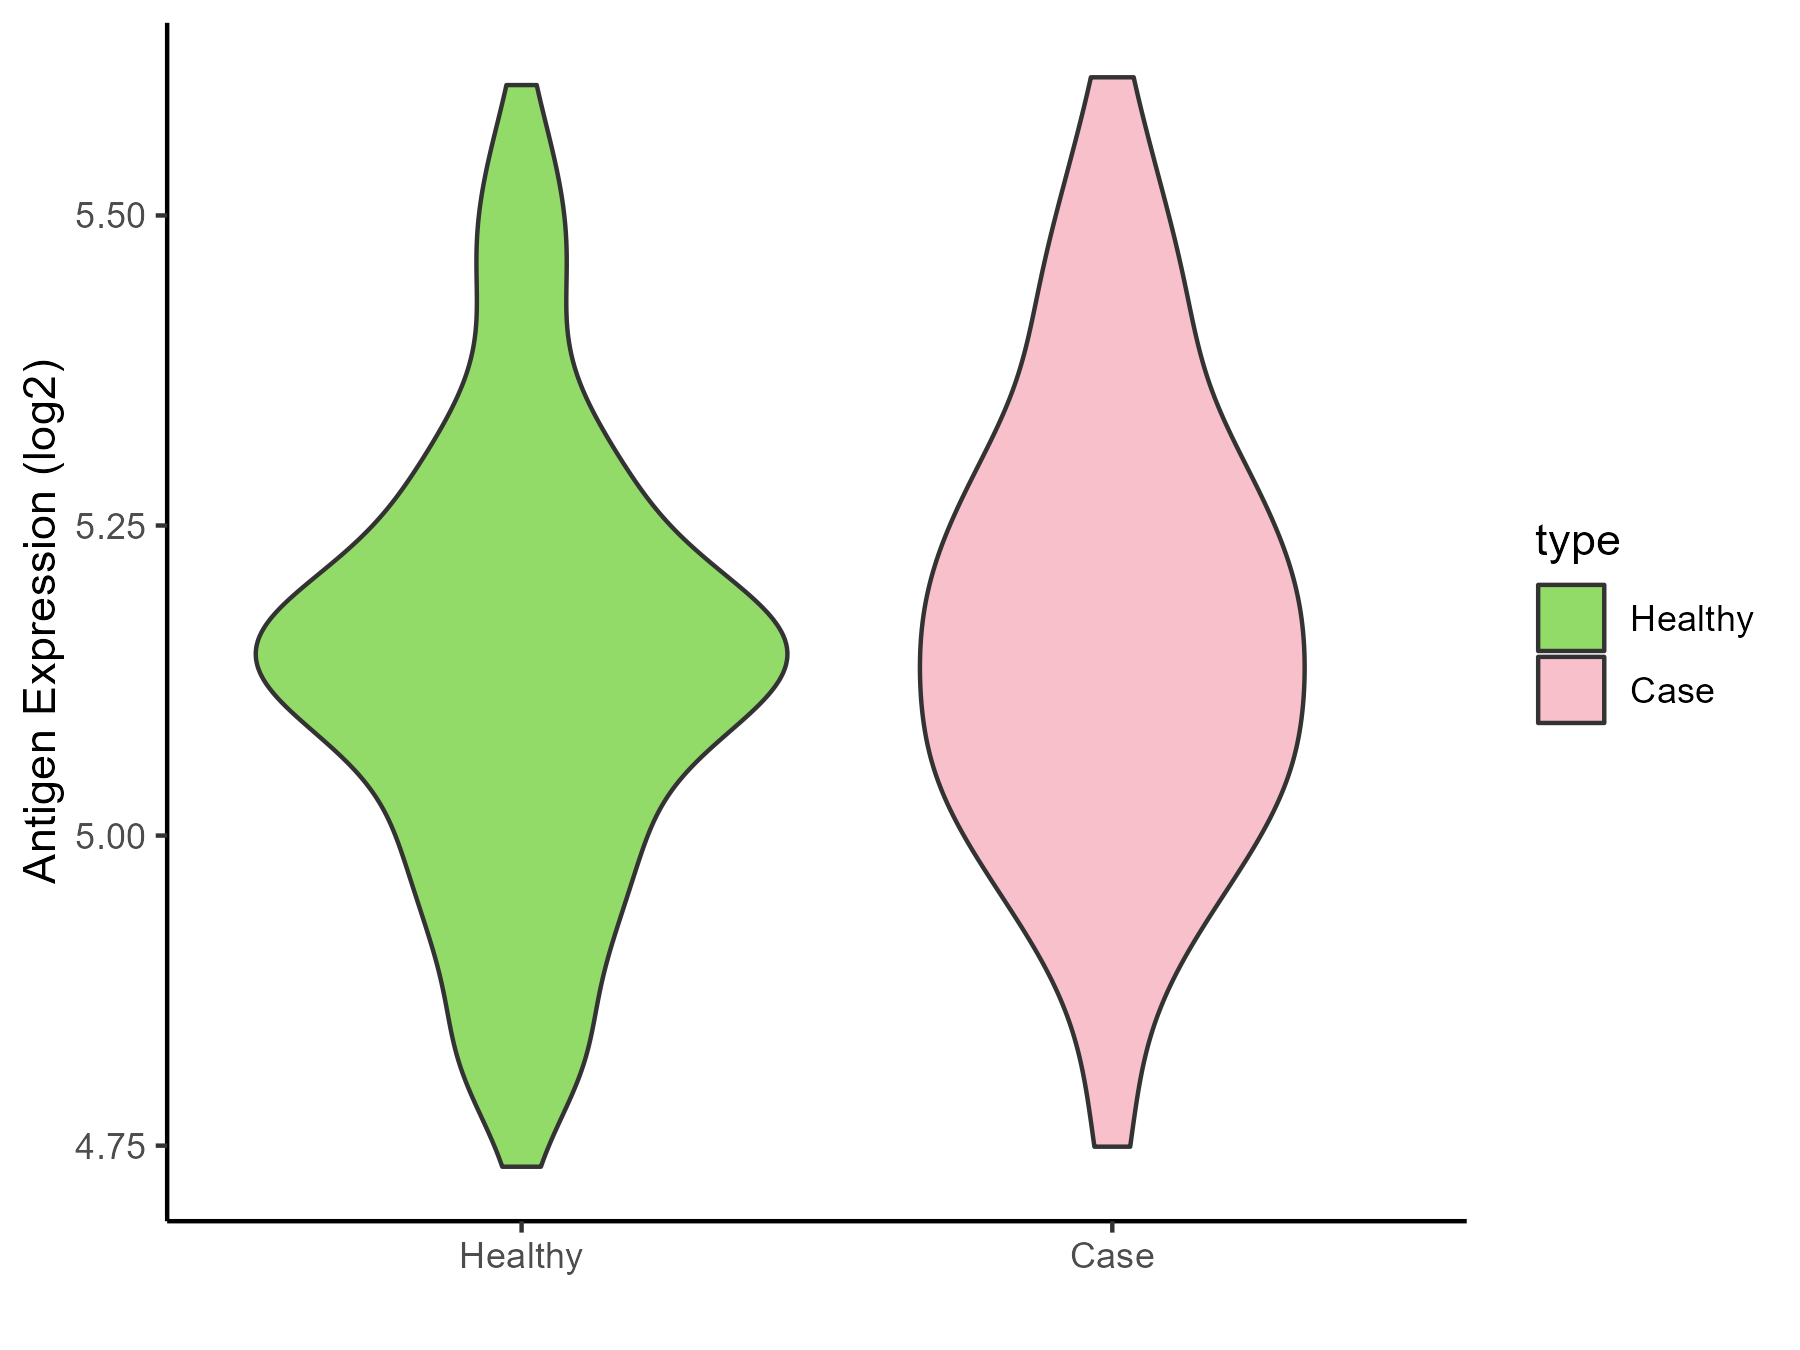
| The Studied Tissue | Entorhinal cortex | |
| The Specific Disease | Alzheimer disease | |
| The Expression Level of Disease Section Compare with the Healthy Individual Tissue | p-value: 0.165107387; Fold-change: 0.026740908; Z-score: 0.15034813 | |
| Disease-specific Antigen Abundances |
|
Click to View the Clearer Original Diagram |
| Differential expression pattern of antigen in diseases | ||
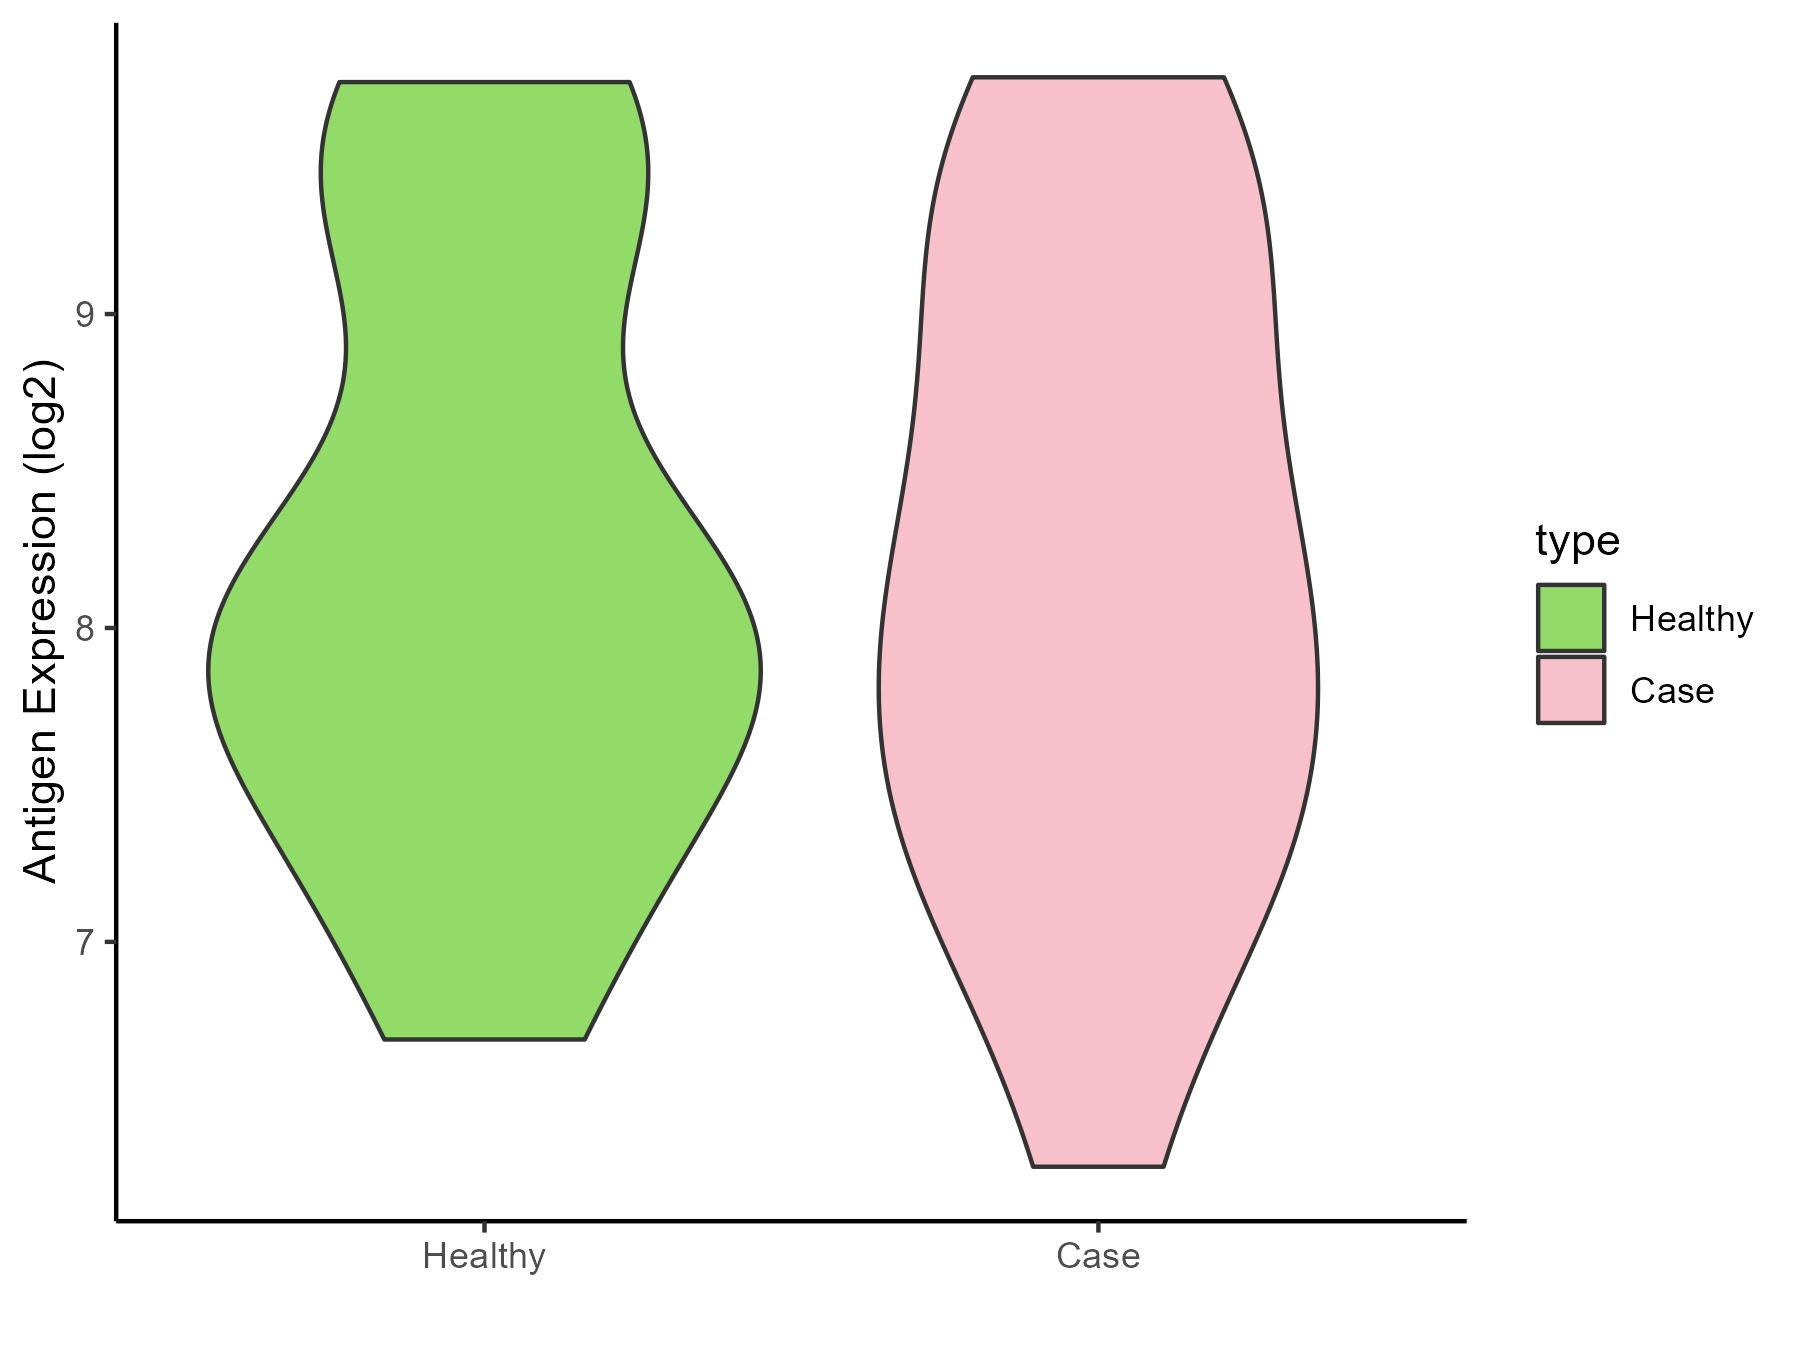
| The Studied Tissue | Whole blood | |
| The Specific Disease | Seizure | |
| The Expression Level of Disease Section Compare with the Healthy Individual Tissue | p-value: 0.87089754; Fold-change: 0.031386688; Z-score: 0.032399444 | |
| Disease-specific Antigen Abundances |
|
Click to View the Clearer Original Diagram |
| Differential expression pattern of antigen in diseases | ||
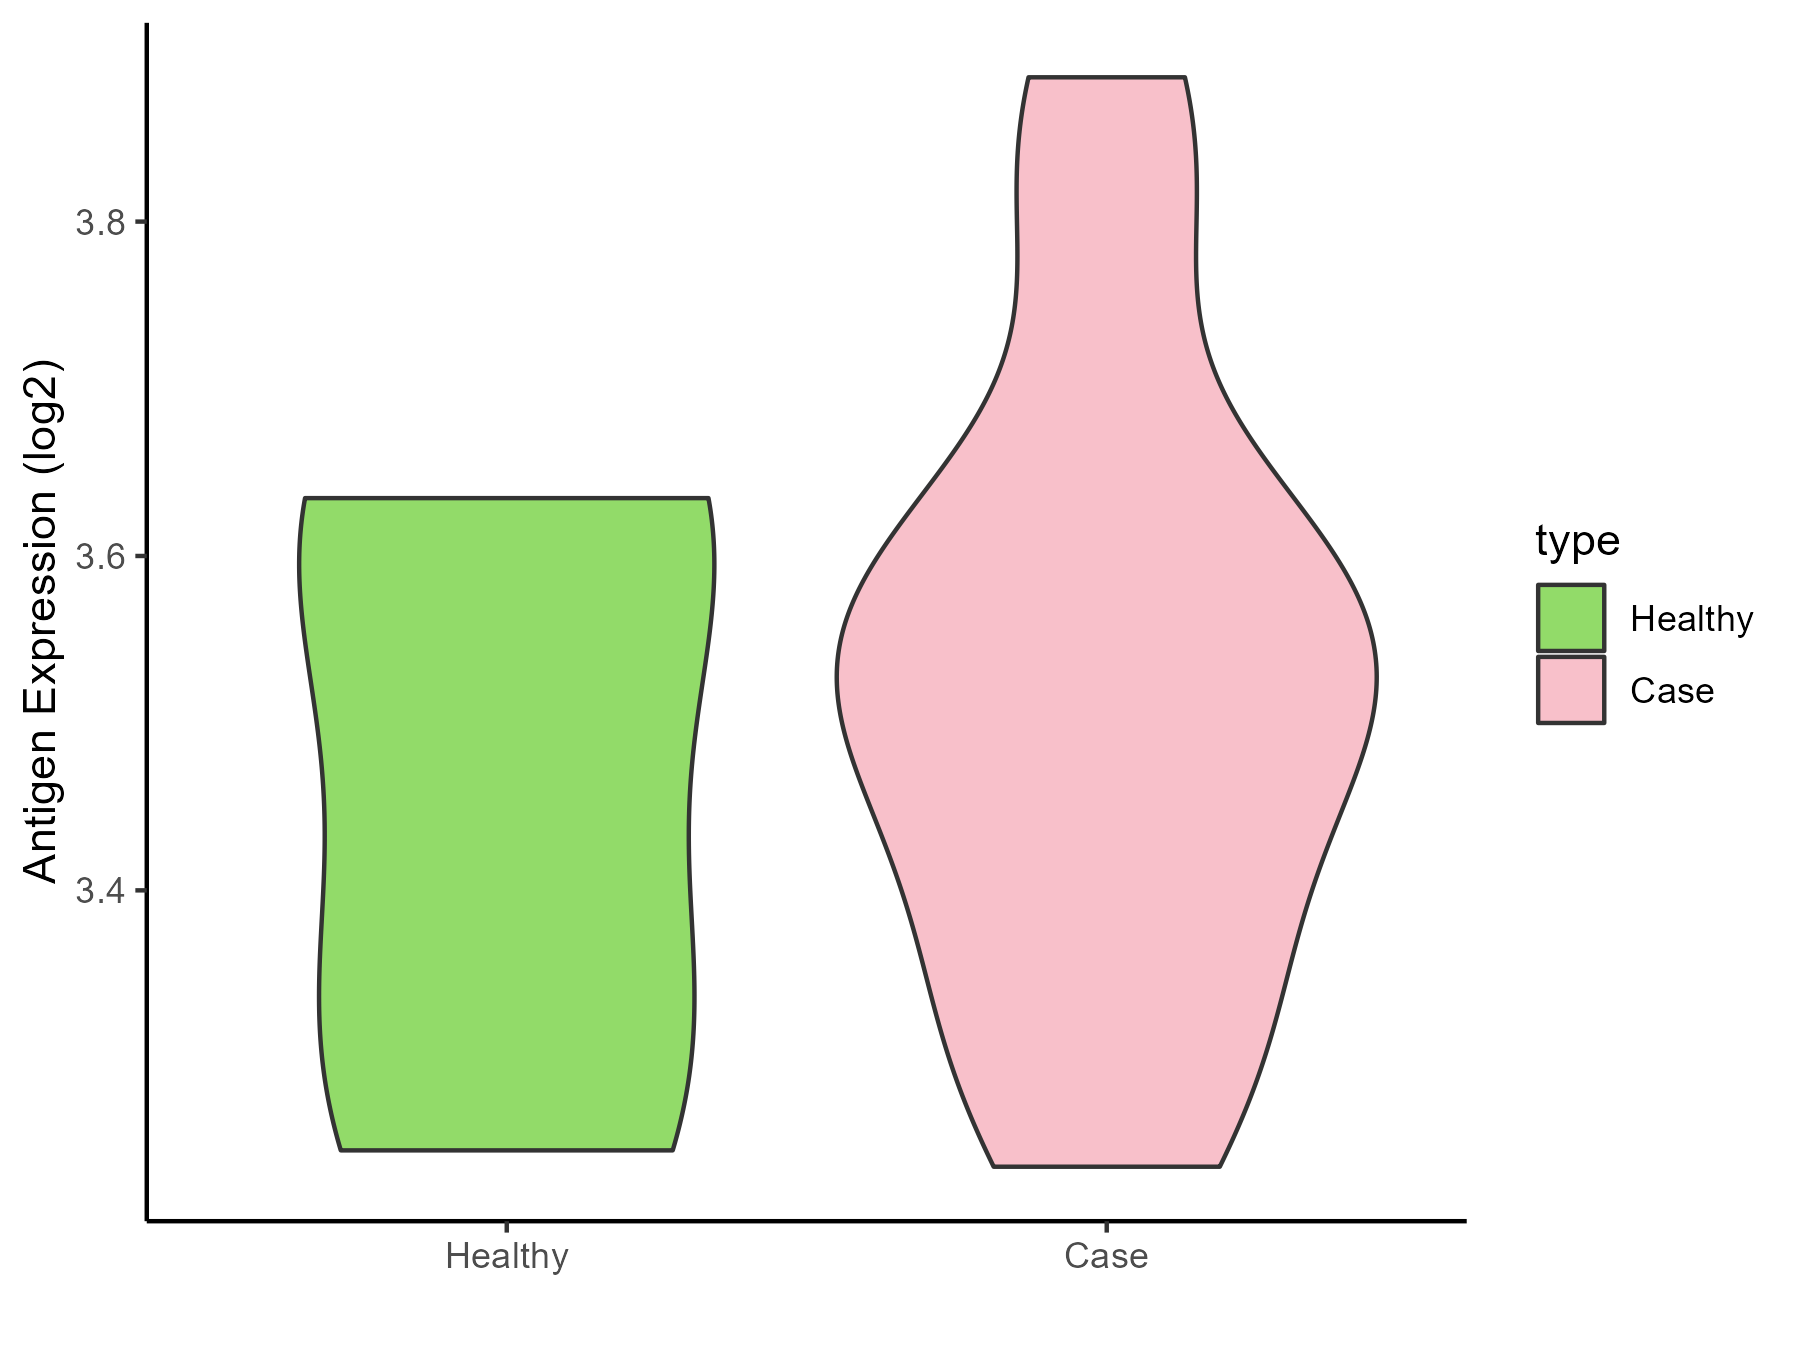
| The Studied Tissue | Skin | |
| The Specific Disease | Lateral sclerosis | |
| The Expression Level of Disease Section Compare with the Healthy Individual Tissue | p-value: 0.602509835; Fold-change: 0.026374548; Z-score: 0.136984142 | |
| Disease-specific Antigen Abundances |
|
Click to View the Clearer Original Diagram |
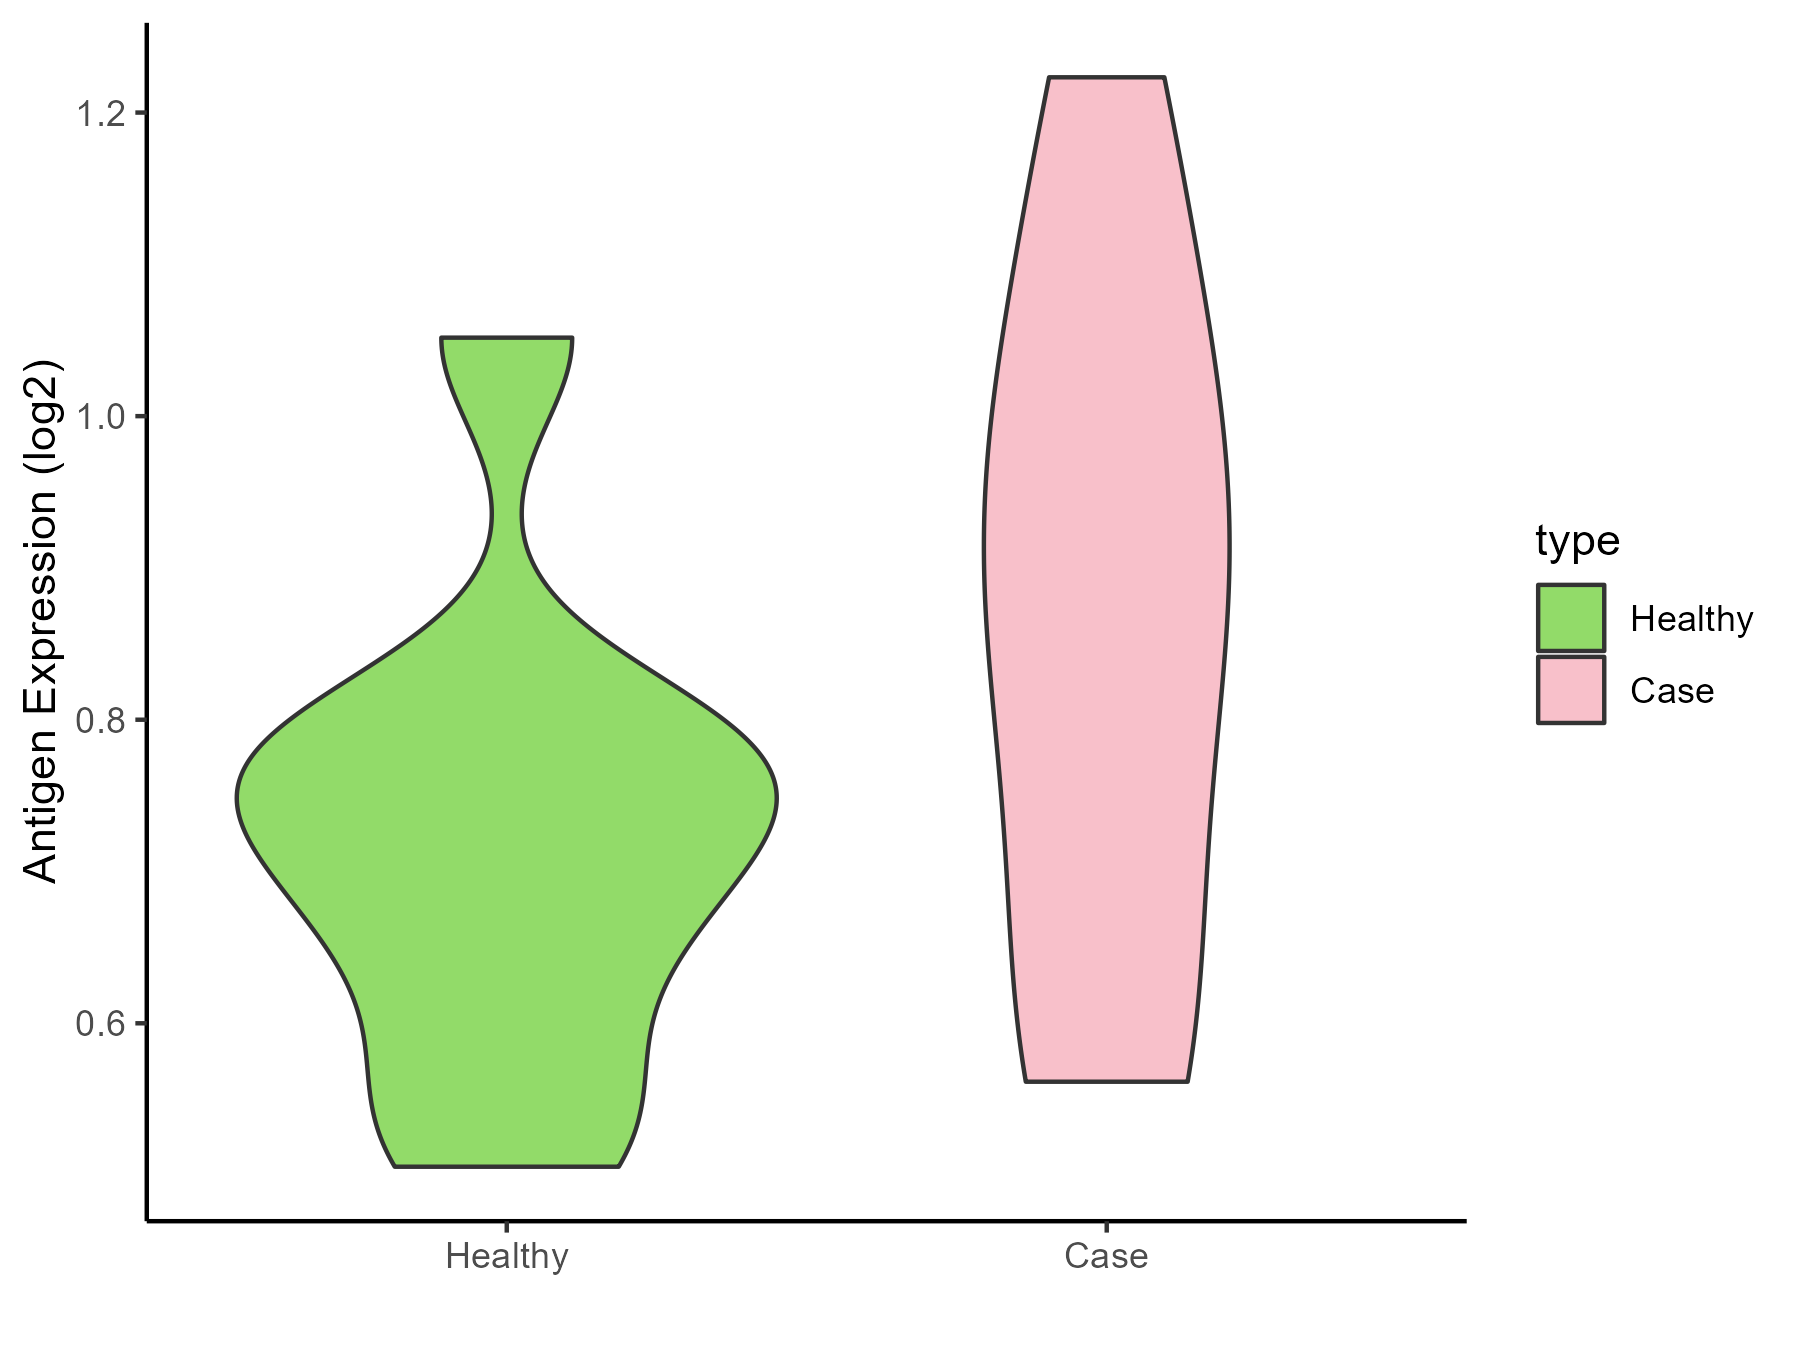
| The Studied Tissue | Cervical spinal cord | |
| The Specific Disease | Lateral sclerosis | |
| The Expression Level of Disease Section Compare with the Healthy Individual Tissue | p-value: 0.115374274; Fold-change: 0.154889127; Z-score: 0.975822215 | |
| Disease-specific Antigen Abundances |
|
Click to View the Clearer Original Diagram |
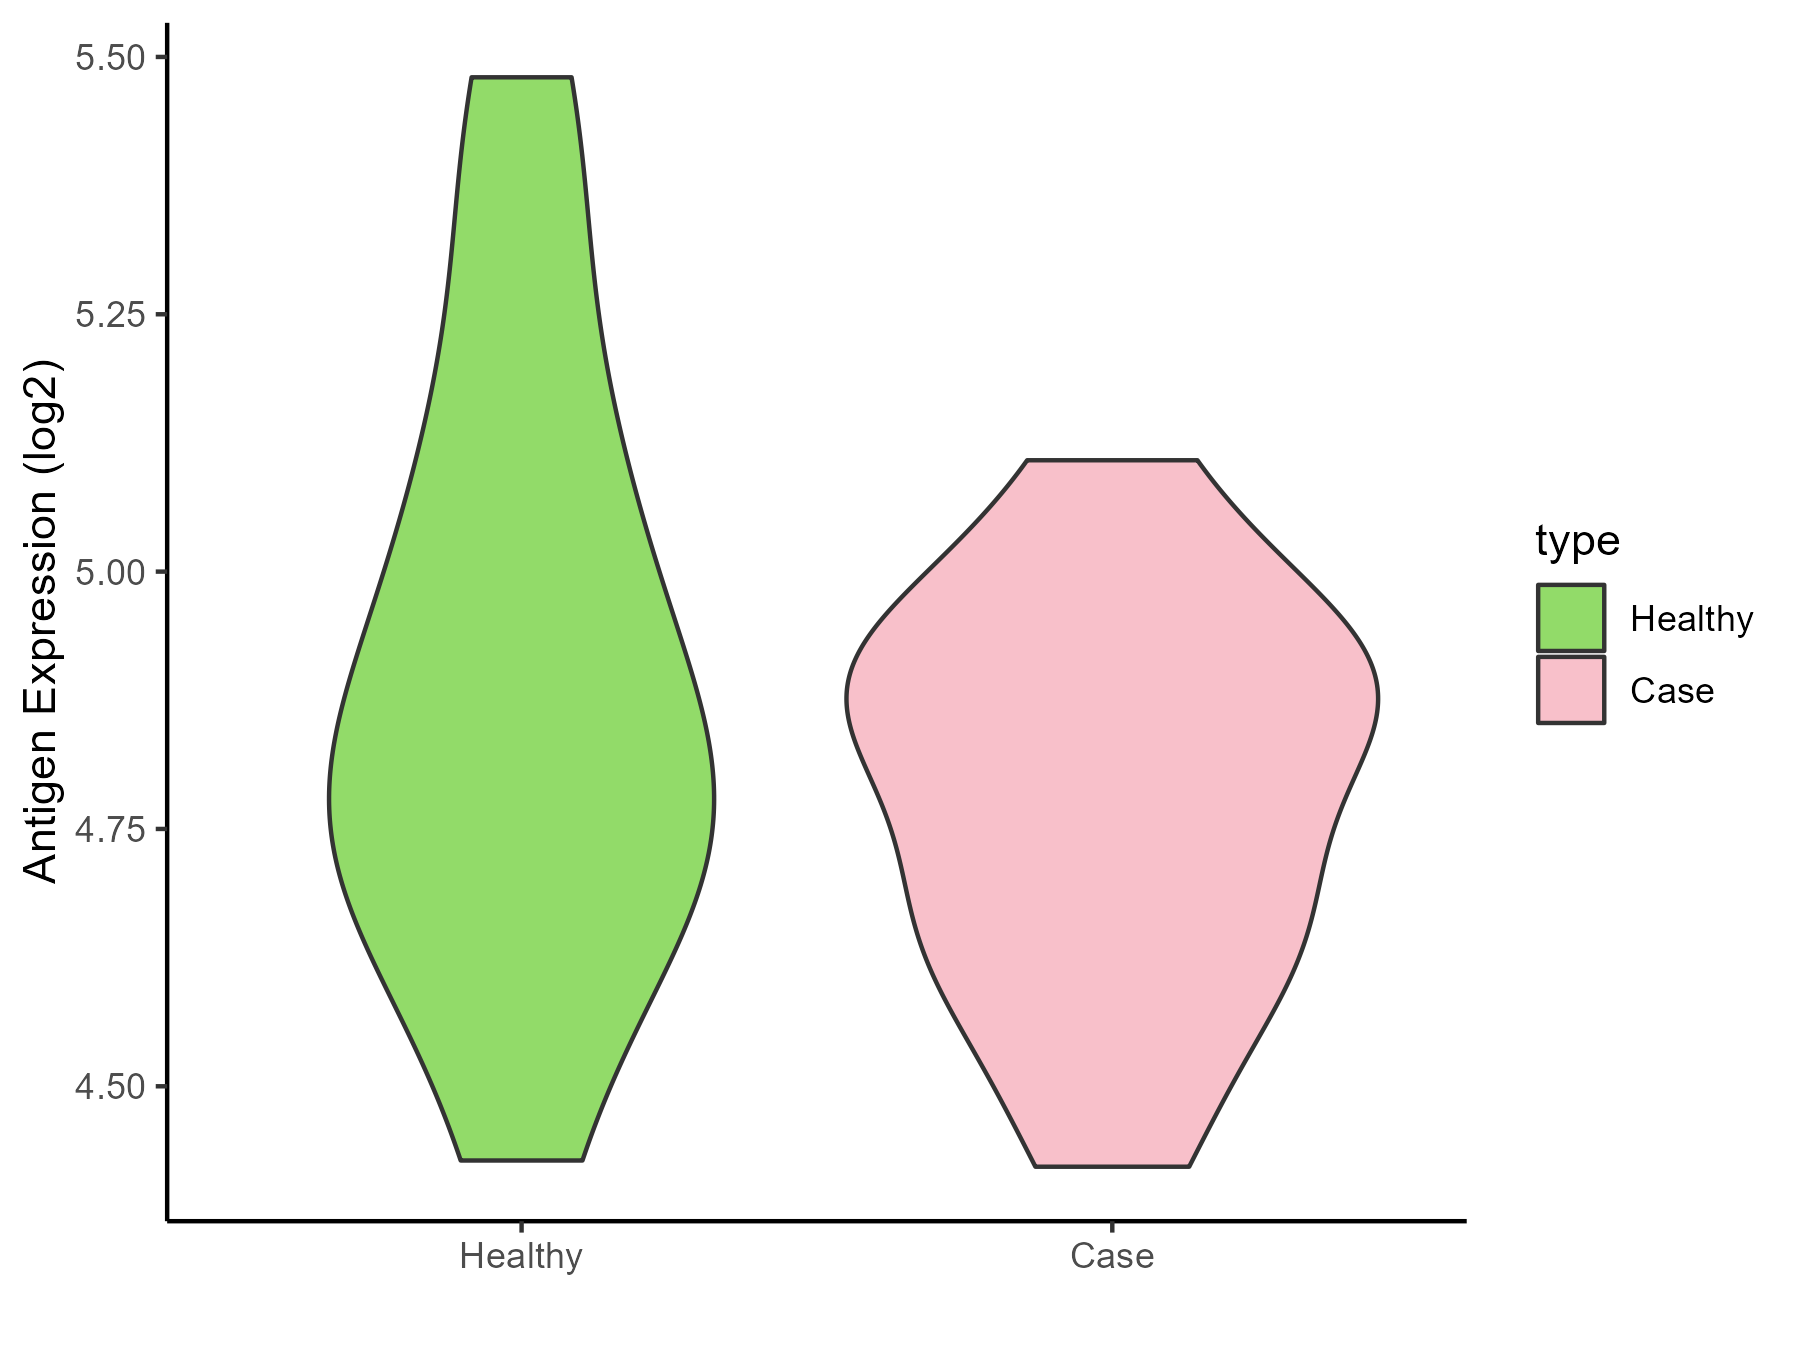
| Differential expression pattern of antigen in diseases | ||
| The Studied Tissue | Muscle | |
| The Specific Disease | Muscular atrophy | |
| The Expression Level of Disease Section Compare with the Healthy Individual Tissue | p-value: 0.241314292; Fold-change: 0.024464764; Z-score: 0.082565212 | |
| Disease-specific Antigen Abundances |
|
Click to View the Clearer Original Diagram |
| Differential expression pattern of antigen in diseases | ||
| The Studied Tissue | Muscle | |
| The Specific Disease | Myopathy | |
| The Expression Level of Disease Section Compare with the Healthy Individual Tissue | p-value: 0.995986682; Fold-change: -0.110648502; Z-score: -0.402953848 | |
| Disease-specific Antigen Abundances |
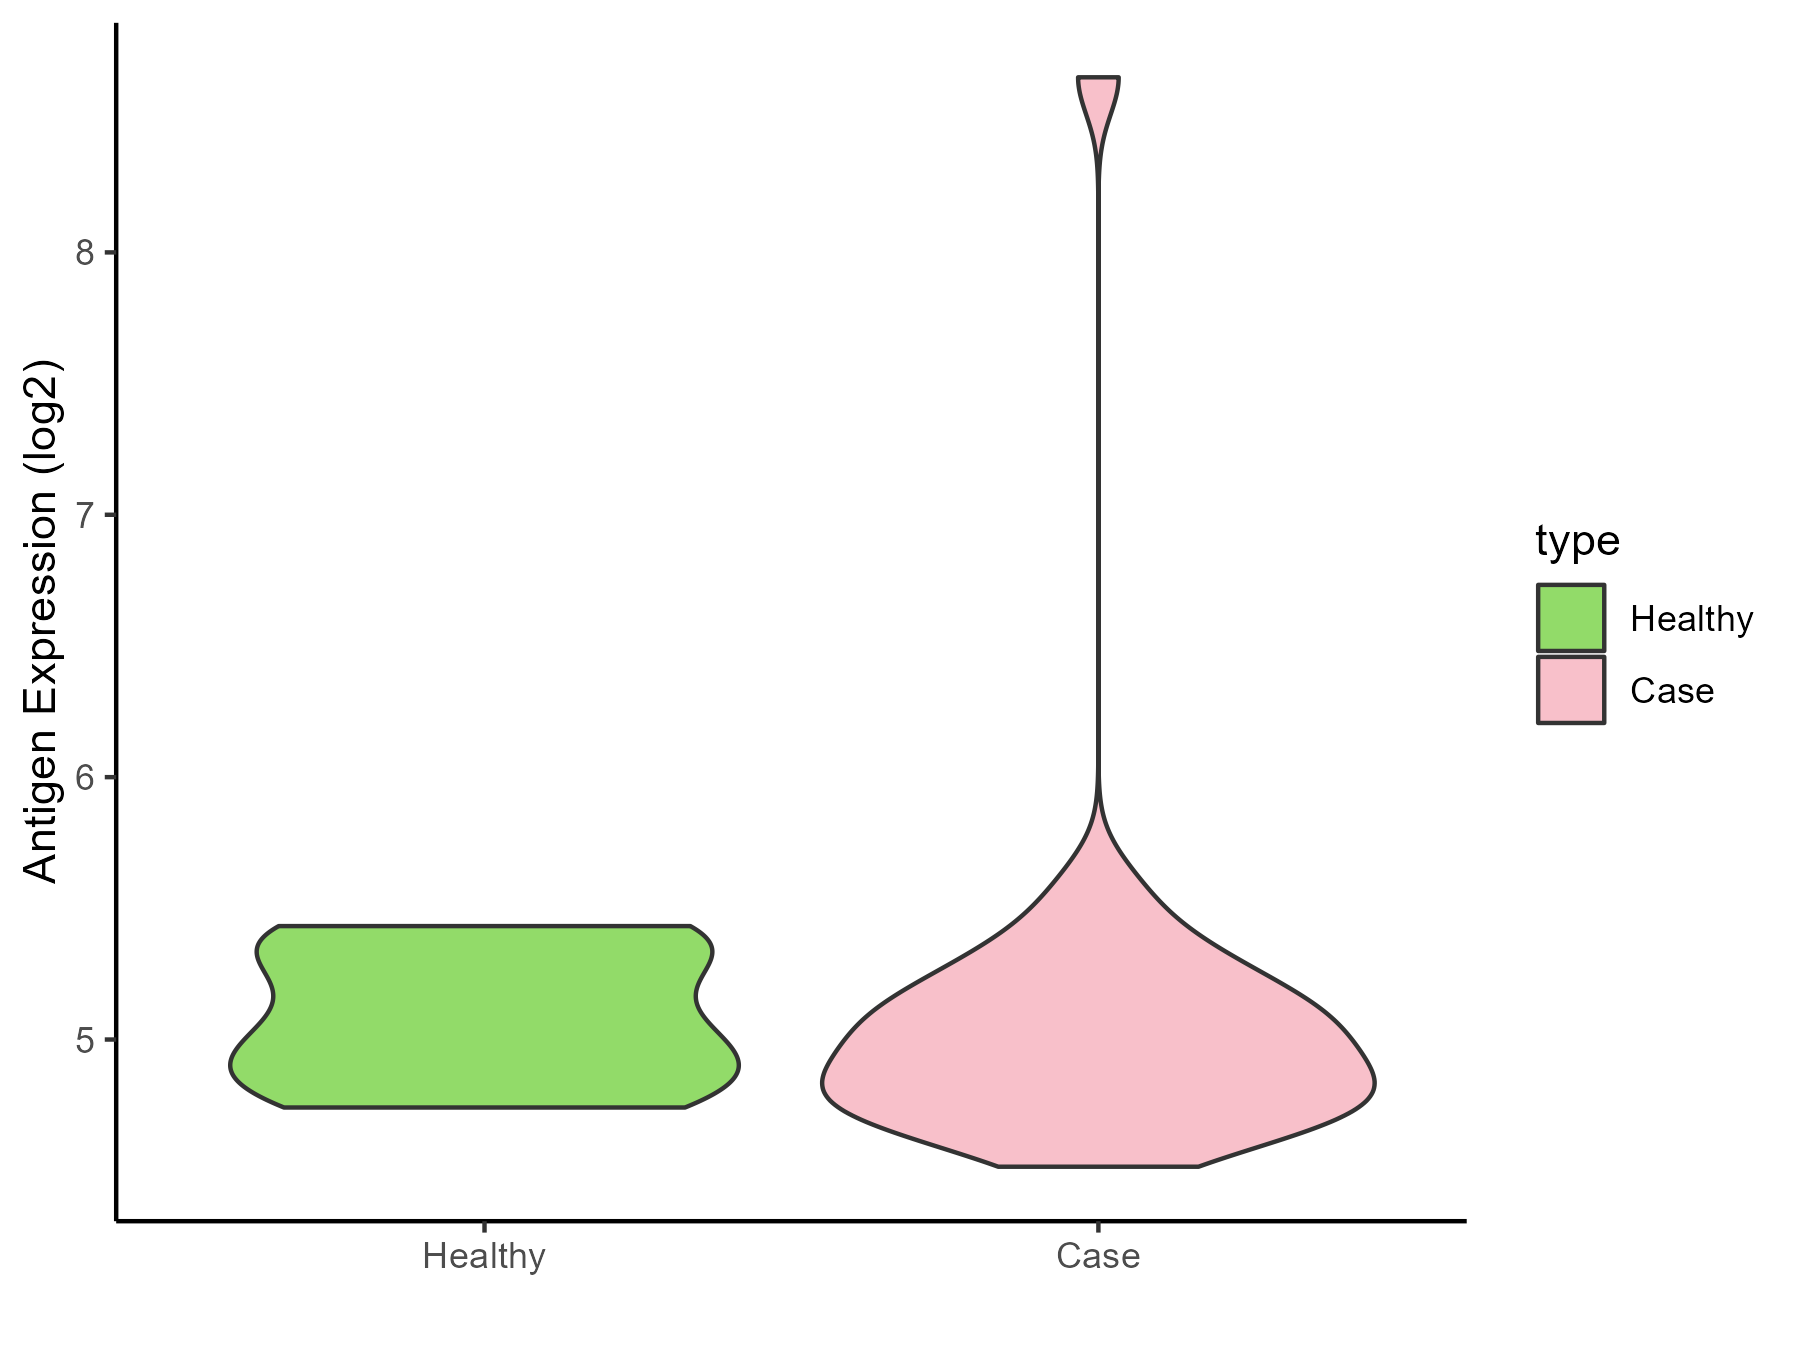
|
Click to View the Clearer Original Diagram |
References
