
Payload Information
General Information of This Payload (ID: PAY0GTSVM)
| Name |
Mertansine DM4
|
|||||
|---|---|---|---|---|---|---|
| Synonyms |
DM4; 796073-69-3; WOB38VS2NI; UNII-WOB38VS2NI; Ravtansine; DM 4; DM-4; (14S,16S,32S,33S,2R,4S,10E,12E,14R)-86-chloro-14-hydroxy-85,14-dimethoxy-33,2,7,10-tetramethyl-12,6-dioxo-7-aza-1(6,4)-oxazinana-3(2,3)-oxirana-8(1,3)-benzenacyclotetradecaphane-10,12-dien-4-yl N-(4-mercapto-4-methylpentanoyl)-N-methyl-L-alaninate; N2'-Deacetyl-N2'-(4-mercapto-4-methyl-1-oxopentyl)-maytansine; Maytansinoid DM 4; SCHEMBL12719514; EX-A3441; CS-6866; AC-36376; HY-12454; D94659; Q27292749; MAYTANSINE, N2'-DEACETYL-N2'-(4-MERCAPTO-4-METHYL-1-OXOPENTYL); [(1S,2R,3S,5S,6S,16E,18E,20R,21S)-11-Chloro-21-hydroxy-12,20-dimethoxy-2,5,9,16-tetramethyl-8,23-dioxo-4,24-dioxa-9,22-diazatetracyclo[19.3.1.110,14.03,5]hexacosa-10,12,14(26),16,18-pentaen-6-yl] (2S)-2-[methyl-(4-methyl-4-sulfanylpentanoyl)amino]propanoate
Click to Show/Hide
|
|||||
| Target | Microtubule (MT) | |||||
| Structure |
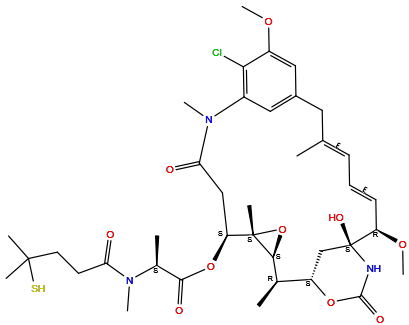
|
|||||
| Formula | C38H54ClN3O10S |
|||||
| Isosmiles | C[C@@H]1[C@@H]2C[C@]([C@@H](/C=C/C=C(/CC3=CC(=C(C(=C3)OC)Cl)N(C(=O)C[C@@H]([C@]4([C@H]1O4)C)OC(=O)[C@H](C)N(C)C(=O)CCC(C)(C)S)C)\C)OC)(NC(=O)O2)O |
|||||
| PubChem CID | ||||||
| InChI |
InChI=1S/C38H54ClN3O10S/c1-21-12-11-13-28(49-10)38(47)20-27(50-35(46)40-38)22(2)33-37(6,52-33)29(51-34(45)23(3)41(7)30(43)14-15-36(4,5)53)19-31(44)42(8)25-17-24(16-21)18-26(48-9)32(25)39/h11-13,17-18,22-23,27-29,33,47,53H,14-16,19-20H2,1-10H3,(H,40,46)/b13-11+,21-12+/t22-,23+,27+,28-,29+,33+,37+,38+/m1/s1
|
|||||
| InChIKey |
JFCFGYGEYRIEBE-YVLHJLIDSA-N
|
|||||
| IUPAC Name |
[(1S,2R,3S,5S,6S,16E,18E,20R,21S)-11-chloro-21-hydroxy-12,20-dimethoxy-2,5,9,16-tetramethyl-8,23-dioxo-4,24-dioxa-9,22-diazatetracyclo[19.3.1.110,14.03,5]hexacosa-10,12,14(26),16,18-pentaen-6-yl] (2S)-2-[methyl-(4-methyl-4-sulfanylpentanoyl)amino]propanoate
|
|||||
| Pharmaceutical Properties | Molecule Weight |
780.4 |
Polar area |
158 |
||
Complexity |
1430 |
xlogp Value |
3.2 |
|||
Heavy Count |
53 |
Rot Bonds |
9 |
|||
Hbond acc |
11 |
Hbond Donor |
3 |
|||
The activity data of This Payload
| Standard Type | Value | Units | Cell line | Disease Model | Cell line ID | Reference |
|---|---|---|---|---|---|---|
| Half Maximal Cell Growth Inhibitory Concentration (GI50) | 1 | nM |
Hep-G2 cells
|
Hepatoblastoma
|
[1] | |
| Half Maximal Inhibitory Concentration (IC50) | 10 | nM |
Lu1 cells
|
Lung carcinoma
|
Undisclosed | [2] |
| Half Maximal Effective Concentration (EC50) | 20 | nM |
Hep-G2 cells
|
Hepatoblastoma
|
[3] | |
| Half Maximal Effective Concentration (EC50) | 510 | nM |
COS-1 cells
|
Normal
|
[3] | |
| Half Maximal Effective Concentration (EC50) | 570 | nM |
Hep-G2 cells
|
Hepatoblastoma
|
[4] | |
| Half Maximal Effective Concentration (EC50) | 75 | nM |
HEK293 cells
|
Normal
|
[5] |
Each Antibody-drug Conjugate Related to This Payload
Full Information of The Activity Data of The ADC(s) Related to This Payload
MEN-1309 [Phase 1]
Identified from the Human Clinical Data
| Experiment 1 Reporting the Activity Date of This ADC | [6] | ||||
| Patients Enrolled |
Inclusion criteria require patients ≥18 years with ECOG PS 0-1 and histologically confirmed recurrent/metastatic Adenoid Cystic Carcinoma (AdCC) of head/neck/trachea, demonstrating RECIST 1.1-defined progression within 6 months prior to screening. Participants must have measurable disease and adequate organ function (ANC ≥2.0×10⁹/L, platelets ≥100×109/L, Hb ≥9.0 g/dL without transfusions, WBC ≥2000/mm 3, AST/ALT ≤2.5×ULN [≤5×ULN with liver metastases], creatinine <1.5×ULN, bilirubin ≤1.5×ULN [<3.0 mg/dL for Gilbert's], normal potassium). Contraception requirements include: WOCBP must use highly effective contraception (failure rate <1%/year) from consent until 4 months post-treatment; males must use condoms/spermicide (with partner contraception) or refrain from semen donation during same period. All participants must have insurance coverage and provide informed consent.
Click to Show/Hide
|
||||
| Administration Dosage |
OBT076, administration at 3mg/kg, (IV ≥ 3h infusion) on Day 1 every 21 days (3-week cycle) until disease progression, unacceptable toxicity, intercurrent conditions that preclude continuation of treatment or patient refusal whichever comes first.
|
||||
| Related Clinical Trial | |||||
| NCT Number | NCT05930951 | Phase Status | PHASE1 | ||
| Clinical Description |
A Phase Ib Study of OBT076 or OBT076 Followed by Balstilimab in Patients with Recurrent or Metastatic (R/M) Adenoid Cystic Carcinoma (AdCC) of the Head and Neck (H&N)
|
||||
| Primary Endpoint |
The primary endpoint is Objective Response Rate (ORR) assessed by investigators using RECIST 1.1 criteria, evaluated through study completion (average 1 year).
|
||||
| Experiment 2 Reporting the Activity Date of This ADC | [7] | ||||
| Patients Enrolled |
Eligibility requires ≥18yo with metastatic CD205+ solid tumors (ECOG 0-1, measurable disease per RECIST v1.1). Breast cancer specifics: HR+ (≥2 prior endocrine therapies), HER2- (ASCO-CAP criteria), or TNBC (≥1 prior metastatic chemo). All subjects require adequate organ function, ≤5 prior chemo lines (if 3-5 lines, last dose ≥12 weeks pre-C1D1), and contraception compliance (negative pregnancy test, barrier methods, no breastfeeding/sperm donation for 4 months post-treatment).
Click to Show/Hide
|
||||
| Administration Dosage |
Intravenous (IV) infusion of OBT076 every 3 weeks.
|
||||
| Related Clinical Trial | |||||
| NCT Number | NCT04064359 | Phase Status | PHASE1 | ||
| Clinical Description |
A Phase I, Open-label, Dose Finding Study to Assess the Safety, Tolerability, PK, and Preliminary Efficacy of OBT076, a CD205-directed ADC, in Recurrent and/or Metastatic CD205+ Solid Tumors
|
||||
| Primary Endpoint |
Primary endpoints include 1-year incidence of AEs (NCI CTCAE v5 grades 1-5) and dose-limiting toxicities (DLTs, grades 3-4 per NCI CTCAE v5 with duration exceptions).
|
||||
| Other Endpoint |
Secondary endpoints assess 2-year efficacy (CBR, ORR, DoR, PFS, OS via RECIST v1.1/Kaplan-Meier) and 1-year PK parameters (AUC, Cmax, Tmax, T1/2, CL, Vd) of OBT076 with full statistical reporting (N, mean, SD, CV%, median, min/max).
|
||||
| Experiment 3 Reporting the Activity Date of This ADC | [8] | ||||
| Related Clinical Trial | |||||
| NCT Number | NCT04064359 | Phase Status | Phase 1 | ||
| Clinical Description |
A phase 1, open-label, dose finding study to assess the safety, tolerability, PK, and preliminary efficacy of OBT076, a CD205-directed ADC, in recurrent and/or metastatic CD205+ solid tumors.
|
||||
| Experiment 4 Reporting the Activity Date of This ADC | [8] | ||||
| Related Clinical Trial | |||||
| NCT Number | NCT03403725 | Phase Status | Phase 1 | ||
| Clinical Description |
Open-label, multicenter, phase 1 dose escalation study of MEN1309, a CD205 antibody-drug conjugate,in patients with CD205-positive metastatic solid tumors and non-Hodgkin lymphoma.
|
||||
Discovered Using Patient-derived Xenograft Model
| Experiment 1 Reporting the Activity Date of This ADC | [9] | ||||
| Efficacy Data | Tumor Growth Inhibition value (TGI) | ≈ 0% | High CD205 expression (CD205+++; IHC 3+) | ||
| Method Description |
To test the in vivo efficacy of MEN1309/OBT076,different xenograft and PDX models were selected on the basis of the IHC analysis for CD205 staining in various tumor types. Efficacy of MEN1309/OBT076,administered with a q21dx3,1.25 mg/kg schedule,was determined by assessing the inhibition of tumor growth at the nadir of tumor volume in treated versus control mice and assessing mRECIST criteria adapted to the mouse from human RECIST. Mice were euthanized when tumors reached 2, 000 mm 3 or when the study endpoint was reached.
Click to Show/Hide
|
||||
| In Vivo Model | Pancreas cancer PDX model (PDX: AspC1) | ||||
| Experiment 2 Reporting the Activity Date of This ADC | [9] | ||||
| Efficacy Data | Tumor Growth Inhibition value (TGI) | ≈ 11.20% | High CD205 expression (CD205+++; IHC 3+) | ||
| Method Description |
To test the in vivo efficacy of MEN1309/OBT076,different xenograft and PDX models were selected on the basis of the IHC analysis for CD205 staining in various tumor types. Efficacy of MEN1309/OBT076,administered with a q21dx3,2.5 mg/kg schedule,was determined by assessing the inhibition of tumor growth at the nadir of tumor volume in treated versus control mice and assessing mRECIST criteria adapted to the mouse from human RECIST. Mice were euthanized when tumors reached 2, 000 mm 3 or when the study endpoint was reached.
Click to Show/Hide
|
||||
| In Vivo Model | Pancreas cancer PDX model (PDX: AspC1) | ||||
| Experiment 3 Reporting the Activity Date of This ADC | [9] | ||||
| Efficacy Data | Tumor Growth Inhibition value (TGI) | ≈ 14.50% | Negative CD205 expression (CD205-; IHC 0) | ||
| Method Description |
To test the in vivo efficacy of MEN1309/OBT076,different xenograft and PDX models were selected on the basis of the IHC analysis for CD205 staining in various tumor types. Efficacy of MEN1309/OBT076,administered with a q21dx3,3.5 mg/kg schedule,was determined by assessing the inhibition of tumor growth at the nadir of tumor volume in treated versus control mice and assessing mRECIST criteria adapted to the mouse from human RECIST. Mice were euthanized when tumors reached 2, 000 mm 3 or when the study endpoint was reached.
Click to Show/Hide
|
||||
| In Vivo Model | Pancreas cancer PDX model (PDX: AspC1) | ||||
| Experiment 4 Reporting the Activity Date of This ADC | [9] | ||||
| Efficacy Data | Tumor Growth Inhibition value (TGI) | ≈ 16.50% | Negative CD205 expression (CD205-; IHC 0) | ||
| Method Description |
To test the in vivo efficacy of MEN1309/OBT076,different xenograft and PDX models were selected on the basis of the IHC analysis for CD205 staining in various tumor types. Efficacy of MEN1309/OBT076,administered with a q21dx3,5 mg/kg schedule,was determined by assessing the inhibition of tumor growth at the nadir of tumor volume in treated versus control mice and assessing mRECIST criteria adapted to the mouse from human RECIST. Mice were euthanized when tumors reached 2, 000 mm 3 or when the study endpoint was reached.
Click to Show/Hide
|
||||
| In Vivo Model | Pancreas cancer PDX model (PDX: AspC1) | ||||
| Experiment 5 Reporting the Activity Date of This ADC | [9] | ||||
| Efficacy Data | Tumor Growth Inhibition value (TGI) | ≈ 20.50% | Negative CD205 expression (CD205-; IHC 0) | ||
| Method Description |
To test the in vivo efficacy of MEN1309/OBT076,different xenograft and PDX models were selected on the basis of the IHC analysis for CD205 staining in various tumor types. Efficacy of MEN1309/OBT076,administered with a q21dx3,1.25 mg/kg schedule,was determined by assessing the inhibition of tumor growth at the nadir of tumor volume in treated versus control mice and assessing mRECIST criteria adapted to the mouse from human RECIST. Mice were euthanized when tumors reached 2, 000 mm 3 or when the study endpoint was reached.
Click to Show/Hide
|
||||
| In Vivo Model | Pancreas cancer PDX model (PDX: HPAFII) | ||||
| Experiment 6 Reporting the Activity Date of This ADC | [9] | ||||
| Efficacy Data | Tumor Growth Inhibition value (TGI) | ≈ 37.80% | Negative CD205 expression (CD205-; IHC 0) | ||
| Method Description |
To test the in vivo efficacy of MEN1309/OBT076,different xenograft and PDX models were selected on the basis of the IHC analysis for CD205 staining in various tumor types. Efficacy of MEN1309/OBT076,administered with a q21dx3,5 mg/kg schedule,was determined by assessing the inhibition of tumor growth at the nadir of tumor volume in treated versus control mice and assessing mRECIST criteria adapted to the mouse from human RECIST. Mice were euthanized when tumors reached 2, 000 mm 3 or when the study endpoint was reached.
Click to Show/Hide
|
||||
| In Vivo Model | Triple-negative breast cancer PDX model (PDX: PDX-22) | ||||
| Experiment 7 Reporting the Activity Date of This ADC | [9] | ||||
| Efficacy Data | Tumor Growth Inhibition value (TGI) | ≈ 38.70% | High CD205 expression (CD205+++; IHC 3+) | ||
| Method Description |
To test the in vivo efficacy of MEN1309/OBT076,different xenograft and PDX models were selected on the basis of the IHC analysis for CD205 staining in various tumor types. Efficacy of MEN1309/OBT076,administered with a q21dx3,5 mg/kg schedule,was determined by assessing the inhibition of tumor growth at the nadir of tumor volume in treated versus control mice and assessing mRECIST criteria adapted to the mouse from human RECIST. Mice were euthanized when tumors reached 2, 000 mm 3 or when the study endpoint was reached.
Click to Show/Hide
|
||||
| In Vivo Model | Bladder cancer PDX model (PDX: PDX-CTG-1652) | ||||
| Experiment 8 Reporting the Activity Date of This ADC | [9] | ||||
| Efficacy Data | Tumor Growth Inhibition value (TGI) | ≈ 49.30% | Low CD205 expression (CD205+; IHC 1+) | ||
| Method Description |
To test the in vivo efficacy of MEN1309/OBT076,different xenograft and PDX models were selected on the basis of the IHC analysis for CD205 staining in various tumor types. Efficacy of MEN1309/OBT076,administered with a q21dx3,5 mg/kg schedule,was determined by assessing the inhibition of tumor growth at the nadir of tumor volume in treated versus control mice and assessing mRECIST criteria adapted to the mouse from human RECIST. Mice were euthanized when tumors reached 2, 000 mm 3 or when the study endpoint was reached.
Click to Show/Hide
|
||||
| In Vivo Model | Bladder cancer PDX model (PDX: PDX-CTG-1388) | ||||
| Experiment 9 Reporting the Activity Date of This ADC | [9] | ||||
| Efficacy Data | Tumor Growth Inhibition value (TGI) | ≈ 50% | Moderate CD205 expression (CD205++; IHC 2+) | ||
| Method Description |
To test the in vivo efficacy of MEN1309/OBT076,different xenograft and PDX models were selected on the basis of the IHC analysis for CD205 staining in various tumor types. Efficacy of MEN1309/OBT076,administered with a q21dx3,5 mg/kg schedule,was determined by assessing the inhibition of tumor growth at the nadir of tumor volume in treated versus control mice and assessing mRECIST criteria adapted to the mouse from human RECIST. Mice were euthanized when tumors reached 2, 000 mm 3 or when the study endpoint was reached.
Click to Show/Hide
|
||||
| In Vivo Model | Pancreas cancer PDX model (PDX: PDX-21) | ||||
| Experiment 10 Reporting the Activity Date of This ADC | [9] | ||||
| Efficacy Data | Tumor Growth Inhibition value (TGI) | ≈ 60.20% | Moderate CD205 expression (CD205++; IHC 2+) | ||
| Method Description |
To test the in vivo efficacy of MEN1309/OBT076,different xenograft and PDX models were selected on the basis of the IHC analysis for CD205 staining in various tumor types. Efficacy of MEN1309/OBT076,administered with a q21dx3,2.5 mg/kg schedule,was determined by assessing the inhibition of tumor growth at the nadir of tumor volume in treated versus control mice and assessing mRECIST criteria adapted to the mouse from human RECIST. Mice were euthanized when tumors reached 2, 000 mm 3 or when the study endpoint was reached.
Click to Show/Hide
|
||||
| In Vivo Model | Pancreas cancer PDX model (PDX: HPAFII) | ||||
| Experiment 11 Reporting the Activity Date of This ADC | [9] | ||||
| Efficacy Data | Tumor Growth Inhibition value (TGI) | ≈ 70.60% | Low CD205 expression (CD205+; IHC 1+) | ||
| Method Description |
To test the in vivo efficacy of MEN1309/OBT076,different xenograft and PDX models were selected on the basis of the IHC analysis for CD205 staining in various tumor types. Efficacy of MEN1309/OBT076,administered with a q21dx3,5 mg/kg schedule,was determined by assessing the inhibition of tumor growth at the nadir of tumor volume in treated versus control mice and assessing mRECIST criteria adapted to the mouse from human RECIST. Mice were euthanized when tumors reached 2, 000 mm 3 or when the study endpoint was reached.
Click to Show/Hide
|
||||
| In Vivo Model | Pancreatic cancer PDX model (PDX: PDX-P6P) | ||||
| Experiment 12 Reporting the Activity Date of This ADC | [9] | ||||
| Efficacy Data | Tumor Growth Inhibition value (TGI) | ≈ 94.60% | High CD205 expression (CD205+++; IHC 3+) | ||
| Method Description |
To test the in vivo efficacy of MEN1309/OBT076,different xenograft and PDX models were selected on the basis of the IHC analysis for CD205 staining in various tumor types. Efficacy of MEN1309/OBT076,administered with a q21dx3,5 mg/kg schedule,was determined by assessing the inhibition of tumor growth at the nadir of tumor volume in treated versus control mice and assessing mRECIST criteria adapted to the mouse from human RECIST. Mice were euthanized when tumors reached 2, 000 mm 3 or when the study endpoint was reached.
Click to Show/Hide
|
||||
| In Vivo Model | Pancreas cancer PDX model (PDX: HPAFII) | ||||
| Experiment 13 Reporting the Activity Date of This ADC | [9] | ||||
| Efficacy Data | Tumor Growth Inhibition value (TGI) | ≈ 95.40% | High CD205 expression (CD205+++; IHC 3+) | ||
| Method Description |
To test the in vivo efficacy of MEN1309/OBT076,different xenograft and PDX models were selected on the basis of the IHC analysis for CD205 staining in various tumor types. Efficacy of MEN1309/OBT076,administered with a q21dx3,5 mg/kg schedule,was determined by assessing the inhibition of tumor growth at the nadir of tumor volume in treated versus control mice and assessing mRECIST criteria adapted to the mouse from human RECIST. Mice were euthanized when tumors reached 2, 000 mm 3 or when the study endpoint was reached.
Click to Show/Hide
|
||||
| In Vivo Model | Triple-negative breast cancer PDX model (PDX: PDX-347) | ||||
| Experiment 14 Reporting the Activity Date of This ADC | [9] | ||||
| Efficacy Data | Tumor Growth Inhibition value (TGI) | ≈ 98.90% | High CD205 expression (CD205+++; IHC 3+) | ||
| Method Description |
To test the in vivo efficacy of MEN1309/OBT076,different xenograft and PDX models were selected on the basis of the IHC analysis for CD205 staining in various tumor types. Efficacy of MEN1309/OBT076,administered with a q21dx3,10 mg/kg schedule,was determined by assessing the inhibition of tumor growth at the nadir of tumor volume in treated versus control mice and assessing mRECIST criteria adapted to the mouse from human RECIST. Mice were euthanized when tumors reached 2, 000 mm 3 or when the study endpoint was reached.
Click to Show/Hide
|
||||
| In Vivo Model | Pancreas cancer PDX model (PDX: HPAFII) | ||||
Discovered Using Cell Line-derived Xenograft Model
| Experiment 1 Reporting the Activity Date of This ADC | [9] | ||||
| Efficacy Data | Tumor Growth Inhibition value (TGI) | ≈ 22.70% | Moderate CD205 expression (CD205++; IHC 2+) | ||
| Method Description |
To test the in vivo efficacy of MEN1309/OBT076,different xenograft and PDX models were selected on the basis of the IHC analysis for CD205 staining in various tumor types. Efficacy of MEN1309/OBT076,administered with a q21dx3,1.25 mg/kg schedule,was determined by assessing the inhibition of tumor growth at the nadir of tumor volume in treated versus control mice and assessing mRECIST criteria adapted to the mouse from human RECIST. Mice were euthanized when tumors reached 2, 000 mm 3 or when the study endpoint was reached.
Click to Show/Hide
|
||||
| In Vivo Model | Triple-negative breast cancer HCC70 CDX model | ||||
| In Vitro Model | Breast ductal carcinoma | HCC70 cells | CVCL_1270 | ||
| Experiment 2 Reporting the Activity Date of This ADC | [9] | ||||
| Efficacy Data | Tumor Growth Inhibition value (TGI) | ≈ 45.60% | Moderate CD205 expression (CD205++) | ||
| Method Description |
To test the in vivo efficacy of MEN1309/OBT076,different xenograft and PDX models were selected on the basis of the IHC analysis for CD205 staining in various tumor types. Efficacy of MEN1309/OBT076,administered with a q21dx3,1.25 mg/kg schedule,was determined by assessing the inhibition of tumor growth at the nadir of tumor volume in treated versus control mice and assessing mRECIST criteria adapted to the mouse from human RECIST. Mice were euthanized when tumors reached 2, 000 mm 3 or when the study endpoint was reached.
Click to Show/Hide
|
||||
| In Vivo Model | Urinary bladder cancer SW780 model | ||||
| In Vitro Model | Bladder carcinoma | SW780 cells | CVCL_1728 | ||
| Experiment 3 Reporting the Activity Date of This ADC | [9] | ||||
| Efficacy Data | Tumor Growth Inhibition value (TGI) | ≈ 63.70% | Low CD205 expression (CD205+; IHC 1+) | ||
| Method Description |
To test the in vivo efficacy of MEN1309/OBT076,different xenograft and PDX models were selected on the basis of the IHC analysis for CD205 staining in various tumor types. Efficacy of MEN1309/OBT076,administered with a q21dx3,1.25 mg/kg schedule,was determined by assessing the inhibition of tumor growth at the nadir of tumor volume in treated versus control mice and assessing mRECIST criteria adapted to the mouse from human RECIST. Mice were euthanized when tumors reached 2, 000 mm 3 or when the study endpoint was reached.
Click to Show/Hide
|
||||
| In Vivo Model | Triple-negative breast cancer HCC1806 CDX model | ||||
| In Vitro Model | Breast squamous cell carcinoma | HCC1806 cells | CVCL_1258 | ||
| Experiment 4 Reporting the Activity Date of This ADC | [9] | ||||
| Efficacy Data | Tumor Growth Inhibition value (TGI) | ≈ 72.30% | High CD205 expression (CD205+++) | ||
| Method Description |
To test the in vivo efficacy of MEN1309/OBT076,different xenograft and PDX models were selected on the basis of the IHC analysis for CD205 staining in various tumor types. Efficacy of MEN1309/OBT076,administered with a q21dx3,2.5 mg/kg schedule,was determined by assessing the inhibition of tumor growth at the nadir of tumor volume in treated versus control mice and assessing mRECIST criteria adapted to the mouse from human RECIST. Mice were euthanized when tumors reached 2, 000 mm 3 or when the study endpoint was reached.
Click to Show/Hide
|
||||
| In Vivo Model | Urinary bladder cancer SW780 model | ||||
| In Vitro Model | Bladder carcinoma | SW780 cells | CVCL_1728 | ||
| Experiment 5 Reporting the Activity Date of This ADC | [9] | ||||
| Efficacy Data | Tumor Growth Inhibition value (TGI) | ≈ 74% | Low CD205 expression (CD205+; IHC 1+) | ||
| Method Description |
The antitumor activity of the ADCs was then evaluated in solid and hematologic mouse xenograft models. A total of 5x10⁶-2x10⁷ cells with or without Matrigel, were injected subcutaneously into the flanks of mice. The treatments were started when average tumor volume reached 88-300 mm3. Animals were randomly assigned into groups (6 mice/group), and treated with MEN1309/OBT076 intravenously with a single dose, 5 mg/kg.
Click to Show/Hide
|
||||
| In Vivo Model | Pancreas cancer CDX model | ||||
| In Vitro Model | Pancreatic cancer | Pancreatic cancer cells | Homo sapiens | ||
| Experiment 6 Reporting the Activity Date of This ADC | [9] | ||||
| Efficacy Data | Tumor Growth Inhibition value (TGI) | ≈ 79.90% | Low CD205 expression (CD205+; IHC 1+) | ||
| Method Description |
To test the in vivo efficacy of MEN1309/OBT076,different xenograft and PDX models were selected on the basis of the IHC analysis for CD205 staining in various tumor types. Efficacy of MEN1309/OBT076,administered with a q21dx3,2.5 mg/kg schedule,was determined by assessing the inhibition of tumor growth at the nadir of tumor volume in treated versus control mice and assessing mRECIST criteria adapted to the mouse from human RECIST. Mice were euthanized when tumors reached 2, 000 mm 3 or when the study endpoint was reached.
Click to Show/Hide
|
||||
| In Vivo Model | Triple-negative breast cancer HCC1806 CDX model | ||||
| In Vitro Model | Breast squamous cell carcinoma | HCC1806 cells | CVCL_1258 | ||
| Experiment 7 Reporting the Activity Date of This ADC | [9] | ||||
| Efficacy Data | Tumor Growth Inhibition value (TGI) | ≈ 87% | Low CD205 expression (CD205+; IHC 1+) | ||
| Method Description |
To test the in vivo efficacy of MEN1309/OBT076,different xenograft and PDX models were selected on the basis of the IHC analysis for CD205 staining in various tumor types. Efficacy of MEN1309/OBT076,administered with a q21dx3,3.5 mg/kg schedule,was determined by assessing the inhibition of tumor growth at the nadir of tumor volume in treated versus control mice and assessing mRECIST criteria adapted to the mouse from human RECIST. Mice were euthanized when tumors reached 2, 000 mm 3 or when the study endpoint was reached.
Click to Show/Hide
|
||||
| In Vivo Model | Triple-negative breast cancer HCC1806 CDX model | ||||
| In Vitro Model | Breast squamous cell carcinoma | HCC1806 cells | CVCL_1258 | ||
| Experiment 8 Reporting the Activity Date of This ADC | [9] | ||||
| Efficacy Data | Tumor Growth Inhibition value (TGI) | ≈ 96.50% | Moderate CD205 expression (CD205++; IHC 2+) | ||
| Method Description |
To test the in vivo efficacy of MEN1309/OBT076,different xenograft and PDX models were selected on the basis of the IHC analysis for CD205 staining in various tumor types. Efficacy of MEN1309/OBT076,administered with a q21dx3,5 mg/kg schedule,was determined by assessing the inhibition of tumor growth at the nadir of tumor volume in treated versus control mice and assessing mRECIST criteria adapted to the mouse from human RECIST. Mice were euthanized when tumors reached 2, 000 mm 3 or when the study endpoint was reached.
Click to Show/Hide
|
||||
| In Vivo Model | Urinary bladder cancer SW780 model | ||||
| In Vitro Model | Bladder carcinoma | SW780 cells | CVCL_1728 | ||
| Experiment 9 Reporting the Activity Date of This ADC | [9] | ||||
| Efficacy Data | Tumor Growth Inhibition value (TGI) | ≈ 97.80% | Moderate CD205 expression (CD205++; IHC 2+) | ||
| Method Description |
To test the in vivo efficacy of MEN1309/OBT076,different xenograft and PDX models were selected on the basis of the IHC analysis for CD205 staining in various tumor types. Efficacy of MEN1309/OBT076,administered with a q21dx3,3.5 mg/kg schedule,was determined by assessing the inhibition of tumor growth at the nadir of tumor volume in treated versus control mice and assessing mRECIST criteria adapted to the mouse from human RECIST. Mice were euthanized when tumors reached 2, 000 mm 3 or when the study endpoint was reached.
Click to Show/Hide
|
||||
| In Vivo Model | Triple-negative breast cancer HCC70 CDX model | ||||
| In Vitro Model | Breast ductal carcinoma | HCC70 cells | CVCL_1270 | ||
| Experiment 10 Reporting the Activity Date of This ADC | [9] | ||||
| Efficacy Data | Tumor Growth Inhibition value (TGI) | ≈ 99.20% | Low CD205 expression (CD205+; IHC 1+) | ||
| Method Description |
To test the in vivo efficacy of MEN1309/OBT076,different xenograft and PDX models were selected on the basis of the IHC analysis for CD205 staining in various tumor types. Efficacy of MEN1309/OBT076,administered with a q21dx3,2.5 mg/kg schedule,was determined by assessing the inhibition of tumor growth at the nadir of tumor volume in treated versus control mice and assessing mRECIST criteria adapted to the mouse from human RECIST. Mice were euthanized when tumors reached 2, 000 mm 3 or when the study endpoint was reached.
Click to Show/Hide
|
||||
| In Vivo Model | Triple-negative breast cancer HCC70 CDX model | ||||
| In Vitro Model | Breast ductal carcinoma | HCC70 cells | CVCL_1270 | ||
| Experiment 11 Reporting the Activity Date of This ADC | [9] | ||||
| Efficacy Data | Tumor Growth Inhibition value (TGI) | ≈ 99.50% | Low CD205 expression (CD205+; IHC 1+) | ||
| Method Description |
The antitumor activity of the ADCs was then evaluated in solid and hematologic mouse xenograft models. A total of 5x10⁶-2x10⁷ cells with or without Matrigel, were injected subcutaneously into the flanks of mice. The treatments were started when average tumor volume reached 88-300 mm3. Animals were randomly assigned into groups (6 mice/group), and treated with MEN1309/OBT076 intravenously once weekly for 2 consecutive weeks, 5 mg/kg.
Click to Show/Hide
|
||||
| In Vivo Model | Diffuse Large B-Cell Lymphoma CDX model | ||||
| In Vitro Model | EBV-related Burkitt lymphoma | Raji cells | CVCL_0511 | ||
| Experiment 12 Reporting the Activity Date of This ADC | [9] | ||||
| Efficacy Data | Tumor Growth Inhibition value (TGI) | ≈ 99.60% | Low CD205 expression (CD205+; IHC 1+) | ||
| Method Description |
To test the in vivo efficacy of MEN1309/OBT076,different xenograft and PDX models were selected on the basis of the IHC analysis for CD205 staining in various tumor types. Efficacy of MEN1309/OBT076,administered with a q21dx3,5 mg/kg schedule,was determined by assessing the inhibition of tumor growth at the nadir of tumor volume in treated versus control mice and assessing mRECIST criteria adapted to the mouse from human RECIST. Mice were euthanized when tumors reached 2, 000 mm 3 or when the study endpoint was reached.
Click to Show/Hide
|
||||
| In Vivo Model | Triple-negative breast cancer HCC1806 CDX model | ||||
| In Vitro Model | Breast squamous cell carcinoma | HCC1806 cells | CVCL_1258 | ||
| Experiment 13 Reporting the Activity Date of This ADC | [9] | ||||
| Efficacy Data | Tumor Growth Inhibition value (TGI) | ≈ 99.70% | Low CD205 expression (CD205+; IHC 1+) | ||
| Method Description |
To test the in vivo efficacy of MEN1309/OBT076,different xenograft and PDX models were selected on the basis of the IHC analysis for CD205 staining in various tumor types. Efficacy of MEN1309/OBT076,administered with a q21dx3,5 mg/kg schedule,was determined by assessing the inhibition of tumor growth at the nadir of tumor volume in treated versus control mice and assessing mRECIST criteria adapted to the mouse from human RECIST. Mice were euthanized when tumors reached 2, 000 mm 3 or when the study endpoint was reached.
Click to Show/Hide
|
||||
| In Vivo Model | Triple-negative breast cancer HCC70 CDX model | ||||
| In Vitro Model | Breast ductal carcinoma | HCC70 cells | CVCL_1270 | ||
| Experiment 14 Reporting the Activity Date of This ADC | [9] | ||||
| Efficacy Data | Tumor Growth Inhibition value (TGI) | ≈ 99.80% | Moderate CD205 expression (CD205++; IHC 2+) | ||
| Method Description |
To test the in vivo efficacy of MEN1309/OBT076,different xenograft and PDX models were selected on the basis of the IHC analysis for CD205 staining in various tumor types. Efficacy of MEN1309/OBT076,administered with a q21dx3,10 mg/kg schedule,was determined by assessing the inhibition of tumor growth at the nadir of tumor volume in treated versus control mice and assessing mRECIST criteria adapted to the mouse from human RECIST. Mice were euthanized when tumors reached 2, 000 mm 3 or when the study endpoint was reached.
Click to Show/Hide
|
||||
| In Vivo Model | Urinary bladder cancer SW780 model | ||||
| In Vitro Model | Bladder carcinoma | SW780 cells | CVCL_1728 | ||
Revealed Based on the Cell Line Data
| Experiment 1 Reporting the Activity Date of This ADC | [10] | ||||
| Efficacy Data | Half Maximal Inhibitory Concentration (IC50) |
100 pM
|
High CD205 expression (CD205+++; IHC 3+) | ||
| Method Description |
The inhibitory activity of MEN-1309 against cancer cell growth against 42 B-cell lymphoma cell lines in vitro. The cells were treated with MEN-1309 for 50 days.
|
||||
| In Vitro Model | Mantle cell lymphoma | Mantle cell lymphoma cells | Homo sapiens | ||
| Experiment 2 Reporting the Activity Date of This ADC | [10] | ||||
| Efficacy Data | Half Maximal Inhibitory Concentration (IC50) |
110 pM
|
High CD205 expression (CD205+++; IHC 3+) | ||
| Method Description |
The inhibitory activity of MEN-1309 against cancer cell growth against 42 B-cell lymphoma cell lines in vitro. The cells were treated with MEN-1309 for 50 days.
|
||||
| In Vitro Model | Marginal zone lymphoma | Marginal zone lymphoma cells | Homo sapiens | ||
| Experiment 3 Reporting the Activity Date of This ADC | [10] | ||||
| Efficacy Data | Half Maximal Inhibitory Concentration (IC50) |
200 pM
|
High CD205 expression (CD205+++; IHC 3+) | ||
| Method Description |
The inhibitory activity of MEN-1309 against cancer cell growth against 42 B-cell lymphoma cell lines in vitro. The cells were treated with MEN-1309 for 50 days.
|
||||
| In Vitro Model | Diffuse large B-cell lymphoma | Diffuse large B-cell lymphoma cells | Homo sapiens | ||
| Experiment 4 Reporting the Activity Date of This ADC | [10] | ||||
| Efficacy Data | Half Maximal Inhibitory Concentration (IC50) |
300 pM
|
Moderate CD205 expression (CD205++; IHC 2+) | ||
| Method Description |
The inhibitory activity of MEN-1309 against cancer cell growth against 42 B-cell lymphoma cell lines in vitro. The cells were treated with MEN-1309 for 50 days.
|
||||
| In Vitro Model | Pancreatic ductal adenocarcinoma | HPAF-II cells | CVCL_0313 | ||
| Experiment 5 Reporting the Activity Date of This ADC | [10] | ||||
| Efficacy Data | Half Maximal Inhibitory Concentration (IC50) |
310 pM
|
Low CD205 expression (CD205+; IHC 1+) | ||
| Method Description |
The inhibitory activity of MEN-1309 against cancer cell growth against 42 B-cell lymphoma cell lines in vitro. The cells were treated with MEN-1309 for 50 days.
|
||||
| In Vitro Model | B-cell chronic lymphocytic leukemia | PCL12 cells | CVCL_2H32 | ||
| Experiment 6 Reporting the Activity Date of This ADC | [9] | ||||
| Efficacy Data | Half Maximal Effective Concentration (EC50) |
0.1 nM
|
High CD205 expression (CD205+++; IHC 3+) | ||
| Method Description |
The expression of the CD205 antigen was evaluated in a panel of human pancreas,bladder,colon cancer,and TNBC cell lines. Tumor cells were incubated with MEN1309/OBT076 for 72 hours at 37°C.
|
||||
| In Vitro Model | Pancreatic ductal adenocarcinoma | HPAF-II cells | CVCL_0313 | ||
| Experiment 7 Reporting the Activity Date of This ADC | [9] | ||||
| Efficacy Data | Half Maximal Effective Concentration (EC50) |
0.26 nM
|
Low CD205 expression (CD205+; IHC 1+) | ||
| Method Description |
The expression of the CD205 antigen was evaluated in a panel of human pancreas,bladder,colon cancer,and TNBC cell lines. Tumor cells were incubated with MEN1309/OBT076 for 72 hours at 37°C.
|
||||
| In Vitro Model | Bladder carcinoma | SW780 cells | CVCL_1728 | ||
| Experiment 8 Reporting the Activity Date of This ADC | [9] | ||||
| Efficacy Data | Half Maximal Effective Concentration (EC50) |
0.37 nM
|
|||
| Method Description |
The expression of the CD205 antigen was evaluated in a panel of human pancreas,bladder,colon cancer,and TNBC cell lines. Tumor cells were incubated with MEN1309/OBT076 for 72 hours at 37°C.
|
||||
| In Vitro Model | Breast adenocarcinoma | MDA-MB-468 cells | CVCL_0419 | ||
| Experiment 9 Reporting the Activity Date of This ADC | [9] | ||||
| Efficacy Data | Half Maximal Effective Concentration (EC50) |
0.4 nM
|
Negative CD205 expression (CD205-; IHC 0) | ||
| Method Description |
The expression of the CD205 antigen was evaluated in a panel of human pancreas,bladder,colon cancer,and TNBC cell lines. Tumor cells were incubated with MEN1309/OBT076 for 72 hours at 37°C.
|
||||
| In Vitro Model | Colon cancer | HT29 cells | CVCL_A8EZ | ||
| Experiment 10 Reporting the Activity Date of This ADC | [9] | ||||
| Efficacy Data | Half Maximal Effective Concentration (EC50) |
0.43 nM
|
Moderate CD205 expression (CD205++; IHC 2+) | ||
| Method Description |
The expression of the CD205 antigen was evaluated in a panel of human pancreas,bladder,colon cancer,and TNBC cell lines. Tumor cells were incubated with MEN1309/OBT076 for 72 hours at 37°C.
|
||||
| In Vitro Model | Pancreatic ductal adenocarcinoma | BxPC-3 cells | CVCL_0186 | ||
| Experiment 11 Reporting the Activity Date of This ADC | [9] | ||||
| Efficacy Data | Half Maximal Effective Concentration (EC50) |
0.71 nM
|
Moderate CD205 expression (CD205++; IHC 2+) | ||
| Method Description |
The expression of the CD205 antigen was evaluated in a panel of human pancreas,bladder,colon cancer,and TNBC cell lines. Tumor cells were incubated with MEN1309/OBT076 for 72 hours at 37°C.
|
||||
| In Vitro Model | Breast ductal carcinoma | HCC70 cells | CVCL_1270 | ||
| Experiment 12 Reporting the Activity Date of This ADC | [9] | ||||
| Efficacy Data | Half Maximal Effective Concentration (EC50) |
0.81 nM
|
Negative CD205 expression (CD205-; IHC 0) | ||
| Method Description |
The expression of the CD205 antigen was evaluated in a panel of human pancreas,bladder,colon cancer,and TNBC cell lines. Tumor cells were incubated with MEN1309/OBT076 for 72 hours at 37°C.
|
||||
| In Vitro Model | Breast squamous cell carcinoma | HCC1806 cells | CVCL_1258 | ||
| Experiment 13 Reporting the Activity Date of This ADC | [9] | ||||
| Efficacy Data | Half Maximal Effective Concentration (EC50) |
0.82 nM
|
|||
| Method Description |
The expression of the CD205 antigen was evaluated in a panel of human pancreas,bladder,colon cancer,and TNBC cell lines. Tumor cells were incubated with MEN1309/OBT076 for 72 hours at 37°C.
|
||||
| In Vitro Model | Breast adenocarcinoma | MDA-MB-468 cells | CVCL_0419 | ||
| Experiment 14 Reporting the Activity Date of This ADC | [9] | ||||
| Efficacy Data | Half Maximal Effective Concentration (EC50) |
1.32 nM
|
Low CD205 expression (CD205+; IHC 1+) | ||
| Method Description |
The expression of the CD205 antigen was evaluated in a panel of human pancreas,bladder,colon cancer,and TNBC cell lines. Tumor cells were incubated with MEN1309/OBT076 for 72 hours at 37°C.
|
||||
| In Vitro Model | Pancreatic adenocarcinoma | SU.86.86 cells | CVCL_3881 | ||
| Experiment 15 Reporting the Activity Date of This ADC | [9] | ||||
| Efficacy Data | Half Maximal Effective Concentration (EC50) |
14.2 nM
|
|||
| Method Description |
The expression of the CD205 antigen was evaluated in a panel of human pancreas,bladder,colon cancer,and TNBC cell lines. Tumor cells were incubated with MEN1309/OBT076 for 72 hours at 37°C.
|
||||
| In Vitro Model | Invasive breast carcinoma | MCF-7 cells | CVCL_0031 | ||
| Experiment 16 Reporting the Activity Date of This ADC | [9] | ||||
| Efficacy Data | Half Maximal Effective Concentration (EC50) |
22.66 nM
|
Negative CD205 expression (CD205-; IHC 0) | ||
| Method Description |
The expression of the CD205 antigen was evaluated in a panel of human pancreas,bladder,colon cancer,and TNBC cell lines. Tumor cells were incubated with MEN1309/OBT076 for 72 hours at 37°C.
|
||||
| In Vitro Model | Pancreatic ductal adenocarcinoma | AsPC-1 cells | CVCL_0152 | ||
| Experiment 17 Reporting the Activity Date of This ADC | [9] | ||||
| Efficacy Data | Half Maximal Effective Concentration (EC50) |
36.23 nM
|
High CD205 expression (CD205+++; IHC 3+) | ||
| Method Description |
The expression of the CD205 antigen was evaluated in a panel of human pancreas,bladder,colon cancer,and TNBC cell lines. Tumor cells were incubated with MEN1309/OBT076 for 72 hours at 37°C.
|
||||
| In Vitro Model | Recurrent bladder carcinoma | HT-1197 cells | CVCL_1291 | ||
Bispecific nBT062-natalizumab-DM4 [Investigative]
Discovered Using Patient-derived Xenograft Model
| Experiment 1 Reporting the Activity Date of This ADC | [11] | ||||
| Efficacy Data | Tumor Growth Inhibition value (TGI) | ≈ 51.60% | Positive CD138 expression (CD138+++/++) | ||
| Method Description |
Bispecific nBT062-natalizumab-DM4 (4 mg/kg/week for three injections in total) induces efficient tumor cell killing in models of MAXF1322 mammary carcinoma cells with CD138 expression with high expression.
|
||||
| In Vivo Model | Breast cancer PDX model (PDX: MAXF 1322) | ||||
Revealed Based on the Cell Line Data
| Experiment 1 Reporting the Activity Date of This ADC | [11] | ||||
| Efficacy Data | Half Maximal Inhibitory Concentration (IC50) |
0.46 nM
|
Positive CD138 expression (CD138+++/++) | ||
| Method Description |
WT nBT062-DM4, stable nBT062-DM4, half nBT062-DM4 or bispecific nBT062-natalizumab-DM4 were added to the cells. Cells were incubated and after 5 days the viability was determined using the WST-1 cell proliferation assay.
|
||||
| In Vitro Model | Plasma cell myeloma | NCI-H929 cells | CVCL_1600 | ||
Anti-DOG1-DM4-ADC [Investigative]
Discovered Using Patient-derived Xenograft Model
| Experiment 1 Reporting the Activity Date of This ADC | [12] | ||||
| Efficacy Data | Tumor Growth Inhibition value (TGI) | ≈ 95.42% | Positive DOG1 expression (DOG1 +++/++) | ||
| Method Description |
5 mg/kg anti-DOG1 ADC and control (PBS) were administered Q3Dx3 via tail vein injection to mice once every three days for a total of three doses.
|
||||
| In Vivo Model | Gastrointestinal stromal tumor (GIST) PDX model | ||||
| Experiment 2 Reporting the Activity Date of This ADC | [12] | ||||
| Efficacy Data | Tumor Growth Inhibition value (TGI) | ≈ 99.90% | Positive DOG1 expression (DOG1 +++/++) | ||
| Method Description |
10 mg/kg anti-DOG1 ADC and control (PBS) were administered Q3Dx3 via tail vein injection to mice once every three days for a total of three doses.
|
||||
| In Vivo Model | Gastrointestinal stromal tumor (GIST) PDX model | ||||
Discovered Using Cell Line-derived Xenograft Model
| Experiment 1 Reporting the Activity Date of This ADC | [12] | ||||
| Efficacy Data | Tumor Growth Inhibition value (TGI) | ≈ 69.69% | Positive DOG1 expression (DOG1 +++/++) | ||
| Method Description |
Nude mice were used to establish cell line derived xenograft (CDX) models. After tumor inoculation, the tumor bearing mice were intravenously injected with naked anti-DOG1 antibody or a 5 mg/kg Q3Dx3 dose of the anti-DOG1 ADC.
|
||||
| In Vivo Model | Kyse-410 CDX model | ||||
| In Vitro Model | Esophageal squamous cell carcinoma | KYSE-410 cells | CVCL_1352 | ||
| Experiment 2 Reporting the Activity Date of This ADC | [12] | ||||
| Efficacy Data | Tumor Growth Inhibition value (TGI) | ≈ 83.30% | Positive DOG1 expression (DOG1 +++/++) | ||
| Method Description |
Nude mice were used to establish cell line derived xenograft (CDX) models. After tumor inoculation, the tumor bearing mice were intravenously injected with naked anti-DOG1 antibody or a 5 mg/kg Q3Dx3 dose of the anti-DOG1 ADC.
|
||||
| In Vivo Model | HepG2 CDX model | ||||
| In Vitro Model | Hepatoblastoma | Hep-G2 cells | CVCL_0027 | ||
| Experiment 3 Reporting the Activity Date of This ADC | [12] | ||||
| Efficacy Data | Tumor Growth Inhibition value (TGI) | ≈ 89.32% | Positive DOG1 expression (DOG1 +++/++) | ||
| Method Description |
Nude mice were used to establish cell line derived xenograft (CDX) models. After tumor inoculation, the tumor bearing mice were intravenously injected with naked anti-DOG1 antibody or a 5 mg/kg Q3Dx3 dose of the anti-DOG1 ADC.
|
||||
| In Vivo Model | HT-29 CDX model | ||||
| In Vitro Model | Colon adenocarcinoma | HT-29 cells | CVCL_0320 | ||
| Experiment 4 Reporting the Activity Date of This ADC | [12] | ||||
| Efficacy Data | Tumor Growth Inhibition value (TGI) | ≈ 92.04% | Positive DOG1 expression (DOG1 +++/++) | ||
| Method Description |
Nude mice were used to establish cell line derived xenograft (CDX) models. After tumor inoculation, the tumor bearing mice were intravenously injected with naked anti-DOG1 antibody or a 10 mg/kg Q3Dx3 dose of the anti-DOG1 ADC.
|
||||
| In Vivo Model | HepG2 CDX model | ||||
| In Vitro Model | Hepatoblastoma | Hep-G2 cells | CVCL_0027 | ||
| Experiment 5 Reporting the Activity Date of This ADC | [12] | ||||
| Efficacy Data | Tumor Growth Inhibition value (TGI) | ≈ 92.11% | Positive DOG1 expression (DOG1 +++/++) | ||
| Method Description |
Nude mice were used to establish cell line derived xenograft (CDX) models. After tumor inoculation, the tumor bearing mice were intravenously injected with naked anti-DOG1 antibody or a 5 mg/kg Q3Dx3 dose of the anti-DOG1 ADC.
|
||||
| In Vivo Model | MGC-803 CDX model | ||||
| In Vitro Model | Gastric cancer | MGC-803 cells | CVCL_5334 | ||
| Experiment 6 Reporting the Activity Date of This ADC | [12] | ||||
| Efficacy Data | Tumor Growth Inhibition value (TGI) | ≈ 95.53% | Positive DOG1 expression (DOG1 +++/++) | ||
| Method Description |
Nude mice were used to establish cell line derived xenograft (CDX) models. After tumor inoculation, the tumor bearing mice were intravenously injected with naked anti-DOG1 antibody or a 10 mg/kg Q3Dx3 dose of the anti-DOG1 ADC.
|
||||
| In Vivo Model | Kyse-410 CDX model | ||||
| In Vitro Model | Esophageal squamous cell carcinoma | KYSE-410 cells | CVCL_1352 | ||
| Experiment 7 Reporting the Activity Date of This ADC | [12] | ||||
| Efficacy Data | Tumor Growth Inhibition value (TGI) | ≈ 96.24% | Positive DOG1 expression (DOG1 +++/++) | ||
| Method Description |
Nude mice were used to establish cell line derived xenograft (CDX) models. After tumor inoculation, the tumor bearing mice were intravenously injected with naked anti-DOG1 antibody or a 10 mg/kg Q3Dx3 dose of the anti-DOG1 ADC.
|
||||
| In Vivo Model | MGC-803 CDX model | ||||
| In Vitro Model | Gastric cancer | MGC-803 cells | CVCL_5334 | ||
| Experiment 8 Reporting the Activity Date of This ADC | [12] | ||||
| Efficacy Data | Tumor Growth Inhibition value (TGI) | ≈ 98.67% | Positive DOG1 expression (DOG1 +++/++) | ||
| Method Description |
Nude mice were used to establish cell line derived xenograft (CDX) models. After tumor inoculation, the tumor bearing mice were intravenously injected with naked anti-DOG1 antibody or a 10 mg/kg Q3Dx3 dose of the anti-DOG1 ADC.
|
||||
| In Vivo Model | HT-29 CDX model | ||||
| In Vitro Model | Colon adenocarcinoma | HT-29 cells | CVCL_0320 | ||
Revealed Based on the Cell Line Data
| Experiment 1 Reporting the Activity Date of This ADC | [12] | ||||
| Efficacy Data | Half Maximal Inhibitory Concentration (IC50) |
8.37 nM
|
Positive DOG1 expression (DOG1 +++/++) | ||
| Method Description |
Cancer cells were treated with anti-DOG1-DM4-ADC or naked anti-DOG1 antibody (as control) at different concentrations for 72 hours.Viable cell counts were determined with RTCA assays and the IC 50 values were calculated.
|
||||
| In Vitro Model | Gastrointestinal stromal tumor | GIST882 cells | CVCL_7044 | ||
| Experiment 2 Reporting the Activity Date of This ADC | [12] | ||||
| Efficacy Data | Half Maximal Inhibitory Concentration (IC50) |
8.87 nM
|
Positive DOG1 expression (DOG1 +++/++) | ||
| Method Description |
Cancer cells were treated with anti-DOG1-DM4-ADC or naked anti-DOG1 antibody (as control) at different concentrations for 72 hours.Viable cell counts were determined with RTCA assays and the IC 50 values were calculated.
|
||||
| In Vitro Model | Gastrointestinal stromal tumor | GIST882 cells (Imatinib resistant) | CVCL_7044 | ||
| Experiment 3 Reporting the Activity Date of This ADC | [12] | ||||
| Efficacy Data | Half Maximal Inhibitory Concentration (IC50) |
9.91 nM
|
Positive DOG1 expression (DOG1 +++/++) | ||
| Method Description |
Cancer cells were treated with anti-DOG1-DM4-ADC or naked anti-DOG1 antibody (as control) at different concentrations for 72 hours.Viable cell counts were determined with RTCA assays and the IC 50 values were calculated.
|
||||
| In Vitro Model | Colon adenocarcinoma | HT-29 cells | CVCL_0320 | ||
| Experiment 4 Reporting the Activity Date of This ADC | [12] | ||||
| Efficacy Data | Half Maximal Inhibitory Concentration (IC50) |
12.11 nM
|
Positive DOG1 expression (DOG1 +++/++) | ||
| Method Description |
Cancer cells were treated with anti-DOG1-DM4-ADC or naked anti-DOG1 antibody (as control) at different concentrations for 72 hours.Viable cell counts were determined with RTCA assays and the IC 50 values were calculated.
|
||||
| In Vitro Model | Esophageal squamous cell carcinoma | KYSE-410 cells | CVCL_1352 | ||
| Experiment 5 Reporting the Activity Date of This ADC | [12] | ||||
| Efficacy Data | Half Maximal Inhibitory Concentration (IC50) |
17.92 nM
|
Positive DOG1 expression (DOG1 +++/++) | ||
| Method Description |
Cancer cells were treated with anti-DOG1-DM4-ADC or naked anti-DOG1 antibody (as control) at different concentrations for 72 hours.Viable cell counts were determined with RTCA assays and the IC 50 values were calculated.
|
||||
| In Vitro Model | Gastric cancer | MGC-803 cells | CVCL_5334 | ||
| Experiment 6 Reporting the Activity Date of This ADC | [12] | ||||
| Efficacy Data | Half Maximal Inhibitory Concentration (IC50) |
24.56 nM
|
Positive DOG1 expression (DOG1 +++/++) | ||
| Method Description |
Cancer cells were treated with anti-DOG1-DM4-ADC or naked anti-DOG1 antibody (as control) at different concentrations for 72 hours.Viable cell counts were determined with RTCA assays and the IC 50 values were calculated.
|
||||
| In Vitro Model | Hepatoblastoma | Hep-G2 cells | CVCL_0027 | ||
| Experiment 7 Reporting the Activity Date of This ADC | [12] | ||||
| Efficacy Data | Half Maximal Inhibitory Concentration (IC50) |
33.19 nM
|
Positive DOG1 expression (DOG1 +++/++) | ||
| Method Description |
Cancer cells were treated with anti-DOG1-DM4-ADC or naked anti-DOG1 antibody (as control) at different concentrations for 72 hours.Viable cell counts were determined with RTCA assays and the IC 50 values were calculated.
|
||||
| In Vitro Model | Adult hepatocellular carcinoma | HCCLM3 cells | CVCL_6832 | ||
| Experiment 8 Reporting the Activity Date of This ADC | [12] | ||||
| Efficacy Data | Half Maximal Inhibitory Concentration (IC50) |
39.99 nM
|
Positive DOG1 expression (DOG1 +++/++) | ||
| Method Description |
Cancer cells were treated with anti-DOG1-DM4-ADC or naked anti-DOG1 antibody (as control) at different concentrations for 72 hours.Viable cell counts were determined with RTCA assays and the IC 50 values were calculated.
|
||||
| In Vitro Model | Colon carcinoma | HCT 116 cells | CVCL_0291 | ||
| Experiment 9 Reporting the Activity Date of This ADC | [12] | ||||
| Efficacy Data | Half Maximal Inhibitory Concentration (IC50) | > 200 nM | Negative DOG1 expression (DOG1 -) | ||
| Method Description |
Cancer cells were treated with anti-DOG1-DM4-ADC or naked anti-DOG1 antibody (as control) at different concentrations for 72 hours.Viable cell counts were determined with RTCA assays and the IC 50 values were calculated.
|
||||
| In Vitro Model | Colon adenocarcinoma | LoVo cells | CVCL_0399 | ||
Stable nBT062-DM4 [Investigative]
Discovered Using Patient-derived Xenograft Model
| Experiment 1 Reporting the Activity Date of This ADC | [11] | ||||
| Efficacy Data | Tumor Growth Inhibition value (TGI) | ≈ 100% | Positive CD138 expression (CD138+++/++) | ||
| Method Description |
Stable nBT062-DM4 (4 mg/kg/week for three injections in total) induces efficient tumor cell killing in models of MAXF1322 mammary carcinoma cells with CD138 expression with high expression.
|
||||
| In Vivo Model | Breast cancer PDX model (PDX: MAXF 1322) | ||||
Revealed Based on the Cell Line Data
| Experiment 1 Reporting the Activity Date of This ADC | [11] | ||||
| Efficacy Data | Half Maximal Inhibitory Concentration (IC50) |
0.14 nM
|
Positive CD138 expression (CD138+++/++) | ||
| Method Description |
WT nBT062-DM4, stable nBT062-DM4, half nBT062-DM4 or bispecific nBT062-natalizumab-DM4 were added to the cells. Cells were incubated and after 5 days the viability was determined using the WST-1 cell proliferation assay.
|
||||
| In Vitro Model | Plasma cell myeloma | NCI-H929 cells | CVCL_1600 | ||
Half nBT062-DM4 [Investigative]
Discovered Using Patient-derived Xenograft Model
| Experiment 1 Reporting the Activity Date of This ADC | [11] | ||||
| Efficacy Data | Tumor Growth Inhibition value (TGI) | ≈ 100% | Positive CD138 expression (CD138+++/++) | ||
| Method Description |
Half nBT062-DM4 (4 mg/kg/week for three injections in total) induces efficient tumor cell killing in models of MAXF1322 mammary carcinoma cells with CD138 expression with high expression.
|
||||
| In Vivo Model | Breast cancer PDX model (PDX: MAXF 1322) | ||||
Revealed Based on the Cell Line Data
| Experiment 1 Reporting the Activity Date of This ADC | [11] | ||||
| Efficacy Data | Half Maximal Inhibitory Concentration (IC50) |
0.09 nM
|
Positive CD138 expression (CD138+++/++) | ||
| Method Description |
WT nBT062-DM4, stable nBT062-DM4, half nBT062-DM4 or bispecific nBT062-natalizumab-DM4 were added to the cells. Cells were incubated and after 5 days the viability was determined using the WST-1 cell proliferation assay.
|
||||
| In Vitro Model | Plasma cell myeloma | NCI-H929 cells | CVCL_1600 | ||
Wild type nBT062-DM4 [Investigative]
Discovered Using Patient-derived Xenograft Model
| Experiment 1 Reporting the Activity Date of This ADC | [11] | ||||
| Efficacy Data | Tumor Growth Inhibition value (TGI) | ≈ 100% | Positive CD138 expression (CD138+++/++) | ||
| Method Description |
Wild type nBT062-DM4 (4 mg/kg/week for three injections in total) induces efficient tumor cell killing in models of MAXF1322 mammary carcinoma cells with CD138 expression with high expression.
|
||||
| In Vivo Model | Breast cancer PDX model (PDX: MAXF 1322) | ||||
Revealed Based on the Cell Line Data
| Experiment 1 Reporting the Activity Date of This ADC | [11] | ||||
| Efficacy Data | Half Maximal Inhibitory Concentration (IC50) |
0.1 nM
|
Positive CD138 expression (CD138+++/++) | ||
| Method Description |
WT nBT062-DM4, stable nBT062-DM4, half nBT062-DM4 or bispecific nBT062-natalizumab-DM4 were added to the cells. Cells were incubated and after 5 days the viability was determined using the WST-1 cell proliferation assay.
|
||||
| In Vitro Model | Plasma cell myeloma | NCI-H929 cells | CVCL_1600 | ||
NOV0712-DM4 [Investigative]
Discovered Using Cell Line-derived Xenograft Model
| Experiment 1 Reporting the Activity Date of This ADC | [13] | ||||
| Efficacy Data | Tumor Growth Inhibition value (TGI) | ≈ 0% | Negative CDH6 expression (CDH6-) | ||
| Method Description |
The CDH6-negative human ovarian tumor cell line ES-2 was subcutaneously inoculated at a dose of 1,000,000 cells to the right flank region of each female nude mouse (Day 0). On the day 7 of grouping, the antibody-drug conjugate NOV0712-DM4 was intravenously administered at doses of 3 mg/kg to thetail of each mouse.
|
||||
| In Vivo Model | ES-2 CDX model | ||||
| In Vitro Model | Ovarian clear cell adenocarcinoma | ES-2 cells | CVCL_3509 | ||
| Experiment 2 Reporting the Activity Date of This ADC | [13] | ||||
| Efficacy Data | Tumor Growth Inhibition value (TGI) | ≈ 0% | Negative CDH6 expression (CDH6-) | ||
| Method Description |
The CDH6-negative human ovarian tumor cell line ES-2 was subcutaneously inoculated at a dose of 1,000,000 cells to the right flank region of each female nude mouse (Day 0). On the day 7 of grouping, the antibody-drug conjugate NOV0712-DM4 was intravenously administered at doses of 1 mg/kg to thetail of each mouse.
|
||||
| In Vivo Model | ES-2 CDX model | ||||
| In Vitro Model | Ovarian clear cell adenocarcinoma | ES-2 cells | CVCL_3509 | ||
| Experiment 3 Reporting the Activity Date of This ADC | [13] | ||||
| Efficacy Data | Tumor Growth Inhibition value (TGI) | ≈ 3.10% | Positive CDH6 expression (CDH6+++/++) | ||
| Method Description |
The CDH6-positive human ovarian tumor cell line OVCAR-3 was subcutane-ously inoculated at a dose of 10,000,000 cells to the right flank region of each female nude mouse (Day 0). On the day 22 of grouping, theantibody-drug conjugate NOV0712-DM4 was intravenously administered at doses of 1 mg/kg to the tail of each mouse.
|
||||
| In Vivo Model | OVCAR-3 CDX model | ||||
| In Vitro Model | Ovarian serous adenocarcinoma | OVCAR-3 cells | CVCL_0465 | ||
| Experiment 4 Reporting the Activity Date of This ADC | [13] | ||||
| Efficacy Data | Tumor Growth Inhibition value (TGI) | ≈ 6.77% | Positive CDH6 expression (CDH6+++/++) | ||
| Method Description |
The CDH6-positive human ovarian tumor cell line PA-1 was subcutaneously inoculatedat a dose of 8,500,000 cells to the right flank region of eachfemale nude mouse (Day 0). On the day 11 of grouping, the antibody-drug conjugate NOV0712-DM4 was intravenously administered at doses of 3 mg/kg to the tail of each mouse.
|
||||
| In Vivo Model | PA-1 CDX model | ||||
| In Vitro Model | Ovarian mixed germ cell tumor | PA-1 cells | CVCL_0479 | ||
| Experiment 5 Reporting the Activity Date of This ADC | [13] | ||||
| Efficacy Data | Tumor Growth Inhibition value (TGI) | ≈ 9.52% | Positive CDH6 expression (CDH6+++/++) | ||
| Method Description |
The CDH6-positive human renal cell tumor cell line786-0 was subcutaneously inoculated at a dose of 5,000,000 cells to the right flank regionof each male SCID mouse (Day 0). On the day 20 of grouping, the anti-body-drug conjugate NOV0712-DM4 was intravenously administered at doses of 1 mg/kg to thetail of each mouse.
|
||||
| In Vivo Model | 786-O CDX model | ||||
| In Vitro Model | Renal cell carcinoma | 786-O cells | CVCL_1051 | ||
| Experiment 6 Reporting the Activity Date of This ADC | [13] | ||||
| Efficacy Data | Tumor Growth Inhibition value (TGI) | ≈ 12.03% | Positive CDH6 expression (CDH6+++/++) | ||
| Method Description |
The CDH6-positive human ovarian tumor cell line PA-1 was subcutaneously inoculatedat a dose of 8,500,000 cells to the right flank region of eachfemale nude mouse (Day 0). On the day 11 of grouping, the antibody-drug conjugate NOV0712-DM4 was intravenously administered at doses of 1 mg/kg to the tail of each mouse.
|
||||
| In Vivo Model | PA-1 CDX model | ||||
| In Vitro Model | Ovarian mixed germ cell tumor | PA-1 cells | CVCL_0479 | ||
| Experiment 7 Reporting the Activity Date of This ADC | [13] | ||||
| Efficacy Data | Tumor Growth Inhibition value (TGI) | ≈ 23.91% | Positive CDH6 expression (CDH6+++/++) | ||
| Method Description |
The CDH6-positive human renal cell tumor cell line786-0 was subcutaneously inoculated at a dose of 5,000,000 cells to the right flank regionof each male SCID mouse (Day 0). On the day 20 of grouping, the anti-body-drug conjugate NOV0712-DM4 was intravenously administered at doses of 3 mg/kg to thetail of each mouse.
|
||||
| In Vivo Model | 786-O CDX model | ||||
| In Vitro Model | Renal cell carcinoma | 786-O cells | CVCL_1051 | ||
| Experiment 8 Reporting the Activity Date of This ADC | [13] | ||||
| Efficacy Data | Tumor Growth Inhibition value (TGI) | ≈ 30.02% | Positive CDH6 expression (CDH6+++/++) | ||
| Method Description |
The CDH6-positive human renal cell tumor cell line 786-O was subcutaneously inoculated at a dose of 5,000,000 cells to the right flank regionof each male SCID mouse (Day 0). On the day 18 of grouping, NOV0712-DM4 was intravenously administered at a dose of 3 mg/kg to the tail of each mouse.
|
||||
| In Vivo Model | 786-O CDX model | ||||
| In Vitro Model | Renal cell carcinoma | 786-O cells | CVCL_1051 | ||
| Experiment 9 Reporting the Activity Date of This ADC | [13] | ||||
| Efficacy Data | Tumor Growth Inhibition value (TGI) | ≈ 72.30% | Positive CDH6 expression (CDH6+++/++) | ||
| Method Description |
The CDH6-positive human ovarian tumor cell line OVCAR-3 was subcutane-ously inoculated at a dose of 10,000,000 cells to the right flank region of each female nude mouse (Day 0). On the day 22 of grouping, theantibody-drug conjugate NOV0712-DM4 was intravenously administered at doses of 3 mg/kg to the tail of each mouse.
|
||||
| In Vivo Model | OVCAR-3 CDX model | ||||
| In Vitro Model | Ovarian serous adenocarcinoma | OVCAR-3 cells | CVCL_0465 | ||
Revealed Based on the Cell Line Data
| Experiment 1 Reporting the Activity Date of This ADC | [13] | ||||
| Efficacy Data | Half Maximal Inhibitory Concentration (IC50) |
1.00-10.00 nM
|
Positive CDH6 expression (CDH6+++/++) | ||
| Method Description |
CDH6-positive human ovarian tumor cell line PA-1 was seeded over a 96-well plate at 2,000 cells/100 L/well in MEM medium supplemented with 10% FBS, and the cells were then cultured overnight. On the next day, each of the 4 humanized hG019-drug conjugates or NOV0712-DM4 was added to the cells.
|
||||
| In Vitro Model | Ovarian mixed germ cell tumor | PA-1 cells | CVCL_0479 | ||
CNTO95-SSNPP-DM4 [Investigative]
Discovered Using Cell Line-derived Xenograft Model
| Experiment 1 Reporting the Activity Date of This ADC | [14] | ||||
| Efficacy Data | Tumor Growth Inhibition value (TGI) | ≈ 0% | Positive ITGAV expression (ITGAV +++/++) | ||
| Method Description |
Female athymic rats were inoculated with 5x10⁶ HT29 cells subcutancously on the rear flank area. The animals were stratified into 13 groups, 6 animals per group based on a mean tumor volume for each group of approximately 250 mm3. On the day of grouping (day 7) each group received its initial dosing (175 ug/kg).
|
||||
| In Vivo Model | HT-29 CDX model | ||||
| In Vitro Model | Colon cancer | HT29 cells | CVCL_A8EZ | ||
| Experiment 2 Reporting the Activity Date of This ADC | [14] | ||||
| Efficacy Data | Tumor Growth Inhibition value (TGI) | ≈ 71.21% | Positive ITGAV expression (ITGAV +++/++) | ||
| Method Description |
Nine-week-old athymic nude rats were subcutaneously inoculated with A375.S2human melanoma cells. ADC (5 mg/kg) andappropriate control compounds were intravenously injected (three injection every other day inthe first week followed by one injection per week for two weeks.
|
||||
| In Vivo Model | A375.S2 CDX model | ||||
| In Vitro Model | Amelanotic melanoma | A375.S2 cells | CVCL_0136 | ||
| Experiment 3 Reporting the Activity Date of This ADC | [14] | ||||
| Efficacy Data | Tumor Growth Inhibition value (TGI) | ≈ 77.15% | Positive ITGAV expression (ITGAV +++/++) | ||
| Method Description |
Nine-week-old athymic nude rats were subcutaneously inoculated with A375.S2human melanoma cells. ADC (10 mg/kg) andappropriate control compounds were intravenously injected (three injection every other day inthe first week followed by one injection per week for two weeks.
|
||||
| In Vivo Model | A375.S2 CDX model | ||||
| In Vitro Model | Amelanotic melanoma | A375.S2 cells | CVCL_0136 | ||
| Experiment 4 Reporting the Activity Date of This ADC | [14] | ||||
| Efficacy Data | Tumor Growth Inhibition value (TGI) | ≈ 95.10% | Positive ITGAV expression (ITGAV +++/++) | ||
| Method Description |
The rear flank region of female athymic rats were implanted with 5x10⁶ cells subcutaneously (0.2 ml of25 x106 cells/ml) on the rear flank area. When mean tumor volumes reached to 250 mm3, dosed intravenously (15 mg/kg) on days 17 and 29 after tumor cell injection.
|
||||
| In Vivo Model | A549 CDX model | ||||
| In Vitro Model | Lung adenocarcinoma | A-549 cells | CVCL_0023 | ||
Revealed Based on the Cell Line Data
| Experiment 1 Reporting the Activity Date of This ADC | [14] | ||||
| Efficacy Data | Half Maximal Effective Concentration (EC50) |
1 ug/mL
|
Positive ITGAV expression (ITGAV +++/++) | ||
| Method Description |
Cells were seeded into white 96-well tissue culture plates (5000 cells/well)in culture medium and incubated for 16 hrs. Serial dilutions of immunoconjugates were added toeach appropraite wells (0-20 ug/ml). Tissue culture plates were incubated at 37°C for 96 hrs.
|
||||
| In Vitro Model | Colon cancer | HT29 cells | CVCL_A8EZ | ||
| Experiment 2 Reporting the Activity Date of This ADC | [14] | ||||
| Efficacy Data | Half Maximal Effective Concentration (EC50) |
1 ug/mL
|
Positive ITGAV expression (ITGAV +++/++) | ||
| Method Description |
Cells were seeded into white 96-well tissue culture plates (5000 cells/well)in culture medium and incubated for 16 hrs. Serial dilutions of immunoconjugates were added toeach appropraite wells (0-20 ug/ml). Tissue culture plates were incubated at 37°C for 96 hrs.
|
||||
| In Vitro Model | Colon cancer | HT29 cells | CVCL_A8EZ | ||
| Experiment 3 Reporting the Activity Date of This ADC | [14] | ||||
| Efficacy Data | Half Maximal Effective Concentration (EC50) |
1.2 ug/mL
|
Positive ITGAV expression (ITGAV +++/++) | ||
| Method Description |
Cells were seeded into white 96-well tissue culture plates (5000 cells/well)in culture medium and incubated for 16 hrs. Serial dilutions of immunoconjugates were added toeach appropraite wells (0-20 ug/ml). Tissue culture plates were incubated at 37°C for 96 hrs.
|
||||
| In Vitro Model | Lung adenocarcinoma | A-549 cells | CVCL_0023 | ||
| Experiment 4 Reporting the Activity Date of This ADC | [14] | ||||
| Efficacy Data | Half Maximal Effective Concentration (EC50) |
1.5 ug/mL
|
Positive ITGAV expression (ITGAV +++/++) | ||
| Method Description |
Cells were seeded into white 96-well tissue culture plates (5000 cells/well)in culture medium and incubated for 16 hrs. Serial dilutions of immunoconjugates were added toeach appropraite wells (0-20 ug/ml). Tissue culture plates were incubated at 37°C for 96 hrs.
|
||||
| In Vitro Model | Lung adenocarcinoma | A-549 cells | CVCL_0023 | ||
| Experiment 5 Reporting the Activity Date of This ADC | [14] | ||||
| Efficacy Data | Half Maximal Effective Concentration (EC50) |
0.19 mg/mL
|
Positive ITGAV expression (ITGAV +++/++) | ||
| Method Description |
Cells were harvested, rinsedsuspended in serum free DMEM, and sequentially incubated for 60 minutes on ice with serialdiluted CNTO 95,CNTO 364, CNTO 365 and CNTO 366 and FITC-labeled anti-humanantibody (10 mg/ml).
|
||||
| In Vitro Model | Colon cancer | HT29 cells | CVCL_A8EZ | ||
| Experiment 6 Reporting the Activity Date of This ADC | [14] | ||||
| Efficacy Data | Half Maximal Effective Concentration (EC50) |
0.27 mg/mL
|
Positive ITGAV expression (ITGAV +++/++) | ||
| Method Description |
Cells were harvested, rinsedsuspended in serum free DMEM, and sequentially incubated for 60 minutes on ice with serialdiluted CNTO 95,CNTO 364, CNTO 365 and CNTO 366 and FITC-labeled anti-humanantibody (10 mg/ml).
|
||||
| In Vitro Model | Ovarian endometrioid adenocarcinoma | A2780 cells | CVCL_0134 | ||
| Experiment 7 Reporting the Activity Date of This ADC | [14] | ||||
| Efficacy Data | Half Maximal Effective Concentration (EC50) |
0.27 mg/mL
|
Positive ITGAV expression (ITGAV +++/++) | ||
| Method Description |
Cells were harvested, rinsedsuspended in serum free DMEM, and sequentially incubated for 60 minutes on ice with serialdiluted CNTO 95,CNTO 364, CNTO 365 and CNTO 366 and FITC-labeled anti-humanantibody (10 mg/ml).
|
||||
| In Vitro Model | Lung adenocarcinoma | A-549 cells | CVCL_0023 | ||
| Experiment 8 Reporting the Activity Date of This ADC | [14] | ||||
| Efficacy Data | Half Maximal Effective Concentration (EC50) |
0.29 mg/mL
|
Positive ITGAV expression (ITGAV +++/++) | ||
| Method Description |
Cells were harvested, rinsedsuspended in serum free DMEM, and sequentially incubated for 60 minutes on ice with serialdiluted CNTO 95,CNTO 364, CNTO 365 and CNTO 366 and FITC-labeled anti-humanantibody (10 mg/ml).
|
||||
| In Vitro Model | Colon cancer | HT29 cells | CVCL_A8EZ | ||
| Experiment 9 Reporting the Activity Date of This ADC | [14] | ||||
| Efficacy Data | Half Maximal Effective Concentration (EC50) |
0.3 mg/mL
|
Positive ITGAV expression (ITGAV +++/++) | ||
| Method Description |
Cells were harvested, rinsedsuspended in serum free DMEM, and sequentially incubated for 60 minutes on ice with serialdiluted CNTO 95,CNTO 364, CNTO 365 and CNTO 366 and FITC-labeled anti-humanantibody (10 mg/ml).
|
||||
| In Vitro Model | Ovarian endometrioid adenocarcinoma | A2780 cells | CVCL_0134 | ||
| Experiment 10 Reporting the Activity Date of This ADC | [14] | ||||
| Efficacy Data | Half Maximal Effective Concentration (EC50) |
0.42 mg/mL
|
Positive ITGAV expression (ITGAV +++/++) | ||
| Method Description |
Cells were harvested, rinsedsuspended in serum free DMEM, and sequentially incubated for 60 minutes on ice with serialdiluted CNTO 95,CNTO 364, CNTO 365 and CNTO 366 and FITC-labeled anti-humanantibody (10 mg/ml).
|
||||
| In Vitro Model | Lung adenocarcinoma | A-549 cells | CVCL_0023 | ||
F105-SSNPP-DM4 [Investigative]
Discovered Using Cell Line-derived Xenograft Model
| Experiment 1 Reporting the Activity Date of This ADC | [14] | ||||
| Efficacy Data | Tumor Growth Inhibition value (TGI) | ≈ 0% | Positive ITGAV expression (ITGAV +++/++) | ||
| Method Description |
Female athymic rats were inoculated with 5x10⁶ HT29 cells subcutancously on the rear flank area. The animals were stratified into 13 groups, 6 animals per group based on a mean tumor volume for each group of approximately 250 mm3. On the day of grouping (day 7) each group received its initial dosing (175 ug/kg).
|
||||
| In Vivo Model | HT-29 CDX model | ||||
| In Vitro Model | Colon cancer | HT29 cells | CVCL_A8EZ | ||
MuFR1-13-PEG4-Mal-DM4 [Investigative]
Discovered Using Cell Line-derived Xenograft Model
| Experiment 1 Reporting the Activity Date of This ADC | [15] | ||||
| Efficacy Data | Tumor Growth Inhibition value (TGI) | ≈ 18.22% | Positive FOLR1 expression (FOLR1 +++/++) | ||
| Method Description |
PEG4Mal-DM4 conjugates of the exemplary anti-FOLR1 antibodies were tested using an established xenograft model of KB cells implanted subcutaneous into SCID mice. Mice were randomized by body weight into treatment groups and treated once on day 3 post cell inoculation with 10 mg/kg of one of the conjugates listed above or with PBS only.
|
||||
| In Vivo Model | KB CDX model | ||||
| In Vitro Model | Human papillomavirus-related endocervical adenocarcinoma | KB cells | CVCL_0372 | ||
Revealed Based on the Cell Line Data
| Experiment 1 Reporting the Activity Date of This ADC | [15] | ||||
| Efficacy Data | Half Maximal Inhibitory Concentration (IC50) |
0.15 nM
|
Positive FOLR1 expression (FOLR1 +++/++) | ||
| Method Description |
FOLR1-expressing SKOV3 cells were incubated with varying concentrations of anti FOLR1 antibodies or their conjugates and processed.
|
||||
| In Vitro Model | Ovarian serous cystadenocarcinoma | SK-OV-3 cells | CVCL_0532 | ||
MuFR1-23-PEG4-Mal-DM4 [Investigative]
Discovered Using Cell Line-derived Xenograft Model
| Experiment 1 Reporting the Activity Date of This ADC | [15] | ||||
| Efficacy Data | Tumor Growth Inhibition value (TGI) | ≈ 20.03% | Positive FOLR1 expression (FOLR1 +++/++) | ||
| Method Description |
PEG4Mal-DM4 conjugates of the exemplary anti-FOLR1 antibodies were tested using an established xenograft model of KB cells implanted subcutaneous into SCID mice. Mice were randomized by body weight into treatment groups and treated once on day 3 post cell inoculation with 10 mg/kg of one of the conjugates listed above or with PBS only.
|
||||
| In Vivo Model | KB CDX model | ||||
| In Vitro Model | Human papillomavirus-related endocervical adenocarcinoma | KB cells | CVCL_0372 | ||
Revealed Based on the Cell Line Data
| Experiment 1 Reporting the Activity Date of This ADC | [15] | ||||
| Efficacy Data | Half Maximal Inhibitory Concentration (IC50) |
0.13 nM
|
Positive FOLR1 expression (FOLR1 +++/++) | ||
| Method Description |
FOLR1-expressing SKOV3 cells were incubated with varying concentrations of anti FOLR1 antibodies or their conjugates and processed.
|
||||
| In Vitro Model | Ovarian serous cystadenocarcinoma | SK-OV-3 cells | CVCL_0532 | ||
HuMov19-PEG4-Mal-DM4 [Investigative]
Discovered Using Cell Line-derived Xenograft Model
| Experiment 1 Reporting the Activity Date of This ADC | [15] | ||||
| Efficacy Data | Tumor Growth Inhibition value (TGI) | ≈ 24.92% | Positive FOLR1 expression (FOLR1 +++/++) | ||
| Method Description |
PEG4Mal-DM4 conjugates of the exemplary anti-FOLR1 antibodies were tested using an established xenograft model of KB cells implanted subcutaneous into SCID mice. Mice were randomized by body weight into treatment groups and treated once on day 6 post cell inoculation with 2.5 mg/kg of one of the conjugates listed above or with PBS only.
|
||||
| In Vivo Model | KB CDX model | ||||
| In Vitro Model | Human papillomavirus-related endocervical adenocarcinoma | KB cells | CVCL_0372 | ||
| Experiment 2 Reporting the Activity Date of This ADC | [15] | ||||
| Efficacy Data | Tumor Growth Inhibition value (TGI) | ≈ 46.37% | Positive FOLR1 expression (FOLR1 +++/++) | ||
| Method Description |
PEG4Mal-DM4 conjugates of the exemplary anti-FOLR1 antibodies were tested using an established xenograft model of KB cells implanted subcutaneous into SCID mice. Mice were randomized by body weight into treatment groups and treated once on day 6 post cell inoculation with 5 mg/kg ofone of the conjugates listed above or with PBS only.
|
||||
| In Vivo Model | KB CDX model | ||||
| In Vitro Model | Human papillomavirus-related endocervical adenocarcinoma | KB cells | CVCL_0372 | ||
| Experiment 3 Reporting the Activity Date of This ADC | [15] | ||||
| Efficacy Data | Tumor Growth Inhibition value (TGI) | ≈ 68.53% | Positive FOLR1 expression (FOLR1 +++/++) | ||
| Method Description |
PEG4Mal-DM4 conjugates of the exemplary anti-FOLR1 antibodies were tested using an established xenograft model of KB cells implanted subcutaneous into SCID mice. Mice were randomized by body weight into treatment groups and treated once on day 3 post cell inoculation with 10 mg/kg of one of the conjugates listed above or with PBS only.
|
||||
| In Vivo Model | KB CDX model | ||||
| In Vitro Model | Human papillomavirus-related endocervical adenocarcinoma | KB cells | CVCL_0372 | ||
| Experiment 4 Reporting the Activity Date of This ADC | [15] | ||||
| Efficacy Data | Tumor Growth Inhibition value (TGI) | ≈ 76.02% | Positive FOLR1 expression (FOLR1 +++/++) | ||
| Method Description |
PEG4Mal-DM4 conjugates of the exemplary anti-FOLR1 antibodies were tested using an established xenograft model of KB cells implanted subcutaneous into SCID mice. Mice were randomized by body weight into treatment groups and treated once on day 6 post cell inoculation with 10 mg/kg of one of the conjugates listed above or with PBS only.
|
||||
| In Vivo Model | KB CDX model | ||||
| In Vitro Model | Human papillomavirus-related endocervical adenocarcinoma | KB cells | CVCL_0372 | ||
| Experiment 5 Reporting the Activity Date of This ADC | [15] | ||||
| Efficacy Data | Tumor Growth Inhibition value (TGI) | ≈ 87.21% | Positive FOLR1 expression (FOLR1 +++/++) | ||
| Method Description |
PEG4Mal-DM4 conjugates of the exemplary anti-FOLR1 antibodies were tested using an established xenograft model of KB cells implanted subcutaneous into SCID mice. Mice were randomized by body weight into treatment groups and treated once on day 6 post cell inoculation with 10 mg/kg (every week, three weeks) of one of the conjugates listed above or with PBS only.
Click to Show/Hide
|
||||
| In Vivo Model | KB CDX model | ||||
| In Vitro Model | Human papillomavirus-related endocervical adenocarcinoma | KB cells | CVCL_0372 | ||
| Experiment 6 Reporting the Activity Date of This ADC | [15] | ||||
| Efficacy Data | Tumor Growth Inhibition value (TGI) | ≈ 100% | Positive FOLR1 expression (FOLR1 +++/++) | ||
| Method Description |
Mice were randomized by body weight into treatment groups and reated either singly (SPDB conjugates) on day 3 post cell inoculation, or three times weekly on days 3, 10, and 17 post KB cell inoculation with 10 mg/kg of a conjugate.
|
||||
| In Vivo Model | KB CDX model | ||||
| In Vitro Model | Human papillomavirus-related endocervical adenocarcinoma | KB cells | CVCL_0372 | ||
Revealed Based on the Cell Line Data
| Experiment 1 Reporting the Activity Date of This ADC | [15] | ||||
| Efficacy Data | Half Maximal Inhibitory Concentration (IC50) |
0.15 nM
|
Positive FOLR1 expression (FOLR1 +++/++) | ||
| Method Description |
FOLR1-expressing SKOV3 cells were incubated with varying concentrations of anti FOLR1 antibodies or their conjugates and processed.
|
||||
| In Vitro Model | Ovarian serous cystadenocarcinoma | SK-OV-3 cells | CVCL_0532 | ||
HuMov19-3-sulfo-Mal-DM4 (DAR 8.23) [Investigative]
Discovered Using Cell Line-derived Xenograft Model
| Experiment 1 Reporting the Activity Date of This ADC | [15] | ||||
| Efficacy Data | Tumor Growth Inhibition value (TGI) | ≈ 26.41% | Positive FOLR1 expression (FOLR1 +++/++) | ||
| Method Description |
Conjugates of the exemplary anti-FOLR1 antibodies were tested using an established xenograft model of KB cells implanted subcutaneous into SCID mice. Mice were randomized by body weight into treatment groups and treated once on day 6 post cell inoculation with 1.1 mg/kg of one of the conjugates listed above or with PBS only.
|
||||
| In Vivo Model | KB CDX model | ||||
| In Vitro Model | Human papillomavirus-related endocervical adenocarcinoma | KB cells | CVCL_0372 | ||
| Experiment 2 Reporting the Activity Date of This ADC | [15] | ||||
| Efficacy Data | Tumor Growth Inhibition value (TGI) | ≈ 39% | Positive FOLR1 expression (FOLR1 +++/++) | ||
| Method Description |
Conjugates of the exemplary anti-FOLR1 antibodies were tested using an established xenograft model of KB cells implanted subcutaneous into SCID mice. Mice were randomized by body weight into treatment groups and treated once on day 6 post cell inoculation with 2.1 mg/kg of one of the conjugates listed above or with PBS only.
|
||||
| In Vivo Model | KB CDX model | ||||
| In Vitro Model | Human papillomavirus-related endocervical adenocarcinoma | KB cells | CVCL_0372 | ||
| Experiment 3 Reporting the Activity Date of This ADC | [15] | ||||
| Efficacy Data | Tumor Growth Inhibition value (TGI) | ≈ 85.77% | Positive FOLR1 expression (FOLR1 +++/++) | ||
| Method Description |
Conjugates of the exemplary anti-FOLR1 antibodies were tested using an established xenograft model of KB cells implanted subcutaneous into SCID mice. Mice were randomized by body weight into treatment groups and treated once on day 6 post cell inoculation with 4.5 mg/kg of one of the conjugates listed above or with PBS only.
|
||||
| In Vivo Model | KB CDX model | ||||
| In Vitro Model | Human papillomavirus-related endocervical adenocarcinoma | KB cells | CVCL_0372 | ||
HuIgG1-SPDB-DM4 [Investigative]
Discovered Using Cell Line-derived Xenograft Model
| Experiment 1 Reporting the Activity Date of This ADC | [16] | ||||
| Efficacy Data | Tumor Growth Inhibition value (TGI) |
30%
|
High FOLR1 expression (FOLR1+++; 4,500,000 FOLR1 molecules/cell) | ||
| Method Description |
Animals with established tumors of about 130 mm3 were treated with intravenous single injection of the M9346A-DM conjugates at 50 mg/kg, equivalent to 82 g conjugated maytansinoid per kg The conjugates were injected on day 4 after cell inoculation.
|
||||
| In Vivo Model | FRalpha-positive KB CDX model | ||||
| In Vitro Model | Human papillomavirus-related endocervical adenocarcinoma | KB cells | CVCL_0372 | ||
MuFR1-22-PEG4-Mal-DM4 [Investigative]
Discovered Using Cell Line-derived Xenograft Model
| Experiment 1 Reporting the Activity Date of This ADC | [15] | ||||
| Efficacy Data | Tumor Growth Inhibition value (TGI) | ≈ 30.33% | Positive FOLR1 expression (FOLR1 +++/++) | ||
| Method Description |
PEG4Mal-DM4 conjugates of the exemplary anti-FOLR1 antibodies were tested using an established xenograft model of KB cells implanted subcutaneous into SCID mice. Mice were randomized by body weight into treatment groups and treated once on day 3 post cell inoculation with 10 mg/kg of one of the conjugates listed above or with PBS only.
|
||||
| In Vivo Model | KB CDX model | ||||
| In Vitro Model | Human papillomavirus-related endocervical adenocarcinoma | KB cells | CVCL_0372 | ||
Revealed Based on the Cell Line Data
| Experiment 1 Reporting the Activity Date of This ADC | [15] | ||||
| Efficacy Data | Half Maximal Inhibitory Concentration (IC50) |
0.14 nM
|
Positive FOLR1 expression (FOLR1 +++/++) | ||
| Method Description |
FOLR1-expressing SKOV3 cells were incubated with varying concentrations of anti FOLR1 antibodies or their conjugates and processed.
|
||||
| In Vitro Model | Ovarian serous cystadenocarcinoma | SK-OV-3 cells | CVCL_0532 | ||
Anti-KIT 9P3-SPDB-DM4 [Investigative]
Discovered Using Cell Line-derived Xenograft Model
| Experiment 1 Reporting the Activity Date of This ADC | [17] | ||||
| Efficacy Data | Tumor Growth Inhibition value (TGI) | ≈ 31.88% | Positive KIT expression (KIT+++/++) | ||
| Method Description |
Female SCID-beige mice were implanted subcutaneously with Kasumi-1 cells. Mice were enrolled in the study 15 days post implantation withaverage tumor volume of about 120 mm3. All treated groups received a single intravenous dose of 2 mg/kg. After being randomly assigned to groups (n = 8/group), mice were administered a single i.v.dose of TBS (5 ml/kg) or ADC (1 mg/kg).
Click to Show/Hide
|
||||
| In Vivo Model | Kasumi-1 CDX model | ||||
| In Vitro Model | Myeloid leukemia with maturation | Kasumi-1 cells | CVCL_0589 | ||
| Experiment 2 Reporting the Activity Date of This ADC | [17] | ||||
| Efficacy Data | Tumor Growth Inhibition value (TGI) | ≈ 91.94% | Positive KIT expression (KIT+++/++) | ||
| Method Description |
Female SCID-beige mice were implanted subcutaneously with Kasumi-1 cells. Mice were enrolled in the study 15 days post implantation withaverage tumor volume of about 120 mm3. All treated groups received a single intravenous dose of 2 mg/kg. After being randomly assigned to groups (n = 8/group), mice were administered a single i.v.dose of TBS (5 ml/kg) or ADC (10 mg/kg).
Click to Show/Hide
|
||||
| In Vivo Model | HMC-1 CDX model | ||||
| In Vitro Model | Mast cell leukemia | HMC-1 cells | CVCL_0003 | ||
| Experiment 3 Reporting the Activity Date of This ADC | [17] | ||||
| Efficacy Data | Tumor Growth Inhibition value (TGI) | ≈ 93% | Positive KIT expression (KIT+++/++) | ||
| Method Description |
Female SCID-beige mice were implanted subcutaneously with 10,000,000 cells. The total injection volume containingcells in suspension was 200 ul. Mice were enrolled in the study 15 days post implantation withaverage tumor volume of about 120 mm3. All treated groups received a single intravenous dose of2 mg/kg. After being randomly assigned to groups (n = 8/group), mice were administered a single i.v.dose of TBS (5 ml/kg) or ADC (2.5 mg/kg).
Click to Show/Hide
|
||||
| In Vivo Model | GIST-T1 CDX model | ||||
| In Vitro Model | Gastrointestinal stromal tumor | GIST-T1 cells | CVCL_4976 | ||
| Experiment 4 Reporting the Activity Date of This ADC | [17] | ||||
| Efficacy Data | Tumor Growth Inhibition value (TGI) | ≈ 97% | Positive KIT expression (KIT+++/++) | ||
| Method Description |
Female SCID-beige mice were implanted subcutaneously with 10,000,000 cells. The total injection volume containingcells in suspension was 200 ul. Mice were enrolled in the study 15 days post implantation withaverage tumor volume of about 120 mm3. All treated groups received a single intravenous dose of2 mg/kg. After being randomly assigned to groups (n = 8/group), mice were administered a single i.v.dose of TBS (5 ml/kg) or ADC (5 mg/kg).
Click to Show/Hide
|
||||
| In Vivo Model | GIST430 CDX model | ||||
| In Vitro Model | Gastrointestinal stromal tumor | GIST430 cells | CVCL_7040 | ||
| Experiment 5 Reporting the Activity Date of This ADC | [17] | ||||
| Efficacy Data | Tumor Growth Inhibition value (TGI) | ≈ 98.09% | Positive KIT expression (KIT+++/++) | ||
| Method Description |
Female SCID-beige mice were implanted subcutaneously with Kasumi-1 cells. Mice were enrolled in the study 15 days post implantation withaverage tumor volume of about 120 mm3. All treated groups received a single intravenous dose of 2 mg/kg. After being randomly assigned to groups (n = 8/group), mice were administered a single i.v.dose of TBS (5 ml/kg) or ADC (5 mg/kg).
Click to Show/Hide
|
||||
| In Vivo Model | Kasumi-1 CDX model | ||||
| In Vitro Model | Myeloid leukemia with maturation | Kasumi-1 cells | CVCL_0589 | ||
| Experiment 6 Reporting the Activity Date of This ADC | [17] | ||||
| Efficacy Data | Tumor Growth Inhibition value (TGI) | ≈ 100% | Positive KIT expression (KIT+++/++) | ||
| Method Description |
Female SCID-beige mice were implanted subcutaneously with 10,000,000 cells. The total injection volume containingcells in suspension was 200 ul. Mice were enrolled in the study 15 days post implantation withaverage tumor volume of about 120 mm3. All treated groups received a single intravenous dose of2 mg/kg. After being randomly assigned to groups (n = 8/group), mice were administered a single i.v.dose of TBS (5 ml/kg) or ADC (5 mg/kg).
Click to Show/Hide
|
||||
| In Vivo Model | GIST-T1 CDX model | ||||
| In Vitro Model | Gastrointestinal stromal tumor | GIST-T1 cells | CVCL_4976 | ||
Revealed Based on the Cell Line Data
| Experiment 1 Reporting the Activity Date of This ADC | [17] | ||||
| Efficacy Data | Max inhibition rate (MIR) |
65%
|
Positive KIT expression (KIT+++/++) | ||
| Method Description |
Cells were cultured in a tissue culture incubator at 37°C with 5% CO2 in culture medium. On the day of the assay, cells were washed twice with PBS, prior to being treated with 0.1% trypsin-EDTA for 5 min and resuspended in the recommended culture medium. Cells were then counted and seeded in 96 well plates at densities of 2,000-10,000 cells/well in 100 ul of cell culture medium.
Click to Show/Hide
|
||||
| In Vitro Model | Gastrointestinal stromal tumor | GIST430 cells | CVCL_7040 | ||
| Experiment 2 Reporting the Activity Date of This ADC | [17] | ||||
| Efficacy Data | Max inhibition rate (MIR) |
75%
|
Positive KIT expression (KIT+++/++) | ||
| Method Description |
Cells were cultured in a tissue culture incubator at 37°C with 5% CO2 in culture medium. On the day of the assay, cells were washed twice with PBS, prior to being treated with 0.1% trypsin-EDTA for 5 min and resuspended in the recommended culture medium. Cells were then counted and seeded in 96 well plates at densities of 2,000-10,000 cells/well in 100 ul of cell culture medium.
Click to Show/Hide
|
||||
| In Vitro Model | Gastrointestinal stromal tumor | GIST-T1 cells | CVCL_4976 | ||
| Experiment 3 Reporting the Activity Date of This ADC | [17] | ||||
| Efficacy Data | Max inhibition rate (MIR) |
84%
|
Positive KIT expression (KIT+++/++) | ||
| Method Description |
Cells were cultured in a tissue culture incubator at 37°C with 5% CO2 in culture medium. On the day of the assay, cells were washed twice with PBS, prior to being treated with 0.1% trypsin-EDTA for 5 min and resuspended in the recommended culture medium. Cells were then counted and seeded in 96 well plates at densities of 2,000-10,000 cells/well in 100 ul of cell culture medium.
Click to Show/Hide
|
||||
| In Vitro Model | Lung small cell carcinoma | NCI-H889 cells | CVCL_1598 | ||
| Experiment 4 Reporting the Activity Date of This ADC | [17] | ||||
| Efficacy Data | Max inhibition rate (MIR) |
88%
|
Positive KIT expression (KIT+++/++) | ||
| Method Description |
Cells were cultured in a tissue culture incubator at 37°C with 5% CO2 in culture medium. On the day of the assay, cells were washed twice with PBS, prior to being treated with 0.1% trypsin-EDTA for 5 min and resuspended in the recommended culture medium. Cells were then counted and seeded in 96 well plates at densities of 2,000-10,000 cells/well in 100 ul of cell culture medium.
Click to Show/Hide
|
||||
| In Vitro Model | Lung small cell carcinoma | NCI-H1930 cells | CVCL_1507 | ||
| Experiment 5 Reporting the Activity Date of This ADC | [17] | ||||
| Efficacy Data | Max inhibition rate (MIR) |
92%
|
Positive KIT expression (KIT+++/++) | ||
| Method Description |
Cells were cultured in a tissue culture incubator at 37°C with 5% CO2 in culture medium. On the day of the assay, cells were washed twice with PBS, prior to being treated with 0.1% trypsin-EDTA for 5 min and resuspended in the recommended culture medium. Cells were then counted and seeded in 96 well plates at densities of 2,000-10,000 cells/well in 100 ul of cell culture medium.
Click to Show/Hide
|
||||
| In Vitro Model | Acute megakaryoblastic leukemia | CMK-11-5 cells | CVCL_0217 | ||
| Experiment 6 Reporting the Activity Date of This ADC | [17] | ||||
| Efficacy Data | Max inhibition rate (MIR) |
94%
|
Positive KIT expression (KIT+++/++) | ||
| Method Description |
Cells were cultured in a tissue culture incubator at 37°C with 5% CO2 in culture medium. On the day of the assay, cells were washed twice with PBS, prior to being treated with 0.1% trypsin-EDTA for 5 min and resuspended in the recommended culture medium. Cells were then counted and seeded in 96 well plates at densities of 2,000-10,000 cells/well in 100 ul of cell culture medium.
Click to Show/Hide
|
||||
| In Vitro Model | Acute myeloid leukemia | Kasumi-6 cells | CVCL_0614 | ||
| Experiment 7 Reporting the Activity Date of This ADC | [17] | ||||
| Efficacy Data | Max inhibition rate (MIR) |
94%
|
Positive KIT expression (KIT+++/++) | ||
| Method Description |
Cells were cultured in a tissue culture incubator at 37°C with 5% CO2 in culture medium. On the day of the assay, cells were washed twice with PBS, prior to being treated with 0.1% trypsin-EDTA for 5 min and resuspended in the recommended culture medium. Cells were then counted and seeded in 96 well plates at densities of 2,000-10,000 cells/well in 100 ul of cell culture medium.
Click to Show/Hide
|
||||
| In Vitro Model | Erythroleukemia | HEL 92.1.7 cells | CVCL_2481 | ||
| Experiment 8 Reporting the Activity Date of This ADC | [17] | ||||
| Efficacy Data | Max inhibition rate (MIR) |
98%
|
Positive KIT expression (KIT+++/++) | ||
| Method Description |
Cells were cultured in a tissue culture incubator at 37°C with 5% CO2 in culture medium. On the day of the assay, cells were washed twice with PBS, prior to being treated with 0.1% trypsin-EDTA for 5 min and resuspended in the recommended culture medium. Cells were then counted and seeded in 96 well plates at densities of 2,000-10,000 cells/well in 100 ul of cell culture medium.
Click to Show/Hide
|
||||
| In Vitro Model | Lung small cell carcinoma | NCI-H526 cells | CVCL_1569 | ||
| Experiment 9 Reporting the Activity Date of This ADC | [17] | ||||
| Efficacy Data | Max inhibition rate (MIR) |
99%
|
Positive KIT expression (KIT+++/++) | ||
| Method Description |
Cells were cultured in a tissue culture incubator at 37°C with 5% CO2 in culture medium. On the day of the assay, cells were washed twice with PBS, prior to being treated with 0.1% trypsin-EDTA for 5 min and resuspended in the recommended culture medium. Cells were then counted and seeded in 96 well plates at densities of 2,000-10,000 cells/well in 100 ul of cell culture medium.
Click to Show/Hide
|
||||
| In Vitro Model | Adult acute myeloid leukemia | SKNO-1 cells | CVCL_2196 | ||
| Experiment 10 Reporting the Activity Date of This ADC | [17] | ||||
| Efficacy Data | Max inhibition rate (MIR) |
99%
|
Positive KIT expression (KIT+++/++) | ||
| Method Description |
Cells were cultured in a tissue culture incubator at 37°C with 5% CO2 in culture medium. On the day of the assay, cells were washed twice with PBS, prior to being treated with 0.1% trypsin-EDTA for 5 min and resuspended in the recommended culture medium. Cells were then counted and seeded in 96 well plates at densities of 2,000-10,000 cells/well in 100 ul of cell culture medium.
Click to Show/Hide
|
||||
| In Vitro Model | Acute megakaryoblastic leukemia | M-07e cells | CVCL_2106 | ||
| Experiment 11 Reporting the Activity Date of This ADC | [17] | ||||
| Efficacy Data | Max inhibition rate (MIR) |
100%
|
Positive KIT expression (KIT+++/++) | ||
| Method Description |
Cells were cultured in a tissue culture incubator at 37°C with 5% CO2 in culture medium. On the day of the assay, cells were washed twice with PBS, prior to being treated with 0.1% trypsin-EDTA for 5 min and resuspended in the recommended culture medium. Cells were then counted and seeded in 96 well plates at densities of 2,000-10,000 cells/well in 100 ul of cell culture medium.
Click to Show/Hide
|
||||
| In Vitro Model | Lung small cell carcinoma | NCI-H1048 cells | CVCL_1453 | ||
| Experiment 12 Reporting the Activity Date of This ADC | [17] | ||||
| Efficacy Data | Max inhibition rate (MIR) |
100%
|
Positive KIT expression (KIT+++/++) | ||
| Method Description |
Cells were cultured in a tissue culture incubator at 37°C with 5% CO2 in culture medium. On the day of the assay, cells were washed twice with PBS, prior to being treated with 0.1% trypsin-EDTA for 5 min and resuspended in the recommended culture medium. Cells were then counted and seeded in 96 well plates at densities of 2,000-10,000 cells/well in 100 ul of cell culture medium.
Click to Show/Hide
|
||||
| In Vitro Model | Essential thrombocythemia | UKE-1 cells | CVCL_0104 | ||
| Experiment 13 Reporting the Activity Date of This ADC | [17] | ||||
| Efficacy Data | Max inhibition rate (MIR) |
100%
|
Positive KIT expression (KIT+++/++) | ||
| Method Description |
Cells were cultured in a tissue culture incubator at 37°C with 5% CO2 in culture medium. On the day of the assay, cells were washed twice with PBS, prior to being treated with 0.1% trypsin-EDTA for 5 min and resuspended in the recommended culture medium. Cells were then counted and seeded in 96 well plates at densities of 2,000-10,000 cells/well in 100 ul of cell culture medium.
Click to Show/Hide
|
||||
| In Vitro Model | Acute myeloid leukemia | OCI-M1 cells | CVCL_2149 | ||
| Experiment 14 Reporting the Activity Date of This ADC | [17] | ||||
| Efficacy Data | Max inhibition rate (MIR) |
100%
|
Positive KIT expression (KIT+++/++) | ||
| Method Description |
Cells were cultured in a tissue culture incubator at 37°C with 5% CO2 in culture medium. On the day of the assay, cells were washed twice with PBS, prior to being treated with 0.1% trypsin-EDTA for 5 min and resuspended in the recommended culture medium. Cells were then counted and seeded in 96 well plates at densities of 2,000-10,000 cells/well in 100 ul of cell culture medium.
Click to Show/Hide
|
||||
| In Vitro Model | Myeloid leukemia with maturation | Kasumi-1 cells | CVCL_0589 | ||
| Experiment 15 Reporting the Activity Date of This ADC | [17] | ||||
| Efficacy Data | Half Maximum Growth Inhibitory Concentration (GI50) |
0.05 nM
|
Positive KIT expression (KIT+++/++) | ||
| Method Description |
Cells were cultured in a tissue culture incubator at 37°C with 5% CO2 in culture medium. On the day of the assay, cells were washed twice with PBS, prior to being treated with 0.1% trypsin-EDTA for 5 min and resuspended in the recommended culture medium. Cells were then counted and seeded in 96 well plates at densities of 2,000-10,000 cells/well in 100 ul of cell culture medium.
Click to Show/Hide
|
||||
| In Vitro Model | Gastrointestinal stromal tumor | GIST-T1 cells | CVCL_4976 | ||
| Experiment 16 Reporting the Activity Date of This ADC | [17] | ||||
| Efficacy Data | Half Maximum Growth Inhibitory Concentration (GI50) |
0.07 nM
|
Positive KIT expression (KIT+++/++) | ||
| Method Description |
Cells were cultured in a tissue culture incubator at 37°C with 5% CO2 in culture medium. On the day of the assay, cells were washed twice with PBS, prior to being treated with 0.1% trypsin-EDTA for 5 min and resuspended in the recommended culture medium. Cells were then counted and seeded in 96 well plates at densities of 2,000-10,000 cells/well in 100 ul of cell culture medium.
Click to Show/Hide
|
||||
| In Vitro Model | Acute megakaryoblastic leukemia | CMK-11-5 cells | CVCL_0217 | ||
| Experiment 17 Reporting the Activity Date of This ADC | [17] | ||||
| Efficacy Data | Half Maximum Growth Inhibitory Concentration (GI50) |
0.11 nM
|
Positive KIT expression (KIT+++/++) | ||
| Method Description |
Cells were cultured in a tissue culture incubator at 37°C with 5% CO2 in culture medium. On the day of the assay, cells were washed twice with PBS, prior to being treated with 0.1% trypsin-EDTA for 5 min and resuspended in the recommended culture medium. Cells were then counted and seeded in 96 well plates at densities of 2,000-10,000 cells/well in 100 ul of cell culture medium.
Click to Show/Hide
|
||||
| In Vitro Model | Acute megakaryoblastic leukemia | M-07e cells | CVCL_2106 | ||
| Experiment 18 Reporting the Activity Date of This ADC | [17] | ||||
| Efficacy Data | Half Maximum Growth Inhibitory Concentration (GI50) |
0.13 nM
|
Positive KIT expression (KIT+++/++) | ||
| Method Description |
Cells were cultured in a tissue culture incubator at 37°C with 5% CO2 in culture medium. On the day of the assay, cells were washed twice with PBS, prior to being treated with 0.1% trypsin-EDTA for 5 min and resuspended in the recommended culture medium. Cells were then counted and seeded in 96 well plates at densities of 2,000-10,000 cells/well in 100 ul of cell culture medium.
Click to Show/Hide
|
||||
| In Vitro Model | Acute myeloid leukemia | OCI-M1 cells | CVCL_2149 | ||
| Experiment 19 Reporting the Activity Date of This ADC | [17] | ||||
| Efficacy Data | Half Maximum Growth Inhibitory Concentration (GI50) |
0.17 nM
|
Positive KIT expression (KIT+++/++) | ||
| Method Description |
Cells were cultured in a tissue culture incubator at 37°C with 5% CO2 in culture medium. On the day of the assay, cells were washed twice with PBS, prior to being treated with 0.1% trypsin-EDTA for 5 min and resuspended in the recommended culture medium. Cells were then counted and seeded in 96 well plates at densities of 2,000-10,000 cells/well in 100 ul of cell culture medium.
Click to Show/Hide
|
||||
| In Vitro Model | Lung small cell carcinoma | NCI-H526 cells | CVCL_1569 | ||
| Experiment 20 Reporting the Activity Date of This ADC | [17] | ||||
| Efficacy Data | Half Maximum Growth Inhibitory Concentration (GI50) |
0.17 nM
|
Positive KIT expression (KIT+++/++) | ||
| Method Description |
Cells were cultured in a tissue culture incubator at 37°C with 5% CO2 in culture medium. On the day of the assay, cells were washed twice with PBS, prior to being treated with 0.1% trypsin-EDTA for 5 min and resuspended in the recommended culture medium. Cells were then counted and seeded in 96 well plates at densities of 2,000-10,000 cells/well in 100 ul of cell culture medium.
Click to Show/Hide
|
||||
| In Vitro Model | Gastrointestinal stromal tumor | GIST430 cells | CVCL_7040 | ||
| Experiment 21 Reporting the Activity Date of This ADC | [17] | ||||
| Efficacy Data | Half Maximum Growth Inhibitory Concentration (GI50) |
0.3 nM
|
Positive KIT expression (KIT+++/++) | ||
| Method Description |
Cells were cultured in a tissue culture incubator at 37°C with 5% CO2 in culture medium. On the day of the assay, cells were washed twice with PBS, prior to being treated with 0.1% trypsin-EDTA for 5 min and resuspended in the recommended culture medium. Cells were then counted and seeded in 96 well plates at densities of 2,000-10,000 cells/well in 100 ul of cell culture medium.
Click to Show/Hide
|
||||
| In Vitro Model | Lung small cell carcinoma | NCI-H1930 cells | CVCL_1507 | ||
| Experiment 22 Reporting the Activity Date of This ADC | [17] | ||||
| Efficacy Data | Half Maximum Growth Inhibitory Concentration (GI50) |
0.83 nM
|
Positive KIT expression (KIT+++/++) | ||
| Method Description |
Cells were cultured in a tissue culture incubator at 37°C with 5% CO2 in culture medium. On the day of the assay, cells were washed twice with PBS, prior to being treated with 0.1% trypsin-EDTA for 5 min and resuspended in the recommended culture medium. Cells were then counted and seeded in 96 well plates at densities of 2,000-10,000 cells/well in 100 ul of cell culture medium.
Click to Show/Hide
|
||||
| In Vitro Model | Myeloid leukemia with maturation | Kasumi-1 cells | CVCL_0589 | ||
| Experiment 23 Reporting the Activity Date of This ADC | [17] | ||||
| Efficacy Data | Half Maximum Growth Inhibitory Concentration (GI50) |
0.91 nM
|
Positive KIT expression (KIT+++/++) | ||
| Method Description |
Cells were cultured in a tissue culture incubator at 37°C with 5% CO2 in culture medium. On the day of the assay, cells were washed twice with PBS, prior to being treated with 0.1% trypsin-EDTA for 5 min and resuspended in the recommended culture medium. Cells were then counted and seeded in 96 well plates at densities of 2,000-10,000 cells/well in 100 ul of cell culture medium.
Click to Show/Hide
|
||||
| In Vitro Model | Acute myeloid leukemia | Kasumi-6 cells | CVCL_0614 | ||
| Experiment 24 Reporting the Activity Date of This ADC | [17] | ||||
| Efficacy Data | Half Maximum Growth Inhibitory Concentration (GI50) |
1.26 nM
|
Positive KIT expression (KIT+++/++) | ||
| Method Description |
Cells were cultured in a tissue culture incubator at 37°C with 5% CO2 in culture medium. On the day of the assay, cells were washed twice with PBS, prior to being treated with 0.1% trypsin-EDTA for 5 min and resuspended in the recommended culture medium. Cells were then counted and seeded in 96 well plates at densities of 2,000-10,000 cells/well in 100 ul of cell culture medium.
Click to Show/Hide
|
||||
| In Vitro Model | Erythroleukemia | HEL 92.1.7 cells | CVCL_2481 | ||
| Experiment 25 Reporting the Activity Date of This ADC | [17] | ||||
| Efficacy Data | Half Maximum Growth Inhibitory Concentration (GI50) |
1.47 nM
|
Positive KIT expression (KIT+++/++) | ||
| Method Description |
Cells were cultured in a tissue culture incubator at 37°C with 5% CO2 in culture medium. On the day of the assay, cells were washed twice with PBS, prior to being treated with 0.1% trypsin-EDTA for 5 min and resuspended in the recommended culture medium. Cells were then counted and seeded in 96 well plates at densities of 2,000-10,000 cells/well in 100 ul of cell culture medium.
Click to Show/Hide
|
||||
| In Vitro Model | Lung small cell carcinoma | NCI-H889 cells | CVCL_1598 | ||
| Experiment 26 Reporting the Activity Date of This ADC | [17] | ||||
| Efficacy Data | Half Maximum Growth Inhibitory Concentration (GI50) |
1.6 nM
|
Positive KIT expression (KIT+++/++) | ||
| Method Description |
Cells were cultured in a tissue culture incubator at 37°C with 5% CO2 in culture medium. On the day of the assay, cells were washed twice with PBS, prior to being treated with 0.1% trypsin-EDTA for 5 min and resuspended in the recommended culture medium. Cells were then counted and seeded in 96 well plates at densities of 2,000-10,000 cells/well in 100 ul of cell culture medium.
Click to Show/Hide
|
||||
| In Vitro Model | Adult acute myeloid leukemia | SKNO-1 cells | CVCL_2196 | ||
| Experiment 27 Reporting the Activity Date of This ADC | [17] | ||||
| Efficacy Data | Half Maximum Growth Inhibitory Concentration (GI50) |
2.77 nM
|
Positive KIT expression (KIT+++/++) | ||
| Method Description |
Cells were cultured in a tissue culture incubator at 37°C with 5% CO2 in culture medium. On the day of the assay, cells were washed twice with PBS, prior to being treated with 0.1% trypsin-EDTA for 5 min and resuspended in the recommended culture medium. Cells were then counted and seeded in 96 well plates at densities of 2,000-10,000 cells/well in 100 ul of cell culture medium.
Click to Show/Hide
|
||||
| In Vitro Model | Lung small cell carcinoma | NCI-H1048 cells | CVCL_1453 | ||
| Experiment 28 Reporting the Activity Date of This ADC | [17] | ||||
| Efficacy Data | Half Maximum Growth Inhibitory Concentration (GI50) |
5.6 nM
|
Positive KIT expression (KIT+++/++) | ||
| Method Description |
Cells were cultured in a tissue culture incubator at 37°C with 5% CO2 in culture medium. On the day of the assay, cells were washed twice with PBS, prior to being treated with 0.1% trypsin-EDTA for 5 min and resuspended in the recommended culture medium. Cells were then counted and seeded in 96 well plates at densities of 2,000-10,000 cells/well in 100 ul of cell culture medium.
Click to Show/Hide
|
||||
| In Vitro Model | Essential thrombocythemia | UKE-1 cells | CVCL_0104 | ||
CDH6-SPDB-DM4 [Investigative]
Discovered Using Cell Line-derived Xenograft Model
| Experiment 1 Reporting the Activity Date of This ADC | [18] | ||||
| Efficacy Data | Tumor Growth Inhibition value (TGI) | ≈ 45% | High CDH6 expression (CDH6+++) | ||
| Method Description |
CDH6-SPDB-DM4 induces efficient tumor cell killing in cell PDX models with CDH6 expression.
|
||||
| In Vivo Model | Ovarian cancer CDX model | ||||
| In Vitro Model | Ovarian cancer | Ovarian cancer cells | Homo sapiens | ||
| Experiment 2 Reporting the Activity Date of This ADC | [18] | ||||
| Efficacy Data | Tumor Growth Inhibition value (TGI) | ≈ 50% | High CDH6 expression (CDH6+++) | ||
| Method Description |
CDH6-SPDB-DM4 induces efficient tumor cell killing in cell PDX models with CDH6 expression.
|
||||
| In Vivo Model | Ovarian cancer CDX model | ||||
| In Vitro Model | Ovarian cancer | Ovarian cancer cells | Homo sapiens | ||
| Experiment 3 Reporting the Activity Date of This ADC | [18] | ||||
| Efficacy Data | Tumor Growth Inhibition value (TGI) | ≈ 100% | High CDH6 expression (CDH6+++) | ||
| Method Description |
CDH6-SPDB-DM4 induces efficient tumor cell killing in cell PDX models with CDH6 expression.
|
||||
| In Vivo Model | Ovarian cancer CDX model | ||||
| In Vitro Model | Ovarian serous adenocarcinoma | OVCAR-3 cells | CVCL_0465 | ||
F105-SSNPB-DM4 [Investigative]
Discovered Using Cell Line-derived Xenograft Model
| Experiment 1 Reporting the Activity Date of This ADC | [14] | ||||
| Efficacy Data | Tumor Growth Inhibition value (TGI) | ≈ 45.81% | Positive ITGAV expression (ITGAV +++/++) | ||
| Method Description |
Female athymic rats were inoculated with 5x10⁶ HT29 cells subcutancously on the rear flank area. The animals were stratified into 13 groups, 6 animals per group based on a mean tumor volume for each group of approximately 250 mm3. On the day of grouping (day 7) each group received its initial dosing (175 ug/kg).
|
||||
| In Vivo Model | HT-29 CDX model | ||||
| In Vitro Model | Colon cancer | HT29 cells | CVCL_A8EZ | ||
HuMov19-3-sulfo-Mal-DM4 (DAR 3.7) [Investigative]
Discovered Using Cell Line-derived Xenograft Model
| Experiment 1 Reporting the Activity Date of This ADC | [15] | ||||
| Efficacy Data | Tumor Growth Inhibition value (TGI) | ≈ 47.64% | Positive FOLR1 expression (FOLR1 +++/++) | ||
| Method Description |
Conjugates of the exemplary anti-FOLR1 antibodies were tested using an established xenograft model of KB cells implanted subcutaneous into SCID mice. Mice were randomized by body weight into treatment groups and treated once on day 6 post cell inoculation with 2.5 mg/kg of one of the conjugates listed above or with PBS only.
|
||||
| In Vivo Model | KB CDX model | ||||
| In Vitro Model | Human papillomavirus-related endocervical adenocarcinoma | KB cells | CVCL_0372 | ||
| Experiment 2 Reporting the Activity Date of This ADC | [15] | ||||
| Efficacy Data | Tumor Growth Inhibition value (TGI) | ≈ 59.21% | Positive FOLR1 expression (FOLR1 +++/++) | ||
| Method Description |
Conjugates of the exemplary anti-FOLR1 antibodies were tested using an established xenograft model of KB cells implanted subcutaneous into SCID mice. Mice were randomized by body weight into treatment groups and treated once on day 6 post cell inoculation with 5 mg/kg of one of the conjugates listed above or with PBS only.
|
||||
| In Vivo Model | KB CDX model | ||||
| In Vitro Model | Human papillomavirus-related endocervical adenocarcinoma | KB cells | CVCL_0372 | ||
| Experiment 3 Reporting the Activity Date of This ADC | [15] | ||||
| Efficacy Data | Tumor Growth Inhibition value (TGI) | ≈ 83.57% | Positive FOLR1 expression (FOLR1 +++/++) | ||
| Method Description |
Conjugates of the exemplary anti-FOLR1 antibodies were tested using an established xenograft model of KB cells implanted subcutaneous into SCID mice. Mice were randomized by body weight into treatment groups and treated once on day 6 post cell inoculation with 10 mg/kg of one of the conjugates listed above or with PBS only.
|
||||
| In Vivo Model | KB CDX model | ||||
| In Vitro Model | Human papillomavirus-related endocervical adenocarcinoma | KB cells | CVCL_0372 | ||
MuFR1-9-PEG4-Mal-DM4 [Investigative]
Discovered Using Cell Line-derived Xenograft Model
| Experiment 1 Reporting the Activity Date of This ADC | [15] | ||||
| Efficacy Data | Tumor Growth Inhibition value (TGI) | ≈ 47.84% | Positive FOLR1 expression (FOLR1 +++/++) | ||
| Method Description |
PEG4Mal-DM4 conjugates of the exemplary anti-FOLR1 antibodies were tested using an established xenograft model of KB cells implanted subcutaneous into SCID mice. Mice were randomized by body weight into treatment groups and treated once on day 3 post cell inoculation with 10 mg/kg of one of the conjugates listed above or with PBS only.
|
||||
| In Vivo Model | KB CDX model | ||||
| In Vitro Model | Human papillomavirus-related endocervical adenocarcinoma | KB cells | CVCL_0372 | ||
Revealed Based on the Cell Line Data
| Experiment 1 Reporting the Activity Date of This ADC | [15] | ||||
| Efficacy Data | Half Maximal Inhibitory Concentration (IC50) |
0.22 nM
|
Positive FOLR1 expression (FOLR1 +++/++) | ||
| Method Description |
FOLR1-expressing SKOV3 cells were incubated with varying concentrations of anti FOLR1 antibodies or their conjugates and processed.
|
||||
| In Vitro Model | Ovarian serous cystadenocarcinoma | SK-OV-3 cells | CVCL_0532 | ||
BT062-SPDB-DM4 [Investigative]
Discovered Using Cell Line-derived Xenograft Model
| Experiment 1 Reporting the Activity Date of This ADC | [19] | ||||
| Efficacy Data | Tumor Growth Inhibition value (TGI) | ≈ 56.56% | |||
| Method Description |
The inhibitory activity of nBT062-SPDB-DM4 against cancer cell growth was evaluated in various human cancer cell lines in vitro. The cells were treated with 100g/kg.
|
||||
| In Vivo Model | SCID-hu MM model | ||||
| In Vitro Model | Plasma cell myeloma | MOLP-8 cells | CVCL_2124 | ||
| Experiment 2 Reporting the Activity Date of This ADC | [19] | ||||
| Efficacy Data | Tumor Growth Inhibition value (TGI) | ≈ 87.92% | |||
| Method Description |
The inhibitory activity of nBT062-SPDB-DM4 against cancer cell growth was evaluated in various human cancer cell lines in vitro. The cells were treated with 250g/kg.
|
||||
| In Vivo Model | SCID-hu MM model | ||||
| In Vitro Model | Plasma cell myeloma | MOLP-8 cells | CVCL_2124 | ||
| Experiment 3 Reporting the Activity Date of This ADC | [19] | ||||
| Efficacy Data | Tumor Growth Inhibition value (TGI) | ≈ 95% | |||
| Method Description |
The inhibitory activity of nBT062-SPDB-DM4 against cancer cell growth was evaluated in various human cancer cell lines in vitro. The cells were treated with 450g/kg.
|
||||
| In Vivo Model | SCID-hu MM model | ||||
| In Vitro Model | Plasma cell myeloma | MOLP-8 cells | CVCL_2124 | ||
Tmab-SSNPP-DM4 [Investigative]
Discovered Using Cell Line-derived Xenograft Model
| Experiment 1 Reporting the Activity Date of This ADC | [20] | ||||
| Efficacy Data | Tumor Growth Inhibition value (TGI) | ≈ 77.60% | High HER2 expression (HER2+++) | ||
| Method Description |
Mice bearing mammary tumor transplants from the MMTV-HER2 Fo5 line were given a single iv injection (10 mg/kg) of Tmab-SPP-DM1, Tmab-SSNPP-DM3, Tmab-SSNPP-DM4, Tmab-MCC-DM1, or vehicle (n=7 mice per group), and tumor growth was monitored for 25 days.
|
||||
| In Vivo Model | MMTV-HER2 Fo5 CDX model (Trastuzumab resistant) | ||||
| In Vitro Model | Breast cancer | MMTV-HER2 cells | Mus musculus | ||
CNTO95-SSNPB-DM4 [Investigative]
Discovered Using Cell Line-derived Xenograft Model
| Experiment 1 Reporting the Activity Date of This ADC | [14] | ||||
| Efficacy Data | Tumor Growth Inhibition value (TGI) | ≈ 82.51% | Positive ITGAV expression (ITGAV +++/++) | ||
| Method Description |
Female athymic rats were inoculated with 5x10⁶ HT29 cells subcutancously on the rear flank area. The animals were stratified into 13 groups, 6 animals per group based on a mean tumor volume for each group of approximately 250 mm3. On the day of grouping (day 7) each group received its initial dosing (175 ug/kg).
|
||||
| In Vivo Model | HT-29 CDX model | ||||
| In Vitro Model | Colon cancer | HT29 cells | CVCL_A8EZ | ||
Revealed Based on the Cell Line Data
| Experiment 1 Reporting the Activity Date of This ADC | [14] | ||||
| Efficacy Data | Half Maximal Effective Concentration (EC50) |
0.24 ug/mL
|
Positive ITGAV expression (ITGAV +++/++) | ||
| Method Description |
Cells were seeded into white 96-well tissue culture plates (5000 cells/well)in culture medium and incubated for 16 hrs. Serial dilutions of immunoconjugates were added toeach appropraite wells (0-20 ug/ml). Tissue culture plates were incubated at 37°C for 96 hrs.
|
||||
| In Vitro Model | Colon cancer | HT29 cells | CVCL_A8EZ | ||
| Experiment 2 Reporting the Activity Date of This ADC | [14] | ||||
| Efficacy Data | Half Maximal Effective Concentration (EC50) |
0.3 ug/mL
|
Positive ITGAV expression (ITGAV +++/++) | ||
| Method Description |
Cells were seeded into white 96-well tissue culture plates (5000 cells/well)in culture medium and incubated for 16 hrs. Serial dilutions of immunoconjugates were added toeach appropraite wells (0-20 ug/ml). Tissue culture plates were incubated at 37°C for 96 hrs.
|
||||
| In Vitro Model | Lung adenocarcinoma | A-549 cells | CVCL_0023 | ||
| Experiment 3 Reporting the Activity Date of This ADC | [14] | ||||
| Efficacy Data | Half Maximal Effective Concentration (EC50) |
0.21 mg/mL
|
Positive ITGAV expression (ITGAV +++/++) | ||
| Method Description |
Cells were harvested, rinsedsuspended in serum free DMEM, and sequentially incubated for 60 minutes on ice with serialdiluted CNTO 95,CNTO 364, CNTO 365 and CNTO 366 and FITC-labeled anti-humanantibody (10 mg/ml).
|
||||
| In Vitro Model | Colon cancer | HT29 cells | CVCL_A8EZ | ||
| Experiment 4 Reporting the Activity Date of This ADC | [14] | ||||
| Efficacy Data | Half Maximal Effective Concentration (EC50) |
0.27 mg/mL
|
Positive ITGAV expression (ITGAV +++/++) | ||
| Method Description |
Cells were harvested, rinsedsuspended in serum free DMEM, and sequentially incubated for 60 minutes on ice with serialdiluted CNTO 95,CNTO 364, CNTO 365 and CNTO 366 and FITC-labeled anti-humanantibody (10 mg/ml).
|
||||
| In Vitro Model | Ovarian endometrioid adenocarcinoma | A2780 cells | CVCL_0134 | ||
| Experiment 5 Reporting the Activity Date of This ADC | [14] | ||||
| Efficacy Data | Half Maximal Effective Concentration (EC50) |
0.34 mg/mL
|
Positive ITGAV expression (ITGAV +++/++) | ||
| Method Description |
Cells were harvested, rinsedsuspended in serum free DMEM, and sequentially incubated for 60 minutes on ice with serialdiluted CNTO 95,CNTO 364, CNTO 365 and CNTO 366 and FITC-labeled anti-humanantibody (10 mg/ml).
|
||||
| In Vitro Model | Lung adenocarcinoma | A-549 cells | CVCL_0023 | ||
Mirvetuximab-SPDB-DM4 [Investigative]
Discovered Using Cell Line-derived Xenograft Model
| Experiment 1 Reporting the Activity Date of This ADC | [16] | ||||
| Efficacy Data | Tumor Growth Inhibition value (TGI) |
83%
|
High FOLR1 expression (FOLR1+++; 1,300,000 FOLR1 molecules/cell) | ||
| Method Description |
Animals with established tumors of about 130 mm3 were treated with intravenous single injection of the M9346A-DM conjugates at 25 02 mg/kg, equivalent to 51 3 g conjugated maytansinoid per kg The conjugates were injected on day 7 after cell inoculation.
|
||||
| In Vivo Model | Ovarian carcinoma Igrov-1 CDX model | ||||
| In Vitro Model | Ovarian endometrioid adenocarcinoma | IGROV-1 cells | CVCL_1304 | ||
| Experiment 2 Reporting the Activity Date of This ADC | [16] | ||||
| Efficacy Data | Tumor Growth Inhibition value (TGI) |
92.22%
|
High FOLR1 expression (FOLR1+++; 4,500,000 FOLR1 molecules/cell) | ||
| Method Description |
Animals with established tumors of about 130 mm3 were treated with intravenous single injection of the M9346A-DM conjugates at 25 02 mg/kg, equivalent to 51 3 g conjugated maytansinoid per kg The conjugates were injected on day 20 after cell inoculation.
|
||||
| In Vivo Model | FRalpha-positive KB CDX model | ||||
| In Vitro Model | Human papillomavirus-related endocervical adenocarcinoma | KB cells | CVCL_0372 | ||
Revealed Based on the Cell Line Data
| Experiment 1 Reporting the Activity Date of This ADC | [16] | ||||
| Efficacy Data | Half Maximal Inhibitory Concentration (IC50) |
0.07±0.02 nM
|
High FOLR1 expression (FOLR1+++; 1,300,000 FOLR1 molecules/cell) | ||
| Method Description |
Dilutions of conjugates or unconjugated maytansinoid in the appropriate culture medium were added to wells of 96-well flat-bottomed plates containing 1 x10³ cells per well The plates were incubated at 37°C, 6% CO2 for either 5 days (continuos exposure) or for 4 hours followed by 5-day incubation in conjugate-free medium (short exposure). Cell viability was determined by the WST-8 assay in accordance with the manufacturer's protocol, and IC50 were generated using a sigmoidal dose-response (variable slope) nonlinear regression curve fit.
Click to Show/Hide
|
||||
| In Vitro Model | Ovarian endometrioid adenocarcinoma | IGROV-1 cells | CVCL_1304 | ||
| Experiment 2 Reporting the Activity Date of This ADC | [16] | ||||
| Efficacy Data | Half Maximal Inhibitory Concentration (IC50) |
0.08±0.01 nM
|
High FOLR1 expression (FOLR1+++; 4,500,000 FOLR1 molecules/cell) | ||
| Method Description |
Dilutions of conjugates or unconjugated maytansinoid in the appropriate culture medium were added to wells of 96-well flat-bottomed plates containing 1 x10³ cells per well The plates were incubated at 37°C, 6% CO2 for either 5 days (continuos exposure) or for 4 hours followed by 5-day incubation in conjugate-free medium (short exposure). Cell viability was determined by the WST-8 assay in accordance with the manufacturer's protocol, and IC50 were generated using a sigmoidal dose-response (variable slope) nonlinear regression curve fit.
Click to Show/Hide
|
||||
| In Vitro Model | Human papillomavirus-related endocervical adenocarcinoma | KB cells | CVCL_0372 | ||
| Experiment 3 Reporting the Activity Date of This ADC | [16] | ||||
| Efficacy Data | Half Maximal Inhibitory Concentration (IC50) |
0.11±0.08 nM
|
Moderate FOLR1 expression (FOLR1++; 290,000 FOLR1 molecules/cell) | ||
| Method Description |
Dilutions of conjugates or unconjugated maytansinoid in the appropriate culture medium were added to wells of 96-well flat-bottomed plates containing 1 x10³ cells per well The plates were incubated at 37°C, 6% CO2 for either 5 days (continuos exposure) or for 4 hours followed by 5-day incubation in conjugate-free medium (short exposure). Cell viability was determined by the WST-8 assay in accordance with the manufacturer's protocol, and IC50 were generated using a sigmoidal dose-response (variable slope) nonlinear regression curve fit.
Click to Show/Hide
|
||||
| In Vitro Model | Gestational choriocarcinoma | JEG-3 cells | CVCL_0363 | ||
1959-sss/DM4 [Investigative]
Discovered Using Cell Line-derived Xenograft Model
| Experiment 1 Reporting the Activity Date of This ADC | [21] | ||||
| Efficacy Data | Tumor Growth Inhibition value (TGI) | ≈ 89.57% | High LGALS3BP expression (LGALS3BP +++) | ||
| Method Description |
Gch6 cell xenograft mice were intravenously treated with 10 mg/kg 1959-sss/DM4 twice weekly for a total of three injections.
|
||||
| In Vivo Model | Gch6 CDX model | ||||
| In Vitro Model | Glioblastoma | Gch6 cells | Homo sapiens | ||
Revealed Based on the Cell Line Data
| Experiment 1 Reporting the Activity Date of This ADC | [21] | ||||
| Efficacy Data | Half Maximal Inhibitory Concentration (IC50) |
1.02 nM
|
High LGALS3BP expression (LGALS3BP +++) | ||
| Method Description |
In vitro cytotoxicity of ADCs against a panel of four multiple human glioblastoma cell lines.
|
||||
| In Vitro Model | Glioblastoma | Gch14 cells | Homo sapiens | ||
| Experiment 2 Reporting the Activity Date of This ADC | [21] | ||||
| Efficacy Data | Half Maximal Inhibitory Concentration (IC50) |
1.57 nM
|
High LGALS3BP expression (LGALS3BP +++) | ||
| Method Description |
In vitro cytotoxicity of ADCs against a panel of four multiple human glioblastoma cell lines.
|
||||
| In Vitro Model | Glioblastoma | Gch6 cells | Homo sapiens | ||
HuMov19-sulfo-SPDB-DM4 (DAR6.8) [Investigative]
Discovered Using Cell Line-derived Xenograft Model
| Experiment 1 Reporting the Activity Date of This ADC | [15] | ||||
| Efficacy Data | Tumor Growth Inhibition value (TGI) | ≈ 90.72% | Positive FOLR1 expression (FOLR1 +++/++) | ||
| Method Description |
Conjugates of the exemplary anti-FOLR1 antibodies were tested using an established xenograft model of KB cells implanted subcutaneous into SCID mice. Mice were randomized by body weight into treatment groups and treated once on day 6 post cell inoculation with 2.5 mg/kg of one of the conjugates listed above or with PBS only.
|
||||
| In Vivo Model | KB CDX model | ||||
| In Vitro Model | Human papillomavirus-related endocervical adenocarcinoma | KB cells | CVCL_0372 | ||
| Experiment 2 Reporting the Activity Date of This ADC | [15] | ||||
| Efficacy Data | Tumor Growth Inhibition value (TGI) | ≈ 100% | Positive FOLR1 expression (FOLR1 +++/++) | ||
| Method Description |
Conjugates of the exemplary anti-FOLR1 antibodies were tested using an established xenograft model of KB cells implanted subcutaneous into SCID mice. Mice were randomized by body weight into treatment groups and treated once on day 6 post cell inoculation with 5 mg/kg of one of the conjugates listed above or with PBS only.
|
||||
| In Vivo Model | KB CDX model | ||||
| In Vitro Model | Human papillomavirus-related endocervical adenocarcinoma | KB cells | CVCL_0372 | ||
HuMov19-SPDB-DM4 [Investigative]
Discovered Using Cell Line-derived Xenograft Model
| Experiment 1 Reporting the Activity Date of This ADC | [15] | ||||
| Efficacy Data | Tumor Growth Inhibition value (TGI) | ≈ 95.72% | Positive FOLR1 expression (FOLR1 +++/++) | ||
| Method Description |
Mice were randomized by body weight into treatment groups and reated either singly (SPDB conjugates) on day 3 post cell inoculation, or three times weekly on days 3, 10, and 17 post KB cell inoculation with 5 mg/kg of a conjugate.
|
||||
| In Vivo Model | KB CDX model | ||||
| In Vitro Model | Human papillomavirus-related endocervical adenocarcinoma | KB cells | CVCL_0372 | ||
| Experiment 2 Reporting the Activity Date of This ADC | [15] | ||||
| Efficacy Data | Tumor Growth Inhibition value (TGI) | ≈ 96.08% | Positive FOLR1 expression (FOLR1 +++/++) | ||
| Method Description |
Conjugates of the exemplary anti-FOLR1 antibodies were tested using an established xenograft model of KB cells implanted subcutaneous into SCID mice. Mice were randomized by body weight into treatment groups and treated once on day 6 post cell inoculation with 2.5 mg/kg of one of the conjugates listed above or with PBS only.
|
||||
| In Vivo Model | KB CDX model | ||||
| In Vitro Model | Human papillomavirus-related endocervical adenocarcinoma | KB cells | CVCL_0372 | ||
| Experiment 3 Reporting the Activity Date of This ADC | [15] | ||||
| Efficacy Data | Tumor Growth Inhibition value (TGI) | ≈ 100% | Positive FOLR1 expression (FOLR1 +++/++) | ||
| Method Description |
Conjugates of the exemplary anti-FOLR1 antibodies were tested using an established xenograft model of KB cells implanted subcutaneous into SCID mice. Mice were randomized by body weight into treatment groups and treated once on day 6 post cell inoculation with 5 mg/kg of one of the conjugates listed above or with PBS only.
|
||||
| In Vivo Model | KB CDX model | ||||
| In Vitro Model | Human papillomavirus-related endocervical adenocarcinoma | KB cells | CVCL_0372 | ||
| Experiment 4 Reporting the Activity Date of This ADC | [15] | ||||
| Efficacy Data | Half Maximal Inhibitory Concentration (IC50) |
0.1 nM
|
Positive FOLR1 expression (FOLR1 +++/++) | ||
| Method Description |
Conjugate in various concentrations was added to FOLR1-expressing cells in a 96 well plate at 1,000 cells per well in 100 pL in complete RPMI medium.
|
||||
| In Vitro Model | Ovarian endometrioid adenocarcinoma | IGROV-1 cells | CVCL_1304 | ||
| Experiment 5 Reporting the Activity Date of This ADC | [15] | ||||
| Efficacy Data | Half Maximal Inhibitory Concentration (IC50) |
0.1 nM
|
Positive FOLR1 expression (FOLR1 +++/++) | ||
| Method Description |
Conjugate in various concentrations was added to FOLR1-expressing cells in a 96 well plate at 1,000 cells per well in 100 pL in complete RPMI medium.
|
||||
| In Vitro Model | Human papillomavirus-related endocervical adenocarcinoma | KB cells | CVCL_0372 | ||
| Experiment 6 Reporting the Activity Date of This ADC | [15] | ||||
| Efficacy Data | Half Maximal Inhibitory Concentration (IC50) |
0.2 nM
|
Moderate FOLR1 expression (FOLR1 ++) | ||
| Method Description |
Conjugate in various concentrations was added to FOLR1-expressing cells in a 96 well plate at 1,000 cells per well in 100 pL in complete RPMI medium.
|
||||
| In Vitro Model | Gestational choriocarcinoma | JEG-3 cells | CVCL_0363 | ||
HuMov19-sulfo-SPDB-DM4 (DAR3.8) [Investigative]
Discovered Using Cell Line-derived Xenograft Model
| Experiment 1 Reporting the Activity Date of This ADC | [15] | ||||
| Efficacy Data | Tumor Growth Inhibition value (TGI) | ≈ 96.08% | Positive FOLR1 expression (FOLR1 +++/++) | ||
| Method Description |
Conjugates of the exemplary anti-FOLR1 antibodies were tested using an established xenograft model of KB cells implanted subcutaneous into SCID mice. Mice were randomized by body weight into treatment groups and treated once on day 6 post cell inoculation with 2.5 mg/kg of one of the conjugates listed above or with PBS only.
|
||||
| In Vivo Model | KB CDX model | ||||
| In Vitro Model | Human papillomavirus-related endocervical adenocarcinoma | KB cells | CVCL_0372 | ||
| Experiment 2 Reporting the Activity Date of This ADC | [15] | ||||
| Efficacy Data | Tumor Growth Inhibition value (TGI) | ≈ 100% | Positive FOLR1 expression (FOLR1 +++/++) | ||
| Method Description |
Conjugates of the exemplary anti-FOLR1 antibodies were tested using an established xenograft model of KB cells implanted subcutaneous into SCID mice. Mice were randomized by body weight into treatment groups and treated once on day 6 post cell inoculation with 5 mg/kg of one of the conjugates listed above or with PBS only.
|
||||
| In Vivo Model | KB CDX model | ||||
| In Vitro Model | Human papillomavirus-related endocervical adenocarcinoma | KB cells | CVCL_0372 | ||
| Experiment 3 Reporting the Activity Date of This ADC | [15] | ||||
| Efficacy Data | Half Maximal Inhibitory Concentration (IC50) |
0.1 nM
|
Positive FOLR1 expression (FOLR1 +++/++) | ||
| Method Description |
Conjugate in various concentrations was added to FOLR1-expressing cells in a 96 well plate at 1,000 cells per well in 100 pL in complete RPMI medium.
|
||||
| In Vitro Model | Human papillomavirus-related endocervical adenocarcinoma | KB cells | CVCL_0372 | ||
| Experiment 4 Reporting the Activity Date of This ADC | [15] | ||||
| Efficacy Data | Half Maximal Inhibitory Concentration (IC50) |
0.3 nM
|
Positive FOLR1 expression (FOLR1 +++/++) | ||
| Method Description |
Conjugate in various concentrations was added to FOLR1-expressing cells in a 96 well plate at 1,000 cells per well in 100 pL in complete RPMI medium.
|
||||
| In Vitro Model | Ovarian endometrioid adenocarcinoma | IGROV-1 cells | CVCL_1304 | ||
| Experiment 5 Reporting the Activity Date of This ADC | [15] | ||||
| Efficacy Data | Half Maximal Inhibitory Concentration (IC50) |
3 nM
|
Moderate FOLR1 expression (FOLR1 ++) | ||
| Method Description |
Conjugate in various concentrations was added to FOLR1-expressing cells in a 96 well plate at 1,000 cells per well in 100 pL in complete RPMI medium.
|
||||
| In Vitro Model | Gestational choriocarcinoma | JEG-3 cells | CVCL_0363 | ||
Anti-FGFR2 mAb-12433 SPDB-DM4 [Investigative]
Discovered Using Cell Line-derived Xenograft Model
| Experiment 1 Reporting the Activity Date of This ADC | [22] | ||||
| Efficacy Data | Tumor Growth Inhibition value (TGI) | ≈ 100% | Positive FGFR2 expression (FGFR2+++/++) | ||
| Method Description |
The total injection volume containing cells in suspension was 200 ul. Mice were enrolled in the first study eight days post implantation with average tumor volume of 233 mm3. After being randomly assigned to one of nine groups (n =8/group), mice were administered PBS or a single 5 mg/kg intravenous (i.v,) injection of one antibody drug conjugates.
Click to Show/Hide
|
||||
| In Vivo Model | SNU-16 CDX model | ||||
| In Vitro Model | Gastric adenocarcinoma | SNU-16 cells | CVCL_0076 | ||
Revealed Based on the Cell Line Data
| Experiment 1 Reporting the Activity Date of This ADC | [22] | ||||
| Efficacy Data | Half Maximal Inhibitory Concentration (IC50) |
0.8 nM
|
Positive FGFR2 expression (FGFR2+++/++) | ||
| Method Description |
Cells were counted and seeded in 96 well plates at densities of 2600-3600 cells/well in 100 ul of cell culture medium, A duplicate plate was generated for a day 0 measurement and all plates were incubated in a tissue culture incubator at 37°C with 5% CO2 overnight. Following this incubation, 50 ul/well of Cell titer Glo reagent was added to the day 0 plates, which were then shaken gently for 10 min and the resulting luminescence intensity was measured.
Click to Show/Hide
|
||||
| In Vitro Model | Gastric adenocarcinoma | SNU-16 cells | CVCL_0076 | ||
M9346A-SPDB-DM4 [Investigative]
Discovered Using Cell Line-derived Xenograft Model
| Experiment 1 Reporting the Activity Date of This ADC | [15] | ||||
| Efficacy Data | Tumor Growth Inhibition value (TGI) | ≈ 100% | Positive FOLR1 expression (FOLR1 +++/++) | ||
| Method Description |
Conjugates of the exemplary anti-FOLR1 antibodies were tested using an established xenograft model of OVCAR-3 cells implanted subcutaneous into SCID mice. Mice were randomized by body weight into treatment groups and treated once post cell inoculation with 5 mg/kg of one of the conjugates listed above or with PBS only.
|
||||
| In Vivo Model | OVCAR-3 CDX model | ||||
| In Vitro Model | Ovarian serous adenocarcinoma | OVCAR-3 cells | CVCL_0465 | ||
M9346A-sulfo-Mal-DM4 [Investigative]
Discovered Using Cell Line-derived Xenograft Model
| Experiment 1 Reporting the Activity Date of This ADC | [15] | ||||
| Efficacy Data | Tumor Growth Inhibition value (TGI) | ≈ 100% | Positive FOLR1 expression (FOLR1 +++/++) | ||
| Method Description |
Conjugates of the exemplary anti-FOLR1 antibodies were tested using an established xenograft model of OVCAR-3 cells implanted subcutaneous into SCID mice. Mice were randomized by body weight into treatment groups and treated once post cell inoculation with 5 mg/kg of one of the conjugates listed above or with PBS only.
|
||||
| In Vivo Model | OVCAR-3 CDX model | ||||
| In Vitro Model | Ovarian serous adenocarcinoma | OVCAR-3 cells | CVCL_0465 | ||
HuDS6v1.01-DM4 [Investigative]
Discovered Using Cell Line-derived Xenograft Model
| Experiment 1 Reporting the Activity Date of This ADC | [23] | ||||
| Efficacy Data | Tumor Growth Inhibition value (TGI) | ≈ 100% | Positive CA6 expression (CA6 +++/++) | ||
| Method Description |
The in vivo activity of huDS6v1.01-DM4 was tested onthe HPAC pancreatic model.HPAC cells were inoculated on Day 0, and immunoconjugate treatments were given on day13 (20 ug/kg). PBS control animals were euthanized once tumor vol-umes exceeded 1000 mm3.
|
||||
| In Vivo Model | HPAC CDX model | ||||
| In Vitro Model | Pancreatic adenocarcinoma | HPAC cells | CVCL_3517 | ||
Revealed Based on the Cell Line Data
| Experiment 1 Reporting the Activity Date of This ADC | [23] | ||||
| Efficacy Data | Half Maximal Inhibitory Concentration (IC50) | < 10 nM | Positive CA6 expression (CA6 +++/++) | ||
| Method Description |
In the MTT assay, cells were seeded in 96-well plates ata density of 1000-5000 cells/well. The cells were plated with serial dilutions of huDS6v1.01-DM4 immunoconjugate in 200 pl of culture media. The cells and antibody/conjugate mixtures were then incubated for 2-7 d, at which time cellviability was assessed by an MTT assay.
|
||||
| In Vitro Model | Human papillomavirus-related endocervical adenocarcinoma | KB cells | CVCL_0372 | ||
Anti-FGFR2/4 mAb-12425 SPDB-DM4 [Investigative]
Revealed Based on the Cell Line Data
| Experiment 1 Reporting the Activity Date of This ADC | [22] | ||||
| Efficacy Data | Half Maximal Inhibitory Concentration (IC50) |
0.04 nM
|
Positive FGFR2 expression (FGFR2+++/++) | ||
| Method Description |
Cells were counted and seeded in 96 well plates at densities of 2600-3600 cells/well in 100 ul of cell culture medium, A duplicate plate was generated for a day 0 measurement and all plates were incubated in a tissue culture incubator at 37°C with 5% CO2 overnight. Following this incubation, 50 ul/well of Cell titer Glo reagent was added to the day 0 plates, which were then shaken gently for 10 min and the resulting luminescence intensity was measured.
Click to Show/Hide
|
||||
| In Vitro Model | Gastric adenocarcinoma | SNU-16 cells | CVCL_0076 | ||
Anti-FGFR2/4 mAb-12422 SPDB-DM4 [Investigative]
Revealed Based on the Cell Line Data
| Experiment 1 Reporting the Activity Date of This ADC | [22] | ||||
| Efficacy Data | Half Maximal Inhibitory Concentration (IC50) |
0.07 nM
|
Positive FGFR2 expression (FGFR2+++/++) | ||
| Method Description |
Cells were counted and seeded in 96 well plates at densities of 2600-3600 cells/well in 100 ul of cell culture medium, A duplicate plate was generated for a day 0 measurement and all plates were incubated in a tissue culture incubator at 37°C with 5% CO2 overnight. Following this incubation, 50 ul/well of Cell titer Glo reagent was added to the day 0 plates, which were then shaken gently for 10 min and the resulting luminescence intensity was measured.
Click to Show/Hide
|
||||
| In Vitro Model | Gastric adenocarcinoma | SNU-16 cells | CVCL_0076 | ||
Farletuzumab-sulfo SPDB-DM4 [Investigative]
Revealed Based on the Cell Line Data
| Experiment 1 Reporting the Activity Date of This ADC | [24] | ||||
| Efficacy Data | Half Maximal Inhibitory Concentration (IC50) |
0.09 nM
|
High FOLR1 expression(FOLR1+++) | ||
| Method Description |
Cells were sub-cultured and seeded at 5,000 cells/well in complete growth medium in 96-well tissue culture plates, and incubated at 37°C, 5% CO2 overnight. Test reagents were serially diluted and added to the cell plates (initial concentration of 100 nM). Plates were incubated at 37°C, 5% CO2 for an additional 3 d.
|
||||
| In Vitro Model | Ovarian endometrioid adenocarcinoma | IGROV-1 cells | CVCL_1304 | ||
| Experiment 2 Reporting the Activity Date of This ADC | [24] | ||||
| Efficacy Data | Half Maximal Inhibitory Concentration (IC50) |
0.49 nM
|
Moderate FOLR1 expression(FOLR1++) | ||
| Method Description |
Cells were sub-cultured and seeded at 5,000 cells/well in complete growth medium in 96-well tissue culture plates, and incubated at 37°C, 5% CO2 overnight. Test reagents were serially diluted and added to the cell plates (initial concentration of 100 nM). Plates were incubated at 37°C, 5% CO2 for an additional 3 d.
|
||||
| In Vitro Model | Ovarian serous adenocarcinoma | OVCAR-3 cells | CVCL_0465 | ||
| Experiment 3 Reporting the Activity Date of This ADC | [24] | ||||
| Efficacy Data | Half Maximal Inhibitory Concentration (IC50) |
0.52 nM
|
Moderate FOLR1 expression(FOLR1++) | ||
| Method Description |
Cells were sub-cultured and seeded at 5,000 cells/well in complete growth medium in 96-well tissue culture plates, and incubated at 37°C, 5% CO2 overnight. Test reagents were serially diluted and added to the cell plates (initial concentration of 100 nM). Plates were incubated at 37°C, 5% CO2 for an additional 3 d.
|
||||
| In Vitro Model | Lung non-small cell carcinoma | NCI-H2110 cells | CVCL_1530 | ||
| Experiment 4 Reporting the Activity Date of This ADC | [24] | ||||
| Efficacy Data | Half Maximal Inhibitory Concentration (IC50) |
0.85 nM
|
Low FOLR1 expression(FOLR1+) | ||
| Method Description |
Cells were sub-cultured and seeded at 5,000 cells/well in complete growth medium in 96-well tissue culture plates, and incubated at 37°C, 5% CO2 overnight. Test reagents were serially diluted and added to the cell plates (initial concentration of 100 nM). Plates were incubated at 37°C, 5% CO2 for an additional 3 d.
|
||||
| In Vitro Model | Gastric tubular adenocarcinoma | NCI-N87 cells | CVCL_1603 | ||
| Experiment 5 Reporting the Activity Date of This ADC | [24] | ||||
| Efficacy Data | Half Maximal Inhibitory Concentration (IC50) |
4.28 nM
|
Negative FOLR1 expression(FOLR1-) | ||
| Method Description |
Cells were sub-cultured and seeded at 5,000 cells/well in complete growth medium in 96-well tissue culture plates, and incubated at 37°C, 5% CO2 overnight. Test reagents were serially diluted and added to the cell plates (initial concentration of 100 nM). Plates were incubated at 37°C, 5% CO2 for an additional 3 d.
|
||||
| In Vitro Model | Skin squamous cell carcinoma | A431 cells | CVCL_0037 | ||
HuFR1-21-PEG4-Mal-DM4 [Investigative]
Revealed Based on the Cell Line Data
| Experiment 1 Reporting the Activity Date of This ADC | [15] | ||||
| Efficacy Data | Half Maximal Inhibitory Concentration (IC50) |
0.1 nM
|
Positive FOLR1 expression (FOLR1 +++/++) | ||
| Method Description |
FOLR1-expressing SKOV3 cells were incubated with varying concentrations of anti FOLR1 antibodies or their conjugates and processed.
|
||||
| In Vitro Model | Ovarian serous cystadenocarcinoma | SK-OV-3 cells | CVCL_0532 | ||
MuFR1-21-PEG4-Mal-DM4 [Investigative]
Revealed Based on the Cell Line Data
| Experiment 1 Reporting the Activity Date of This ADC | [15] | ||||
| Efficacy Data | Half Maximal Inhibitory Concentration (IC50) |
0.1 nM
|
Positive FOLR1 expression (FOLR1 +++/++) | ||
| Method Description |
FOLR1-expressing SKOV3 cells were incubated with varying concentrations of anti FOLR1 antibodies or their conjugates and processed.
|
||||
| In Vitro Model | Ovarian serous cystadenocarcinoma | SK-OV-3 cells | CVCL_0532 | ||
CNTO95-SPDB-DM4 [Investigative]
Revealed Based on the Cell Line Data
| Experiment 1 Reporting the Activity Date of This ADC | [14] | ||||
| Efficacy Data | Half Maximal Effective Concentration (EC50) |
0.24 ug/mL
|
Positive ITGAV expression (ITGAV +++/++) | ||
| Method Description |
Cells were seeded into white 96-well tissue culture plates (5000 cells/well)in culture medium and incubated for 16 hrs. Serial dilutions of immunoconjugates were added toeach appropraite wells (0-20 ug/ml). Tissue culture plates were incubated at 37°C for 96 hrs.
|
||||
| In Vitro Model | Colon cancer | HT29 cells | CVCL_A8EZ | ||
| Experiment 2 Reporting the Activity Date of This ADC | [14] | ||||
| Efficacy Data | Half Maximal Effective Concentration (EC50) |
0.3 ug/mL
|
Positive ITGAV expression (ITGAV +++/++) | ||
| Method Description |
Cells were seeded into white 96-well tissue culture plates (5000 cells/well)in culture medium and incubated for 16 hrs. Serial dilutions of immunoconjugates were added toeach appropraite wells (0-20 ug/ml). Tissue culture plates were incubated at 37°C for 96 hrs.
|
||||
| In Vitro Model | Lung adenocarcinoma | A-549 cells | CVCL_0023 | ||
| Experiment 3 Reporting the Activity Date of This ADC | [14] | ||||
| Efficacy Data | Half Maximal Effective Concentration (EC50) |
0.21 mg/mL
|
Positive ITGAV expression (ITGAV +++/++) | ||
| Method Description |
Cells were harvested, rinsedsuspended in serum free DMEM, and sequentially incubated for 60 minutes on ice with serialdiluted CNTO 95,CNTO 364, CNTO 365 and CNTO 366 and FITC-labeled anti-humanantibody (10 mg/ml).
|
||||
| In Vitro Model | Colon cancer | HT29 cells | CVCL_A8EZ | ||
| Experiment 4 Reporting the Activity Date of This ADC | [14] | ||||
| Efficacy Data | Half Maximal Effective Concentration (EC50) |
0.27 mg/mL
|
Positive ITGAV expression (ITGAV +++/++) | ||
| Method Description |
Cells were harvested, rinsedsuspended in serum free DMEM, and sequentially incubated for 60 minutes on ice with serialdiluted CNTO 95,CNTO 364, CNTO 365 and CNTO 366 and FITC-labeled anti-humanantibody (10 mg/ml).
|
||||
| In Vitro Model | Ovarian endometrioid adenocarcinoma | A2780 cells | CVCL_0134 | ||
| Experiment 5 Reporting the Activity Date of This ADC | [14] | ||||
| Efficacy Data | Half Maximal Effective Concentration (EC50) |
0.34 mg/mL
|
Positive ITGAV expression (ITGAV +++/++) | ||
| Method Description |
Cells were harvested, rinsedsuspended in serum free DMEM, and sequentially incubated for 60 minutes on ice with serialdiluted CNTO 95,CNTO 364, CNTO 365 and CNTO 366 and FITC-labeled anti-humanantibody (10 mg/ml).
|
||||
| In Vitro Model | Lung adenocarcinoma | A-549 cells | CVCL_0023 | ||
CNTO95-SPP-DM4 [Investigative]
Revealed Based on the Cell Line Data
| Experiment 1 Reporting the Activity Date of This ADC | [14] | ||||
| Efficacy Data | Half Maximal Effective Concentration (EC50) |
1 ug/mL
|
Positive ITGAV expression (ITGAV +++/++) | ||
| Method Description |
Cells were seeded into white 96-well tissue culture plates (5000 cells/well)in culture medium and incubated for 16 hrs. Serial dilutions of immunoconjugates were added toeach appropraite wells (0-20 ug/ml). Tissue culture plates were incubated at 37°C for 96 hrs.
|
||||
| In Vitro Model | Colon cancer | HT29 cells | CVCL_A8EZ | ||
| Experiment 2 Reporting the Activity Date of This ADC | [14] | ||||
| Efficacy Data | Half Maximal Effective Concentration (EC50) |
1.5 ug/mL
|
Positive ITGAV expression (ITGAV +++/++) | ||
| Method Description |
Cells were seeded into white 96-well tissue culture plates (5000 cells/well)in culture medium and incubated for 16 hrs. Serial dilutions of immunoconjugates were added toeach appropraite wells (0-20 ug/ml). Tissue culture plates were incubated at 37°C for 96 hrs.
|
||||
| In Vitro Model | Lung adenocarcinoma | A-549 cells | CVCL_0023 | ||
| Experiment 3 Reporting the Activity Date of This ADC | [14] | ||||
| Efficacy Data | Half Maximal Effective Concentration (EC50) |
0.29 mg/mL
|
Positive ITGAV expression (ITGAV +++/++) | ||
| Method Description |
Cells were harvested, rinsedsuspended in serum free DMEM, and sequentially incubated for 60 minutes on ice with serialdiluted CNTO 95,CNTO 364, CNTO 365 and CNTO 366 and FITC-labeled anti-humanantibody (10 mg/ml).
|
||||
| In Vitro Model | Colon cancer | HT29 cells | CVCL_A8EZ | ||
| Experiment 4 Reporting the Activity Date of This ADC | [14] | ||||
| Efficacy Data | Half Maximal Effective Concentration (EC50) |
0.3 mg/mL
|
Positive ITGAV expression (ITGAV +++/++) | ||
| Method Description |
Cells were harvested, rinsedsuspended in serum free DMEM, and sequentially incubated for 60 minutes on ice with serialdiluted CNTO 95,CNTO 364, CNTO 365 and CNTO 366 and FITC-labeled anti-humanantibody (10 mg/ml).
|
||||
| In Vitro Model | Ovarian endometrioid adenocarcinoma | A2780 cells | CVCL_0134 | ||
| Experiment 5 Reporting the Activity Date of This ADC | [14] | ||||
| Efficacy Data | Half Maximal Effective Concentration (EC50) |
0.42 mg/mL
|
Positive ITGAV expression (ITGAV +++/++) | ||
| Method Description |
Cells were harvested, rinsedsuspended in serum free DMEM, and sequentially incubated for 60 minutes on ice with serialdiluted CNTO 95,CNTO 364, CNTO 365 and CNTO 366 and FITC-labeled anti-humanantibody (10 mg/ml).
|
||||
| In Vitro Model | Lung adenocarcinoma | A-549 cells | CVCL_0023 | ||
WO2024181570A1 ADC2 [Investigative]
Discovered Using Cell Line-derived Xenograft Model
| Experiment 1 Reporting the Activity Date of This ADC | [25] | ||||
| Efficacy Data | Tumor Growth lnhibition value (TGl) | ≈ 0% | Positive CD138 expression (CD138+++/++) | ||
| Method Description |
1x10⁷cells/100 uL, ADC3 at 1 mg/kg, intravenous injection,
|
||||
| In Vivo Model | Capan-1 derived Xenograft Model | ||||
| Experiment 2 Reporting the Activity Date of This ADC | [25] | ||||
| Efficacy Data | Tumor Growth lnhibition value (TGl) | ≈ 7% | Positive CD138 expression (CD138+++/++) | ||
| Method Description |
1x10⁷cells/100 uL, ADC3 at 1 mg/kg, intravenous injection,
|
||||
| In Vivo Model | Capan-1 derived Xenograft Model | ||||
| Experiment 3 Reporting the Activity Date of This ADC | [25] | ||||
| Efficacy Data | Tumor Growth lnhibition value (TGl) | ≈ 70% | Positive CD138 expression (CD138+++/++) | ||
| Method Description |
1x10⁷cells/100 uL, ADC3 at 1 mg/kg, intravenous injection,
|
||||
| In Vivo Model | Capan-1 derived Xenograft Model | ||||
Revealed Based on the Cell Line Data
| Experiment 1 Reporting the Activity Date of This ADC | [25] | ||||
| Efficacy Data | Half Maximal inhibitory Concentration (lC50) |
248 ng/mL
|
Positive CD138 expression (CD138+++/++) | ||
| Method Description |
1000 cells/well of Capan-1 in 96 well, 37 °C for 5 days.
|
||||
| In Vitro Model | Pancreatic ductal adenocarcinoma | Capan-1 cells | CVCL_0237 | ||
| Experiment 2 Reporting the Activity Date of This ADC | [25] | ||||
| Efficacy Data | Half Maximal inhibitory Concentration (lC50) |
274 ng/mL
|
Negative CD138 expression (CD138-) | ||
| Method Description |
1000 cells/well of Jurkat in 96 well, 37 °C for 5 days.
|
||||
| In Vitro Model | T acute lymphoblastic leukemia | Jurkat cells | CVCL_0065 | ||
T4H11-DM4 [Investigative]
Revealed Based on the Cell Line Data
| Experiment 1 Reporting the Activity Date of This ADC | [26] | ||||
| Efficacy Data | Half Maximal inhibitory Concentration (lC50) |
3.35۪.53 nM
|
Positive DDR1 expression (DDR1+++/++) | ||
| Method Description |
The in vitro cytotoxicity of T4H11 and T4H11-DM4 were evaluated in BC cell lines that expressed different levels of DDR1. The cells were plated at a density of 3.5-5 × 10² cells per 96-well in 100 ul of medium. After overnight incubation, T4H11 and T4H11-DM4 were diluted by consecutive double dilutions and added to different wells. The concentrations of the two drugs ranged from 1.95 to 1000 nM. After 72 h of drug exposure, cell viability was measured by Cell Counting Kit-8 (CCK-8; Dojindo, China) assays. The half-maximal inhibitory concentration (IC50) of the ADC was calculated using GraphPad Prism.
Click to Show/Hide
|
||||
| In Vitro Model | Invasive breast carcinoma | ZR-75-1 cells | CVCL_0588 | ||
| Experiment 2 Reporting the Activity Date of This ADC | [26] | ||||
| Efficacy Data | Half Maximal inhibitory Concentration (lC50) |
7.44۫.18 nM
|
Positive DDR1 expression (DDR1+++/++) | ||
| Method Description |
The in vitro cytotoxicity of T4H11 and T4H11-DM4 were evaluated in BC cell lines that expressed different levels of DDR1. The cells were plated at a density of 3.5-5 × 10² cells per 96-well in 100 ul of medium. After overnight incubation, T4H11 and T4H11-DM4 were diluted by consecutive double dilutions and added to different wells. The concentrations of the two drugs ranged from 1.95 to 1000 nM. After 72 h of drug exposure, cell viability was measured by Cell Counting Kit-8 (CCK-8; Dojindo, China) assays. The half-maximal inhibitory concentration (IC50) of the ADC was calculated using GraphPad Prism.
Click to Show/Hide
|
||||
| In Vitro Model | Invasive breast carcinoma of no special type | T47D cells | CVCL_0553 | ||
| Experiment 3 Reporting the Activity Date of This ADC | [26] | ||||
| Efficacy Data | Half Maximal inhibitory Concentration (lC50) |
13.85۬.08 nM
|
Positive DDR1 expression (DDR1+++/++) | ||
| Method Description |
The in vitro cytotoxicity of T4H11 and T4H11-DM4 were evaluated in BC cell lines that expressed different levels of DDR1. The cells were plated at a density of 3.5-5 × 10² cells per 96-well in 100 ul of medium. After overnight incubation, T4H11 and T4H11-DM4 were diluted by consecutive double dilutions and added to different wells. The concentrations of the two drugs ranged from 1.95 to 1000 nM. After 72 h of drug exposure, cell viability was measured by Cell Counting Kit-8 (CCK-8; Dojindo, China) assays. The half-maximal inhibitory concentration (IC50) of the ADC was calculated using GraphPad Prism.
Click to Show/Hide
|
||||
| In Vitro Model | Invasive breast carcinoma | BT-474 cells | CVCL_0179 | ||
| Experiment 4 Reporting the Activity Date of This ADC | [26] | ||||
| Efficacy Data | Half Maximal inhibitory Concentration (lC50) |
47.49۫.14 nM
|
Positive DDR1 expression (DDR1+++/++) | ||
| Method Description |
The in vitro cytotoxicity of T4H11 and T4H11-DM4 were evaluated in BC cell lines that expressed different levels of DDR1. The cells were plated at a density of 3.5-5 × 10² cells per 96-well in 100 ul of medium. After overnight incubation, T4H11 and T4H11-DM4 were diluted by consecutive double dilutions and added to different wells. The concentrations of the two drugs ranged from 1.95 to 1000 nM. After 72 h of drug exposure, cell viability was measured by Cell Counting Kit-8 (CCK-8; Dojindo, China) assays. The half-maximal inhibitory concentration (IC50) of the ADC was calculated using GraphPad Prism.
Click to Show/Hide
|
||||
| In Vitro Model | Breast adenocarcinoma | SK-BR-3 cells | CVCL_0033 | ||
| Experiment 5 Reporting the Activity Date of This ADC | [26] | ||||
| Efficacy Data | Half Maximal inhibitory Concentration (lC50) |
107.5۪.25 nM
|
Positive DDR1 expression (DDR1+++/++) | ||
| Method Description |
The in vitro cytotoxicity of T4H11 and T4H11-DM4 were evaluated in BC cell lines that expressed different levels of DDR1. The cells were plated at a density of 3.5-5 × 10² cells per 96-well in 100 ul of medium. After overnight incubation, T4H11 and T4H11-DM4 were diluted by consecutive double dilutions and added to different wells. The concentrations of the two drugs ranged from 1.95 to 1000 nM. After 72 h of drug exposure, cell viability was measured by Cell Counting Kit-8 (CCK-8; Dojindo, China) assays. The half-maximal inhibitory concentration (IC50) of the ADC was calculated using GraphPad Prism.
Click to Show/Hide
|
||||
| In Vitro Model | Breast adenocarcinoma | MDA-MB-231 cells | CVCL_0062 | ||
| Experiment 6 Reporting the Activity Date of This ADC | [26] | ||||
| Efficacy Data | Half Maximal inhibitory Concentration (lC50) | > 1000 nM | Positive DDR1 expression (DDR1+++/++) | ||
| Method Description |
The in vitro cytotoxicity of T4H11 and T4H11-DM4 were evaluated in BC cell lines that expressed different levels of DDR1. The cells were plated at a density of 3.5-5 × 10² cells per 96-well in 100 ul of medium. After overnight incubation, T4H11 and T4H11-DM4 were diluted by consecutive double dilutions and added to different wells. The concentrations of the two drugs ranged from 1.95 to 1000 nM. After 72 h of drug exposure, cell viability was measured by Cell Counting Kit-8 (CCK-8; Dojindo, China) assays. The half-maximal inhibitory concentration (IC50) of the ADC was calculated using GraphPad Prism.
Click to Show/Hide
|
||||
| In Vitro Model | Invasive breast carcinoma | MCF-7 cells | CVCL_0031 | ||
IN202417078684A+ADC5 [Investigative]
Revealed Based on the Cell Line Data
| Experiment 1 Reporting the Activity Date of This ADC | [27] | ||||
| Efficacy Data | Half Maximal inhibitory Concentration (lC50) |
927 ng/ml
|
|||
| Method Description |
The cytotoxicity of ADC against cell lines was evaluated by cell viability test with CellTiter-Glo 2.0 luminescence method.
|
||||
| Experiment 2 Reporting the Activity Date of This ADC | [27] | ||||
| Efficacy Data | Half Maximal inhibitory Concentration (lC50) |
2118 ng/ml
|
|||
| Method Description |
The cytotoxicity of ADC against cell lines was evaluated by cell viability test with CellTiter-Glo 2.0 luminescence method.
|
||||
References