Antigen Information
General Information of This Antigen
| Antigen ID | TAR0QHAVI |
|||||
|---|---|---|---|---|---|---|
| Antigen Name | Folate receptor alpha (FOLR1) |
|||||
| Gene Name | FOLR1 |
|||||
| Gene ID | ||||||
| Synonym | FOLR; Adult folate-binding protein;Folate receptor 1;Folate receptor, adult;KB cells FBP;Ovarian tumor-associated antigen MOv18 |
|||||
| Sequence |
MAQRMTTQLLLLLVWVAVVGEAQTRIAWARTELLNVCMNAKHHKEKPGPEDKLHEQCRPW
RKNACCSTNTSQEAHKDVSYLYRFNWNHCGEMAPACKRHFIQDTCLYECSPNLGPWIQQV DQSWRKERVLNVPLCKEDCEQWWEDCRTSYTCKSNWHKGWNWTSGFNKCAVGAACQPFHF YFPTPTVLCNEIWTHSYKVSNYSRGSGRCIQMWFDPAQGNPNEEVARFYAAAMSGAGPWA AWPFLLSLALMLLWLLS Click to Show/Hide
|
|||||
| Family | Ephrin family |
|||||
| Function |
Binds to folate and reduced folic acid derivatives and mediates delivery of 5-methyltetrahydrofolate and folate analogs into the interior of cells. Has high affinity for folate and folic acid analogs at neutral pH. Exposure to slightly acidic pH after receptor endocytosis triggers a conformation change that strongly reduces its affinity for folates and mediates their release. Required for normal embryonic development and normal cell proliferation.
Click to Show/Hide
|
|||||
| Uniprot Entry | ||||||
| HGNC ID | ||||||
| KEGG ID | ||||||
Each Antibody-drug Conjuate AND It's Component Related to This Antigen
Full List of The ADC Related to This Antigen
Ab-151
| ADC Info | ADC Name | Payload | Target | Linker | Ref |
|---|---|---|---|---|---|
AMT-151 |
Duostatin 5 |
Microtubule (MT) |
Undisclosed |
[1] |
Anti-FOLR1 huFR1-48
| ADC Info | ADC Name | Payload | Target | Linker | Ref |
|---|---|---|---|---|---|
HuFR1-48-SMCC-DM1 |
Mertansine DM1 |
Microtubule (MT) |
Succinimidyl-4-(N-maleimidomethyl)cyclohexane-1-carboxylate (SMCC) |
[2] |
Anti-FOLR1 huFR1-49
| ADC Info | ADC Name | Payload | Target | Linker | Ref |
|---|---|---|---|---|---|
HuFR1-49-SMCC-DM1 |
Mertansine DM1 |
Microtubule (MT) |
Succinimidyl-4-(N-maleimidomethyl)cyclohexane-1-carboxylate (SMCC) |
[2] |
Anti-FOLR1 huFR1-57
| ADC Info | ADC Name | Payload | Target | Linker | Ref |
|---|---|---|---|---|---|
HuFR1-57-SMCC-DM1 |
Mertansine DM1 |
Microtubule (MT) |
Succinimidyl-4-(N-maleimidomethyl)cyclohexane-1-carboxylate (SMCC) |
[2] |
Anti-FOLR1 huFR1-65
| ADC Info | ADC Name | Payload | Target | Linker | Ref |
|---|---|---|---|---|---|
HuFR1-65-SMCC-DM1 |
Mertansine DM1 |
Microtubule (MT) |
Succinimidyl-4-(N-maleimidomethyl)cyclohexane-1-carboxylate (SMCC) |
[2] |
Anti-FOLR1 mAb
| ADC Info | ADC Name | Payload | Target | Linker | Ref |
|---|---|---|---|---|---|
Anti-FOLR1-Ala-Ala-IGN |
Indolinobenzodiazepine dimer |
Human Deoxyribonucleic acid (hDNA) |
Ala-Ala dipeptide |
[3] | |
Anti-FOLR1-Val-Gln-IGN |
Indolinobenzodiazepine dimer |
Human Deoxyribonucleic acid (hDNA) |
Val-Gln dipeptide linker |
[3] | |
FOLR1-ADC 13a |
PBD dimer 13a |
Human Deoxyribonucleic acid (hDNA) |
Adipic acid-Val-Ala-PABC |
[4] | |
FOLR1-ADC 13b |
PBD dimer 13b |
Human Deoxyribonucleic acid (hDNA) |
Adipic acid-Val-Ala-PABC |
[4] | |
FOLR1-ADC 13c |
PBD dimer 13c |
Human Deoxyribonucleic acid (hDNA) |
Adipic acid-Val-Ala-PABC |
[4] | |
FOLR1-ADC 15 |
PBD dimer 13c |
Human Deoxyribonucleic acid (hDNA) |
Adipic acid-Val-CIt-PABC |
[4] |
F131
| ADC Info | ADC Name | Payload | Target | Linker | Ref |
|---|---|---|---|---|---|
F131-LD038 |
F131-LD038 payload |
Undisclosed |
F131-LD038 linker |
[5] | |
F131-LD100 |
F131-LD100 payload |
Undisclosed |
F131-LD100 linker |
[5] | |
F131-LD101 |
F131-LD101 payload |
Undisclosed |
F131-LD101 linker |
[5] | |
F131-LD110 |
F131-LD110 payload |
Undisclosed |
F131-LD110 linker |
[5] | |
F131-LD111 |
F131-LD111 payload |
Undisclosed |
F131-LD111 linker |
[5] |
Farletuzumab
| ADC Info | ADC Name | Payload | Target | Linker | Ref |
|---|---|---|---|---|---|
Farletuzumab ecteribulin |
Eribulin |
Microtubule (MT) |
Mal-PEG2Val-Cit-PAB-OH |
[6] | |
Farletuzumab-3-sulfo-Mal-DM4 |
Mertansine DM4 |
Microtubule (MT) |
3-sulfo-Mal |
[7] | |
Farletuzumab-PEG4-Mal-DM1 |
Mertansine DM1 |
Microtubule (MT) |
PEG4-Mal |
[7] | |
Farletuzumab-PEG4-Mal-DM4 |
Mertansine DM4 |
Microtubule (MT) |
PEG4-Mal |
[7] | |
Farletuzumab-SIA-DM1 |
Mertansine DM1 |
Microtubule (MT) |
N-succinimidyl iodoacetate (SIA) |
[7] | |
Farletuzumab-SMCC-DM1 |
Mertansine DM1 |
Microtubule (MT) |
Succinimidyl-4-(N-maleimidomethyl)cyclohexane-1-carboxylate (SMCC) |
[7] | |
Farletuzumab-SPDB-DM4 |
Mertansine DM4 |
Microtubule (MT) |
N-succinimidyl 4-(2-pyridyldithio) butanoate (SPDB) |
[7] | |
Farletuzumab-SPP-DM1 |
Mertansine DM1 |
Microtubule (MT) |
N-succinimidyl 4-(2-pyridyldithio) pentanoate (SPP) |
[7] | |
Farletuzumab-sulfo SPDB-DM4 |
Mertansine DM4 |
Microtubule (MT) |
Sulfo-SPDB |
[8] | |
Farletuzumab-sulfo-SPDB-DM4 |
Mertansine DM4 |
Microtubule (MT) |
Sulfo-SPDB |
[7] | |
FOLR1-Mal-Caproyl-Val-Cit-PABC-Eribulin |
Eribulin |
Microtubule (MT) |
Maleimide-Caproyl-Val-Cit-PABC |
[8] | |
FOLR1-Mal-Caproyl-Val-Cit-PABC-MMAE |
Monomethyl auristatin E |
Microtubule (MT) |
Maleimide-Caproyl-Val-Cit-PABC |
[8] | |
FOLR1-Mal-Caproyl-Val-Cit-PABC-MMAF |
Monomethyl auristatin F |
Microtubule (MT) |
Maleimide-Caproyl-Val-Cit-PABC |
[8] | |
FOLR1-Mal-PEG2-Ala-Ala-Asn-PABC-Eribulin |
Eribulin |
Microtubule (MT) |
Mal-PEG2-Ala-Ala-Asn-PABC |
[8] | |
FOLR1-Mal-PEG2-Eribulin |
Eribulin |
Microtubule (MT) |
Mal-PEG2 |
[8] | |
FOLR1-Mal-PEG2-Val-Cit-PABC-Eribulin |
Eribulin |
Microtubule (MT) |
Mal-PEG2-Val-Cit-PABC |
[8] | |
FOLR1-Mal-PEG4-Eribulin |
Eribulin |
Microtubule (MT) |
Mal-PEG4 |
[8] | |
FOLR1-Mal-PEG4-tria-PEG3-Dis-dim-PABC-Eribulin |
Eribulin |
Microtubule (MT) |
Mal-PEG4-triazole-PEG3-Disulfidyl-dimethyl-PABC |
[8] | |
FOLR1-Mal-PEG4-tria-PEG3-Sulfo-Eribulin |
Eribulin |
Microtubule (MT) |
Mal-PEG4-triazole-PEG3-Sulfonamide |
[8] | |
FOLR1-Mal-PEG8-Val-Cit-PABC-Eribulin |
Eribulin |
Microtubule (MT) |
Mal-PEG8-Val-Cit-PABC |
[8] | |
FOLR1-Mal-PEG-Val-Cit-PABC-Cryptophycin |
Cryptophycin |
Microtubule (MT) |
Mal-PEG-Val-Cit-PABC |
[8] | |
FOLR1-Suc/SPAAC-PEG2-Eribulin |
Eribulin |
Microtubule (MT) |
Succinamide-SPAAC-PEG2 |
[8] | |
FOLR1-Suc/SPAAC-PEG3-Dis-dim-PABC-Eribulin |
Eribulin |
Microtubule (MT) |
Succinamide-SPAAC-PEG3-Disylfidyl-dimethyl-PABC |
[8] | |
FOLR1-Suc/SPAAC-PEG3-Sulfonamide-Eribulin |
Eribulin |
Microtubule (MT) |
Succinamide-SPAAC-PEG3-Sulfonamide |
[8] | |
FOLR1-Suc/SPAAC-PEG4-Eribulin |
Eribulin |
Microtubule (MT) |
Succinamide-SPAAC-PEG4 |
[8] | |
FOLR1-Suc/SPAAC-PEG4-Val-Cit-PABC-Eribulin |
Eribulin |
Microtubule (MT) |
Succinamide-SPAAC-PEG4-Val-Cit-PABC |
[8] |
Fc-silent FR specific humanized IgG1 antibody
| ADC Info | ADC Name | Payload | Target | Linker | Ref |
|---|---|---|---|---|---|
LY-4170156 |
Exatecan |
DNA topoisomerase 1 (TOP1) |
Mal-Polysarcosine10-Val-Ala-PABC |
[9] |
FR1-21
| ADC Info | ADC Name | Payload | Target | Linker | Ref |
|---|---|---|---|---|---|
FR1-21-3-sulfo-Mal-DM4 |
Mertansine DM4 |
Microtubule (MT) |
3-sulfo-Mal |
[7] | |
FR1-21-PEG4-Mal-DM1 |
Mertansine DM1 |
Microtubule (MT) |
PEG4-Mal |
[7] | |
FR1-21-PEG4-Mal-DM4 |
Mertansine DM4 |
Microtubule (MT) |
PEG4-Mal |
[7] | |
FR1-21-SIA-DM1 |
Mertansine DM1 |
Microtubule (MT) |
N-succinimidyl iodoacetate (SIA) |
[7] | |
FR1-21-SMCC-DM1 |
Mertansine DM1 |
Microtubule (MT) |
Succinimidyl-4-(N-maleimidomethyl)cyclohexane-1-carboxylate (SMCC) |
[7] | |
FR1-21-SPDB-DM4 |
Mertansine DM4 |
Microtubule (MT) |
N-succinimidyl 4-(2-pyridyldithio) butanoate (SPDB) |
[7] | |
FR1-21-SPP-DM1 |
Mertansine DM1 |
Microtubule (MT) |
N-succinimidyl 4-(2-pyridyldithio) pentanoate (SPP) |
[7] | |
FR1-21-sulfo-SPDB-DM4 |
Mertansine DM4 |
Microtubule (MT) |
Sulfo-SPDB |
[7] |
FR1-48
| ADC Info | ADC Name | Payload | Target | Linker | Ref |
|---|---|---|---|---|---|
FR1-48-3-sulfo-Mal-DM4 |
Mertansine DM4 |
Microtubule (MT) |
3-sulfo-Mal |
[7] | |
FR1-48-PEG4-Mal-DM1 |
Mertansine DM1 |
Microtubule (MT) |
PEG4-Mal |
[7] | |
FR1-48-PEG4-Mal-DM4 |
Mertansine DM4 |
Microtubule (MT) |
PEG4-Mal |
[7] | |
FR1-48-SIA-DM1 |
Mertansine DM1 |
Microtubule (MT) |
N-succinimidyl iodoacetate (SIA) |
[7] | |
FR1-48-SMCC-DM1 |
Mertansine DM1 |
Microtubule (MT) |
Succinimidyl-4-(N-maleimidomethyl)cyclohexane-1-carboxylate (SMCC) |
[7] | |
FR1-48-SPDB-DM4 |
Mertansine DM4 |
Microtubule (MT) |
N-succinimidyl 4-(2-pyridyldithio) butanoate (SPDB) |
[7] | |
FR1-48-SPP-DM1 |
Mertansine DM1 |
Microtubule (MT) |
N-succinimidyl 4-(2-pyridyldithio) pentanoate (SPP) |
[7] | |
FR1-48-sulfo-SPDB-DM4 |
Mertansine DM4 |
Microtubule (MT) |
Sulfo-SPDB |
[7] |
FR1-49
| ADC Info | ADC Name | Payload | Target | Linker | Ref |
|---|---|---|---|---|---|
FR1-49-3-sulfo-Mal-DM4 |
Mertansine DM4 |
Microtubule (MT) |
3-sulfo-Mal |
[7] | |
FR1-49-PEG4-Mal-DM1 |
Mertansine DM1 |
Microtubule (MT) |
PEG4-Mal |
[7] | |
FR1-49-PEG4-Mal-DM4 |
Mertansine DM4 |
Microtubule (MT) |
PEG4-Mal |
[7] | |
FR1-49-SIA-DM1 |
Mertansine DM1 |
Microtubule (MT) |
N-succinimidyl iodoacetate (SIA) |
[7] | |
FR1-49-SMCC-DM1 |
Mertansine DM1 |
Microtubule (MT) |
Succinimidyl-4-(N-maleimidomethyl)cyclohexane-1-carboxylate (SMCC) |
[7] | |
FR1-49-SPDB-DM4 |
Mertansine DM4 |
Microtubule (MT) |
N-succinimidyl 4-(2-pyridyldithio) butanoate (SPDB) |
[7] | |
FR1-49-SPP-DM1 |
Mertansine DM1 |
Microtubule (MT) |
N-succinimidyl 4-(2-pyridyldithio) pentanoate (SPP) |
[7] | |
FR1-49-sulfo-SPDB-DM4 |
Mertansine DM4 |
Microtubule (MT) |
Sulfo-SPDB |
[7] |
FR1-57
| ADC Info | ADC Name | Payload | Target | Linker | Ref |
|---|---|---|---|---|---|
FR1-57-3-sulfo-Mal-DM4 |
Mertansine DM4 |
Microtubule (MT) |
3-sulfo-Mal |
[7] | |
FR1-57-PEG4-Mal-DM1 |
Mertansine DM1 |
Microtubule (MT) |
PEG4-Mal |
[7] | |
FR1-57-PEG4-Mal-DM4 |
Mertansine DM4 |
Microtubule (MT) |
PEG4-Mal |
[7] | |
FR1-57-SIA-DM1 |
Mertansine DM1 |
Microtubule (MT) |
N-succinimidyl iodoacetate (SIA) |
[7] | |
FR1-57-SMCC-DM1 |
Mertansine DM1 |
Microtubule (MT) |
Succinimidyl-4-(N-maleimidomethyl)cyclohexane-1-carboxylate (SMCC) |
[7] | |
FR1-57-SPDB-DM4 |
Mertansine DM4 |
Microtubule (MT) |
N-succinimidyl 4-(2-pyridyldithio) butanoate (SPDB) |
[7] | |
FR1-57-SPP-DM1 |
Mertansine DM1 |
Microtubule (MT) |
N-succinimidyl 4-(2-pyridyldithio) pentanoate (SPP) |
[7] | |
FR1-57-sulfo-SPDB-DM4 |
Mertansine DM4 |
Microtubule (MT) |
Sulfo-SPDB |
[7] |
FR1-65
| ADC Info | ADC Name | Payload | Target | Linker | Ref |
|---|---|---|---|---|---|
FR1-65-3-sulfo-Mal-DM4 |
Mertansine DM4 |
Microtubule (MT) |
3-sulfo-Mal |
[7] | |
FR1-65-PEG4-Mal-DM1 |
Mertansine DM1 |
Microtubule (MT) |
PEG4-Mal |
[7] | |
FR1-65-PEG4-Mal-DM4 |
Mertansine DM4 |
Microtubule (MT) |
PEG4-Mal |
[7] | |
FR1-65-SIA-DM1 |
Mertansine DM1 |
Microtubule (MT) |
N-succinimidyl iodoacetate (SIA) |
[7] | |
FR1-65-SMCC-DM1 |
Mertansine DM1 |
Microtubule (MT) |
Succinimidyl-4-(N-maleimidomethyl)cyclohexane-1-carboxylate (SMCC) |
[7] | |
FR1-65-SPDB-DM4 |
Mertansine DM4 |
Microtubule (MT) |
N-succinimidyl 4-(2-pyridyldithio) butanoate (SPDB) |
[7] | |
FR1-65-SPP-DM1 |
Mertansine DM1 |
Microtubule (MT) |
N-succinimidyl 4-(2-pyridyldithio) pentanoate (SPP) |
[7] | |
FR1-65-sulfo-SPDB-DM4 |
Mertansine DM4 |
Microtubule (MT) |
Sulfo-SPDB |
[7] |
huFR1-21
| ADC Info | ADC Name | Payload | Target | Linker | Ref |
|---|---|---|---|---|---|
huFR1-21-3-sulfo-Mal-DM4 |
Mertansine DM4 |
Microtubule (MT) |
3-sulfo-Mal |
[7] | |
huFR1-21-PEG4-Mal-DM1 |
Mertansine DM1 |
Microtubule (MT) |
PEG4-Mal |
[7] | |
huFR1-21-PEG4-Mal-DM4 |
Mertansine DM4 |
Microtubule (MT) |
PEG4-Mal |
[7] | |
huFR1-21-SIA-DM1 |
Mertansine DM1 |
Microtubule (MT) |
N-succinimidyl iodoacetate (SIA) |
[7] | |
huFR1-21-SMCC-DM1 |
Mertansine DM1 |
Microtubule (MT) |
Succinimidyl-4-(N-maleimidomethyl)cyclohexane-1-carboxylate (SMCC) |
[7] | |
huFR1-21-SPDB-DM4 |
Mertansine DM4 |
Microtubule (MT) |
N-succinimidyl 4-(2-pyridyldithio) butanoate (SPDB) |
[7] | |
huFR1-21-SPP-DM1 |
Mertansine DM1 |
Microtubule (MT) |
N-succinimidyl 4-(2-pyridyldithio) pentanoate (SPP) |
[7] | |
huFR1-21-sulfo-SPDB-DM4 |
Mertansine DM4 |
Microtubule (MT) |
Sulfo-SPDB |
[7] |
huFR1-23
| ADC Info | ADC Name | Payload | Target | Linker | Ref |
|---|---|---|---|---|---|
huFR1-23-3-sulfo-Mal-DM4 |
Mertansine DM4 |
Microtubule (MT) |
3-sulfo-Mal |
[7] | |
huFR1-23-PEG4-Mal-DM1 |
Mertansine DM1 |
Microtubule (MT) |
PEG4-Mal |
[7] | |
huFR1-23-PEG4-Mal-DM4 |
Mertansine DM4 |
Microtubule (MT) |
PEG4-Mal |
[7] | |
huFR1-23-SIA-DM1 |
Mertansine DM1 |
Microtubule (MT) |
N-succinimidyl iodoacetate (SIA) |
[7] | |
huFR1-23-SMCC-DM1 |
Mertansine DM1 |
Microtubule (MT) |
Succinimidyl-4-(N-maleimidomethyl)cyclohexane-1-carboxylate (SMCC) |
[7] | |
huFR1-23-SPDB-DM4 |
Mertansine DM4 |
Microtubule (MT) |
N-succinimidyl 4-(2-pyridyldithio) butanoate (SPDB) |
[7] | |
huFR1-23-SPP-DM1 |
Mertansine DM1 |
Microtubule (MT) |
N-succinimidyl 4-(2-pyridyldithio) pentanoate (SPP) |
[7] | |
huFR1-23-sulfo-SPDB-DM4 |
Mertansine DM4 |
Microtubule (MT) |
Sulfo-SPDB |
[7] |
Humanized Anti-FOLR1 IgG1 mAb
| ADC Info | ADC Name | Payload | Target | Linker | Ref |
|---|---|---|---|---|---|
ZW191 |
ZD06519 |
DNA topoisomerase 1 (TOP1) |
Mc-Gly-Gly-Phe-Gly-AM |
[10] |
huMov19
| ADC Info | ADC Name | Payload | Target | Linker | Ref |
|---|---|---|---|---|---|
huMov19-3-sulfo-Mal-DM4 (DAR 3.7) |
Mertansine DM4 |
Microtubule (MT) |
3-sulfo-Mal |
[7] | |
huMov19-3-sulfo-Mal-DM4 (DAR 8.23) |
Mertansine DM4 |
Microtubule (MT) |
3-sulfo-Mal |
[7] | |
huMov19-PEG4-Mal-DM1 |
Mertansine DM1 |
Microtubule (MT) |
PEG4-Mal |
[7] | |
huMov19-PEG4-Mal-DM4 |
Mertansine DM4 |
Microtubule (MT) |
PEG4-Mal |
[7] | |
huMov19-SIA-DM1 |
Mertansine DM1 |
Microtubule (MT) |
N-succinimidyl iodoacetate (SIA) |
[7] | |
huMov19-SMCC-DM1 |
Mertansine DM1 |
Microtubule (MT) |
Succinimidyl-4-(N-maleimidomethyl)cyclohexane-1-carboxylate (SMCC) |
[7] | |
huMov19-SPDB-DM4 |
Mertansine DM4 |
Microtubule (MT) |
N-succinimidyl 4-(2-pyridyldithio) butanoate (SPDB) |
[7] | |
huMov19-SPP-DM1 |
Mertansine DM1 |
Microtubule (MT) |
N-succinimidyl 4-(2-pyridyldithio) pentanoate (SPP) |
[7] | |
huMov19-sulfo-SPDB-DM4 (DAR3.8) |
Mertansine DM4 |
Microtubule (MT) |
Sulfo-SPDB |
[7] | |
huMov19-sulfo-SPDB-DM4 (DAR6.8) |
Mertansine DM4 |
Microtubule (MT) |
Sulfo-SPDB |
[7] |
huMOV19v1.0
| ADC Info | ADC Name | Payload | Target | Linker | Ref |
|---|---|---|---|---|---|
huMOV19v1.0-3-sulfo-Mal-DM4 |
Mertansine DM4 |
Microtubule (MT) |
3-sulfo-Mal |
[7] | |
huMOV19v1.0-PEG4-Mal-DM1 |
Mertansine DM1 |
Microtubule (MT) |
PEG4-Mal |
[7] | |
huMOV19v1.0-PEG4-Mal-DM4 |
Mertansine DM4 |
Microtubule (MT) |
PEG4-Mal |
[7] | |
huMOV19v1.0-SIA-DM1 |
Mertansine DM1 |
Microtubule (MT) |
N-succinimidyl iodoacetate (SIA) |
[7] | |
huMOV19v1.0-SMCC-DM1 |
Mertansine DM1 |
Microtubule (MT) |
Succinimidyl-4-(N-maleimidomethyl)cyclohexane-1-carboxylate (SMCC) |
[7] | |
huMOV19v1.0-SPDB-DM4 |
Mertansine DM4 |
Microtubule (MT) |
N-succinimidyl 4-(2-pyridyldithio) butanoate (SPDB) |
[7] | |
huMOV19v1.0-SPP-DM1 |
Mertansine DM1 |
Microtubule (MT) |
N-succinimidyl 4-(2-pyridyldithio) pentanoate (SPP) |
[7] | |
huMOV19v1.0-sulfo-SPDB-DM4 |
Mertansine DM4 |
Microtubule (MT) |
Sulfo-SPDB |
[7] |
huMOV19v1.6
| ADC Info | ADC Name | Payload | Target | Linker | Ref |
|---|---|---|---|---|---|
huMOV19v1.6-3-sulfo-Mal-DM4 |
Mertansine DM4 |
Microtubule (MT) |
3-sulfo-Mal |
[7] | |
huMOV19v1.6-PEG4-Mal-DM1 |
Mertansine DM1 |
Microtubule (MT) |
PEG4-Mal |
[7] | |
huMOV19v1.6-PEG4-Mal-DM4 |
Mertansine DM4 |
Microtubule (MT) |
PEG4-Mal |
[7] | |
huMOV19v1.6-SIA-DM1 |
Mertansine DM1 |
Microtubule (MT) |
N-succinimidyl iodoacetate (SIA) |
[7] | |
huMOV19v1.6-SMCC-DM1 |
Mertansine DM1 |
Microtubule (MT) |
Succinimidyl-4-(N-maleimidomethyl)cyclohexane-1-carboxylate (SMCC) |
[7] | |
huMOV19v1.6-SPDB-DM4 |
Mertansine DM4 |
Microtubule (MT) |
N-succinimidyl 4-(2-pyridyldithio) butanoate (SPDB) |
[7] | |
huMOV19v1.6-SPP-DM1 |
Mertansine DM1 |
Microtubule (MT) |
N-succinimidyl 4-(2-pyridyldithio) pentanoate (SPP) |
[7] | |
huMOV19v1.6-sulfo-SPDB-DM4 |
Mertansine DM4 |
Microtubule (MT) |
Sulfo-SPDB |
[7] |
Isumab01
| ADC Info | ADC Name | Payload | Target | Linker | Ref |
|---|---|---|---|---|---|
IKS-01 |
FGX2-62 |
Human Deoxyribonucleic acid (hDNA) |
Undisclosed |
[11] |
Luveltamab
| ADC Info | ADC Name | Payload | Target | Linker | Ref |
|---|---|---|---|---|---|
Luveltamab tazevibulin |
SC209 |
Microtubule (MT) |
Val-Cit-PABA |
[12] |
Mirvetuximab
| ADC Info | ADC Name | Payload | Target | Linker | Ref |
|---|---|---|---|---|---|
Mirvetuximab soravtansine |
Mertansine DM4 |
Microtubule (MT) |
Sulfo-SPDB |
[13] | |
M9346A Sulfo-SPDB DM4 |
Mertansine DM4 |
Microtubule (MT) |
Sulfo-SPDB |
[2] | |
M9346A-CX-DM1 |
Mertansine DM1 |
Microtubule (MT) |
triglycyl peptide linker CX |
[14] | |
M9346A-SMCC-DM1 |
Mertansine DM1 |
Microtubule (MT) |
Succinimidyl-4-(N-maleimidomethyl)cyclohexane-1-carboxylate (SMCC) |
[7] | |
M9346A-SPDB-DM4 |
Mertansine DM4 |
Microtubule (MT) |
N-succinimidyl 4-(2-pyridyldithio) butanoate (SPDB) |
[7] | |
M9346A-SPP-DM1 |
Mertansine DM1 |
Microtubule (MT) |
N-succinimidyl 4-(2-pyridyldithio) pentanoate (SPP) |
[7] | |
M9346A-sulfo-Mal-DM4 |
Mertansine DM4 |
Microtubule (MT) |
3-sulfo-Mal |
[7] | |
Mirvetuximab-SMCC-DM1 |
Mertansine DM1 |
Microtubule (MT) |
Succinimidyl-4-(N-maleimidomethyl)cyclohexane-1-carboxylate (SMCC) |
[2] | |
Mirvetuximab-SPDB-DM4 |
Mertansine DM4 |
Microtubule (MT) |
N-succinimidyl 4-(2-pyridyldithio) butanoate (SPDB) |
[15] | |
Mirvetuximab-SPP-DM1 |
Mertansine DM1 |
Microtubule (MT) |
N-succinimidyl 4-(2-pyridyldithio) pentanoate (SPP) |
[2] |
Mirvetuximab (engineered cysteine HC-C118)
| ADC Info | ADC Name | Payload | Target | Linker | Ref |
|---|---|---|---|---|---|
M9346A-4c-Cxxx-Mal-CX-DM1 |
Mertansine DM1 |
Microtubule (MT) |
Cxxx-Mal-CX |
[14] |
Mirvetuximab (engineered cysteine HC-C239)
| ADC Info | ADC Name | Payload | Target | Linker | Ref |
|---|---|---|---|---|---|
M9346A-4d-Cxxx-Mal-CX-DM1 |
Mertansine DM1 |
Microtubule (MT) |
Cxxx-Mal-CX |
[14] |
Mirvetuximab (engineered cysteine LC-C205)
| ADC Info | ADC Name | Payload | Target | Linker | Ref |
|---|---|---|---|---|---|
M9346A-4a-Cxxx-Mal-CX-DM1 |
Mertansine DM1 |
Microtubule (MT) |
Cxxx-Mal-CX |
[14] |
Mirvetuximab (engineered cysteine LC-C400)
| ADC Info | ADC Name | Payload | Target | Linker | Ref |
|---|---|---|---|---|---|
M9346A-4b-Cxxx-Mal-CX-DM1 |
Mertansine DM1 |
Microtubule (MT) |
Cxxx-Mal-CX |
[14] |
Mov19
| ADC Info | ADC Name | Payload | Target | Linker | Ref |
|---|---|---|---|---|---|
Mov19-3-sulfo-Mal-DM4 |
Mertansine DM4 |
Microtubule (MT) |
3-sulfo-Mal |
[7] | |
Mov19-PEG4-Mal-DM1 |
Mertansine DM1 |
Microtubule (MT) |
PEG4-Mal |
[7] | |
Mov19-PEG4-Mal-DM4 |
Mertansine DM4 |
Microtubule (MT) |
PEG4-Mal |
[7] | |
Mov19-SIA-DM1 |
Mertansine DM1 |
Microtubule (MT) |
N-succinimidyl iodoacetate (SIA) |
[7] | |
Mov19-SMCC-DM1 |
Mertansine DM1 |
Microtubule (MT) |
Succinimidyl-4-(N-maleimidomethyl)cyclohexane-1-carboxylate (SMCC) |
[7] | |
Mov19-SPDB-DM4 |
Mertansine DM4 |
Microtubule (MT) |
N-succinimidyl 4-(2-pyridyldithio) butanoate (SPDB) |
[7] | |
Mov19-SPP-DM1 |
Mertansine DM1 |
Microtubule (MT) |
N-succinimidyl 4-(2-pyridyldithio) pentanoate (SPP) |
[7] | |
Mov19-sulfo-SPDB-DM4 |
Mertansine DM4 |
Microtubule (MT) |
Sulfo-SPDB |
[7] |
mu-FR1-13
| ADC Info | ADC Name | Payload | Target | Linker | Ref |
|---|---|---|---|---|---|
muFR1-13-3-sulfo-Mal-DM4 |
Mertansine DM4 |
Microtubule (MT) |
3-sulfo-Mal |
[7] | |
muFR1-13-PEG4-Mal-DM1 |
Mertansine DM1 |
Microtubule (MT) |
PEG4-Mal |
[7] | |
muFR1-13-PEG4-Mal-DM4 |
Mertansine DM4 |
Microtubule (MT) |
PEG4-Mal |
[7] | |
muFR1-13-SIA-DM1 |
Mertansine DM1 |
Microtubule (MT) |
N-succinimidyl iodoacetate (SIA) |
[7] | |
muFR1-13-SMCC-DM1 |
Mertansine DM1 |
Microtubule (MT) |
Succinimidyl-4-(N-maleimidomethyl)cyclohexane-1-carboxylate (SMCC) |
[7] | |
muFR1-13-SPDB-DM4 |
Mertansine DM4 |
Microtubule (MT) |
N-succinimidyl 4-(2-pyridyldithio) butanoate (SPDB) |
[7] | |
muFR1-13-SPP-DM1 |
Mertansine DM1 |
Microtubule (MT) |
N-succinimidyl 4-(2-pyridyldithio) pentanoate (SPP) |
[7] | |
muFR1-13-sulfo-SPDB-DM4 |
Mertansine DM4 |
Microtubule (MT) |
Sulfo-SPDB |
[7] |
mu-FR1-21
| ADC Info | ADC Name | Payload | Target | Linker | Ref |
|---|---|---|---|---|---|
muFR1-21-3-sulfo-Mal-DM4 |
Mertansine DM4 |
Microtubule (MT) |
3-sulfo-Mal |
[7] | |
muFR1-21-PEG4-Mal-DM1 |
Mertansine DM1 |
Microtubule (MT) |
PEG4-Mal |
[7] | |
muFR1-21-PEG4-Mal-DM4 |
Mertansine DM4 |
Microtubule (MT) |
PEG4-Mal |
[7] | |
muFR1-21-SIA-DM1 |
Mertansine DM1 |
Microtubule (MT) |
N-succinimidyl iodoacetate (SIA) |
[7] | |
muFR1-21-SMCC-DM1 |
Mertansine DM1 |
Microtubule (MT) |
Succinimidyl-4-(N-maleimidomethyl)cyclohexane-1-carboxylate (SMCC) |
[7] | |
muFR1-21-SPDB-DM4 |
Mertansine DM4 |
Microtubule (MT) |
N-succinimidyl 4-(2-pyridyldithio) butanoate (SPDB) |
[7] | |
muFR1-21-SPP-DM1 |
Mertansine DM1 |
Microtubule (MT) |
N-succinimidyl 4-(2-pyridyldithio) pentanoate (SPP) |
[7] | |
muFR1-21-sulfo-SPDB-DM4 |
Mertansine DM4 |
Microtubule (MT) |
Sulfo-SPDB |
[7] |
mu-FR1-22
| ADC Info | ADC Name | Payload | Target | Linker | Ref |
|---|---|---|---|---|---|
muFR1-22-3-sulfo-Mal-DM4 |
Mertansine DM4 |
Microtubule (MT) |
3-sulfo-Mal |
[7] | |
muFR1-22-PEG4-Mal-DM1 |
Mertansine DM1 |
Microtubule (MT) |
PEG4-Mal |
[7] | |
muFR1-22-PEG4-Mal-DM4 |
Mertansine DM4 |
Microtubule (MT) |
PEG4-Mal |
[7] | |
muFR1-22-SIA-DM1 |
Mertansine DM1 |
Microtubule (MT) |
N-succinimidyl iodoacetate (SIA) |
[7] | |
muFR1-22-SMCC-DM1 |
Mertansine DM1 |
Microtubule (MT) |
Succinimidyl-4-(N-maleimidomethyl)cyclohexane-1-carboxylate (SMCC) |
[7] | |
muFR1-22-SPDB-DM4 |
Mertansine DM4 |
Microtubule (MT) |
N-succinimidyl 4-(2-pyridyldithio) butanoate (SPDB) |
[7] | |
muFR1-22-SPP-DM1 |
Mertansine DM1 |
Microtubule (MT) |
N-succinimidyl 4-(2-pyridyldithio) pentanoate (SPP) |
[7] | |
muFR1-22-sulfo-SPDB-DM4 |
Mertansine DM4 |
Microtubule (MT) |
Sulfo-SPDB |
[7] |
mu-FR1-23
| ADC Info | ADC Name | Payload | Target | Linker | Ref |
|---|---|---|---|---|---|
muFR1-23-3-sulfo-Mal-DM4 |
Mertansine DM4 |
Microtubule (MT) |
3-sulfo-Mal |
[7] | |
muFR1-23-PEG4-Mal-DM1 |
Mertansine DM1 |
Microtubule (MT) |
PEG4-Mal |
[7] | |
muFR1-23-PEG4-Mal-DM4 |
Mertansine DM4 |
Microtubule (MT) |
PEG4-Mal |
[7] | |
muFR1-23-SIA-DM1 |
Mertansine DM1 |
Microtubule (MT) |
N-succinimidyl iodoacetate (SIA) |
[7] | |
muFR1-23-SMCC-DM1 |
Mertansine DM1 |
Microtubule (MT) |
Succinimidyl-4-(N-maleimidomethyl)cyclohexane-1-carboxylate (SMCC) |
[7] | |
muFR1-23-SPDB-DM4 |
Mertansine DM4 |
Microtubule (MT) |
N-succinimidyl 4-(2-pyridyldithio) butanoate (SPDB) |
[7] | |
muFR1-23-SPP-DM1 |
Mertansine DM1 |
Microtubule (MT) |
N-succinimidyl 4-(2-pyridyldithio) pentanoate (SPP) |
[7] | |
muFR1-23-sulfo-SPDB-DM4 |
Mertansine DM4 |
Microtubule (MT) |
Sulfo-SPDB |
[7] |
mu-FR1-9
| ADC Info | ADC Name | Payload | Target | Linker | Ref |
|---|---|---|---|---|---|
muFR1-9-3-sulfo-Mal-DM4 |
Mertansine DM4 |
Microtubule (MT) |
3-sulfo-Mal |
[7] | |
muFR1-9-PEG4-Mal-DM1 |
Mertansine DM1 |
Microtubule (MT) |
PEG4-Mal |
[7] | |
muFR1-9-PEG4-Mal-DM4 |
Mertansine DM4 |
Microtubule (MT) |
PEG4-Mal |
[7] | |
muFR1-9-SIA-DM1 |
Mertansine DM1 |
Microtubule (MT) |
N-succinimidyl iodoacetate (SIA) |
[7] | |
muFR1-9-SMCC-DM1 |
Mertansine DM1 |
Microtubule (MT) |
Succinimidyl-4-(N-maleimidomethyl)cyclohexane-1-carboxylate (SMCC) |
[7] | |
muFR1-9-SPDB-DM4 |
Mertansine DM4 |
Microtubule (MT) |
N-succinimidyl 4-(2-pyridyldithio) butanoate (SPDB) |
[7] | |
muFR1-9-SPP-DM1 |
Mertansine DM1 |
Microtubule (MT) |
N-succinimidyl 4-(2-pyridyldithio) pentanoate (SPP) |
[7] | |
muFR1-9-sulfo-SPDB-DM4 |
Mertansine DM4 |
Microtubule (MT) |
Sulfo-SPDB |
[7] |
Opugotamig
| ADC Info | ADC Name | Payload | Target | Linker | Ref |
|---|---|---|---|---|---|
IMGN151 |
DM21-C |
Microtubule (MT) |
Stable cleavable peptide linker |
[16] |
Rinatabart
| ADC Info | ADC Name | Payload | Target | Linker | Ref |
|---|---|---|---|---|---|
PRO1184 |
Exatecan |
DNA topoisomerase 1 (TOP1) |
Cys-11 ADC linker |
[17] |
Undisclosed
| ADC Info | ADC Name | Payload | Target | Linker | Ref |
|---|---|---|---|---|---|
AZD5335 |
AZ14170132 |
DNA topoisomerase 1 (TOP1) |
Mal-PEG8-Val-Ala |
[18] | |
BAT8006 |
Exatecan |
DNA topoisomerase 1 (TOP1) |
Cleavable linker |
[19] | |
ALT-Q5 |
Undisclosed |
Undisclosed |
Undisclosed |
[20] | |
Anti-FolRa Iadc |
Undisclosed |
Undisclosed |
Undisclosed |
[21] | |
DNA-alkylating anti-FRalpha antibody-drug conjugate |
Undisclosed |
Undisclosed |
Undisclosed |
[22] | |
FOLR1 maytansinoid based antibody-drug conjugate |
Undisclosed |
Undisclosed |
Undisclosed |
[23] | |
IKS-012 |
Undisclosed |
Undisclosed |
Undisclosed |
[24] | |
M-DGN549 |
Undisclosed |
Undisclosed |
Undisclosed |
[25] | |
HuIgG1-SPDB-DM4 |
Mertansine DM4 |
Microtubule (MT) |
N-succinimidyl 4-(2-pyridyldithio) butanoate (SPDB) |
[2] | |
BB-17 |
Undisclosed |
Undisclosed |
Undisclosed |
[26] |
Tissue/Disease specific Abundances of This Antigen
Tissue specific Abundances of This Antigen
ICD Disease Classification 01
| Differential expression pattern of antigen in diseases | ||
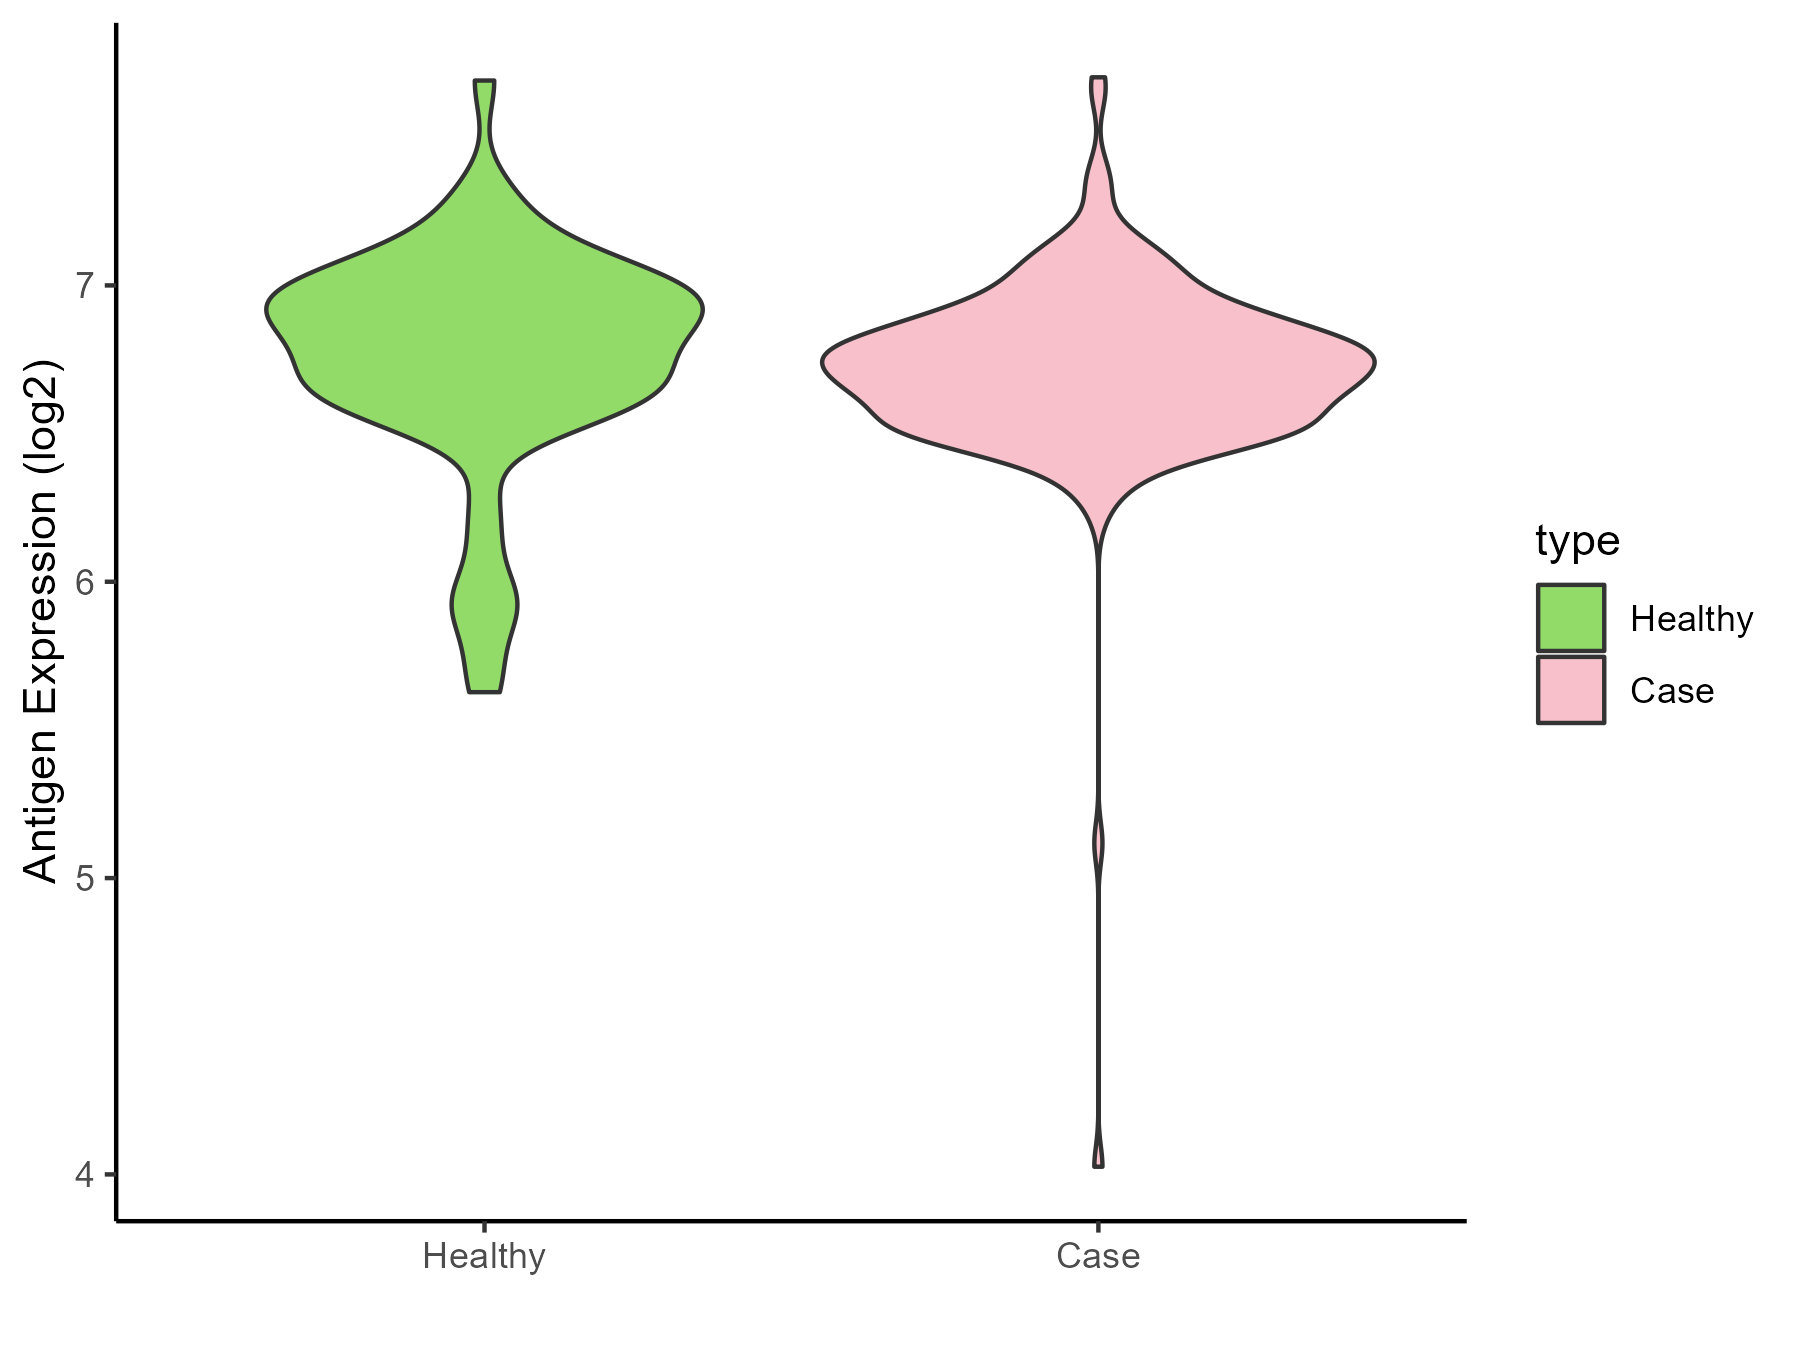
| The Studied Tissue | Gingival | |
| The Specific Disease | Bacterial infection of gingival | |
| The Expression Level of Disease Section Compare with the Healthy Individual Tissue | p-value: 0.416631034; Fold-change: -0.101542206; Z-score: -0.269317074 | |
| Disease-specific Antigen Abundances |
|
Click to View the Clearer Original Diagram |
ICD Disease Classification 02
| Differential expression pattern of antigen in diseases | ||
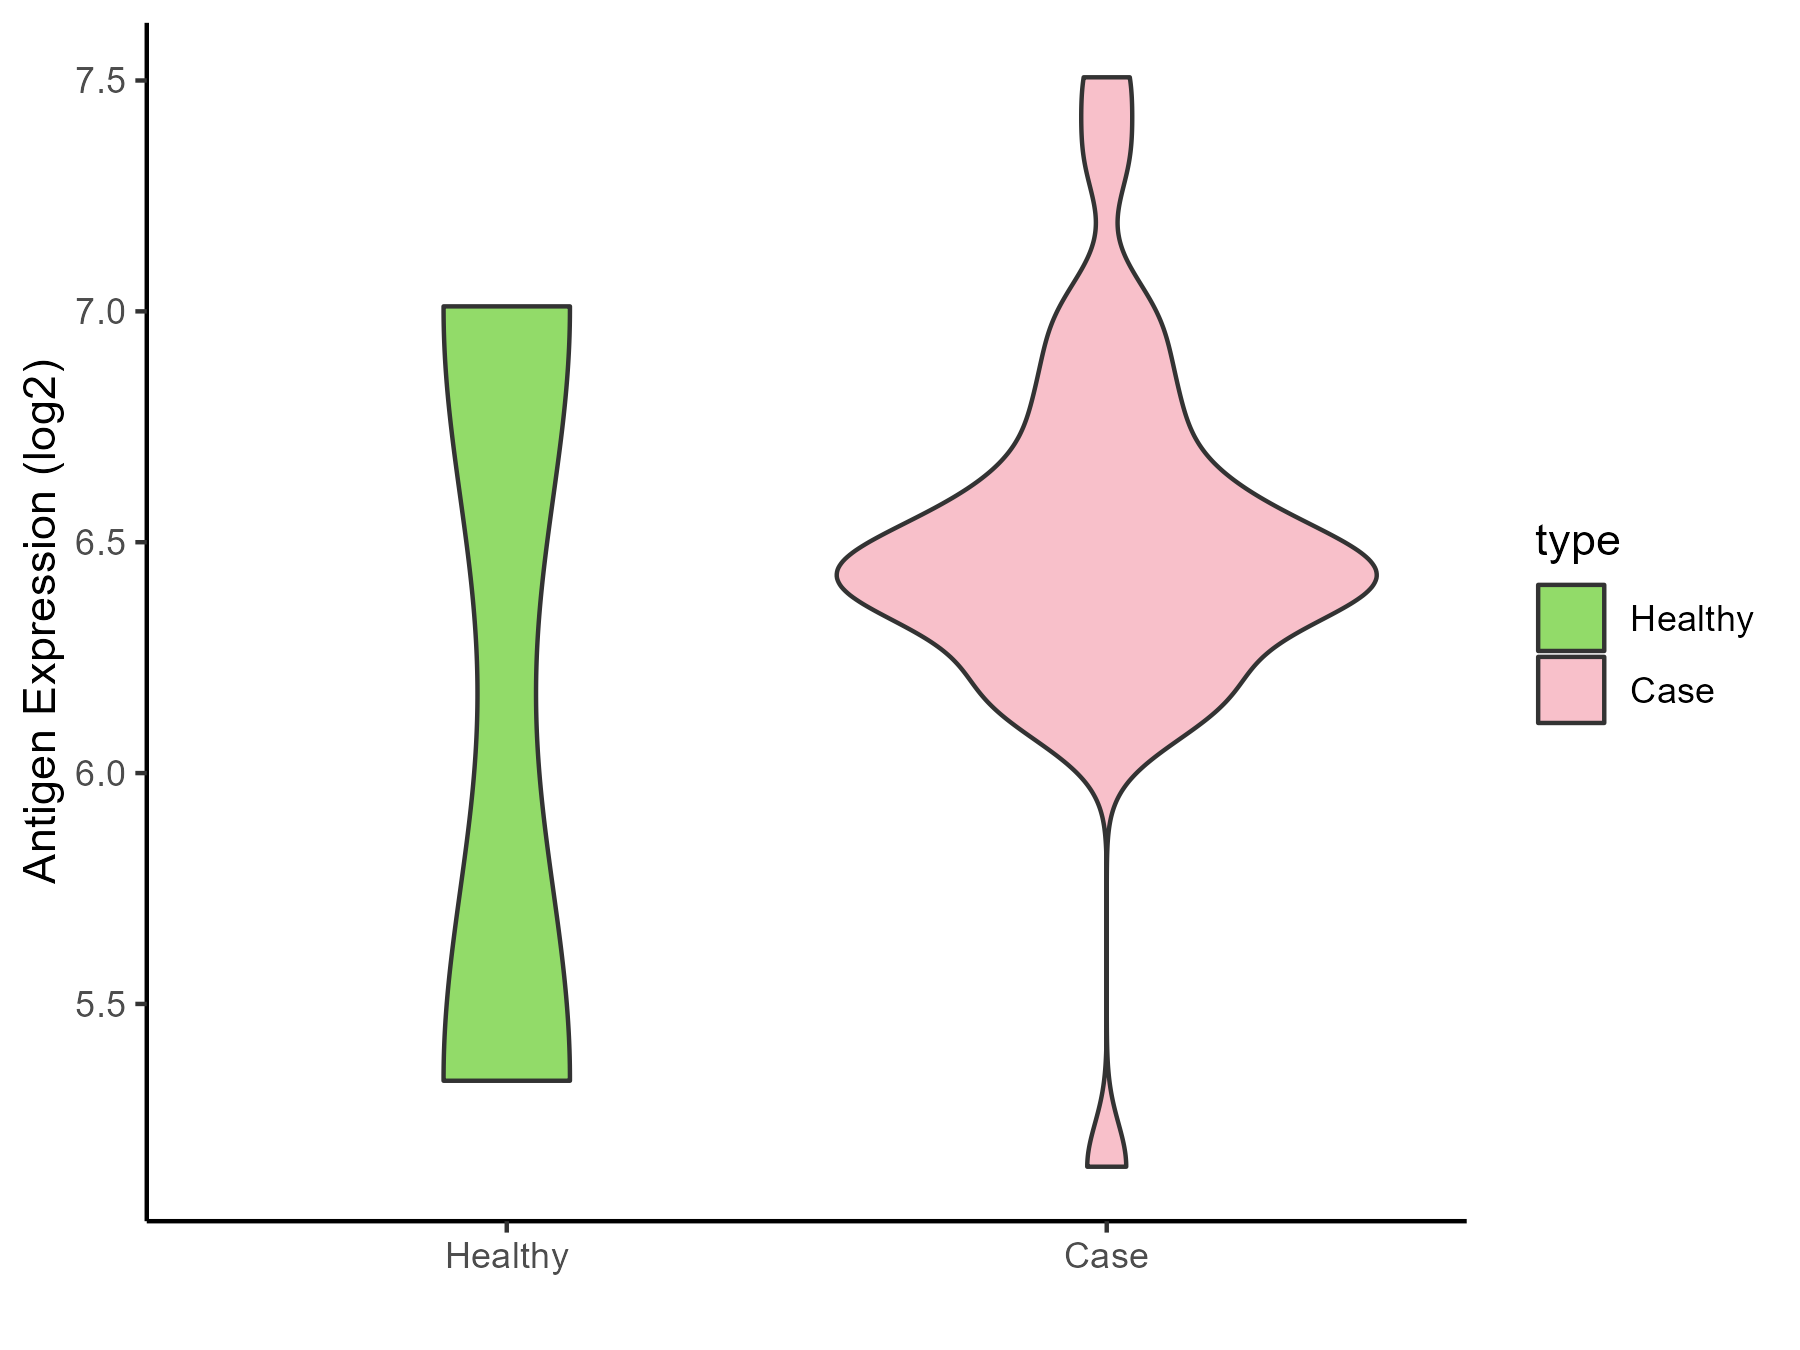
| The Studied Tissue | Brainstem | |
| The Specific Disease | Glioma | |
| The Expression Level of Disease Section Compare with the Healthy Individual Tissue | p-value: 0.767866434; Fold-change: 0.272303811; Z-score: 0.229612518 | |
| Disease-specific Antigen Abundances |
|
Click to View the Clearer Original Diagram |
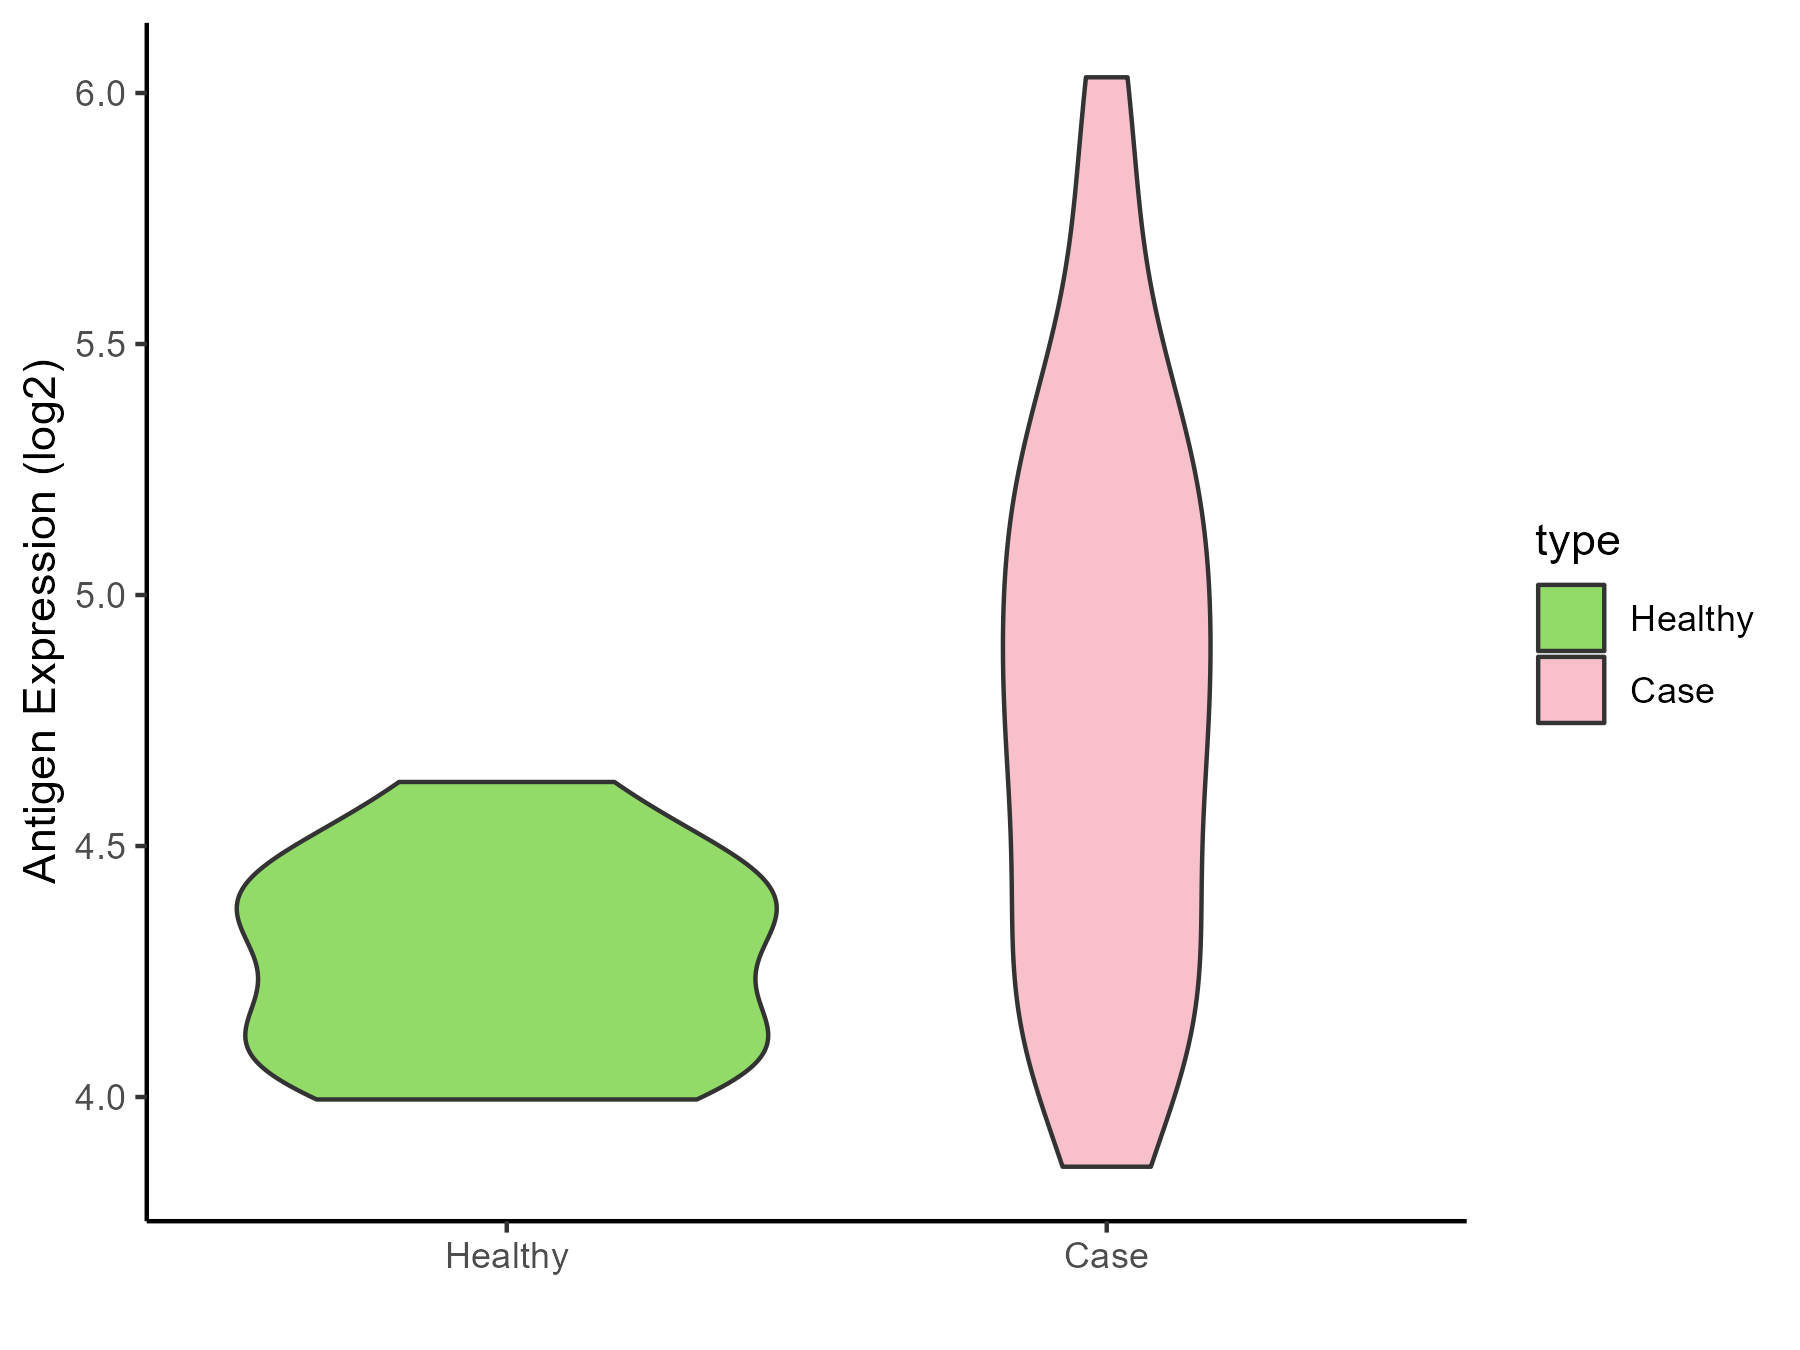
| The Studied Tissue | White matter | |
| The Specific Disease | Glioma | |
| The Expression Level of Disease Section Compare with the Healthy Individual Tissue | p-value: 1.49E-05; Fold-change: 0.472663157; Z-score: 2.337980161 | |
| Disease-specific Antigen Abundances |
|
Click to View the Clearer Original Diagram |
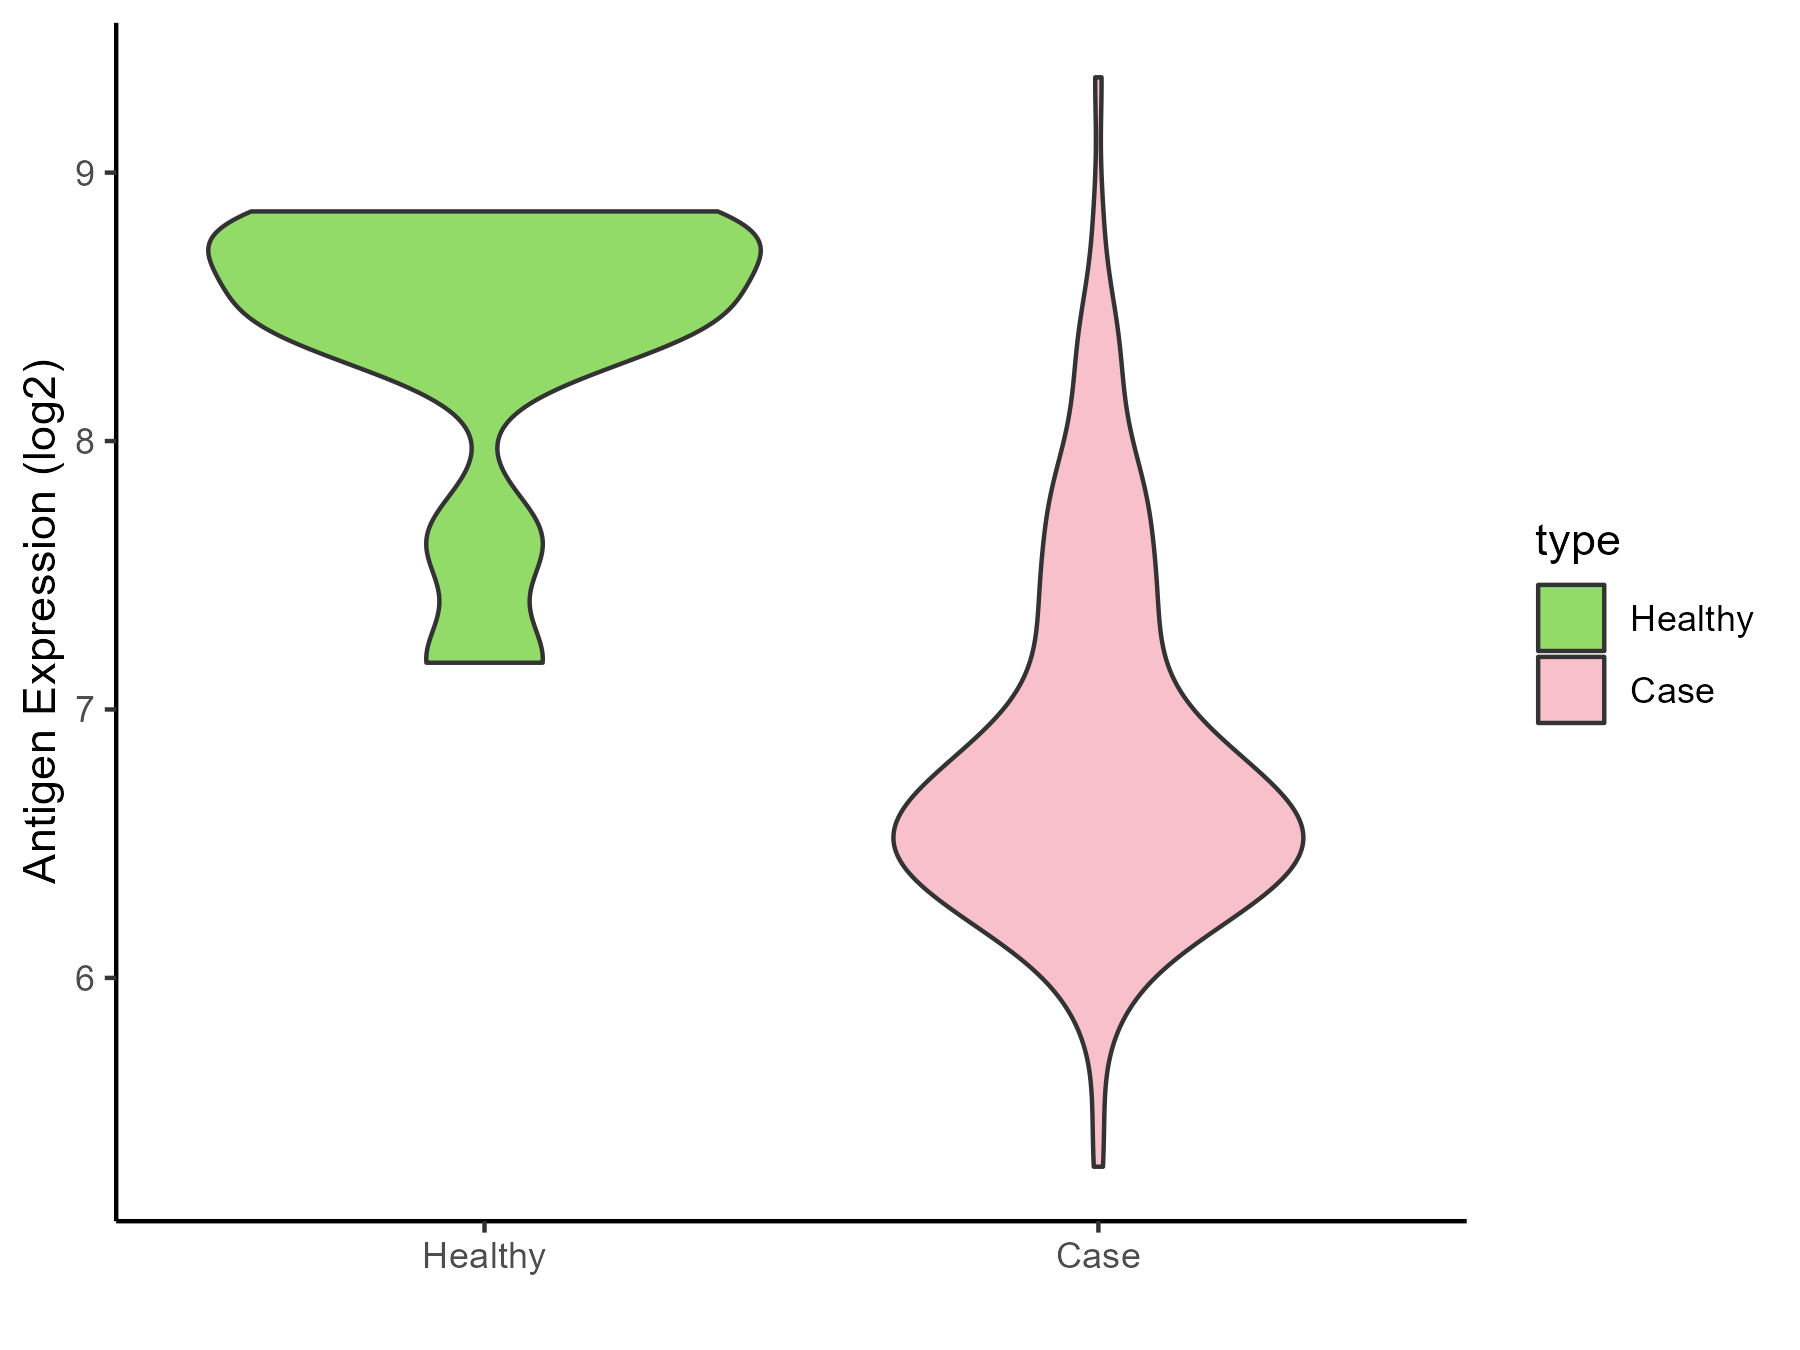
| The Studied Tissue | Brainstem | |
| The Specific Disease | Neuroectodermal tumor | |
| The Expression Level of Disease Section Compare with the Healthy Individual Tissue | p-value: 5.42E-06; Fold-change: -1.86570532; Z-score: -3.352427456 | |
| Disease-specific Antigen Abundances |
|
Click to View the Clearer Original Diagram |
| The Studied Tissue | Nervous | |
| The Specific Disease | Brain cancer | |
| The Expression Level of Disease Section Compare with the Healthy Individual Tissue | p-value: 0.000173461; Fold-change: -0.117057172; Z-score: -0.16702187 | |
| Disease-specific Antigen Abundances |
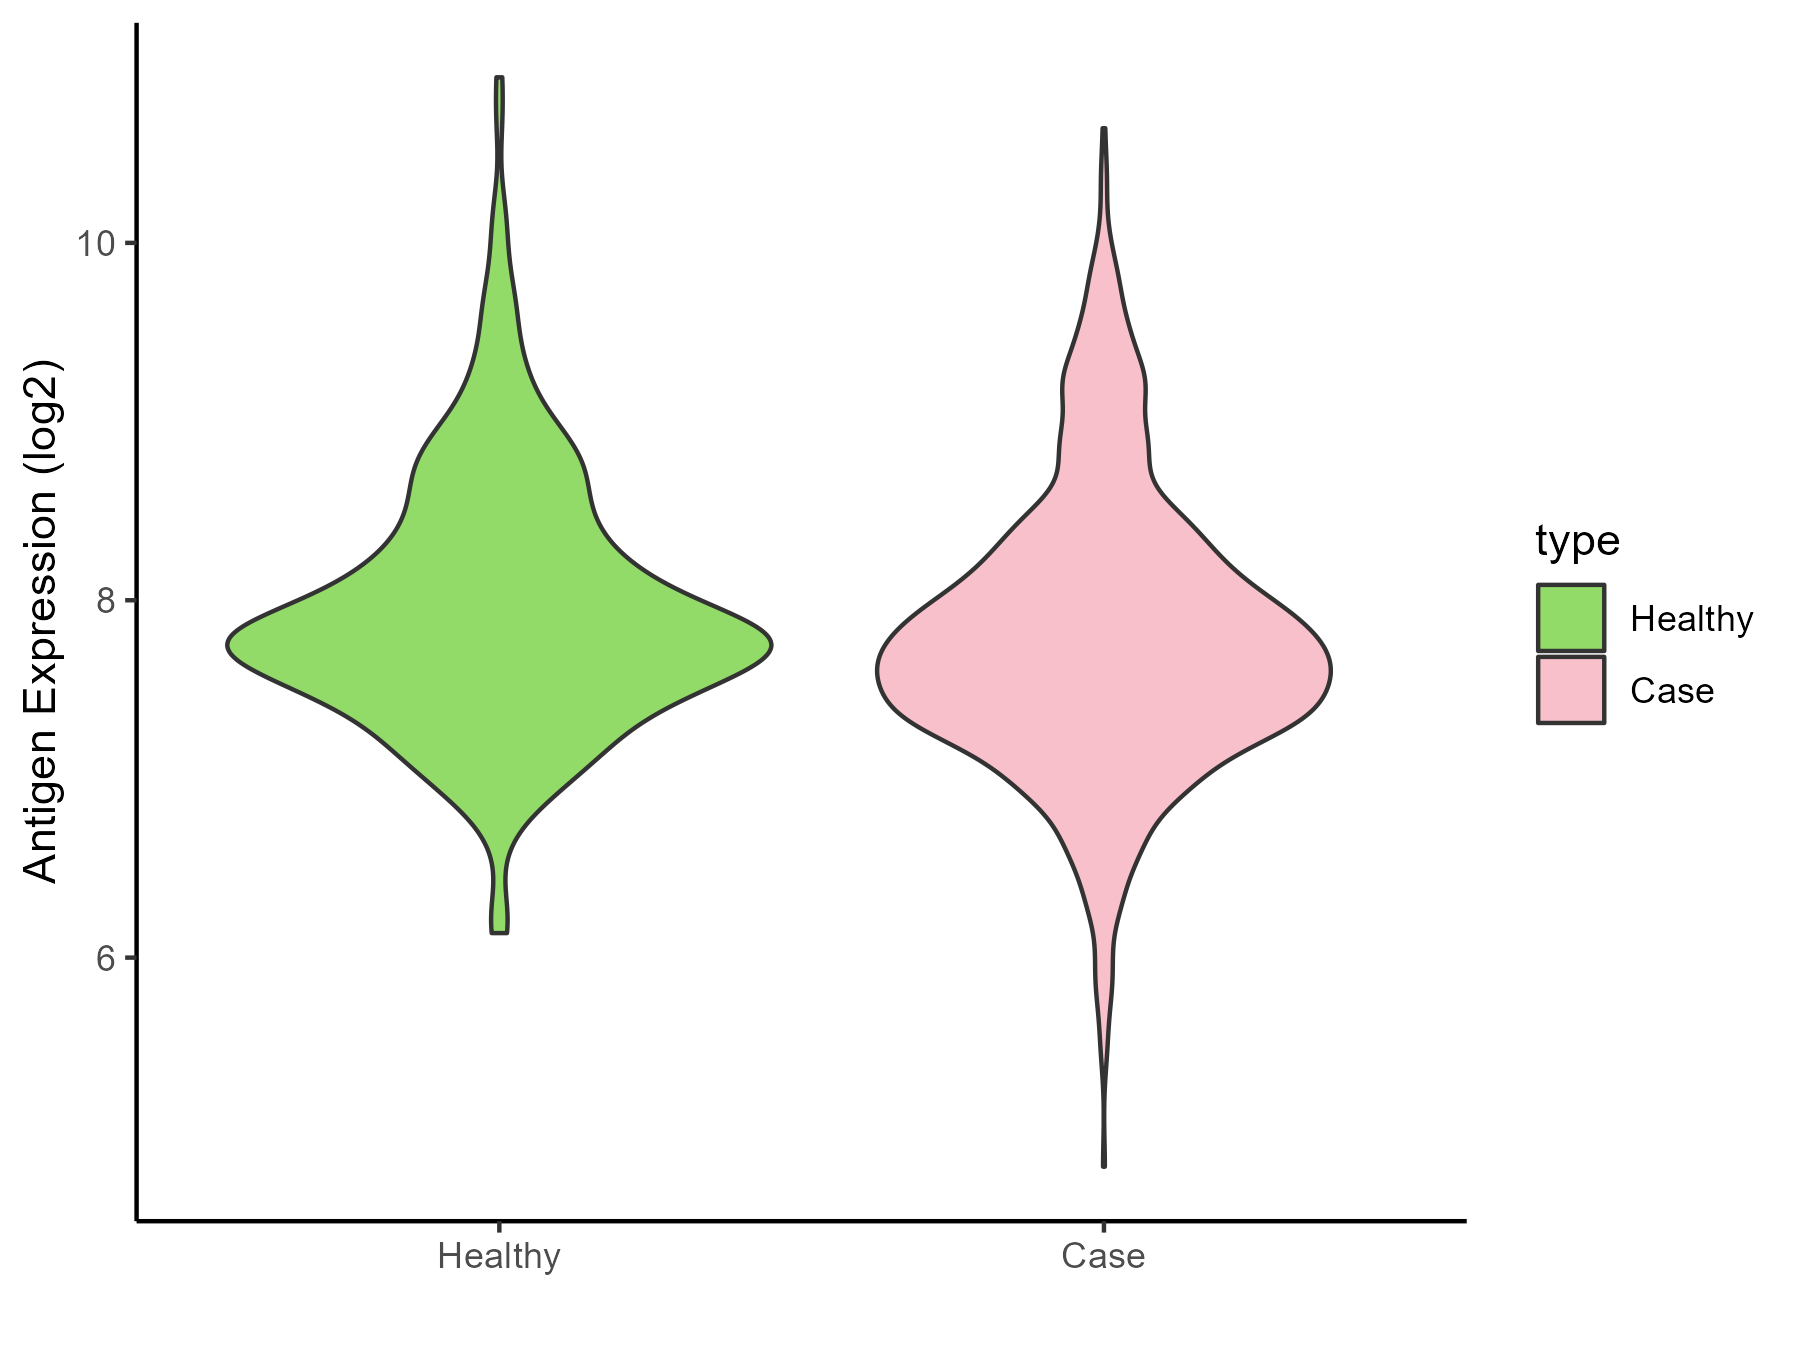
|
Click to View the Clearer Original Diagram |
| Differential expression pattern of antigen in diseases | ||
| The Studied Tissue | Whole blood | |
| The Specific Disease | Polycythemia vera | |
| The Expression Level of Disease Section Compare with the Healthy Individual Tissue | p-value: 0.027958502; Fold-change: 0.036497549; Z-score: 0.138822954 | |
| Disease-specific Antigen Abundances |
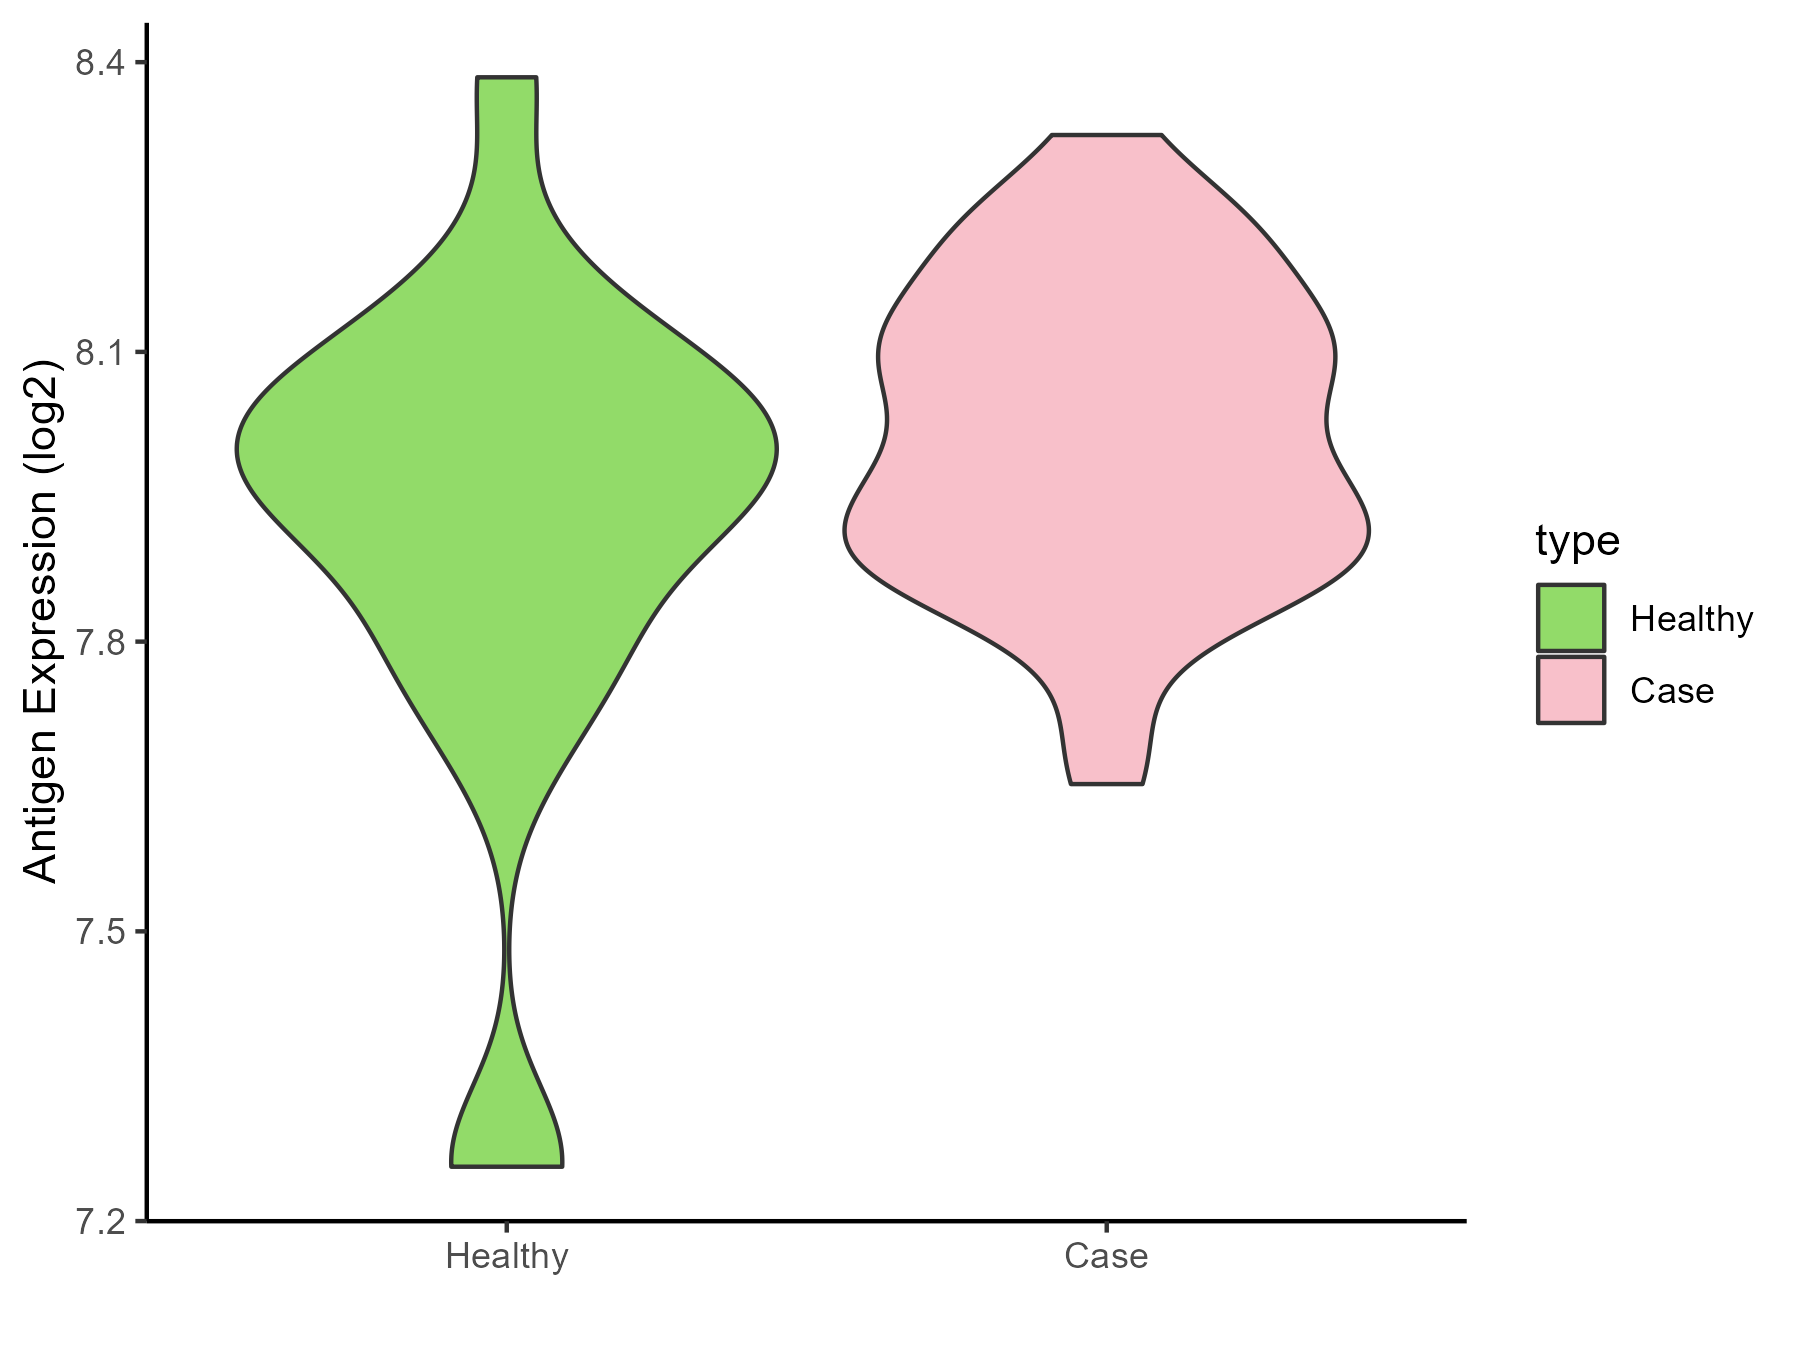
|
Click to View the Clearer Original Diagram |
| The Studied Tissue | Whole blood | |
| The Specific Disease | Myelofibrosis | |
| The Expression Level of Disease Section Compare with the Healthy Individual Tissue | p-value: 5.38E-05; Fold-change: 0.207536395; Z-score: 0.866015541 | |
| Disease-specific Antigen Abundances |
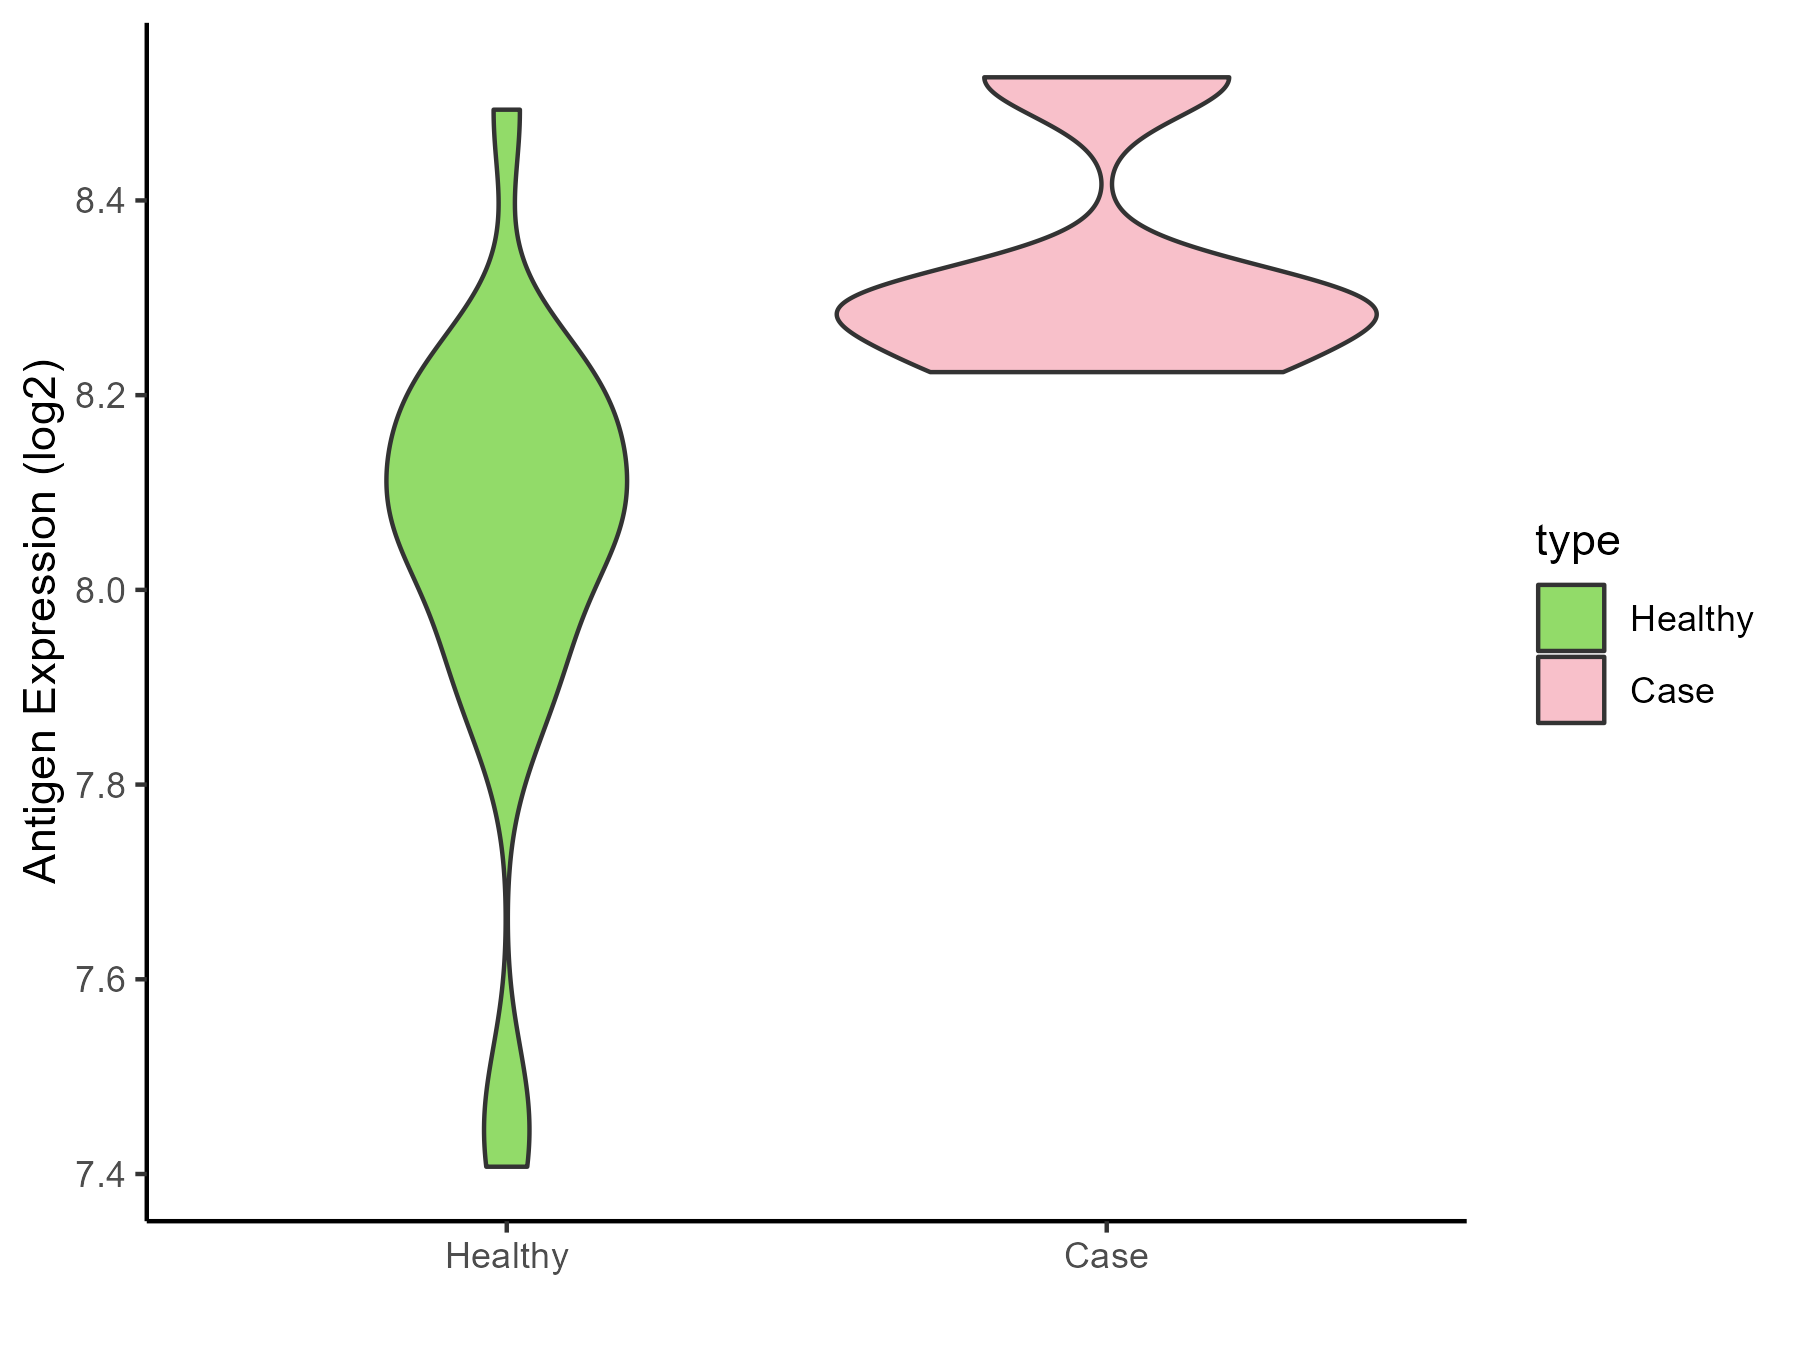
|
Click to View the Clearer Original Diagram |
| Differential expression pattern of antigen in diseases | ||
| The Studied Tissue | Bone marrow | |
| The Specific Disease | Myelodysplastic syndromes | |
| The Expression Level of Disease Section Compare with the Healthy Individual Tissue | p-value: 0.305280741; Fold-change: 0.024091433; Z-score: 0.035357892 | |
| The Expression Level of Disease Section Compare with the Adjacent Tissue | p-value: 0.495457292; Fold-change: -0.116804255; Z-score: -0.354198329 | |
| Disease-specific Antigen Abundances |
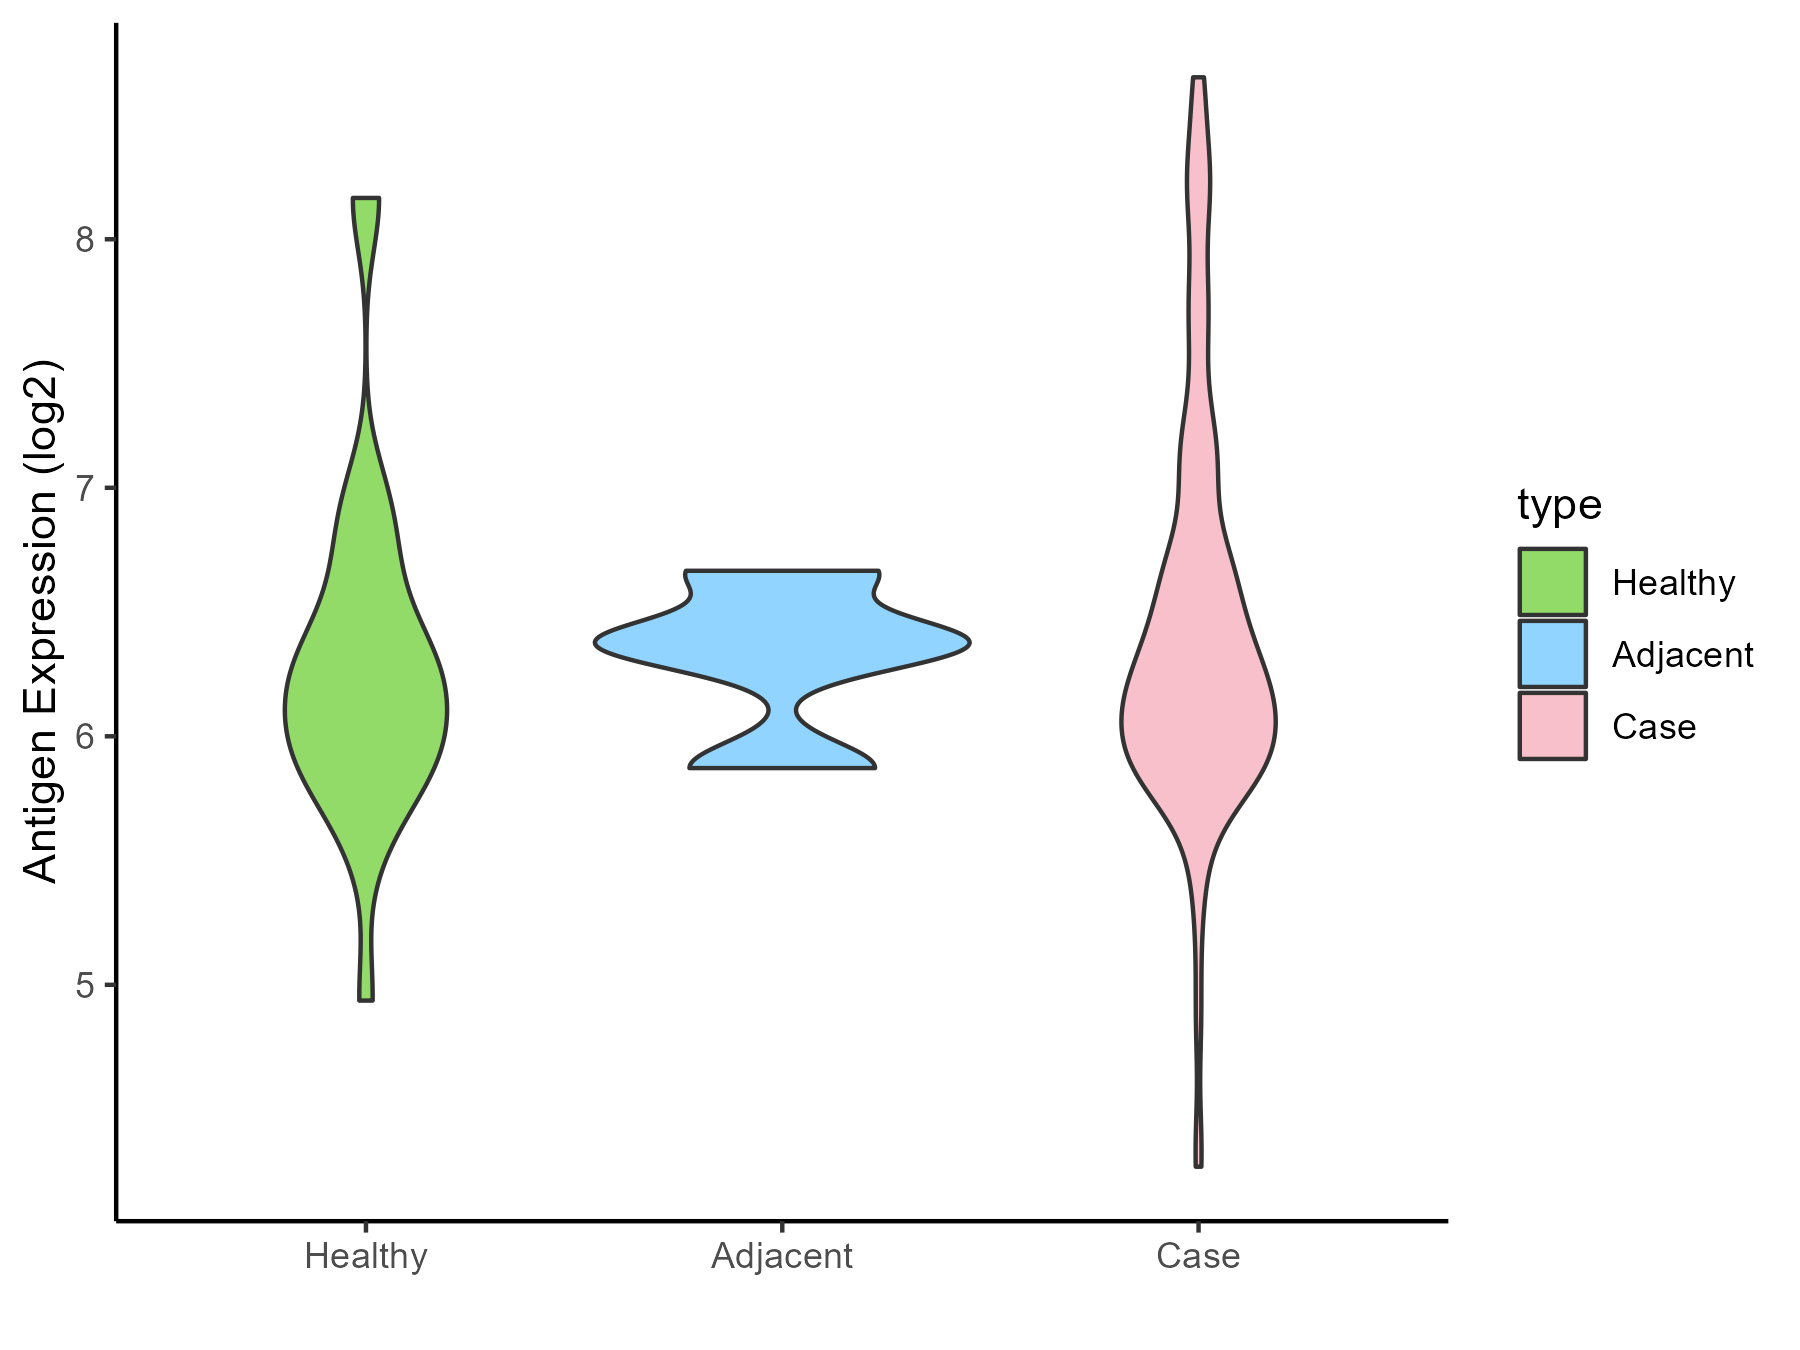
|
Click to View the Clearer Original Diagram |
| Differential expression pattern of antigen in diseases | ||
| The Studied Tissue | Tonsil | |
| The Specific Disease | Lymphoma | |
| The Expression Level of Disease Section Compare with the Healthy Individual Tissue | p-value: 0.525830436; Fold-change: 0.063779836; Z-score: 0.13156394 | |
| Disease-specific Antigen Abundances |
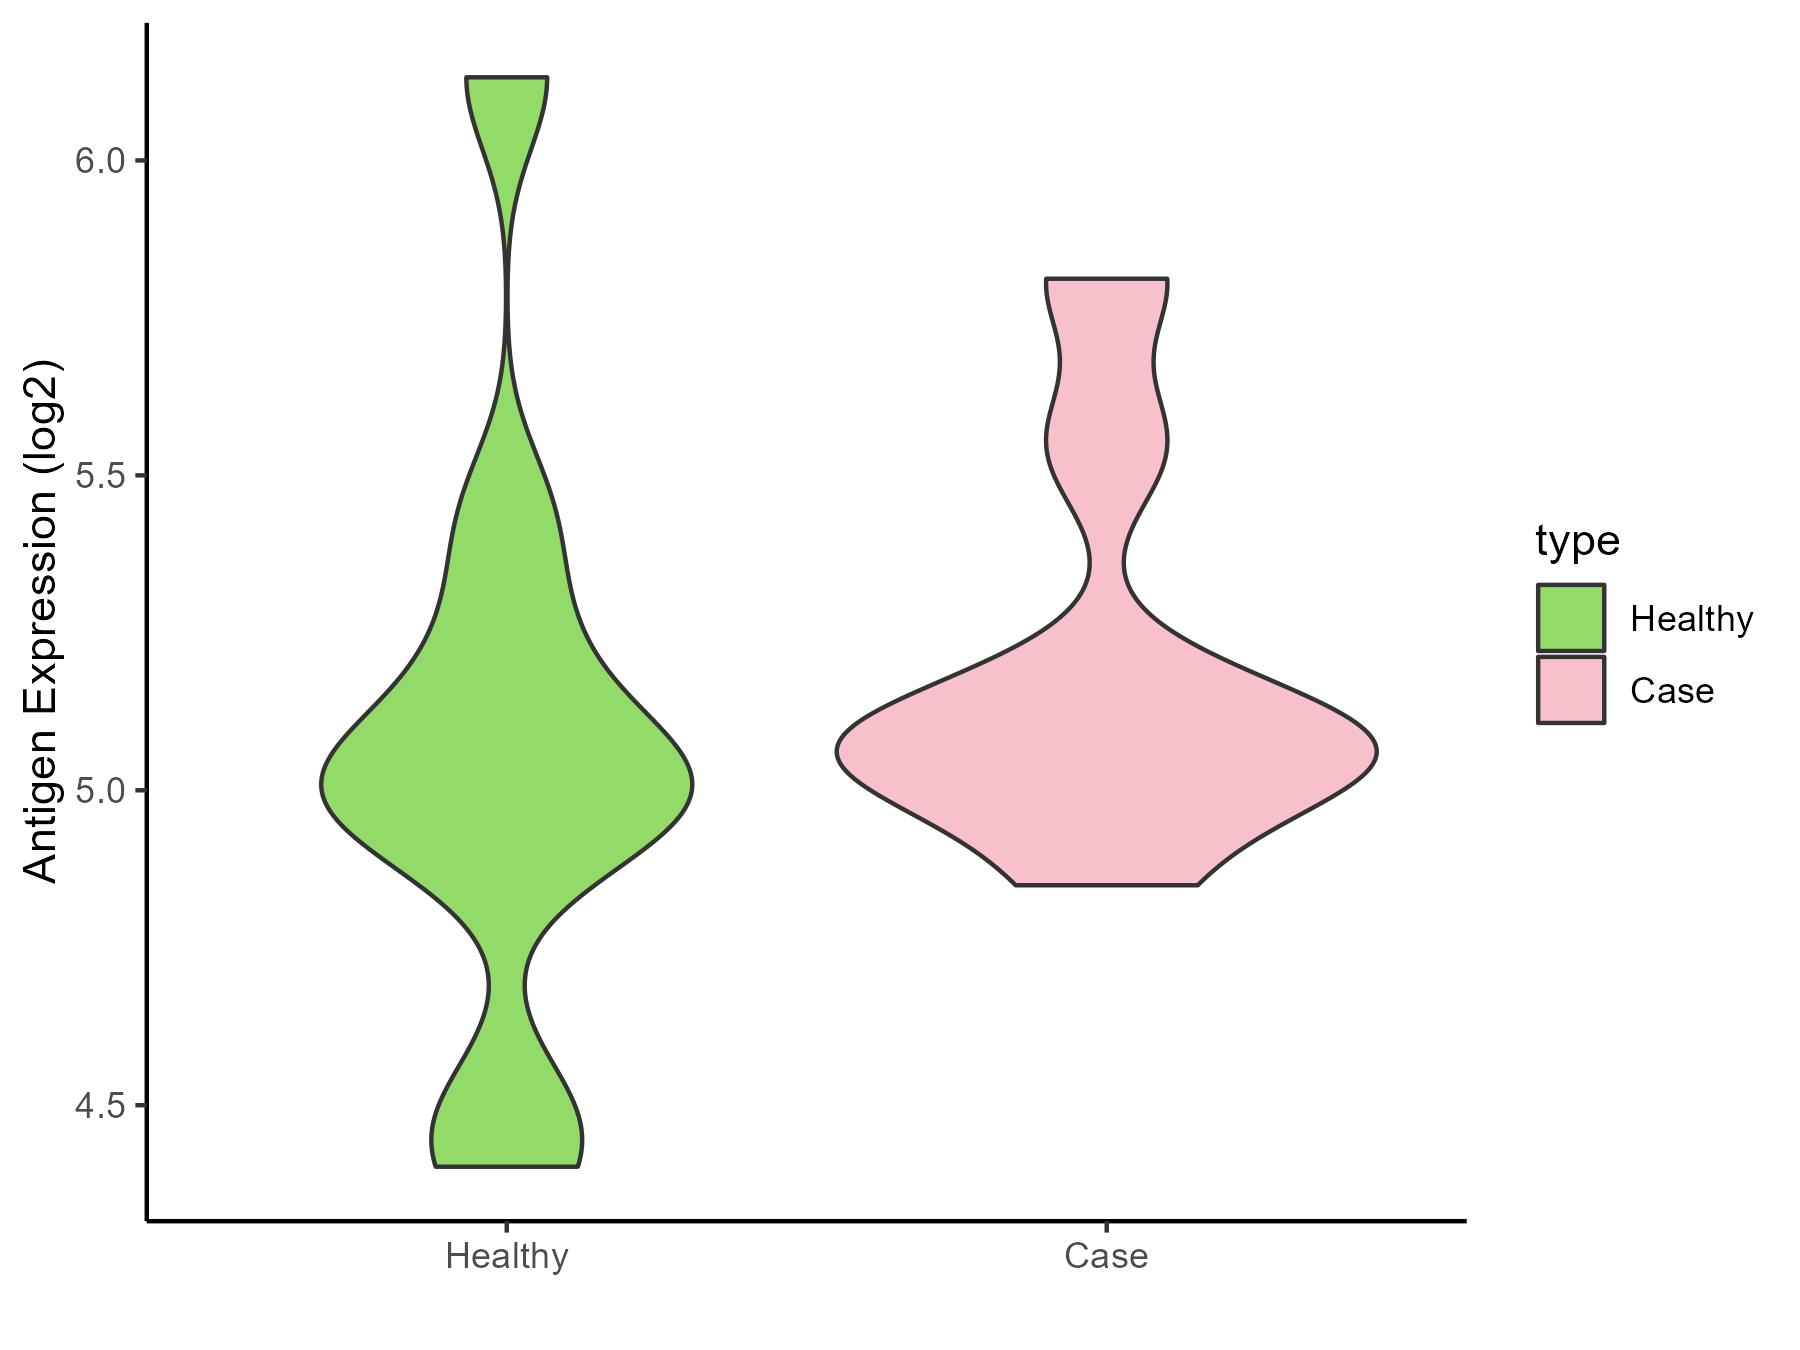
|
Click to View the Clearer Original Diagram |
| Differential expression pattern of antigen in diseases | ||
| The Studied Tissue | Gastric | |
| The Specific Disease | Gastric cancer | |
| The Expression Level of Disease Section Compare with the Healthy Individual Tissue | p-value: 0.102778877; Fold-change: -1.386387424; Z-score: -2.358597925 | |
| The Expression Level of Disease Section Compare with the Adjacent Tissue | p-value: 0.000893243; Fold-change: -1.014839276; Z-score: -1.338138593 | |
| Disease-specific Antigen Abundances |
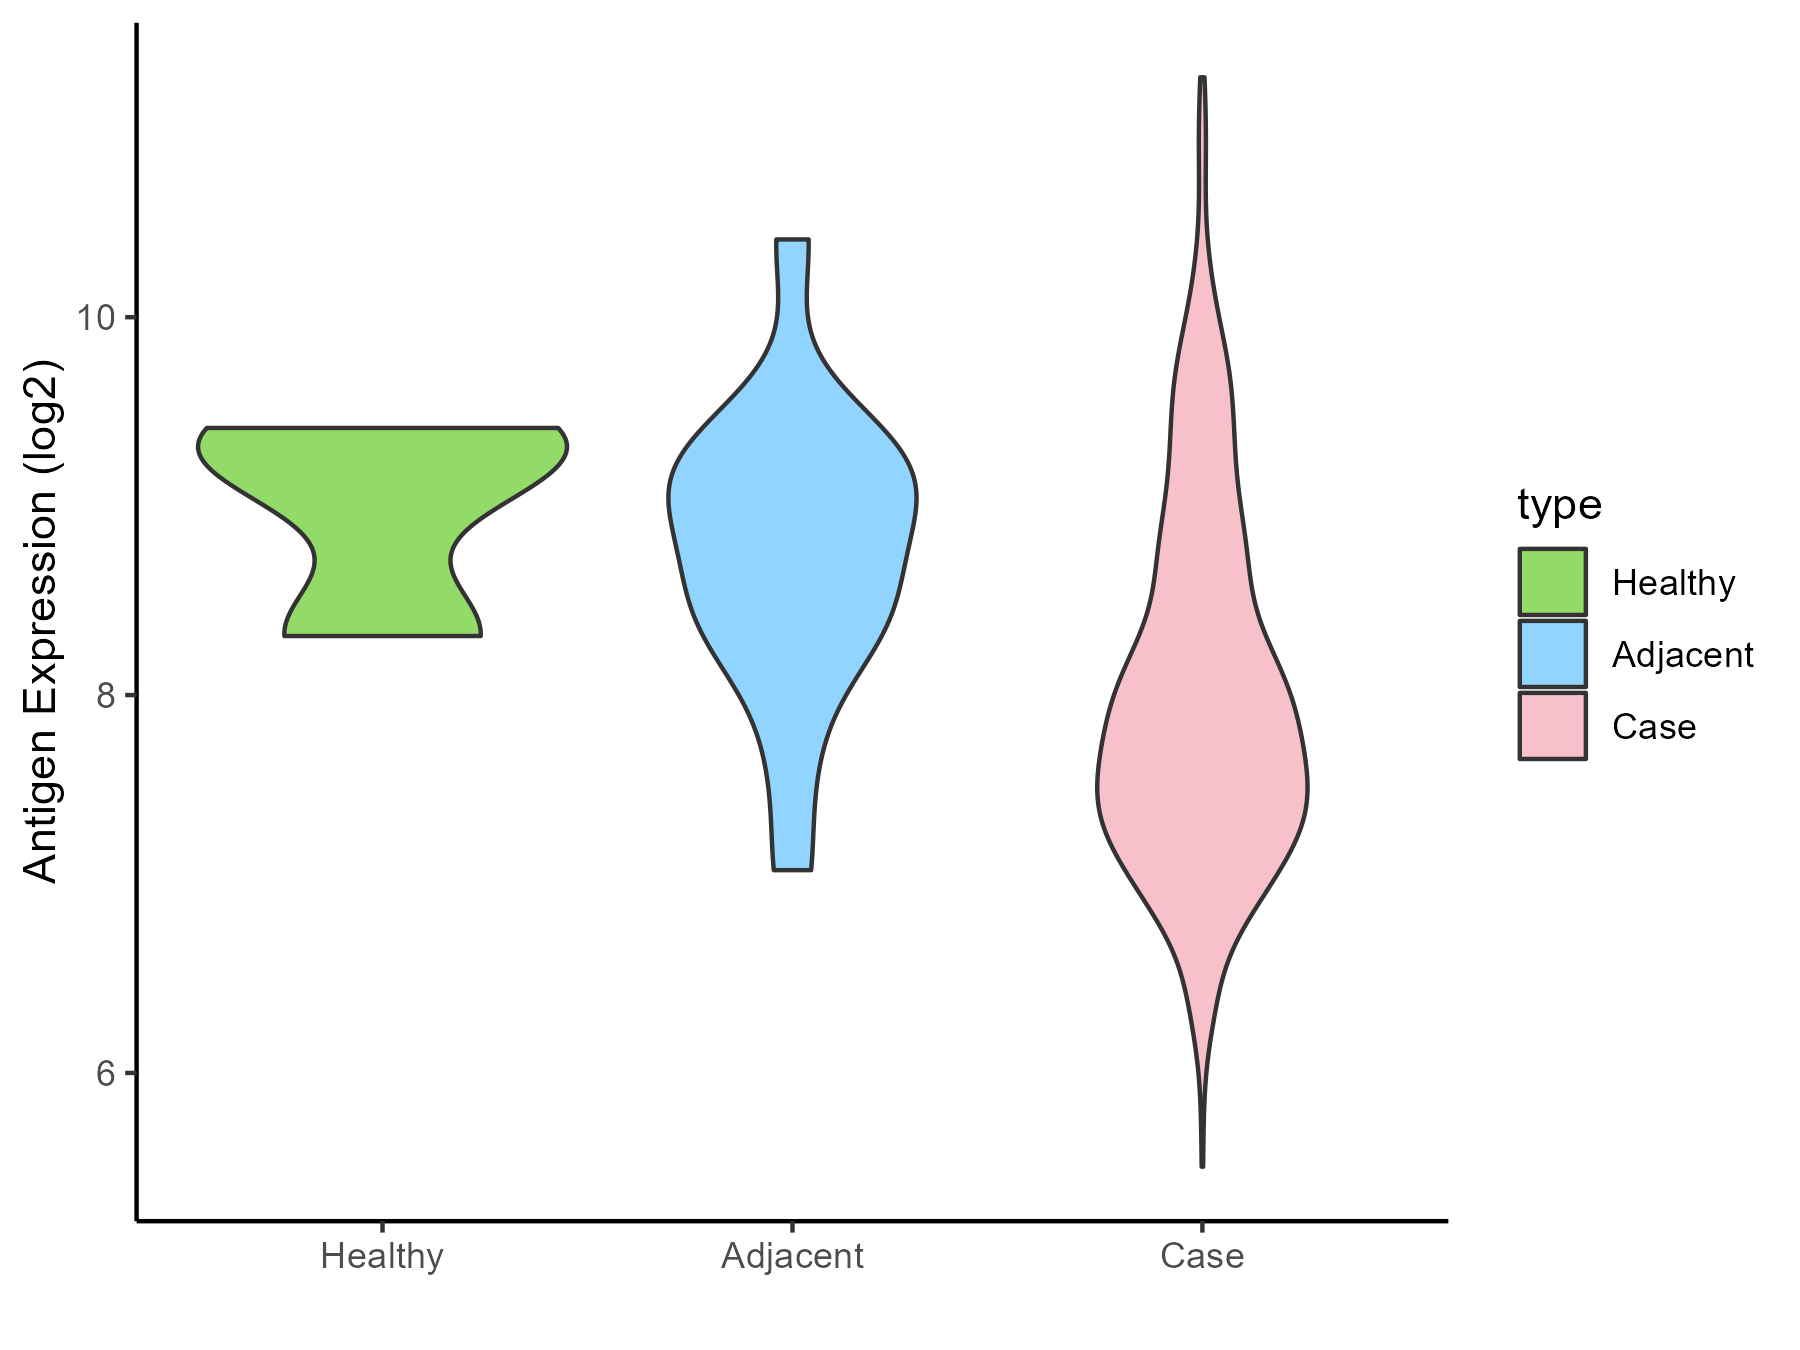
|
Click to View the Clearer Original Diagram |
| Differential expression pattern of antigen in diseases | ||
| The Studied Tissue | Colon | |
| The Specific Disease | Colon cancer | |
| The Expression Level of Disease Section Compare with the Healthy Individual Tissue | p-value: 0.004290765; Fold-change: 0.172007864; Z-score: 0.359654598 | |
| The Expression Level of Disease Section Compare with the Adjacent Tissue | p-value: 1.65E-14; Fold-change: 0.533479351; Z-score: 0.766436414 | |
| Disease-specific Antigen Abundances |
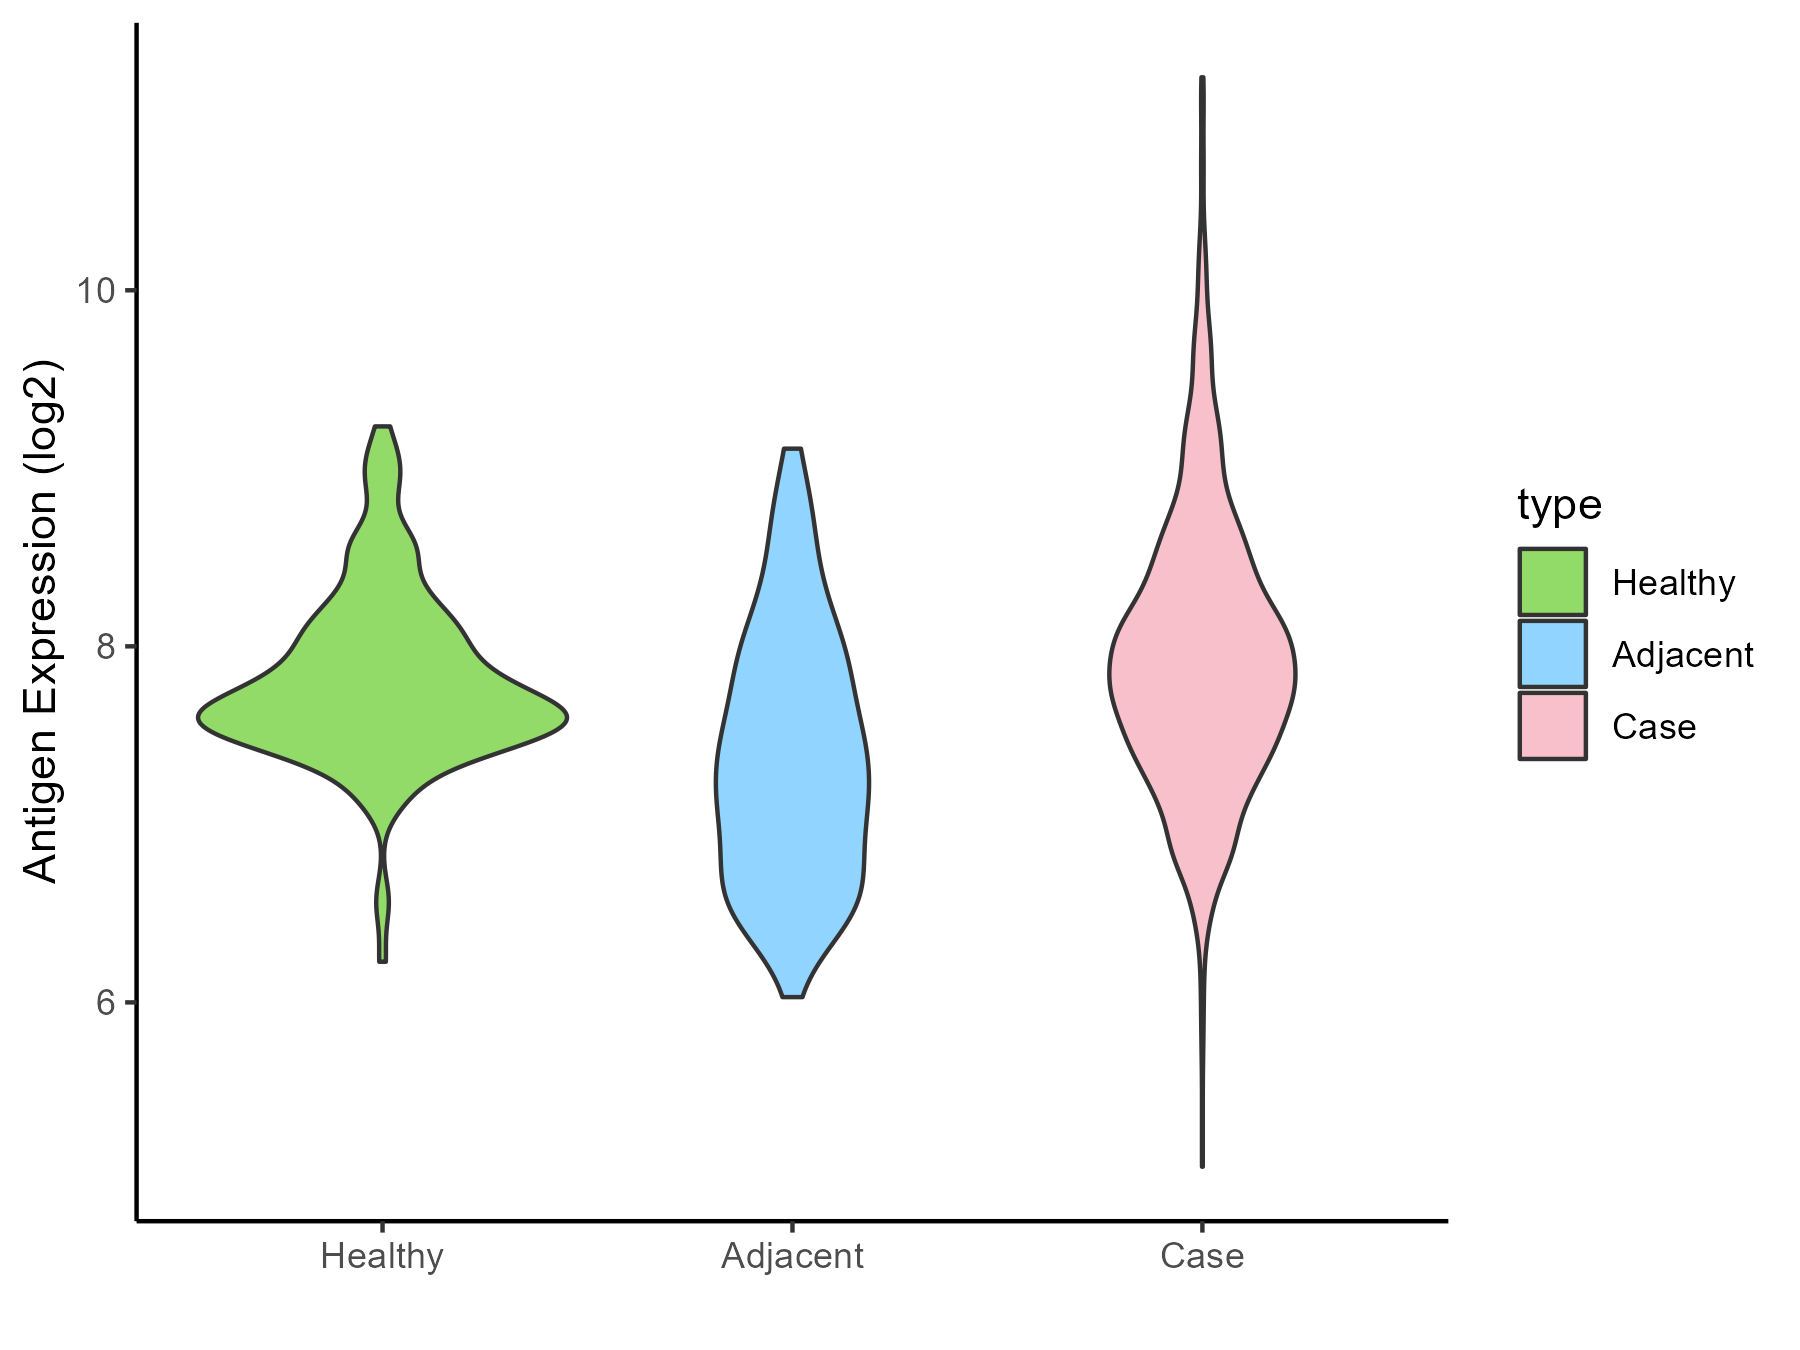
|
Click to View the Clearer Original Diagram |
| Differential expression pattern of antigen in diseases | ||
| The Studied Tissue | Pancreas | |
| The Specific Disease | Pancreatic cancer | |
| The Expression Level of Disease Section Compare with the Healthy Individual Tissue | p-value: 0.296394245; Fold-change: -0.355054646; Z-score: -0.31941577 | |
| The Expression Level of Disease Section Compare with the Adjacent Tissue | p-value: 0.000271454; Fold-change: -0.787210139; Z-score: -0.907752876 | |
| Disease-specific Antigen Abundances |
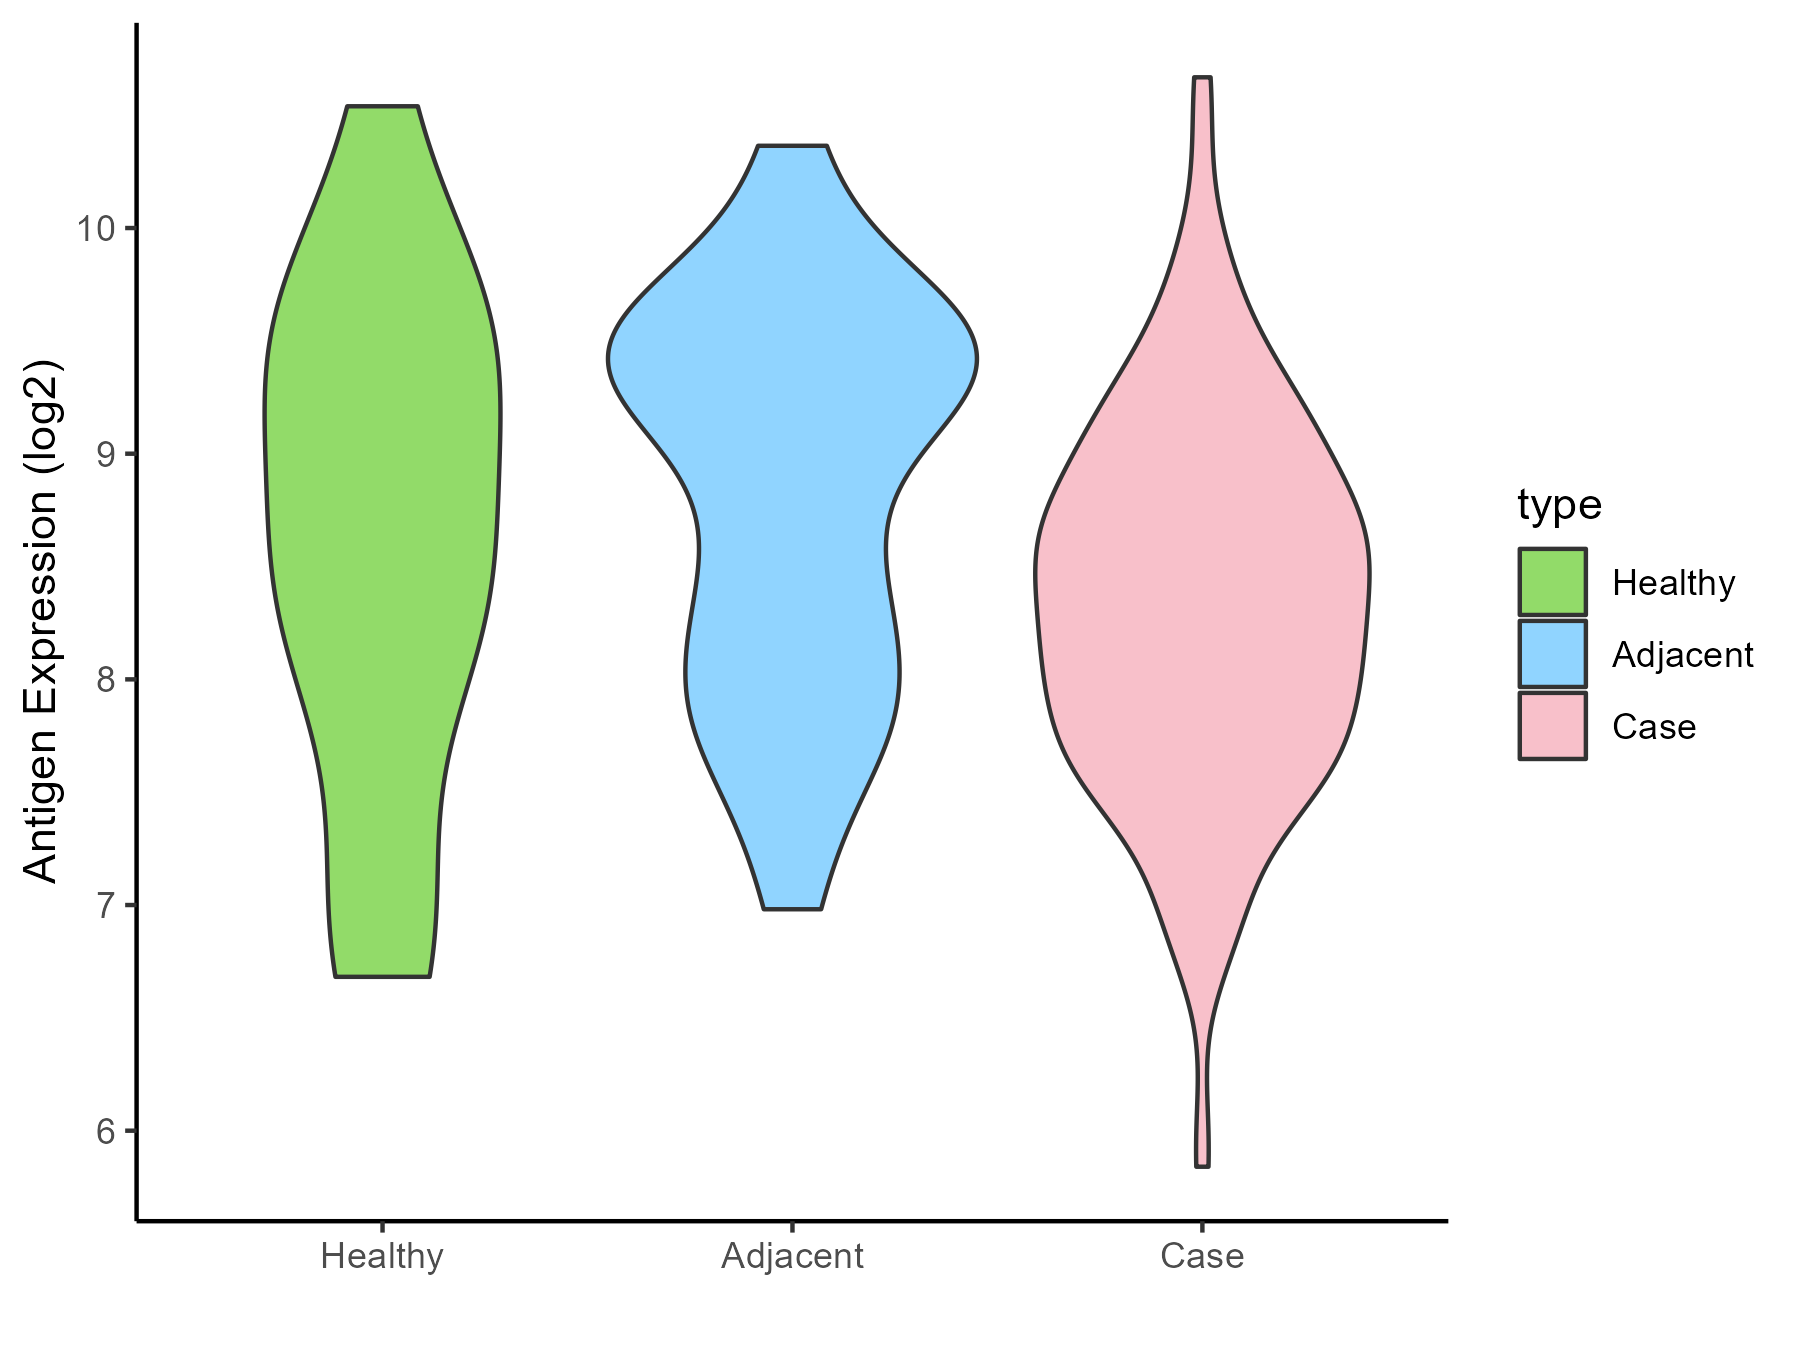
|
Click to View the Clearer Original Diagram |
| Differential expression pattern of antigen in diseases | ||
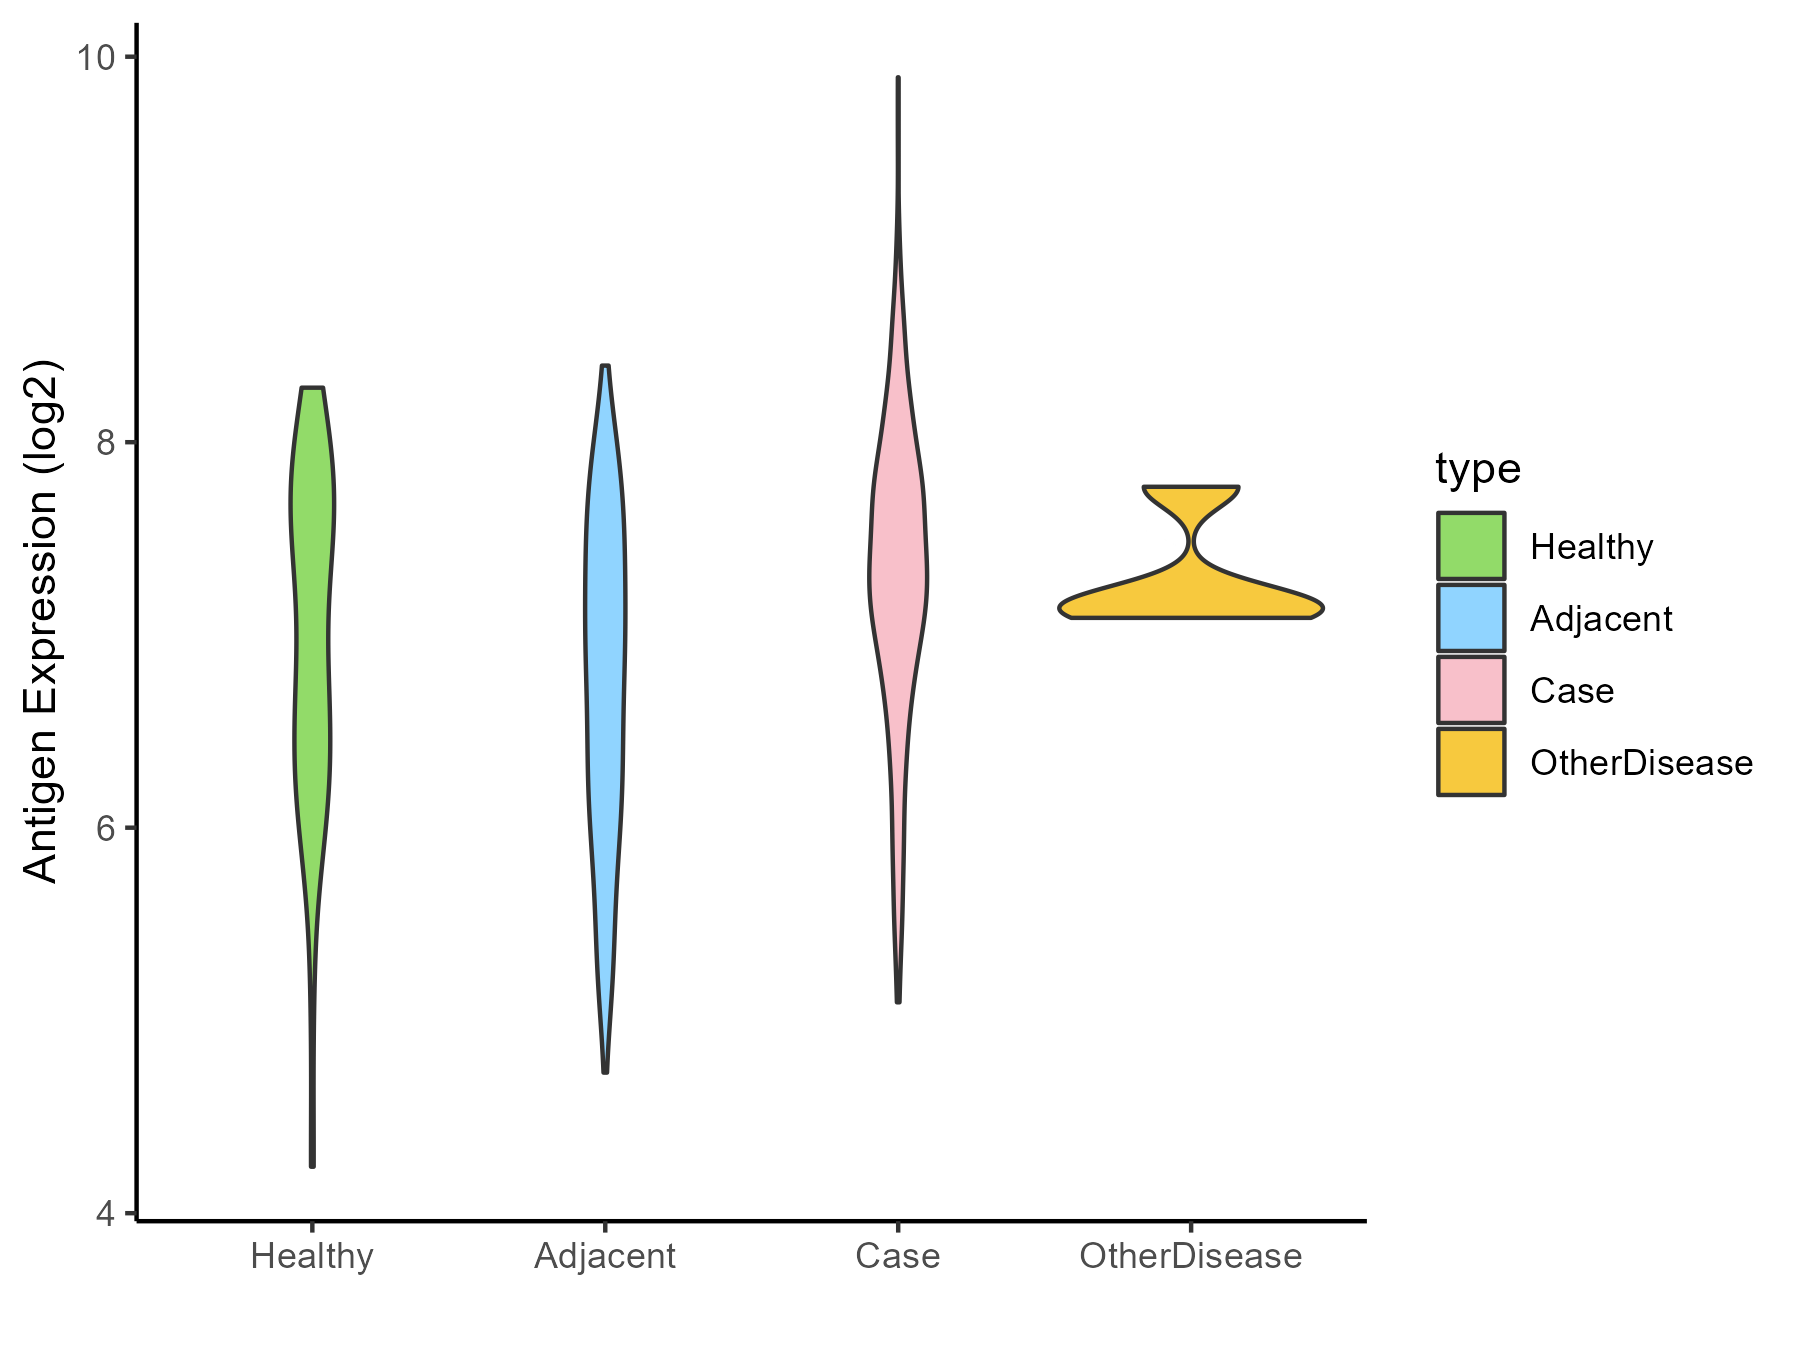
| The Studied Tissue | Liver | |
| The Specific Disease | Liver cancer | |
| The Expression Level of Disease Section Compare with the Healthy Individual Tissue | p-value: 0.030955384; Fold-change: 0.291392264; Z-score: 0.326944581 | |
| The Expression Level of Disease Section Compare with the Adjacent Tissue | p-value: 4.89E-13; Fold-change: 0.507544491; Z-score: 0.60068777 | |
| The Expression Level of Disease Section Compare with the Other Disease Section | p-value: 0.983855722; Fold-change: 0.16662252; Z-score: 0.524691751 | |
| Disease-specific Antigen Abundances |
|
Click to View the Clearer Original Diagram |
| Differential expression pattern of antigen in diseases | ||
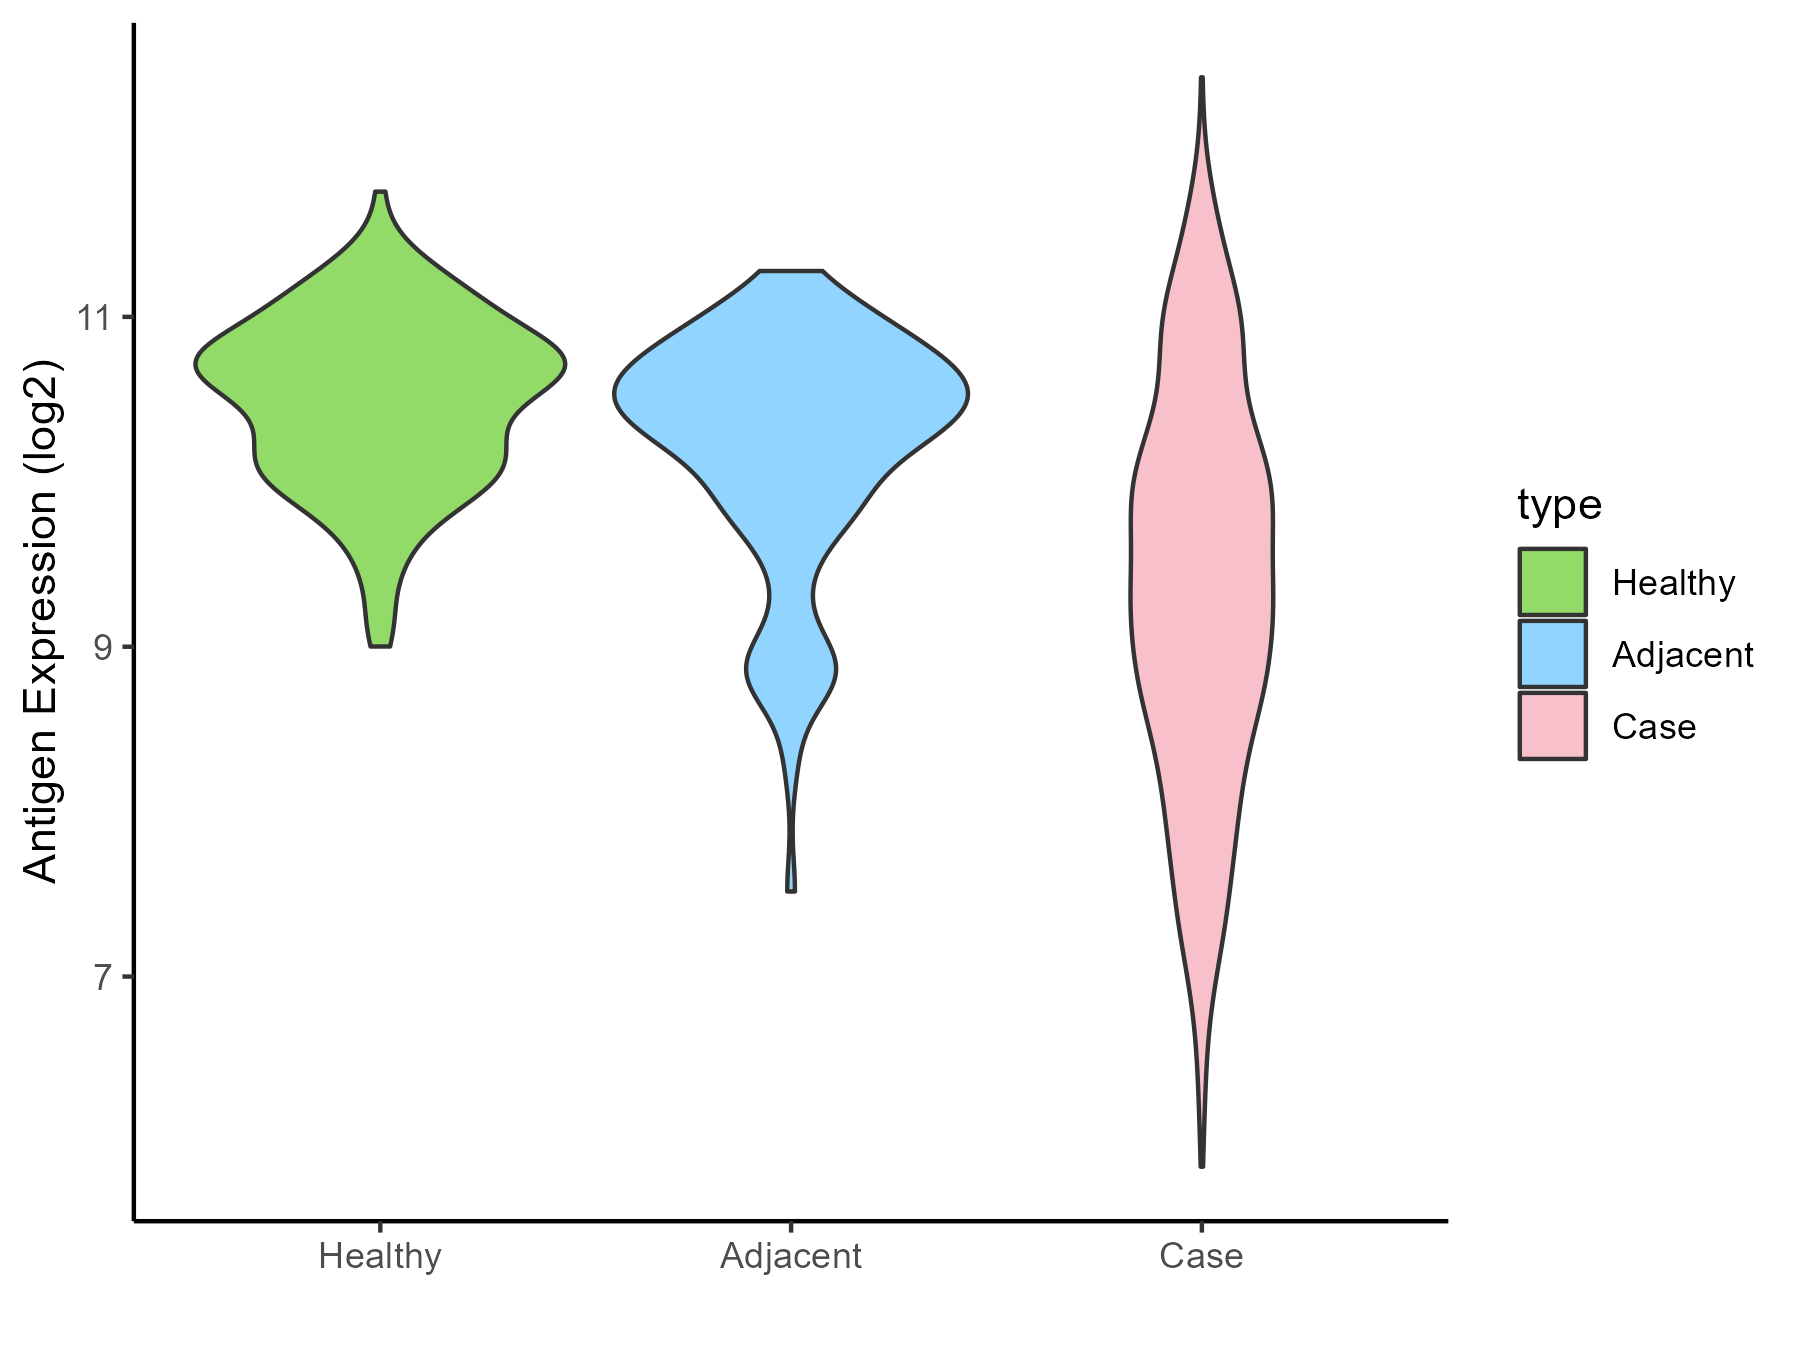
| The Studied Tissue | Lung | |
| The Specific Disease | Lung cancer | |
| The Expression Level of Disease Section Compare with the Healthy Individual Tissue | p-value: 7.73E-75; Fold-change: -1.182517793; Z-score: -2.303058889 | |
| The Expression Level of Disease Section Compare with the Adjacent Tissue | p-value: 2.90E-22; Fold-change: -0.99478227; Z-score: -1.383907538 | |
| Disease-specific Antigen Abundances |
|
Click to View the Clearer Original Diagram |
| Differential expression pattern of antigen in diseases | ||
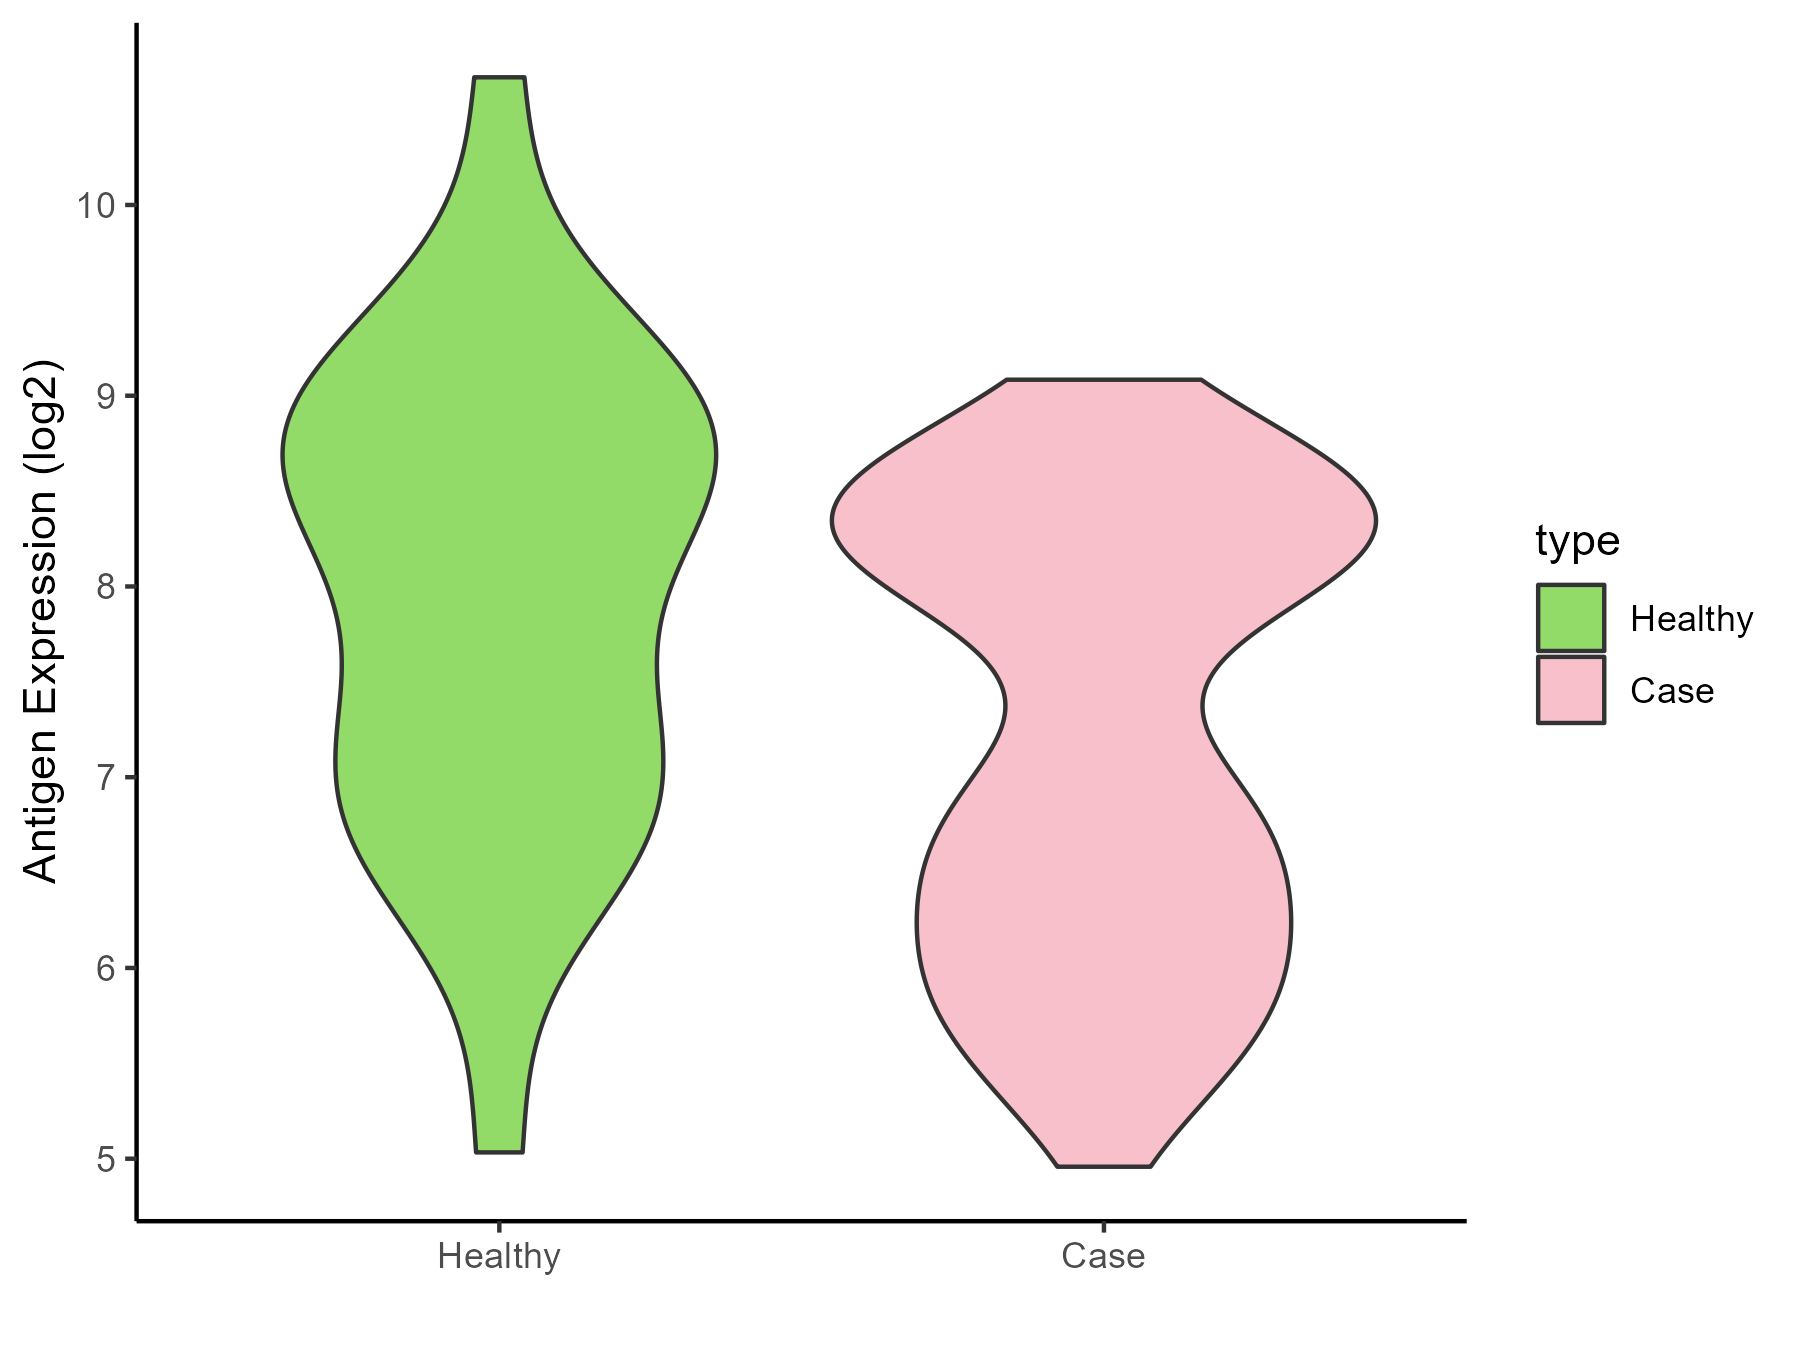
| The Studied Tissue | Skin | |
| The Specific Disease | Melanoma | |
| The Expression Level of Disease Section Compare with the Healthy Individual Tissue | p-value: 0.015385097; Fold-change: -1.307425538; Z-score: -1.036371431 | |
| Disease-specific Antigen Abundances |
|
Click to View the Clearer Original Diagram |
| Differential expression pattern of antigen in diseases | ||
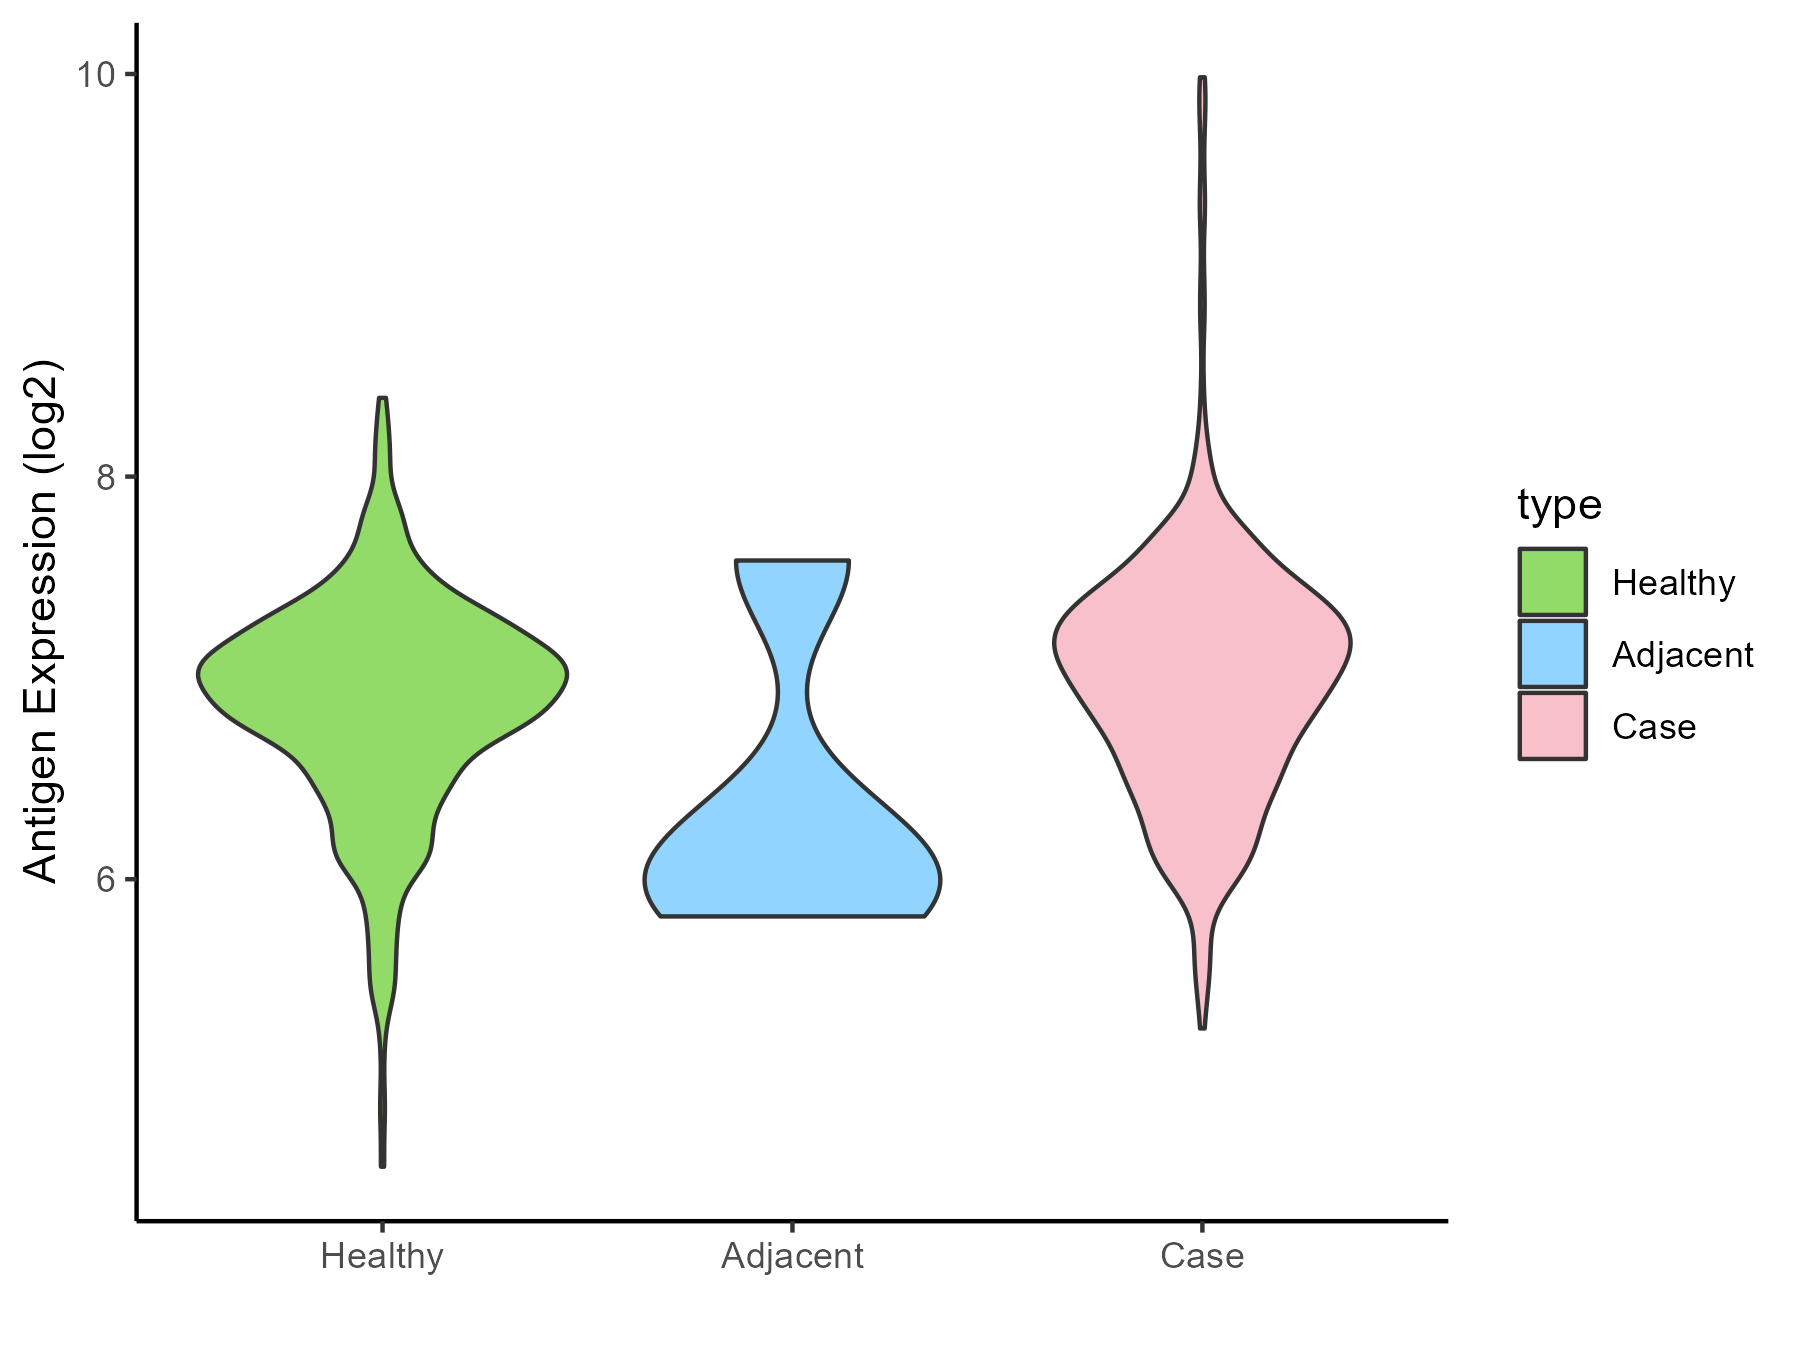
| The Studied Tissue | Muscle | |
| The Specific Disease | Sarcoma | |
| The Expression Level of Disease Section Compare with the Healthy Individual Tissue | p-value: 0.000343273; Fold-change: 0.098551888; Z-score: 0.184353202 | |
| The Expression Level of Disease Section Compare with the Adjacent Tissue | p-value: 0.239420147; Fold-change: 0.937227152; Z-score: 1.160340111 | |
| Disease-specific Antigen Abundances |
|
Click to View the Clearer Original Diagram |
| Differential expression pattern of antigen in diseases | ||
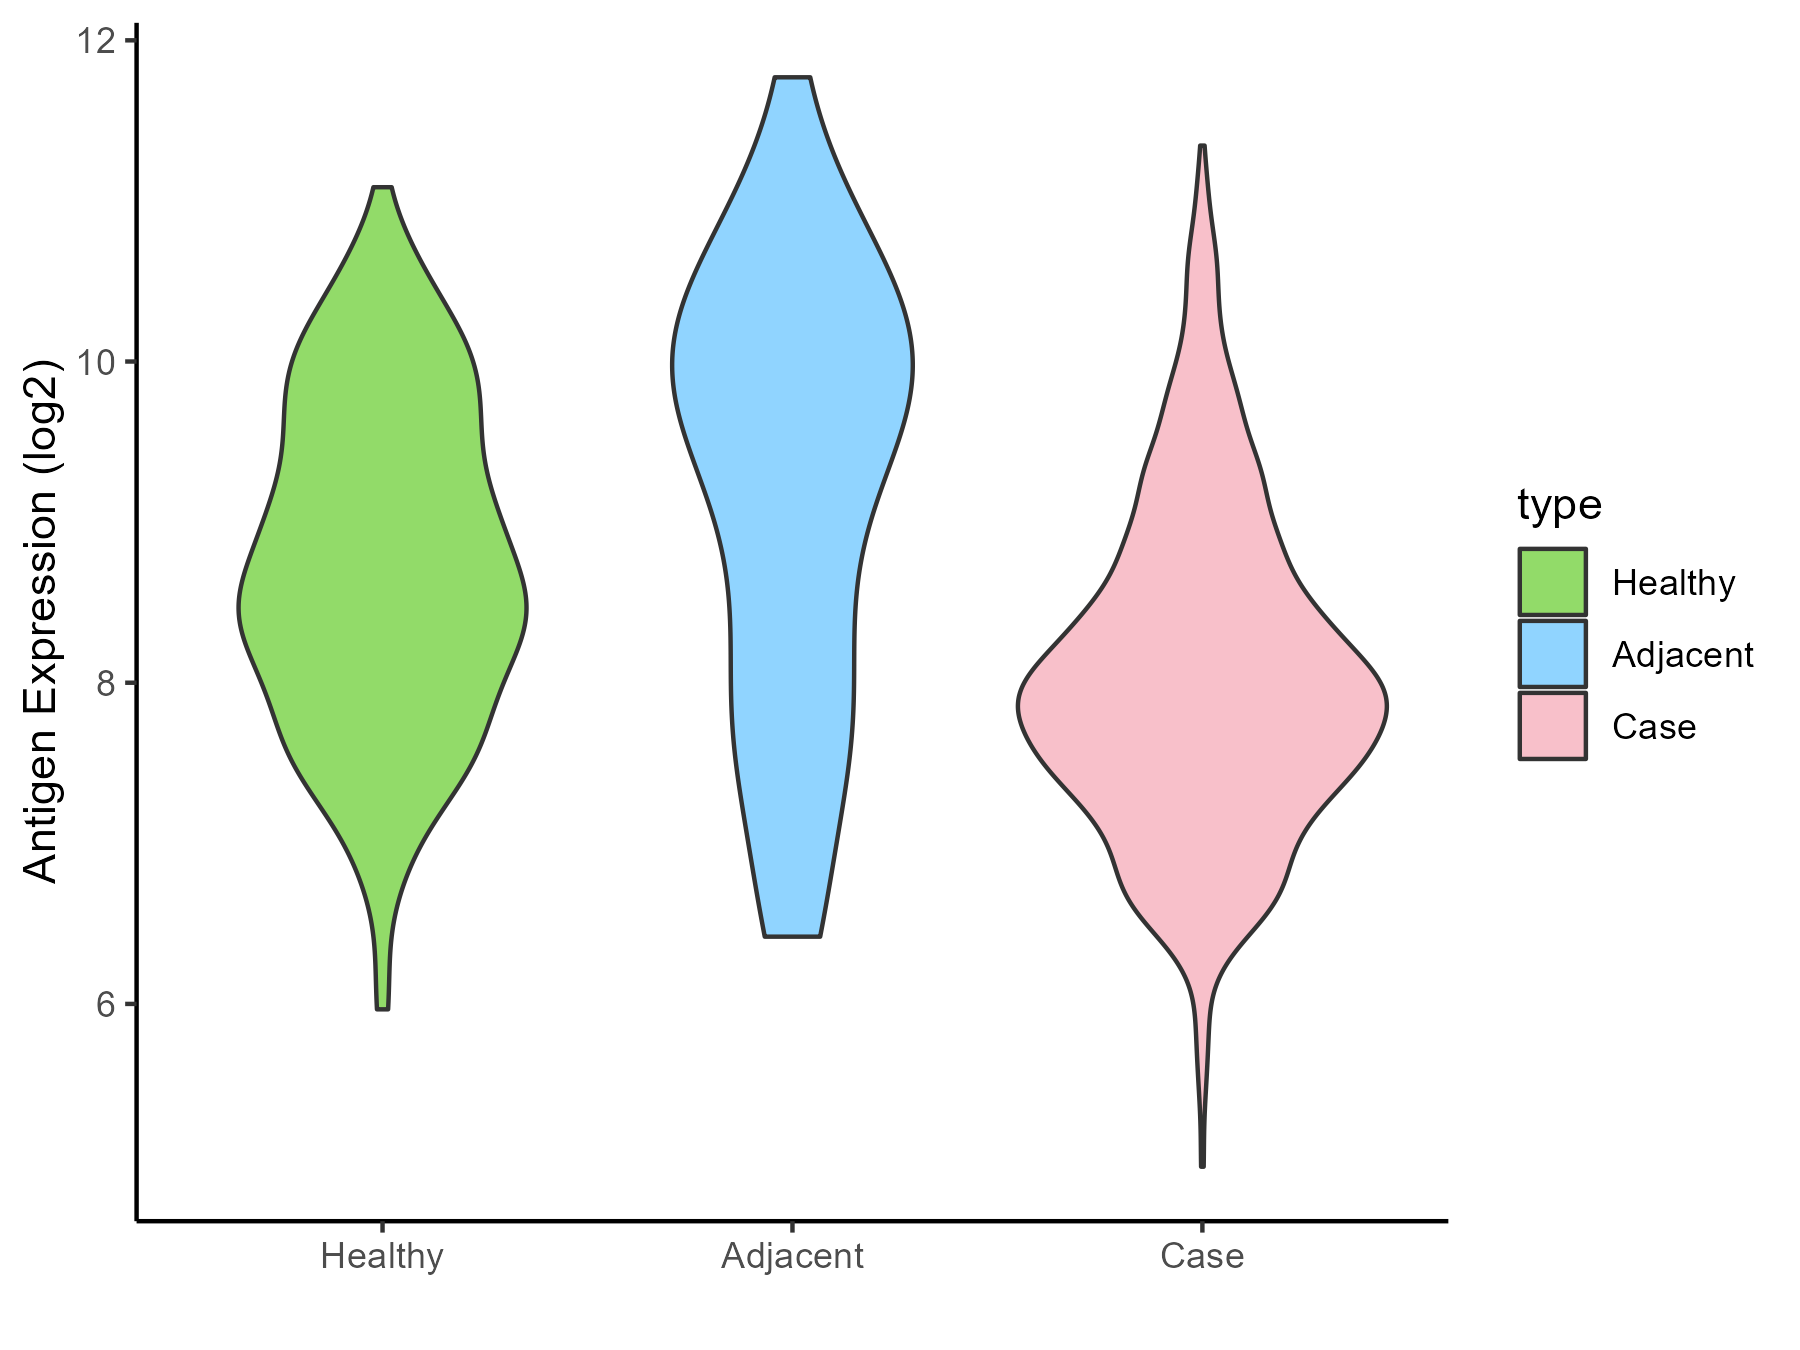
| The Studied Tissue | Breast | |
| The Specific Disease | Breast cancer | |
| The Expression Level of Disease Section Compare with the Healthy Individual Tissue | p-value: 8.60E-22; Fold-change: -0.707234874; Z-score: -0.695709406 | |
| The Expression Level of Disease Section Compare with the Adjacent Tissue | p-value: 1.19E-07; Fold-change: -1.649081853; Z-score: -1.211044377 | |
| Disease-specific Antigen Abundances |
|
Click to View the Clearer Original Diagram |
| Differential expression pattern of antigen in diseases | ||
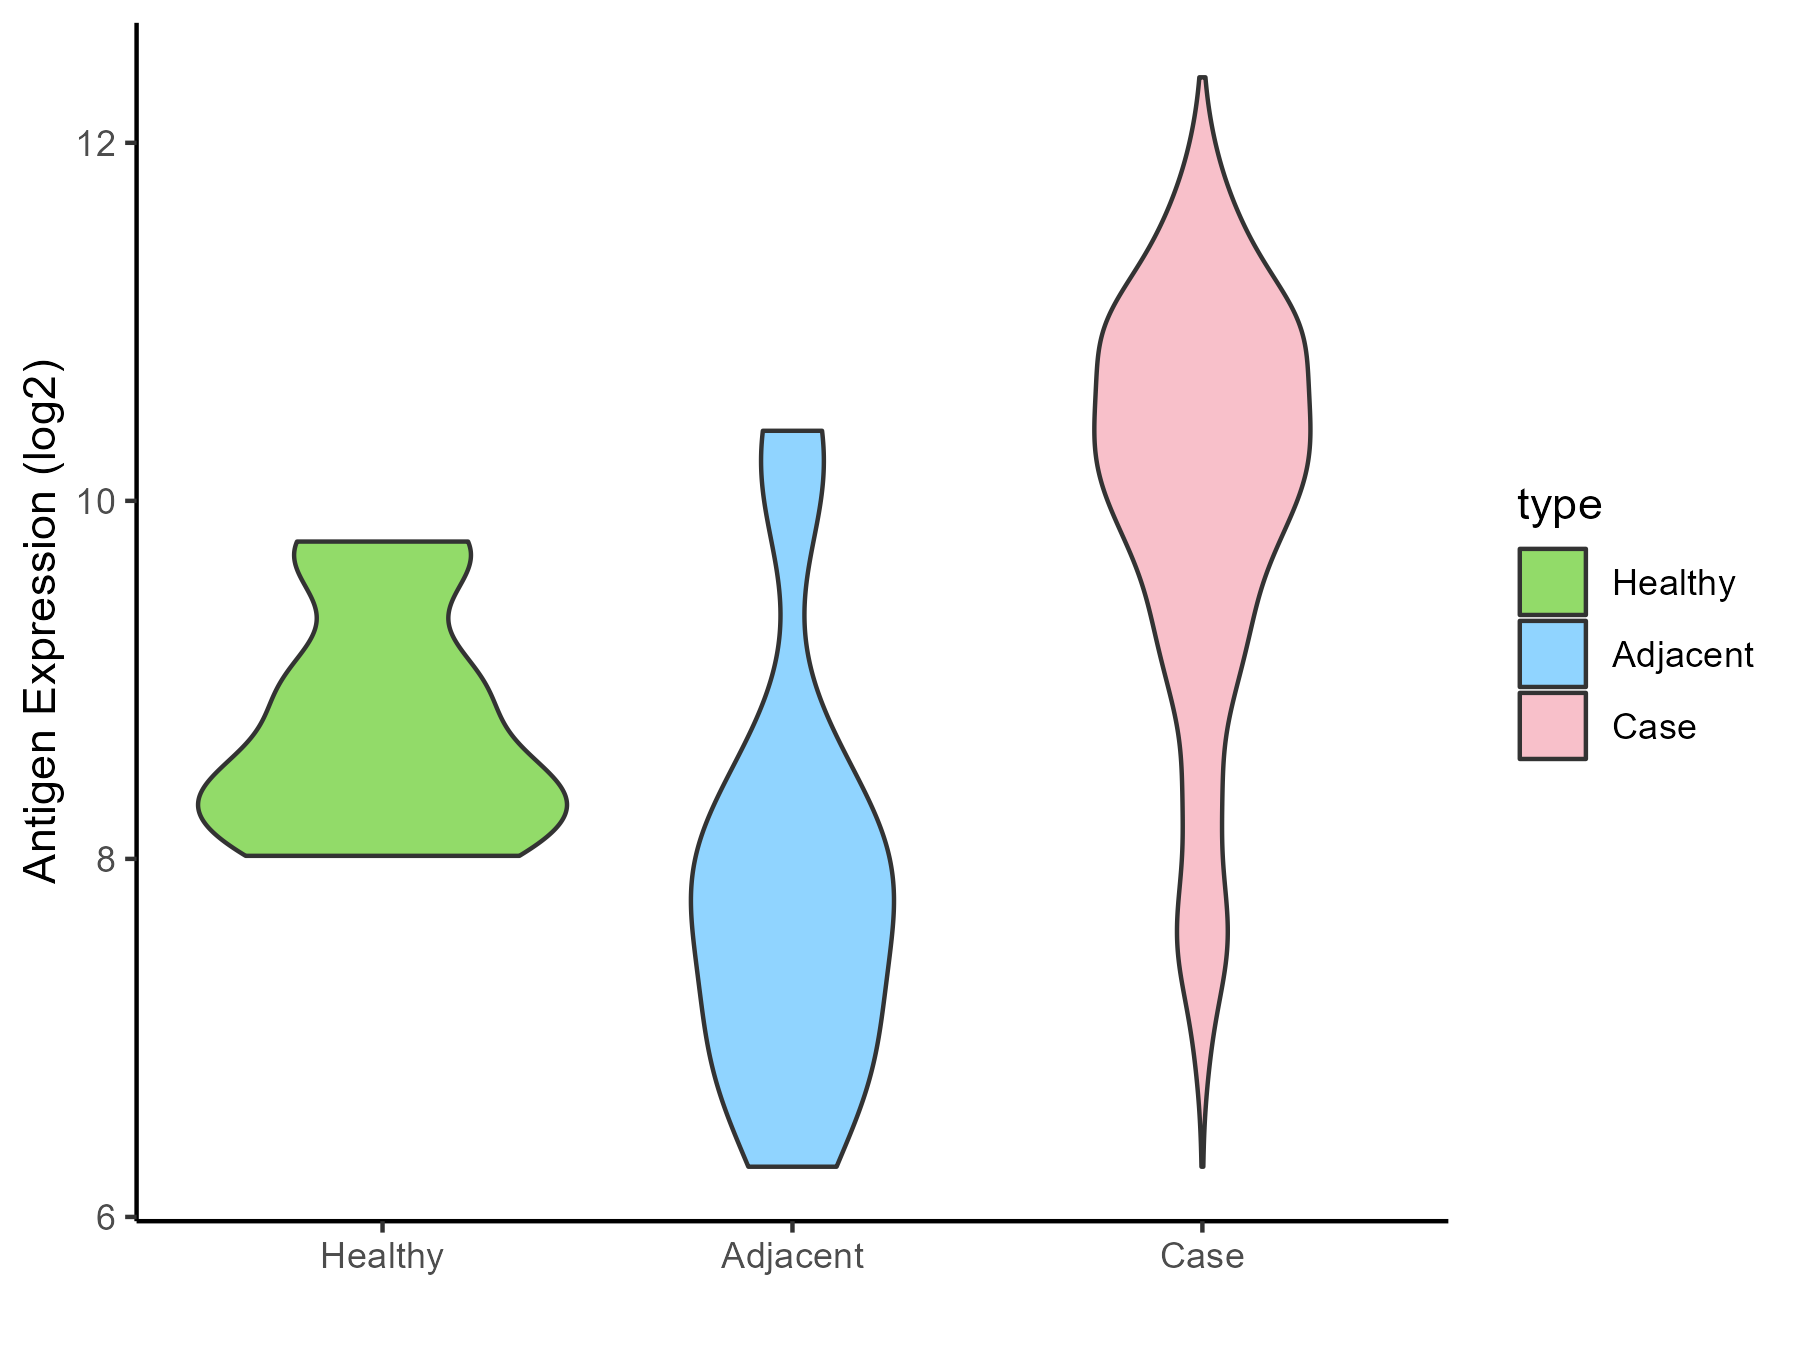
| The Studied Tissue | Ovarian | |
| The Specific Disease | Ovarian cancer | |
| The Expression Level of Disease Section Compare with the Healthy Individual Tissue | p-value: 0.000299394; Fold-change: 1.814366231; Z-score: 2.811538221 | |
| The Expression Level of Disease Section Compare with the Adjacent Tissue | p-value: 1.35E-05; Fold-change: 2.431487159; Z-score: 2.045455627 | |
| Disease-specific Antigen Abundances |
|
Click to View the Clearer Original Diagram |
| Differential expression pattern of antigen in diseases | ||
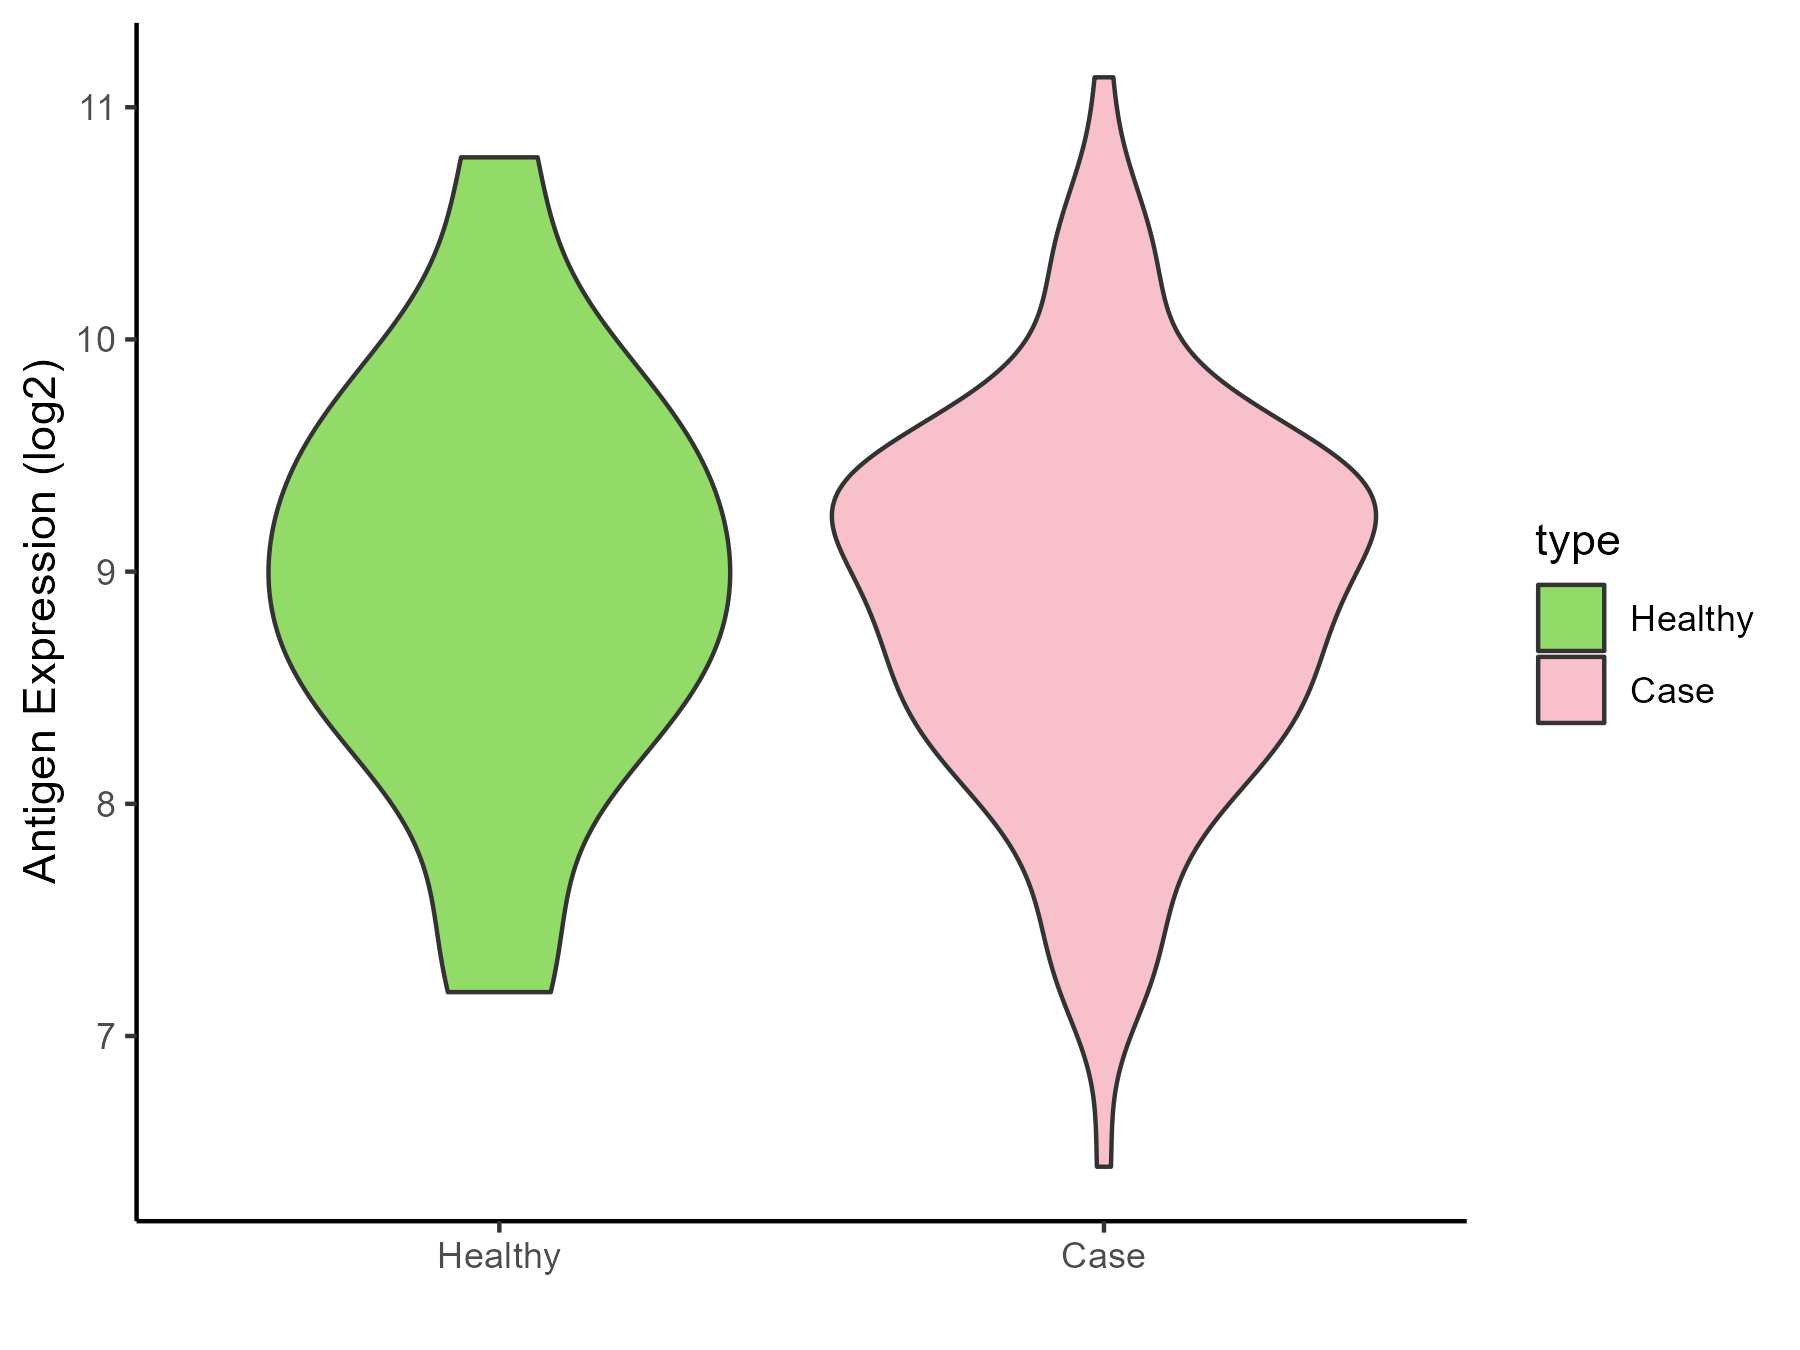
| The Studied Tissue | Cervical | |
| The Specific Disease | Cervical cancer | |
| The Expression Level of Disease Section Compare with the Healthy Individual Tissue | p-value: 0.742918333; Fold-change: -0.109102262; Z-score: -0.123438684 | |
| Disease-specific Antigen Abundances |
|
Click to View the Clearer Original Diagram |
| Differential expression pattern of antigen in diseases | ||
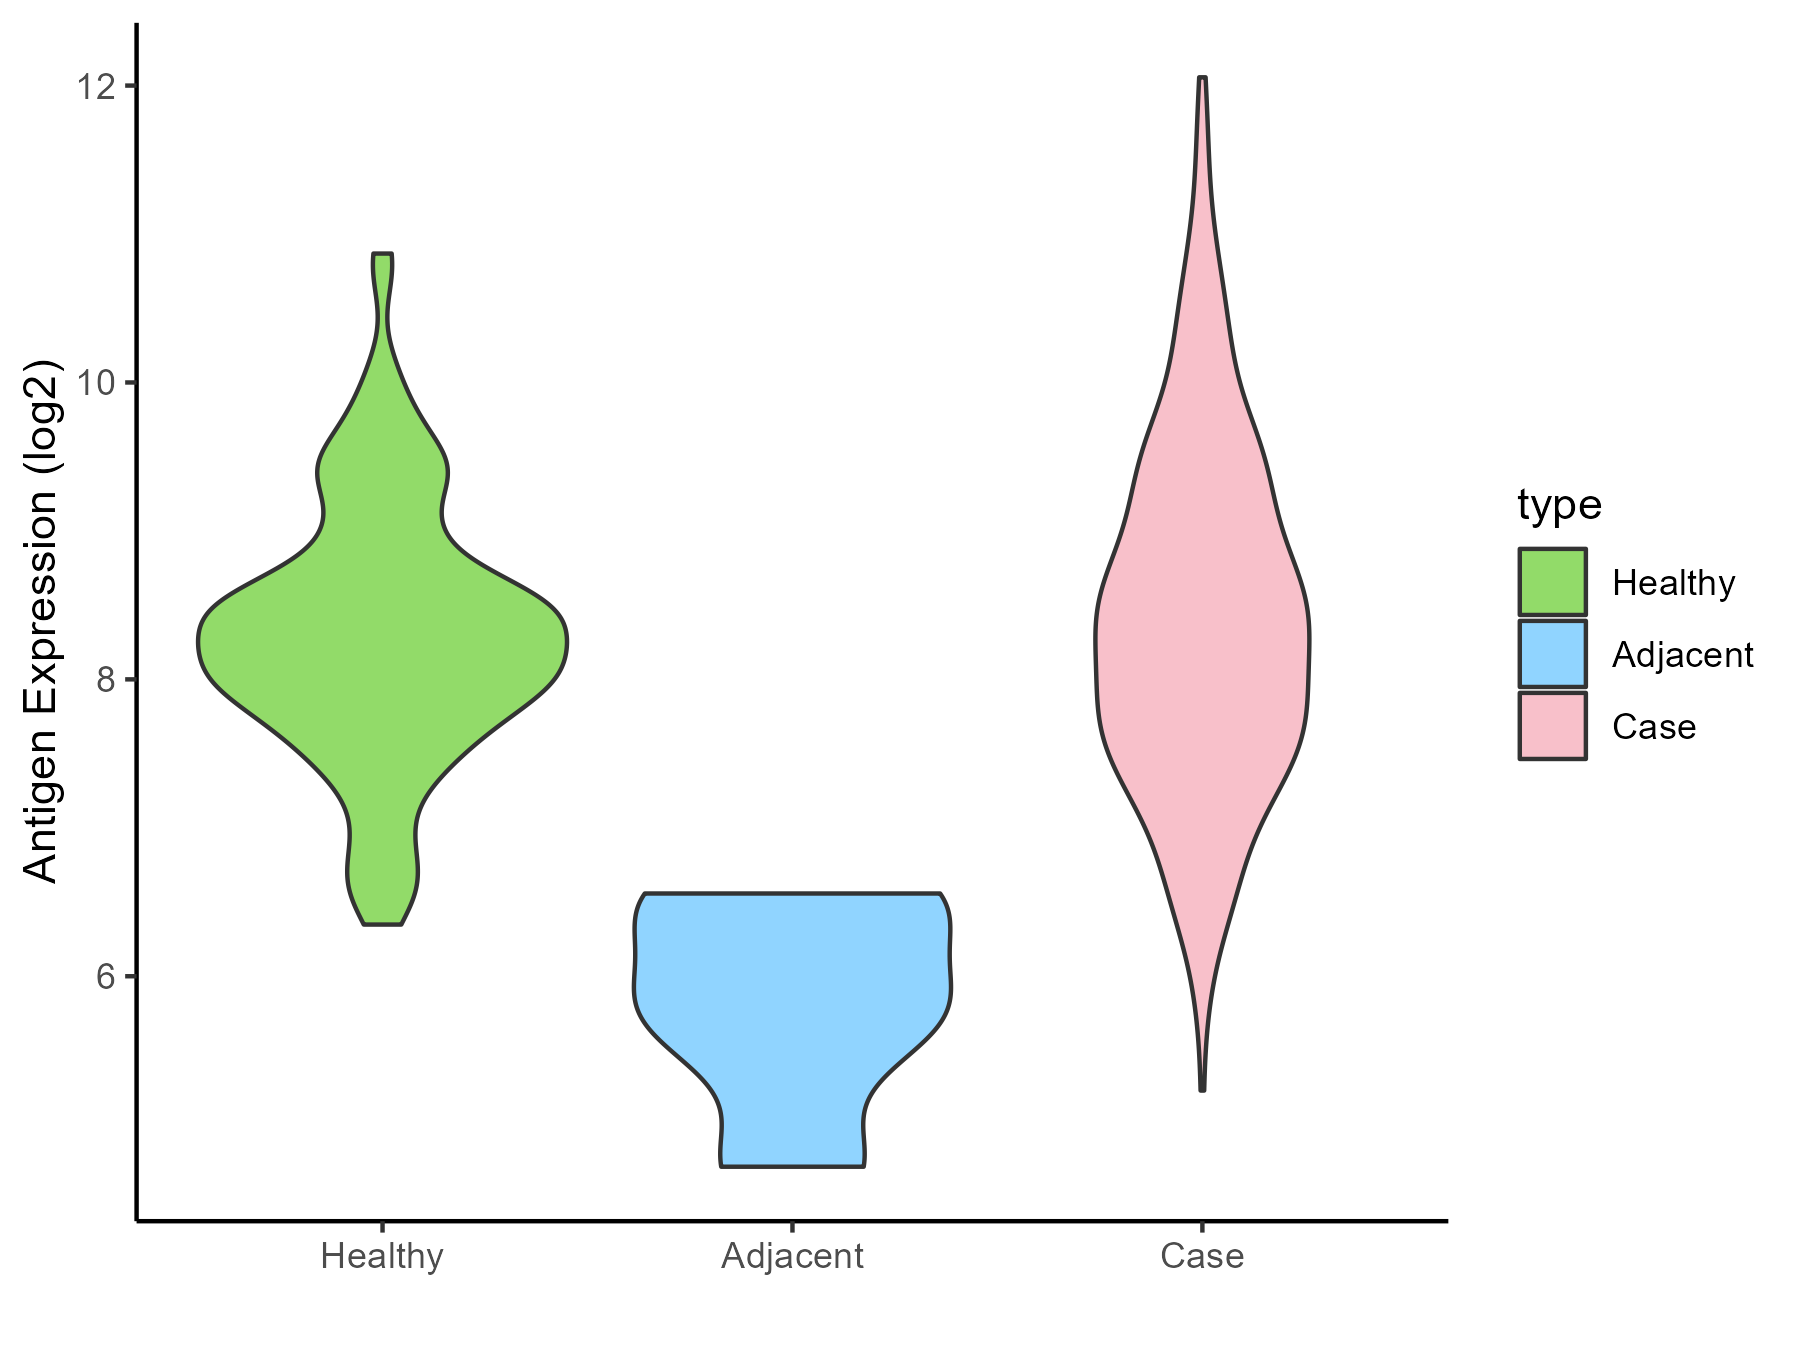
| The Studied Tissue | Endometrium | |
| The Specific Disease | Uterine cancer | |
| The Expression Level of Disease Section Compare with the Healthy Individual Tissue | p-value: 0.344641356; Fold-change: 0.112563422; Z-score: 0.131928097 | |
| The Expression Level of Disease Section Compare with the Adjacent Tissue | p-value: 0.001262576; Fold-change: 2.600283911; Z-score: 3.485606176 | |
| Disease-specific Antigen Abundances |
|
Click to View the Clearer Original Diagram |
| Differential expression pattern of antigen in diseases | ||
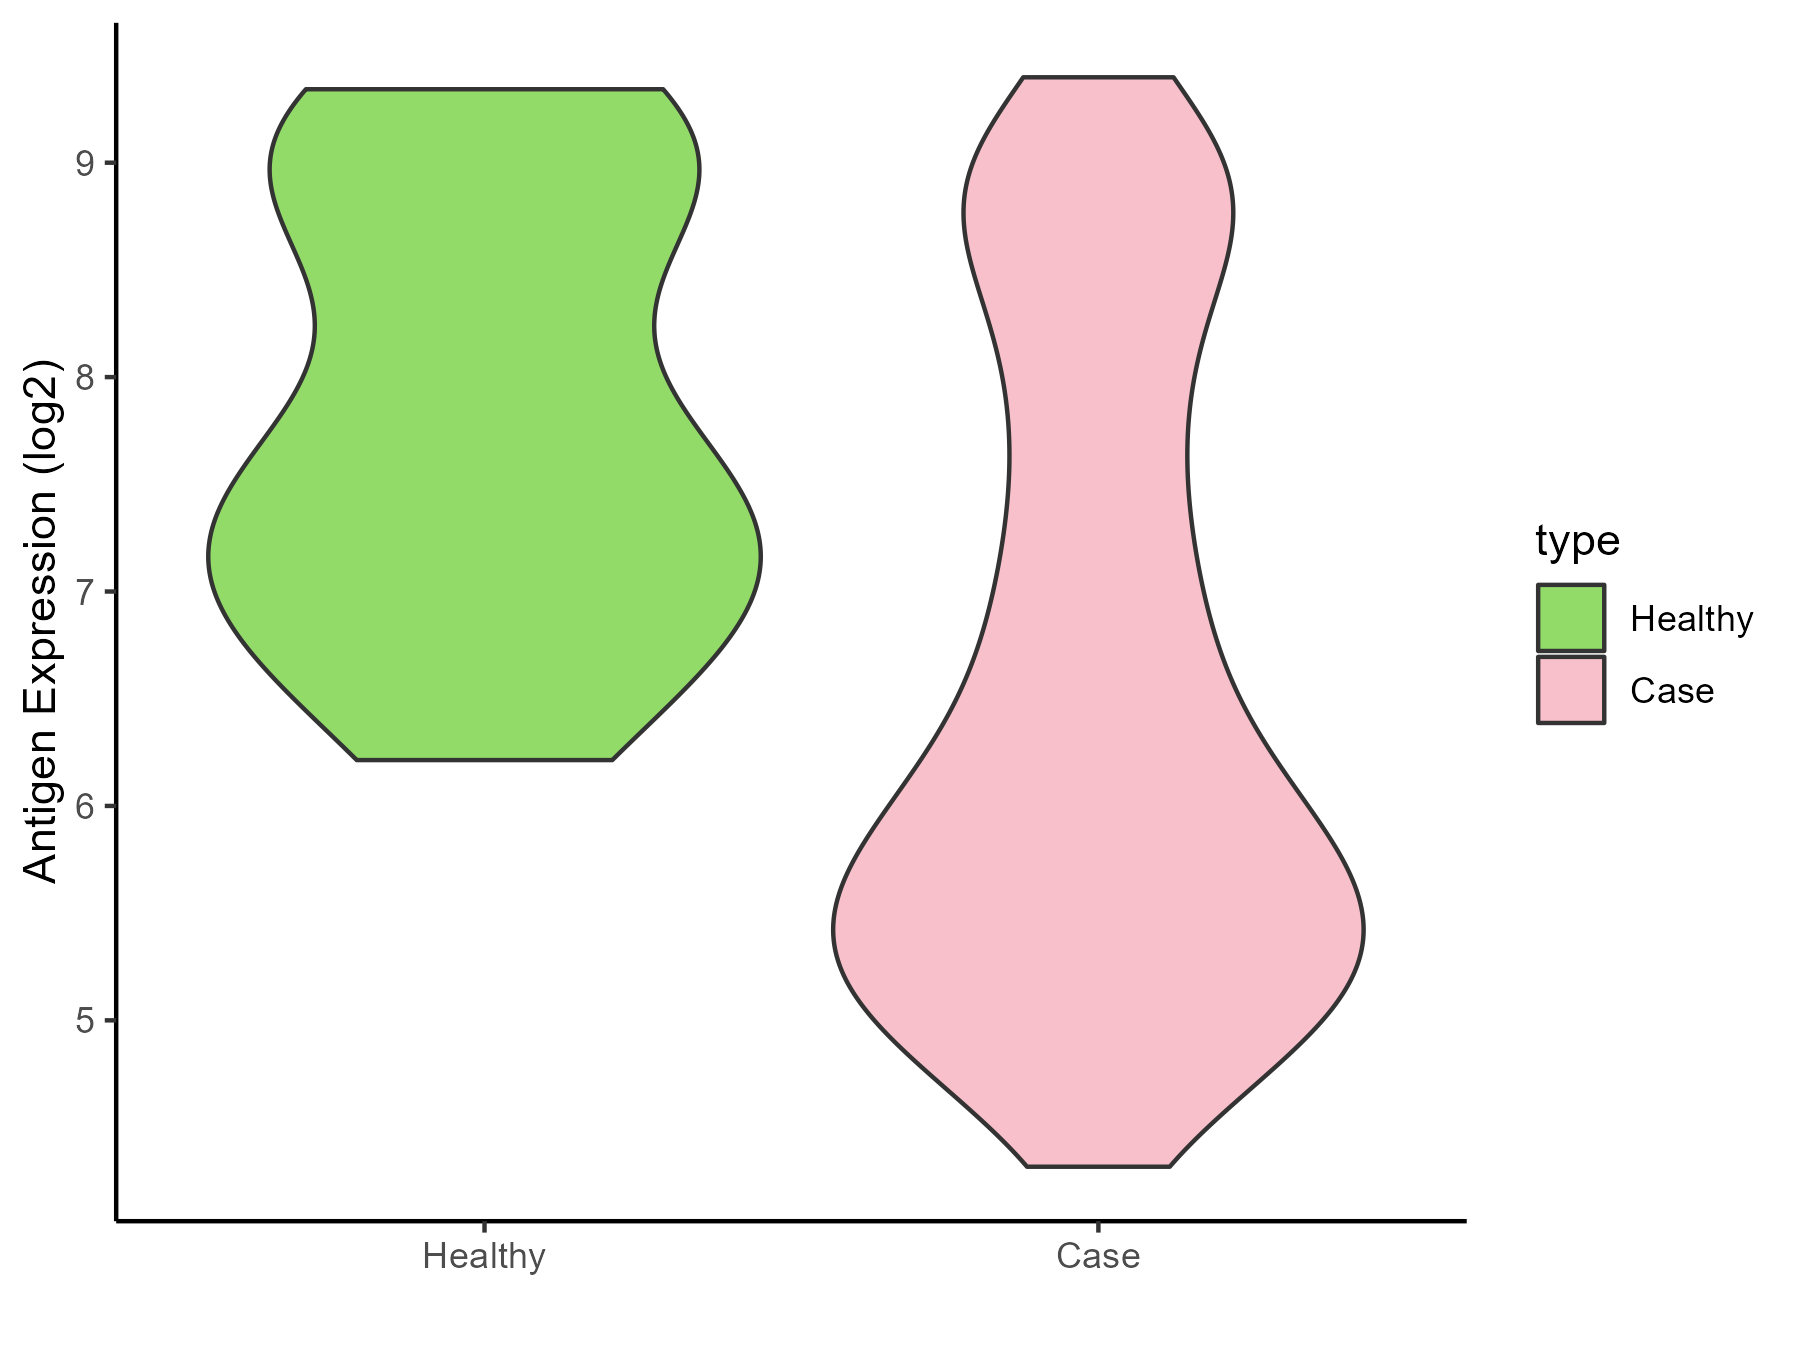
| The Studied Tissue | Prostate | |
| The Specific Disease | Prostate cancer | |
| The Expression Level of Disease Section Compare with the Healthy Individual Tissue | p-value: 1.60E-05; Fold-change: -1.559732592; Z-score: -1.519462285 | |
| Disease-specific Antigen Abundances |
|
Click to View the Clearer Original Diagram |
| Differential expression pattern of antigen in diseases | ||
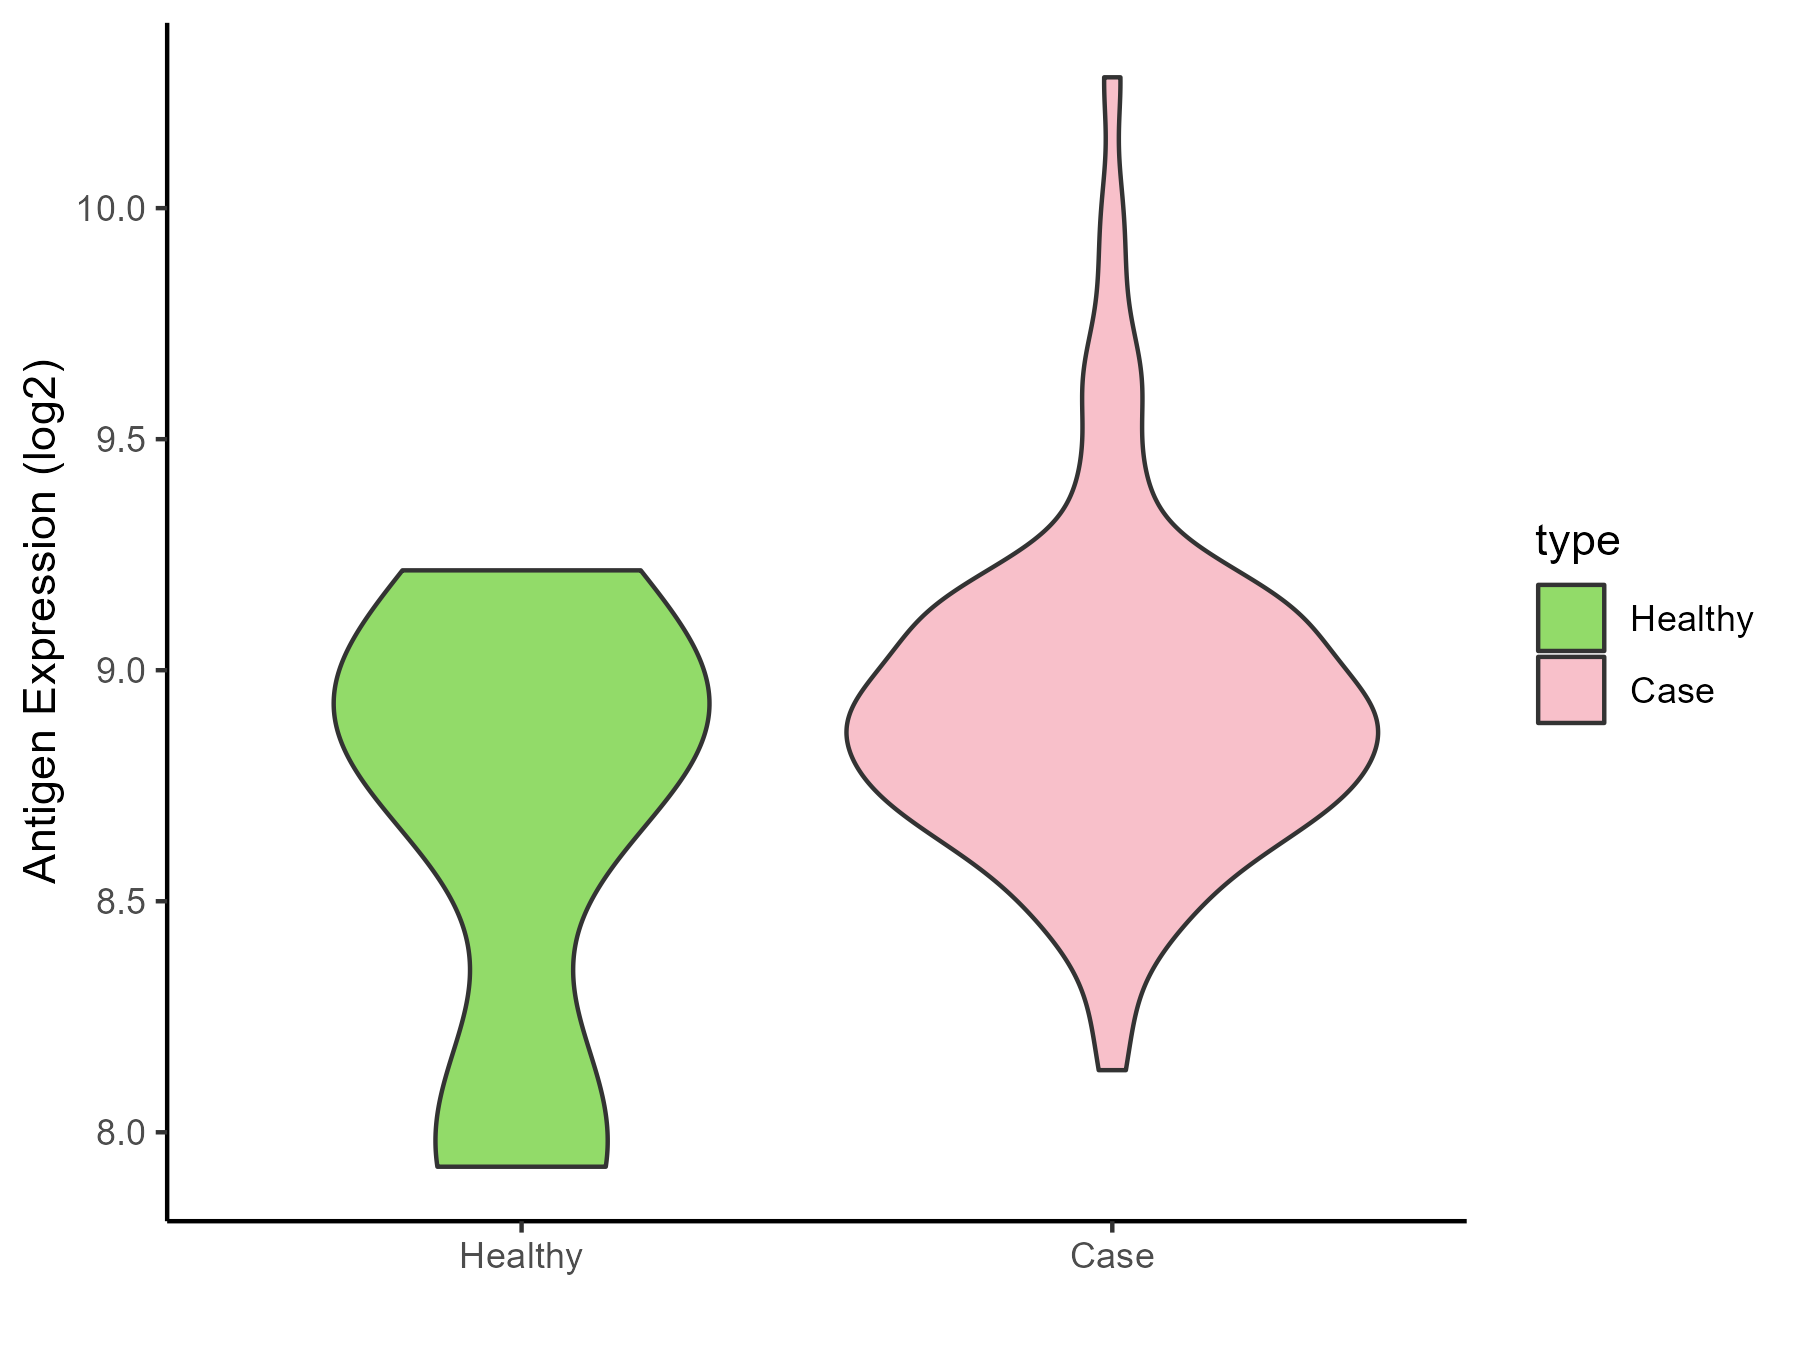
| The Studied Tissue | Bladder | |
| The Specific Disease | Bladder cancer | |
| The Expression Level of Disease Section Compare with the Healthy Individual Tissue | p-value: 0.216097922; Fold-change: 0.03173553; Z-score: 0.064142983 | |
| Disease-specific Antigen Abundances |
|
Click to View the Clearer Original Diagram |
| Differential expression pattern of antigen in diseases | ||
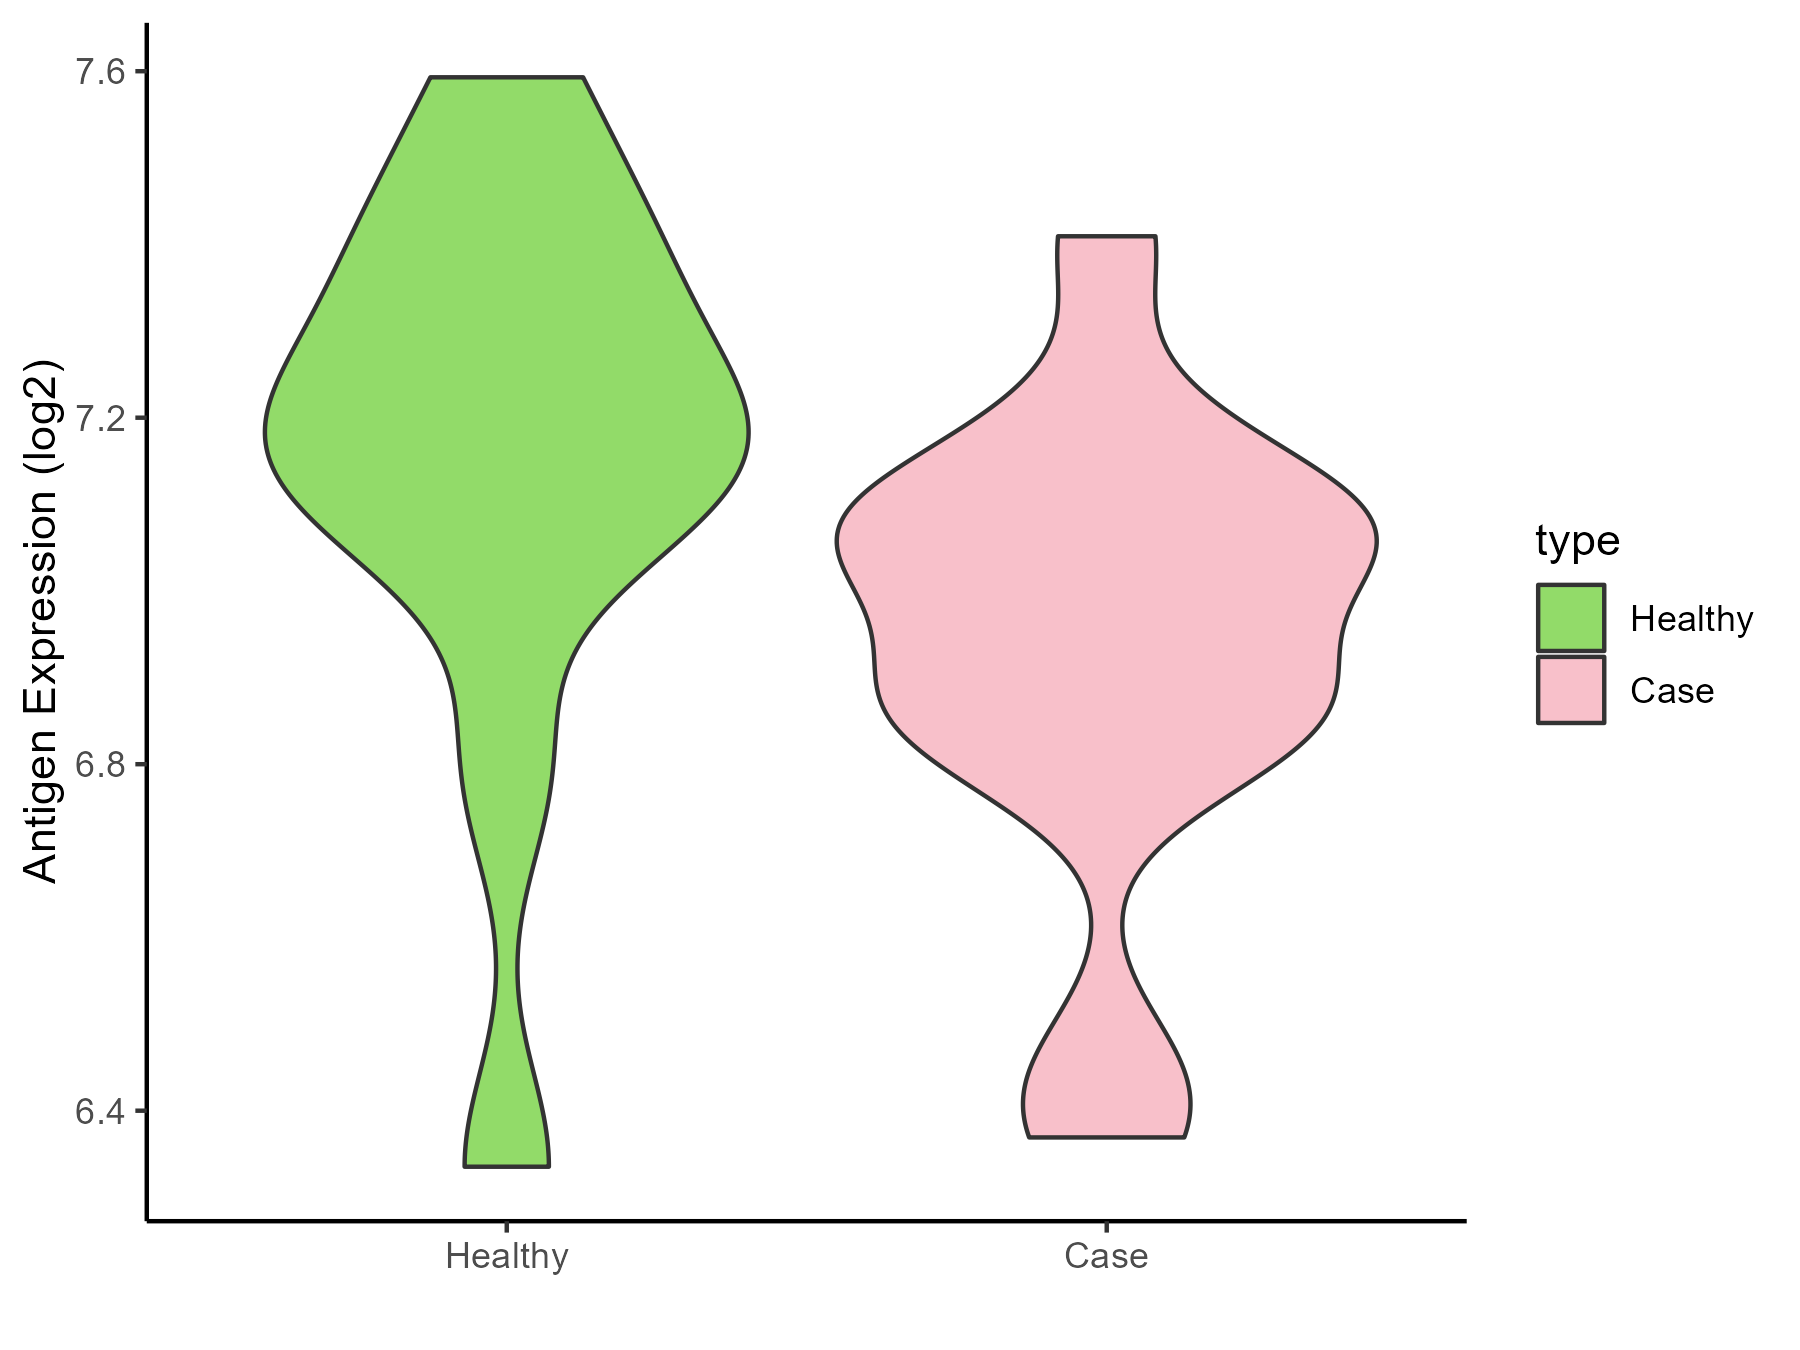
| The Studied Tissue | Uvea | |
| The Specific Disease | Retinoblastoma tumor | |
| The Expression Level of Disease Section Compare with the Healthy Individual Tissue | p-value: 0.084868647; Fold-change: -0.193287331; Z-score: -0.584784076 | |
| Disease-specific Antigen Abundances |
|
Click to View the Clearer Original Diagram |
| Differential expression pattern of antigen in diseases | ||
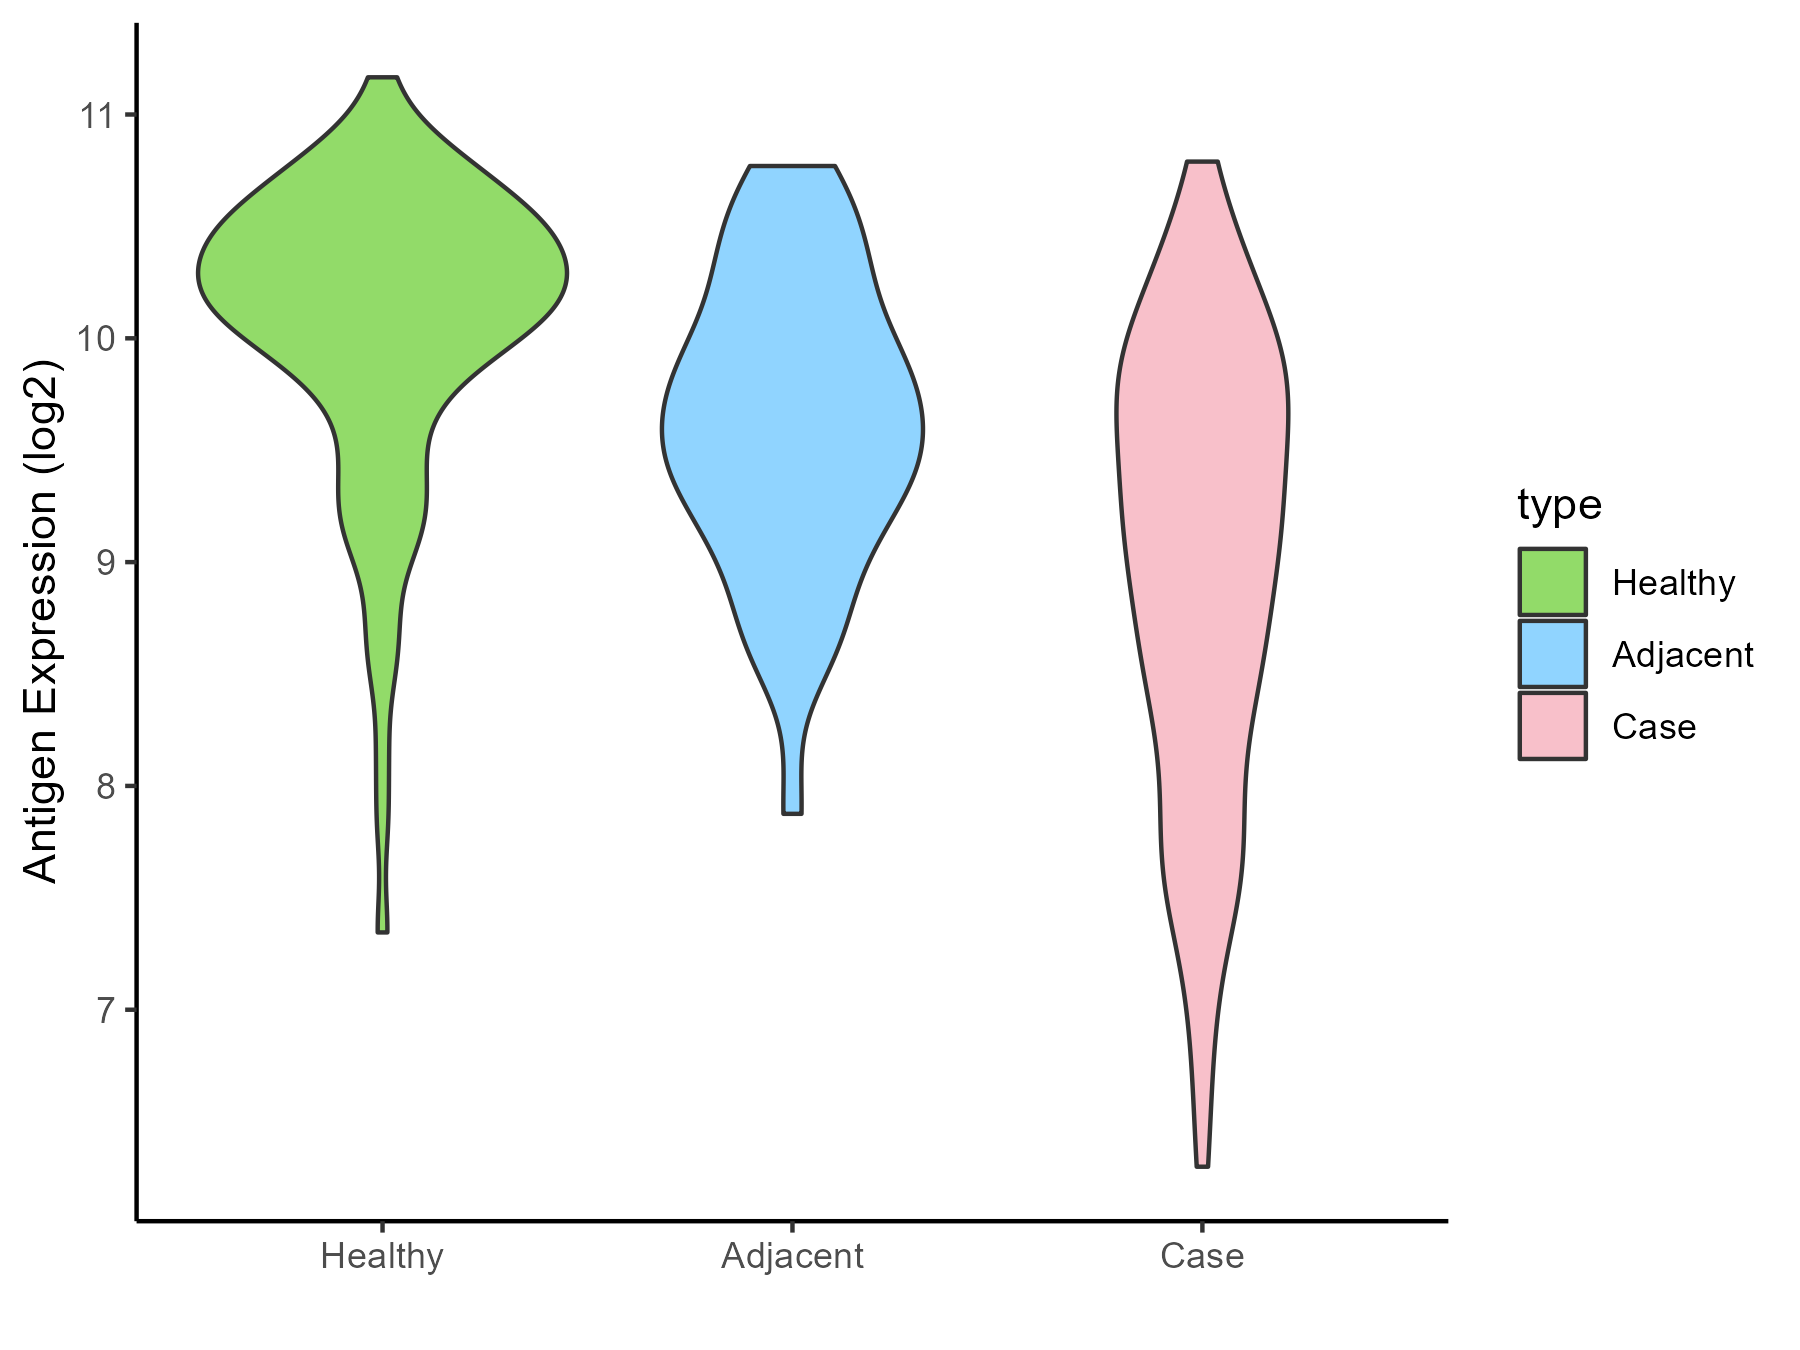
| The Studied Tissue | Thyroid | |
| The Specific Disease | Thyroid cancer | |
| The Expression Level of Disease Section Compare with the Healthy Individual Tissue | p-value: 2.51E-26; Fold-change: -1.063778915; Z-score: -1.588004832 | |
| The Expression Level of Disease Section Compare with the Adjacent Tissue | p-value: 1.43E-06; Fold-change: -0.51014243; Z-score: -0.779773379 | |
| Disease-specific Antigen Abundances |
|
Click to View the Clearer Original Diagram |
| Differential expression pattern of antigen in diseases | ||
| The Studied Tissue | Adrenal cortex | |
| The Specific Disease | Adrenocortical carcinoma | |
| The Expression Level of Disease Section Compare with the Other Disease Section | p-value: 0.000769907; Fold-change: -0.550675221; Z-score: -1.405371256 | |
| Disease-specific Antigen Abundances |
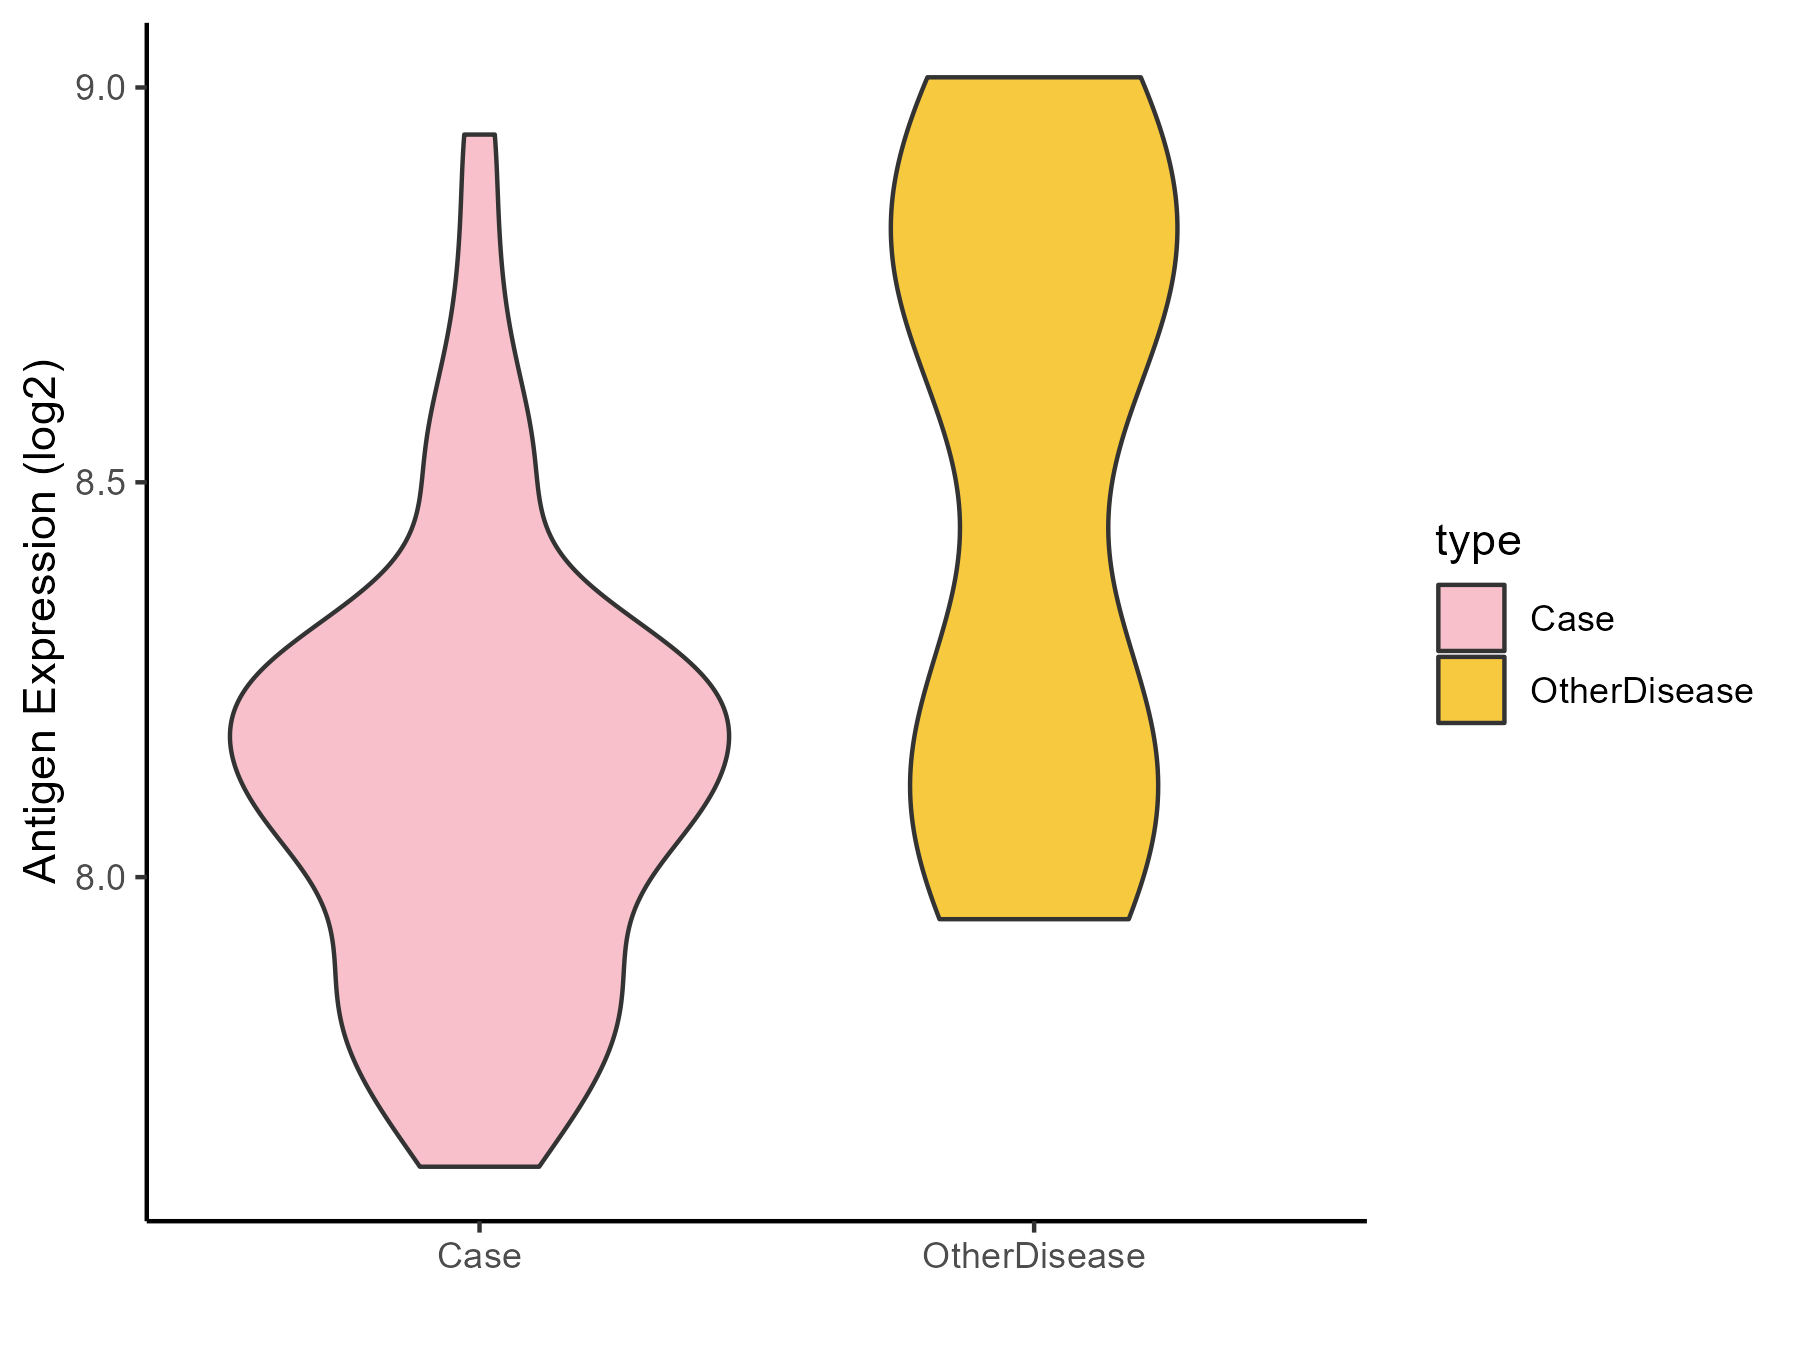
|
Click to View the Clearer Original Diagram |
| Differential expression pattern of antigen in diseases | ||
| The Studied Tissue | Head and neck | |
| The Specific Disease | Head and neck cancer | |
| The Expression Level of Disease Section Compare with the Healthy Individual Tissue | p-value: 1.70E-12; Fold-change: -0.857618095; Z-score: -1.15030746 | |
| Disease-specific Antigen Abundances |
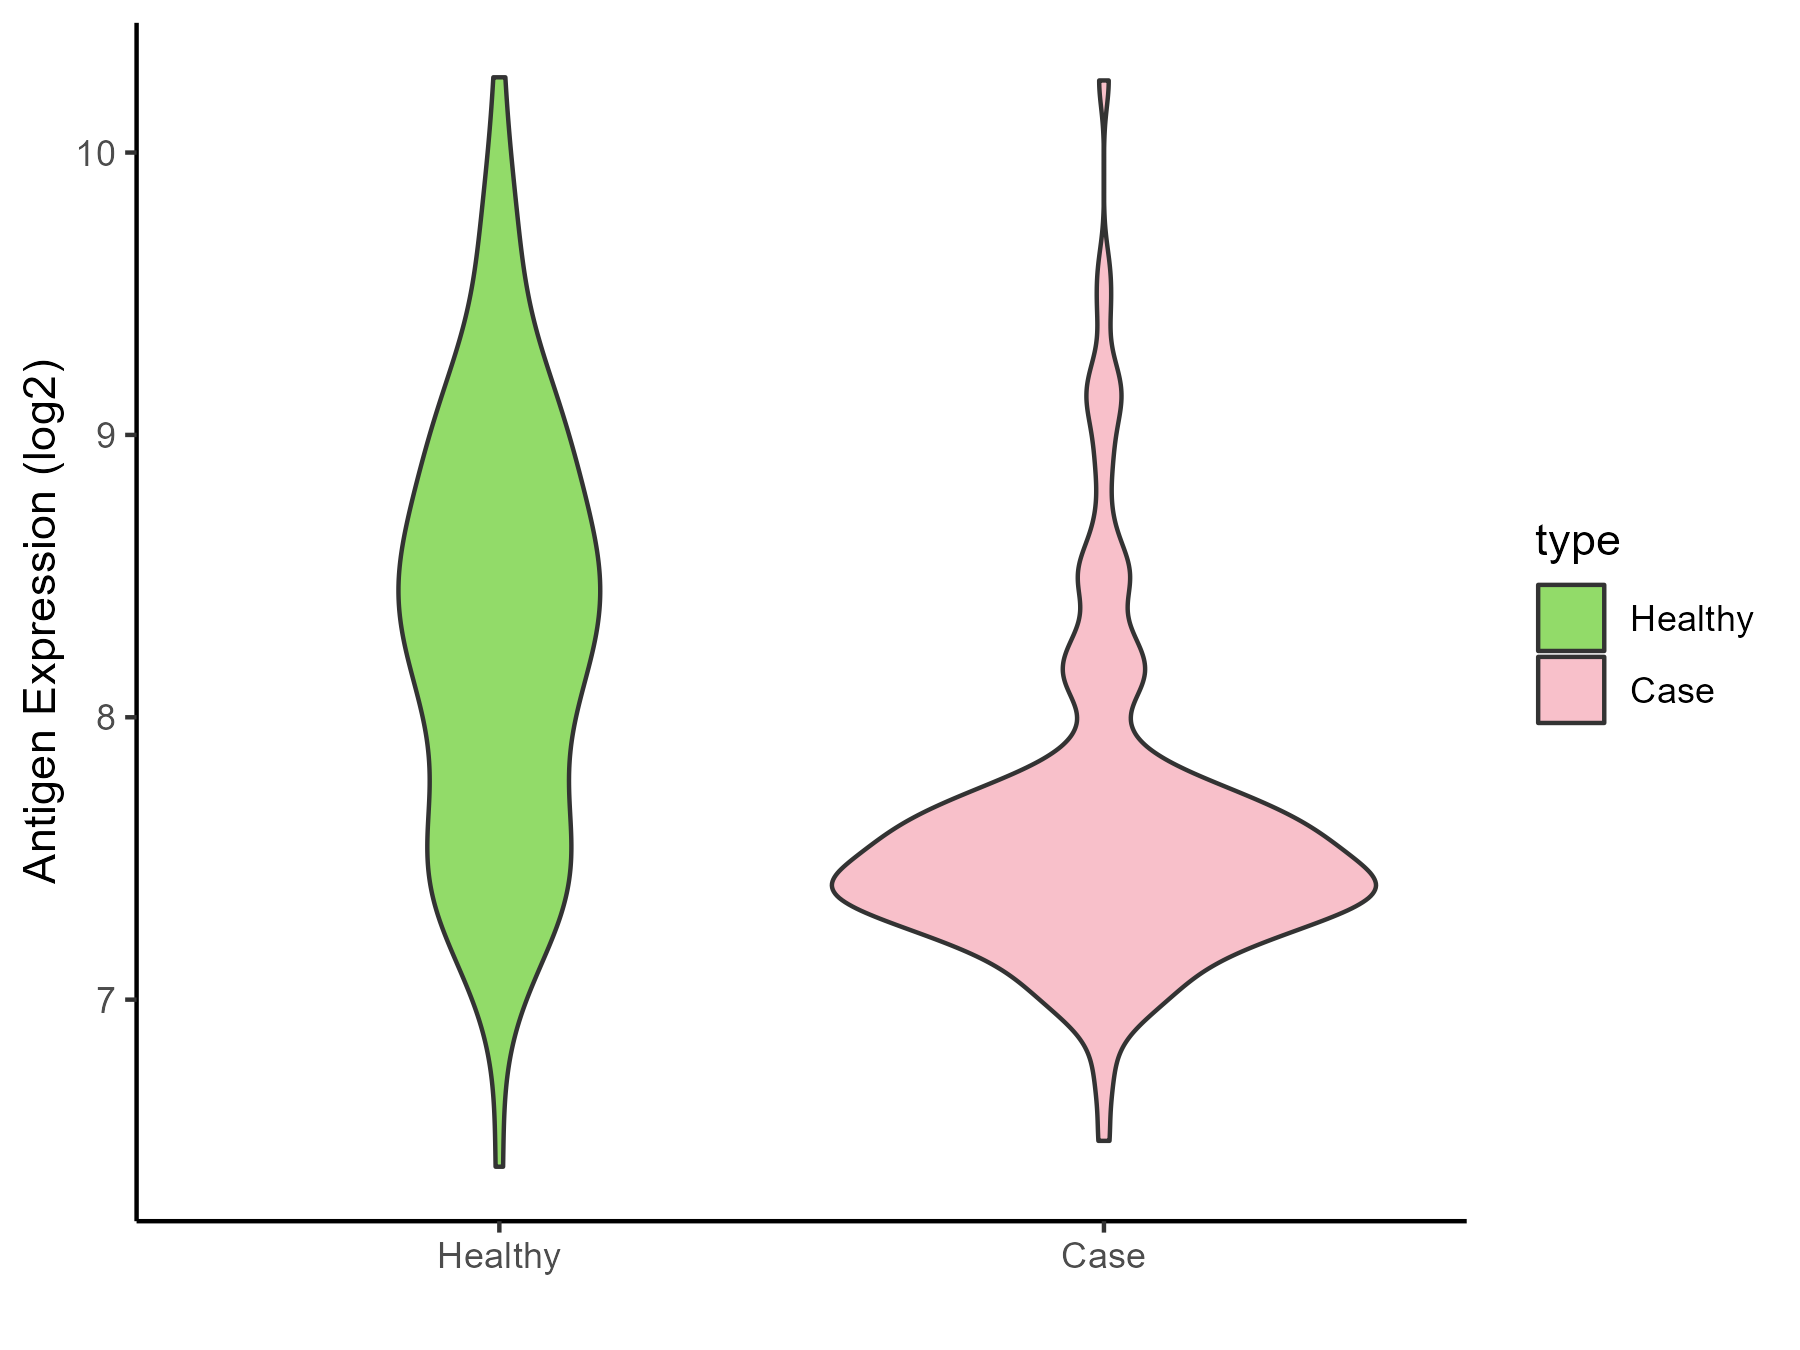
|
Click to View the Clearer Original Diagram |
| Differential expression pattern of antigen in diseases | ||
| The Studied Tissue | Pituitary | |
| The Specific Disease | Pituitary gonadotrope tumor | |
| The Expression Level of Disease Section Compare with the Healthy Individual Tissue | p-value: 0.014832123; Fold-change: 1.211747472; Z-score: 2.625628238 | |
| Disease-specific Antigen Abundances |
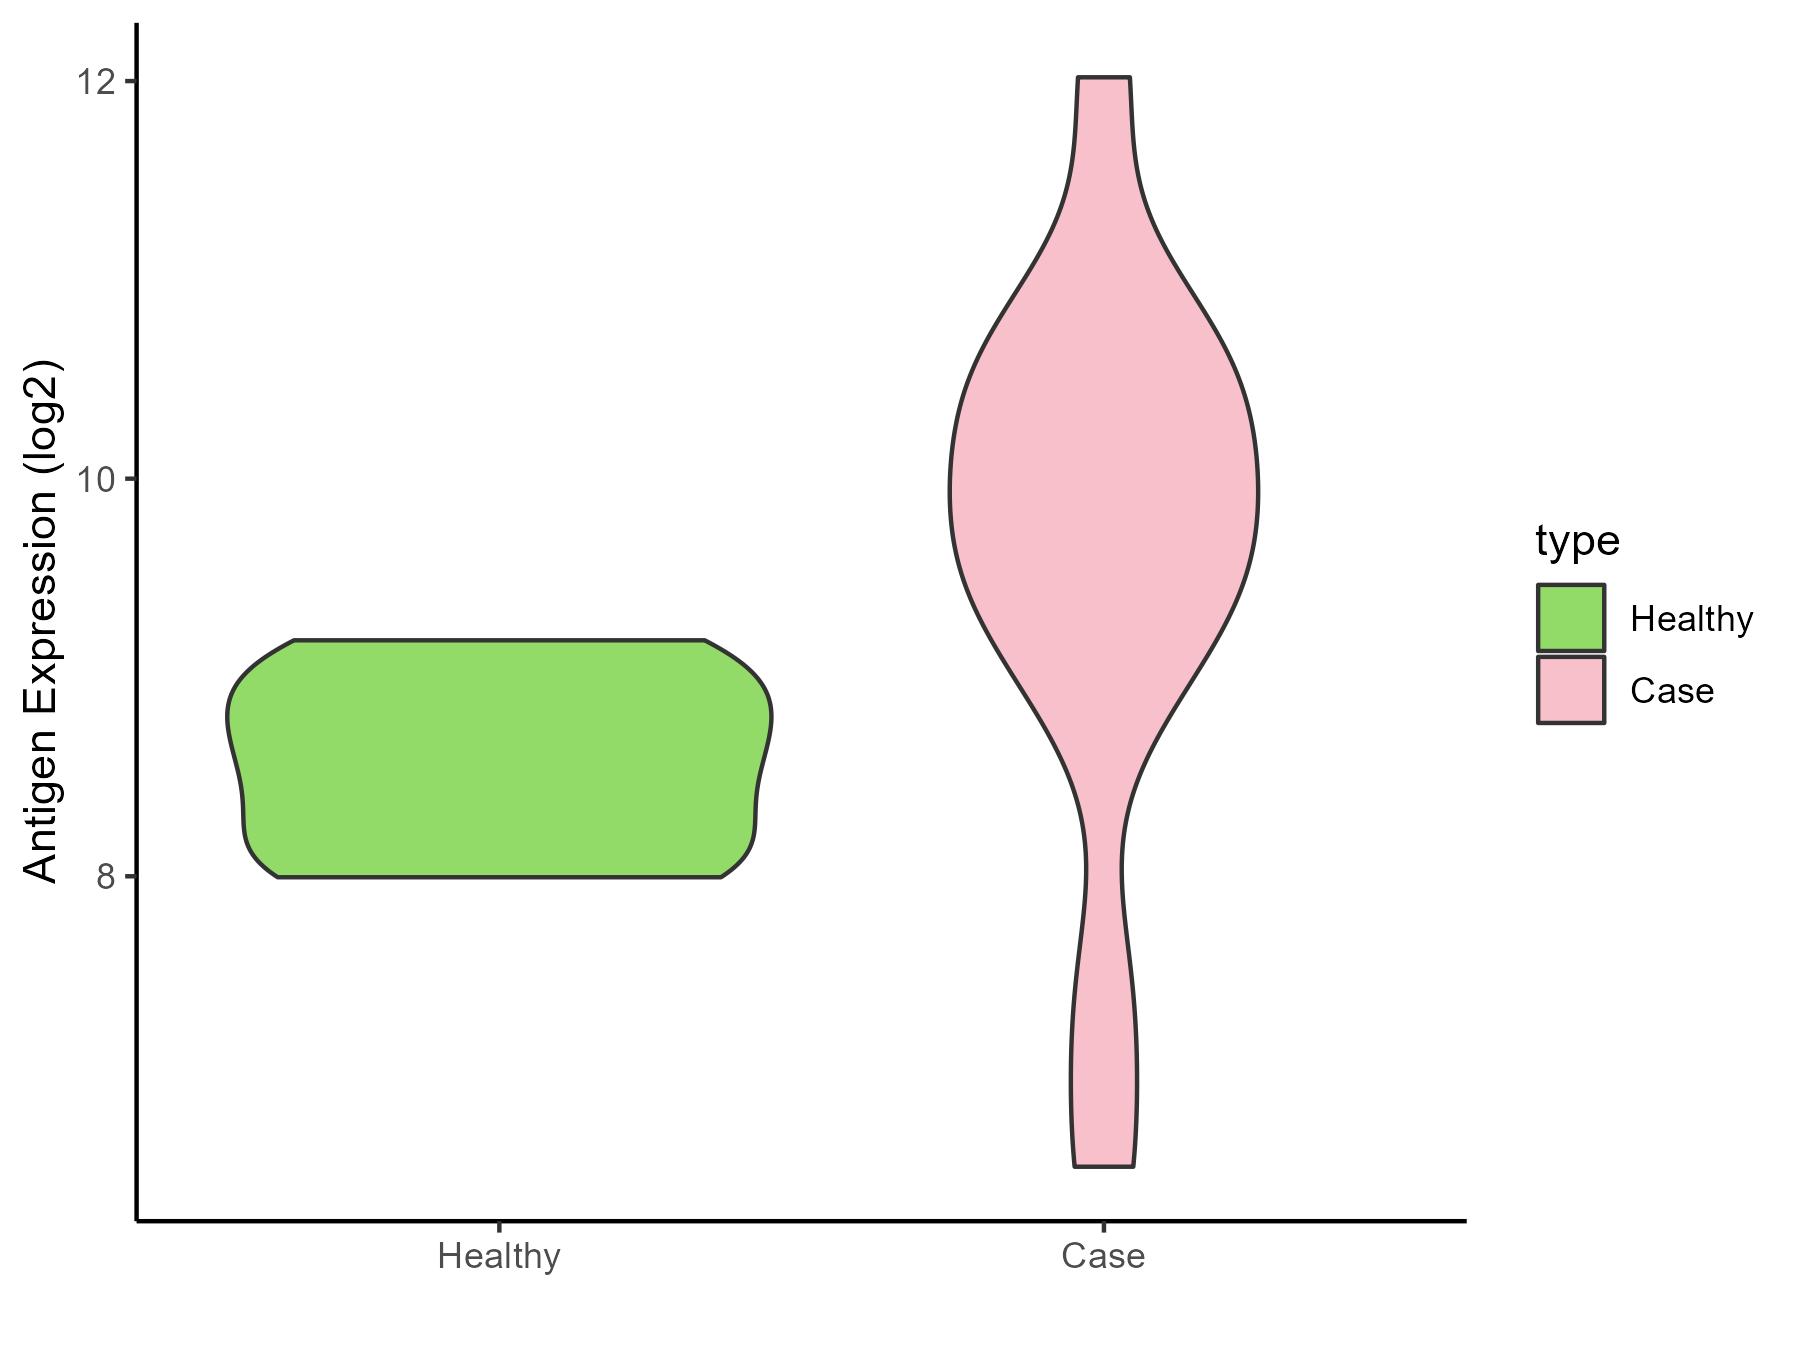
|
Click to View the Clearer Original Diagram |
| The Studied Tissue | Pituitary | |
| The Specific Disease | Pituitary cancer | |
| The Expression Level of Disease Section Compare with the Healthy Individual Tissue | p-value: 0.721570184; Fold-change: 0.21602485; Z-score: 0.369039119 | |
| Disease-specific Antigen Abundances |
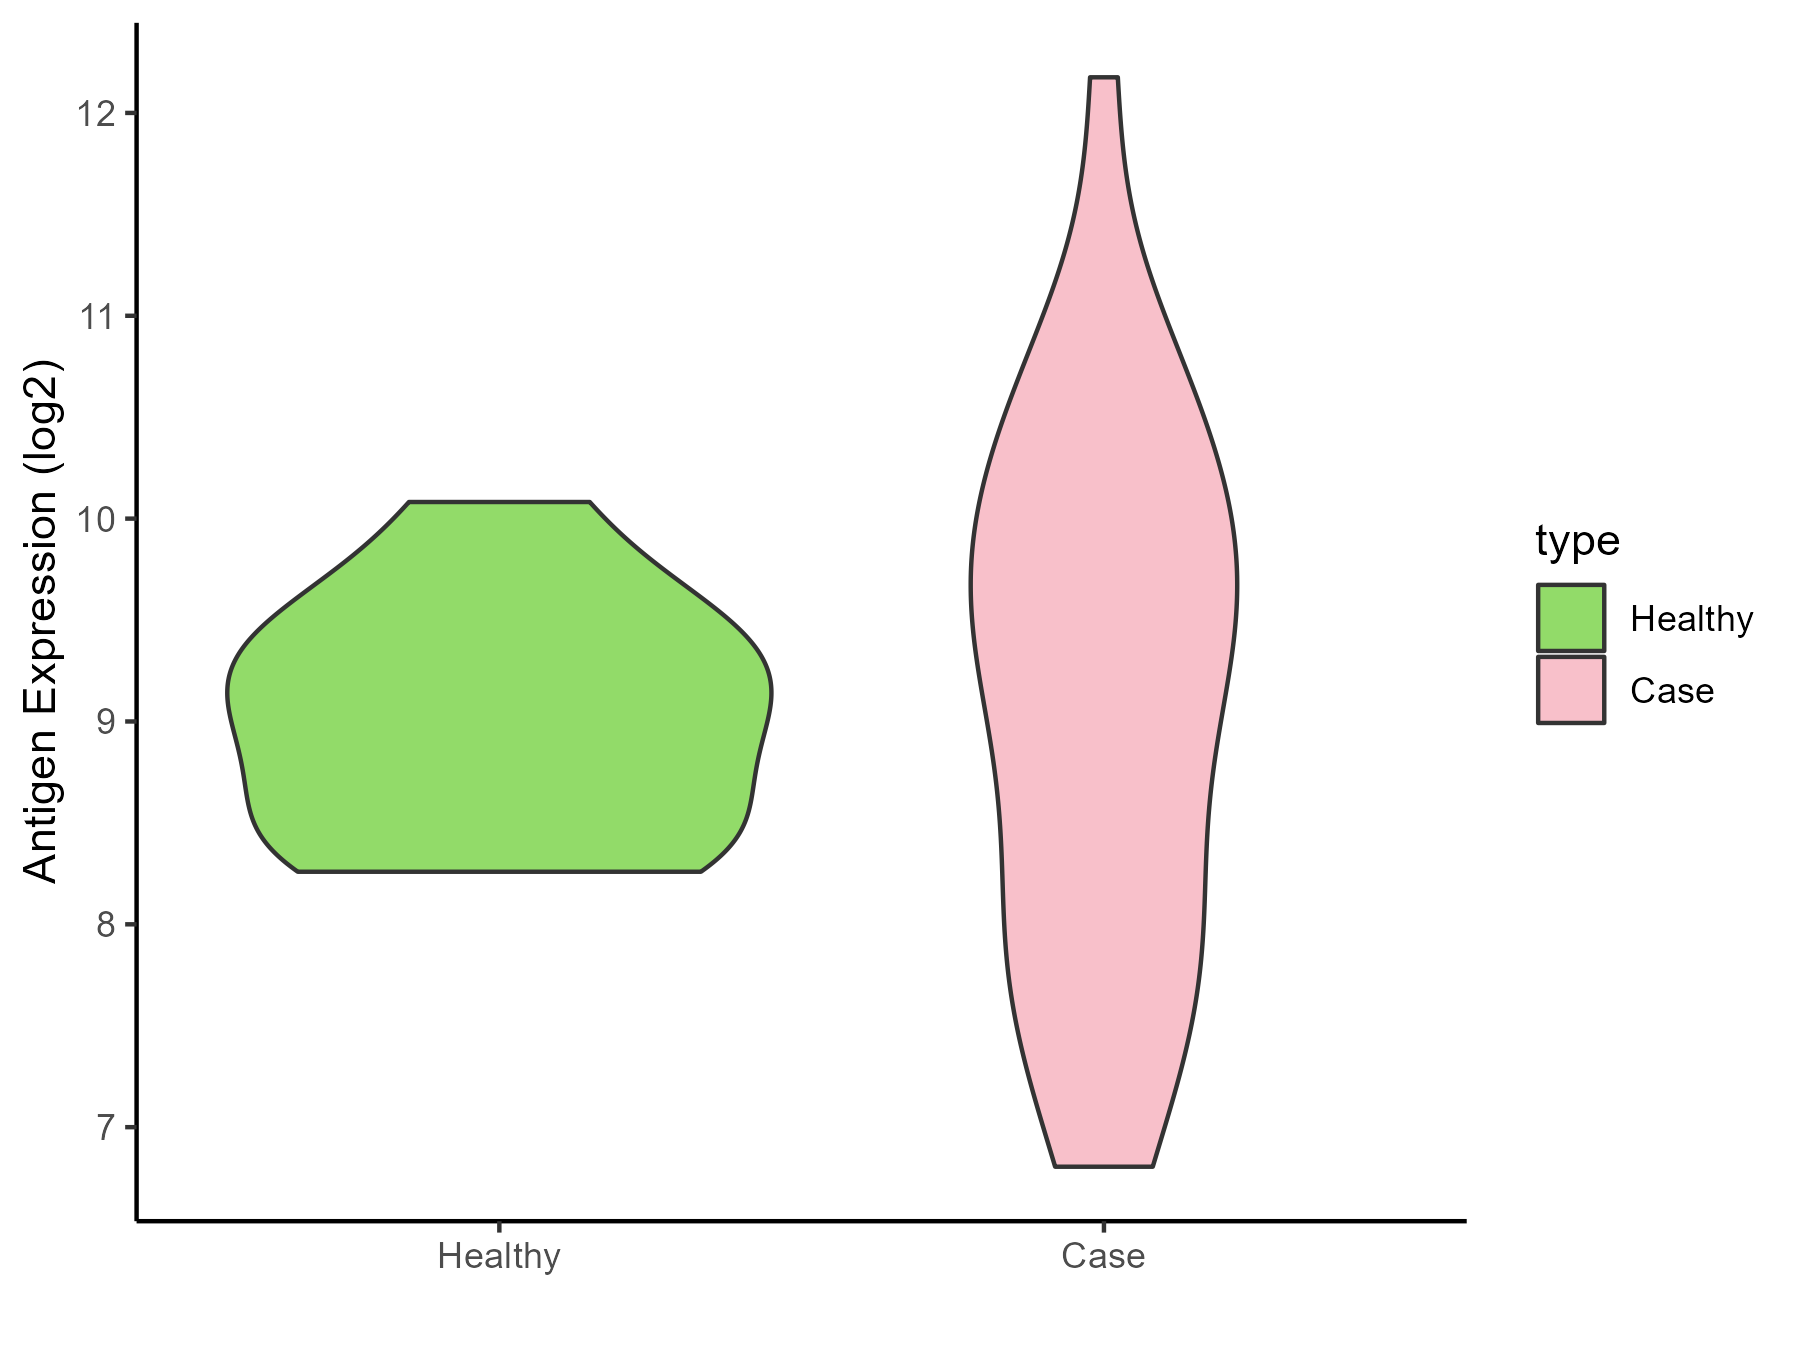
|
Click to View the Clearer Original Diagram |
ICD Disease Classification 03
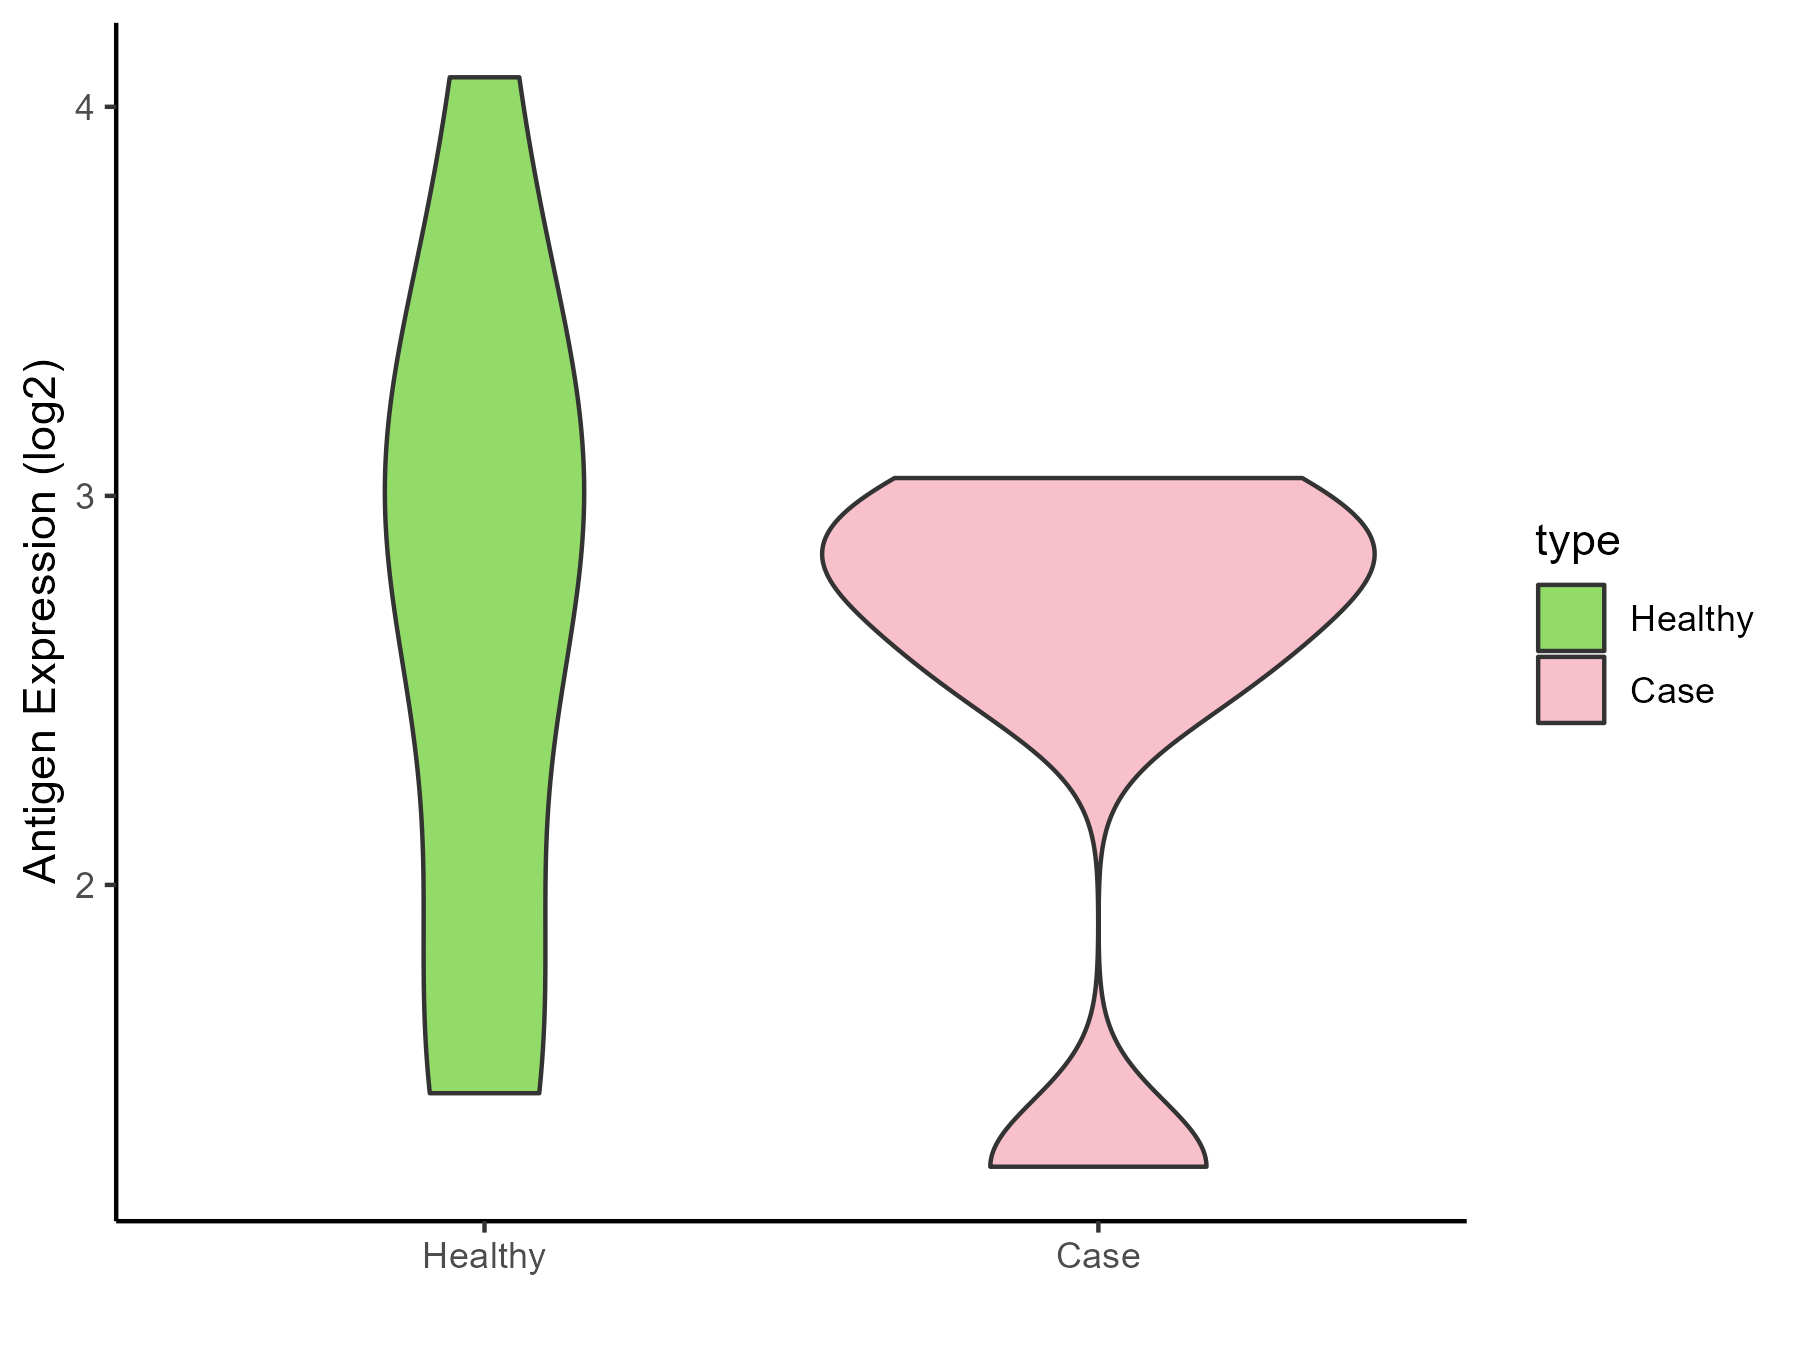
| Differential expression pattern of antigen in diseases | ||
| The Studied Tissue | Whole blood | |
| The Specific Disease | Thrombocytopenia | |
| The Expression Level of Disease Section Compare with the Healthy Individual Tissue | p-value: 0.658326265; Fold-change: -0.087290173; Z-score: -0.102271942 | |
| Disease-specific Antigen Abundances |
|
Click to View the Clearer Original Diagram |
ICD Disease Classification 04
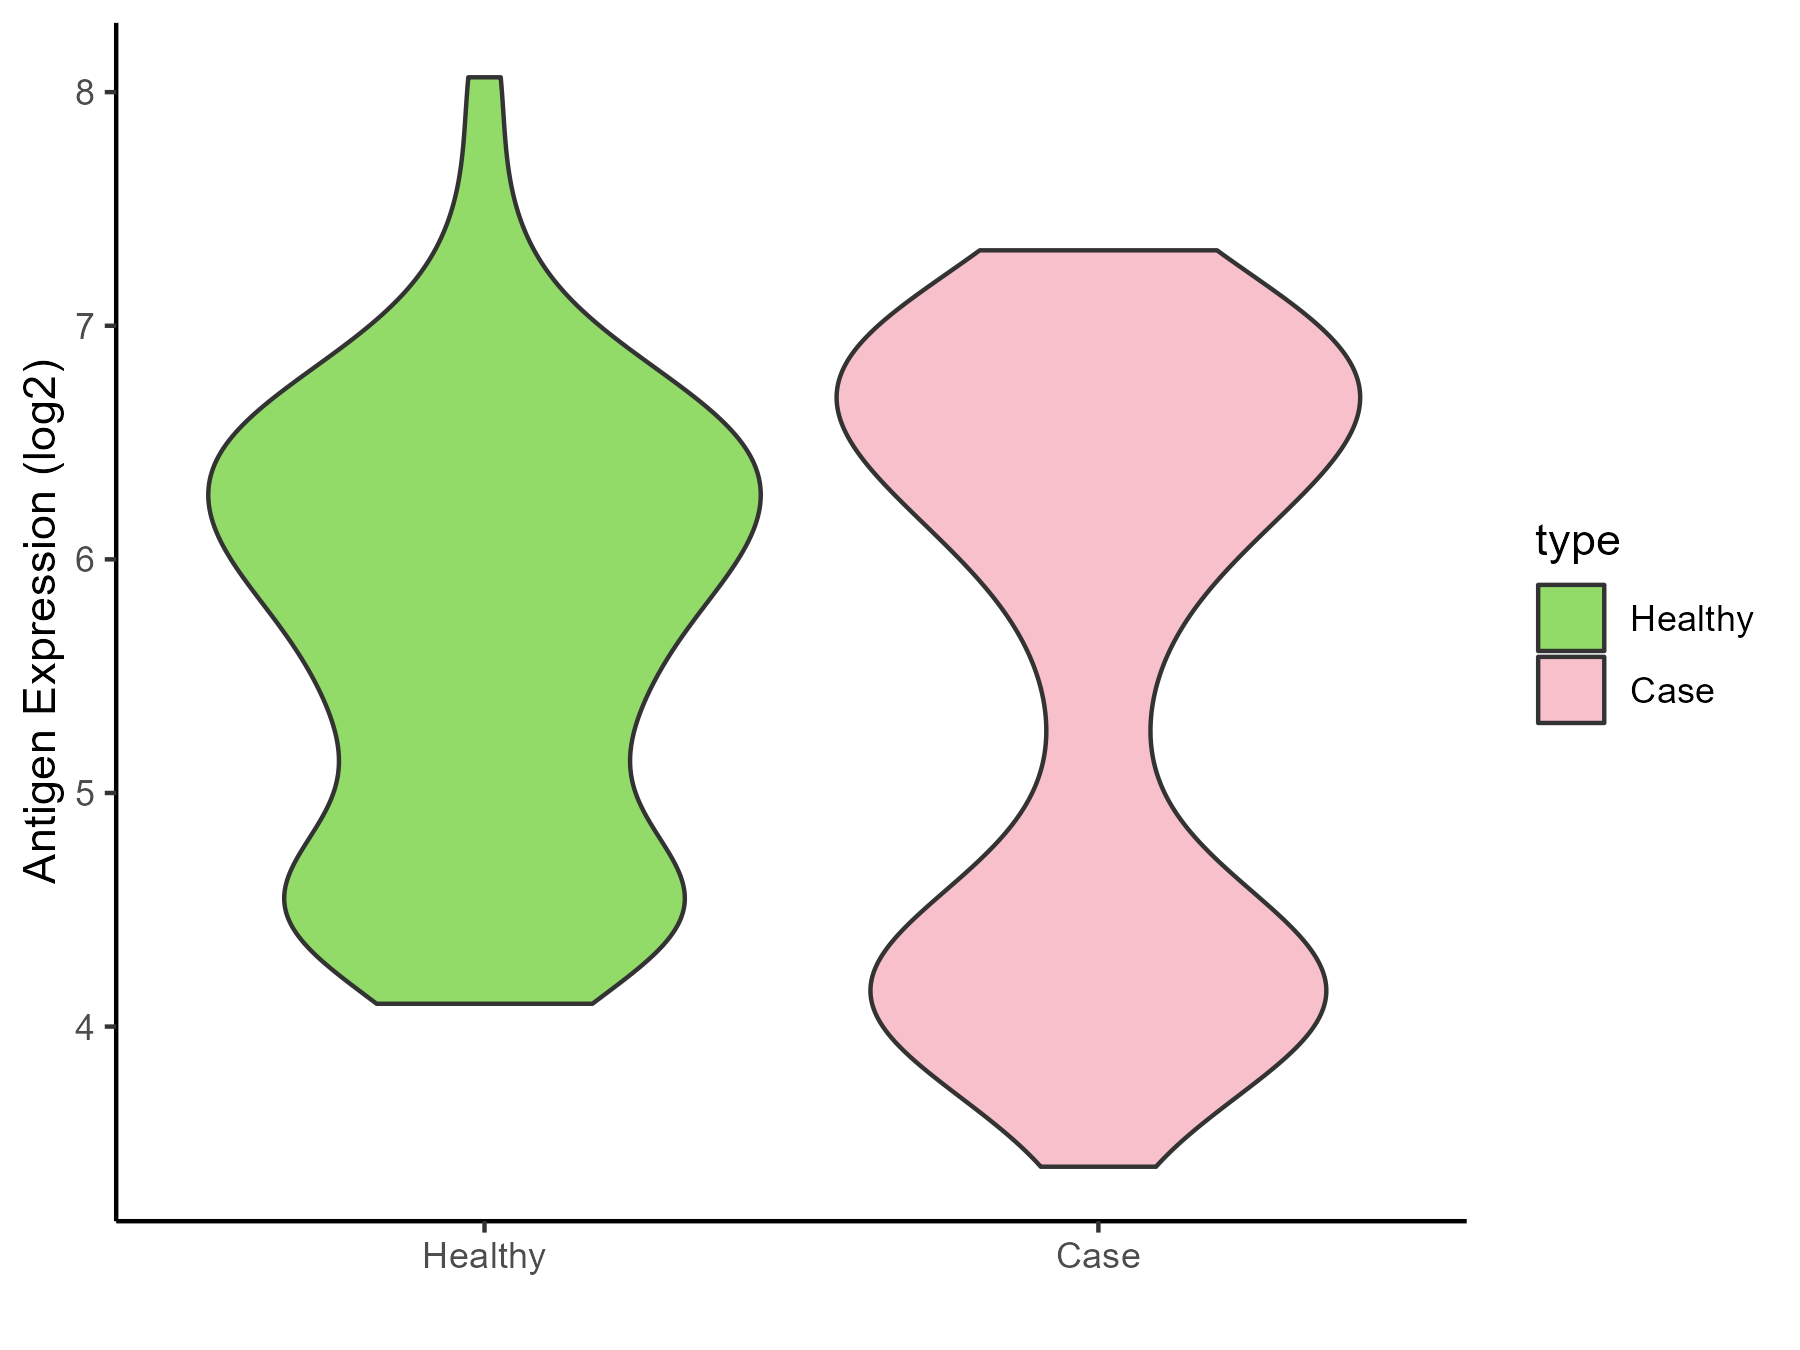
| Differential expression pattern of antigen in diseases | ||
| The Studied Tissue | Whole blood | |
| The Specific Disease | Lupus erythematosus | |
| The Expression Level of Disease Section Compare with the Healthy Individual Tissue | p-value: 0.187527526; Fold-change: 0.126015948; Z-score: 0.135338393 | |
| Disease-specific Antigen Abundances |
|
Click to View the Clearer Original Diagram |
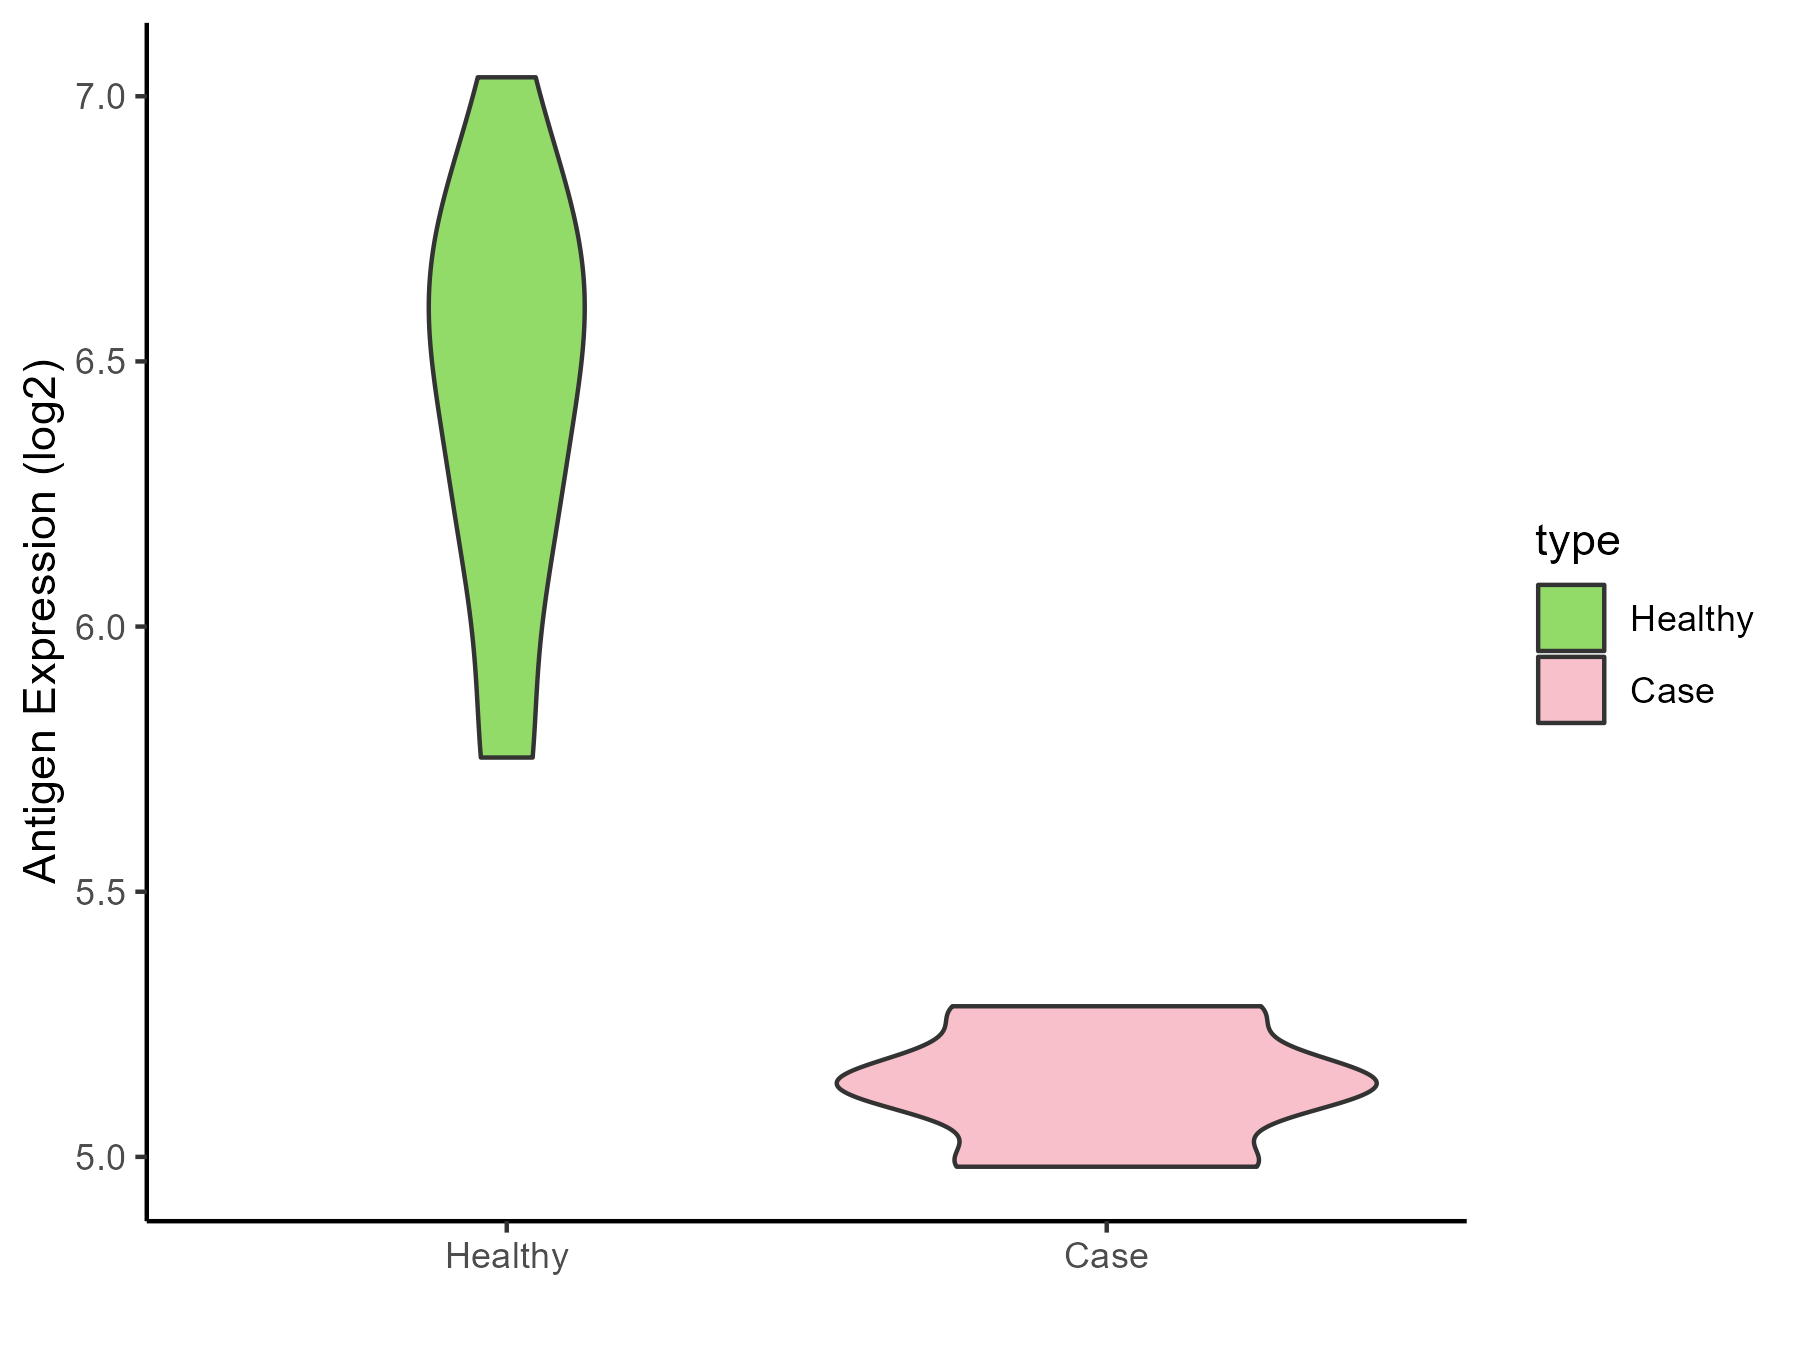
| Differential expression pattern of antigen in diseases | ||
| The Studied Tissue | Peripheral monocyte | |
| The Specific Disease | Autoimmune uveitis | |
| The Expression Level of Disease Section Compare with the Healthy Individual Tissue | p-value: 7.09E-09; Fold-change: -1.410517099; Z-score: -3.708325101 | |
| Disease-specific Antigen Abundances |
|
Click to View the Clearer Original Diagram |
ICD Disease Classification 05
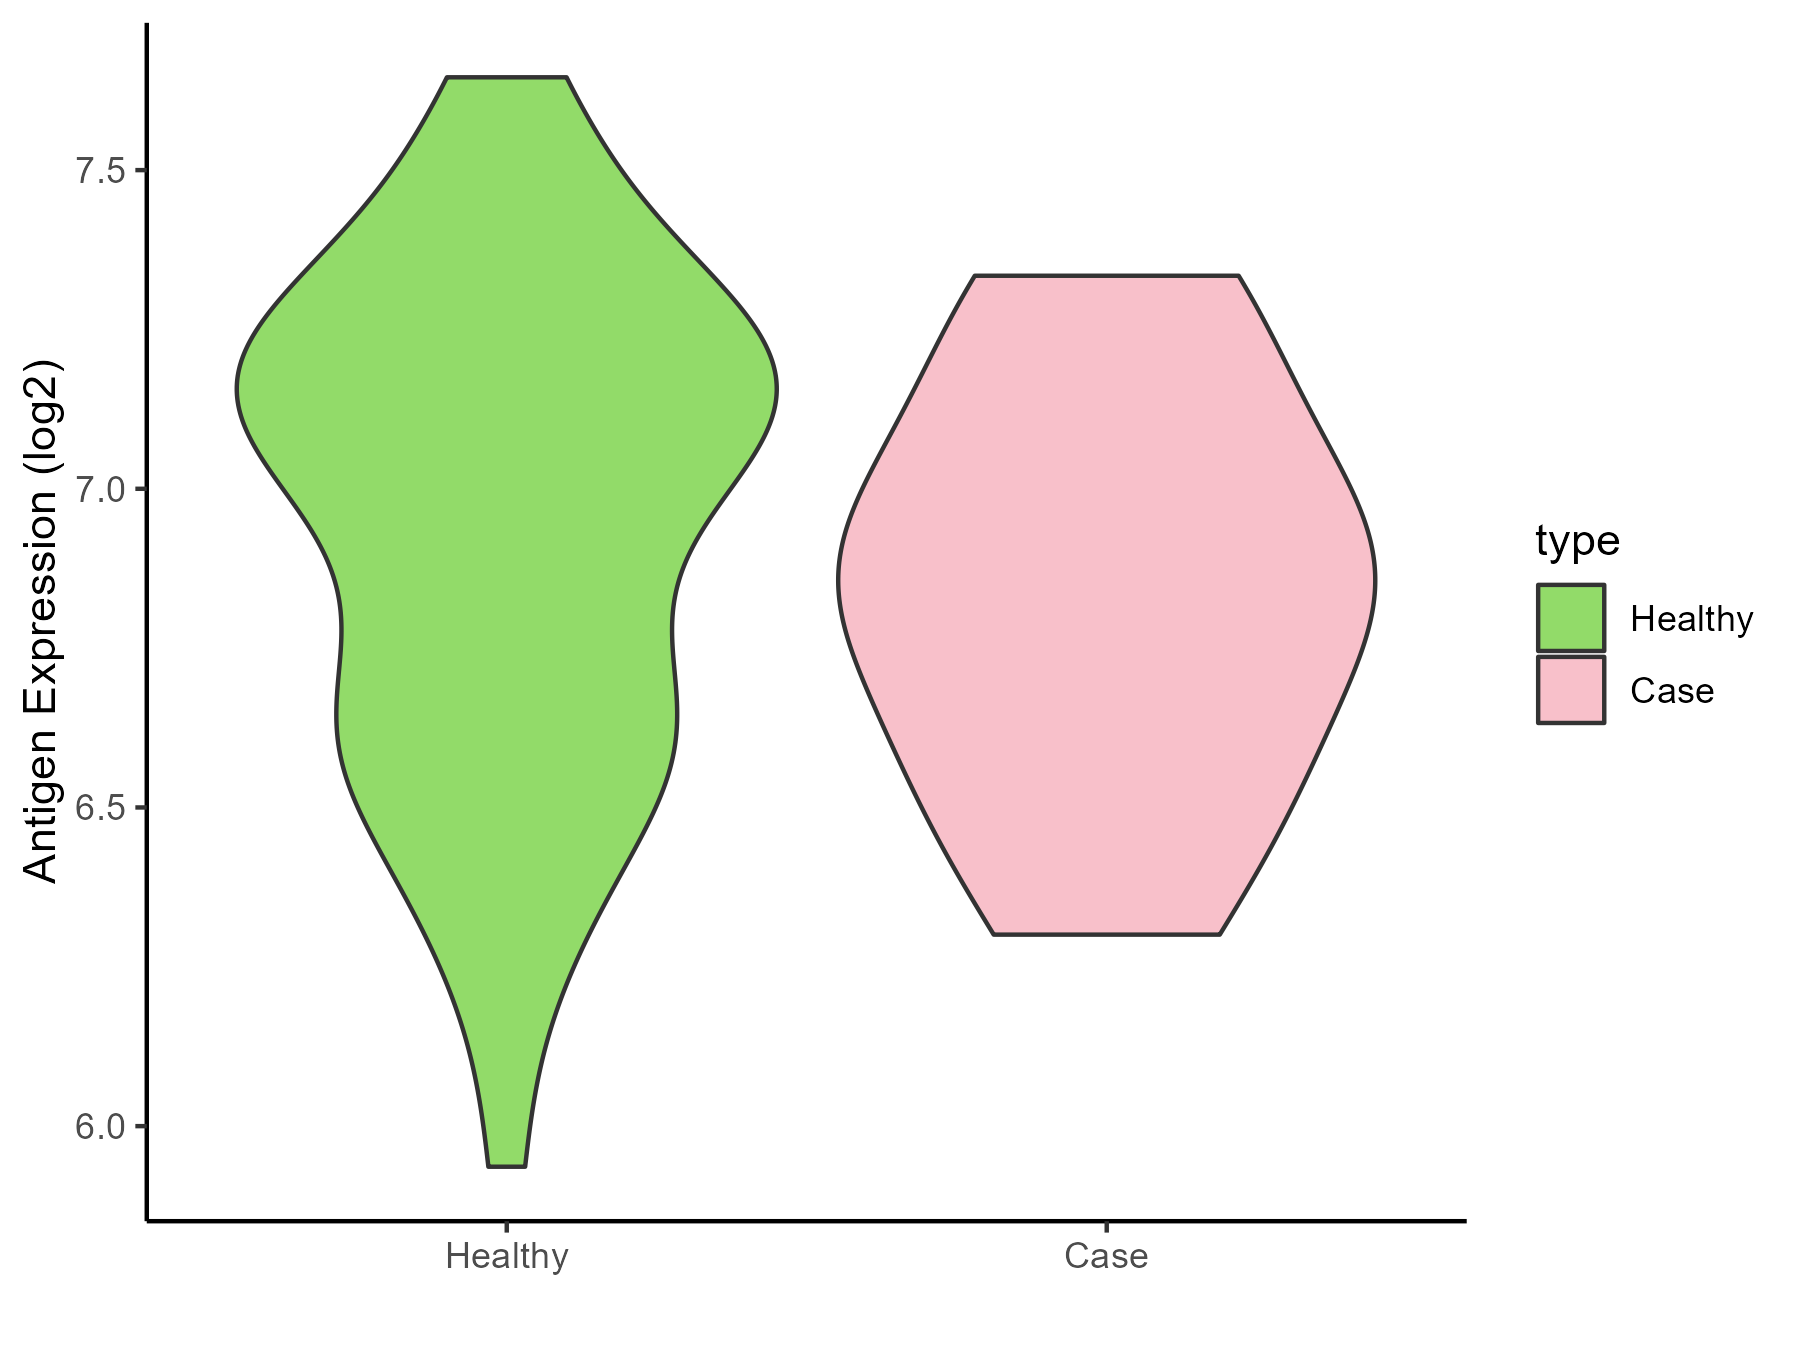
| Differential expression pattern of antigen in diseases | ||
| The Studied Tissue | Whole blood | |
| The Specific Disease | Familial hypercholesterolemia | |
| The Expression Level of Disease Section Compare with the Healthy Individual Tissue | p-value: 0.378372413; Fold-change: -0.214571388; Z-score: -0.550365417 | |
| Disease-specific Antigen Abundances |
|
Click to View the Clearer Original Diagram |
ICD Disease Classification 06
| Differential expression pattern of antigen in diseases | ||
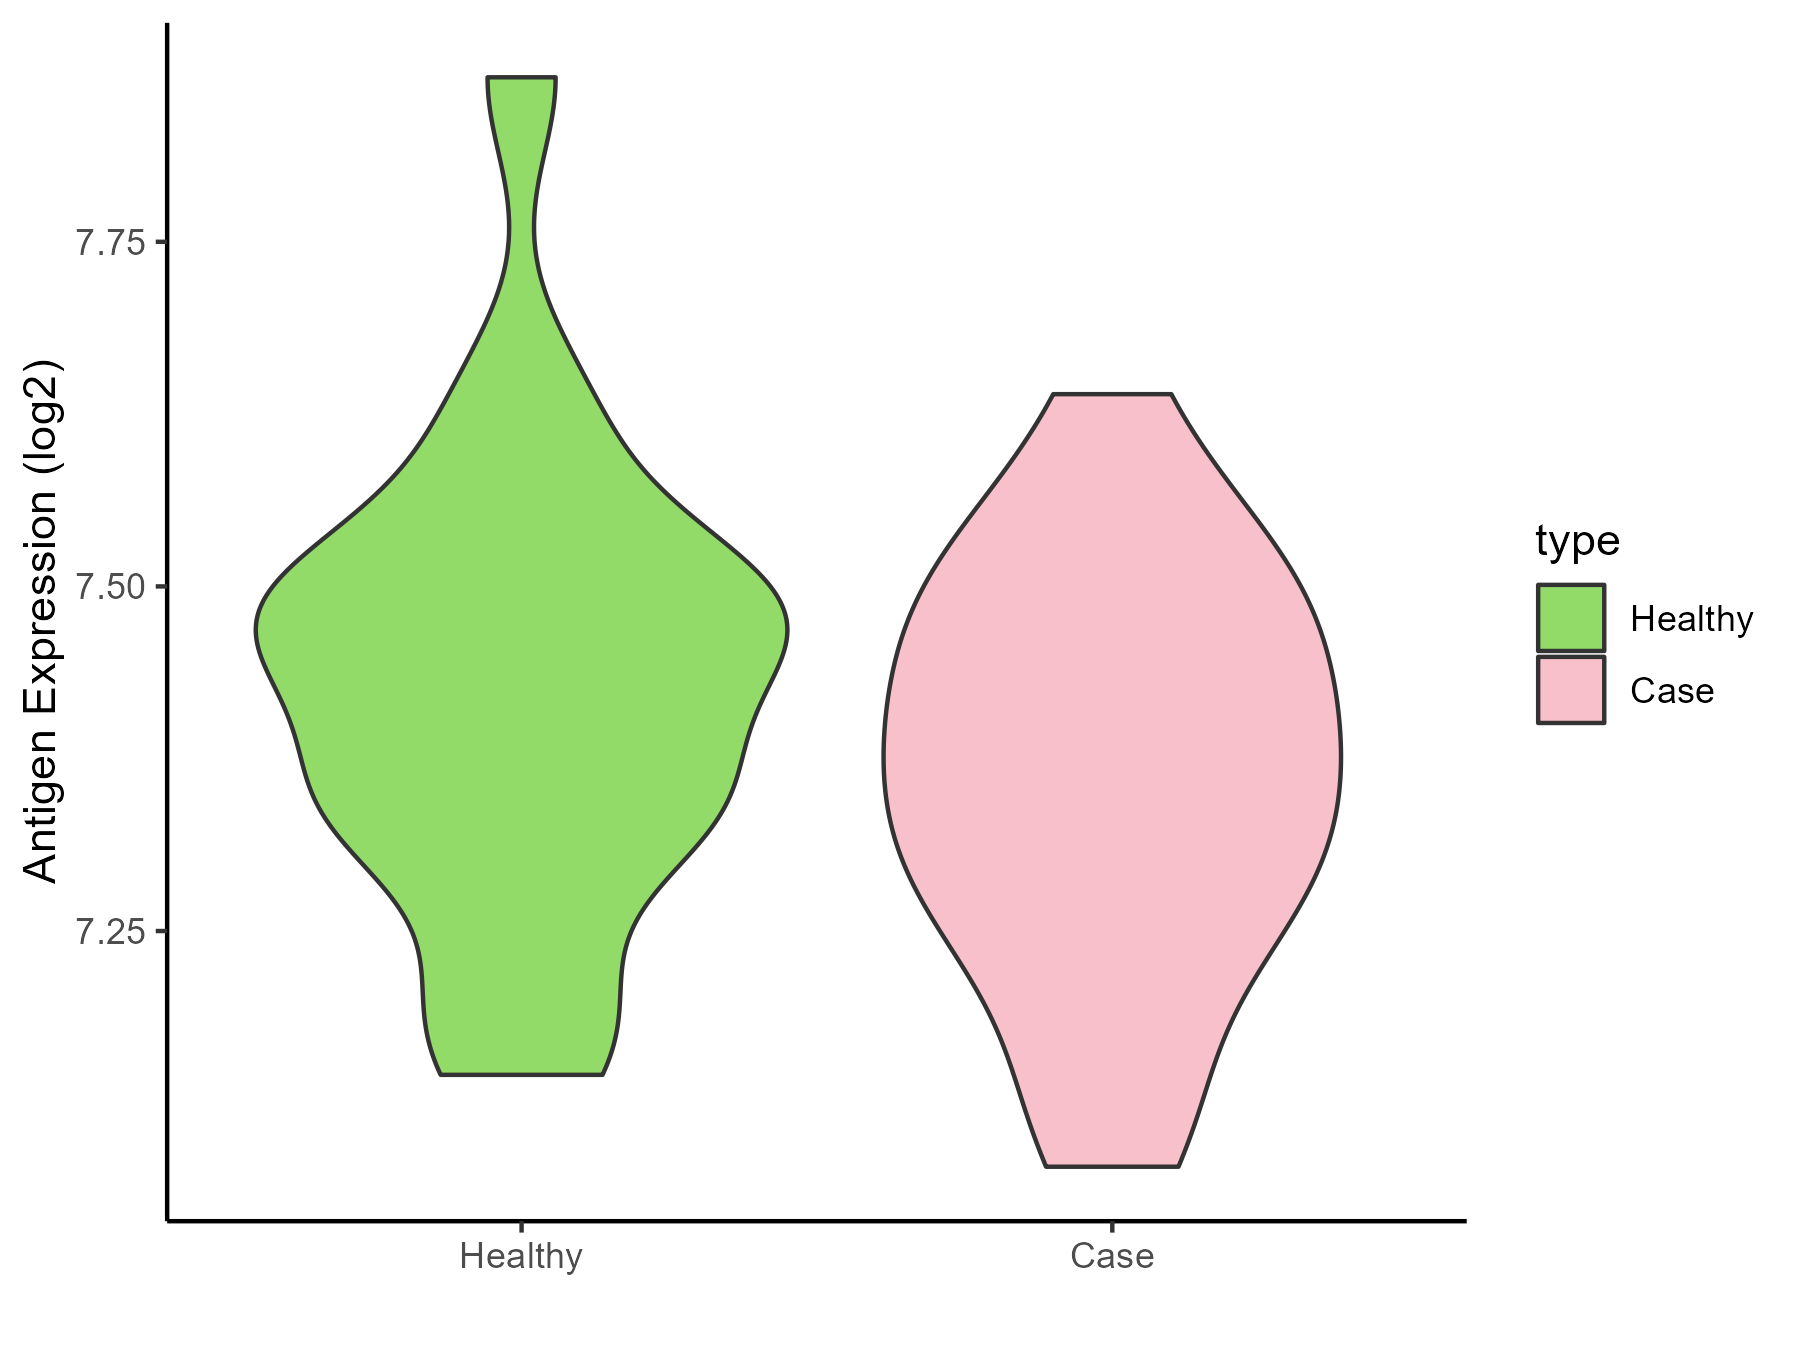
| The Studied Tissue | Superior temporal cortex | |
| The Specific Disease | Schizophrenia | |
| The Expression Level of Disease Section Compare with the Healthy Individual Tissue | p-value: 0.201222997; Fold-change: -0.088265422; Z-score: -0.519380998 | |
| Disease-specific Antigen Abundances |
|
Click to View the Clearer Original Diagram |
ICD Disease Classification 08
| Differential expression pattern of antigen in diseases | ||
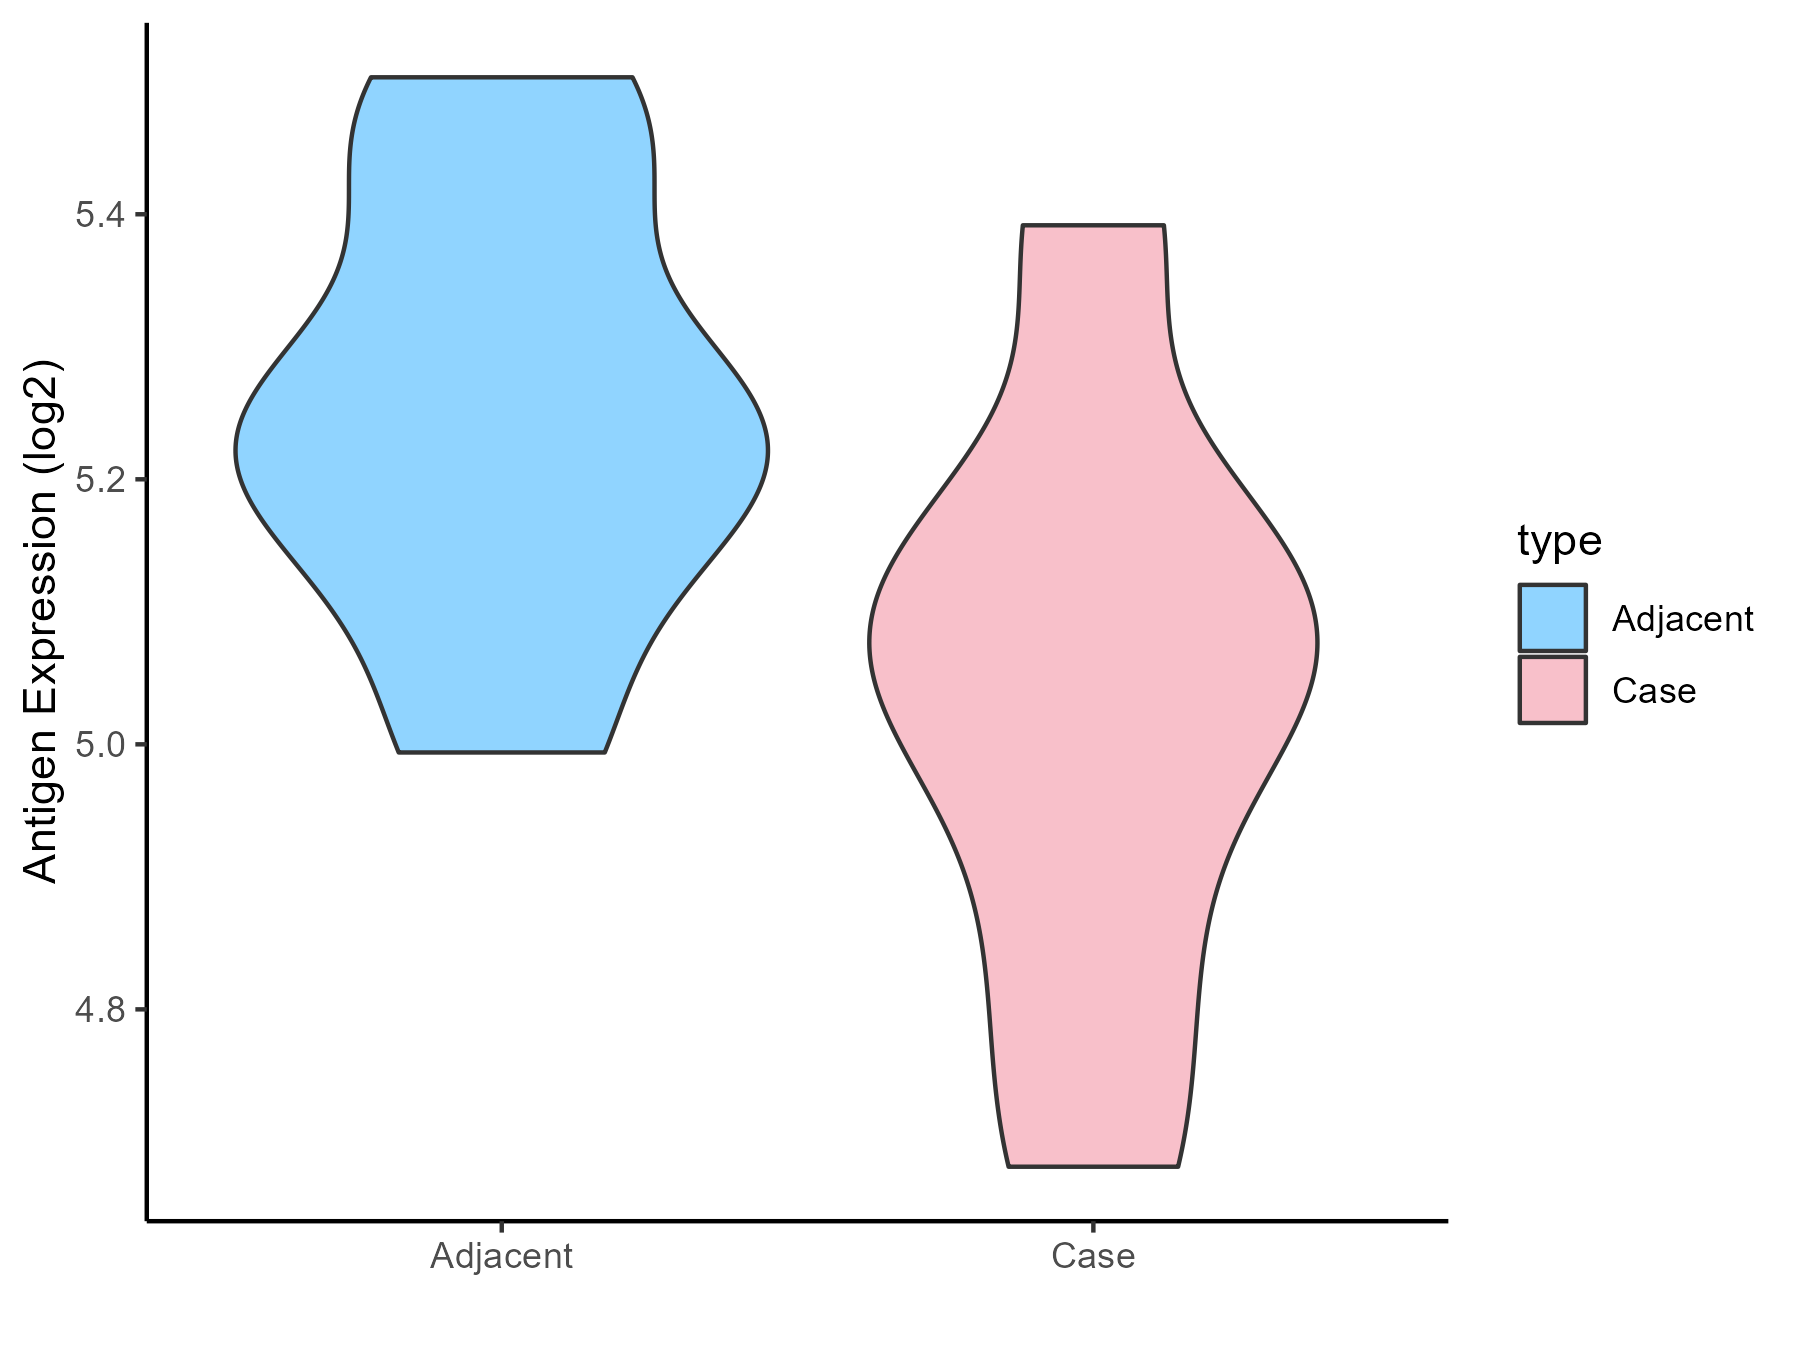
| The Studied Tissue | Spinal cord | |
| The Specific Disease | Multiple sclerosis | |
| The Expression Level of Disease Section Compare with the Adjacent Tissue | p-value: 0.066021968; Fold-change: -0.17920137; Z-score: -1.042340968 | |
| Disease-specific Antigen Abundances |
|
Click to View the Clearer Original Diagram |
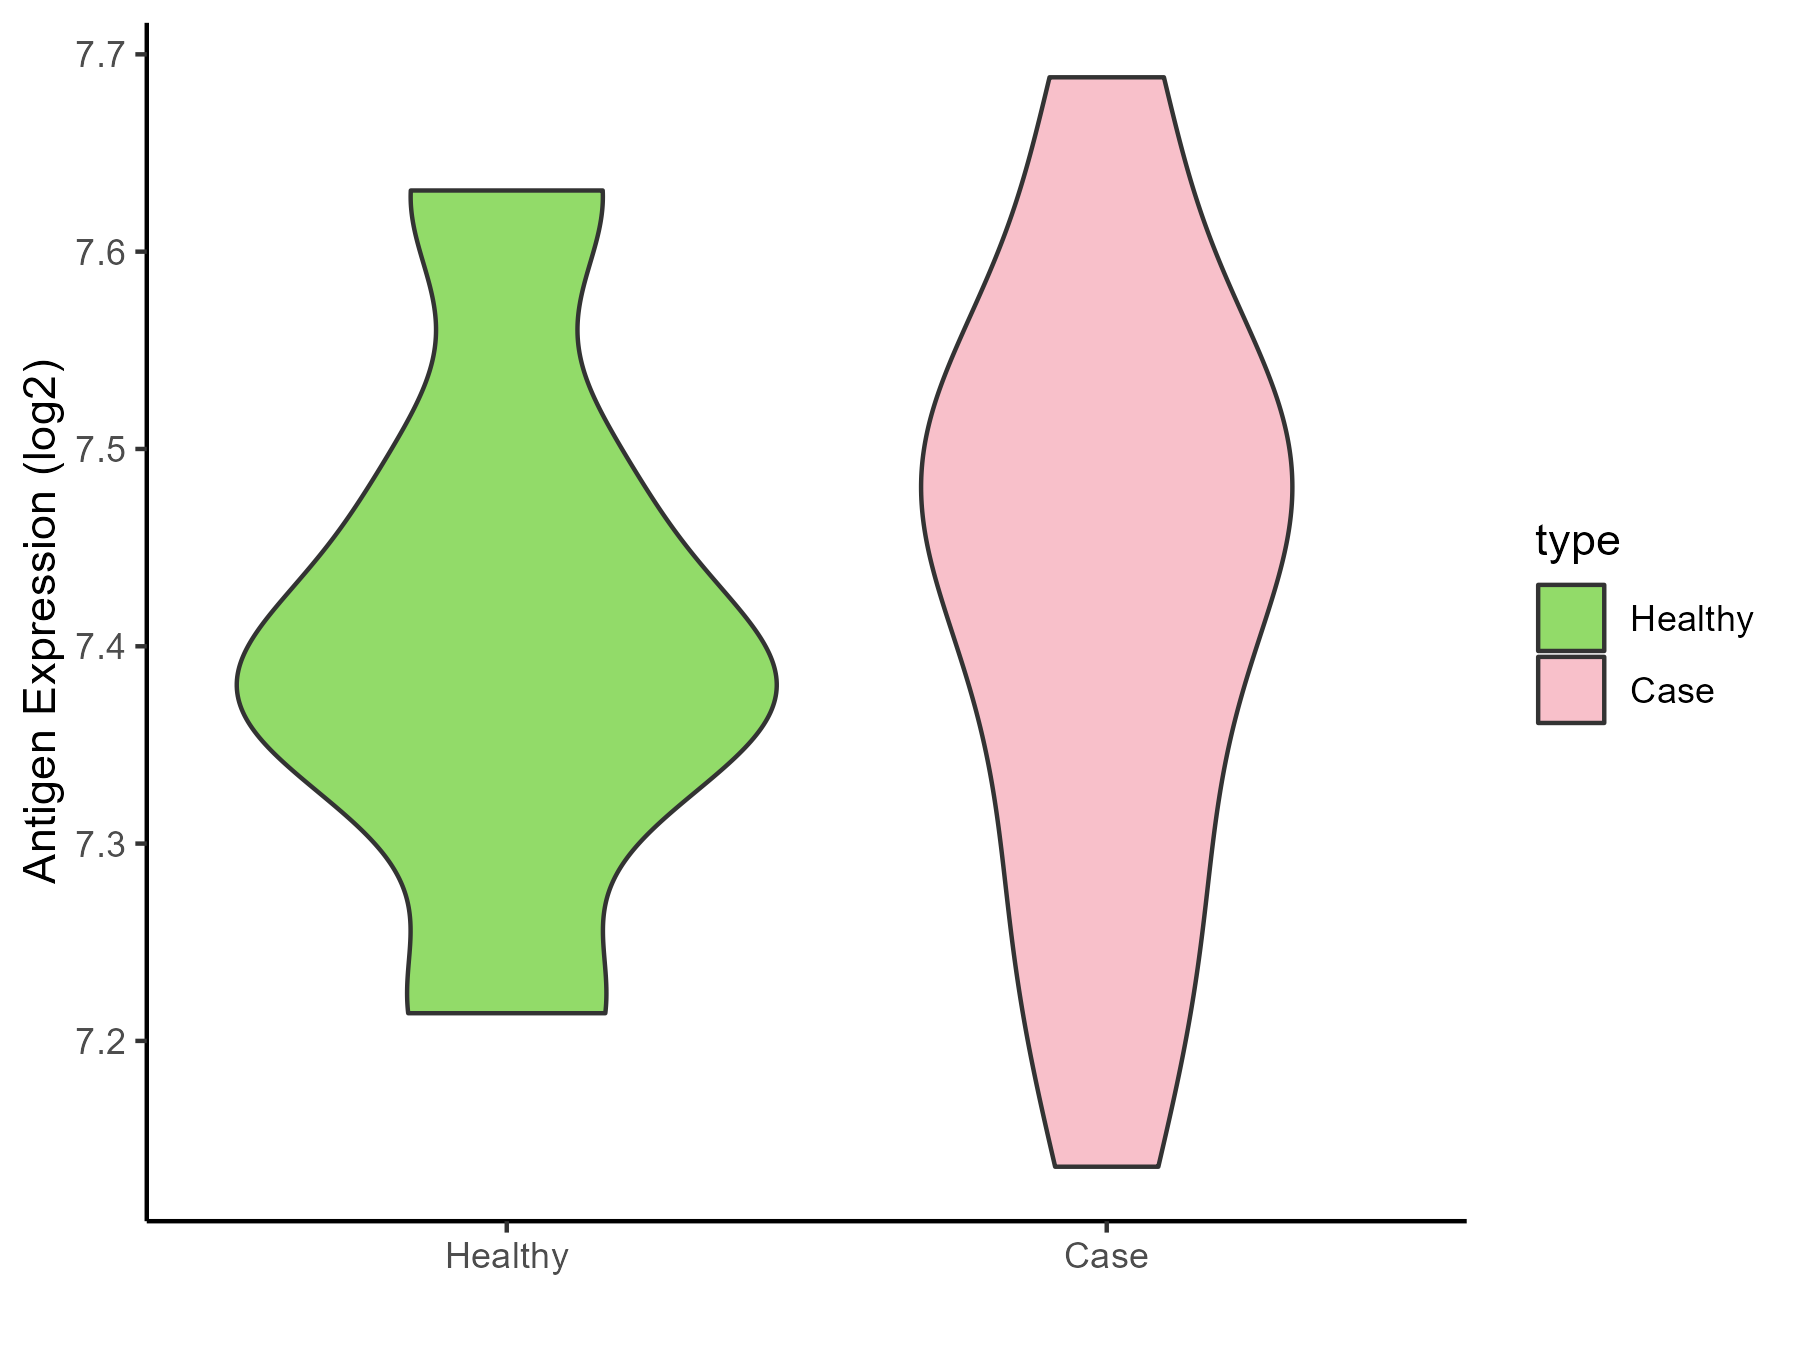
| The Studied Tissue | Plasmacytoid dendritic cells | |
| The Specific Disease | Multiple sclerosis | |
| The Expression Level of Disease Section Compare with the Healthy Individual Tissue | p-value: 0.78023544; Fold-change: 0.070719679; Z-score: 0.50472622 | |
| Disease-specific Antigen Abundances |
|
Click to View the Clearer Original Diagram |
| Differential expression pattern of antigen in diseases | ||
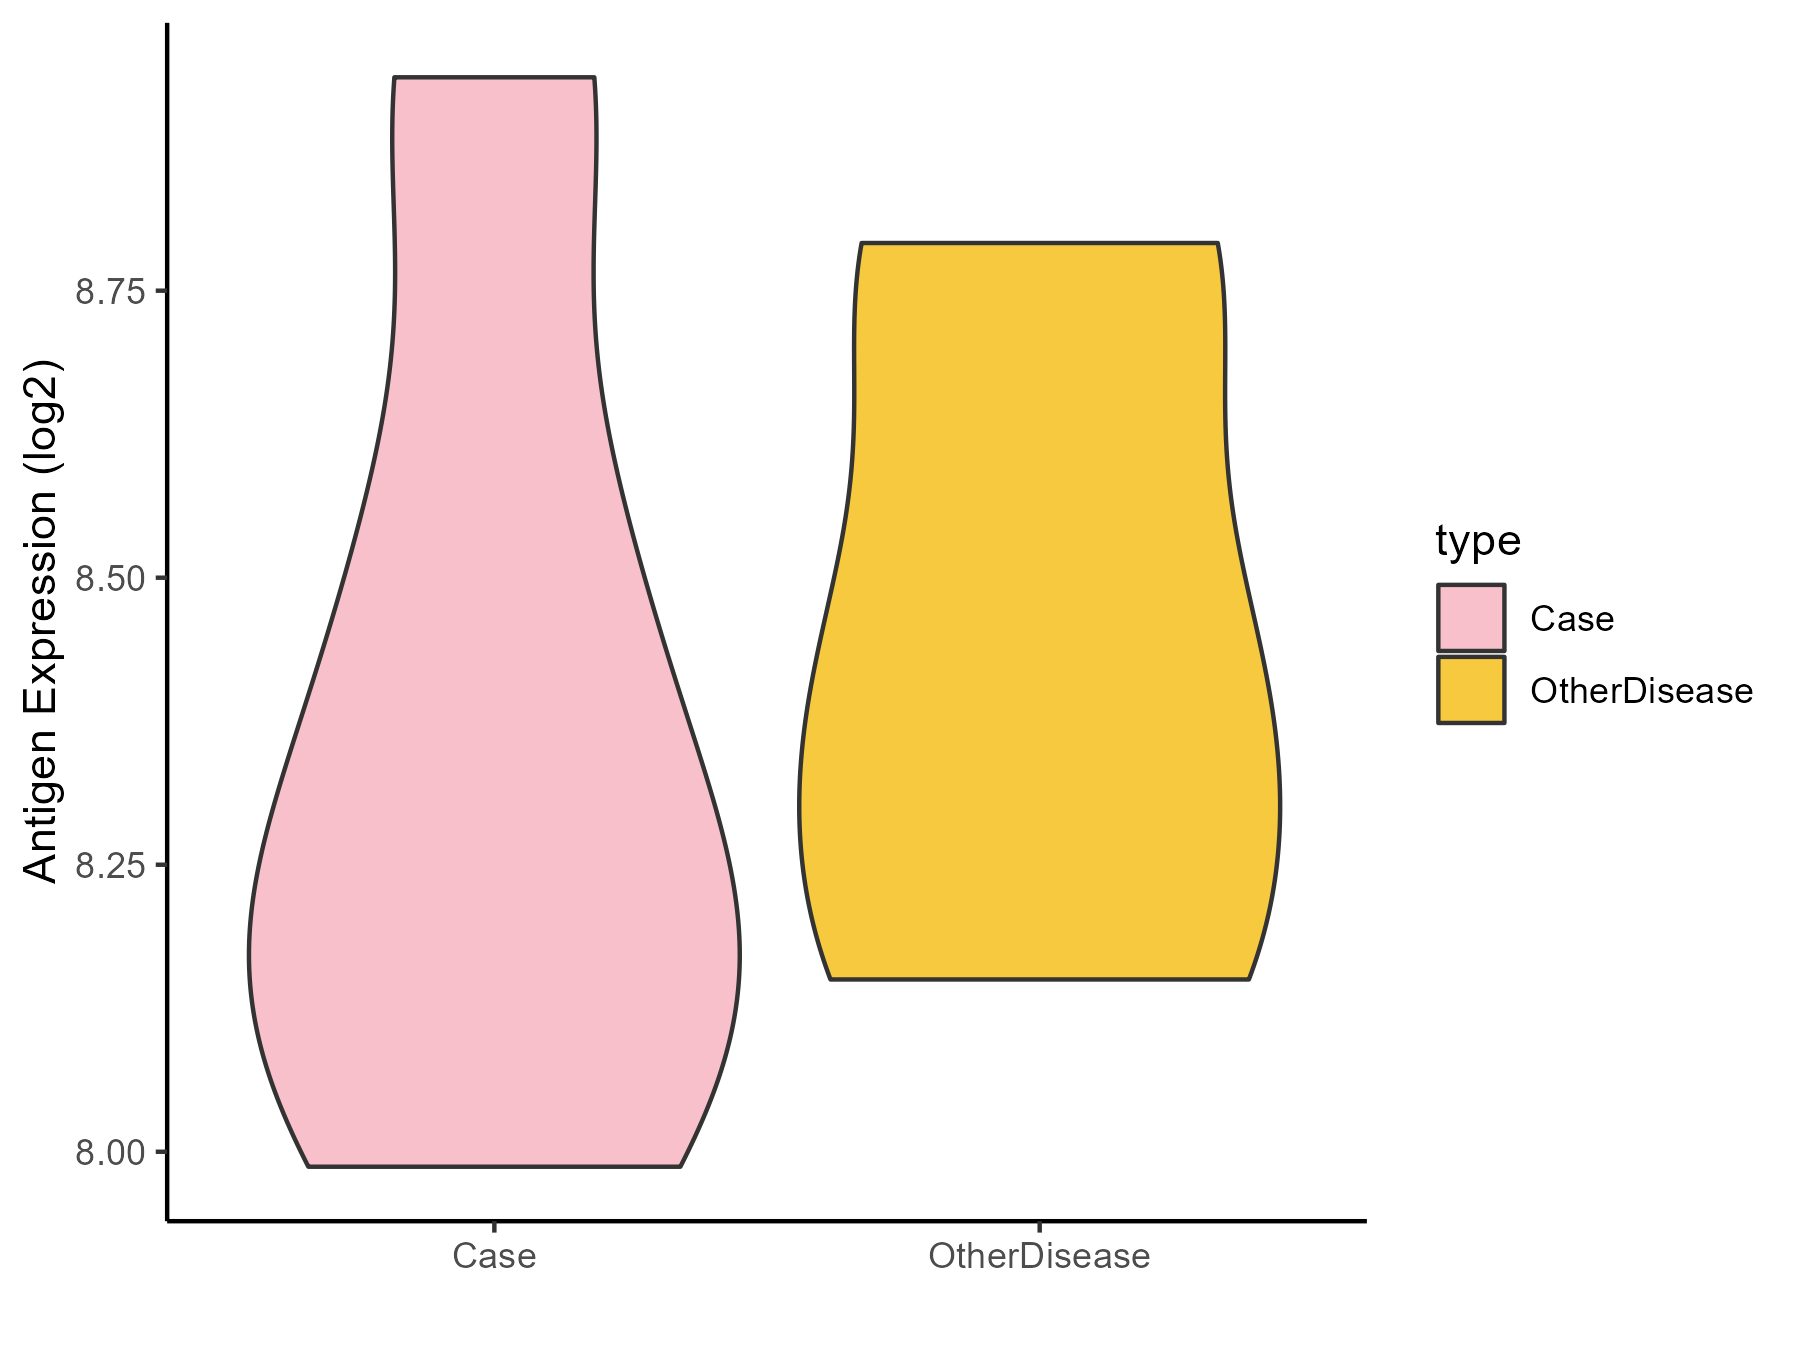
| The Studied Tissue | Peritumoral cortex | |
| The Specific Disease | Epilepsy | |
| The Expression Level of Disease Section Compare with the Other Disease Section | p-value: 0.751629437; Fold-change: -0.166588299; Z-score: -0.517310845 | |
| Disease-specific Antigen Abundances |
|
Click to View the Clearer Original Diagram |
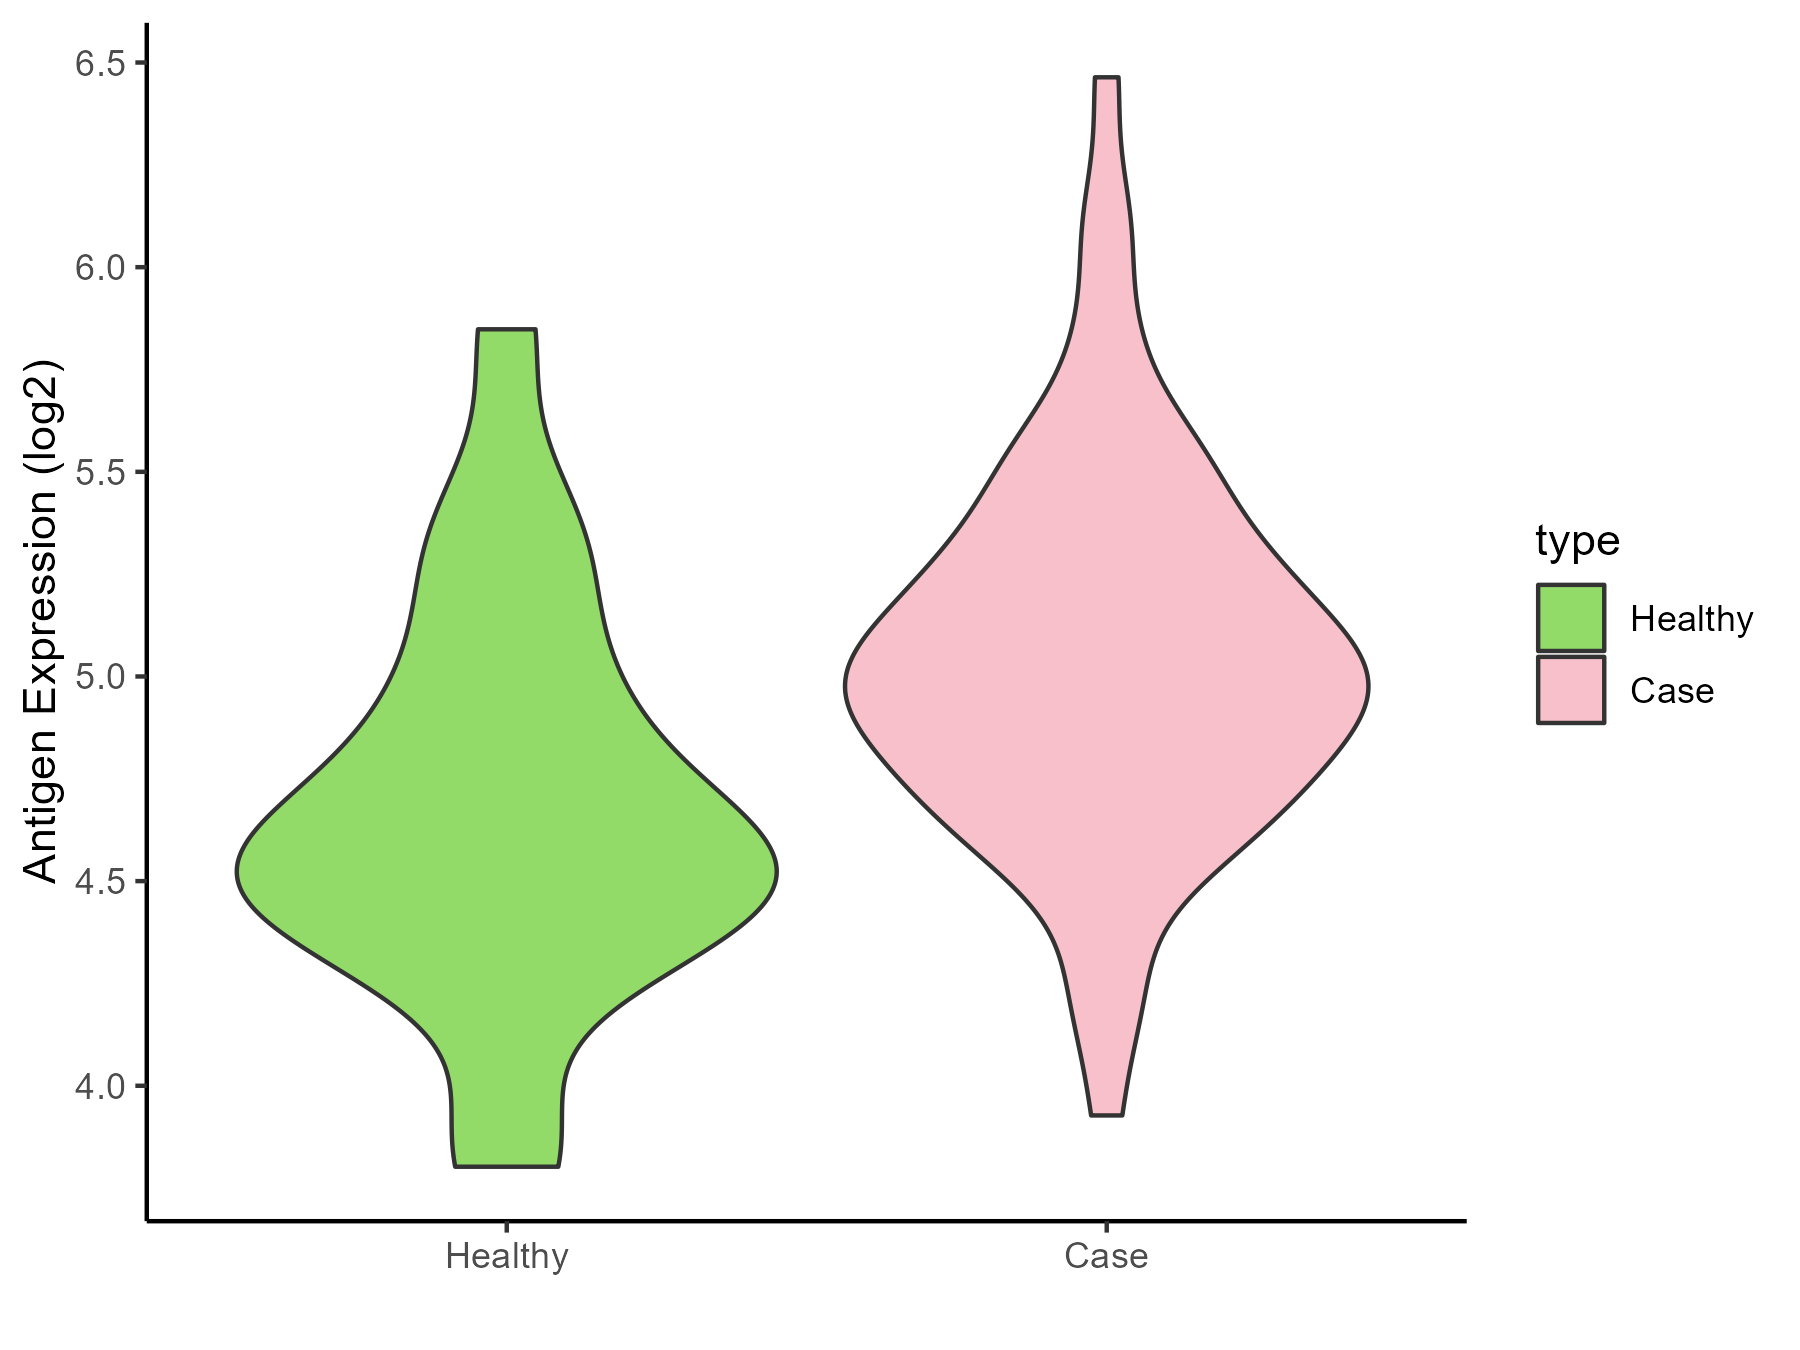
| Differential expression pattern of antigen in diseases | ||
| The Studied Tissue | Whole blood | |
| The Specific Disease | Cardioembolic Stroke | |
| The Expression Level of Disease Section Compare with the Healthy Individual Tissue | p-value: 0.004917737; Fold-change: 0.448629411; Z-score: 0.921816579 | |
| Disease-specific Antigen Abundances |
|
Click to View the Clearer Original Diagram |
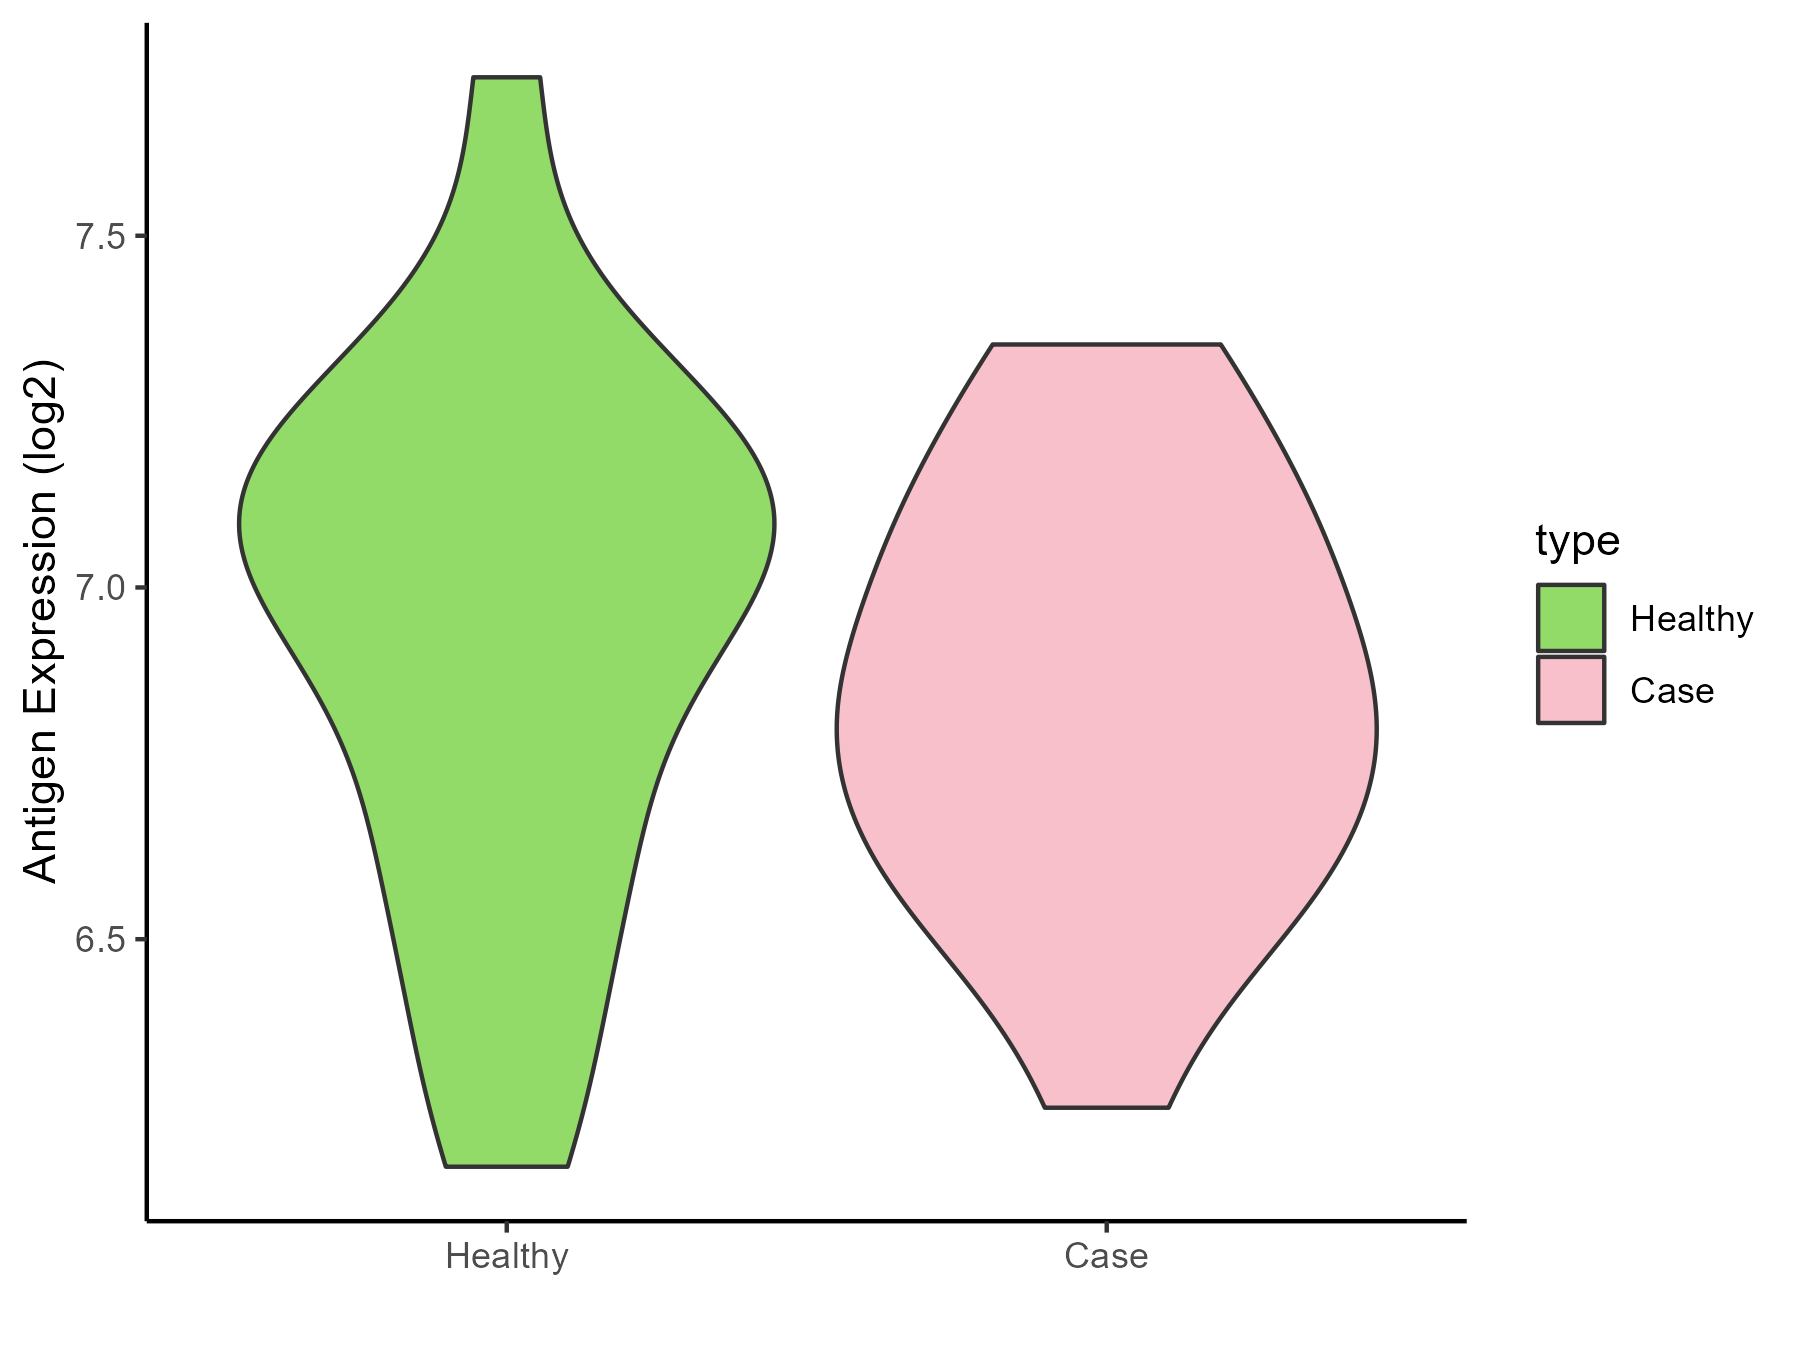
| The Studied Tissue | Peripheral blood | |
| The Specific Disease | Ischemic stroke | |
| The Expression Level of Disease Section Compare with the Healthy Individual Tissue | p-value: 0.4160284; Fold-change: -0.197214597; Z-score: -0.516060675 | |
| Disease-specific Antigen Abundances |
|
Click to View the Clearer Original Diagram |
ICD Disease Classification 1
| Differential expression pattern of antigen in diseases | ||
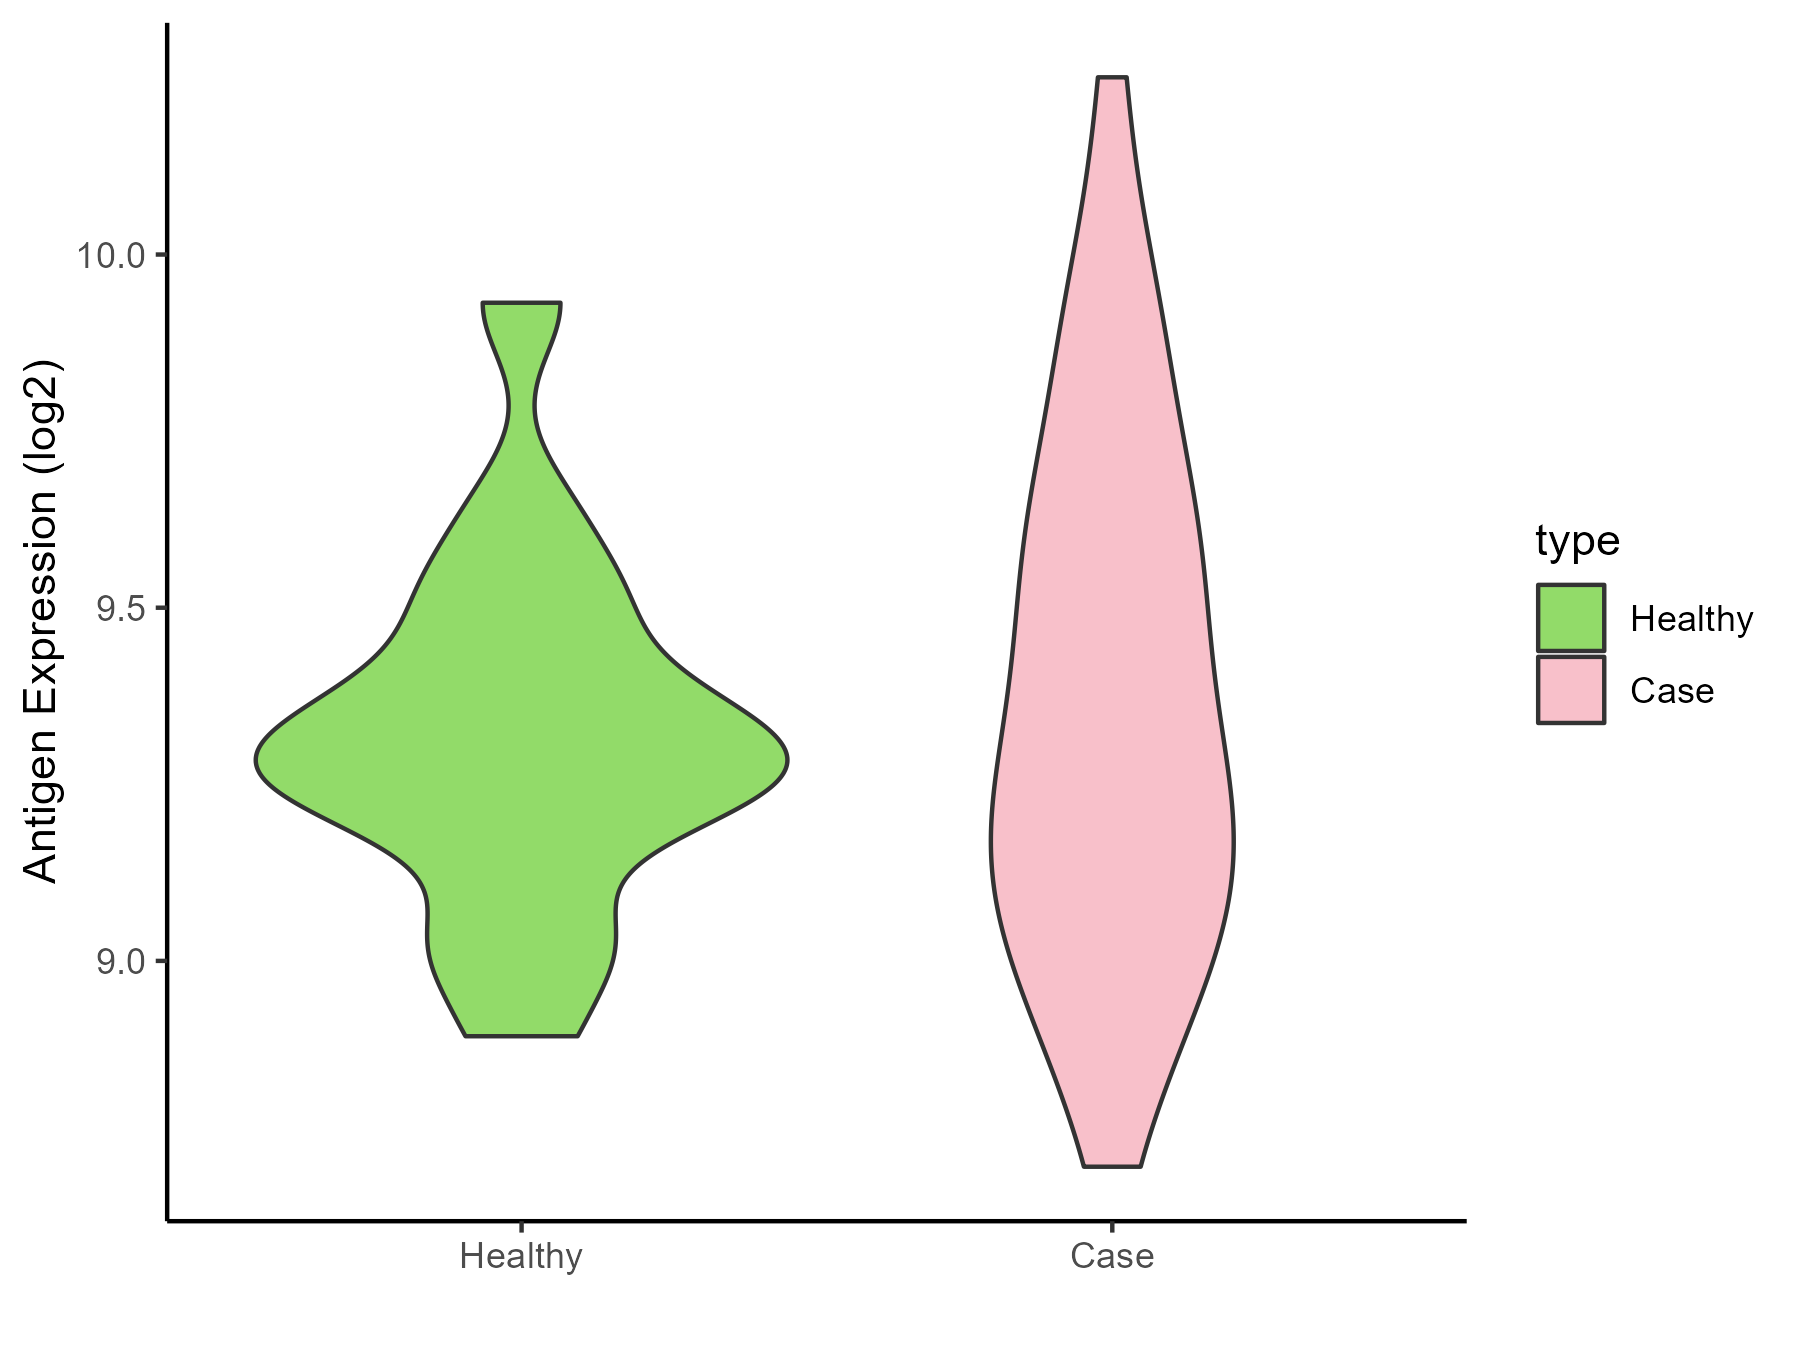
| The Studied Tissue | White matter | |
| The Specific Disease | HIV | |
| The Expression Level of Disease Section Compare with the Healthy Individual Tissue | p-value: 0.550720519; Fold-change: 0.030323615; Z-score: 0.120581484 | |
| Disease-specific Antigen Abundances |
|
Click to View the Clearer Original Diagram |
| Differential expression pattern of antigen in diseases | ||
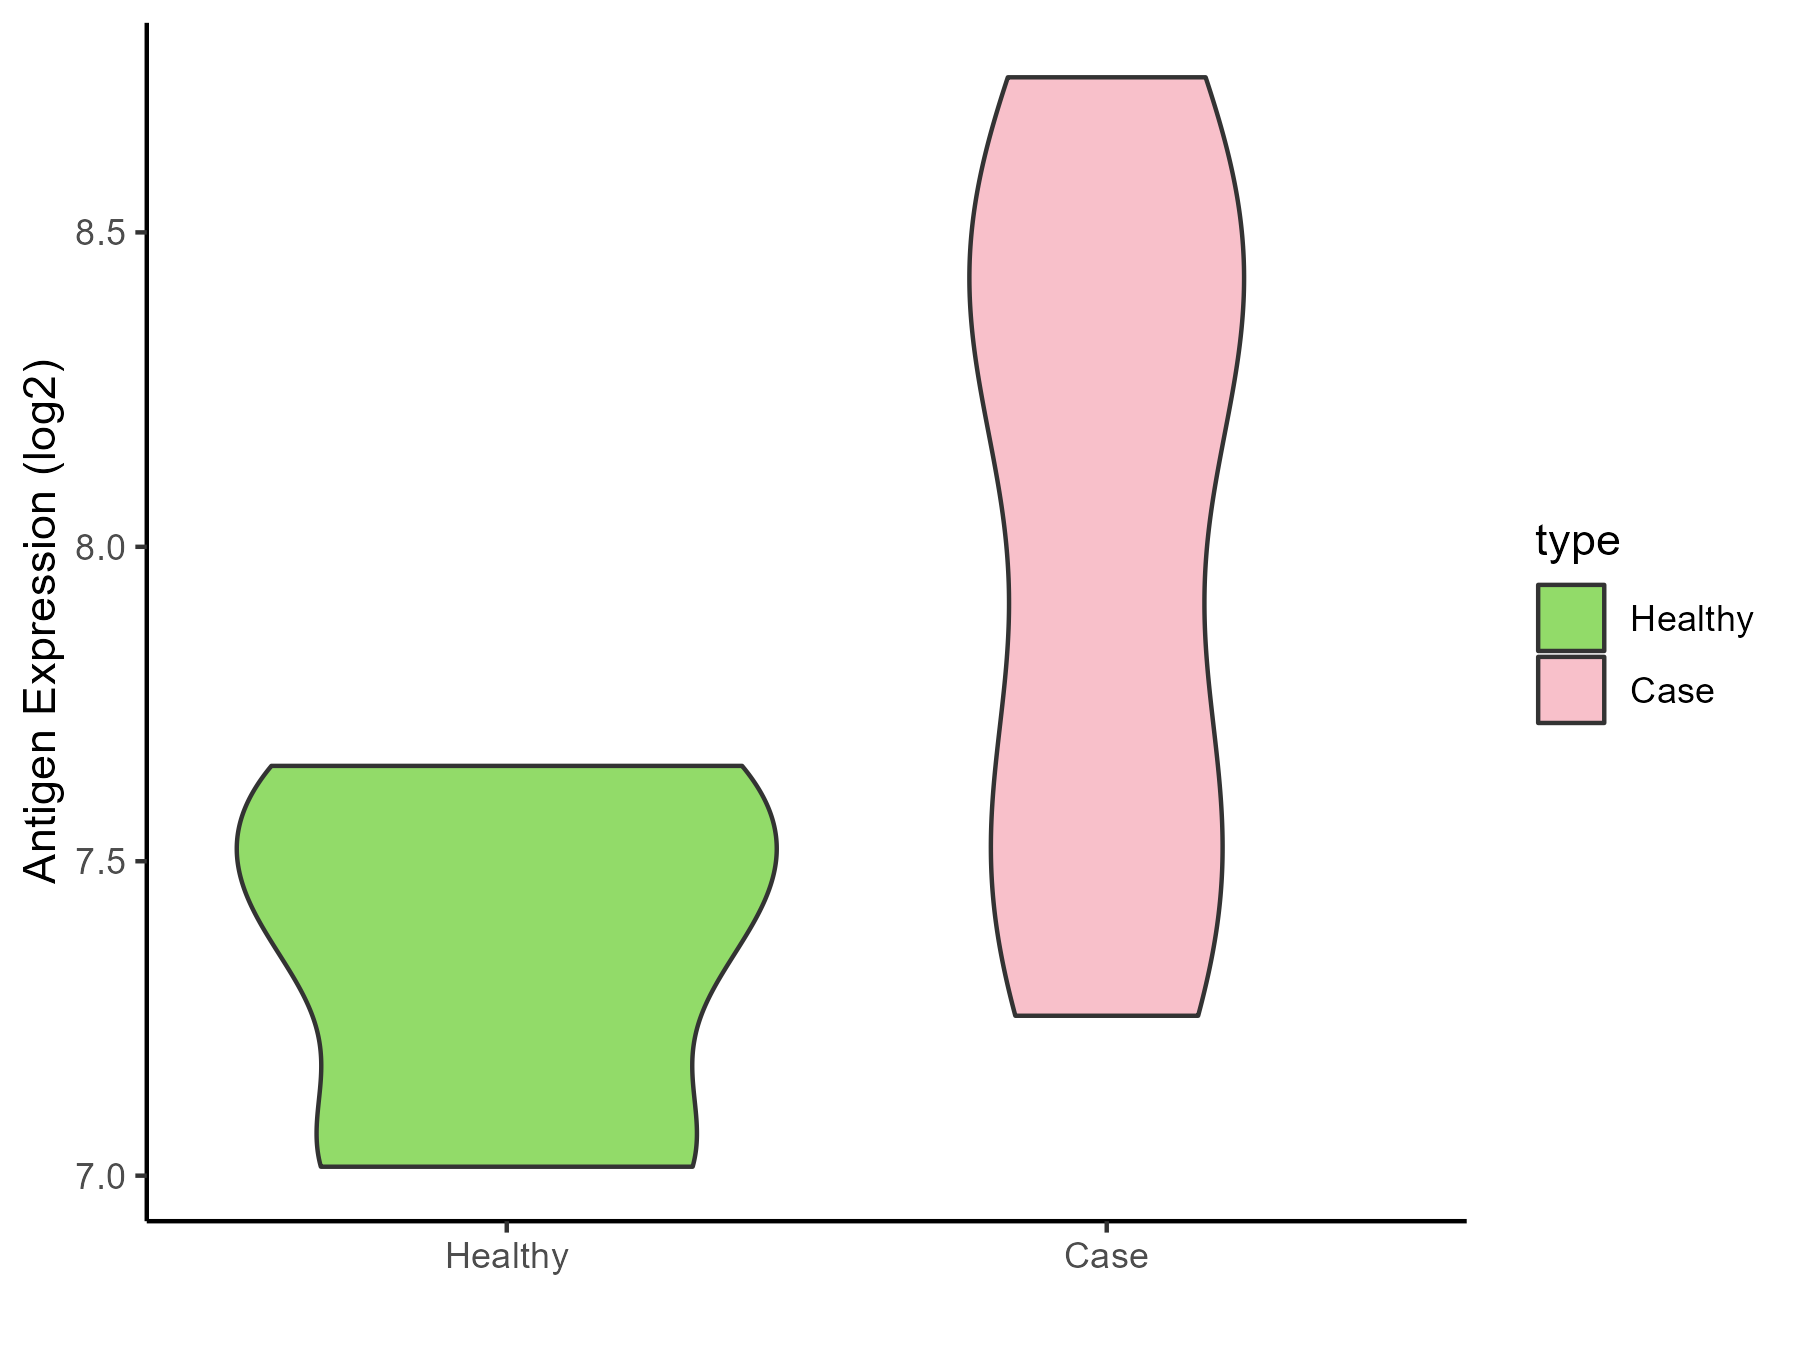
| The Studied Tissue | Whole blood | |
| The Specific Disease | Influenza | |
| The Expression Level of Disease Section Compare with the Healthy Individual Tissue | p-value: 0.040823202; Fold-change: 0.856223889; Z-score: 2.663422098 | |
| Disease-specific Antigen Abundances |
|
Click to View the Clearer Original Diagram |
| Differential expression pattern of antigen in diseases | ||
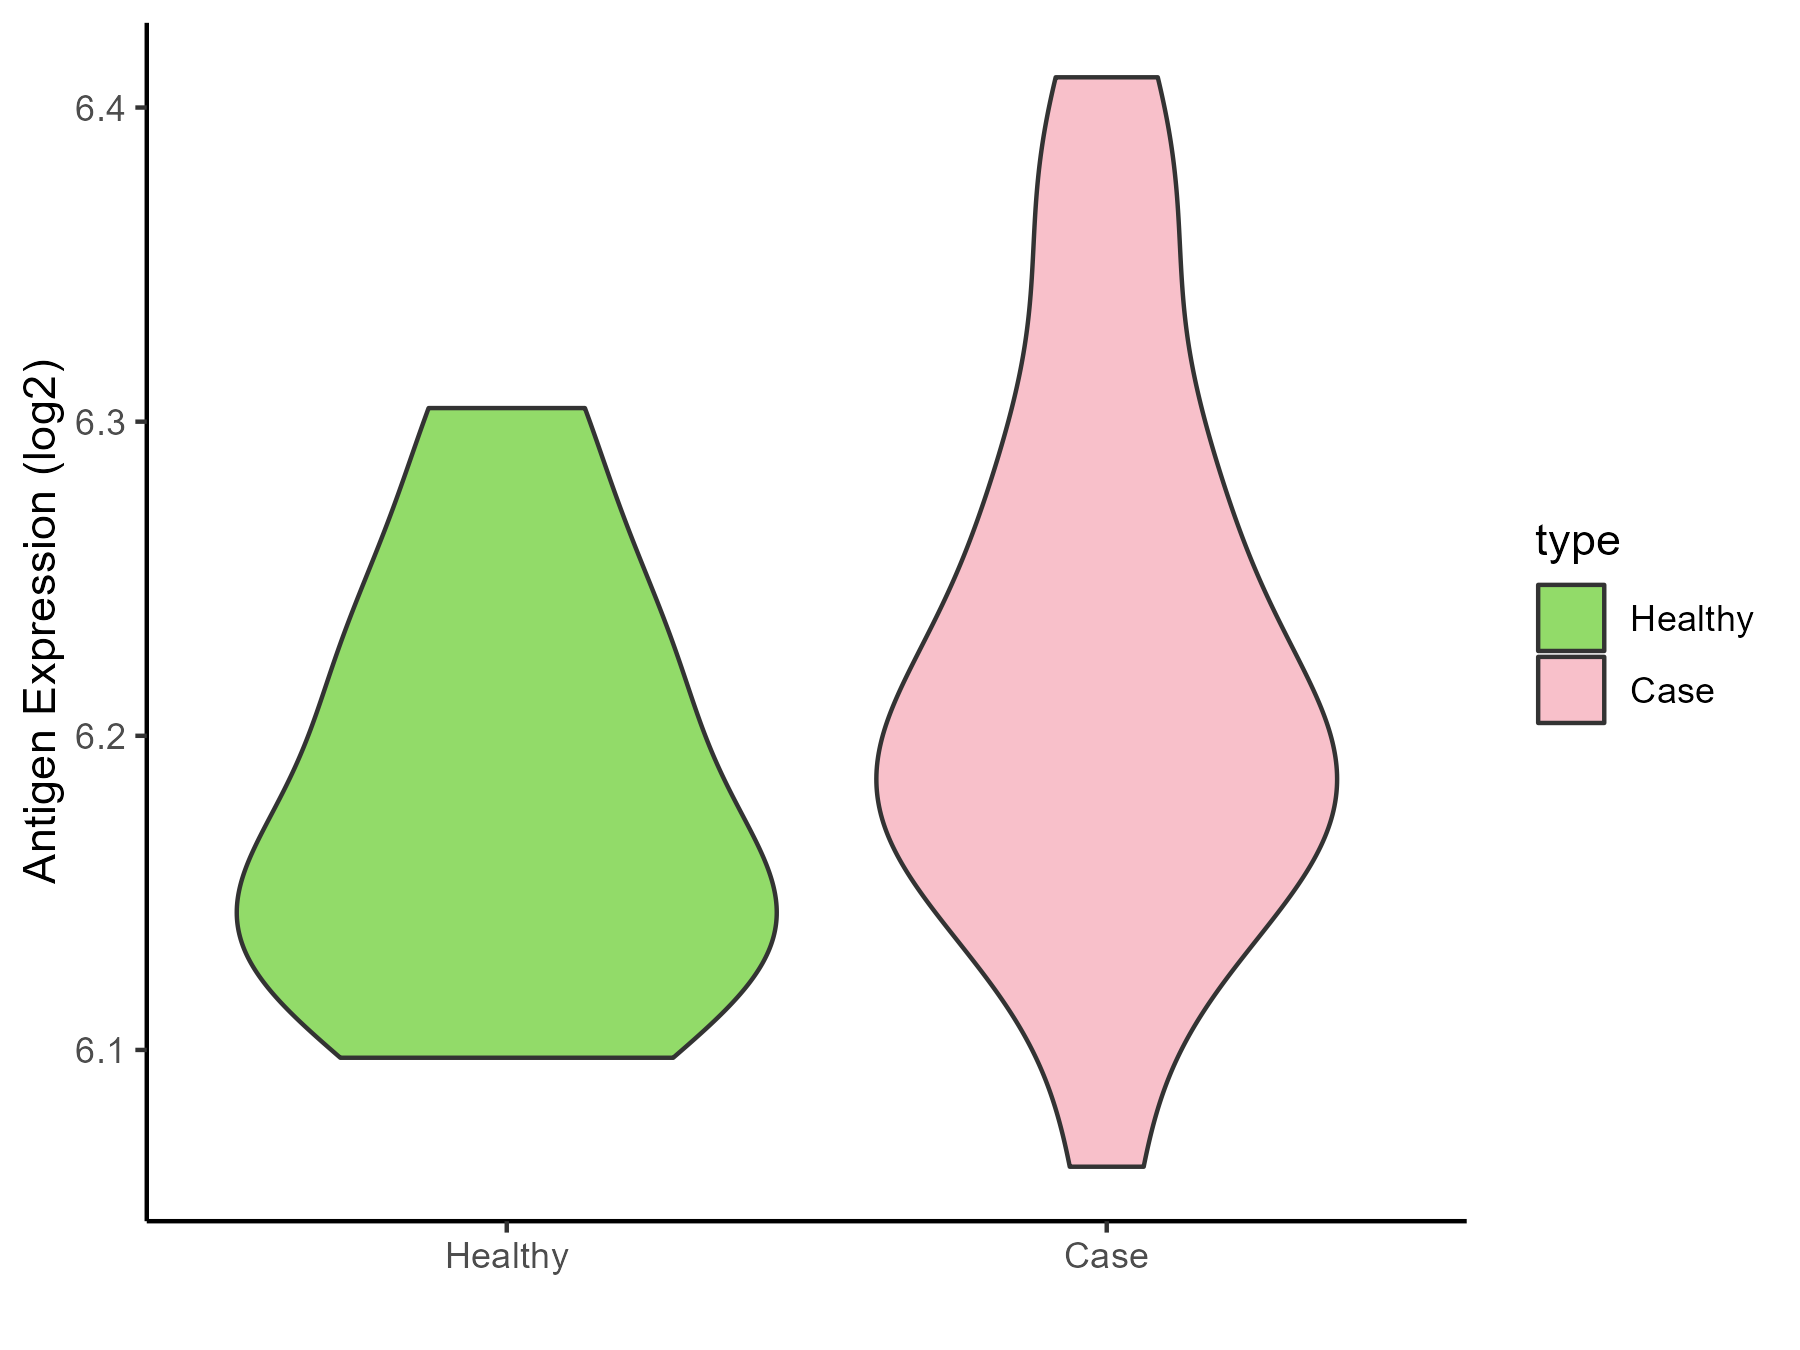
| The Studied Tissue | Whole blood | |
| The Specific Disease | Chronic hepatitis C | |
| The Expression Level of Disease Section Compare with the Healthy Individual Tissue | p-value: 0.151379667; Fold-change: 0.03758707; Z-score: 0.577573991 | |
| Disease-specific Antigen Abundances |
|
Click to View the Clearer Original Diagram |
| Differential expression pattern of antigen in diseases | ||
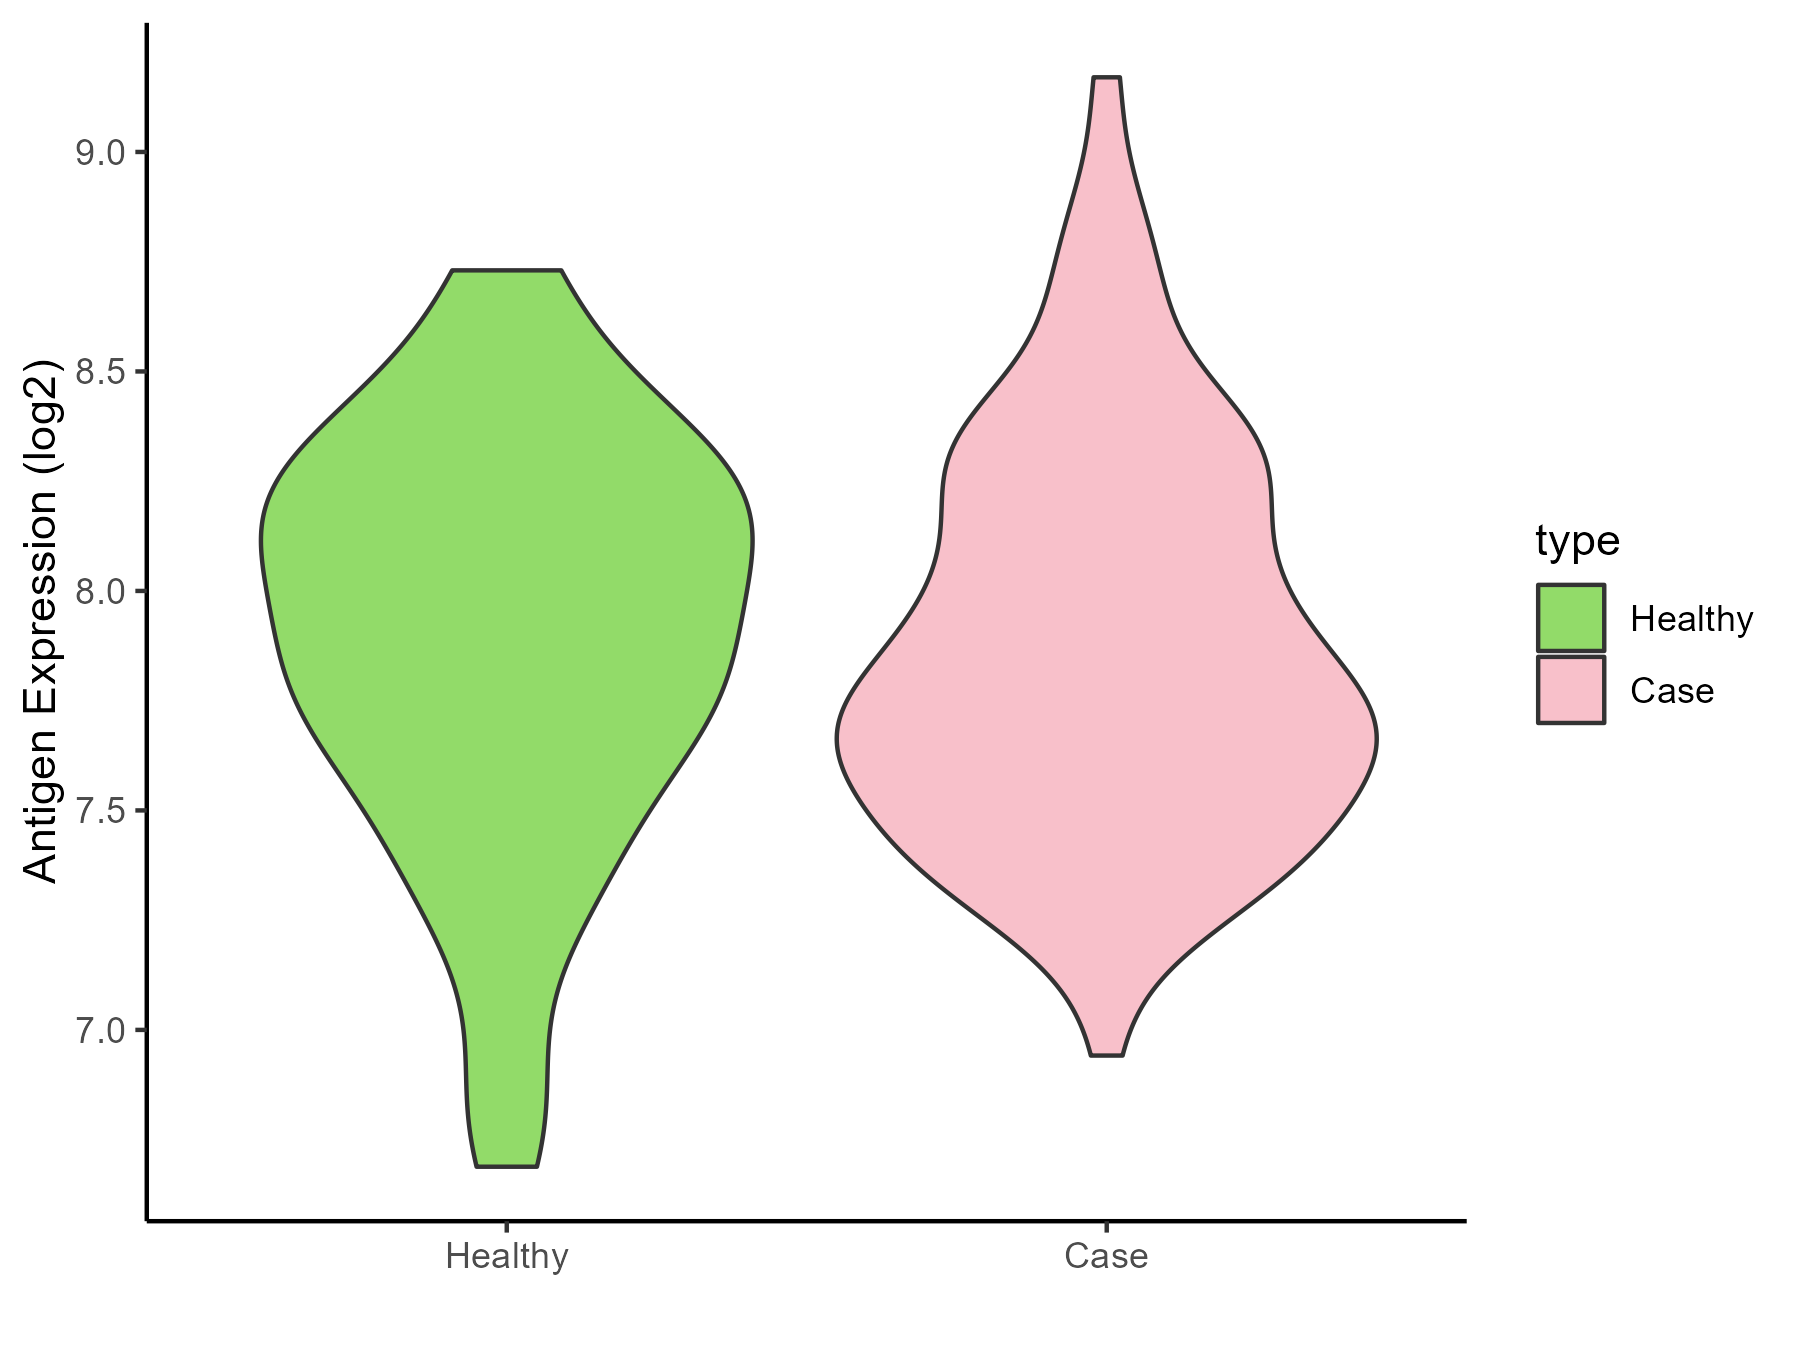
| The Studied Tissue | Whole blood | |
| The Specific Disease | Sepsis | |
| The Expression Level of Disease Section Compare with the Healthy Individual Tissue | p-value: 0.787914373; Fold-change: -0.147217066; Z-score: -0.315434735 | |
| Disease-specific Antigen Abundances |
|
Click to View the Clearer Original Diagram |
| Differential expression pattern of antigen in diseases | ||
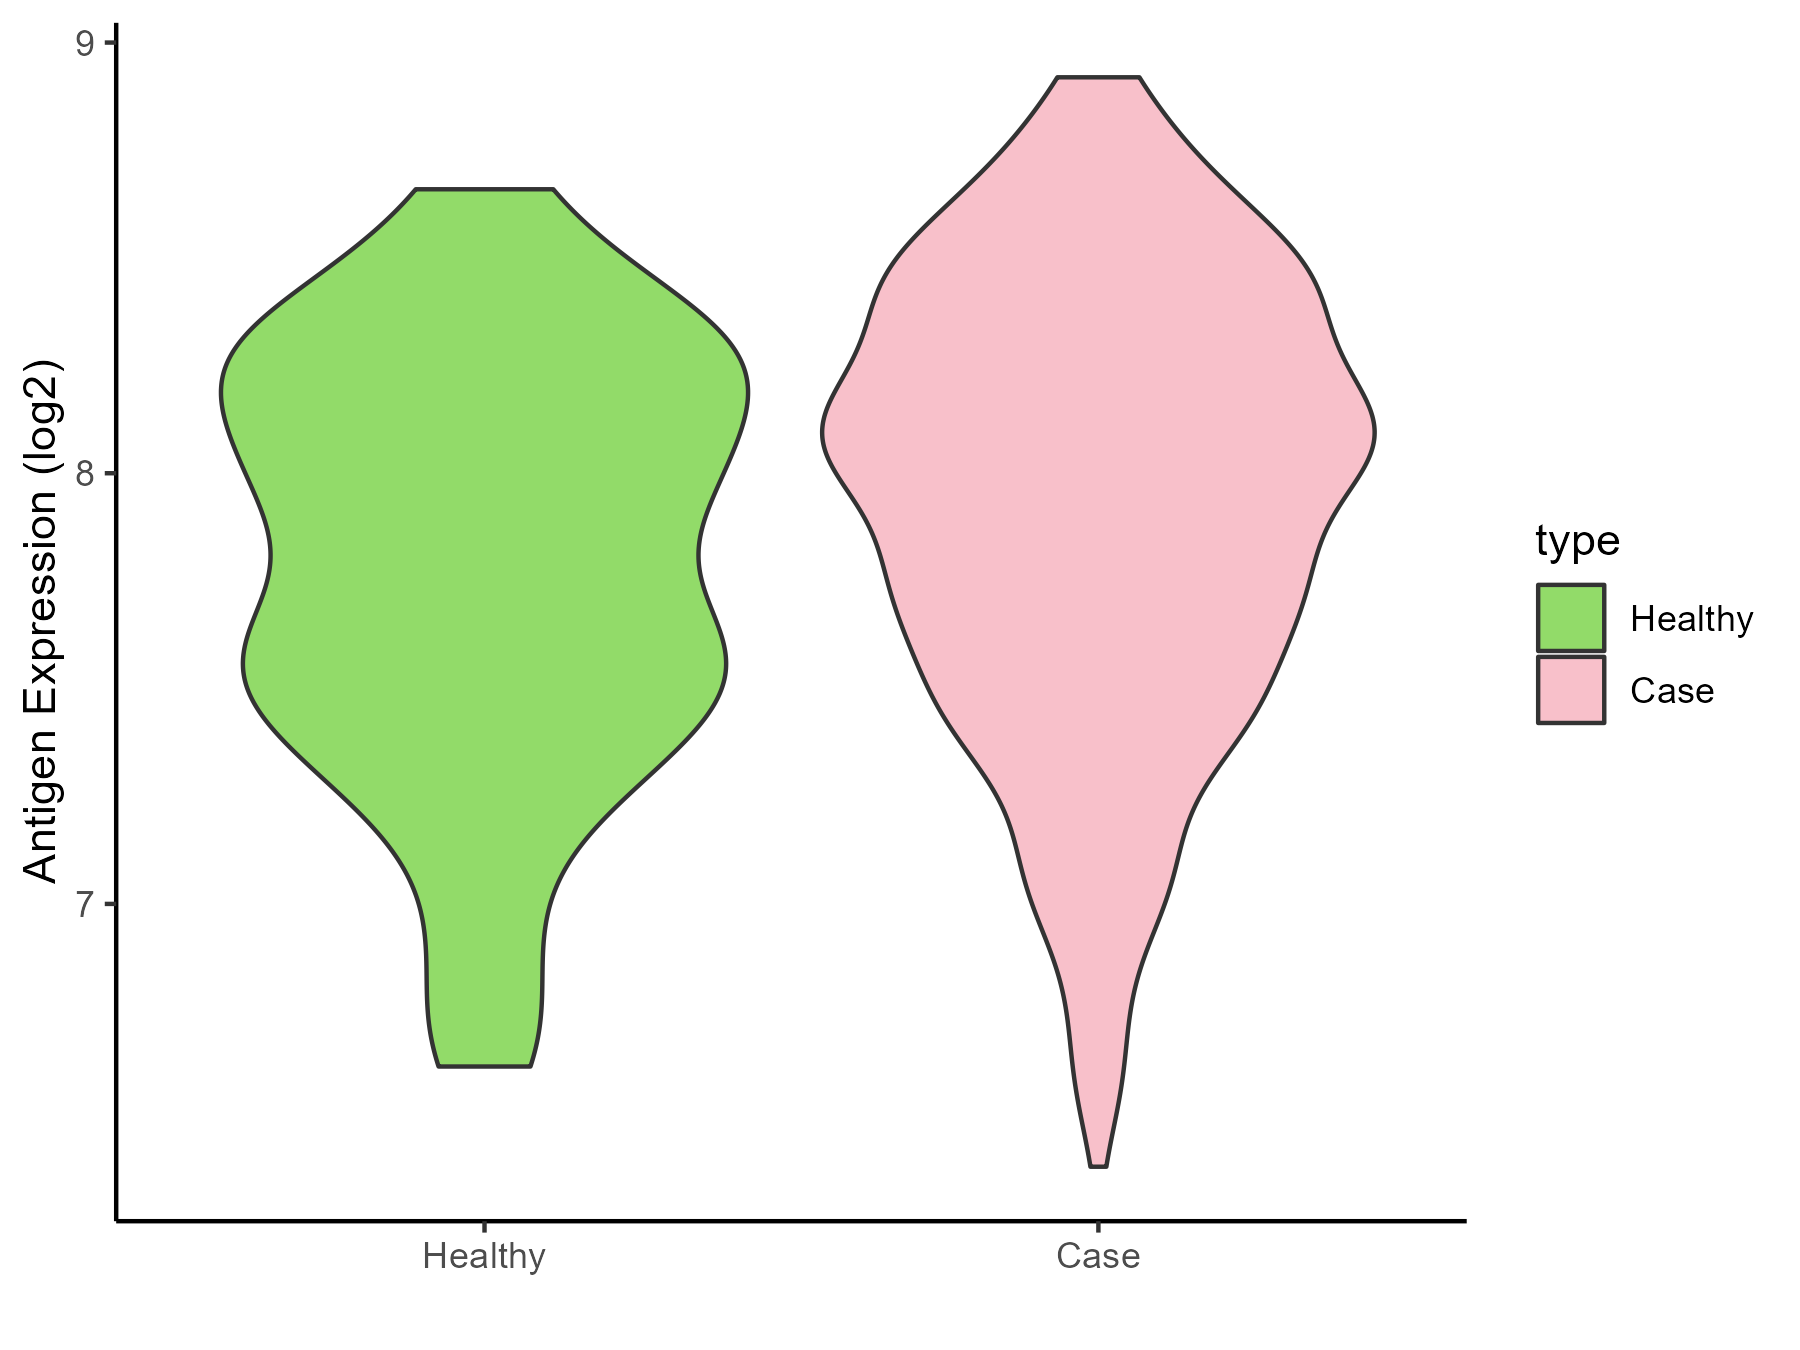
| The Studied Tissue | Whole blood | |
| The Specific Disease | Septic shock | |
| The Expression Level of Disease Section Compare with the Healthy Individual Tissue | p-value: 0.002333186; Fold-change: 0.137687843; Z-score: 0.27639074 | |
| Disease-specific Antigen Abundances |
|
Click to View the Clearer Original Diagram |
| Differential expression pattern of antigen in diseases | ||
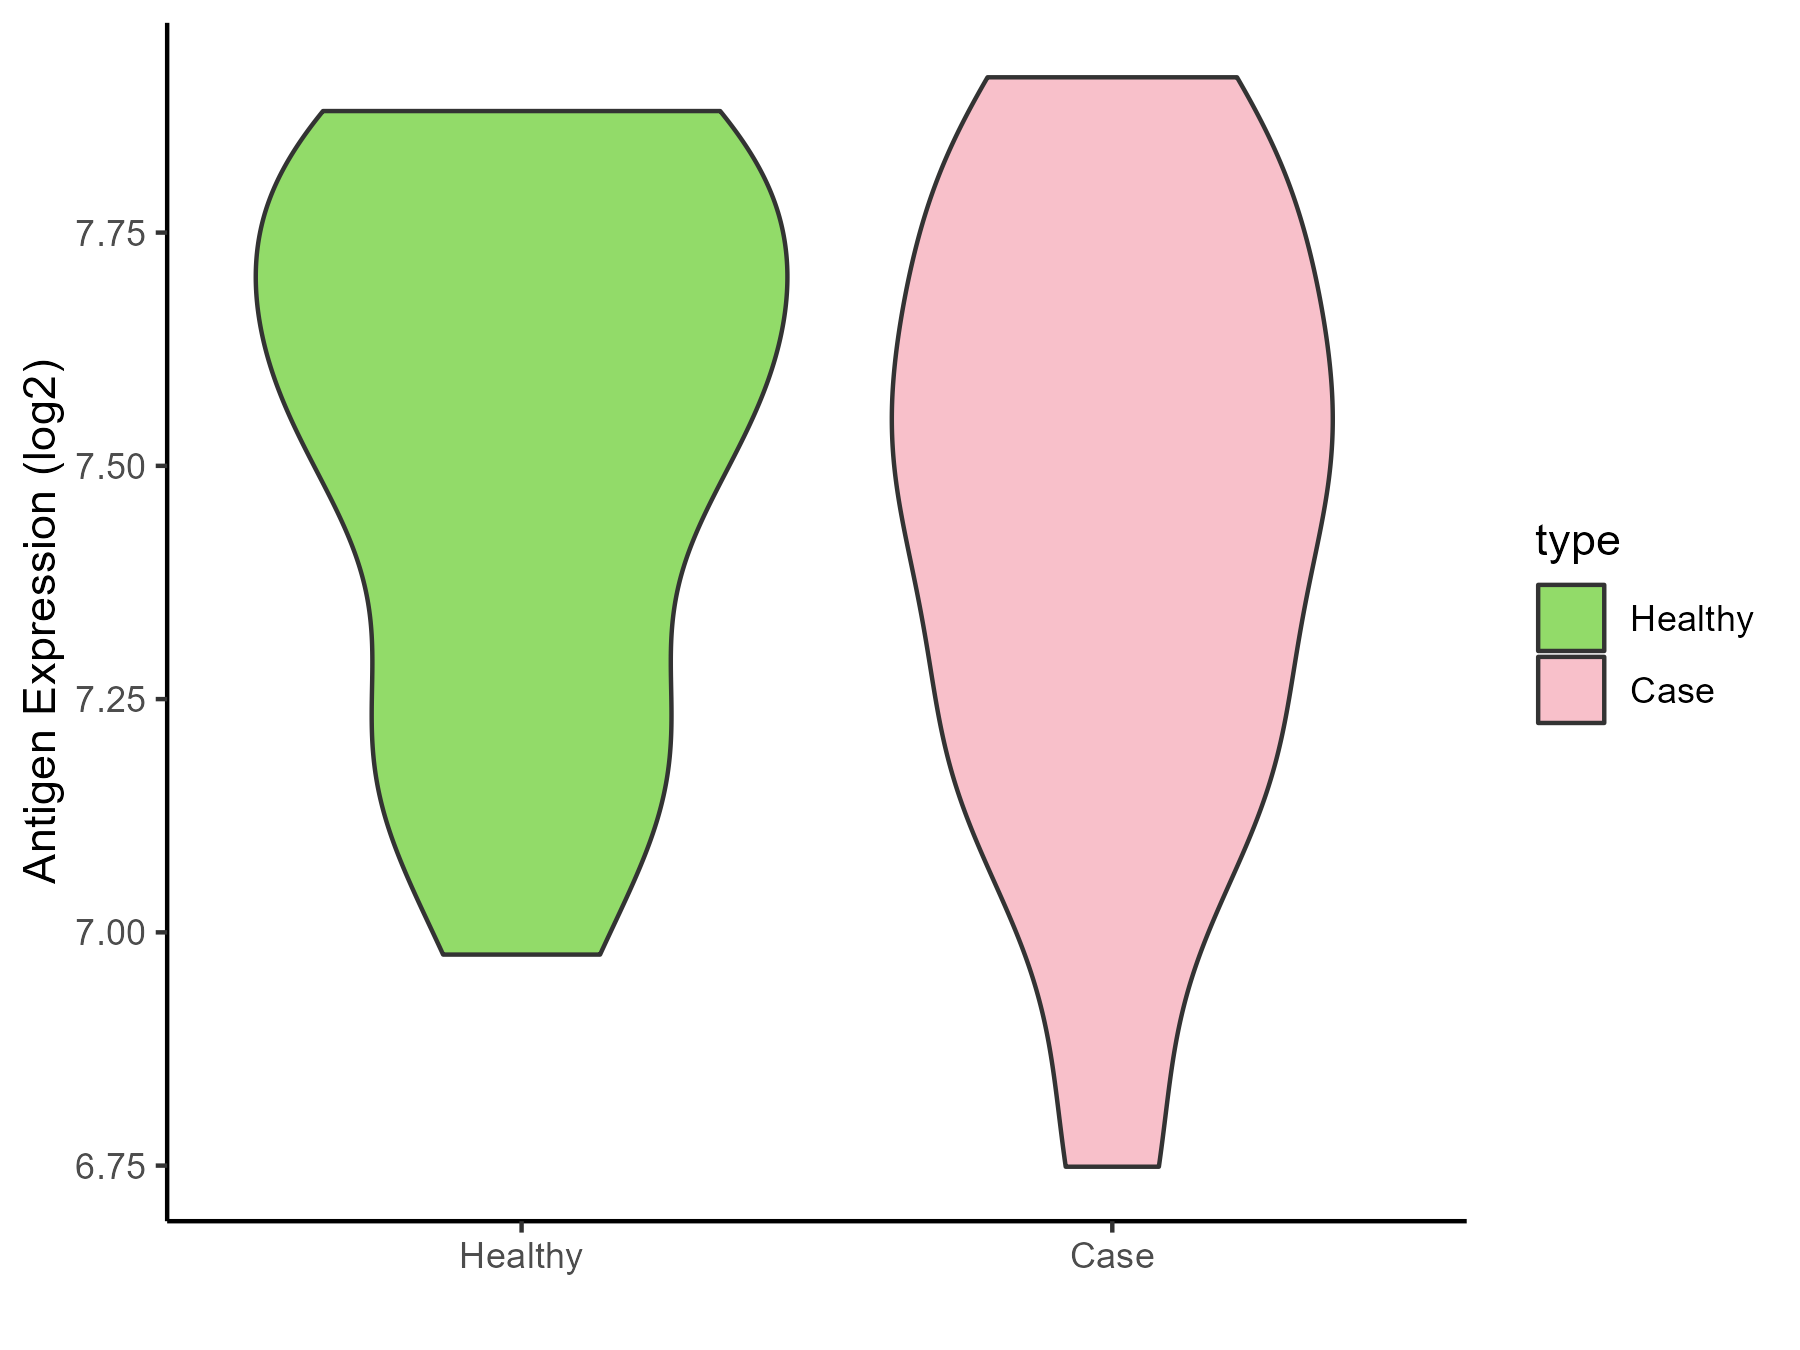
| The Studied Tissue | Peripheral blood | |
| The Specific Disease | Pediatric respiratory syncytial virus infection | |
| The Expression Level of Disease Section Compare with the Healthy Individual Tissue | p-value: 0.362501311; Fold-change: -0.077639239; Z-score: -0.271478241 | |
| Disease-specific Antigen Abundances |
|
Click to View the Clearer Original Diagram |
ICD Disease Classification 11
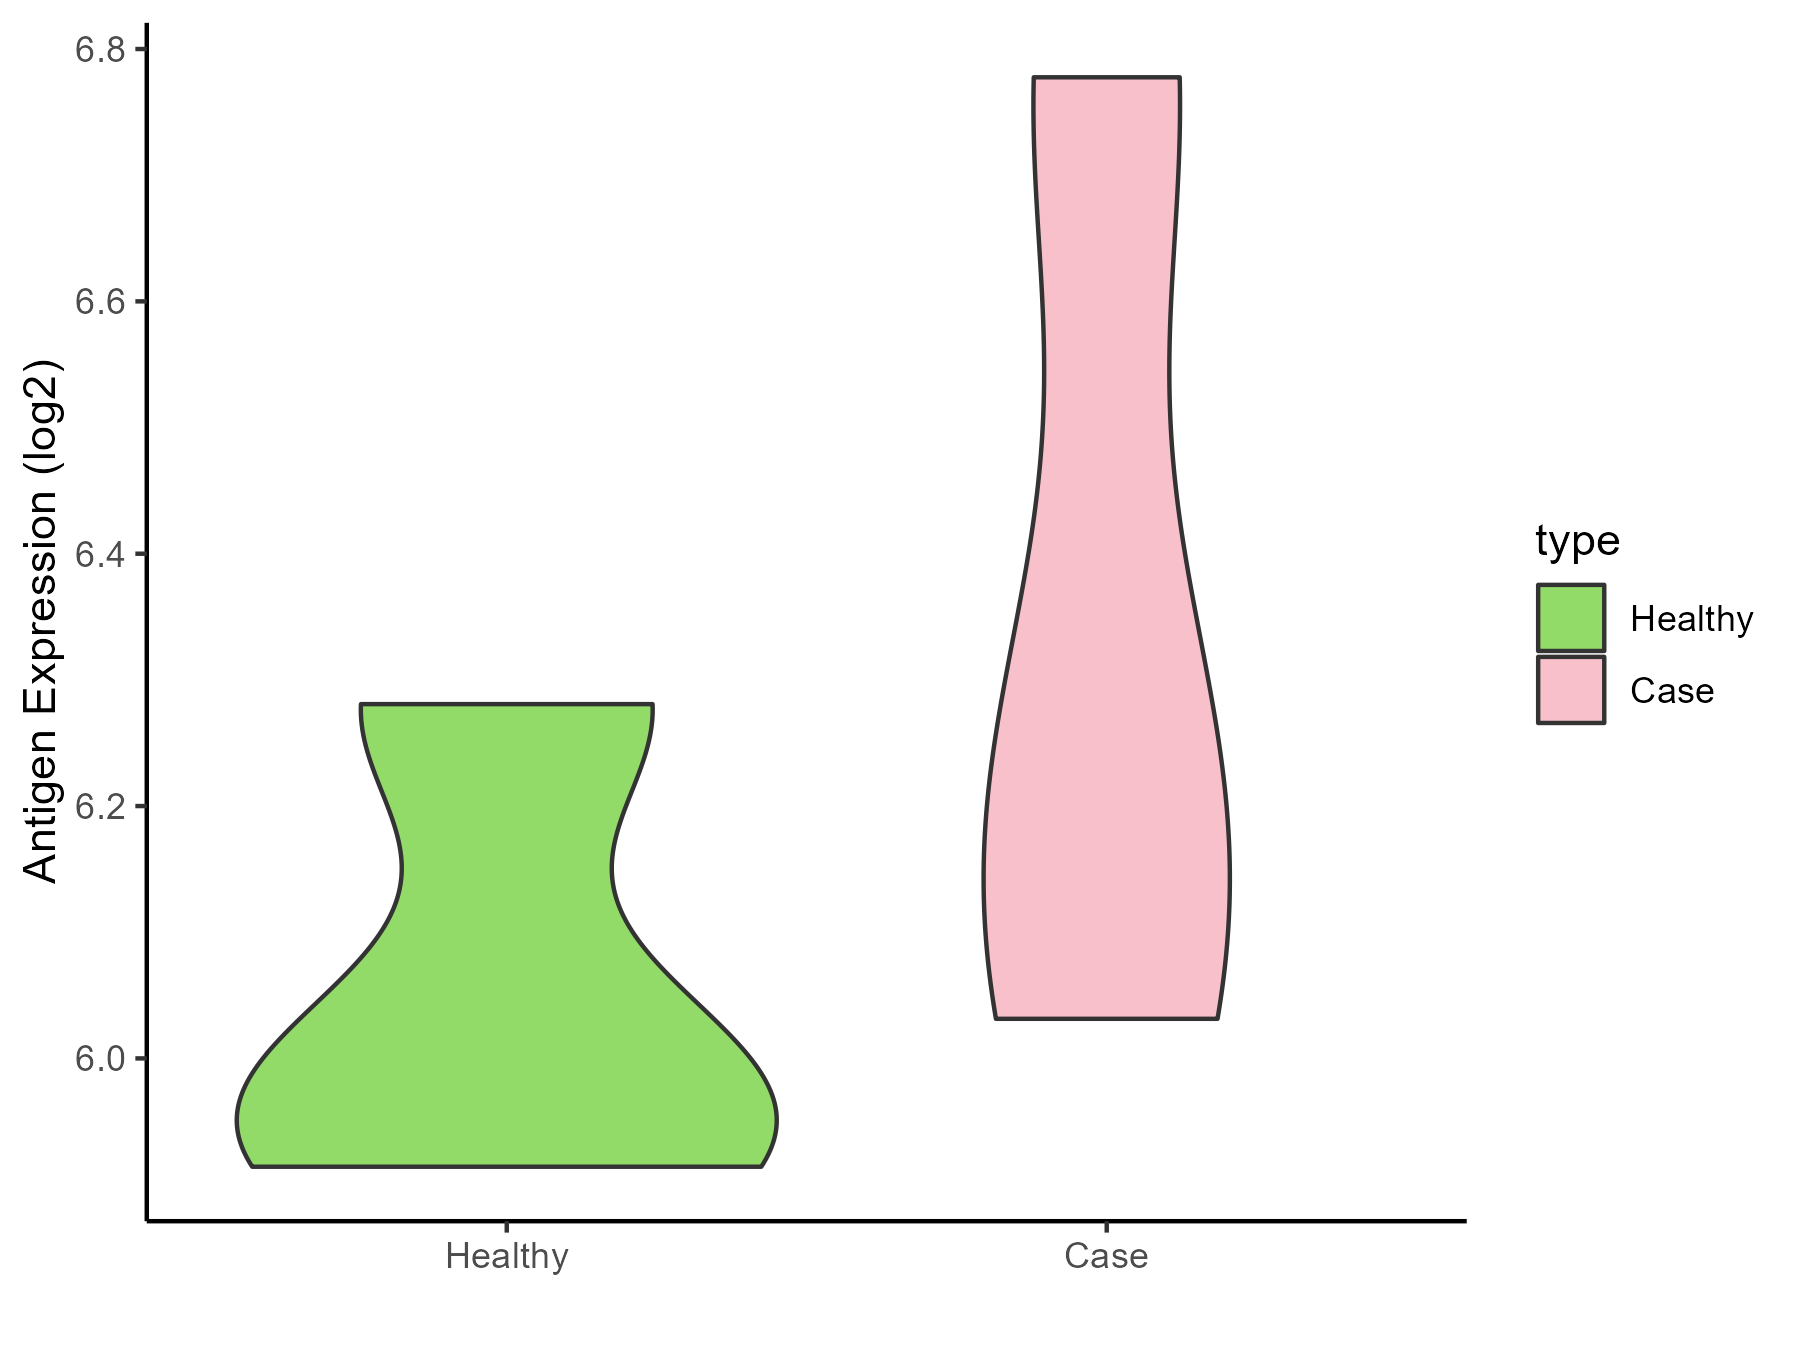
| Differential expression pattern of antigen in diseases | ||
| The Studied Tissue | Peripheral blood | |
| The Specific Disease | Essential hypertension | |
| The Expression Level of Disease Section Compare with the Healthy Individual Tissue | p-value: 0.326599128; Fold-change: 0.260244997; Z-score: 1.339664739 | |
| Disease-specific Antigen Abundances |
|
Click to View the Clearer Original Diagram |
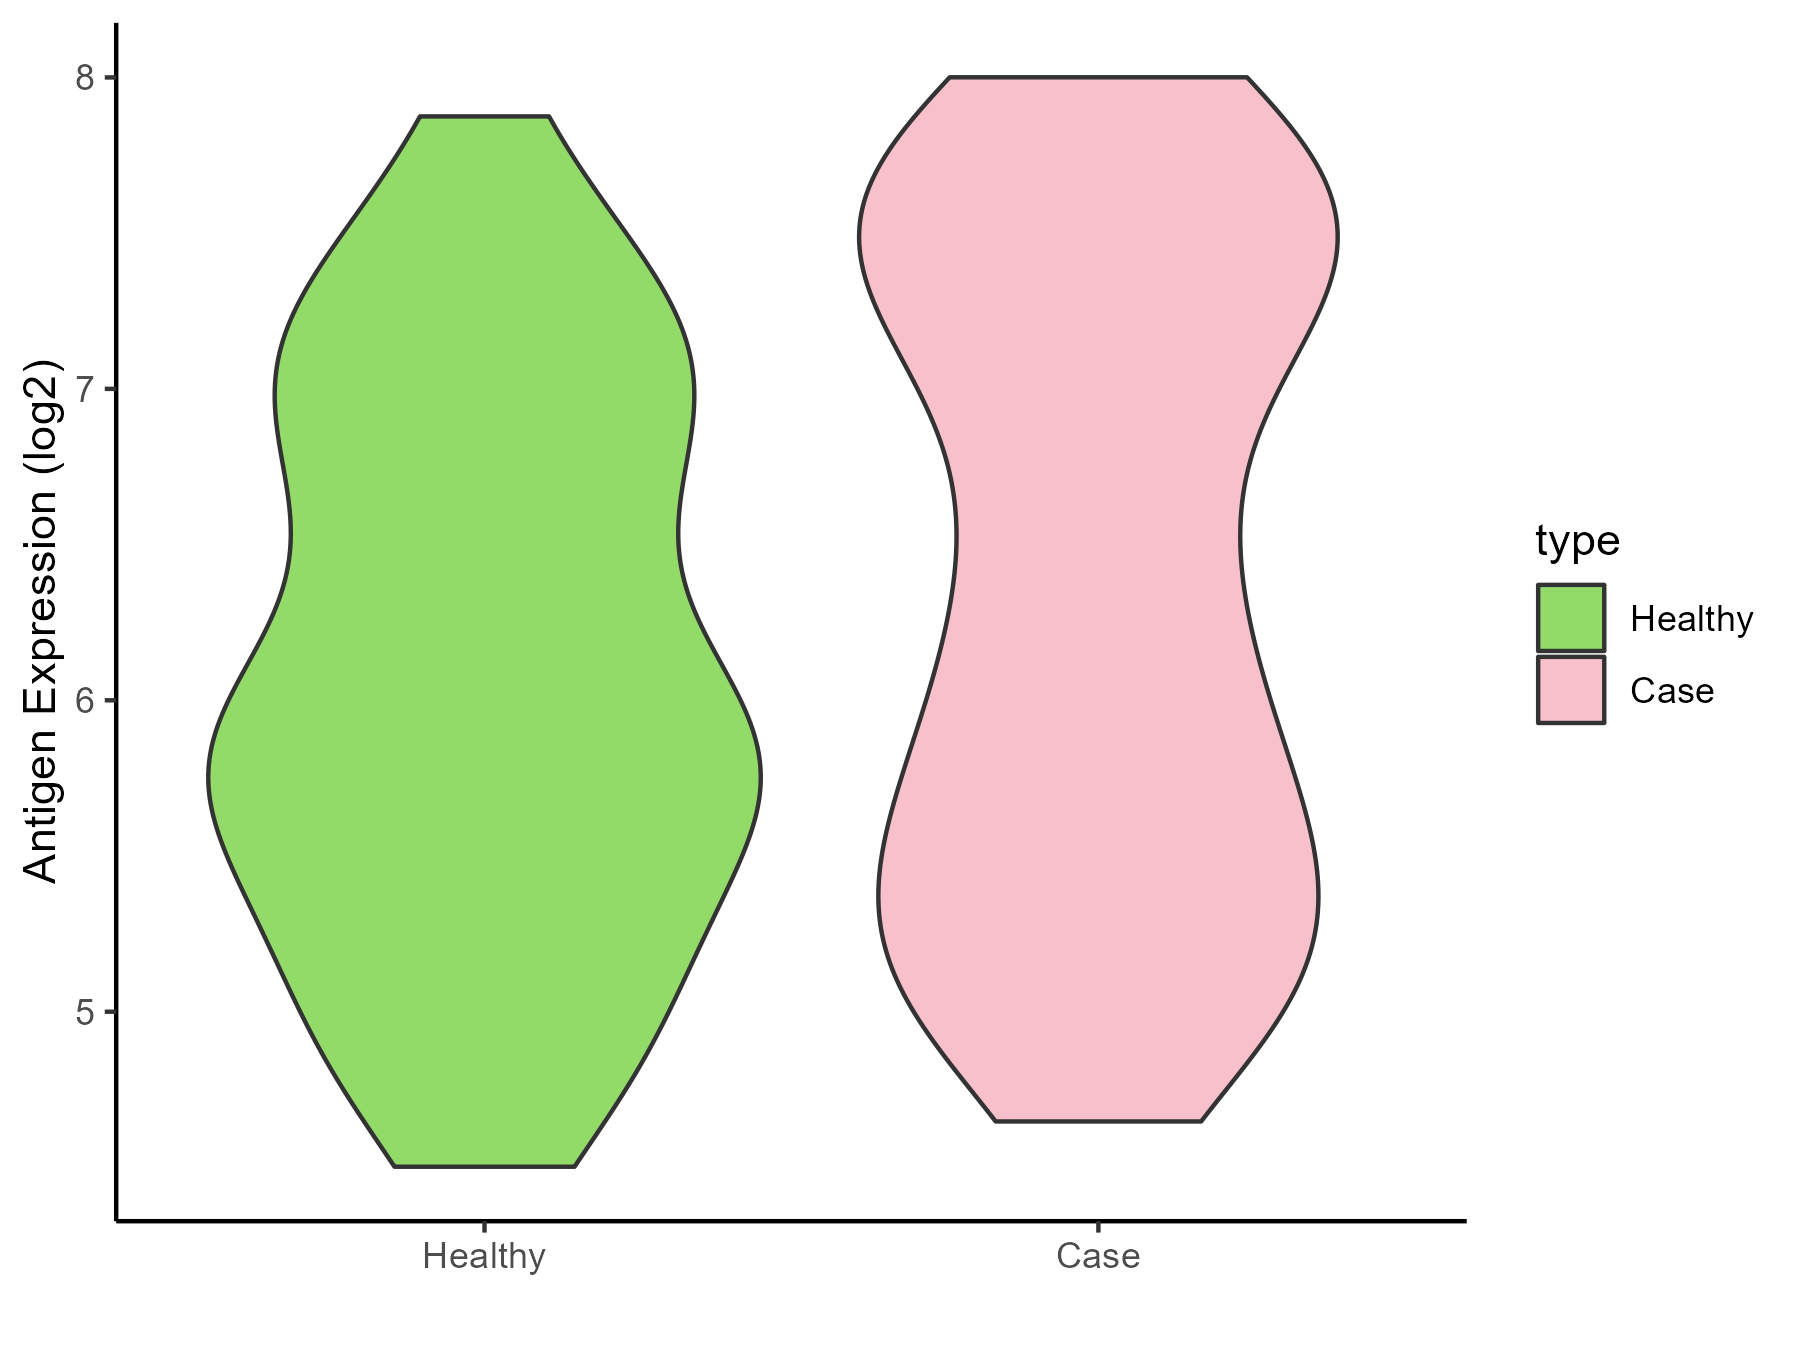
| Differential expression pattern of antigen in diseases | ||
| The Studied Tissue | Peripheral blood | |
| The Specific Disease | Myocardial infarction | |
| The Expression Level of Disease Section Compare with the Healthy Individual Tissue | p-value: 0.07460613; Fold-change: 0.422351205; Z-score: 0.470147269 | |
| Disease-specific Antigen Abundances |
|
Click to View the Clearer Original Diagram |
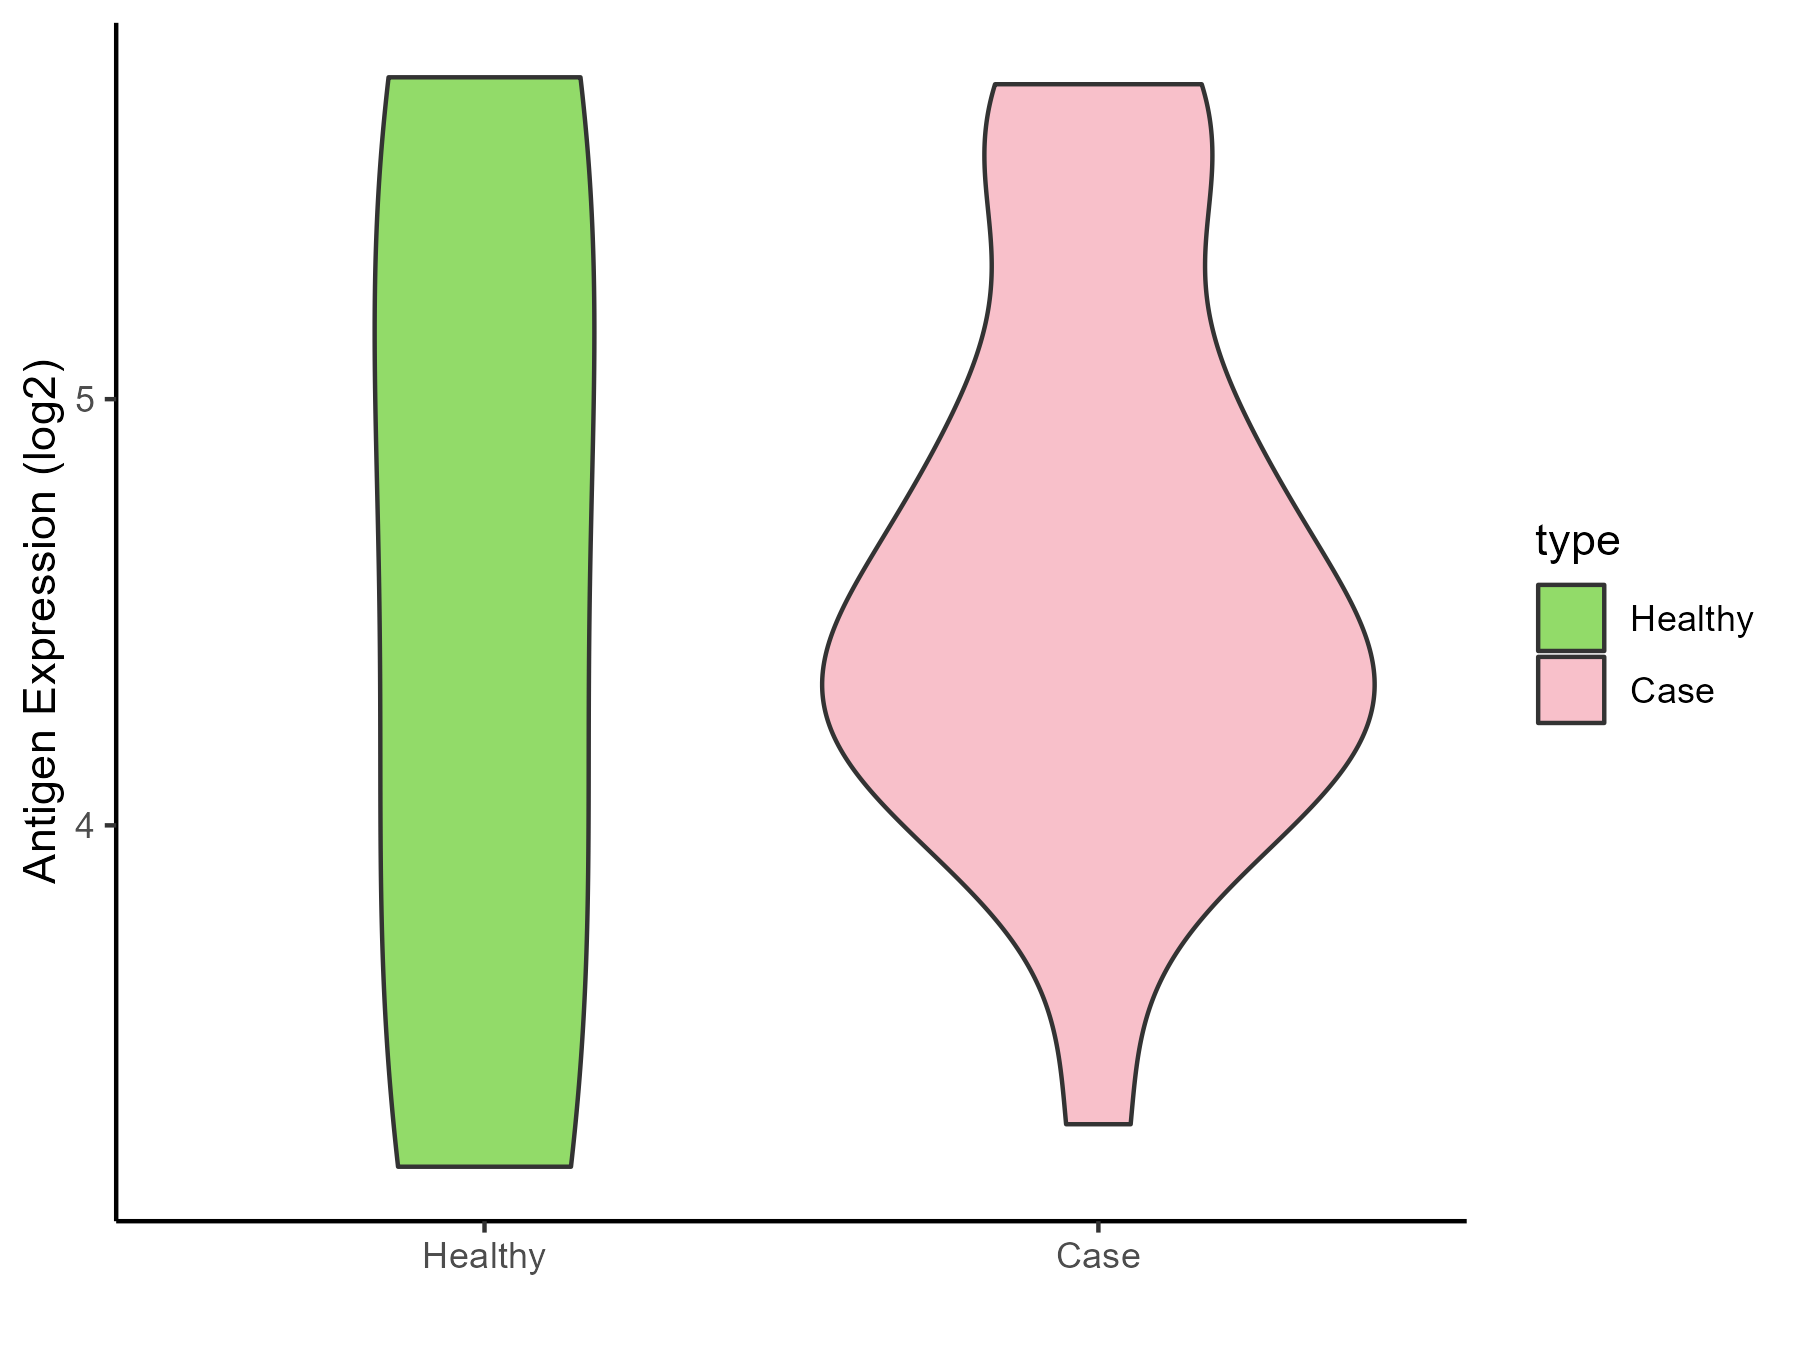
| Differential expression pattern of antigen in diseases | ||
| The Studied Tissue | Peripheral blood | |
| The Specific Disease | Coronary artery disease | |
| The Expression Level of Disease Section Compare with the Healthy Individual Tissue | p-value: 0.884310147; Fold-change: -0.122847101; Z-score: -0.106279729 | |
| Disease-specific Antigen Abundances |
|
Click to View the Clearer Original Diagram |
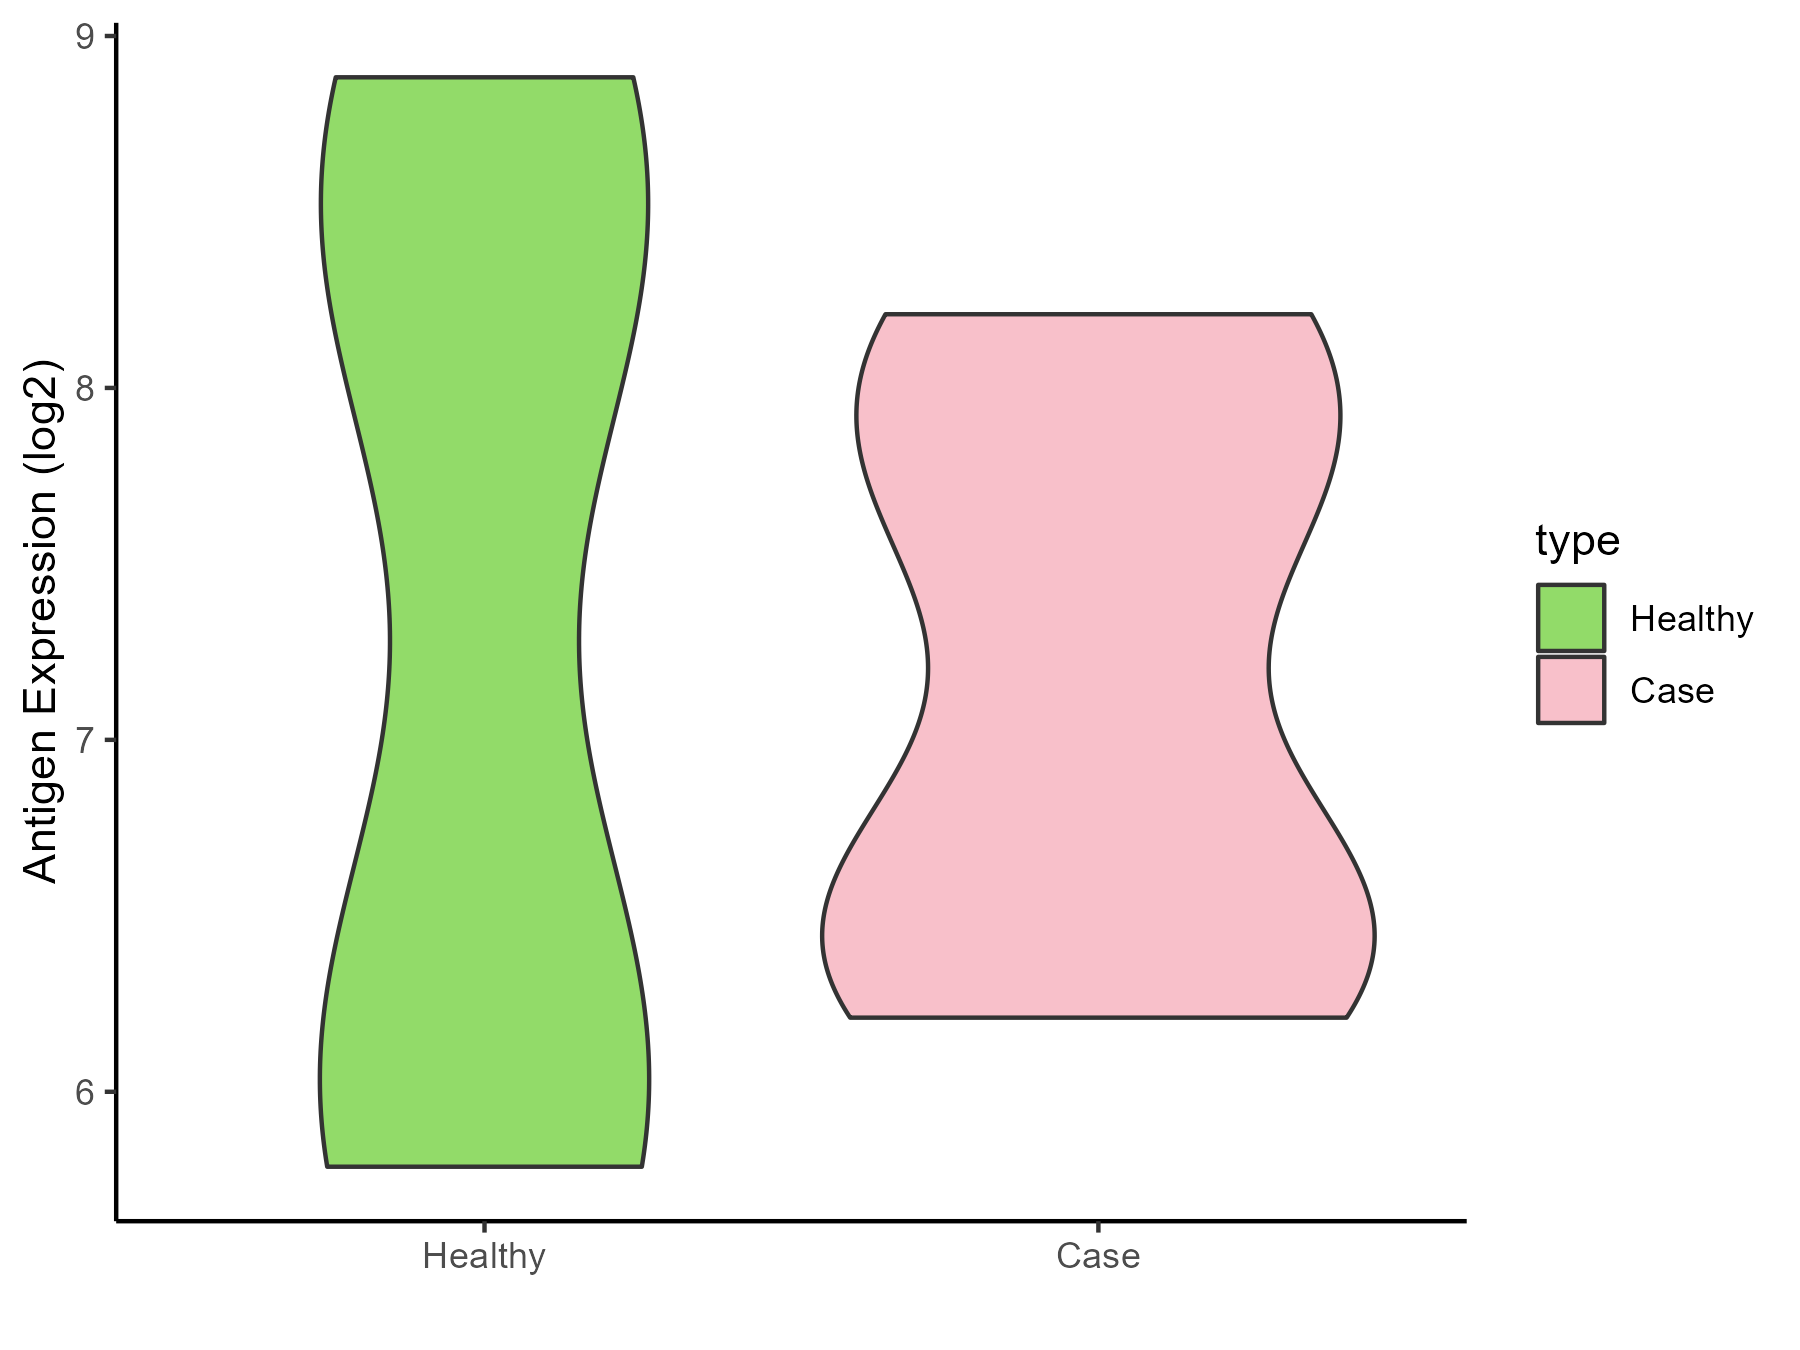
| Differential expression pattern of antigen in diseases | ||
| The Studied Tissue | Calcified aortic valve | |
| The Specific Disease | Aortic stenosis | |
| The Expression Level of Disease Section Compare with the Healthy Individual Tissue | p-value: 0.833674319; Fold-change: -0.184099376; Z-score: -0.13645486 | |
| Disease-specific Antigen Abundances |
|
Click to View the Clearer Original Diagram |
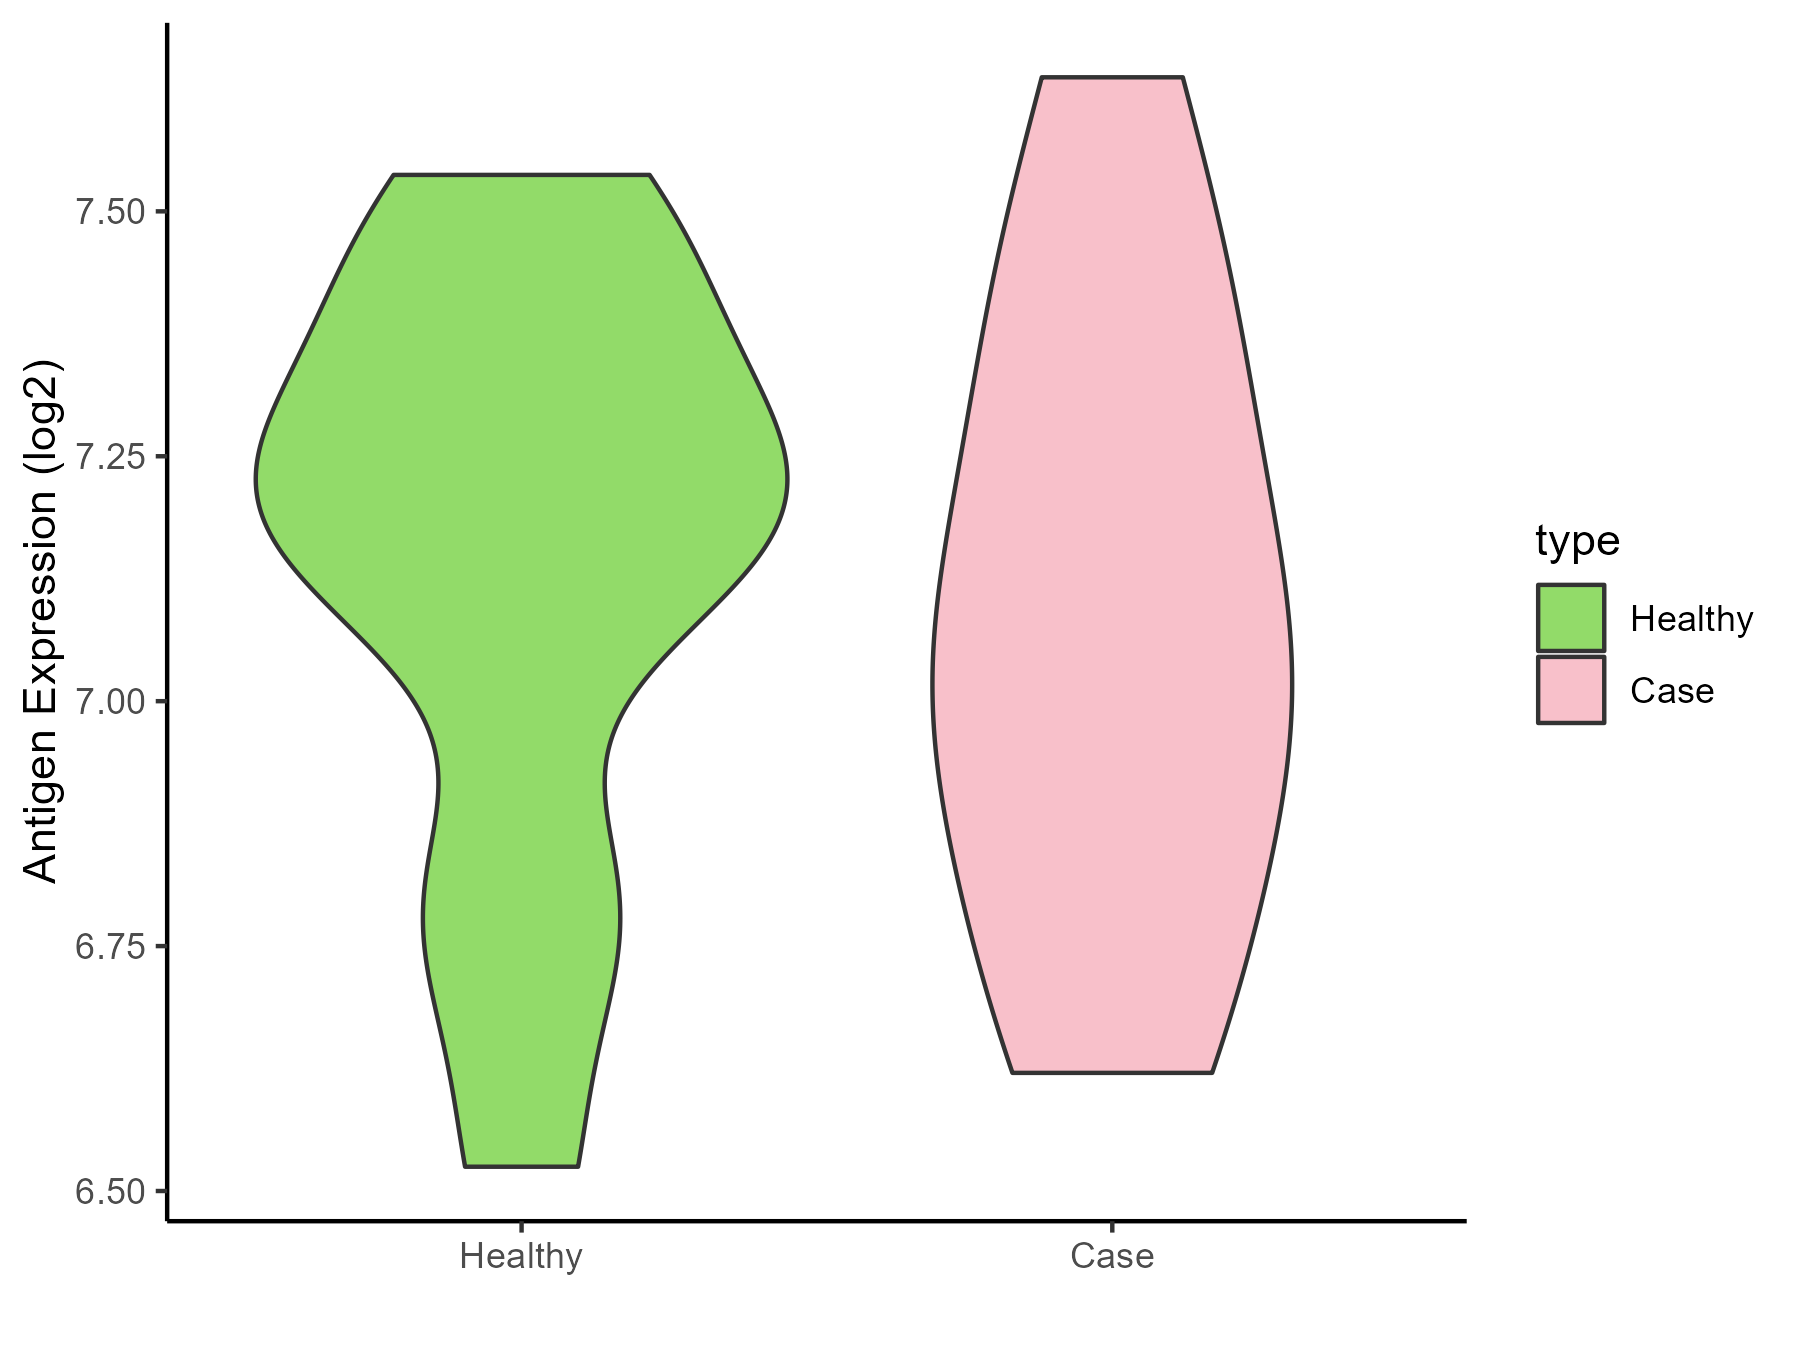
| Differential expression pattern of antigen in diseases | ||
| The Studied Tissue | Peripheral blood | |
| The Specific Disease | Arteriosclerosis | |
| The Expression Level of Disease Section Compare with the Healthy Individual Tissue | p-value: 0.665378759; Fold-change: -0.16505186; Z-score: -0.543362662 | |
| Disease-specific Antigen Abundances |
|
Click to View the Clearer Original Diagram |
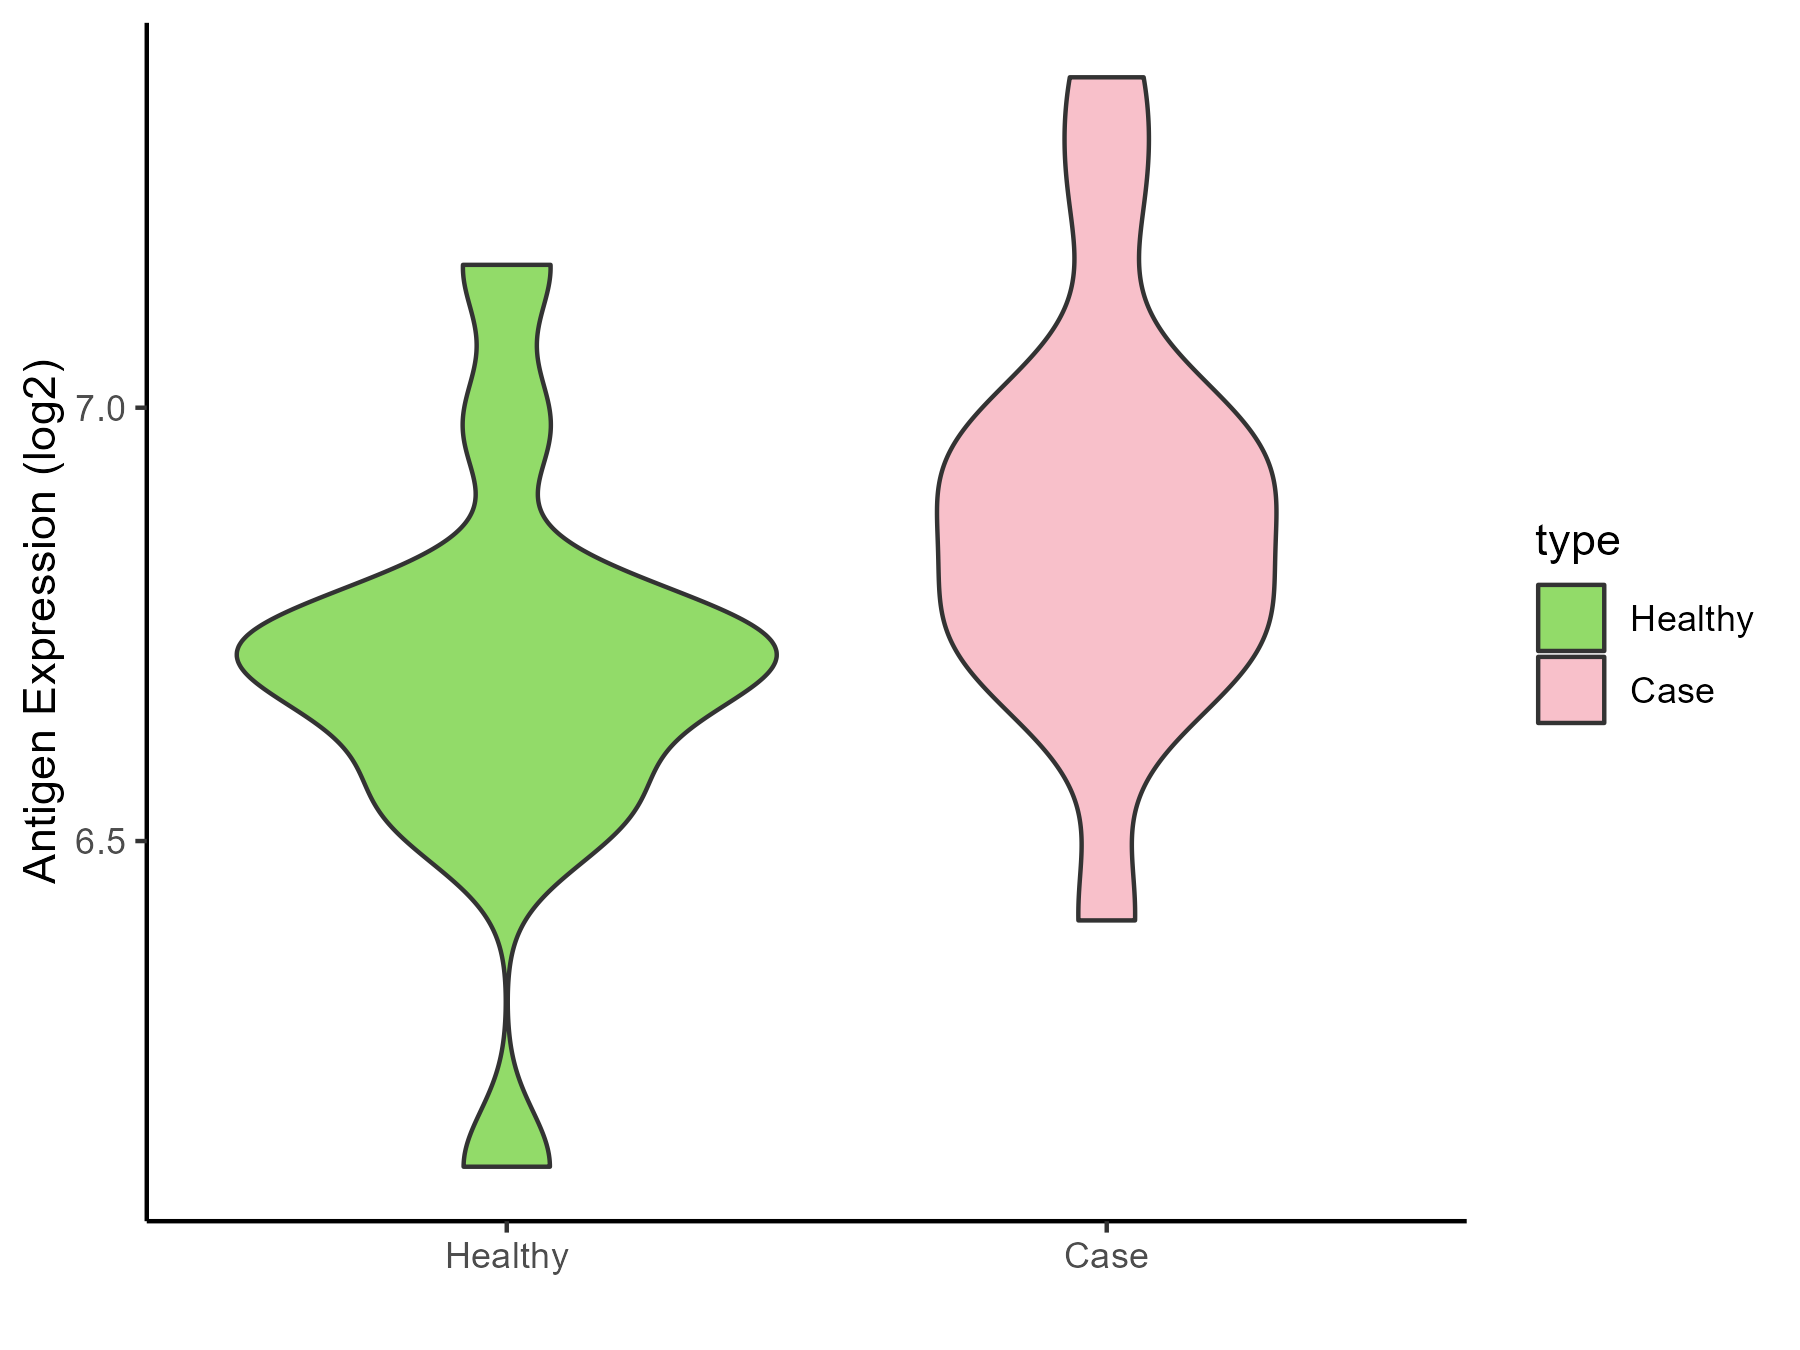
| Differential expression pattern of antigen in diseases | ||
| The Studied Tissue | Intracranial artery | |
| The Specific Disease | Aneurysm | |
| The Expression Level of Disease Section Compare with the Healthy Individual Tissue | p-value: 0.052287607; Fold-change: 0.171997336; Z-score: 0.707513602 | |
| Disease-specific Antigen Abundances |
|
Click to View the Clearer Original Diagram |
ICD Disease Classification 12
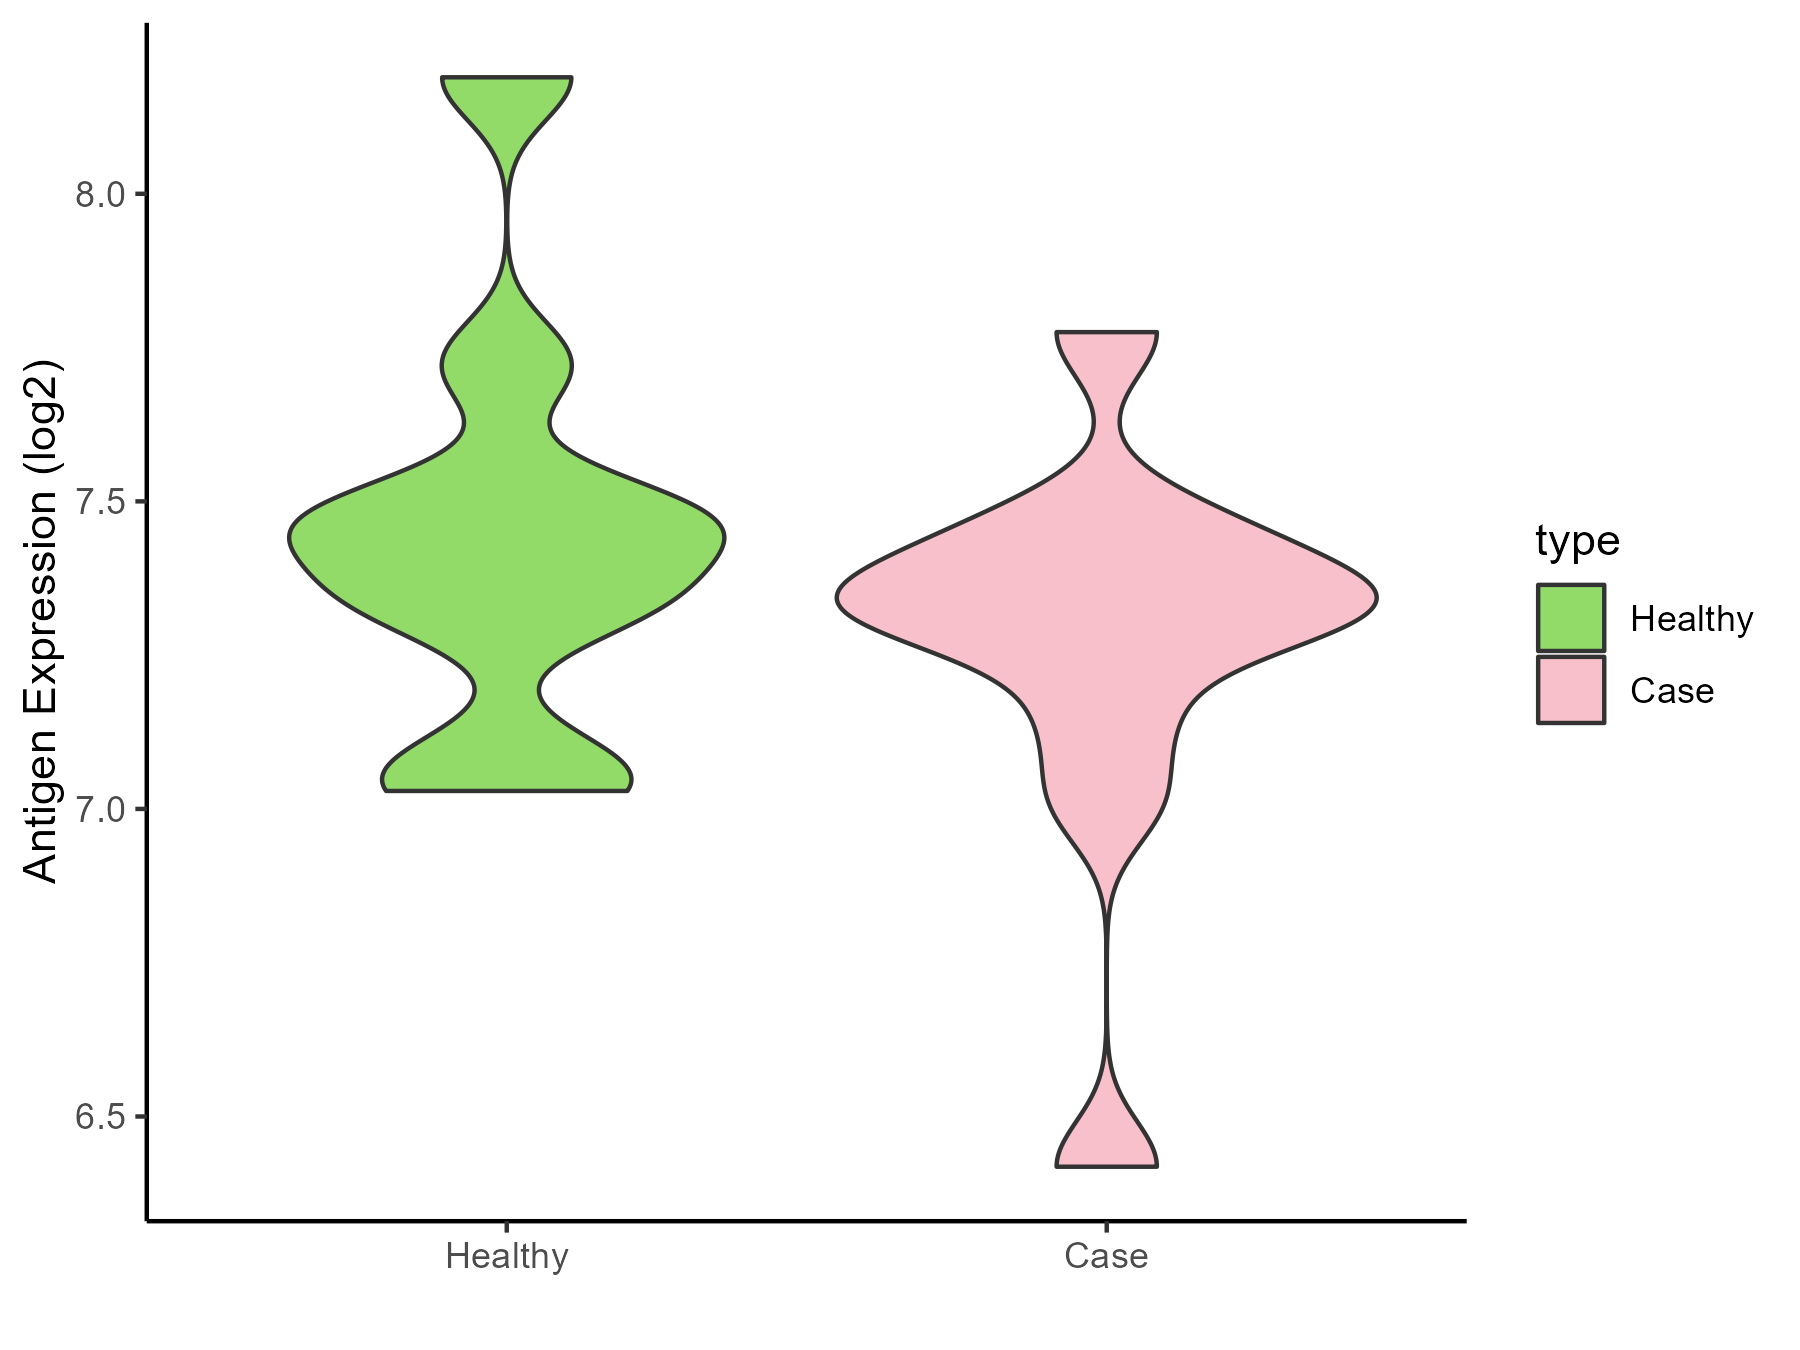
| Differential expression pattern of antigen in diseases | ||
| The Studied Tissue | Peripheral blood | |
| The Specific Disease | Immunodeficiency | |
| The Expression Level of Disease Section Compare with the Healthy Individual Tissue | p-value: 0.233279289; Fold-change: -0.111946987; Z-score: -0.321134132 | |
| Disease-specific Antigen Abundances |
|
Click to View the Clearer Original Diagram |
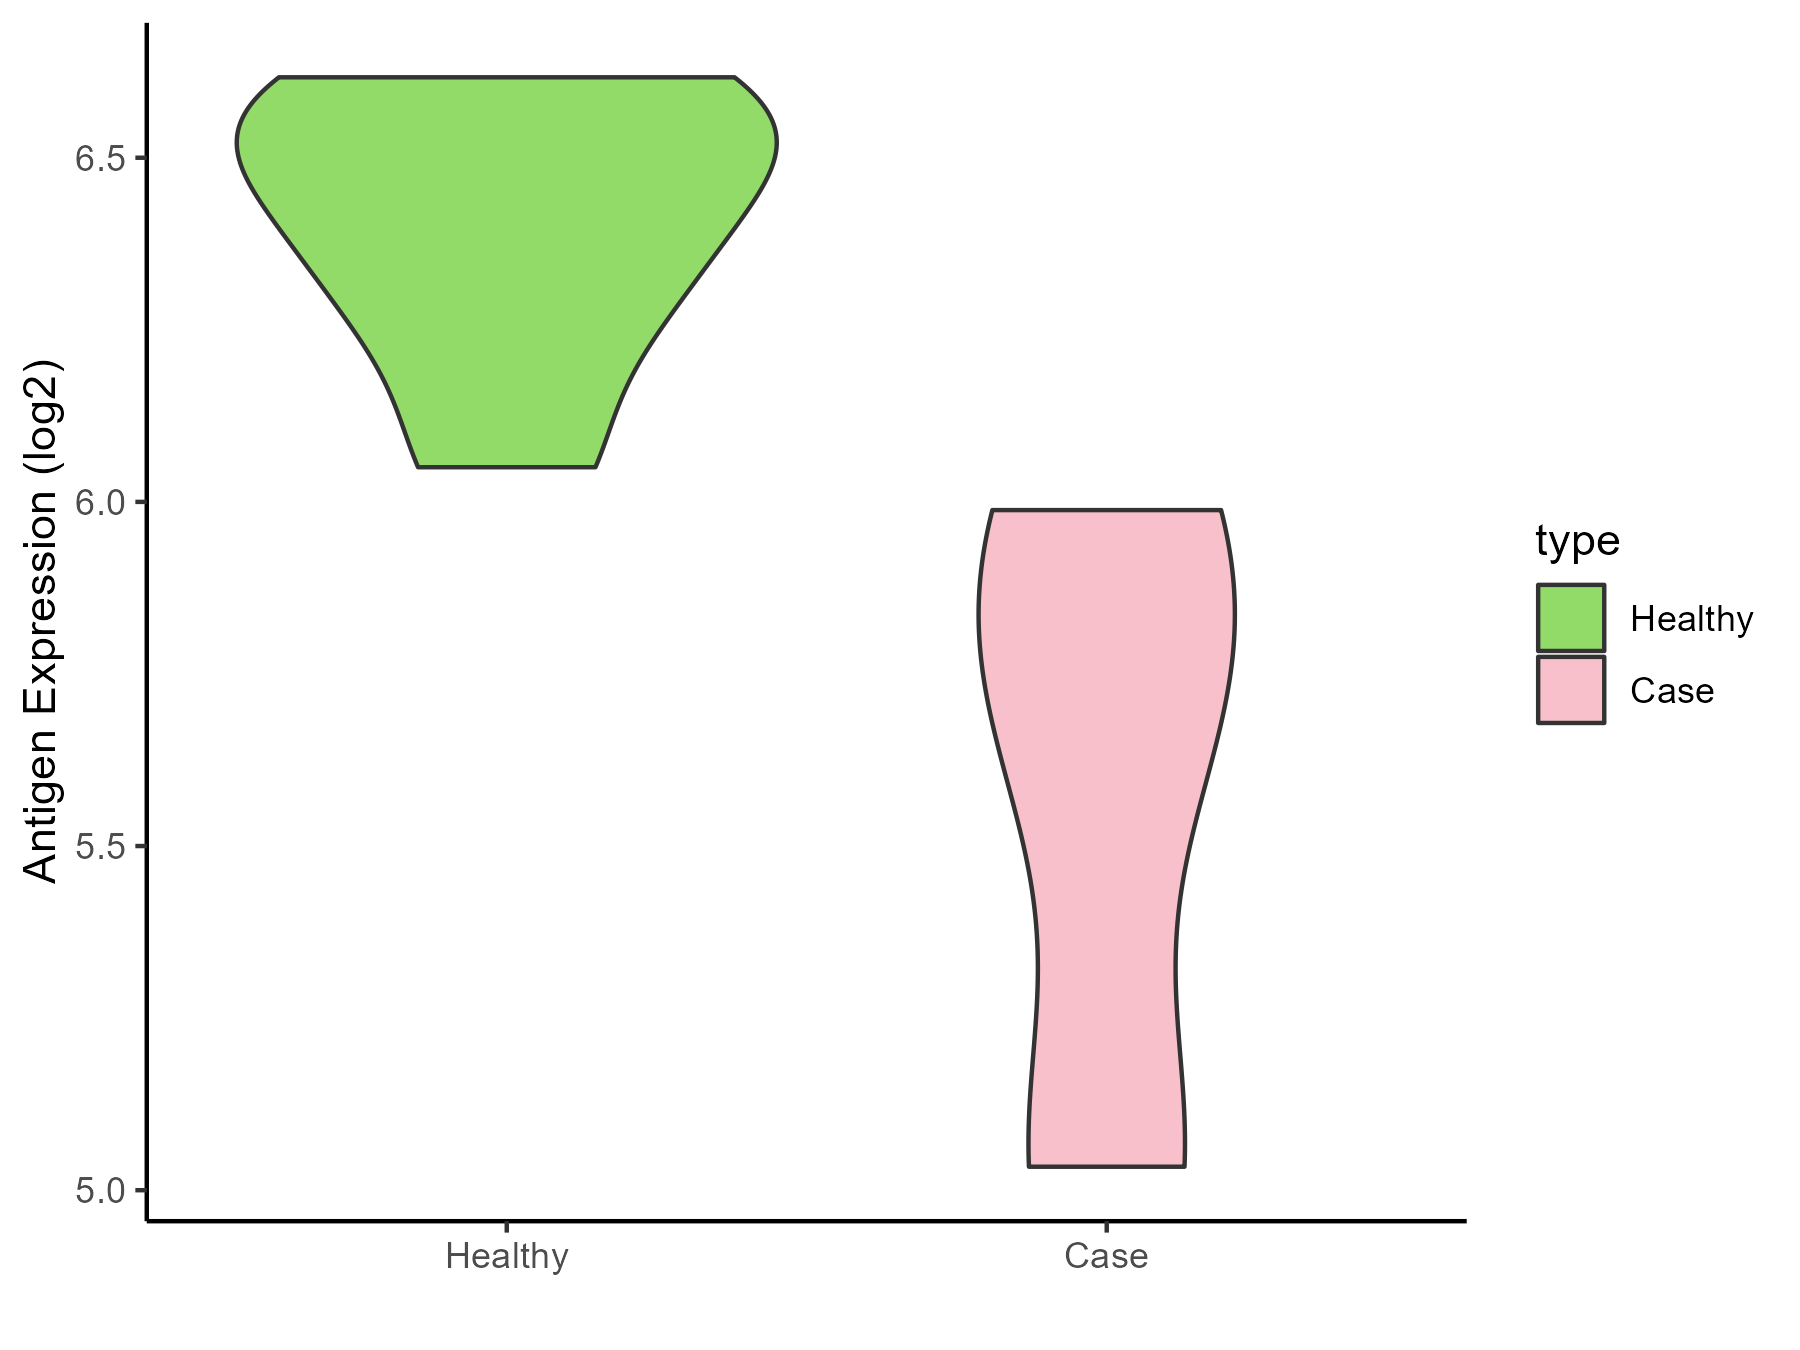
| Differential expression pattern of antigen in diseases | ||
| The Studied Tissue | Hyperplastic tonsil | |
| The Specific Disease | Apnea | |
| The Expression Level of Disease Section Compare with the Healthy Individual Tissue | p-value: 0.087943498; Fold-change: -0.765417522; Z-score: -3.735875809 | |
| Disease-specific Antigen Abundances |
|
Click to View the Clearer Original Diagram |
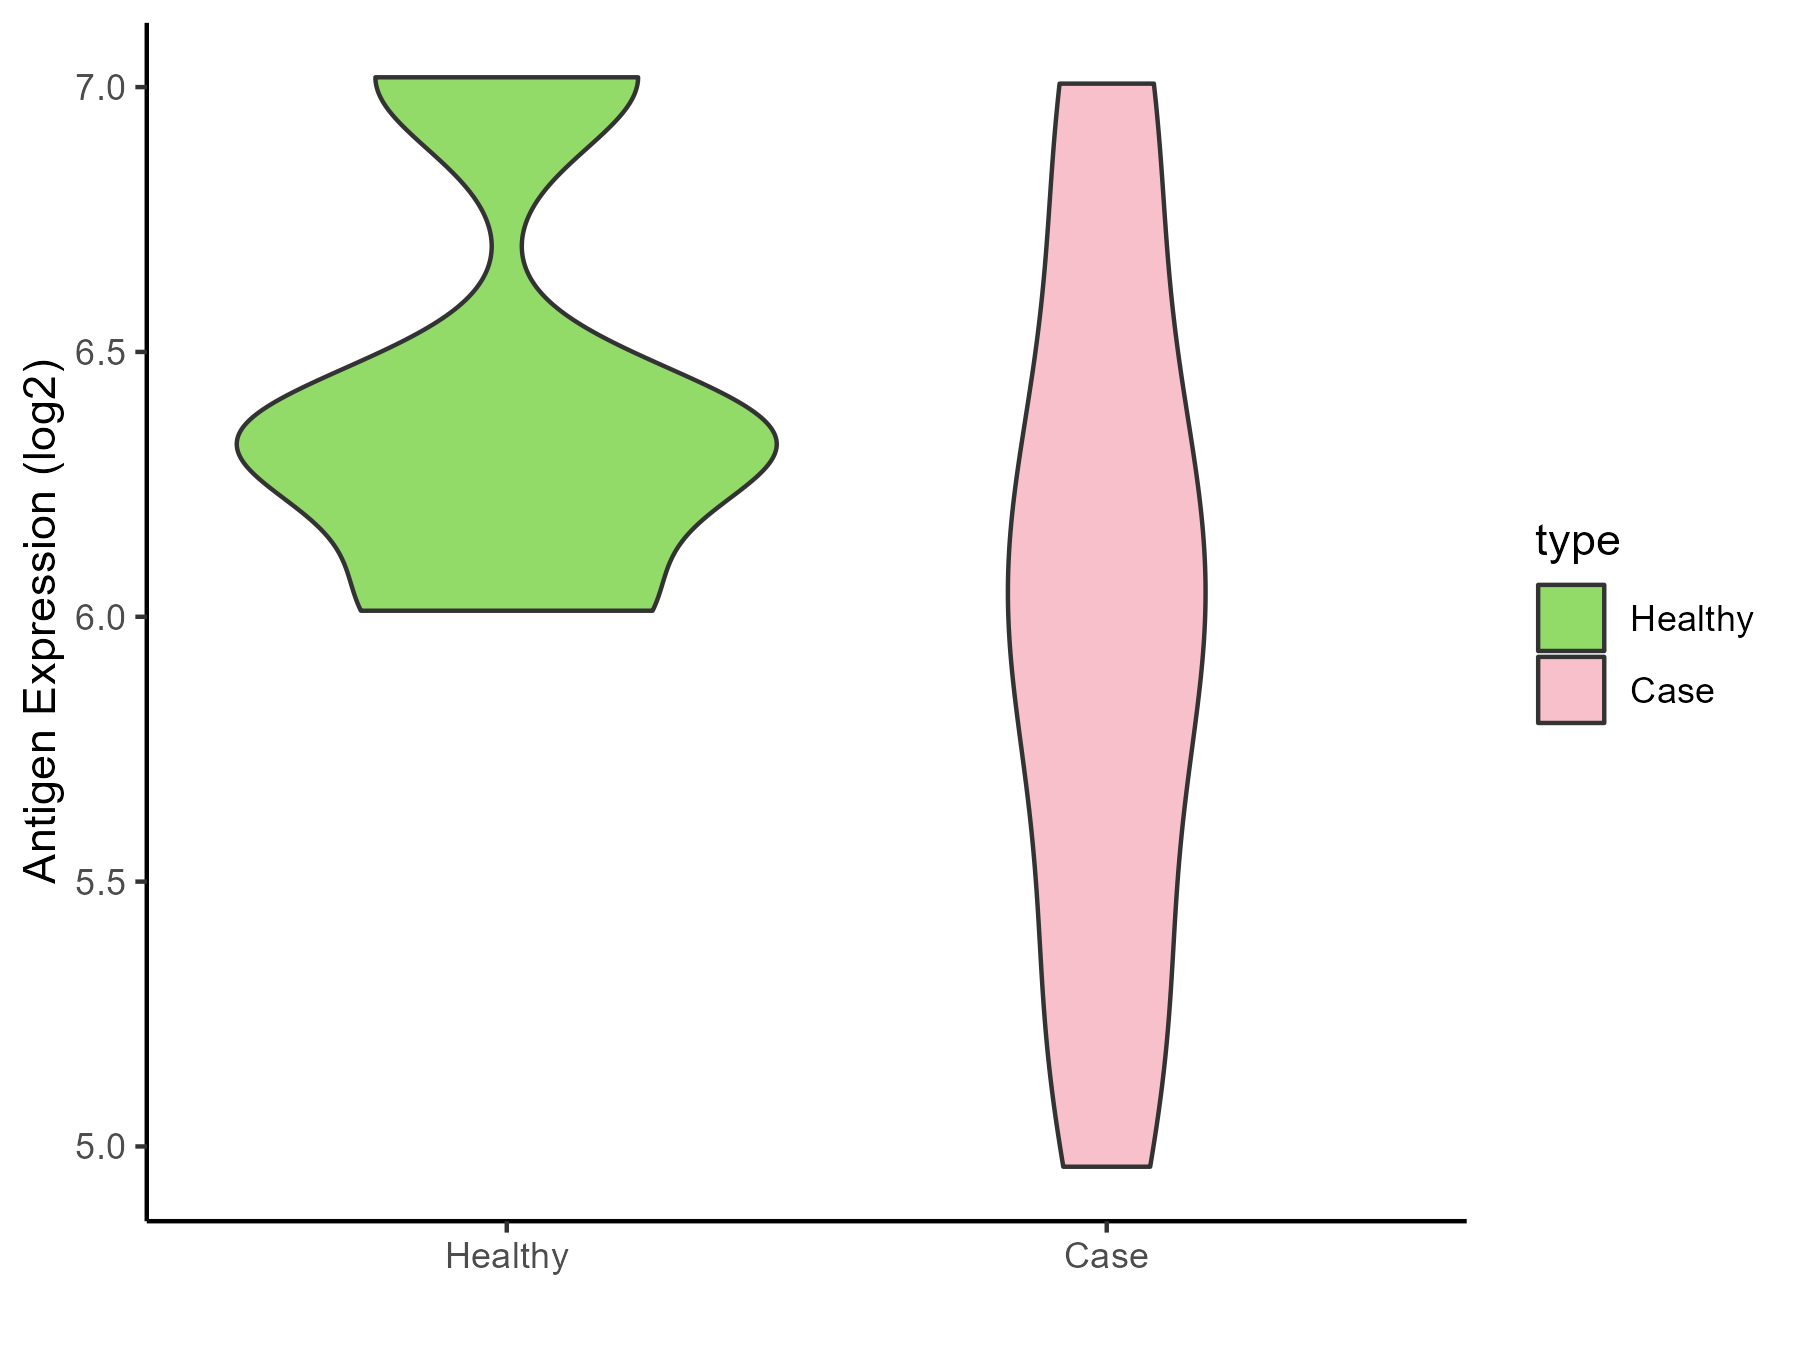
| Differential expression pattern of antigen in diseases | ||
| The Studied Tissue | Peripheral blood | |
| The Specific Disease | Olive pollen allergy | |
| The Expression Level of Disease Section Compare with the Healthy Individual Tissue | p-value: 0.169654793; Fold-change: -0.281988256; Z-score: -0.665188654 | |
| Disease-specific Antigen Abundances |
|
Click to View the Clearer Original Diagram |
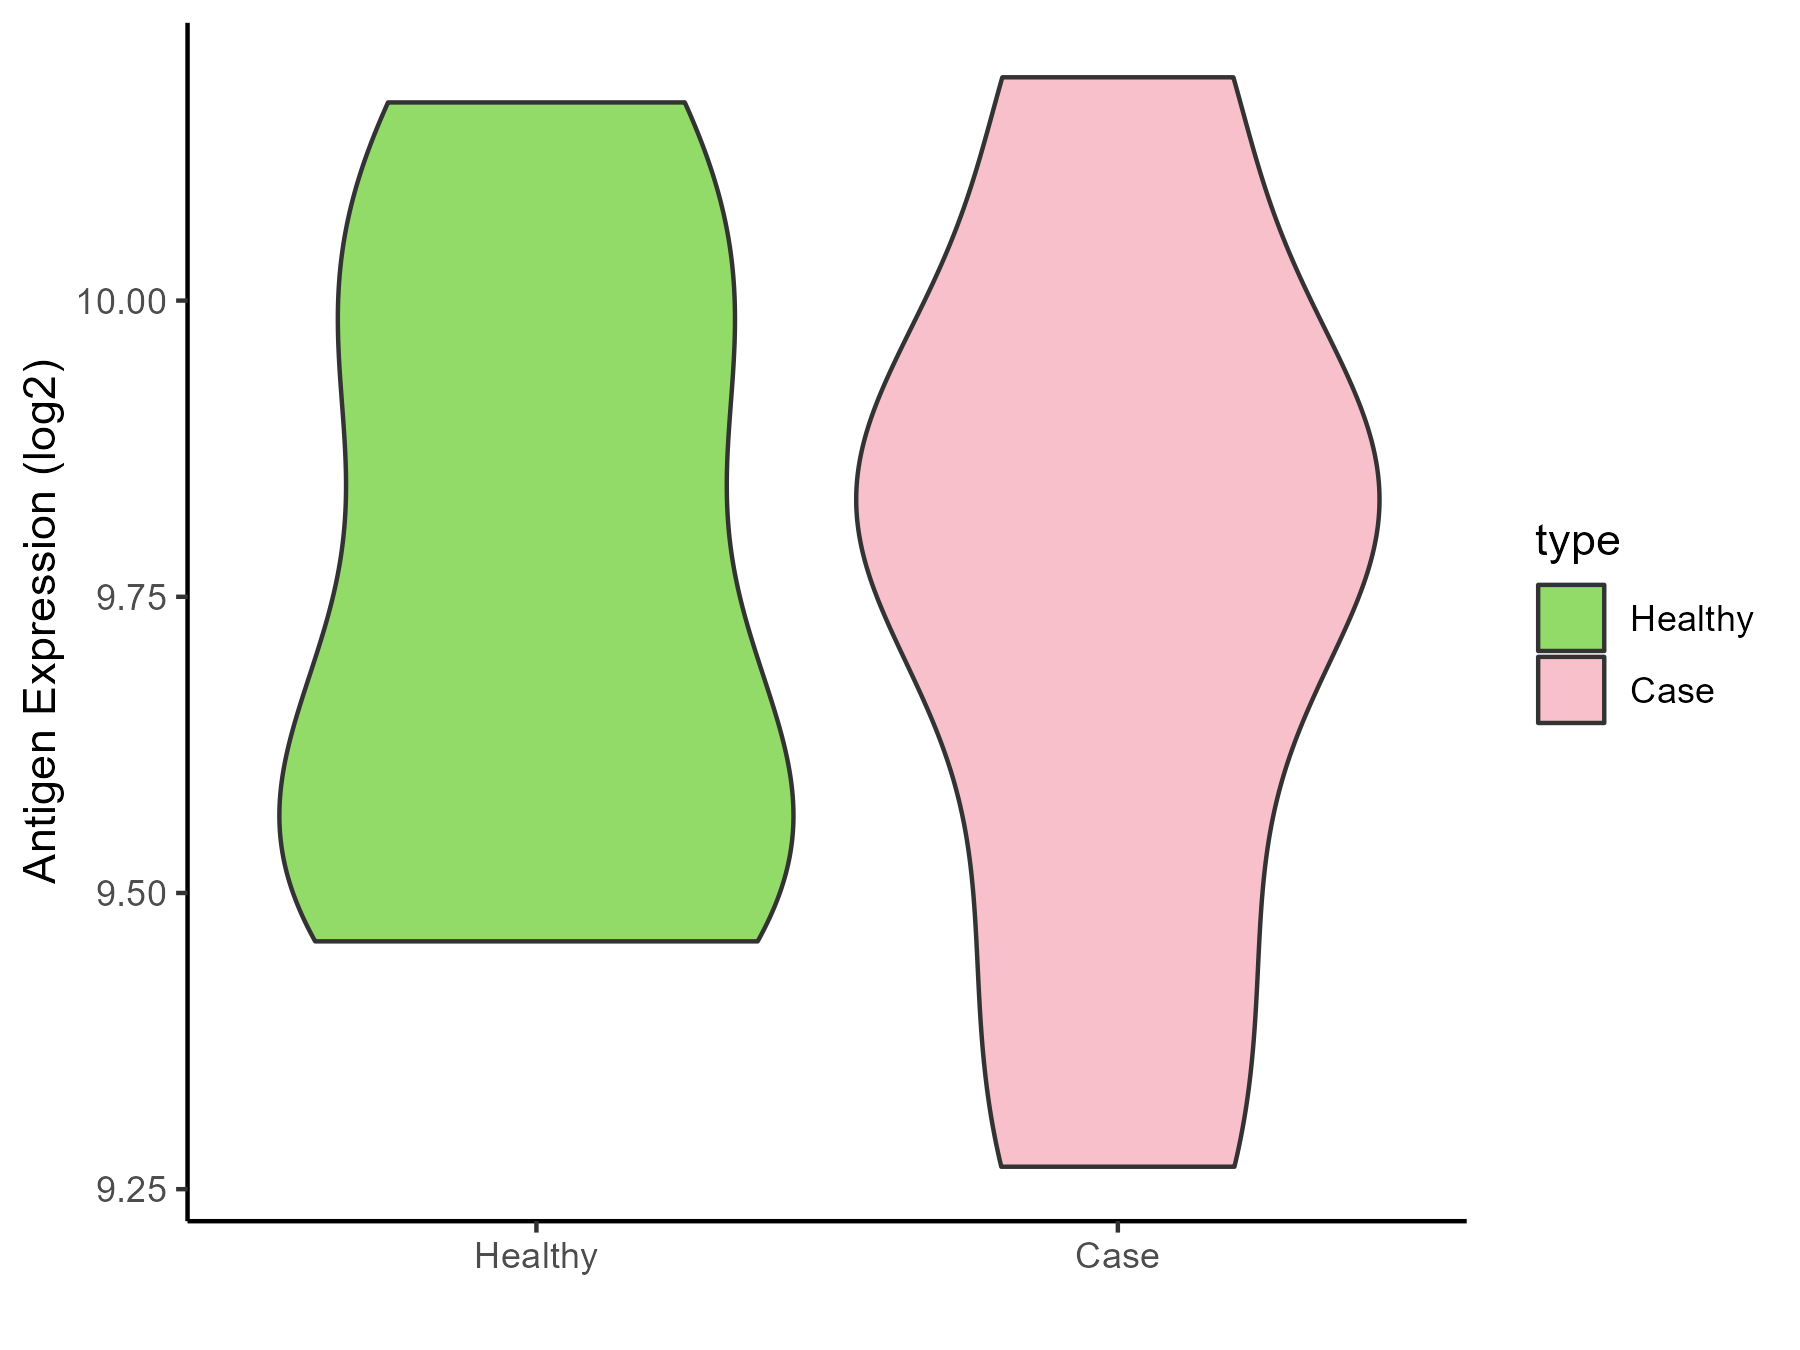
| Differential expression pattern of antigen in diseases | ||
| The Studied Tissue | Sinus mucosa | |
| The Specific Disease | Chronic rhinosinusitis | |
| The Expression Level of Disease Section Compare with the Healthy Individual Tissue | p-value: 0.892120354; Fold-change: 0.104463902; Z-score: 0.388407129 | |
| Disease-specific Antigen Abundances |
|
Click to View the Clearer Original Diagram |
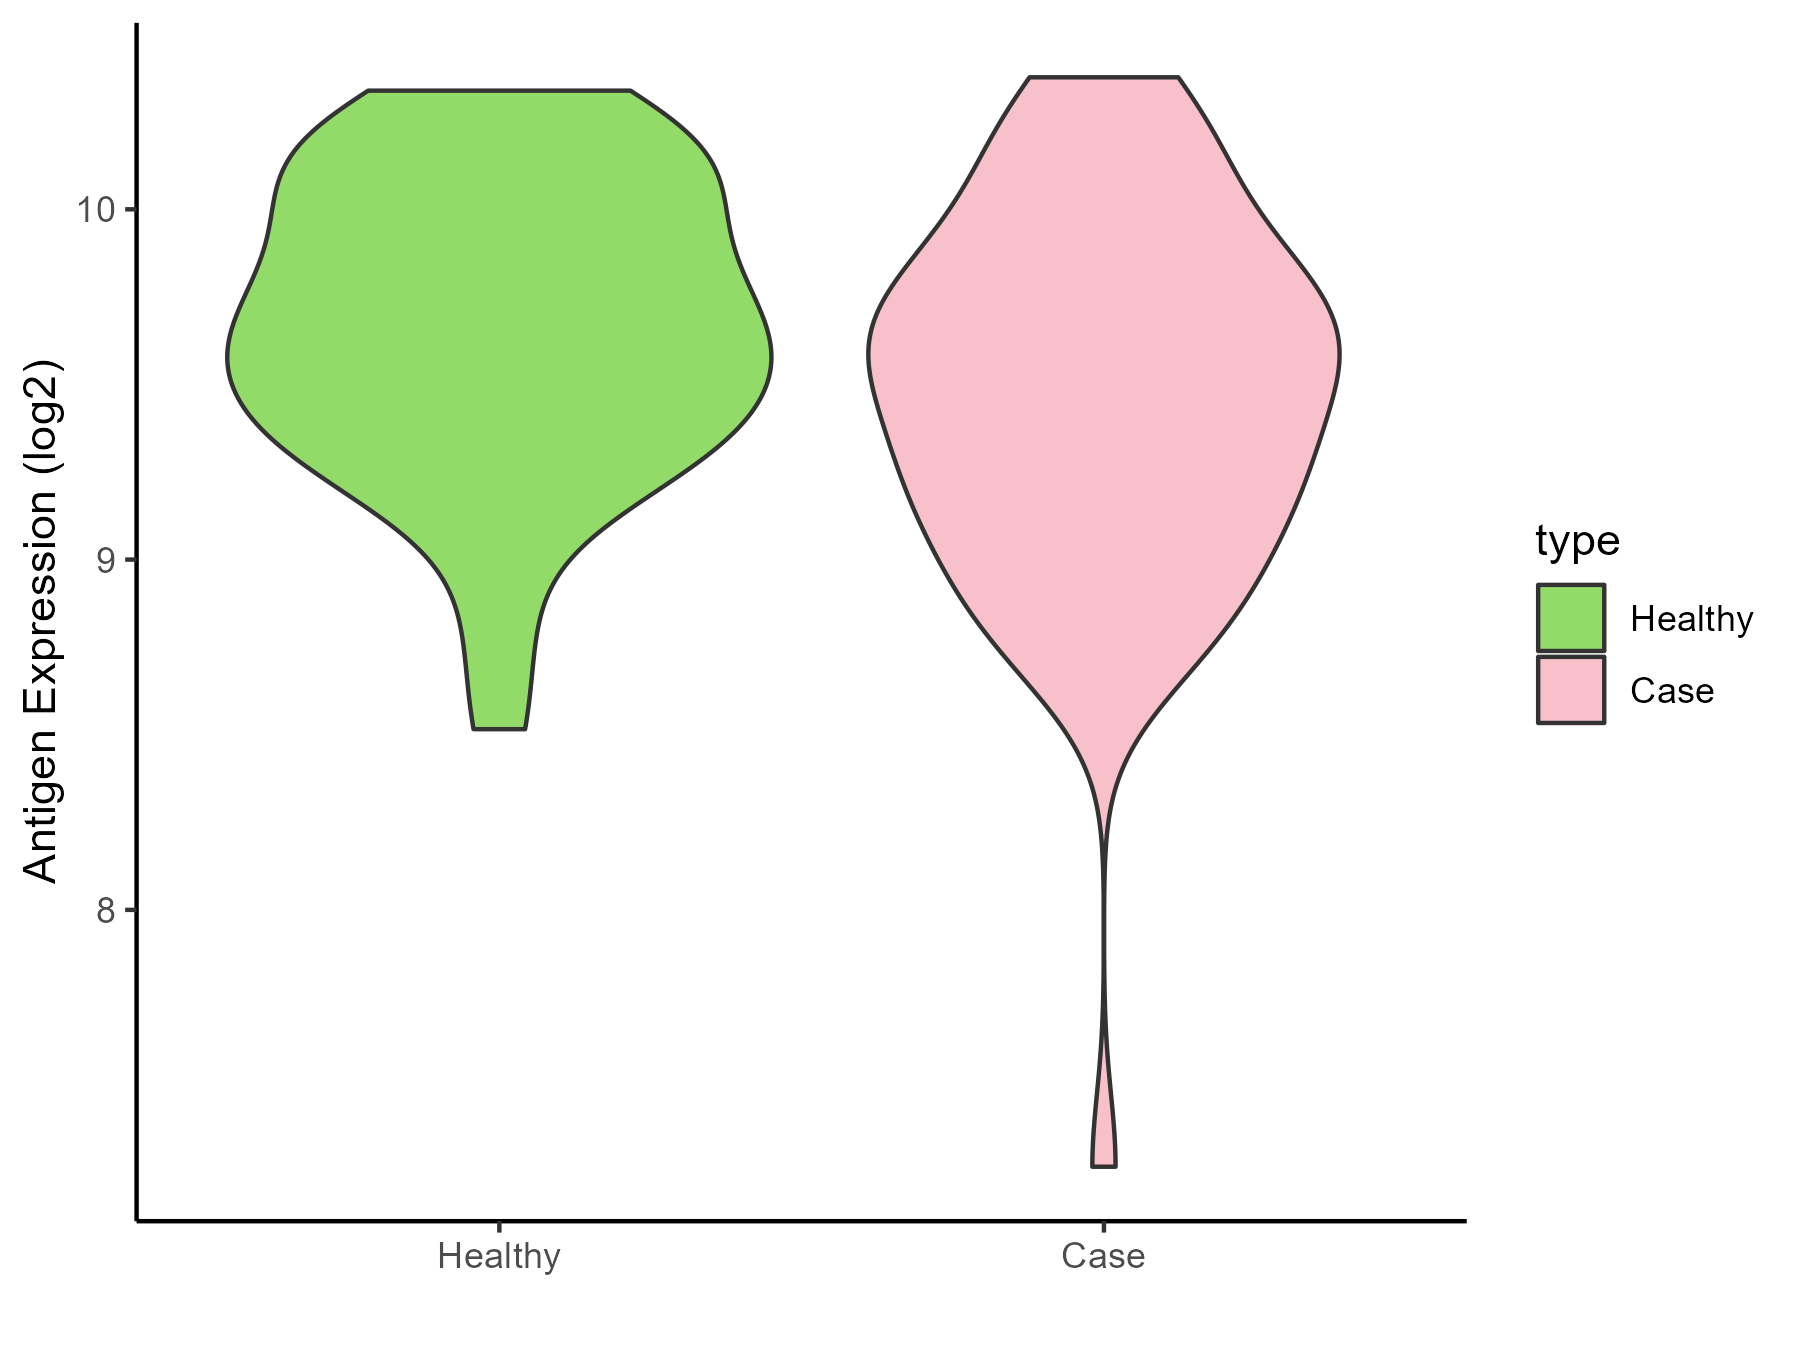
| Differential expression pattern of antigen in diseases | ||
| The Studied Tissue | Lung | |
| The Specific Disease | Chronic obstructive pulmonary disease | |
| The Expression Level of Disease Section Compare with the Healthy Individual Tissue | p-value: 0.045540616; Fold-change: -0.143560375; Z-score: -0.336108711 | |
| Disease-specific Antigen Abundances |
|
Click to View the Clearer Original Diagram |
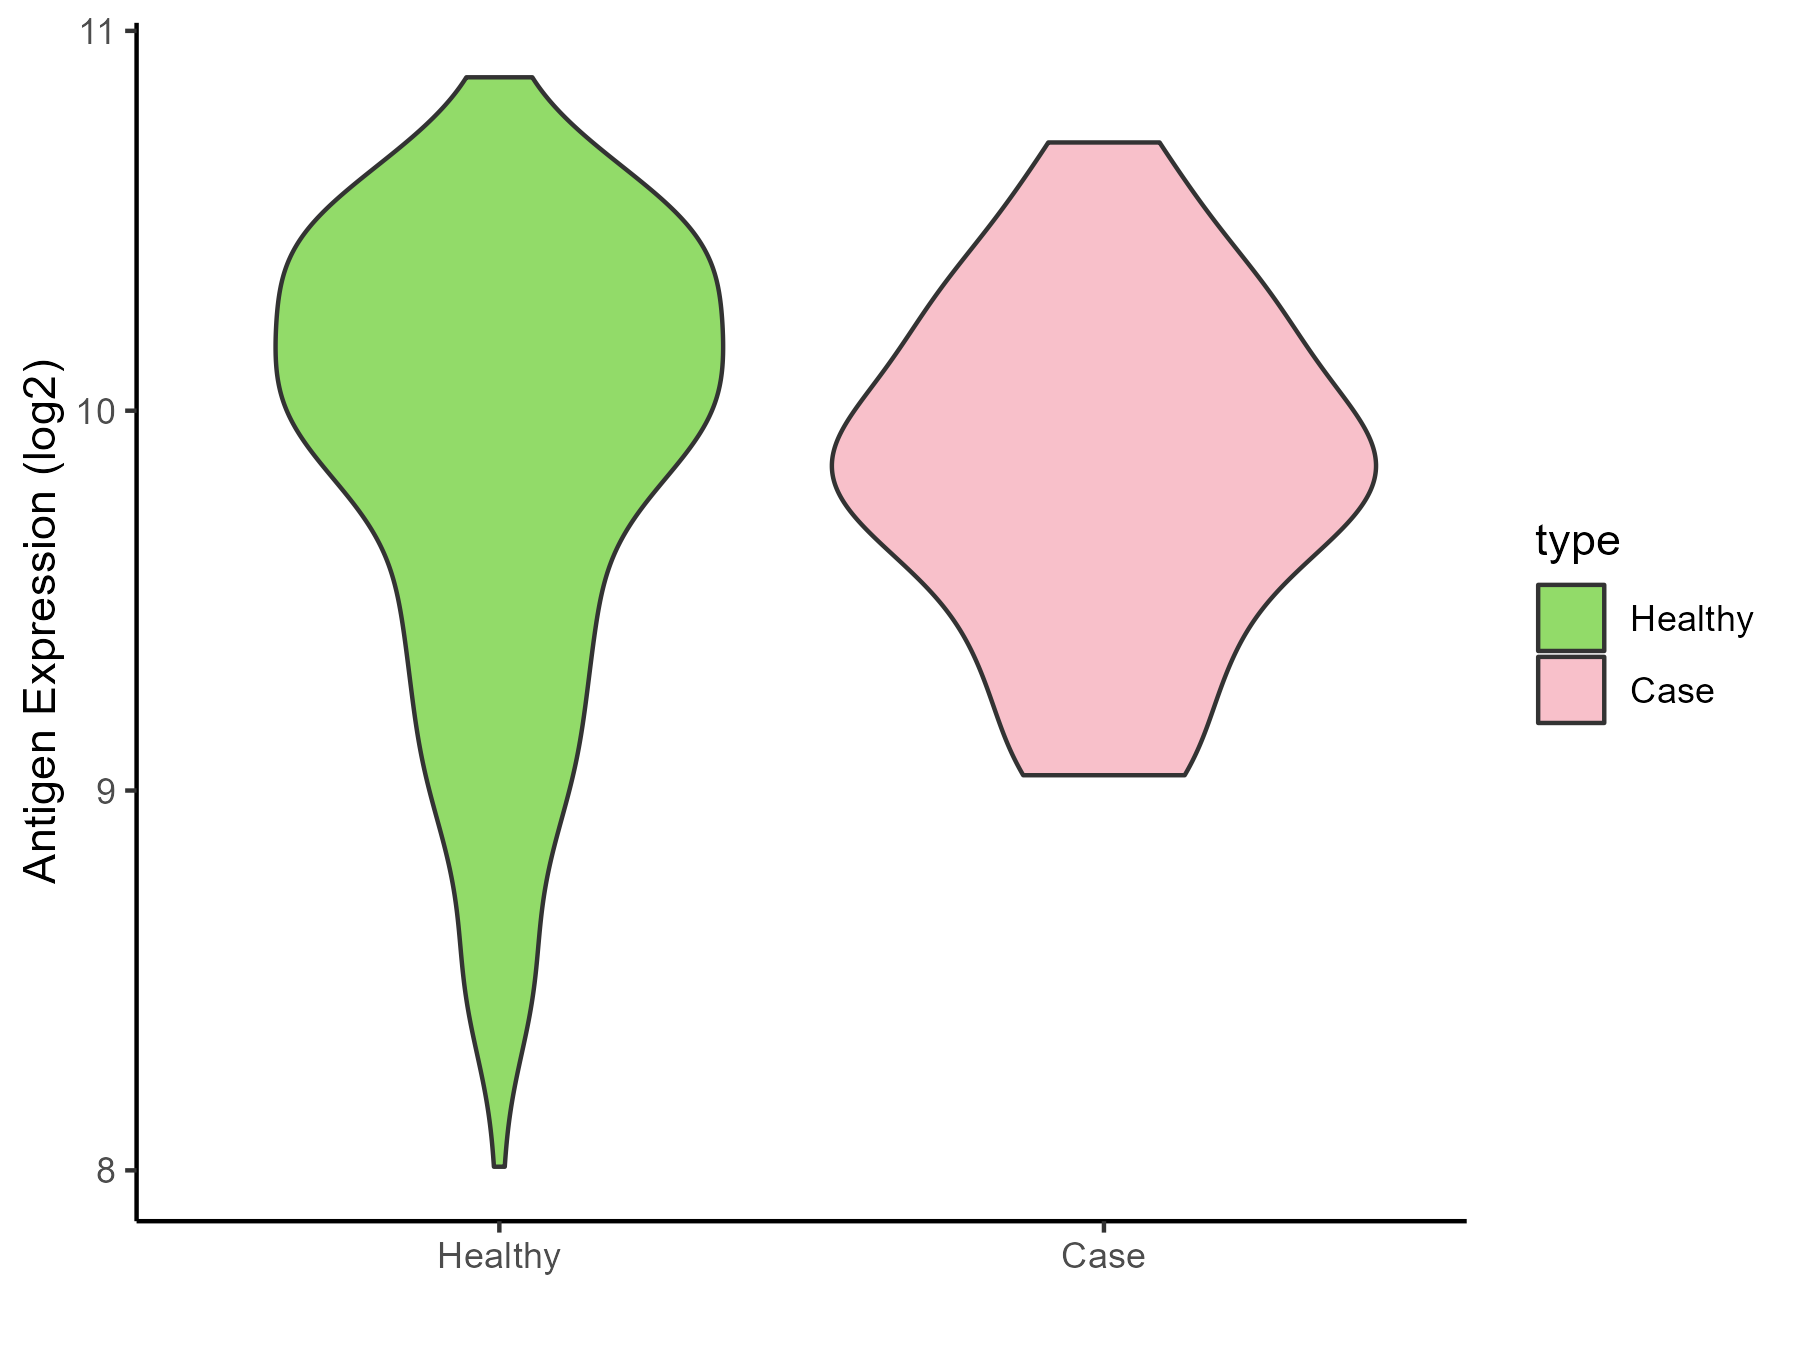
| The Studied Tissue | Small airway epithelium | |
| The Specific Disease | Chronic obstructive pulmonary disease | |
| The Expression Level of Disease Section Compare with the Healthy Individual Tissue | p-value: 0.843488124; Fold-change: -0.142692181; Z-score: -0.236821249 | |
| Disease-specific Antigen Abundances |
|
Click to View the Clearer Original Diagram |
| Differential expression pattern of antigen in diseases | ||
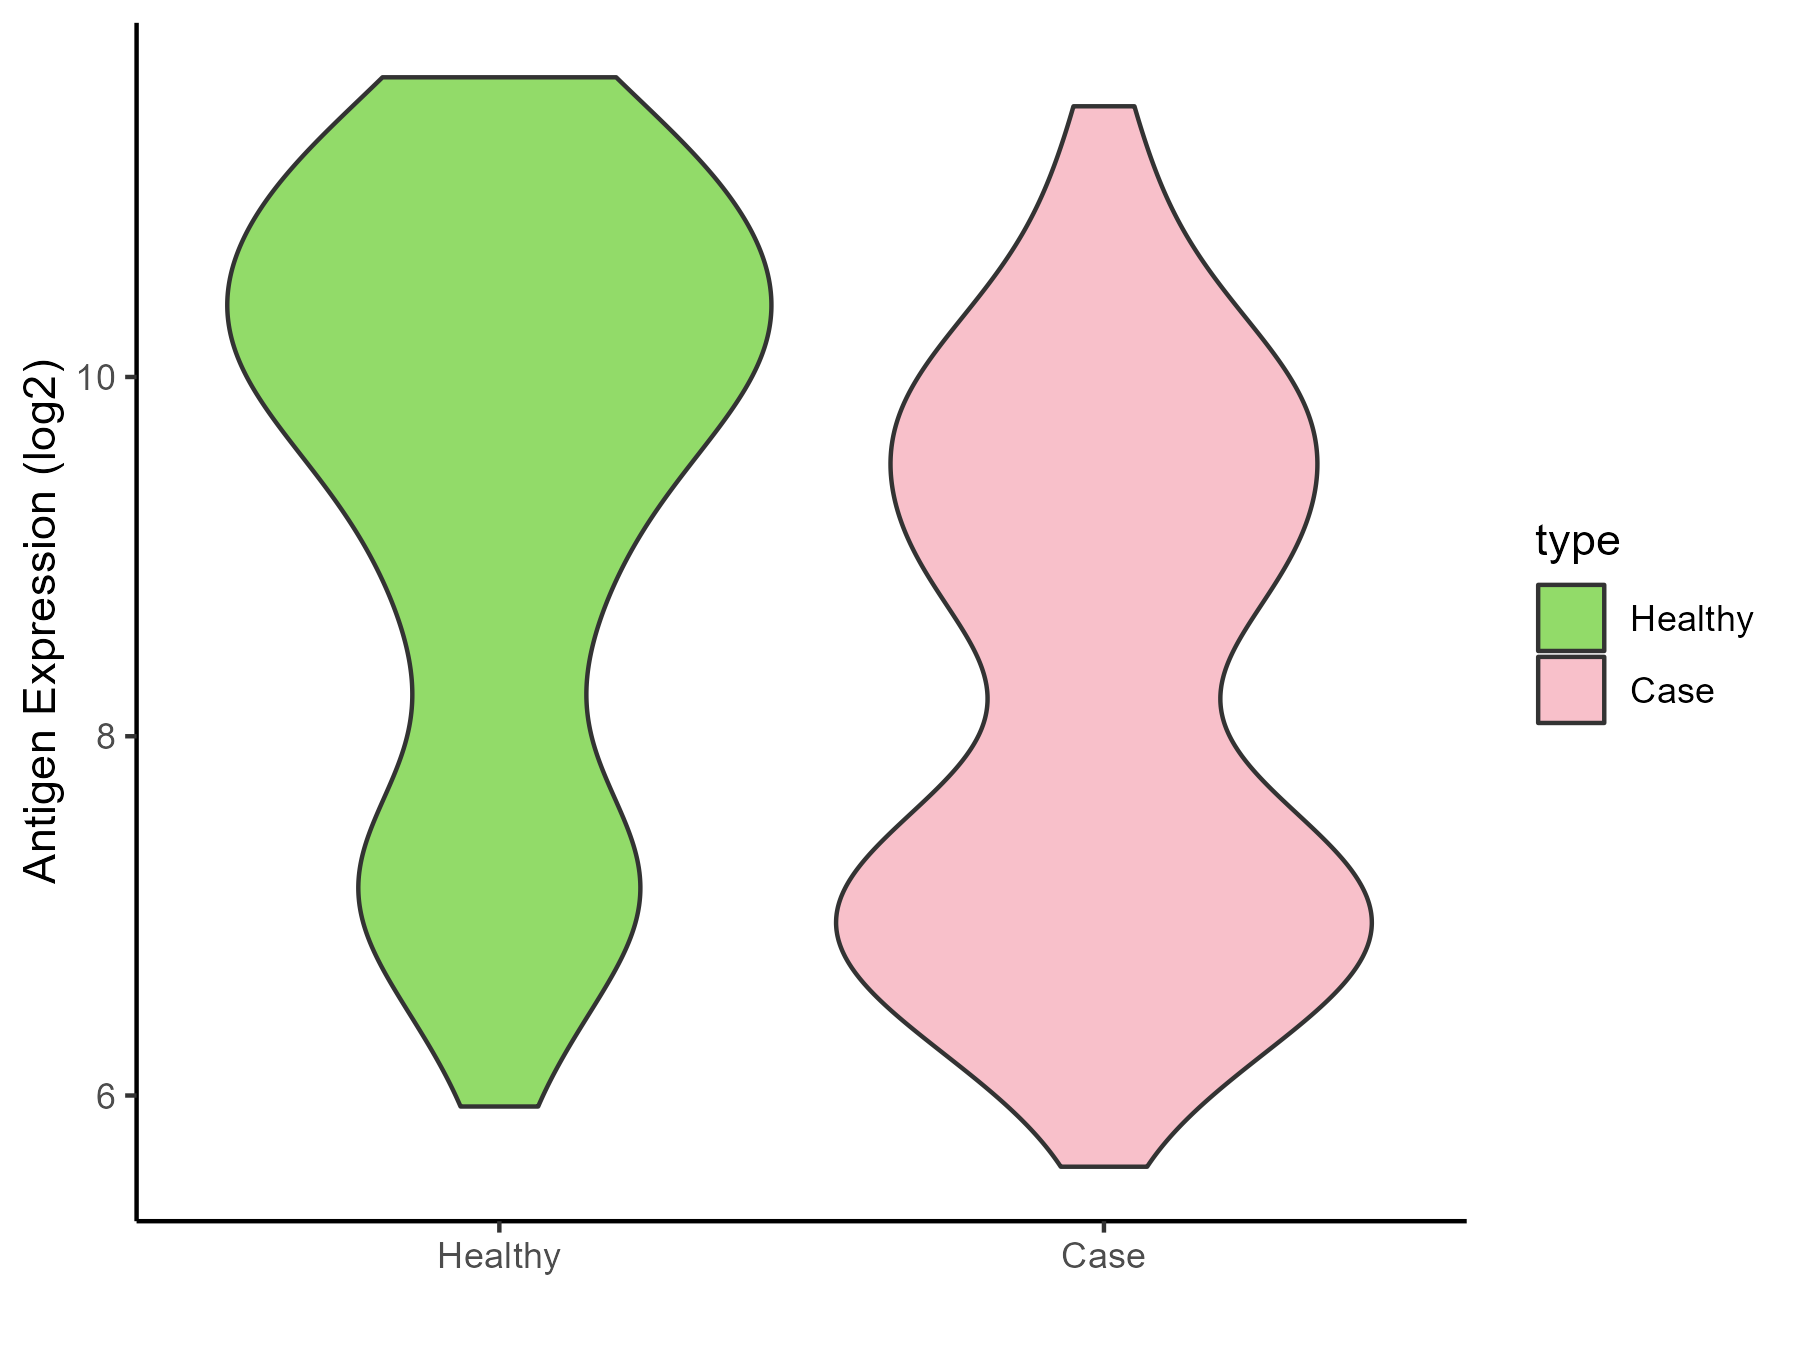
| The Studied Tissue | Nasal and bronchial airway | |
| The Specific Disease | Asthma | |
| The Expression Level of Disease Section Compare with the Healthy Individual Tissue | p-value: 2.99E-09; Fold-change: -1.666319838; Z-score: -1.04924428 | |
| Disease-specific Antigen Abundances |
|
Click to View the Clearer Original Diagram |
| Differential expression pattern of antigen in diseases | ||
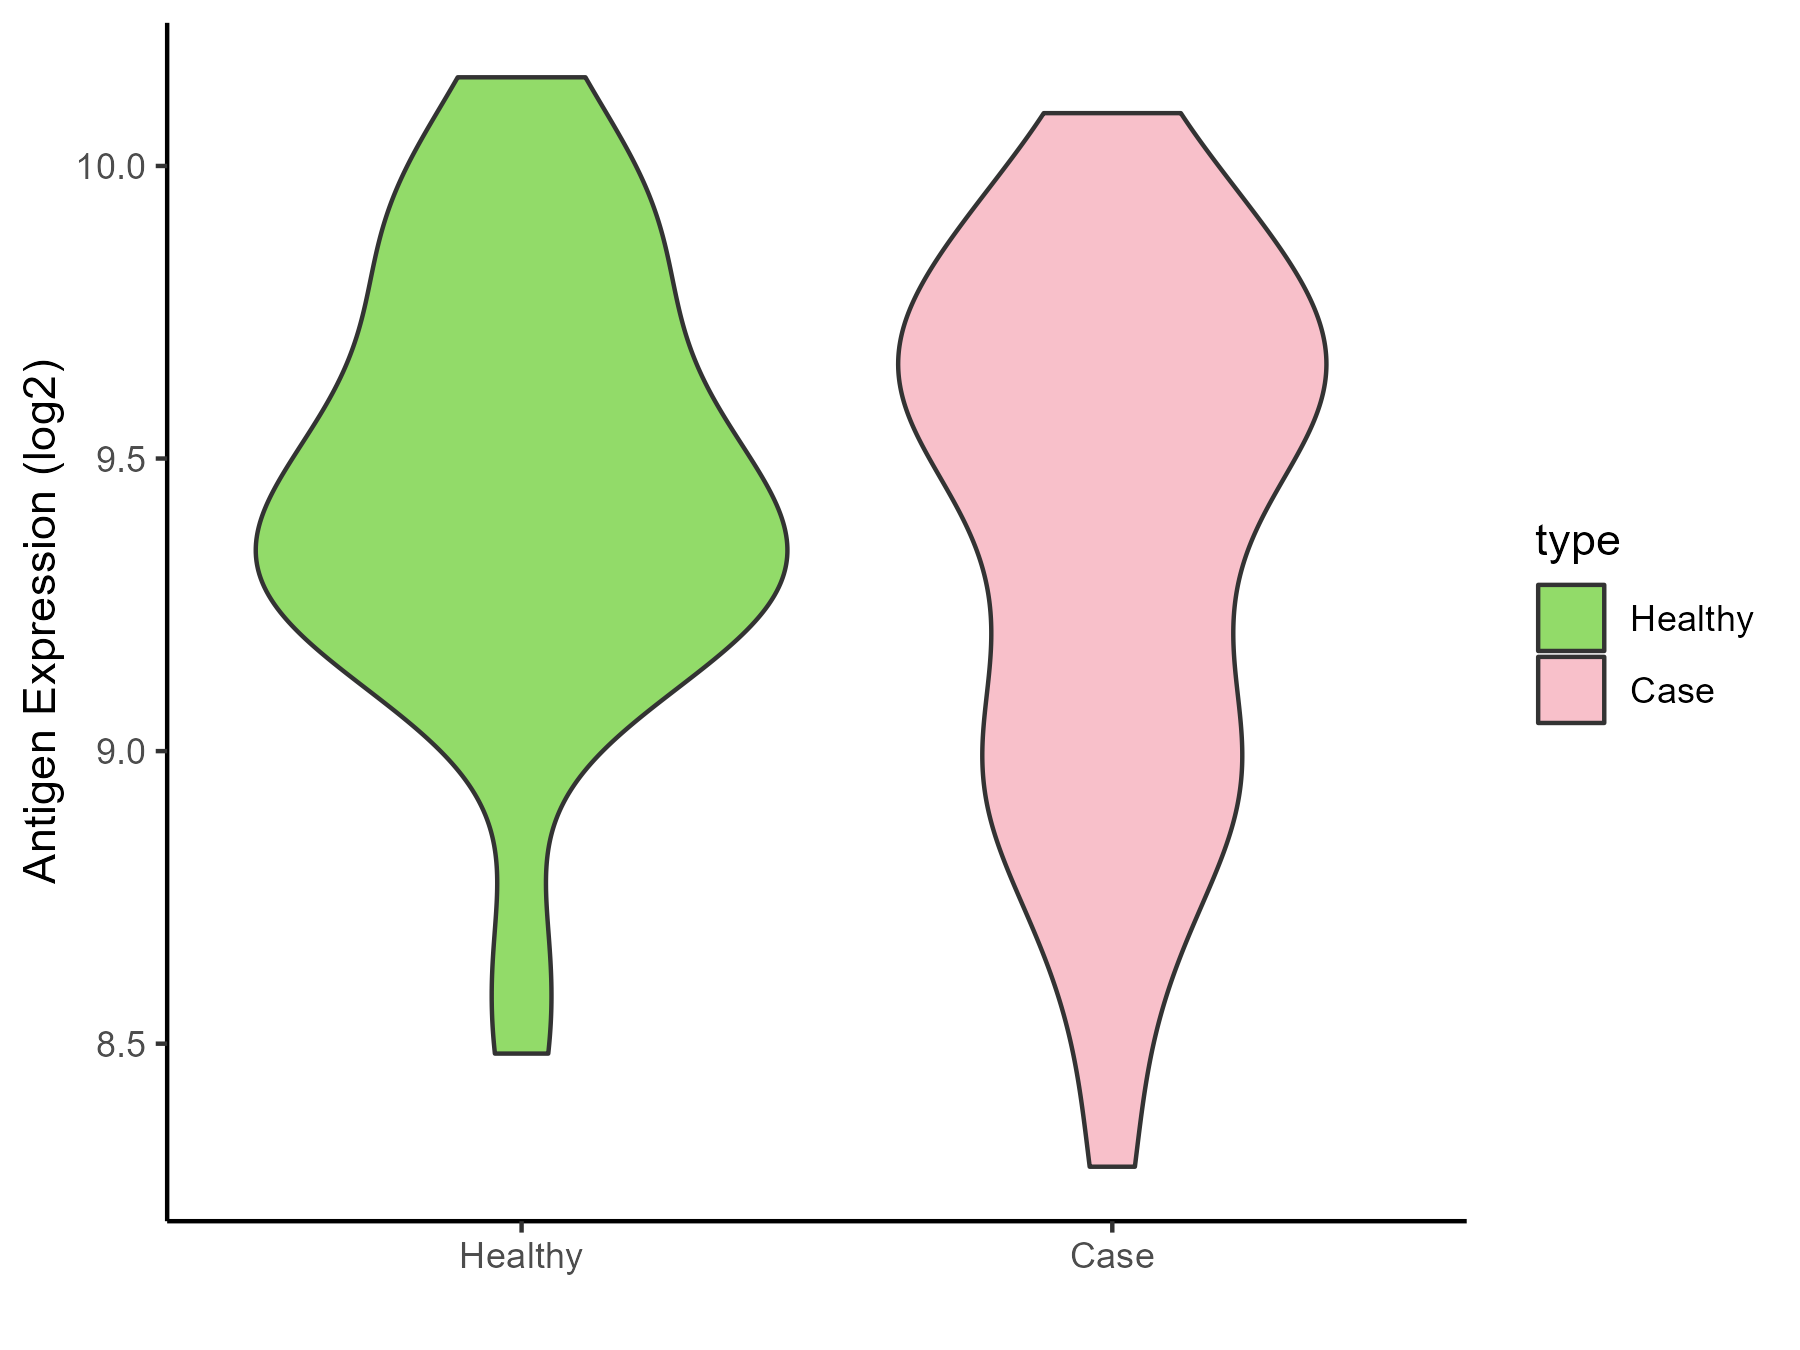
| The Studied Tissue | Nasal Epithelium | |
| The Specific Disease | Human rhinovirus infection | |
| The Expression Level of Disease Section Compare with the Healthy Individual Tissue | p-value: 0.310279718; Fold-change: 0.103640315; Z-score: 0.28017505 | |
| Disease-specific Antigen Abundances |
|
Click to View the Clearer Original Diagram |
| Differential expression pattern of antigen in diseases | ||
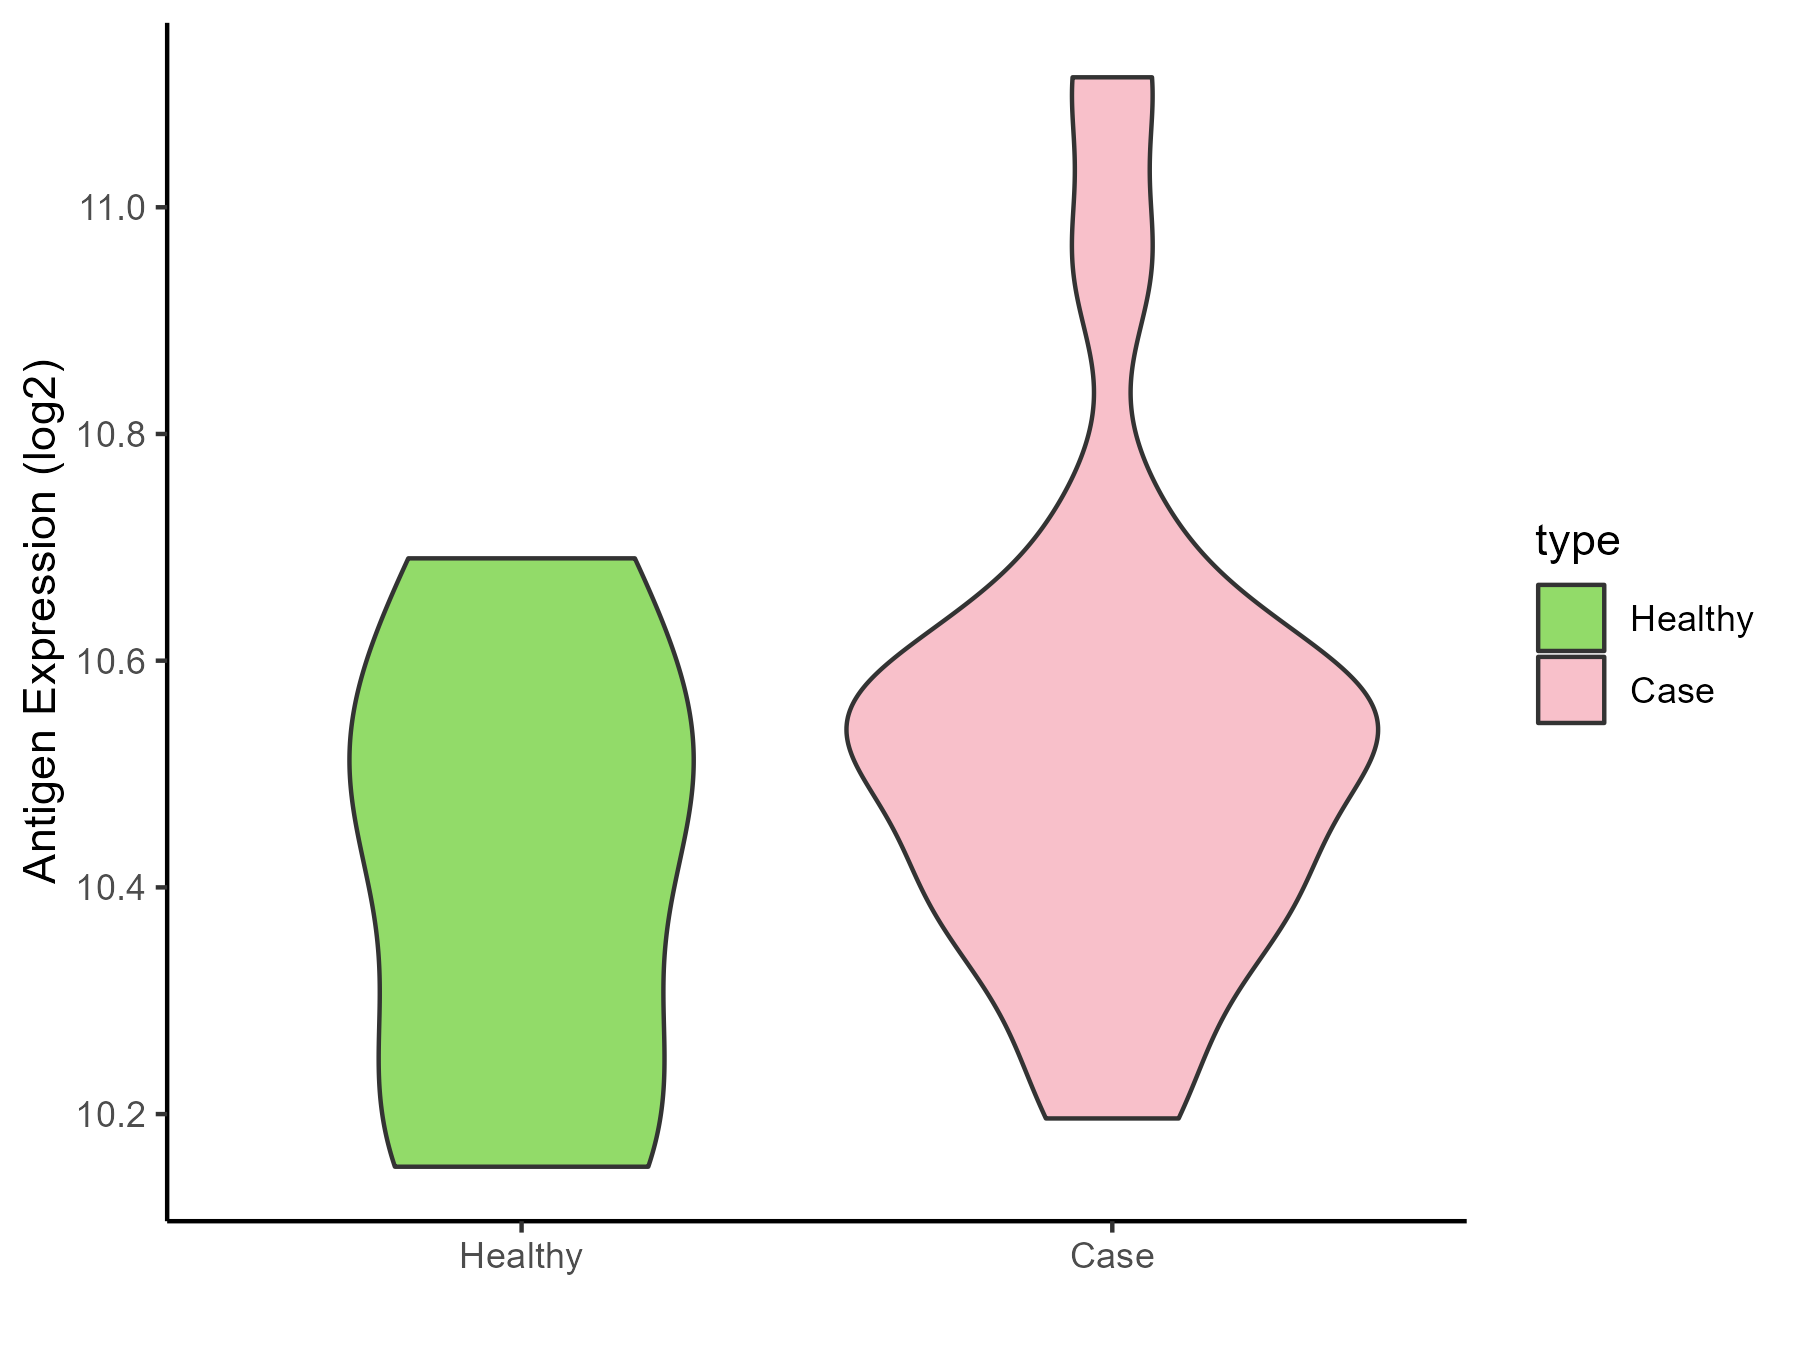
| The Studied Tissue | Lung | |
| The Specific Disease | Idiopathic pulmonary fibrosis | |
| The Expression Level of Disease Section Compare with the Healthy Individual Tissue | p-value: 0.304366652; Fold-change: 0.045258902; Z-score: 0.209503739 | |
| Disease-specific Antigen Abundances |
|
Click to View the Clearer Original Diagram |
ICD Disease Classification 13
| Differential expression pattern of antigen in diseases | ||
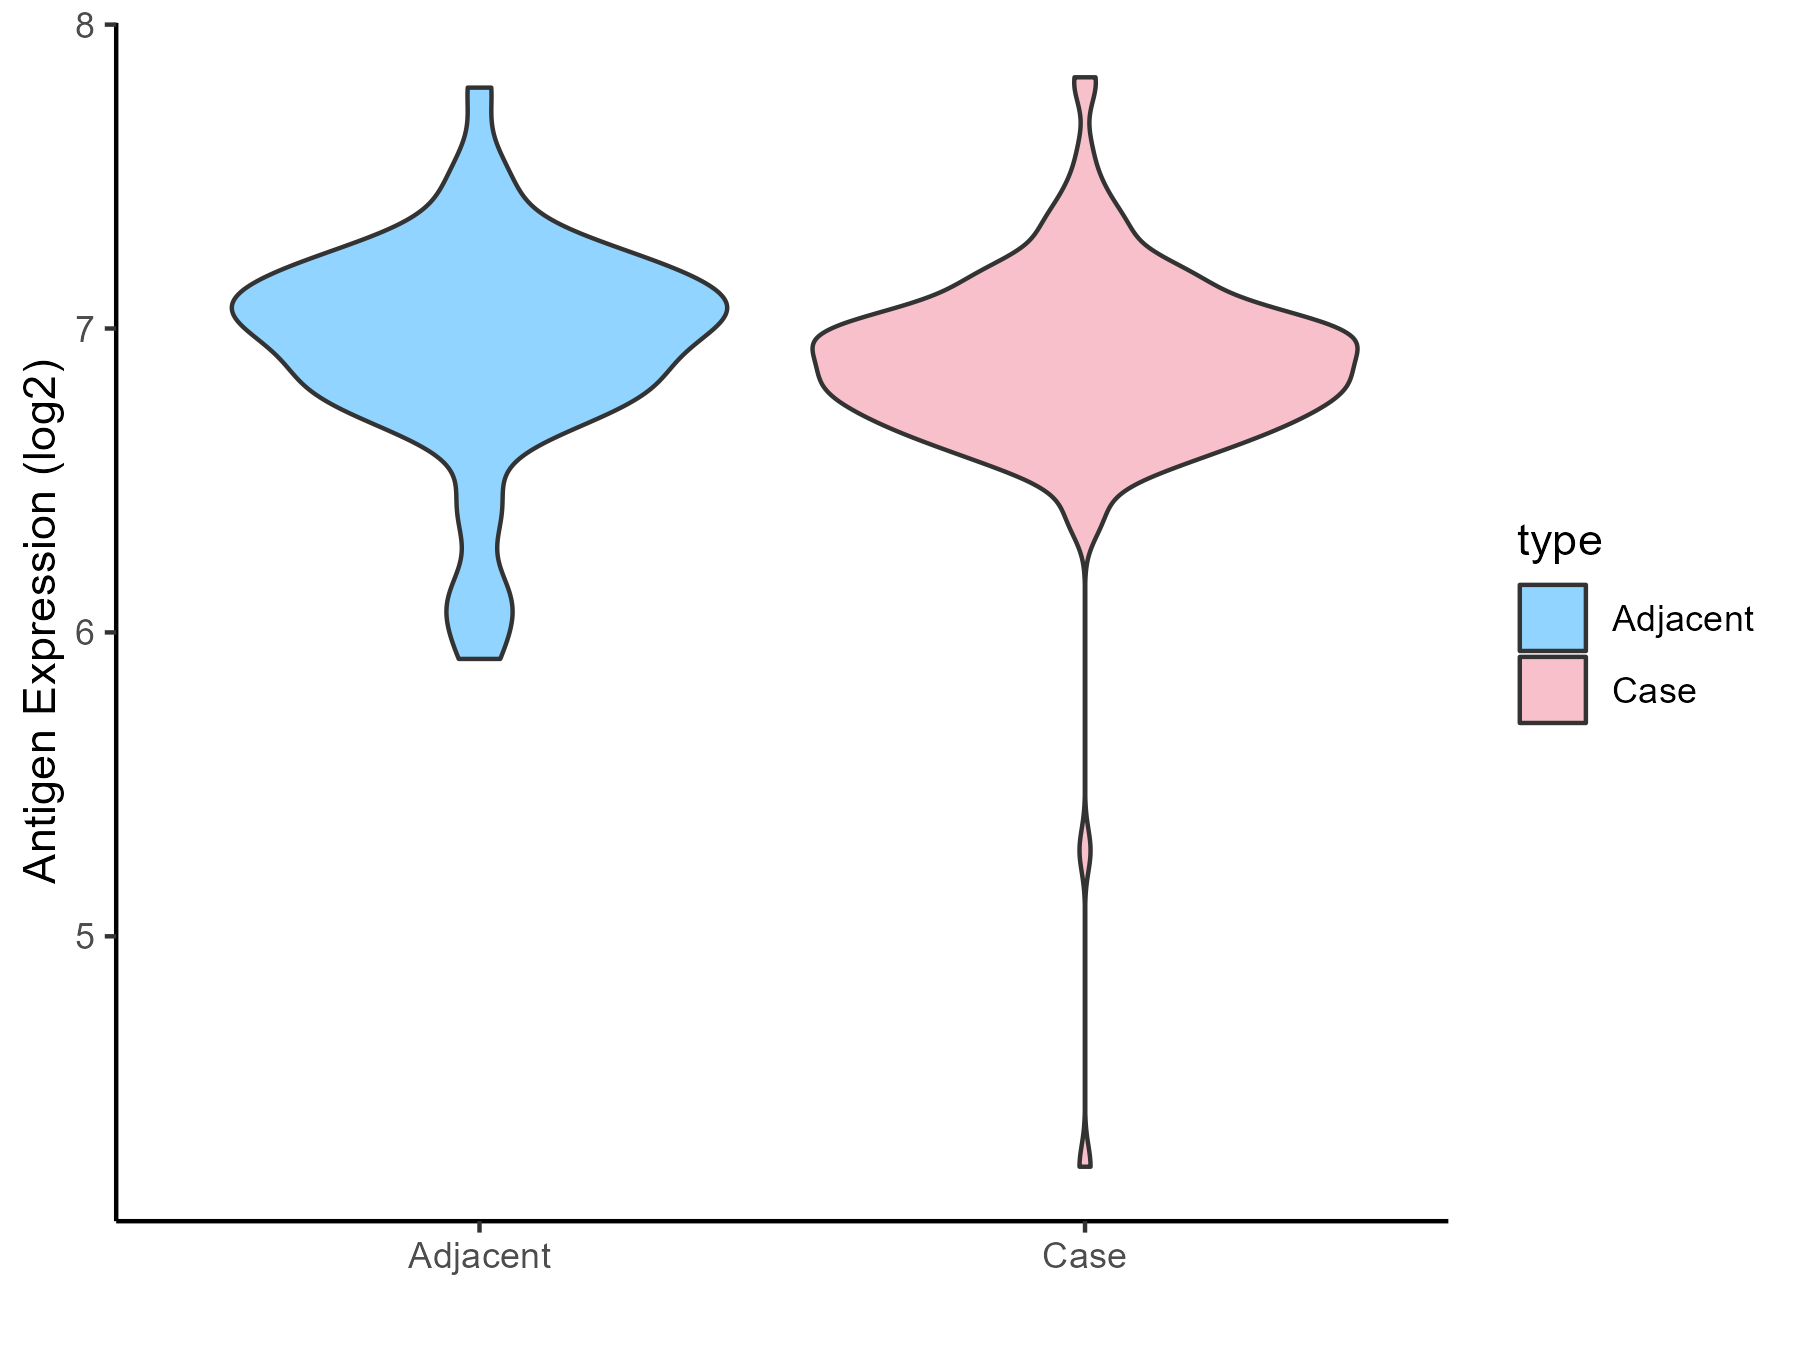
| The Studied Tissue | Gingival | |
| The Specific Disease | Periodontal disease | |
| The Expression Level of Disease Section Compare with the Adjacent Tissue | p-value: 0.207973129; Fold-change: -0.127312898; Z-score: -0.361304287 | |
| Disease-specific Antigen Abundances |
|
Click to View the Clearer Original Diagram |
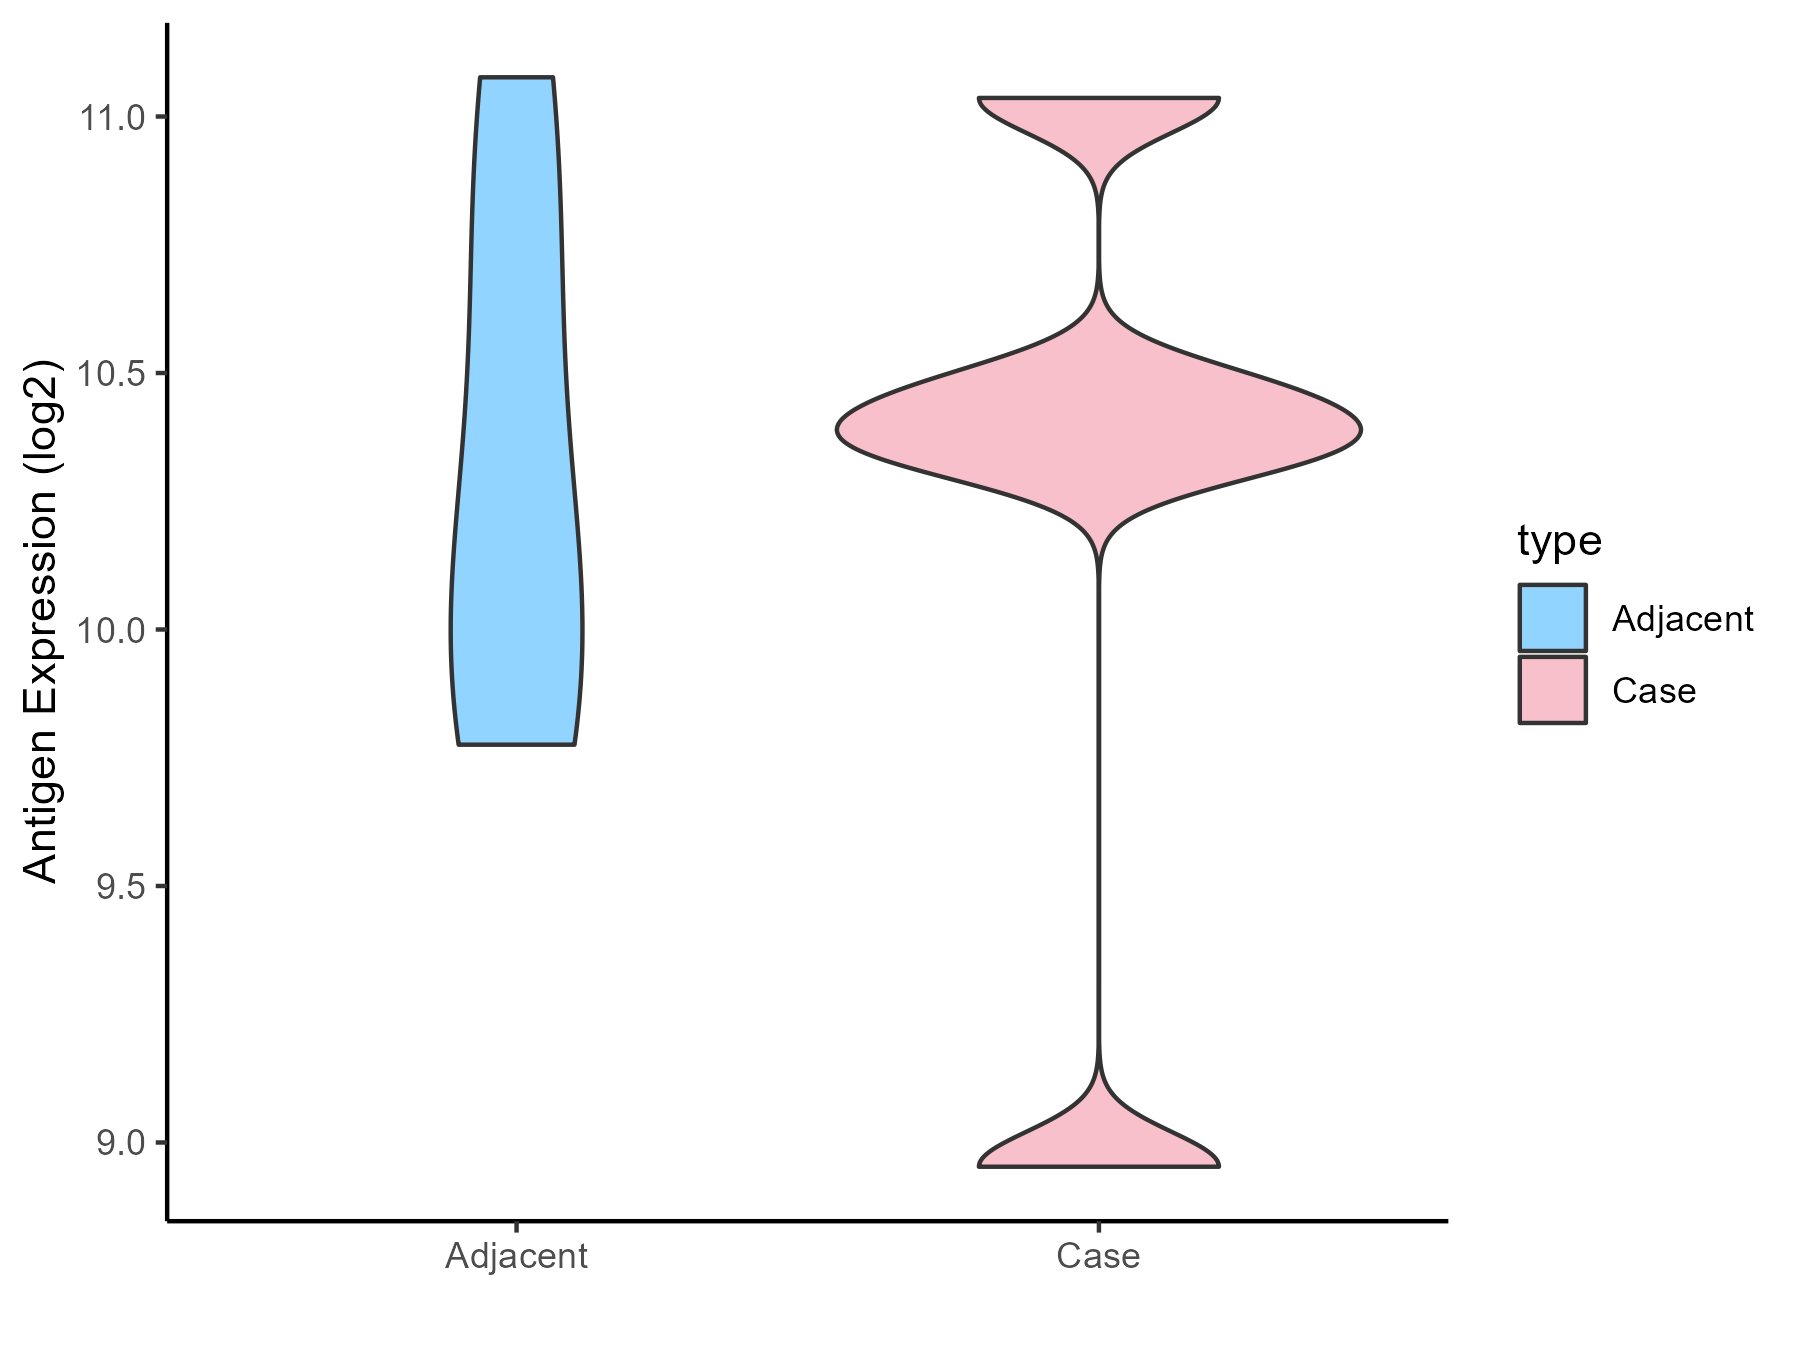
| Differential expression pattern of antigen in diseases | ||
| The Studied Tissue | Gastric antrum | |
| The Specific Disease | Eosinophilic gastritis | |
| The Expression Level of Disease Section Compare with the Adjacent Tissue | p-value: 0.844658622; Fold-change: 0.237571576; Z-score: 0.435801822 | |
| Disease-specific Antigen Abundances |
|
Click to View the Clearer Original Diagram |
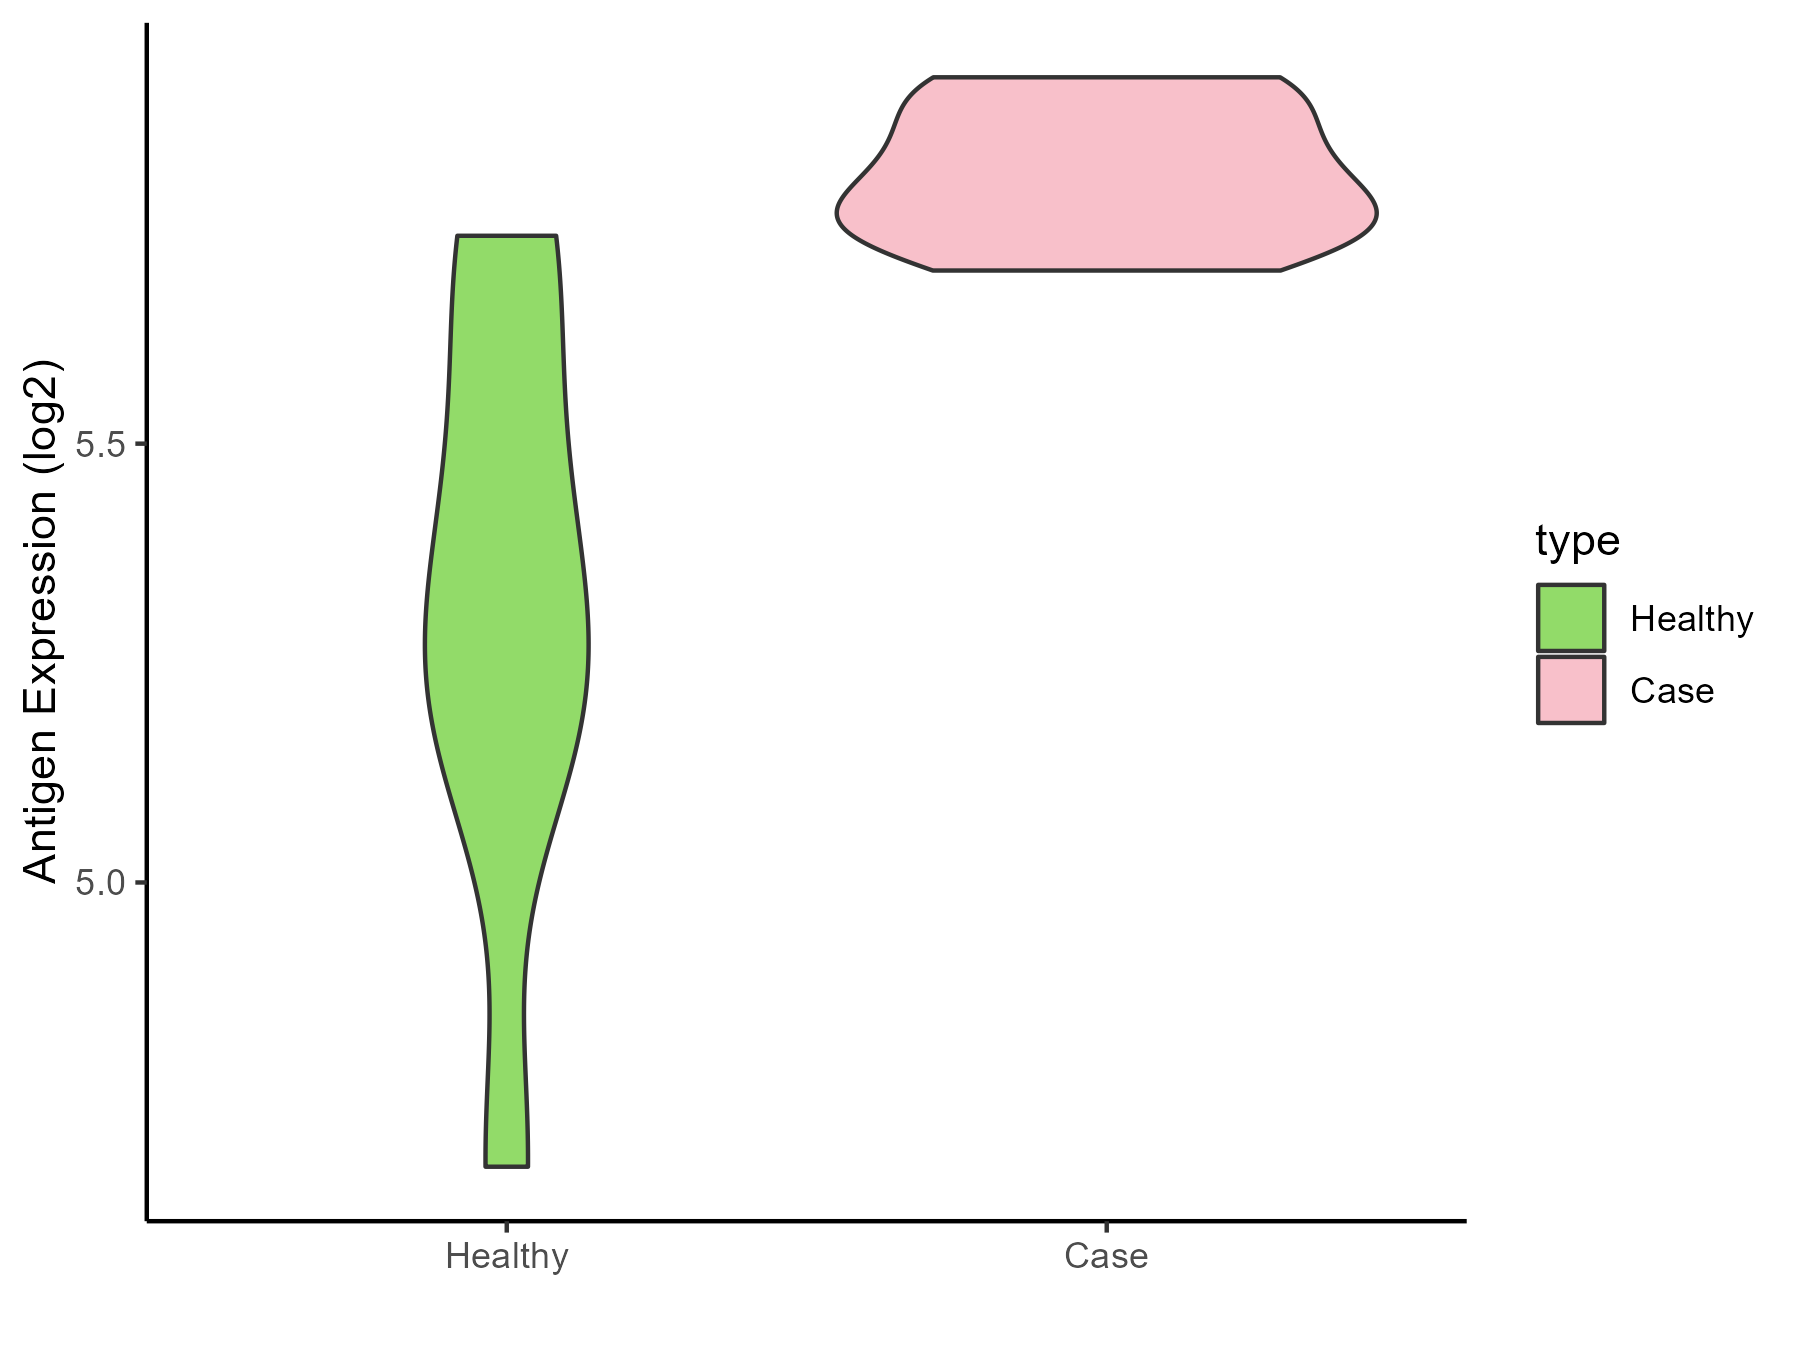
| Differential expression pattern of antigen in diseases | ||
| The Studied Tissue | Liver | |
| The Specific Disease | Liver failure | |
| The Expression Level of Disease Section Compare with the Healthy Individual Tissue | p-value: 0.004918225; Fold-change: 0.488906104; Z-score: 1.426433965 | |
| Disease-specific Antigen Abundances |
|
Click to View the Clearer Original Diagram |
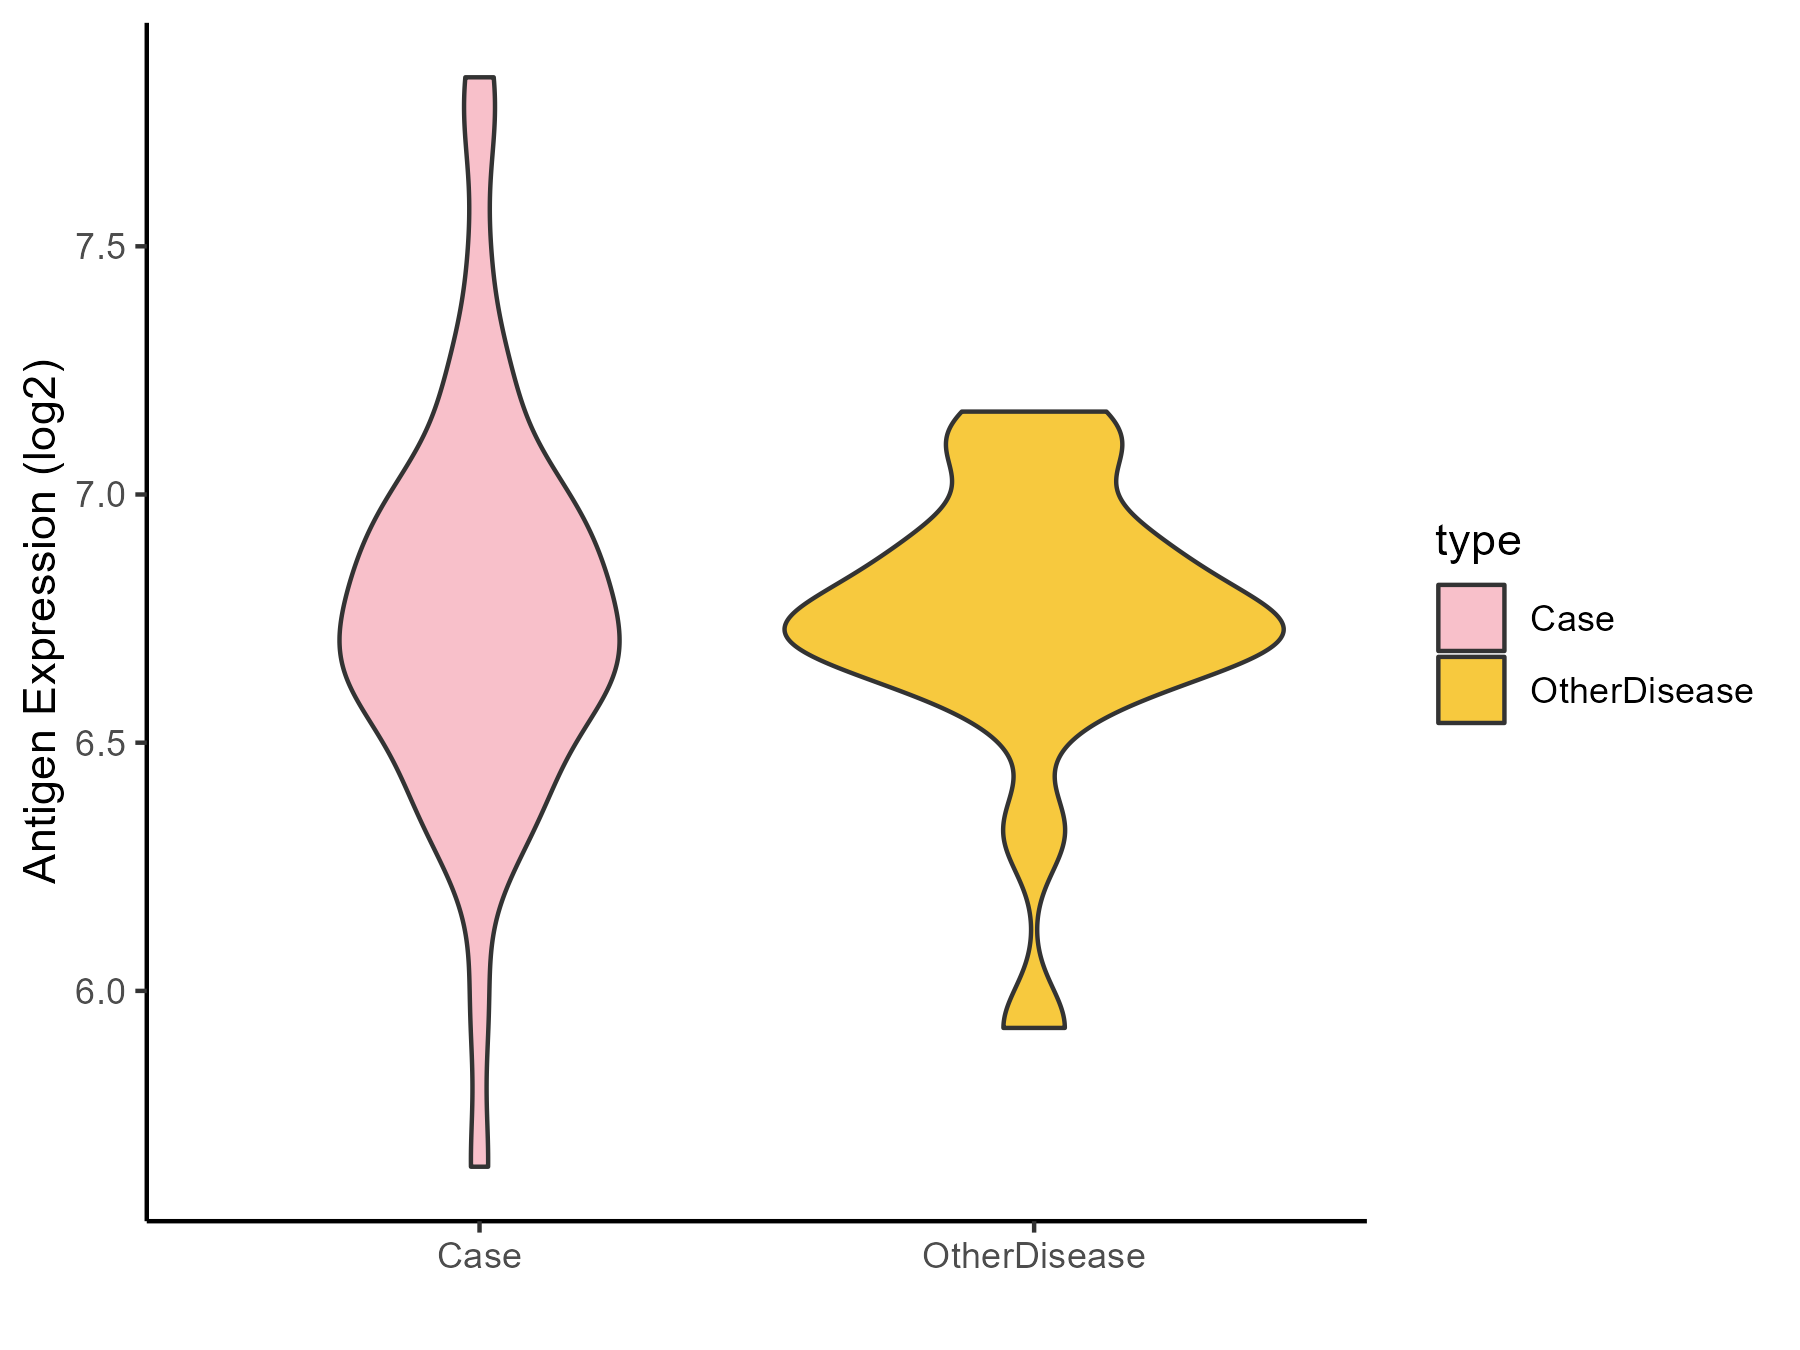
| Differential expression pattern of antigen in diseases | ||
| The Studied Tissue | Colon mucosal | |
| The Specific Disease | Ulcerative colitis | |
| The Expression Level of Disease Section Compare with the Adjacent Tissue | p-value: 0.865796867; Fold-change: -0.011721496; Z-score: -0.040754733 | |
| Disease-specific Antigen Abundances |
|
Click to View the Clearer Original Diagram |
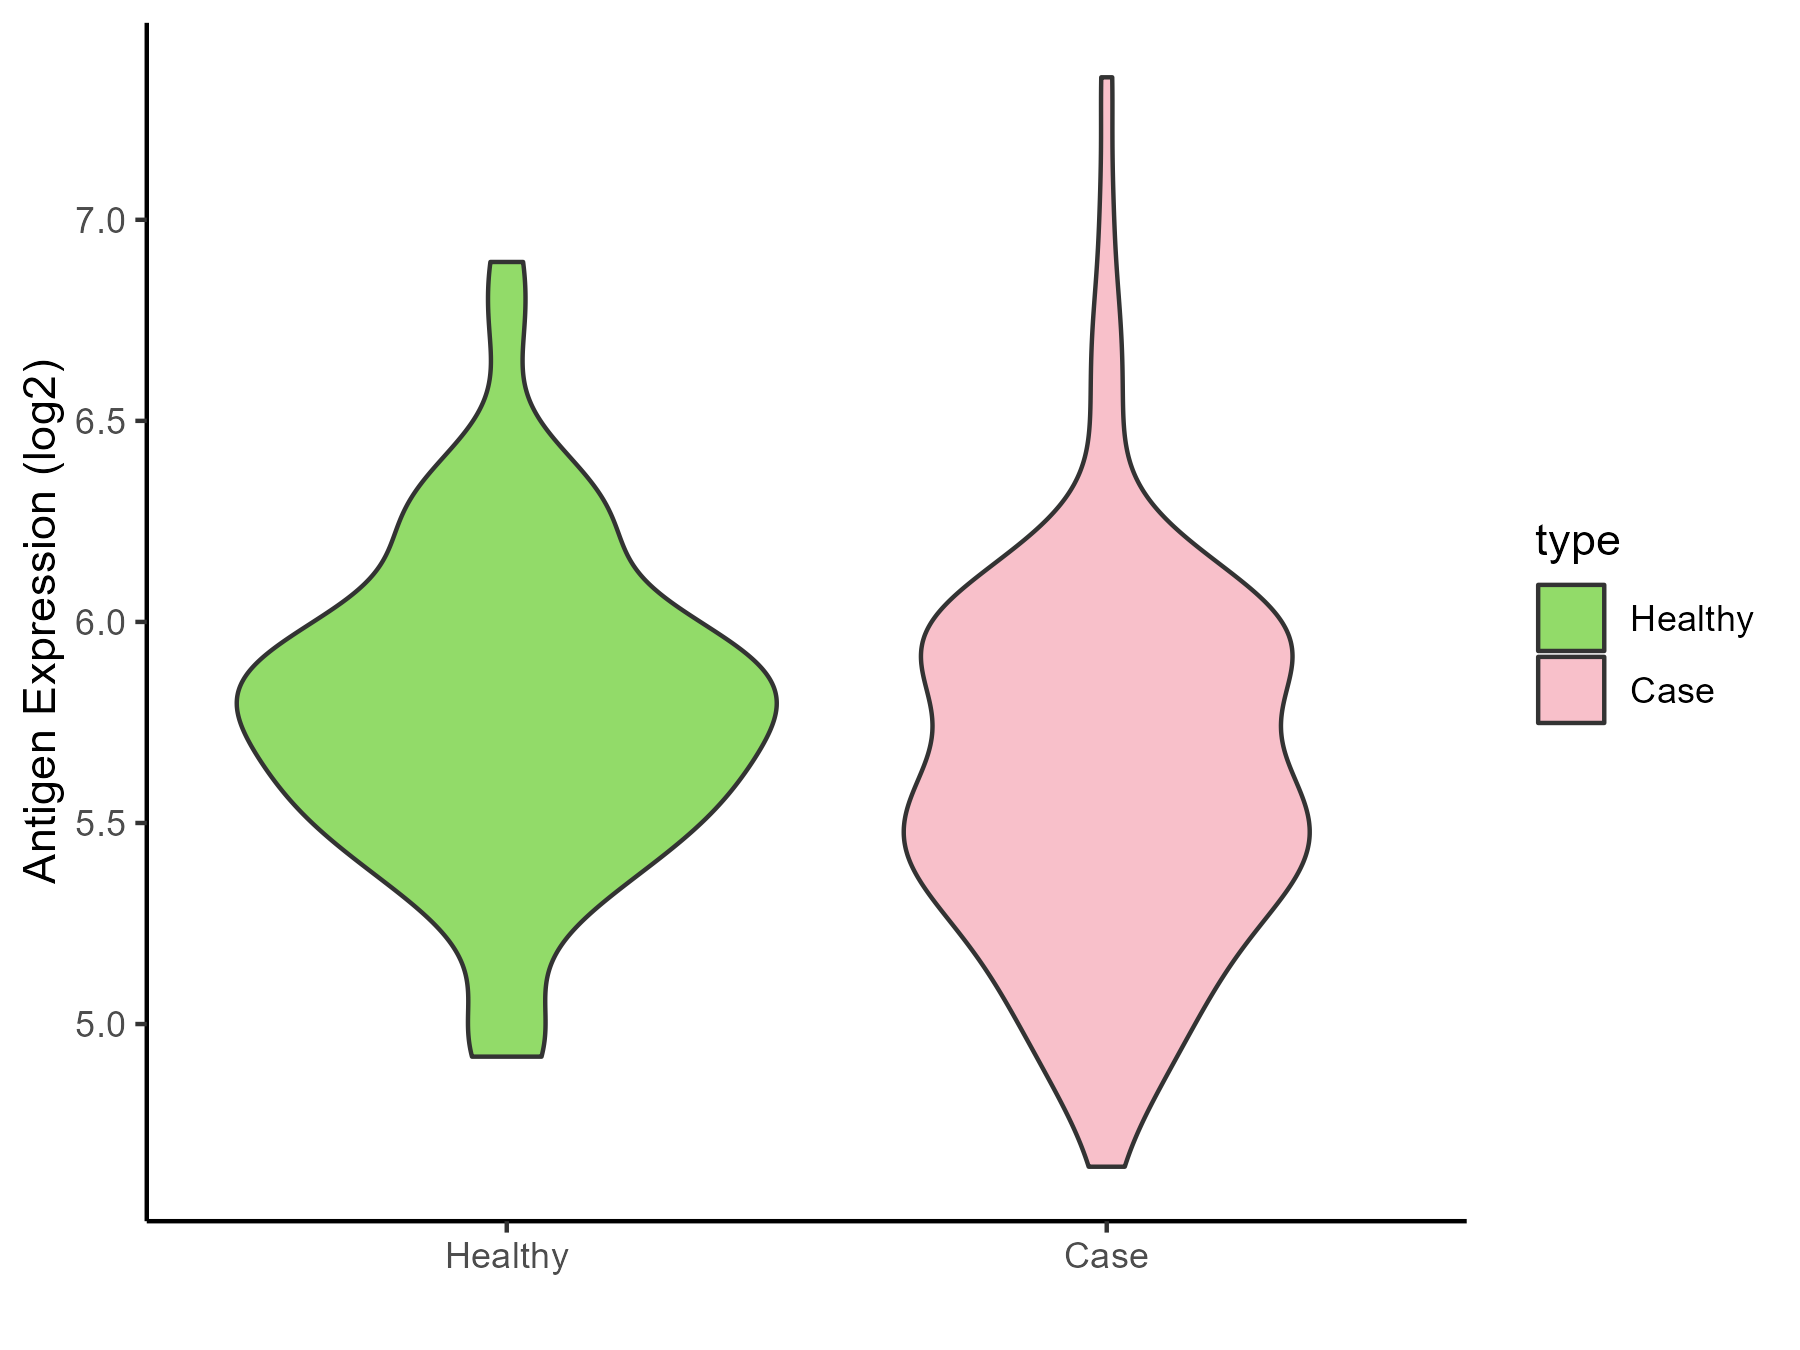
| Differential expression pattern of antigen in diseases | ||
| The Studied Tissue | Rectal colon | |
| The Specific Disease | Irritable bowel syndrome | |
| The Expression Level of Disease Section Compare with the Healthy Individual Tissue | p-value: 0.01611077; Fold-change: -0.201998377; Z-score: -0.525701048 | |
| Disease-specific Antigen Abundances |
|
Click to View the Clearer Original Diagram |
ICD Disease Classification 14
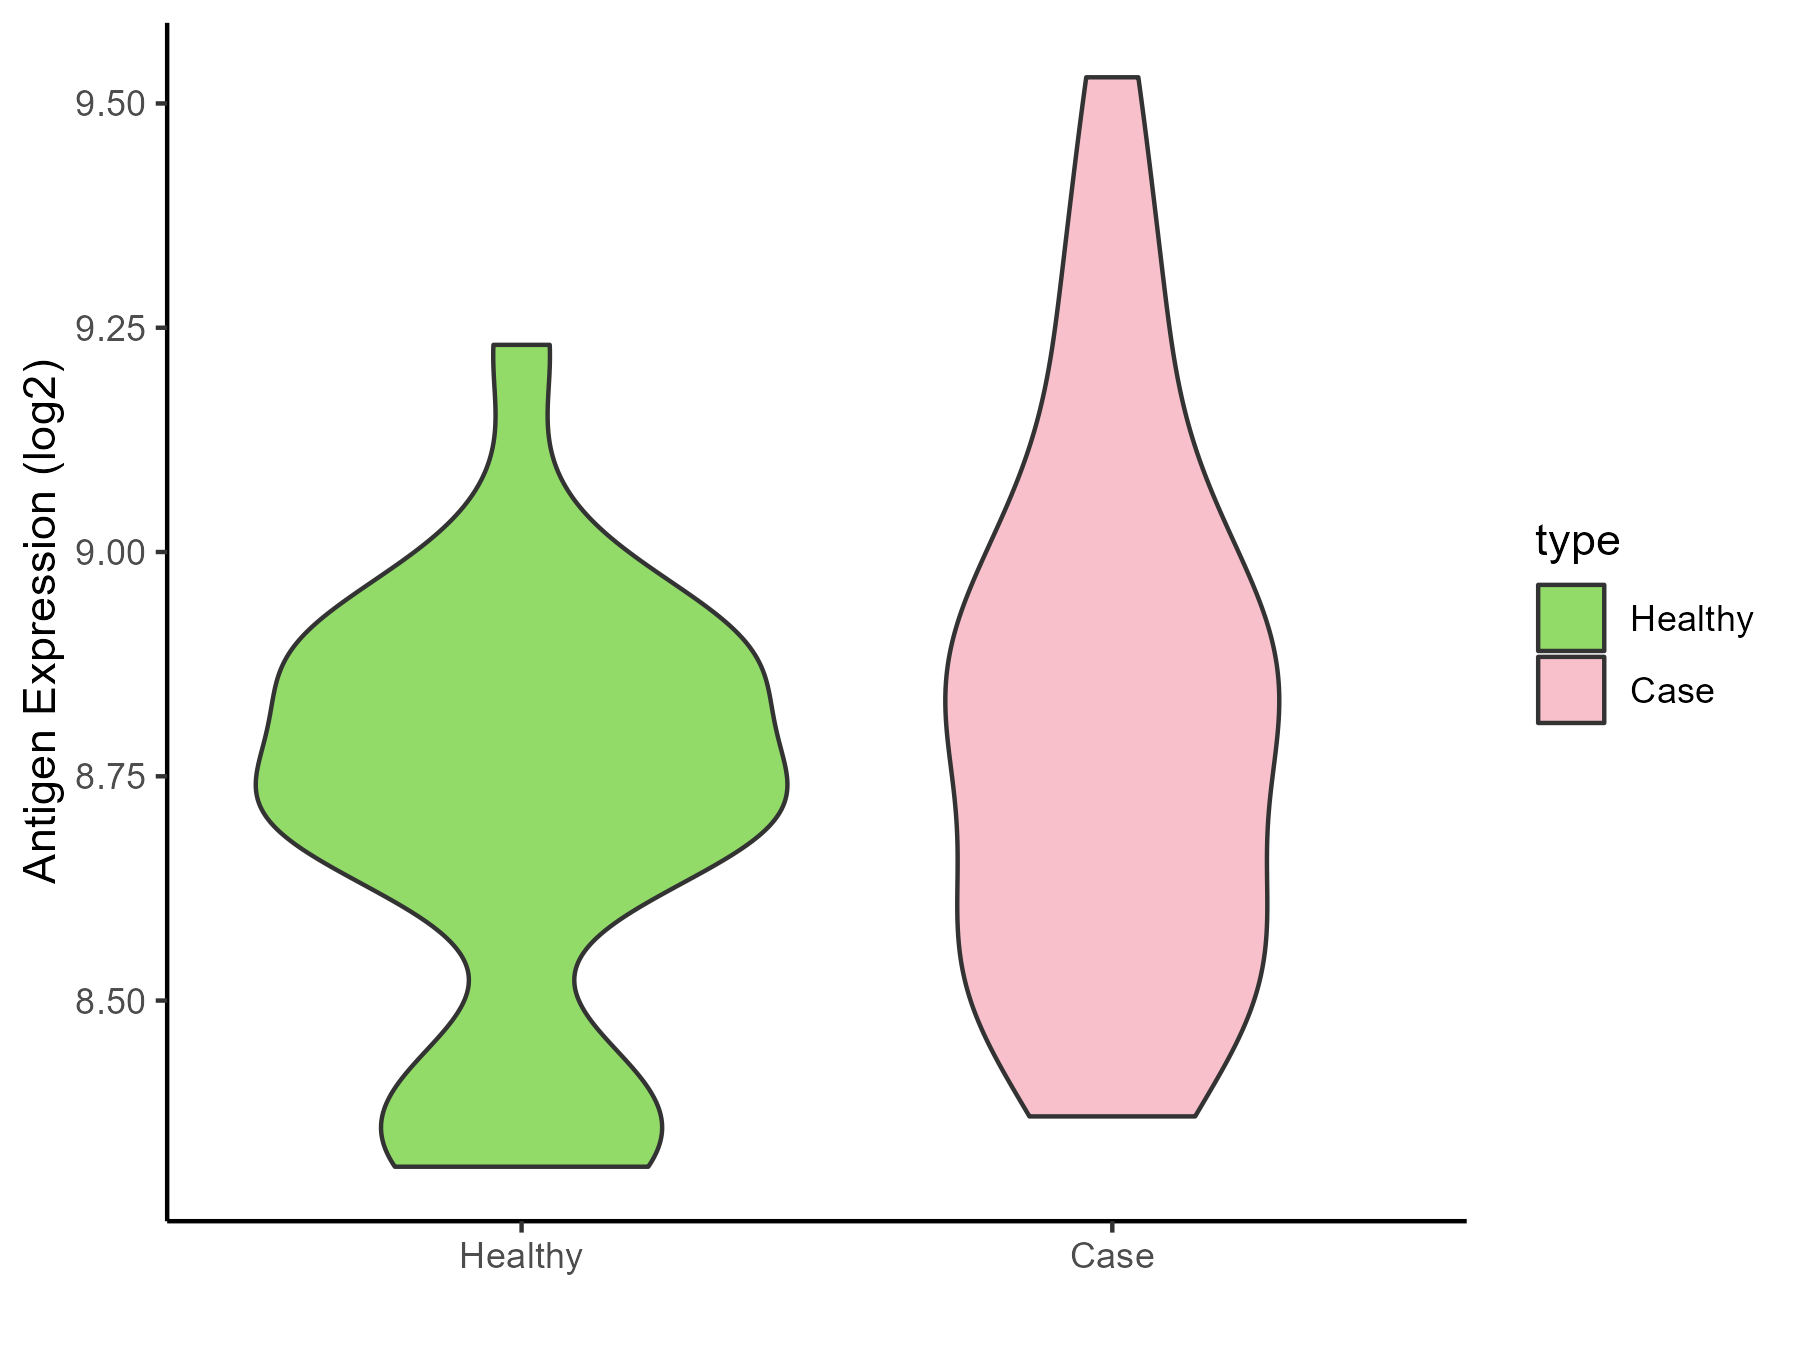
| Differential expression pattern of antigen in diseases | ||
| The Studied Tissue | Skin | |
| The Specific Disease | Atopic dermatitis | |
| The Expression Level of Disease Section Compare with the Healthy Individual Tissue | p-value: 0.139969827; Fold-change: 0.089550769; Z-score: 0.37413836 | |
| Disease-specific Antigen Abundances |
|
Click to View the Clearer Original Diagram |
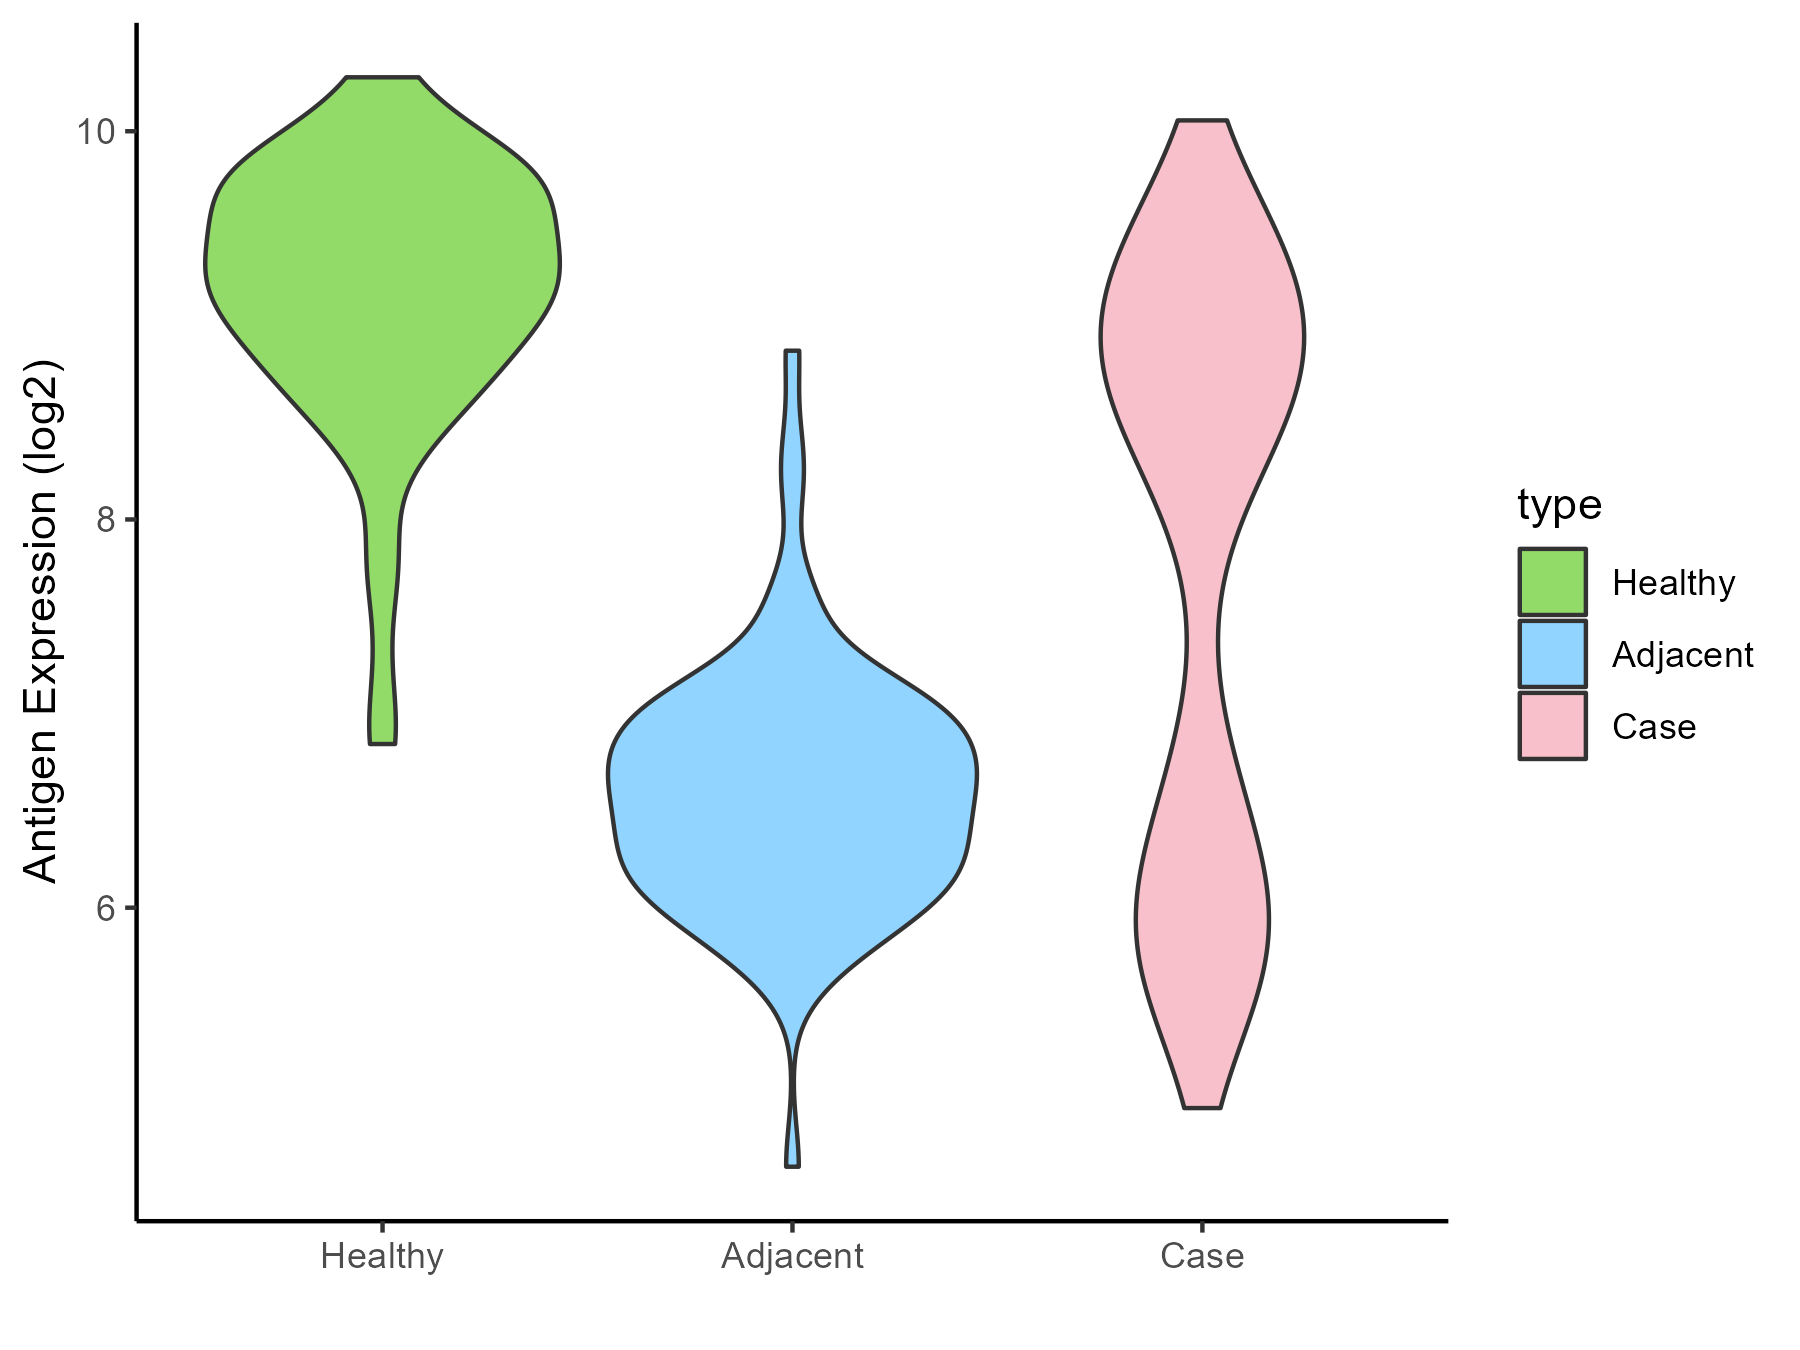
| Differential expression pattern of antigen in diseases | ||
| The Studied Tissue | Skin | |
| The Specific Disease | Psoriasis | |
| The Expression Level of Disease Section Compare with the Healthy Individual Tissue | p-value: 9.89E-28; Fold-change: -0.820275784; Z-score: -1.201995272 | |
| The Expression Level of Disease Section Compare with the Adjacent Tissue | p-value: 4.23E-23; Fold-change: 1.850657949; Z-score: 2.989590094 | |
| Disease-specific Antigen Abundances |
|
Click to View the Clearer Original Diagram |
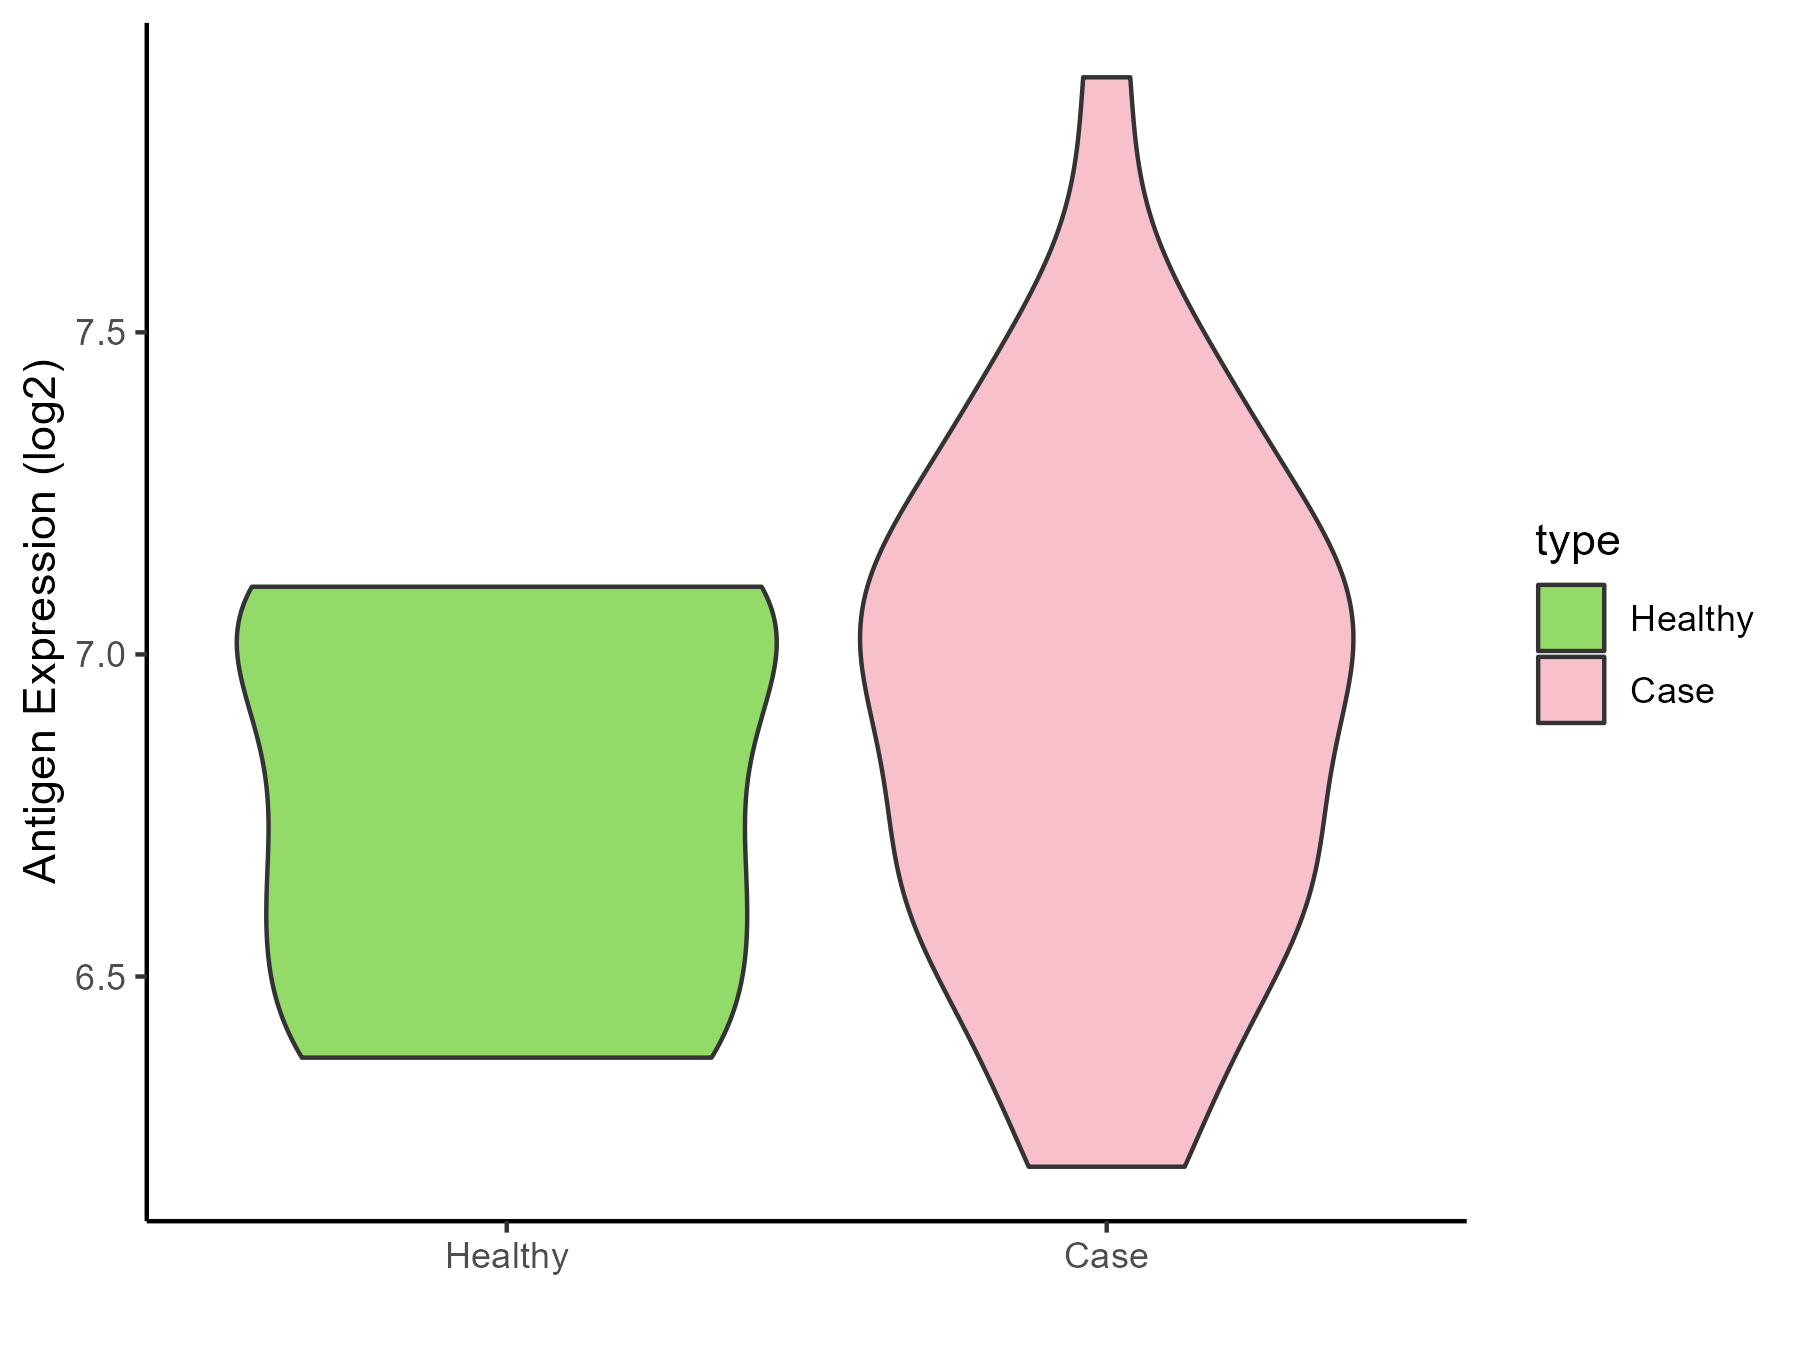
| Differential expression pattern of antigen in diseases | ||
| The Studied Tissue | Skin | |
| The Specific Disease | Vitiligo | |
| The Expression Level of Disease Section Compare with the Healthy Individual Tissue | p-value: 0.310695009; Fold-change: 0.259330814; Z-score: 0.818657096 | |
| Disease-specific Antigen Abundances |
|
Click to View the Clearer Original Diagram |
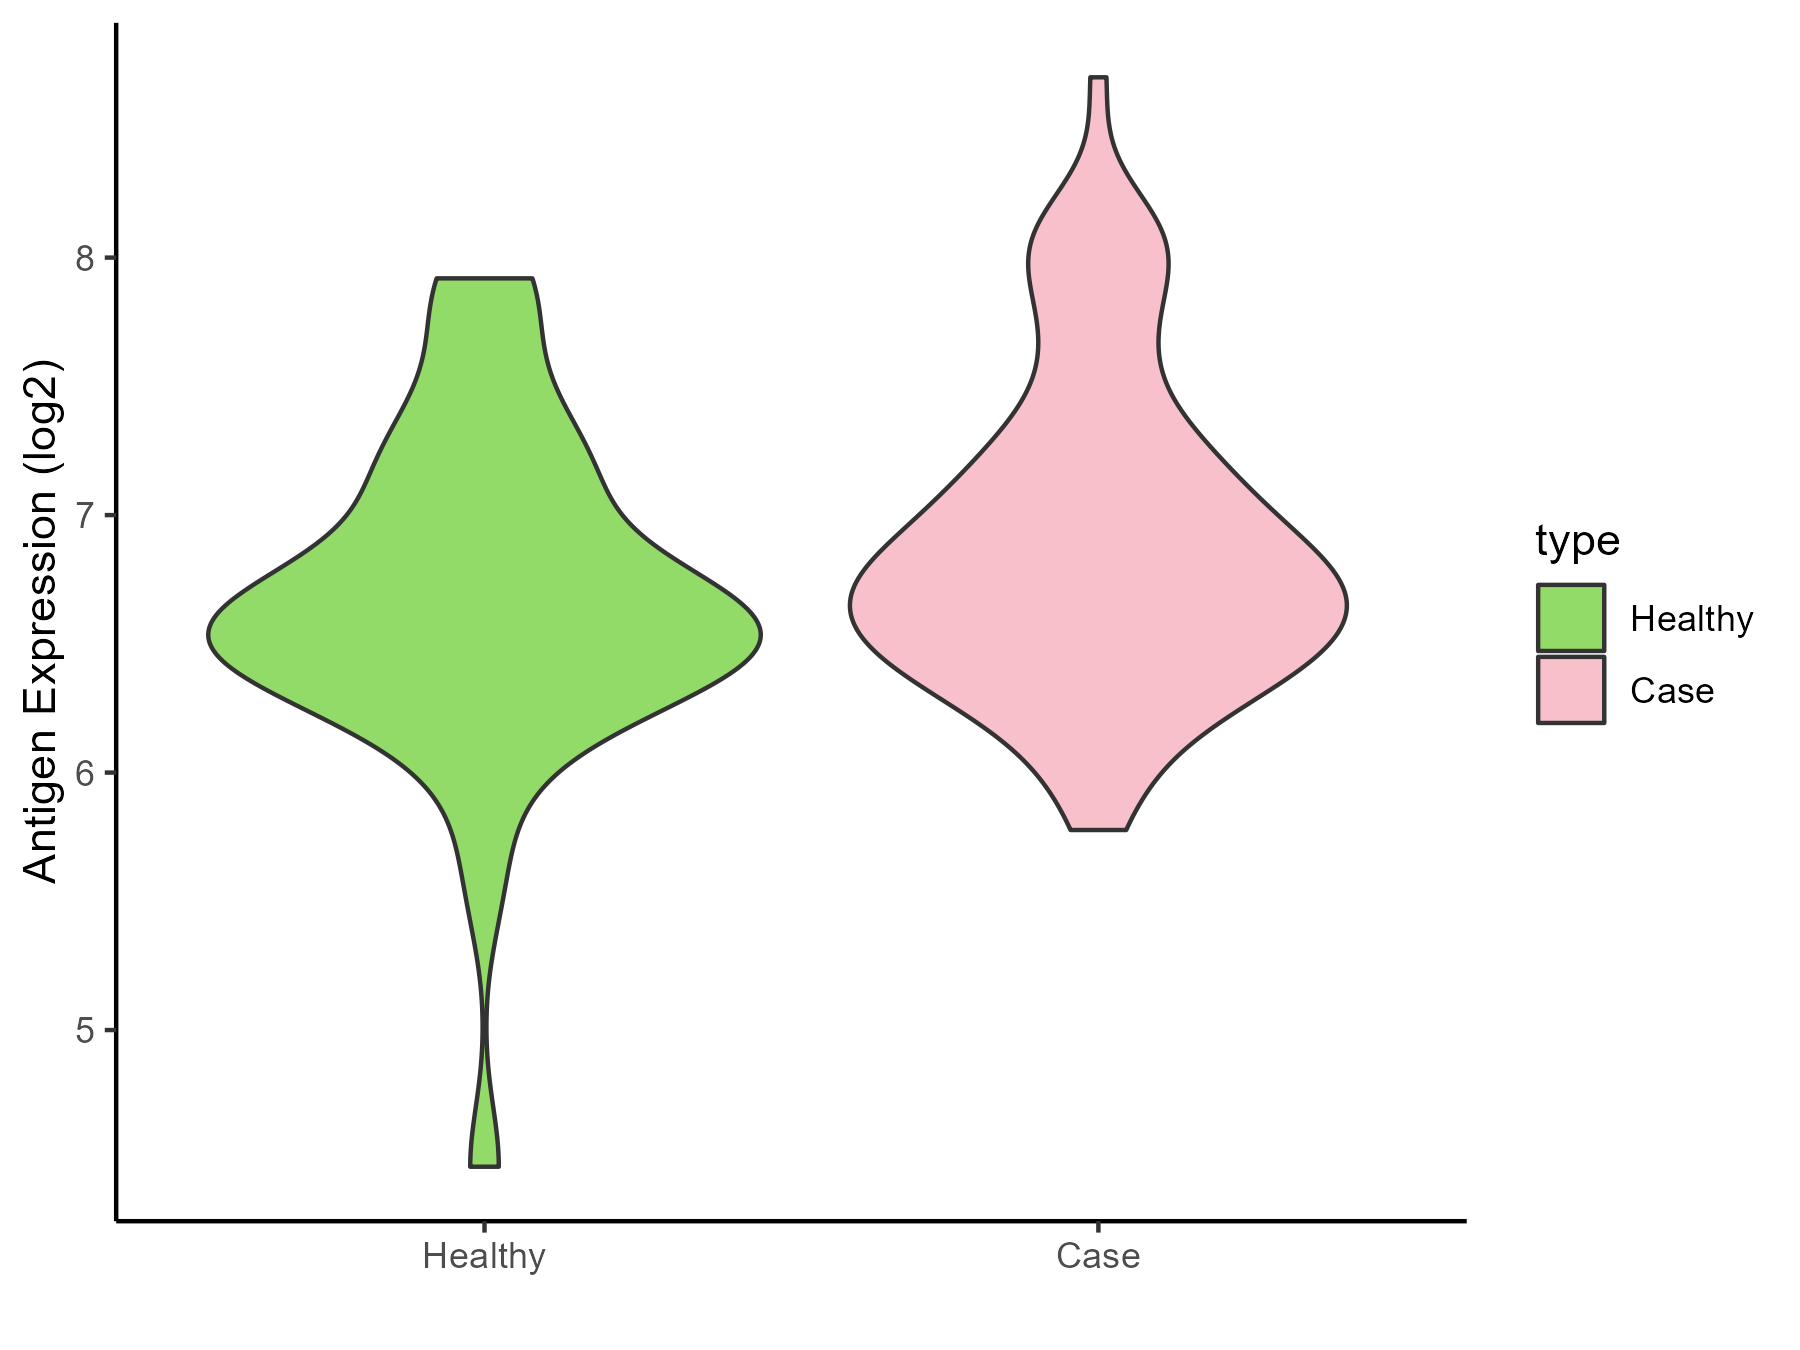
| Differential expression pattern of antigen in diseases | ||
| The Studied Tissue | Skin from scalp | |
| The Specific Disease | Alopecia | |
| The Expression Level of Disease Section Compare with the Healthy Individual Tissue | p-value: 0.070384671; Fold-change: 0.127149557; Z-score: 0.198280125 | |
| Disease-specific Antigen Abundances |
|
Click to View the Clearer Original Diagram |
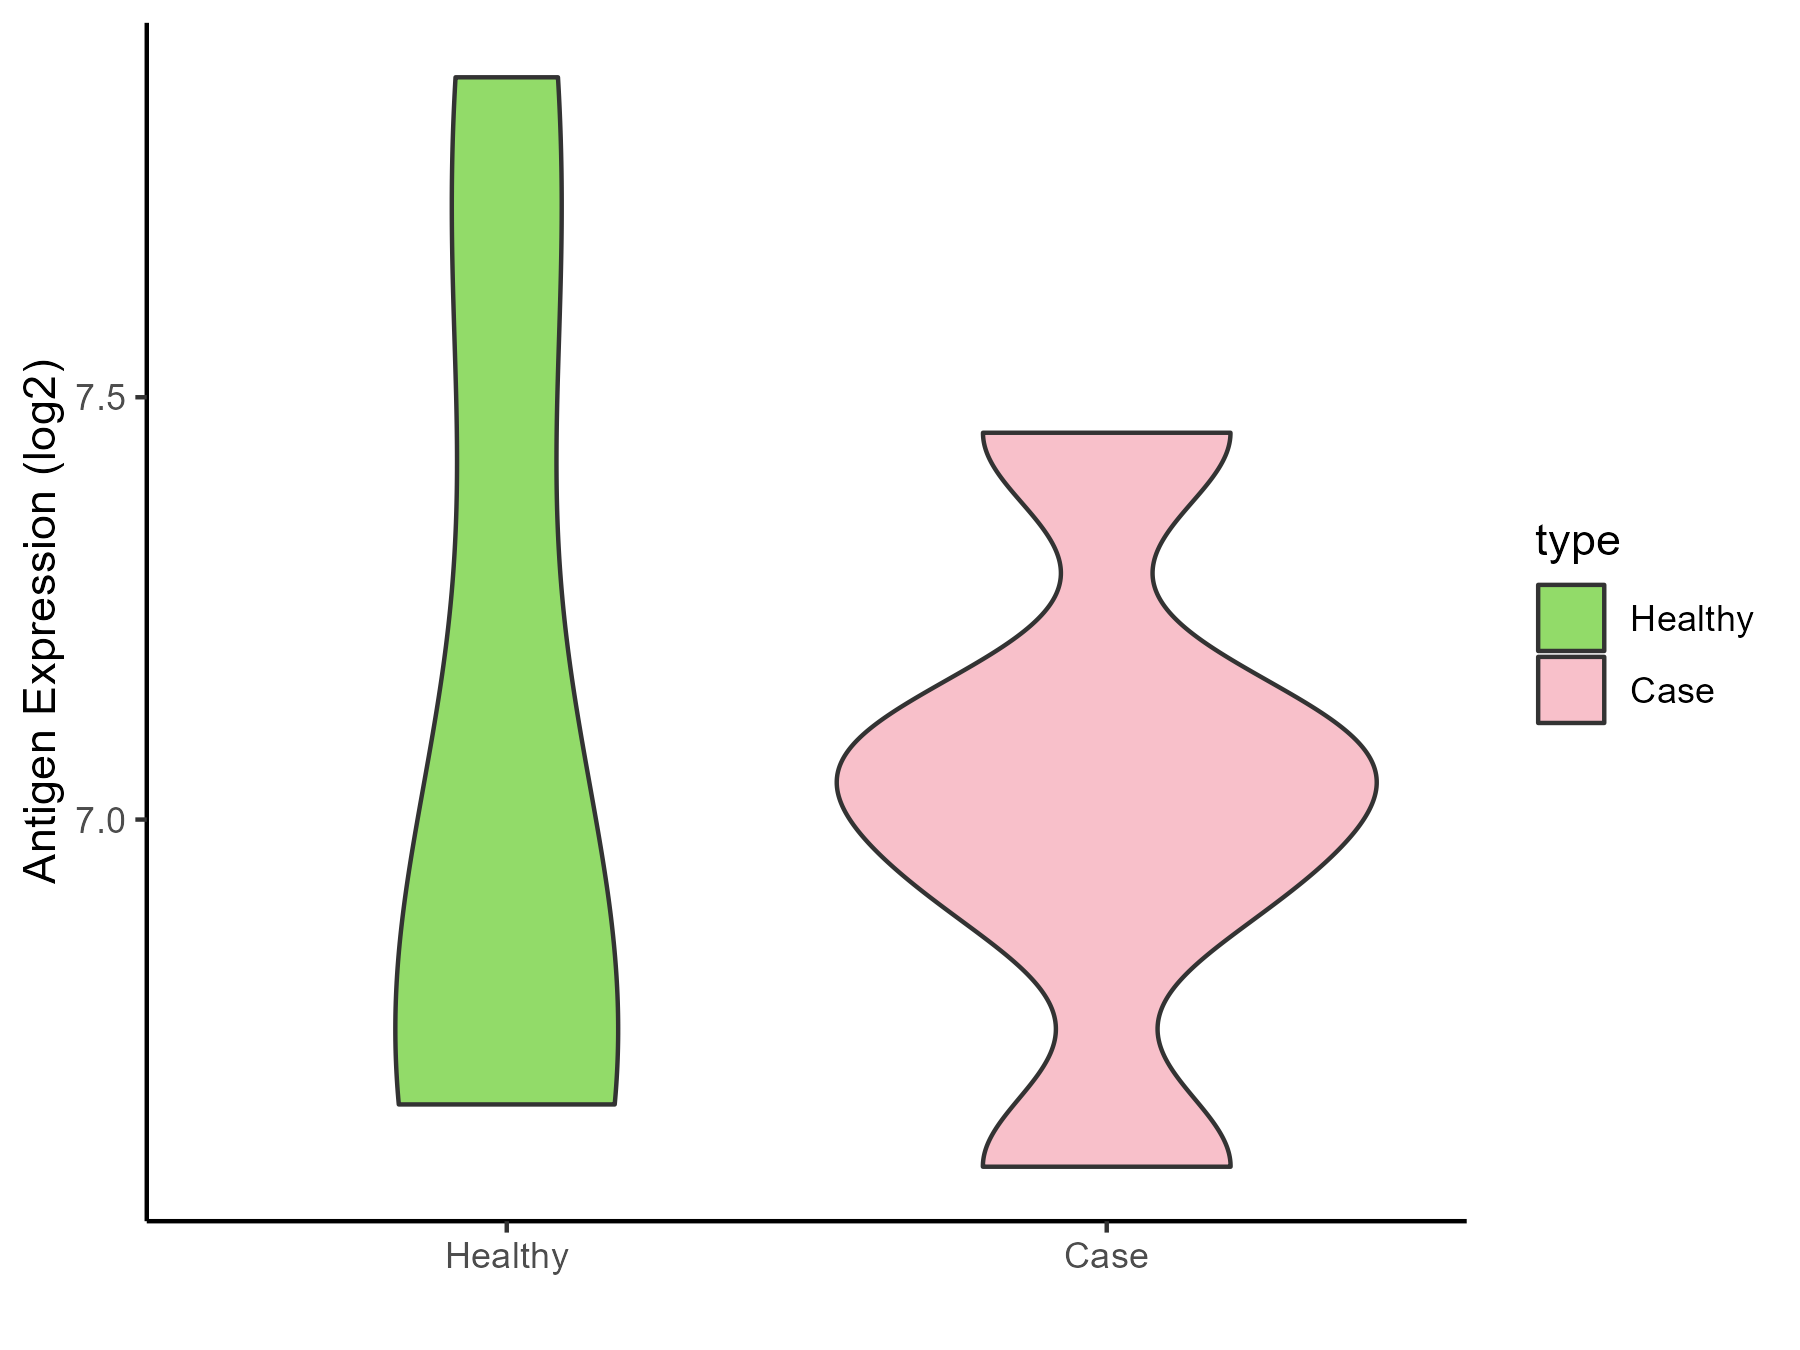
| Differential expression pattern of antigen in diseases | ||
| The Studied Tissue | Skin | |
| The Specific Disease | Sensitive skin | |
| The Expression Level of Disease Section Compare with the Healthy Individual Tissue | p-value: 0.822705258; Fold-change: 0.232209401; Z-score: 0.433330353 | |
| Disease-specific Antigen Abundances |
|
Click to View the Clearer Original Diagram |
ICD Disease Classification 15
| Differential expression pattern of antigen in diseases | ||
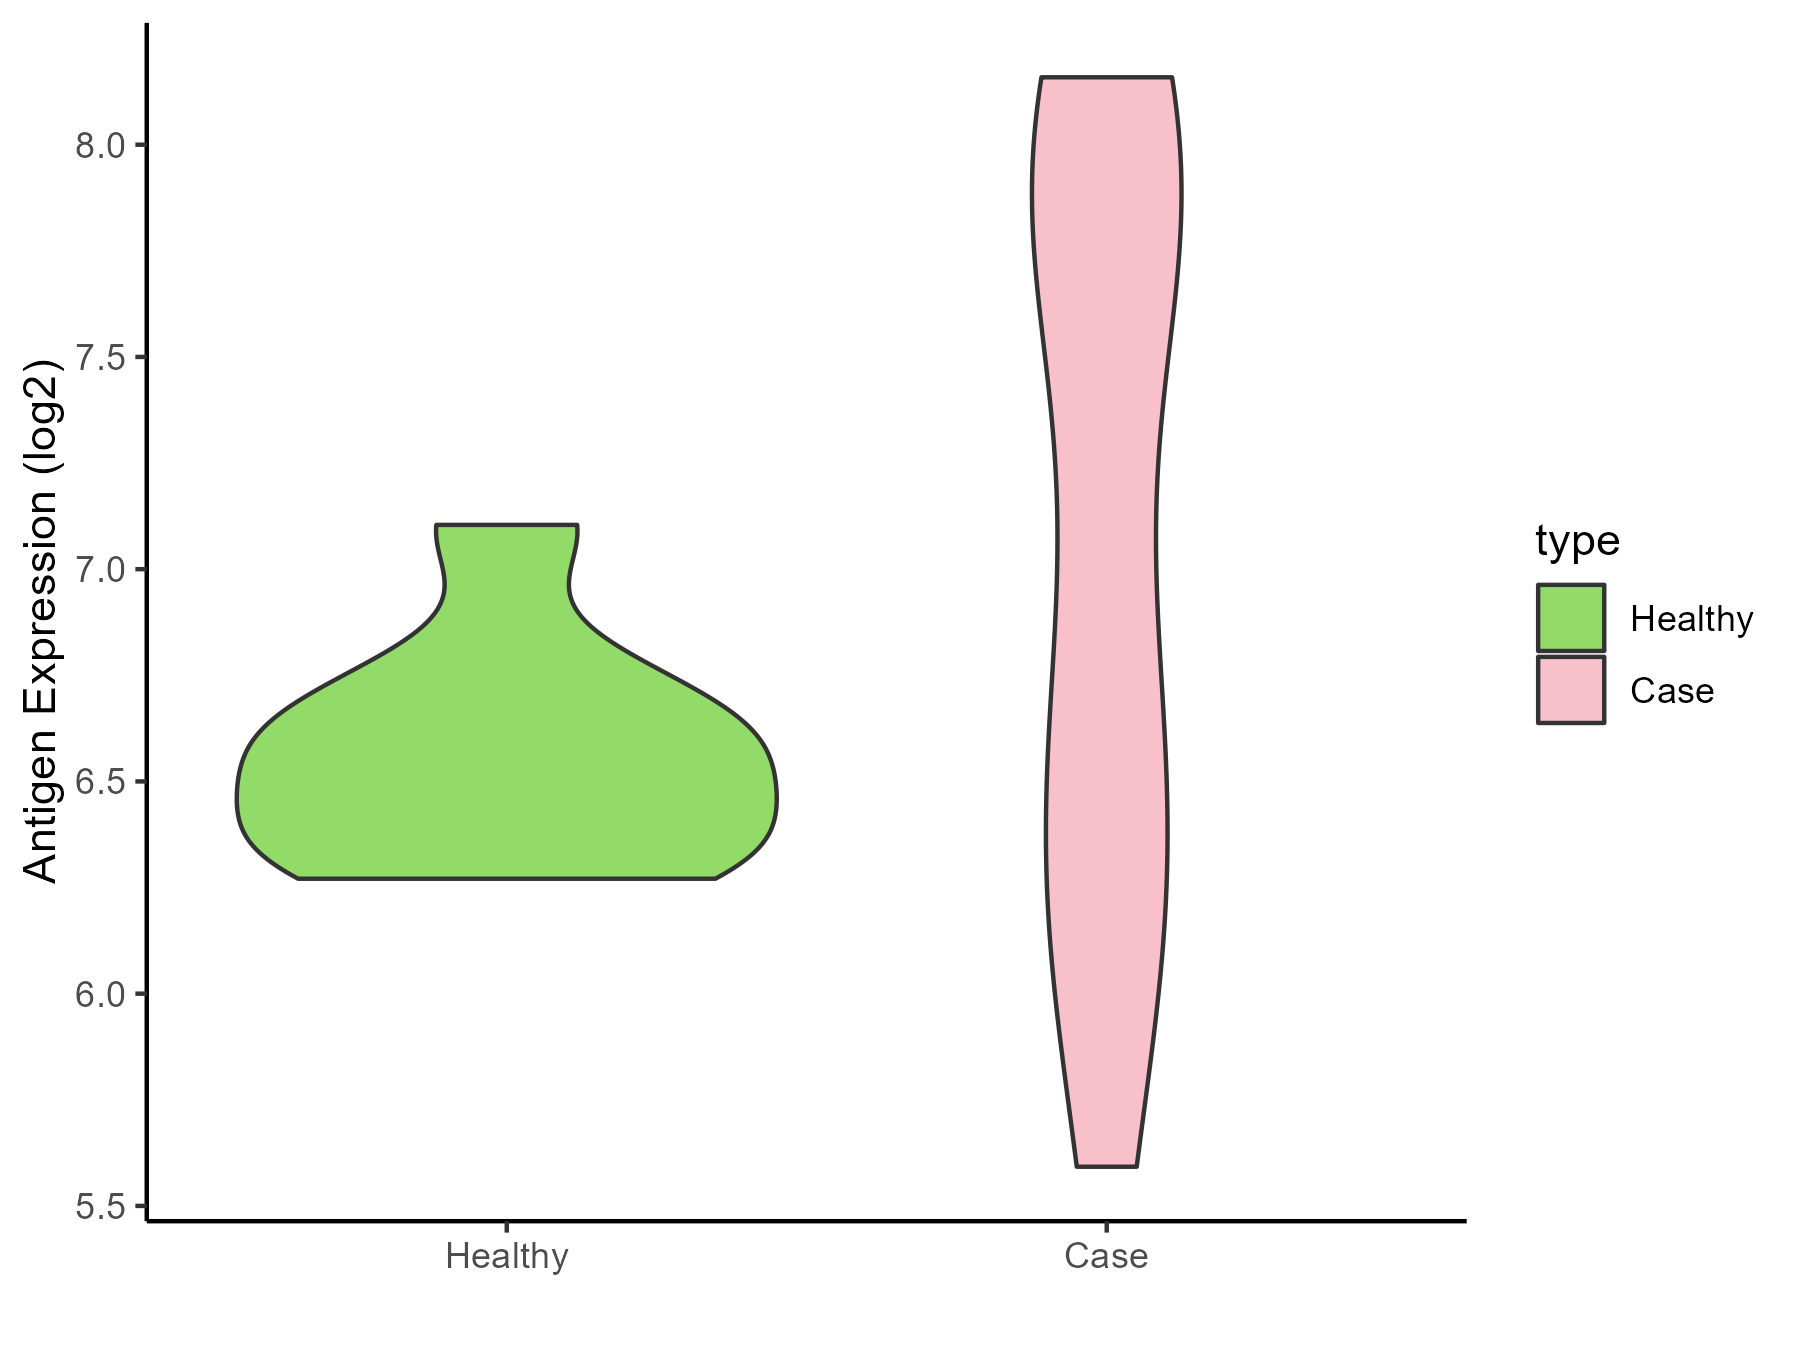
| The Studied Tissue | Synovial | |
| The Specific Disease | Osteoarthritis | |
| The Expression Level of Disease Section Compare with the Healthy Individual Tissue | p-value: 0.043079546; Fold-change: 0.588307108; Z-score: 2.167077156 | |
| Disease-specific Antigen Abundances |
|
Click to View the Clearer Original Diagram |
| Differential expression pattern of antigen in diseases | ||
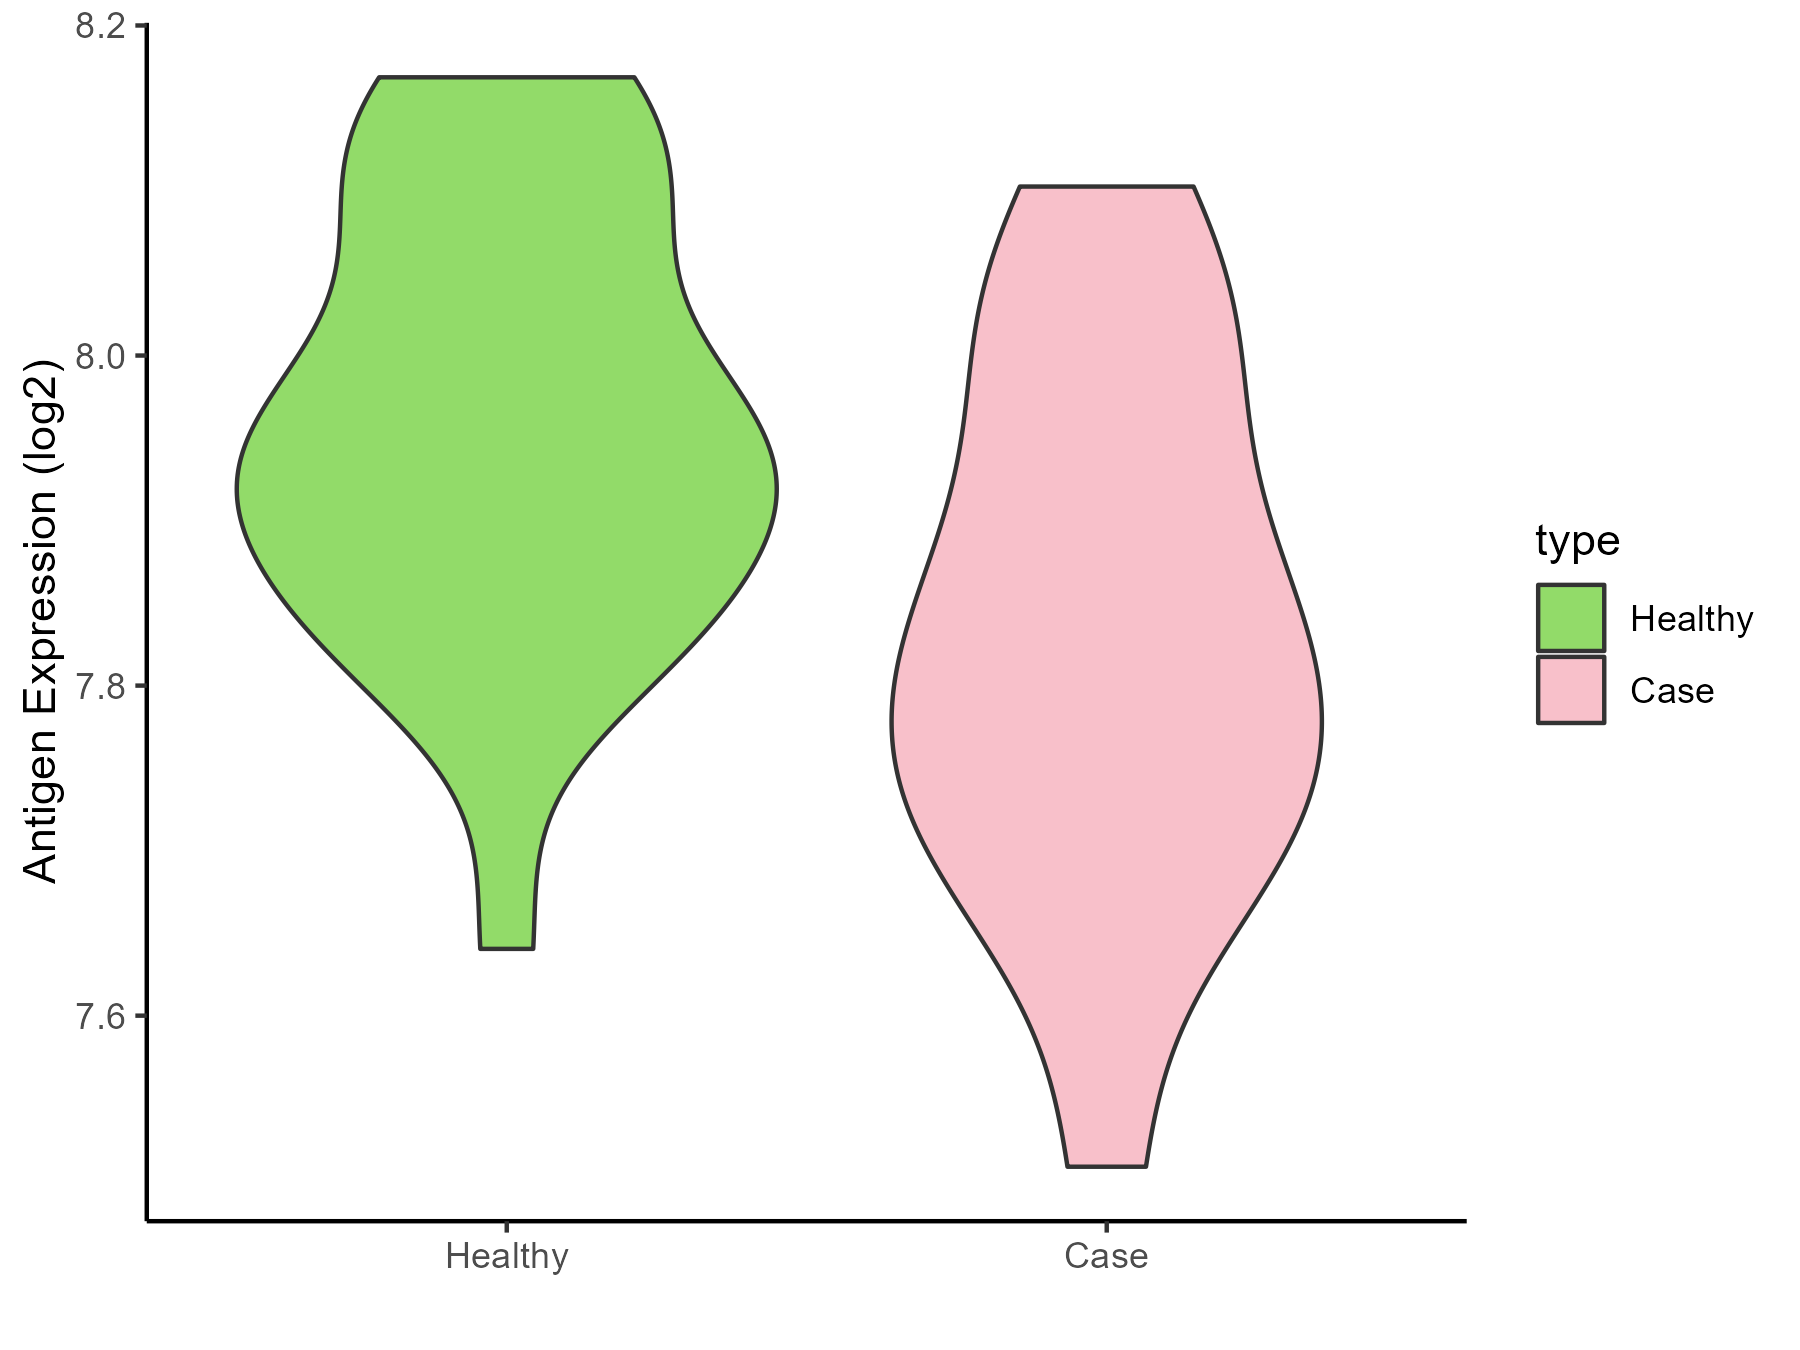
| The Studied Tissue | Peripheral blood | |
| The Specific Disease | Arthropathy | |
| The Expression Level of Disease Section Compare with the Healthy Individual Tissue | p-value: 0.015978922; Fold-change: -0.135342831; Z-score: -1.016565856 | |
| Disease-specific Antigen Abundances |
|
Click to View the Clearer Original Diagram |
| Differential expression pattern of antigen in diseases | ||
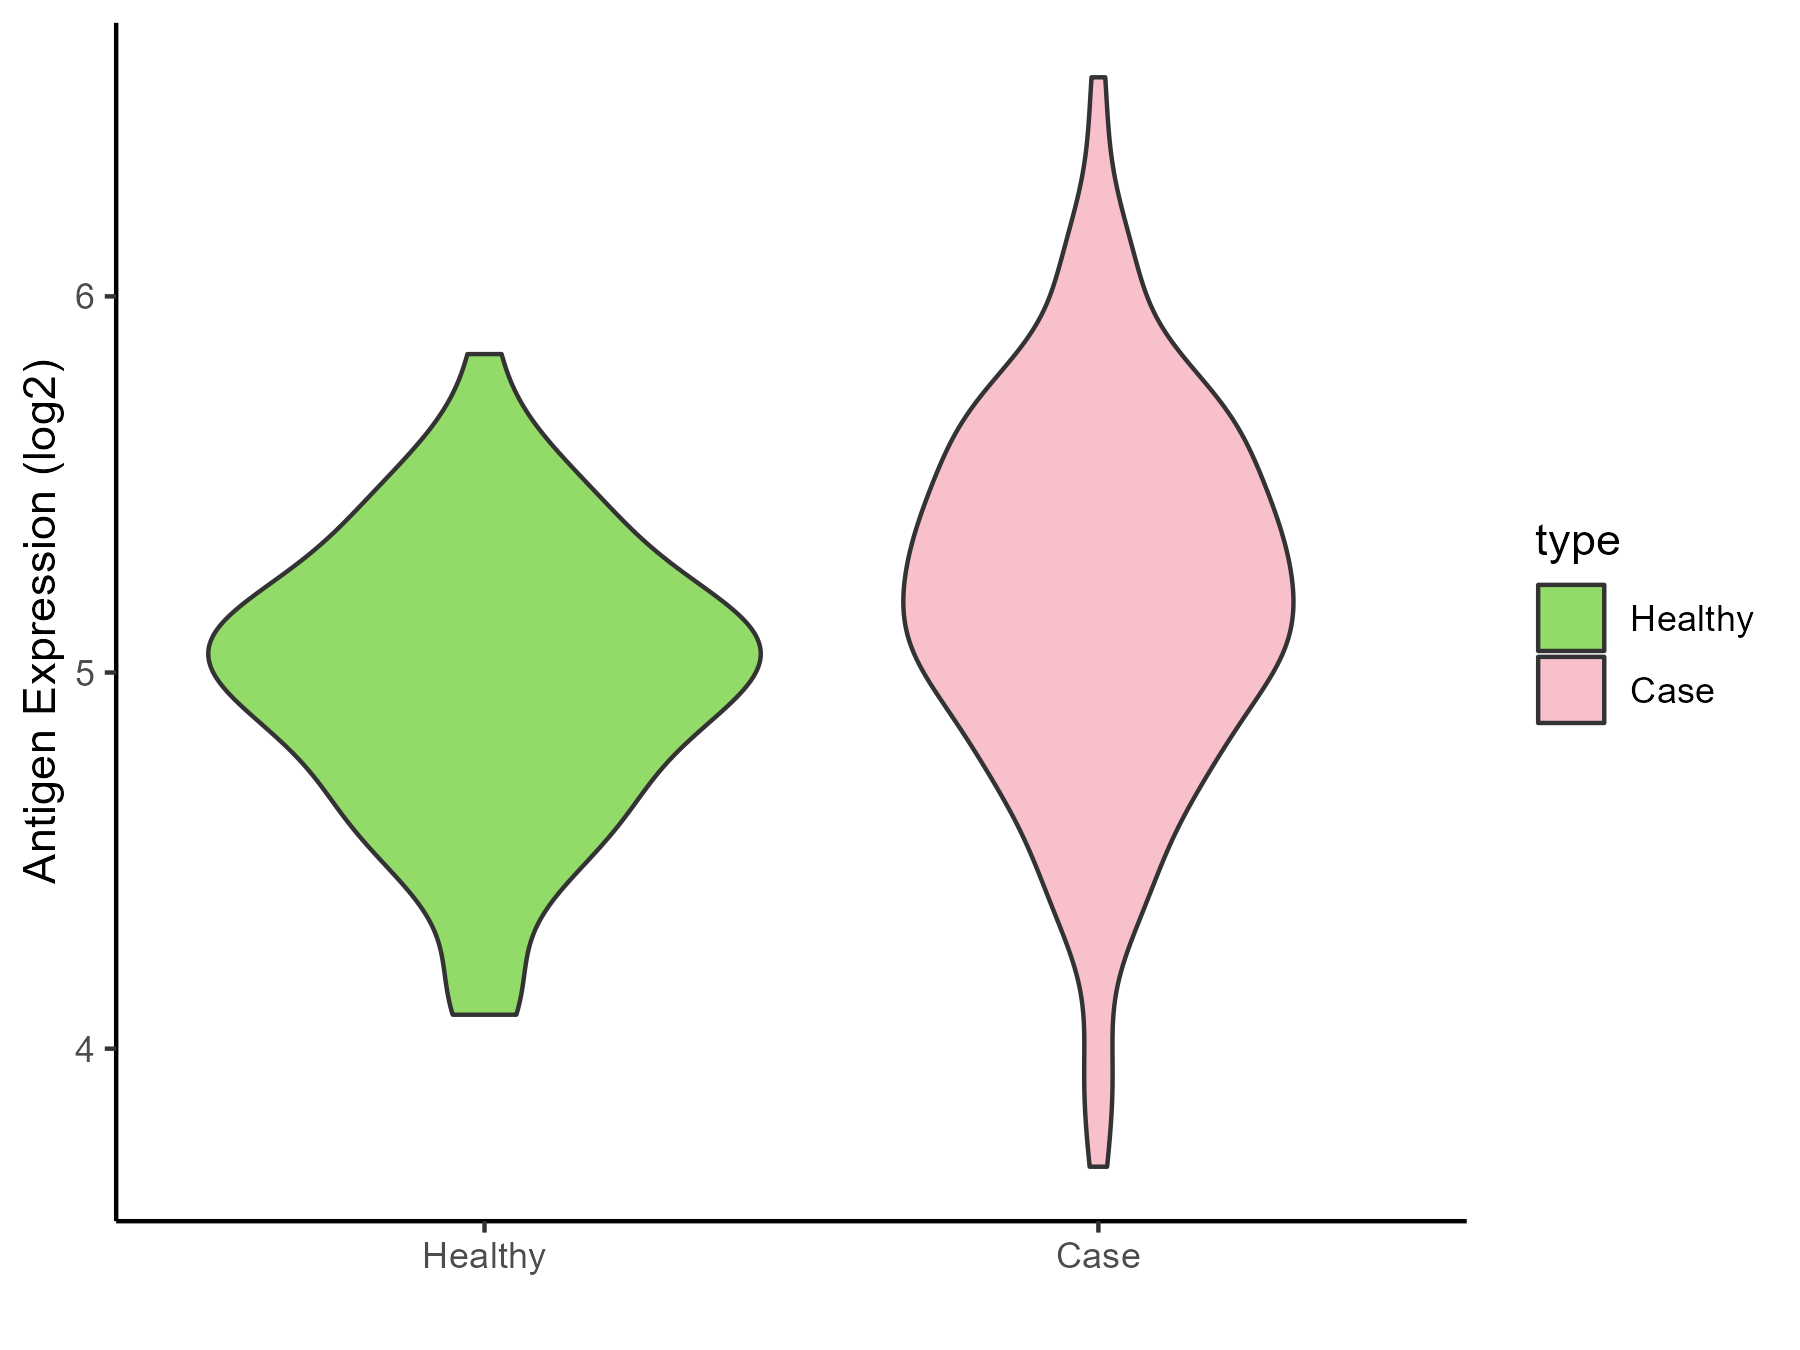
| The Studied Tissue | Peripheral blood | |
| The Specific Disease | Arthritis | |
| The Expression Level of Disease Section Compare with the Healthy Individual Tissue | p-value: 0.000233563; Fold-change: 0.192987236; Z-score: 0.530311981 | |
| Disease-specific Antigen Abundances |
|
Click to View the Clearer Original Diagram |
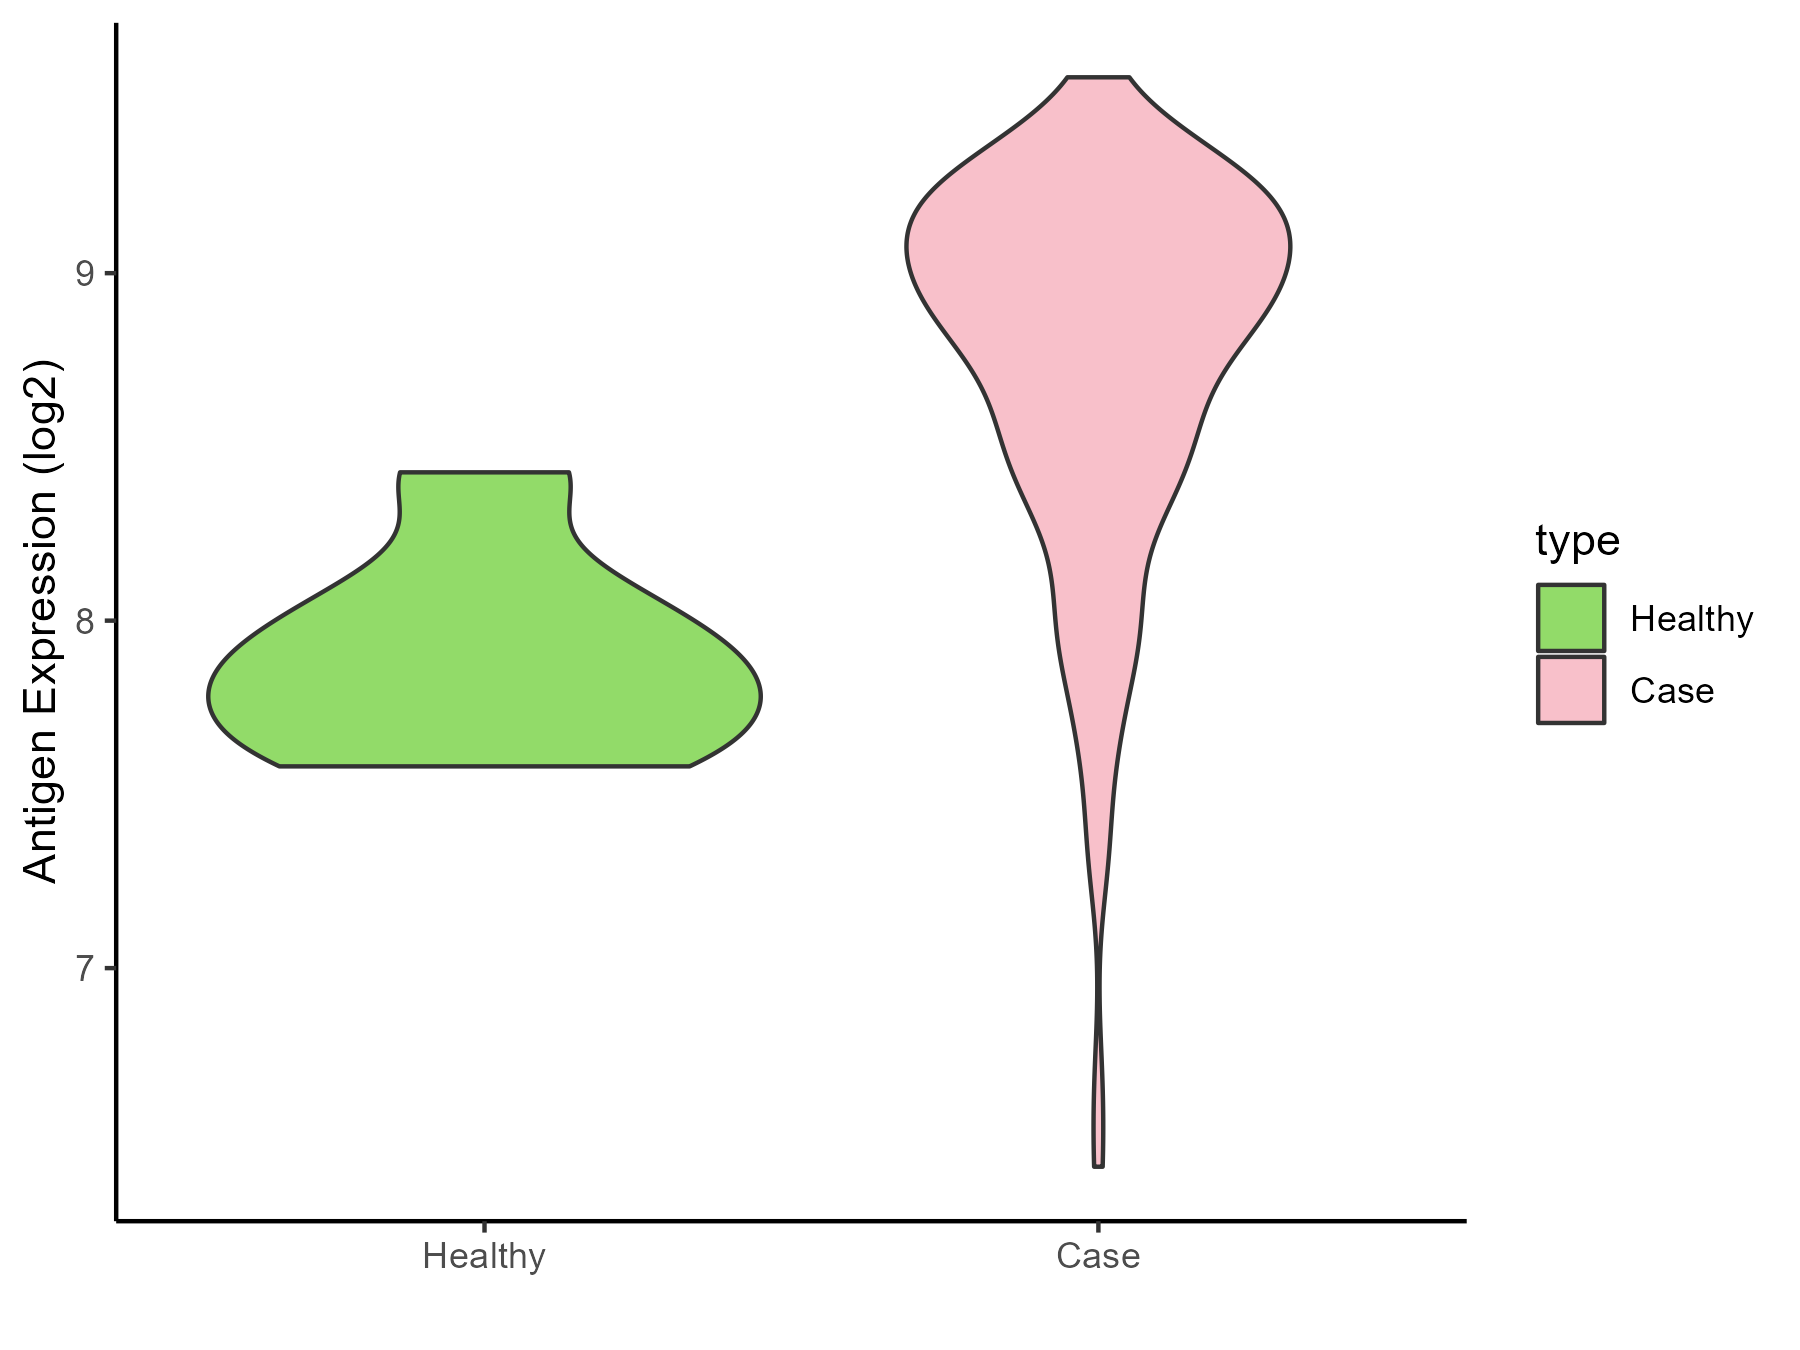
| Differential expression pattern of antigen in diseases | ||
| The Studied Tissue | Synovial | |
| The Specific Disease | Rheumatoid arthritis | |
| The Expression Level of Disease Section Compare with the Healthy Individual Tissue | p-value: 9.27E-05; Fold-change: 1.064442985; Z-score: 3.65053917 | |
| Disease-specific Antigen Abundances |
|
Click to View the Clearer Original Diagram |
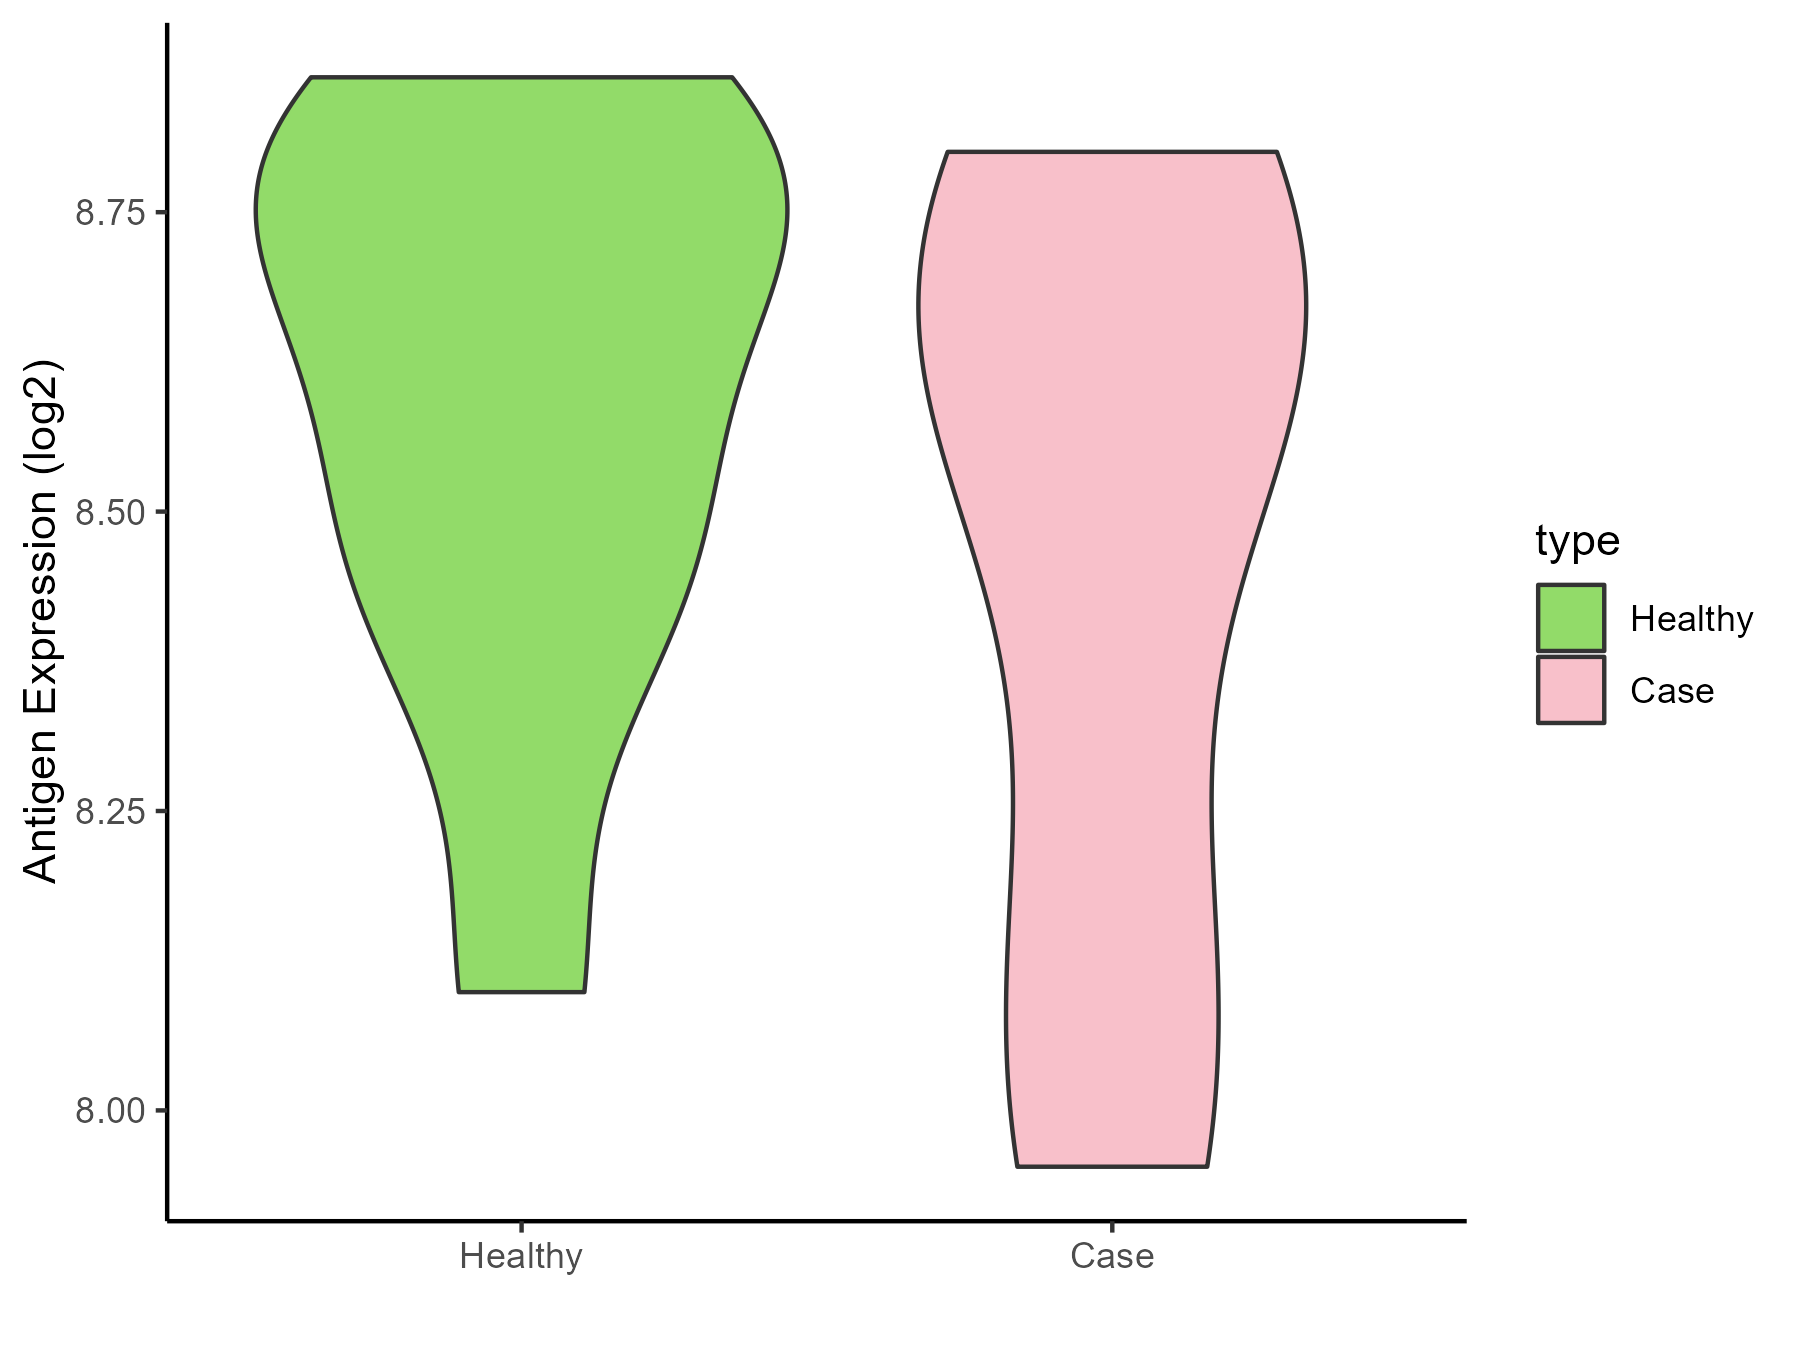
| Differential expression pattern of antigen in diseases | ||
| The Studied Tissue | Pheripheral blood | |
| The Specific Disease | Ankylosing spondylitis | |
| The Expression Level of Disease Section Compare with the Healthy Individual Tissue | p-value: 0.356148727; Fold-change: -0.064683813; Z-score: -0.26100526 | |
| Disease-specific Antigen Abundances |
|
Click to View the Clearer Original Diagram |
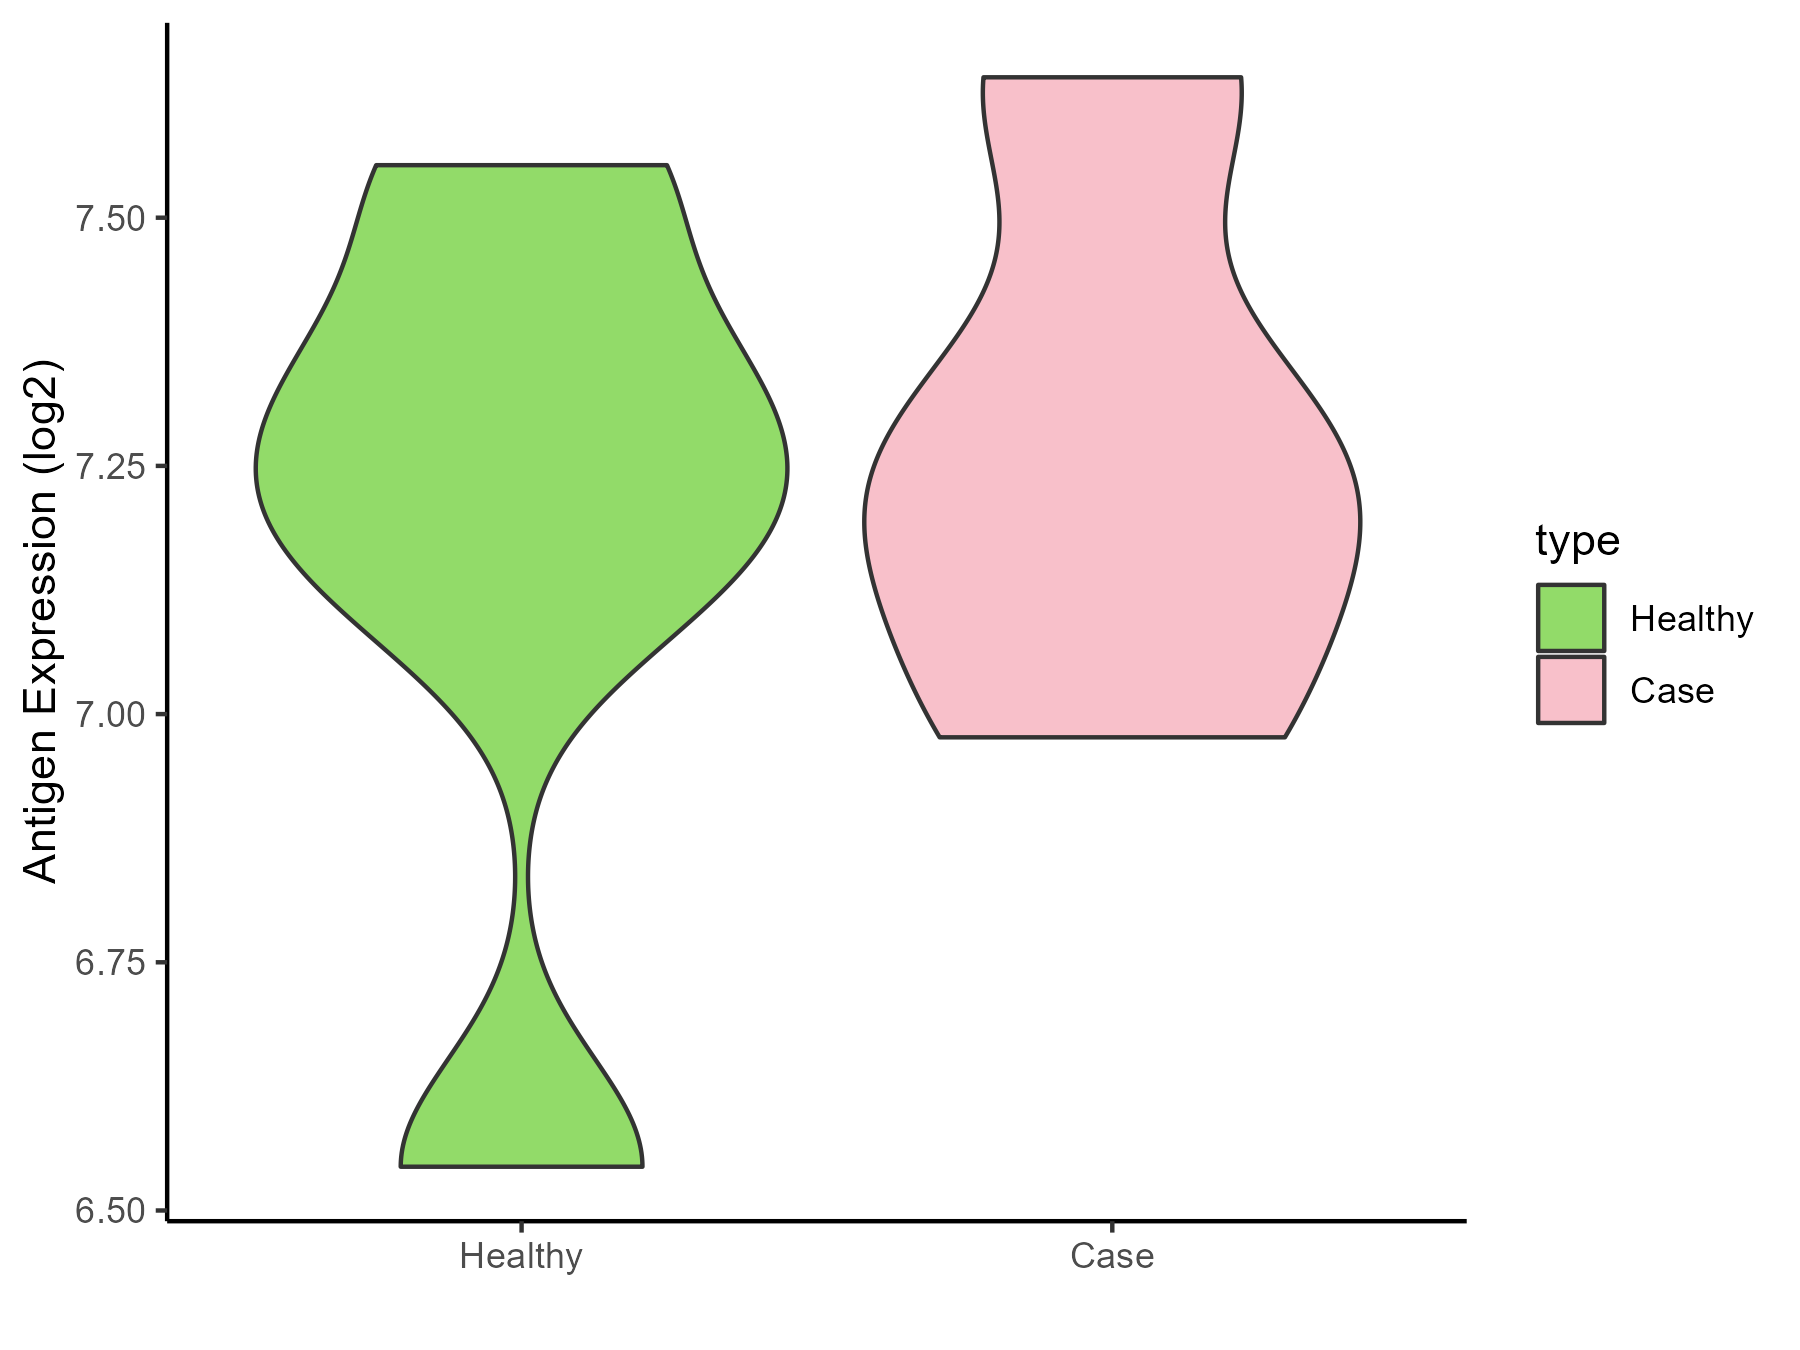
| Differential expression pattern of antigen in diseases | ||
| The Studied Tissue | Bone marrow | |
| The Specific Disease | Osteoporosis | |
| The Expression Level of Disease Section Compare with the Healthy Individual Tissue | p-value: 0.642233014; Fold-change: -0.007482308; Z-score: -0.019673148 | |
| Disease-specific Antigen Abundances |
|
Click to View the Clearer Original Diagram |
ICD Disease Classification 16
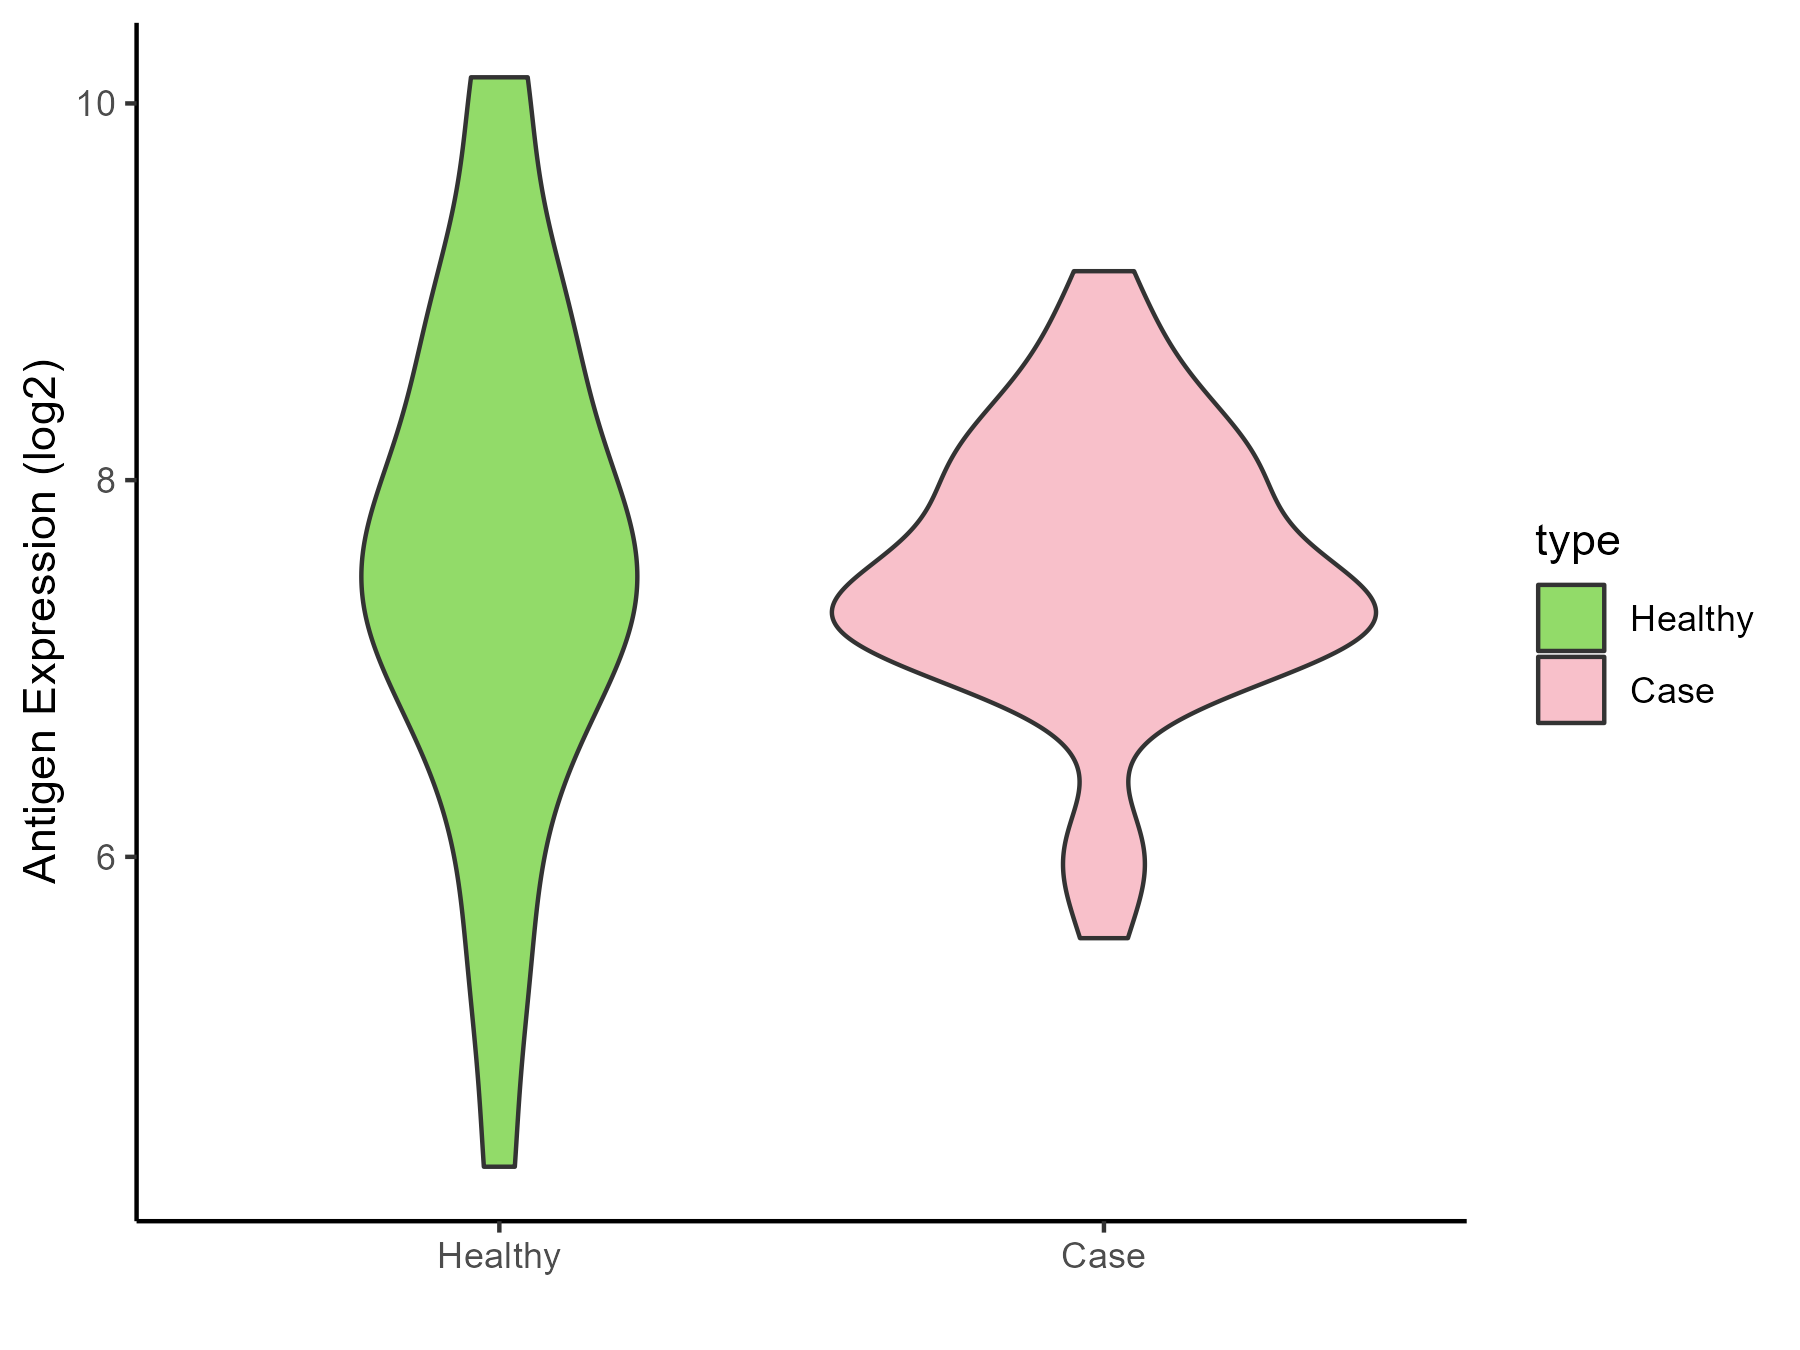
| Differential expression pattern of antigen in diseases | ||
| The Studied Tissue | Endometrium | |
| The Specific Disease | Endometriosis | |
| The Expression Level of Disease Section Compare with the Healthy Individual Tissue | p-value: 0.861657068; Fold-change: -0.188566131; Z-score: -0.139075525 | |
| Disease-specific Antigen Abundances |
|
Click to View the Clearer Original Diagram |
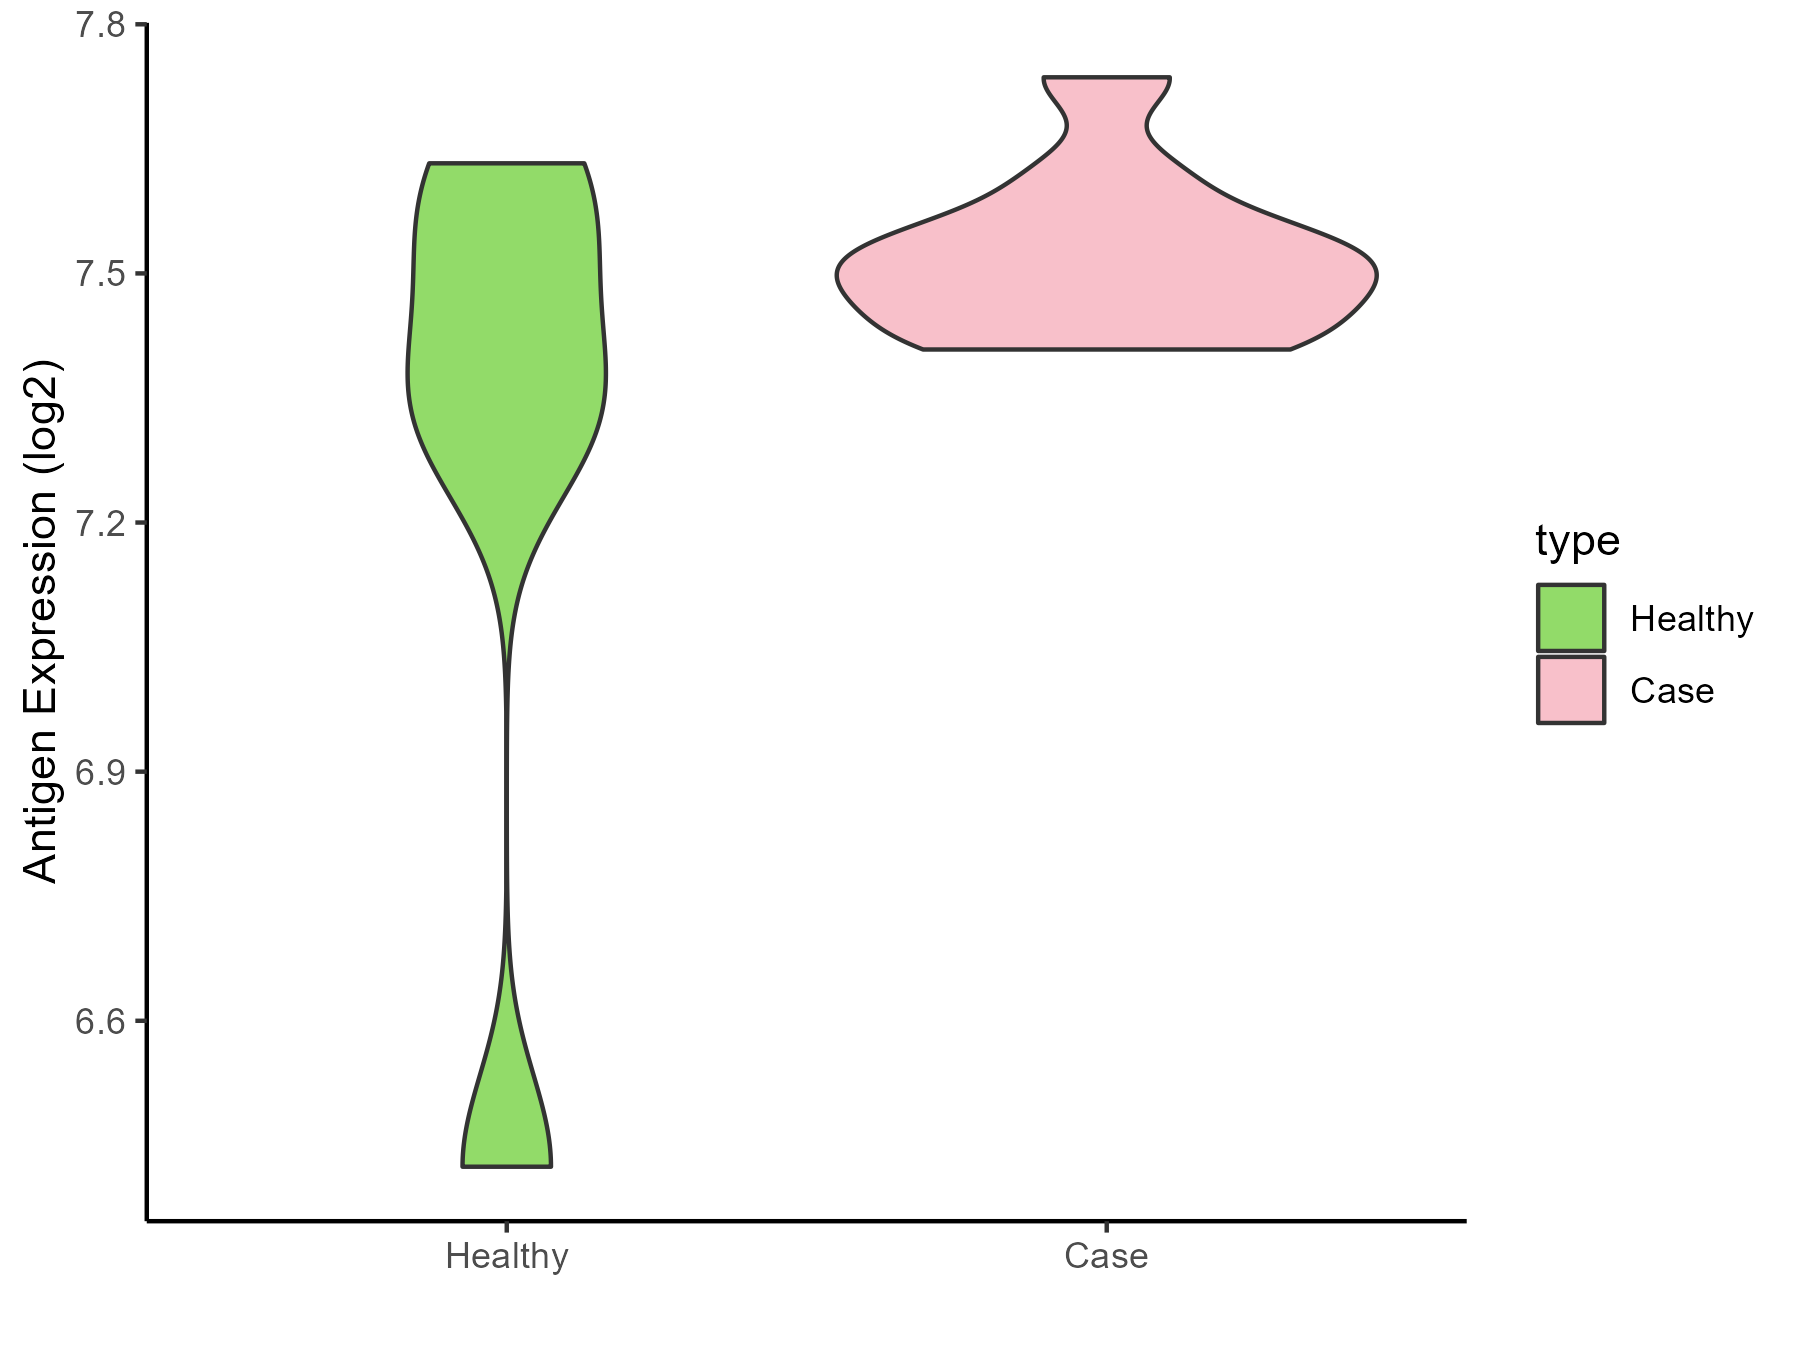
| Differential expression pattern of antigen in diseases | ||
| The Studied Tissue | Bladder | |
| The Specific Disease | Interstitial cystitis | |
| The Expression Level of Disease Section Compare with the Healthy Individual Tissue | p-value: 0.286427884; Fold-change: 0.143671733; Z-score: 0.298437742 | |
| Disease-specific Antigen Abundances |
|
Click to View the Clearer Original Diagram |
ICD Disease Classification 19
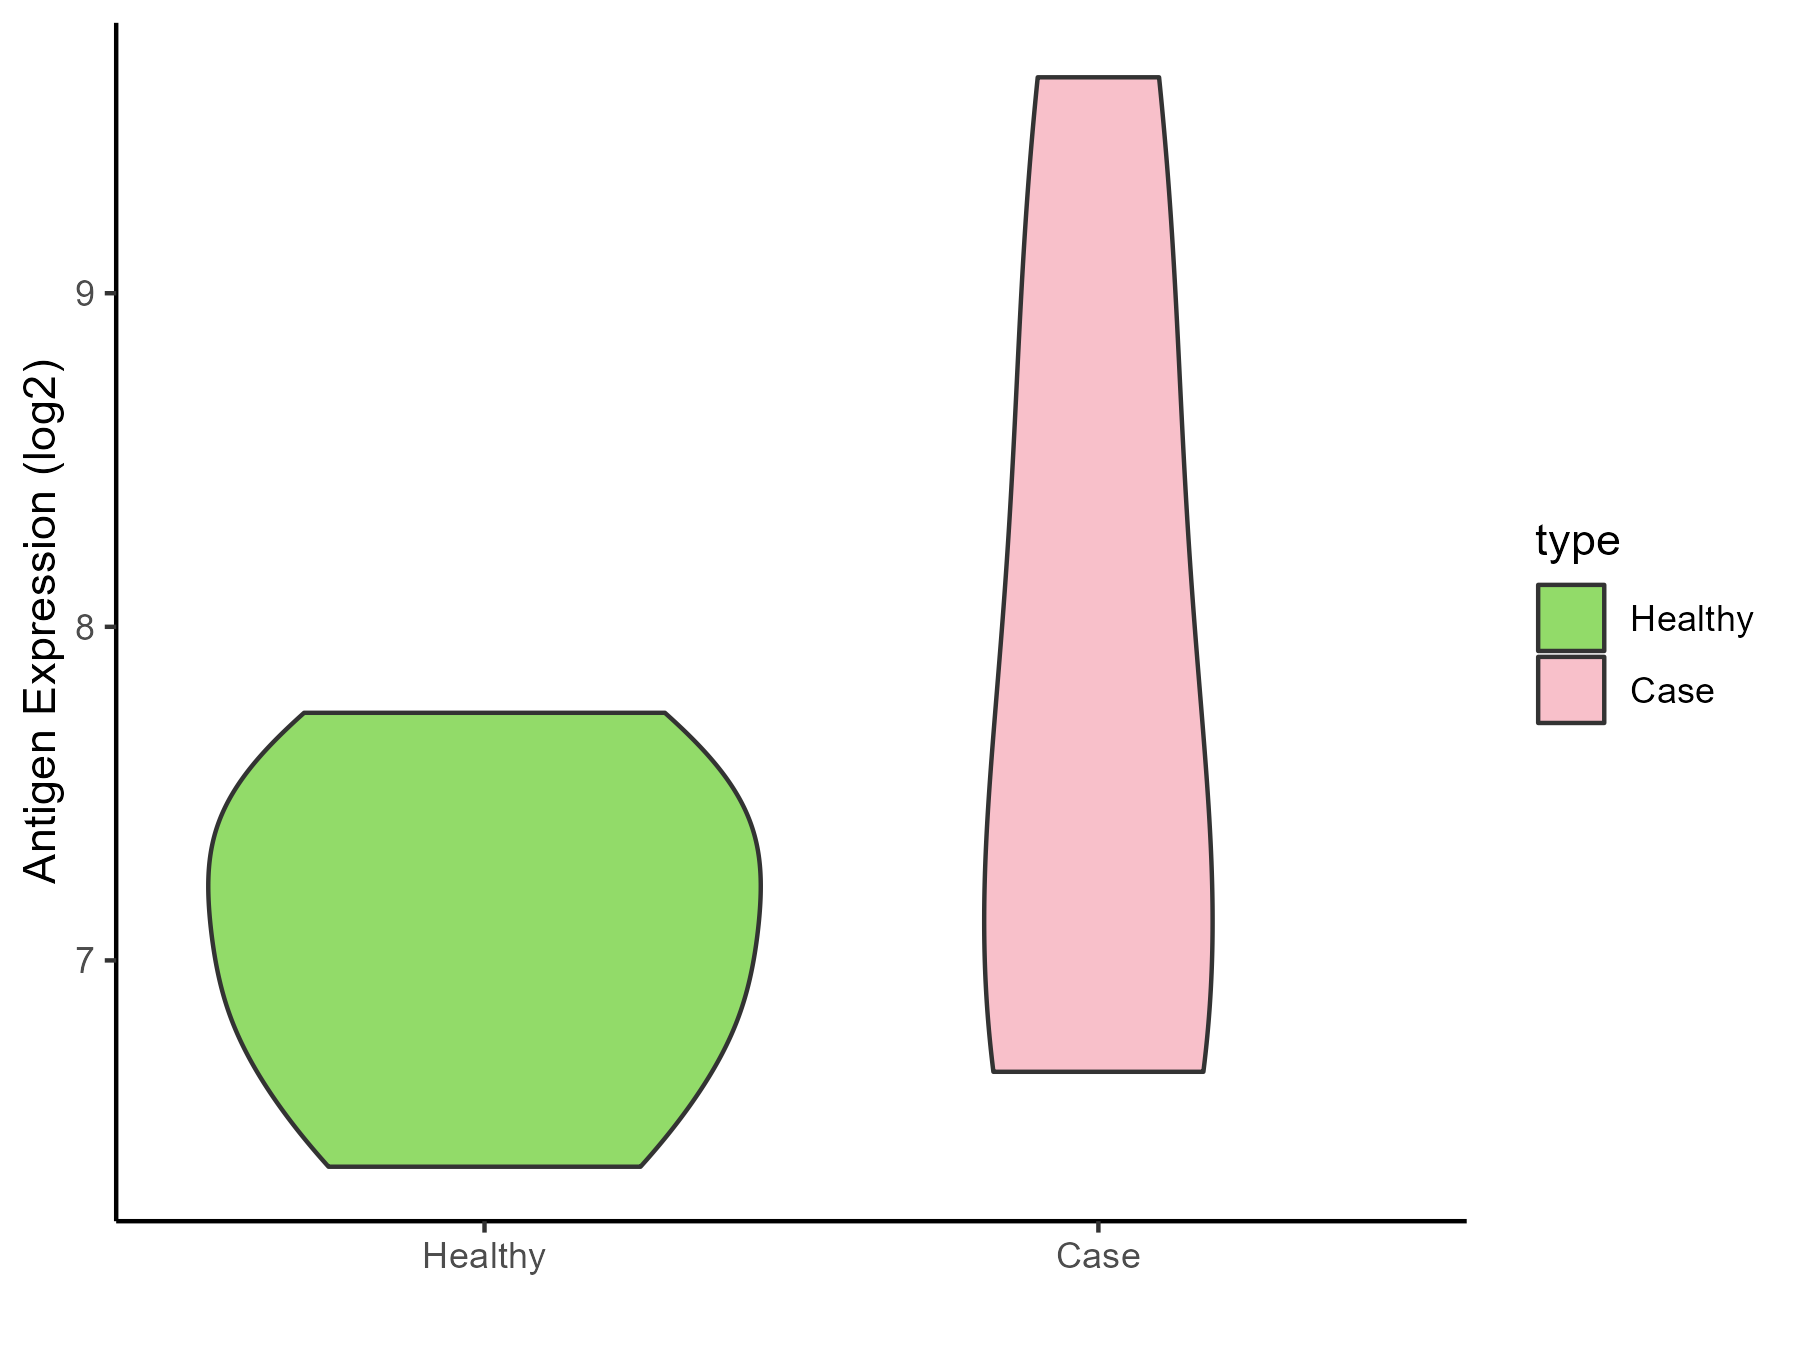
| Differential expression pattern of antigen in diseases | ||
| The Studied Tissue | Myometrium | |
| The Specific Disease | Preterm birth | |
| The Expression Level of Disease Section Compare with the Healthy Individual Tissue | p-value: 0.262137539; Fold-change: 0.481804096; Z-score: 0.975828316 | |
| Disease-specific Antigen Abundances |
|
Click to View the Clearer Original Diagram |
ICD Disease Classification 2
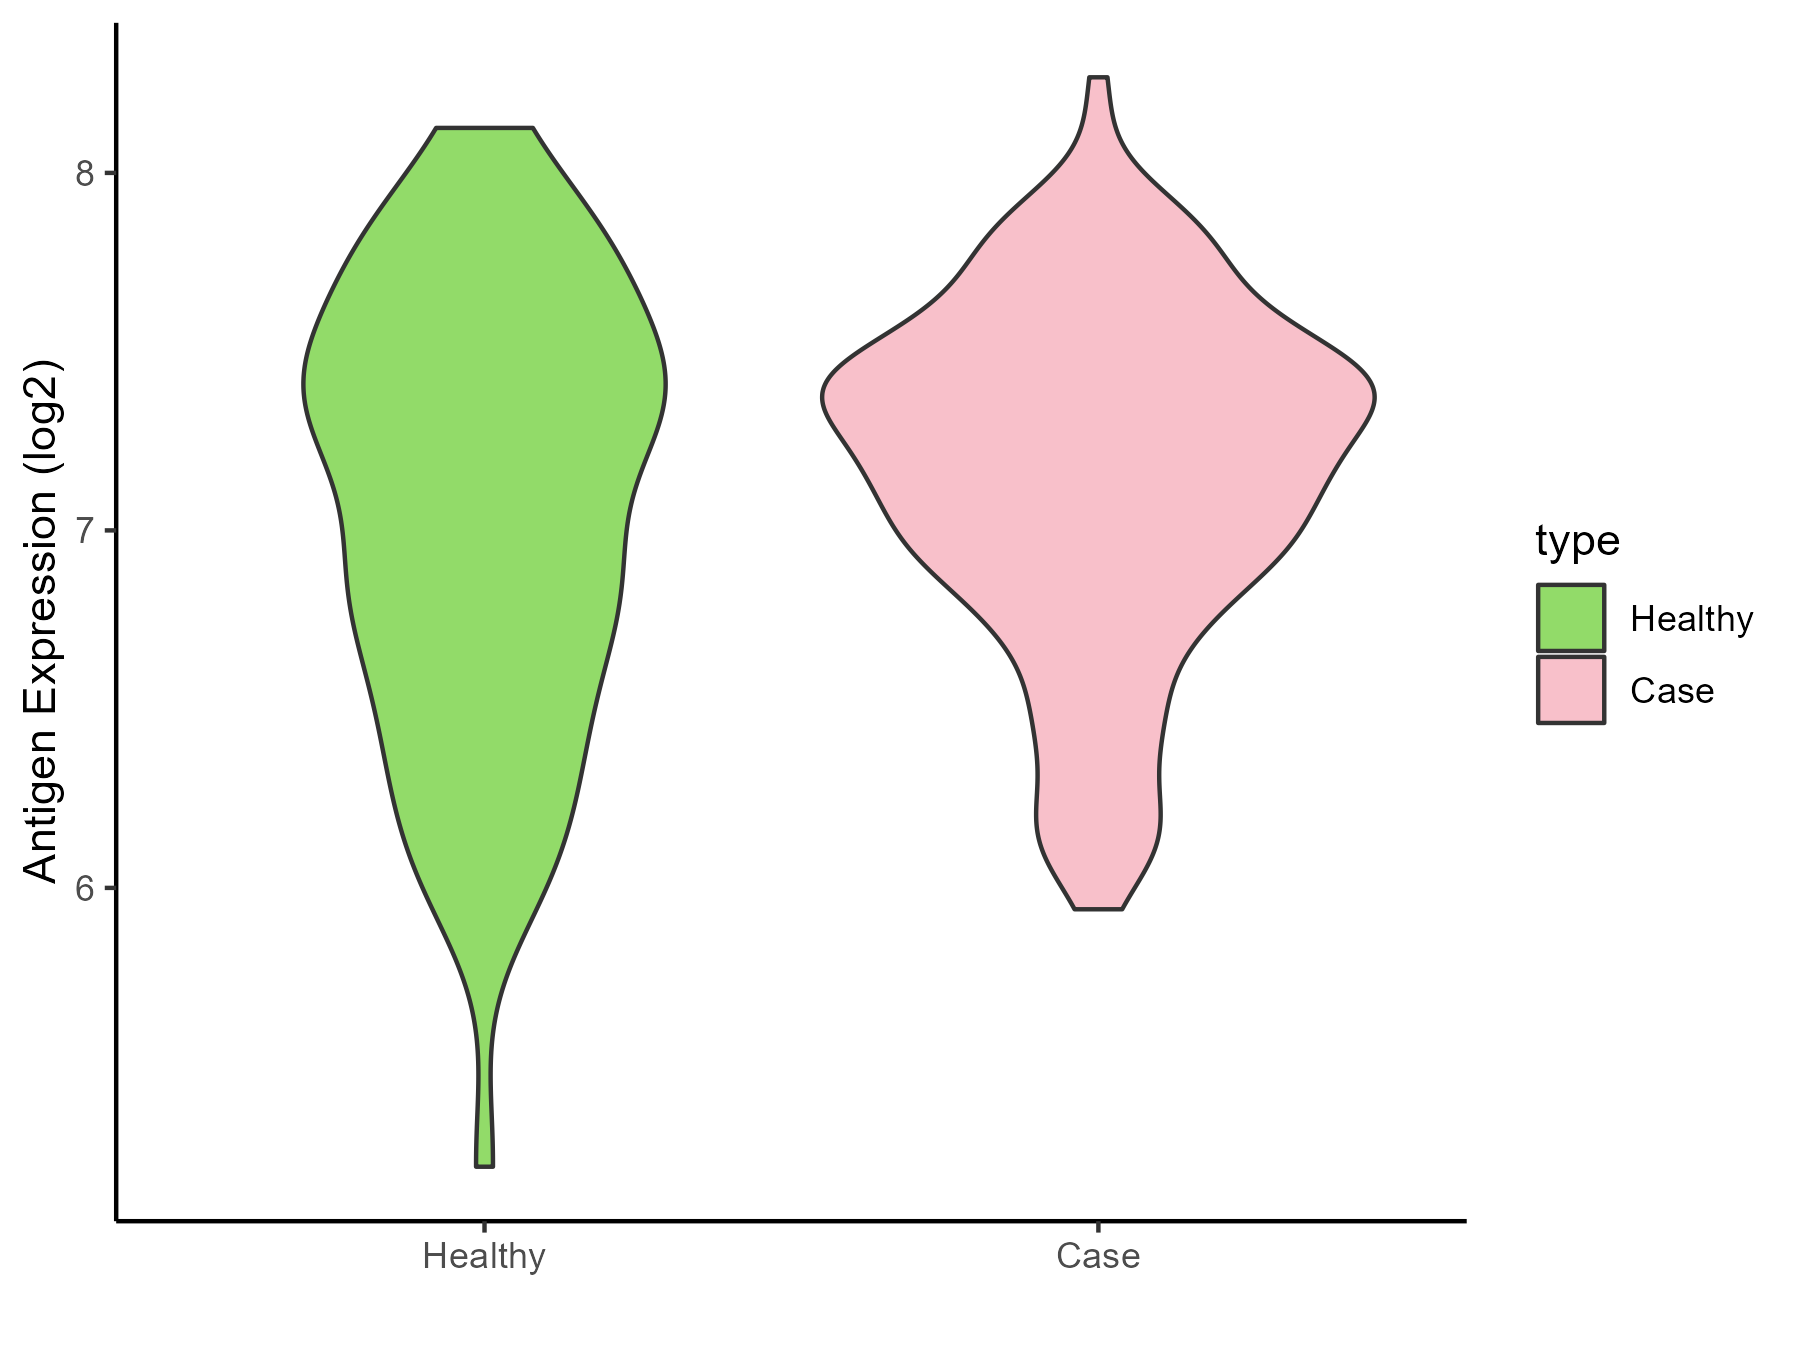
| Differential expression pattern of antigen in diseases | ||
| The Studied Tissue | Bone marrow | |
| The Specific Disease | Acute myelocytic leukemia | |
| The Expression Level of Disease Section Compare with the Healthy Individual Tissue | p-value: 0.083199454; Fold-change: 0.04554798; Z-score: 0.073149416 | |
| Disease-specific Antigen Abundances |
|
Click to View the Clearer Original Diagram |
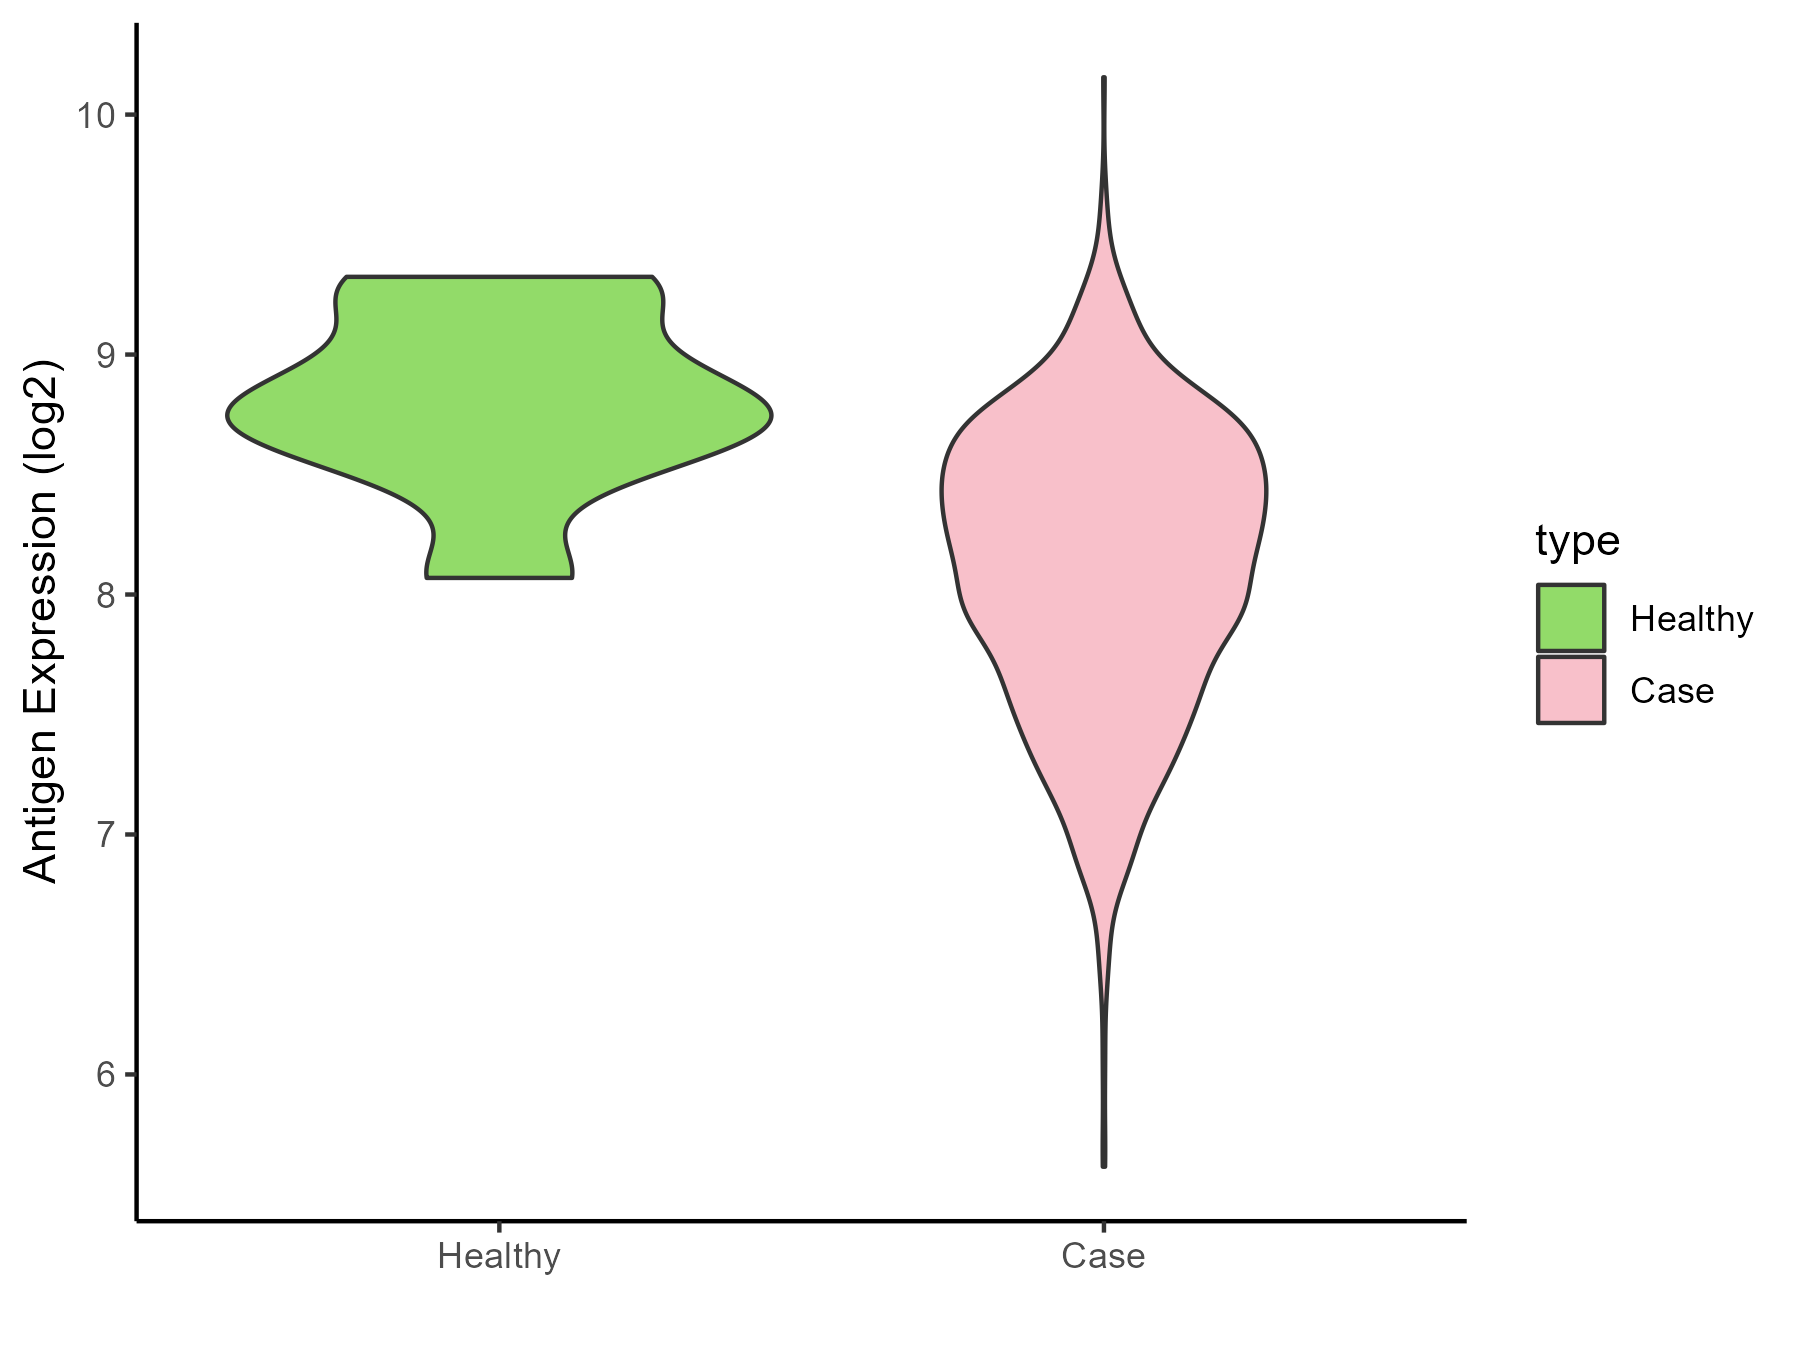
| Differential expression pattern of antigen in diseases | ||
| The Studied Tissue | Bone marrow | |
| The Specific Disease | Myeloma | |
| The Expression Level of Disease Section Compare with the Healthy Individual Tissue | p-value: 0.001900739; Fold-change: -0.583079932; Z-score: -1.433892612 | |
| Disease-specific Antigen Abundances |
|
Click to View the Clearer Original Diagram |
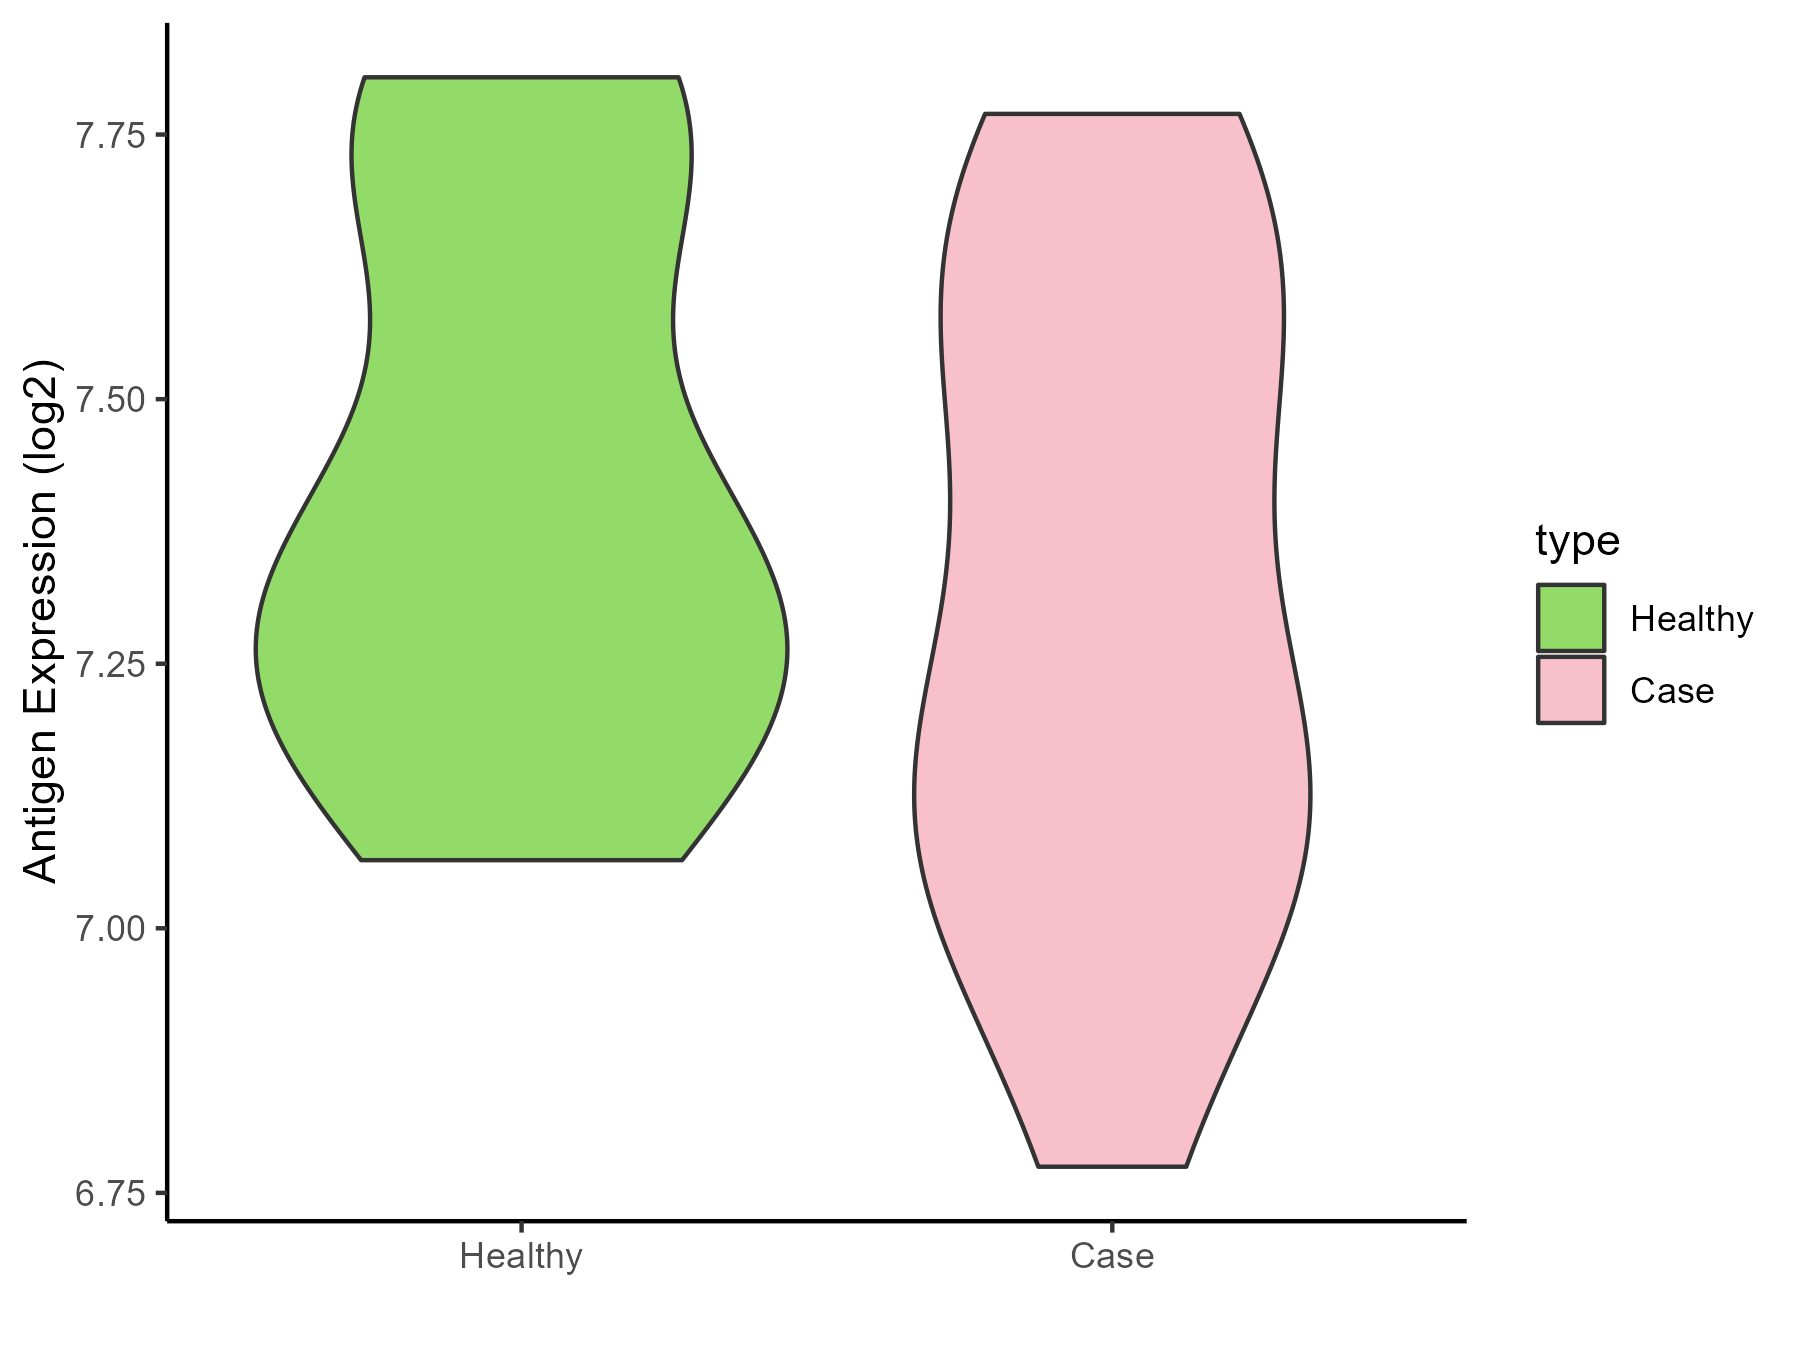
| The Studied Tissue | Peripheral blood | |
| The Specific Disease | Myeloma | |
| The Expression Level of Disease Section Compare with the Healthy Individual Tissue | p-value: 0.345888225; Fold-change: -0.067140406; Z-score: -0.252525205 | |
| Disease-specific Antigen Abundances |
|
Click to View the Clearer Original Diagram |
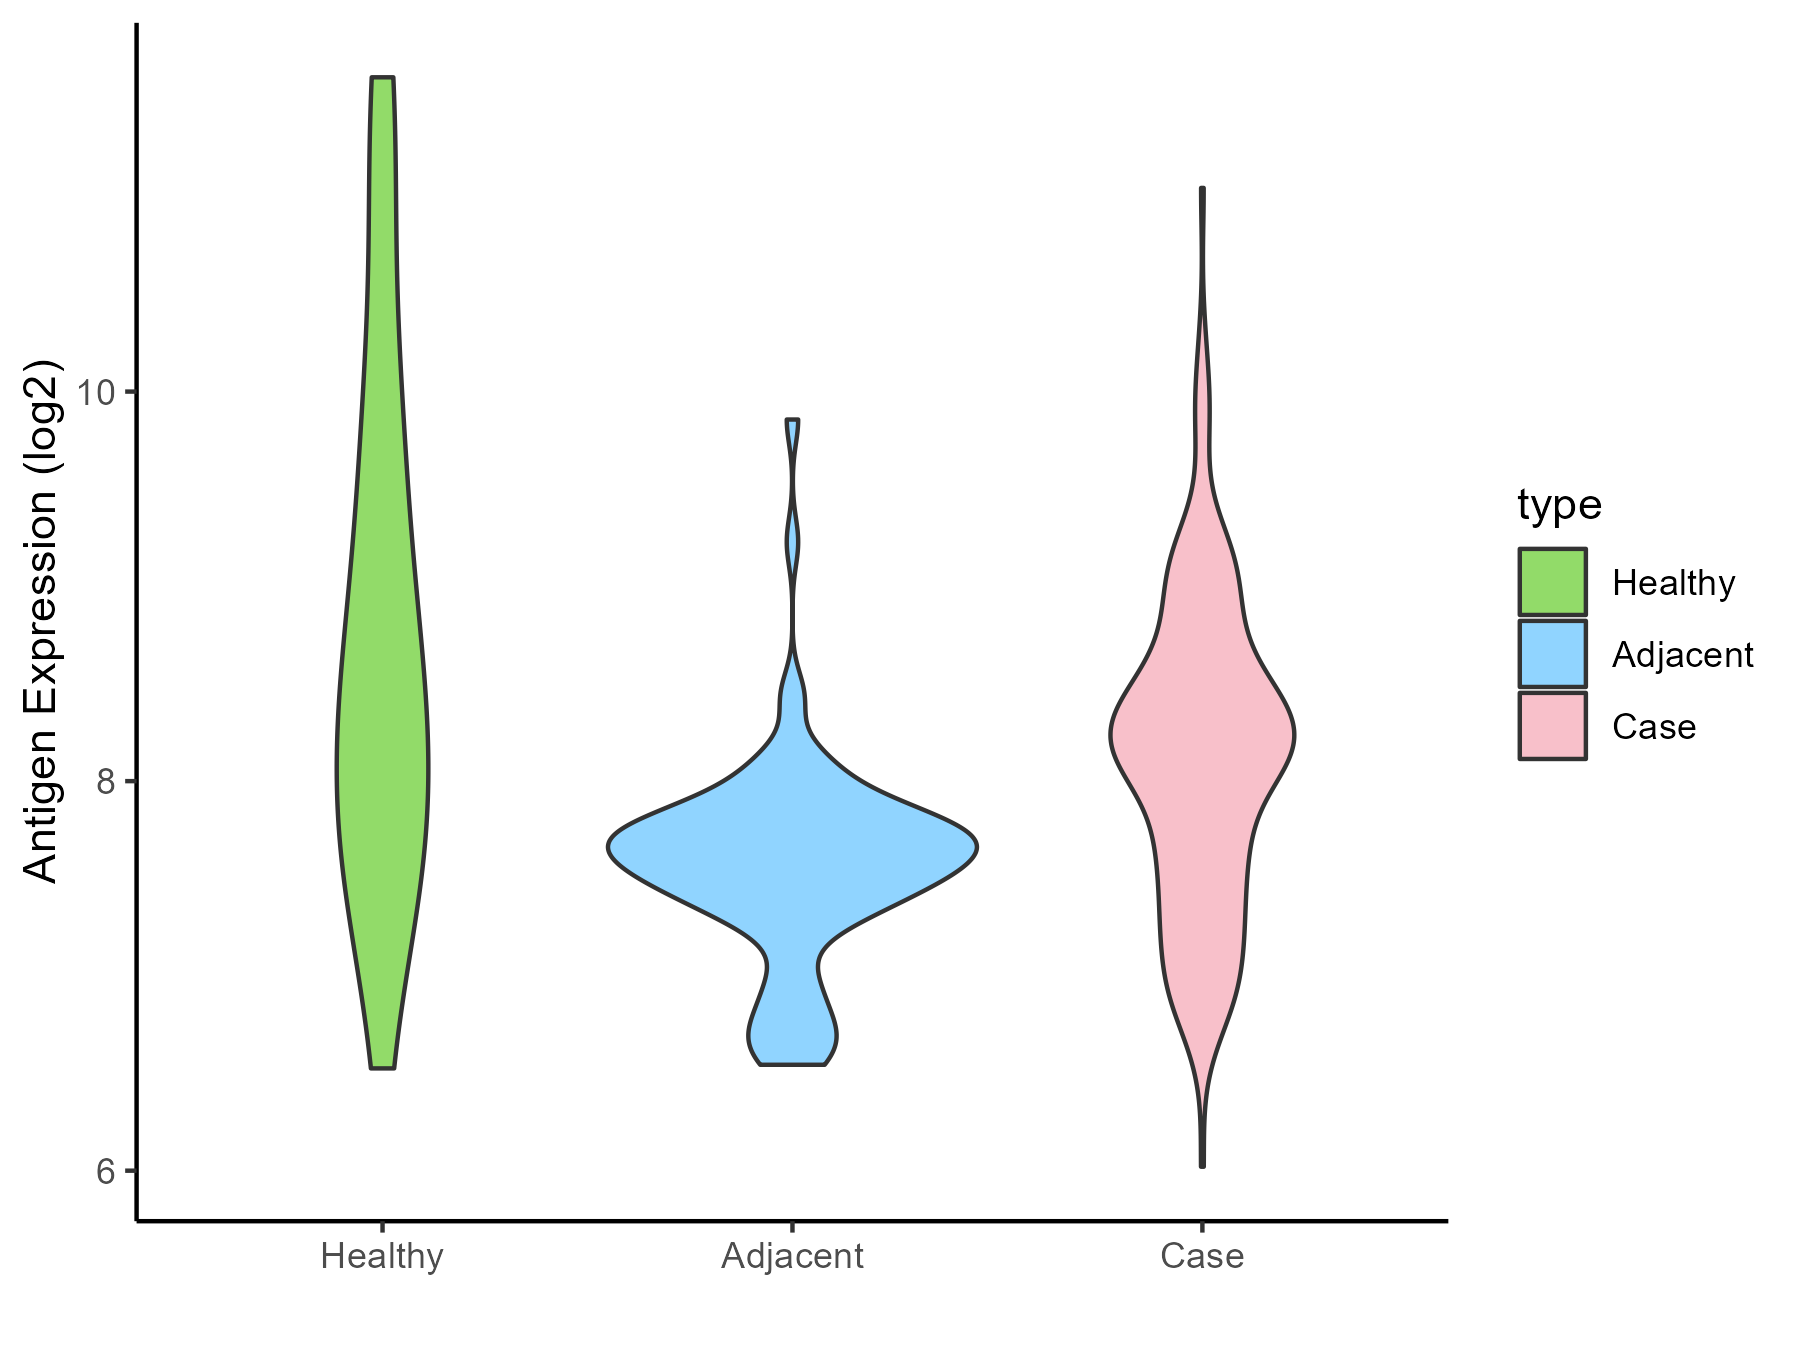
| Differential expression pattern of antigen in diseases | ||
| The Studied Tissue | Oral | |
| The Specific Disease | Oral cancer | |
| The Expression Level of Disease Section Compare with the Healthy Individual Tissue | p-value: 0.025228469; Fold-change: -0.356287563; Z-score: -0.265063477 | |
| The Expression Level of Disease Section Compare with the Adjacent Tissue | p-value: 2.75E-11; Fold-change: 0.548280627; Z-score: 1.055560484 | |
| Disease-specific Antigen Abundances |
|
Click to View the Clearer Original Diagram |
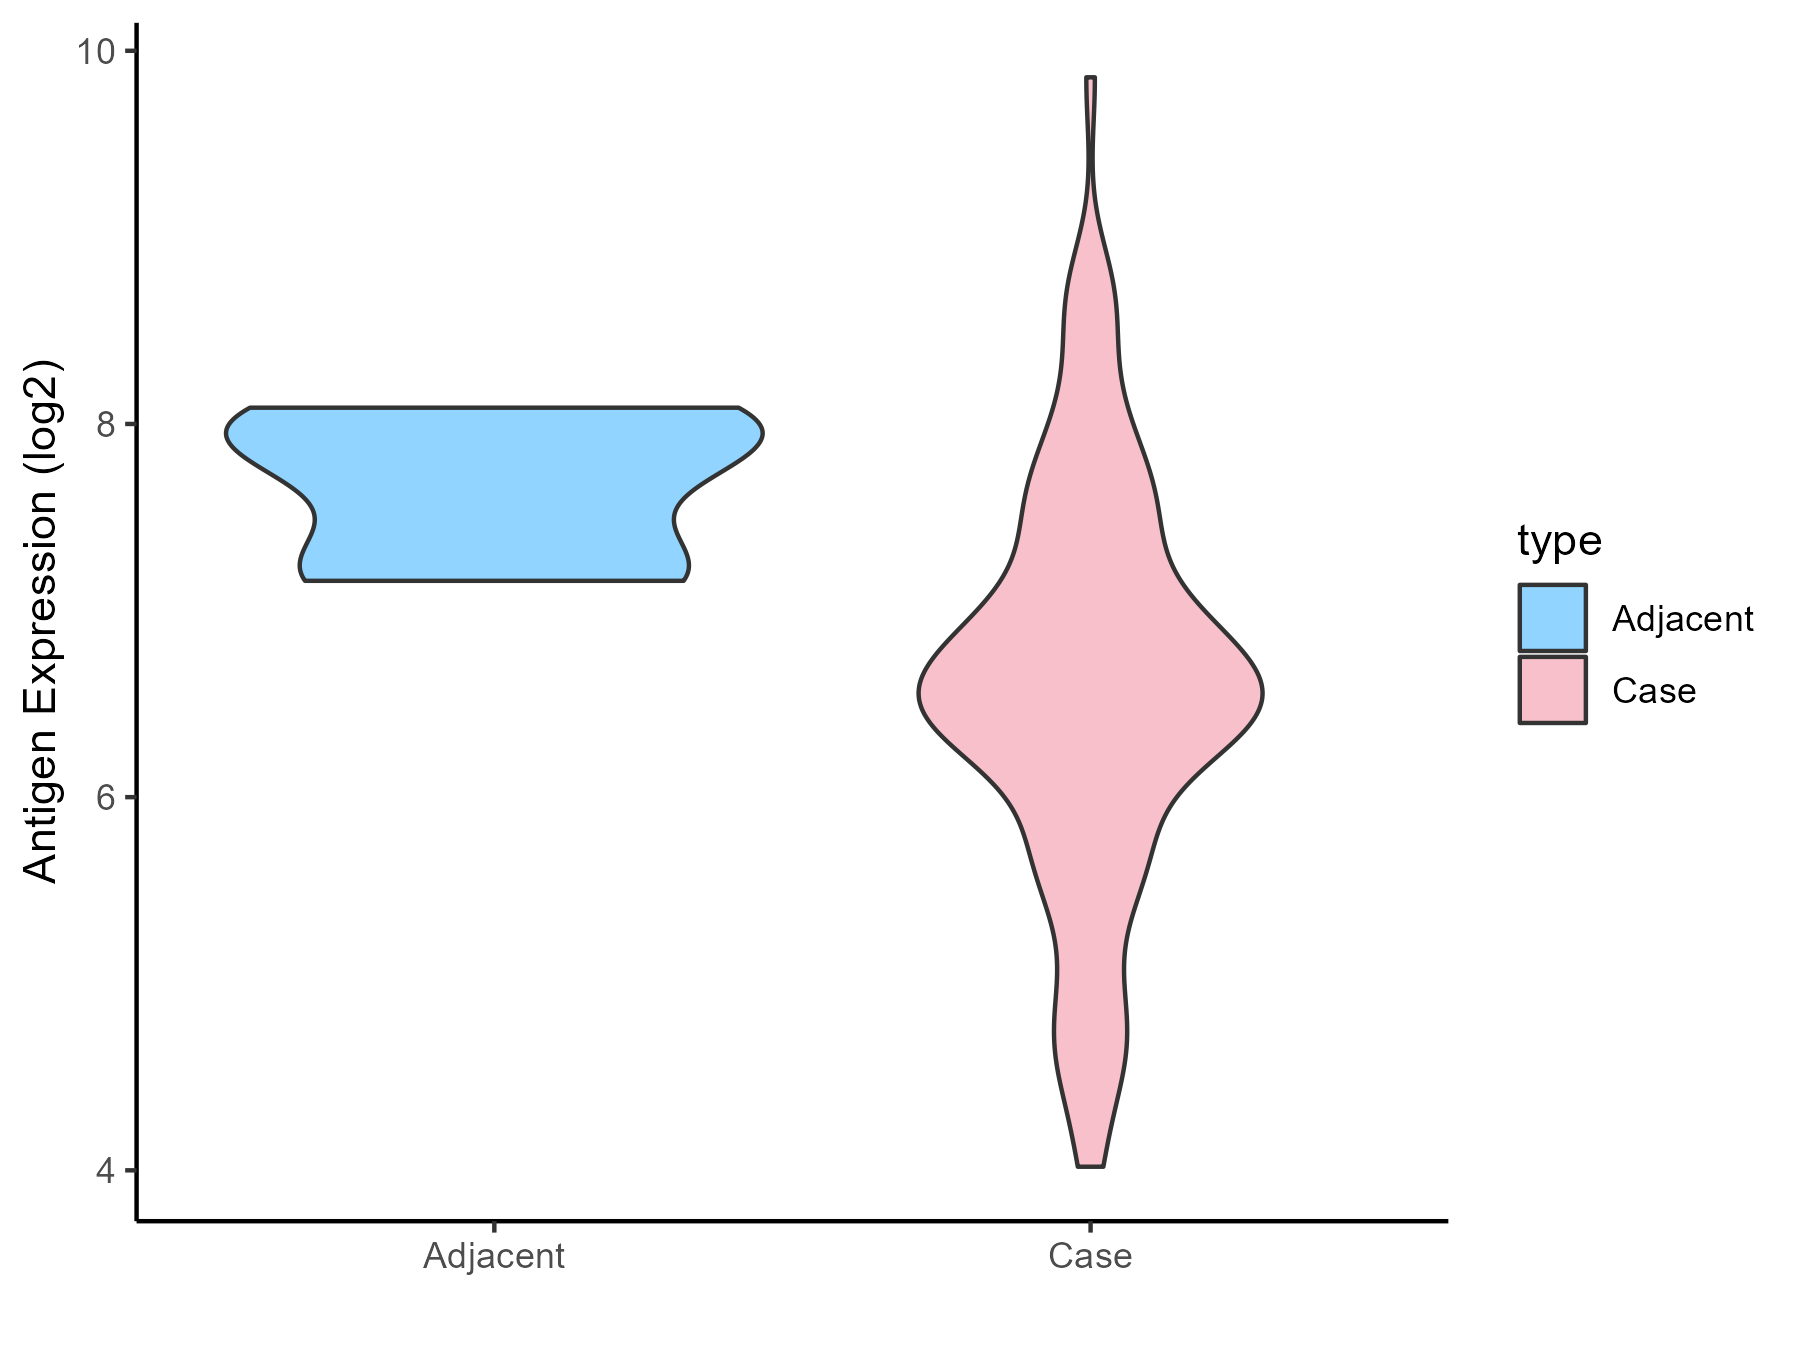
| Differential expression pattern of antigen in diseases | ||
| The Studied Tissue | Esophagus | |
| The Specific Disease | Esophagal cancer | |
| The Expression Level of Disease Section Compare with the Adjacent Tissue | p-value: 0.002146834; Fold-change: -1.305277454; Z-score: -3.013407758 | |
| Disease-specific Antigen Abundances |
|
Click to View the Clearer Original Diagram |
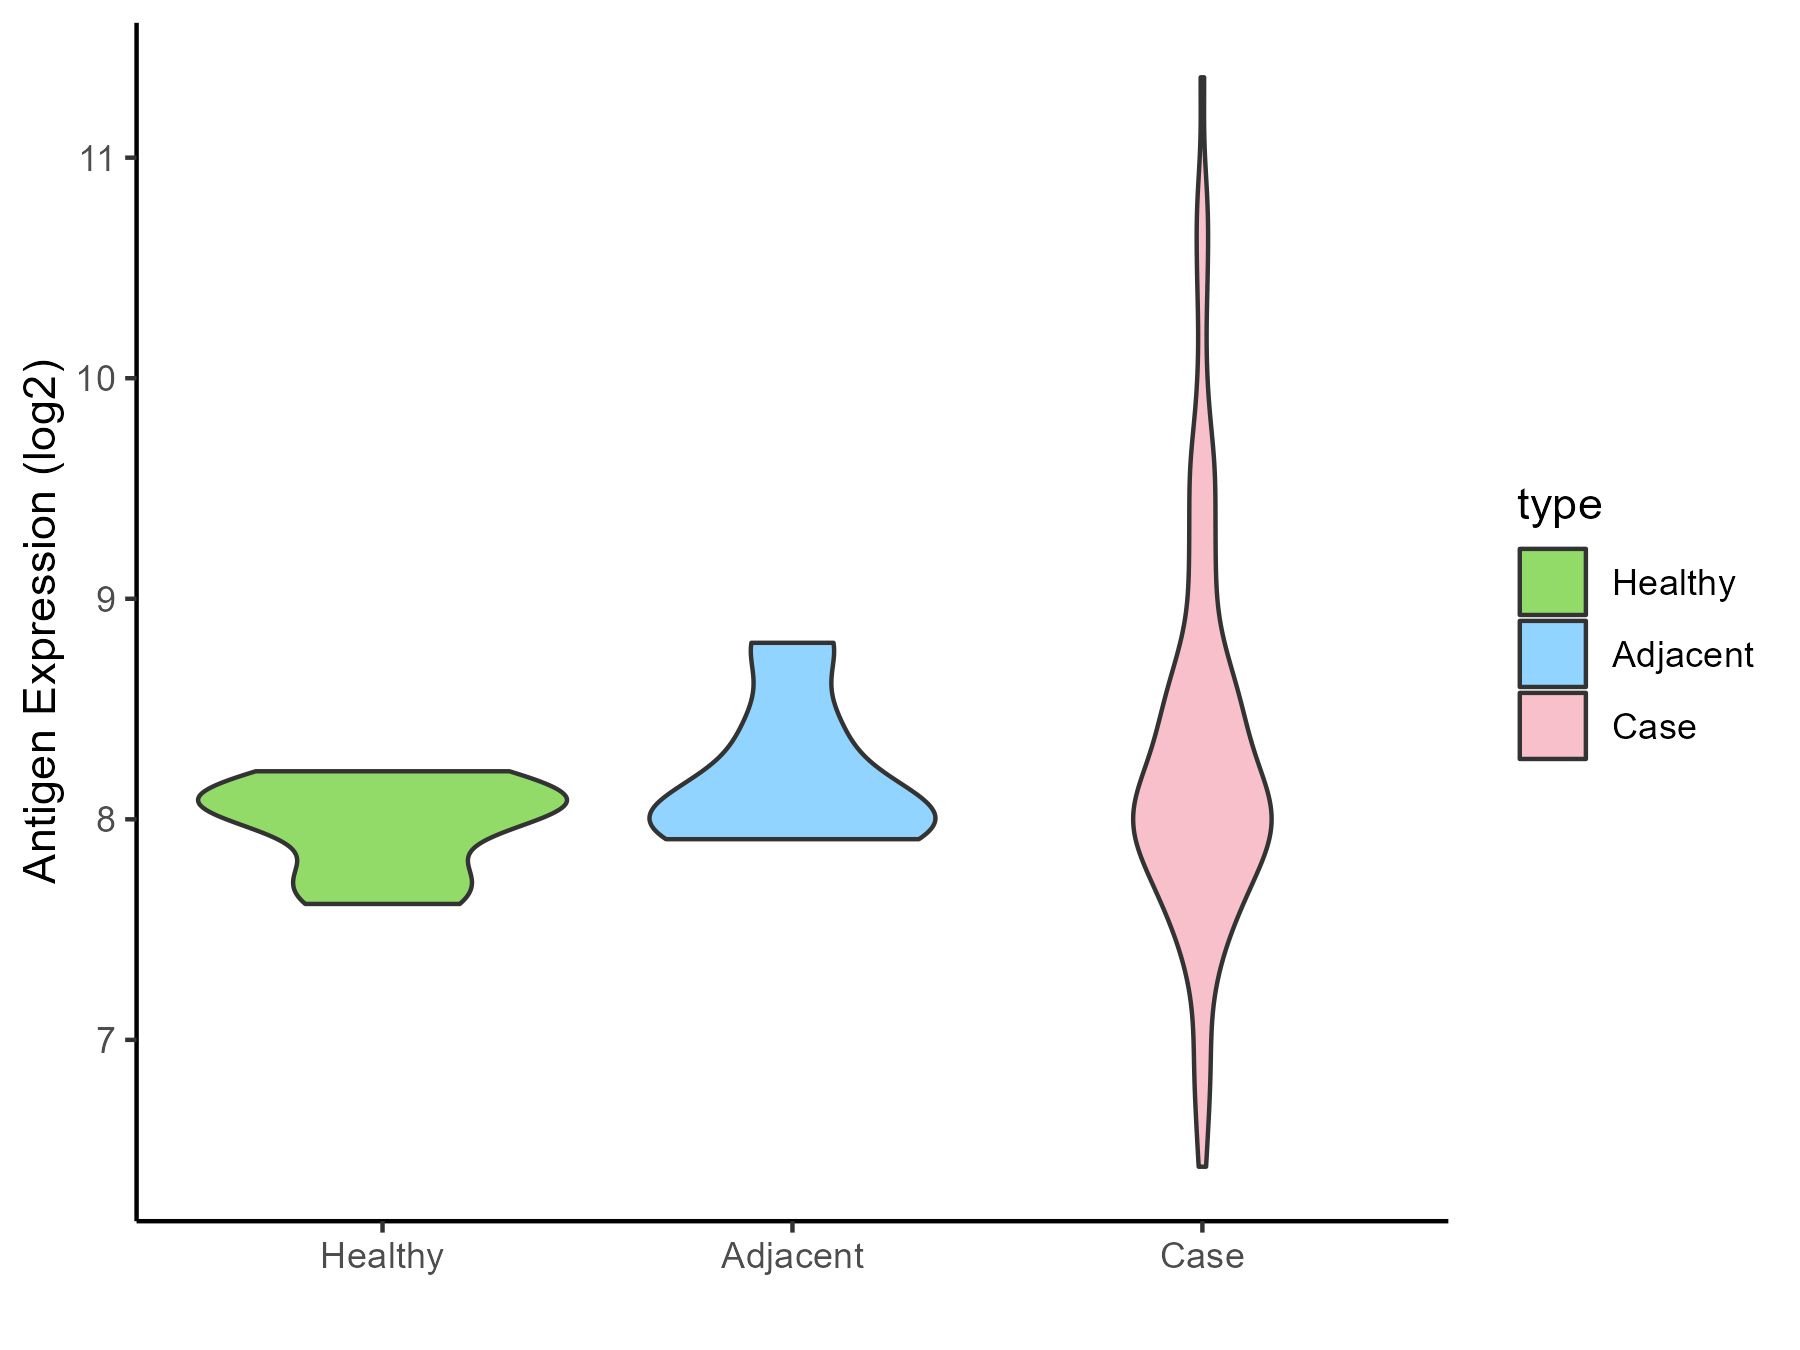
| Differential expression pattern of antigen in diseases | ||
| The Studied Tissue | Rectal colon | |
| The Specific Disease | Rectal cancer | |
| The Expression Level of Disease Section Compare with the Healthy Individual Tissue | p-value: 0.014041586; Fold-change: 0.053035702; Z-score: 0.234525508 | |
| The Expression Level of Disease Section Compare with the Adjacent Tissue | p-value: 0.523344837; Fold-change: 0.029544671; Z-score: 0.086394047 | |
| Disease-specific Antigen Abundances |
|
Click to View the Clearer Original Diagram |
| Differential expression pattern of antigen in diseases | ||
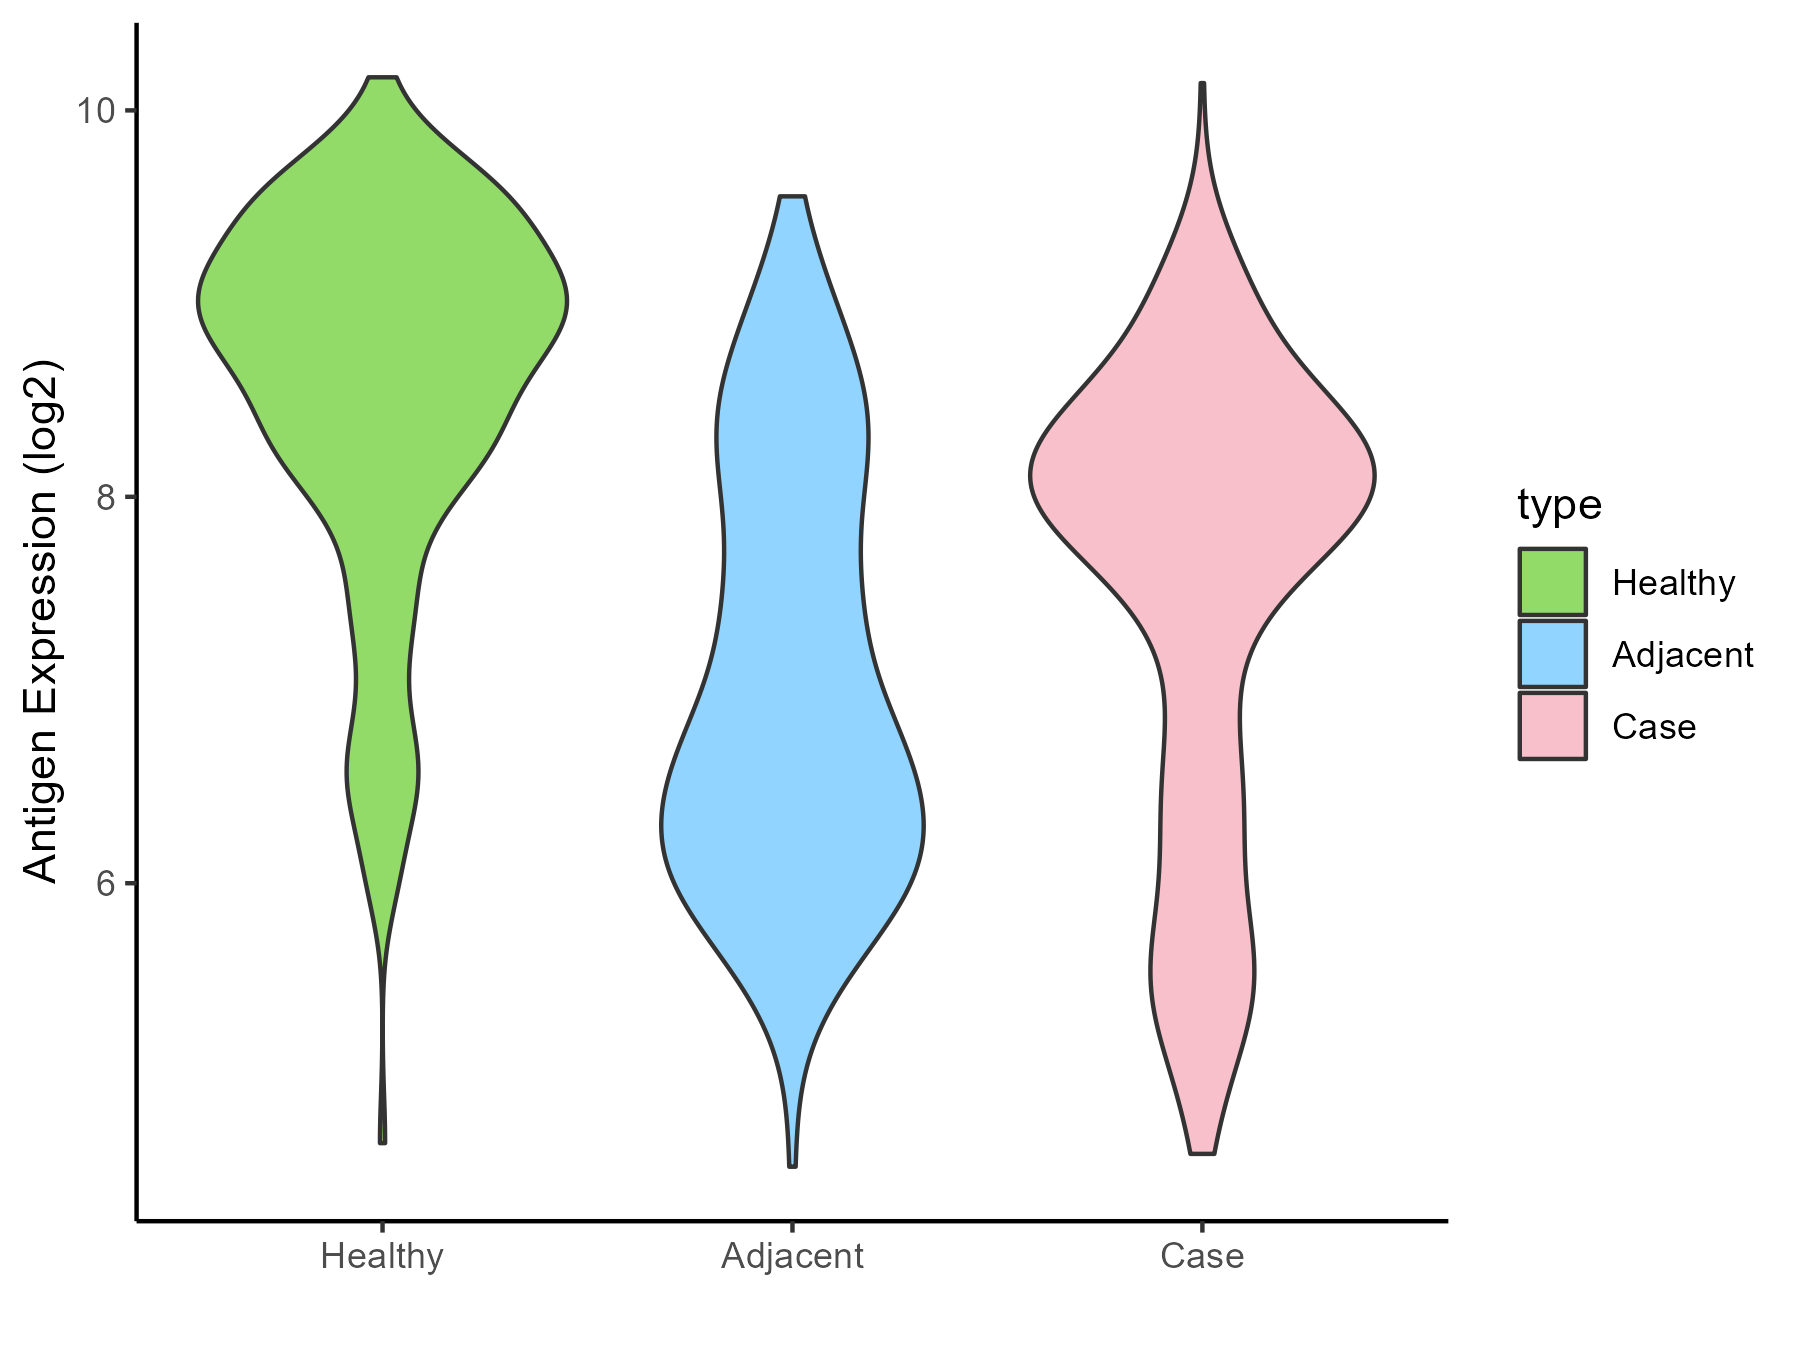
| The Studied Tissue | Skin | |
| The Specific Disease | Skin cancer | |
| The Expression Level of Disease Section Compare with the Healthy Individual Tissue | p-value: 5.11E-28; Fold-change: -0.876615156; Z-score: -0.903783616 | |
| The Expression Level of Disease Section Compare with the Adjacent Tissue | p-value: 1.33E-05; Fold-change: 1.10373055; Z-score: 1.012787222 | |
| Disease-specific Antigen Abundances |
|
Click to View the Clearer Original Diagram |
| Differential expression pattern of antigen in diseases | ||
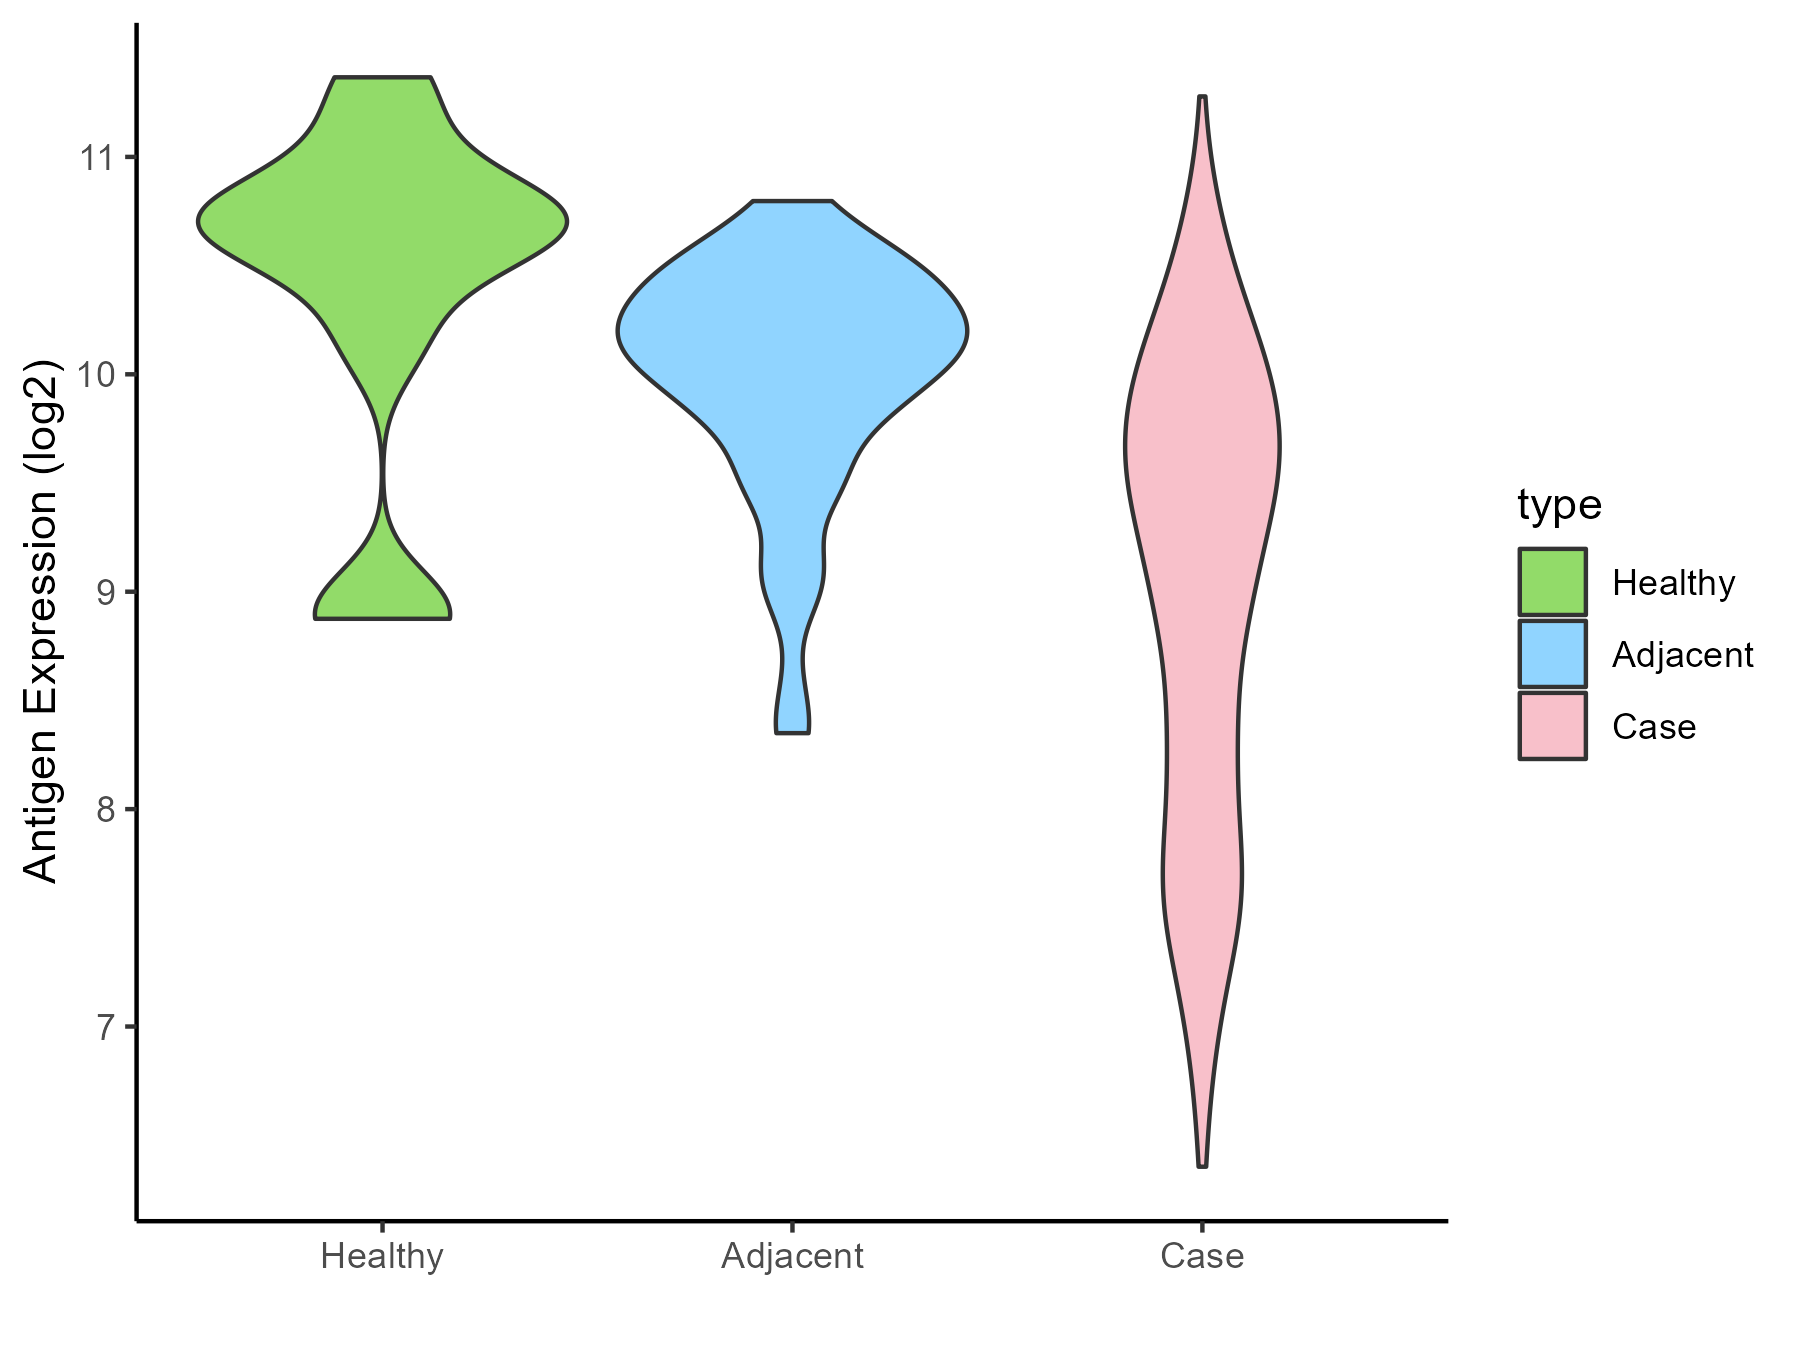
| The Studied Tissue | Kidney | |
| The Specific Disease | Renal cancer | |
| The Expression Level of Disease Section Compare with the Healthy Individual Tissue | p-value: 0.000184952; Fold-change: -1.40970948; Z-score: -1.745532264 | |
| The Expression Level of Disease Section Compare with the Adjacent Tissue | p-value: 4.02E-23; Fold-change: -0.853737626; Z-score: -1.567779055 | |
| Disease-specific Antigen Abundances |
|
Click to View the Clearer Original Diagram |
| Differential expression pattern of antigen in diseases | ||
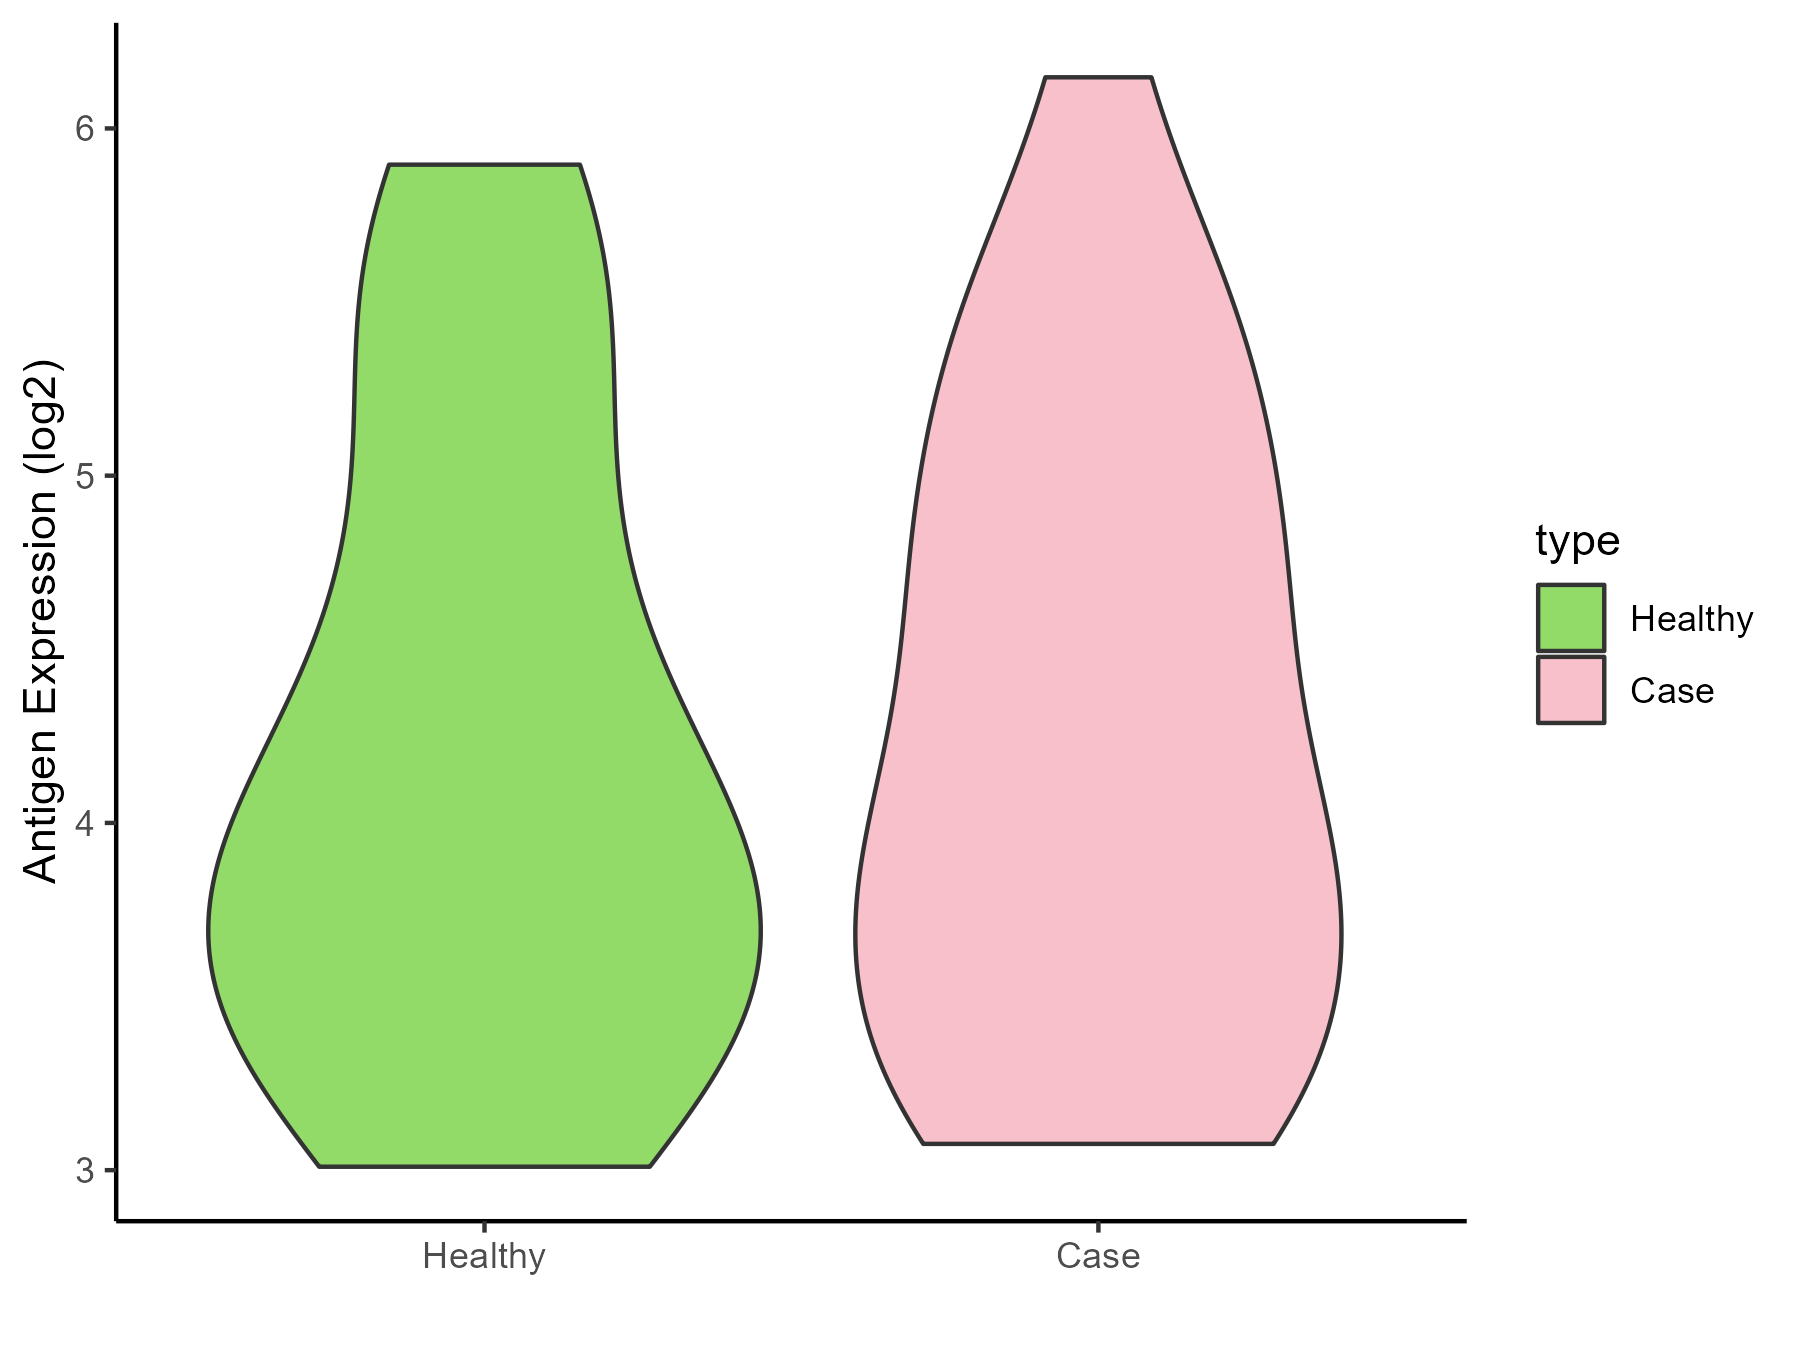
| The Studied Tissue | Urothelium | |
| The Specific Disease | Ureter cancer | |
| The Expression Level of Disease Section Compare with the Healthy Individual Tissue | p-value: 0.852609568; Fold-change: 0.077969295; Z-score: 0.085373594 | |
| Disease-specific Antigen Abundances |
|
Click to View the Clearer Original Diagram |
ICD Disease Classification 20
| Differential expression pattern of antigen in diseases | ||
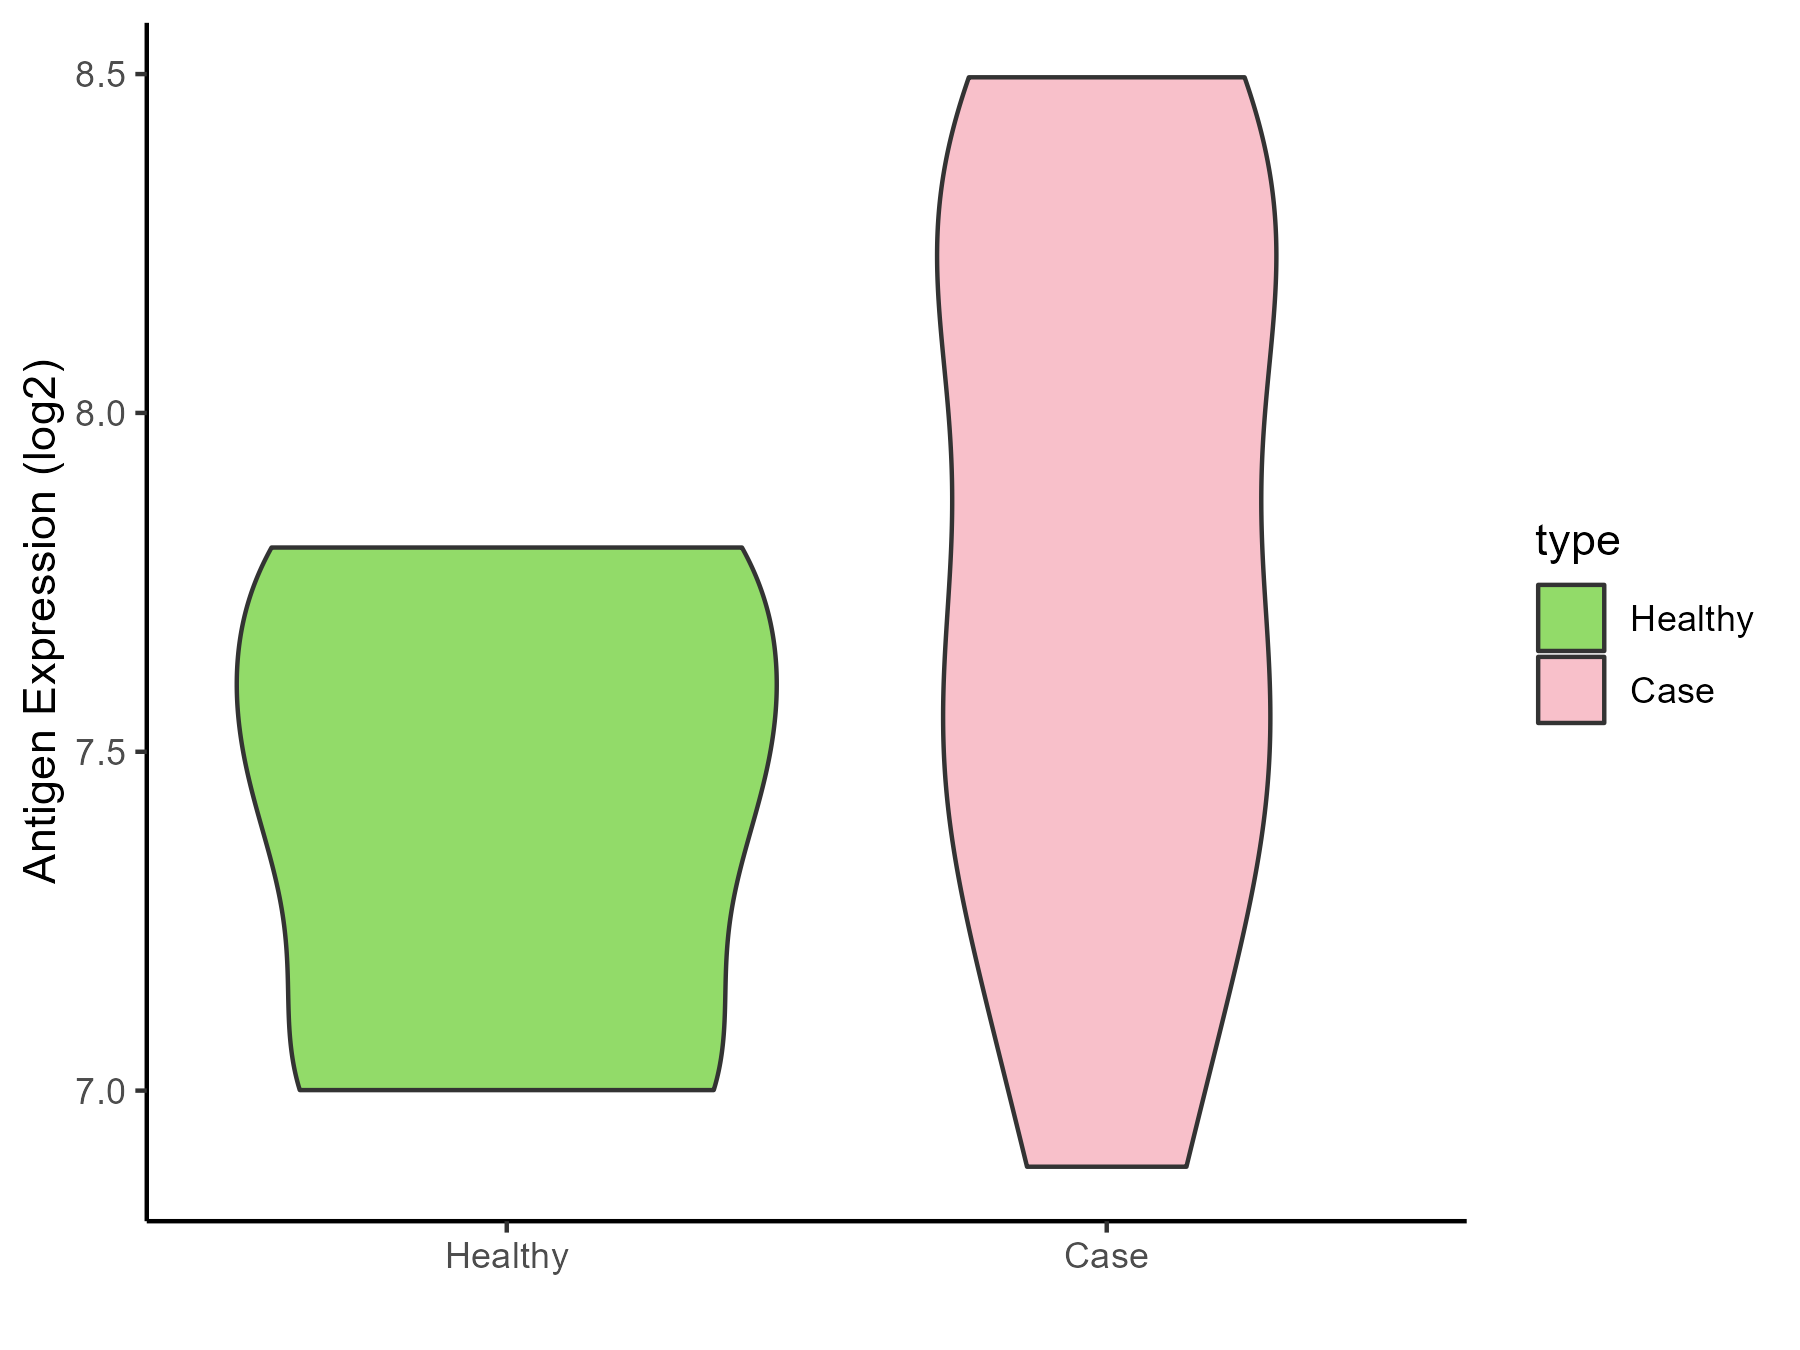
| The Studied Tissue | Adipose | |
| The Specific Disease | Simpson golabi behmel syndrome | |
| The Expression Level of Disease Section Compare with the Healthy Individual Tissue | p-value: 0.268210691; Fold-change: 0.193076533; Z-score: 0.481109405 | |
| Disease-specific Antigen Abundances |
|
Click to View the Clearer Original Diagram |
| Differential expression pattern of antigen in diseases | ||
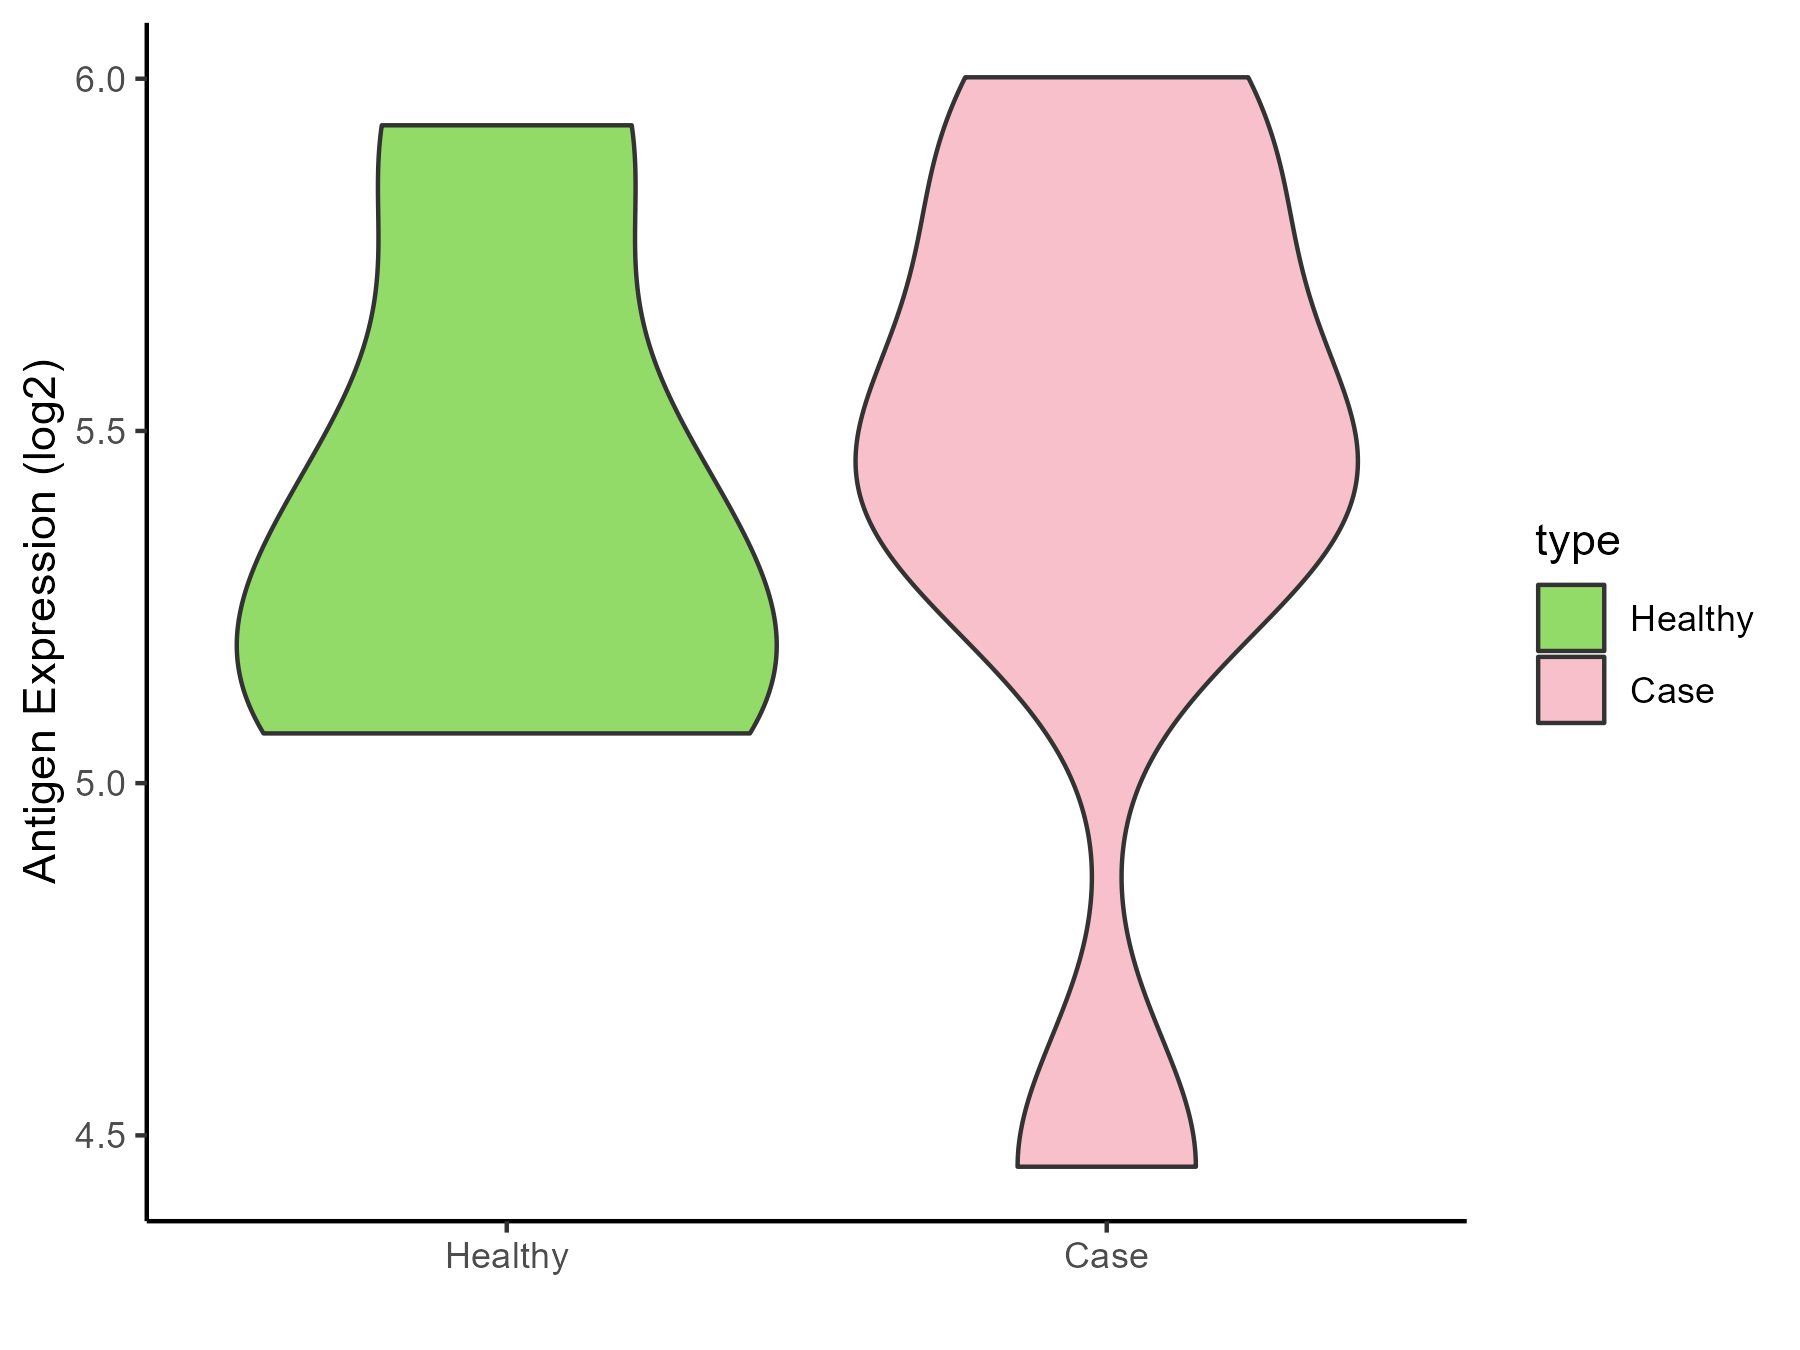
| The Studied Tissue | Perituberal | |
| The Specific Disease | Tuberous sclerosis complex | |
| The Expression Level of Disease Section Compare with the Healthy Individual Tissue | p-value: 0.969271797; Fold-change: 0.166939779; Z-score: 0.432049021 | |
| Disease-specific Antigen Abundances |
|
Click to View the Clearer Original Diagram |
ICD Disease Classification 3
| Differential expression pattern of antigen in diseases | ||
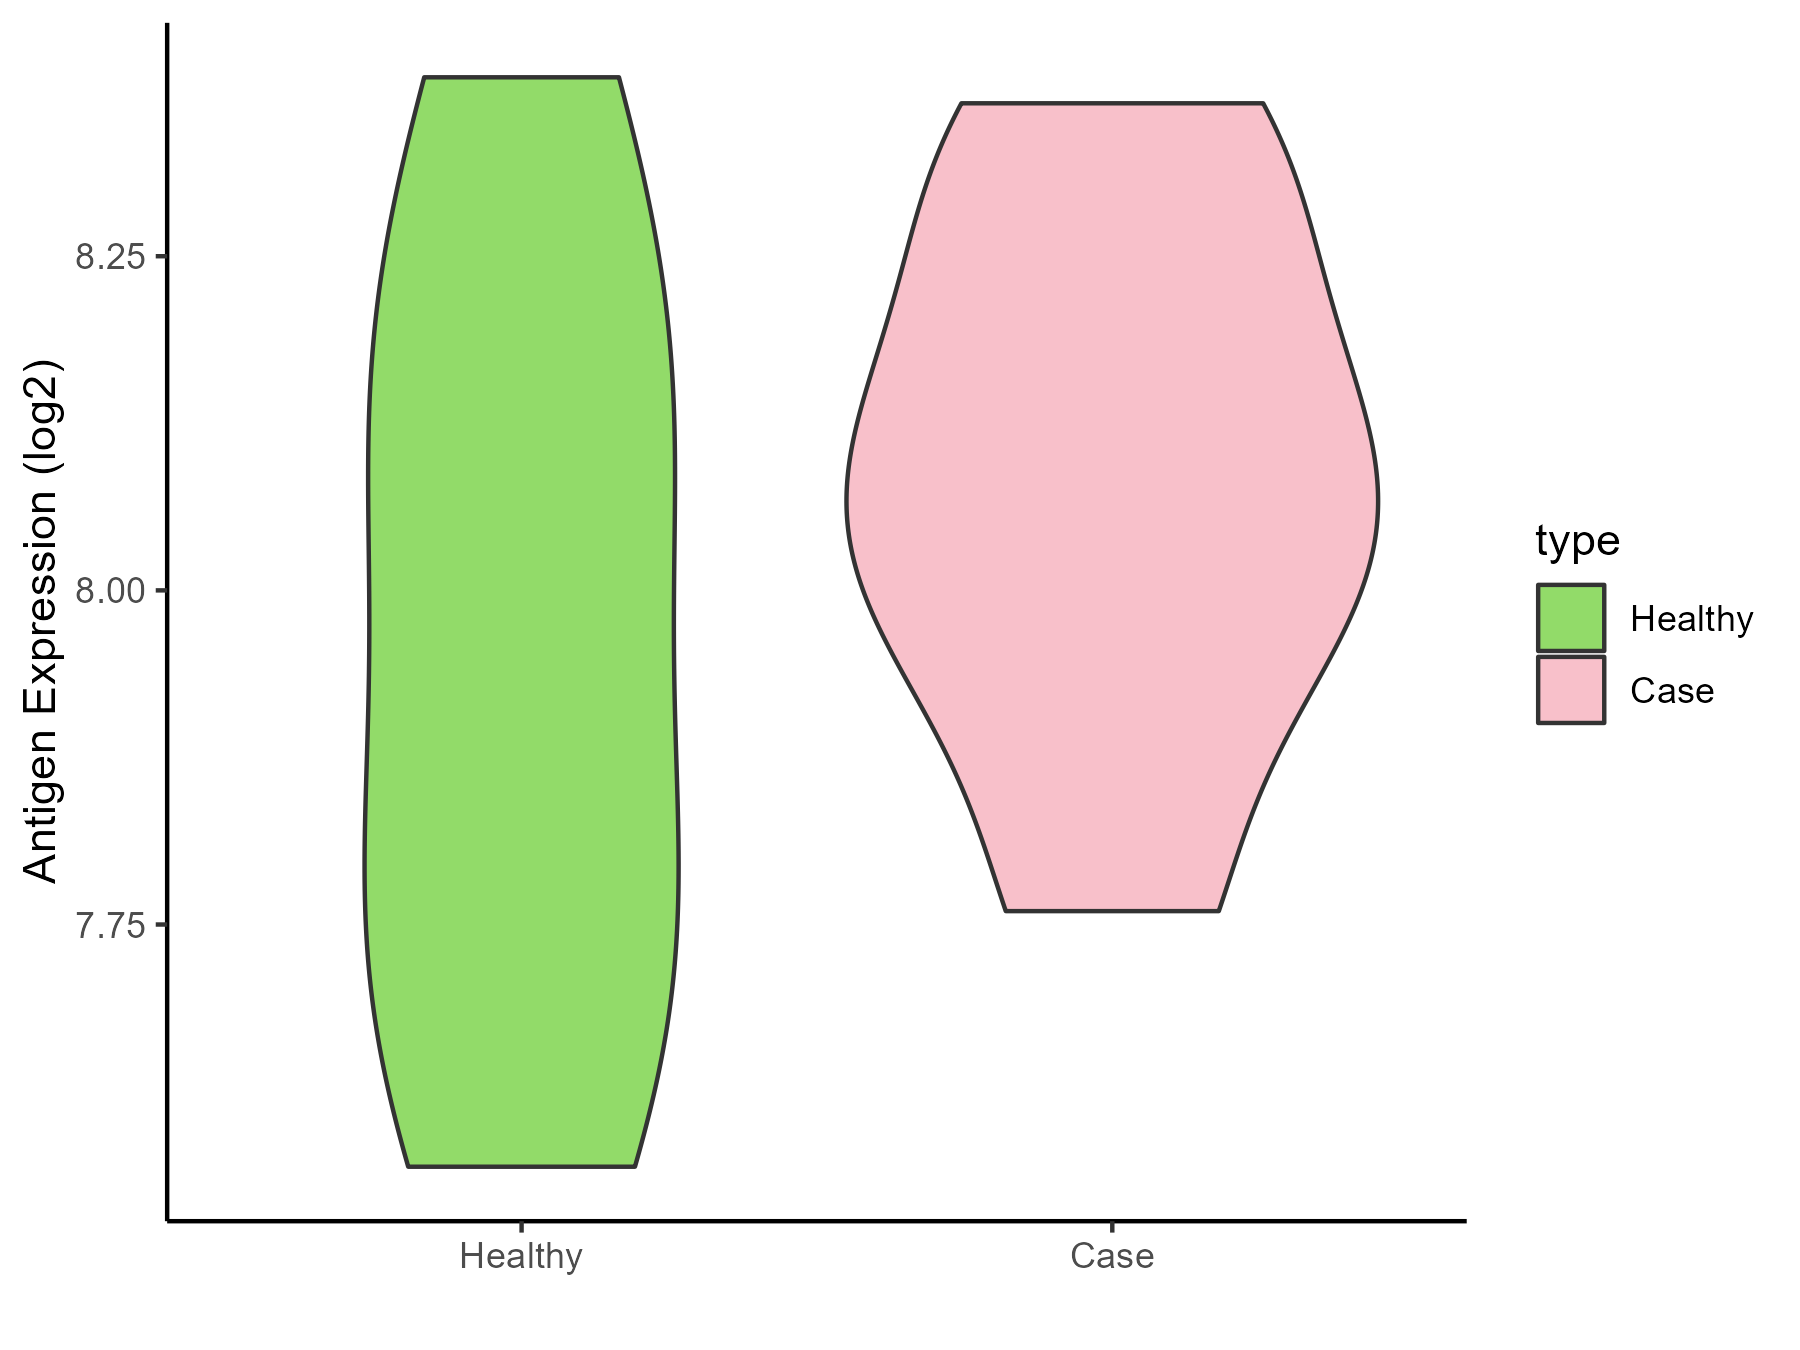
| The Studied Tissue | Bone marrow | |
| The Specific Disease | Anemia | |
| The Expression Level of Disease Section Compare with the Healthy Individual Tissue | p-value: 0.38605703; Fold-change: 0.130663716; Z-score: 0.446706961 | |
| Disease-specific Antigen Abundances |
|
Click to View the Clearer Original Diagram |
| Differential expression pattern of antigen in diseases | ||
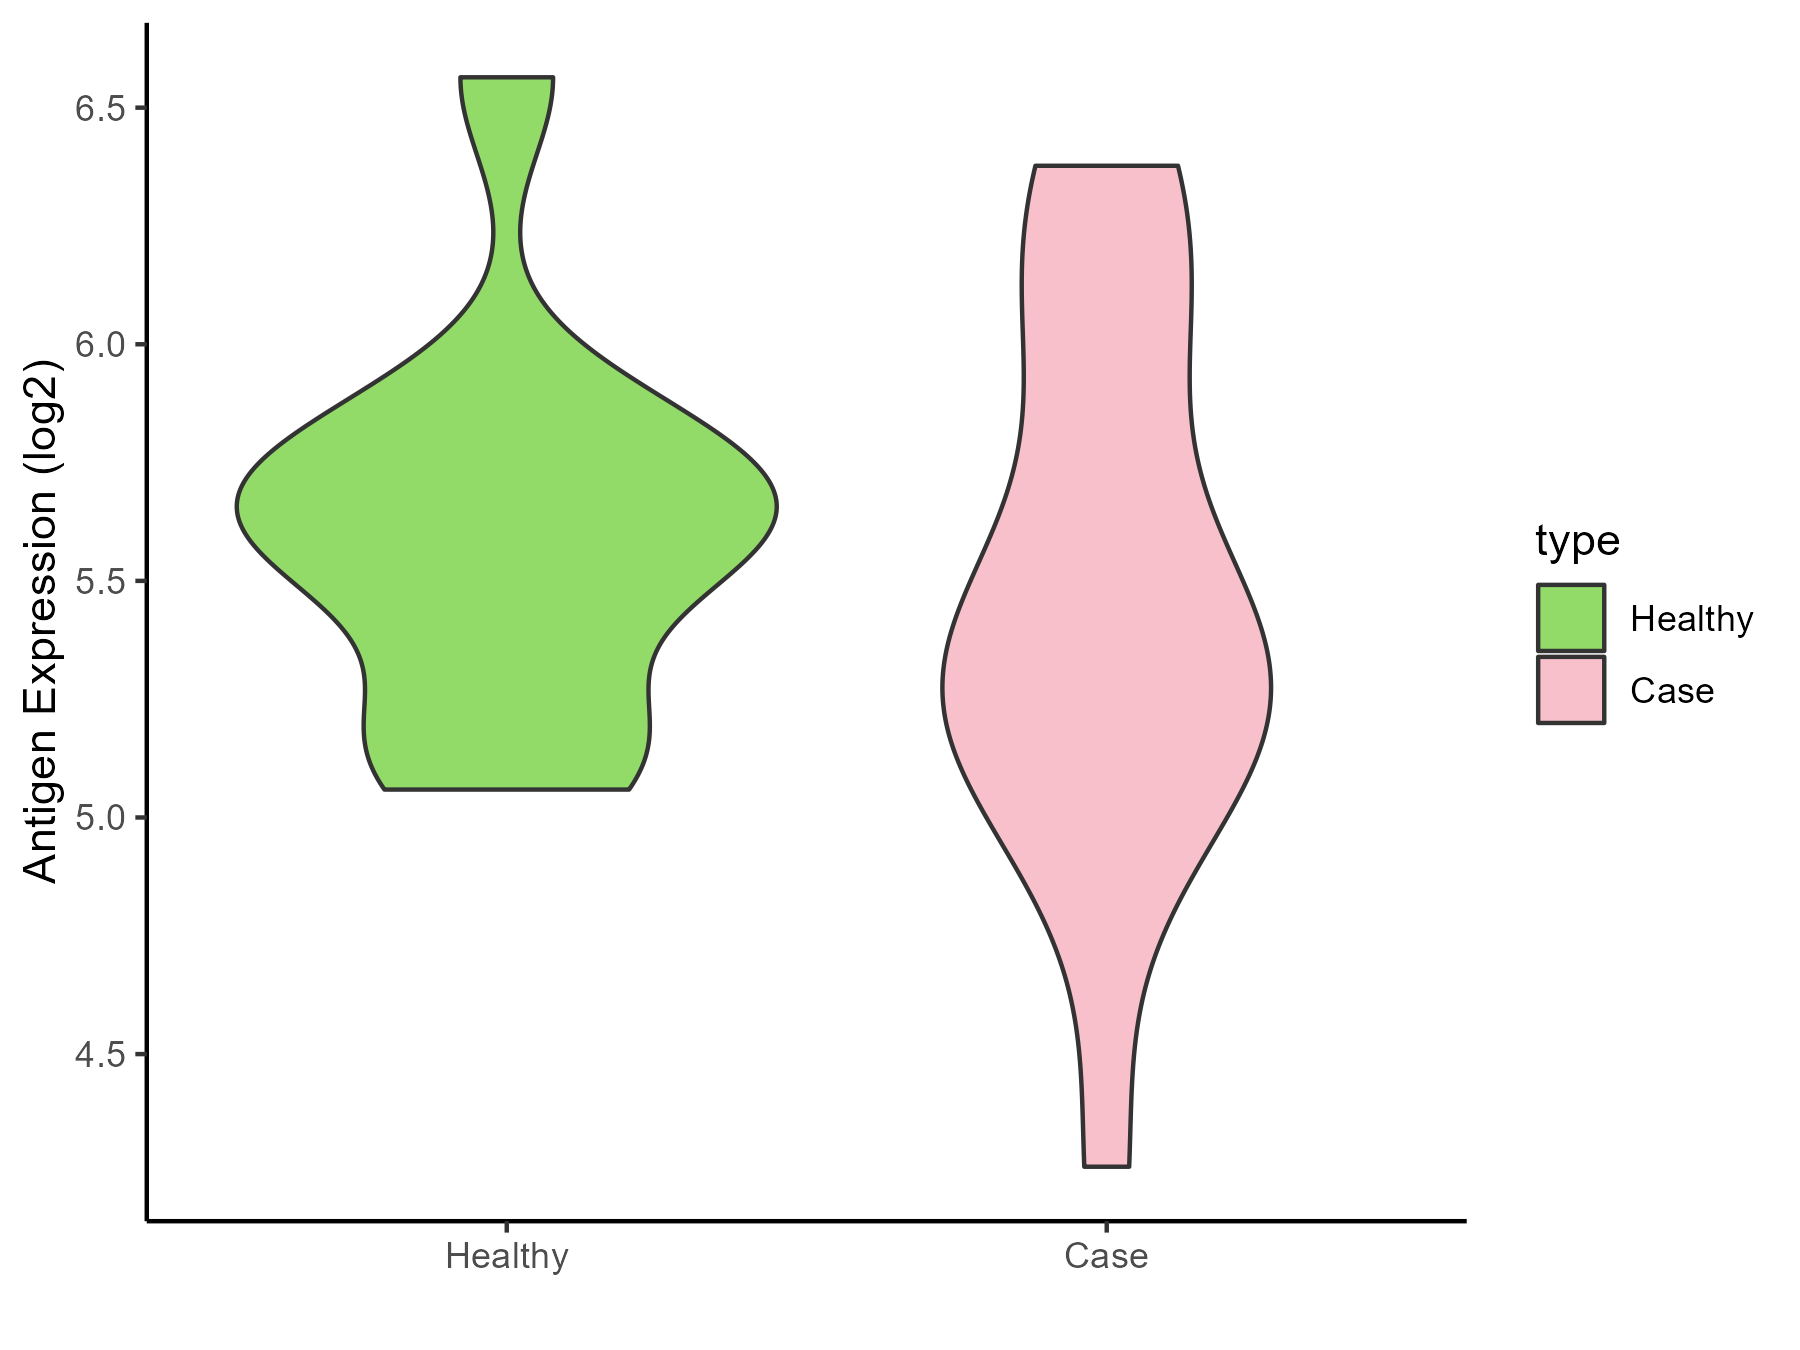
| The Studied Tissue | Peripheral blood | |
| The Specific Disease | Sickle cell disease | |
| The Expression Level of Disease Section Compare with the Healthy Individual Tissue | p-value: 0.531915624; Fold-change: -0.23395813; Z-score: -0.567186118 | |
| Disease-specific Antigen Abundances |
|
Click to View the Clearer Original Diagram |
| Differential expression pattern of antigen in diseases | ||
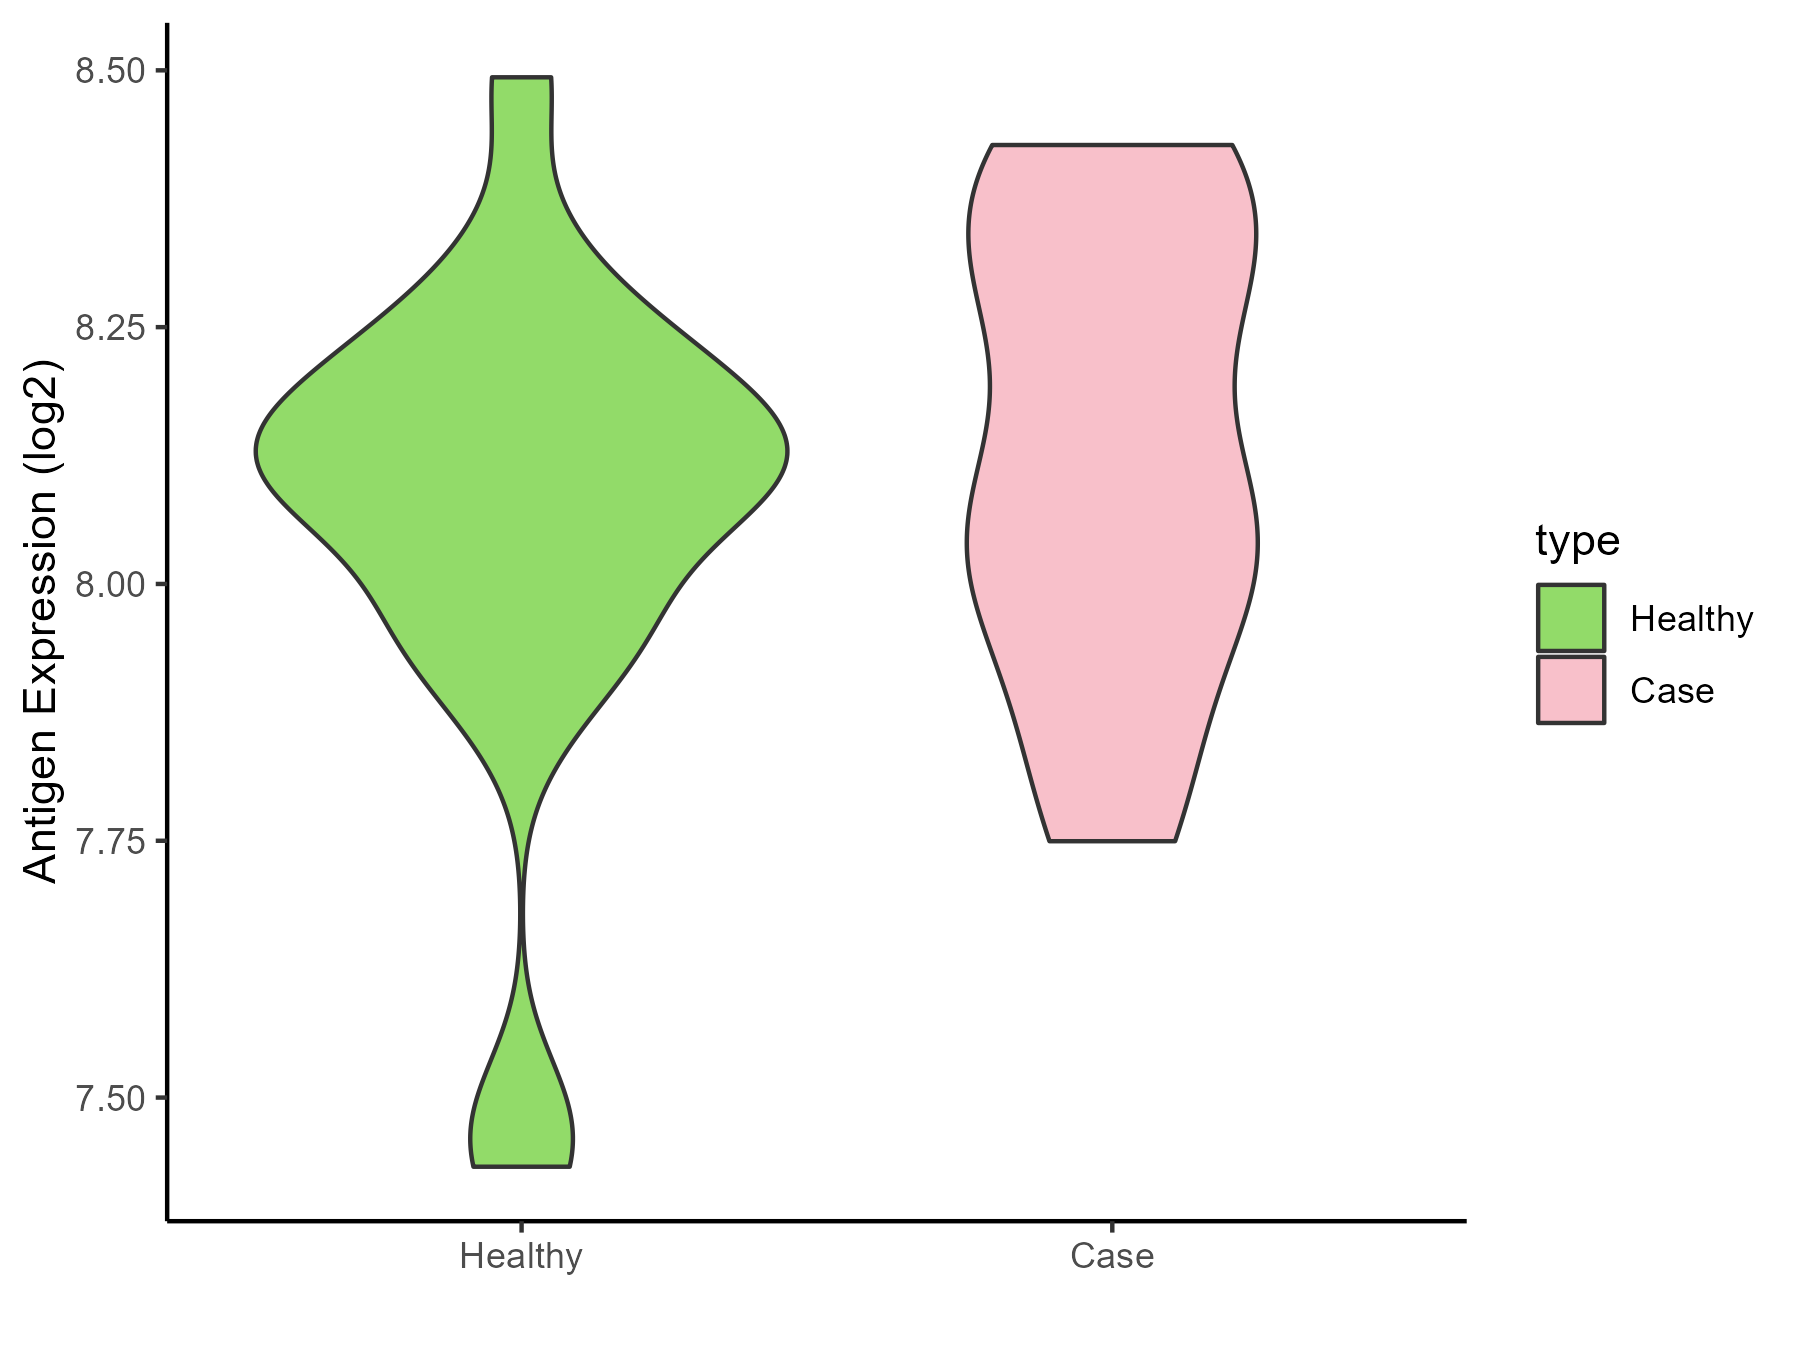
| The Studied Tissue | Whole blood | |
| The Specific Disease | Thrombocythemia | |
| The Expression Level of Disease Section Compare with the Healthy Individual Tissue | p-value: 0.221833743; Fold-change: -0.030398444; Z-score: -0.126245384 | |
| Disease-specific Antigen Abundances |
|
Click to View the Clearer Original Diagram |
ICD Disease Classification 4
| Differential expression pattern of antigen in diseases | ||
| The Studied Tissue | Whole blood | |
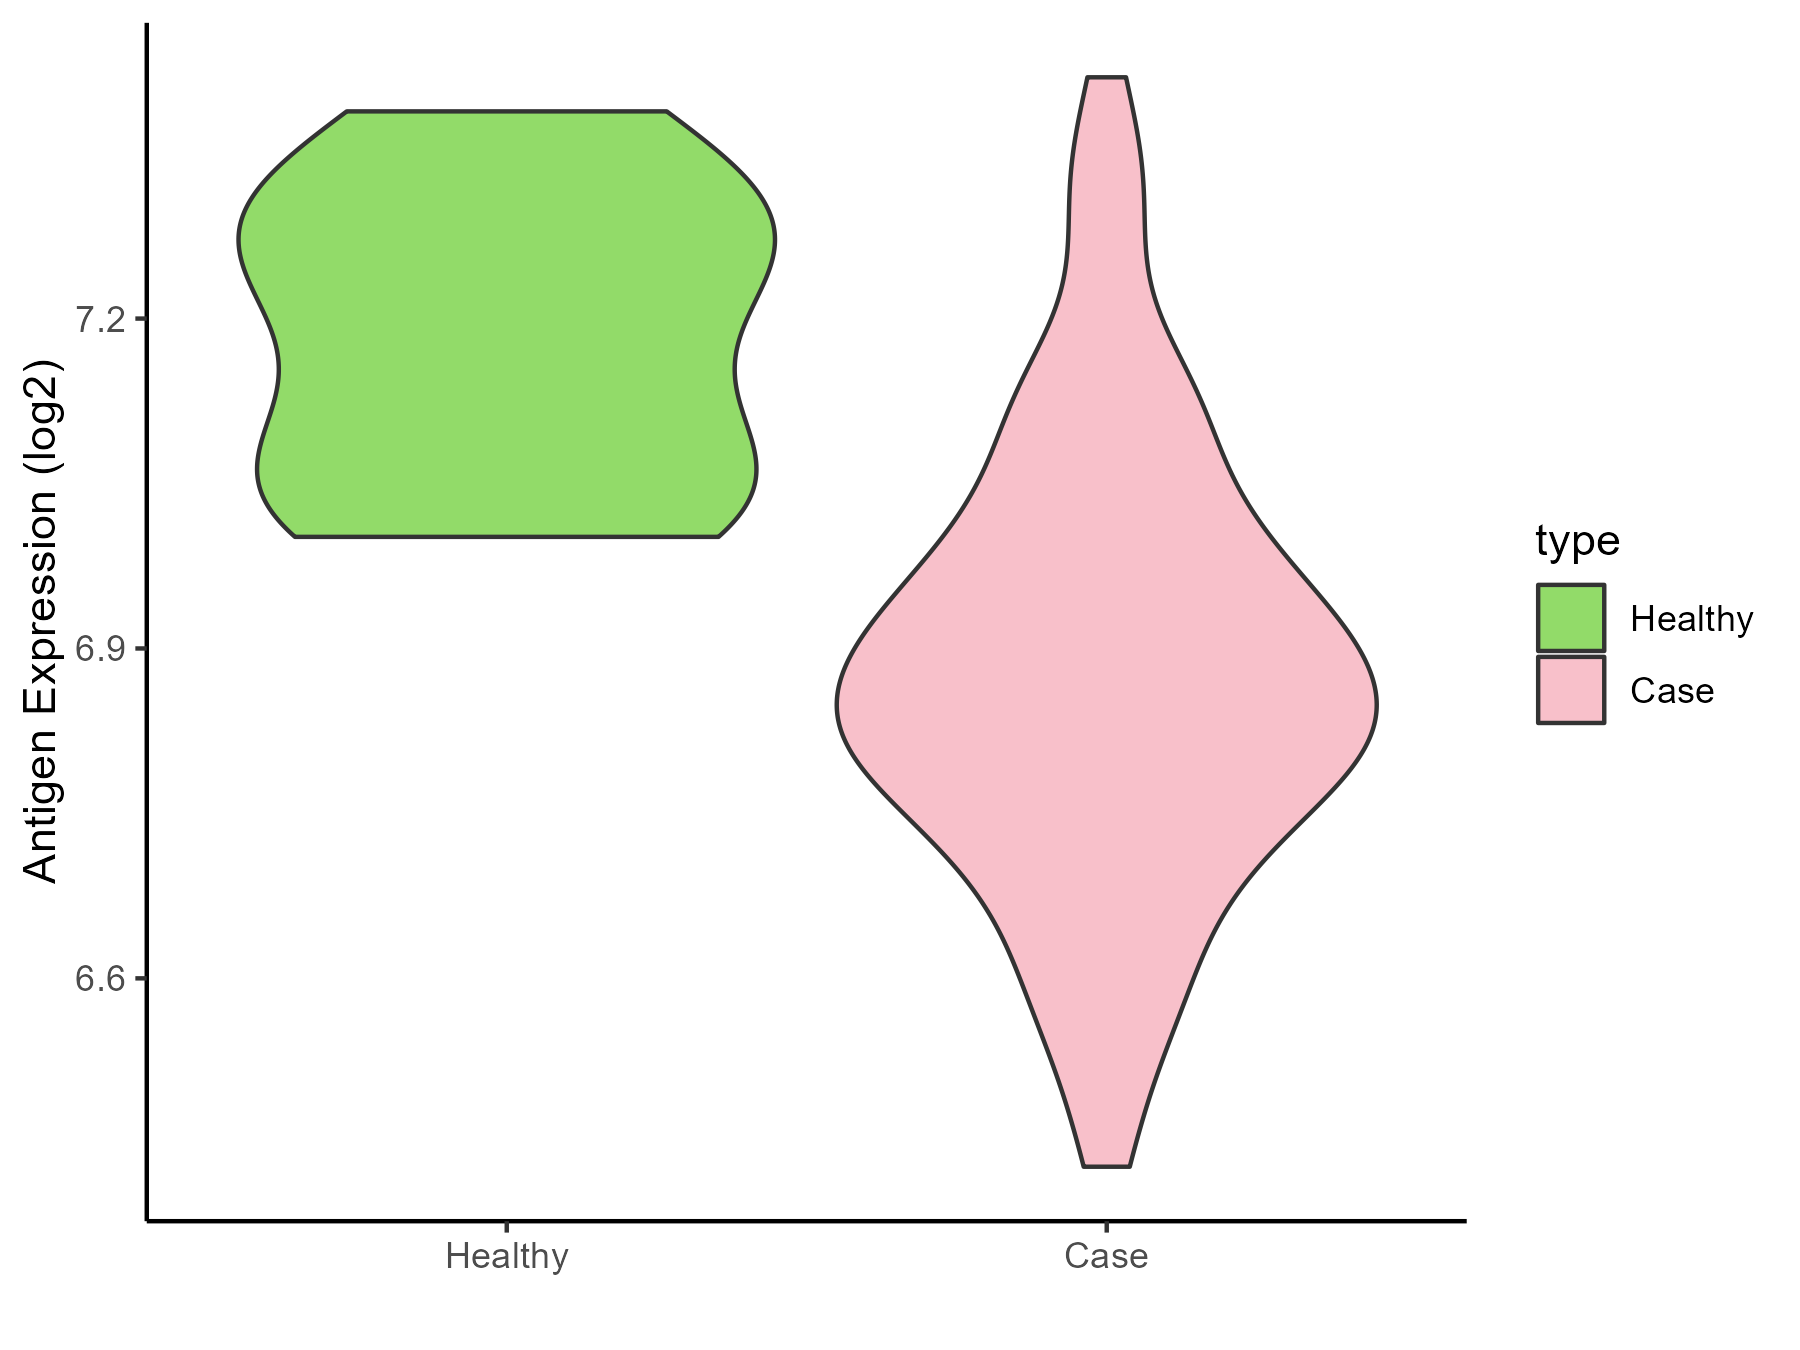
| The Specific Disease | Scleroderma | |
| The Expression Level of Disease Section Compare with the Healthy Individual Tissue | p-value: 8.07E-05; Fold-change: -0.342916678; Z-score: -2.466796539 | |
| Disease-specific Antigen Abundances |
|
Click to View the Clearer Original Diagram |
| Differential expression pattern of antigen in diseases | ||
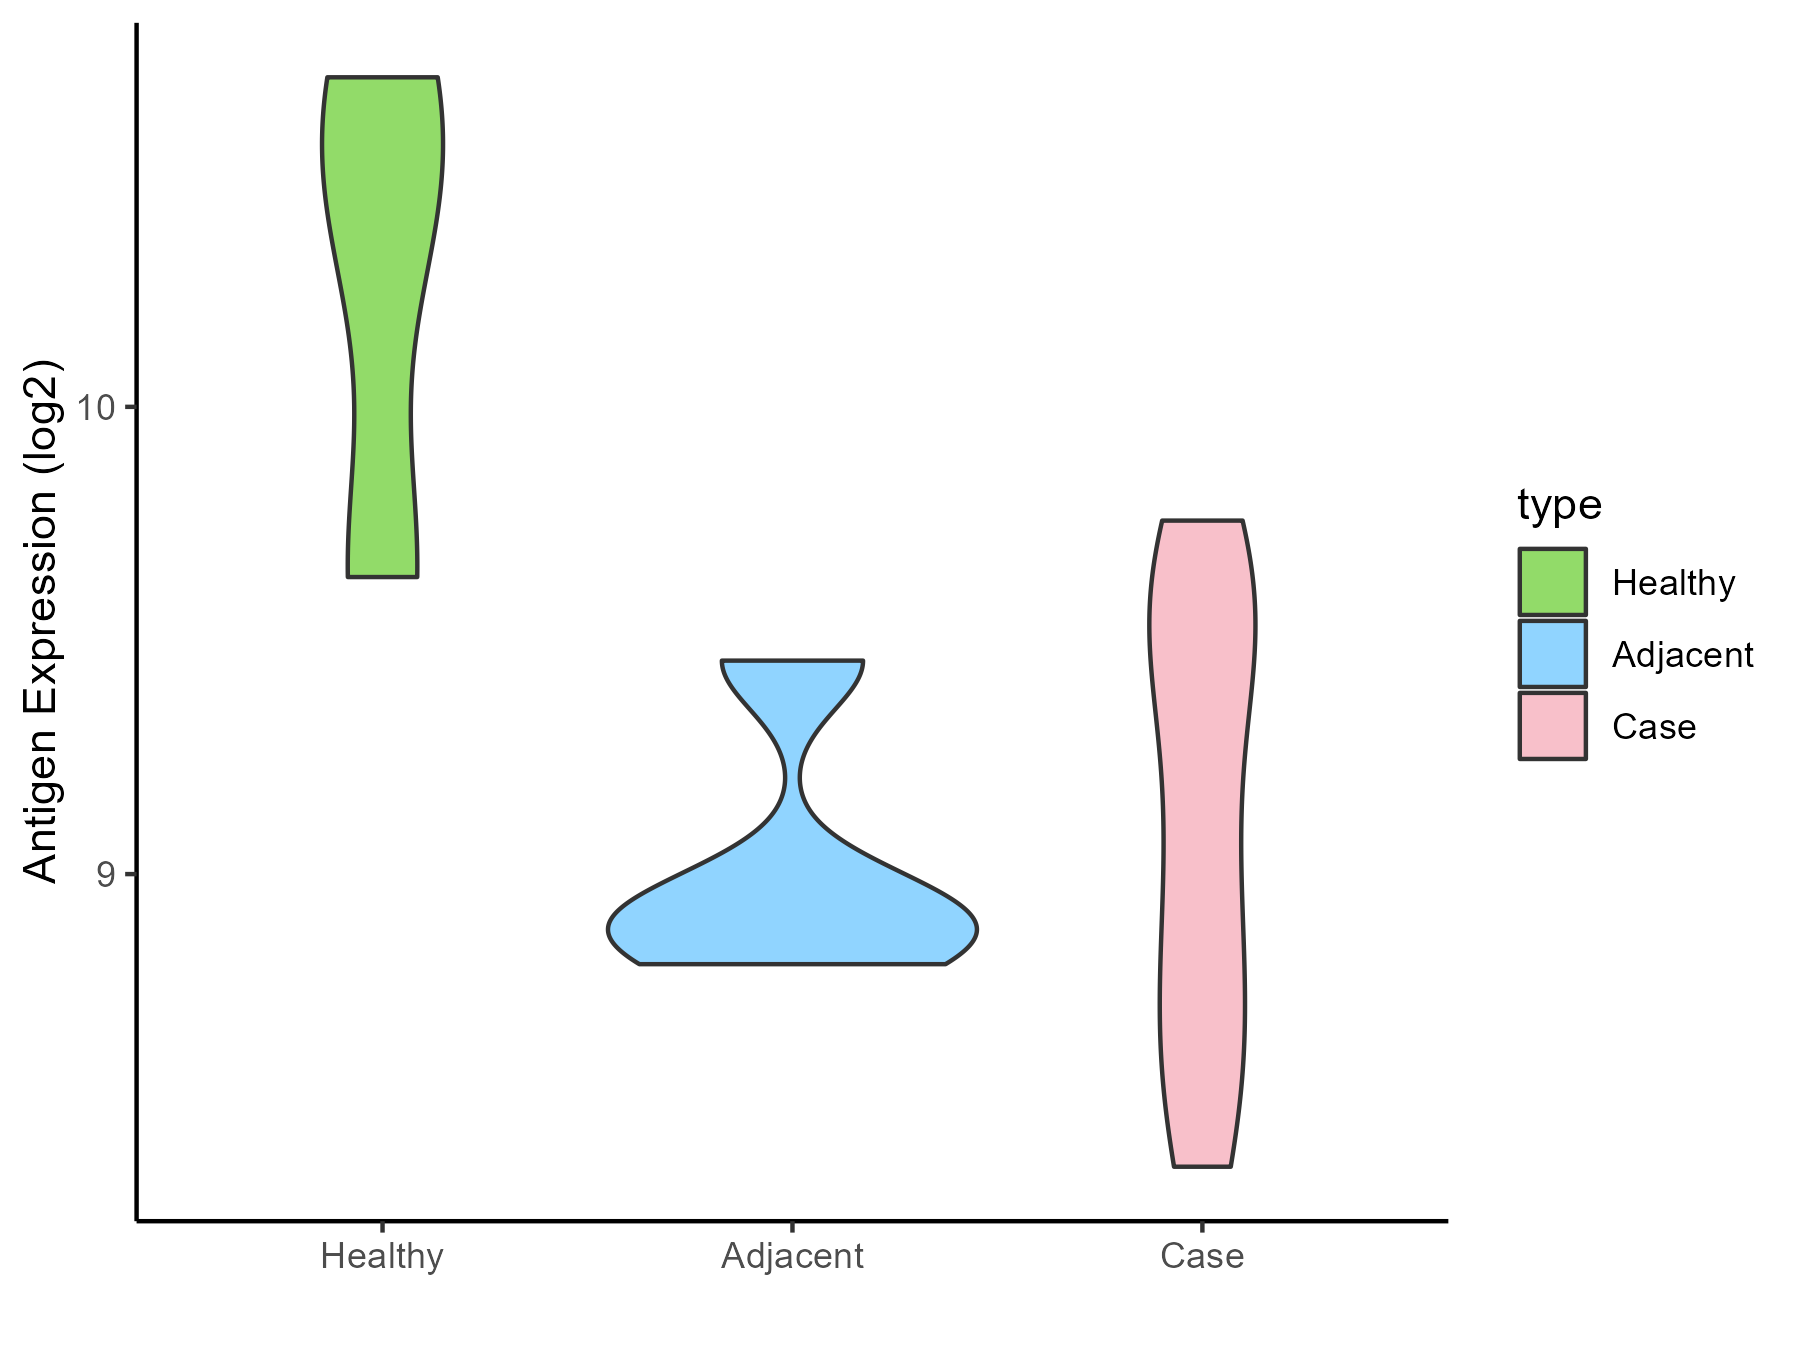
| The Studied Tissue | Salivary gland | |
| The Specific Disease | Sjogren syndrome | |
| The Expression Level of Disease Section Compare with the Healthy Individual Tissue | p-value: 0.058194208; Fold-change: -1.360617761; Z-score: -2.452000086 | |
| The Expression Level of Disease Section Compare with the Adjacent Tissue | p-value: 0.602108639; Fold-change: 0.151280978; Z-score: 0.514253633 | |
| Disease-specific Antigen Abundances |
|
Click to View the Clearer Original Diagram |
| Differential expression pattern of antigen in diseases | ||
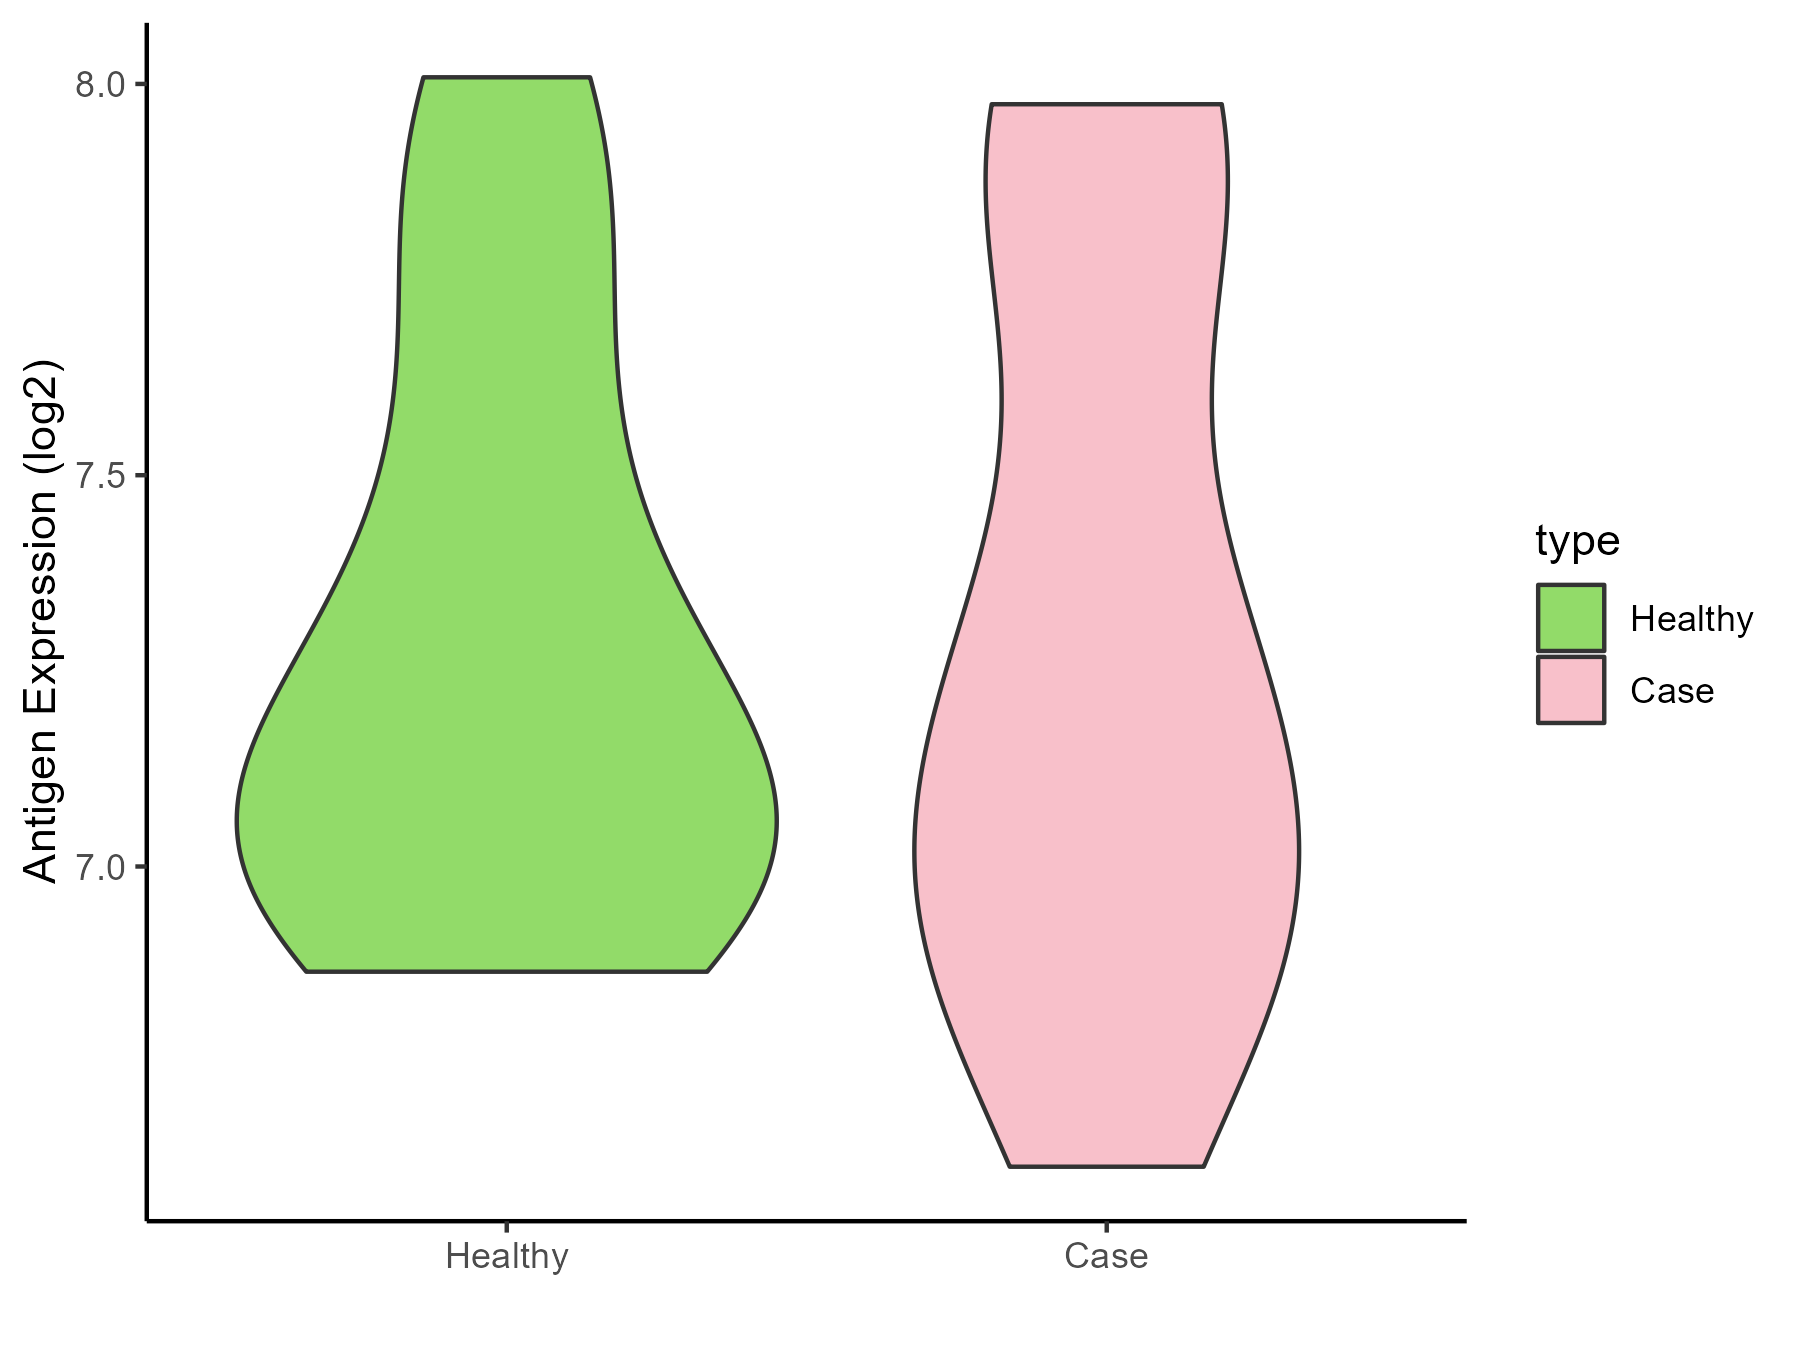
| The Studied Tissue | Peripheral blood | |
| The Specific Disease | Behcet disease | |
| The Expression Level of Disease Section Compare with the Healthy Individual Tissue | p-value: 0.956234834; Fold-change: 0.091115366; Z-score: 0.238706453 | |
| Disease-specific Antigen Abundances |
|
Click to View the Clearer Original Diagram |
| Differential expression pattern of antigen in diseases | ||
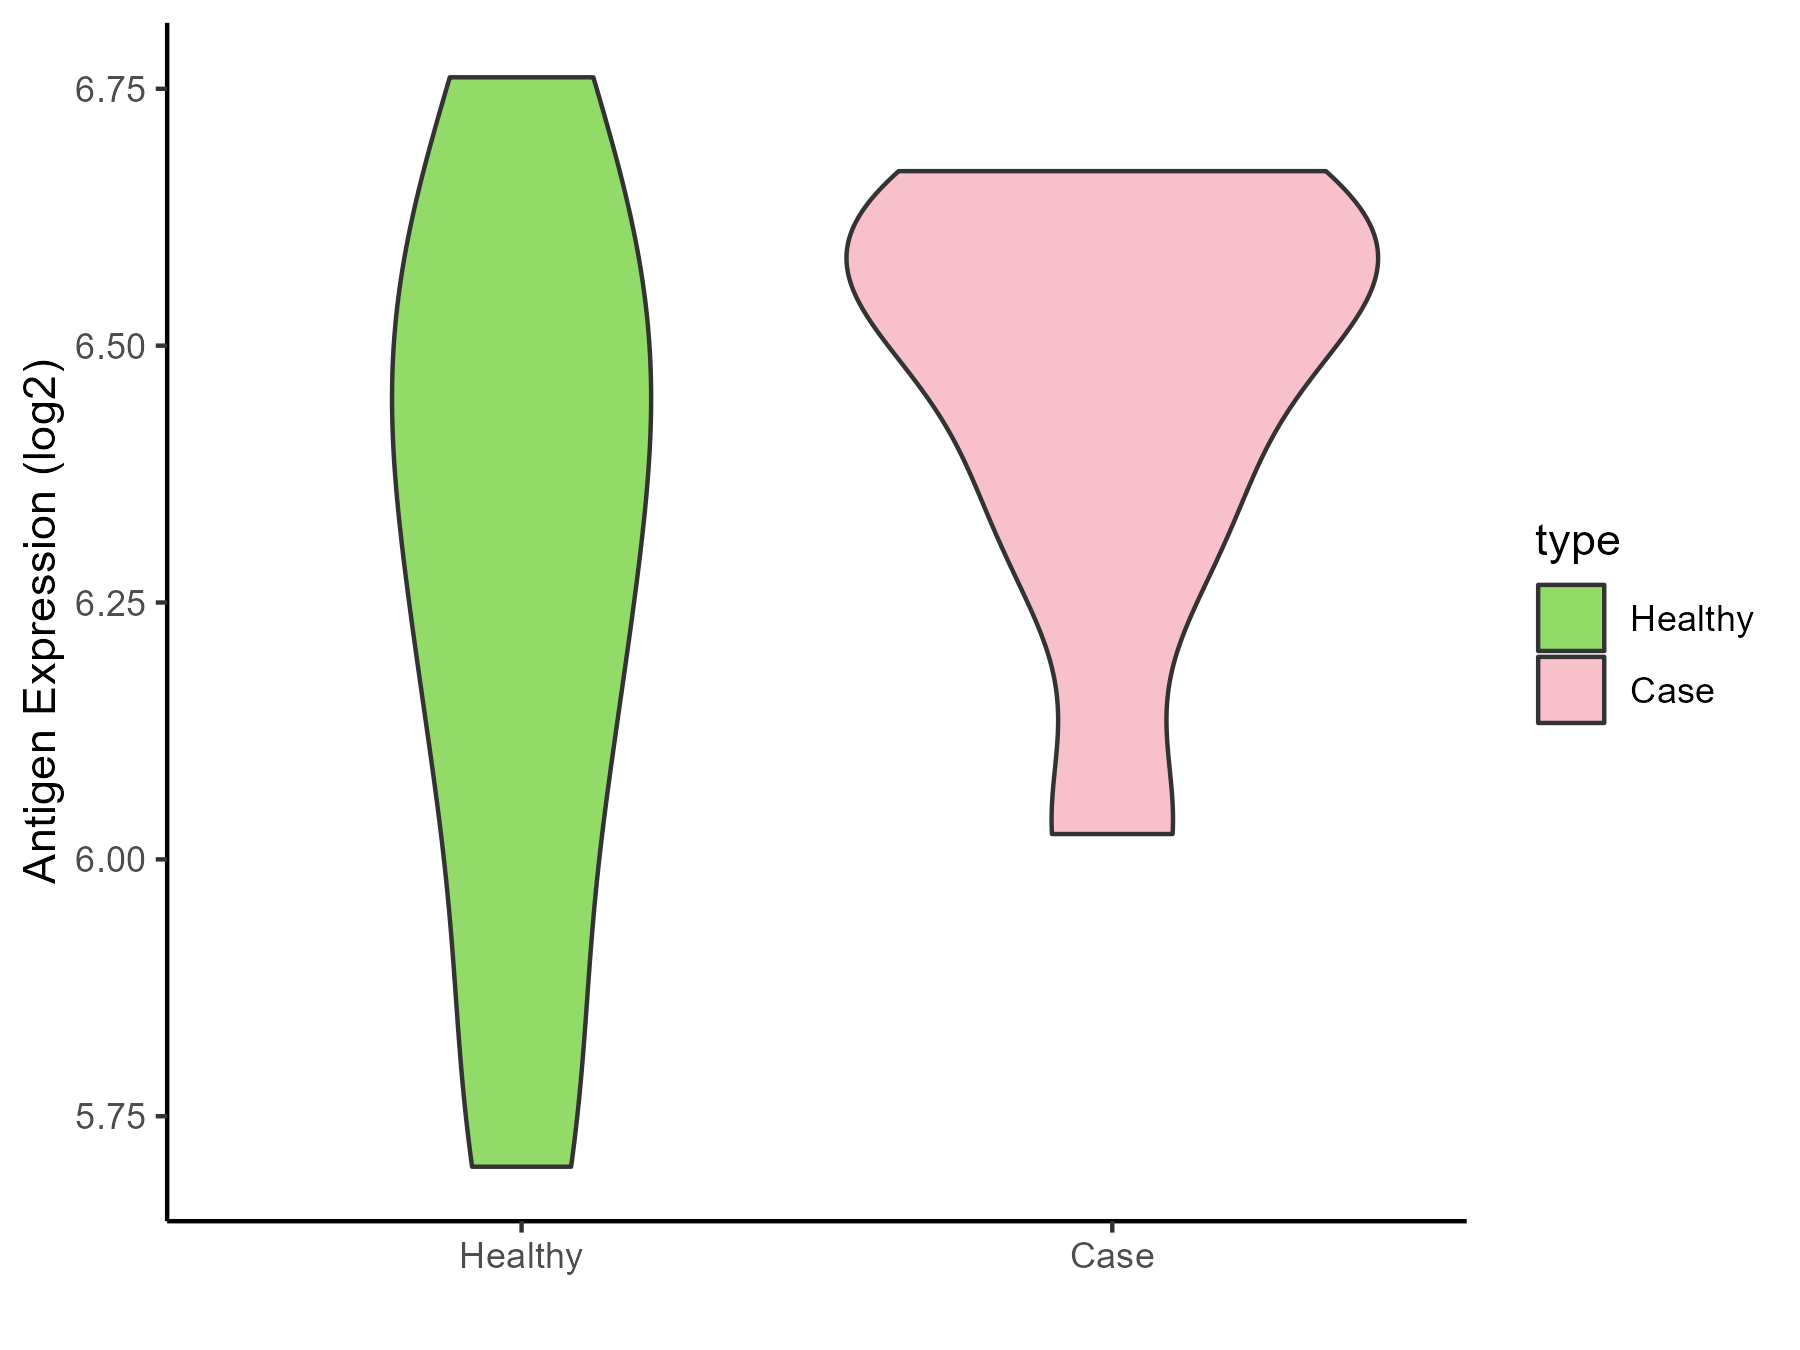
| The Studied Tissue | Whole blood | |
| The Specific Disease | Autosomal dominant monocytopenia | |
| The Expression Level of Disease Section Compare with the Healthy Individual Tissue | p-value: 0.197108265; Fold-change: 0.167605091; Z-score: 0.497749642 | |
| Disease-specific Antigen Abundances |
|
Click to View the Clearer Original Diagram |
ICD Disease Classification 5
| Differential expression pattern of antigen in diseases | ||
| The Studied Tissue | Liver | |
| The Specific Disease | Type 2 diabetes | |
| The Expression Level of Disease Section Compare with the Healthy Individual Tissue | p-value: 0.287356411; Fold-change: 0.228443176; Z-score: 0.163179294 | |
| Disease-specific Antigen Abundances |

|
Click to View the Clearer Original Diagram |
| Differential expression pattern of antigen in diseases | ||
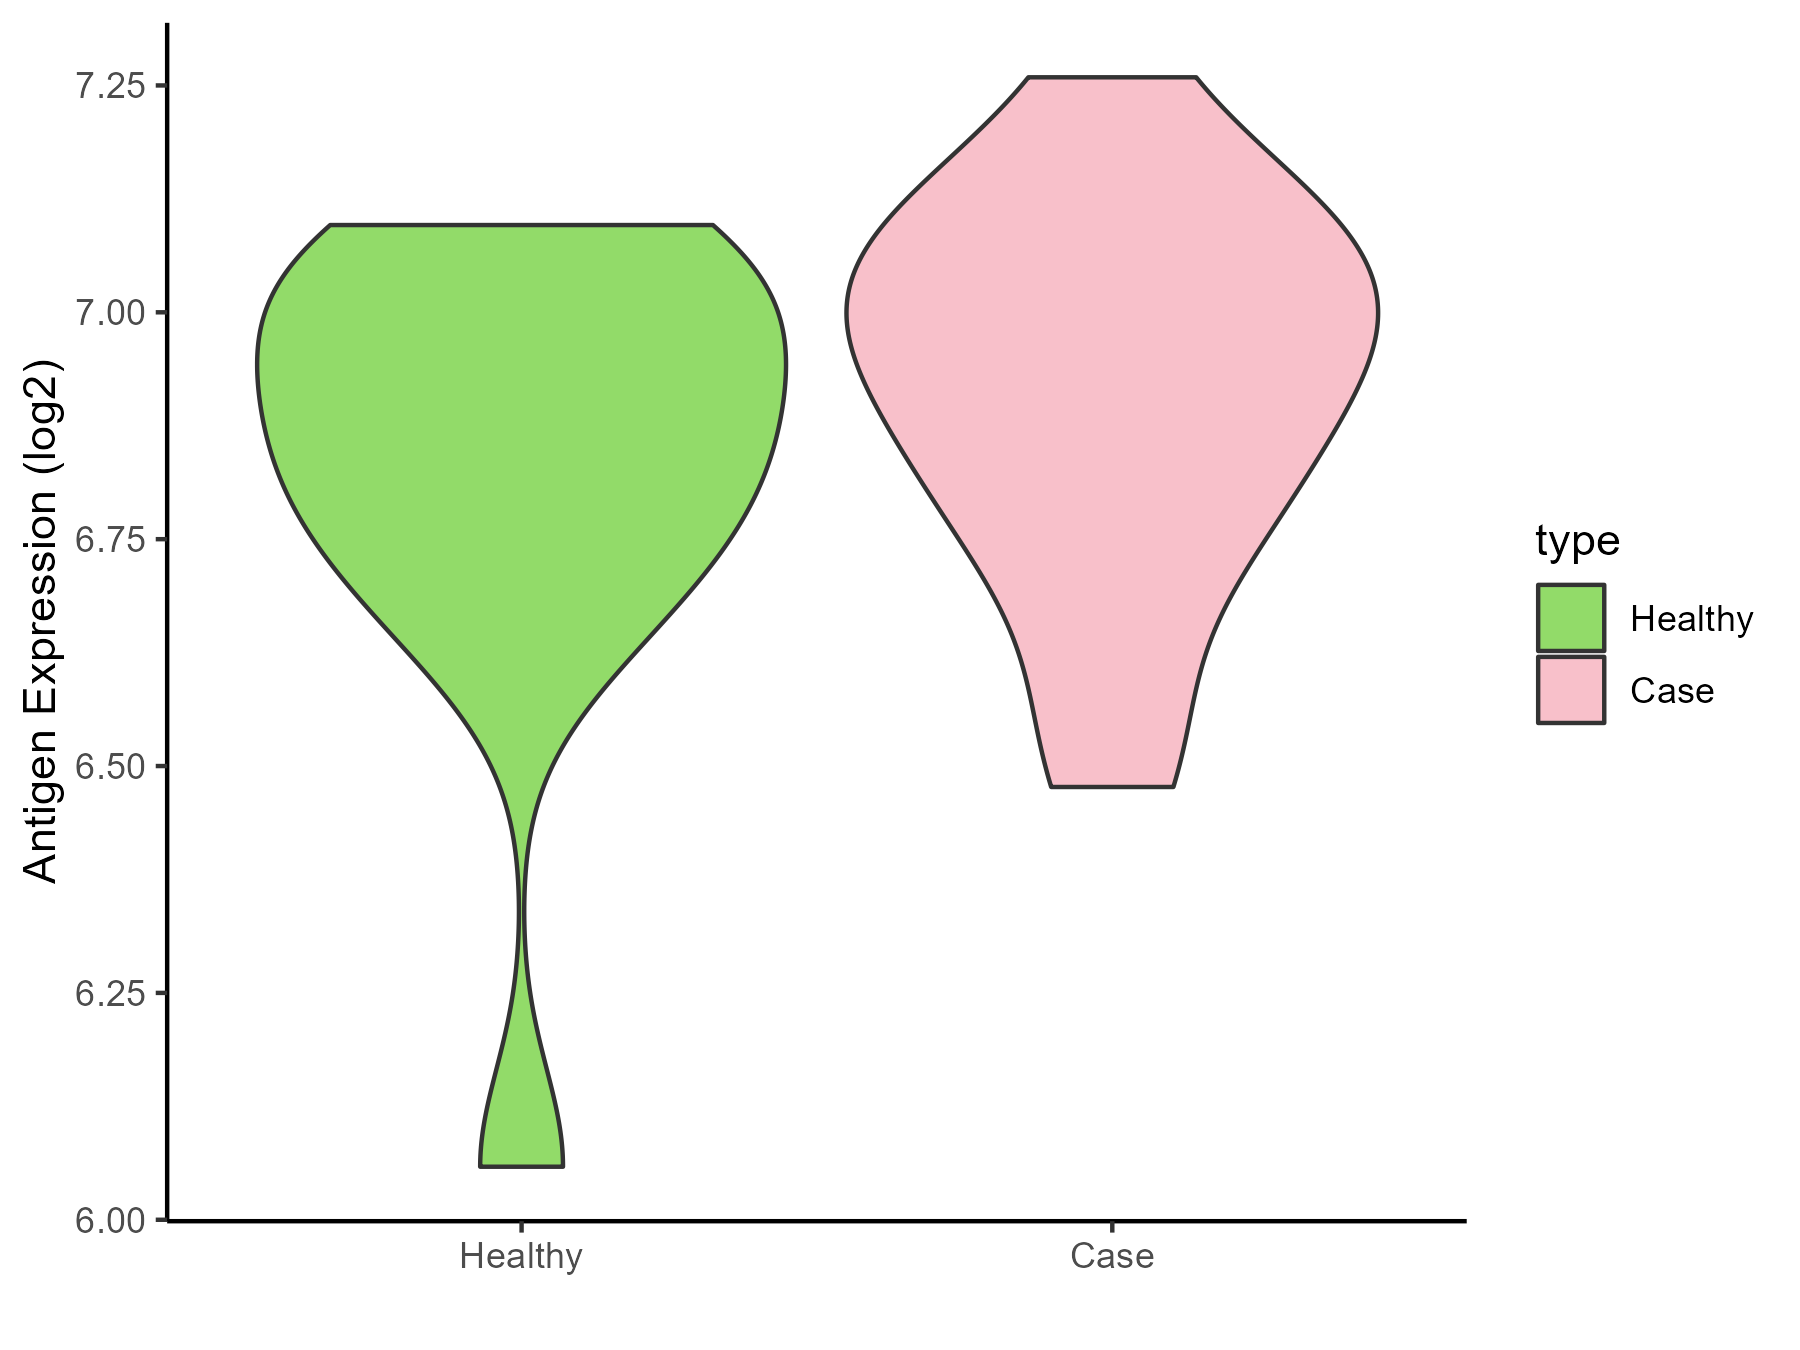
| The Studied Tissue | Vastus lateralis muscle | |
| The Specific Disease | Polycystic ovary syndrome | |
| The Expression Level of Disease Section Compare with the Healthy Individual Tissue | p-value: 0.361645108; Fold-change: 0.077112384; Z-score: 0.28123064 | |
| Disease-specific Antigen Abundances |
|
Click to View the Clearer Original Diagram |
| Differential expression pattern of antigen in diseases | ||
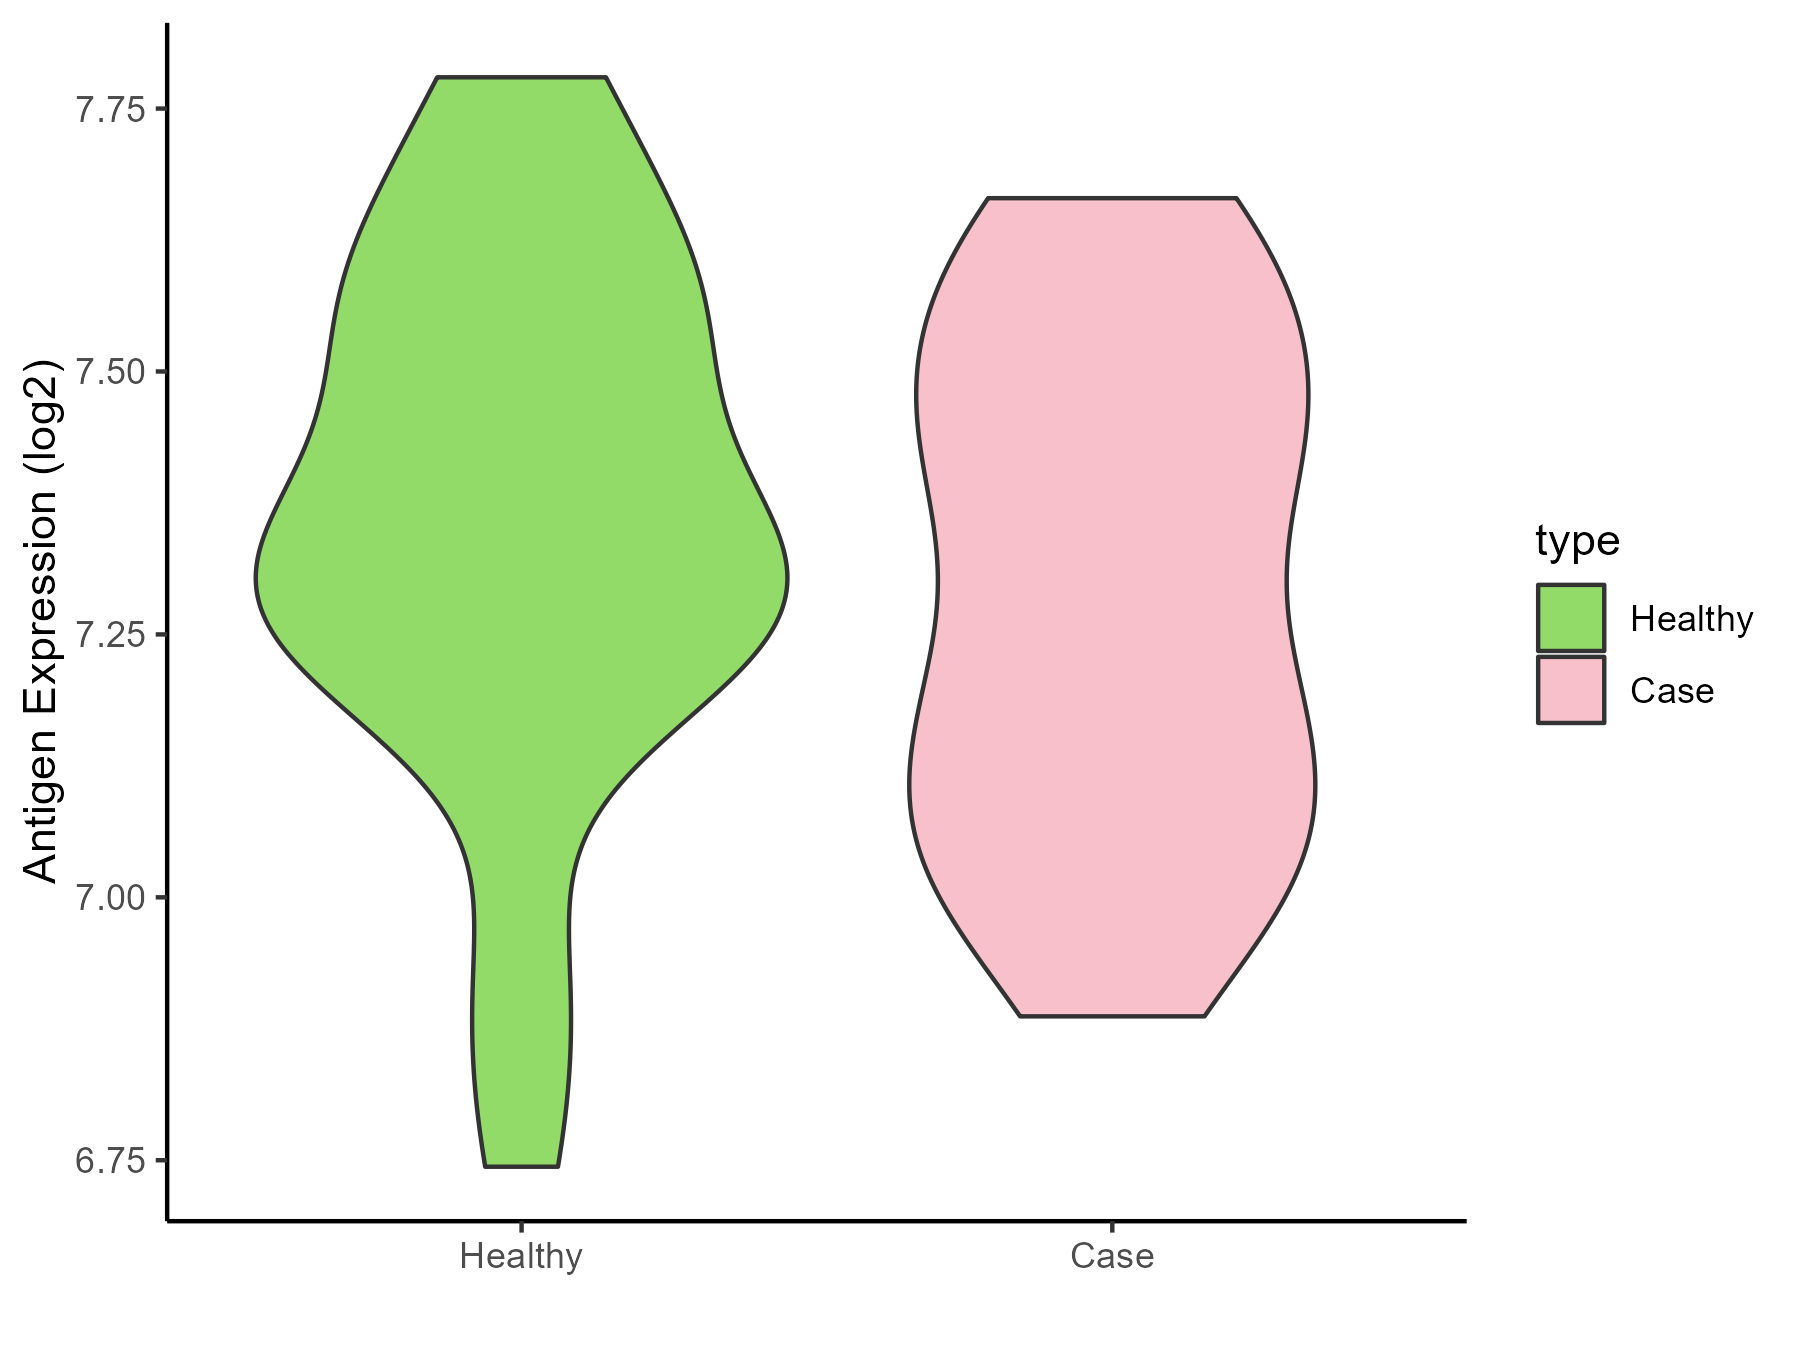
| The Studied Tissue | Subcutaneous Adipose | |
| The Specific Disease | Obesity | |
| The Expression Level of Disease Section Compare with the Healthy Individual Tissue | p-value: 0.311341731; Fold-change: -0.06092053; Z-score: -0.240246113 | |
| Disease-specific Antigen Abundances |
|
Click to View the Clearer Original Diagram |
| Differential expression pattern of antigen in diseases | ||
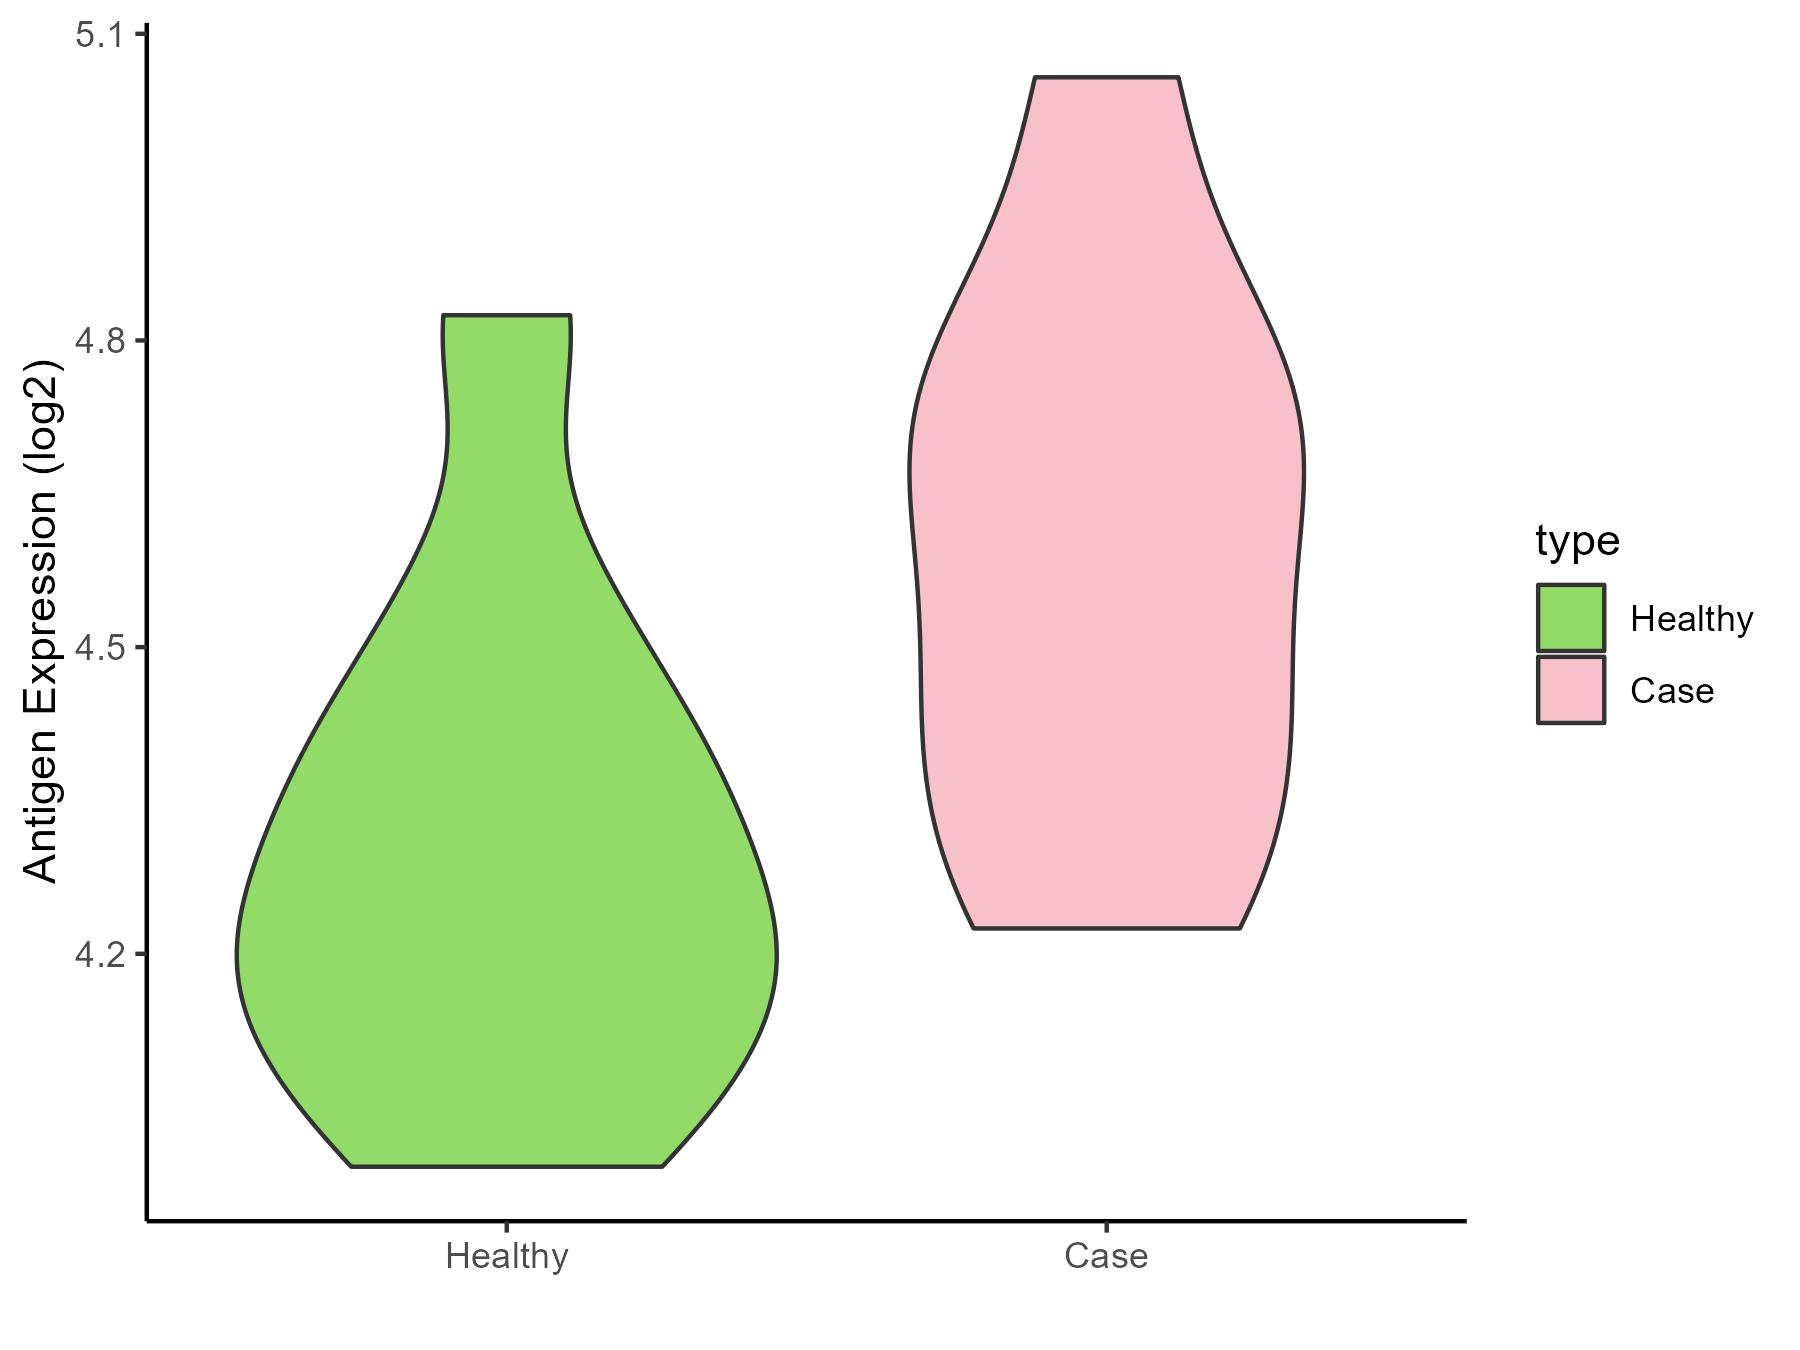
| The Studied Tissue | Biceps muscle | |
| The Specific Disease | Pompe disease | |
| The Expression Level of Disease Section Compare with the Healthy Individual Tissue | p-value: 0.039013507; Fold-change: 0.34608692; Z-score: 1.38337304 | |
| Disease-specific Antigen Abundances |
|
Click to View the Clearer Original Diagram |
| Differential expression pattern of antigen in diseases | ||
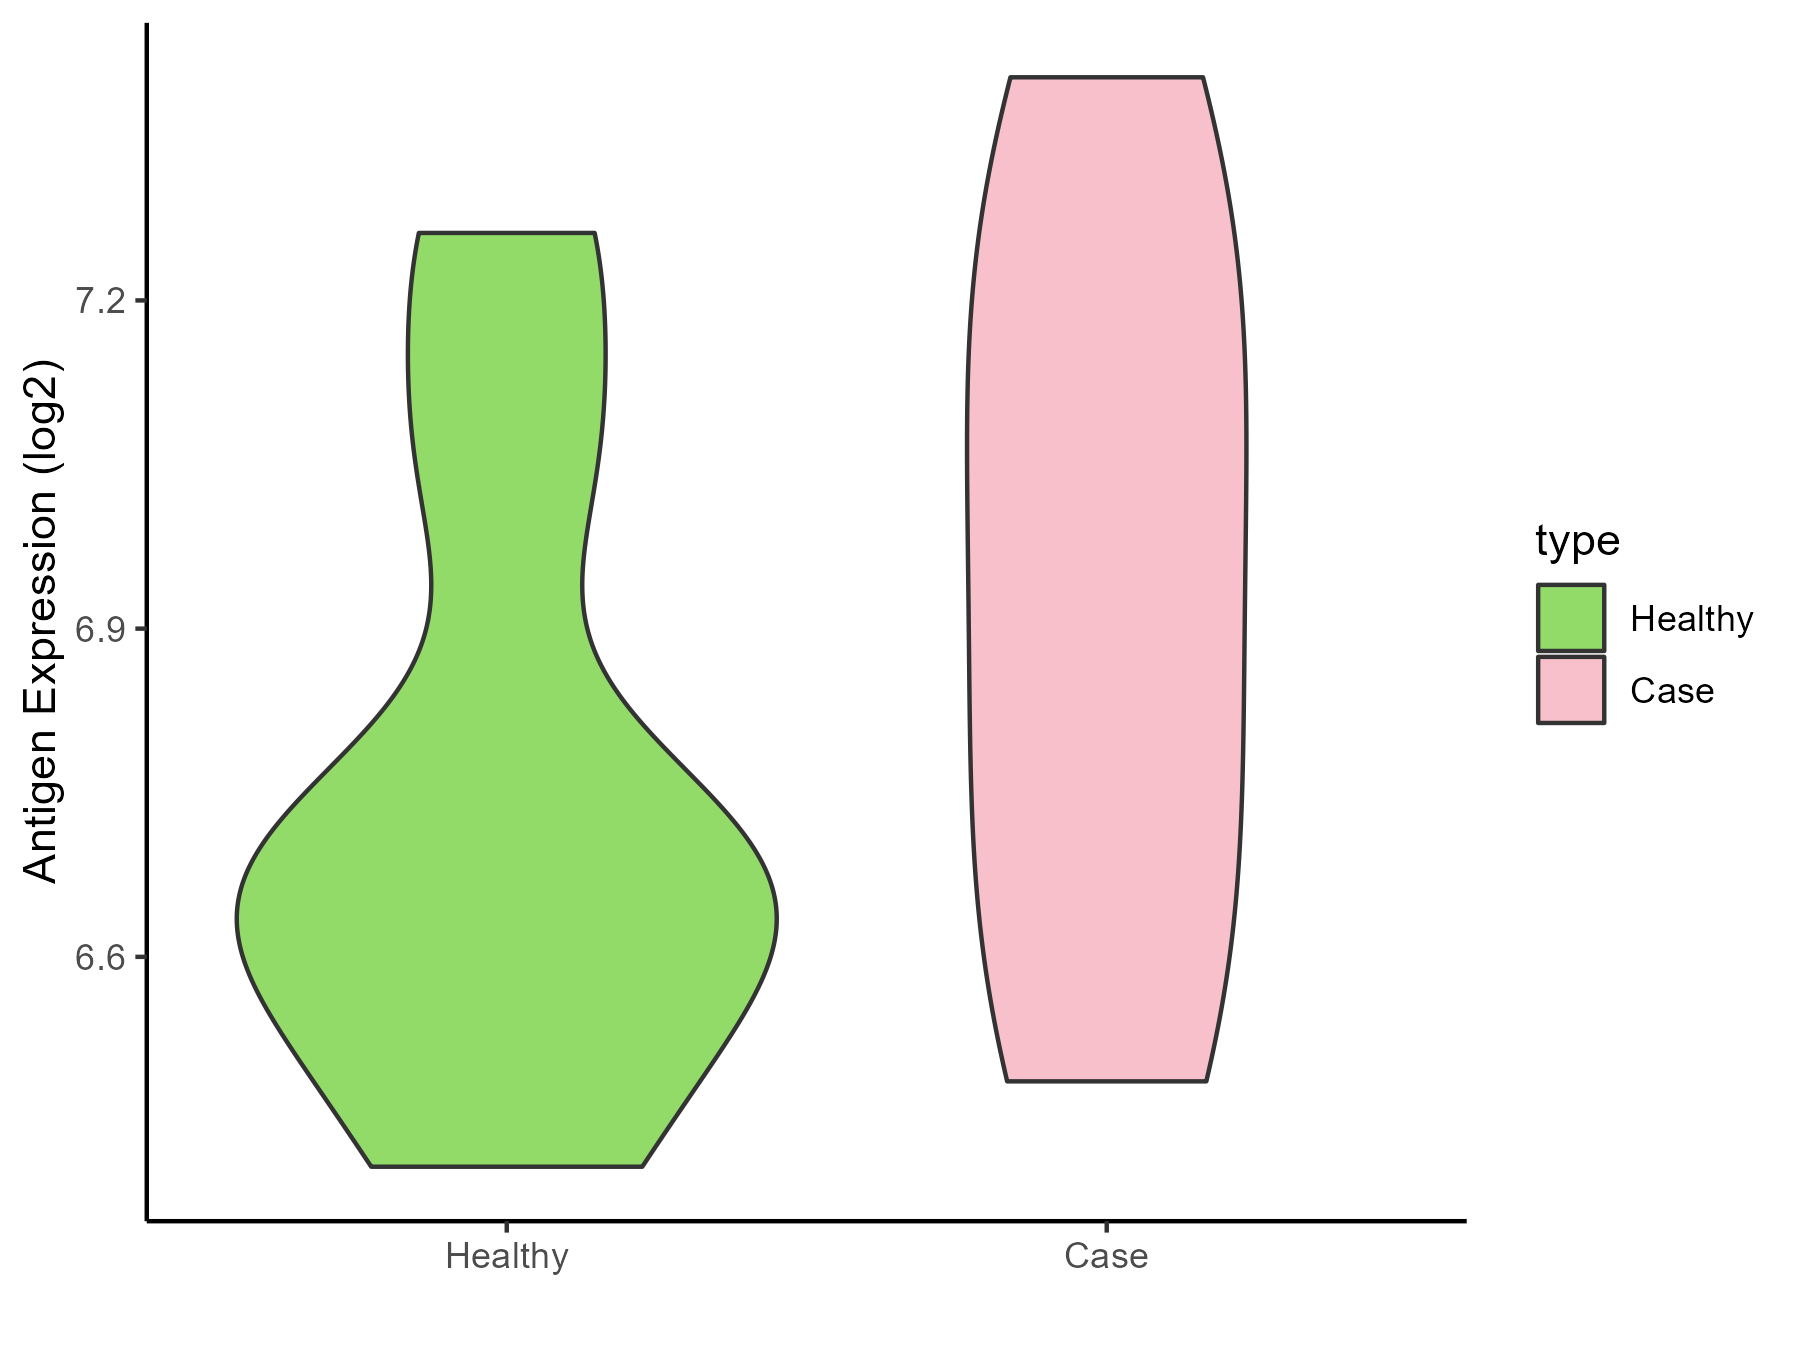
| The Studied Tissue | Whole blood | |
| The Specific Disease | Batten disease | |
| The Expression Level of Disease Section Compare with the Healthy Individual Tissue | p-value: 0.295302989; Fold-change: 0.267435345; Z-score: 0.900773198 | |
| Disease-specific Antigen Abundances |
|
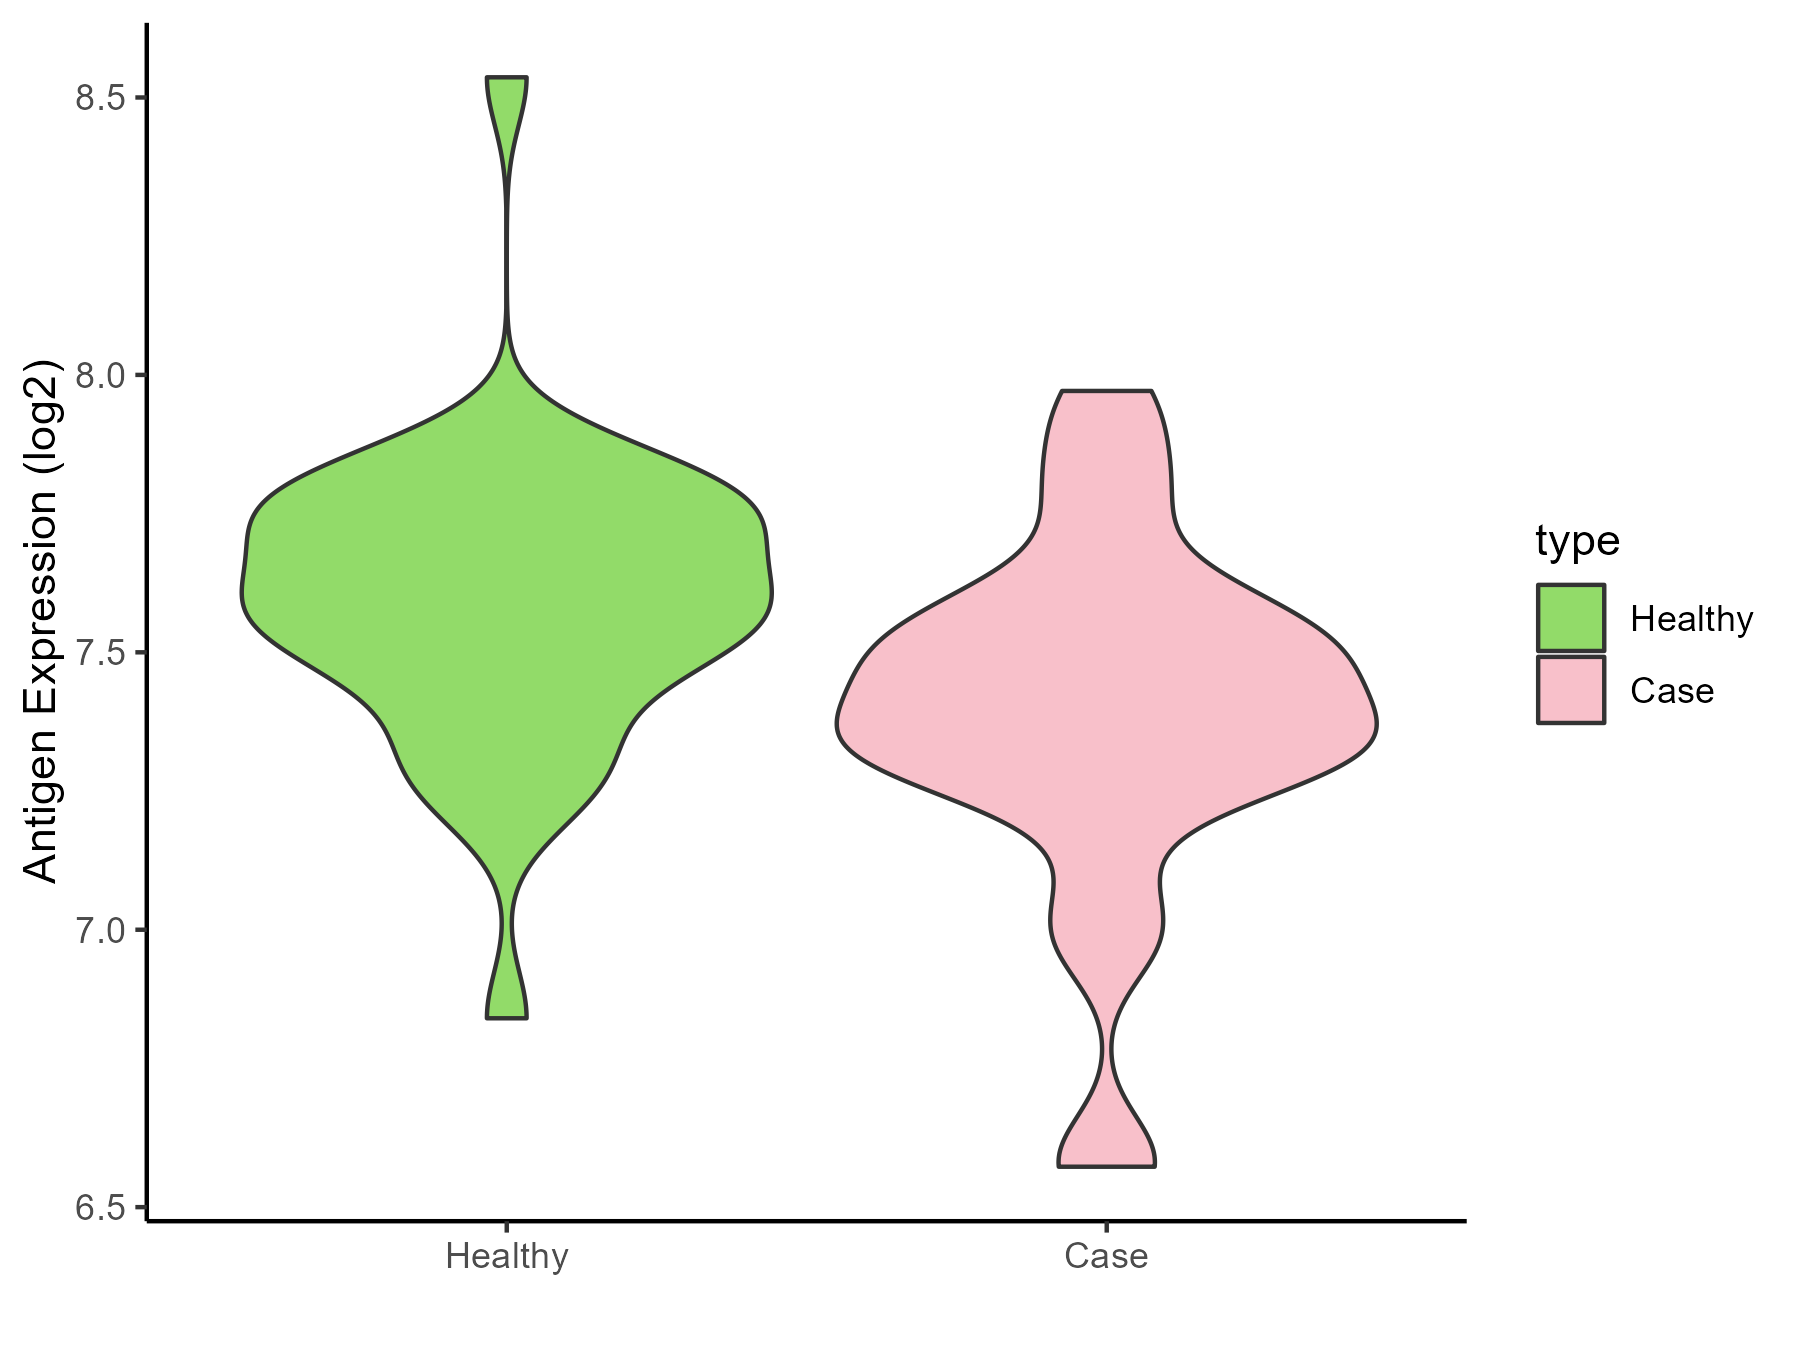
Click to View the Clearer Original Diagram |
ICD Disease Classification 6
| Differential expression pattern of antigen in diseases | ||
| The Studied Tissue | Whole blood | |
| The Specific Disease | Autism | |
| The Expression Level of Disease Section Compare with the Healthy Individual Tissue | p-value: 0.00571126; Fold-change: -0.187491667; Z-score: -0.688242644 | |
| Disease-specific Antigen Abundances |
|
Click to View the Clearer Original Diagram |
| Differential expression pattern of antigen in diseases | ||
| The Studied Tissue | Whole blood | |
| The Specific Disease | Anxiety disorder | |
| The Expression Level of Disease Section Compare with the Healthy Individual Tissue | p-value: 0.184662059; Fold-change: 0.054466154; Z-score: 0.180458767 | |
| Disease-specific Antigen Abundances |
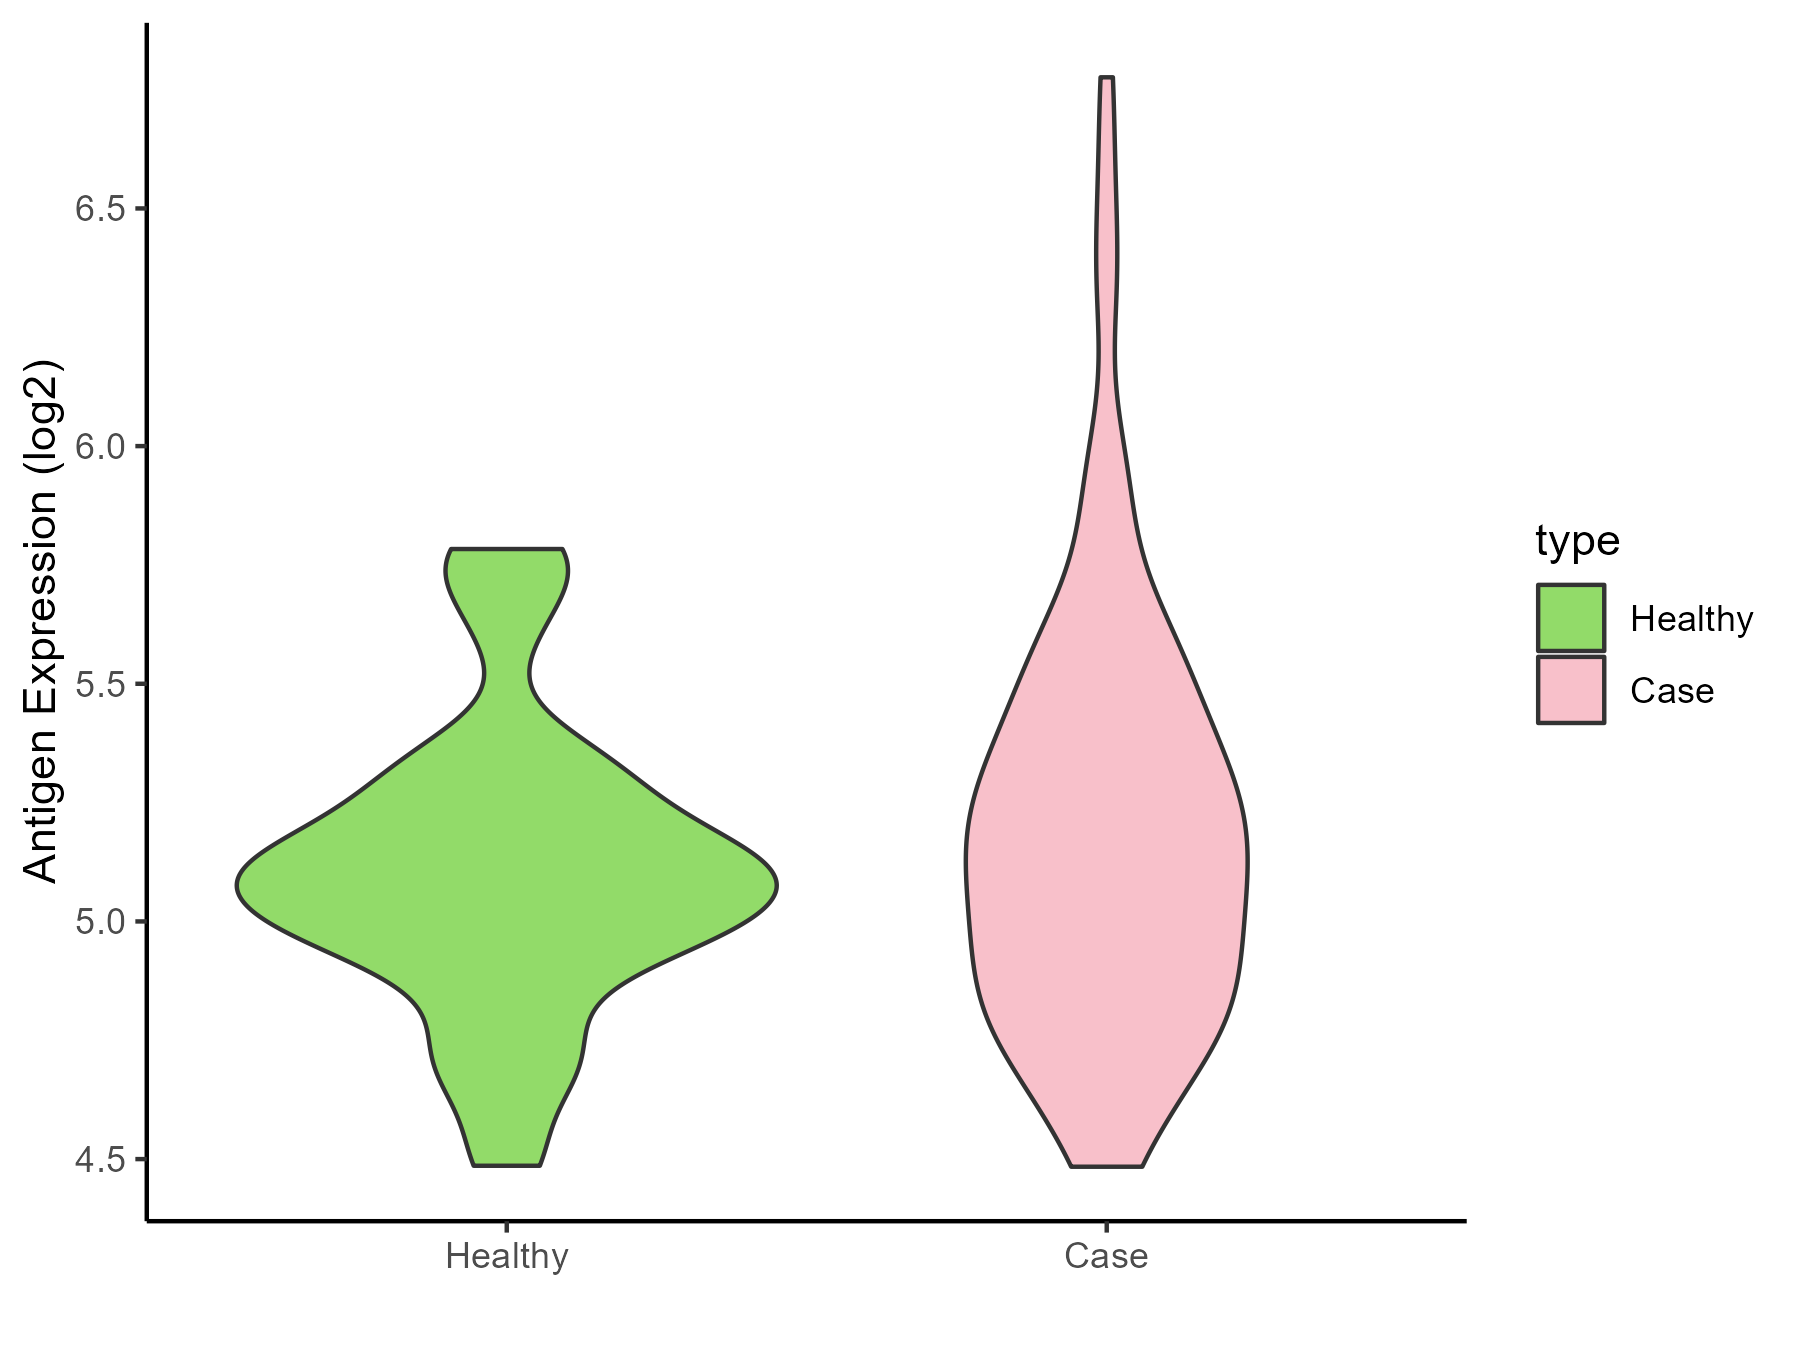
|
Click to View the Clearer Original Diagram |
ICD Disease Classification 8
| Differential expression pattern of antigen in diseases | ||
| The Studied Tissue | Substantia nigra | |
| The Specific Disease | Parkinson disease | |
| The Expression Level of Disease Section Compare with the Healthy Individual Tissue | p-value: 0.684848796; Fold-change: 0.218941125; Z-score: 0.663406219 | |
| Disease-specific Antigen Abundances |
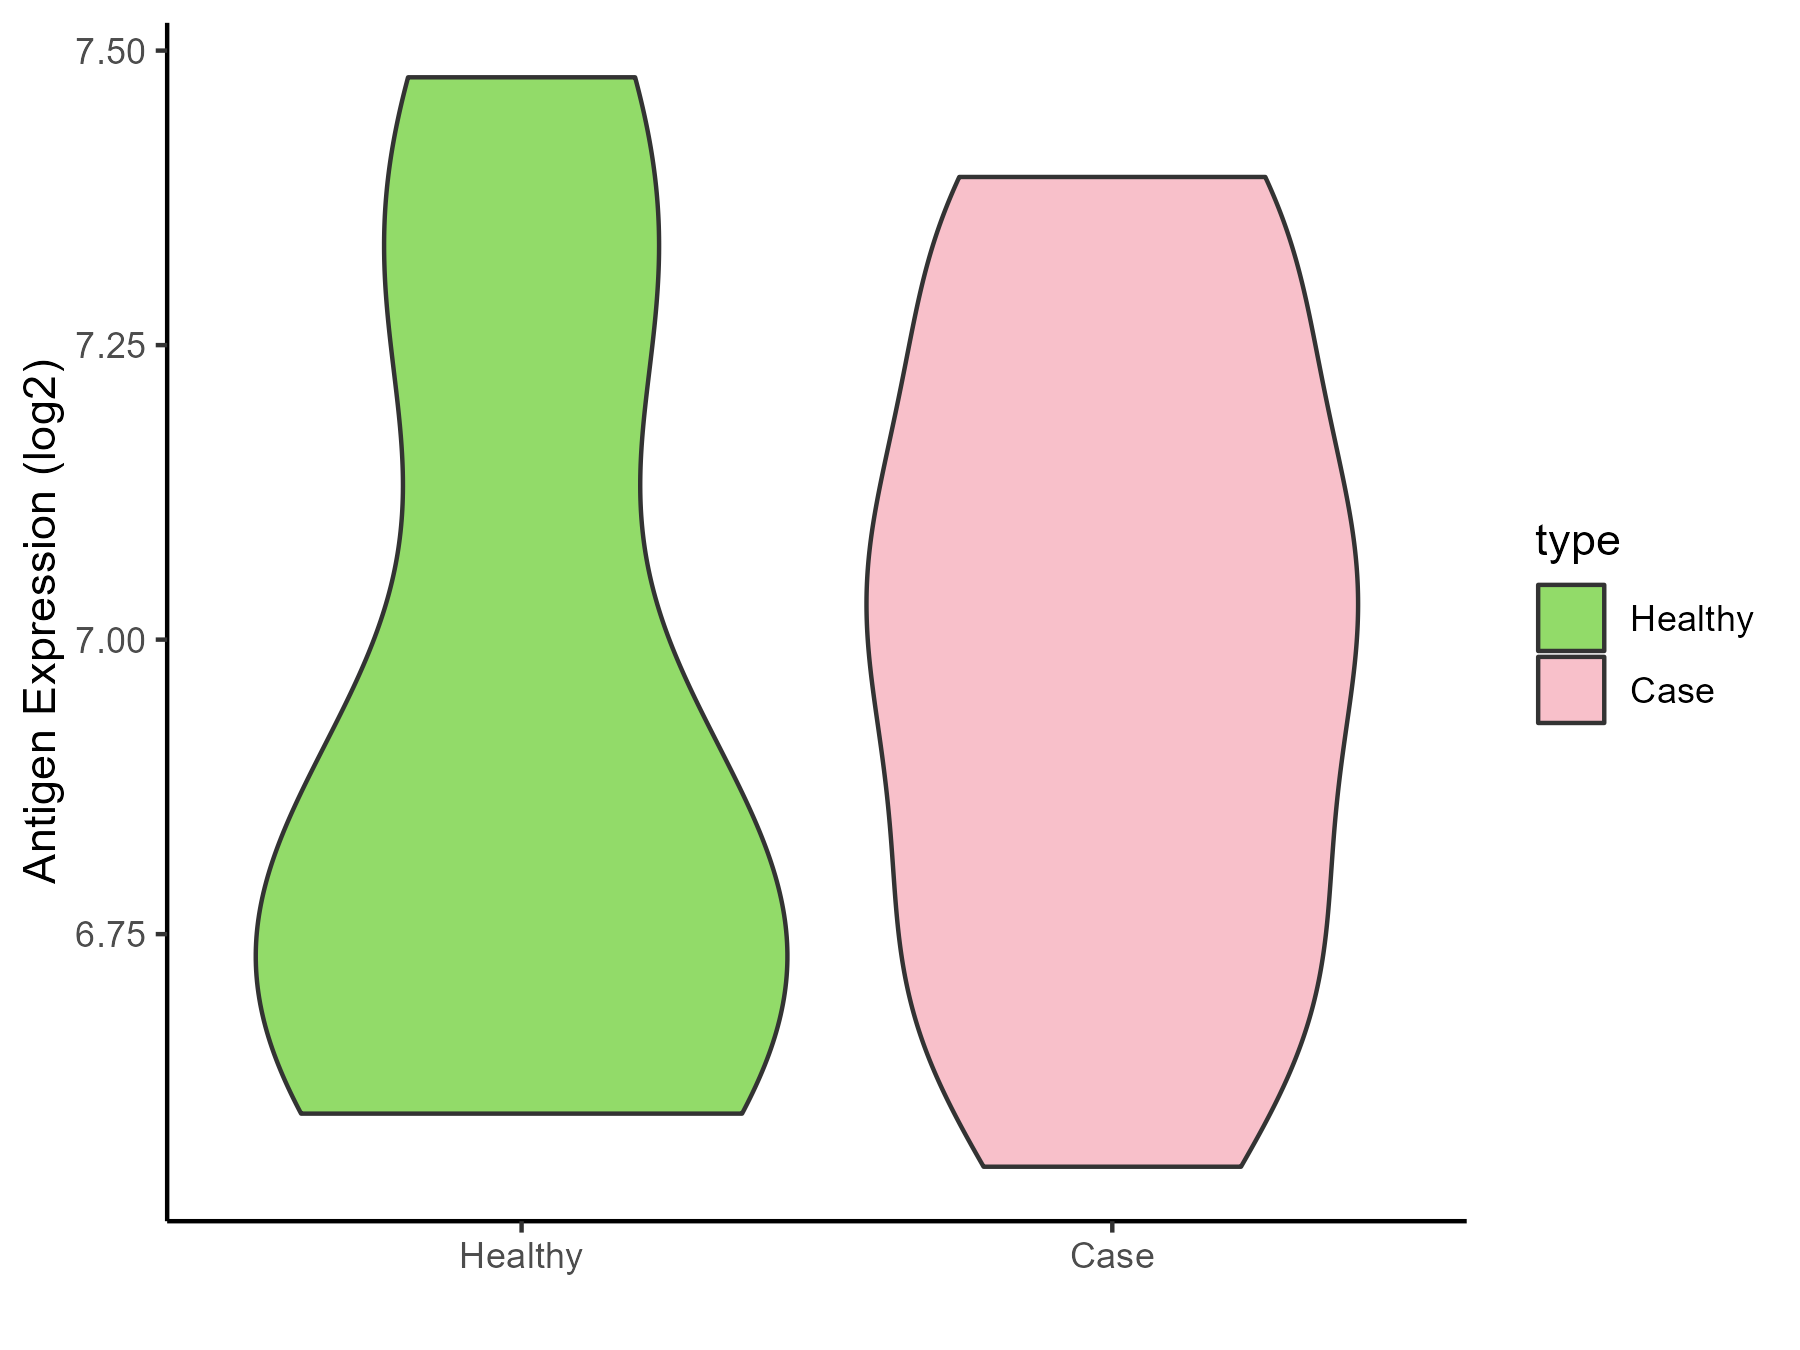
|
Click to View the Clearer Original Diagram |
| Differential expression pattern of antigen in diseases | ||
| The Studied Tissue | Whole blood | |
| The Specific Disease | Huntington disease | |
| The Expression Level of Disease Section Compare with the Healthy Individual Tissue | p-value: 0.626434938; Fold-change: -0.189058822; Z-score: -0.265771322 | |
| Disease-specific Antigen Abundances |
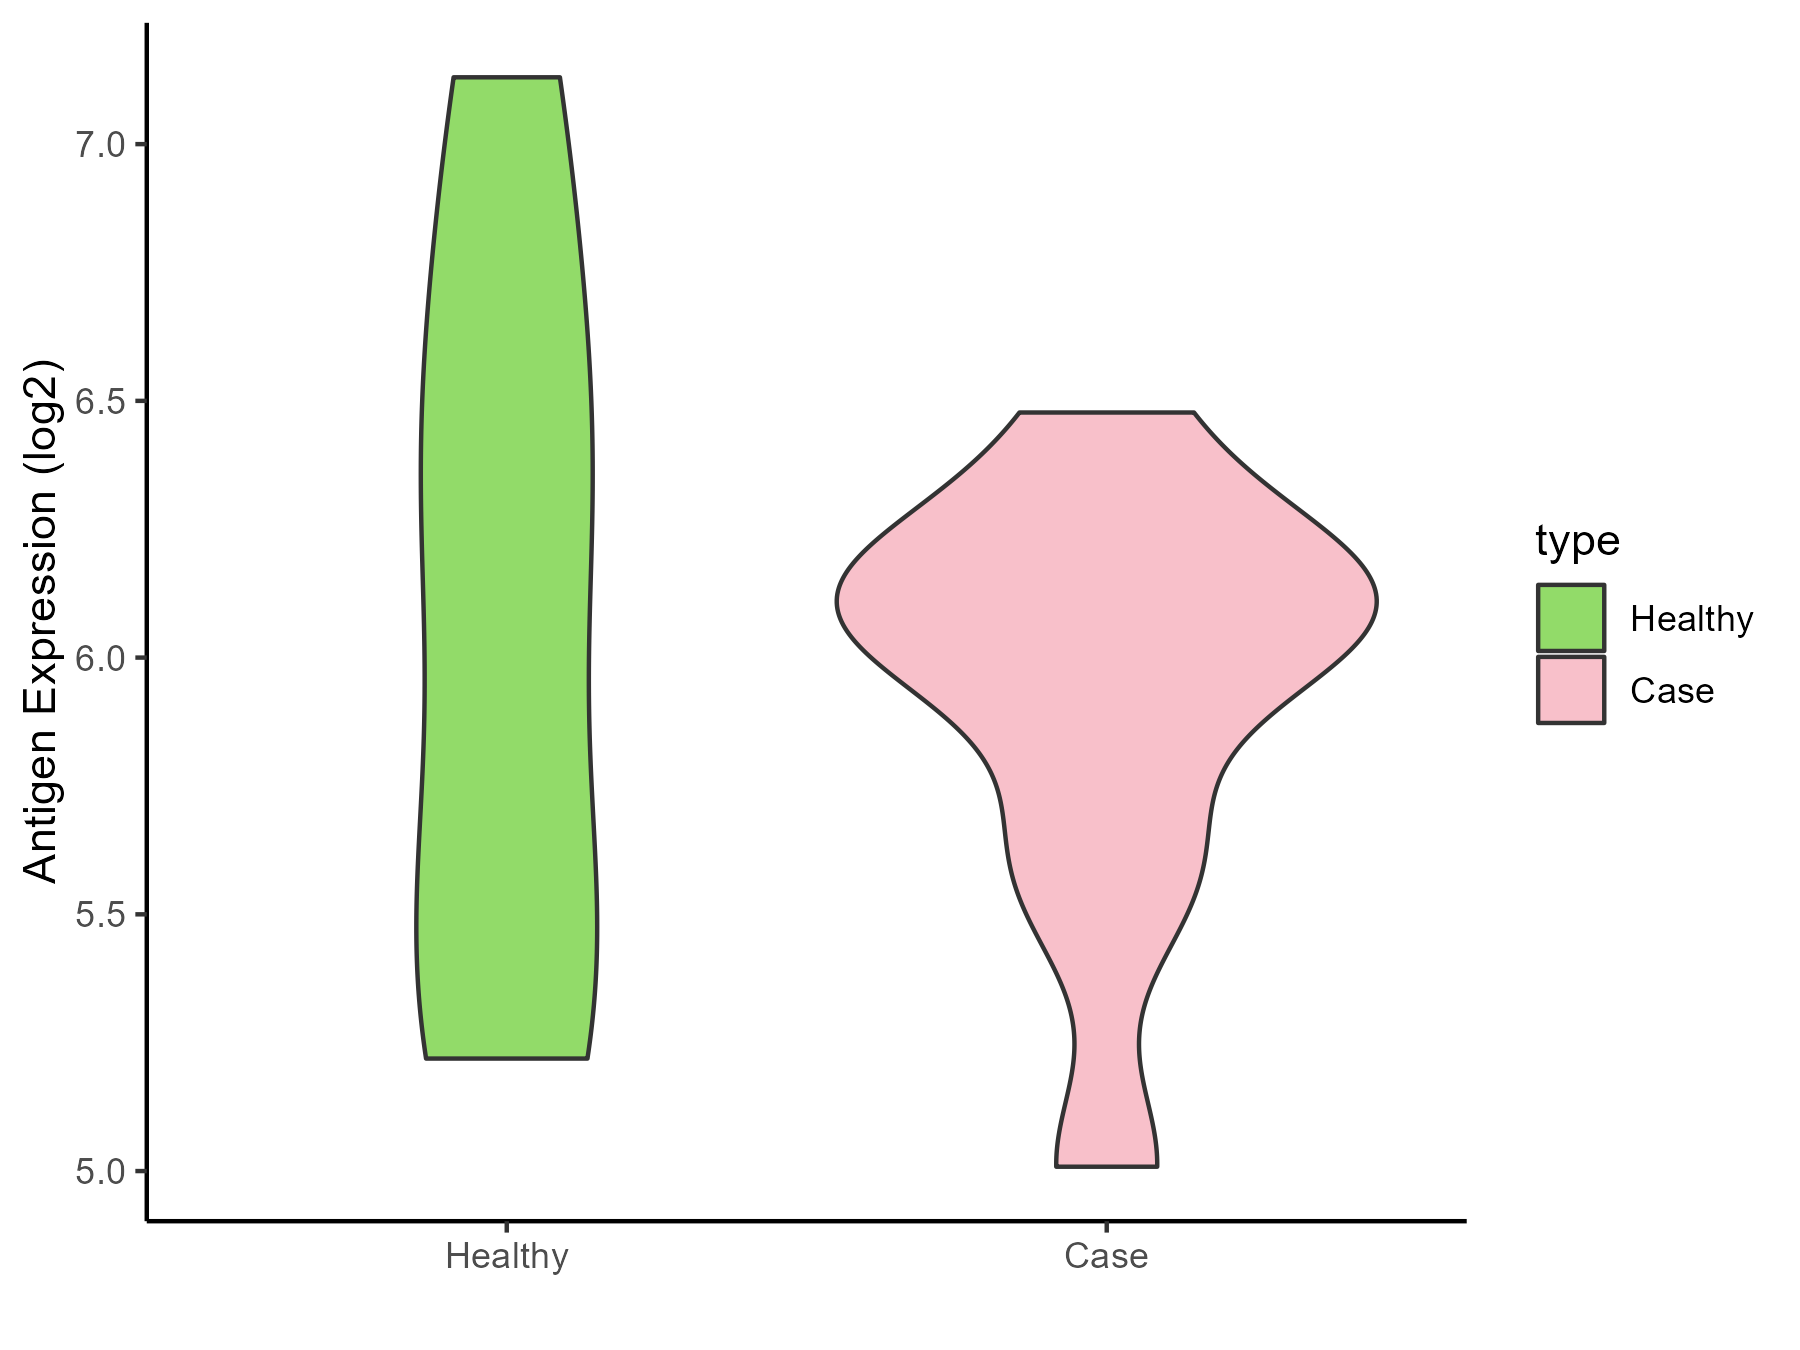
|
Click to View the Clearer Original Diagram |
| Differential expression pattern of antigen in diseases | ||
| The Studied Tissue | Entorhinal cortex | |
| The Specific Disease | Alzheimer disease | |
| The Expression Level of Disease Section Compare with the Healthy Individual Tissue | p-value: 0.189879079; Fold-change: 0.145402711; Z-score: 0.324596586 | |
| Disease-specific Antigen Abundances |
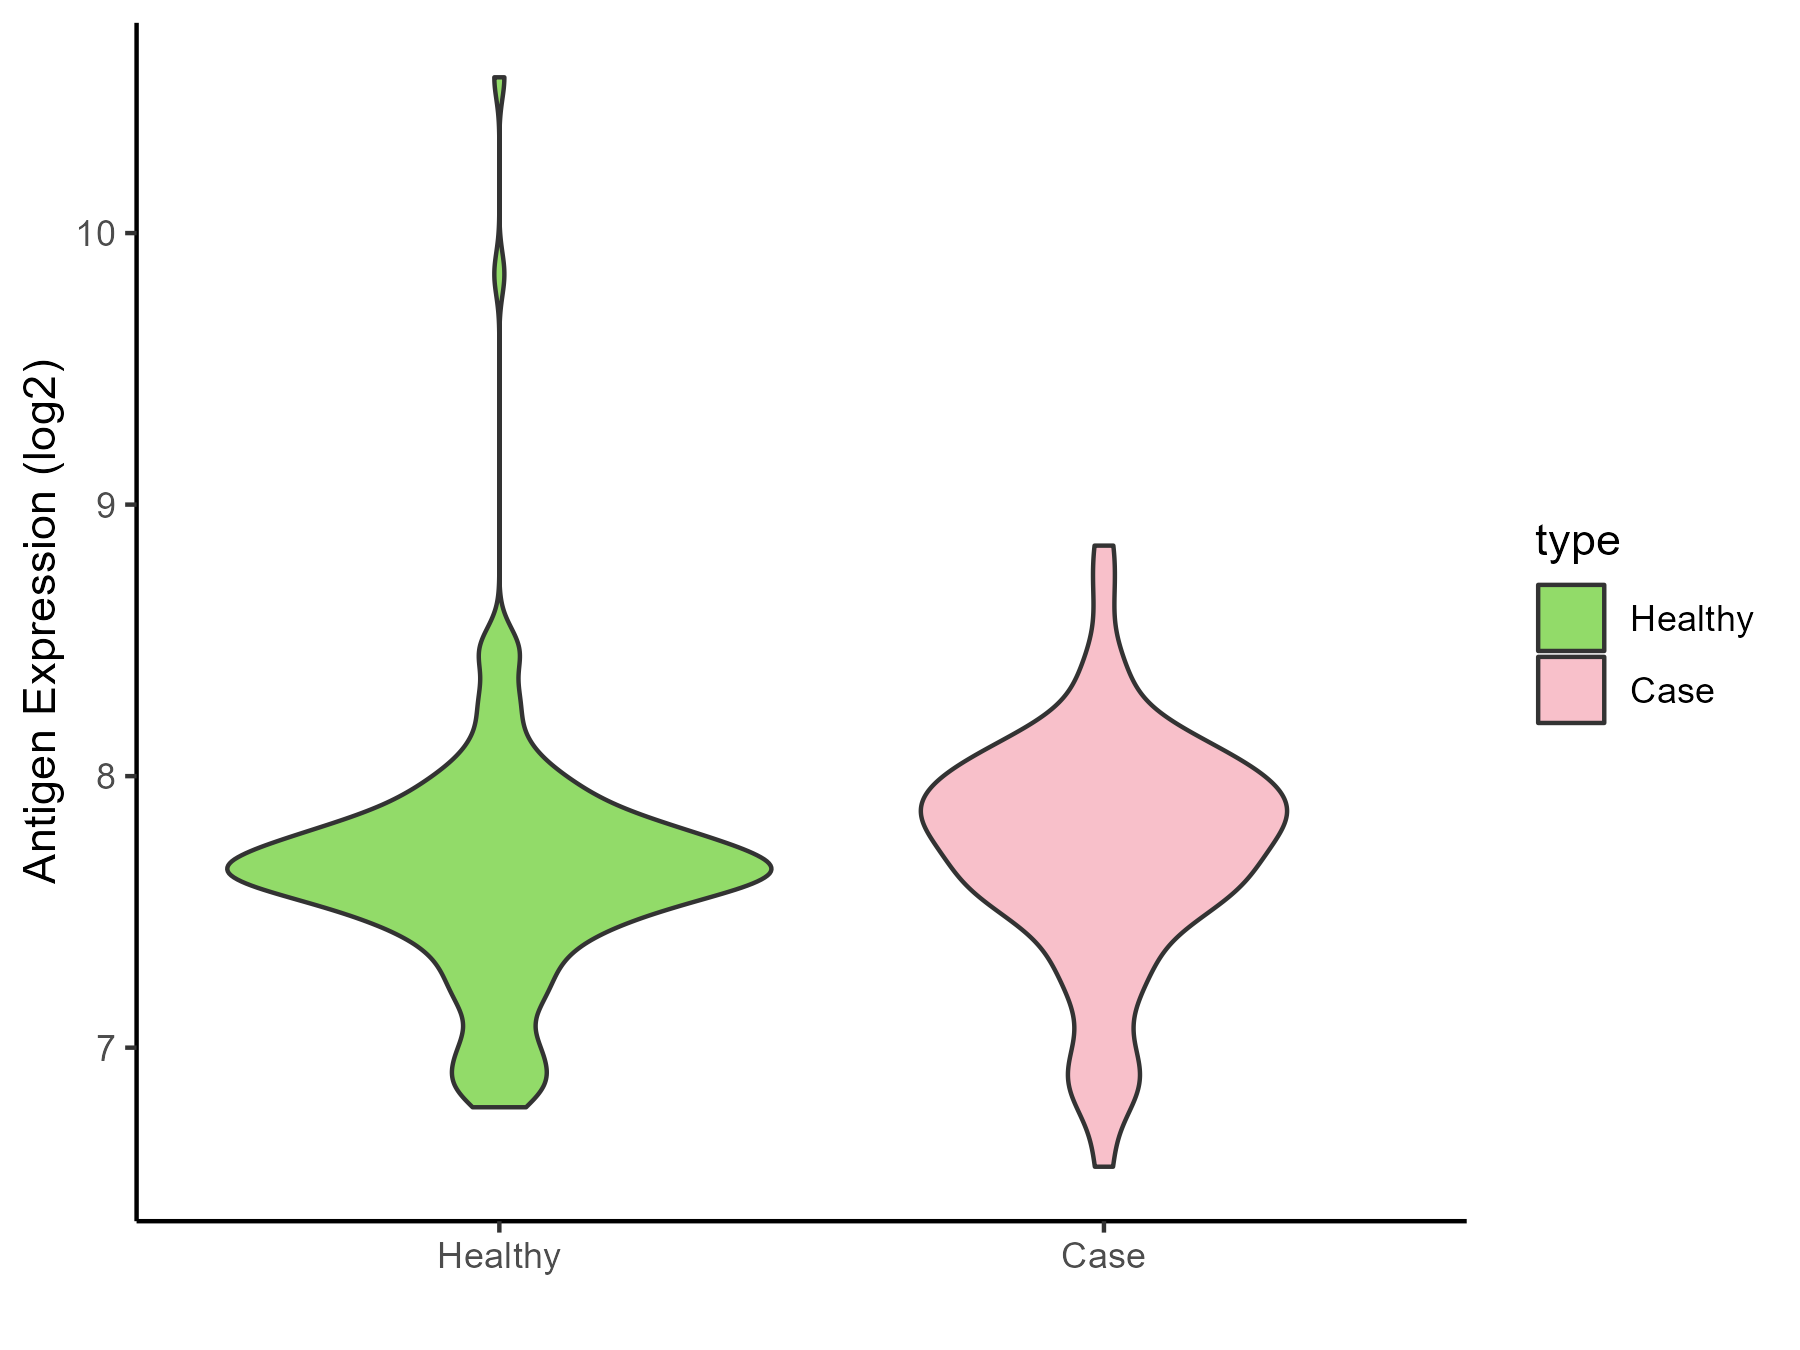
|
Click to View the Clearer Original Diagram |
| Differential expression pattern of antigen in diseases | ||
| The Studied Tissue | Whole blood | |
| The Specific Disease | Seizure | |
| The Expression Level of Disease Section Compare with the Healthy Individual Tissue | p-value: 0.092069246; Fold-change: 0.25190915; Z-score: 0.483741805 | |
| Disease-specific Antigen Abundances |
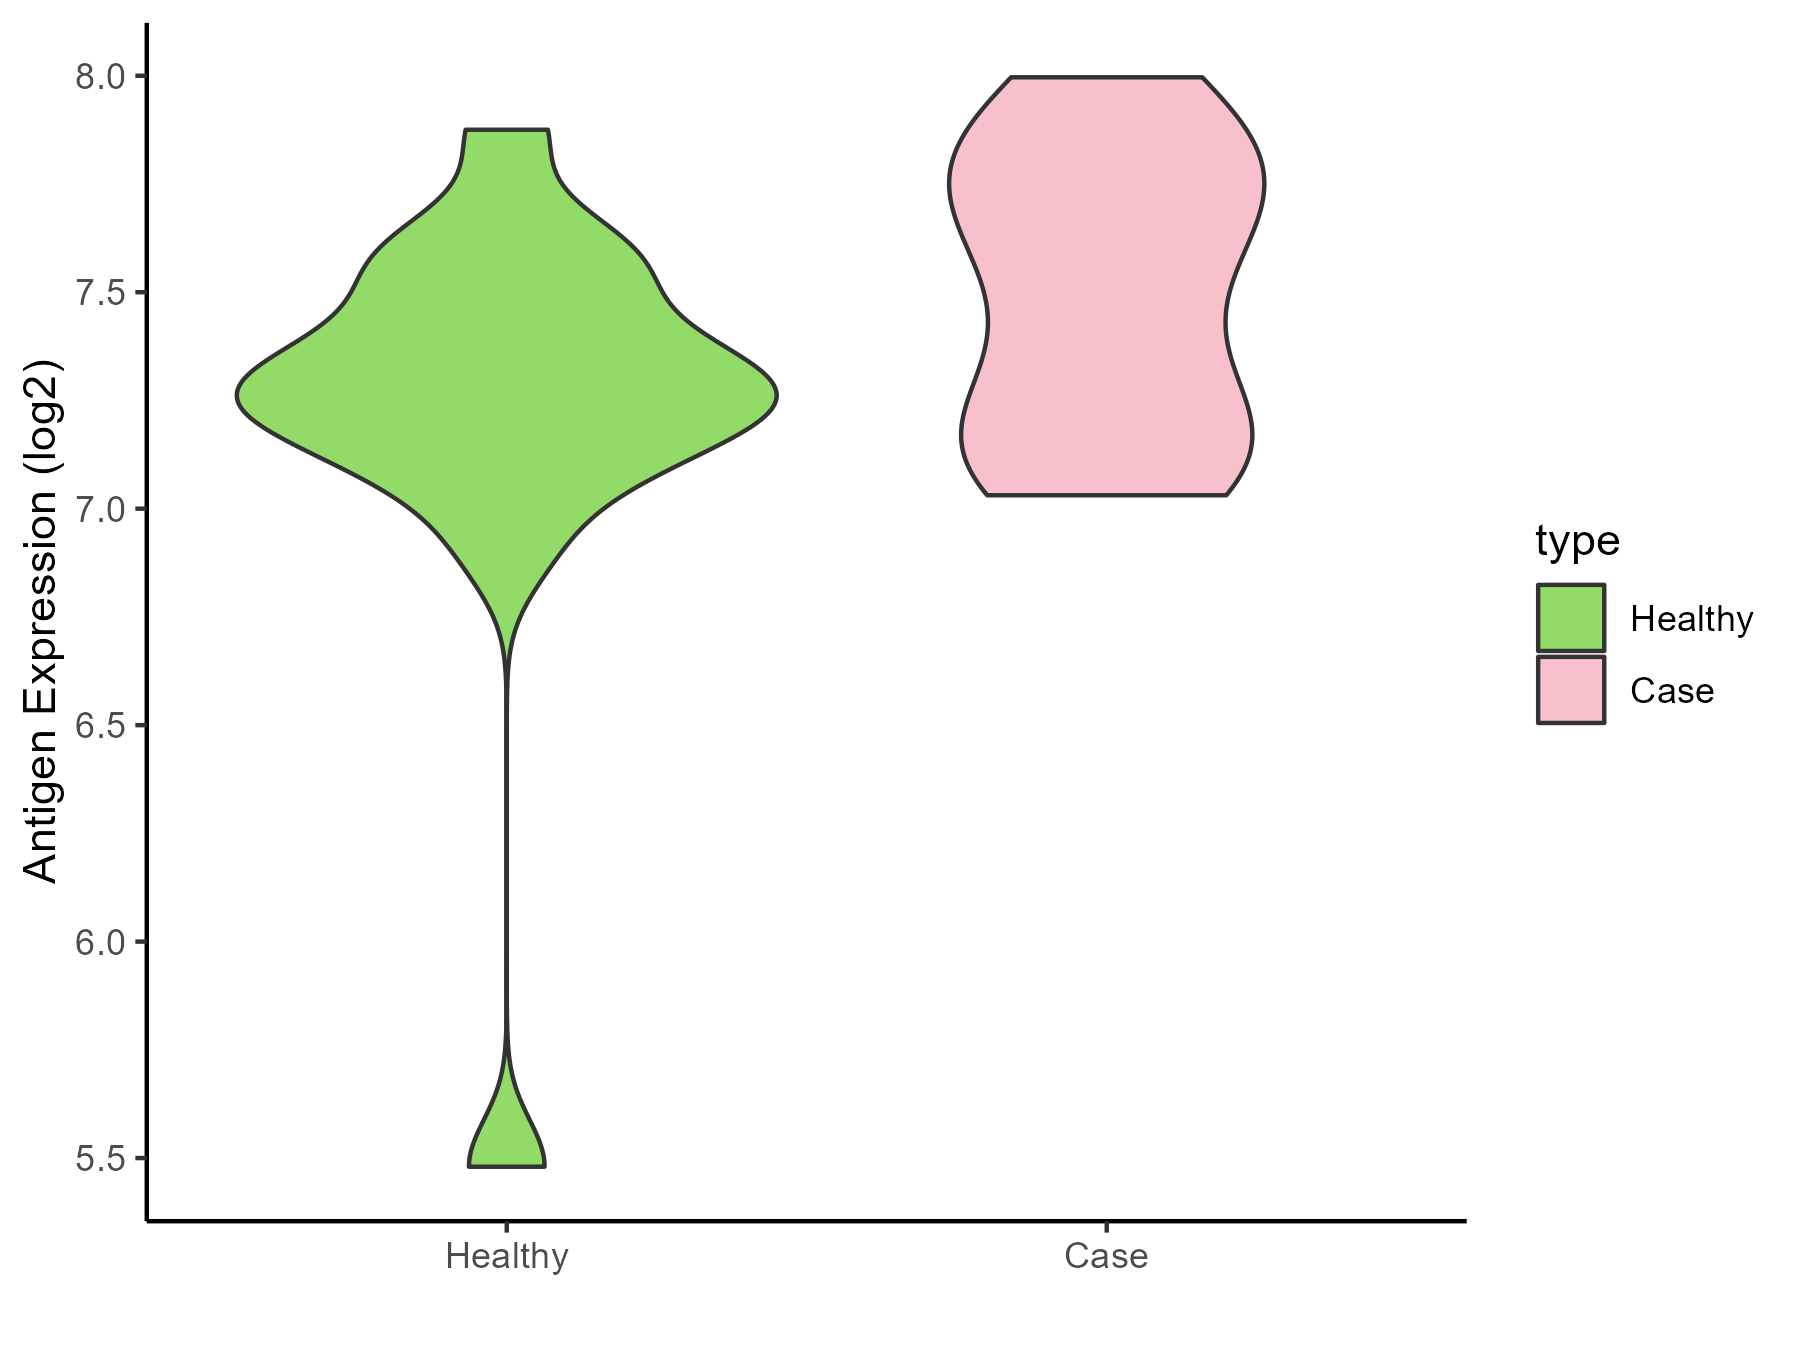
|
Click to View the Clearer Original Diagram |
| Differential expression pattern of antigen in diseases | ||
| The Studied Tissue | Skin | |
| The Specific Disease | Lateral sclerosis | |
| The Expression Level of Disease Section Compare with the Healthy Individual Tissue | p-value: 0.227609236; Fold-change: -0.190459895; Z-score: -1.007670525 | |
| Disease-specific Antigen Abundances |
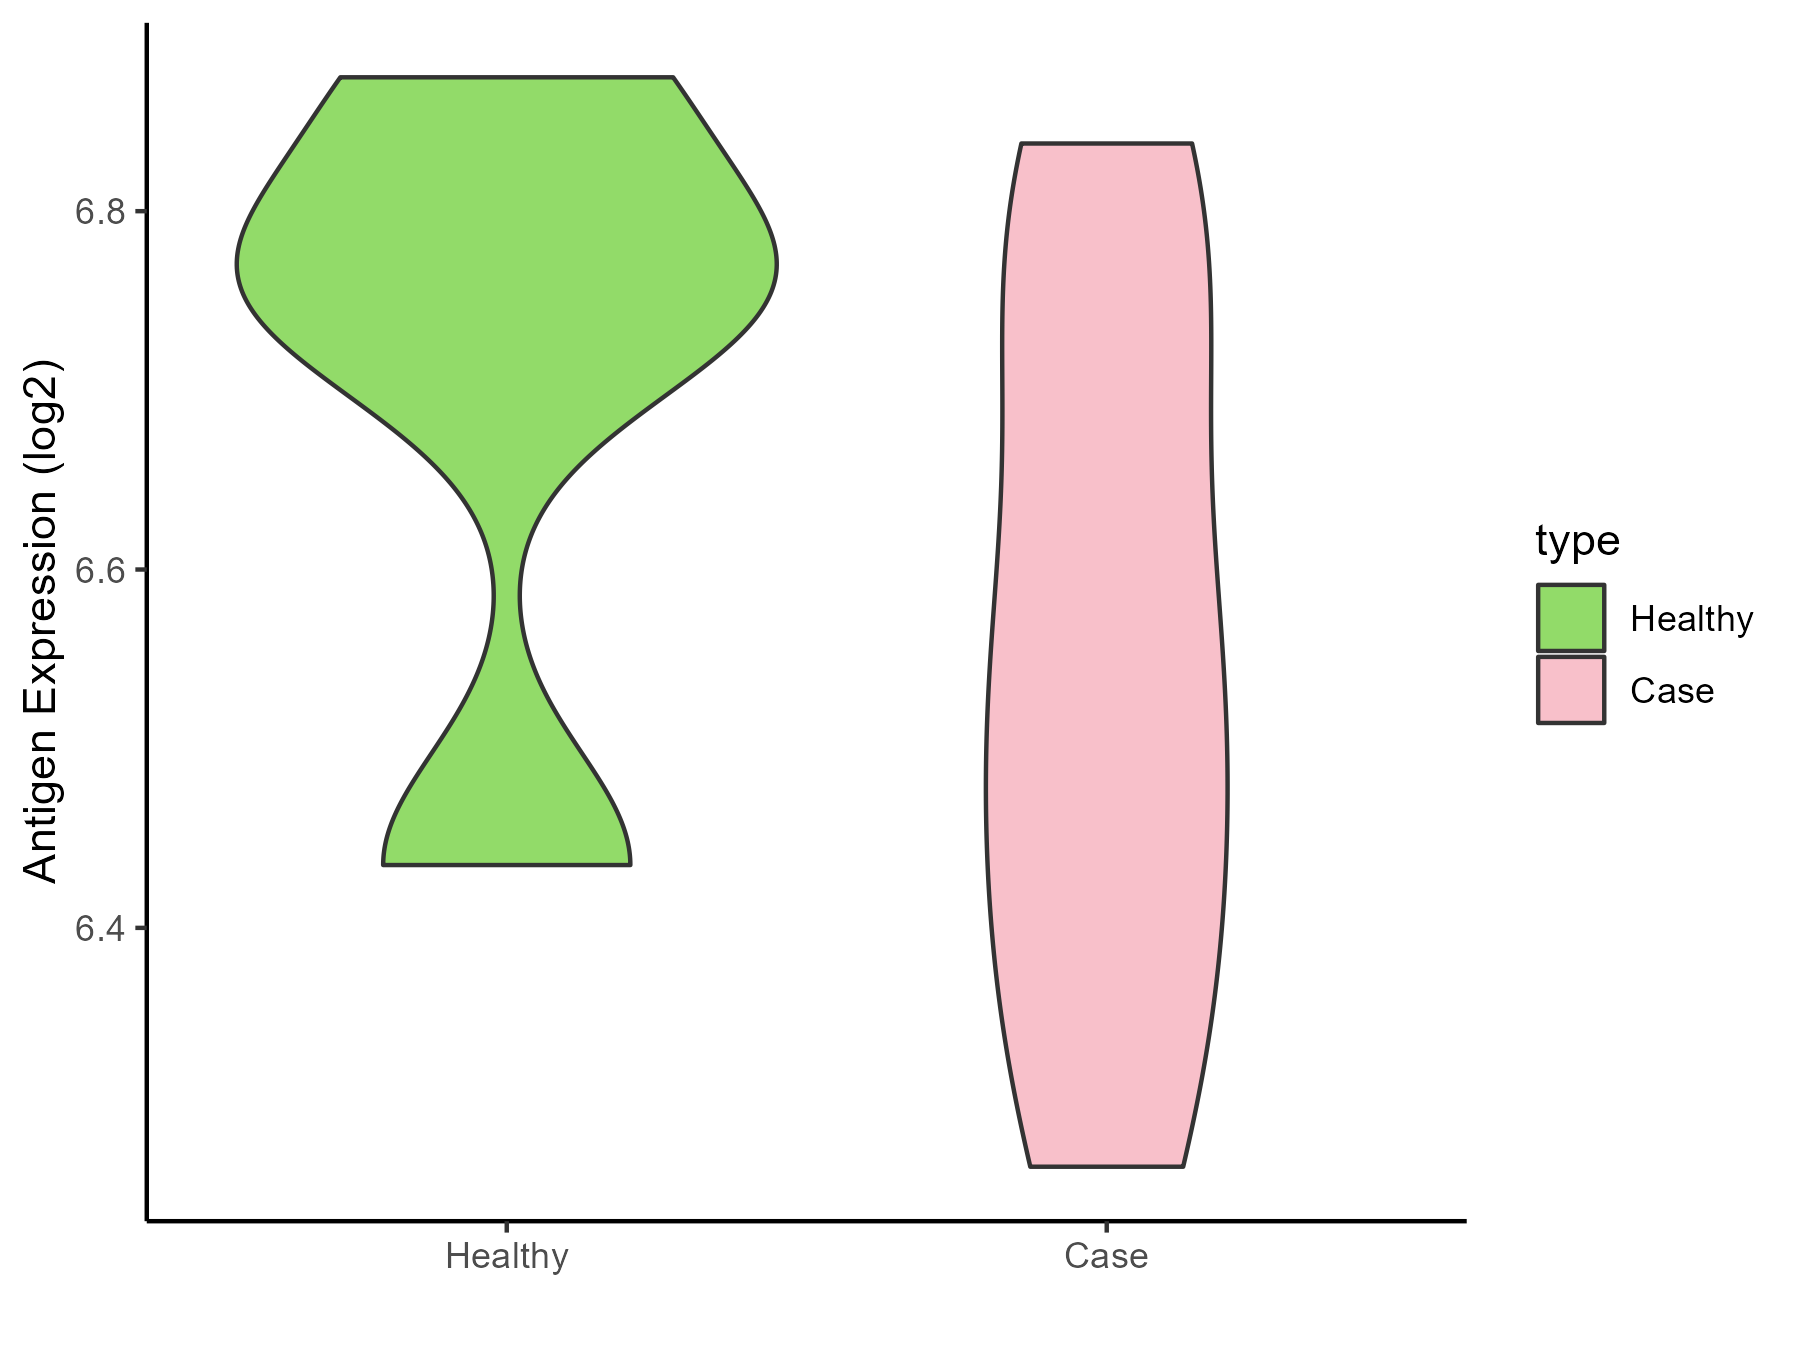
|
Click to View the Clearer Original Diagram |
| The Studied Tissue | Cervical spinal cord | |
| The Specific Disease | Lateral sclerosis | |
| The Expression Level of Disease Section Compare with the Healthy Individual Tissue | p-value: 0.19155416; Fold-change: 0.114662897; Z-score: 0.243129356 | |
| Disease-specific Antigen Abundances |
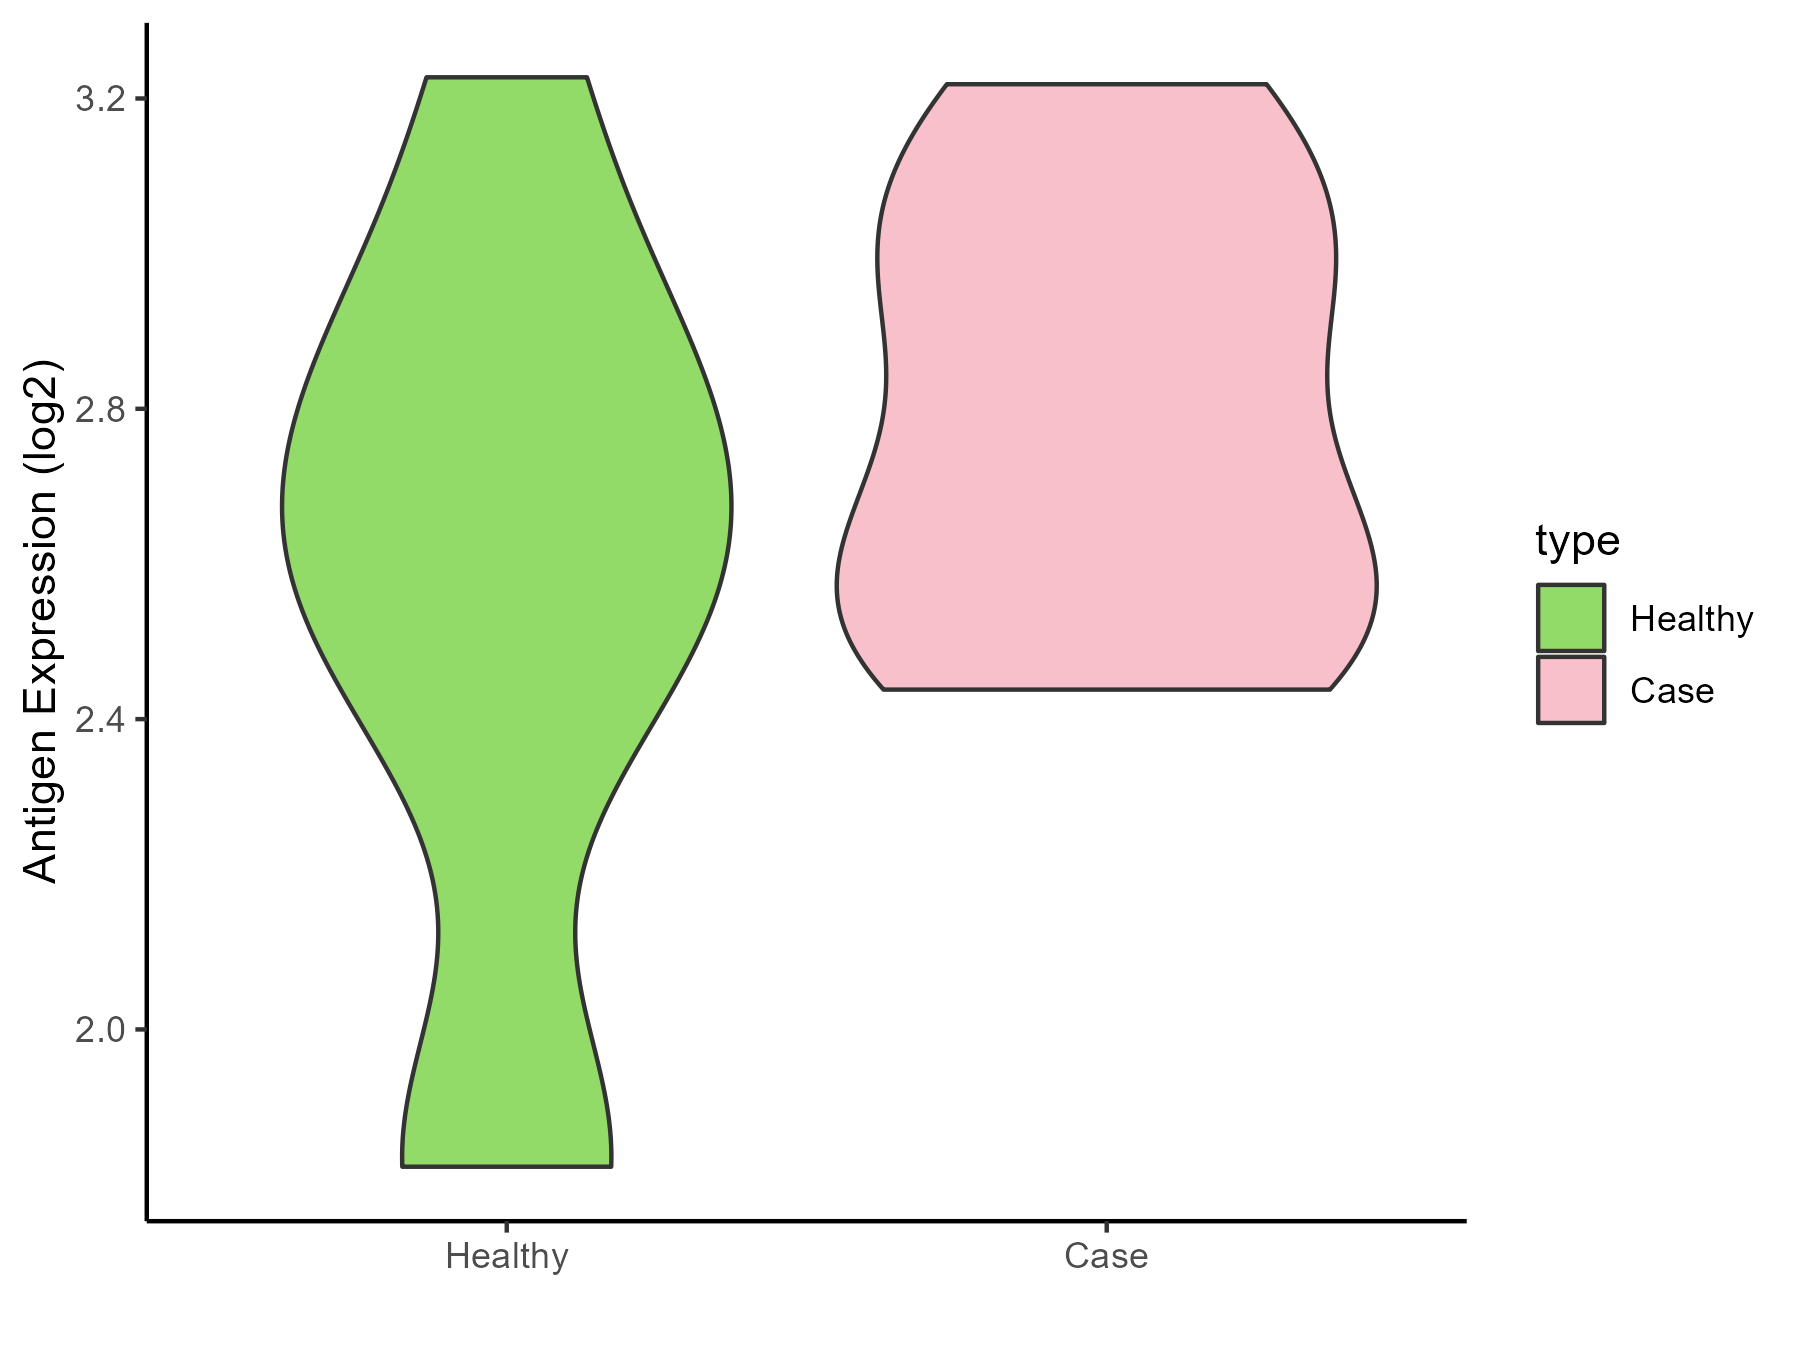
|
Click to View the Clearer Original Diagram |
| Differential expression pattern of antigen in diseases | ||
| The Studied Tissue | Muscle | |
| The Specific Disease | Muscular atrophy | |
| The Expression Level of Disease Section Compare with the Healthy Individual Tissue | p-value: 0.252284751; Fold-change: 0.103990907; Z-score: 0.300130605 | |
| Disease-specific Antigen Abundances |
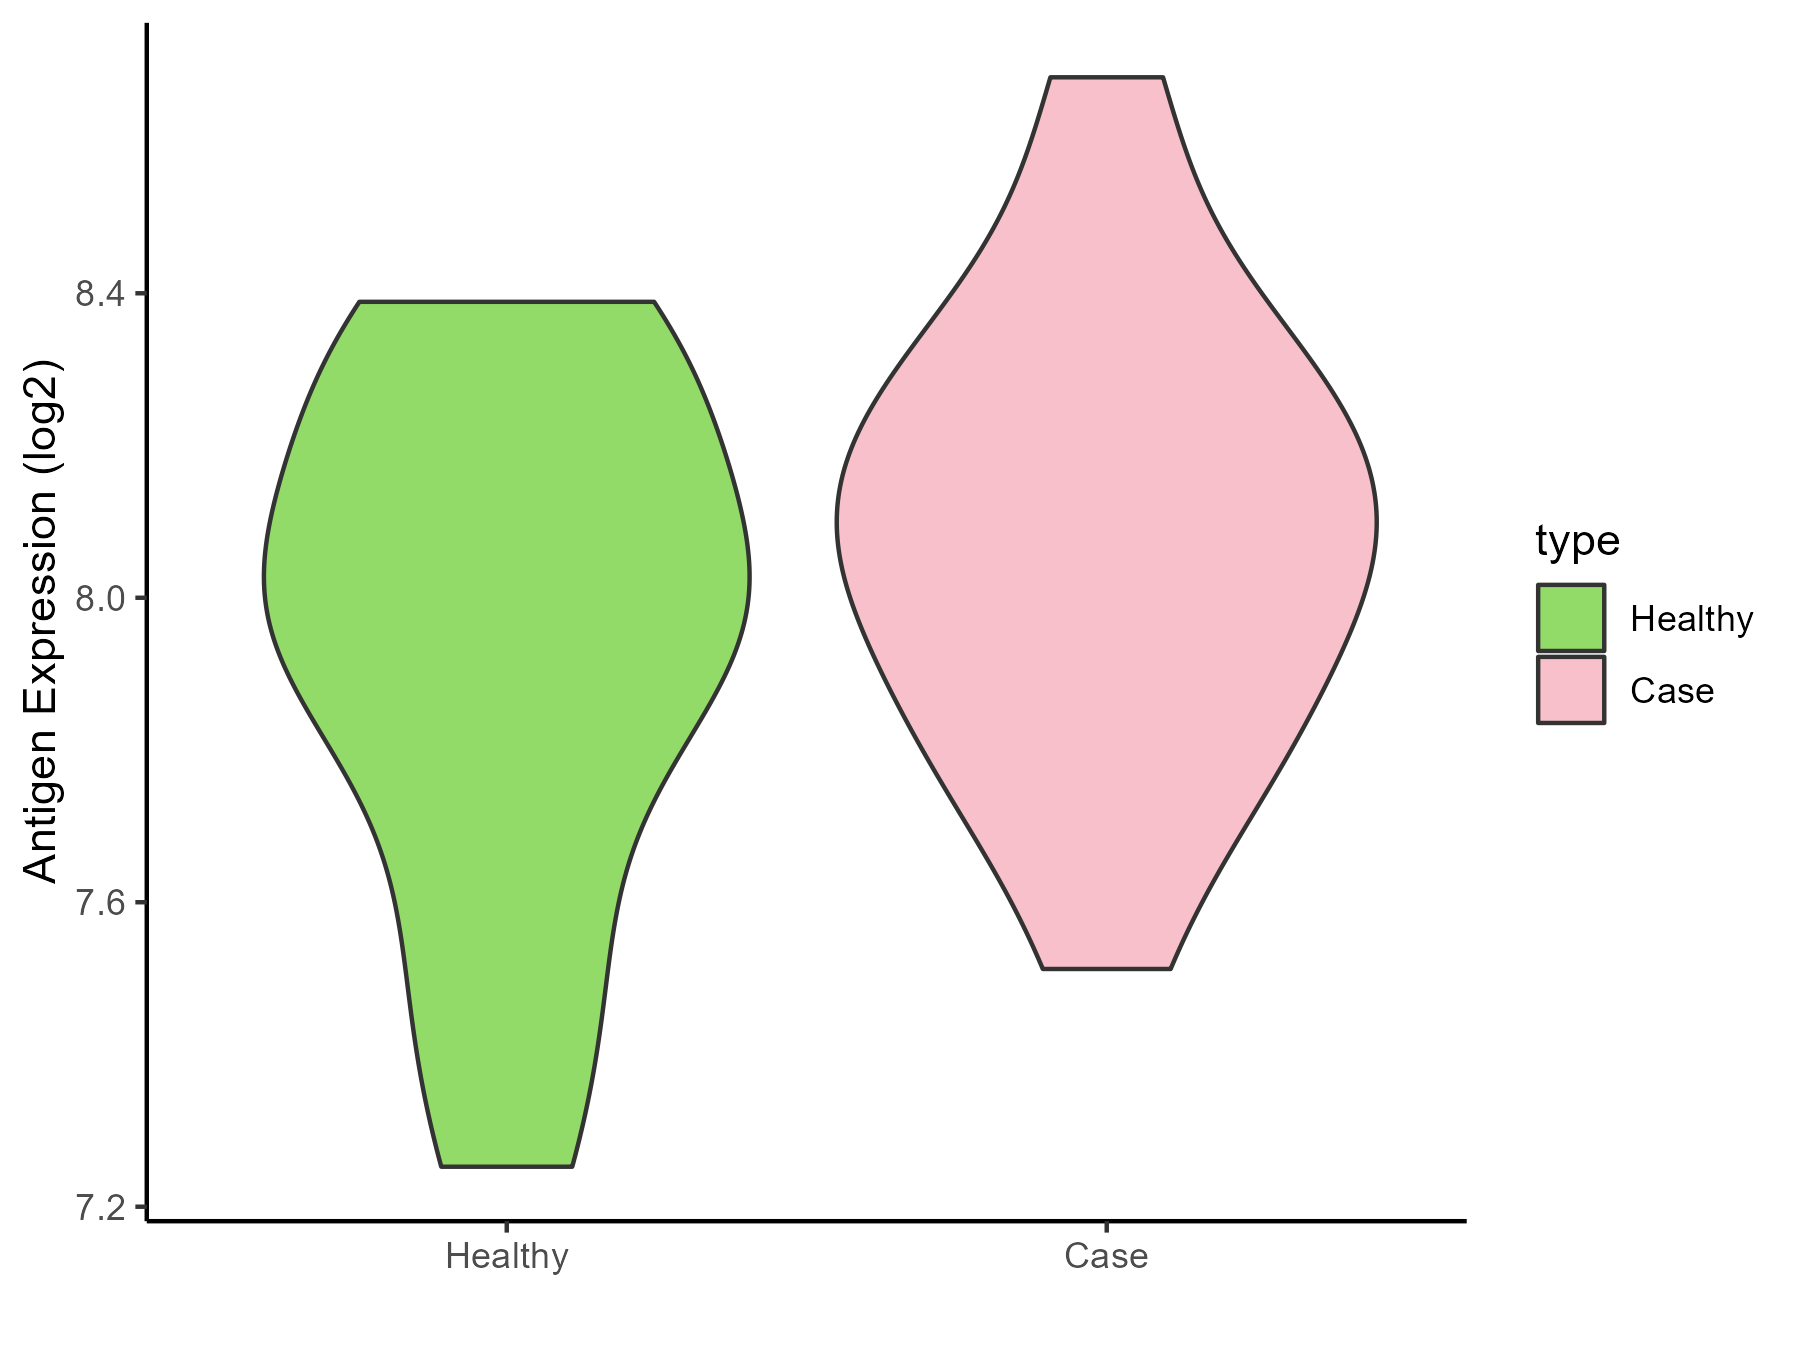
|
Click to View the Clearer Original Diagram |
| Differential expression pattern of antigen in diseases | ||
| The Studied Tissue | Muscle | |
| The Specific Disease | Myopathy | |
| The Expression Level of Disease Section Compare with the Healthy Individual Tissue | p-value: 0.043910009; Fold-change: 0.108326642; Z-score: 0.304382856 | |
| Disease-specific Antigen Abundances |
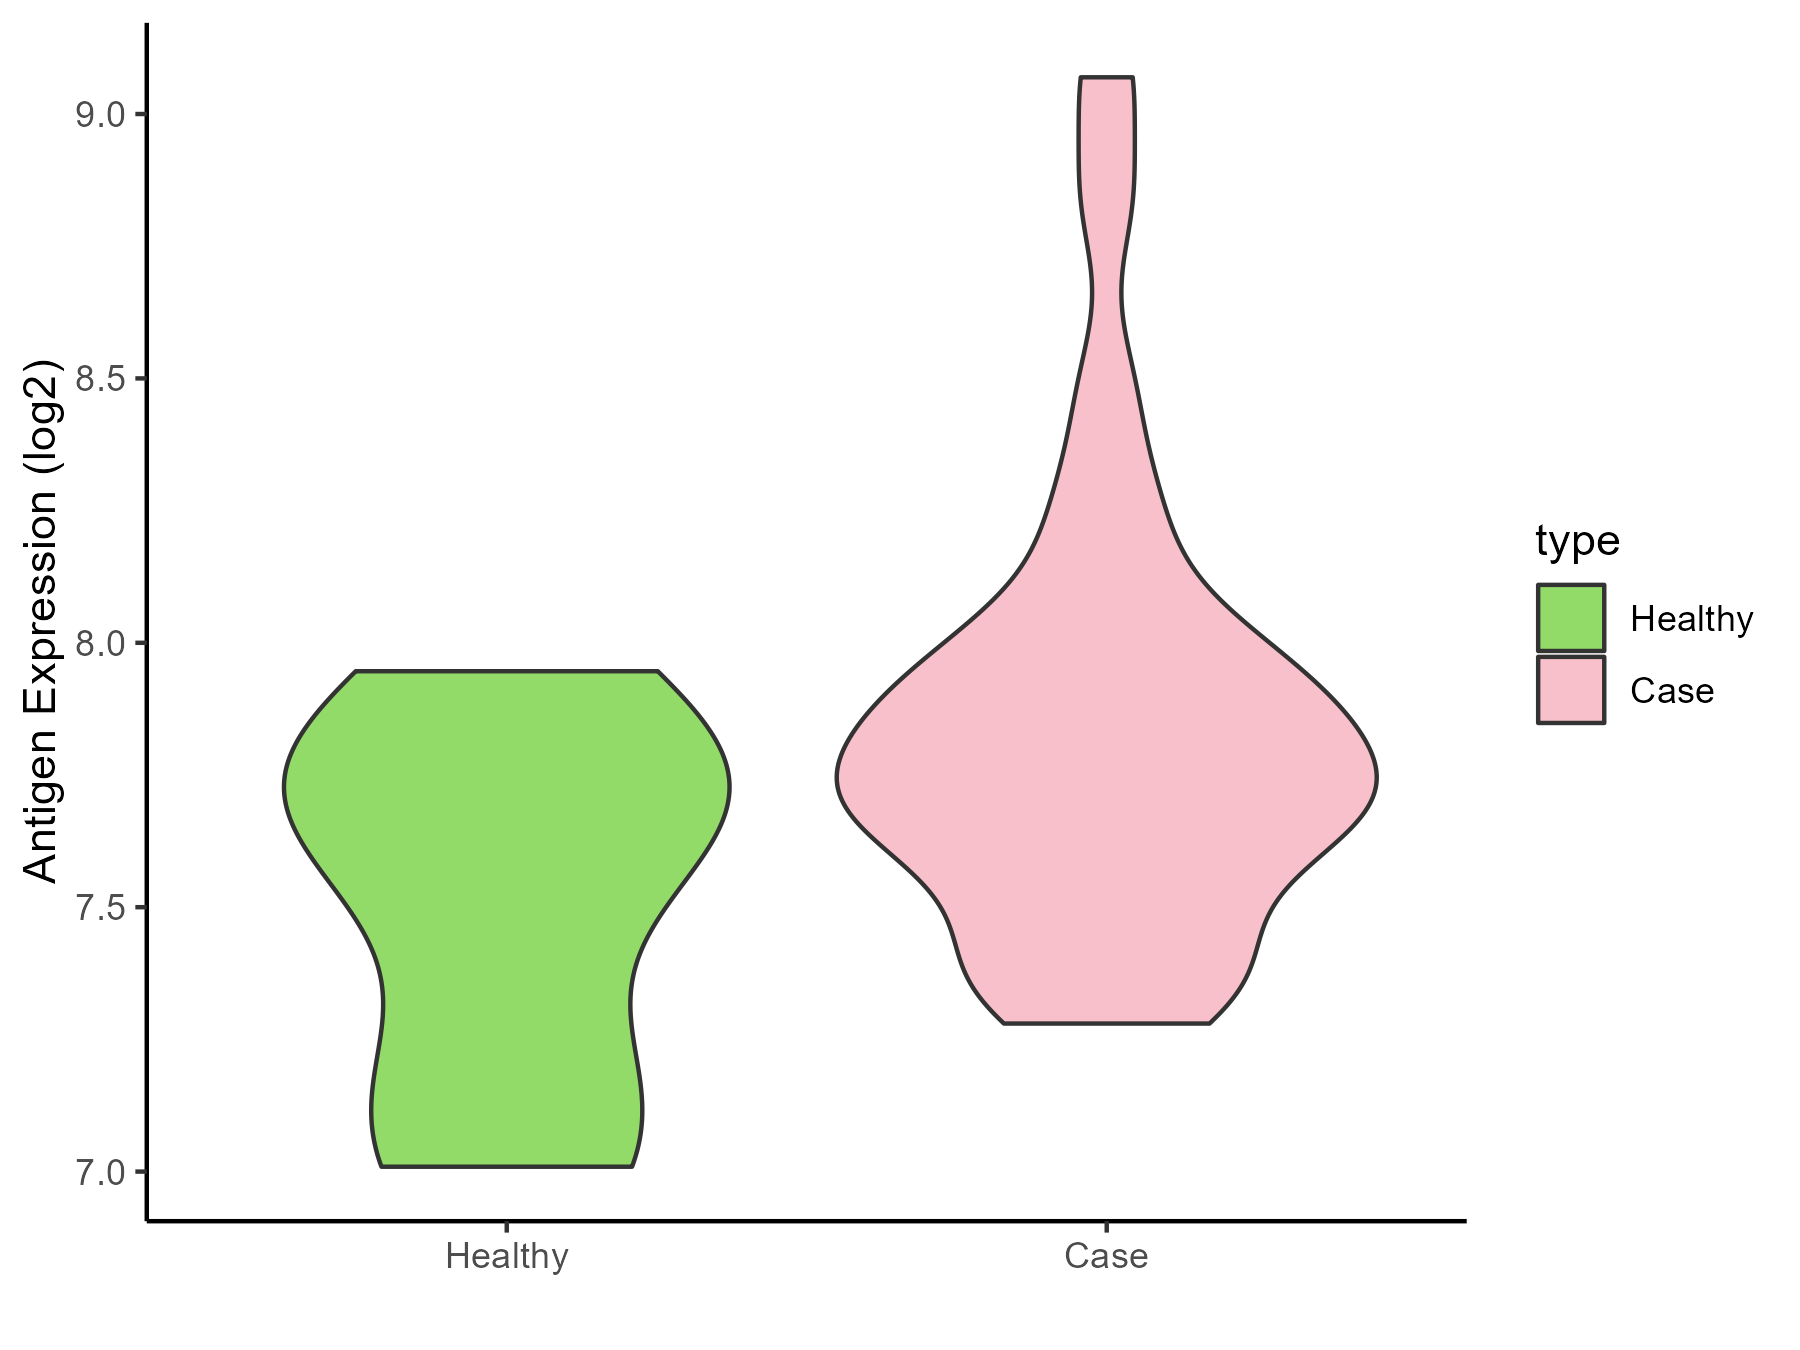
|
Click to View the Clearer Original Diagram |
References
