
Antibody-drug Conjugate Information
General Information of This Antibody-drug Conjugate (ID: DRG0HPUIL)
| ADC Name |
Farletuzumab ecteribulin
|
|||||
|---|---|---|---|---|---|---|
| Synonyms |
farletuzumab ecteribulin; MORAb-202; eribulin conjugated farletuzumab; farletuzumab-ecteribulin; BMS-986445; FZEC
Click to Show/Hide
|
|||||
| Organization |
Morphotek (Originator);Bristol-Myers Squibb (Top20 MNC) (No Rights)
|
|||||
| Drug Status |
Phase 2
|
|||||
| Drug-to-Antibody Ratio |
4
|
|||||
| Structure |
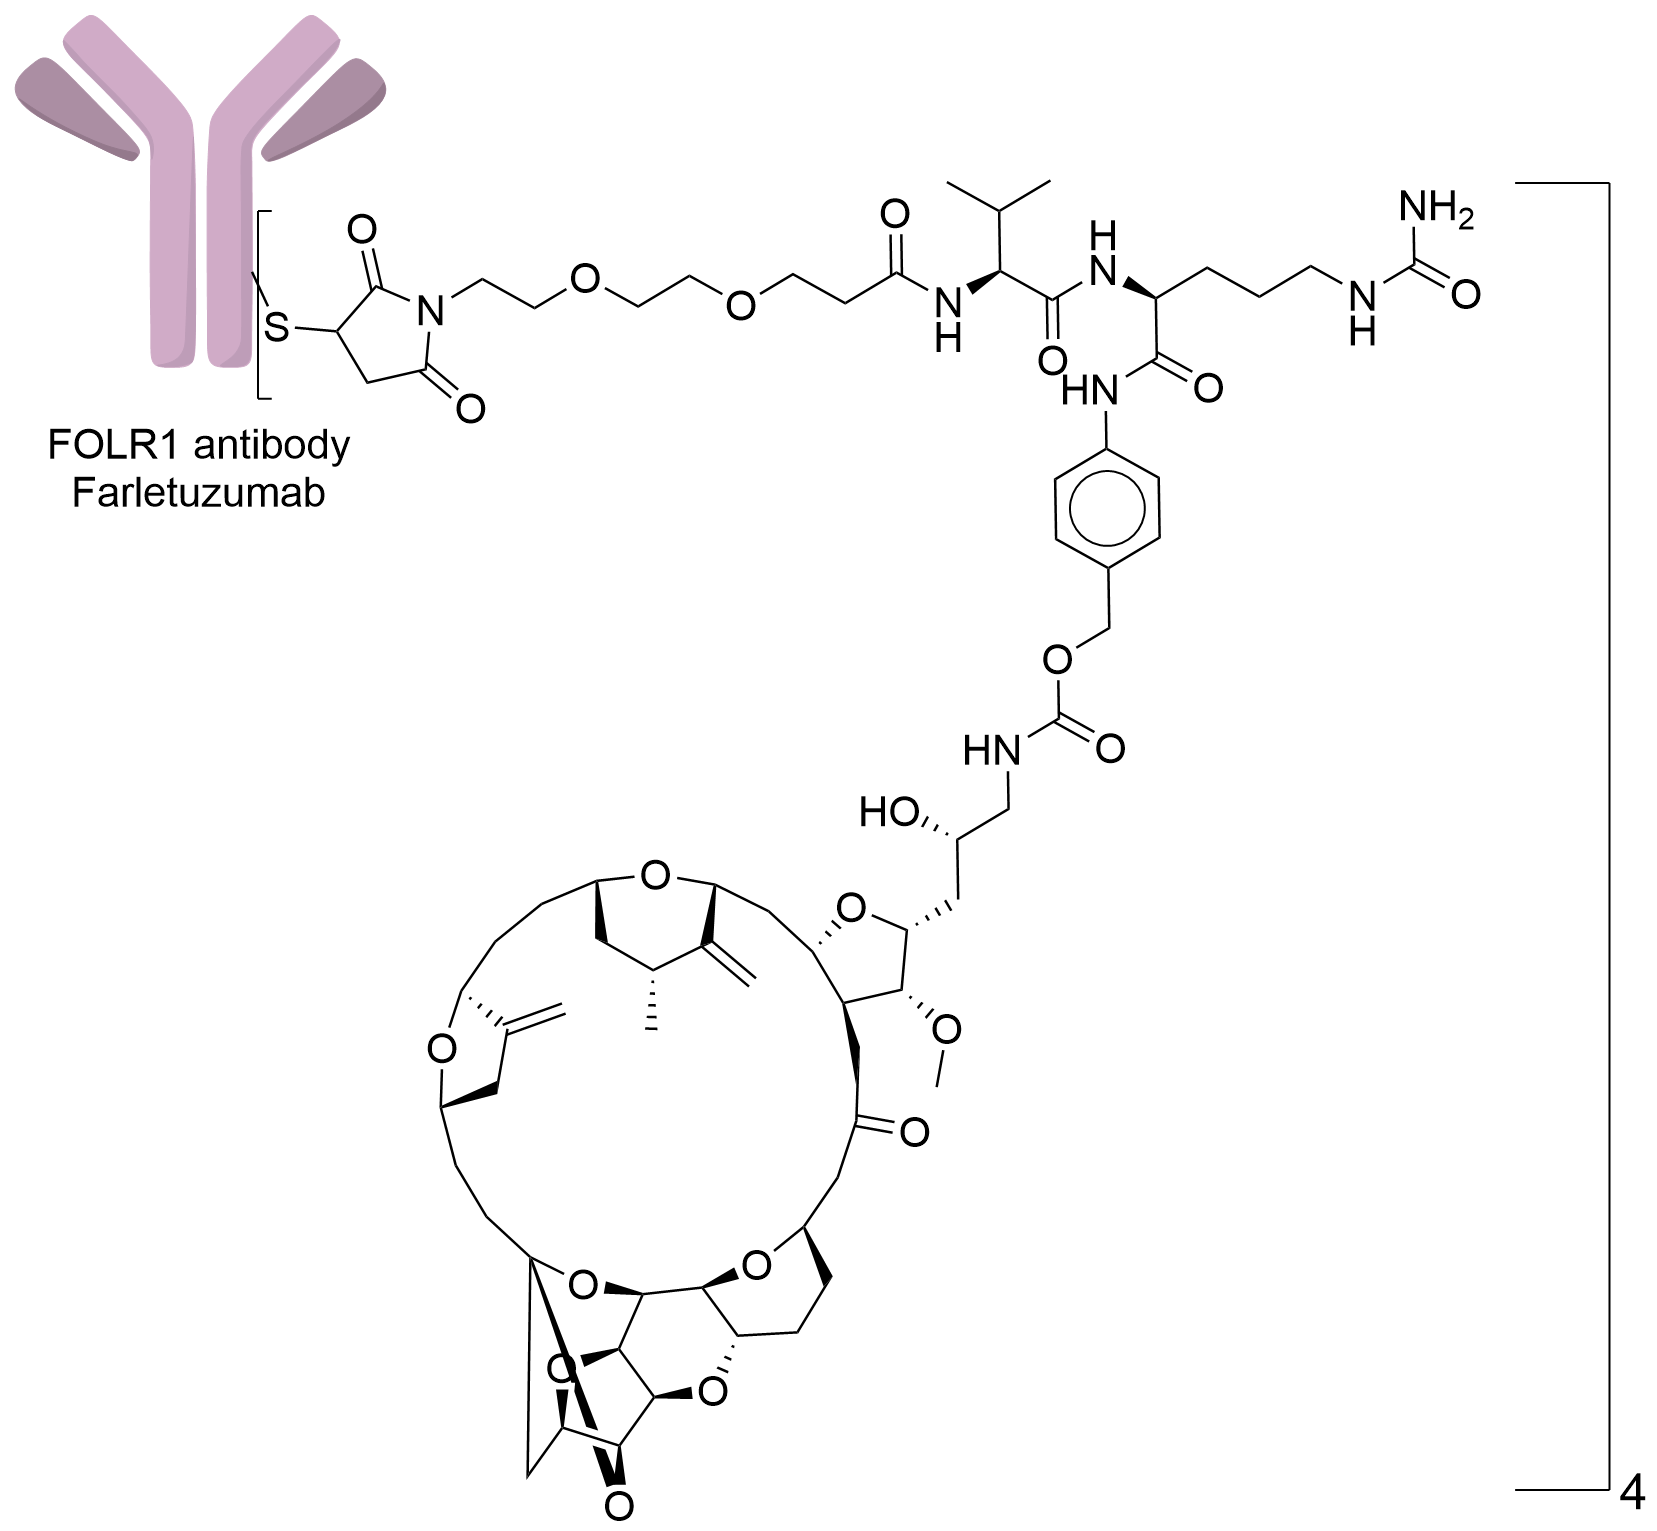
|
|||||
| Antibody Name |
Farletuzumab
|
Antibody Info | ||||
| Antigen Name |
Folate receptor alpha (FOLR1)
|
Antigen Info | ||||
| Payload Name |
Eribulin
|
Payload Info | ||||
| Payload Target |
Microtubule (MT)
|
Target Info | ||||
| Linker Name |
Mal-PEG2-Val-Cit-PABC
|
Linker Info | ||||
| Conjugate Type |
Random Cysteines
|
|||||
| Combination Type |
ecteribulin
|
|||||
2027 Update
The disease landscape of This ADC
2027 Update
The clinical trial pipelines of This ADC
| Disease Name | Phase 1 | Phase 2 | Phase 3 | Approved |
|---|---|---|---|---|
| Lung cancer | ||||
| Peritoneal cancer | ||||
| Breast cancer | ||||
| Ovarian cancer | ||||
| Fallopian tube cancer | ||||
| Endometrial cancer | ||||
| Unspecific solid tumor |
2027 Update
ADC-specific functional property
Bystander Killing Effect
| Bystander Killing Effect | Description | Reference |
|---|---|---|
| yes |
The effect of MORAb-202 was further characterized in an in vitro coculture system of the FRalpha- HL60 and FRalpha+ IGROV1 cell lines. A consistent in vitro effect of MORAb-202 was observed from 48 to 96 hours. Endpoint supernatant recovered from the coculture exhibited cell cytotoxicity in FRalpha- cells, suggesting that released eribulin is liable for the observed effect.
Click to Show/Hide
|
[1]
|
| yes |
This result demonstrated that eribulin conjugated to MORAb-202 was efficiently cleaved in NLG-IGROV-1 cells, and free eribulin released from the apoptotic NLR-IGROV-1 cells was cytotoxic to adjacent NLR-HL-60 cells, resulting in bystander killing.
Click to Show/Hide
|
[3]
|
2027 Update
General Information of The ADMET Data Related to This ADC
Absorption
| Standard Type | Value | Units | Description | Reference |
|---|---|---|---|---|
| Area Under the Concentration-Time Curve (AUC) | 7160 | ug·h/mL |
MORAb-202 was administered Q3Wx2 (2, 4, and 6 mg/kg) to cynomolgus monkeys, 2 mg/kg, Male, Day 1, AUC0-t.
|
[3] |
| Area Under the Concentration-Time Curve (AUC) | 7800 | ug·h/mL |
MORAb-202 was administered Q3Wx2 (2, 4, and 6 mg/kg) to cynomolgus monkeys, 2 mg/kg, Male, Day 22, AUC0-t.
|
[3] |
| Area Under the Concentration-Time Curve (AUC) | 6300 | ug·h/mL |
MORAb-202 was administered Q3Wx2 (2, 4, and 6 mg/kg) to cynomolgus monkeys, 2 mg/kg, Female, Day 1, AUC0-t.
|
[3] |
| Area Under the Concentration-Time Curve (AUC) | 6970 | ug·h/mL |
MORAb-202 was administered Q3Wx2 (2, 4, and 6 mg/kg) to cynomolgus monkeys, 2 mg/kg, Female, Day 22, AUC0-t.
|
[3] |
| Area Under the Concentration-Time Curve (AUC) | 12300 | ug·h/mL |
MORAb-202 was administered Q3Wx2 (2, 4, and 6 mg/kg) to cynomolgus monkeys, 4 mg/kg, Male, Day 1, AUC0-t.
|
[3] |
| Area Under the Concentration-Time Curve (AUC) | 13400 | ug·h/mL |
MORAb-202 was administered Q3Wx2 (2, 4, and 6 mg/kg) to cynomolgus monkeys, 4 mg/kg, Male, Day 22, AUC0-t.
|
[3] |
| Area Under the Concentration-Time Curve (AUC) | 11500 | ug·h/mL |
MORAb-202 was administered Q3Wx2 (2, 4, and 6 mg/kg) to cynomolgus monkeys, 4 mg/kg, Female, Day 1, AUC0-t.
|
[3] |
| Area Under the Concentration-Time Curve (AUC) | 11800 | ug·h/mL |
MORAb-202 was administered Q3Wx2 (2, 4, and 6 mg/kg) to cynomolgus monkeys, 4 mg/kg, Female, Day 22, AUC0-t.
|
[3] |
| Area Under the Concentration-Time Curve (AUC) | 18300 | ug·h/mL |
MORAb-202 was administered Q3Wx2 (2, 4, and 6 mg/kg) to cynomolgus monkeys, 6 mg/kg, Male, Day 1, AUC0-t.
|
[3] |
| Area Under the Concentration-Time Curve (AUC) | 19000 | ug·h/mL |
MORAb-202 was administered Q3Wx2 (2, 4, and 6 mg/kg) to cynomolgus monkeys, 6 mg/kg, Male, Day 22, AUC0-t.
|
[3] |
| Area Under the Concentration-Time Curve (AUC) | 17100 | ug·h/mL |
MORAb-202 was administered Q3Wx2 (2, 4, and 6 mg/kg) to cynomolgus monkeys, 6 mg/kg, Female, Day 1, AUC0-t.
|
[3] |
| Area Under the Concentration-Time Curve (AUC) | 17200 | ug·h/mL |
MORAb-202 was administered Q3Wx2 (2, 4, and 6 mg/kg) to cynomolgus monkeys, 6 mg/kg, Female, Day 22, AUC0-t.
|
[3] |
Distribution
| Standard Type | Value | Units | Description | Reference |
|---|---|---|---|---|
| Volume of Distribution (Vd) | 2.47 | L |
Farletuzumab ecteribulin PK was well described by a 2-compartment model with linear elimination from the central compartment
|
[1], [2] |
Excretion
| Standard Type | Value | Units | Description | Reference |
|---|---|---|---|---|
| Clearance (CL) | 0.0162 | L/h |
Farletuzumab ecteribulin PK was well described by a 2-compartment model with linear elimination from the central compartment
|
[1], [2] |
| Elimination Half-Life (t1/2) | 192 | h |
MORAb-202 was administered Q3Wx2 (2, 4, and 6 mg/kg) to cynomolgus monkeys, 2 mg/kg, Day 1, Male.
|
[3] |
| Elimination Half-Life (t1/2) | 175 | h |
MORAb-202 was administered Q3Wx2 (2, 4, and 6 mg/kg) to cynomolgus monkeys, 2 mg/kg, Day 22, Male.
|
[3] |
| Elimination Half-Life (t1/2) | 162 | h |
MORAb-202 was administered Q3Wx2 (2, 4, and 6 mg/kg) to cynomolgus monkeys, 2 mg/kg, Day 1, Female.
|
[3] |
| Elimination Half-Life (t1/2) | 148 | h |
MORAb-202 was administered Q3Wx2 (2, 4, and 6 mg/kg) to cynomolgus monkeys, 2 mg/kg, Day 22, Female.
|
[3] |
| Elimination Half-Life (t1/2) | 192 | h |
MORAb-202 was administered Q3Wx2 (2, 4, and 6 mg/kg) to cynomolgus monkeys, 4 mg/kg, Day 1, Male.
|
[3] |
| Elimination Half-Life (t1/2) | 164 | h |
MORAb-202 was administered Q3Wx2 (2, 4, and 6 mg/kg) to cynomolgus monkeys, 4 mg/kg, Day 22, Male.
|
[3] |
| Elimination Half-Life (t1/2) | 151 | h |
MORAb-202 was administered Q3Wx2 (2, 4, and 6 mg/kg) to cynomolgus monkeys, 4 mg/kg, Day 1, Female.
|
[3] |
| Elimination Half-Life (t1/2) | 144 | h |
MORAb-202 was administered Q3Wx2 (2, 4, and 6 mg/kg) to cynomolgus monkeys, 4 mg/kg, Day 22, Female.
|
[3] |
| Elimination Half-Life (t1/2) | 186 | h |
MORAb-202 was administered Q3Wx2 (2, 4, and 6 mg/kg) to cynomolgus monkeys, 6 mg/kg, Day 1, Male.
|
[3] |
| Elimination Half-Life (t1/2) | 144 | h |
MORAb-202 was administered Q3Wx2 (2, 4, and 6 mg/kg) to cynomolgus monkeys, 6 mg/kg, Day 22, Male.
|
[3] |
| Elimination Half-Life (t1/2) | 147 | h |
MORAb-202 was administered Q3Wx2 (2, 4, and 6 mg/kg) to cynomolgus monkeys, 6 mg/kg, Day 1, Female.
|
[3] |
| Elimination Half-Life (t1/2) | 152 | h |
MORAb-202 was administered Q3Wx2 (2, 4, and 6 mg/kg) to cynomolgus monkeys, 6 mg/kg, Day 22, Female.
|
[3] |
General Information of The Activity Data Related to This ADC
Identified from the Human Clinical Data
Discovered Using Patient-derived Xenograft Model
Revealed Based on the Cell Line Data
Full List of Activity Data of This Antibody-drug Conjugate
Identified from the Human Clinical Data
| Experiment 1 Reporting the Activity Date of This ADC | [4] | ||||
| Patients Enrolled |
Eligibility requires histologically confirmed metastatic NSCLC adenocarcinoma (IASLC 8th ed.), measurable disease (RECIST 1.1), and ECOG PS 0-1. Exclusions include non-adenocarcinoma NSCLC histologies, uncontrolled third-space fluid accumulation, prior pneumonectomy (<12 months), recent chest radiotherapy (<6 months), and protocol-specified criteria affecting safety or study integrity.
Click to Show/Hide
|
||||
| Administration Dosage |
Specified dose on specified days
|
||||
| Related Clinical Trial | |||||
| NCT Number | NCT05577715 | Clinical Status | PHASE2 | ||
| Clinical Description | A Phase 2, Open-label, Randomized Study of MORAb-202 (Farletuzumab Ecteribulin), a Folate Receptor Alpha-targeting Antibody-Drug Conjugate, in Participants With Metastatic Non-Small Cell Lung Cancer (NSCLC) Adenocarcinoma (AC) After Progression on Prior Therapies | ||||
| Primary Endpoint |
Primary endpoints assess treatment-related adverse events (TRAEs) leading to discontinuation and objective response rate (ORR) by RECIST 1.1, both evaluated over a 2-year timeframe through investigator assessment to determine safety and efficacy profiles.
|
||||
| Other Endpoint |
Safety monitoring tracks adverse events (AEs), serious AEs (SAEs), treatment-related AEs/SAEs, AEs of special interest (AESIs), deaths, and lab abnormalities over 2 years. Key efficacy measures include progression-free survival (PFS), disease control rate (DCR), and duration of response (DoR), all assessed via RECIST 1.1 by investigators during the same 2-year period.
Click to Show/Hide
|
||||
| Experiment 2 Reporting the Activity Date of This ADC | [5] | ||||
| Patients Enrolled |
Eligible participants must have confirmed high-grade serous ovarian/peritoneal/fallopian tube cancer with platinum-resistant disease (1-3 prior lines) and measurable progression per RECIST v1.1. Key exclusions include non-HGS histologies, platinum-refractory status, significant pulmonary/ILD issues, uncontrolled effusions, hypersensitivity to study drugs, and protocol-specified lab/clinical abnormalities that may compromise safety or interpretation.
Click to Show/Hide
|
||||
| Administration Dosage |
Specified dose on specified days
|
||||
| Related Clinical Trial | |||||
| NCT Number | NCT05613088 | Clinical Status | PHASE2 | ||
| Clinical Description | A Phase 2 Open-label Randomized Study of Farletuzumab Ecteribulin (MORAb-202), a Folate Receptor Alpha-targeting Antibody-drug Conjugate, Versus Investigator's Choice Chemotherapy in Women With Platinum-resistant High-grade Serous (HGS) Ovarian, Primary Peritoneal, or Fallopian Tube Cancer | ||||
| Primary Endpoint |
The primary endpoints evaluate efficacy and tolerability, measuring objective response rate (ORR) by RECIST v1.1 and treatment-related adverse events (TRAEs) causing study discontinuation, both assessed over a 2-year period to determine the treatment's clinical benefit and safety profile.
|
||||
| Other Endpoint |
Secondary outcomes include comprehensive safety monitoring of adverse events (AEs), serious AEs (SAEs), AE-related discontinuations, and laboratory abnormalities, along with efficacy assessments of disease control rate (DCR), duration of response (DoR), and progression-free survival (PFS) by RECIST v1.1 - all tracked for 2 years to characterize the treatment's overall risk-benefit profile.
Click to Show/Hide
|
||||
| Experiment 3 Reporting the Activity Date of This ADC | [6] | ||||
| Patients Enrolled |
Eligible participants (≥20 years, ECOG 0-1) require FRA-positive solid tumors (Part 1) or specific ovarian/NSCLC histologies (Part 2) with adequate organ function. Key exclusions: uncontrolled cardiovascular disease, active infections, ILD, brain metastases, prior FRalpha/eribulin intolerance, or concurrent malignancies. Reproductive-age participants must use contraception, and prior anticancer therapies require appropriate washout periods (2-4 weeks depending on treatment type).
Click to Show/Hide
|
||||
| Administration Dosage |
Part 1: farletuzumab ecteribulin intravenous (IV) infusion administered every 3 weeks starting at a 0.3 mg/kg dose and successively increasing doses until DLT. Part 2: farletuzumab ecteribulin administered IV every 3 weeks at a dose determined in Part 1 until any of the criteria for discontinuation are met.
|
||||
| Related Clinical Trial | |||||
| NCT Number | NCT03386942 | Clinical Status | PHASE1 | ||
| Clinical Description | A Phase 1 Study of MORAb-202 in Subjects With Solid Tumors | ||||
| Primary Endpoint |
The study evaluates safety through dose-limiting toxicities (DLTs) in Cycle 1 (21 days), including severe hematologic events (grade 4 neutropenia/thrombocytopenia/anemia) and clinically significant grade 3-4 non-hematologic toxicities. Additional safety assessments over 50 months monitor AEs, SAEs, lab abnormalities, vital signs, ECOG PS changes, and immunogenicity via ADA titers to characterize the treatment's long-term safety profile.
Click to Show/Hide
|
||||
| Other Endpoint |
Pharmacokinetics analysis measures maximum serum concentration (Cmax) of farletuzumab ecteribulin, total antibody, and free eribulin to establish the maximum tolerated dose (MTD) and recommended dose (RD) based on DLT rates (target 25%). Efficacy outcomes over 50 months include RECIST v1.1-based responses (ORR, DCR, CBR, BOR), with Part 2 specifically tracking survival metrics (PFS, OS) and duration of response (DOR) in defined cohorts.
Click to Show/Hide
|
||||
| Experiment 4 Reporting the Activity Date of This ADC | [7] | ||||
| Patients Enrolled |
Eligible participants (≥18 years, ECOG 0-1) include platinum-resistant ovarian, TNBC, NSCLC adenocarcinoma, or endometrial cancer patients with measurable disease and adequate organ function. Key exclusions: prior FRalpha/eribulin therapy, uncontrolled cardiovascular/autoimmune conditions, active infections (HIV/hepatitis), untreated brain metastases, pregnancy, or ILD risk factors (e.g., abnormal PFTs, chest radiotherapy <2 years). Contraception is mandated for reproductive-age participants, with washout periods (2-4 weeks) required for prior therapies.
Click to Show/Hide
|
||||
| Administration Dosage |
The initial cohort has enrolled 7 patients at a MORAb-202 25 mg/m2 IV Q3W dose and is ongoing; further enrollment of patients at 25 mg/m2 and 33 mg/m2 will occur following ILD safety evaluation. Tumor assessments will be conducted by investigators using RECIST v1.1 at screening, every 6 weeks for 24 weeks, then every 12 weeks or as needed.
|
||||
| Related Clinical Trial | |||||
| NCT Number | NCT04300556 | Clinical Status | PHASE1|||PHASE2 | ||
| Clinical Description | A Multicenter, Open-Label Phase 1/2 Trial Evaluating the Safety, Tolerability, and Efficacy of MORAb-202, a Folate Receptor Alpha (FRalpha)-Targeting Antibody-drug Conjugate (ADC) in Subjects With Selected Tumor Types | ||||
| Primary Endpoint |
The study assesses safety through dose-limiting toxicities (DLTs) in Cycle 1 (21 days), including severe hematologic and non-hematologic events (grade 3-4 per NCI CTCAE v5.0). Long-term safety (up to ~4 years 8 months) monitors SAEs, AEs leading to discontinuation, AEIs (e.g., ILD), lab/vital sign abnormalities, and immunogenicity via ADA titers. Efficacy endpoints include ORR (RECIST v1.1, up to ~24 weeks) and dose-finding for the RP2D.
Click to Show/Hide
|
||||
| Other Endpoint |
Secondary outcomes evaluate pharmacokinetics (Cmax, AUC, t½) of farletuzumab ecteribulin and its components, alongside RECIST v1.1-based efficacy measures (DOR, DCR, CBR, PFS, OS) over ~4.8 years. Exploratory analyses correlate tumor FRA expression with clinical outcomes (ORR, PFS). Additional metrics include ECOG PS changes, SpO2 levels, and cardiac/laboratory parameters to comprehensively assess treatment impact.
Click to Show/Hide
|
||||
Discovered Using Patient-derived Xenograft Model
| Experiment 1 Reporting the Activity Date of This ADC | [8] | ||||
| Efficacy Data | Tumor Growth Inhibition value (TGI) | ≈ 2.10% | Moderate FOLR1 expression (FOLR1++) | ||
| Method Description |
The each group was randomized to be a similar mean volume of 100-250 mm3.The treatment schedule was as follows: a single IV injection of vehicle at day 0, and a single IV injection of MORAb-202 at 2.5 mg/kg at day 0 ((Q1Dx1) or every 11 days (Q11Dx2)).
|
||||
| In Vivo Model | Breast cancer PDX model (PDX: OD-BRE-0631) | ||||
| Experiment 2 Reporting the Activity Date of This ADC | [8] | ||||
| Efficacy Data | Tumor Growth Inhibition value (TGI) | ≈ 65.70% | Moderate FOLR1 expression (FOLR1++) | ||
| Method Description |
The each group was randomized to be a similar mean volume of 100-250 mm3.The treatment schedule was as follows: a single IV injection of vehicle at day 0, and a single IV injection of MORAb-202 at 5 mg/kg at day 0 ((Q1Dx1) or every 11 days (Q11Dx2)).
|
||||
| In Vivo Model | Breast cancer PDX model (PDX: OD-BRE-0631) | ||||
| Experiment 3 Reporting the Activity Date of This ADC | [8] | ||||
| Efficacy Data | Tumor Growth Inhibition value (TGI) | ≈ 98.30% | High FOLR1 expression (FOLR1+++) | ||
| Method Description |
The each group was randomized to be a similar mean volume of 100-250 mm3.The treatment schedule was as follows: a single IV injection of vehicle at day 0, and a single IV injection of MORAb-202 at 5 mg/kg at day 0 ((Q1Dx1) or every 11 days (Q11Dx2)).
|
||||
| In Vivo Model | Breast cancer PDX model (PDX: IM-BRE-563) | ||||
Revealed Based on the Cell Line Data
| Experiment 1 Reporting the Activity Date of This ADC | [8] | ||||
| Efficacy Data | Half Maximal Inhibitory Concentration (IC50) | 0.01 pM | High FOLR1 expression (FOLR1+++) | ||
| Method Description |
Threefold serial dilutions of MORAb-202 (5.1x10¹² - 1.0x10⁷ mol/L) were added to the cell lines, and the cells were cultured for 5 days. Cells were stained with 0.2% crystal violet solution, a triarylmethane dye which accumulates in the nucleus of viable cells, washed with water, and solubilized with 1% sodium dodecyl sulfate. The viable cell number was determined by measuring the optical density (OD 570 nm) of the resulting lysate.
Click to Show/Hide
|
||||
| In Vitro Model | Ovarian endometrioid adenocarcinoma | IGROV-1 cells | CVCL_1304 | ||
| Experiment 2 Reporting the Activity Date of This ADC | [8] | ||||
| Efficacy Data | Half Maximal Inhibitory Concentration (IC50) | 0.74 pM | High FOLR1 expression (FOLR1+++) | ||
| Method Description |
Threefold serial dilutions of MORAb-202 (5.1x10¹² - 1.0x10⁷ mol/L) were added to the cell lines, and the cells were cultured for 5 days. Cells were stained with 0.2% crystal violet solution, a triarylmethane dye which accumulates in the nucleus of viable cells, washed with water, and solubilized with 1% sodium dodecyl sulfate. The viable cell number was determined by measuring the optical density (OD 570 nm) of the resulting lysate.
Click to Show/Hide
|
||||
| In Vitro Model | Lung non-small cell carcinoma | NCI-H2110 cells | CVCL_1530 | ||
| Experiment 3 Reporting the Activity Date of This ADC | [8] | ||||
| Efficacy Data | Half Maximal Inhibitory Concentration (IC50) | > 1 pM | Negative FOLR1 expression (FOLR1-) | ||
| Method Description |
Threefold serial dilutions of MORAb-202 (5.1x10¹² - 1.0x10⁷ mol/L) were added to the cell lines, and the cells were cultured for 5 days. Cells were stained with 0.2% crystal violet solution, a triarylmethane dye which accumulates in the nucleus of viable cells, washed with water, and solubilized with 1% sodium dodecyl sulfate. The viable cell number was determined by measuring the optical density (OD 570 nm) of the resulting lysate.
Click to Show/Hide
|
||||
| In Vitro Model | Osteosarcoma | SJSA-1 cells | CVCL_1697 | ||
| Experiment 4 Reporting the Activity Date of This ADC | [8] | ||||
| Efficacy Data | Half Maximal Inhibitory Concentration (IC50) | 23 pM | Moderate FOLR1 expression (FOLR1++) | ||
| Method Description |
Threefold serial dilutions of MORAb-202 (5.1x10¹² - 1.0x10⁷ mol/L) were added to the cell lines, and the cells were cultured for 5 days. Cells were stained with 0.2% crystal violet solution, a triarylmethane dye which accumulates in the nucleus of viable cells, washed with water, and solubilized with 1% sodium dodecyl sulfate. The viable cell number was determined by measuring the optical density (OD 570 nm) of the resulting lysate.
Click to Show/Hide
|
||||
| In Vitro Model | Skin squamous cell carcinoma | A431-A3 cells | CVCL_0037 | ||
| Experiment 5 Reporting the Activity Date of This ADC | [9] | ||||
| Efficacy Data | Half Maximal Inhibitory Concentration (IC50) | 0.02 nM | High FOLR1 expression(FOLR1+++) | ||
| Method Description |
Cells were sub-cultured and seeded at 5,000 cells/well in complete growth medium in 96-well tissue culture plates, and incubated at 37°C, 5% CO2 overnight. Test reagents were serially diluted and added to the cell plates (initial concentration of 100 nM). Plates were incubated at 37°C, 5% CO2 for an additional 3 d.
|
||||
| In Vitro Model | Ovarian endometrioid adenocarcinoma | IGROV-1 cells | CVCL_1304 | ||
| Experiment 6 Reporting the Activity Date of This ADC | [9] | ||||
| Efficacy Data | Half Maximal Inhibitory Concentration (IC50) | 0.42 nM | Moderate FOLR1 expression(FOLR1++) | ||
| Method Description |
Cells were sub-cultured and seeded at 5,000 cells/well in complete growth medium in 96-well tissue culture plates, and incubated at 37°C, 5% CO2 overnight. Test reagents were serially diluted and added to the cell plates (initial concentration of 100 nM). Plates were incubated at 37°C, 5% CO2 for an additional 3 d.
|
||||
| In Vitro Model | Lung non-small cell carcinoma | NCI-H2110 cells | CVCL_1530 | ||
| Experiment 7 Reporting the Activity Date of This ADC | [9] | ||||
| Efficacy Data | Half Maximal Inhibitory Concentration (IC50) | 0.43 nM | Moderate FOLR1 expression(FOLR1++) | ||
| Method Description |
Cells were sub-cultured and seeded at 5,000 cells/well in complete growth medium in 96-well tissue culture plates, and incubated at 37°C, 5% CO2 overnight. Test reagents were serially diluted and added to the cell plates (initial concentration of 100 nM). Plates were incubated at 37°C, 5% CO2 for an additional 3 d.
|
||||
| In Vitro Model | Ovarian serous adenocarcinoma | Caov-3 cells | CVCL_0201 | ||
| Experiment 8 Reporting the Activity Date of This ADC | [9] | ||||
| Efficacy Data | Half Maximal Inhibitory Concentration (IC50) | 0.75 nM | Moderate FOLR1 expression(FOLR1++) | ||
| Method Description |
Cells were sub-cultured and seeded at 5,000 cells/well in complete growth medium in 96-well tissue culture plates, and incubated at 37°C, 5% CO2 overnight. Test reagents were serially diluted and added to the cell plates (initial concentration of 100 nM). Plates were incubated at 37°C, 5% CO2 for an additional 3 d.
|
||||
| In Vitro Model | Ovarian serous adenocarcinoma | OVCAR-3 cells | CVCL_0465 | ||
| Experiment 9 Reporting the Activity Date of This ADC | [9] | ||||
| Efficacy Data | Half Maximal Inhibitory Concentration (IC50) | 1.03 nM | Low FOLR1 expression(FOLR1+) | ||
| Method Description |
Cells were sub-cultured and seeded at 5,000 cells/well in complete growth medium in 96-well tissue culture plates, and incubated at 37°C, 5% CO2 overnight. Test reagents were serially diluted and added to the cell plates (initial concentration of 100 nM). Plates were incubated at 37°C, 5% CO2 for an additional 3 d.
|
||||
| In Vitro Model | Endometrial adenocarcinoma | HEC-59 cells | CVCL_2930 | ||
| Experiment 10 Reporting the Activity Date of This ADC | [9] | ||||
| Efficacy Data | Half Maximal Inhibitory Concentration (IC50) | 1.42 nM | Low FOLR1 expression(FOLR1+) | ||
| Method Description |
Cells were sub-cultured and seeded at 5,000 cells/well in complete growth medium in 96-well tissue culture plates, and incubated at 37°C, 5% CO2 overnight. Test reagents were serially diluted and added to the cell plates (initial concentration of 100 nM). Plates were incubated at 37°C, 5% CO2 for an additional 3 d.
|
||||
| In Vitro Model | Breast ductal carcinoma | HCC1954 cells | CVCL_1259 | ||
| Experiment 11 Reporting the Activity Date of This ADC | [9] | ||||
| Efficacy Data | Half Maximal Inhibitory Concentration (IC50) | 1.76 nM | Moderate FOLR1 expression(FOLR1++) | ||
| Method Description |
Cells were sub-cultured and seeded at 5,000 cells/well in complete growth medium in 96-well tissue culture plates, and incubated at 37°C, 5% CO2 overnight. Test reagents were serially diluted and added to the cell plates (initial concentration of 100 nM). Plates were incubated at 37°C, 5% CO2 for an additional 3 d.
|
||||
| In Vitro Model | Gastric tubular adenocarcinoma | MKN74 cells | CVCL_2791 | ||
| Experiment 12 Reporting the Activity Date of This ADC | [9] | ||||
| Efficacy Data | Half Maximal Inhibitory Concentration (IC50) | 1.81 nM | Moderate FOLR1 expression(FOLR1++) | ||
| Method Description |
Cells were sub-cultured and seeded at 5,000 cells/well in complete growth medium in 96-well tissue culture plates, and incubated at 37°C, 5% CO2 overnight. Test reagents were serially diluted and added to the cell plates (initial concentration of 100 nM). Plates were incubated at 37°C, 5% CO2 for an additional 3 d.
|
||||
| In Vitro Model | Endometrial adenocarcinoma | HEC-1-A cells | CVCL_0293 | ||
| Experiment 13 Reporting the Activity Date of This ADC | [9] | ||||
| Efficacy Data | Half Maximal Inhibitory Concentration (IC50) | 2.17 nM | Moderate FOLR1 expression(FOLR1++) | ||
| Method Description |
Cells were sub-cultured and seeded at 5,000 cells/well in complete growth medium in 96-well tissue culture plates, and incubated at 37°C, 5% CO2 overnight. Test reagents were serially diluted and added to the cell plates (initial concentration of 100 nM). Plates were incubated at 37°C, 5% CO2 for an additional 3 d.
|
||||
| In Vitro Model | Gastric tubular adenocarcinoma | MKN7 cells | CVCL_1417 | ||
| Experiment 14 Reporting the Activity Date of This ADC | [9] | ||||
| Efficacy Data | Half Maximal Inhibitory Concentration (IC50) | 4.42 nM | Low FOLR1 expression(FOLR1+) | ||
| Method Description |
Cells were sub-cultured and seeded at 5,000 cells/well in complete growth medium in 96-well tissue culture plates, and incubated at 37°C, 5% CO2 overnight. Test reagents were serially diluted and added to the cell plates (initial concentration of 100 nM). Plates were incubated at 37°C, 5% CO2 for an additional 3 d.
|
||||
| In Vitro Model | Gastric tubular adenocarcinoma | NCI-N87 cells | CVCL_1603 | ||
| Experiment 15 Reporting the Activity Date of This ADC | [9] | ||||
| Efficacy Data | Half Maximal Inhibitory Concentration (IC50) | 13.15 nM | Moderate FOLR1 expression(FOLR1++) | ||
| Method Description |
Cells were sub-cultured and seeded at 5,000 cells/well in complete growth medium in 96-well tissue culture plates, and incubated at 37°C, 5% CO2 overnight. Test reagents were serially diluted and added to the cell plates (initial concentration of 100 nM). Plates were incubated at 37°C, 5% CO2 for an additional 3 d.
|
||||
| In Vitro Model | Endometrial carcinoma | HEC-251 cells | CVCL_2927 | ||
| Experiment 16 Reporting the Activity Date of This ADC | [9] | ||||
| Efficacy Data | Half Maximal Inhibitory Concentration (IC50) | 24.58 nM | Low FOLR1 expression(FOLR1+) | ||
| Method Description |
Cells were sub-cultured and seeded at 5,000 cells/well in complete growth medium in 96-well tissue culture plates, and incubated at 37°C, 5% CO2 overnight. Test reagents were serially diluted and added to the cell plates (initial concentration of 100 nM). Plates were incubated at 37°C, 5% CO2 for an additional 3 d.
|
||||
| In Vitro Model | Gastric carcinoma | NUGC-3 cells | CVCL_1612 | ||
| Experiment 17 Reporting the Activity Date of This ADC | [9] | ||||
| Efficacy Data | Half Maximal Inhibitory Concentration (IC50) | > 100 nM | Negative FOLR1 expression(FOLR1-) | ||
| Method Description |
Cells were sub-cultured and seeded at 5,000 cells/well in complete growth medium in 96-well tissue culture plates, and incubated at 37°C, 5% CO2 overnight. Test reagents were serially diluted and added to the cell plates (initial concentration of 100 nM). Plates were incubated at 37°C, 5% CO2 for an additional 3 d.
|
||||
| In Vitro Model | Skin squamous cell carcinoma | A431 cells | CVCL_0037 | ||
References