Antigen Information
General Information of This Antigen
| Antigen ID | TAR0BWSFH |
|||||
|---|---|---|---|---|---|---|
| Antigen Name | Mucin-1 (MUC1) |
|||||
| Gene Name | MUC1 |
|||||
| Gene ID | ||||||
| Synonym | PUM; Breast carcinoma-associated antigen DF3;Cancer antigen 15-3;Carcinoma-associated mucin;Episialin;H23AG;Krebs von den Lungen-6;PEMT;Peanut-reactive urinary mucin;Polymorphic epithelial mucin;Tumor-associated epithelial membrane antigen;Tumor-associated mucin;CD_antigen=CD227 |
|||||
| Sequence |
MTPGTQSPFFLLLLLTVLTVVTGSGHASSTPGGEKETSATQRSSVPSSTEKNAVSMTSSV
LSSHSPGSGSSTTQGQDVTLAPATEPASGSAATWGQDVTSVPVTRPALGSTTPPAHDVTS APDNKPAPGSTAPPAHGVTSAPDTRPAPGSTAPPAHGVTSAPDTRPAPGSTAPPAHGVTS APDTRPAPGSTAPPAHGVTSAPDTRPAPGSTAPPAHGVTSAPDTRPAPGSTAPPAHGVTS APDTRPAPGSTAPPAHGVTSAPDTRPAPGSTAPPAHGVTSAPDTRPAPGSTAPPAHGVTS APDTRPAPGSTAPPAHGVTSAPDTRPAPGSTAPPAHGVTSAPDTRPAPGSTAPPAHGVTS APDTRPAPGSTAPPAHGVTSAPDTRPAPGSTAPPAHGVTSAPDTRPAPGSTAPPAHGVTS APDTRPAPGSTAPPAHGVTSAPDTRPAPGSTAPPAHGVTSAPDTRPAPGSTAPPAHGVTS APDTRPAPGSTAPPAHGVTSAPDTRPAPGSTAPPAHGVTSAPDTRPAPGSTAPPAHGVTS APDTRPAPGSTAPPAHGVTSAPDTRPAPGSTAPPAHGVTSAPDTRPAPGSTAPPAHGVTS APDTRPAPGSTAPPAHGVTSAPDTRPAPGSTAPPAHGVTSAPDTRPAPGSTAPPAHGVTS APDTRPAPGSTAPPAHGVTSAPDTRPAPGSTAPPAHGVTSAPDTRPAPGSTAPPAHGVTS APDTRPAPGSTAPPAHGVTSAPDTRPAPGSTAPPAHGVTSAPDTRPAPGSTAPPAHGVTS APDTRPAPGSTAPPAHGVTSAPDTRPAPGSTAPPAHGVTSAPDTRPAPGSTAPPAHGVTS APDTRPAPGSTAPPAHGVTSAPDTRPAPGSTAPPAHGVTSAPDTRPAPGSTAPPAHGVTS APDTRPAPGSTAPPAHGVTSAPDTRPAPGSTAPPAHGVTSAPDNRPALGSTAPPVHNVTS ASGSASGSASTLVHNGTSARATTTPASKSTPFSIPSHHSDTPTTLASHSTKTDASSTHHS SVPPLTSSNHSTSPQLSTGVSFFFLSFHISNLQFNSSLEDPSTDYYQELQRDISEMFLQI YKQGGFLGLSNIKFRPGSVVVQLTLAFREGTINVHDVETQFNQYKTEAASRYNLTISDVS VSDVPFPFSAQSGAGVPGWGIALLVLVCVLVALAIVYLIALAVCQCRRKNYGQLDIFPAR DTYHPMSEYPTYHTHGRYVPPSSTDRSPYEKVSAGNGGSSLSYTNPAVAATSANL Click to Show/Hide
|
|||||
| Function |
The alpha subunit has cell adhesive properties. Can act both as an adhesion and an anti-adhesion protein. May provide a protective layer on epithelial cells against bacterial and enzyme attack. The beta subunit contains a C-terminal domain which is involved in cell signaling, through phosphorylations and protein- protein interactions. Modulates signaling in ERK, SRC and NF-kappa-B pathways. In activated T-cells, influences directly or indirectly the Ras/MAPK pathway. Promotes tumor progression. Regulates TP53-mediated transcription and determines cell fate in the genotoxic stress response. Binds, together with KLF4, the PE21 promoter element of TP53 and represses TP53 activity.
Click to Show/Hide
|
|||||
| Uniprot Entry | ||||||
| HGNC ID | ||||||
| KEGG ID | ||||||
Each Antibody-drug Conjuate AND It's Component Related to This Antigen
Full List of The ADC Related to This Antigen
2.80E+05
| ADC Info | ADC Name | Payload | Target | Linker | Ref |
|---|---|---|---|---|---|
28E4-DM1 |
Mertansine DM1 |
Microtubule (MT) |
N-succinimidyl 4-(2-pyridyldithio) pentanoate (SPP) |
[1] |
Anti-CA6 mAb muDS6
| ADC Info | ADC Name | Payload | Target | Linker | Ref |
|---|---|---|---|---|---|
muDS6-DM1 |
Mertansine DM1 |
Microtubule (MT) |
N-succinimidyl 4-(2-pyridyldithio) pentanoate (SPP) |
[1] | |
muDS6-SSNPP-MM1-202 |
Mertansine DM1 |
Microtubule (MT) |
Sulfosuccinimidyl-N-succinimidyl-4-(5-nitro-2-pyridyldithio) pentanoate (SSNPP) |
[1] |
Anti-CD138 mAb C242
| ADC Info | ADC Name | Payload | Target | Linker | Ref |
|---|---|---|---|---|---|
Monoclonal antibody C242-PE conjugate |
Pseudomonas exotoxin PE40 |
Eukaryotic elongation factor 2 (EEF2) |
Undisclosed |
[2] |
Anti-MUC1 mAb DS6
| ADC Info | ADC Name | Payload | Target | Linker | Ref |
|---|---|---|---|---|---|
DS6-DM1 |
Mertansine DM1 |
Microtubule (MT) |
N-succinimidyl 4-(2-pyridyldithio) butanoate (SPDB) |
[3] |
Anti-MUC1 mAb hCTM01
| ADC Info | ADC Name | Payload | Target | Linker | Ref |
|---|---|---|---|---|---|
CMB-401 |
N-acetyl-gamma-calicheamicin |
Human Deoxyribonucleic acid (hDNA) |
Amide-based linker |
[4] |
Anti-MUC1 mAb hPAM4
| ADC Info | ADC Name | Payload | Target | Linker | Ref |
|---|---|---|---|---|---|
HPAM4-CL2A-SN38 |
Active metabolite of irinotecan SN38 |
DNA topoisomerase 1 (TOP1) |
CL2A |
[5] |
Cantuzumab
| ADC Info | ADC Name | Payload | Target | Linker | Ref |
|---|---|---|---|---|---|
Cantuzumab ravtansine |
Mertansine DM4 |
Microtubule (MT) |
N-succinimidyl 4-(2-pyridyldithio) butanoate (SPDB) |
[6] | |
Cantuzumab mertansine |
Mertansine DM1 |
Microtubule (MT) |
N-succinimidyl 4-(2-pyridyldithio) pentanoate (SPP) |
[7] |
Gatipotuzumab
| ADC Info | ADC Name | Payload | Target | Linker | Ref |
|---|---|---|---|---|---|
DS-3939a |
DX-8951 derivative (DXd) |
DNA topoisomerase 1 (TOP1) |
Mc-Gly-Gly-Phe-Gly |
[8] |
HAZcPB
| ADC Info | ADC Name | Payload | Target | Linker | Ref |
|---|---|---|---|---|---|
HAZcPB-DM1 |
Mertansine DM1 |
Microtubule (MT) |
N-succinimidyl 4-(2-pyridyldithio) pentanoate (SPP) |
[1] |
huDS6v1.01
| ADC Info | ADC Name | Payload | Target | Linker | Ref |
|---|---|---|---|---|---|
huDS6v1.01-DM4 |
Mertansine DM4 |
Microtubule (MT) |
N-succinimidyl 4-(2-pyridyldithio) butanoate (SPDB) |
[1] |
huDS6v1.21
| ADC Info | ADC Name | Payload | Target | Linker | Ref |
|---|---|---|---|---|---|
huDS6v1.21-DM4 |
Mertansine DM4 |
Microtubule (MT) |
N-succinimidyl 4-(2-pyridyldithio) butanoate (SPDB) |
[1] |
HzMUC1
| ADC Info | ADC Name | Payload | Target | Linker | Ref |
|---|---|---|---|---|---|
HzMUC1-MMAE |
Monomethyl auristatin E |
Microtubule (MT) |
Mc-Val-Cit-PABC |
[9] |
Pab-001
| ADC Info | ADC Name | Payload | Target | Linker | Ref |
|---|---|---|---|---|---|
Pab-001-MMAE |
Monomethyl auristatin E |
Microtubule (MT) |
Undisclosed |
[10] |
PAb001
| ADC Info | ADC Name | Payload | Target | Linker | Ref |
|---|---|---|---|---|---|
PAb001-ADC |
Undisclosed |
Undisclosed |
Undisclosed |
[11] |
SSaPB
| ADC Info | ADC Name | Payload | Target | Linker | Ref |
|---|---|---|---|---|---|
SSaPB-DM1 |
Mertansine DM1 |
Microtubule (MT) |
N-succinimidyl 4-(2-pyridyldithio) pentanoate (SPP) |
[1] |
Undisclosed
| ADC Info | ADC Name | Payload | Target | Linker | Ref |
|---|---|---|---|---|---|
DXC-005 |
Tubulysin B analog Tub201 |
Microtubule (MT) |
Undisclosed |
[12] |
Tissue/Disease specific Abundances of This Antigen
Tissue specific Abundances of This Antigen
ICD Disease Classification 01
| Differential expression pattern of antigen in diseases | ||
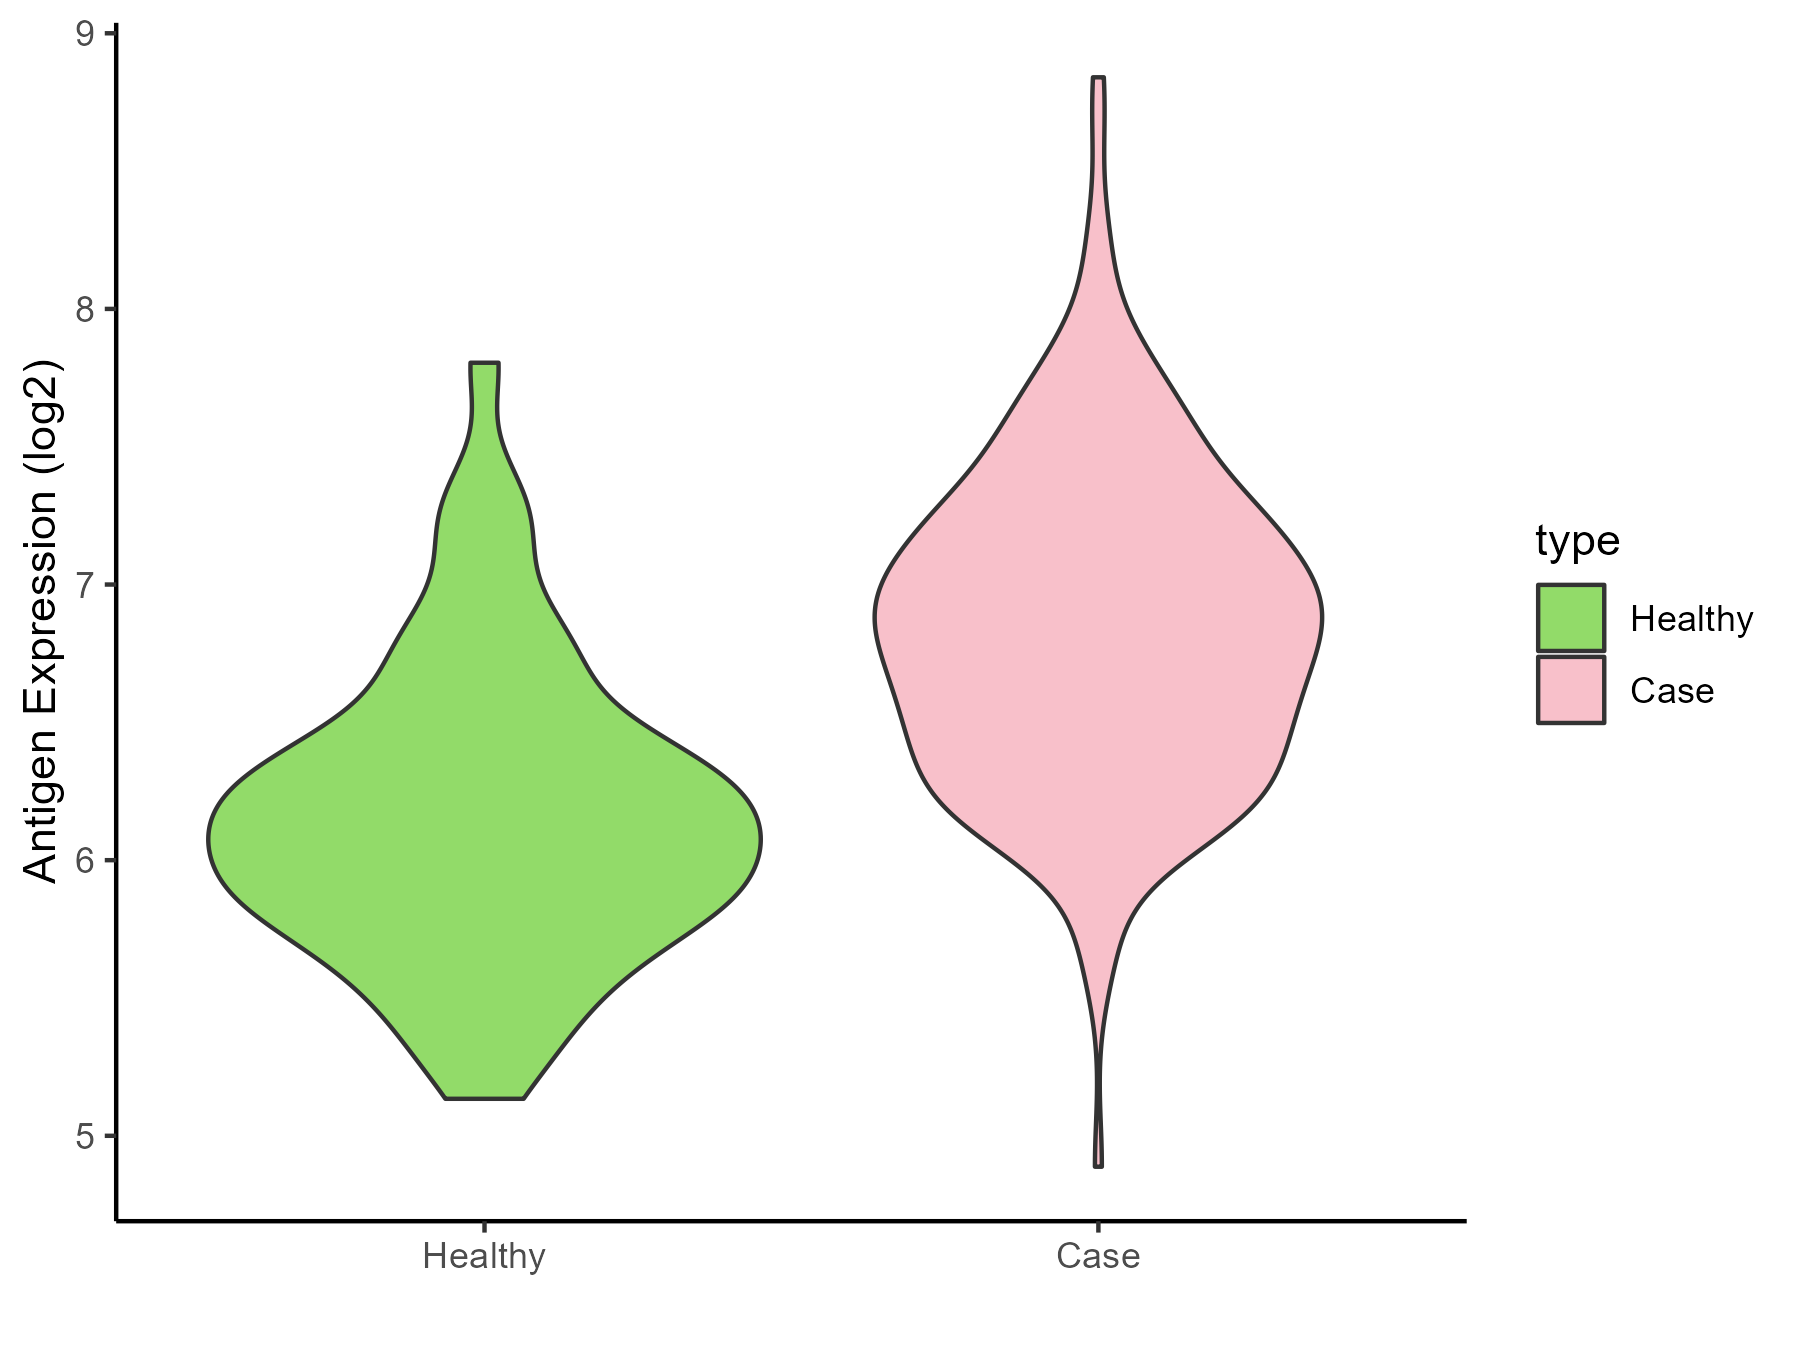
| The Studied Tissue | Gingival | |
| The Specific Disease | Bacterial infection of gingival | |
| The Expression Level of Disease Section Compare with the Healthy Individual Tissue | p-value: 1.48E-13; Fold-change: 0.71780155; Z-score: 1.338468647 | |
| Disease-specific Antigen Abundances |
|
Click to View the Clearer Original Diagram |
ICD Disease Classification 02
| Differential expression pattern of antigen in diseases | ||
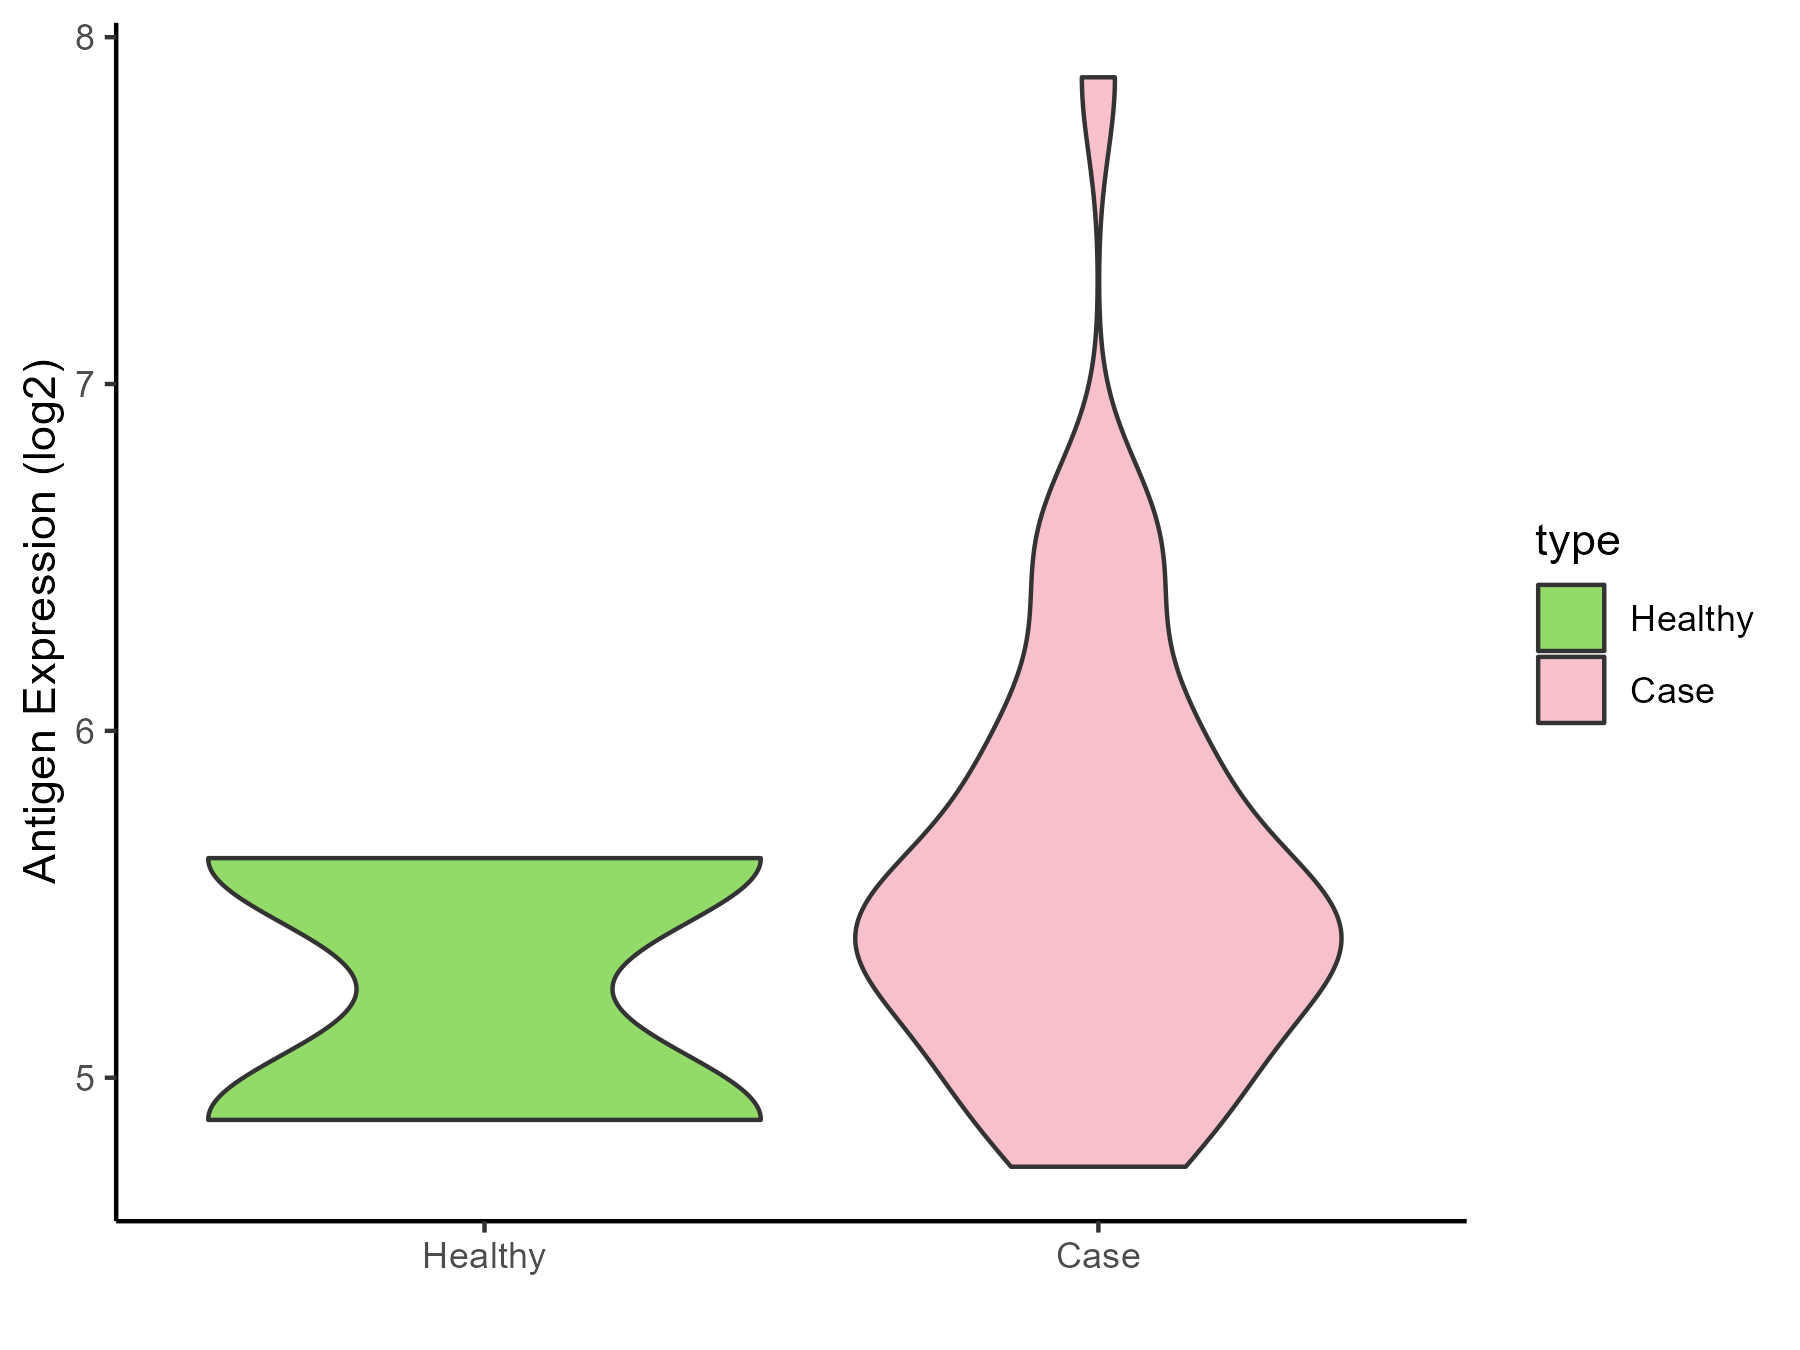
| The Studied Tissue | Brainstem | |
| The Specific Disease | Glioma | |
| The Expression Level of Disease Section Compare with the Healthy Individual Tissue | p-value: 0.514204703; Fold-change: 0.190000803; Z-score: 0.356013029 | |
| Disease-specific Antigen Abundances |
|
Click to View the Clearer Original Diagram |
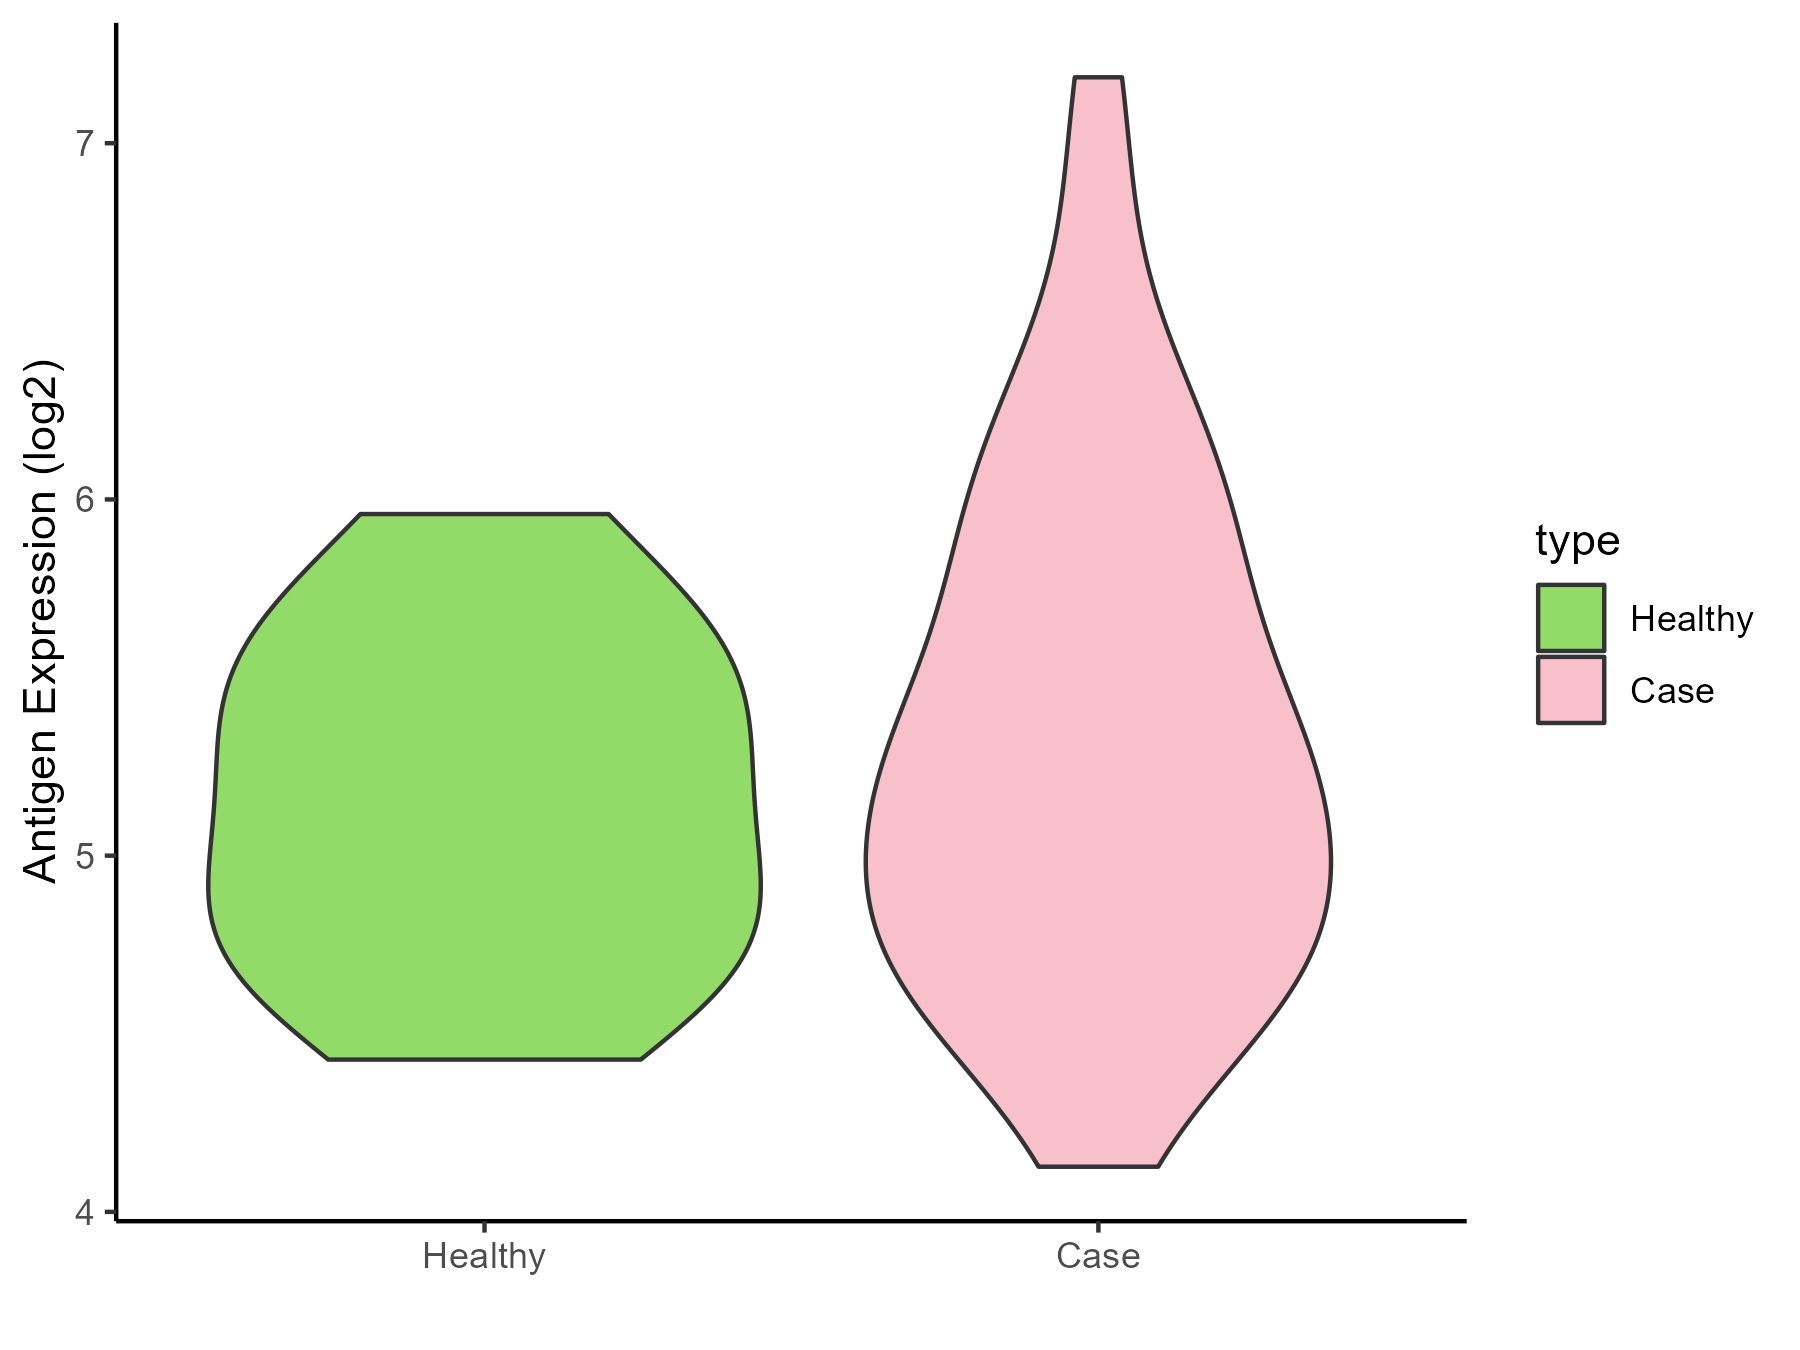
| The Studied Tissue | White matter | |
| The Specific Disease | Glioma | |
| The Expression Level of Disease Section Compare with the Healthy Individual Tissue | p-value: 0.332390711; Fold-change: 0.055855684; Z-score: 0.116762016 | |
| Disease-specific Antigen Abundances |
|
Click to View the Clearer Original Diagram |
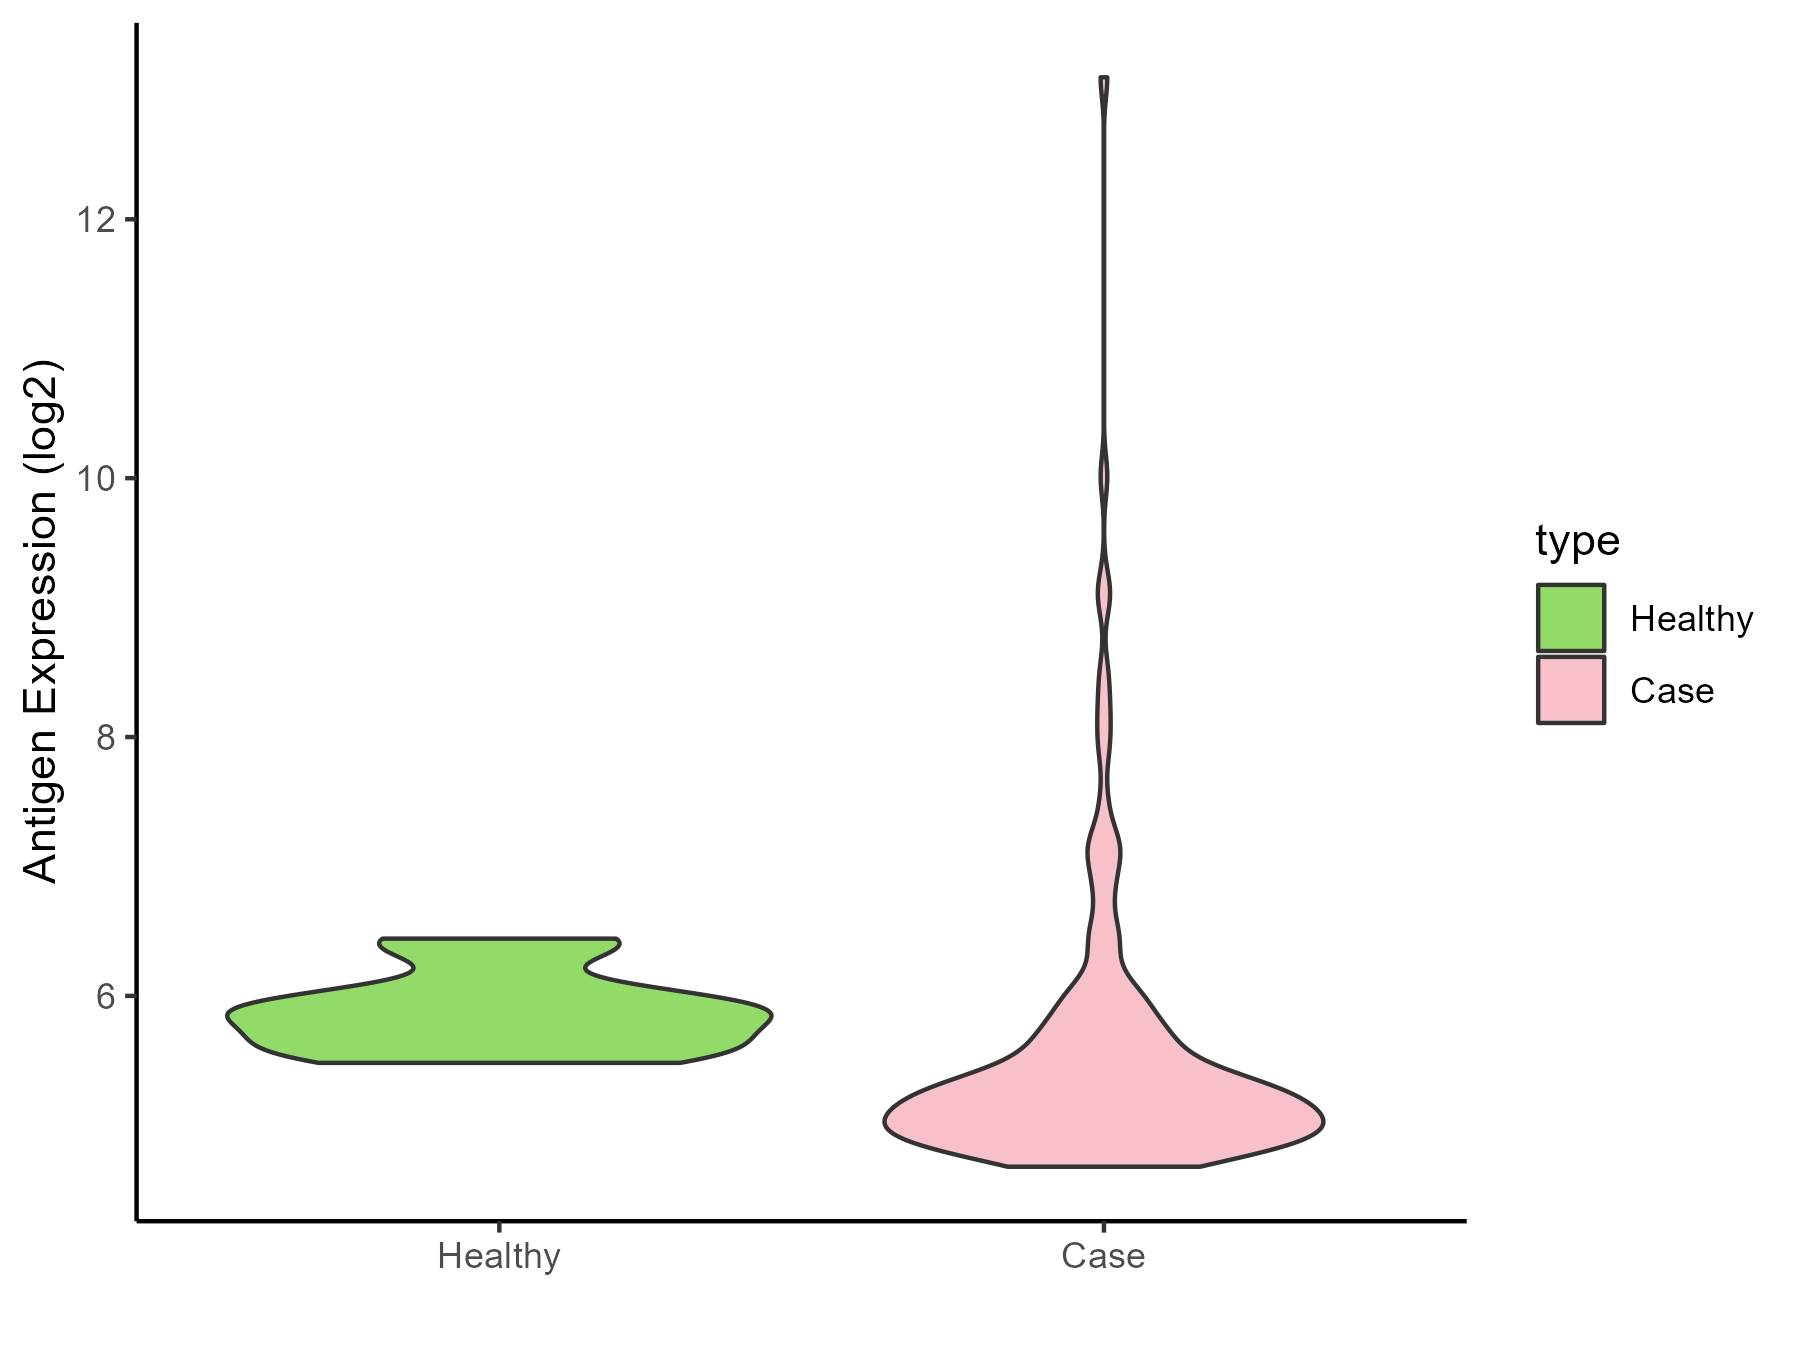
| The Studied Tissue | Brainstem | |
| The Specific Disease | Neuroectodermal tumor | |
| The Expression Level of Disease Section Compare with the Healthy Individual Tissue | p-value: 0.010363792; Fold-change: -0.653179513; Z-score: -2.012166117 | |
| Disease-specific Antigen Abundances |
|
Click to View the Clearer Original Diagram |
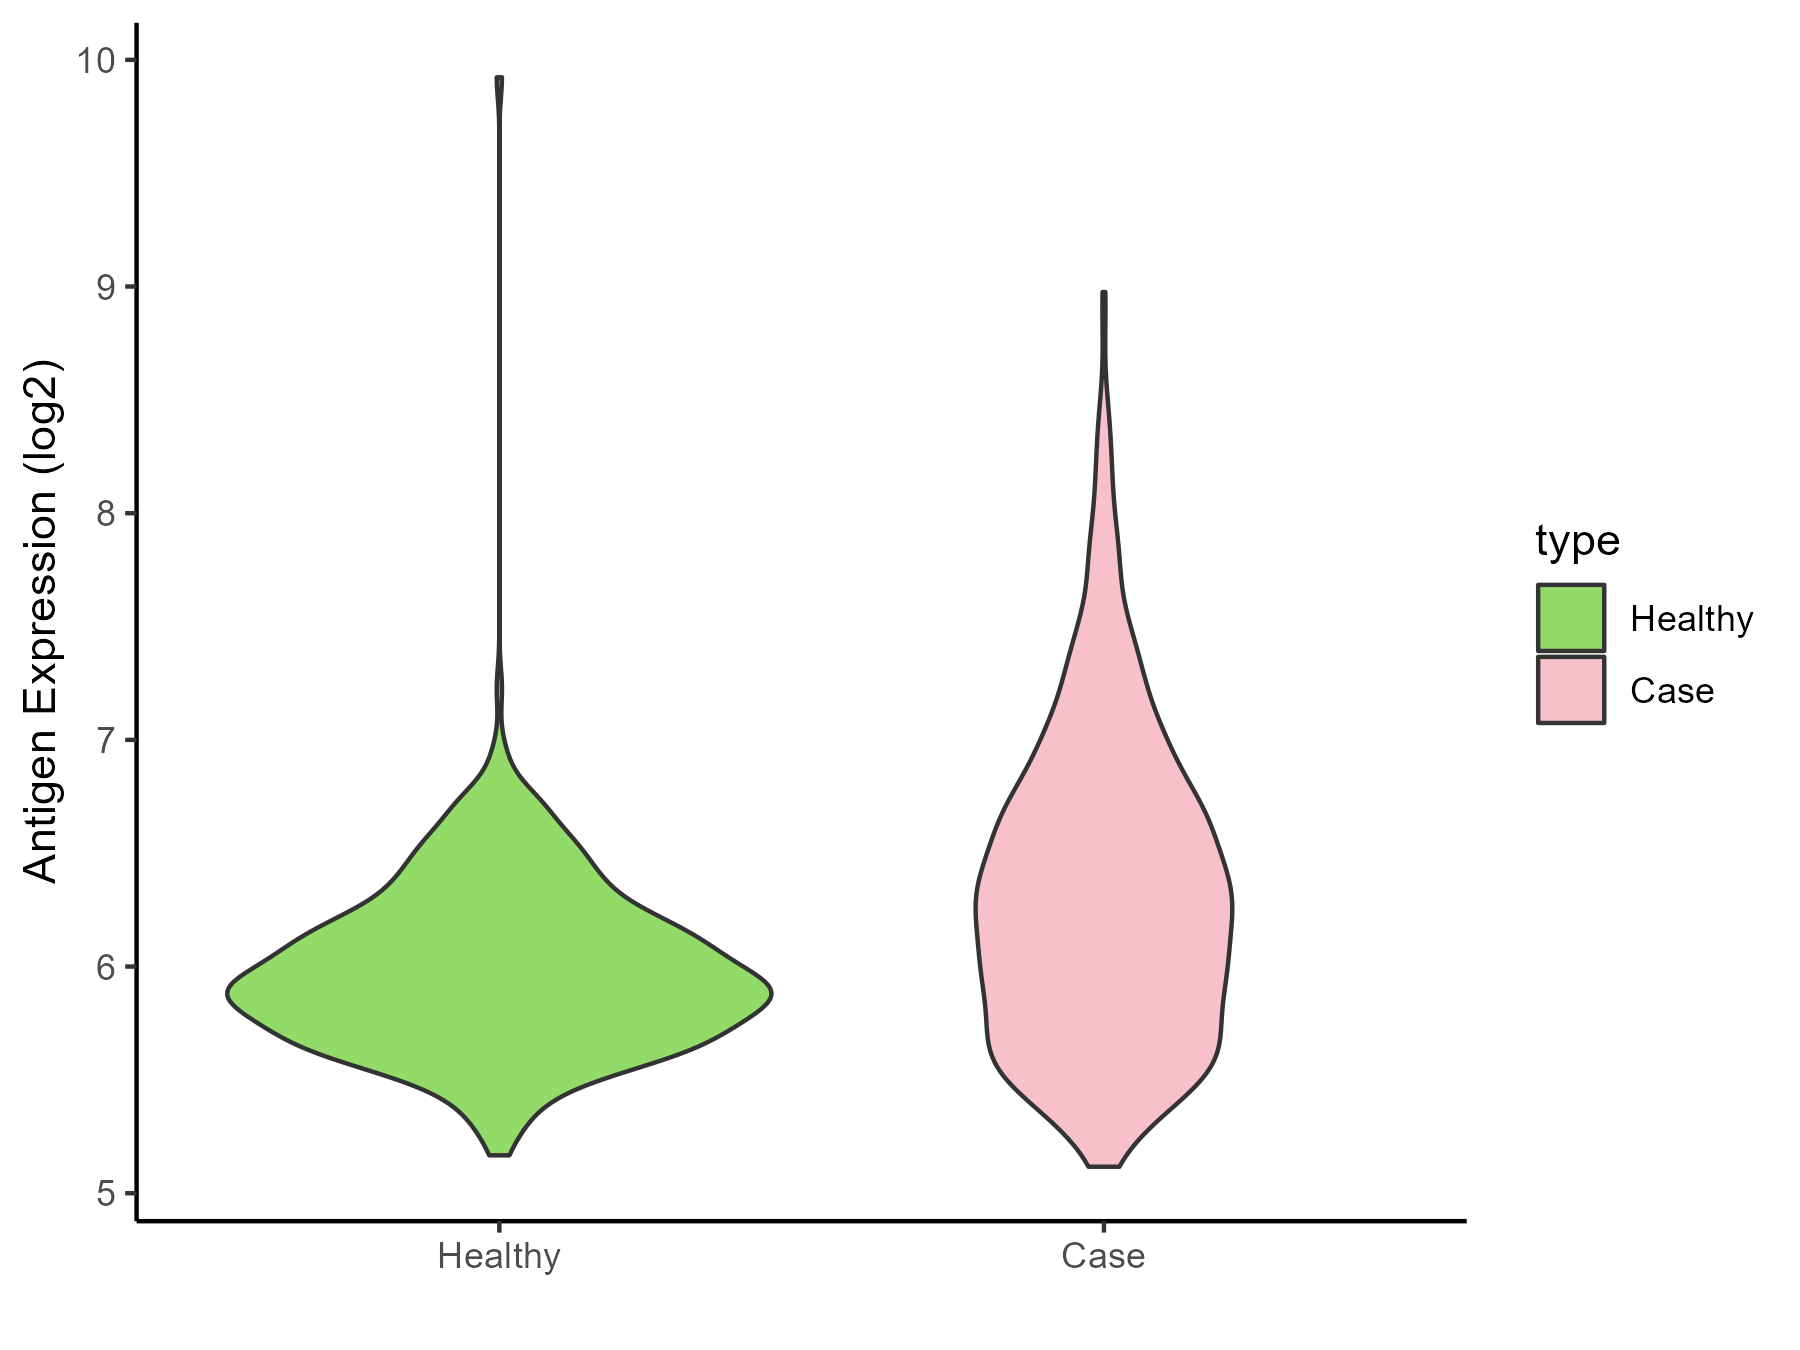
| The Studied Tissue | Nervous | |
| The Specific Disease | Brain cancer | |
| The Expression Level of Disease Section Compare with the Healthy Individual Tissue | p-value: 8.48E-29; Fold-change: 0.323059235; Z-score: 0.811919141 | |
| Disease-specific Antigen Abundances |
|
Click to View the Clearer Original Diagram |
| Differential expression pattern of antigen in diseases | ||
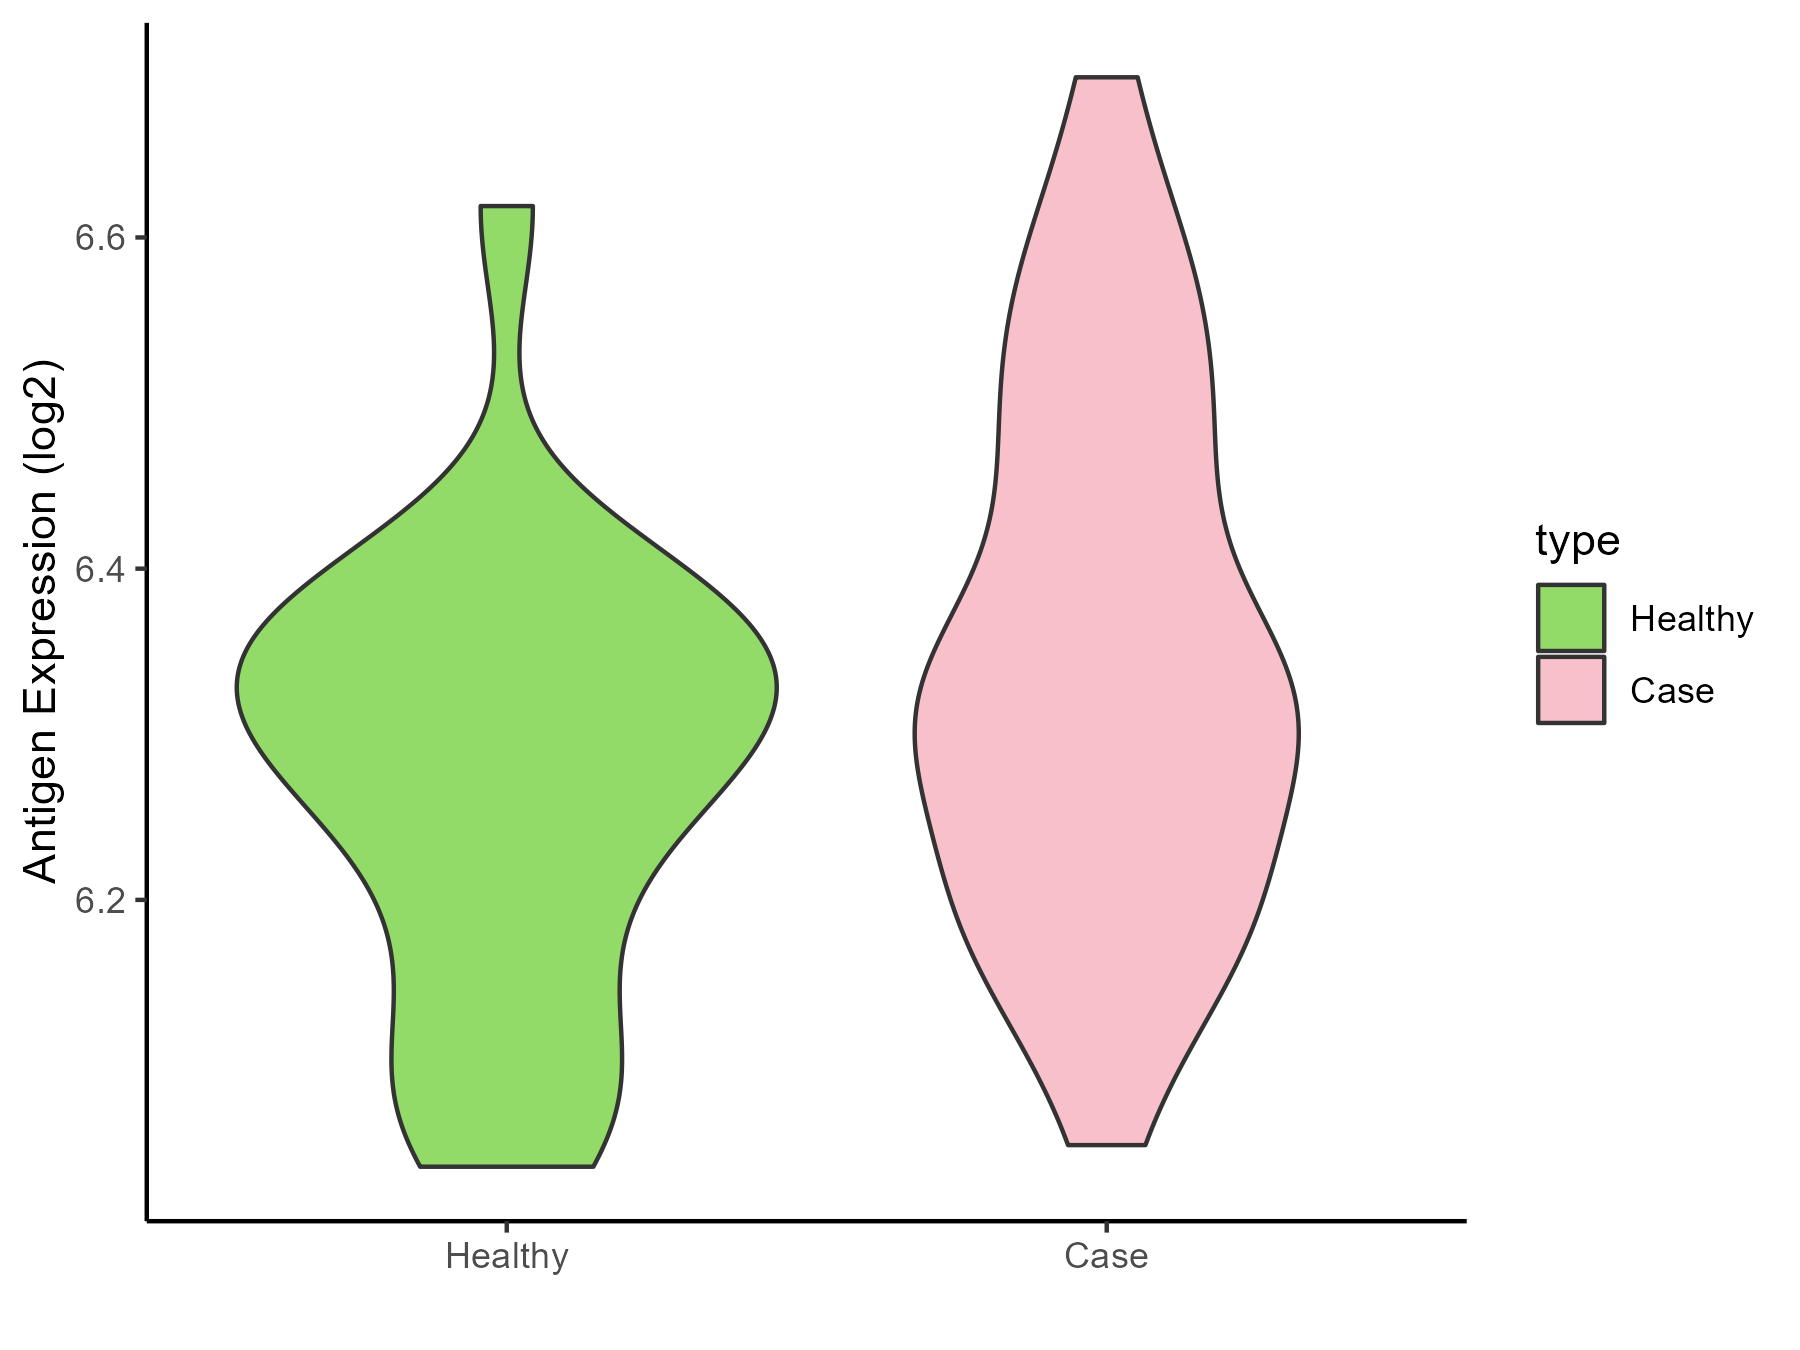
| The Studied Tissue | Whole blood | |
| The Specific Disease | Polycythemia vera | |
| The Expression Level of Disease Section Compare with the Healthy Individual Tissue | p-value: 0.013825084; Fold-change: 0.0245186; Z-score: 0.181731852 | |
| Disease-specific Antigen Abundances |
|
Click to View the Clearer Original Diagram |
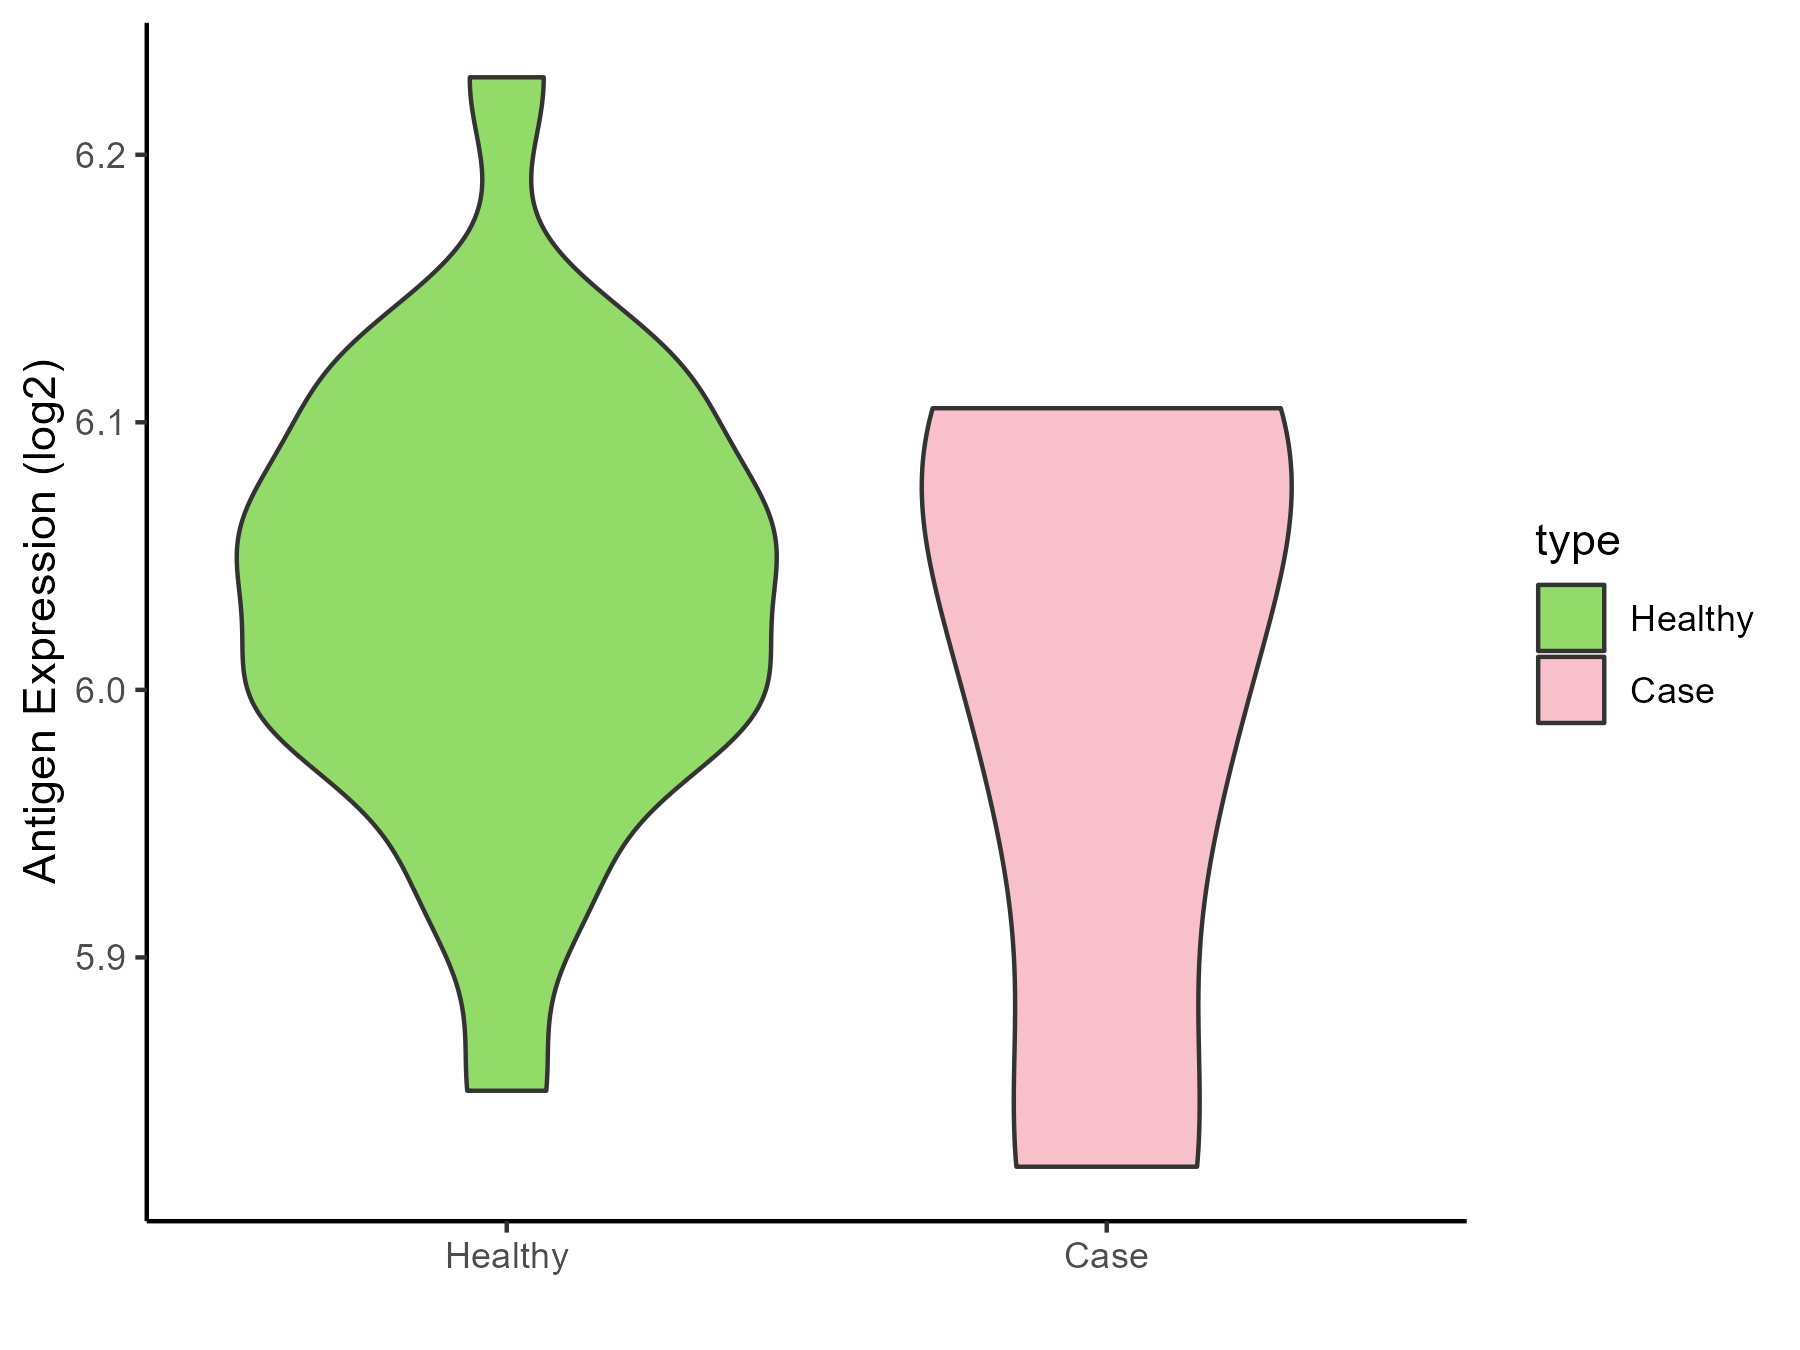
| The Studied Tissue | Whole blood | |
| The Specific Disease | Myelofibrosis | |
| The Expression Level of Disease Section Compare with the Healthy Individual Tissue | p-value: 0.381055022; Fold-change: -0.017293133; Z-score: -0.208856751 | |
| Disease-specific Antigen Abundances |
|
Click to View the Clearer Original Diagram |
| Differential expression pattern of antigen in diseases | ||
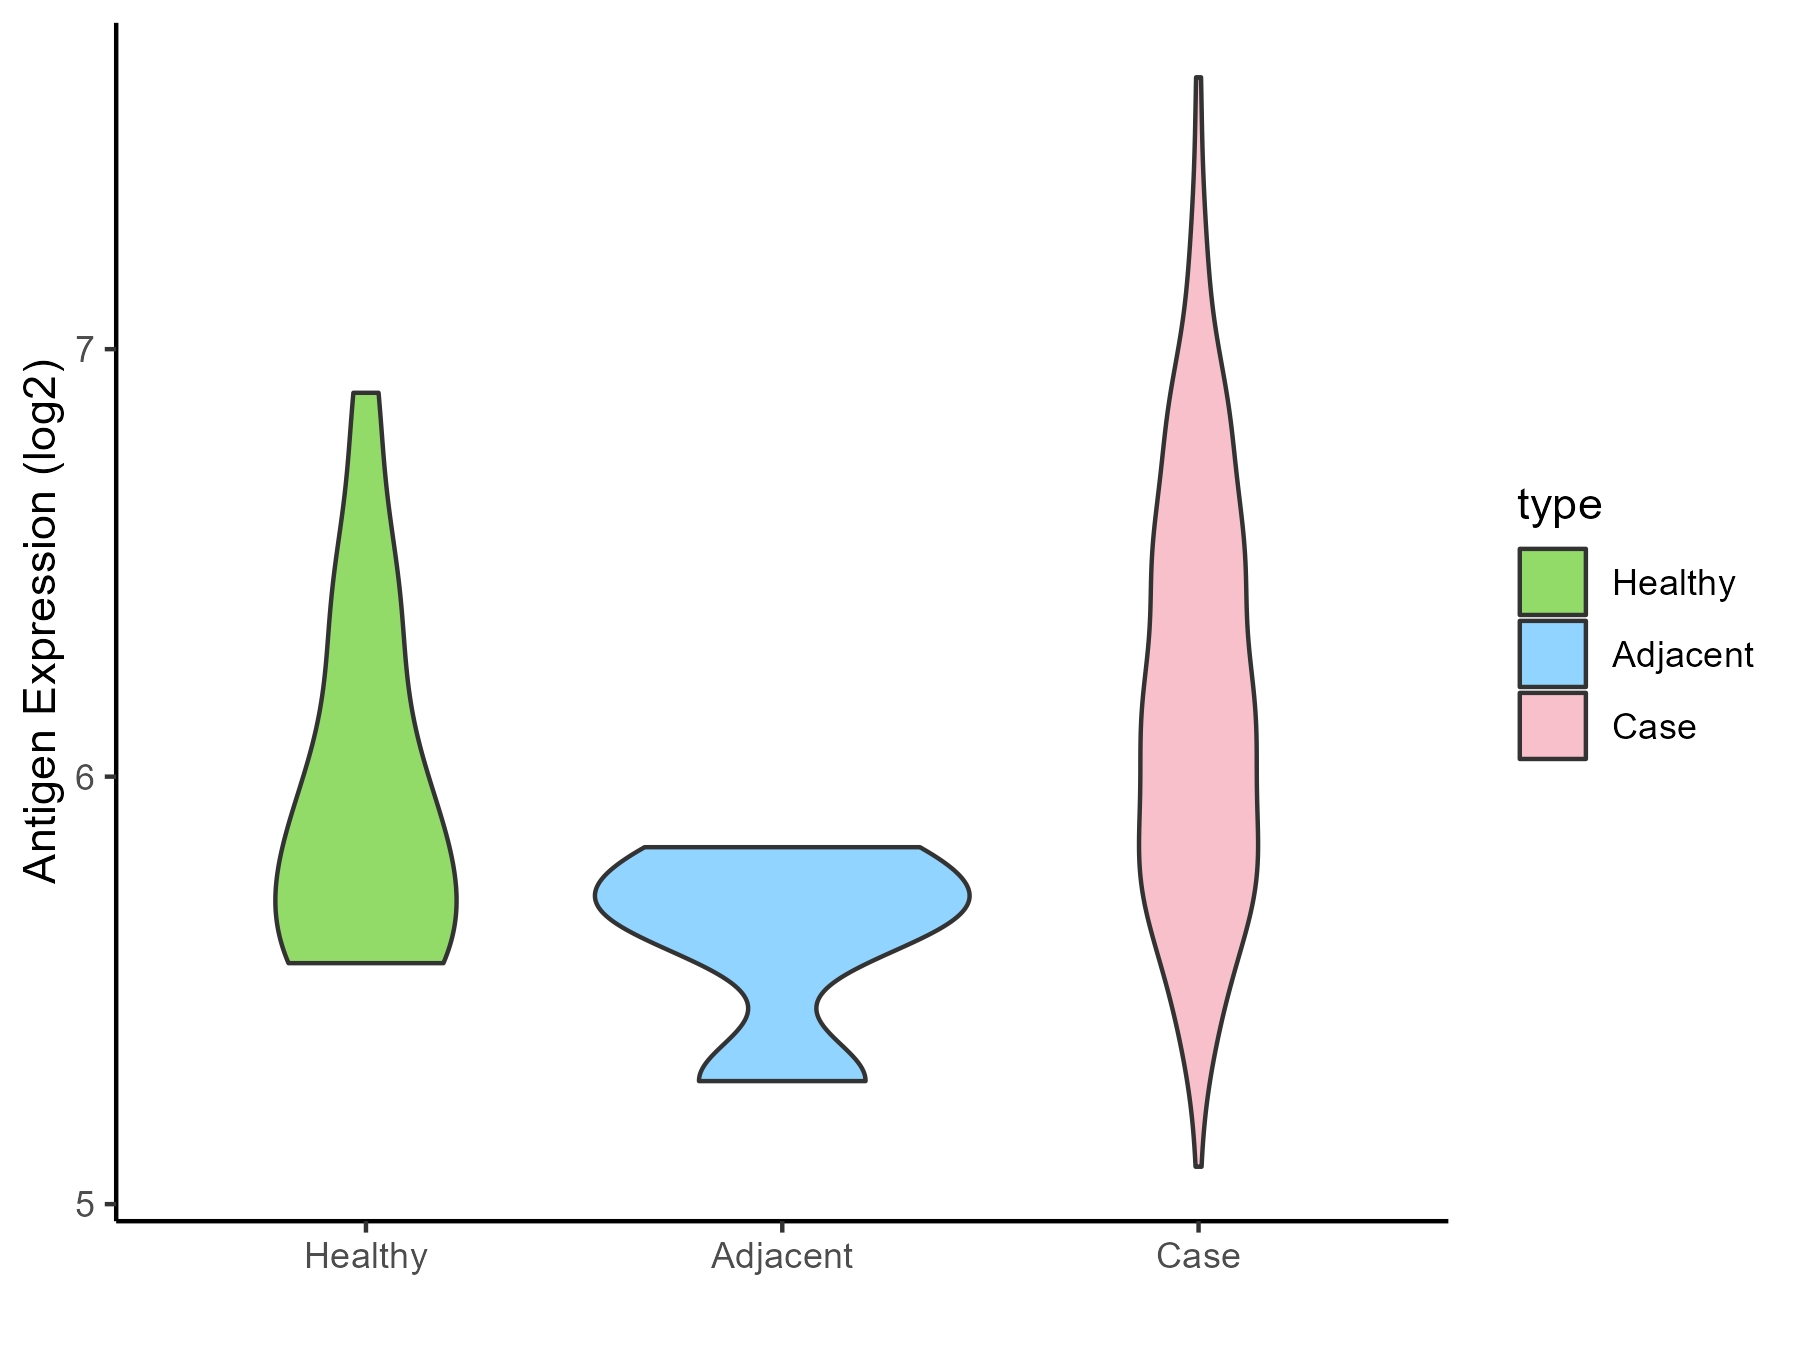
| The Studied Tissue | Bone marrow | |
| The Specific Disease | Myelodysplastic syndromes | |
| The Expression Level of Disease Section Compare with the Healthy Individual Tissue | p-value: 0.003967014; Fold-change: 0.292308438; Z-score: 0.752660522 | |
| The Expression Level of Disease Section Compare with the Adjacent Tissue | p-value: 0.013706388; Fold-change: 0.478993451; Z-score: 2.029361659 | |
| Disease-specific Antigen Abundances |
|
Click to View the Clearer Original Diagram |
| Differential expression pattern of antigen in diseases | ||
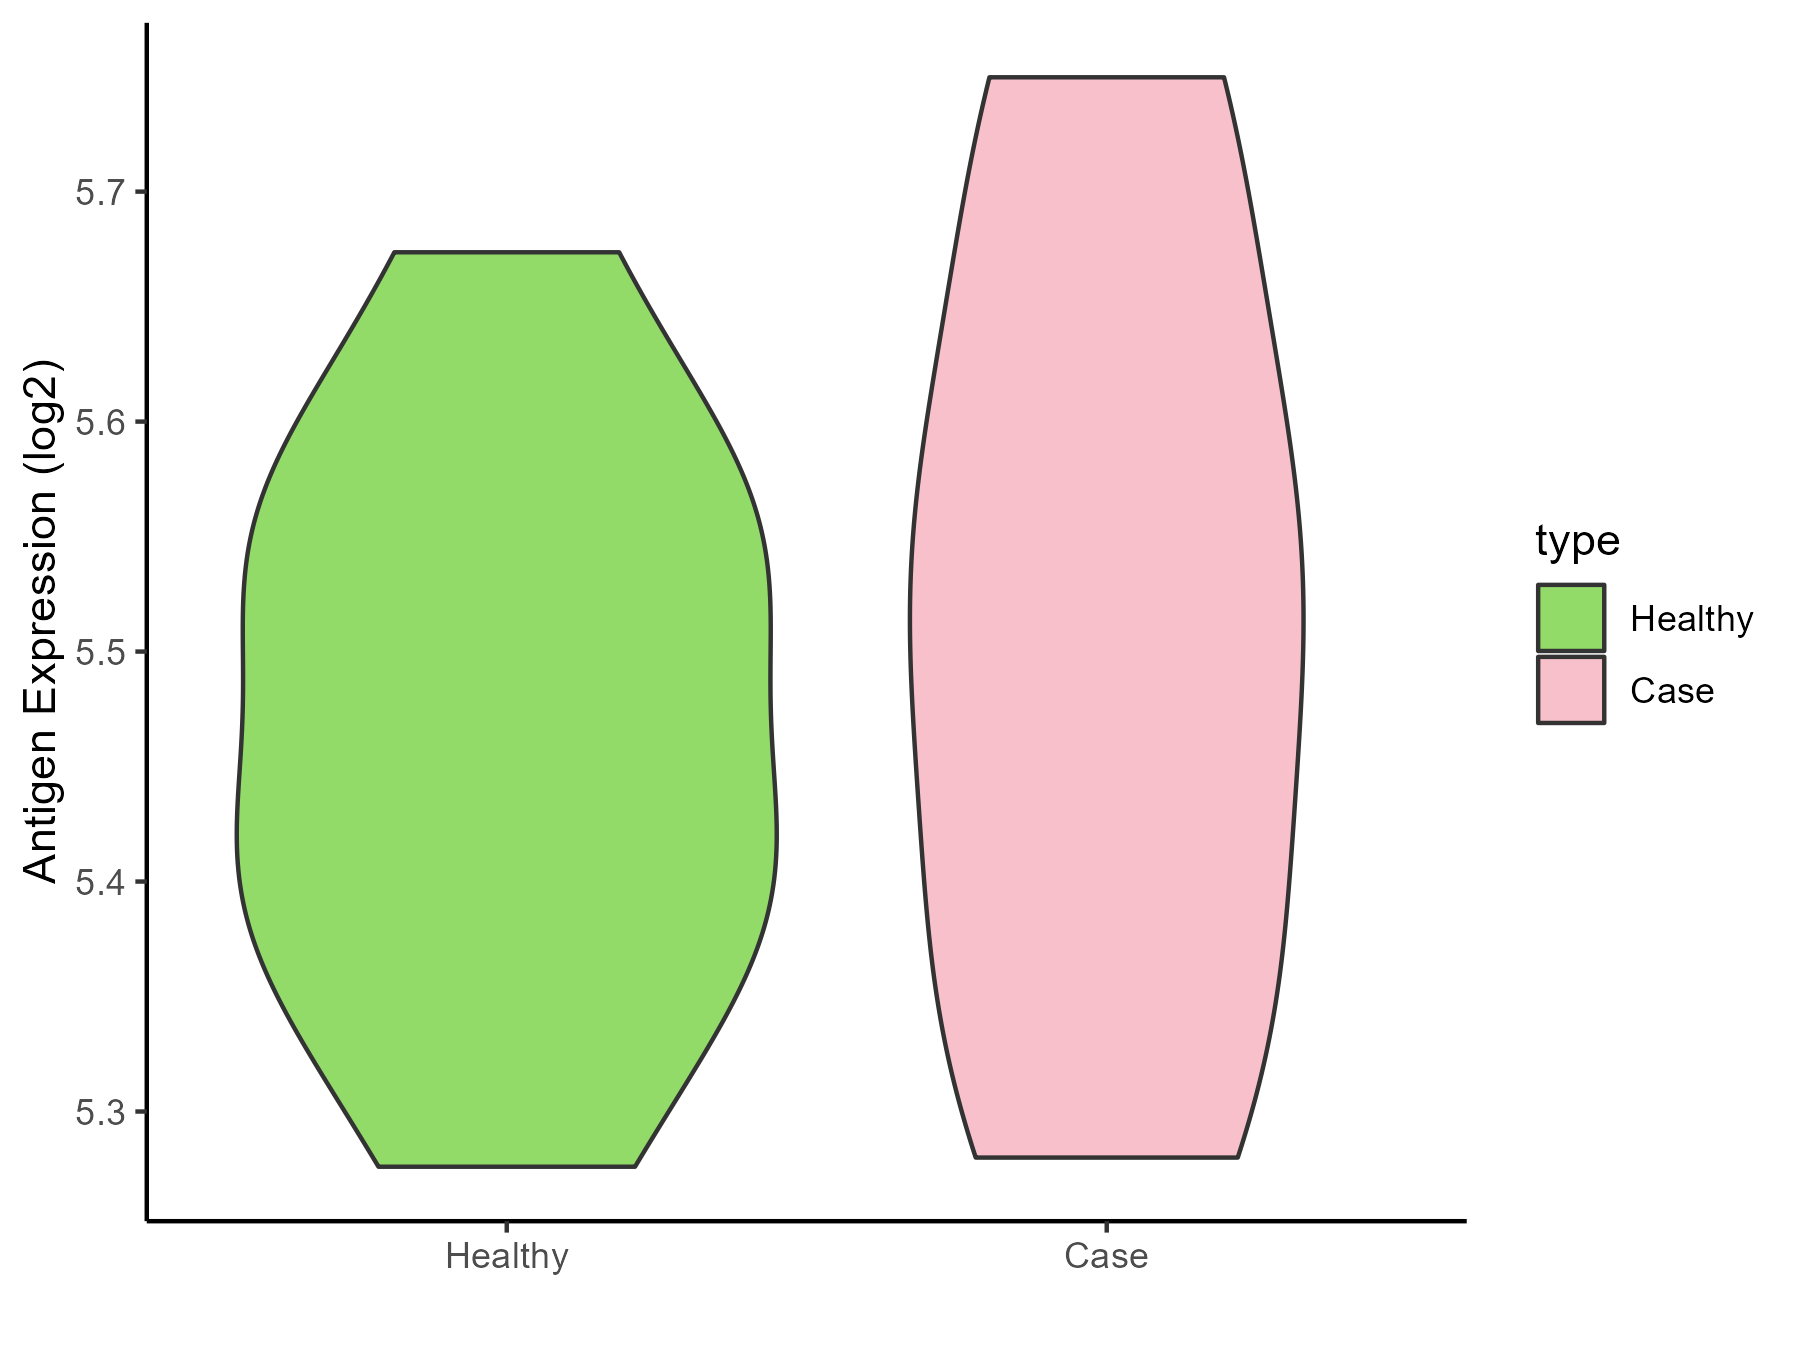
| The Studied Tissue | Tonsil | |
| The Specific Disease | Lymphoma | |
| The Expression Level of Disease Section Compare with the Healthy Individual Tissue | p-value: 0.582521671; Fold-change: 0.062936638; Z-score: 0.515535857 | |
| Disease-specific Antigen Abundances |
|
Click to View the Clearer Original Diagram |
| Differential expression pattern of antigen in diseases | ||
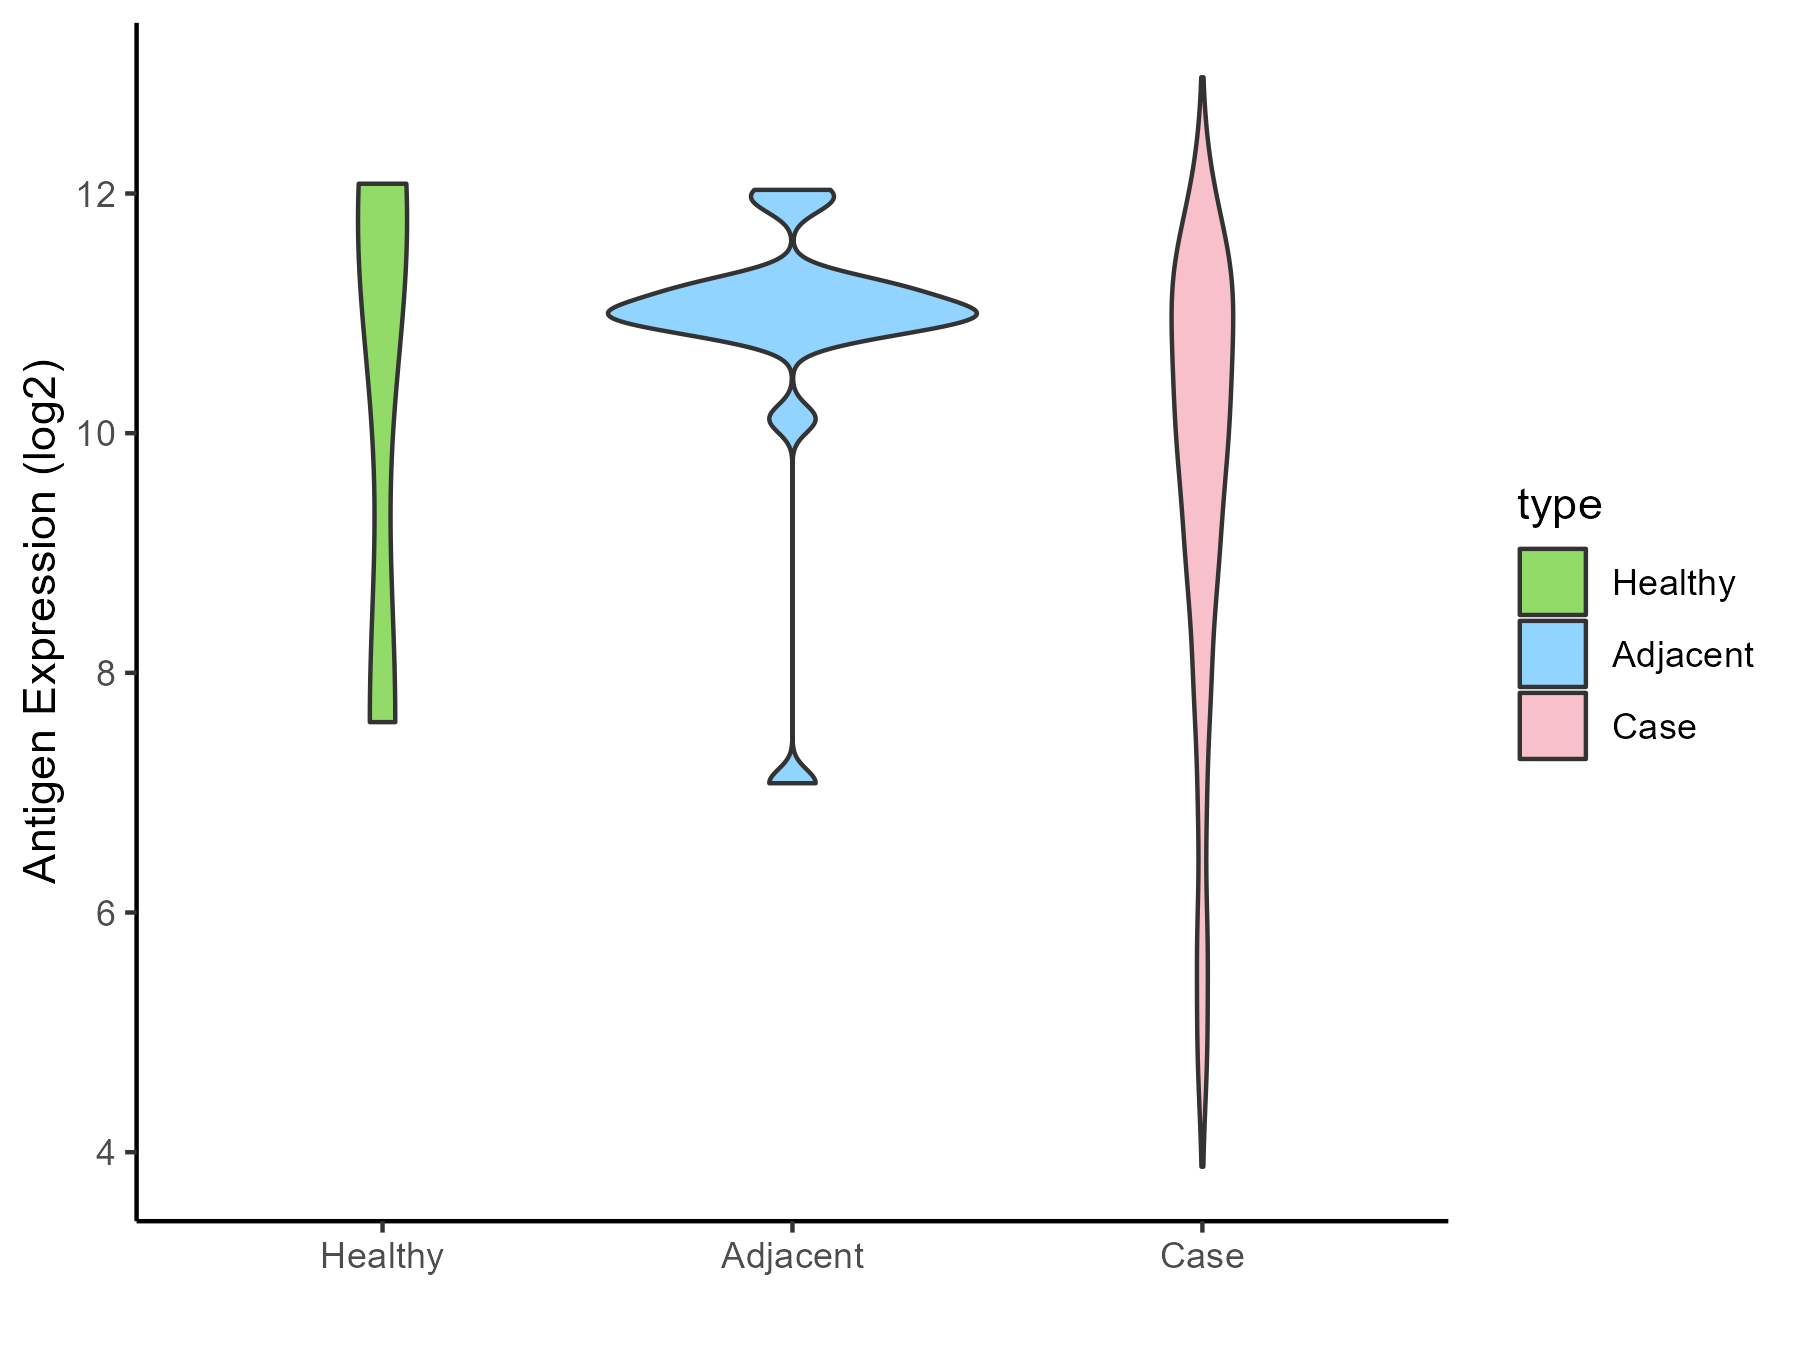
| The Studied Tissue | Gastric | |
| The Specific Disease | Gastric cancer | |
| The Expression Level of Disease Section Compare with the Healthy Individual Tissue | p-value: 0.649875366; Fold-change: -1.41861307; Z-score: -0.581009906 | |
| The Expression Level of Disease Section Compare with the Adjacent Tissue | p-value: 0.000224427; Fold-change: -0.935787511; Z-score: -0.882354574 | |
| Disease-specific Antigen Abundances |
|
Click to View the Clearer Original Diagram |
| Differential expression pattern of antigen in diseases | ||
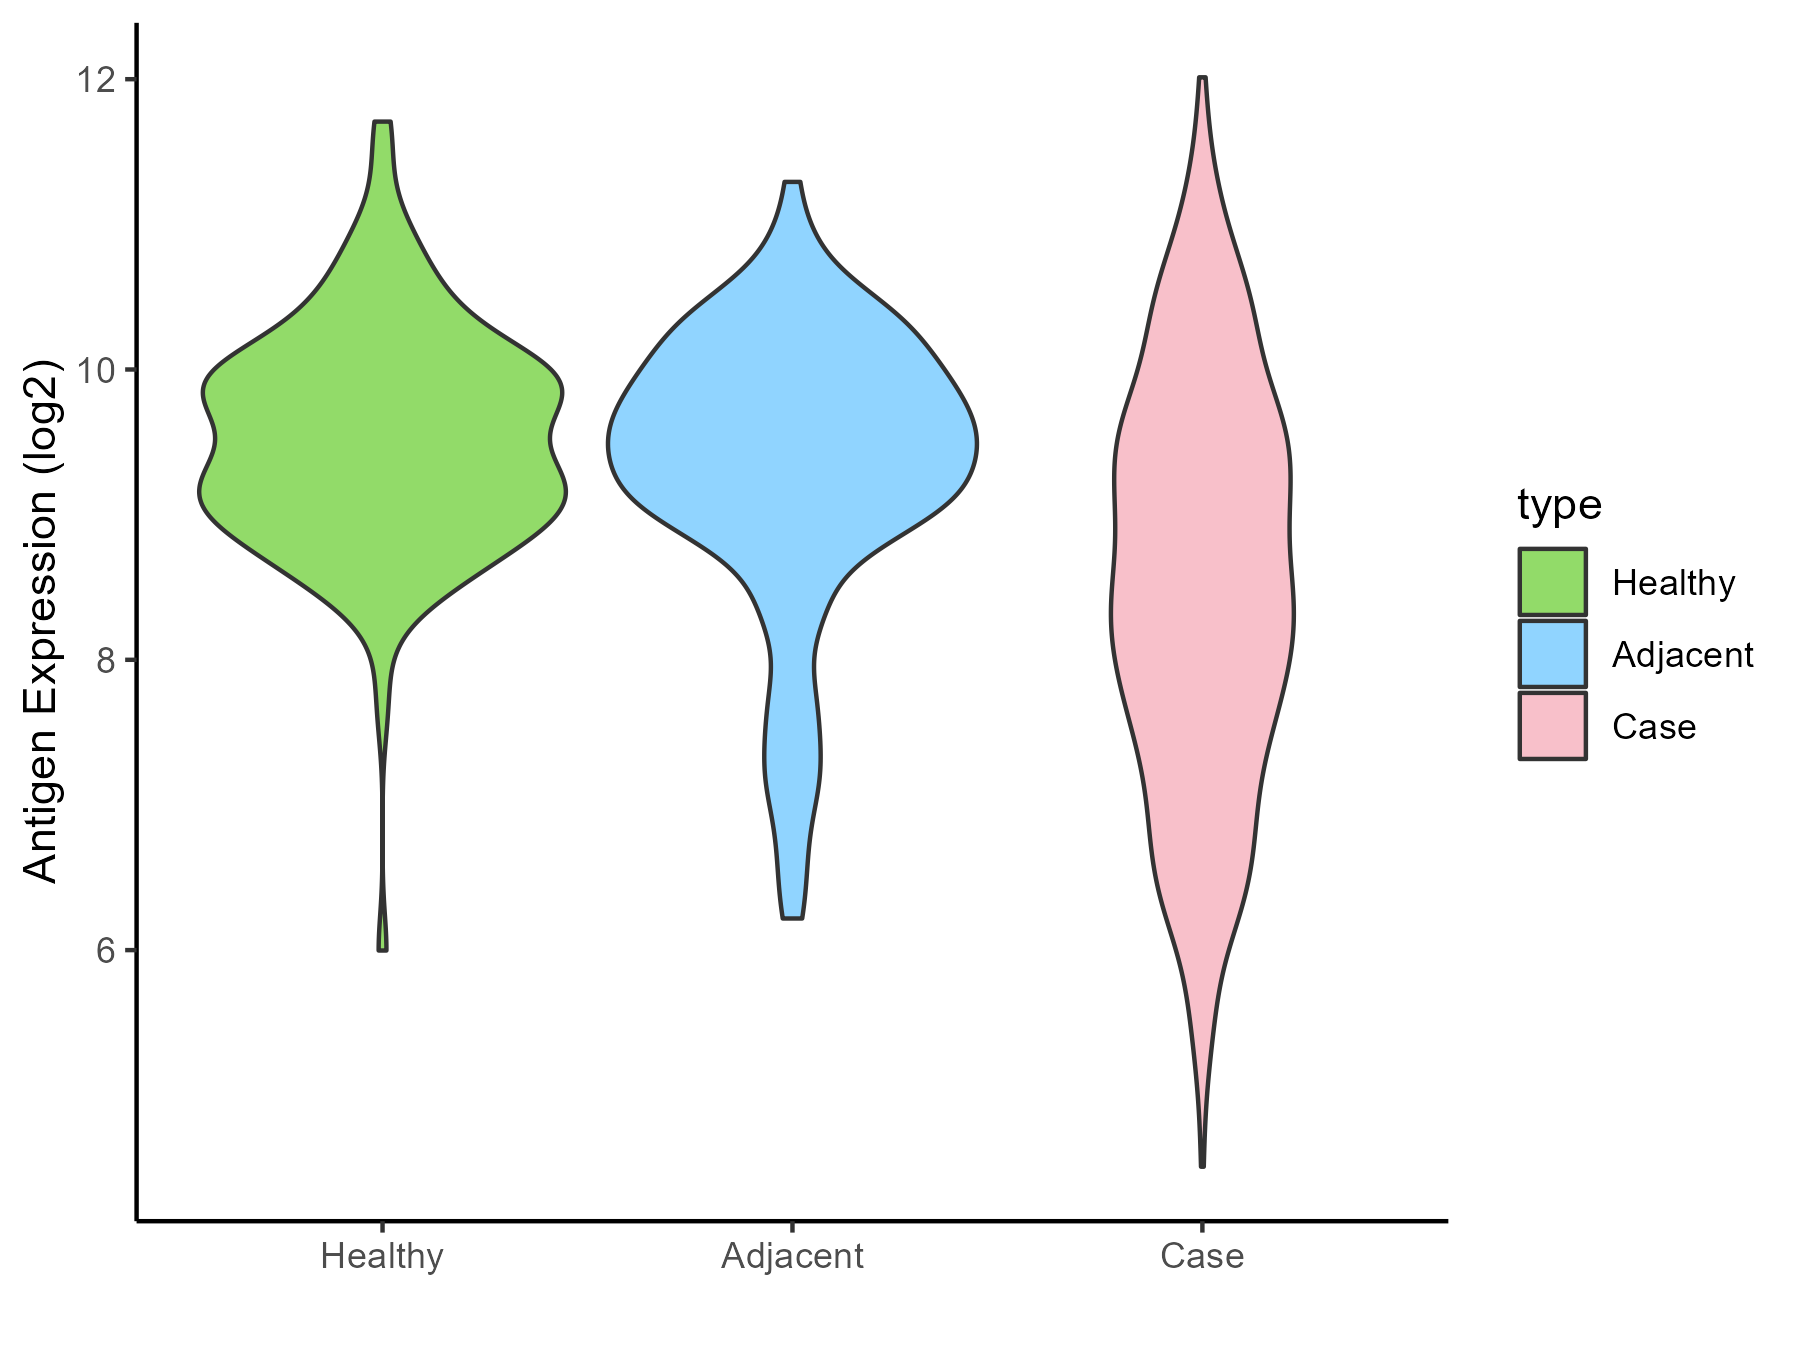
| The Studied Tissue | Colon | |
| The Specific Disease | Colon cancer | |
| The Expression Level of Disease Section Compare with the Healthy Individual Tissue | p-value: 3.48E-33; Fold-change: -0.989869092; Z-score: -1.300292359 | |
| The Expression Level of Disease Section Compare with the Adjacent Tissue | p-value: 2.31E-14; Fold-change: -0.928628285; Z-score: -0.949639496 | |
| Disease-specific Antigen Abundances |
|
Click to View the Clearer Original Diagram |
| Differential expression pattern of antigen in diseases | ||
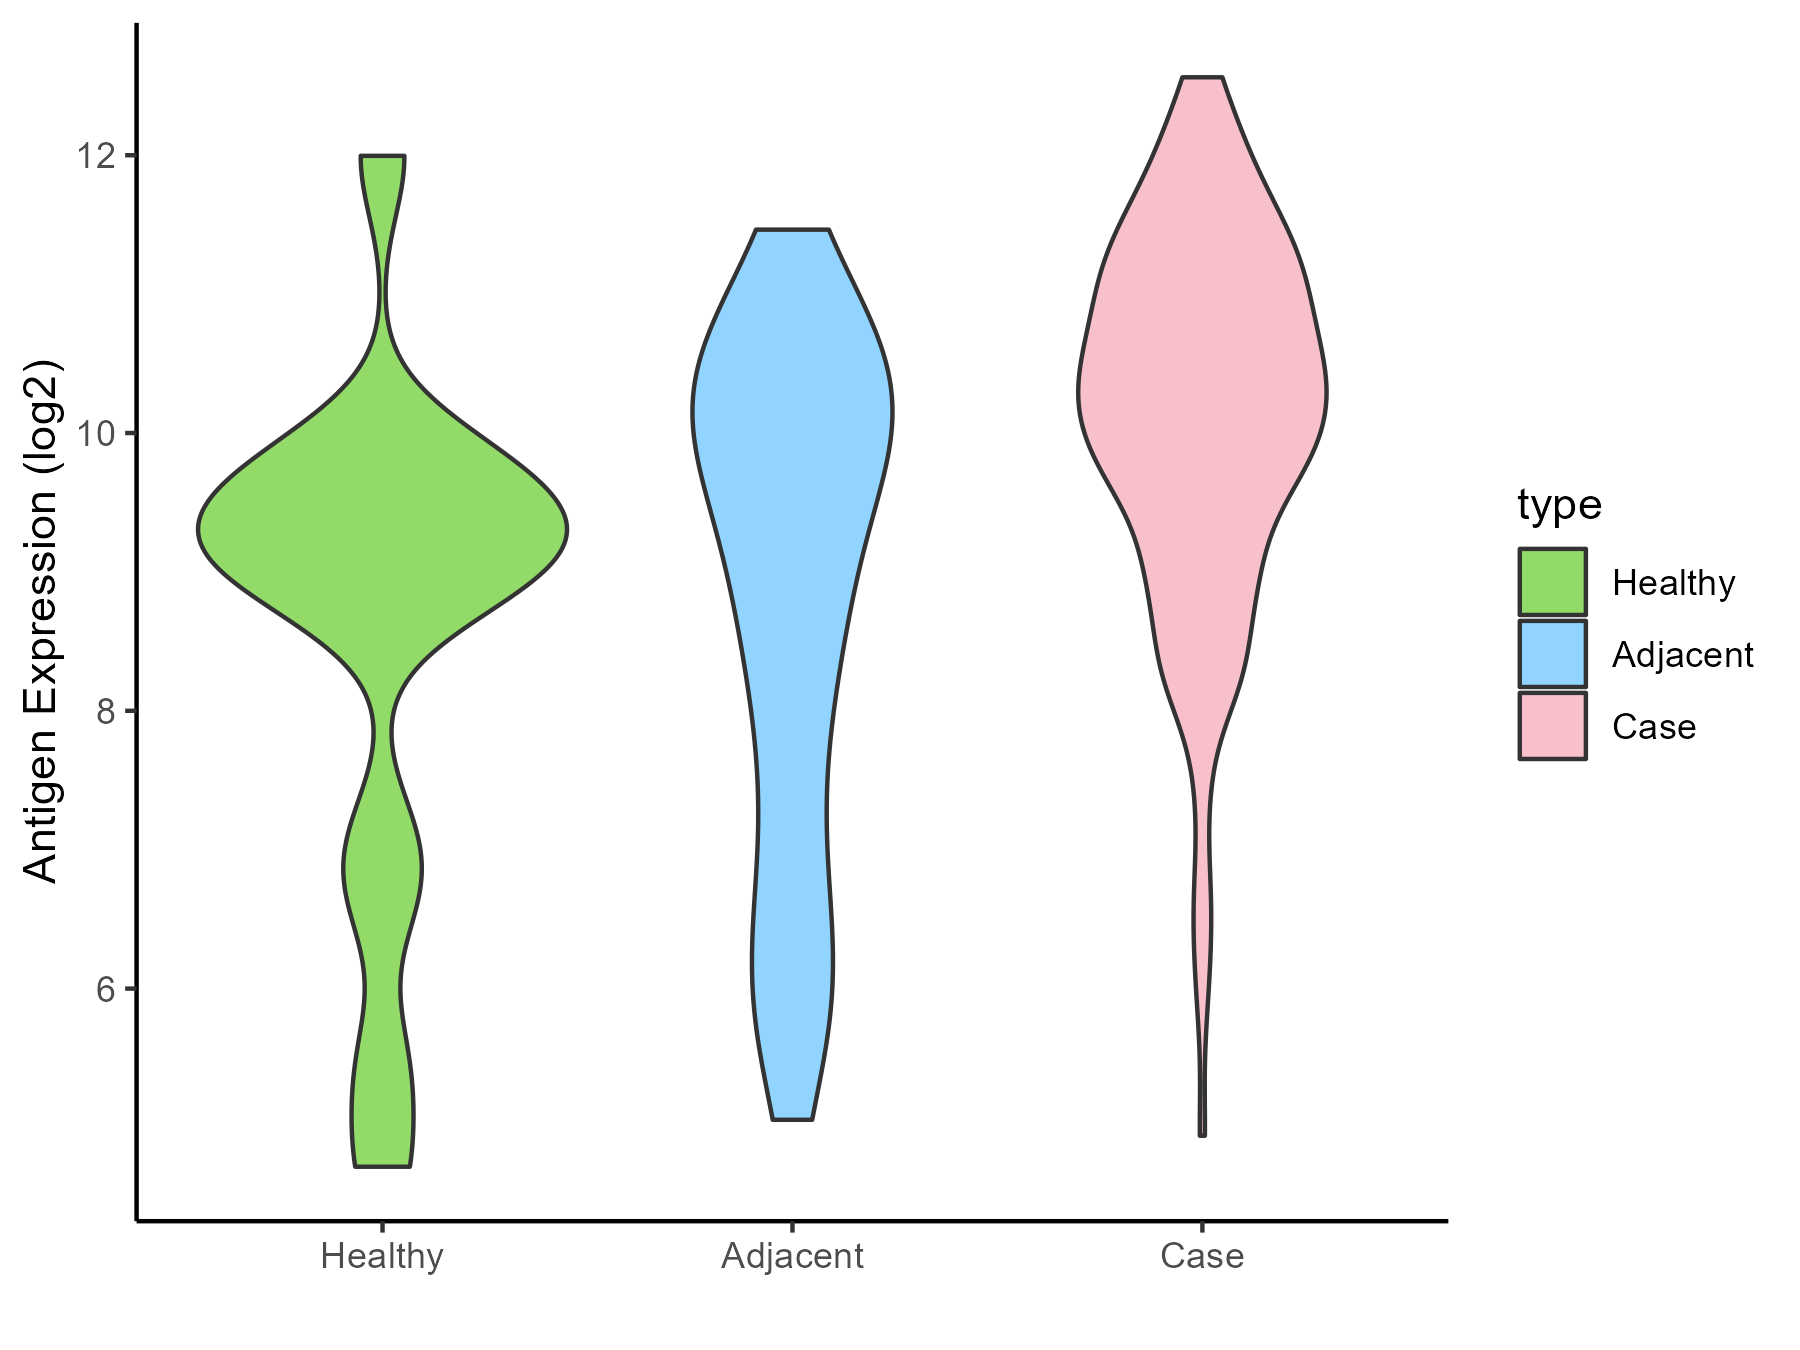
| The Studied Tissue | Pancreas | |
| The Specific Disease | Pancreatic cancer | |
| The Expression Level of Disease Section Compare with the Healthy Individual Tissue | p-value: 0.00592365; Fold-change: 1.12947434; Z-score: 0.620346071 | |
| The Expression Level of Disease Section Compare with the Adjacent Tissue | p-value: 6.65E-06; Fold-change: 0.740593279; Z-score: 0.416374062 | |
| Disease-specific Antigen Abundances |
|
Click to View the Clearer Original Diagram |
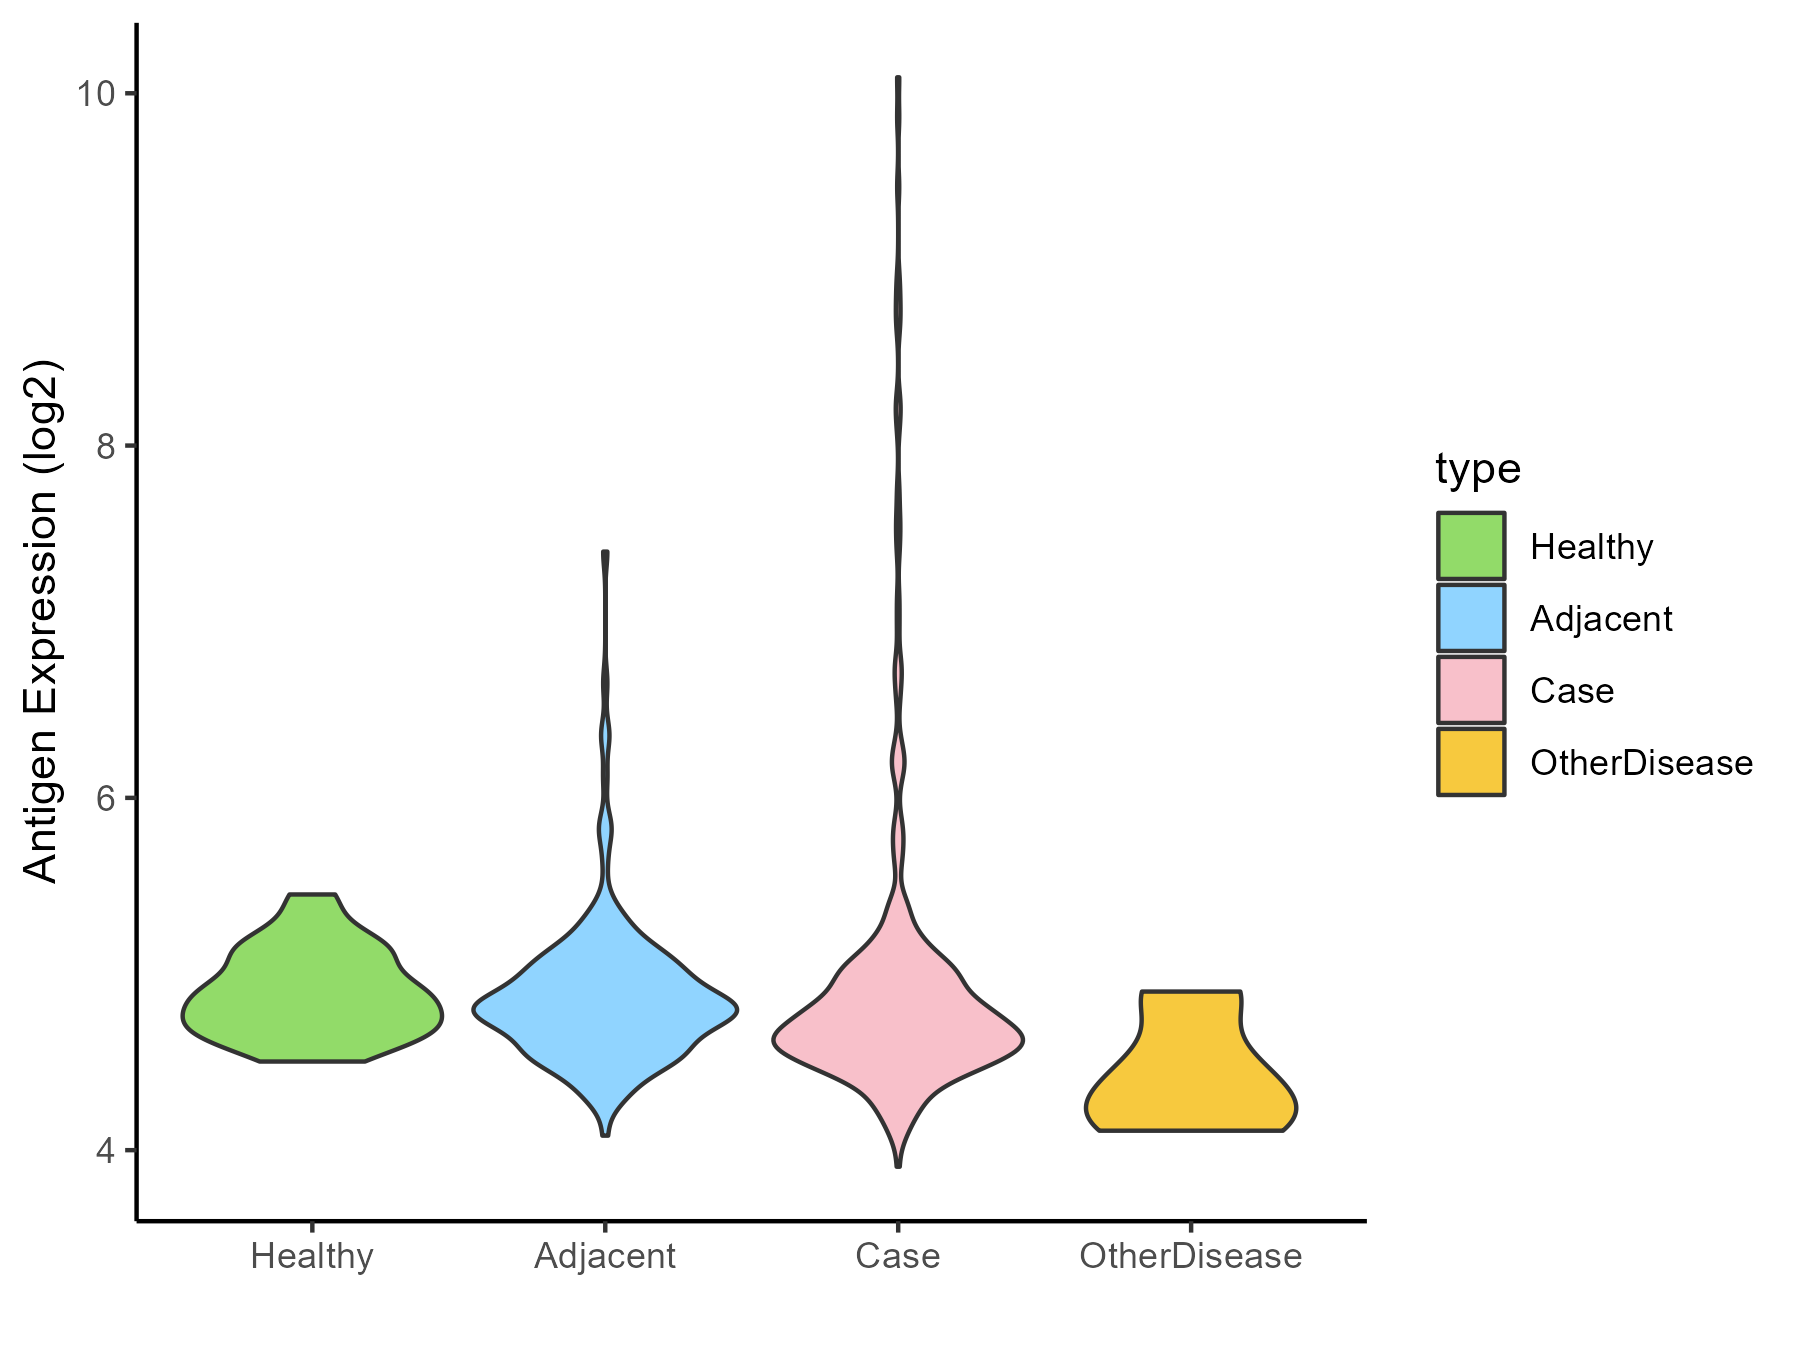
| Differential expression pattern of antigen in diseases | ||
| The Studied Tissue | Liver | |
| The Specific Disease | Liver cancer | |
| The Expression Level of Disease Section Compare with the Healthy Individual Tissue | p-value: 0.497137416; Fold-change: -0.162663594; Z-score: -0.656996194 | |
| The Expression Level of Disease Section Compare with the Adjacent Tissue | p-value: 0.220311663; Fold-change: -0.106420256; Z-score: -0.260340199 | |
| The Expression Level of Disease Section Compare with the Other Disease Section | p-value: 0.058977212; Fold-change: 0.359714718; Z-score: 1.031218837 | |
| Disease-specific Antigen Abundances |
|
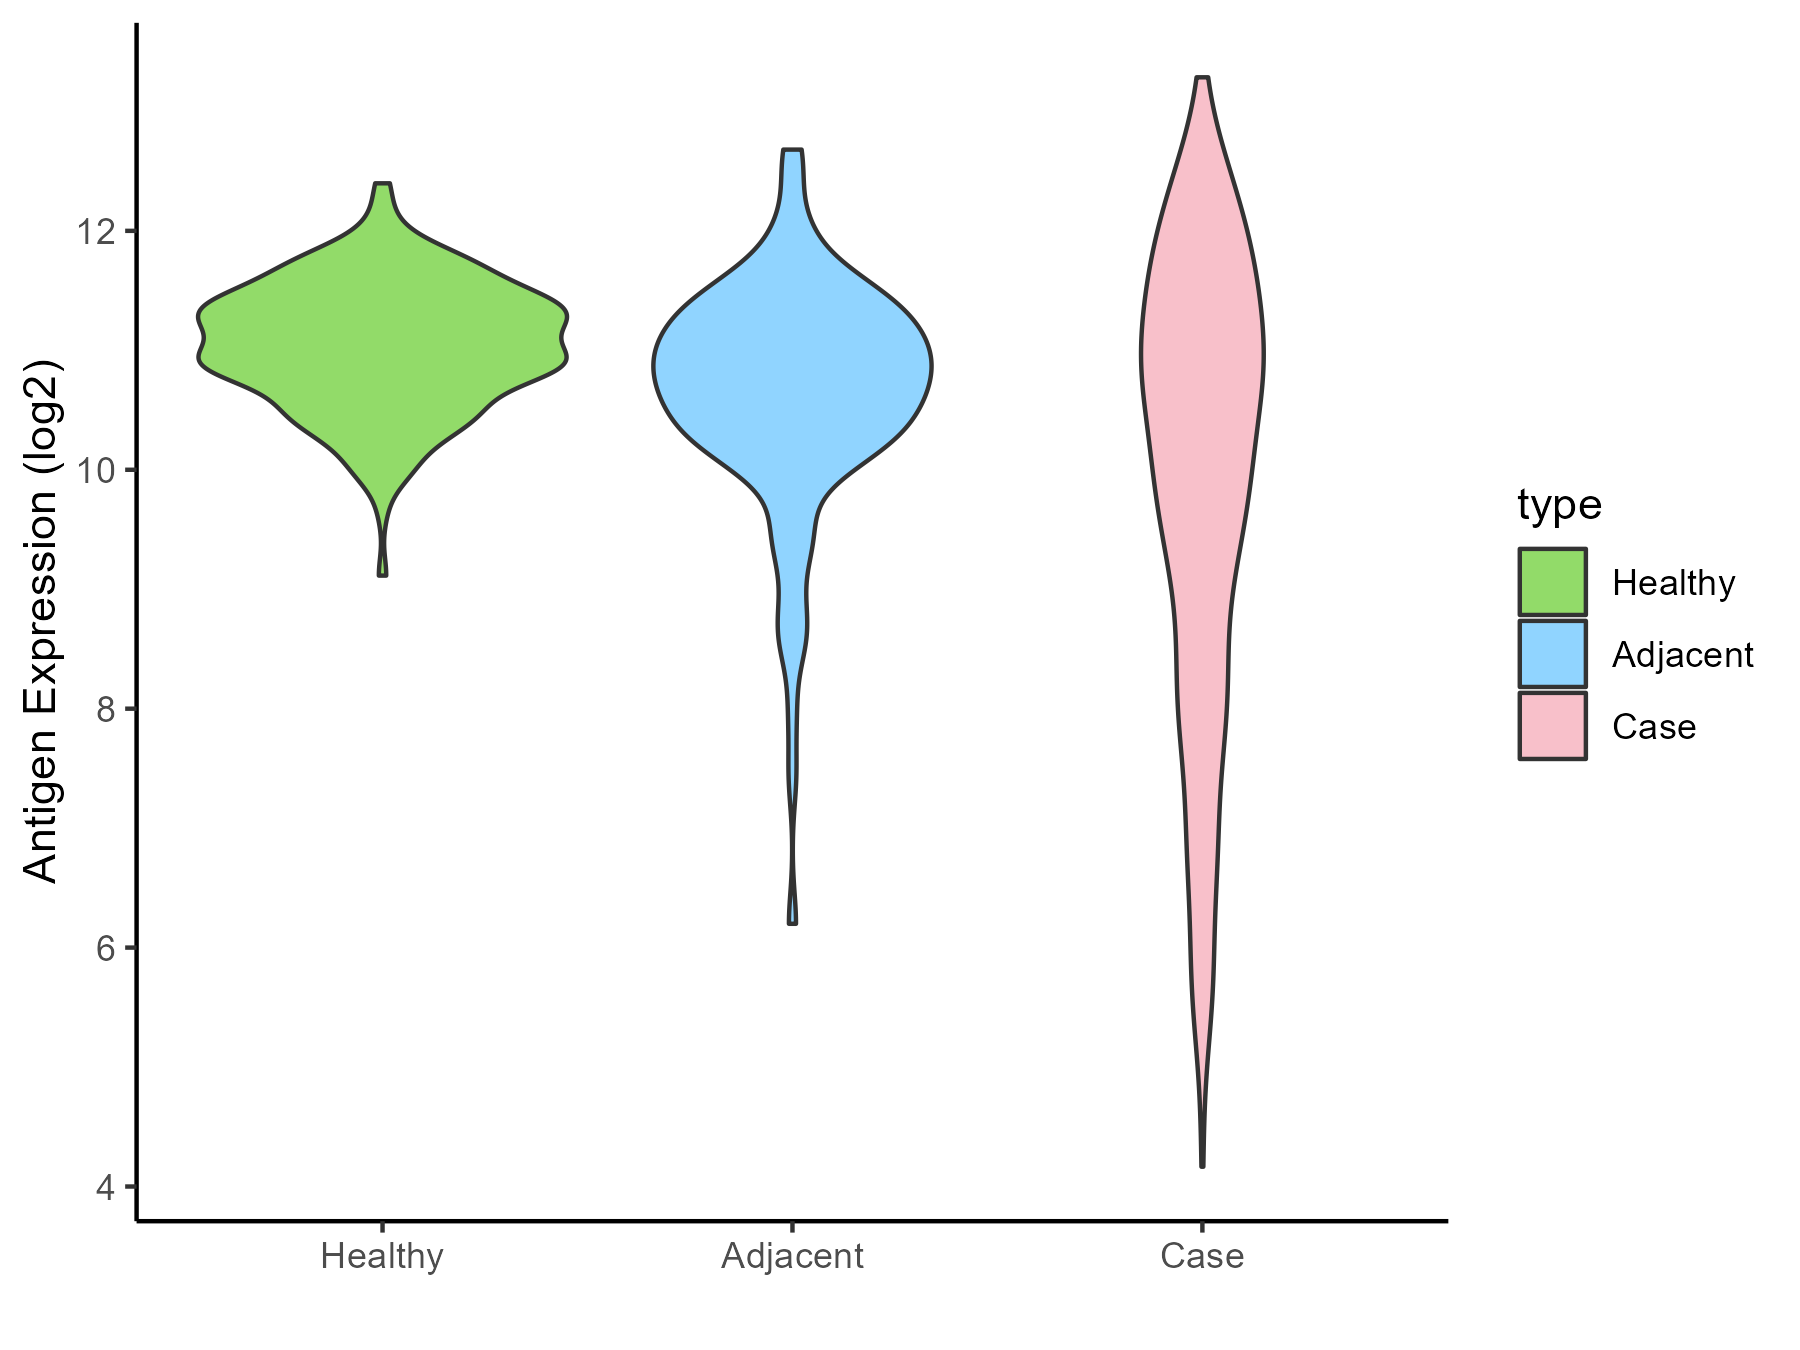
Click to View the Clearer Original Diagram |
| Differential expression pattern of antigen in diseases | ||
| The Studied Tissue | Lung | |
| The Specific Disease | Lung cancer | |
| The Expression Level of Disease Section Compare with the Healthy Individual Tissue | p-value: 6.28E-51; Fold-change: -0.724644372; Z-score: -1.380598646 | |
| The Expression Level of Disease Section Compare with the Adjacent Tissue | p-value: 1.41E-10; Fold-change: -0.392574395; Z-score: -0.40862998 | |
| Disease-specific Antigen Abundances |
|
Click to View the Clearer Original Diagram |
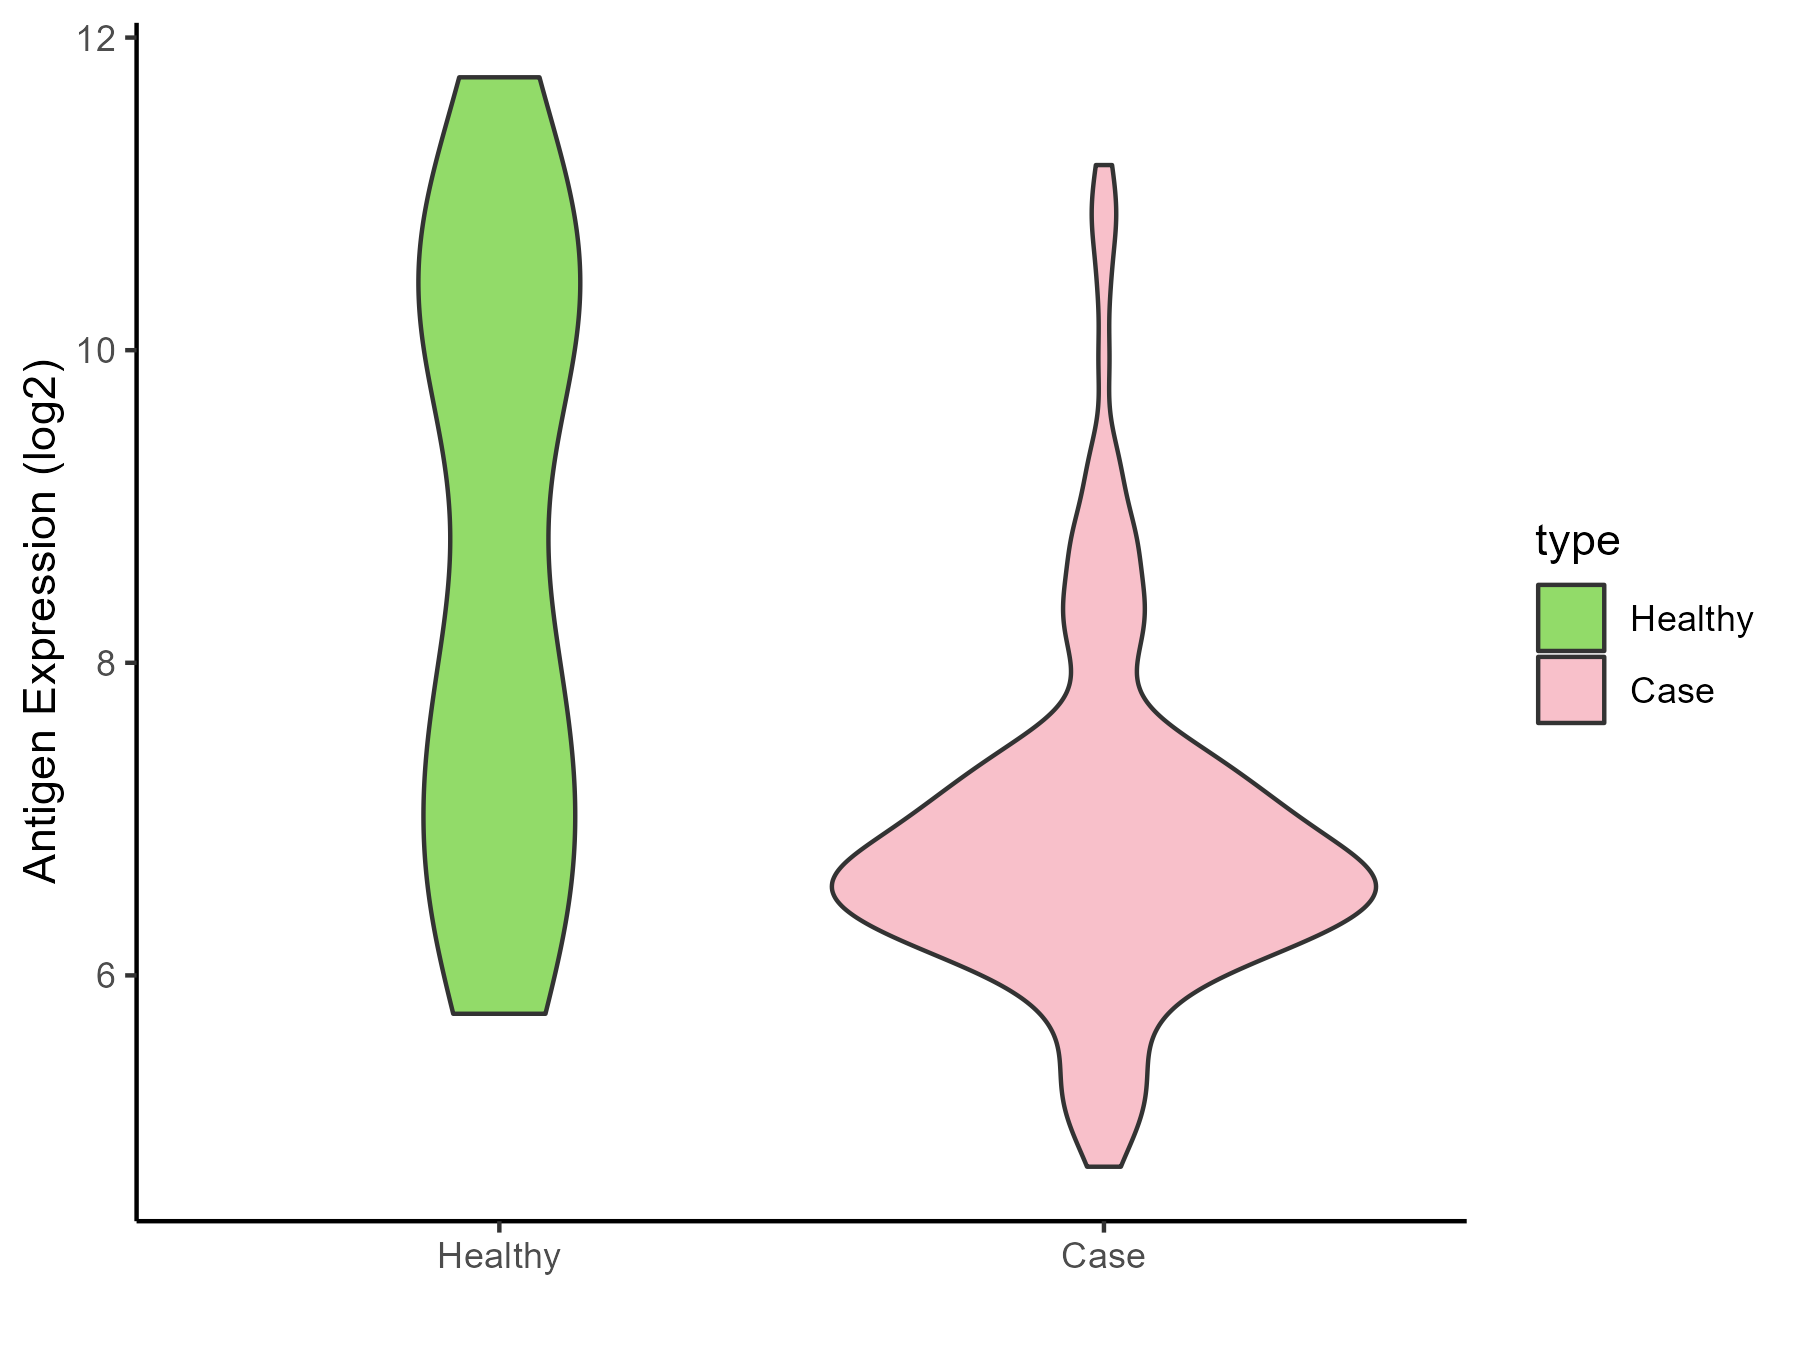
| Differential expression pattern of antigen in diseases | ||
| The Studied Tissue | Skin | |
| The Specific Disease | Melanoma | |
| The Expression Level of Disease Section Compare with the Healthy Individual Tissue | p-value: 0.00018595; Fold-change: -1.34431309; Z-score: -0.703836757 | |
| Disease-specific Antigen Abundances |
|
Click to View the Clearer Original Diagram |
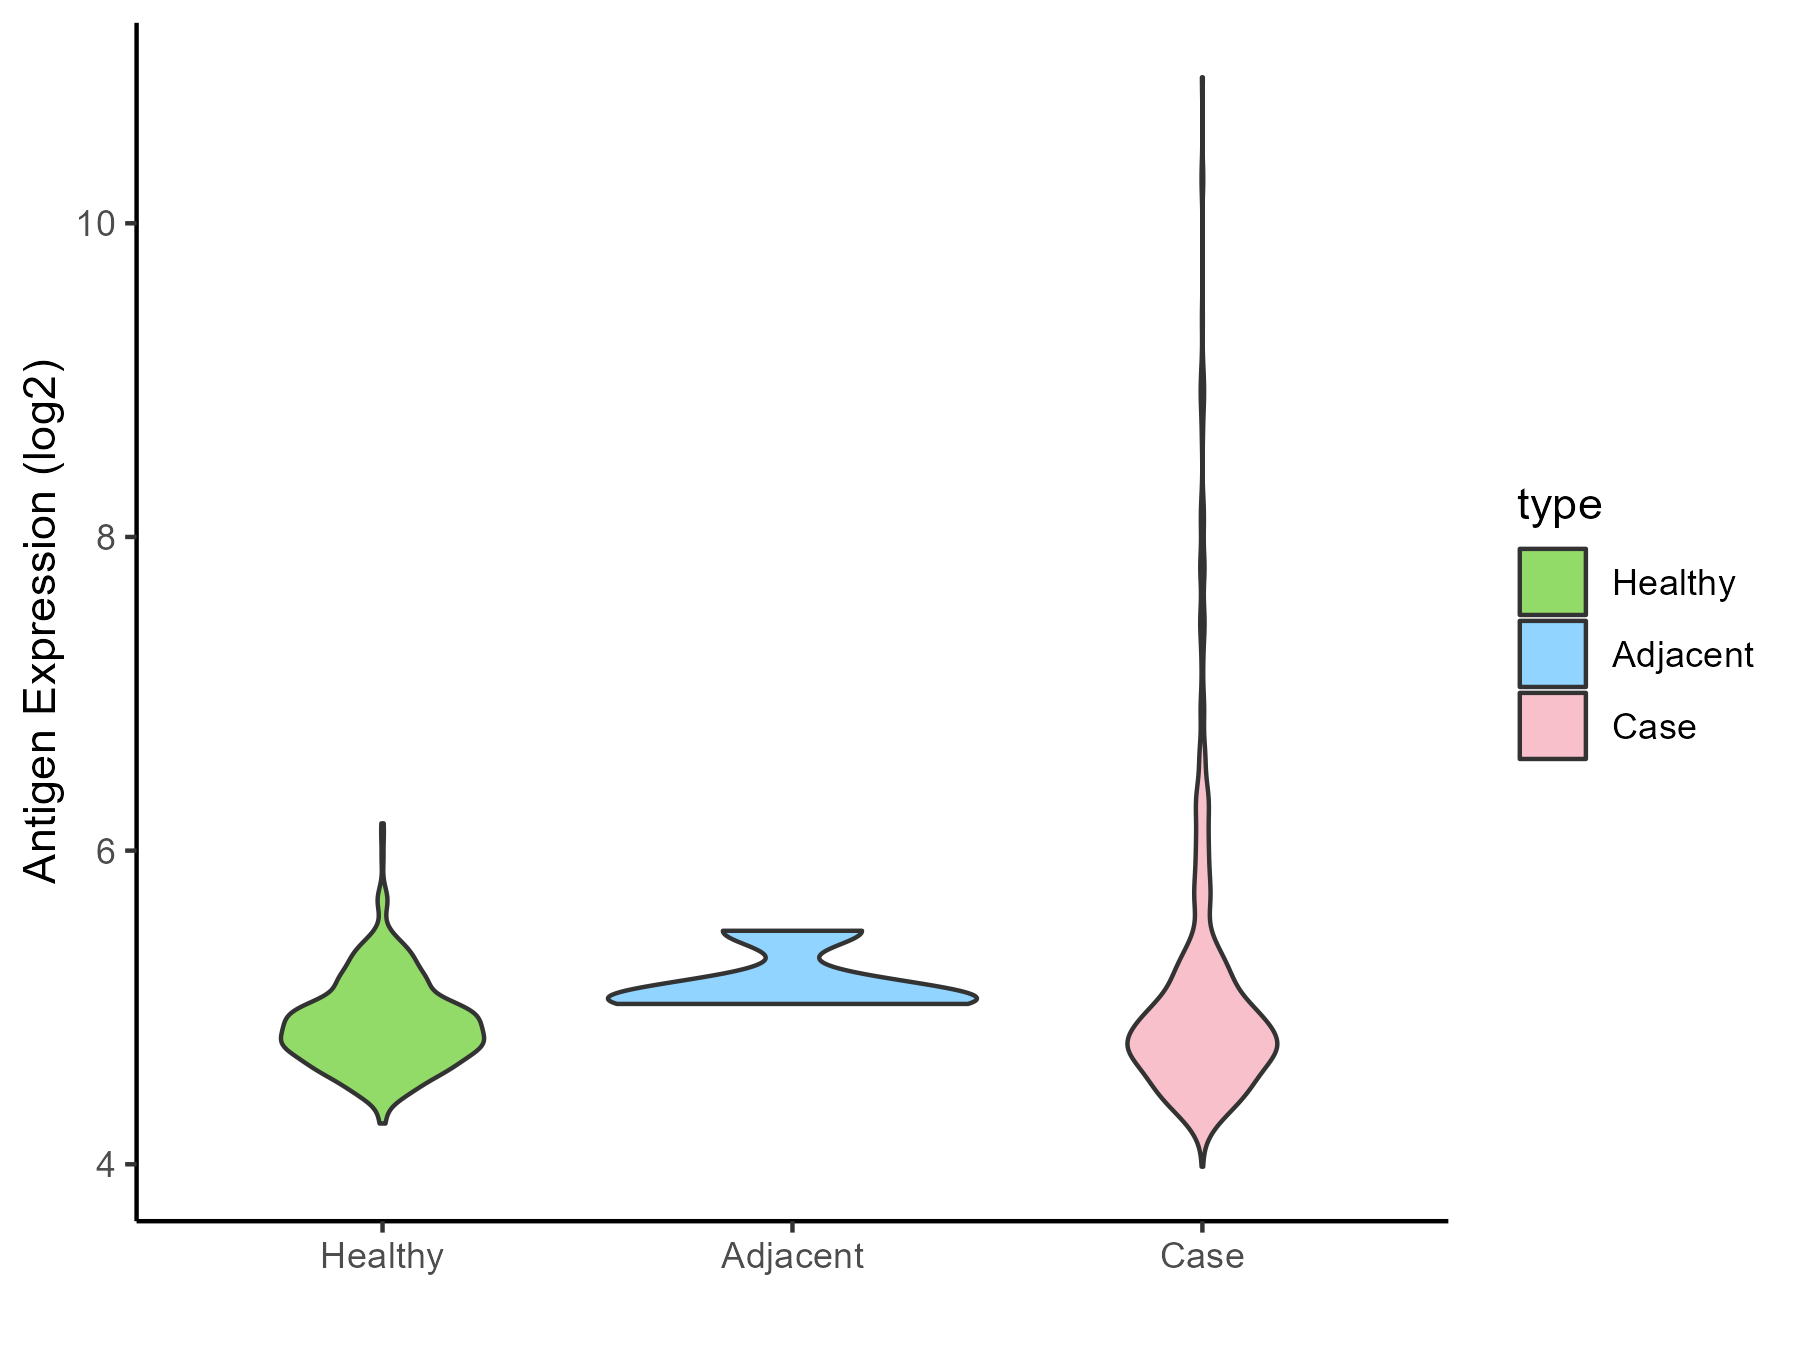
| Differential expression pattern of antigen in diseases | ||
| The Studied Tissue | Muscle | |
| The Specific Disease | Sarcoma | |
| The Expression Level of Disease Section Compare with the Healthy Individual Tissue | p-value: 2.59E-07; Fold-change: -0.020357463; Z-score: -0.072517471 | |
| The Expression Level of Disease Section Compare with the Adjacent Tissue | p-value: 0.617159365; Fold-change: -0.235078165; Z-score: -1.074362159 | |
| Disease-specific Antigen Abundances |
|
Click to View the Clearer Original Diagram |
| Differential expression pattern of antigen in diseases | ||
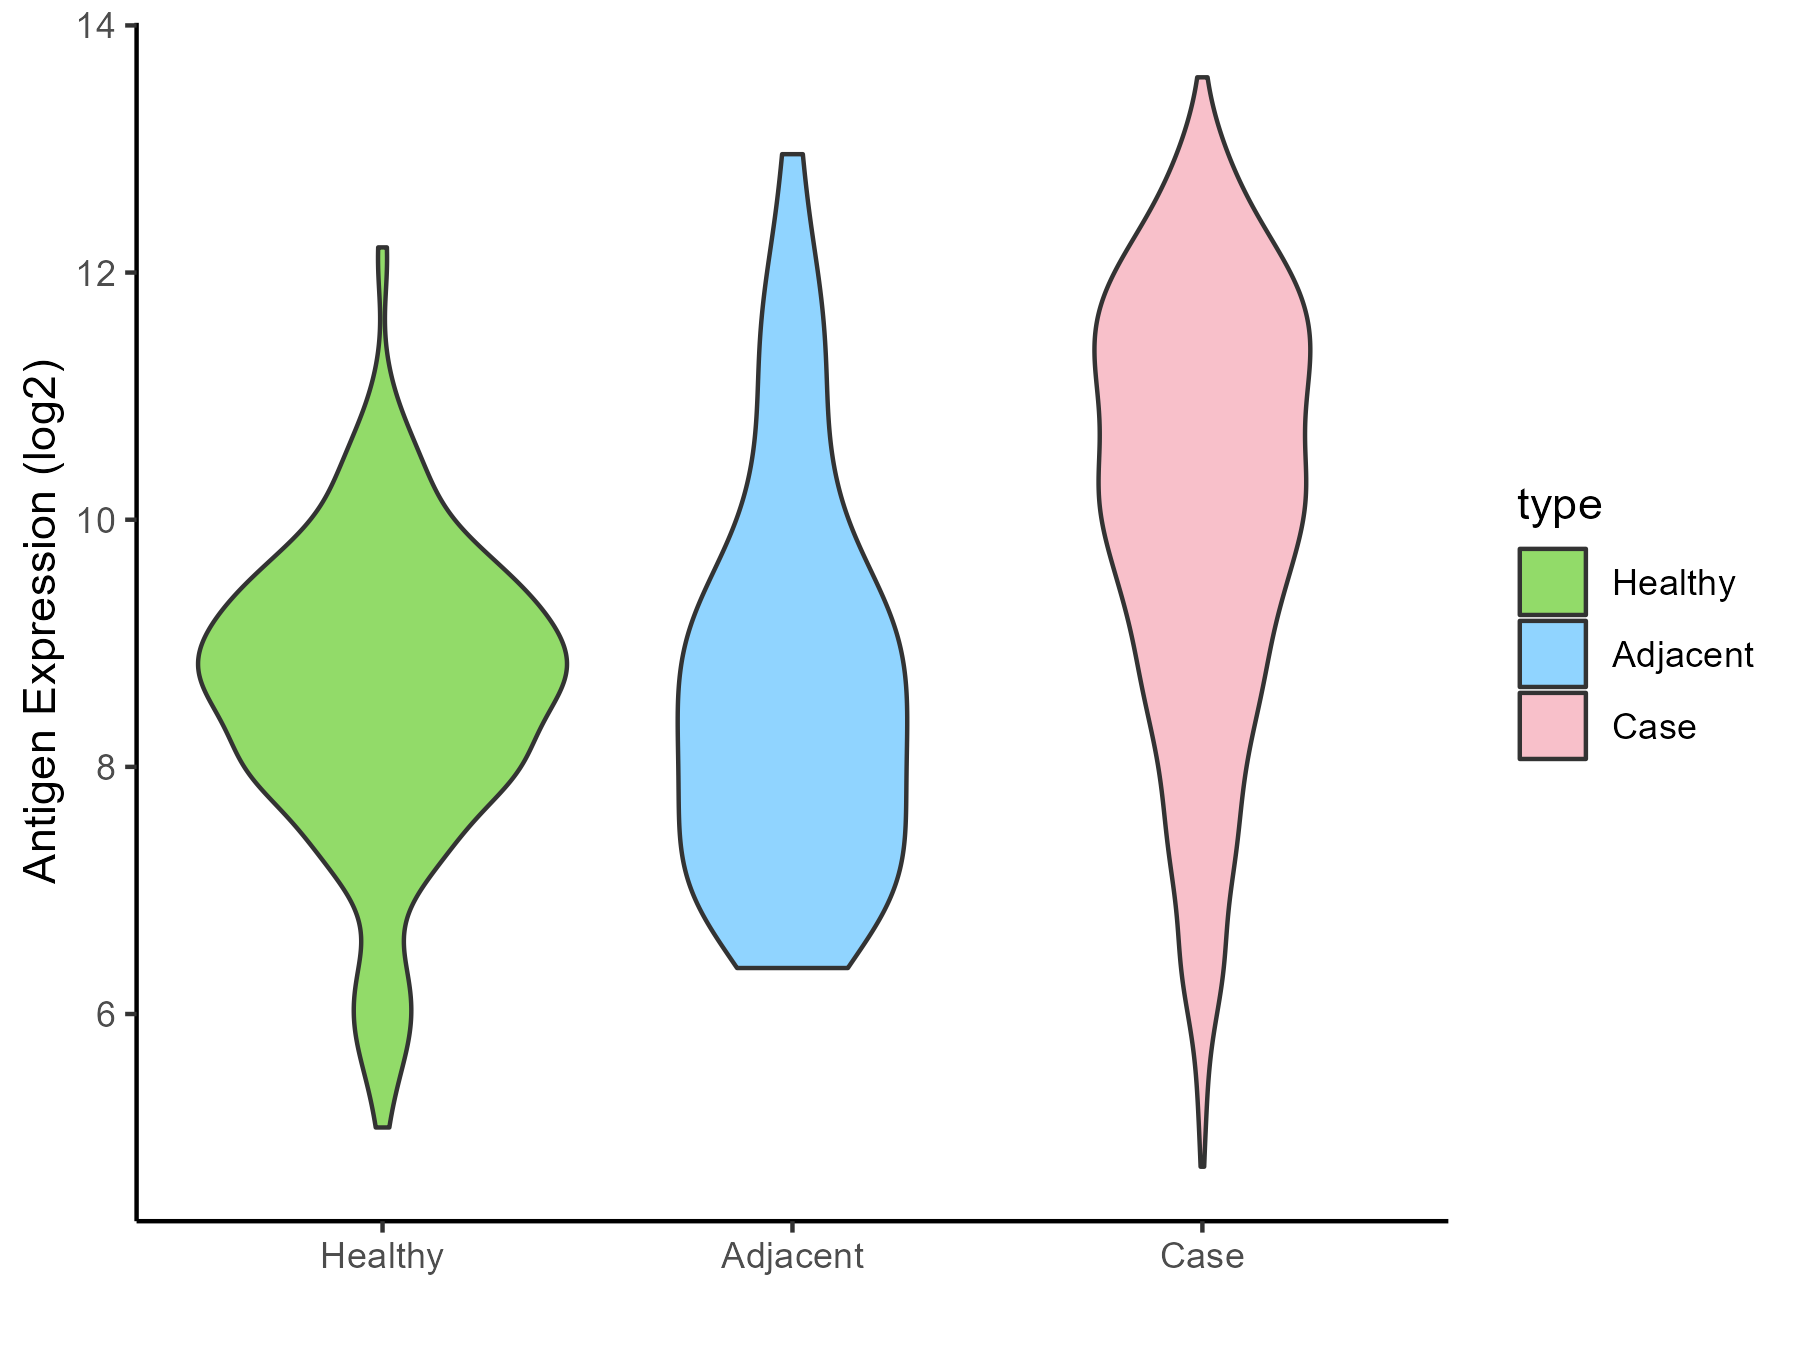
| The Studied Tissue | Breast | |
| The Specific Disease | Breast cancer | |
| The Expression Level of Disease Section Compare with the Healthy Individual Tissue | p-value: 1.85E-53; Fold-change: 1.612274152; Z-score: 1.373674358 | |
| The Expression Level of Disease Section Compare with the Adjacent Tissue | p-value: 9.93E-08; Fold-change: 1.895512113; Z-score: 1.191887858 | |
| Disease-specific Antigen Abundances |
|
Click to View the Clearer Original Diagram |
| Differential expression pattern of antigen in diseases | ||
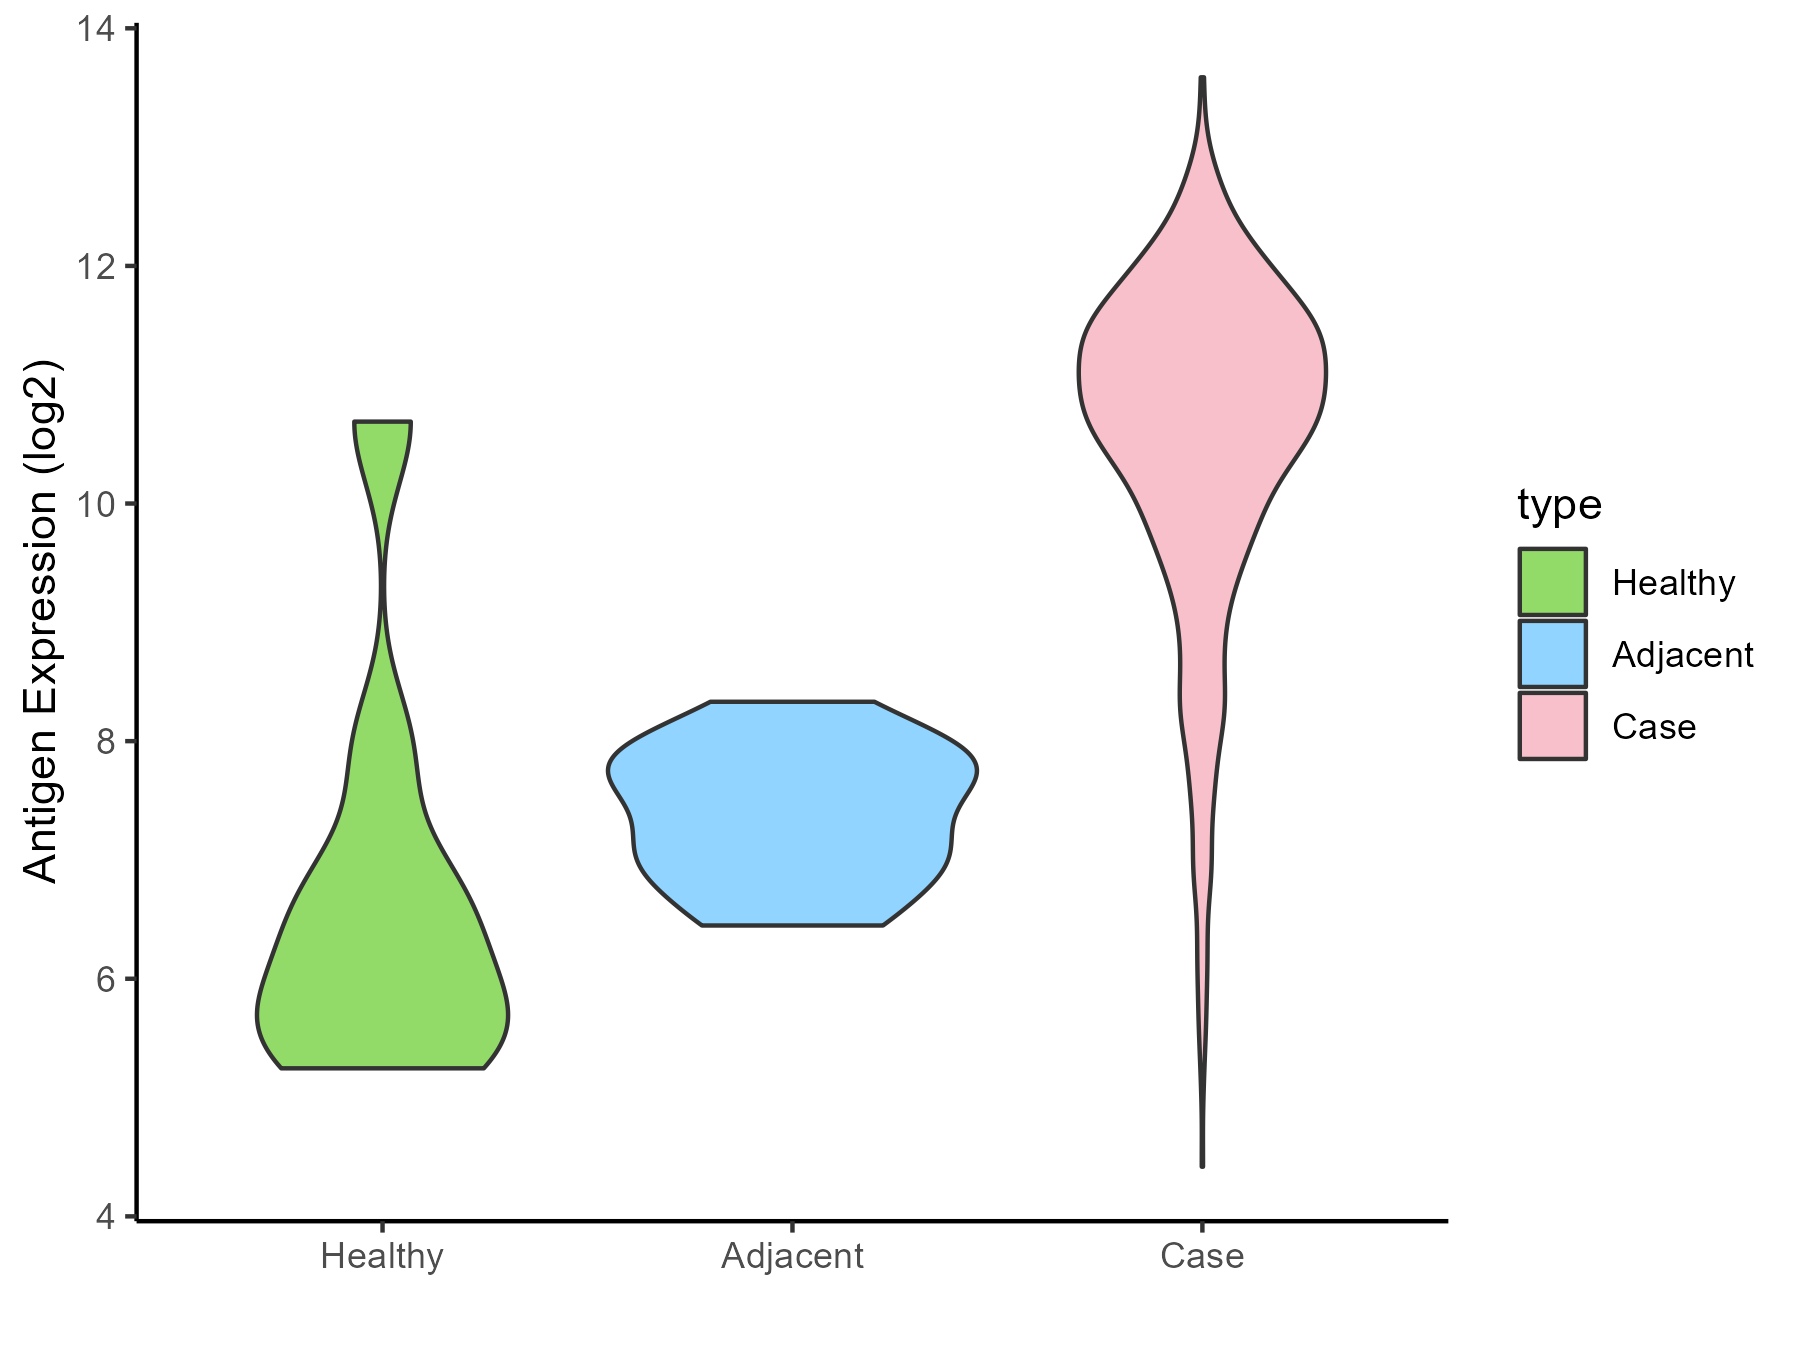
| The Studied Tissue | Ovarian | |
| The Specific Disease | Ovarian cancer | |
| The Expression Level of Disease Section Compare with the Healthy Individual Tissue | p-value: 0.000143706; Fold-change: 4.592975896; Z-score: 2.680552149 | |
| The Expression Level of Disease Section Compare with the Adjacent Tissue | p-value: 2.52E-12; Fold-change: 3.362077274; Z-score: 5.727604135 | |
| Disease-specific Antigen Abundances |
|
Click to View the Clearer Original Diagram |
| Differential expression pattern of antigen in diseases | ||
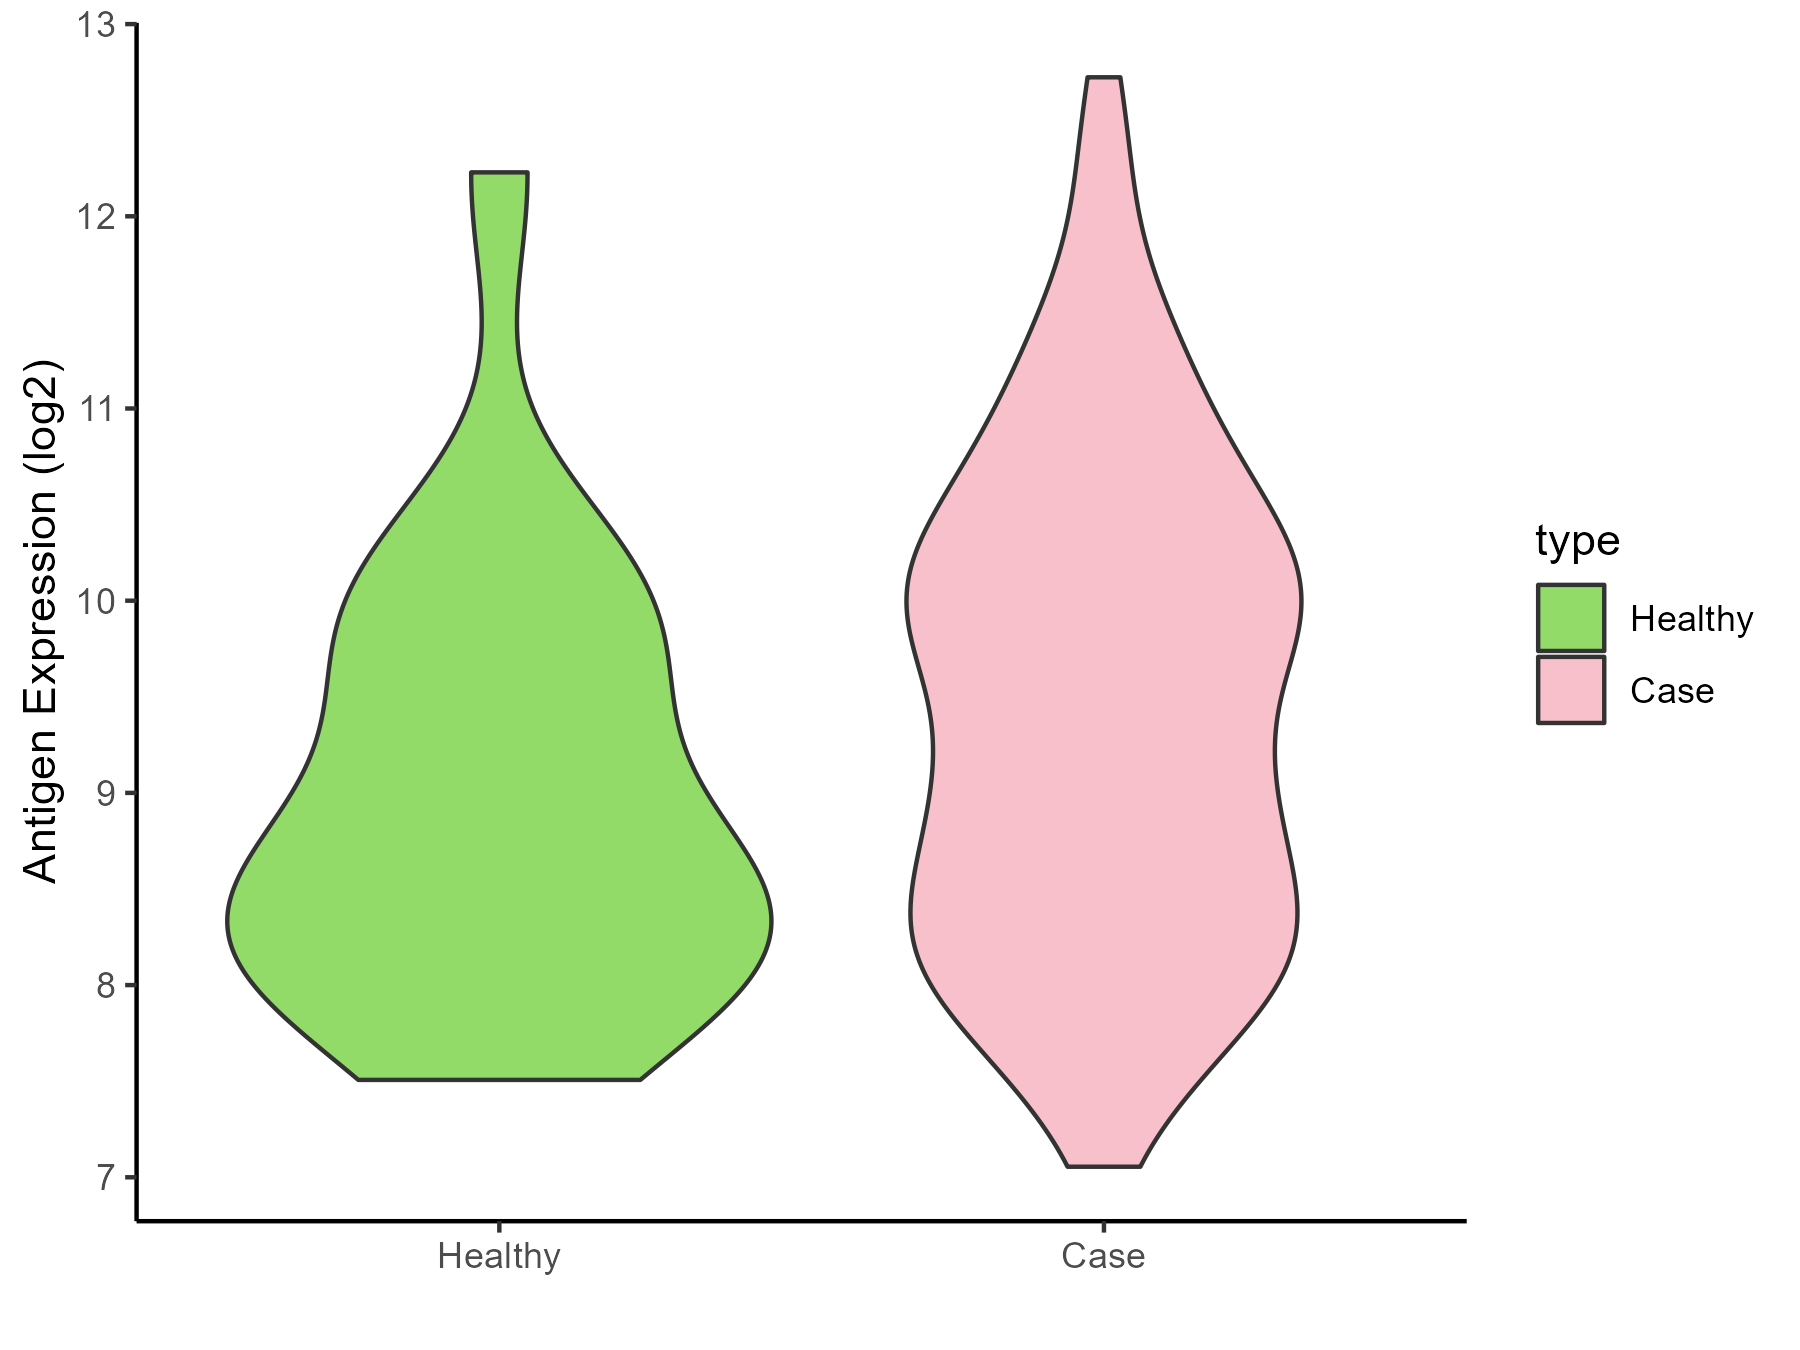
| The Studied Tissue | Cervical | |
| The Specific Disease | Cervical cancer | |
| The Expression Level of Disease Section Compare with the Healthy Individual Tissue | p-value: 0.144362755; Fold-change: 0.817605836; Z-score: 0.705650121 | |
| Disease-specific Antigen Abundances |
|
Click to View the Clearer Original Diagram |
| Differential expression pattern of antigen in diseases | ||
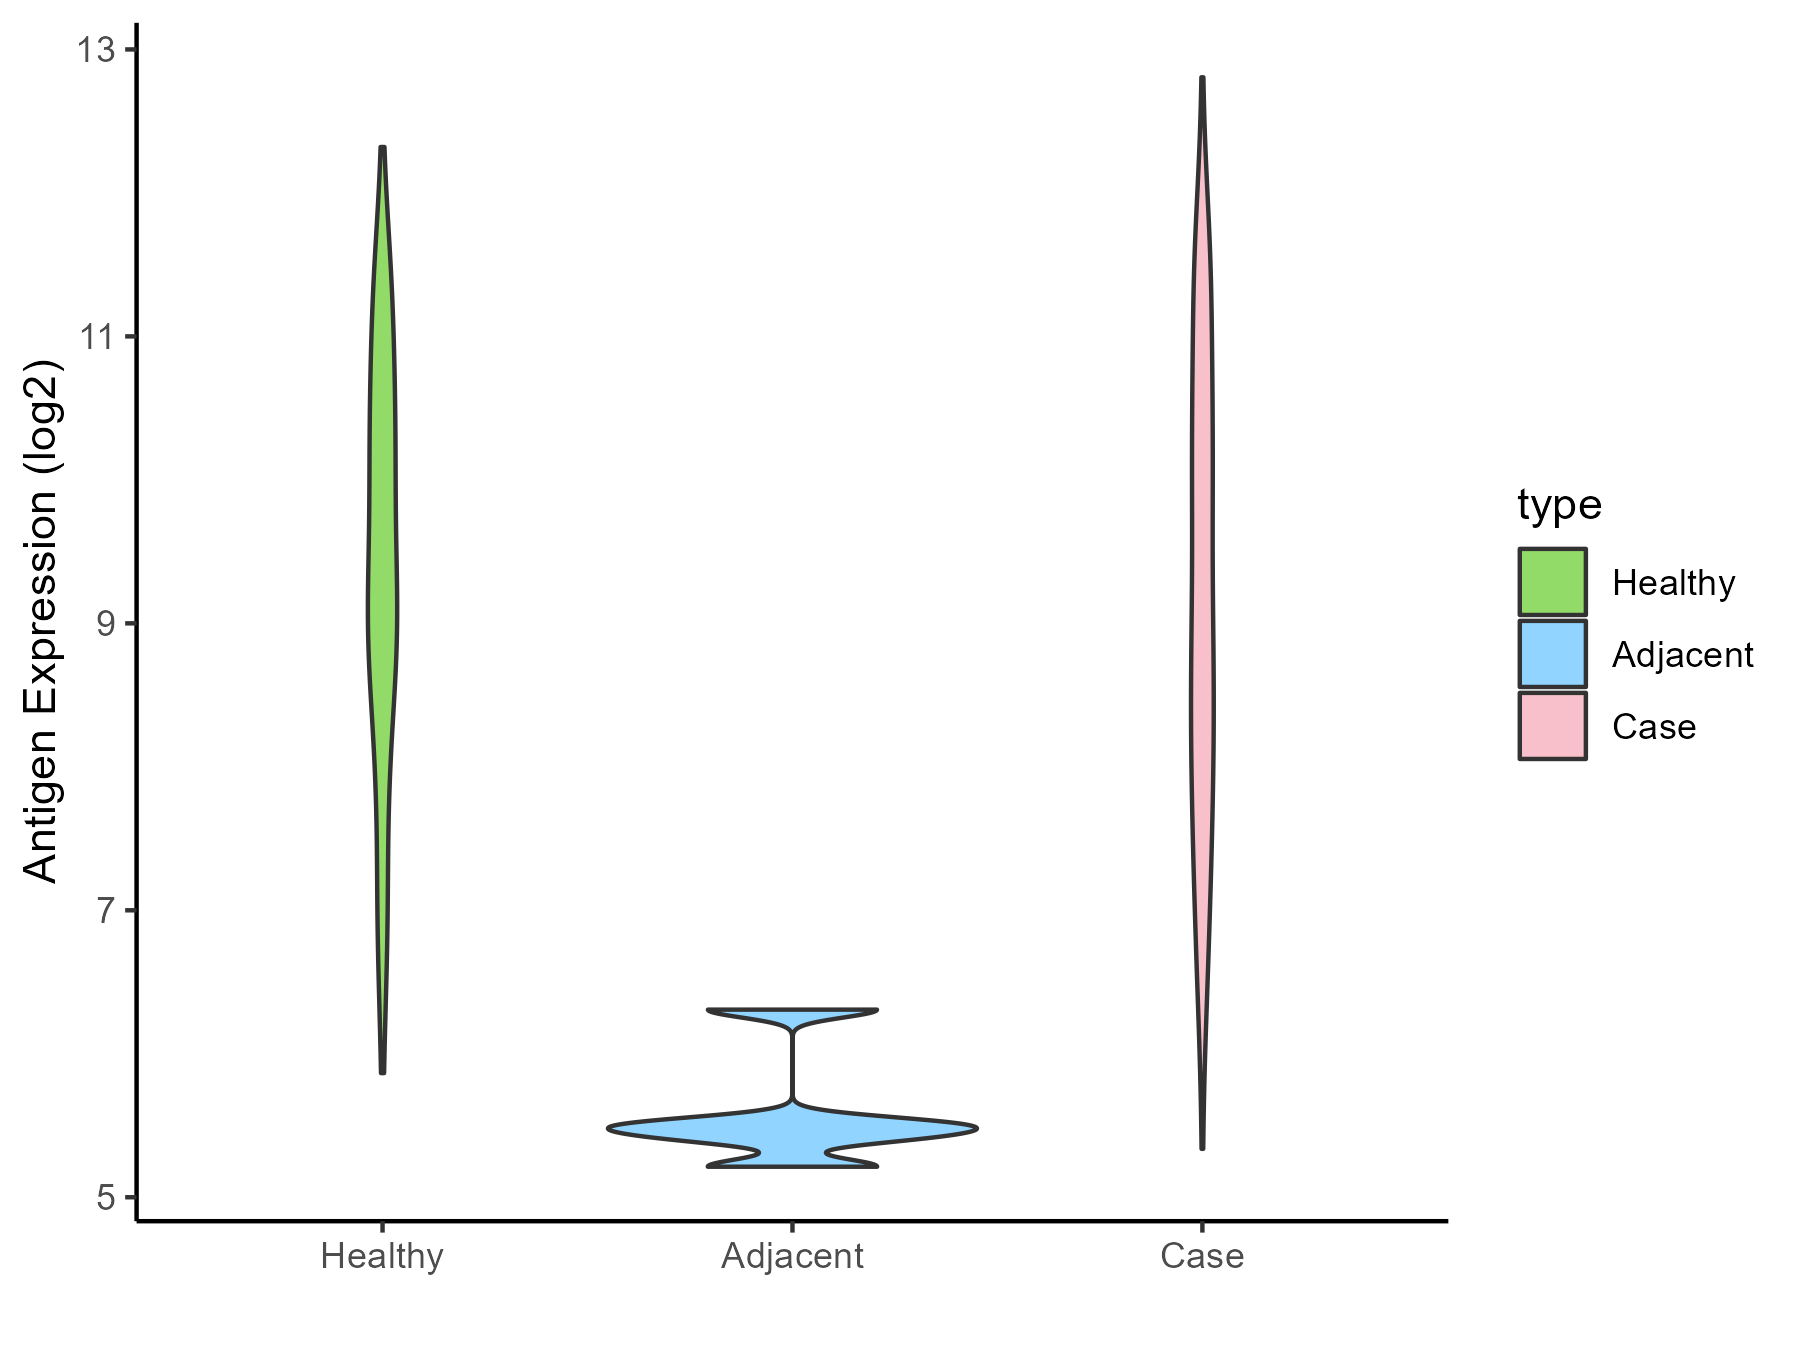
| The Studied Tissue | Endometrium | |
| The Specific Disease | Uterine cancer | |
| The Expression Level of Disease Section Compare with the Healthy Individual Tissue | p-value: 0.183273042; Fold-change: -0.251140679; Z-score: -0.172943129 | |
| The Expression Level of Disease Section Compare with the Adjacent Tissue | p-value: 2.01E-06; Fold-change: 3.708441435; Z-score: 8.82840755 | |
| Disease-specific Antigen Abundances |
|
Click to View the Clearer Original Diagram |
| Differential expression pattern of antigen in diseases | ||
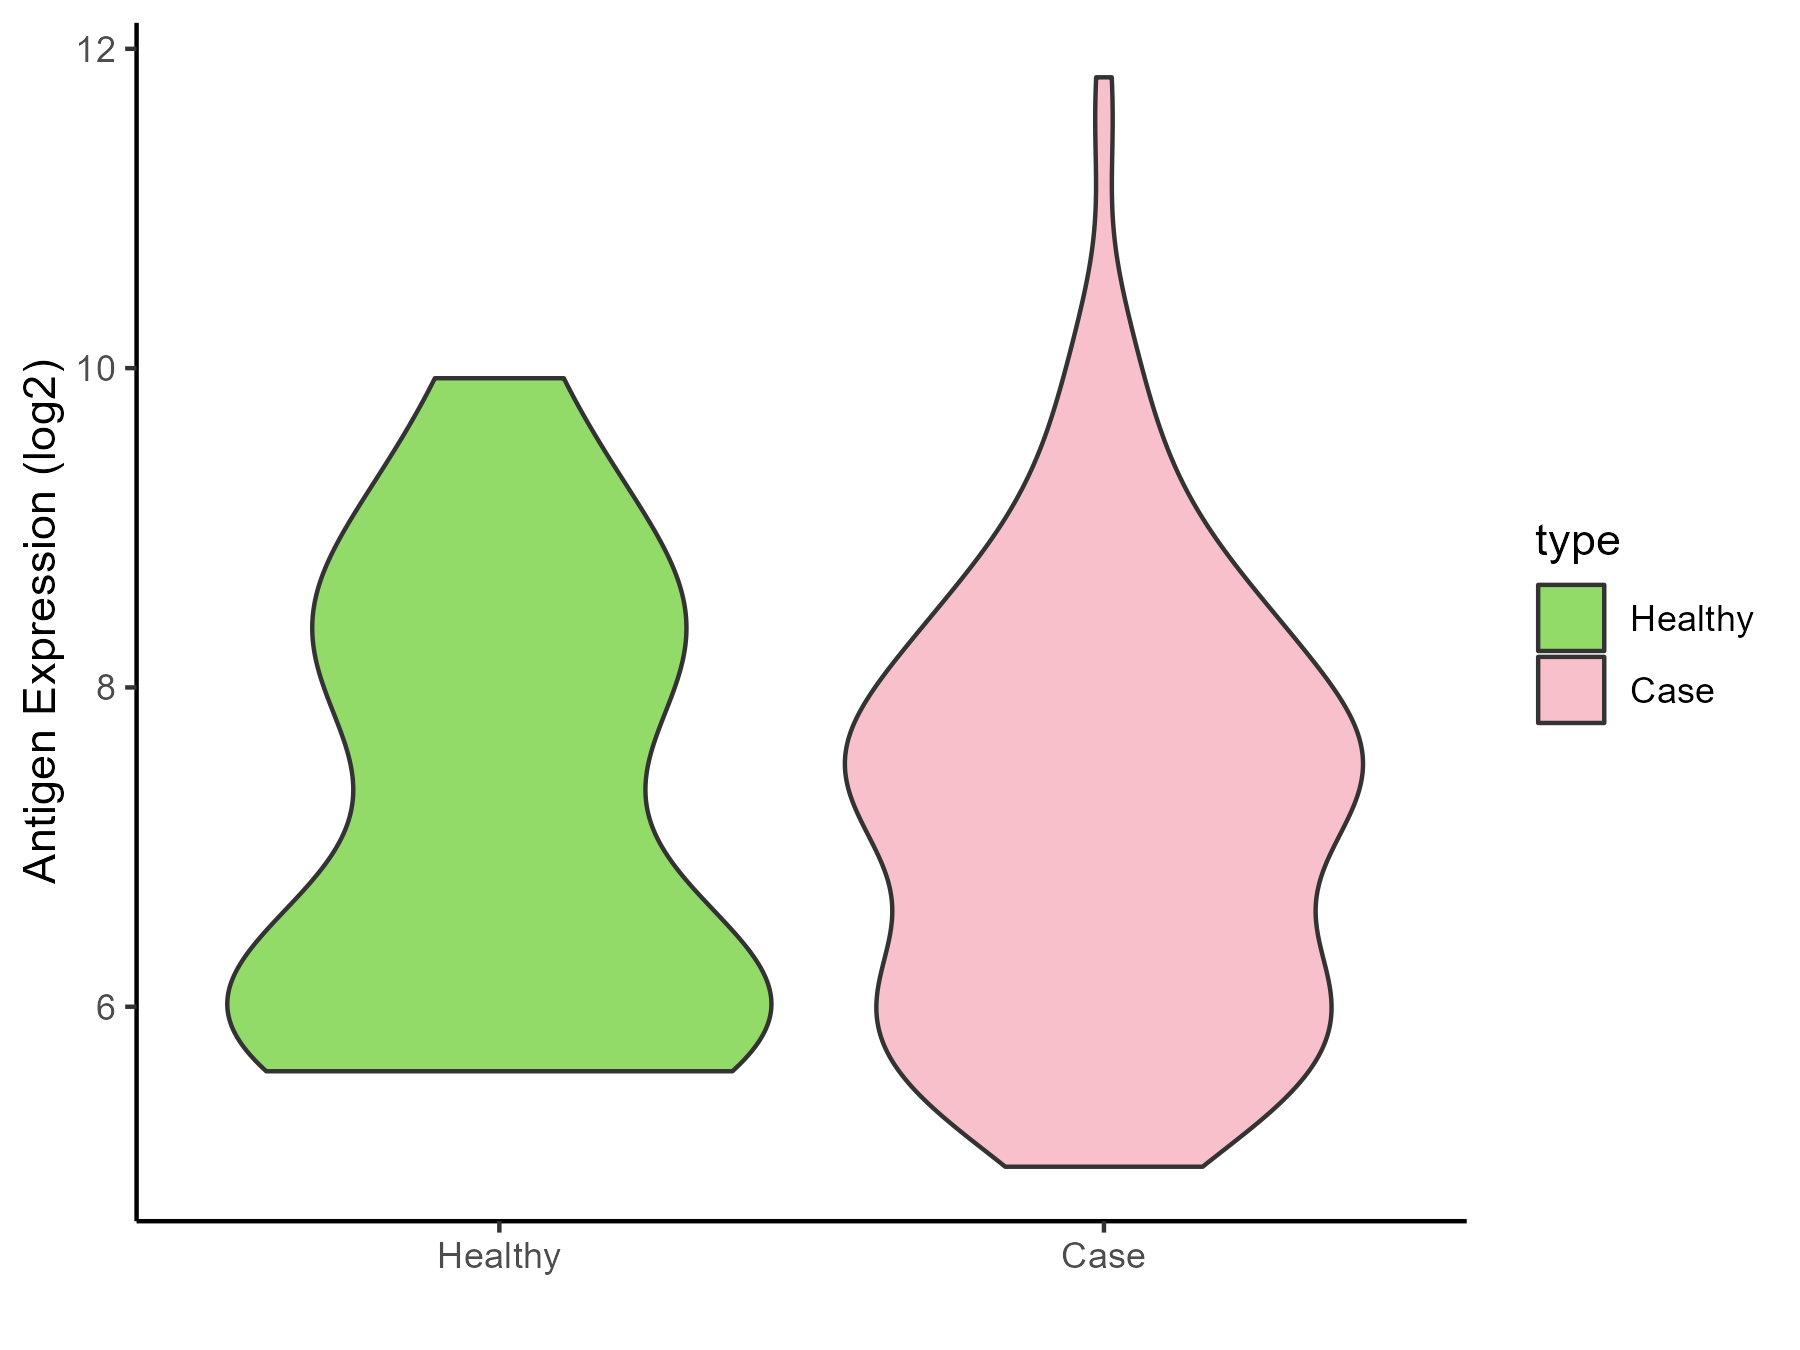
| The Studied Tissue | Prostate | |
| The Specific Disease | Prostate cancer | |
| The Expression Level of Disease Section Compare with the Healthy Individual Tissue | p-value: 0.983223912; Fold-change: 0.301082636; Z-score: 0.215834692 | |
| Disease-specific Antigen Abundances |
|
Click to View the Clearer Original Diagram |
| Differential expression pattern of antigen in diseases | ||
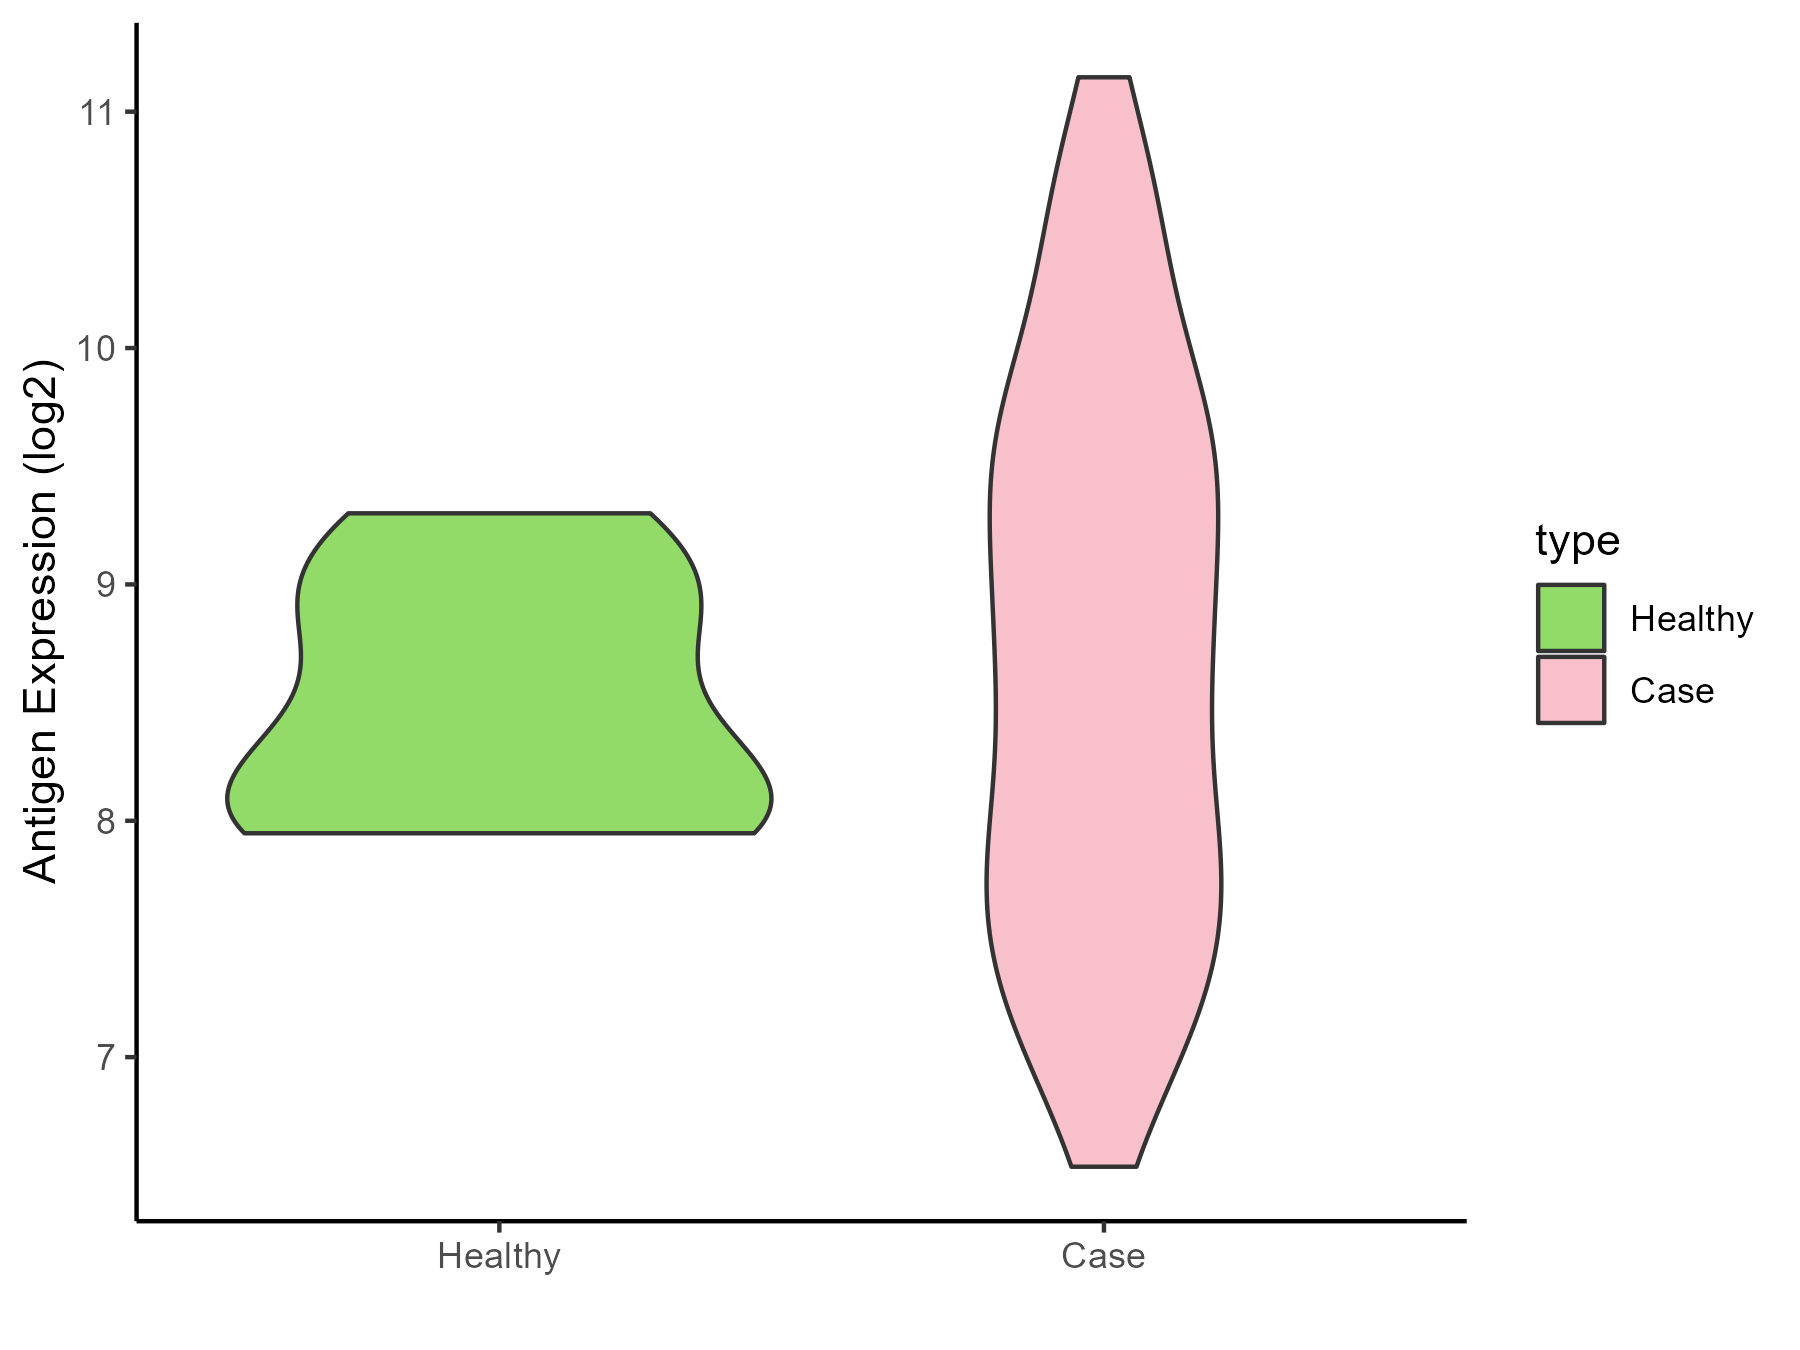
| The Studied Tissue | Bladder | |
| The Specific Disease | Bladder cancer | |
| The Expression Level of Disease Section Compare with the Healthy Individual Tissue | p-value: 0.404710489; Fold-change: 0.37677651; Z-score: 0.686377979 | |
| Disease-specific Antigen Abundances |
|
Click to View the Clearer Original Diagram |
| Differential expression pattern of antigen in diseases | ||
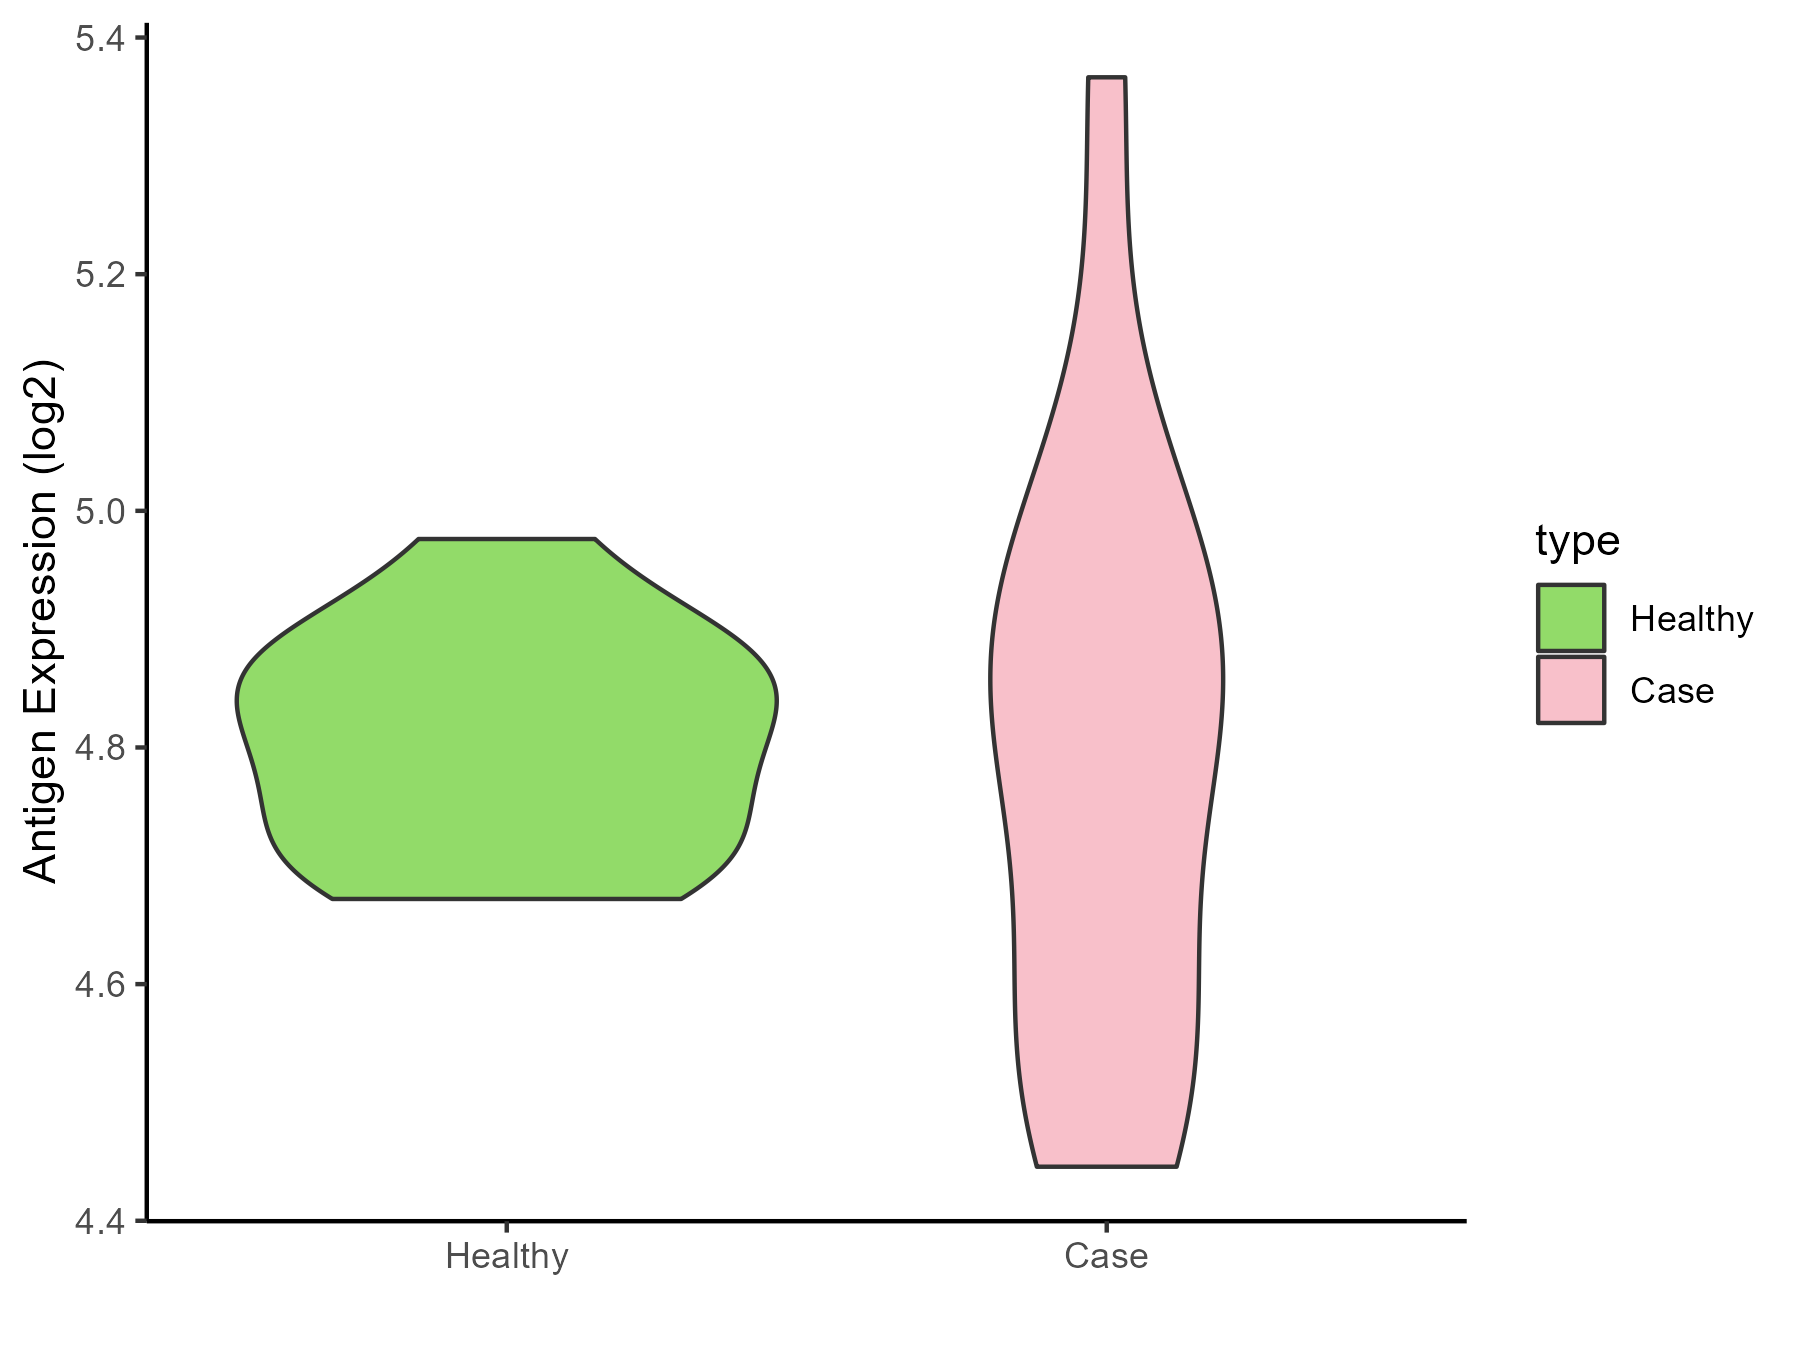
| The Studied Tissue | Uvea | |
| The Specific Disease | Retinoblastoma tumor | |
| The Expression Level of Disease Section Compare with the Healthy Individual Tissue | p-value: 0.847611626; Fold-change: 0.014280264; Z-score: 0.151881144 | |
| Disease-specific Antigen Abundances |
|
Click to View the Clearer Original Diagram |
| Differential expression pattern of antigen in diseases | ||
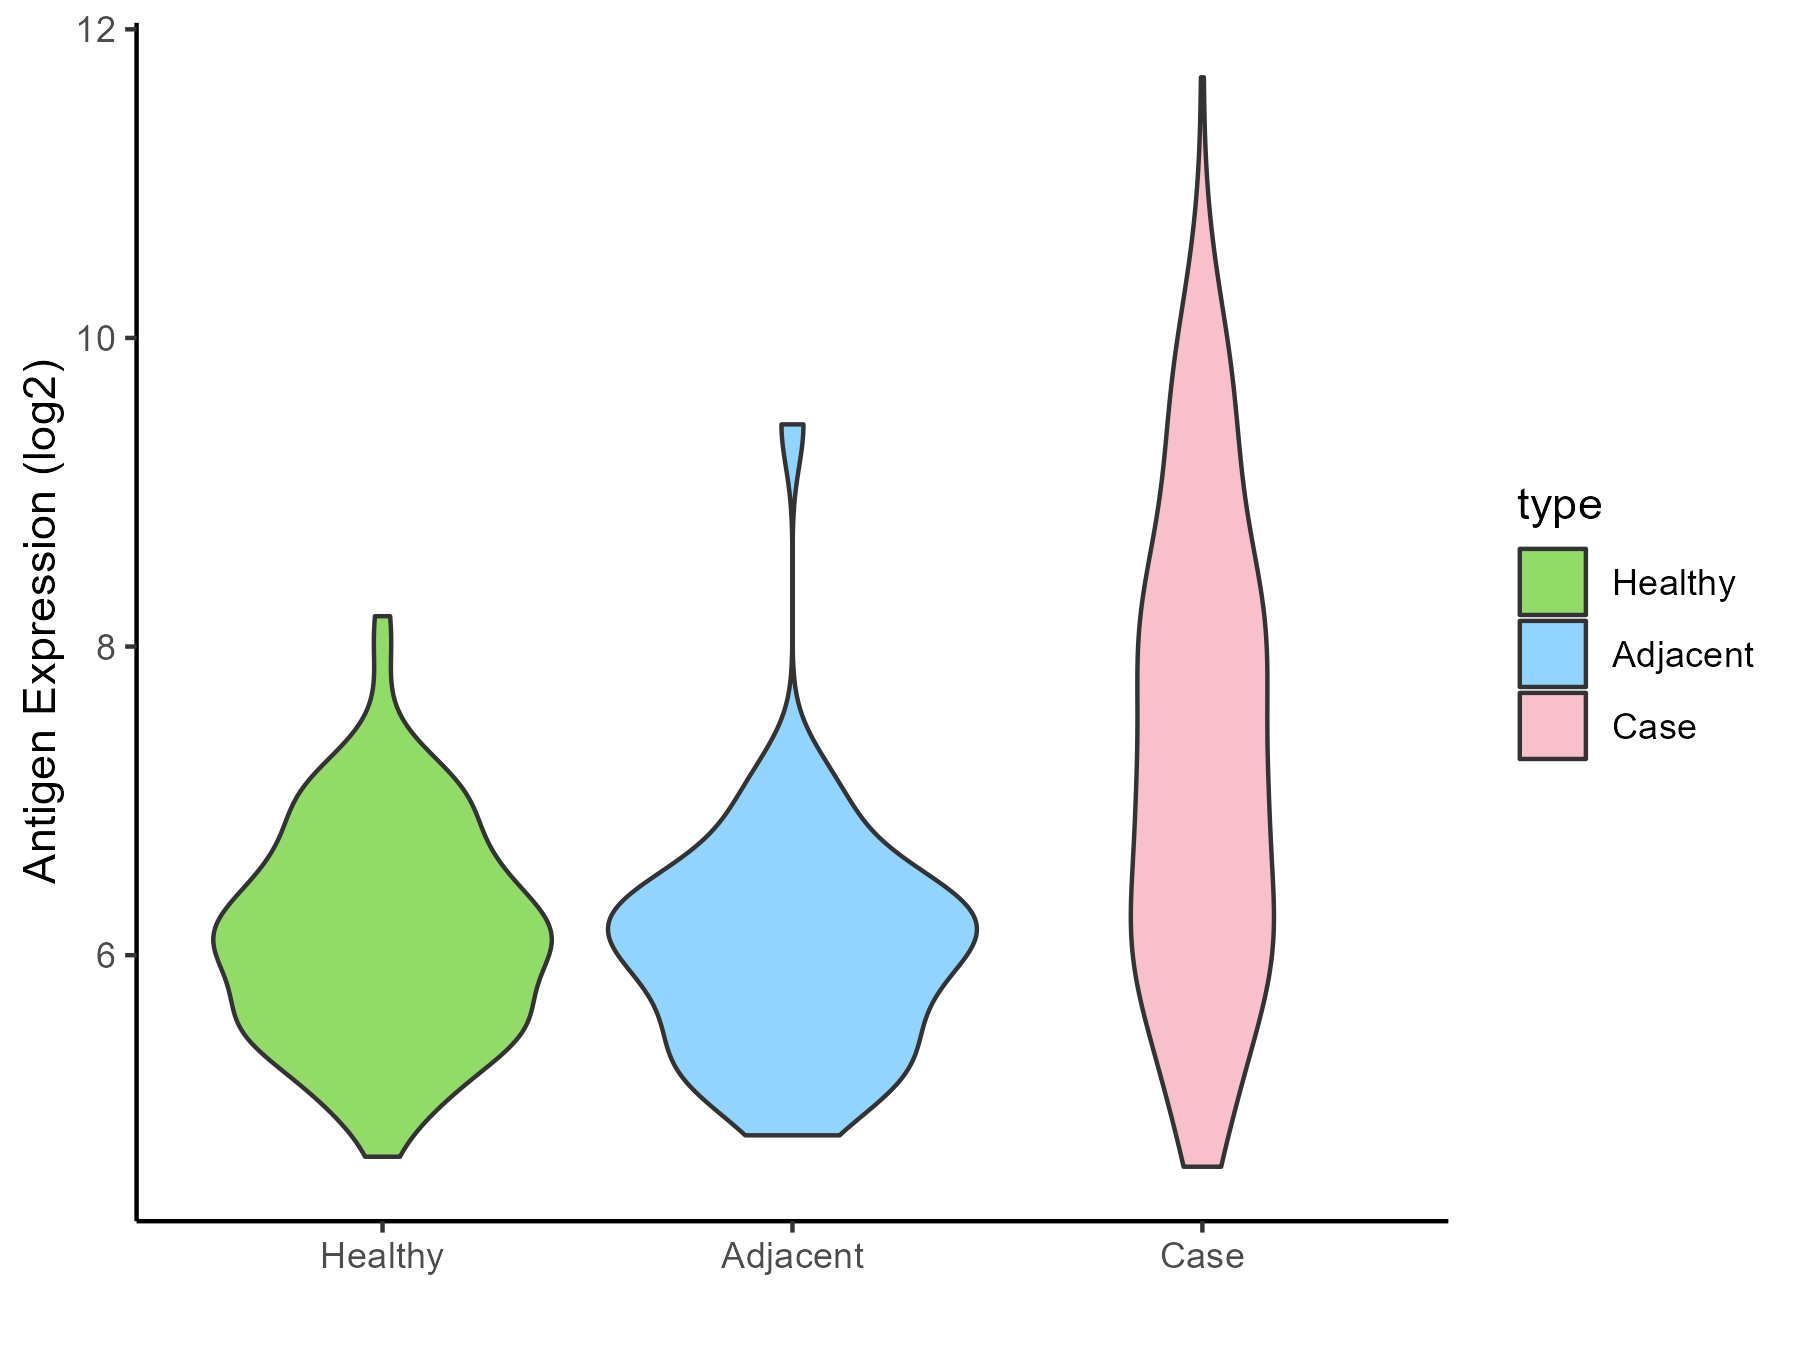
| The Studied Tissue | Thyroid | |
| The Specific Disease | Thyroid cancer | |
| The Expression Level of Disease Section Compare with the Healthy Individual Tissue | p-value: 1.14E-22; Fold-change: 1.066401612; Z-score: 1.571815538 | |
| The Expression Level of Disease Section Compare with the Adjacent Tissue | p-value: 2.19E-12; Fold-change: 1.064512853; Z-score: 1.332025956 | |
| Disease-specific Antigen Abundances |
|
Click to View the Clearer Original Diagram |
| Differential expression pattern of antigen in diseases | ||
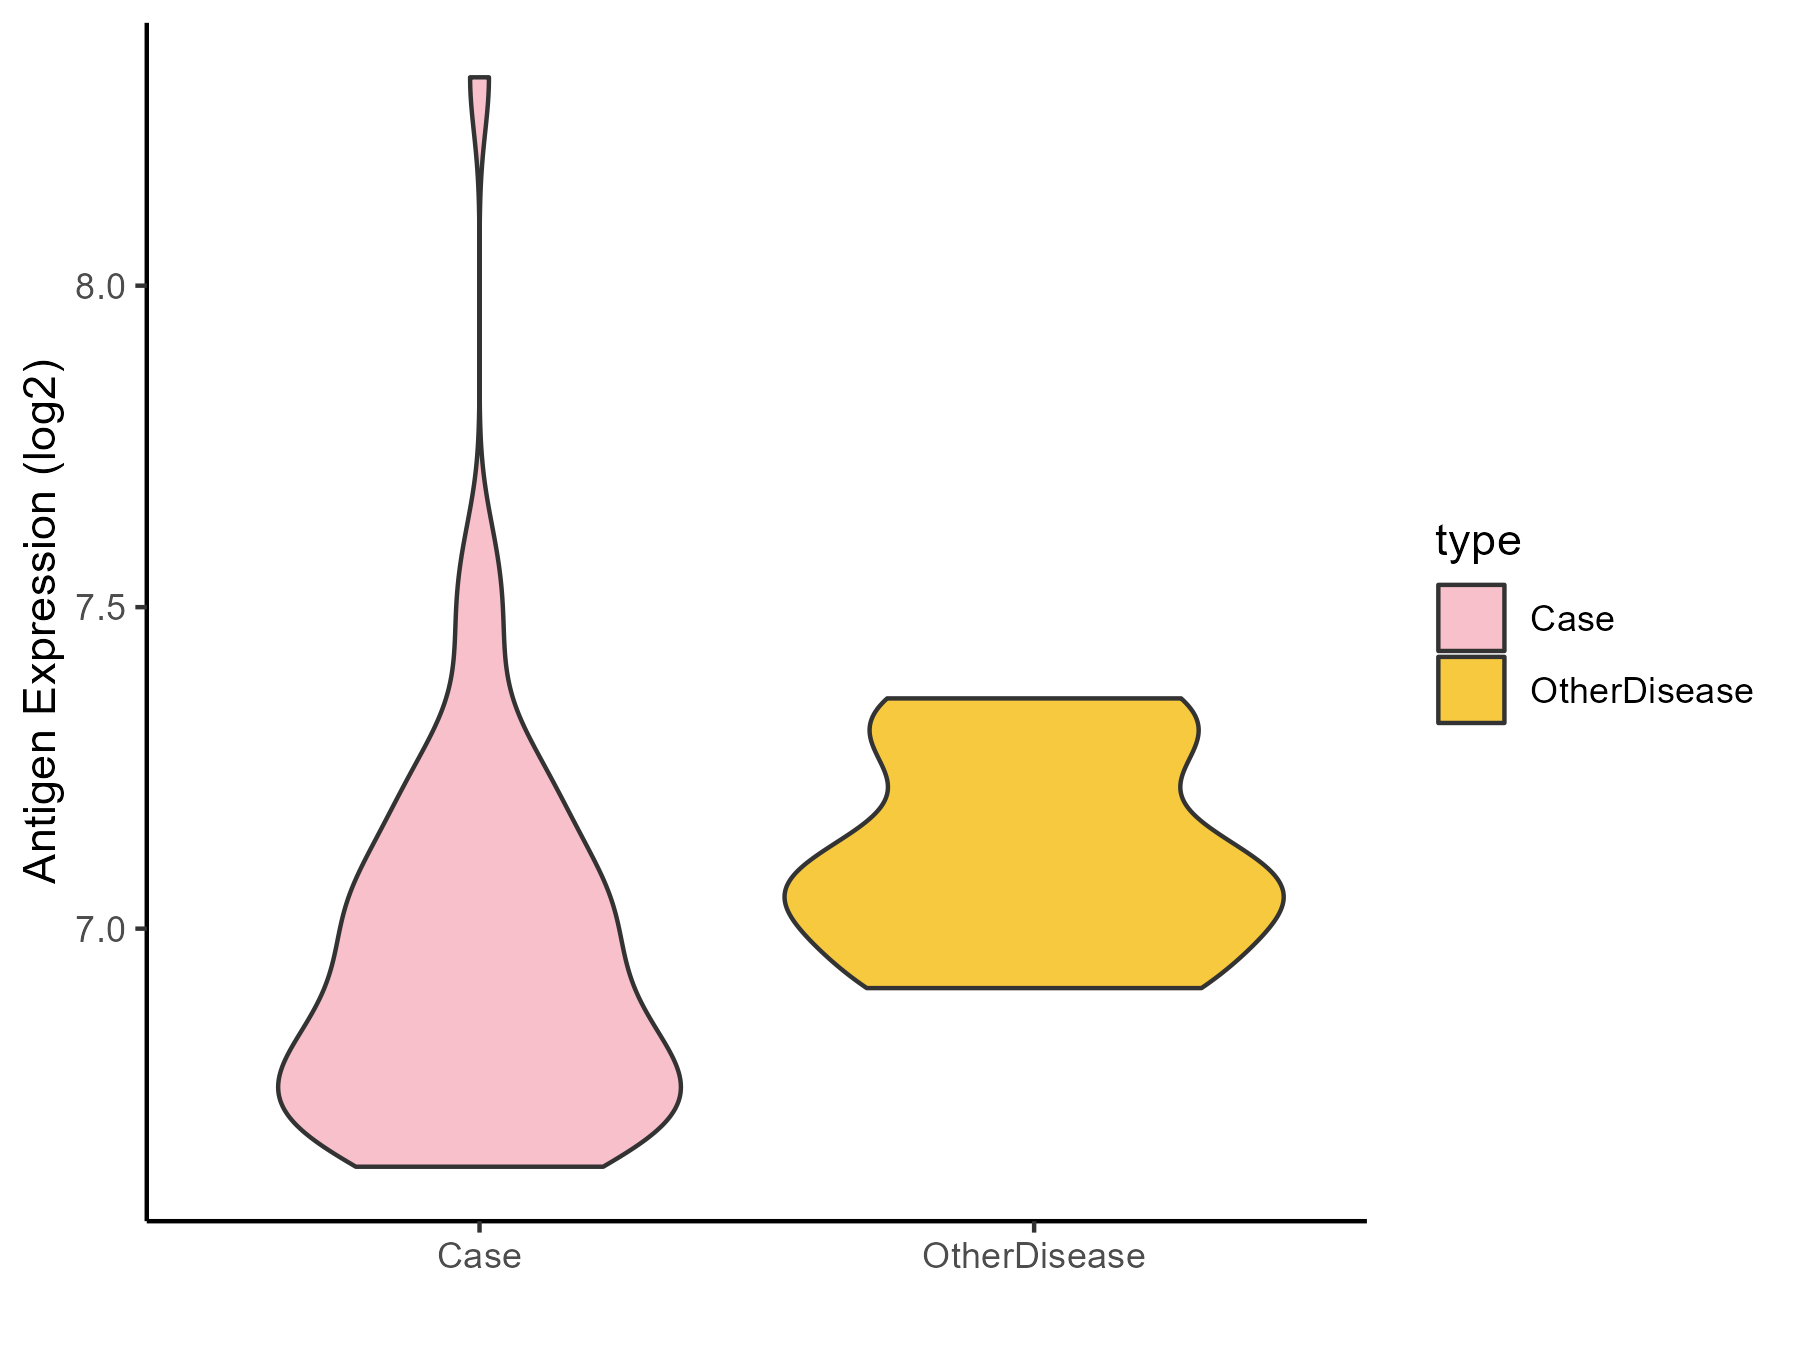
| The Studied Tissue | Adrenal cortex | |
| The Specific Disease | Adrenocortical carcinoma | |
| The Expression Level of Disease Section Compare with the Other Disease Section | p-value: 0.001774012; Fold-change: -0.195869142; Z-score: -1.208441766 | |
| Disease-specific Antigen Abundances |
|
Click to View the Clearer Original Diagram |
| Differential expression pattern of antigen in diseases | ||
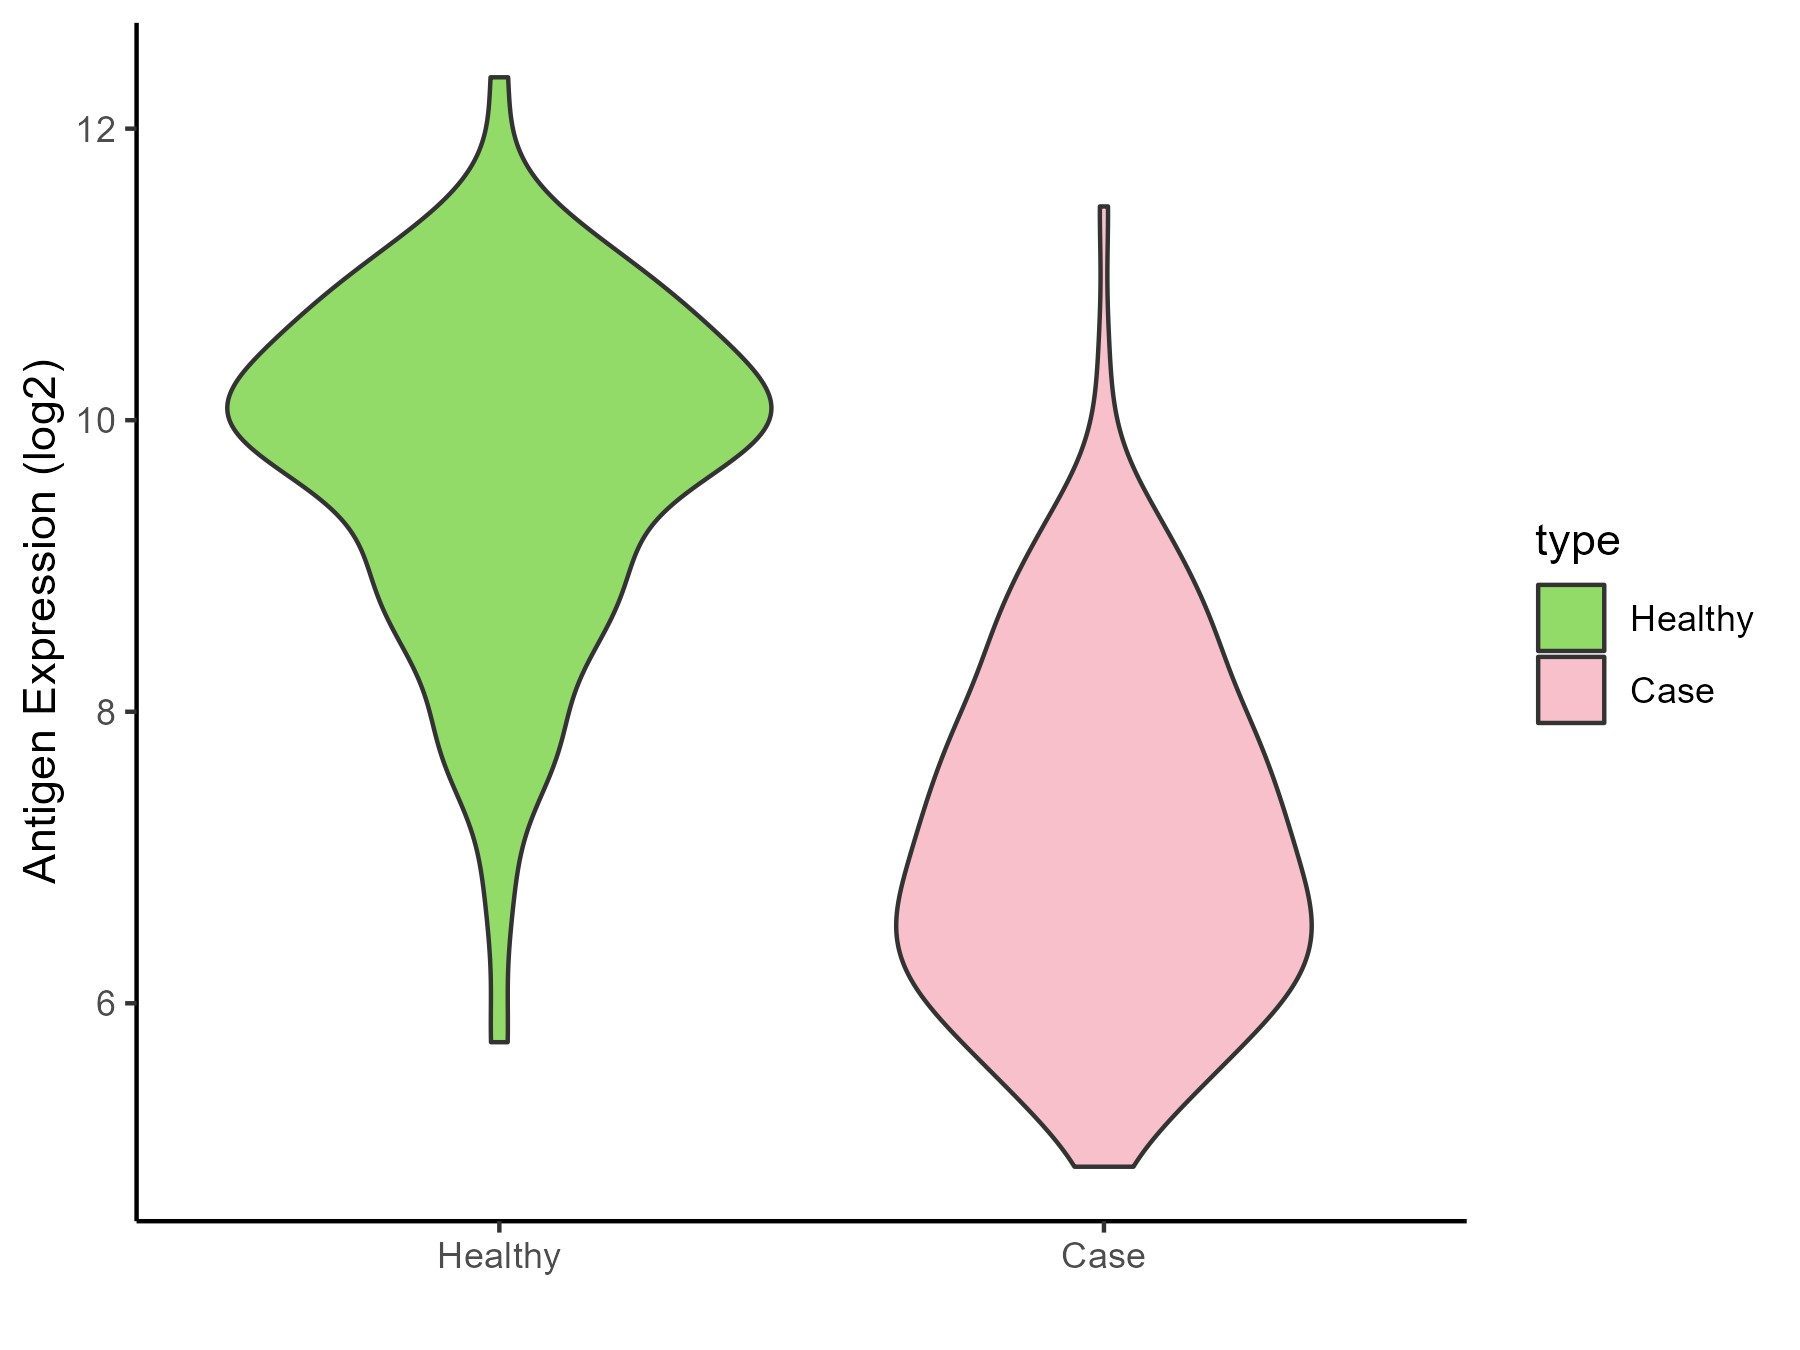
| The Studied Tissue | Head and neck | |
| The Specific Disease | Head and neck cancer | |
| The Expression Level of Disease Section Compare with the Healthy Individual Tissue | p-value: 3.77E-37; Fold-change: -2.866240037; Z-score: -2.479743608 | |
| Disease-specific Antigen Abundances |
|
Click to View the Clearer Original Diagram |
| Differential expression pattern of antigen in diseases | ||
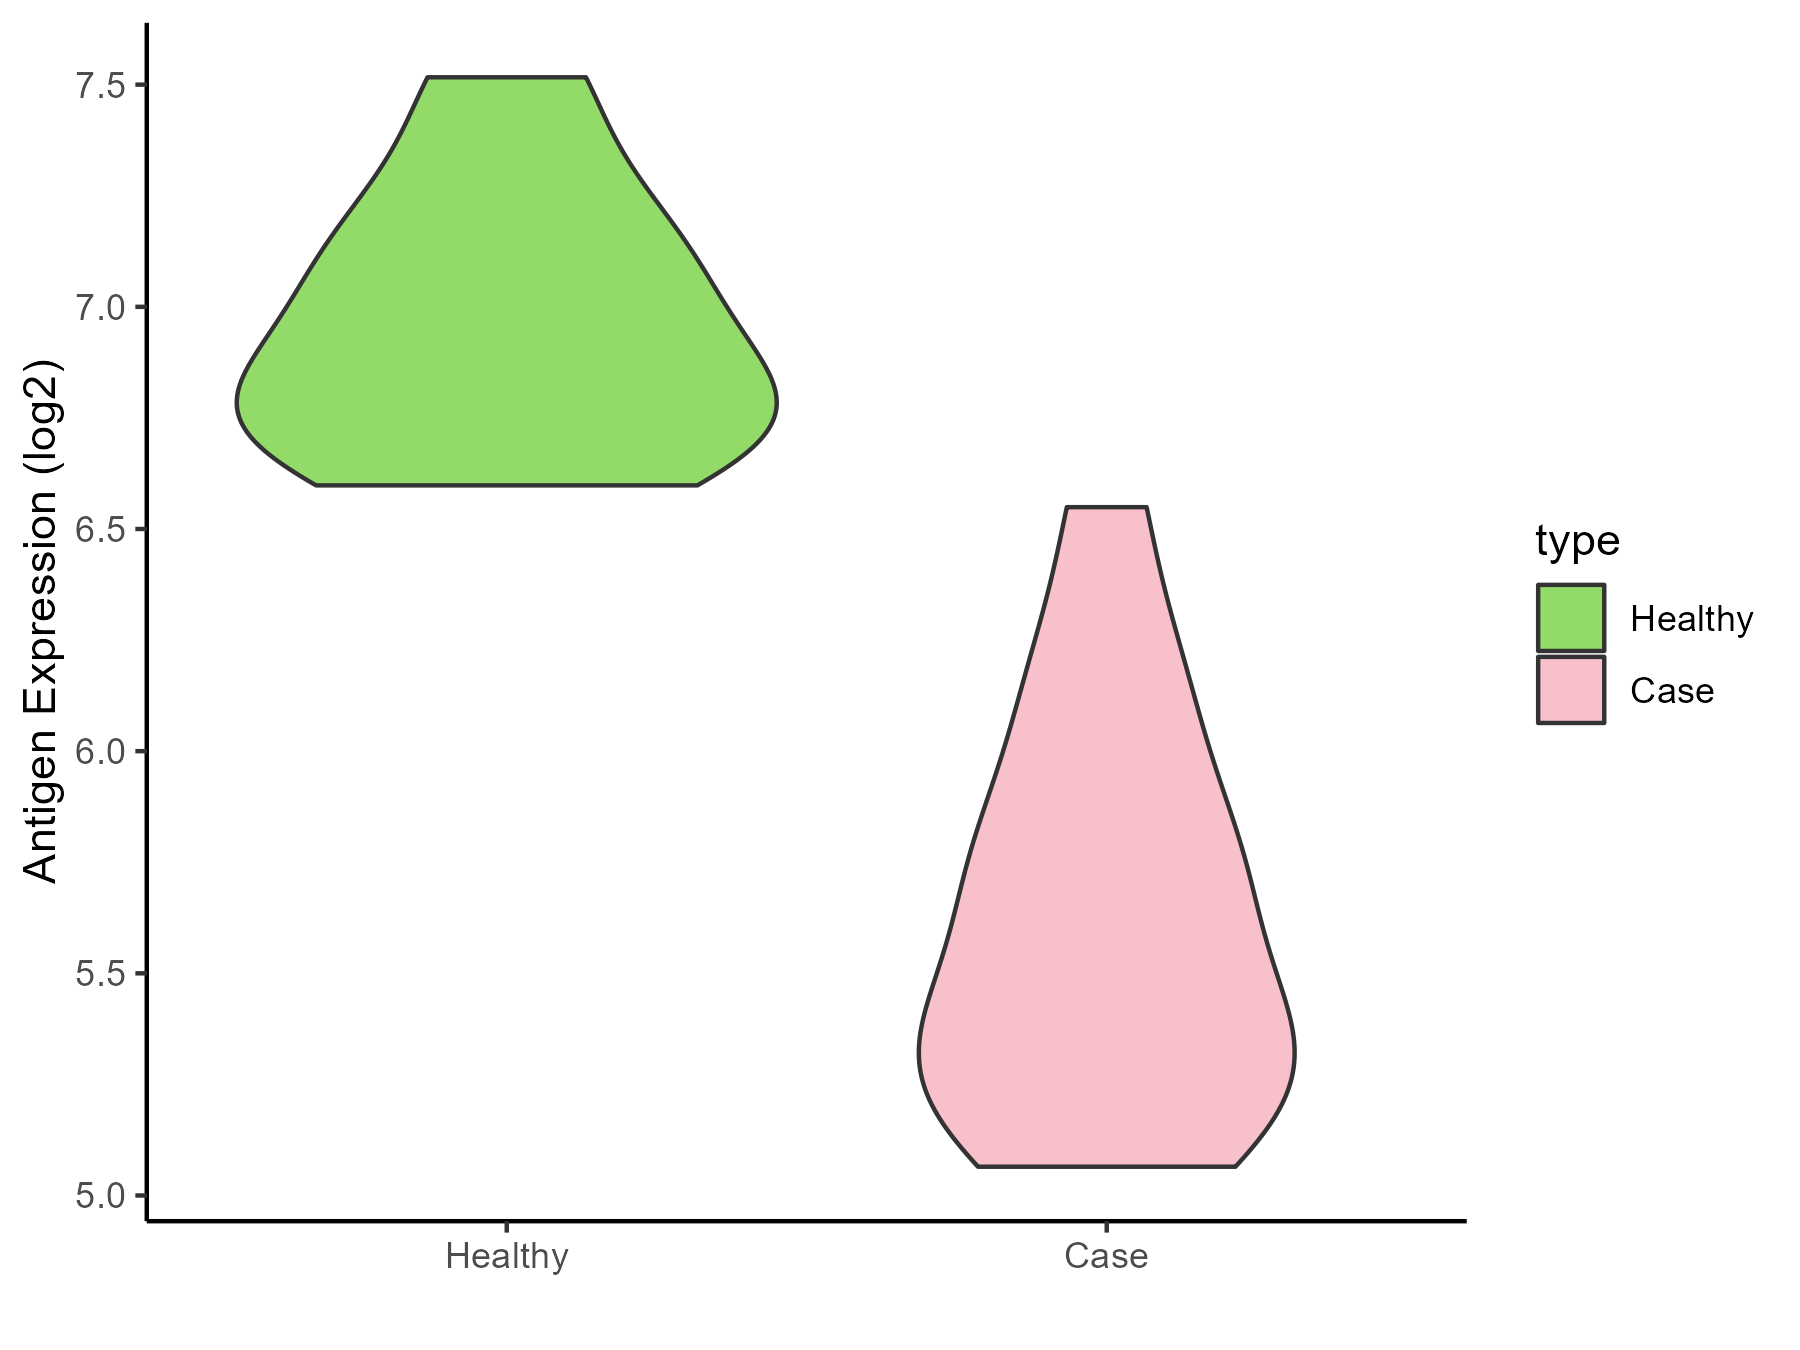
| The Studied Tissue | Pituitary | |
| The Specific Disease | Pituitary gonadotrope tumor | |
| The Expression Level of Disease Section Compare with the Healthy Individual Tissue | p-value: 2.31E-08; Fold-change: -1.3487389; Z-score: -4.519012833 | |
| Disease-specific Antigen Abundances |
|
Click to View the Clearer Original Diagram |
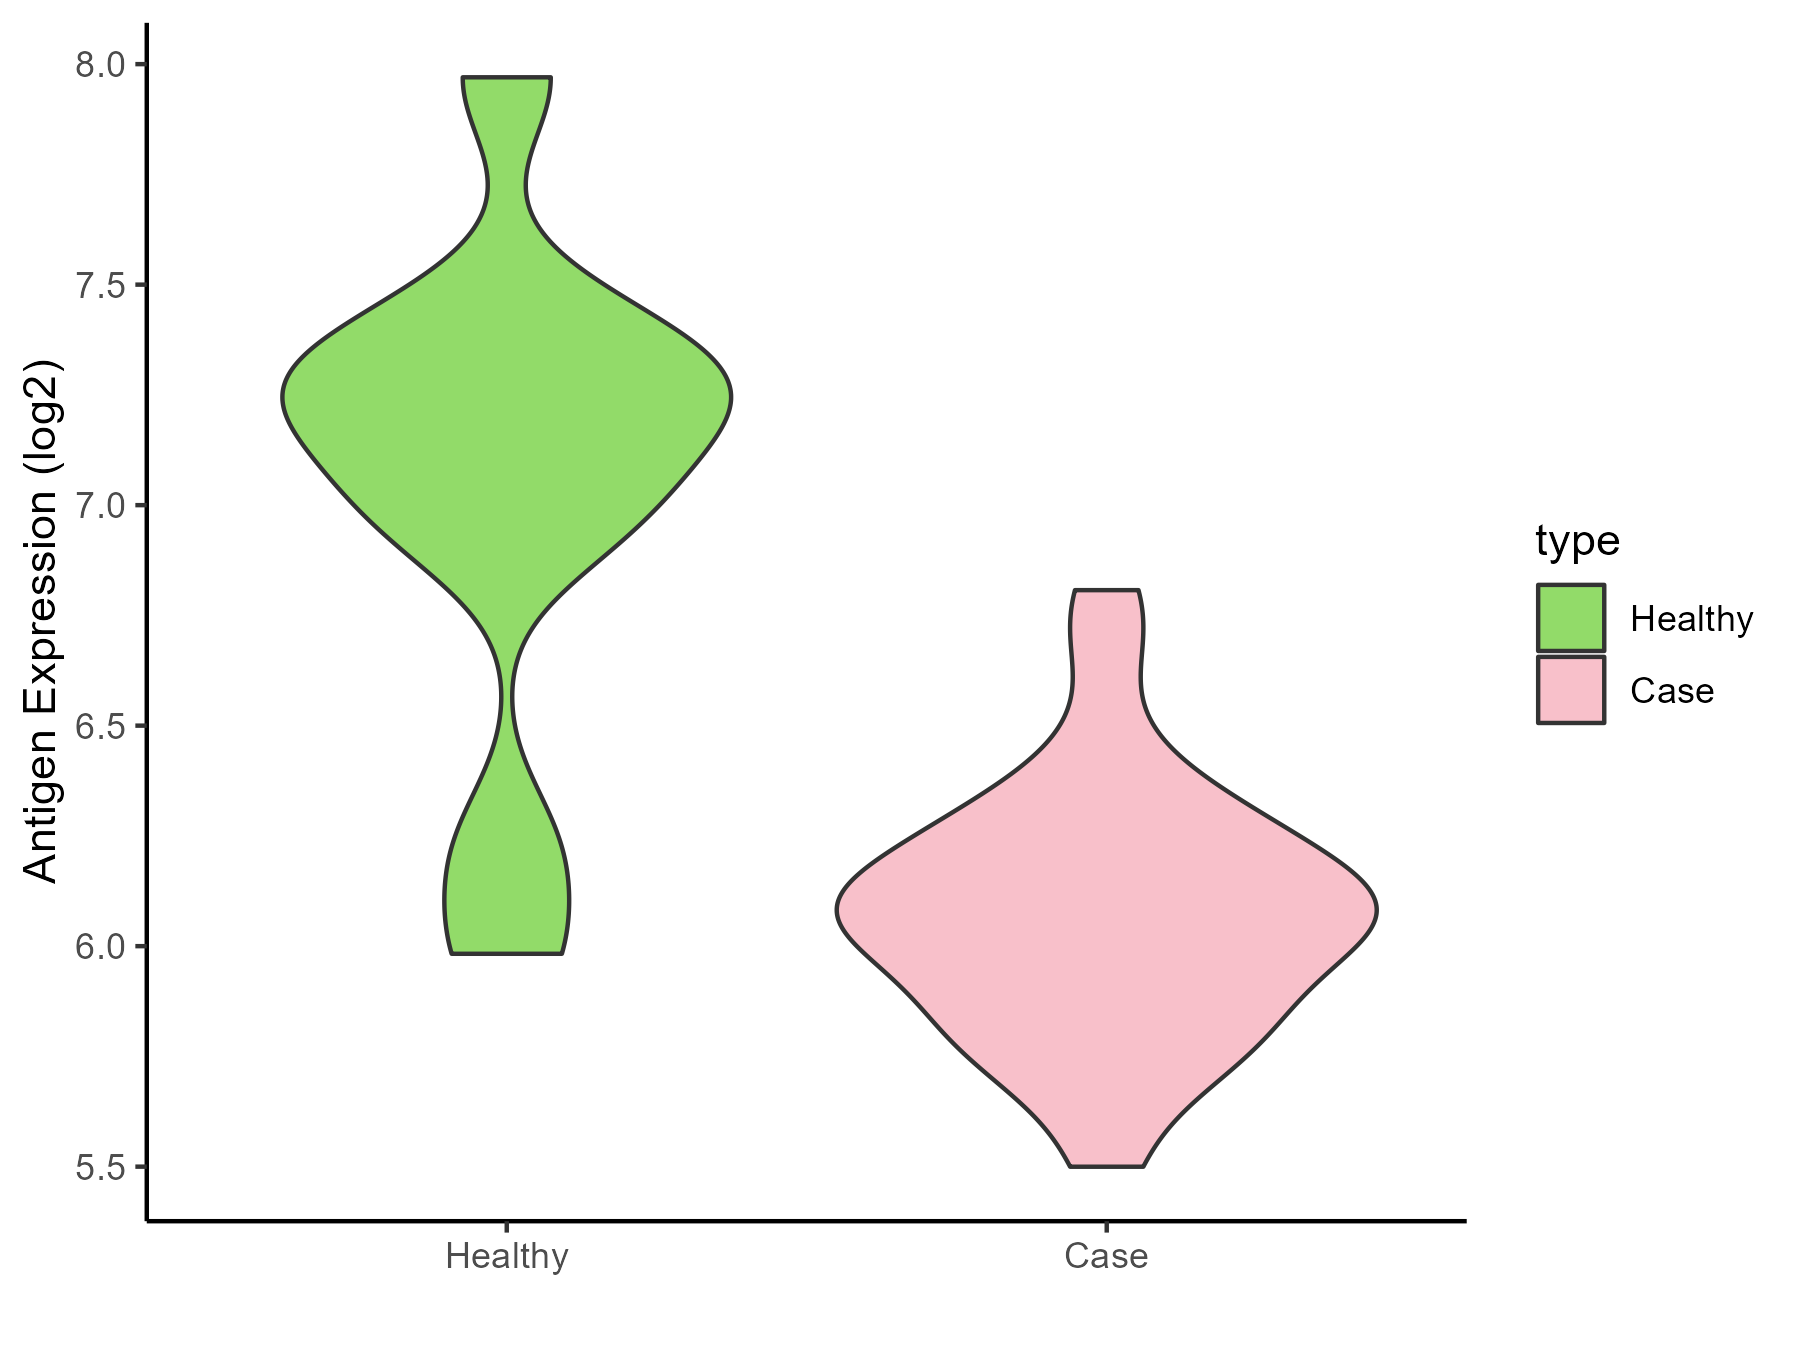
| The Studied Tissue | Pituitary | |
| The Specific Disease | Pituitary cancer | |
| The Expression Level of Disease Section Compare with the Healthy Individual Tissue | p-value: 9.75E-05; Fold-change: -1.151326249; Z-score: -2.088225947 | |
| Disease-specific Antigen Abundances |
|
Click to View the Clearer Original Diagram |
ICD Disease Classification 03
| Differential expression pattern of antigen in diseases | ||
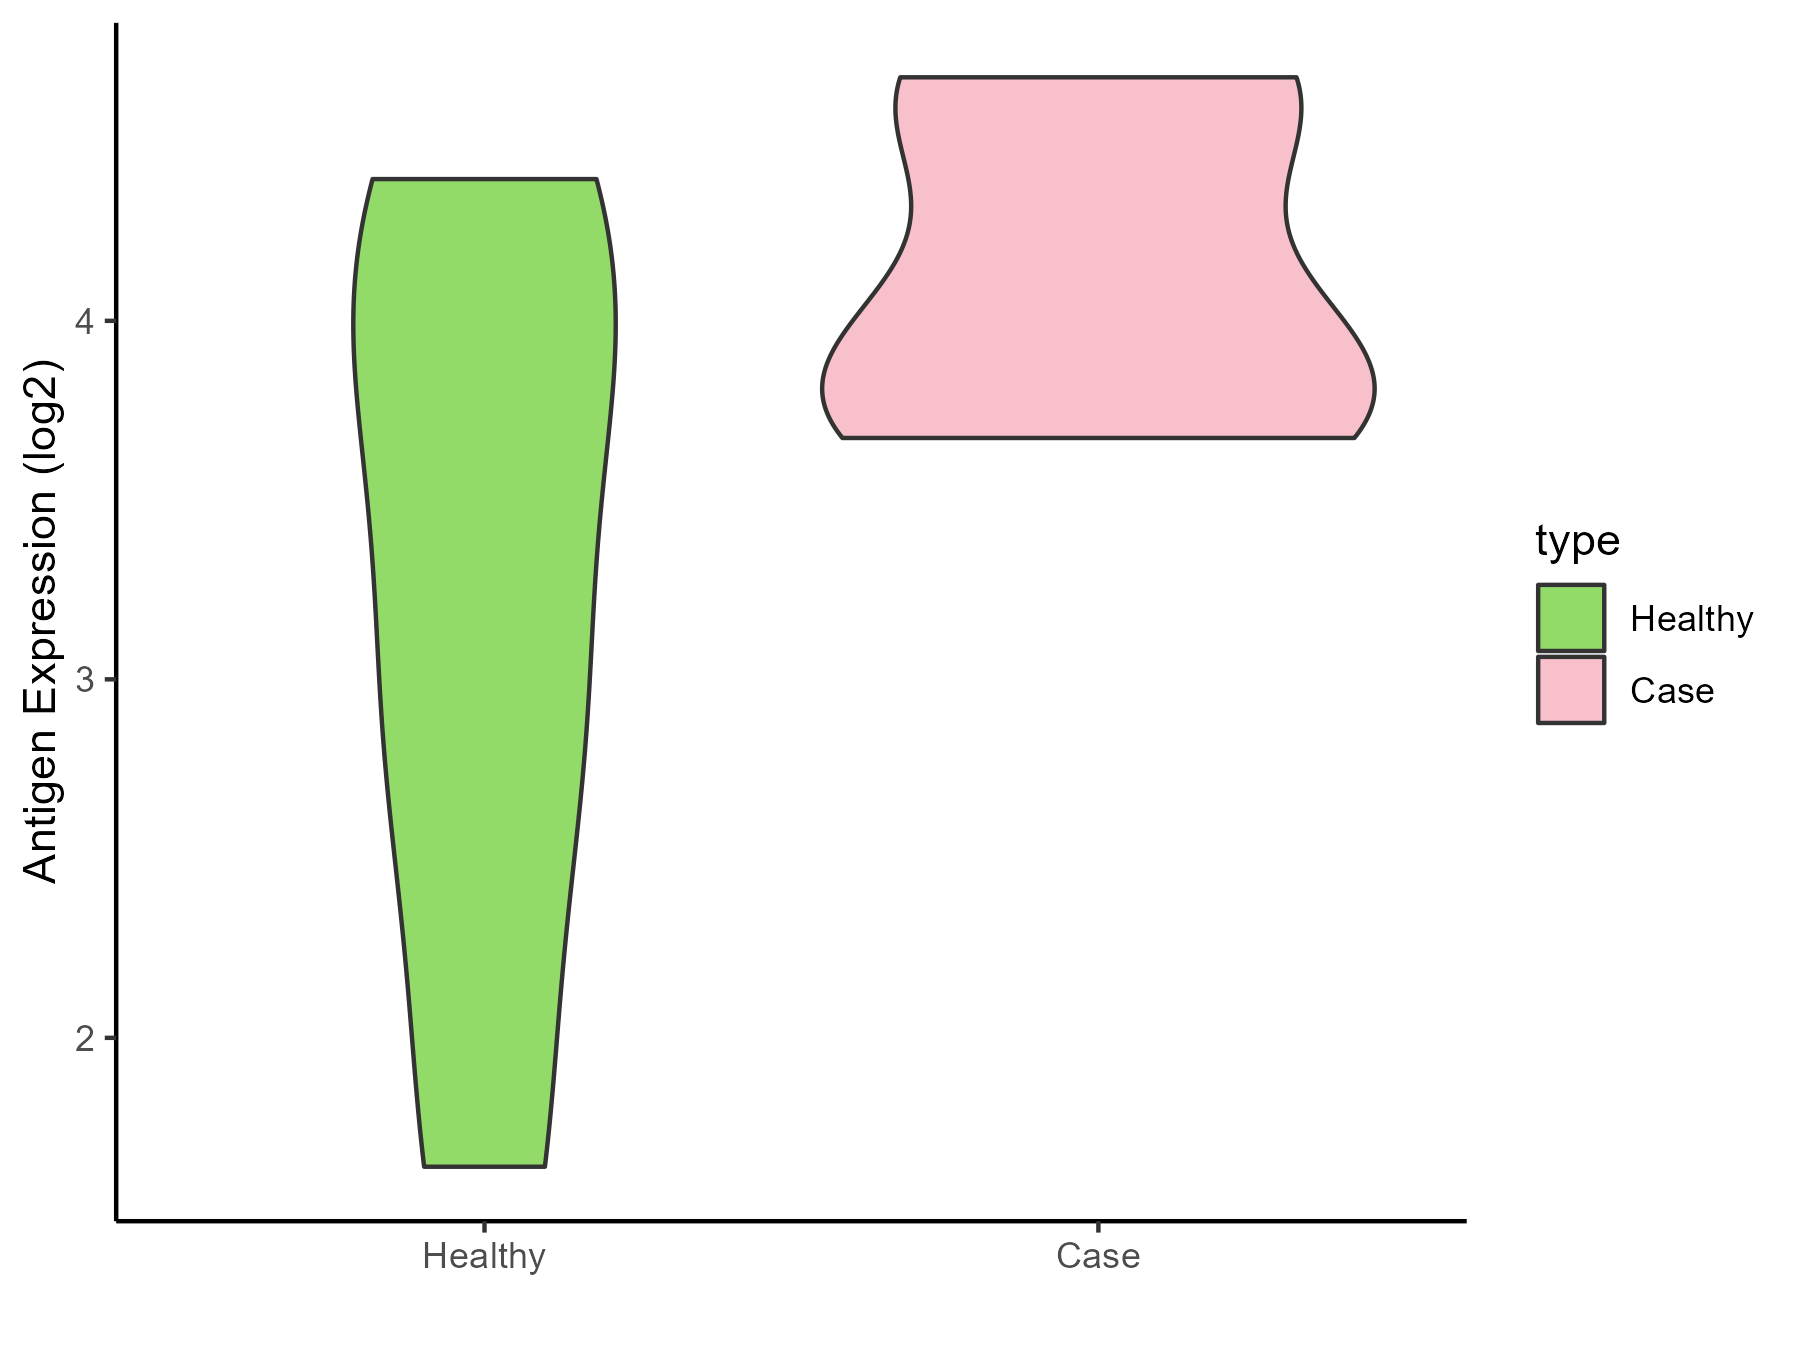
| The Studied Tissue | Whole blood | |
| The Specific Disease | Thrombocytopenia | |
| The Expression Level of Disease Section Compare with the Healthy Individual Tissue | p-value: 0.037014248; Fold-change: 0.628998415; Z-score: 0.626926185 | |
| Disease-specific Antigen Abundances |
|
Click to View the Clearer Original Diagram |
ICD Disease Classification 04
| Differential expression pattern of antigen in diseases | ||
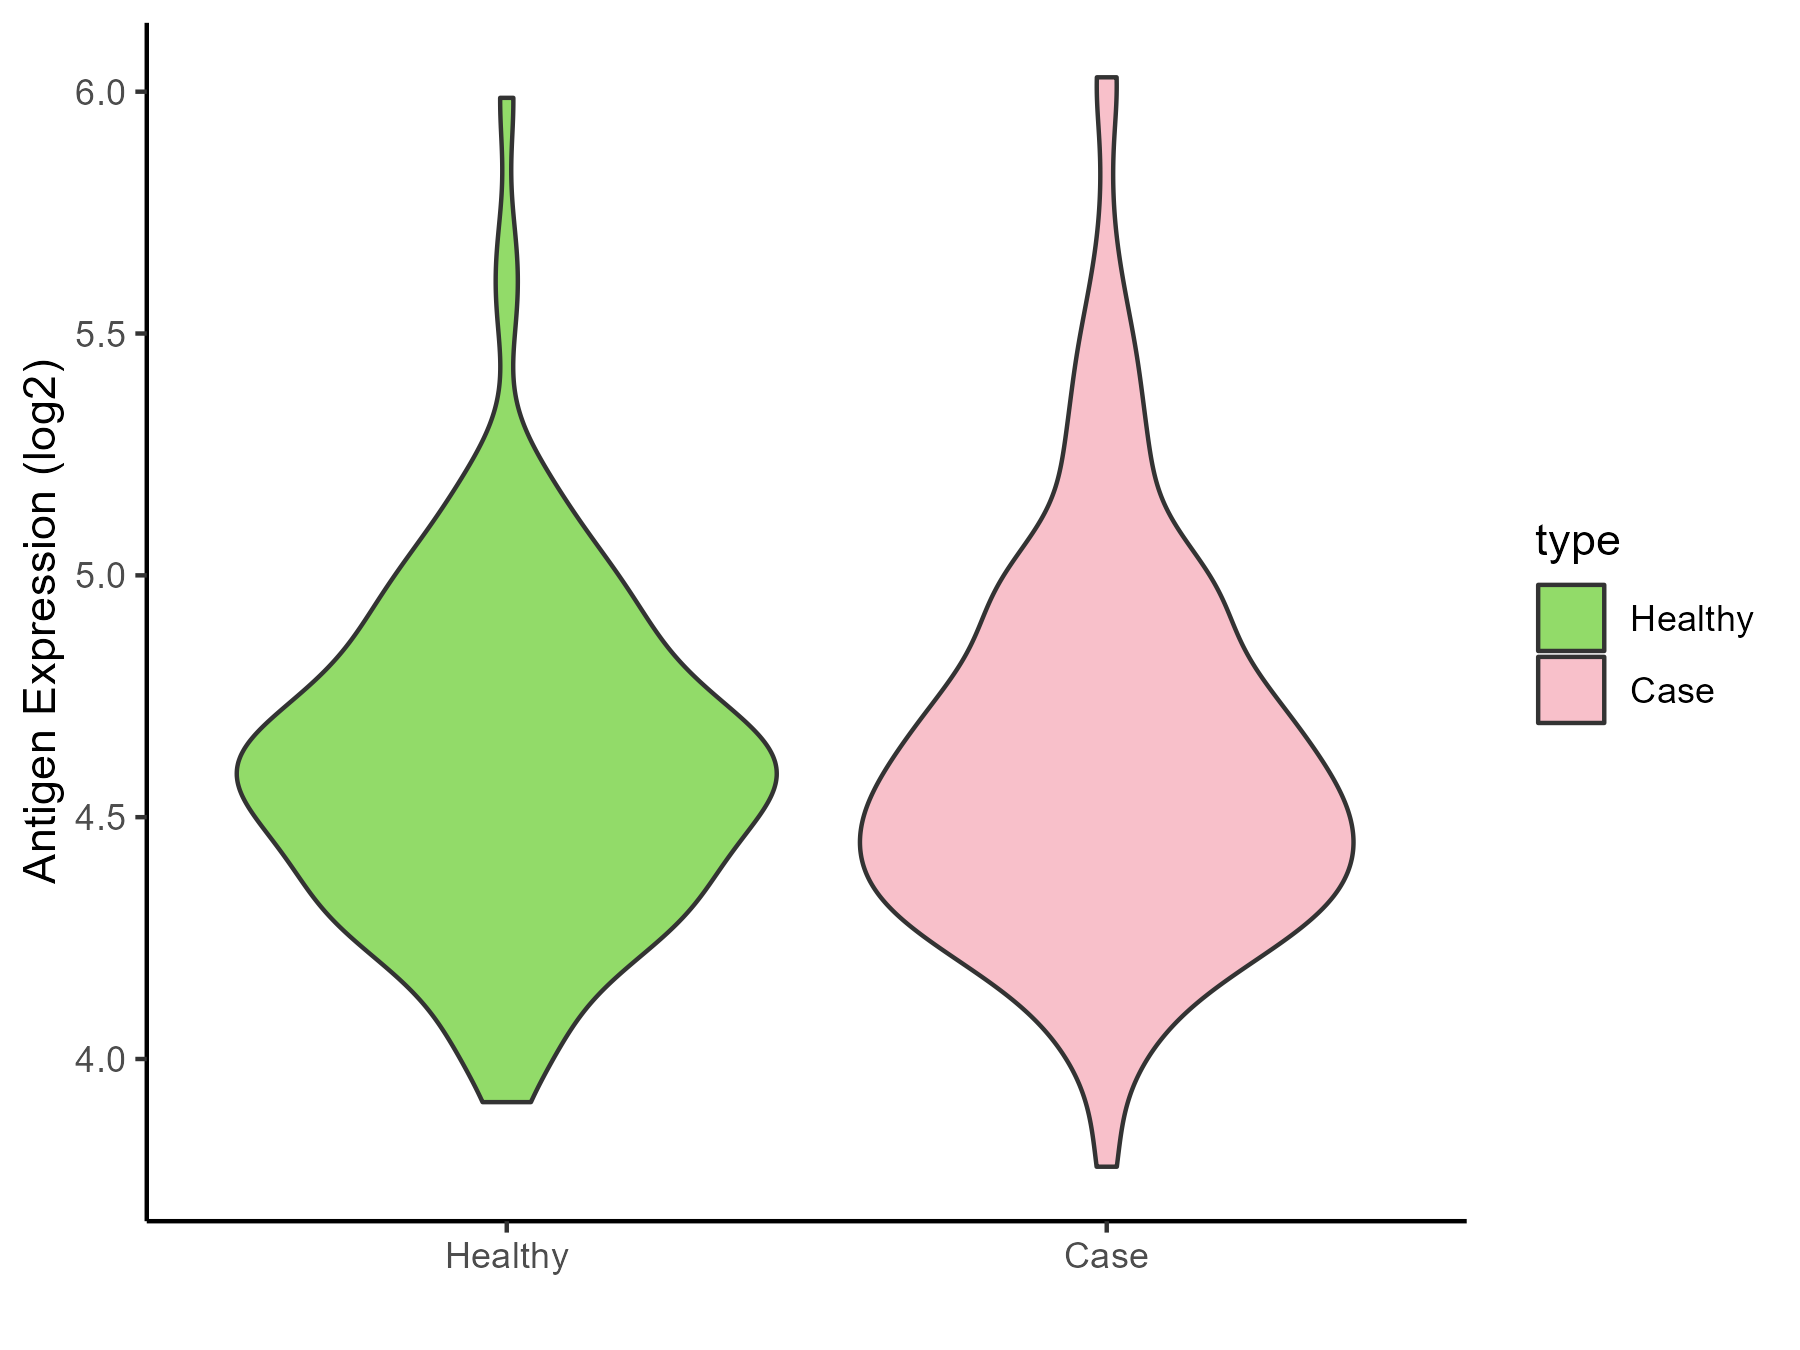
| The Studied Tissue | Whole blood | |
| The Specific Disease | Lupus erythematosus | |
| The Expression Level of Disease Section Compare with the Healthy Individual Tissue | p-value: 0.731148117; Fold-change: -0.041445109; Z-score: -0.12277472 | |
| Disease-specific Antigen Abundances |
|
Click to View the Clearer Original Diagram |
| Differential expression pattern of antigen in diseases | ||
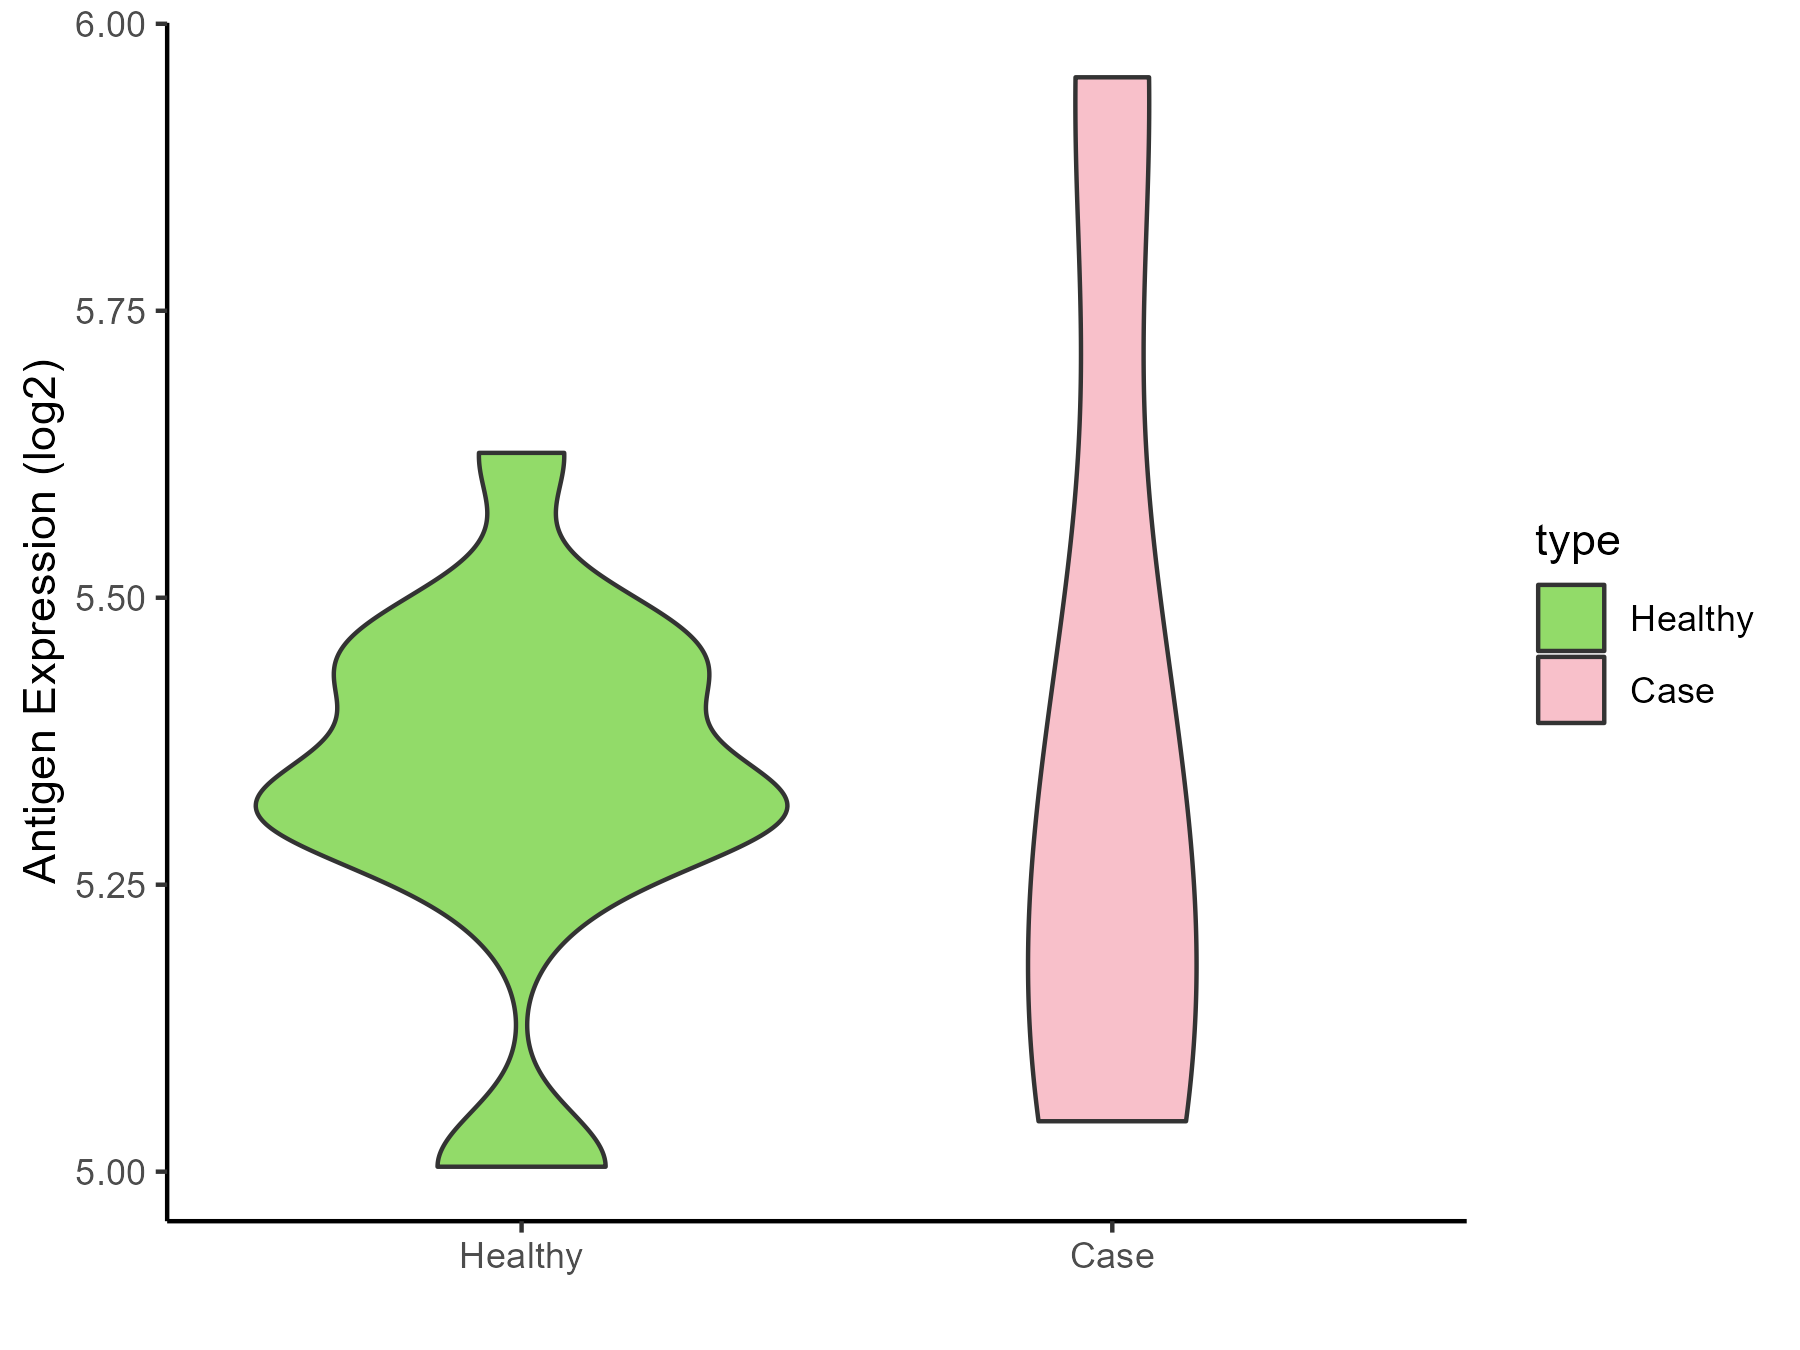
| The Studied Tissue | Peripheral monocyte | |
| The Specific Disease | Autoimmune uveitis | |
| The Expression Level of Disease Section Compare with the Healthy Individual Tissue | p-value: 0.79768917; Fold-change: -0.028752904; Z-score: -0.174135509 | |
| Disease-specific Antigen Abundances |
|
Click to View the Clearer Original Diagram |
ICD Disease Classification 05
| Differential expression pattern of antigen in diseases | ||
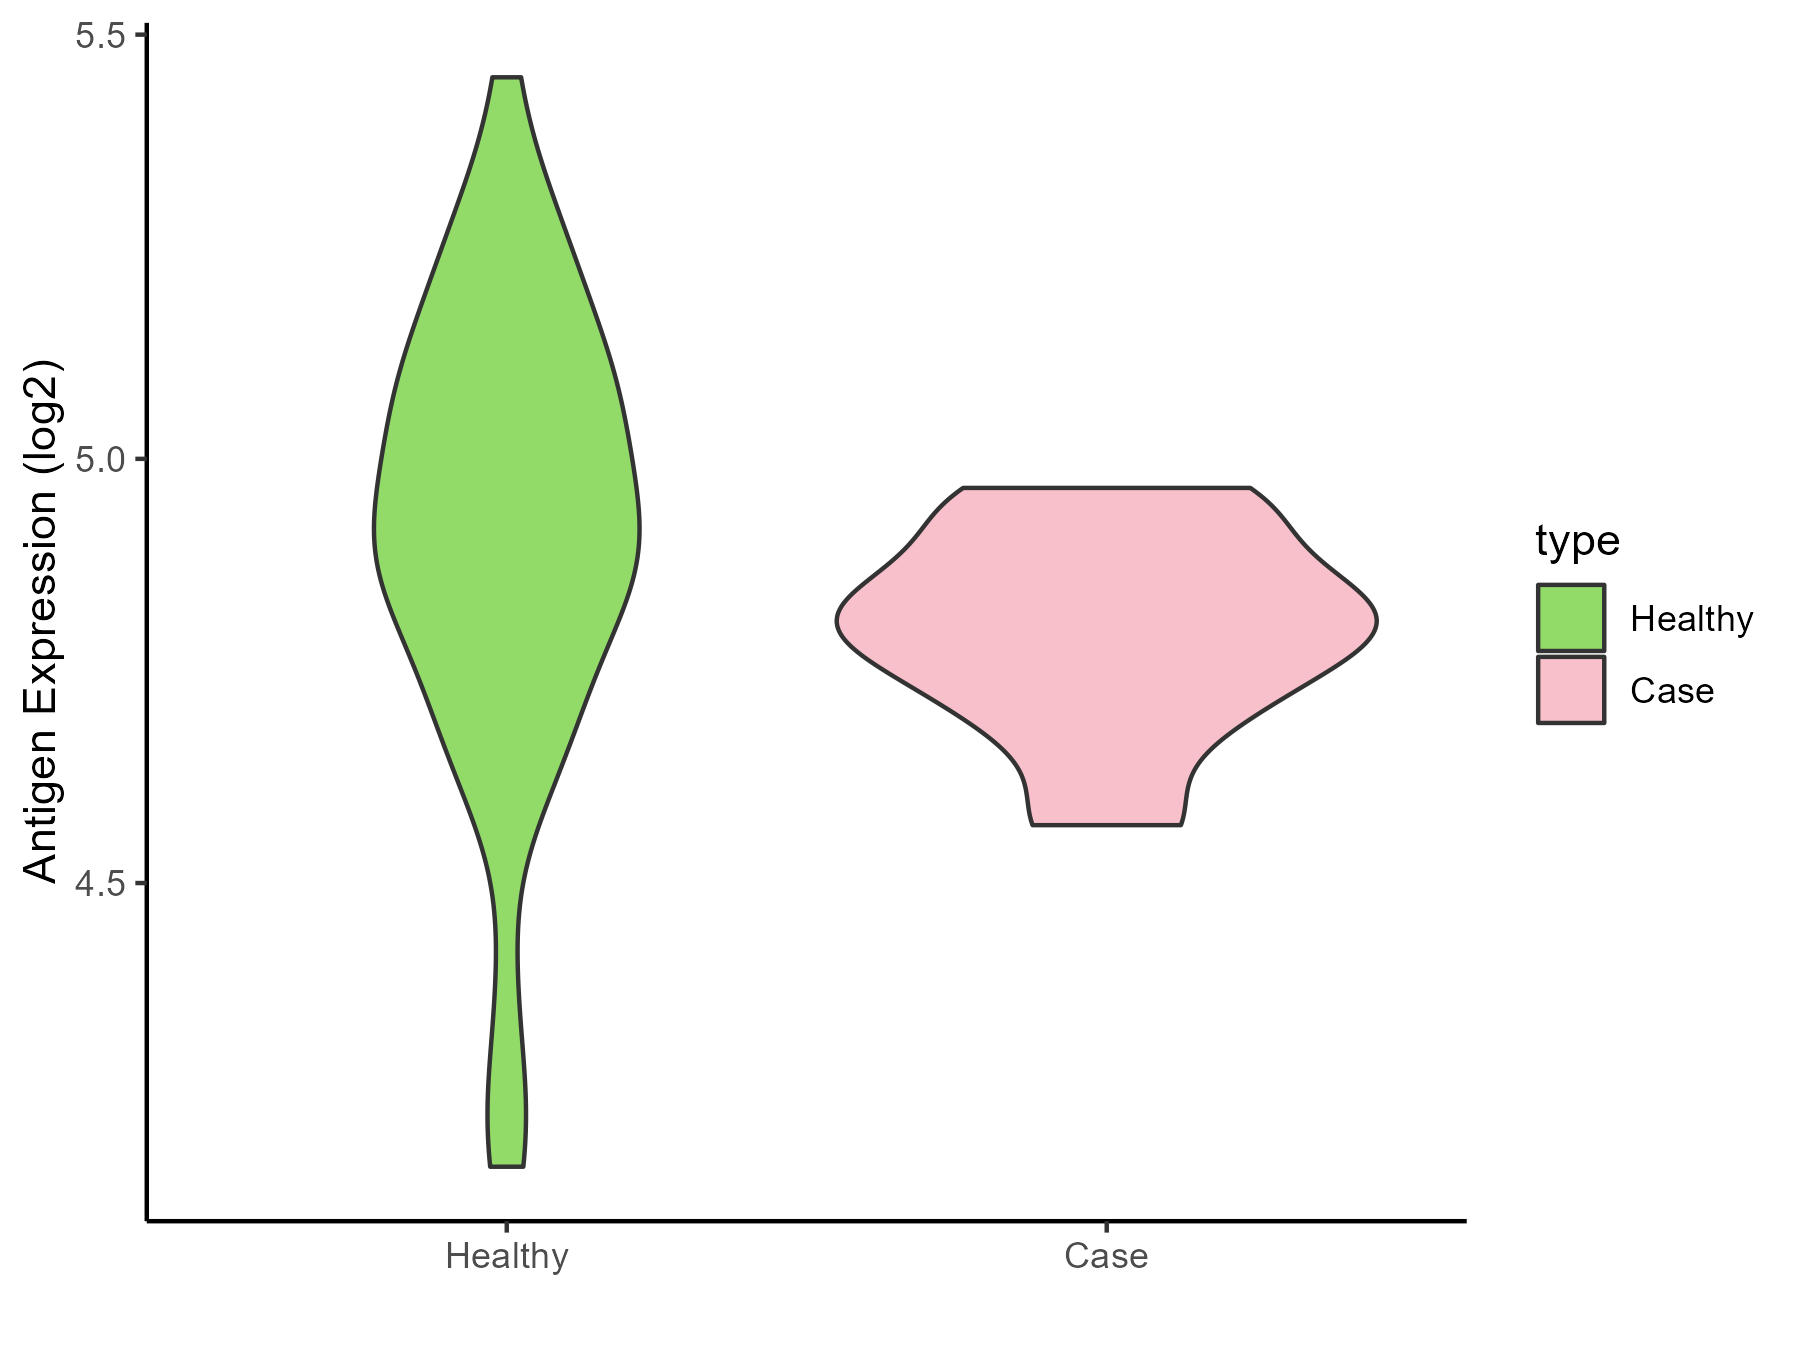
| The Studied Tissue | Whole blood | |
| The Specific Disease | Familial hypercholesterolemia | |
| The Expression Level of Disease Section Compare with the Healthy Individual Tissue | p-value: 0.045262876; Fold-change: -0.101115747; Z-score: -0.374418726 | |
| Disease-specific Antigen Abundances |
|
Click to View the Clearer Original Diagram |
ICD Disease Classification 06
| Differential expression pattern of antigen in diseases | ||
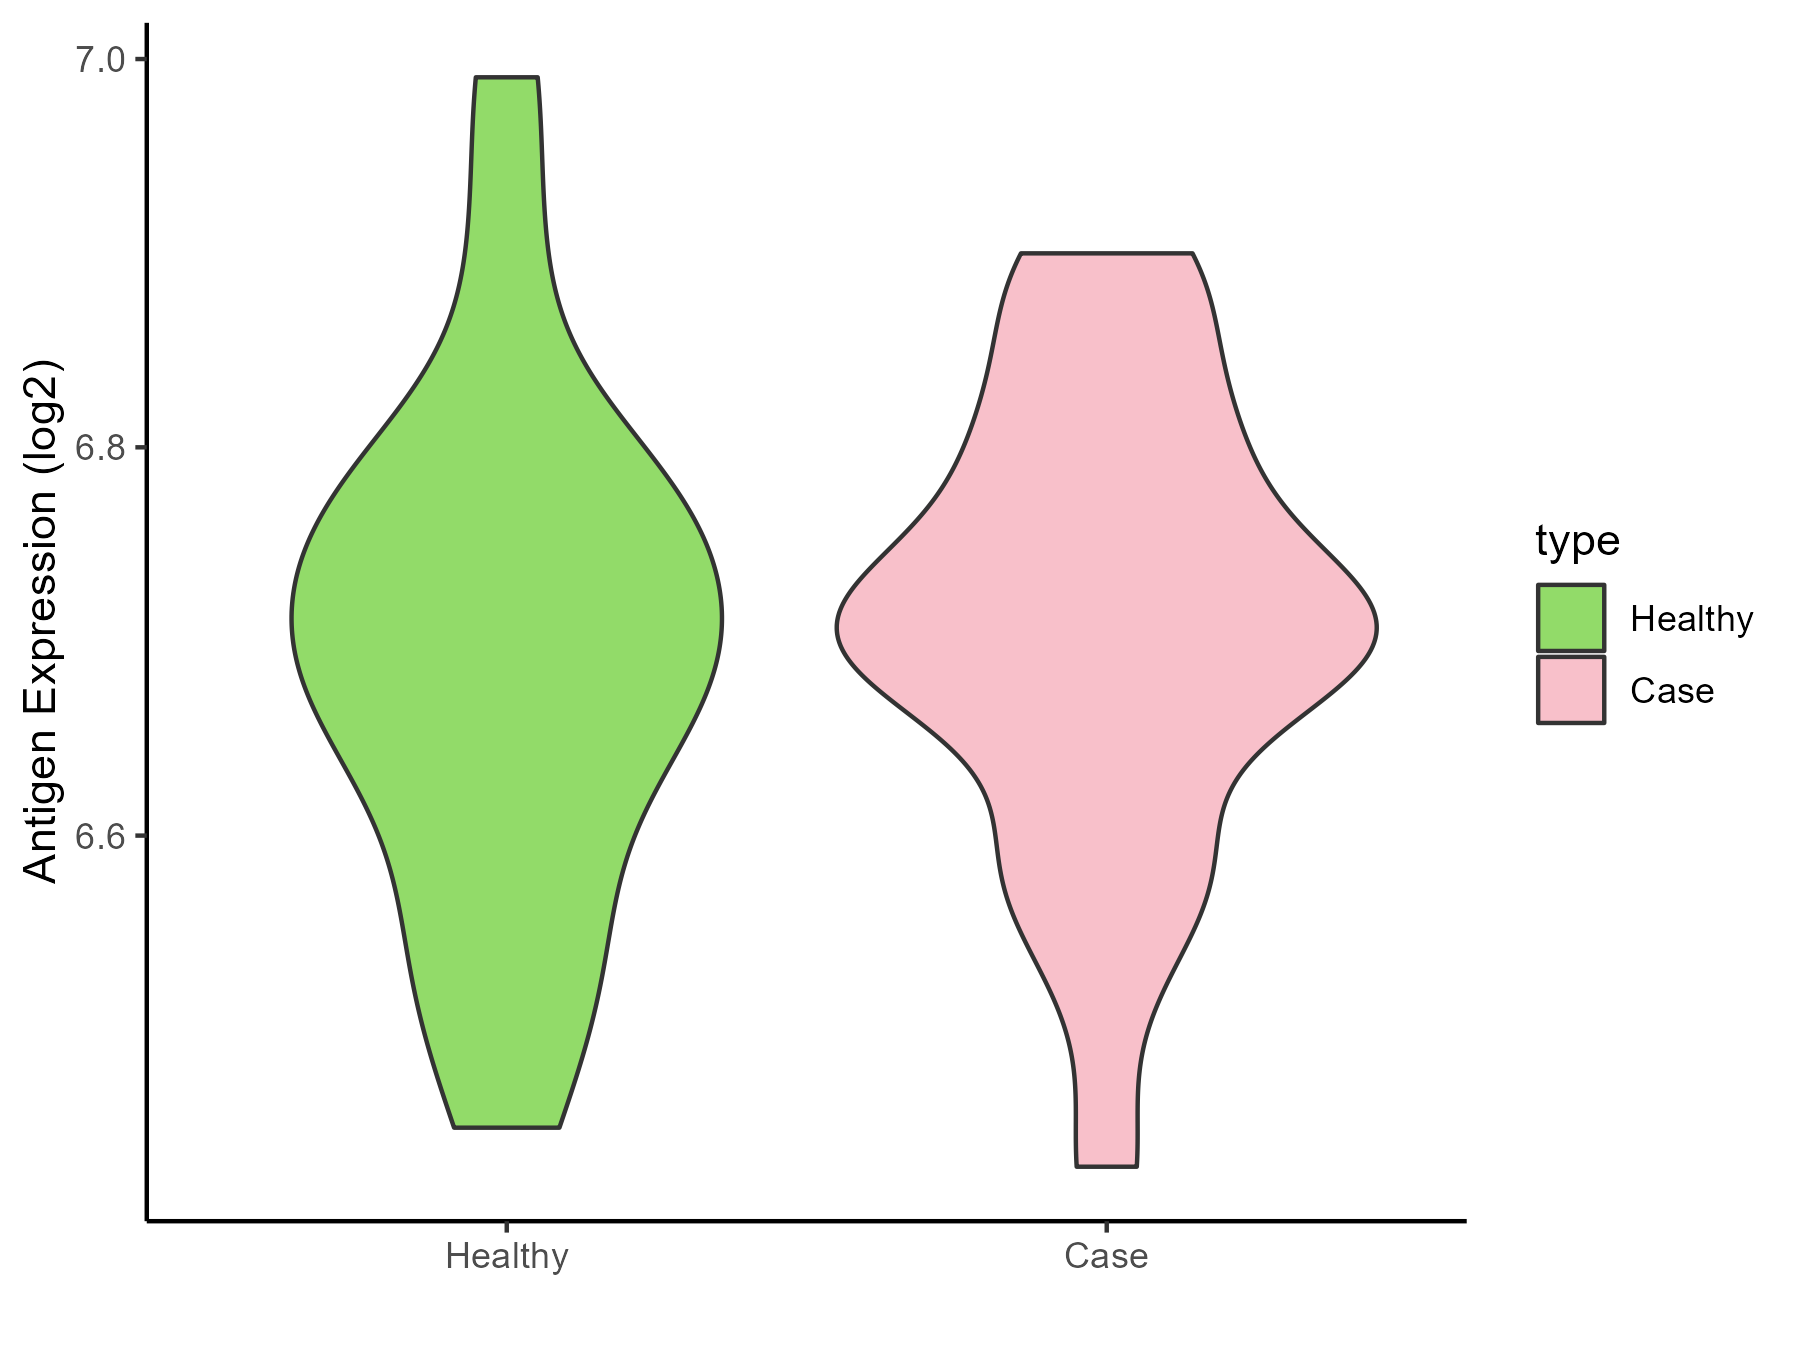
| The Studied Tissue | Superior temporal cortex | |
| The Specific Disease | Schizophrenia | |
| The Expression Level of Disease Section Compare with the Healthy Individual Tissue | p-value: 0.710553085; Fold-change: 0.009067513; Z-score: 0.068579016 | |
| Disease-specific Antigen Abundances |
|
Click to View the Clearer Original Diagram |
ICD Disease Classification 08
| Differential expression pattern of antigen in diseases | ||
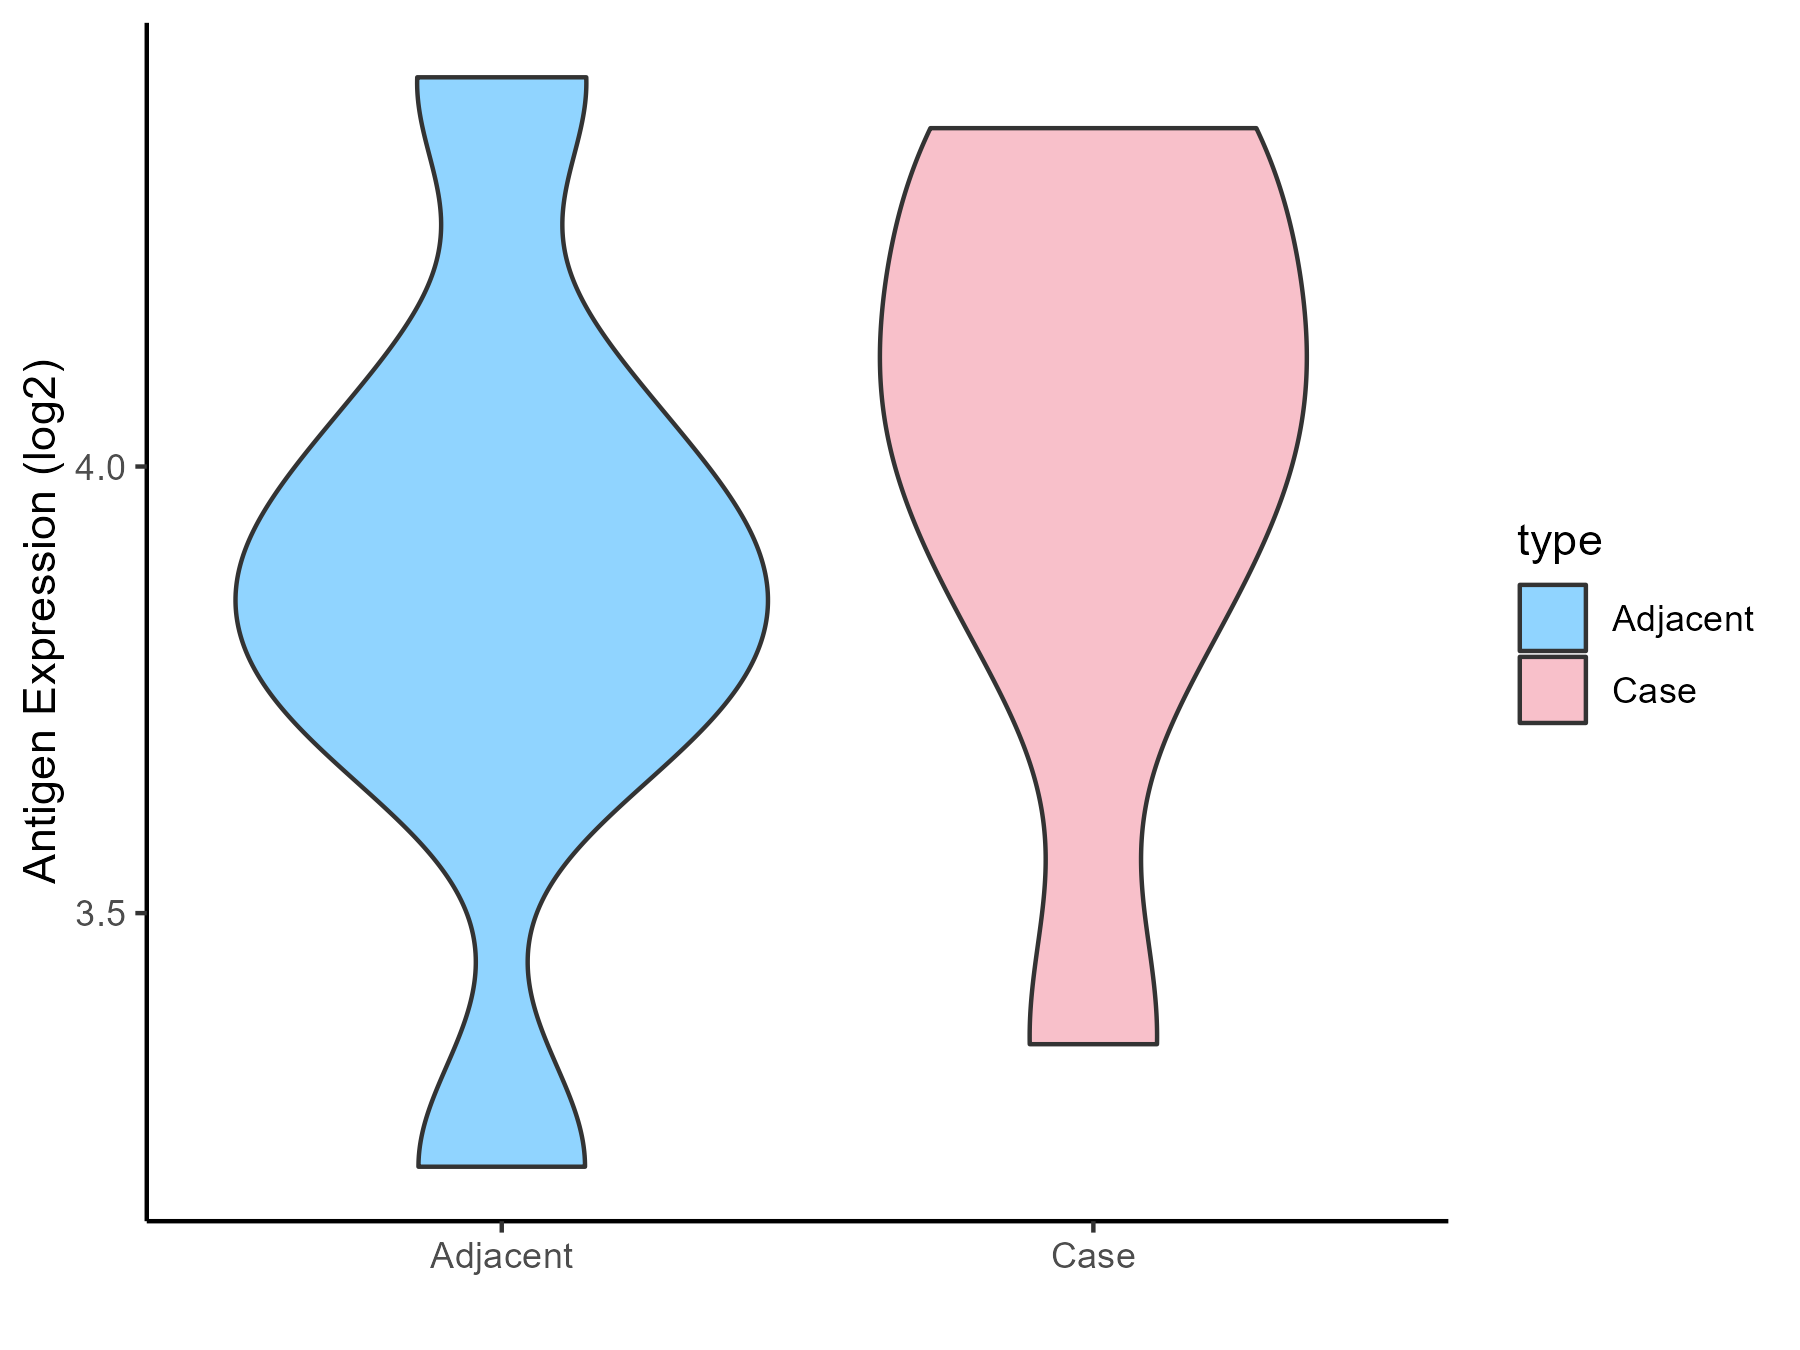
| The Studied Tissue | Spinal cord | |
| The Specific Disease | Multiple sclerosis | |
| The Expression Level of Disease Section Compare with the Adjacent Tissue | p-value: 0.431016139; Fold-change: 0.212000629; Z-score: 0.568269179 | |
| Disease-specific Antigen Abundances |
|
Click to View the Clearer Original Diagram |
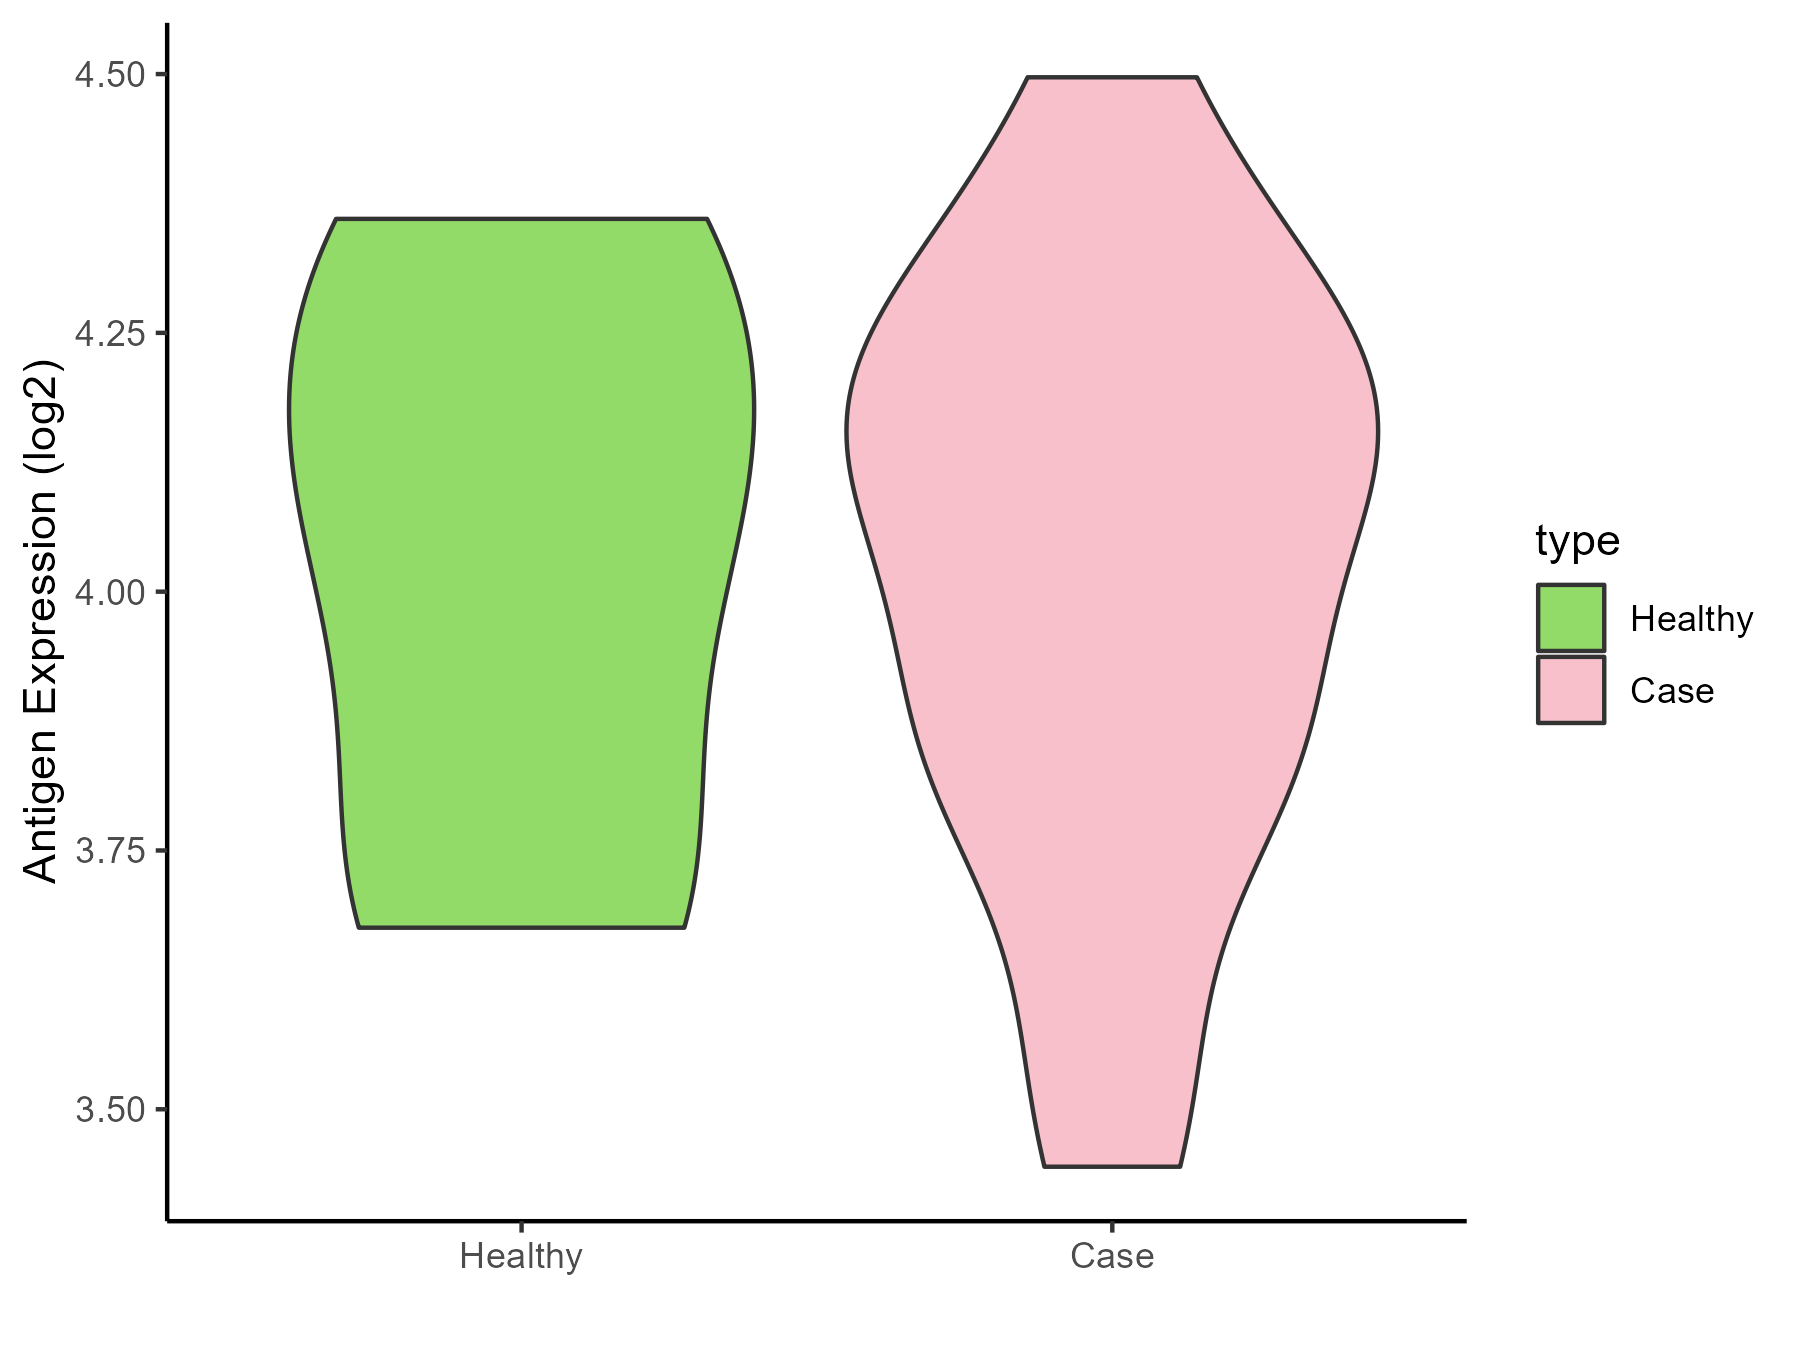
| The Studied Tissue | Plasmacytoid dendritic cells | |
| The Specific Disease | Multiple sclerosis | |
| The Expression Level of Disease Section Compare with the Healthy Individual Tissue | p-value: 0.949828705; Fold-change: 0.031343907; Z-score: 0.110411222 | |
| Disease-specific Antigen Abundances |
|
Click to View the Clearer Original Diagram |
| Differential expression pattern of antigen in diseases | ||
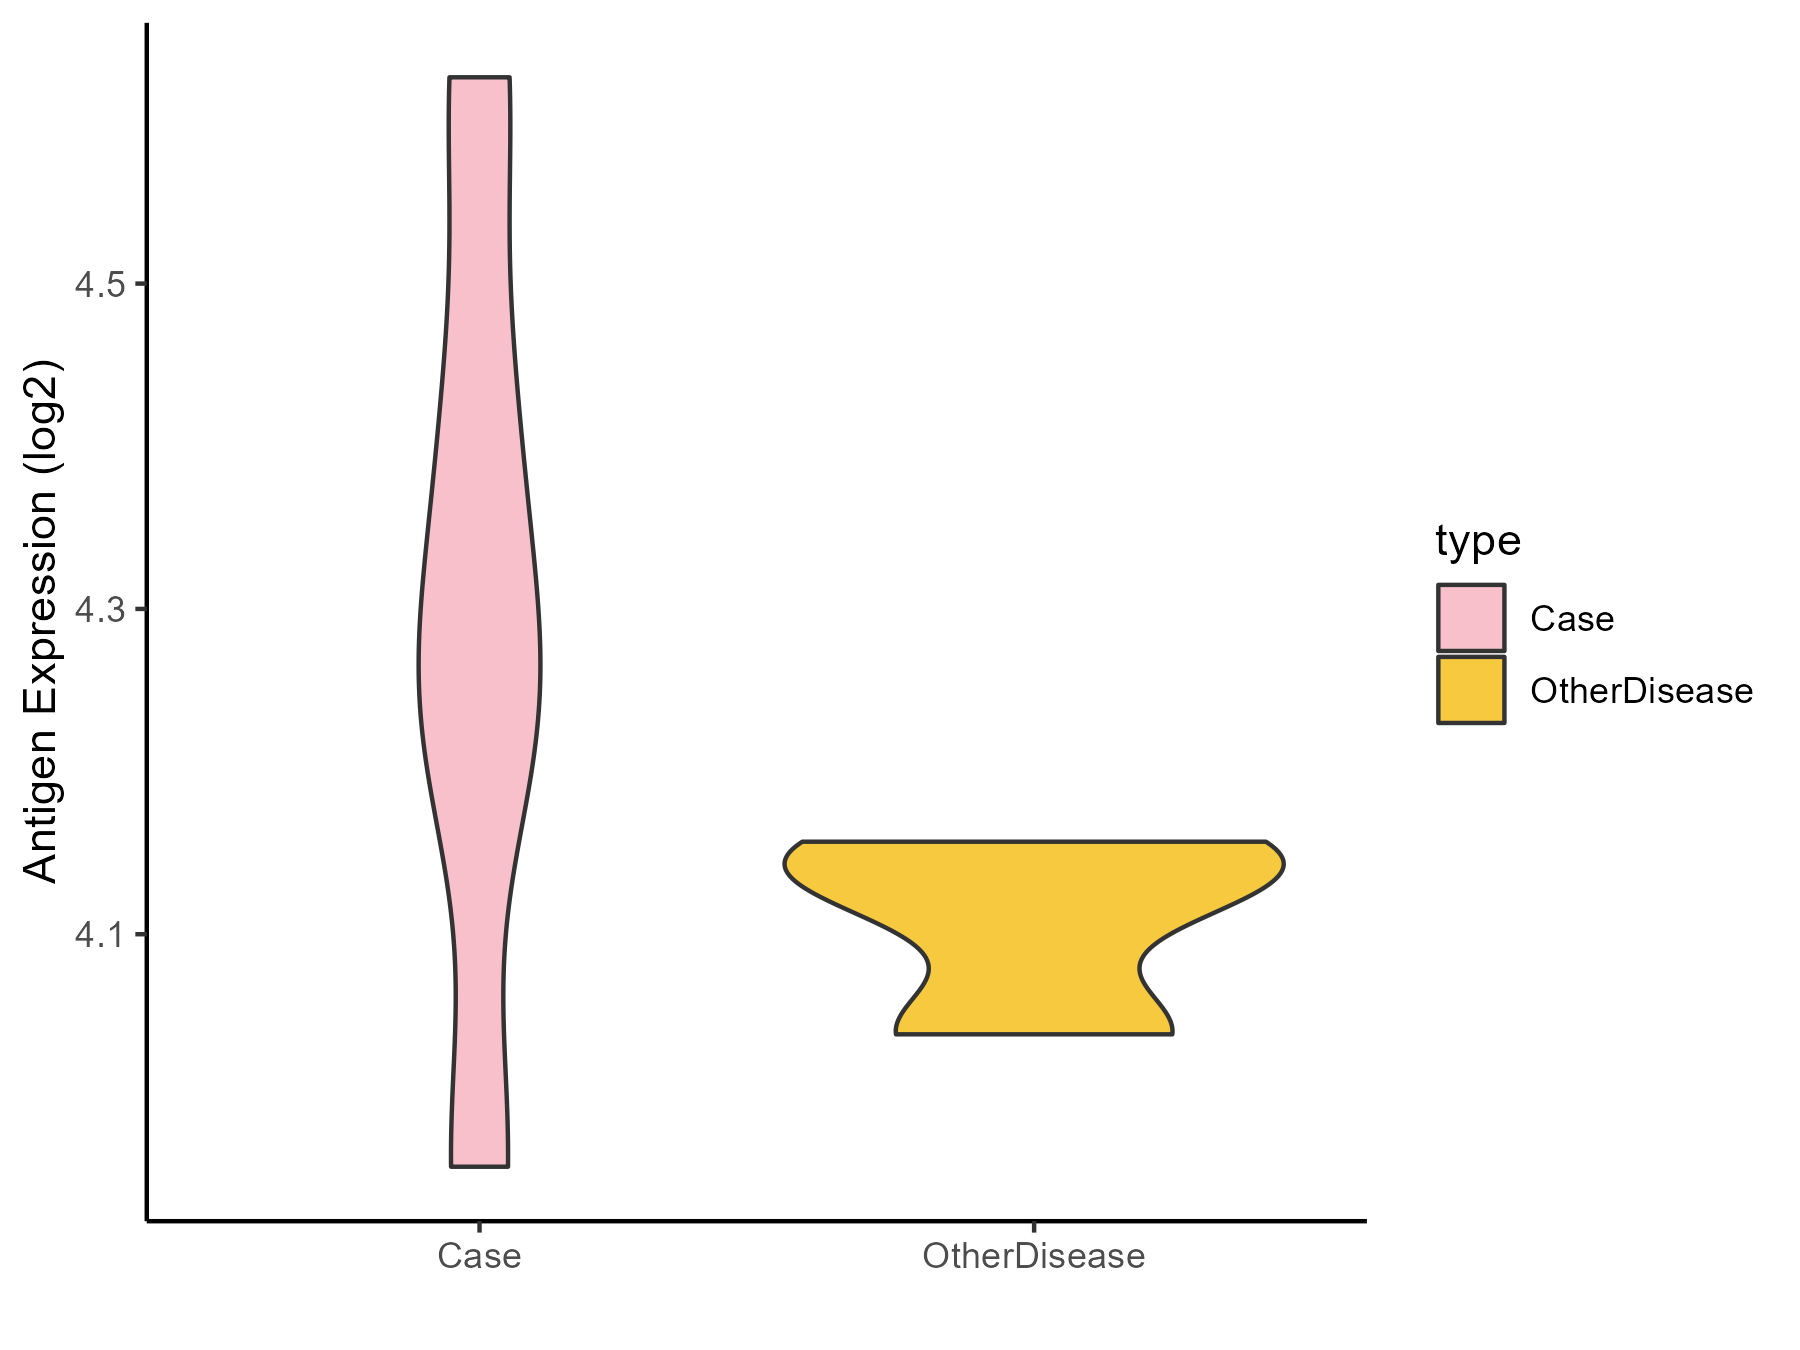
| The Studied Tissue | Peritumoral cortex | |
| The Specific Disease | Epilepsy | |
| The Expression Level of Disease Section Compare with the Other Disease Section | p-value: 0.168030896; Fold-change: 0.13303982; Z-score: 2.141848821 | |
| Disease-specific Antigen Abundances |
|
Click to View the Clearer Original Diagram |
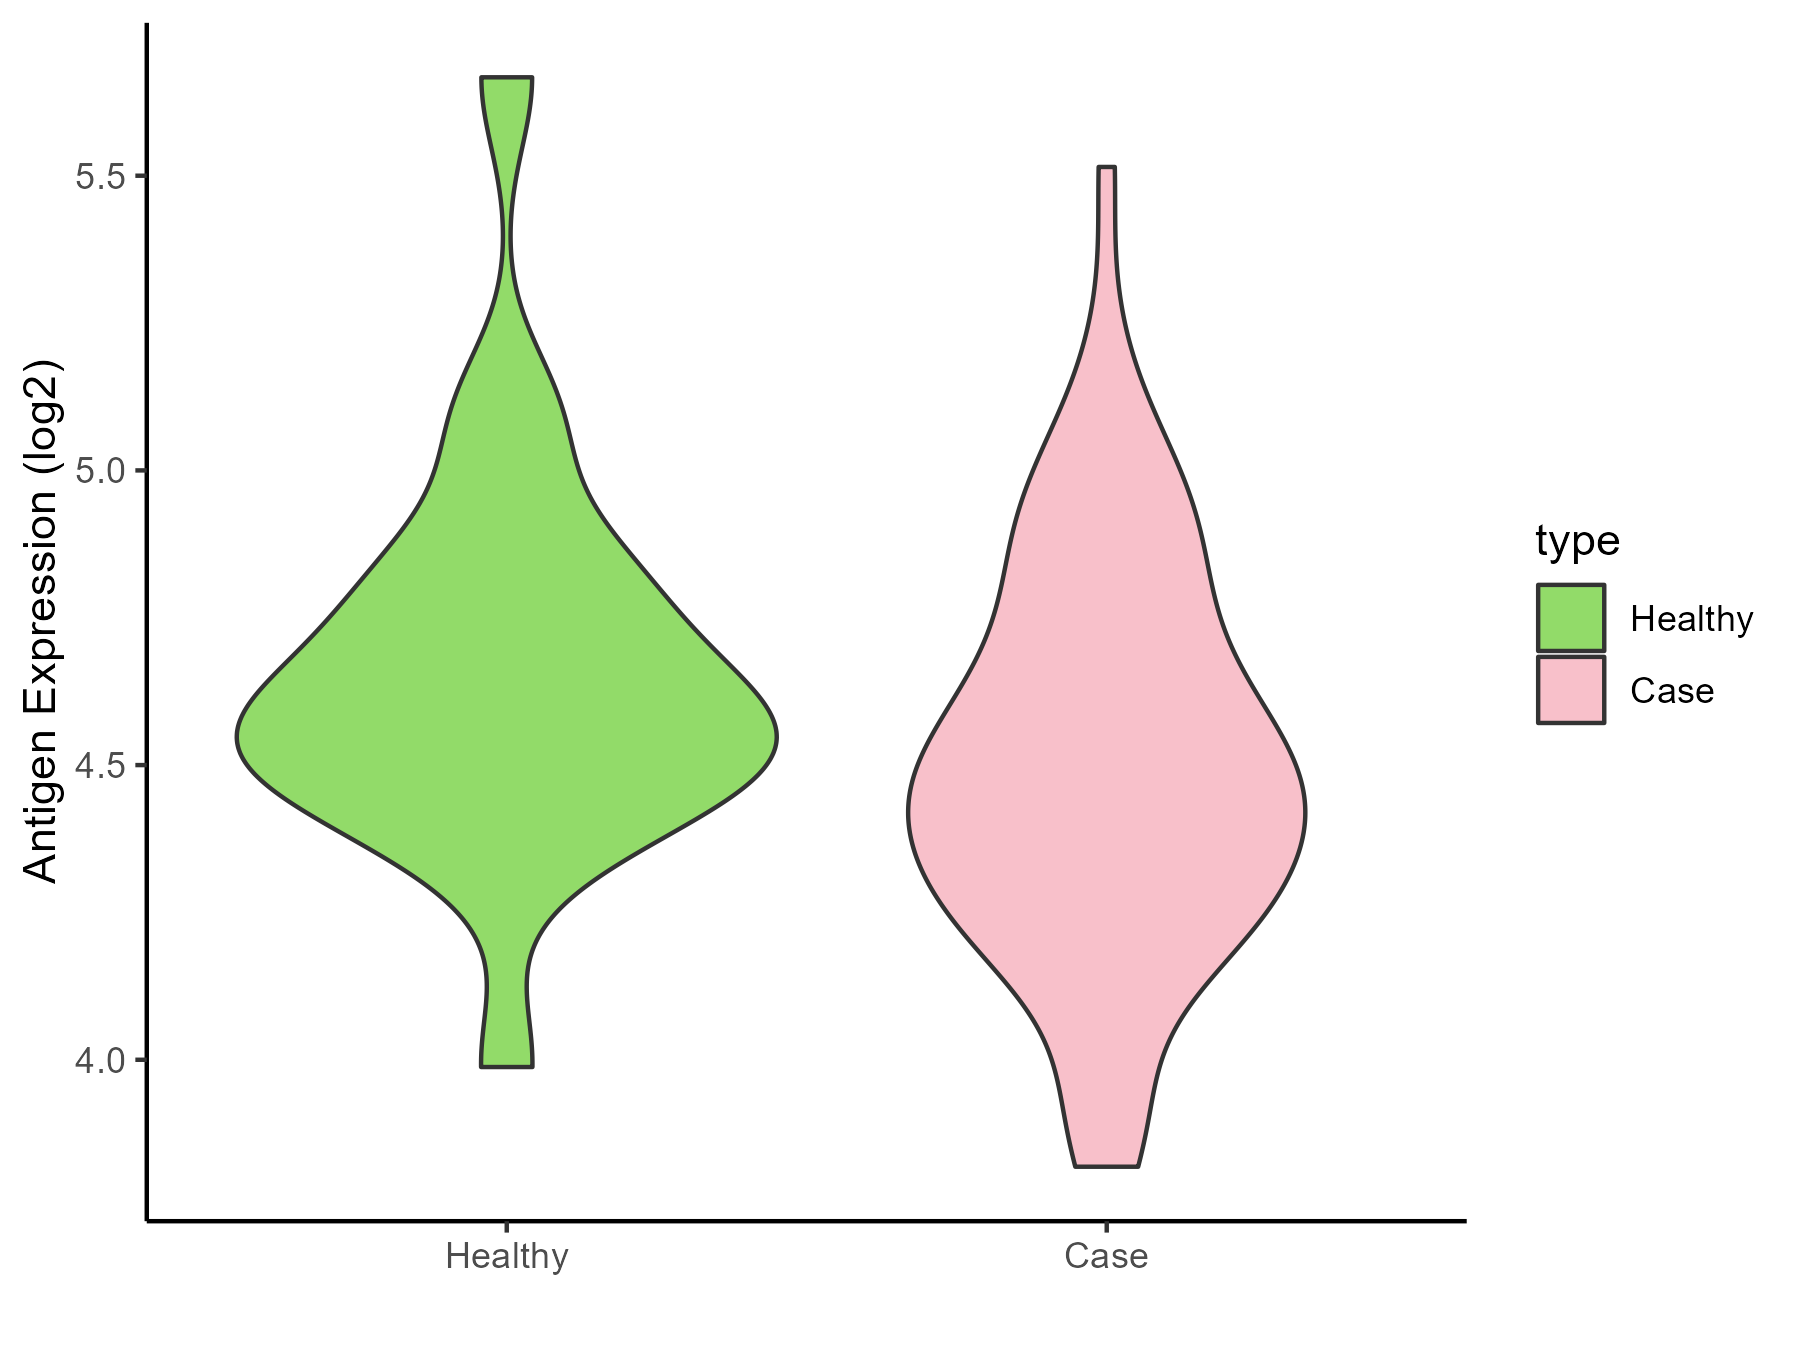
| Differential expression pattern of antigen in diseases | ||
| The Studied Tissue | Whole blood | |
| The Specific Disease | Cardioembolic Stroke | |
| The Expression Level of Disease Section Compare with the Healthy Individual Tissue | p-value: 0.070984371; Fold-change: -0.107005683; Z-score: -0.31890683 | |
| Disease-specific Antigen Abundances |
|
Click to View the Clearer Original Diagram |
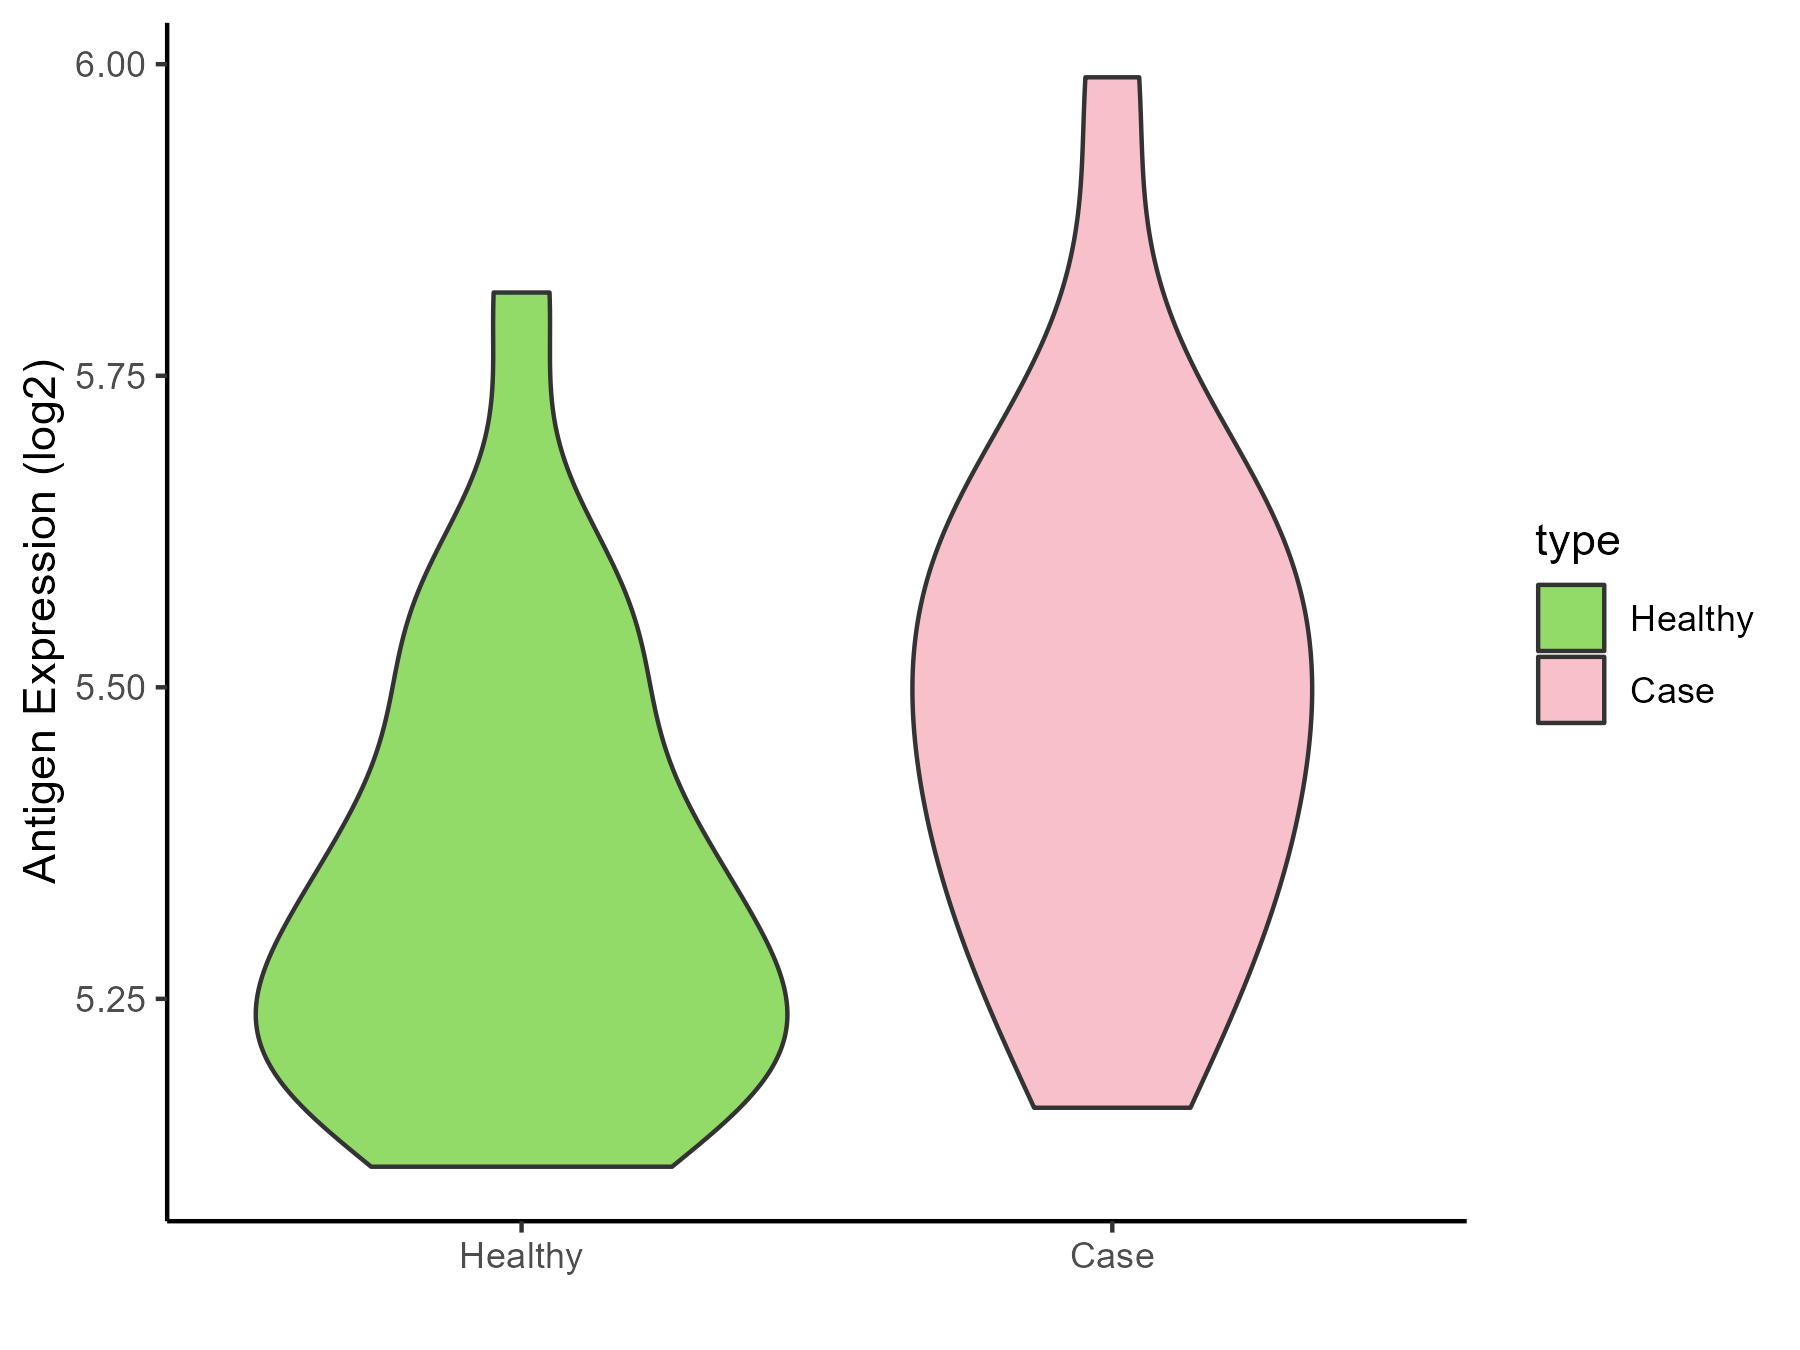
| The Studied Tissue | Peripheral blood | |
| The Specific Disease | Ischemic stroke | |
| The Expression Level of Disease Section Compare with the Healthy Individual Tissue | p-value: 0.023230168; Fold-change: 0.172830608; Z-score: 0.957686769 | |
| Disease-specific Antigen Abundances |
|
Click to View the Clearer Original Diagram |
ICD Disease Classification 1
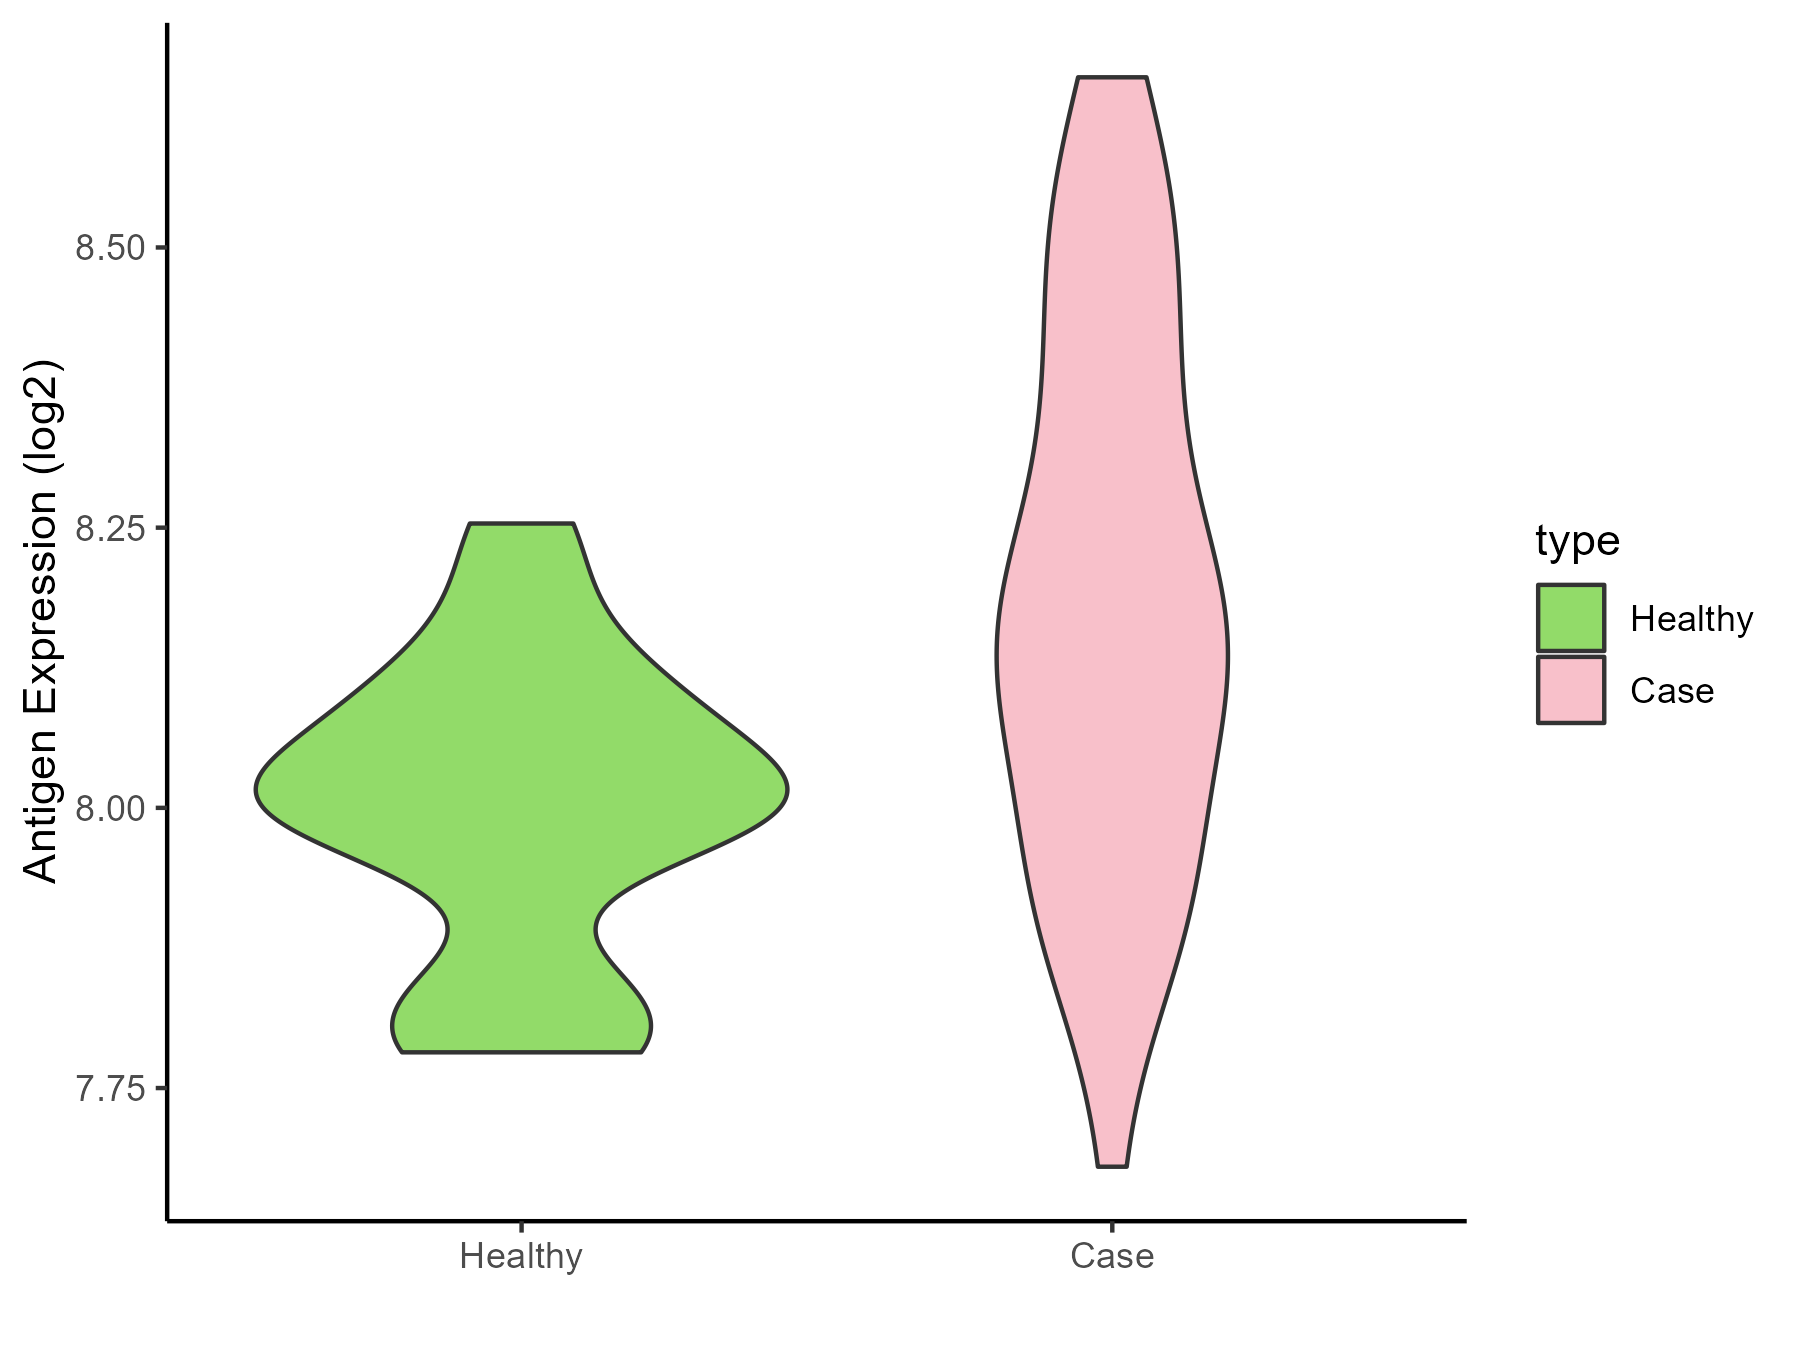
| Differential expression pattern of antigen in diseases | ||
| The Studied Tissue | White matter | |
| The Specific Disease | HIV | |
| The Expression Level of Disease Section Compare with the Healthy Individual Tissue | p-value: 0.0004563; Fold-change: 0.153292098; Z-score: 1.119448186 | |
| Disease-specific Antigen Abundances |
|
Click to View the Clearer Original Diagram |
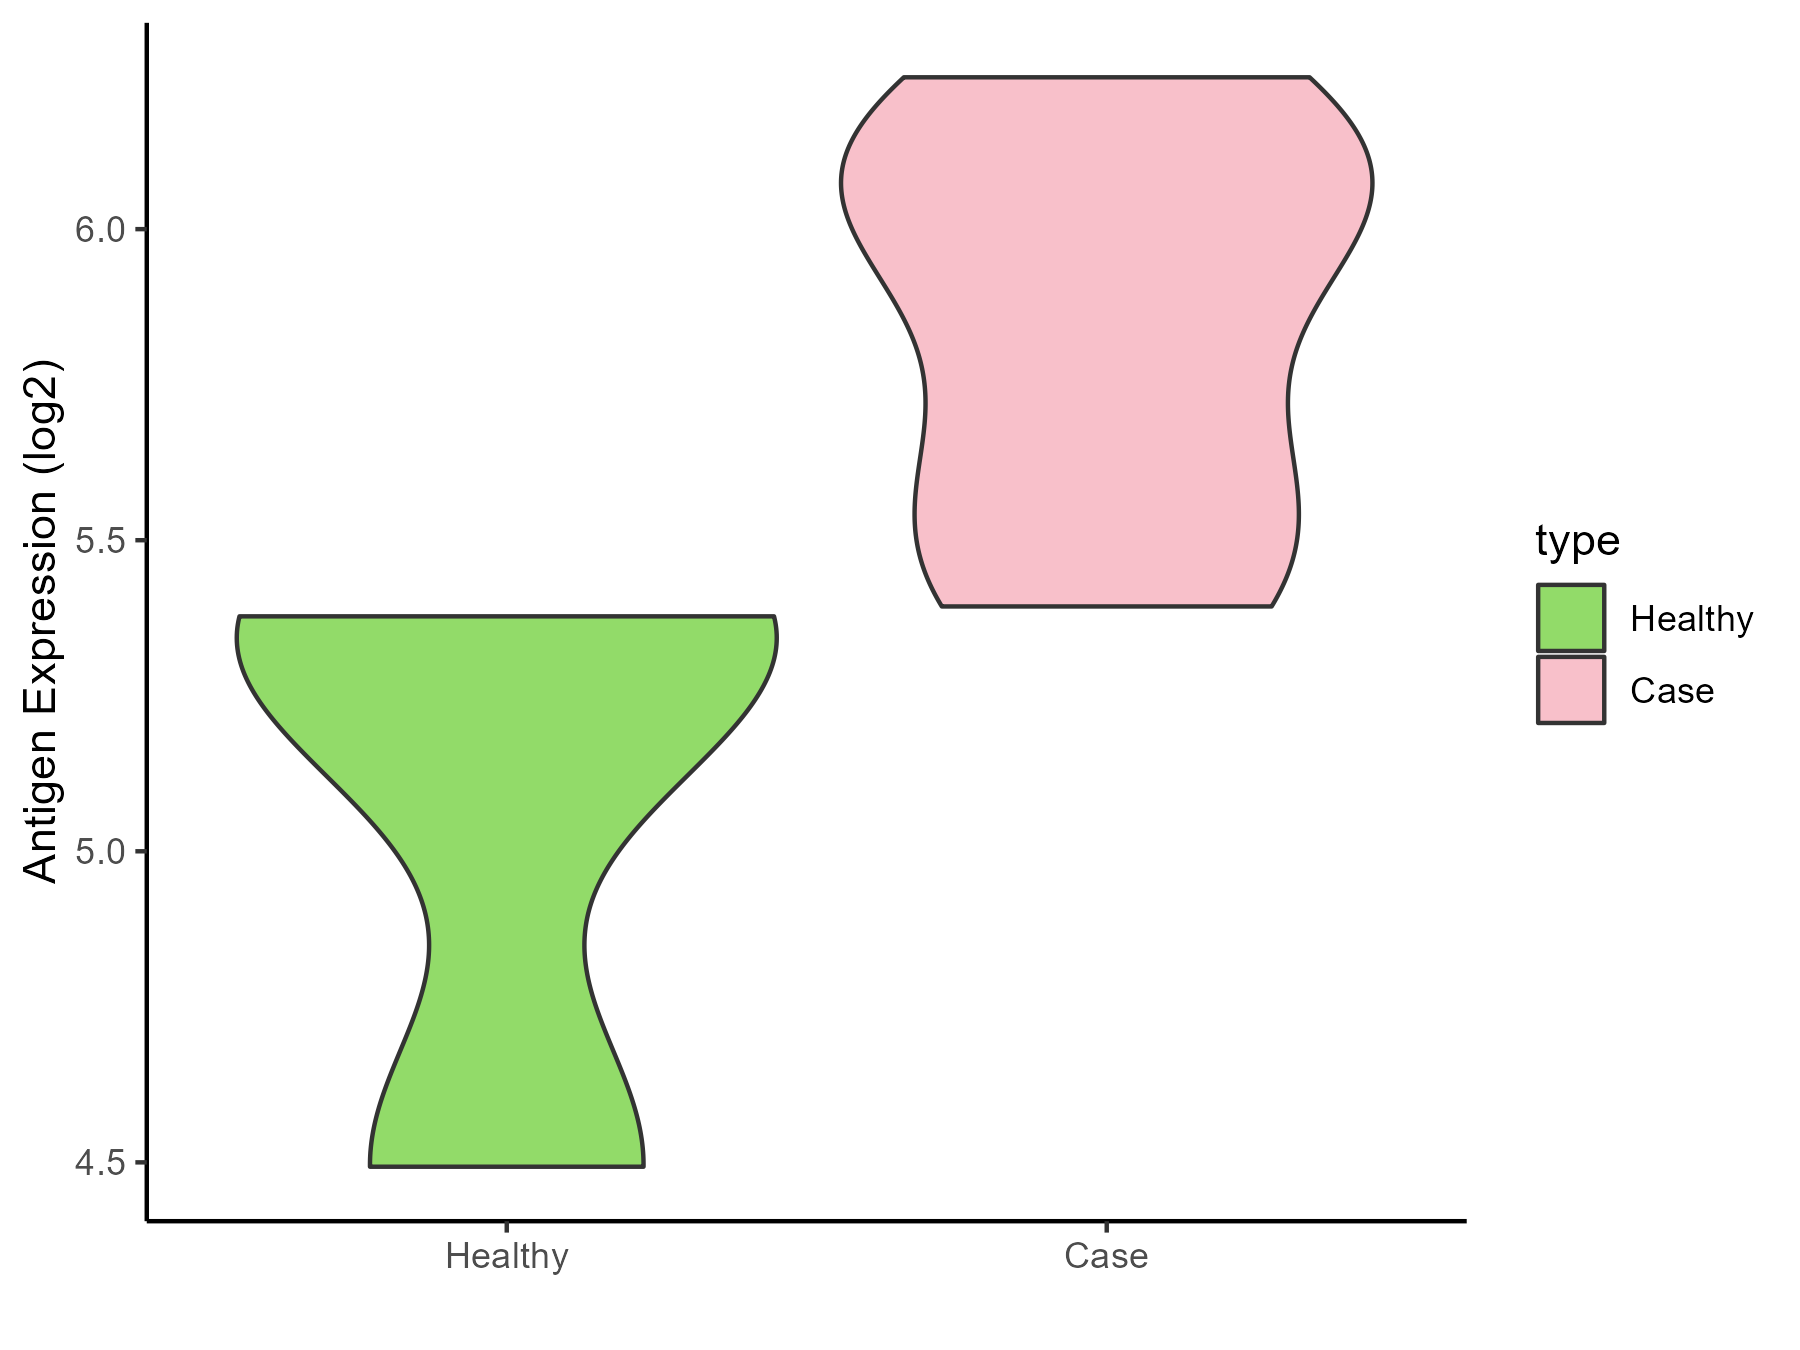
| Differential expression pattern of antigen in diseases | ||
| The Studied Tissue | Whole blood | |
| The Specific Disease | Influenza | |
| The Expression Level of Disease Section Compare with the Healthy Individual Tissue | p-value: 0.094236313; Fold-change: 0.666675839; Z-score: 1.353939318 | |
| Disease-specific Antigen Abundances |
|
Click to View the Clearer Original Diagram |
| Differential expression pattern of antigen in diseases | ||
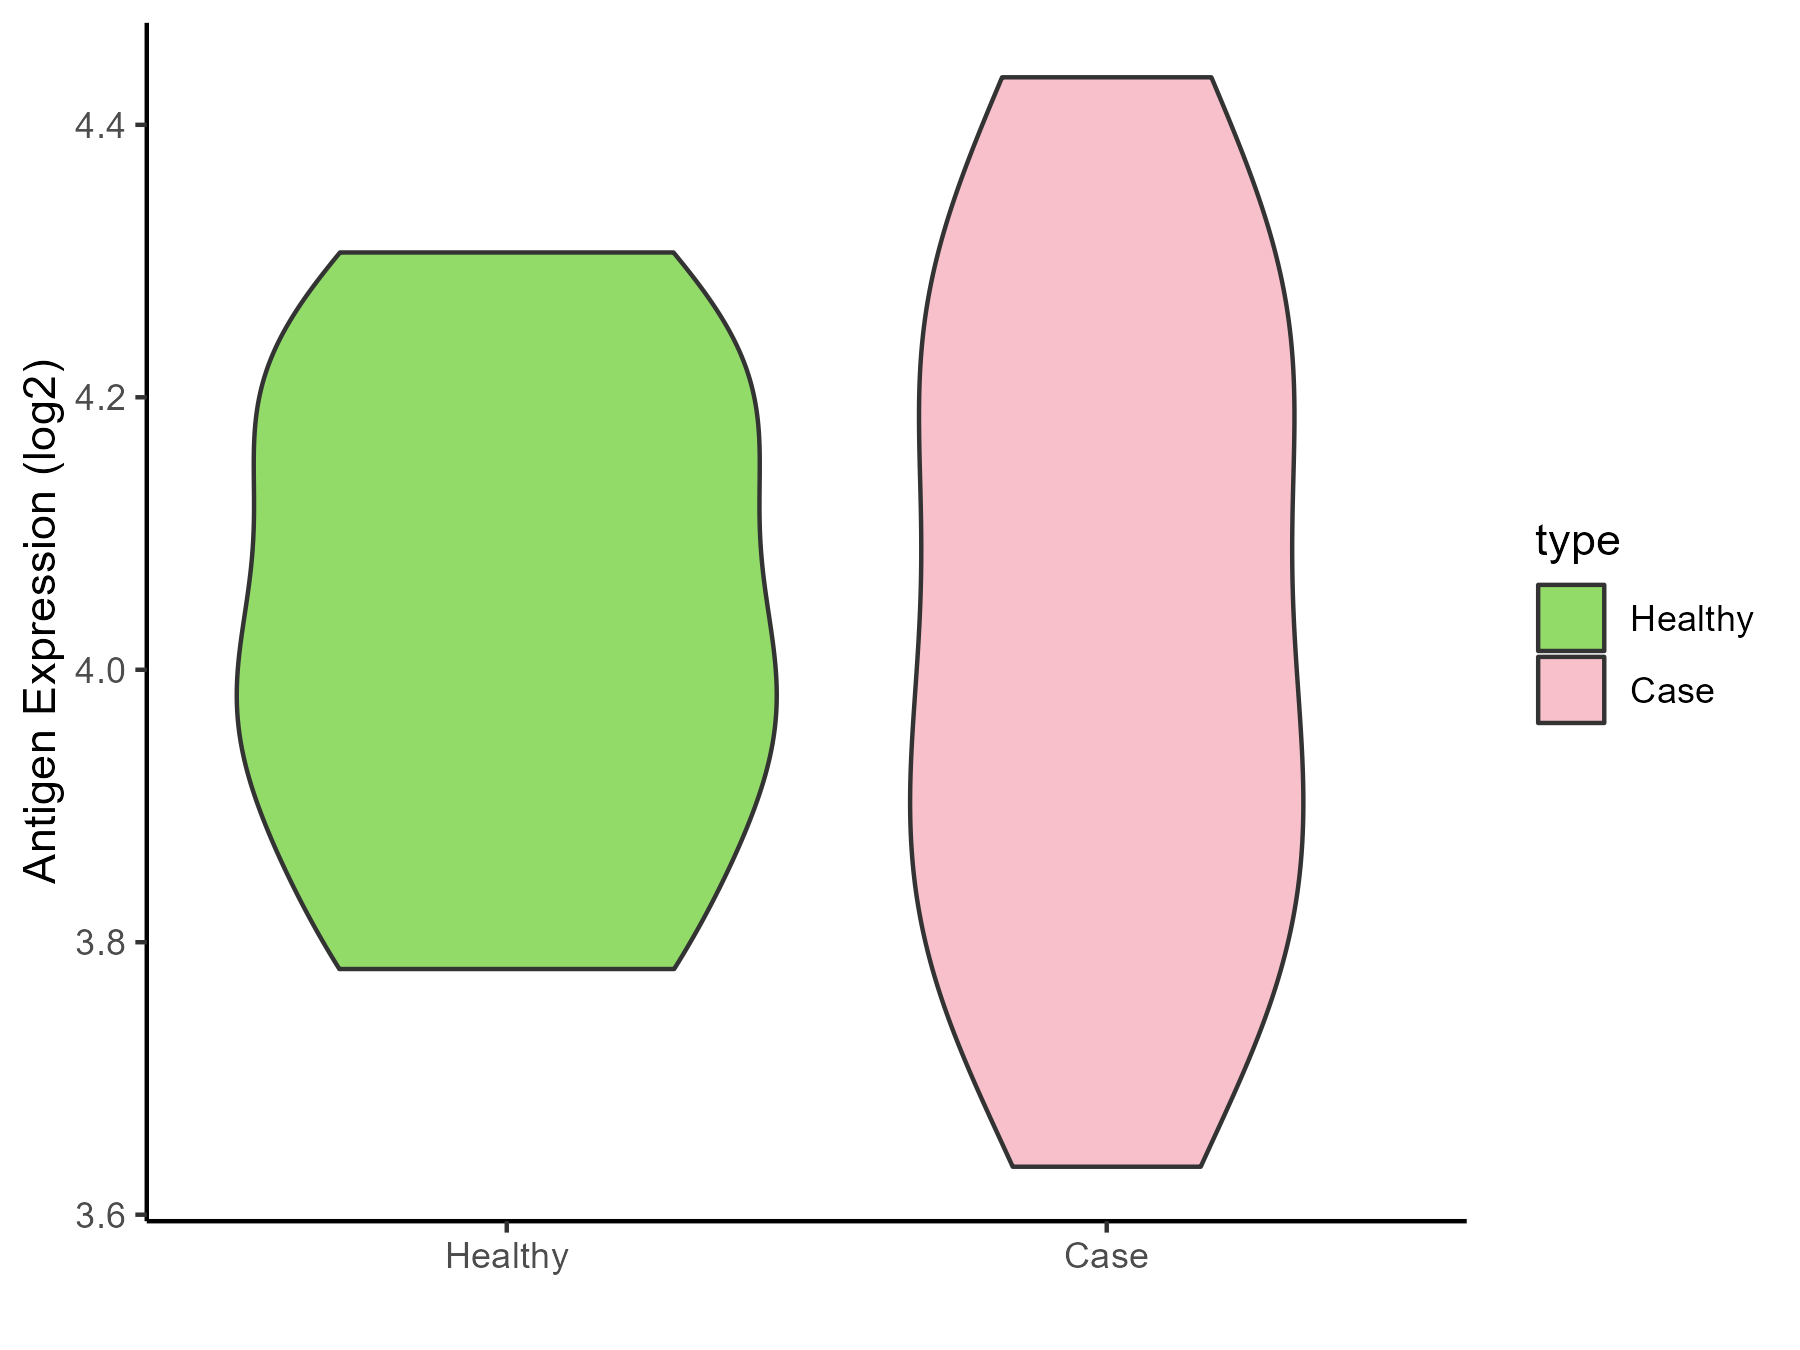
| The Studied Tissue | Whole blood | |
| The Specific Disease | Chronic hepatitis C | |
| The Expression Level of Disease Section Compare with the Healthy Individual Tissue | p-value: 0.958261135; Fold-change: 0.02174185; Z-score: 0.120644829 | |
| Disease-specific Antigen Abundances |
|
Click to View the Clearer Original Diagram |
| Differential expression pattern of antigen in diseases | ||
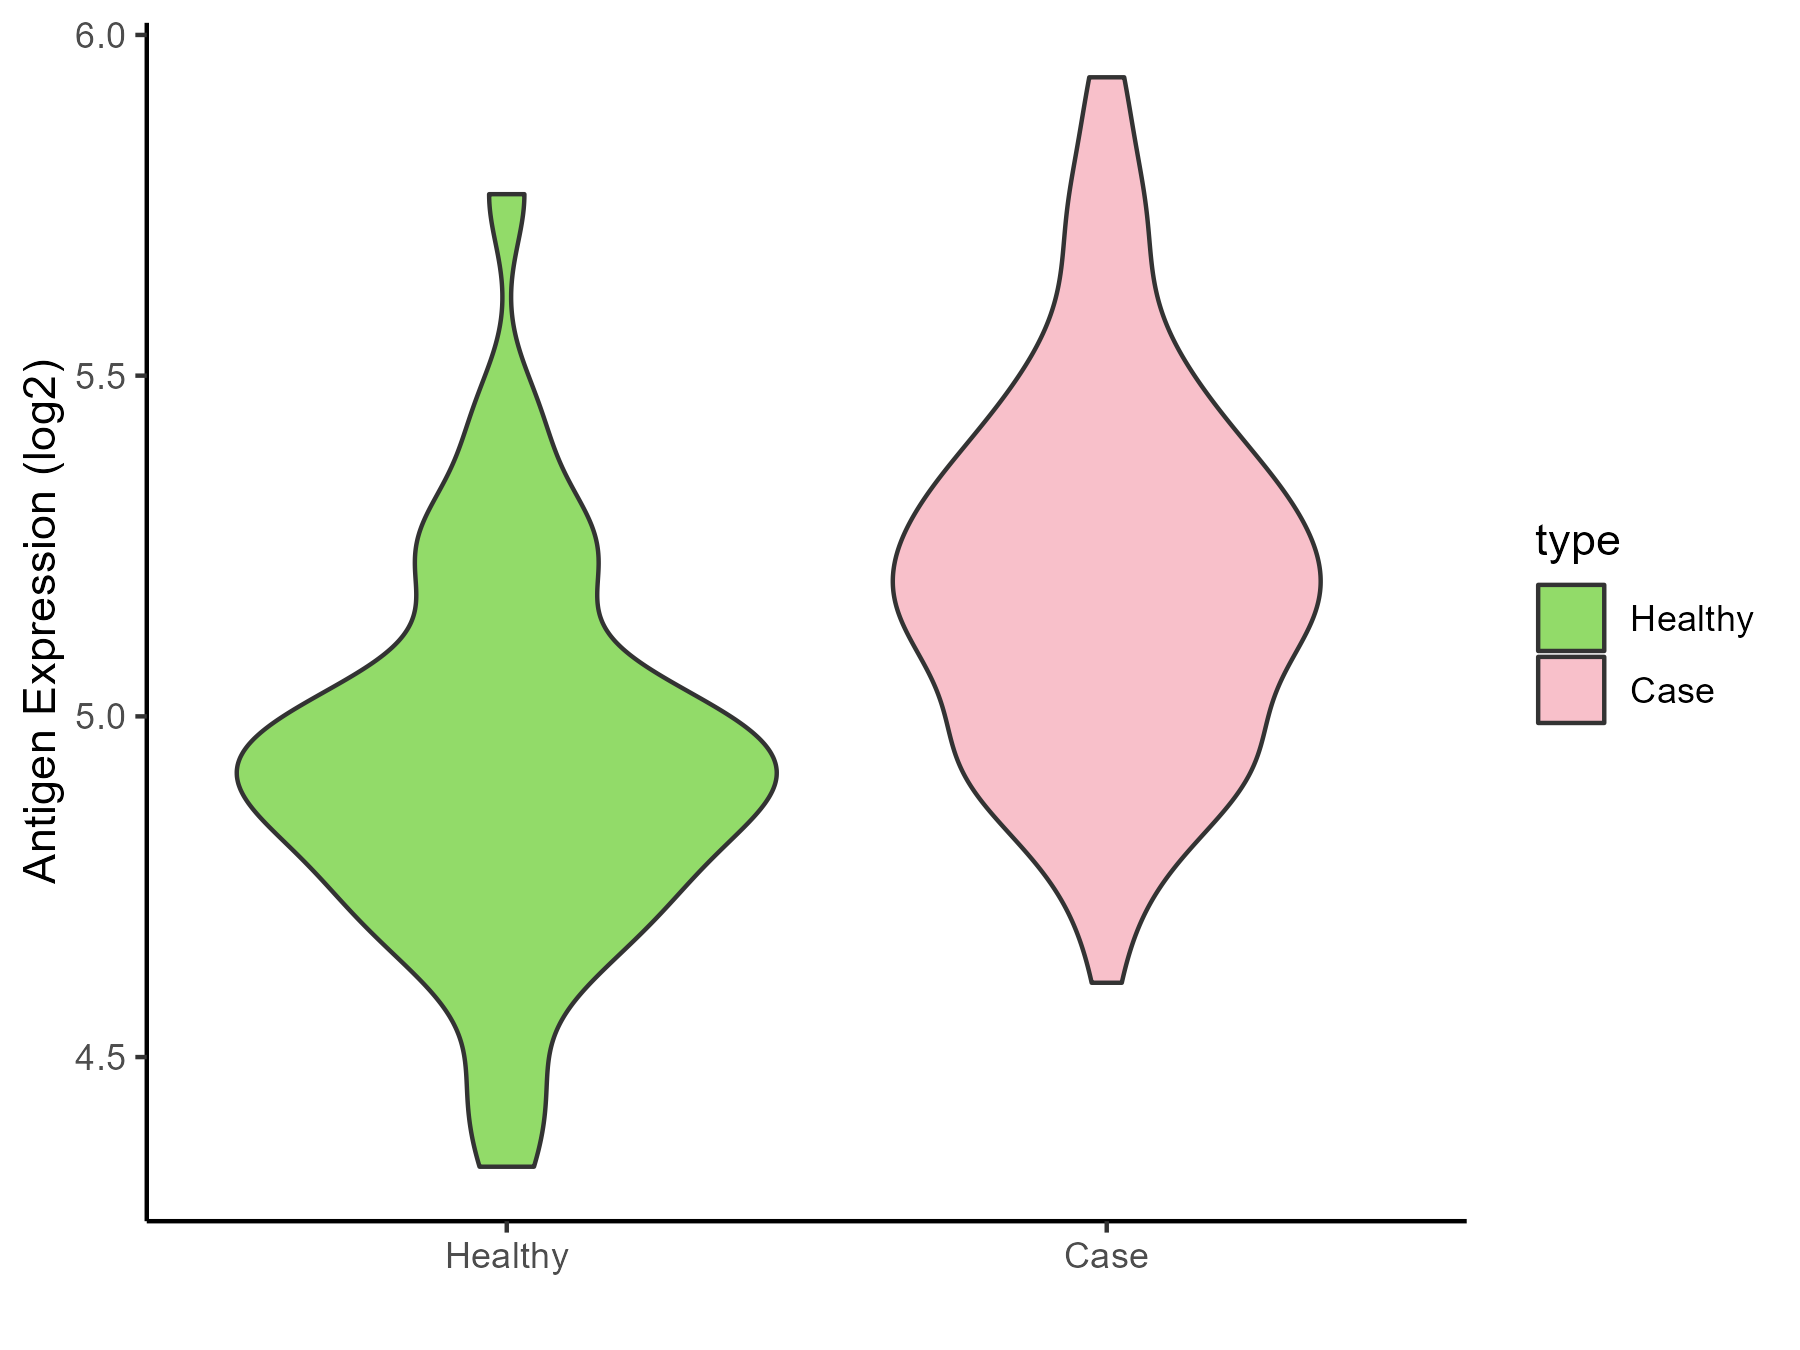
| The Studied Tissue | Whole blood | |
| The Specific Disease | Sepsis | |
| The Expression Level of Disease Section Compare with the Healthy Individual Tissue | p-value: 2.77E-12; Fold-change: 0.278746012; Z-score: 1.027474752 | |
| Disease-specific Antigen Abundances |
|
Click to View the Clearer Original Diagram |
| Differential expression pattern of antigen in diseases | ||
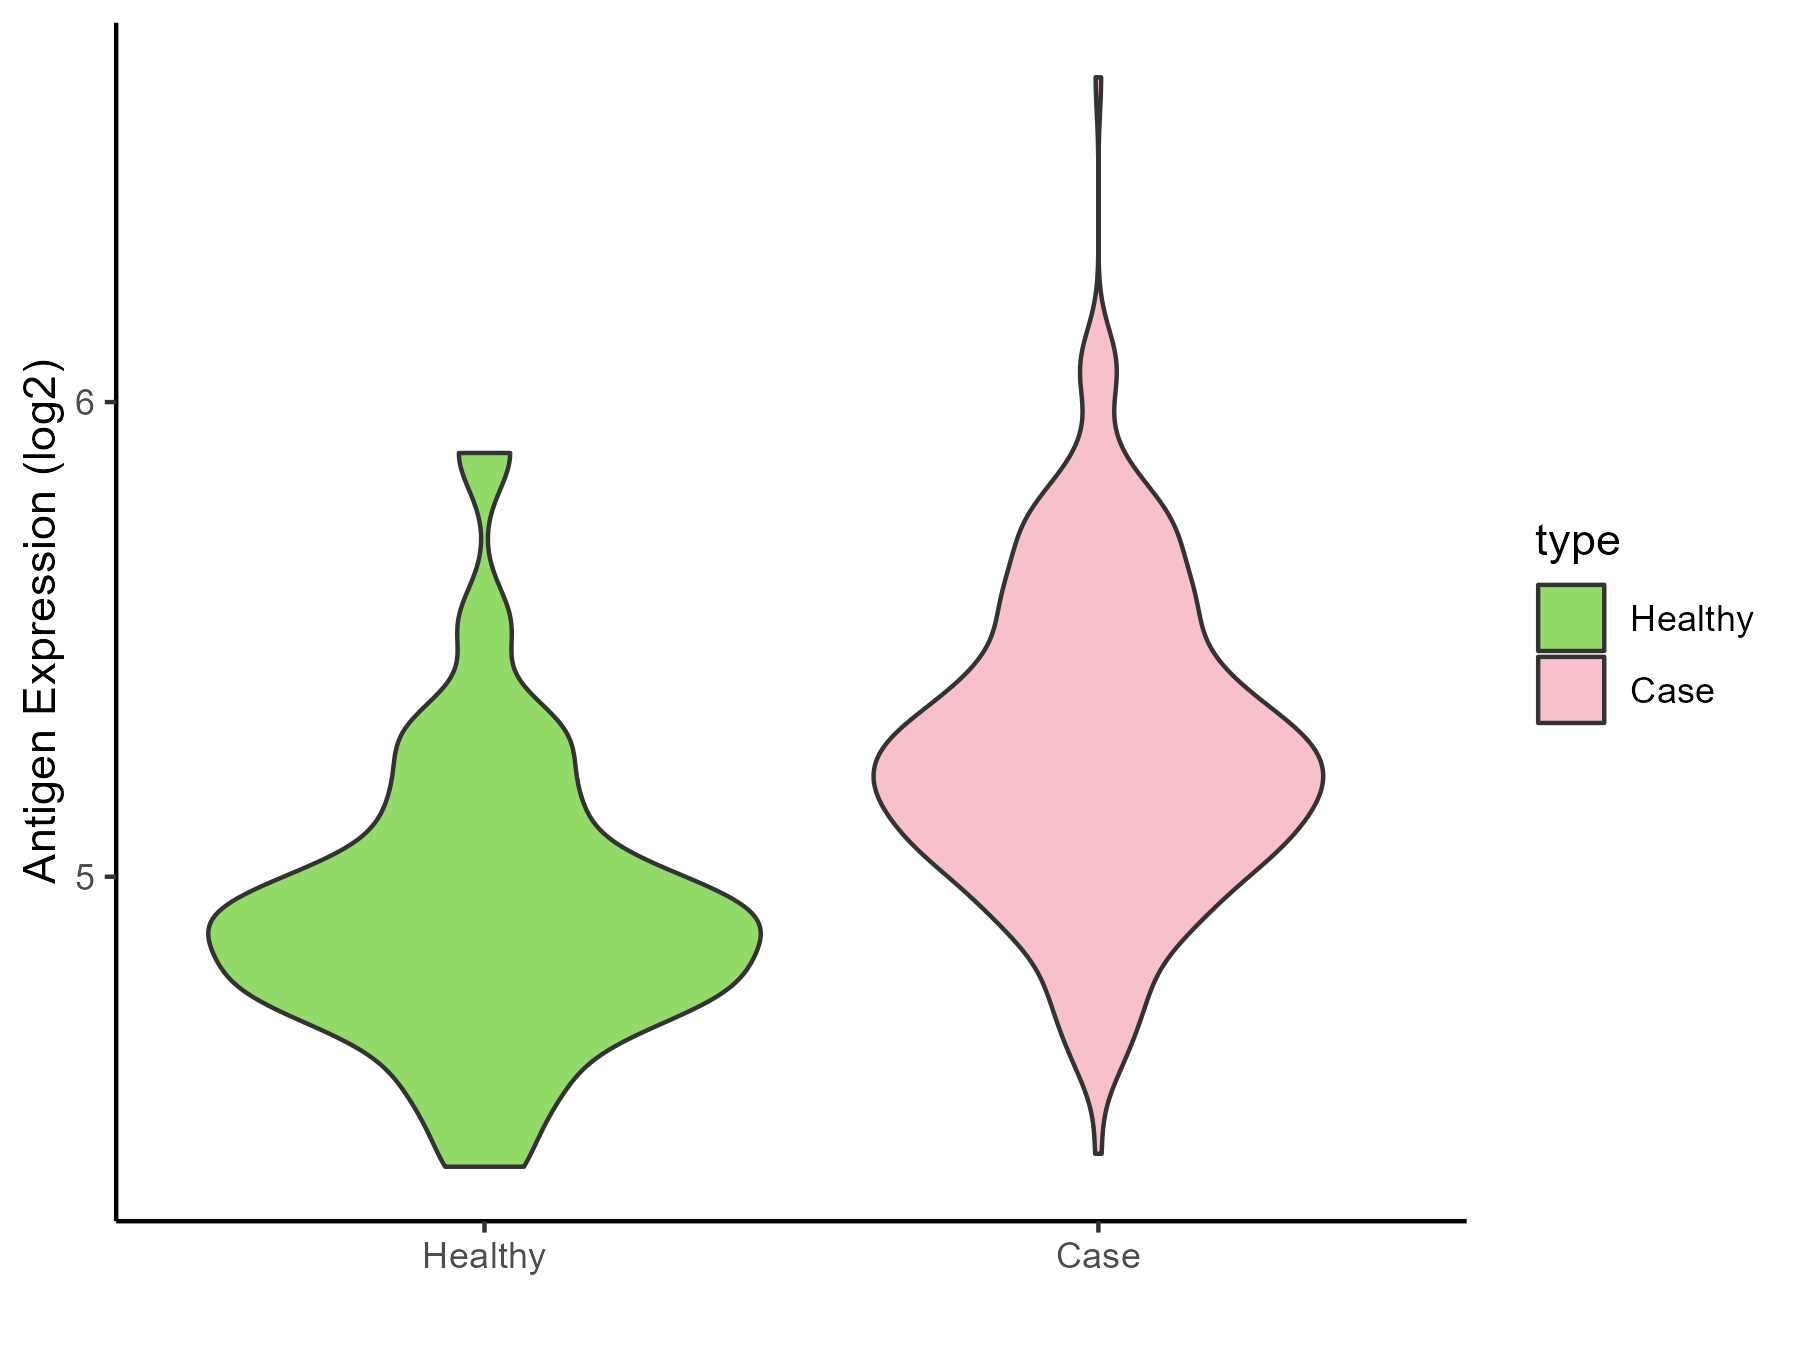
| The Studied Tissue | Whole blood | |
| The Specific Disease | Septic shock | |
| The Expression Level of Disease Section Compare with the Healthy Individual Tissue | p-value: 1.39E-27; Fold-change: 0.346579437; Z-score: 1.149777583 | |
| Disease-specific Antigen Abundances |
|
Click to View the Clearer Original Diagram |
| Differential expression pattern of antigen in diseases | ||
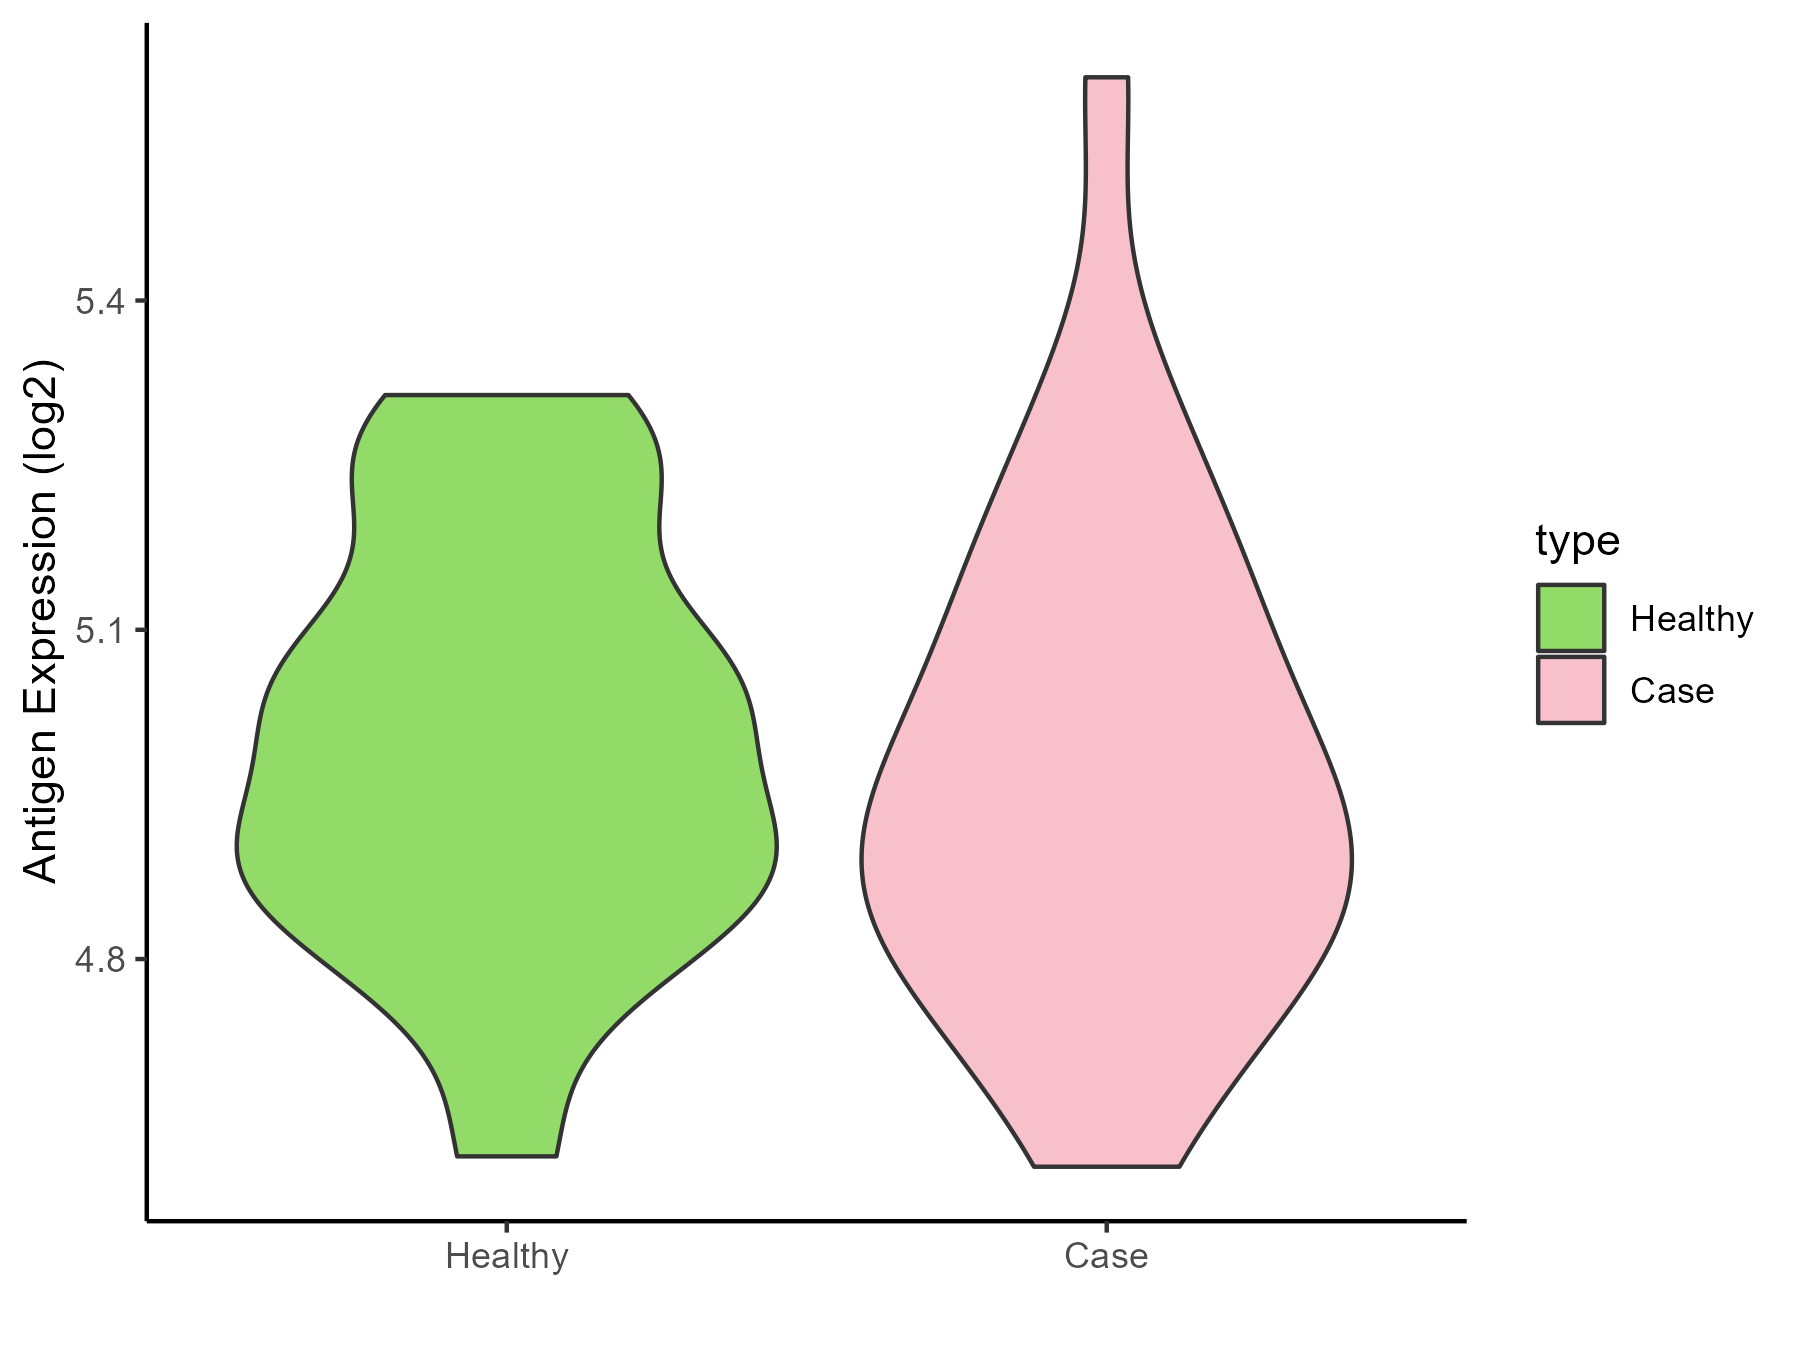
| The Studied Tissue | Peripheral blood | |
| The Specific Disease | Pediatric respiratory syncytial virus infection | |
| The Expression Level of Disease Section Compare with the Healthy Individual Tissue | p-value: 0.744465348; Fold-change: -0.055821209; Z-score: -0.293575452 | |
| Disease-specific Antigen Abundances |
|
Click to View the Clearer Original Diagram |
ICD Disease Classification 11
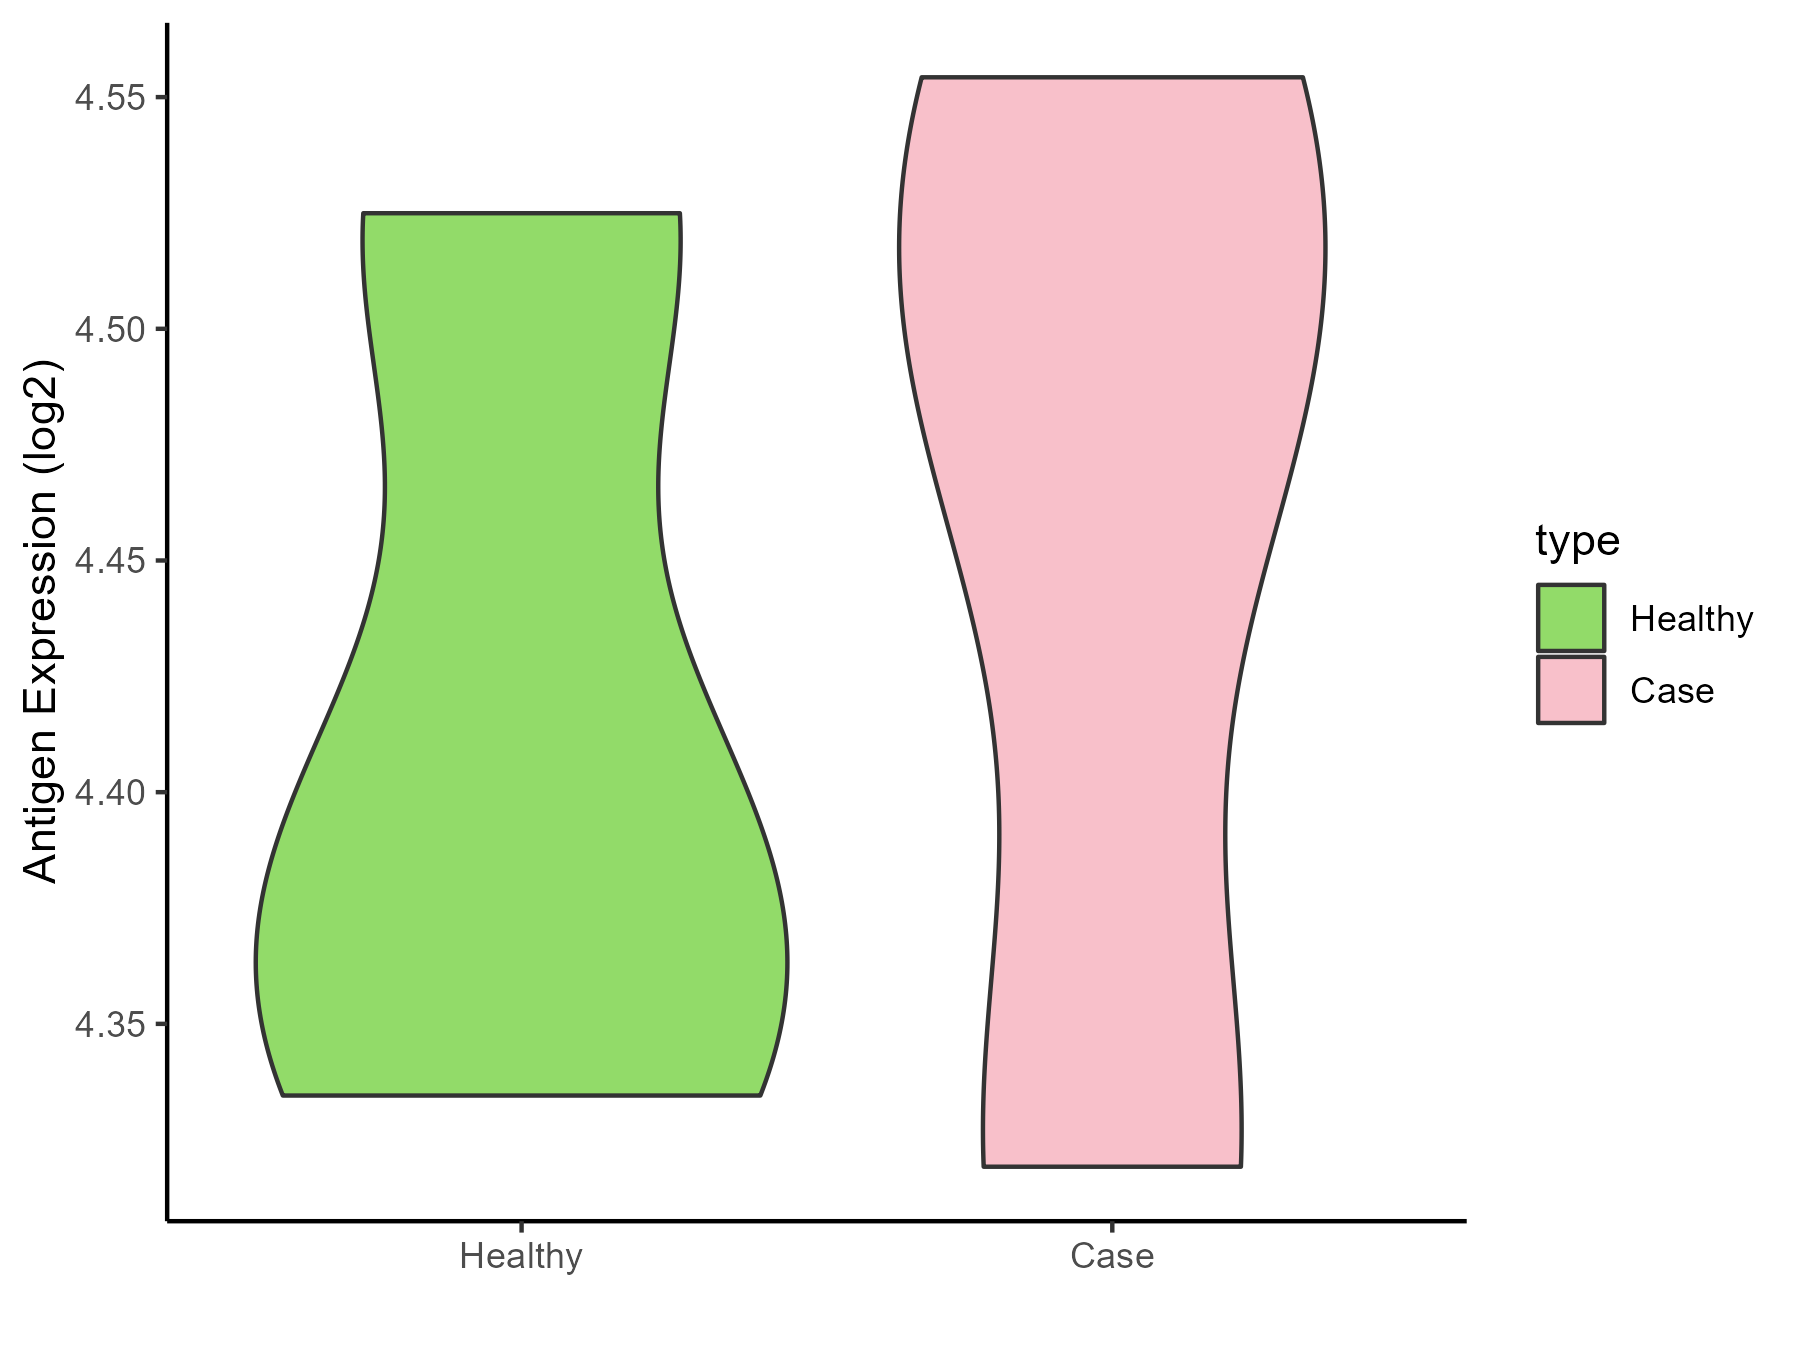
| Differential expression pattern of antigen in diseases | ||
| The Studied Tissue | Peripheral blood | |
| The Specific Disease | Essential hypertension | |
| The Expression Level of Disease Section Compare with the Healthy Individual Tissue | p-value: 0.711605021; Fold-change: 0.093176485; Z-score: 0.951591937 | |
| Disease-specific Antigen Abundances |
|
Click to View the Clearer Original Diagram |
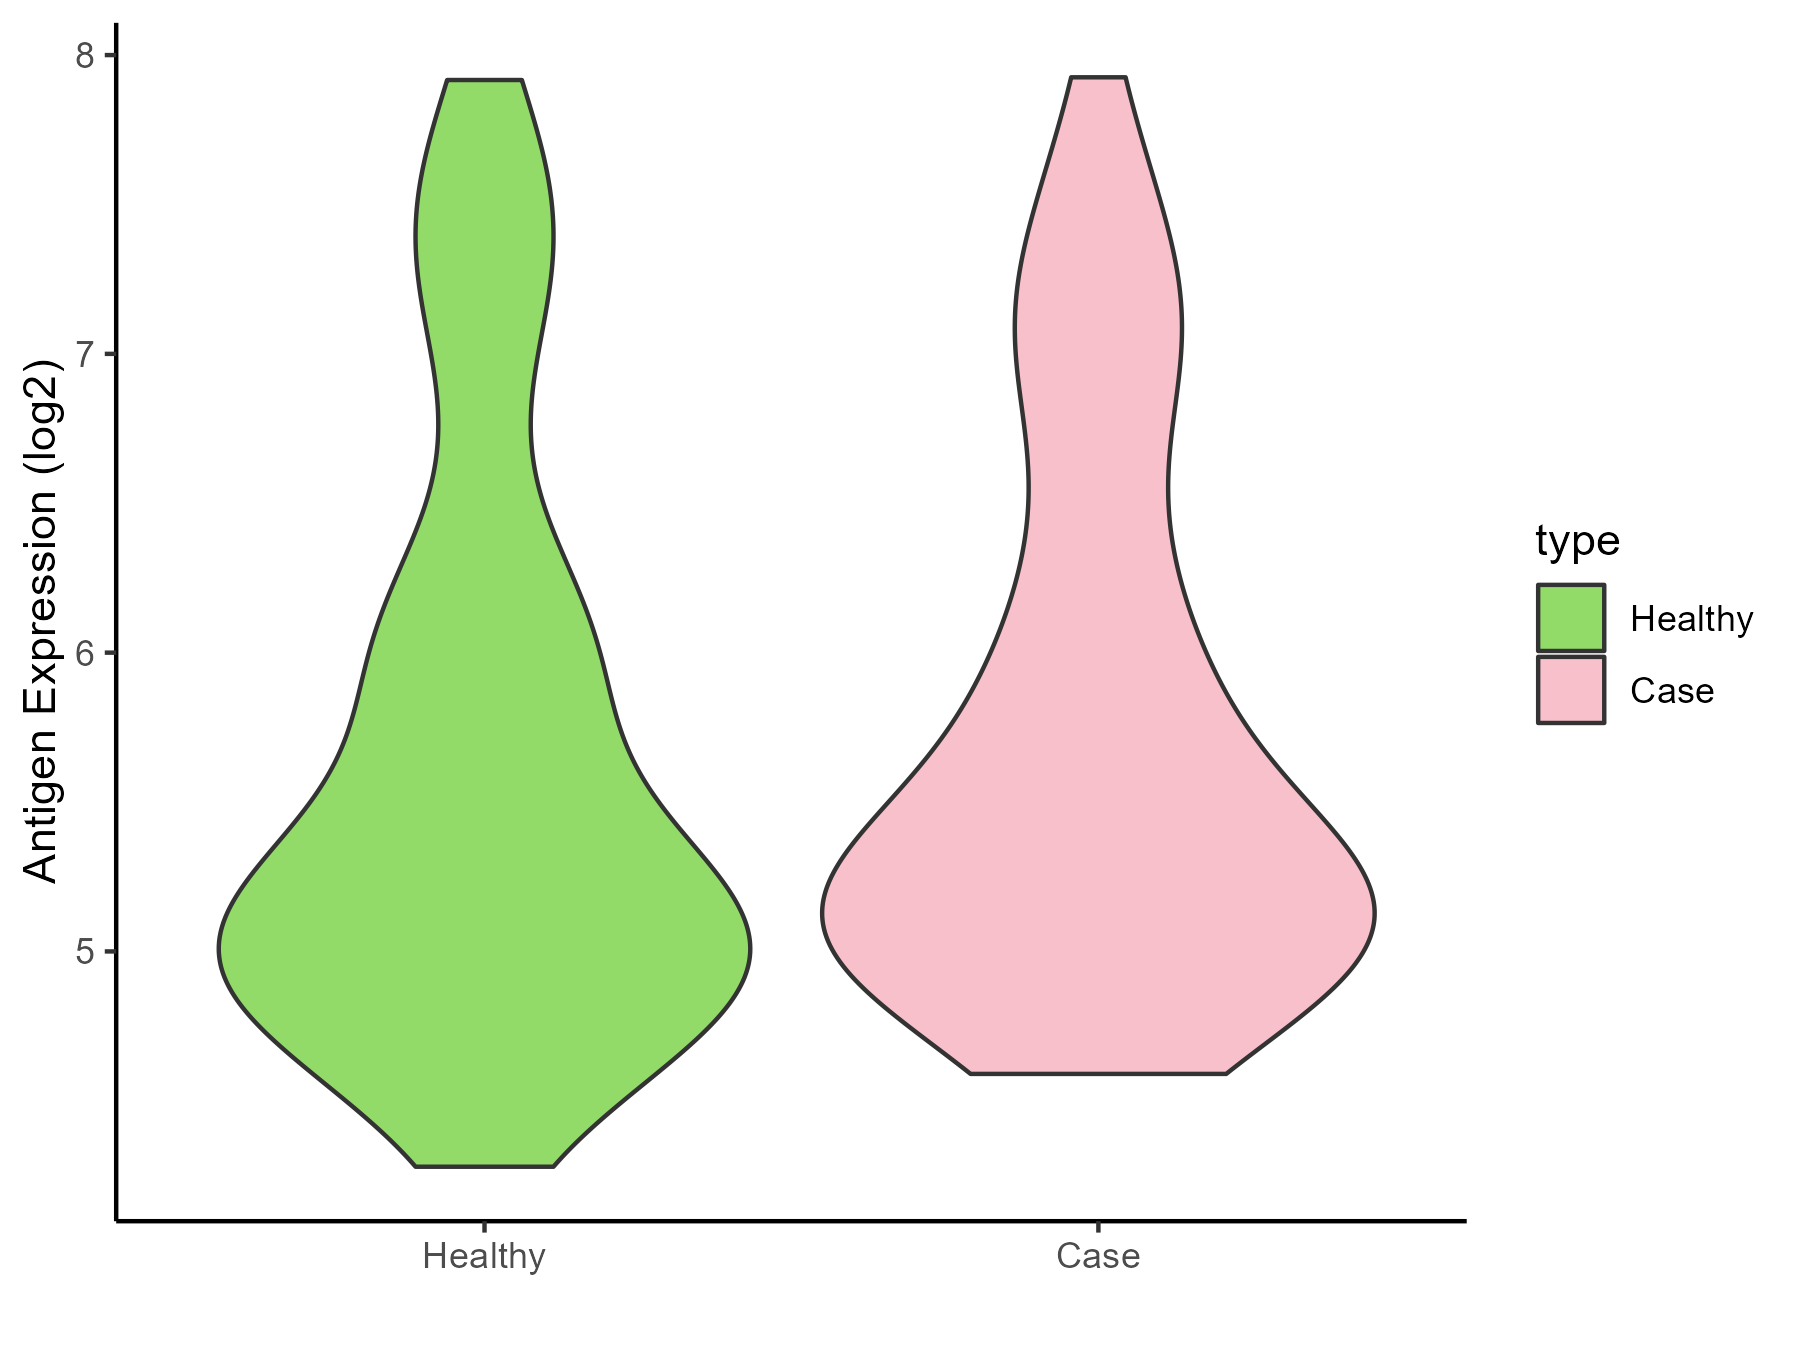
| Differential expression pattern of antigen in diseases | ||
| The Studied Tissue | Peripheral blood | |
| The Specific Disease | Myocardial infarction | |
| The Expression Level of Disease Section Compare with the Healthy Individual Tissue | p-value: 0.582233279; Fold-change: 0.095321743; Z-score: 0.099842816 | |
| Disease-specific Antigen Abundances |
|
Click to View the Clearer Original Diagram |
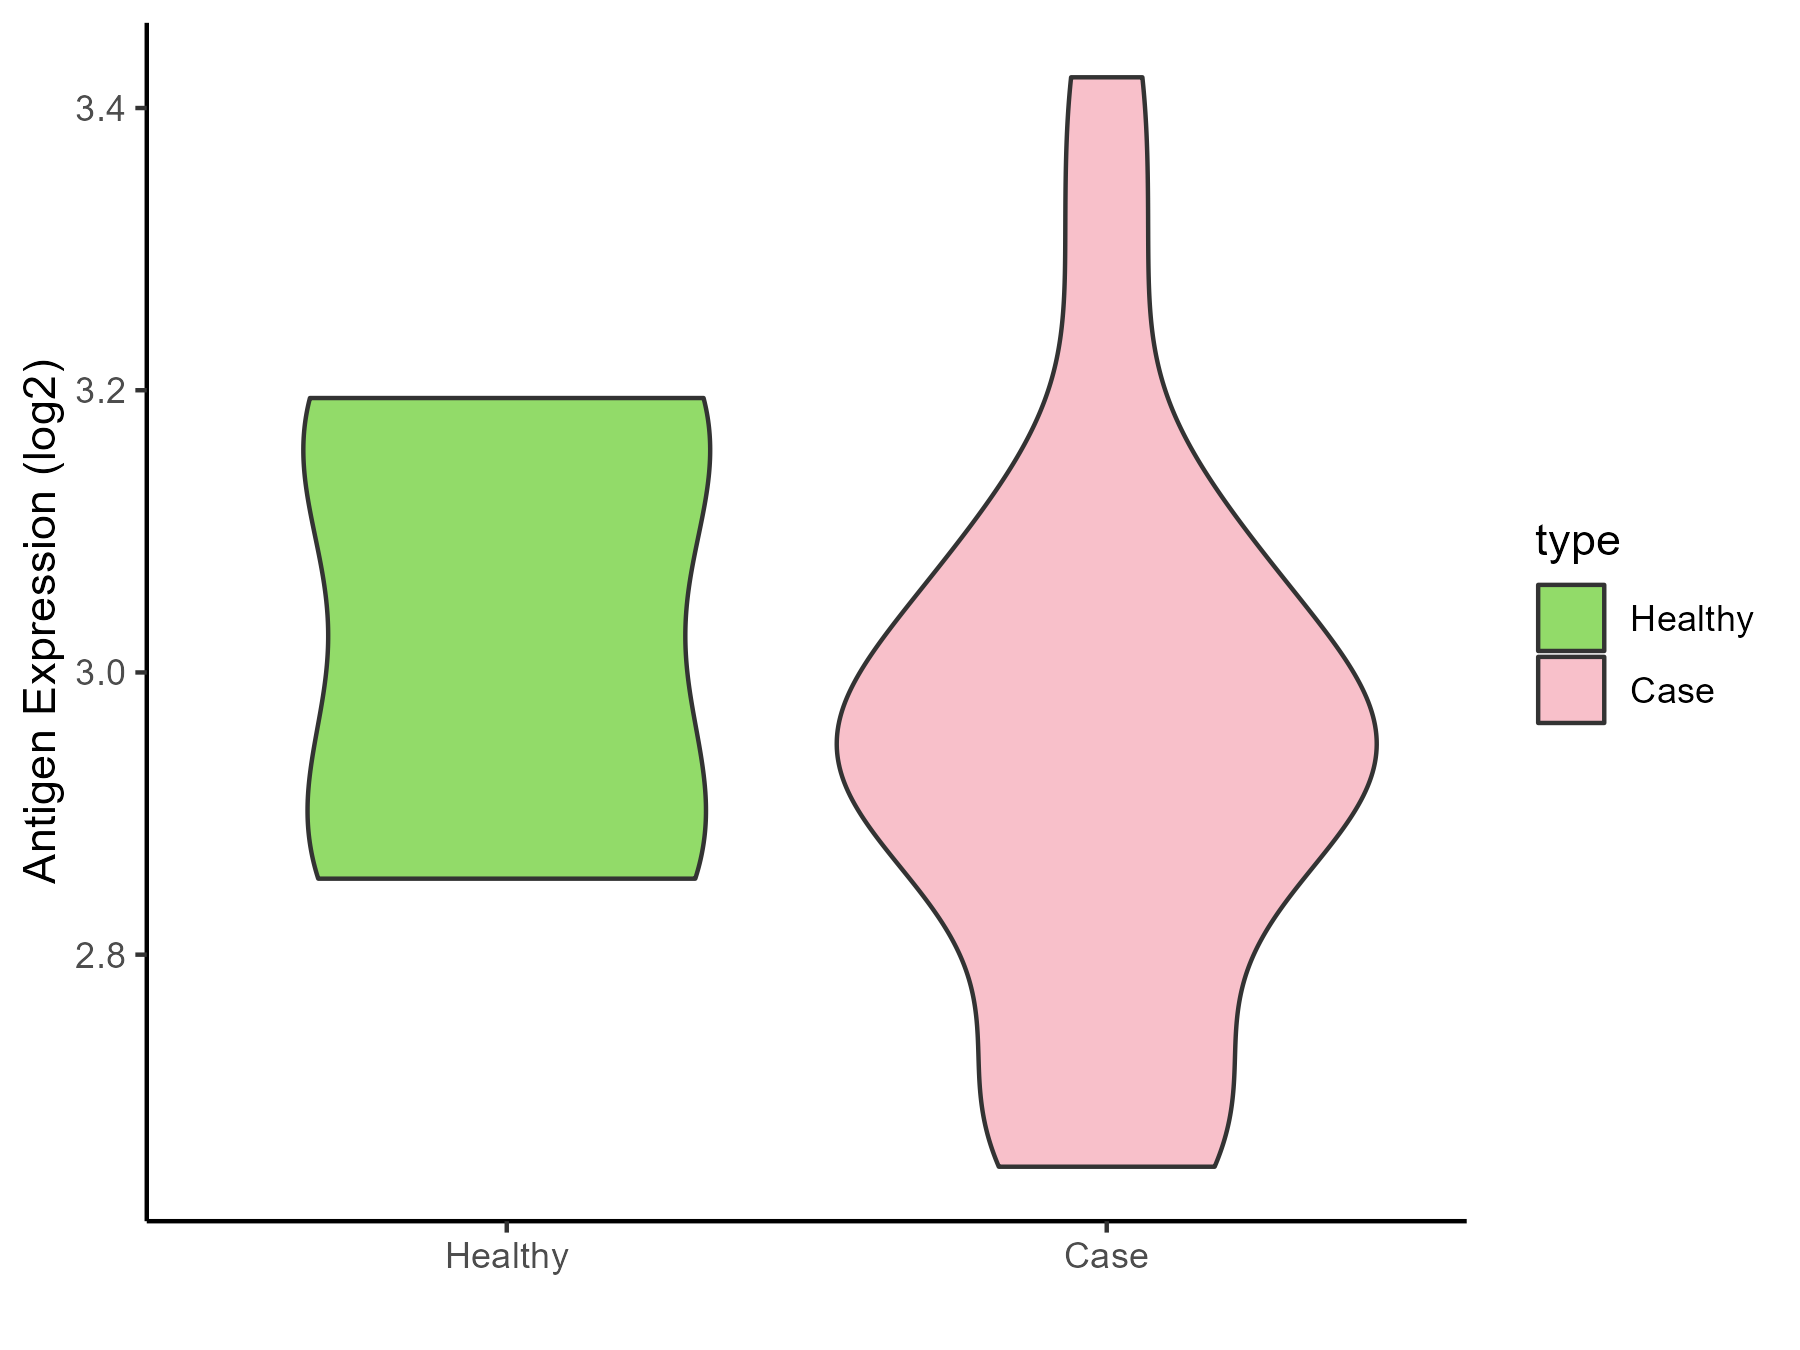
| Differential expression pattern of antigen in diseases | ||
| The Studied Tissue | Peripheral blood | |
| The Specific Disease | Coronary artery disease | |
| The Expression Level of Disease Section Compare with the Healthy Individual Tissue | p-value: 0.433190834; Fold-change: -0.095725096; Z-score: -0.553398105 | |
| Disease-specific Antigen Abundances |
|
Click to View the Clearer Original Diagram |
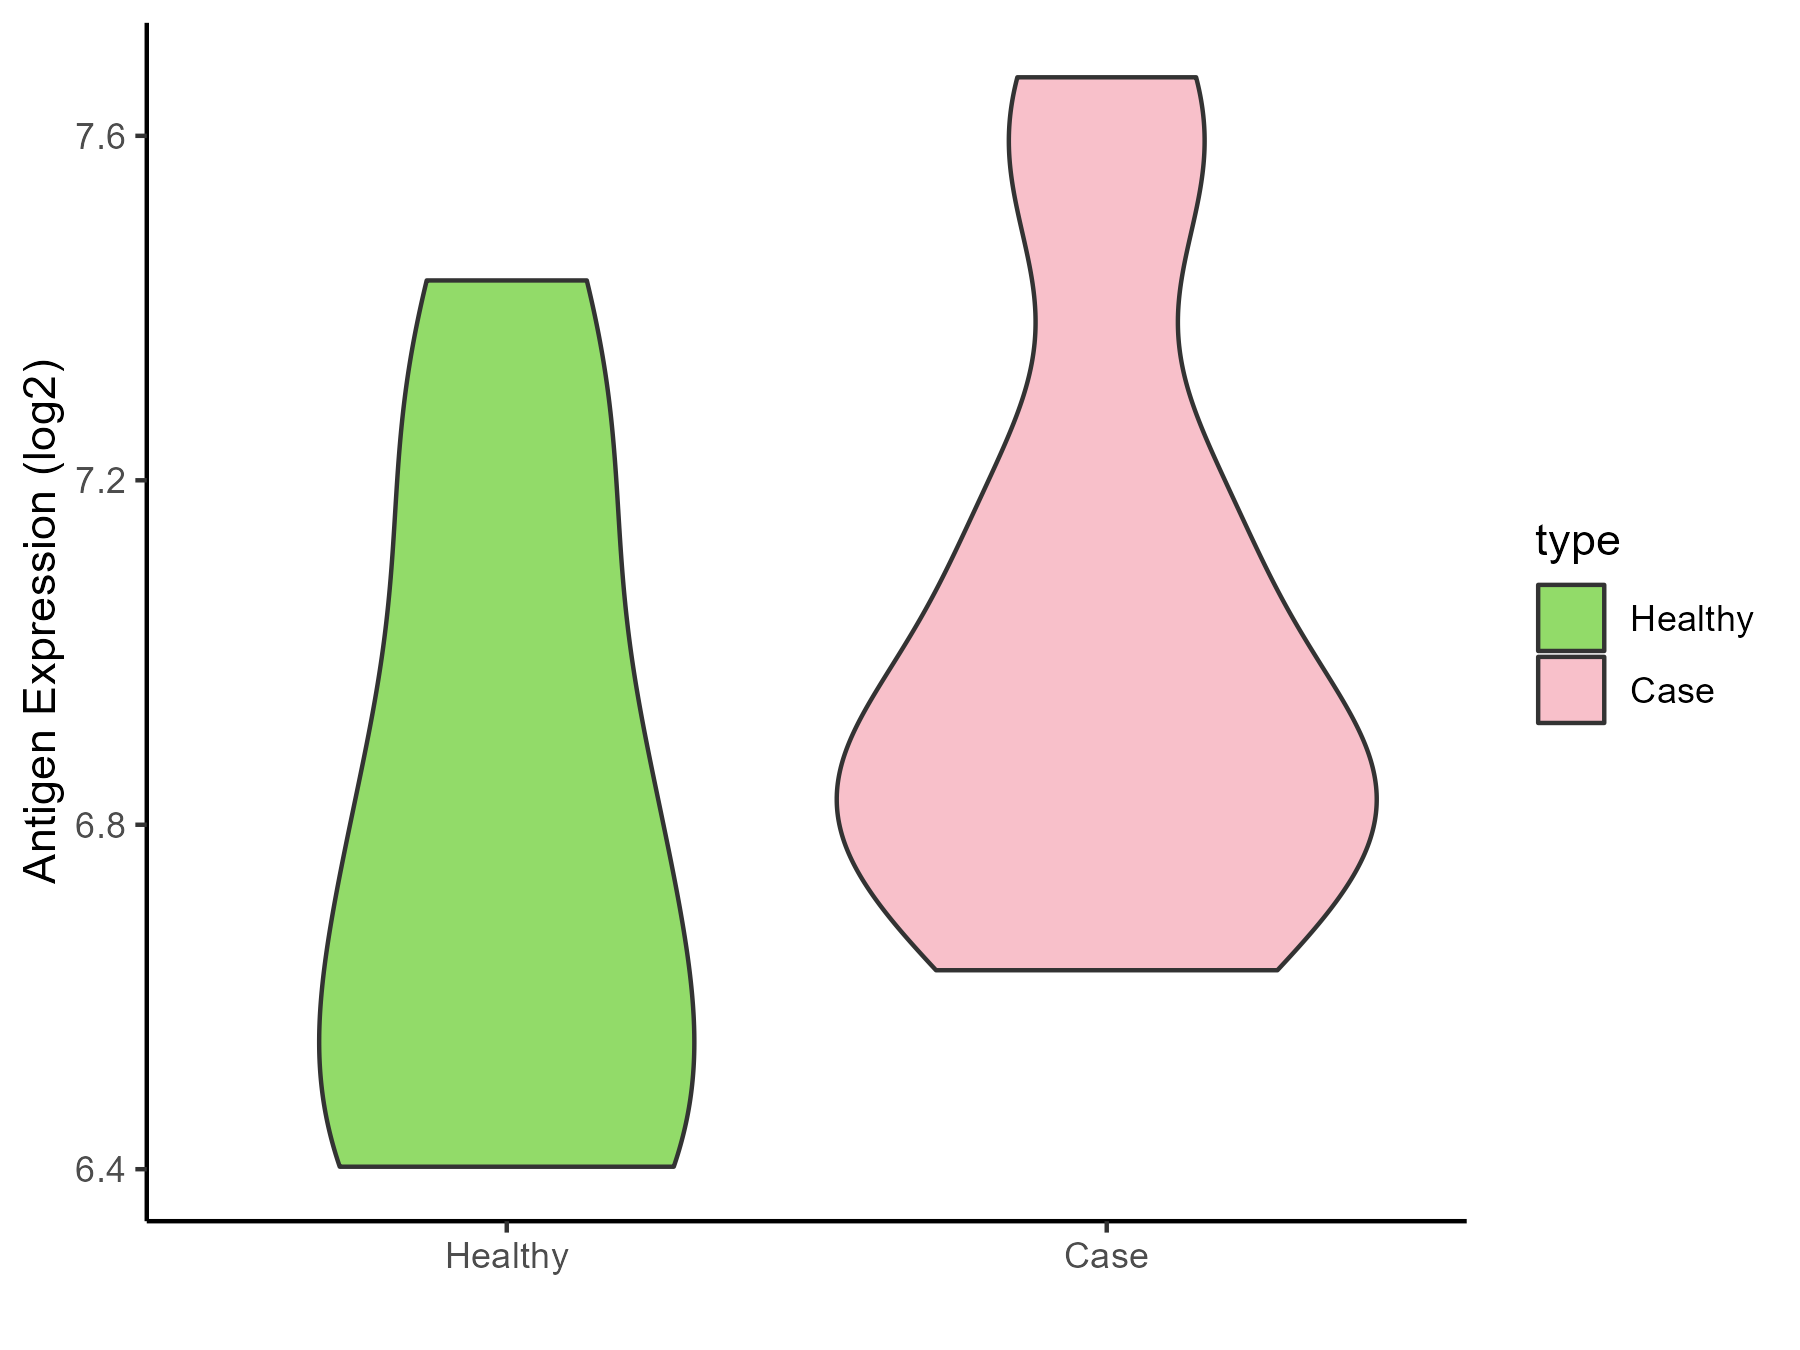
| Differential expression pattern of antigen in diseases | ||
| The Studied Tissue | Calcified aortic valve | |
| The Specific Disease | Aortic stenosis | |
| The Expression Level of Disease Section Compare with the Healthy Individual Tissue | p-value: 0.175069366; Fold-change: 0.132902879; Z-score: 0.353819984 | |
| Disease-specific Antigen Abundances |
|
Click to View the Clearer Original Diagram |
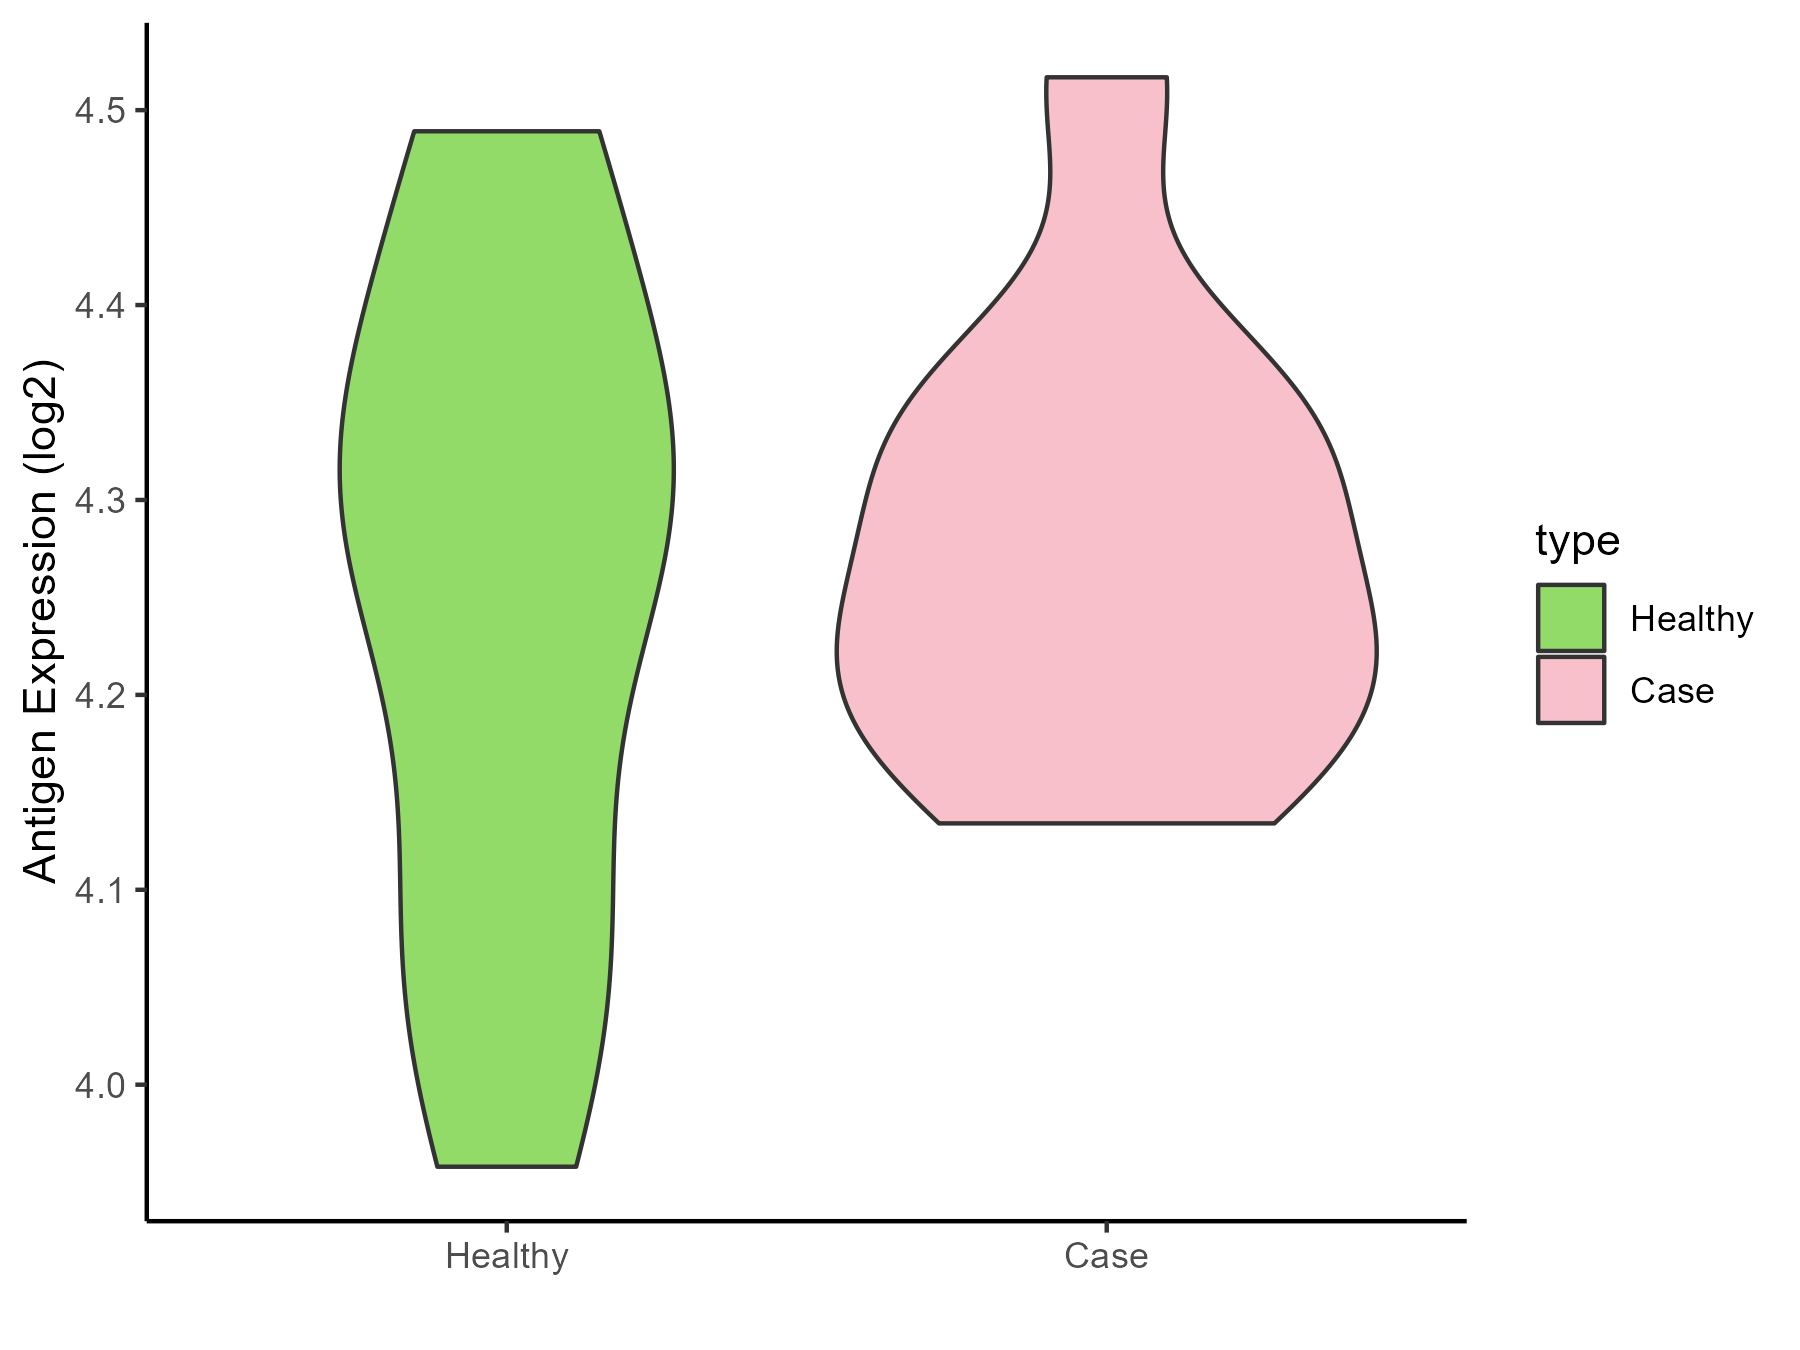
| Differential expression pattern of antigen in diseases | ||
| The Studied Tissue | Peripheral blood | |
| The Specific Disease | Arteriosclerosis | |
| The Expression Level of Disease Section Compare with the Healthy Individual Tissue | p-value: 0.67827719; Fold-change: -0.030674305; Z-score: -0.177547945 | |
| Disease-specific Antigen Abundances |
|
Click to View the Clearer Original Diagram |
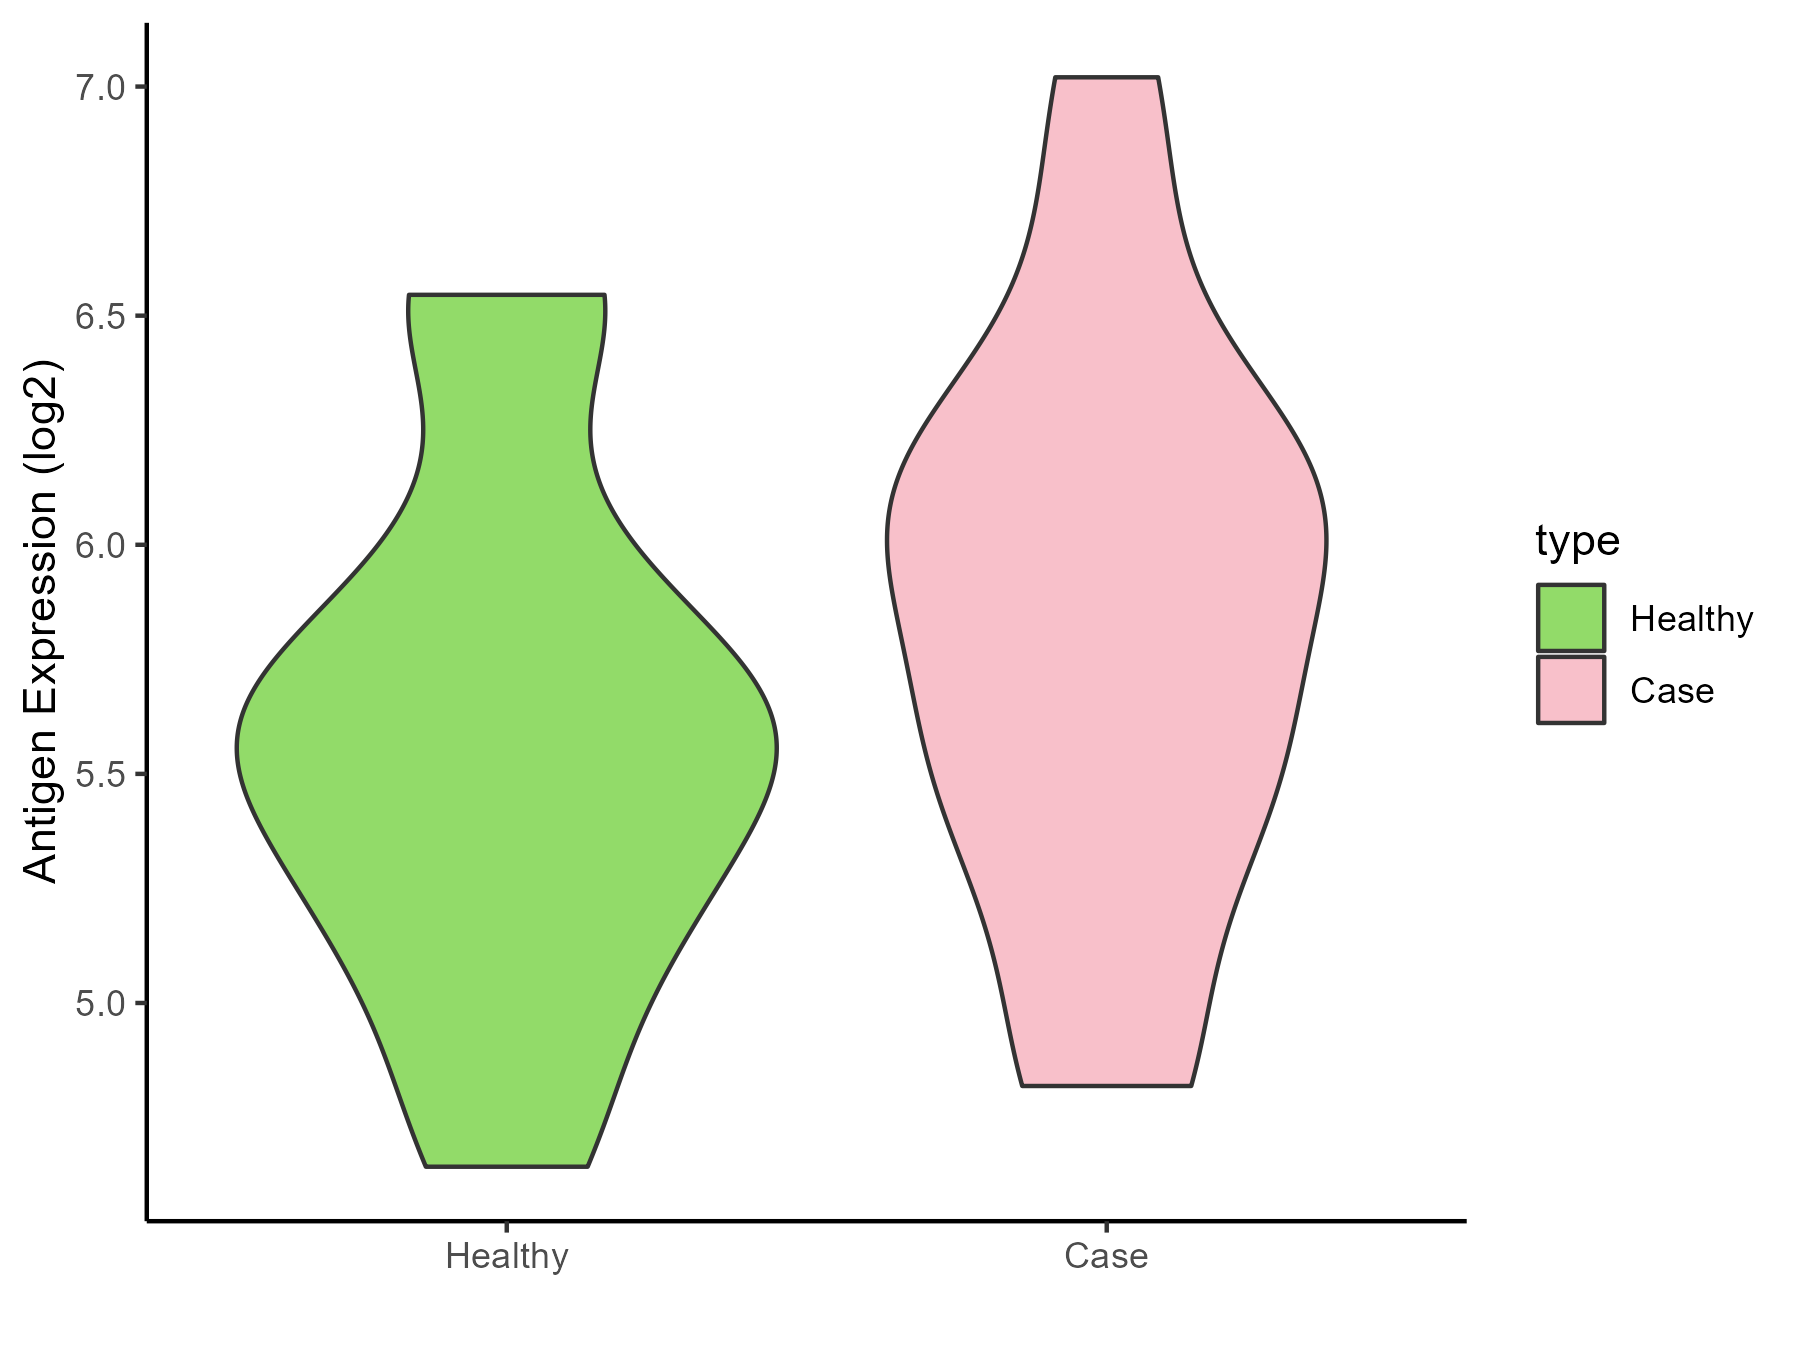
| Differential expression pattern of antigen in diseases | ||
| The Studied Tissue | Intracranial artery | |
| The Specific Disease | Aneurysm | |
| The Expression Level of Disease Section Compare with the Healthy Individual Tissue | p-value: 0.292203563; Fold-change: 0.282179092; Z-score: 0.497079493 | |
| Disease-specific Antigen Abundances |
|
Click to View the Clearer Original Diagram |
ICD Disease Classification 12
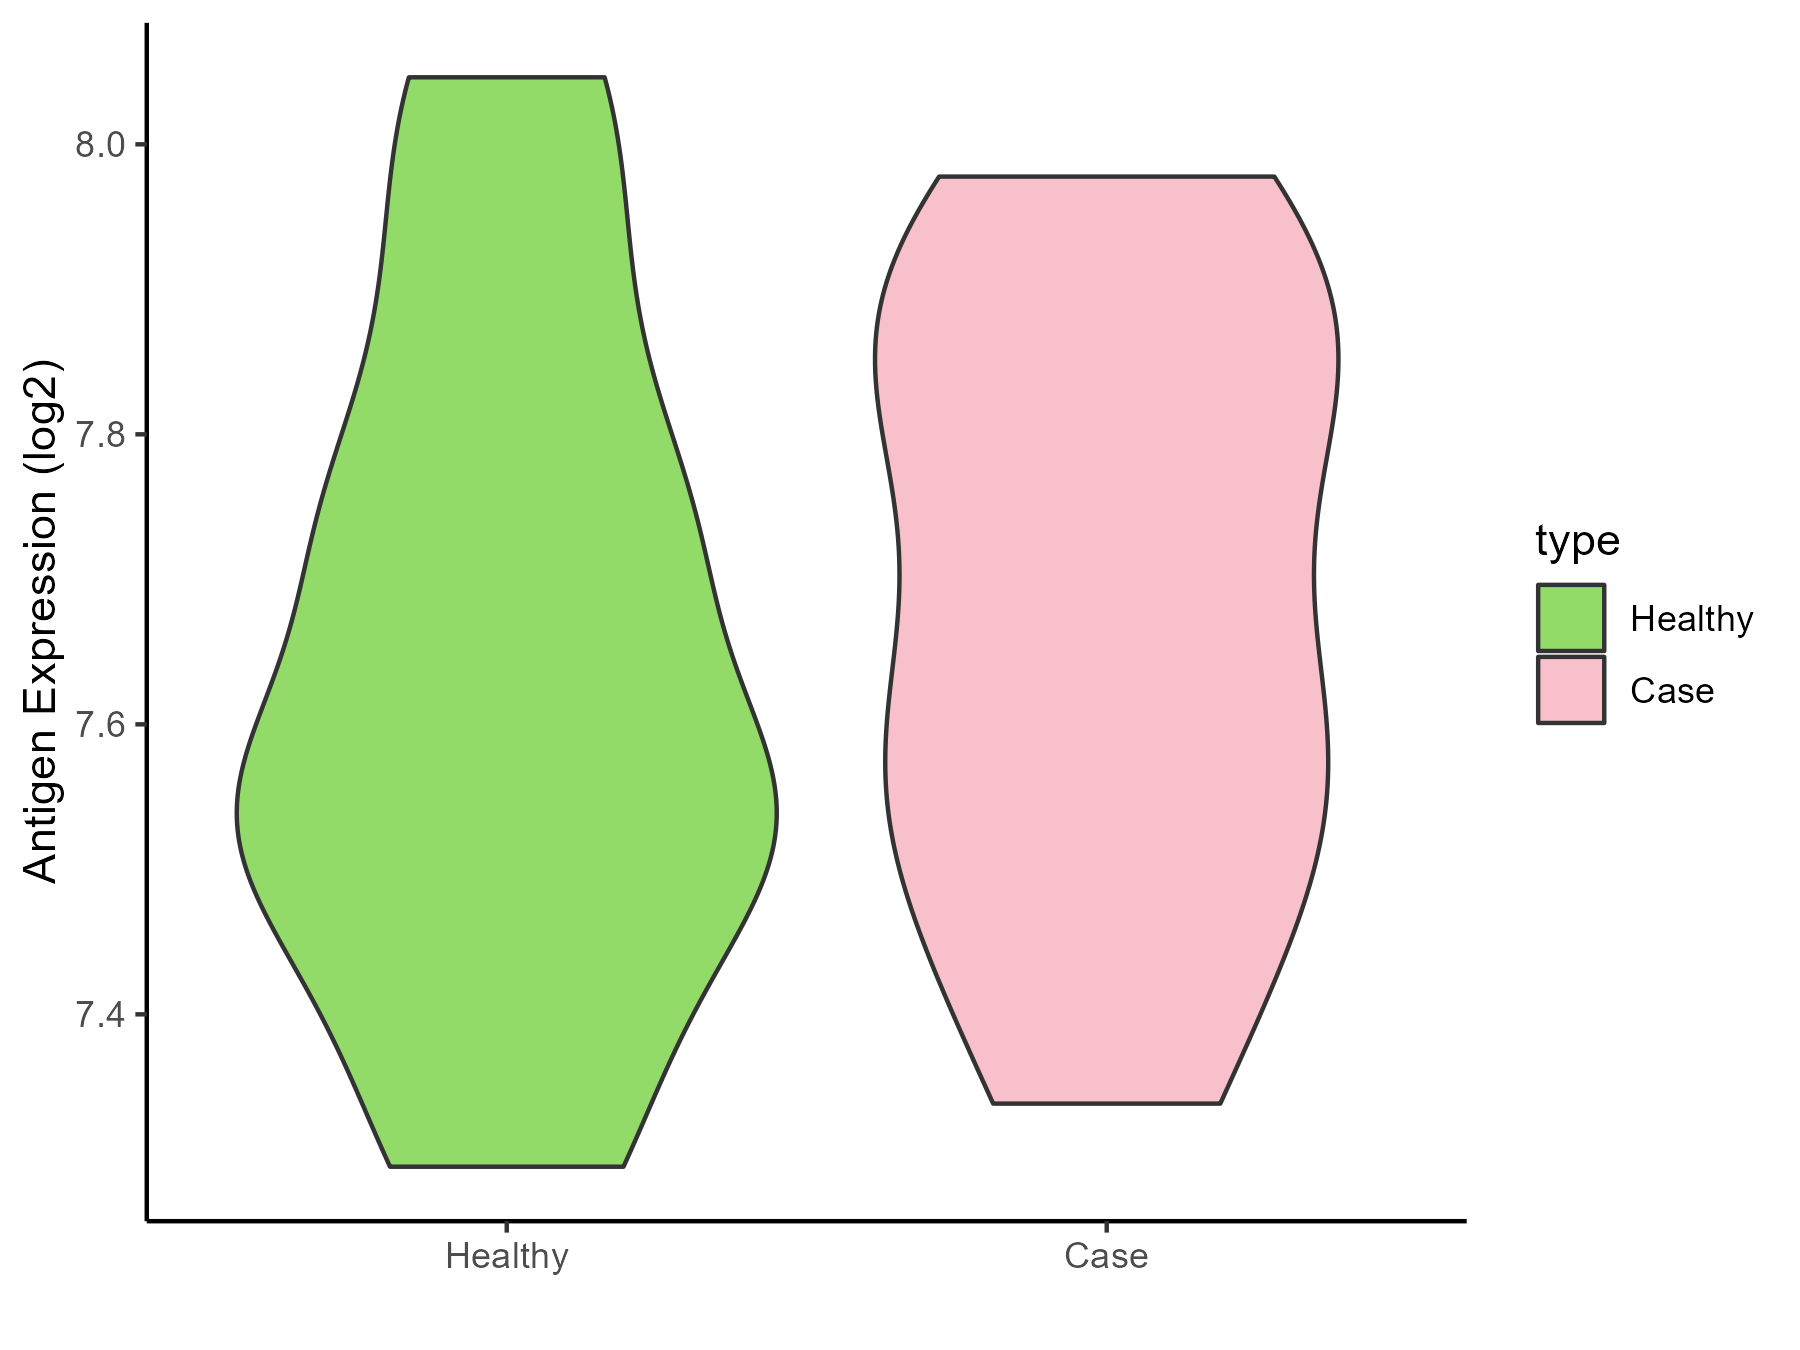
| Differential expression pattern of antigen in diseases | ||
| The Studied Tissue | Peripheral blood | |
| The Specific Disease | Immunodeficiency | |
| The Expression Level of Disease Section Compare with the Healthy Individual Tissue | p-value: 0.668460654; Fold-change: 0.092832582; Z-score: 0.39077476 | |
| Disease-specific Antigen Abundances |
|
Click to View the Clearer Original Diagram |
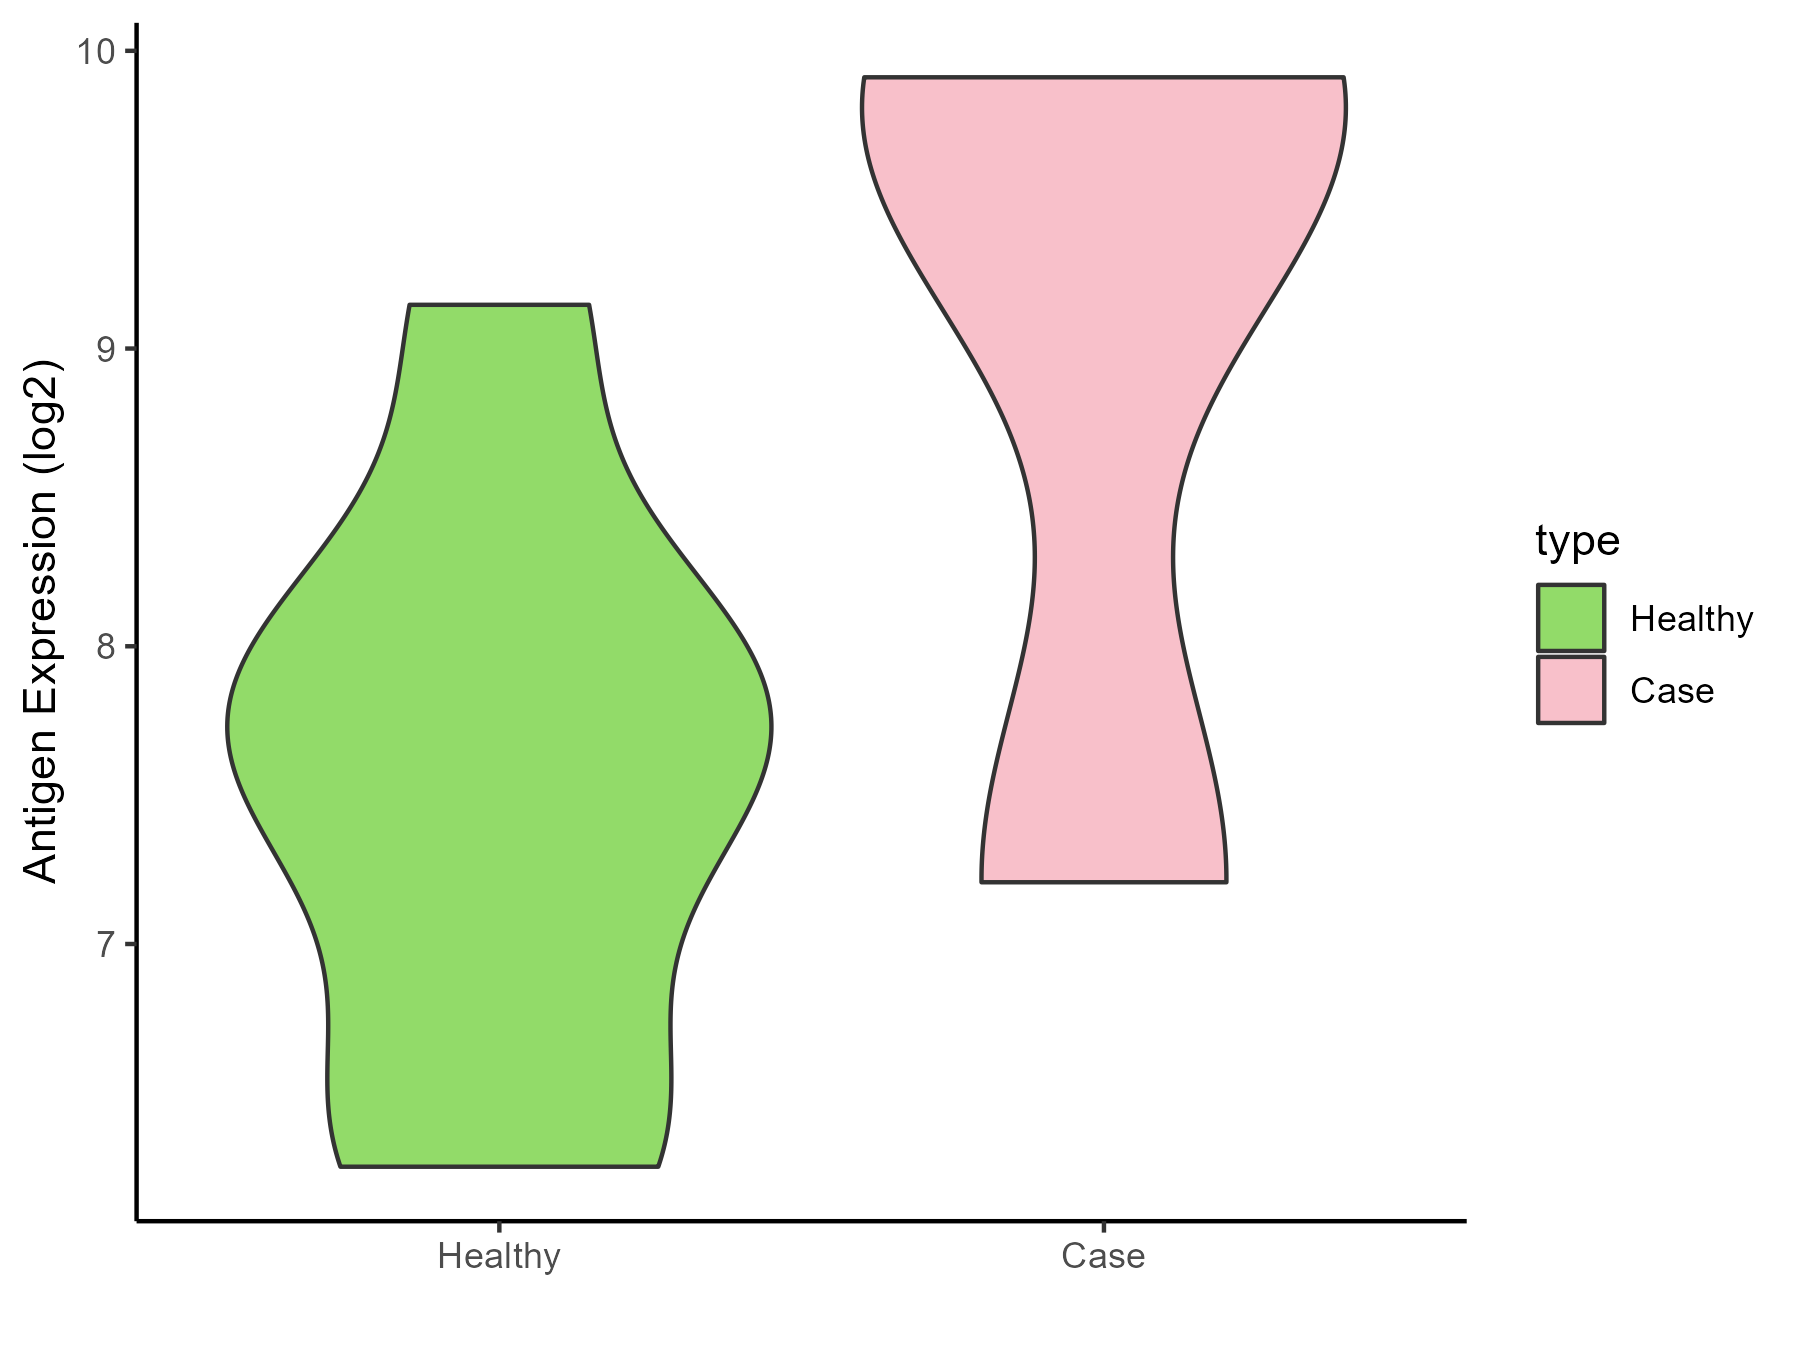
| Differential expression pattern of antigen in diseases | ||
| The Studied Tissue | Hyperplastic tonsil | |
| The Specific Disease | Apnea | |
| The Expression Level of Disease Section Compare with the Healthy Individual Tissue | p-value: 0.242528948; Fold-change: 1.997969977; Z-score: 2.013267294 | |
| Disease-specific Antigen Abundances |
|
Click to View the Clearer Original Diagram |
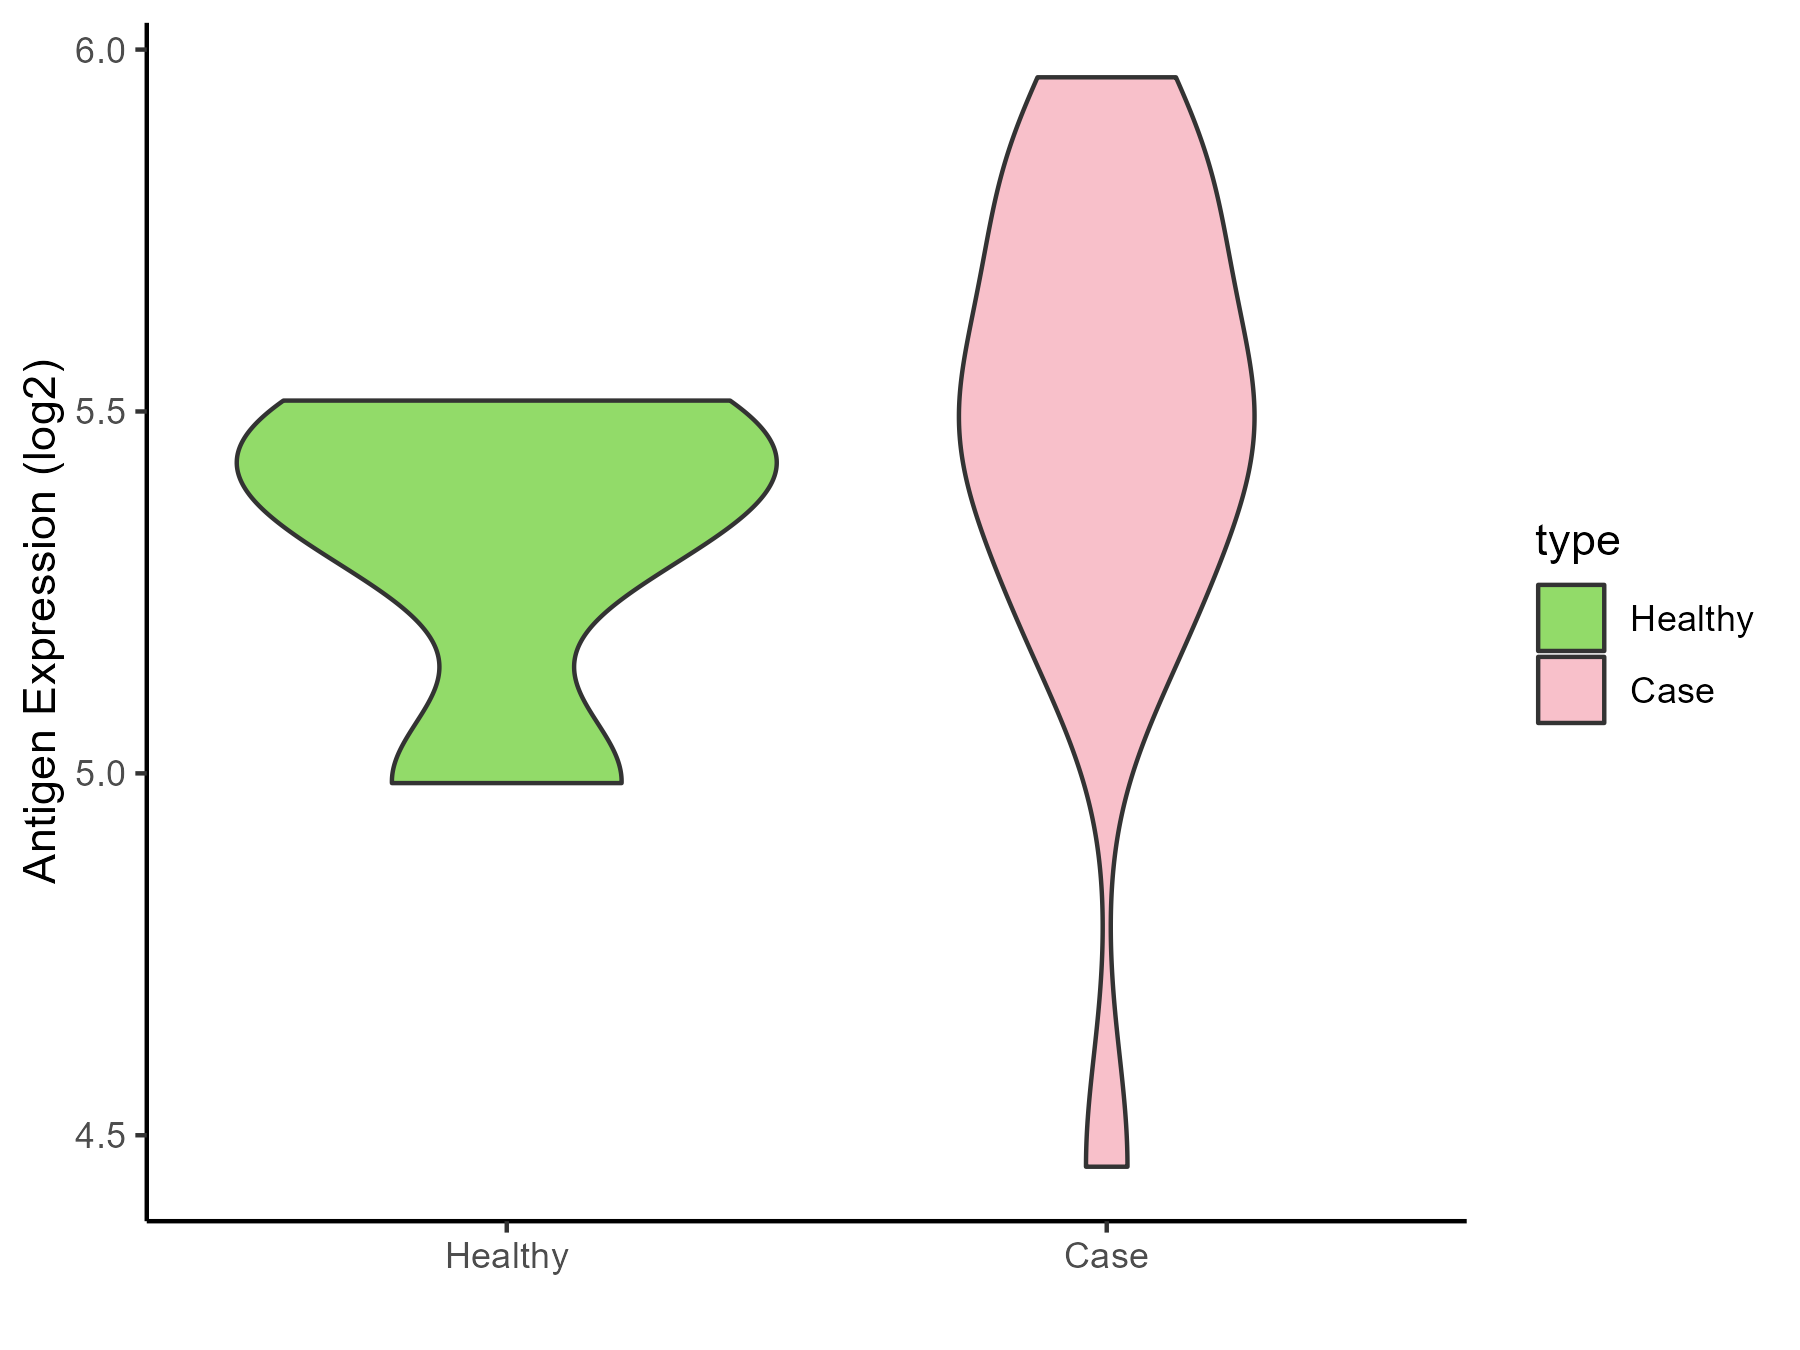
| Differential expression pattern of antigen in diseases | ||
| The Studied Tissue | Peripheral blood | |
| The Specific Disease | Olive pollen allergy | |
| The Expression Level of Disease Section Compare with the Healthy Individual Tissue | p-value: 0.313736403; Fold-change: 0.102585827; Z-score: 0.441795929 | |
| Disease-specific Antigen Abundances |
|
Click to View the Clearer Original Diagram |
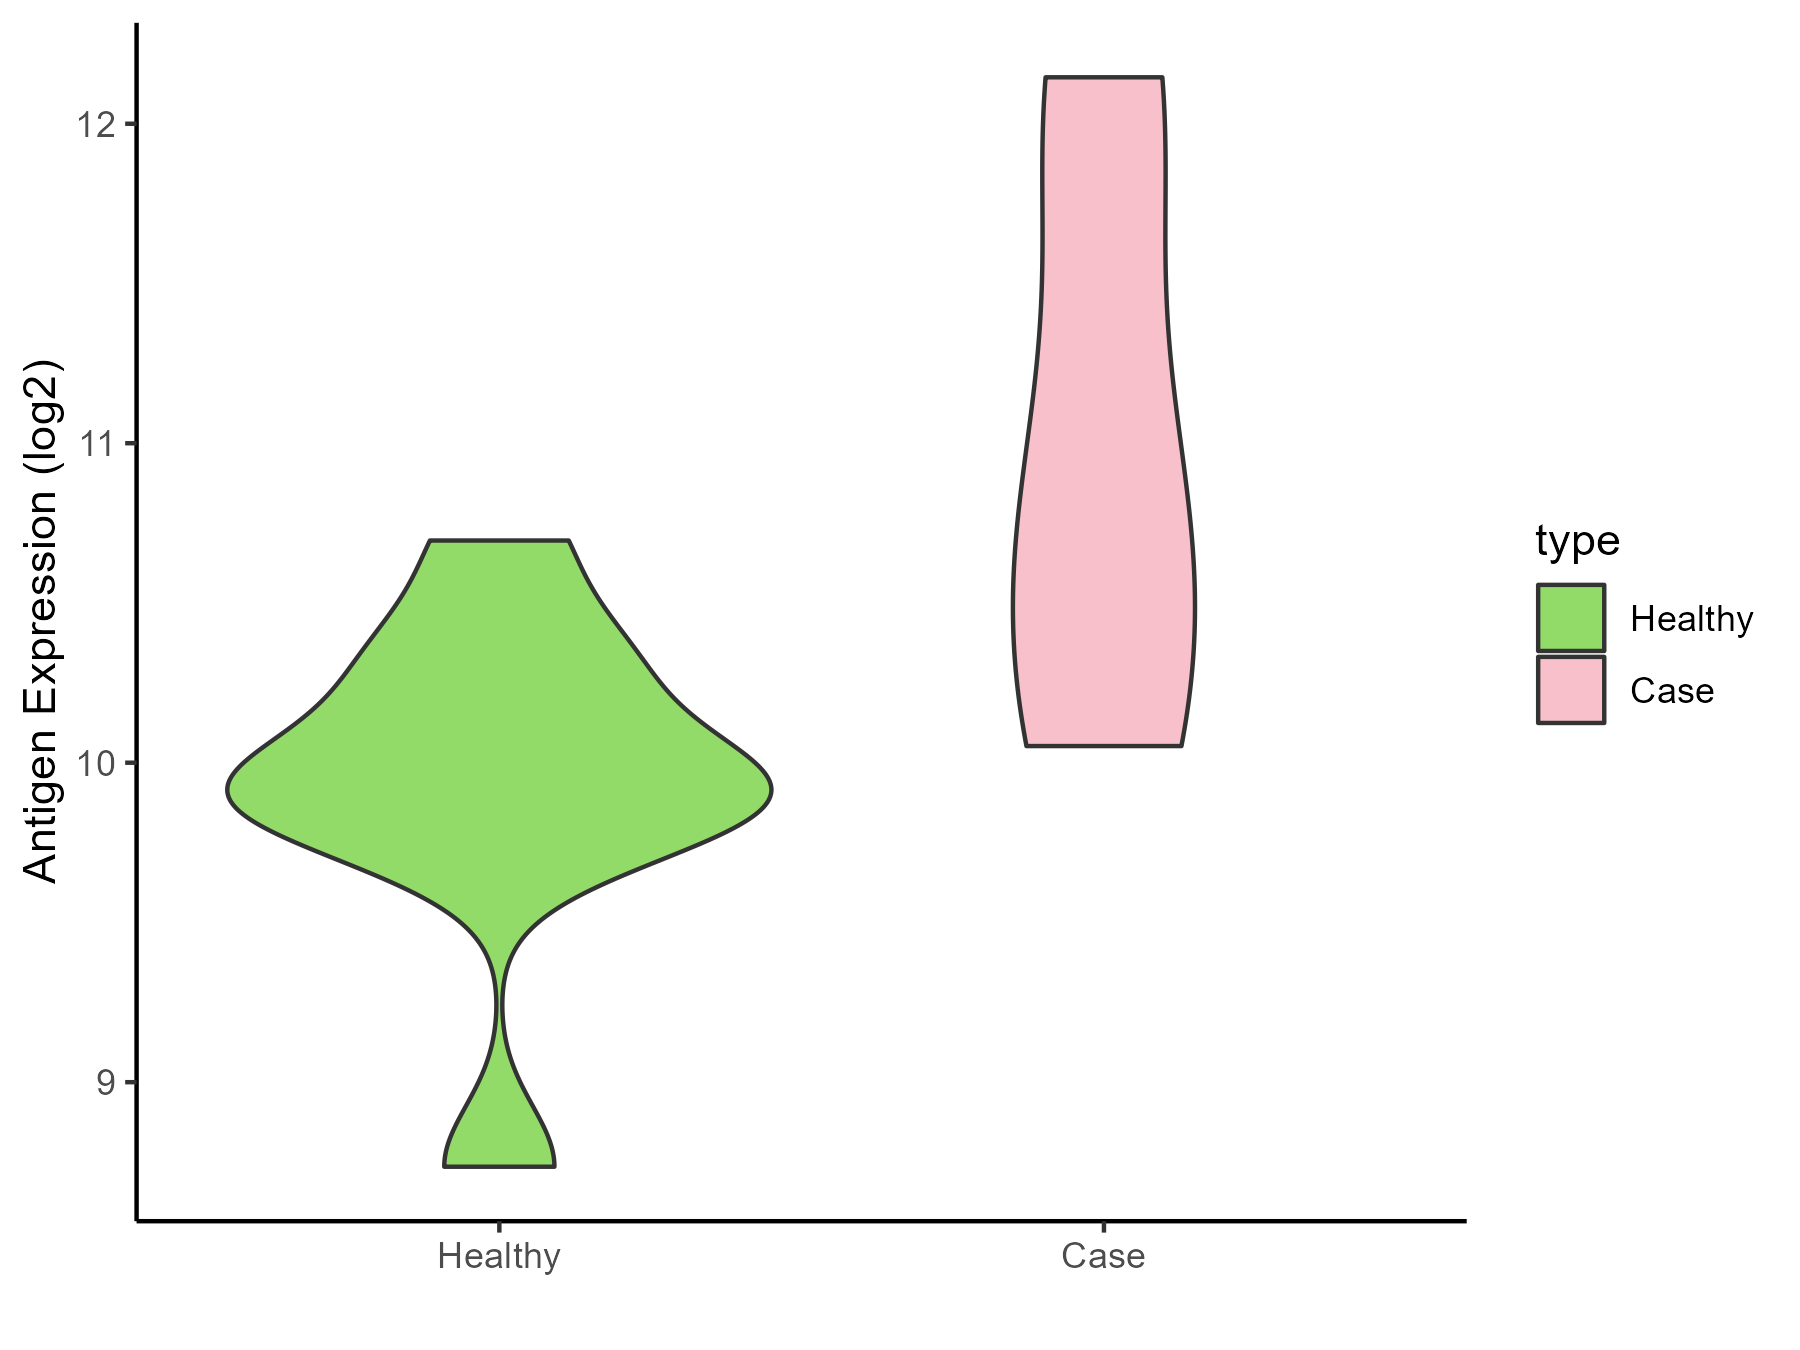
| Differential expression pattern of antigen in diseases | ||
| The Studied Tissue | Sinus mucosa | |
| The Specific Disease | Chronic rhinosinusitis | |
| The Expression Level of Disease Section Compare with the Healthy Individual Tissue | p-value: 0.035666181; Fold-change: 0.880483326; Z-score: 1.632086565 | |
| Disease-specific Antigen Abundances |
|
Click to View the Clearer Original Diagram |
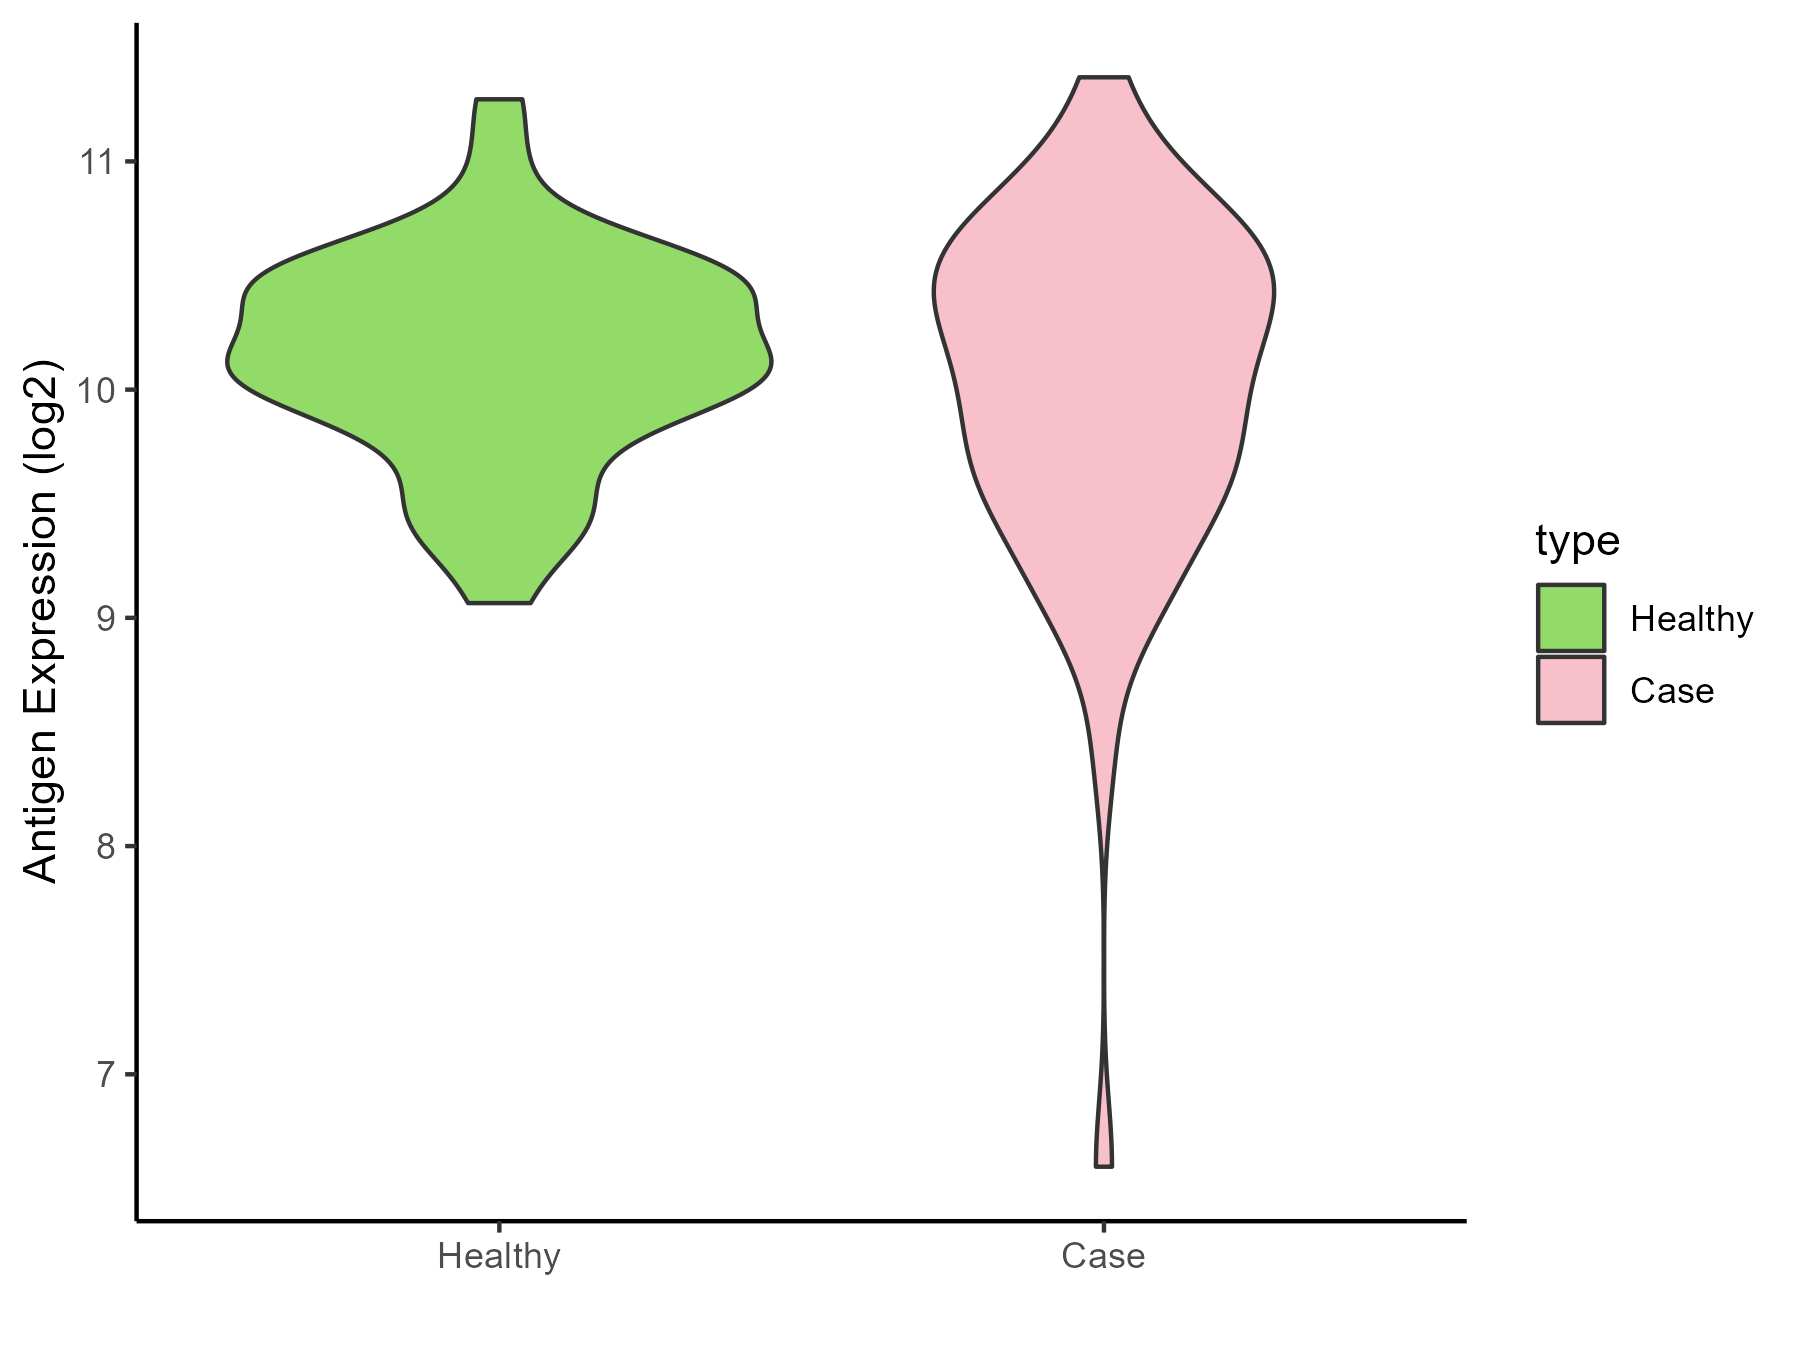
| Differential expression pattern of antigen in diseases | ||
| The Studied Tissue | Lung | |
| The Specific Disease | Chronic obstructive pulmonary disease | |
| The Expression Level of Disease Section Compare with the Healthy Individual Tissue | p-value: 0.285357863; Fold-change: -0.036562189; Z-score: -0.079258335 | |
| Disease-specific Antigen Abundances |
|
Click to View the Clearer Original Diagram |
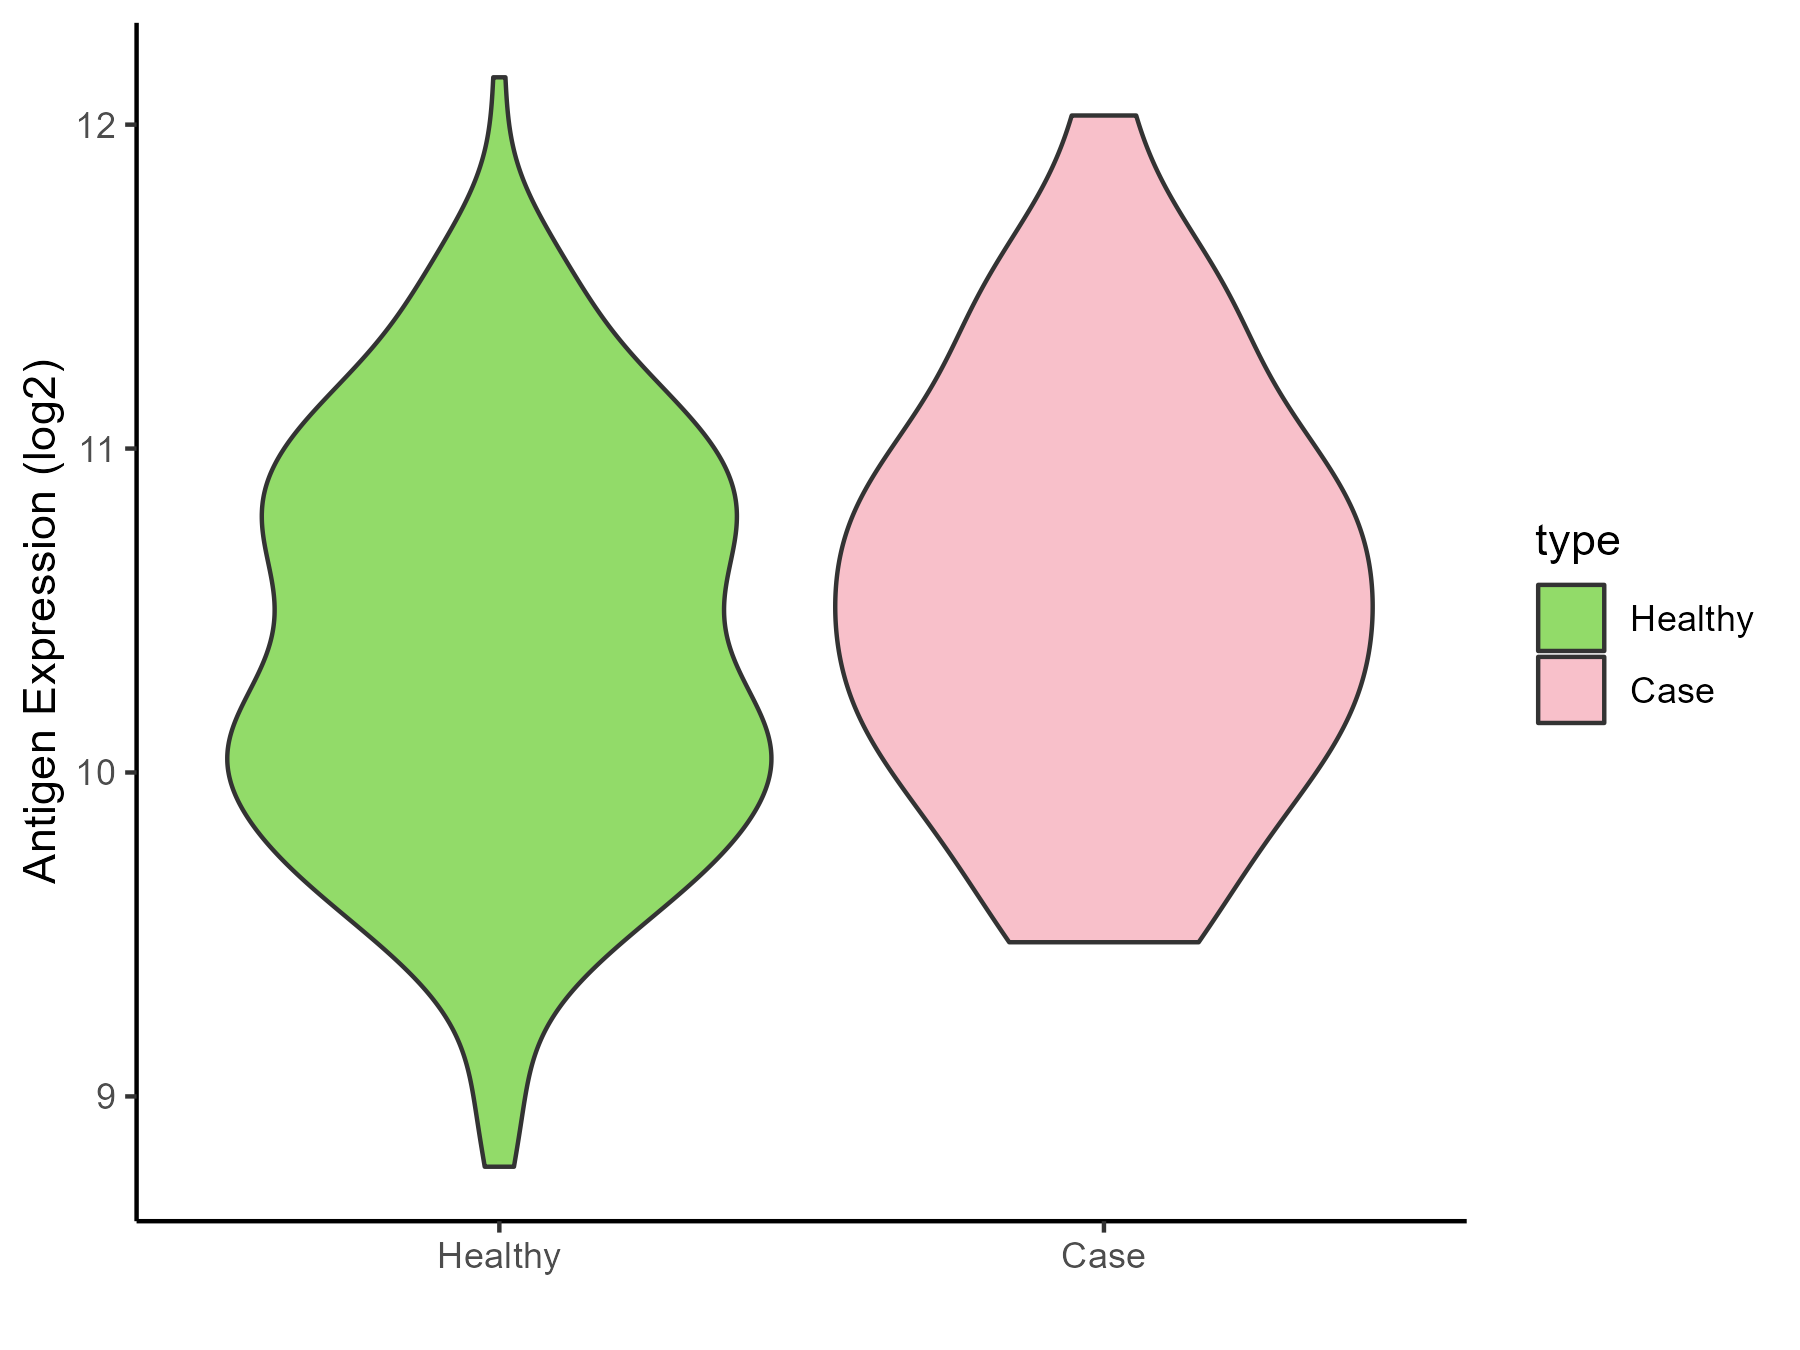
| The Studied Tissue | Small airway epithelium | |
| The Specific Disease | Chronic obstructive pulmonary disease | |
| The Expression Level of Disease Section Compare with the Healthy Individual Tissue | p-value: 0.121680468; Fold-change: 0.185608327; Z-score: 0.293574353 | |
| Disease-specific Antigen Abundances |
|
Click to View the Clearer Original Diagram |
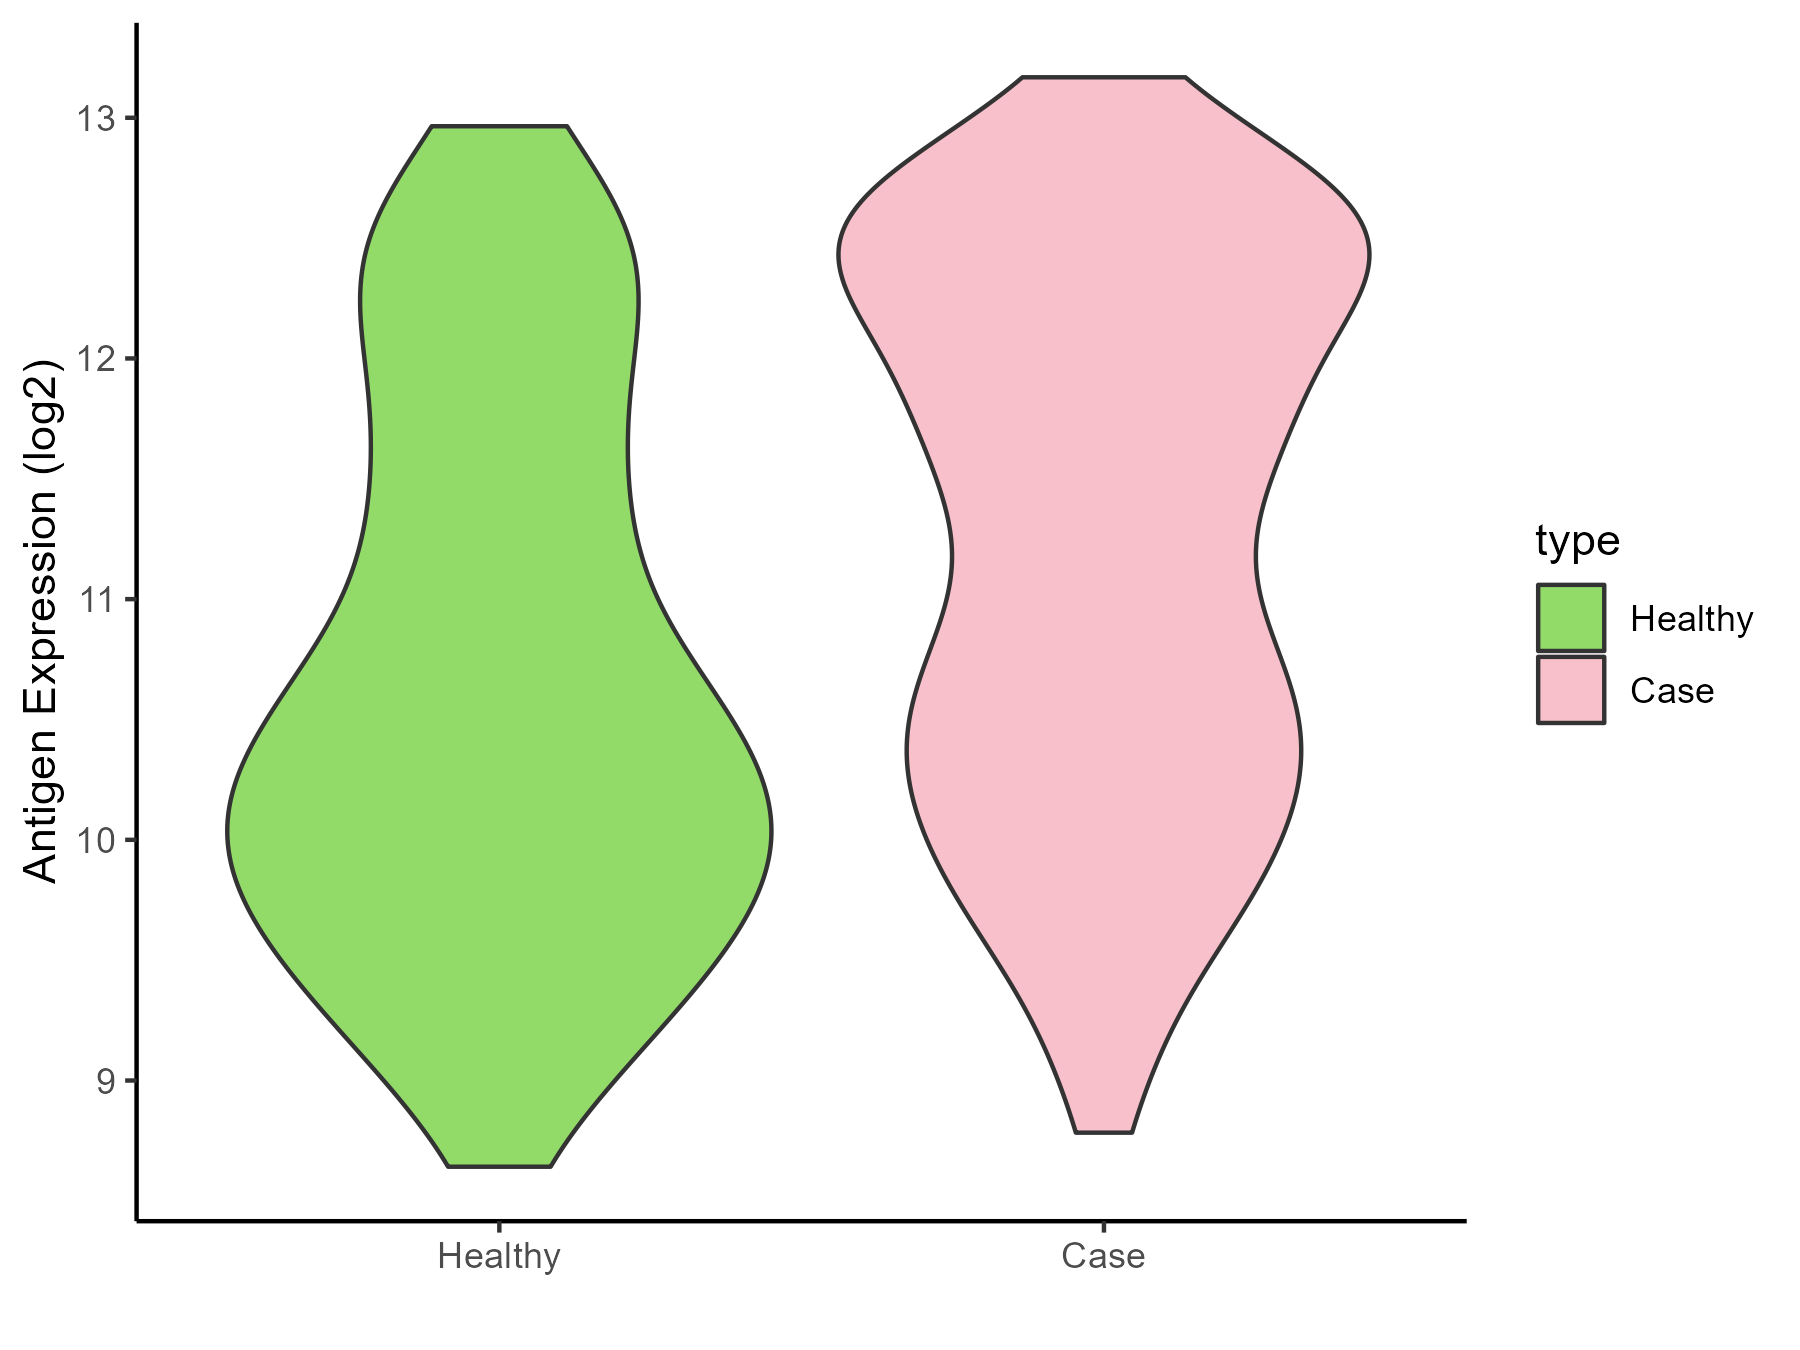
| Differential expression pattern of antigen in diseases | ||
| The Studied Tissue | Nasal and bronchial airway | |
| The Specific Disease | Asthma | |
| The Expression Level of Disease Section Compare with the Healthy Individual Tissue | p-value: 2.35E-06; Fold-change: 1.071880435; Z-score: 0.946581783 | |
| Disease-specific Antigen Abundances |
|
Click to View the Clearer Original Diagram |
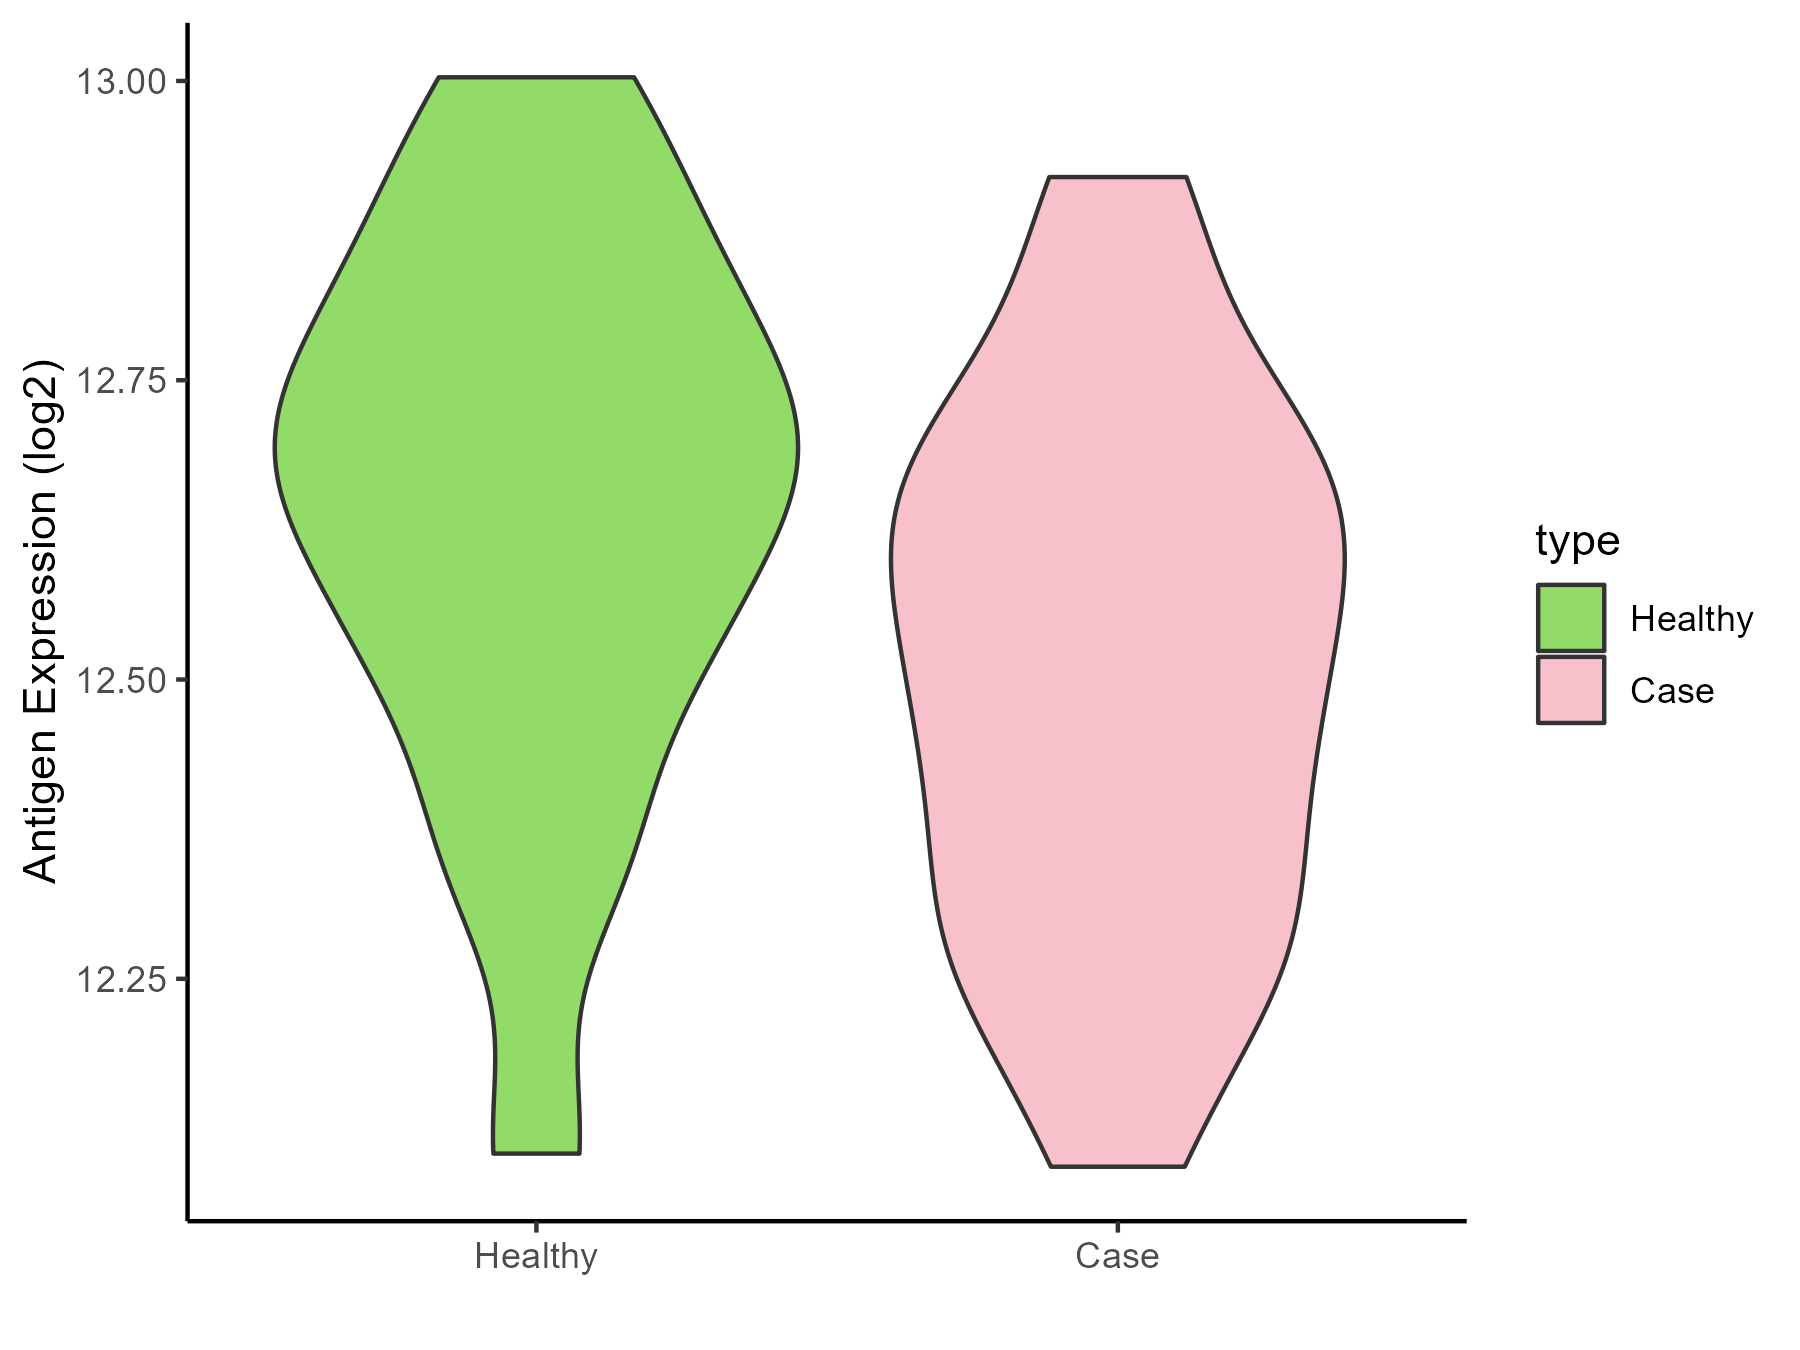
| Differential expression pattern of antigen in diseases | ||
| The Studied Tissue | Nasal Epithelium | |
| The Specific Disease | Human rhinovirus infection | |
| The Expression Level of Disease Section Compare with the Healthy Individual Tissue | p-value: 0.008795918; Fold-change: -0.152741056; Z-score: -0.657924101 | |
| Disease-specific Antigen Abundances |
|
Click to View the Clearer Original Diagram |
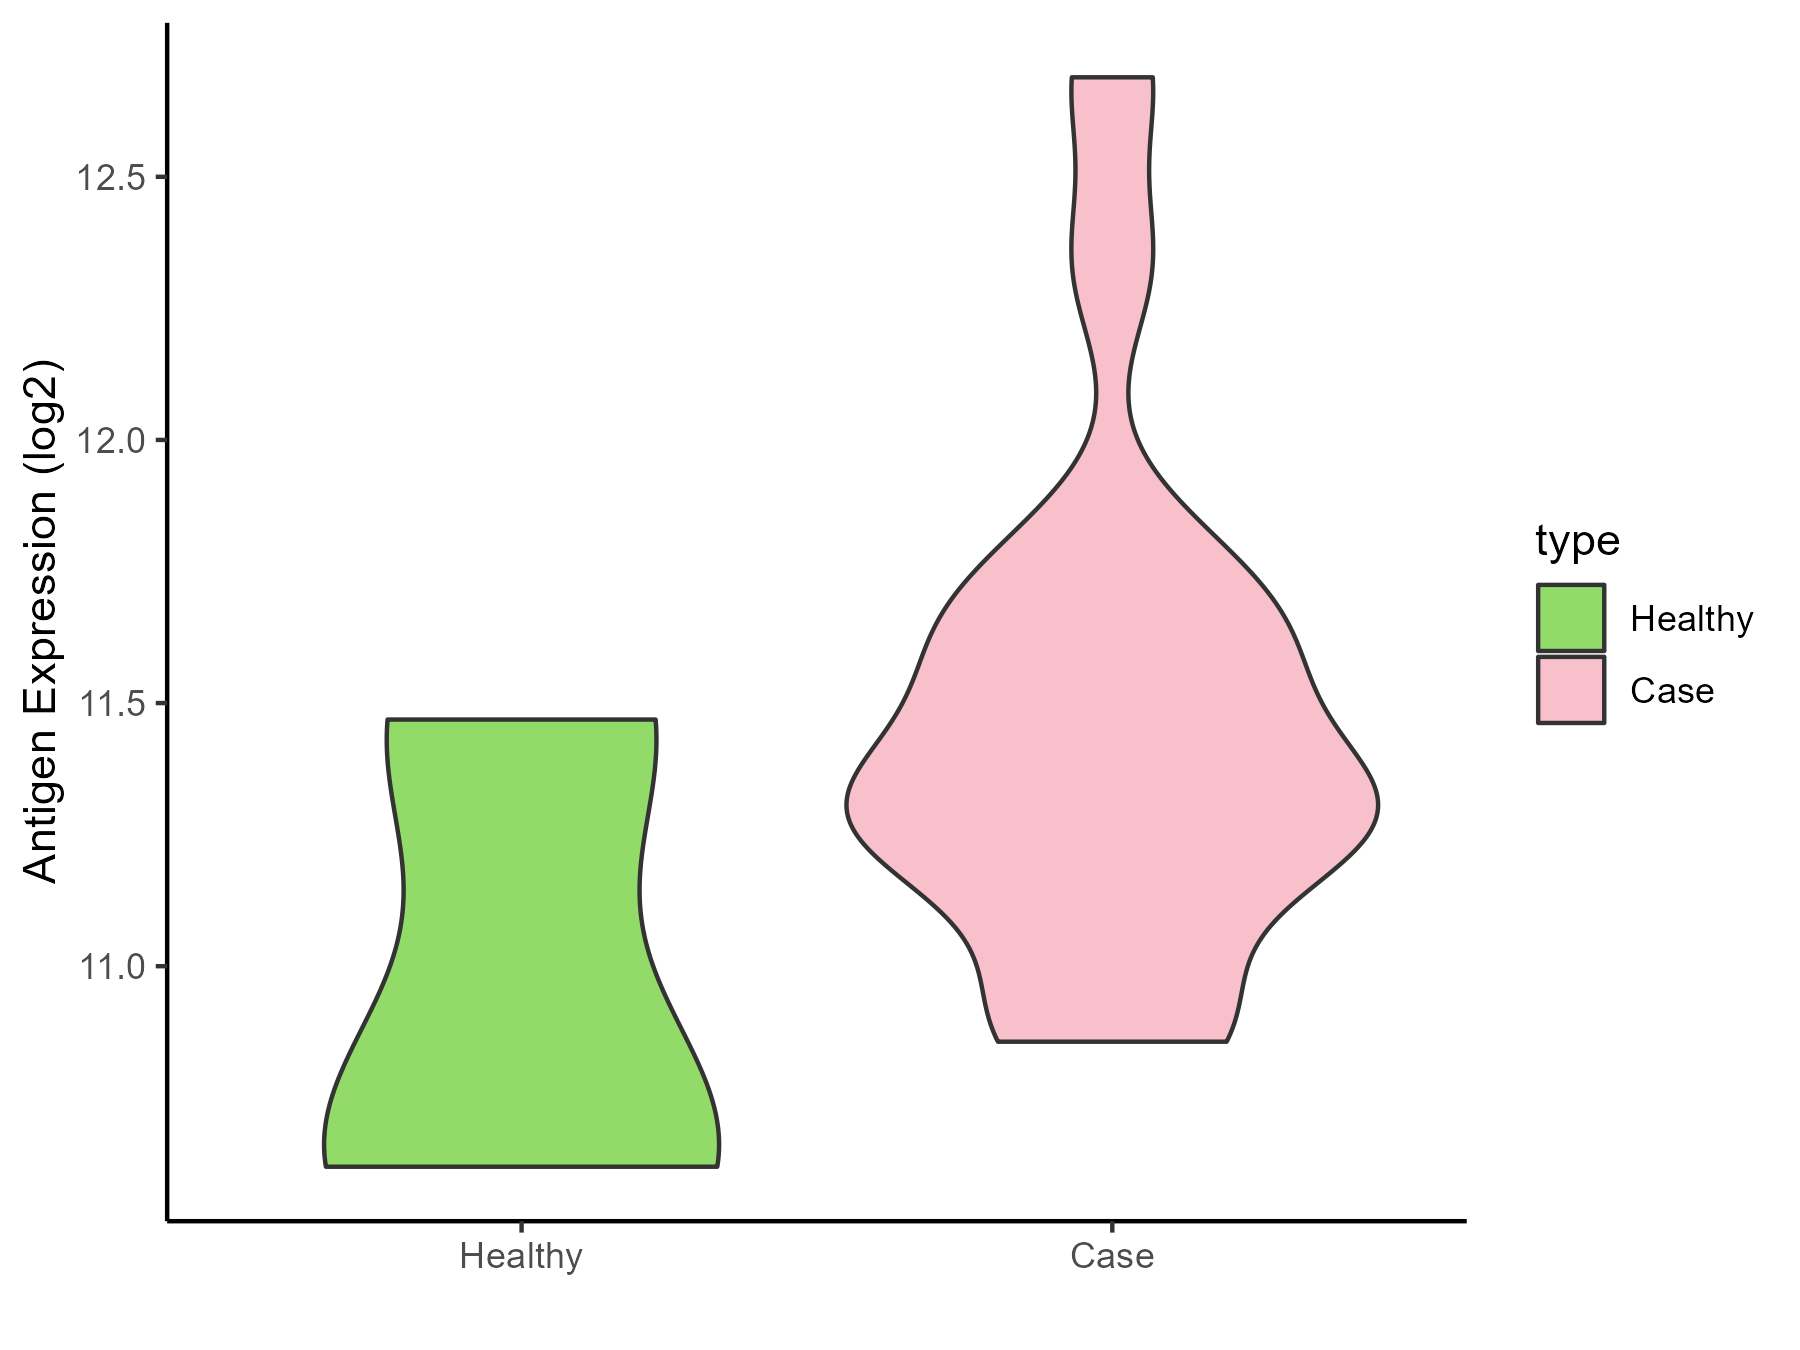
| Differential expression pattern of antigen in diseases | ||
| The Studied Tissue | Lung | |
| The Specific Disease | Idiopathic pulmonary fibrosis | |
| The Expression Level of Disease Section Compare with the Healthy Individual Tissue | p-value: 0.070729209; Fold-change: 0.657513987; Z-score: 1.472273194 | |
| Disease-specific Antigen Abundances |
|
Click to View the Clearer Original Diagram |
ICD Disease Classification 13
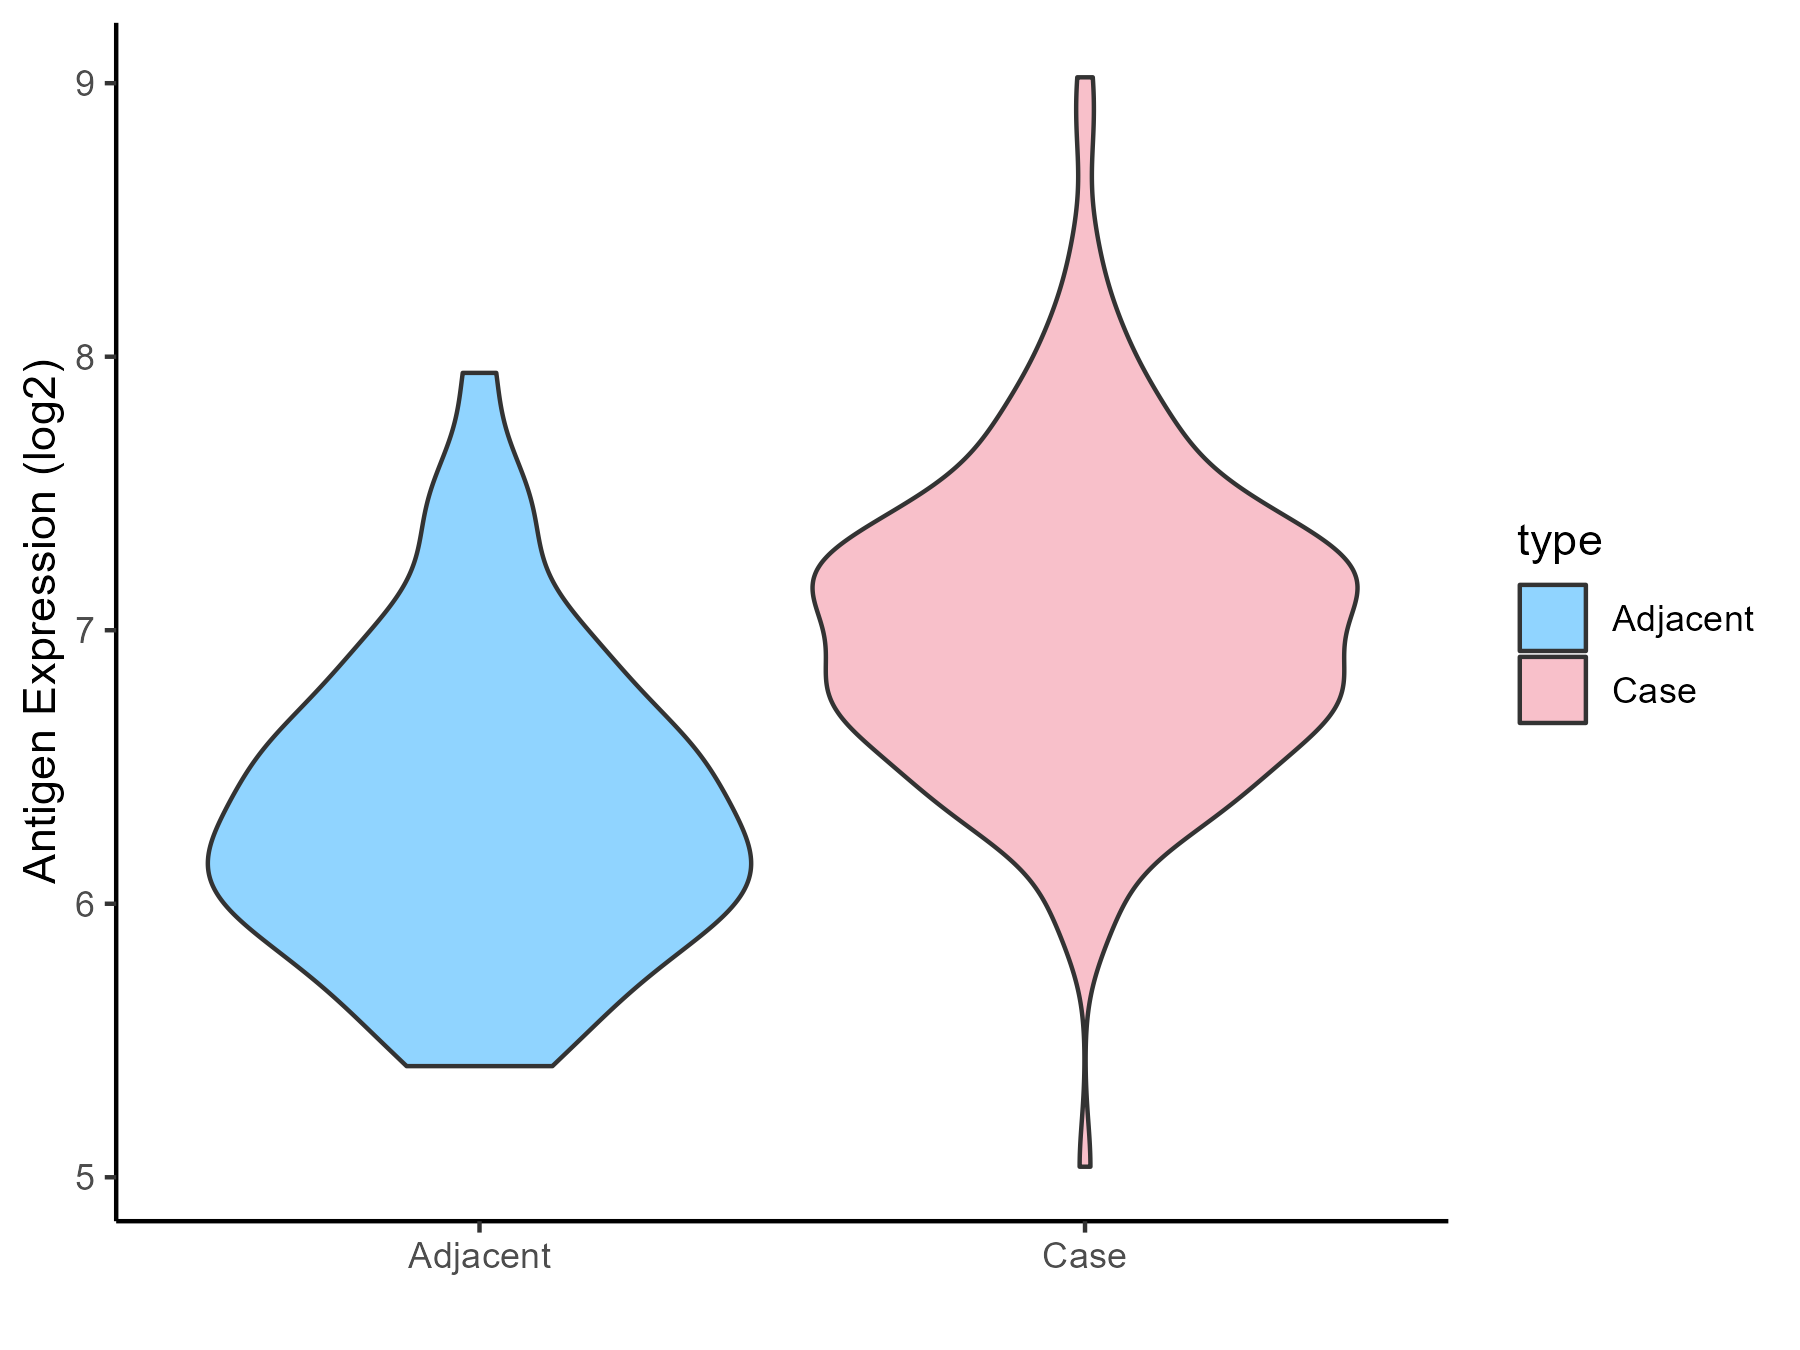
| Differential expression pattern of antigen in diseases | ||
| The Studied Tissue | Gingival | |
| The Specific Disease | Periodontal disease | |
| The Expression Level of Disease Section Compare with the Adjacent Tissue | p-value: 7.21E-12; Fold-change: 0.730993317; Z-score: 1.307219039 | |
| Disease-specific Antigen Abundances |
|
Click to View the Clearer Original Diagram |
| Differential expression pattern of antigen in diseases | ||
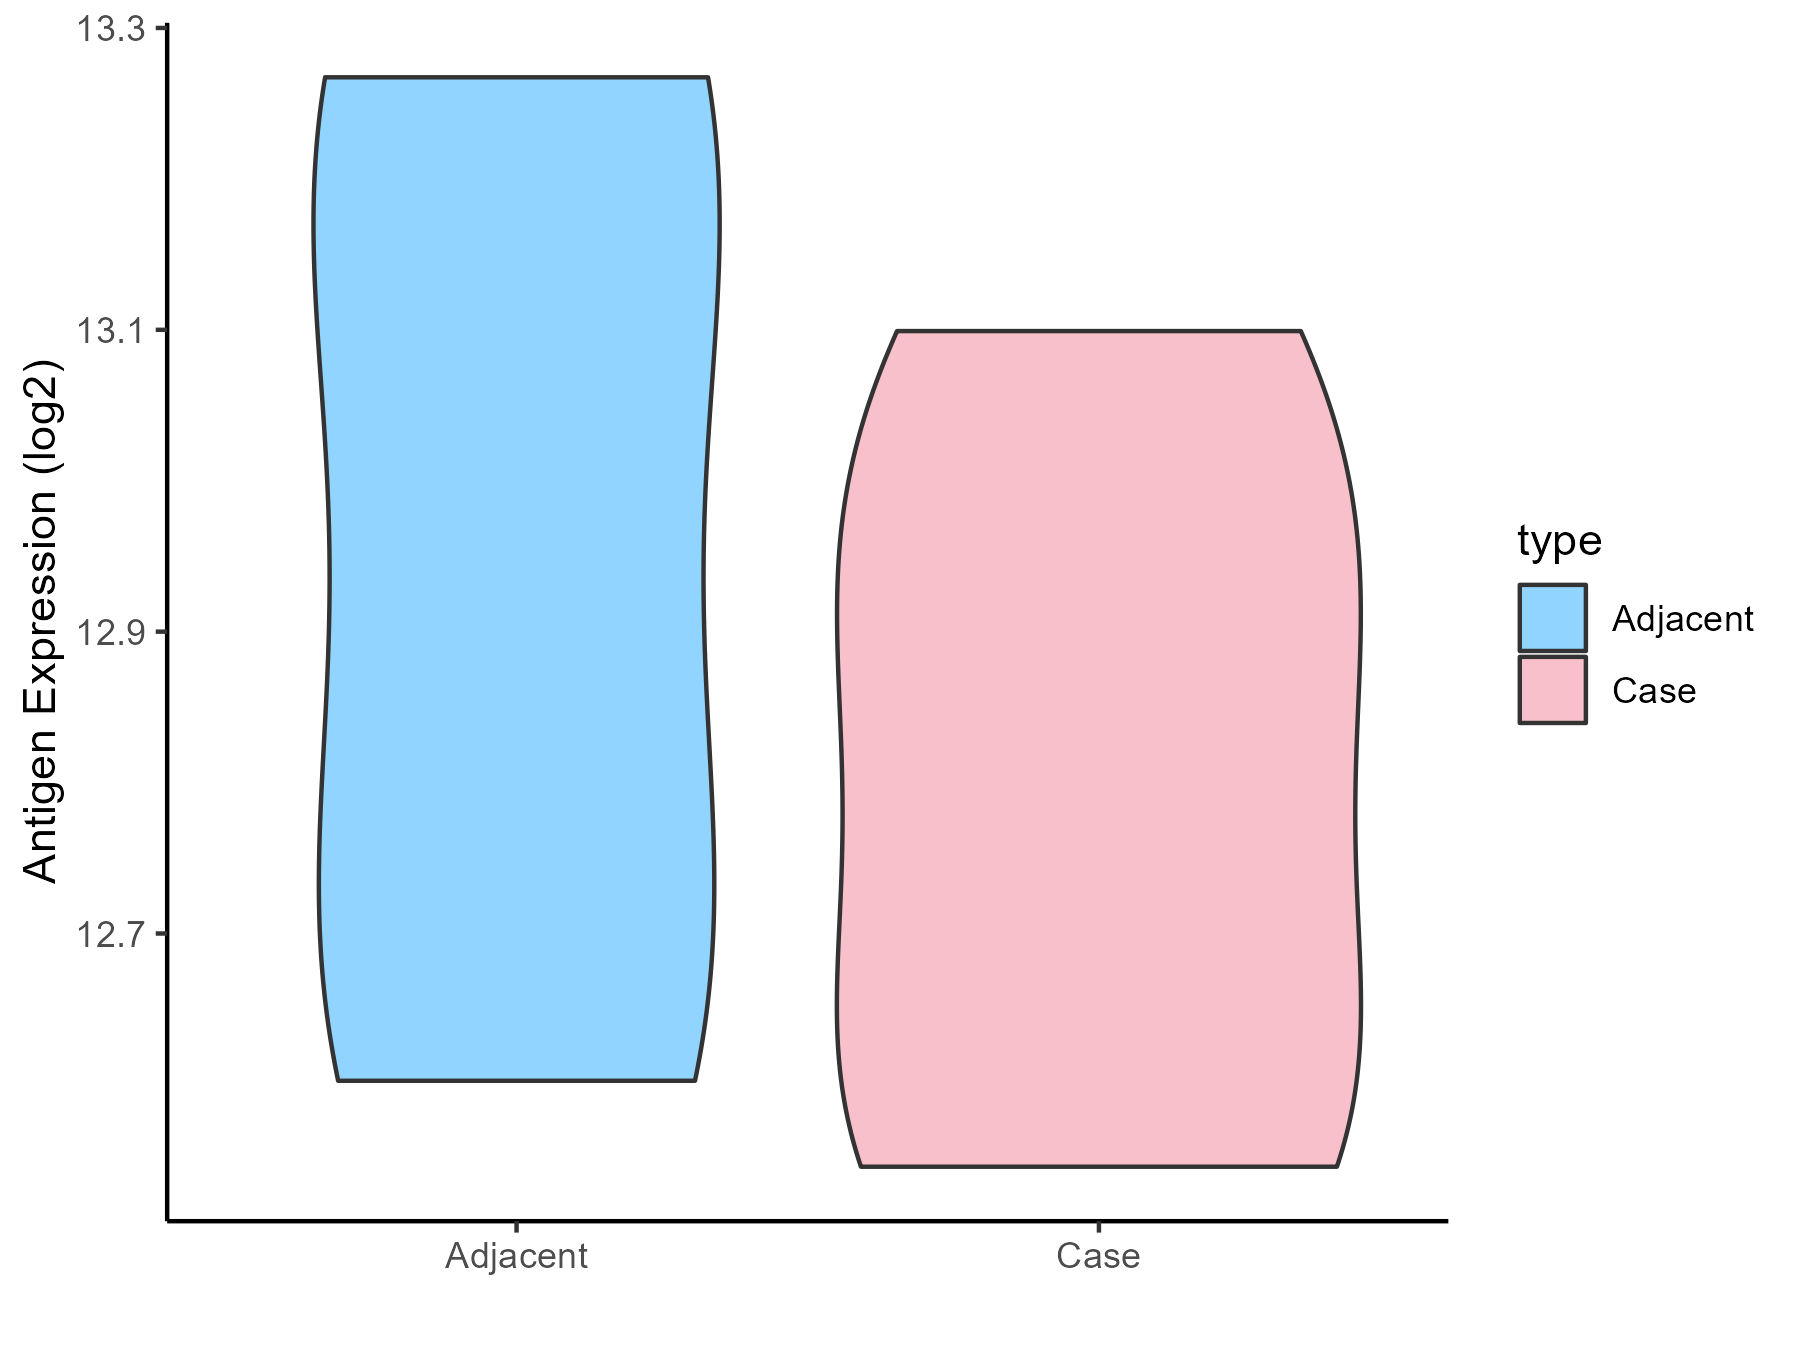
| The Studied Tissue | Gastric antrum | |
| The Specific Disease | Eosinophilic gastritis | |
| The Expression Level of Disease Section Compare with the Adjacent Tissue | p-value: 0.422830187; Fold-change: -0.139187397; Z-score: -0.449249688 | |
| Disease-specific Antigen Abundances |
|
Click to View the Clearer Original Diagram |
| Differential expression pattern of antigen in diseases | ||
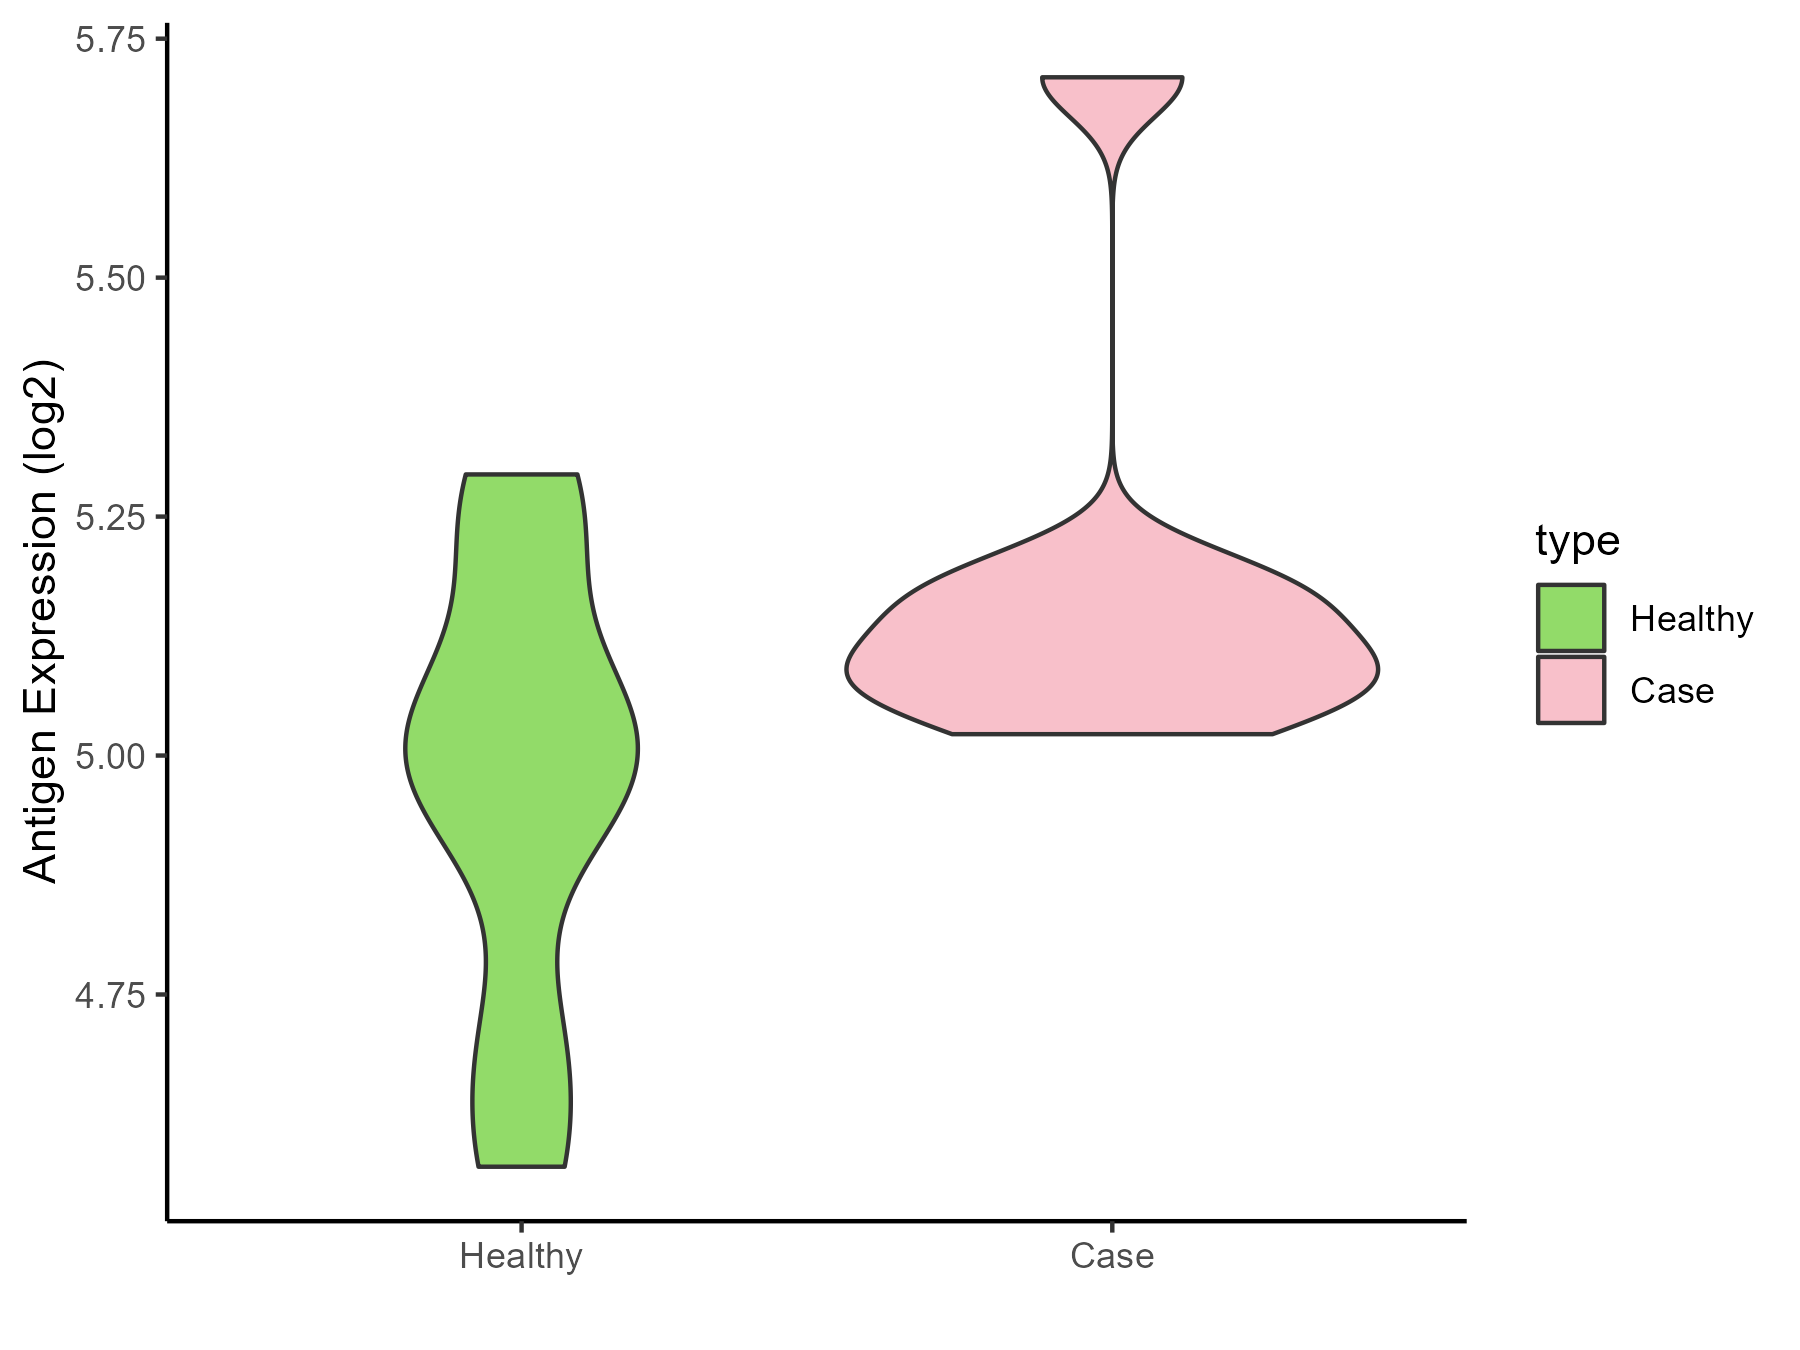
| The Studied Tissue | Liver | |
| The Specific Disease | Liver failure | |
| The Expression Level of Disease Section Compare with the Healthy Individual Tissue | p-value: 0.09151845; Fold-change: 0.104981916; Z-score: 0.433476351 | |
| Disease-specific Antigen Abundances |
|
Click to View the Clearer Original Diagram |
| Differential expression pattern of antigen in diseases | ||
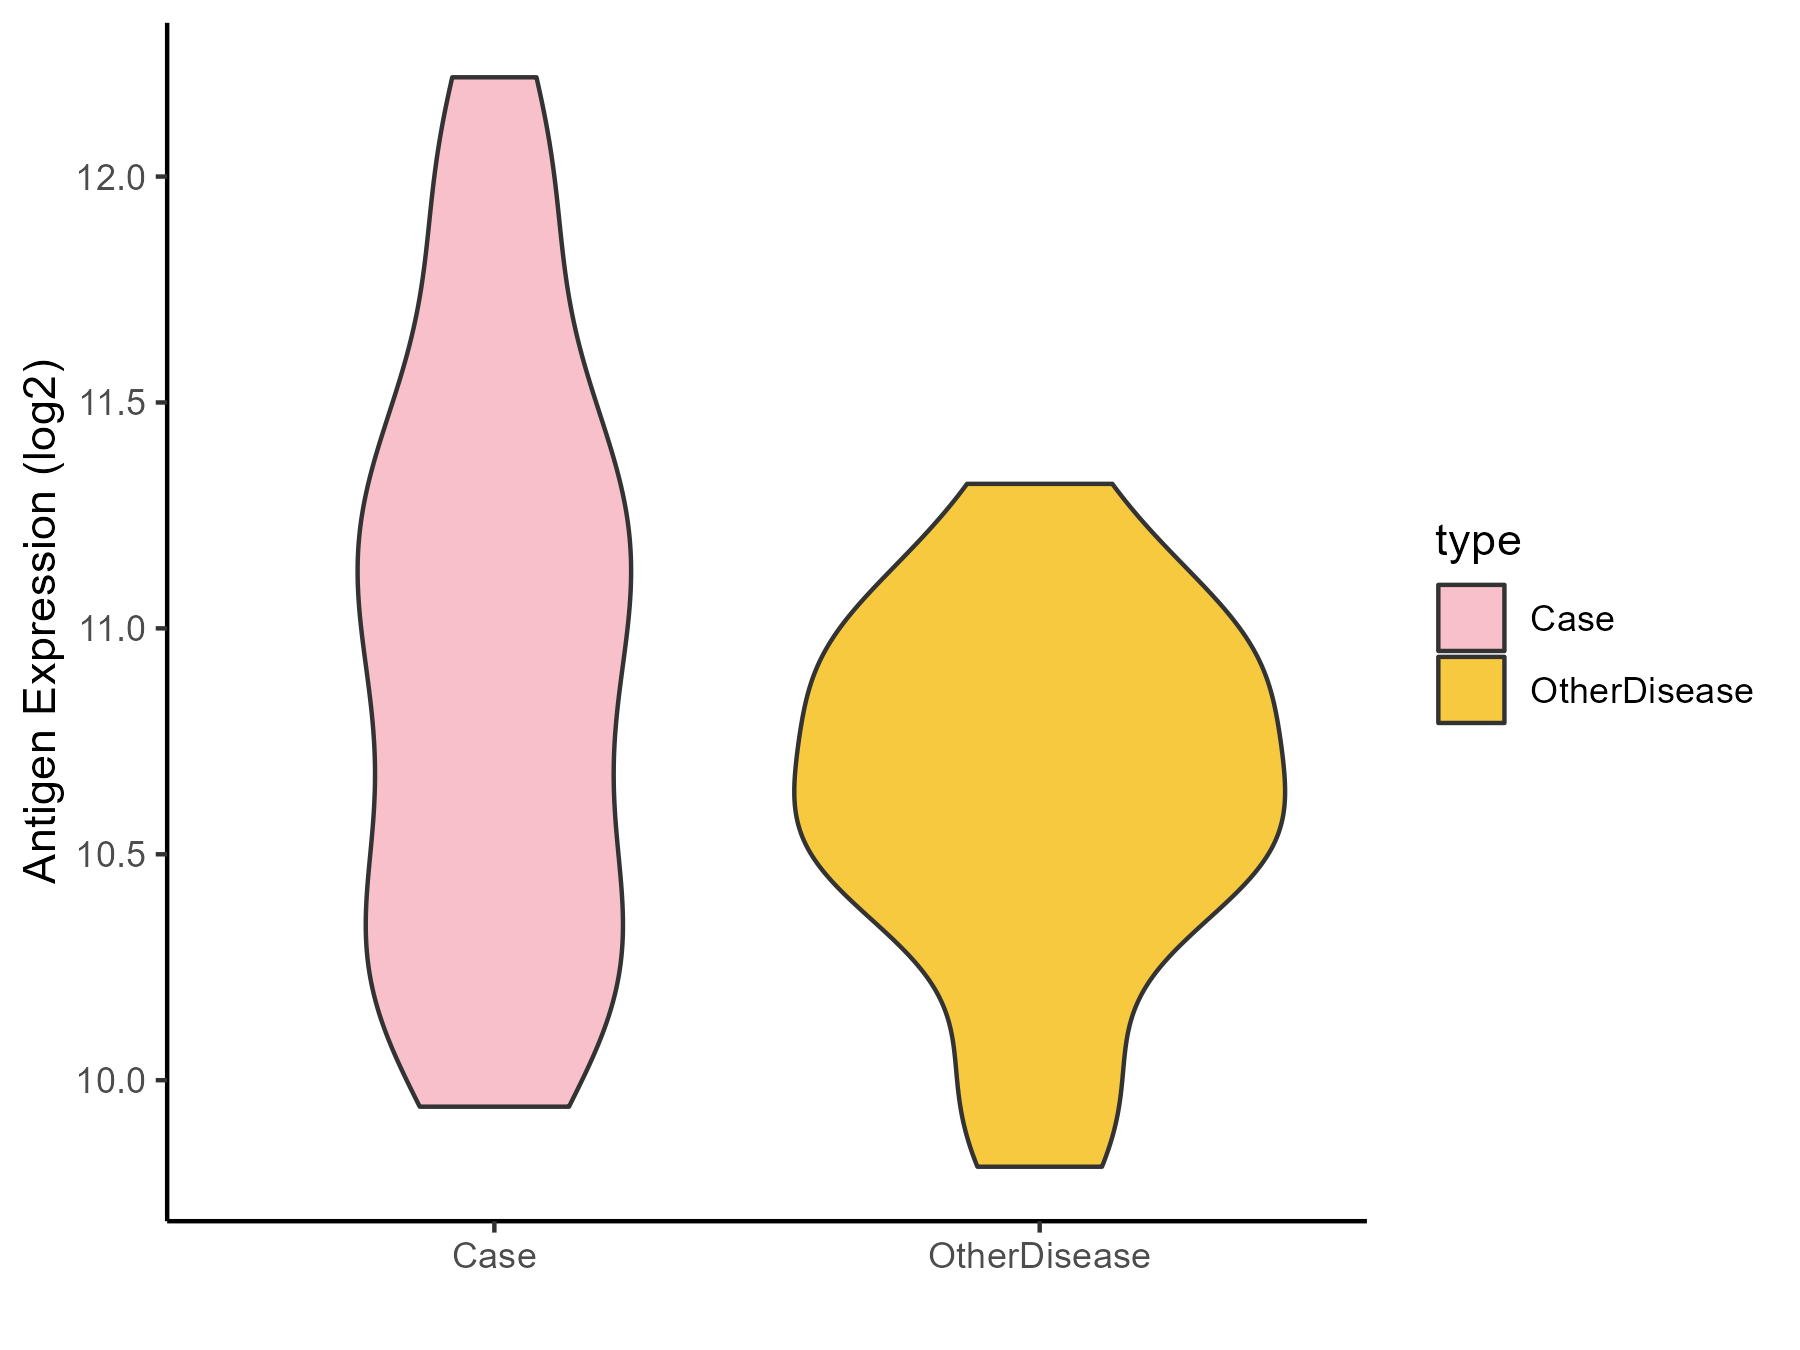
| The Studied Tissue | Colon mucosal | |
| The Specific Disease | Ulcerative colitis | |
| The Expression Level of Disease Section Compare with the Adjacent Tissue | p-value: 0.025862262; Fold-change: 0.273867752; Z-score: 0.681600363 | |
| Disease-specific Antigen Abundances |
|
Click to View the Clearer Original Diagram |
| Differential expression pattern of antigen in diseases | ||
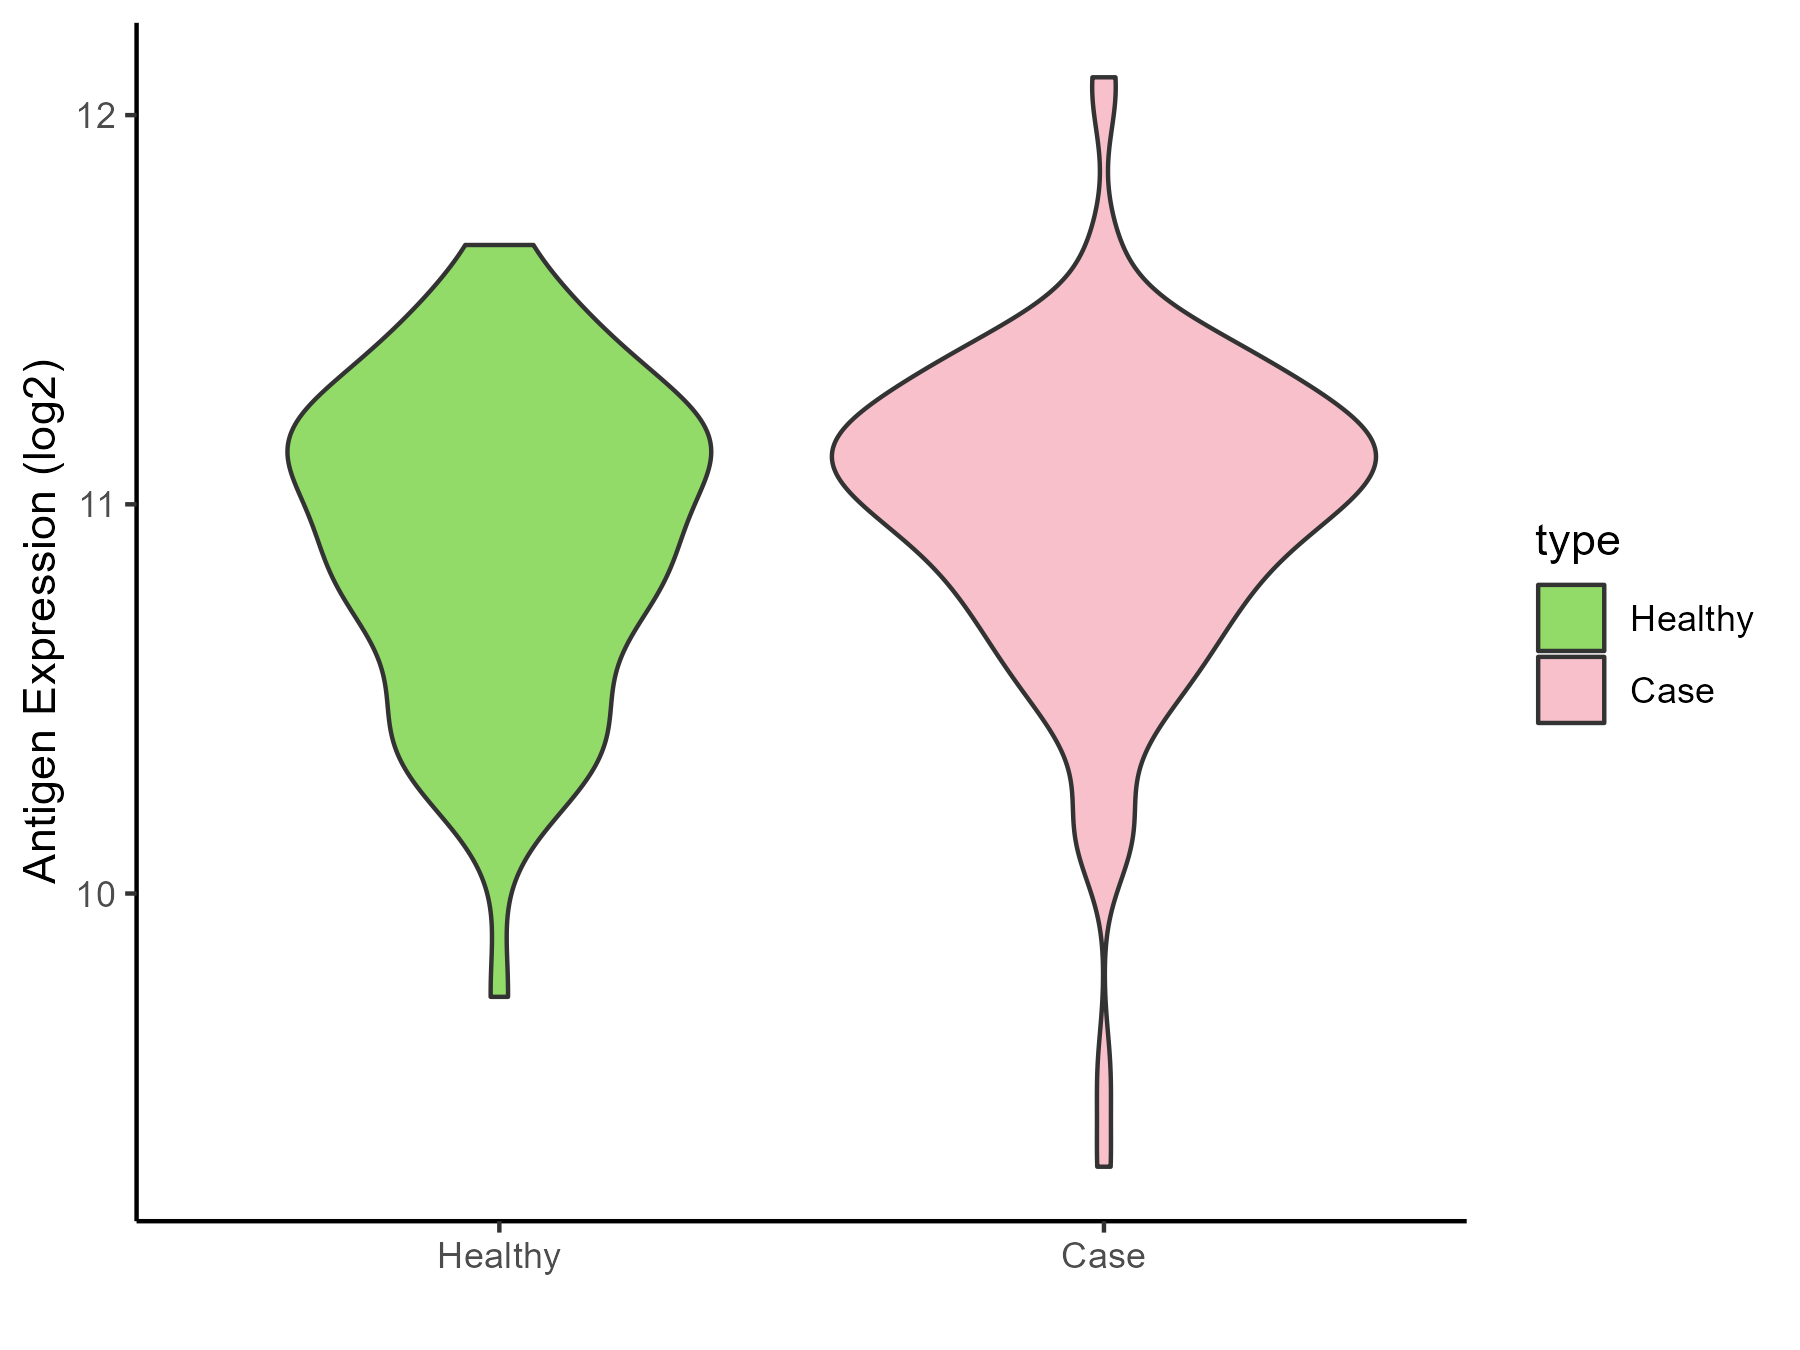
| The Studied Tissue | Rectal colon | |
| The Specific Disease | Irritable bowel syndrome | |
| The Expression Level of Disease Section Compare with the Healthy Individual Tissue | p-value: 0.253616588; Fold-change: 0.115944667; Z-score: 0.295579565 | |
| Disease-specific Antigen Abundances |
|
Click to View the Clearer Original Diagram |
ICD Disease Classification 14
| Differential expression pattern of antigen in diseases | ||
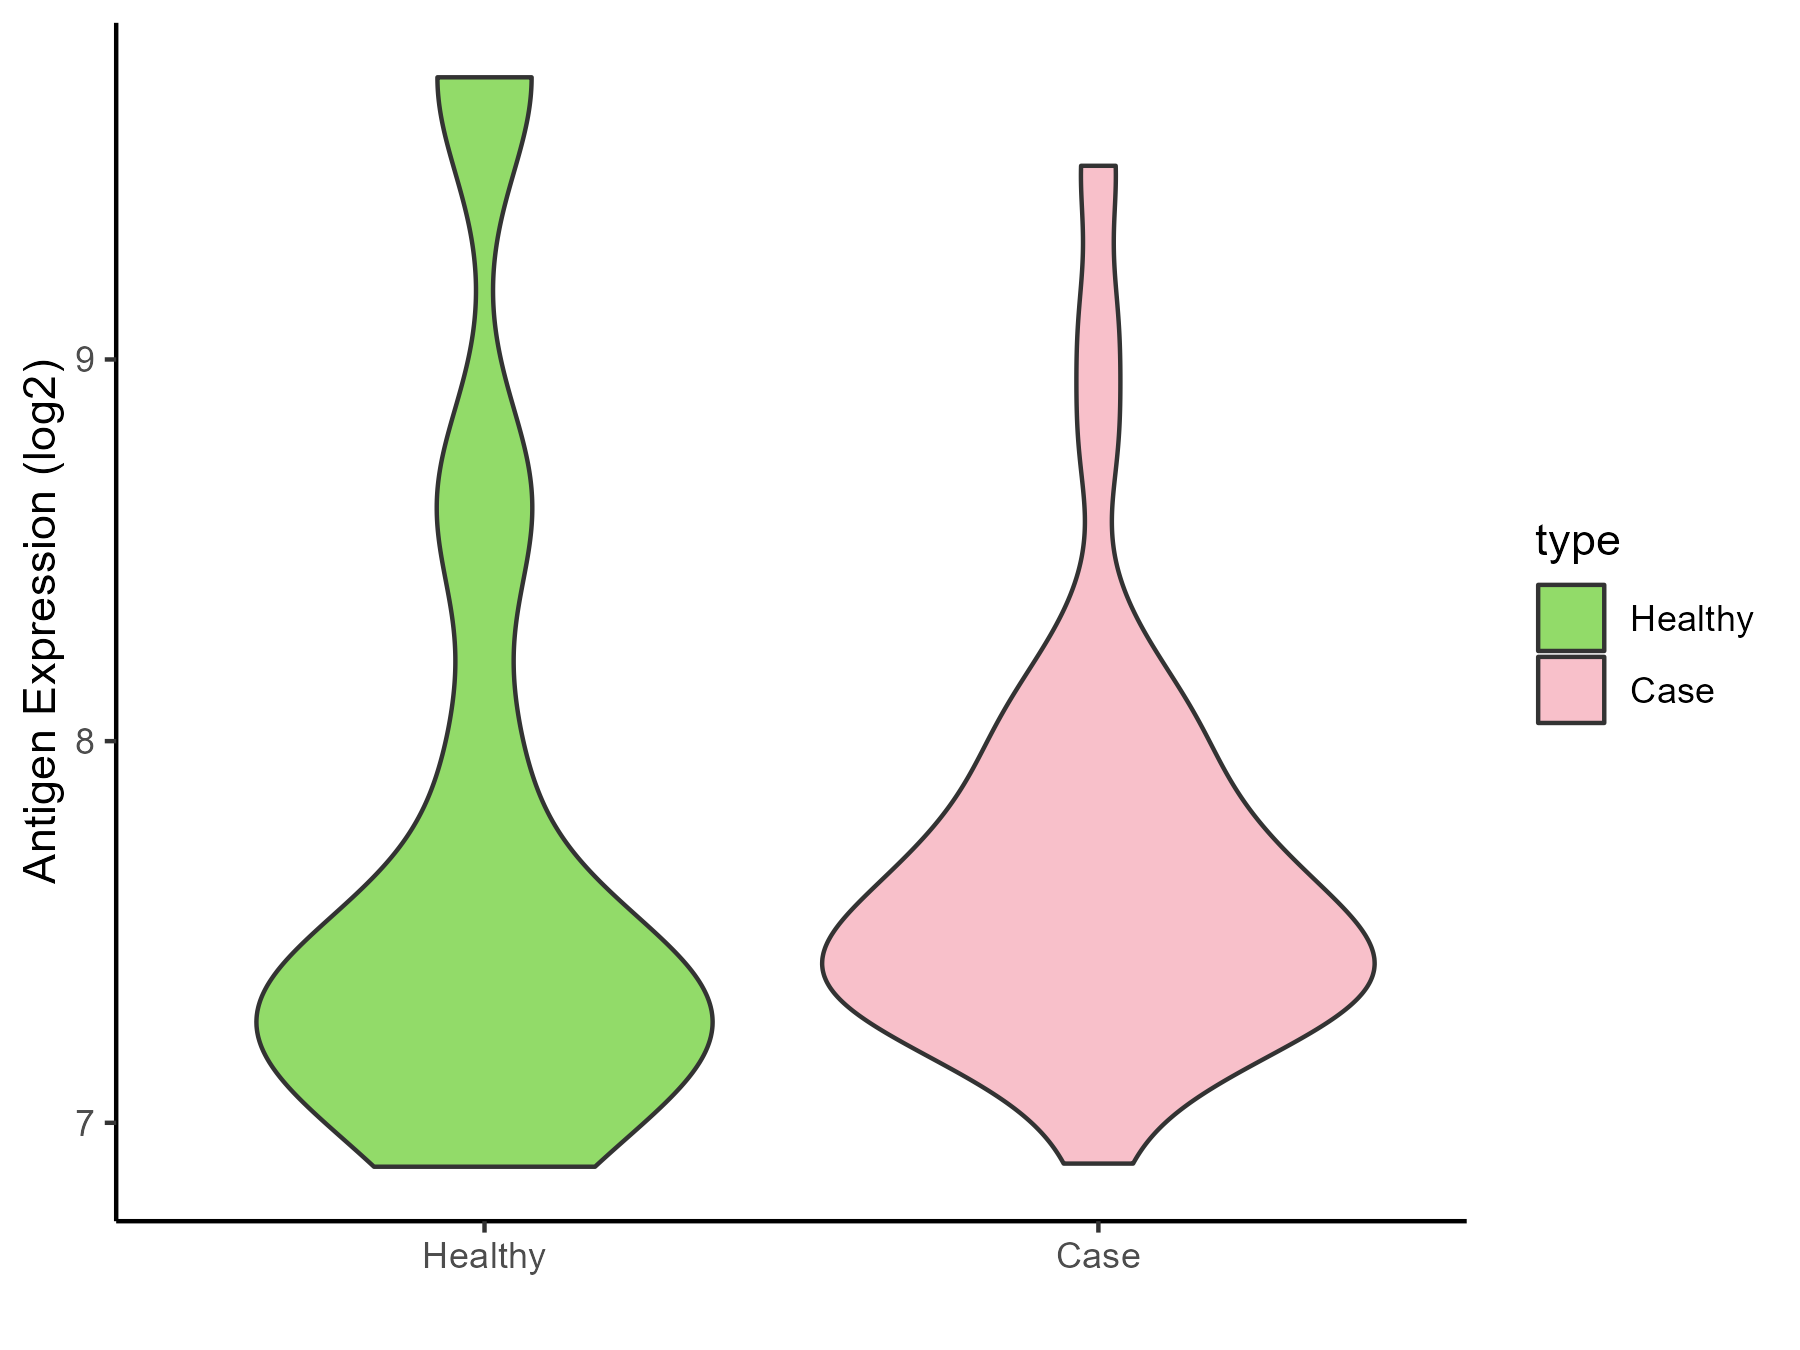
| The Studied Tissue | Skin | |
| The Specific Disease | Atopic dermatitis | |
| The Expression Level of Disease Section Compare with the Healthy Individual Tissue | p-value: 0.730924675; Fold-change: 0.155591783; Z-score: 0.174317841 | |
| Disease-specific Antigen Abundances |
|
Click to View the Clearer Original Diagram |
| Differential expression pattern of antigen in diseases | ||
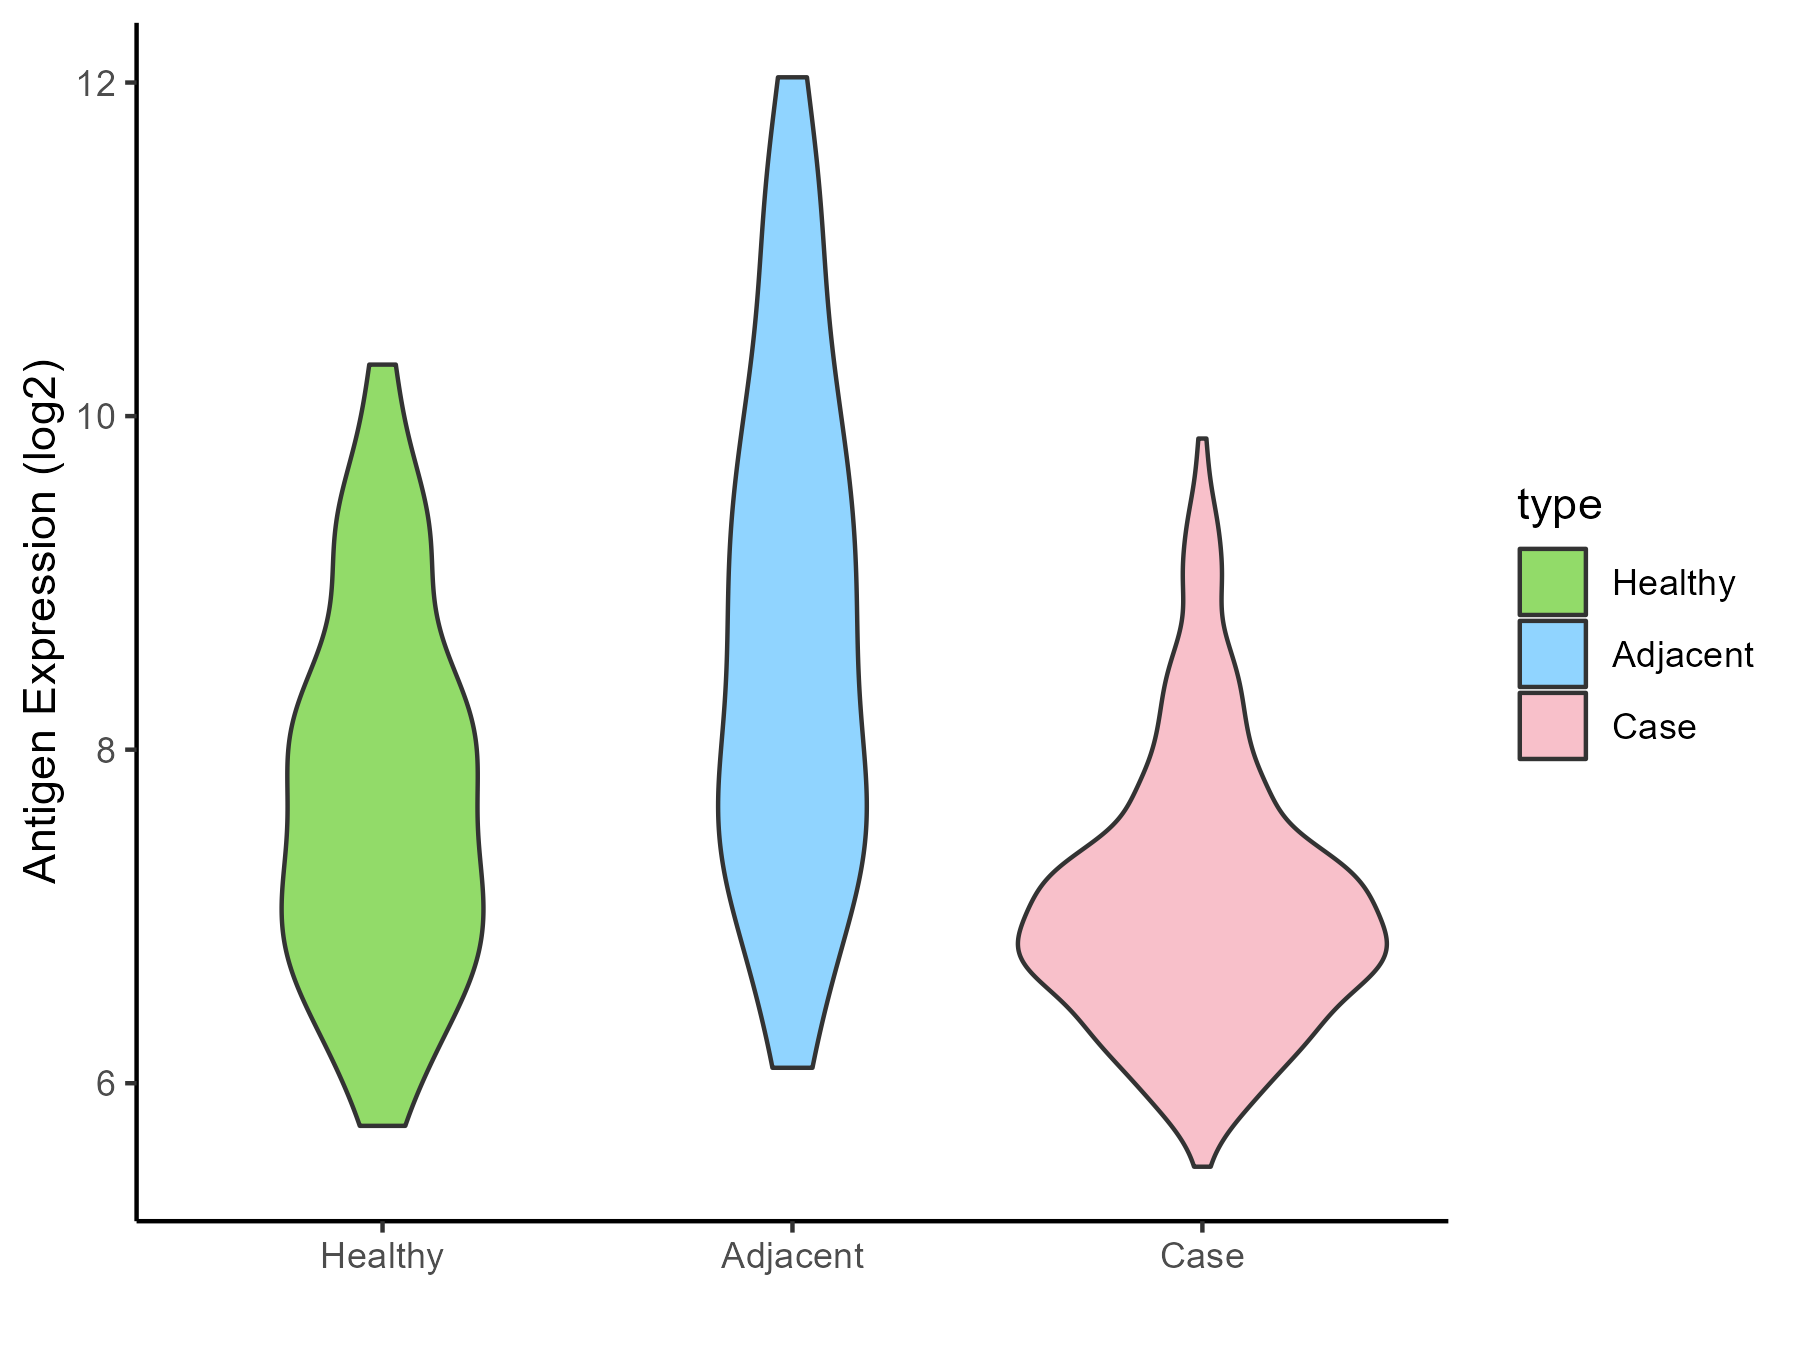
| The Studied Tissue | Skin | |
| The Specific Disease | Psoriasis | |
| The Expression Level of Disease Section Compare with the Healthy Individual Tissue | p-value: 1.68E-06; Fold-change: -0.678103166; Z-score: -0.622304294 | |
| The Expression Level of Disease Section Compare with the Adjacent Tissue | p-value: 2.05E-15; Fold-change: -1.590825646; Z-score: -1.056809243 | |
| Disease-specific Antigen Abundances |
|
Click to View the Clearer Original Diagram |
| Differential expression pattern of antigen in diseases | ||
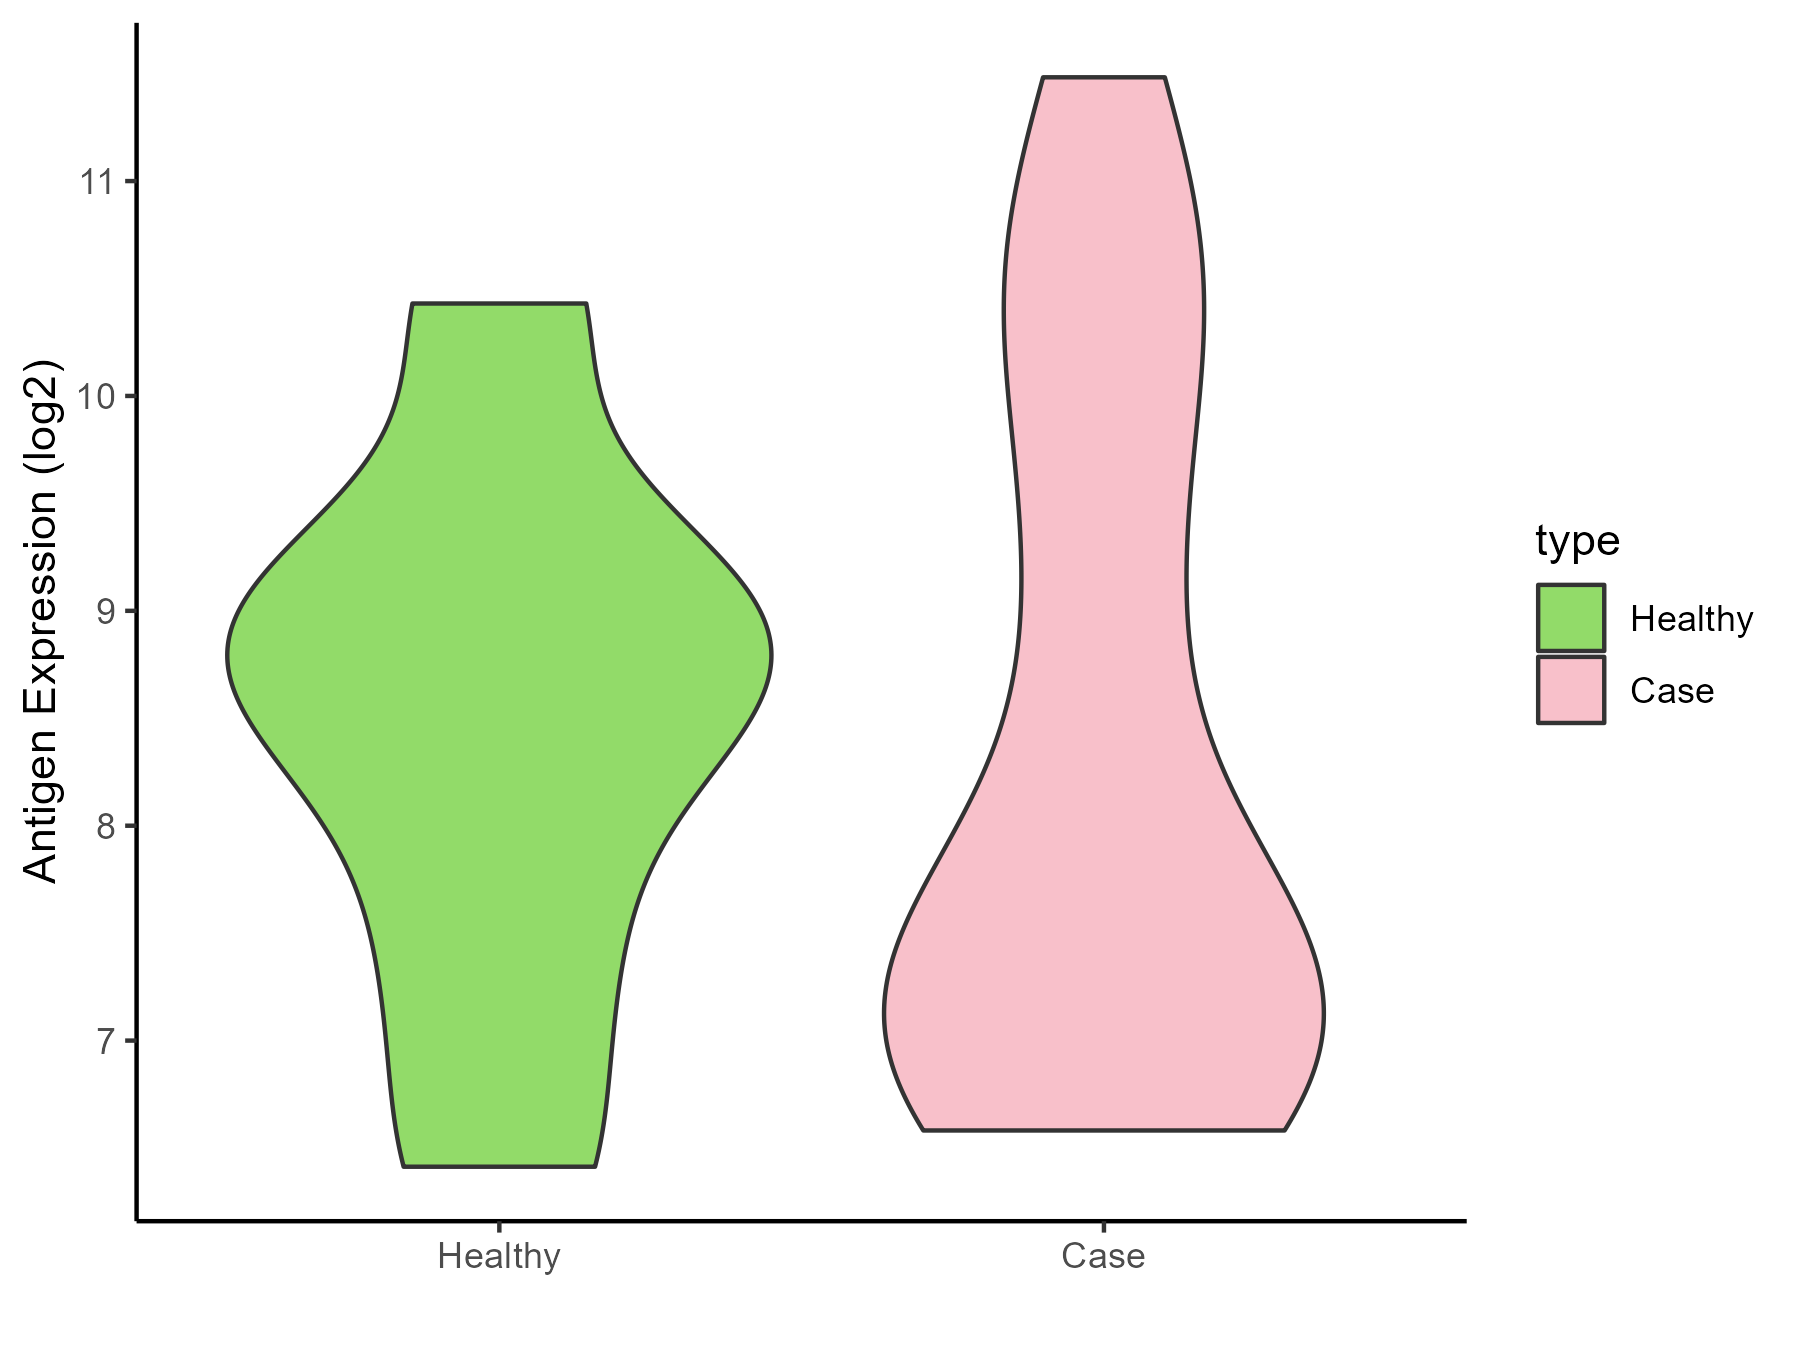
| The Studied Tissue | Skin | |
| The Specific Disease | Vitiligo | |
| The Expression Level of Disease Section Compare with the Healthy Individual Tissue | p-value: 0.810443739; Fold-change: -1.114610992; Z-score: -0.861972529 | |
| Disease-specific Antigen Abundances |
|
Click to View the Clearer Original Diagram |
| Differential expression pattern of antigen in diseases | ||
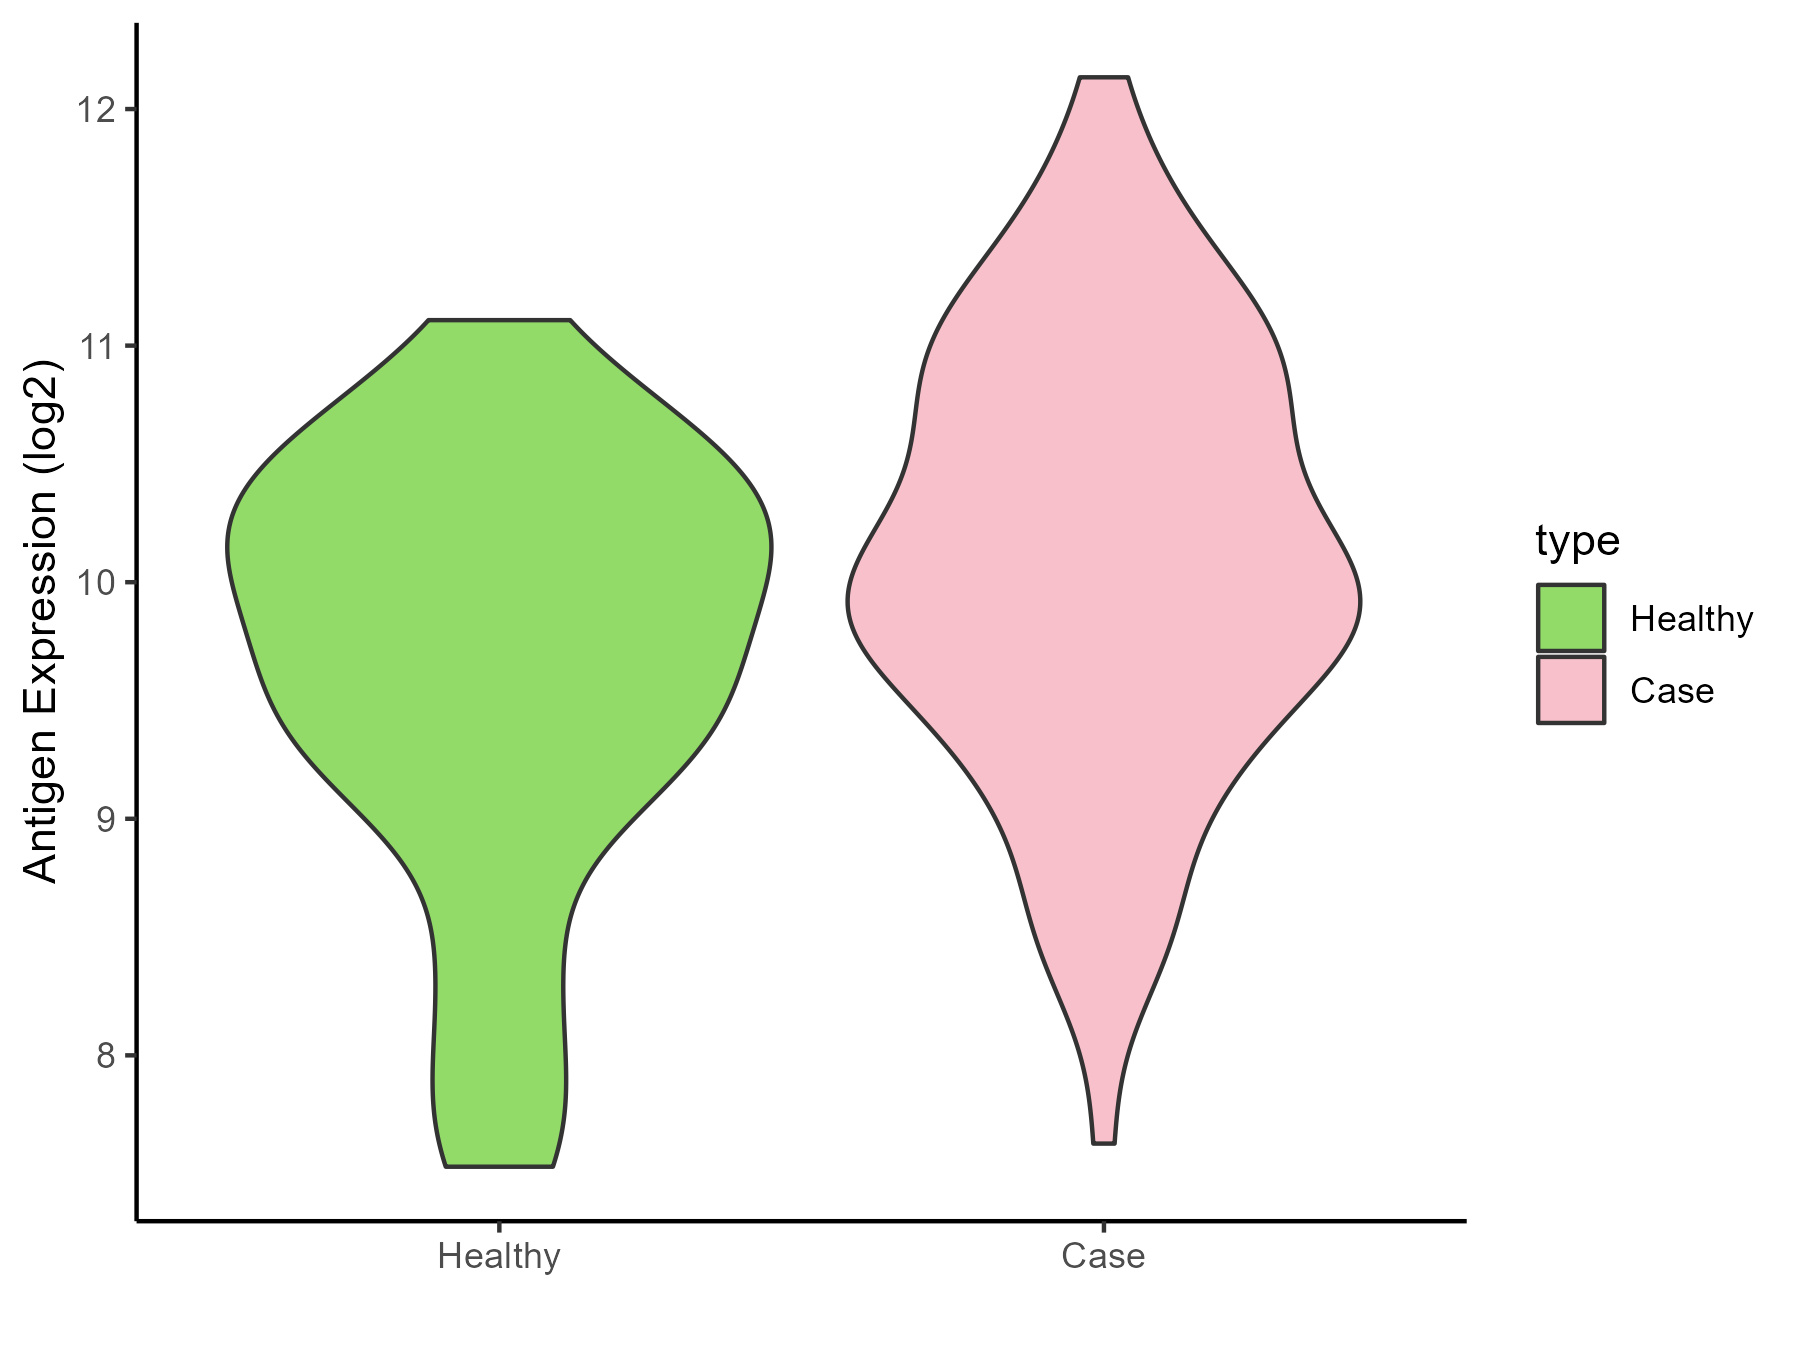
| The Studied Tissue | Skin from scalp | |
| The Specific Disease | Alopecia | |
| The Expression Level of Disease Section Compare with the Healthy Individual Tissue | p-value: 0.014020705; Fold-change: 0.280277417; Z-score: 0.309208359 | |
| Disease-specific Antigen Abundances |
|
Click to View the Clearer Original Diagram |
| Differential expression pattern of antigen in diseases | ||
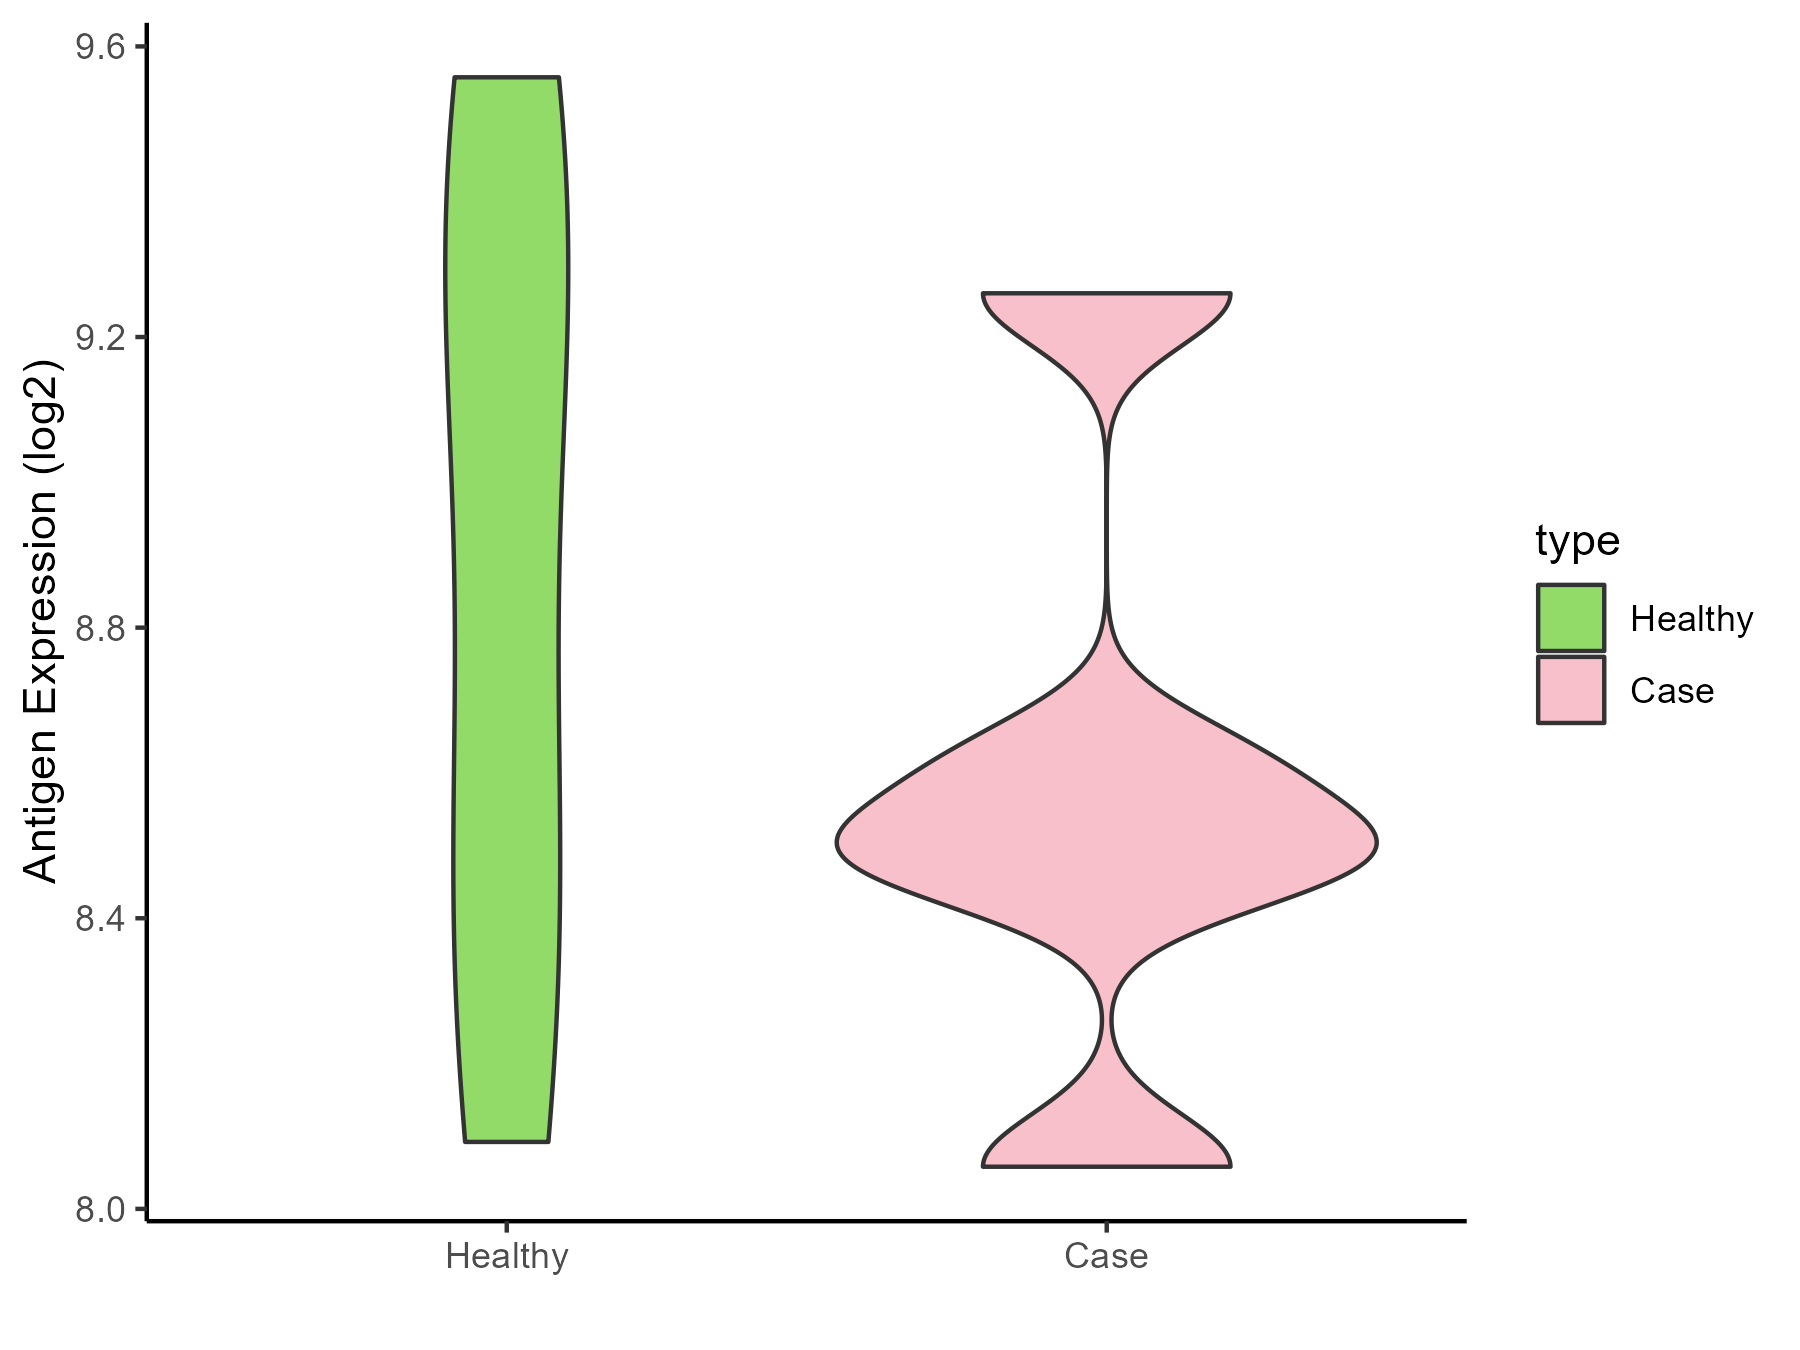
| The Studied Tissue | Skin | |
| The Specific Disease | Sensitive skin | |
| The Expression Level of Disease Section Compare with the Healthy Individual Tissue | p-value: 0.363326327; Fold-change: -0.455472908; Z-score: -0.779669542 | |
| Disease-specific Antigen Abundances |
|
Click to View the Clearer Original Diagram |
ICD Disease Classification 15
| Differential expression pattern of antigen in diseases | ||
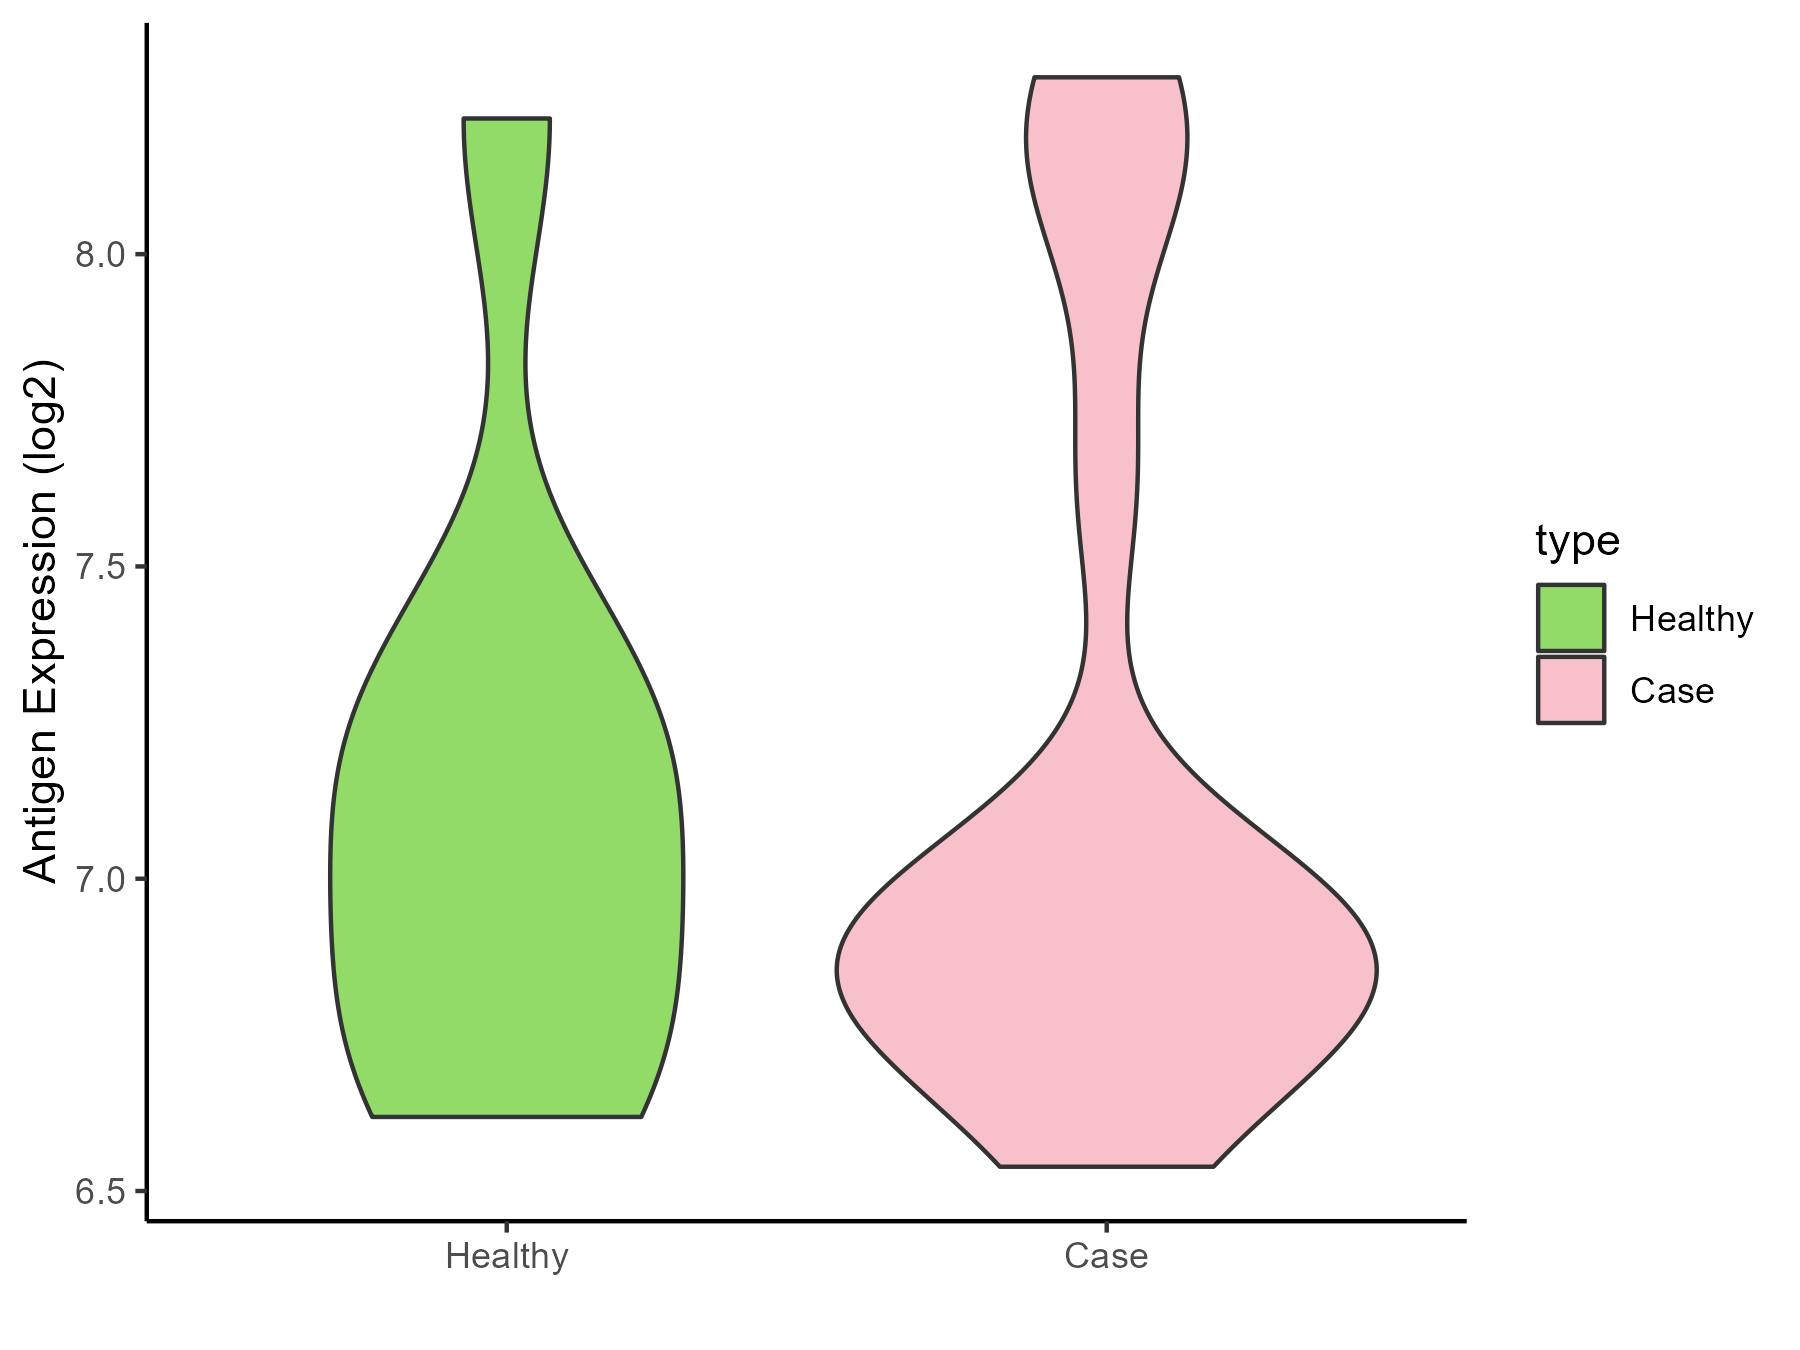
| The Studied Tissue | Synovial | |
| The Specific Disease | Osteoarthritis | |
| The Expression Level of Disease Section Compare with the Healthy Individual Tissue | p-value: 0.915990543; Fold-change: -0.165896261; Z-score: -0.324607404 | |
| Disease-specific Antigen Abundances |
|
Click to View the Clearer Original Diagram |
| Differential expression pattern of antigen in diseases | ||
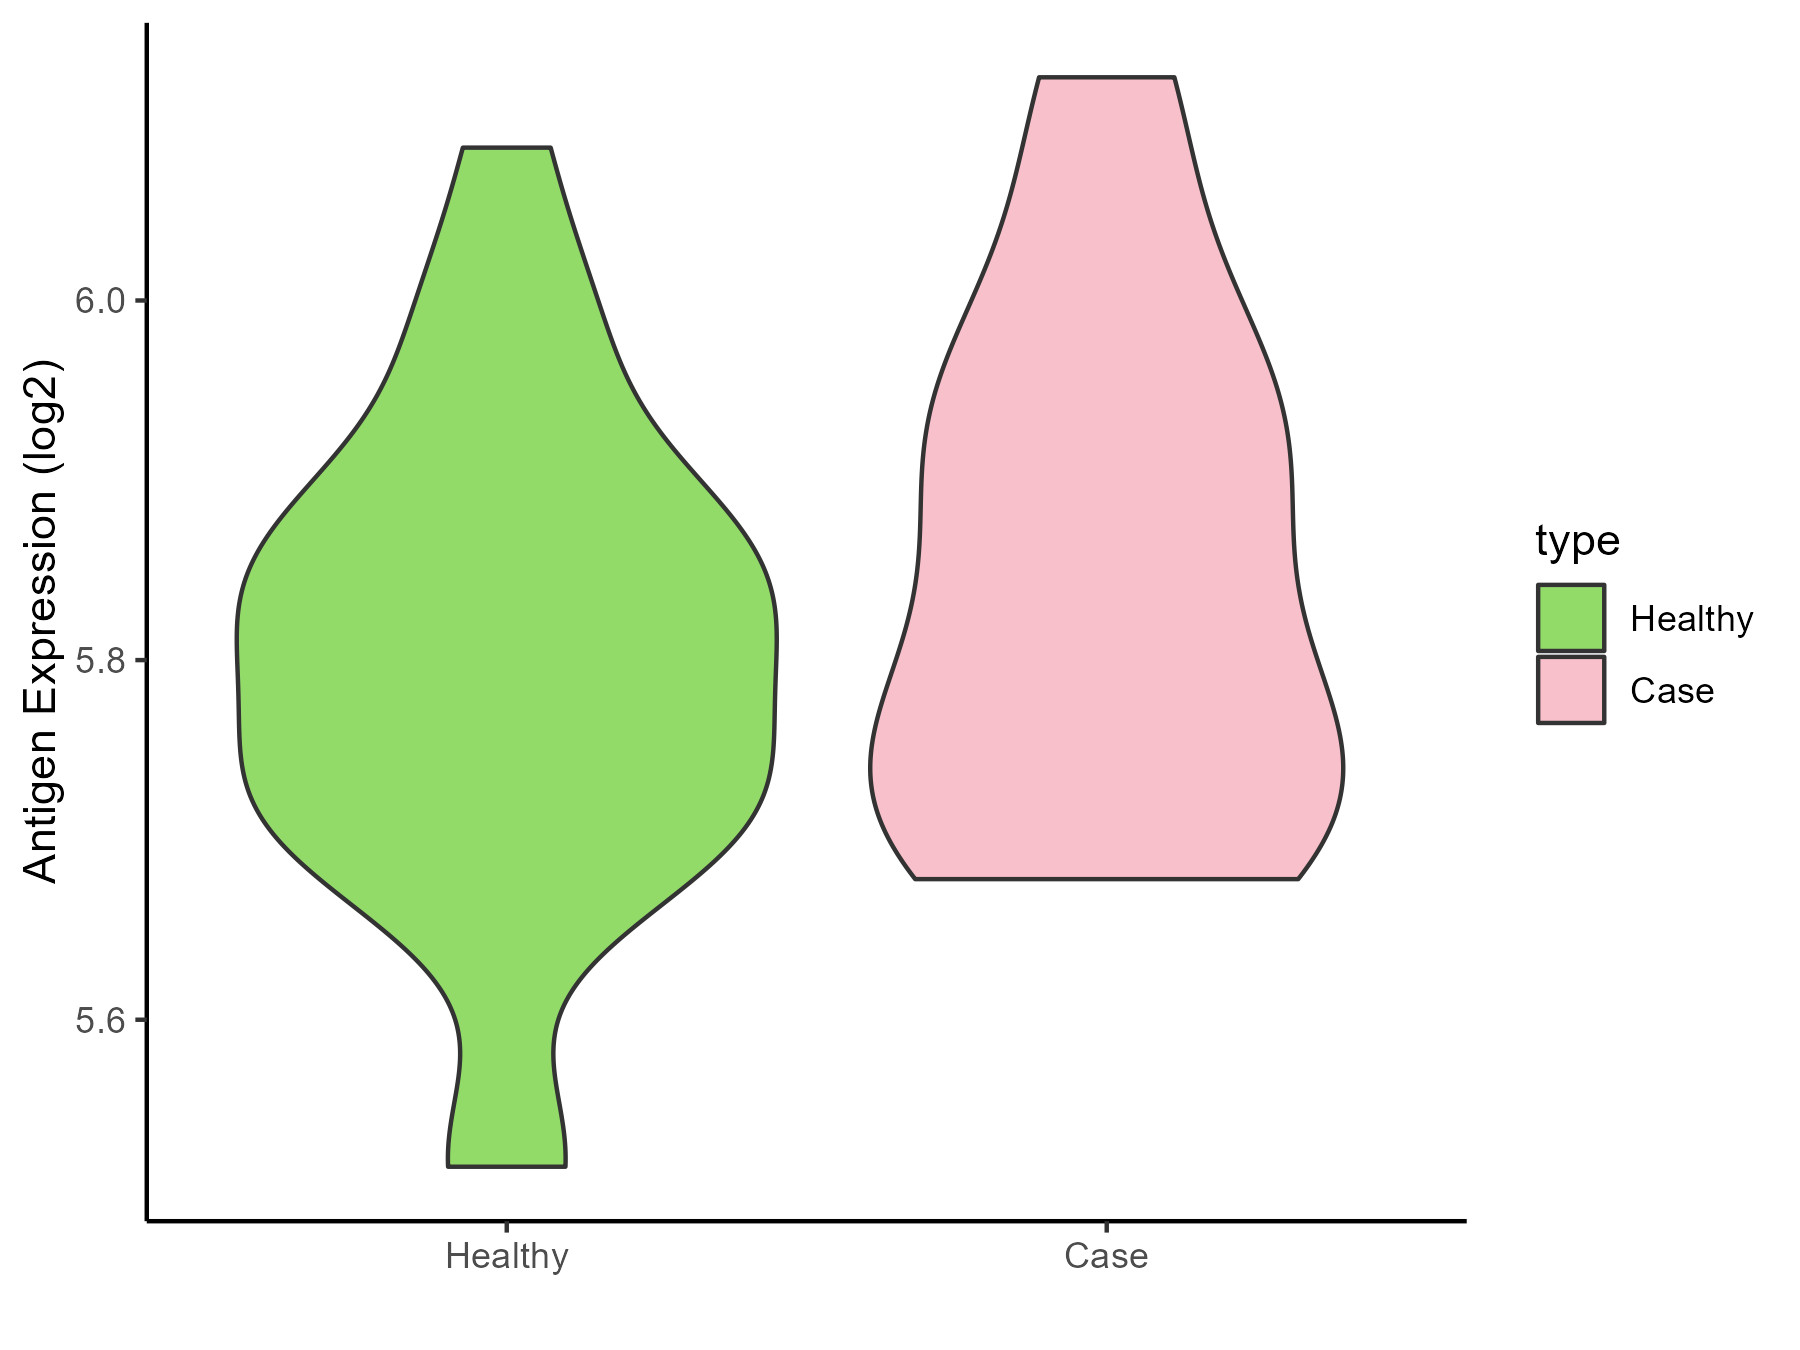
| The Studied Tissue | Peripheral blood | |
| The Specific Disease | Arthropathy | |
| The Expression Level of Disease Section Compare with the Healthy Individual Tissue | p-value: 0.29092977; Fold-change: 0.029467067; Z-score: 0.216334062 | |
| Disease-specific Antigen Abundances |
|
Click to View the Clearer Original Diagram |
| Differential expression pattern of antigen in diseases | ||
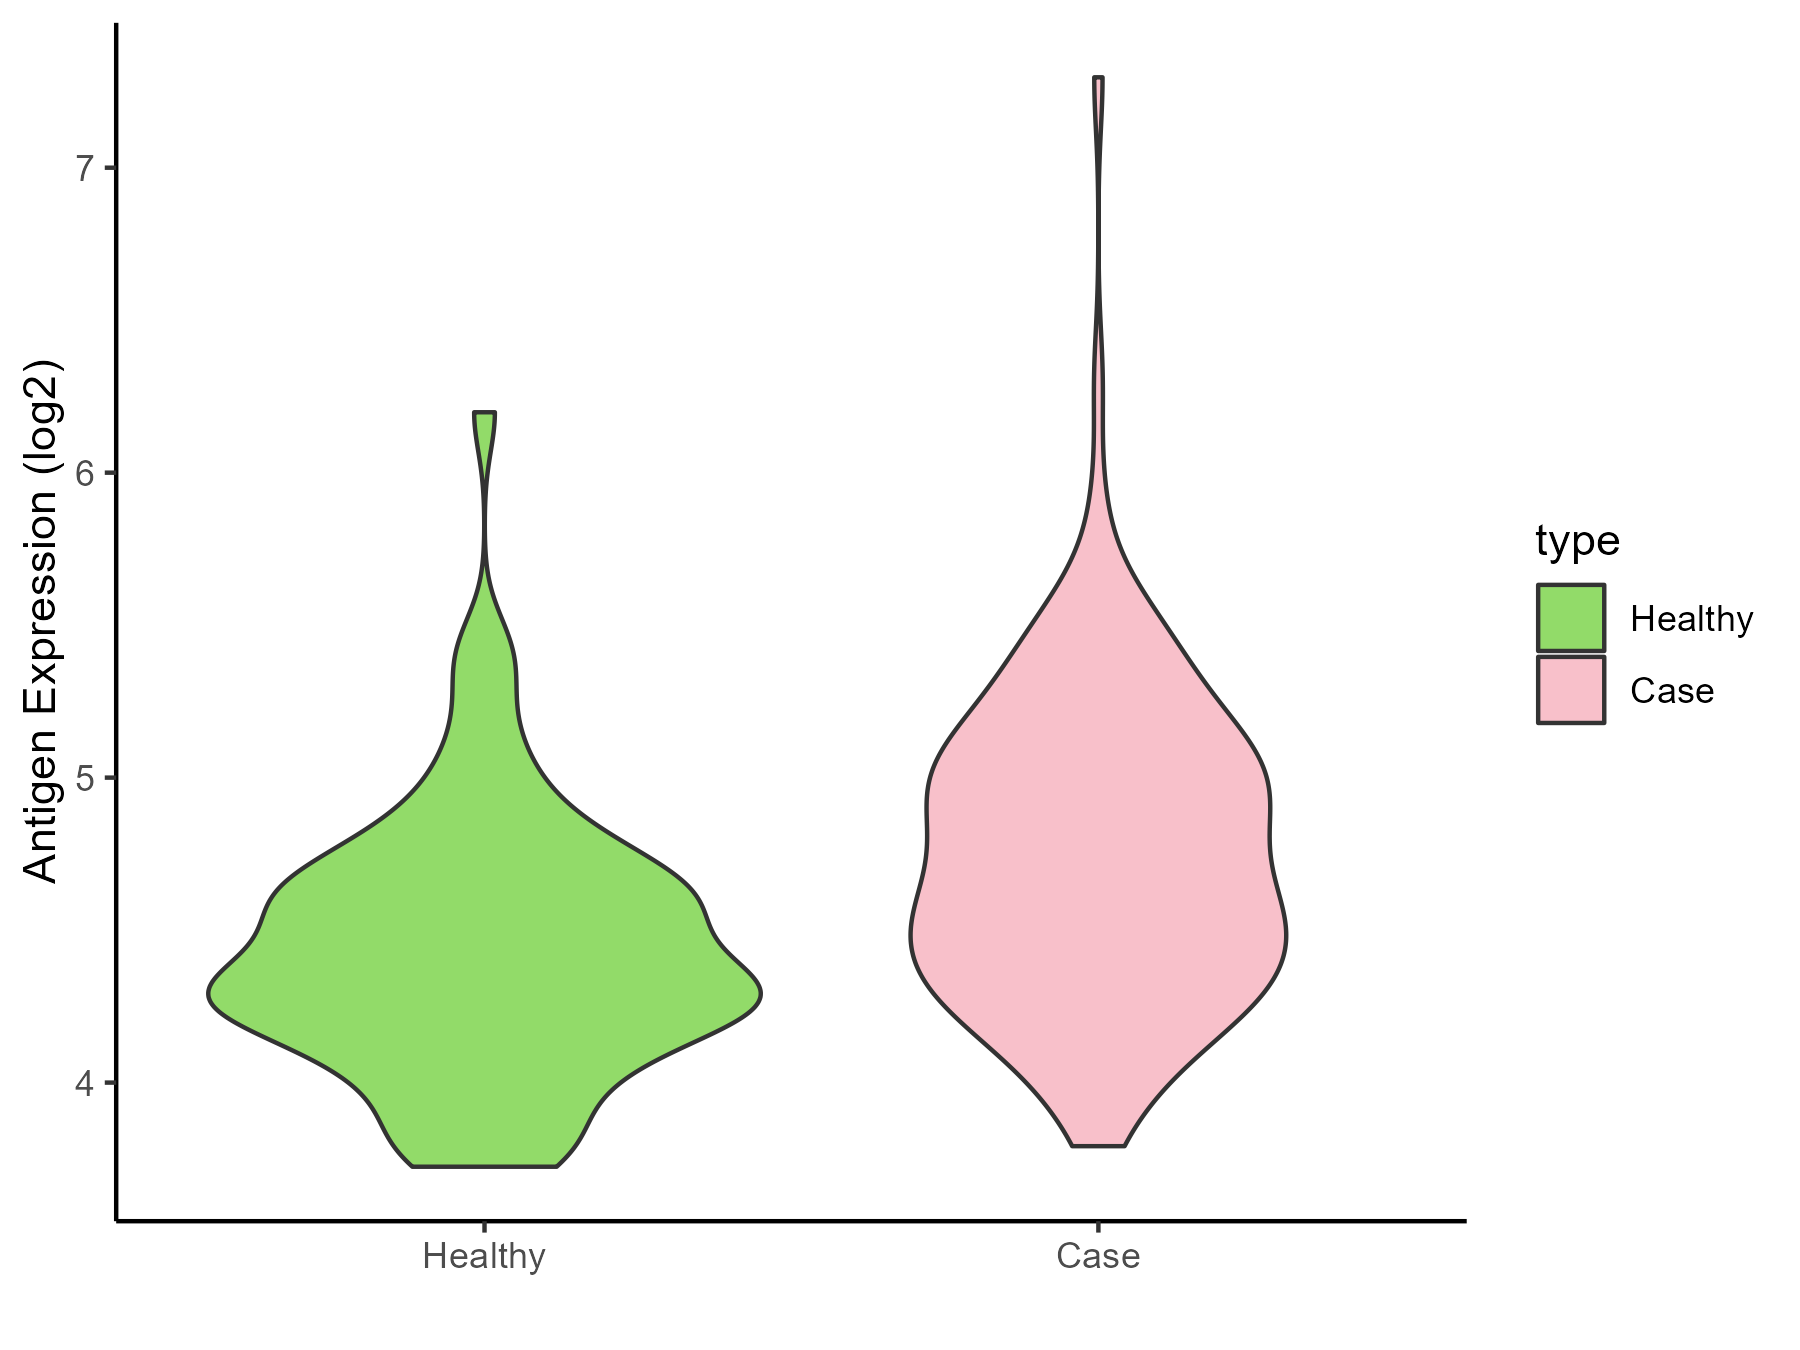
| The Studied Tissue | Peripheral blood | |
| The Specific Disease | Arthritis | |
| The Expression Level of Disease Section Compare with the Healthy Individual Tissue | p-value: 1.53E-06; Fold-change: 0.340971205; Z-score: 0.788517897 | |
| Disease-specific Antigen Abundances |
|
Click to View the Clearer Original Diagram |
| Differential expression pattern of antigen in diseases | ||
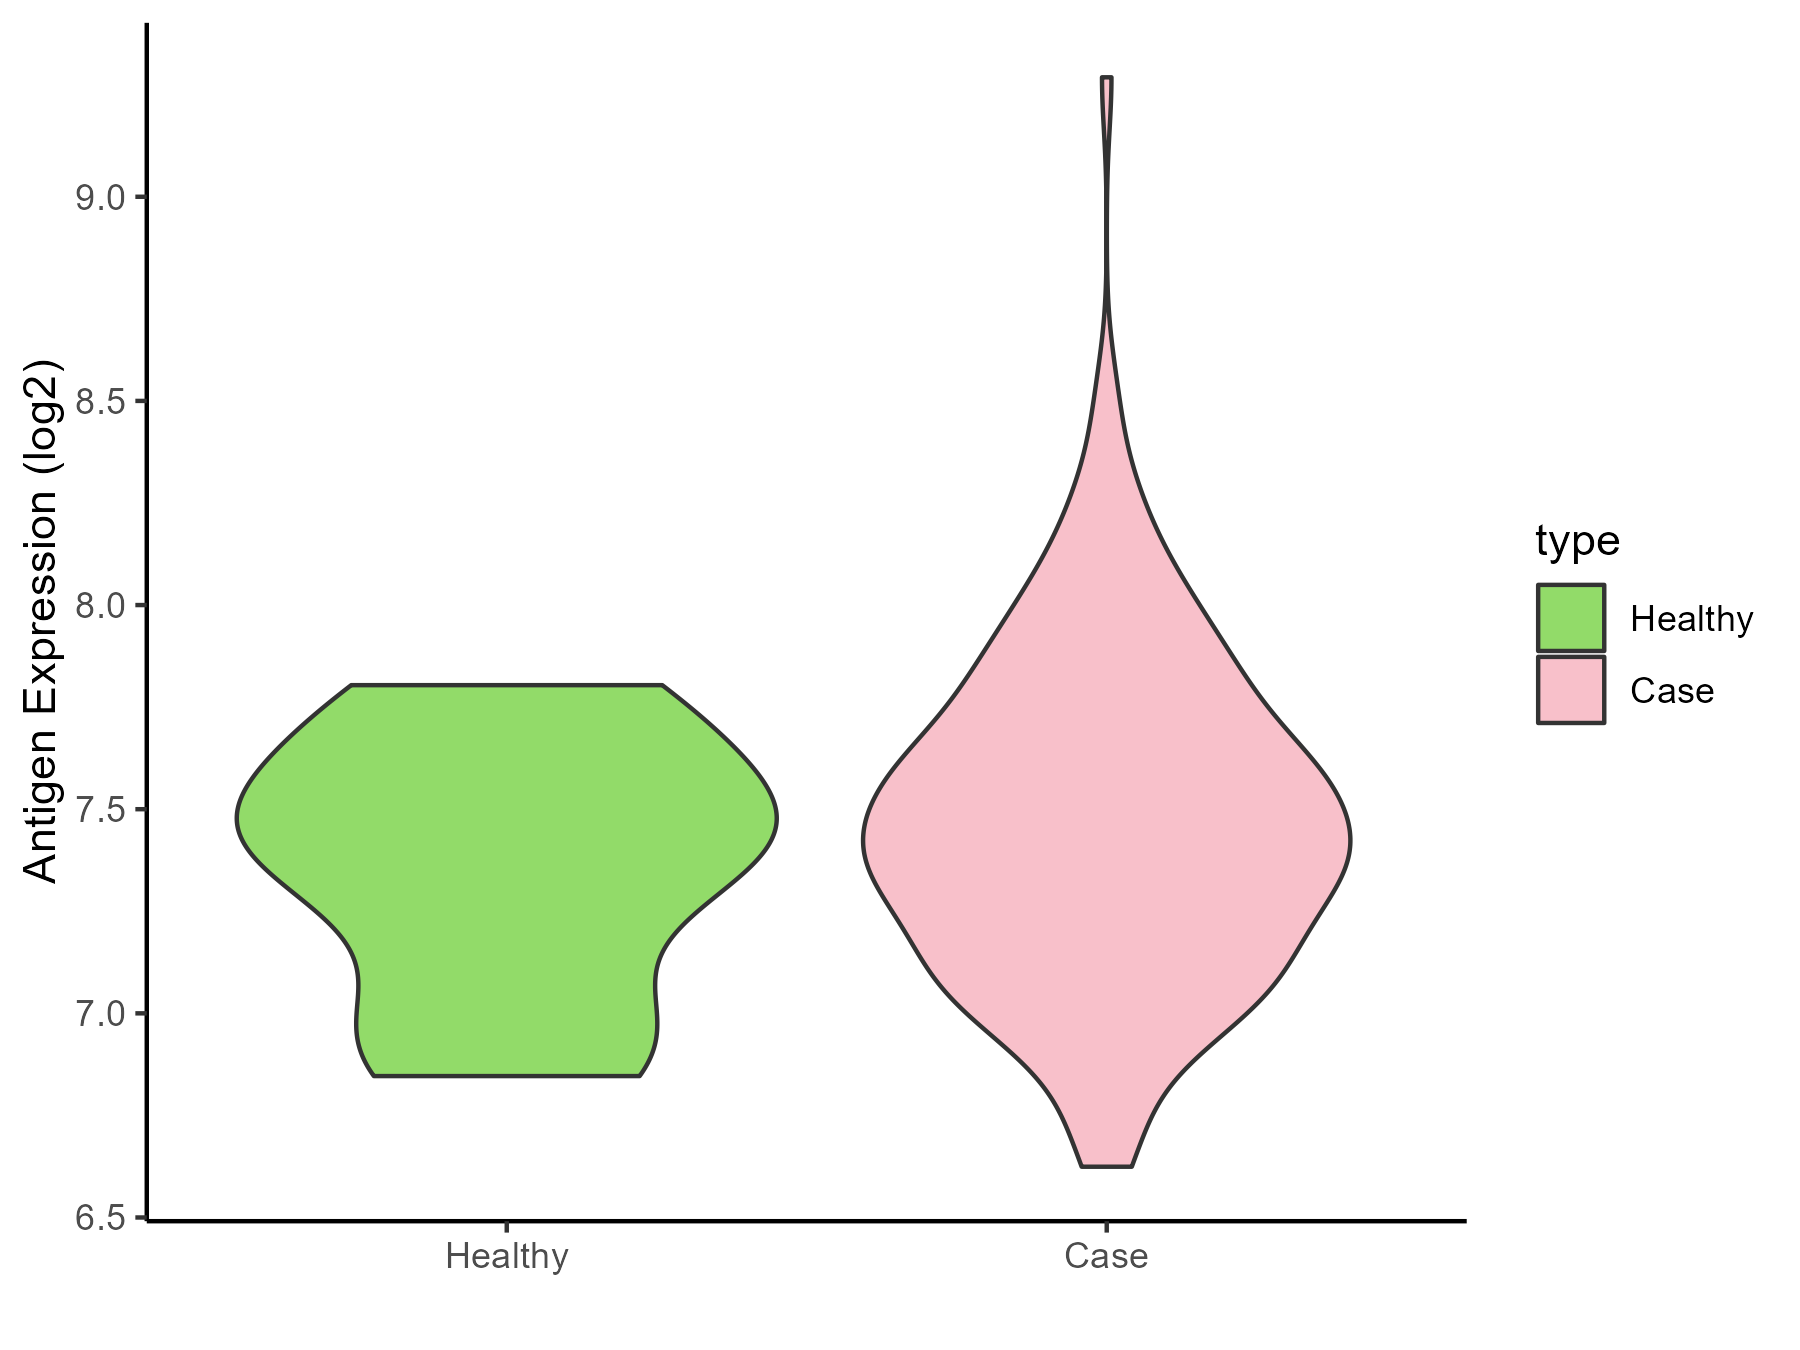
| The Studied Tissue | Synovial | |
| The Specific Disease | Rheumatoid arthritis | |
| The Expression Level of Disease Section Compare with the Healthy Individual Tissue | p-value: 0.429715875; Fold-change: -0.022854561; Z-score: -0.067056092 | |
| Disease-specific Antigen Abundances |
|
Click to View the Clearer Original Diagram |
| Differential expression pattern of antigen in diseases | ||
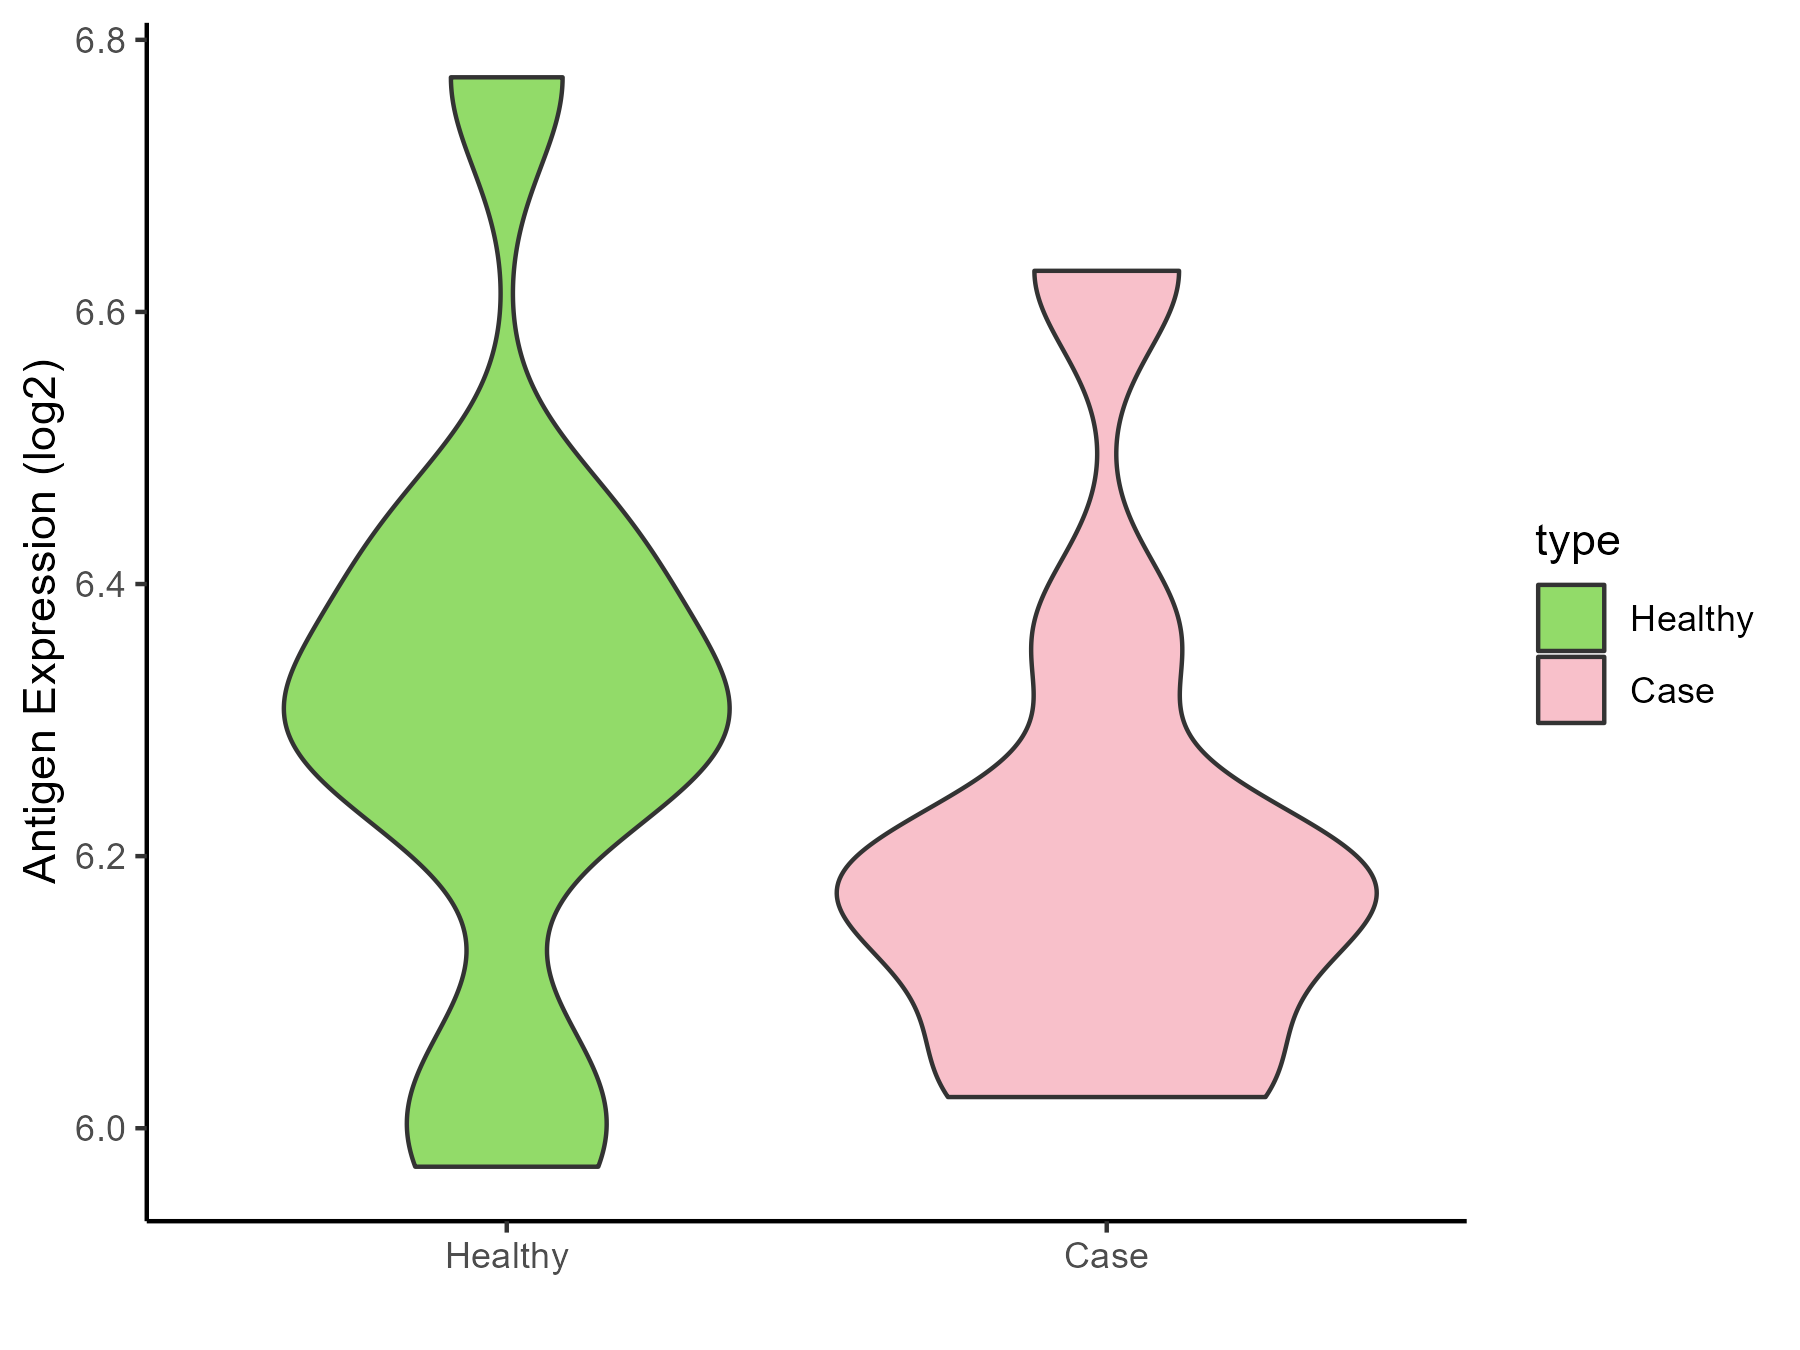
| The Studied Tissue | Pheripheral blood | |
| The Specific Disease | Ankylosing spondylitis | |
| The Expression Level of Disease Section Compare with the Healthy Individual Tissue | p-value: 0.389500919; Fold-change: -0.124419517; Z-score: -0.532106637 | |
| Disease-specific Antigen Abundances |
|
Click to View the Clearer Original Diagram |
| Differential expression pattern of antigen in diseases | ||
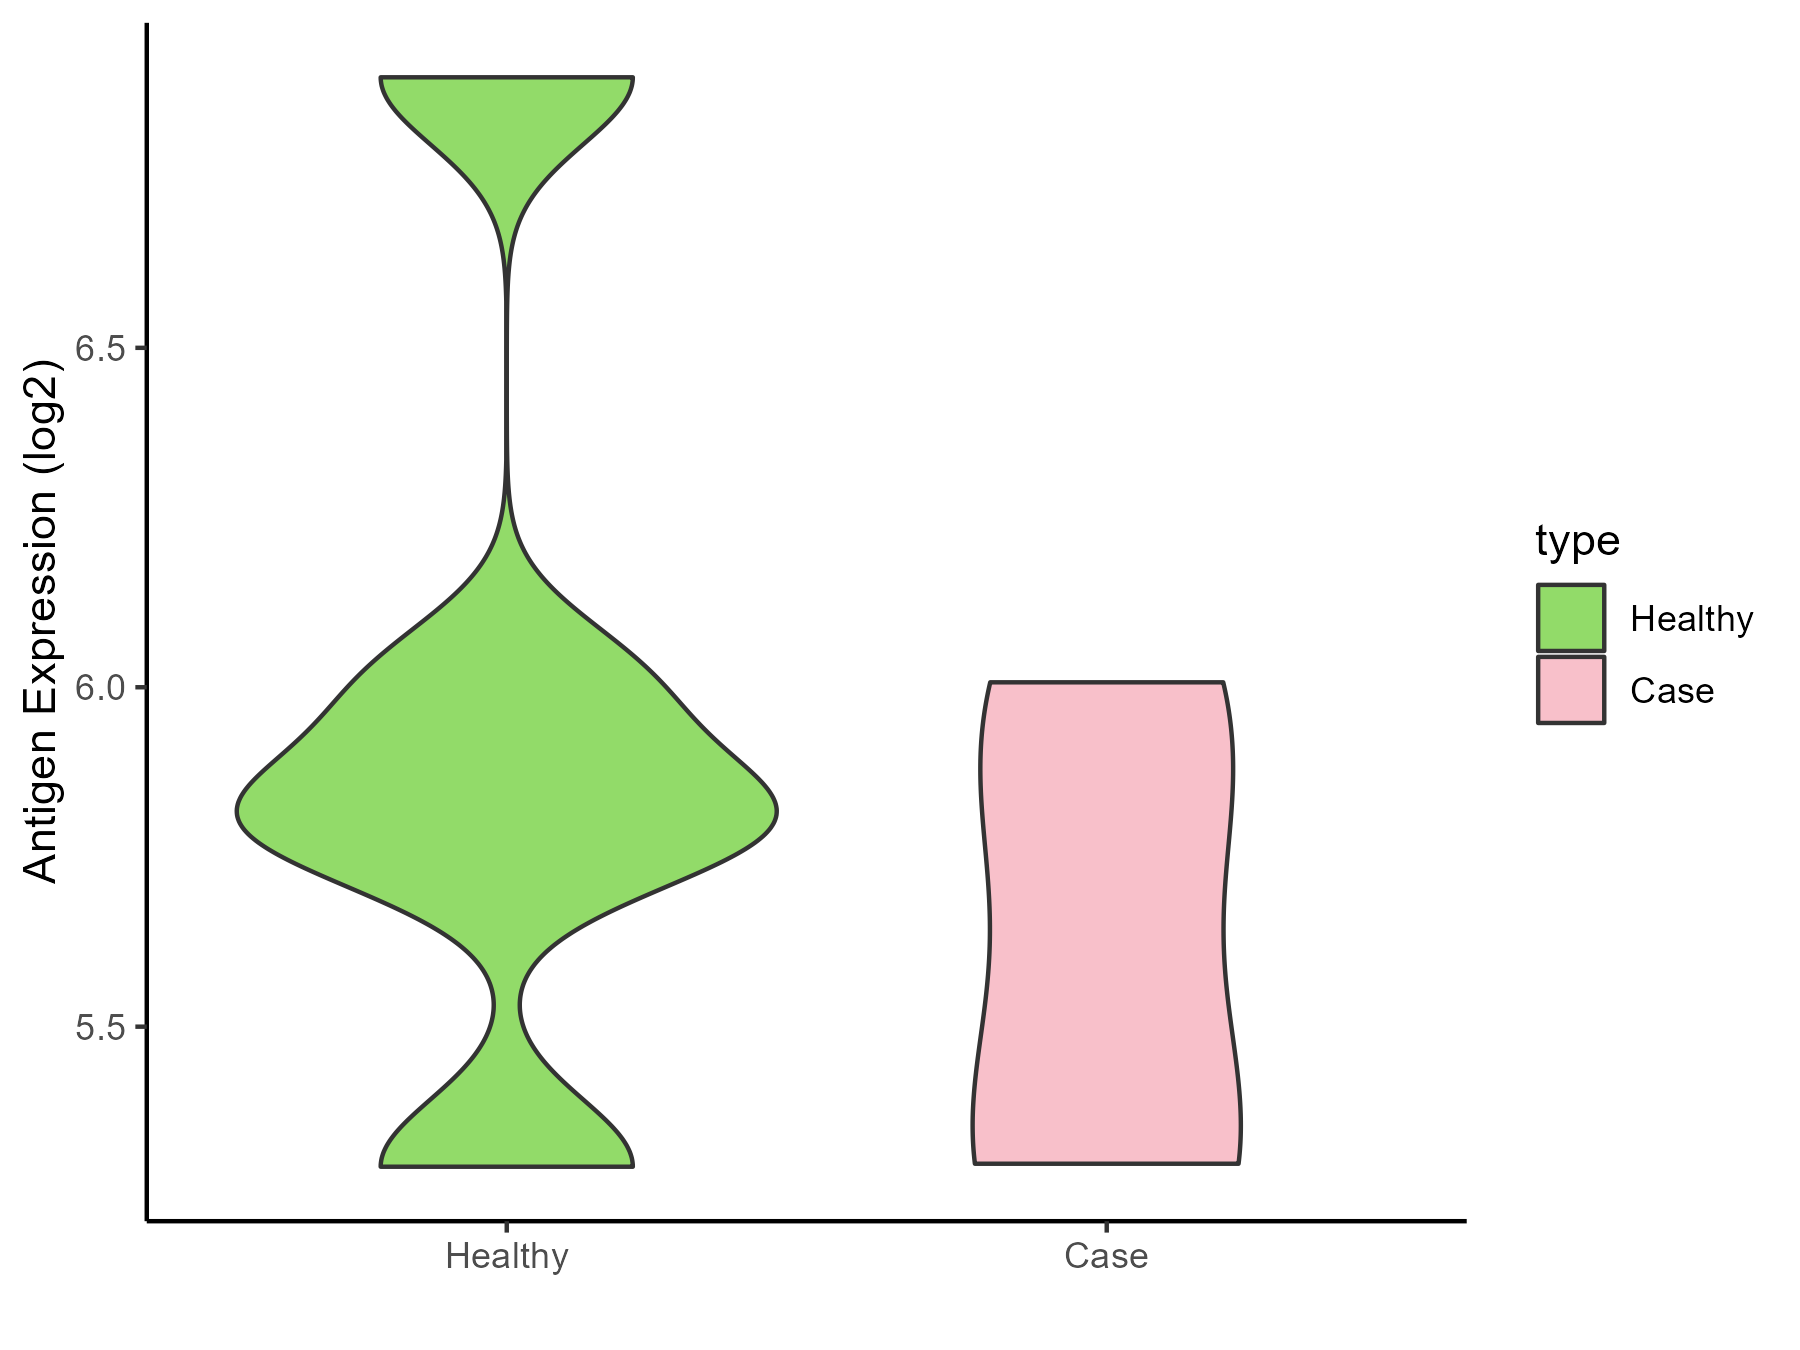
| The Studied Tissue | Bone marrow | |
| The Specific Disease | Osteoporosis | |
| The Expression Level of Disease Section Compare with the Healthy Individual Tissue | p-value: 0.322042228; Fold-change: -0.216489908; Z-score: -0.36898649 | |
| Disease-specific Antigen Abundances |
|
Click to View the Clearer Original Diagram |
ICD Disease Classification 16
| Differential expression pattern of antigen in diseases | ||
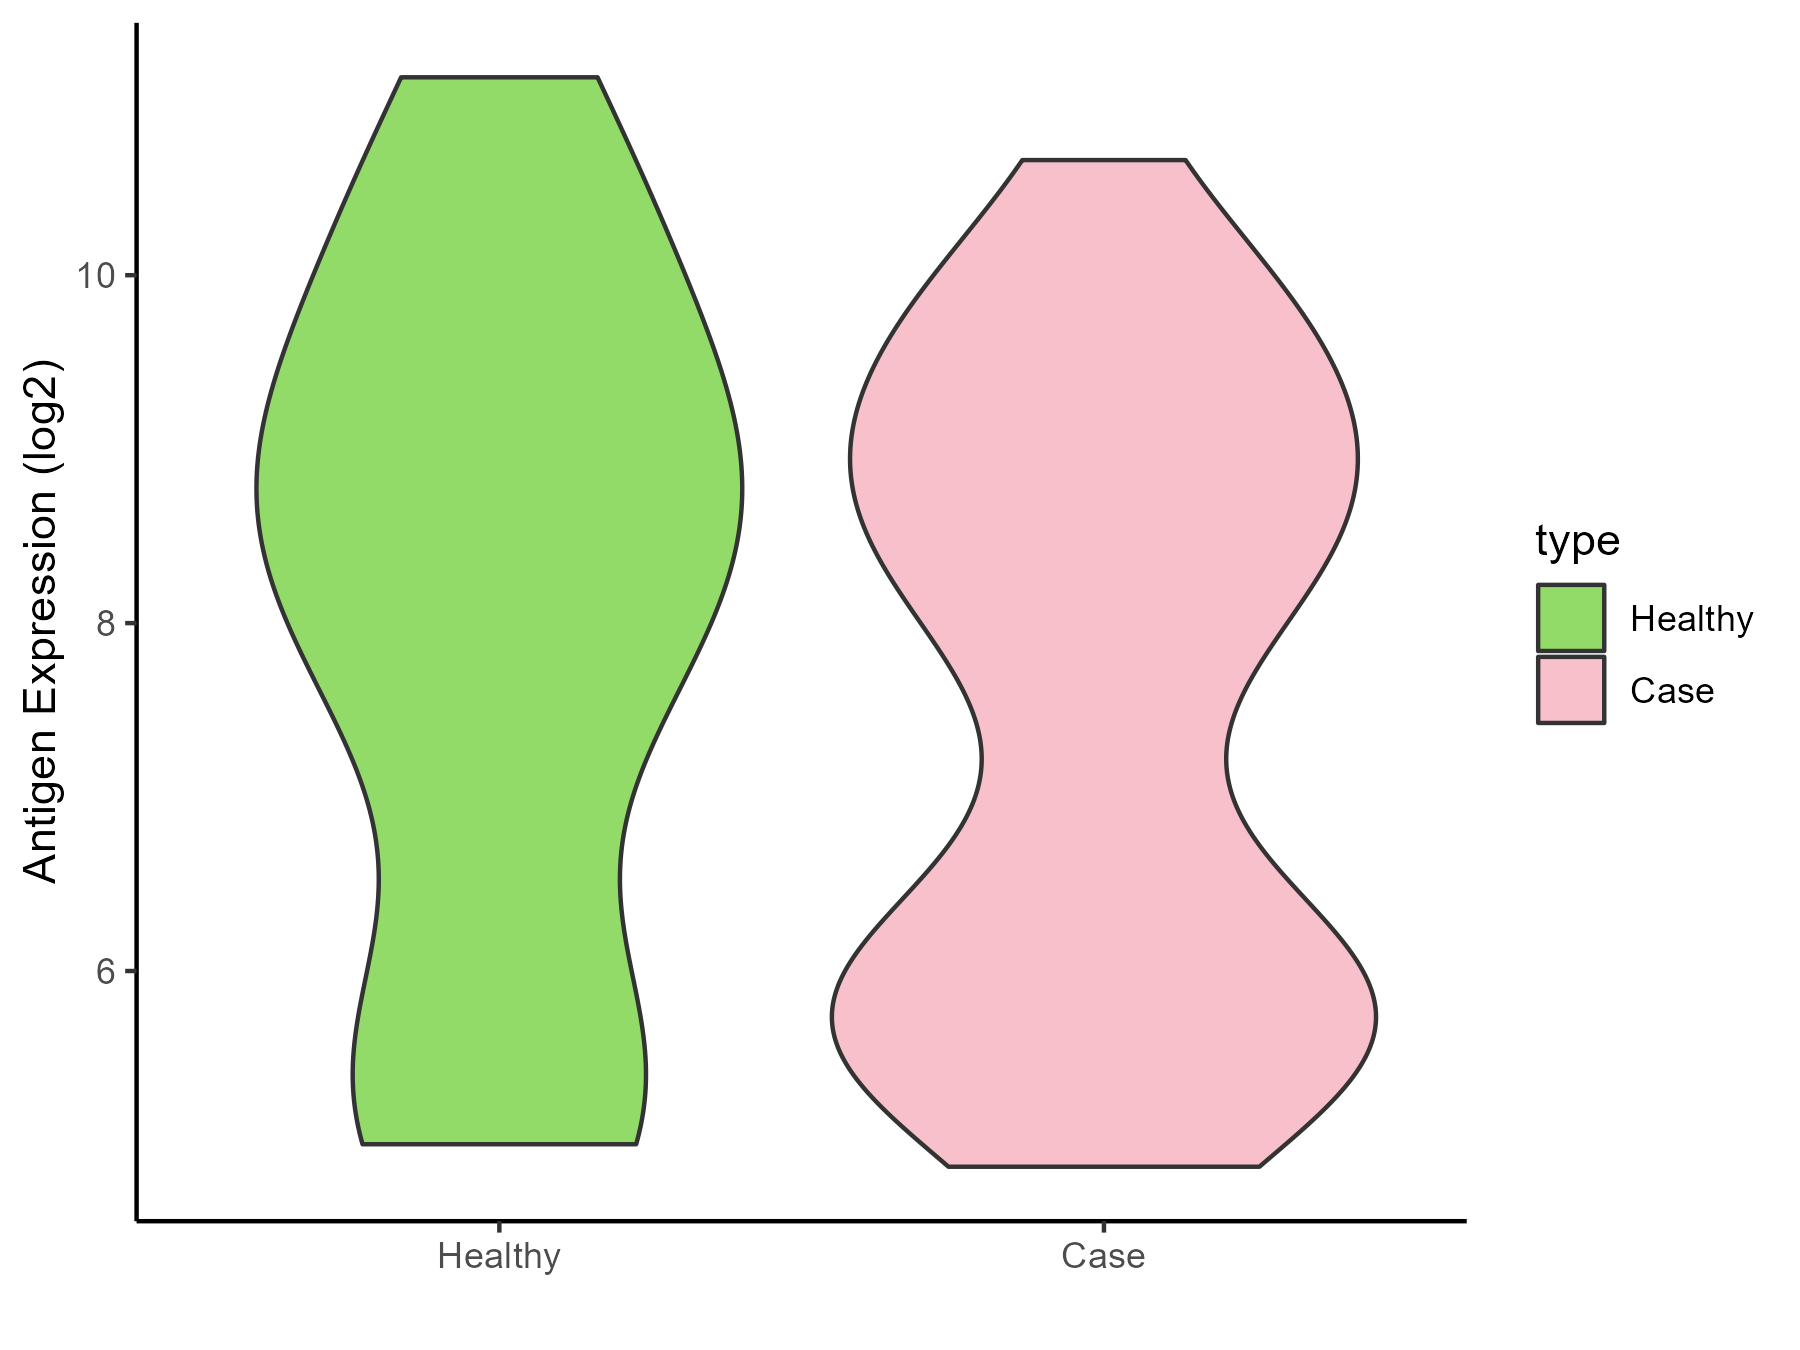
| The Studied Tissue | Endometrium | |
| The Specific Disease | Endometriosis | |
| The Expression Level of Disease Section Compare with the Healthy Individual Tissue | p-value: 0.311420091; Fold-change: -0.285463883; Z-score: -0.145880019 | |
| Disease-specific Antigen Abundances |
|
Click to View the Clearer Original Diagram |
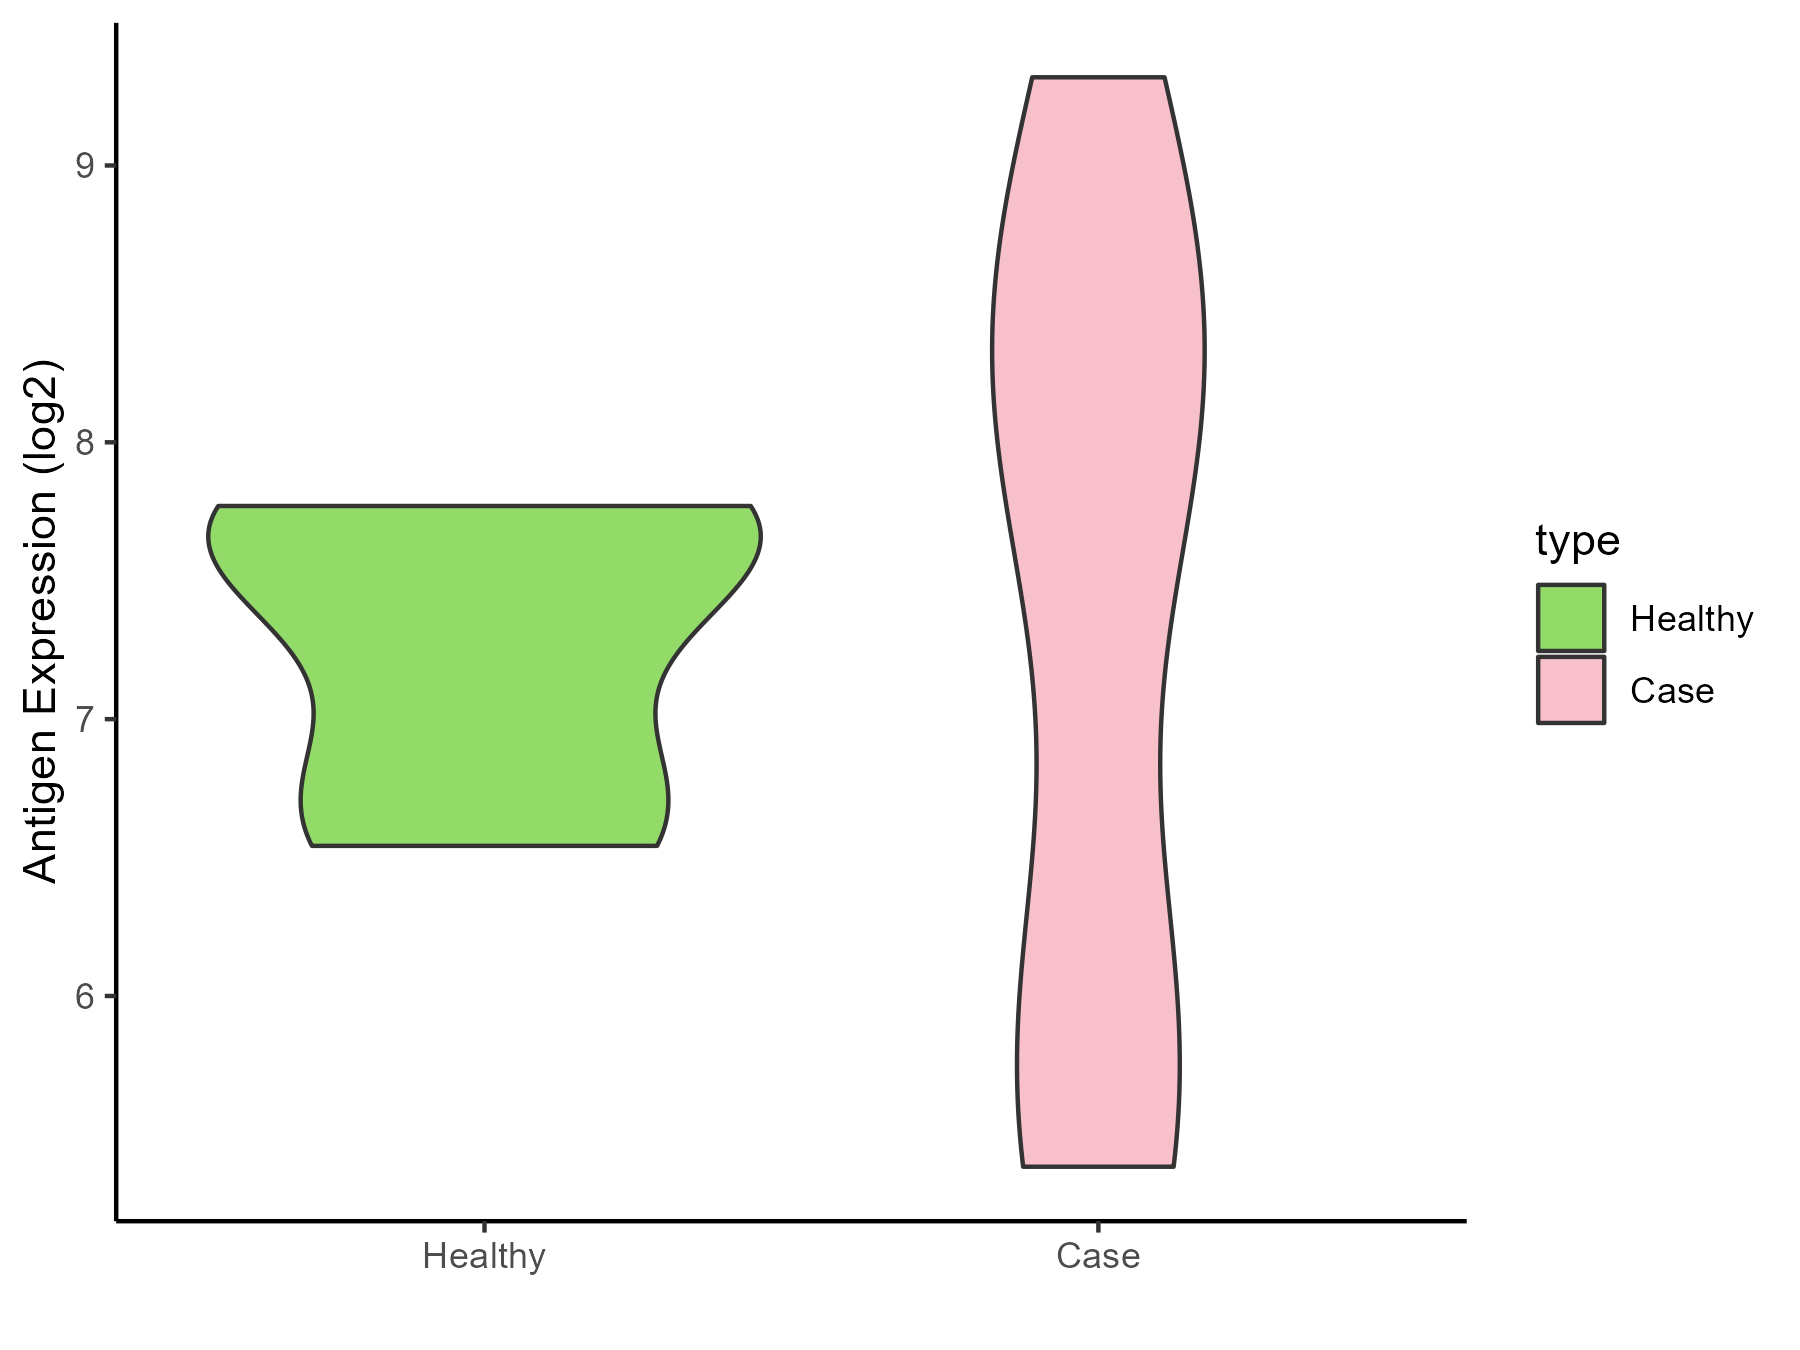
| Differential expression pattern of antigen in diseases | ||
| The Studied Tissue | Bladder | |
| The Specific Disease | Interstitial cystitis | |
| The Expression Level of Disease Section Compare with the Healthy Individual Tissue | p-value: 0.925114164; Fold-change: 0.24645214; Z-score: 0.429328056 | |
| Disease-specific Antigen Abundances |
|
Click to View the Clearer Original Diagram |
ICD Disease Classification 19
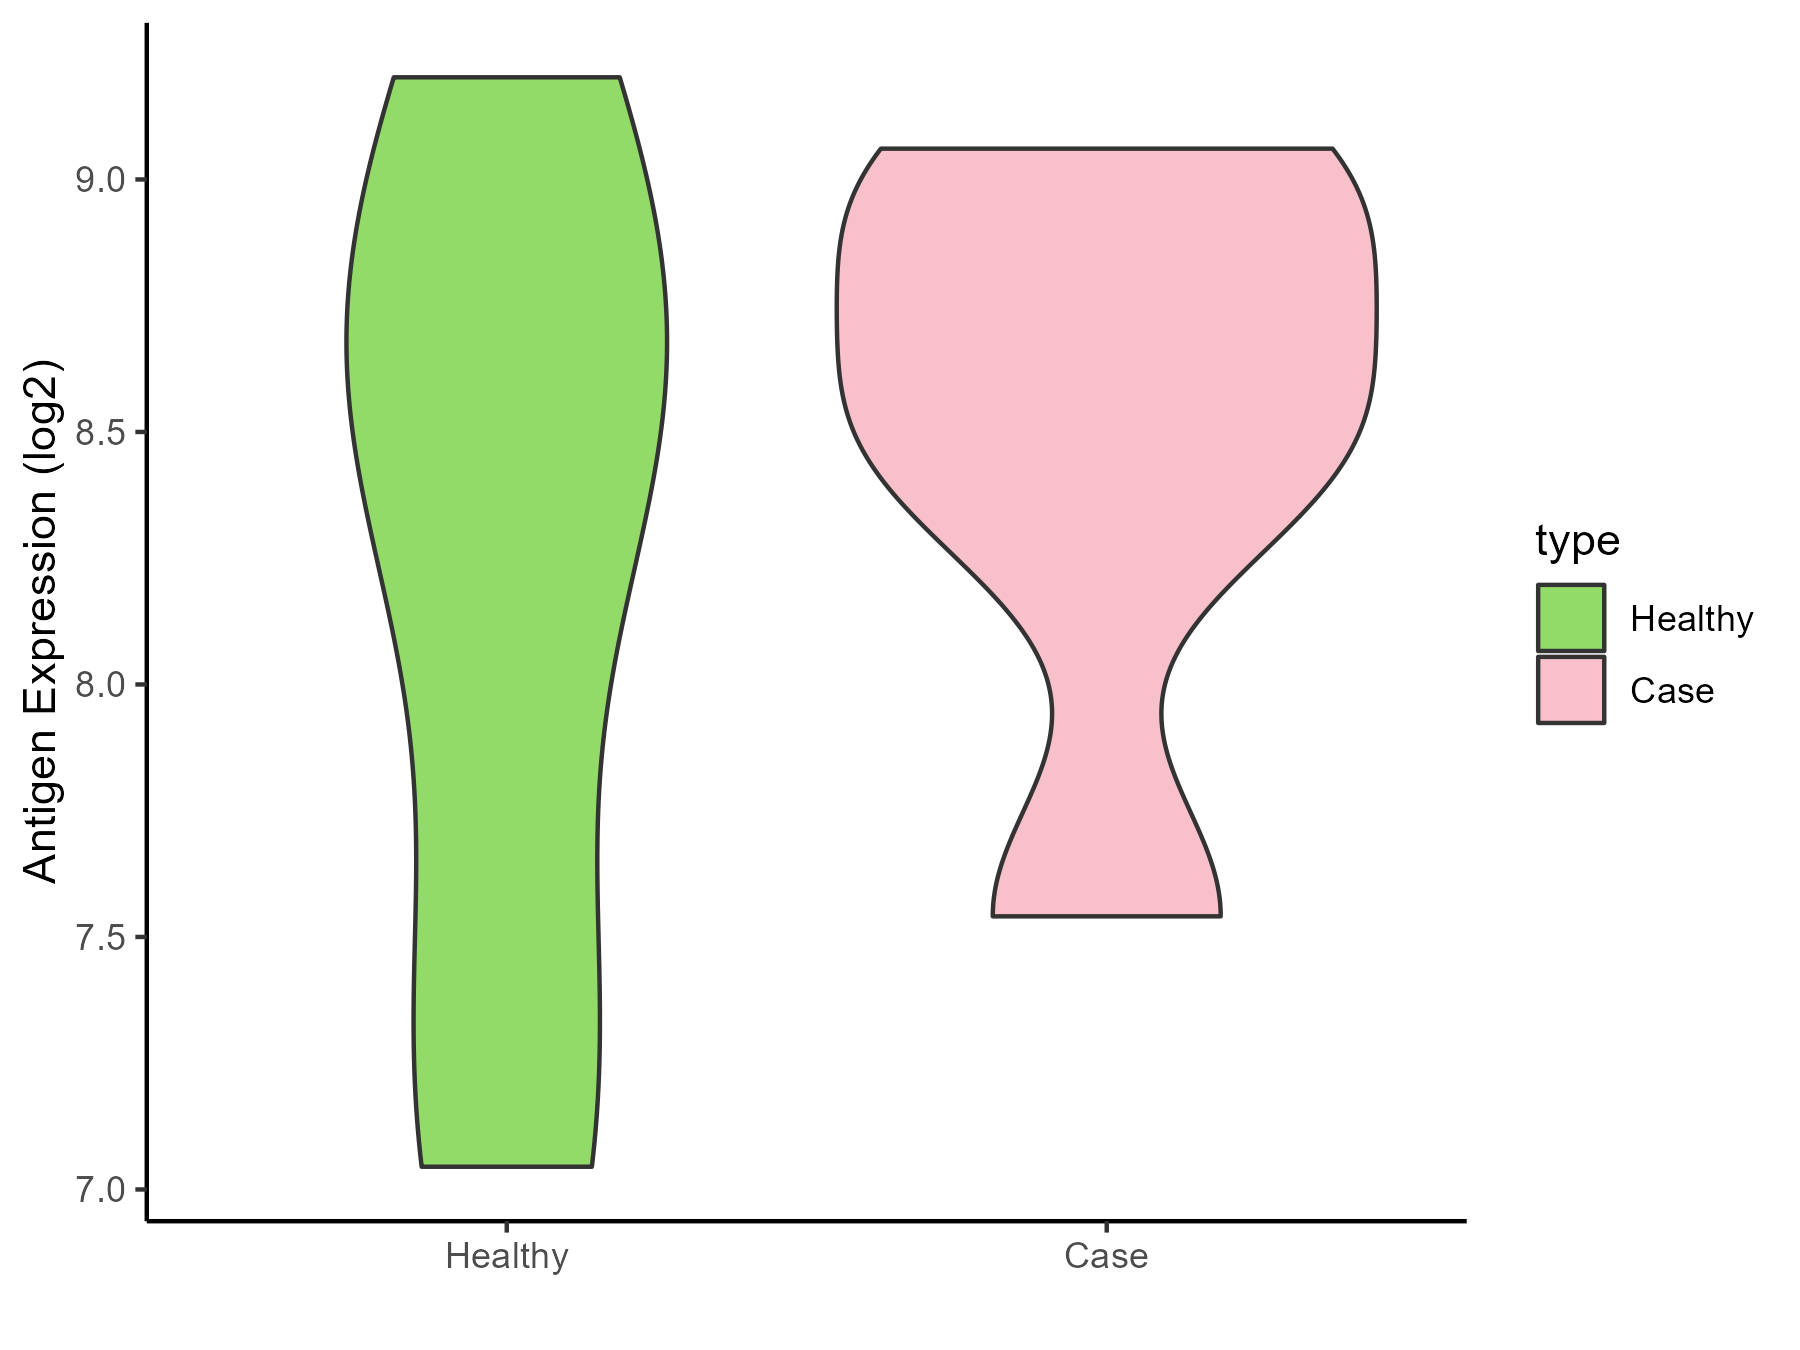
| Differential expression pattern of antigen in diseases | ||
| The Studied Tissue | Myometrium | |
| The Specific Disease | Preterm birth | |
| The Expression Level of Disease Section Compare with the Healthy Individual Tissue | p-value: 0.554865222; Fold-change: 0.061326198; Z-score: 0.073257079 | |
| Disease-specific Antigen Abundances |
|
Click to View the Clearer Original Diagram |
ICD Disease Classification 2
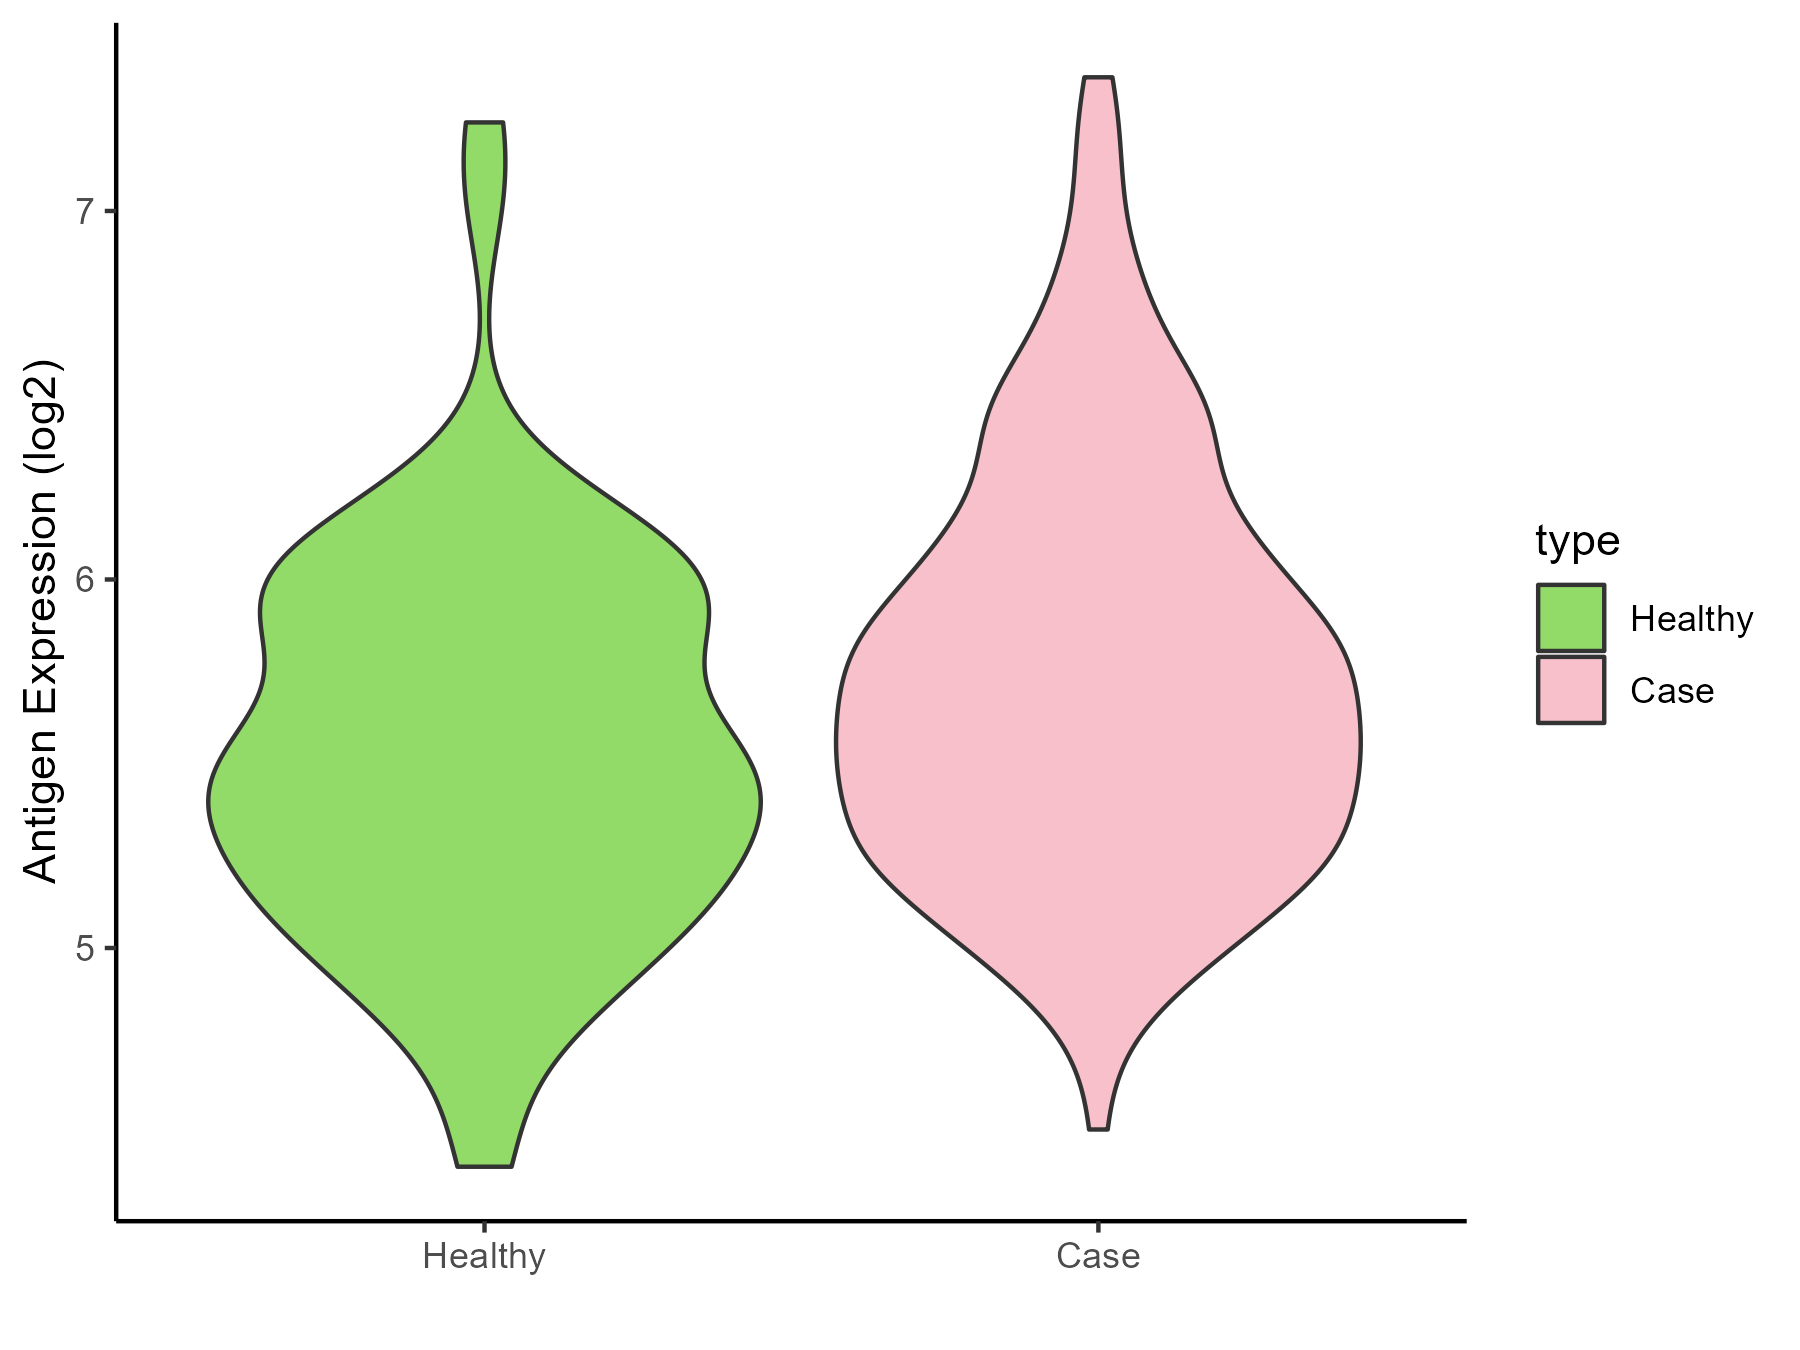
| Differential expression pattern of antigen in diseases | ||
| The Studied Tissue | Bone marrow | |
| The Specific Disease | Acute myelocytic leukemia | |
| The Expression Level of Disease Section Compare with the Healthy Individual Tissue | p-value: 0.00028958; Fold-change: 0.200118064; Z-score: 0.383817361 | |
| Disease-specific Antigen Abundances |
|
Click to View the Clearer Original Diagram |
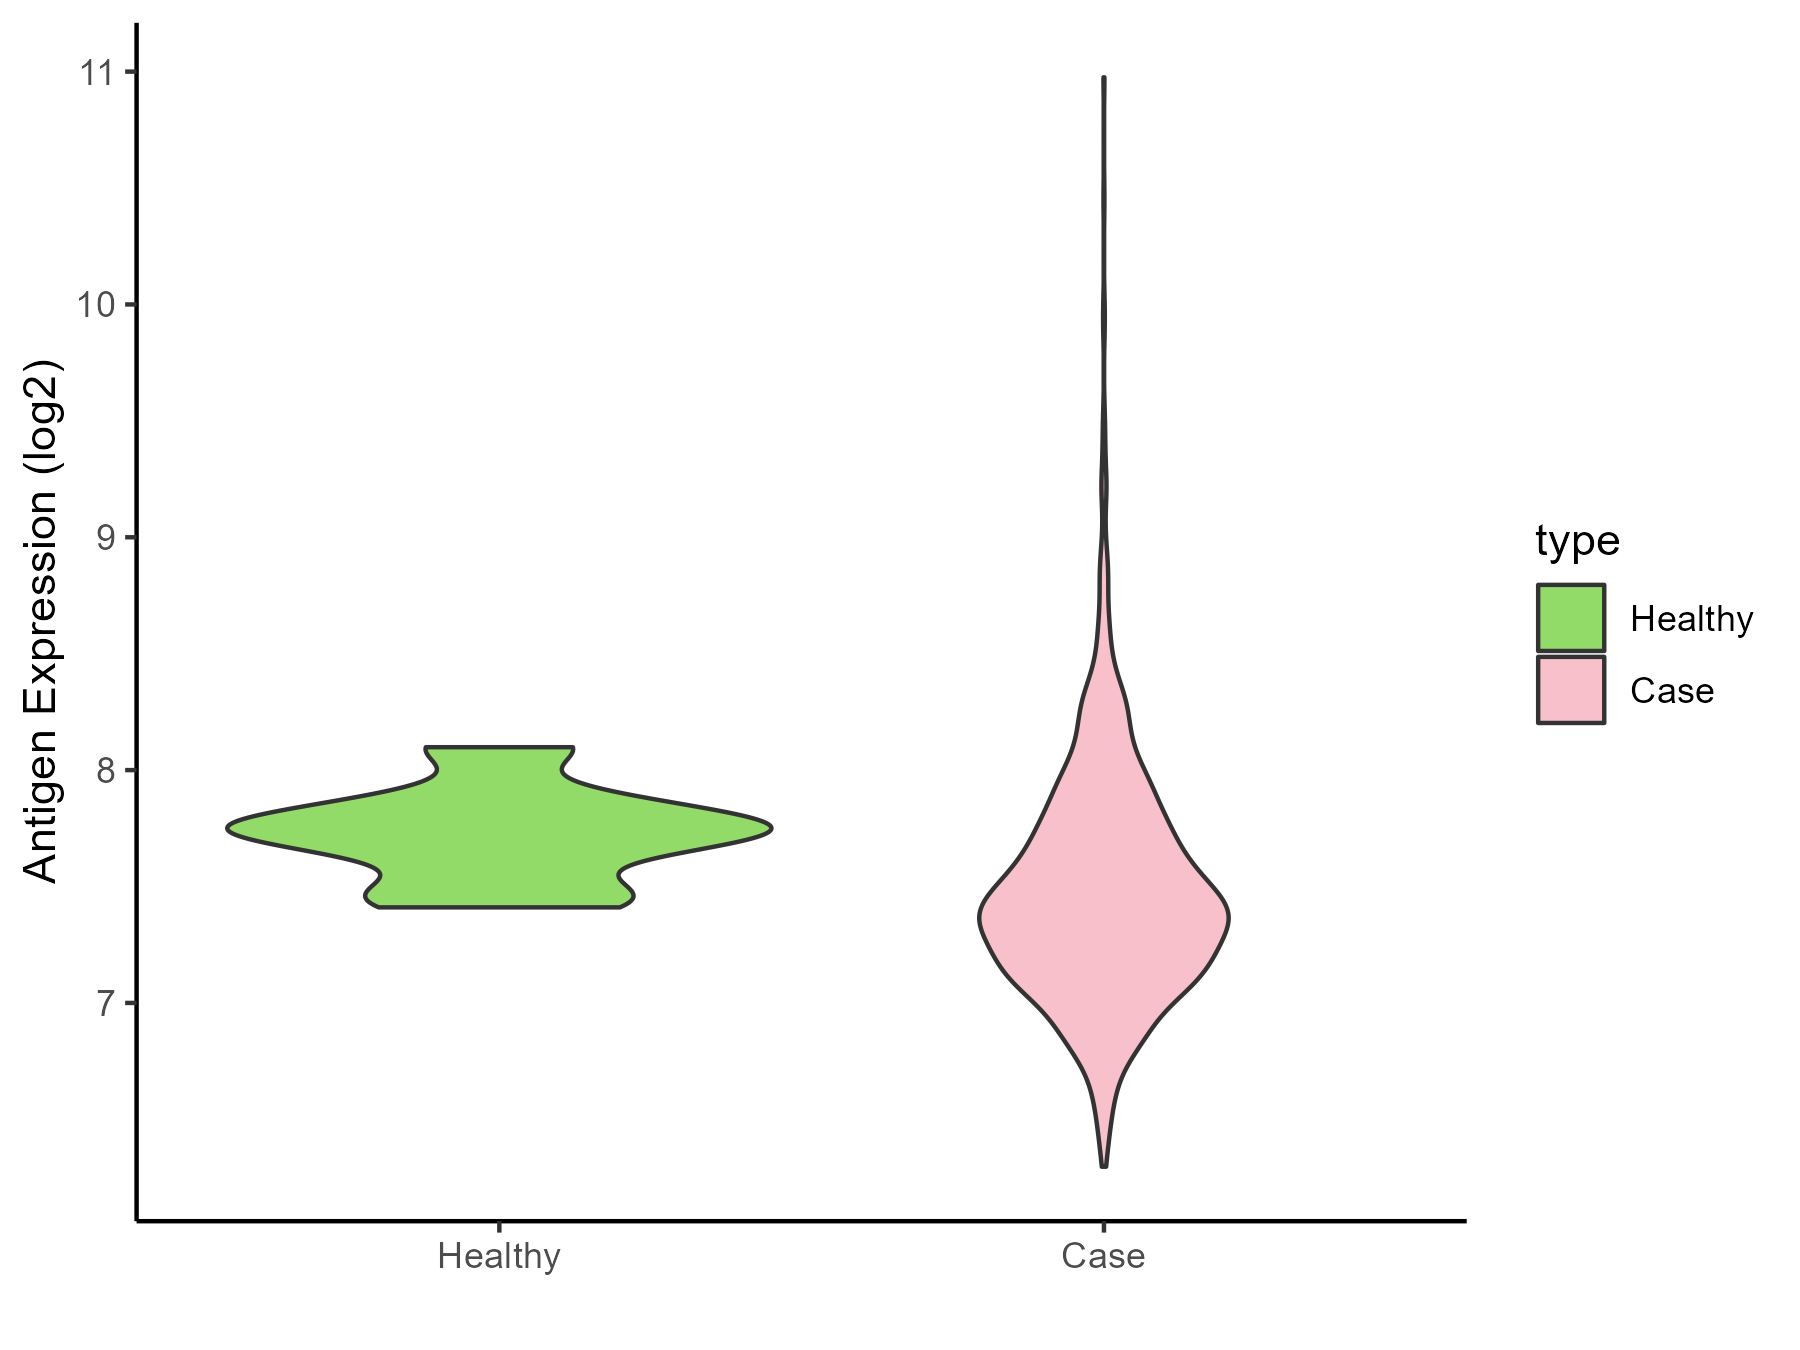
| Differential expression pattern of antigen in diseases | ||
| The Studied Tissue | Bone marrow | |
| The Specific Disease | Myeloma | |
| The Expression Level of Disease Section Compare with the Healthy Individual Tissue | p-value: 0.015279456; Fold-change: -0.33107999; Z-score: -1.535684909 | |
| Disease-specific Antigen Abundances |
|
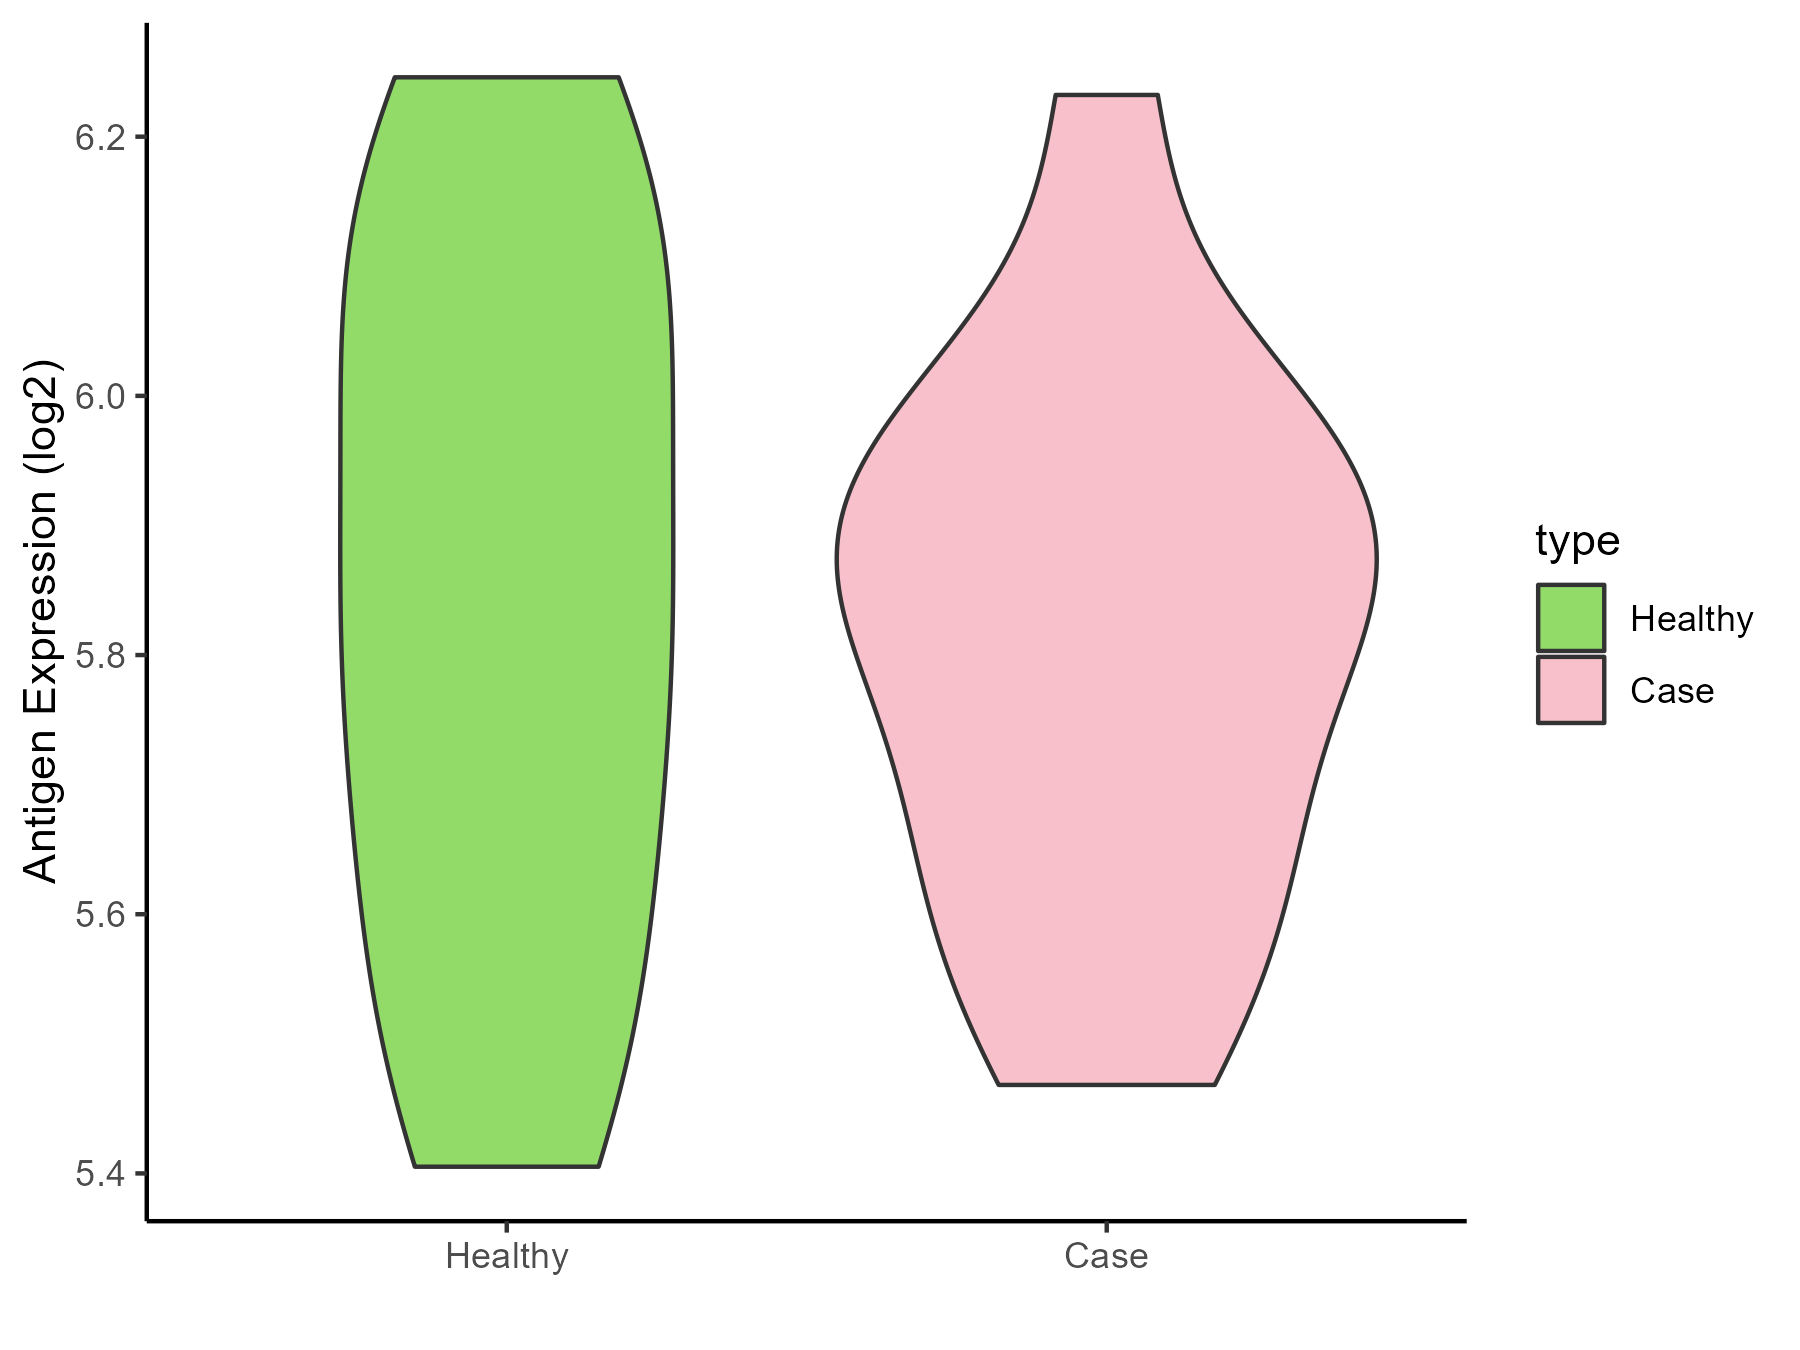
Click to View the Clearer Original Diagram |
| The Studied Tissue | Peripheral blood | |
| The Specific Disease | Myeloma | |
| The Expression Level of Disease Section Compare with the Healthy Individual Tissue | p-value: 0.734198535; Fold-change: 0.023768986; Z-score: 0.086043133 | |
| Disease-specific Antigen Abundances |
|
Click to View the Clearer Original Diagram |
| Differential expression pattern of antigen in diseases | ||
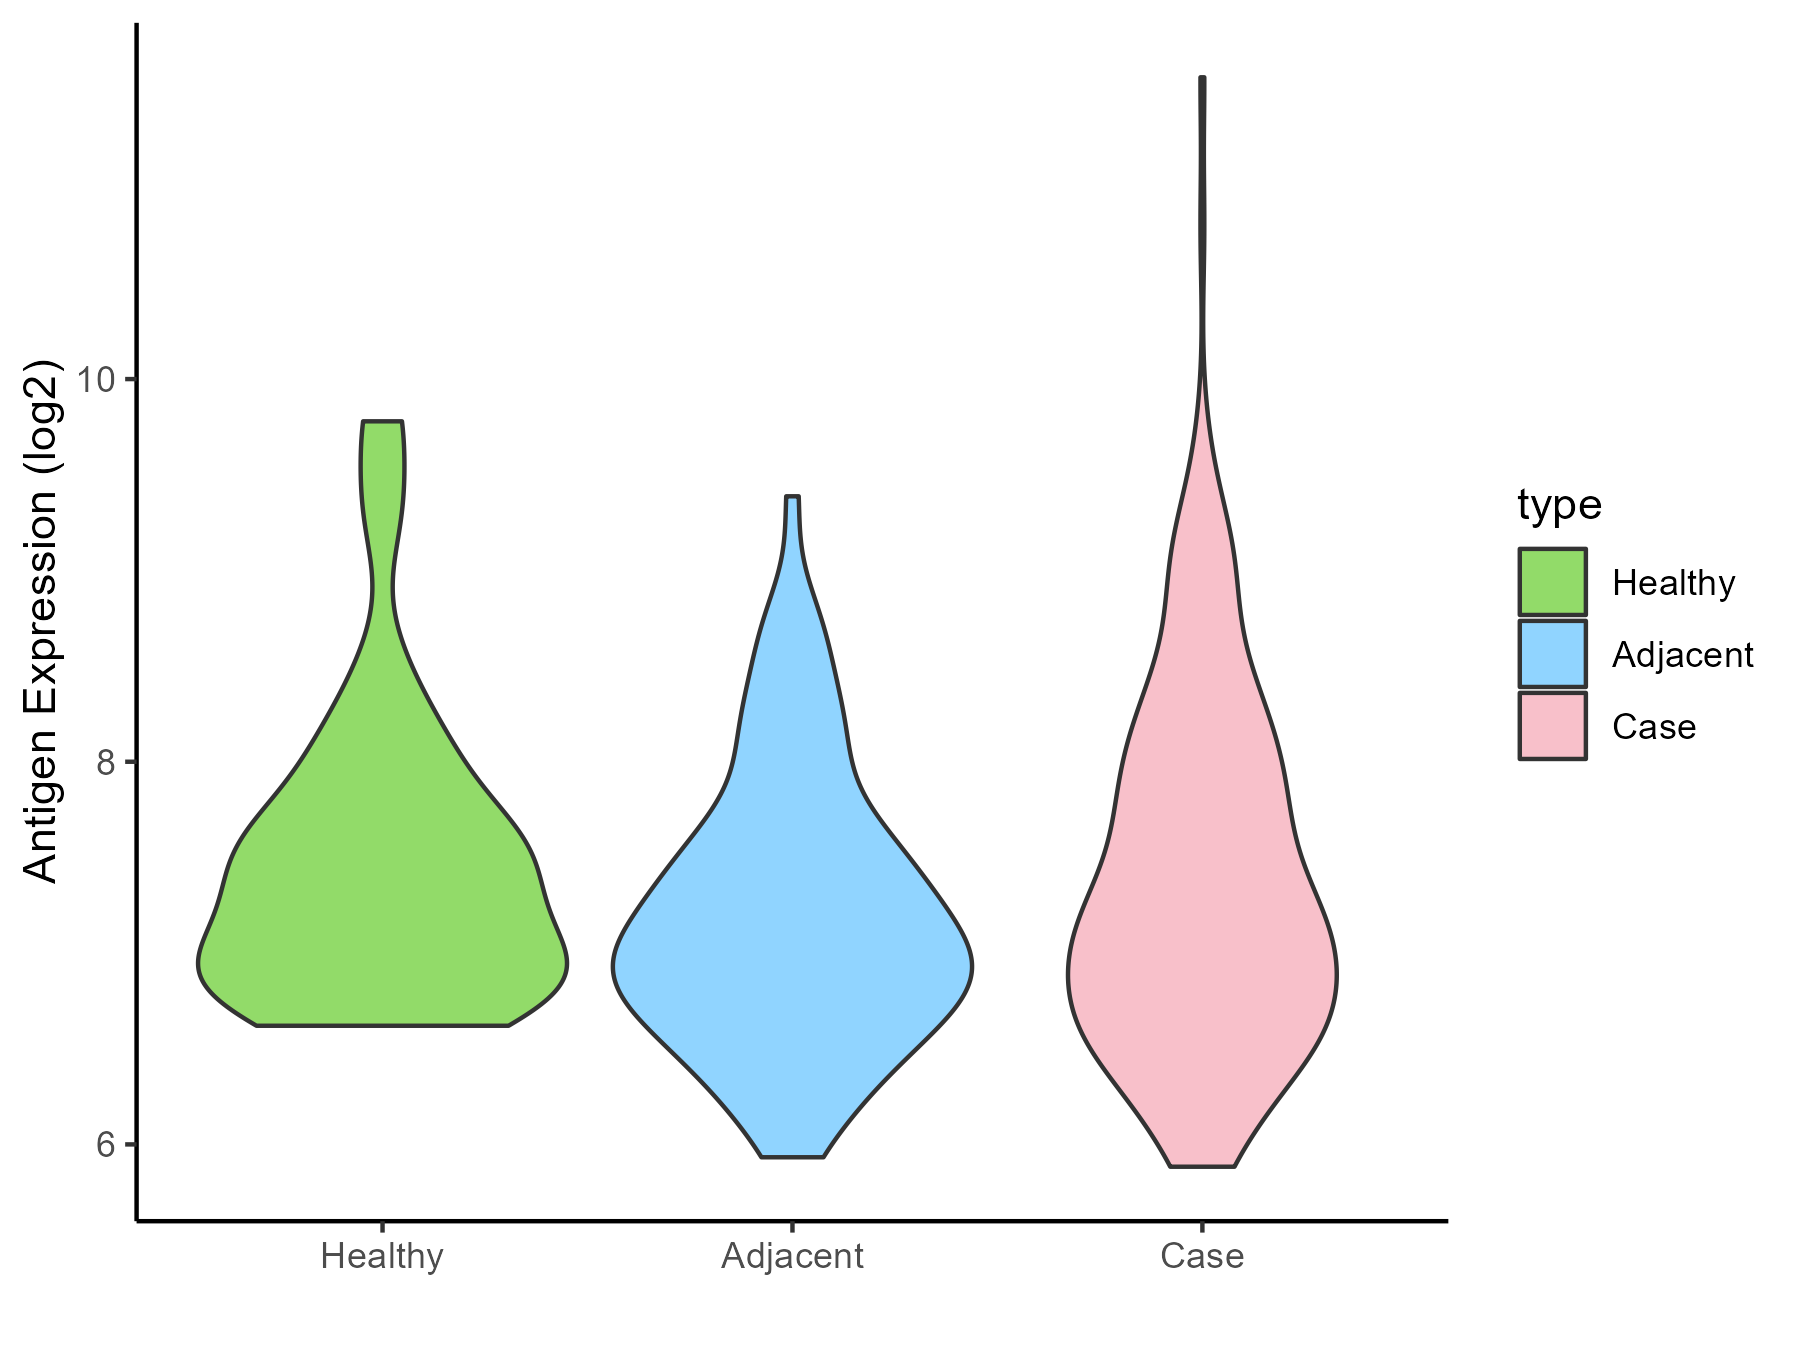
| The Studied Tissue | Oral | |
| The Specific Disease | Oral cancer | |
| The Expression Level of Disease Section Compare with the Healthy Individual Tissue | p-value: 0.665943638; Fold-change: -0.138640205; Z-score: -0.178491155 | |
| The Expression Level of Disease Section Compare with the Adjacent Tissue | p-value: 0.05536751; Fold-change: 0.135377668; Z-score: 0.190629701 | |
| Disease-specific Antigen Abundances |
|
Click to View the Clearer Original Diagram |
| Differential expression pattern of antigen in diseases | ||
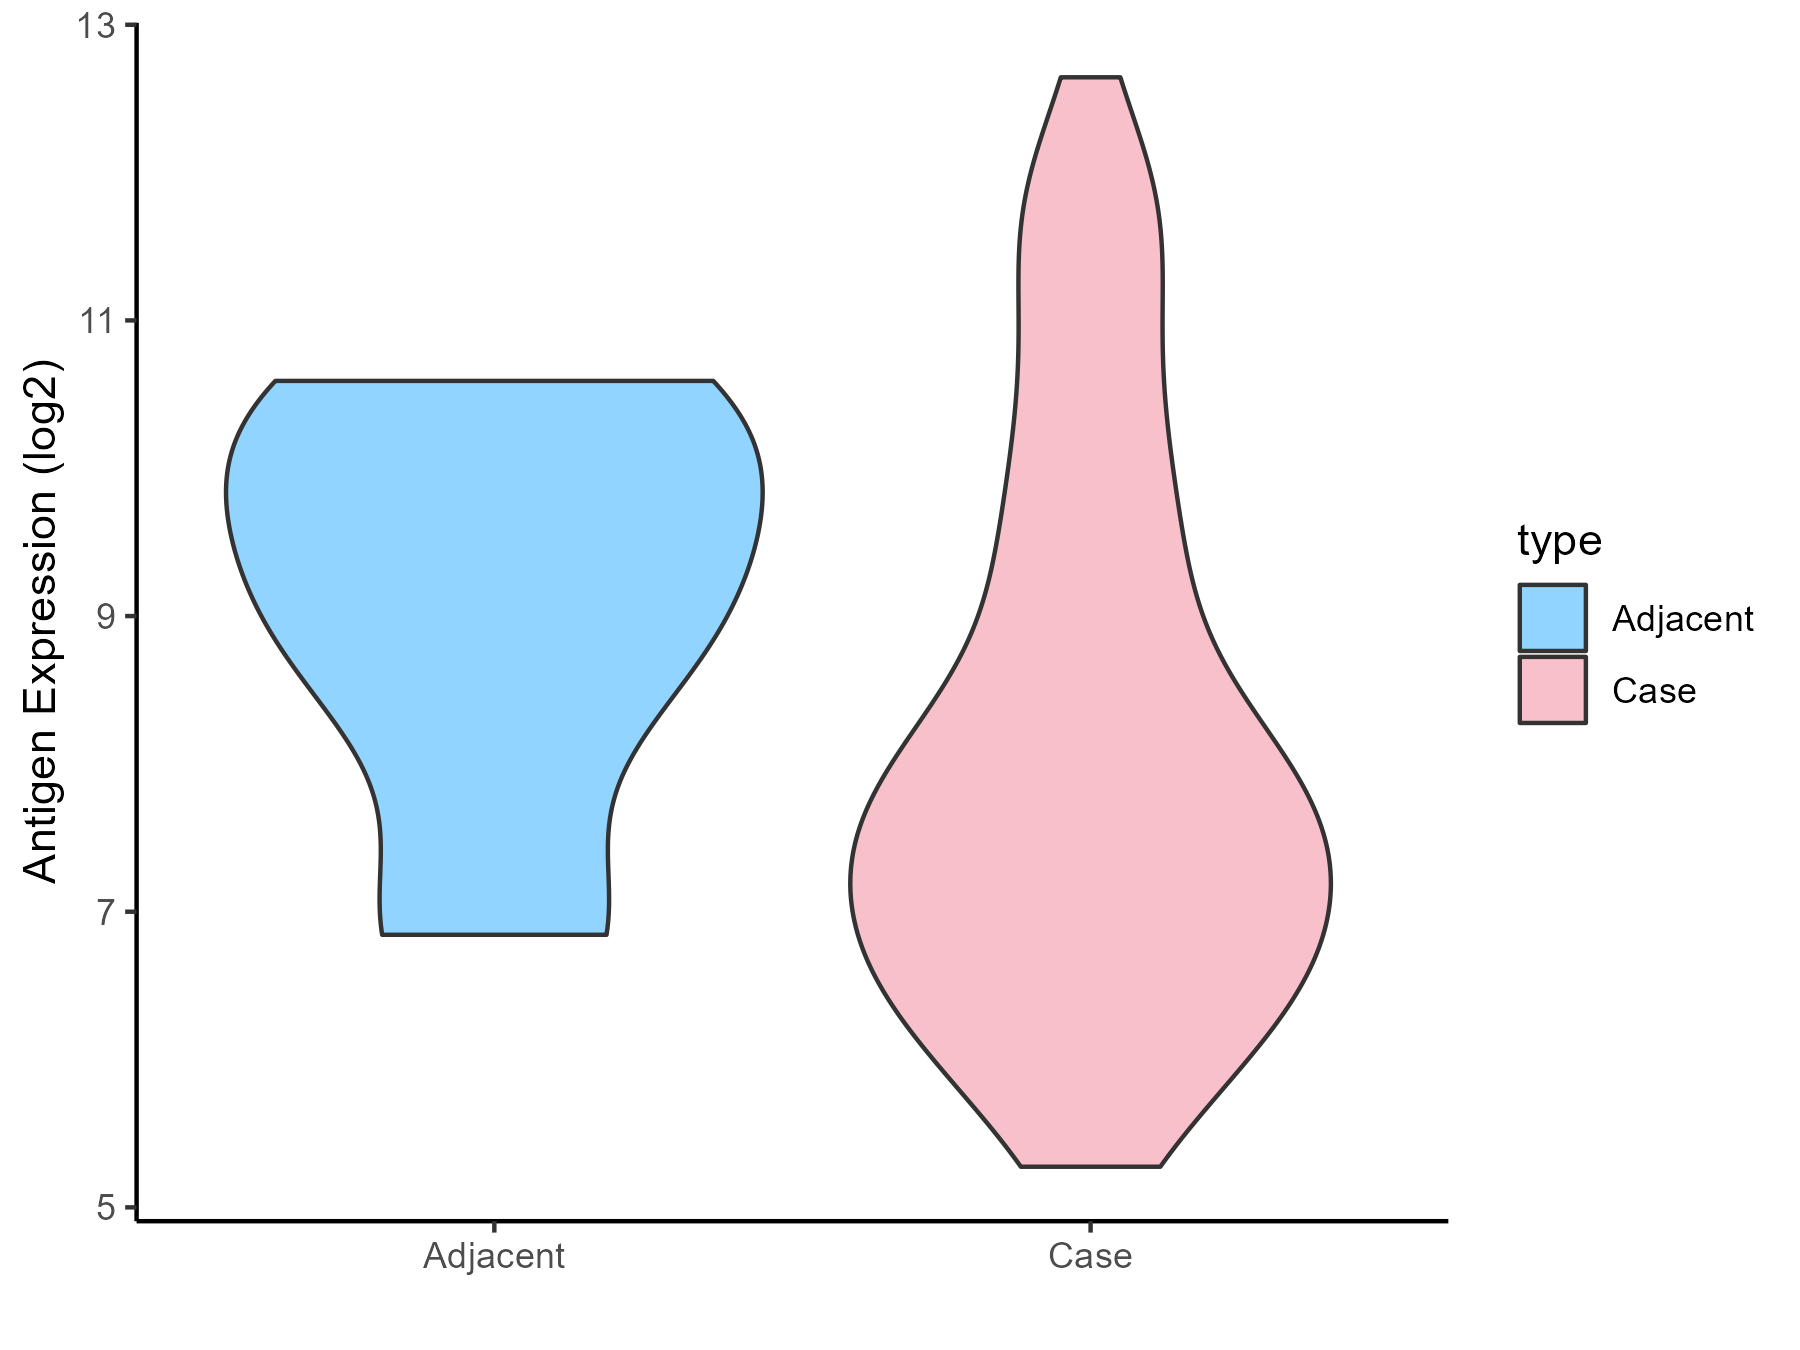
| The Studied Tissue | Esophagus | |
| The Specific Disease | Esophagal cancer | |
| The Expression Level of Disease Section Compare with the Adjacent Tissue | p-value: 0.218294663; Fold-change: -1.593063962; Z-score: -1.081485529 | |
| Disease-specific Antigen Abundances |
|
Click to View the Clearer Original Diagram |
| Differential expression pattern of antigen in diseases | ||
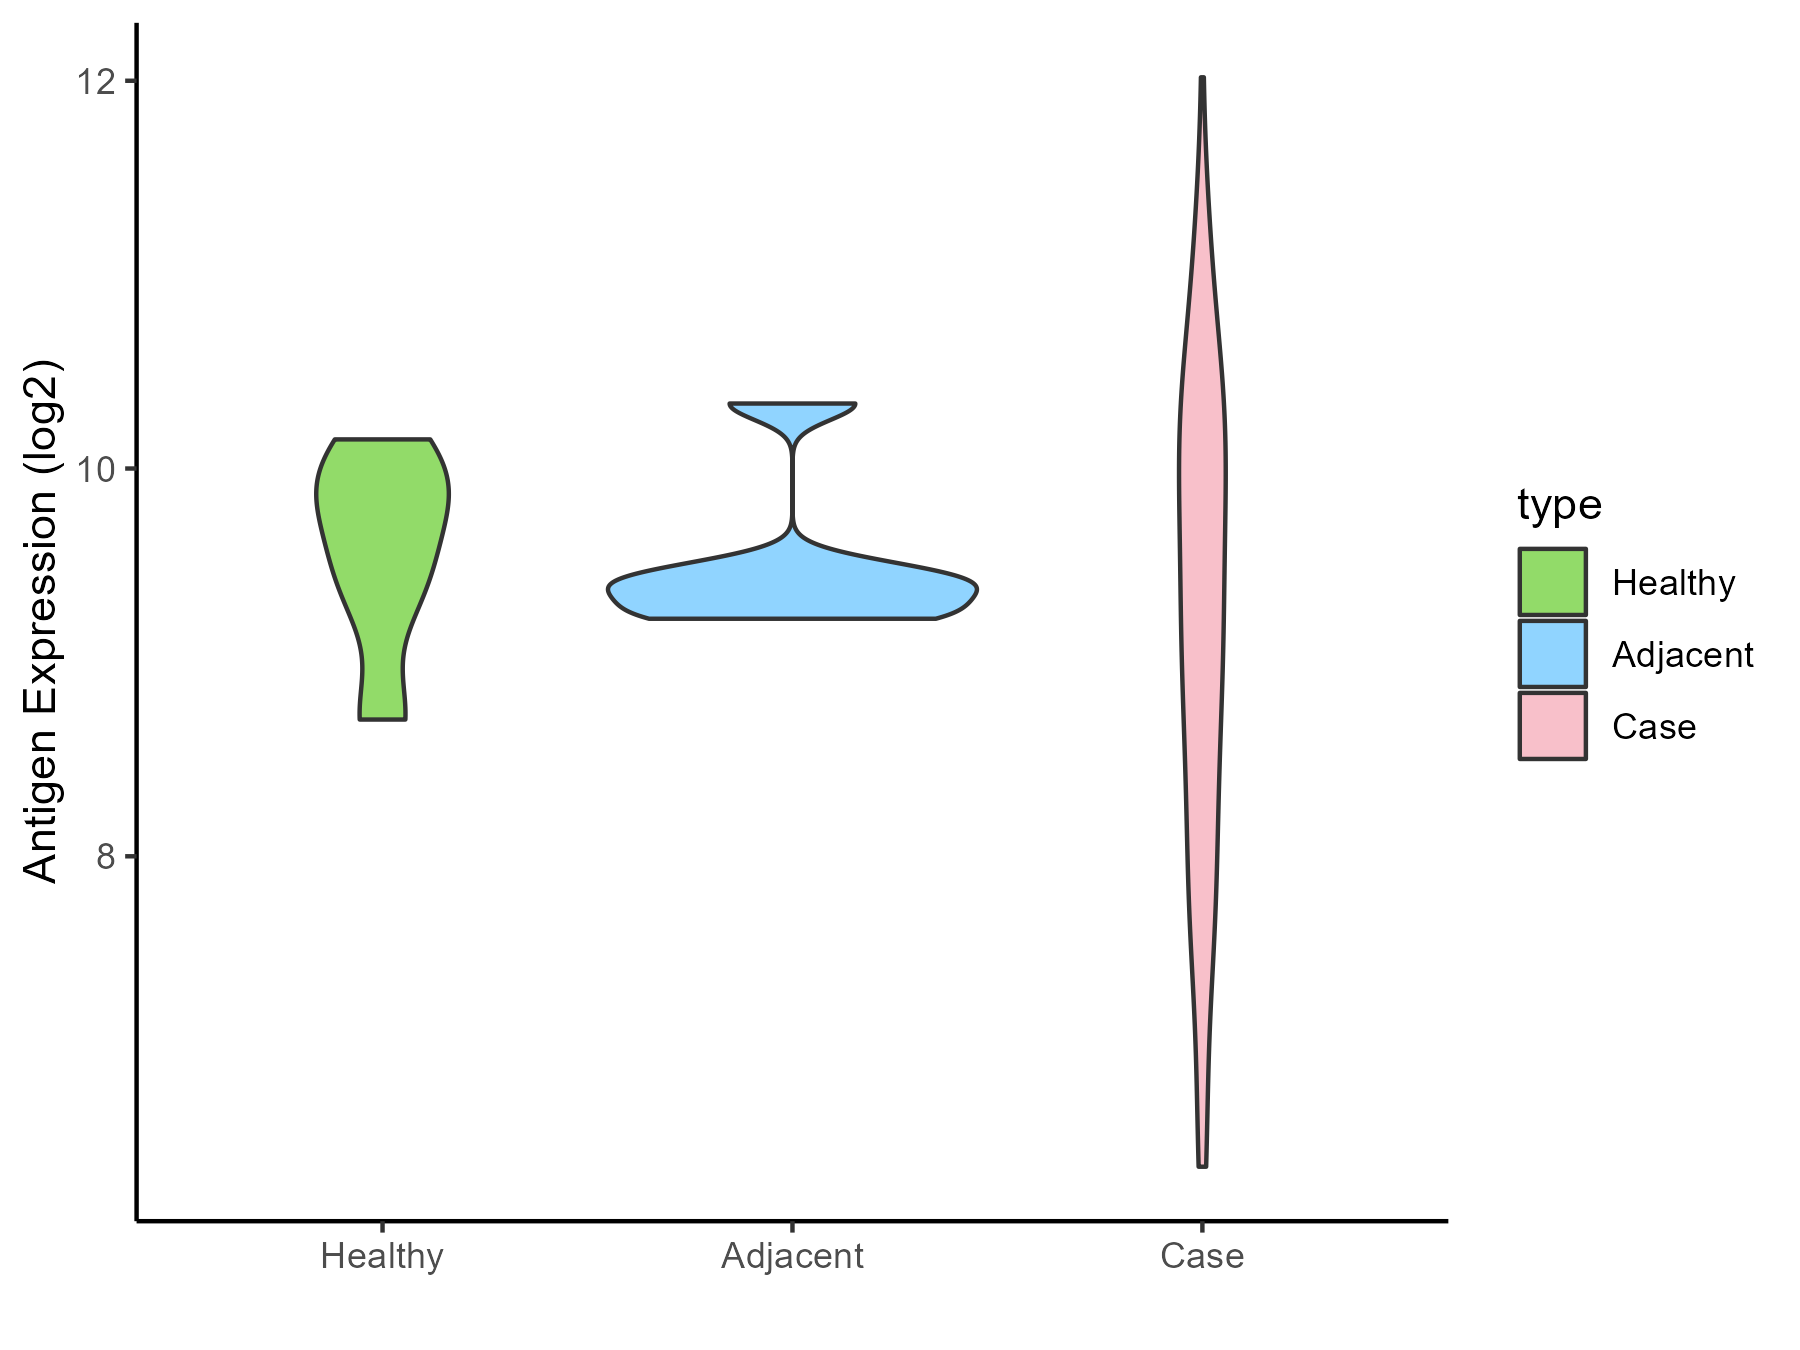
| The Studied Tissue | Rectal colon | |
| The Specific Disease | Rectal cancer | |
| The Expression Level of Disease Section Compare with the Healthy Individual Tissue | p-value: 0.160509127; Fold-change: -0.432524509; Z-score: -0.834554353 | |
| The Expression Level of Disease Section Compare with the Adjacent Tissue | p-value: 0.17746242; Fold-change: -0.113744238; Z-score: -0.274577272 | |
| Disease-specific Antigen Abundances |
|
Click to View the Clearer Original Diagram |
| Differential expression pattern of antigen in diseases | ||
| The Studied Tissue | Skin | |
| The Specific Disease | Skin cancer | |
| The Expression Level of Disease Section Compare with the Healthy Individual Tissue | p-value: 6.95E-20; Fold-change: -1.031422057; Z-score: -0.748607571 | |
| The Expression Level of Disease Section Compare with the Adjacent Tissue | p-value: 2.11E-32; Fold-change: -1.6807201; Z-score: -1.126348291 | |
| Disease-specific Antigen Abundances |

|
Click to View the Clearer Original Diagram |
| Differential expression pattern of antigen in diseases | ||
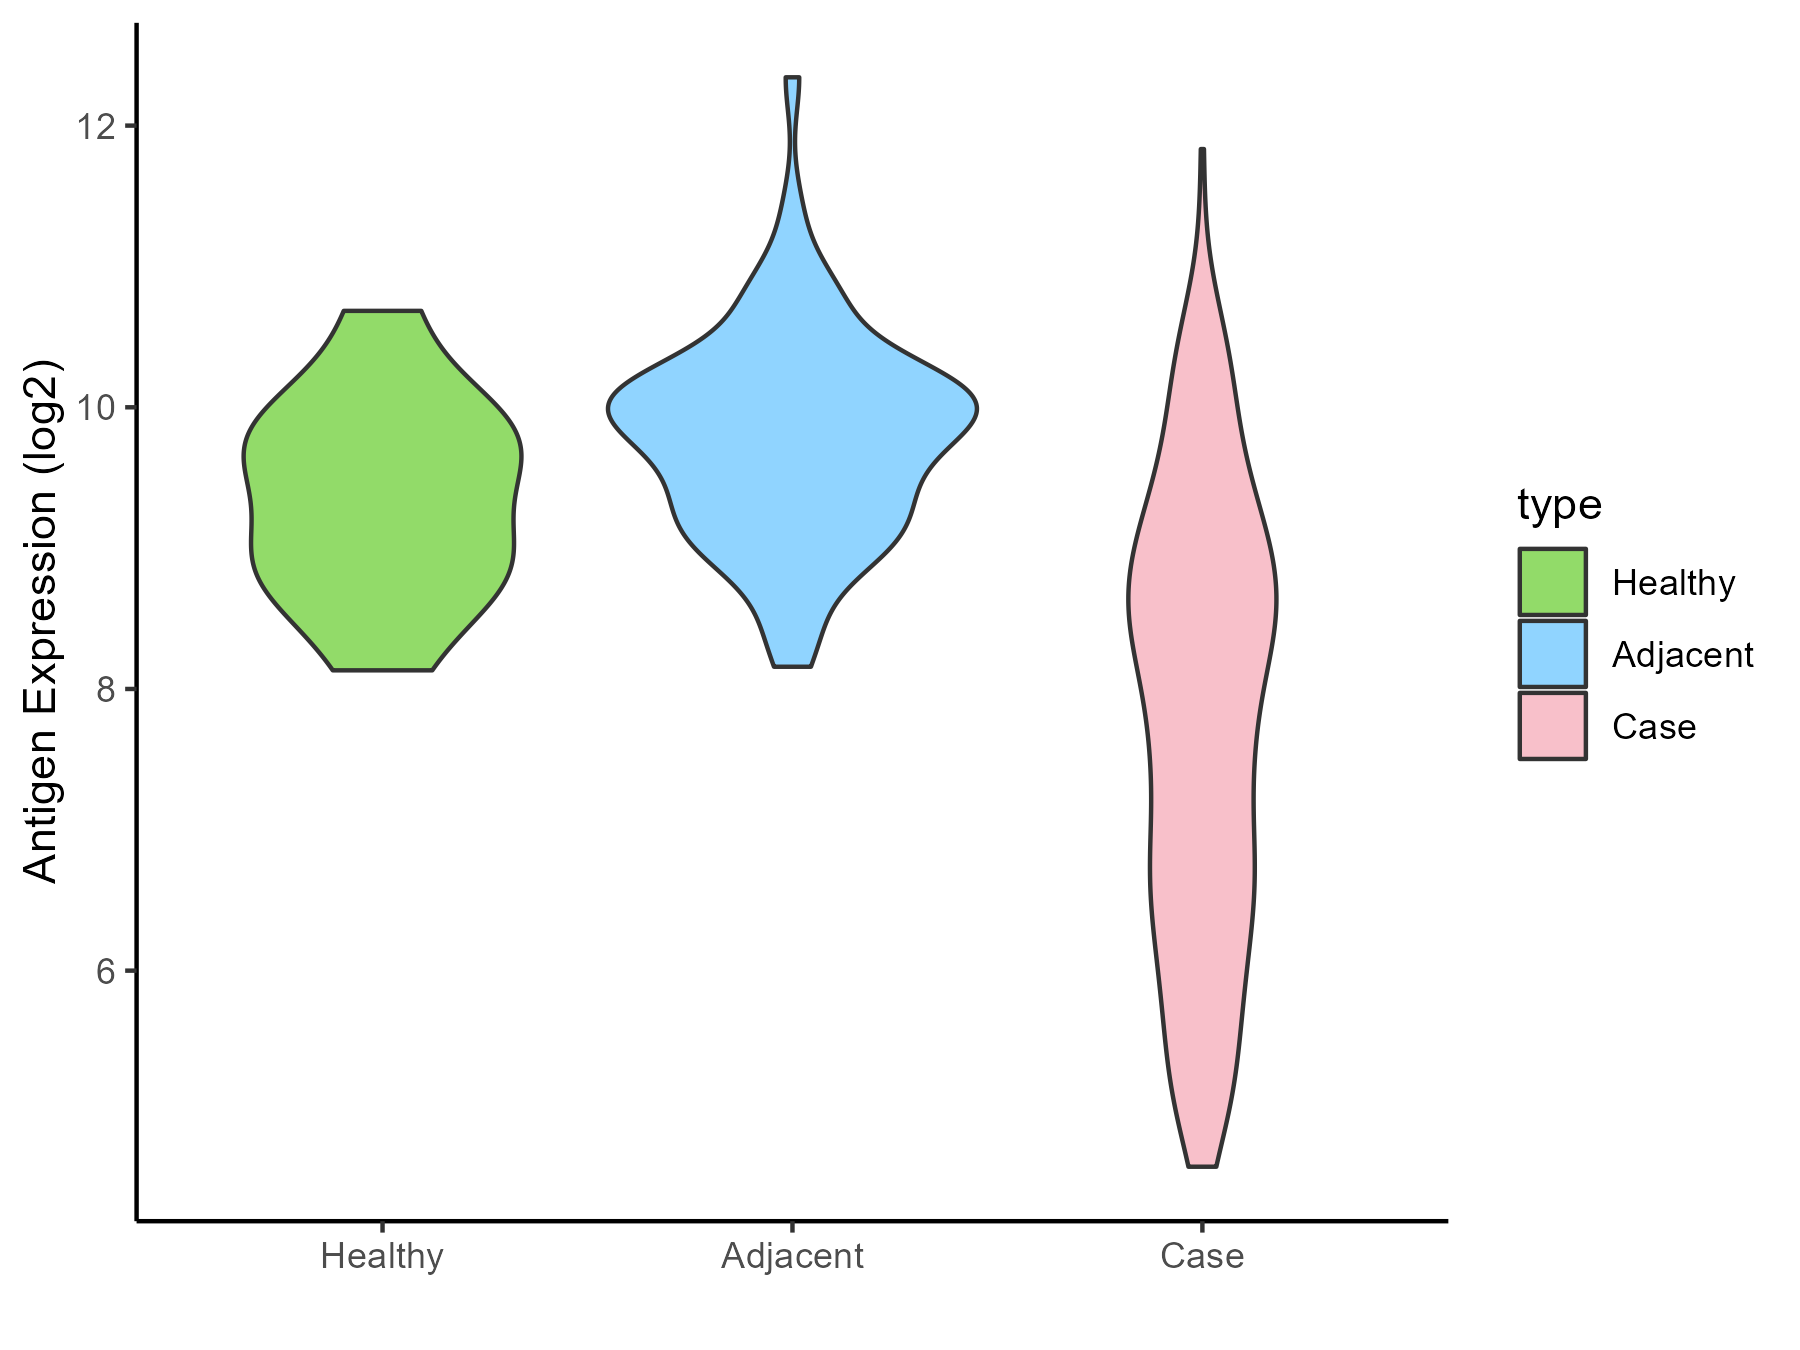
| The Studied Tissue | Kidney | |
| The Specific Disease | Renal cancer | |
| The Expression Level of Disease Section Compare with the Healthy Individual Tissue | p-value: 1.65E-05; Fold-change: -1.449244494; Z-score: -2.011244761 | |
| The Expression Level of Disease Section Compare with the Adjacent Tissue | p-value: 3.86E-40; Fold-change: -1.82743949; Z-score: -2.500302831 | |
| Disease-specific Antigen Abundances |
|
Click to View the Clearer Original Diagram |
| Differential expression pattern of antigen in diseases | ||
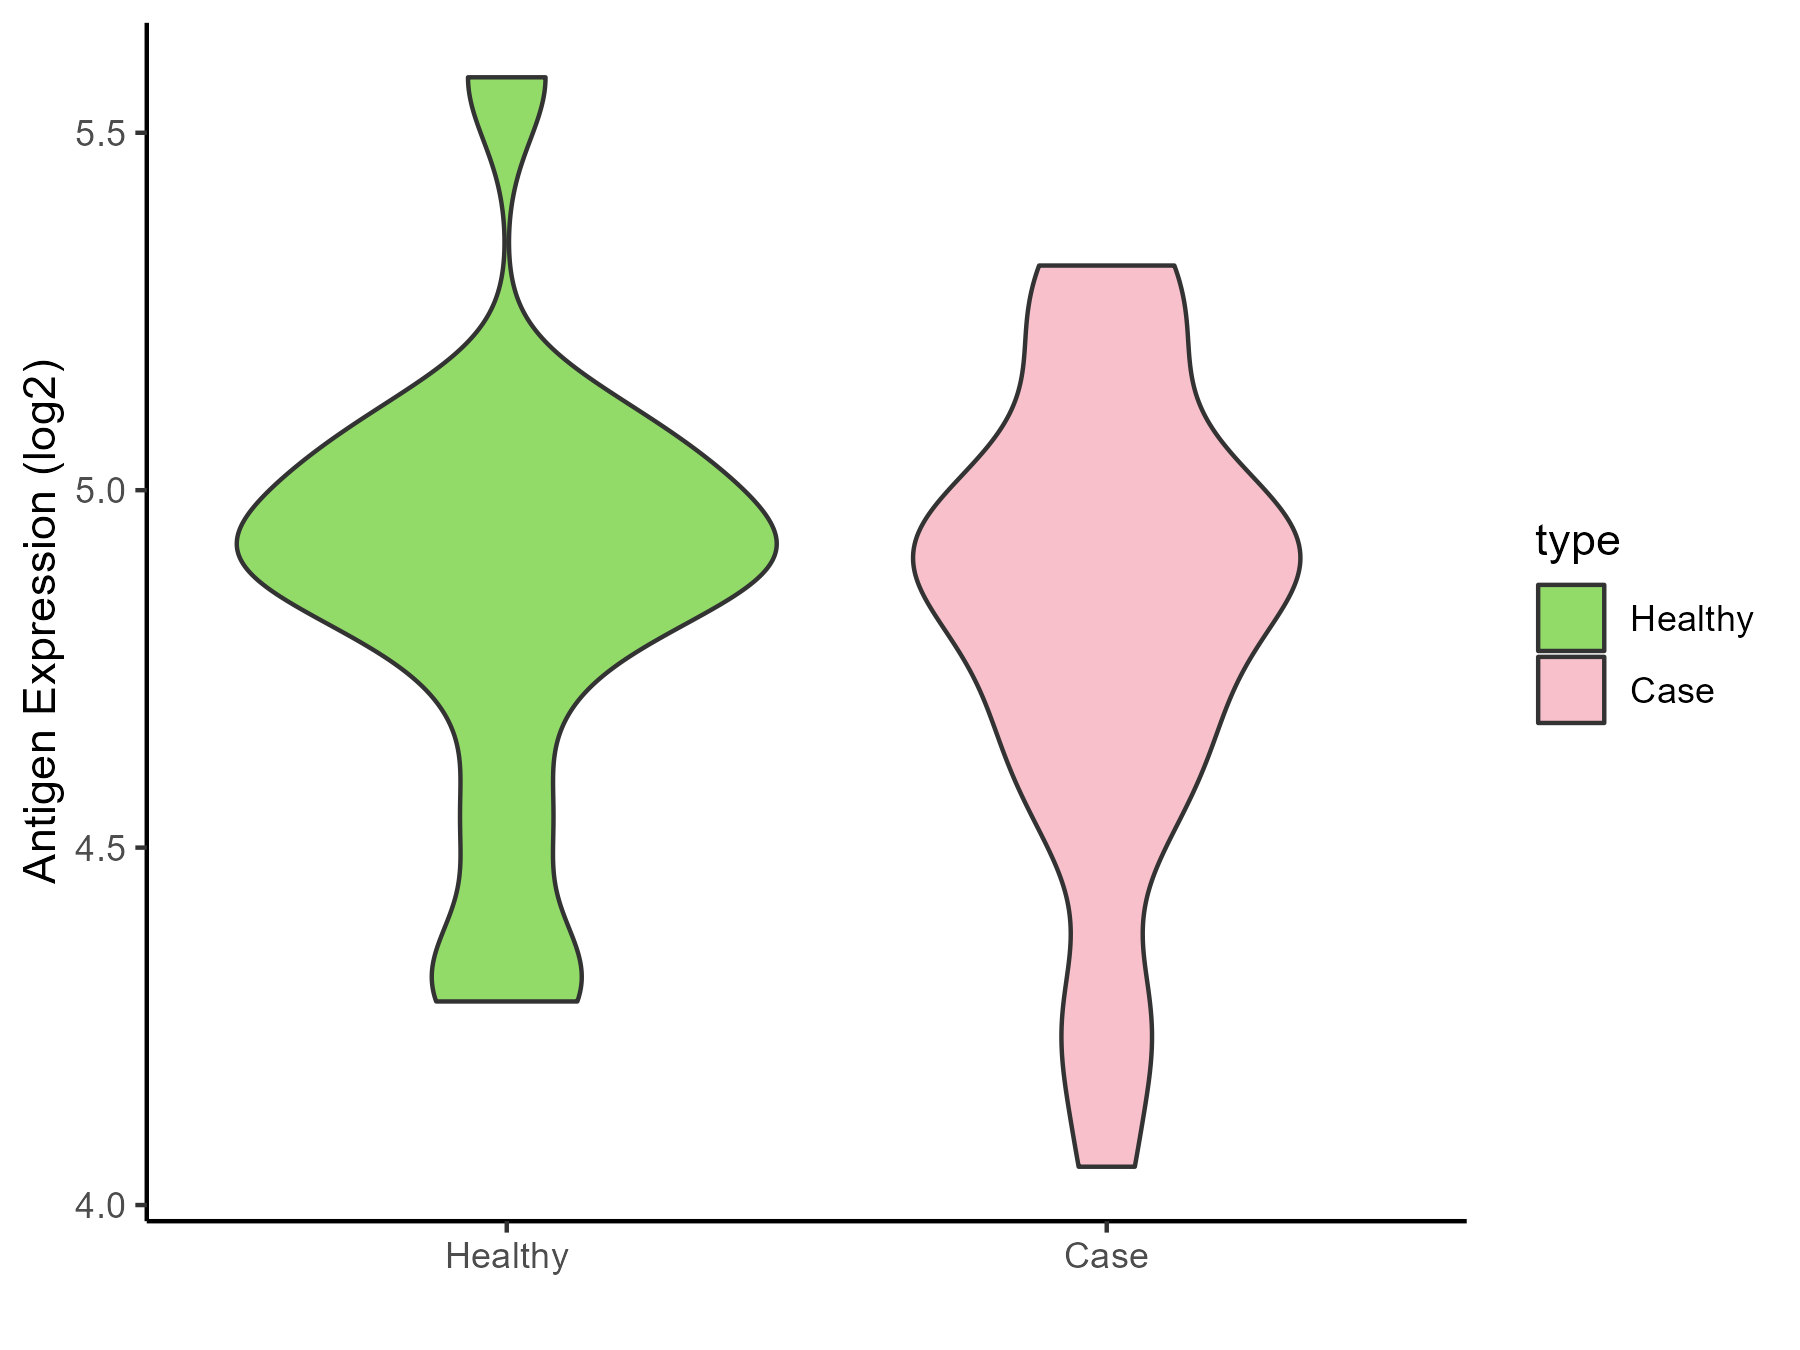
| The Studied Tissue | Urothelium | |
| The Specific Disease | Ureter cancer | |
| The Expression Level of Disease Section Compare with the Healthy Individual Tissue | p-value: 0.627846061; Fold-change: 0.002228483; Z-score: 0.007047065 | |
| Disease-specific Antigen Abundances |
|
Click to View the Clearer Original Diagram |
ICD Disease Classification 20
| Differential expression pattern of antigen in diseases | ||
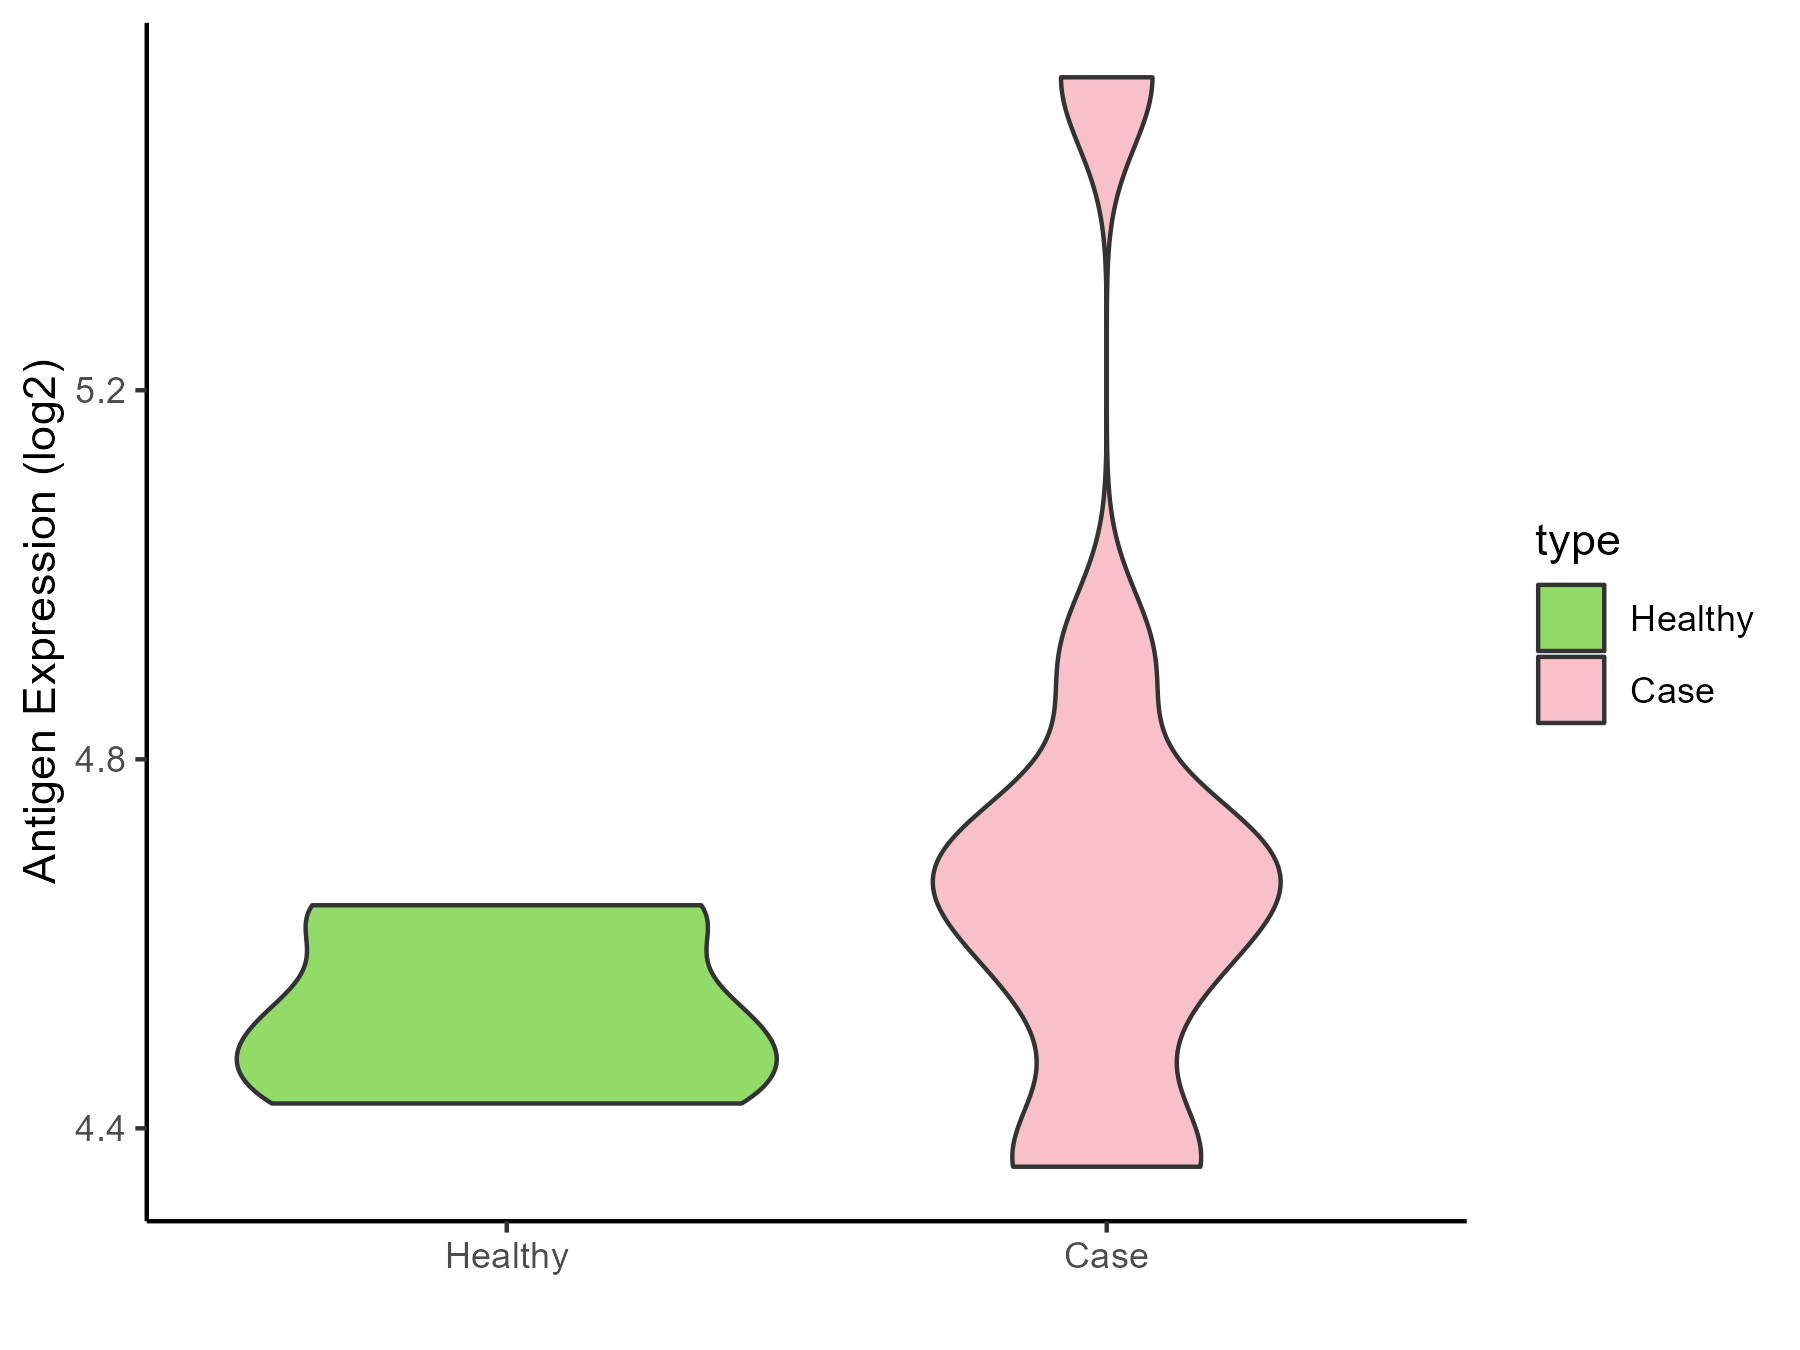
| The Studied Tissue | Adipose | |
| The Specific Disease | Simpson golabi behmel syndrome | |
| The Expression Level of Disease Section Compare with the Healthy Individual Tissue | p-value: 0.196031074; Fold-change: 0.148871353; Z-score: 1.377986495 | |
| Disease-specific Antigen Abundances |
|
Click to View the Clearer Original Diagram |
| Differential expression pattern of antigen in diseases | ||
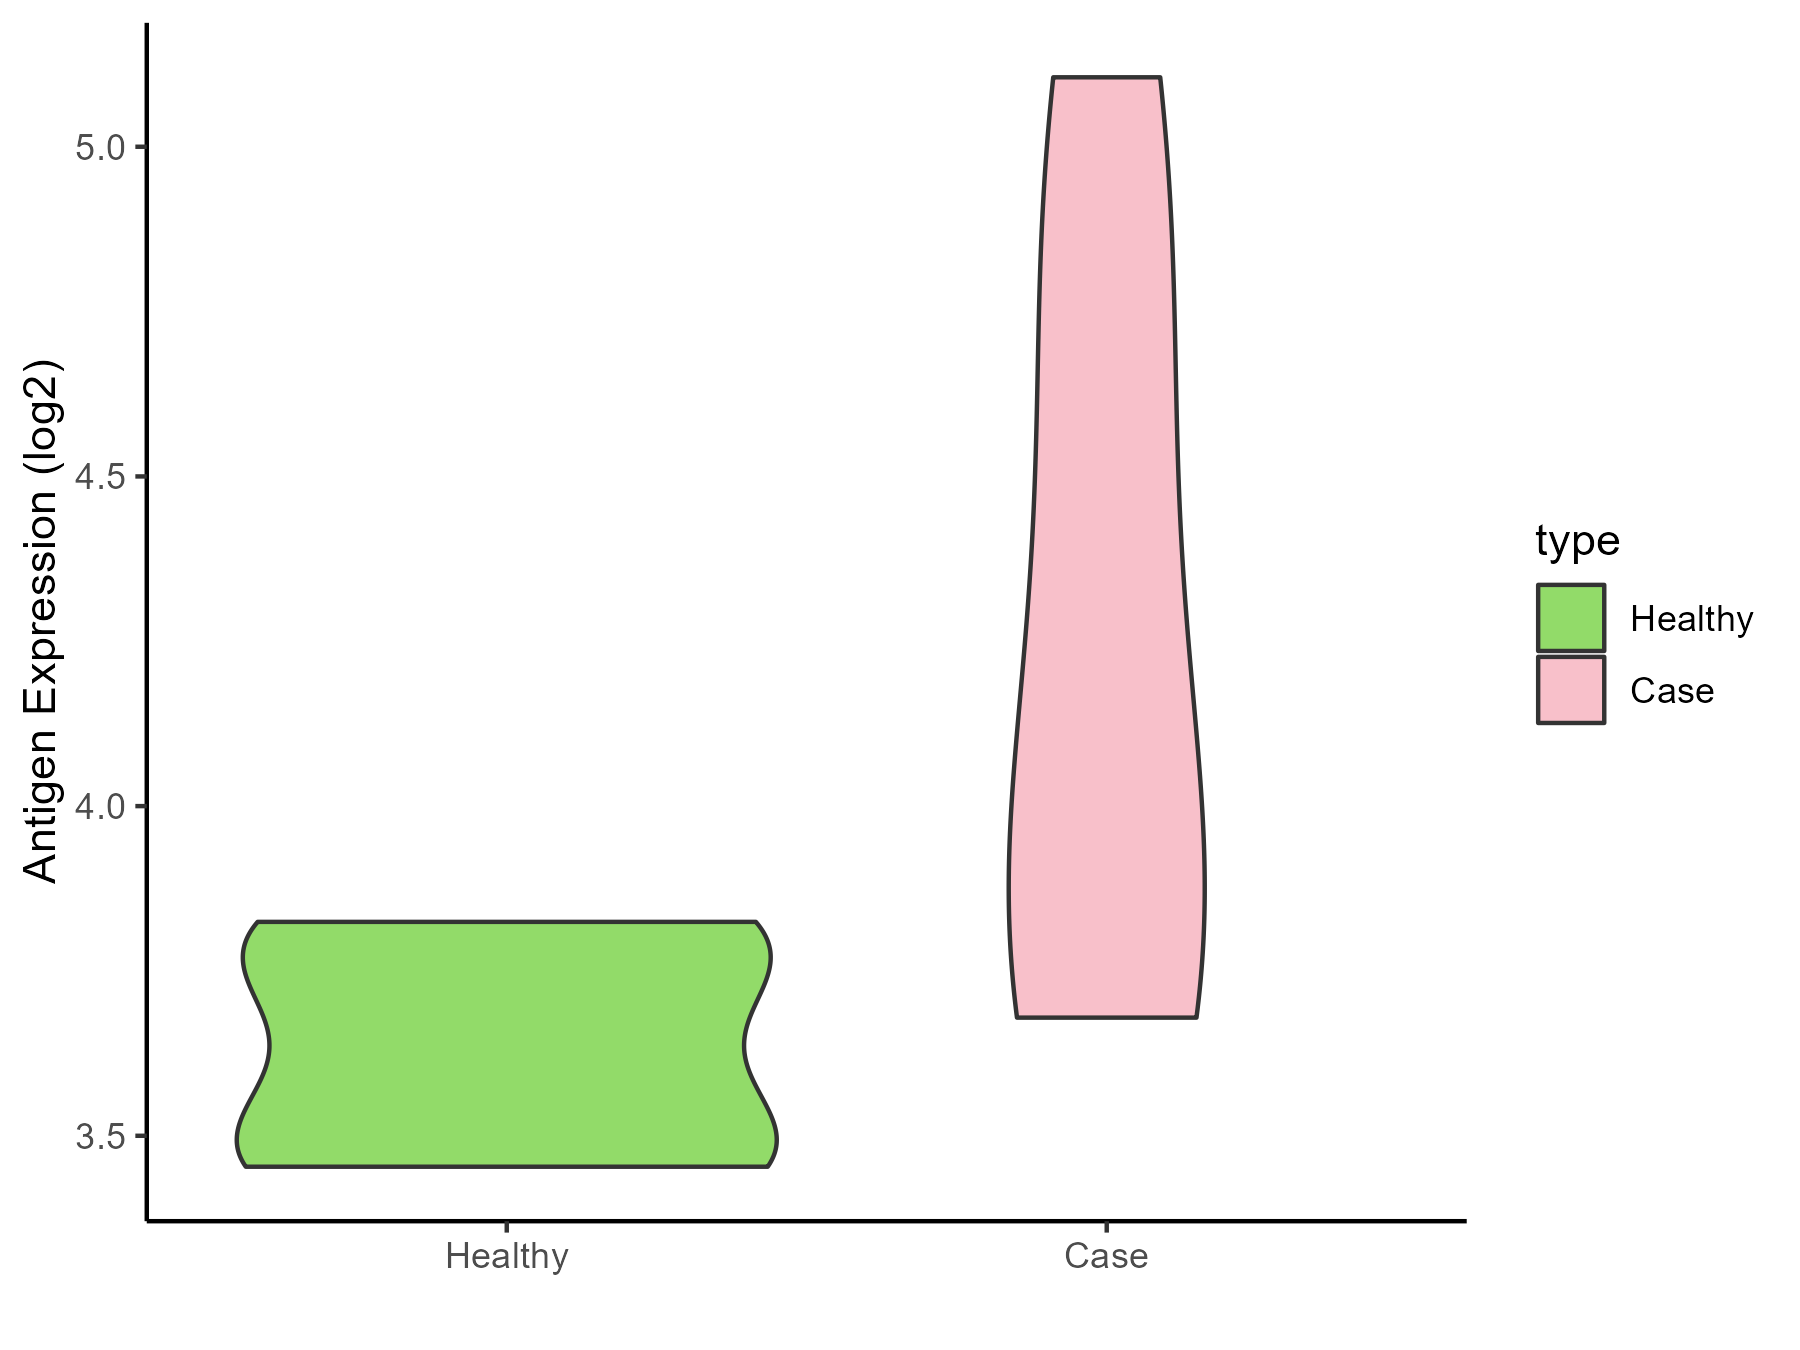
| The Studied Tissue | Perituberal | |
| The Specific Disease | Tuberous sclerosis complex | |
| The Expression Level of Disease Section Compare with the Healthy Individual Tissue | p-value: 0.049058416; Fold-change: 0.502892001; Z-score: 2.675284856 | |
| Disease-specific Antigen Abundances |
|
Click to View the Clearer Original Diagram |
ICD Disease Classification 3
| Differential expression pattern of antigen in diseases | ||
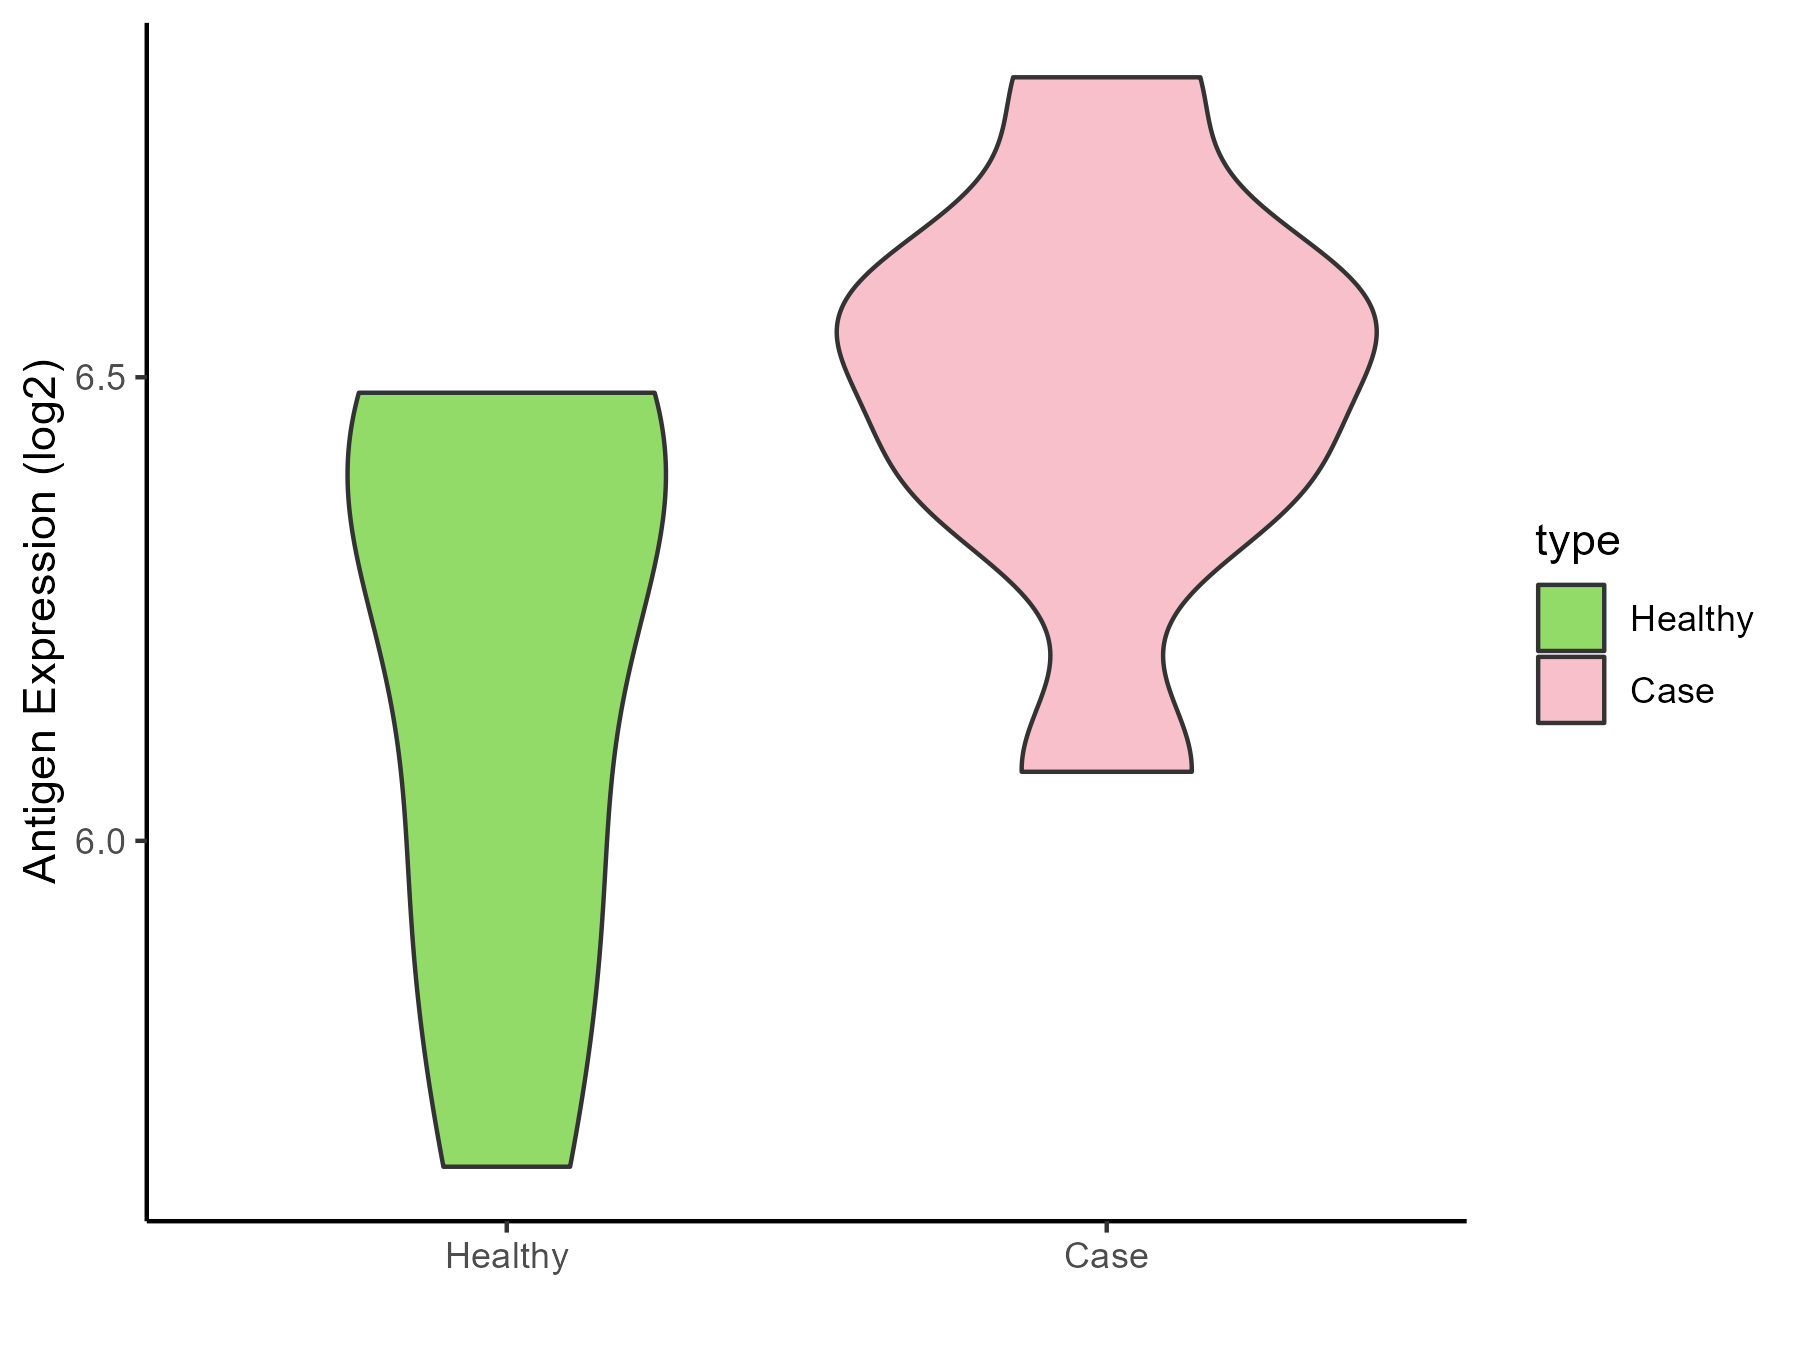
| The Studied Tissue | Bone marrow | |
| The Specific Disease | Anemia | |
| The Expression Level of Disease Section Compare with the Healthy Individual Tissue | p-value: 0.068803749; Fold-change: 0.196833163; Z-score: 0.608183921 | |
| Disease-specific Antigen Abundances |
|
Click to View the Clearer Original Diagram |
| Differential expression pattern of antigen in diseases | ||
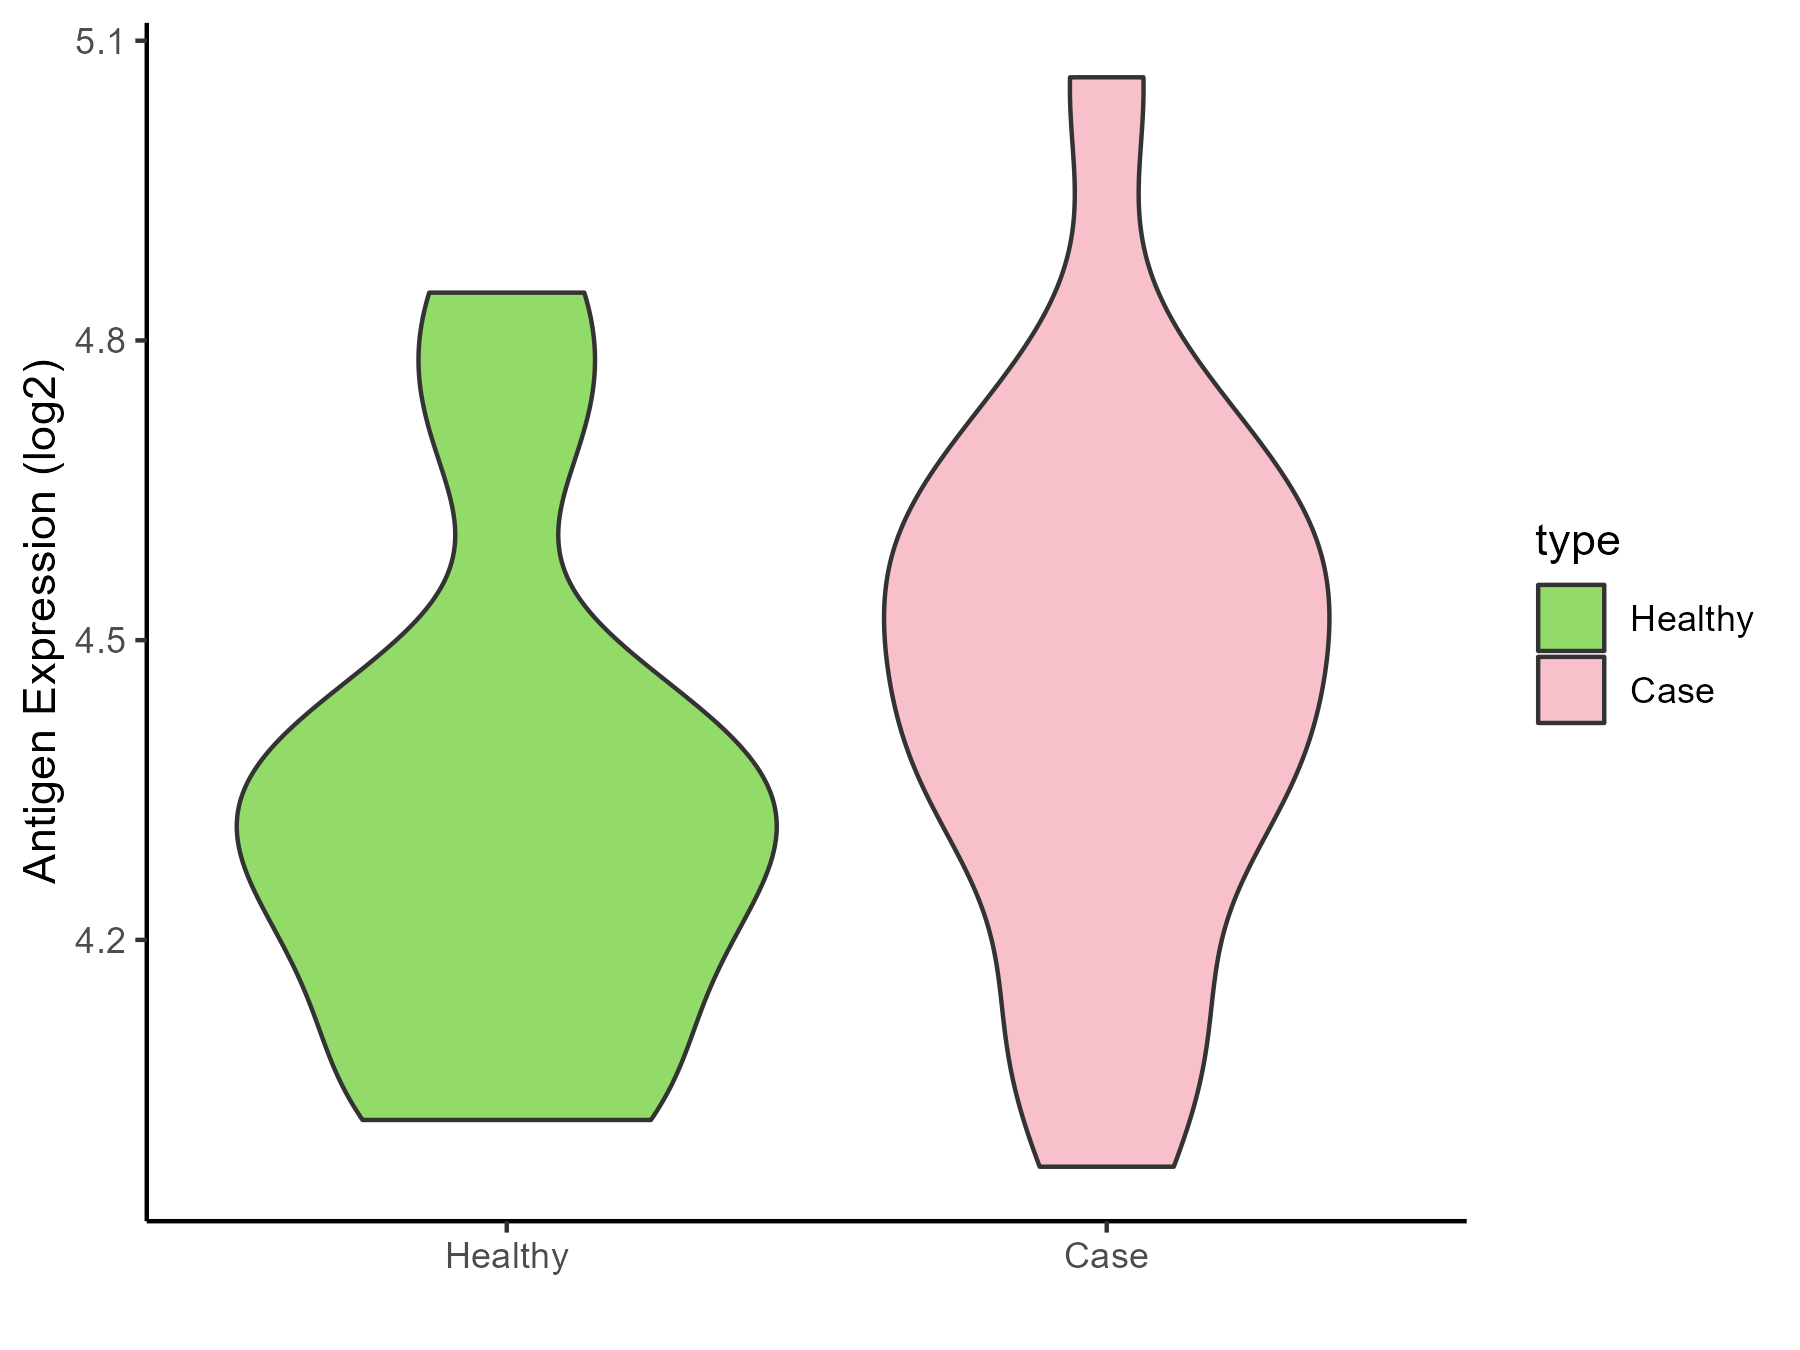
| The Studied Tissue | Peripheral blood | |
| The Specific Disease | Sickle cell disease | |
| The Expression Level of Disease Section Compare with the Healthy Individual Tissue | p-value: 0.262109595; Fold-change: 0.198514773; Z-score: 0.77241484 | |
| Disease-specific Antigen Abundances |
|
Click to View the Clearer Original Diagram |
| Differential expression pattern of antigen in diseases | ||
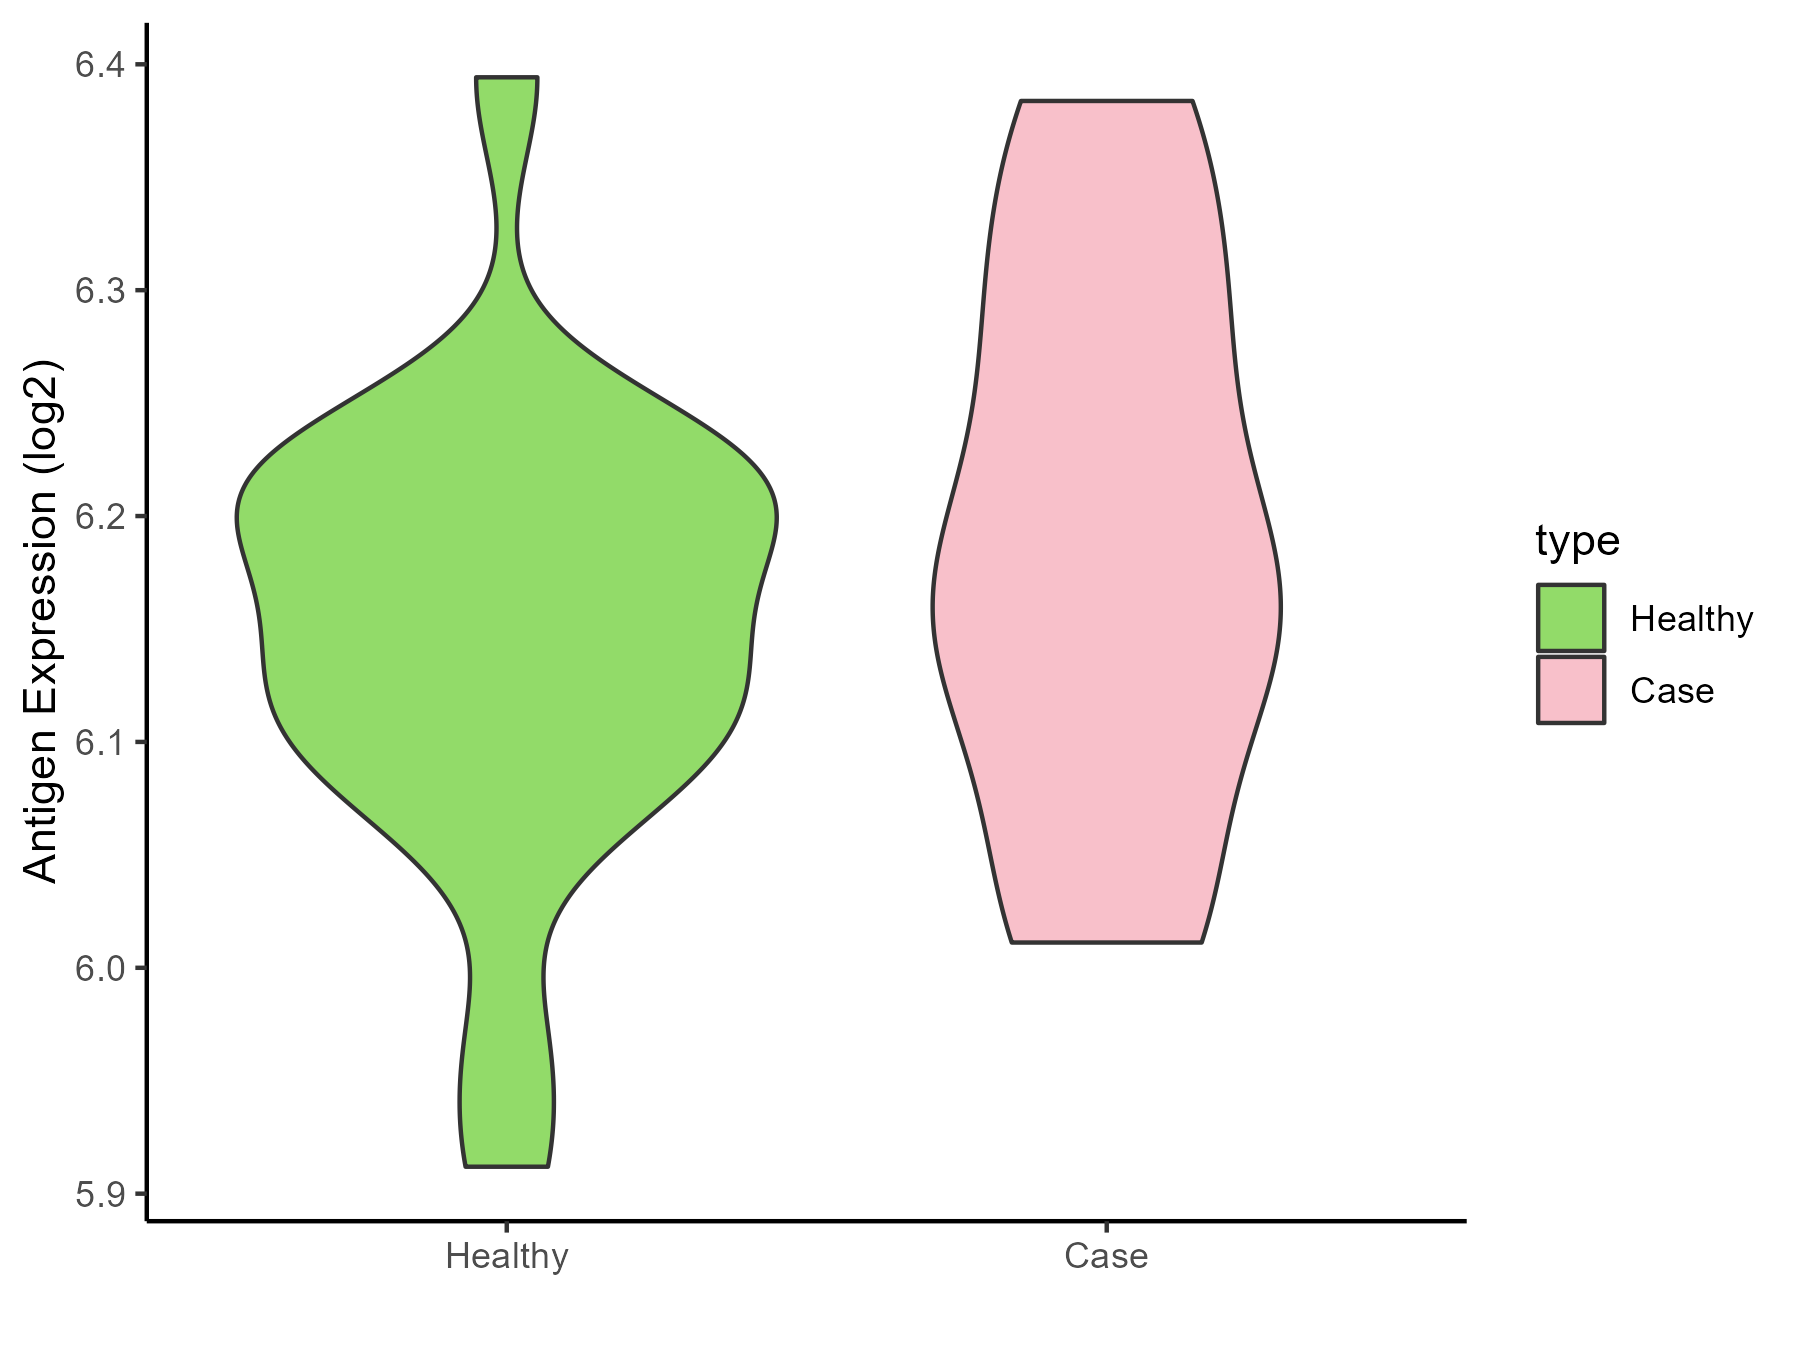
| The Studied Tissue | Whole blood | |
| The Specific Disease | Thrombocythemia | |
| The Expression Level of Disease Section Compare with the Healthy Individual Tissue | p-value: 0.167711283; Fold-change: 0.019322943; Z-score: 0.192198581 | |
| Disease-specific Antigen Abundances |
|
Click to View the Clearer Original Diagram |
ICD Disease Classification 4
| Differential expression pattern of antigen in diseases | ||
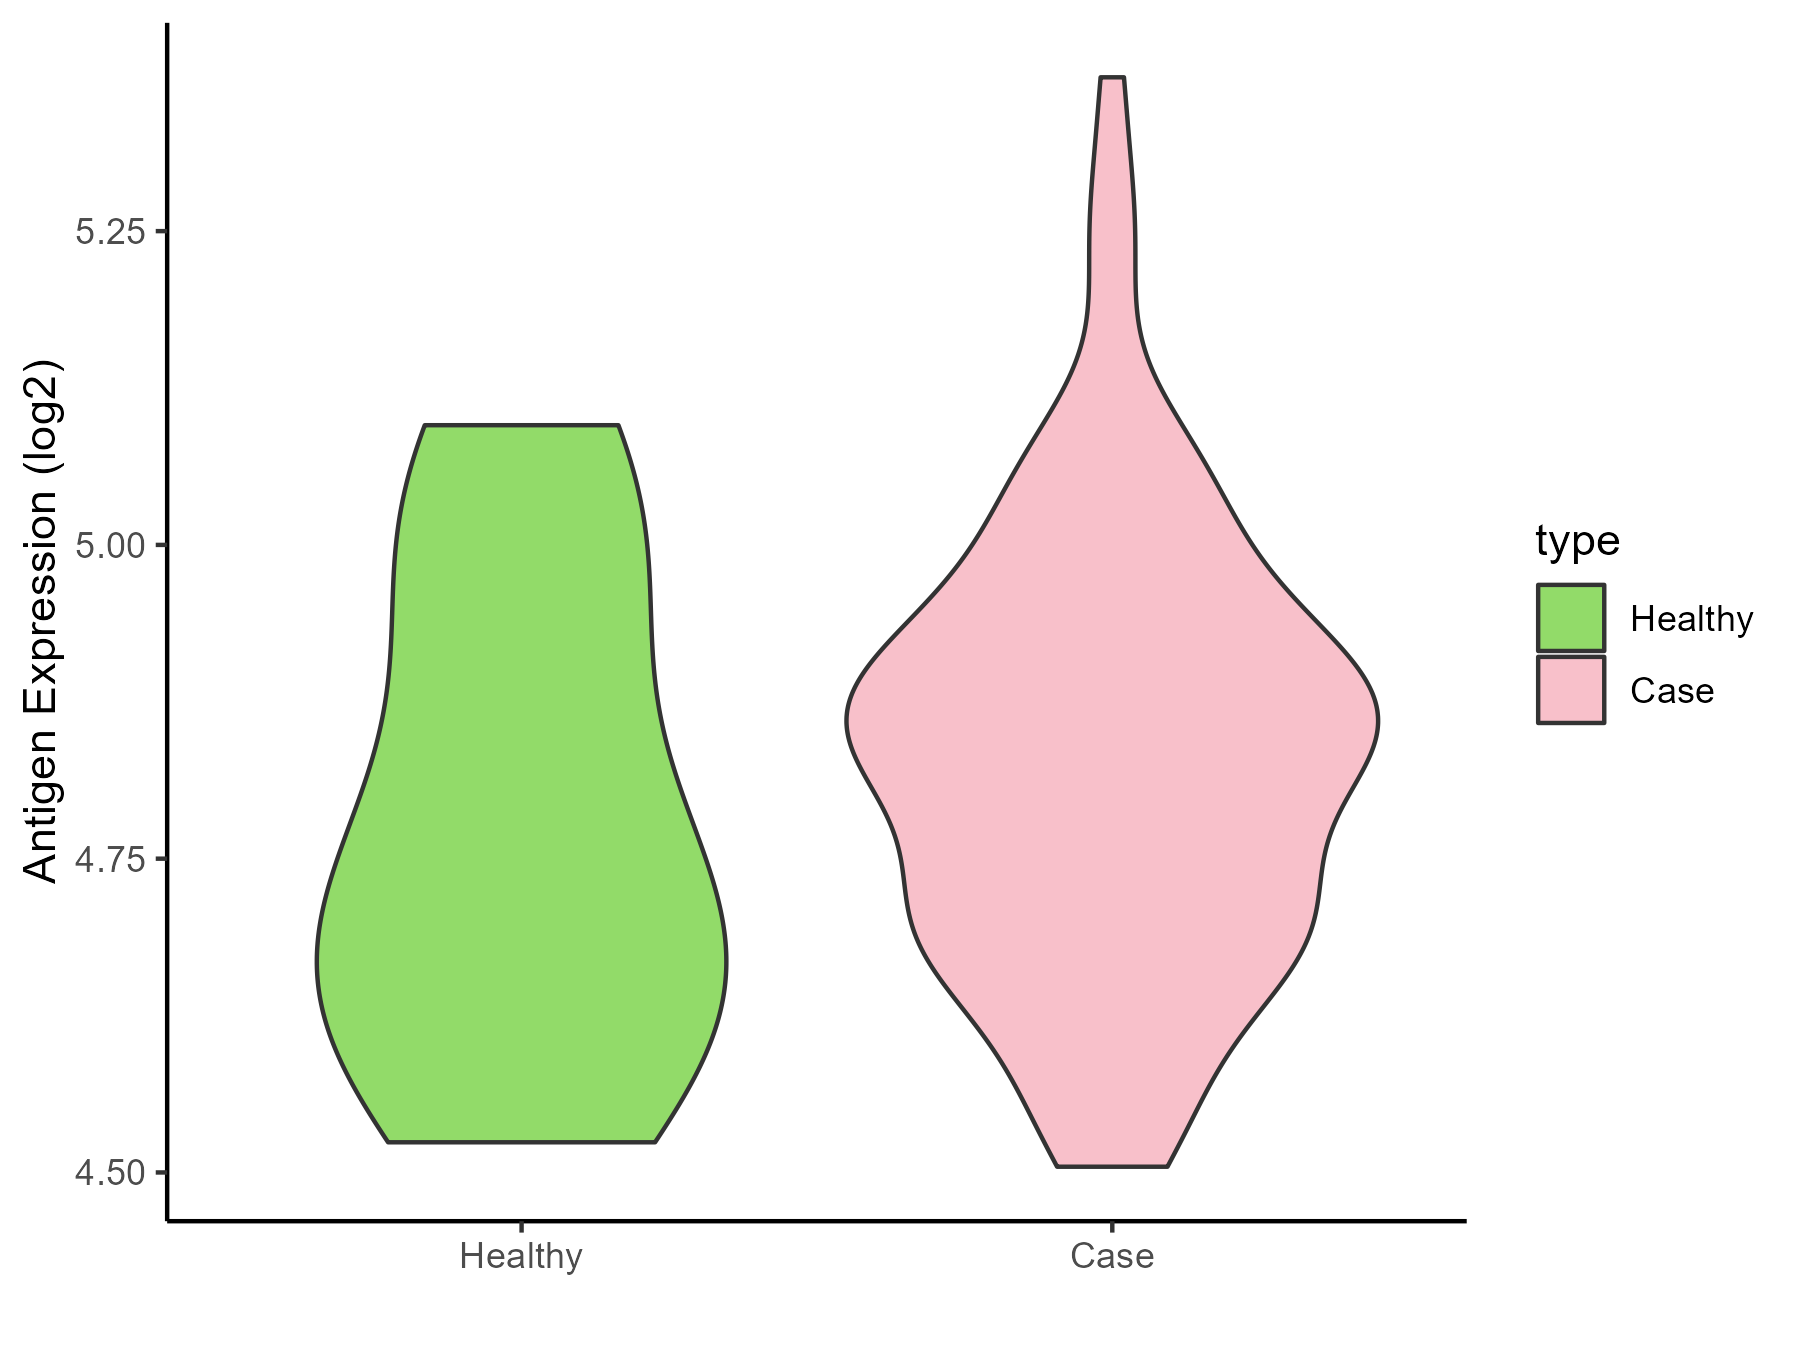
| The Studied Tissue | Whole blood | |
| The Specific Disease | Scleroderma | |
| The Expression Level of Disease Section Compare with the Healthy Individual Tissue | p-value: 0.468070892; Fold-change: 0.086215787; Z-score: 0.437518774 | |
| Disease-specific Antigen Abundances |
|
Click to View the Clearer Original Diagram |
| Differential expression pattern of antigen in diseases | ||
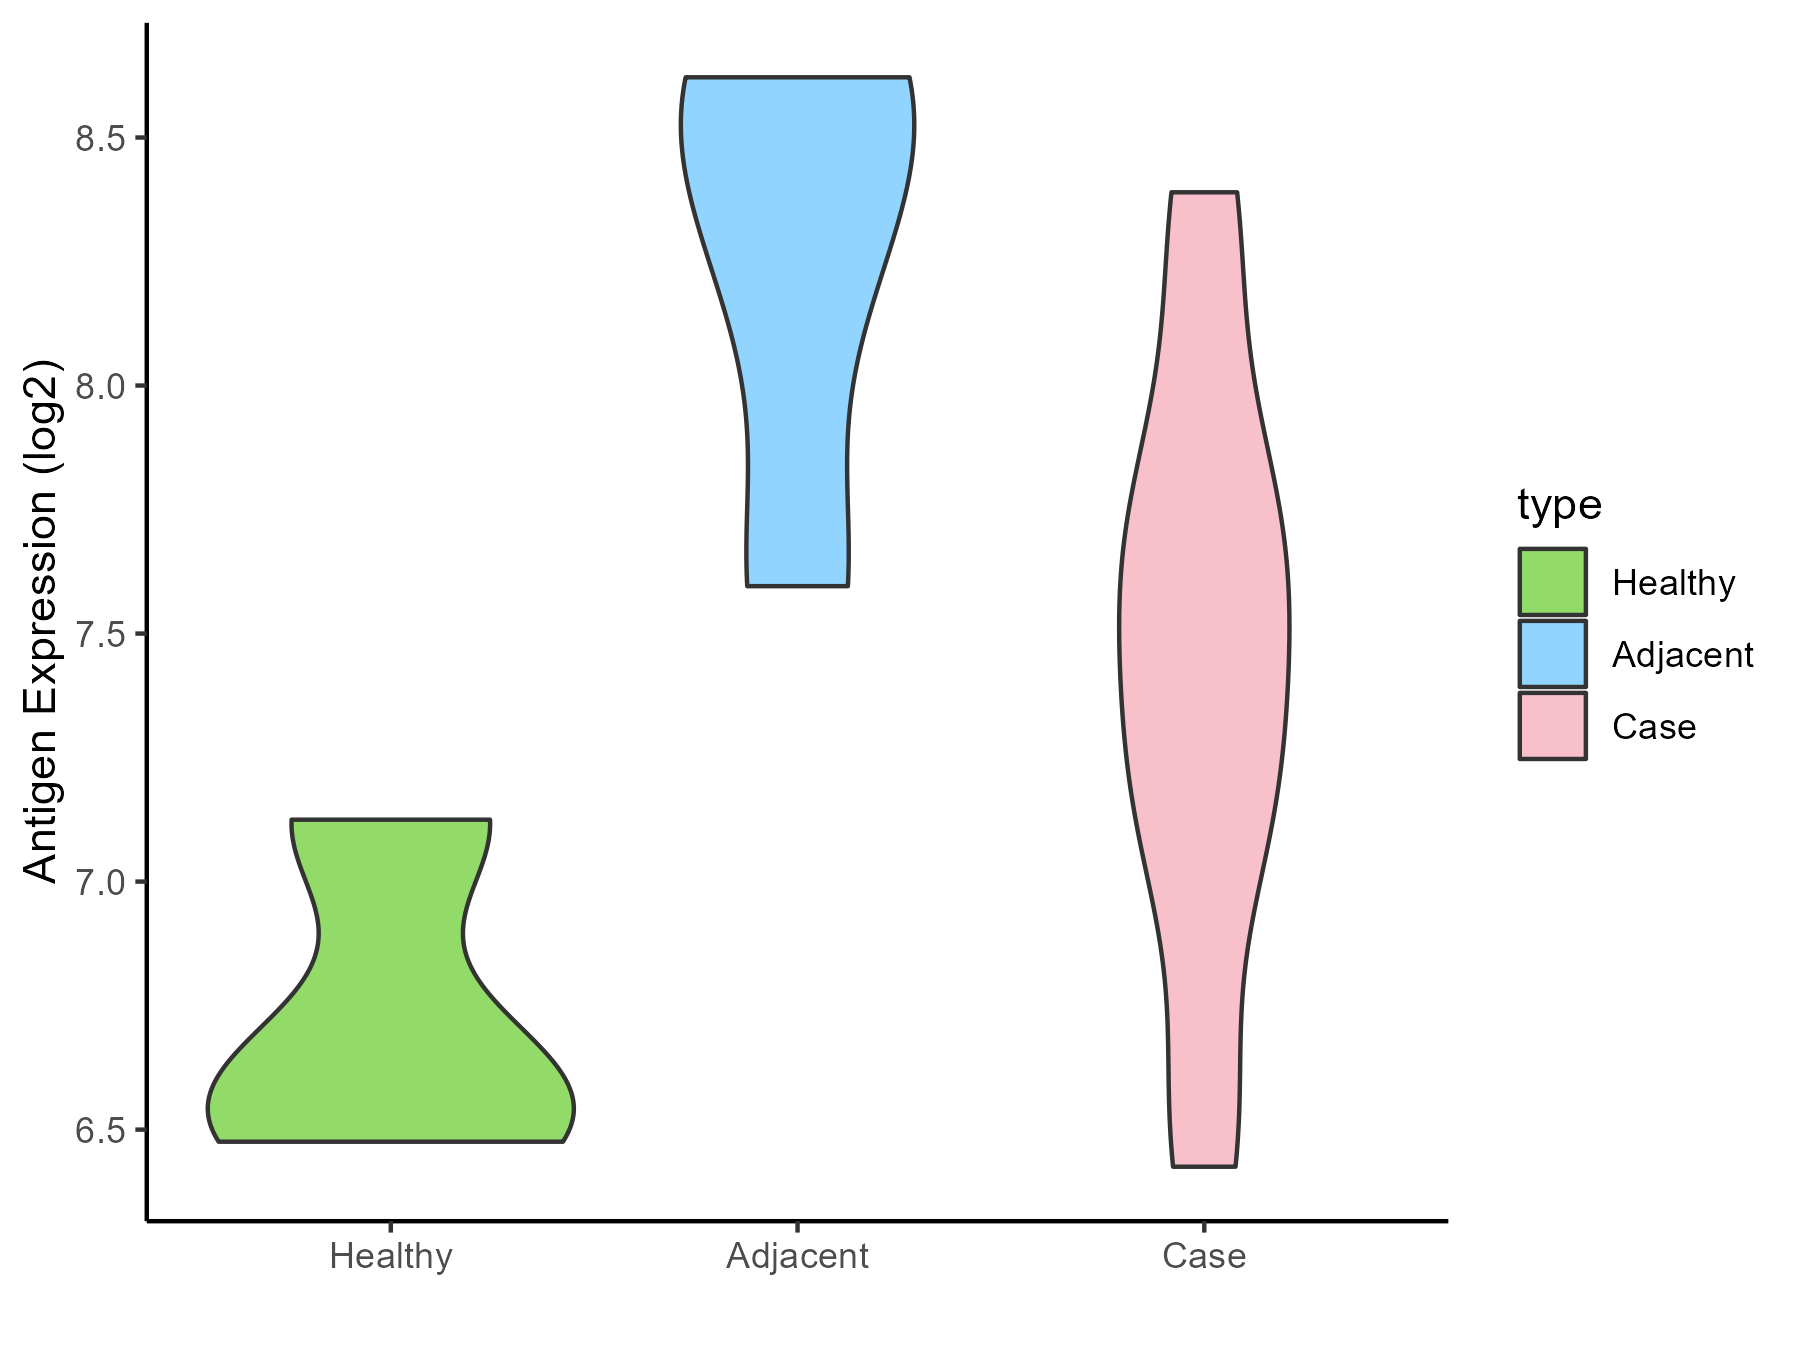
| The Studied Tissue | Salivary gland | |
| The Specific Disease | Sjogren syndrome | |
| The Expression Level of Disease Section Compare with the Healthy Individual Tissue | p-value: 0.040211671; Fold-change: 0.920222507; Z-score: 2.679973121 | |
| The Expression Level of Disease Section Compare with the Adjacent Tissue | p-value: 0.029925661; Fold-change: -0.894920311; Z-score: -1.862752497 | |
| Disease-specific Antigen Abundances |
|
Click to View the Clearer Original Diagram |
| Differential expression pattern of antigen in diseases | ||
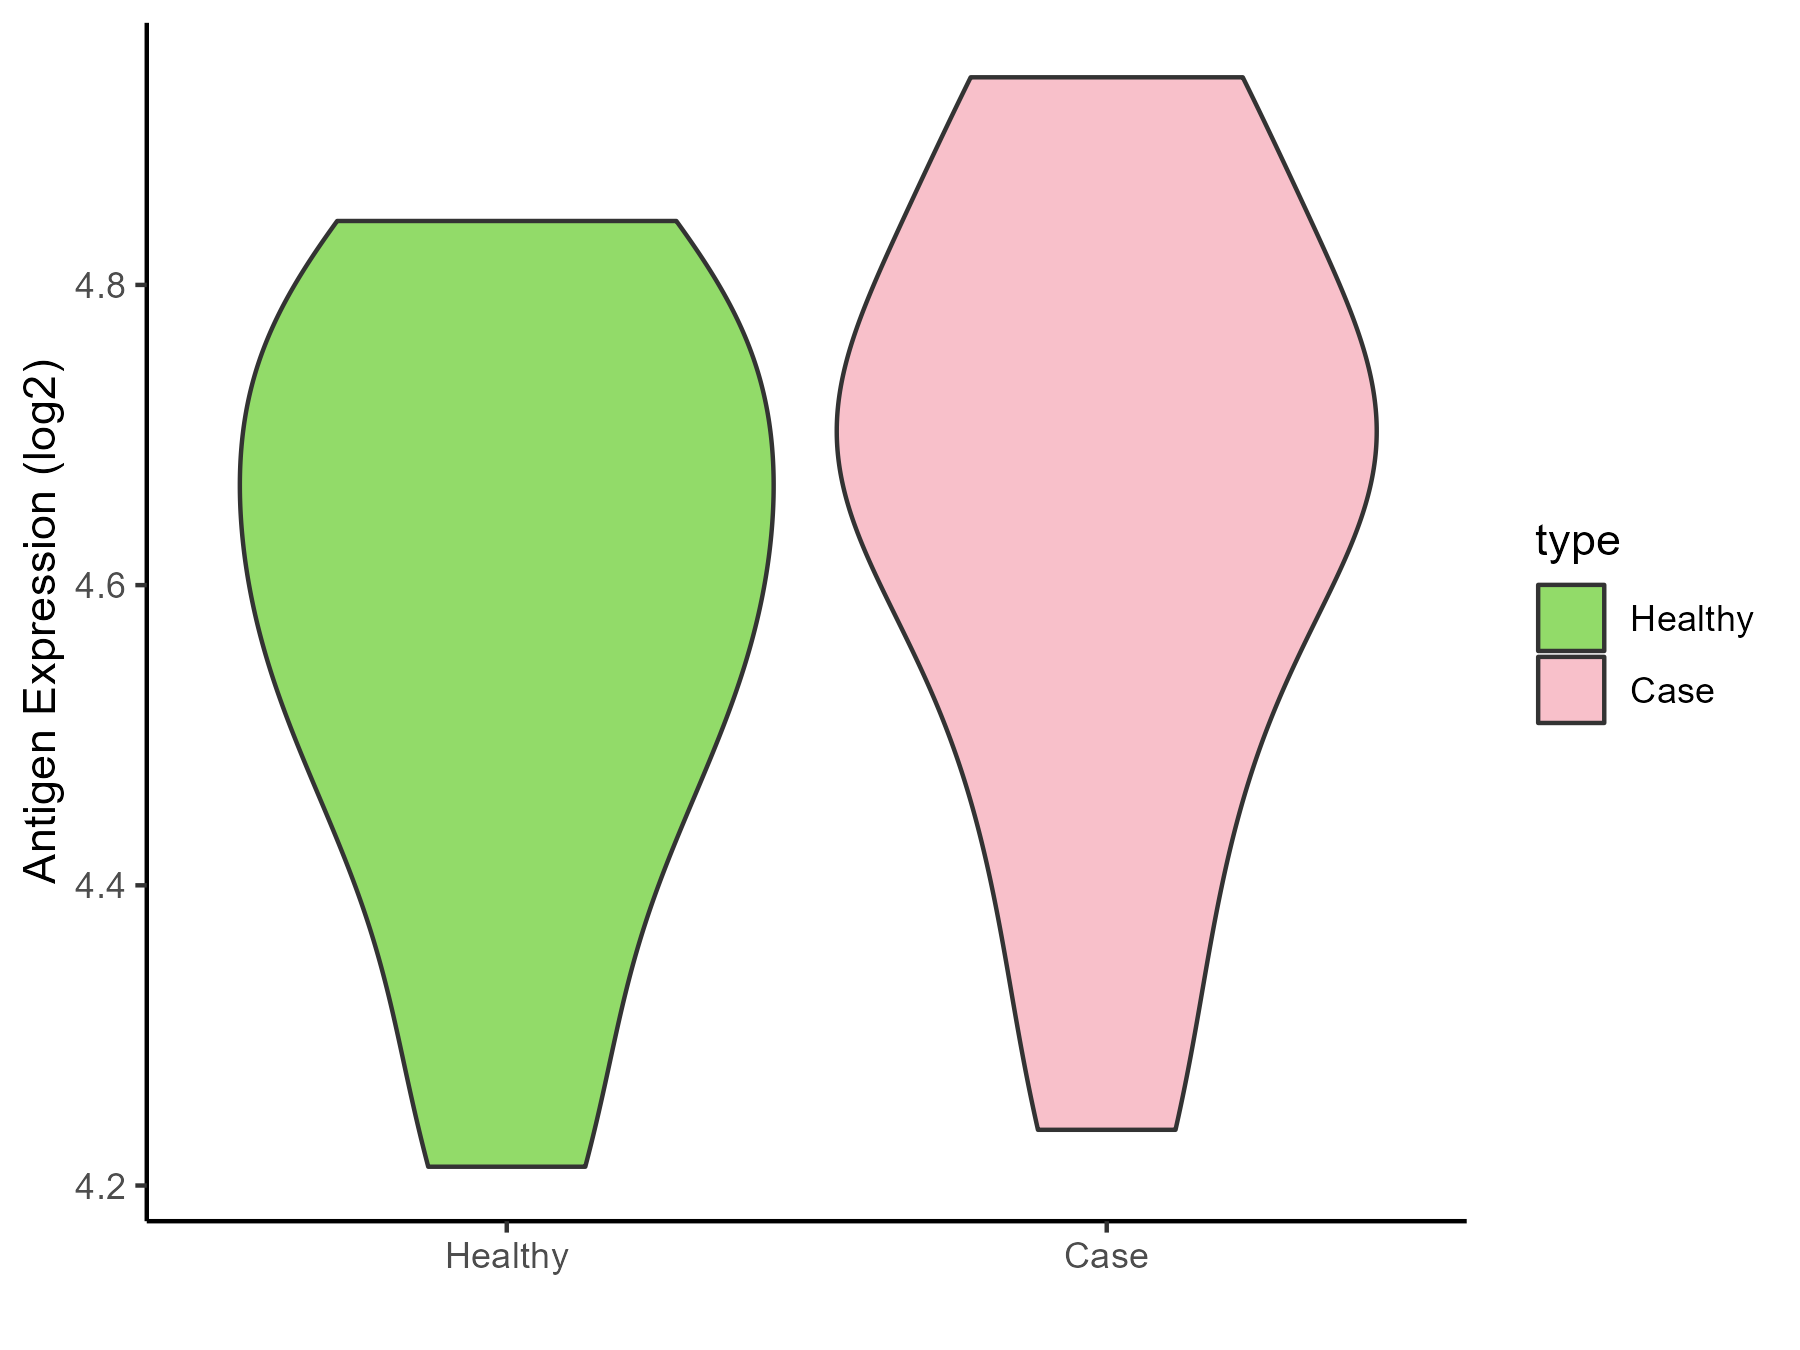
| The Studied Tissue | Peripheral blood | |
| The Specific Disease | Behcet disease | |
| The Expression Level of Disease Section Compare with the Healthy Individual Tissue | p-value: 0.424004637; Fold-change: 0.073577003; Z-score: 0.381441813 | |
| Disease-specific Antigen Abundances |
|
Click to View the Clearer Original Diagram |
| Differential expression pattern of antigen in diseases | ||
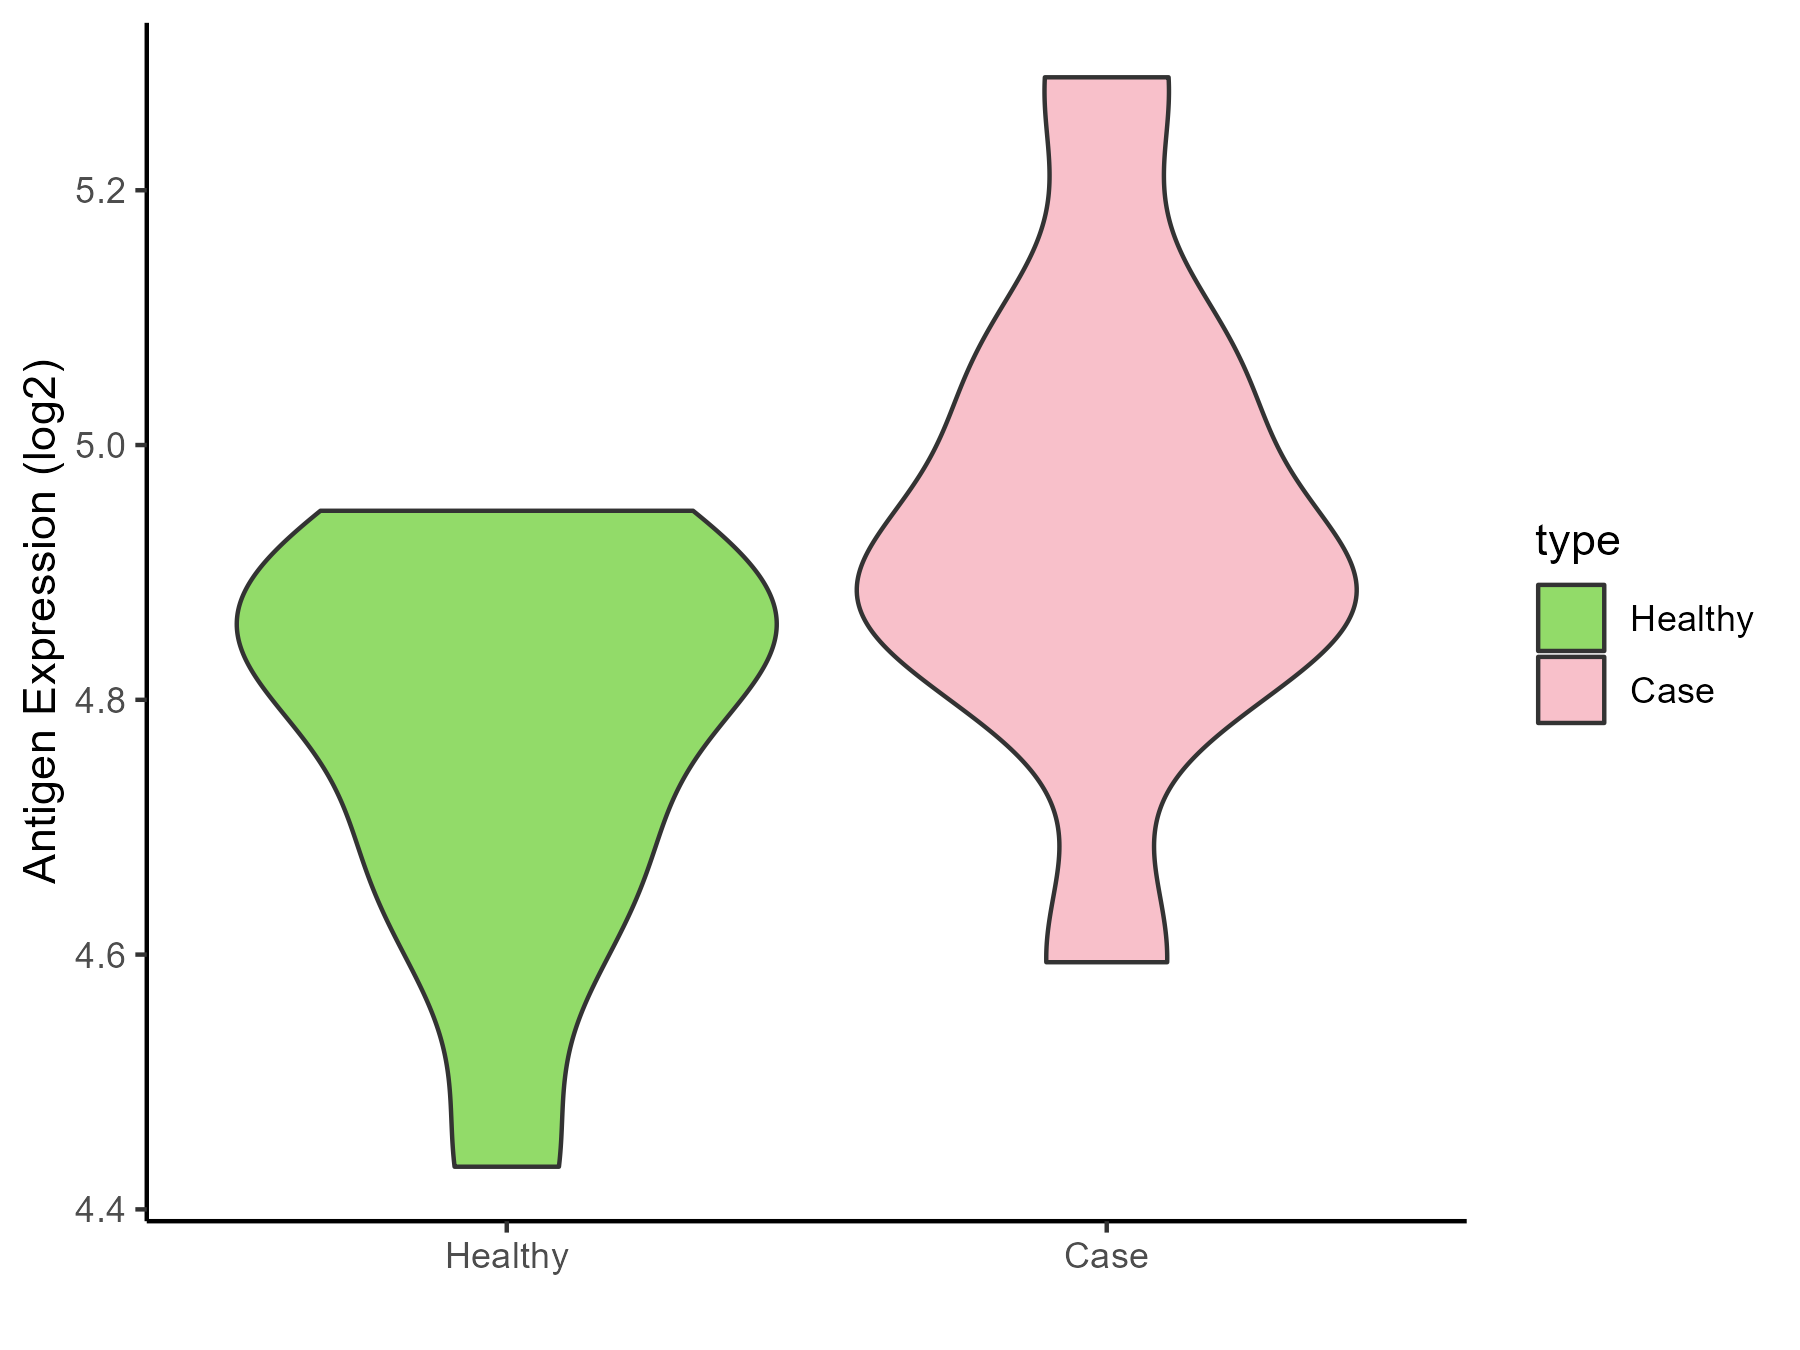
| The Studied Tissue | Whole blood | |
| The Specific Disease | Autosomal dominant monocytopenia | |
| The Expression Level of Disease Section Compare with the Healthy Individual Tissue | p-value: 0.078599317; Fold-change: 0.05105079; Z-score: 0.321882551 | |
| Disease-specific Antigen Abundances |
|
Click to View the Clearer Original Diagram |
ICD Disease Classification 5
| Differential expression pattern of antigen in diseases | ||
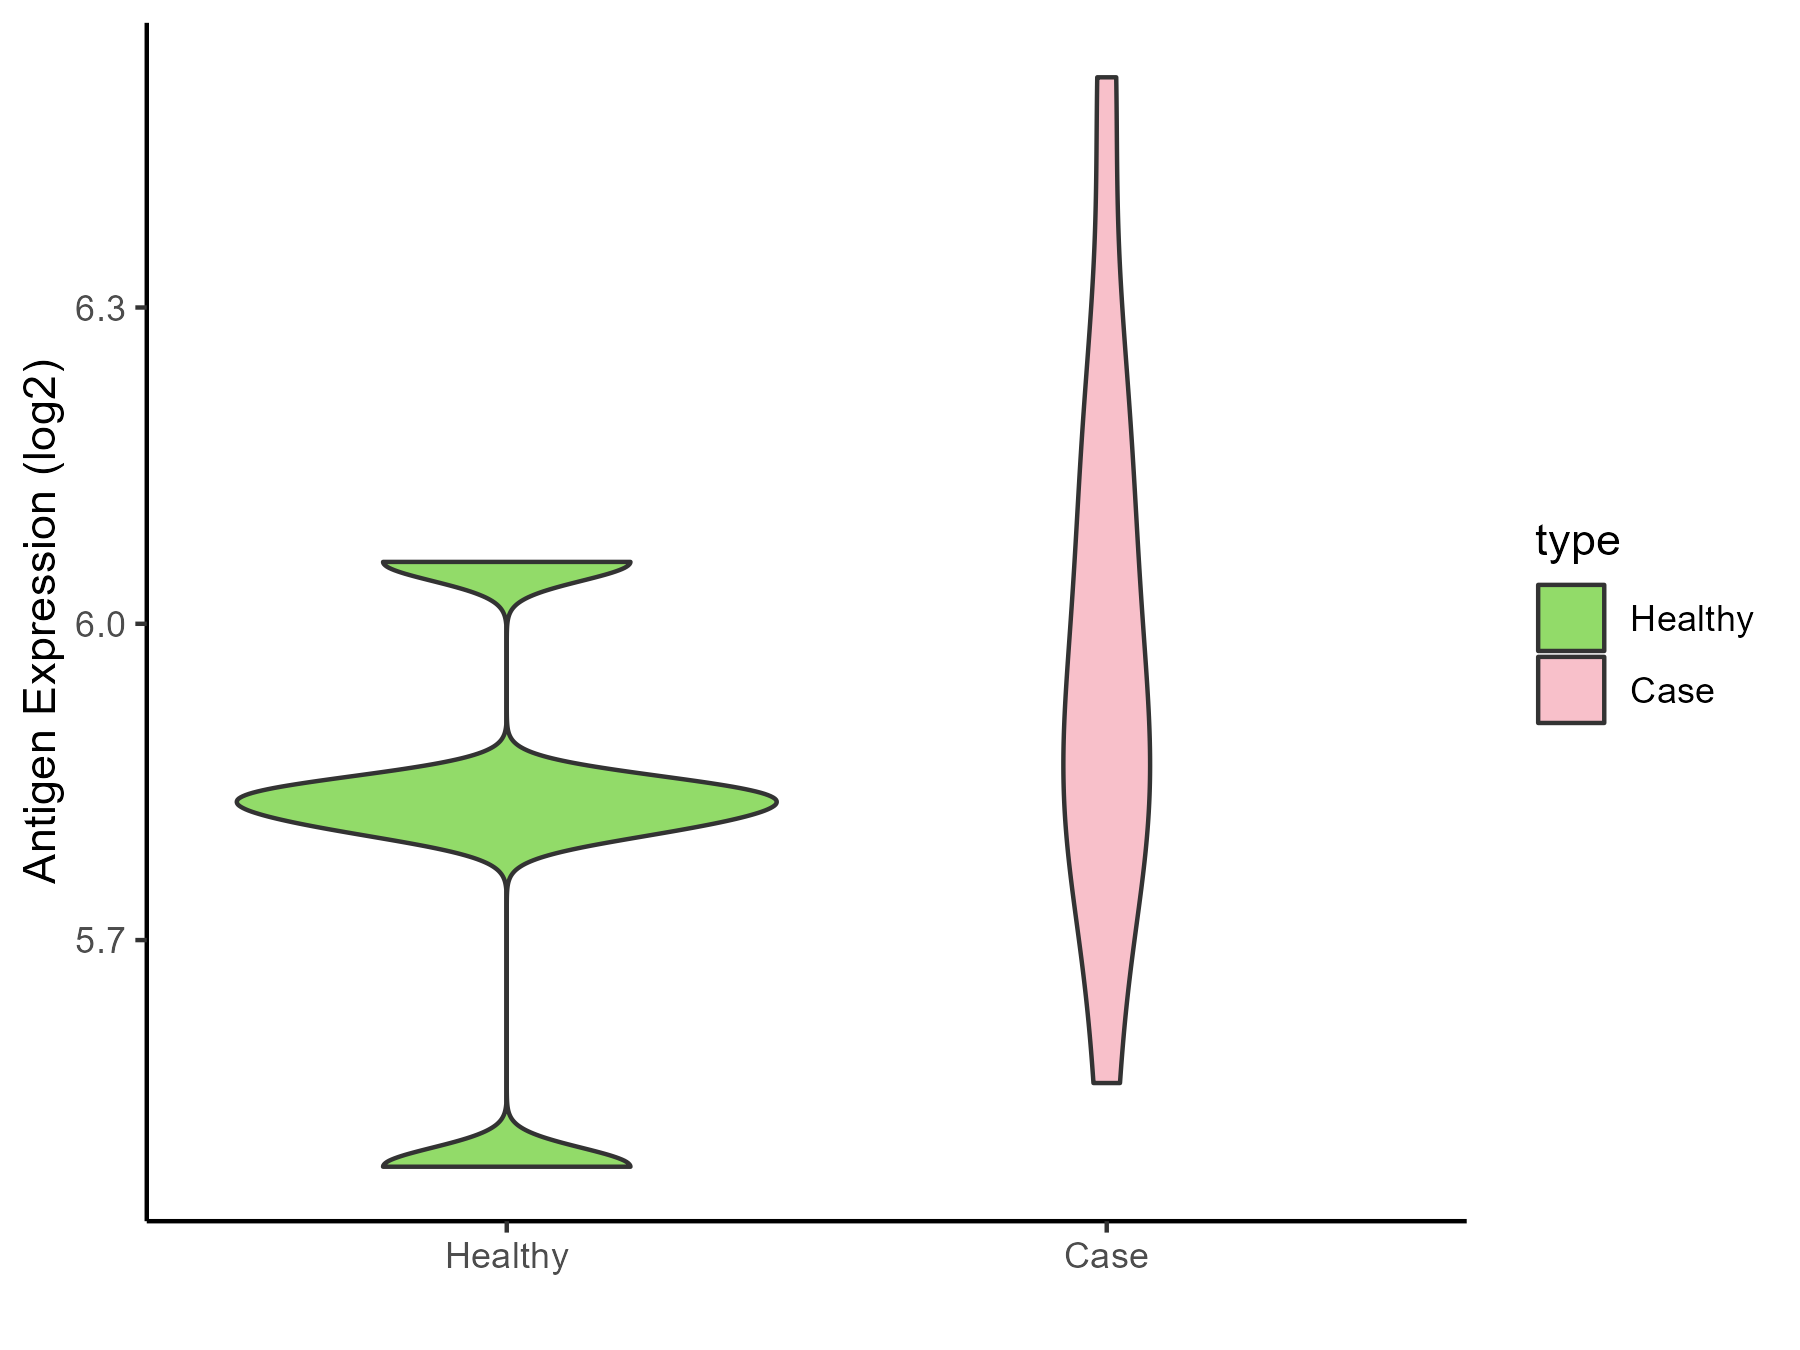
| The Studied Tissue | Liver | |
| The Specific Disease | Type 2 diabetes | |
| The Expression Level of Disease Section Compare with the Healthy Individual Tissue | p-value: 0.197636573; Fold-change: 0.078349059; Z-score: 0.381206044 | |
| Disease-specific Antigen Abundances |
|
Click to View the Clearer Original Diagram |
| Differential expression pattern of antigen in diseases | ||
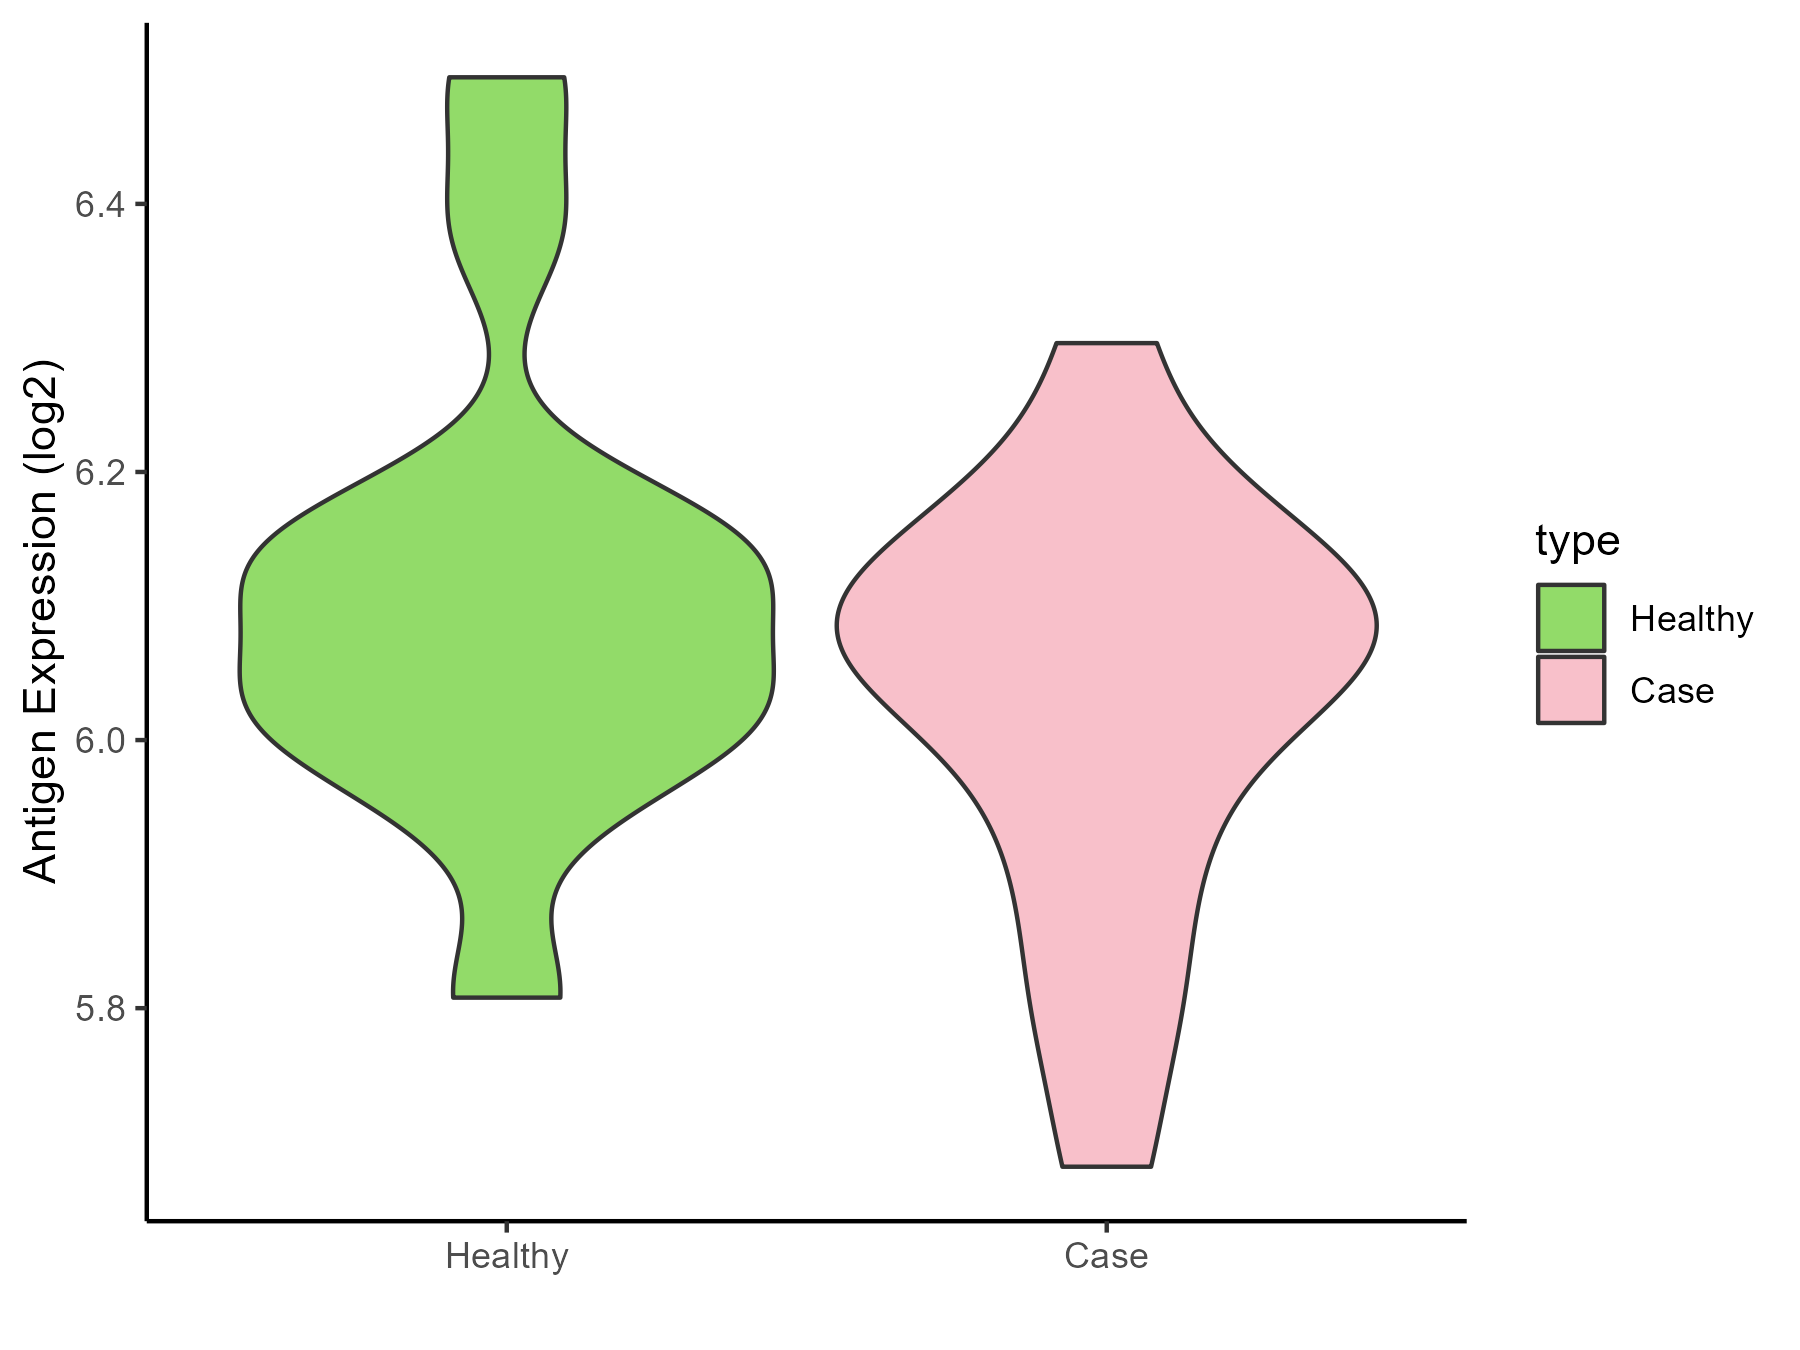
| The Studied Tissue | Vastus lateralis muscle | |
| The Specific Disease | Polycystic ovary syndrome | |
| The Expression Level of Disease Section Compare with the Healthy Individual Tissue | p-value: 0.219330127; Fold-change: -0.018928827; Z-score: -0.106880954 | |
| Disease-specific Antigen Abundances |
|
Click to View the Clearer Original Diagram |
| Differential expression pattern of antigen in diseases | ||
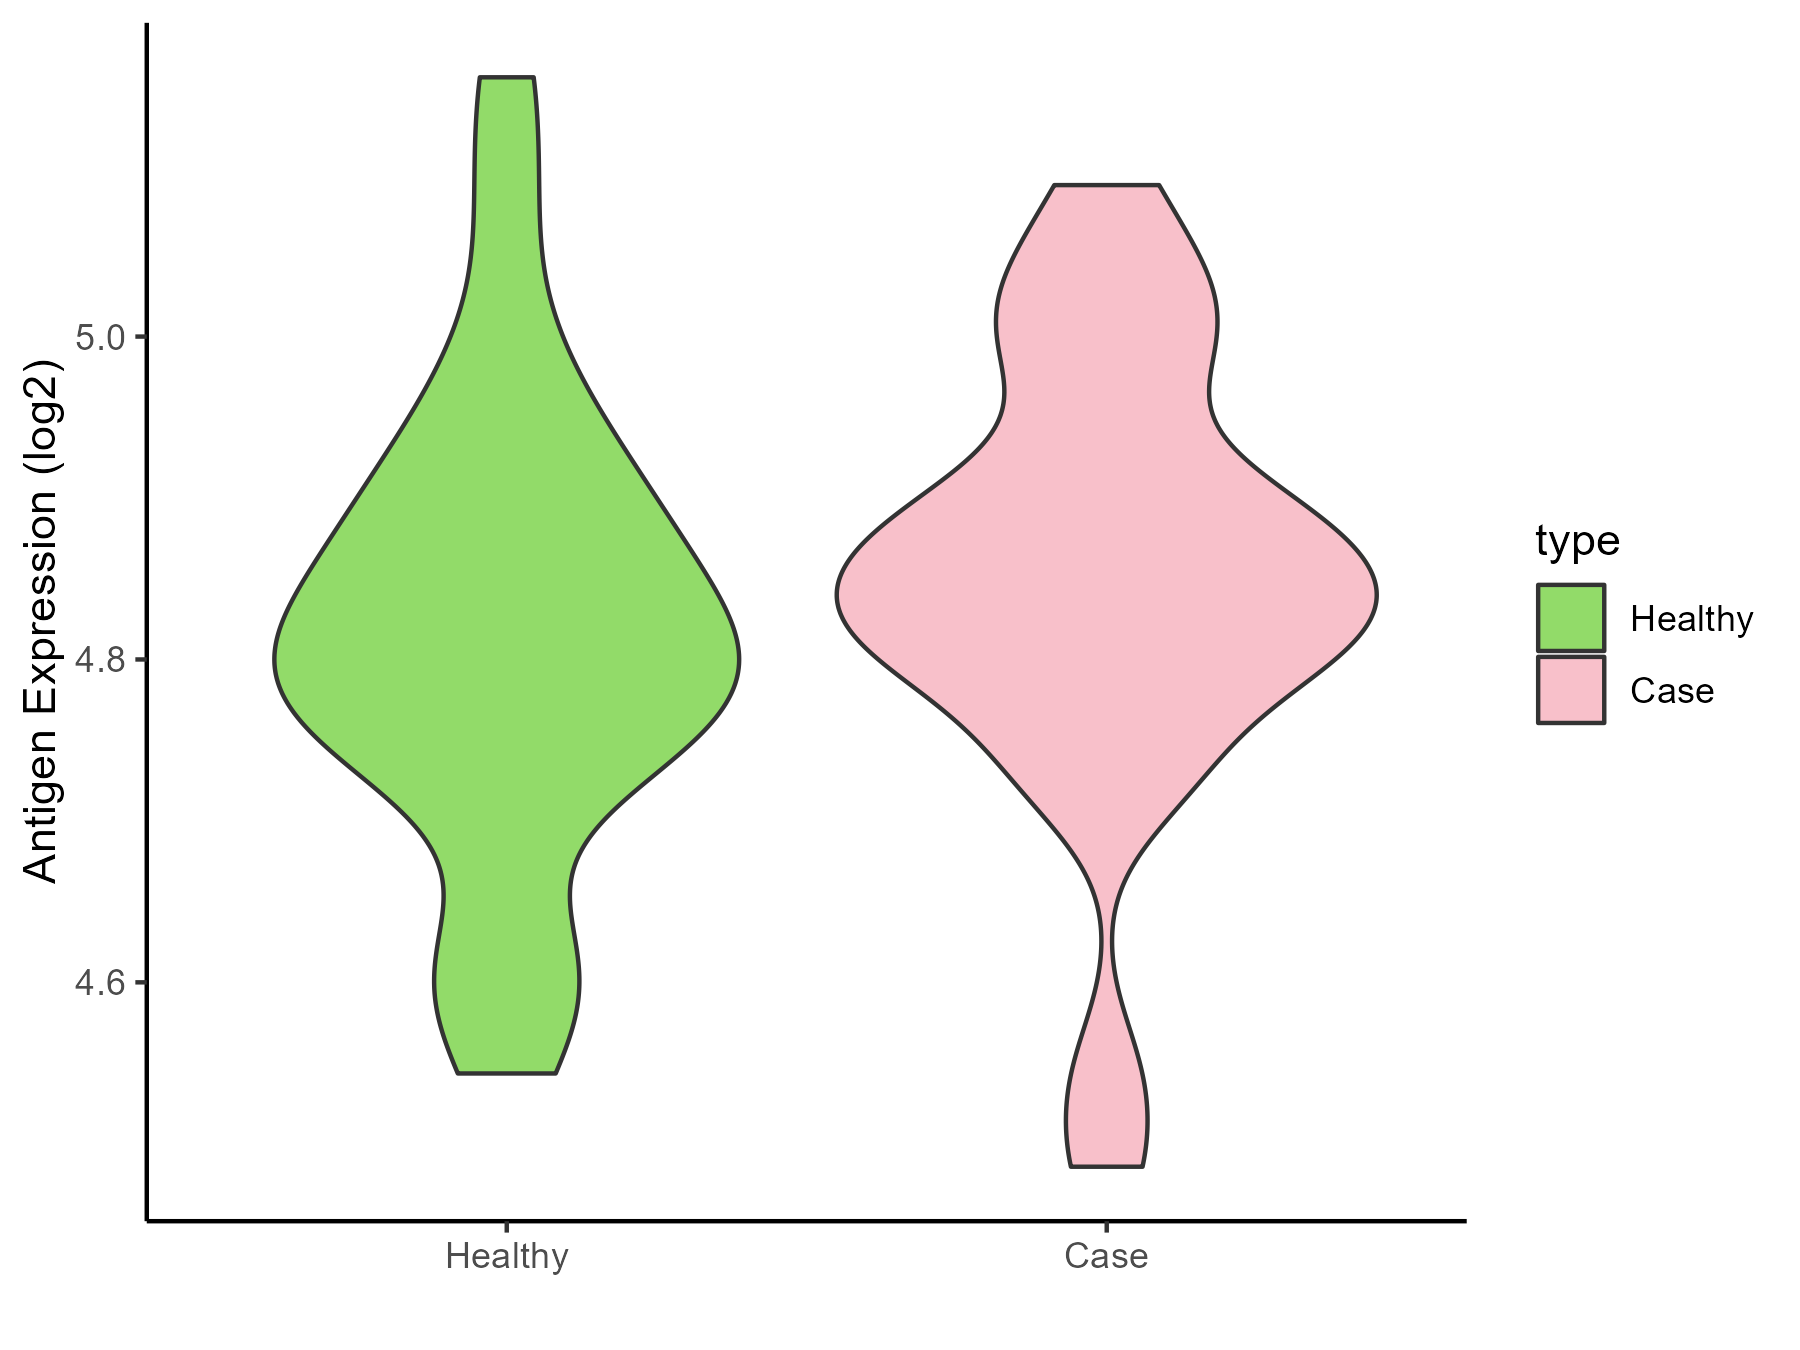
| The Studied Tissue | Subcutaneous Adipose | |
| The Specific Disease | Obesity | |
| The Expression Level of Disease Section Compare with the Healthy Individual Tissue | p-value: 0.416736235; Fold-change: 0.041836382; Z-score: 0.293646787 | |
| Disease-specific Antigen Abundances |
|
Click to View the Clearer Original Diagram |
| Differential expression pattern of antigen in diseases | ||
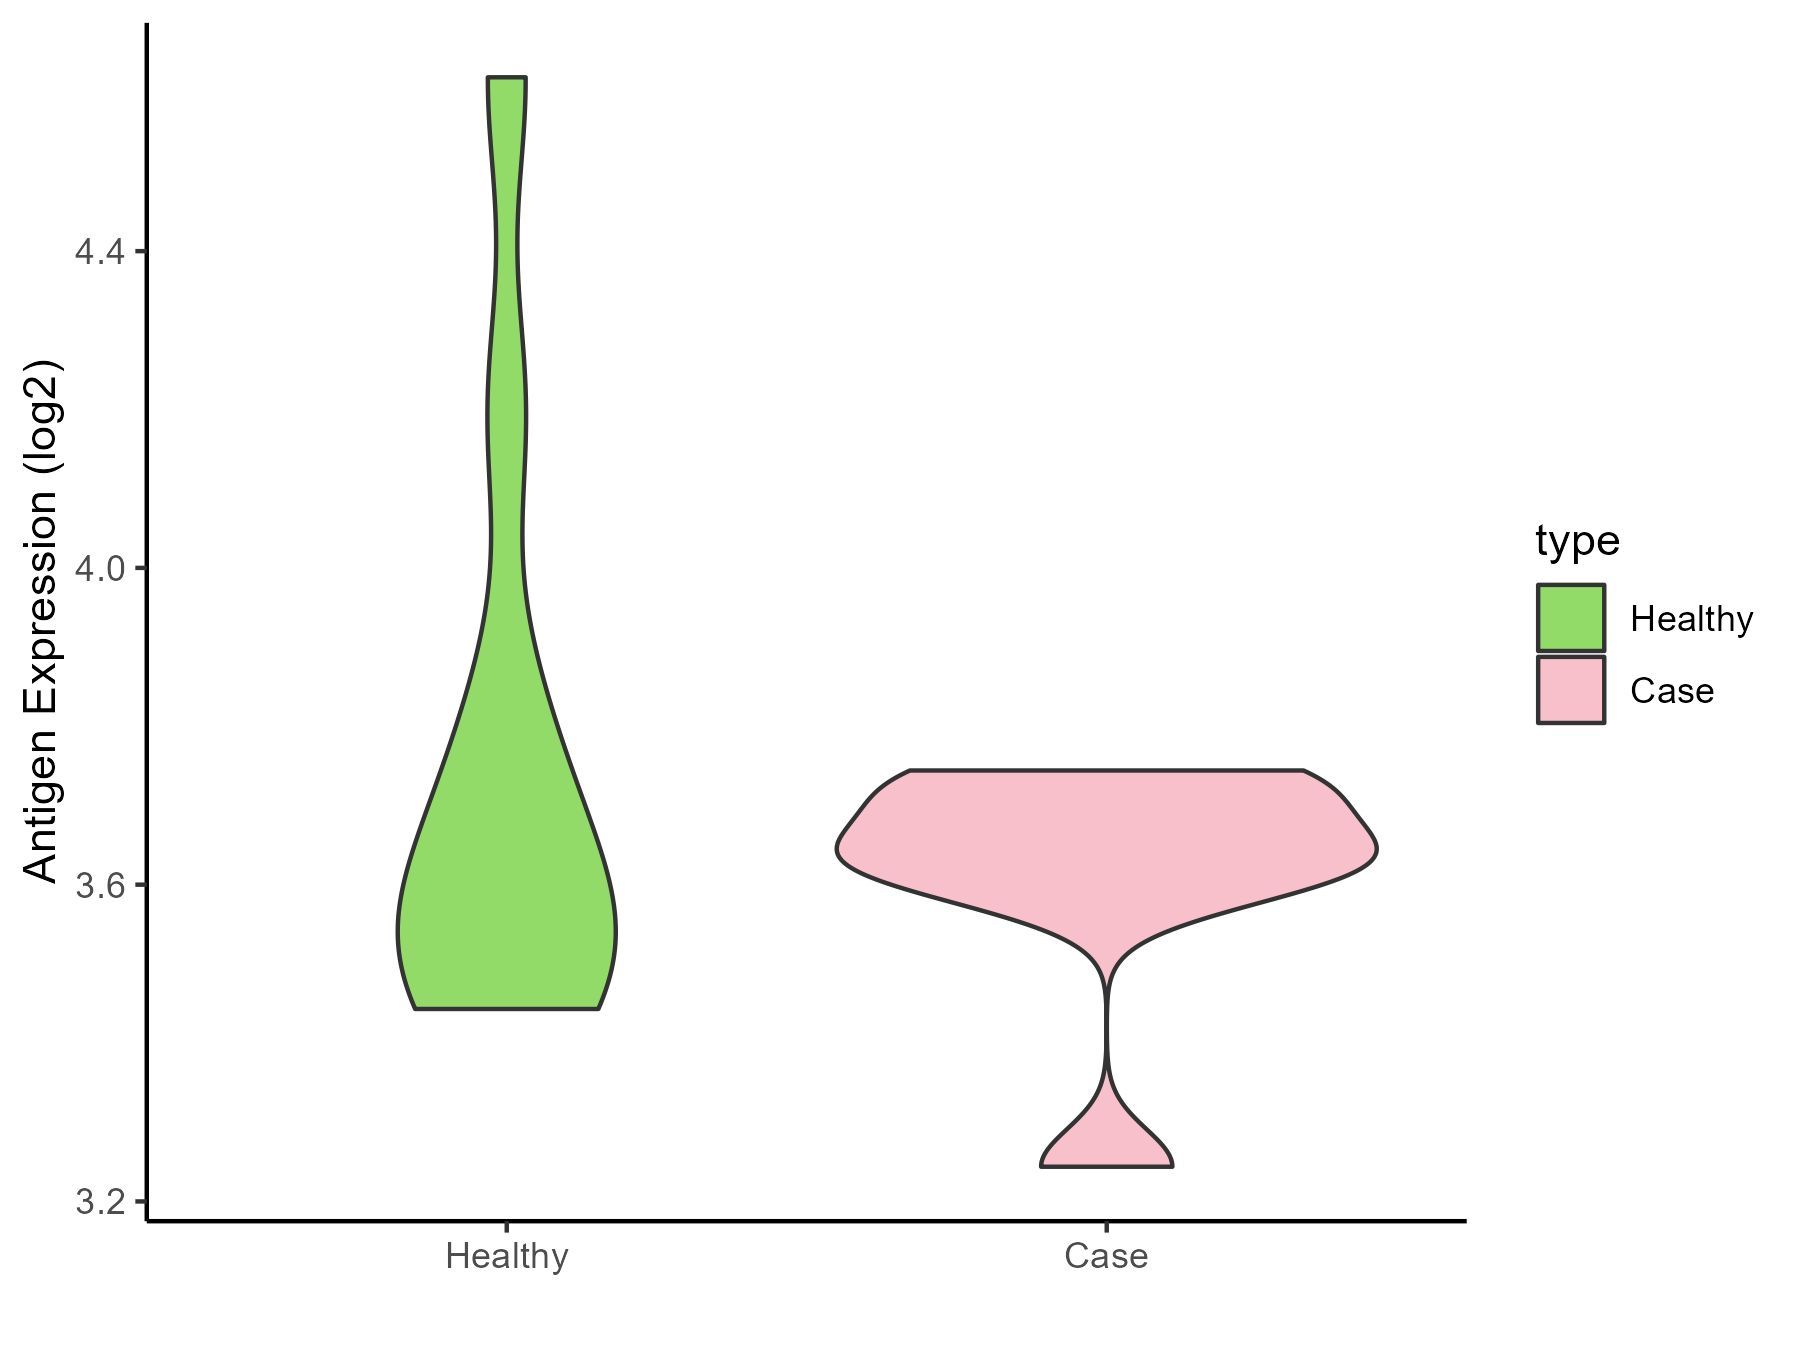
| The Studied Tissue | Biceps muscle | |
| The Specific Disease | Pompe disease | |
| The Expression Level of Disease Section Compare with the Healthy Individual Tissue | p-value: 0.343846854; Fold-change: 0.039052454; Z-score: 0.102576259 | |
| Disease-specific Antigen Abundances |
|
Click to View the Clearer Original Diagram |
| Differential expression pattern of antigen in diseases | ||
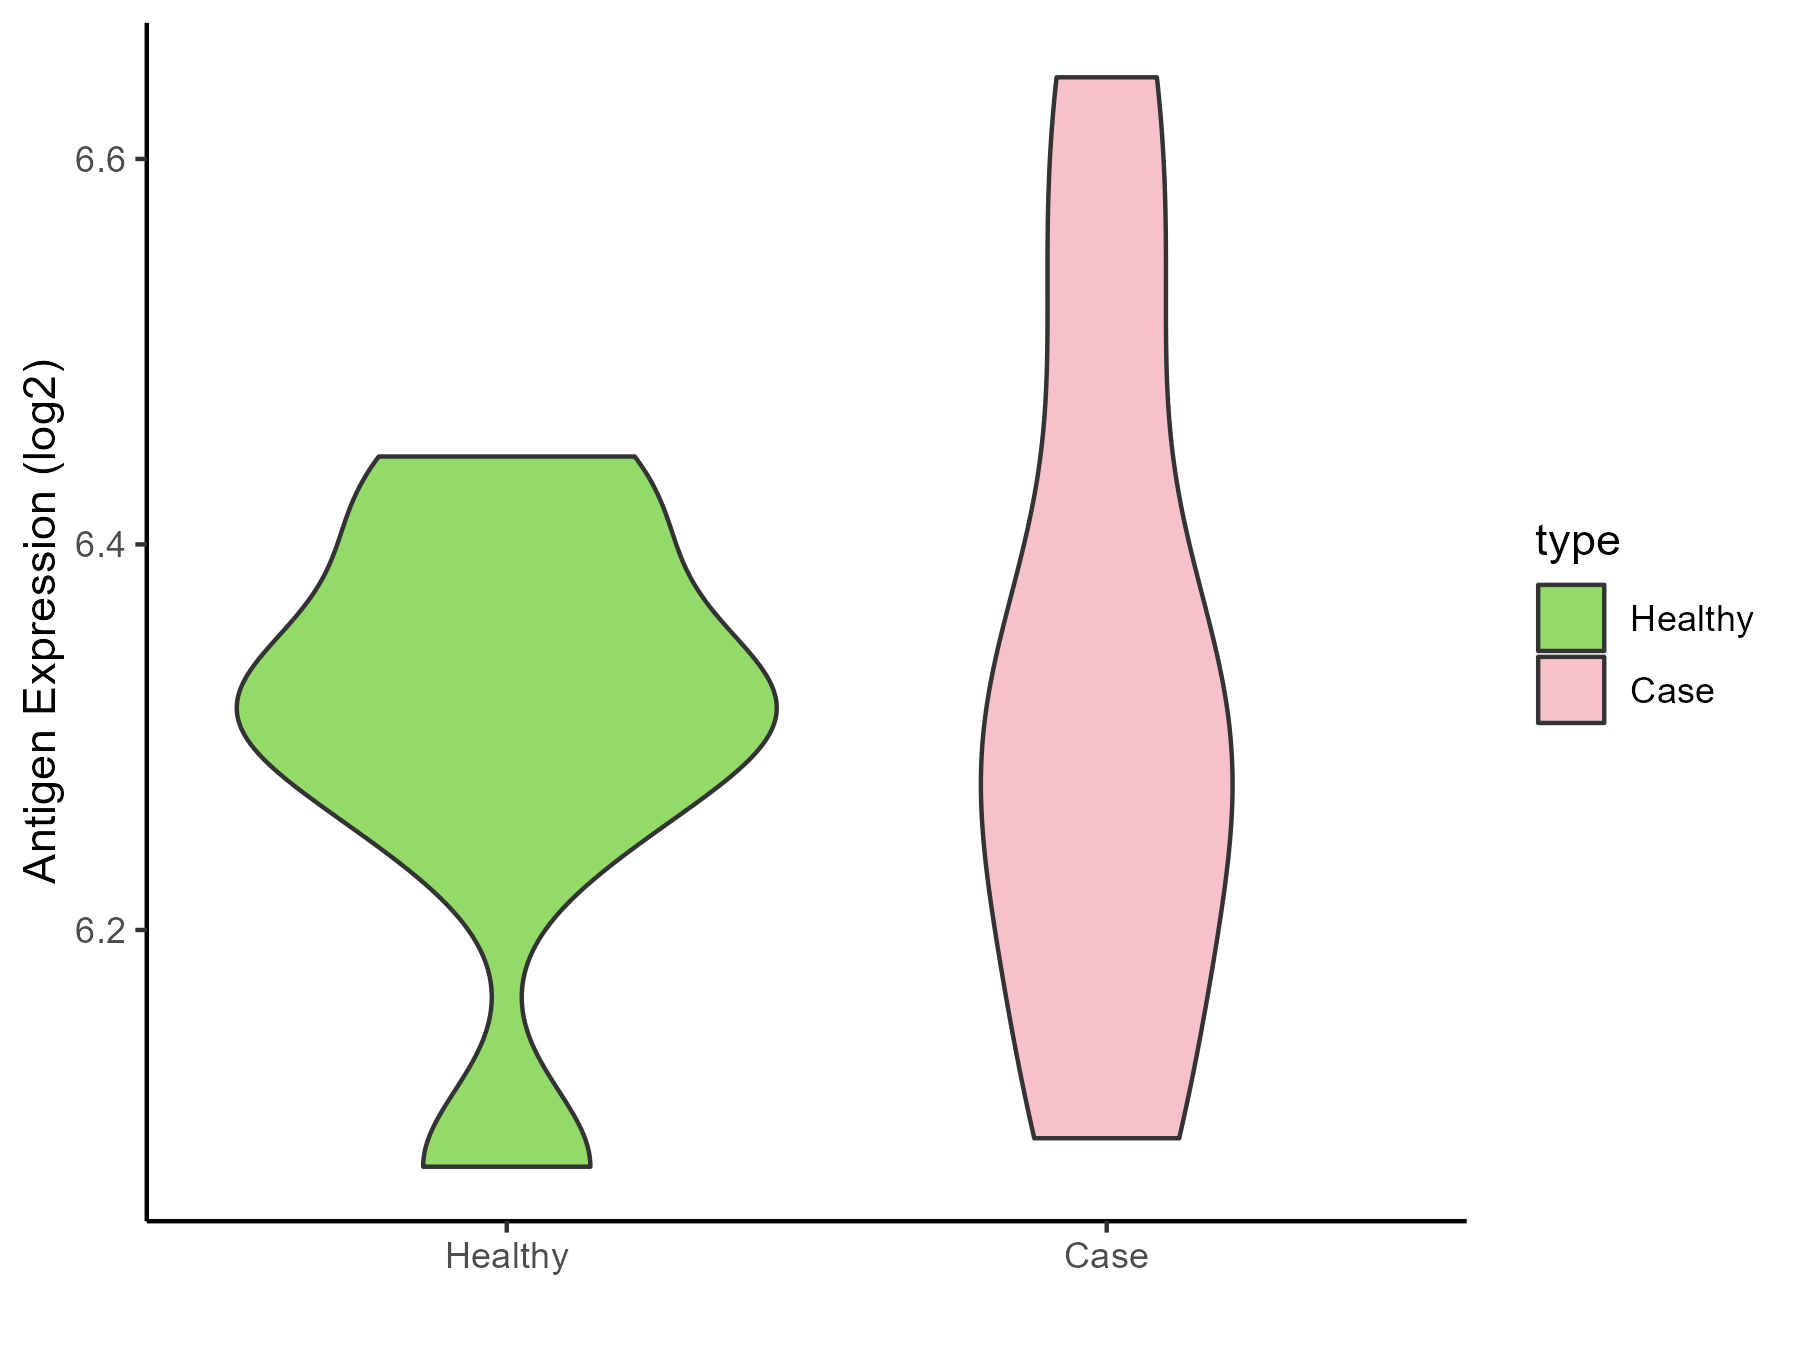
| The Studied Tissue | Whole blood | |
| The Specific Disease | Batten disease | |
| The Expression Level of Disease Section Compare with the Healthy Individual Tissue | p-value: 0.763345549; Fold-change: -0.003017417; Z-score: -0.025477681 | |
| Disease-specific Antigen Abundances |
|
Click to View the Clearer Original Diagram |
ICD Disease Classification 6
| Differential expression pattern of antigen in diseases | ||
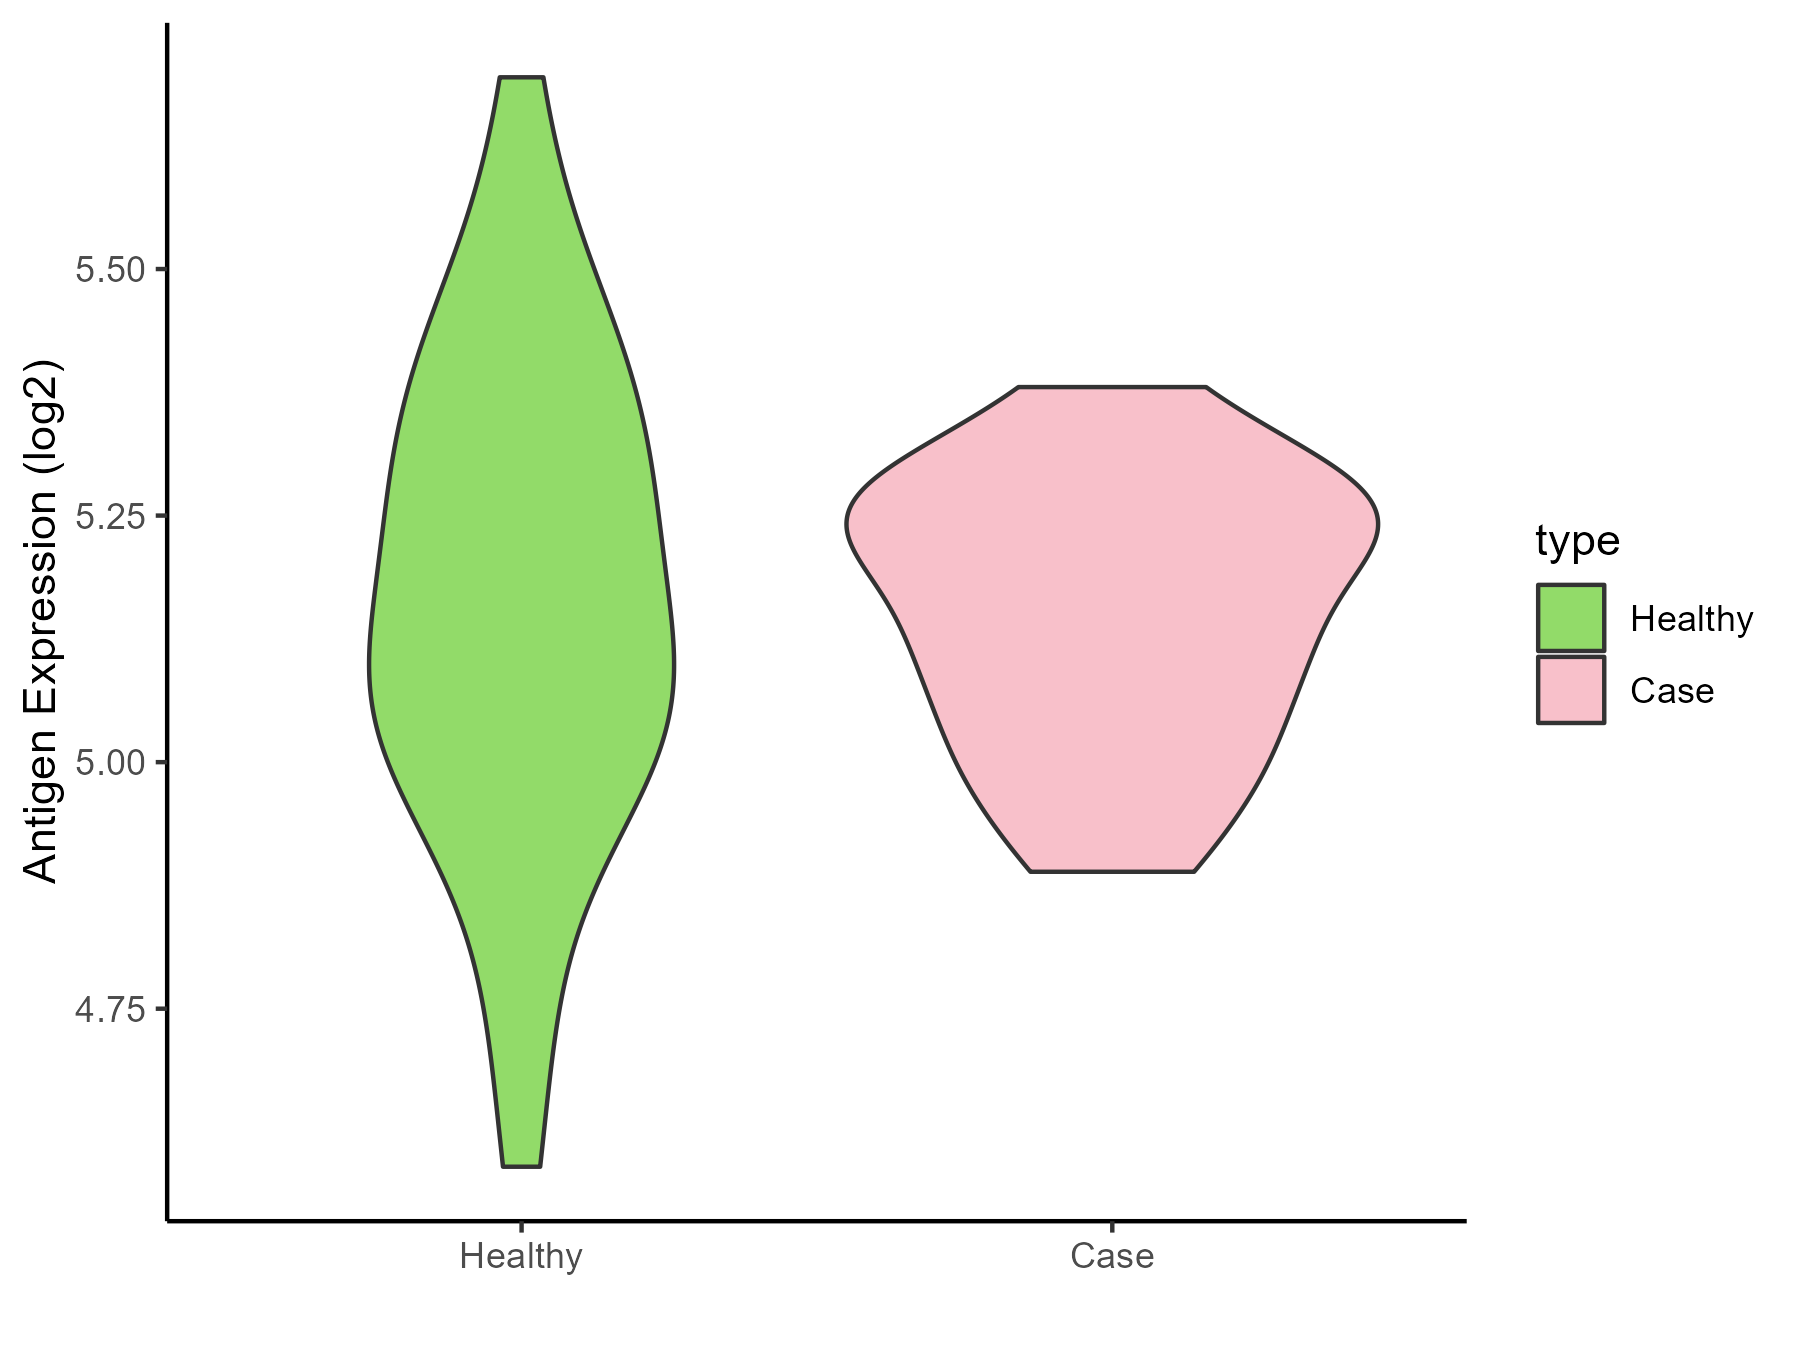
| The Studied Tissue | Whole blood | |
| The Specific Disease | Autism | |
| The Expression Level of Disease Section Compare with the Healthy Individual Tissue | p-value: 0.772192779; Fold-change: 0.029256359; Z-score: 0.119152181 | |
| Disease-specific Antigen Abundances |
|
Click to View the Clearer Original Diagram |
| Differential expression pattern of antigen in diseases | ||
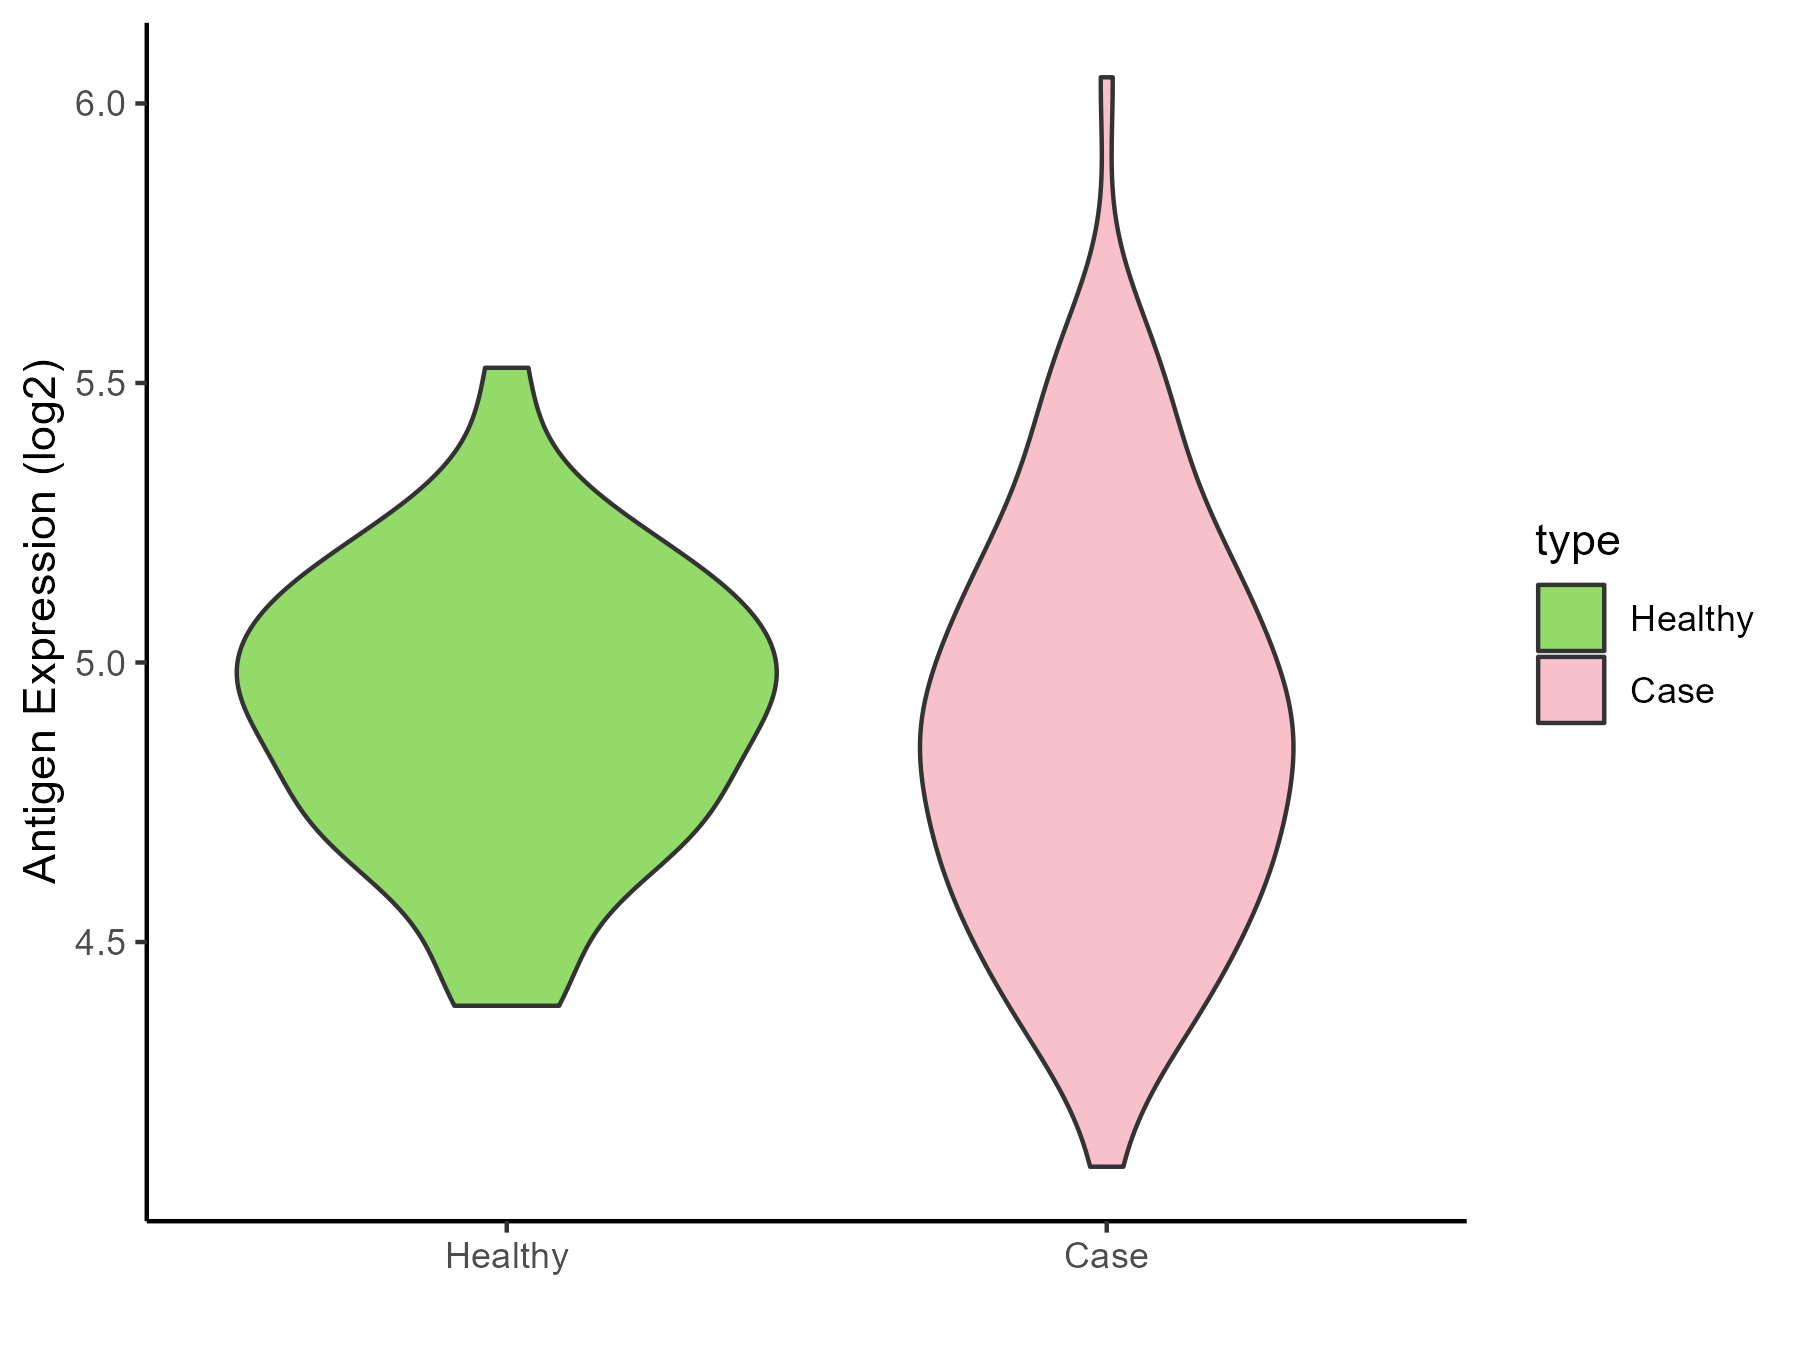
| The Studied Tissue | Whole blood | |
| The Specific Disease | Anxiety disorder | |
| The Expression Level of Disease Section Compare with the Healthy Individual Tissue | p-value: 0.595328696; Fold-change: -0.062948105; Z-score: -0.250782298 | |
| Disease-specific Antigen Abundances |
|
Click to View the Clearer Original Diagram |
ICD Disease Classification 8
| Differential expression pattern of antigen in diseases | ||
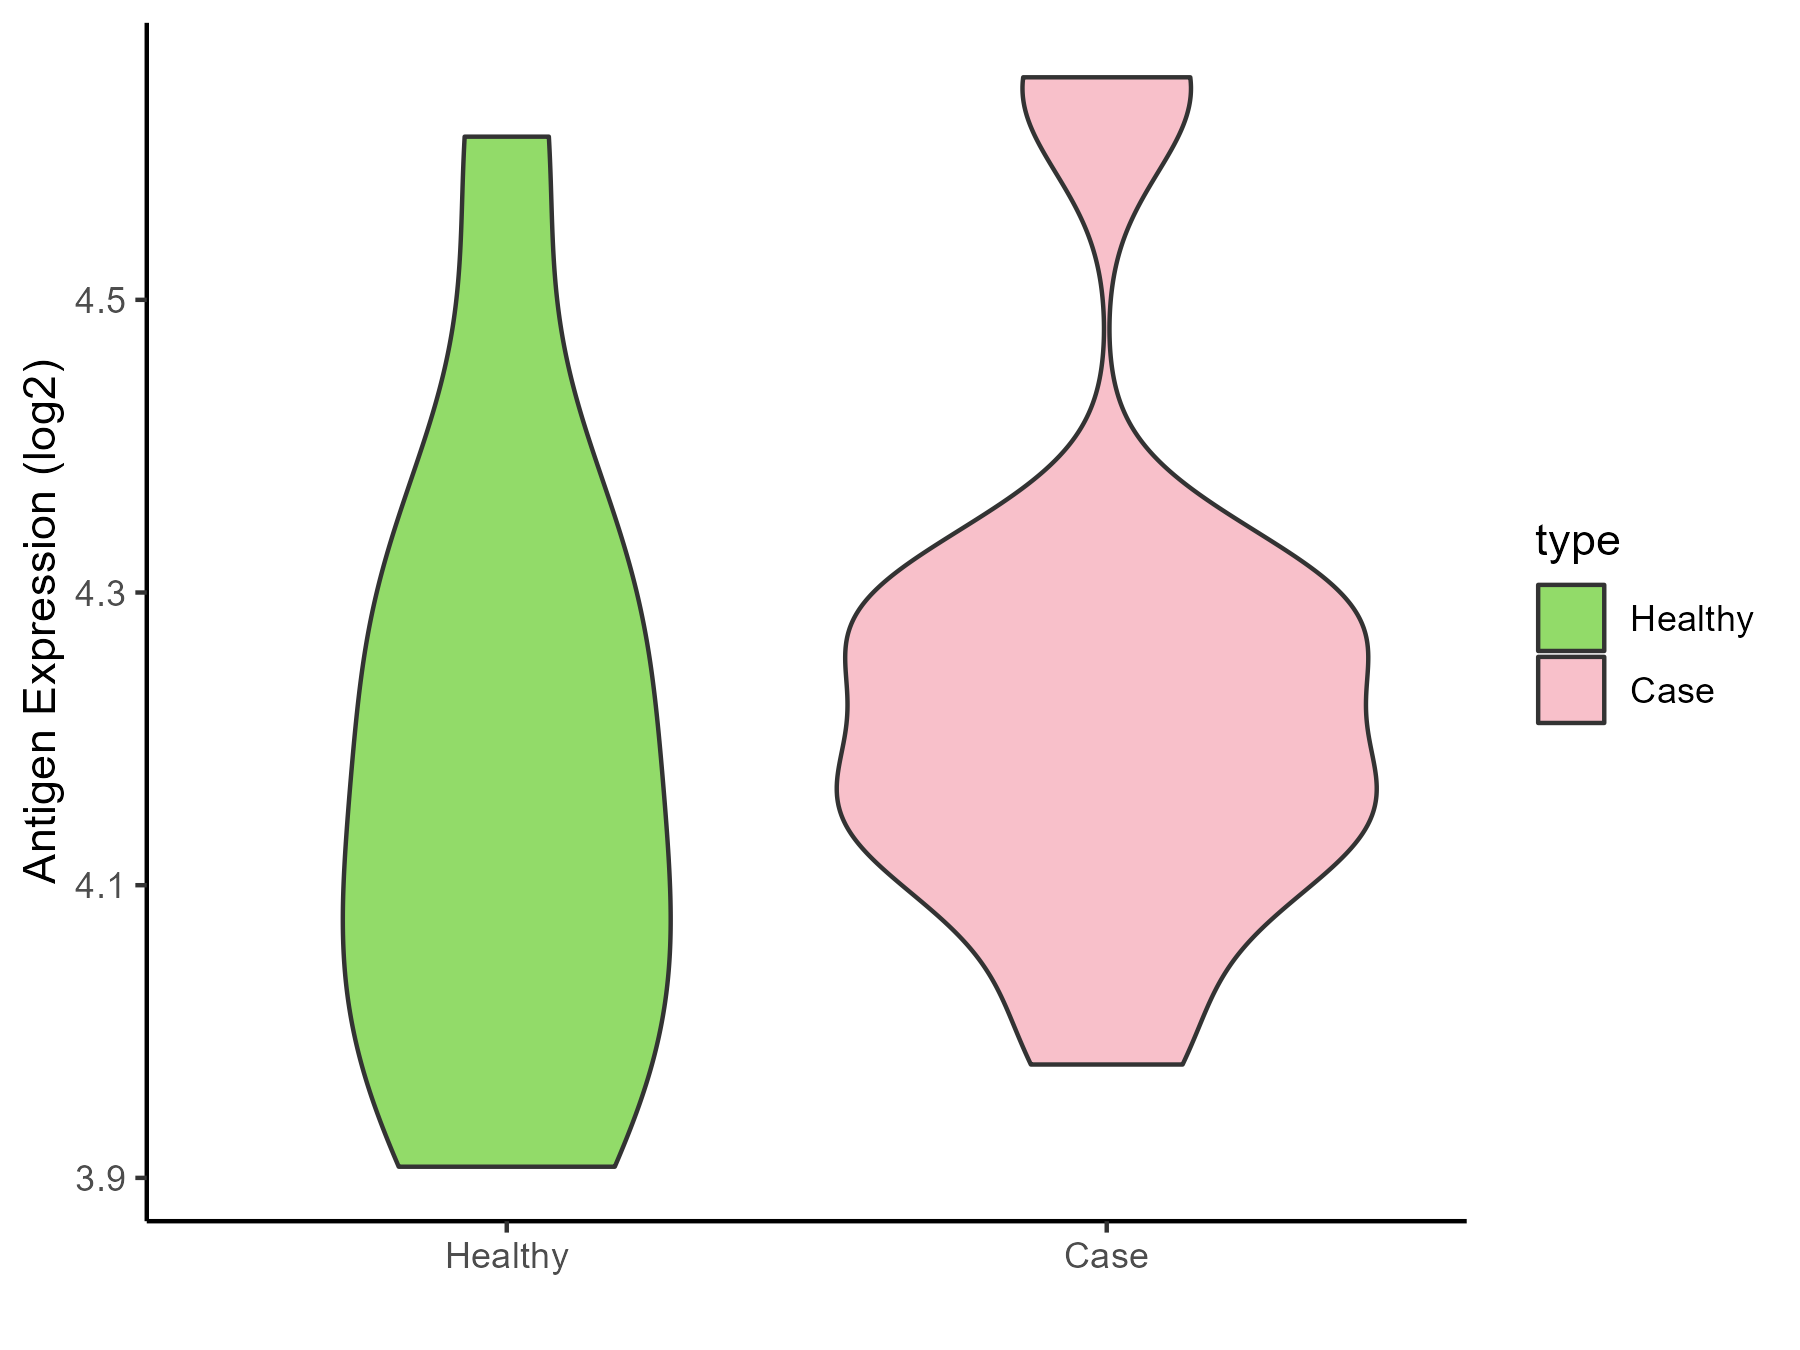
| The Studied Tissue | Substantia nigra | |
| The Specific Disease | Parkinson disease | |
| The Expression Level of Disease Section Compare with the Healthy Individual Tissue | p-value: 0.503500532; Fold-change: 0.079314383; Z-score: 0.362332198 | |
| Disease-specific Antigen Abundances |
|
Click to View the Clearer Original Diagram |
| Differential expression pattern of antigen in diseases | ||
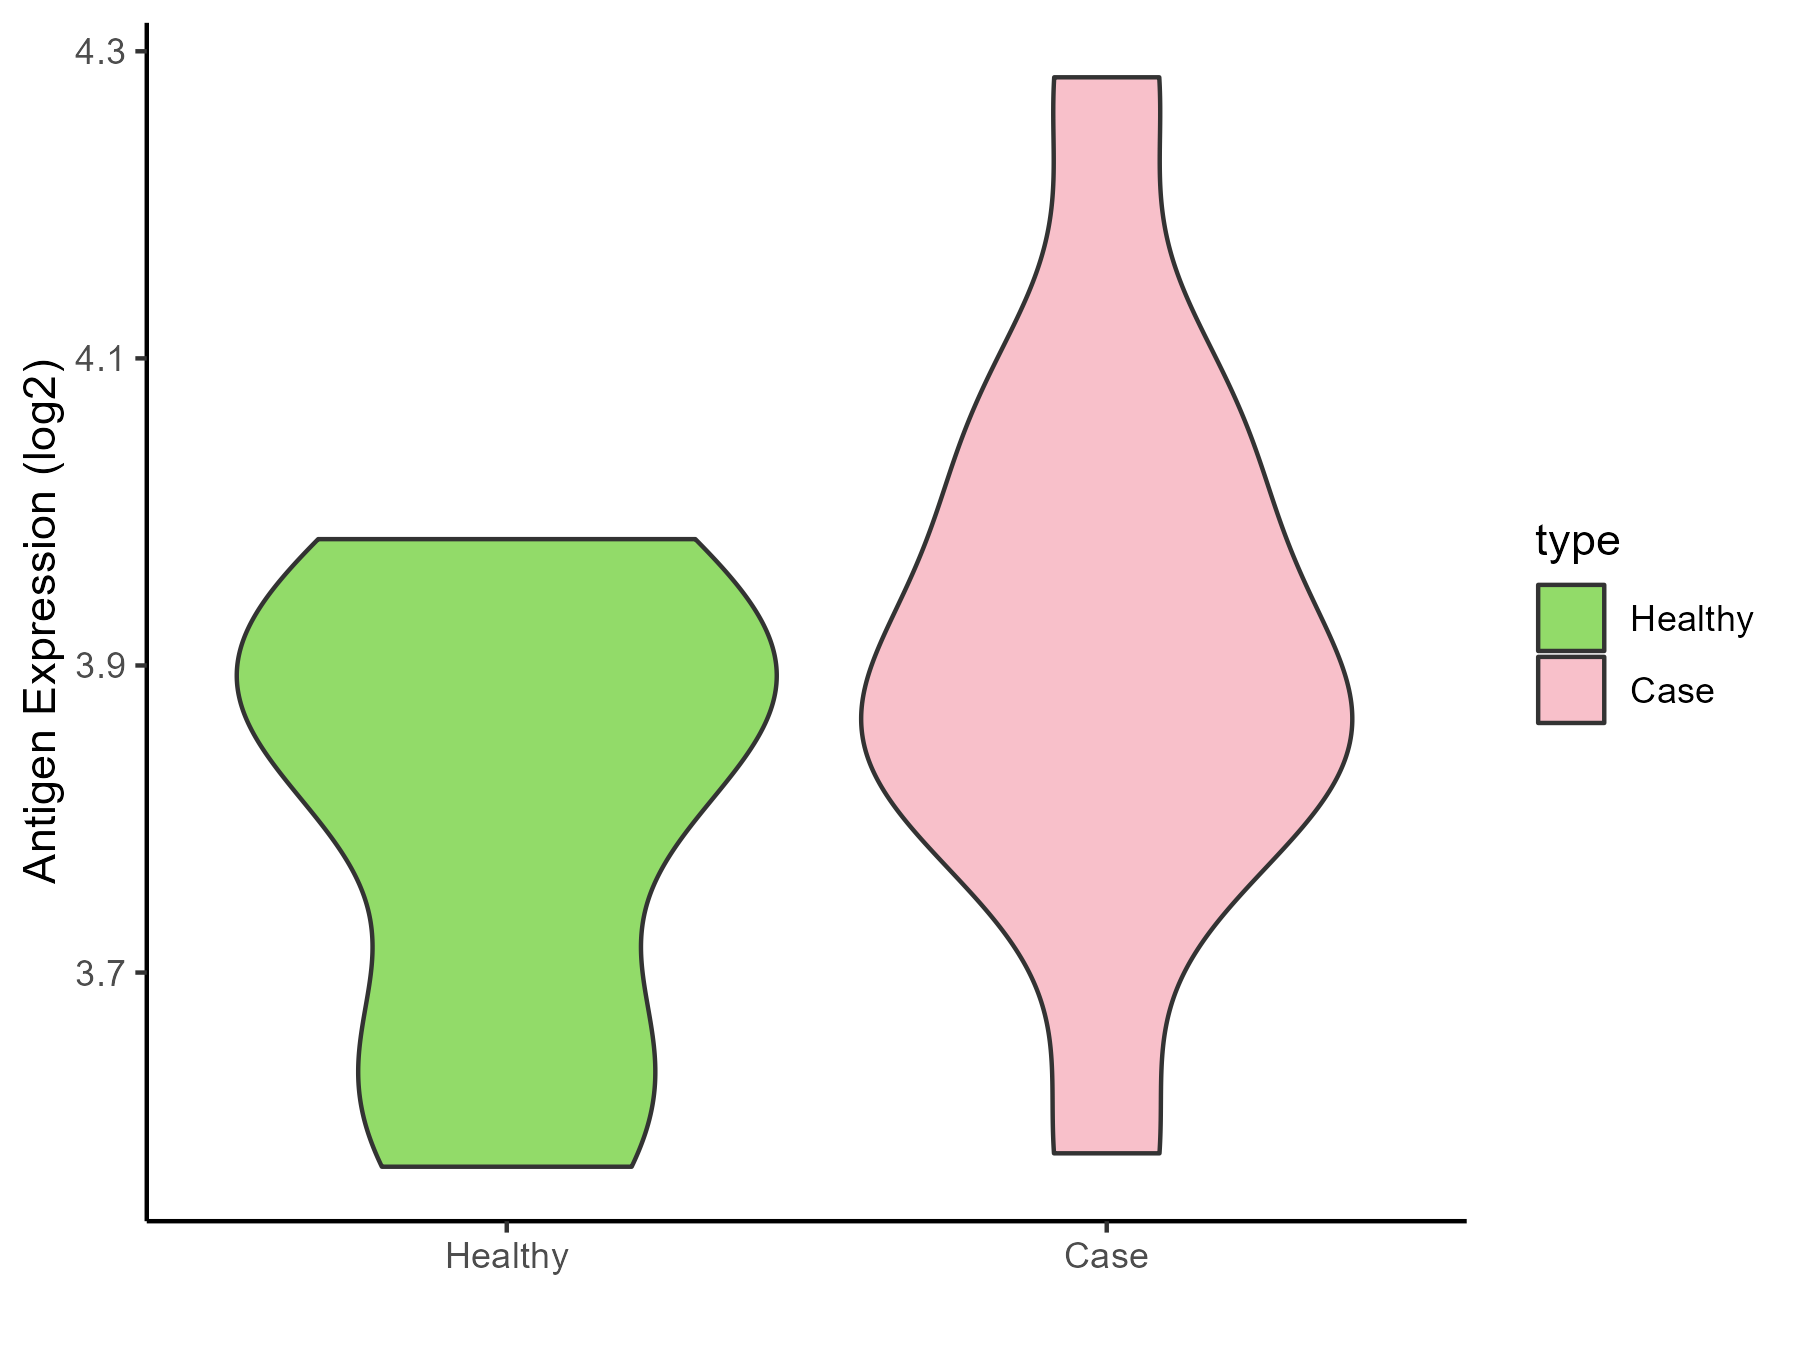
| The Studied Tissue | Whole blood | |
| The Specific Disease | Huntington disease | |
| The Expression Level of Disease Section Compare with the Healthy Individual Tissue | p-value: 0.171988154; Fold-change: 0.024706693; Z-score: 0.167645335 | |
| Disease-specific Antigen Abundances |
|
Click to View the Clearer Original Diagram |
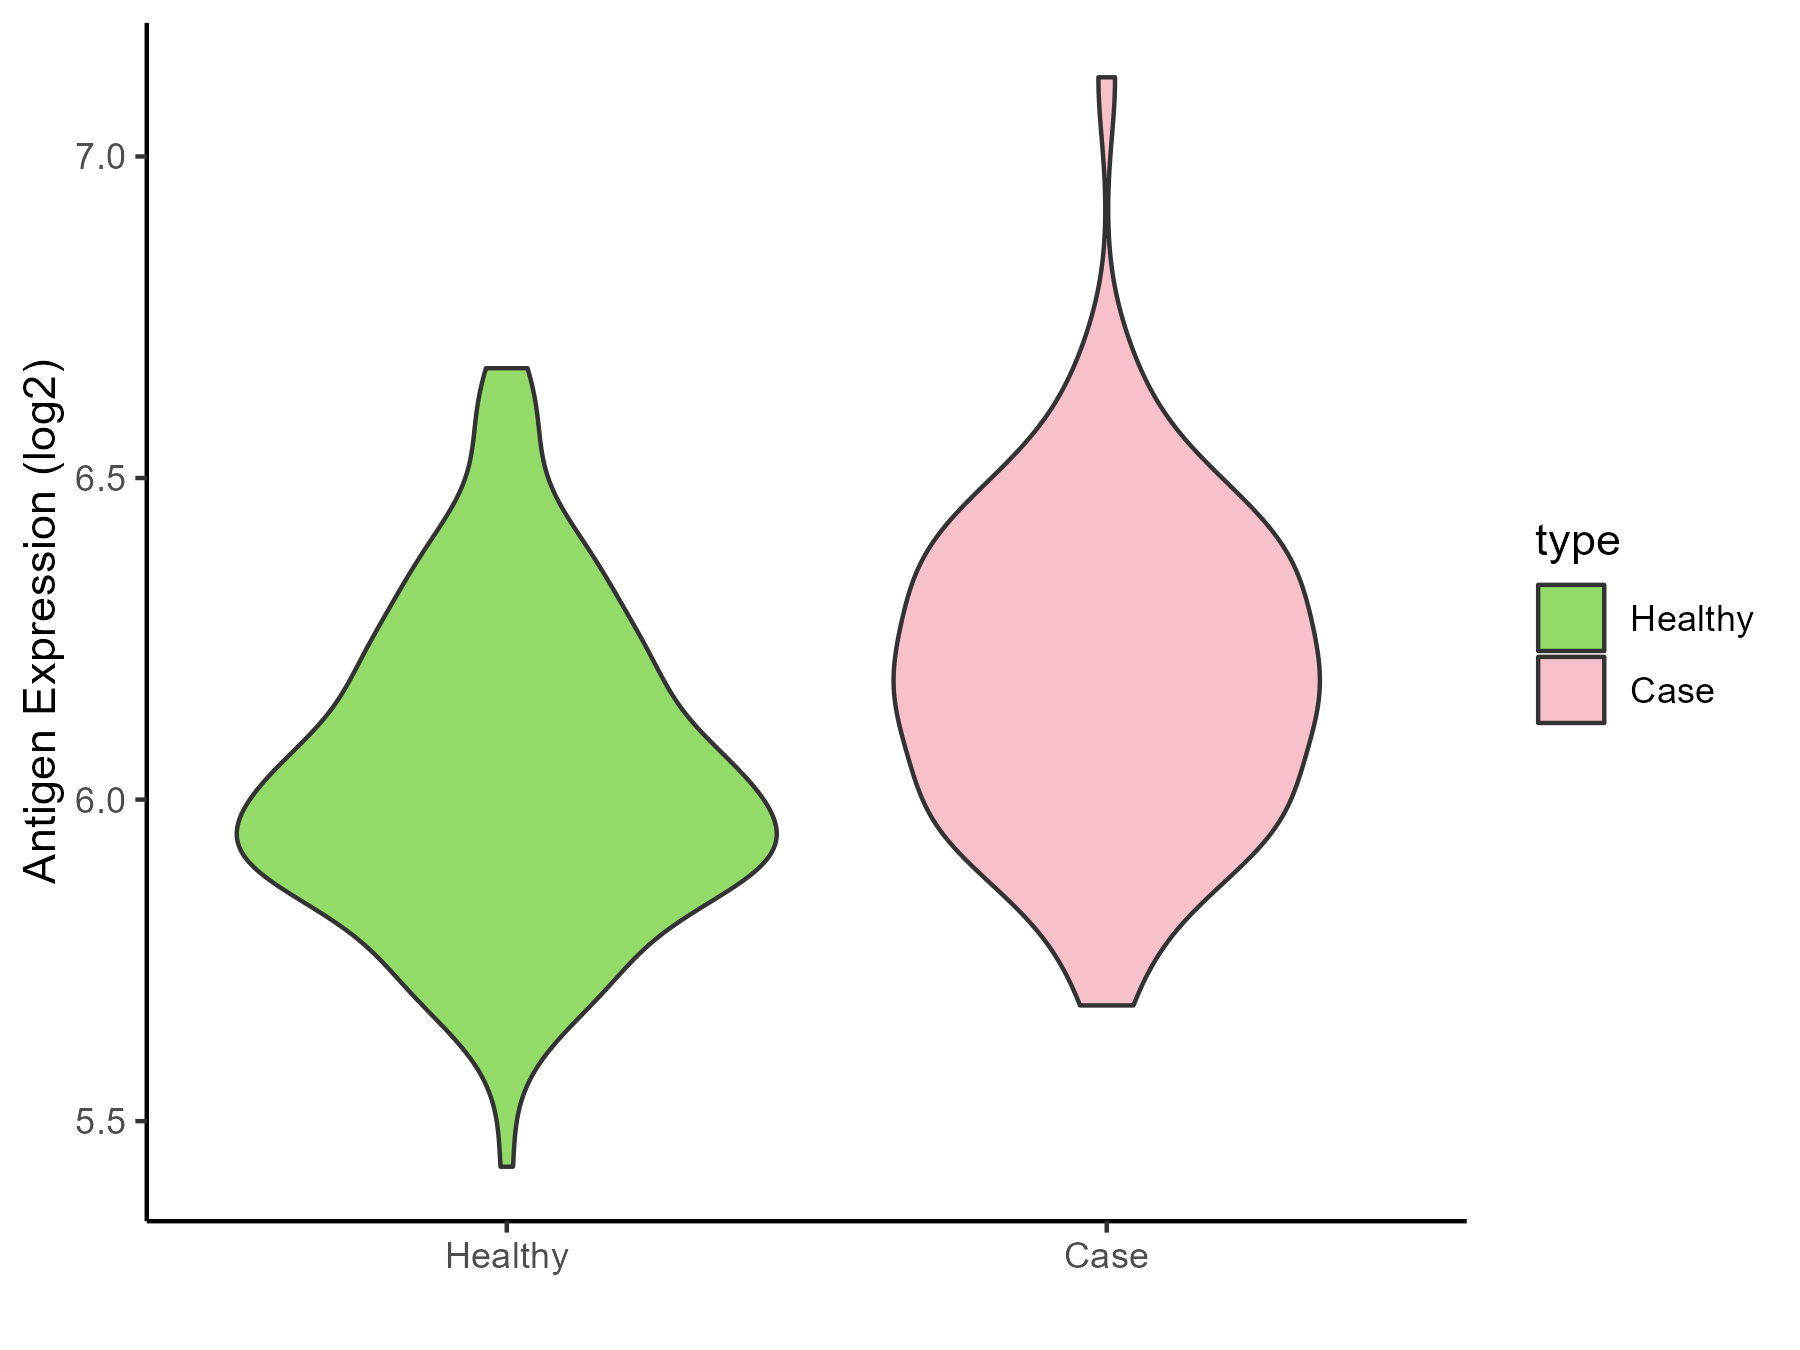
| Differential expression pattern of antigen in diseases | ||
| The Studied Tissue | Entorhinal cortex | |
| The Specific Disease | Alzheimer disease | |
| The Expression Level of Disease Section Compare with the Healthy Individual Tissue | p-value: 7.34E-06; Fold-change: 0.177599333; Z-score: 0.756424942 | |
| Disease-specific Antigen Abundances |
|
Click to View the Clearer Original Diagram |
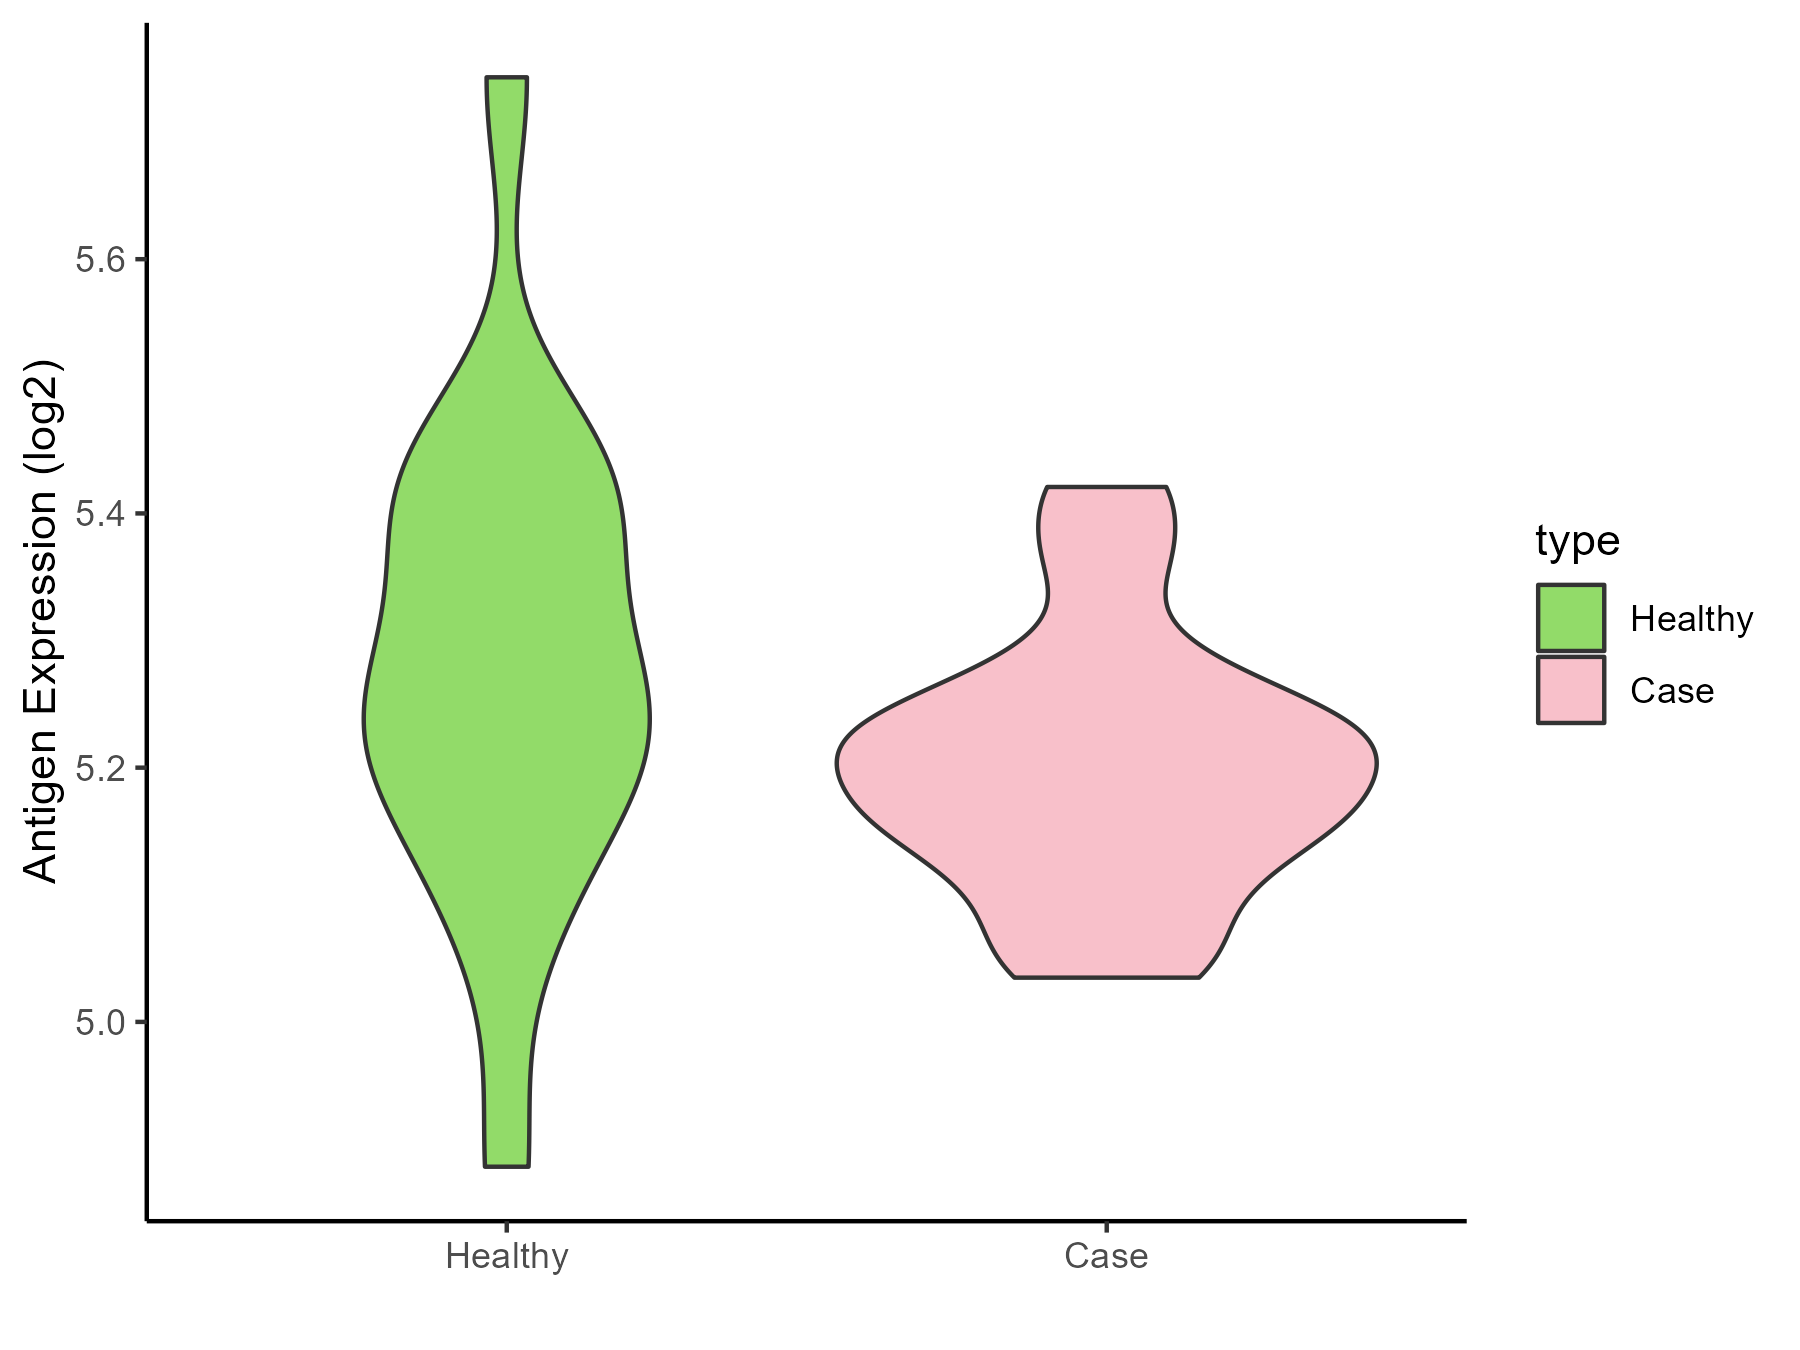
| Differential expression pattern of antigen in diseases | ||
| The Studied Tissue | Whole blood | |
| The Specific Disease | Seizure | |
| The Expression Level of Disease Section Compare with the Healthy Individual Tissue | p-value: 0.143033735; Fold-change: -0.049265274; Z-score: -0.254641415 | |
| Disease-specific Antigen Abundances |
|
Click to View the Clearer Original Diagram |
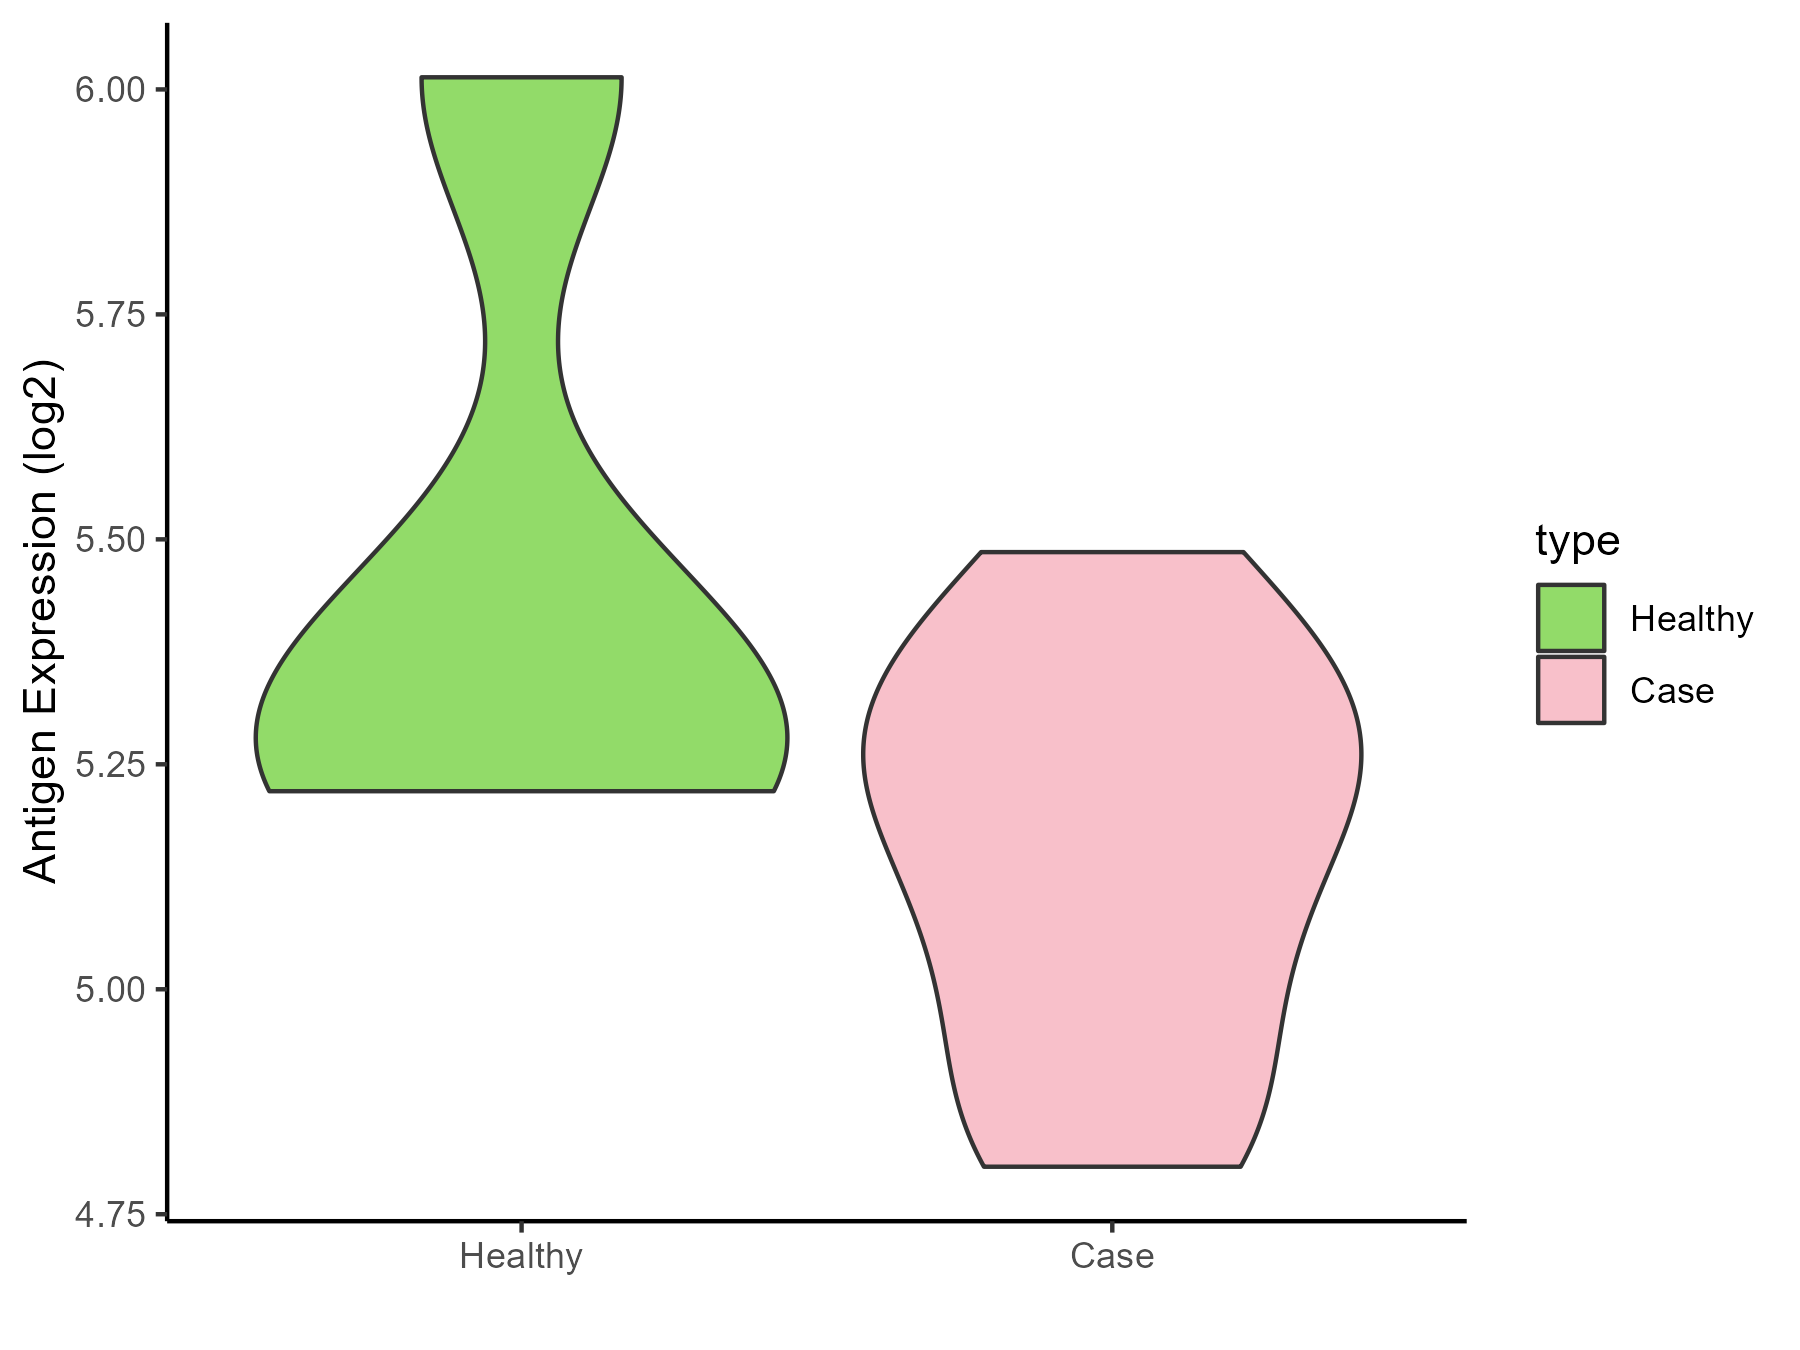
| Differential expression pattern of antigen in diseases | ||
| The Studied Tissue | Skin | |
| The Specific Disease | Lateral sclerosis | |
| The Expression Level of Disease Section Compare with the Healthy Individual Tissue | p-value: 0.188522543; Fold-change: -0.118140293; Z-score: -0.317835347 | |
| Disease-specific Antigen Abundances |
|
Click to View the Clearer Original Diagram |
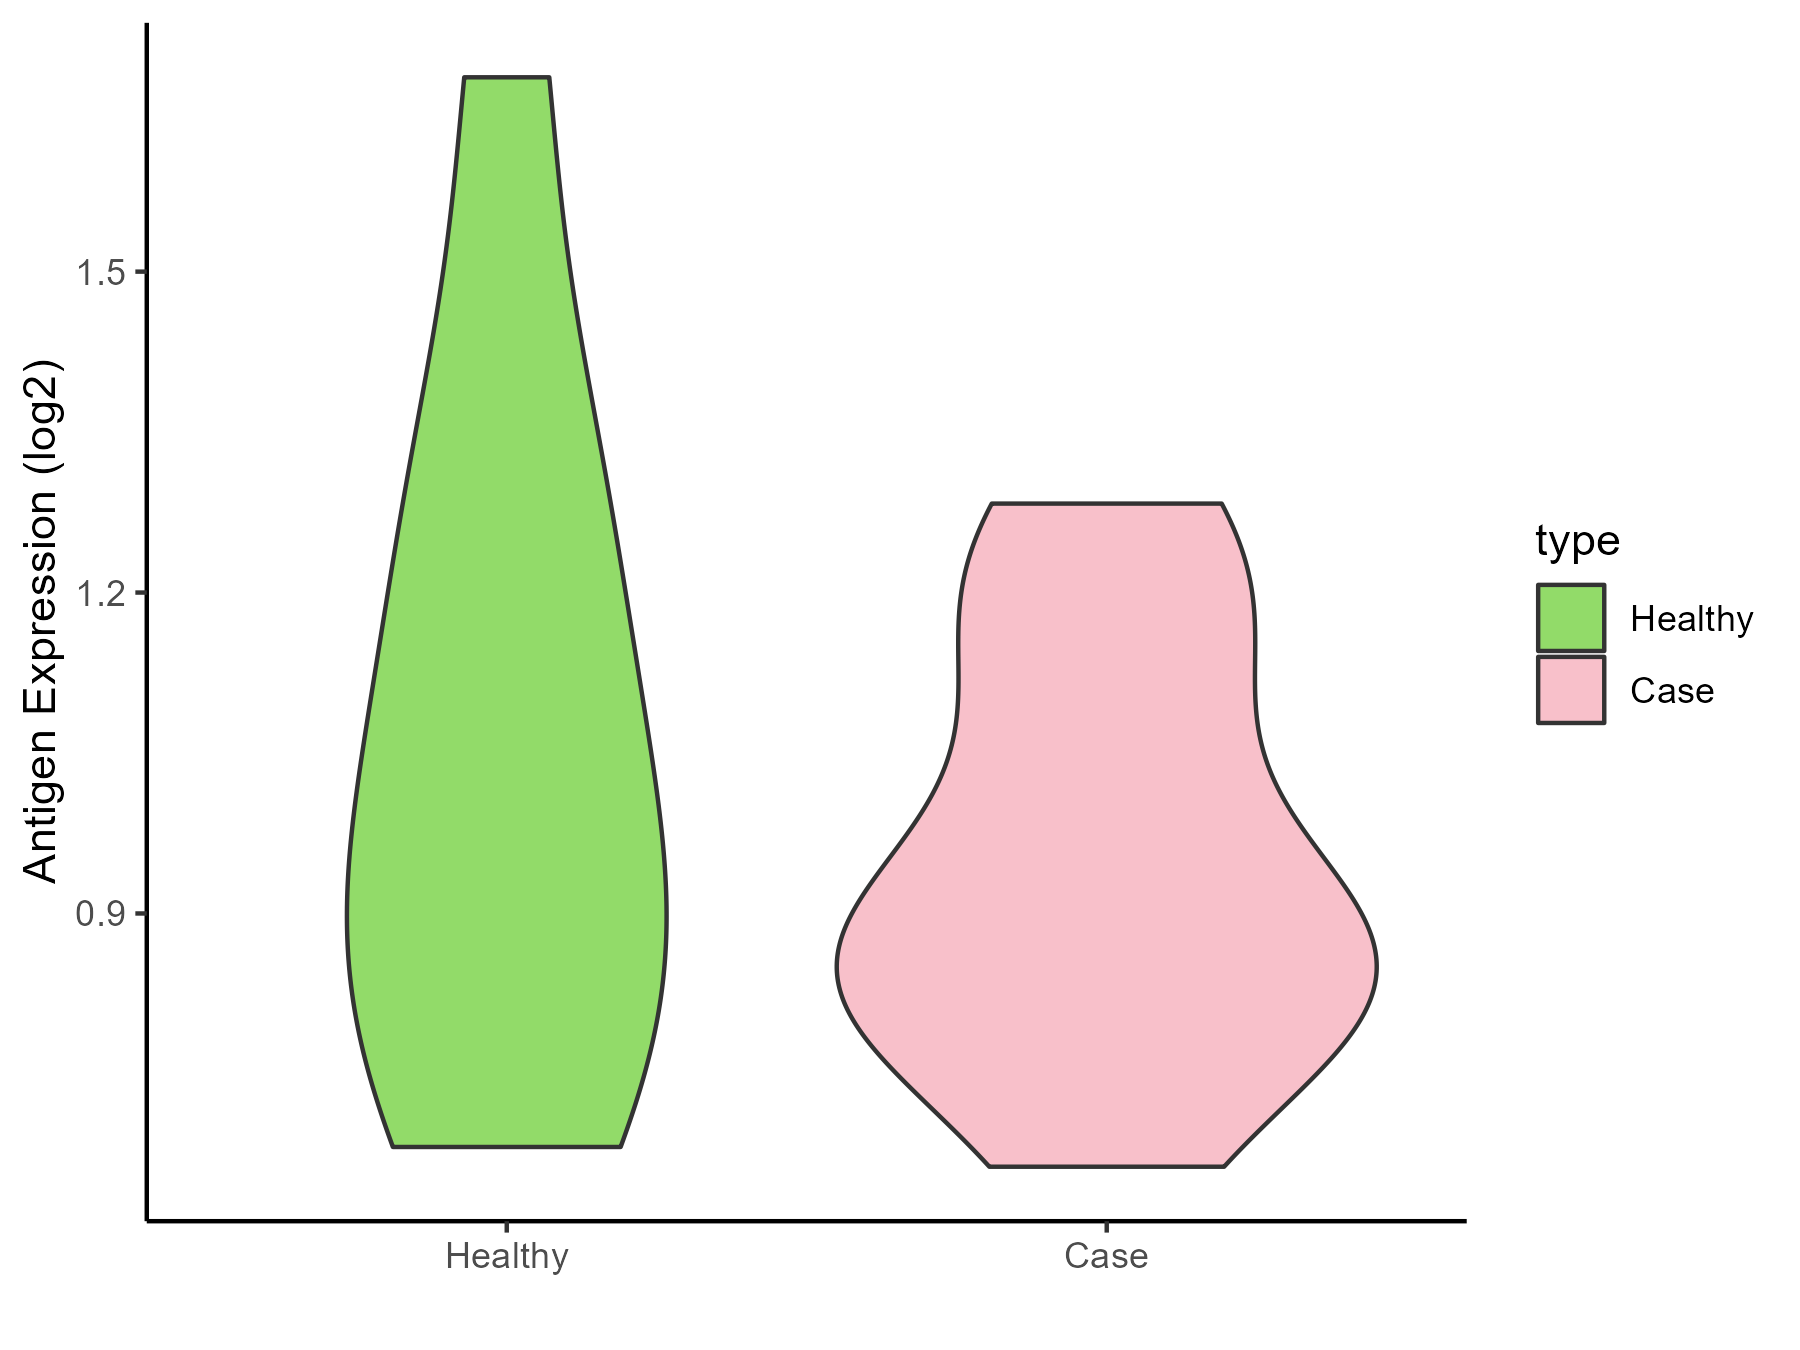
| The Studied Tissue | Cervical spinal cord | |
| The Specific Disease | Lateral sclerosis | |
| The Expression Level of Disease Section Compare with the Healthy Individual Tissue | p-value: 0.3918231; Fold-change: -0.119096928; Z-score: -0.371207564 | |
| Disease-specific Antigen Abundances |
|
Click to View the Clearer Original Diagram |
| Differential expression pattern of antigen in diseases | ||
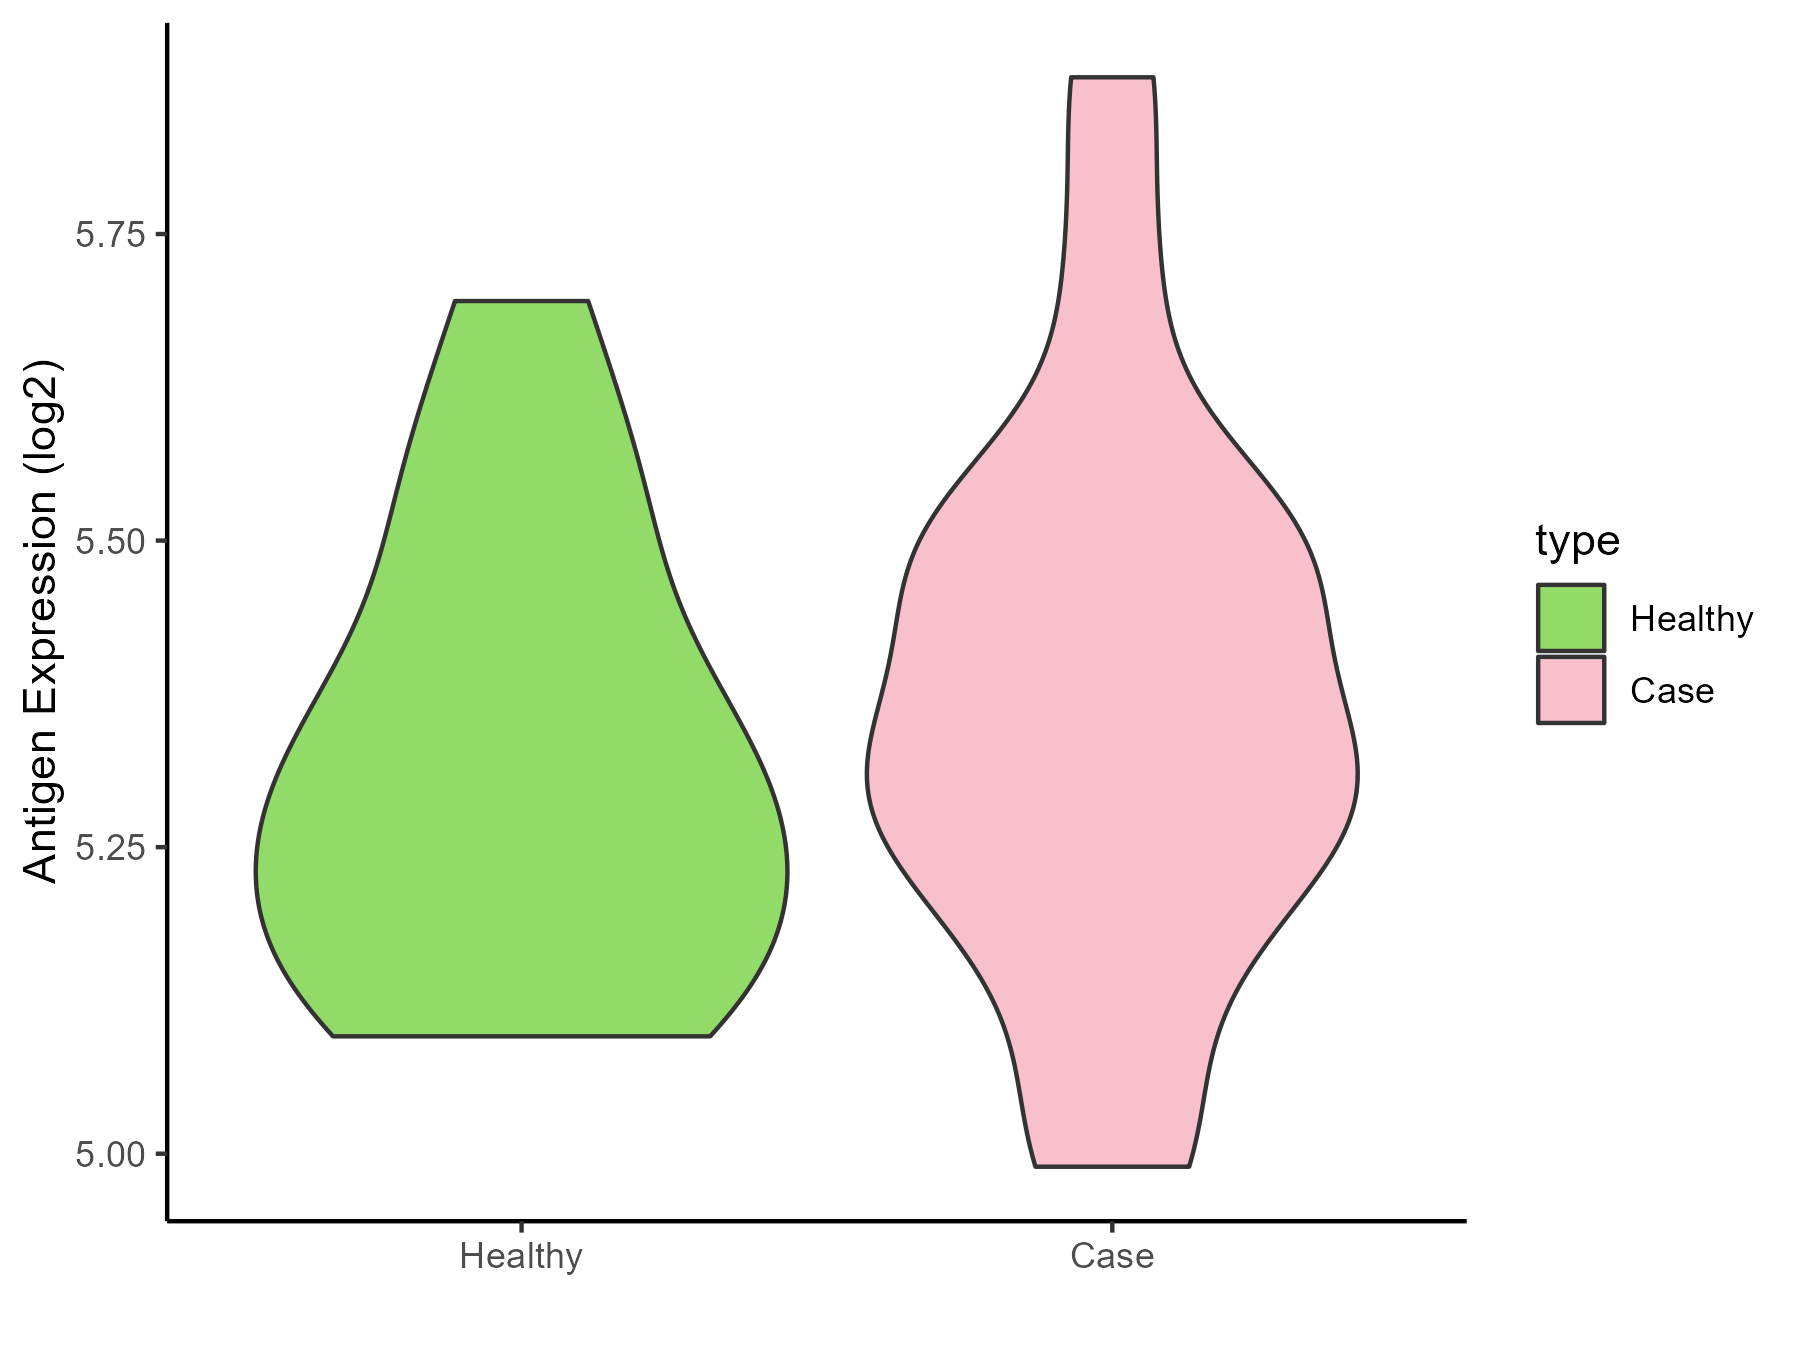
| The Studied Tissue | Muscle | |
| The Specific Disease | Muscular atrophy | |
| The Expression Level of Disease Section Compare with the Healthy Individual Tissue | p-value: 0.530228782; Fold-change: 0.036834963; Z-score: 0.198777357 | |
| Disease-specific Antigen Abundances |
|
Click to View the Clearer Original Diagram |
| Differential expression pattern of antigen in diseases | ||
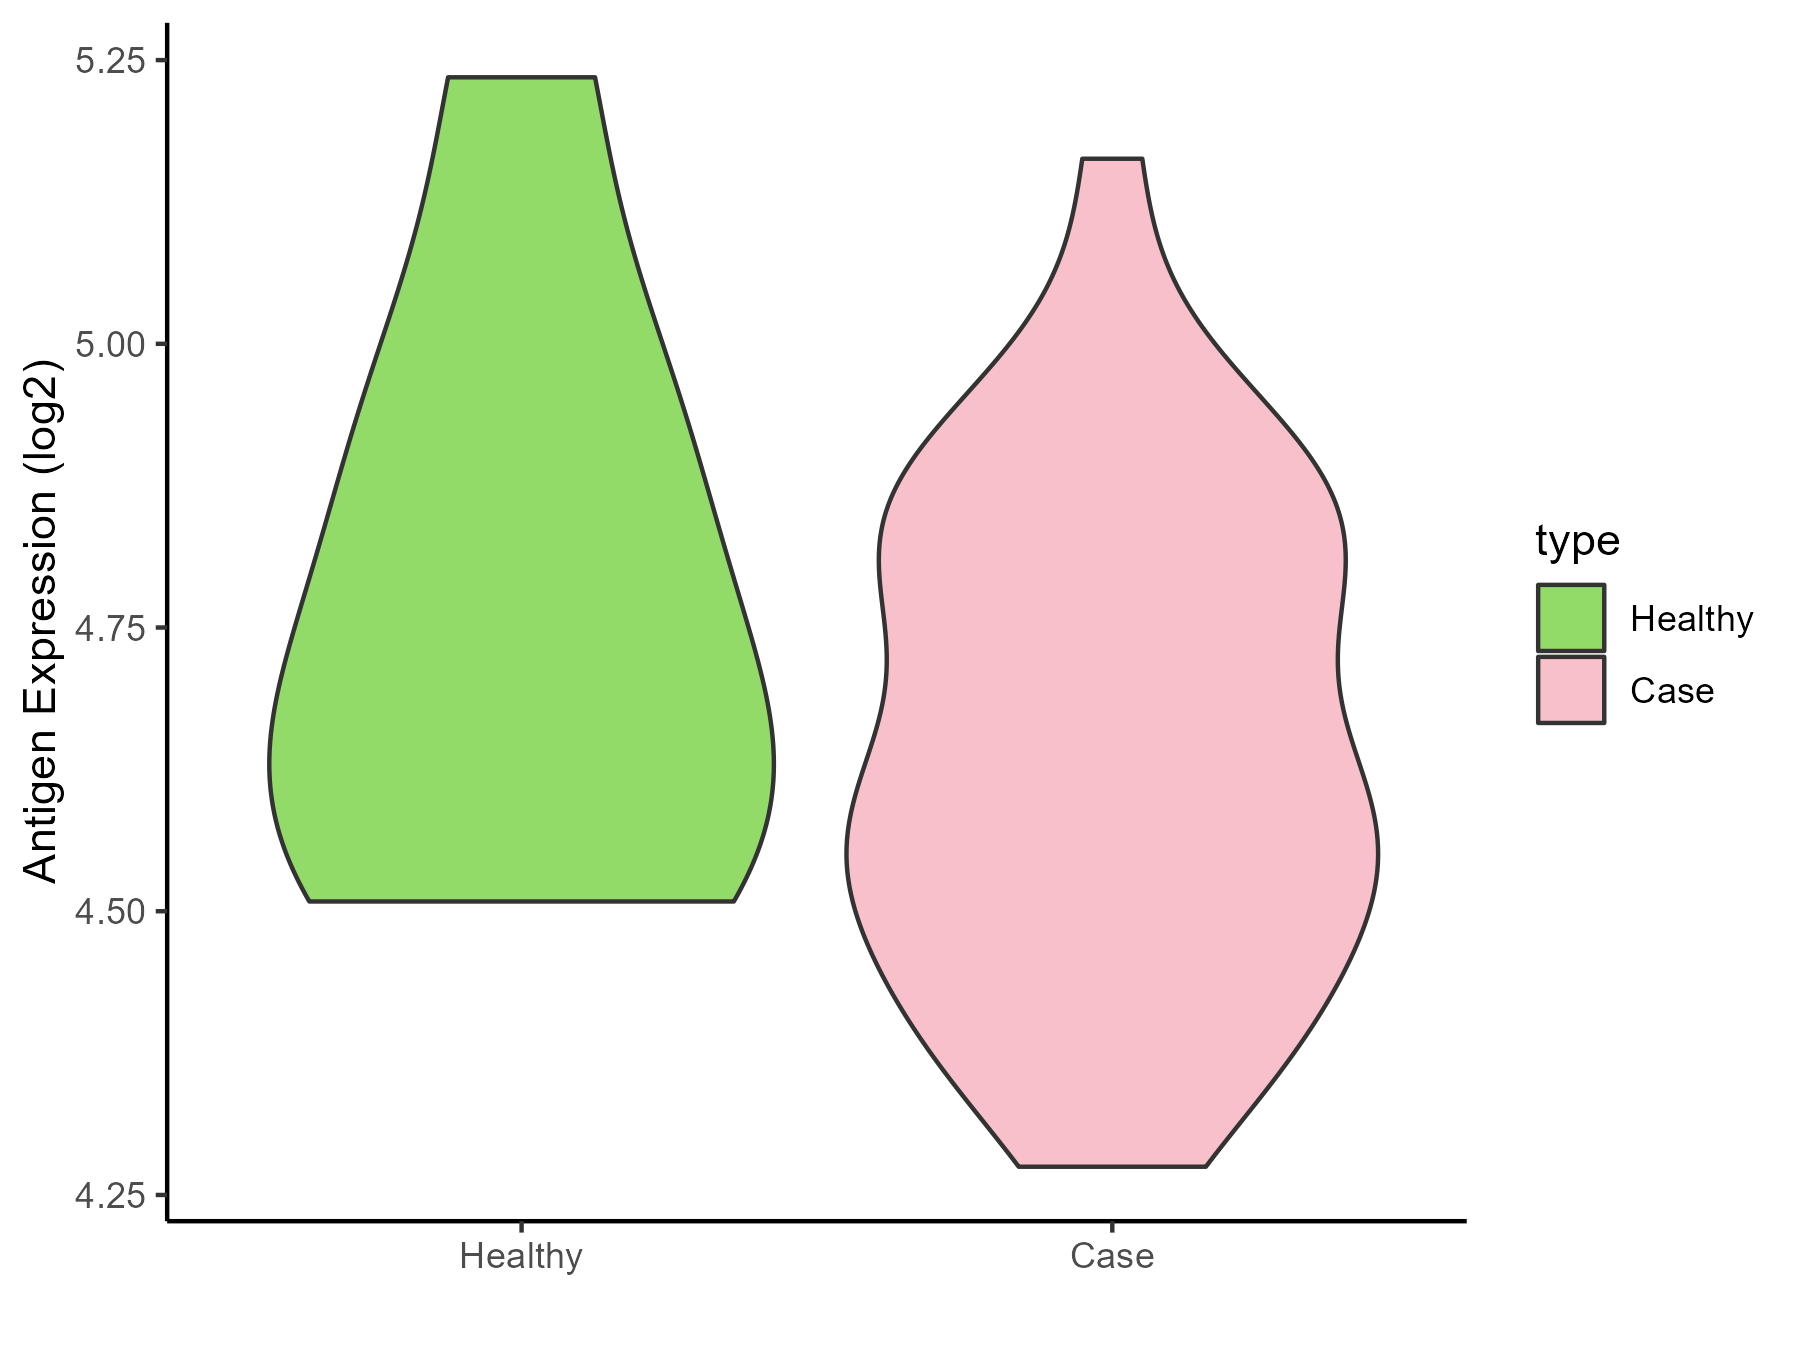
| The Studied Tissue | Muscle | |
| The Specific Disease | Myopathy | |
| The Expression Level of Disease Section Compare with the Healthy Individual Tissue | p-value: 0.269427553; Fold-change: -0.097411887; Z-score: -0.386237809 | |
| Disease-specific Antigen Abundances |
|
Click to View the Clearer Original Diagram |
References
