Antigen Information
General Information of This Antigen
| Antigen ID | TAR0MYDAB |
|||||
|---|---|---|---|---|---|---|
| Antigen Name | Receptor tyrosine-protein kinase erbB-3 (HER3) |
|||||
| Gene Name | ERBB3 |
|||||
| Gene ID | ||||||
| Synonym | HER3; Proto-oncogene-like protein c-ErbB-3;Tyrosine kinase-type cell surface receptor HER3 |
|||||
| Sequence |
MRANDALQVLGLLFSLARGSEVGNSQAVCPGTLNGLSVTGDAENQYQTLYKLYERCEVVM
GNLEIVLTGHNADLSFLQWIREVTGYVLVAMNEFSTLPLPNLRVVRGTQVYDGKFAIFVM LNYNTNSSHALRQLRLTQLTEILSGGVYIEKNDKLCHMDTIDWRDIVRDRDAEIVVKDNG RSCPPCHEVCKGRCWGPGSEDCQTLTKTICAPQCNGHCFGPNPNQCCHDECAGGCSGPQD TDCFACRHFNDSGACVPRCPQPLVYNKLTFQLEPNPHTKYQYGGVCVASCPHNFVVDQTS CVRACPPDKMEVDKNGLKMCEPCGGLCPKACEGTGSGSRFQTVDSSNIDGFVNCTKILGN LDFLITGLNGDPWHKIPALDPEKLNVFRTVREITGYLNIQSWPPHMHNFSVFSNLTTIGG RSLYNRGFSLLIMKNLNVTSLGFRSLKEISAGRIYISANRQLCYHHSLNWTKVLRGPTEE RLDIKHNRPRRDCVAEGKVCDPLCSSGGCWGPGPGQCLSCRNYSRGGVCVTHCNFLNGEP REFAHEAECFSCHPECQPMEGTATCNGSGSDTCAQCAHFRDGPHCVSSCPHGVLGAKGPI YKYPDVQNECRPCHENCTQGCKGPELQDCLGQTLVLIGKTHLTMALTVIAGLVVIFMMLG GTFLYWRGRRIQNKRAMRRYLERGESIEPLDPSEKANKVLARIFKETELRKLKVLGSGVF GTVHKGVWIPEGESIKIPVCIKVIEDKSGRQSFQAVTDHMLAIGSLDHAHIVRLLGLCPG SSLQLVTQYLPLGSLLDHVRQHRGALGPQLLLNWGVQIAKGMYYLEEHGMVHRNLAARNV LLKSPSQVQVADFGVADLLPPDDKQLLYSEAKTPIKWMALESIHFGKYTHQSDVWSYGVT VWELMTFGAEPYAGLRLAEVPDLLEKGERLAQPQICTIDVYMVMVKCWMIDENIRPTFKE LANEFTRMARDPPRYLVIKRESGPGIAPGPEPHGLTNKKLEEVELEPELDLDLDLEAEED NLATTTLGSALSLPVGTLNRPRGSQSLLSPSSGYMPMNQGNLGESCQESAVSGSSERCPR PVSLHPMPRGCLASESSEGHVTGSEAELQEKVSMCRSRSRSRSPRPRGDSAYHSQRHSLL TPVTPLSPPGLEEEDVNGYVMPDTHLKGTPSSREGTLSSVGLSSVLGTEEEDEDEEYEYM NRRRRHSPPHPPRPSSLEELGYEYMDVGSDLSASLGSTQSCPLHPVPIMPTAGTTPDEDY EYMNRQRDGGGPGGDYAAMGACPASEQGYEEMRAFQGPGHQAPHVHYARLKTLRSLEATD SAFDNPDYWHSRLFPKANAQRT Click to Show/Hide
|
|||||
| Family | Tyr protein family |
|||||
| Function |
Tyrosine-protein kinase that plays an essential role as cell surface receptor for neuregulins. Binds to neuregulin-1 (NRG1) and is activated by it; ligand-binding increases phosphorylation on tyrosine residues and promotes its association with the p85 subunit of phosphatidylinositol 3-kinase. May also be activated by CSPG5. Involved in the regulation of myeloid cell differentiation.
Click to Show/Hide
|
|||||
| Uniprot Entry | ||||||
| HGNC ID | ||||||
| KEGG ID | ||||||
Each Antibody-drug Conjuate AND It's Component Related to This Antigen
Full List of The ADC Related to This Antigen
A humanized anti-HER3 IgG1 monoclonal antibody
| ADC Info | ADC Name | Payload | Target | Linker | Ref |
|---|---|---|---|---|---|
DB-1310 |
P1021 |
DNA topoisomerase 1 (TOP1) |
Maleimide tetrapeptide-based cleavable linker |
[1] |
Ab562
| ADC Info | ADC Name | Payload | Target | Linker | Ref |
|---|---|---|---|---|---|
AMT-562 |
Exatecan |
DNA topoisomerase 1 (TOP1) |
T800 |
[2] |
An anti-HER3 IgG1 monoclonal antibody
| ADC Info | ADC Name | Payload | Target | Linker | Ref |
|---|---|---|---|---|---|
YL-202 |
YL0010014 |
DNA topoisomerase 1 (TOP1) |
Tumor microenviroment activable tripeptide linker |
[3] |
Anti-HER3 mAb
| ADC Info | ADC Name | Payload | Target | Linker | Ref |
|---|---|---|---|---|---|
SIBP-A13 |
Undisclosed |
Undisclosed |
Undisclosed |
[4] |
Anti-Her3 mAb 202-2-1
| ADC Info | ADC Name | Payload | Target | Linker | Ref |
|---|---|---|---|---|---|
Her3-ADC-05 (DAR4) |
Her3-ADC-05(DAR4) payload |
Undisclosed |
Her3-ADC-05(DAR4) linker |
[5] | |
Her3-ADC-07 (DAR4) |
Her3-ADC-07(DAR4) payload |
Undisclosed |
Her3-ADC-07(DAR4) linker |
[5] | |
Her3-ADC-07 (DAR6) |
Her3-ADC-07(DAR6) payload |
Undisclosed |
Her3-ADC-07(DAR6) linker |
[5] | |
Her3-ADC-07 (DAR8) |
Her3-ADC-07(DAR8) payload |
Undisclosed |
Her3-ADC-07(DAR8) linker |
[5] | |
Her3-ADC-15 (DAR2) |
Her3-ADC-15(DAR2) payload |
Undisclosed |
Her3-ADC-15(DAR2) linker |
[5] | |
Her3-ADC-15 (DAR8) |
Her3-ADC-15(DAR8) payload |
Undisclosed |
Her3-ADC-15(DAR8) linker |
[5] | |
Her3-ADC-21 (DAR4) |
Her3-ADC-21(DAR4) payload |
Undisclosed |
Her3-ADC-21(DAR4) linker |
[5] | |
Her3-ADC-23 (DAR4) |
Her3-ADC-23(DAR4) payload |
Undisclosed |
Her3-ADC-23(DAR4) linker |
[5] | |
Her3-ADC-33 (DAR4) |
Her3-ADC-33(DAR4) payload |
Undisclosed |
Her3-ADC-33(DAR4) linker |
[5] |
Anti-HER3 mAb 9F7-F11
| ADC Info | ADC Name | Payload | Target | Linker | Ref |
|---|---|---|---|---|---|
MMAE-9F7-F11 ADC |
Monomethyl auristatin E |
Microtubule (MT) |
Mc-Val-Cit-PABC |
[6] |
Barecetamab
| ADC Info | ADC Name | Payload | Target | Linker | Ref |
|---|---|---|---|---|---|
Barecetamab-ADC-Tb4-1 |
Barecetamab-ADC-Tb4-1 payload |
Undisclosed |
Barecetamab-ADC-Tb4-1 linker |
[5] | |
Barecetamab-ADC-Tb4-2 |
Barecetamab-ADC-Tb4-2 payload |
Undisclosed |
Barecetamab-ADC-Tb4-2 linker |
[5] | |
Barecetamab-ADC-Tb4-3 |
Barecetamab-ADC-Tb4-3 payload |
Undisclosed |
Barecetamab-ADC-Tb4-3 linker |
[5] | |
Barecetamab-ADC-Tb4-4 |
Barecetamab-ADC-Tb4-4 payload |
Undisclosed |
Barecetamab-ADC-Tb4-4 linker |
[5] |
CDX3379
| ADC Info | ADC Name | Payload | Target | Linker | Ref |
|---|---|---|---|---|---|
CDX3379-MMAE |
Monomethyl auristatin E |
Microtubule (MT) |
Mc-Val-Cit-PABC |
[7] |
Duligotuzumab
| ADC Info | ADC Name | Payload | Target | Linker | Ref |
|---|---|---|---|---|---|
Duligotuzumab-ADC-Tb4-1 |
Duligotuzumab-ADC-Tb4-1 payload |
Undisclosed |
Duligotuzumab-ADC-Tb4-1 linker |
[5] | |
Duligotuzumab-ADC-Tb4-2 |
Duligotuzumab-ADC-Tb4-2 payload |
Undisclosed |
Duligotuzumab-ADC-Tb4-2 linker |
[5] | |
Duligotuzumab-ADC-Tb4-3 |
Duligotuzumab-ADC-Tb4-3 payload |
Undisclosed |
Duligotuzumab-ADC-Tb4-3 linker |
[5] | |
Duligotuzumab-ADC-Tb4-4 |
Duligotuzumab-ADC-Tb4-4 payload |
Undisclosed |
Duligotuzumab-ADC-Tb4-4 linker |
[5] |
Elgemtumab
| ADC Info | ADC Name | Payload | Target | Linker | Ref |
|---|---|---|---|---|---|
Elgemtumab-ADC-Tb4-1 |
Elgemtumab-ADC-Tb4-1 payload |
Undisclosed |
Elgemtumab-ADC-Tb4-1 linker |
[5] | |
Elgemtumab-ADC-Tb4-2 |
Elgemtumab-ADC-Tb4-2 payload |
Undisclosed |
Elgemtumab-ADC-Tb4-2 linker |
[5] | |
Elgemtumab-ADC-Tb4-3 |
Elgemtumab-ADC-Tb4-3 payload |
Undisclosed |
Elgemtumab-ADC-Tb4-3 linker |
[5] | |
Elgemtumab-ADC-Tb4-4 |
Elgemtumab-ADC-Tb4-4 payload |
Undisclosed |
Elgemtumab-ADC-Tb4-4 linker |
[5] |
EV20
| ADC Info | ADC Name | Payload | Target | Linker | Ref |
|---|---|---|---|---|---|
EV20/MMAF |
Monomethyl auristatin F |
Microtubule (MT) |
Maleimido-caproyl |
[8] | |
EV20/NMS-P945 |
NMS-P528 |
Human Deoxyribonucleic acid (hDNA) |
Cathepsin-cleavable peptidic linker with self-immolating spacer |
[9] | |
MP-EV-20 |
Monomethyl auristatin F |
Microtubule (MT) |
Undisclosed |
[10] |
Her3-C3
| ADC Info | ADC Name | Payload | Target | Linker | Ref |
|---|---|---|---|---|---|
Her3-C3-ADC-05 (DAR4) |
Her3-C3-ADC-05(DAR4) payload |
Undisclosed |
Her3-C3-ADC-05(DAR4) linker |
[5] | |
Her3-C3-ADC-21 (DAR4) |
Her3-C3-ADC-21(DAR4) payload |
Undisclosed |
Her3-C3-ADC-21(DAR4) linker |
[5] | |
Her3-C3-ADC-21 (DAR8) |
Her3-C3-ADC-21(DAR8) payload |
Undisclosed |
Her3-C3-ADC-21(DAR8) linker |
[5] | |
Her3-C3-ADC-23 (DAR4) |
Her3-C3-ADC-23(DAR4) payload |
Undisclosed |
Her3-C3-ADC-23(DAR4) linker |
[5] |
Lumretuzumab
| ADC Info | ADC Name | Payload | Target | Linker | Ref |
|---|---|---|---|---|---|
Lumretuzumab-ADC-Tb4-1 |
Lumretuzumab-ADC-Tb4-1 payload |
Undisclosed |
Lumretuzumab-ADC-Tb4-1 linker |
[5] | |
Lumretuzumab-ADC-Tb4-2 |
Lumretuzumab-ADC-Tb4-2 payload |
Undisclosed |
Lumretuzumab-ADC-Tb4-2 linker |
[5] | |
Lumretuzumab-ADC-Tb4-3 |
Lumretuzumab-ADC-Tb4-3 payload |
Undisclosed |
Lumretuzumab-ADC-Tb4-3 linker |
[5] | |
Lumretuzumab-ADC-Tb4-4 |
Lumretuzumab-ADC-Tb4-4 payload |
Undisclosed |
Lumretuzumab-ADC-Tb4-4 linker |
[5] |
Patritumab
| ADC Info | ADC Name | Payload | Target | Linker | Ref |
|---|---|---|---|---|---|
Patritumab deruxtecan |
DX-8951 derivative (DXd) |
DNA topoisomerase 1 (TOP1) |
Mc-Gly-Gly-Phe-Gly |
[11] | |
ADC3-10 |
ADC 3-10 payload |
DNA topoisomerase 1 (TOP1) |
ADC 3-10 linker |
[12] | |
ADC3-11 |
ADC 3-11 payload |
DNA topoisomerase 1 (TOP1) |
ADC 3-11 linker |
[12] | |
ADC3-12 |
ADC 3-12 payload |
DNA topoisomerase 1 (TOP1) |
ADC 3-12 linker |
[12] | |
ADC3-13 |
ADC 3-13 payload |
DNA topoisomerase 1 (TOP1) |
ADC 3-13 linker |
[12] | |
ADC3-14 |
ADC 3-14 payload |
DNA topoisomerase 1 (TOP1) |
ADC 3-14 linker |
[12] | |
ADC3-15 |
ADC 3-15 payload |
DNA topoisomerase 1 (TOP1) |
ADC 3-15 linker |
[12] | |
ADC3-16 |
ADC 3-16 payload |
DNA topoisomerase 1 (TOP1) |
ADC 3-16 linker |
[12] | |
ADC3-17 |
ADC 3-17 payload |
DNA topoisomerase 1 (TOP1) |
ADC 3-17 linker |
[12] | |
ADC3-18 |
ADC 3-18 payload |
DNA topoisomerase 1 (TOP1) |
ADC 3-18 linker |
[12] | |
ADC3-19 |
ADC 3-19 payload |
DNA topoisomerase 1 (TOP1) |
ADC 3-19 linker |
[12] | |
ADC3-20 |
ADC 3-20 payload |
DNA topoisomerase 1 (TOP1) |
ADC 3-20 linker |
[12] | |
ADC3-6 |
ADC 3-6 payload |
DNA topoisomerase 1 (TOP1) |
ADC 3-6 linker |
[12] | |
ADC3-7 |
ADC 3-7 payload |
DNA topoisomerase 1 (TOP1) |
ADC 3-7 linker |
[12] | |
ADC3-8 |
ADC 3-8 payload |
DNA topoisomerase 1 (TOP1) |
ADC 3-8 linker |
[12] | |
ADC3-9 |
ADC 3-9 payload |
DNA topoisomerase 1 (TOP1) |
ADC 3-9 linker |
[12] | |
ADC-C1 |
ADC-C1 payload |
DNA topoisomerase 1 (TOP1) |
ADC-C1 linker |
[12] | |
ADC-C2 |
ADC-C2 payload |
DNA topoisomerase 1 (TOP1) |
ADC-C2 linker |
[12] | |
ADC-C3 |
ADC-C3 payload |
DNA topoisomerase 1 (TOP1) |
ADC-C3 linker |
[12] | |
ADC-C4 |
ADC-C4 payload |
DNA topoisomerase 1 (TOP1) |
ADC-C4 linker |
[12] | |
ADC-C5 |
ADC-C5 payload |
DNA topoisomerase 1 (TOP1) |
ADC-C5 linker |
[12] | |
Patritumab-ADC-Tb4-1 |
Patritumab-ADC-Tb4-1 payload |
Undisclosed |
Patritumab-ADC-Tb4-1 linker |
[5] | |
Patritumab-ADC-Tb4-2 |
Patritumab-ADC-Tb4-2 payload |
Undisclosed |
Patritumab-ADC-Tb4-2 linker |
[5] | |
Patritumab-ADC-Tb4-3 |
Patritumab-ADC-Tb4-3 payload |
Undisclosed |
Patritumab-ADC-Tb4-3 linker |
[5] | |
Patritumab-ADC-Tb4-4 |
Patritumab-ADC-Tb4-4 payload |
Undisclosed |
Patritumab-ADC-Tb4-4 linker |
[5] |
Ruzaltatug
| ADC Info | ADC Name | Payload | Target | Linker | Ref |
|---|---|---|---|---|---|
SHR-A2009 |
9106-IM-2 |
DNA topoisomerase 1 (TOP1) |
Mc-Gly-Gly-Phe-Gly |
[13] |
Seribantumab
| ADC Info | ADC Name | Payload | Target | Linker | Ref |
|---|---|---|---|---|---|
Seribantumab-ADC-Tb4-1 |
Seribantumab-ADC-Tb4-1 payload |
Undisclosed |
Seribantumab-ADC-Tb4-1 linker |
[5] | |
Seribantumab-ADC-Tb4-2 |
Seribantumab-ADC-Tb4-2 payload |
Undisclosed |
Seribantumab-ADC-Tb4-2 linker |
[5] | |
Seribantumab-ADC-Tb4-3 |
Seribantumab-ADC-Tb4-3 payload |
Undisclosed |
Seribantumab-ADC-Tb4-3 linker |
[5] | |
Seribantumab-ADC-Tb4-4 |
Seribantumab-ADC-Tb4-4 payload |
Undisclosed |
Seribantumab-ADC-Tb4-4 linker |
[5] |
Undisclosed
| ADC Info | ADC Name | Payload | Target | Linker | Ref |
|---|---|---|---|---|---|
HMBD-501 |
Exatecan |
DNA topoisomerase 1 (TOP1) |
Undisclosed |
[14] | |
MP-HER3-ADC |
Monomethyl auristatin F |
Microtubule (MT) |
Undisclosed |
[15] | |
HER3-ADC9 (Jiangsu Hengrui) |
Undisclosed |
Undisclosed |
Undisclosed |
[16] | |
STI-A050X |
Undisclosed |
Undisclosed |
Undisclosed |
[17] |
Tissue/Disease specific Abundances of This Antigen
Tissue specific Abundances of This Antigen
ICD Disease Classification 01
| Differential expression pattern of antigen in diseases | ||
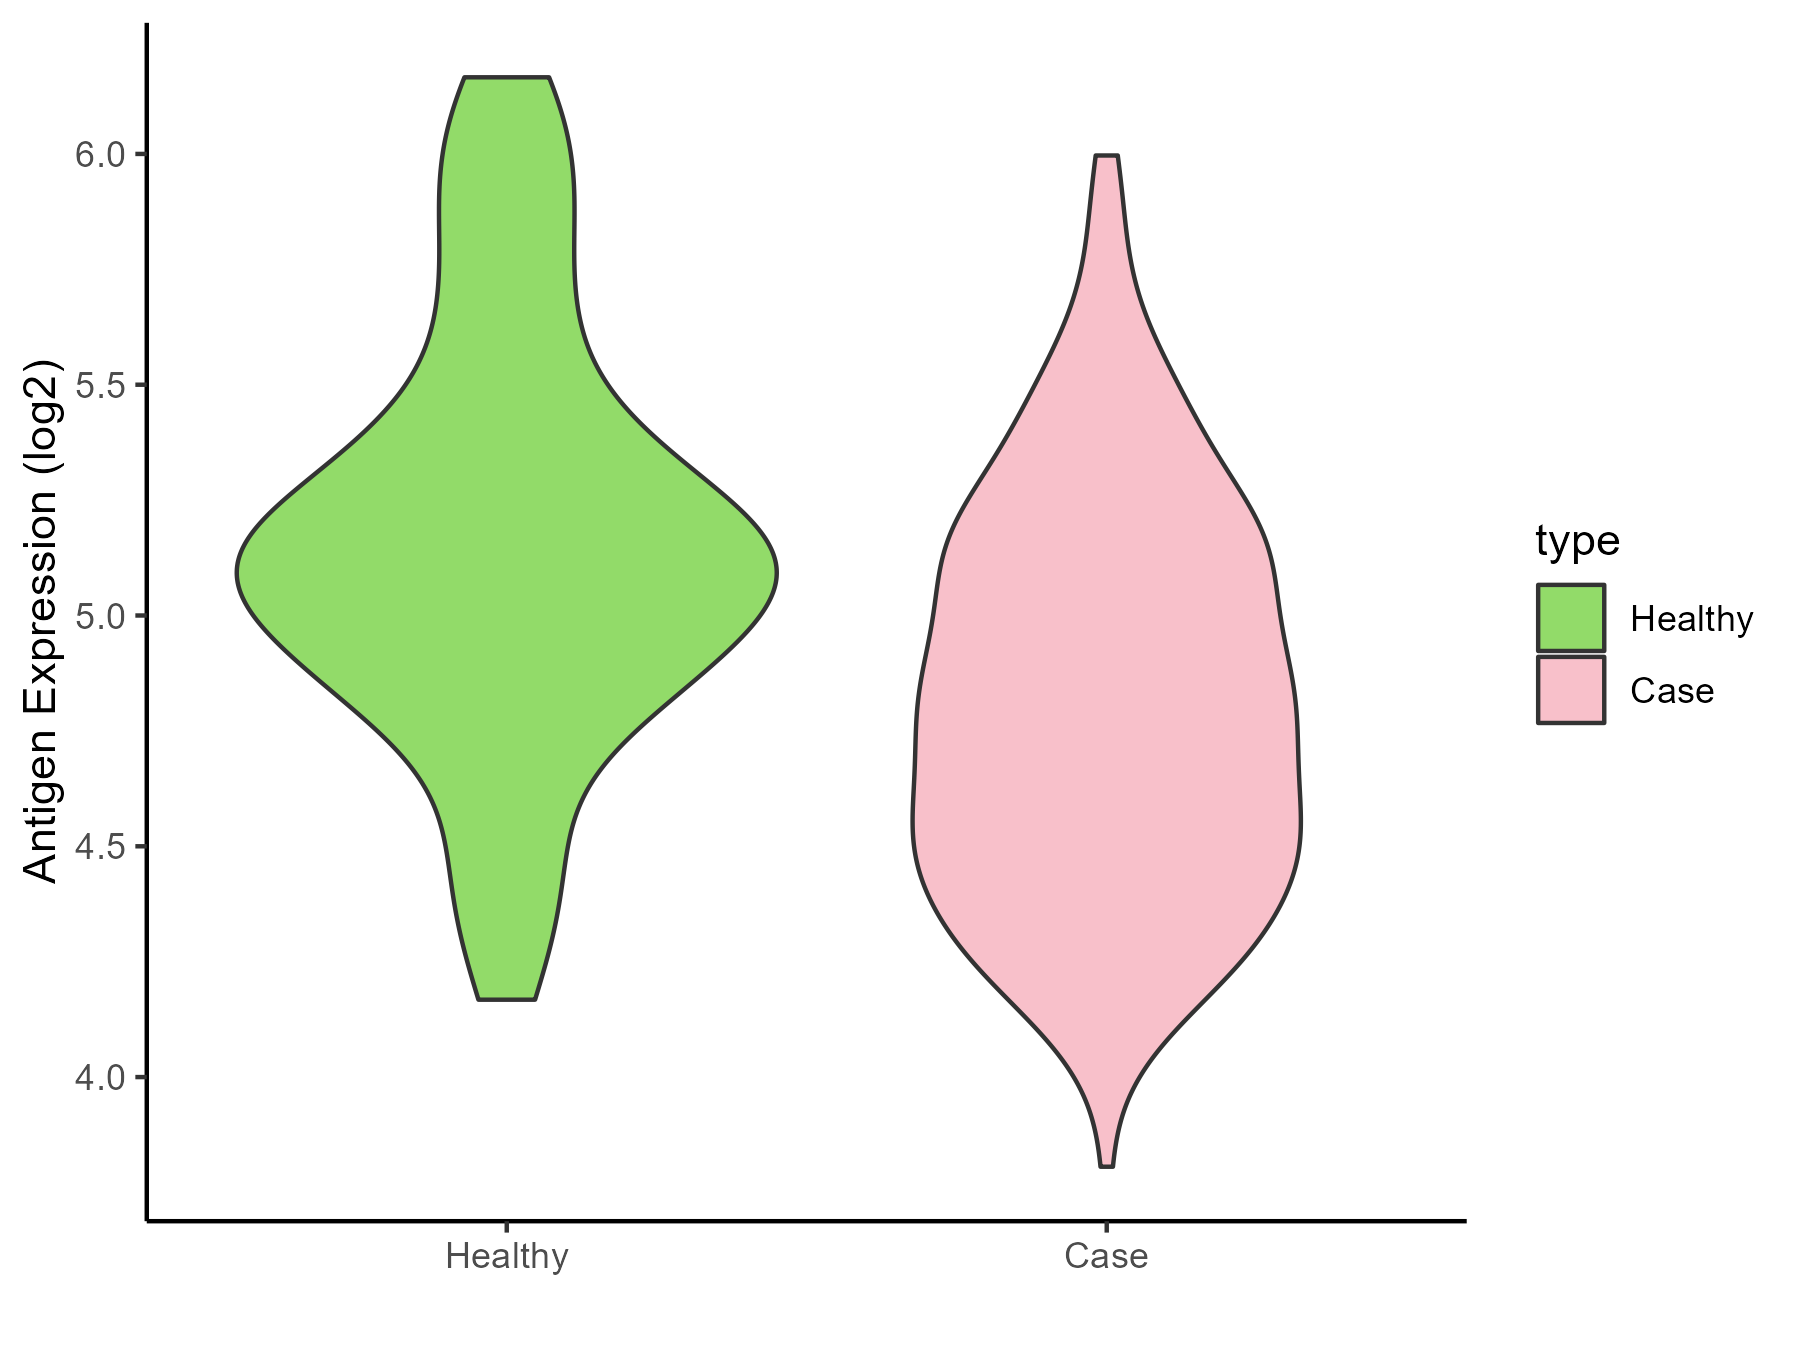
| The Studied Tissue | Gingival | |
| The Specific Disease | Bacterial infection of gingival | |
| The Expression Level of Disease Section Compare with the Healthy Individual Tissue | p-value: 7.80E-07; Fold-change: -0.322401576; Z-score: -0.715309242 | |
| Disease-specific Antigen Abundances |
|
Click to View the Clearer Original Diagram |
ICD Disease Classification 02
| Differential expression pattern of antigen in diseases | ||
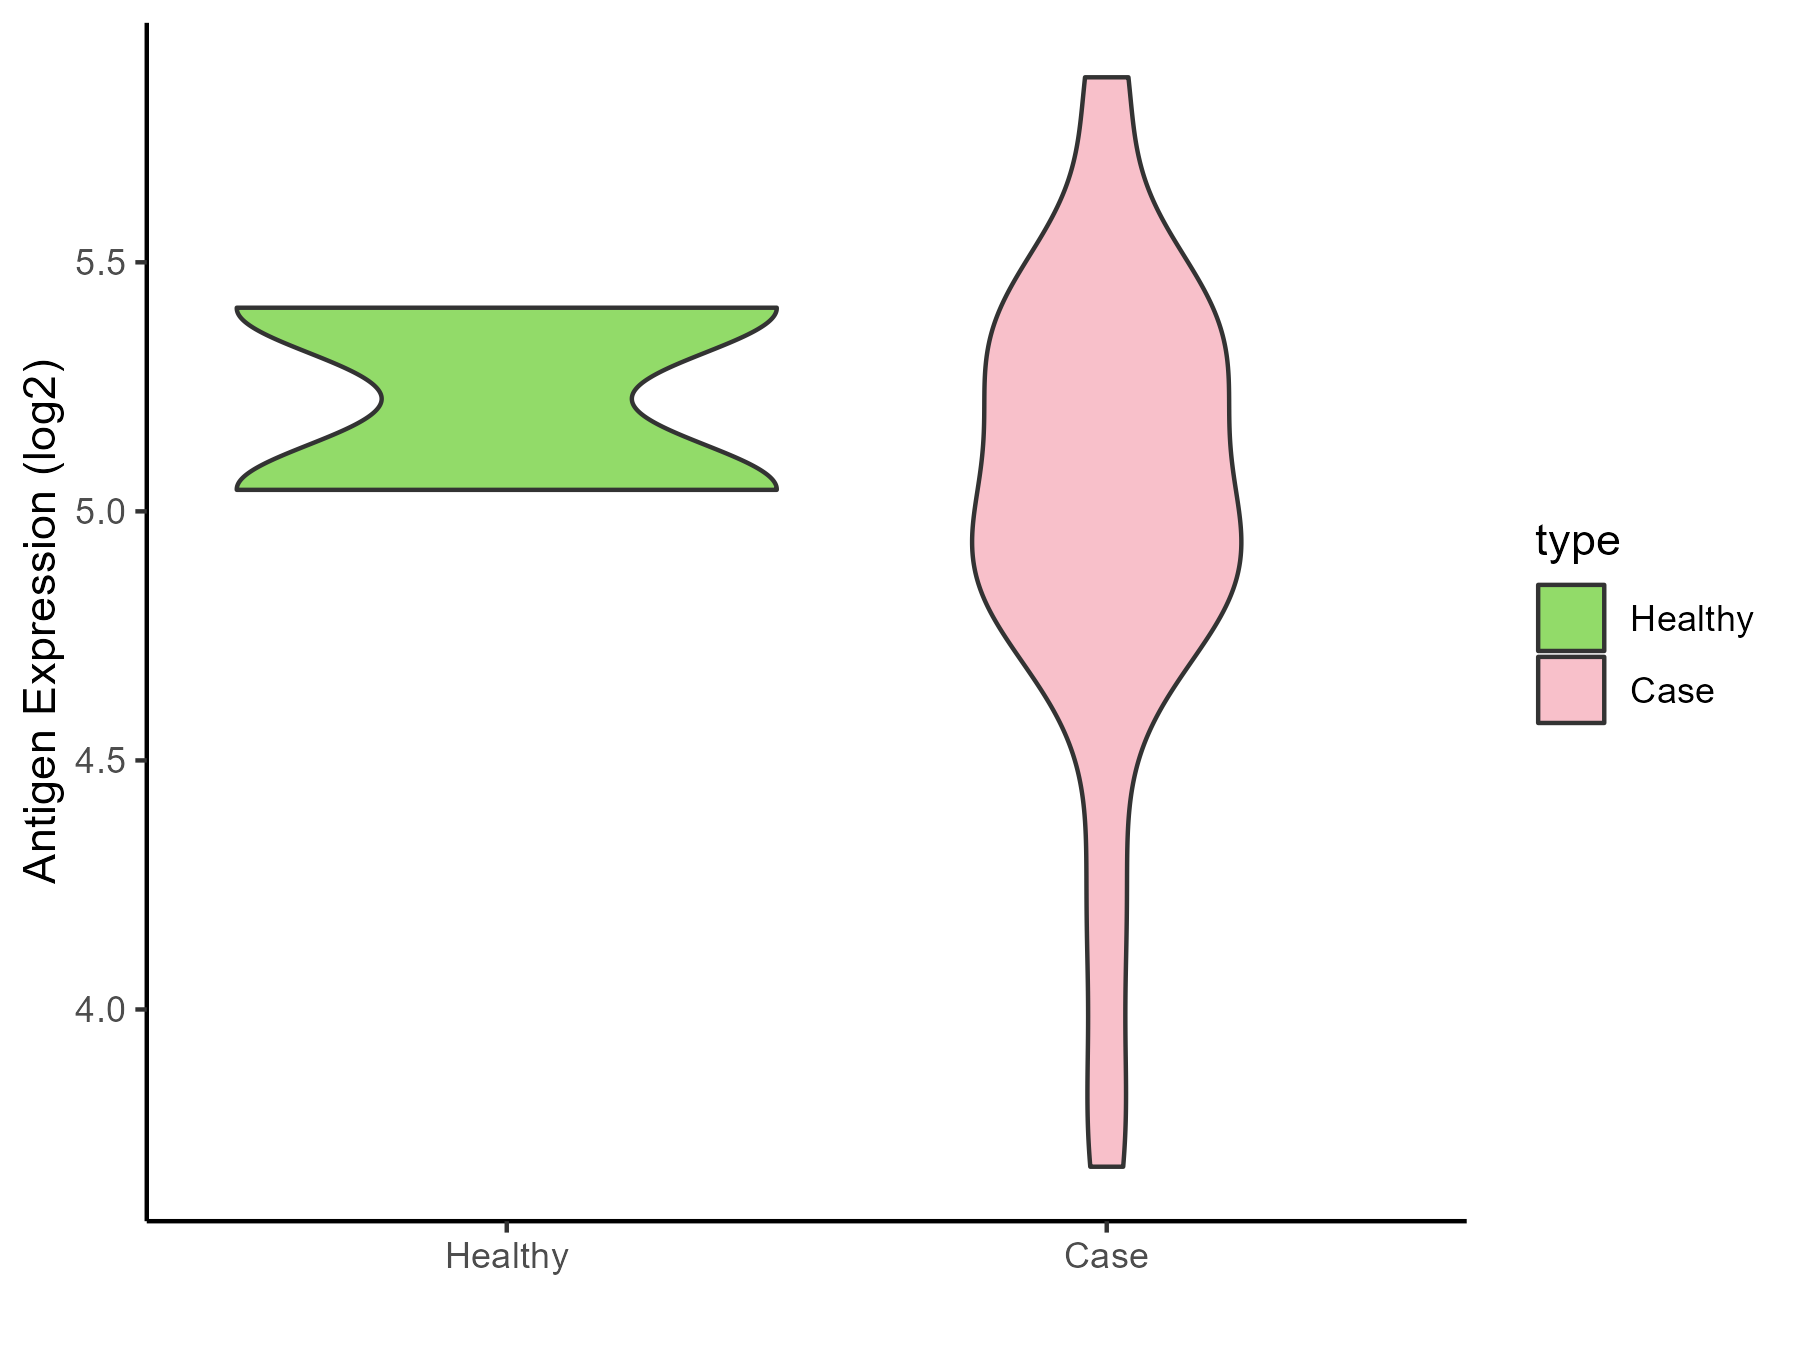
| The Studied Tissue | Brainstem | |
| The Specific Disease | Glioma | |
| The Expression Level of Disease Section Compare with the Healthy Individual Tissue | p-value: 0.4075402; Fold-change: -0.195282798; Z-score: -0.755278016 | |
| Disease-specific Antigen Abundances |
|
Click to View the Clearer Original Diagram |
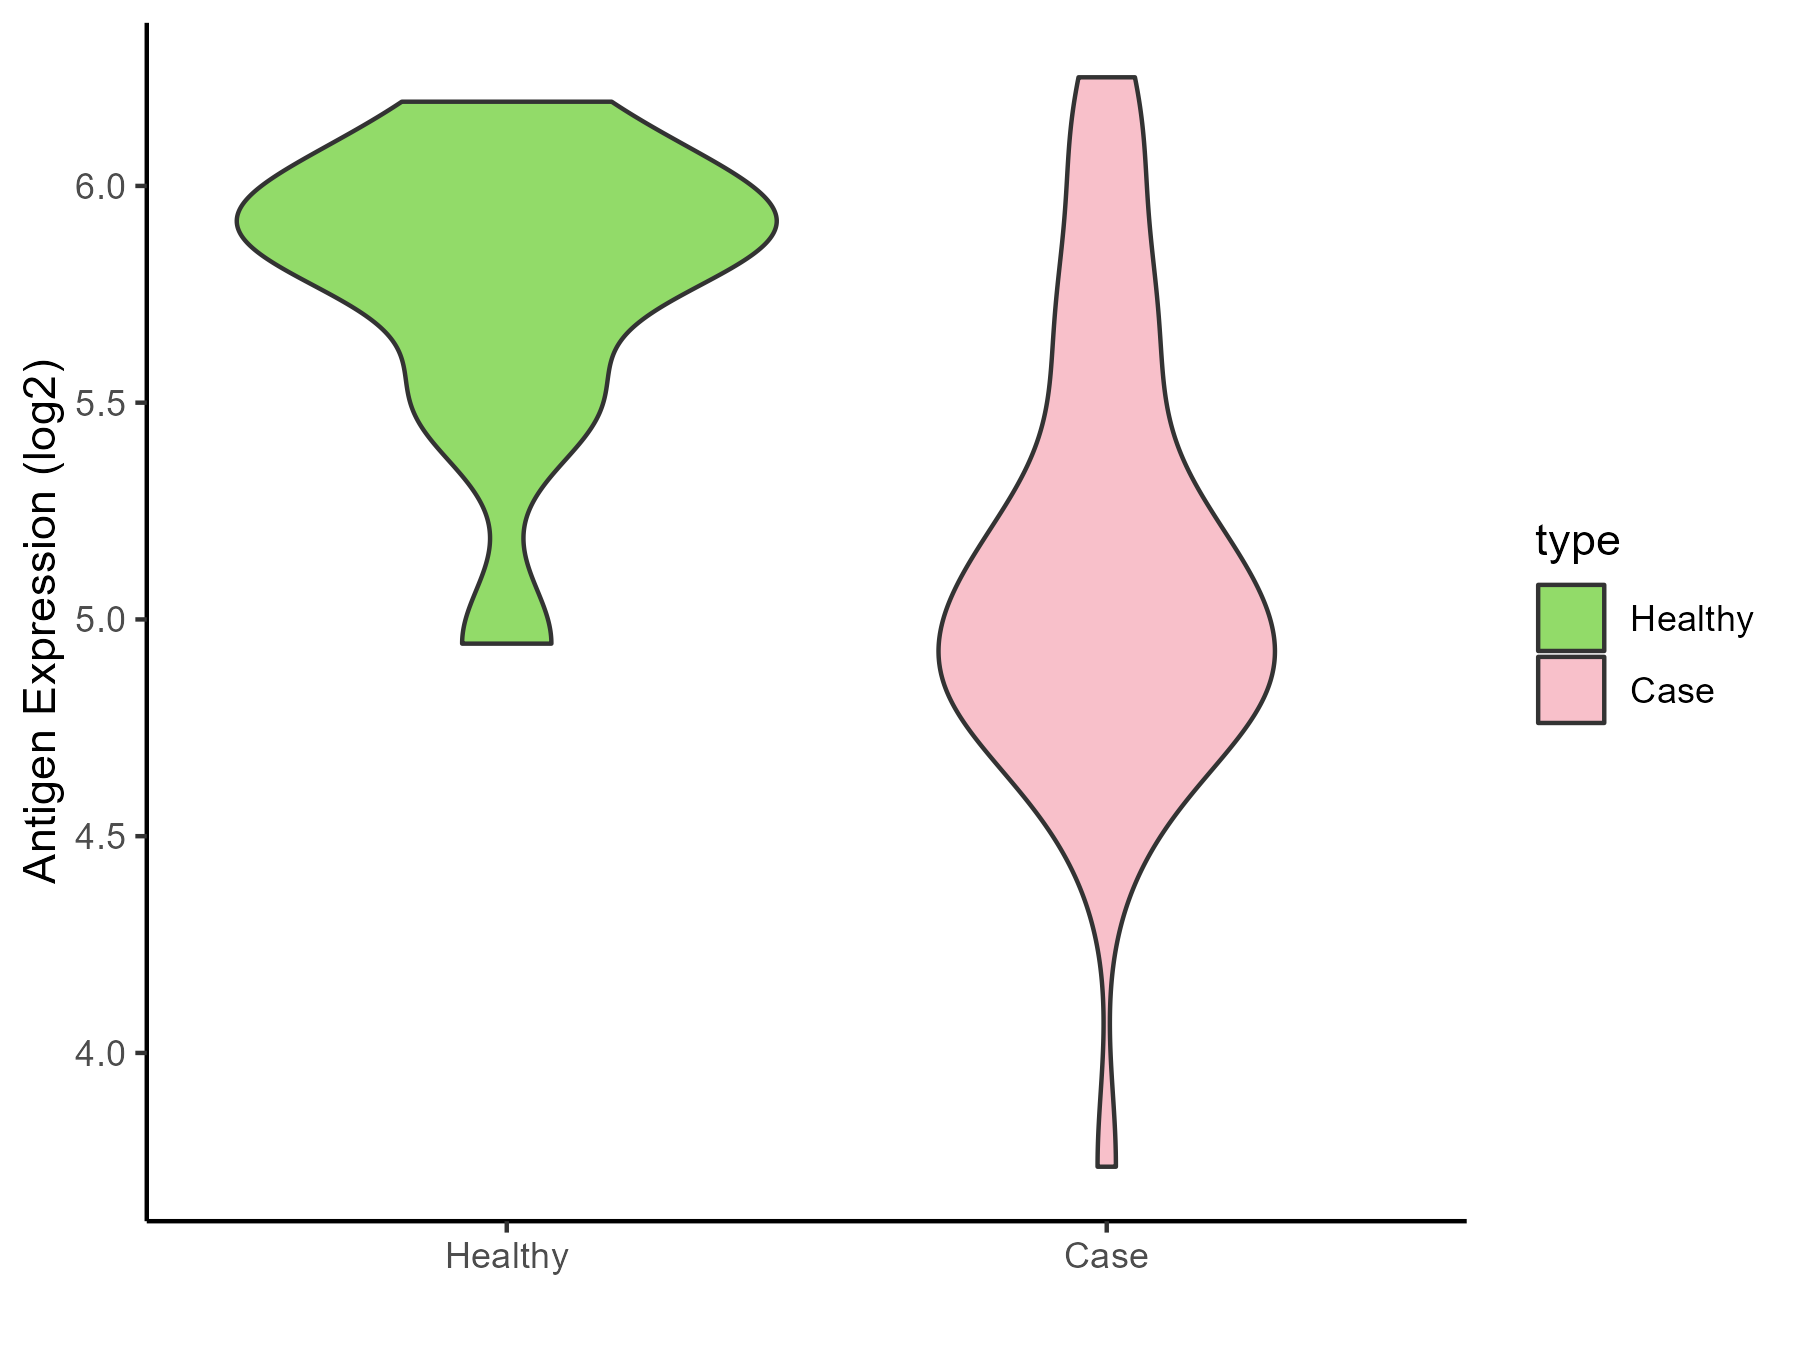
| The Studied Tissue | White matter | |
| The Specific Disease | Glioma | |
| The Expression Level of Disease Section Compare with the Healthy Individual Tissue | p-value: 6.27E-05; Fold-change: -0.844103329; Z-score: -2.427450581 | |
| Disease-specific Antigen Abundances |
|
Click to View the Clearer Original Diagram |
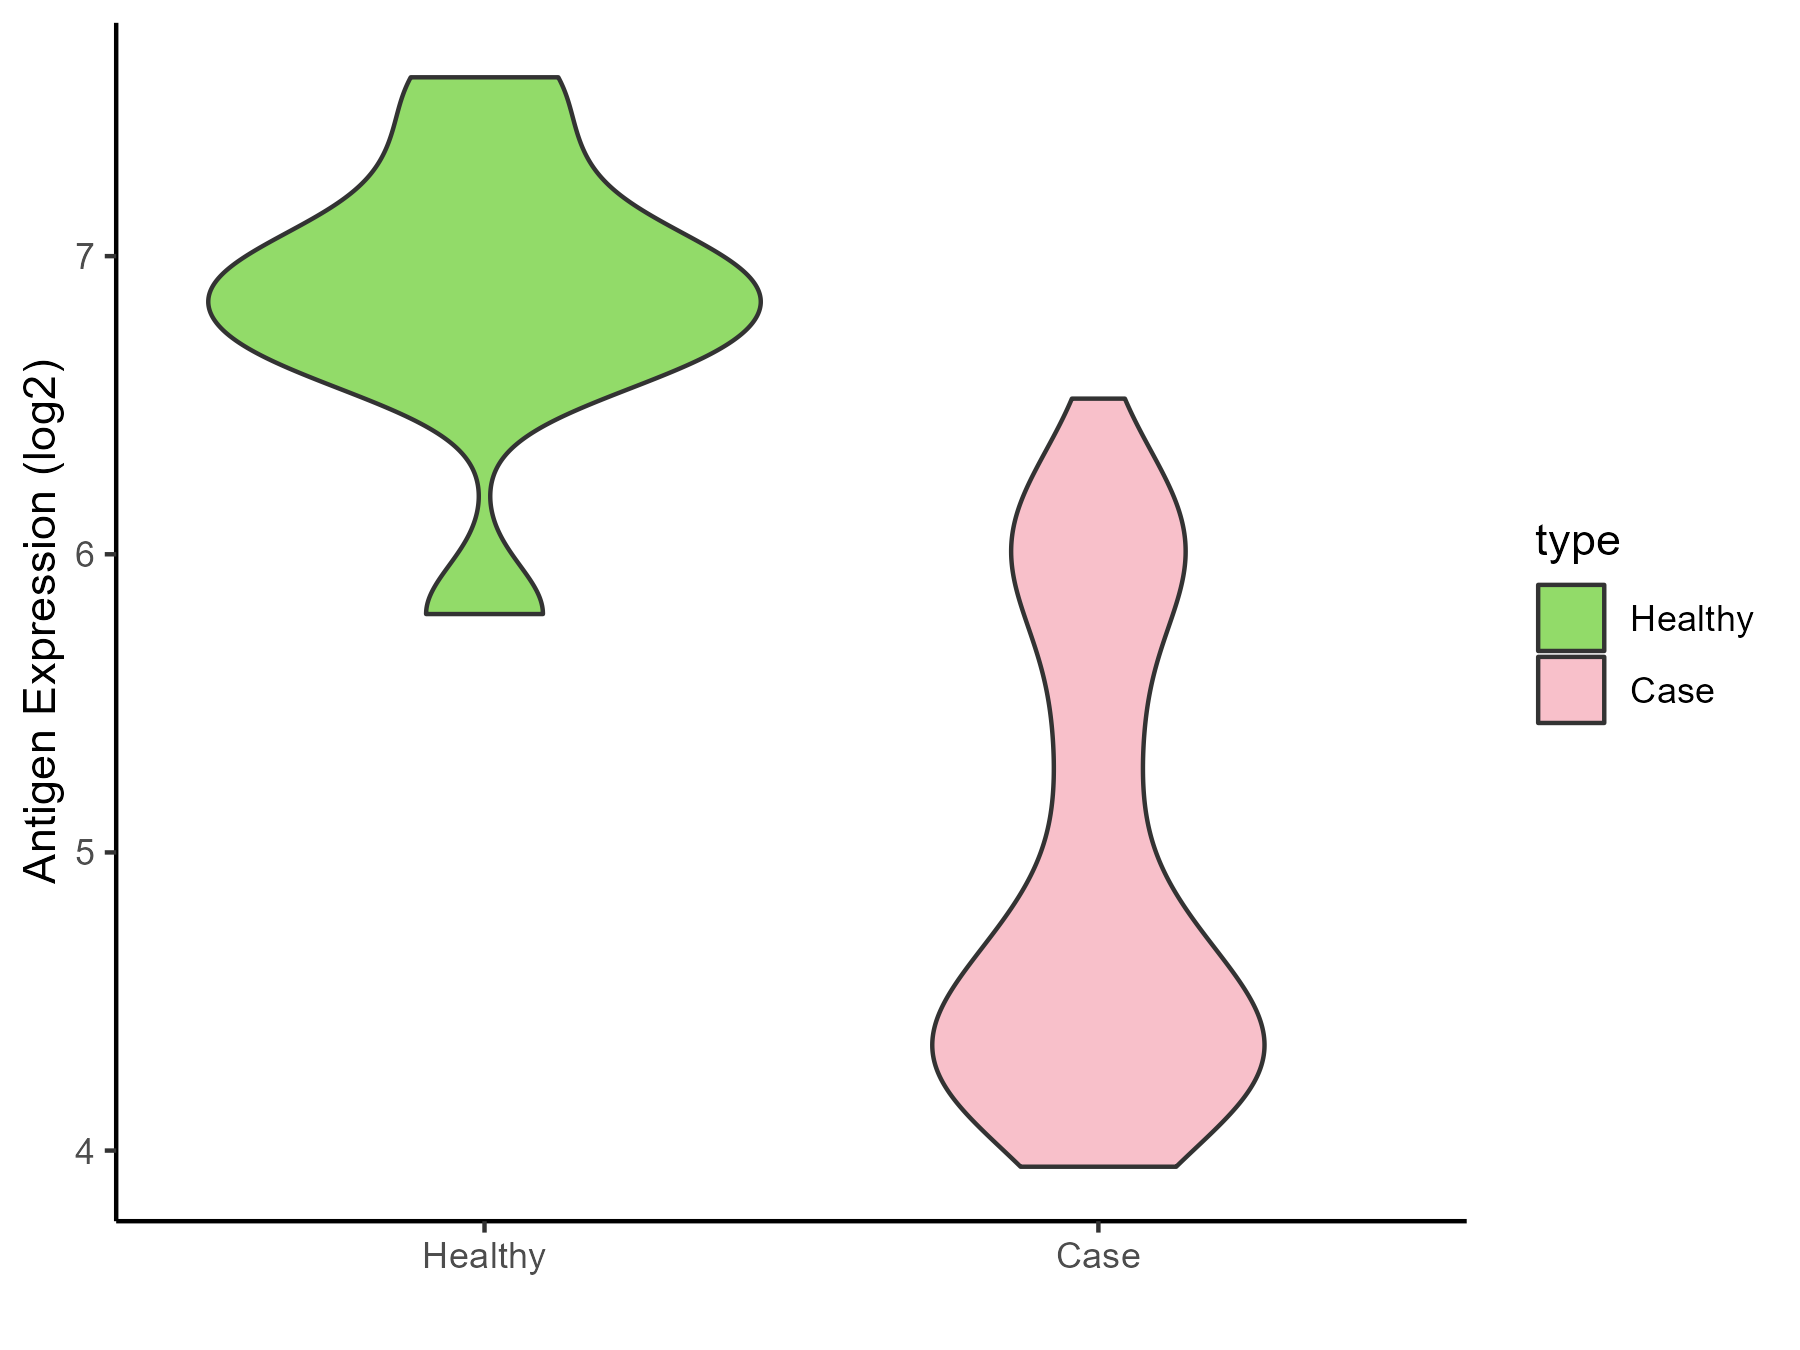
| The Studied Tissue | Brainstem | |
| The Specific Disease | Neuroectodermal tumor | |
| The Expression Level of Disease Section Compare with the Healthy Individual Tissue | p-value: 6.57E-08; Fold-change: -2.237221981; Z-score: -4.667713711 | |
| Disease-specific Antigen Abundances |
|
Click to View the Clearer Original Diagram |
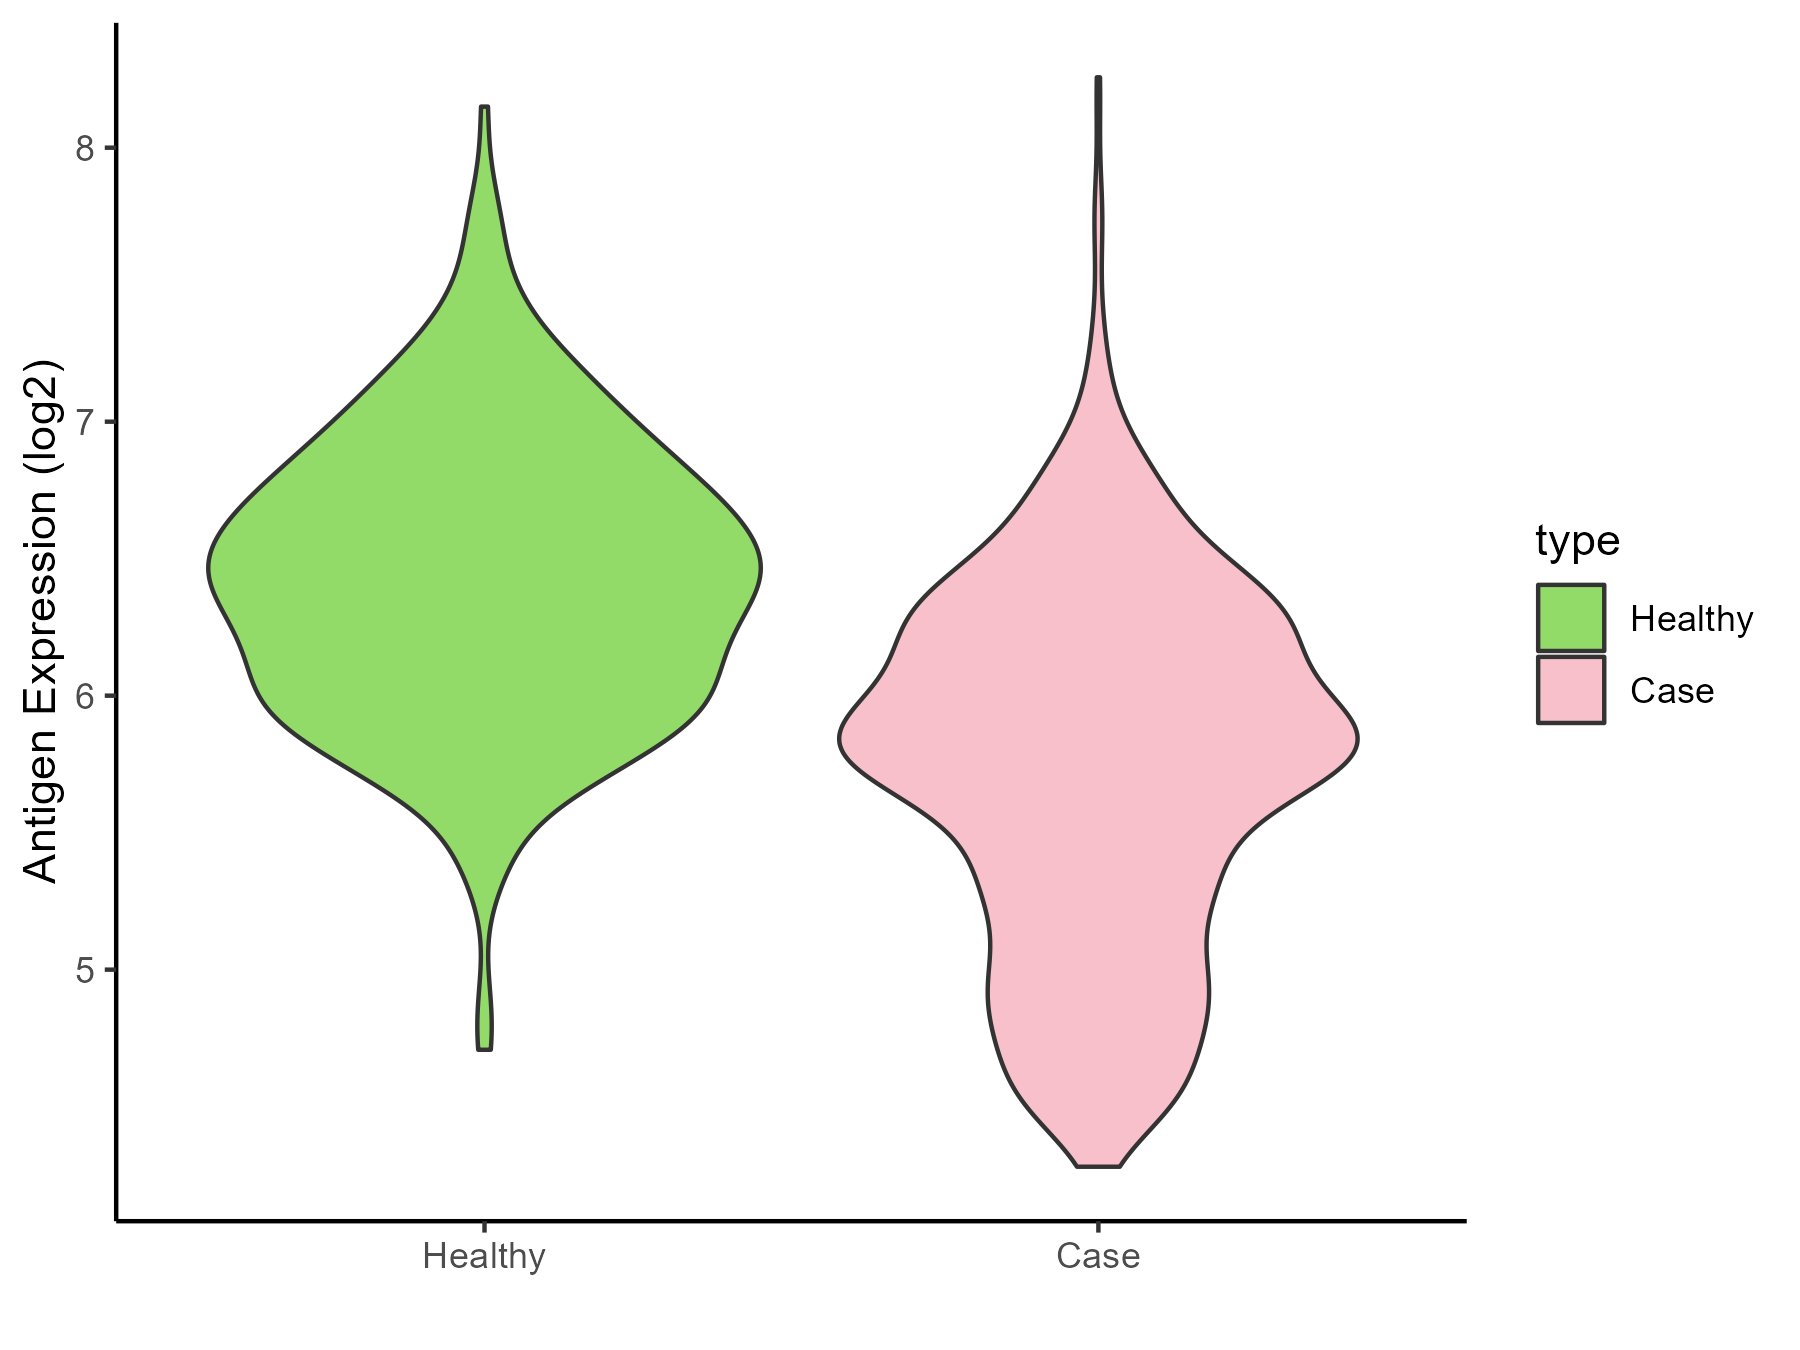
| The Studied Tissue | Nervous | |
| The Specific Disease | Brain cancer | |
| The Expression Level of Disease Section Compare with the Healthy Individual Tissue | p-value: 8.64E-76; Fold-change: -0.597811565; Z-score: -1.155941675 | |
| Disease-specific Antigen Abundances |
|
Click to View the Clearer Original Diagram |
| Differential expression pattern of antigen in diseases | ||
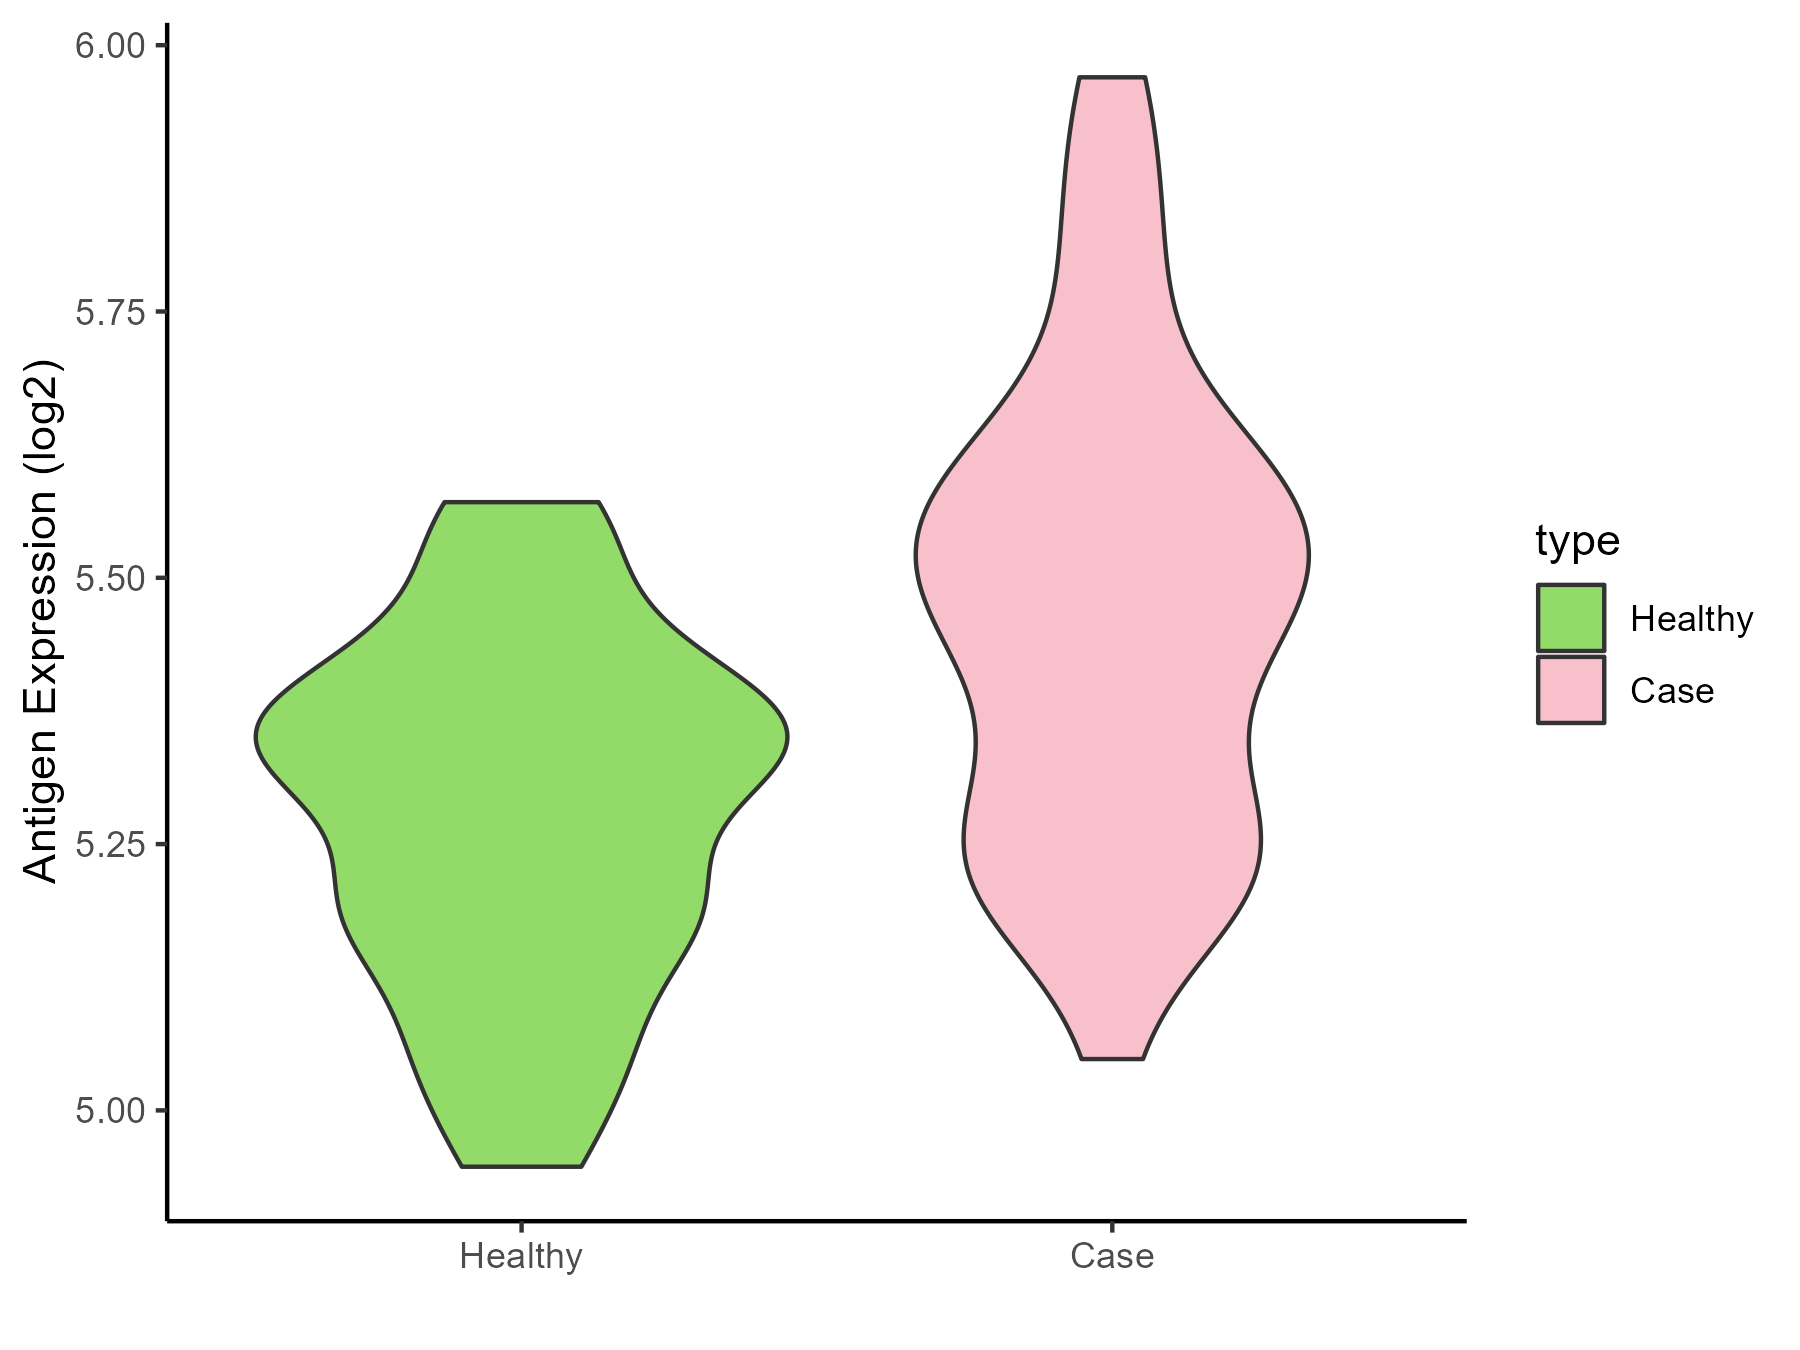
| The Studied Tissue | Whole blood | |
| The Specific Disease | Polycythemia vera | |
| The Expression Level of Disease Section Compare with the Healthy Individual Tissue | p-value: 7.99E-07; Fold-change: 0.165461279; Z-score: 0.99624091 | |
| Disease-specific Antigen Abundances |
|
Click to View the Clearer Original Diagram |
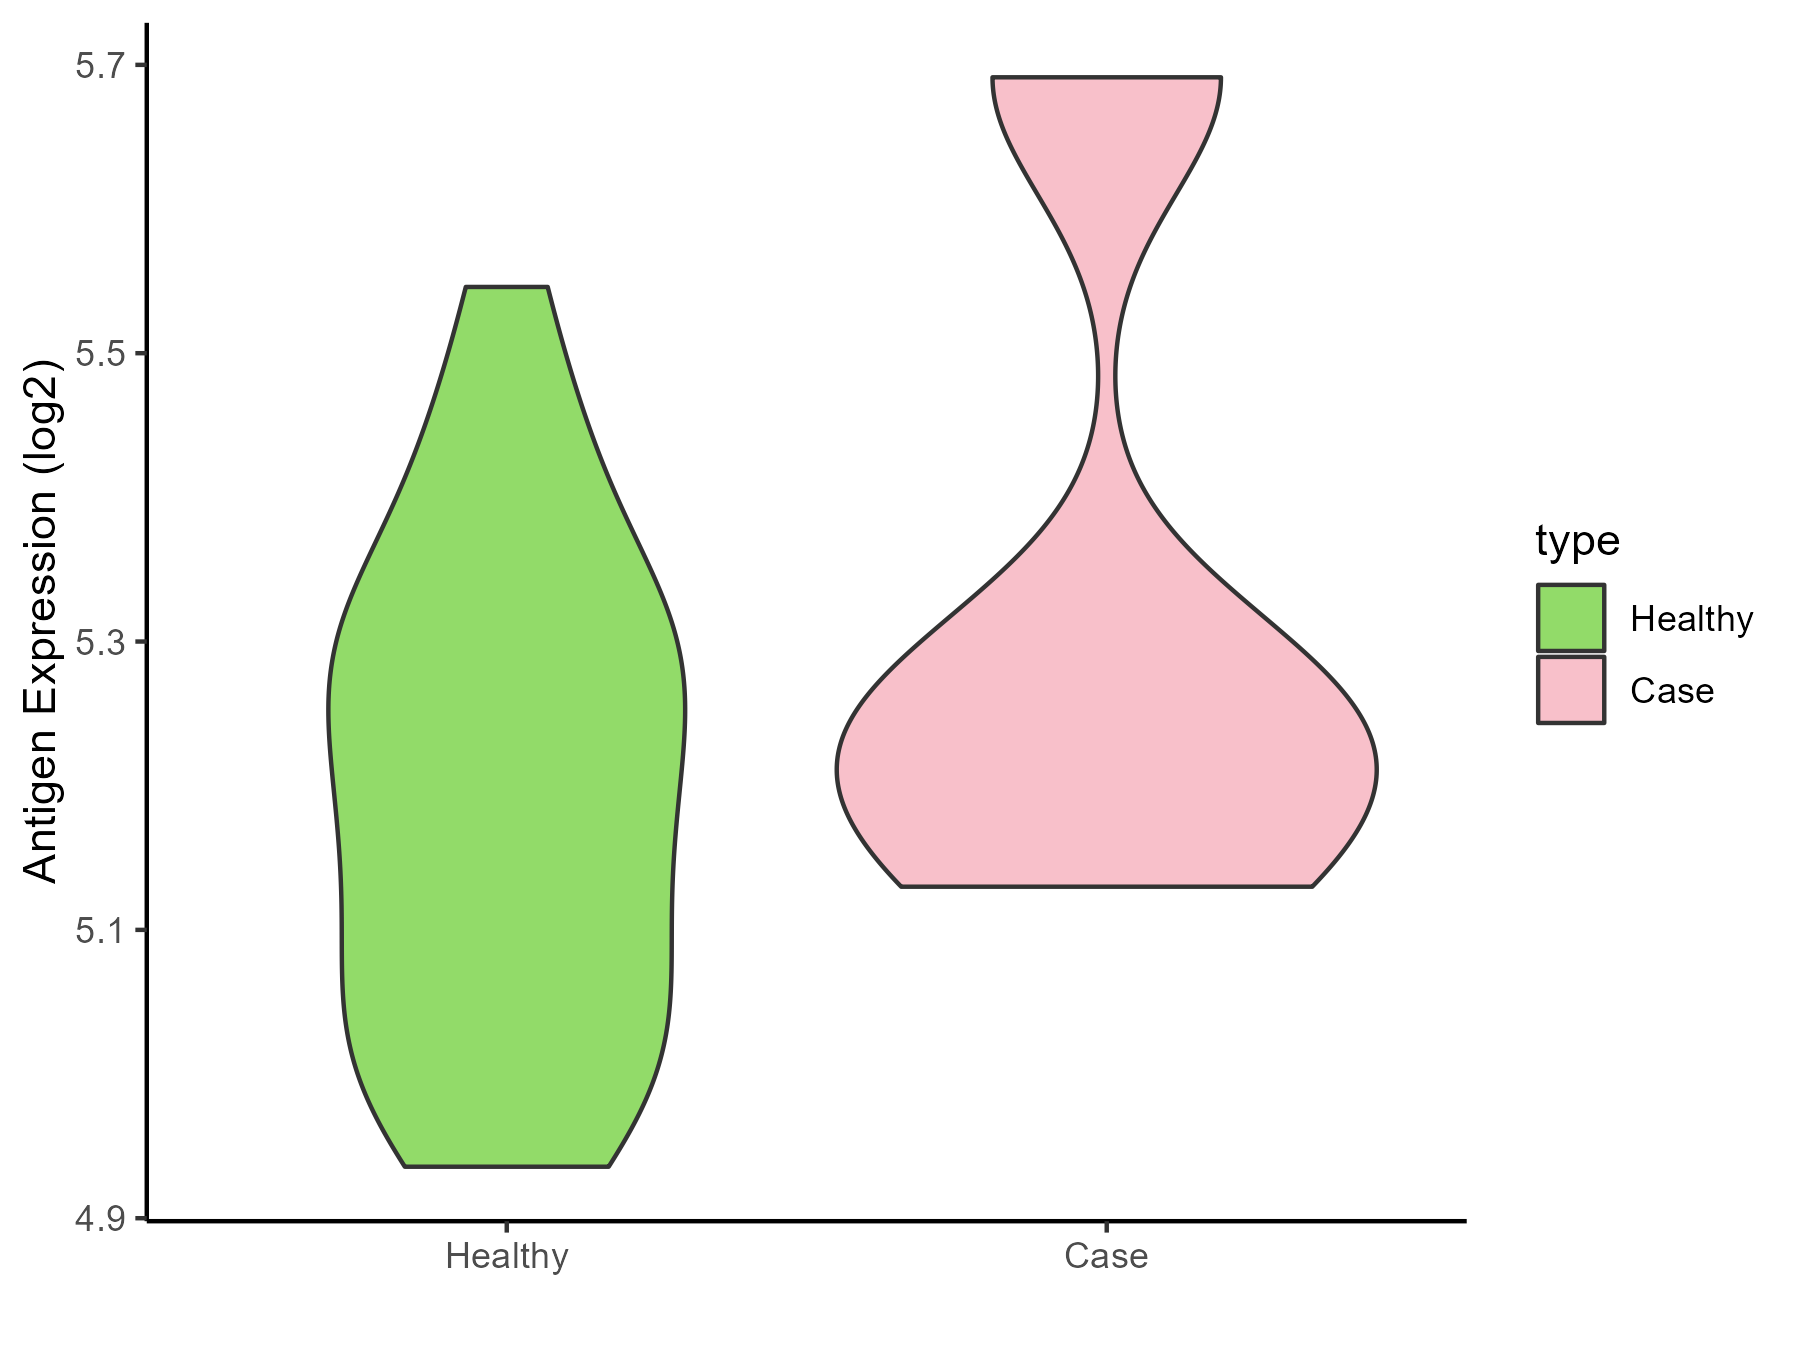
| The Studied Tissue | Whole blood | |
| The Specific Disease | Myelofibrosis | |
| The Expression Level of Disease Section Compare with the Healthy Individual Tissue | p-value: 0.164177223; Fold-change: 0.057993732; Z-score: 0.342258485 | |
| Disease-specific Antigen Abundances |
|
Click to View the Clearer Original Diagram |
| Differential expression pattern of antigen in diseases | ||
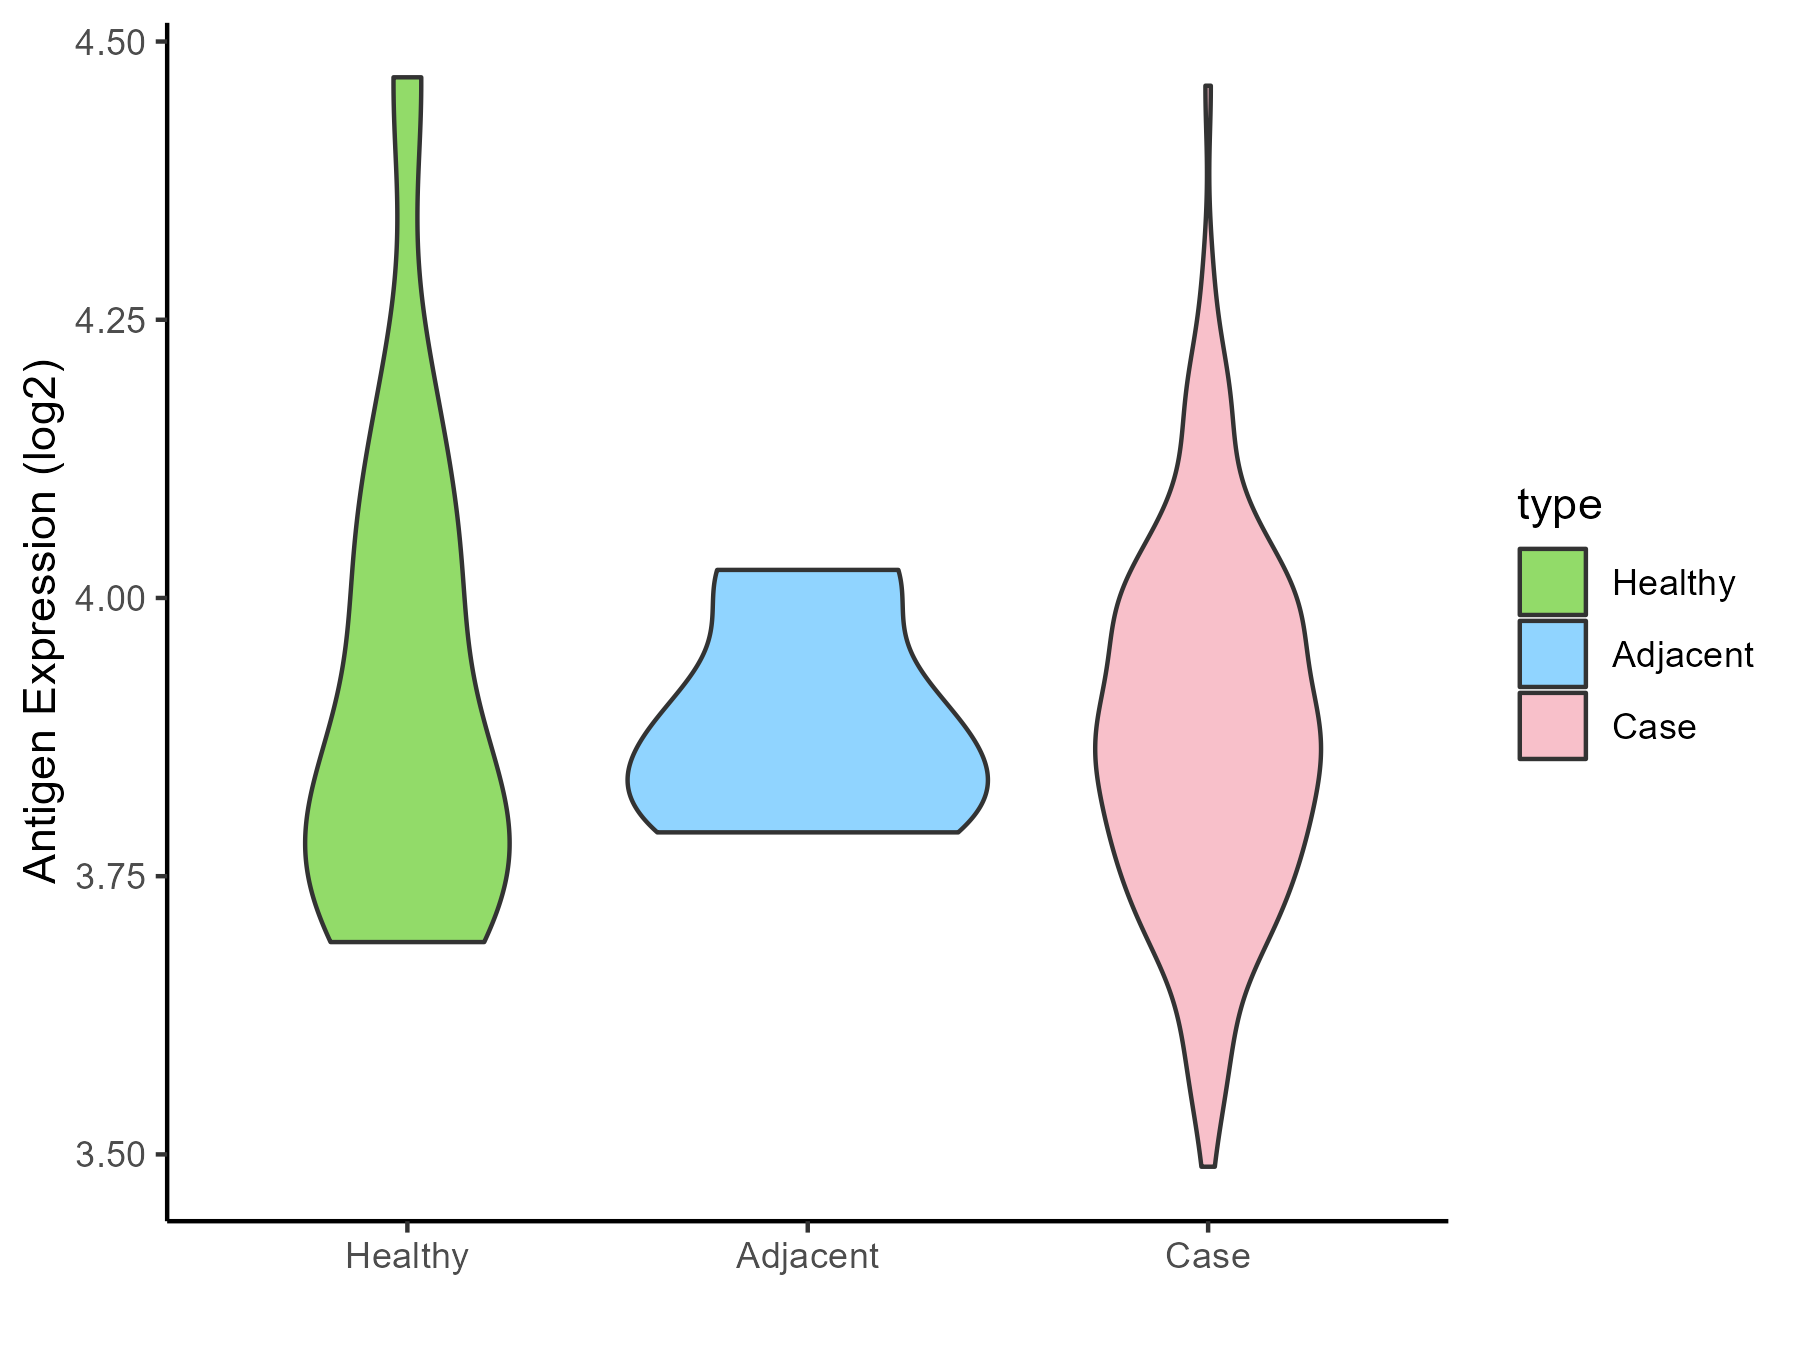
| The Studied Tissue | Bone marrow | |
| The Specific Disease | Myelodysplastic syndromes | |
| The Expression Level of Disease Section Compare with the Healthy Individual Tissue | p-value: 0.386618293; Fold-change: 0.026275604; Z-score: 0.12210698 | |
| The Expression Level of Disease Section Compare with the Adjacent Tissue | p-value: 0.905178196; Fold-change: 0.003783842; Z-score: 0.03693325 | |
| Disease-specific Antigen Abundances |
|
Click to View the Clearer Original Diagram |
| Differential expression pattern of antigen in diseases | ||
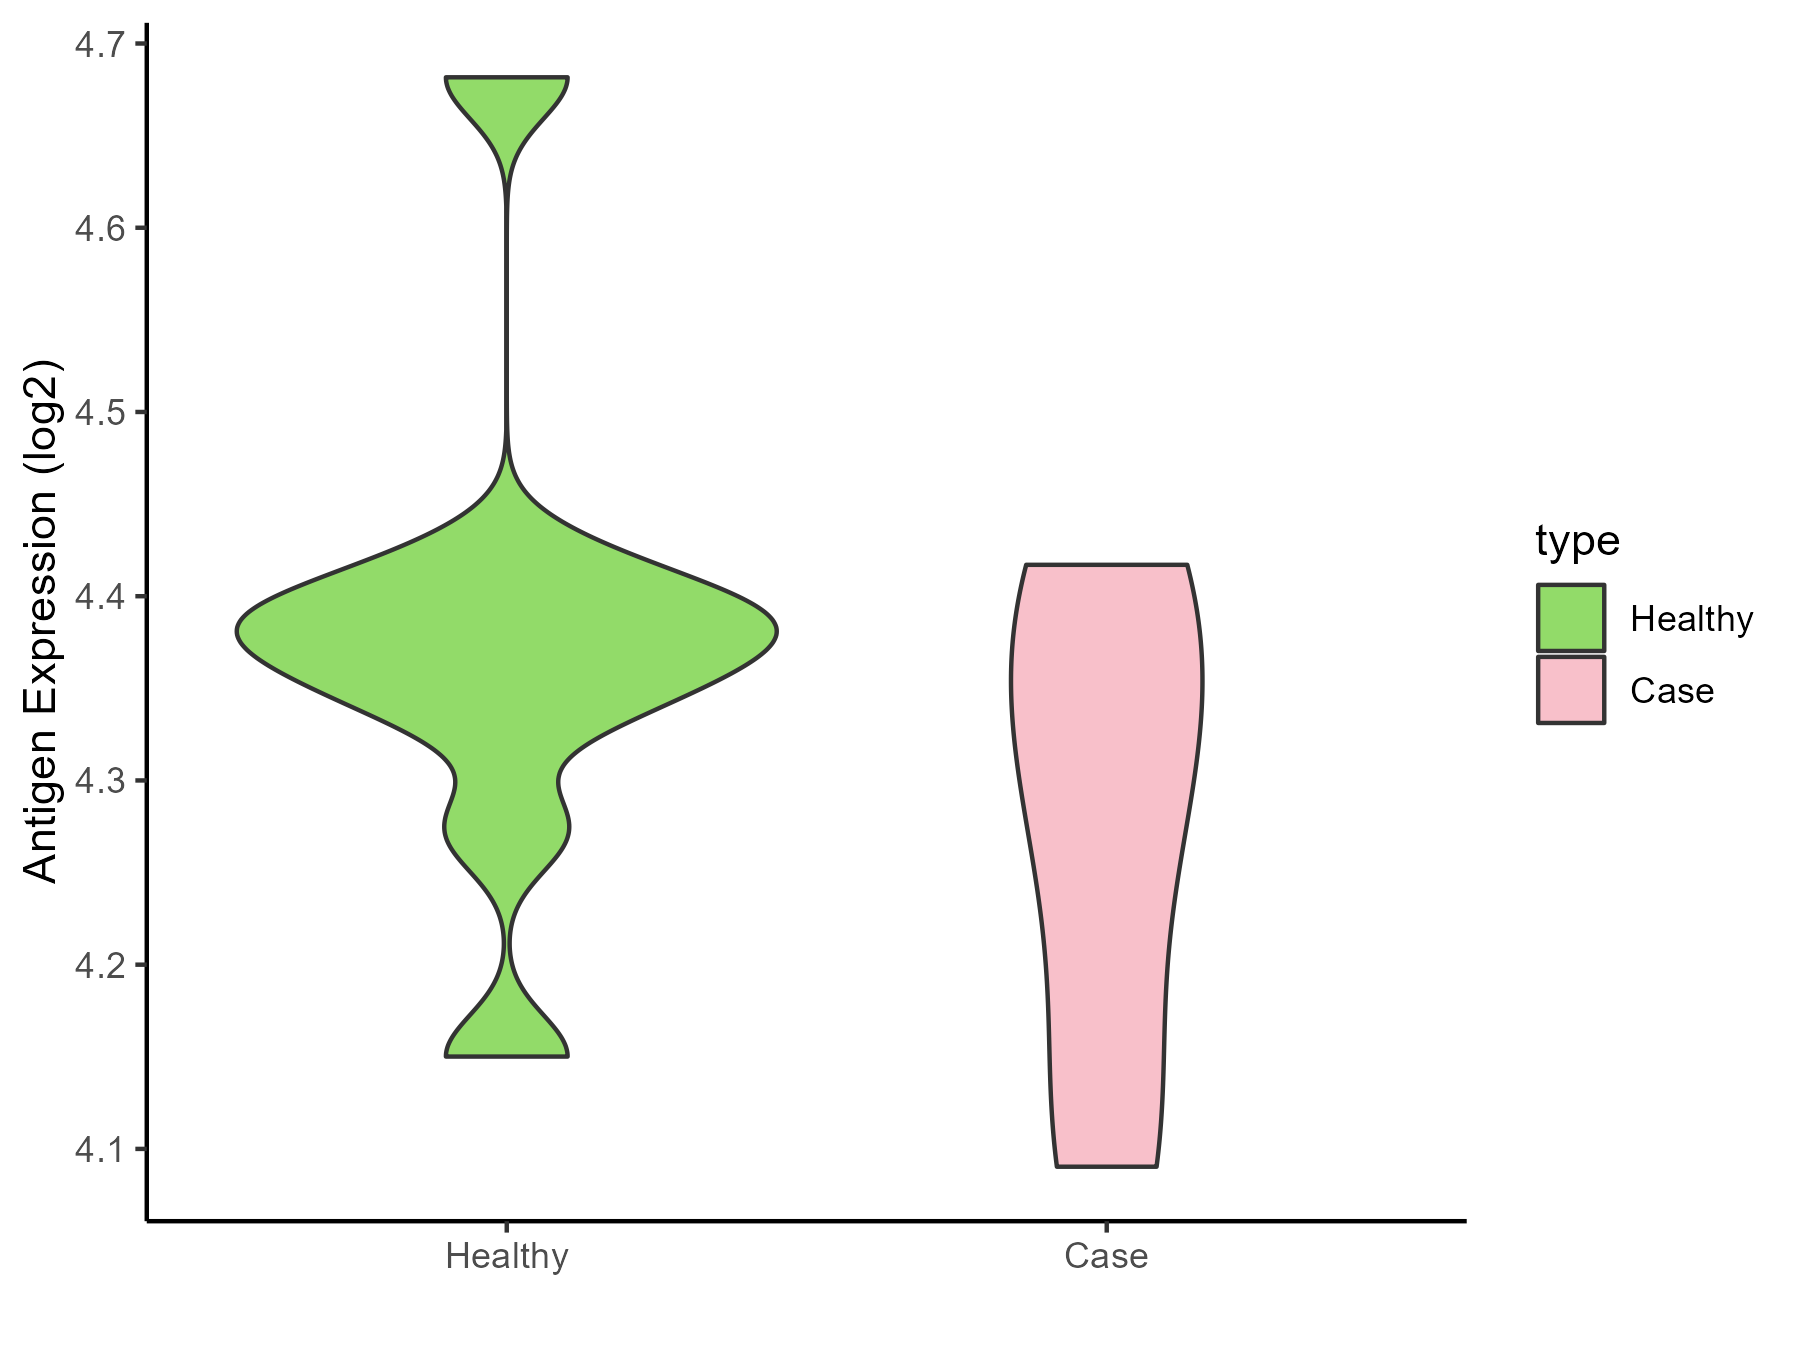
| The Studied Tissue | Tonsil | |
| The Specific Disease | Lymphoma | |
| The Expression Level of Disease Section Compare with the Healthy Individual Tissue | p-value: 0.146544693; Fold-change: -0.068901528; Z-score: -0.517089327 | |
| Disease-specific Antigen Abundances |
|
Click to View the Clearer Original Diagram |
| Differential expression pattern of antigen in diseases | ||
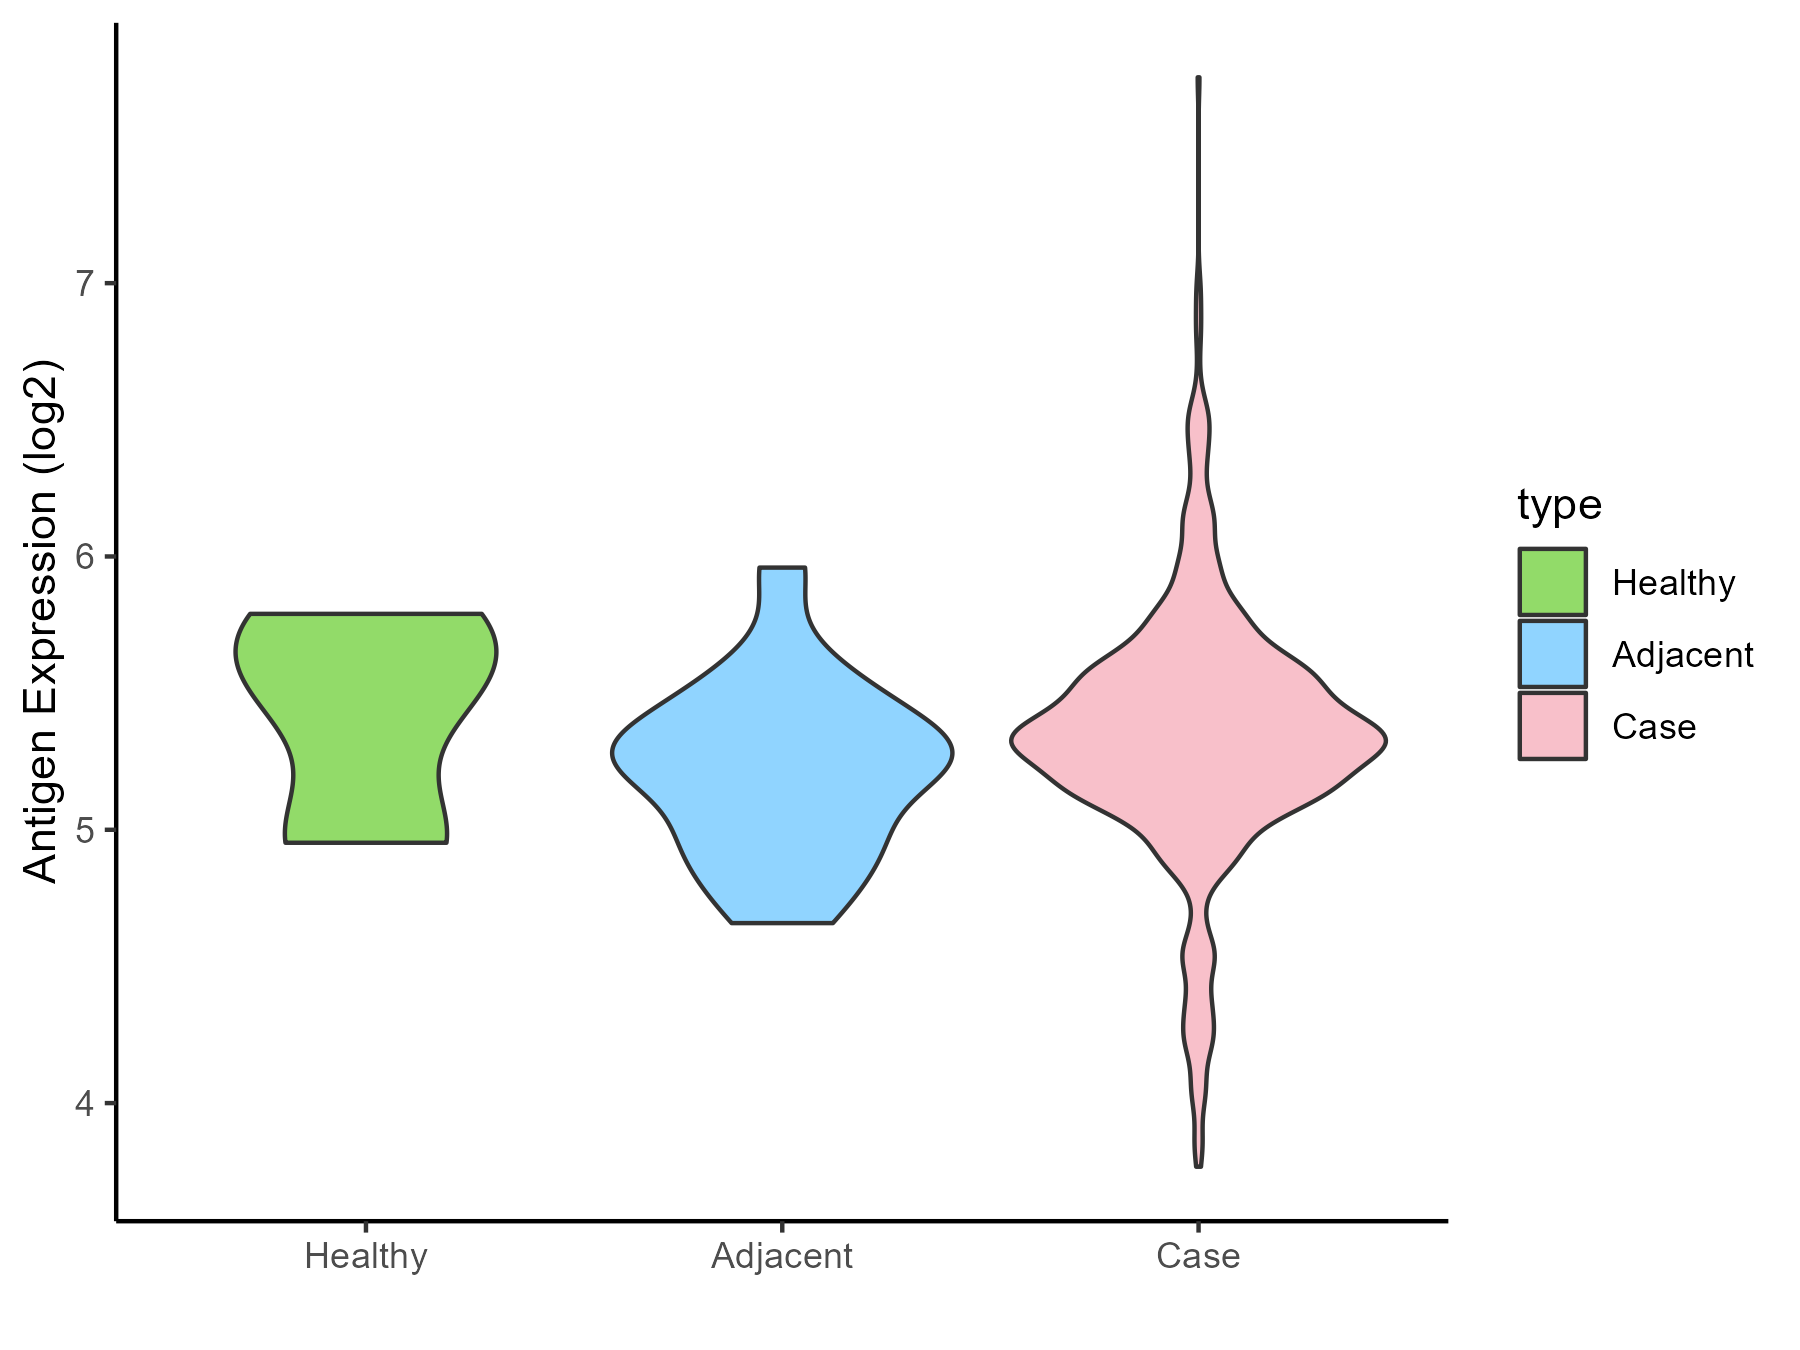
| The Studied Tissue | Gastric | |
| The Specific Disease | Gastric cancer | |
| The Expression Level of Disease Section Compare with the Healthy Individual Tissue | p-value: 0.777367798; Fold-change: -0.183038638; Z-score: -0.427818213 | |
| The Expression Level of Disease Section Compare with the Adjacent Tissue | p-value: 0.139205963; Fold-change: 0.087533963; Z-score: 0.270061841 | |
| Disease-specific Antigen Abundances |
|
Click to View the Clearer Original Diagram |
| Differential expression pattern of antigen in diseases | ||
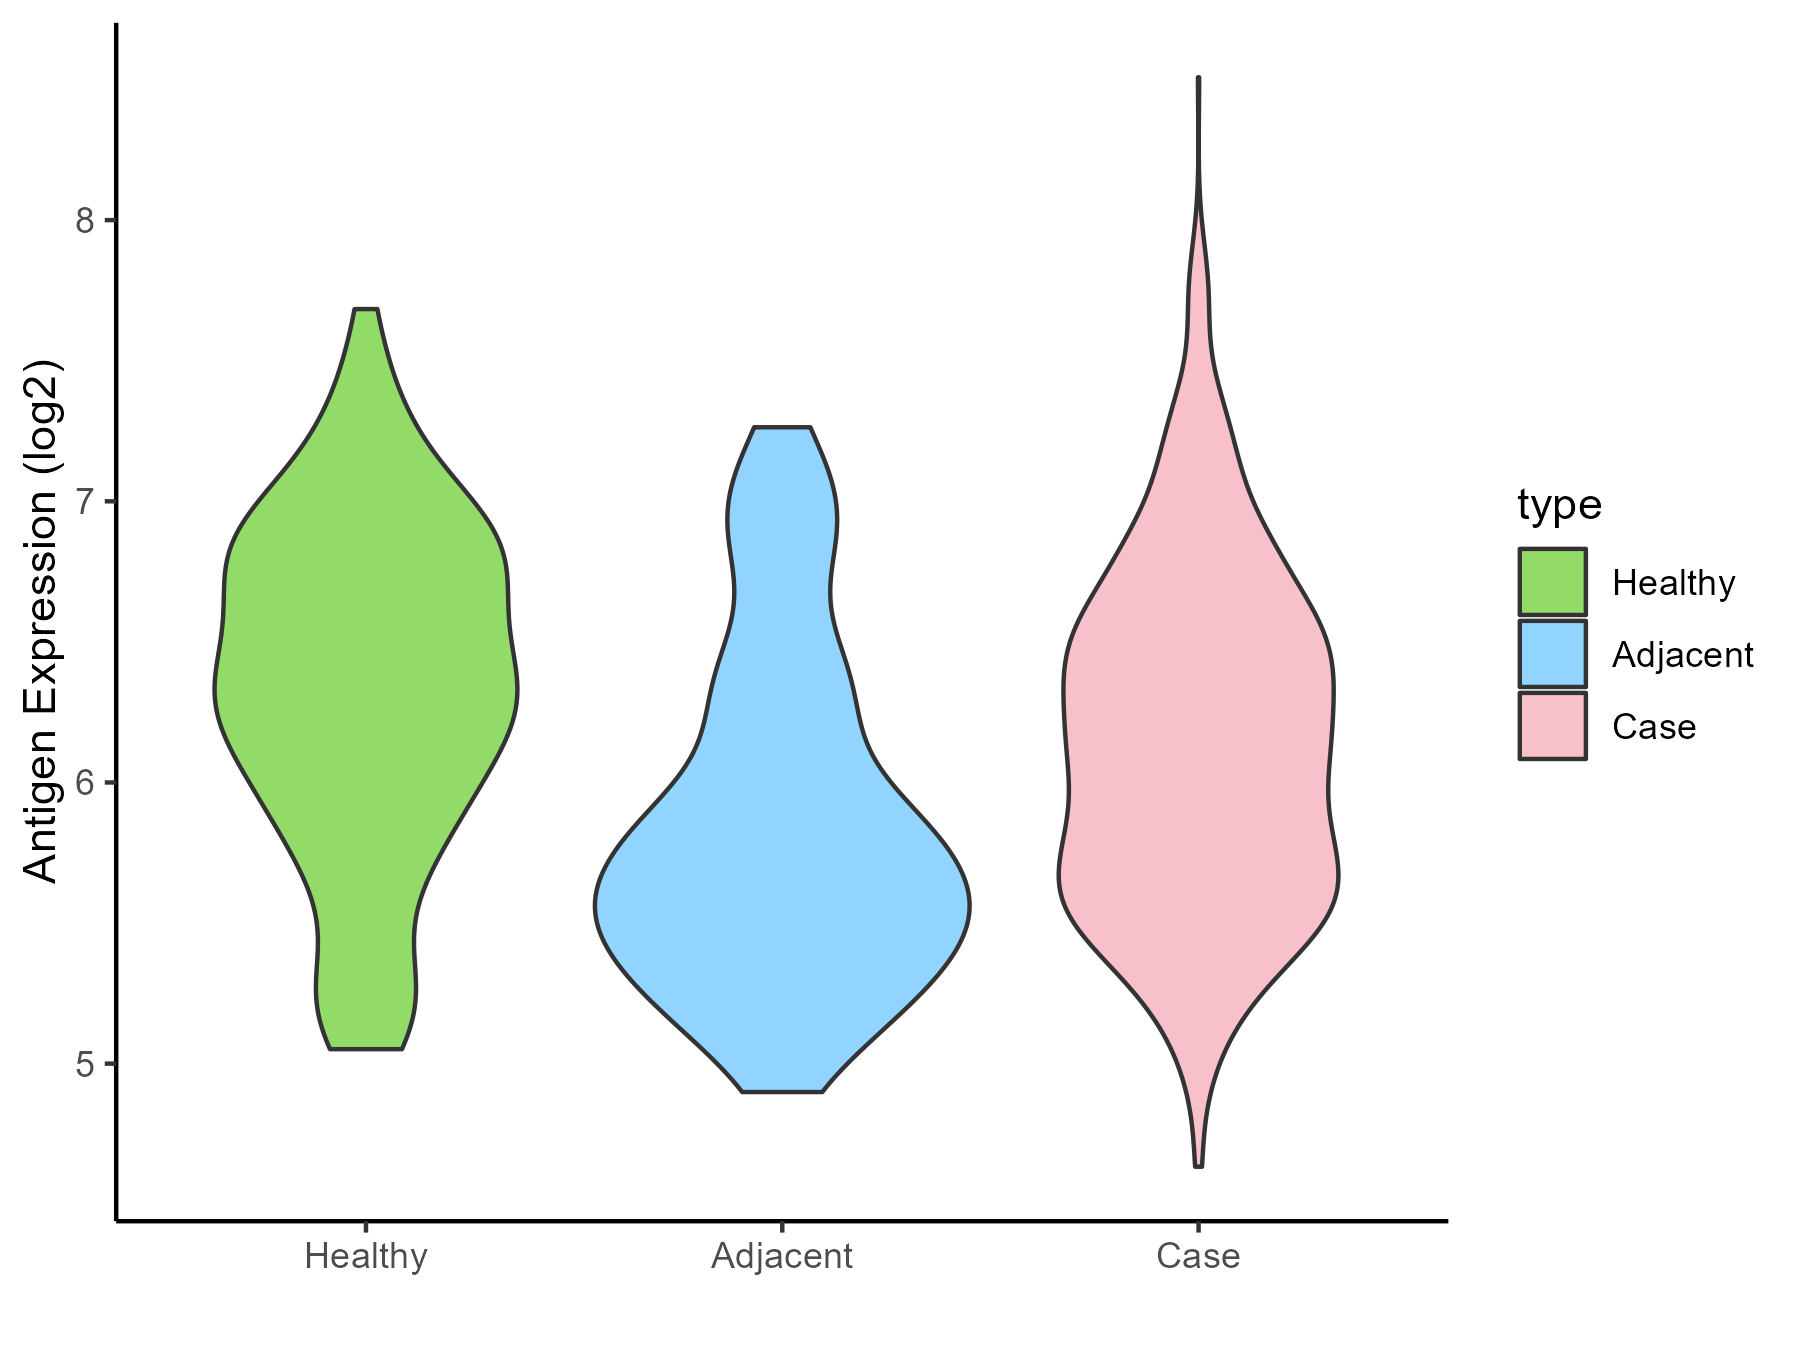
| The Studied Tissue | Colon | |
| The Specific Disease | Colon cancer | |
| The Expression Level of Disease Section Compare with the Healthy Individual Tissue | p-value: 0.000136754; Fold-change: -0.255089061; Z-score: -0.42909424 | |
| The Expression Level of Disease Section Compare with the Adjacent Tissue | p-value: 7.41E-07; Fold-change: 0.408304975; Z-score: 0.691336013 | |
| Disease-specific Antigen Abundances |
|
Click to View the Clearer Original Diagram |
| Differential expression pattern of antigen in diseases | ||
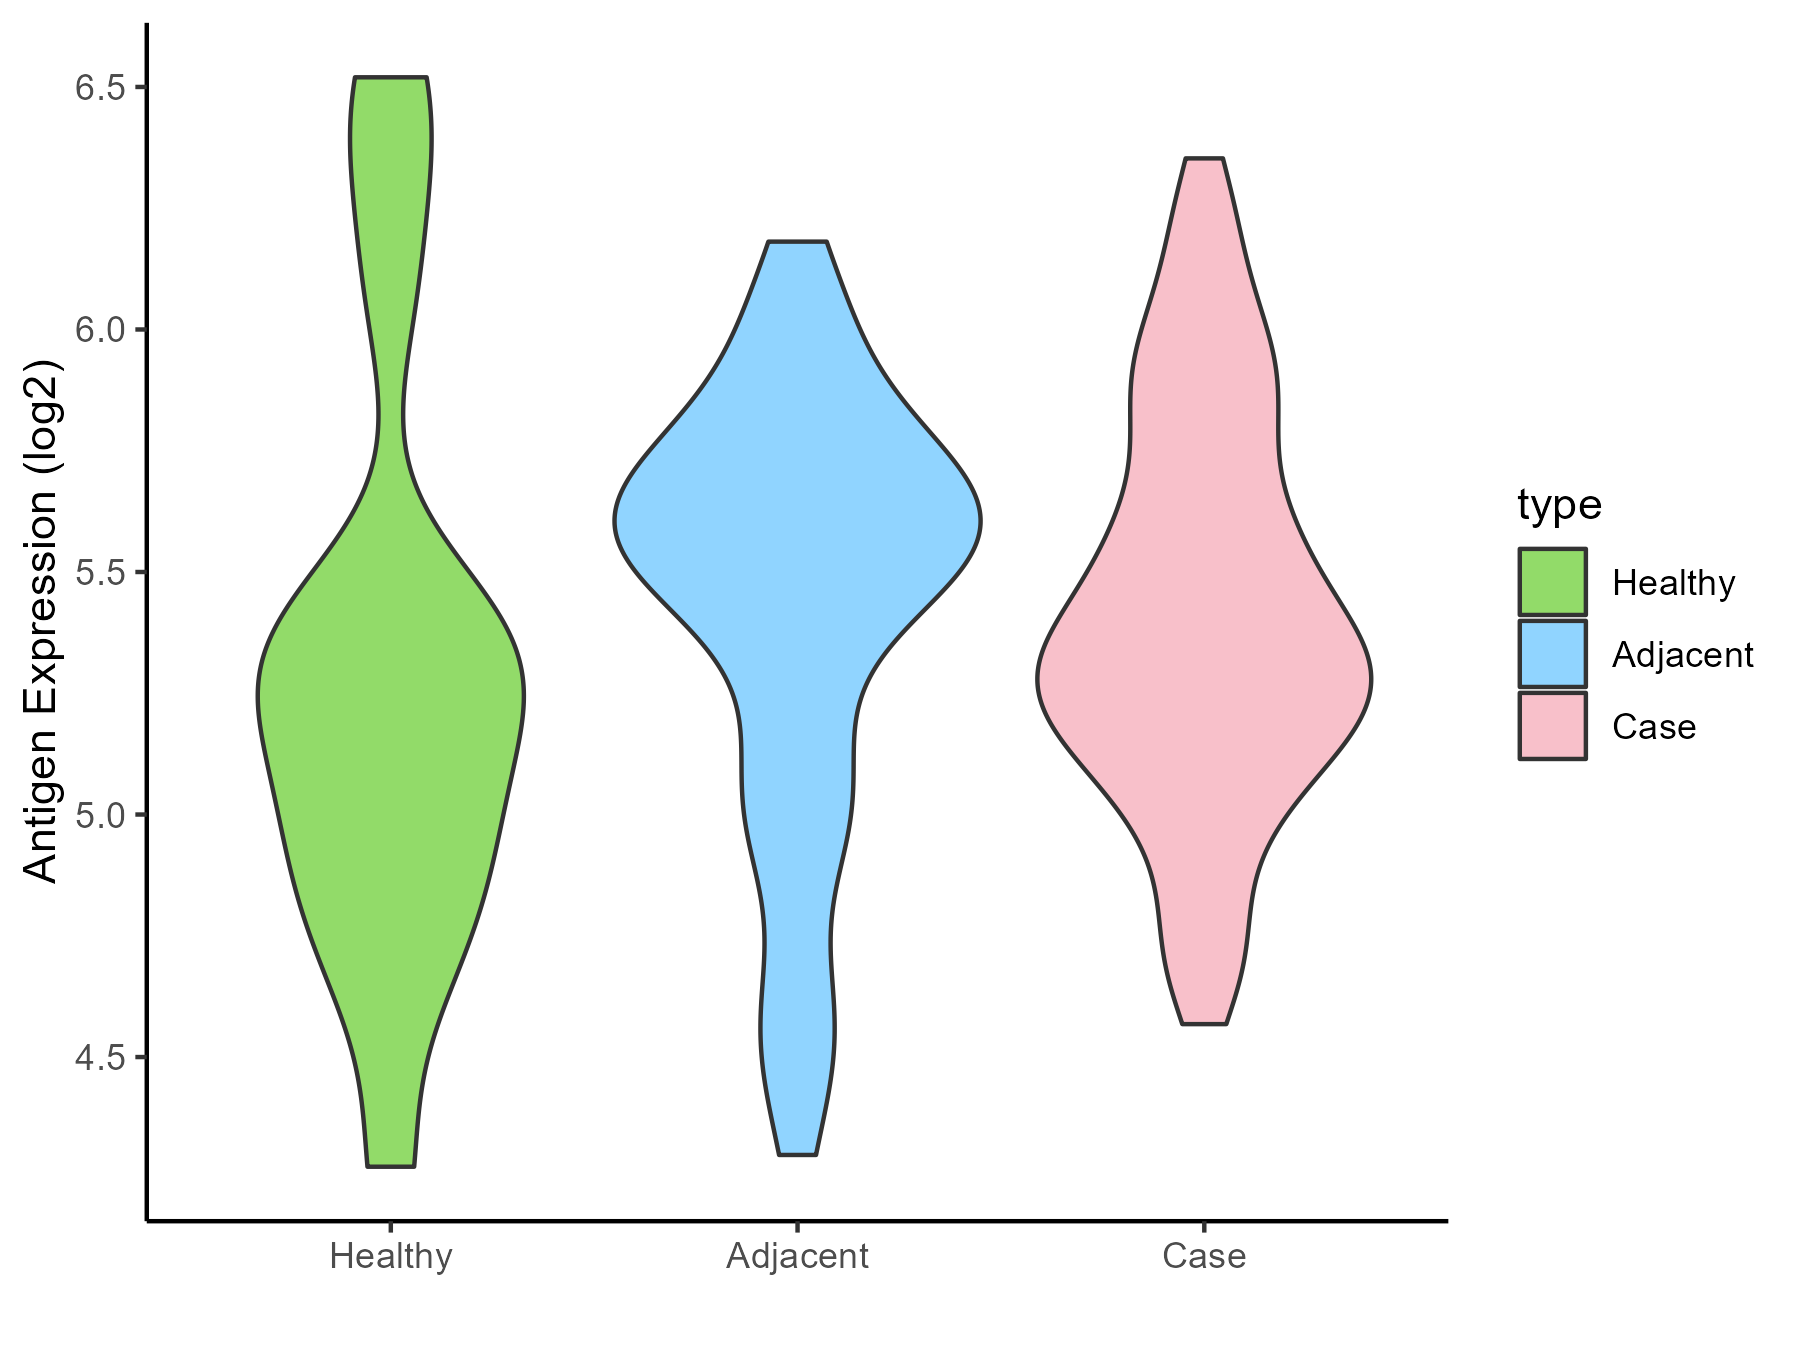
| The Studied Tissue | Pancreas | |
| The Specific Disease | Pancreatic cancer | |
| The Expression Level of Disease Section Compare with the Healthy Individual Tissue | p-value: 0.39318219; Fold-change: 0.109606213; Z-score: 0.180522631 | |
| The Expression Level of Disease Section Compare with the Adjacent Tissue | p-value: 0.785430879; Fold-change: -0.211145867; Z-score: -0.472597608 | |
| Disease-specific Antigen Abundances |
|
Click to View the Clearer Original Diagram |
| Differential expression pattern of antigen in diseases | ||
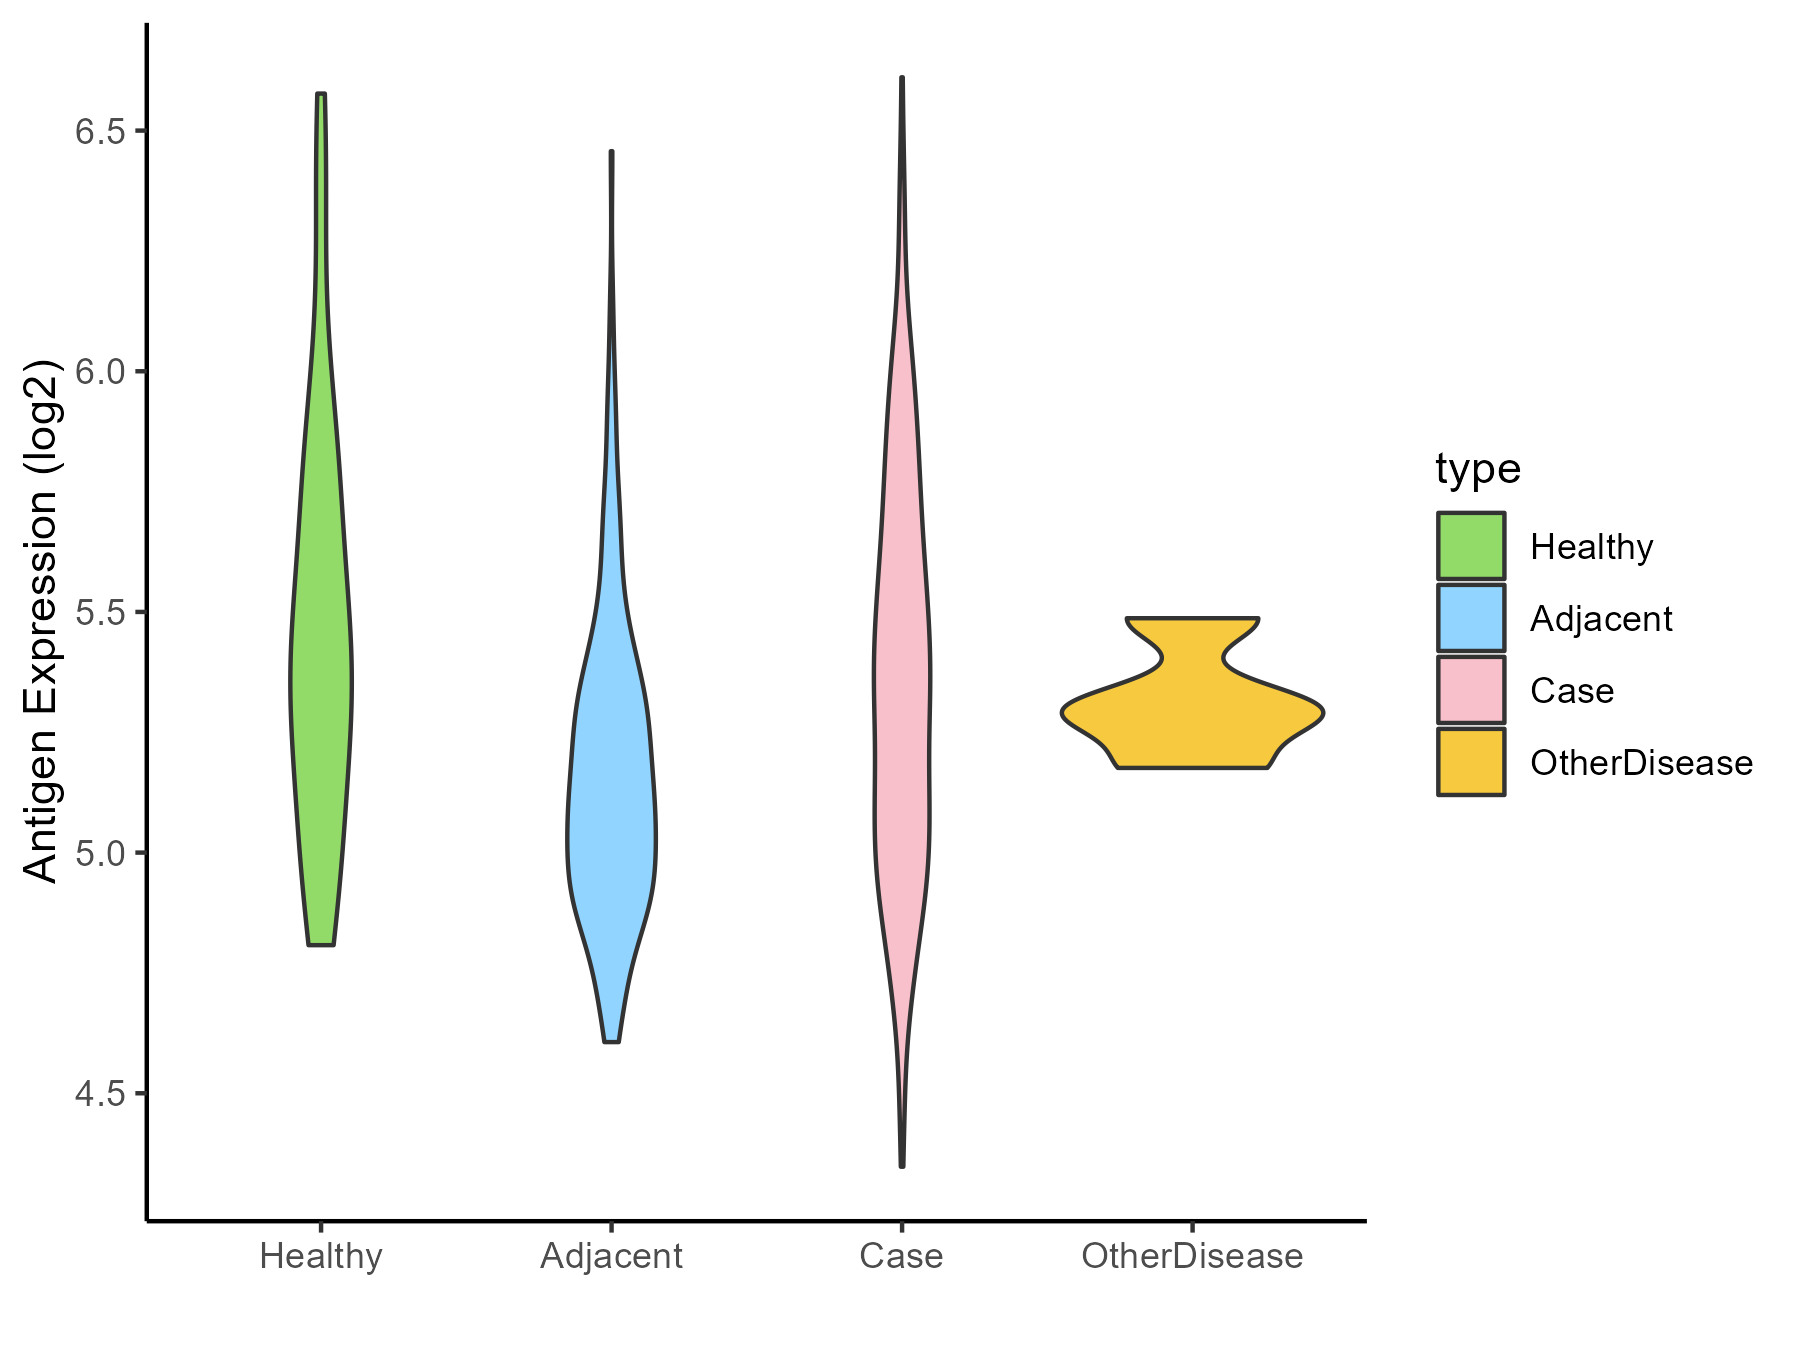
| The Studied Tissue | Liver | |
| The Specific Disease | Liver cancer | |
| The Expression Level of Disease Section Compare with the Healthy Individual Tissue | p-value: 0.158076337; Fold-change: -0.035146607; Z-score: -0.08217277 | |
| The Expression Level of Disease Section Compare with the Adjacent Tissue | p-value: 1.85E-09; Fold-change: 0.212789479; Z-score: 0.678232569 | |
| The Expression Level of Disease Section Compare with the Other Disease Section | p-value: 0.557641599; Fold-change: 0.041029886; Z-score: 0.317633443 | |
| Disease-specific Antigen Abundances |
|
Click to View the Clearer Original Diagram |
| Differential expression pattern of antigen in diseases | ||
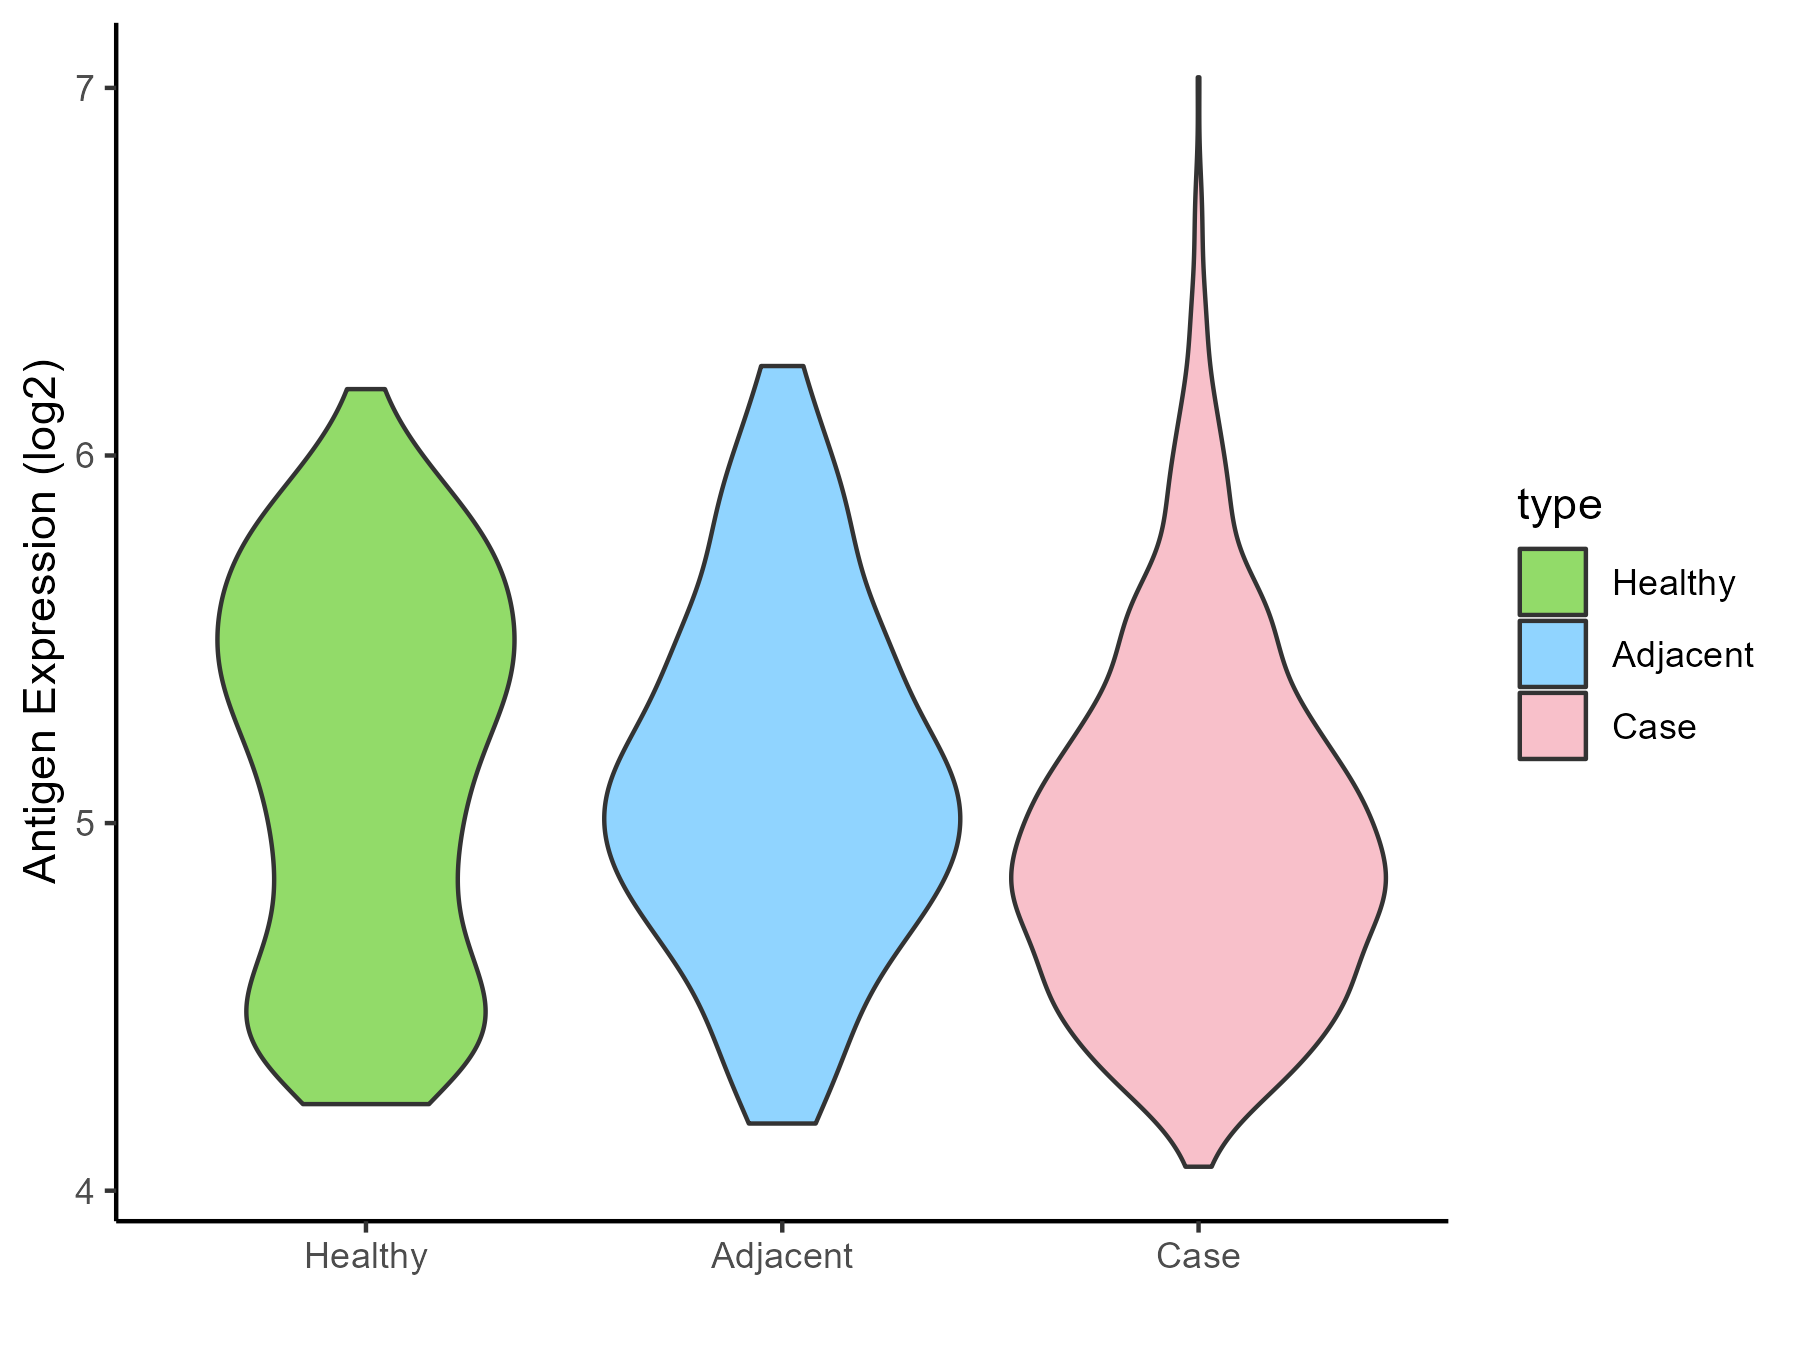
| The Studied Tissue | Lung | |
| The Specific Disease | Lung cancer | |
| The Expression Level of Disease Section Compare with the Healthy Individual Tissue | p-value: 7.21E-05; Fold-change: -0.321694755; Z-score: -0.619125272 | |
| The Expression Level of Disease Section Compare with the Adjacent Tissue | p-value: 0.002969306; Fold-change: -0.145654383; Z-score: -0.30487295 | |
| Disease-specific Antigen Abundances |
|
Click to View the Clearer Original Diagram |
| Differential expression pattern of antigen in diseases | ||
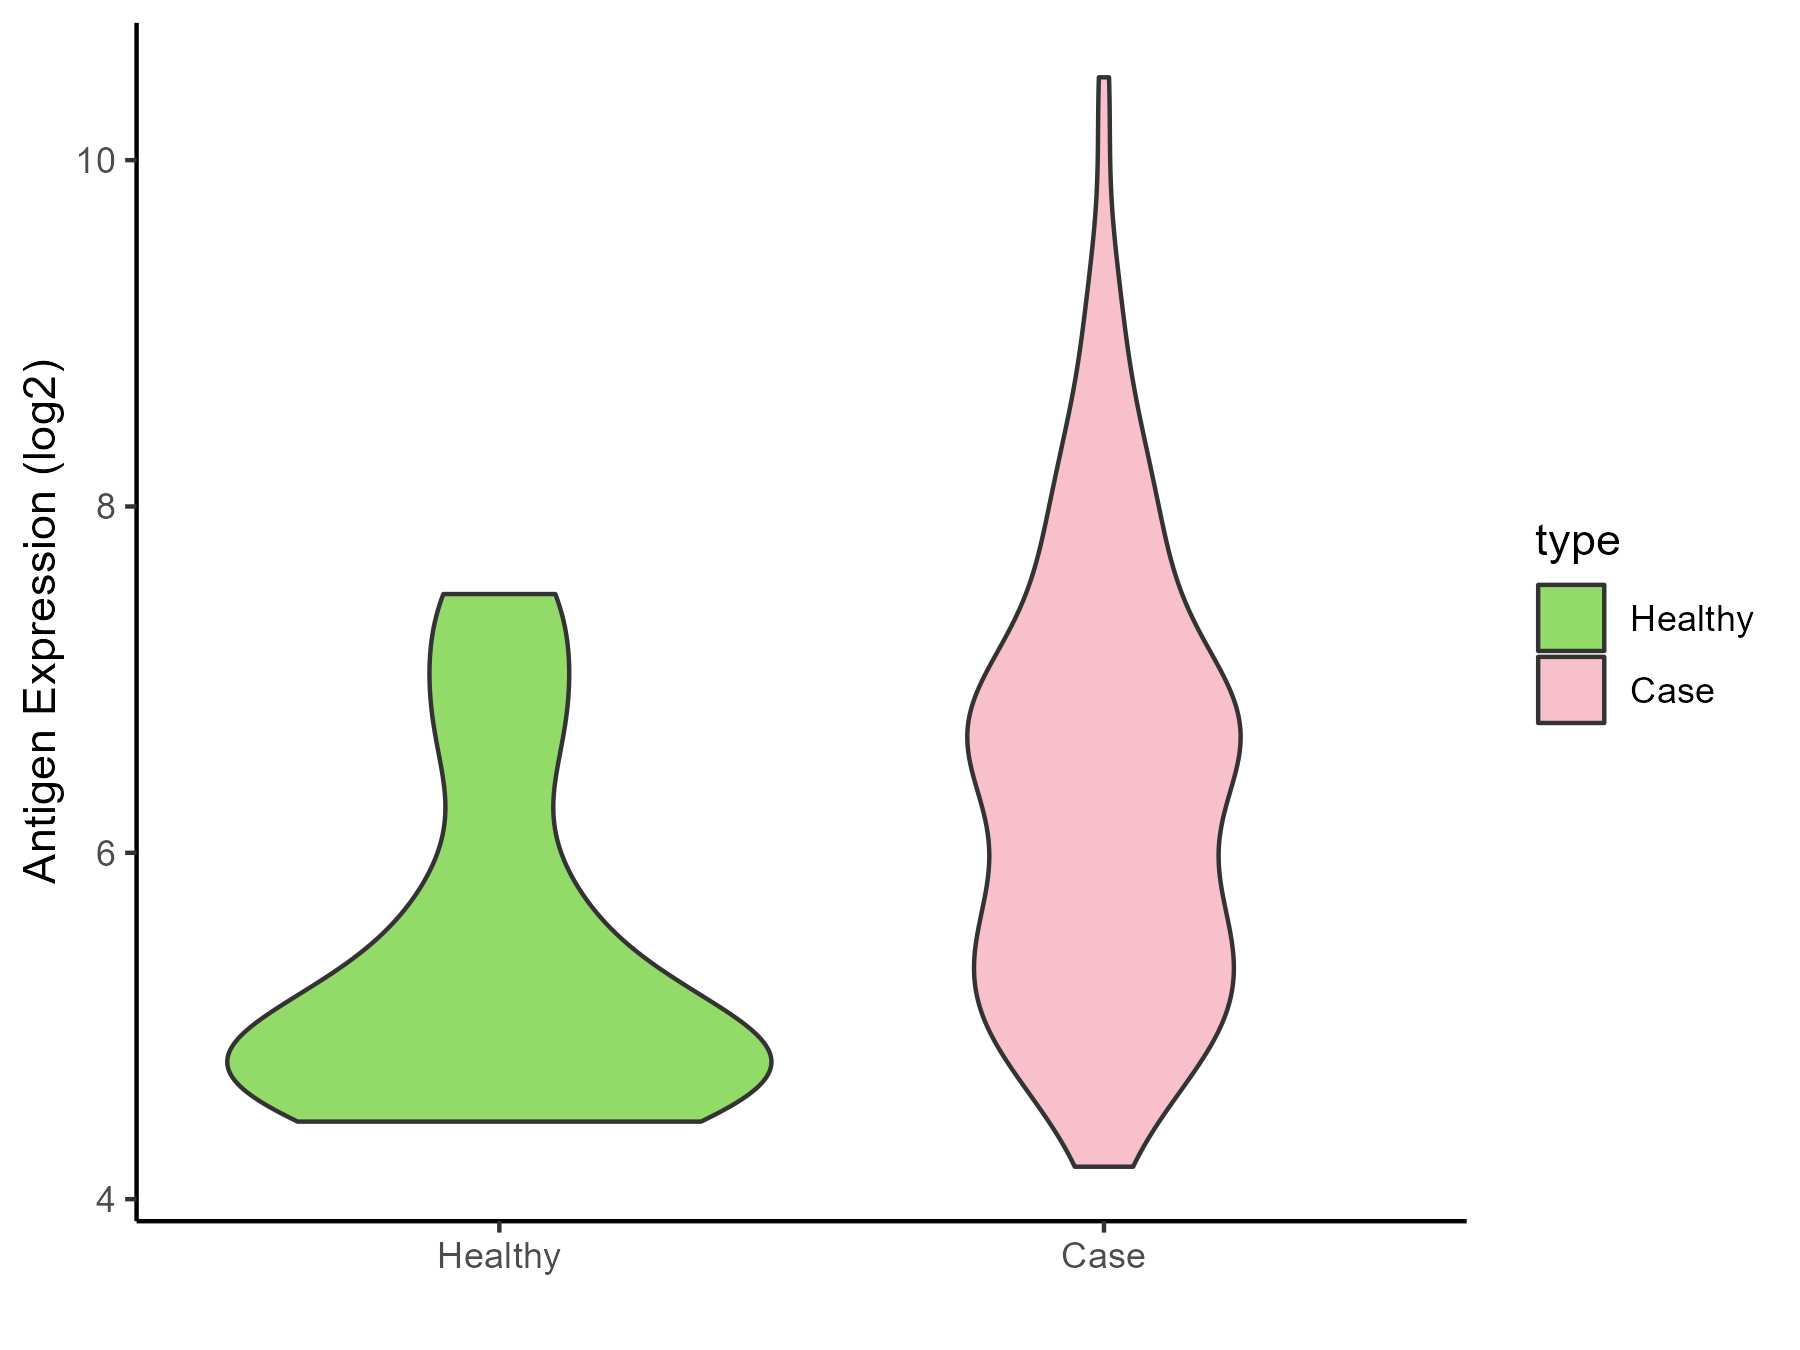
| The Studied Tissue | Skin | |
| The Specific Disease | Melanoma | |
| The Expression Level of Disease Section Compare with the Healthy Individual Tissue | p-value: 0.000139654; Fold-change: 1.472155713; Z-score: 1.500125799 | |
| Disease-specific Antigen Abundances |
|
Click to View the Clearer Original Diagram |
| Differential expression pattern of antigen in diseases | ||
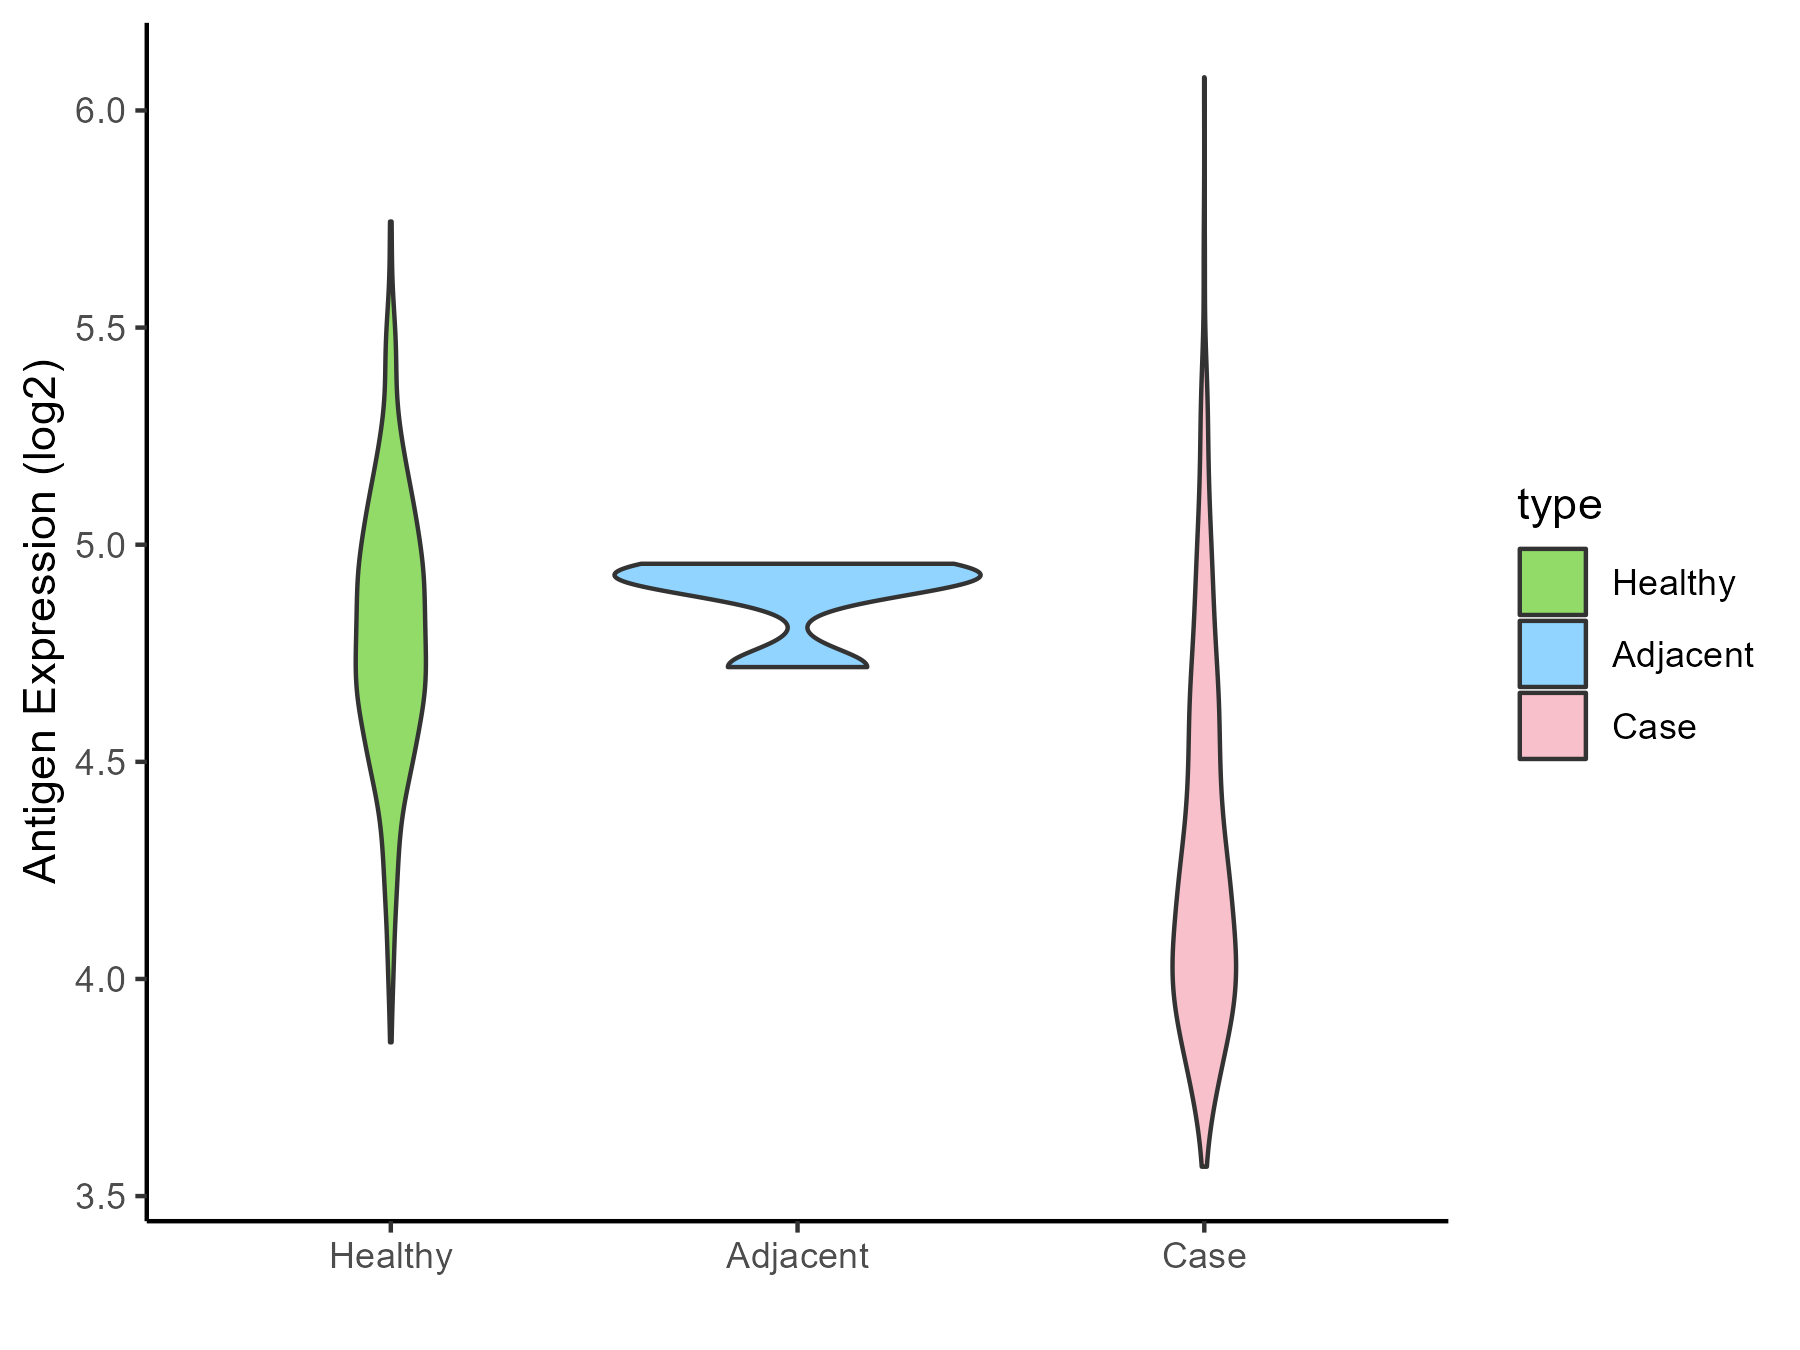
| The Studied Tissue | Muscle | |
| The Specific Disease | Sarcoma | |
| The Expression Level of Disease Section Compare with the Healthy Individual Tissue | p-value: 8.84E-86; Fold-change: -0.596522932; Z-score: -1.891867884 | |
| The Expression Level of Disease Section Compare with the Adjacent Tissue | p-value: 0.000840394; Fold-change: -0.711778794; Z-score: -6.584059626 | |
| Disease-specific Antigen Abundances |
|
Click to View the Clearer Original Diagram |
| Differential expression pattern of antigen in diseases | ||
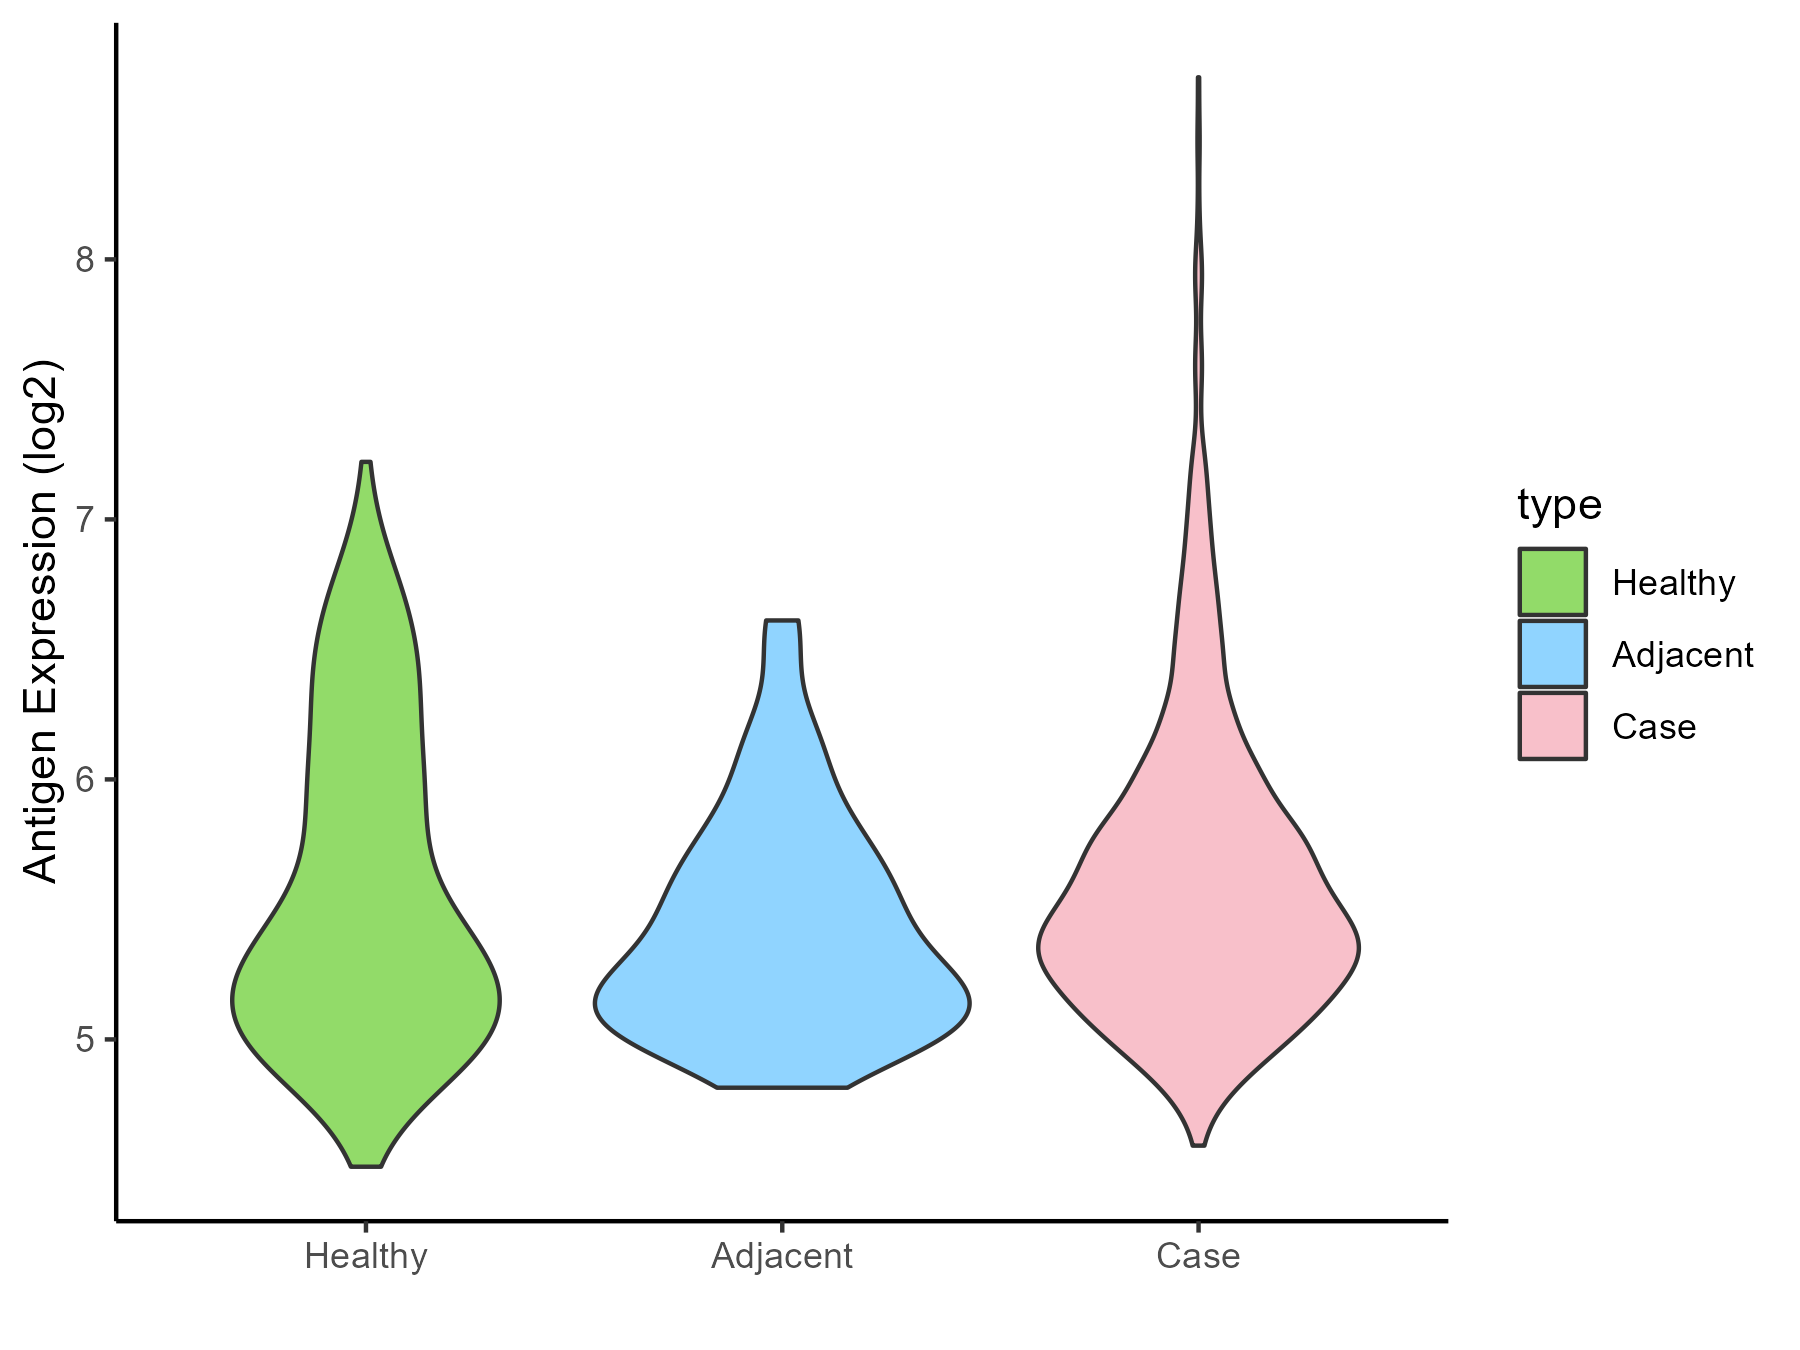
| The Studied Tissue | Breast | |
| The Specific Disease | Breast cancer | |
| The Expression Level of Disease Section Compare with the Healthy Individual Tissue | p-value: 0.351295896; Fold-change: 0.101303707; Z-score: 0.165085819 | |
| The Expression Level of Disease Section Compare with the Adjacent Tissue | p-value: 0.002363699; Fold-change: 0.166499592; Z-score: 0.394814294 | |
| Disease-specific Antigen Abundances |
|
Click to View the Clearer Original Diagram |
| Differential expression pattern of antigen in diseases | ||
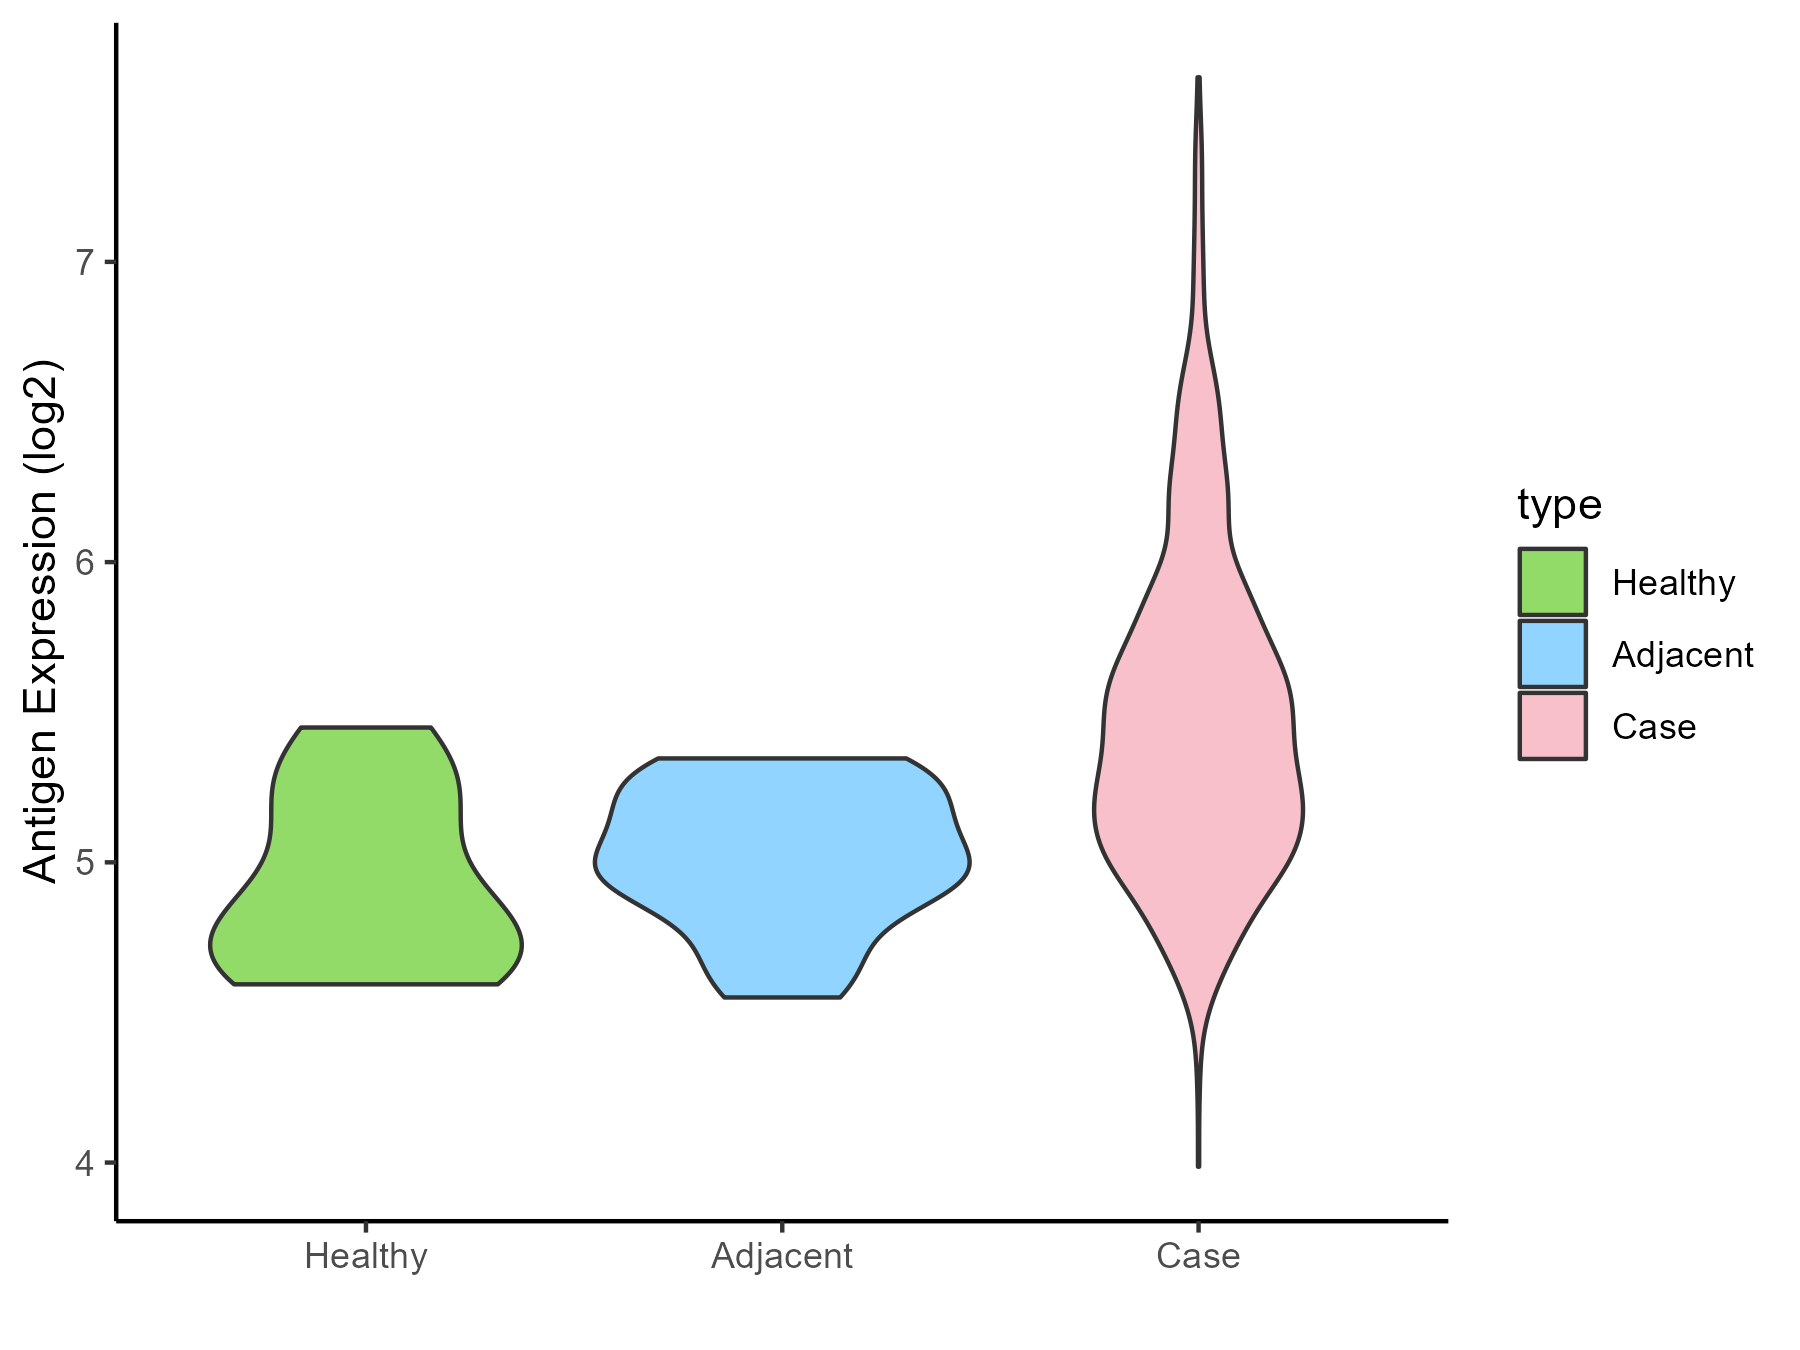
| The Studied Tissue | Ovarian | |
| The Specific Disease | Ovarian cancer | |
| The Expression Level of Disease Section Compare with the Healthy Individual Tissue | p-value: 0.000584153; Fold-change: 0.627265171; Z-score: 2.010820501 | |
| The Expression Level of Disease Section Compare with the Adjacent Tissue | p-value: 4.41E-06; Fold-change: 0.401921008; Z-score: 1.645091107 | |
| Disease-specific Antigen Abundances |
|
Click to View the Clearer Original Diagram |
| Differential expression pattern of antigen in diseases | ||
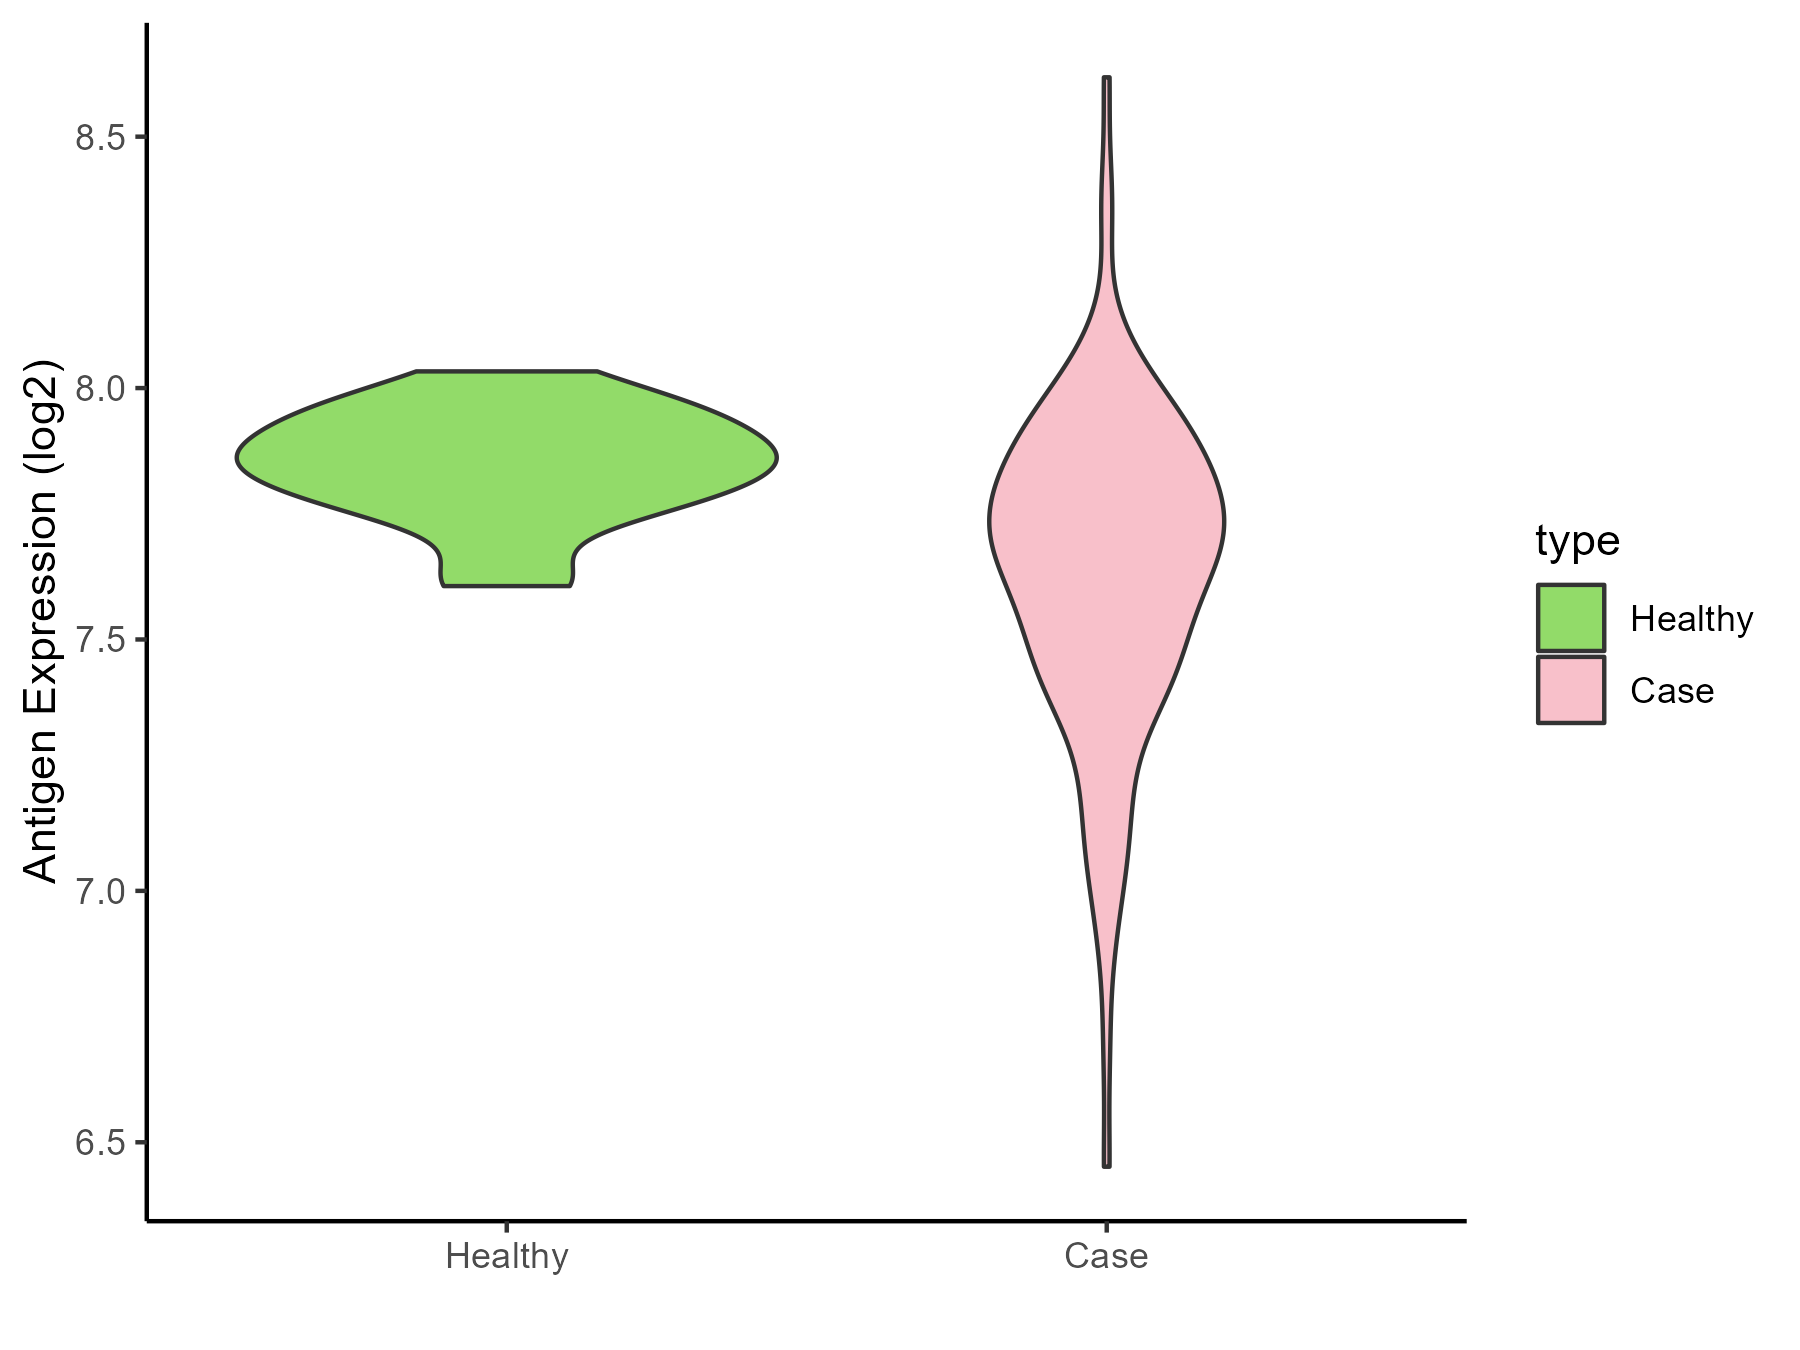
| The Studied Tissue | Cervical | |
| The Specific Disease | Cervical cancer | |
| The Expression Level of Disease Section Compare with the Healthy Individual Tissue | p-value: 1.27E-06; Fold-change: -0.171146606; Z-score: -1.49659741 | |
| Disease-specific Antigen Abundances |
|
Click to View the Clearer Original Diagram |
| Differential expression pattern of antigen in diseases | ||
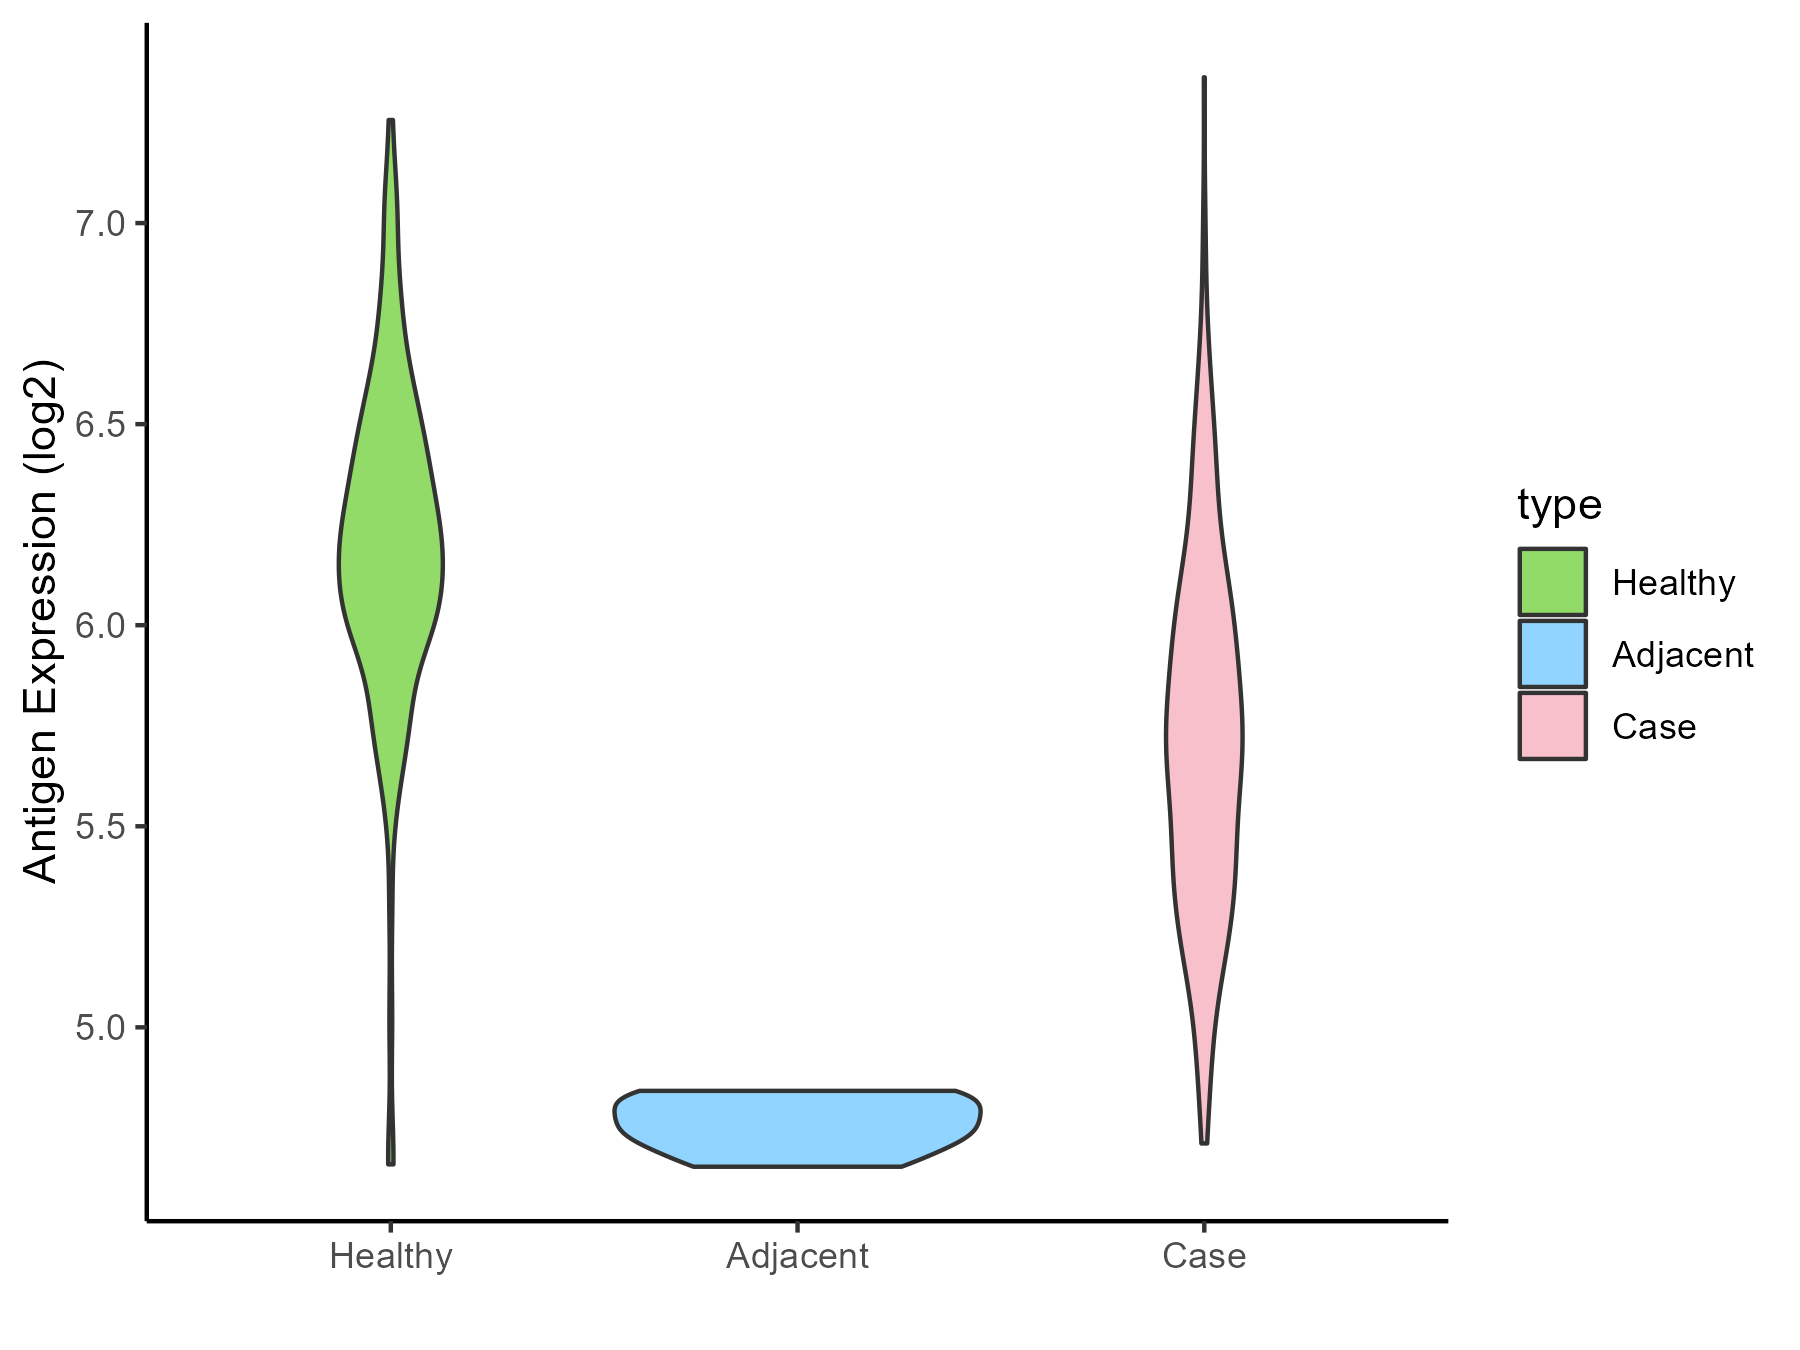
| The Studied Tissue | Endometrium | |
| The Specific Disease | Uterine cancer | |
| The Expression Level of Disease Section Compare with the Healthy Individual Tissue | p-value: 4.23E-21; Fold-change: -0.490721314; Z-score: -1.1831257 | |
| The Expression Level of Disease Section Compare with the Adjacent Tissue | p-value: 2.16E-09; Fold-change: 0.955970651; Z-score: 12.48256318 | |
| Disease-specific Antigen Abundances |
|
Click to View the Clearer Original Diagram |
| Differential expression pattern of antigen in diseases | ||
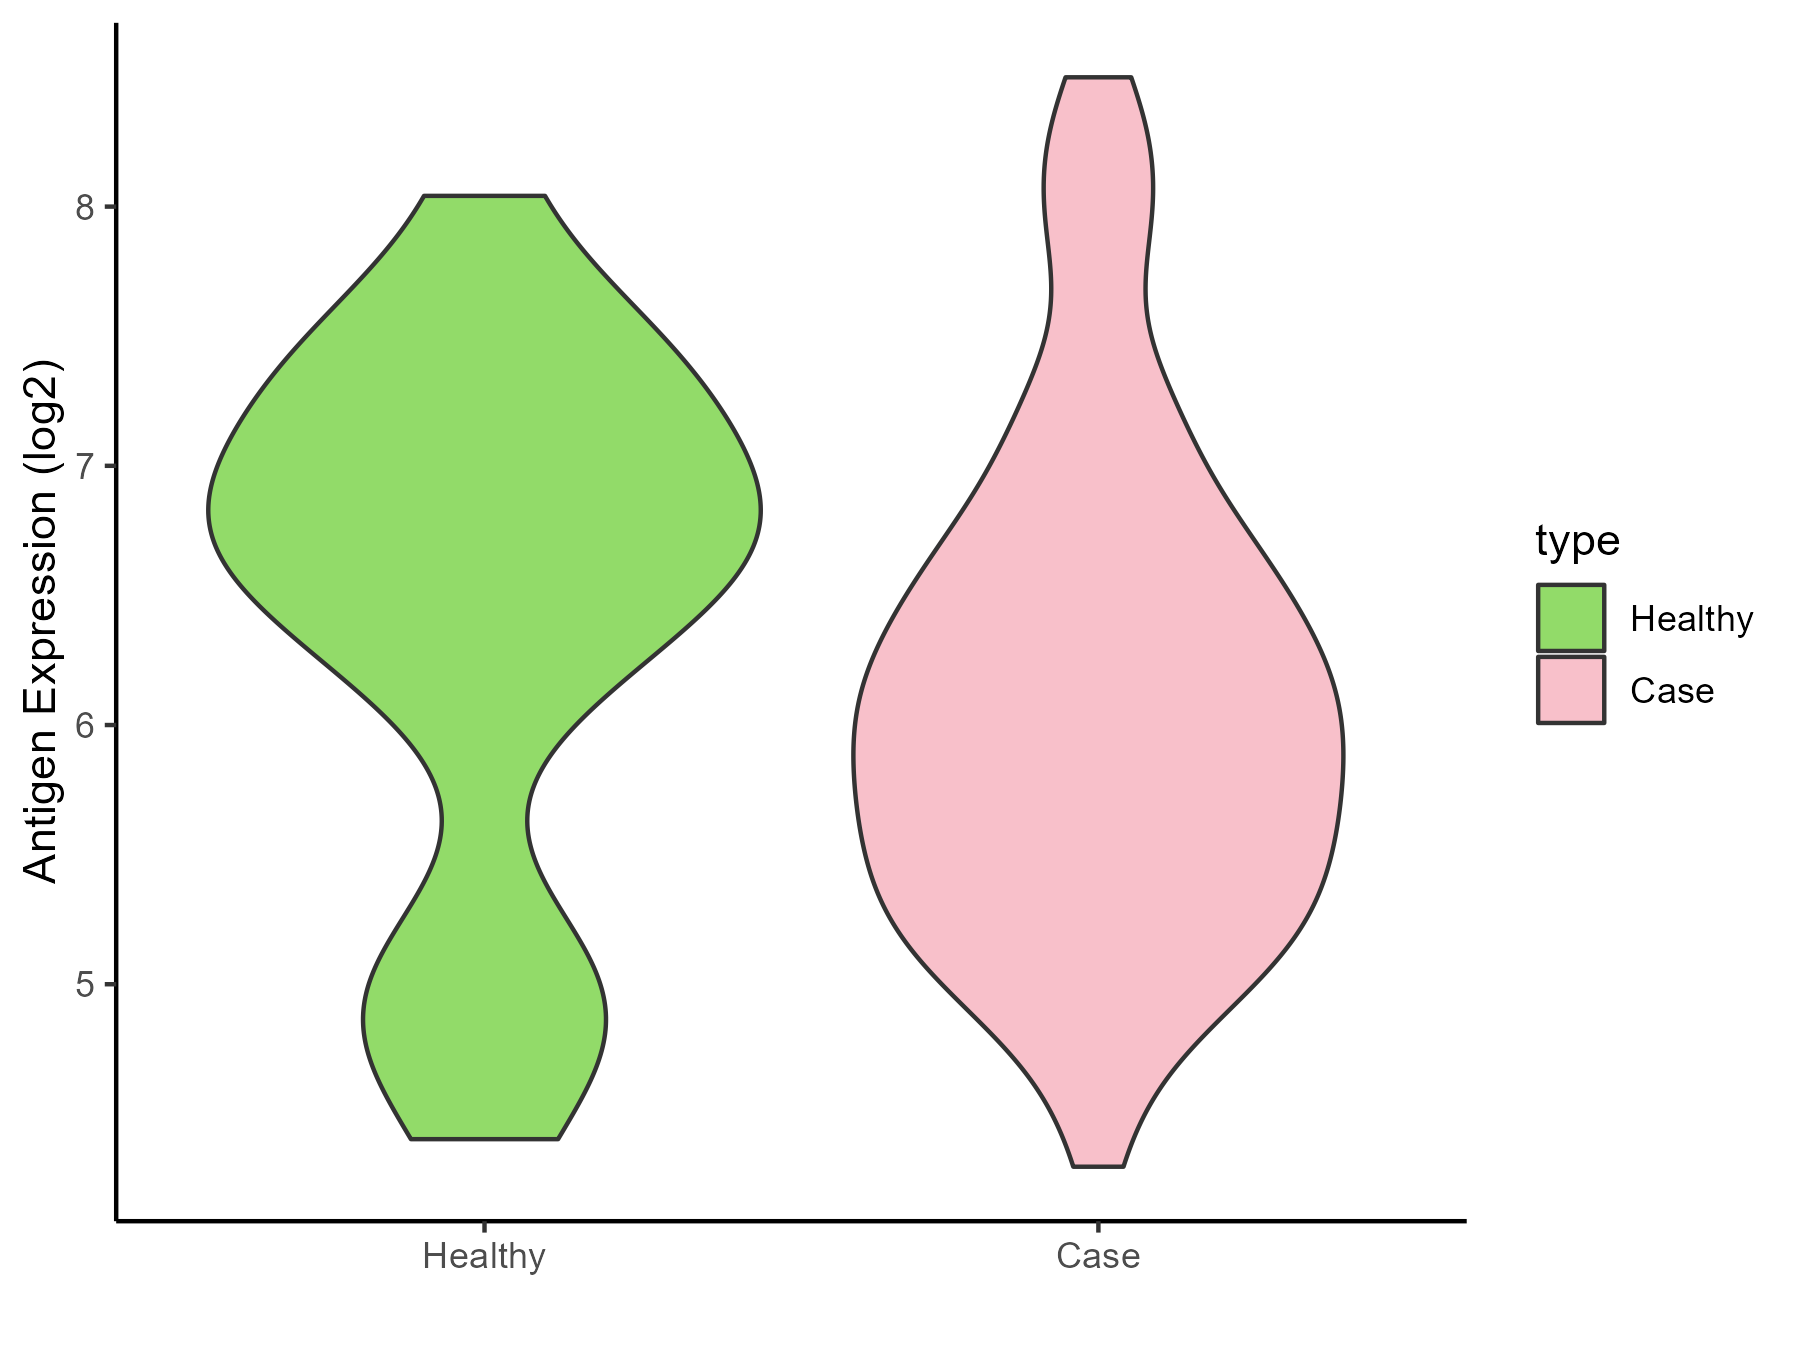
| The Studied Tissue | Prostate | |
| The Specific Disease | Prostate cancer | |
| The Expression Level of Disease Section Compare with the Healthy Individual Tissue | p-value: 0.165867953; Fold-change: -0.749722161; Z-score: -0.726862856 | |
| Disease-specific Antigen Abundances |
|
Click to View the Clearer Original Diagram |
| Differential expression pattern of antigen in diseases | ||
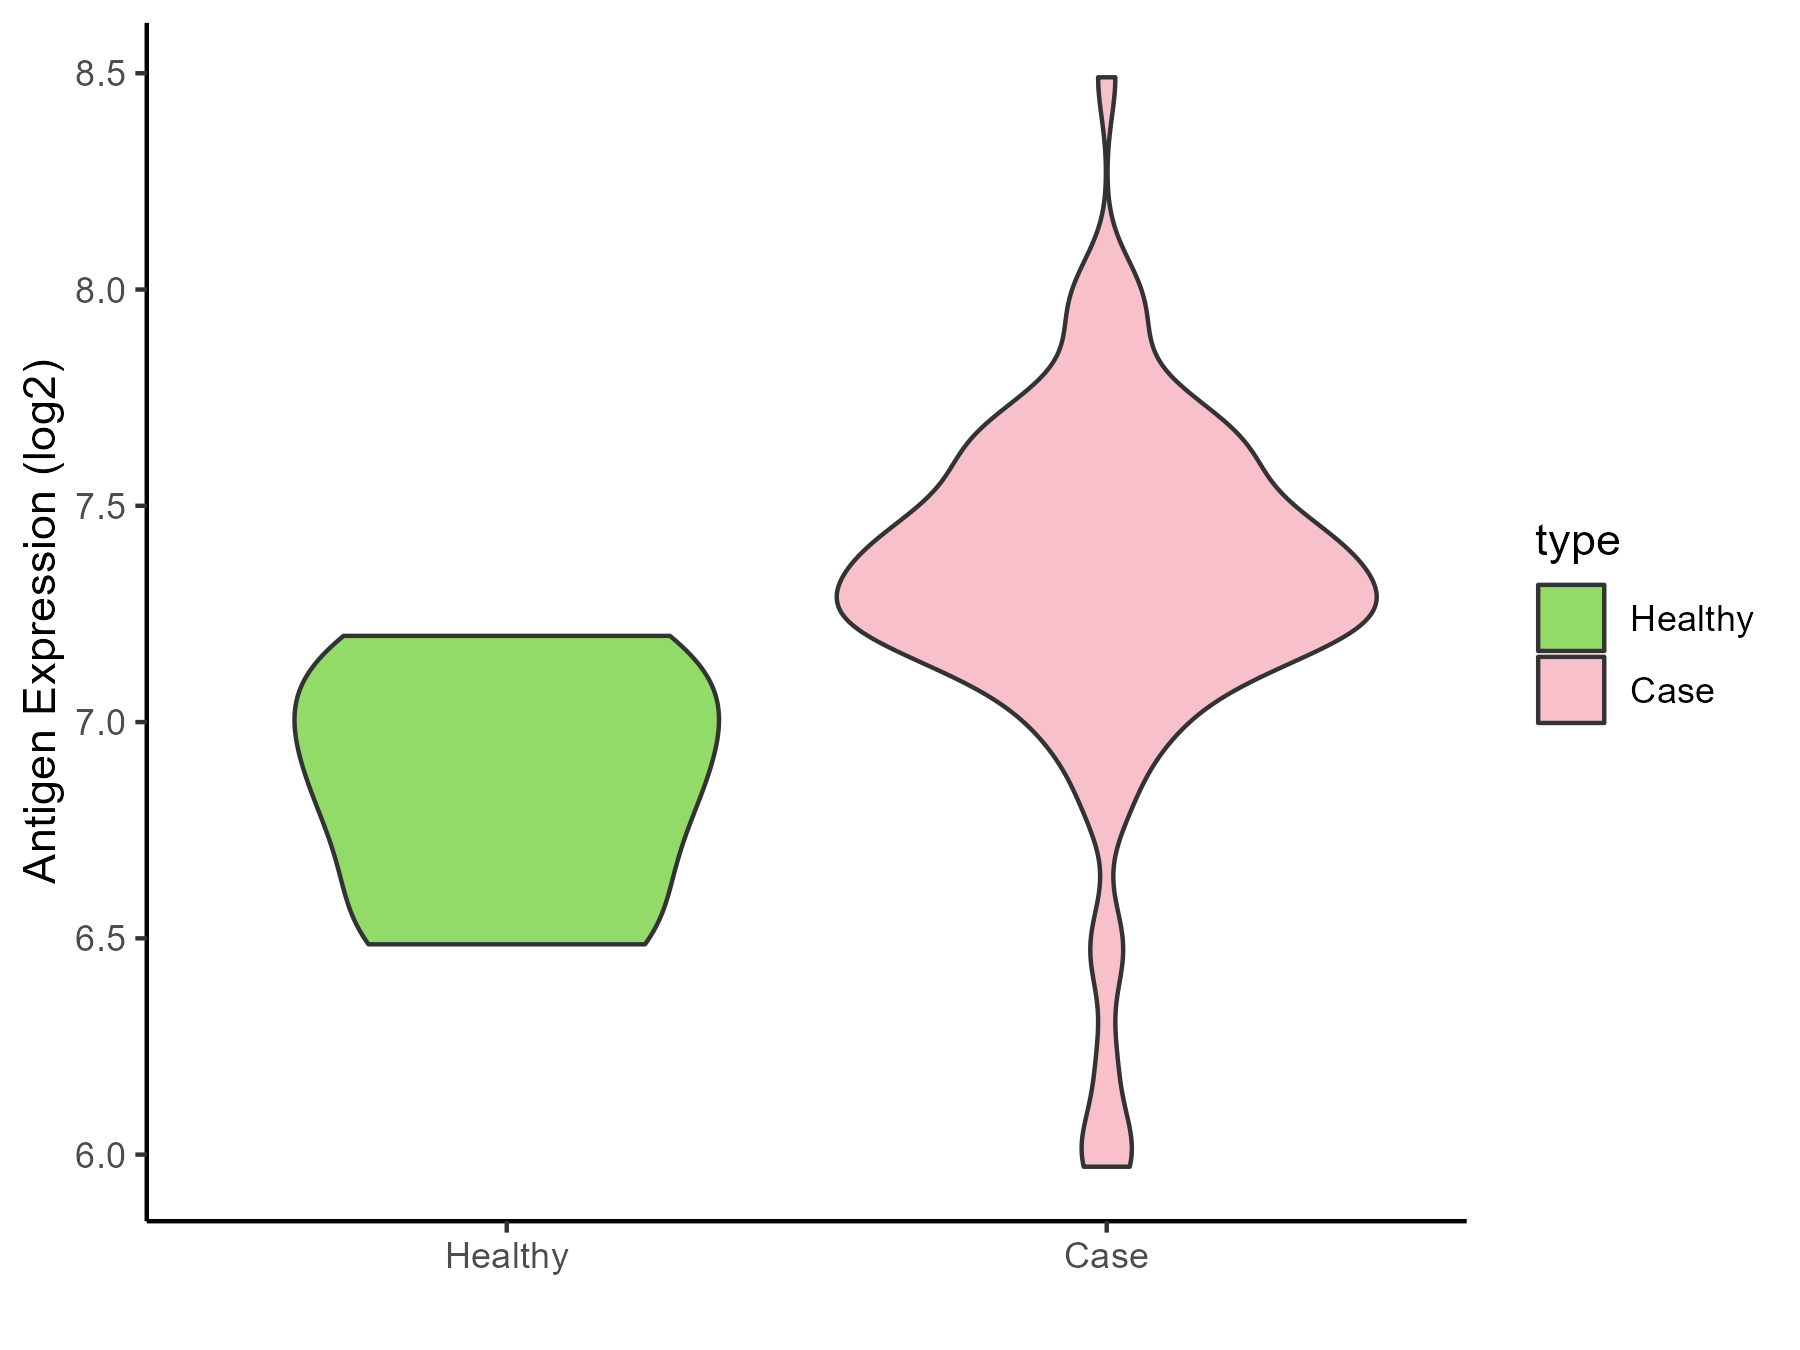
| The Studied Tissue | Bladder | |
| The Specific Disease | Bladder cancer | |
| The Expression Level of Disease Section Compare with the Healthy Individual Tissue | p-value: 0.003475716; Fold-change: 0.516556613; Z-score: 1.872759634 | |
| Disease-specific Antigen Abundances |
|
Click to View the Clearer Original Diagram |
| Differential expression pattern of antigen in diseases | ||
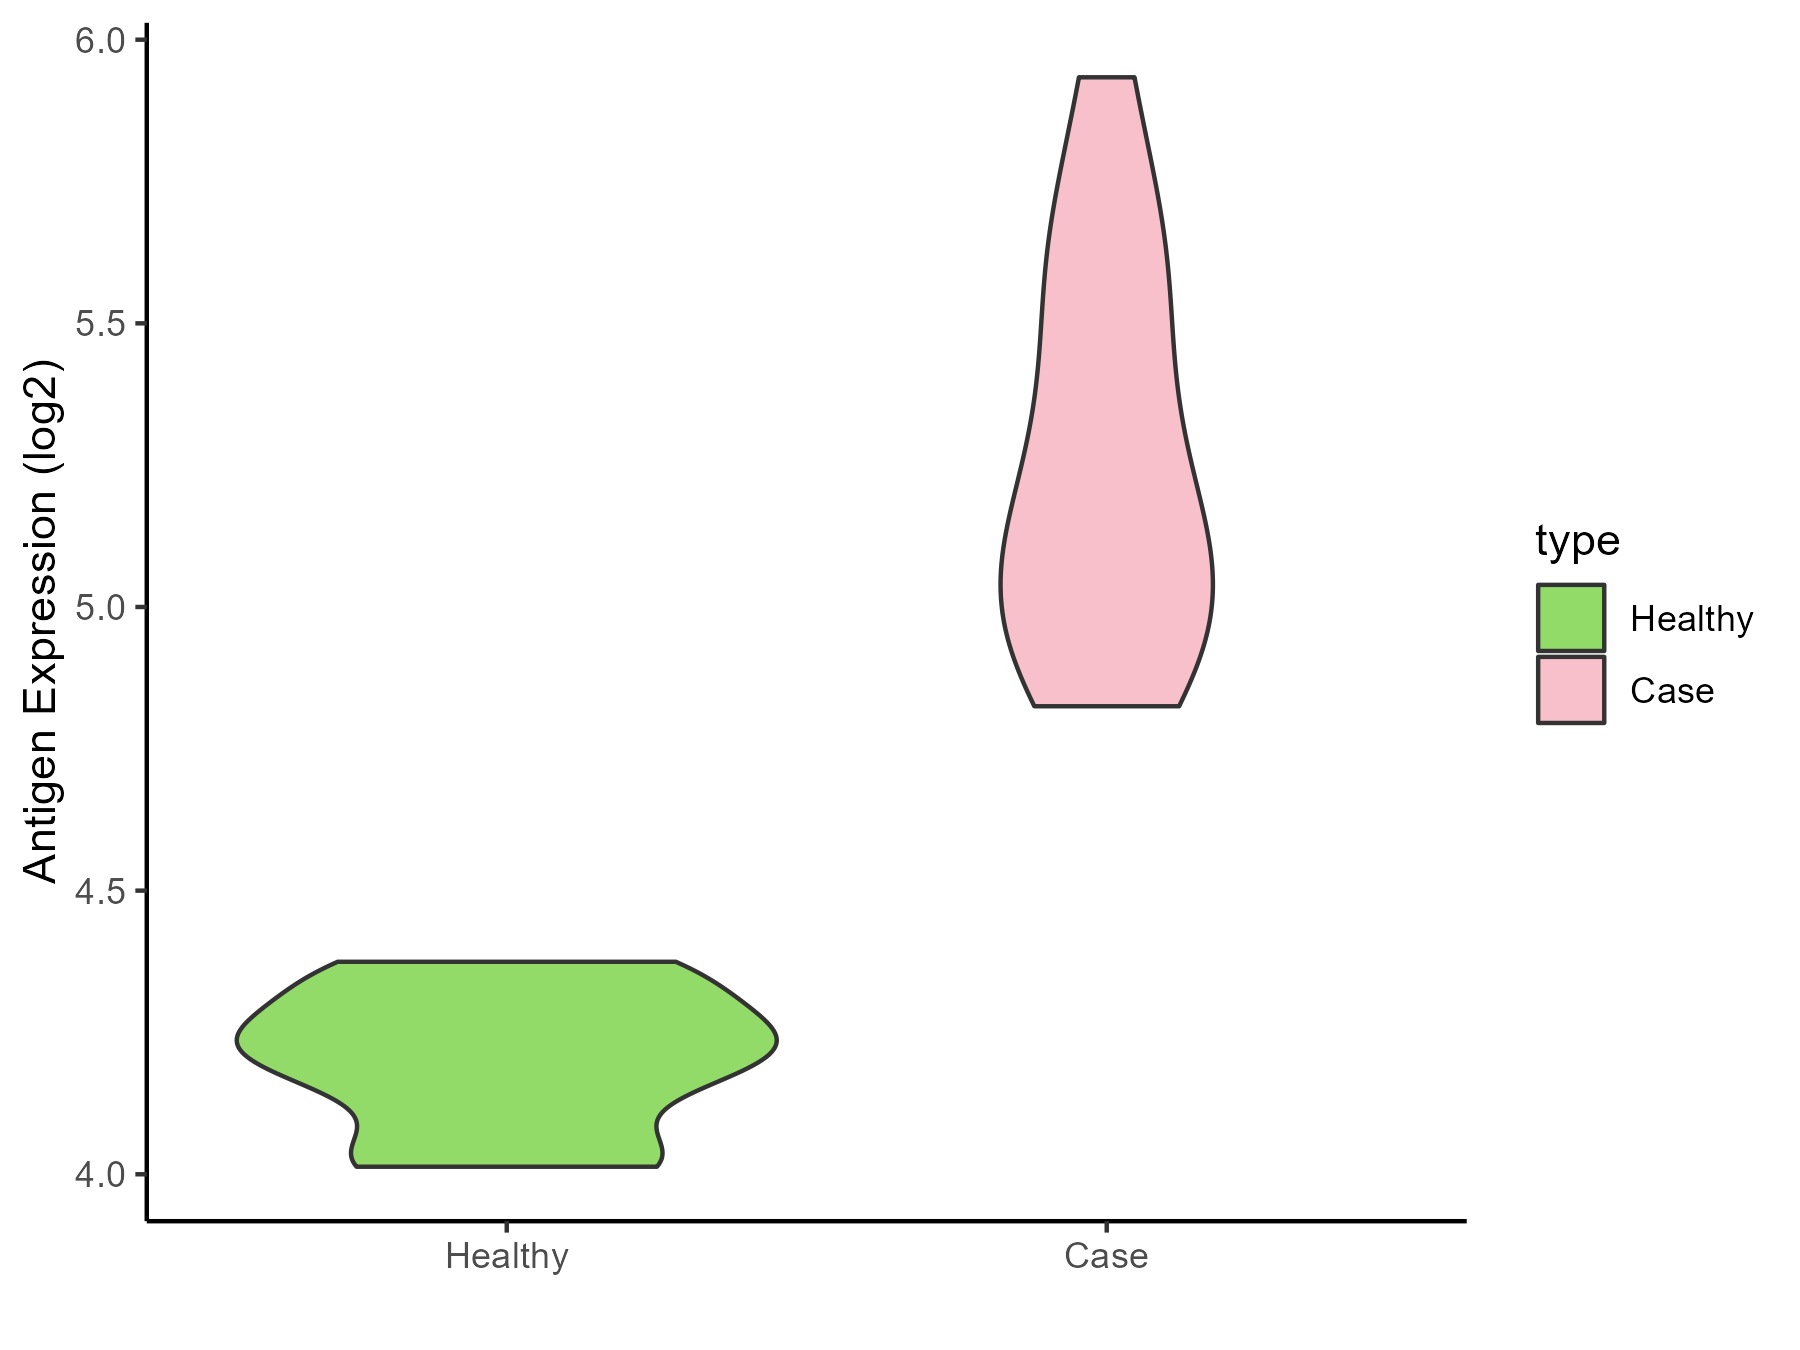
| The Studied Tissue | Uvea | |
| The Specific Disease | Retinoblastoma tumor | |
| The Expression Level of Disease Section Compare with the Healthy Individual Tissue | p-value: 5.42E-09; Fold-change: 0.934750996; Z-score: 7.213643493 | |
| Disease-specific Antigen Abundances |
|
Click to View the Clearer Original Diagram |
| Differential expression pattern of antigen in diseases | ||
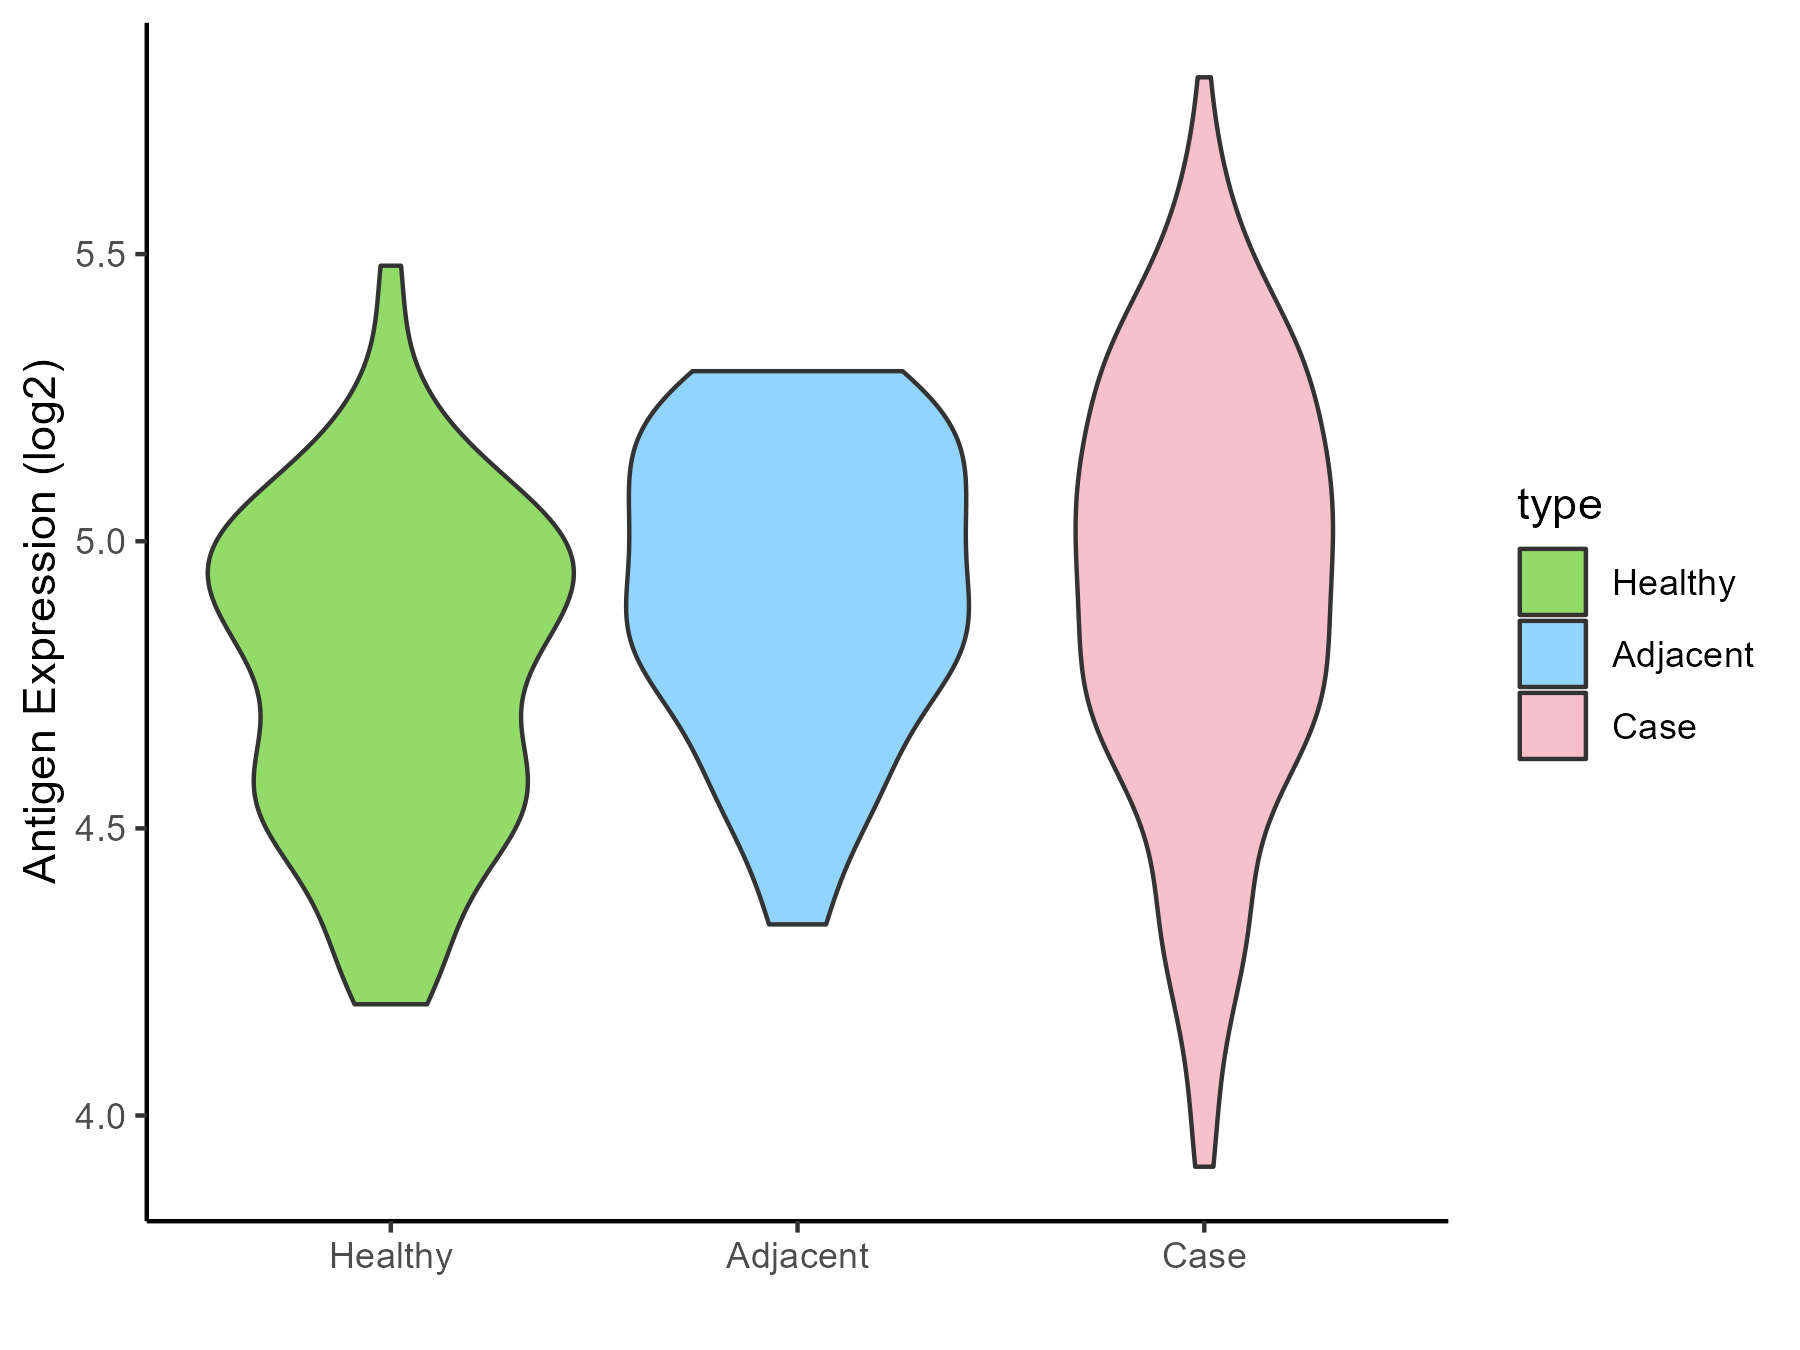
| The Studied Tissue | Thyroid | |
| The Specific Disease | Thyroid cancer | |
| The Expression Level of Disease Section Compare with the Healthy Individual Tissue | p-value: 0.000125129; Fold-change: 0.133712954; Z-score: 0.476007924 | |
| The Expression Level of Disease Section Compare with the Adjacent Tissue | p-value: 0.979645469; Fold-change: 0.042027504; Z-score: 0.164256376 | |
| Disease-specific Antigen Abundances |
|
Click to View the Clearer Original Diagram |
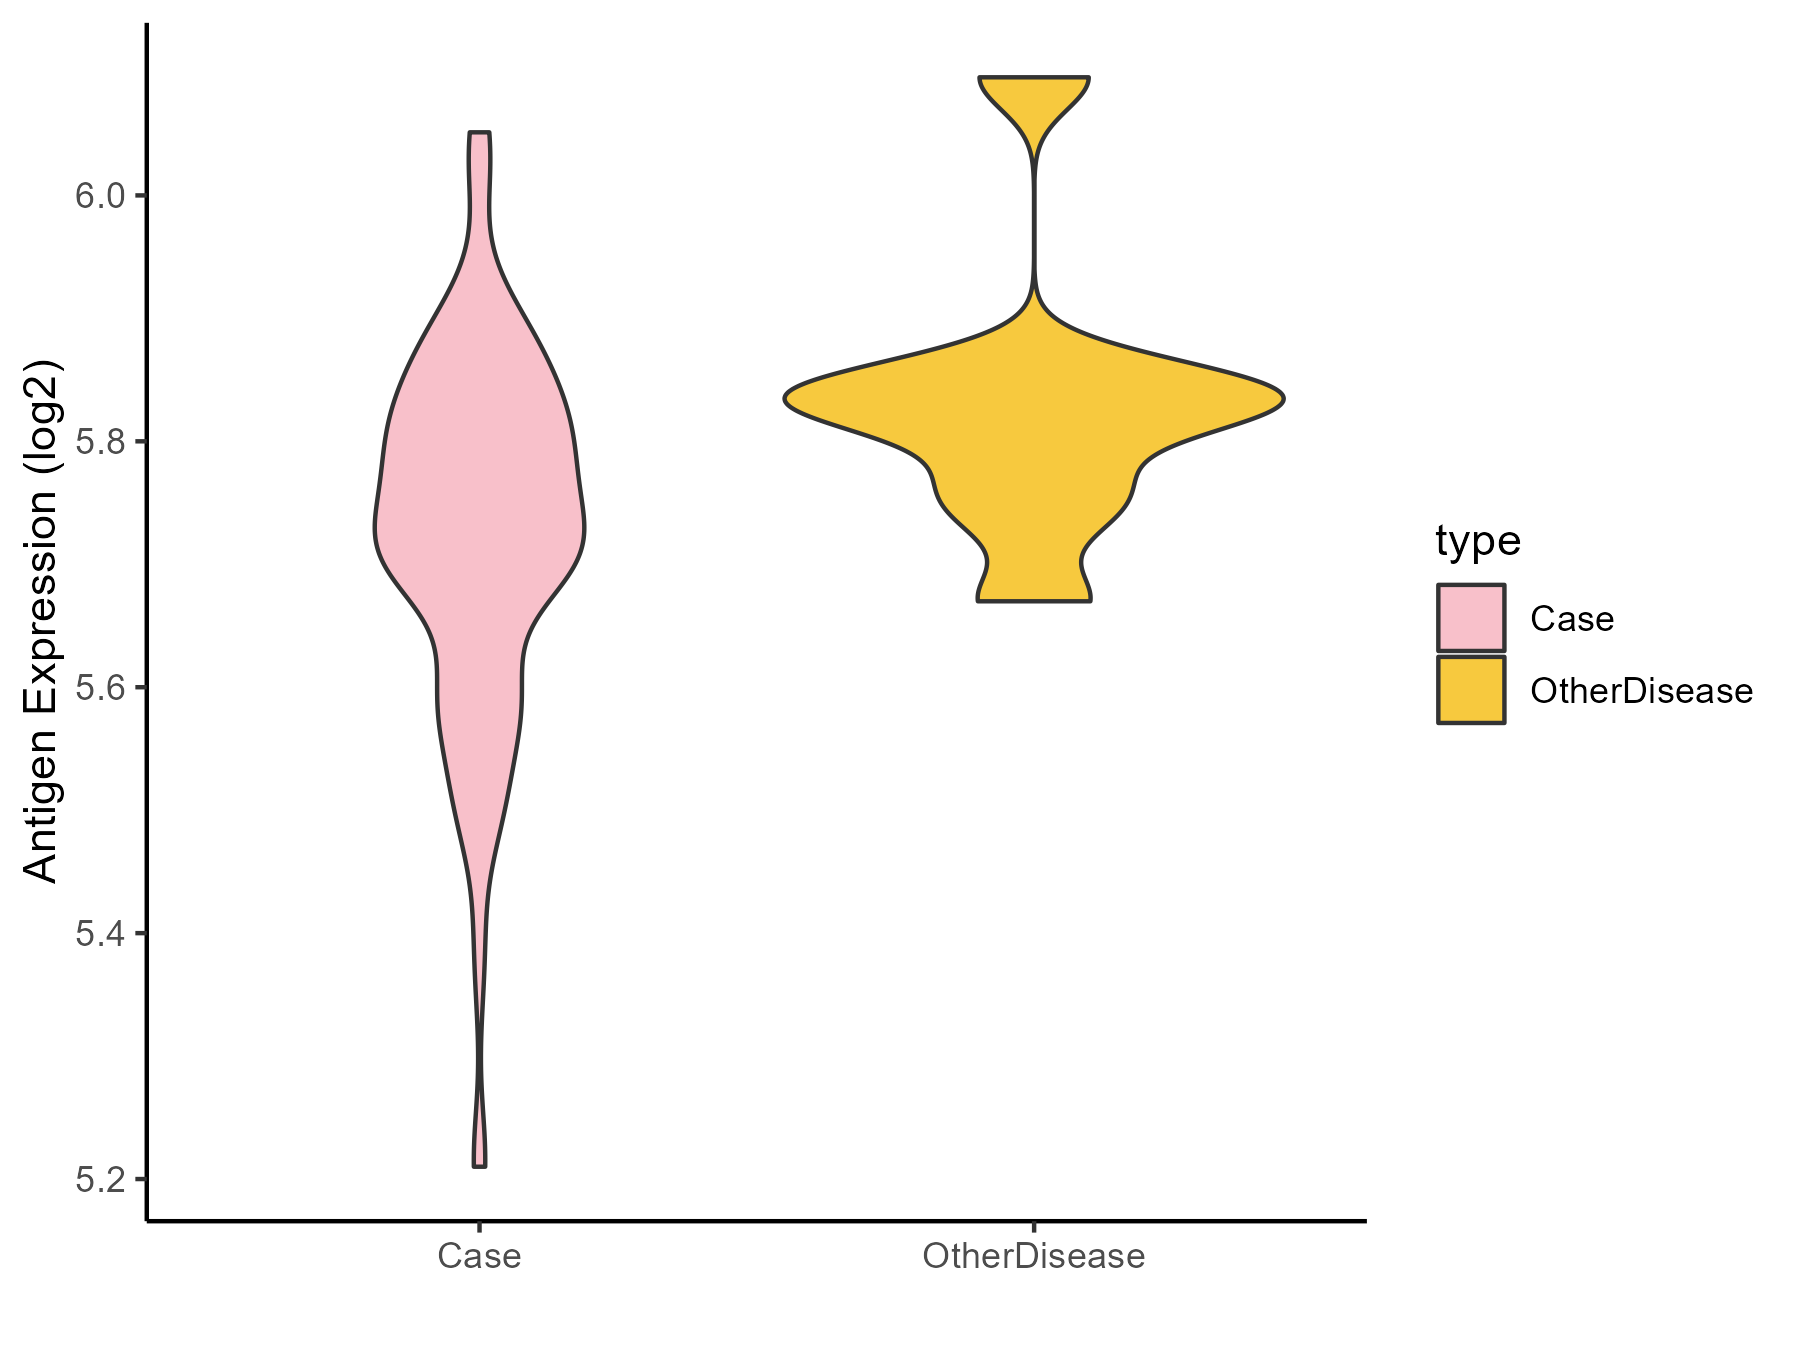
| Differential expression pattern of antigen in diseases | ||
| The Studied Tissue | Adrenal cortex | |
| The Specific Disease | Adrenocortical carcinoma | |
| The Expression Level of Disease Section Compare with the Other Disease Section | p-value: 0.002364709; Fold-change: -0.097731445; Z-score: -0.863594037 | |
| Disease-specific Antigen Abundances |
|
Click to View the Clearer Original Diagram |
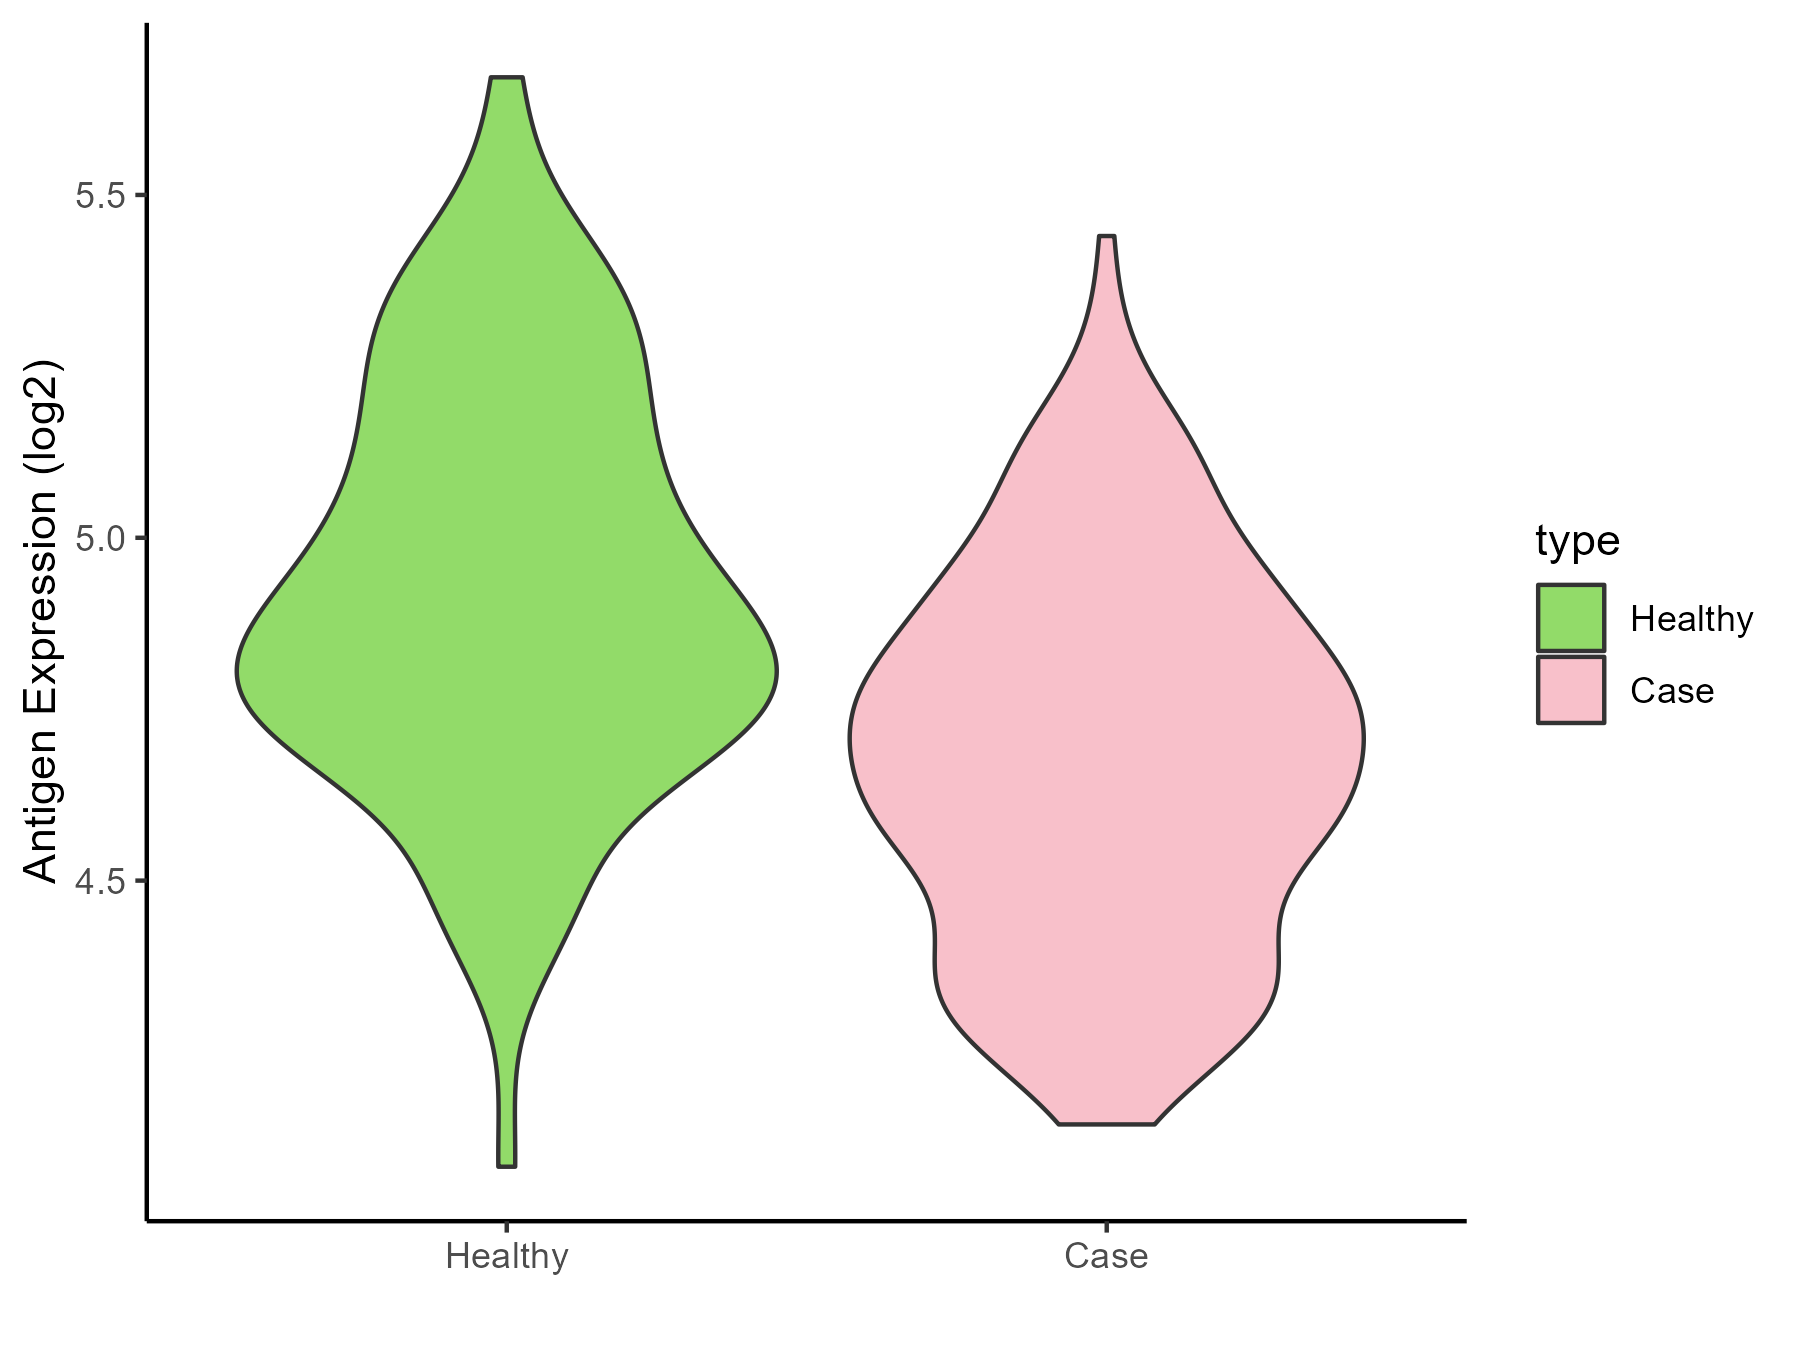
| Differential expression pattern of antigen in diseases | ||
| The Studied Tissue | Head and neck | |
| The Specific Disease | Head and neck cancer | |
| The Expression Level of Disease Section Compare with the Healthy Individual Tissue | p-value: 8.46E-10; Fold-change: -0.1968635; Z-score: -0.660981102 | |
| Disease-specific Antigen Abundances |
|
Click to View the Clearer Original Diagram |
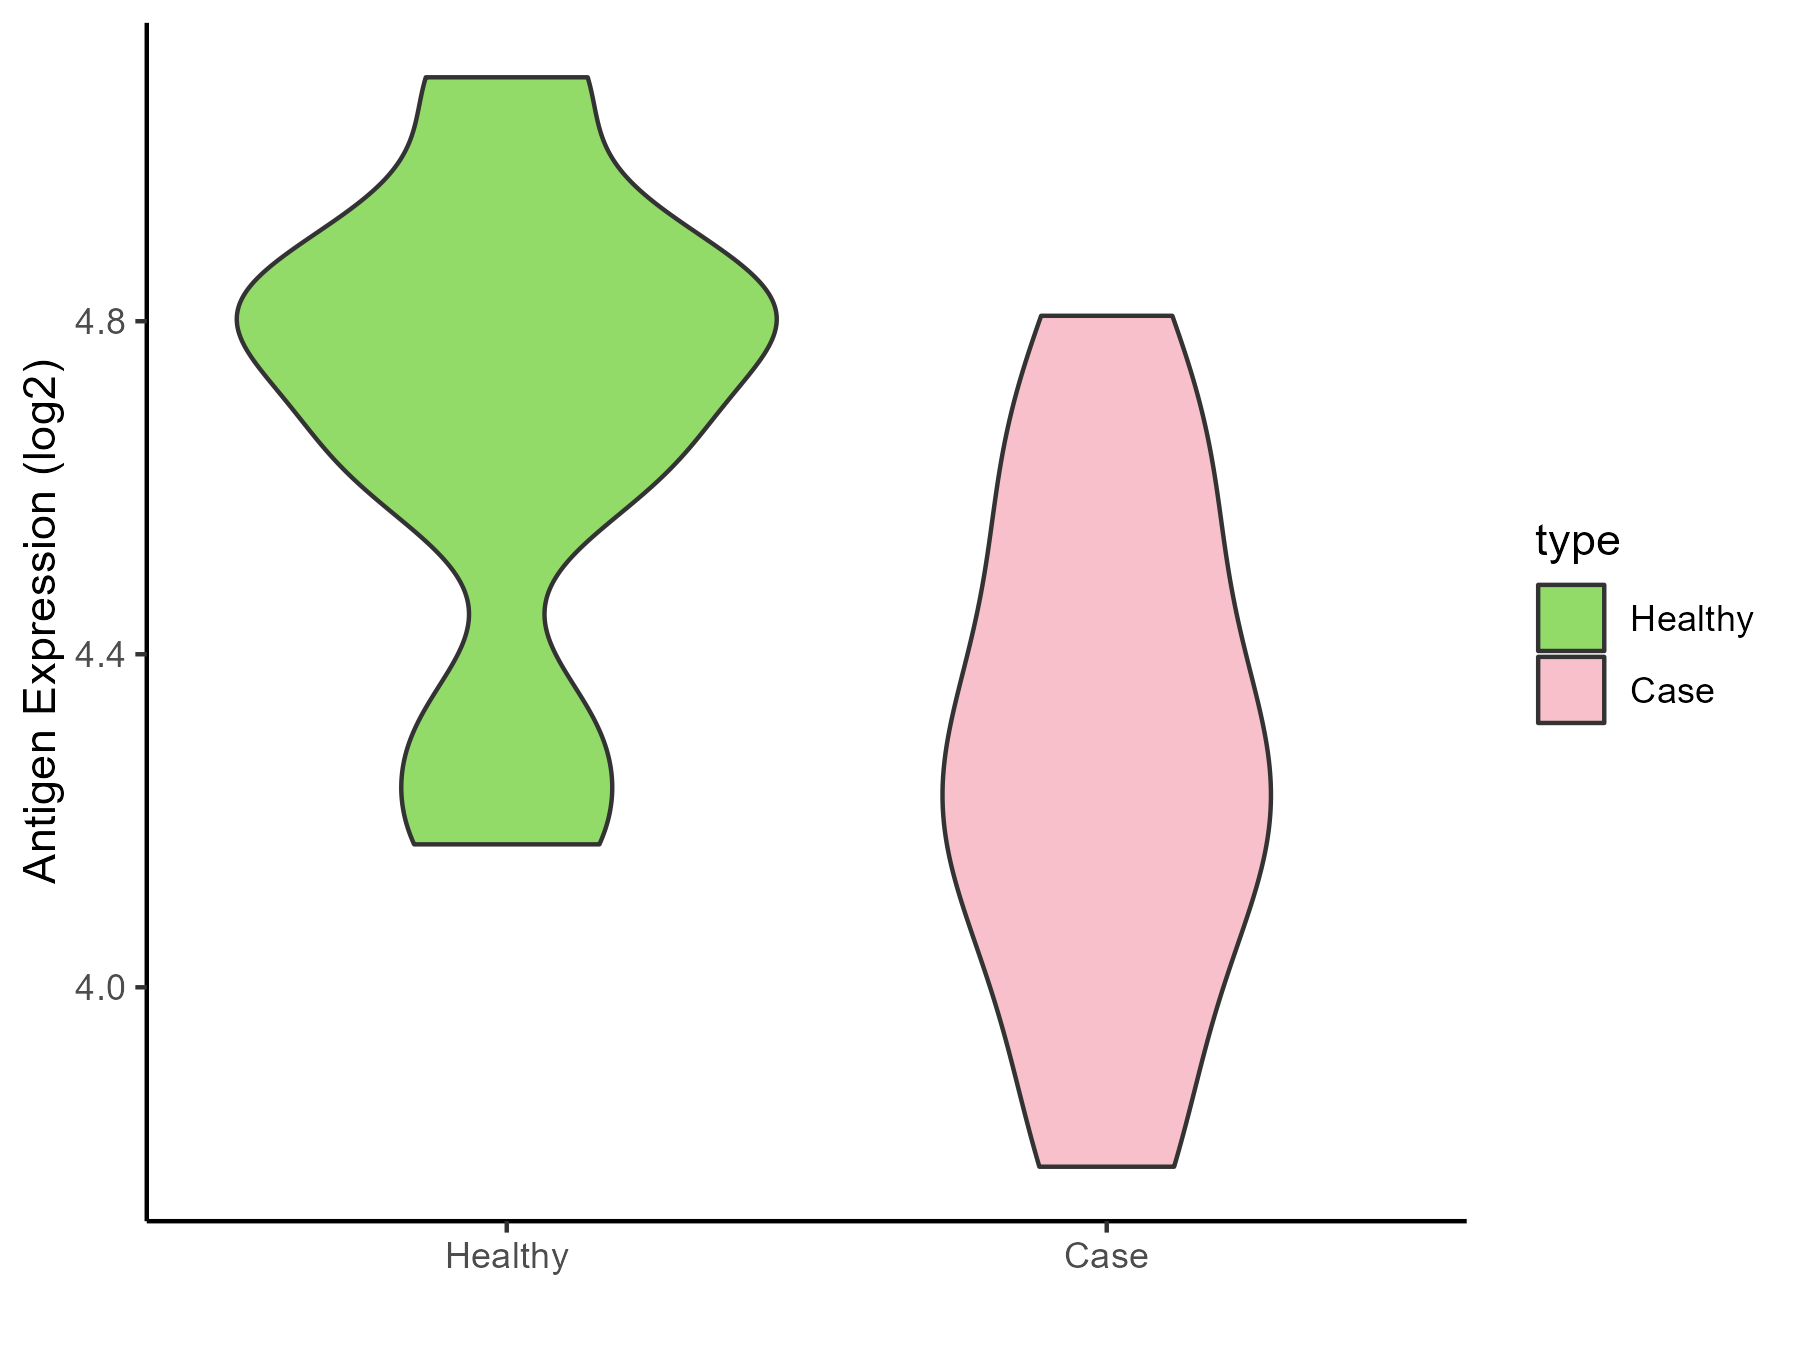
| Differential expression pattern of antigen in diseases | ||
| The Studied Tissue | Pituitary | |
| The Specific Disease | Pituitary gonadotrope tumor | |
| The Expression Level of Disease Section Compare with the Healthy Individual Tissue | p-value: 0.005518949; Fold-change: -0.523468084; Z-score: -1.805365916 | |
| Disease-specific Antigen Abundances |
|
Click to View the Clearer Original Diagram |
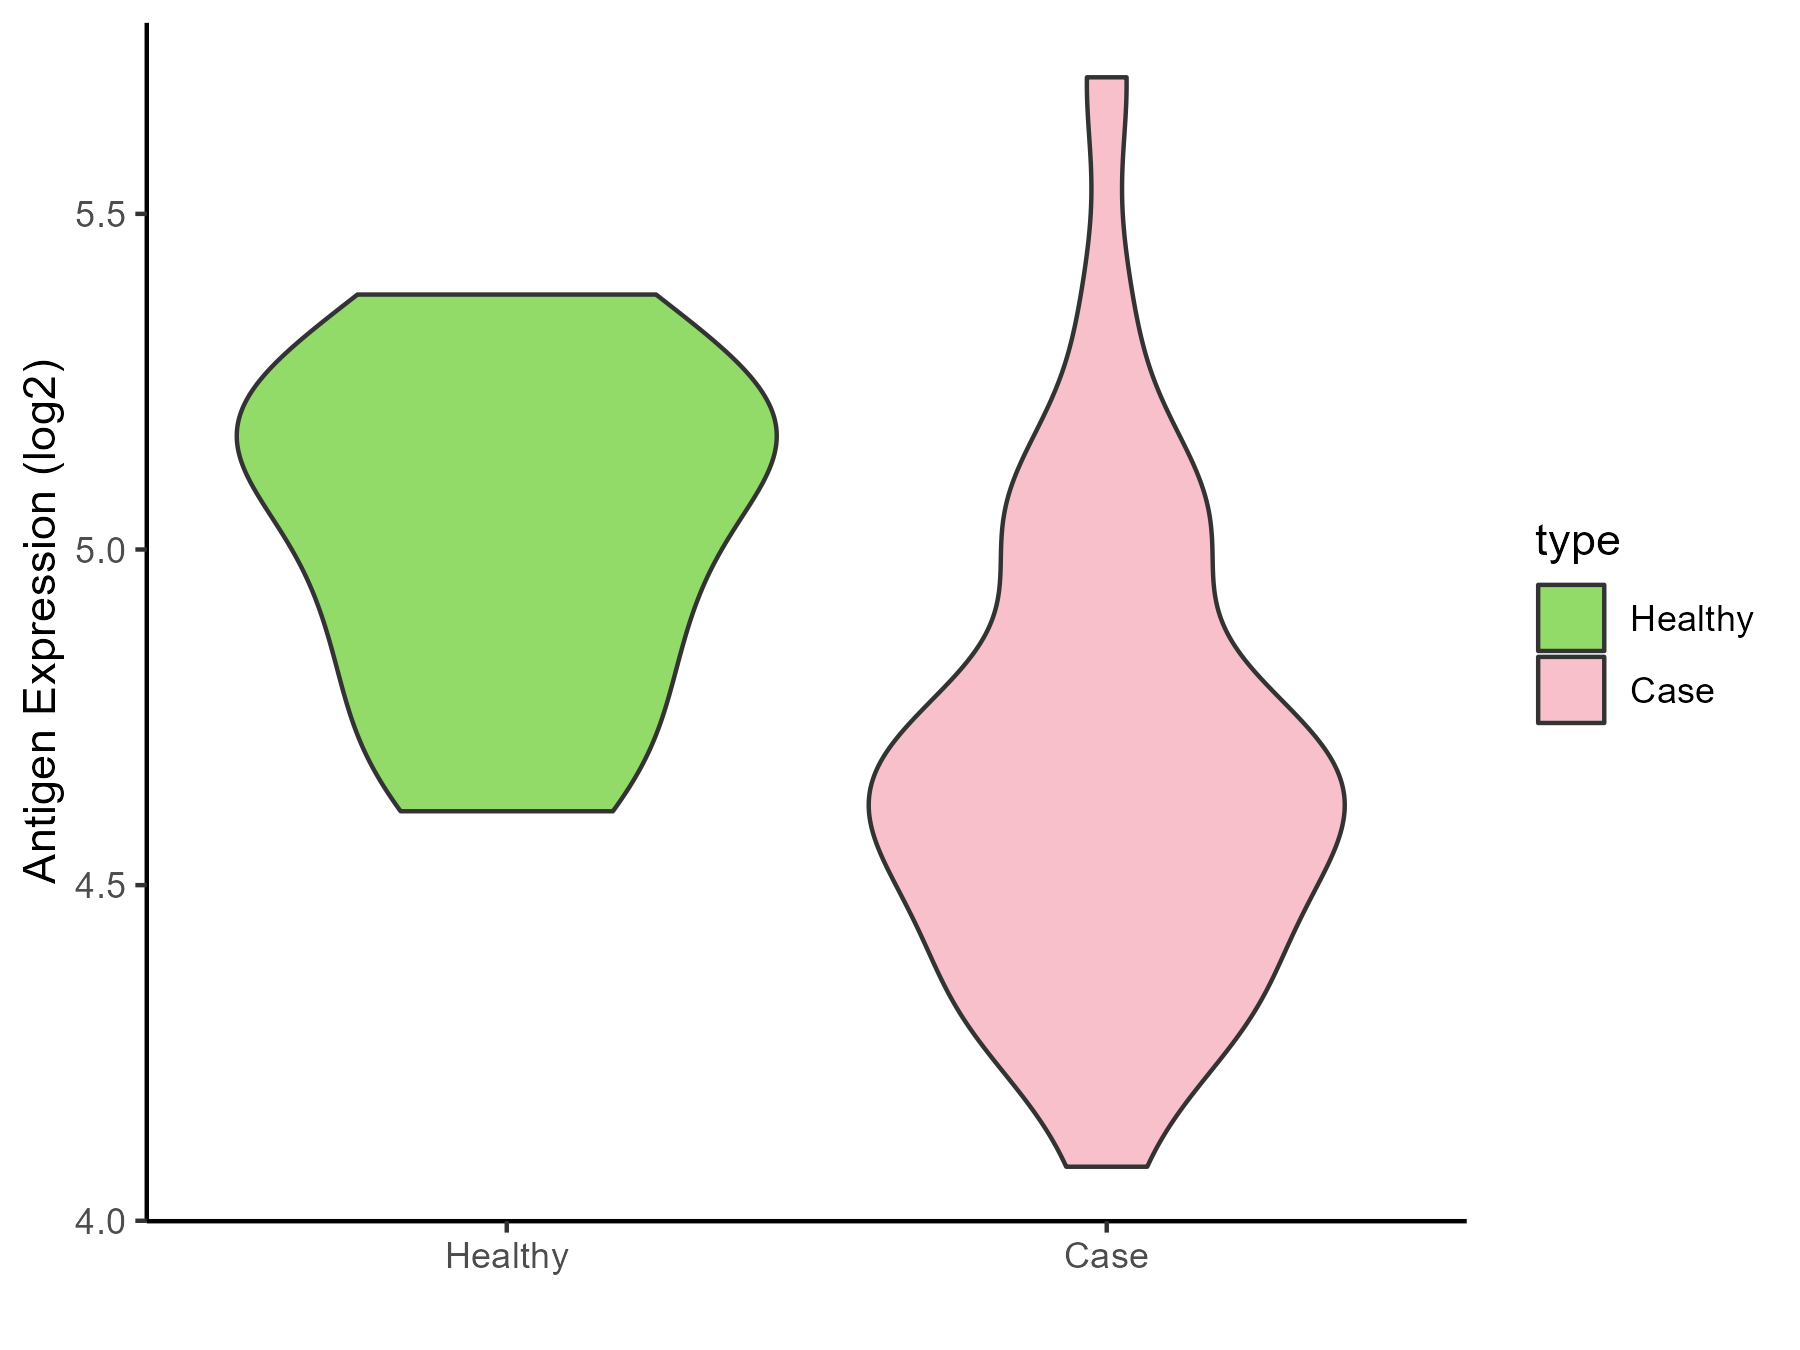
| The Studied Tissue | Pituitary | |
| The Specific Disease | Pituitary cancer | |
| The Expression Level of Disease Section Compare with the Healthy Individual Tissue | p-value: 0.001575386; Fold-change: -0.482758038; Z-score: -1.956107682 | |
| Disease-specific Antigen Abundances |
|
Click to View the Clearer Original Diagram |
ICD Disease Classification 03
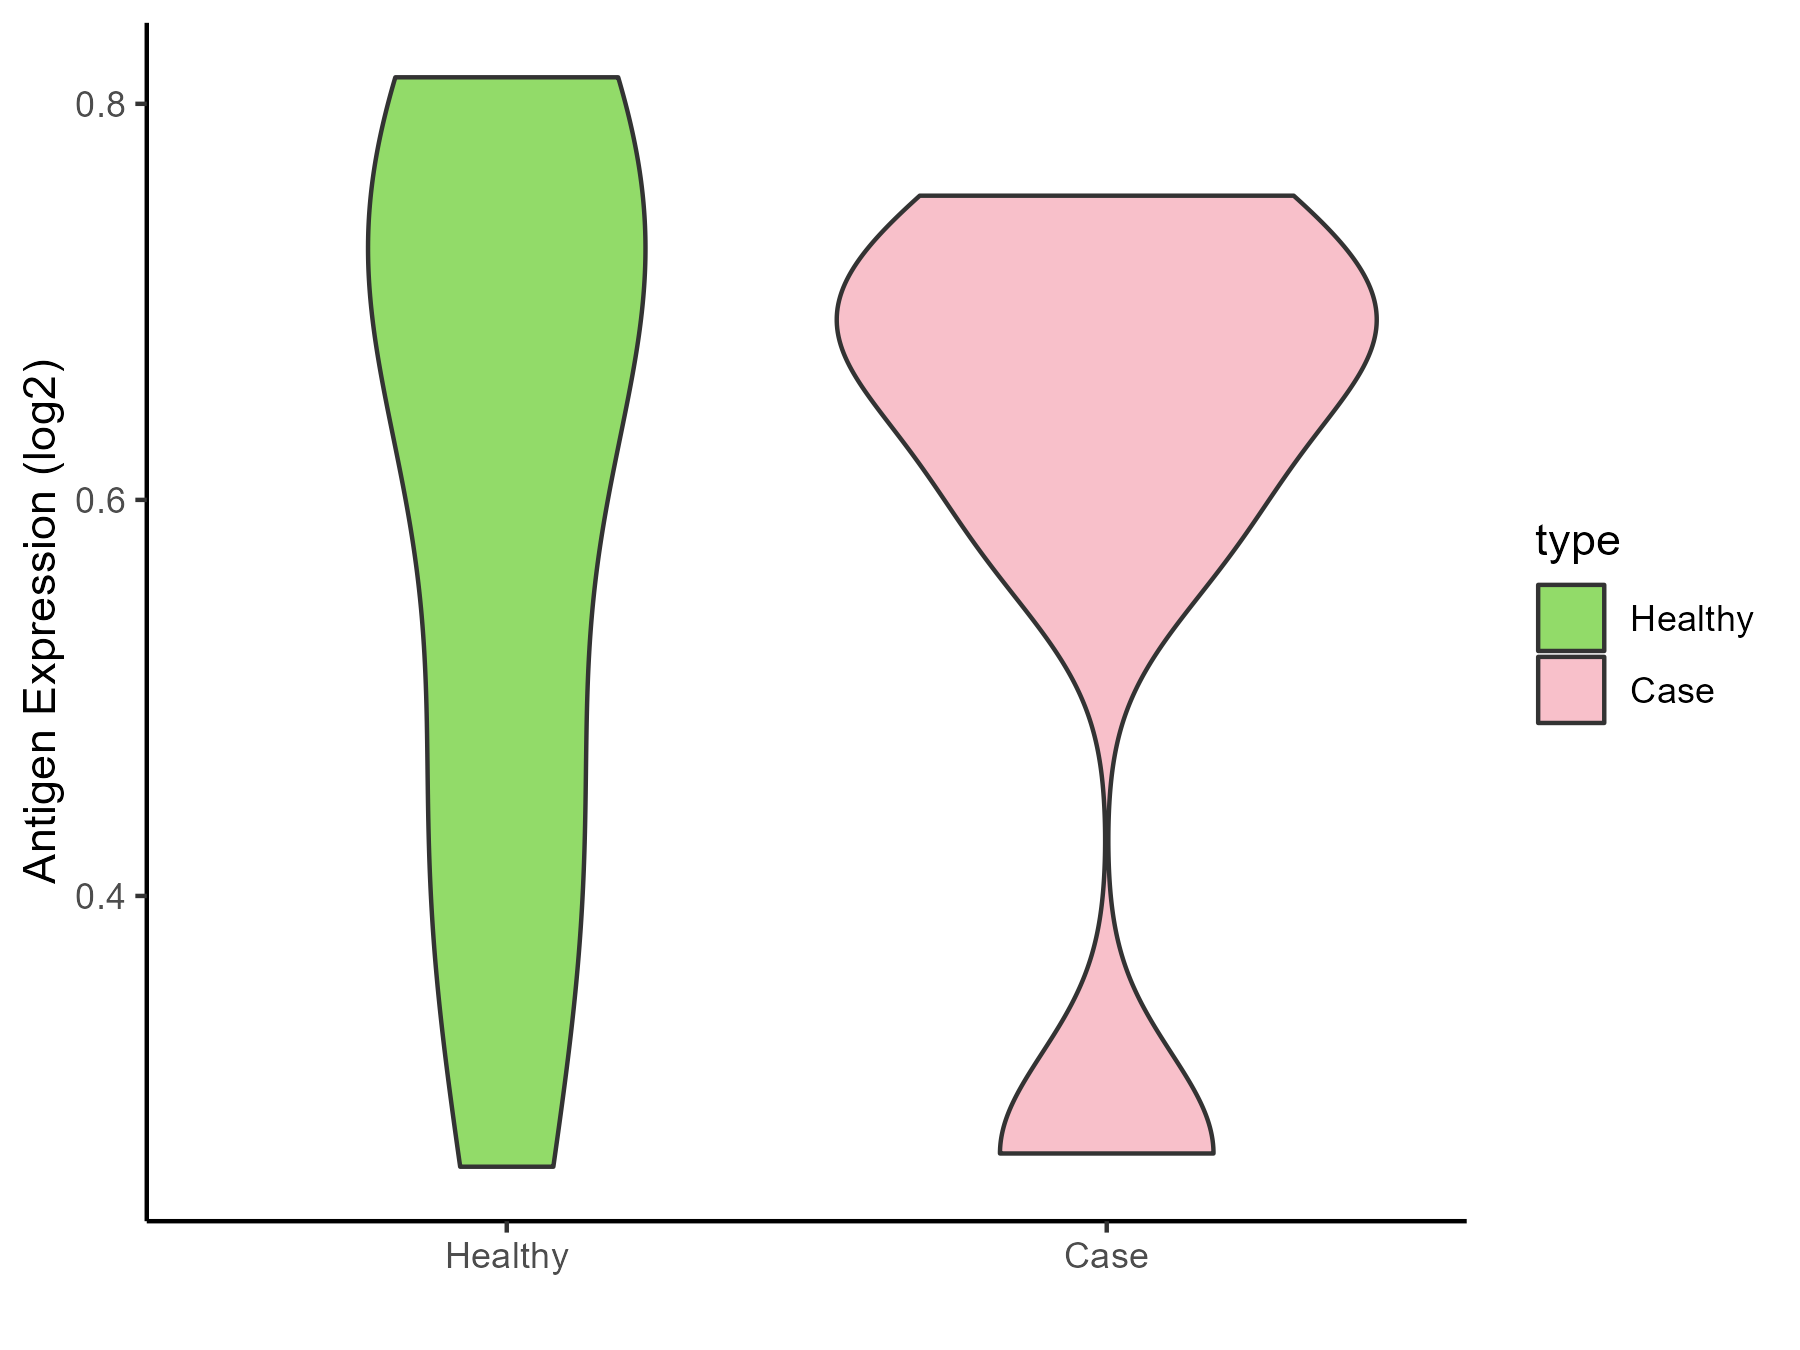
| Differential expression pattern of antigen in diseases | ||
| The Studied Tissue | Whole blood | |
| The Specific Disease | Thrombocytopenia | |
| The Expression Level of Disease Section Compare with the Healthy Individual Tissue | p-value: 0.935246539; Fold-change: -0.003316367; Z-score: -0.017512856 | |
| Disease-specific Antigen Abundances |
|
Click to View the Clearer Original Diagram |
ICD Disease Classification 04
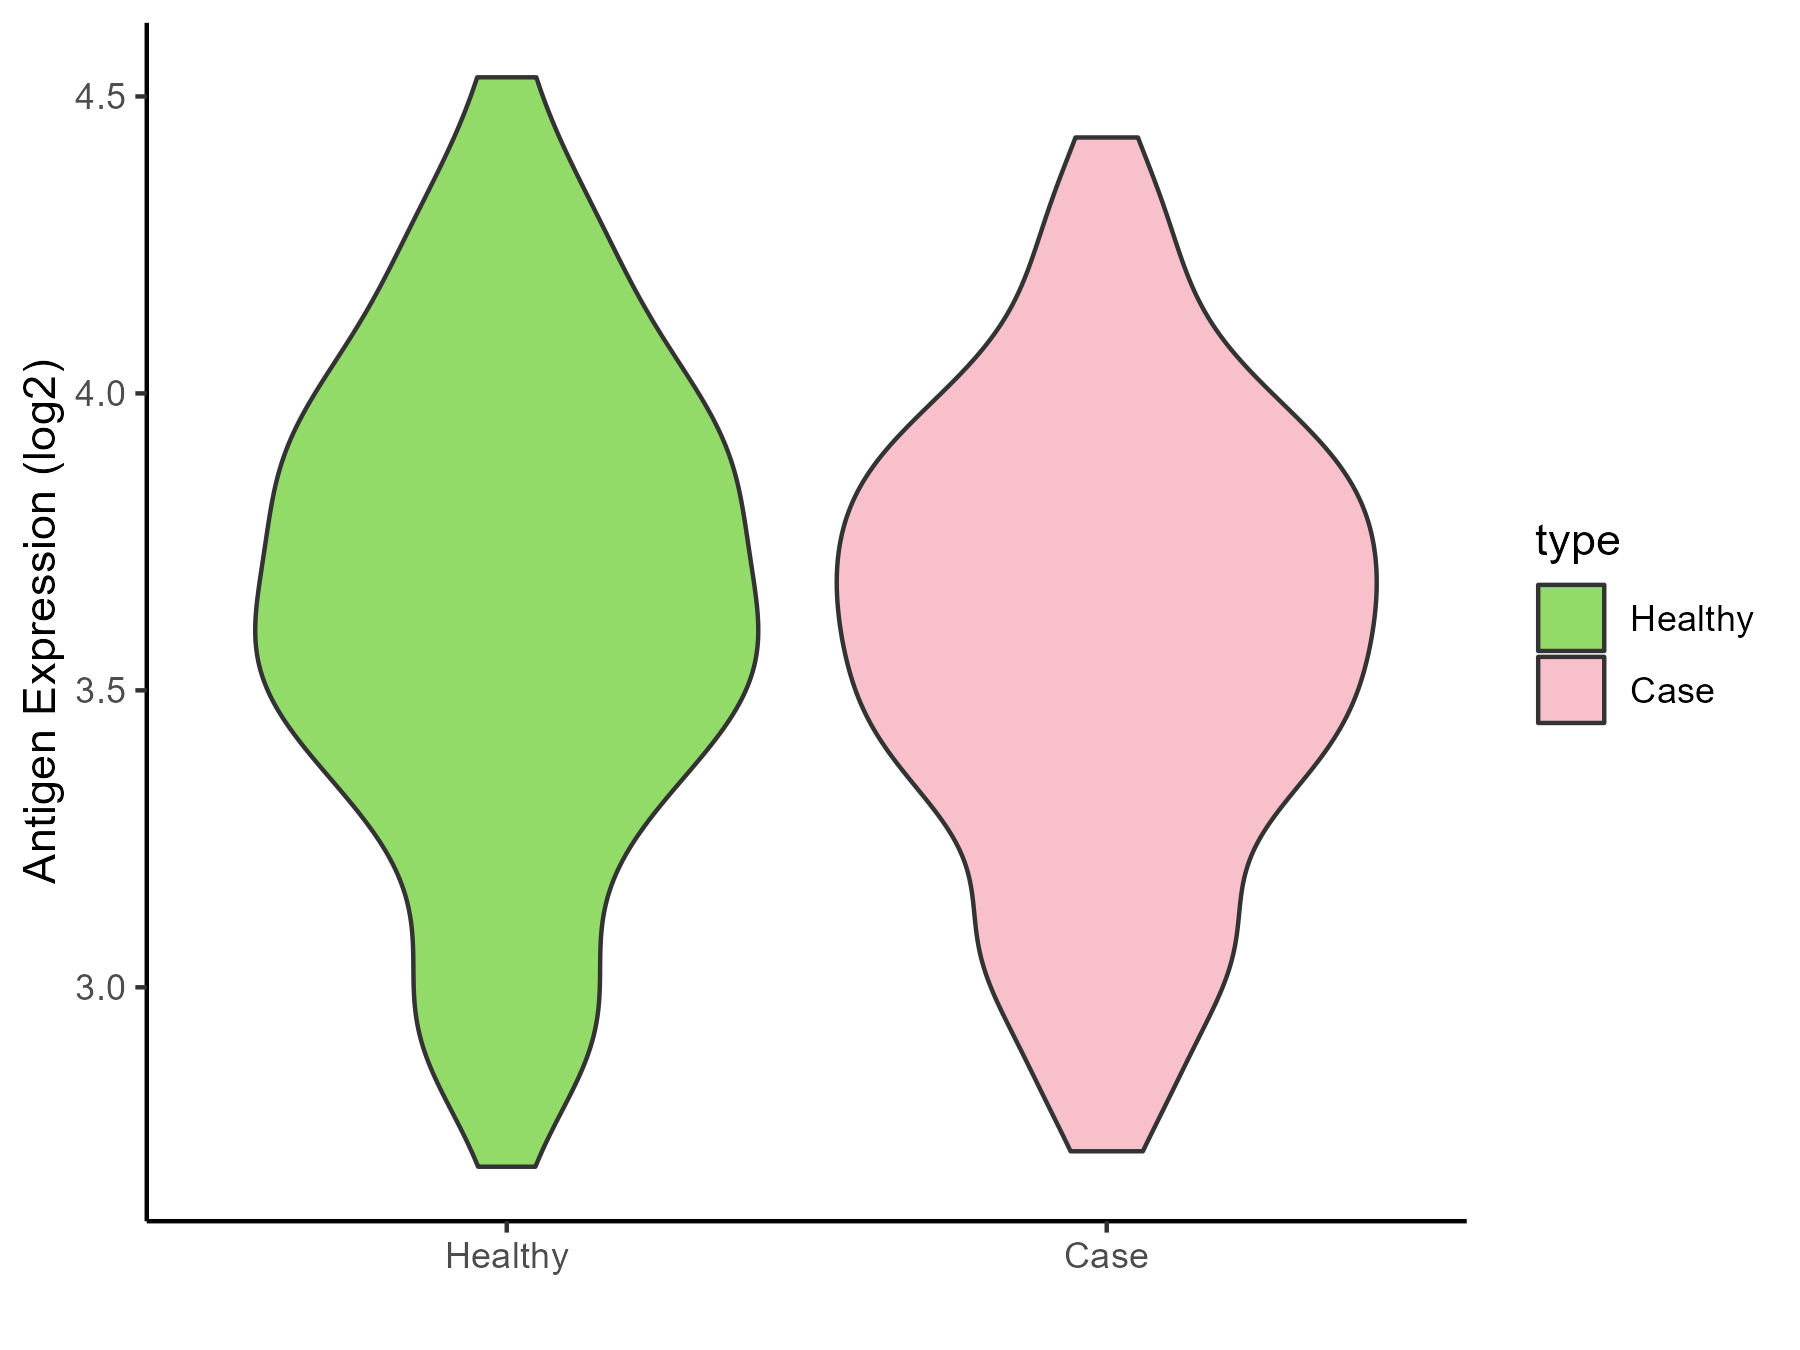
| Differential expression pattern of antigen in diseases | ||
| The Studied Tissue | Whole blood | |
| The Specific Disease | Lupus erythematosus | |
| The Expression Level of Disease Section Compare with the Healthy Individual Tissue | p-value: 0.133453789; Fold-change: -0.05365248; Z-score: -0.131851316 | |
| Disease-specific Antigen Abundances |
|
Click to View the Clearer Original Diagram |
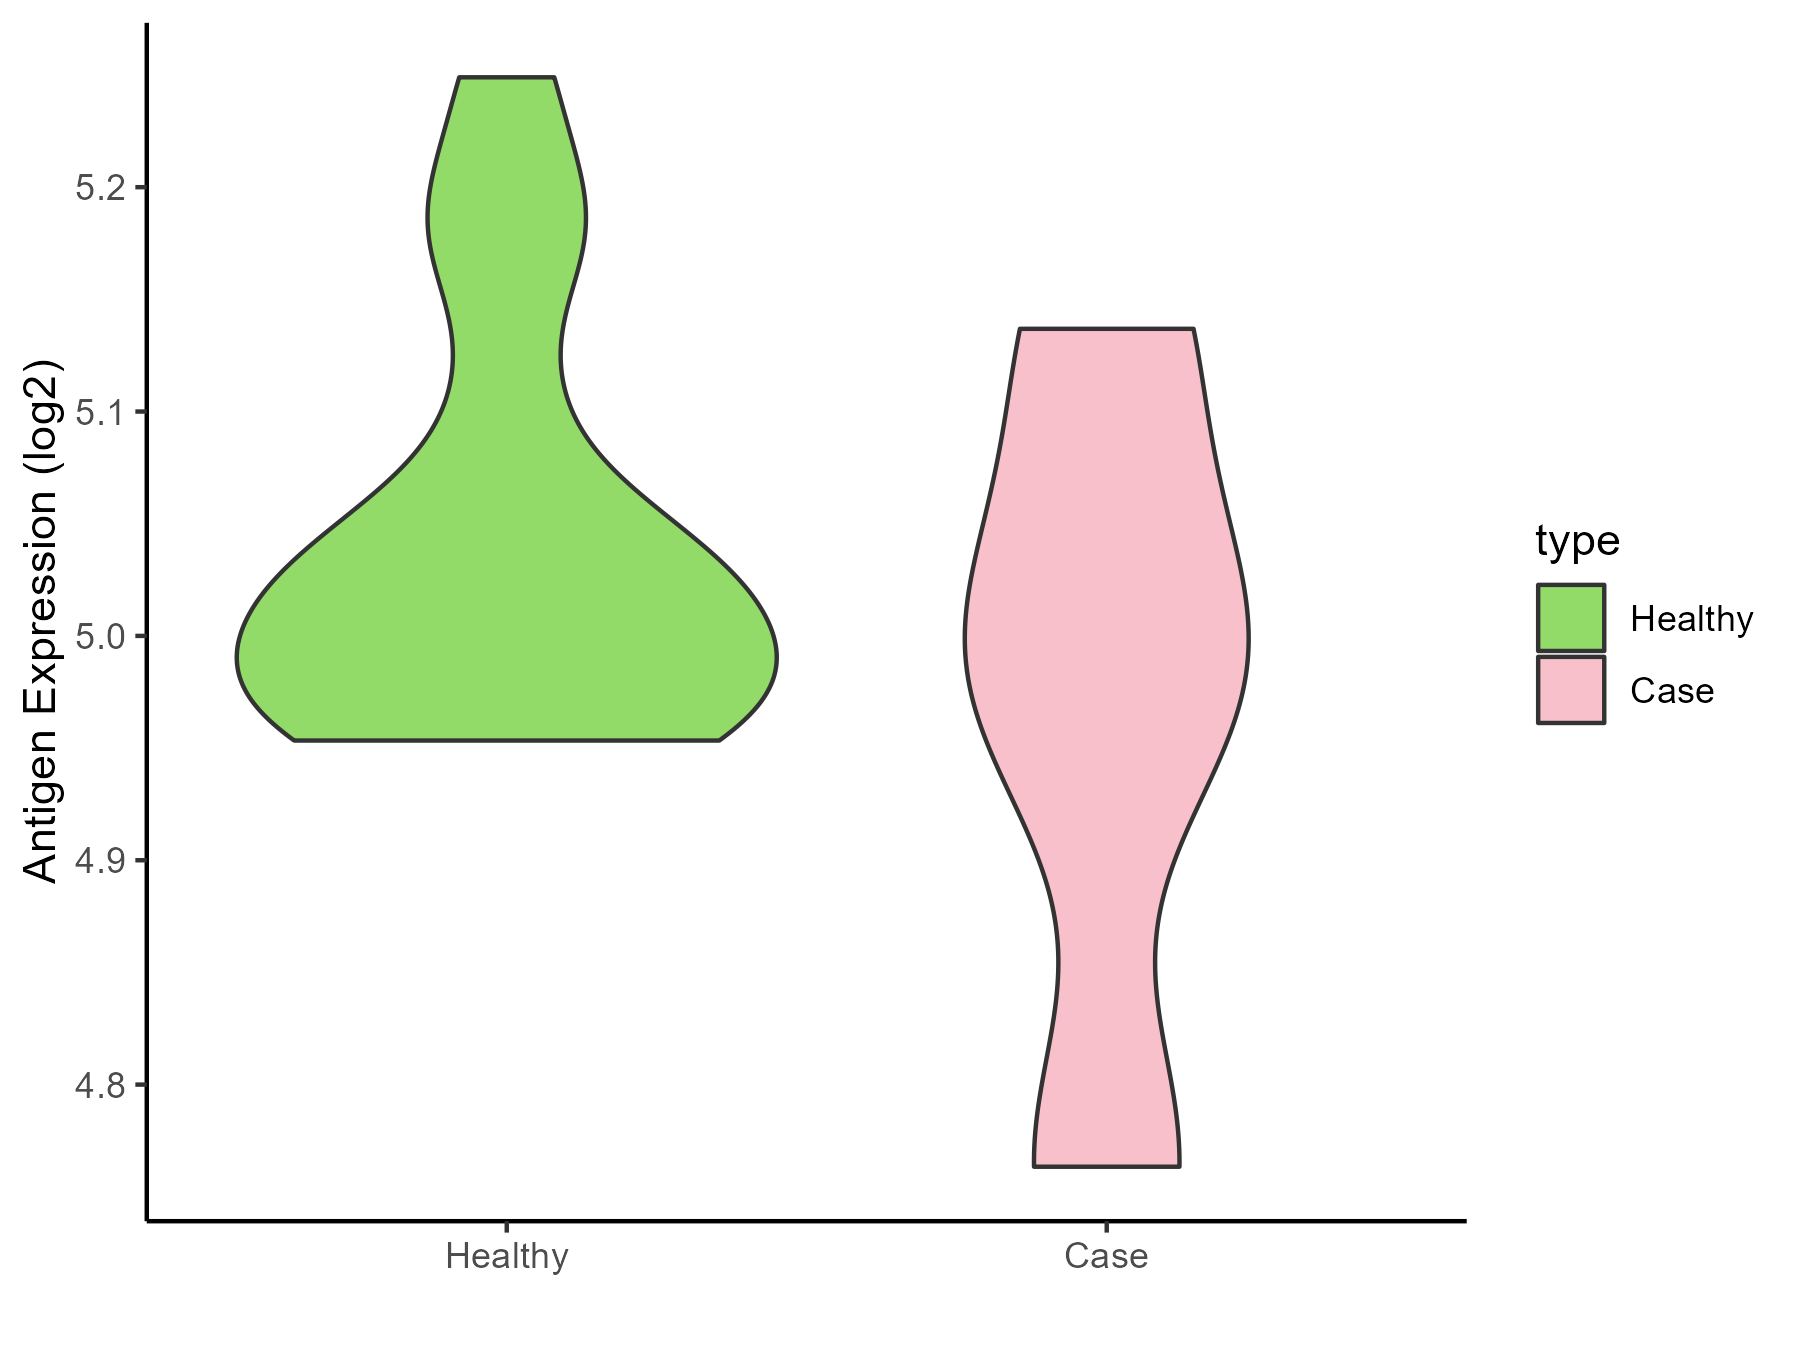
| Differential expression pattern of antigen in diseases | ||
| The Studied Tissue | Peripheral monocyte | |
| The Specific Disease | Autoimmune uveitis | |
| The Expression Level of Disease Section Compare with the Healthy Individual Tissue | p-value: 0.422980091; Fold-change: -0.042300611; Z-score: -0.453531462 | |
| Disease-specific Antigen Abundances |
|
Click to View the Clearer Original Diagram |
ICD Disease Classification 05
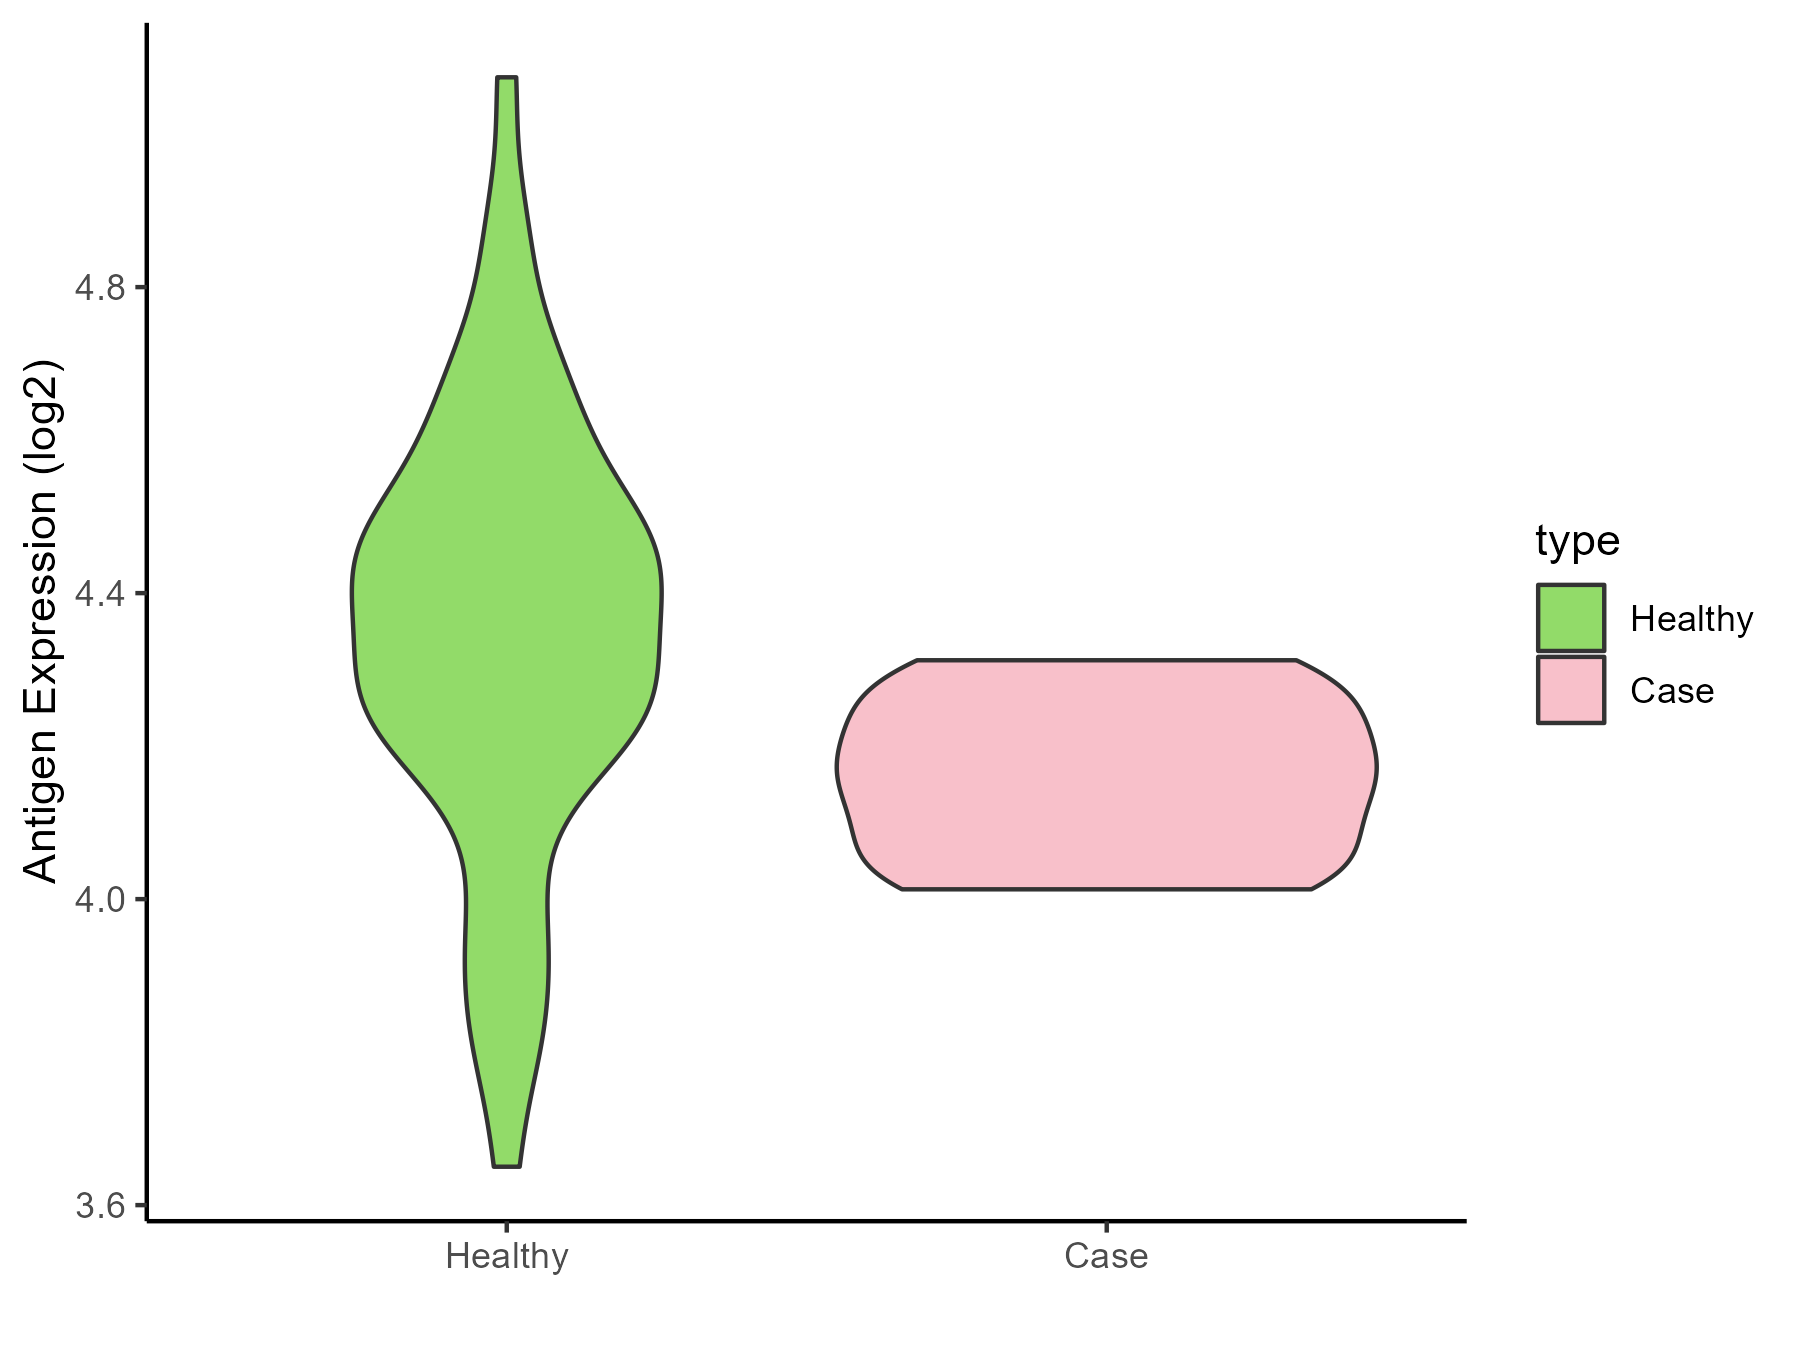
| Differential expression pattern of antigen in diseases | ||
| The Studied Tissue | Whole blood | |
| The Specific Disease | Familial hypercholesterolemia | |
| The Expression Level of Disease Section Compare with the Healthy Individual Tissue | p-value: 0.001042452; Fold-change: -0.189572611; Z-score: -0.669644317 | |
| Disease-specific Antigen Abundances |
|
Click to View the Clearer Original Diagram |
ICD Disease Classification 06
| Differential expression pattern of antigen in diseases | ||
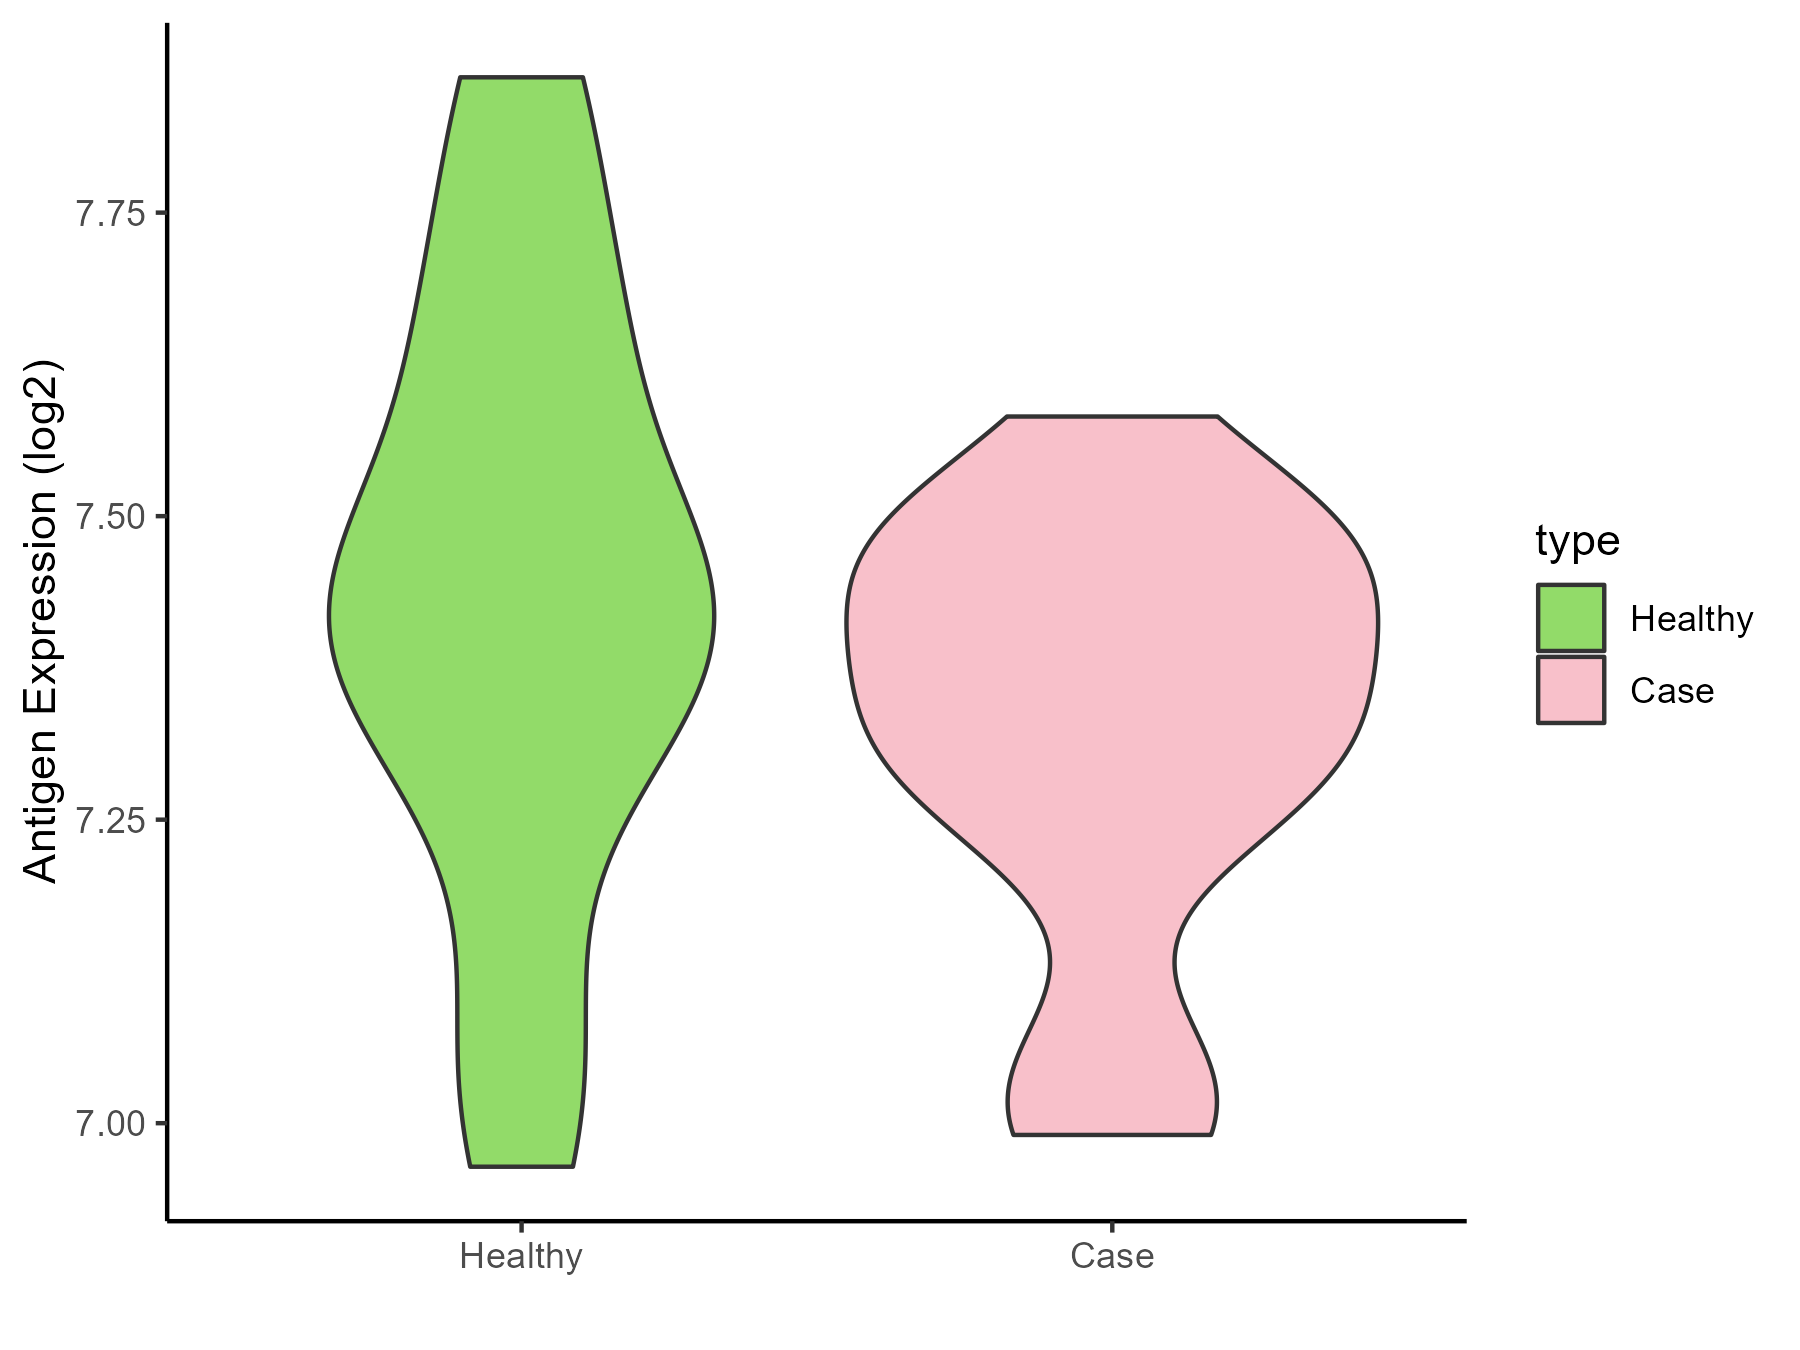
| The Studied Tissue | Superior temporal cortex | |
| The Specific Disease | Schizophrenia | |
| The Expression Level of Disease Section Compare with the Healthy Individual Tissue | p-value: 0.105062958; Fold-change: -0.067730966; Z-score: -0.271727241 | |
| Disease-specific Antigen Abundances |
|
Click to View the Clearer Original Diagram |
ICD Disease Classification 08
| Differential expression pattern of antigen in diseases | ||
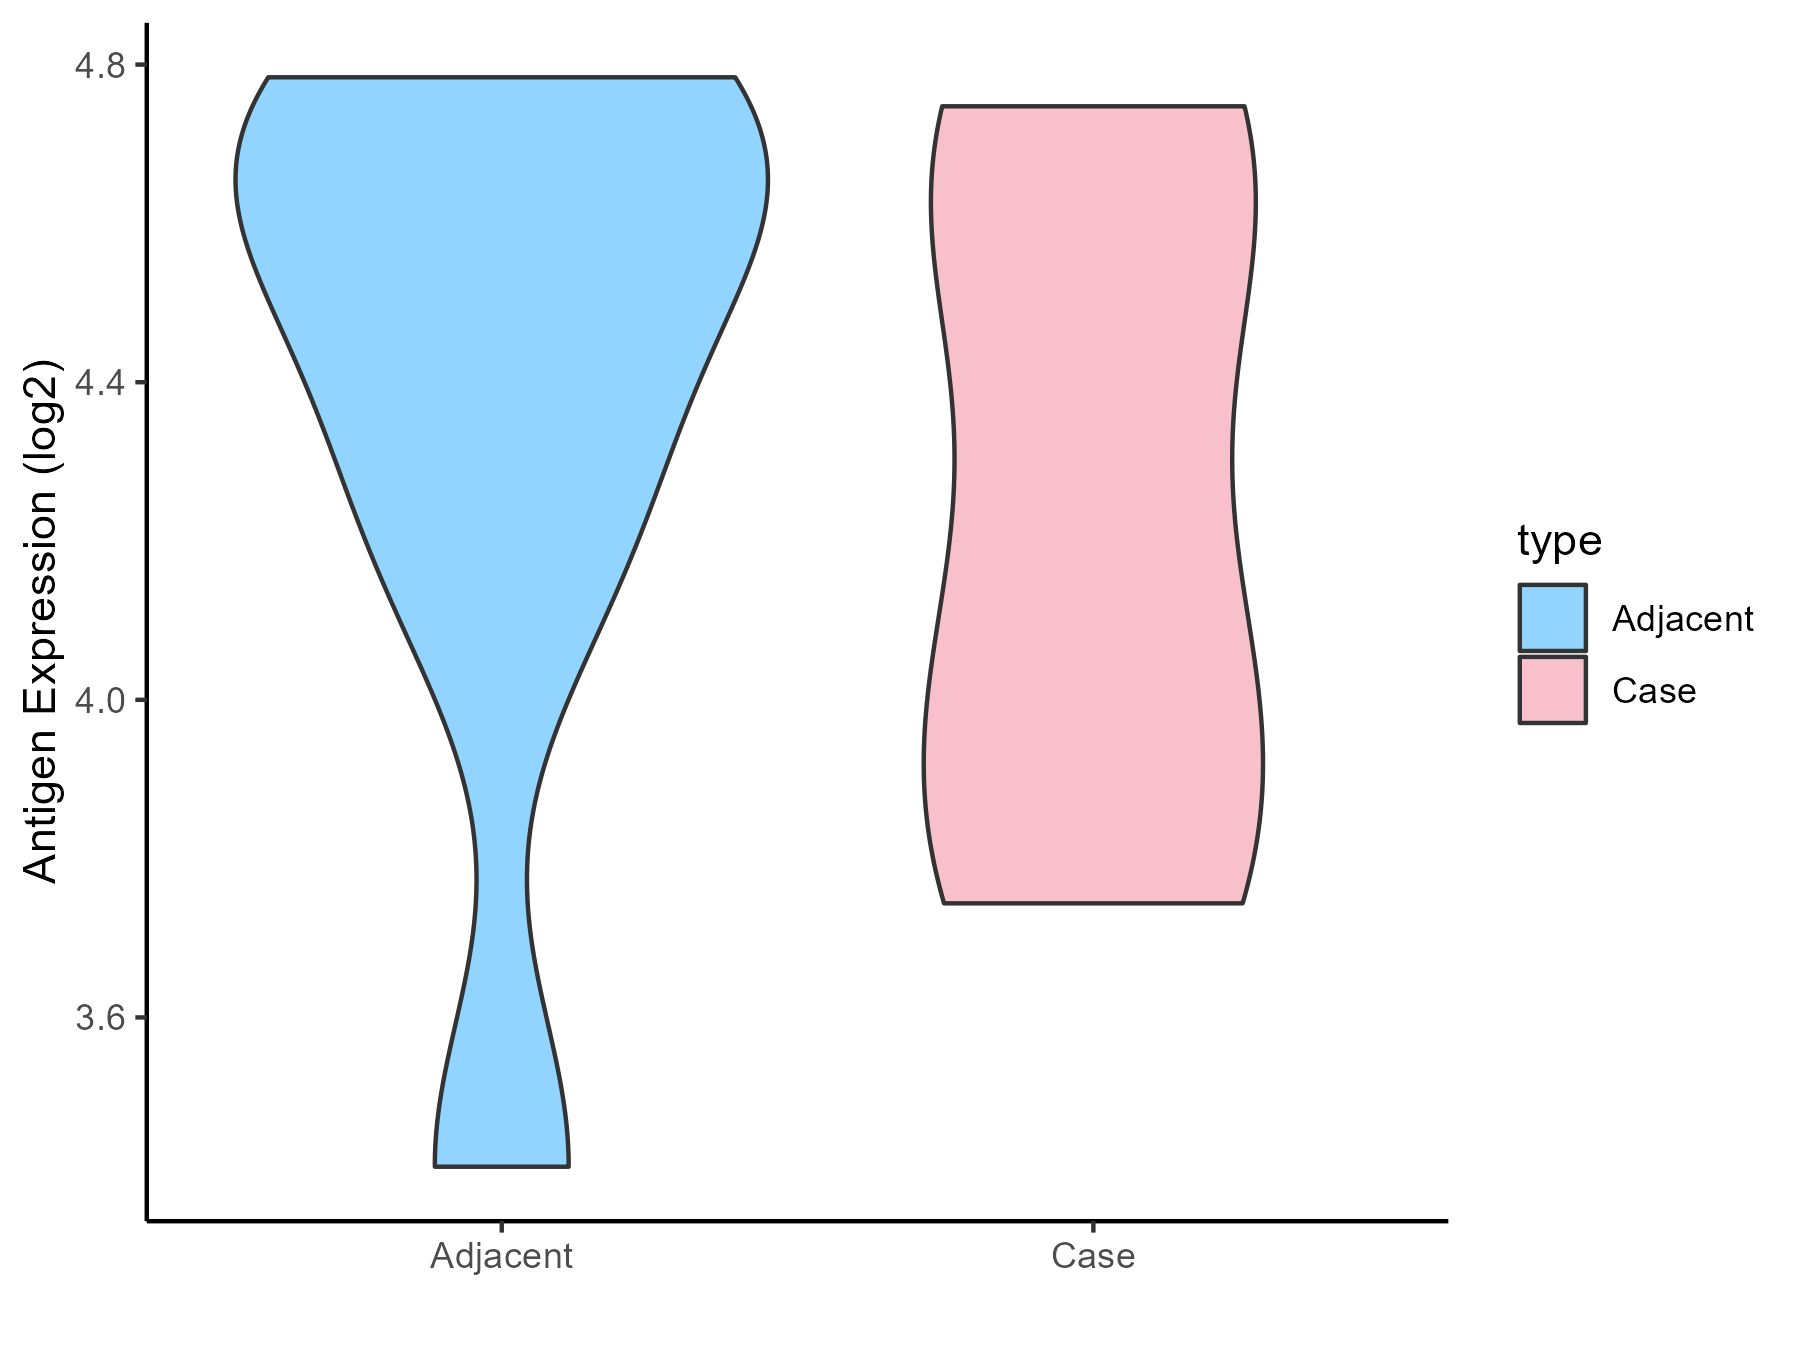
| The Studied Tissue | Spinal cord | |
| The Specific Disease | Multiple sclerosis | |
| The Expression Level of Disease Section Compare with the Adjacent Tissue | p-value: 0.577737054; Fold-change: -0.436557413; Z-score: -0.901391595 | |
| Disease-specific Antigen Abundances |
|
Click to View the Clearer Original Diagram |
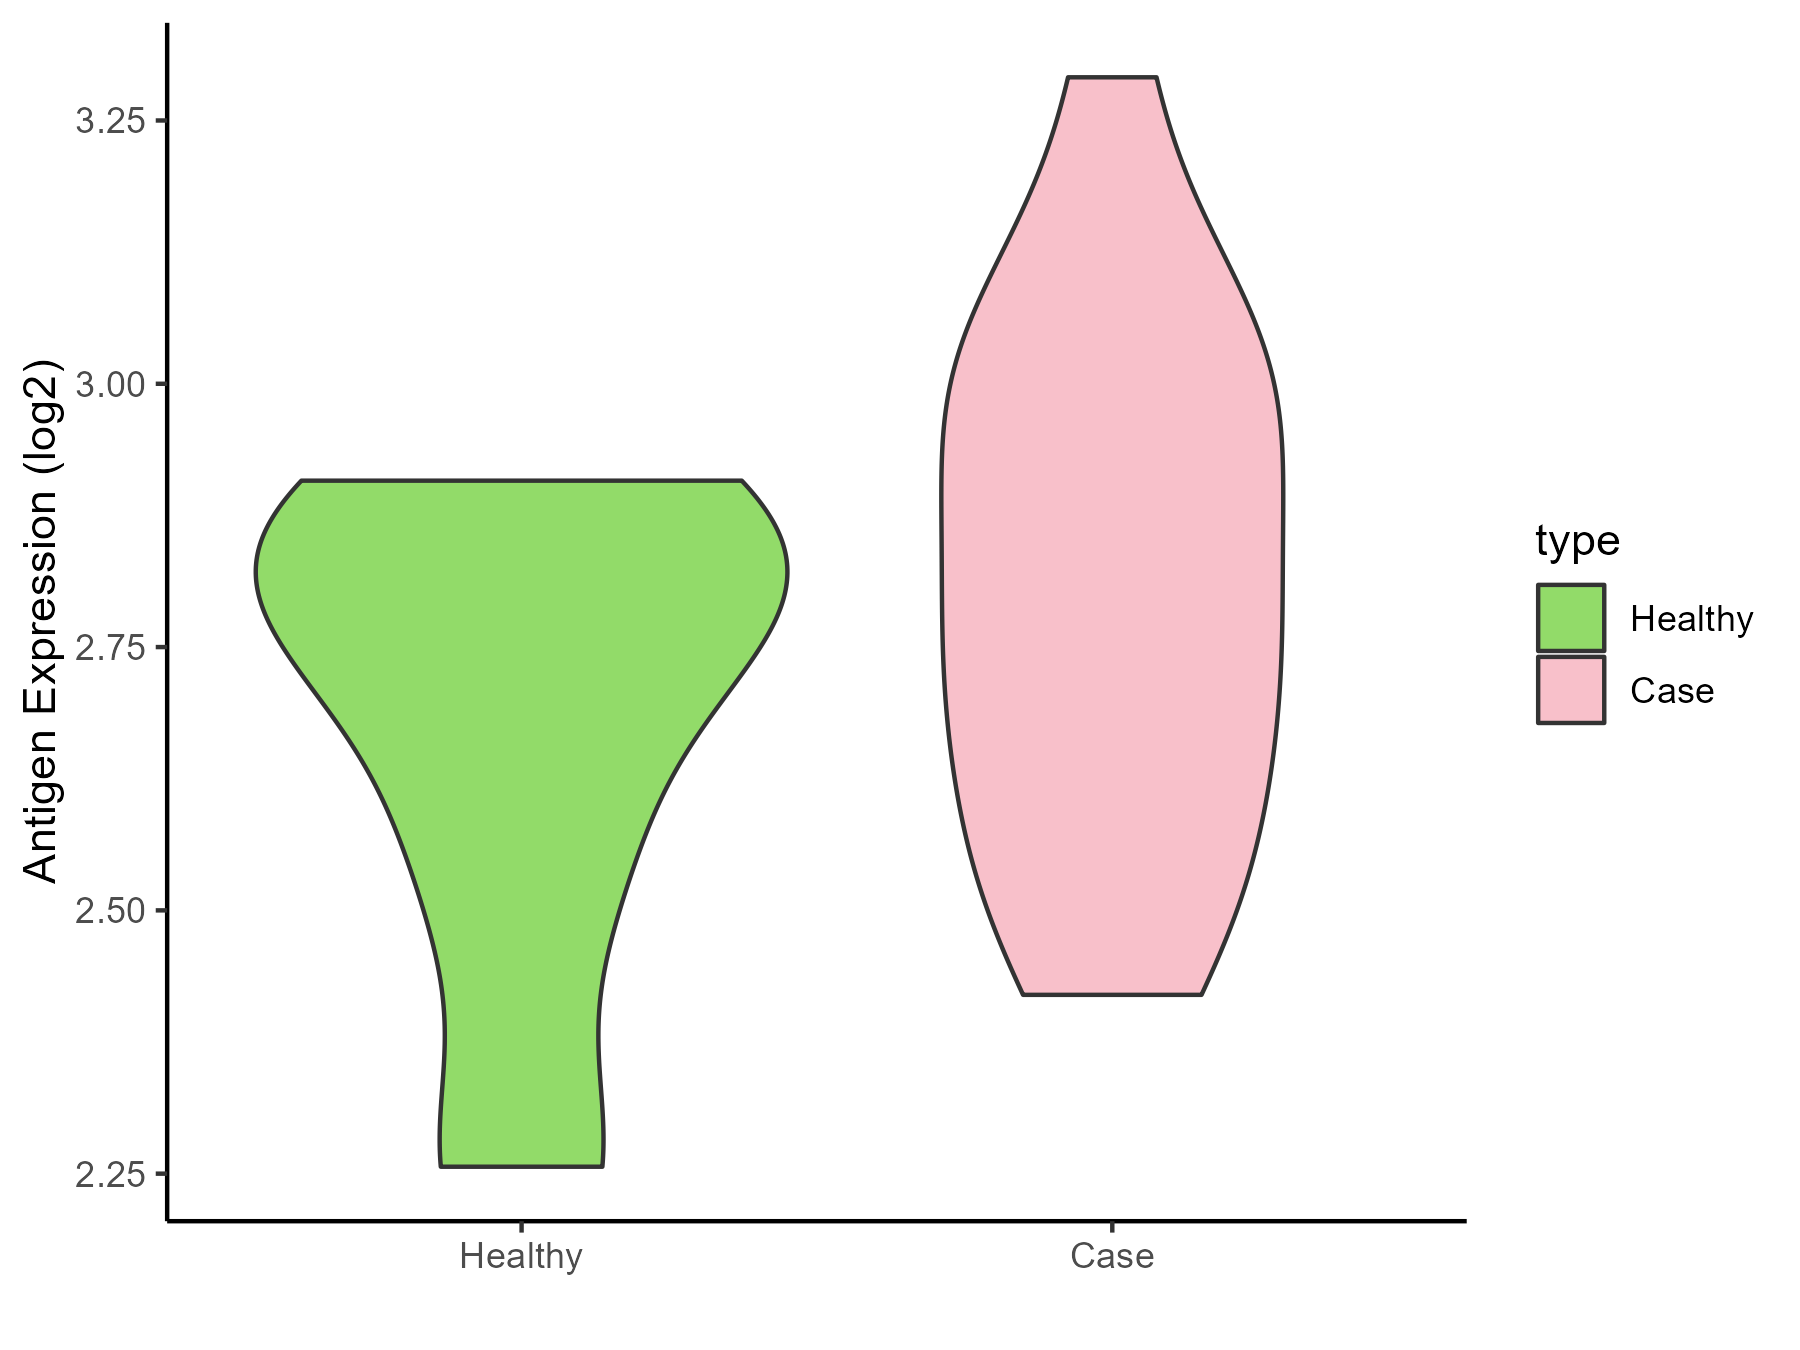
| The Studied Tissue | Plasmacytoid dendritic cells | |
| The Specific Disease | Multiple sclerosis | |
| The Expression Level of Disease Section Compare with the Healthy Individual Tissue | p-value: 0.294698044; Fold-change: 0.03801617; Z-score: 0.155415869 | |
| Disease-specific Antigen Abundances |
|
Click to View the Clearer Original Diagram |
| Differential expression pattern of antigen in diseases | ||
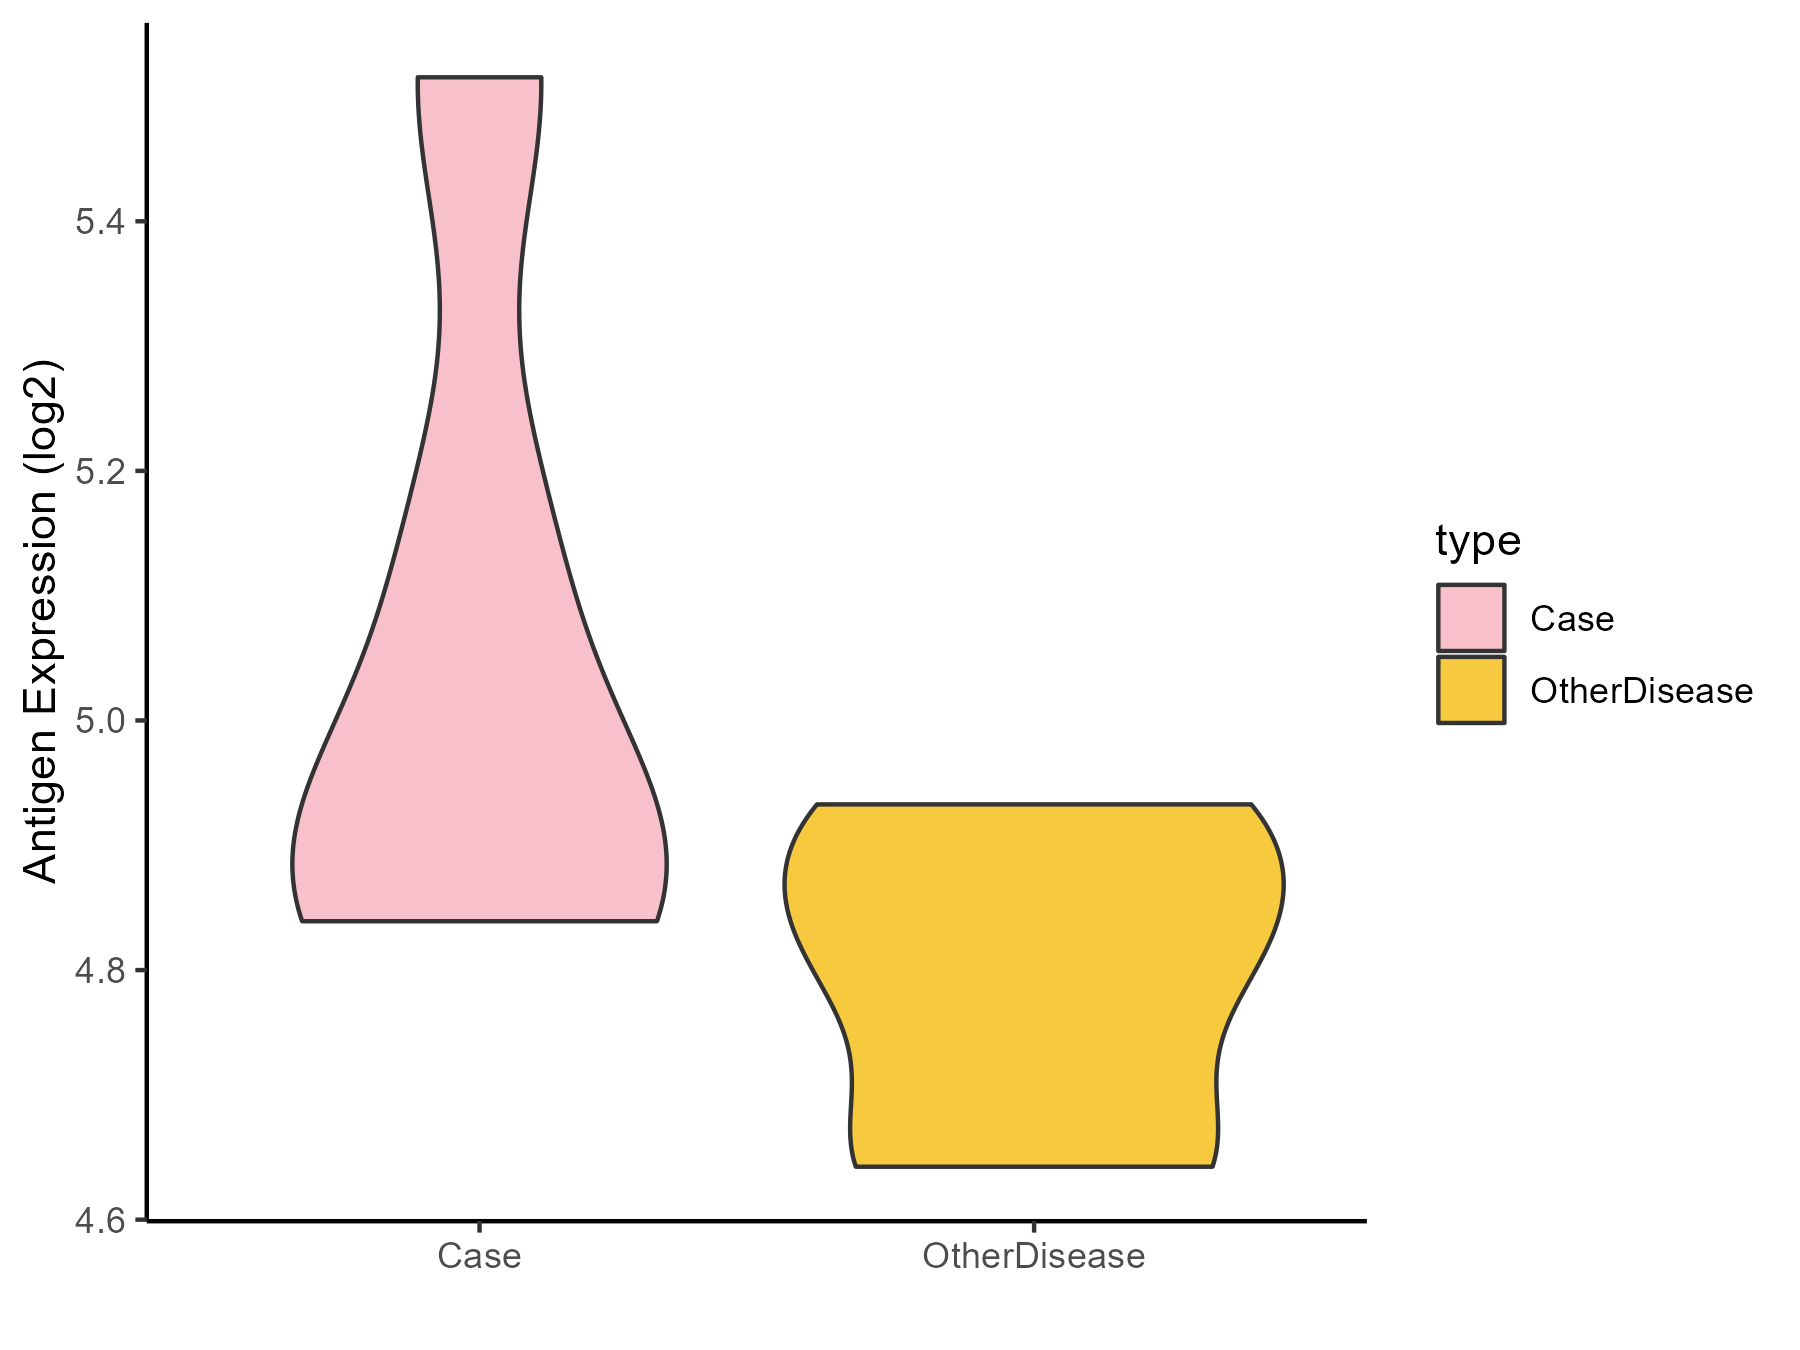
| The Studied Tissue | Peritumoral cortex | |
| The Specific Disease | Epilepsy | |
| The Expression Level of Disease Section Compare with the Other Disease Section | p-value: 0.14221503; Fold-change: 0.085777967; Z-score: 0.587382695 | |
| Disease-specific Antigen Abundances |
|
Click to View the Clearer Original Diagram |
| Differential expression pattern of antigen in diseases | ||
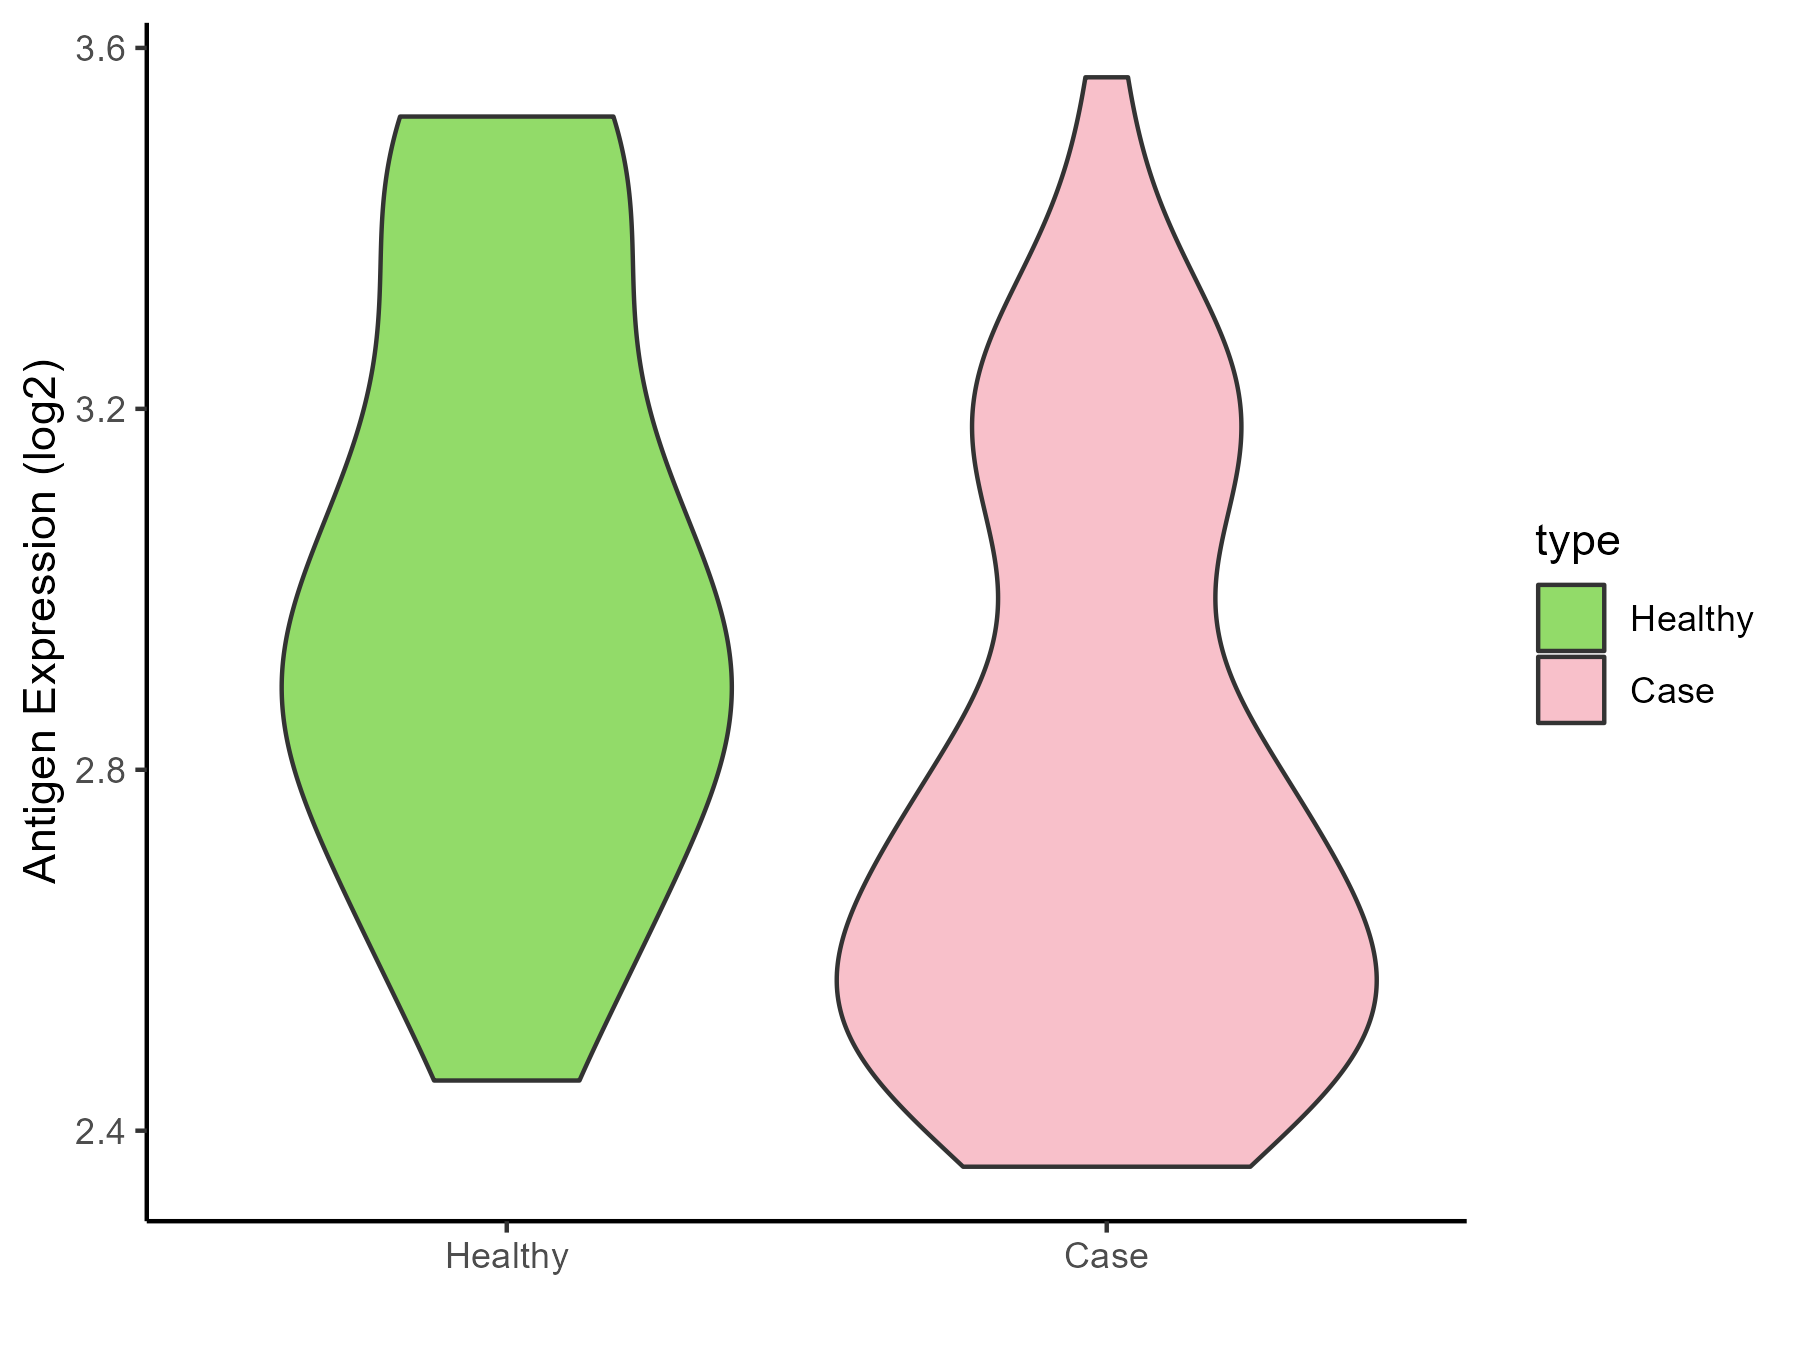
| The Studied Tissue | Whole blood | |
| The Specific Disease | Cardioembolic Stroke | |
| The Expression Level of Disease Section Compare with the Healthy Individual Tissue | p-value: 0.009767022; Fold-change: -0.221169009; Z-score: -0.691337875 | |
| Disease-specific Antigen Abundances |
|
Click to View the Clearer Original Diagram |
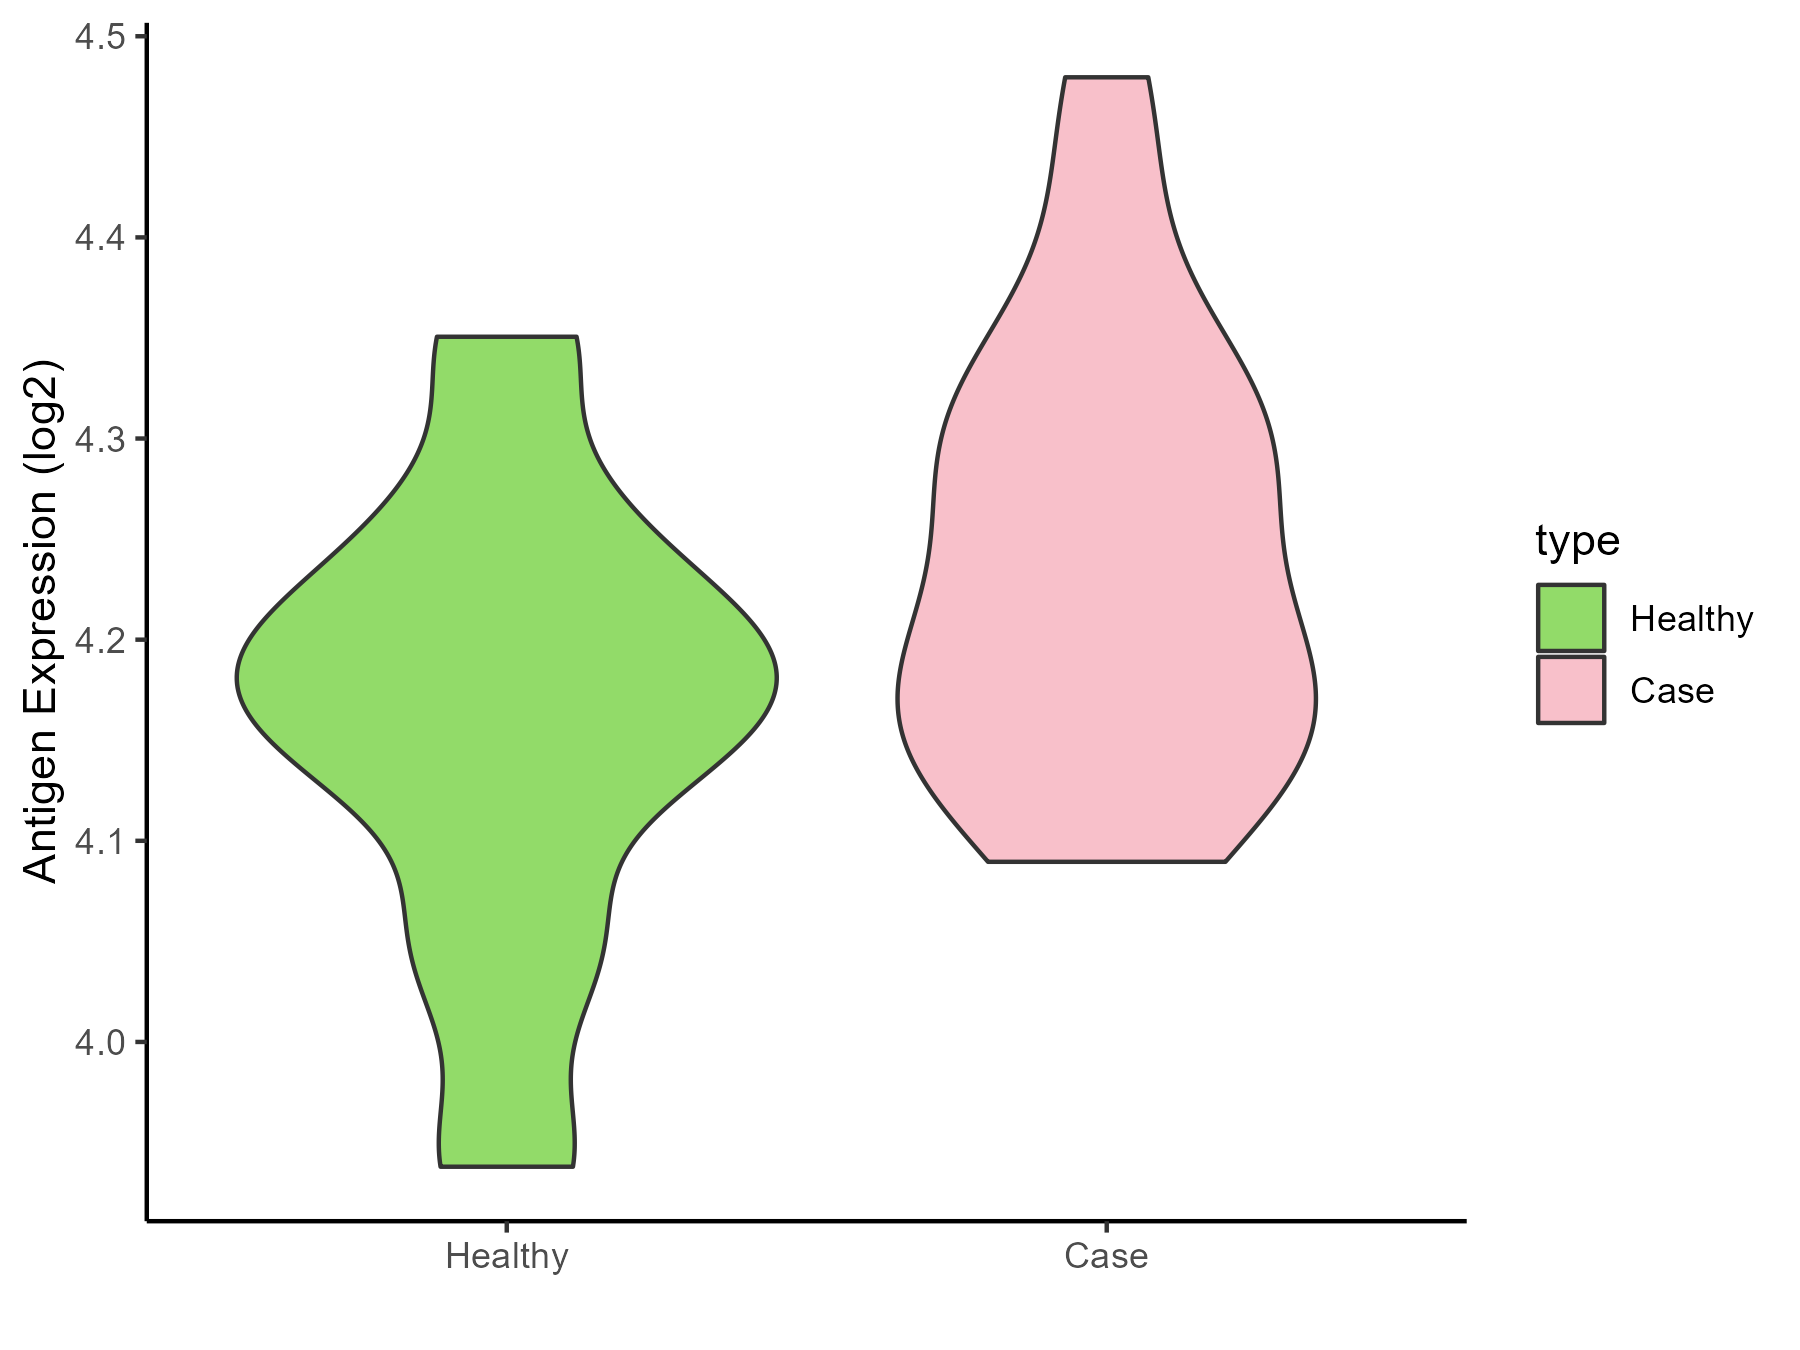
| The Studied Tissue | Peripheral blood | |
| The Specific Disease | Ischemic stroke | |
| The Expression Level of Disease Section Compare with the Healthy Individual Tissue | p-value: 0.028938171; Fold-change: 0.026369894; Z-score: 0.232763644 | |
| Disease-specific Antigen Abundances |
|
Click to View the Clearer Original Diagram |
ICD Disease Classification 1
| Differential expression pattern of antigen in diseases | ||
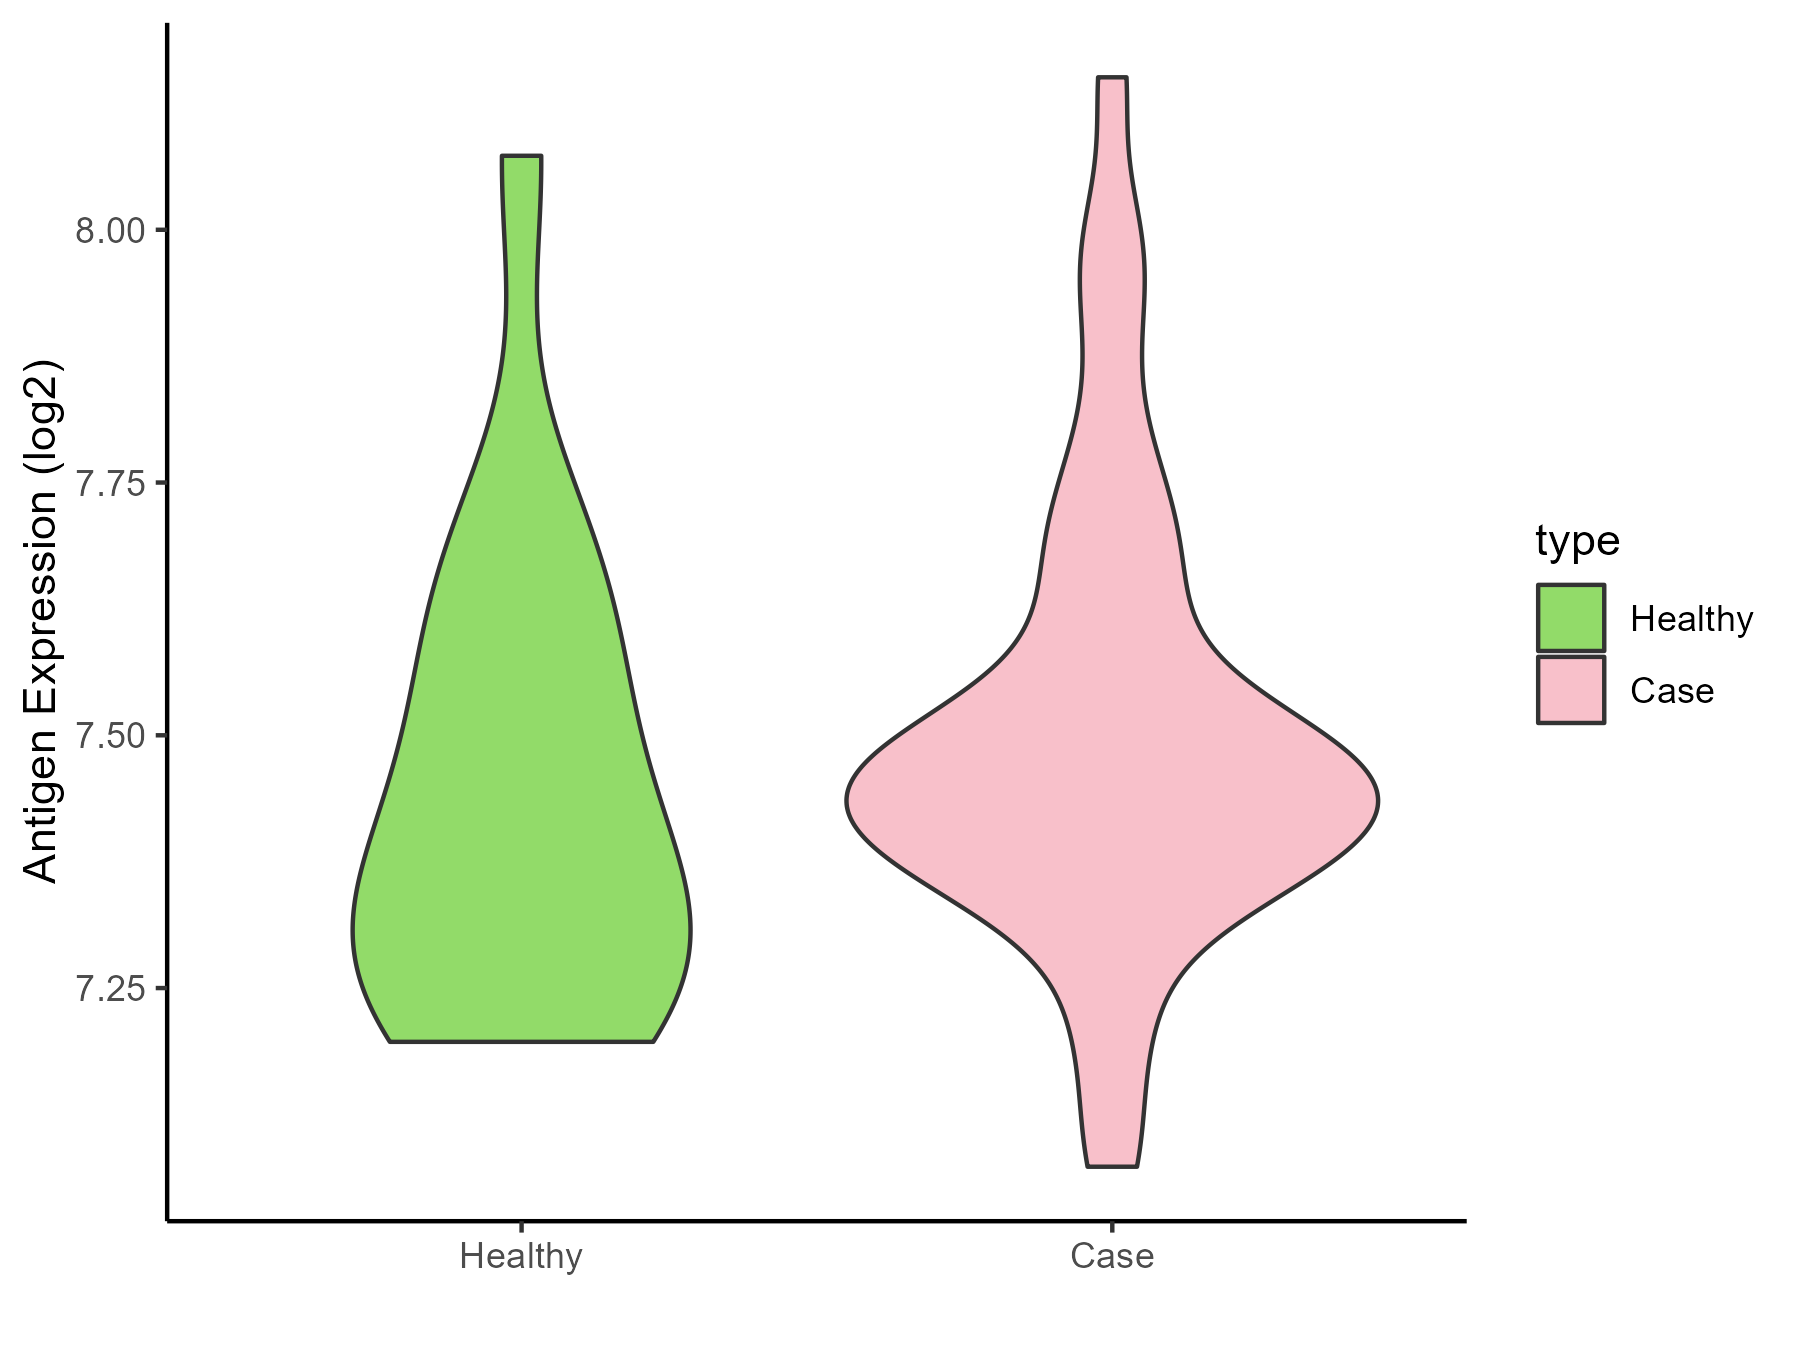
| The Studied Tissue | White matter | |
| The Specific Disease | HIV | |
| The Expression Level of Disease Section Compare with the Healthy Individual Tissue | p-value: 0.391150881; Fold-change: 0.084550363; Z-score: 0.359289596 | |
| Disease-specific Antigen Abundances |
|
Click to View the Clearer Original Diagram |
| Differential expression pattern of antigen in diseases | ||
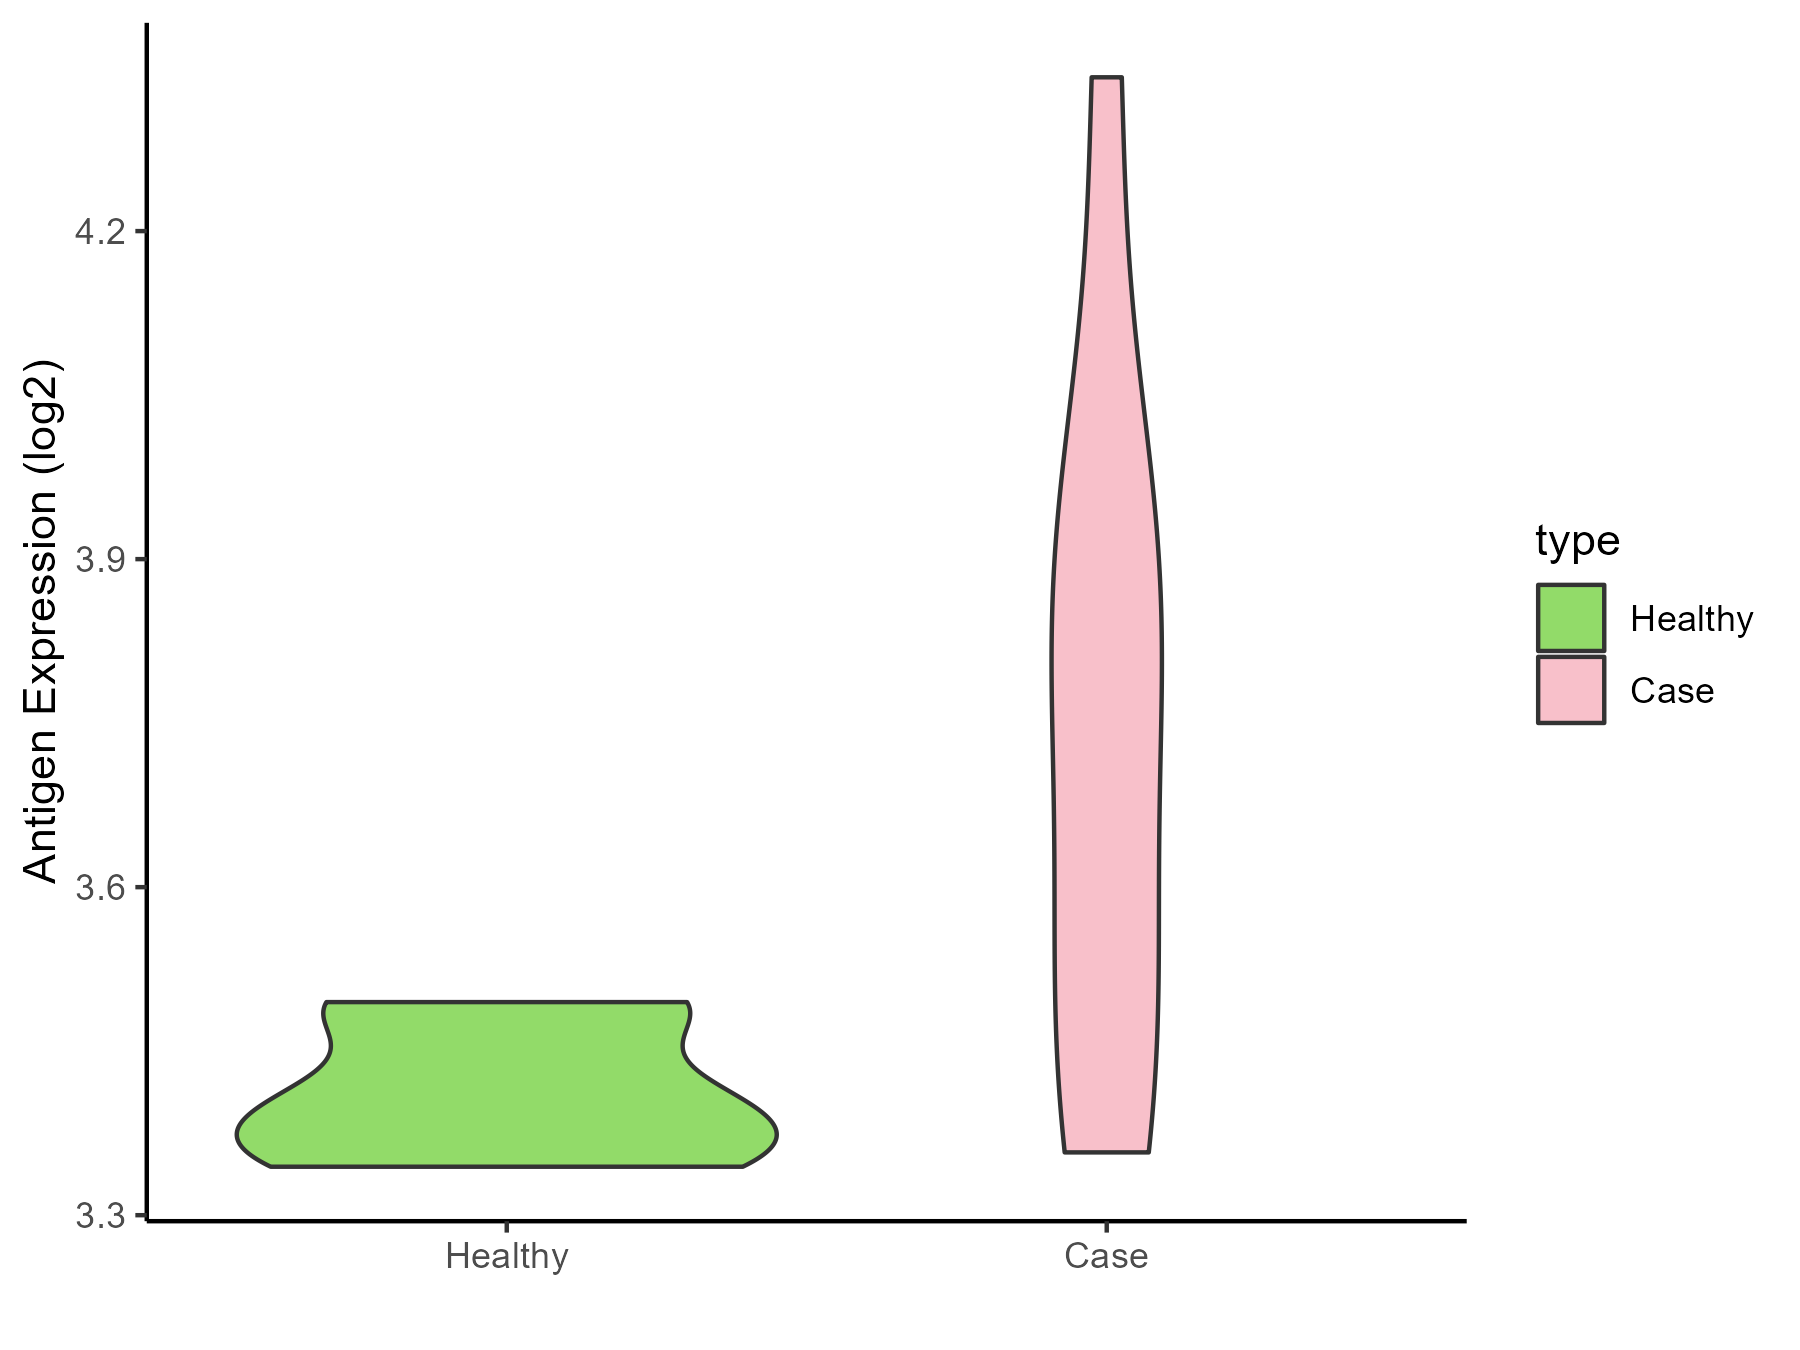
| The Studied Tissue | Whole blood | |
| The Specific Disease | Influenza | |
| The Expression Level of Disease Section Compare with the Healthy Individual Tissue | p-value: 0.016463642; Fold-change: 0.415113609; Z-score: 5.451922695 | |
| Disease-specific Antigen Abundances |
|
Click to View the Clearer Original Diagram |
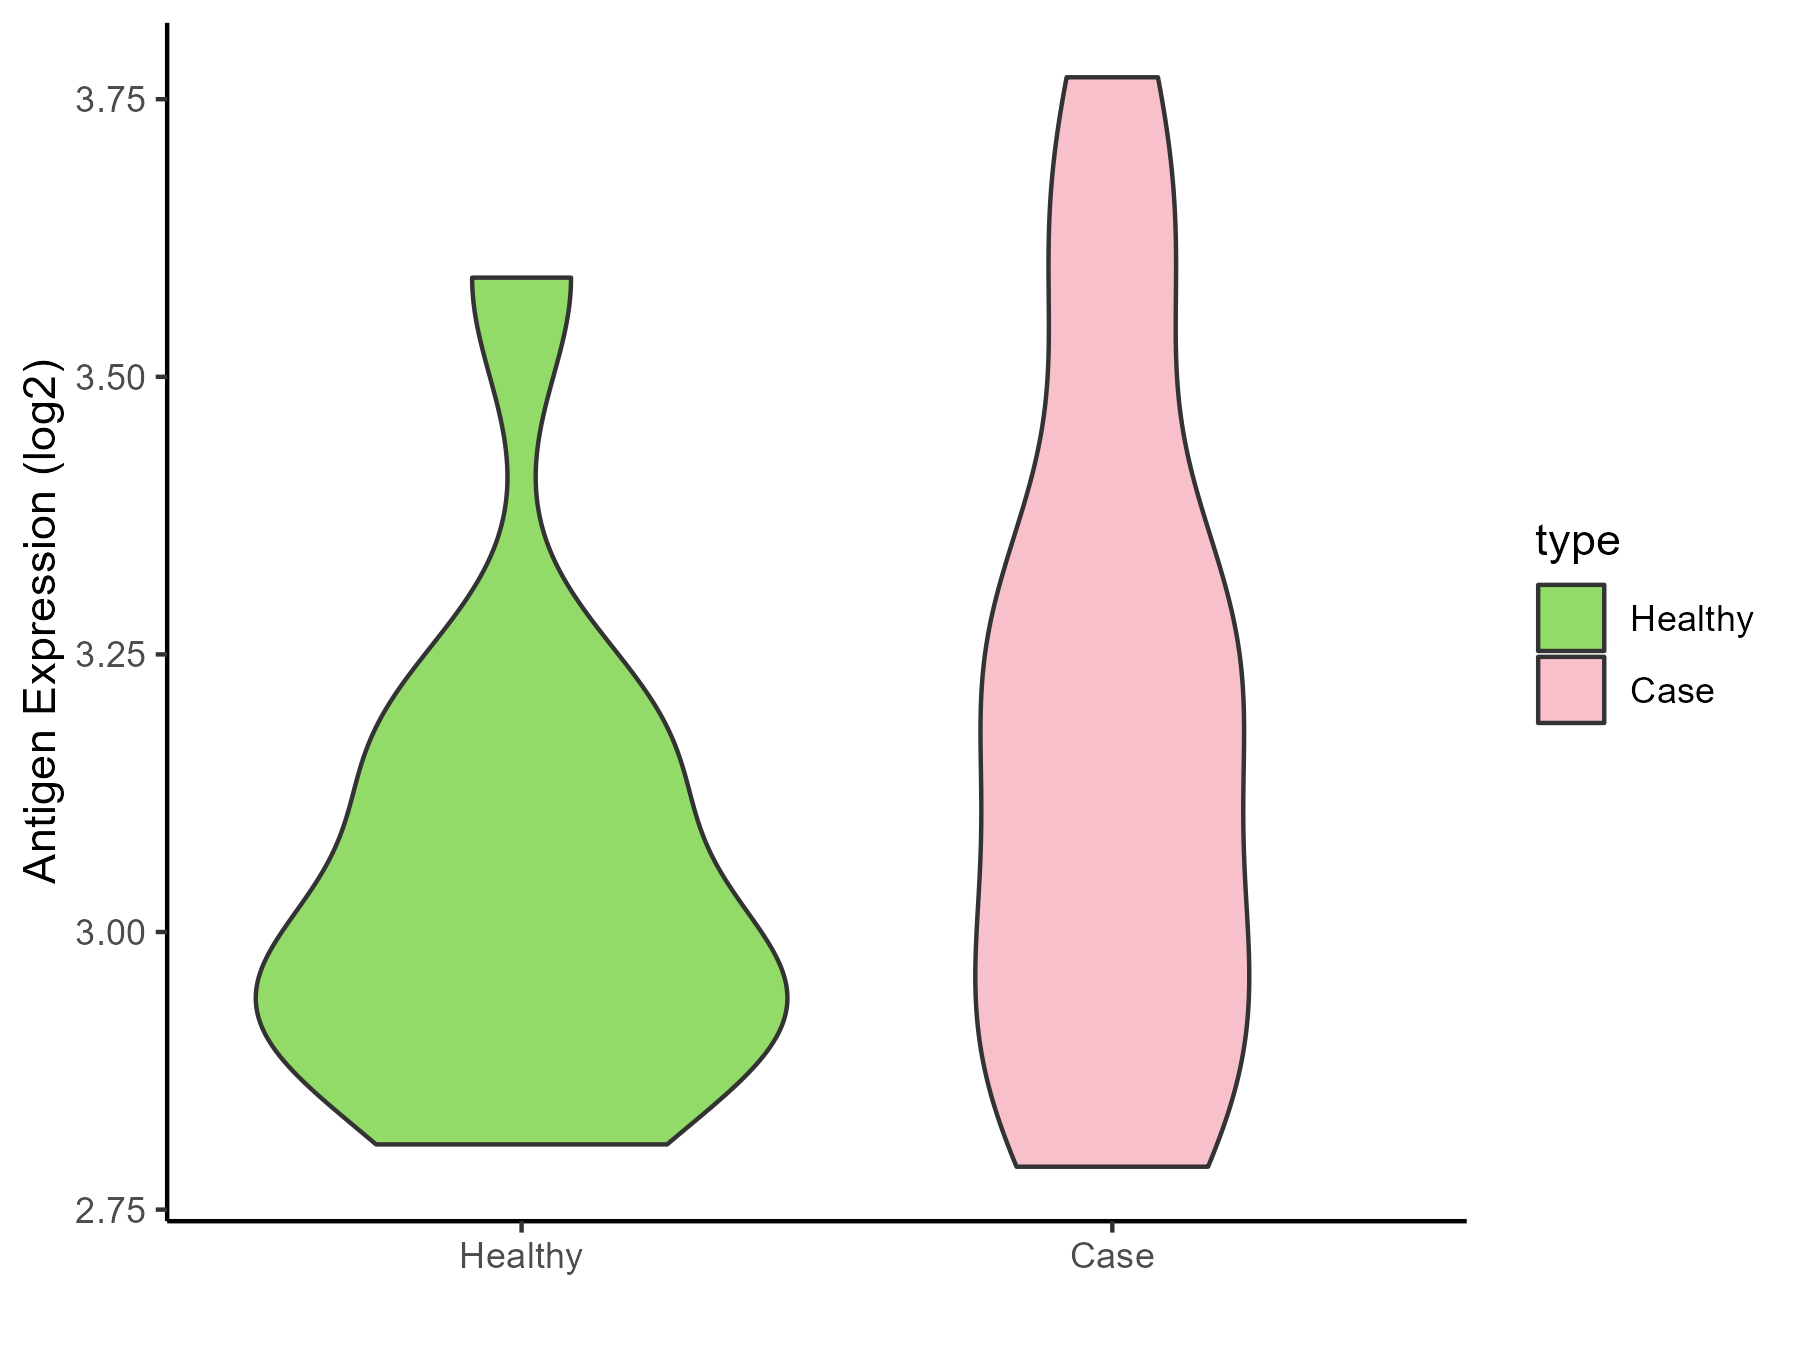
| Differential expression pattern of antigen in diseases | ||
| The Studied Tissue | Whole blood | |
| The Specific Disease | Chronic hepatitis C | |
| The Expression Level of Disease Section Compare with the Healthy Individual Tissue | p-value: 0.215504856; Fold-change: 0.225627846; Z-score: 1.003708503 | |
| Disease-specific Antigen Abundances |
|
Click to View the Clearer Original Diagram |
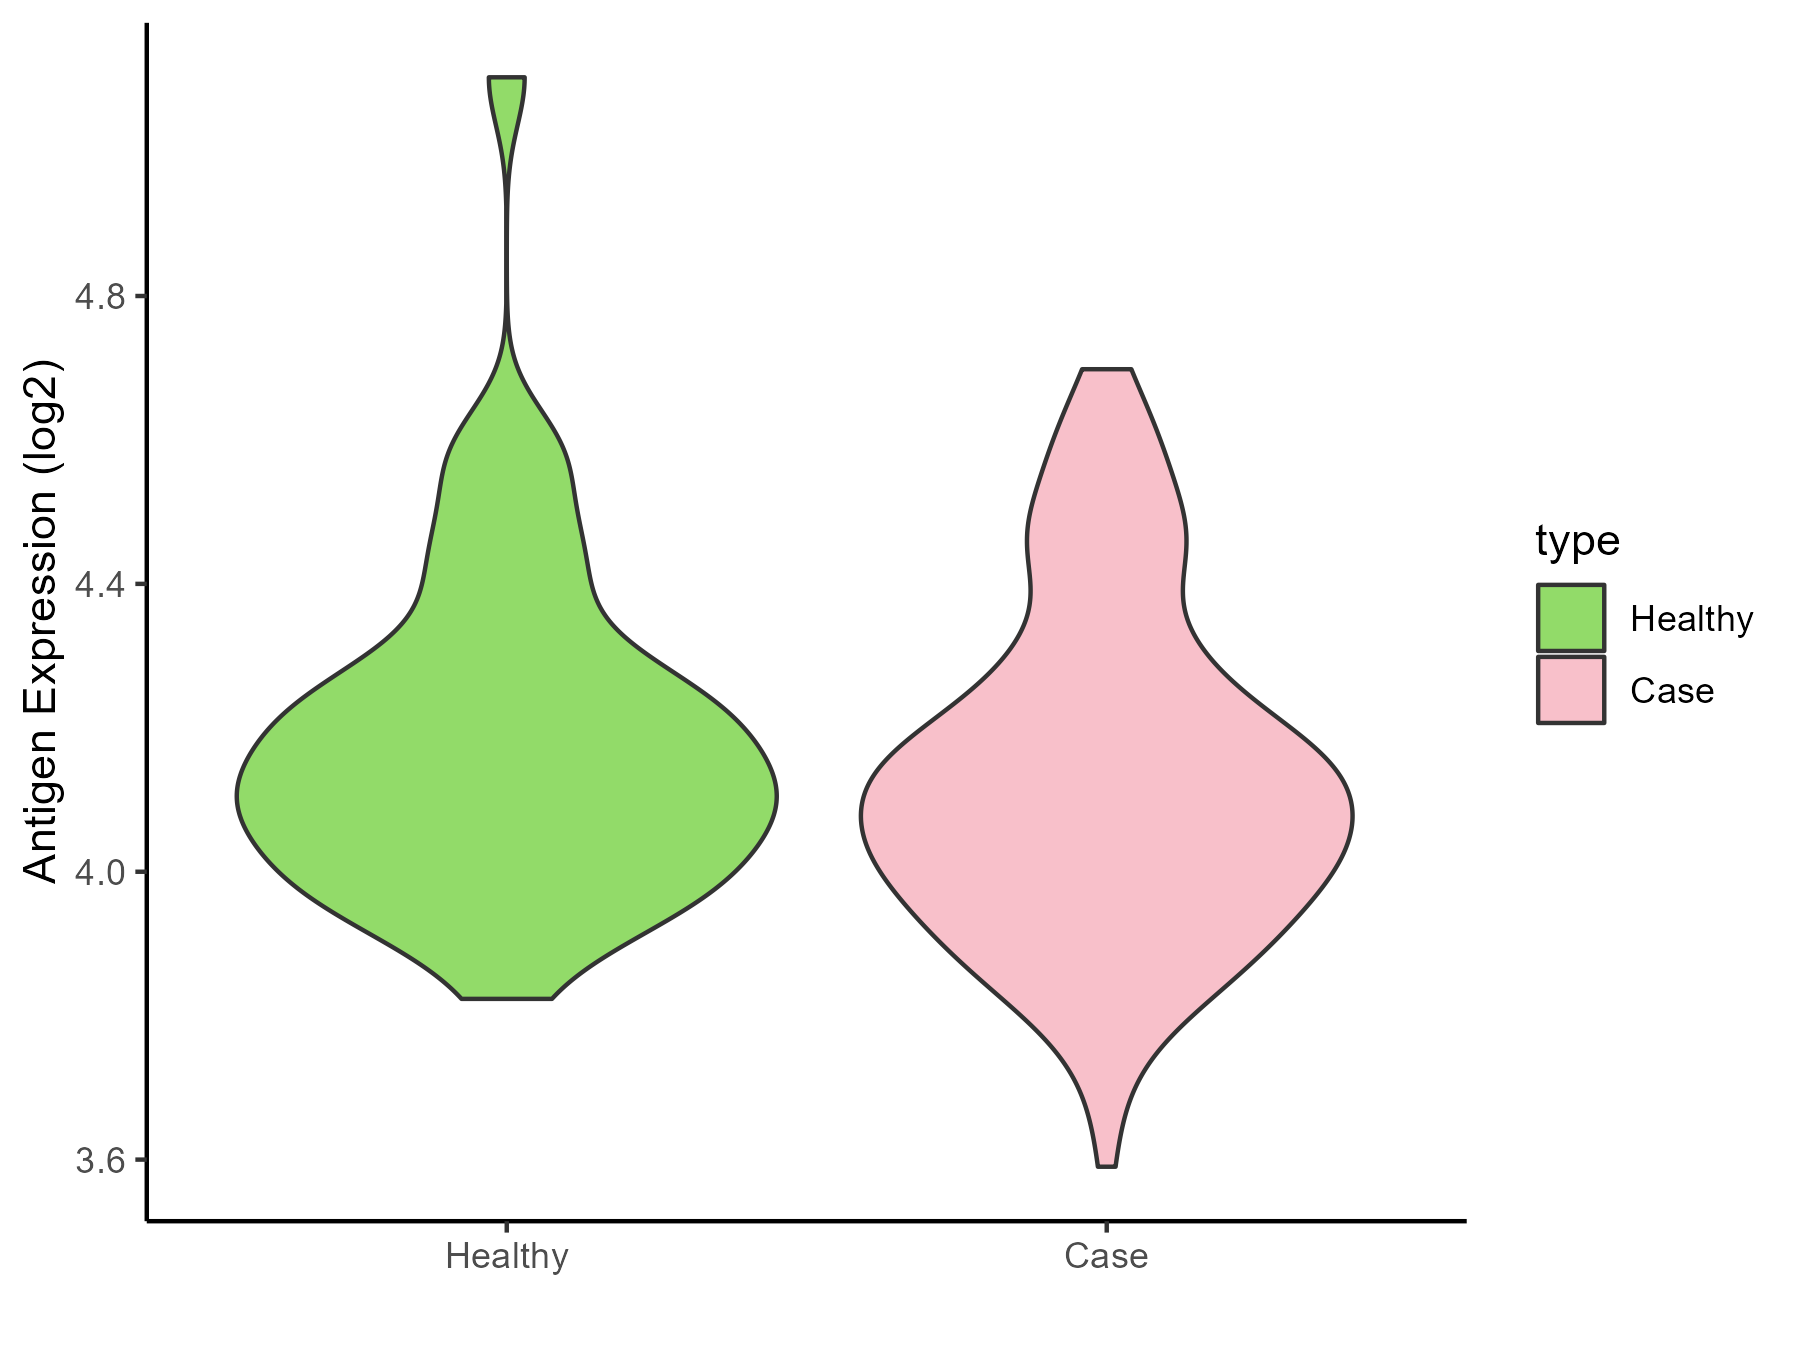
| Differential expression pattern of antigen in diseases | ||
| The Studied Tissue | Whole blood | |
| The Specific Disease | Sepsis | |
| The Expression Level of Disease Section Compare with the Healthy Individual Tissue | p-value: 0.062911669; Fold-change: -0.034639276; Z-score: -0.147733422 | |
| Disease-specific Antigen Abundances |
|
Click to View the Clearer Original Diagram |
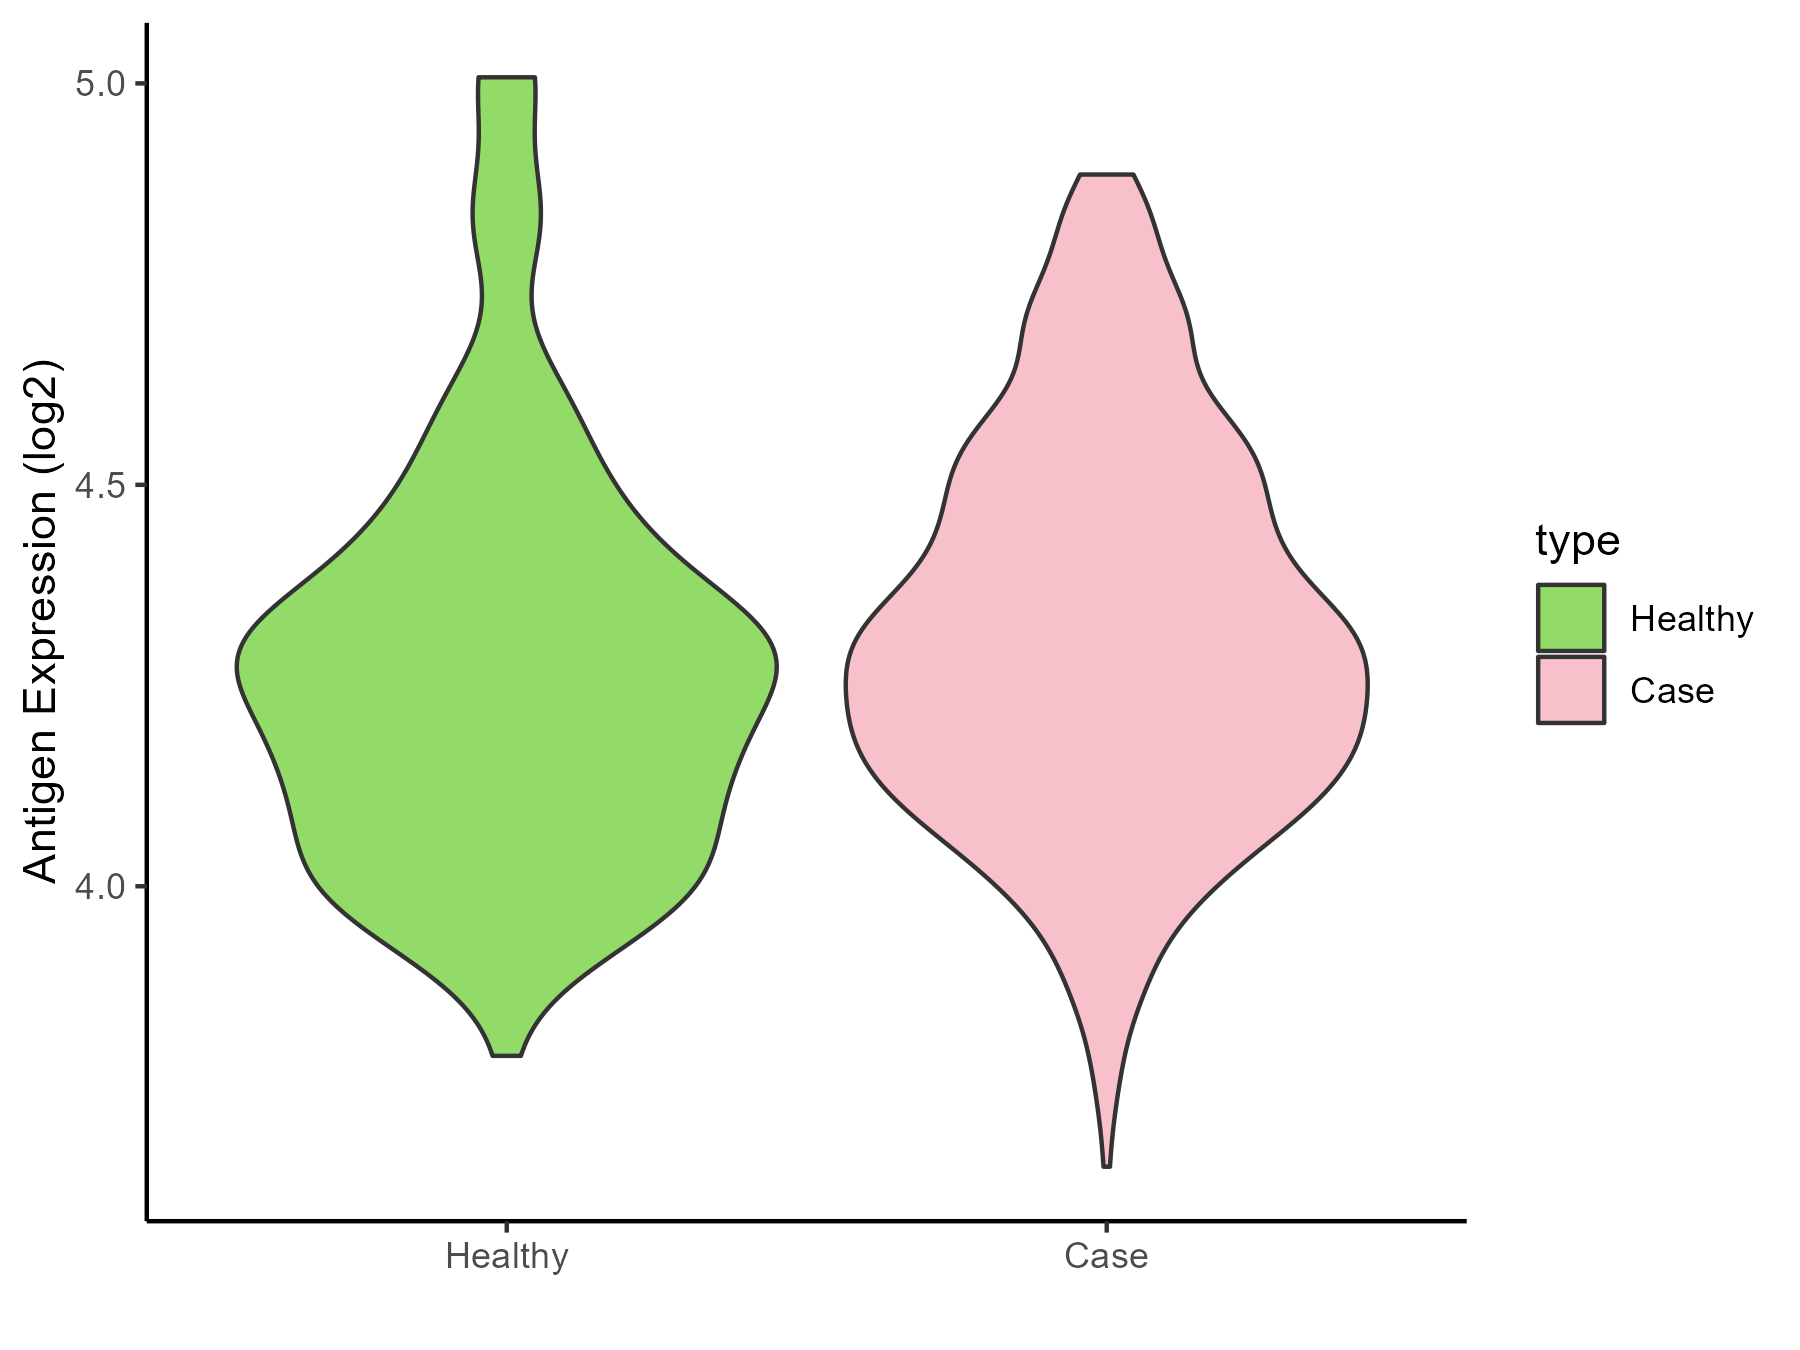
| Differential expression pattern of antigen in diseases | ||
| The Studied Tissue | Whole blood | |
| The Specific Disease | Septic shock | |
| The Expression Level of Disease Section Compare with the Healthy Individual Tissue | p-value: 0.079757279; Fold-change: 0.038438506; Z-score: 0.151995675 | |
| Disease-specific Antigen Abundances |
|
Click to View the Clearer Original Diagram |
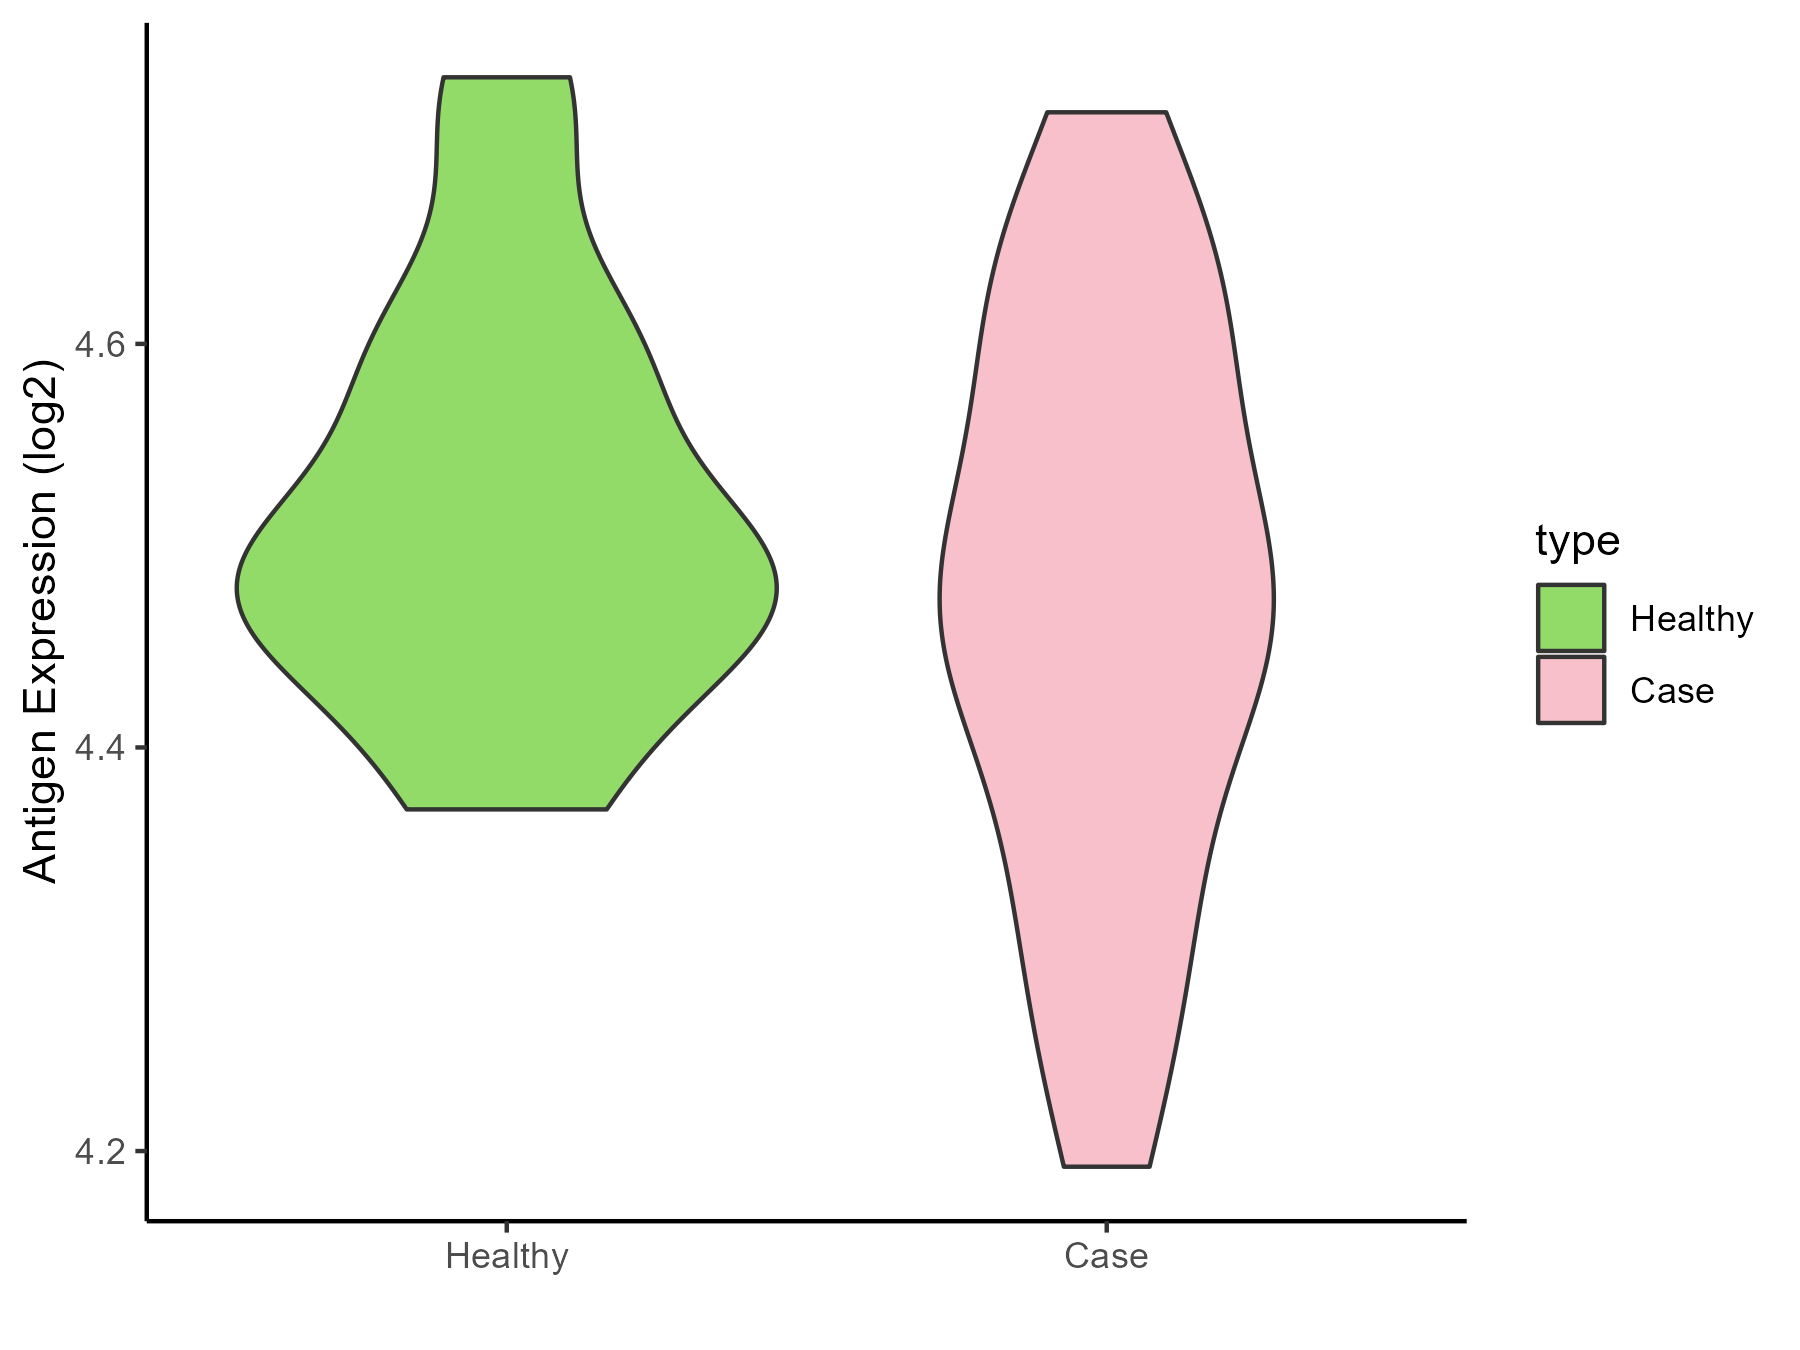
| Differential expression pattern of antigen in diseases | ||
| The Studied Tissue | Peripheral blood | |
| The Specific Disease | Pediatric respiratory syncytial virus infection | |
| The Expression Level of Disease Section Compare with the Healthy Individual Tissue | p-value: 0.220859891; Fold-change: -0.018928135; Z-score: -0.18344425 | |
| Disease-specific Antigen Abundances |
|
Click to View the Clearer Original Diagram |
ICD Disease Classification 11
| Differential expression pattern of antigen in diseases | ||
| The Studied Tissue | Peripheral blood | |
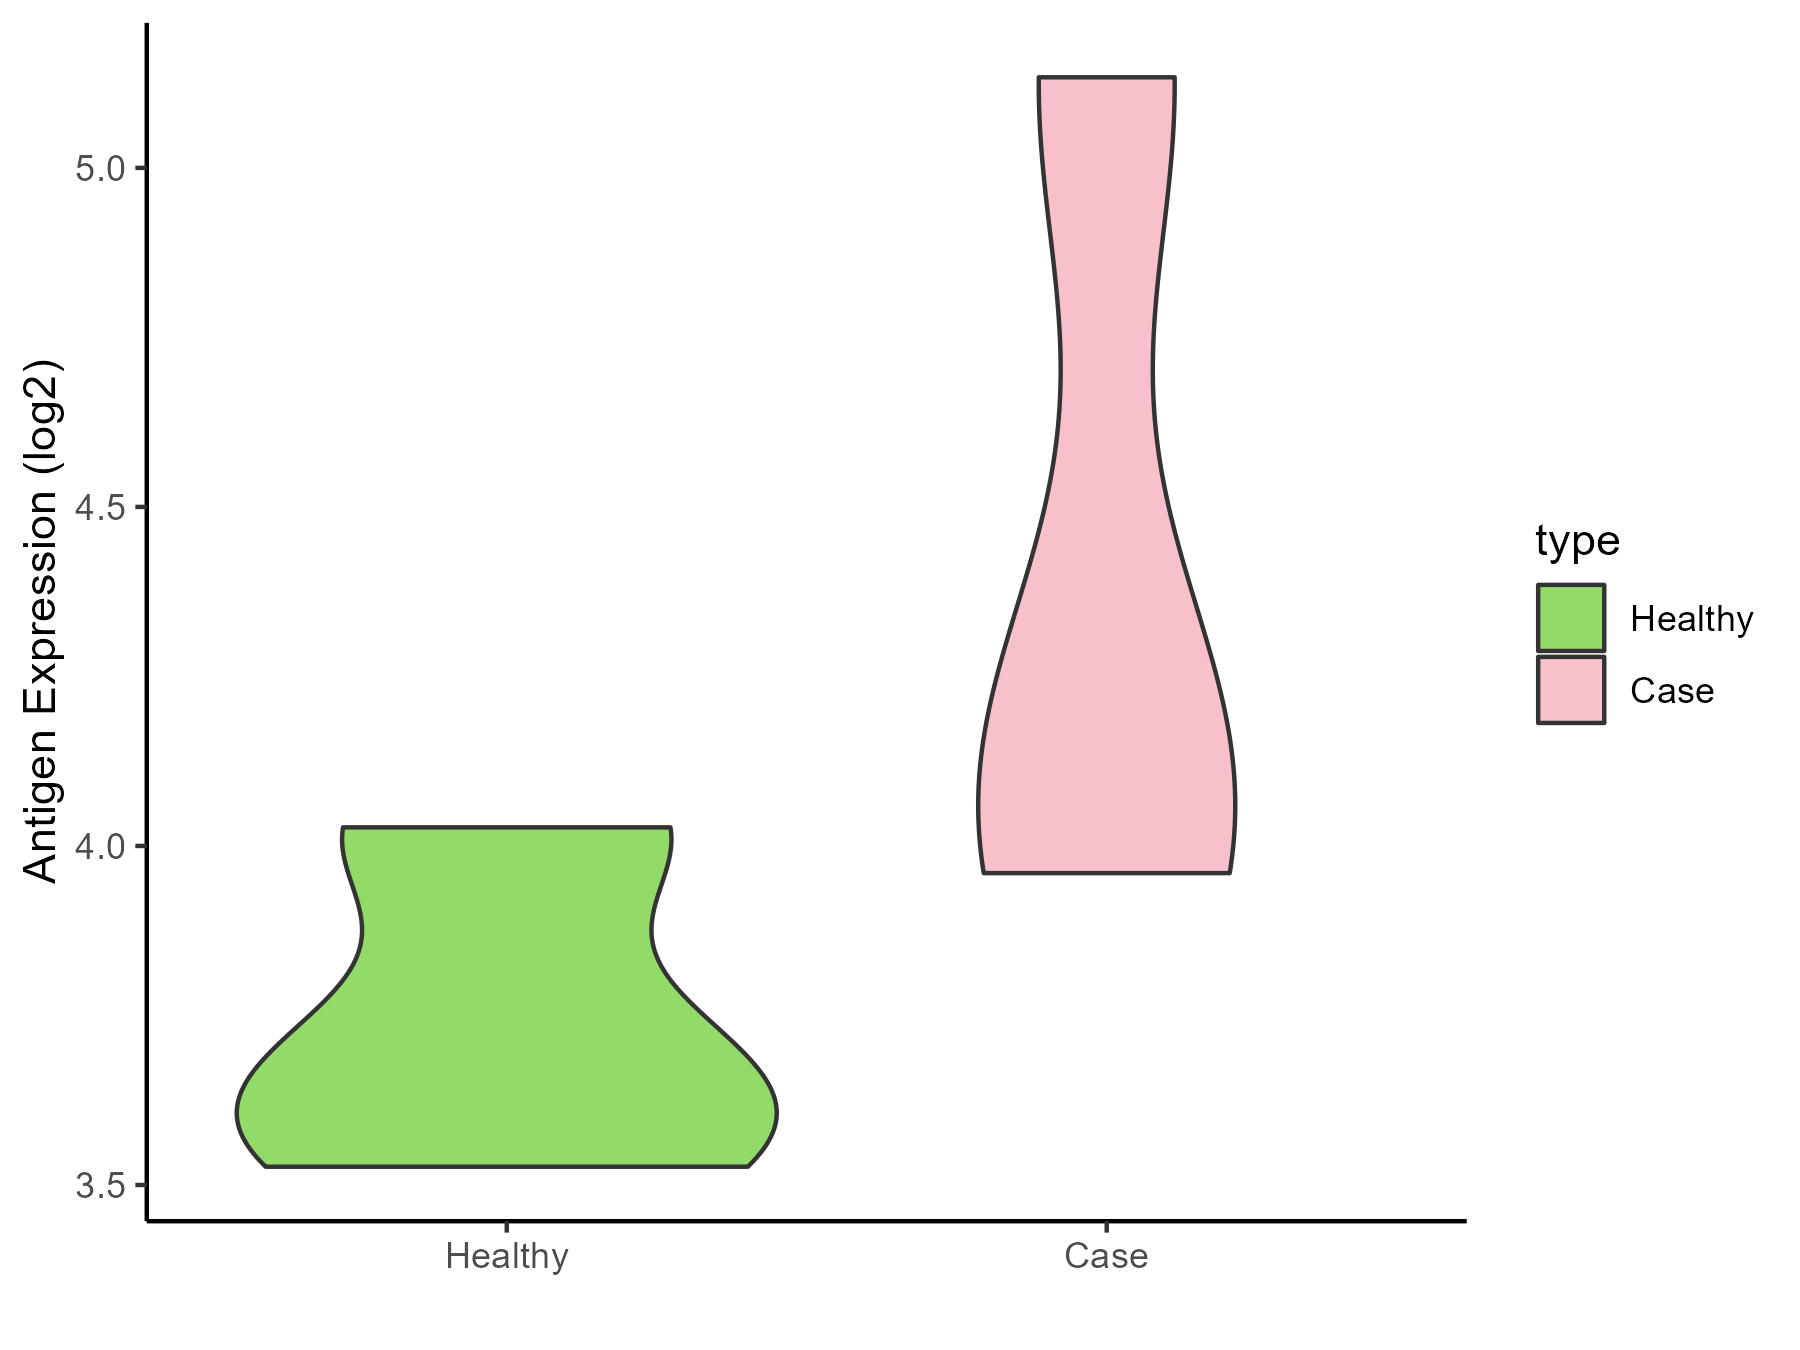
| The Specific Disease | Essential hypertension | |
| The Expression Level of Disease Section Compare with the Healthy Individual Tissue | p-value: 0.197356696; Fold-change: 0.475290933; Z-score: 1.853125216 | |
| Disease-specific Antigen Abundances |
|
Click to View the Clearer Original Diagram |
| Differential expression pattern of antigen in diseases | ||
| The Studied Tissue | Peripheral blood | |
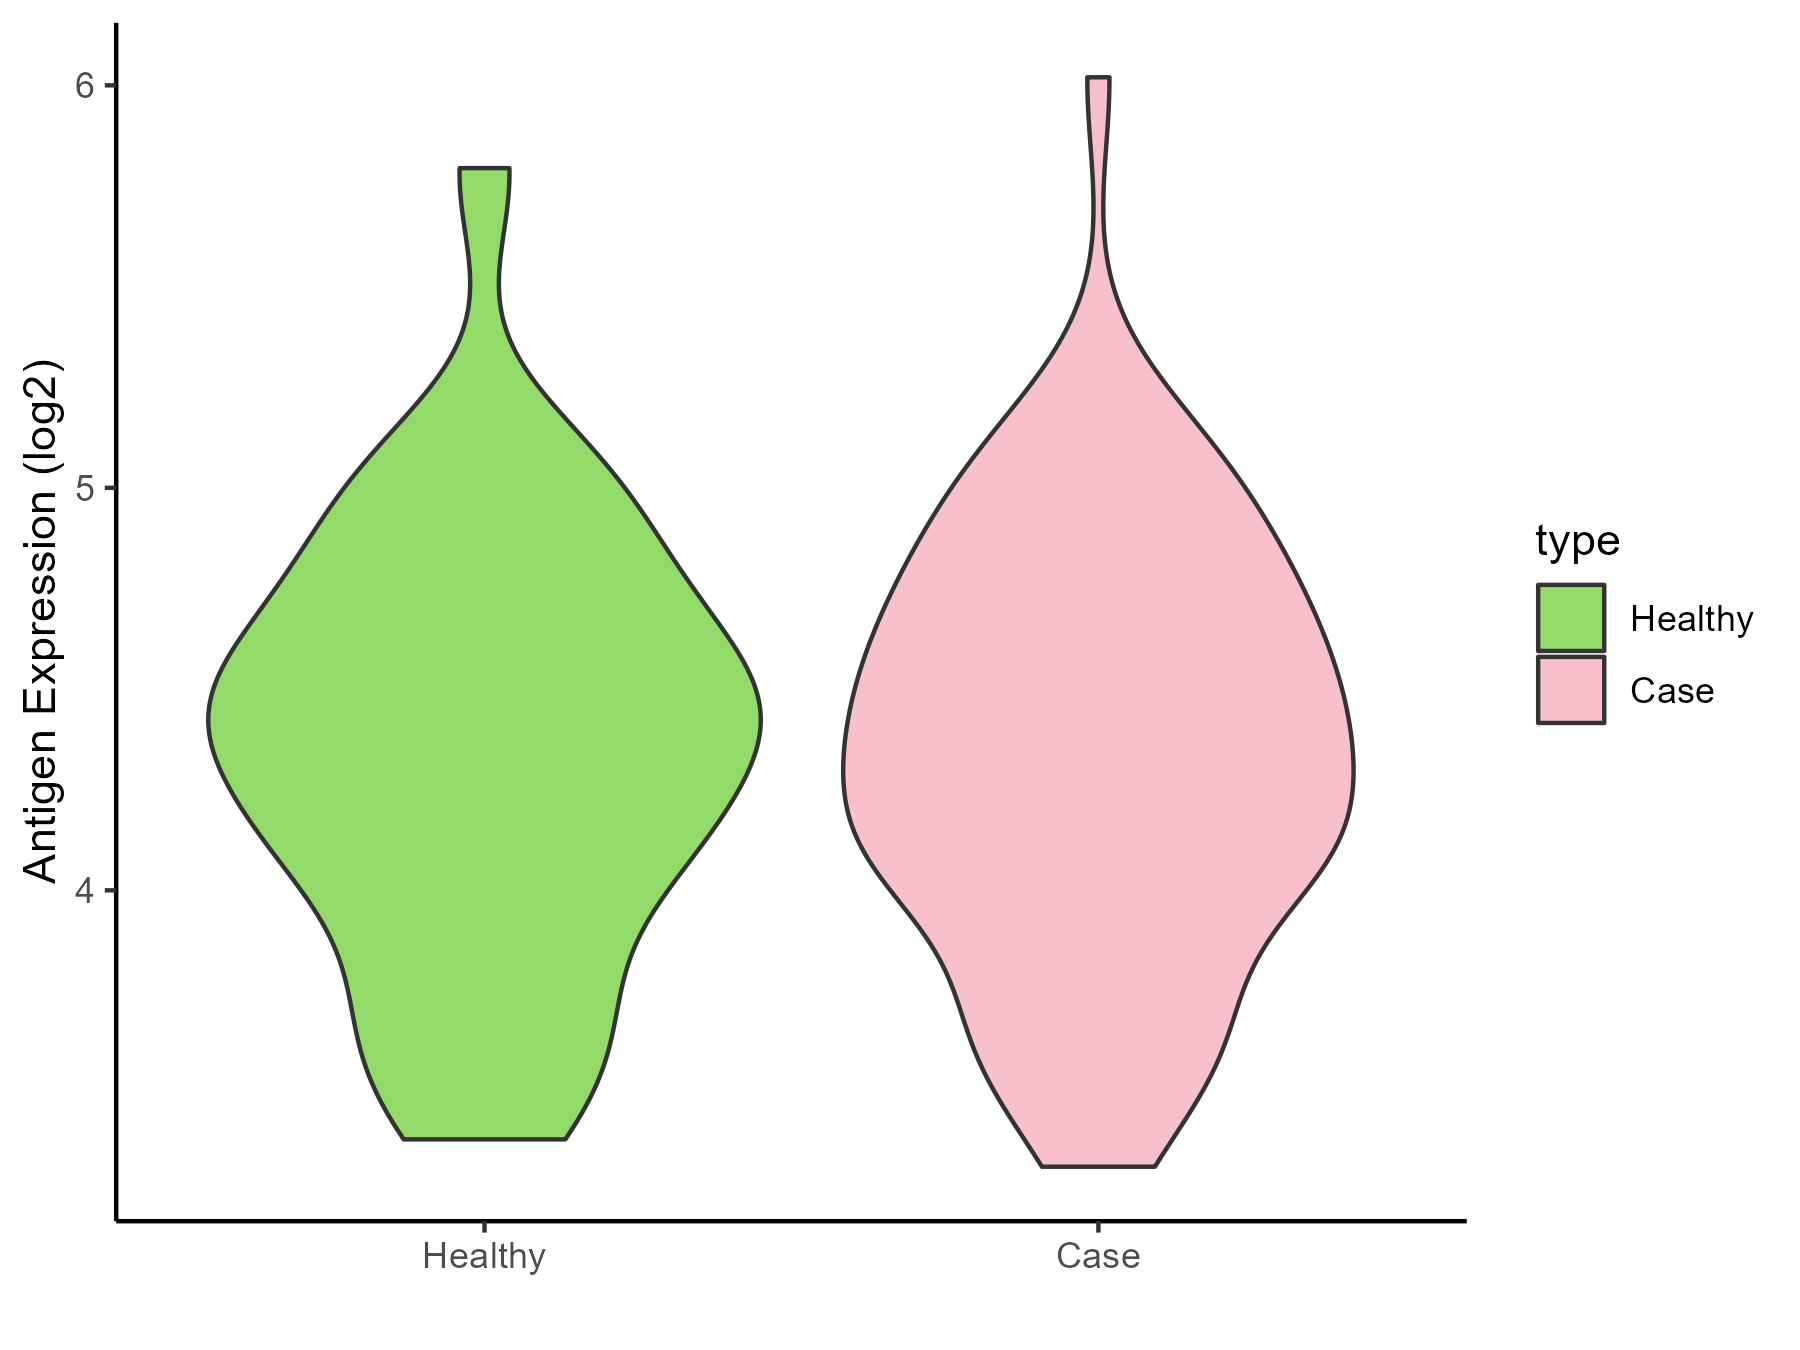
| The Specific Disease | Myocardial infarction | |
| The Expression Level of Disease Section Compare with the Healthy Individual Tissue | p-value: 0.909269533; Fold-change: -0.037534412; Z-score: -0.069932936 | |
| Disease-specific Antigen Abundances |
|
Click to View the Clearer Original Diagram |
| Differential expression pattern of antigen in diseases | ||
| The Studied Tissue | Peripheral blood | |
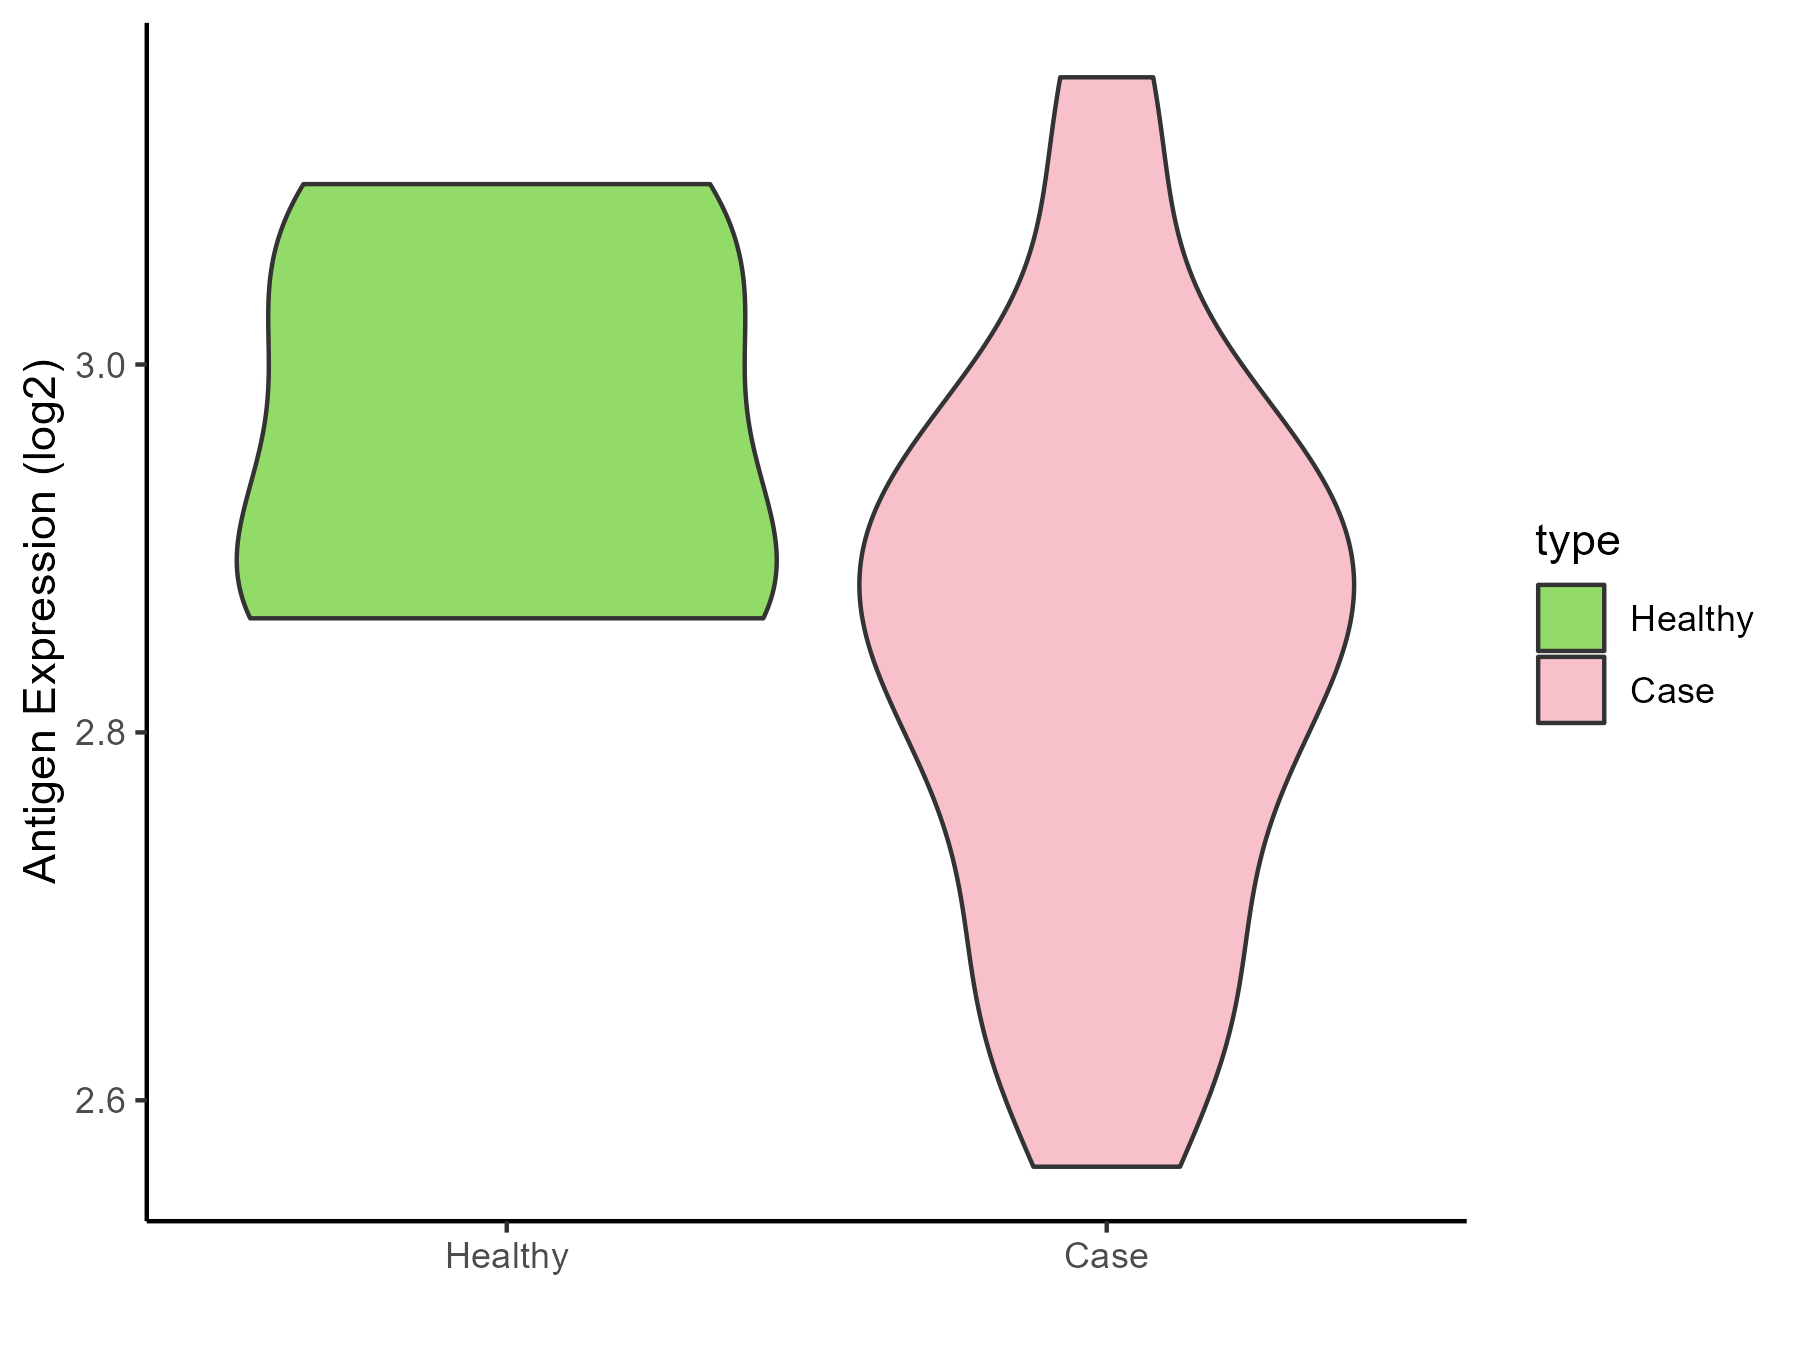
| The Specific Disease | Coronary artery disease | |
| The Expression Level of Disease Section Compare with the Healthy Individual Tissue | p-value: 0.110866129; Fold-change: -0.103384719; Z-score: -0.918715325 | |
| Disease-specific Antigen Abundances |
|
Click to View the Clearer Original Diagram |
| Differential expression pattern of antigen in diseases | ||
| The Studied Tissue | Calcified aortic valve | |
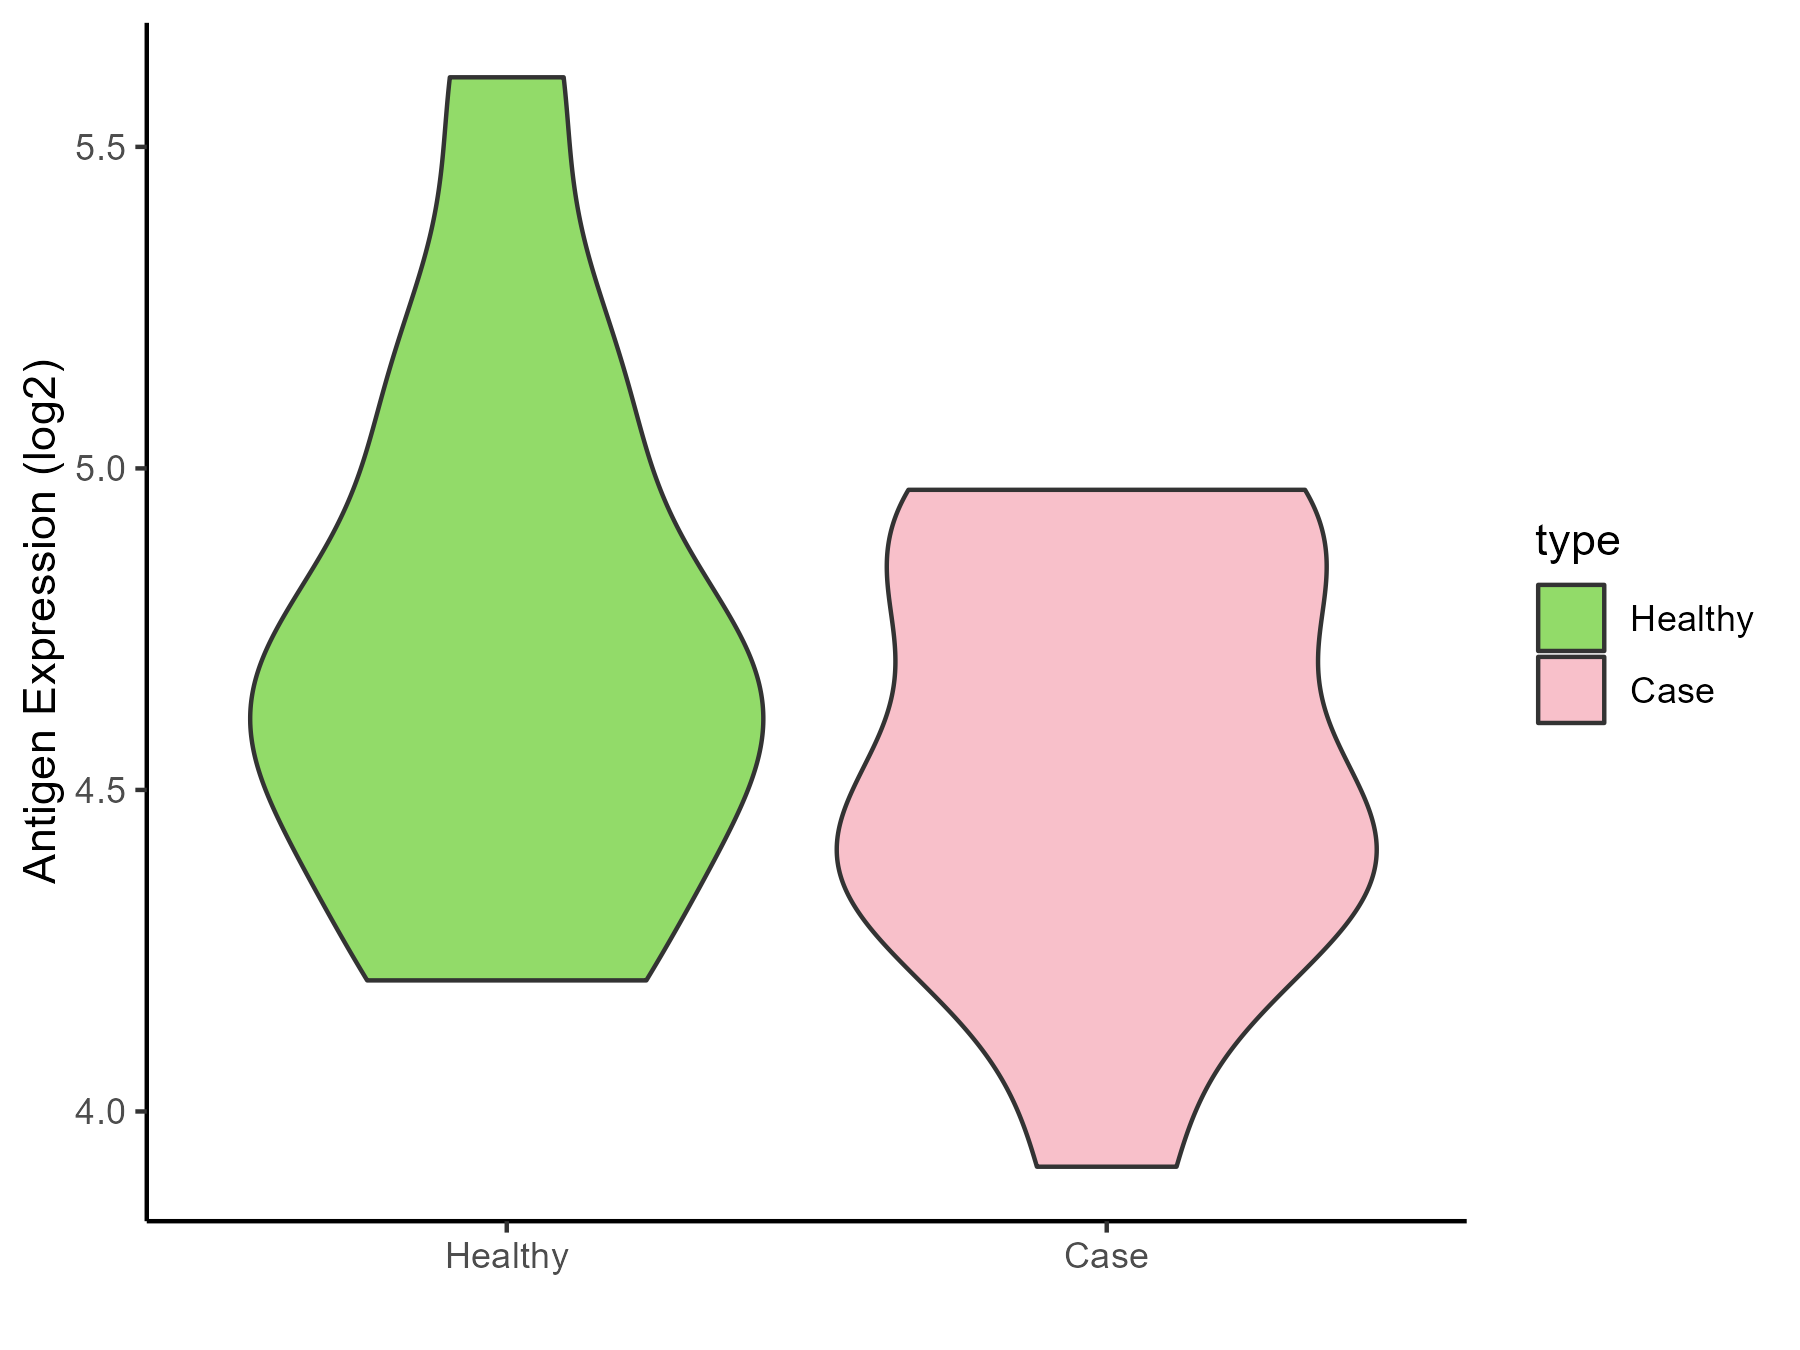
| The Specific Disease | Aortic stenosis | |
| The Expression Level of Disease Section Compare with the Healthy Individual Tissue | p-value: 0.271988867; Fold-change: -0.21765627; Z-score: -0.507300363 | |
| Disease-specific Antigen Abundances |
|
Click to View the Clearer Original Diagram |
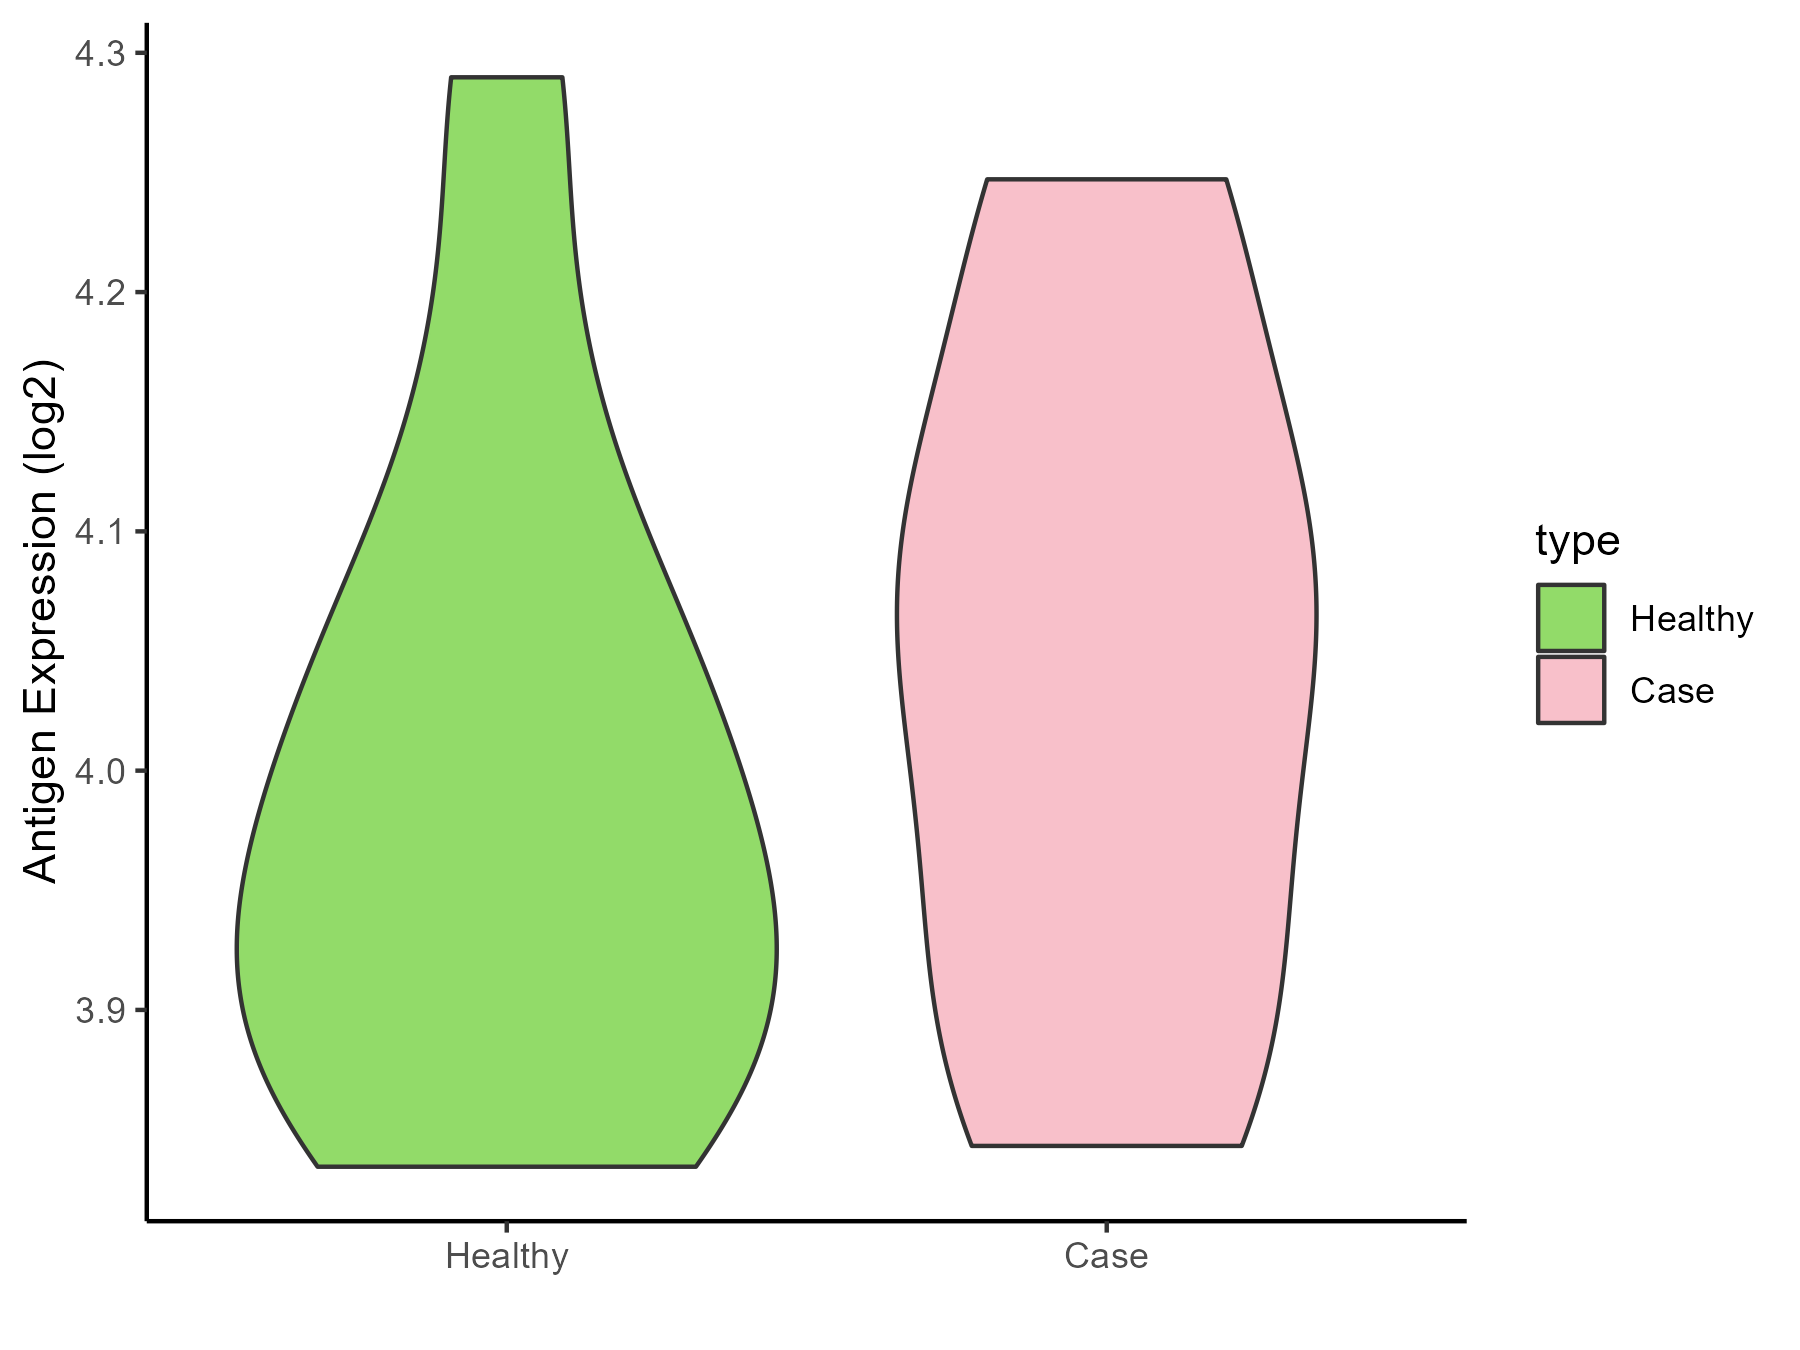
| Differential expression pattern of antigen in diseases | ||
| The Studied Tissue | Peripheral blood | |
| The Specific Disease | Arteriosclerosis | |
| The Expression Level of Disease Section Compare with the Healthy Individual Tissue | p-value: 0.423076831; Fold-change: 0.09172998; Z-score: 0.667810522 | |
| Disease-specific Antigen Abundances |
|
Click to View the Clearer Original Diagram |
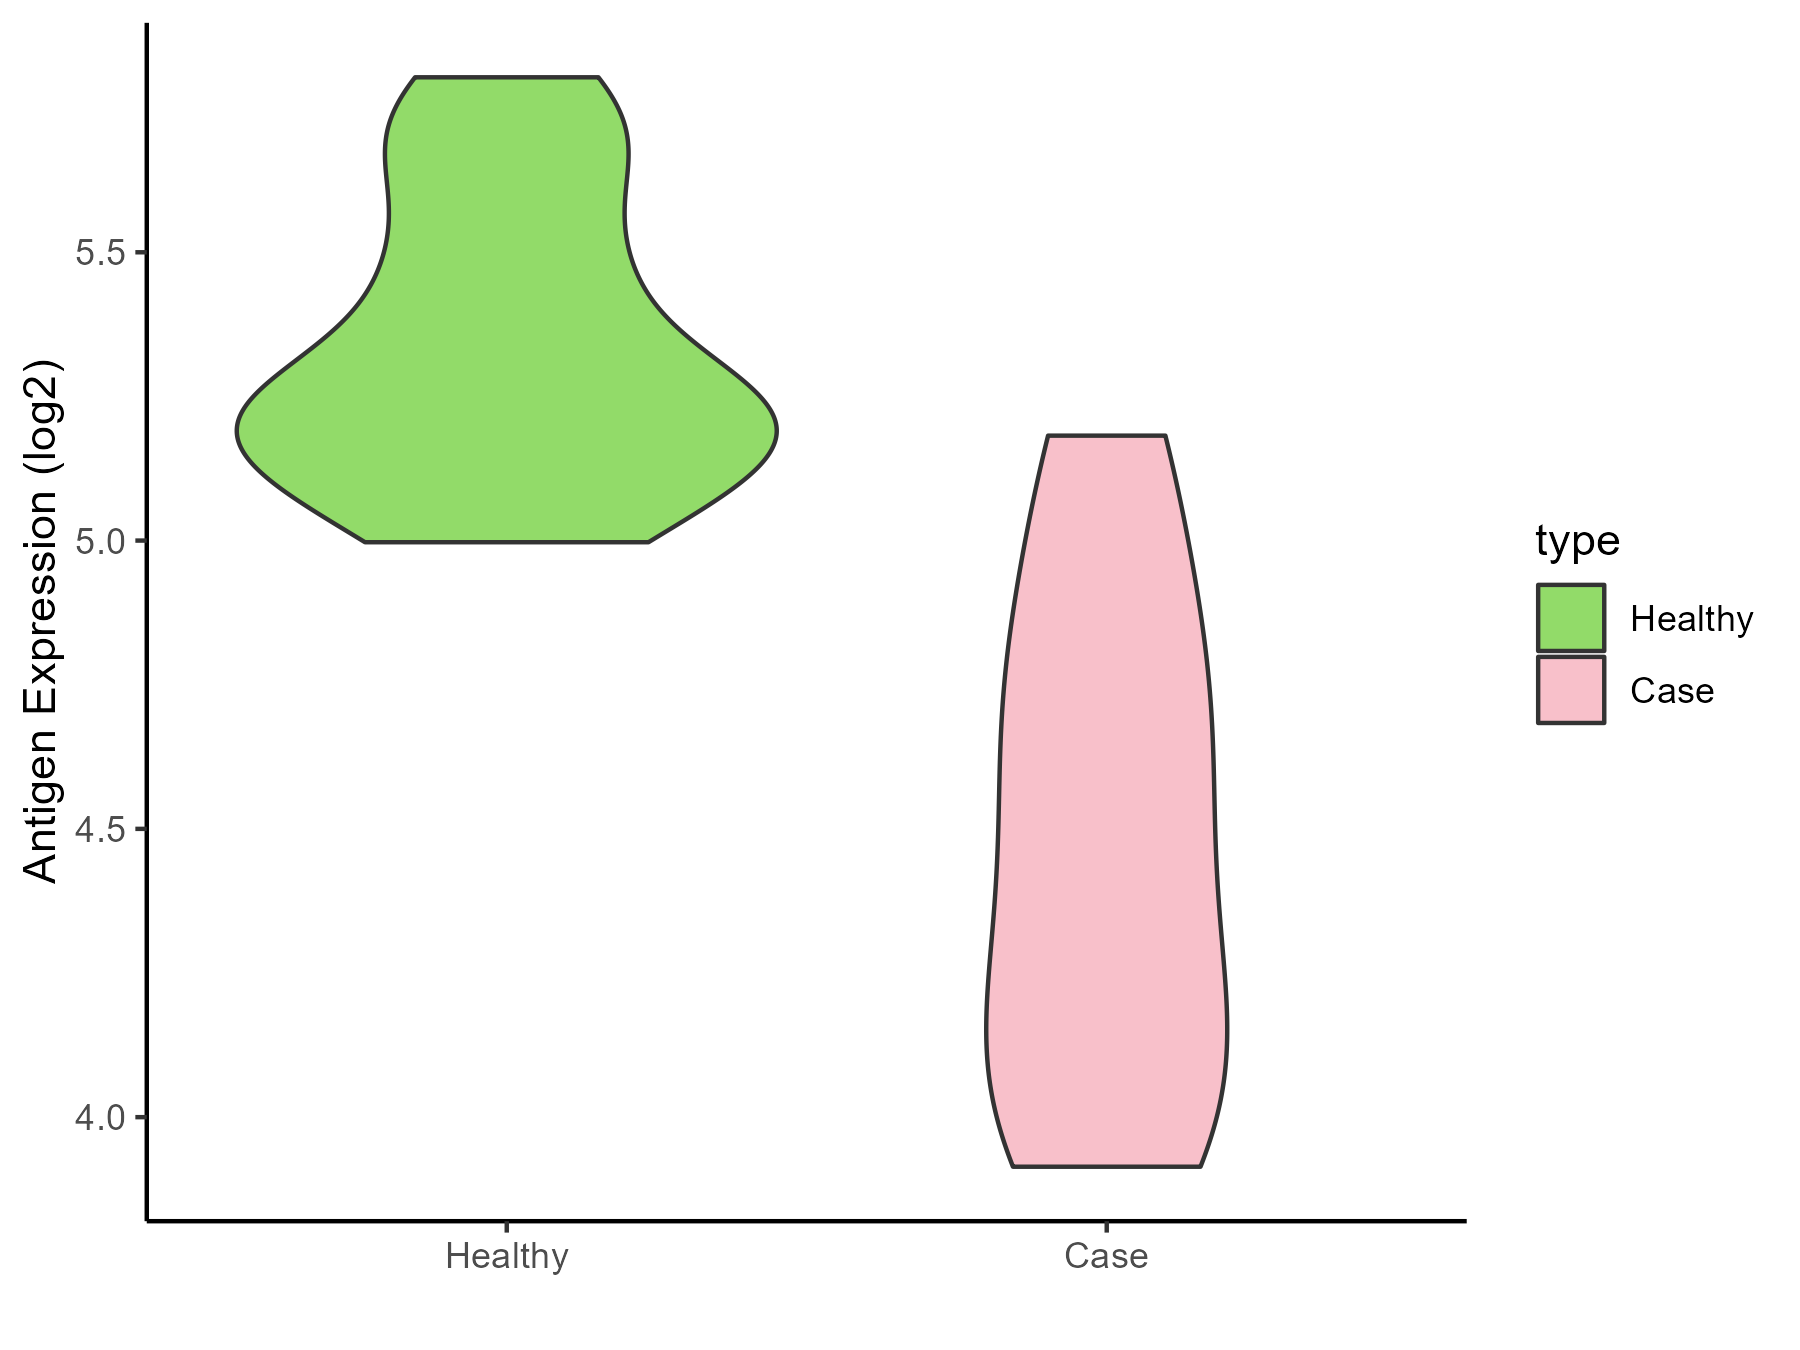
| Differential expression pattern of antigen in diseases | ||
| The Studied Tissue | Intracranial artery | |
| The Specific Disease | Aneurysm | |
| The Expression Level of Disease Section Compare with the Healthy Individual Tissue | p-value: 2.48E-06; Fold-change: -0.790016737; Z-score: -3.069241725 | |
| Disease-specific Antigen Abundances |
|
Click to View the Clearer Original Diagram |
ICD Disease Classification 12
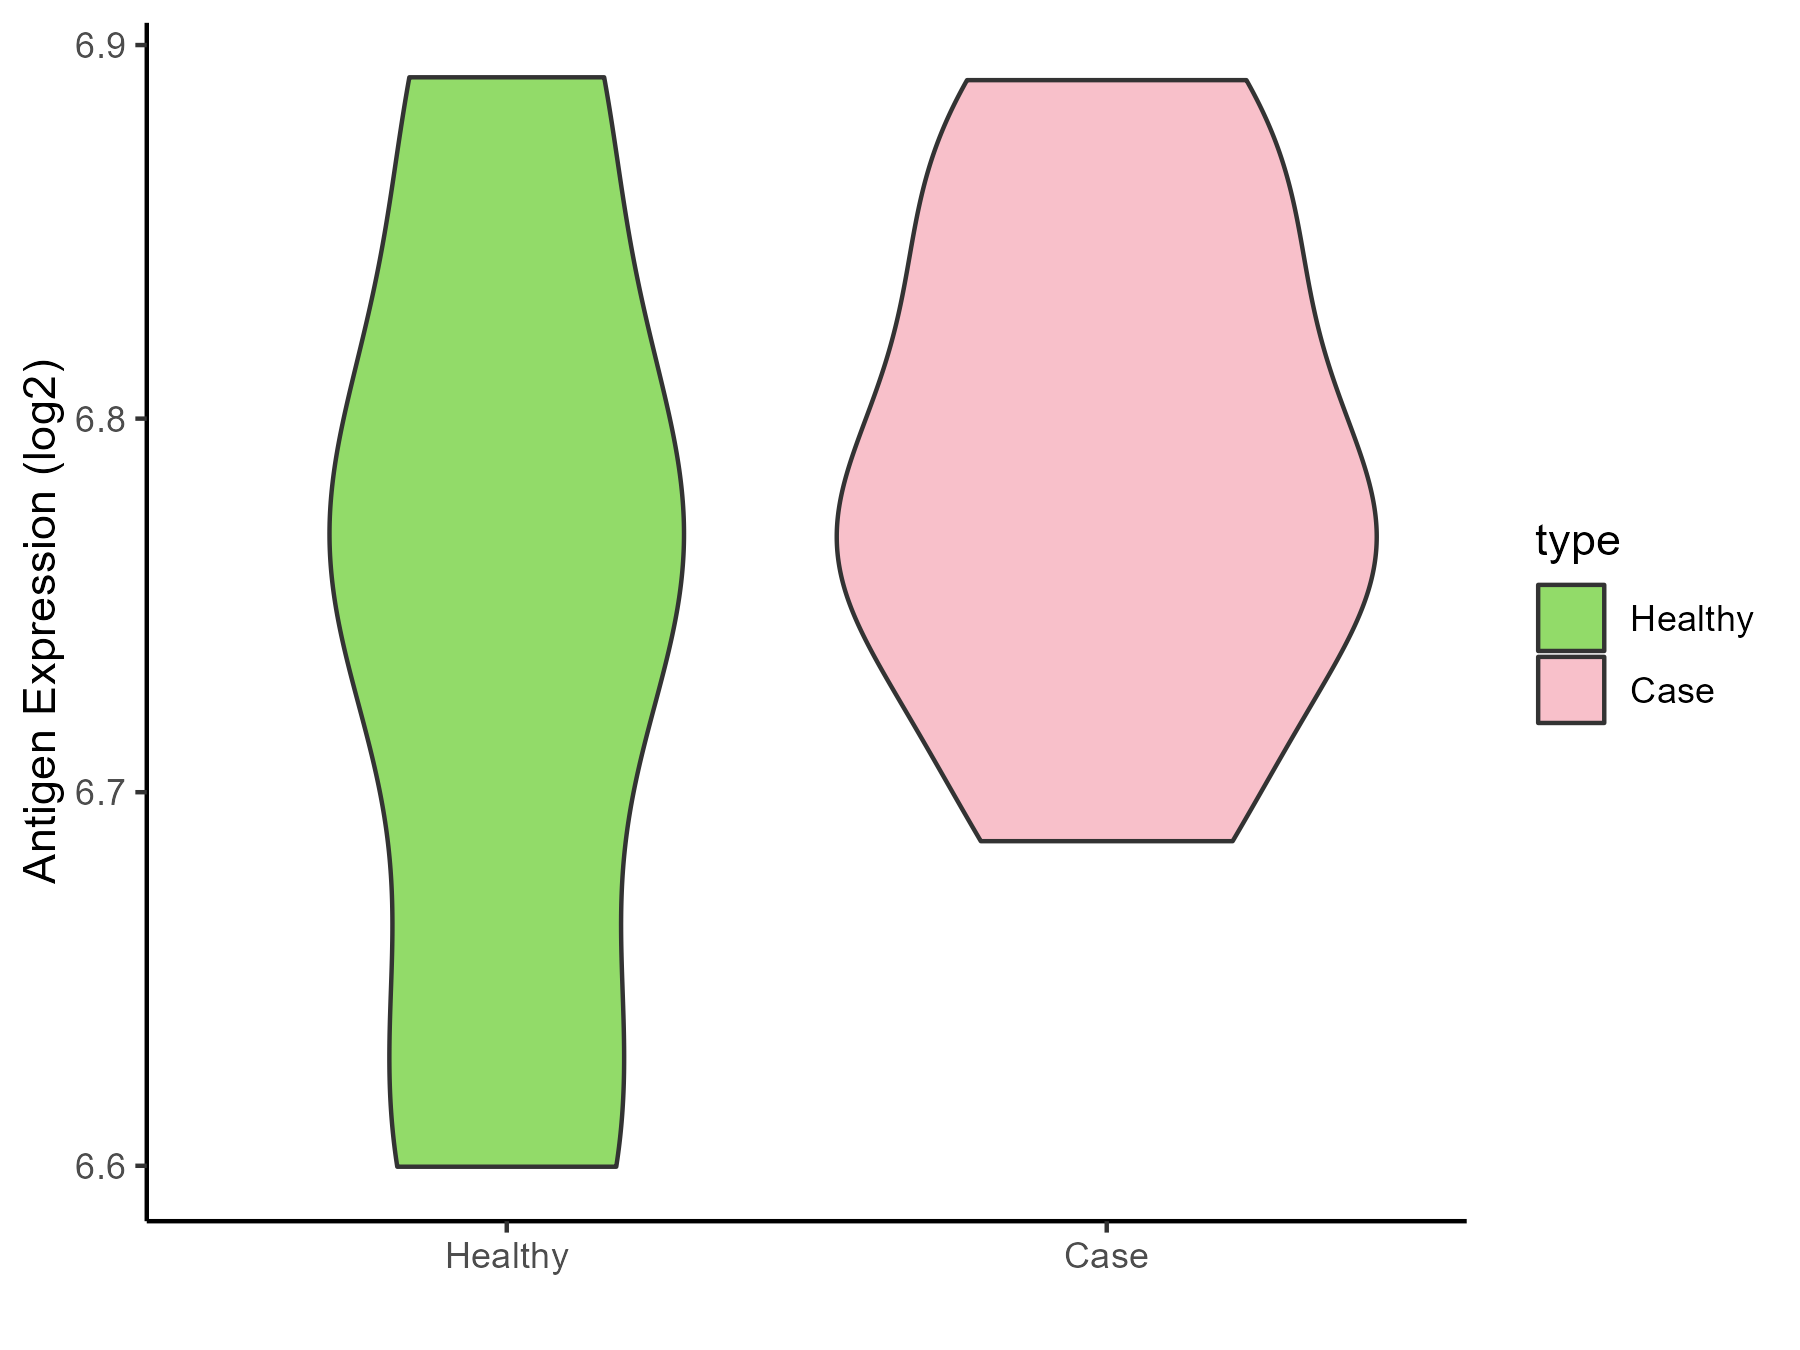
| Differential expression pattern of antigen in diseases | ||
| The Studied Tissue | Peripheral blood | |
| The Specific Disease | Immunodeficiency | |
| The Expression Level of Disease Section Compare with the Healthy Individual Tissue | p-value: 0.300887259; Fold-change: 0.014524841; Z-score: 0.135028731 | |
| Disease-specific Antigen Abundances |
|
Click to View the Clearer Original Diagram |
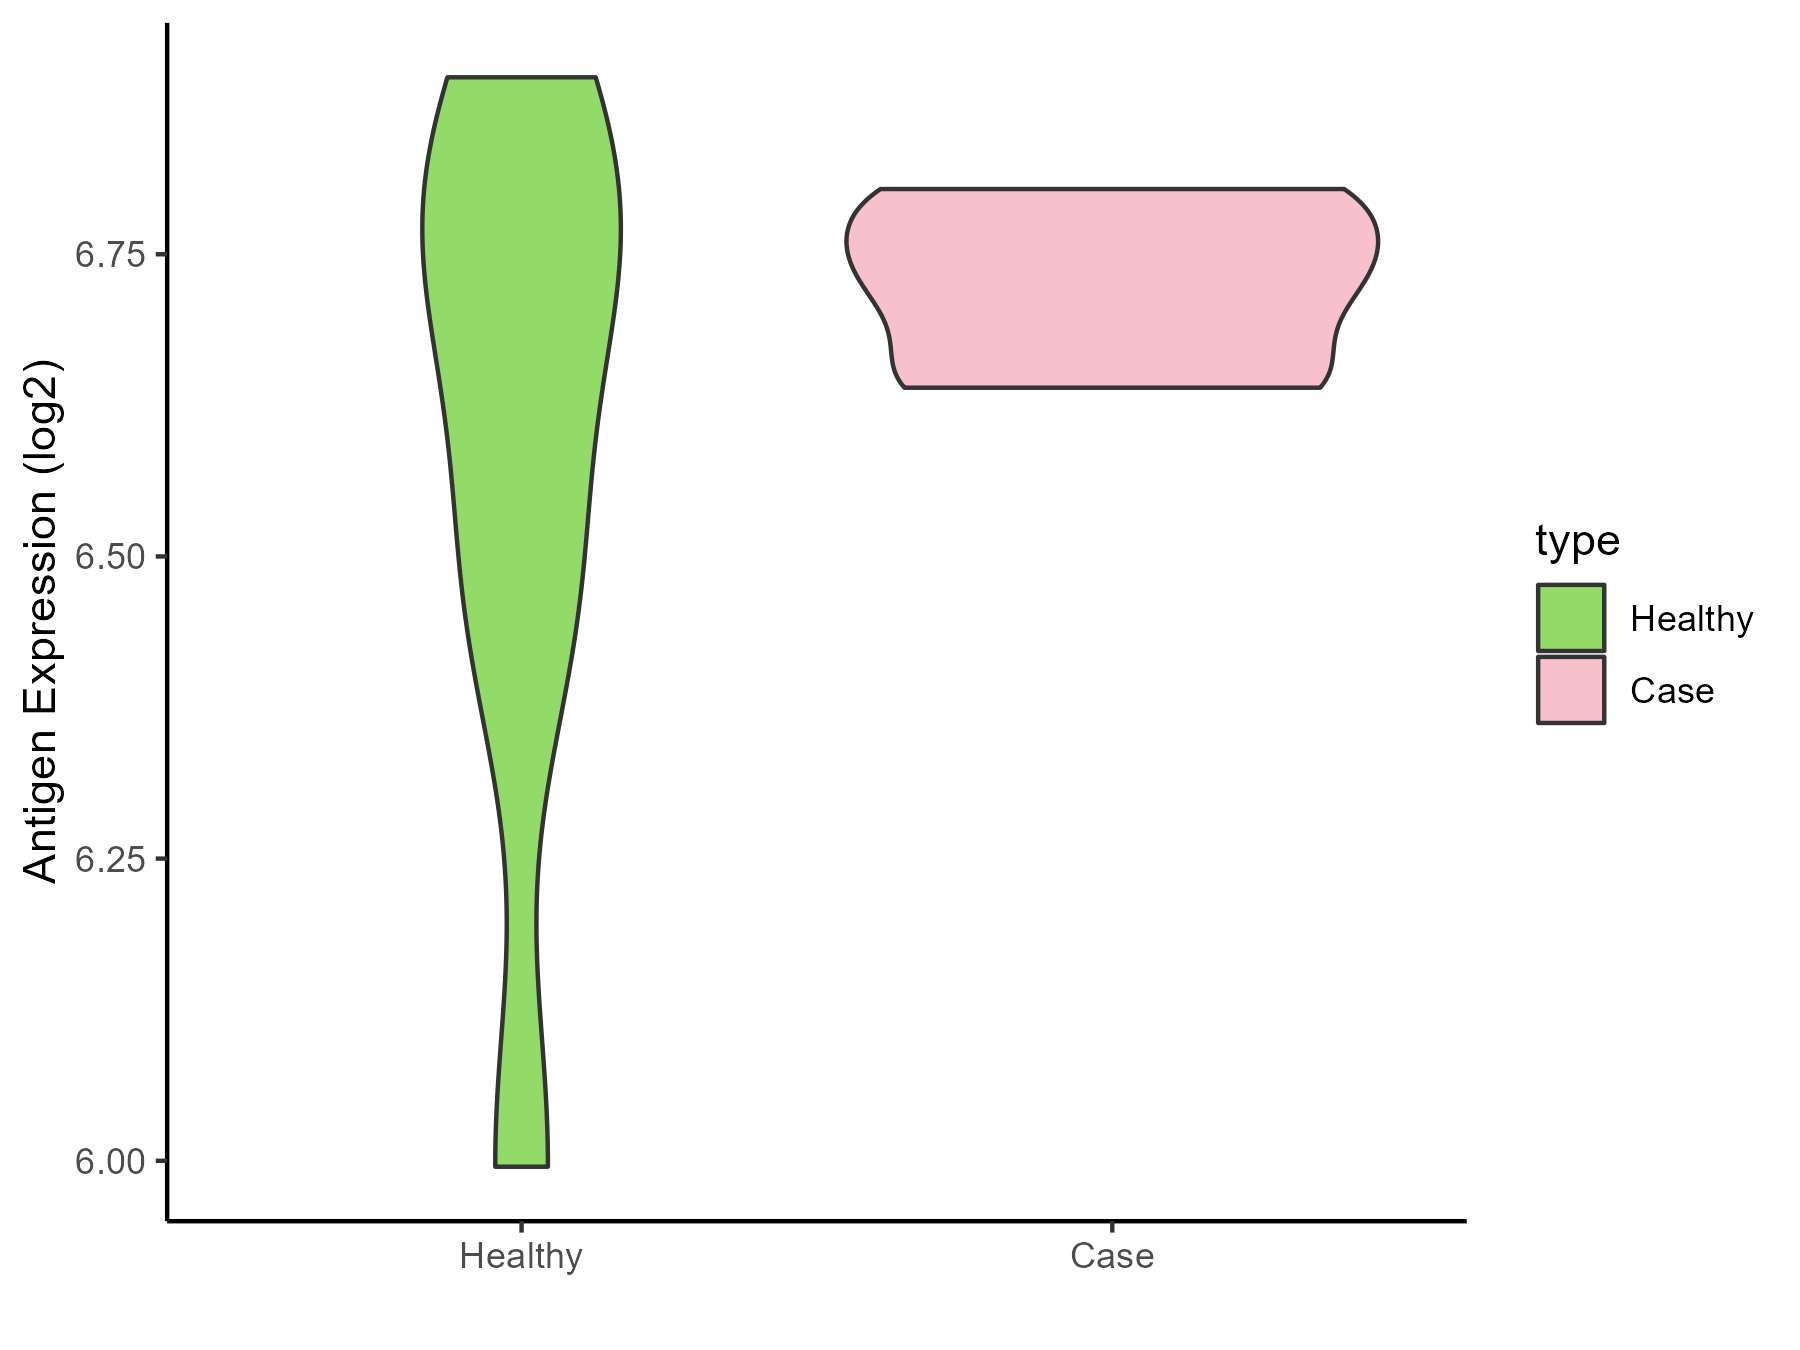
| Differential expression pattern of antigen in diseases | ||
| The Studied Tissue | Hyperplastic tonsil | |
| The Specific Disease | Apnea | |
| The Expression Level of Disease Section Compare with the Healthy Individual Tissue | p-value: 0.315563964; Fold-change: -0.014531008; Z-score: -0.047339313 | |
| Disease-specific Antigen Abundances |
|
Click to View the Clearer Original Diagram |
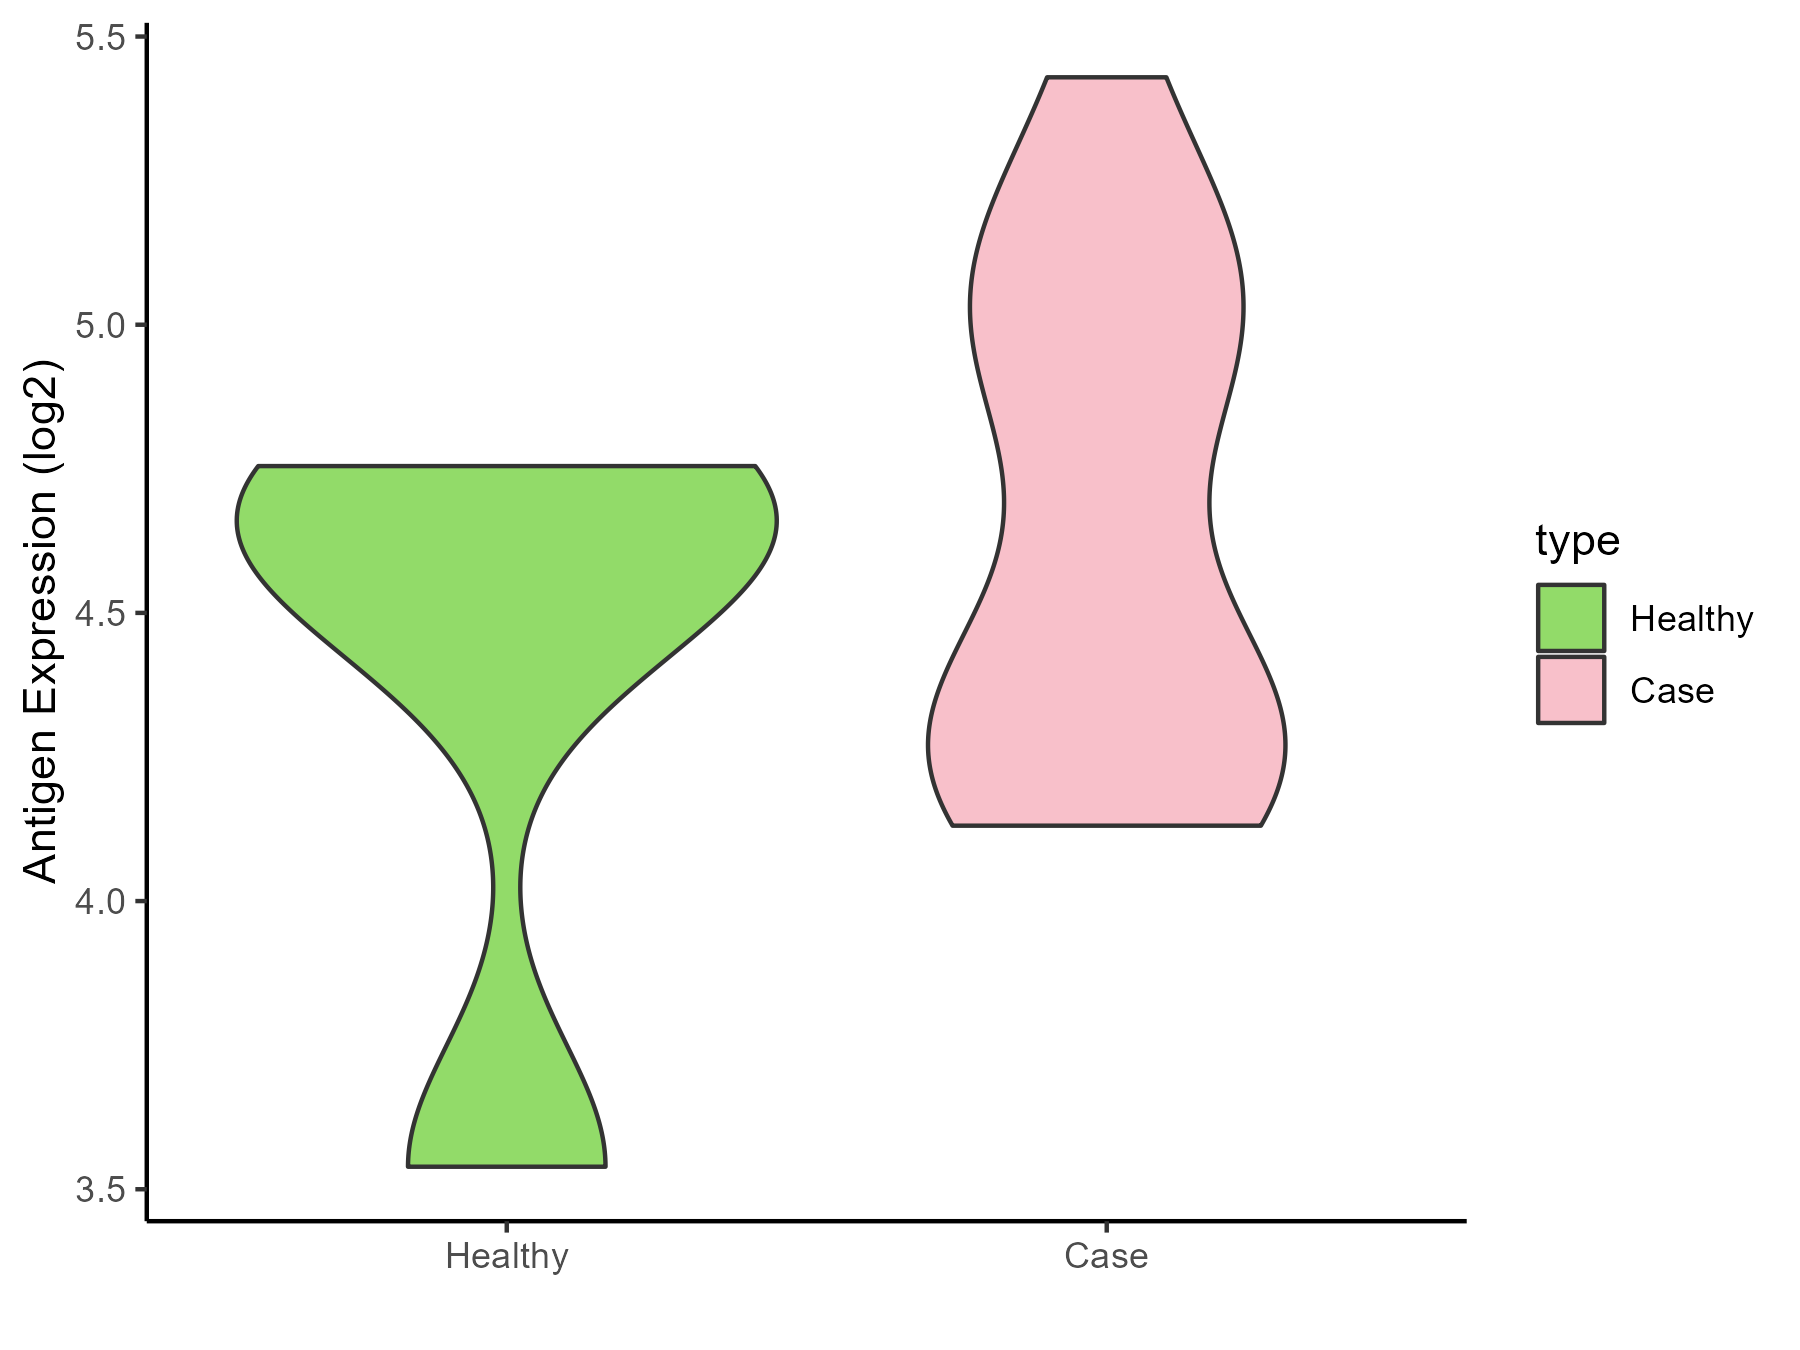
| Differential expression pattern of antigen in diseases | ||
| The Studied Tissue | Peripheral blood | |
| The Specific Disease | Olive pollen allergy | |
| The Expression Level of Disease Section Compare with the Healthy Individual Tissue | p-value: 0.428575494; Fold-change: -0.104183603; Z-score: -0.184050824 | |
| Disease-specific Antigen Abundances |
|
Click to View the Clearer Original Diagram |
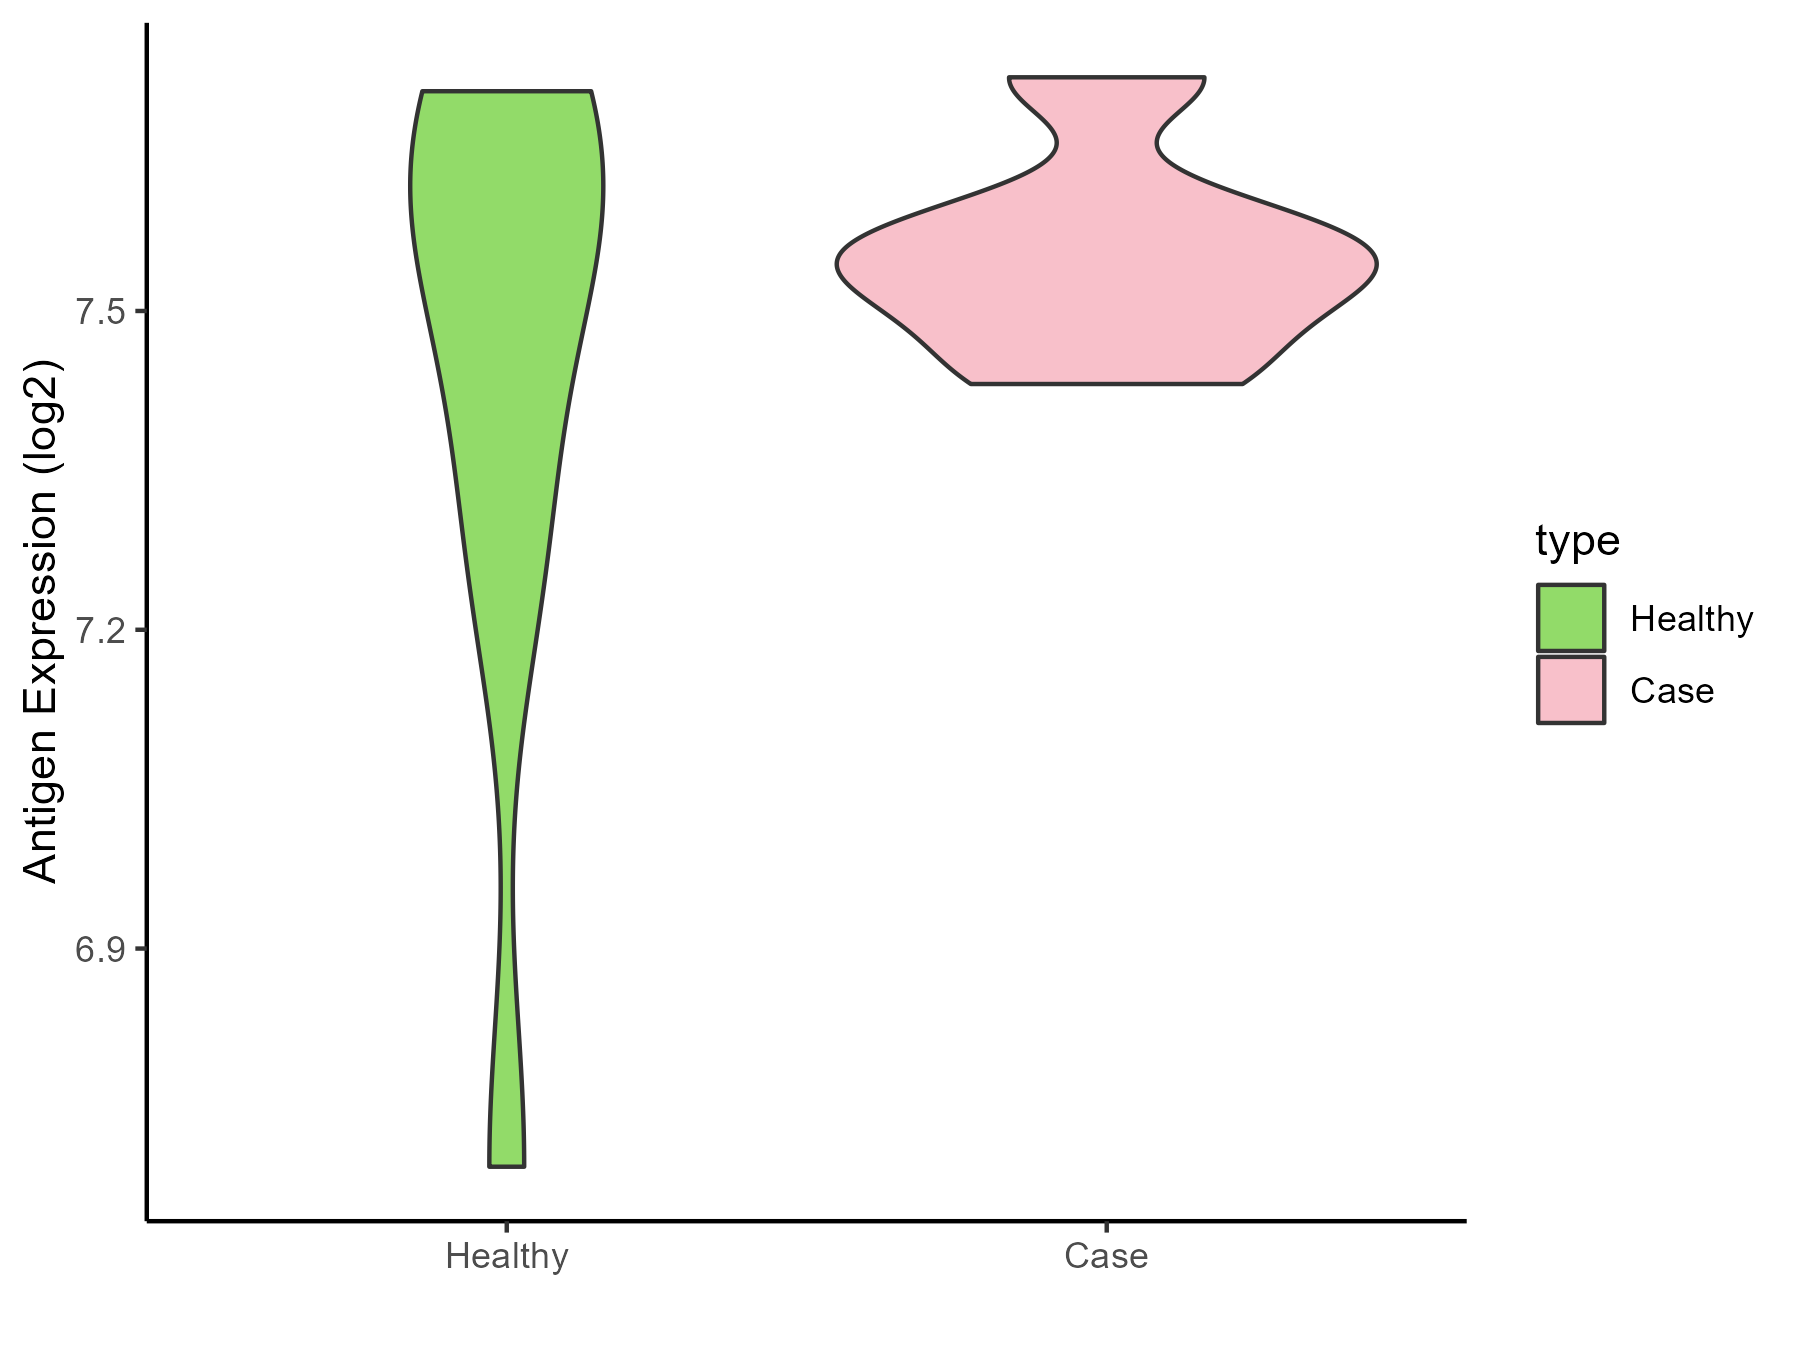
| Differential expression pattern of antigen in diseases | ||
| The Studied Tissue | Sinus mucosa | |
| The Specific Disease | Chronic rhinosinusitis | |
| The Expression Level of Disease Section Compare with the Healthy Individual Tissue | p-value: 0.391128078; Fold-change: -0.008172554; Z-score: -0.025197105 | |
| Disease-specific Antigen Abundances |
|
Click to View the Clearer Original Diagram |
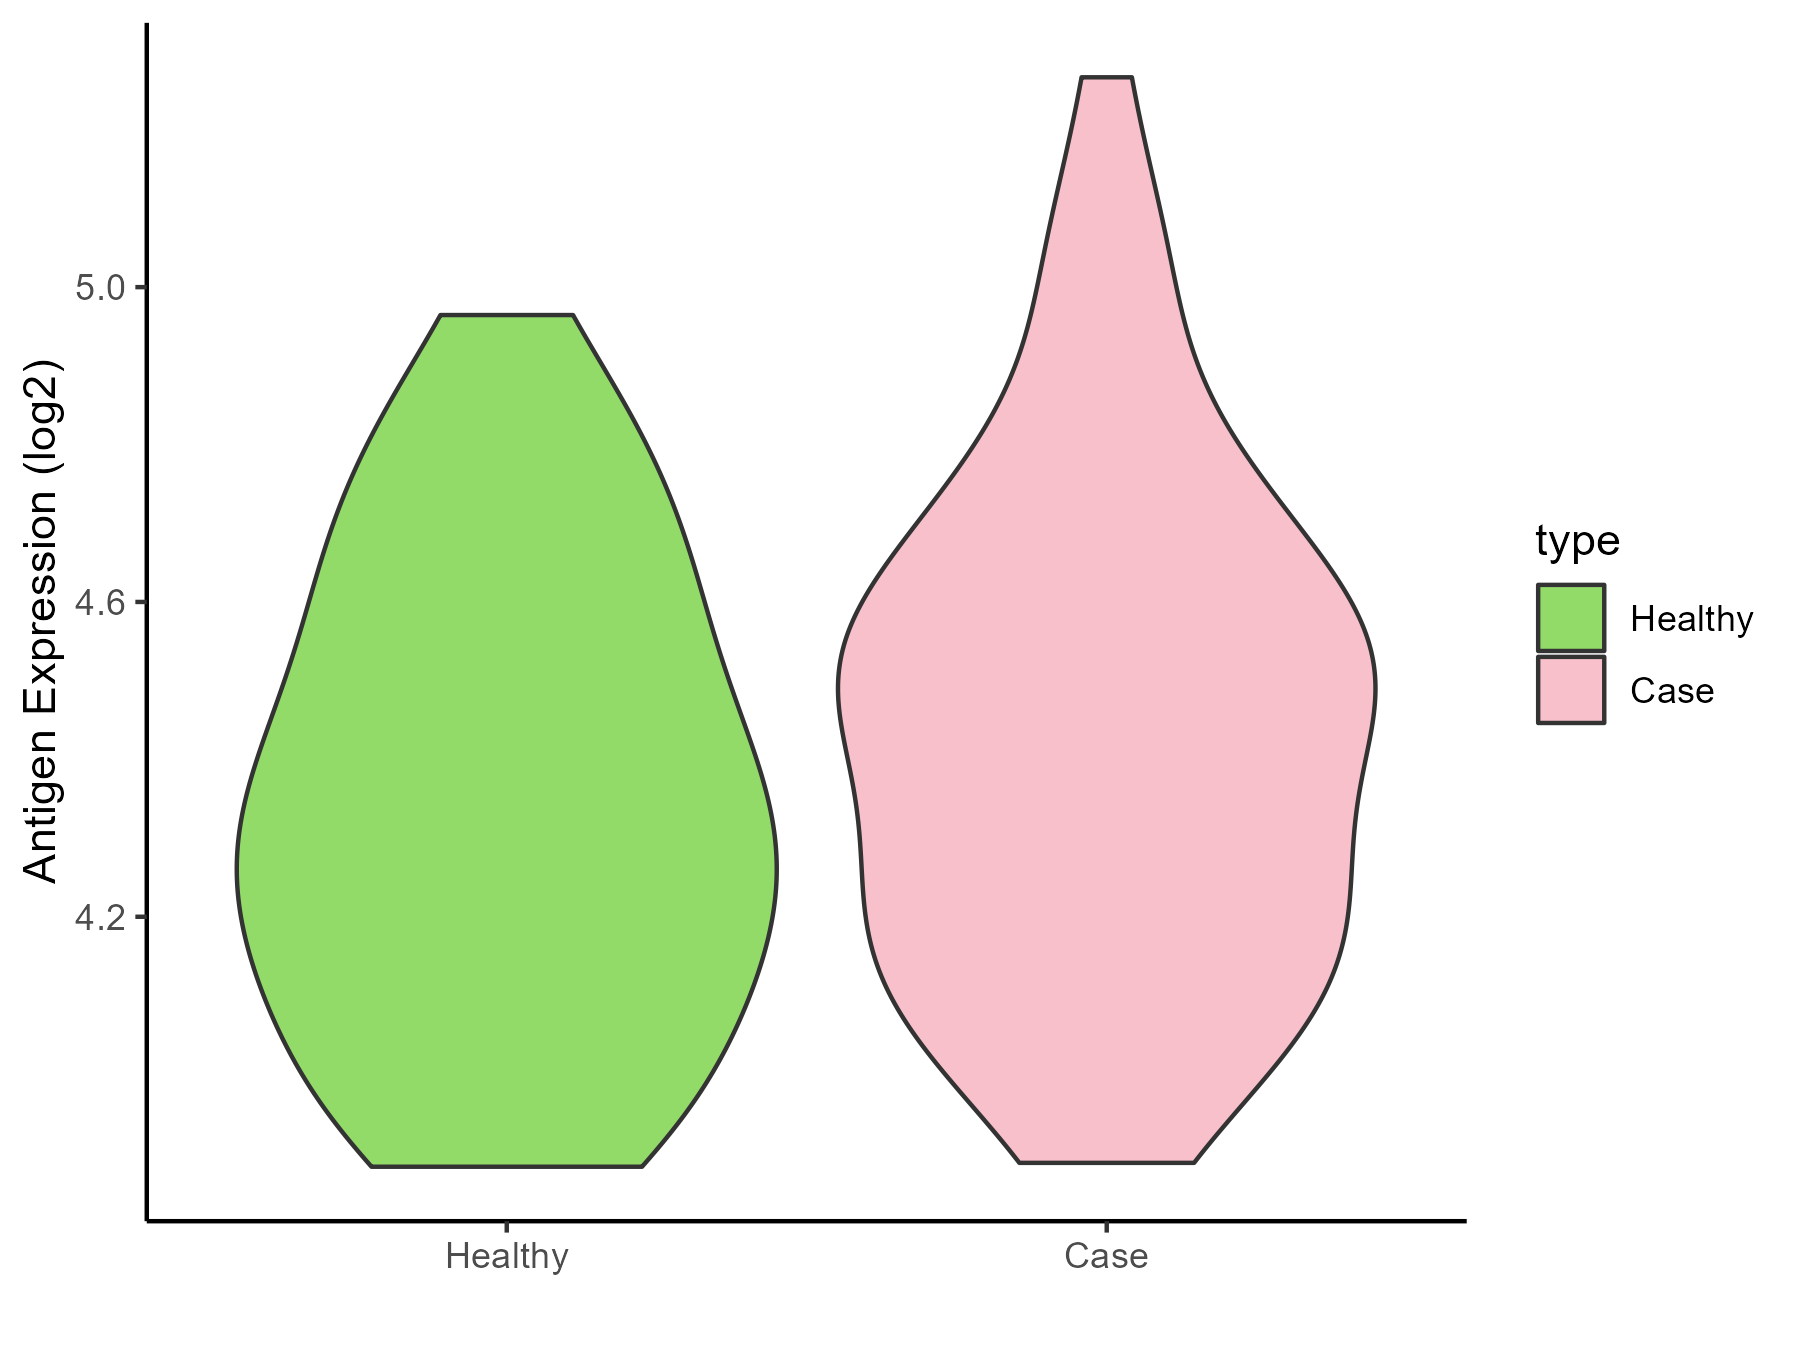
| Differential expression pattern of antigen in diseases | ||
| The Studied Tissue | Lung | |
| The Specific Disease | Chronic obstructive pulmonary disease | |
| The Expression Level of Disease Section Compare with the Healthy Individual Tissue | p-value: 0.212360538; Fold-change: 0.112762024; Z-score: 0.376693945 | |
| Disease-specific Antigen Abundances |
|
Click to View the Clearer Original Diagram |
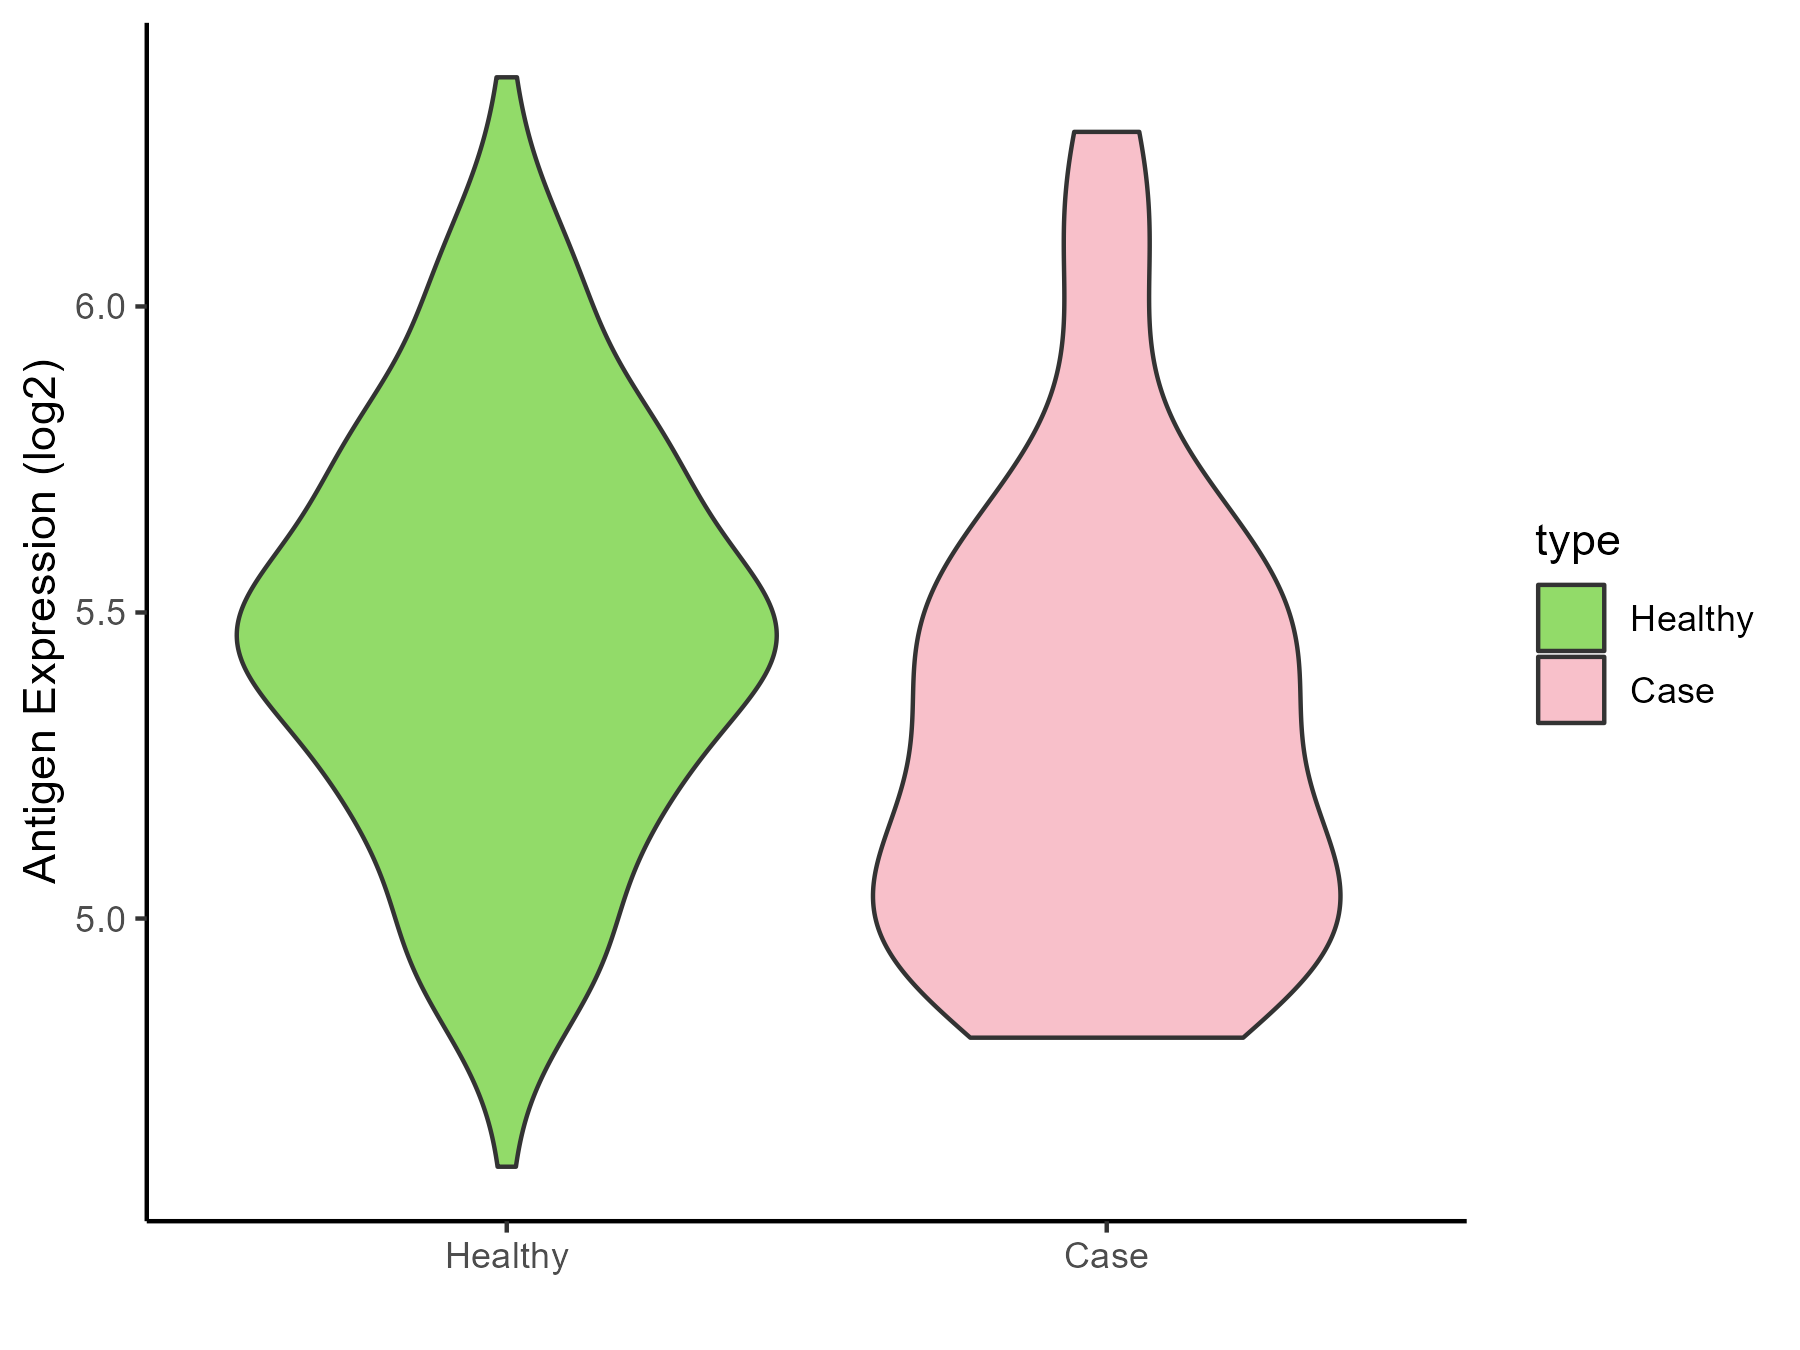
| The Studied Tissue | Small airway epithelium | |
| The Specific Disease | Chronic obstructive pulmonary disease | |
| The Expression Level of Disease Section Compare with the Healthy Individual Tissue | p-value: 0.019265566; Fold-change: -0.221400667; Z-score: -0.645657356 | |
| Disease-specific Antigen Abundances |
|
Click to View the Clearer Original Diagram |
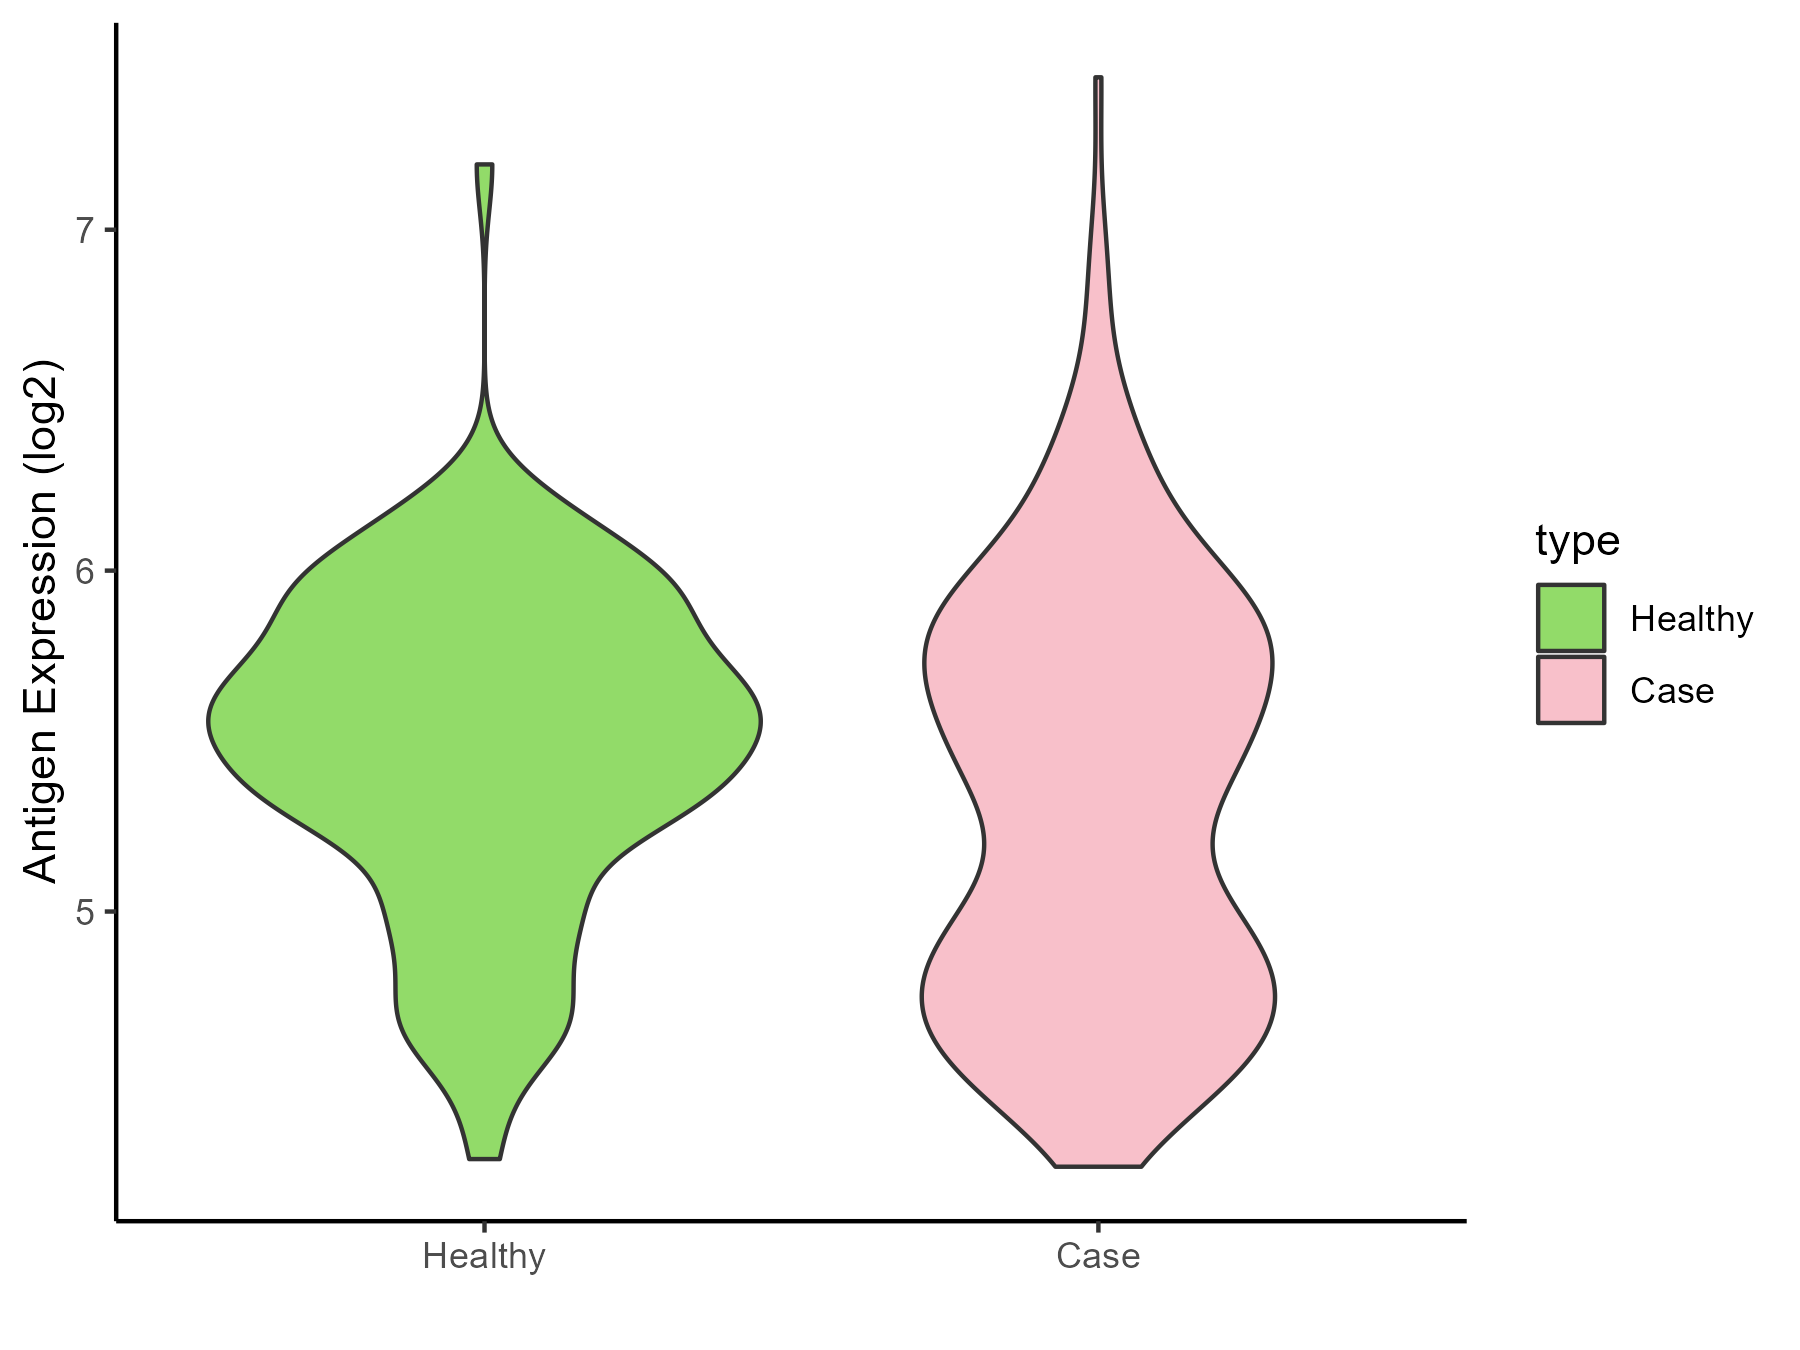
| Differential expression pattern of antigen in diseases | ||
| The Studied Tissue | Nasal and bronchial airway | |
| The Specific Disease | Asthma | |
| The Expression Level of Disease Section Compare with the Healthy Individual Tissue | p-value: 0.013604765; Fold-change: -0.154784102; Z-score: -0.329278808 | |
| Disease-specific Antigen Abundances |
|
Click to View the Clearer Original Diagram |
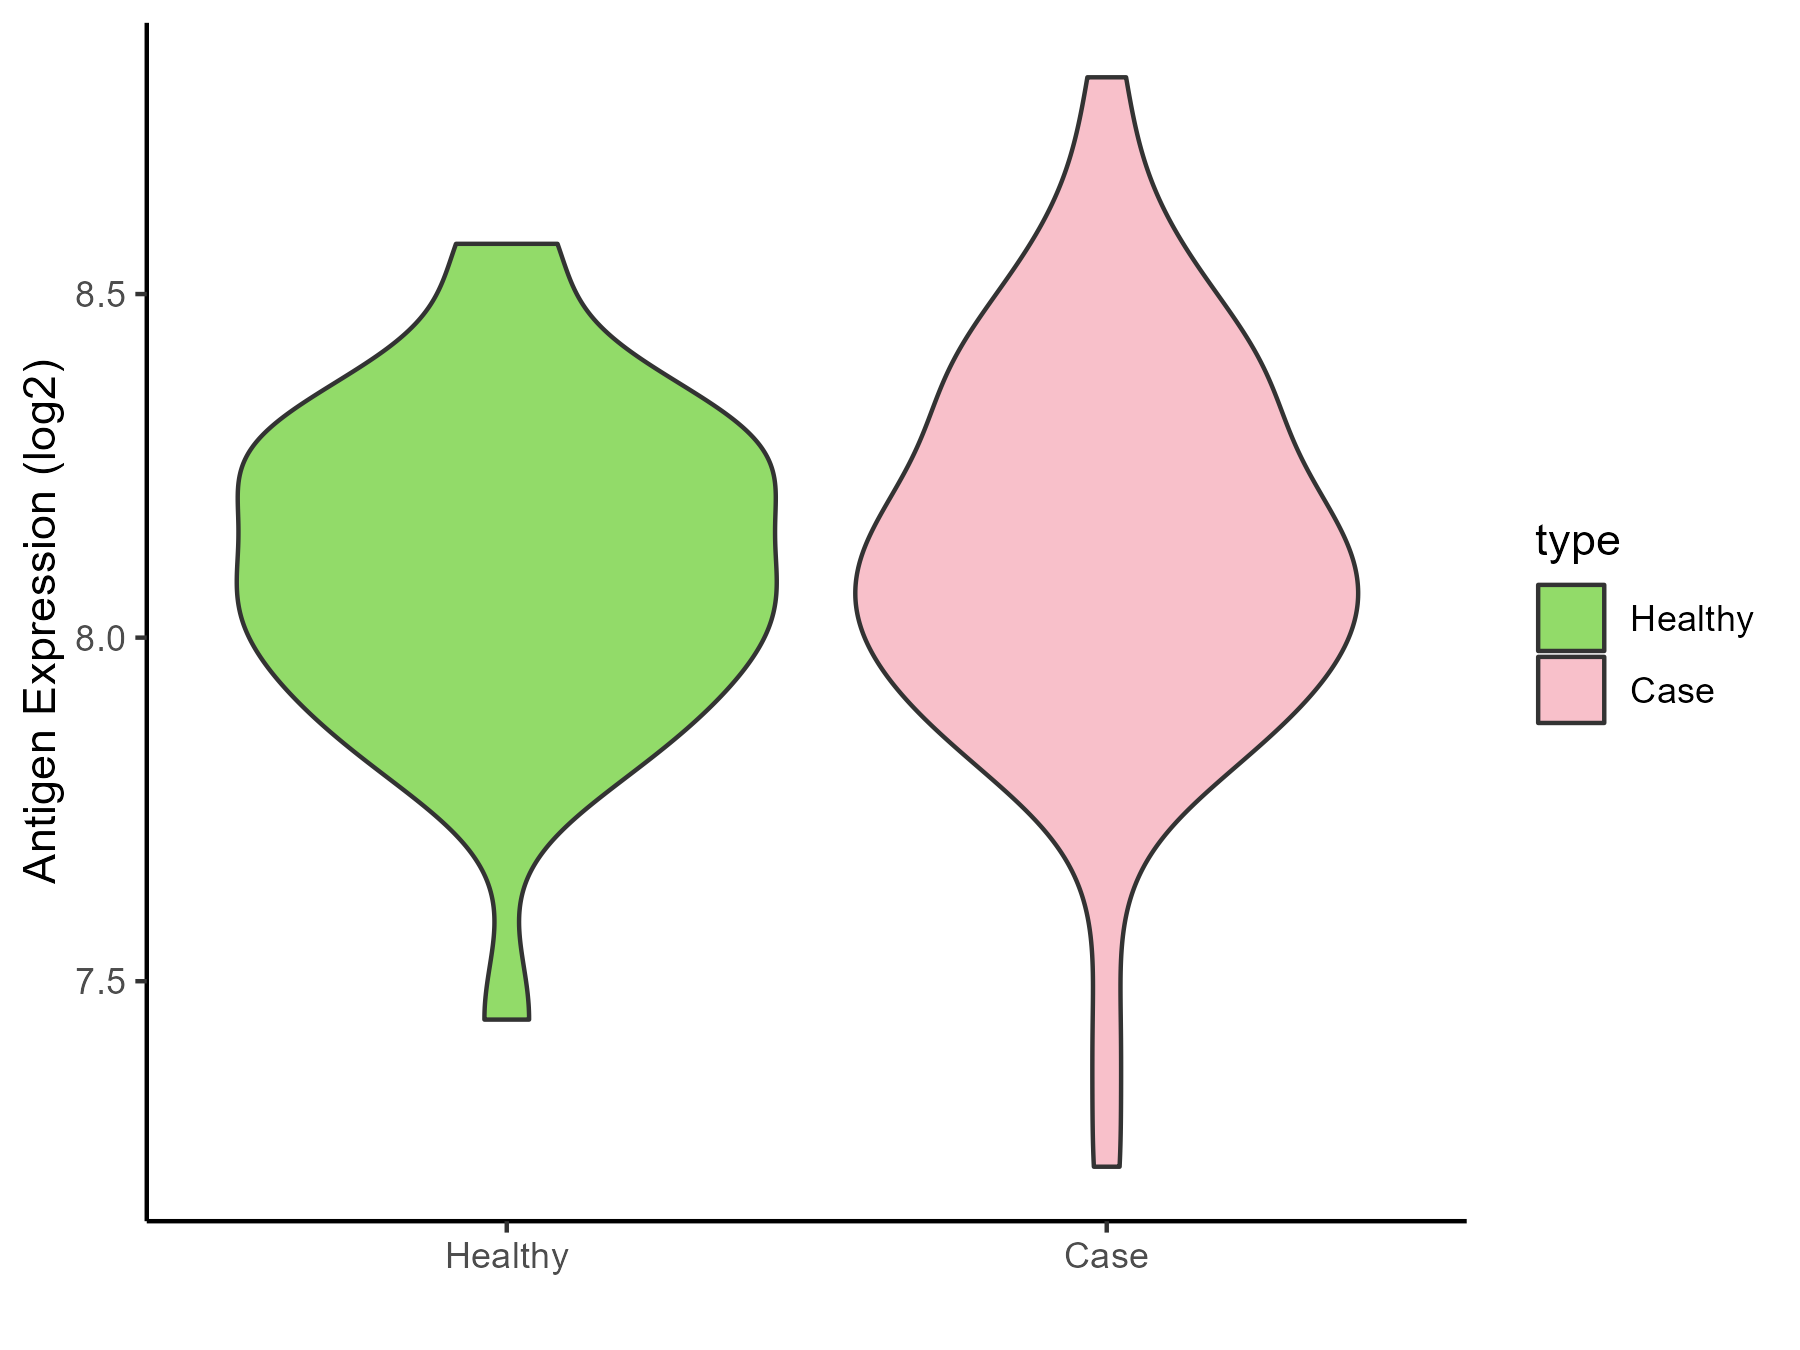
| Differential expression pattern of antigen in diseases | ||
| The Studied Tissue | Nasal Epithelium | |
| The Specific Disease | Human rhinovirus infection | |
| The Expression Level of Disease Section Compare with the Healthy Individual Tissue | p-value: 0.723218355; Fold-change: 0.024452521; Z-score: 0.10497088 | |
| Disease-specific Antigen Abundances |
|
Click to View the Clearer Original Diagram |
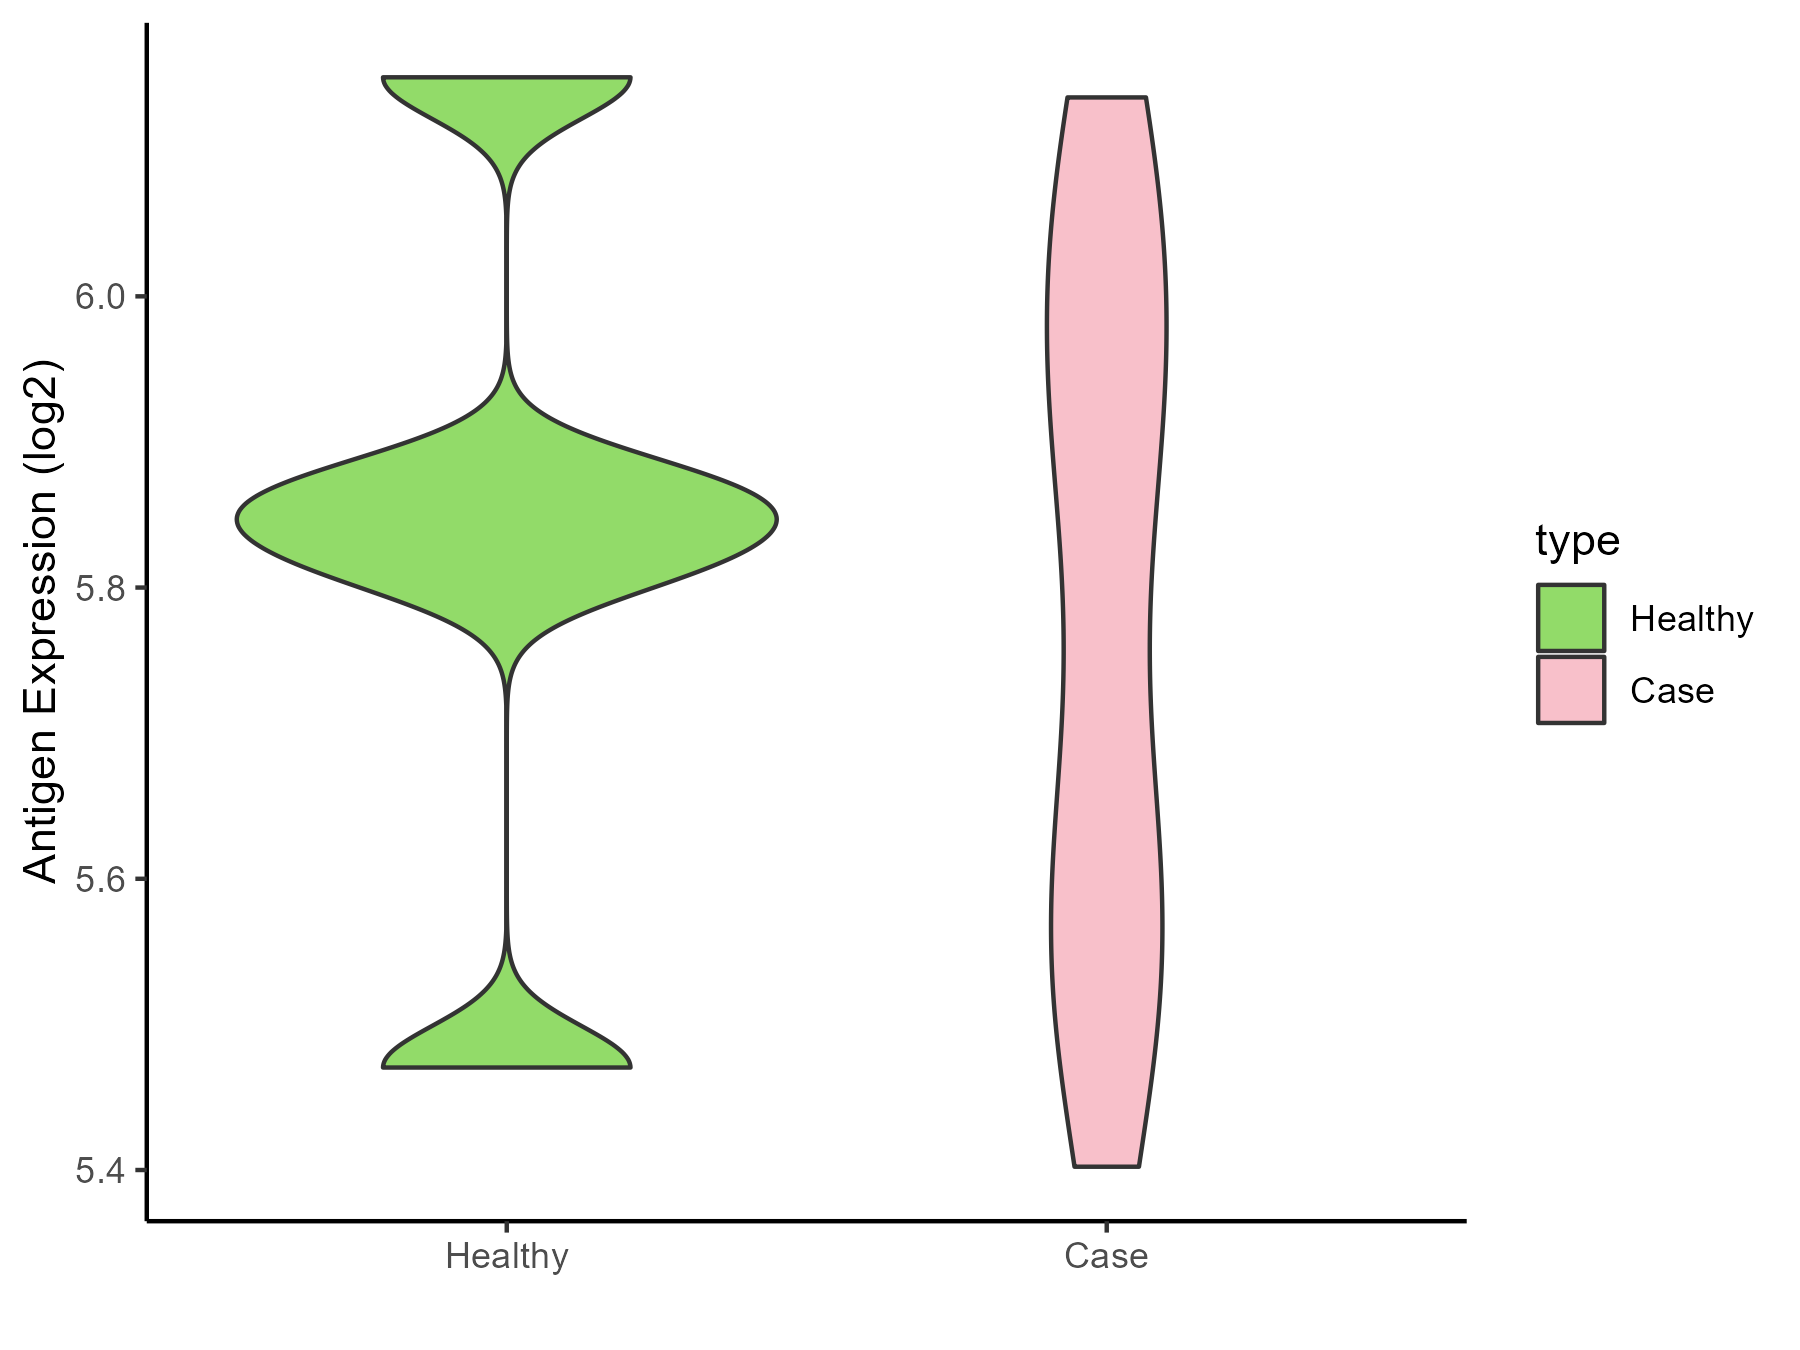
| Differential expression pattern of antigen in diseases | ||
| The Studied Tissue | Lung | |
| The Specific Disease | Idiopathic pulmonary fibrosis | |
| The Expression Level of Disease Section Compare with the Healthy Individual Tissue | p-value: 0.736332751; Fold-change: -0.011655968; Z-score: -0.048159129 | |
| Disease-specific Antigen Abundances |
|
Click to View the Clearer Original Diagram |
ICD Disease Classification 13
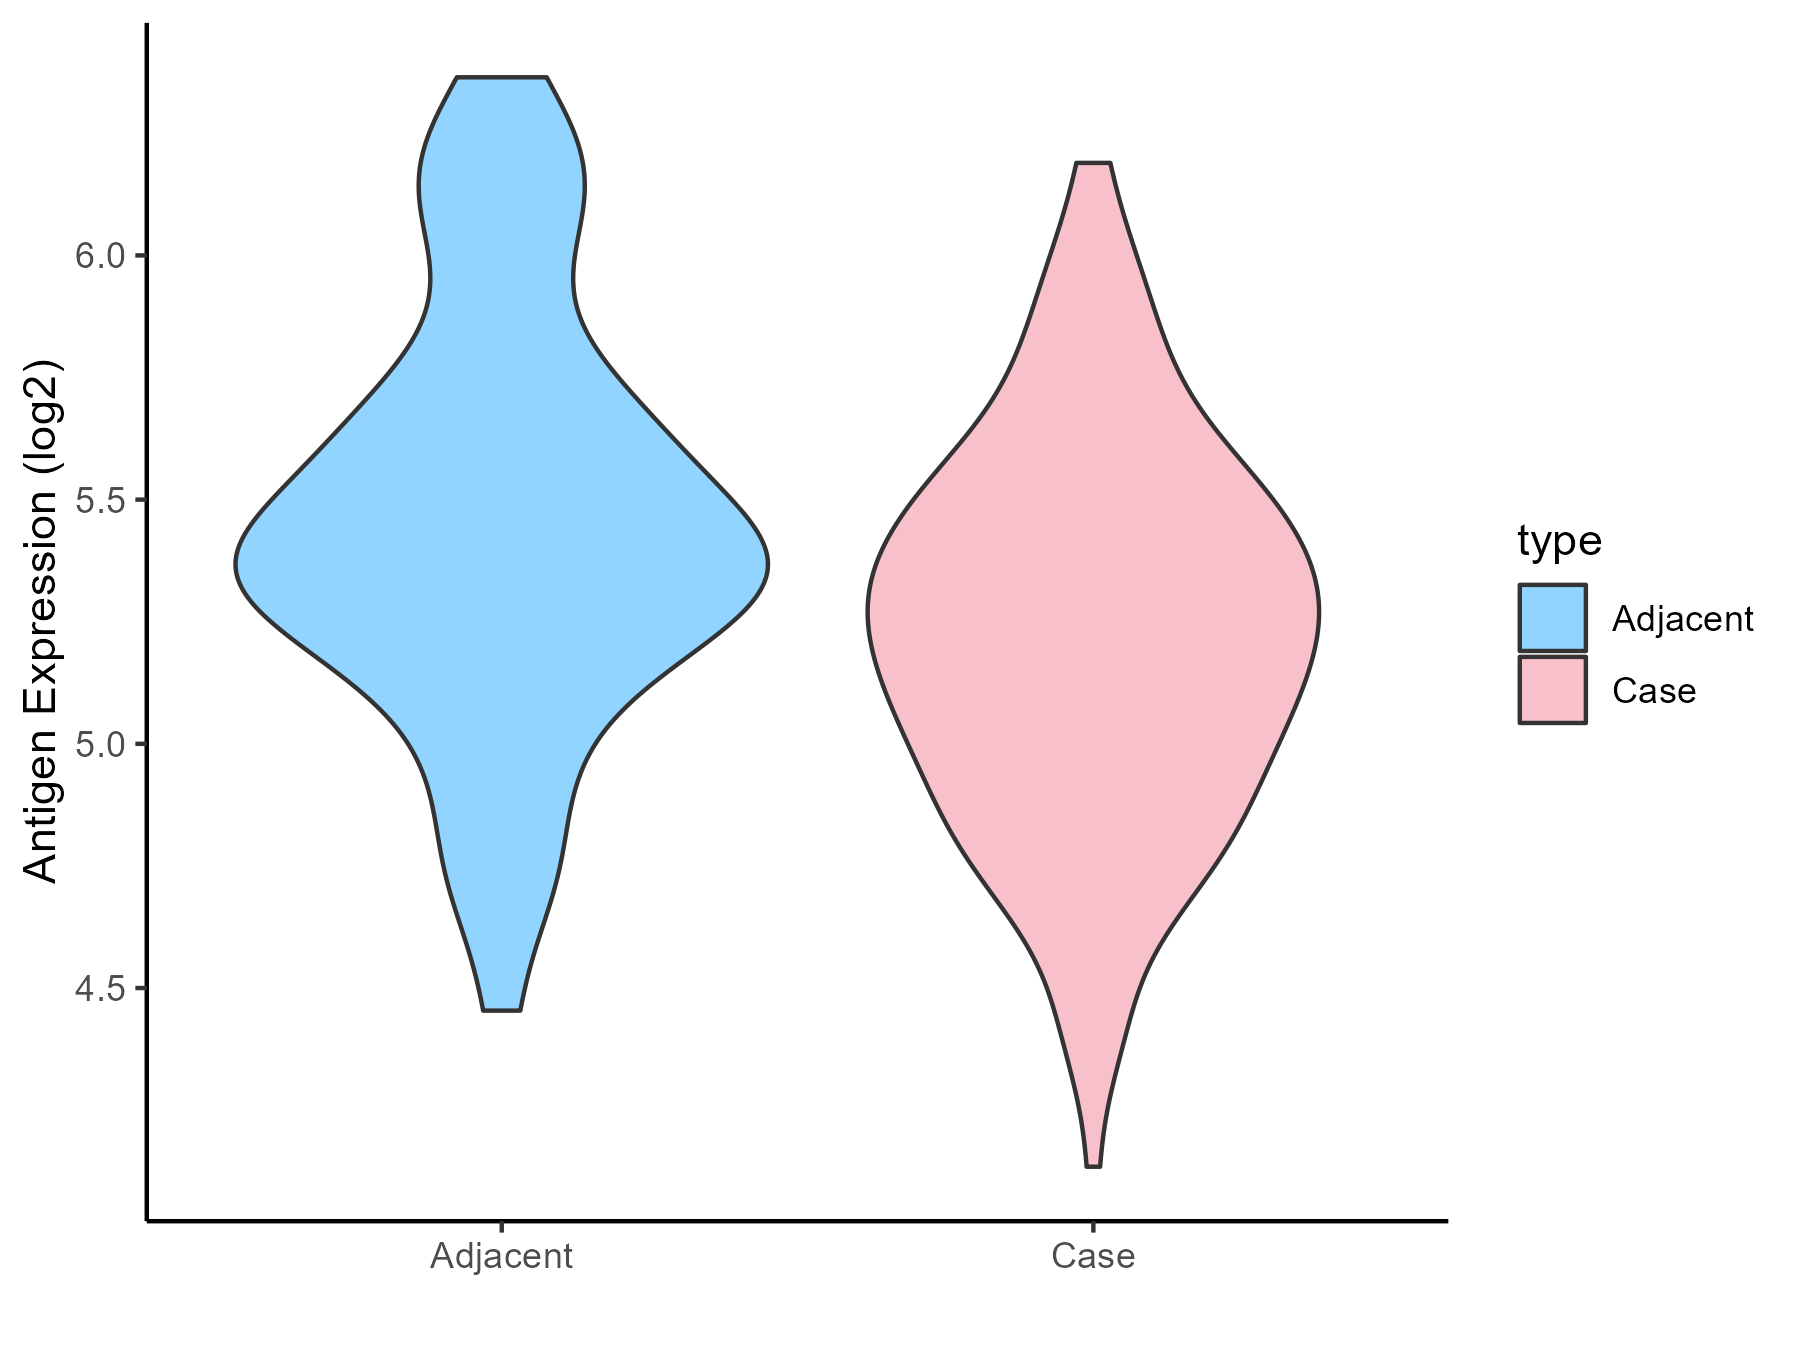
| Differential expression pattern of antigen in diseases | ||
| The Studied Tissue | Gingival | |
| The Specific Disease | Periodontal disease | |
| The Expression Level of Disease Section Compare with the Adjacent Tissue | p-value: 0.000423311; Fold-change: -0.165882782; Z-score: -0.389774716 | |
| Disease-specific Antigen Abundances |
|
Click to View the Clearer Original Diagram |
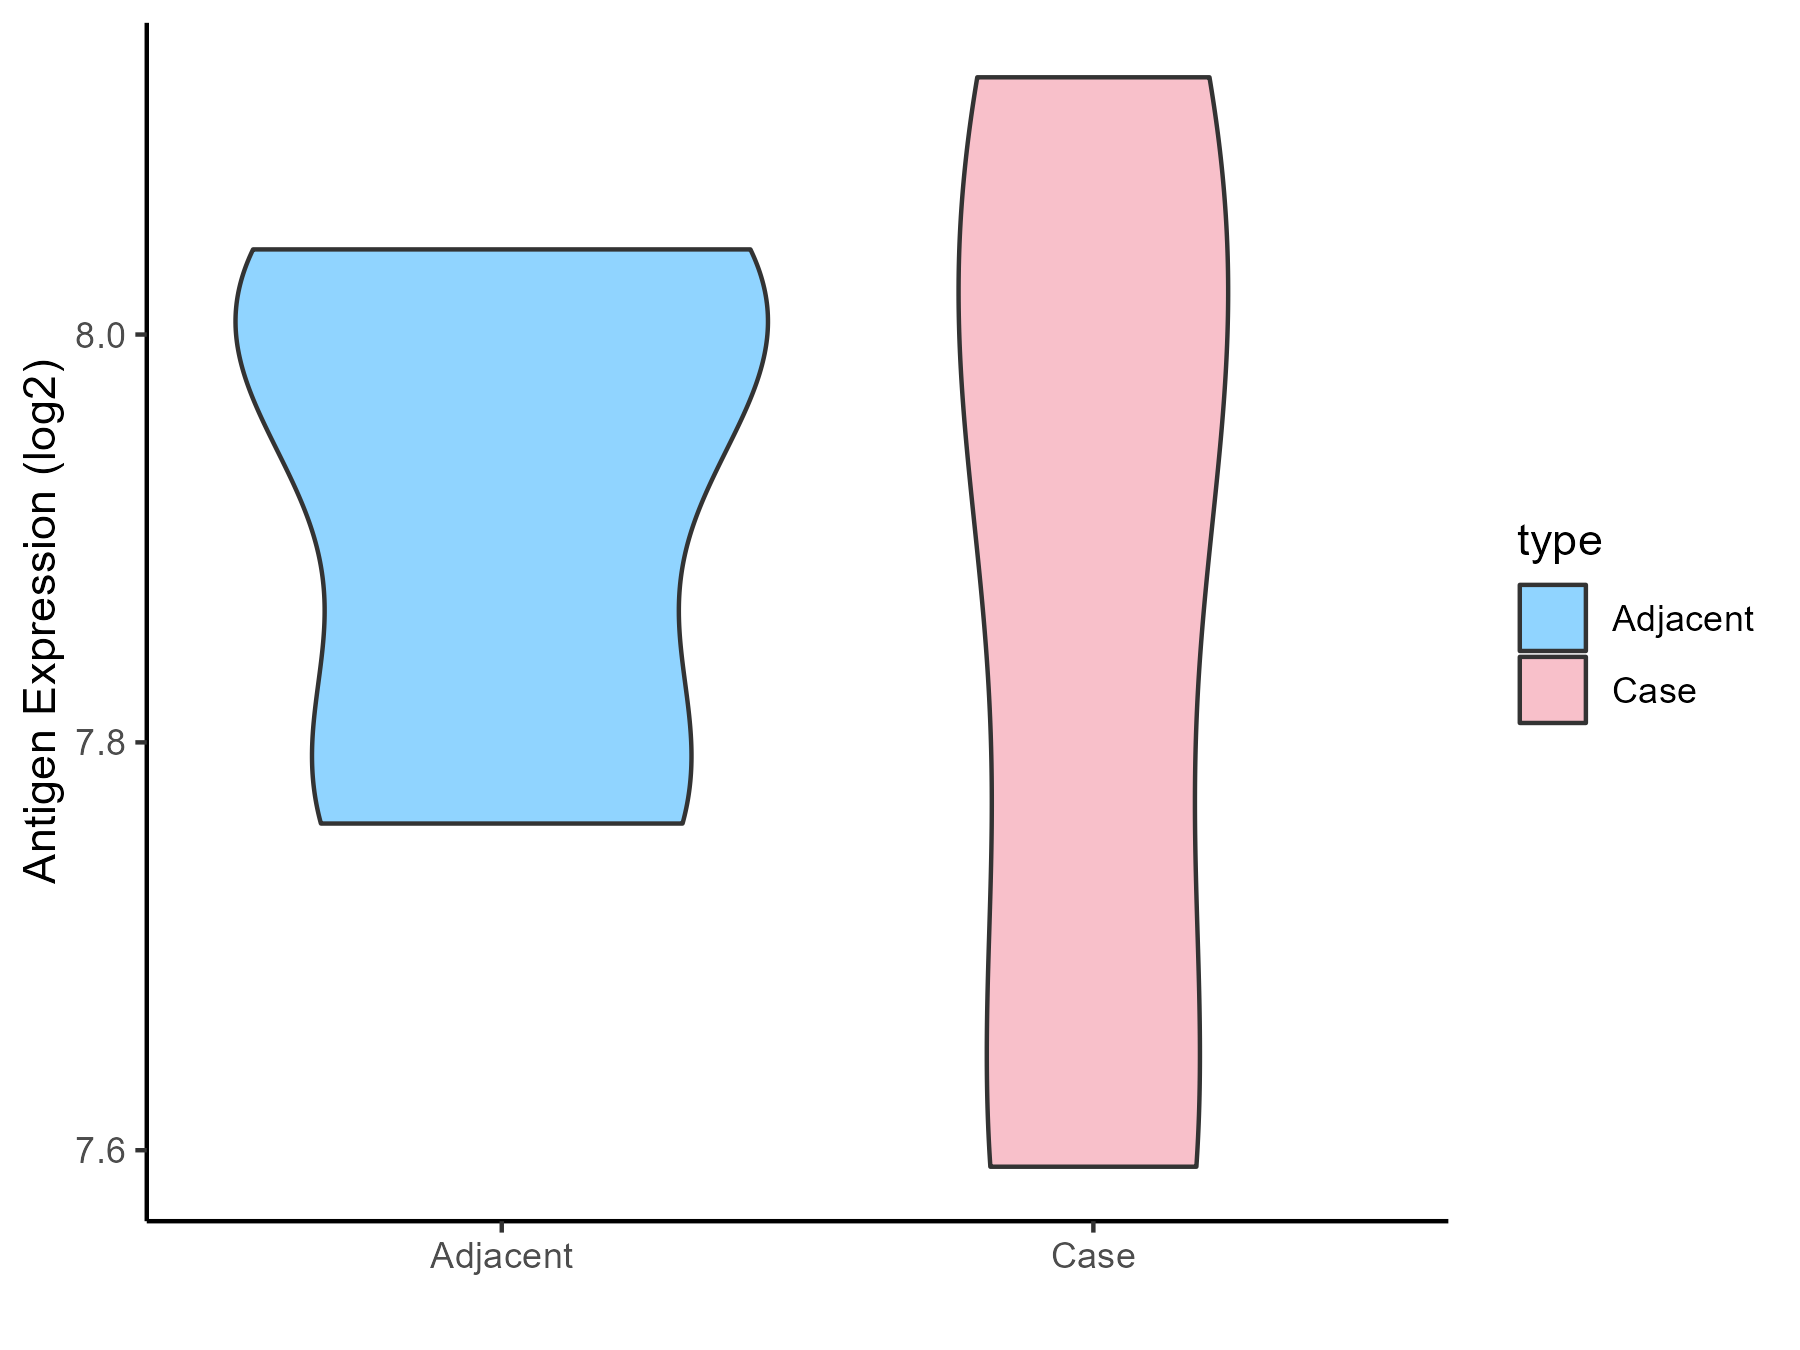
| Differential expression pattern of antigen in diseases | ||
| The Studied Tissue | Gastric antrum | |
| The Specific Disease | Eosinophilic gastritis | |
| The Expression Level of Disease Section Compare with the Adjacent Tissue | p-value: 0.672060272; Fold-change: -0.035991699; Z-score: -0.275102962 | |
| Disease-specific Antigen Abundances |
|
Click to View the Clearer Original Diagram |
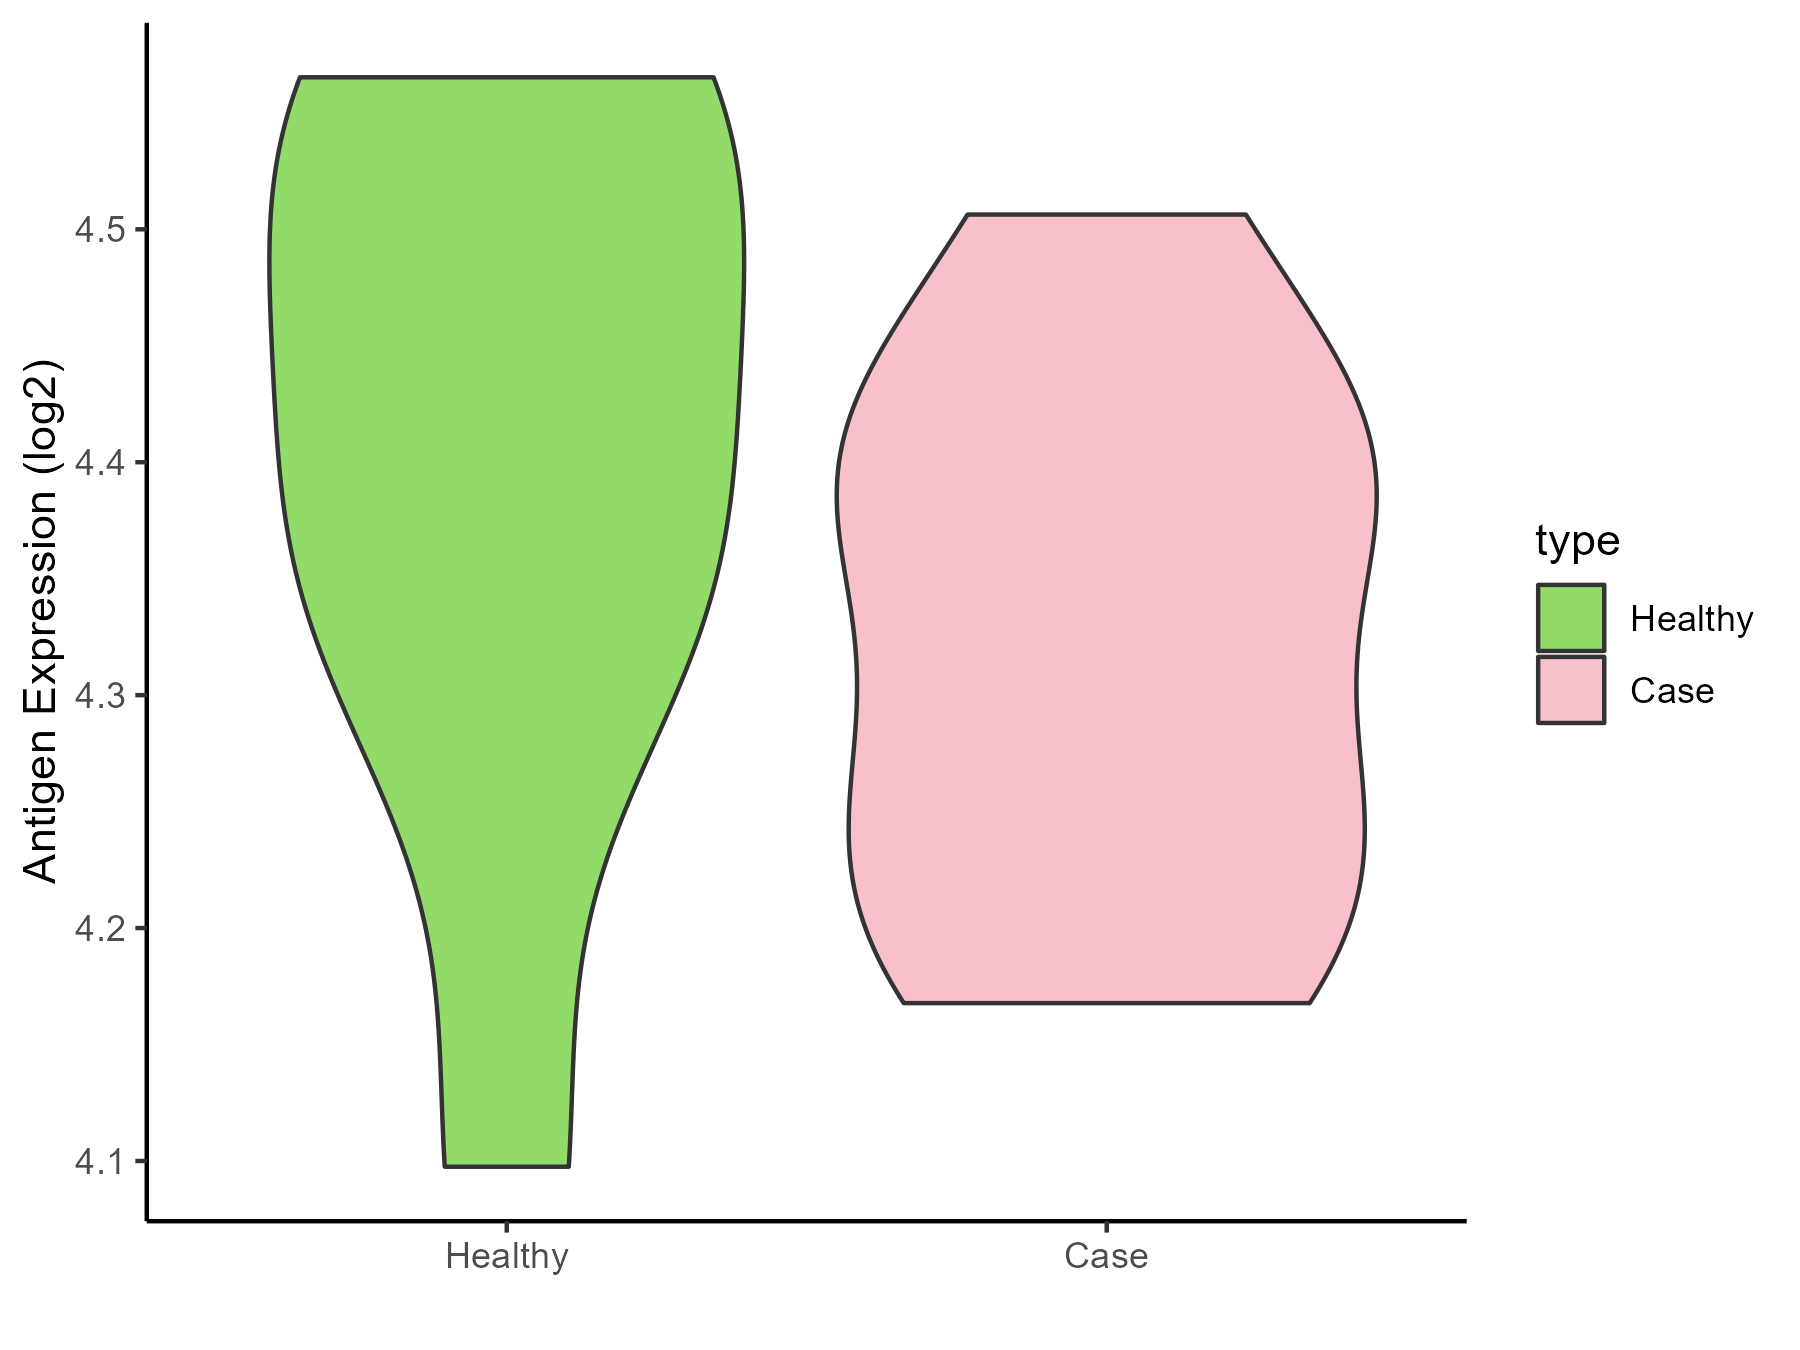
| Differential expression pattern of antigen in diseases | ||
| The Studied Tissue | Liver | |
| The Specific Disease | Liver failure | |
| The Expression Level of Disease Section Compare with the Healthy Individual Tissue | p-value: 0.255865837; Fold-change: -0.08567336; Z-score: -0.54133859 | |
| Disease-specific Antigen Abundances |
|
Click to View the Clearer Original Diagram |
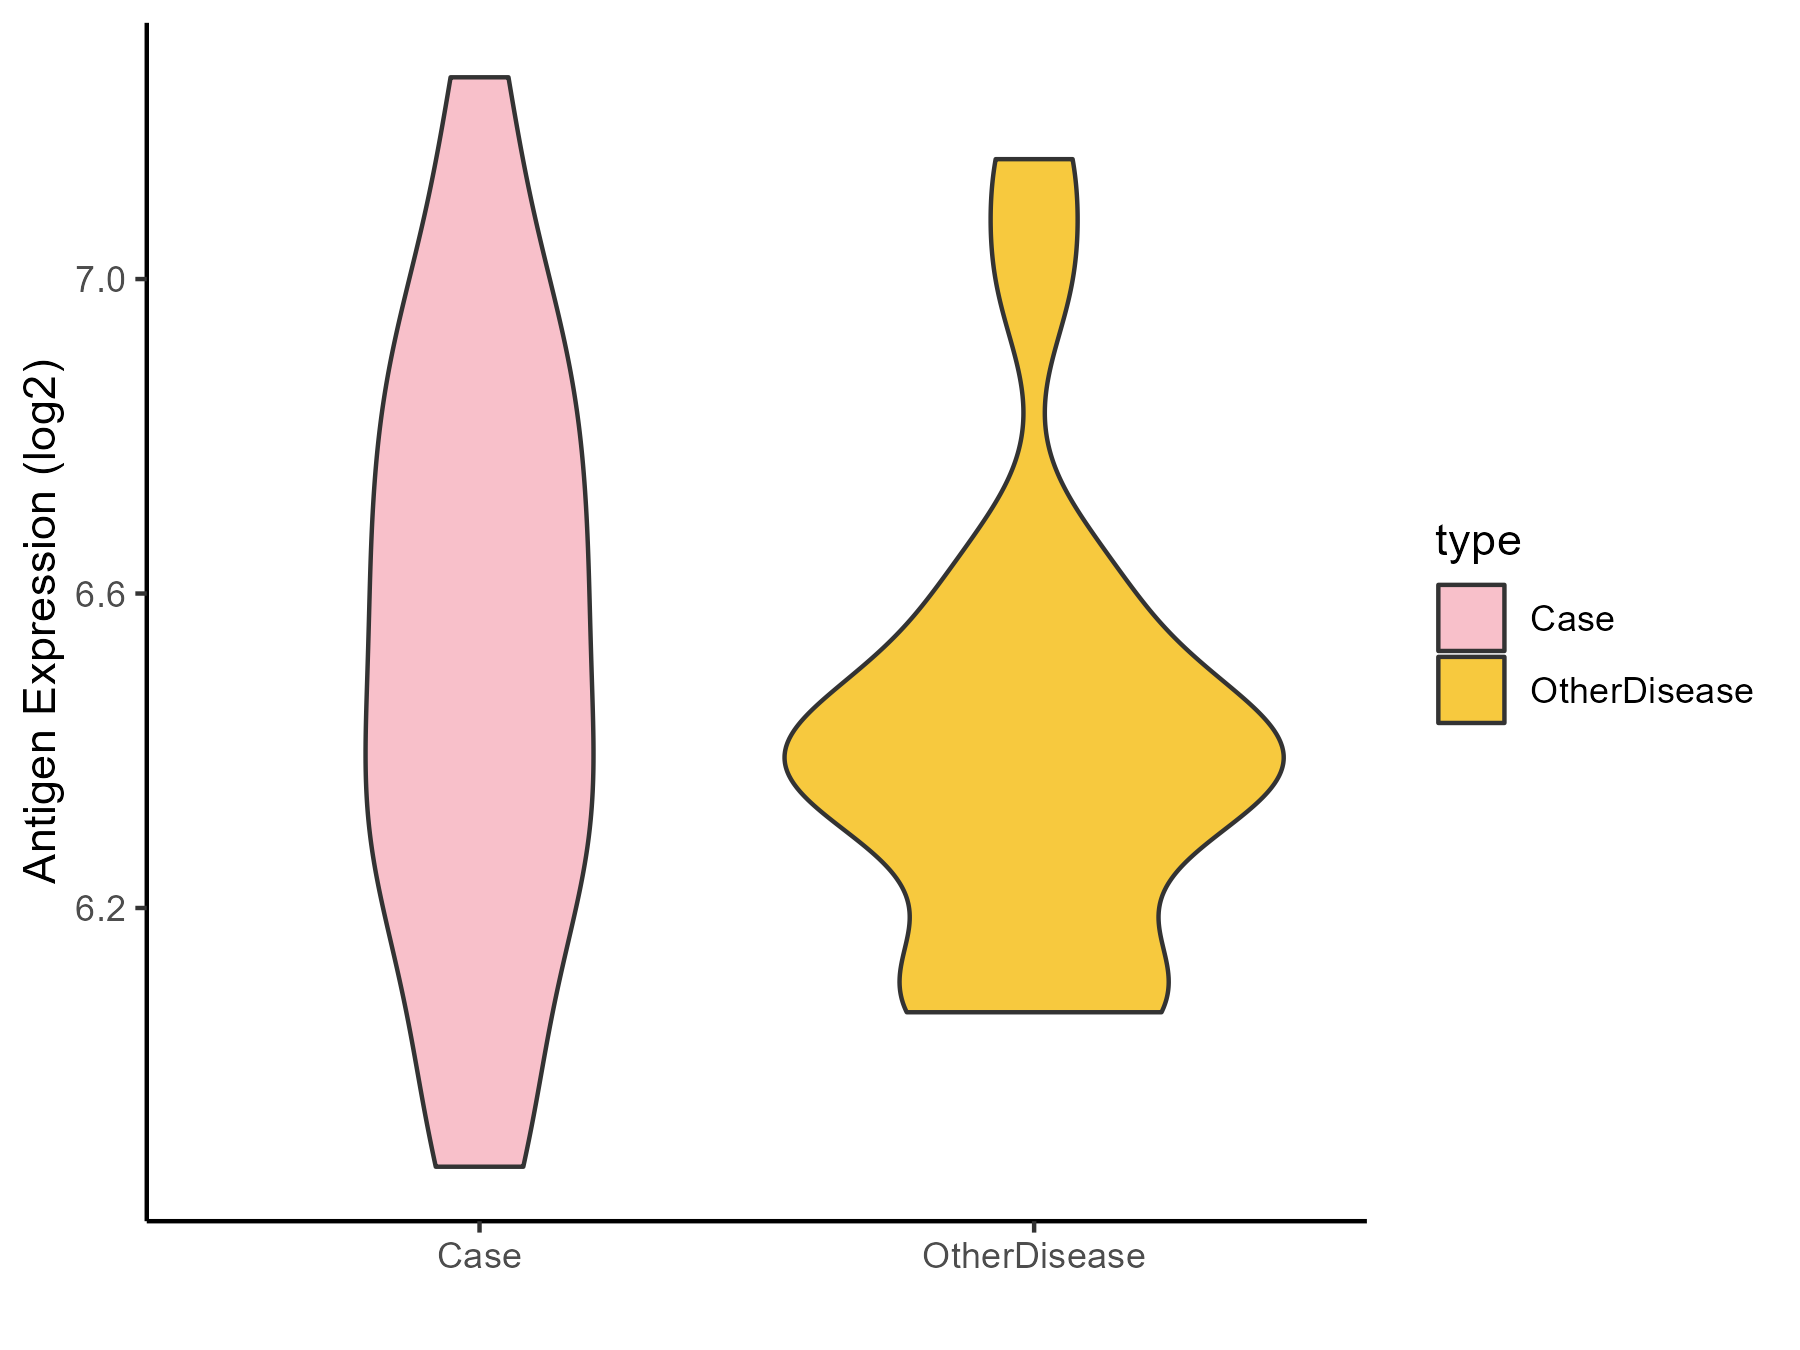
| Differential expression pattern of antigen in diseases | ||
| The Studied Tissue | Colon mucosal | |
| The Specific Disease | Ulcerative colitis | |
| The Expression Level of Disease Section Compare with the Adjacent Tissue | p-value: 0.247520189; Fold-change: 0.148265343; Z-score: 0.504090398 | |
| Disease-specific Antigen Abundances |
|
Click to View the Clearer Original Diagram |
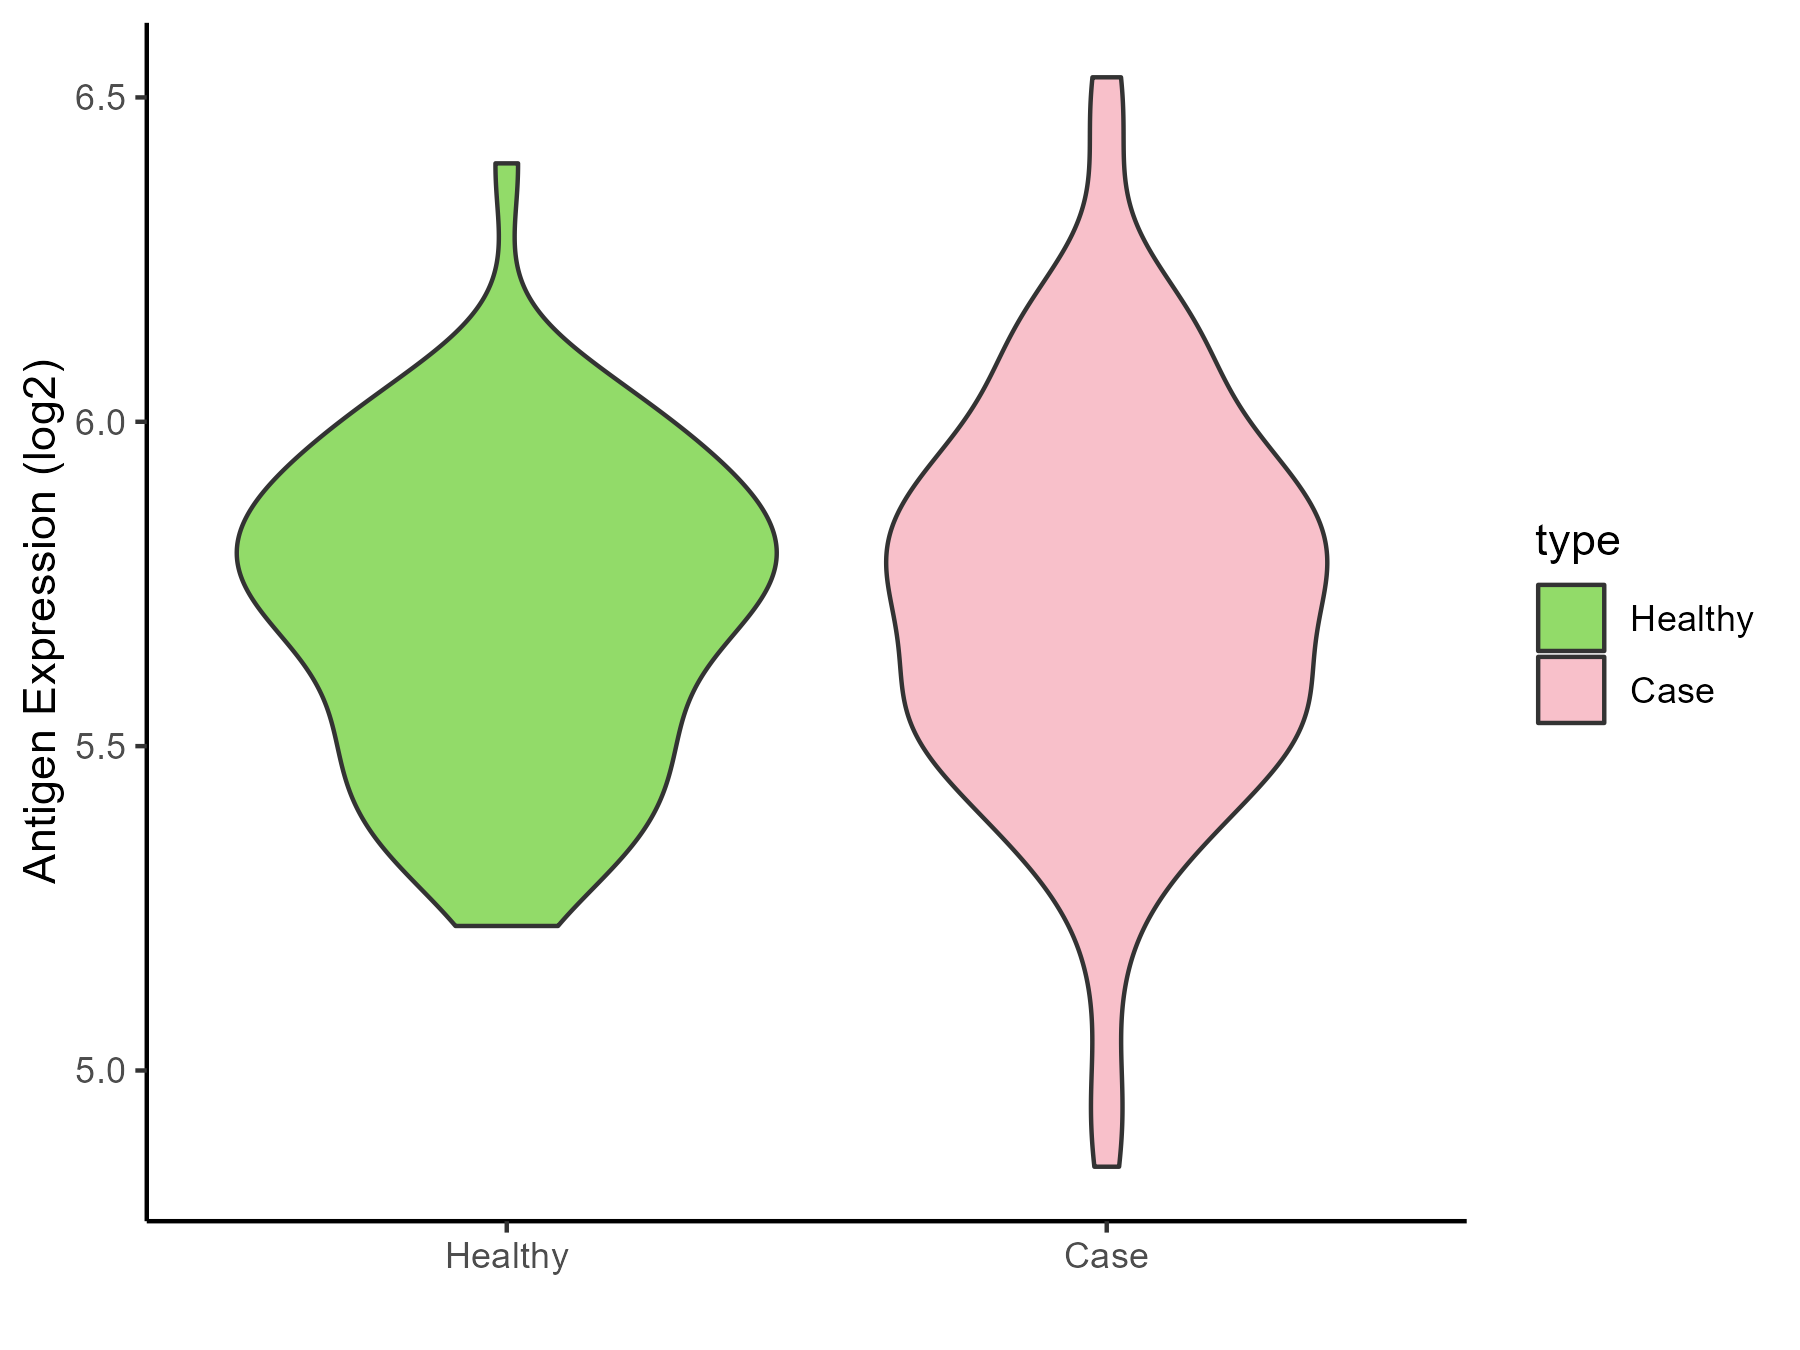
| Differential expression pattern of antigen in diseases | ||
| The Studied Tissue | Rectal colon | |
| The Specific Disease | Irritable bowel syndrome | |
| The Expression Level of Disease Section Compare with the Healthy Individual Tissue | p-value: 0.668471875; Fold-change: 0.009659003; Z-score: 0.040686981 | |
| Disease-specific Antigen Abundances |
|
Click to View the Clearer Original Diagram |
ICD Disease Classification 14
| Differential expression pattern of antigen in diseases | ||
| The Studied Tissue | Skin | |
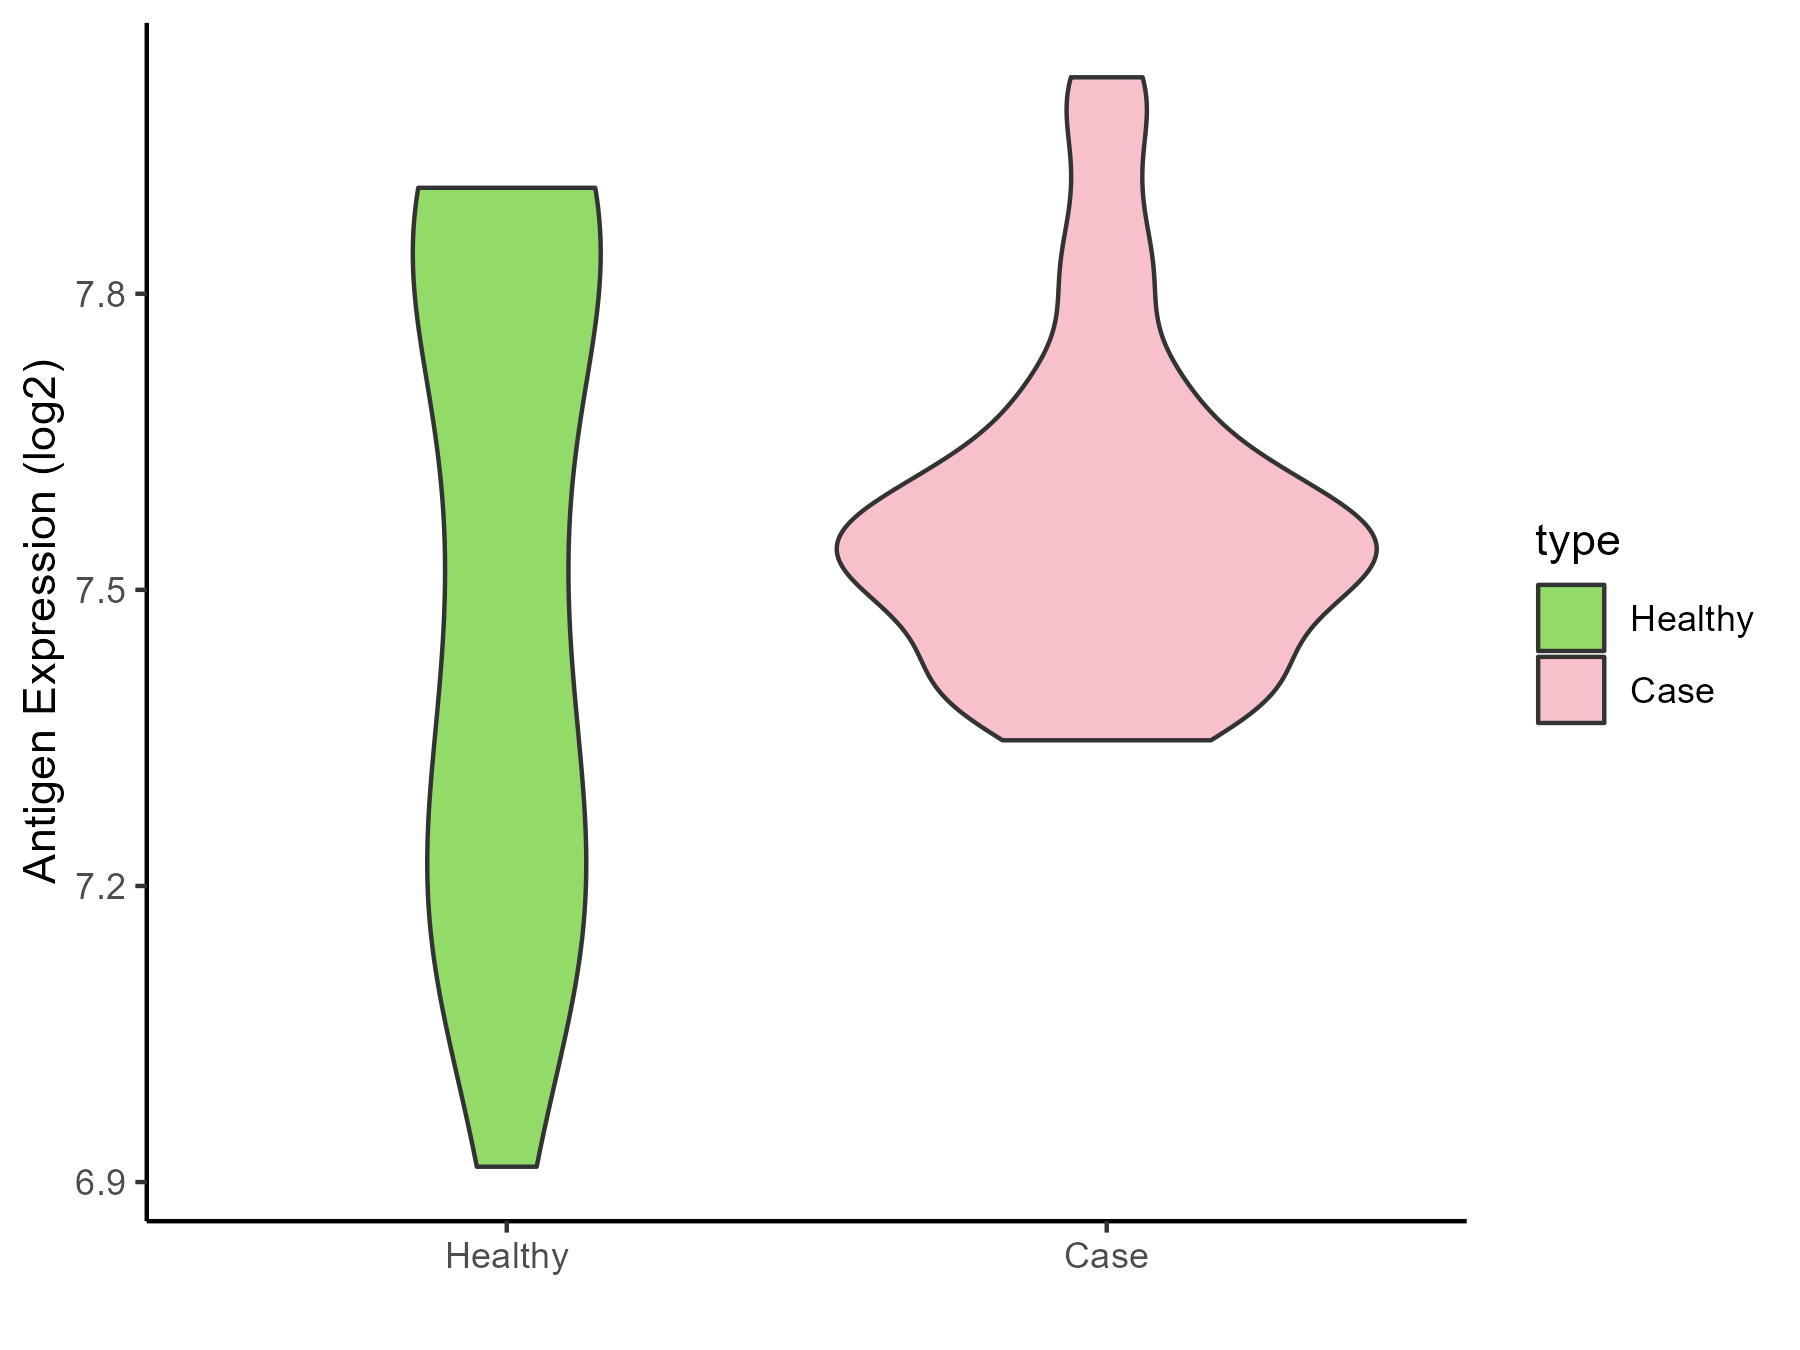
| The Specific Disease | Atopic dermatitis | |
| The Expression Level of Disease Section Compare with the Healthy Individual Tissue | p-value: 0.468163003; Fold-change: 0.005069775; Z-score: 0.015238151 | |
| Disease-specific Antigen Abundances |
|
Click to View the Clearer Original Diagram |
| Differential expression pattern of antigen in diseases | ||
| The Studied Tissue | Skin | |
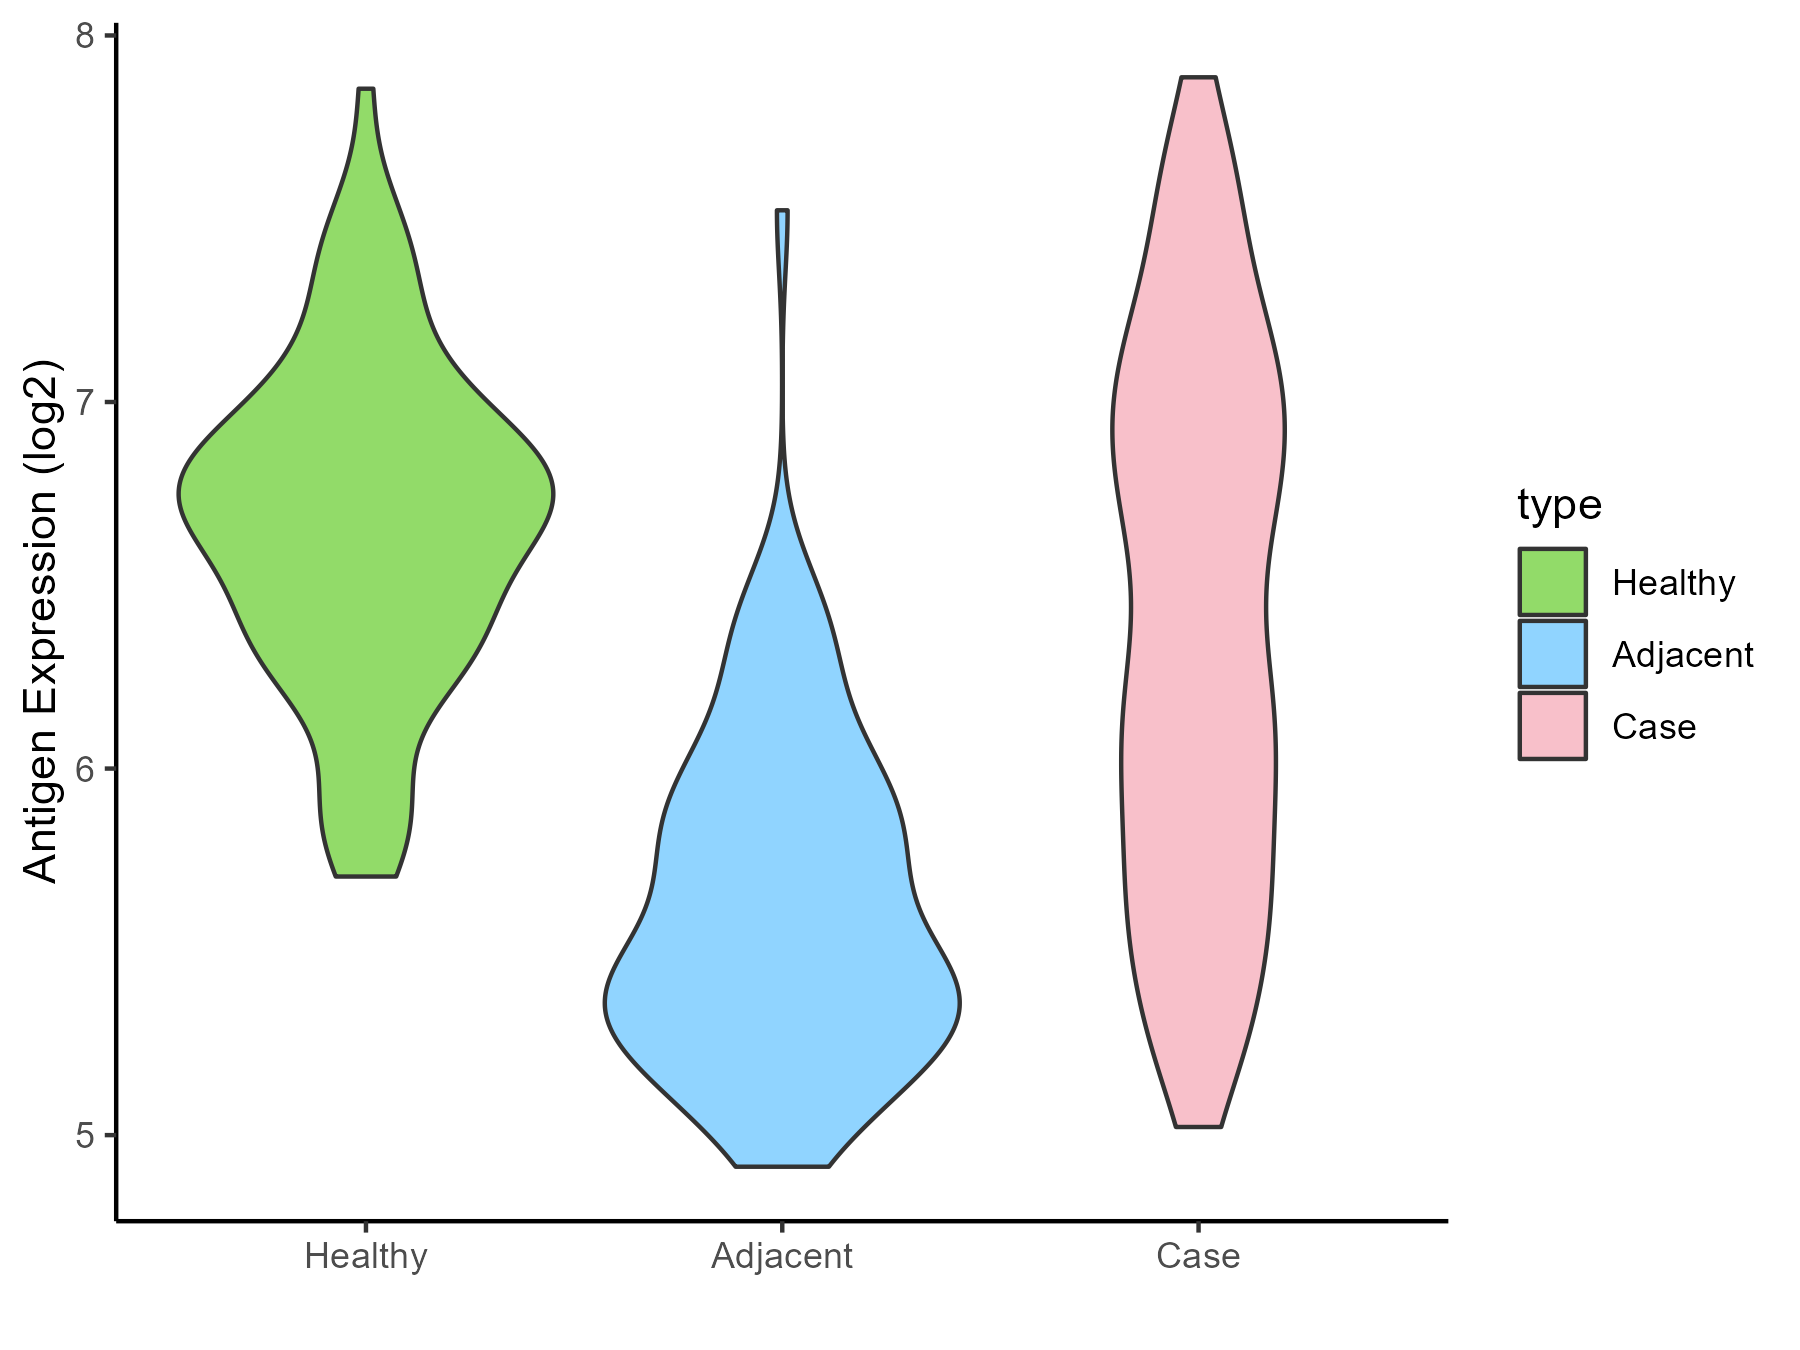
| The Specific Disease | Psoriasis | |
| The Expression Level of Disease Section Compare with the Healthy Individual Tissue | p-value: 6.18E-05; Fold-change: -0.331486187; Z-score: -0.750717775 | |
| The Expression Level of Disease Section Compare with the Adjacent Tissue | p-value: 7.92E-25; Fold-change: 0.852955476; Z-score: 1.878455719 | |
| Disease-specific Antigen Abundances |
|
Click to View the Clearer Original Diagram |
| Differential expression pattern of antigen in diseases | ||
| The Studied Tissue | Skin | |
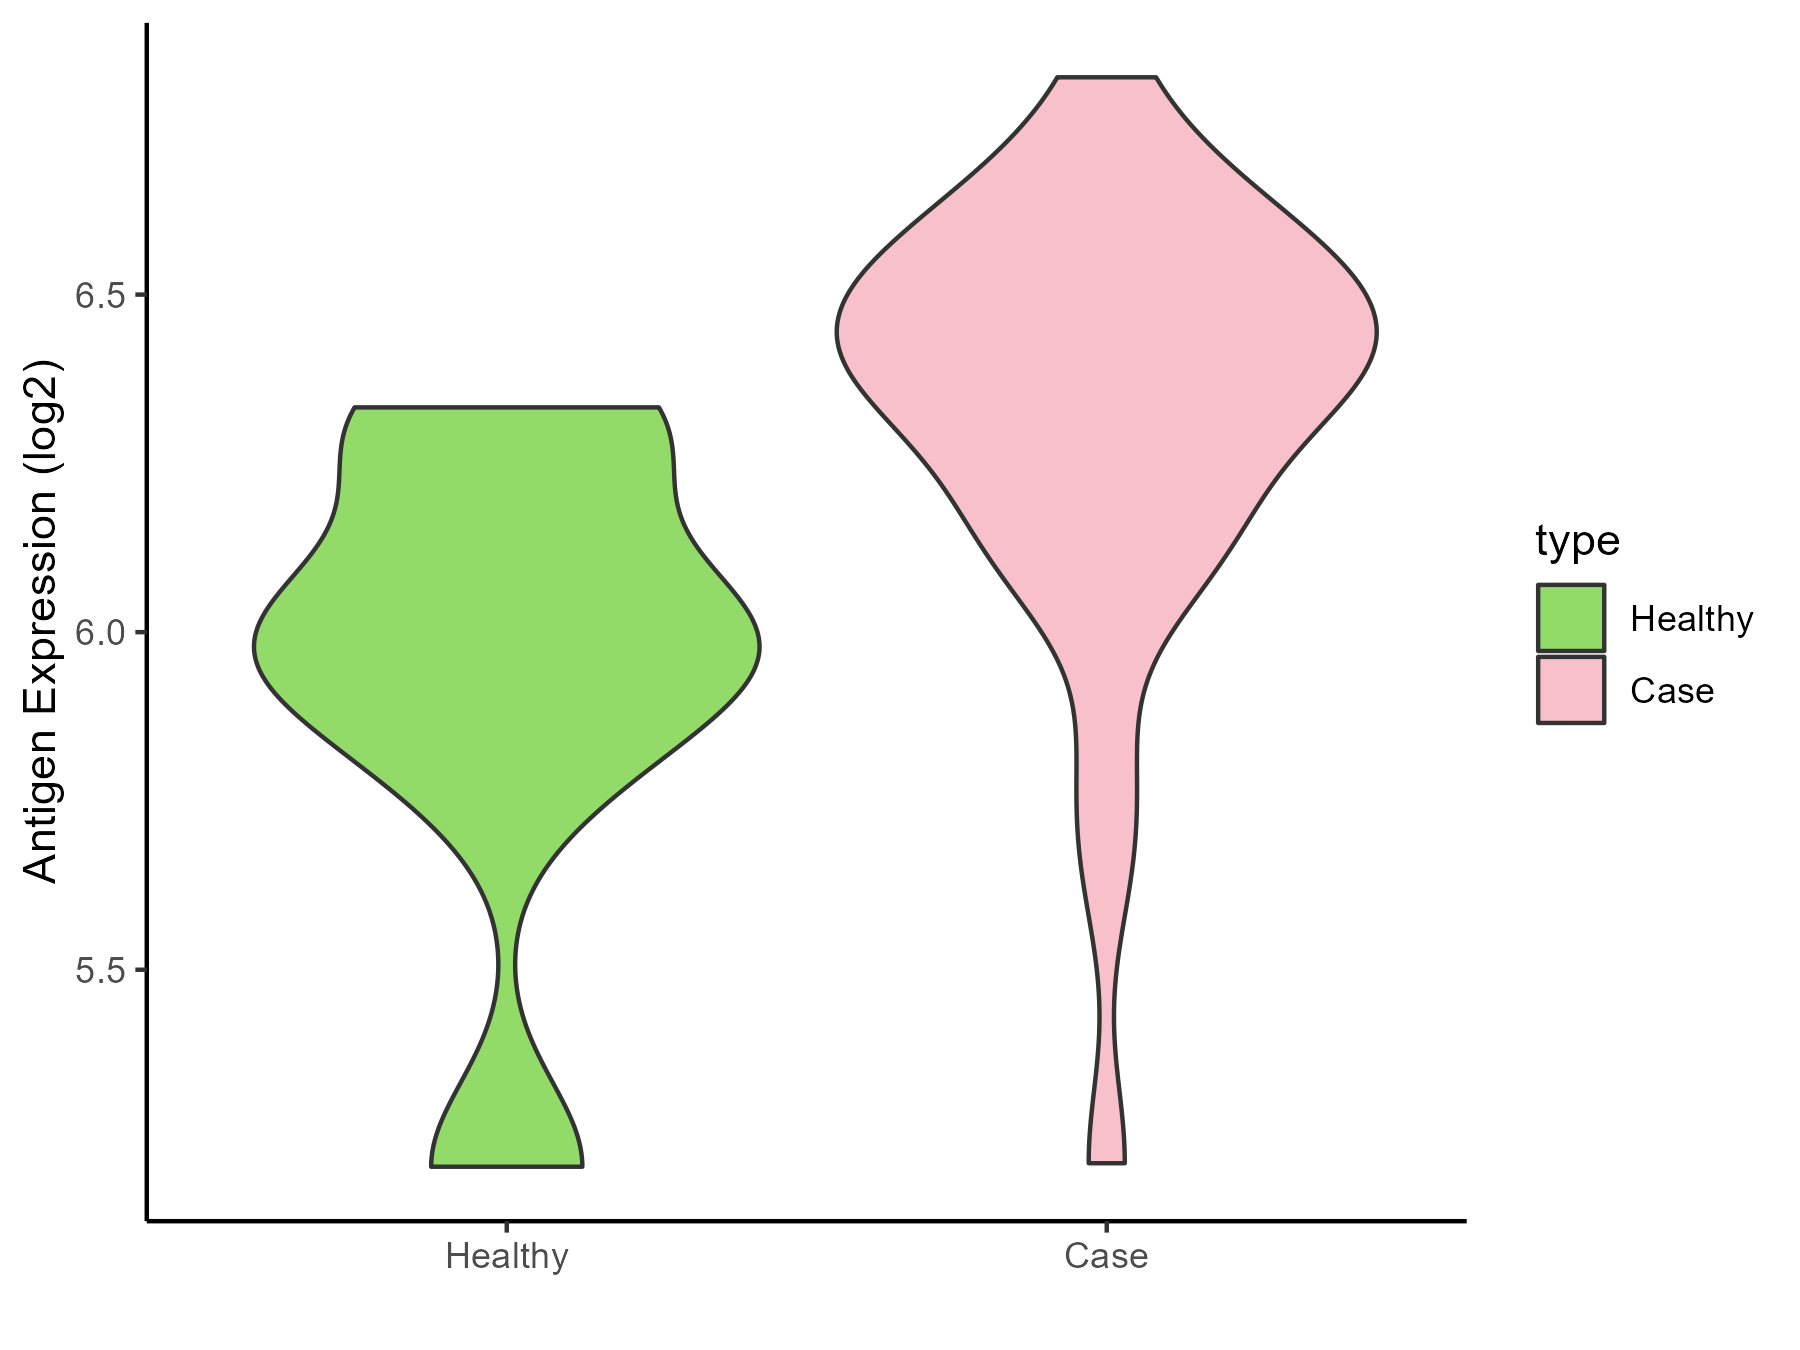
| The Specific Disease | Vitiligo | |
| The Expression Level of Disease Section Compare with the Healthy Individual Tissue | p-value: 0.035894218; Fold-change: 0.418525806; Z-score: 1.122304633 | |
| Disease-specific Antigen Abundances |
|
Click to View the Clearer Original Diagram |
| Differential expression pattern of antigen in diseases | ||
| The Studied Tissue | Skin from scalp | |
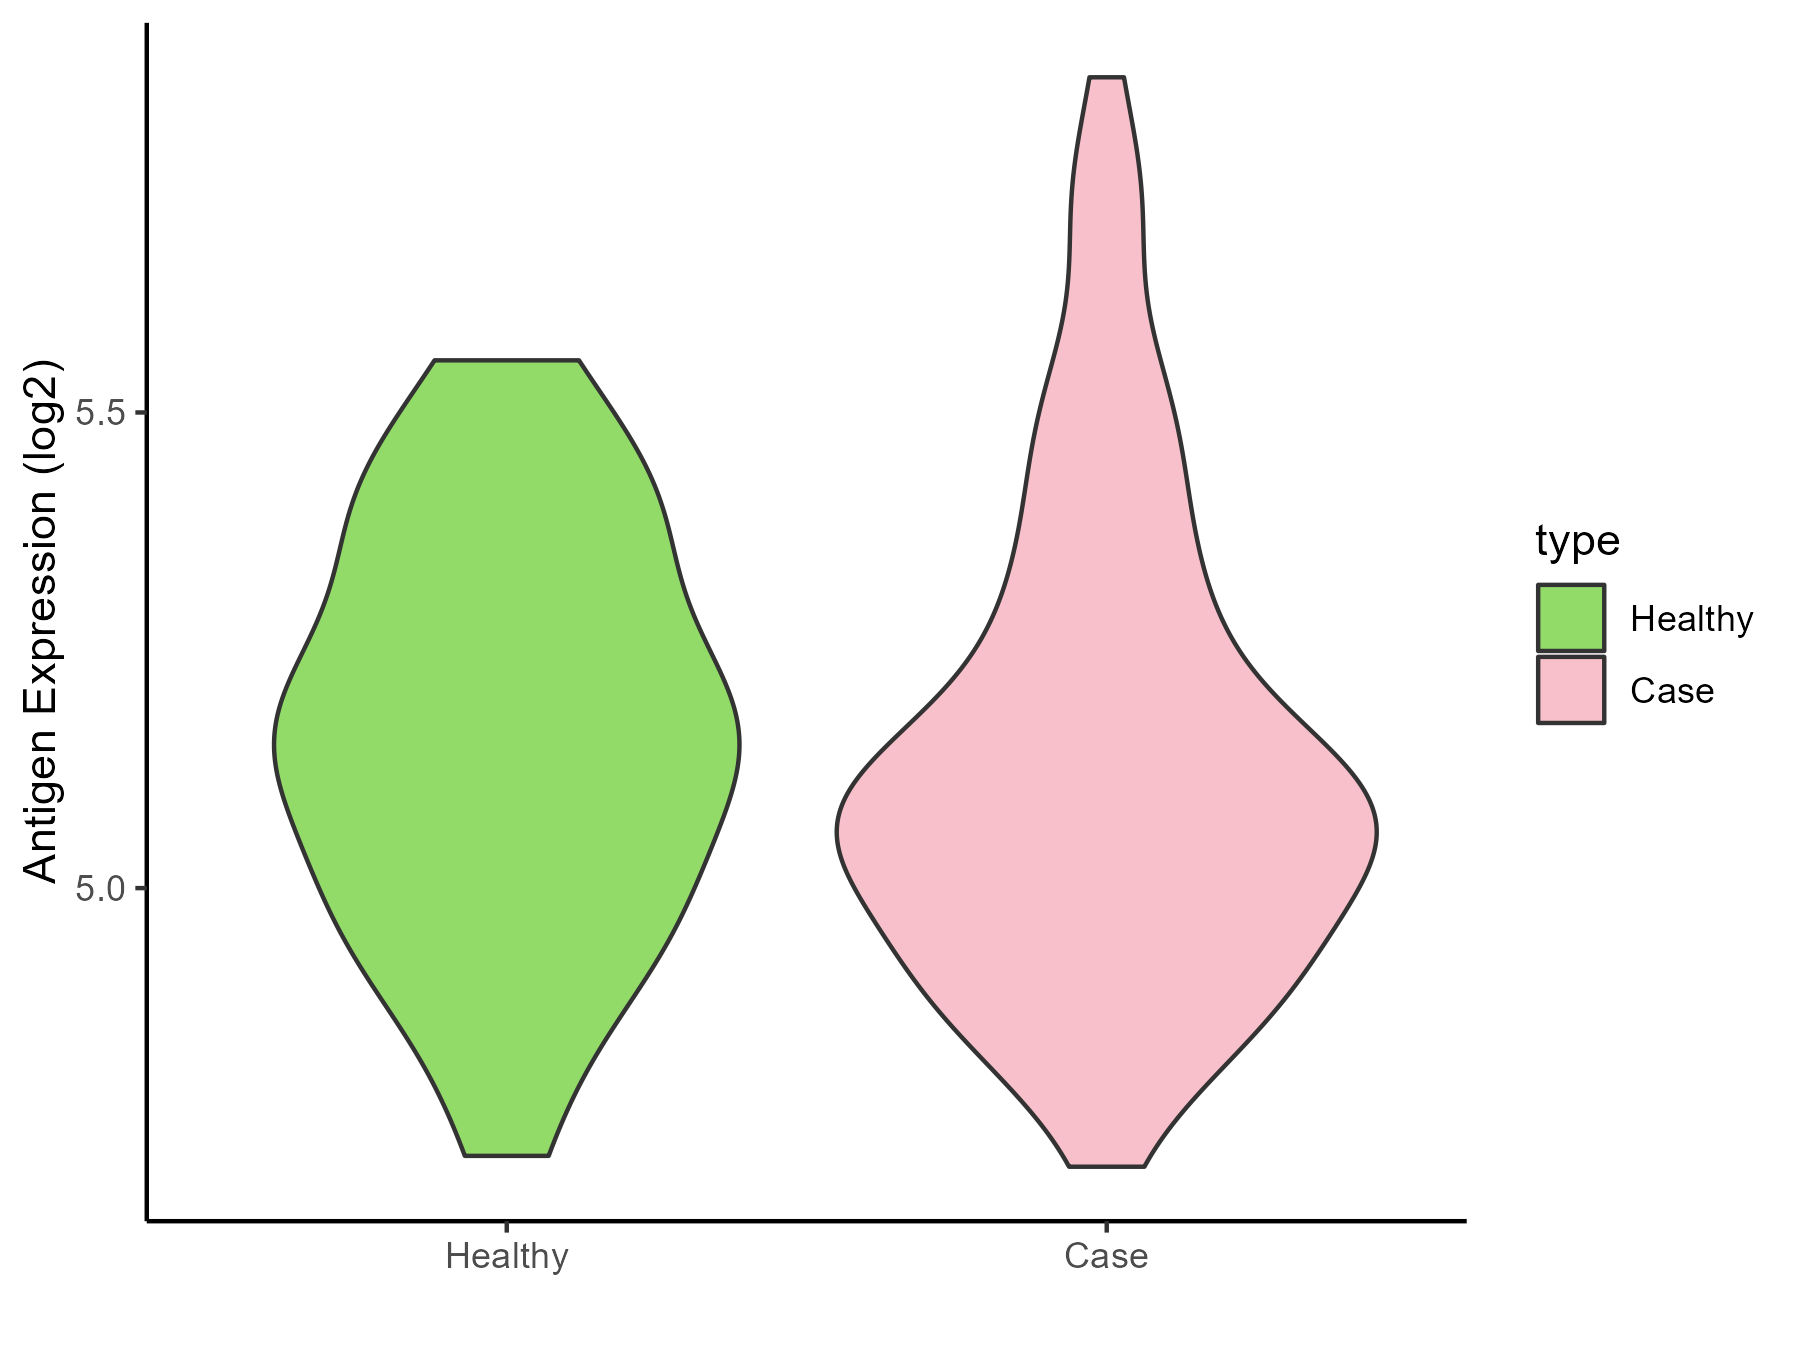
| The Specific Disease | Alopecia | |
| The Expression Level of Disease Section Compare with the Healthy Individual Tissue | p-value: 0.537664845; Fold-change: -0.082781846; Z-score: -0.389754019 | |
| Disease-specific Antigen Abundances |
|
Click to View the Clearer Original Diagram |
| Differential expression pattern of antigen in diseases | ||
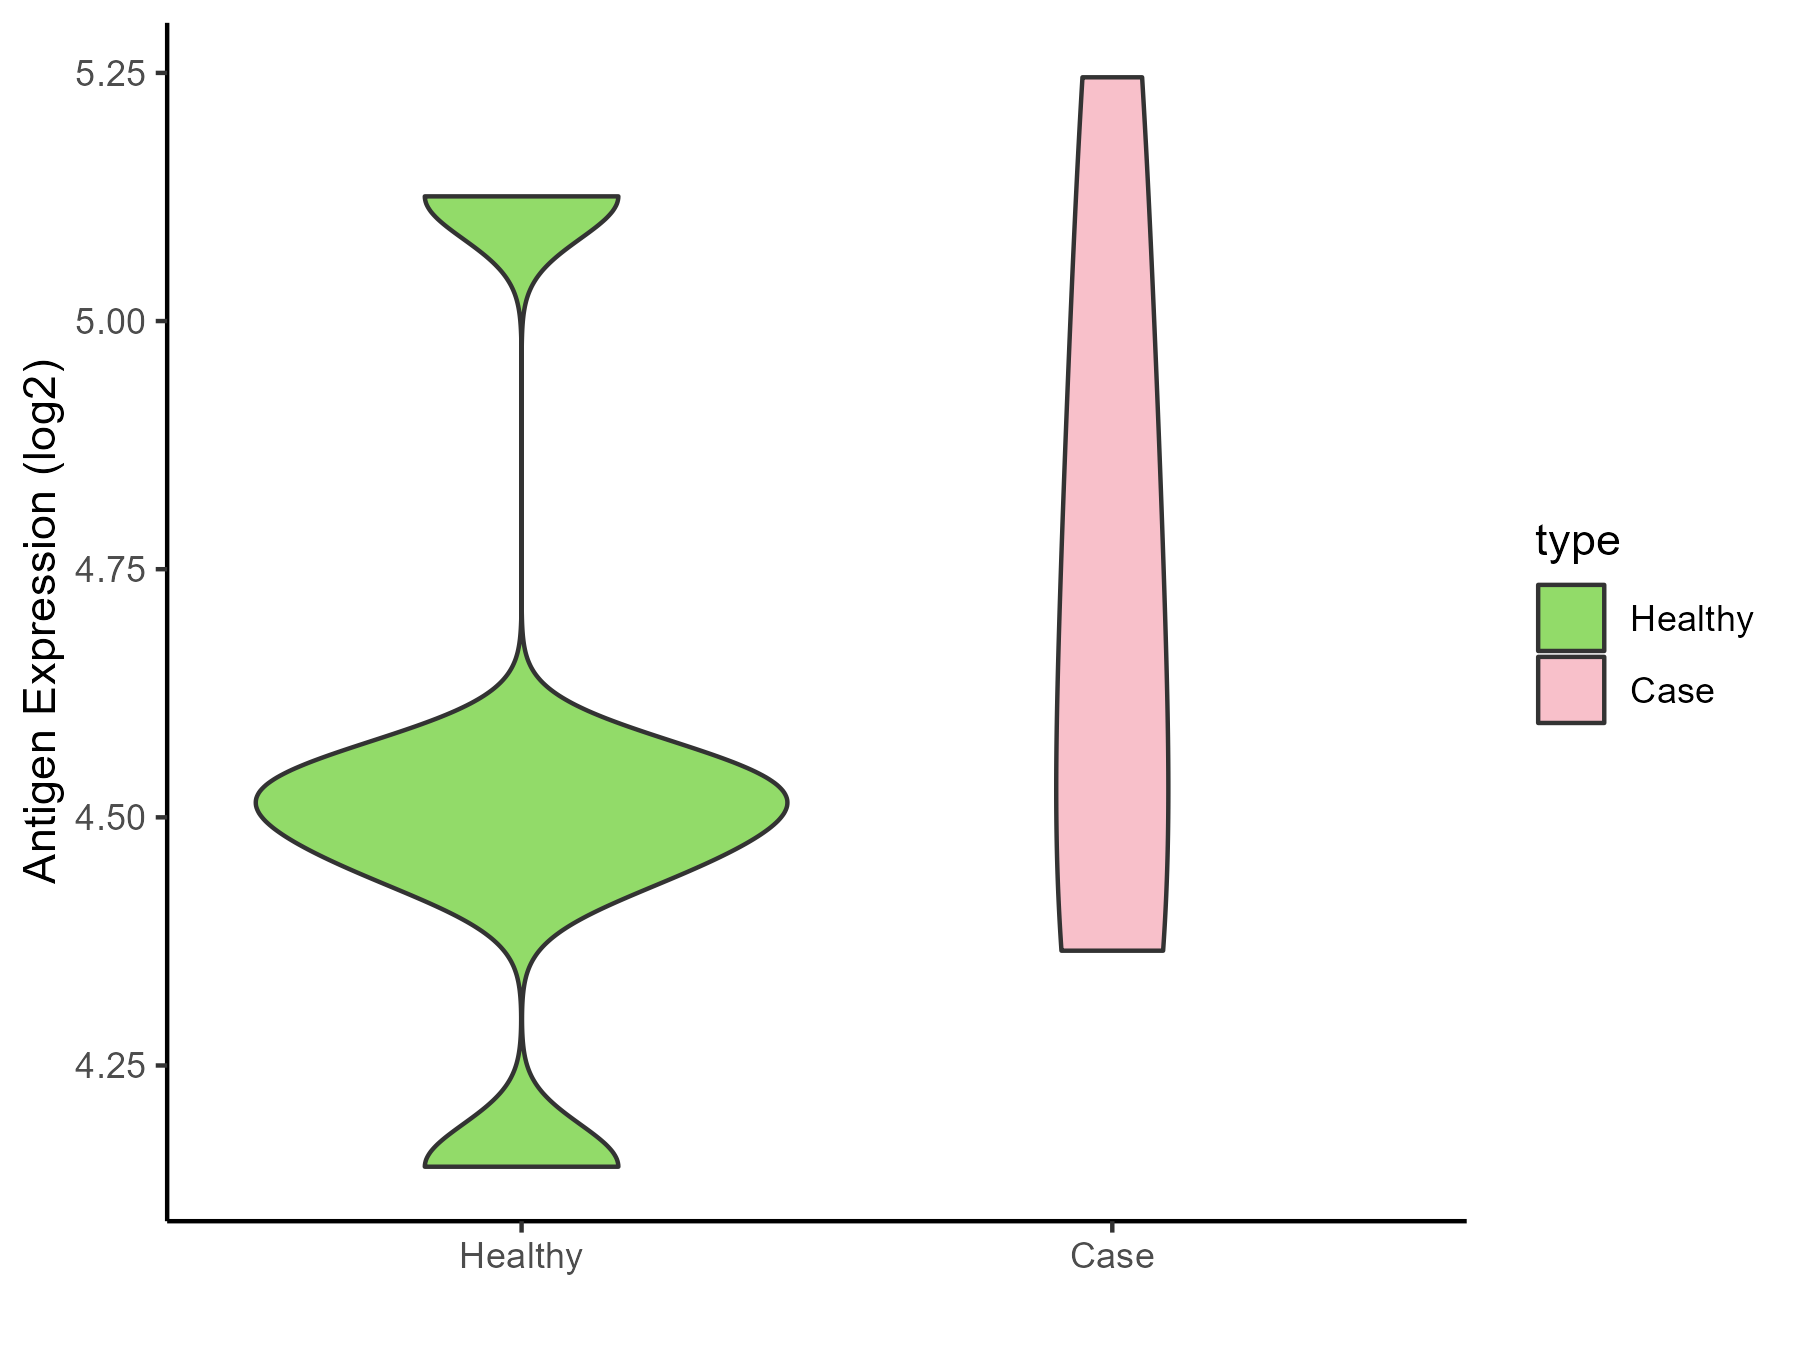
| The Studied Tissue | Skin | |
| The Specific Disease | Sensitive skin | |
| The Expression Level of Disease Section Compare with the Healthy Individual Tissue | p-value: 0.442770502; Fold-change: 0.181716135; Z-score: 0.570375176 | |
| Disease-specific Antigen Abundances |
|
Click to View the Clearer Original Diagram |
ICD Disease Classification 15
| Differential expression pattern of antigen in diseases | ||
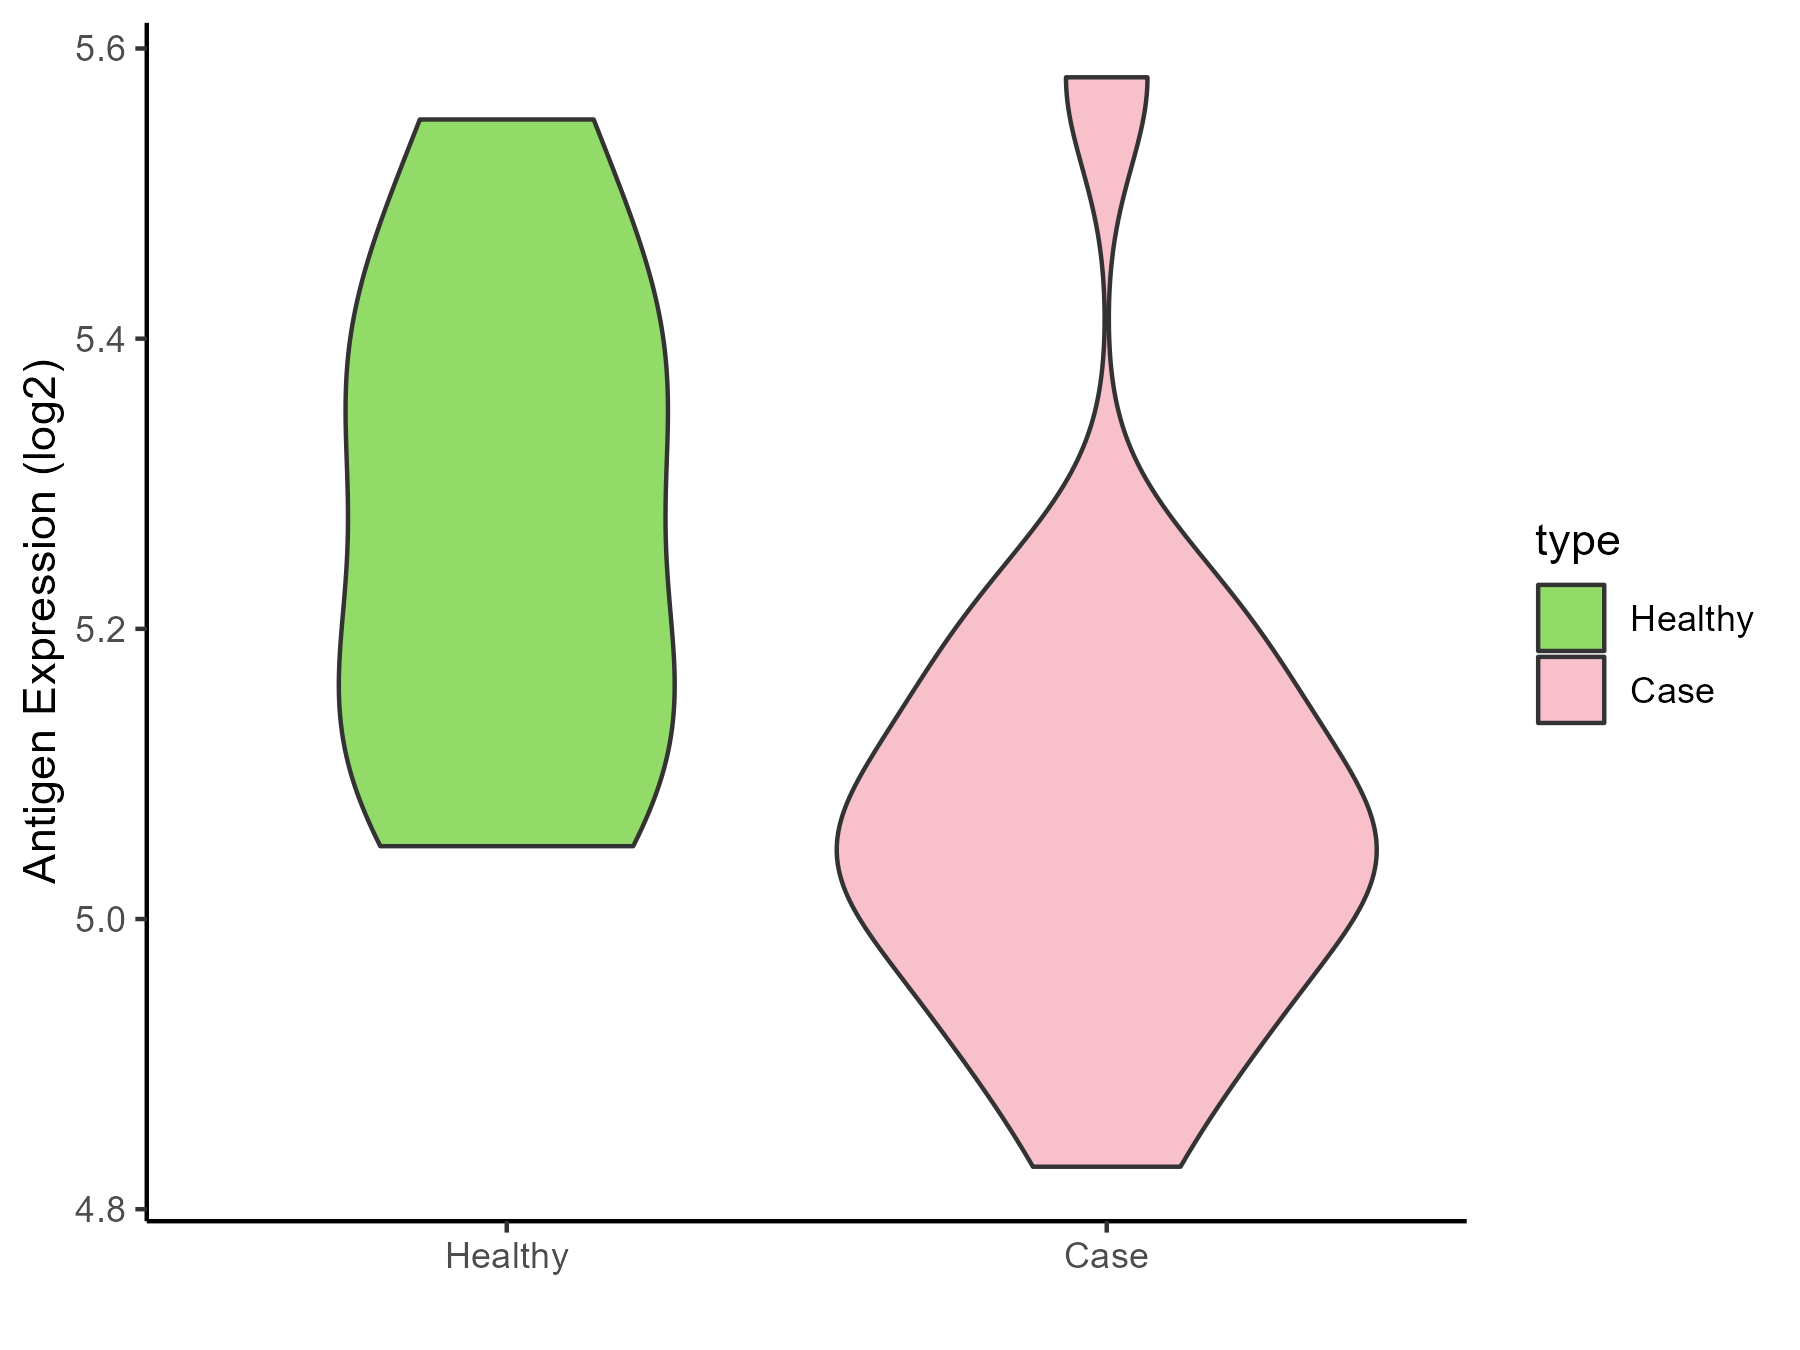
| The Studied Tissue | Synovial | |
| The Specific Disease | Osteoarthritis | |
| The Expression Level of Disease Section Compare with the Healthy Individual Tissue | p-value: 0.022267605; Fold-change: -0.248324584; Z-score: -1.428270082 | |
| Disease-specific Antigen Abundances |
|
Click to View the Clearer Original Diagram |
| Differential expression pattern of antigen in diseases | ||
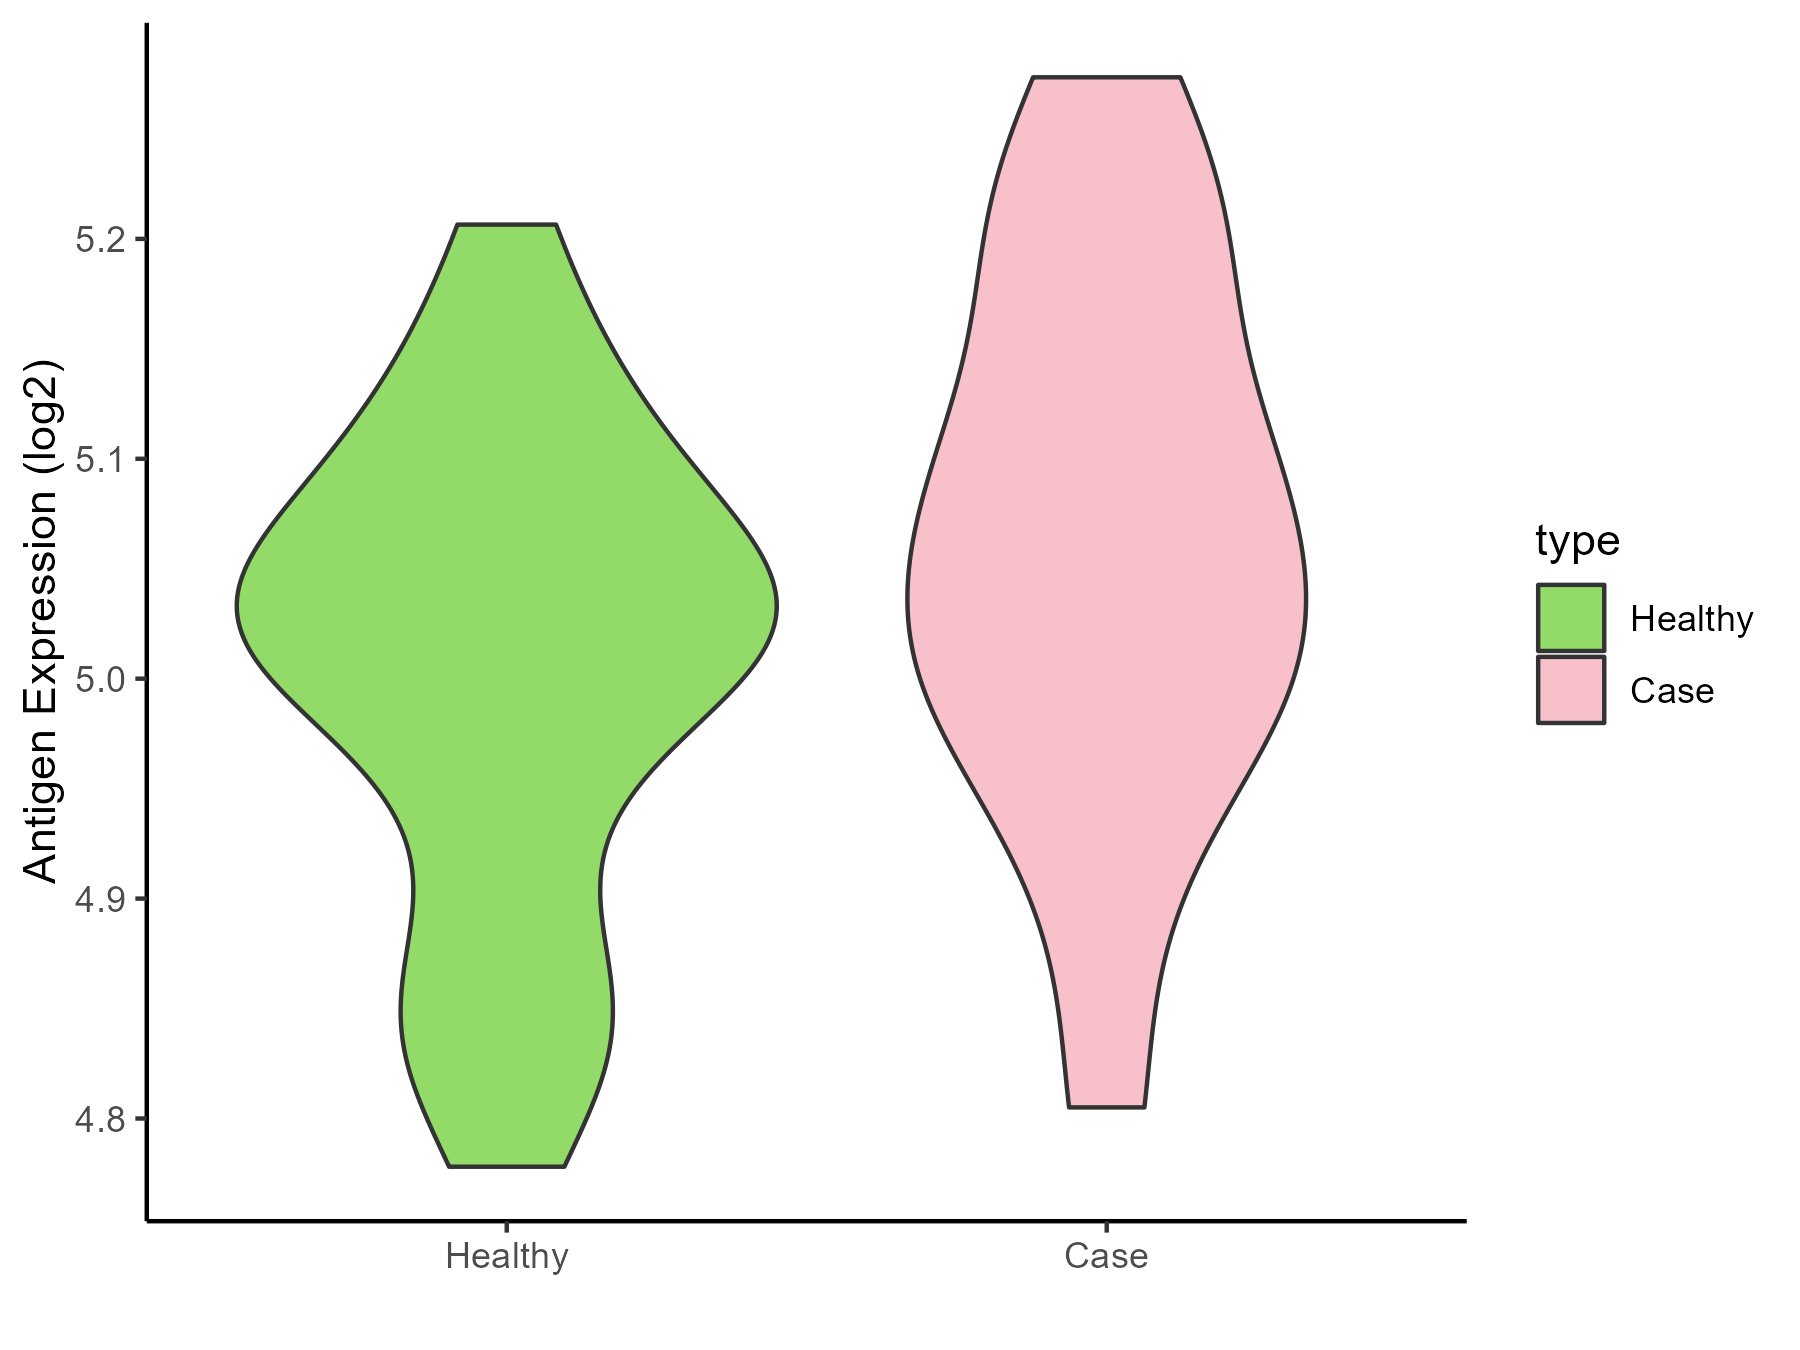
| The Studied Tissue | Peripheral blood | |
| The Specific Disease | Arthropathy | |
| The Expression Level of Disease Section Compare with the Healthy Individual Tissue | p-value: 0.151433417; Fold-change: 0.053539316; Z-score: 0.483495694 | |
| Disease-specific Antigen Abundances |
|
Click to View the Clearer Original Diagram |
| Differential expression pattern of antigen in diseases | ||
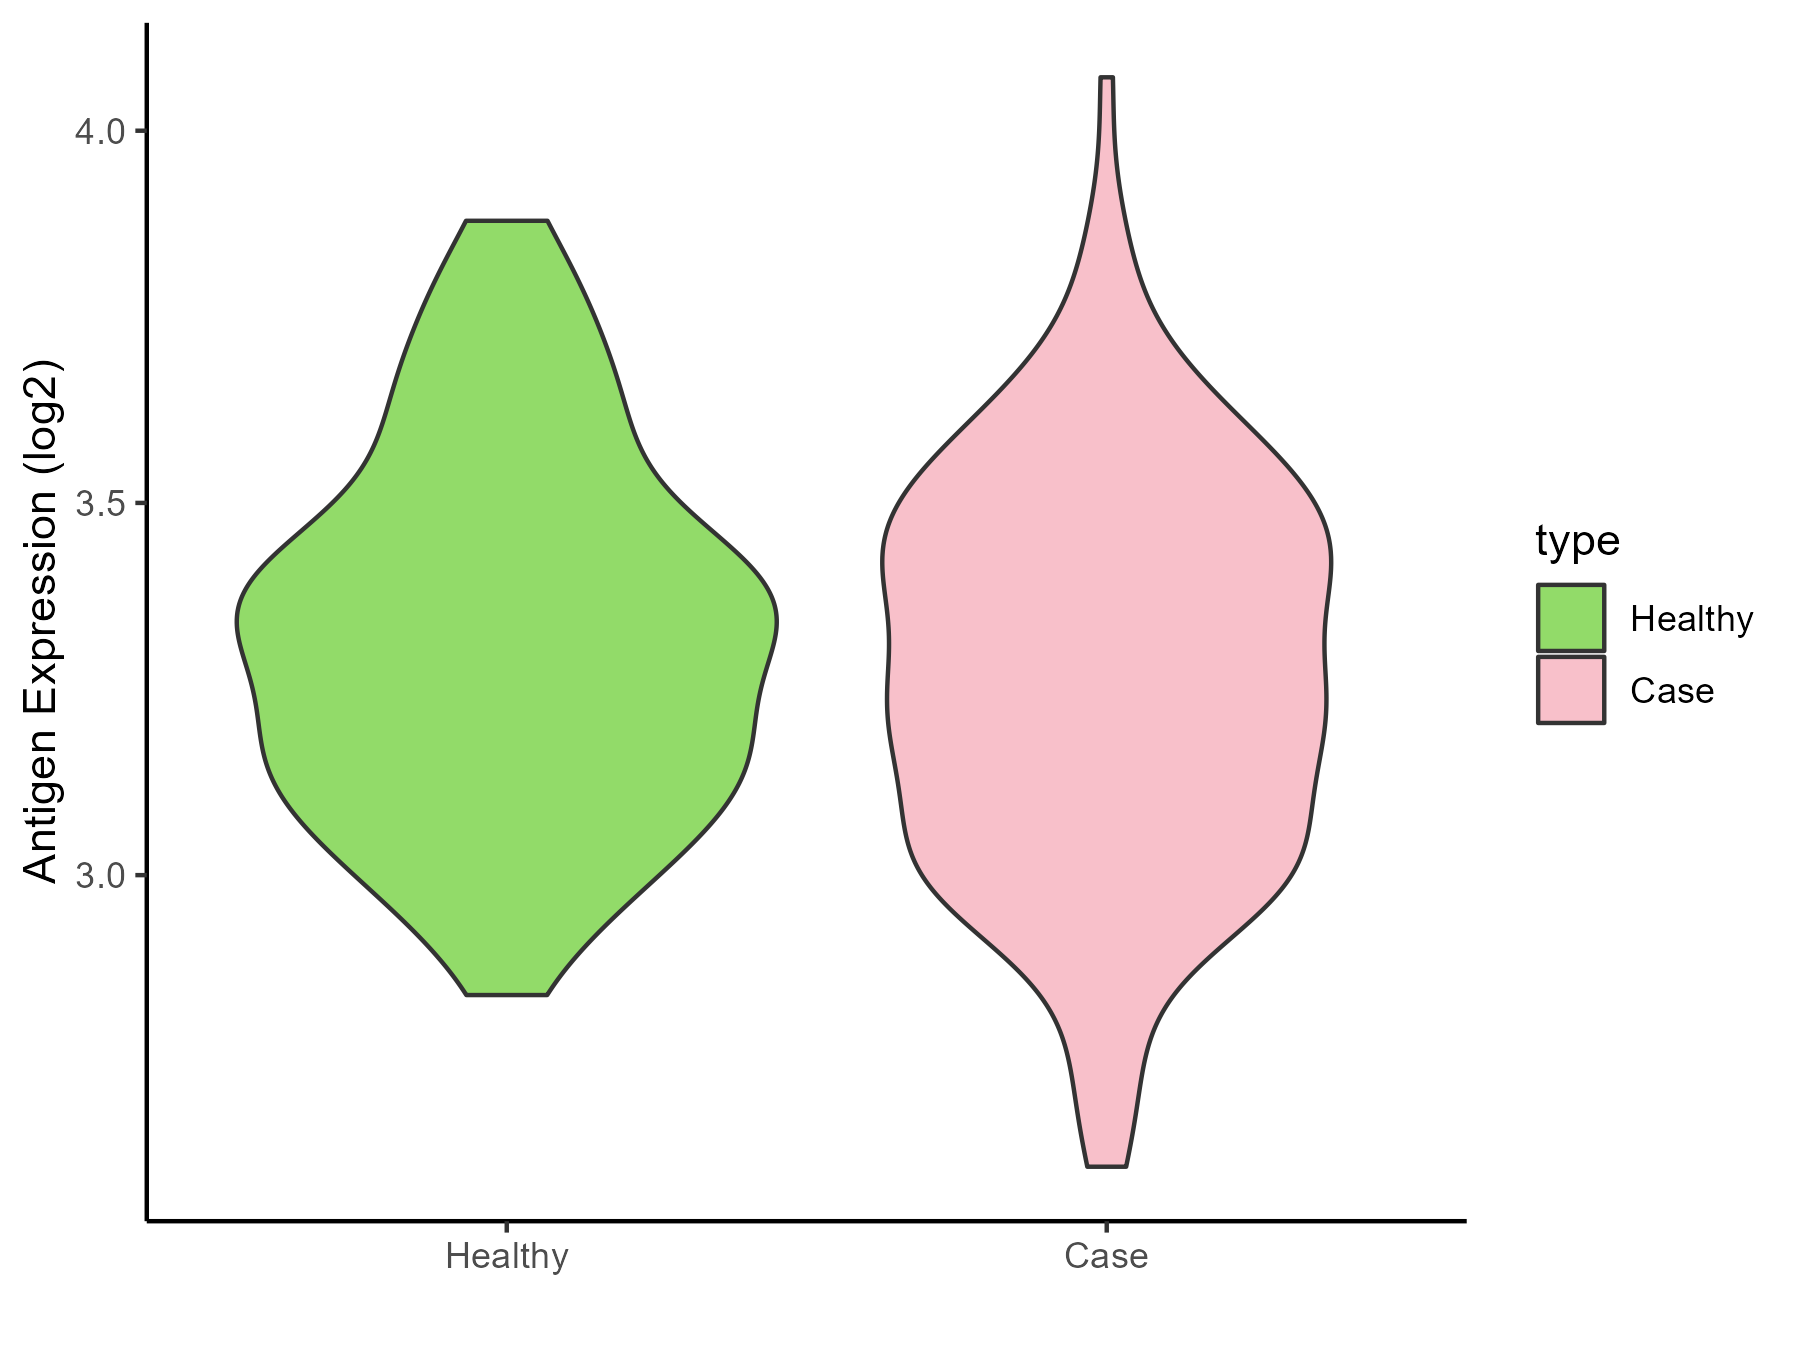
| The Studied Tissue | Peripheral blood | |
| The Specific Disease | Arthritis | |
| The Expression Level of Disease Section Compare with the Healthy Individual Tissue | p-value: 0.16289099; Fold-change: -0.055576177; Z-score: -0.229866292 | |
| Disease-specific Antigen Abundances |
|
Click to View the Clearer Original Diagram |
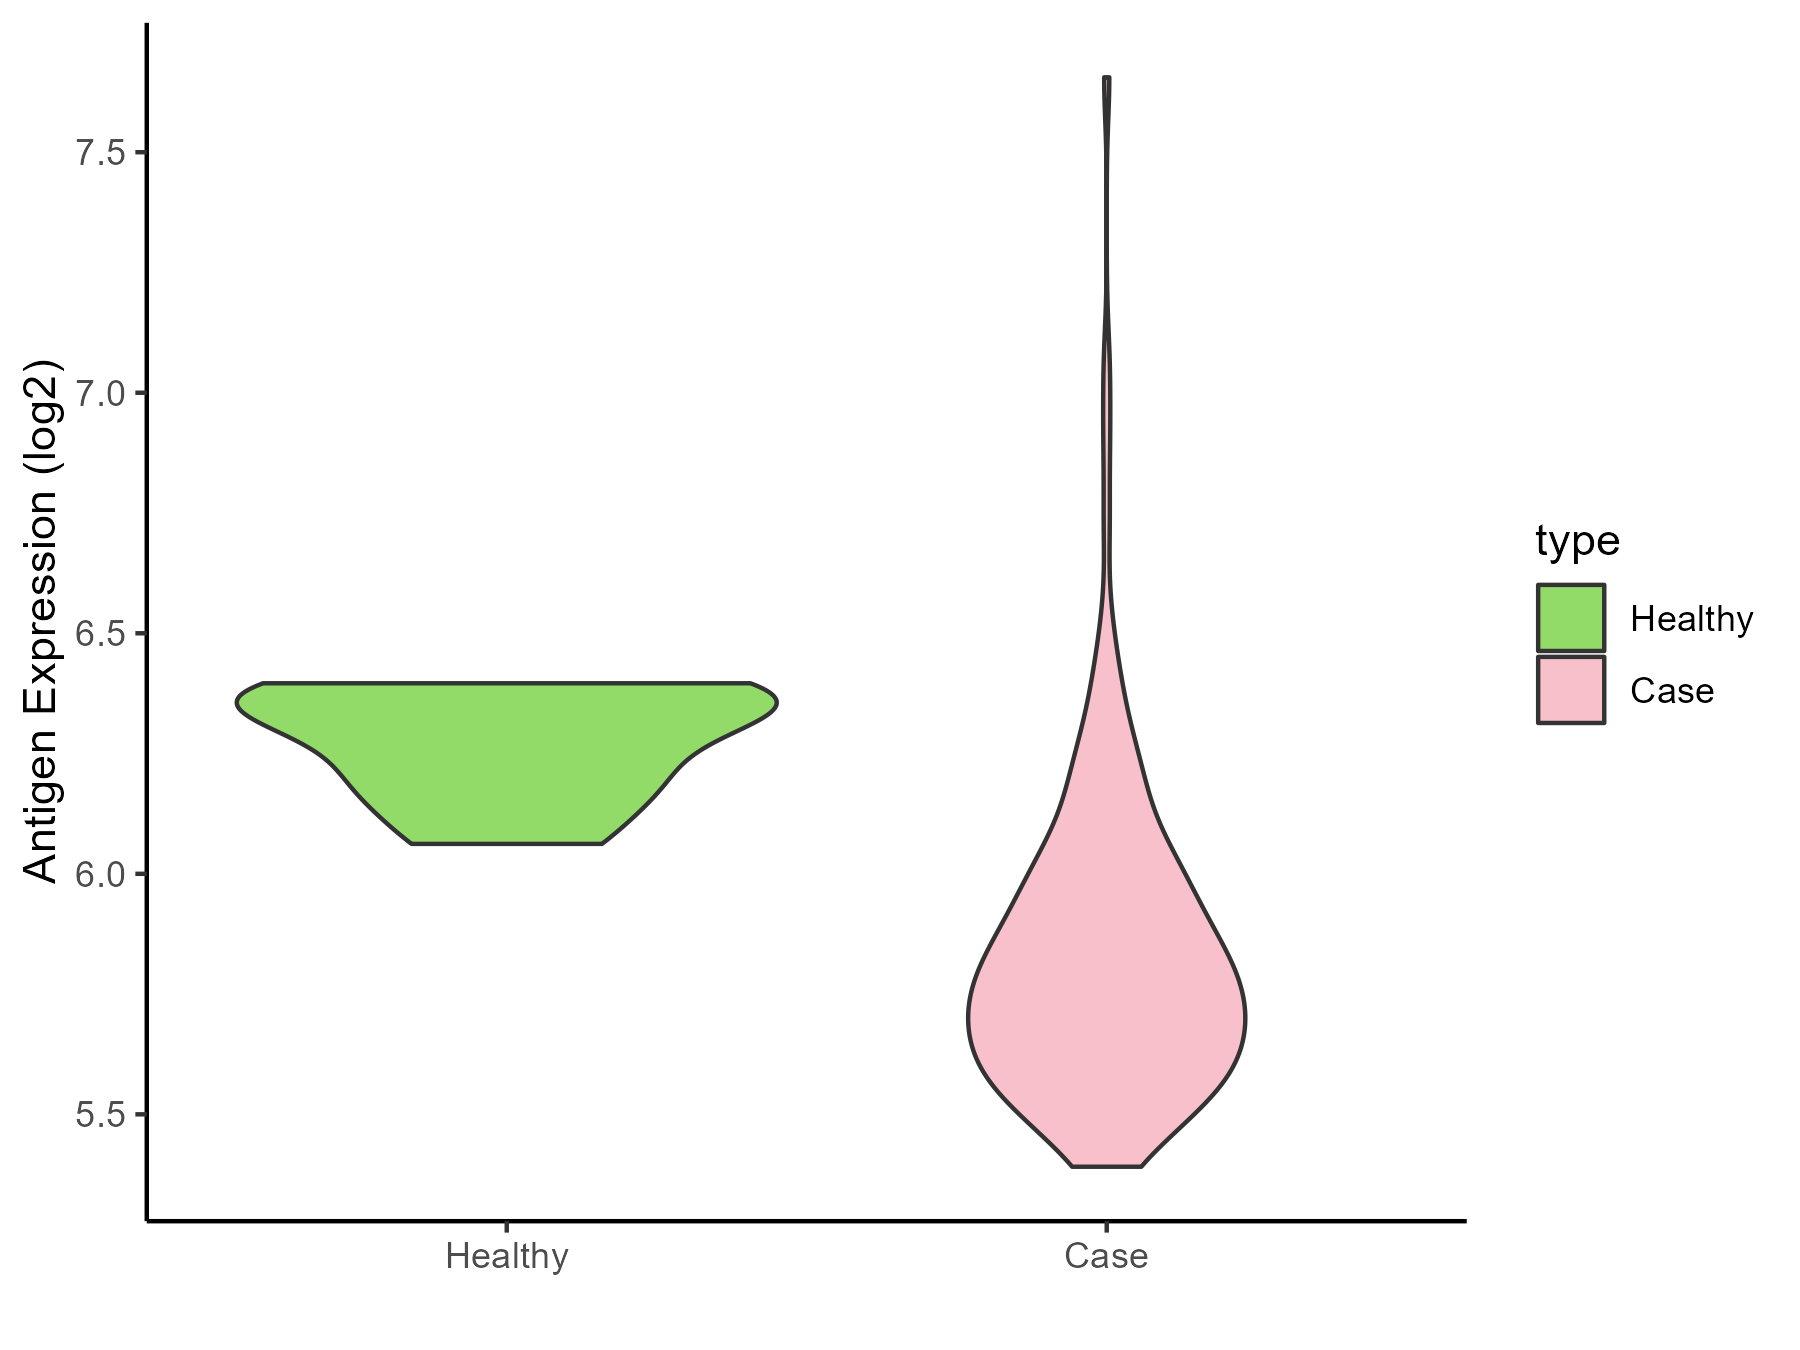
| Differential expression pattern of antigen in diseases | ||
| The Studied Tissue | Synovial | |
| The Specific Disease | Rheumatoid arthritis | |
| The Expression Level of Disease Section Compare with the Healthy Individual Tissue | p-value: 1.02E-05; Fold-change: -0.563096132; Z-score: -4.500823082 | |
| Disease-specific Antigen Abundances |
|
Click to View the Clearer Original Diagram |
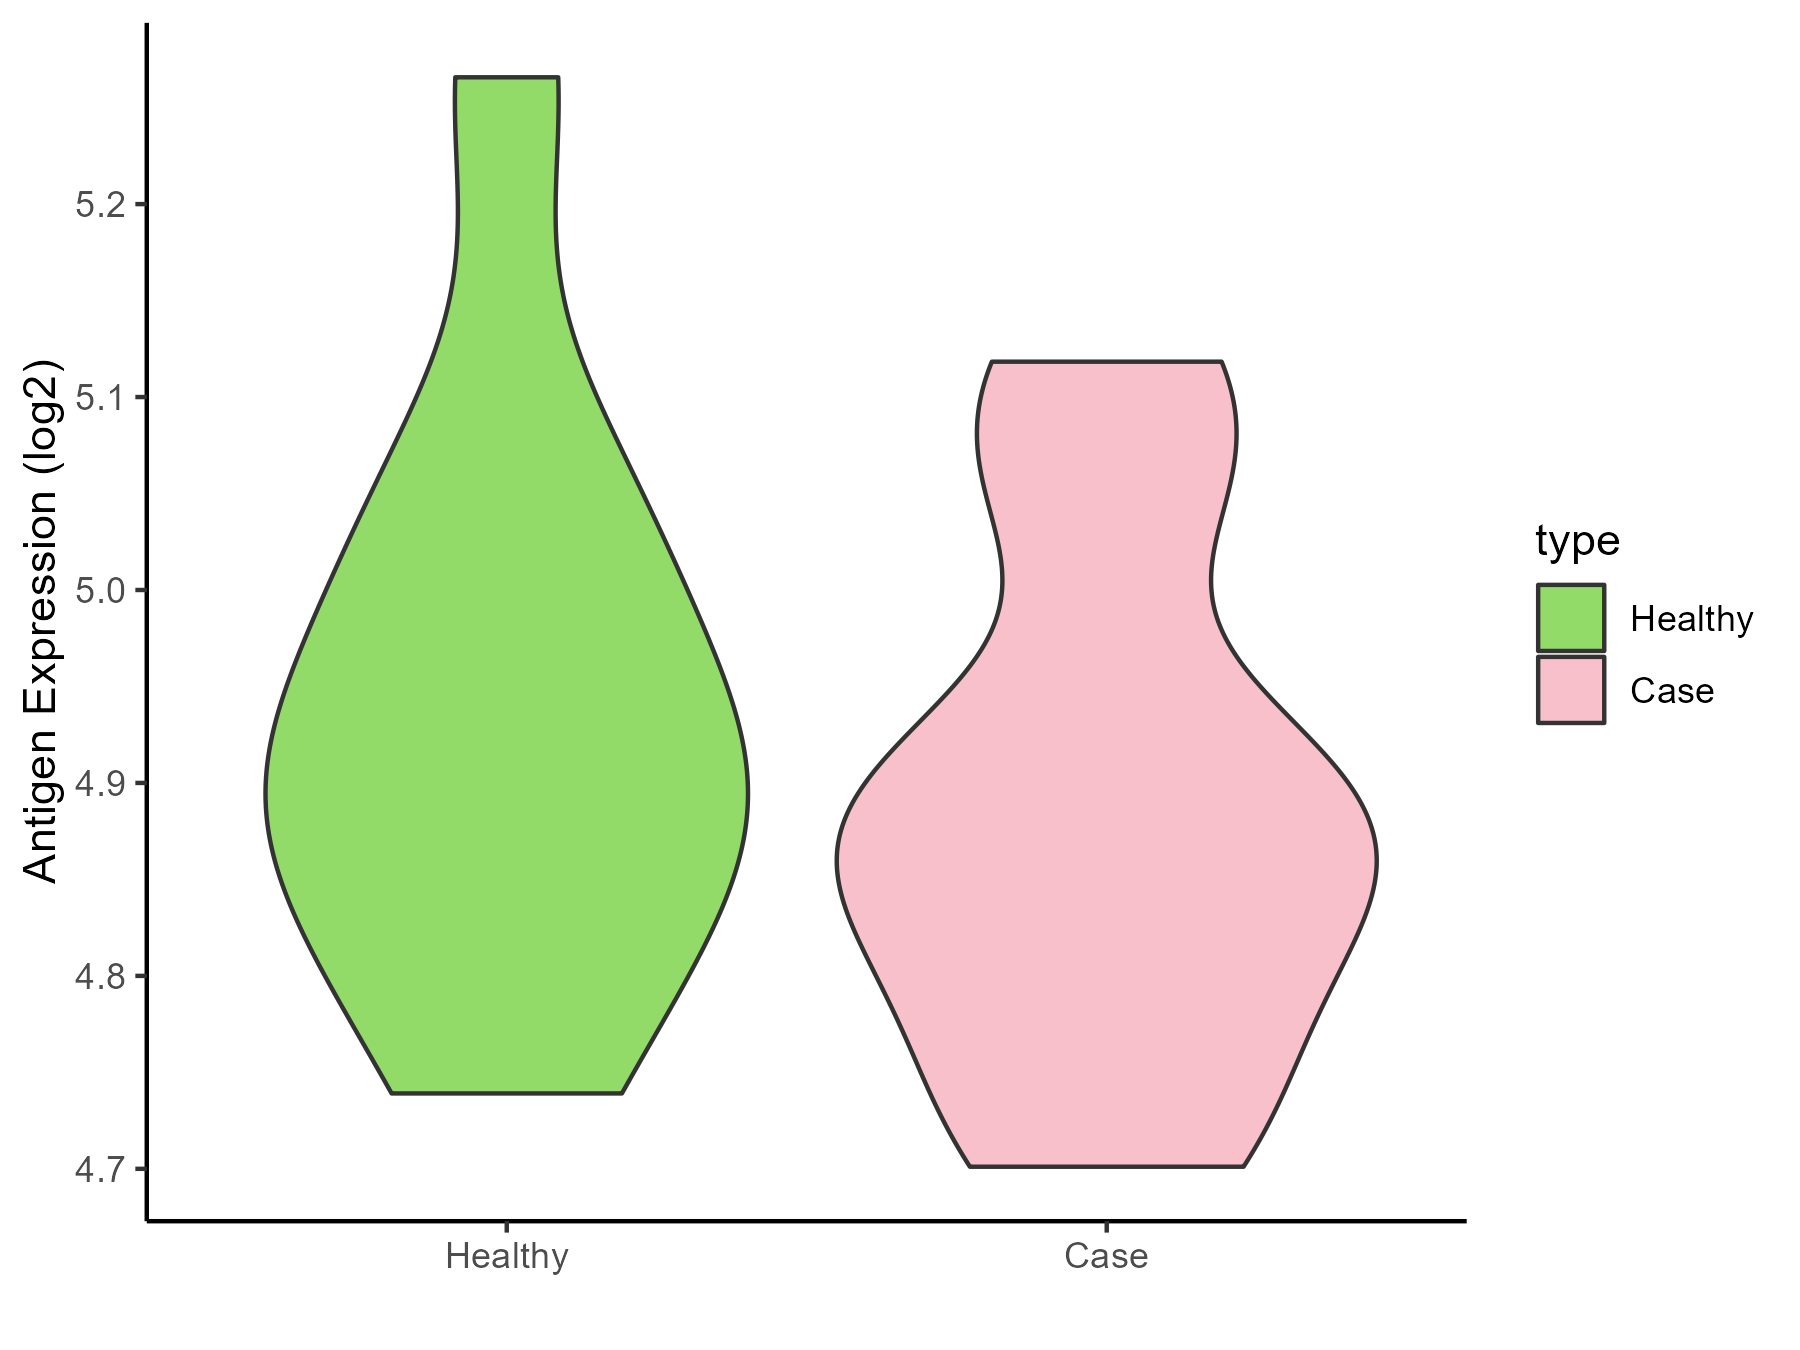
| Differential expression pattern of antigen in diseases | ||
| The Studied Tissue | Pheripheral blood | |
| The Specific Disease | Ankylosing spondylitis | |
| The Expression Level of Disease Section Compare with the Healthy Individual Tissue | p-value: 0.457722773; Fold-change: -0.036830749; Z-score: -0.236653911 | |
| Disease-specific Antigen Abundances |
|
Click to View the Clearer Original Diagram |
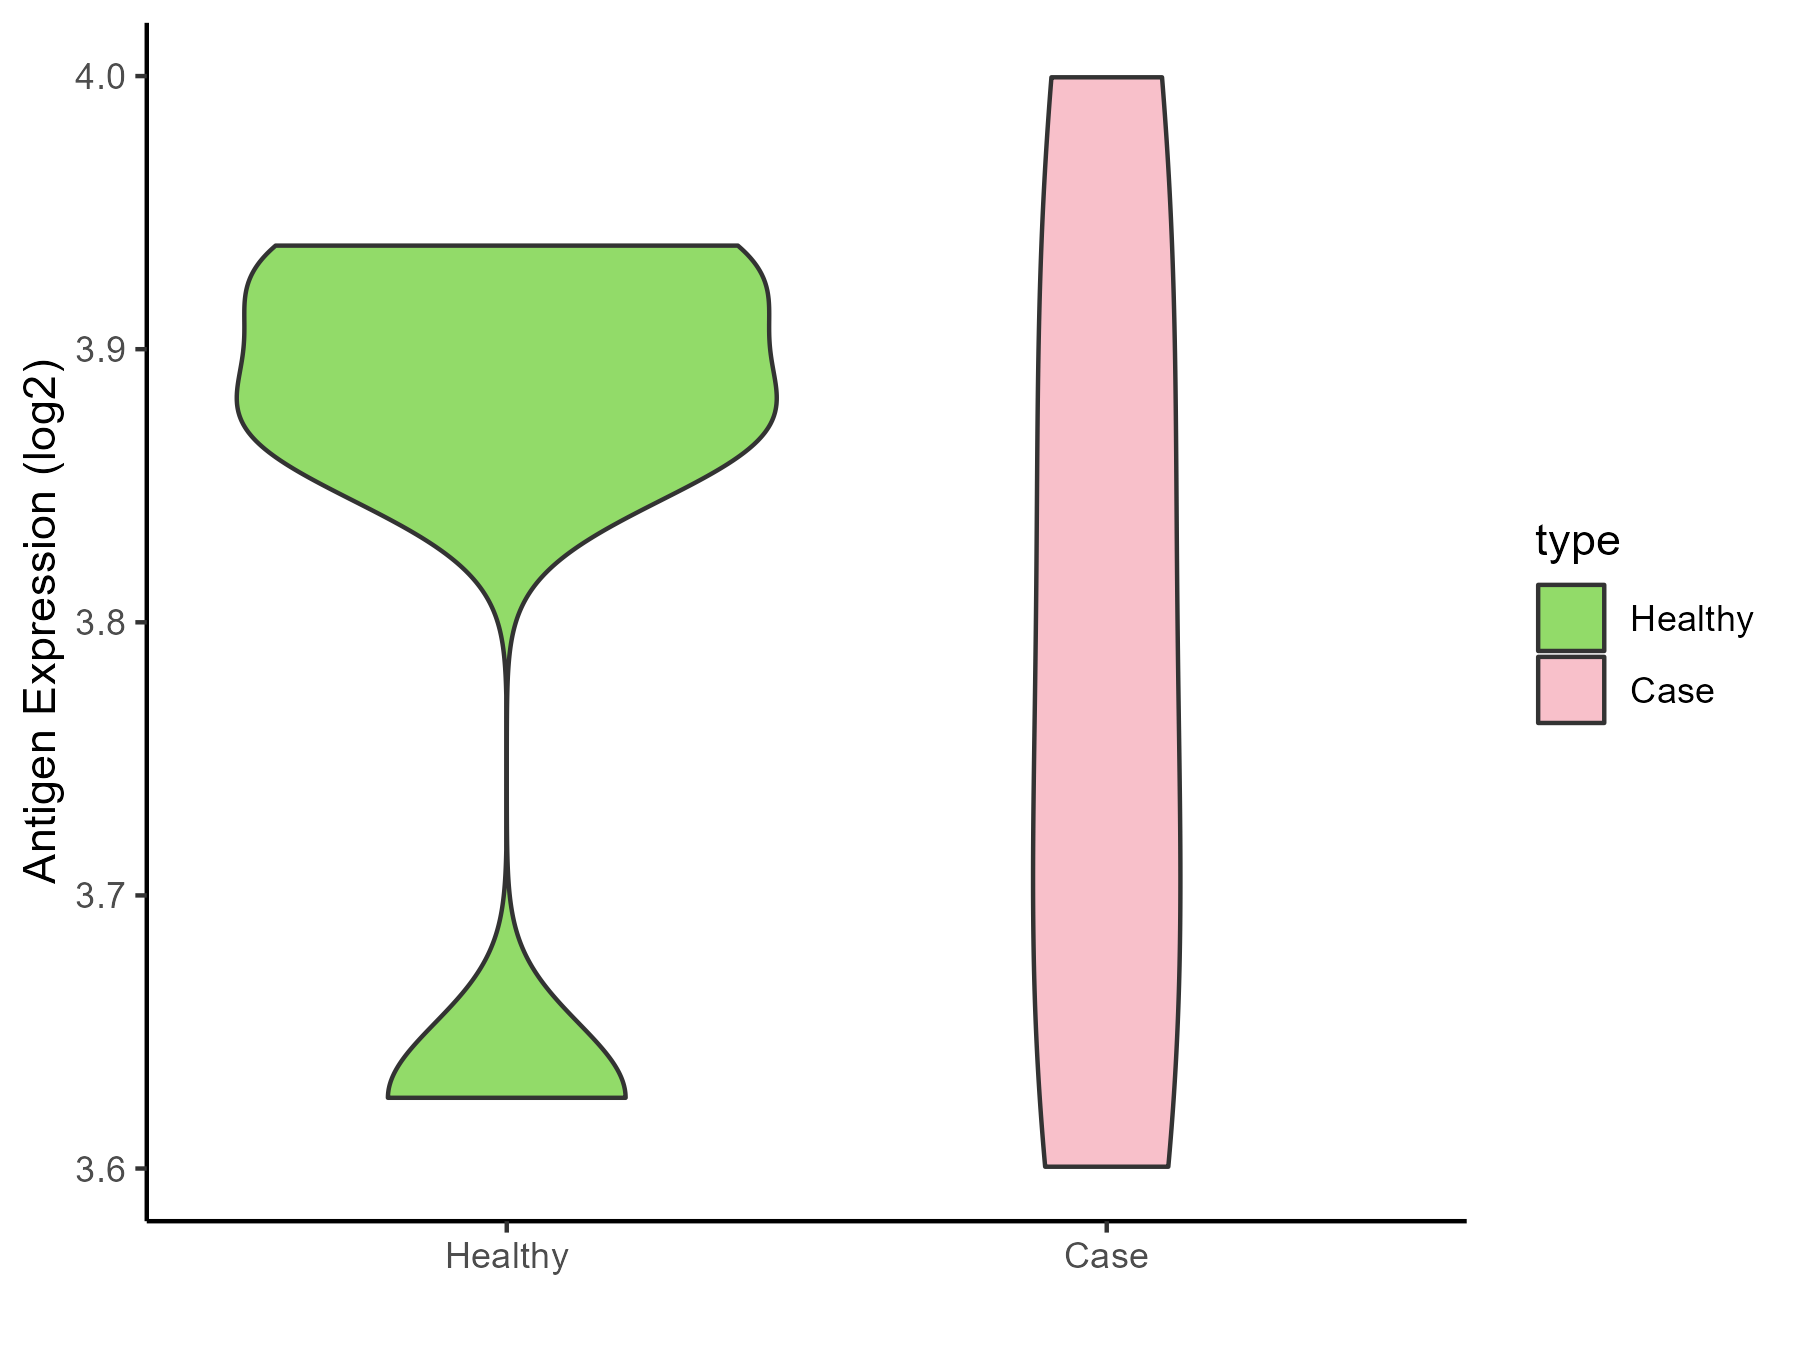
| Differential expression pattern of antigen in diseases | ||
| The Studied Tissue | Bone marrow | |
| The Specific Disease | Osteoporosis | |
| The Expression Level of Disease Section Compare with the Healthy Individual Tissue | p-value: 0.638026748; Fold-change: -0.088279953; Z-score: -0.698376106 | |
| Disease-specific Antigen Abundances |
|
Click to View the Clearer Original Diagram |
ICD Disease Classification 16
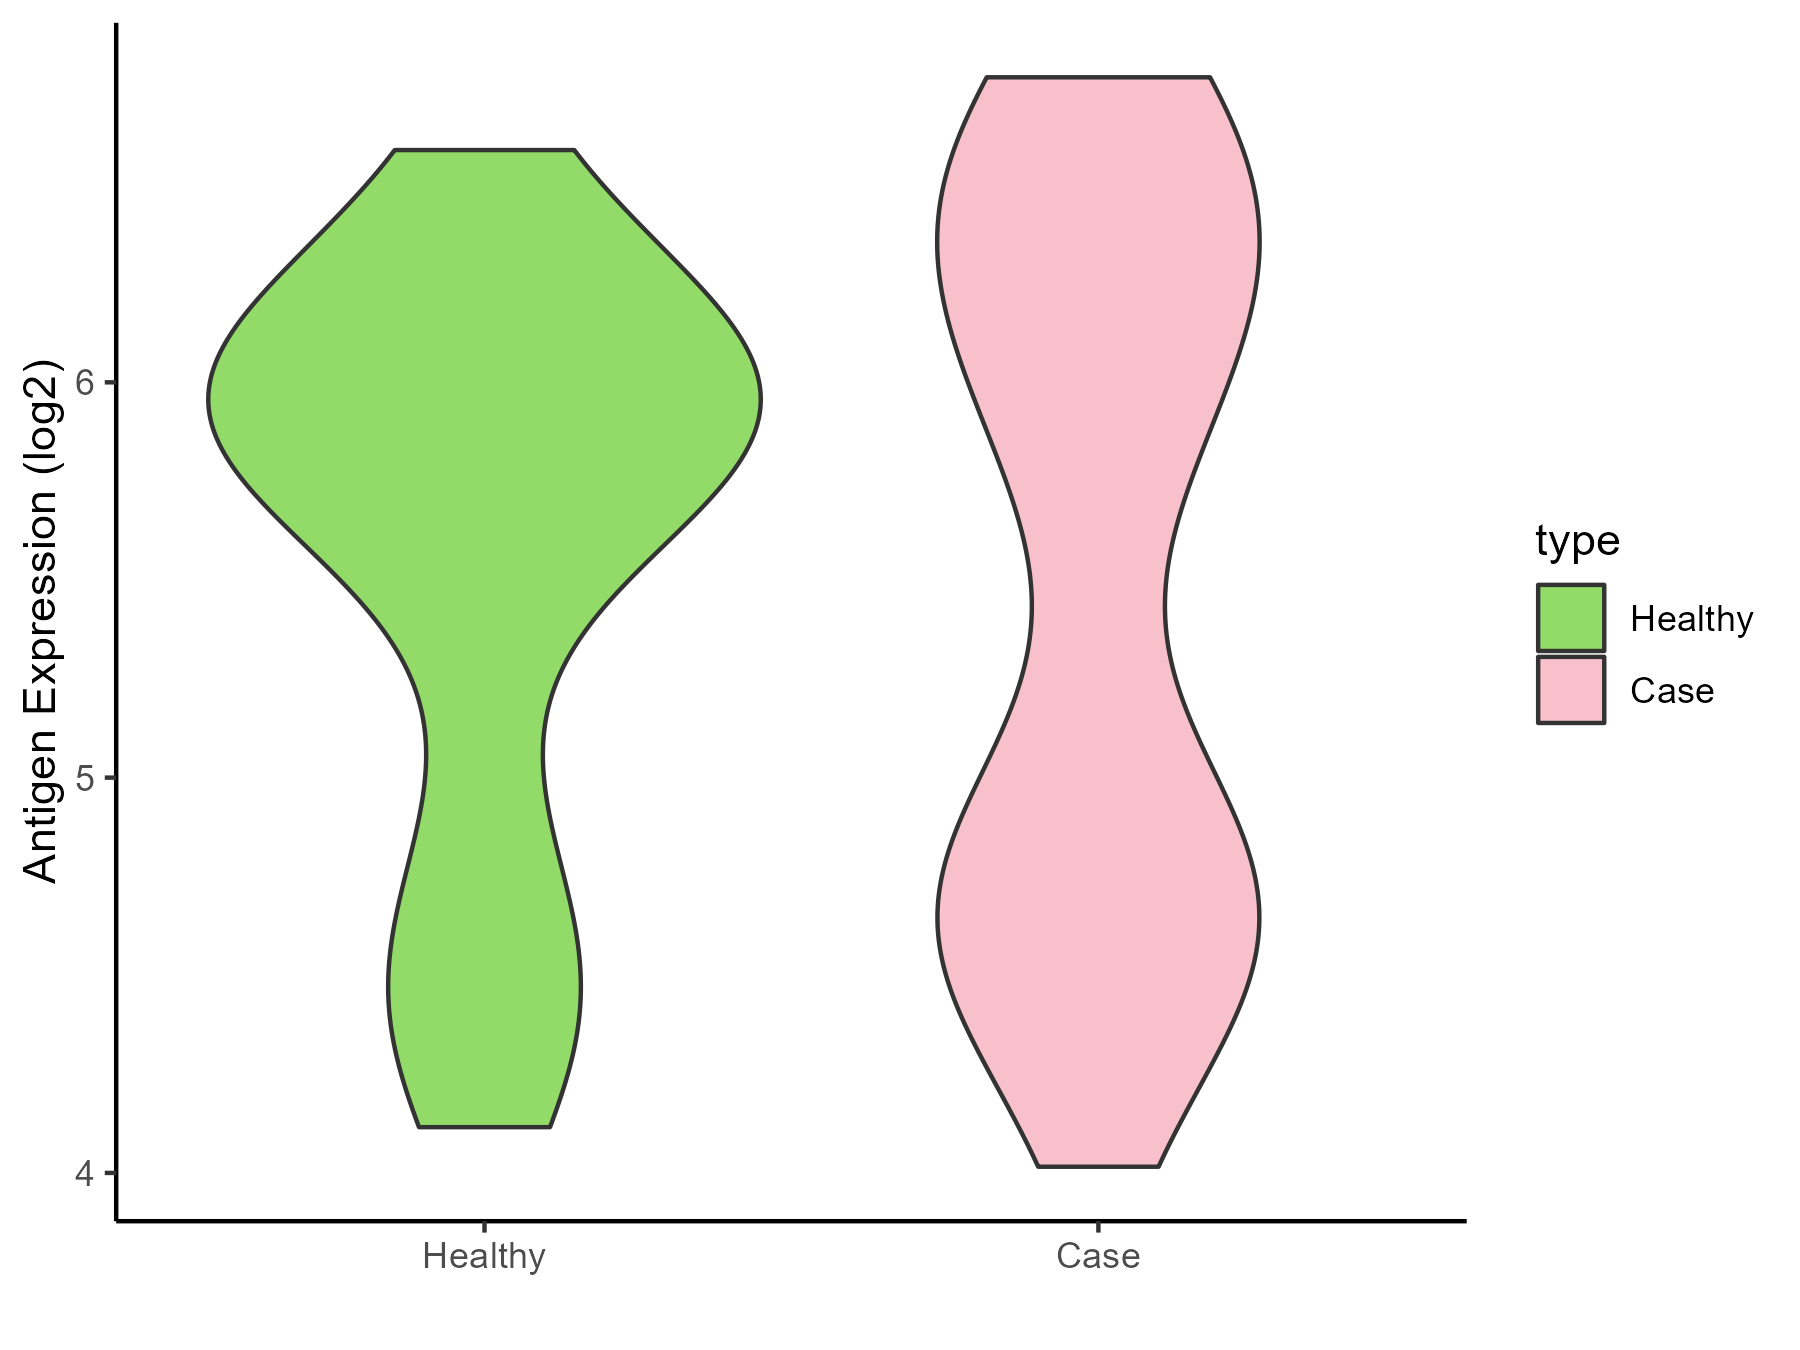
| Differential expression pattern of antigen in diseases | ||
| The Studied Tissue | Endometrium | |
| The Specific Disease | Endometriosis | |
| The Expression Level of Disease Section Compare with the Healthy Individual Tissue | p-value: 0.700931979; Fold-change: -0.060801171; Z-score: -0.084681011 | |
| Disease-specific Antigen Abundances |
|
Click to View the Clearer Original Diagram |
| Differential expression pattern of antigen in diseases | ||
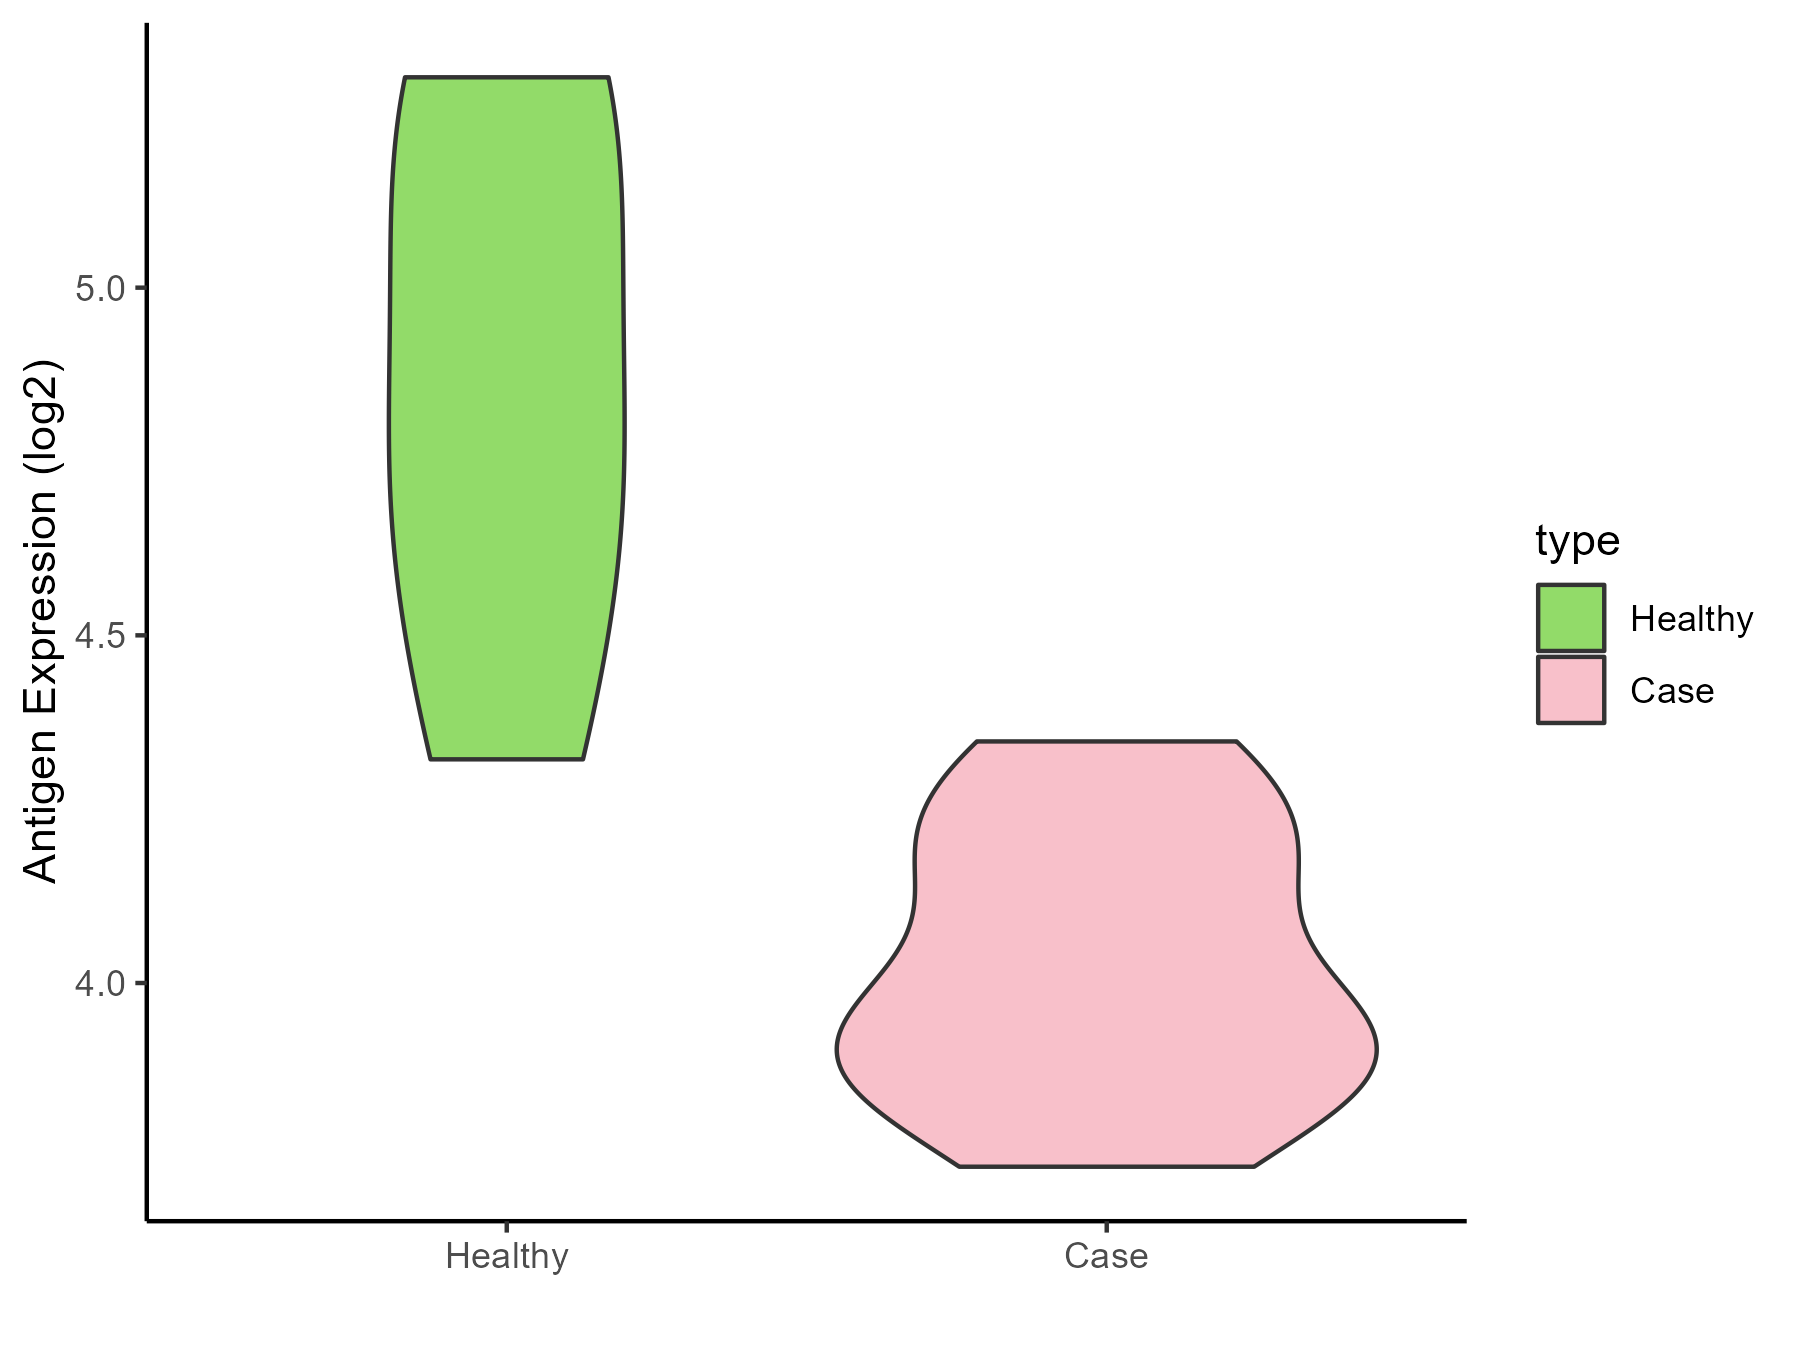
| The Studied Tissue | Bladder | |
| The Specific Disease | Interstitial cystitis | |
| The Expression Level of Disease Section Compare with the Healthy Individual Tissue | p-value: 0.007174122; Fold-change: -0.848288435; Z-score: -2.101127413 | |
| Disease-specific Antigen Abundances |
|
Click to View the Clearer Original Diagram |
ICD Disease Classification 19
| Differential expression pattern of antigen in diseases | ||
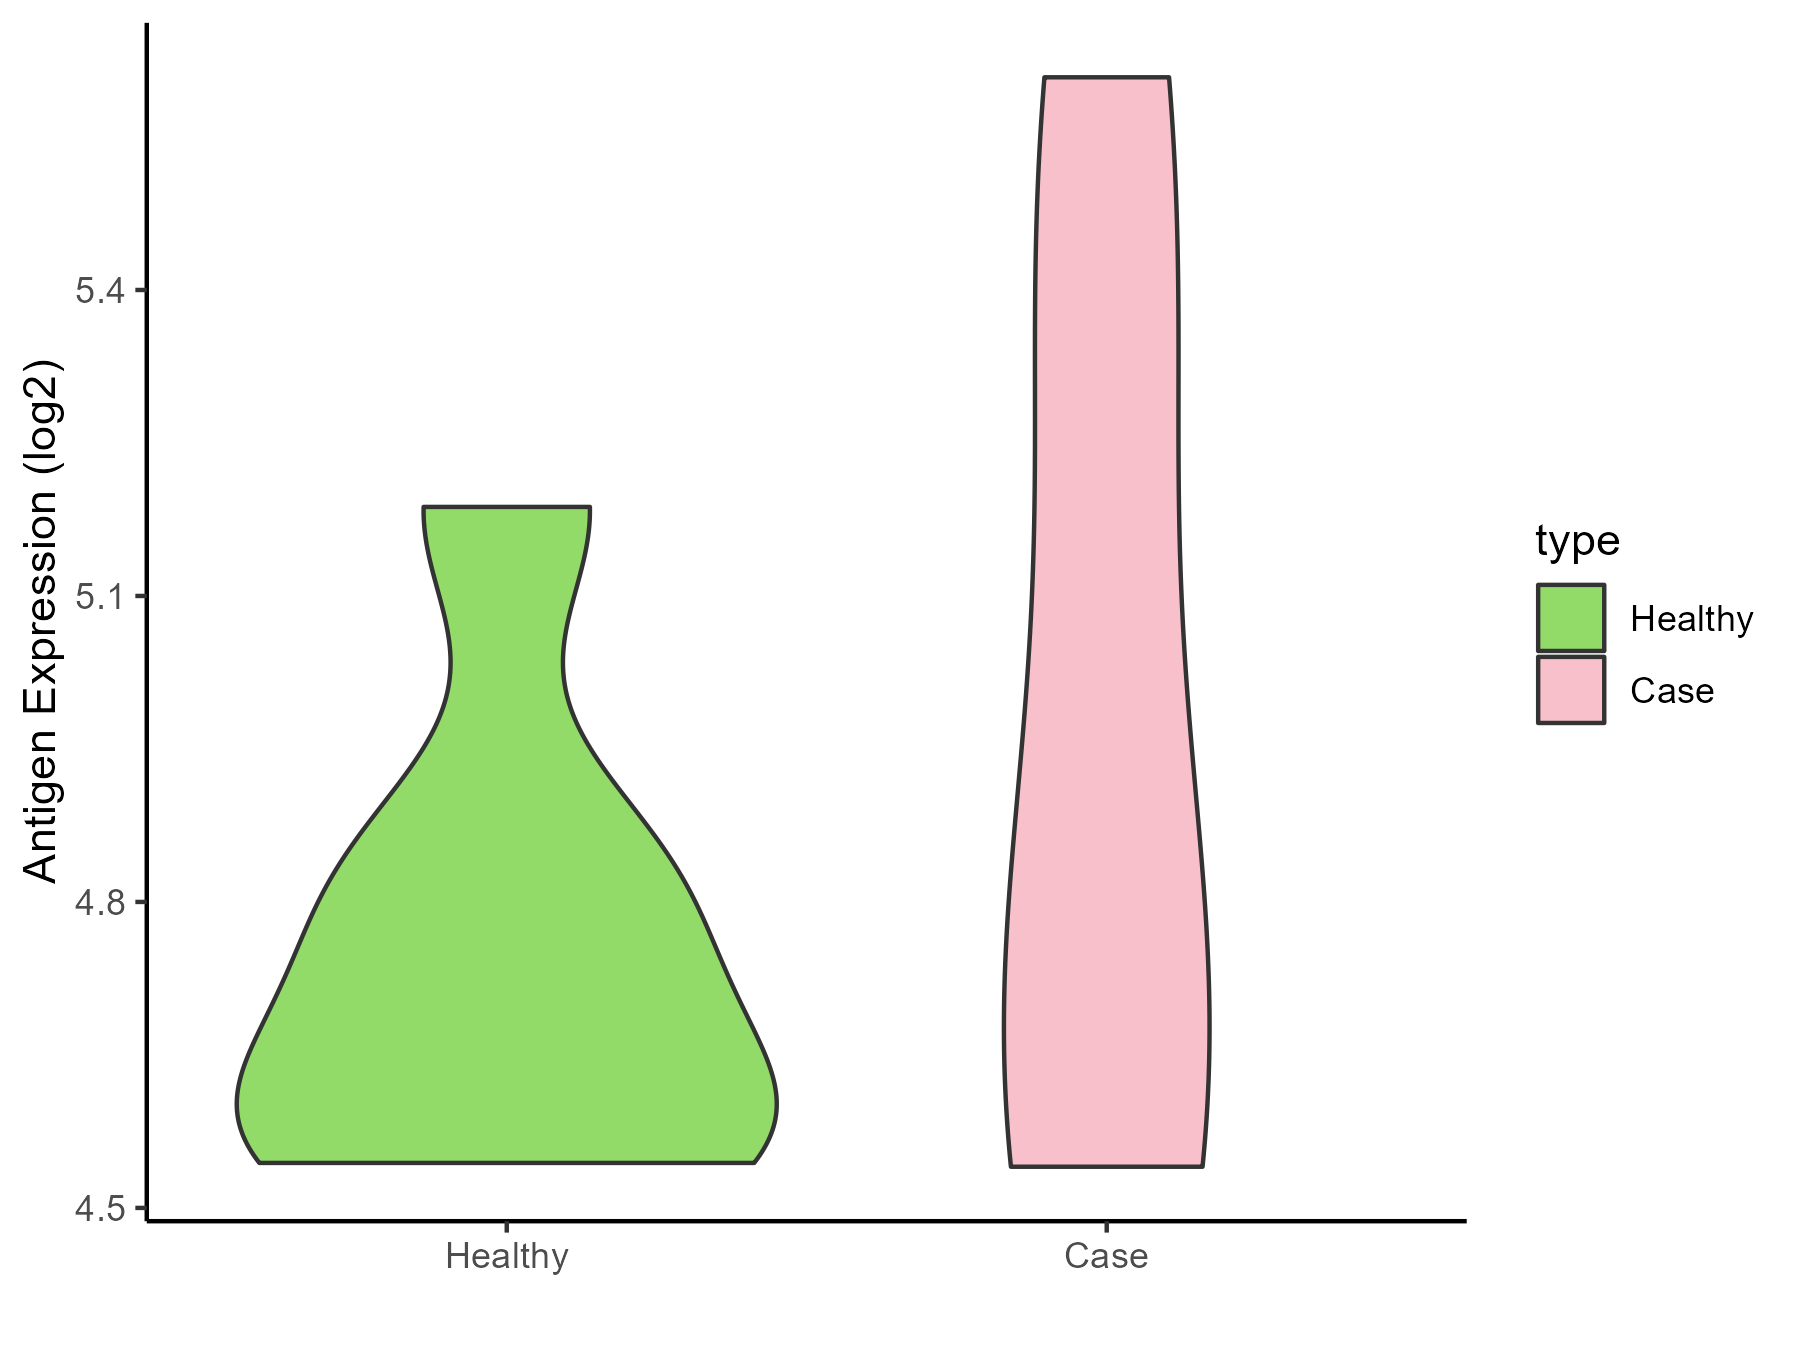
| The Studied Tissue | Myometrium | |
| The Specific Disease | Preterm birth | |
| The Expression Level of Disease Section Compare with the Healthy Individual Tissue | p-value: 0.365937152; Fold-change: 0.136699949; Z-score: 0.562871352 | |
| Disease-specific Antigen Abundances |
|
Click to View the Clearer Original Diagram |
ICD Disease Classification 2
| Differential expression pattern of antigen in diseases | ||
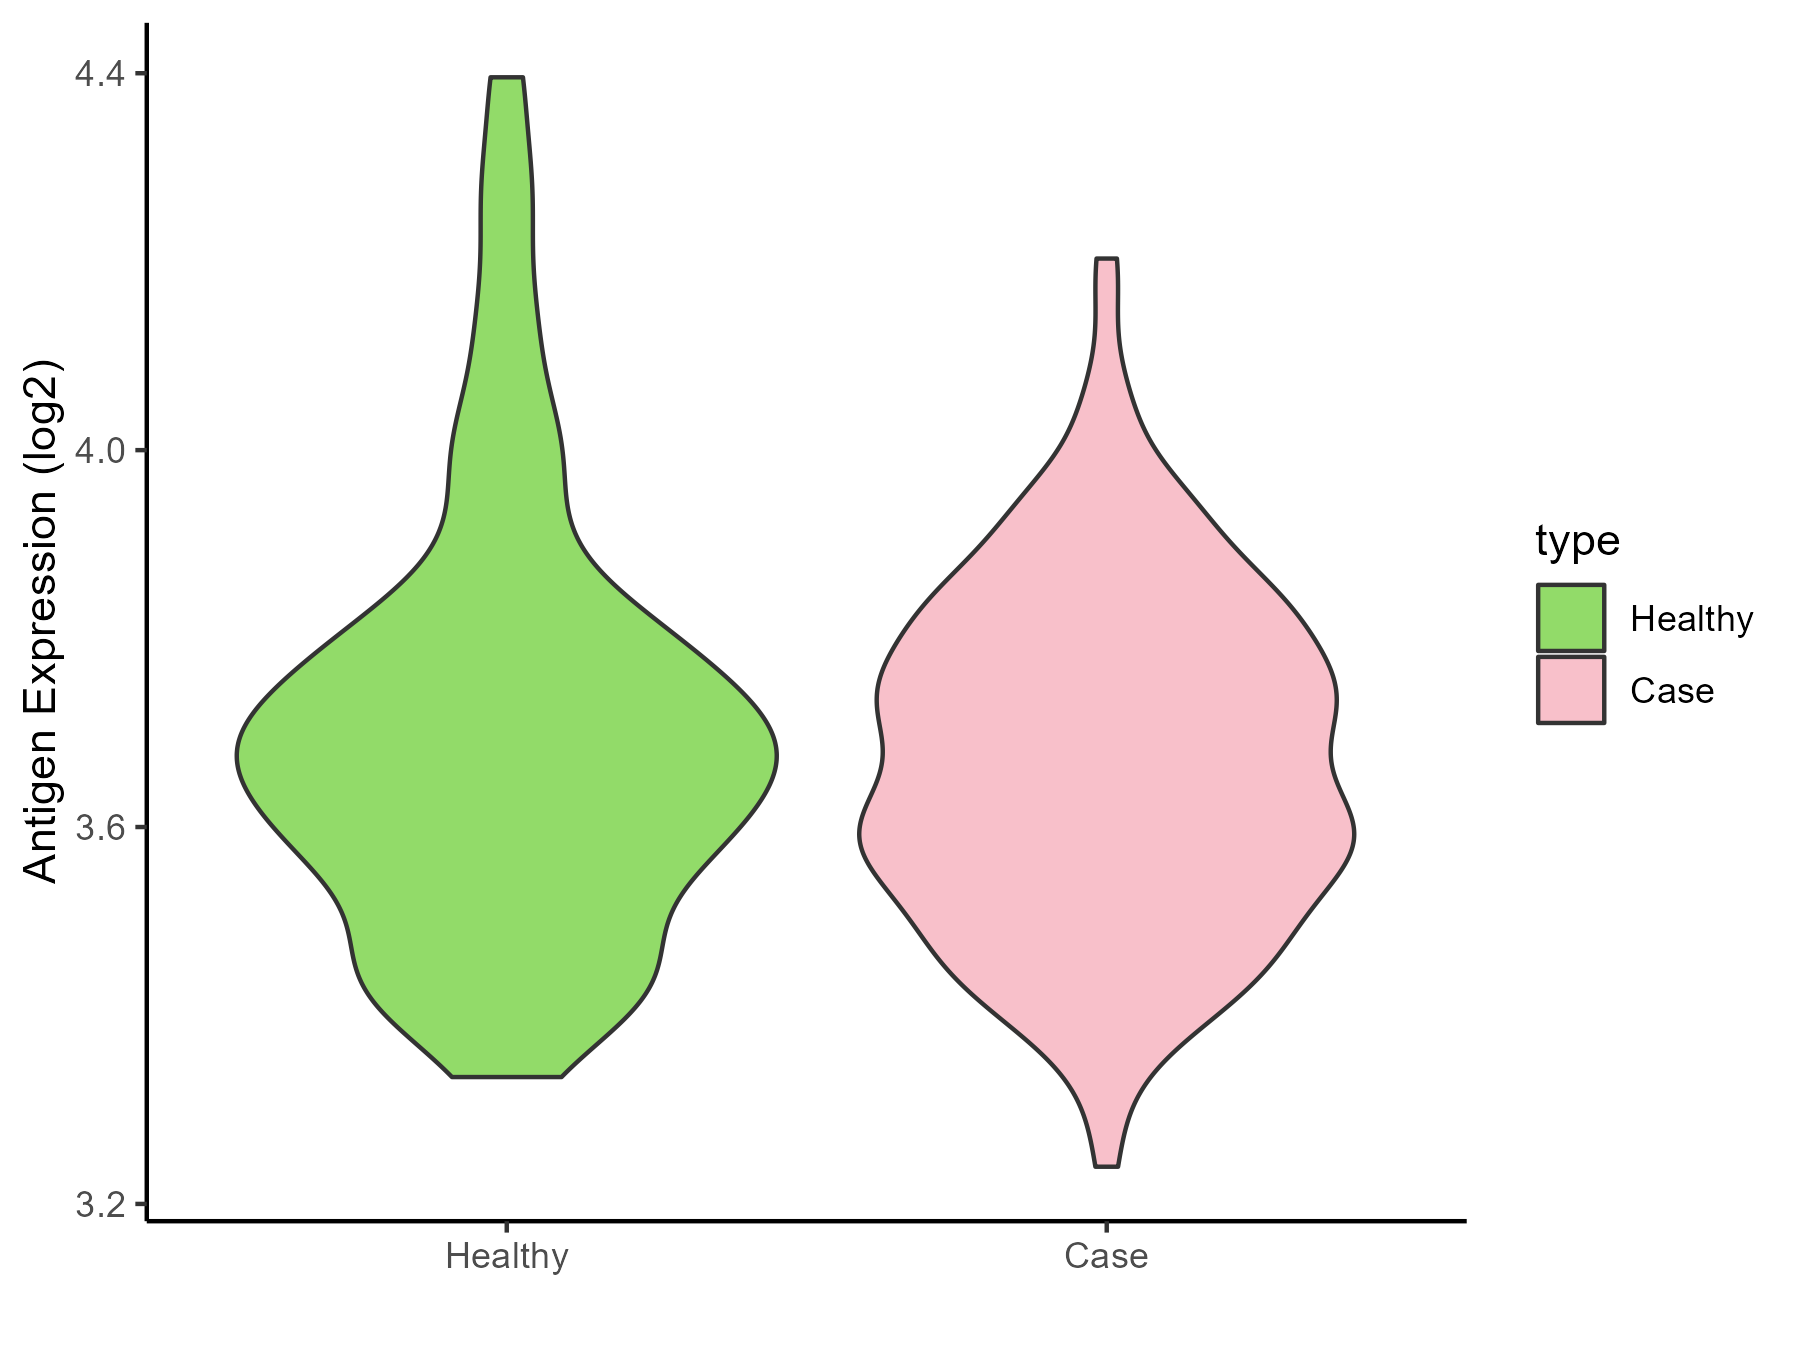
| The Studied Tissue | Bone marrow | |
| The Specific Disease | Acute myelocytic leukemia | |
| The Expression Level of Disease Section Compare with the Healthy Individual Tissue | p-value: 0.154694558; Fold-change: -0.014190819; Z-score: -0.06341144 | |
| Disease-specific Antigen Abundances |
|
Click to View the Clearer Original Diagram |
| Differential expression pattern of antigen in diseases | ||
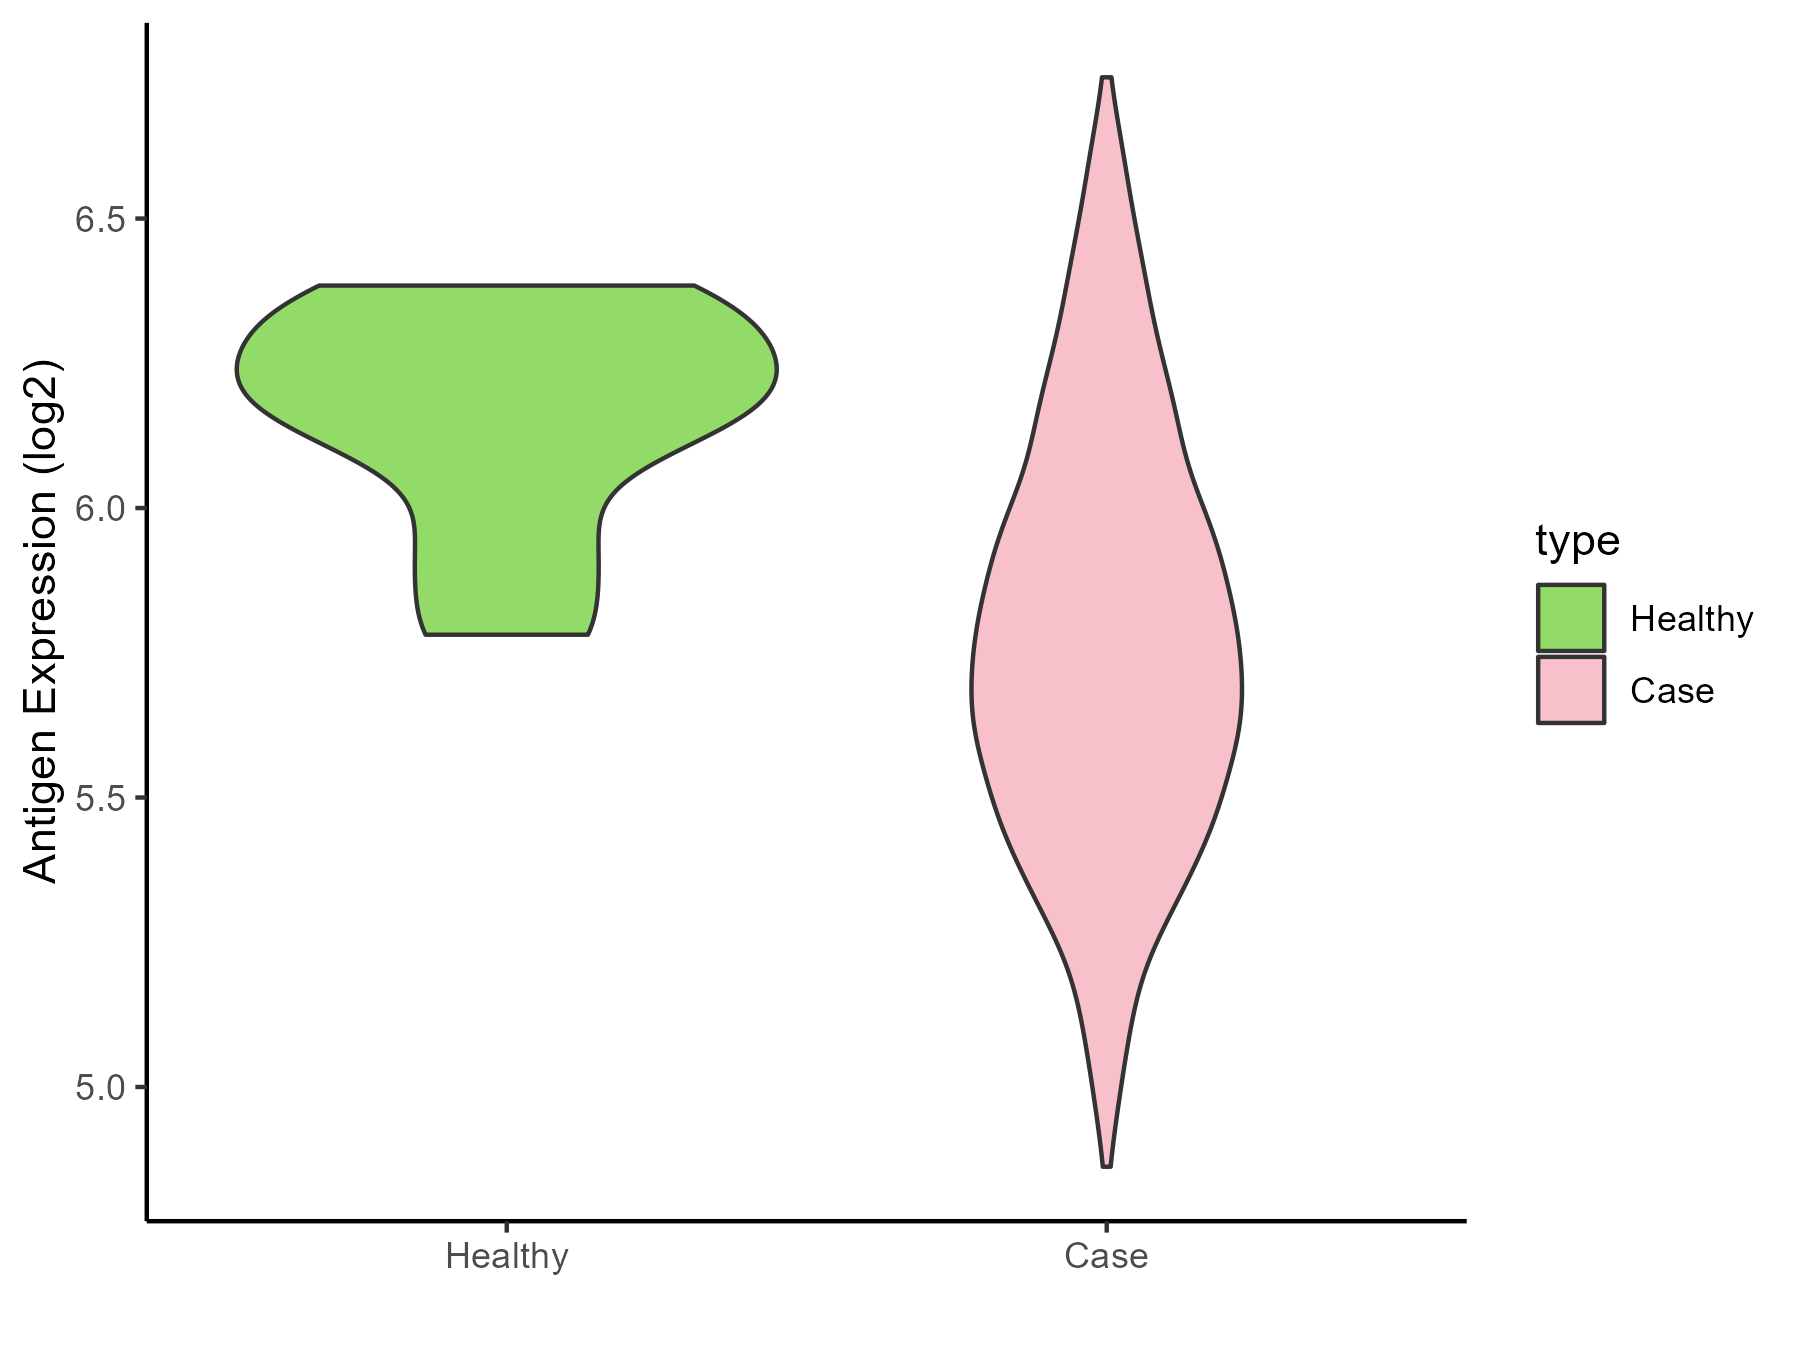
| The Studied Tissue | Bone marrow | |
| The Specific Disease | Myeloma | |
| The Expression Level of Disease Section Compare with the Healthy Individual Tissue | p-value: 0.001030185; Fold-change: -0.434172727; Z-score: -2.127910015 | |
| Disease-specific Antigen Abundances |
|
Click to View the Clearer Original Diagram |
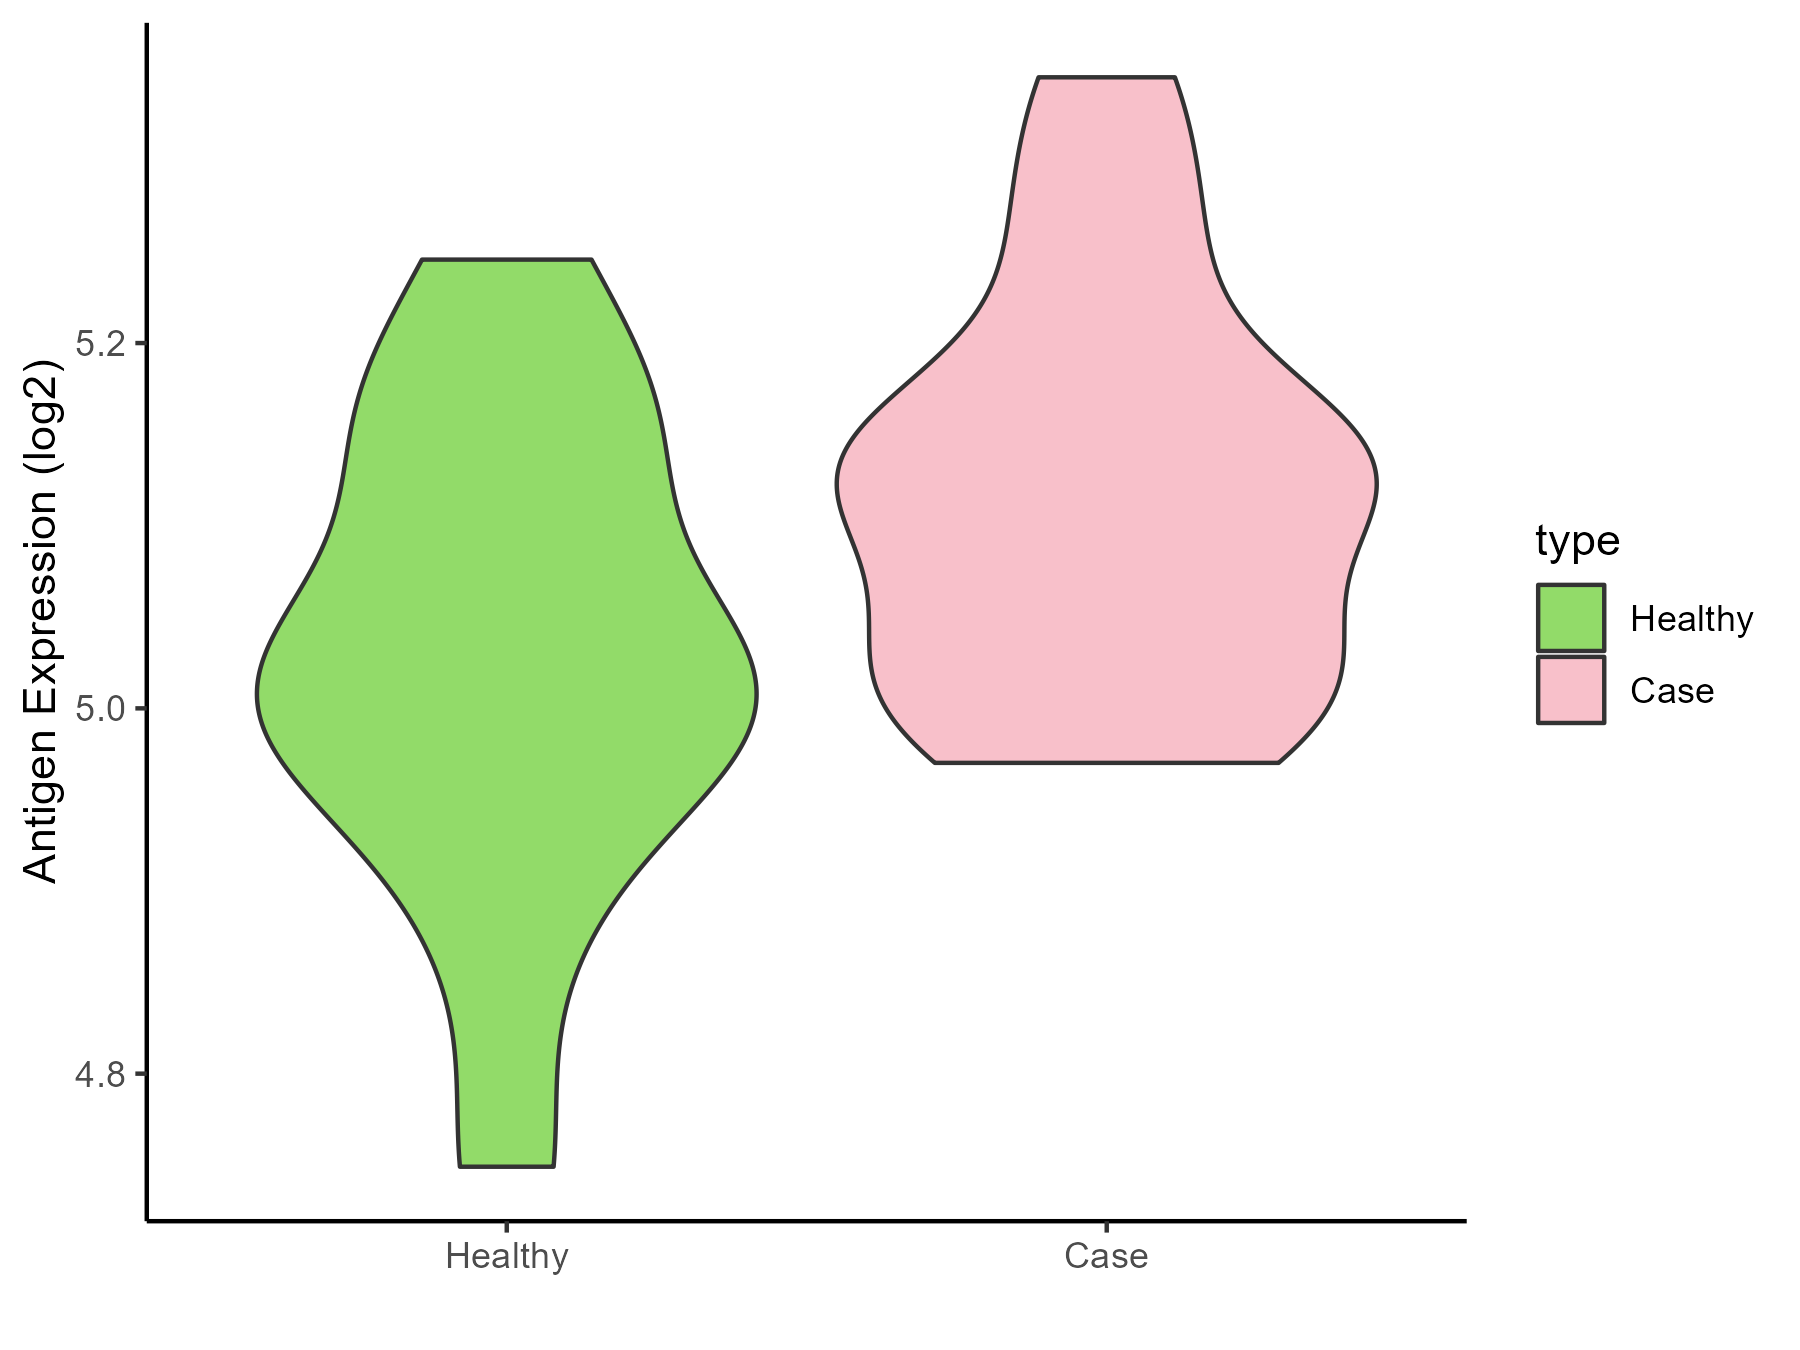
| The Studied Tissue | Peripheral blood | |
| The Specific Disease | Myeloma | |
| The Expression Level of Disease Section Compare with the Healthy Individual Tissue | p-value: 0.087020745; Fold-change: 0.10517238; Z-score: 0.778696638 | |
| Disease-specific Antigen Abundances |
|
Click to View the Clearer Original Diagram |
| Differential expression pattern of antigen in diseases | ||
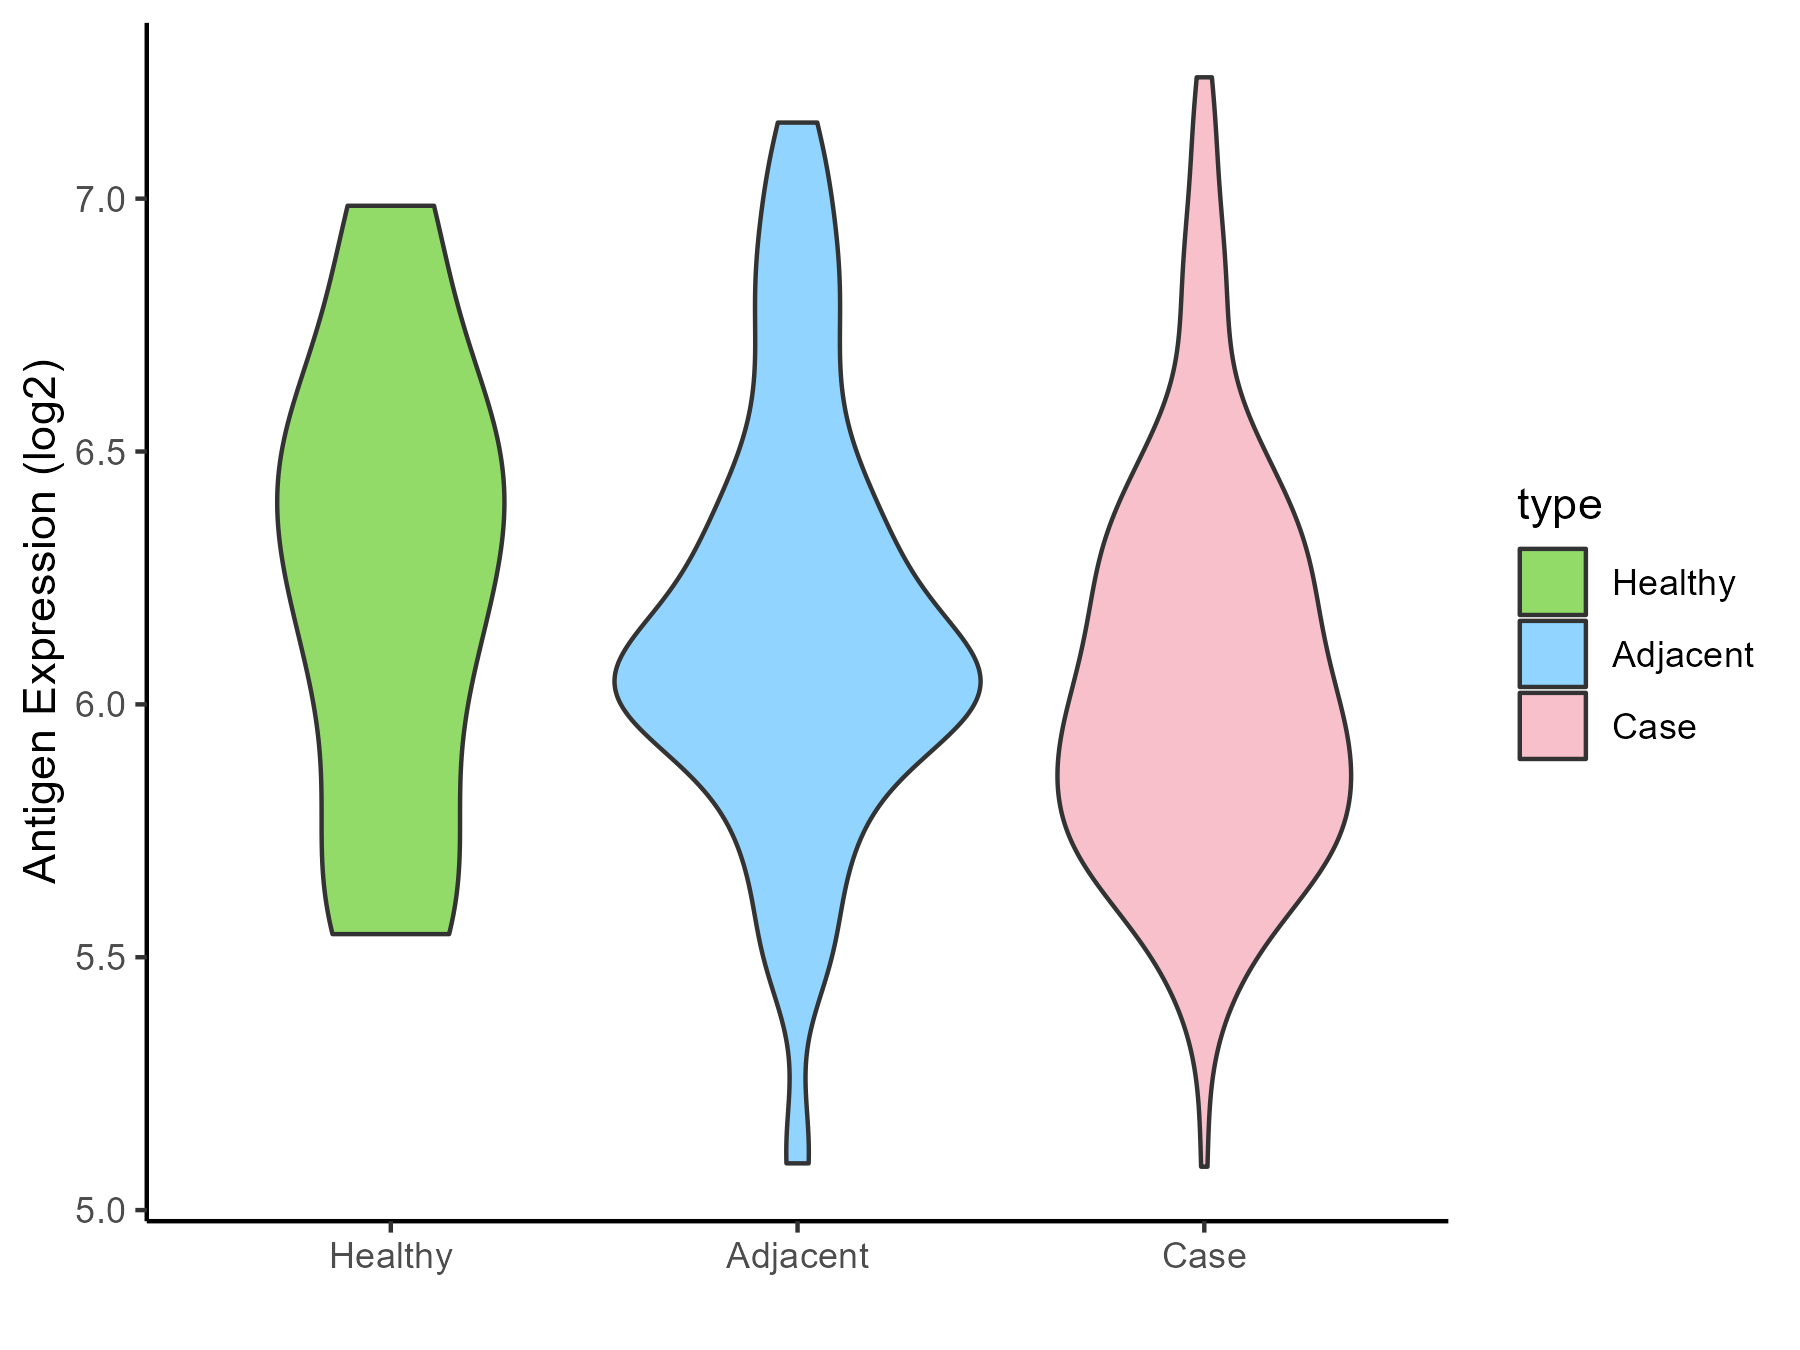
| The Studied Tissue | Oral | |
| The Specific Disease | Oral cancer | |
| The Expression Level of Disease Section Compare with the Healthy Individual Tissue | p-value: 0.038777561; Fold-change: -0.270613501; Z-score: -0.610659743 | |
| The Expression Level of Disease Section Compare with the Adjacent Tissue | p-value: 0.053333887; Fold-change: -0.075365547; Z-score: -0.179044214 | |
| Disease-specific Antigen Abundances |
|
Click to View the Clearer Original Diagram |
| Differential expression pattern of antigen in diseases | ||
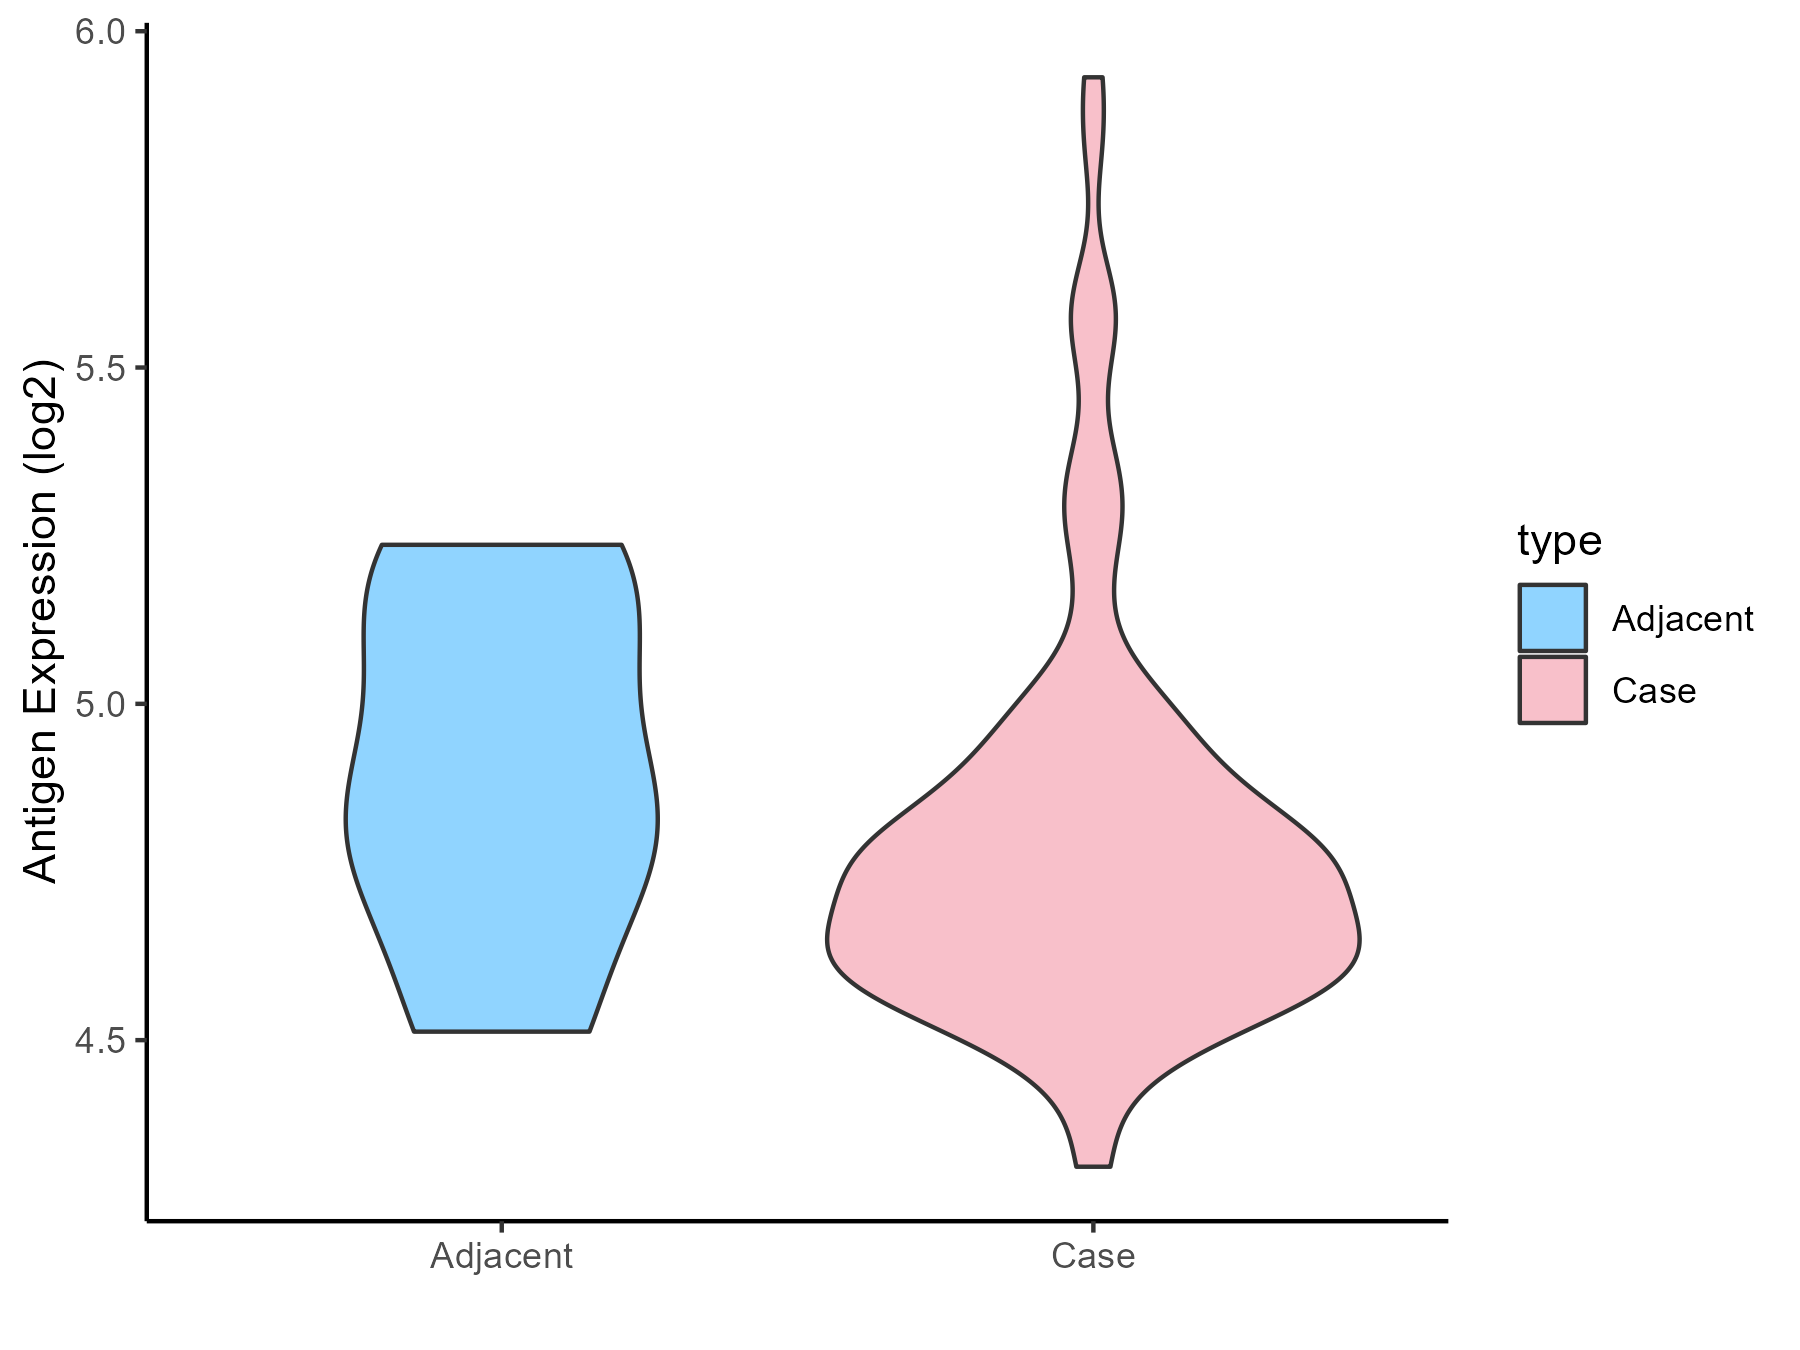
| The Studied Tissue | Esophagus | |
| The Specific Disease | Esophagal cancer | |
| The Expression Level of Disease Section Compare with the Adjacent Tissue | p-value: 0.461625553; Fold-change: -0.095714861; Z-score: -0.336434857 | |
| Disease-specific Antigen Abundances |
|
Click to View the Clearer Original Diagram |
| Differential expression pattern of antigen in diseases | ||
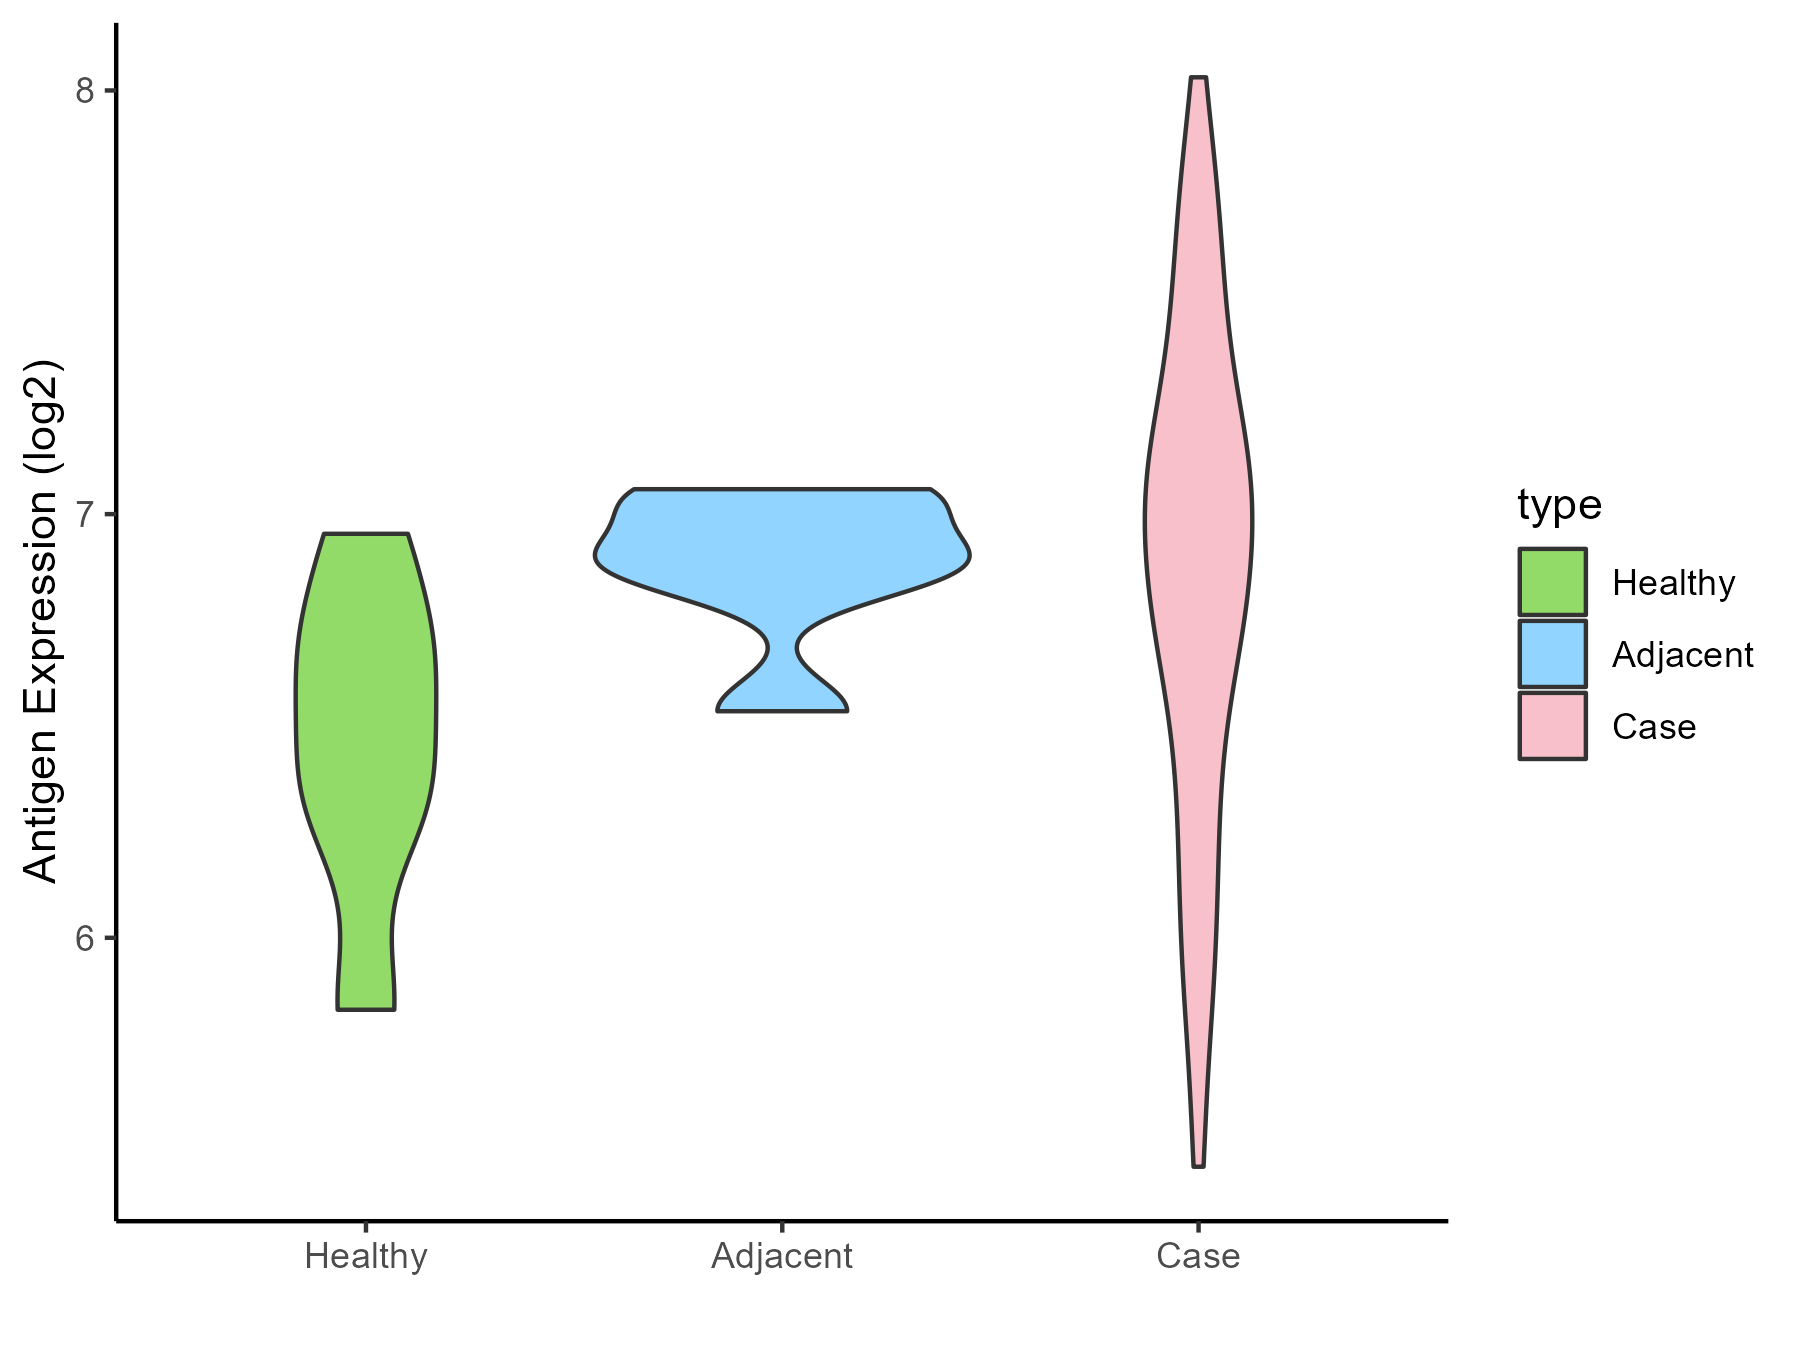
| The Studied Tissue | Rectal colon | |
| The Specific Disease | Rectal cancer | |
| The Expression Level of Disease Section Compare with the Healthy Individual Tissue | p-value: 0.04795117; Fold-change: 0.450706063; Z-score: 1.154459123 | |
| The Expression Level of Disease Section Compare with the Adjacent Tissue | p-value: 0.945918695; Fold-change: 0.042051702; Z-score: 0.22043818 | |
| Disease-specific Antigen Abundances |
|
Click to View the Clearer Original Diagram |
| Differential expression pattern of antigen in diseases | ||
| The Studied Tissue | Skin | |
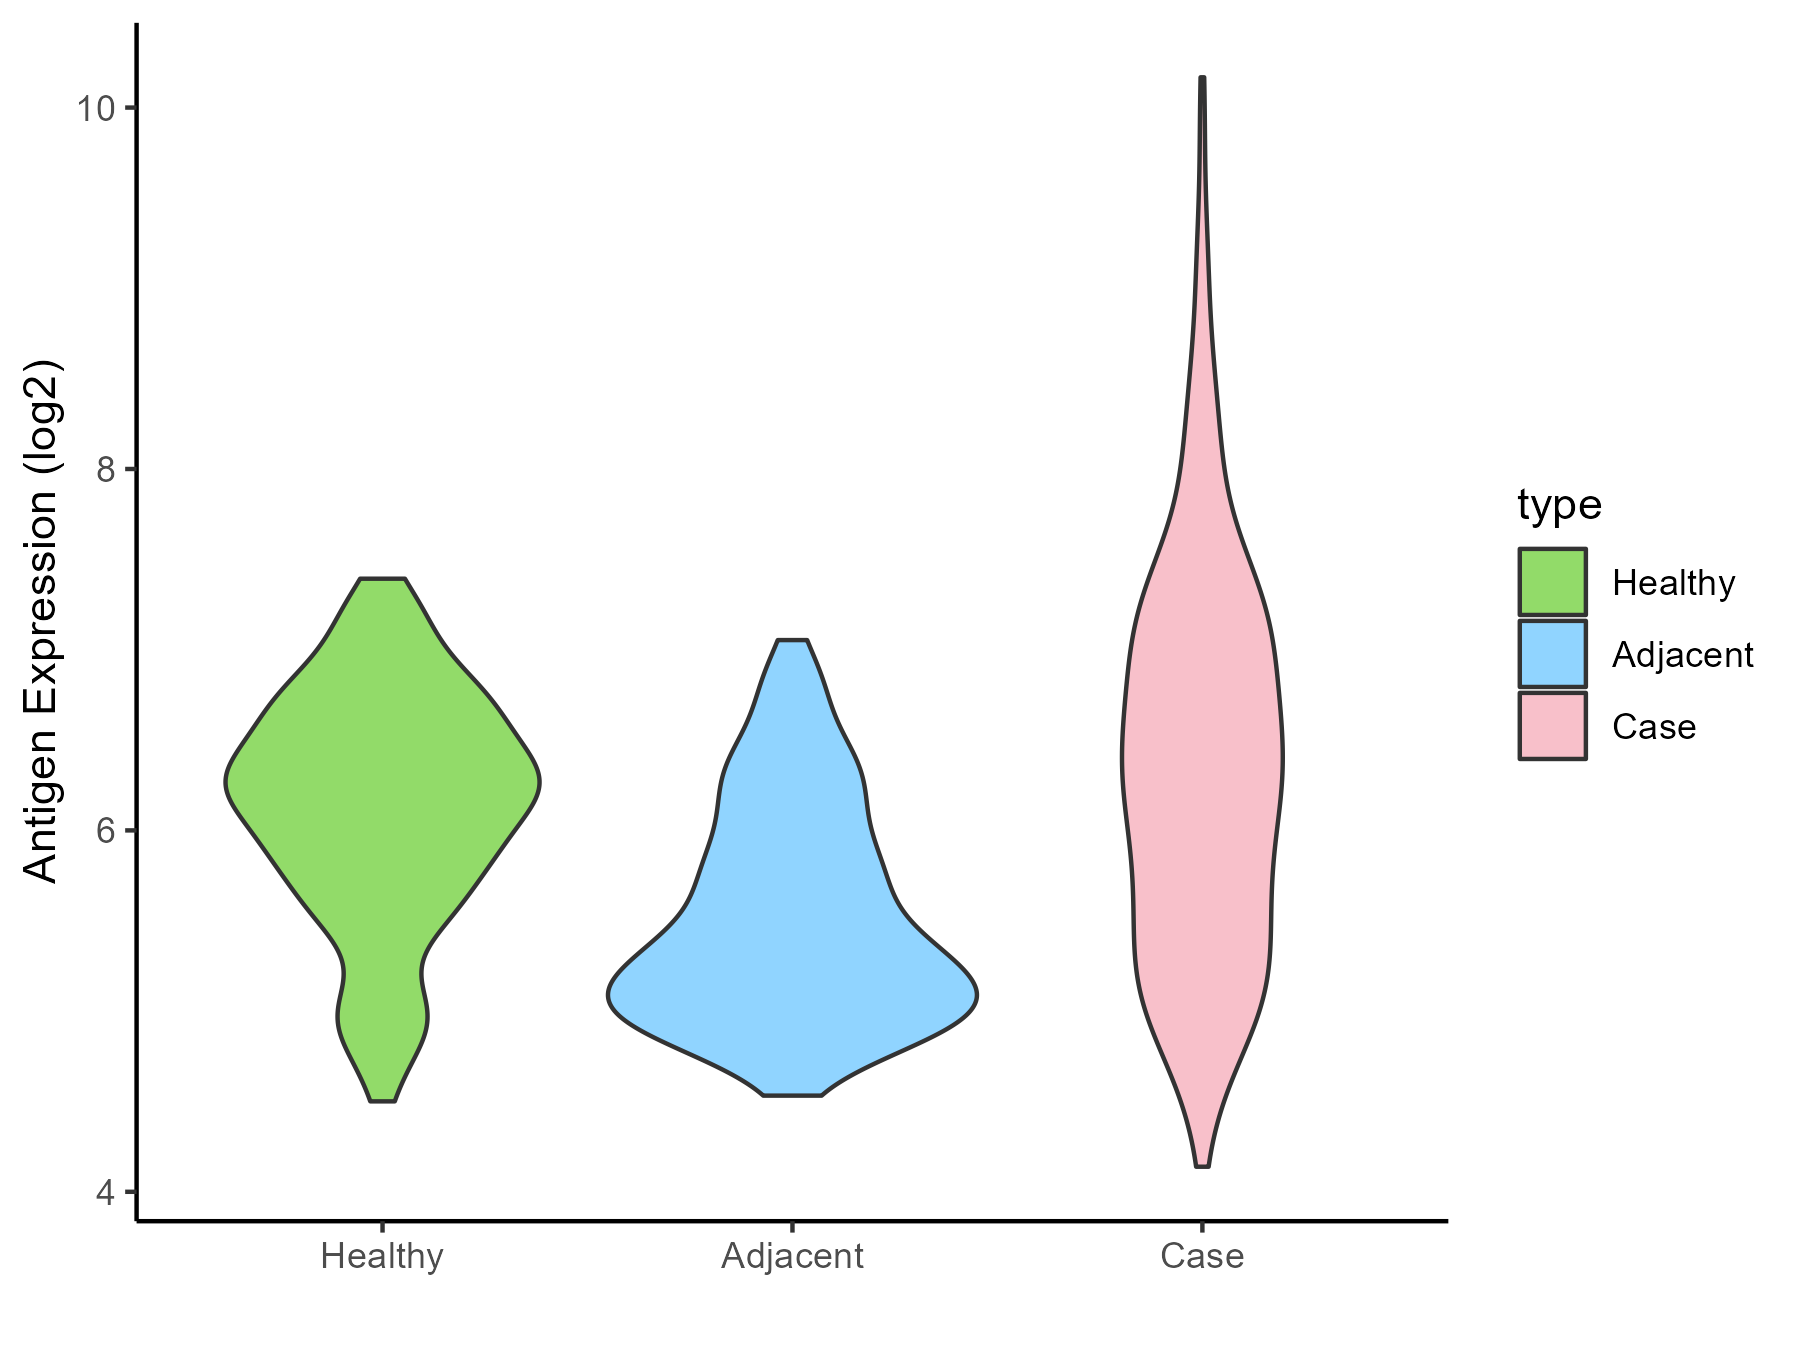
| The Specific Disease | Skin cancer | |
| The Expression Level of Disease Section Compare with the Healthy Individual Tissue | p-value: 0.000864162; Fold-change: 0.110835857; Z-score: 0.173478703 | |
| The Expression Level of Disease Section Compare with the Adjacent Tissue | p-value: 2.81E-29; Fold-change: 0.972896342; Z-score: 1.632726074 | |
| Disease-specific Antigen Abundances |
|
Click to View the Clearer Original Diagram |
| Differential expression pattern of antigen in diseases | ||
| The Studied Tissue | Kidney | |
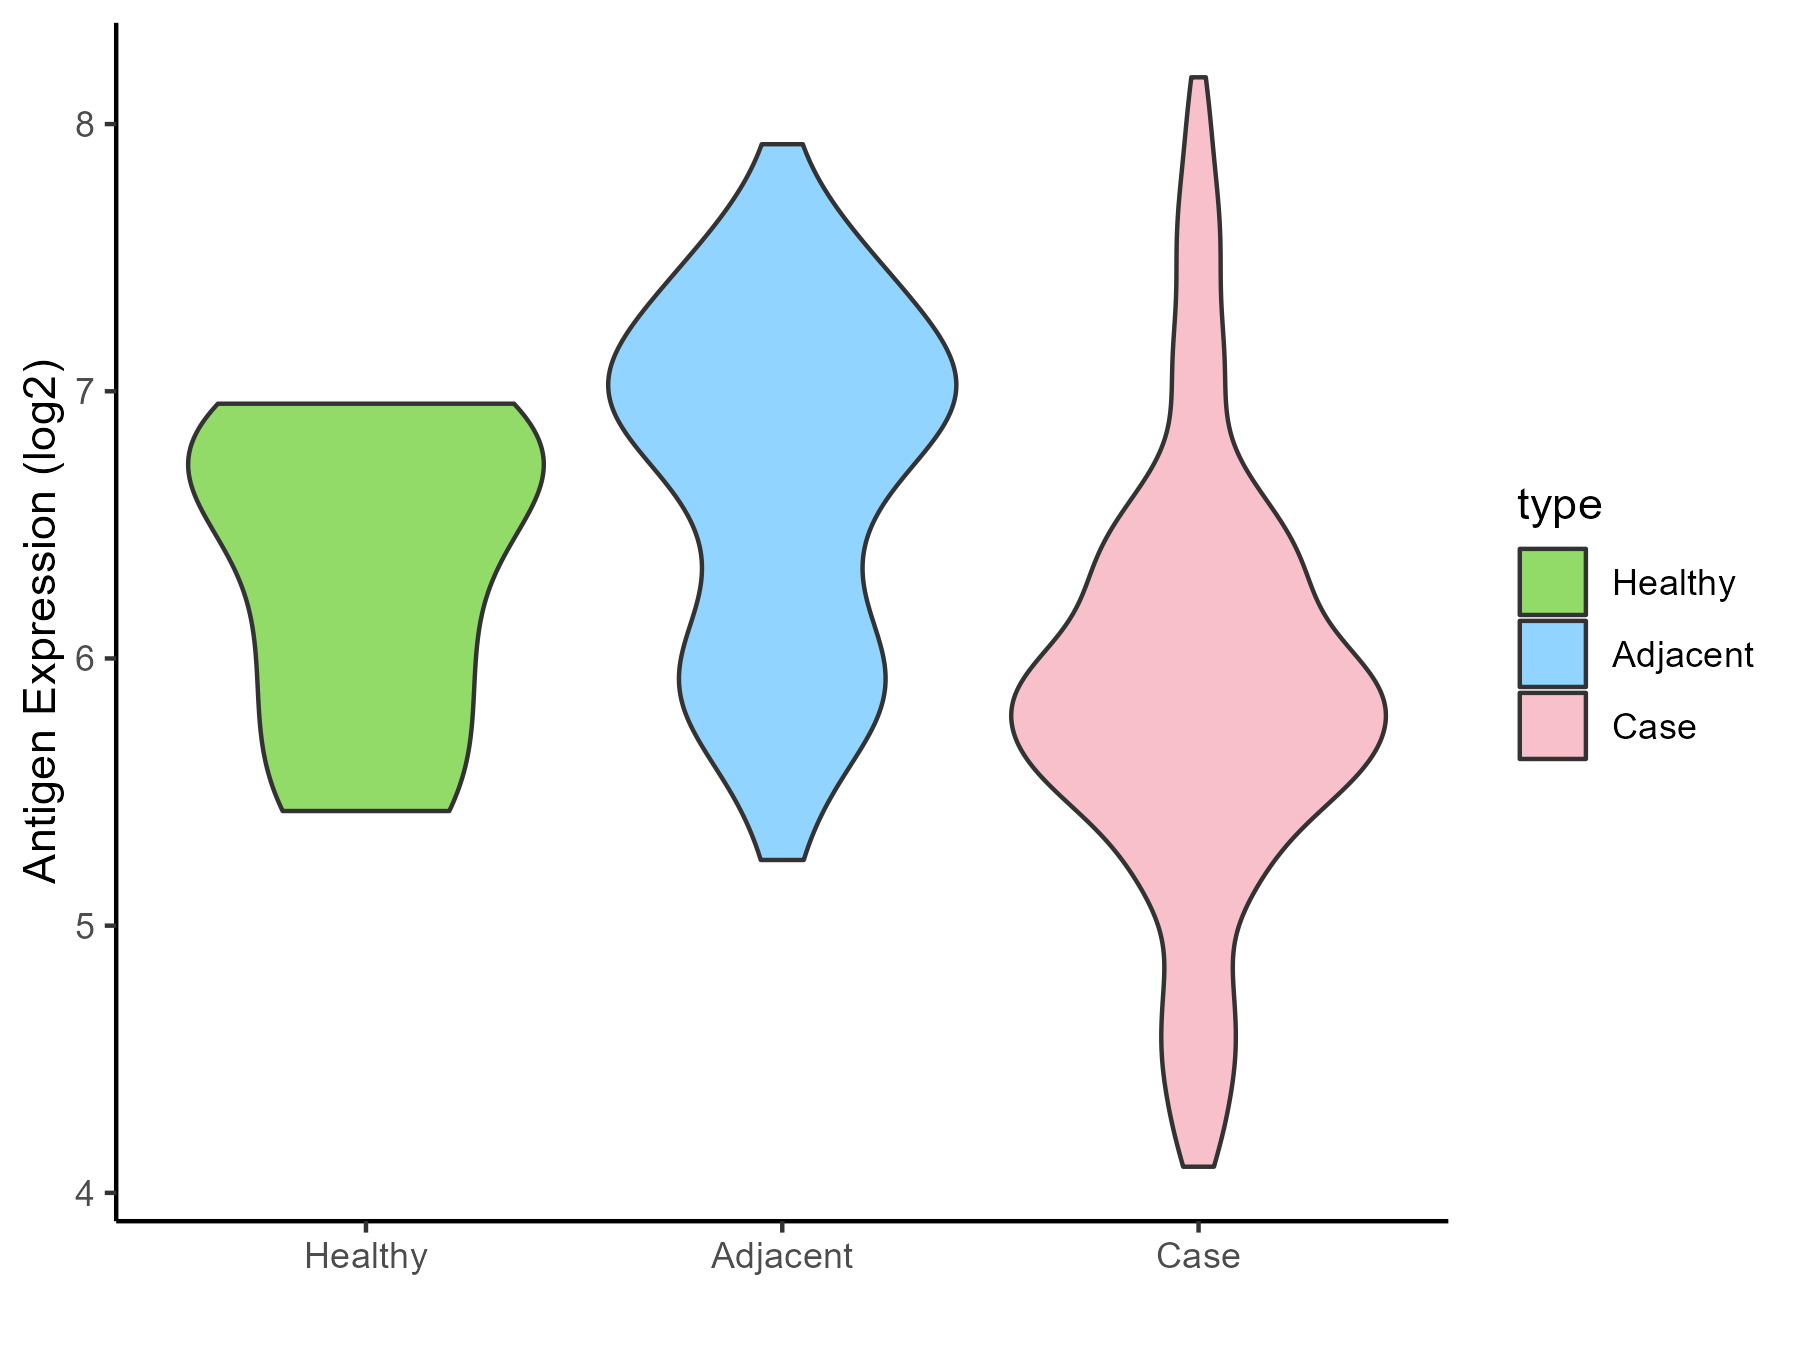
| The Specific Disease | Renal cancer | |
| The Expression Level of Disease Section Compare with the Healthy Individual Tissue | p-value: 0.029720273; Fold-change: -0.709009952; Z-score: -1.267571875 | |
| The Expression Level of Disease Section Compare with the Adjacent Tissue | p-value: 8.49E-15; Fold-change: -0.993088233; Z-score: -1.542123896 | |
| Disease-specific Antigen Abundances |
|
Click to View the Clearer Original Diagram |
| Differential expression pattern of antigen in diseases | ||
| The Studied Tissue | Urothelium | |
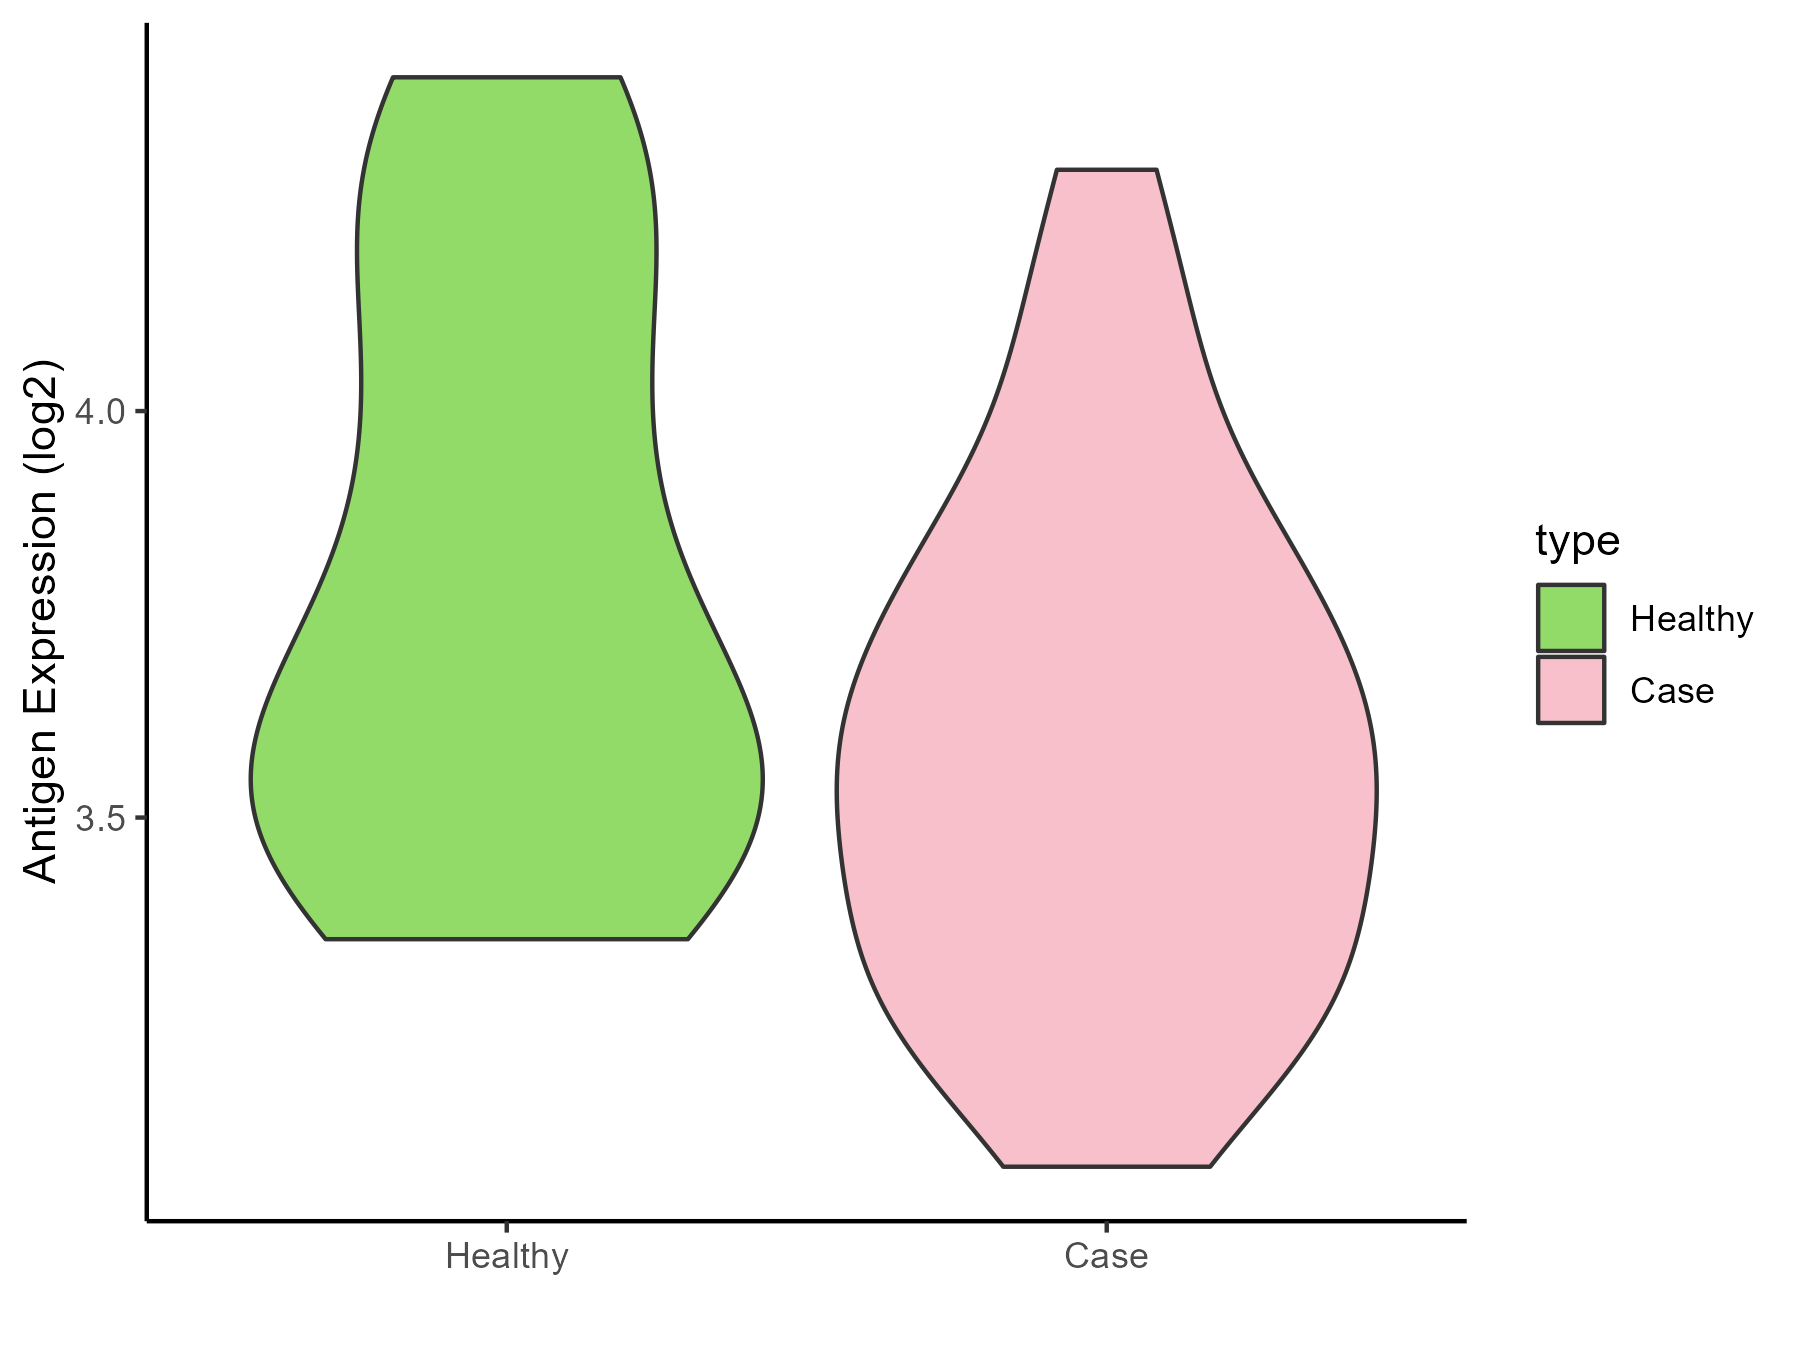
| The Specific Disease | Ureter cancer | |
| The Expression Level of Disease Section Compare with the Healthy Individual Tissue | p-value: 0.06703473; Fold-change: -0.138430894; Z-score: -0.383569792 | |
| Disease-specific Antigen Abundances |
|
Click to View the Clearer Original Diagram |
ICD Disease Classification 20
| Differential expression pattern of antigen in diseases | ||
| The Studied Tissue | Adipose | |
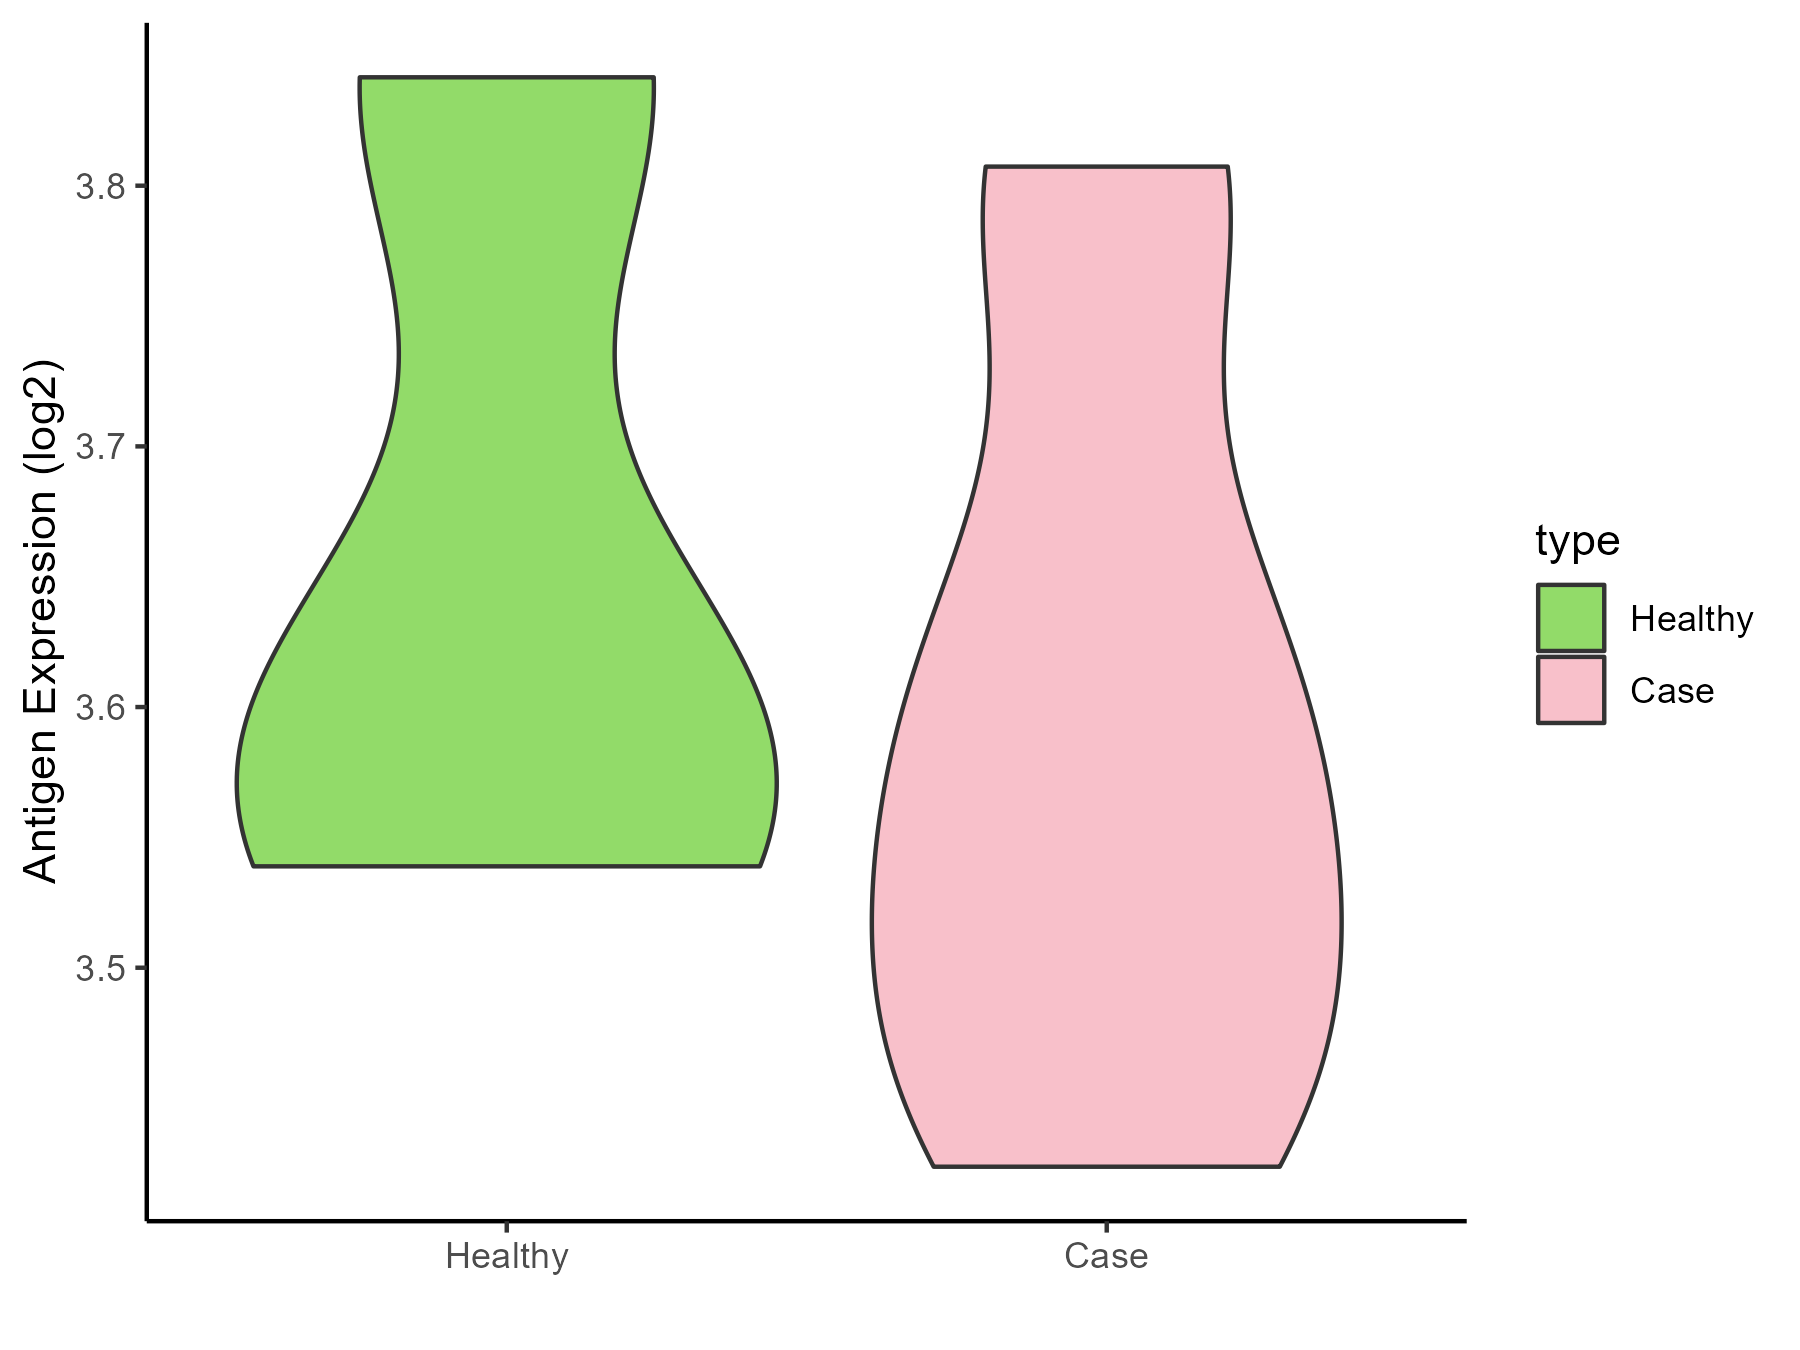
| The Specific Disease | Simpson golabi behmel syndrome | |
| The Expression Level of Disease Section Compare with the Healthy Individual Tissue | p-value: 0.559515928; Fold-change: -0.008971057; Z-score: -0.056132976 | |
| Disease-specific Antigen Abundances |
|
Click to View the Clearer Original Diagram |
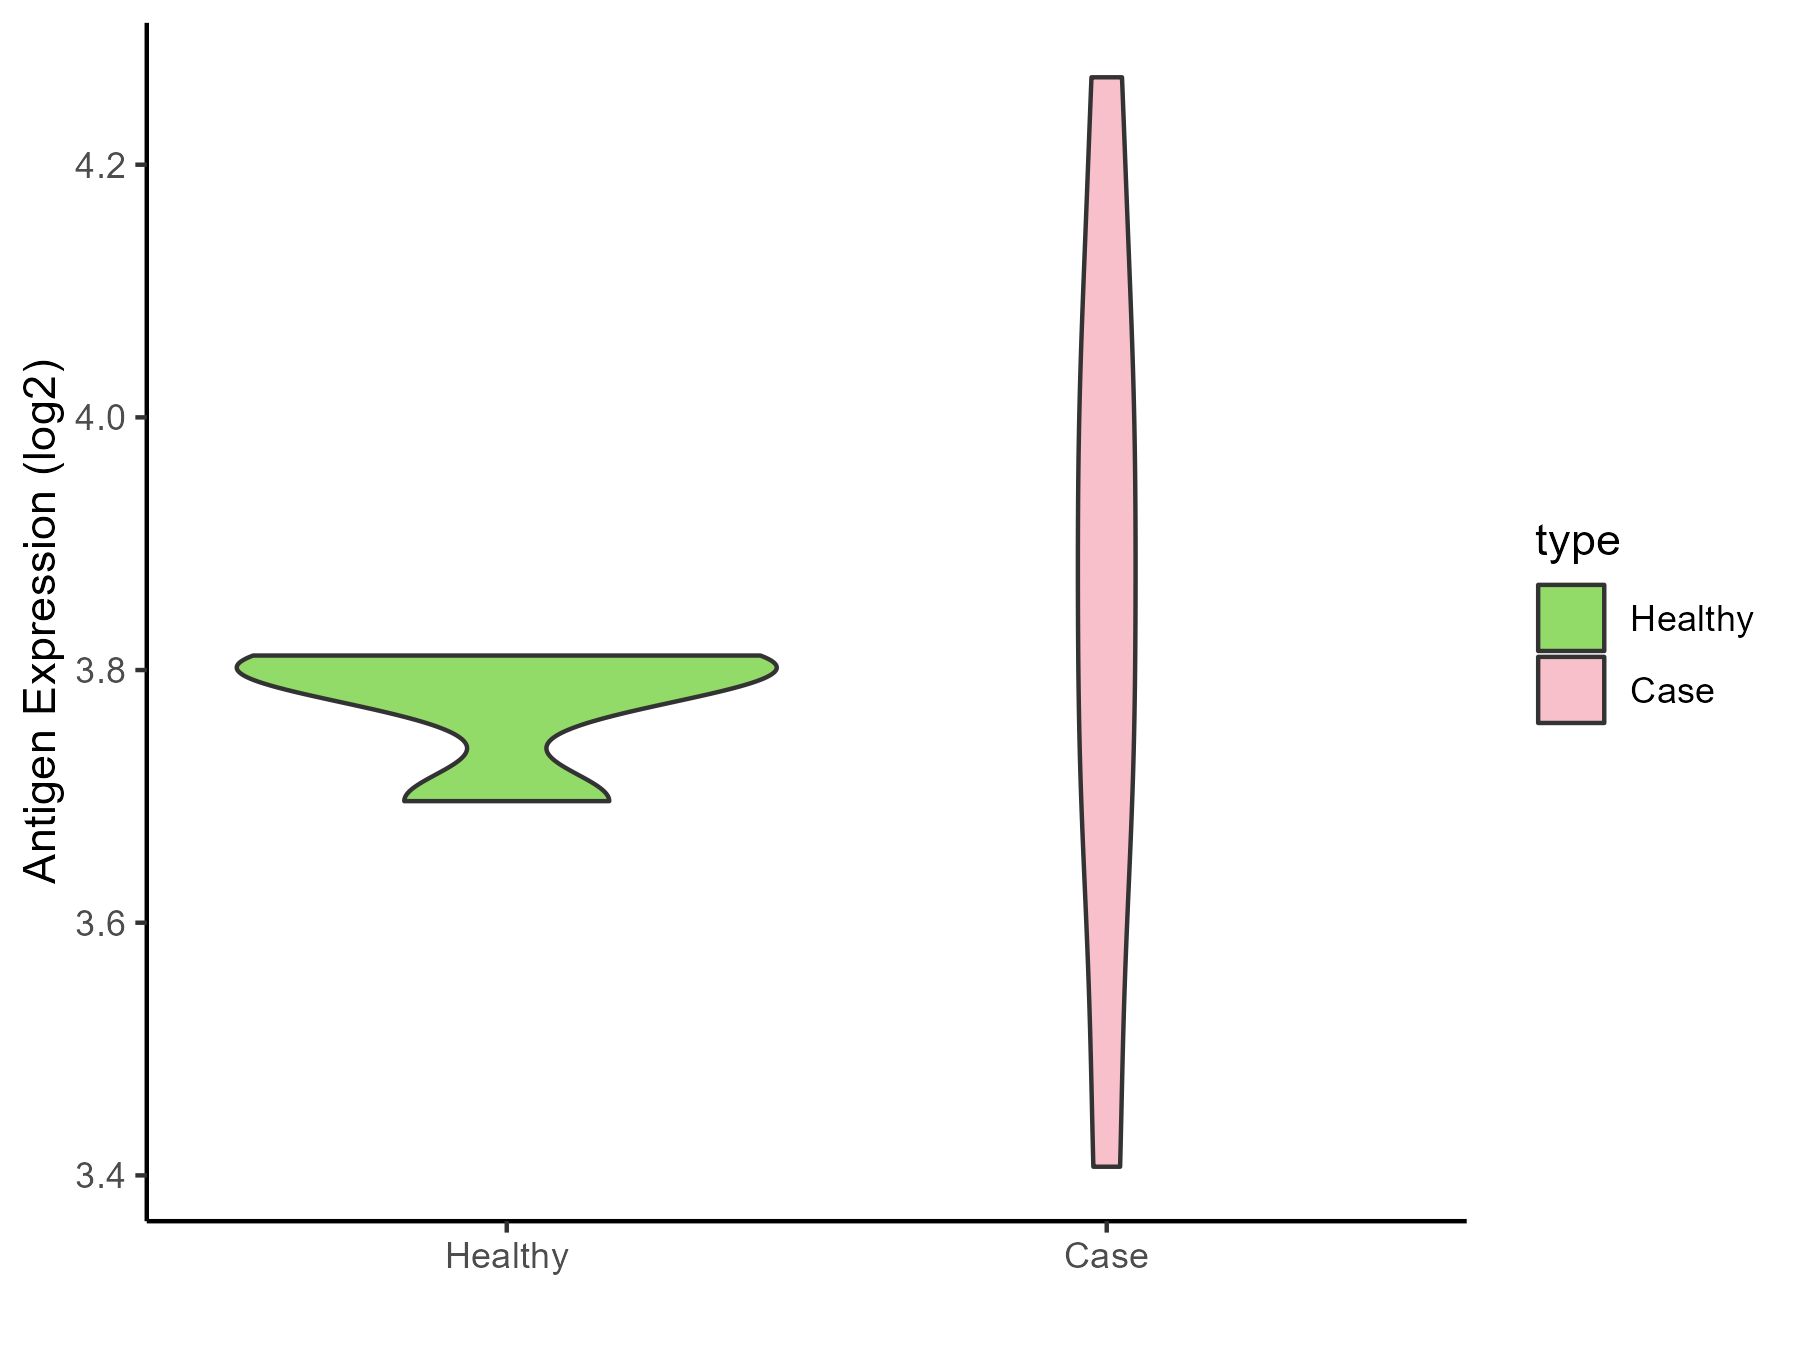
| Differential expression pattern of antigen in diseases | ||
| The Studied Tissue | Perituberal | |
| The Specific Disease | Tuberous sclerosis complex | |
| The Expression Level of Disease Section Compare with the Healthy Individual Tissue | p-value: 0.556018696; Fold-change: 0.066332397; Z-score: 1.237164472 | |
| Disease-specific Antigen Abundances |
|
Click to View the Clearer Original Diagram |
ICD Disease Classification 3
| Differential expression pattern of antigen in diseases | ||
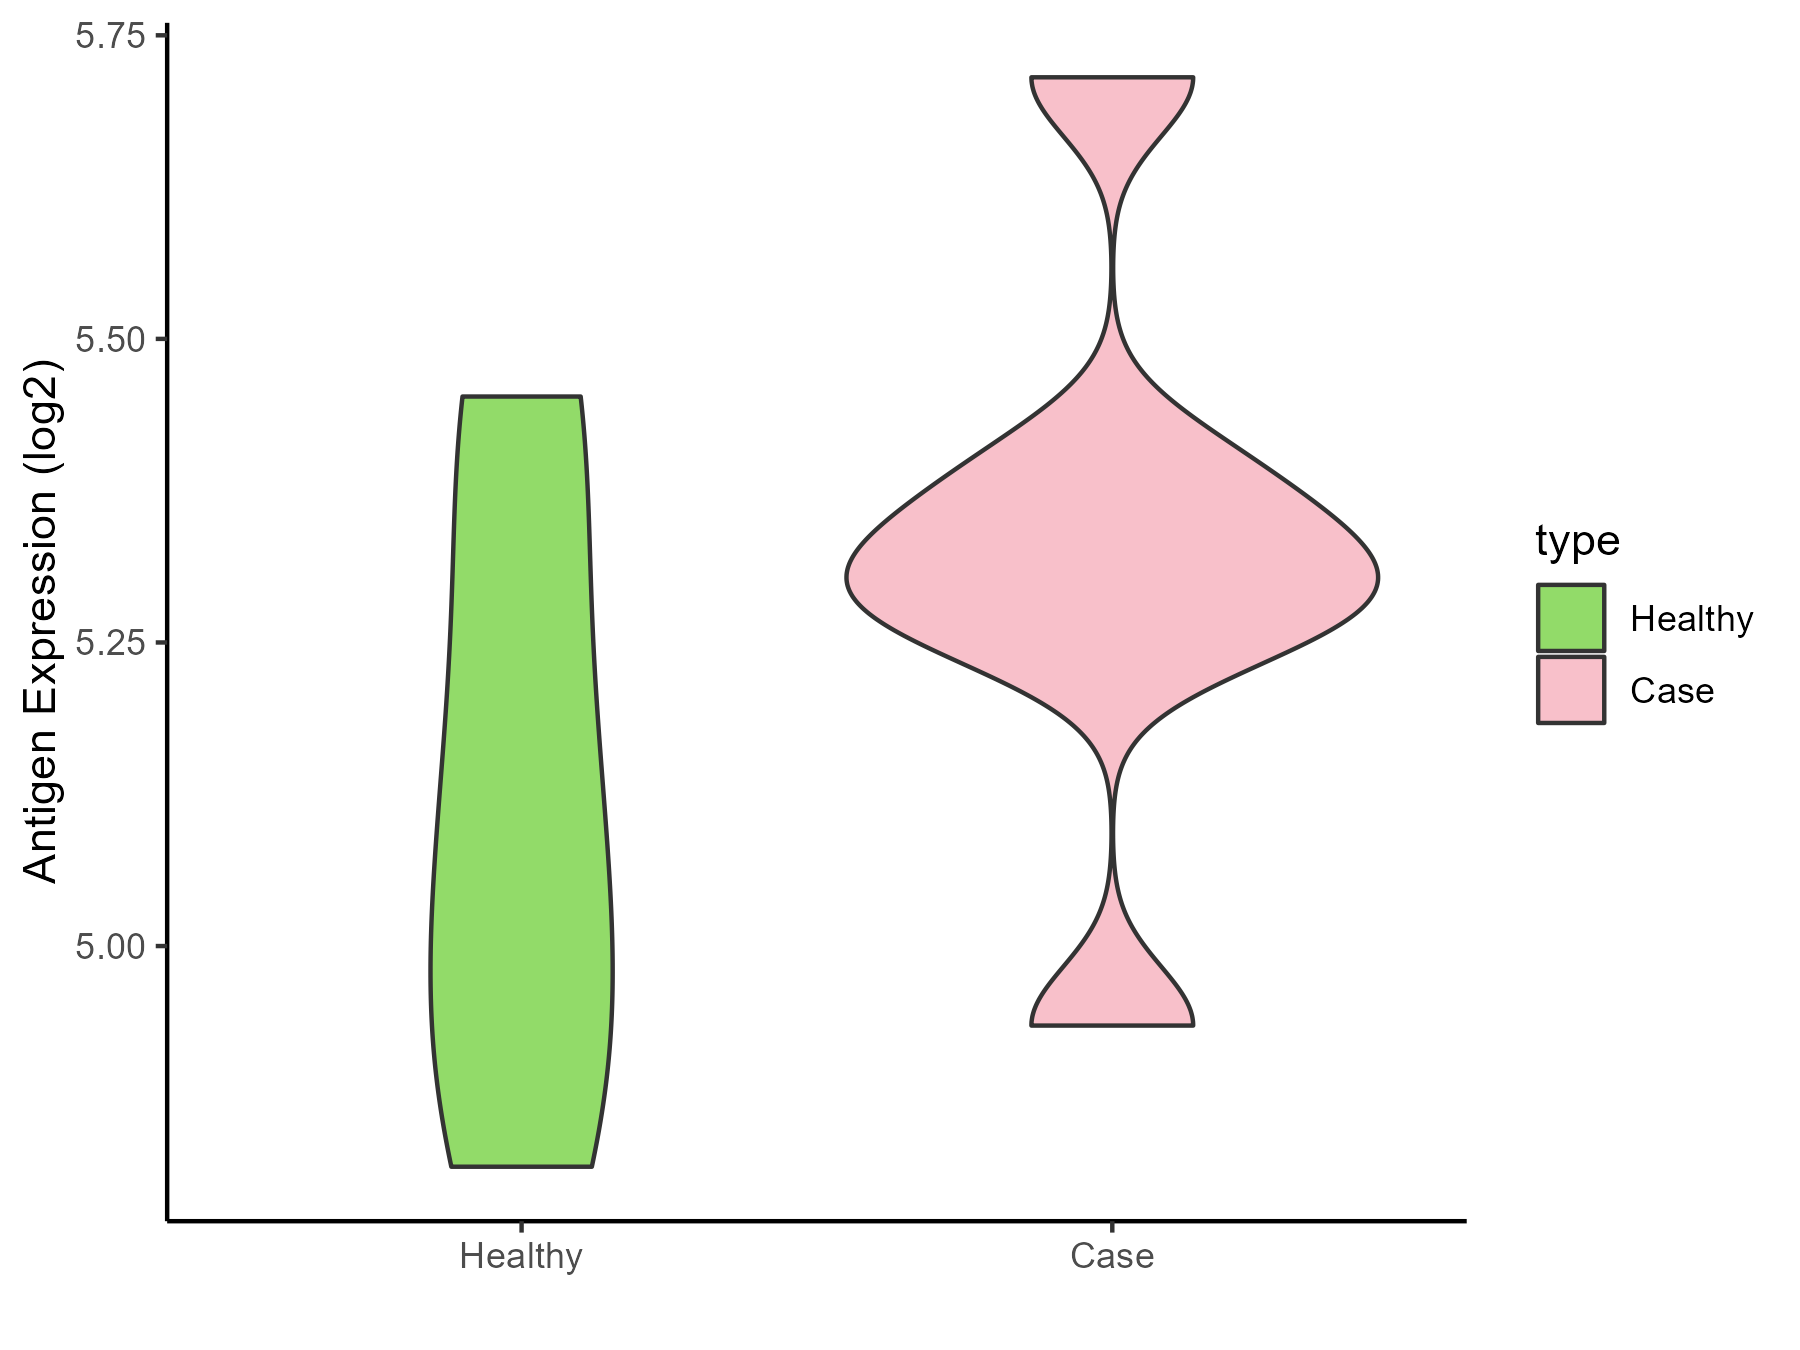
| The Studied Tissue | Bone marrow | |
| The Specific Disease | Anemia | |
| The Expression Level of Disease Section Compare with the Healthy Individual Tissue | p-value: 0.146985214; Fold-change: 0.198063105; Z-score: 0.797365822 | |
| Disease-specific Antigen Abundances |
|
Click to View the Clearer Original Diagram |
| Differential expression pattern of antigen in diseases | ||
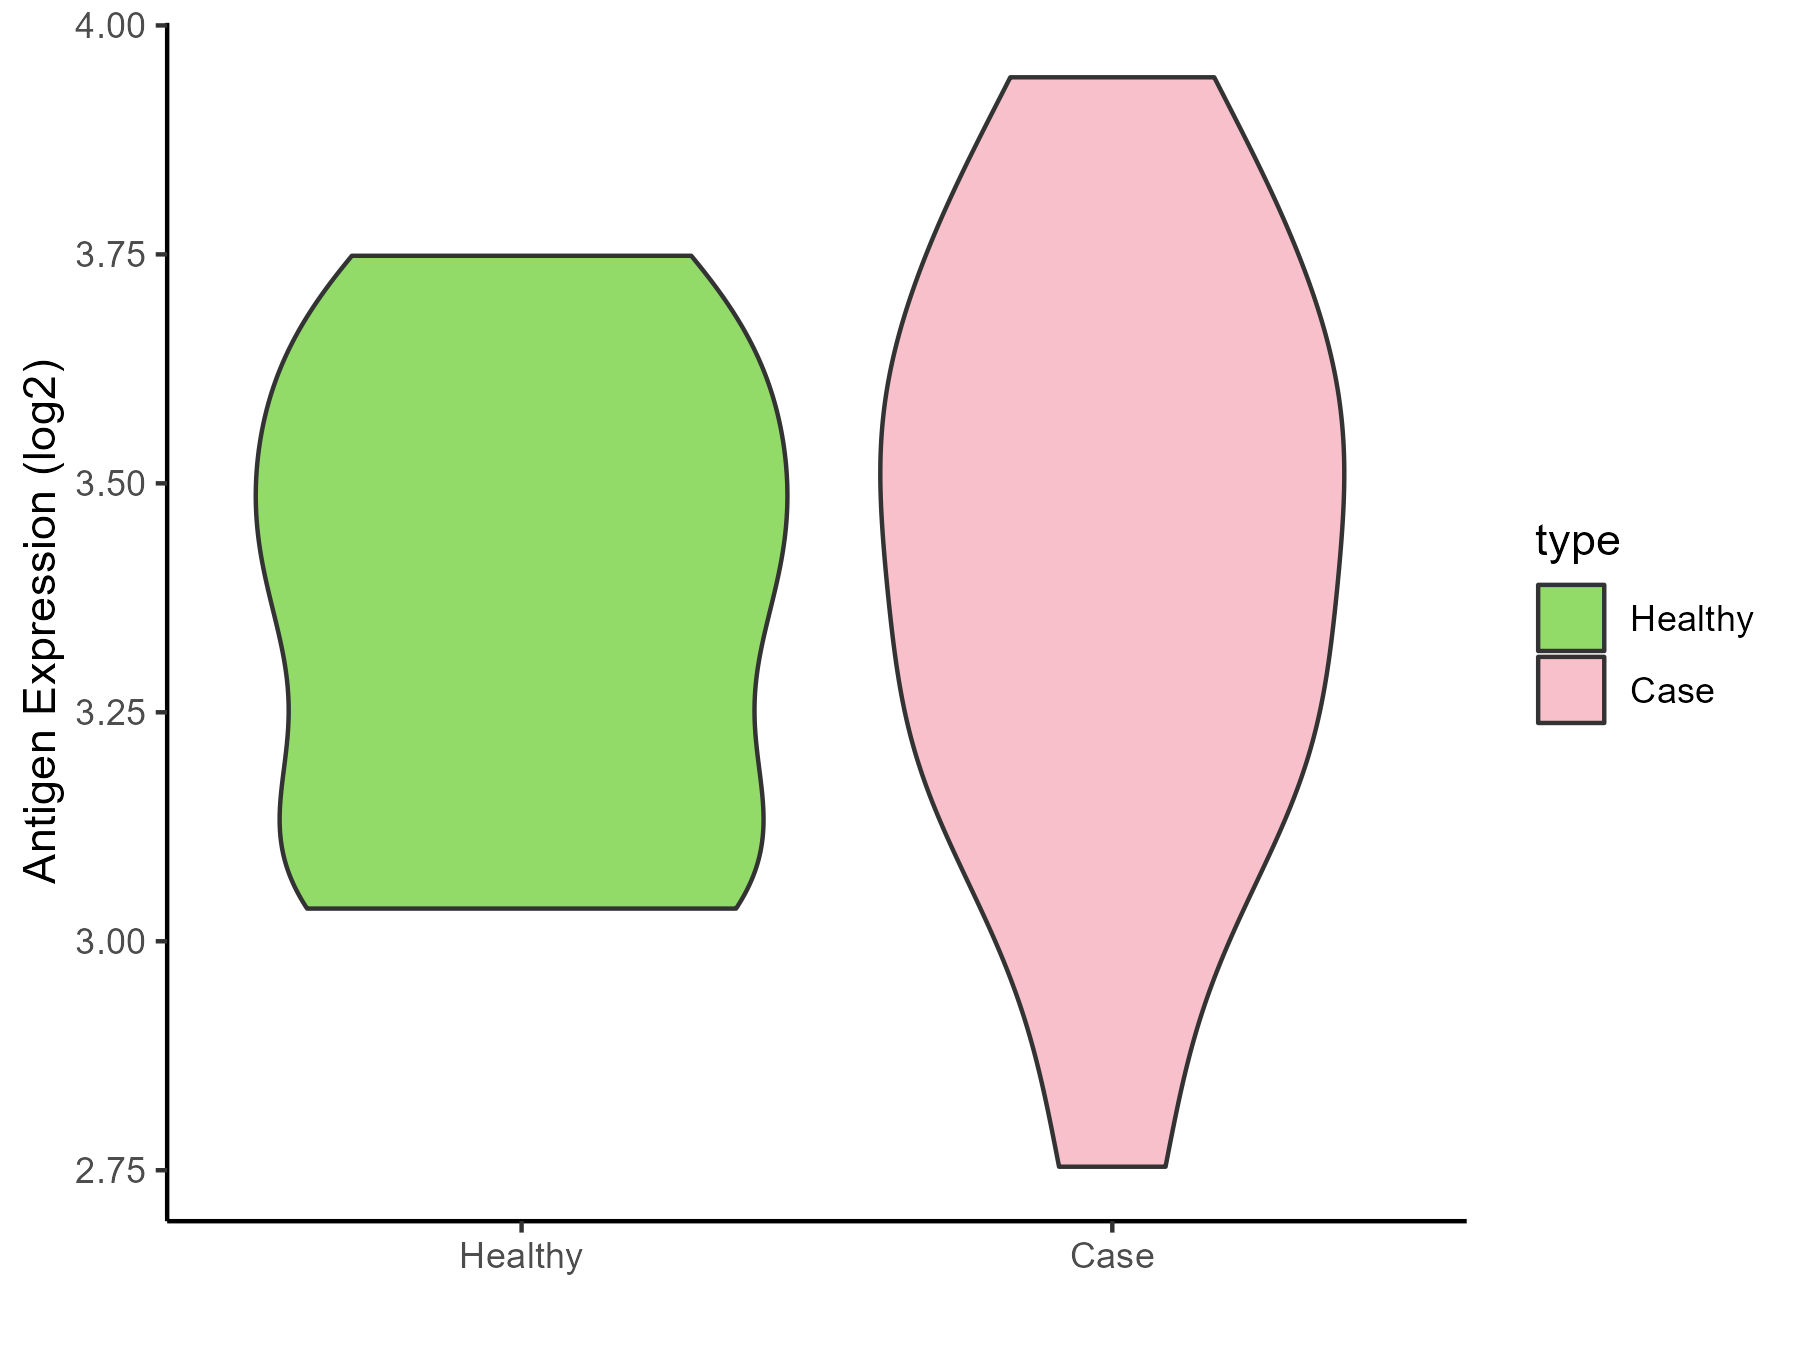
| The Studied Tissue | Peripheral blood | |
| The Specific Disease | Sickle cell disease | |
| The Expression Level of Disease Section Compare with the Healthy Individual Tissue | p-value: 0.670580395; Fold-change: 0.095962608; Z-score: 0.374772966 | |
| Disease-specific Antigen Abundances |
|
Click to View the Clearer Original Diagram |
| Differential expression pattern of antigen in diseases | ||
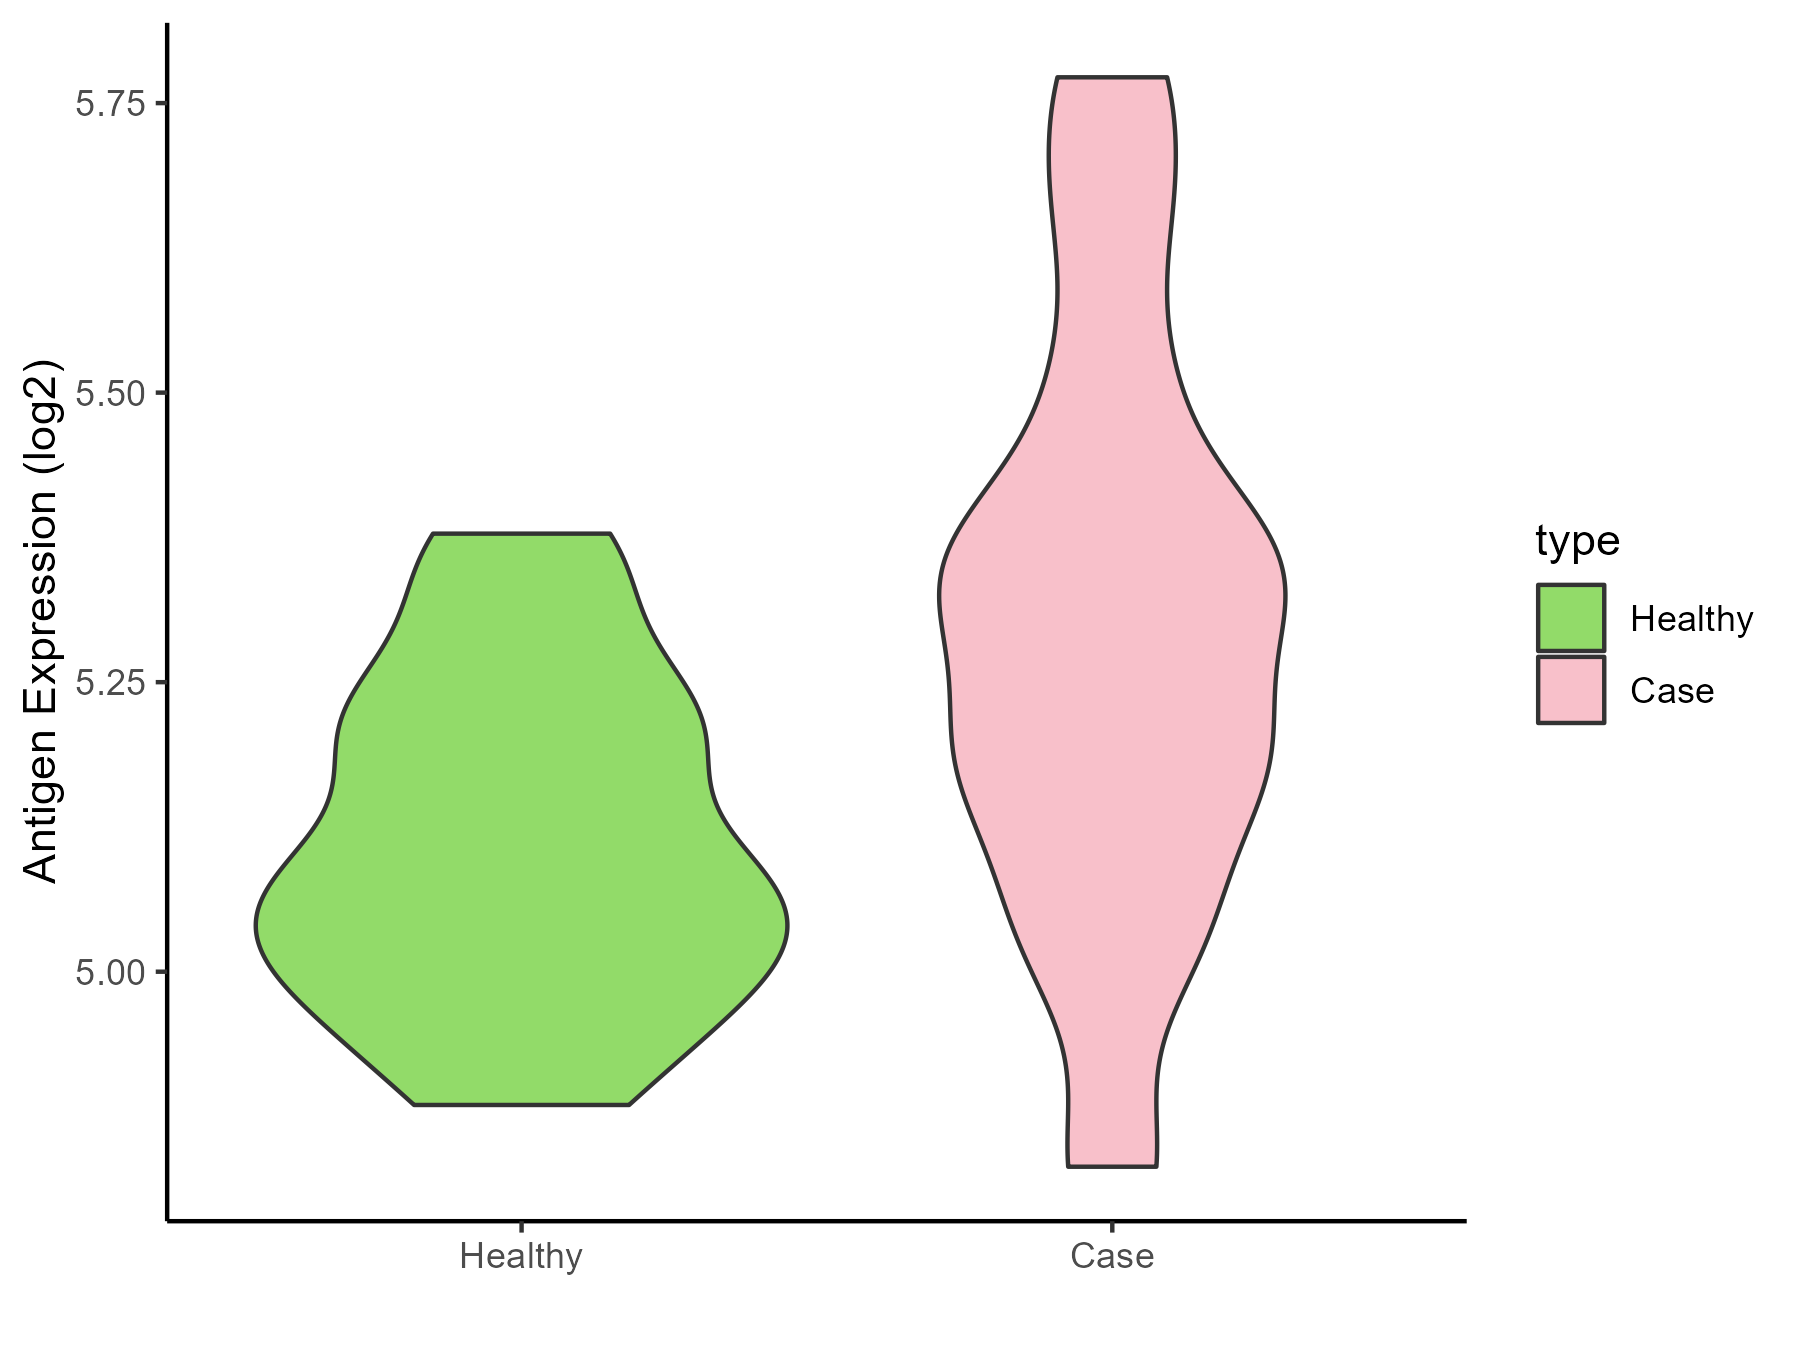
| The Studied Tissue | Whole blood | |
| The Specific Disease | Thrombocythemia | |
| The Expression Level of Disease Section Compare with the Healthy Individual Tissue | p-value: 0.00209457; Fold-change: 0.226497225; Z-score: 1.589489561 | |
| Disease-specific Antigen Abundances |
|
Click to View the Clearer Original Diagram |
ICD Disease Classification 4
| Differential expression pattern of antigen in diseases | ||
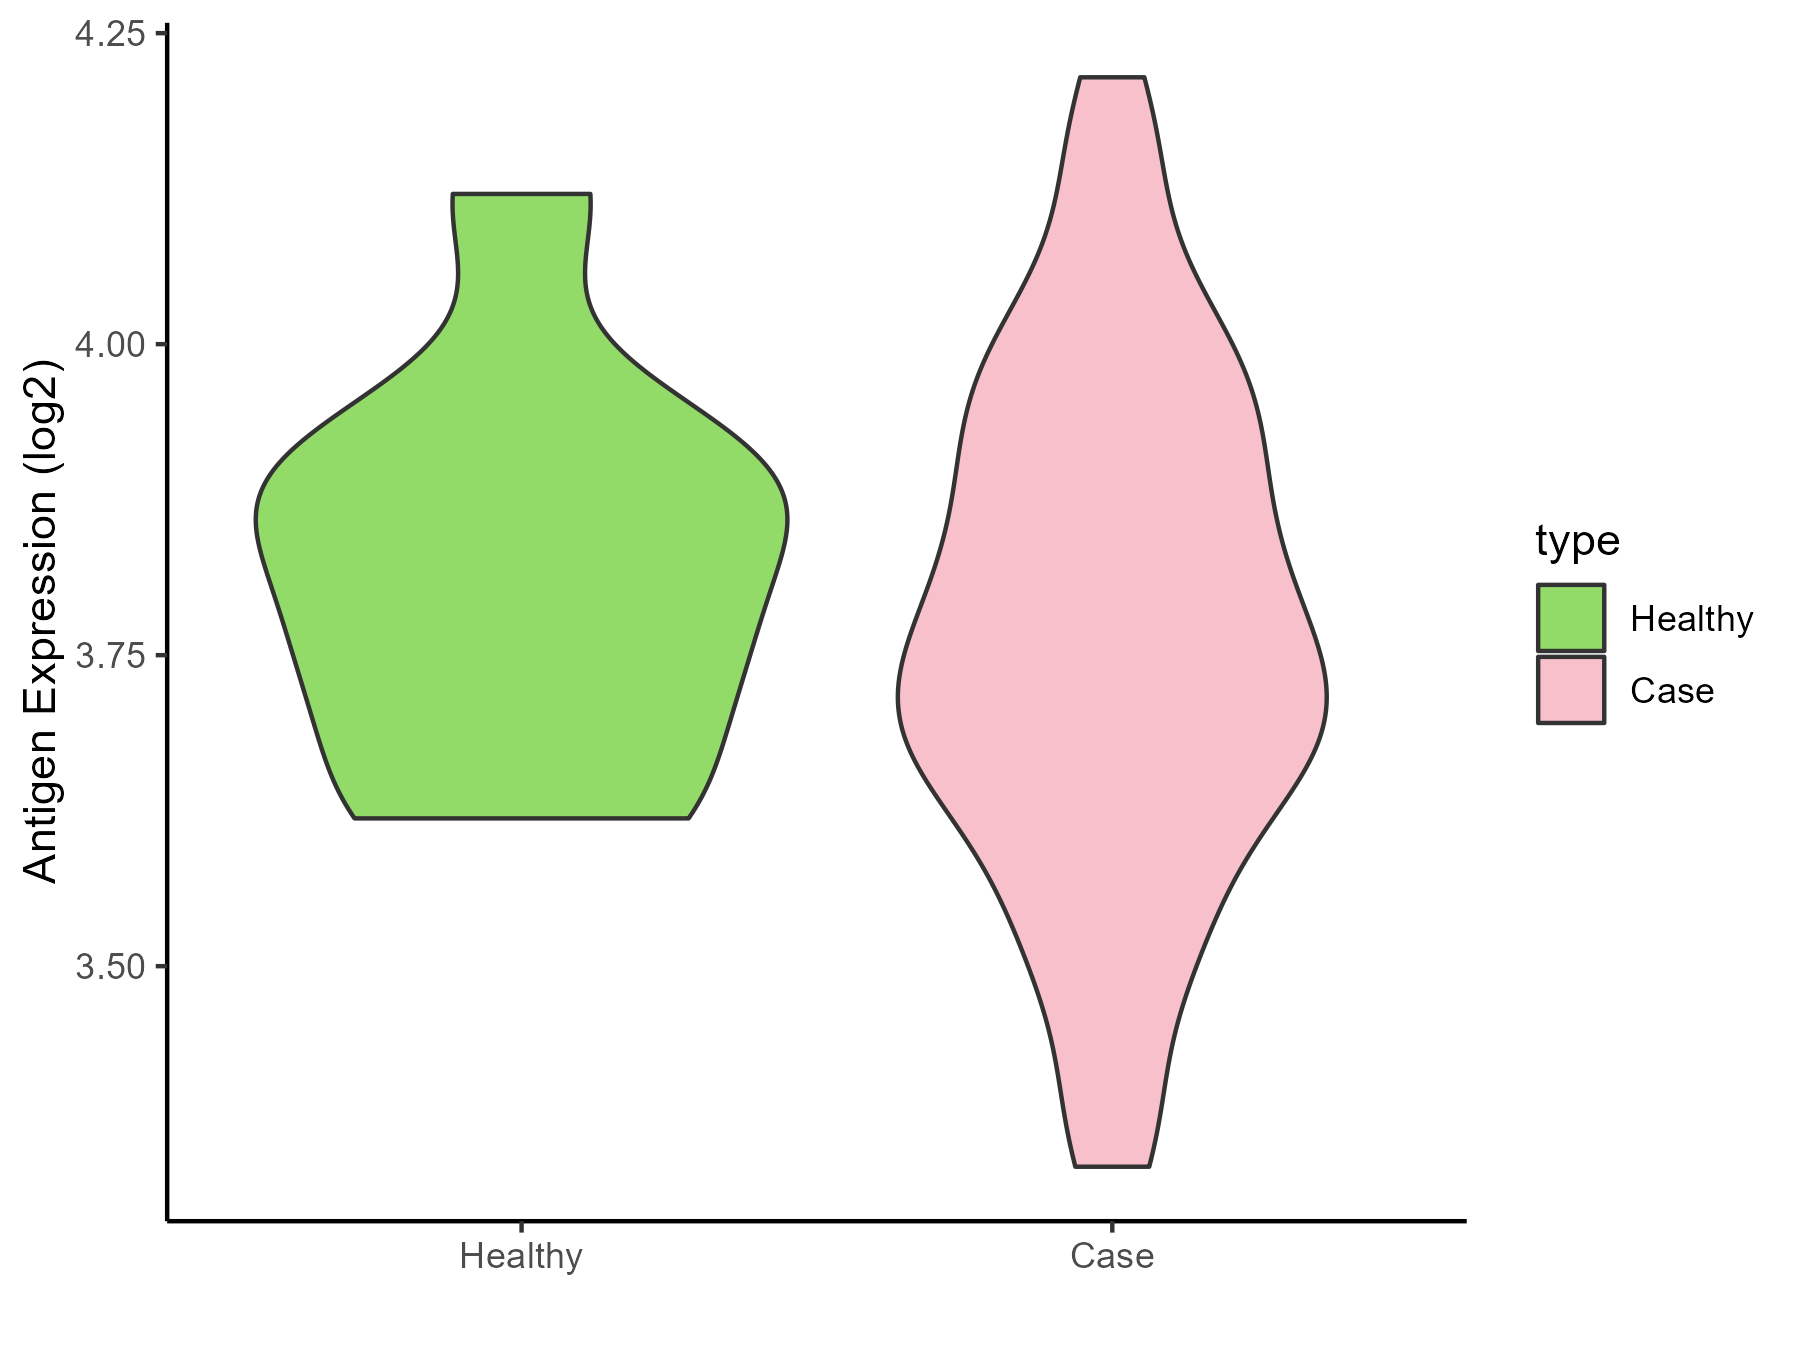
| The Studied Tissue | Whole blood | |
| The Specific Disease | Scleroderma | |
| The Expression Level of Disease Section Compare with the Healthy Individual Tissue | p-value: 0.423787007; Fold-change: -0.05771096; Z-score: -0.364746787 | |
| Disease-specific Antigen Abundances |
|
Click to View the Clearer Original Diagram |
| Differential expression pattern of antigen in diseases | ||
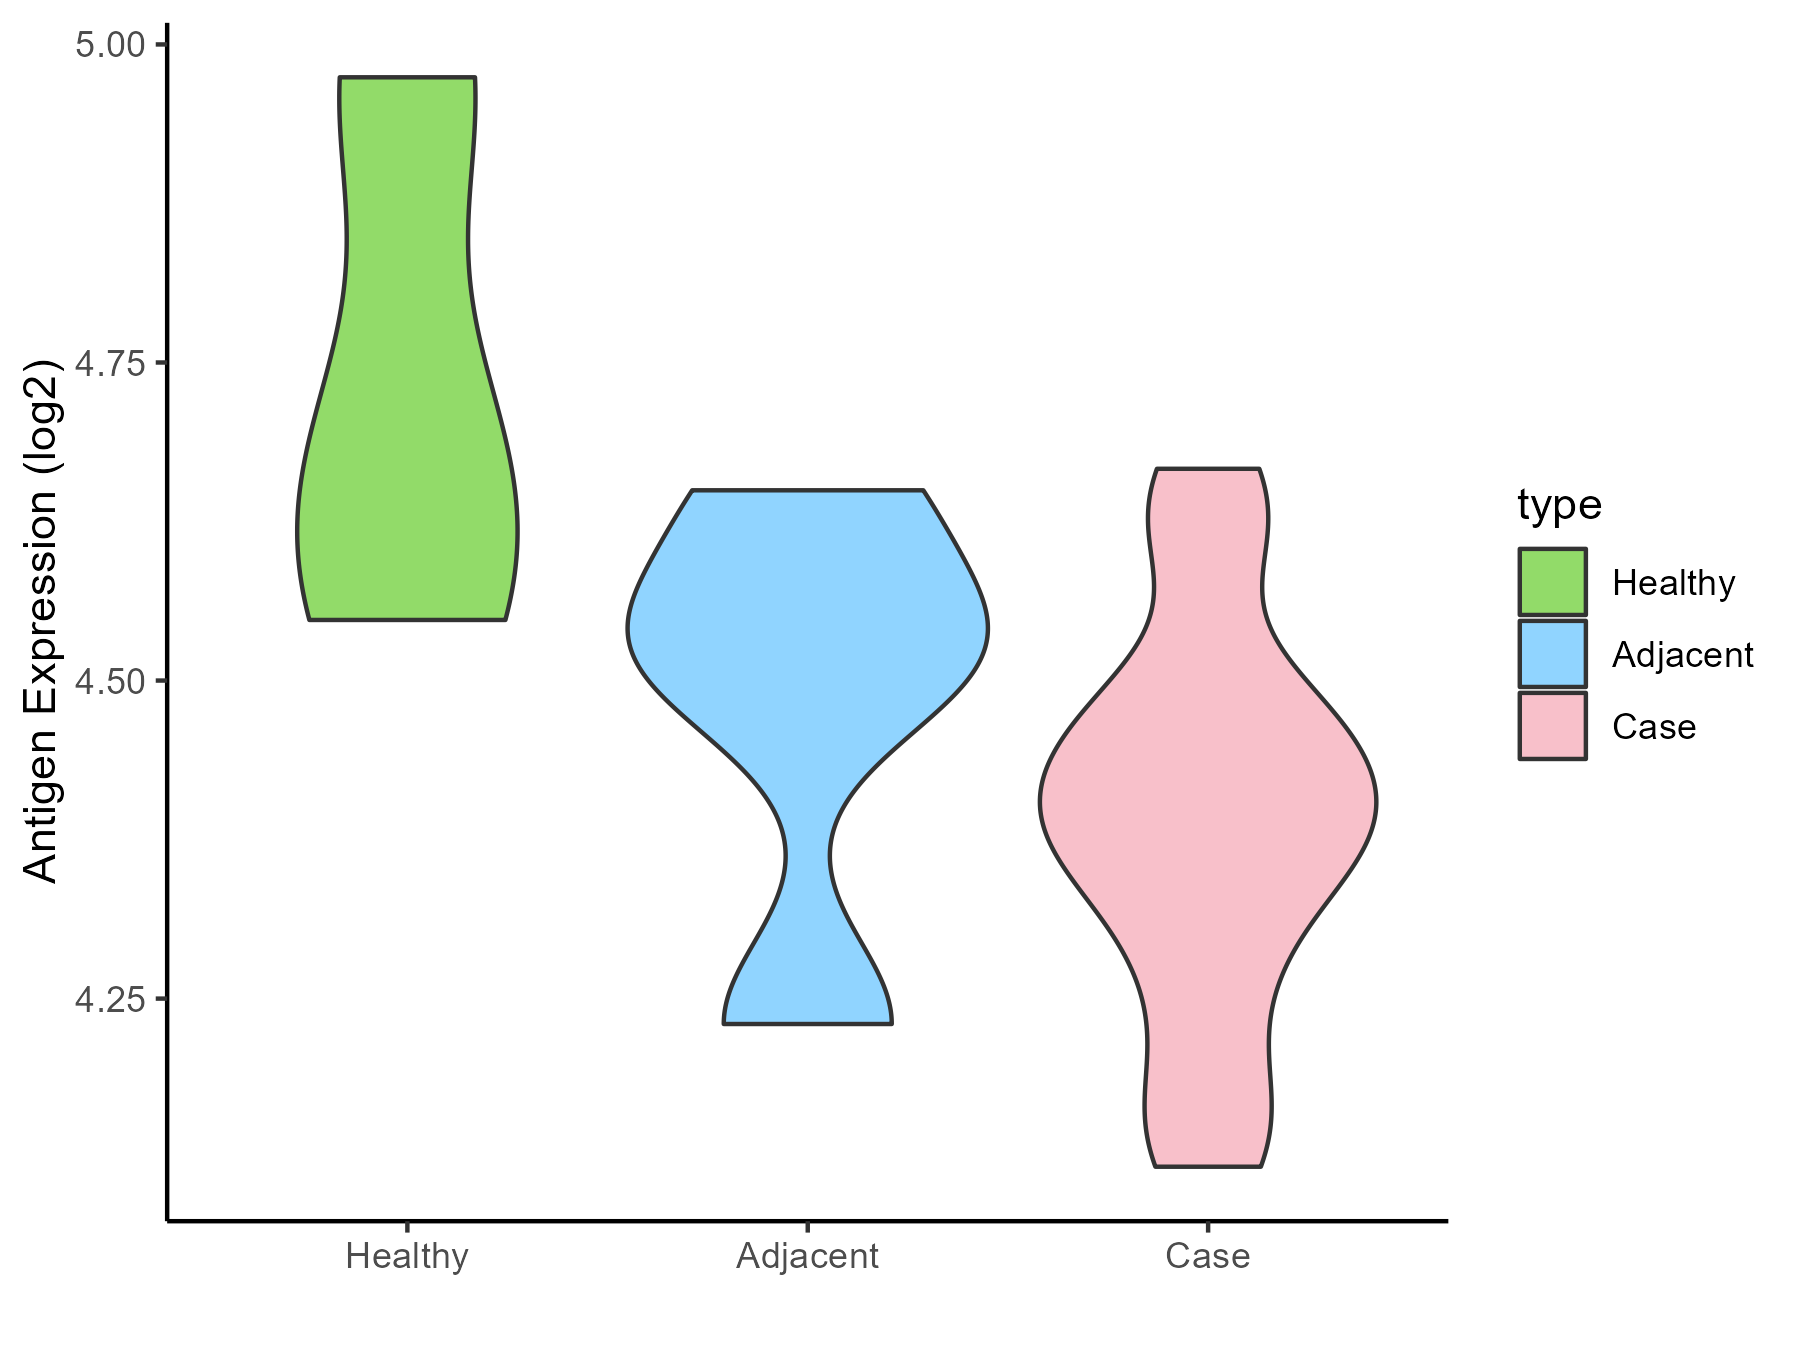
| The Studied Tissue | Salivary gland | |
| The Specific Disease | Sjogren syndrome | |
| The Expression Level of Disease Section Compare with the Healthy Individual Tissue | p-value: 0.103120577; Fold-change: -0.289146057; Z-score: -1.325639651 | |
| The Expression Level of Disease Section Compare with the Adjacent Tissue | p-value: 0.402173647; Fold-change: -0.131929756; Z-score: -0.738353869 | |
| Disease-specific Antigen Abundances |
|
Click to View the Clearer Original Diagram |
| Differential expression pattern of antigen in diseases | ||
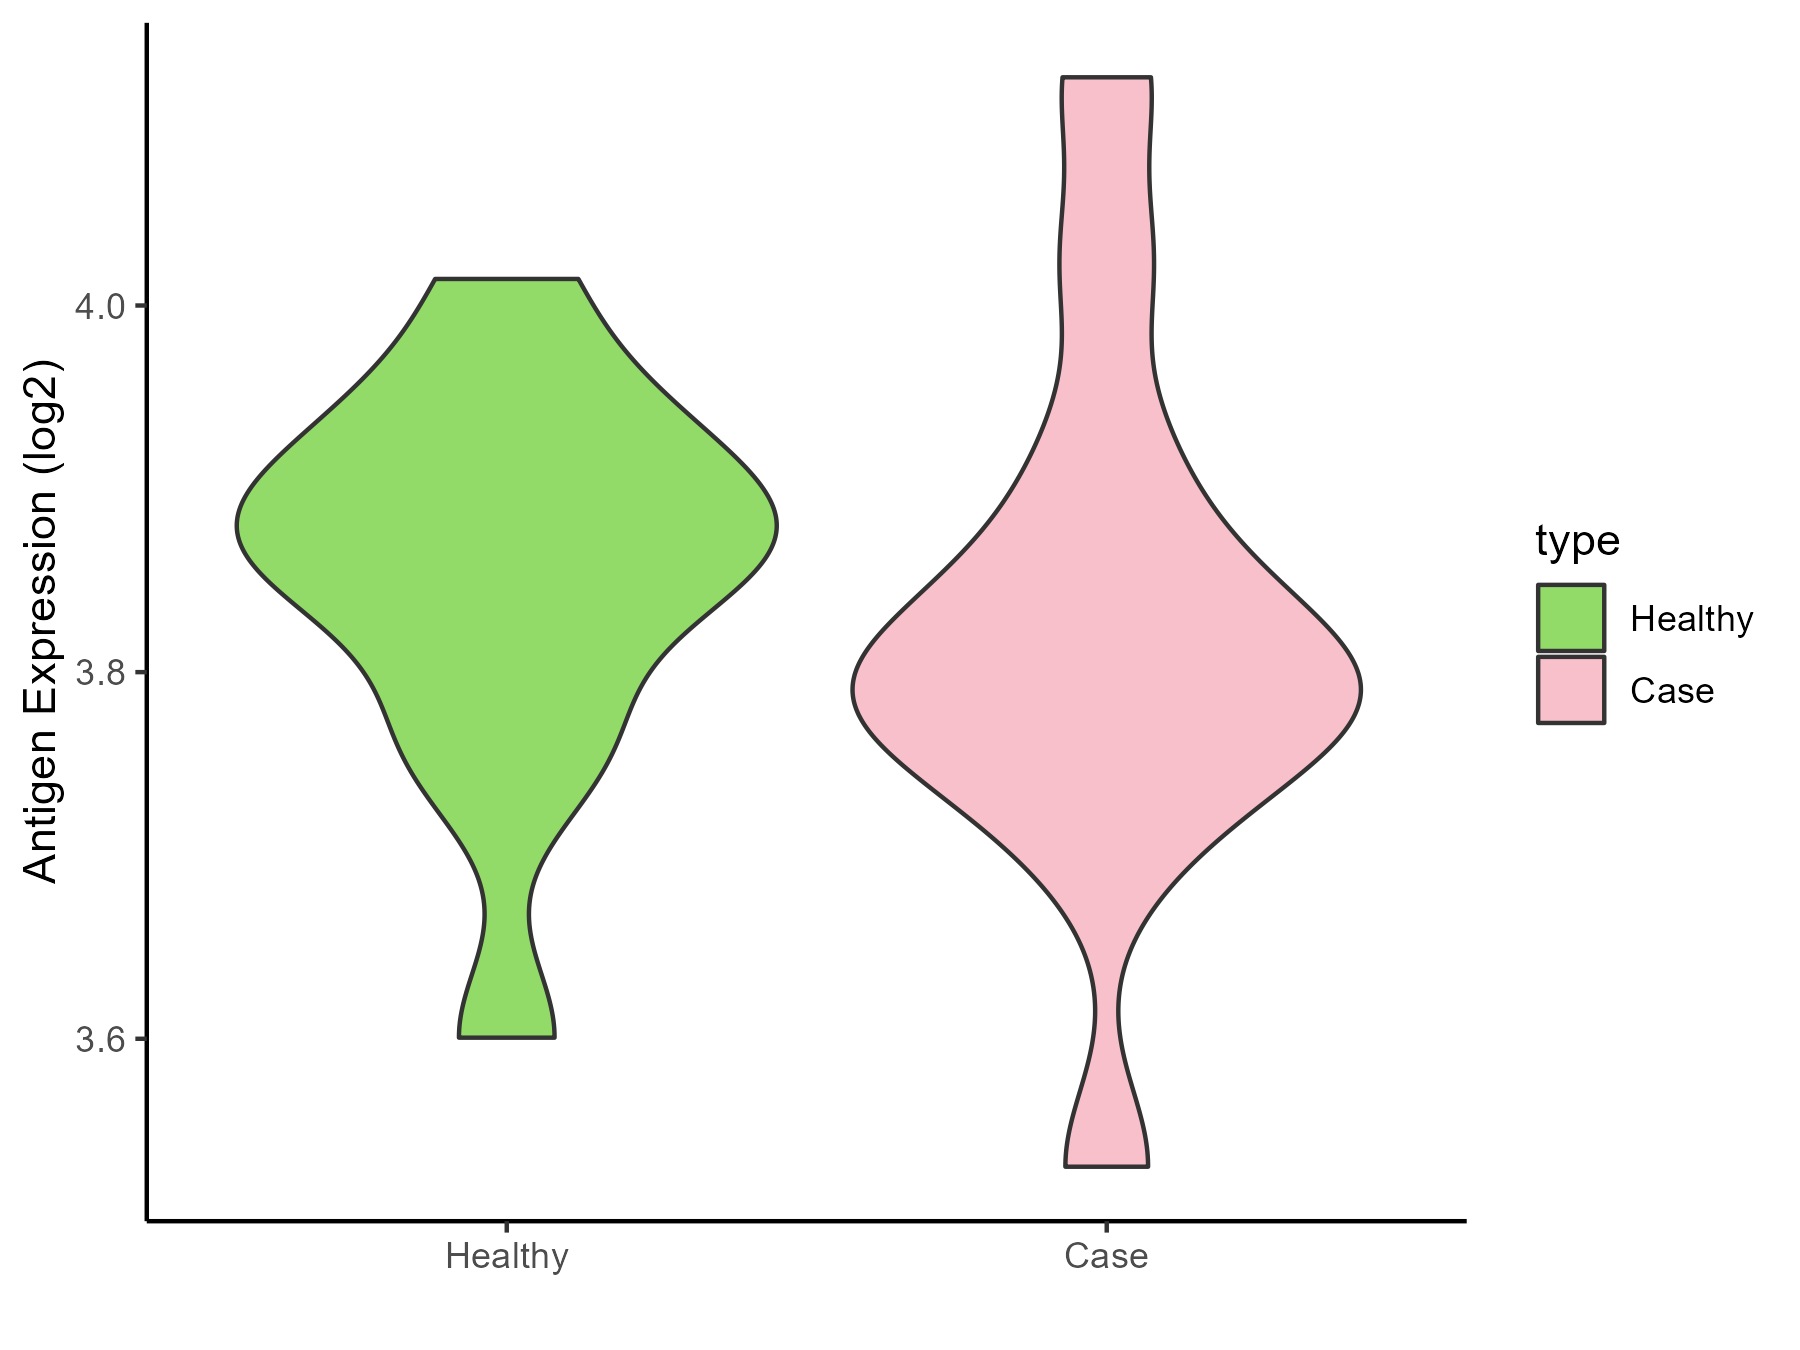
| The Studied Tissue | Peripheral blood | |
| The Specific Disease | Behcet disease | |
| The Expression Level of Disease Section Compare with the Healthy Individual Tissue | p-value: 0.581333855; Fold-change: -0.066661849; Z-score: -0.613625797 | |
| Disease-specific Antigen Abundances |
|
Click to View the Clearer Original Diagram |
| Differential expression pattern of antigen in diseases | ||
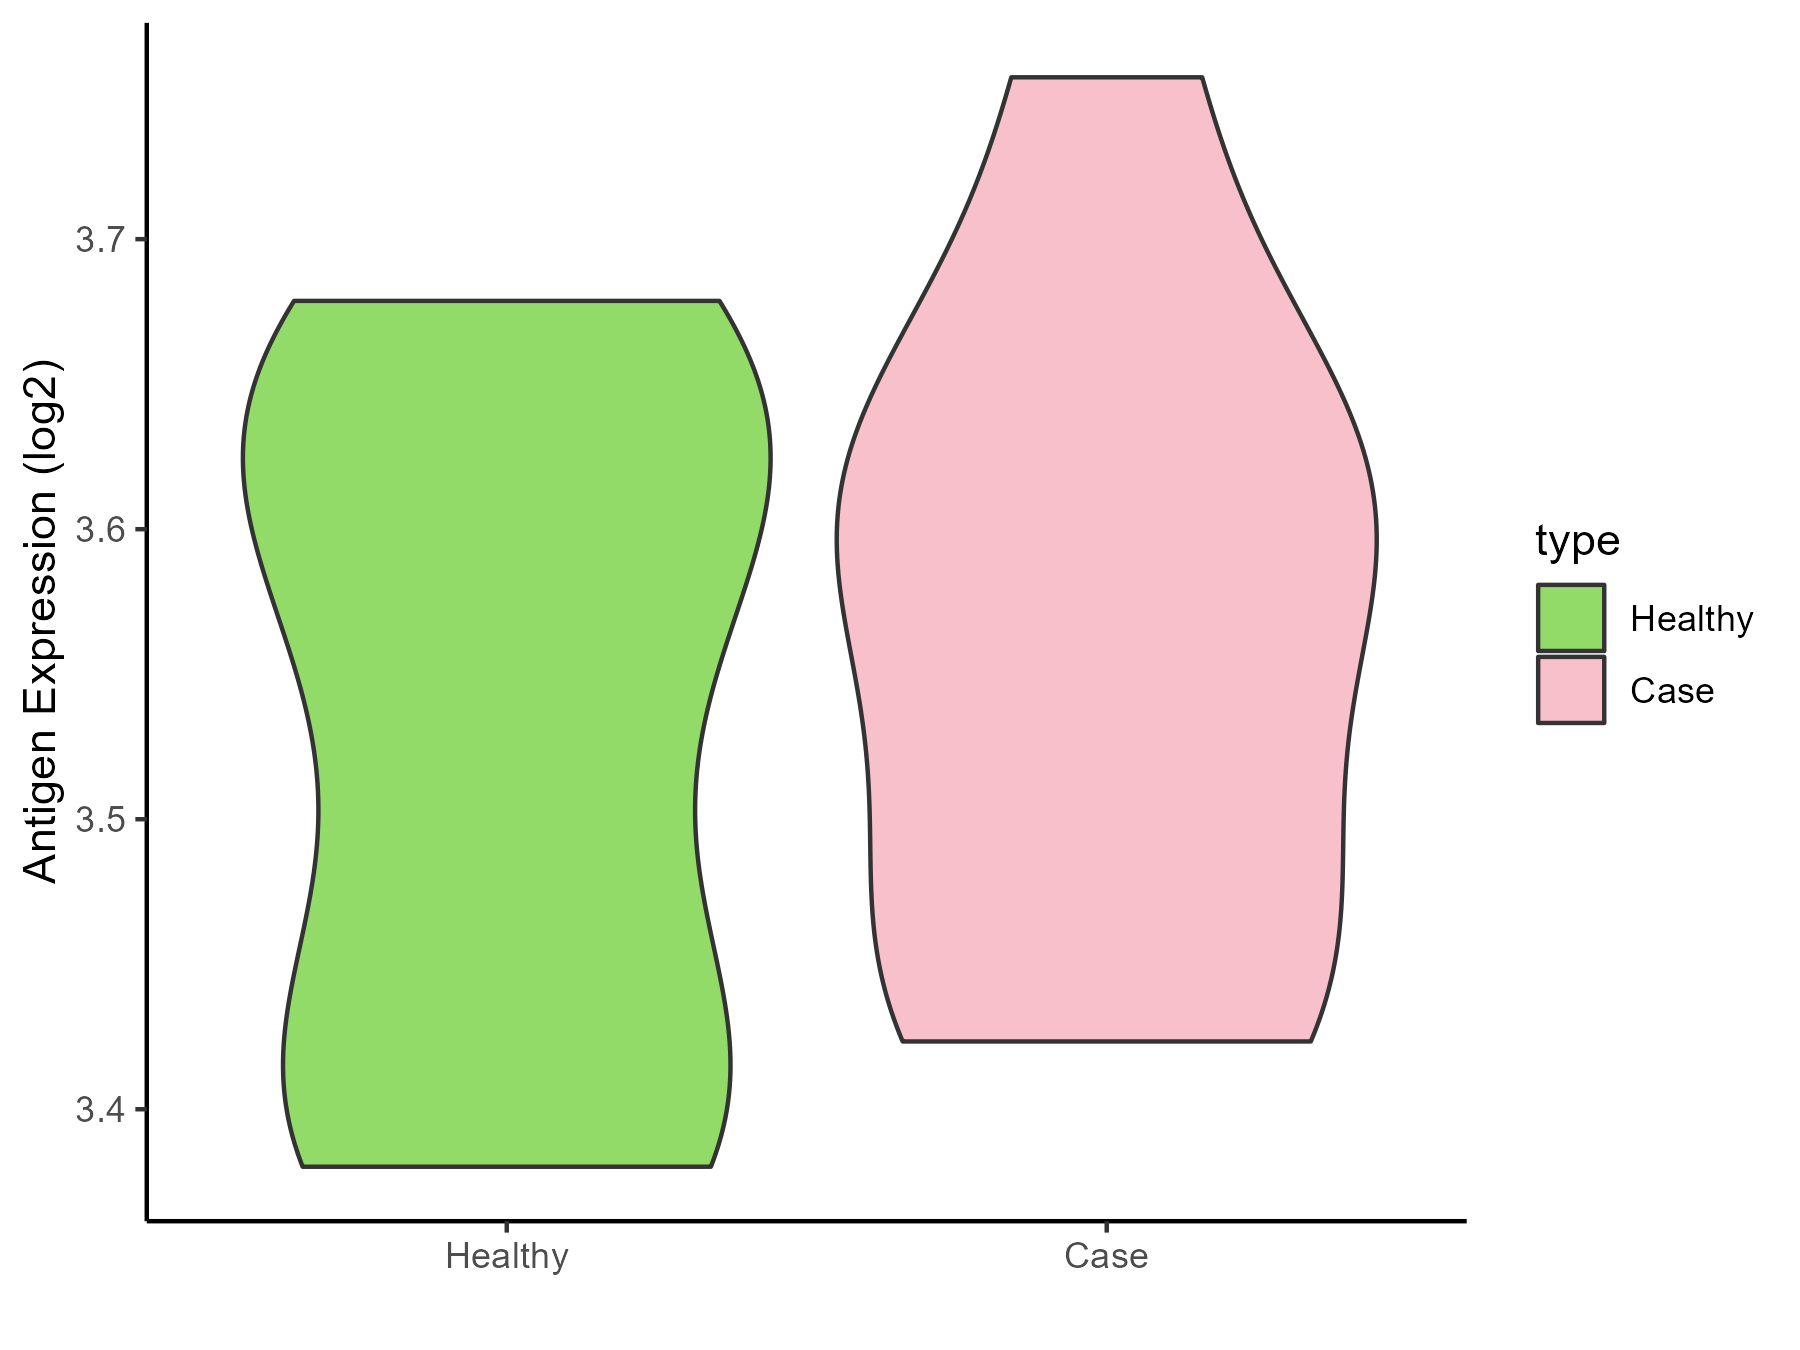
| The Studied Tissue | Whole blood | |
| The Specific Disease | Autosomal dominant monocytopenia | |
| The Expression Level of Disease Section Compare with the Healthy Individual Tissue | p-value: 0.570835969; Fold-change: 0.033290946; Z-score: 0.285226964 | |
| Disease-specific Antigen Abundances |
|
Click to View the Clearer Original Diagram |
ICD Disease Classification 5
| Differential expression pattern of antigen in diseases | ||
| The Studied Tissue | Liver | |
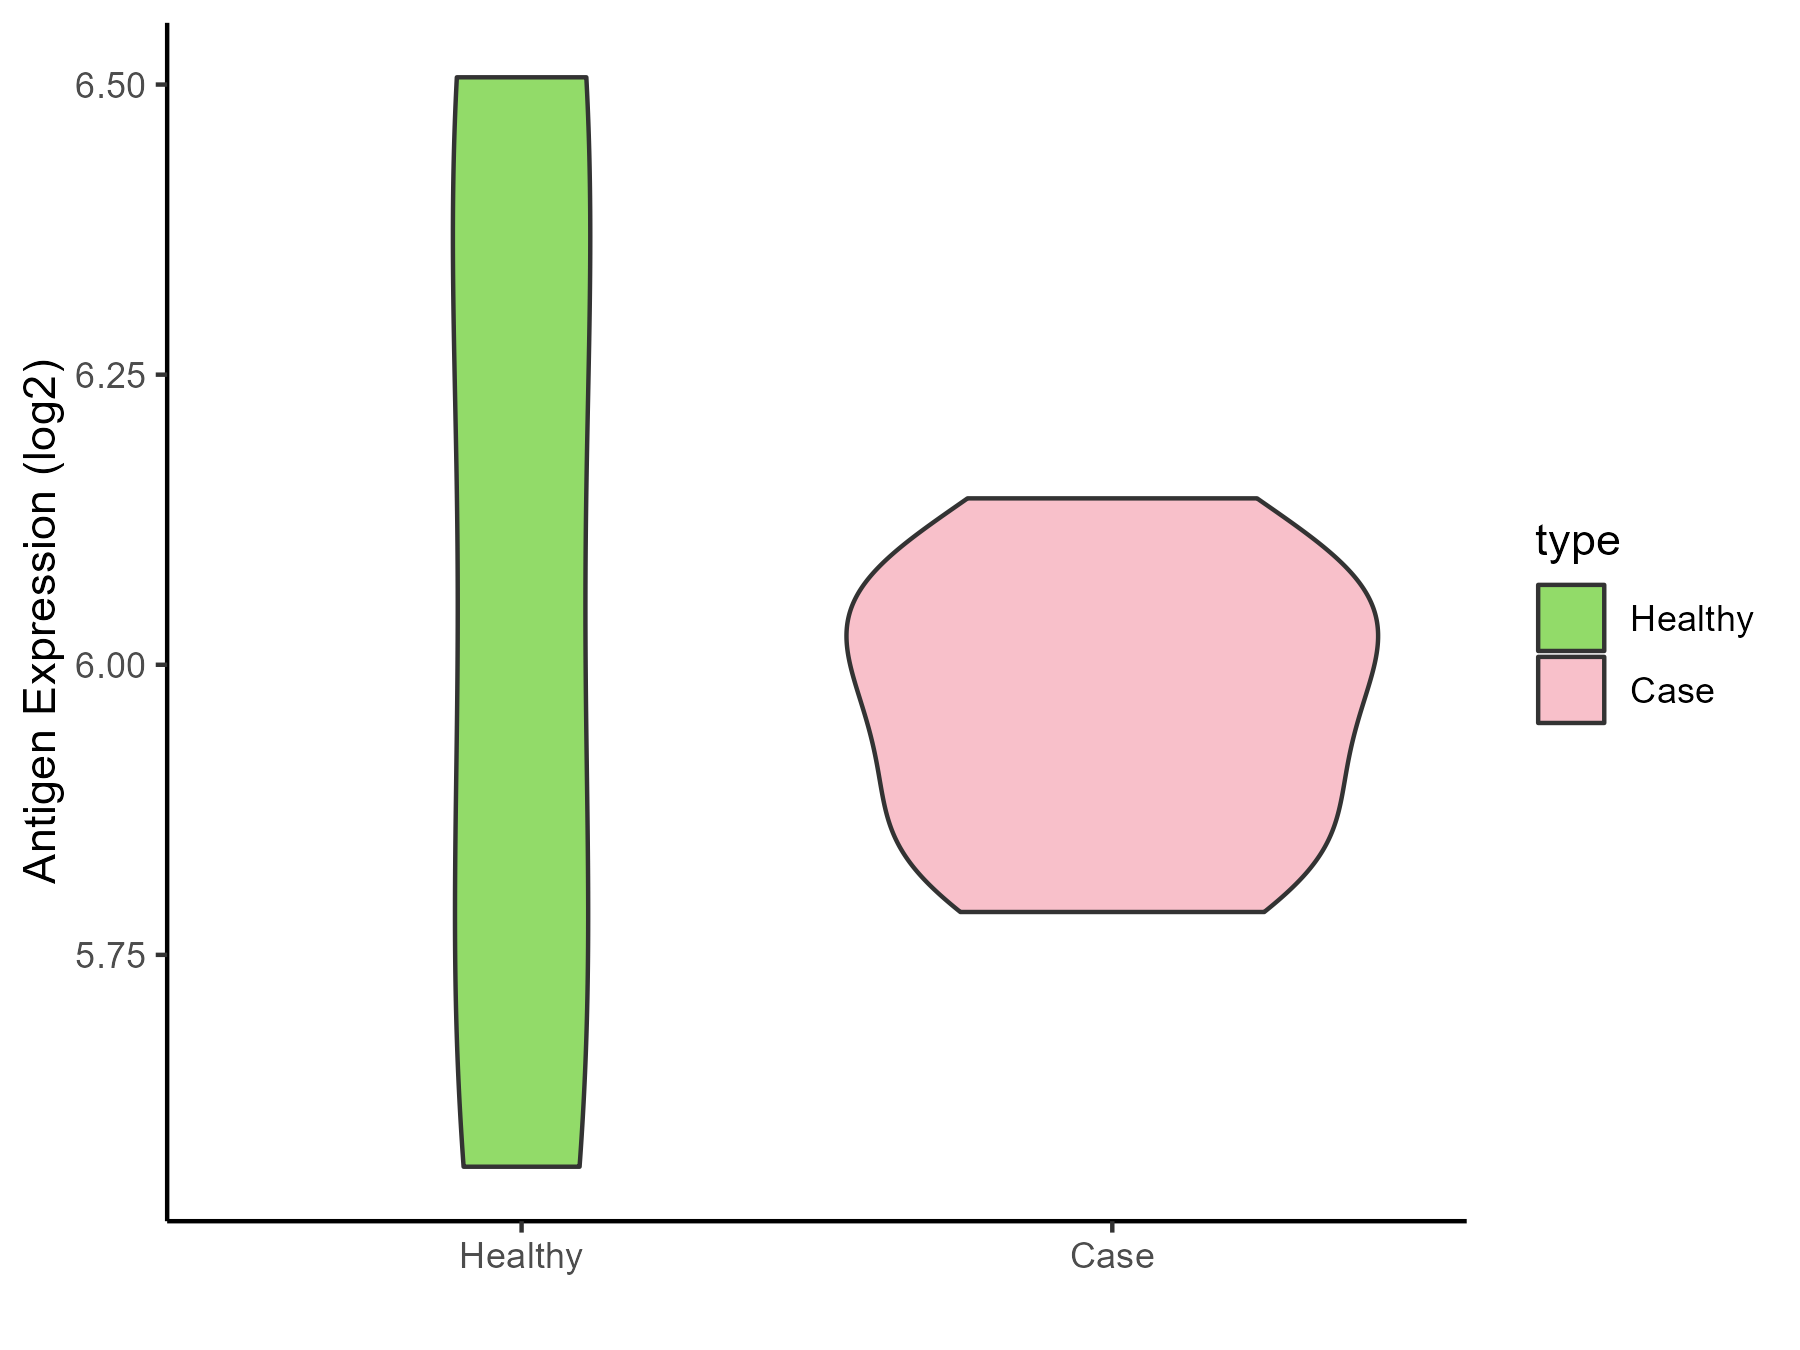
| The Specific Disease | Type 2 diabetes | |
| The Expression Level of Disease Section Compare with the Healthy Individual Tissue | p-value: 0.624191315; Fold-change: -0.100560515; Z-score: -0.233932628 | |
| Disease-specific Antigen Abundances |
|
Click to View the Clearer Original Diagram |
| Differential expression pattern of antigen in diseases | ||
| The Studied Tissue | Vastus lateralis muscle | |
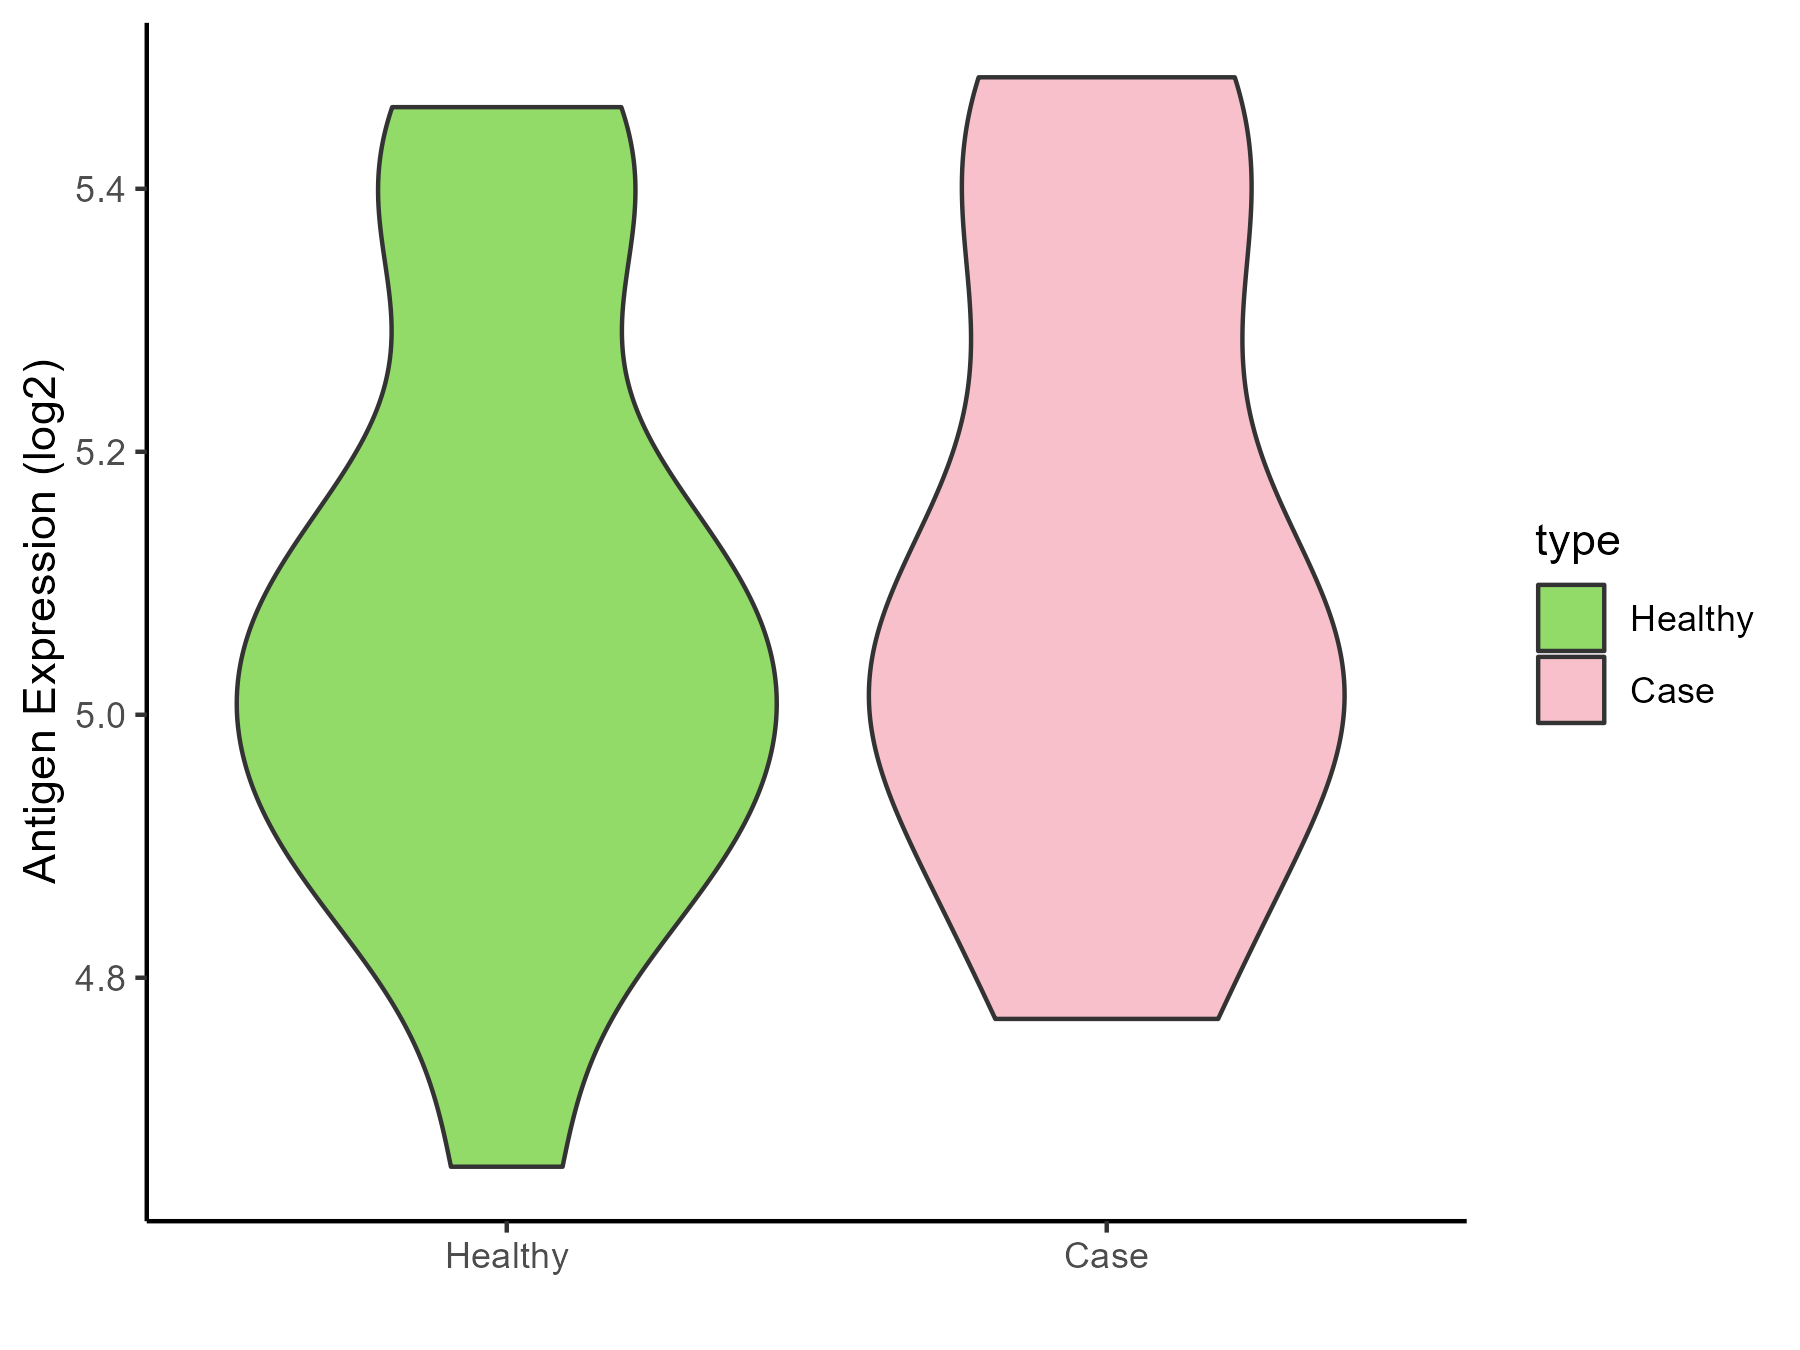
| The Specific Disease | Polycystic ovary syndrome | |
| The Expression Level of Disease Section Compare with the Healthy Individual Tissue | p-value: 0.618095699; Fold-change: -0.004199947; Z-score: -0.017973221 | |
| Disease-specific Antigen Abundances |
|
Click to View the Clearer Original Diagram |
| Differential expression pattern of antigen in diseases | ||
| The Studied Tissue | Subcutaneous Adipose | |
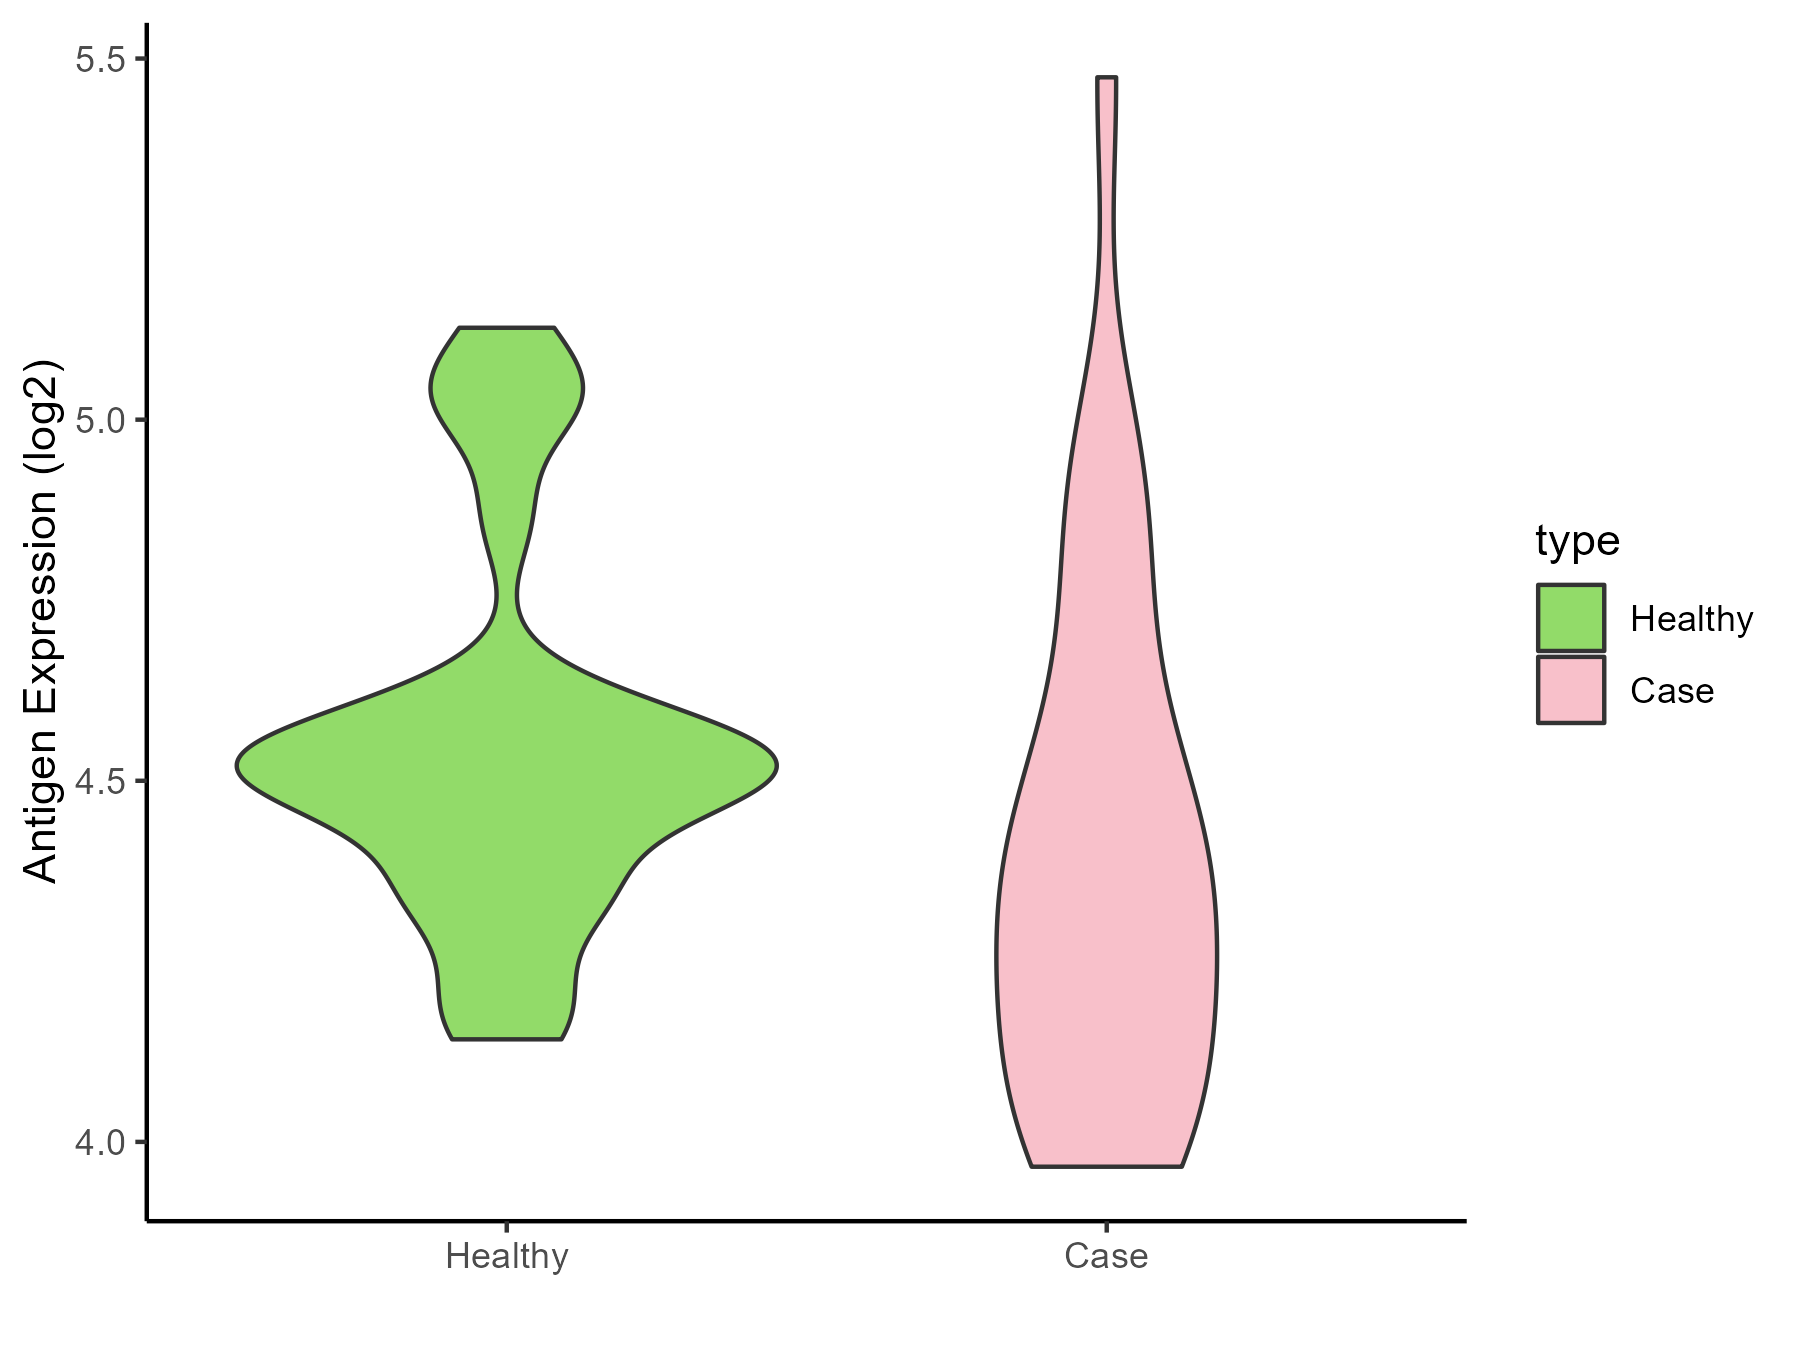
| The Specific Disease | Obesity | |
| The Expression Level of Disease Section Compare with the Healthy Individual Tissue | p-value: 0.091692087; Fold-change: -0.169140193; Z-score: -0.640883627 | |
| Disease-specific Antigen Abundances |
|
Click to View the Clearer Original Diagram |
| Differential expression pattern of antigen in diseases | ||
| The Studied Tissue | Biceps muscle | |
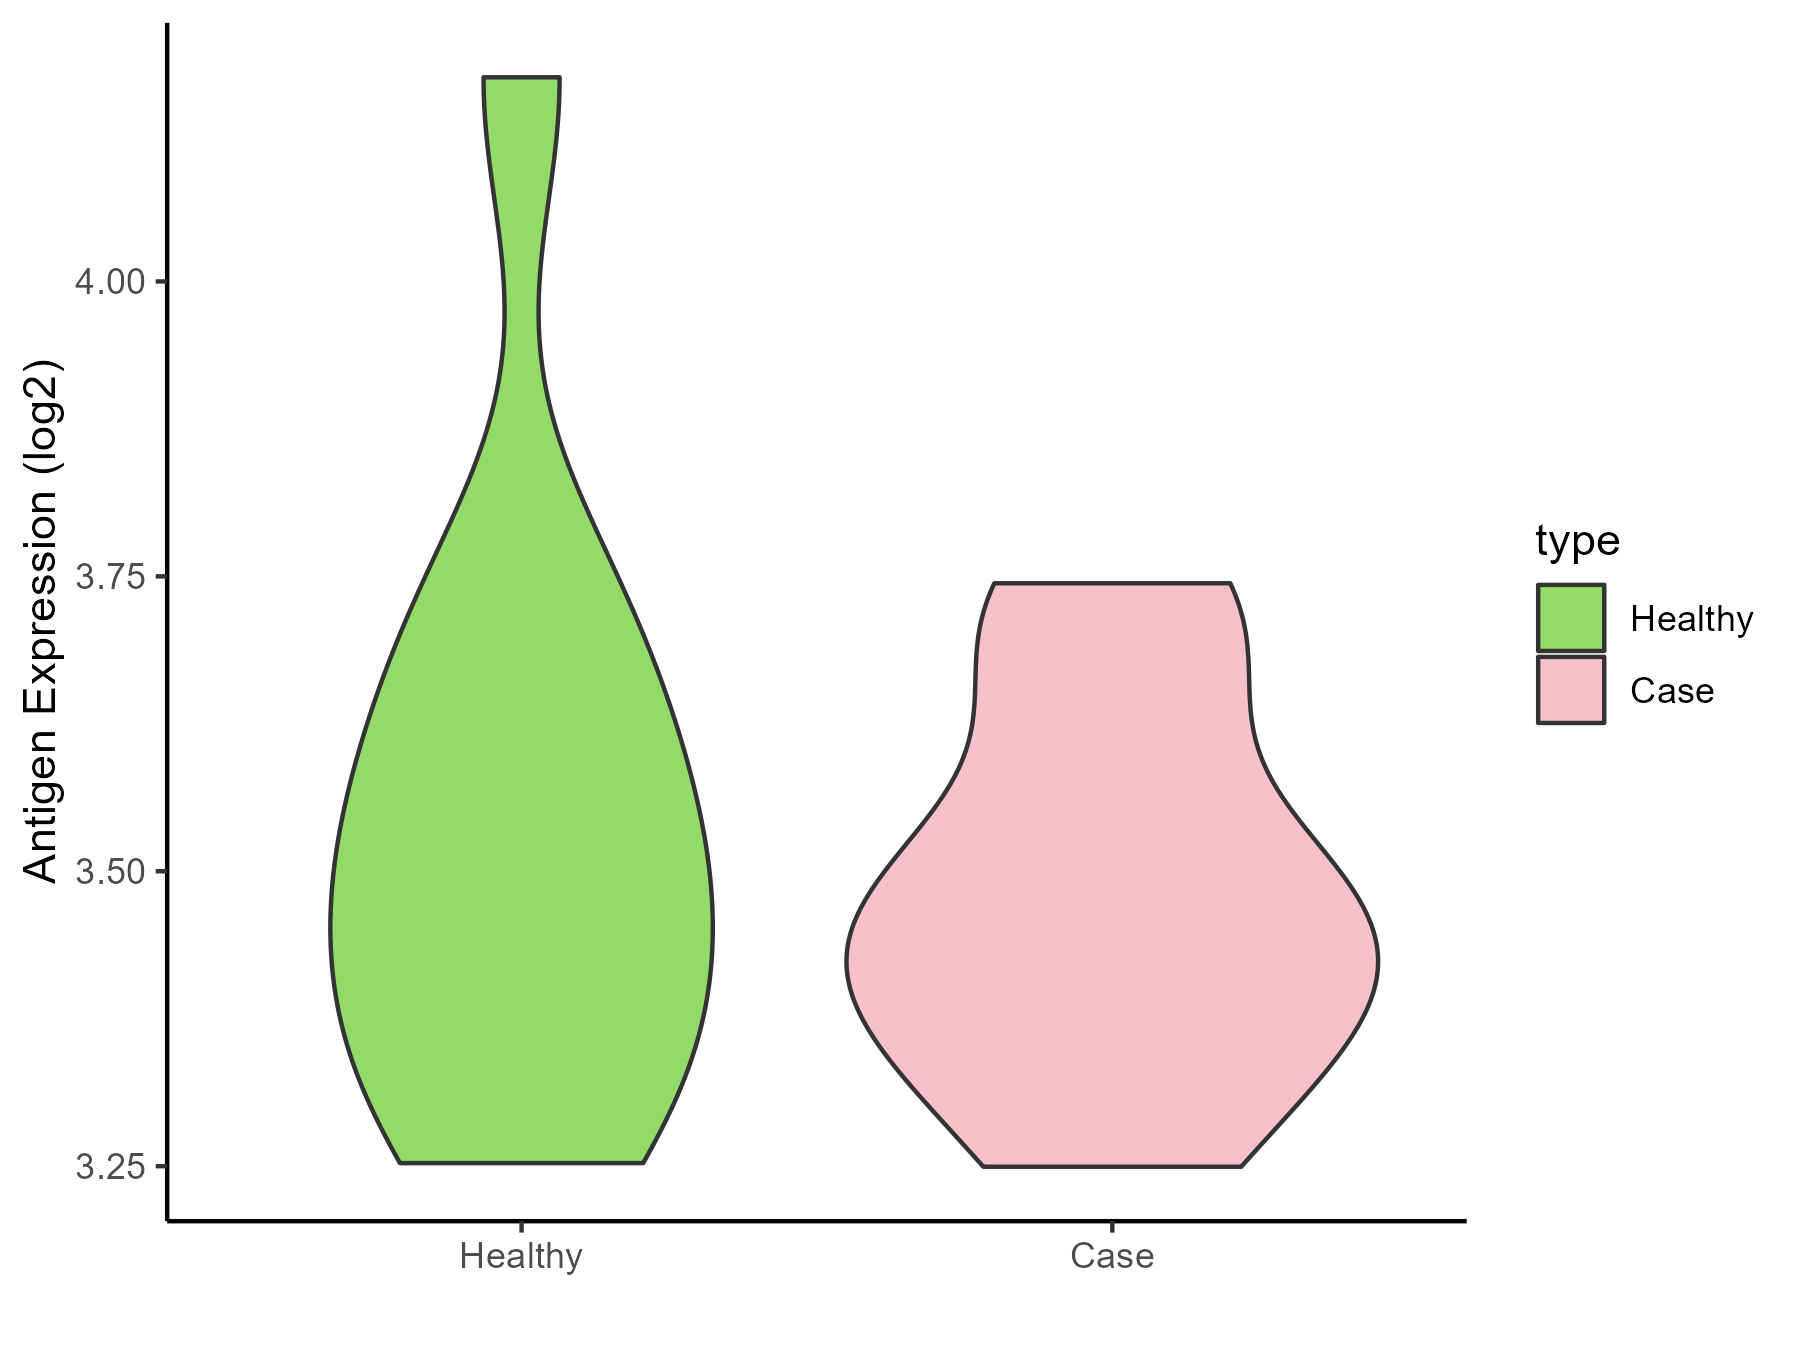
| The Specific Disease | Pompe disease | |
| The Expression Level of Disease Section Compare with the Healthy Individual Tissue | p-value: 0.49517273; Fold-change: -0.063072743; Z-score: -0.235672229 | |
| Disease-specific Antigen Abundances |
|
Click to View the Clearer Original Diagram |
| Differential expression pattern of antigen in diseases | ||
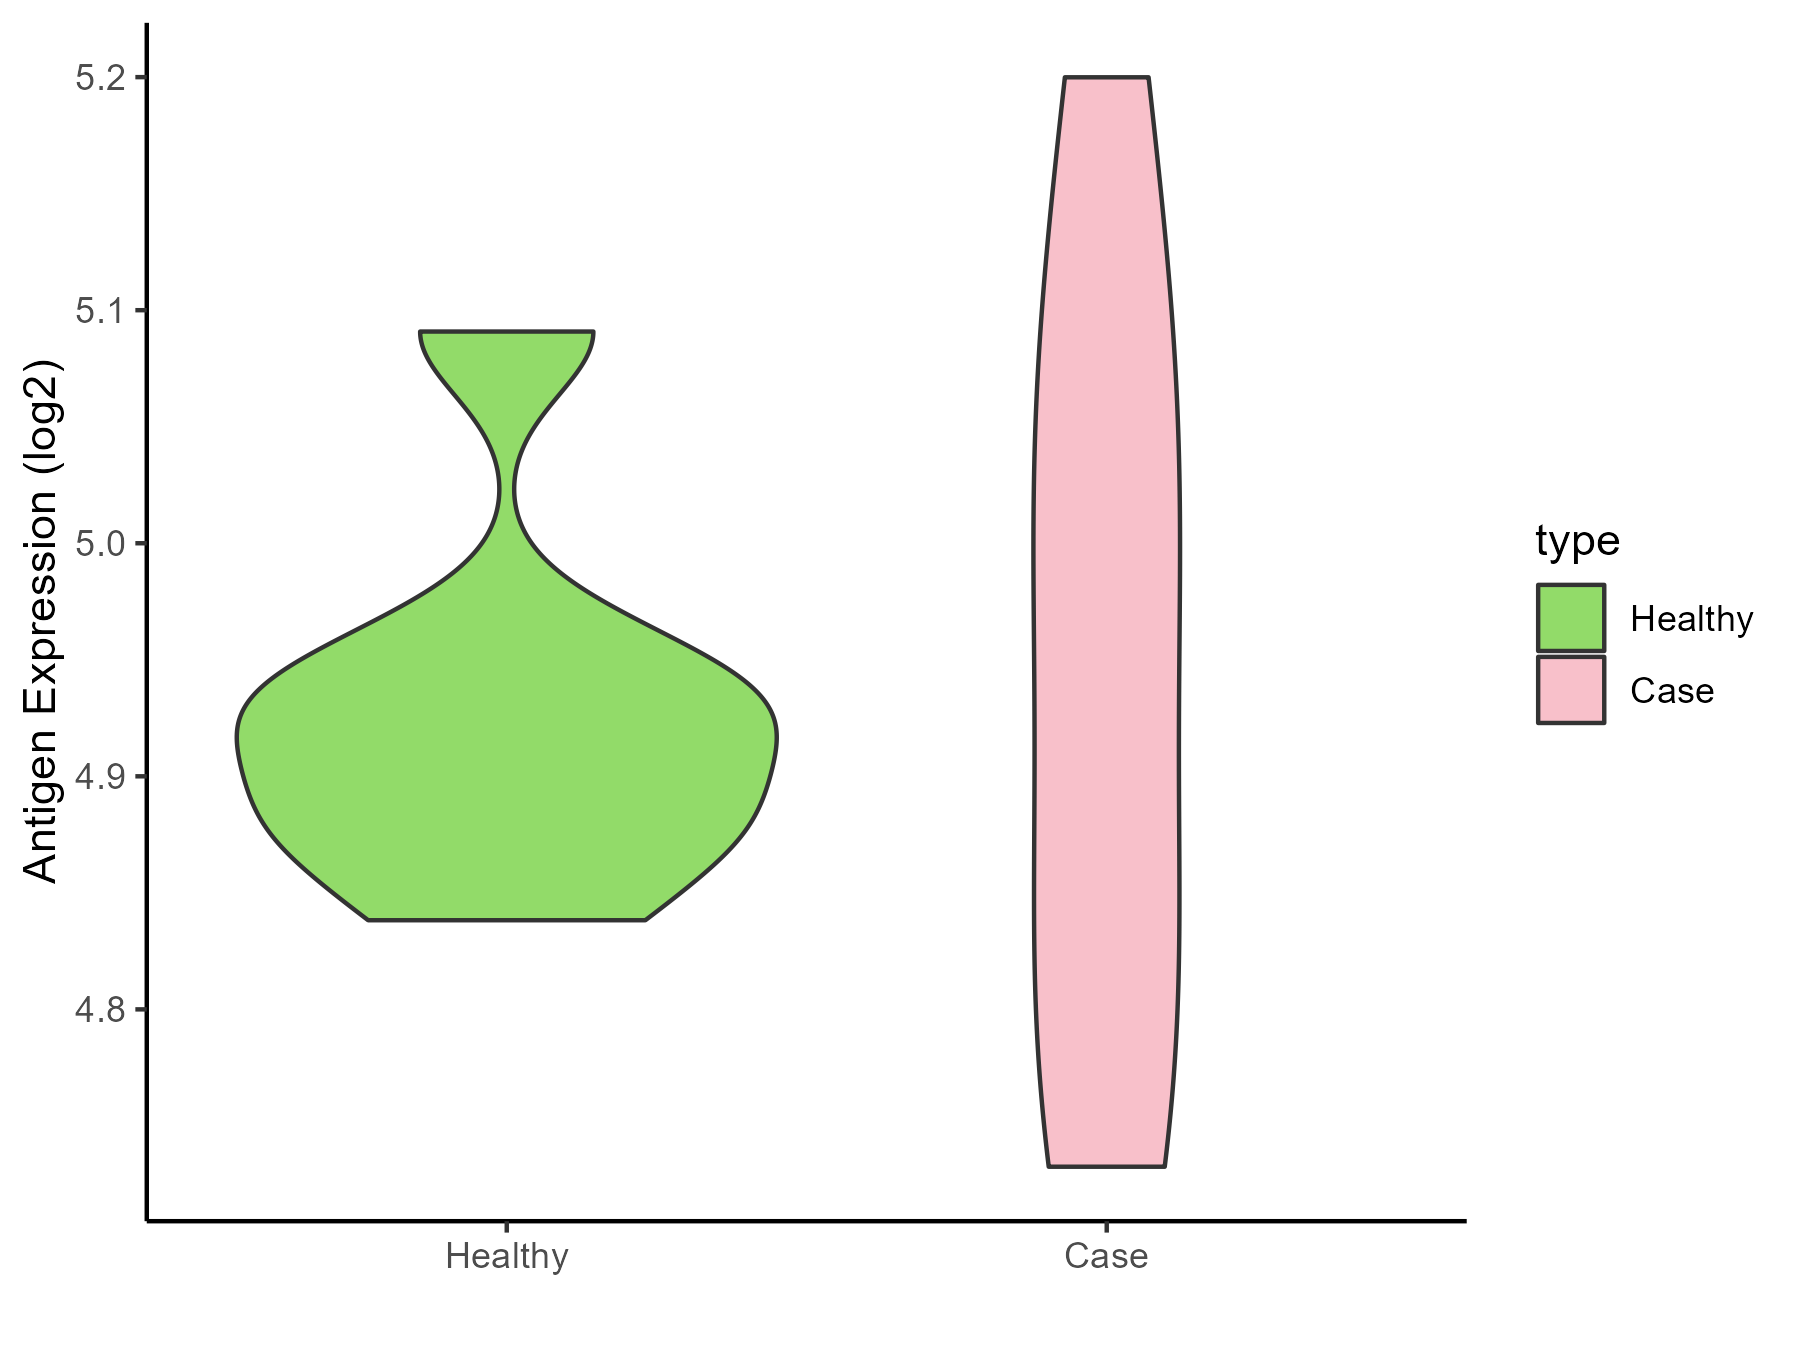
| The Studied Tissue | Whole blood | |
| The Specific Disease | Batten disease | |
| The Expression Level of Disease Section Compare with the Healthy Individual Tissue | p-value: 0.793773274; Fold-change: 0.03444657; Z-score: 0.42306702 | |
| Disease-specific Antigen Abundances |
|
Click to View the Clearer Original Diagram |
ICD Disease Classification 6
| Differential expression pattern of antigen in diseases | ||
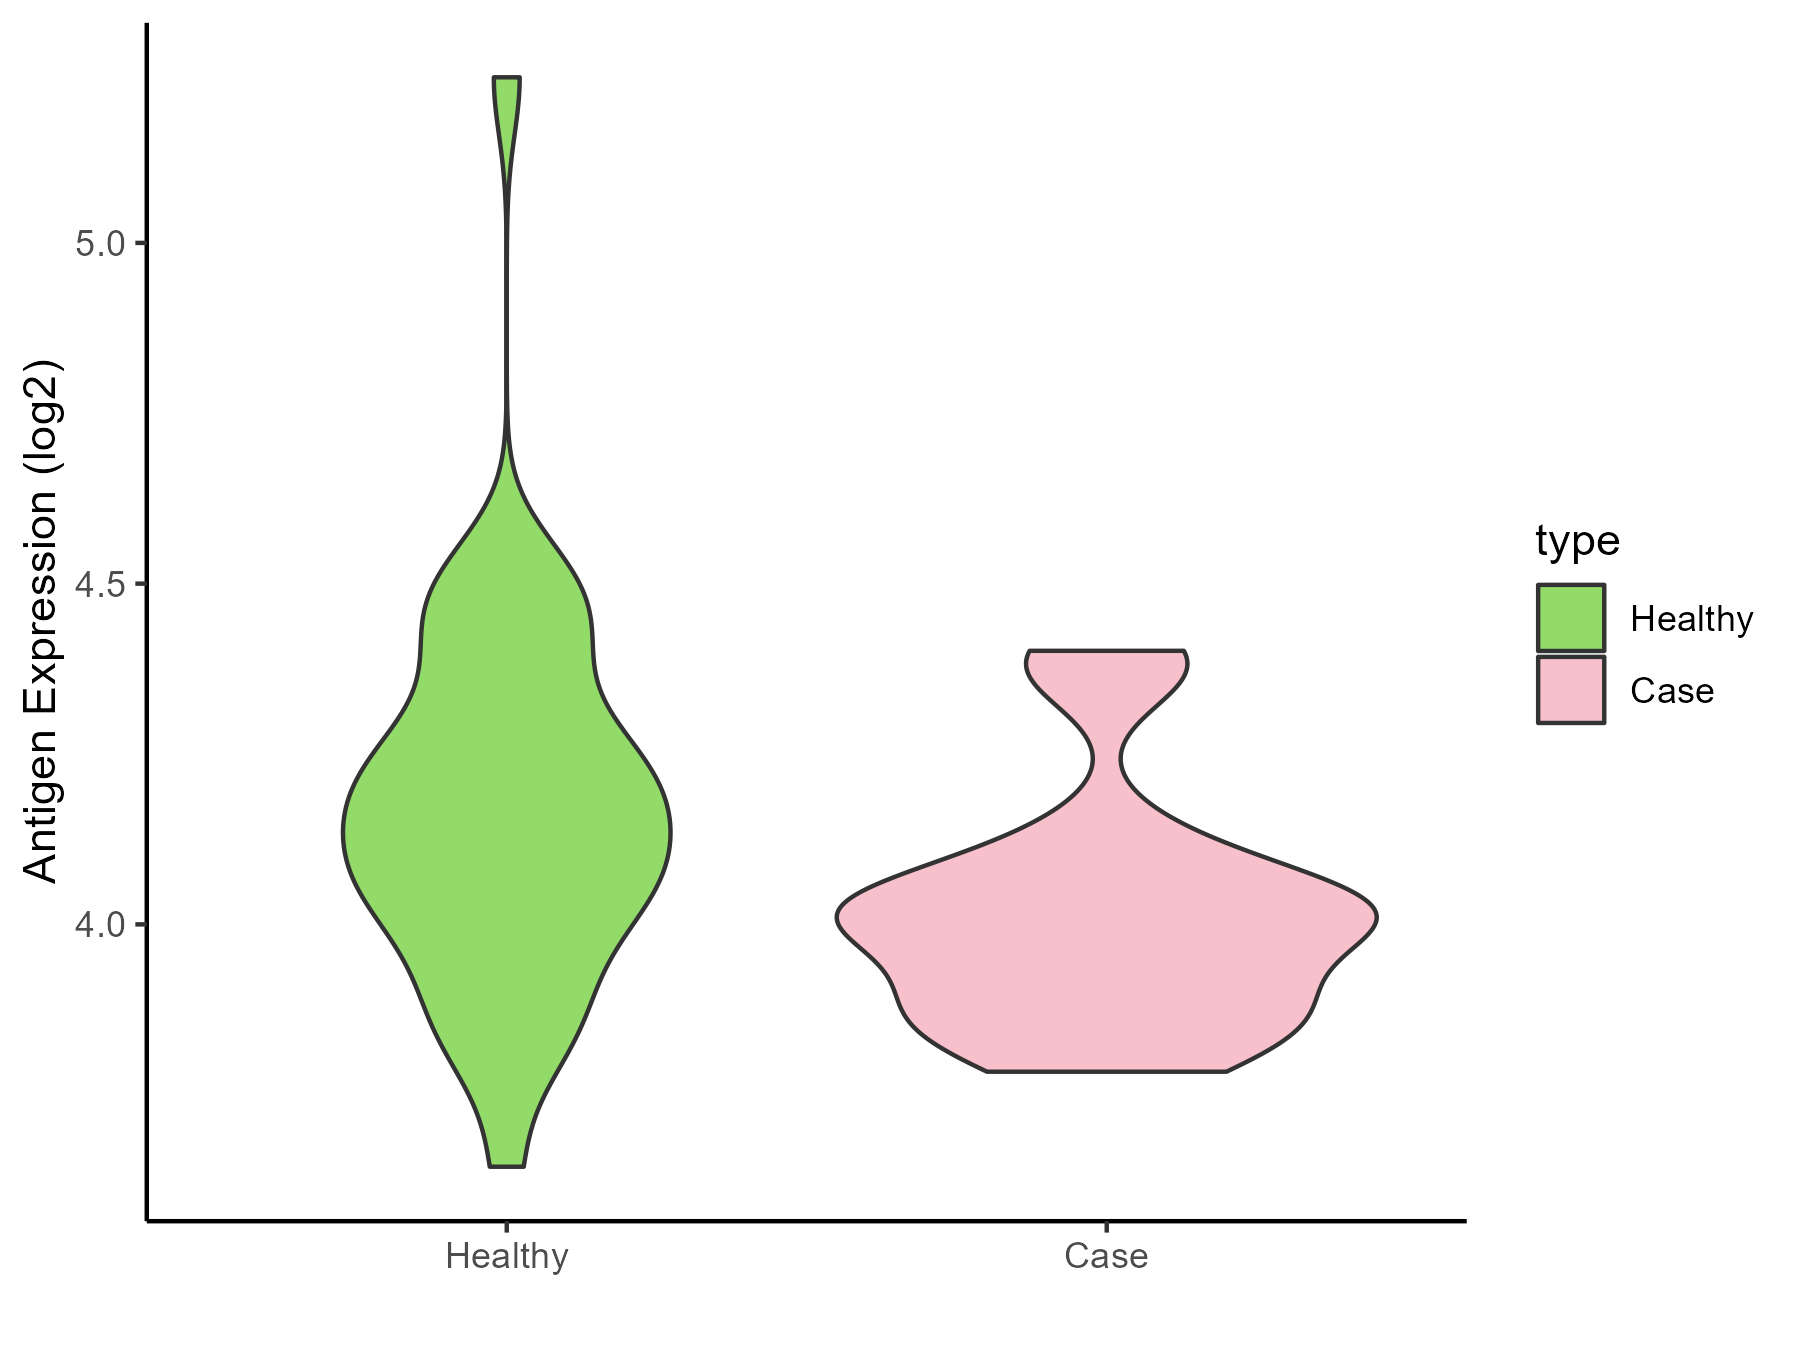
| The Studied Tissue | Whole blood | |
| The Specific Disease | Autism | |
| The Expression Level of Disease Section Compare with the Healthy Individual Tissue | p-value: 0.006190545; Fold-change: -0.165867379; Z-score: -0.58366212 | |
| Disease-specific Antigen Abundances |
|
Click to View the Clearer Original Diagram |
| Differential expression pattern of antigen in diseases | ||
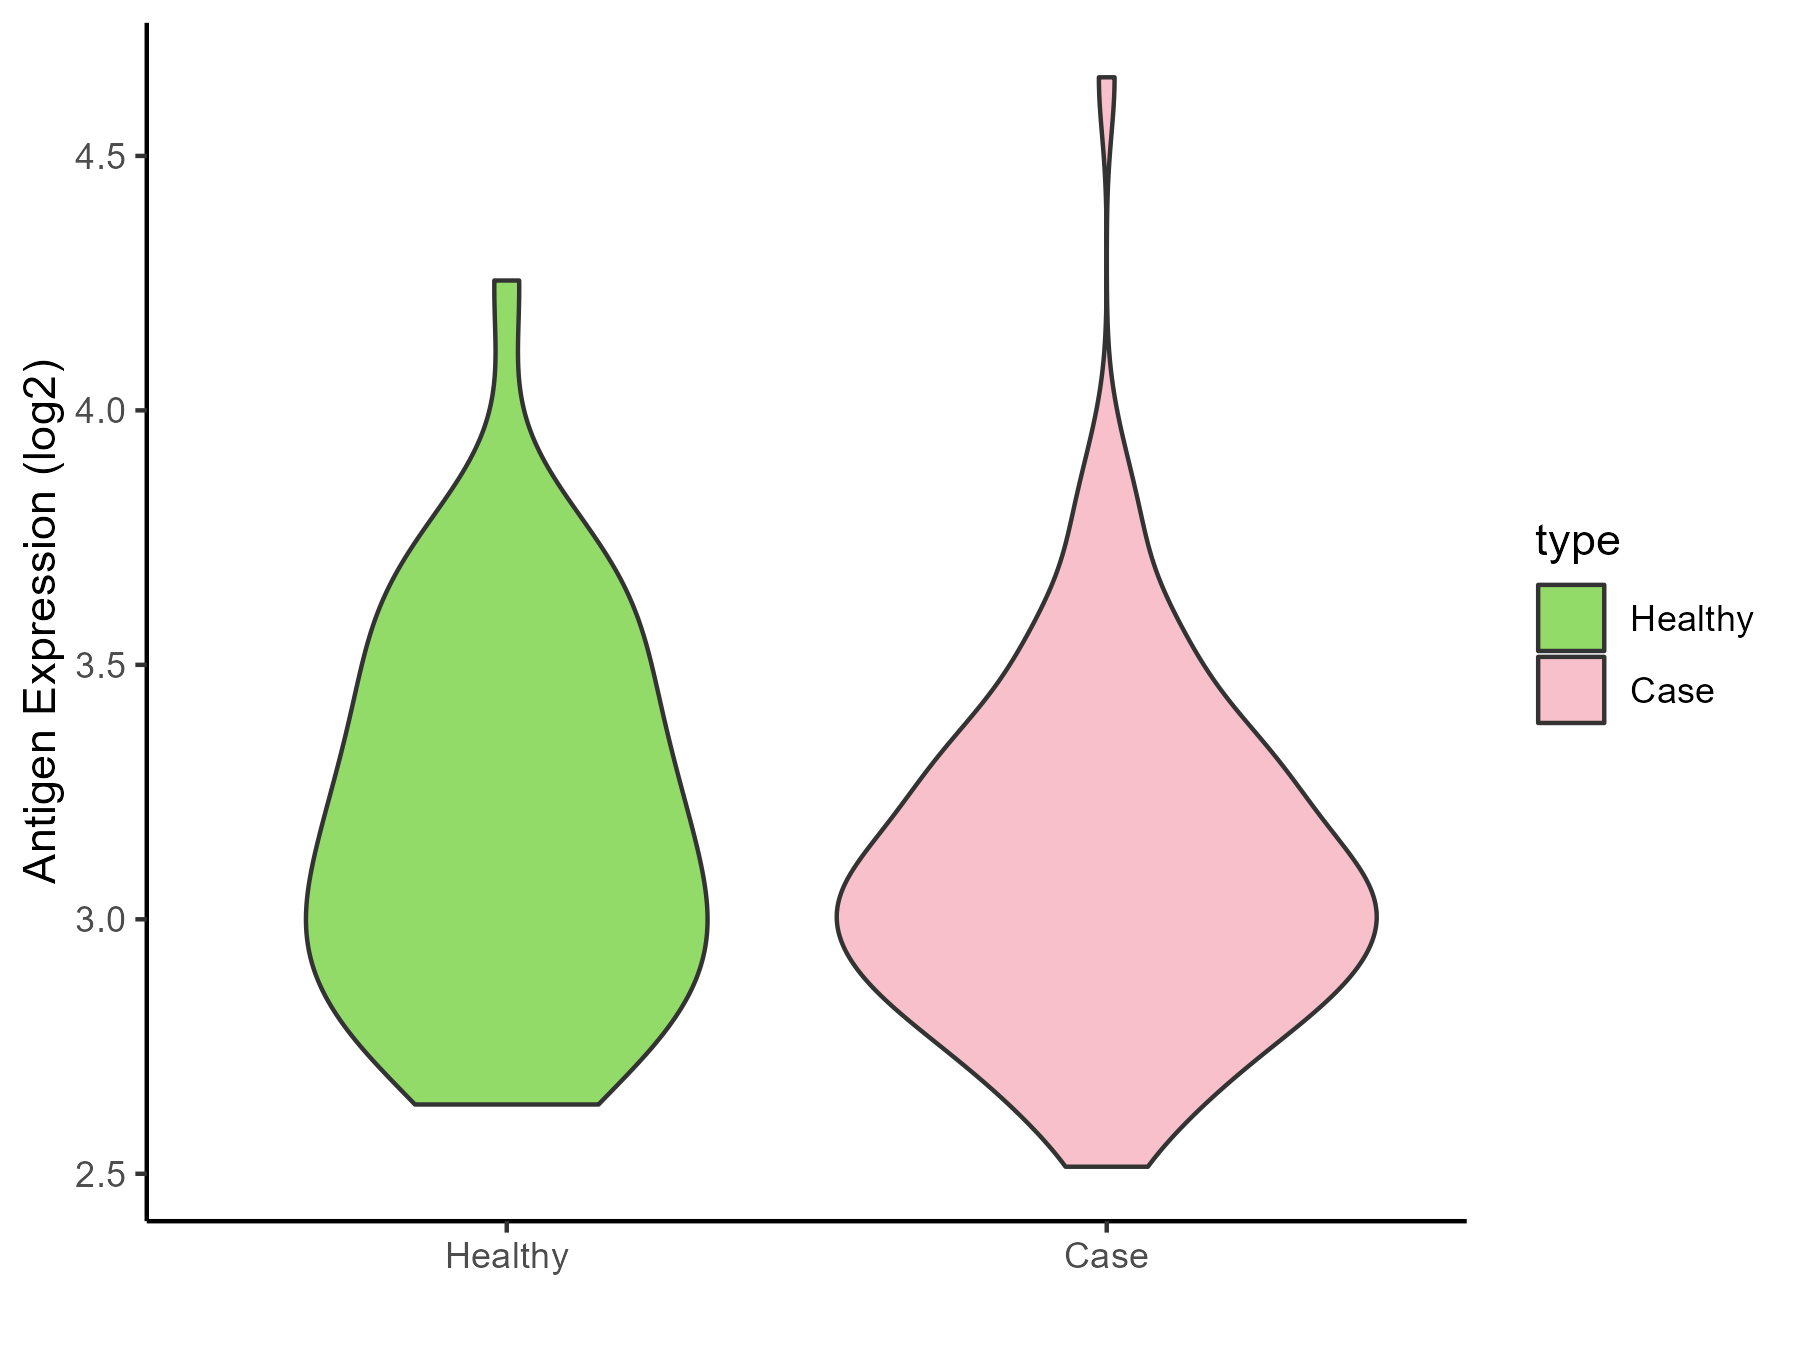
| The Studied Tissue | Whole blood | |
| The Specific Disease | Anxiety disorder | |
| The Expression Level of Disease Section Compare with the Healthy Individual Tissue | p-value: 0.17537909; Fold-change: -0.110061157; Z-score: -0.302092086 | |
| Disease-specific Antigen Abundances |
|
Click to View the Clearer Original Diagram |
ICD Disease Classification 8
| Differential expression pattern of antigen in diseases | ||
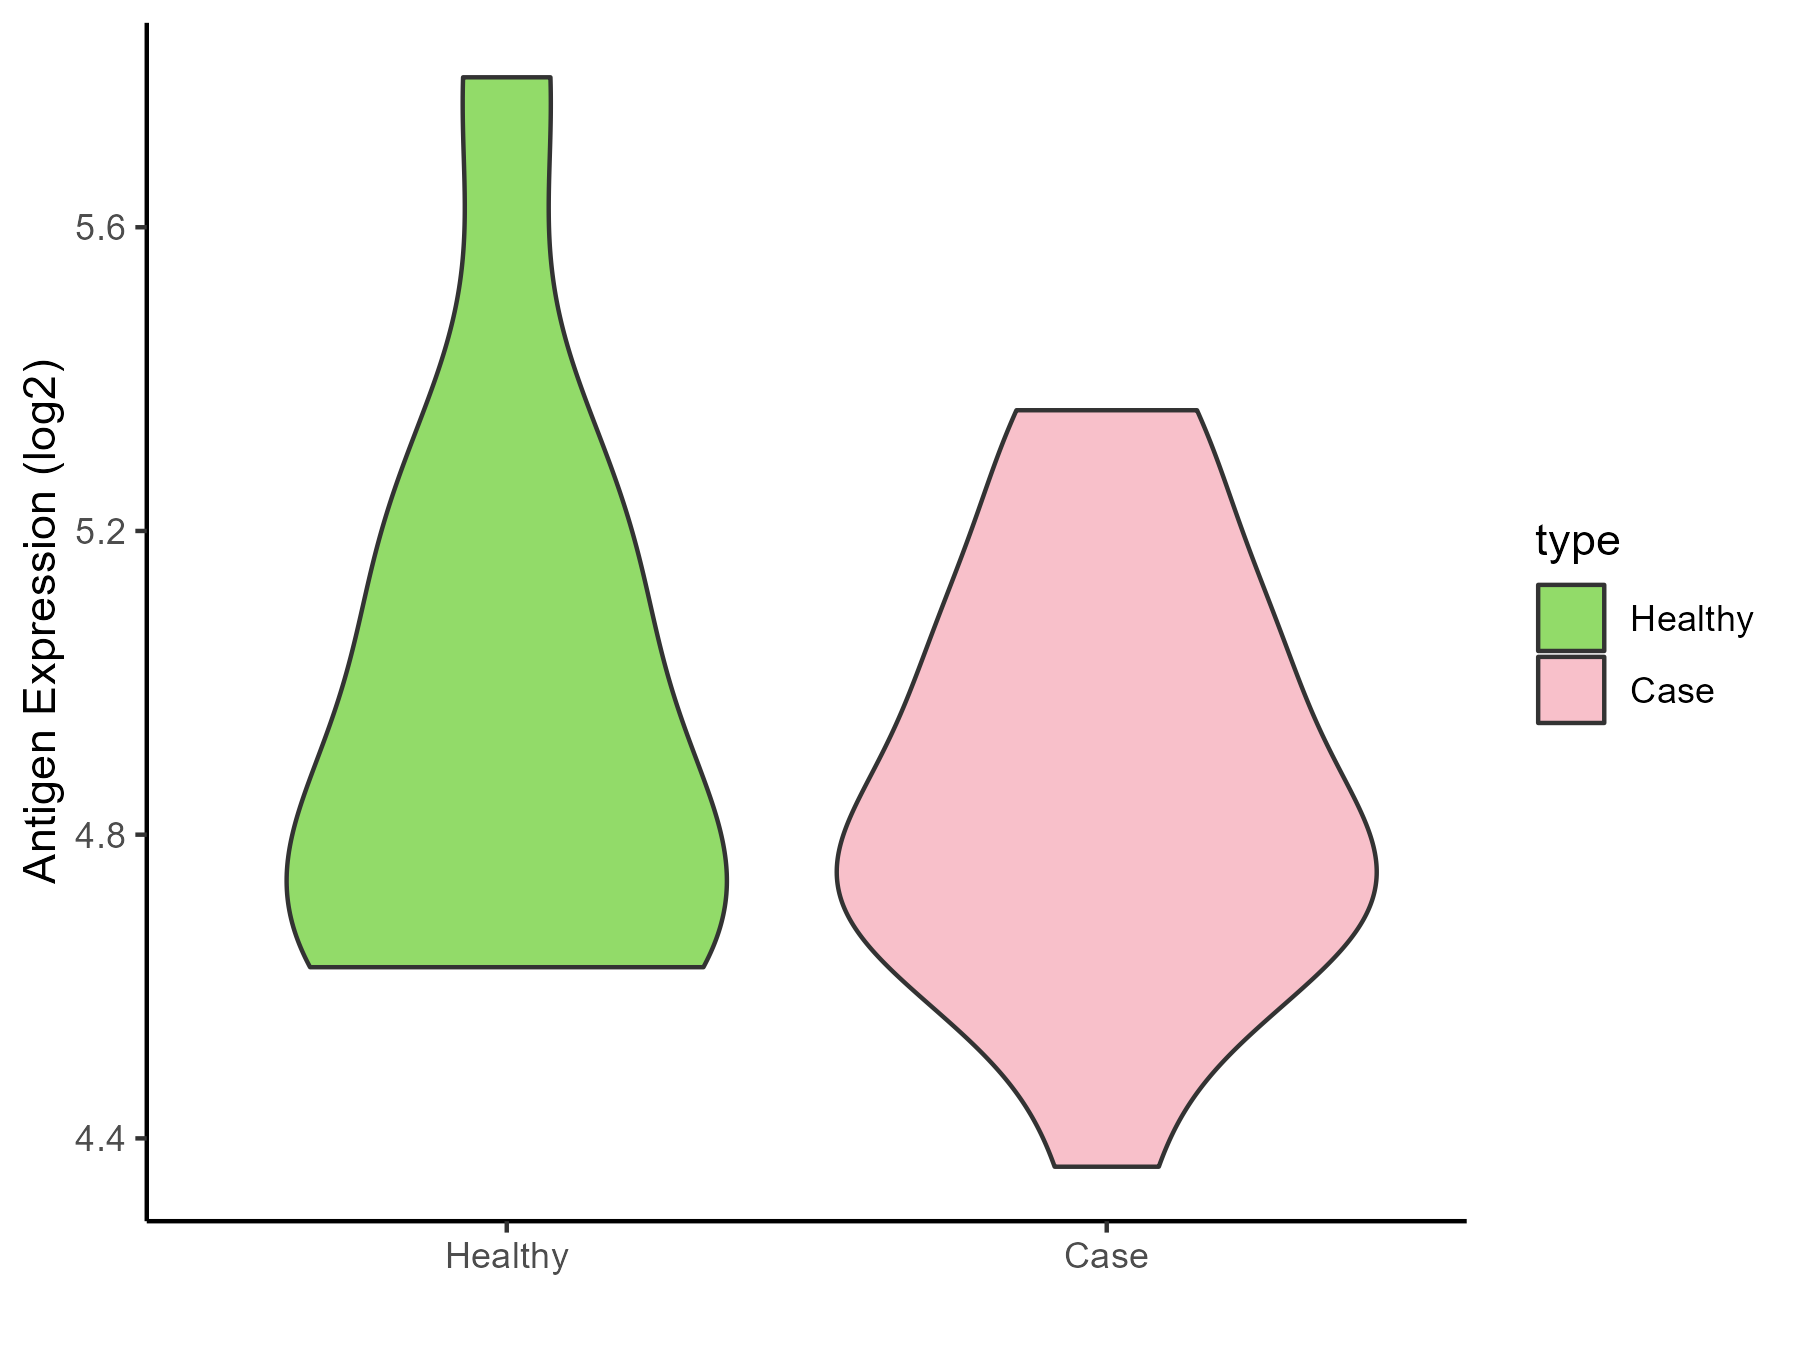
| The Studied Tissue | Substantia nigra | |
| The Specific Disease | Parkinson disease | |
| The Expression Level of Disease Section Compare with the Healthy Individual Tissue | p-value: 0.497422023; Fold-change: 0.025549458; Z-score: 0.066367406 | |
| Disease-specific Antigen Abundances |
|
Click to View the Clearer Original Diagram |
| Differential expression pattern of antigen in diseases | ||
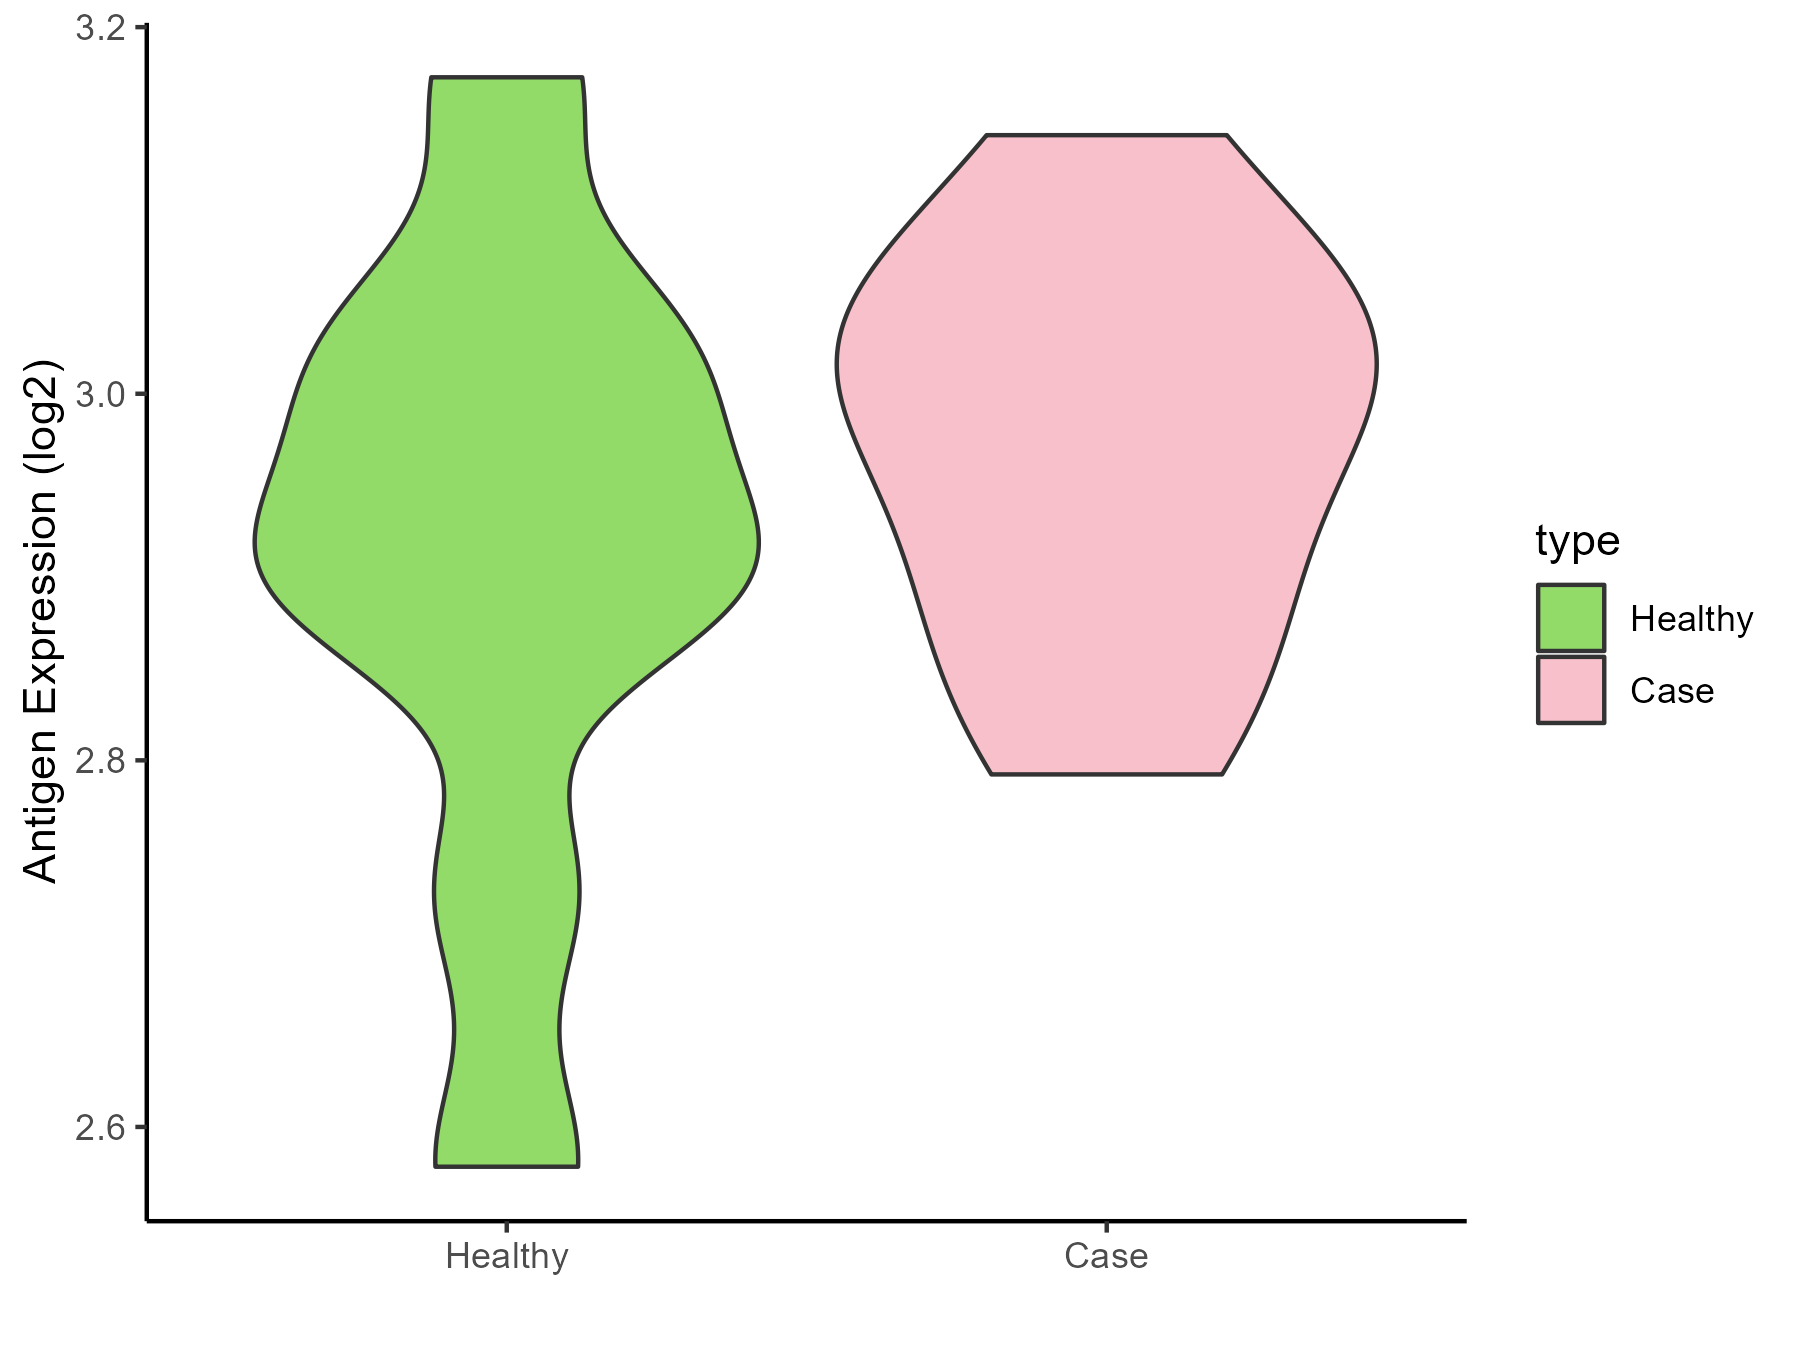
| The Studied Tissue | Whole blood | |
| The Specific Disease | Huntington disease | |
| The Expression Level of Disease Section Compare with the Healthy Individual Tissue | p-value: 0.387513999; Fold-change: 0.09168742; Z-score: 0.522064954 | |
| Disease-specific Antigen Abundances |
|
Click to View the Clearer Original Diagram |
| Differential expression pattern of antigen in diseases | ||
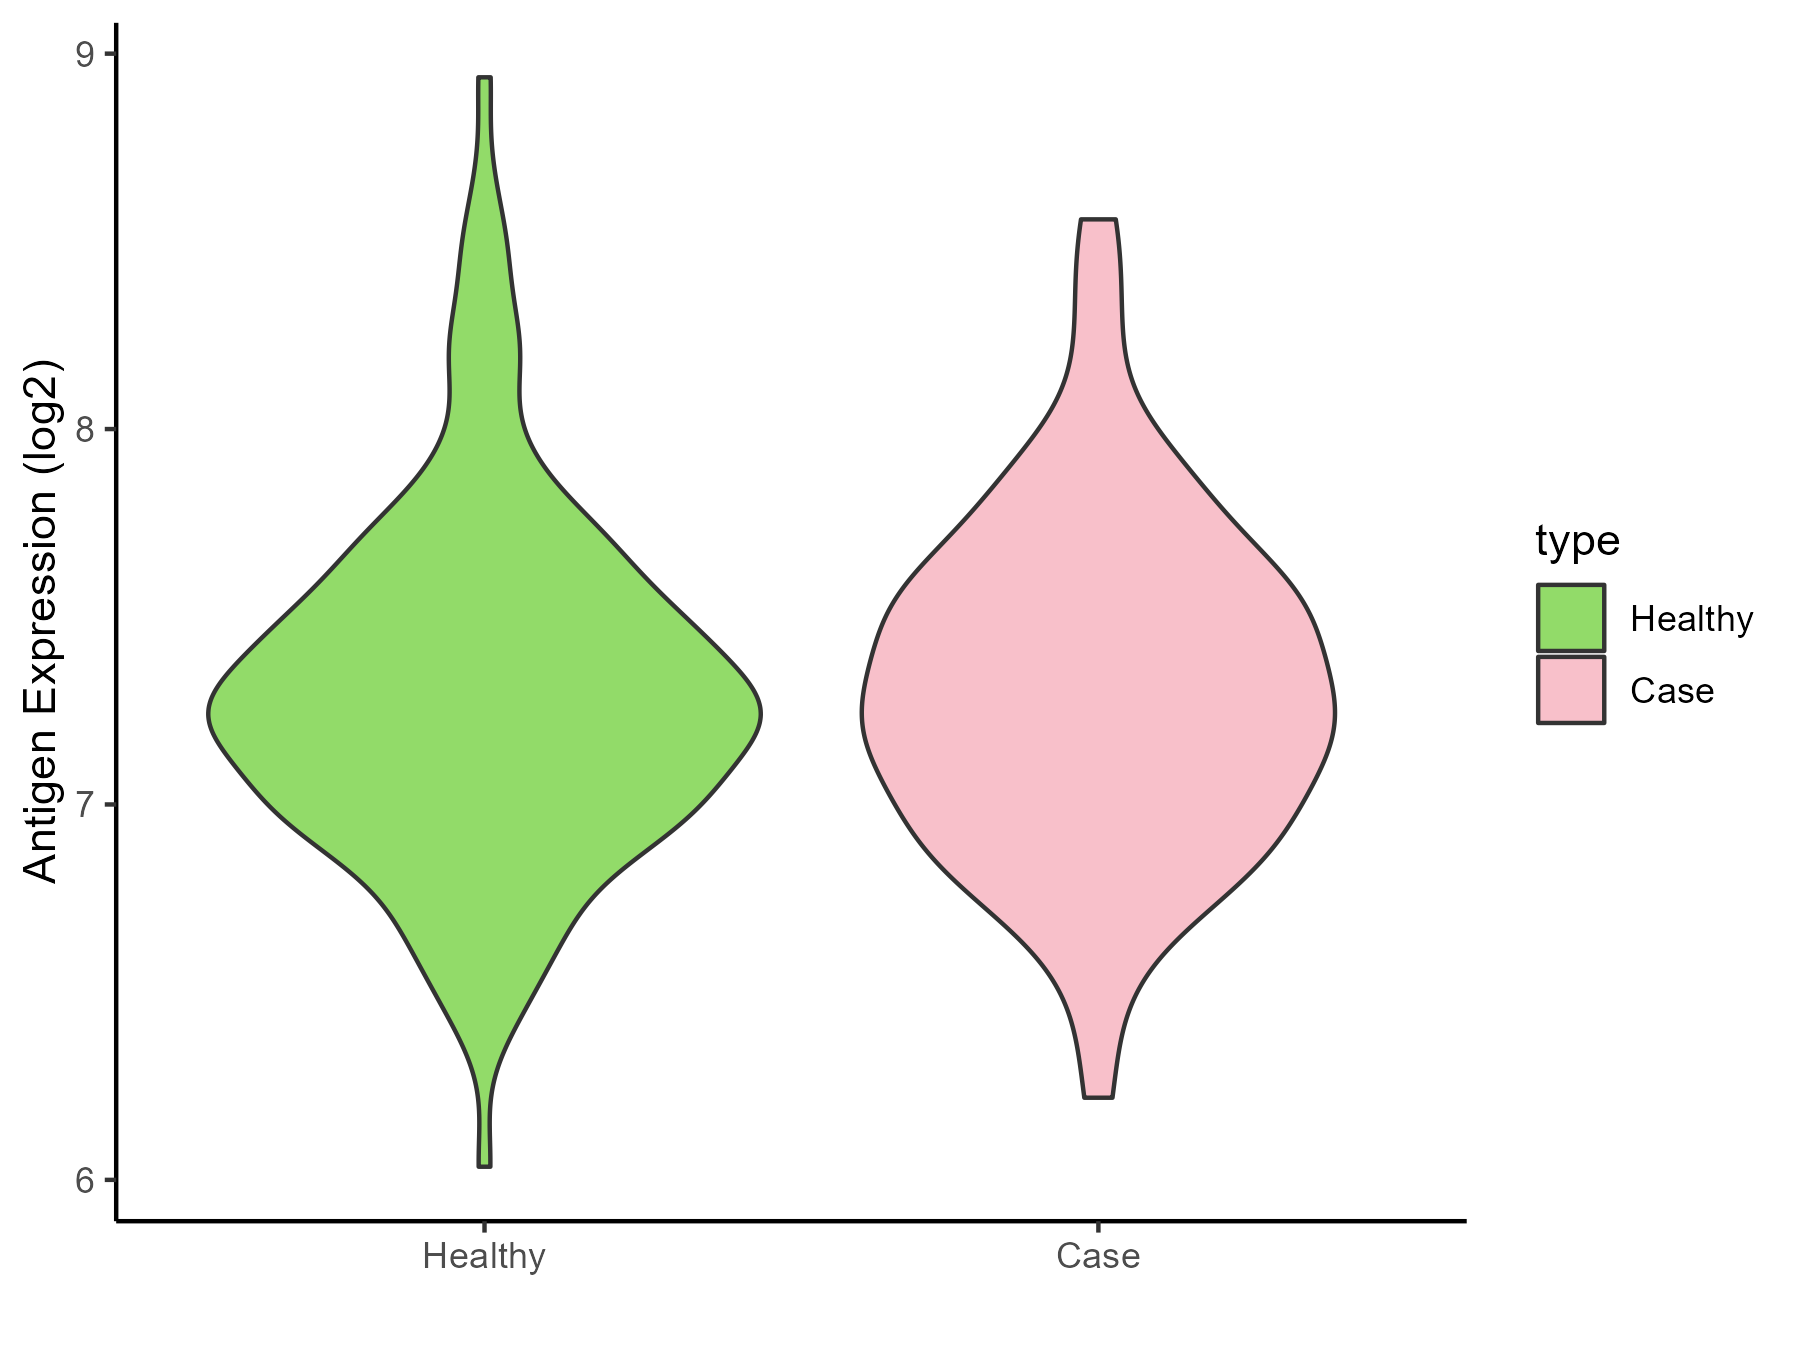
| The Studied Tissue | Entorhinal cortex | |
| The Specific Disease | Alzheimer disease | |
| The Expression Level of Disease Section Compare with the Healthy Individual Tissue | p-value: 0.917148806; Fold-change: 0.003172074; Z-score: 0.006821178 | |
| Disease-specific Antigen Abundances |
|
Click to View the Clearer Original Diagram |
| Differential expression pattern of antigen in diseases | ||
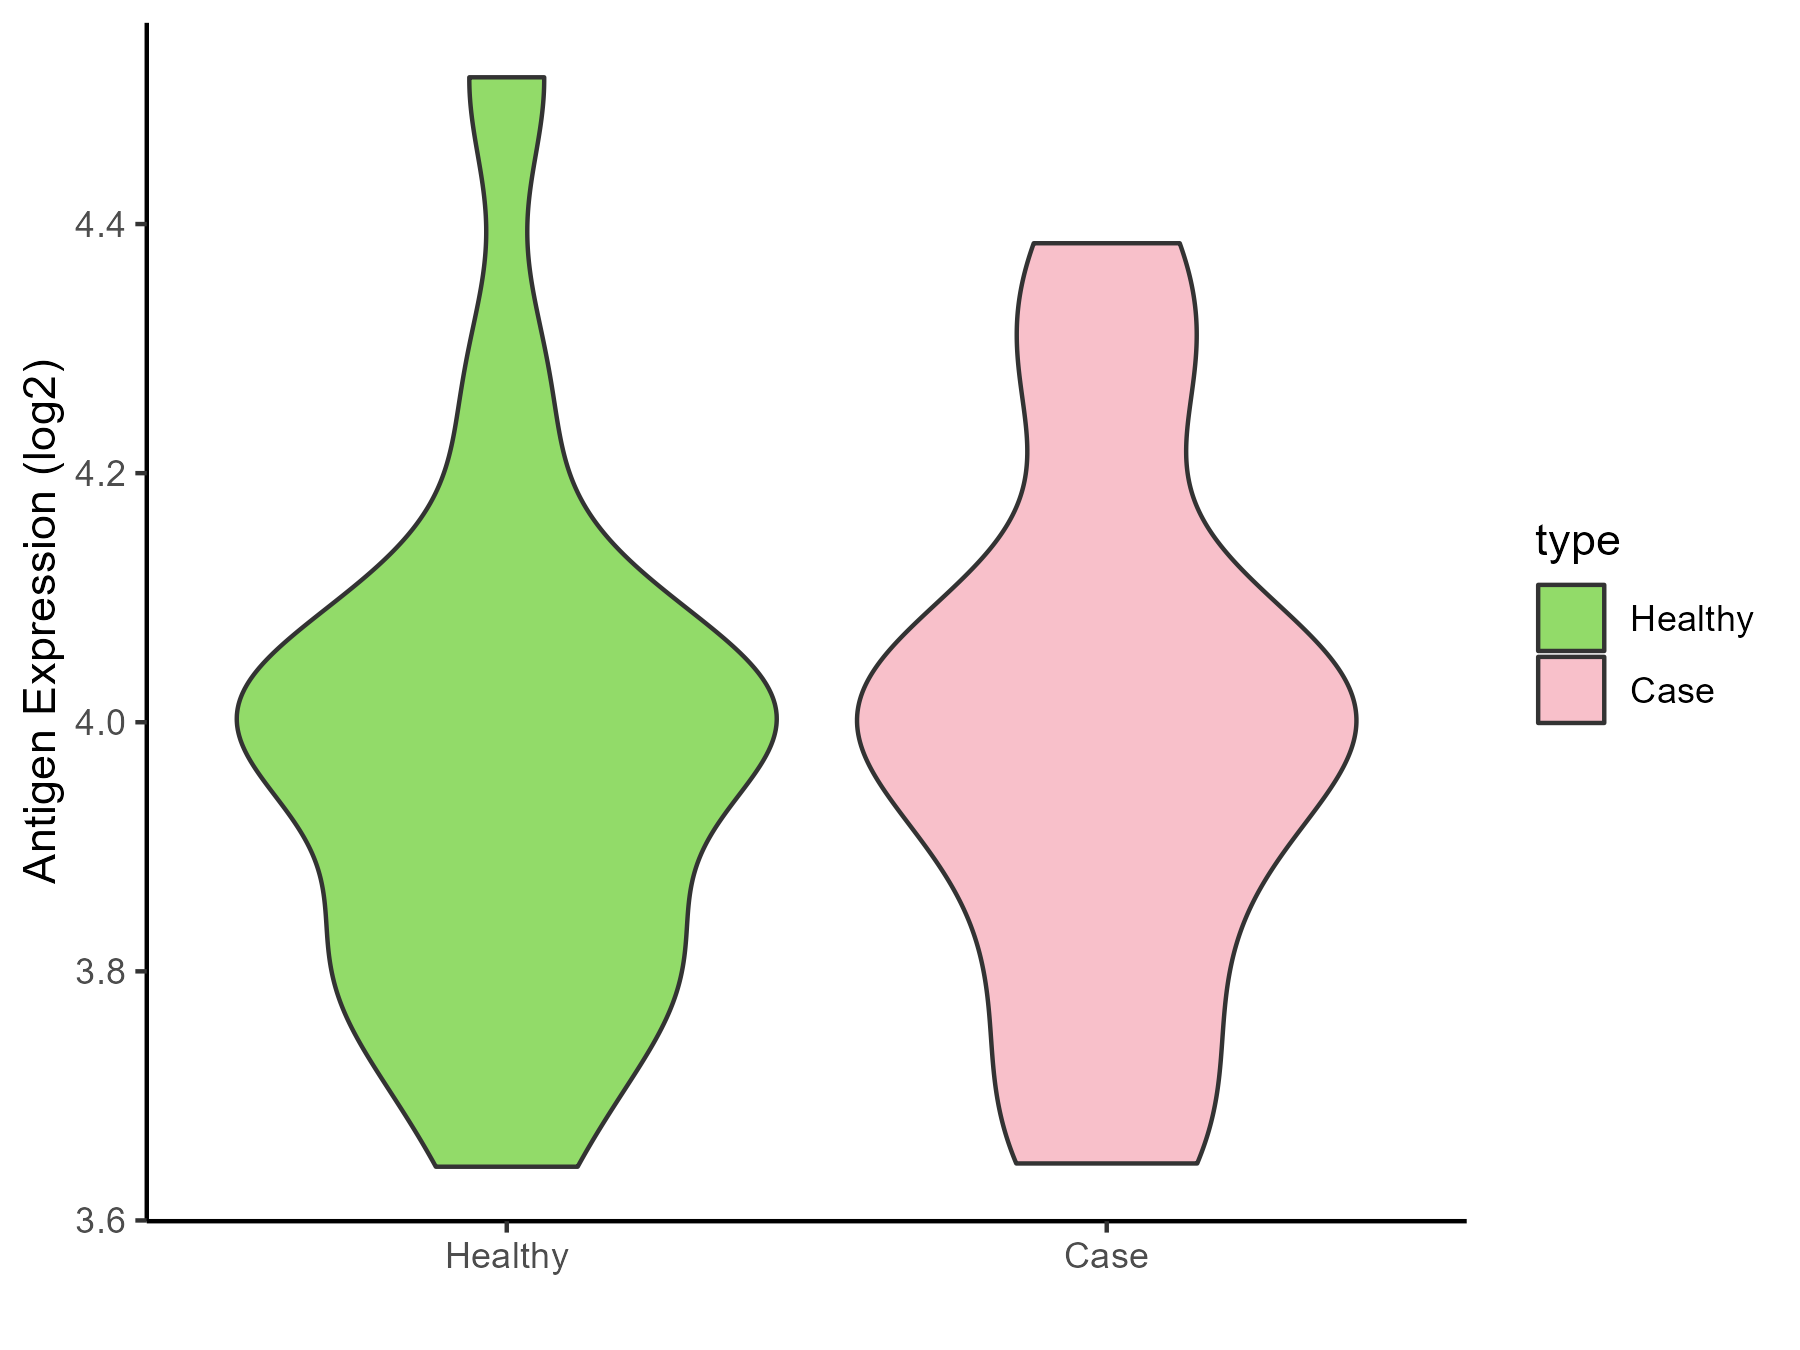
| The Studied Tissue | Whole blood | |
| The Specific Disease | Seizure | |
| The Expression Level of Disease Section Compare with the Healthy Individual Tissue | p-value: 0.848995004; Fold-change: 0.005784188; Z-score: 0.027093532 | |
| Disease-specific Antigen Abundances |
|
Click to View the Clearer Original Diagram |
| Differential expression pattern of antigen in diseases | ||
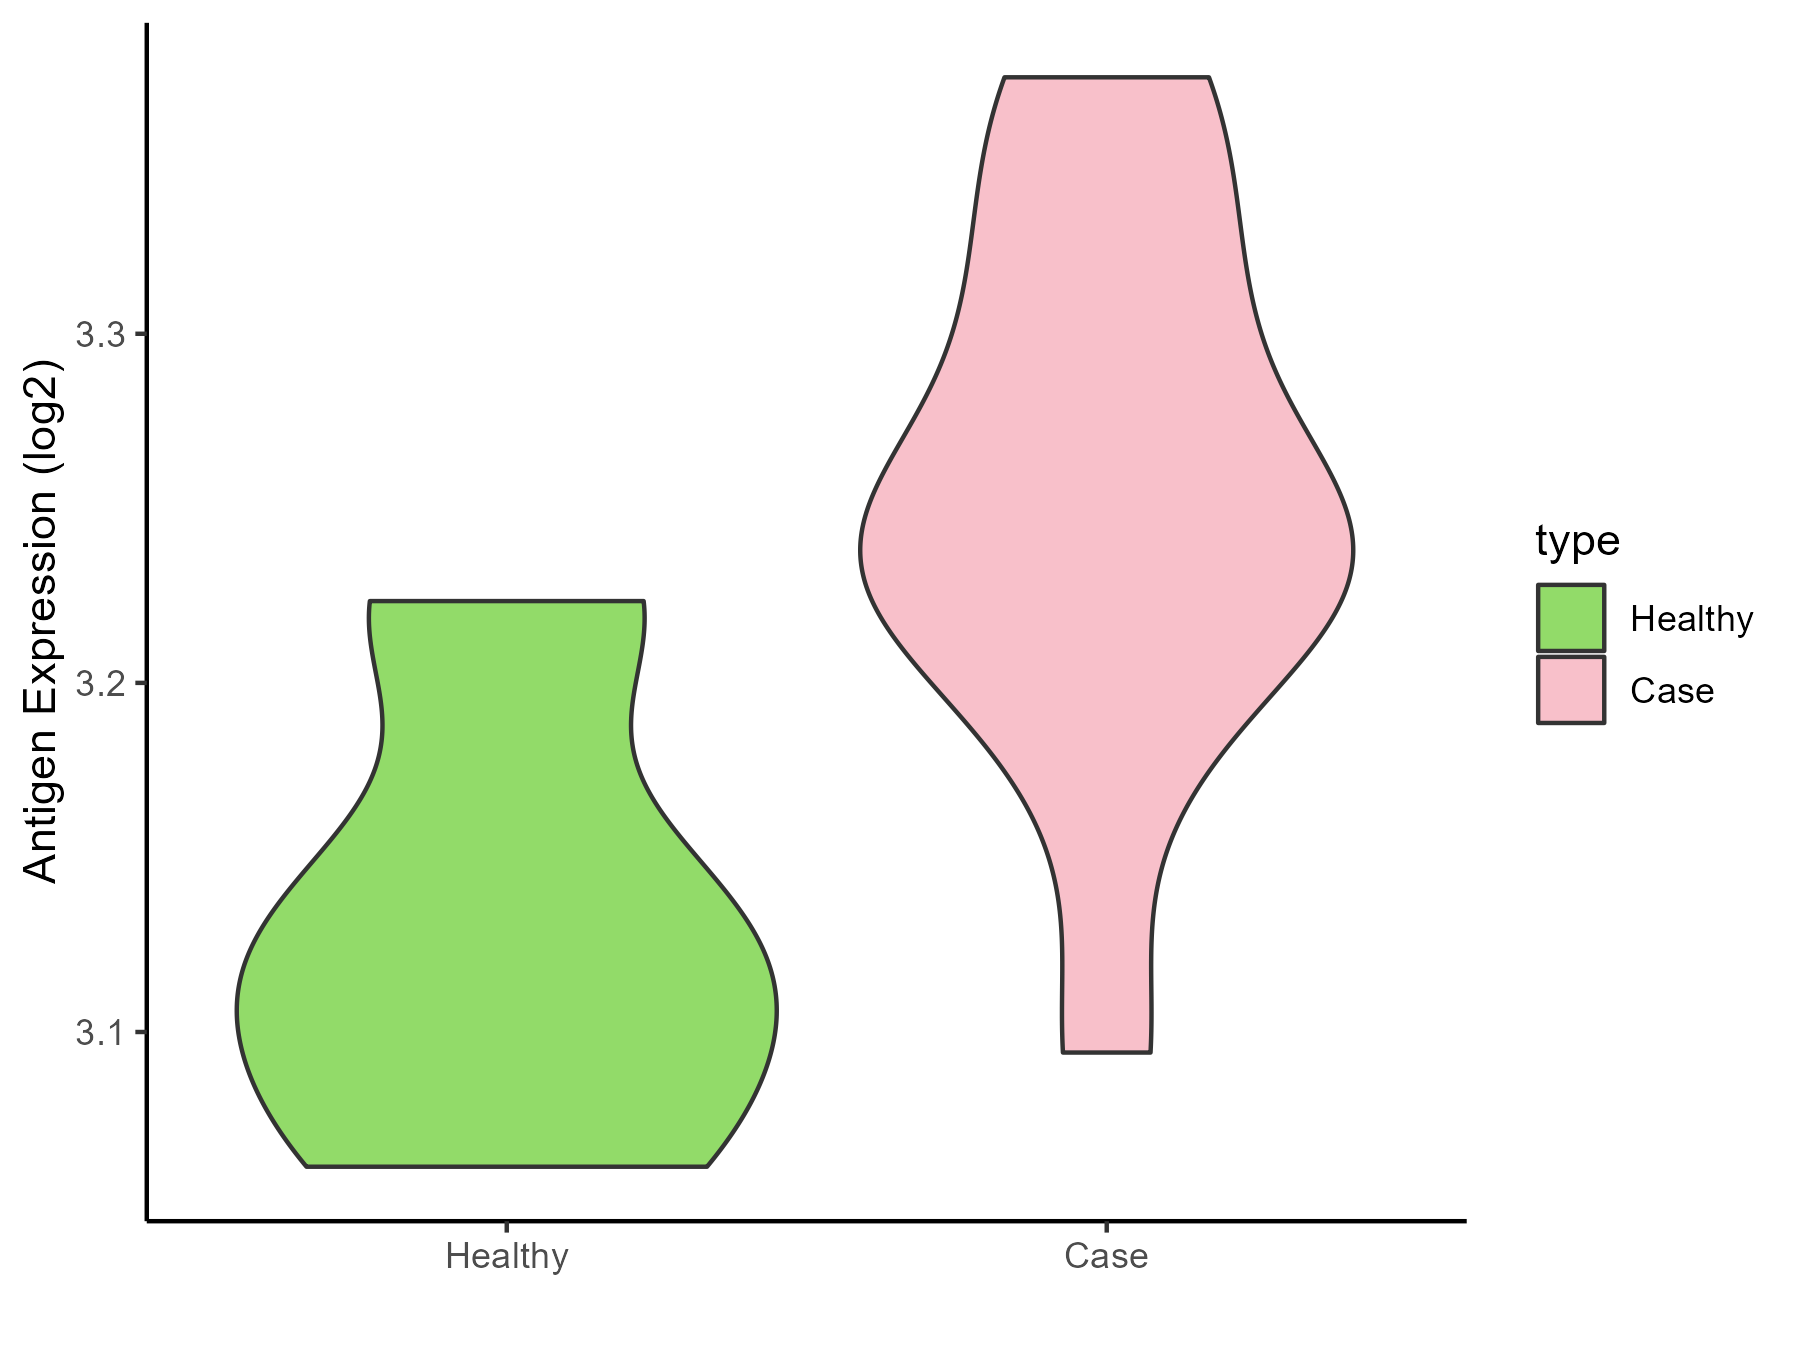
| The Studied Tissue | Skin | |
| The Specific Disease | Lateral sclerosis | |
| The Expression Level of Disease Section Compare with the Healthy Individual Tissue | p-value: 0.024006049; Fold-change: 0.120046152; Z-score: 1.747309325 | |
| Disease-specific Antigen Abundances |
|
Click to View the Clearer Original Diagram |
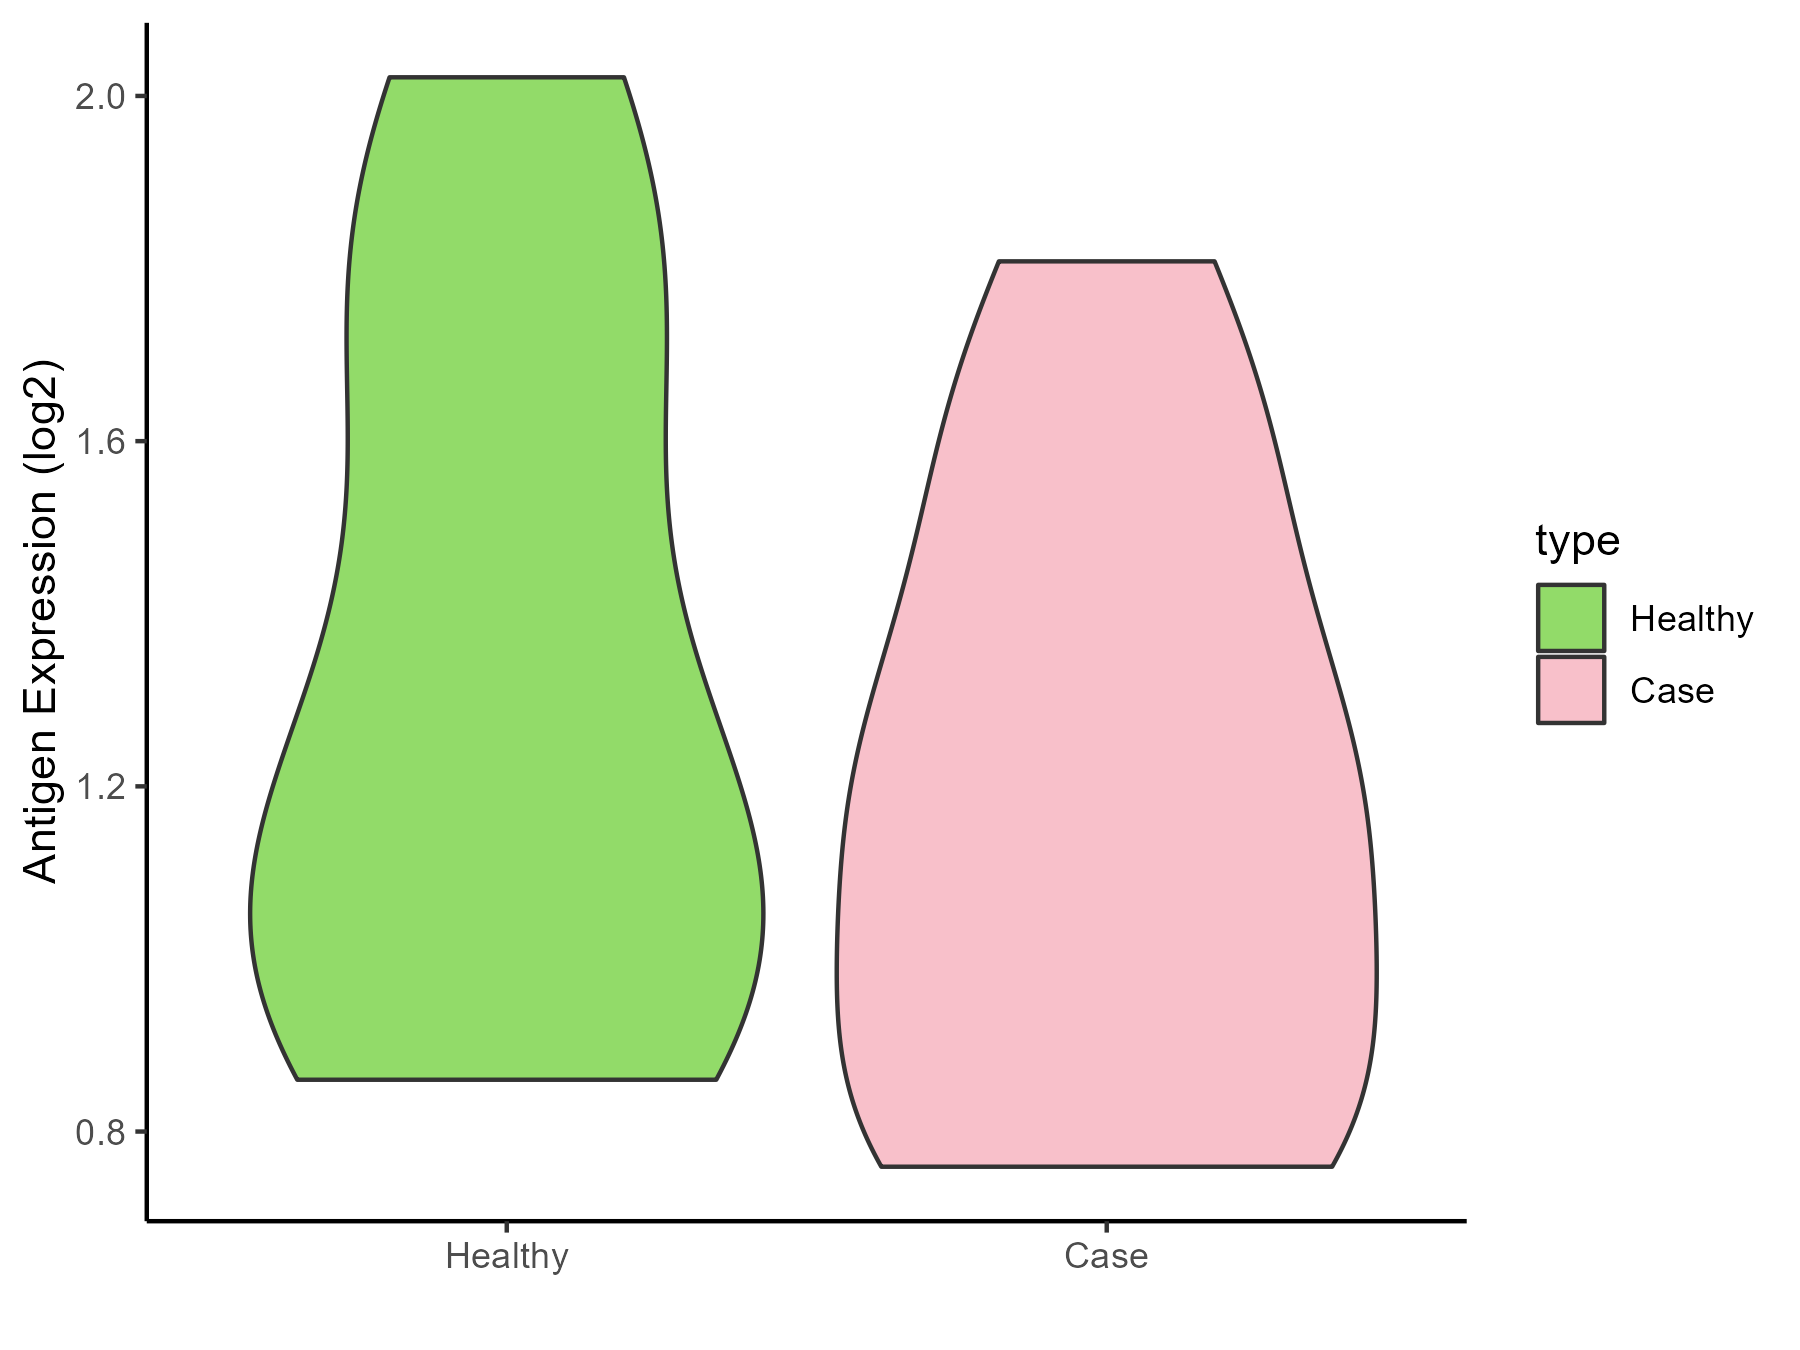
| The Studied Tissue | Cervical spinal cord | |
| The Specific Disease | Lateral sclerosis | |
| The Expression Level of Disease Section Compare with the Healthy Individual Tissue | p-value: 0.383643507; Fold-change: -0.016331101; Z-score: -0.03868759 | |
| Disease-specific Antigen Abundances |
|
Click to View the Clearer Original Diagram |
| Differential expression pattern of antigen in diseases | ||
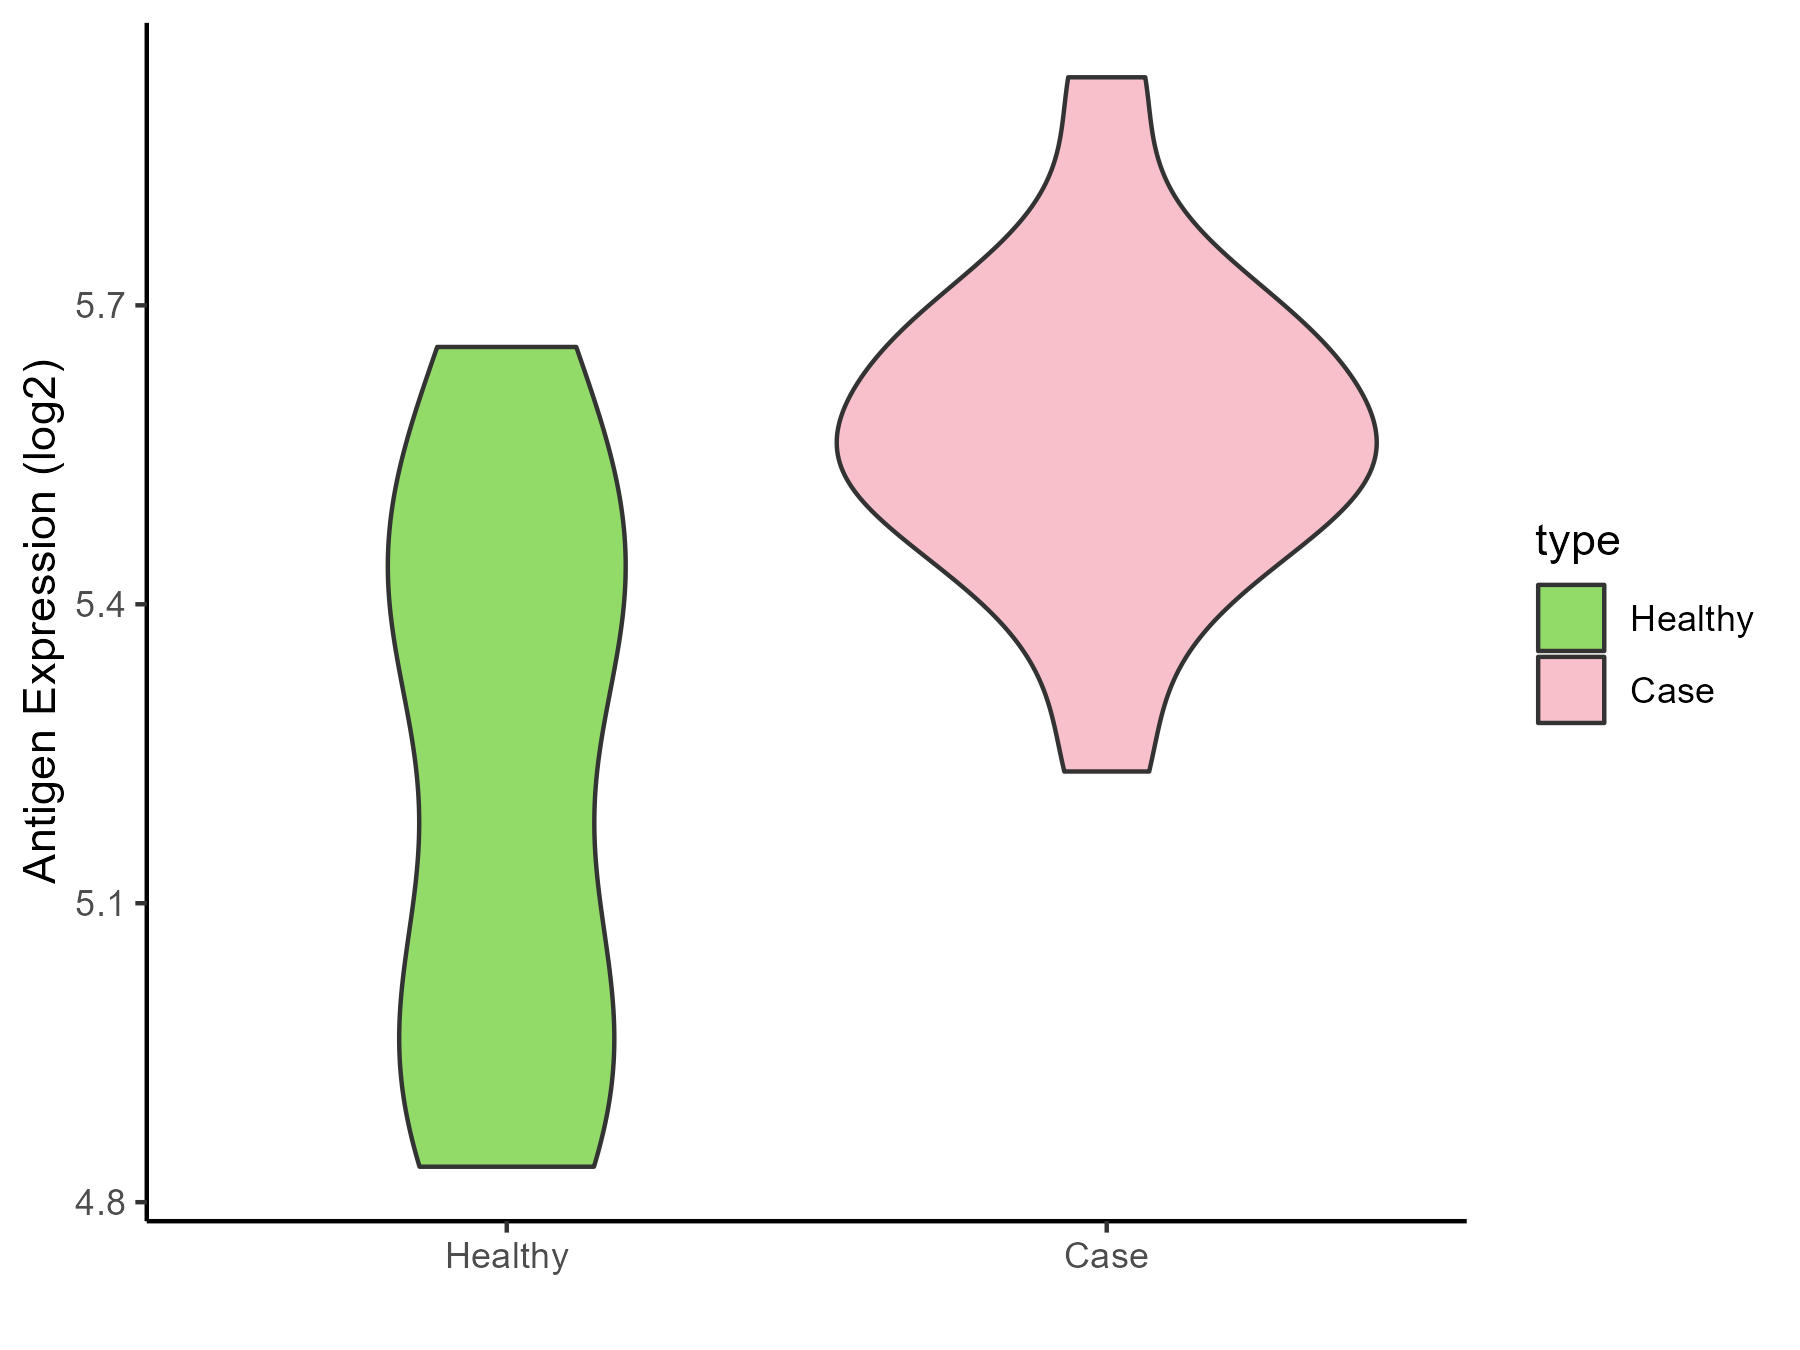
| The Studied Tissue | Muscle | |
| The Specific Disease | Muscular atrophy | |
| The Expression Level of Disease Section Compare with the Healthy Individual Tissue | p-value: 0.001161704; Fold-change: 0.231565306; Z-score: 0.80605852 | |
| Disease-specific Antigen Abundances |
|
Click to View the Clearer Original Diagram |
| Differential expression pattern of antigen in diseases | ||
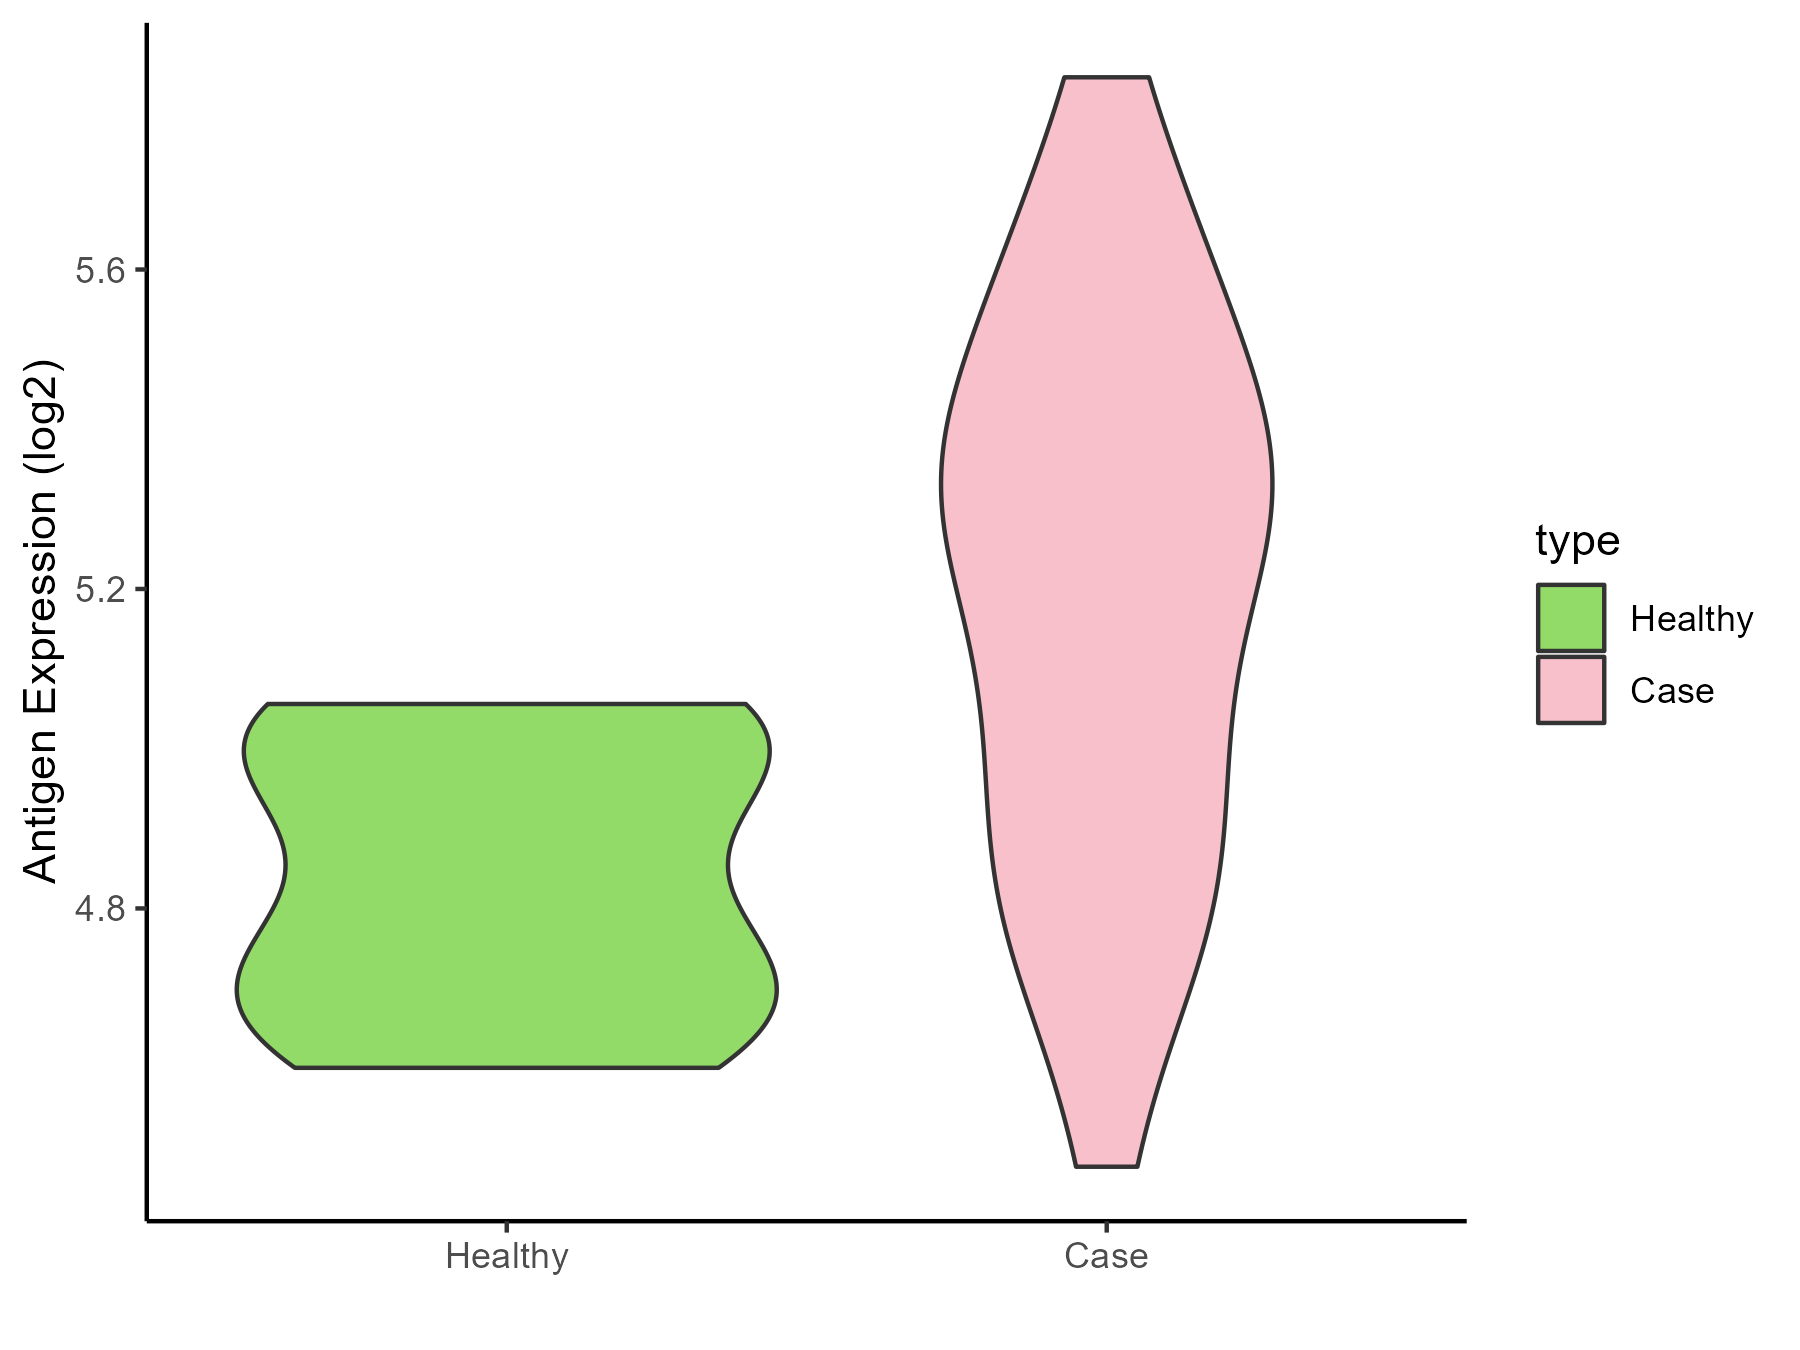
| The Studied Tissue | Muscle | |
| The Specific Disease | Myopathy | |
| The Expression Level of Disease Section Compare with the Healthy Individual Tissue | p-value: 0.000551983; Fold-change: 0.473056049; Z-score: 2.600369306 | |
| Disease-specific Antigen Abundances |
|
Click to View the Clearer Original Diagram |
References
