
Payload Information
General Information of This Payload (ID: PAY0UXDSB)
| Name |
DX-8951 derivative (DXd)
|
|||||
|---|---|---|---|---|---|---|
| Synonyms |
1599440-33-1; Dxd; OQM5SD32BQ; N-[(10S,23S)-10-ethyl-18-fluoro-10-hydroxy-19-methyl-5,9-dioxo-8-oxa-4,15-diazahexacyclo[14.7.1.02,14.04,13.06,11.020,24]tetracosa-1,6(11),12,14,16,18,20(24)-heptaen-23-yl]-2-hydroxyacetamide; Exatecan derivative for ADC; Acetamide, N-((1S,9S)-9-ethyl-5-fluoro-2,3,9,10,13,15-hexahydro-9-hydroxy-4-methyl-10,13-dioxo-1H,12H-benzo(de)pyrano(3',4':6,7)indolizino(1,2-b)quinolin-1-yl)-2-hydroxy-; N-((1S,9S)-9-Ethyl-5-fluoro-2,3,9,10,13,15-hexahydro-9-hydroxy-4-methyl-10,13-dioxo-1H,12H-benzo(de)pyrano(3',4':6,7)indolizino(1,2-b)quinolin-1-yl)-2-hydroxyacetamide; N-((1S,9S)-9-ethyl-5-fluoro-9-hydroxy-4-methyl-10,13-dioxo-2,3,9,10,13,15-hexahydro-1H,12H-benzo[de]pyrano[3',4':6,7]indolizino[1,2-b]quinolin-1-yl)-2-hydroxyacetamide; N-[(1S,9S)-9-Ethyl-5-fluoro-2,3,9,10,13,15-hexahydro-9-hydroxy-4-methyl-10,13-dioxo-1H,12H-benzo[de]pyrano[3',4':6,7]indolizino[1,2-b]quinolin-1-yl]-2-hydroxyacetamide; UNII-OQM5SD32BQ; SCHEMBL16485136; EX-A4319; HY-13631D; NSC825332; AT21797; NSC-825332; AC-32494; BP-27997; MS-29164; CS-0044752; A936339; N-[(10S,23S)-10-ethyl-18-fluoro-10-hydroxy-19-methyl-5,9-dioxo-8-oxa-4,15-diazahexacyclo[14.7.1.0,.0,.0,.0,tetracosa-1,6(11),12,14,16,18,20(24)-heptaen-23-yl]-2-hydroxyacetamide
Click to Show/Hide
|
|||||
| Target | DNA topoisomerase 1 (TOP1) | |||||
| Structure |
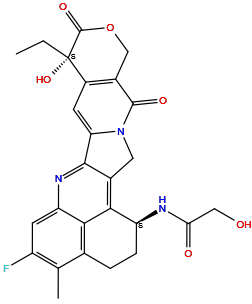
|
|||||
| Formula | C26H24FN3O6 |
|||||
| Isosmiles | CC[C@@]1(C2=C(COC1=O)C(=O)N3CC4=C5[C@H](CCC6=C5C(=CC(=C6C)F)N=C4C3=C2)NC(=O)CO)O |
|||||
| PubChem CID | ||||||
| InChI |
InChI=1S/C26H24FN3O6/c1-3-26(35)15-6-19-23-13(8-30(19)24(33)14(15)10-36-25(26)34)22-17(28-20(32)9-31)5-4-12-11(2)16(27)7-18(29-23)21(12)22/h6-7,17,31,35H,3-5,8-10H2,1-2H3,(H,28,32)/t17-,26-/m0/s1
|
|||||
| InChIKey |
PLXLYXLUCNZSAA-QLXKLKPCSA-N
|
|||||
| IUPAC Name |
N-[(10S,23S)-10-ethyl-18-fluoro-10-hydroxy-19-methyl-5,9-dioxo-8-oxa-4,15-diazahexacyclo[14.7.1.02,14.04,13.06,11.020,24]tetracosa-1,6(11),12,14,16,18,20(24)-heptaen-23-yl]-2-hydroxyacetamide
|
|||||
| Pharmaceutical Properties | Molecule Weight |
493.5 |
Polar area |
129 |
||
Complexity |
1080 |
xlogp Value |
0 |
|||
Heavy Count |
36 |
Rot Bonds |
3 |
|||
Hbond acc |
8 |
Hbond Donor |
3 |
|||
The activity data of This Payload
Each Antibody-drug Conjugate Related to This Payload
Full Information of The Activity Data of The ADC(s) Related to This Payload
H01L02-DXd [Investigative]
Discovered Using Cell Line-derived Xenograft Model
| Experiment 1 Reporting the Activity Date of This ADC | [2] | ||||
| Efficacy Data | Tumor Growth Inhibition value (TGI) | ≈ 0% | Negative CDH6 expression (CDH6-) | ||
| Method Description |
The CDH6-negative human ovarian tumor cell line ES-2 was subcutaneously inoculated at a dose of 1,000,000 cells to the right flank region of each female nude mouse (Day 0). On the day 7 of grouping, the antibody-drug conjugate H01L02-DXd was intravenously administered at doses of 3 mg/kg to thetail of each mouse.
|
||||
| In Vivo Model | ES-2 CDX model | ||||
| In Vitro Model | Ovarian clear cell adenocarcinoma | ES-2 cells | CVCL_3509 | ||
| Experiment 2 Reporting the Activity Date of This ADC | [2] | ||||
| Efficacy Data | Tumor Growth Inhibition value (TGI) | ≈ 0% | Negative CDH6 expression (CDH6-) | ||
| Method Description |
The CDH6-negative human ovarian tumor cell line ES-2 was subcutaneously inoculated at a dose of 1,000,000 cells to the right flank region of each female nude mouse (Day 0). On the day 7 of grouping, the antibody-drug conjugate H01L02-DXd was intravenously administered at doses of 1 mg/kg to thetail of each mouse.
|
||||
| In Vivo Model | ES-2 CDX model | ||||
| In Vitro Model | Ovarian clear cell adenocarcinoma | ES-2 cells | CVCL_3509 | ||
| Experiment 3 Reporting the Activity Date of This ADC | [2] | ||||
| Efficacy Data | Tumor Growth Inhibition value (TGI) | ≈ 41.87% | Positive CDH6 expression (CDH6+++/++) | ||
| Method Description |
The CDH6-positive human renal cell tumor cell line786-O was subcutaneously inoculated at a dose of 5,000,000 cells to the right flank regionof each male SCID mouse (Day 0). On the day 20 of grouping, the anti-body-drug conjugate H01L02-DXd was intravenously administered at doses of 1 mg/kg to thetail of each mouse.
|
||||
| In Vivo Model | 786-O CDX model | ||||
| In Vitro Model | Renal cell carcinoma | 786-O cells | CVCL_1051 | ||
| Experiment 4 Reporting the Activity Date of This ADC | [2] | ||||
| Efficacy Data | Tumor Growth Inhibition value (TGI) | ≈ 75.34% | Positive CDH6 expression (CDH6+++/++) | ||
| Method Description |
The CDH6-positive human renal cell tumor cell line786-O was subcutaneously inoculated at a dose of 5,000,000 cells to the right flank regionof each male SCID mouse (Day 0). On the day 20 of grouping, the anti-body-drug conjugate H01L02-DXd was intravenously administered at doses of 3 mg/kg to thetail of each mouse.
|
||||
| In Vivo Model | 786-O CDX model | ||||
| In Vitro Model | Renal cell carcinoma | 786-O cells | CVCL_1051 | ||
| Experiment 5 Reporting the Activity Date of This ADC | [2] | ||||
| Efficacy Data | Tumor Growth Inhibition value (TGI) | ≈ 79.79% | Positive CDH6 expression (CDH6+++/++) | ||
| Method Description |
The CDH6-positive human ovarian tumor cell line OVCAR-3 was subcutane-ously inoculated at a dose of 10,000,000 cells to the right flank region of each female nude mouse (Day 0). On the day 22 of grouping, theantibody-drug conjugate H01L02-DXd was intravenously administered at doses of 1 mg/kg to the tail of each mouse.
|
||||
| In Vivo Model | OVCAR-3 CDX model | ||||
| In Vitro Model | Ovarian serous adenocarcinoma | OVCAR-3 cells | CVCL_0465 | ||
| Experiment 6 Reporting the Activity Date of This ADC | [2] | ||||
| Efficacy Data | Tumor Growth Inhibition value (TGI) | ≈ 85.25% | Positive CDH6 expression (CDH6+++/++) | ||
| Method Description |
The CDH6-positive human renal cell tumor cell line 786-O was subcutaneously inoculated at a dose of 5,000,000 cells to the right flank regionof each male SCID mouse (Day 0). On the day 18 of grouping, H01L02-DXd was intravenously administered at a dose of 3 mg/kg to the tail of each mouse.
|
||||
| In Vivo Model | 786-O CDX model | ||||
| In Vitro Model | Renal cell carcinoma | 786-O cells | CVCL_1051 | ||
| Experiment 7 Reporting the Activity Date of This ADC | [2] | ||||
| Efficacy Data | Tumor Growth Inhibition value (TGI) | ≈ 88.96% | Positive CDH6 expression (CDH6+++/++) | ||
| Method Description |
The CDH6-positive human ovarian tumor cell line PA-1 was subcutaneously inoculatedat a dose of 8,500,000 cells to the right flank region of eachfemale nude mouse (Day 0). On the day 11 of grouping, the antibody-drug conjugate H01L02-DXd was intravenously administered at doses of 1 mg/kg to the tail of each mouse.
|
||||
| In Vivo Model | PA-1 CDX model | ||||
| In Vitro Model | Ovarian mixed germ cell tumor | PA-1 cells | CVCL_0479 | ||
| Experiment 8 Reporting the Activity Date of This ADC | [2] | ||||
| Efficacy Data | Tumor Growth Inhibition value (TGI) | ≈ 92.76% | Positive CDH6 expression (CDH6+++/++) | ||
| Method Description |
The CDH6-positive human ovarian tumor cell line OVCAR-3 was subcutane-ously inoculated at a dose of 10,000,000 cells to the right flank region of each female nude mouse (Day 0). On the day 22 of grouping, theantibody-drug conjugate H01L02-DXd was intravenously administered at doses of 3 mg/kg to the tail of each mouse.
|
||||
| In Vivo Model | OVCAR-3 CDX model | ||||
| In Vitro Model | Ovarian serous adenocarcinoma | OVCAR-3 cells | CVCL_0465 | ||
| Experiment 9 Reporting the Activity Date of This ADC | [2] | ||||
| Efficacy Data | Tumor Growth Inhibition value (TGI) | ≈ 98.37% | Positive CDH6 expression (CDH6+++/++) | ||
| Method Description |
The CDH6-positive human ovarian tumor cell line PA-1 was subcutaneously inoculatedat a dose of 8,500,000 cells to the right flank region of eachfemale nude mouse (Day 0). On the day 11 of grouping, the antibody-drug conjugate H01L02-DXd was intravenously administered at doses of 3 mg/kg to the tail of each mouse.
|
||||
| In Vivo Model | PA-1 CDX model | ||||
| In Vitro Model | Ovarian mixed germ cell tumor | PA-1 cells | CVCL_0479 | ||
Revealed Based on the Cell Line Data
| Experiment 1 Reporting the Activity Date of This ADC | [2] | ||||
| Efficacy Data | Half Maximal Inhibitory Concentration (IC50) |
0.01-0.10 nM
|
Positive CDH6 expression (CDH6+++/++) | ||
| Method Description |
CDH6-positive human ovarian tumor cell line PA-1 was seeded over a 96-well plate at 2,000 cells/100 L/well in MEM medium supplemented with 10% FBS, and the cells were then cultured overnight. On the next day, each of the 4 humanized hG019-drug conjugates or NOV0712-DM4 was added to the cells.
|
||||
| In Vitro Model | Ovarian mixed germ cell tumor | PA-1 cells | CVCL_0479 | ||
CAC10-DT [Investigative]
Discovered Using Cell Line-derived Xenograft Model
| Experiment 1 Reporting the Activity Date of This ADC | [3] | ||||
| Efficacy Data | Tumor Growth Inhibition value (TGI) | ≈ 0% | Low CD30 expression (CD30+) | ||
| Method Description |
Tumor cells, as suspensions, were implanted subcutaneously in SCID or nude mice. Upon tumor engraftment, mice were randomized to study groups (5 mice per group) when the average tumor volume reached about 100 mm3. The ADC or vehicle controls were dosed once via intraperitoneal injection. The dose of cAC10-DT=3 mg/kg.
|
||||
| In Vivo Model | HD CDX model | ||||
| In Vitro Model | Hodgkin lymphoma | L-428 cells | CVCL_1361 | ||
| Experiment 2 Reporting the Activity Date of This ADC | [3] | ||||
| Efficacy Data | Tumor Growth Inhibition value (TGI) | ≈ 0% | Low CD30 expression (CD30+) | ||
| Method Description |
Tumor cells, as suspensions, were implanted subcutaneously in SCID or nude mice. Upon tumor engraftment, mice were randomized to study groups (5 mice per group) when the average tumor volume reached about 100 mm3. The ADC or vehicle controls were dosed once via intraperitoneal injection. The dose of cAC10-DT=1 mg/kg.
|
||||
| In Vivo Model | HD CDX model | ||||
| In Vitro Model | Hodgkin lymphoma | L-428 cells | CVCL_1361 | ||
| Experiment 3 Reporting the Activity Date of This ADC | [3] | ||||
| Efficacy Data | Tumor Growth Inhibition value (TGI) | ≈ 72% | Positive CD30 expression (CD30+++/++) | ||
| Method Description |
Tumor cells, as suspensions, were implanted subcutaneously in SCID or nude mice. Upon tumor engraftment, mice were randomized to study groups (5 mice per group) when the average tumor volume reached about 100 mm3. The ADC or vehicle controls were dosed once via intraperitoneal injection. The dose of cAC10-DT=3 mg/kg.
|
||||
| In Vivo Model | ALCL CDX model | ||||
| In Vitro Model | ALK-positive anaplastic large cell lymphoma | Karpas-299 cells/Karpas BVR cells | CVCL_1324 | ||
| Experiment 4 Reporting the Activity Date of This ADC | [3] | ||||
| Efficacy Data | Tumor Growth Inhibition value (TGI) | ≈ 90% | Positive CD30 expression (CD30+++/++) | ||
| Method Description |
Tumor cells, as suspensions, were implanted subcutaneously in SCID or nude mice. Upon tumor engraftment, mice were randomized to study groups (5 mice per group) when the average tumor volume reached about 100 mm3. The ADC or vehicle controls were dosed once via intraperitoneal injection. The dose of cAC10-DT=10 mg/kg.
|
||||
| In Vivo Model | ALCL CDX model | ||||
| In Vitro Model | ALK-positive anaplastic large cell lymphoma | Karpas-299 cells/Karpas BVR cells | CVCL_1324 | ||
| Experiment 5 Reporting the Activity Date of This ADC | [3] | ||||
| Efficacy Data | Half Maximal Inhibitory Concentration (IC50) |
7 ng/mL
|
High CD30 expression (CD30+++; 285,000 CD30 molecules/cell) | ||
| Method Description |
Serial dilutions of ADCs in cell culture media were prepared at 4x working concentrations, and 50 uL of each dilution was added to the 96-well plates. Following addition of test articles, cells were incubated for 4 days at 37°C, after which growth inhibition was assessed by the addition of CellTiter-Glo and luminescence was measured on a plate reader.
Click to Show/Hide
|
||||
| In Vitro Model | Precursor T-cell acute lymphoblastic leukemia | ALCL cells | CVCL_A036 | ||
| Experiment 6 Reporting the Activity Date of This ADC | [3] | ||||
| Efficacy Data | Half Maximal Inhibitory Concentration (IC50) |
16 ng/mL
|
High CD30 expression (CD30+++; 180,000 CD30 molecules/cell) | ||
| Method Description |
Serial dilutions of ADCs in cell culture media were prepared at 4x working concentrations, and 50 uL of each dilution was added to the 96-well plates. Following addition of test articles, cells were incubated for 4 days at 37°C, after which growth inhibition was assessed by the addition of CellTiter-Glo and luminescence was measured on a plate reader.
Click to Show/Hide
|
||||
| In Vitro Model | Anaplastic large cell lymphoma | DEL/BVR cells | CVCL_1170 | ||
| Experiment 7 Reporting the Activity Date of This ADC | [3] | ||||
| Efficacy Data | Half Maximal Inhibitory Concentration (IC50) |
26 ng/mL
|
High CD30 expression (CD30+++; 400,000 CD30 molecules/cell) | ||
| Method Description |
Serial dilutions of ADCs in cell culture media were prepared at 4x working concentrations, and 50 uL of each dilution was added to the 96-well plates. Following addition of test articles, cells were incubated for 4 days at 37°C, after which growth inhibition was assessed by the addition of CellTiter-Glo and luminescence was measured on a plate reader.
Click to Show/Hide
|
||||
| In Vitro Model | Hodgkin's disease | L540cy cells | Homo sapiens | ||
| Experiment 8 Reporting the Activity Date of This ADC | [3] | ||||
| Efficacy Data | Half Maximal Inhibitory Concentration (IC50) | > 1000 ng/mL | Low CD30 expression (CD30+; 70,000 CD30 molecules/cell) | ||
| Method Description |
Serial dilutions of ADCs in cell culture media were prepared at 4x working concentrations, and 50 uL of each dilution was added to the 96-well plates. Following addition of test articles, cells were incubated for 4 days at 37°C, after which growth inhibition was assessed by the addition of CellTiter-Glo and luminescence was measured on a plate reader.
Click to Show/Hide
|
||||
| In Vitro Model | Hodgkin lymphoma | L-428 cells | CVCL_1361 | ||
| Experiment 9 Reporting the Activity Date of This ADC | [3] | ||||
| Efficacy Data | Half Maximal Inhibitory Concentration (IC50) | > 1000 ng/mL | High CD30 expression (CD30+++; 320,000 CD30 molecules/cell) | ||
| Method Description |
Serial dilutions of ADCs in cell culture media were prepared at 4x working concentrations, and 50 uL of each dilution was added to the 96-well plates. Following addition of test articles, cells were incubated for 4 days at 37°C, after which growth inhibition was assessed by the addition of CellTiter-Glo and luminescence was measured on a plate reader.
Click to Show/Hide
|
||||
| In Vitro Model | ALK-positive anaplastic large cell lymphoma | Karpas-299 cells | CVCL_1324 | ||
NOV0712-DXd [Investigative]
Discovered Using Cell Line-derived Xenograft Model
| Experiment 1 Reporting the Activity Date of This ADC | [2] | ||||
| Efficacy Data | Tumor Growth Inhibition value (TGI) | ≈ 73.20% | Positive CDH6 expression (CDH6+++/++) | ||
| Method Description |
The CDH6-positive human ovarian tumor cell line PA-1 was subcutaneously inoculatedat a dose of 8,500,000 cells to the right flank region of eachfemale nude mouse (Day 0). On the day 11 of grouping, the antibody-drug conjugate NOV0712-DXd was intravenously administered at doses of 1 mg/kg to the tail of each mouse.
|
||||
| In Vivo Model | PA-1 CDX model | ||||
| In Vitro Model | Ovarian mixed germ cell tumor | PA-1 cells | CVCL_0479 | ||
| Experiment 2 Reporting the Activity Date of This ADC | [2] | ||||
| Efficacy Data | Tumor Growth Inhibition value (TGI) | ≈ 90.12% | Positive CDH6 expression (CDH6+++/++) | ||
| Method Description |
The CDH6-positive human ovarian tumor cell line PA-1 was subcutaneously inoculatedat a dose of 8,500,000 cells to the right flank region of eachfemale nude mouse (Day 0). On the day 11 of grouping, the antibody-drug conjugate NOV0712-DXd was intravenously administered at doses of 3 mg/kg to the tail of each mouse.
|
||||
| In Vivo Model | PA-1 CDX model | ||||
| In Vitro Model | Ovarian mixed germ cell tumor | PA-1 cells | CVCL_0479 | ||
H02L03-DXd [Investigative]
Discovered Using Cell Line-derived Xenograft Model
| Experiment 1 Reporting the Activity Date of This ADC | [2] | ||||
| Efficacy Data | Tumor Growth Inhibition value (TGI) | ≈ 87.59% | Positive CDH6 expression (CDH6+++/++) | ||
| Method Description |
The CDH6-positive human renal cell tumor cell line 786-O was subcutaneously inoculated at a dose of 5,000,000 cells to the right flank regionof each male SCID mouse (Day 0). On the day 18 of grouping, H02L03-DXd was intravenously administered at a dose of 3 mg/kg to the tail of each mouse.
|
||||
| In Vivo Model | 786-O CDX model | ||||
| In Vitro Model | Renal cell carcinoma | 786-O cells | CVCL_1051 | ||
Revealed Based on the Cell Line Data
| Experiment 1 Reporting the Activity Date of This ADC | [2] | ||||
| Efficacy Data | Half Maximal Inhibitory Concentration (IC50) |
0.1 nM
|
Positive CDH6 expression (CDH6+++/++) | ||
| Method Description |
CDH6-positive human ovarian tumor cell line PA-1 was seeded over a 96-well plate at 2,000 cells/100 L/well in MEM medium supplemented with 10% FBS, and the cells were then cultured overnight. On the next day, each of the 4 humanized hG019-drug conjugates or NOV0712-DM4 was added to the cells.
|
||||
| In Vitro Model | Ovarian mixed germ cell tumor | PA-1 cells | CVCL_0479 | ||
H04L02-DXd [Investigative]
Discovered Using Cell Line-derived Xenograft Model
| Experiment 1 Reporting the Activity Date of This ADC | [2] | ||||
| Efficacy Data | Tumor Growth Inhibition value (TGI) | ≈ 88.53% | Positive CDH6 expression (CDH6+++/++) | ||
| Method Description |
The CDH6-positive human renal cell tumor cell line 786-O was subcutaneously inoculated at a dose of 5,000,000 cells to the right flank regionof each male SCID mouse (Day 0). On the day 18 of grouping, H04L02-DXd was intravenously administered at a dose of 3 mg/kg to the tail of each mouse.
|
||||
| In Vivo Model | 786-O CDX model | ||||
| In Vitro Model | Renal cell carcinoma | 786-O cells | CVCL_1051 | ||
Revealed Based on the Cell Line Data
| Experiment 1 Reporting the Activity Date of This ADC | [2] | ||||
| Efficacy Data | Half Maximal Inhibitory Concentration (IC50) |
0.10-1.00 nM
|
Positive CDH6 expression (CDH6+++/++) | ||
| Method Description |
CDH6-positive human ovarian tumor cell line PA-1 was seeded over a 96-well plate at 2,000 cells/100 L/well in MEM medium supplemented with 10% FBS, and the cells were then cultured overnight. On the next day, each of the 4 humanized hG019-drug conjugates or NOV0712-DM4 was added to the cells.
|
||||
| In Vitro Model | Ovarian mixed germ cell tumor | PA-1 cells | CVCL_0479 | ||
H02L02-DXd [Investigative]
Discovered Using Cell Line-derived Xenograft Model
| Experiment 1 Reporting the Activity Date of This ADC | [2] | ||||
| Efficacy Data | Tumor Growth Inhibition value (TGI) | ≈ 92% | Positive CDH6 expression (CDH6+++/++) | ||
| Method Description |
The CDH6-positive human renal cell tumor cell line 786-O was subcutaneously inoculated at a dose of 5,000,000 cells to the right flank regionof each male SCID mouse (Day 0). On the day 18 of grouping, H02L02-DXd was intravenously administered at a dose of 3 mg/kg to the tail of each mouse.
|
||||
| In Vivo Model | 786-O CDX model | ||||
| In Vitro Model | Renal cell carcinoma | 786-O cells | CVCL_1051 | ||
Revealed Based on the Cell Line Data
| Experiment 1 Reporting the Activity Date of This ADC | [2] | ||||
| Efficacy Data | Half Maximal Inhibitory Concentration (IC50) |
0.01-0.10 nM
|
Positive CDH6 expression (CDH6+++/++) | ||
| Method Description |
CDH6-positive human ovarian tumor cell line PA-1 was seeded over a 96-well plate at 2,000 cells/100 L/well in MEM medium supplemented with 10% FBS, and the cells were then cultured overnight. On the next day, each of the 4 humanized hG019-drug conjugates or NOV0712-DM4 was added to the cells.
|
||||
| In Vitro Model | Ovarian mixed germ cell tumor | PA-1 cells | CVCL_0479 | ||
H00-DT [Investigative]
Discovered Using Cell Line-derived Xenograft Model
| Experiment 1 Reporting the Activity Date of This ADC | [3] | ||||
| Efficacy Data | Half Maximal Inhibitory Concentration (IC50) | > 1000 ng/mL | High CD30 expression (CD30+++; 180,000 CD30 molecules/cell) | ||
| Method Description |
Serial dilutions of ADCs in cell culture media were prepared at 4x working concentrations, and 50 uL of each dilution was added to the 96-well plates. Following addition of test articles, cells were incubated for 4 days at 37°C, after which growth inhibition was assessed by the addition of CellTiter-Glo and luminescence was measured on a plate reader.
Click to Show/Hide
|
||||
| In Vitro Model | Anaplastic large cell lymphoma | DEL/BVR cells | CVCL_1170 | ||
| Experiment 2 Reporting the Activity Date of This ADC | [3] | ||||
| Efficacy Data | Half Maximal Inhibitory Concentration (IC50) | > 1000 ng/mL | High CD30 expression (CD30+++; 285,000 CD30 molecules/cell) | ||
| Method Description |
Serial dilutions of ADCs in cell culture media were prepared at 4x working concentrations, and 50 uL of each dilution was added to the 96-well plates. Following addition of test articles, cells were incubated for 4 days at 37°C, after which growth inhibition was assessed by the addition of CellTiter-Glo and luminescence was measured on a plate reader.
Click to Show/Hide
|
||||
| In Vitro Model | Precursor T-cell acute lymphoblastic leukemia | ALCL cells | CVCL_A036 | ||
| Experiment 3 Reporting the Activity Date of This ADC | [3] | ||||
| Efficacy Data | Half Maximal Inhibitory Concentration (IC50) | > 1000 ng/mL | Low CD30 expression (CD30+; 70,000 CD30 molecules/cell) | ||
| Method Description |
Serial dilutions of ADCs in cell culture media were prepared at 4x working concentrations, and 50 uL of each dilution was added to the 96-well plates. Following addition of test articles, cells were incubated for 4 days at 37°C, after which growth inhibition was assessed by the addition of CellTiter-Glo and luminescence was measured on a plate reader.
Click to Show/Hide
|
||||
| In Vitro Model | Hodgkin lymphoma | L-428 cells | CVCL_1361 | ||
| Experiment 4 Reporting the Activity Date of This ADC | [3] | ||||
| Efficacy Data | Half Maximal Inhibitory Concentration (IC50) | > 1000 ng/mL | High CD30 expression (CD30+++; 320,000 CD30 molecules/cell) | ||
| Method Description |
Serial dilutions of ADCs in cell culture media were prepared at 4x working concentrations, and 50 uL of each dilution was added to the 96-well plates. Following addition of test articles, cells were incubated for 4 days at 37°C, after which growth inhibition was assessed by the addition of CellTiter-Glo and luminescence was measured on a plate reader.
Click to Show/Hide
|
||||
| In Vitro Model | ALK-positive anaplastic large cell lymphoma | Karpas-299 cells | CVCL_1324 | ||
| Experiment 5 Reporting the Activity Date of This ADC | [3] | ||||
| Efficacy Data | Half Maximal Inhibitory Concentration (IC50) | > 1000 ng/mL | High CD30 expression (CD30+++; 400,000 CD30 molecules/cell) | ||
| Method Description |
Serial dilutions of ADCs in cell culture media were prepared at 4x working concentrations, and 50 uL of each dilution was added to the 96-well plates. Following addition of test articles, cells were incubated for 4 days at 37°C, after which growth inhibition was assessed by the addition of CellTiter-Glo and luminescence was measured on a plate reader.
Click to Show/Hide
|
||||
| In Vitro Model | Hodgkin's disease | L540cy cells | Homo sapiens | ||
40H3-Deruxtecan [Investigative]
Revealed Based on the Cell Line Data
| Experiment 1 Reporting the Activity Date of This ADC | [4] | ||||
| Efficacy Data | Half Maximal Inhibitory Concentration (IC50) |
9.32 nM
|
High EGFR expression (EGFR+++) | ||
| Method Description |
1 x10⁴ cells per well in a volume of 100 ul were plated in 96-well tissue culture plates. After 24 h, ADCs were added at the indicated concentrations. After 72 h, the medium was removed and the viability was determined using the CellTiter-Glo luminescent cell viability assay kit.
|
||||
| In Vitro Model | Breast adenocarcinoma | MDA-MB-468 cells | CVCL_0419 | ||
| Experiment 2 Reporting the Activity Date of This ADC | [4] | ||||
| Efficacy Data | Half Maximal Inhibitory Concentration (IC50) |
70.36 nM
|
Moderate EGFR expression (EGFR++) | ||
| Method Description |
1 x10⁴ cells per well in a volume of 100 ul were plated in 96-well tissue culture plates. After 24 h, ADCs were added at the indicated concentrations. After 72 h, the medium was removed and the viability was determined using the CellTiter-Glo luminescent cell viability assay kit.
|
||||
| In Vitro Model | Invasive breast carcinoma of no special type | BT-20 cells | CVCL_0178 | ||
| Experiment 3 Reporting the Activity Date of This ADC | [4] | ||||
| Efficacy Data | Half Maximal Inhibitory Concentration (IC50) |
90.21 nM
|
High EGFR expression (EGFR+++) | ||
| Method Description |
1 x10⁴ cells per well in a volume of 100 ul were plated in 96-well tissue culture plates. After 24 h, ADCs were added at the indicated concentrations. After 72 h, the medium was removed and the viability was determined using the CellTiter-Glo luminescent cell viability assay kit.
|
||||
| In Vitro Model | Skin squamous cell carcinoma | A431 cells | CVCL_0037 | ||
| Experiment 4 Reporting the Activity Date of This ADC | [4] | ||||
| Efficacy Data | Half Maximal Inhibitory Concentration (IC50) | > 100 nM | Negative EGFR expression (EGFR-) | ||
| Method Description |
1 x10⁴ cells per well in a volume of 100 ul were plated in 96-well tissue culture plates. After 24 h, ADCs were added at the indicated concentrations. After 72 h, the medium was removed and the viability was determined using the CellTiter-Glo luminescent cell viability assay kit.
|
||||
| In Vitro Model | Breast adenocarcinoma | MDA-MB-231 cells | CVCL_0062 | ||
AU2023279443A1 Example A11 [Investigative]
Discovered Using Cell Line-derived Xenograft Model
| Experiment 1 Reporting the Activity Date of This ADC | [5] | ||||
| Efficacy Data | Tumor Growth lnhibition value (TGl) | > 50% | Positive HER2 expression (HER2+++/++) | ||
| Method Description |
A mixed solvent of PBS and and Matrigel was used to prepare a cell suspension of 5.0x10⁷ cells / mL. The prepared cell suspension was subcutaneously injected to the right flank region of female BALB/c-nu/nu mice at 0.1 mL per mouse. Individuals having a tumor volume within a range of 50 to 500 mm 3 were selected. test compound at a concentration of 3 mg/kg or the solvent alone was intravenously administered. the tumor volume was measured at Day 0 and Day 21.
Click to Show/Hide
|
||||
| In Vivo Model | NCI-N87 female BALB/c-nu/nu mice model | ||||
DS-1062 [Investigative]
Discovered Using Patient-derived Xenograft Model
| Experiment 1 Reporting the Activity Date of This ADC | [6] | ||||
| Efficacy Data | Tumor Growth lnhibition value (TGl) |
72%
|
Positive TROP2 expression (TROP2+++/++) | ||
| Method Description |
This PDX was obtained in accordance with appropriate consent procedures. This ovarian PDX model was subcutaneously passaged in vivo as fragments from animal to animal in nude mice. When tumors reached approximately 250 mm 3 similar-sized tumors were randomly assigned to treatment groups, DS-1062 was administered as a single dose at 10 mg/kg on day 1. Duration of dosing was 21 days. TGI responses (Day 28 TGI%) was measurede.
Click to Show/Hide
|
||||
| In Vivo Model | CTG-3718 human patient-derived xenograft (PDX) model | ||||
| Experiment 2 Reporting the Activity Date of This ADC | [6] | ||||
| Efficacy Data | Tumor Growth lnhibition value (TGl) |
88%
|
Positive TROP2 expression (TROP2+++/++) | ||
| Method Description |
Female Nude mice (Charles River) aged 5-8 weeks were used, following 7 days acclimatisation before entry into the study. The human patient-derived xenograft (PDX) model, CTG-3303, was established from fragments of freshly resected tumor of a triple negative breast cancer (TNBC) patient whom relapsed on treatment with PARP inhibitor talazoparib. This PDX was obtained in accordance with appropriate consent procedures. This TNBC PDX model was subcutaneously passaged in vivo as fragments from animal to animal in nude mice. When tumors reached approximately 250 mm 3 , similar-sized tumors were randomly assigned to treatment groups. DS-1062 was administered as a single dose at 10 mg/kg on day 1. Duration of dosing schedule was 21 days. TGI responses (Day 46 TGI%) was measurede.
Click to Show/Hide
|
||||
| In Vivo Model | CTG-3303 human patient-derived xenograft (PDX) model | ||||
Discovered Using Cell Line-derived Xenograft Model
| Experiment 1 Reporting the Activity Date of This ADC | [6] | ||||
| Efficacy Data | Tumor Growth lnhibition value (TGl) |
82%
|
Positive TROP2 expression (TROP2+++/++) | ||
| Method Description |
Nude mice (Charles River) aged 5-8 weeks wereused,following 7 days acclimatisation before entry intothe study.5x106 NCI-N87 tumor cells (gastric cancercell line) (1:1 in Matrigel)were implantedsubcutaneously onto the flank of the female Nude mice.When tumors reached approximately 250 mm,similar-sizedtumors were randomly assigned to treatment groups, DS-1062 was administered as a single dose at 10 mg/kg on day 1. Duration of dosing schedule was 21 days.
Click to Show/Hide
|
||||
| In Vivo Model | NCI-N87 Xenograft model | ||||
38354417 T-DL7 [Investigative]
Revealed Based on the Cell Line Data
| Experiment 1 Reporting the Activity Date of This ADC | [7] | ||||
| Efficacy Data | Half Maximal inhibitory Concentration (lC50) |
0.009 nM
|
High HER2 expression (HER2 +++) | ||
| Method Description |
A total of 30,000 SK-BR-3 (HER2-high) cells were seeded either as monocultures or cocultures in TC-treated 48-well microtiter plates (Greiner Bio-One, catalog no. 667180) and treated with 1.0 or 0.1 nmol/L ADCs diluted in growth medium.
|
||||
| In Vitro Model | Breast adenocarcinoma | SK-BR-3 cells | CVCL_0033 | ||
| Experiment 2 Reporting the Activity Date of This ADC | [7] | ||||
| Efficacy Data | Half Maximal inhibitory Concentration (lC50) | > 30 nM | Negative HER2 expression (HER2-) | ||
| Method Description |
A total of 10,000 MDA-MB-468 (HER2-negative) cells were seeded either as monocultures or cocultures in TC-treated 48-well microtiter plates (Greiner Bio-One, catalog no. 667180) and treated with 1.0 or 0.1 nmol/L ADCs diluted in growth medium.
|
||||
| In Vitro Model | Breast adenocarcinoma | MDA-MB-468 cells | CVCL_0419 | ||
H01L02-ADC [Investigative]
Revealed Based on the Cell Line Data
| Experiment 1 Reporting the Activity Date of This ADC | [8] | ||||
| Efficacy Data | Half Maximal inhibitory Concentration (lC50) |
0.0572 nM
|
High Nectin-4 expression (Nectin-4 +++) | ||
| Method Description |
Ab1 ADC was tested in T24 mScarlet clone 5 nectin-4 negative cells;and with a DAR of 8
|
||||
| In Vitro Model | Bladder carcinoma | T24 mScarlet clone 5 nectin-4 negative cells | CVCL_0554 | ||
ICAM-1-Dxd [Investigative]
Revealed Based on the Cell Line Data
| Experiment 1 Reporting the Activity Date of This ADC | [9] | ||||
| Efficacy Data | Half Maximal inhibitory Concentration (lC50) |
0.075 nM
|
Positive ICAM-1 expression (ICAM-1+++/++) | ||
| Method Description |
Cells from triple-negative breast cancer were propagated in slides with 96 chambers, each well containing 5000 cells. The medium was replaced with medium supplemented with nanoparticle Nab PTX, IgG-Dxd, or ICAM-1-Dxd at various concentrations. After 72 h, the toxic effects on the cells were assessed via a CCK-8 test. In brief, the medium containing the pharmaceuticals was discarded, and the cells were carefully rinsed with chilled PBS. The samples were subsequently incubated in a CCK-8 solution maintained at 37 °C for 4 h. The degree to which cell growth was suppressed was determined by comparing the optical density of agent-exposed cells to that of untreated control cells. In addition, extracellular ATP concentrations were quantified via a Beyotime ATP detection kit (S0026).
Click to Show/Hide
|
||||
| In Vitro Model | Mammary carcinoma | 4T1 cells | CVCL_0125 | ||
| Experiment 2 Reporting the Activity Date of This ADC | [9] | ||||
| Efficacy Data | Half Maximal inhibitory Concentration (lC50) |
0.132 nM
|
Positive ICAM-1 expression (ICAM-1+++/++) | ||
| Method Description |
Cells from triple-negative breast cancer were propagated in slides with 96 chambers, each well containing 5000 cells. The medium was replaced with medium supplemented with nanoparticle Nab PTX, IgG-Dxd, or ICAM-1-Dxd at various concentrations. After 72 h, the toxic effects on the cells were assessed via a CCK-8 test. In brief, the medium containing the pharmaceuticals was discarded, and the cells were carefully rinsed with chilled PBS. The samples were subsequently incubated in a CCK-8 solution maintained at 37 °C for 4 h. The degree to which cell growth was suppressed was determined by comparing the optical density of agent-exposed cells to that of untreated control cells. In addition, extracellular ATP concentrations were quantified via a Beyotime ATP detection kit (S0026).
Click to Show/Hide
|
||||
| In Vitro Model | Breast adenocarcinoma | MDA-MB-231 cells | CVCL_0062 | ||
| Experiment 3 Reporting the Activity Date of This ADC | [9] | ||||
| Efficacy Data | Half Maximal inhibitory Concentration (lC50) |
0.141 nM
|
Positive ICAM-1 expression (ICAM-1+++/++) | ||
| Method Description |
Cells from triple-negative breast cancer were propagated in slides with 96 chambers, each well containing 5000 cells. The medium was replaced with medium supplemented with nanoparticle Nab PTX, IgG-Dxd, or ICAM-1-Dxd at various concentrations. After 72 h, the toxic effects on the cells were assessed via a CCK-8 test. In brief, the medium containing the pharmaceuticals was discarded, and the cells were carefully rinsed with chilled PBS. The samples were subsequently incubated in a CCK-8 solution maintained at 37 °C for 4 h. The degree to which cell growth was suppressed was determined by comparing the optical density of agent-exposed cells to that of untreated control cells. In addition, extracellular ATP concentrations were quantified via a Beyotime ATP detection kit (S0026).
Click to Show/Hide
|
||||
| In Vitro Model | Breast ductal carcinoma | BT-549 cells | CVCL_1092 | ||
aHer2- (AL4c-LP13C)n [Investigative]
Revealed Based on the Cell Line Data
| Experiment 1 Reporting the Activity Date of This ADC | [10] | ||||
| Efficacy Data | Half Maximal inhibitory Concentration (lC50) |
0.106 nM
|
High HER2 expression (HER2 +++) | ||
| Method Description |
The cell line used in the anti-proliferation assays was SK-BR-3, a human breast, adenocarcinoma (pleural effusion) cell line; The cells were grown in McCoy's 5a Medium+10% FBS. To run the assay, the cells (80 ul, 1000 cells) were added to each well in a 96-well plate and incubated for 24 hours at 37°C. with CO,. Next, the cells were treated with test compounds (20 ul) at various concentrations in appropriate cell culture medium (total volume, 0.1 mL). The control wells contain cells and the medium but lack the test compounds. The plates were incubated for 144
hours at 37°C. with CO,. CTG reagent was then added to the wells (100 il). After the plates were shaken for 10 min and then incubated for 10 min at room temperature, paste the clear bottom with white back seal and record luminescence with Envision. The inhibition % was calculated according to the following equation: inhibition %=[1- (assay-blank)/ (control-blank)|x100.
Click to Show/Hide
|
||||
| In Vitro Model | Breast adenocarcinoma | SK-BR-3 cells | CVCL_0033 | ||
aHer2- (AL7-LP1)n [Investigative]
Revealed Based on the Cell Line Data
| Experiment 1 Reporting the Activity Date of This ADC | [10] | ||||
| Efficacy Data | Half Maximal inhibitory Concentration (lC50) |
0.114 nM
|
High HER2 expression (HER2 +++) | ||
| Method Description |
The cell line used in the anti-proliferation assays was SK-BR-3, a human breast, adenocarcinoma (pleural effusion) cell line; The cells were grown in McCoy's 5a Medium+10% FBS. To run the assay, the cells (80 ul, 1000 cells) were added to each well in a 96-well plate and incubated for 24 hours at 37°C. with CO,. Next, the cells were treated with test compounds (20 ul) at various concentrations in appropriate cell culture medium (total volume, 0.1 mL). The control wells contain cells and the medium but lack the test compounds. The plates were incubated for 144
hours at 37°C. with CO,. CTG reagent was then added to the wells (100 il). After the plates were shaken for 10 min and then incubated for 10 min at room temperature, paste the clear bottom with white back seal and record luminescence with Envision. The inhibition % was calculated according to the following equation: inhibition %=[1- (assay-blank)/ (control-blank)|x100.
Click to Show/Hide
|
||||
| In Vitro Model | Breast adenocarcinoma | SK-BR-3 cells | CVCL_0033 | ||
aHer2- (AL7-LP13)n [Investigative]
Revealed Based on the Cell Line Data
| Experiment 1 Reporting the Activity Date of This ADC | [10] | ||||
| Efficacy Data | Half Maximal inhibitory Concentration (lC50) |
0.123 nM
|
High HER2 expression (HER2 +++) | ||
| Method Description |
The cell line used in the anti-proliferation assays was SK-BR-3, a human breast, adenocarcinoma (pleural effusion) cell line; The cells were grown in McCoy's 5a Medium+10% FBS. To run the assay, the cells (80 ul, 1000 cells) were added to each well in a 96-well plate and incubated for 24 hours at 37°C. with CO,. Next, the cells were treated with test compounds (20 ul) at various concentrations in appropriate cell culture medium (total volume, 0.1 mL). The control wells contain cells and the medium but lack the test compounds. The plates were incubated for 144
hours at 37°C. with CO,. CTG reagent was then added to the wells (100 il). After the plates were shaken for 10 min and then incubated for 10 min at room temperature, paste the clear bottom with white back seal and record luminescence with Envision. The inhibition % was calculated according to the following equation: inhibition %=[1- (assay-blank)/ (control-blank)|x100.
Click to Show/Hide
|
||||
| In Vitro Model | Breast adenocarcinoma | SK-BR-3 cells | CVCL_0033 | ||
aHer2- (AL11a-LP13)n [Investigative]
Revealed Based on the Cell Line Data
| Experiment 1 Reporting the Activity Date of This ADC | [10] | ||||
| Efficacy Data | Half Maximal inhibitory Concentration (lC50) |
0.151 nM
|
High HER2 expression (HER2 +++) | ||
| Method Description |
The cell line used in the anti-proliferation assays was SK-BR-3, a human breast, adenocarcinoma (pleural effusion) cell line; The cells were grown in McCoy's 5a Medium+10% FBS. To run the assay, the cells (80 ul, 1000 cells) were added to each well in a 96-well plate and incubated for 24 hours at 37°C. with CO,. Next, the cells were treated with test compounds (20 ul) at various concentrations in appropriate cell culture medium (total volume, 0.1 mL). The control wells contain cells and the medium but lack the test compounds. The plates were incubated for 144
hours at 37°C. with CO,. CTG reagent was then added to the wells (100 il). After the plates were shaken for 10 min and then incubated for 10 min at room temperature, paste the clear bottom with white back seal and record luminescence with Envision. The inhibition % was calculated according to the following equation: inhibition %=[1- (assay-blank)/ (control-blank)|x100.
Click to Show/Hide
|
||||
| In Vitro Model | Breast adenocarcinoma | SK-BR-3 cells | CVCL_0033 | ||
aHer2- (AL11a-LP1)n [Investigative]
Revealed Based on the Cell Line Data
| Experiment 1 Reporting the Activity Date of This ADC | [10] | ||||
| Efficacy Data | Half Maximal inhibitory Concentration (lC50) |
0.152 nM
|
High HER2 expression (HER2 +++) | ||
| Method Description |
The cell line used in the anti-proliferation assays was SK-BR-3, a human breast, adenocarcinoma (pleural effusion) cell line; The cells were grown in McCoy's 5a Medium+10% FBS. To run the assay, the cells (80 ul, 1000 cells) were added to each well in a 96-well plate and incubated for 24 hours at 37°C. with CO,. Next, the cells were treated with test compounds (20 ul) at various concentrations in appropriate cell culture medium (total volume, 0.1 mL). The control wells contain cells and the medium but lack the test compounds. The plates were incubated for 144
hours at 37°C. with CO,. CTG reagent was then added to the wells (100 il). After the plates were shaken for 10 min and then incubated for 10 min at room temperature, paste the clear bottom with white back seal and record luminescence with Envision. The inhibition % was calculated according to the following equation: inhibition %=[1- (assay-blank)/ (control-blank)|x100.
Click to Show/Hide
|
||||
| In Vitro Model | Breast adenocarcinoma | SK-BR-3 cells | CVCL_0033 | ||
aHer2- (BL1-LP1)n [Investigative]
Revealed Based on the Cell Line Data
| Experiment 1 Reporting the Activity Date of This ADC | [10] | ||||
| Efficacy Data | Half Maximal inhibitory Concentration (lC50) |
0.16 nM
|
High HER2 expression (HER2 +++) | ||
| Method Description |
The cell line used in the anti-proliferation assays was SK-BR-3, a human breast, adenocarcinoma (pleural effusion) cell line; The cells were grown in McCoy's 5a Medium+10% FBS. To run the assay, the cells (80 ul, 1000 cells) were added to each well in a 96-well plate and incubated for 24 hours at 37°C. with CO,. Next, the cells were treated with test compounds (20 ul) at various concentrations in appropriate cell culture medium (total volume, 0.1 mL). The control wells contain cells and the medium but lack the test compounds. The plates were incubated for 144
hours at 37°C. with CO,. CTG reagent was then added to the wells (100 il). After the plates were shaken for 10 min and then incubated for 10 min at room temperature, paste the clear bottom with white back seal and record luminescence with Envision. The inhibition % was calculated according to the following equation: inhibition %=[1- (assay-blank)/ (control-blank)|x100.
Click to Show/Hide
|
||||
| In Vitro Model | Breast adenocarcinoma | SK-BR-3 cells | CVCL_0033 | ||
aHer2- (AL7-LP3)3.88 [Investigative]
Revealed Based on the Cell Line Data
| Experiment 1 Reporting the Activity Date of This ADC | [11] | ||||
| Efficacy Data | Half Maximal inhibitory Concentration (lC50) |
0.172 nM
|
Positive HER2 expression (HER2+++/++) | ||
| Method Description |
Cells were seeded in their growth media into 96 well plates (Thermo #136101) one day prior to adding ADCs: 1000/well SK-BR-3 cells in 80 uL media (target positive cells). 20ul assay media diluted ADC/ isotype conjugates (1:4 10 pts starting from 100uM) as well as free drug were transferred to above cells. The plates were incubated at 37°C, 5% CO2 for 6 days.
Click to Show/Hide
|
||||
| In Vitro Model | Breast adenocarcinoma | SK-BR-3 cells | CVCL_0033 | ||
| Experiment 2 Reporting the Activity Date of This ADC | [11] | ||||
| Efficacy Data | Half Maximal inhibitory Concentration (lC50) |
0.31 nM
|
Positive HER2 expression (HER2+++/++) | ||
| Method Description |
Cells were seeded in their growth media into 96 well plates (Thermo #136101) one day prior to adding ADCs: 1000/well Calu-3 in 80 uL media (target positive cells). 20ul assay media diluted ADC/ isotype conjugates (1:4 10 pts starting from 100uM) as well as free drug were transferred to above cells. The plates were incubated at 37°C, 5% CO2 for 6 days.
Click to Show/Hide
|
||||
| In Vitro Model | Lung adenocarcinoma | Calu-3 cells | CVCL_0609 | ||
| Experiment 3 Reporting the Activity Date of This ADC | [11] | ||||
| Efficacy Data | Half Maximal inhibitory Concentration (lC50) |
4.73 nM
|
Positive HER2 expression (HER2+++/++) | ||
| Method Description |
Cells were seeded in their growth media into 96 well plates (Thermo #136101) one day prior to adding ADCs: 1000/well NCI-N87 cells in 80 uL media (target positive cells). 20ul assay media diluted ADC/ isotype conjugates (1:4 10 pts starting from 100uM) as well as free drug were transferred to above cells. The plates were incubated at 37°C, 5% CO2 for 6 days.
Click to Show/Hide
|
||||
| In Vitro Model | Gastric tubular adenocarcinoma | NCI-N87 cells | CVCL_1603 | ||
| Experiment 4 Reporting the Activity Date of This ADC | [11] | ||||
| Efficacy Data | Half Maximal inhibitory Concentration (lC50) | > 400 nM | Negative HER2 expression (HER2-) | ||
| Method Description |
Cells were seeded in their growth media into 96 well plates (Thermo #136101) one day prior to adding ADCs: 800/well NCI-H1975 cells in 80ul media (target negative cells). 20ul assay media diluted ADC/ isotype conjugates (1:4 10 pts starting from 100uM) as well as free drug were transferred to above cells. The plates were incubated at 37°C, 5% CO2 for 6 days.
Click to Show/Hide
|
||||
| In Vitro Model | Lung adenocarcinoma | NCI-H1975 cells | CVCL_1511 | ||
aHer2- (AL7-LP4)3.84 [Investigative]
Revealed Based on the Cell Line Data
| Experiment 1 Reporting the Activity Date of This ADC | [11] | ||||
| Efficacy Data | Half Maximal inhibitory Concentration (lC50) |
0.186 nM
|
Positive HER2 expression (HER2+++/++) | ||
| Method Description |
Cells were seeded in their growth media into 96 well plates (Thermo #136101) one day prior to adding ADCs: 1000/well SK-BR-3 cells in 80 uL media (target positive cells). 20ul assay media diluted ADC/ isotype conjugates (1:4 10 pts starting from 100uM) as well as free drug were transferred to above cells. The plates were incubated at 37°C, 5% CO2 for 6 days.
Click to Show/Hide
|
||||
| In Vitro Model | Breast adenocarcinoma | SK-BR-3 cells | CVCL_0033 | ||
| Experiment 2 Reporting the Activity Date of This ADC | [11] | ||||
| Efficacy Data | Half Maximal inhibitory Concentration (lC50) |
0.222 nM
|
Positive HER2 expression (HER2+++/++) | ||
| Method Description |
Cells were seeded in their growth media into 96 well plates (Thermo #136101) one day prior to adding ADCs: 1000/well Calu-3 in 80 uL media (target positive cells). 20ul assay media diluted ADC/ isotype conjugates (1:4 10 pts starting from 100uM) as well as free drug were transferred to above cells. The plates were incubated at 37°C, 5% CO2 for 6 days.
Click to Show/Hide
|
||||
| In Vitro Model | Lung adenocarcinoma | Calu-3 cells | CVCL_0609 | ||
| Experiment 3 Reporting the Activity Date of This ADC | [11] | ||||
| Efficacy Data | Half Maximal inhibitory Concentration (lC50) |
2.07 nM
|
Positive HER2 expression (HER2+++/++) | ||
| Method Description |
Cells were seeded in their growth media into 96 well plates (Thermo #136101) one day prior to adding ADCs: 1000/well NCI-N87 cells in 80 uL media (target positive cells). 20ul assay media diluted ADC/ isotype conjugates (1:4 10 pts starting from 100uM) as well as free drug were transferred to above cells. The plates were incubated at 37°C, 5% CO2 for 6 days.
Click to Show/Hide
|
||||
| In Vitro Model | Gastric tubular adenocarcinoma | NCI-N87 cells | CVCL_1603 | ||
| Experiment 4 Reporting the Activity Date of This ADC | [11] | ||||
| Efficacy Data | Half Maximal inhibitory Concentration (lC50) | > 400 nM | Negative HER2 expression (HER2-) | ||
| Method Description |
Cells were seeded in their growth media into 96 well plates (Thermo #136101) one day prior to adding ADCs: 800/well NCI-H1975 cells in 80ul media (target negative cells). 20ul assay media diluted ADC/ isotype conjugates (1:4 10 pts starting from 100uM) as well as free drug were transferred to above cells. The plates were incubated at 37°C, 5% CO2 for 6 days.
Click to Show/Hide
|
||||
| In Vitro Model | Lung adenocarcinoma | NCI-H1975 cells | CVCL_1511 | ||
Trastuzumab-Example 8 [Investigative]
Revealed Based on the Cell Line Data
| Experiment 1 Reporting the Activity Date of This ADC | [12] | ||||
| Efficacy Data | Half Maximal inhibitory Concentration (lC50) |
0.239 nM
|
High HER2 expression (HER2 +++) | ||
| Method Description |
On the day of administration, HER2 targeted ADC and HER2 were prepared at a 10 fold ratio in standard growth medium. Add the prepared targeted ADC treatment to cells to obtain a final concentration of 3.81e-5nM to 100nM and a final volume of 50uL/well. Each drug concentration is tested in quadruplicate. On the same day, the cell viability of untreated cells at the time of administration was evaluated by adding 25 u L of CellTiter (ProMag catalog number G7573), a reagent for lysing cells and measuring total adenosine triphosphate (ATP) content. Incubate the plate at room temperature for 10 minutes to stabilize the luminescence signal before reading. Use luminous readingThe PHERAstar FSX ELISA reader (BMG Labtech) was used to measure the luminescence signals of all plates. This signal represents the cell viability of untreated cells on the day of administration or day 0.
Click to Show/Hide
|
||||
| In Vitro Model | Breast carcinoma | ZR-75-30 cells | CVCL_1661 | ||
| Experiment 2 Reporting the Activity Date of This ADC | [12] | ||||
| Efficacy Data | Half Maximal inhibitory Concentration (lC50) |
1.892 nM
|
High HER2 expression (HER2 +++) | ||
| Method Description |
On the day of administration, HER2 targeted ADC and HER2 were prepared at a 10 fold ratio in standard growth medium. Add the prepared targeted ADC treatment to cells to obtain a final concentration of 3.81e-5nM to 100nM and a final volume of 50uL/well. Each drug concentration is tested in quadruplicate. On the same day, the cell viability of untreated cells at the time of administration was evaluated by adding 25 u L of CellTiter (ProMag catalog number G7573), a reagent for lysing cells and measuring total adenosine triphosphate (ATP) content. Incubate the plate at room temperature for 10 minutes to stabilize the luminescence signal before reading. Use luminous readingThe PHERAstar FSX ELISA reader (BMG Labtech) was used to measure the luminescence signals of all plates. This signal represents the cell viability of untreated cells on the day of administration or day 0.
Click to Show/Hide
|
||||
| In Vitro Model | Invasive breast carcinoma of no special type | UACC812 cells | CVCL_1781 | ||
| Experiment 3 Reporting the Activity Date of This ADC | [12] | ||||
| Efficacy Data | Half Maximal inhibitory Concentration (lC50) |
4.991 nM
|
High HER2 expression (HER2 +++) | ||
| Method Description |
On the day of administration, HER2 targeted ADC and HER2 were prepared at a 10 fold ratio in standard growth medium. Add the prepared targeted ADC treatment to cells to obtain a final concentration of 3.81e-5nM to 100nM and a final volume of 50uL/well. Each drug concentration is tested in quadruplicate. On the same day, the cell viability of untreated cells at the time of administration was evaluated by adding 25 u L of CellTiter (ProMag catalog number G7573), a reagent for lysing cells and measuring total adenosine triphosphate (ATP) content. Incubate the plate at room temperature for 10 minutes to stabilize the luminescence signal before reading. Use luminous readingThe PHERAstar FSX ELISA reader (BMG Labtech) was used to measure the luminescence signals of all plates. This signal represents the cell viability of untreated cells on the day of administration or day 0.
Click to Show/Hide
|
||||
| In Vitro Model | Invasive breast carcinoma | BT-474 cells | CVCL_0179 | ||
aHer2- (AL4c-LP1B)n [Investigative]
Revealed Based on the Cell Line Data
| Experiment 1 Reporting the Activity Date of This ADC | [10] | ||||
| Efficacy Data | Half Maximal inhibitory Concentration (lC50) |
0.256 nM
|
High HER2 expression (HER2 +++) | ||
| Method Description |
The cell line used in the anti-proliferation assays was SK-BR-3, a human breast, adenocarcinoma (pleural effusion) cell line; The cells were grown in McCoy's 5a Medium+10% FBS. To run the assay, the cells (80 ul, 1000 cells) were added to each well in a 96-well plate and incubated for 24 hours at 37°C. with CO,. Next, the cells were treated with test compounds (20 ul) at various concentrations in appropriate cell culture medium (total volume, 0.1 mL). The control wells contain cells and the medium but lack the test compounds. The plates were incubated for 144
hours at 37°C. with CO,. CTG reagent was then added to the wells (100 il). After the plates were shaken for 10 min and then incubated for 10 min at room temperature, paste the clear bottom with white back seal and record luminescence with Envision. The inhibition % was calculated according to the following equation: inhibition %=[1- (assay-blank)/ (control-blank)|x100.
Click to Show/Hide
|
||||
| In Vitro Model | Breast adenocarcinoma | SK-BR-3 cells | CVCL_0033 | ||
hu1084-DXd-DAR8 [Investigative]
Revealed Based on the Cell Line Data
| Experiment 1 Reporting the Activity Date of This ADC | [13] | ||||
| Efficacy Data | Half Maximal inhibitory Concentration (lC50) |
0.54۪.02 nM
|
Moderate TF expression (TF++) | ||
| Method Description |
Pancreatic cancer cell lines HPAF-II, BxPC-3, or PSN-1 were harvested on 96-well plates (Corning) and incubated at 37°C overnight. Payloads and ADCs were applied to each well at various concentrations, and the plates were incubated at 37°C for 6 days (n = 3). Cancer cell viability was measured using CCK-8 (Dojindo).
|
||||
| In Vitro Model | Pancreatic ductal adenocarcinoma | BxPC-3 cells | CVCL_0186 | ||
| Experiment 2 Reporting the Activity Date of This ADC | [13] | ||||
| Efficacy Data | Half Maximal inhibitory Concentration (lC50) |
1.39۪.47 nM
|
High TF expression (TF +++) | ||
| Method Description |
Pancreatic cancer cell lines HPAF-II, BxPC-3, or PSN-1 were harvested on 96-well plates (Corning) and incubated at 37°C overnight. Payloads and ADCs were applied to each well at various concentrations, and the plates were incubated at 37°C for 6 days (n = 3). Cancer cell viability was measured using CCK-8 (Dojindo).
|
||||
| In Vitro Model | Pancreatic ductal adenocarcinoma | HPAF-II cells | CVCL_0313 | ||
| Experiment 3 Reporting the Activity Date of This ADC | [13] | ||||
| Efficacy Data | Half Maximal inhibitory Concentration (lC50) | > 100 nM | Low TF expression (TF+) | ||
| Method Description |
Pancreatic cancer cell lines HPAF-II, BxPC-3, or PSN-1 were harvested on 96-well plates (Corning) and incubated at 37°C overnight. Payloads and ADCs were applied to each well at various concentrations, and the plates were incubated at 37°C for 6 days (n = 3). Cancer cell viability was measured using CCK-8 (Dojindo).
|
||||
| In Vitro Model | Pancreatic adenocarcinoma | PSN-1 cells | CVCL_1644 | ||
hu1084-DXd-DAR3 [Investigative]
Revealed Based on the Cell Line Data
| Experiment 1 Reporting the Activity Date of This ADC | [13] | ||||
| Efficacy Data | Half Maximal inhibitory Concentration (lC50) |
0.55۪.20 nM
|
Moderate TF expression (TF++) | ||
| Method Description |
Pancreatic cancer cell lines HPAF-II, BxPC-3, or PSN-1 were harvested on 96-well plates (Corning) and incubated at 37°C overnight. Payloads and ADCs were applied to each well at various concentrations, and the plates were incubated at 37°C for 6 days (n = 3). Cancer cell viability was measured using CCK-8 (Dojindo).
|
||||
| In Vitro Model | Pancreatic ductal adenocarcinoma | BxPC-3 cells | CVCL_0186 | ||
| Experiment 2 Reporting the Activity Date of This ADC | [13] | ||||
| Efficacy Data | Half Maximal inhibitory Concentration (lC50) |
2.09۪.29 nM
|
High TF expression (TF +++) | ||
| Method Description |
Pancreatic cancer cell lines HPAF-II, BxPC-3, or PSN-1 were harvested on 96-well plates (Corning) and incubated at 37°C overnight. Payloads and ADCs were applied to each well at various concentrations, and the plates were incubated at 37°C for 6 days (n = 3). Cancer cell viability was measured using CCK-8 (Dojindo).
|
||||
| In Vitro Model | Pancreatic ductal adenocarcinoma | HPAF-II cells | CVCL_0313 | ||
| Experiment 3 Reporting the Activity Date of This ADC | [13] | ||||
| Efficacy Data | Half Maximal inhibitory Concentration (lC50) | > 100 nM | Low TF expression (TF+) | ||
| Method Description |
Pancreatic cancer cell lines HPAF-II, BxPC-3, or PSN-1 were harvested on 96-well plates (Corning) and incubated at 37°C overnight. Payloads and ADCs were applied to each well at various concentrations, and the plates were incubated at 37°C for 6 days (n = 3). Cancer cell viability was measured using CCK-8 (Dojindo).
|
||||
| In Vitro Model | Pancreatic adenocarcinoma | PSN-1 cells | CVCL_1644 | ||
38139459 8D302-DXd [Investigative]
Revealed Based on the Cell Line Data
| Experiment 1 Reporting the Activity Date of This ADC | [14] | ||||
| Efficacy Data | Half Maximal inhibitory Concentration (lC50) |
2.05 nM
|
Moderate SORT1 expression (SORT1++) | ||
| Method Description |
The in vitro cell-killing assay was carried out using MDA-MB-231, MCF-7, MCF-10A, and T47D. Cells were plated in 96-well plates (5000 cells/well). After 1 h incubation, ADCs were added in a serial of concentrations with three replicates per concentration. The concentration of ADCs against MDA-MB-231, MCF-7, and MCF-10A ranged from 300 nM to 137 pM, while the range of concentration was from 100 nM to 46 pM for T47D. This was followed by another 72 h of culture. Cell viability was detected using the Cell Counting Kit 8 (APExBIO, Houston, TX, USA).
Click to Show/Hide
|
||||
| In Vitro Model | Invasive breast carcinoma of no special type | T47D cells | CVCL_0553 | ||
| Experiment 2 Reporting the Activity Date of This ADC | [14] | ||||
| Efficacy Data | Half Maximal inhibitory Concentration (lC50) |
24.07 nM
|
Moderate SORT1 expression (SORT1++) | ||
| Method Description |
The in vitro cell-killing assay was carried out using MDA-MB-231, MCF-7, MCF-10A, and T47D. Cells were plated in 96-well plates (5000 cells/well). After 1 h incubation, ADCs were added in a serial of concentrations with three replicates per concentration. The concentration of ADCs against MDA-MB-231, MCF-7, and MCF-10A ranged from 300 nM to 137 pM, while the range of concentration was from 100 nM to 46 pM for T47D. This was followed by another 72 h of culture. Cell viability was detected using the Cell Counting Kit 8 (APExBIO, Houston, TX, USA).
Click to Show/Hide
|
||||
| In Vitro Model | Invasive breast carcinoma | MCF-7 cells | CVCL_0031 | ||
37520726 I1-DXd [Investigative]
Revealed Based on the Cell Line Data
| Experiment 1 Reporting the Activity Date of This ADC | [15] | ||||
| Efficacy Data | Half Maximal inhibitory Concentration (lC50) |
2.48۪.88 nM
|
|||
| Method Description |
Human thyroid cancer cells were seeded in a 96-well plate at a density of 3000 cells per well overnight. The cell culture medium was replaced with the medium containing either chemo drugs (maximum concentration: 117.11 umol/L) or ICAM1-ADCs at serial diluted concentrations (maximum concentration: 0.67 umol/L). After 96h, cell cytotoxicity was determined by using a CCK-8 kit (KeyGEN Biotech, China) following the manufacturer's protocol. The absorbance at 450 nm was measured with an ELISA browser (Bio-Tek EL 800, USA). The experiments were repeated three times.
Click to Show/Hide
|
||||
| In Vitro Model | Differentiated thyroid carcinoma, Thyroid gland papillary carcinoma | IHH4 cells | CVCL_2960 | ||
| Experiment 2 Reporting the Activity Date of This ADC | [15] | ||||
| Efficacy Data | Half Maximal inhibitory Concentration (lC50) |
54.1䔷.4 nM
|
|||
| Method Description |
Human thyroid cancer cells were seeded in a 96-well plate at a density of 3000 cells per well overnight. The cell culture medium was replaced with the medium containing either chemo drugs (maximum concentration: 117.11 umol/L) or ICAM1-ADCs at serial diluted concentrations (maximum concentration: 0.67 umol/L). After 96h, cell cytotoxicity was determined by using a CCK-8 kit (KeyGEN Biotech, China) following the manufacturer's protocol. The absorbance at 450 nm was measured with an ELISA browser (Bio-Tek EL 800, USA). The experiments were repeated three times.
Click to Show/Hide
|
||||
| In Vitro Model | Thyroid carcinoma | BCPAP cells | CVCL_0153 | ||
FeID1- (AL4c-LP1B)n [Investigative]
Revealed Based on the Cell Line Data
| Experiment 1 Reporting the Activity Date of This ADC | [10] | ||||
| Efficacy Data | Half Maximal inhibitory Concentration (lC50) |
11.4 nM
|
Low ID1 expression (ID1+) | ||
| Method Description |
The cell line used in the anti-proliferation assays was SK-BR-3, a human breast, adenocarcinoma (pleural effusion) cell line; The cells were grown in McCoy's 5a Medium+10% FBS. To run the assay, the cells (80 ul, 1000 cells) were added to each well in a 96-well plate and incubated for 24 hours at 37°C. with CO,. Next, the cells were treated with test compounds (20 ul) at various concentrations in appropriate cell culture medium (total volume, 0.1 mL). The control wells contain cells and the medium but lack the test compounds. The plates were incubated for 144
hours at 37°C. with CO,. CTG reagent was then added to the wells (100 il). After the plates were shaken for 10 min and then incubated for 10 min at room temperature, paste the clear bottom with white back seal and record luminescence with Envision. The inhibition % was calculated according to the following equation: inhibition %=[1- (assay-blank)/ (control-blank)|x100.
Click to Show/Hide
|
||||
| In Vitro Model | Breast adenocarcinoma | SK-BR-3 cells | CVCL_0033 | ||
FeID1- (AL4c-LP13C)n [Investigative]
Revealed Based on the Cell Line Data
| Experiment 1 Reporting the Activity Date of This ADC | [10] | ||||
| Efficacy Data | Half Maximal inhibitory Concentration (lC50) |
13.3 nM
|
Low ID1 expression (ID1+) | ||
| Method Description |
The cell line used in the anti-proliferation assays was SK-BR-3, a human breast, adenocarcinoma (pleural effusion) cell line; The cells were grown in McCoy's 5a Medium+10% FBS. To run the assay, the cells (80 ul, 1000 cells) were added to each well in a 96-well plate and incubated for 24 hours at 37°C. with CO,. Next, the cells were treated with test compounds (20 ul) at various concentrations in appropriate cell culture medium (total volume, 0.1 mL). The control wells contain cells and the medium but lack the test compounds. The plates were incubated for 144
hours at 37°C. with CO,. CTG reagent was then added to the wells (100 il). After the plates were shaken for 10 min and then incubated for 10 min at room temperature, paste the clear bottom with white back seal and record luminescence with Envision. The inhibition % was calculated according to the following equation: inhibition %=[1- (assay-blank)/ (control-blank)|x100.
Click to Show/Hide
|
||||
| In Vitro Model | Breast adenocarcinoma | SK-BR-3 cells | CVCL_0033 | ||
HER2-Dxd [Investigative]
Revealed Based on the Cell Line Data
| Experiment 1 Reporting the Activity Date of This ADC | [16] | ||||
| Efficacy Data | Half Maximal inhibitory Concentration (lC50) |
80.71 nM
|
Negative HER expression (HER-) | ||
| Method Description |
Using standard cell viability assay, the cytotoxicity and targeting specificity of ADC described in this paper were evaluated for her 2 positive SkBr-3 and her 2 negative MDA-MB-468 cancer cells.
|
||||
| In Vitro Model | Breast adenocarcinoma | SK-BR-3 cells | CVCL_0033 | ||
| Experiment 2 Reporting the Activity Date of This ADC | [16] | ||||
| Efficacy Data | Half Maximal Effective Concentration (EC50) |
8.52 nM
|
Positive HER expression (HER+++/++) | ||
| Method Description |
Using standard cell viability assay, the cytotoxicity and targeting specificity of ADC described in this paper were evaluated for her 2 positive SkBr-3 and her 2 negative MDA-MB-468 cancer cells.
|
||||
| In Vitro Model | Breast adenocarcinoma | MDA-MB-468 cells | CVCL_0419 | ||
FeID1- (BL1-LP1)n [Investigative]
Revealed Based on the Cell Line Data
| Experiment 1 Reporting the Activity Date of This ADC | [10] | ||||
| Efficacy Data | Half Maximal inhibitory Concentration (lC50) |
89.1 nM
|
Low ID1 expression (ID1+) | ||
| Method Description |
The cell line used in the anti-proliferation assays was SK-BR-3, a human breast, adenocarcinoma (pleural effusion) cell line; The cells were grown in McCoy's 5a Medium+10% FBS. To run the assay, the cells (80 ul, 1000 cells) were added to each well in a 96-well plate and incubated for 24 hours at 37°C. with CO,. Next, the cells were treated with test compounds (20 ul) at various concentrations in appropriate cell culture medium (total volume, 0.1 mL). The control wells contain cells and the medium but lack the test compounds. The plates were incubated for 144
hours at 37°C. with CO,. CTG reagent was then added to the wells (100 il). After the plates were shaken for 10 min and then incubated for 10 min at room temperature, paste the clear bottom with white back seal and record luminescence with Envision. The inhibition % was calculated according to the following equation: inhibition %=[1- (assay-blank)/ (control-blank)|x100.
Click to Show/Hide
|
||||
| In Vitro Model | Breast adenocarcinoma | SK-BR-3 cells | CVCL_0033 | ||
Control-DXd-DAR8 [Investigative]
Revealed Based on the Cell Line Data
| Experiment 1 Reporting the Activity Date of This ADC | [13] | ||||
| Efficacy Data | Half Maximal inhibitory Concentration (lC50) | > 100 nM | Moderate TF expression (TF++) | ||
| Method Description |
Pancreatic cancer cell lines HPAF-II, BxPC-3, or PSN-1 were harvested on 96-well plates (Corning) and incubated at 37°C overnight. Payloads and ADCs were applied to each well at various concentrations, and the plates were incubated at 37°C for 6 days (n = 3). Cancer cell viability was measured using CCK-8 (Dojindo).
|
||||
| In Vitro Model | Pancreatic ductal adenocarcinoma | BxPC-3 cells | CVCL_0186 | ||
FelD1- (AL7-LP3)3.82 [Investigative]
Revealed Based on the Cell Line Data
| Experiment 1 Reporting the Activity Date of This ADC | [11] | ||||
| Efficacy Data | Half Maximal inhibitory Concentration (lC50) |
121 nM
|
Positive HER2expression (HER2+++/++) | ||
| Method Description |
Cells were seeded in their growth media into 96 well plates (Thermo #136101) one day prior to adding ADCs: 1000/well SK-BR-3 cells in 80 uL media (target positive cells). 20ul assay media diluted ADC/ isotype conjugates (1:4 10 pts starting from 100uM) as well as free drug were transferred to above cells. The plates were incubated at 37°C, 5% CO2 for 6 days.
Click to Show/Hide
|
||||
| In Vitro Model | Breast adenocarcinoma | SK-BR-3 cells | CVCL_0033 | ||
| Experiment 2 Reporting the Activity Date of This ADC | [11] | ||||
| Efficacy Data | Half Maximal inhibitory Concentration (lC50) |
341 nM
|
Positive HER2expression (HER2+++/++) | ||
| Method Description |
Cells were seeded in their growth media into 96 well plates (Thermo #136101) one day prior to adding ADCs: 1000/well Calu-3 in 80 uL media (target positive cells). 20ul assay media diluted ADC/ isotype conjugates (1:4 10 pts starting from 100uM) as well as free drug were transferred to above cells. The plates were incubated at 37°C, 5% CO2 for 6 days.
Click to Show/Hide
|
||||
| In Vitro Model | Lung adenocarcinoma | Calu-3 cells | CVCL_0609 | ||
| Experiment 3 Reporting the Activity Date of This ADC | [11] | ||||
| Efficacy Data | Half Maximal inhibitory Concentration (lC50) | > 400 nM | Positive HER2expression (HER2+++/++) | ||
| Method Description |
Cells were seeded in their growth media into 96 well plates (Thermo #136101) one day prior to adding ADCs: 1000/well NCI-N87 cells in 80 uL media (target positive cells). 20ul assay media diluted ADC/ isotype conjugates (1:4 10 pts starting from 100uM) as well as free drug were transferred to above cells. The plates were incubated at 37°C, 5% CO2 for 6 days.
Click to Show/Hide
|
||||
| In Vitro Model | Gastric tubular adenocarcinoma | NCI-N87 cells | CVCL_1603 | ||
| Experiment 4 Reporting the Activity Date of This ADC | [11] | ||||
| Efficacy Data | Half Maximal inhibitory Concentration (lC50) | > 400 nM | Negative HER2 expression (HER2-) | ||
| Method Description |
Cells were seeded in their growth media into 96 well plates (Thermo #136101) one day prior to adding ADCs: 800/well NCI-H1975 cells in 80ul media (target negative cells). 20ul assay media diluted ADC/ isotype conjugates (1:4 10 pts starting from 100uM) as well as free drug were transferred to above cells. The plates were incubated at 37°C, 5% CO2 for 6 days.
Click to Show/Hide
|
||||
| In Vitro Model | Lung adenocarcinoma | NCI-H1975 cells | CVCL_1511 | ||
40285886 7300-Deruxtecan [Investigative]
Revealed Based on the Cell Line Data
| Experiment 1 Reporting the Activity Date of This ADC | [17] | ||||
| Efficacy Data | Half Maximal inhibitory Concentration (lC50) |
124.5 nM
|
|||
| Method Description |
SHP-77 cells were grown in RPMI-1640 medium supplemented with 10% FBS and 1 ug/mL puromycin at 37 °C in a 5% CO2 incubator. SHP-77 cells were dissociated using TrypLETM Express Enzyme (Thermo Fisher Scientific, Waltham, MA, USA) and, after counting, the cells were resuspended in RPMI-1640 medium supplemented with 10% FBS at a density of 3 × 10⁴ cells/mL. The cells were plated in 96-well plates and incubated at 37 °C for 24 h. ADCs and payloads were diluted separately and added to the 96-well cell culture plates containing cells, followed by incubation in a 5% CO2 incubator for 5 days. A multifunctional microplate reader was used, and the absorbance was measured at 450 nm with a reference wavelength of 630 nm. The IC50 values were calculated using GraphPad Prism 10.1.2 software.
Click to Show/Hide
|
||||
| In Vitro Model | Small cell lung carcinoma | SHP-77 cells | CVCL_1693 | ||
FeID1- (AL7-LP1)n [Investigative]
Revealed Based on the Cell Line Data
| Experiment 1 Reporting the Activity Date of This ADC | [10] | ||||
| Efficacy Data | Half Maximal inhibitory Concentration (lC50) |
156 nM
|
Low ID1 expression (ID1+) | ||
| Method Description |
The cell line used in the anti-proliferation assays was SK-BR-3, a human breast, adenocarcinoma (pleural effusion) cell line; The cells were grown in McCoy's 5a Medium+10% FBS. To run the assay, the cells (80 ul, 1000 cells) were added to each well in a 96-well plate and incubated for 24 hours at 37°C. with CO,. Next, the cells were treated with test compounds (20 ul) at various concentrations in appropriate cell culture medium (total volume, 0.1 mL). The control wells contain cells and the medium but lack the test compounds. The plates were incubated for 144
hours at 37°C. with CO,. CTG reagent was then added to the wells (100 il). After the plates were shaken for 10 min and then incubated for 10 min at room temperature, paste the clear bottom with white back seal and record luminescence with Envision. The inhibition % was calculated according to the following equation: inhibition %=[1- (assay-blank)/ (control-blank)|x100.
Click to Show/Hide
|
||||
| In Vitro Model | Breast adenocarcinoma | SK-BR-3 cells | CVCL_0033 | ||
FelD1- (AL7-LP4)3.82 [Investigative]
Revealed Based on the Cell Line Data
| Experiment 1 Reporting the Activity Date of This ADC | [11] | ||||
| Efficacy Data | Half Maximal inhibitory Concentration (lC50) |
212 nM
|
Positive HER2expression (HER2+++/++) | ||
| Method Description |
Cells were seeded in their growth media into 96 well plates (Thermo #136101) one day prior to adding ADCs: 1000/well SK-BR-3 cells in 80 uL media (target positive cells). 20ul assay media diluted ADC/ isotype conjugates (1:4 10 pts starting from 100uM) as well as free drug were transferred to above cells. The plates were incubated at 37°C, 5% CO2 for 6 days.
Click to Show/Hide
|
||||
| In Vitro Model | Breast adenocarcinoma | SK-BR-3 cells | CVCL_0033 | ||
| Experiment 2 Reporting the Activity Date of This ADC | [11] | ||||
| Efficacy Data | Half Maximal inhibitory Concentration (lC50) | > 400 nM | Positive HER2expression (HER2+++/++) | ||
| Method Description |
Cells were seeded in their growth media into 96 well plates (Thermo #136101) one day prior to adding ADCs: 1000/well NCI-N87 cells in 80 uL media (target positive cells). 20ul assay media diluted ADC/ isotype conjugates (1:4 10 pts starting from 100uM) as well as free drug were transferred to above cells. The plates were incubated at 37°C, 5% CO2 for 6 days.
Click to Show/Hide
|
||||
| In Vitro Model | Gastric tubular adenocarcinoma | NCI-N87 cells | CVCL_1603 | ||
| Experiment 3 Reporting the Activity Date of This ADC | [11] | ||||
| Efficacy Data | Half Maximal inhibitory Concentration (lC50) | > 400 nM | Positive HER2expression (HER2+++/++) | ||
| Method Description |
Cells were seeded in their growth media into 96 well plates (Thermo #136101) one day prior to adding ADCs: 1000/well Calu-3 in 80 uL media (target positive cells). 20ul assay media diluted ADC/ isotype conjugates (1:4 10 pts starting from 100uM) as well as free drug were transferred to above cells. The plates were incubated at 37°C, 5% CO2 for 6 days.
Click to Show/Hide
|
||||
| In Vitro Model | Lung adenocarcinoma | Calu-3 cells | CVCL_0609 | ||
| Experiment 4 Reporting the Activity Date of This ADC | [11] | ||||
| Efficacy Data | Half Maximal inhibitory Concentration (lC50) | > 400 nM | Negative HER2 expression (HER2-) | ||
| Method Description |
Cells were seeded in their growth media into 96 well plates (Thermo #136101) one day prior to adding ADCs: 800/well NCI-H1975 cells in 80ul media (target negative cells). 20ul assay media diluted ADC/ isotype conjugates (1:4 10 pts starting from 100uM) as well as free drug were transferred to above cells. The plates were incubated at 37°C, 5% CO2 for 6 days.
Click to Show/Hide
|
||||
| In Vitro Model | Lung adenocarcinoma | NCI-H1975 cells | CVCL_1511 | ||
FeID1- (AL11a-LP1)n [Investigative]
Revealed Based on the Cell Line Data
| Experiment 1 Reporting the Activity Date of This ADC | [10] | ||||
| Efficacy Data | Half Maximal inhibitory Concentration (lC50) | > 400 nM | Low ID1 expression (ID1+) | ||
| Method Description |
The cell line used in the anti-proliferation assays was SK-BR-3, a human breast, adenocarcinoma (pleural effusion) cell line; The cells were grown in McCoy's 5a Medium+10% FBS. To run the assay, the cells (80 ul, 1000 cells) were added to each well in a 96-well plate and incubated for 24 hours at 37°C. with CO,. Next, the cells were treated with test compounds (20 ul) at various concentrations in appropriate cell culture medium (total volume, 0.1 mL). The control wells contain cells and the medium but lack the test compounds. The plates were incubated for 144
hours at 37°C. with CO,. CTG reagent was then added to the wells (100 il). After the plates were shaken for 10 min and then incubated for 10 min at room temperature, paste the clear bottom with white back seal and record luminescence with Envision. The inhibition % was calculated according to the following equation: inhibition %=[1- (assay-blank)/ (control-blank)|x100.
Click to Show/Hide
|
||||
| In Vitro Model | Breast adenocarcinoma | SK-BR-3 cells | CVCL_0033 | ||
FeID1- (AL7-LP13)n [Investigative]
Revealed Based on the Cell Line Data
| Experiment 1 Reporting the Activity Date of This ADC | [10] | ||||
| Efficacy Data | Half Maximal inhibitory Concentration (lC50) | > 400 nM | Low ID1 expression (ID1+) | ||
| Method Description |
The cell line used in the anti-proliferation assays was SK-BR-3, a human breast, adenocarcinoma (pleural effusion) cell line; The cells were grown in McCoy's 5a Medium+10% FBS. To run the assay, the cells (80 ul, 1000 cells) were added to each well in a 96-well plate and incubated for 24 hours at 37°C. with CO,. Next, the cells were treated with test compounds (20 ul) at various concentrations in appropriate cell culture medium (total volume, 0.1 mL). The control wells contain cells and the medium but lack the test compounds. The plates were incubated for 144
hours at 37°C. with CO,. CTG reagent was then added to the wells (100 il). After the plates were shaken for 10 min and then incubated for 10 min at room temperature, paste the clear bottom with white back seal and record luminescence with Envision. The inhibition % was calculated according to the following equation: inhibition %=[1- (assay-blank)/ (control-blank)|x100.
Click to Show/Hide
|
||||
| In Vitro Model | Breast adenocarcinoma | SK-BR-3 cells | CVCL_0033 | ||
FeID1- (AL11a-LP13)n [Investigative]
Revealed Based on the Cell Line Data
| Experiment 1 Reporting the Activity Date of This ADC | [10] | ||||
| Efficacy Data | Half Maximal inhibitory Concentration (lC50) | > 400 nM | Low ID1 expression (ID1+) | ||
| Method Description |
The cell line used in the anti-proliferation assays was SK-BR-3, a human breast, adenocarcinoma (pleural effusion) cell line; The cells were grown in McCoy's 5a Medium+10% FBS. To run the assay, the cells (80 ul, 1000 cells) were added to each well in a 96-well plate and incubated for 24 hours at 37°C. with CO,. Next, the cells were treated with test compounds (20 ul) at various concentrations in appropriate cell culture medium (total volume, 0.1 mL). The control wells contain cells and the medium but lack the test compounds. The plates were incubated for 144
hours at 37°C. with CO,. CTG reagent was then added to the wells (100 il). After the plates were shaken for 10 min and then incubated for 10 min at room temperature, paste the clear bottom with white back seal and record luminescence with Envision. The inhibition % was calculated according to the following equation: inhibition %=[1- (assay-blank)/ (control-blank)|x100.
Click to Show/Hide
|
||||
| In Vitro Model | Breast adenocarcinoma | SK-BR-3 cells | CVCL_0033 | ||
IN202417078684A+ADC8 [Investigative]
Revealed Based on the Cell Line Data
| Experiment 1 Reporting the Activity Date of This ADC | [18] | ||||
| Efficacy Data | Half Maximal inhibitory Concentration (lC50) |
1784 ng/ml
|
|||
| Method Description |
The cytotoxicity of ADC against cell lines was evaluated by cell viability test with CellTiter-Glo 2.0 luminescence method.
|
||||
| Experiment 2 Reporting the Activity Date of This ADC | [18] | ||||
| Efficacy Data | Half Maximal inhibitory Concentration (lC50) |
3986 ng/ml
|
|||
| Method Description |
The cytotoxicity of ADC against cell lines was evaluated by cell viability test with CellTiter-Glo 2.0 luminescence method.
|
||||
WO2024181570A1 ADC5 [Investigative]
Revealed Based on the Cell Line Data
| Experiment 1 Reporting the Activity Date of This ADC | [19] | ||||
| Efficacy Data | Half Maximal inhibitory Concentration (lC50) |
2016 ng/mL
|
Negative CD138 expression (CD138-) | ||
| Method Description |
1000 cells/well of Jurkat in 96 well, 37 °C for 5 days.
|
||||
| In Vitro Model | T acute lymphoblastic leukemia | Jurkat cells | CVCL_0065 | ||
| Experiment 2 Reporting the Activity Date of This ADC | [19] | ||||
| Efficacy Data | Half Maximal inhibitory Concentration (lC50) | > 10000 ng/mL | Positive CD138 expression (CD138+++/++) | ||
| Method Description |
1000 cells/well of Capan-1 in 96 well, 37 °C for 5 days.
|
||||
| In Vitro Model | Pancreatic ductal adenocarcinoma | Capan-1 cells | CVCL_0237 | ||
IN202417078684A+ADC7 [Investigative]
Revealed Based on the Cell Line Data
| Experiment 1 Reporting the Activity Date of This ADC | [18] | ||||
| Efficacy Data | Half Maximal inhibitory Concentration (lC50) | > 10000 ng/ml | |||
| Method Description |
The cytotoxicity of ADC against cell lines was evaluated by cell viability test with CellTiter-Glo 2.0 luminescence method.
|
||||
| Experiment 2 Reporting the Activity Date of This ADC | [18] | ||||
| Efficacy Data | Half Maximal inhibitory Concentration (lC50) | > 10000 ng/ml | |||
| Method Description |
The cytotoxicity of ADC against cell lines was evaluated by cell viability test with CellTiter-Glo 2.0 luminescence method.
|
||||
WO2024181570A1 ADC6 [Investigative]
Revealed Based on the Cell Line Data
| Experiment 1 Reporting the Activity Date of This ADC | [19] | ||||
| Efficacy Data | Half Maximal inhibitory Concentration (lC50) | > 10000 ng/mL | Positive CD138 expression (CD138+++/++) | ||
| Method Description |
1000 cells/well of Capan-1 in 96 well, 37 °C for 5 days.
|
||||
| In Vitro Model | Pancreatic ductal adenocarcinoma | Capan-1 cells | CVCL_0237 | ||
| Experiment 2 Reporting the Activity Date of This ADC | [19] | ||||
| Efficacy Data | Half Maximal inhibitory Concentration (lC50) | > 10000 ng/mL | Negative CD138 expression (CD138-) | ||
| Method Description |
1000 cells/well of Jurkat in 96 well, 37 °C for 5 days.
|
||||
| In Vitro Model | T acute lymphoblastic leukemia | Jurkat cells | CVCL_0065 | ||
EP4471061A1 17c10_MC-Dxd [Investigative]
Revealed Based on the Cell Line Data
| Experiment 1 Reporting the Activity Date of This ADC | [20] | ||||
| Efficacy Data | Half Maximal inhibitory Concentration (lC50) |
5- 2 × 10 -5 ug/mL
|
Positive ASCT2 expression (ASCT2+++/++) | ||
| Method Description |
Target cells were seeded in triplicates into flat-bottom 384-wells plate (400 cells for HCT116 cells). Cells were incubated for 3 to 4 hours at 37°C before addition of an equivalent volume of 2X concentrated ADC or free drug-linker dose range (see table 1 for details). Cells were then incubated into a live cell imaging instrument (Incucyte®) for 6 to 8 days and their confluency was monitored all along the culture.
Click to Show/Hide
|
||||
| In Vitro Model | Colon carcinoma | HCT116 cells | CVCL_0291 | ||
| Experiment 2 Reporting the Activity Date of This ADC | [20] | ||||
| Efficacy Data | Half Maximal inhibitory Concentration (lC50) |
135- 6.9 × 10 -3 g/mL
|
Positive ASCT2 expression (ASCT2+++/++) | ||
| Method Description |
Target cells were seeded in triplicates into flat-bottom 384-wells plate (400 cells for HCT116 cells). Cells were incubated for 3 to 4 hours at 37°C before addition of an equivalent volume of 2X concentrated ADC or free drug-linker dose range (see table 1 for details). Cells were then incubated into a live cell imaging instrument (Incucyte®) for 6 to 8 days and their confluency was monitored all along the culture.
Click to Show/Hide
|
||||
| In Vitro Model | Colon adenocarcinoma | WiDr cells | CVCL_2760 | ||
ICT_MC-Dxd (Isotype control) [Investigative]
Revealed Based on the Cell Line Data
| Experiment 1 Reporting the Activity Date of This ADC | [20] | ||||
| Efficacy Data | Half Maximal inhibitory Concentration (lC50) |
5- 2 × 10 -5 ug/mL
|
Positive ASCT2 expression (ASCT2+++/++) | ||
| Method Description |
Target cells were seeded in triplicates into flat-bottom 384-wells plate (400 cells for HCT116 cells). Cells were incubated for 3 to 4 hours at 37°C before addition of an equivalent volume of 2X concentrated ADC or free drug-linker dose range (see table 1 for details). Cells were then incubated into a live cell imaging instrument (Incucyte®) for 6 to 8 days and their confluency was monitored all along the culture.
Click to Show/Hide
|
||||
| In Vitro Model | Colon carcinoma | HCT116 cells | CVCL_0291 | ||
| Experiment 2 Reporting the Activity Date of This ADC | [20] | ||||
| Efficacy Data | Half Maximal inhibitory Concentration (lC50) |
135- 6.9 × 10 -3 g/mL
|
Positive ASCT2 expression (ASCT2+++/++) | ||
| Method Description |
Target cells were seeded in triplicates into flat-bottom 384-wells plate (400 cells for HCT116 cells). Cells were incubated for 3 to 4 hours at 37°C before addition of an equivalent volume of 2X concentrated ADC or free drug-linker dose range (see table 1 for details). Cells were then incubated into a live cell imaging instrument (Incucyte®) for 6 to 8 days and their confluency was monitored all along the culture.
Click to Show/Hide
|
||||
| In Vitro Model | Colon adenocarcinoma | WiDr cells | CVCL_2760 | ||
EP4471061A1 MC_Dxd [Investigative]
Revealed Based on the Cell Line Data
| Experiment 1 Reporting the Activity Date of This ADC | [20] | ||||
| Efficacy Data | Half Maximal inhibitory Concentration (lC50) |
9- 4.6 × 10 -4 ug/mL
|
Positive ASCT2 expression (ASCT2+++/++) | ||
| Method Description |
Target cells were seeded in triplicates into flat-bottom 384-wells plate (400 cells for HCT116 cells). Cells were incubated for 3 to 4 hours at 37°C before addition of an equivalent volume of 2X concentrated ADC or free drug-linker dose range (see table 1 for details). Cells were then incubated into a live cell imaging instrument (Incucyte®) for 6 to 8 days and their confluency was monitored all along the culture.
Click to Show/Hide
|
||||
| In Vitro Model | Colon carcinoma | HCT116 cells | CVCL_0291 | ||
| Experiment 2 Reporting the Activity Date of This ADC | [20] | ||||
| Efficacy Data | Half Maximal inhibitory Concentration (lC50) |
9- 4.6 × 10 -4 ug/mL
|
Positive ASCT2 expression (ASCT2+++/++) | ||
| Method Description |
Target cells were seeded in triplicates into flat-bottom 384-wells plate (400 cells for HCT116 cells). Cells were incubated for 3 to 4 hours at 37°C before addition of an equivalent volume of 2X concentrated ADC or free drug-linker dose range (see table 1 for details). Cells were then incubated into a live cell imaging instrument (Incucyte®) for 6 to 8 days and their confluency was monitored all along the culture.
Click to Show/Hide
|
||||
| In Vitro Model | Colon adenocarcinoma | WiDr cells | CVCL_2760 | ||
SG11202408662TA ADC-C1 [Investigative]
Revealed Based on the Cell Line Data
| Experiment 1 Reporting the Activity Date of This ADC | [21] | ||||
| Efficacy Data | Half Maximal Effective Concentration (EC50) |
0.022 nM
|
High B7H3 expression (B7H3 +++) | ||
| Method Description |
Adding the fresh growth-medium containing the varying concentrations of ADCs, 40ul/well
into H358, H441, H1048 and MDA-MB-487.
|
||||
| In Vitro Model | Minimally invasive lung adenocarcinoma | H358 cells | CVCL_1559 | ||
| Experiment 2 Reporting the Activity Date of This ADC | [21] | ||||
| Efficacy Data | Half Maximal Effective Concentration (EC50) |
0.034 nM
|
Positive B7H3 expression (B7H3+++/++) | ||
| Method Description |
Adding the fresh growth-medium containing the varying concentrations of ADCs, 40ul/well
into H358, H441, H1048 and MDA-MB-487.
|
||||
| In Vitro Model | Lung small cell carcinoma, Small cell lung cancer | H1048 cells | CVCL_1453 | ||
| Experiment 3 Reporting the Activity Date of This ADC | [21] | ||||
| Efficacy Data | Half Maximal Effective Concentration (EC50) |
2.201 nM
|
Positive B7H3 expression (B7H3+++/++) | ||
| Method Description |
Adding the fresh growth-medium containing the varying concentrations of ADCs, 40ul/well
into H358, H441, H1048 and MDA-MB-487.
|
||||
| In Vitro Model | Lung papillary adenocarcinoma | H441 cells | CVCL_1561 | ||
| Experiment 4 Reporting the Activity Date of This ADC | [21] | ||||
| Efficacy Data | Half Maximal Effective Concentration (EC50) | > 100 nM | Negative B7H3 expression (B7H3-) | ||
| Method Description |
Adding the fresh growth-medium containing the varying concentrations of ADCs, 40ul/well
into H358, H441, H1048 and MDA-MB-487.
|
||||
| In Vitro Model | Breast adenocarcinoma | MDA-MB-453 cells | CVCL_0418 | ||
ZA202500202A 2188-D04-Y180/F404/K42/E161-LP10 [Investigative]
Revealed Based on the Cell Line Data
| Experiment 1 Reporting the Activity Date of This ADC | [22] | ||||
| Efficacy Data | Half Maximal Effective Concentration (EC50) |
0.048 nM
|
Positive ROR1 expression (ROR1+++/++) | ||
| Method Description |
Ntera-2 cell at 625 cells/25 pL were seeded in a 384-well plat. ADCs were formulated at 2x starting concentration. Filter sterilized samples were serial diluted (1:3) under sterile conditions and added onto cells in triplicates. For cell viability measurement, 30 microliter of Cell Titer-Glo@ reagent (Promega Corp, Madison, WI) was added into each well, and plates processed as per product instructions.
Click to Show/Hide
|
||||
| In Vitro Model | Embryonal carcinoma | Ntera-2 cells | CVCL_0034 | ||
| Experiment 2 Reporting the Activity Date of This ADC | [22] | ||||
| Efficacy Data | Half Maximal Effective Concentration (EC50) | > 10 nM | Negative ROR1 expression (ROR1-) | ||
| Method Description |
MCF-7 cells at 625 cells/25 pL were seeded in a 384-well plat. ADCs were formulated at 2x starting concentration. Filter sterilized samples were serial diluted (1:3) under sterile conditions and added onto cells in triplicates. For cell viability measurement, 30 microliter of Cell Titer-Glo@ reagent (Promega Corp, Madison, WI) was added into each well, and plates processed as per product instructions.
Click to Show/Hide
|
||||
| In Vitro Model | Invasive breast carcinoma | MCF-7 cells | CVCL_0031 | ||
IN202417103159A 2188-IN202417103159A D04-Yl80/F404/K42/E161 LP10 [Investigative]
Revealed Based on the Cell Line Data
| Experiment 1 Reporting the Activity Date of This ADC | [23] | ||||
| Efficacy Data | Half Maximal Effective Concentration (EC50) |
0.048 nM
|
Positive ROR1 expression (ROR1+++/++) | ||
| Method Description |
The cell killing EC5o and Span for RORI ADCs conjugated to different linker warheads at different DARs on RORI positive Ntera-2 cell and RORI negative MCF-7 cells
|
||||
| In Vitro Model | Embryonal carcinoma | Ntera-2 cells | CVCL_0034 | ||
| Experiment 2 Reporting the Activity Date of This ADC | [23] | ||||
| Efficacy Data | Half Maximal Effective Concentration (EC50) | > 10 nM | Negative ROR1 expression (ROR1-) | ||
| Method Description |
The cell killing EC5o and Span for RORI ADCs conjugated to different linker warheads at different DARs on RORI positive Ntera-2 cell and RORI negative MCF-7 cells
|
||||
| In Vitro Model | Invasive breast carcinoma | MCF-7 cells | CVCL_0031 | ||
ZA202500202A 2188-D04-Y180/F404-LP10 [Investigative]
Revealed Based on the Cell Line Data
| Experiment 1 Reporting the Activity Date of This ADC | [22] | ||||
| Efficacy Data | Half Maximal Effective Concentration (EC50) |
0.08 nM
|
Positive ROR1 expression (ROR1+++/++) | ||
| Method Description |
Ntera-2 cell at 625 cells/25 pL were seeded in a 384-well plat. ADCs were formulated at 2x starting concentration. Filter sterilized samples were serial diluted (1:3) under sterile conditions and added onto cells in triplicates. For cell viability measurement, 30 microliter of Cell Titer-Glo@ reagent (Promega Corp, Madison, WI) was added into each well, and plates processed as per product instructions.
Click to Show/Hide
|
||||
| In Vitro Model | Embryonal carcinoma | Ntera-2 cells | CVCL_0034 | ||
| Experiment 2 Reporting the Activity Date of This ADC | [22] | ||||
| Efficacy Data | Half Maximal Effective Concentration (EC50) | > 10 nM | Negative ROR1 expression (ROR1-) | ||
| Method Description |
MCF-7 cells at 625 cells/25 pL were seeded in a 384-well plat. ADCs were formulated at 2x starting concentration. Filter sterilized samples were serial diluted (1:3) under sterile conditions and added onto cells in triplicates. For cell viability measurement, 30 microliter of Cell Titer-Glo@ reagent (Promega Corp, Madison, WI) was added into each well, and plates processed as per product instructions.
Click to Show/Hide
|
||||
| In Vitro Model | Invasive breast carcinoma | MCF-7 cells | CVCL_0031 | ||
IN202417103159A 2188-IN202417103159A D04-Yl80/F404-LP10 [Investigative]
Revealed Based on the Cell Line Data
| Experiment 1 Reporting the Activity Date of This ADC | [23] | ||||
| Efficacy Data | Half Maximal Effective Concentration (EC50) |
0.08 nM
|
Positive ROR1 expression (ROR1+++/++) | ||
| Method Description |
The cell killing EC5o and Span for RORI ADCs conjugated to different linker warheads at different DARs on RORI positive Ntera-2 cell and RORI negative MCF-7 cells
|
||||
| In Vitro Model | Embryonal carcinoma | Ntera-2 cells | CVCL_0034 | ||
| Experiment 2 Reporting the Activity Date of This ADC | [23] | ||||
| Efficacy Data | Half Maximal Effective Concentration (EC50) | > 10 nM | Negative ROR1 expression (ROR1-) | ||
| Method Description |
The cell killing EC5o and Span for RORI ADCs conjugated to different linker warheads at different DARs on RORI positive Ntera-2 cell and RORI negative MCF-7 cells
|
||||
| In Vitro Model | Invasive breast carcinoma | MCF-7 cells | CVCL_0031 | ||
BGA2588 [Investigative]
Revealed Based on the Cell Line Data
| Experiment 1 Reporting the Activity Date of This ADC | [24] | ||||
| Efficacy Data | Half Maximal Effective Concentration (EC50) |
0.22 nM
|
Positive CEA expression (CEA+++/++) | ||
| Method Description |
NCI-H2122 cells were plated at a density of 2000 cells per well and the next day were treated with payload compounds (5x dilution) for 6 days.
|
||||
| In Vitro Model | Lung adenocarcinoma | NCI-H2122 cells | CVCL_1531 | ||
| Experiment 2 Reporting the Activity Date of This ADC | [24] | ||||
| Efficacy Data | Half Maximal Effective Concentration (EC50) |
0.46 nM
|
Positive CEA expression (CEA+++/++) | ||
| Method Description |
MKN45 cells were plated at a density of 5000 cells per well and the next day were treated with payload compounds (5x dilution) for 6 days.
|
||||
| In Vitro Model | Gastric adenocarcinoma | MKN45 cells | CVCL_0434 | ||
| Experiment 3 Reporting the Activity Date of This ADC | [24] | ||||
| Efficacy Data | Half Maximal Effective Concentration (EC50) |
1.12 nM
|
Positive CEA expression (CEA+++/++) | ||
| Method Description |
Ls147T cells were plated at a density of 5000 cells per well and the next day were treated with payload compounds (5x dilution) for 6 days.
|
||||
| In Vitro Model | Colon adenocarcinoma | Ls147T cells | CVCL_1384 | ||
| Experiment 4 Reporting the Activity Date of This ADC | [24] | ||||
| Efficacy Data | Half Maximal Effective Concentration (EC50) | > 100 nM | Negative CEA expression (CEA-) | ||
| Method Description |
MDA-MB-231 cells were plated at a density of 2000 cells per well and the next day were treated with payload compounds (5x dilution) for 6 days.
|
||||
| In Vitro Model | Breast adenocarcinoma | MDA-MB-231 cells | CVCL_0062 | ||
CN119317630A ADC-C14 [Investigative]
Revealed Based on the Cell Line Data
| Experiment 1 Reporting the Activity Date of This ADC | [25] | ||||
| Efficacy Data | Half Maximal Effective Concentration (EC50) |
64 nM
|
|||
| Method Description |
Distribute the cell lines H358 (1E3/well), to 3D-96-well plates (Corning: 4520), with 80 ul/well. Incubate overnight at 37°C and 5% CO2. Detect the cell viability of H358, H441, H1048 and MDA-MB-453 cells using 3D reagent (Promega, G9683).
|
||||
| In Vitro Model | Minimally invasive lung adenocarcinoma | H358 cells | CVCL_1559 | ||
| Experiment 2 Reporting the Activity Date of This ADC | [25] | ||||
| Efficacy Data | Half Maximal Effective Concentration (EC50) |
100 nM
|
|||
| Method Description |
Distribute the cell lines H441 (1E3/well) to 3D-96-well plates (Corning: 4520), with 80 ul/well. Incubate overnight at 37°C and 5% CO2. Detect the cell viability of H358, H441, H1048 and MDA-MB-453 cells using 3D reagent (Promega, G9683).
|
||||
| In Vitro Model | Lung papillary adenocarcinoma | H441 cells | CVCL_1561 | ||
| Experiment 3 Reporting the Activity Date of This ADC | [25] | ||||
| Efficacy Data | Half Maximal Effective Concentration (EC50) |
100 nM
|
|||
| Method Description |
Distribute the cell lines H1048 (1E3/well) to 3D-96-well plates (Corning: 4520), with 80 ul/well. Incubate overnight at 37°C and 5% CO2. Detect the cell viability of H358, H441, H1048 and MDA-MB-453 cells using 3D reagent (Promega, G9683).
|
||||
| In Vitro Model | Lung small cell carcinoma, Small cell lung cancer | H1048 cells | CVCL_1453 | ||
CN119317630A ADC-C10 [Investigative]
Revealed Based on the Cell Line Data
| Experiment 1 Reporting the Activity Date of This ADC | [25] | ||||
| Efficacy Data | Half Maximal Effective Concentration (EC50) |
66 nM
|
|||
| Method Description |
Distribute the cell lines H358 (1E3/well), to 3D-96-well plates (Corning: 4520), with 80 ul/well. Incubate overnight at 37°C and 5% CO2. Detect the cell viability of H358, H441, H1048 and MDA-MB-453 cells using 3D reagent (Promega, G9683).
|
||||
| In Vitro Model | Minimally invasive lung adenocarcinoma | H358 cells | CVCL_1559 | ||
| Experiment 2 Reporting the Activity Date of This ADC | [25] | ||||
| Efficacy Data | Half Maximal Effective Concentration (EC50) |
96 nM
|
|||
| Method Description |
Distribute the cell lines H1048 (1E3/well) to 3D-96-well plates (Corning: 4520), with 80 ul/well. Incubate overnight at 37°C and 5% CO2. Detect the cell viability of H358, H441, H1048 and MDA-MB-453 cells using 3D reagent (Promega, G9683).
|
||||
| In Vitro Model | Lung small cell carcinoma, Small cell lung cancer | H1048 cells | CVCL_1453 | ||
| Experiment 3 Reporting the Activity Date of This ADC | [25] | ||||
| Efficacy Data | Half Maximal Effective Concentration (EC50) |
100 nM
|
|||
| Method Description |
Distribute the cell lines H441 (1E3/well) to 3D-96-well plates (Corning: 4520), with 80 ul/well. Incubate overnight at 37°C and 5% CO2. Detect the cell viability of H358, H441, H1048 and MDA-MB-453 cells using 3D reagent (Promega, G9683).
|
||||
| In Vitro Model | Lung papillary adenocarcinoma | H441 cells | CVCL_1561 | ||
CN119317630A ADC-C1 [Investigative]
Revealed Based on the Cell Line Data
| Experiment 1 Reporting the Activity Date of This ADC | [25] | ||||
| Efficacy Data | Half Maximal Effective Concentration (EC50) |
72 nM
|
|||
| Method Description |
Distribute the cell lines H358 (1E3/well), to 3D-96-well plates (Corning: 4520), with 80 ul/well. Incubate overnight at 37°C and 5% CO2. Detect the cell viability of H358, H441, H1048 and MDA-MB-453 cells using 3D reagent (Promega, G9683).
|
||||
| In Vitro Model | Minimally invasive lung adenocarcinoma | H358 cells | CVCL_1559 | ||
| Experiment 2 Reporting the Activity Date of This ADC | [25] | ||||
| Efficacy Data | Half Maximal Effective Concentration (EC50) |
96 nM
|
|||
| Method Description |
Distribute the cell lines H1048 (1E3/well) to 3D-96-well plates (Corning: 4520), with 80 ul/well. Incubate overnight at 37°C and 5% CO2. Detect the cell viability of H358, H441, H1048 and MDA-MB-453 cells using 3D reagent (Promega, G9683).
|
||||
| In Vitro Model | Lung small cell carcinoma, Small cell lung cancer | H1048 cells | CVCL_1453 | ||
| Experiment 3 Reporting the Activity Date of This ADC | [25] | ||||
| Efficacy Data | Half Maximal Effective Concentration (EC50) |
100 nM
|
|||
| Method Description |
Distribute the cell lines H441 (1E3/well) to 3D-96-well plates (Corning: 4520), with 80 ul/well. Incubate overnight at 37°C and 5% CO2. Detect the cell viability of H358, H441, H1048 and MDA-MB-453 cells using 3D reagent (Promega, G9683).
|
||||
| In Vitro Model | Lung papillary adenocarcinoma | H441 cells | CVCL_1561 | ||
CN119317630A ADC-C11 [Investigative]
Revealed Based on the Cell Line Data
| Experiment 1 Reporting the Activity Date of This ADC | [25] | ||||
| Efficacy Data | Half Maximal Effective Concentration (EC50) |
72 nM
|
|||
| Method Description |
Distribute the cell lines H358 (1E3/well), to 3D-96-well plates (Corning: 4520), with 80 ul/well. Incubate overnight at 37°C and 5% CO2. Detect the cell viability of H358, H441, H1048 and MDA-MB-453 cells using 3D reagent (Promega, G9683).
|
||||
| In Vitro Model | Minimally invasive lung adenocarcinoma | H358 cells | CVCL_1559 | ||
| Experiment 2 Reporting the Activity Date of This ADC | [25] | ||||
| Efficacy Data | Half Maximal Effective Concentration (EC50) |
94 nM
|
|||
| Method Description |
Distribute the cell lines H1048 (1E3/well) to 3D-96-well plates (Corning: 4520), with 80 ul/well. Incubate overnight at 37°C and 5% CO2. Detect the cell viability of H358, H441, H1048 and MDA-MB-453 cells using 3D reagent (Promega, G9683).
|
||||
| In Vitro Model | Lung small cell carcinoma, Small cell lung cancer | H1048 cells | CVCL_1453 | ||
| Experiment 3 Reporting the Activity Date of This ADC | [25] | ||||
| Efficacy Data | Half Maximal Effective Concentration (EC50) |
100 nM
|
|||
| Method Description |
Distribute the cell lines H441 (1E3/well) to 3D-96-well plates (Corning: 4520), with 80 ul/well. Incubate overnight at 37°C and 5% CO2. Detect the cell viability of H358, H441, H1048 and MDA-MB-453 cells using 3D reagent (Promega, G9683).
|
||||
| In Vitro Model | Lung papillary adenocarcinoma | H441 cells | CVCL_1561 | ||
CN119317630A ADC-C13 [Investigative]
Revealed Based on the Cell Line Data
| Experiment 1 Reporting the Activity Date of This ADC | [25] | ||||
| Efficacy Data | Half Maximal Effective Concentration (EC50) |
73 nM
|
|||
| Method Description |
Distribute the cell lines H358 (1E3/well), to 3D-96-well plates (Corning: 4520), with 80 ul/well. Incubate overnight at 37°C and 5% CO2. Detect the cell viability of H358, H441, H1048 and MDA-MB-453 cells using 3D reagent (Promega, G9683).
|
||||
| In Vitro Model | Minimally invasive lung adenocarcinoma | H358 cells | CVCL_1559 | ||
| Experiment 2 Reporting the Activity Date of This ADC | [25] | ||||
| Efficacy Data | Half Maximal Effective Concentration (EC50) |
95 nM
|
|||
| Method Description |
Distribute the cell lines H1048 (1E3/well) to 3D-96-well plates (Corning: 4520), with 80 ul/well. Incubate overnight at 37°C and 5% CO2. Detect the cell viability of H358, H441, H1048 and MDA-MB-453 cells using 3D reagent (Promega, G9683).
|
||||
| In Vitro Model | Lung small cell carcinoma, Small cell lung cancer | H1048 cells | CVCL_1453 | ||
| Experiment 3 Reporting the Activity Date of This ADC | [25] | ||||
| Efficacy Data | Half Maximal Effective Concentration (EC50) |
100 nM
|
|||
| Method Description |
Distribute the cell lines H441 (1E3/well) to 3D-96-well plates (Corning: 4520), with 80 ul/well. Incubate overnight at 37°C and 5% CO2. Detect the cell viability of H358, H441, H1048 and MDA-MB-453 cells using 3D reagent (Promega, G9683).
|
||||
| In Vitro Model | Lung papillary adenocarcinoma | H441 cells | CVCL_1561 | ||
Ab[AL- LP9] [Investigative]
Revealed Based on the Cell Line Data
| Experiment 1 Reporting the Activity Date of This ADC | [26] | ||||
| Efficacy Data | Half Maximal Effective Concentration (EC50) |
285.967 nM
|
Positive HER expression (HER+++/++) | ||
| Method Description |
In vitro cytotoxicity of the ADCs, isotype control ADCs, and reference free payloads were evaluated using the CellTiter-Glo 2.5 Assay Kit
|
||||
| In Vitro Model | Breast adenocarcinoma | SK-BR-3 cells | CVCL_0033 | ||
CN117337196A Compound93 [Investigative]
Revealed Based on the Cell Line Data
| Experiment 1 Reporting the Activity Date of This ADC | [27] | ||||
| Efficacy Data | Cell growth inhibition ratio | ≈ -10% | Positive CD47/PD-L1 expression (CD47/PD-L1+++/++) | ||
| Method Description |
CD47/PD-L1-positive tumor cell line HS746T cells were selected to be inoculated into 96-well plates with 3x10⁵ cells/well and treated with the compound 93 with a dose of 5 ug/mL. Cell viability was measured by Cell Counting Kit-8 (CCK-8), and cell proliferation inhibition rate was calculated.
|
||||
| In Vitro Model | Gastric adenocarcinoma | HS746T cells | CVCL_0333 | ||
| Experiment 2 Reporting the Activity Date of This ADC | [27] | ||||
| Efficacy Data | Cell growth inhibition ratio | ≈ -5% | Positive CD47/PD-L1 expression (CD47/PD-L1+++/++) | ||
| Method Description |
CD47/PD-L1-positive tumor cell line BxPC3 cells were selected to be inoculated into 96-well plates with 3x10⁵ cells/well and treated with the compound 93 with a dose of 10 ug/mL. Cell viability was measured by Cell Counting Kit-8 (CCK-8), and cell proliferation inhibition rate was calculated.
|
||||
| In Vitro Model | Pancreatic ductal adenocarcinoma | BxPC3 cells | CVCL_0186 | ||
| Experiment 3 Reporting the Activity Date of This ADC | [27] | ||||
| Efficacy Data | Cell growth inhibition ratio | ≈ -5% | Positive CD47/PD-L1 expression (CD47/PD-L1+++/++) | ||
| Method Description |
CD47/PD-L1-positive tumor cell line Calu6 cells were selected to be inoculated into 96-well plates with 3x10⁵ cells/well and treated with the compound 93 with a dose of 10 ug/mL. Cell viability was measured by Cell Counting Kit-8 (CCK-8), and cell proliferation inhibition rate was calculated.
|
||||
| In Vitro Model | Lung adenocarcinoma | Calu-6 cells | CVCL_0236 | ||
| Experiment 4 Reporting the Activity Date of This ADC | [27] | ||||
| Efficacy Data | Cell growth inhibition ratio | ≈ 0% | Positive CD47/PD-L1 expression (CD47/PD-L1+++/++) | ||
| Method Description |
CD47/PD-L1-positive tumor cell line NCI-H661 cells were selected to be inoculated into 96-well plates with 3x10⁵ cells/well and treated with the compound 93 with a dose of 5 ug/mL. Cell viability was measured by Cell Counting Kit-8 (CCK-8), and cell proliferation inhibition rate was calculated.
|
||||
| In Vitro Model | Lung large cell carcinoma | NCI-H661 cells | CVCL_1577 | ||
| Experiment 5 Reporting the Activity Date of This ADC | [27] | ||||
| Efficacy Data | Cell growth inhibition ratio | ≈ 5% | Positive CD47/PD-L1 expression (CD47/PD-L1+++/++) | ||
| Method Description |
CD47/PD-L1-positive tumor cell line U87.MG cells were selected to be inoculated into 96-well plates with 3x10⁵ cells/well and treated with the compound 93 with a dose of 5 ug/mL. Cell viability was measured by Cell Counting Kit-8 (CCK-8), and cell proliferation inhibition rate was calculated.
|
||||
| In Vitro Model | Glioblastoma | U87 MG cells | CVCL_0022 | ||
| Experiment 6 Reporting the Activity Date of This ADC | [27] | ||||
| Efficacy Data | Cell growth inhibition ratio | ≈ 7% | Positive CD47/PD-L1 expression (CD47/PD-L1+++/++) | ||
| Method Description |
CD47/PD-L1-positive tumor cell line BxPC3 cells were selected to be inoculated into 96-well plates with 3x10⁵ cells/well and treated with the compound 93 with a dose of 20 ug/mL. Cell viability was measured by Cell Counting Kit-8 (CCK-8), and cell proliferation inhibition rate was calculated.
|
||||
| In Vitro Model | Pancreatic ductal adenocarcinoma | BxPC3 cells | CVCL_0186 | ||
| Experiment 7 Reporting the Activity Date of This ADC | [27] | ||||
| Efficacy Data | Cell growth inhibition ratio | ≈ 8% | Positive CD47/PD-L1 expression (CD47/PD-L1+++/++) | ||
| Method Description |
CD47/PD-L1-positive tumor cell line T47D cells were selected to be inoculated into 96-well plates with 3x10⁵ cells/well and treated with the compound 93 with a dose of 5 ug/mL. Cell viability was measured by Cell Counting Kit-8 (CCK-8), and cell proliferation inhibition rate was calculated.
|
||||
| In Vitro Model | Invasive breast carcinoma of no special type | T47D cells | CVCL_0553 | ||
| Experiment 8 Reporting the Activity Date of This ADC | [27] | ||||
| Efficacy Data | Cell growth inhibition ratio | ≈ 10% | Positive CD47/PD-L1 expression (CD47/PD-L1+++/++) | ||
| Method Description |
CD47/PD-L1-positive tumor cell line NCI-H661 cells were selected to be inoculated into 96-well plates with 3x10⁵ cells/well and treated with the compound 93 with a dose of 10 ug/mL. Cell viability was measured by Cell Counting Kit-8 (CCK-8), and cell proliferation inhibition rate was calculated.
|
||||
| In Vitro Model | Lung large cell carcinoma | NCI-H661 cells | CVCL_1577 | ||
| Experiment 9 Reporting the Activity Date of This ADC | [27] | ||||
| Efficacy Data | Cell growth inhibition ratio | ≈ 15% | Positive CD47/PD-L1 expression (CD47/PD-L1+++/++) | ||
| Method Description |
CD47/PD-L1-positive tumor cell line HS746T cells were selected to be inoculated into 96-well plates with 3x10⁵ cells/well and treated with the compound 93 with a dose of 10 ug/mL. Cell viability was measured by Cell Counting Kit-8 (CCK-8), and cell proliferation inhibition rate was calculated.
|
||||
| In Vitro Model | Gastric adenocarcinoma | HS746T cells | CVCL_0333 | ||
| Experiment 10 Reporting the Activity Date of This ADC | [27] | ||||
| Efficacy Data | Cell growth inhibition ratio | ≈ 15% | Positive CD47/PD-L1 expression (CD47/PD-L1+++/++) | ||
| Method Description |
CD47/PD-L1-positive tumor cell line U87.MG cells were selected to be inoculated into 96-well plates with 3x10⁵ cells/well and treated with the compound 93 with a dose of 10 ug/mL. Cell viability was measured by Cell Counting Kit-8 (CCK-8), and cell proliferation inhibition rate was calculated.
|
||||
| In Vitro Model | Glioblastoma | U87 MG cells | CVCL_0022 | ||
| Experiment 11 Reporting the Activity Date of This ADC | [27] | ||||
| Efficacy Data | Cell growth inhibition ratio | ≈ 18% | Positive CD47/PD-L1 expression (CD47/PD-L1+++/++) | ||
| Method Description |
CD47/PD-L1-positive tumor cell line T47D cells were selected to be inoculated into 96-well plates with 3x10⁵ cells/well and treated with the compound 93 with a dose of 10 ug/mL. Cell viability was measured by Cell Counting Kit-8 (CCK-8), and cell proliferation inhibition rate was calculated.
|
||||
| In Vitro Model | Invasive breast carcinoma of no special type | T47D cells | CVCL_0553 | ||
| Experiment 12 Reporting the Activity Date of This ADC | [27] | ||||
| Efficacy Data | Cell growth inhibition ratio | ≈ 18% | Positive CD47/PD-L1 expression (CD47/PD-L1+++/++) | ||
| Method Description |
CD47/PD-L1-positive tumor cell line Calu6 cells were selected to be inoculated into 96-well plates with 3x10⁵ cells/well and treated with the compound 93 with a dose of 20 ug/mL. Cell viability was measured by Cell Counting Kit-8 (CCK-8), and cell proliferation inhibition rate was calculated.
|
||||
| In Vitro Model | Lung adenocarcinoma | Calu-6 cells | CVCL_0236 | ||
| Experiment 13 Reporting the Activity Date of This ADC | [27] | ||||
| Efficacy Data | Cell growth inhibition ratio | ≈ 20% | Positive CD47/PD-L1 expression (CD47/PD-L1+++/++) | ||
| Method Description |
CD47/PD-L1-positive tumor cell line NCI-H661 cells were selected to be inoculated into 96-well plates with 3x10⁵ cells/well and treated with the compound 93 with a dose of 20 ug/mL. Cell viability was measured by Cell Counting Kit-8 (CCK-8), and cell proliferation inhibition rate was calculated.
|
||||
| In Vitro Model | Lung large cell carcinoma | NCI-H661 cells | CVCL_1577 | ||
| Experiment 14 Reporting the Activity Date of This ADC | [27] | ||||
| Efficacy Data | Cell growth inhibition ratio | ≈ 25% | Positive CD47/PD-L1 expression (CD47/PD-L1+++/++) | ||
| Method Description |
CD47/PD-L1-positive tumor cell line BxPC3 cells were selected to be inoculated into 96-well plates with 3x10⁵ cells/well and treated with the compound 93 with a dose of 40 ug/mL. Cell viability was measured by Cell Counting Kit-8 (CCK-8), and cell proliferation inhibition rate was calculated.
|
||||
| In Vitro Model | Pancreatic ductal adenocarcinoma | BxPC3 cells | CVCL_0186 | ||
| Experiment 15 Reporting the Activity Date of This ADC | [27] | ||||
| Efficacy Data | Cell growth inhibition ratio | ≈ 28% | Positive CD47/PD-L1 expression (CD47/PD-L1+++/++) | ||
| Method Description |
CD47/PD-L1-positive tumor cell line T47D cells were selected to be inoculated into 96-well plates with 3x10⁵ cells/well and treated with the compound 93 with a dose of 20 ug/mL. Cell viability was measured by Cell Counting Kit-8 (CCK-8), and cell proliferation inhibition rate was calculated.
|
||||
| In Vitro Model | Invasive breast carcinoma of no special type | T47D cells | CVCL_0553 | ||
| Experiment 16 Reporting the Activity Date of This ADC | [27] | ||||
| Efficacy Data | Cell growth inhibition ratio | ≈ 30% | Positive CD47/PD-L1 expression (CD47/PD-L1+++/++) | ||
| Method Description |
CD47/PD-L1-positive tumor cell line HS746T cells were selected to be inoculated into 96-well plates with 3x10⁵ cells/well and treated with the compound 93 with a dose of 20 ug/mL. Cell viability was measured by Cell Counting Kit-8 (CCK-8), and cell proliferation inhibition rate was calculated.
|
||||
| In Vitro Model | Gastric adenocarcinoma | HS746T cells | CVCL_0333 | ||
| Experiment 17 Reporting the Activity Date of This ADC | [27] | ||||
| Efficacy Data | Cell growth inhibition ratio | ≈ 35% | Positive CD47/PD-L1 expression (CD47/PD-L1+++/++) | ||
| Method Description |
CD47/PD-L1-positive tumor cell line U87.MG cells were selected to be inoculated into 96-well plates with 3x10⁵ cells/well and treated with the compound 93 with a dose of 20 ug/mL. Cell viability was measured by Cell Counting Kit-8 (CCK-8), and cell proliferation inhibition rate was calculated.
|
||||
| In Vitro Model | Glioblastoma | U87 MG cells | CVCL_0022 | ||
| Experiment 18 Reporting the Activity Date of This ADC | [27] | ||||
| Efficacy Data | Cell growth inhibition ratio | ≈ 38% | Positive CD47/PD-L1 expression (CD47/PD-L1+++/++) | ||
| Method Description |
CD47/PD-L1-positive tumor cell line T47D cells were selected to be inoculated into 96-well plates with 3x10⁵ cells/well and treated with the compound 93 with a dose of 40 ug/mL. Cell viability was measured by Cell Counting Kit-8 (CCK-8), and cell proliferation inhibition rate was calculated.
|
||||
| In Vitro Model | Invasive breast carcinoma of no special type | T47D cells | CVCL_0553 | ||
| Experiment 19 Reporting the Activity Date of This ADC | [27] | ||||
| Efficacy Data | Cell growth inhibition ratio | ≈ 38% | Positive CD47/PD-L1 expression (CD47/PD-L1+++/++) | ||
| Method Description |
CD47/PD-L1-positive tumor cell line Calu6 cells were selected to be inoculated into 96-well plates with 3x10⁵ cells/well and treated with the compound 93 with a dose of 40 ug/mL. Cell viability was measured by Cell Counting Kit-8 (CCK-8), and cell proliferation inhibition rate was calculated.
|
||||
| In Vitro Model | Lung adenocarcinoma | Calu-6 cells | CVCL_0236 | ||
| Experiment 20 Reporting the Activity Date of This ADC | [27] | ||||
| Efficacy Data | Cell growth inhibition ratio | ≈ 45% | Positive CD47/PD-L1 expression (CD47/PD-L1+++/++) | ||
| Method Description |
CD47/PD-L1-positive tumor cell line HS746T cells were selected to be inoculated into 96-well plates with 3x10⁵ cells/well and treated with the compound 93 with a dose of 40 ug/mL. Cell viability was measured by Cell Counting Kit-8 (CCK-8), and cell proliferation inhibition rate was calculated.
|
||||
| In Vitro Model | Gastric adenocarcinoma | HS746T cells | CVCL_0333 | ||
| Experiment 21 Reporting the Activity Date of This ADC | [27] | ||||
| Efficacy Data | Cell growth inhibition ratio | ≈ 60% | Positive CD47/PD-L1 expression (CD47/PD-L1+++/++) | ||
| Method Description |
CD47/PD-L1-positive tumor cell line NCI-H661 cells were selected to be inoculated into 96-well plates with 3x10⁵ cells/well and treated with the compound 93 with a dose of 40 ug/mL. Cell viability was measured by Cell Counting Kit-8 (CCK-8), and cell proliferation inhibition rate was calculated.
|
||||
| In Vitro Model | Lung large cell carcinoma | NCI-H661 cells | CVCL_1577 | ||
| Experiment 22 Reporting the Activity Date of This ADC | [27] | ||||
| Efficacy Data | Cell growth inhibition ratio | ≈ 75% | Positive CD47/PD-L1 expression (CD47/PD-L1+++/++) | ||
| Method Description |
CD47/PD-L1-positive tumor cell line U87.MG cells were selected to be inoculated into 96-well plates with 3x10⁵ cells/well and treated with the compound 93 with a dose of 40 ug/mL. Cell viability was measured by Cell Counting Kit-8 (CCK-8), and cell proliferation inhibition rate was calculated.
|
||||
| In Vitro Model | Glioblastoma | U87 MG cells | CVCL_0022 | ||
References