
Antibody-drug Conjugate Information
General Information of This Antibody-drug Conjugate (ID: DRG0ERKBH)
| ADC Name |
Trastuzumab deruxtecan
|
|||||
|---|---|---|---|---|---|---|
| Brand Name |
Enhertu
|
|||||
| Synonyms |
trastuzumab deruxtecan; DS-8201; fam-trastuzumab deruxtecan-nxki; Enhertu; trastuzumab deruxtecan-nxki; DS-8201a; T-DXd
Click to Show/Hide
|
|||||
| Organization |
Daiichi Sankyo (Originator);AstraZeneca (Top20 MNC)
|
|||||
| Drug Status |
Approved in 2019
|
|||||
| Drug-to-Antibody Ratio |
8
|
|||||
| Structure |
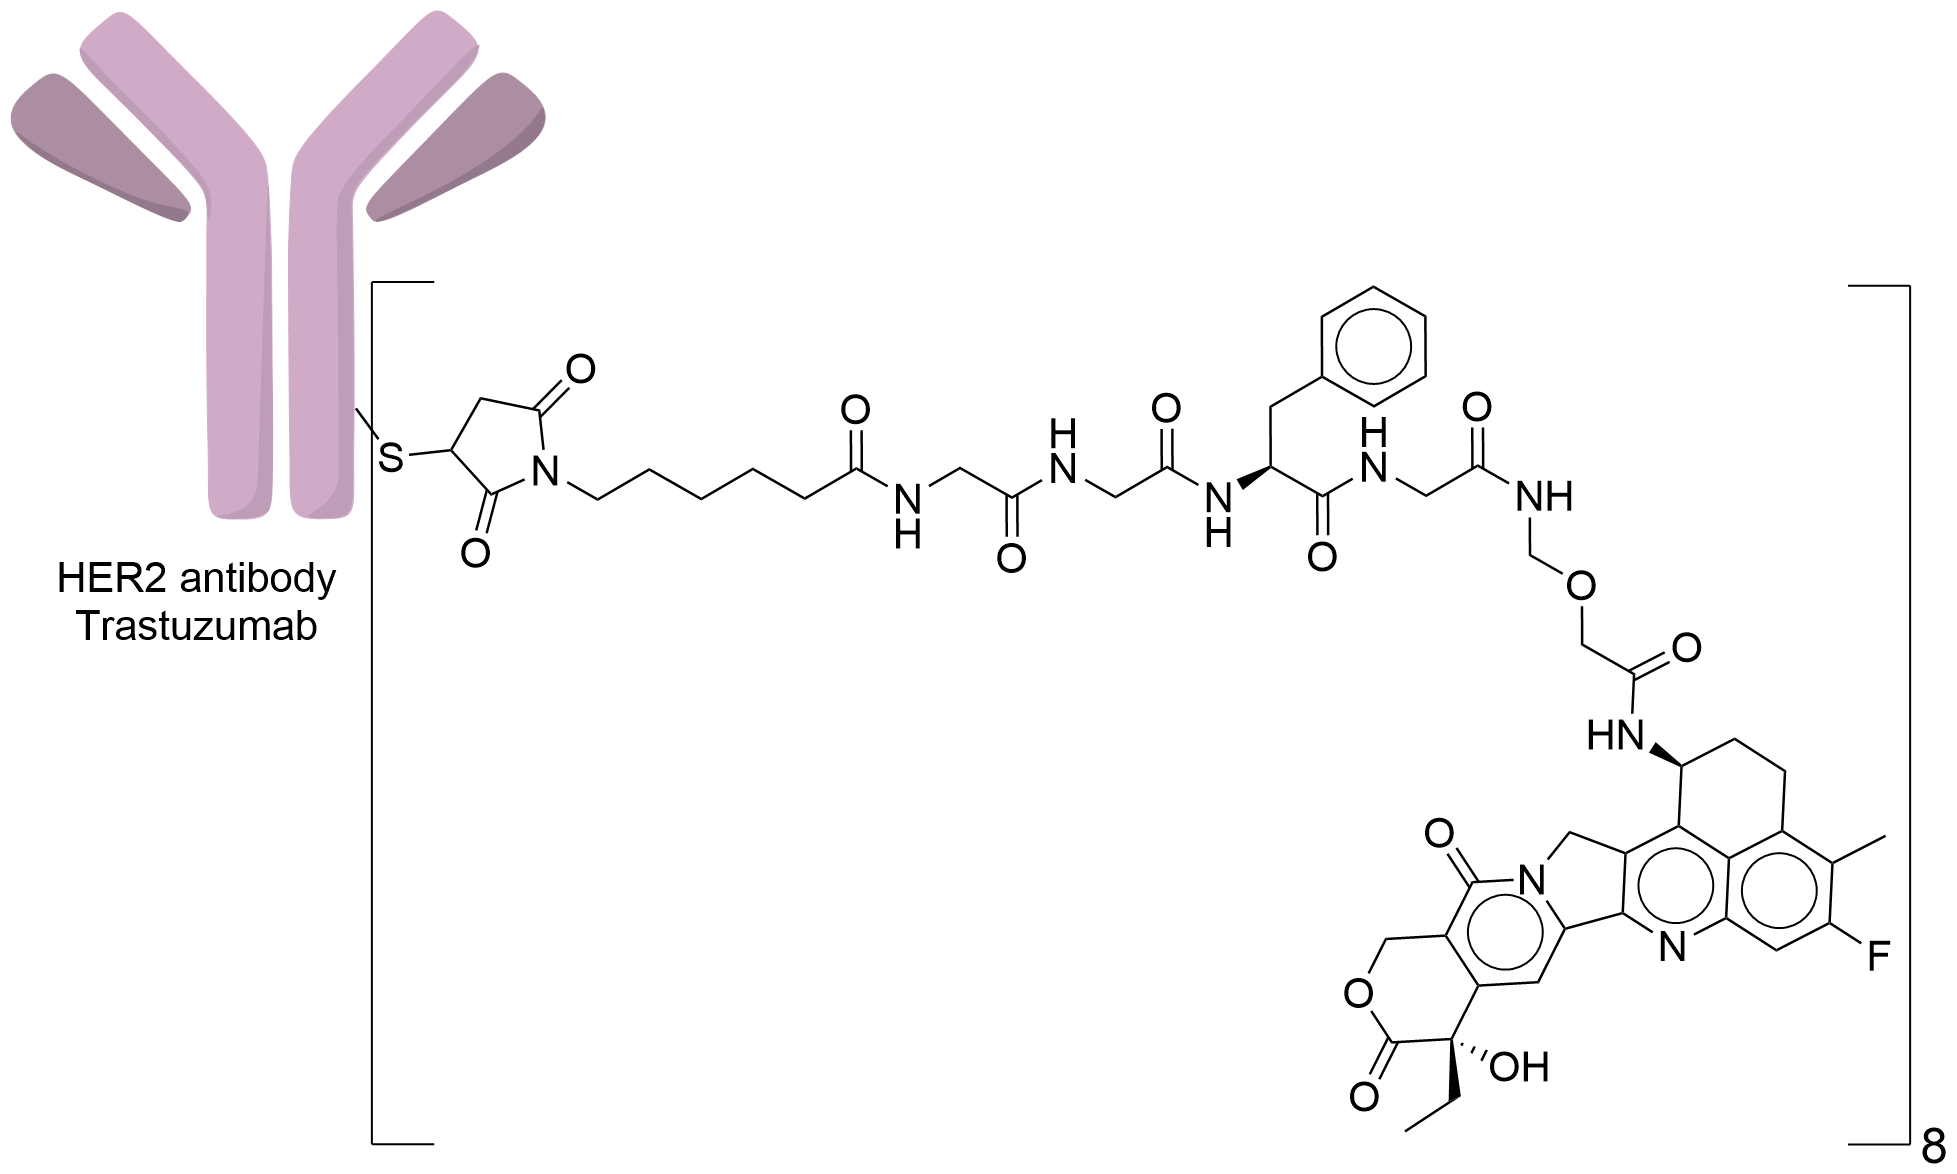
|
|||||
| Antibody Name |
Trastuzumab
|
Antibody Info | ||||
| Antigen Name |
Receptor tyrosine-protein kinase erbB-2 (HER2)
|
Antigen Info | ||||
| Payload Name |
DXd
|
Payload Info | ||||
| Payload Target |
DNA topoisomerase 1 (TOP1)
|
Target Info | ||||
| Linker Name |
Mc-Gly-Gly-Phe-Gly
|
Linker Info | ||||
| Conjugate Type |
Random Cysteines
|
|||||
| Combination Type |
deruxtecan
|
|||||
| Special Approval(s) |
Priority review (FDA); Accelerated approval (FDA); Fast track (FDA); Orphan drug (FDA); Breakthrough therapy (FDA); Priority review (NMPA); Breakthrough therapy (NMPA)
|
|||||
2027 Update
The disease landscape of This ADC
2027 Update
The clinical trial pipelines of This ADC
| Disease Name | Phase 1 | Phase 2 | Phase 3 | Approved | ||||||||||||||||||||||||||||||||||||
|---|---|---|---|---|---|---|---|---|---|---|---|---|---|---|---|---|---|---|---|---|---|---|---|---|---|---|---|---|---|---|---|---|---|---|---|---|---|---|---|---|
| Brain cancer | ||||||||||||||||||||||||||||||||||||||||
| Sarcoma | ||||||||||||||||||||||||||||||||||||||||
| Oral cavity cancer | ||||||||||||||||||||||||||||||||||||||||
| Oesophageal cancer | ||||||||||||||||||||||||||||||||||||||||
| Gastroesophageal junction adenocarcinoma | ||||||||||||||||||||||||||||||||||||||||
| Gastric cancer |
5 Trials
|
|||||||||||||||||||||||||||||||||||||||
| Colorectal cancer | ||||||||||||||||||||||||||||||||||||||||
| Pancreatic cancer | ||||||||||||||||||||||||||||||||||||||||
| Biliary tract cancer | ||||||||||||||||||||||||||||||||||||||||
| Lung cancer | ||||||||||||||||||||||||||||||||||||||||
| Melanoma | ||||||||||||||||||||||||||||||||||||||||
| Breast cancer |
22 Trials
|
12 Trials
|
||||||||||||||||||||||||||||||||||||||
| Ovarian cancer | ||||||||||||||||||||||||||||||||||||||||
| Endometrial cancer | ||||||||||||||||||||||||||||||||||||||||
| Cervical cancer | ||||||||||||||||||||||||||||||||||||||||
| Prostate cancer | ||||||||||||||||||||||||||||||||||||||||
| Urothelial cancer | ||||||||||||||||||||||||||||||||||||||||
| Unspecific solid tumor |
7 Trials
|
2027 Update
ADC-specific functional property
Bystander Killing Effect
| Bystander Killing Effect | Description | Reference |
|---|---|---|
| yes |
Preclinical in-vitro and in-vivo studies suggest that trastuzumab deruxtecan has a potent cytotoxic bystander effect, by contrast with trastuzumab emtansine, DS-8201a kills both HER2-positive and HER2-negative cells under coculture conditions
Click to Show/Hide
|
[1]
|
Binding Affinity
| Dissocation Constant (Kd) | Binding Target | Description | Reference |
|---|---|---|---|
| 7.3 ng/mL |
HER2
|
The Kd values of the antibody and DS-8201a for the HER2 ECD protein were 7.8 ng/ml and 7.3 ng/ ml, respectively.
|
[1]
|
Circulating Stability
| Incubation Time | 21days | Release | 4% | Reference |
[1]
|
|---|---|---|---|---|---|
| Incubation Medium | cynomolgus monkey plasma | ||||
| Description |
the linker of DS-8201a was stable, which was consistent with the fact that only 4% of DXd was released even after 21 days of in vitro incubation of DS-8201a in cynomolgus monkey plasma.
|
||||
2027 Update
General Information of The ADMET Data Related to This ADC
Absorption
| Standard Type | Value | Units | Description | Reference |
|---|---|---|---|---|
| Maximum Observed Concentration (Cmax) | 133 | ug/mL |
At the recommended dosage of ENHERTU for patients with metastatic breast cancer, the geometric mean (coefficient of variation [CV]%) Cmax of fam-trastuzumab deruxtecan-nxki was 133 ug/mL (19%).
|
[1] |
| Area Under the Concentration-Time Curve (AUC) | 780 | day·ug/mL |
At the recommended dosage of ENHERTU for patients with metastatic breast cancer, the AUC of fam-trastuzumab deruxtecan-nxki was 780 ug·day/mL.
|
[1] |
| Area Under the Concentration-Time Curve (AUC) | 1.87±0.487 | day·ug/mL |
PK parameters of 0.1 mg/kg DS-8201a following iv administration of DS-8201a to monkeys (N = 3)
|
[2] |
| Area Under the Concentration-Time Curve (AUC) | 8.43±0.859 | day·ug/mL |
PK parameters of 0.3 mg/kg DS-8201a following iv administration of DS-8201a to monkeys (N = 3
|
[2] |
| Area Under the Concentration-Time Curve (AUC) | 46.1±4.52 | day·ug/mL |
PK parameters of 1 mg/kg DS-8201a following iv administration of DS-8201a to monkeys (N = 3)
|
[2] |
| Area Under the Concentration-Time Curve (AUC) | 216±20.7 | day·ug/mL |
PK parameters of 3 mg/kg DS-8201a following iv administration of DS-8201a to monkeys (N = 3)
|
[2] |
| Area Under the Concentration-Time Curve (AUC) | 670±97 | day·ug/mL |
PK parameters of 8 mg/kg DS-8201a following iv administration of DS-8201a to monkeys (N = 3)
|
[2] |
| Area Under the Concentration-Time Curve (AUC) | 1.96 | uM·day |
Following a 10 mg/kg IV dose, test in Capan-1 NOD-SCID mouse.
|
[3] |
| Area Under the Concentration-Time Curve (AUC) | 2.75 | uM·day |
Following a 10 mg/kg IV dose, test in JIMT-1 Nude mouse.
|
[3] |
| Area Under the Concentration-Time Curve (AUC) | 2.48 | uM·day |
Following a 10 mg/kg IV dose, test in MDA-MB-468 NOD-SCID mouse.
|
[3] |
| Area Under the Concentration-Time Curve (AUC) | 0.2 | uM·day |
Following a 1 mg/kg IV dose, test in NCI-N87 Nude mouse.
|
[3] |
| Area Under the Concentration-Time Curve (AUC) | 2.4 | uM·day |
Following a 10 mg/kg IV dose, test in NCI-N87 Nude mouse.
|
[3] |
| Maximum Observed Concentration (Cmax) | 133 | ug/mL |
Pharmacokinetics of T-DXd in patients receiving T-DXd alone (cycle 2, cohort 1) .
|
[4] |
| Maximum Observed Concentration (Cmax) | 139 | ug/mL |
Pharmacokinetics of T-DXd in patients receiving T-DXd alone (cycle 2, cohort 2) .
|
[4] |
| Area Under the Concentration-Time Curve (AUC) | 650 | day·ug/mL |
Pharmacokinetics of T-DXd in patients receiving T-DXd alone (cycle 2, cohort 1) , area under the serum concentration-time curve through day 17 of cycle.
|
[4] |
| Area Under the Concentration-Time Curve (AUC) | 701 | day·ug/mL |
Pharmacokinetics of T-DXd in patients receiving T-DXd alone (cycle 2, cohort 2) , area under the serum concentration-time curve through day 17 of cycle.
|
[4] |
| Area Under the Concentration-Time Curve (AUC) | 644 | day·ug/mL |
Pharmacokinetics of T-DXd in patients receiving T-DXd alone (cycle 2, cohort 1) , area under plasma concentration-time curve over dosing interval.
|
[4] |
| Area Under the Concentration-Time Curve (AUC) | 706 | day·ug/mL |
Pharmacokinetics of T-DXd in patients receiving T-DXd alone (cycle 2, cohort 2) , area under plasma concentration-time curve over dosing interval.
|
[4] |
| Maximum Observed Concentration (Cmax) | 179 | ug/mL |
Pharmacokinetics parameters for T-DXd, all 51 patients (Pharmacokinetics Analysis Set; cutoff date of December 5, 2018) were included in the analysis for cycle 1,.
|
[6] |
| Maximum Observed Concentration (Cmax) | 154 | ug/mL |
Pharmacokinetics parameters for T-DXd, all 51 patients (Pharmacokinetics Analysis Set; cutoff date of December 5, 2018) were included in the analysis for cycle 1 and of 47 patients still on treatment at cycle 3
Click to Show/Hide
|
[6] |
| Area Under the Concentration-Time Curve (AUC) | 677 | day·ug/mL |
Pharmacokinetics parameters for T-DXd, all 51 patients (Pharmacokinetics Analysis Set; cutoff date of December 5, 2018) were included in the analysis for cycle 1,area under the serum concentration-time curve during the dosing interval.
Click to Show/Hide
|
[6] |
| Area Under the Concentration-Time Curve (AUC) | 905 | day·ug/mL |
Pharmacokinetics parameters for T-DXd, all 51 patients (Pharmacokinetics Analysis Set; cutoff date of December 5, 2018) were included in the analysis for cycle 1 and of 47 patients still on treatment at cycle 3, area under the serum concentration-time curve during the dosing interval.
Click to Show/Hide
|
[6] |
| Area Under the Concentration-Time Curve (AUC) | 677 | day·ug/mL |
Pharmacokinetics parameters for T-DXd, all 51 patients (Pharmacokinetics Analysis Set; cutoff date of December 5, 2018) were included in the analysis for cycle 1, area under the serum concentration-time curve up to the last quantifiable time.
Click to Show/Hide
|
[6] |
| Area Under the Concentration-Time Curve (AUC) | 731 | day·ug/mL |
Pharmacokinetics parameters for T-DXd, all 51 patients (Pharmacokinetics Analysis Set; cutoff date of December 5, 2018) were included in the analysis for cycle 1, area under the serum concentration-time curve up to infinity.
Click to Show/Hide
|
[6] |
| Area Under the Concentration-Time Curve (AUC) | 623 | day·ug/mL |
330P Pharmacokinetics of T-DXd, cycle 2, area under the concentration-time curve from cycle day 1-17.
|
[7] |
| Area Under the Concentration-Time Curve (AUC) | 742 | day·ug/mL |
330P Pharmacokinetics of T-DXd, cycle 3, area under the concentration-time curve from cycle day 1-17.
|
[7] |
| Maximum Observed Concentration (Cmax) | 131 | ug/mL |
330P Pharmacokinetics of T-DXd, cycle 2.
|
[7] |
| Maximum Observed Concentration (Cmax) | 138 | ug/mL |
330P Pharmacokinetics of T-DXd, cycle 3.
|
[7] |
| Area Under the Concentration-Time Curve (AUC) | 318±19 | day·ug/mL |
Pharmacokinetic parameters of total Ab and T-DXd after a single iv administration of T-DXd at 3 mg/kg in mice (N = 3, mean ± SD).
|
[9] |
| Maximum Observed Concentration (Cmax) | 122 | ug/mL |
The Cmax of trastuzumab deruxtecan at normal therapeutic doses was 122 ug/mL (20%).
|
[10] |
| Area Under the Concentration-Time Curve (AUC) | 735 | ug·day/mL |
The AUC of trastuzumab deruxtecan was 735 ug·day/mL (31%).
|
[10] |
Distribution
| Standard Type | Value | Units | Description | Reference |
|---|---|---|---|---|
| Volume of Distribution (Vd) | 75.2 | mL/kg |
At the recommended dose of 5.4 mg/kg, the volume of distribution at steady state was 75.2 ml/kg
|
[1] |
| Volume of Distribution (Vd) | 45.3±6.73 | mL/kg |
PK parameters of 8 mg/kg DS-8201a following iv administration of DS-8201a to monkeys (N = 3)
|
[2] |
| Volume of Distribution (Vd) | 30.6±3.89 | mL/kg |
PK parameters of 8 mg/kg DS-8201a following iv administration of DS-8201a to monkeys (N = 3)
|
[2] |
| Volume of Distribution (Vd) | 55.4±2.61 | mL/kg |
PK parameters of 8 mg/kg DS-8201a following iv administration of DS-8201a to monkeys (N = 3)
|
[2] |
| Volume of Distribution (Vd) | 52.7±11.3 | mL/kg |
PK parameters of 8 mg/kg DS-8201a following iv administration of DS-8201a to monkeys (N = 3)
|
[2] |
| Volume of Distribution (Vd) | 60.8±5.8 | mL/kg |
PK parameters of 8 mg/kg DS-8201a following iv administration of DS-8201a to monkeys (N = 3)
|
[2] |
| Volume of Distribution (Vd) | 79.5 | mL/kg |
Following a 10 mg/kg IV dose, test in NCI-N87 Nude mouse.
|
[3] |
| Volume of Distribution (Vd) | 105.5 | mL/kg |
Following a 10 mg/kg IV dose, test in NCI-N87 Nude mouse.
|
[3] |
| Volume of Distribution (Vd) | 99.6 | mL/kg |
Following a 10 mg/kg IV dose, test in NCI-N87 Nude mouse.
|
[3] |
| Volume of Distribution (Vd) | 123.7 | mL/kg |
Following a 10 mg/kg IV dose, test in NCI-N87 Nude mouse.
|
[3] |
| Volume of Distribution (Vd) | 146.3 | mL/kg |
Following a 10 mg/kg IV dose, test in NCI-N87 Nude mouse.
|
[3] |
| Volume of Distribution (Vd) | 72 | mL/kg |
Pharmacokinetics of T-DXd in patients receiving T-DXd alone (cycle 2, cohort 1) .
|
[4] |
| Volume of Distribution (Vd) | 71.9 | mL/kg |
Pharmacokinetics of T-DXd in patients receiving T-DXd alone (cycle 2, cohort 2) .
|
[4] |
| Volume of Distribution (Vd) | 2.78 | L |
In the final PopPK model, the pharmacokinetic profile of T-DXd was adequately described by a 2-compartment model with linear elimination, and the pharmacokinetic profile of DXd was described as a 1-compartment model with a 2-component, time-varying release rate from T-DXd. Central volume of distribution
Click to Show/Hide
|
[5] |
| Clearance (CL) | 0.198 | L/d |
In the final PopPK model, the pharmacokinetic profile of T-DXd was adequately described by a 2-compartment model with linear elimination, and the pharmacokinetic profile of DXd was described as a 1-compartment model with a 2-component, time-varying release rate from T-DXd. Distributional clearance.
Click to Show/Hide
|
[5] |
| Volume of Distribution (Vd) | 4.98 | L |
In the final PopPK model, the pharmacokinetic profile of T-DXd was adequately described by a 2-compartment model with linear elimination, and the pharmacokinetic profile of DXd was described as a 1-compartment model with a 2-component, time-varying release rate from T-DXd. Peripheral volume of distribution.
Click to Show/Hide
|
[5] |
| Volume of Distribution (Vd) | 60.9 | mL/kg |
Pharmacokinetics parameters for T-DXd, all 51 patients (Pharmacokinetics Analysis Set; cutoff date of December 5, 2018) were included in the analysis for cycle 1,.
|
[6] |
| Volume of Distribution (Vd) | 66.3 | mL/kg |
Pharmacokinetics parameters for T-DXd, all 51 patients (Pharmacokinetics Analysis Set; cutoff date of December 5, 2018) were included in the analysis for cycle 1 and of 47 patients still on treatment at cycle 3
Click to Show/Hide
|
[6] |
| Volume of Distribution (Vd) | 2.77 | L |
Parameter estimates from the final population pharmacokinetics model for intact trastuzumab deruxtecan, Central volume of distribution
|
[8] |
| Clearance (CL) | 0.199 | L/d |
Parameter estimates from the final population pharmacokinetics model for intact trastuzumab deruxtecan, Distributional clearance
|
[8] |
| Volume of Distribution (Vd) | 5.16 | L |
Parameter estimates from the final population pharmacokinetics model for intact trastuzumab deruxtecan, Peripheral volume of distribution.
|
[8] |
| Volume of Distribution (Vd) | 87±4.8 | mL/kg |
Pharmacokinetic parameters of total Ab and T-DXd after a single iv administration of T-DXd at 3 mg/kg in mice (N = 3, mean ± SD).
|
[9] |
Metabolism
| Description | Reference |
|---|---|
|
Trastuzumab deruxtecan is likely broken down into small peptides and amino acids through catabolism, just as the metabolism of endogenous IgG. Cathepsin B and L enzymes are thought to be involved in the cleavage of the peptide linker that joins the topoisomerase I inhibitor and the antibody.In vitro, DXd, the topoisomerase inhibitor portion of the drug, is found to be metabolized by CYP3A4.
Click to Show/Hide
|
[10], [11], [12] |
Excretion
| Standard Type | Value | Units | Description | Reference |
|---|---|---|---|---|
| Elimination Half-Life (t1/2) | 5.8 | days |
In a pharmacokinetic study, the median elimination half-life of trastuzumab deruxtecan was about 5.8 days.
|
[1] |
| Clearance (CL) | 0.42 | L/day |
Trastuzumab deruxtecan is rapidly cleared from systemic circulation. Estimated systemic clearance of trastuzumab deruxtecan is 0.42 L/day, according to a population pharmacokinetic analysis. DXd showed a systemic clearance of about 19.2 L/h
Click to Show/Hide
|
[1] |
| Elimination Half-Life (t1/2) | 0.641±0.137 | days |
PK parameters of 0.1 mg/kg DS-8201a following iv administration of DS-8201a to monkeys (N = 3)
|
[2] |
| Elimination Half-Life (t1/2) | 0.686±0.191 | days |
PK parameters of 0.3 mg/kg DS-8201a following iv administration of DS-8201a to monkeys (N = 3
|
[2] |
| Elimination Half-Life (t1/2) | 2.90±0.0829 | days |
PK parameters of 1 mg/kg DS-8201a following iv administration of DS-8201a to monkeys (N = 3)
|
[2] |
| Elimination Half-Life (t1/2) | 3.92±1.71 | days |
PK parameters of 3 mg/kg DS-8201a following iv administration of DS-8201a to monkeys (N = 3)
|
[2] |
| Elimination Half-Life (t1/2) | 4.54±0.48 | days |
PK parameters of 8 mg/kg DS-8201a following iv administration of DS-8201a to monkeys (N = 3)
|
[2] |
| Clearance (CL) | 55.7±13.4 | mL/day/kg |
PK parameters of 8 mg/kg DS-8201a following iv administration of DS-8201a to monkeys (N = 3)
|
[2] |
| Clearance (CL) | 35.9±3.78 | mL/day/kg |
PK parameters of 8 mg/kg DS-8201a following iv administration of DS-8201a to monkeys (N = 3)
|
[2] |
| Clearance (CL) | 21.8±2.27 | mL/day/kg |
PK parameters of 8 mg/kg DS-8201a following iv administration of DS-8201a to monkeys (N = 3)
|
[2] |
| Clearance (CL) | 14.0±1.35 | mL/day/kg |
PK parameters of 8 mg/kg DS-8201a following iv administration of DS-8201a to monkeys (N = 3)
|
[2] |
| Clearance (CL) | 12.2±1.7 | mL/day/kg |
PK parameters of 8 mg/kg DS-8201a following iv administration of DS-8201a to monkeys (N = 3)
|
[2] |
| Elimination Half-Life (t1/2) | 1.5 | days |
Following a 10 mg/kg IV dose, test in Capan-1 NOD-SCID mouse.
|
[3] |
| Elimination Half-Life (t1/2) | 3.4 | days |
Following a 10 mg/kg IV dose, test in JIMT-1 Nude mouse.
|
[3] |
| Elimination Half-Life (t1/2) | 3.2 | days |
Following a 10 mg/kg IV dose, test in MDA-MB-468 NOD-SCID mouse.
|
[3] |
| Elimination Half-Life (t1/2) | 2.9 | days |
Following a 1 mg/kg IV dose, test in NCI-N87 Nude mouse.
|
[3] |
| Elimination Half-Life (t1/2) | 4.5 | days |
Following a 10 mg/kg IV dose, test in NCI-N87 Nude mouse.
|
[3] |
| Clearance (CL) | 33.2 | mL/kg/day |
Following a 10 mg/kg IV dose, test in NCI-N87 Nude mouse.
|
[3] |
| Clearance (CL) | 23.7 | mL/kg/day |
Following a 10 mg/kg IV dose, test in NCI-N87 Nude mouse.
|
[3] |
| Clearance (CL) | 26.2 | mL/kg/day |
Following a 10 mg/kg IV dose, test in NCI-N87 Nude mouse.
|
[3] |
| Clearance (CL) | 32.5 | mL/kg/day |
Following a 10 mg/kg IV dose, test in NCI-N87 Nude mouse.
|
[3] |
| Clearance (CL) | 26.6 | mL/kg/day |
Following a 10 mg/kg IV dose, test in NCI-N87 Nude mouse.
|
[3] |
| Elimination Half-Life (t1/2) | 7.19 | days |
Pharmacokinetics of T-DXd in patients receiving T-DXd alone (cycle 2, cohort 1) .
|
[4] |
| Elimination Half-Life (t1/2) | 7.13 | days |
Pharmacokinetics of T-DXd in patients receiving T-DXd alone (cycle 2, cohort 2) .
|
[4] |
| Clearance (CL) | 8.22 | mL/day/kg |
Pharmacokinetics of T-DXd in patients receiving T-DXd alone (cycle 2, cohort 1) .
|
[4] |
| Clearance (CL) | 8.39 | mL/day/kg |
Pharmacokinetics of T-DXd in patients receiving T-DXd alone (cycle 2, cohort 2) .
|
[4] |
| Clearance (CL) | 0.42 | L/d |
In the final PopPK model, the pharmacokinetic profile of T-DXd was adequately described by a 2-compartment model with linear elimination, and the pharmacokinetic profile of DXd was described as a 1-compartment model with a 2-component, time-varying release rate from T-DXd.
Click to Show/Hide
|
[5] |
| Elimination Half-Life (t1/2) | 5.82 | day |
Pharmacokinetics parameters for T-DXd, all 51 patients (Pharmacokinetics Analysis Set; cutoff date of December 5, 2018) were included in the analysis for cycle 1,.
|
[6] |
| Elimination Half-Life (t1/2) | 7.4 | day |
Pharmacokinetics parameters for T-DXd, all 51 patients (Pharmacokinetics Analysis Set; cutoff date of December 5, 2018) were included in the analysis for cycle 1 and of 47 patients still on treatment at cycle 3
Click to Show/Hide
|
[6] |
| Clearance (CL) | 9.18 | mL/day/kg |
Pharmacokinetics parameters for T-DXd, all 51 patients (Pharmacokinetics Analysis Set; cutoff date of December 5, 2018) were included in the analysis for cycle 1,.
|
[6] |
| Clearance (CL) | 7.4 | mL/day/kg |
Pharmacokinetics parameters for T-DXd, all 51 patients (Pharmacokinetics Analysis Set; cutoff date of December 5, 2018) were included in the analysis for cycle 1 and of 47 patients still on treatment at cycle 3
Click to Show/Hide
|
[6] |
| Clearance (CL) | 0.421 | L/d |
Parameter estimates from the final population pharmacokinetics model for intact trastuzumab deruxtecan
|
[8] |
| Elimination Half-Life (t1/2) | 8.23±1.39 | day |
Pharmacokinetic parameters of total Ab and T-DXd after a single iv administration of T-DXd at 3 mg/kg in mice (N = 3, mean ± SD).
|
[9] |
| Clearance (CL) | 7.92±0.83 | mL/day/kg |
Pharmacokinetic parameters of total Ab and T-DXd after a single iv administration of T-DXd at 3 mg/kg in mice (N = 3, mean ± SD).
|
[9] |
Toxicity
| Description | Reference |
|---|---|
|
LD50 and overdose information are not currently available, but effects of an overdose are likely to impact the lungs, heart, and circulatory system, leading to significant toxicity.
|
[10] |
General Information of The Activity Data Related to This ADC
Revealed Based on the Cell Line Data
Identified from the Human Clinical Data
Discovered Using Patient-derived Xenograft Model
Discovered Using Cell Line-derived Xenograft Model
Full List of Activity Data of This Antibody-drug Conjugate
Revealed Based on the Cell Line Data
| Experiment 1 Reporting the Activity Date of This ADC | [13] | ||||
| Efficacy Data | Half Maximal inhibitory Concentration (IC50)Human PBMC | 0.0652 nM | Positive HER2 expression (HER2 +++/++) | ||
| Method Description |
After sample addition, culture for 6 days. Thaw the CellTiter-Glo® reagent and place the cell culture plate at room temperature to equilibrate for 30 minutes. Then add 50 to each well. Shake and lyse the cell plate in a shaker for 2 minutes, then incubate at room temperature for 10 minutes to stabilize the luminescence signal.
|
||||
| In Vitro Model | Breast adenocarcinoma | SK-BR-3 cells | CVCL_0033 | ||
| Experiment 2 Reporting the Activity Date of This ADC | [13] | ||||
| Efficacy Data | Half Maximal inhibitory Concentration (IC50)Human PBMC | 0.2344 nM | High HER2 expression (HER2+++; >300,000 HER2 molecules/cell) | ||
| Method Description |
After sample addition, culture for 6 days. Thaw the CellTiter-Glo® reagent and place the cell culture plate at room temperature to equilibrate for 30 minutes. Then add 50 to each well. Shake and lyse the cell plate in a shaker for 2 minutes, then incubate at room temperature for 10 minutes to stabilize the luminescence signal.
|
||||
| In Vitro Model | Gastric tubular adenocarcinoma | NCI-N87 cells | CVCL_1603 | ||
| Experiment 3 Reporting the Activity Date of This ADC | [13] | ||||
| Efficacy Data | Half Maximal inhibitory Concentration (IC50)Human PBMC | > 100 nM | Positive HER2 expression (HER2 +++/++) | ||
| Method Description |
After sample addition, culture for 6 days. Thaw the CellTiter-Glo® reagent and place the cell culture plate at room temperature to equilibrate for 30 minutes. Then add 50 to each well. Shake and lyse the cell plate in a shaker for 2 minutes, then incubate at room temperature for 10 minutes to stabilize the luminescence signal.
|
||||
| In Vitro Model | Breast ductal carcinoma | JIMT-1 cells | CVCL_2077 | ||
| Experiment 4 Reporting the Activity Date of This ADC | [13] | ||||
| Efficacy Data | Half Maximal inhibitory Concentration (IC50)Human PBMC | > 100 nM | Negative HER2 expression (HER2-) | ||
| Method Description |
After sample addition, culture for 6 days. Thaw the CellTiter-Glo® reagent and place the cell culture plate at room temperature to equilibrate for 30 minutes. Then add 50 to each well. Shake and lyse the cell plate in a shaker for 2 minutes, then incubate at room temperature for 10 minutes to stabilize the luminescence signal.
|
||||
| In Vitro Model | Invasive breast carcinoma | MCF-7 cells | CVCL_0031 | ||
| Experiment 5 Reporting the Activity Date of This ADC | [27] | ||||
| Efficacy Data | Half Maximal Inhibitory Concentration (IC50) | 0.7 ng/mL | Moderate HER2 expression (HER2 ++) | ||
| Method Description |
In vitro cytotoxicity of DS-8201 plus PARP inhibitor AZD2281 and ATR inhibitor AZD2281 against a panel of multiple human cancer cell lines. IC50 values were determined by sulforhodamine B assay in cells treated with different concentrations of drugs for 120 h.
|
||||
| In Vitro Model | Breast adenocarcinoma | SK-BR-3 cells | CVCL_0033 | ||
| Experiment 6 Reporting the Activity Date of This ADC | [27] | ||||
| Efficacy Data | Half Maximal Inhibitory Concentration (IC50) | 4.8 ng/mL | Moderate HER2 expression (HER2 ++) | ||
| Method Description |
In vitro cytotoxicity of ADCs against a panel of multiple human cancer cell lines. IC50 values were determined by sulforhodamine B assay in cells treated with different concentrations of drugs for 120 h.
|
||||
| In Vitro Model | Breast adenocarcinoma | SK-BR-3 cells | CVCL_0033 | ||
| Experiment 7 Reporting the Activity Date of This ADC | [27] | ||||
| Efficacy Data | Half Maximal Inhibitory Concentration (IC50) | 5.1 ng/mL | High HER2 expression (HER2 +++) | ||
| Method Description |
In vitro cytotoxicity of DS-8201 plus PARP inhibitor AZD2281 and ATR inhibitor AZD2281 against a panel of multiple human cancer cell lines. IC50 values were determined by sulforhodamine B assay in cells treated with different concentrations of drugs for 120 h.
|
||||
| In Vitro Model | Breast adenocarcinoma | MDA-MB-453 cells | CVCL_0418 | ||
| Experiment 8 Reporting the Activity Date of This ADC | [27] | ||||
| Efficacy Data | Half Maximal Inhibitory Concentration (IC50) | 5.3 ng/mL | Moderate HER2 expression (HER2 ++) | ||
| Method Description |
In vitro cytotoxicity of DS-8201 plus ATR inhibitor AZD2281 against a panel of multiple human cancer cell lines. IC50 values were determined by sulforhodamine B assay in cells treated with different concentrations of drugs for 120 h.
|
||||
| In Vitro Model | Breast adenocarcinoma | SK-BR-3 cells | CVCL_0033 | ||
| Experiment 9 Reporting the Activity Date of This ADC | [27] | ||||
| Efficacy Data | Half Maximal Inhibitory Concentration (IC50) | 6.1 ng/mL | High HER2 expression (HER2 +++) | ||
| Method Description |
In vitro cytotoxicity of DS-8201 plus PARP inhibitor AZD2281 against a panel of multiple human cancer cell lines. IC50 values were determined by sulforhodamine B assay in cells treated with different concentrations of drugs for 120 h.
|
||||
| In Vitro Model | Breast adenocarcinoma | MDA-MB-453 cells | CVCL_0418 | ||
| Experiment 10 Reporting the Activity Date of This ADC | [25] | ||||
| Efficacy Data | Half Maximal Inhibitory Concentration (IC50) |
6.7 ng/mL
|
|||
| Method Description |
The inhibitory activity of DS-8201a against cancer cell growth was compared with an anti-HER2 Ab and control IgG-ADC-conjugated with DXd against various human cancer cell lines in vitroThe cells were treated with DS-8201a, anti-HER2 Ab, and control IgG-ADC for 6 days.
|
||||
| In Vitro Model | Breast adenocarcinoma | SK-BR-3 cells | CVCL_0033 | ||
| Experiment 11 Reporting the Activity Date of This ADC | [27] | ||||
| Efficacy Data | Half Maximal Inhibitory Concentration (IC50) | 7.6 ng/mL | High HER2 expression (HER2 +++) | ||
| Method Description |
In vitro cytotoxicity of DS-8201 plus PARP inhibitor AZD2281 and ATR inhibitor BAY1895344 against a panel of multiple human cancer cell lines. IC50 values were determined by sulforhodamine B assay in cells treated with different concentrations of drugs for 120 h.
|
||||
| In Vitro Model | Invasive breast carcinoma | BT-474 cells | CVCL_0179 | ||
| Experiment 12 Reporting the Activity Date of This ADC | [27] | ||||
| Efficacy Data | Half Maximal Inhibitory Concentration (IC50) | 7.6 ng/mL | Moderate HER2 expression (HER2 ++) | ||
| Method Description |
In vitro cytotoxicity of DS-8201 plus PARP inhibitor BAY1895344 against a panel of multiple human cancer cell lines. IC50 values were determined by sulforhodamine B assay in cells treated with different concentrations of drugs for 120 h.
|
||||
| In Vitro Model | Breast adenocarcinoma | SK-BR-3 cells | CVCL_0033 | ||
| Experiment 13 Reporting the Activity Date of This ADC | [27] | ||||
| Efficacy Data | Half Maximal Inhibitory Concentration (IC50) | 8.1 ng/mL | High HER2 expression (HER2 +++) | ||
| Method Description |
In vitro cytotoxicity of DS-8201 plus PARP inhibitor AZD2281 and ATR inhibitor BAY1898344 against a panel of multiple human cancer cell lines. IC50 values were determined by sulforhodamine B assay in cells treated with different concentrations of drugs for 120 h.
|
||||
| In Vitro Model | Gastric tubular adenocarcinoma | NCI-N87 cells | CVCL_1603 | ||
| Experiment 14 Reporting the Activity Date of This ADC | [27] | ||||
| Efficacy Data | Half Maximal Inhibitory Concentration (IC50) | 9 ng/mL | High HER2 expression (HER2 +++) | ||
| Method Description |
In vitro cytotoxicity of DS-8201 plus ATR inhibitor BAY1895344 against a panel of multiple human cancer cell lines. IC50 values were determined by sulforhodamine B assay in cells treated with different concentrations of drugs for 120 h.
|
||||
| In Vitro Model | Breast adenocarcinoma | MDA-MB-453 cells | CVCL_0418 | ||
| Experiment 15 Reporting the Activity Date of This ADC | [27] | ||||
| Efficacy Data | Half Maximal Inhibitory Concentration (IC50) | 11.5 ng/mL | High HER2 expression (HER2 +++) | ||
| Method Description |
In vitro cytotoxicity of ADCs against a panel of multiple human cancer cell lines. IC50 values were determined by sulforhodamine B assay in cells treated with different concentrations of drugs for 120 h.
|
||||
| In Vitro Model | Breast adenocarcinoma | MDA-MB-453 cells | CVCL_0418 | ||
| Experiment 16 Reporting the Activity Date of This ADC | [27] | ||||
| Efficacy Data | Half Maximal Inhibitory Concentration (IC50) | 15.1 ng/mL | Moderate HER2 expression (HER2 ++) | ||
| Method Description |
In vitro cytotoxicity of DS-8201 plus PARP inhibitor AZD2281 and ATR inhibitor BAY1895344 against a panel of multiple human cancer cell lines. IC50 values were determined by sulforhodamine B assay in cells treated with different concentrations of drugs for 120 h.
|
||||
| In Vitro Model | Lung adenocarcinoma | Calu-3 cells | CVCL_0609 | ||
| Experiment 17 Reporting the Activity Date of This ADC | [27] | ||||
| Efficacy Data | Half Maximal Inhibitory Concentration (IC50) | 15.7 ng/mL | High HER2 expression (HER2 +++) | ||
| Method Description |
In vitro cytotoxicity of DS-8201 plus PARP inhibitor AZD2281 against a panel of multiple human cancer cell lines. IC50 values were determined by sulforhodamine B assay in cells treated with different concentrations of drugs for 120 h.
|
||||
| In Vitro Model | Gastric tubular adenocarcinoma | NCI-N87 cells | CVCL_1603 | ||
| Experiment 18 Reporting the Activity Date of This ADC | [27] | ||||
| Efficacy Data | Half Maximal Inhibitory Concentration (IC50) | 24.9 ng/mL | High HER2 expression (HER2 +++) | ||
| Method Description |
In vitro cytotoxicity of DS-8201 plus ATR inhibitor AZD2281 against a panel of multiple human cancer cell lines. IC50 values were determined by sulforhodamine B assay in cells treated with different concentrations of drugs for 120 h.
|
||||
| In Vitro Model | Gastric tubular adenocarcinoma | NCI-N87 cells | CVCL_1603 | ||
| Experiment 19 Reporting the Activity Date of This ADC | [25] | ||||
| Efficacy Data | Half Maximal Inhibitory Concentration (IC50) |
25.4 ng/mL
|
|||
| Method Description |
The inhibitory activity of DS-8201a against cancer cell growth was compared with an anti-HER2 Ab and control IgG-ADC-conjugated with DXd against various human cancer cell lines in vitroThe cells were treated with DS-8201a, anti-HER2 Ab, and control IgG-ADC for 6 days.
|
||||
| In Vitro Model | Gastric tubular adenocarcinoma | NCI-N87 cells | CVCL_1603 | ||
| Experiment 20 Reporting the Activity Date of This ADC | [25] | ||||
| Efficacy Data | Half Maximal Inhibitory Concentration (IC50) |
26.8 ng/mL
|
|||
| Method Description |
The inhibitory activity of DS-8201a against cancer cell growth was compared with an anti-HER2 Ab and control IgG-ADC-conjugated with DXd against various human cancer cell lines in vitroThe cells were treated with DS-8201a, anti-HER2 Ab, and control IgG-ADC for 6 days.
|
||||
| In Vitro Model | Breast inflammatory carcinoma | KPL-4 cells | CVCL_5310 | ||
| Experiment 21 Reporting the Activity Date of This ADC | [27] | ||||
| Efficacy Data | Half Maximal Inhibitory Concentration (IC50) | 32.7 ng/mL | High HER2 expression (HER2 +++) | ||
| Method Description |
In vitro cytotoxicity of ADCs against a panel of multiple human cancer cell lines. IC50 values were determined by sulforhodamine B assay in cells treated with different concentrations of drugs for 120 h.
|
||||
| In Vitro Model | Gastric tubular adenocarcinoma | NCI-N87 cells | CVCL_1603 | ||
| Experiment 22 Reporting the Activity Date of This ADC | [27] | ||||
| Efficacy Data | Half Maximal Inhibitory Concentration (IC50) | 34.8 ng/mL | Moderate HER2 expression (HER2 ++) | ||
| Method Description |
In vitro cytotoxicity of DS-8201 plus PARP inhibitor AZD2281 against a panel of multiple human cancer cell lines. IC50 values were determined by sulforhodamine B assay in cells treated with different concentrations of drugs for 120 h.
|
||||
| In Vitro Model | Lung adenocarcinoma | Calu-3 cells | CVCL_0609 | ||
| Experiment 23 Reporting the Activity Date of This ADC | [27] | ||||
| Efficacy Data | Half Maximal Inhibitory Concentration (IC50) | 41.7 ng/mL | Moderate HER2 expression (HER2 ++) | ||
| Method Description |
In vitro cytotoxicity of ADCs against a panel of multiple human cancer cell lines. IC50 values were determined by sulforhodamine B assay in cells treated with different concentrations of drugs for 120 h.
|
||||
| In Vitro Model | Lung adenocarcinoma | Calu-3 cells | CVCL_0609 | ||
| Experiment 24 Reporting the Activity Date of This ADC | [27] | ||||
| Efficacy Data | Half Maximal Inhibitory Concentration (IC50) | 41.8 ng/mL | Moderate HER2 expression (HER2 ++) | ||
| Method Description |
In vitro cytotoxicity of DS-8201 plus ATR inhibitor AZD2281 against a panel of multiple human cancer cell lines. IC50 values were determined by sulforhodamine B assay in cells treated with different concentrations of drugs for 120 h.
|
||||
| In Vitro Model | Lung adenocarcinoma | Calu-3 cells | CVCL_0609 | ||
| Experiment 25 Reporting the Activity Date of This ADC | [27] | ||||
| Efficacy Data | Half Maximal Inhibitory Concentration (IC50) | > 3000 ng/mL | Negative HER2 expression (HER2 -) | ||
| Method Description |
In vitro cytotoxicity of DS-8201 plus PARP inhibitor AZD2281 and ATR inhibitor AZD2281 against a panel of multiple human cancer cell lines. IC50 values were determined by sulforhodamine B assay in cells treated with different concentrations of drugs for 120 h.
|
||||
| In Vitro Model | Breast adenocarcinoma | MDA-MB-231 cells | CVCL_0062 | ||
| Experiment 26 Reporting the Activity Date of This ADC | [27] | ||||
| Efficacy Data | Half Maximal Inhibitory Concentration (IC50) | > 3000 ng/mL | Negative HER2 expression (HER2 -) | ||
| Method Description |
In vitro cytotoxicity of DS-8201 plus ATR inhibitor AZD2281 against a panel of multiple human cancer cell lines. IC50 values were determined by sulforhodamine B assay in cells treated with different concentrations of drugs for 120 h.
|
||||
| In Vitro Model | Breast adenocarcinoma | MDA-MB-231 cells | CVCL_0062 | ||
| Experiment 27 Reporting the Activity Date of This ADC | [27] | ||||
| Efficacy Data | Half Maximal Inhibitory Concentration (IC50) | > 3000 ng/mL | High HER2 expression (HER2 +++) | ||
| Method Description |
In vitro cytotoxicity of DS-8201 plus ATR inhibitor AZD2281 against a panel of multiple human cancer cell lines. IC50 values were determined by sulforhodamine B assay in cells treated with different concentrations of drugs for 120 h.
|
||||
| In Vitro Model | Invasive breast carcinoma | BT-474 cells | CVCL_0179 | ||
| Experiment 28 Reporting the Activity Date of This ADC | [27] | ||||
| Efficacy Data | Half Maximal Inhibitory Concentration (IC50) | > 3000 ng/mL | Negative HER2 expression (HER2 -) | ||
| Method Description |
In vitro cytotoxicity of DS-8201 plus PARP inhibitor AZD2281 against a panel of multiple human cancer cell lines. IC50 values were determined by sulforhodamine B assay in cells treated with different concentrations of drugs for 120 h.
|
||||
| In Vitro Model | Breast adenocarcinoma | MDA-MB-231 cells | CVCL_0062 | ||
| Experiment 29 Reporting the Activity Date of This ADC | [27] | ||||
| Efficacy Data | Half Maximal Inhibitory Concentration (IC50) | > 3000 ng/mL | High HER2 expression (HER2 +++) | ||
| Method Description |
In vitro cytotoxicity of DS-8201 plus PARP inhibitor AZD2281 against a panel of multiple human cancer cell lines. IC50 values were determined by sulforhodamine B assay in cells treated with different concentrations of drugs for 120 h.
|
||||
| In Vitro Model | Invasive breast carcinoma | BT-474 cells | CVCL_0179 | ||
| Experiment 30 Reporting the Activity Date of This ADC | [27] | ||||
| Efficacy Data | Half Maximal Inhibitory Concentration (IC50) | > 3000 ng/mL | Negative HER2 expression (HER2 -) | ||
| Method Description |
In vitro cytotoxicity of ADCs against a panel of multiple human cancer cell lines. IC50 values were determined by sulforhodamine B assay in cells treated with different concentrations of drugs for 120 h.
|
||||
| In Vitro Model | Breast adenocarcinoma | MDA-MB-231 cells | CVCL_0062 | ||
| Experiment 31 Reporting the Activity Date of This ADC | [27] | ||||
| Efficacy Data | Half Maximal Inhibitory Concentration (IC50) | > 3000 ng/mL | High HER2 expression (HER2 +++) | ||
| Method Description |
In vitro cytotoxicity of ADCs against a panel of multiple human cancer cell lines. IC50 values were determined by sulforhodamine B assay in cells treated with different concentrations of drugs for 120 h.
|
||||
| In Vitro Model | Invasive breast carcinoma | BT-474 cells | CVCL_0179 | ||
| Experiment 32 Reporting the Activity Date of This ADC | [26] | ||||
| Efficacy Data | Half Maximal Inhibitory Concentration (IC50) | 3 ug/mL | High HER2 expression (HER2 +++, IHC 3+) | ||
| Method Description |
Viability of NCI-N87 cells as well as of parental HCT116 cells and their derivatives (Mock, H2L and H2H) after incubation with the indicated concentrations of trastuzumab deruxtecan (DS-8201a) or T-DM1 for 144 h.
|
||||
| In Vitro Model | Colon carcinoma | HCT 116-H2H cells (High HER2 expression) | CVCL_0291 | ||
| Experiment 33 Reporting the Activity Date of This ADC | [25] | ||||
| Efficacy Data | Half Maximal Inhibitory Concentration (IC50) | > 10 ug/mL | |||
| Method Description |
The inhibitory activity of DS-8201a against cancer cell growth was compared with an anti-HER2 Ab and control IgG-ADC-conjugated with DXd against various human cancer cell lines in vitroThe cells were treated with DS-8201a, anti-HER2 Ab, and control IgG-ADC for 6 days.
|
||||
| In Vitro Model | Breast adenocarcinoma | MDA-MB-468 cells | CVCL_0419 | ||
| Experiment 34 Reporting the Activity Date of This ADC | [26] | ||||
| Efficacy Data | Half Maximal Inhibitory Concentration (IC50) | 97 ug/mL | High HER2 expression (HER2 +++) | ||
| Method Description |
Viability of NCI-N87 cells as well as of parental HCT116 cells and their derivatives (Mock, H2L and H2H) after incubation with the indicated concentrations of trastuzumab deruxtecan (DS-8201a) or T-DM1 for 144 h.
|
||||
| In Vitro Model | Gastric tubular adenocarcinoma | NCI-N87 cells | CVCL_1603 | ||
Identified from the Human Clinical Data
| Experiment 1 Reporting the Activity Date of This ADC | [14] | ||||
| Efficacy Data | Objective Response Rate (ORR) |
52.90
52.30 % |
|||
| Patients Enrolled |
HER2-low metastatic breast cancer who had received one or two previous lines of chemotherapy.
|
||||
| Administration Dosage |
Intravenously every 3 weeks at a dose of 5.40 mg per kilogram of body weight.
|
||||
| Related Clinical Trial | |||||
| NCT Number | NCT03734029 | Clinical Status | Phase 3 | ||
| Clinical Description | A phase 3, multicenter, randomized, open-label, active controlled trial of DS-8201a, an Anti-HER2-antibody drug conjugate (ADC), versus treatment of physician's choice for HER2-low, unresectable and/or metastatic breast cancer subjects. | ||||
| Primary Endpoint |
In HR+ cohort, for ENHERTU (N=331), median Progression-Free Survival (mFPS)=10.10 months (95% Cl 9.50-11.50), for Chemotherapy (N=163), median Progression-Free Survival (mFPS)=5.40 months(95% Cl 4.40-7.10), hazard radio=0.51 (95% Cl 0.40-0.64) and p-value<0.0001.
|
||||
| Other Endpoint |
In HR+ cohort, for ENHERTU (N=331), median overall survival (months)=23.90 (95% Cl 20.80-24.80), Confirmed Objective Response Rate=52.90% (95% Cl 47.30-58.40), Complete Response rate=36.00%, Partial Response rate= 49.50%, median Duration of Response (months)=10.70 (95% Cl 8.50-13.70); for Chemotherapy (N=163), median overall survival (months)=17.50 (95% Cl 15.20-24.80), Confirmed Objective Response Rate=16.60% (95% Cl 11.20-23.20), Complete Response rate=0.60%, Partial Response rate= 16.00%, median Duration of Response (months)=6.80 (95% Cl 6.50-9.90). In HR+ and HR- cohort, for ENHERTU (N=373), median Progression-Free Survival (mFPS)=9.90 months (95% Cl 9.00-11.30), median overall survival (months) = 23.40 (95% Cl 20.00-24.80), Confirmed Objective Response Rate = 52.30% (95% Cl 47.10-57.40), Complete Response rate=35.00%, Partial Response rate= 49.10%, median Duration of Response(months)=10.70 (95% Cl 8.50-13.20); for Chemotherapy (N=184), median Progression-Free Survival (mFPS)=5.40 months(95% Cl 4.20-6.80), median overall survival (months)=16.80(95% Cl 14.50-20.00), Confirmed Objective Response Rate=16.30% (95% Cl 11.30-22.50), Complete Response rate=11.00%, Partial Response rate= 15.20%, median Duration of Response(months)=6.80 (95% Cl 6.00-9.90).
Click to Show/Hide
|
||||
| Experiment 2 Reporting the Activity Date of This ADC | [15] | ||||
| Efficacy Data | Objective Response Rate (ORR) |
79.70%
|
|||
| Patients Enrolled |
HER2-positive unresectable or metastatic breast cancer who were previously treated with trastuzumab and a taxane in the advanced or metastatic setting.
|
||||
| Administration Dosage |
.
|
||||
| Related Clinical Trial | |||||
| NCT Number | NCT03529110 | Clinical Status | Phase 3 | ||
| Clinical Description | A phase 3, multicenter, randomized, open-label, active-controlled study of DS-8201a (Trastuzumab Deruxtecan), an Anti-HER2 antibody drug conjugate (ADC), versus Ado Trastuzumab Emtansine (T-DM1) for HER2-positive, unresectable and/or metastatic breast cancer subjects previously treated with trastuzumab and taxane. | ||||
| Primary Endpoint |
The median patient age was 54 years. Approximately 50% of patients were treated with 0-1 prior lines of therapy in the metastatic setting, and 50% were treated with 2 prior treatment regimens. At baseline, 16.50% of patients in the T-DXd group and 14.80% of those in the T-DM1 group had brain metastases. At a median follow-up of 15.90 months, T-DXd significantly improved PFS by 72% compared with T-DM1 across all patient subgroups. Findings were consistent irrespective of hormone receptor status, prior treatment with pertuzumab, number of prior lines of therapy, presence or absence of visceral disease, and presence or absence of brain metastases. The overall response rate (ORR) in the overall study cohort was 79.70% and 34.20% in the T-DXd and T-DM1 groups, respectively, representing an absolute improvement in ORR of 45% with T-DXd Findings were consistent across all patient subgroups, with the absolute improvement in ORR associated with T-DXd relative to T-DM1 ranging from 39% to 52%.
Click to Show/Hide
|
||||
| Experiment 3 Reporting the Activity Date of This ADC | [16] | ||||
| Efficacy Data | Objective Response Rate (ORR) |
79.70%
|
|||
| Patients Enrolled |
HER2-positive metastatic breast cancer previously treated with trastuzumab and a taxane.
|
||||
| Administration Dosage |
Intravenously every 3 weeks at a dose of 5.40 mg per kilogram of body weigh.
|
||||
| Related Clinical Trial | |||||
| NCT Number | NCT03529110 | Clinical Status | Phase 3 | ||
| Clinical Description | A phase 3, multicenter, randomized, open-label, active-controlled study of DS-8201a (Trastuzumab Deruxtecan), an Anti-HER2 antibody drug conjugate (ADC), versus Ado Trastuzumab Emtansine (T-DM1) for HER2-positive, unresectable and/or metastatic breast cancer subjects previously treated with trastuzumab and taxane. | ||||
| Primary Endpoint |
For ENHERTU 5.40 mg/kg, Median Progression-Free Survival (mPFS)=not reached (95% Cl 18.5-not estimable); For Ado-trastuzumab emtansine 3.60 mg/kg, Median Progression-Free Survival (mPFS)=6.80months (95% Cl 5.60-8.20), hazard radio=0.28 (95% Cl 0.22-0.37) and p-value<0.0001.
|
||||
| Other Endpoint |
For ENHERTU 5.40 mg/kg, Confirmed Objective Response Rate (ORR)=79.70% (95% Cl 74.30%-84.40%), complete response rate=16.10%, partial response rate=63.60%; For Ado-trastuzumab emtansine 3.60 mg/kg, Confirmed Objective Response Rate (ORR)=34.20% (95% Cl 28.50%-40.30%), complete response rate=8.70%, partial response rate=25.50%.
|
||||
| Experiment 4 Reporting the Activity Date of This ADC | [17] | ||||
| Efficacy Data | Objective Response Rate (ORR) | 43% | Positive HER2 expression (HER2+++/++; HER2 MFI=562) | ||
| Patients Enrolled |
HER2-positive gastric or gastroesophageal junction adenocarcinoma that had progressed while they were receiving at least two previous therapies, including trastuzumab.
|
||||
| Administration Dosage |
6.40 mg per kilogram of body weight every 3 weeks.
|
||||
| Related Clinical Trial | |||||
| NCT Number | NCT03329690 | Clinical Status | Phase 2 | ||
| Clinical Description | A phase 2, multicenter, open-label study of DS-8201a in subjects with HER2-expressing advanced gastric or gastroesophageal junction adenocarcinoma. | ||||
| Primary Endpoint |
In the trastuzumab deruxtecan group, confirmed objective response rate=43.00% (95% Cl 34.00-52.00%), complete response rate=8.00%, partial response rate=34.00%. In the chemotherapy group, confirmed objective response rate=12.00% (95% Cl 5.00-24.00%), complete response rate=0.00%, partial response rate=12.00%.
|
||||
| Other Endpoint |
In the trastuzumab deruxtecan group (N=119), confirmed disease control rate=86.00% (95% Cl 78.00-91.00%), median Duration of Response (mDOR)=11.30 months (95% Cl 5.60-not estimable), median overall survival (mOS)=12.50 months (95% Cl 9.60-14.30), estimated overall survival was 80.00% at 6 months and 52.00% at 12 months, median progression-free survival (mPFS)=5.60 months (95% CI, 4.30-6.90), estimated progression-free survival=43.00% at 6 months and 30.00% at 12 months In the chemotherapy group (N=56), confirmed disease control rate=62.00% (95% Cl 49.00-75.00%), median Duration of Response (mDOR)=3.90 months (95% Cl 3.0-4.9), median overall survival (mOS)=8.40 months (95% Cl 6.90-10.70), estimated overall survival was 66.00% at 6 months and 29.00% at 12 months, median progression-free survival (mPFS)=3.50 months (95% CI, 2.00-4.30), estimated progression-free survival=21.00% at 6 months and 0.00% at 12 months.
Click to Show/Hide
|
||||
| Experiment 5 Reporting the Activity Date of This ADC | [18] | ||||
| Efficacy Data | Objective Response Rate (ORR) | 45.30% | High HER2 expression (HER2 +++) | ||
| Patients Enrolled |
86 patients with metastatic colorectal cancer (mCRC) were enrolled and received at least 1 dose of T-DXd, including 53 patients in cohort A (HER2-positive, immunohistochemistry [IHC] 3+ or IHC 2+/in situ hybridization [ISH]+), 15 patients in cohort B (HER2 IHC 2+/ISH), and 18 patients in cohort C (HER2 IHC 1+).
|
||||
| Administration Dosage |
6.4 mg/kg every 3 weeks
|
||||
| Related Clinical Trial | |||||
| NCT Number | NCT04744831 | Clinical Status | Phase 2 | ||
| Clinical Description | A phase 2, multicenter, randomized, study of trastuzumab deruxtecan in participants with HER2-overexpressing locally advanced, unresectable or metastatic colorectal cancer (DESTINY-CRC02). | ||||
| Primary Endpoint |
ORR of 45.30% in cohort A
|
||||
| Other Endpoint |
No responses occurred in cohorts B or C. Median progression-free survival, overall survival, and duration of response were 6.90, 15.50, and 7.00 months, respectively.
|
||||
| Experiment 6 Reporting the Activity Date of This ADC | [19] | ||||
| Efficacy Data | Objective Response Rate (ORR) | 55% | Positive HER2 expression (HER2+++/++; HER2 MFI=1016) | ||
| Patients Enrolled |
HER2-overexpressing or HER2-mutant non-small cell lung cancer (NSCLC).
|
||||
| Administration Dosage |
Intravenously every 3 weeks at a dose of 6.40 mg per kilogram of body weight.
|
||||
| Related Clinical Trial | |||||
| NCT Number | NCT03505710 | Clinical Status | Phase 2 | ||
| Clinical Description | A phase 2, multicenter, open-label, 2-cohort study of Trastuzumab Deruxtecan (DS-8201a), an anti-HER2 antibody drug conjugate (ADC), for HER2-over-expressing or -mutated, unresectable and/or metastatic non small cell lung cancer (NSCLC) (DESTINY-Lung01). | ||||
| Primary Endpoint |
Confirmed objective response rate=55.00% (95% CI, 44.00%-65.00%), confirmed complete response rate=1.00%, confirmed partial response=54.00%.
|
||||
| Other Endpoint |
Median duration of response (mDOR) = 9.30 months (95% CI, 5.70-14.70), Median progression-free survival (mPFS) = 8.20 months (95% CI, 6.00-11.90), median overall survival=17.80 months (95% CI, 13.80-22.10).
|
||||
| Experiment 7 Reporting the Activity Date of This ADC | [20] | ||||
| Efficacy Data | Objective Response Rate (ORR) | 57.70% | Negative HER2 expression (HER2-; HER2 MFI=10) | ||
| Patients Enrolled |
HER2-mutated metastatic non-small cell lung cancer (NSCLC).
|
||||
| Administration Dosage |
6.40 mg/kg administered by intravenous infusion every 3 weeks (Q3W).
|
||||
| Related Clinical Trial | |||||
| NCT Number | NCT04644237 | Clinical Status | Phase 2 | ||
| Clinical Description | A phase 2, multicenter, randomized study of trastuzumab deruxtecan in subjects with HER2-mutated metastatic non-small cell lung cancer (NSCLC) (DESTINY-LUNG02). | ||||
| Primary Endpoint |
Confirmed Objective Response Rate=57.70% (95% CI, 43.20-71.30%), Complete Response rate=19.00%, Partial Response=55.80%.
|
||||
| Other Endpoint |
Median Duration of Response (mDOR) = 8.70 months (95% Cl 7.10-not estimable).
|
||||
| Experiment 8 Reporting the Activity Date of This ADC | [21] | ||||
| Efficacy Data | Objective Response Rate (ORR) | 60.90% | Positive HER2 expression (HER2+++/++; HER2 MFI=957) | ||
| Patients Enrolled |
Pathologically documented HER2-positive, unresectable or metastatic breast cancer who had received previous treatment with trastuzumab emtansine.
|
||||
| Administration Dosage |
5.4 mg per kilogram administered by intravenous infusion every 3 weeks.
|
||||
| Related Clinical Trial | |||||
| NCT Number | NCT03248492 | Clinical Status | Phase 2 | ||
| Clinical Description | A phase 2, multicenter, open-label study of DS-8201a, an anti-HER2-antibody drug conjugate (ADC) for HER2-positive, unresectable and/or metastatic breast cancer subjects previously treated with T-DM1 (DESTINY-Breast01). | ||||
| Primary Endpoint |
Confirmed Objective Response Rate=60.90% (95% CI, 53.40%-68.00%), complete response rate=6.00%, partial response rate= 54.90%.
|
||||
| Other Endpoint |
Disease-control rate was 97.30% (95% CI, 93.80-99.10), Median Duration of Response (months)=14.80 (95% CI, 13.80-16.90), clinical-benefit rate was 76.10% (95% CI, 69.30-82.10), median duration of progression-free survival was 16.40 months (95% CI, 12.70-not reached), estimated overall survival was 93.90% (95% CI, 89.30-96.60) at 6 months and 86.20% (95% CI, 79.80-90.70) at 12 months.
Click to Show/Hide
|
||||
| Experiment 9 Reporting the Activity Date of This ADC | [22] | ||||
| Efficacy Data | Objective Response Rate (ORR) |
73.33%
|
|||
| Patients Enrolled |
HER2-positive breast cancer and newly diagnosed untreated brain metastases or brain metastases progressing after previous local therapy, previous exposure to trastuzumab and pertuzumab and no indication for immediate local therapy.
|
||||
| Administration Dosage |
5.40 mg per kg bodyweight once every 3 weeks intravenously.
|
||||
| Related Clinical Trial | |||||
| NCT Number | NCT04752059 | Clinical Status | Phase 2 | ||
| Clinical Description | Phase 2 study of trastuzumab-deruxtecan (T-DX; DS-8201a) in HER2-positive breast cancer patients with newly diagnosed or progressing brain metastases. | ||||
| Primary Endpoint |
In the ITT population (n=15 patients), intracranial response rate by RANO-BM was 73.33% (95% CI 48.10-89.10%) (11/15 patients; 2 patients in complete remission (13.33%); 9 patients in partial remission (60.00%)). In the per protocol population (PP;n=14 patients), the response rate was 78.57% (95% CI 49.20-95.30%) (11/14). Two patients had stable disease for 6 months and one patient had stable disease at first restaging and progressed after four cycles of trastuzumab deruxtecan. Clinical benefit rate was 13/14 (92.86%; 95% CI 66.10-99.80%) in the PP population.
Click to Show/Hide
|
||||
| Other Endpoint |
In patients with extracranial metastases at baseline (n=13), a partial response by RECIST 11 was observed in 5/13 (27.8%; 95% CI 13.9-68.4%) patients, with the remainder having stable disease. None of the patients progressing on trastuzumab deruxtecan had extracranial progression as the first site of progressive disease In patients with measurable extracranial disease at baseline (n=8), a partial remission was observed in 5/8 (62.50%; 95% CI 24.50-91.50%) patients, with the remainder having stable disease.
Click to Show/Hide
|
||||
| Experiment 10 Reporting the Activity Date of This ADC | [23] | ||||
| Efficacy Data | Objective Response Rate (ORR) | 37% | Low HER2 expression (HER2 -) | ||
| Patients Enrolled |
54 patients with HER2-low breast cancer
|
||||
| Administration Dosage |
5.4 or 6.4 mg/kg.
|
||||
| Related Clinical Trial | |||||
| NCT Number | NCT02564900 | Clinical Status | Phase 1 | ||
| Clinical Description | Phase 1, two-part, multicenter, non-randomized, open-label, multiple dose first-in-human study of DS-8201A, in subjects with advanced solid malignant tumors. | ||||
| Primary Endpoint |
Median duration of response = 10.40 months, median progression free survival (PFS) = 11.10 months, median overall survival = 29.40 months.
|
||||
| Other Endpoint |
Confirmed ORR = 24.00 ; DOR, Median=11.00 months; TTR, months Median=2.80 ;PFS, months Median=8.00.
|
||||
| Experiment 11 Reporting the Activity Date of This ADC | [24] | ||||
| Efficacy Data | Objective Response Rate (ORR) |
54.50
70.00 % |
|||
| Patients Enrolled |
Recurrent uterine carcinosarcoma (UCS) with HER2 immunohistochemistry scores 1+ previously treated with chemotherapy were included.
|
||||
| Administration Dosage |
6.40 or 5.40 mg/kg was administered intravenously once every 3 weeks.
|
||||
Discovered Using Patient-derived Xenograft Model
| Experiment 1 Reporting the Activity Date of This ADC | [25] | ||||
| Efficacy Data | Tumor Growth Inhibition value (TGI) | ≈ 88.90% | High HER2 expression (HER2+++; IHC 3+) | ||
| Method Description |
The antitumor activity of DS-8201a was evaluated in various patient-derived xenograft models with different HER2 expression levels. Each cell suspension or tumor fragment was inoculated subcutaneously into specific pathogen-free female nude mice.The tumor-bearing mice were randomized into treatment and control groups based on the tumor volumes, and dosing was initiated on day 0. In this group, 3 mg/kg or 10 mg/kg DS-8201a was i.v. respectively to the tumor-bearing mice.
Click to Show/Hide
|
||||
| In Vivo Model | Gastric cancer PDX model (PDX: NIBIO G016) | ||||
| Experiment 2 Reporting the Activity Date of This ADC | [25] | ||||
| Efficacy Data | Tumor Growth Inhibition value (TGI) | ≈ 96.30% | Low HER2 expression (HER2+; IHC 1+) | ||
| Method Description |
The antitumor activity of DS-8201a was evaluated in various patient-derived xenograft models with different HER2 expression levels. Each cell suspension or tumor fragment was inoculated subcutaneously into specific pathogen-free female nude mice.The tumor-bearing mice were randomized into treatment and control groups based on the tumor volumes, and dosing was initiated on day 0. In this group, 10 mg/kg DS-8201a was i.v. to the tumor-bearing mice.
Click to Show/Hide
|
||||
| In Vivo Model | Breast cancer PDX model (PDX: ST313) | ||||
| Experiment 3 Reporting the Activity Date of This ADC | [25] | ||||
| Efficacy Data | Tumor Growth Inhibition value (TGI) | ≈ 98.20% | Low HER2 expression (HER2+; IHC 1+) | ||
| Method Description |
The antitumor activity of DS-8201a was evaluated in various patient-derived xenograft models with different HER2 expression levels. Each cell suspension or tumor fragment was inoculated subcutaneously into specific pathogen-free female nude mice.The tumor-bearing mice were randomized into treatment and control groups based on the tumor volumes, and dosing was initiated on day 0. In this group, 10 mg/kg DS-8201a was i.v. to the tumor-bearing mice.
Click to Show/Hide
|
||||
| In Vivo Model | Breast cancer PDX model (PDX: ST565) | ||||
| Experiment 4 Reporting the Activity Date of This ADC | [25] | ||||
| Efficacy Data | Tumor Growth Inhibition value (TGI) | ≈ 98.60% | Moderate HER2 expression (HER2++; IHC 2+) | ||
| Method Description |
The antitumor activity of DS-8201a was evaluated in various patient-derived xenograft models with different HER2 expression levels. Each cell suspension or tumor fragment was inoculated subcutaneously into specific pathogen-free female nude mice.The tumor-bearing mice were randomized into treatment and control groups based on the tumor volumes, and dosing was initiated on day 0. In this group, 10 mg/kg DS-8201a was i.v. to the tumor-bearing mice.
Click to Show/Hide
|
||||
| In Vivo Model | Breast cancer PDX model (PDX: ST225) | ||||
Discovered Using Cell Line-derived Xenograft Model
| Experiment 1 Reporting the Activity Date of This ADC | [26] | ||||
| Efficacy Data | Tumor Growth Inhibition value (TGI) | ≈ 0% | Negative HER2 expression (HER2 -) | ||
| Method Description |
Volume of tumors formed by HCT116-Mock, HCT116-H2L or HCT116-H2H cells in nude mice injected intraperitoneally once every 3 weeks with PBS vehicle or trastuzumab deruxtecan (DS-8201a, 3 mg/kg) beginning at Day 0.
|
||||
| In Vivo Model | HCT116-Mock CDX model | ||||
| In Vitro Model | Colon carcinoma | HCT 116-Mock cells (Negative HER2 expression) | CVCL_0291 | ||
| Experiment 2 Reporting the Activity Date of This ADC | [25] | ||||
| Efficacy Data | Tumor Growth Inhibition value (TGI) | ≈ 13.50% | Low HER2 expression (HER2+) | ||
| Method Description |
The antitumor activity of DS-8201a and trastuzumab were evaluated in various mice xenograft models with different HER2 expression levels; CFPAC-1 (low-expression). Each cell suspension or tumor fragment was inoculated subcutaneously into specific pathogen-free female nude mice.The tumor-bearing mice were randomized into treatment and control groups based on the tumor volumes, and dosing was initiated on day 0. In this group, 1 mg/kg DS-8201a or 10 mg/kg trastuzumab was i.v. to the tumor-bearing mice.
Click to Show/Hide
|
||||
| In Vivo Model | CFPAC-1 cell line xenograft model | ||||
| In Vitro Model | Cystic fibrosis | CFPAC-1 cells | CVCL_1119 | ||
| Experiment 3 Reporting the Activity Date of This ADC | [25] | ||||
| Efficacy Data | Tumor Growth Inhibition value (TGI) | ≈ 17.20% | Negative HER2 expression (HER2-) | ||
| Method Description |
The antitumor activity of DS-8201a was evaluated in various mice xenograft models with different HER2 expression levels; GCIY (negative). Each cell suspension or tumor fragment was inoculated subcutaneously into specific pathogen-free female nude mice.The tumor-bearing mice were randomized into treatment and control groups based on the tumor volumes, and dosing was initiated on day 0. In this group, 10 mg/kg DS-8201a or Anti-HER2 ADC(same drug-linker as DS-8201a and DAR=3.4) was i.v. to the tumor-bearing mice.
Click to Show/Hide
|
||||
| In Vivo Model | GCIY cell line xenograft model | ||||
| In Vitro Model | Gastric adenocarcinoma | GCIY cells | CVCL_1228 | ||
| Experiment 4 Reporting the Activity Date of This ADC | [25] | ||||
| Efficacy Data | Tumor Growth Inhibition value (TGI) | ≈ 28.80% | Positive HER2 expression (HER2+++/++; HER2 MFI=1016) | ||
| Method Description |
The in vivo antitumor activity of DS-8201a was evaluated in a HER2-positive NCI-N87 xenograft model. Each cell suspension or tumor fragment was inoculated subcutaneously into specific pathogen-free female nude mice. The tumor-bearing mice were randomized into treatment and control groups based on the tumor volumes, and dosing was initiated on day 0 In this group, 0.25 mg/kg DS-8201a was iv to the tumor-bearing mice.
Click to Show/Hide
|
||||
| In Vivo Model | HER2-positive NCI-N87 xenograft model | ||||
| In Vitro Model | Gastric tubular adenocarcinoma | NCI-N87 cells | CVCL_1603 | ||
| Experiment 5 Reporting the Activity Date of This ADC | [25] | ||||
| Efficacy Data | Tumor Growth Inhibition value (TGI) | ≈ 58.50% | |||
| Method Description |
The antitumor activity of DS-8201a was evaluated in various mice xenograft models with different HER2 expression levels; JIMT-1 (moderate positive). Each cell suspension or tumor fragment was inoculated subcutaneously into specific pathogen-free female nude mice.The tumor-bearing mice were randomized into treatment and control groups based on the tumor volumes, and dosing was initiated on day 0. In this group, 10 mg/kg DS-8201a or Anti-HER2 ADC(same drug-linker as DS-8201a and DAR=3.4) was i.v. to the tumor-bearing mice.
Click to Show/Hide
|
||||
| In Vivo Model | JIMT-1 cell line xenograft model | ||||
| In Vitro Model | Breast ductal carcinoma | JIMT-1 cells | CVCL_2077 | ||
| Experiment 6 Reporting the Activity Date of This ADC | [25] | ||||
| Efficacy Data | Tumor Growth Inhibition value (TGI) | ≈ 61.60% | Low HER2 expression (HER2+) | ||
| Method Description |
The antitumor activity of DS-8201a was evaluated in various mice xenograft models with different HER2 expression levels; Capan-1 (weak positive). Each cell suspension or tumor fragment was inoculated subcutaneously into specific pathogen-free female nude mice.The tumor-bearing mice were randomized into treatment and control groups based on the tumor volumes, and dosing was initiated on day 0. In this group, 10 mg/kg DS-8201a or Anti-HER2 ADC(same drug-linker as DS-8201a and DAR=3.4) was i.v. to the tumor-bearing mice.
Click to Show/Hide
|
||||
| In Vivo Model | Capan-1 cell line xenograft model | ||||
| In Vitro Model | Pancreatic ductal adenocarcinoma | Capan-1 cells | CVCL_0237 | ||
| Experiment 7 Reporting the Activity Date of This ADC | [25] | ||||
| Efficacy Data | Tumor Growth Inhibition value (TGI) | ≈ 62.50% | Positive HER2 expression (HER2+++/++; HER2 MFI=1016) | ||
| Method Description |
The in vivo antitumor activity of DS-8201a was evaluated in a HER2-positive NCI-N87 xenograft model. Each cell suspension or tumor fragment was inoculated subcutaneously into specific pathogen-free female nude mice. The tumor-bearing mice were randomized into treatment and control groups based on the tumor volumes, and dosing was initiated on day 0 In this group, 0.5 mg/kg DS-8201a was iv to the tumor-bearing mice.
Click to Show/Hide
|
||||
| In Vivo Model | HER2-positive NCI-N87 xenograft model | ||||
| In Vitro Model | Gastric tubular adenocarcinoma | NCI-N87 cells | CVCL_1603 | ||
| Experiment 8 Reporting the Activity Date of This ADC | [26] | ||||
| Efficacy Data | Tumor Growth Inhibition value (TGI) | ≈ 66.70% | Positive HER2 expression (HER2 +++/++) | ||
| Method Description |
Trastuzumab deruxtecan (10 mg/kg, every seven days 2) induces efficient tumor cell killing in cell line-derived models of EMT6-hHER2 cells with HER2 expression with high expression.
|
||||
| In Vivo Model | EMT6 CDX model (Expressing hHER2) | ||||
| In Vitro Model | Mammary gland malignant neoplasms | EMT6 cells (High HER2 expression) | CVCL_1923 | ||
| Experiment 9 Reporting the Activity Date of This ADC | [26] | ||||
| Efficacy Data | Tumor Growth Inhibition value (TGI) | ≈ 68.70% | Low HER2 expression (HER2 +, IHC 1+) | ||
| Method Description |
Volume of tumors formed by HCT116-Mock, HCT116-H2L or HCT116-H2H cells in nude mice injected intraperitoneally once every 3 weeks with PBS vehicle or trastuzumab deruxtecan (DS-8201a, 3 mg/kg) beginning at Day 0.
|
||||
| In Vivo Model | HCT116-H2L CDX model | ||||
| In Vitro Model | Colon carcinoma | HCT 116-H2L cells (Low HER2 expression) | CVCL_0291 | ||
| Experiment 10 Reporting the Activity Date of This ADC | [25] | ||||
| Efficacy Data | Tumor Growth Inhibition value (TGI) | ≈ 86% | Positive HER2 expression (HER2+++/++; HER2 MFI=1016) | ||
| Method Description |
The in vivo antitumor activity of DS-8201a was evaluated in a HER2-positive NCI-N87 xenograft model. Each cell suspension or tumor fragment was inoculated subcutaneously into specific pathogen-free female nude mice.The tumor-bearing mice were randomized into treatment and control groups based on the tumor volumes, and dosing was initiated on day 0. In this group, 1 mg/kg DS-8201a was i.v. to the tumor-bearing mice.
Click to Show/Hide
|
||||
| In Vivo Model | HER2-positive NCI-N87 xenograft model | ||||
| In Vitro Model | Gastric tubular adenocarcinoma | NCI-N87 cells | CVCL_1603 | ||
| Experiment 11 Reporting the Activity Date of This ADC | [25] | ||||
| Efficacy Data | Tumor Growth Inhibition value (TGI) | ≈ 88.30% | Positive HER2 expression (HER2+++/++; HER2 MFI=95.7) | ||
| Method Description |
The antitumor activity of DS-8201a was evaluated in various mice xenograft models with different HER2 expression levels; KPL-4 (strong positive). Each cell suspension or tumor fragment was inoculated subcutaneously into specific pathogen-free female nude mice.The tumor-bearing mice were randomized into treatment and control groups based on the tumor volumes, and dosing was initiated on day 0. In this group, 10 mg/kg DS-8201a or Anti-HER2 ADC(same drug-linker as DS-8201a and DAR=3.4) was i.v. to the tumor-bearing mice.
Click to Show/Hide
|
||||
| In Vivo Model | KPL-4 cell line xenograft model | ||||
| In Vitro Model | Breast inflammatory carcinoma | KPL-4 cells | CVCL_5310 | ||
| Experiment 12 Reporting the Activity Date of This ADC | [26] | ||||
| Efficacy Data | Tumor Growth Inhibition value (TGI) | ≈ 96.10% | High HER2 expression (HER2 +++, IHC 3+) | ||
| Method Description |
Volume of tumors formed by HCT116-Mock, HCT116-H2L or HCT116-H2H cells in nude mice injected intraperitoneally once every 3 weeks with PBS vehicle or trastuzumab deruxtecan (DS-8201a, 3 mg/kg) beginning at Day 0.
|
||||
| In Vivo Model | HCT116-H2H CDX model | ||||
| In Vitro Model | Colon carcinoma | HCT 116-H2H cells (High HER2 expression) | CVCL_0291 | ||
| Experiment 13 Reporting the Activity Date of This ADC | [25] | ||||
| Efficacy Data | Tumor Growth Inhibition value (TGI) | ≈ 97.30% | Positive HER2 expression (HER2+++/++; HER2 MFI=1016) | ||
| Method Description |
The in vivo antitumor activity of DS-8201a was evaluated in a HER2-positive NCI-N87 xenograft model. Each cell suspension or tumor fragment was inoculated subcutaneously into specific pathogen-free female nude mice.The tumor-bearing mice were randomized into treatment and control groups based on the tumor volumes, and dosing was initiated on day 0. In this group, 2 mg/kg DS-8201a was i.v. to the tumor-bearing mice.
Click to Show/Hide
|
||||
| In Vivo Model | HER2-positive NCI-N87 xenograft model | ||||
| In Vitro Model | Gastric tubular adenocarcinoma | NCI-N87 cells | CVCL_1603 | ||
| Experiment 14 Reporting the Activity Date of This ADC | [25] | ||||
| Efficacy Data | Tumor Growth Inhibition value (TGI) | ≈ 99.10% | Positive HER2 expression (HER2+++/++; HER2 MFI=1016) | ||
| Method Description |
The in vivo antitumor activity of DS-8201a was evaluated in a HER2-positive NCI-N87 xenograft model. Each cell suspension or tumor fragment was inoculated subcutaneously into specific pathogen-free female nude mice.The tumor-bearing mice were randomized into treatment and control groups based on the tumor volumes, and dosing was initiated on day 0. In this group, 4 mg/kg DS-8201a was i.v. to the tumor-bearing mice.
Click to Show/Hide
|
||||
| In Vivo Model | HER2-positive NCI-N87 xenograft model | ||||
| In Vitro Model | Gastric tubular adenocarcinoma | NCI-N87 cells | CVCL_1603 | ||
References