Antigen Information
General Information of This Antigen
| Antigen ID | TAR0XTCGM |
|||||
|---|---|---|---|---|---|---|
| Antigen Name | B-cell receptor CD22 (CD22) |
|||||
| Gene Name | CD22 |
|||||
| Gene ID | ||||||
| Synonym | B-lymphocyte cell adhesion molecule;Sialic acid-binding Ig-like lectin 2;T-cell surface antigen Leu-14;CD_antigen=CD22 |
|||||
| Sequence |
MHLLGPWLLLLVLEYLAFSDSSKWVFEHPETLYAWEGACVWIPCTYRALDGDLESFILFH
NPEYNKNTSKFDGTRLYESTKDGKVPSEQKRVQFLGDKNKNCTLSIHPVHLNDSGQLGLR MESKTEKWMERIHLNVSERPFPPHIQLPPEIQESQEVTLTCLLNFSCYGYPIQLQWLLEG VPMRQAAVTSTSLTIKSVFTRSELKFSPQWSHHGKIVTCQLQDADGKFLSNDTVQLNVKH TPKLEIKVTPSDAIVREGDSVTMTCEVSSSNPEYTTVSWLKDGTSLKKQNTFTLNLREVT KDQSGKYCCQVSNDVGPGRSEEVFLQVQYAPEPSTVQILHSPAVEGSQVEFLCMSLANPL PTNYTWYHNGKEMQGRTEEKVHIPKILPWHAGTYSCVAENILGTGQRGPGAELDVQYPPK KVTTVIQNPMPIREGDTVTLSCNYNSSNPSVTRYEWKPHGAWEEPSLGVLKIQNVGWDNT TIACAACNSWCSWASPVALNVQYAPRDVRVRKIKPLSEIHSGNSVSLQCDFSSSHPKEVQ FFWEKNGRLLGKESQLNFDSISPEDAGSYSCWVNNSIGQTASKAWTLEVLYAPRRLRVSM SPGDQVMEGKSATLTCESDANPPVSHYTWFDWNNQSLPYHSQKLRLEPVKVQHSGAYWCQ GTNSVGKGRSPLSTLTVYYSPETIGRRVAVGLGSCLAILILAICGLKLQRRWKRTQSQQG LQENSSGQSFFVRNKKVRRAPLSEGPHSLGCYNPMMEDGISYTTLRFPEMNIPRTGDAES SEMQRPPPDCDDTVTYSALHKRQVGDYENVIPDFPEDEGIHYSELIQFGVGERPQAQENV DYVILKH Click to Show/Hide
|
|||||
| Family | LISCH7 family |
|||||
| Function |
Mediates B-cell B-cell interactions. May be involved in the localization of B-cells in lymphoid tissues. Binds sialylated glycoproteins; one of which is CD45. Preferentially binds to alpha-2,6- linked sialic acid. The sialic acid recognition site can be masked by cis interactions with sialic acids on the same cell surface. Upon ligand induced tyrosine phosphorylation in the immune response seems to be involved in regulation of B-cell antigen receptor signaling. Plays a role in positive regulation through interaction with Src family tyrosine kinases and may also act as an inhibitory receptor by recruiting cytoplasmic phosphatases via their SH2 domains that block signal transduction through dephosphorylation of signaling molecules.
Click to Show/Hide
|
|||||
| Uniprot Entry | ||||||
| HGNC ID | ||||||
| KEGG ID | ||||||
Each Antibody-drug Conjuate AND It's Component Related to This Antigen
Full List of The ADC Related to This Antigen
Anti-CD22 10F4 Thiomab (LC:K149C)
| ADC Info | ADC Name | Payload | Target | Linker | Ref |
|---|---|---|---|---|---|
Anti-CD22-SN36248 |
seco-CBI-dimer |
Human Deoxyribonucleic acid (hDNA) |
Mal-PEG2 |
[1] |
Anti-CD22 Anti-ody (LC-K149C)
| ADC Info | ADC Name | Payload | Target | Linker | Ref |
|---|---|---|---|---|---|
Anti-CD22-K149C-DM1 |
Mertansine DM1 |
Microtubule (MT) |
Succinimidyl-4-(N-maleimidomethyl)cyclohexane-1-carboxylate (SMCC) |
[2] | |
Anti-CD22-K149C-MBT-DM4 |
Mertansine DM4 |
Microtubule (MT) |
MBT |
[2] | |
Anti-CD22-K149C-MPEO-DM1 |
Mertansine DM1 |
Microtubule (MT) |
MPEO |
[2] | |
Anti-CD22-SPDB-DM4 |
Mertansine DM4 |
Microtubule (MT) |
N-succinimidyl 4-(2-pyridyldithio) butanoate (SPDB) |
[2] |
Anti-CD22 mAb AbBJ
| ADC Info | ADC Name | Payload | Target | Linker | Ref |
|---|---|---|---|---|---|
AbBJ-ConjA |
AbBJ-ConjA payload |
Undisclosed |
AbBJ-ConjA linker |
[3] | |
AbBJ-ConjB |
AbBJ-ConjB payload |
Undisclosed |
AbBJ-ConjB linker |
[3] | |
AbBJ-ConjC |
AbBJ-ConjC payload |
Undisclosed |
AbBJ-ConjC linker |
[3] | |
AbBJ-ConjD |
AbBJ-ConjD payload |
Undisclosed |
AbBJ-ConjD linker |
[3] | |
AbBJ-ConjE |
AbBJ-ConjE payload |
Undisclosed |
AbBJ-ConjE linker |
[3] | |
AbBJ-ConjF |
AbBJ-ConjF payload |
Undisclosed |
AbBJ-ConjF linker |
[3] | |
AbBJ-ConjG |
AbBJ-ConjG payload |
Undisclosed |
AbBJ-ConjG linker |
[3] | |
AbBJ-ConjH |
AbBJ-ConjH payload |
Undisclosed |
AbBJ-ConjH linker |
[3] |
Anti-CD22 mAb AbCJX
| ADC Info | ADC Name | Payload | Target | Linker | Ref |
|---|---|---|---|---|---|
AbCJX-ConjA |
AbCJX-ConjA payload |
Undisclosed |
AbCJX-ConjA linker |
[3] | |
AbCJX-ConjB |
AbCJX-ConjB payload |
Undisclosed |
AbCJX-ConjB linker |
[3] | |
AbCJX-ConjC |
AbCJX-ConjC payload |
Undisclosed |
AbCJX-ConjC linker |
[3] | |
AbCJX-ConjD |
AbCJX-ConjD payload |
Undisclosed |
AbCJX-ConjD linker |
[3] | |
AbCJX-ConjE |
AbCJX-ConjE payload |
Undisclosed |
AbCJX-ConjE linker |
[3] | |
AbCJX-ConjF |
AbCJX-ConjF payload |
Undisclosed |
AbCJX-ConjF linker |
[3] | |
AbCJX-ConjG |
AbCJX-ConjG payload |
Undisclosed |
AbCJX-ConjG linker |
[3] | |
AbCJX-ConjH |
AbCJX-ConjH payload |
Undisclosed |
AbCJX-ConjH linker |
[3] |
Anti-CD22 mAb AbDJ
| ADC Info | ADC Name | Payload | Target | Linker | Ref |
|---|---|---|---|---|---|
AbDJ-ConjA |
AbDJ-ConjA payload |
Undisclosed |
AbDJ-ConjA linker |
[3] | |
AbDJ-ConjB |
AbDJ-ConjB payload |
Undisclosed |
AbDJ-ConjB linker |
[3] | |
AbDJ-ConjC |
AbDJ-ConjC payload |
Undisclosed |
AbDJ-ConjC linker |
[3] | |
AbDJ-ConjD |
AbDJ-ConjD payload |
Undisclosed |
AbDJ-ConjD linker |
[3] | |
AbDJ-ConjE |
AbDJ-ConjE payload |
Undisclosed |
AbDJ-ConjE linker |
[3] | |
AbDJ-ConjF |
AbDJ-ConjF payload |
Undisclosed |
AbDJ-ConjF linker |
[3] | |
AbDJ-ConjG |
AbDJ-ConjG payload |
Undisclosed |
AbDJ-ConjG linker |
[3] | |
AbDJ-ConjH |
AbDJ-ConjH payload |
Undisclosed |
AbDJ-ConjH linker |
[3] |
Anti-CD22 mAb AbHJ
| ADC Info | ADC Name | Payload | Target | Linker | Ref |
|---|---|---|---|---|---|
AbHJ-ConjA |
AbHJ-ConjA payload |
Undisclosed |
AbHJ-ConjA linker |
[3] | |
AbHJ-ConjB |
AbHJ-ConjB payload |
Undisclosed |
AbHJ-ConjB linker |
[3] | |
AbHJ-ConjC |
AbHJ-ConjC payload |
Undisclosed |
AbHJ-ConjC linker |
[3] | |
AbHJ-ConjD |
AbHJ-ConjD payload |
Undisclosed |
AbHJ-ConjD linker |
[3] | |
AbHJ-ConjE |
AbHJ-ConjE payload |
Undisclosed |
AbHJ-ConjE linker |
[3] | |
AbHJ-ConjF |
AbHJ-ConjF payload |
Undisclosed |
AbHJ-ConjF linker |
[3] | |
AbHJ-ConjG |
AbHJ-ConjG payload |
Undisclosed |
AbHJ-ConjG linker |
[3] | |
AbHJ-ConjH |
AbHJ-ConjH payload |
Undisclosed |
AbHJ-ConjH linker |
[3] |
Anti-CD22 mAb AbLJ
| ADC Info | ADC Name | Payload | Target | Linker | Ref |
|---|---|---|---|---|---|
AbLJ-ConjA |
AbLJ-ConjA payload |
Undisclosed |
AbLJ-ConjA linker |
[3] | |
AbLJ-ConjB |
AbLJ-ConjB payload |
Undisclosed |
AbLJ-ConjB linker |
[3] | |
AbLJ-ConjC |
AbLJ-ConjC payload |
Undisclosed |
AbLJ-ConjC linker |
[3] | |
AbLJ-ConjD |
AbLJ-ConjD payload |
Undisclosed |
AbLJ-ConjD linker |
[3] | |
AbLJ-ConjE |
AbLJ-ConjE payload |
Undisclosed |
AbLJ-ConjE linker |
[3] | |
AbLJ-ConjF |
AbLJ-ConjF payload |
Undisclosed |
AbLJ-ConjF linker |
[3] | |
AbLJ-ConjG |
AbLJ-ConjG payload |
Undisclosed |
AbLJ-ConjG linker |
[3] | |
AbLJ-ConjH |
AbLJ-ConjH payload |
Undisclosed |
AbLJ-ConjH linker |
[3] |
Anti-CD22 mAb HB22.7
| ADC Info | ADC Name | Payload | Target | Linker | Ref |
|---|---|---|---|---|---|
HB22.7-SAP |
Saporin |
Microtubule (MT) |
Undisclosed |
[4] |
Anti-CD22 mAb xCD22
| ADC Info | ADC Name | Payload | Target | Linker | Ref |
|---|---|---|---|---|---|
WO2013055987A1 xCD22-103 |
SG2000 |
Human Deoxyribonucleic acid (hDNA) |
WO2013055987A1_xCD22-103 linker |
[5] |
Anti-CD22-HC-A140C
| ADC Info | ADC Name | Payload | Target | Linker | Ref |
|---|---|---|---|---|---|
Alpha-CD22-HC-A140C-10 |
seco-CBI-dimer |
Human Deoxyribonucleic acid (hDNA) |
Mc-peptidomimetic based linker 10 |
[6] | |
Alpha-CD22-HC-A140C-11 |
seco-CBI-dimer |
Human Deoxyribonucleic acid (hDNA) |
Mc-PEG2 |
[6] |
Anti-CD22-LC-K149C
| ADC Info | ADC Name | Payload | Target | Linker | Ref |
|---|---|---|---|---|---|
ACD22-LC-K149C-10 |
PA-seco-CBI-dimer |
Human Deoxyribonucleic acid (hDNA) |
Mc-cBu-Cit |
[7] | |
Alpha-CD22-LC-K149C-10 |
seco-CBI-dimer |
Human Deoxyribonucleic acid (hDNA) |
Mc-peptidomimetic based linker 10 |
[6] | |
Alpha-CD22-LC-K149C-11 |
seco-CBI-dimer |
Human Deoxyribonucleic acid (hDNA) |
Mal-PEG2 |
[6] | |
Alpha-CD22-LC-K149C-12 |
Seco-CBI-dimer 12 |
Human Deoxyribonucleic acid (hDNA) |
Mc-peptidomimetic based linker 12 |
[6] |
Anti-CD22-LC-V205C
| ADC Info | ADC Name | Payload | Target | Linker | Ref |
|---|---|---|---|---|---|
Alpha-CD22-LC-V205C-10 |
seco-CBI-dimer |
Human Deoxyribonucleic acid (hDNA) |
Mc-peptidomimetic based linker 10 |
[6] |
CN105828840B_ADC-101 antibody
| ADC Info | ADC Name | Payload | Target | Linker | Ref |
|---|---|---|---|---|---|
CN105828840B ADC-101 |
CN105828840B_ADC-101 payload |
Undisclosed |
CN105828840B_ADC-101 linker |
[8] |
CN105828840B_ADC-104 antibody
| ADC Info | ADC Name | Payload | Target | Linker | Ref |
|---|---|---|---|---|---|
CN105828840B ADC-104 |
CN105828840B_ADC-104 payload |
Undisclosed |
CN105828840B_ADC-104 linker |
[8] |
CN105828840B_ADC-108 antibody
| ADC Info | ADC Name | Payload | Target | Linker | Ref |
|---|---|---|---|---|---|
CN105828840B ADC-108 |
CN105828840B_ADC-108 payload |
Undisclosed |
CN105828840B_ADC-108 linker |
[8] |
CN105828840B_ADC-110 antibody
| ADC Info | ADC Name | Payload | Target | Linker | Ref |
|---|---|---|---|---|---|
CN105828840B ADC-110 |
CN105828840B_ADC-110 payload |
Undisclosed |
CN105828840B_ADC-110 linker |
[8] |
CN105828840B_ADC-111 antibody
| ADC Info | ADC Name | Payload | Target | Linker | Ref |
|---|---|---|---|---|---|
CN105828840B ADC-111 |
CN105828840B_ADC-111 payload |
Undisclosed |
CN105828840B_ADC-111 linker |
[8] |
CN105828840B_ADC-115 antibody
| ADC Info | ADC Name | Payload | Target | Linker | Ref |
|---|---|---|---|---|---|
CN105828840B ADC-115 |
CN105828840B_ADC-115 payload |
Undisclosed |
CN105828840B_ADC-115 linker |
[8] |
CN105828840B_ADC-116 antibody
| ADC Info | ADC Name | Payload | Target | Linker | Ref |
|---|---|---|---|---|---|
CN105828840B ADC-116 |
CN105828840B_ADC-116 payload |
Undisclosed |
CN105828840B_ADC-116 linker |
[8] |
CN105828840B_ADC-120 antibody
| ADC Info | ADC Name | Payload | Target | Linker | Ref |
|---|---|---|---|---|---|
CN105828840B ADC-120 |
CN105828840B_ADC-120 payload |
Undisclosed |
CN105828840B_ADC-120 linker |
[8] |
CN105828840B_ADC-122 antibody
| ADC Info | ADC Name | Payload | Target | Linker | Ref |
|---|---|---|---|---|---|
CN105828840B ADC-122 |
CN105828840B_ADC-122 payload |
Undisclosed |
CN105828840B_ADC-122 linker |
[8] |
CN105828840B_ADC-124 antibody
| ADC Info | ADC Name | Payload | Target | Linker | Ref |
|---|---|---|---|---|---|
CN105828840B ADC-124 |
CN105828840B_ADC-124 payload |
Undisclosed |
CN105828840B_ADC-124 linker |
[8] |
Epratuzumab
| ADC Info | ADC Name | Payload | Target | Linker | Ref |
|---|---|---|---|---|---|
ADCT-602 |
SG3199 |
Human Deoxyribonucleic acid (hDNA) |
Mal-PEG8-Val-Ala-PABC |
[9] | |
BAY-1862864 |
227Th |
Unclear |
Undisclosed |
[10] | |
RNAse monoclonal antibody-LL2-I-131-conjugate |
Undisclosed |
Undisclosed |
Undisclosed |
[11] | |
Emab-CL2E-SN38 |
Active metabolite of irinotecan SN38 |
DNA topoisomerase 1 (TOP1) |
CL2E |
[12] | |
Epratuzumab-CL2E-SN-38 |
Active metabolite of irinotecan SN38 |
DNA topoisomerase 1 (TOP1) |
CL2E |
[13] | |
Epratuzumab-SN-38 |
Active metabolite of irinotecan SN38 |
DNA topoisomerase 1 (TOP1) |
CL2A |
[13] | |
HLL2-PBD |
SG3199 |
Human Deoxyribonucleic acid (hDNA) |
Mal-PEG8-Val-Ala-PABC |
[14] |
Inotuzumab
| ADC Info | ADC Name | Payload | Target | Linker | Ref |
|---|---|---|---|---|---|
Inotuzumab ozogamicin |
N-acetyl-gamma-calicheamicin |
Human Deoxyribonucleic acid (hDNA) |
AcButDMH |
[15] | |
Inotuzumab-ADC-24-1 |
Inotuzumab-ADC-24-1 payload |
Undisclosed |
Inotuzumab-ADC-24-1 linker |
[16] | |
Inotuzumab-ADC-24-10 |
Inotuzumab-ADC-24-10 payload |
Undisclosed |
Inotuzumab-ADC-24-10 linker |
[16] | |
Inotuzumab-ADC-24-11 |
Inotuzumab-ADC-24-11 payload |
Undisclosed |
Inotuzumab-ADC-24-11 linker |
[16] | |
Inotuzumab-ADC-24-12 |
Inotuzumab-ADC-24-12 payload |
Undisclosed |
Inotuzumab-ADC-24-12 linker |
[16] | |
Inotuzumab-ADC-24-13 |
Inotuzumab-ADC-24-13 payload |
Undisclosed |
Inotuzumab-ADC-24-13 linker |
[16] | |
Inotuzumab-ADC-24-2 |
Inotuzumab-ADC-24-2 payload |
Undisclosed |
Inotuzumab-ADC-24-2 linker |
[16] | |
Inotuzumab-ADC-24-3 |
Inotuzumab-ADC-24-3 payload |
Undisclosed |
Inotuzumab-ADC-24-3 linker |
[16] | |
Inotuzumab-ADC-24-4 |
Inotuzumab-ADC-24-4 payload |
Undisclosed |
Inotuzumab-ADC-24-4 linker |
[16] | |
Inotuzumab-ADC-24-5 |
Inotuzumab-ADC-24-5 payload |
Undisclosed |
Inotuzumab-ADC-24-5 linker |
[16] | |
Inotuzumab-ADC-24-6 |
Inotuzumab-ADC-24-6 payload |
Undisclosed |
Inotuzumab-ADC-24-6 linker |
[16] | |
Inotuzumab-ADC-24-7 |
Inotuzumab-ADC-24-7 payload |
Undisclosed |
Inotuzumab-ADC-24-7 linker |
[16] | |
Inotuzumab-ADC-24-8 |
Inotuzumab-ADC-24-8 payload |
Undisclosed |
Inotuzumab-ADC-24-8 linker |
[16] | |
Inotuzumab-ADC-24-9 |
Inotuzumab-ADC-24-9 payload |
Undisclosed |
Inotuzumab-ADC-24-9 linker |
[16] |
Moxetumomab
| ADC Info | ADC Name | Payload | Target | Linker | Ref |
|---|---|---|---|---|---|
Moxetumomab pasudotox |
Pseudomonas exotoxin PE38 |
Eukaryotic elongation factor 2 (EEF2) |
Mc-Val-Cit-PABC |
[17] |
Mozistobart
| ADC Info | ADC Name | Payload | Target | Linker | Ref |
|---|---|---|---|---|---|
TAC-001 |
Differentiated TLR-9 agonist (T-CpG) |
Toll-like receptor 9 (TLR9) |
Undisclosed |
[18] |
Pinatuzumab
| ADC Info | ADC Name | Payload | Target | Linker | Ref |
|---|---|---|---|---|---|
Pinatuzumab vedotin |
Monomethyl auristatin E |
Microtubule (MT) |
Mc-Val-Cit-PABC |
[19] | |
Anti-CD22- (LC:K149C)-SN36248 |
seco-CBI-dimer |
Human Deoxyribonucleic acid (hDNA) |
Mal-PEG2 |
[1] | |
Anti-CD22-NMS249 |
PNU-159682 |
DNA topoisomerase 2-alpha (TOP2A) |
Mc-Val-Cit-PAB-DEA |
[20] | |
Pinatuzumab-ADC-24-1 |
Pinatuzumab-ADC-24-1 payload |
Undisclosed |
Pinatuzumab-ADC-24-1 linker |
[16] | |
Pinatuzumab-ADC-24-10 |
Pinatuzumab-ADC-24-10 payload |
Undisclosed |
Pinatuzumab-ADC-24-10 linker |
[16] | |
Pinatuzumab-ADC-24-11 |
Pinatuzumab-ADC-24-11 payload |
Undisclosed |
Pinatuzumab-ADC-24-11 linker |
[16] | |
Pinatuzumab-ADC-24-12 |
Pinatuzumab-ADC-24-12 payload |
Undisclosed |
Pinatuzumab-ADC-24-12 linker |
[16] | |
Pinatuzumab-ADC-24-13 |
Pinatuzumab-ADC-24-13 payload |
Undisclosed |
Pinatuzumab-ADC-24-13 linker |
[16] | |
Pinatuzumab-ADC-24-2 |
Pinatuzumab-ADC-24-2 payload |
Undisclosed |
Pinatuzumab-ADC-24-2 linker |
[16] | |
Pinatuzumab-ADC-24-3 |
Pinatuzumab-ADC-24-3 payload |
Undisclosed |
Pinatuzumab-ADC-24-3 linker |
[16] | |
Pinatuzumab-ADC-24-4 |
Pinatuzumab-ADC-24-4 payload |
Undisclosed |
Pinatuzumab-ADC-24-4 linker |
[16] | |
Pinatuzumab-ADC-24-5 |
Pinatuzumab-ADC-24-5 payload |
Undisclosed |
Pinatuzumab-ADC-24-5 linker |
[16] | |
Pinatuzumab-ADC-24-6 |
Pinatuzumab-ADC-24-6 payload |
Undisclosed |
Pinatuzumab-ADC-24-6 linker |
[16] | |
Pinatuzumab-ADC-24-7 |
Pinatuzumab-ADC-24-7 payload |
Undisclosed |
Pinatuzumab-ADC-24-7 linker |
[16] | |
Pinatuzumab-ADC-24-8 |
Pinatuzumab-ADC-24-8 payload |
Undisclosed |
Pinatuzumab-ADC-24-8 linker |
[16] | |
Pinatuzumab-ADC-24-9 |
Pinatuzumab-ADC-24-9 payload |
Undisclosed |
Pinatuzumab-ADC-24-9 linker |
[16] |
RFB4
| ADC Info | ADC Name | Payload | Target | Linker | Ref |
|---|---|---|---|---|---|
RFB4-SMPT-dgA |
Deglycosylated ricin A-chain (dgA) |
Ribosome (RB) |
Succynimidyloxycarbonyl-alpha-methyl-alpha-(2-pyridyl-dithio) toluene (SMPT) |
[21] |
Thio Anti-CD22 10F4v3 LC V205C
| ADC Info | ADC Name | Payload | Target | Linker | Ref |
|---|---|---|---|---|---|
WO2017214024A1 ADC-101 |
WO2017214024A1_ADC-101 payload |
Undisclosed |
WO2017214024A1_ADC-101 linker |
[22] |
Thio hu Anti-CD22 10F43 HC L177C
| ADC Info | ADC Name | Payload | Target | Linker | Ref |
|---|---|---|---|---|---|
WO2017059289A1 ADC-116 |
WO2017059289A1_ADC-116 payload |
Undisclosed |
WO2017059289A1_ADC-116 linker |
[23] |
Thio hu Anti-CD22 10F4v3
| ADC Info | ADC Name | Payload | Target | Linker | Ref |
|---|---|---|---|---|---|
WO2017059289A1 ADC-202 |
WO2017059289A1_ADC-202 payload |
Undisclosed |
WO2017059289A1_ADC-202 linker |
[23] |
Thio hu Anti-CD22 10F4v3 HC A118C
| ADC Info | ADC Name | Payload | Target | Linker | Ref |
|---|---|---|---|---|---|
WO2014159981A2 ADC-115 |
WO2014159981A2_ADC-115 payload |
Undisclosed |
WO2014159981A2_ADC-115 linker |
[24] | |
WO2014159981A2 ADC-125 |
WO2014159981A2_ADC-125 payload |
Undisclosed |
WO2014159981A2_ADC-125 linker |
[24] | |
WO2014159981A2 ADC-135 |
WO2014159981A2_ADC-135 payload |
Undisclosed |
WO2014159981A2_ADC-135 linker |
[24] | |
WO2014159981A2 ADC-212 |
WO2014159981A2_ADC-212 payload |
Undisclosed |
WO2014159981A2_ADC-212 linker |
[24] | |
WO2014159981A2 ADC-CD22-22 |
WO2014159981A2_ADC-CD22-22 payload |
Undisclosed |
WO2014159981A2_ADC-CD22-22 linker |
[24] | |
WO2014159981A2 ADC-CD22-41 |
WO2014159981A2_ADC-CD22-41 payload |
Undisclosed |
WO2014159981A2_ADC-CD22-41 linker |
[24] | |
WO2014159981A2 ADC-CD22-44 |
WO2014159981A2_ADC-CD22-44 payload |
Undisclosed |
WO2014159981A2_ADC-CD22-44 linker |
[24] | |
WO2014159981A2 ADC-CD22-48 |
WO2014159981A2_ADC-CD22-48 payload |
Undisclosed |
WO2014159981A2_ADC-CD22-48 linker |
[24] |
Thio hu Anti-CD22 10F4v3 HC A140C
| ADC Info | ADC Name | Payload | Target | Linker | Ref |
|---|---|---|---|---|---|
WO2017214024A1 ADC-105 |
WO2017214024A1_ADC-105 payload |
Undisclosed |
WO2017214024A1_ADC-105 linker |
[22] |
Thio hu Anti-CD22 10F4v3 HC Y376C
| ADC Info | ADC Name | Payload | Target | Linker | Ref |
|---|---|---|---|---|---|
WO2017059289A1 ADC-118 |
WO2017059289A1_ADC-118 payload |
Undisclosed |
WO2017059289A1_ADC-118 linker |
[23] |
Thio hu Anti-CD22 10F4v3 LC K149C
| ADC Info | ADC Name | Payload | Target | Linker | Ref |
|---|---|---|---|---|---|
WO2017059289A1 ADC-103 |
WO2017059289A1_ADC-103 payload |
Undisclosed |
WO2017059289A1_ADC-103 linker |
[23] | |
WO2017059289A1 ADC-105 |
WO2017059289A1_ADC-105 payload |
Undisclosed |
WO2017059289A1_ADC-105 linker |
[23] | |
WO2017059289A1 ADC-107 |
WO2017059289A1_ADC-107 payload |
Undisclosed |
WO2017059289A1_ADC-107 linker |
[23] | |
WO2017059289A1 ADC-110 |
WO2017059289A1_ADC-110 payload |
Undisclosed |
WO2017059289A1_ADC-110 linker |
[23] | |
WO2017059289A1 ADC-204 |
WO2017059289A1_ADC-204 payload |
Undisclosed |
WO2017059289A1_ADC-204 linker |
[23] | |
WO2017059289A1 ADC-206 |
WO2017059289A1_ADC-206 payload |
Undisclosed |
WO2017059289A1_ADC-206 linker |
[23] | |
WO2017059289A1 ADC-207 |
WO2017059289A1_ADC-207 payload |
Undisclosed |
WO2017059289A1_ADC-207 linker |
[23] | |
WO2017214024A1 ADC-104 |
WO2017214024A1_ADC-104 payload |
Undisclosed |
WO2017214024A1_ADC-104 linker |
[22] | |
WO2017214024A1 ADC-108 |
WO2017214024A1_ADC-108 payload |
Undisclosed |
WO2017214024A1_ADC-108 linker |
[22] | |
WO2017214024A1 ADC-110 |
WO2017214024A1_ADC-110 payload |
Undisclosed |
WO2017214024A1_ADC-110 linker |
[22] |
Thio hu Anti-CD22 10F4v3 LC K149C HC L177C
| ADC Info | ADC Name | Payload | Target | Linker | Ref |
|---|---|---|---|---|---|
WO2017059289A1 ADC-111 |
WO2017059289A1_ADC-111 payload |
Undisclosed |
WO2017059289A1_ADC-111 linker |
[23] | |
WO2017059289A1 ADC-112 |
WO2017059289A1_ADC-112 payload |
Undisclosed |
WO2017059289A1_ADC-112 linker |
[23] |
Undisclosed
| ADC Info | ADC Name | Payload | Target | Linker | Ref |
|---|---|---|---|---|---|
TRPH-222 |
Maytansinoid derivative of TRPH-222 |
Microtubule (MT) |
HIPS-4AP |
[25] | |
Anti-CD22 antibody drug-conjugate (Medarex/BMS) |
Undisclosed |
Undisclosed |
Undisclosed |
[26] | |
Anti-CD22 antibody-drug conjugate (Ambrx) |
Undisclosed |
Undisclosed |
Undisclosed |
[27] |
Tissue/Disease specific Abundances of This Antigen
Tissue specific Abundances of This Antigen
ICD Disease Classification 01
| Differential expression pattern of antigen in diseases | ||
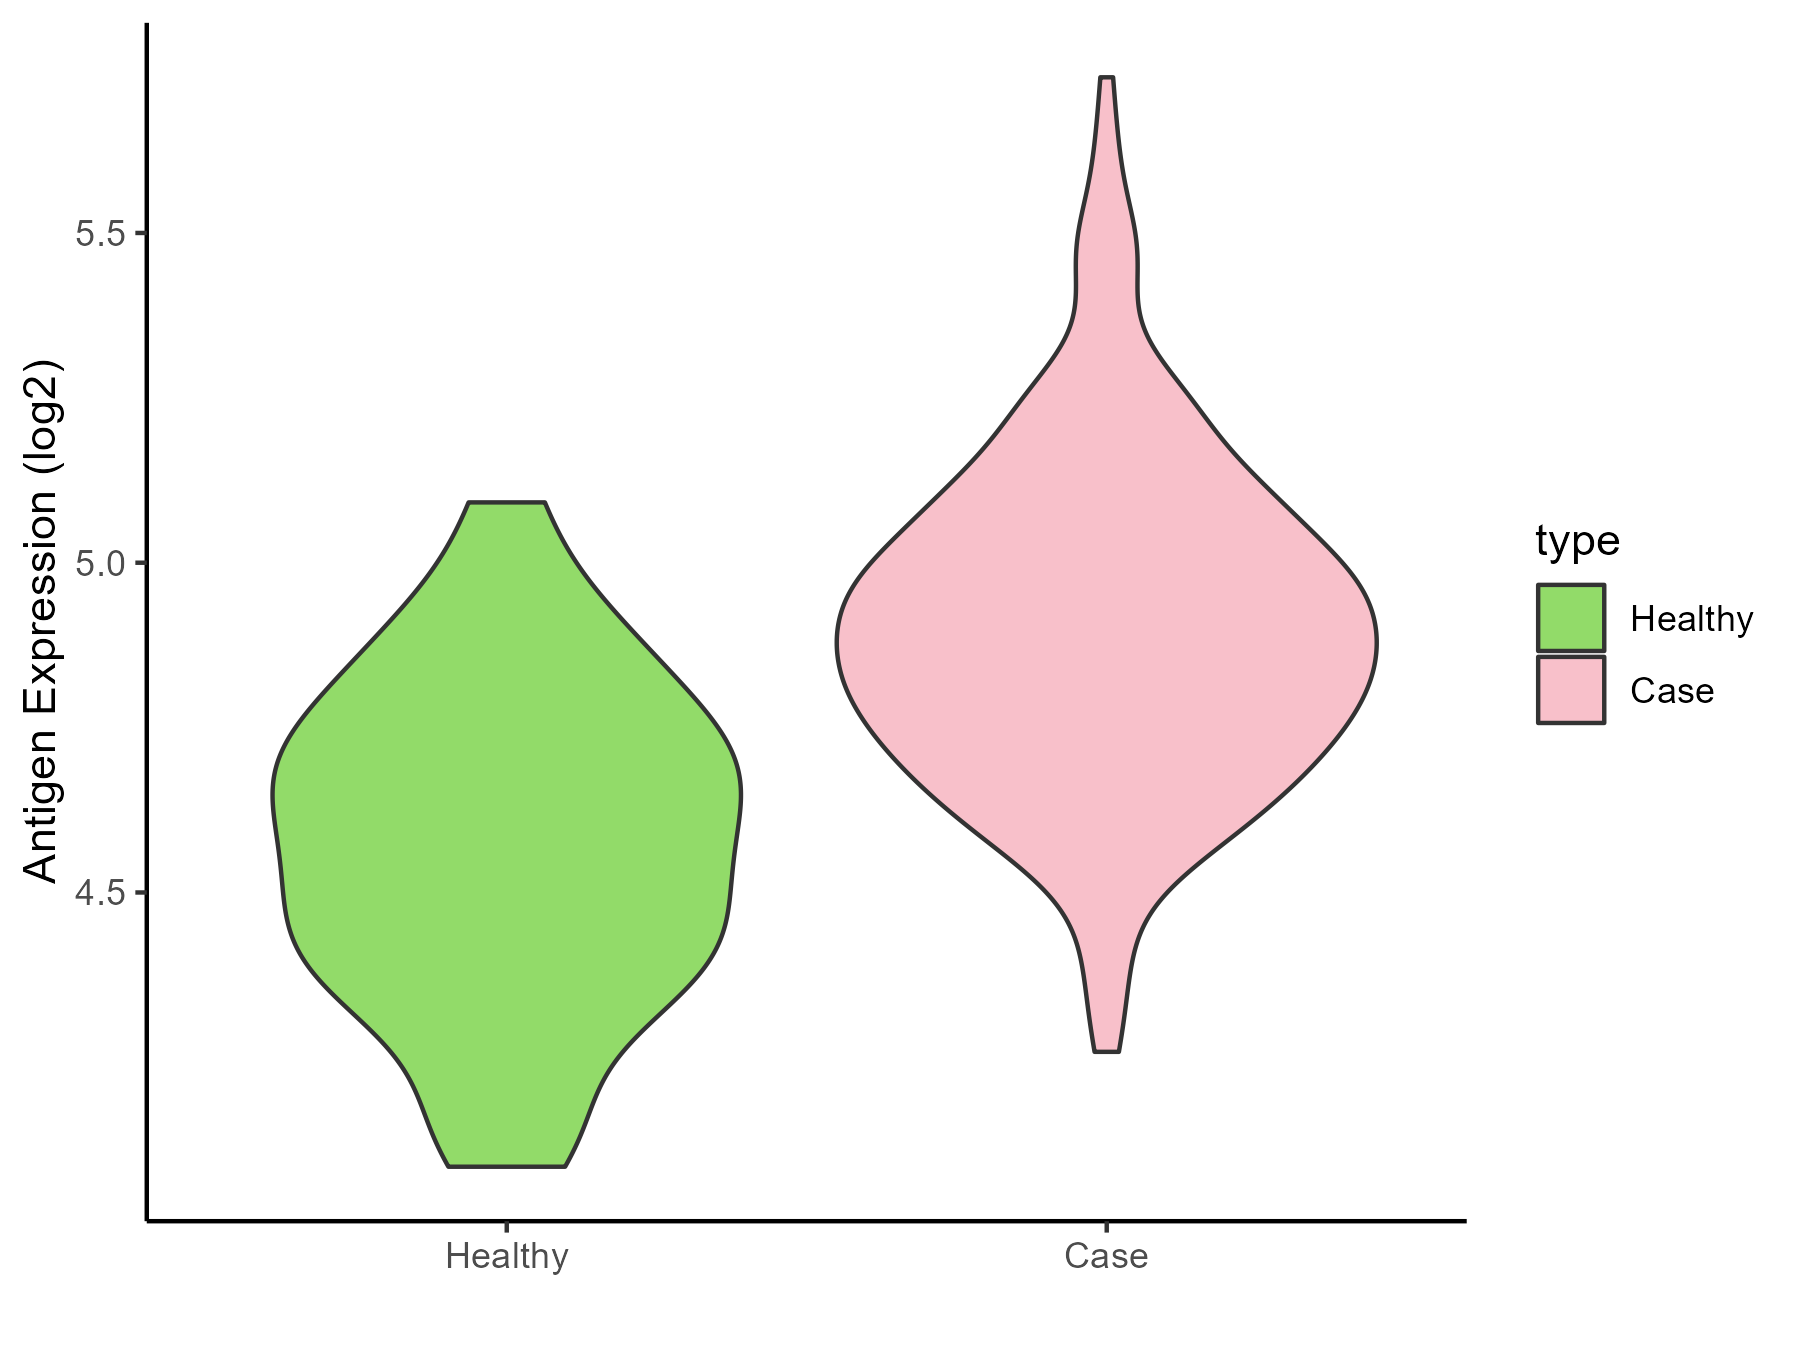
| The Studied Tissue | Gingival | |
| The Specific Disease | Bacterial infection of gingival | |
| The Expression Level of Disease Section Compare with the Healthy Individual Tissue | p-value: 7.63E-15; Fold-change: 0.324121092; Z-score: 1.331251827 | |
| Disease-specific Antigen Abundances |
|
Click to View the Clearer Original Diagram |
ICD Disease Classification 02
| Differential expression pattern of antigen in diseases | ||
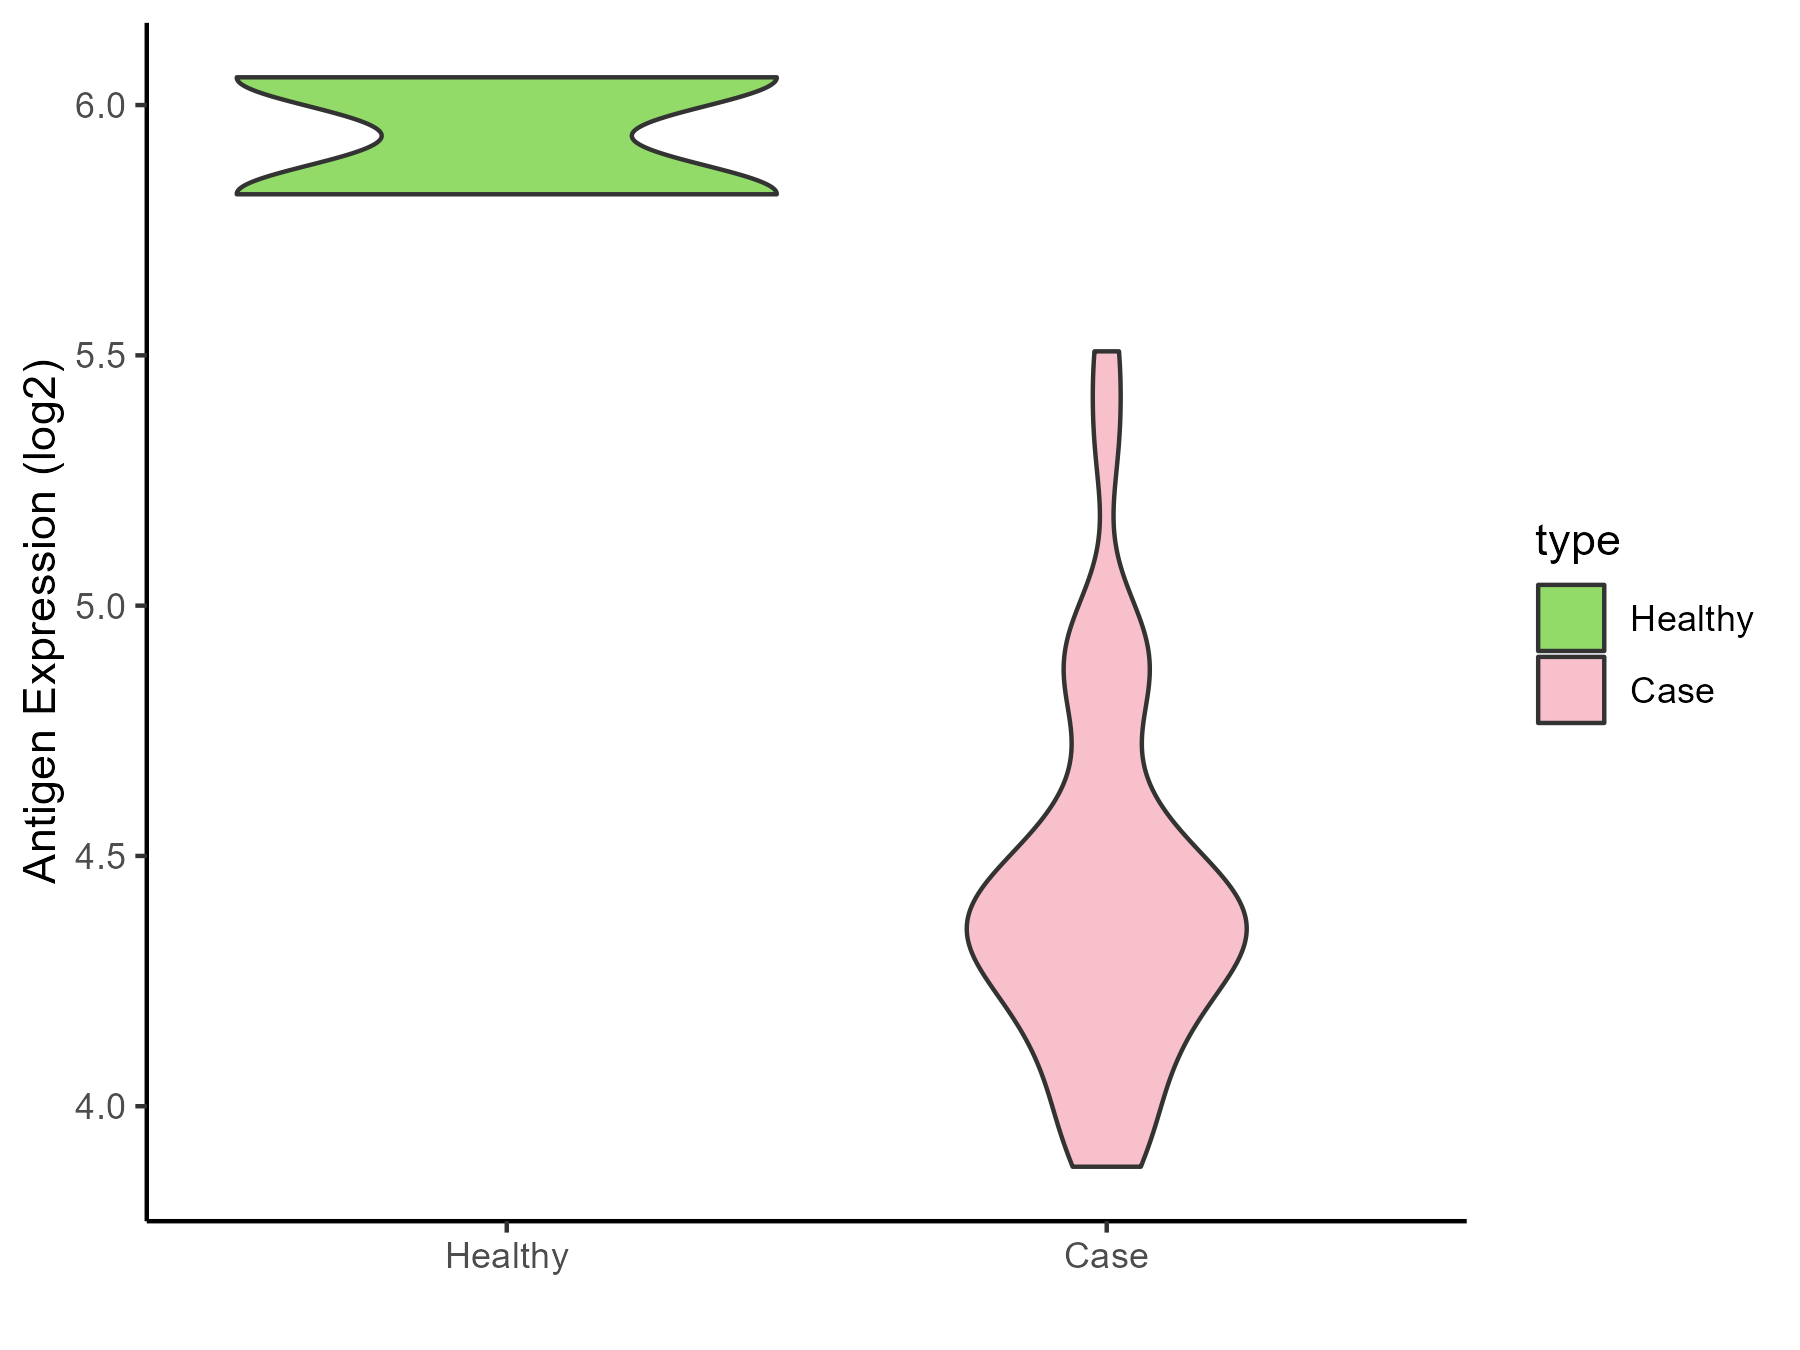
| The Studied Tissue | Brainstem | |
| The Specific Disease | Glioma | |
| The Expression Level of Disease Section Compare with the Healthy Individual Tissue | p-value: 0.014132974; Fold-change: -1.578440596; Z-score: -9.55296882 | |
| Disease-specific Antigen Abundances |
|
Click to View the Clearer Original Diagram |
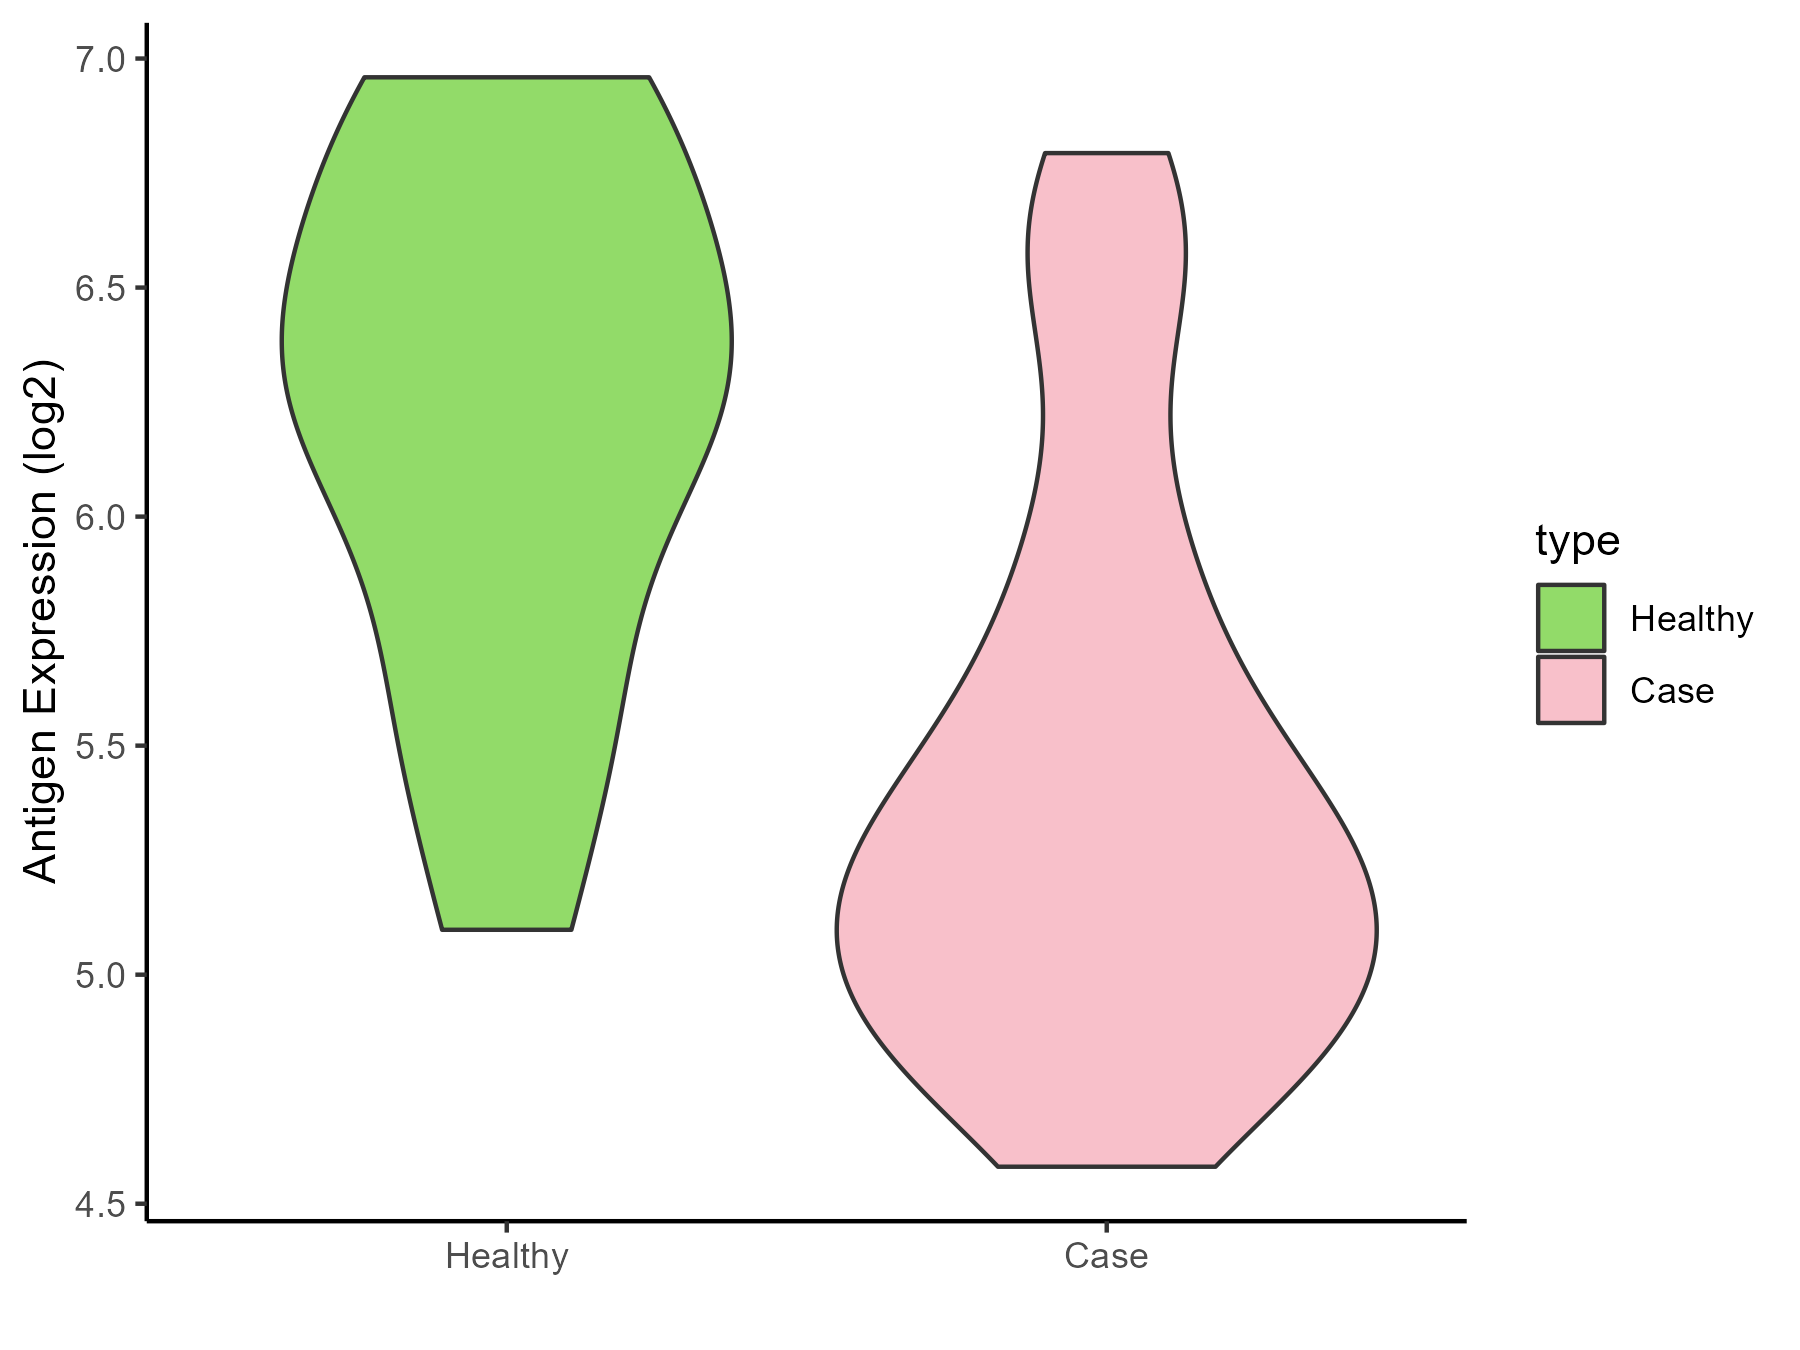
| The Studied Tissue | White matter | |
| The Specific Disease | Glioma | |
| The Expression Level of Disease Section Compare with the Healthy Individual Tissue | p-value: 0.001195006; Fold-change: -1.024981823; Z-score: -1.751946496 | |
| Disease-specific Antigen Abundances |
|
Click to View the Clearer Original Diagram |
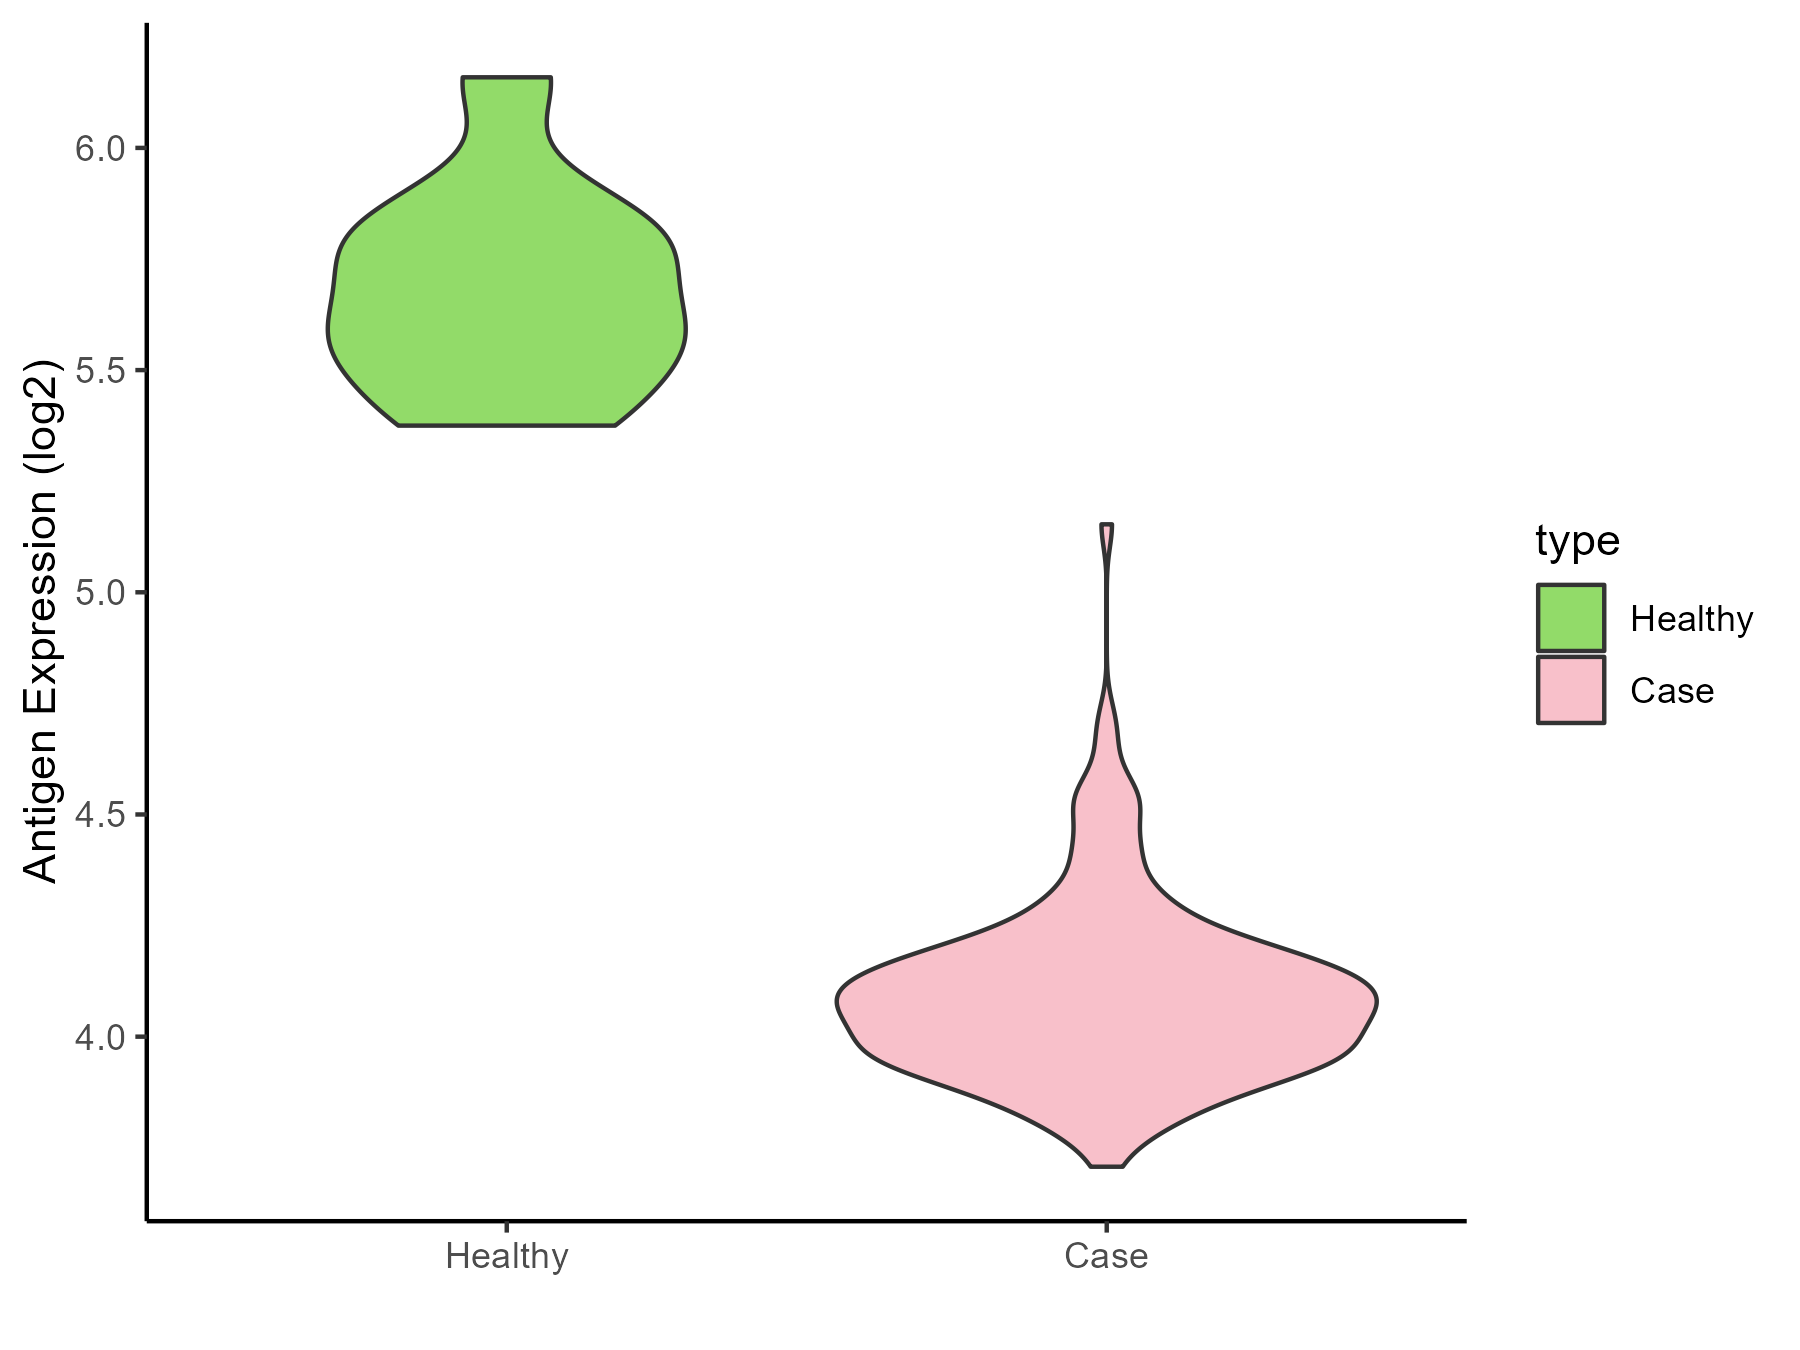
| The Studied Tissue | Brainstem | |
| The Specific Disease | Neuroectodermal tumor | |
| The Expression Level of Disease Section Compare with the Healthy Individual Tissue | p-value: 1.82E-09; Fold-change: -1.576291081; Z-score: -6.723357581 | |
| Disease-specific Antigen Abundances |
|
Click to View the Clearer Original Diagram |
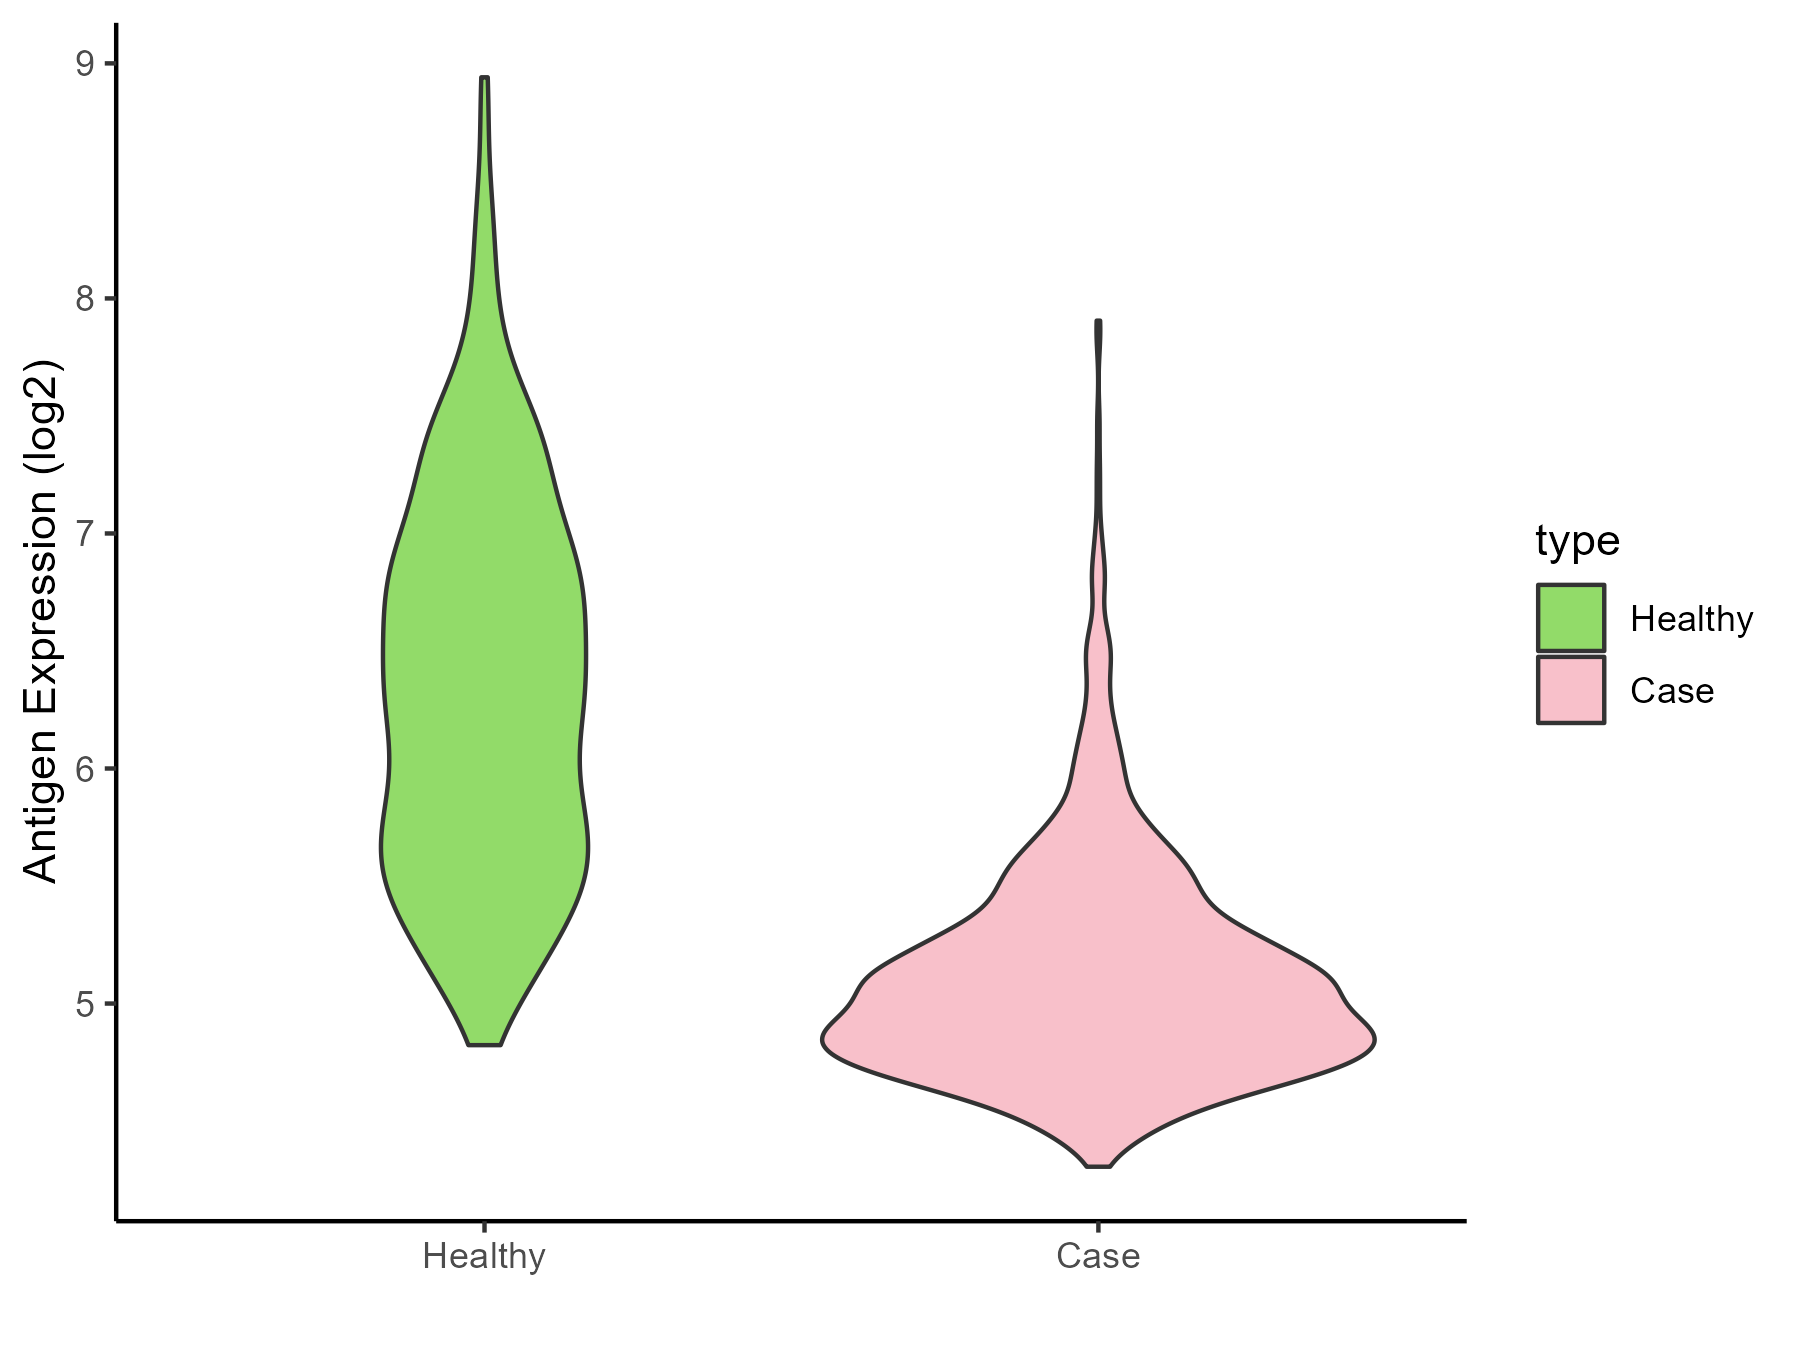
| The Studied Tissue | Nervous | |
| The Specific Disease | Brain cancer | |
| The Expression Level of Disease Section Compare with the Healthy Individual Tissue | p-value: 3.30E-103; Fold-change: -1.281366451; Z-score: -1.585343532 | |
| Disease-specific Antigen Abundances |
|
Click to View the Clearer Original Diagram |
| Differential expression pattern of antigen in diseases | ||
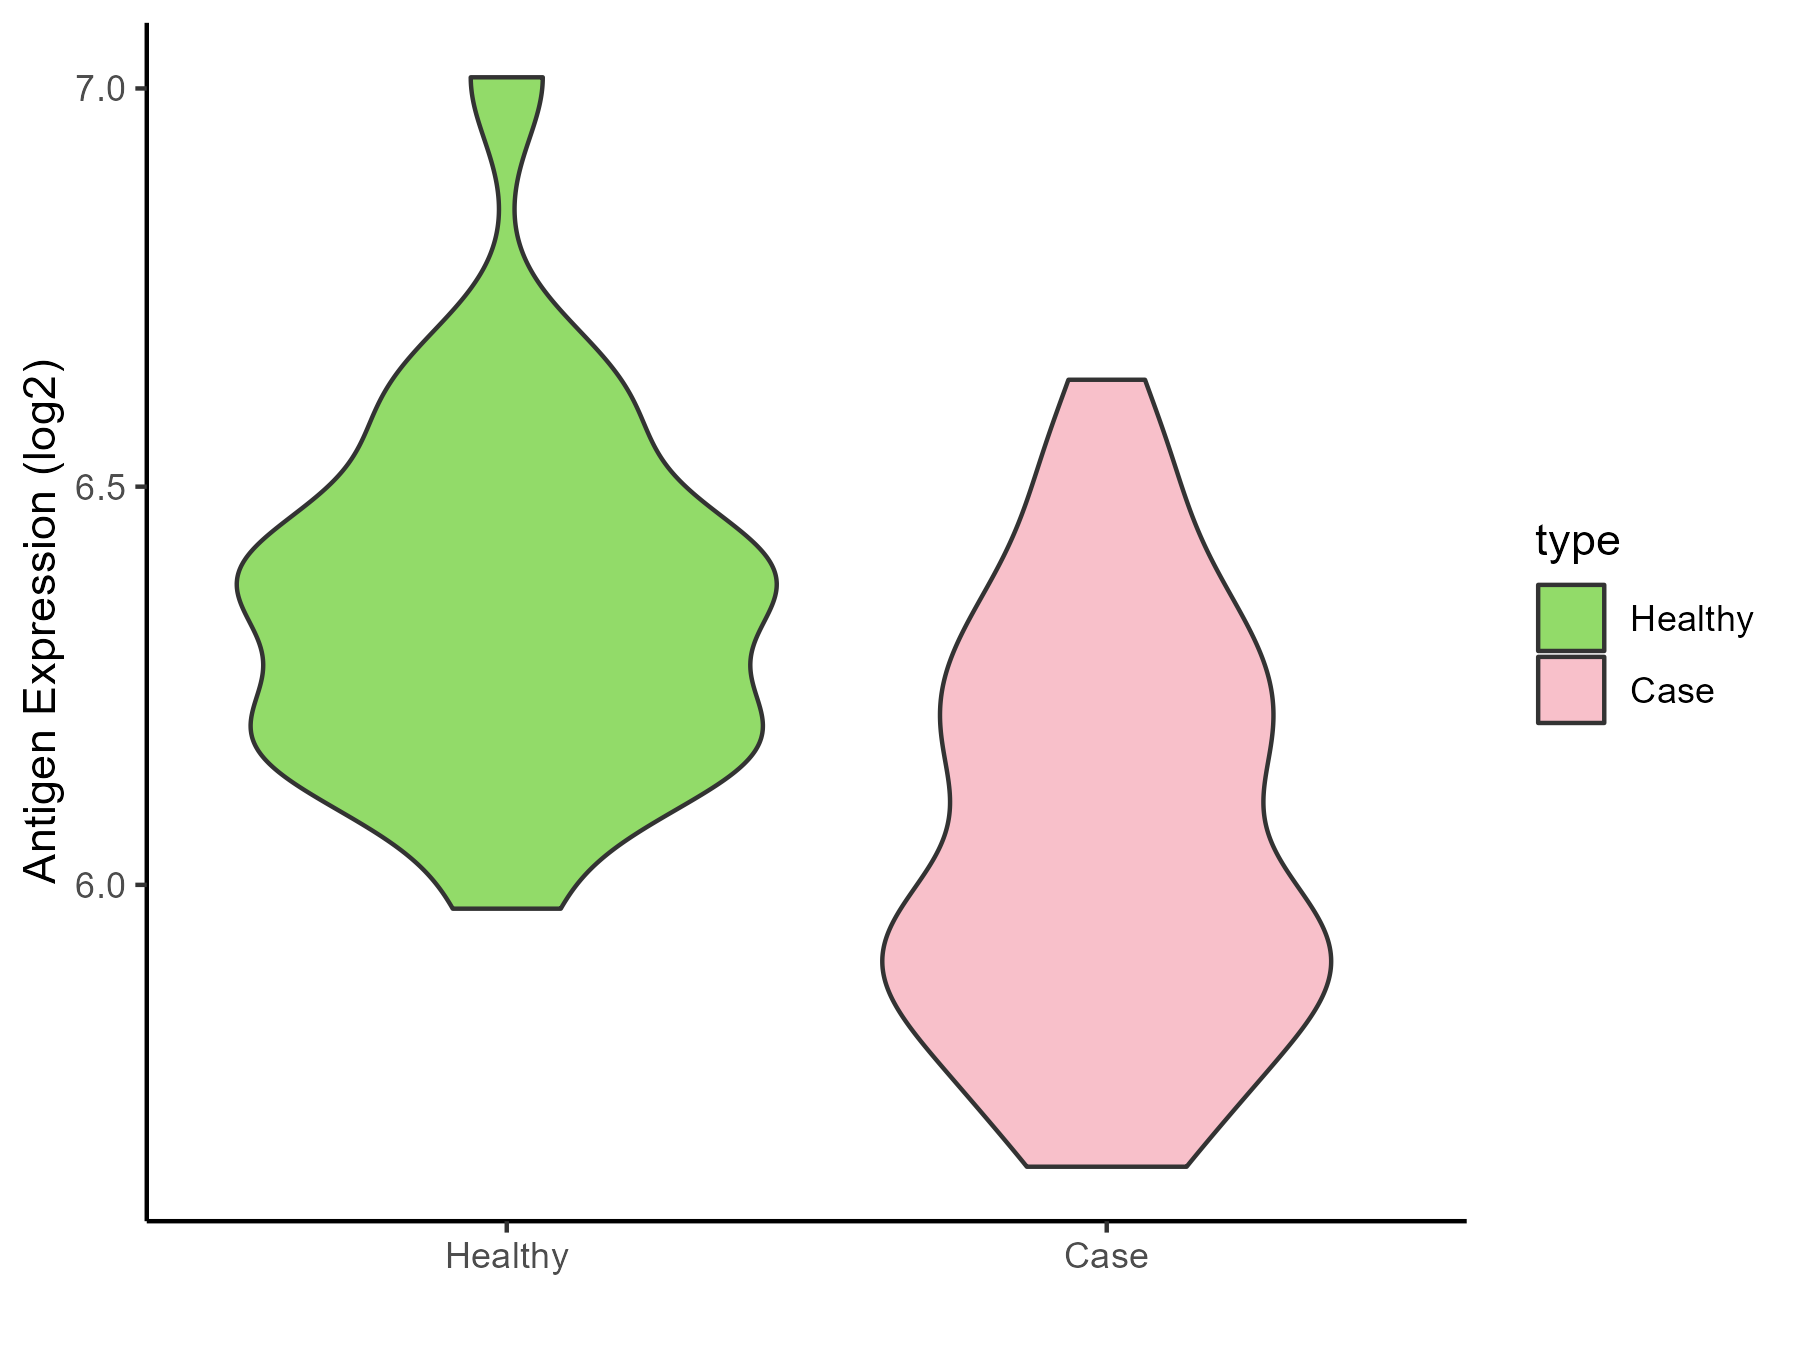
| The Studied Tissue | Whole blood | |
| The Specific Disease | Polycythemia vera | |
| The Expression Level of Disease Section Compare with the Healthy Individual Tissue | p-value: 9.24E-09; Fold-change: -0.3893891; Z-score: -1.680620845 | |
| Disease-specific Antigen Abundances |
|
Click to View the Clearer Original Diagram |
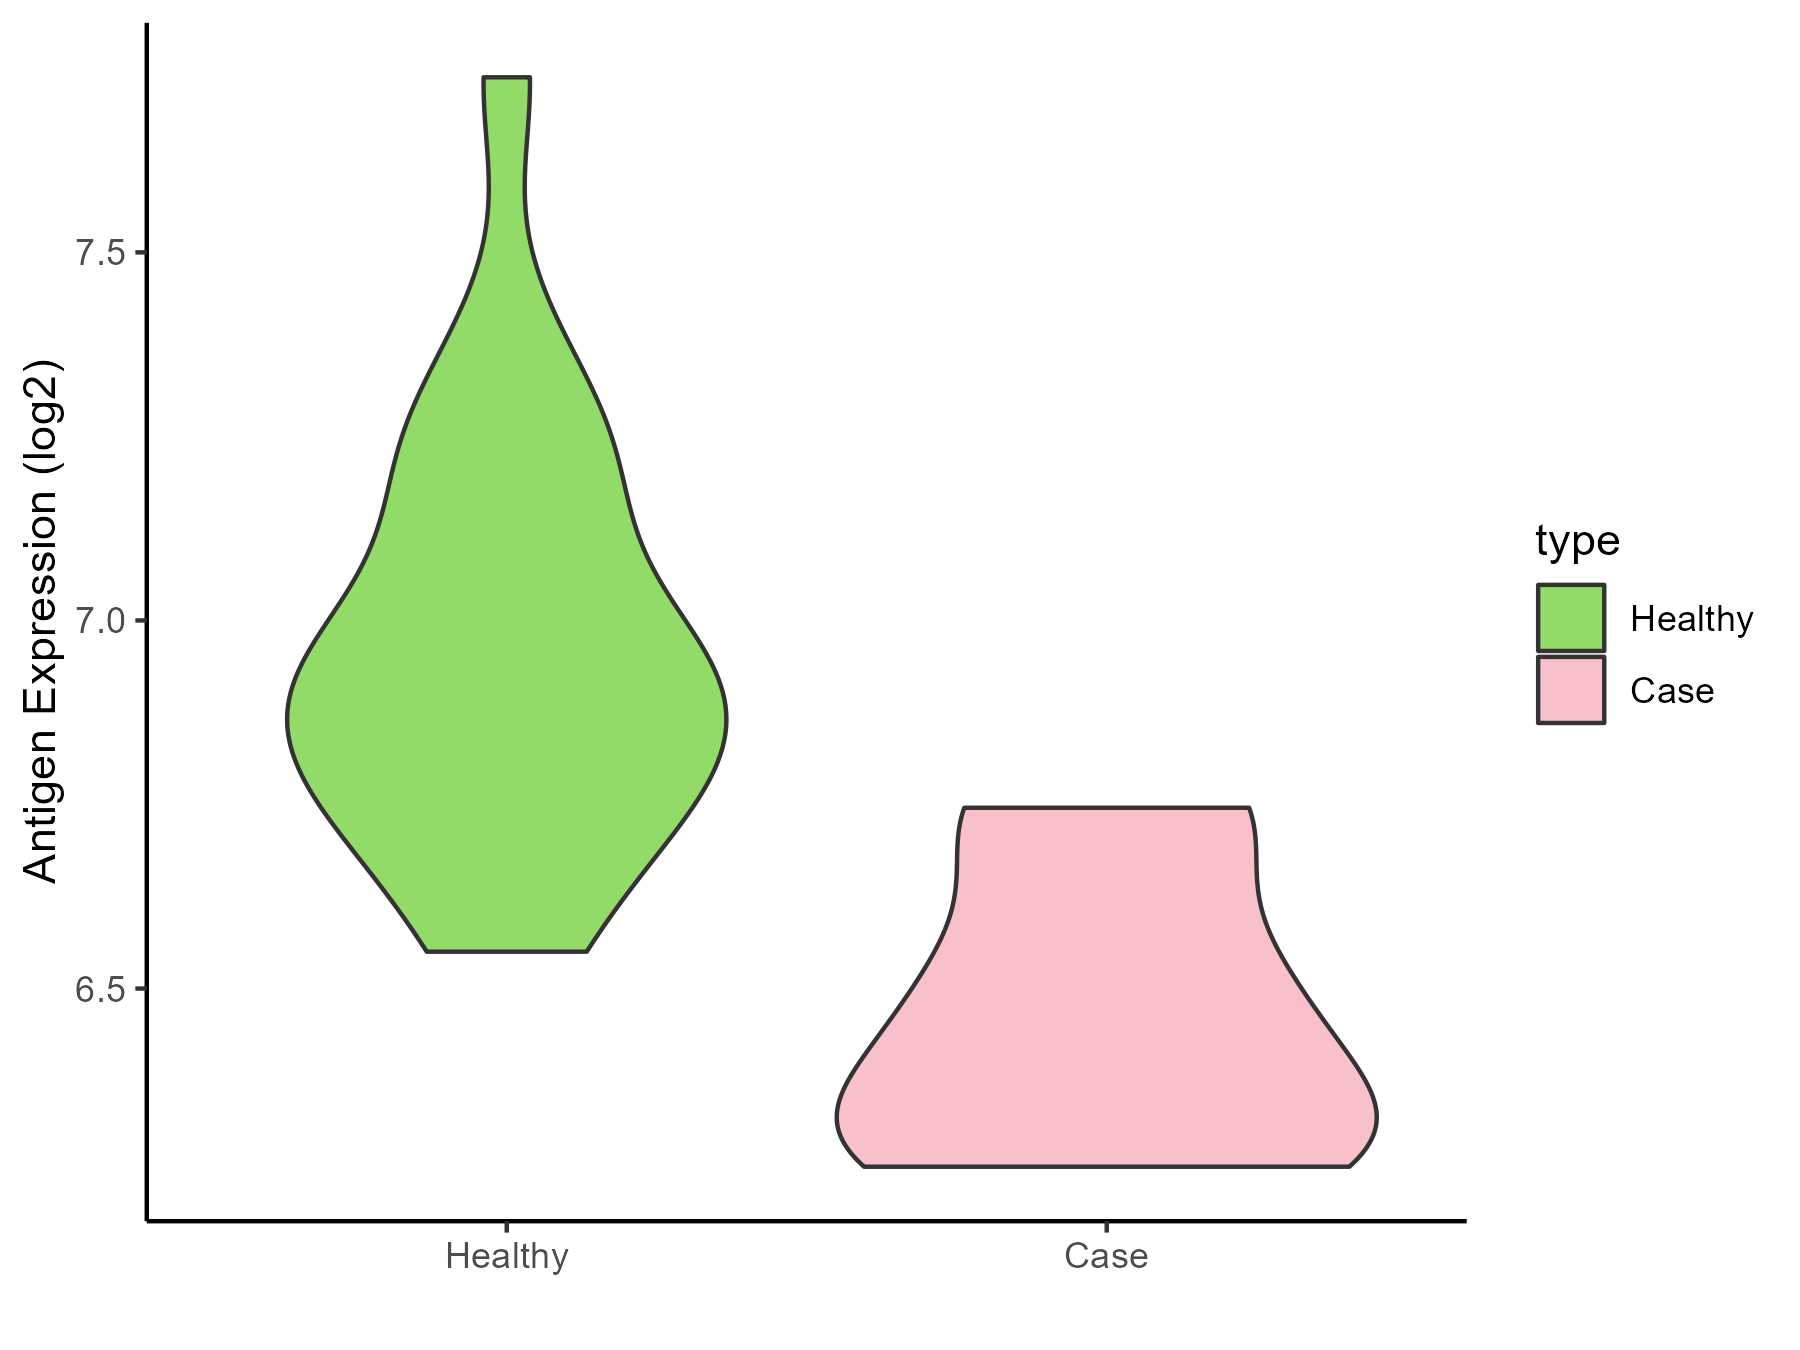
| The Studied Tissue | Whole blood | |
| The Specific Disease | Myelofibrosis | |
| The Expression Level of Disease Section Compare with the Healthy Individual Tissue | p-value: 3.97E-05; Fold-change: -0.489015375; Z-score: -1.722154604 | |
| Disease-specific Antigen Abundances |
|
Click to View the Clearer Original Diagram |
| Differential expression pattern of antigen in diseases | ||
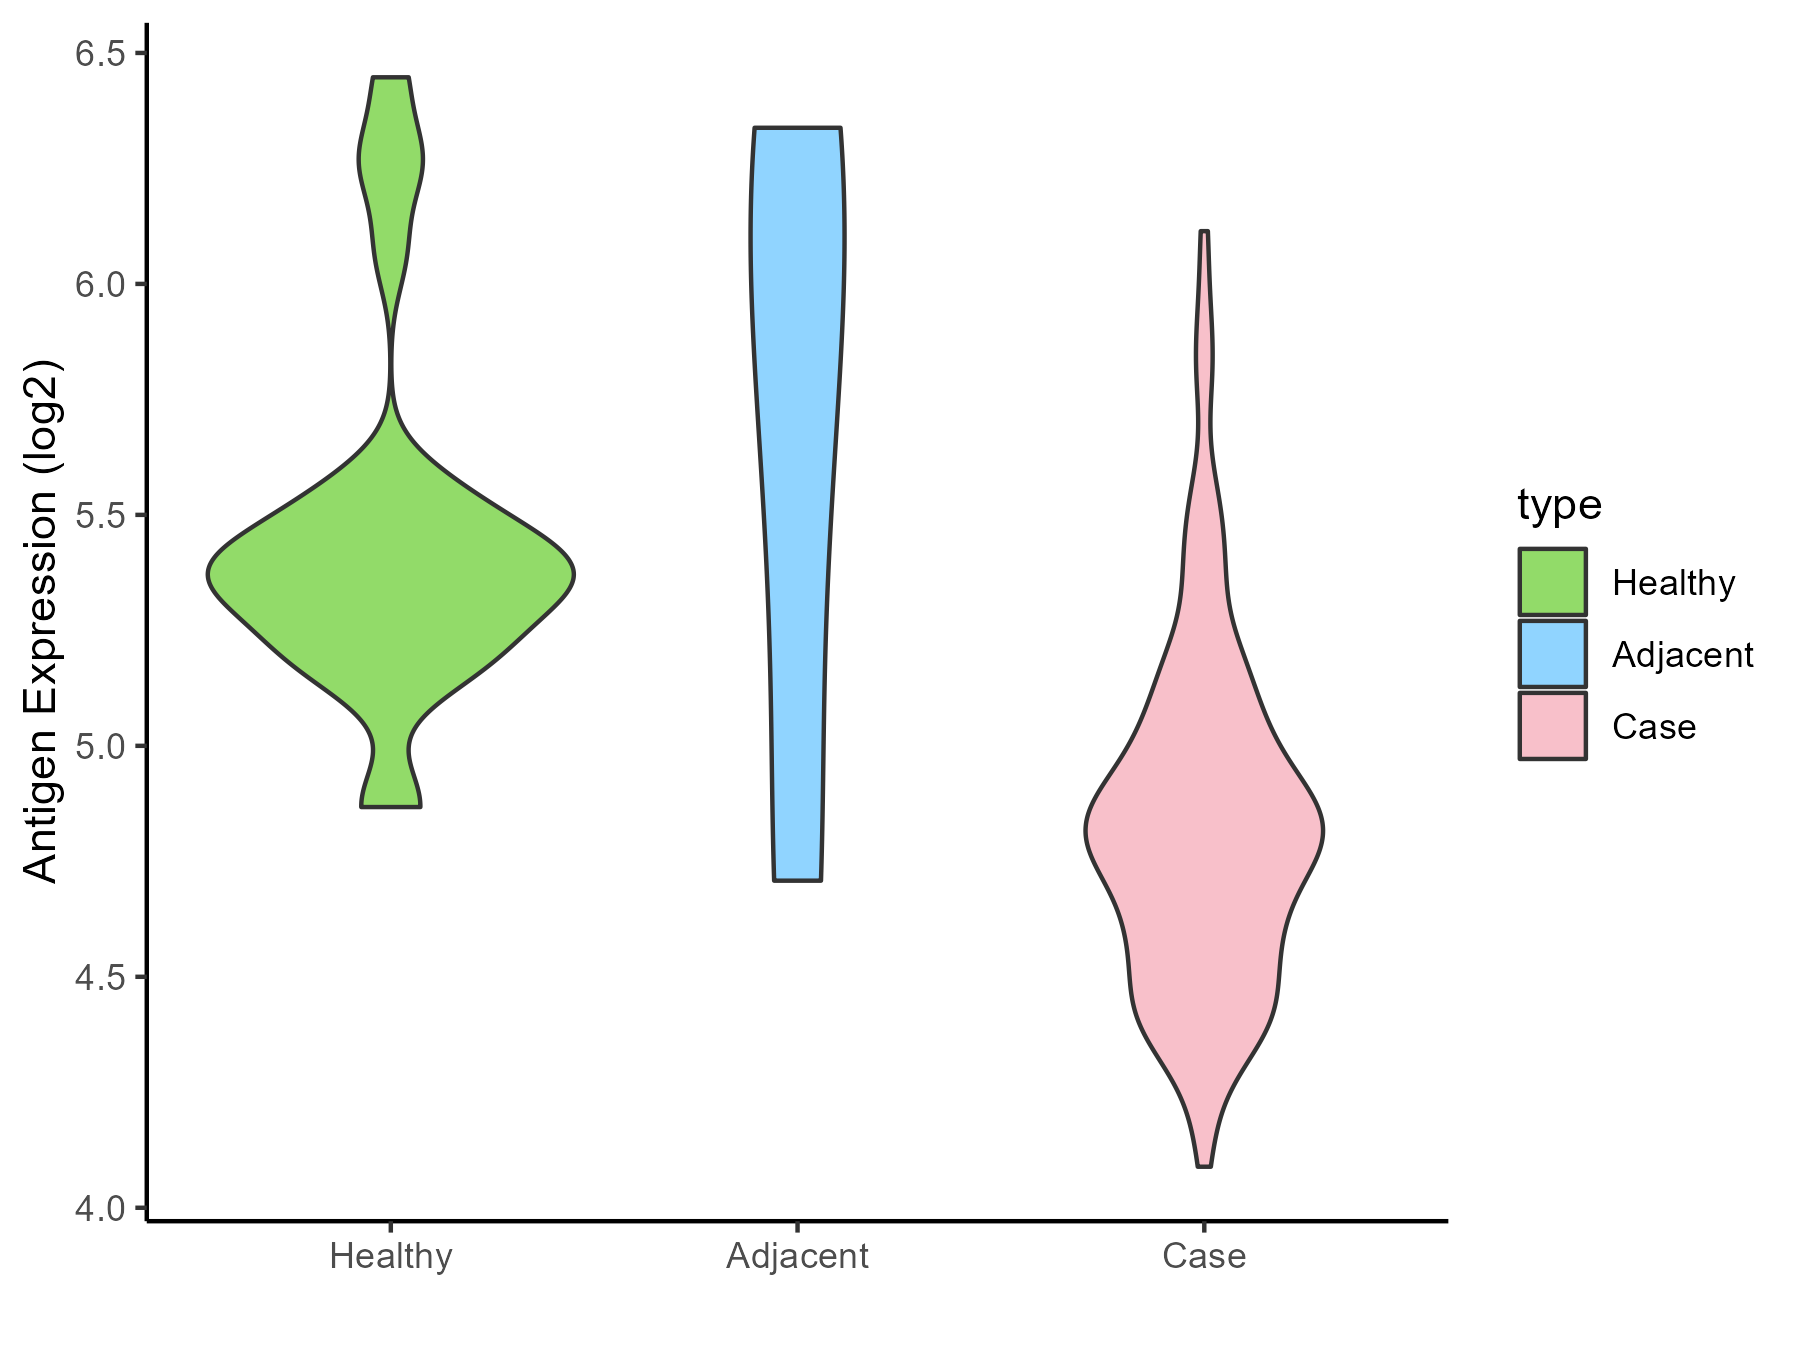
| The Studied Tissue | Bone marrow | |
| The Specific Disease | Myelodysplastic syndromes | |
| The Expression Level of Disease Section Compare with the Healthy Individual Tissue | p-value: 2.26E-09; Fold-change: -0.560977873; Z-score: -1.474118472 | |
| The Expression Level of Disease Section Compare with the Adjacent Tissue | p-value: 0.101552992; Fold-change: -1.055350327; Z-score: -1.435793957 | |
| Disease-specific Antigen Abundances |
|
Click to View the Clearer Original Diagram |
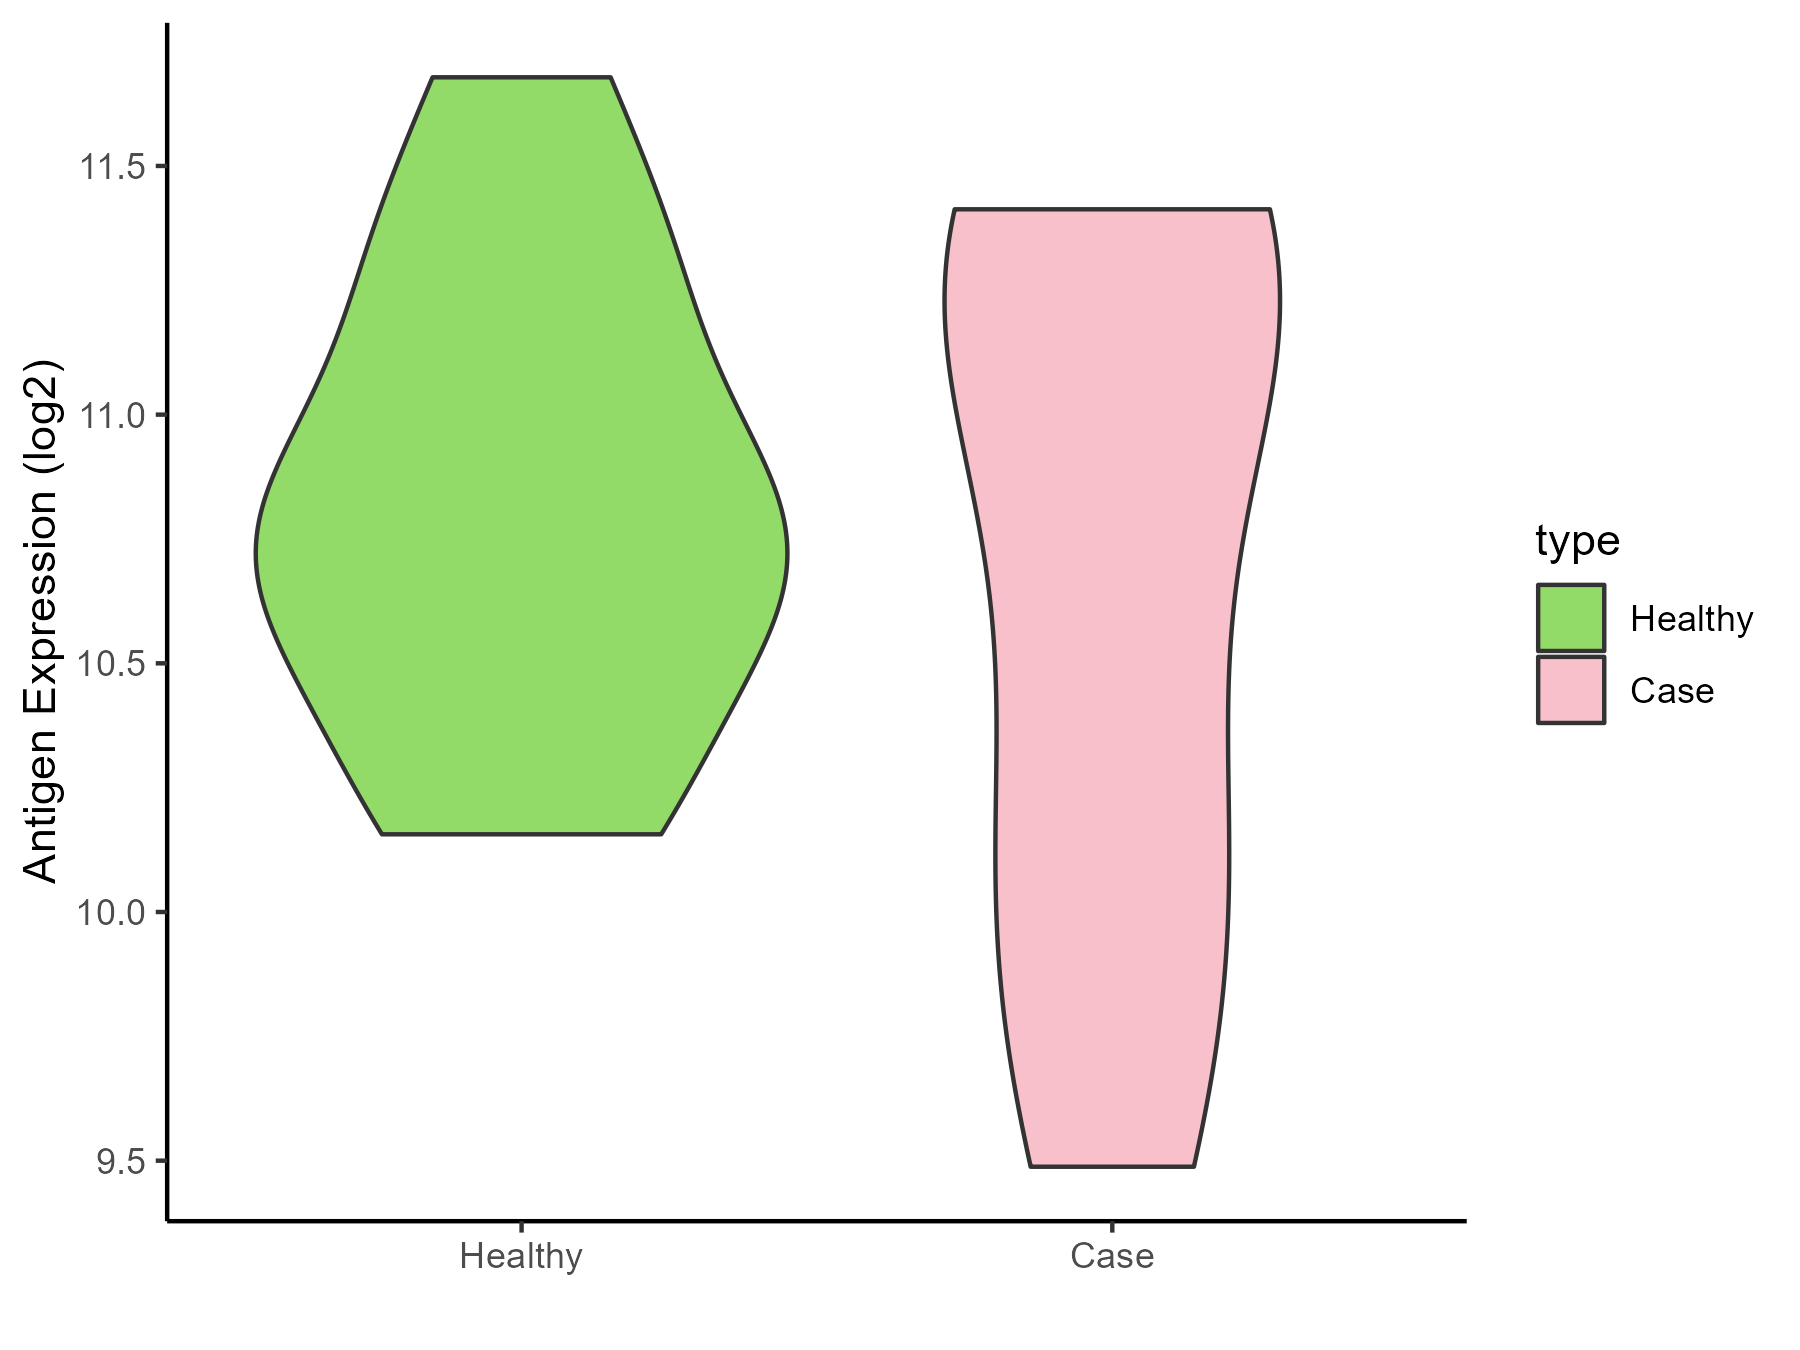
| Differential expression pattern of antigen in diseases | ||
| The Studied Tissue | Tonsil | |
| The Specific Disease | Lymphoma | |
| The Expression Level of Disease Section Compare with the Healthy Individual Tissue | p-value: 0.598292491; Fold-change: 0.137048949; Z-score: 0.286507434 | |
| Disease-specific Antigen Abundances |
|
Click to View the Clearer Original Diagram |
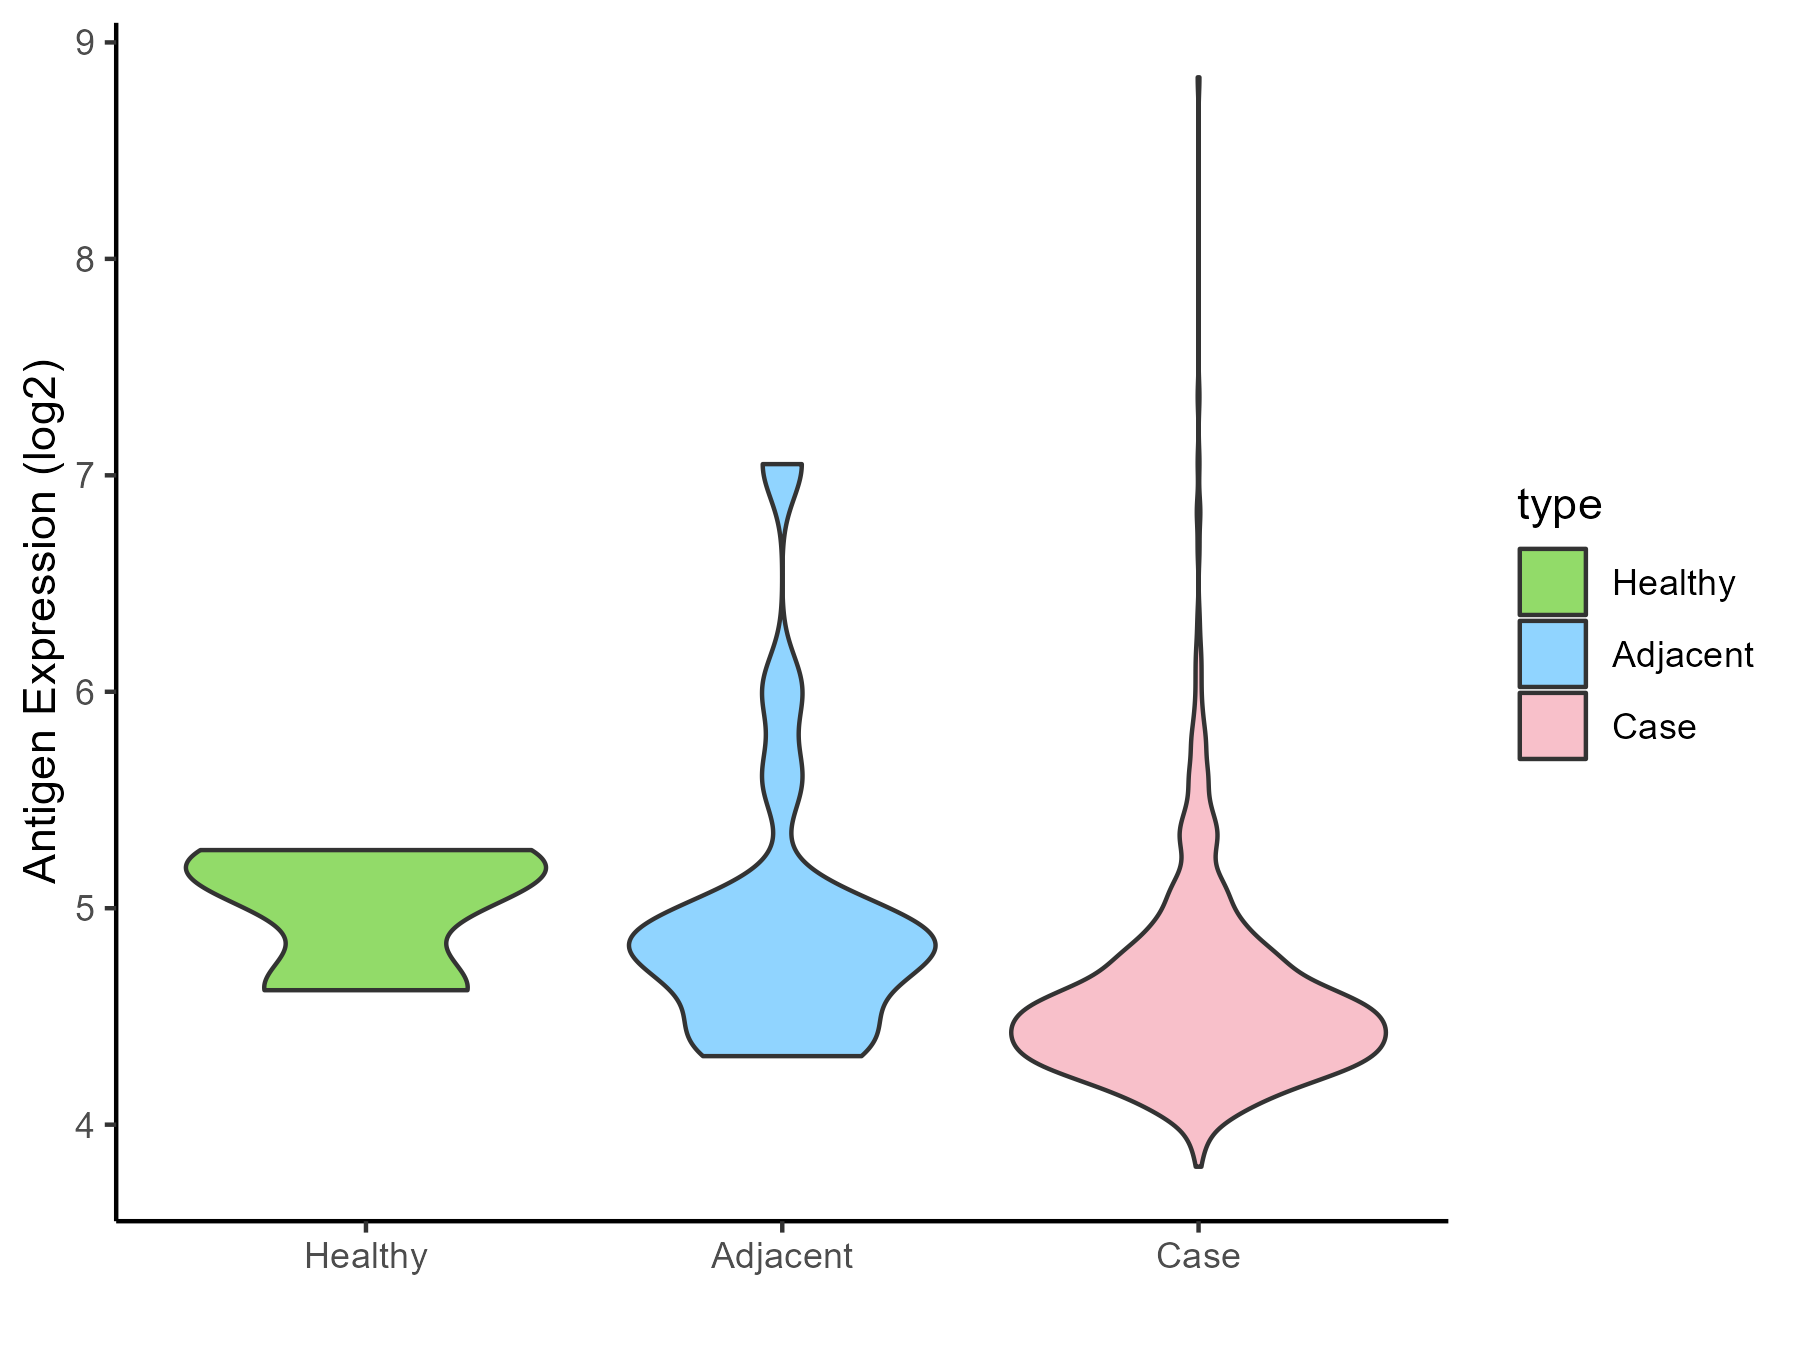
| Differential expression pattern of antigen in diseases | ||
| The Studied Tissue | Gastric | |
| The Specific Disease | Gastric cancer | |
| The Expression Level of Disease Section Compare with the Healthy Individual Tissue | p-value: 0.167478653; Fold-change: -0.617420844; Z-score: -1.829445511 | |
| The Expression Level of Disease Section Compare with the Adjacent Tissue | p-value: 0.04050186; Fold-change: -0.328644753; Z-score: -0.476074428 | |
| Disease-specific Antigen Abundances |
|
Click to View the Clearer Original Diagram |
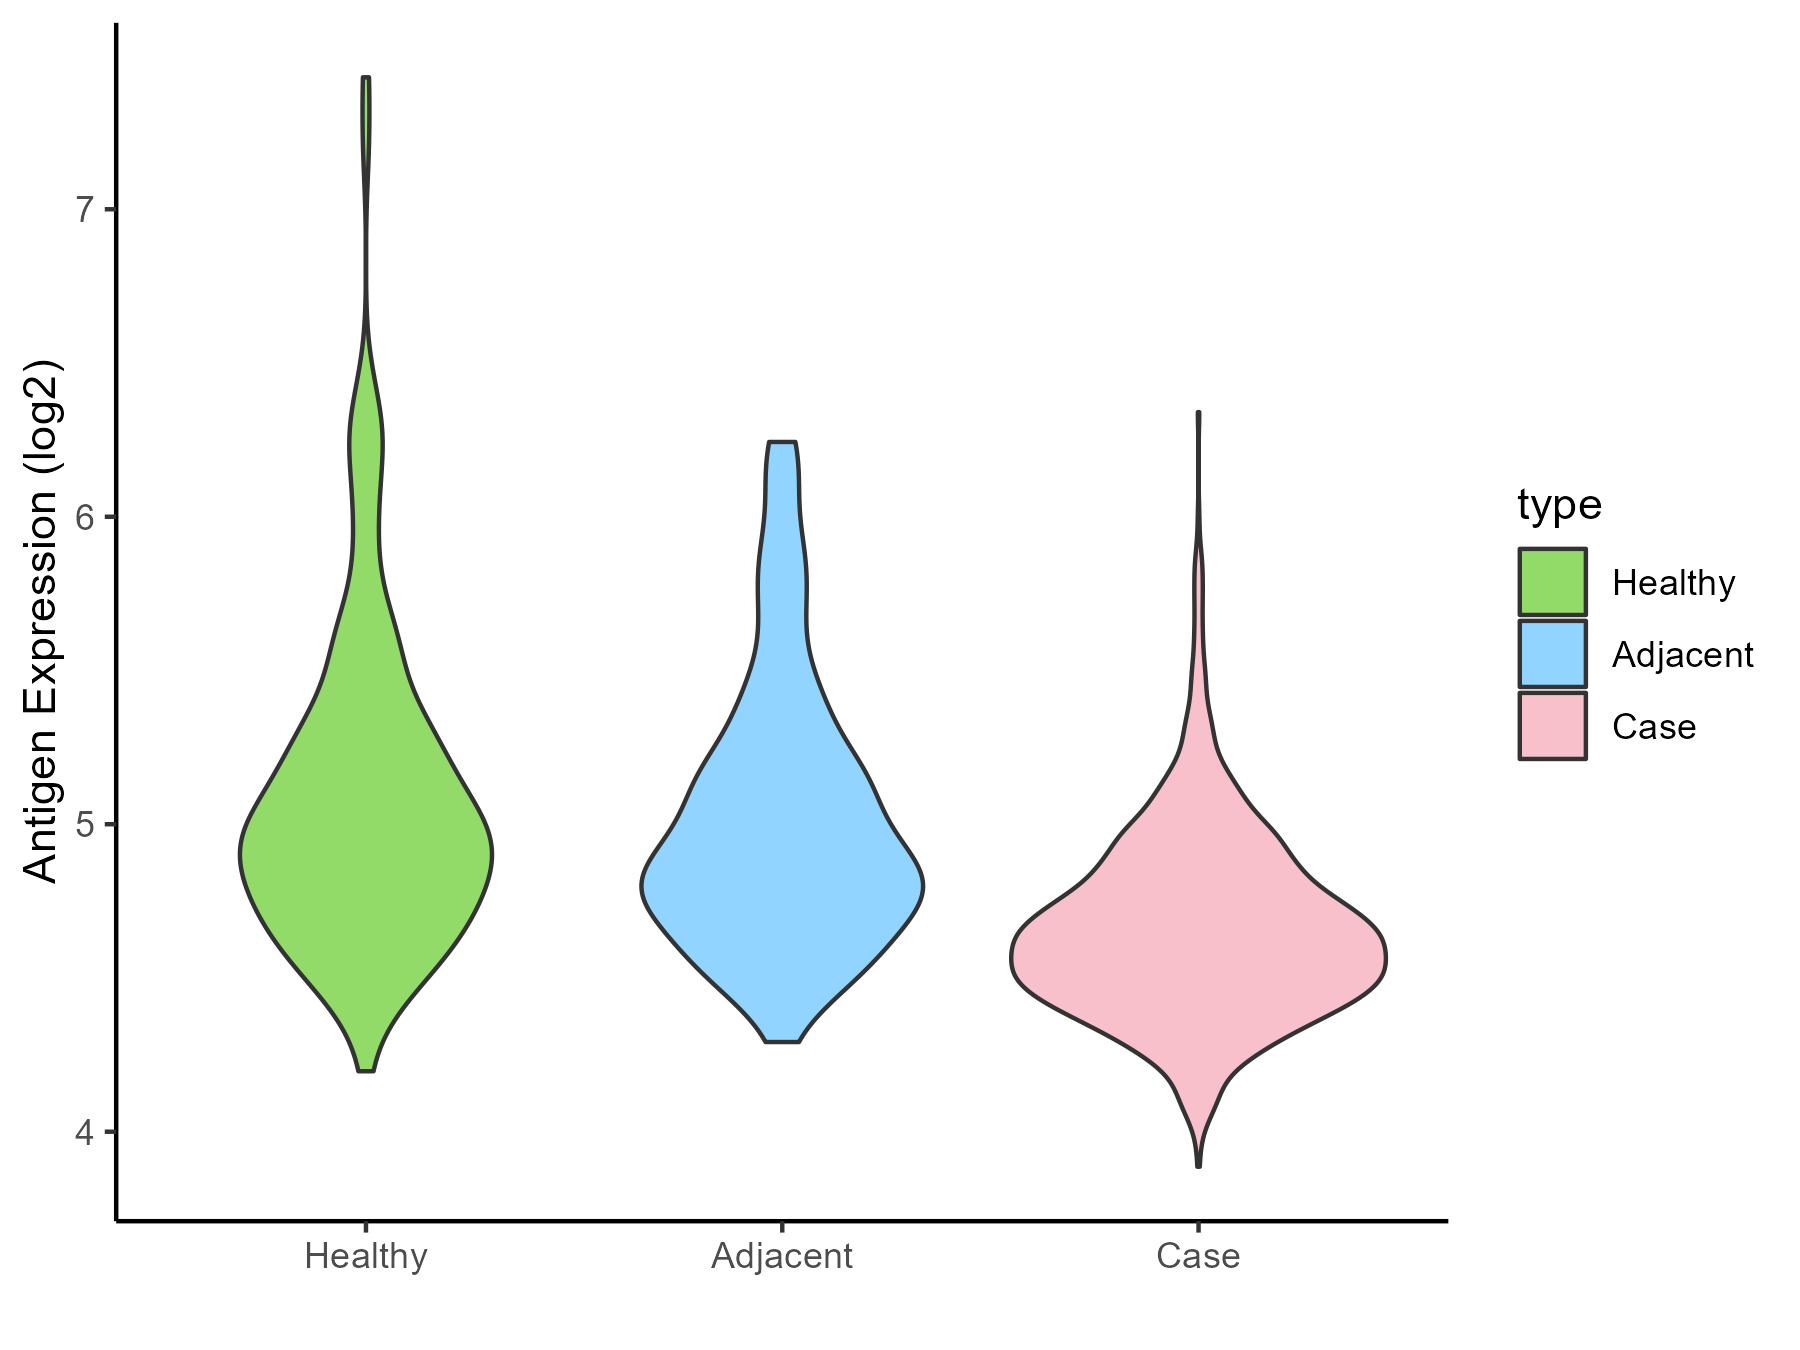
| Differential expression pattern of antigen in diseases | ||
| The Studied Tissue | Colon | |
| The Specific Disease | Colon cancer | |
| The Expression Level of Disease Section Compare with the Healthy Individual Tissue | p-value: 1.80E-18; Fold-change: -0.346869264; Z-score: -0.665076181 | |
| The Expression Level of Disease Section Compare with the Adjacent Tissue | p-value: 4.57E-15; Fold-change: -0.289591363; Z-score: -0.665445097 | |
| Disease-specific Antigen Abundances |
|
Click to View the Clearer Original Diagram |
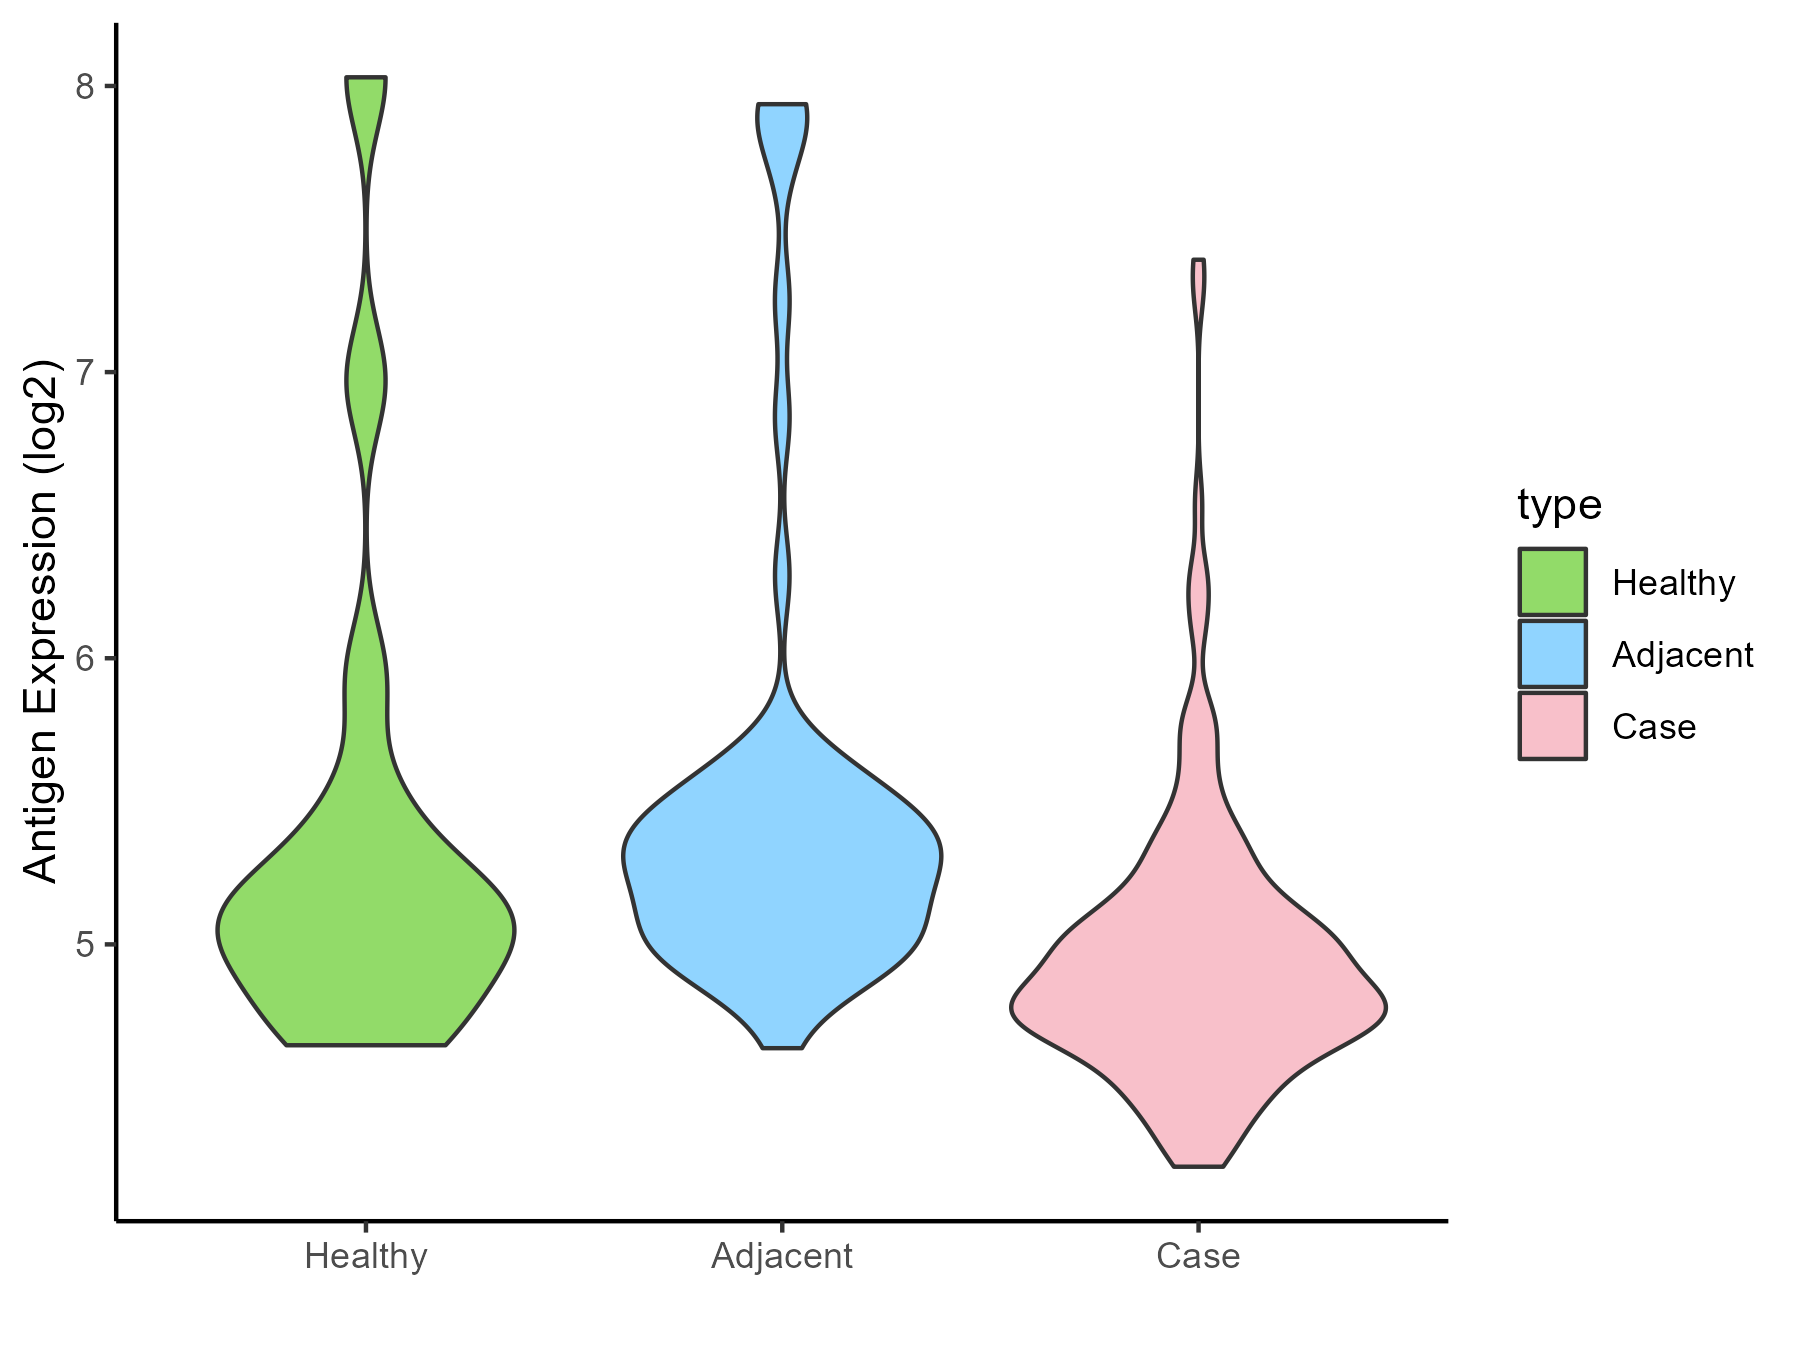
| Differential expression pattern of antigen in diseases | ||
| The Studied Tissue | Pancreas | |
| The Specific Disease | Pancreatic cancer | |
| The Expression Level of Disease Section Compare with the Healthy Individual Tissue | p-value: 0.075084502; Fold-change: -0.240903304; Z-score: -0.266041872 | |
| The Expression Level of Disease Section Compare with the Adjacent Tissue | p-value: 6.48E-06; Fold-change: -0.438459529; Z-score: -0.555935616 | |
| Disease-specific Antigen Abundances |
|
Click to View the Clearer Original Diagram |
| Differential expression pattern of antigen in diseases | ||
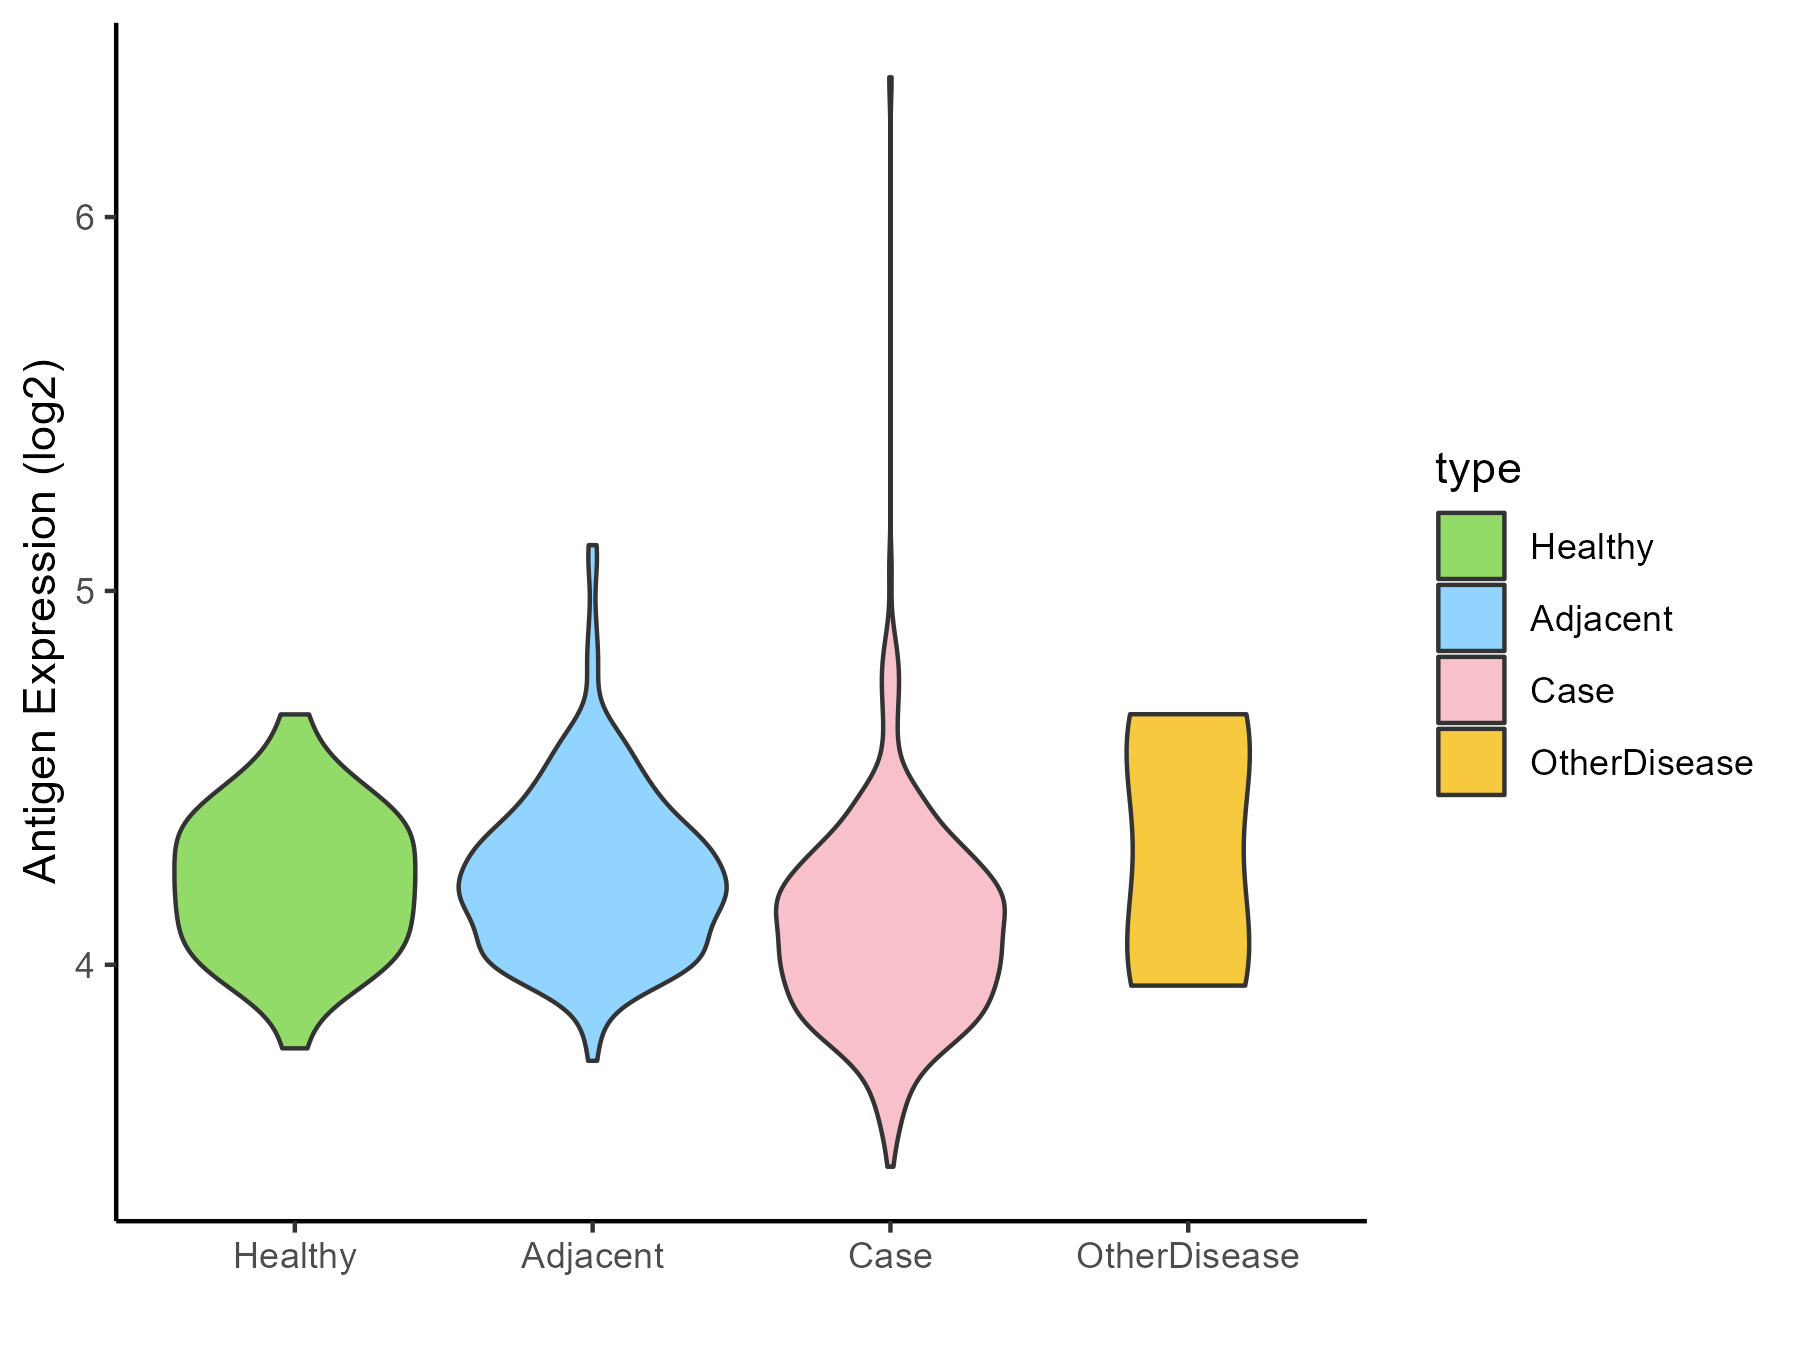
| The Studied Tissue | Liver | |
| The Specific Disease | Liver cancer | |
| The Expression Level of Disease Section Compare with the Healthy Individual Tissue | p-value: 0.000458833; Fold-change: -0.128039161; Z-score: -0.656402195 | |
| The Expression Level of Disease Section Compare with the Adjacent Tissue | p-value: 3.83E-11; Fold-change: -0.135463058; Z-score: -0.619536876 | |
| The Expression Level of Disease Section Compare with the Other Disease Section | p-value: 0.317188099; Fold-change: -0.234331697; Z-score: -0.656689652 | |
| Disease-specific Antigen Abundances |
|
Click to View the Clearer Original Diagram |
| Differential expression pattern of antigen in diseases | ||
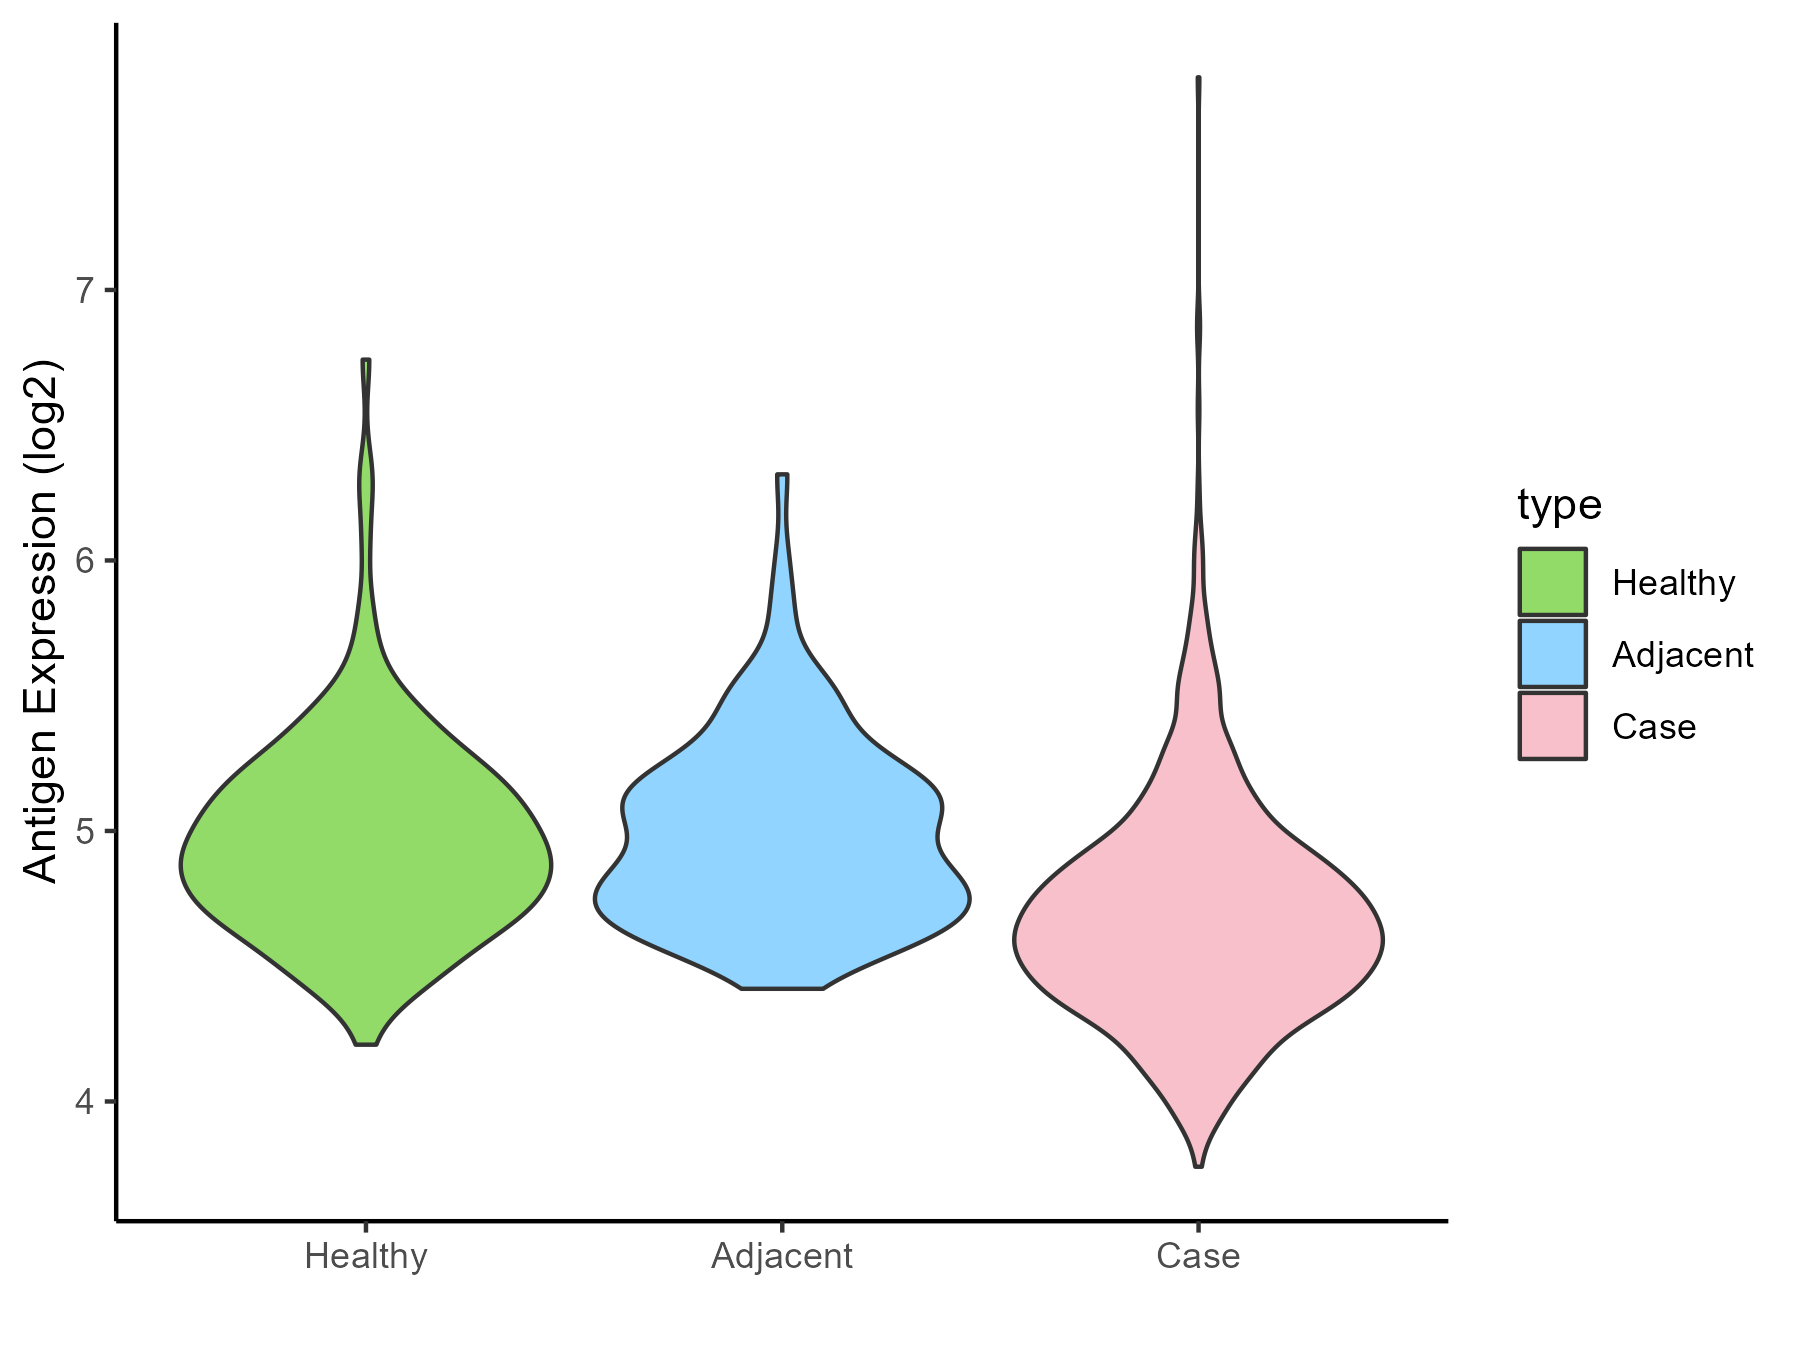
| The Studied Tissue | Lung | |
| The Specific Disease | Lung cancer | |
| The Expression Level of Disease Section Compare with the Healthy Individual Tissue | p-value: 1.09E-17; Fold-change: -0.282766326; Z-score: -0.762158311 | |
| The Expression Level of Disease Section Compare with the Adjacent Tissue | p-value: 4.28E-15; Fold-change: -0.305994004; Z-score: -0.884042103 | |
| Disease-specific Antigen Abundances |
|
Click to View the Clearer Original Diagram |
| Differential expression pattern of antigen in diseases | ||
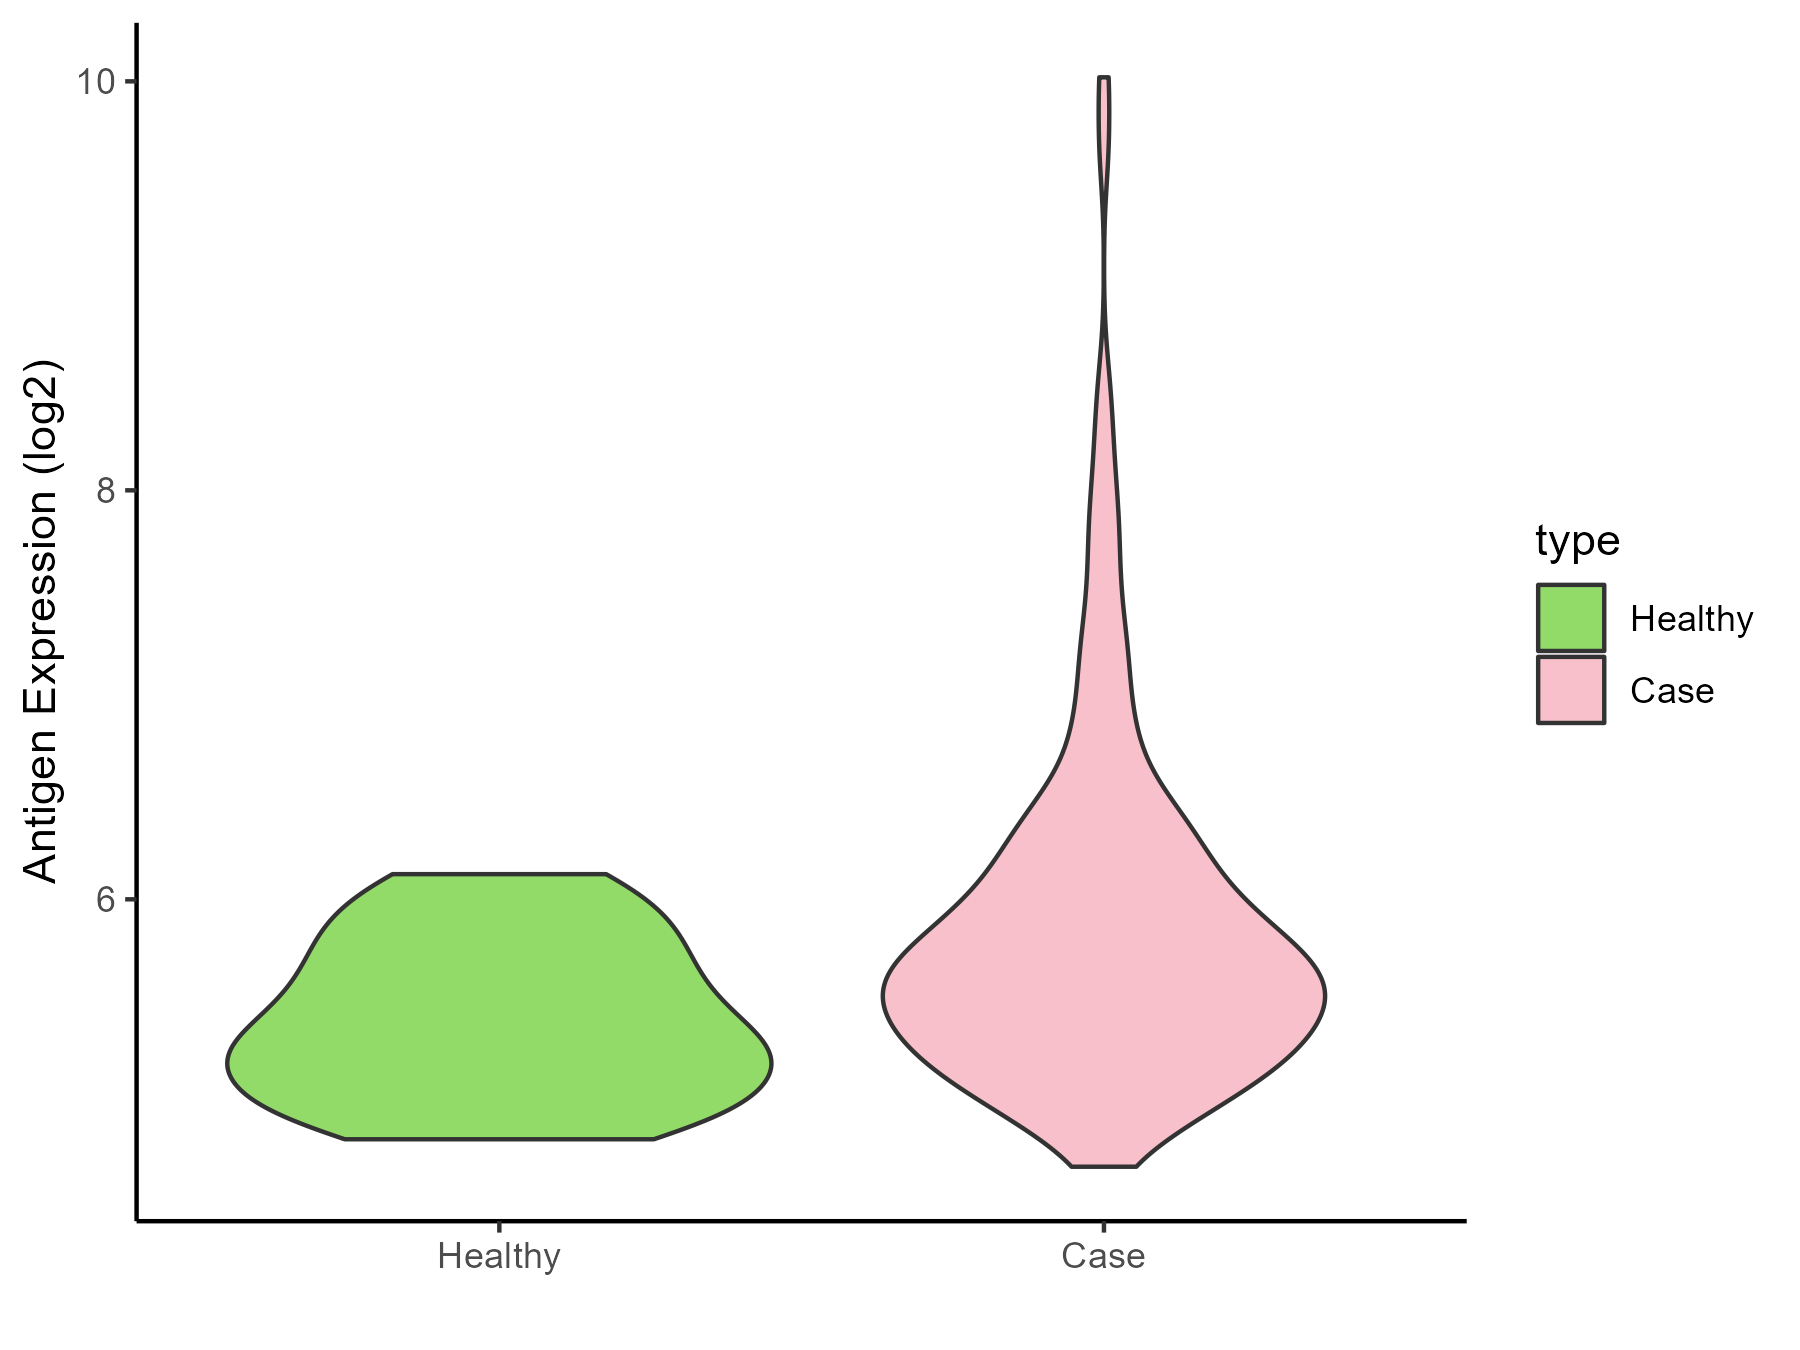
| The Studied Tissue | Skin | |
| The Specific Disease | Melanoma | |
| The Expression Level of Disease Section Compare with the Healthy Individual Tissue | p-value: 5.68E-05; Fold-change: 0.382077492; Z-score: 0.968848072 | |
| Disease-specific Antigen Abundances |
|
Click to View the Clearer Original Diagram |
| Differential expression pattern of antigen in diseases | ||
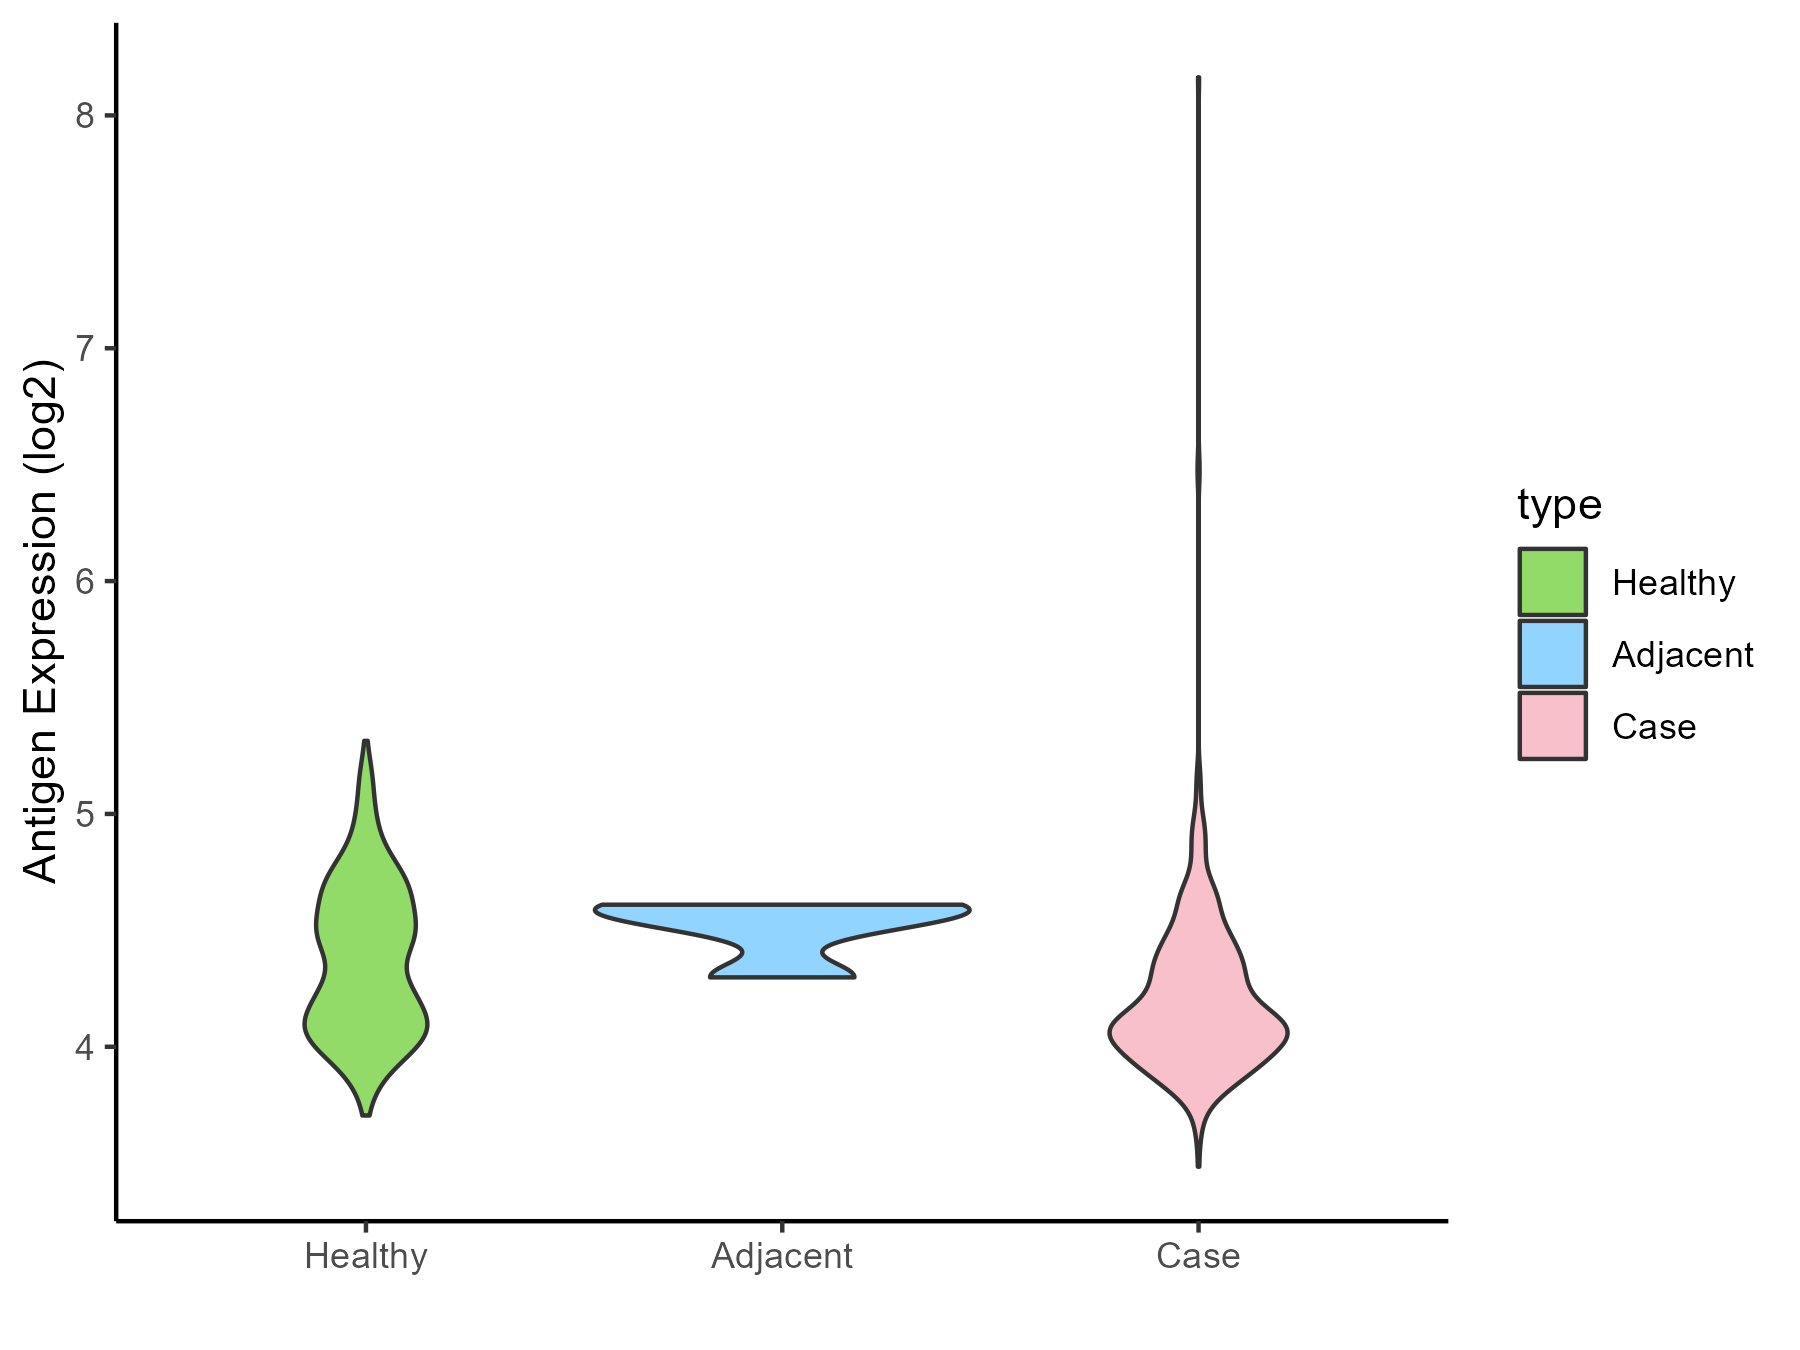
| The Studied Tissue | Muscle | |
| The Specific Disease | Sarcoma | |
| The Expression Level of Disease Section Compare with the Healthy Individual Tissue | p-value: 7.27E-16; Fold-change: -0.236036021; Z-score: -0.723641984 | |
| The Expression Level of Disease Section Compare with the Adjacent Tissue | p-value: 0.023017722; Fold-change: -0.441776735; Z-score: -3.001987792 | |
| Disease-specific Antigen Abundances |
|
Click to View the Clearer Original Diagram |
| Differential expression pattern of antigen in diseases | ||
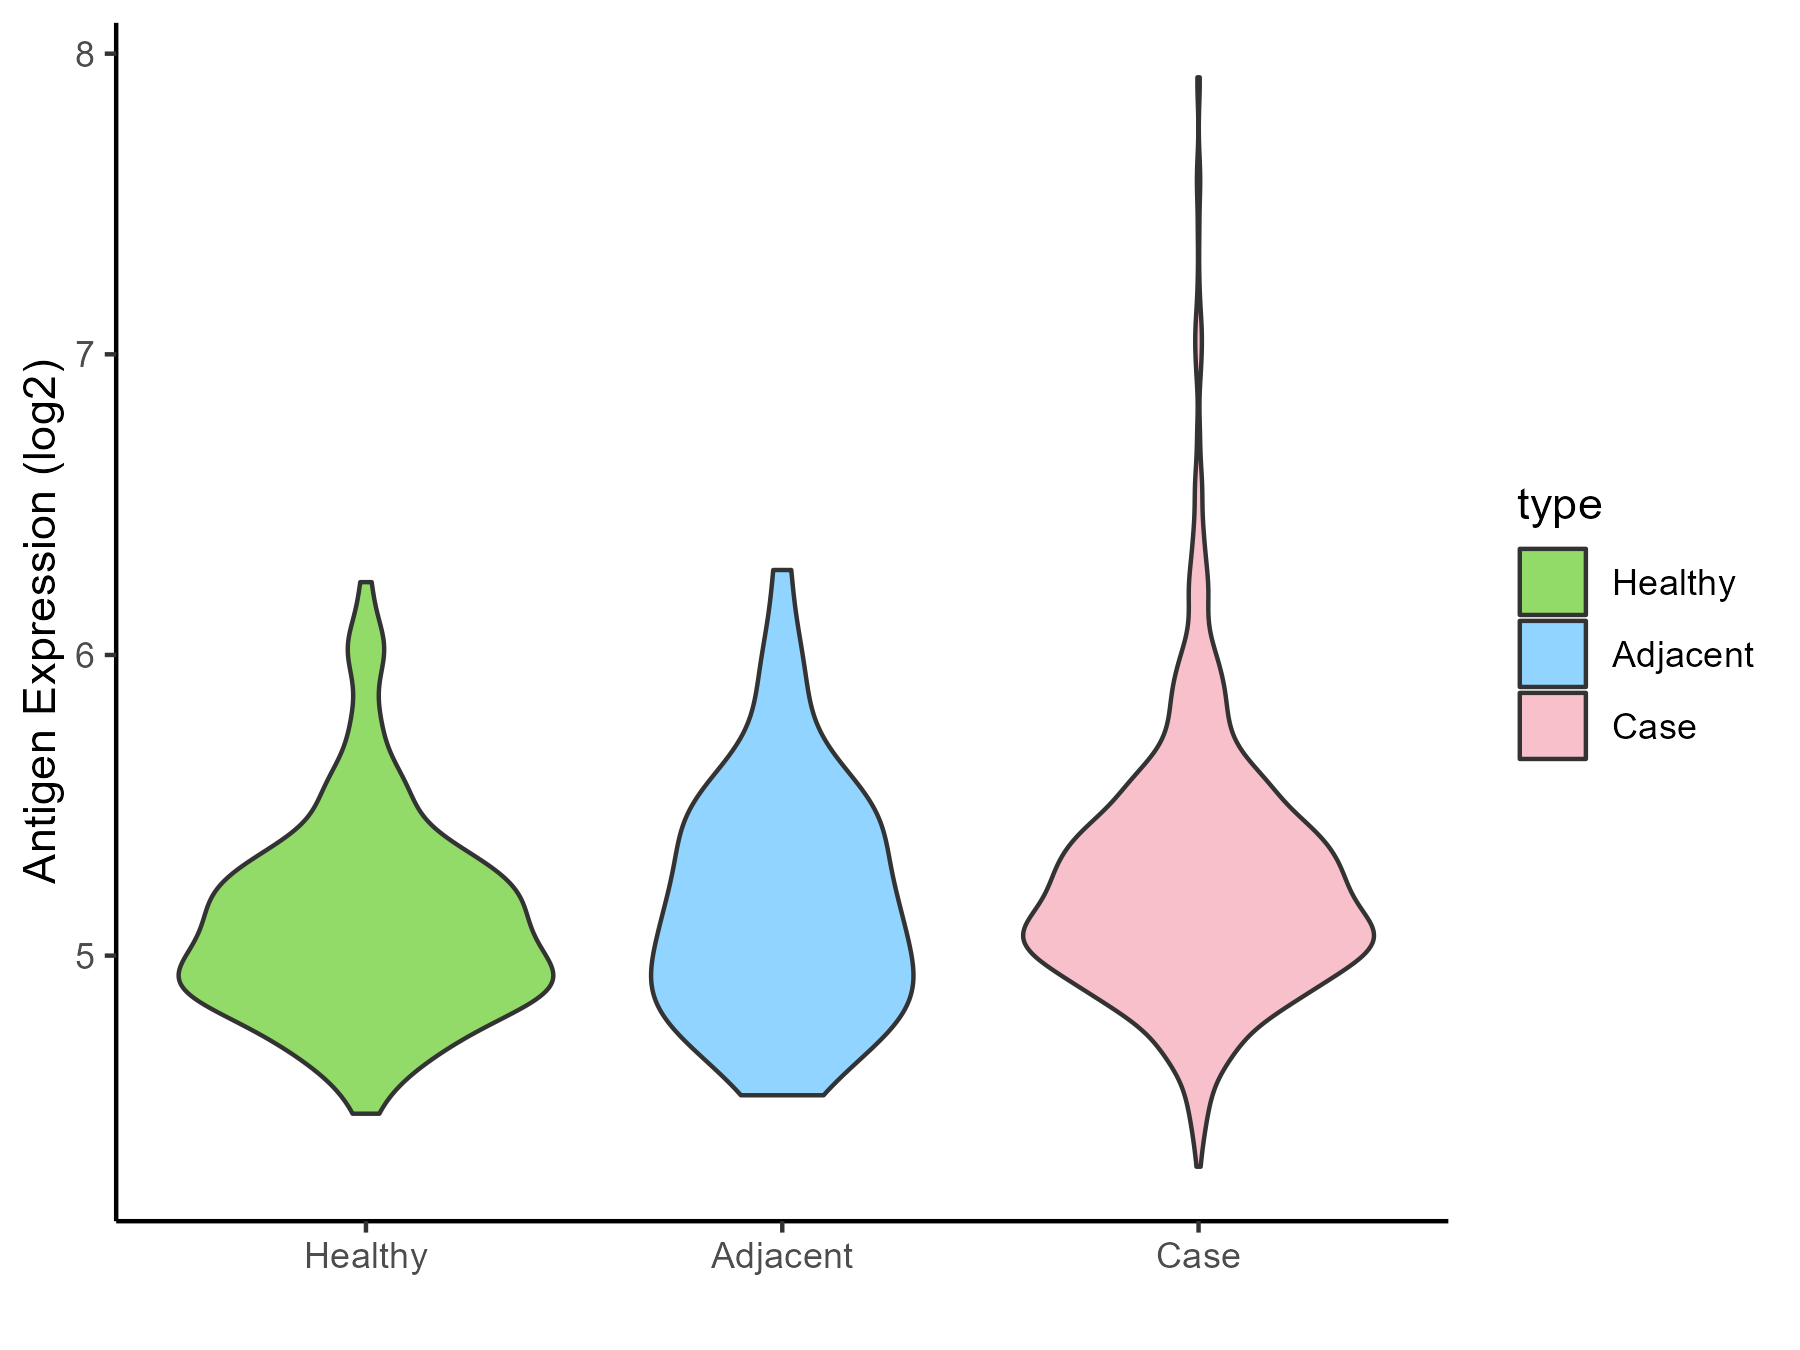
| The Studied Tissue | Breast | |
| The Specific Disease | Breast cancer | |
| The Expression Level of Disease Section Compare with the Healthy Individual Tissue | p-value: 4.17E-10; Fold-change: 0.134511935; Z-score: 0.41268807 | |
| The Expression Level of Disease Section Compare with the Adjacent Tissue | p-value: 0.133675931; Fold-change: 0.076366668; Z-score: 0.19777896 | |
| Disease-specific Antigen Abundances |
|
Click to View the Clearer Original Diagram |
| Differential expression pattern of antigen in diseases | ||
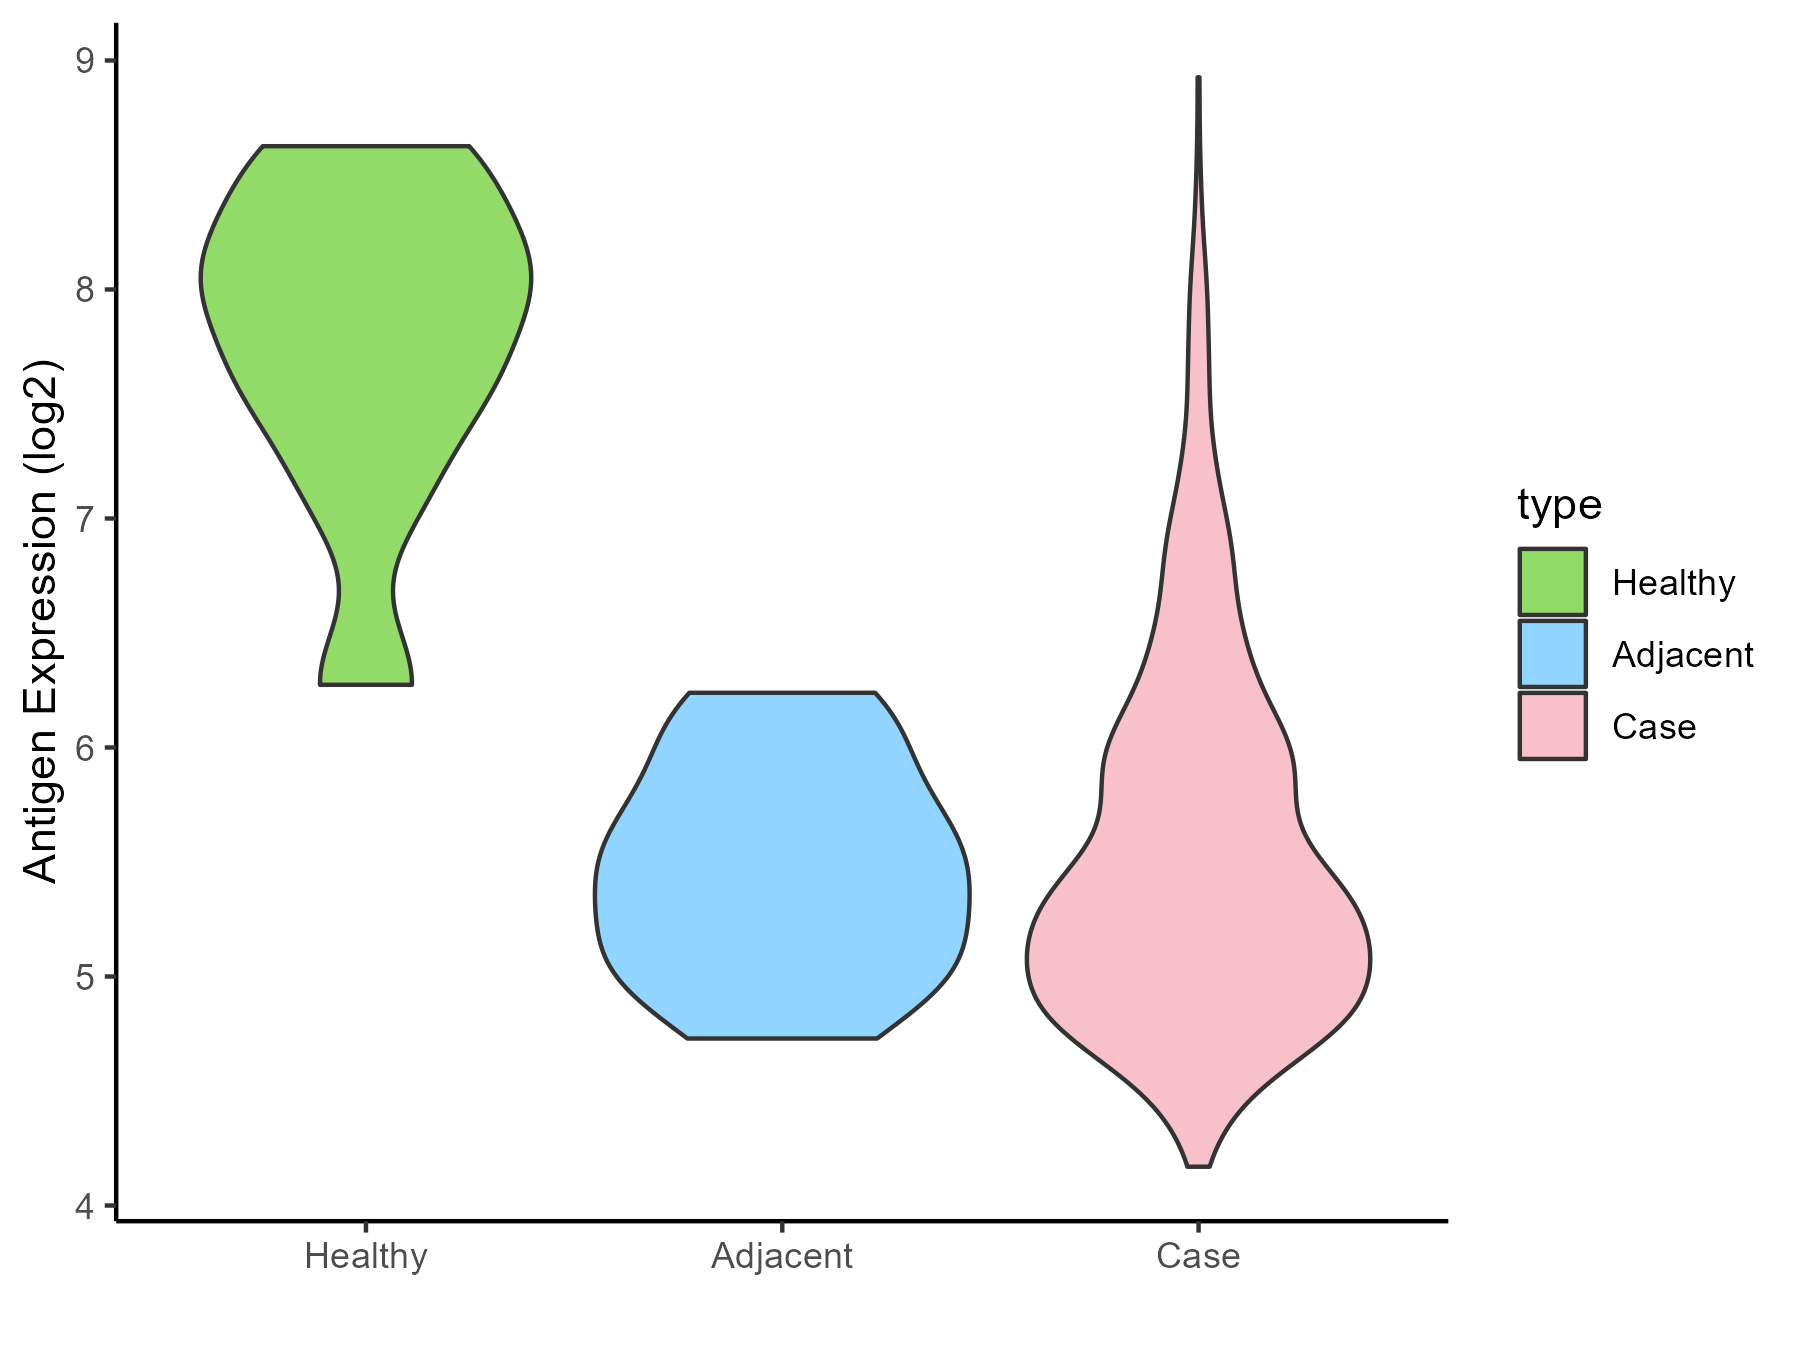
| The Studied Tissue | Ovarian | |
| The Specific Disease | Ovarian cancer | |
| The Expression Level of Disease Section Compare with the Healthy Individual Tissue | p-value: 1.61E-05; Fold-change: -2.583685935; Z-score: -3.529089248 | |
| The Expression Level of Disease Section Compare with the Adjacent Tissue | p-value: 0.491482319; Fold-change: -0.116233775; Z-score: -0.247384118 | |
| Disease-specific Antigen Abundances |
|
Click to View the Clearer Original Diagram |
| Differential expression pattern of antigen in diseases | ||
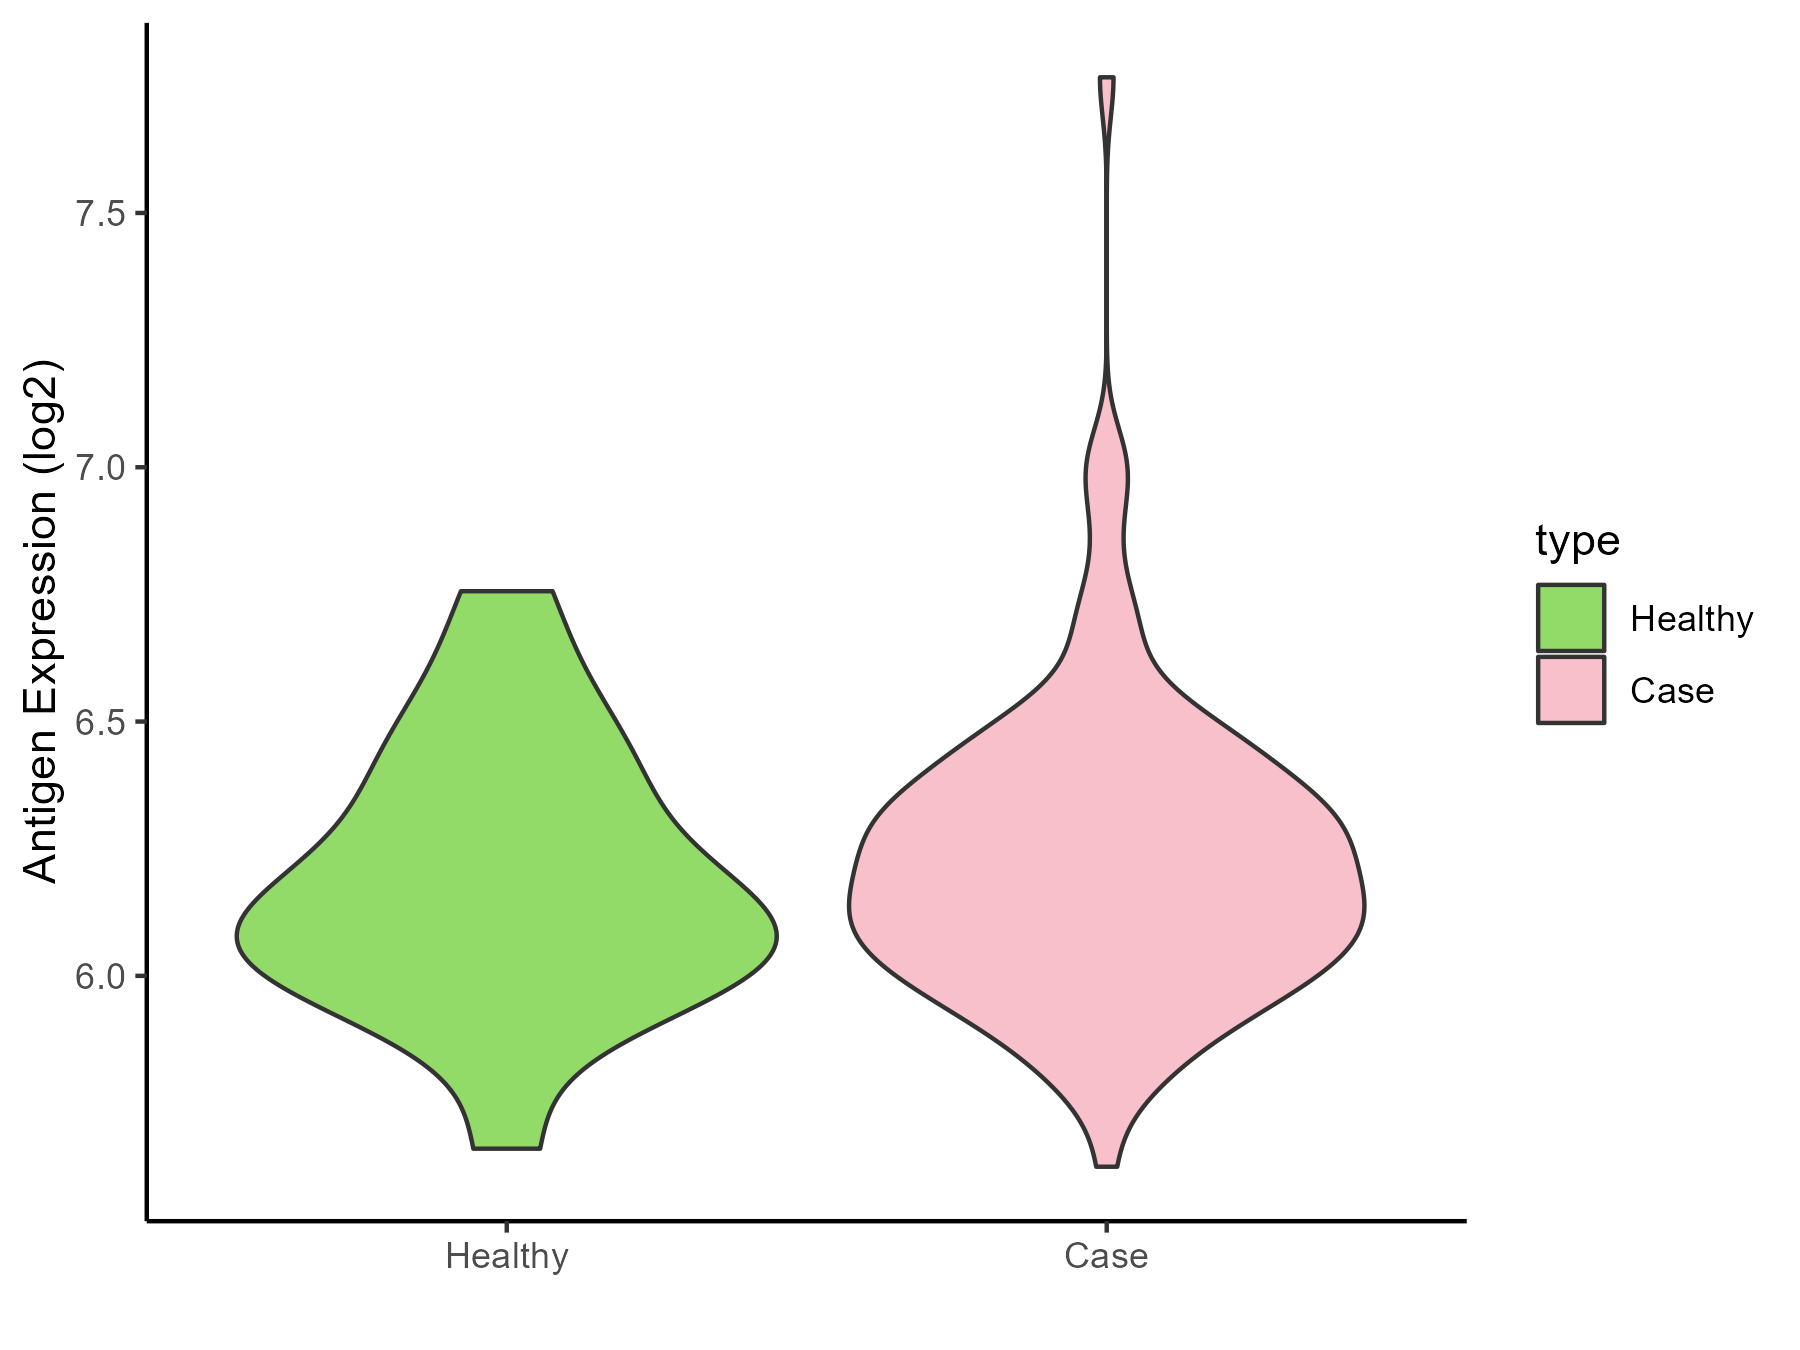
| The Studied Tissue | Cervical | |
| The Specific Disease | Cervical cancer | |
| The Expression Level of Disease Section Compare with the Healthy Individual Tissue | p-value: 0.542631949; Fold-change: 0.073738656; Z-score: 0.280461132 | |
| Disease-specific Antigen Abundances |
|
Click to View the Clearer Original Diagram |
| Differential expression pattern of antigen in diseases | ||
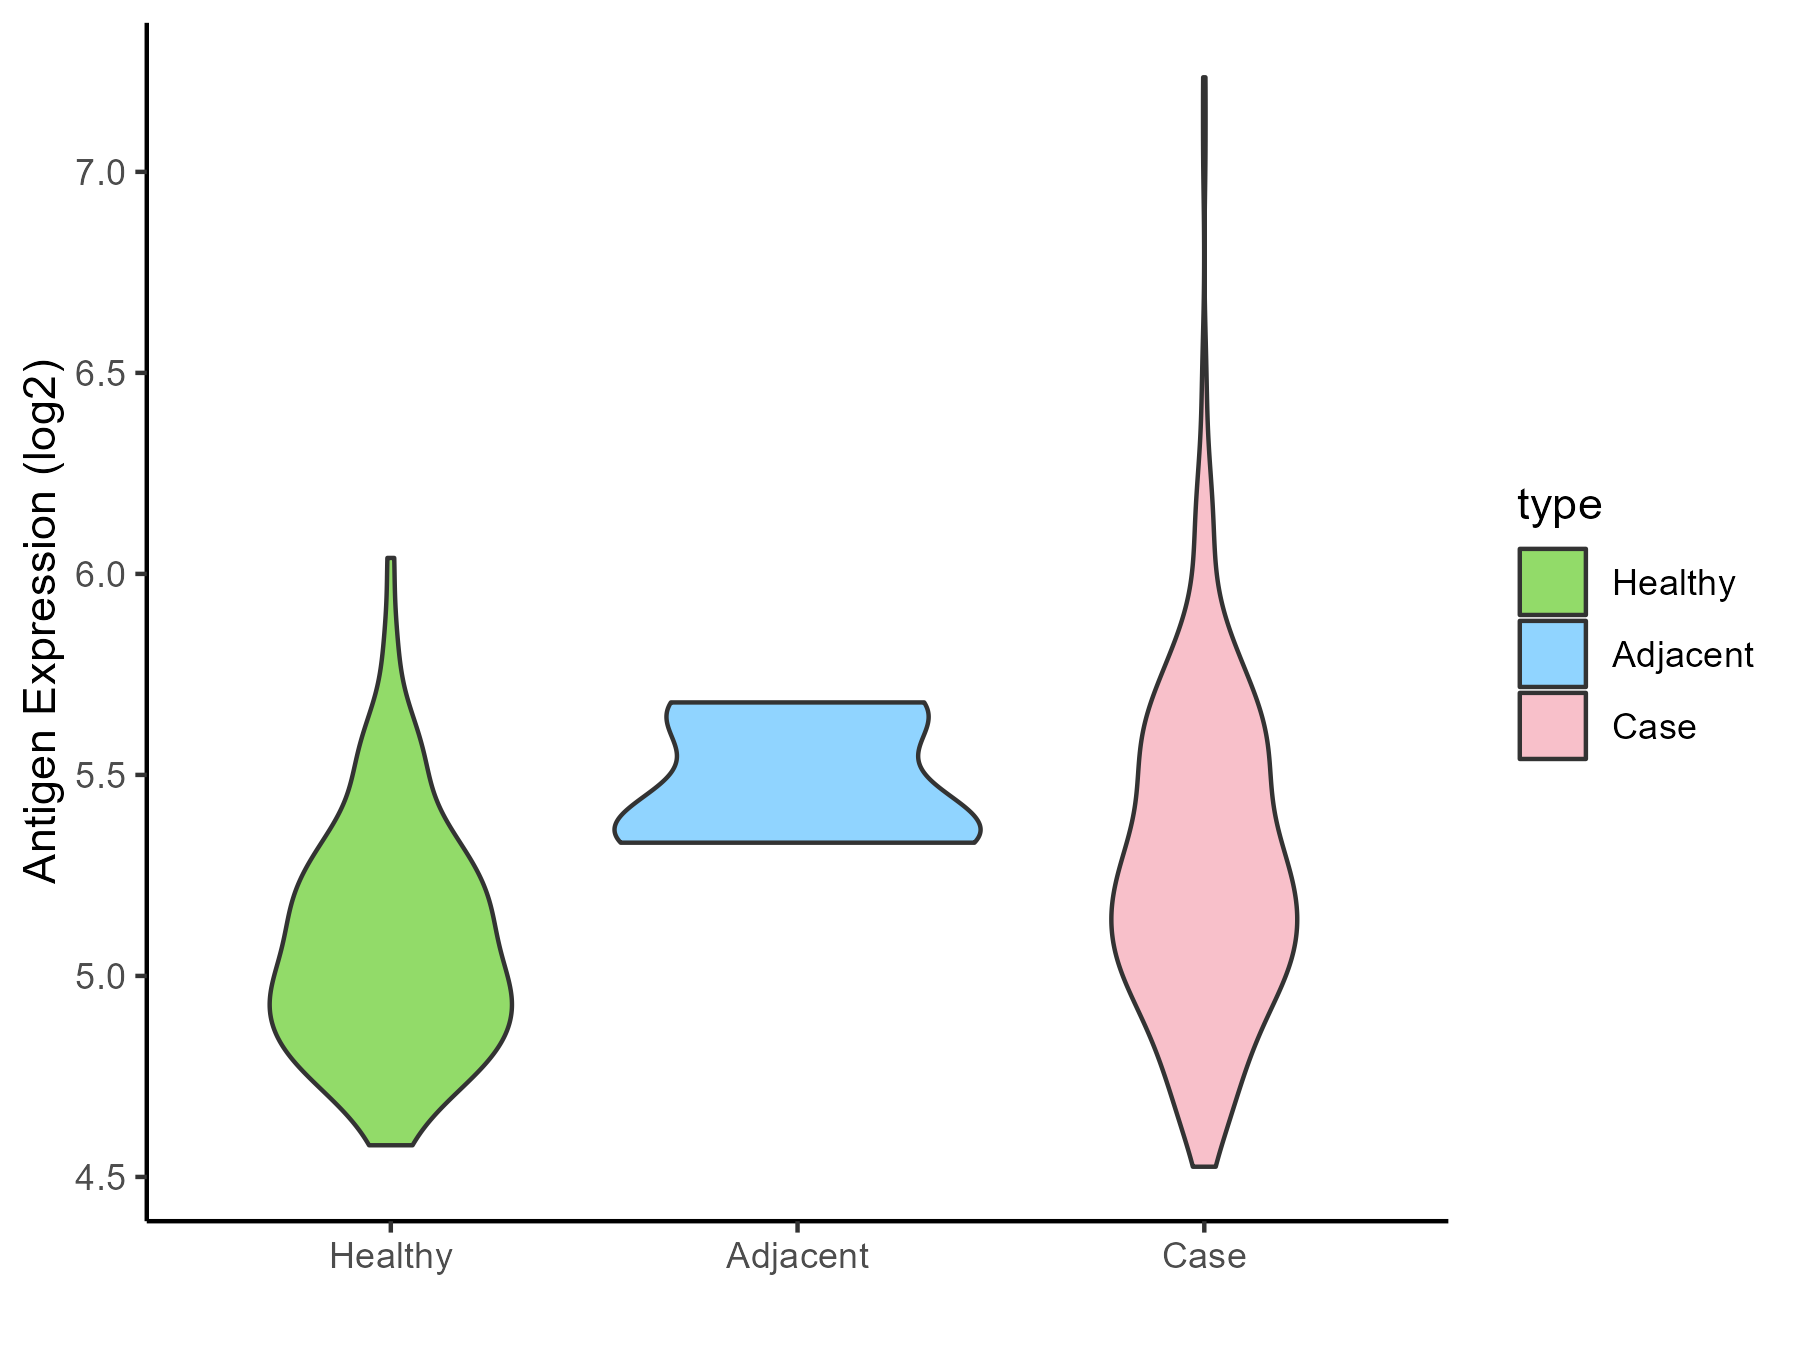
| The Studied Tissue | Endometrium | |
| The Specific Disease | Uterine cancer | |
| The Expression Level of Disease Section Compare with the Healthy Individual Tissue | p-value: 3.35E-09; Fold-change: 0.208751578; Z-score: 0.741593929 | |
| The Expression Level of Disease Section Compare with the Adjacent Tissue | p-value: 0.063864511; Fold-change: -0.16583691; Z-score: -0.975646774 | |
| Disease-specific Antigen Abundances |
|
Click to View the Clearer Original Diagram |
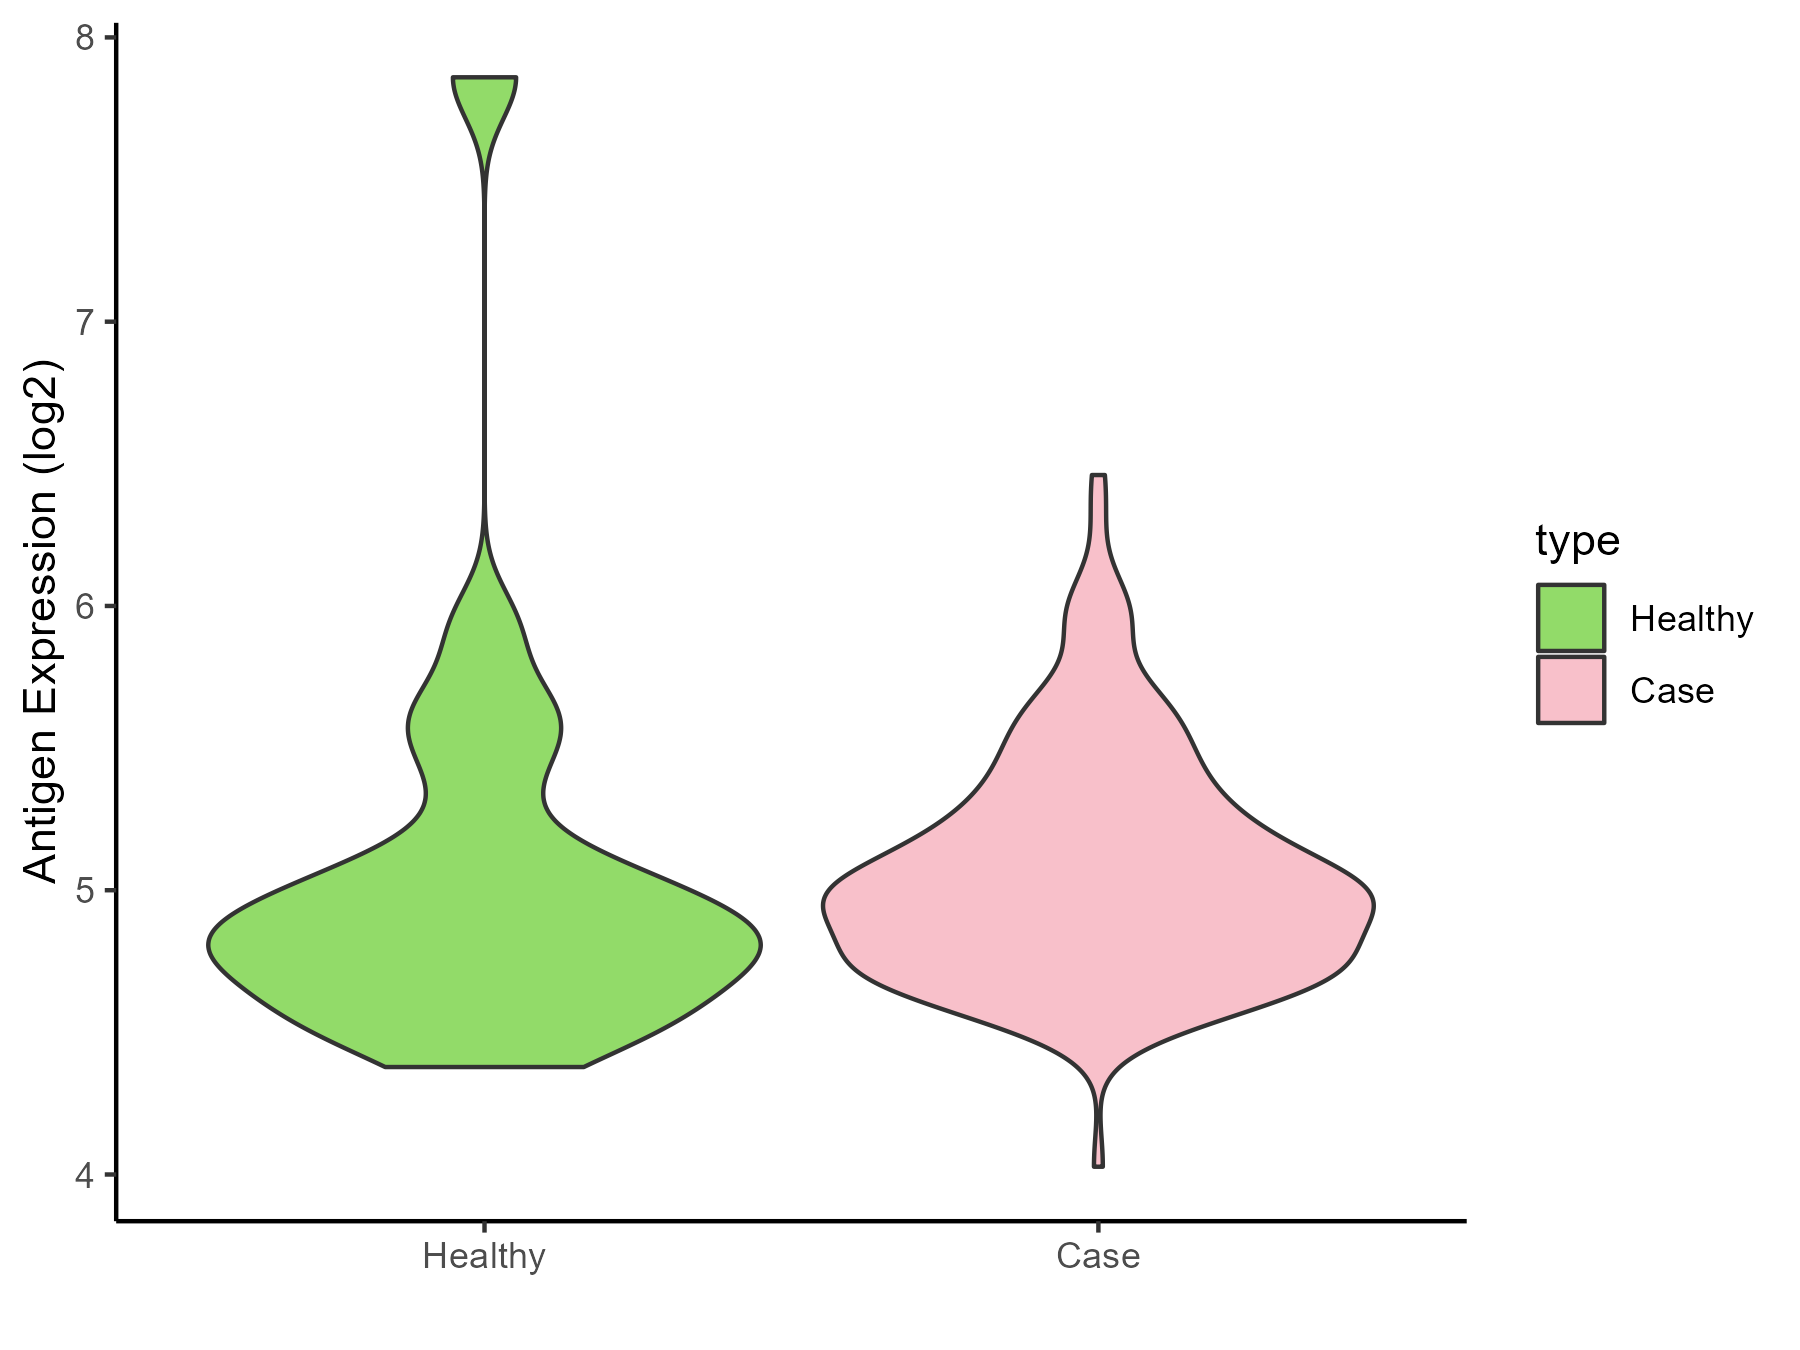
| Differential expression pattern of antigen in diseases | ||
| The Studied Tissue | Prostate | |
| The Specific Disease | Prostate cancer | |
| The Expression Level of Disease Section Compare with the Healthy Individual Tissue | p-value: 0.924623156; Fold-change: 0.142971001; Z-score: 0.190276696 | |
| Disease-specific Antigen Abundances |
|
Click to View the Clearer Original Diagram |
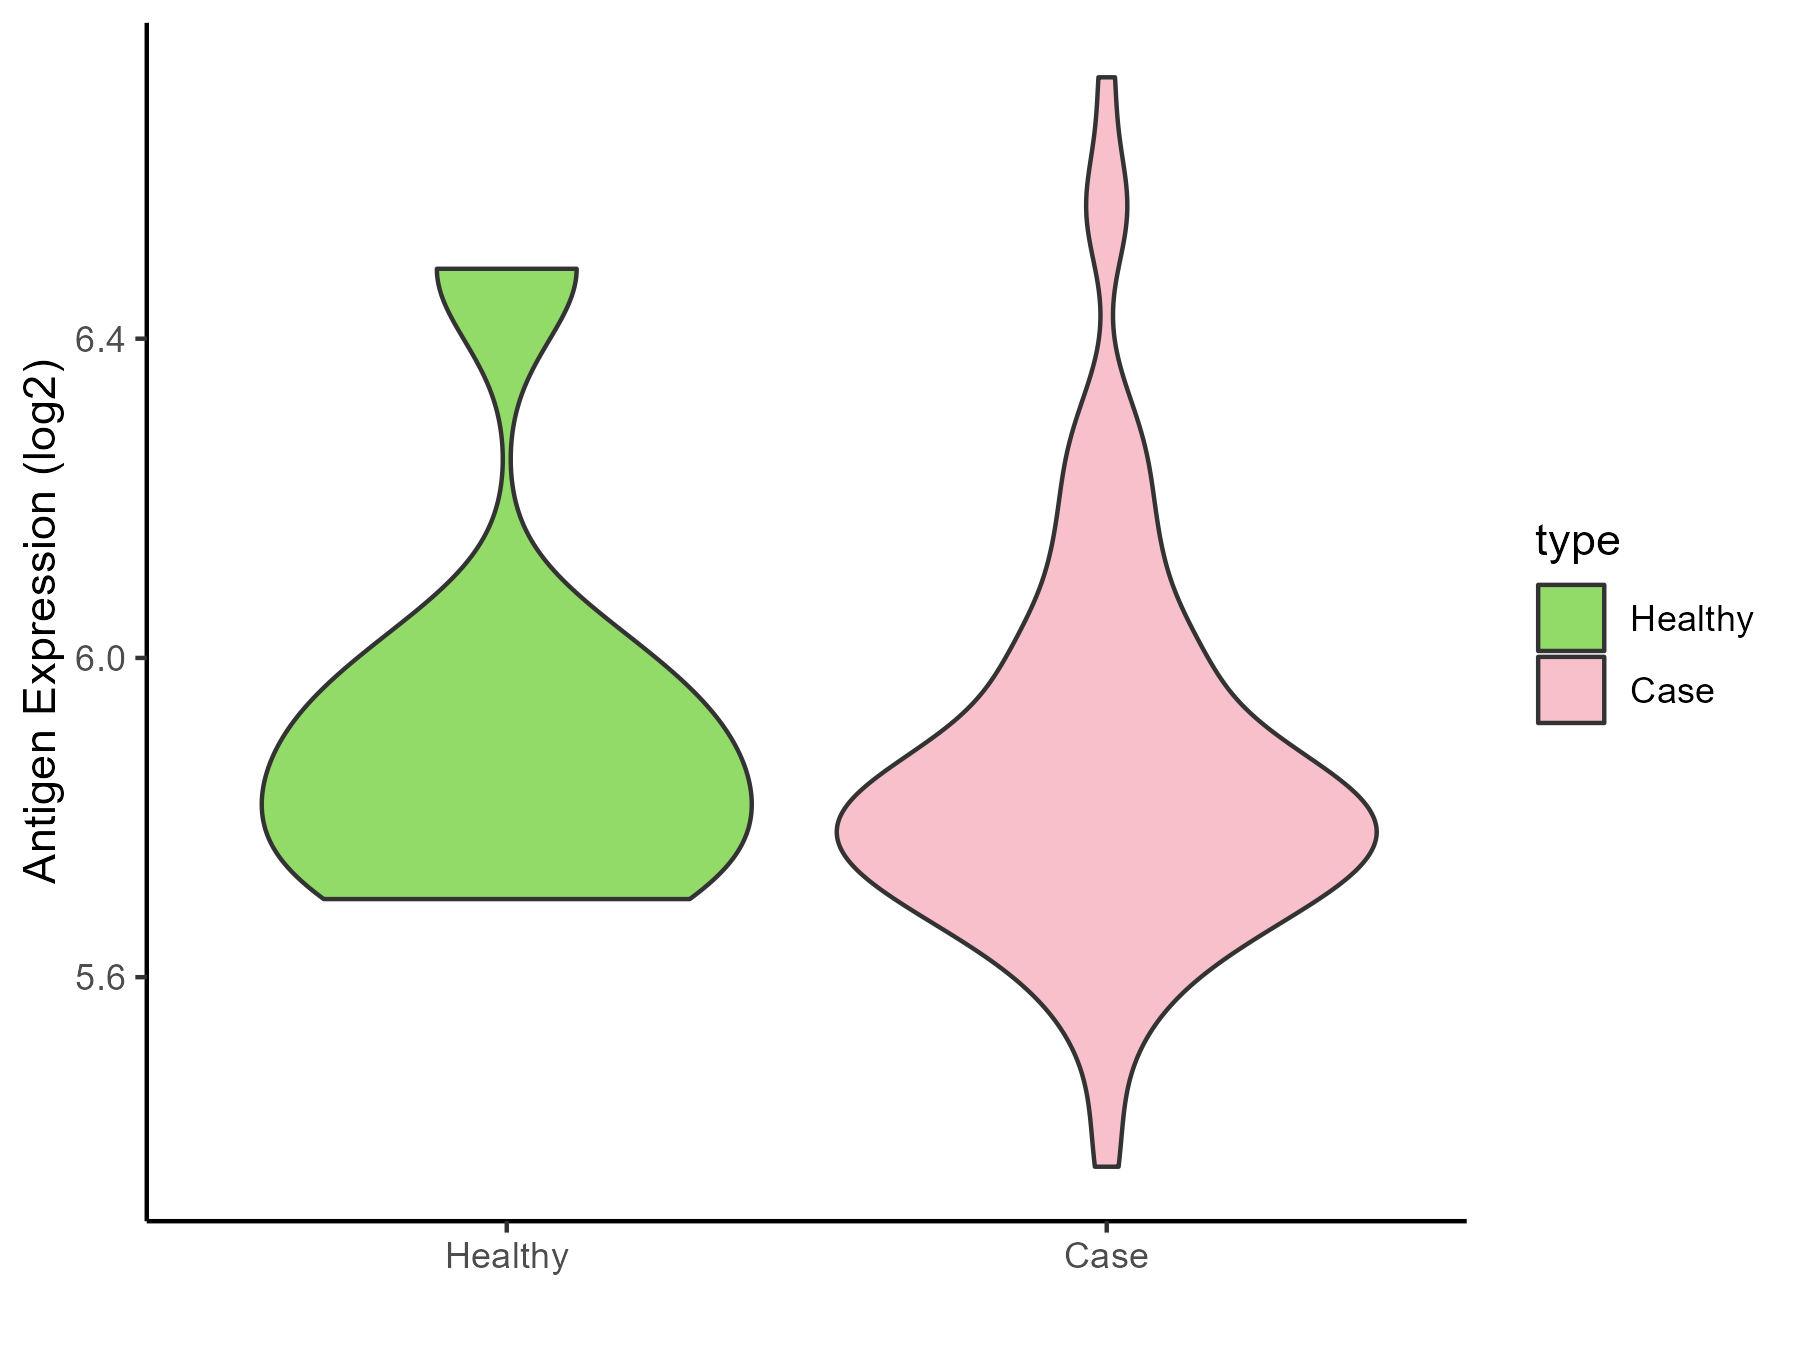
| Differential expression pattern of antigen in diseases | ||
| The Studied Tissue | Bladder | |
| The Specific Disease | Bladder cancer | |
| The Expression Level of Disease Section Compare with the Healthy Individual Tissue | p-value: 0.55748764; Fold-change: -0.050021237; Z-score: -0.187113607 | |
| Disease-specific Antigen Abundances |
|
Click to View the Clearer Original Diagram |
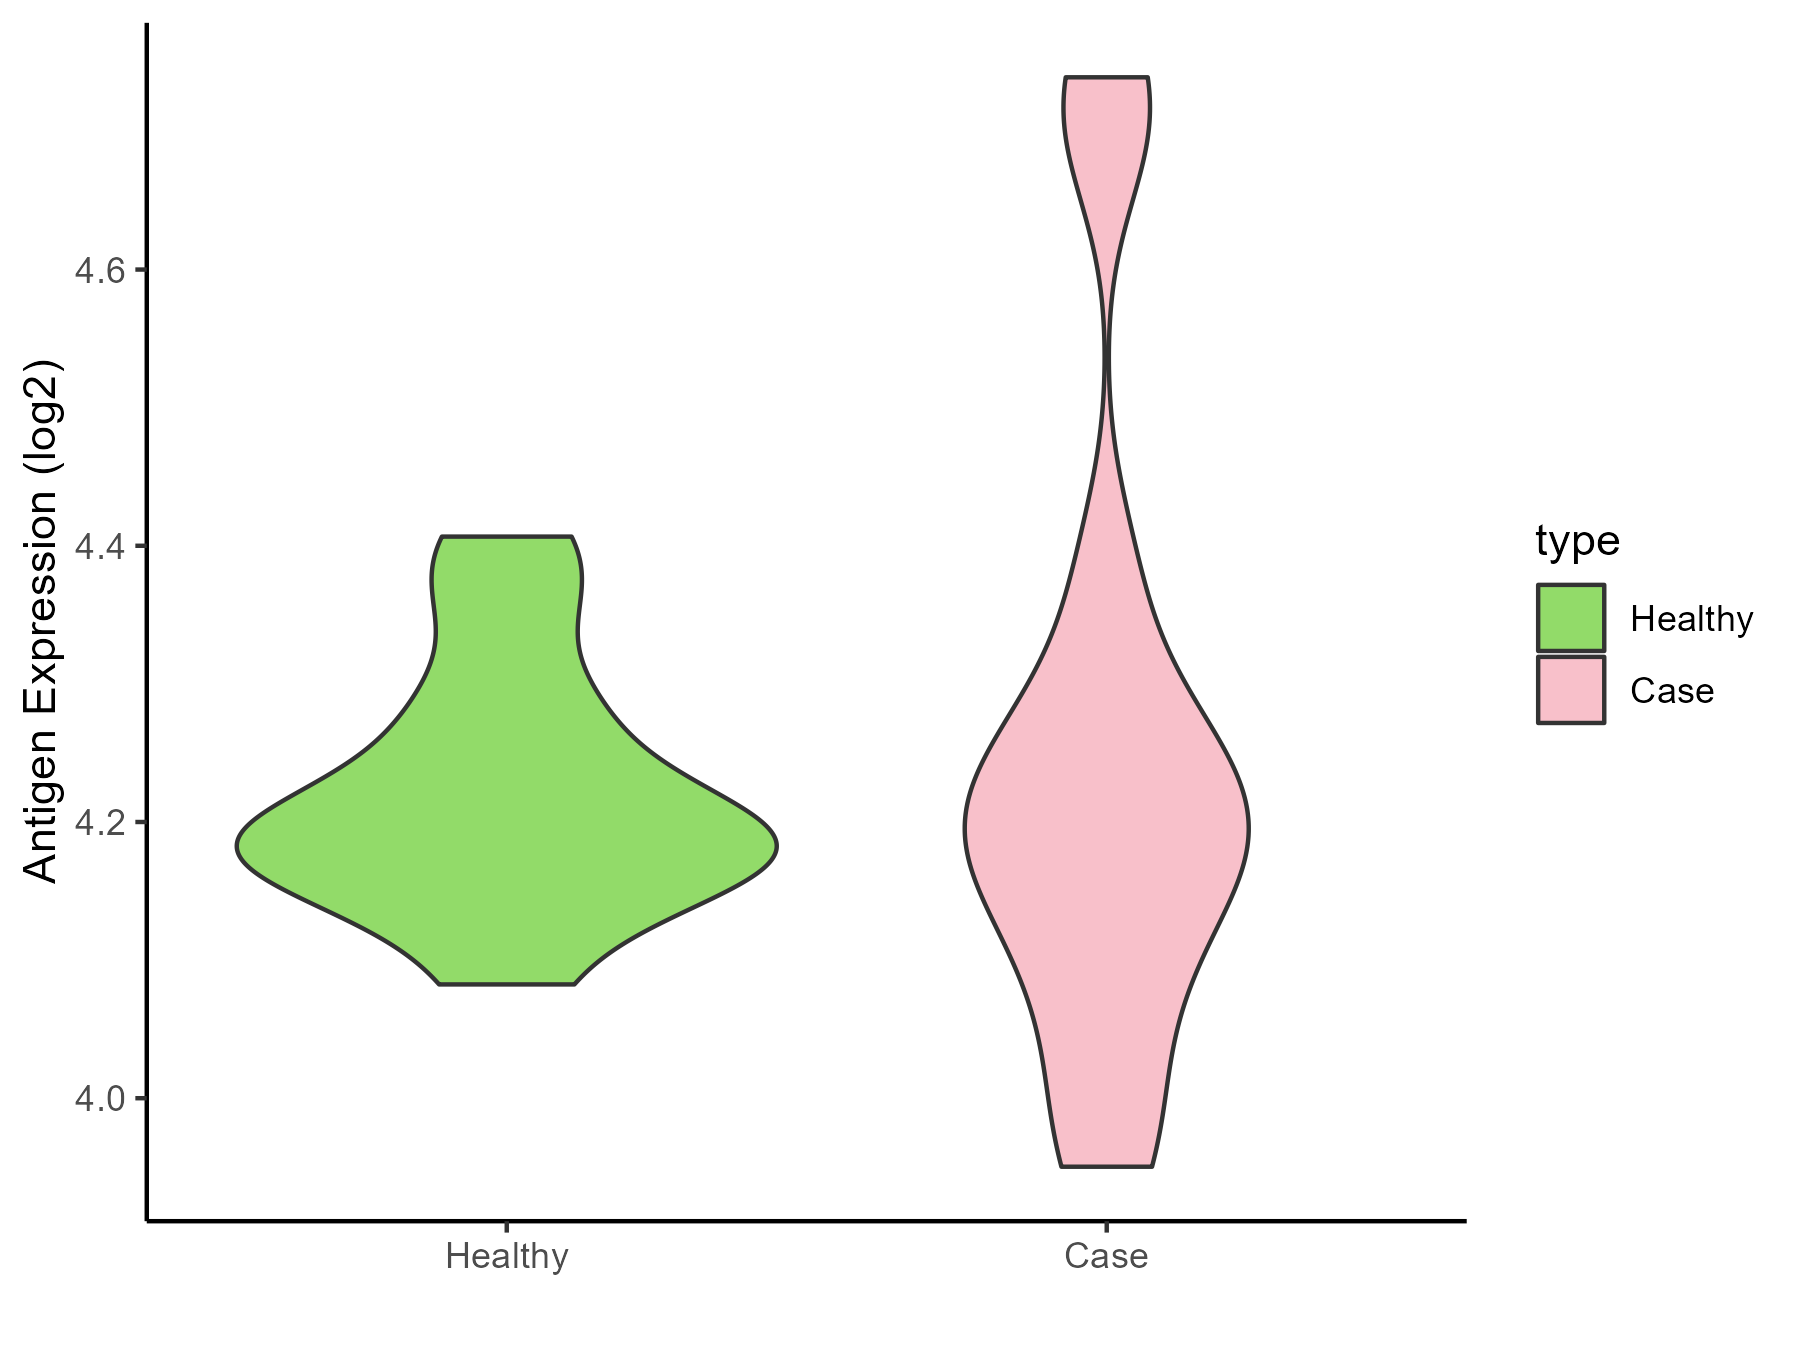
| Differential expression pattern of antigen in diseases | ||
| The Studied Tissue | Uvea | |
| The Specific Disease | Retinoblastoma tumor | |
| The Expression Level of Disease Section Compare with the Healthy Individual Tissue | p-value: 0.719384018; Fold-change: -9.59E-05; Z-score: -0.001035094 | |
| Disease-specific Antigen Abundances |
|
Click to View the Clearer Original Diagram |
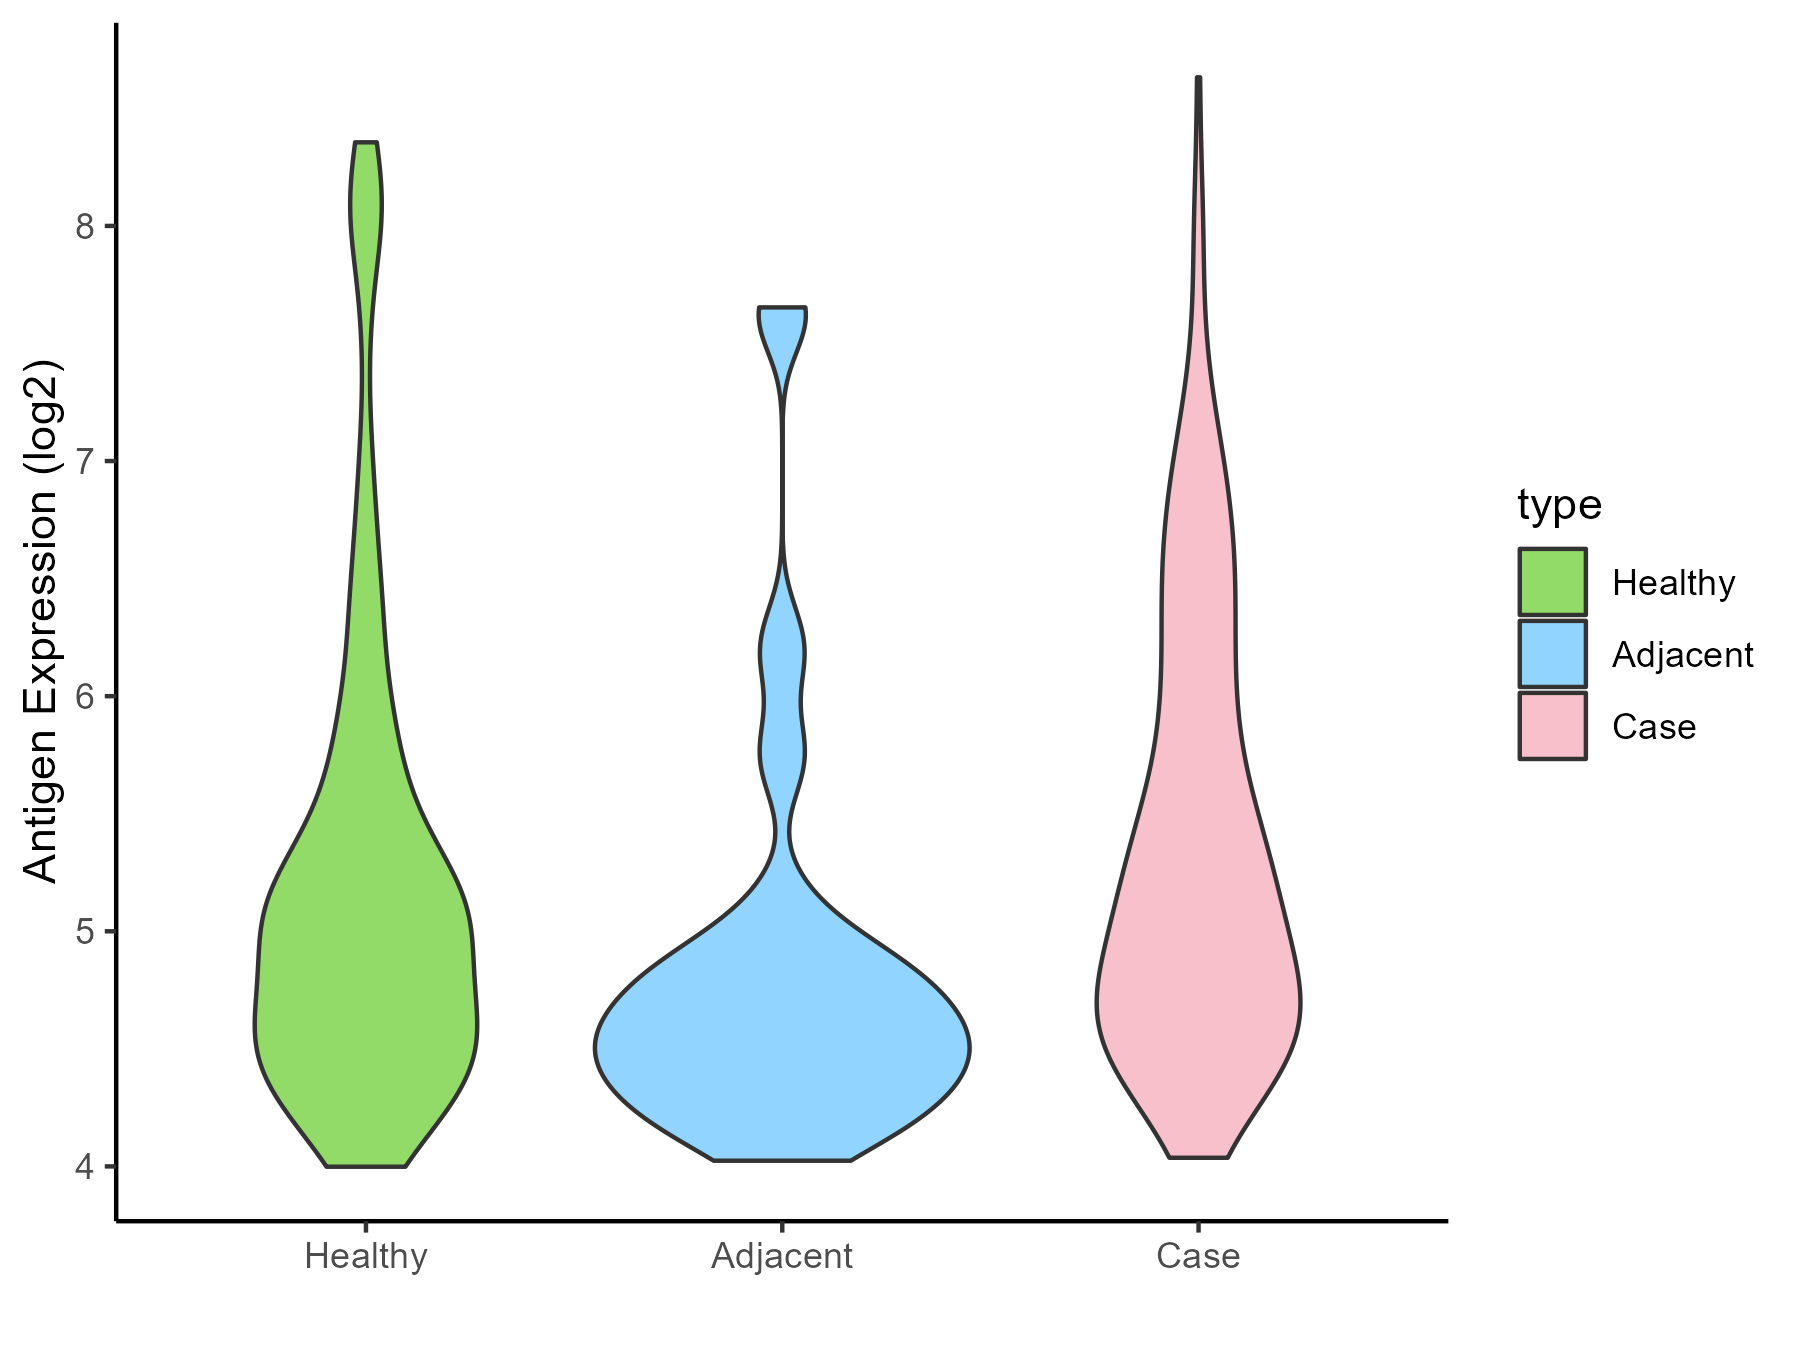
| Differential expression pattern of antigen in diseases | ||
| The Studied Tissue | Thyroid | |
| The Specific Disease | Thyroid cancer | |
| The Expression Level of Disease Section Compare with the Healthy Individual Tissue | p-value: 0.099621021; Fold-change: 0.125571268; Z-score: 0.126003528 | |
| The Expression Level of Disease Section Compare with the Adjacent Tissue | p-value: 0.000217147; Fold-change: 0.522049054; Z-score: 0.637037059 | |
| Disease-specific Antigen Abundances |
|
Click to View the Clearer Original Diagram |
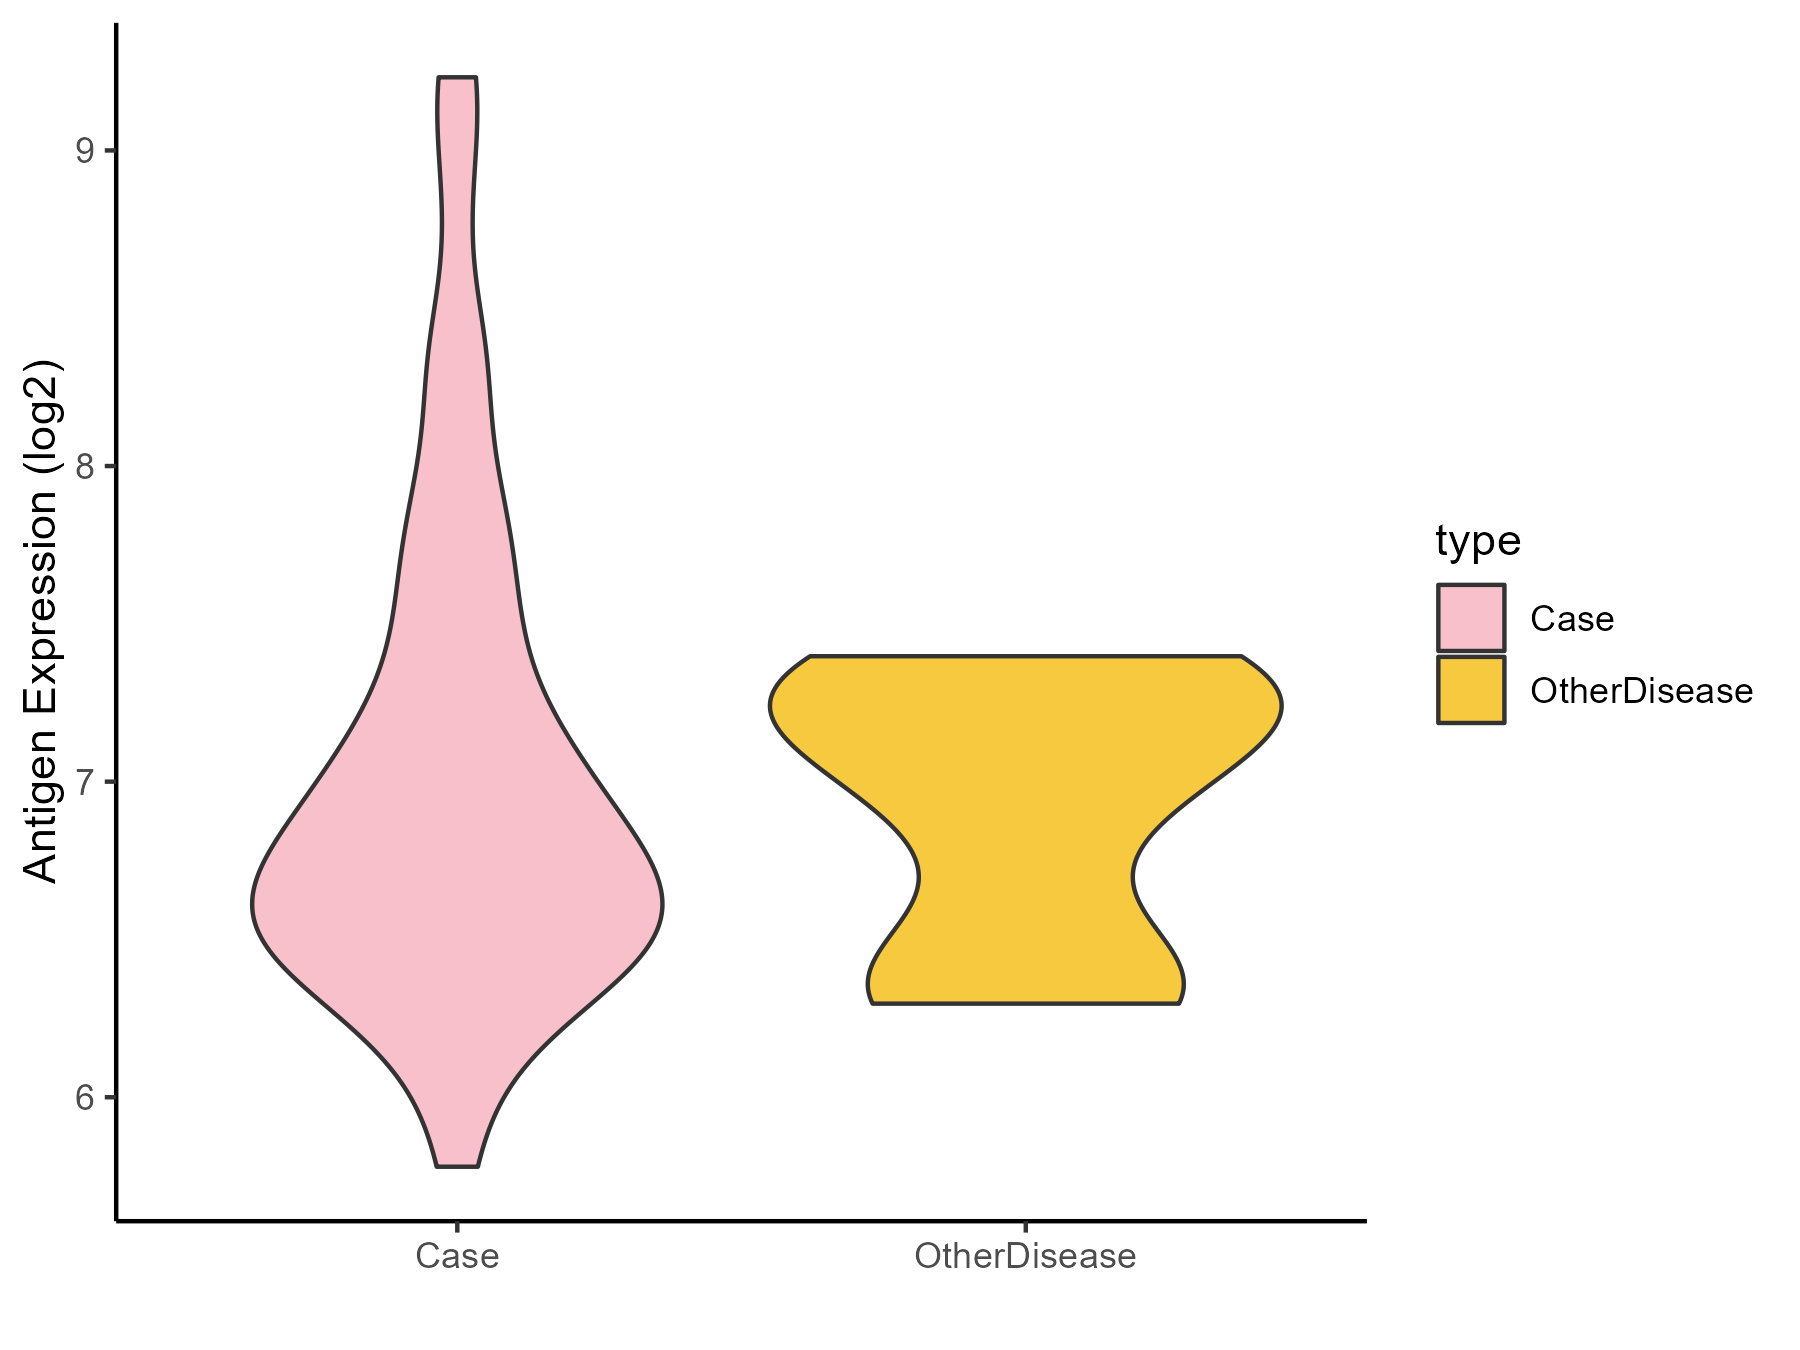
| Differential expression pattern of antigen in diseases | ||
| The Studied Tissue | Adrenal cortex | |
| The Specific Disease | Adrenocortical carcinoma | |
| The Expression Level of Disease Section Compare with the Other Disease Section | p-value: 0.390962545; Fold-change: -0.291079496; Z-score: -0.662902372 | |
| Disease-specific Antigen Abundances |
|
Click to View the Clearer Original Diagram |
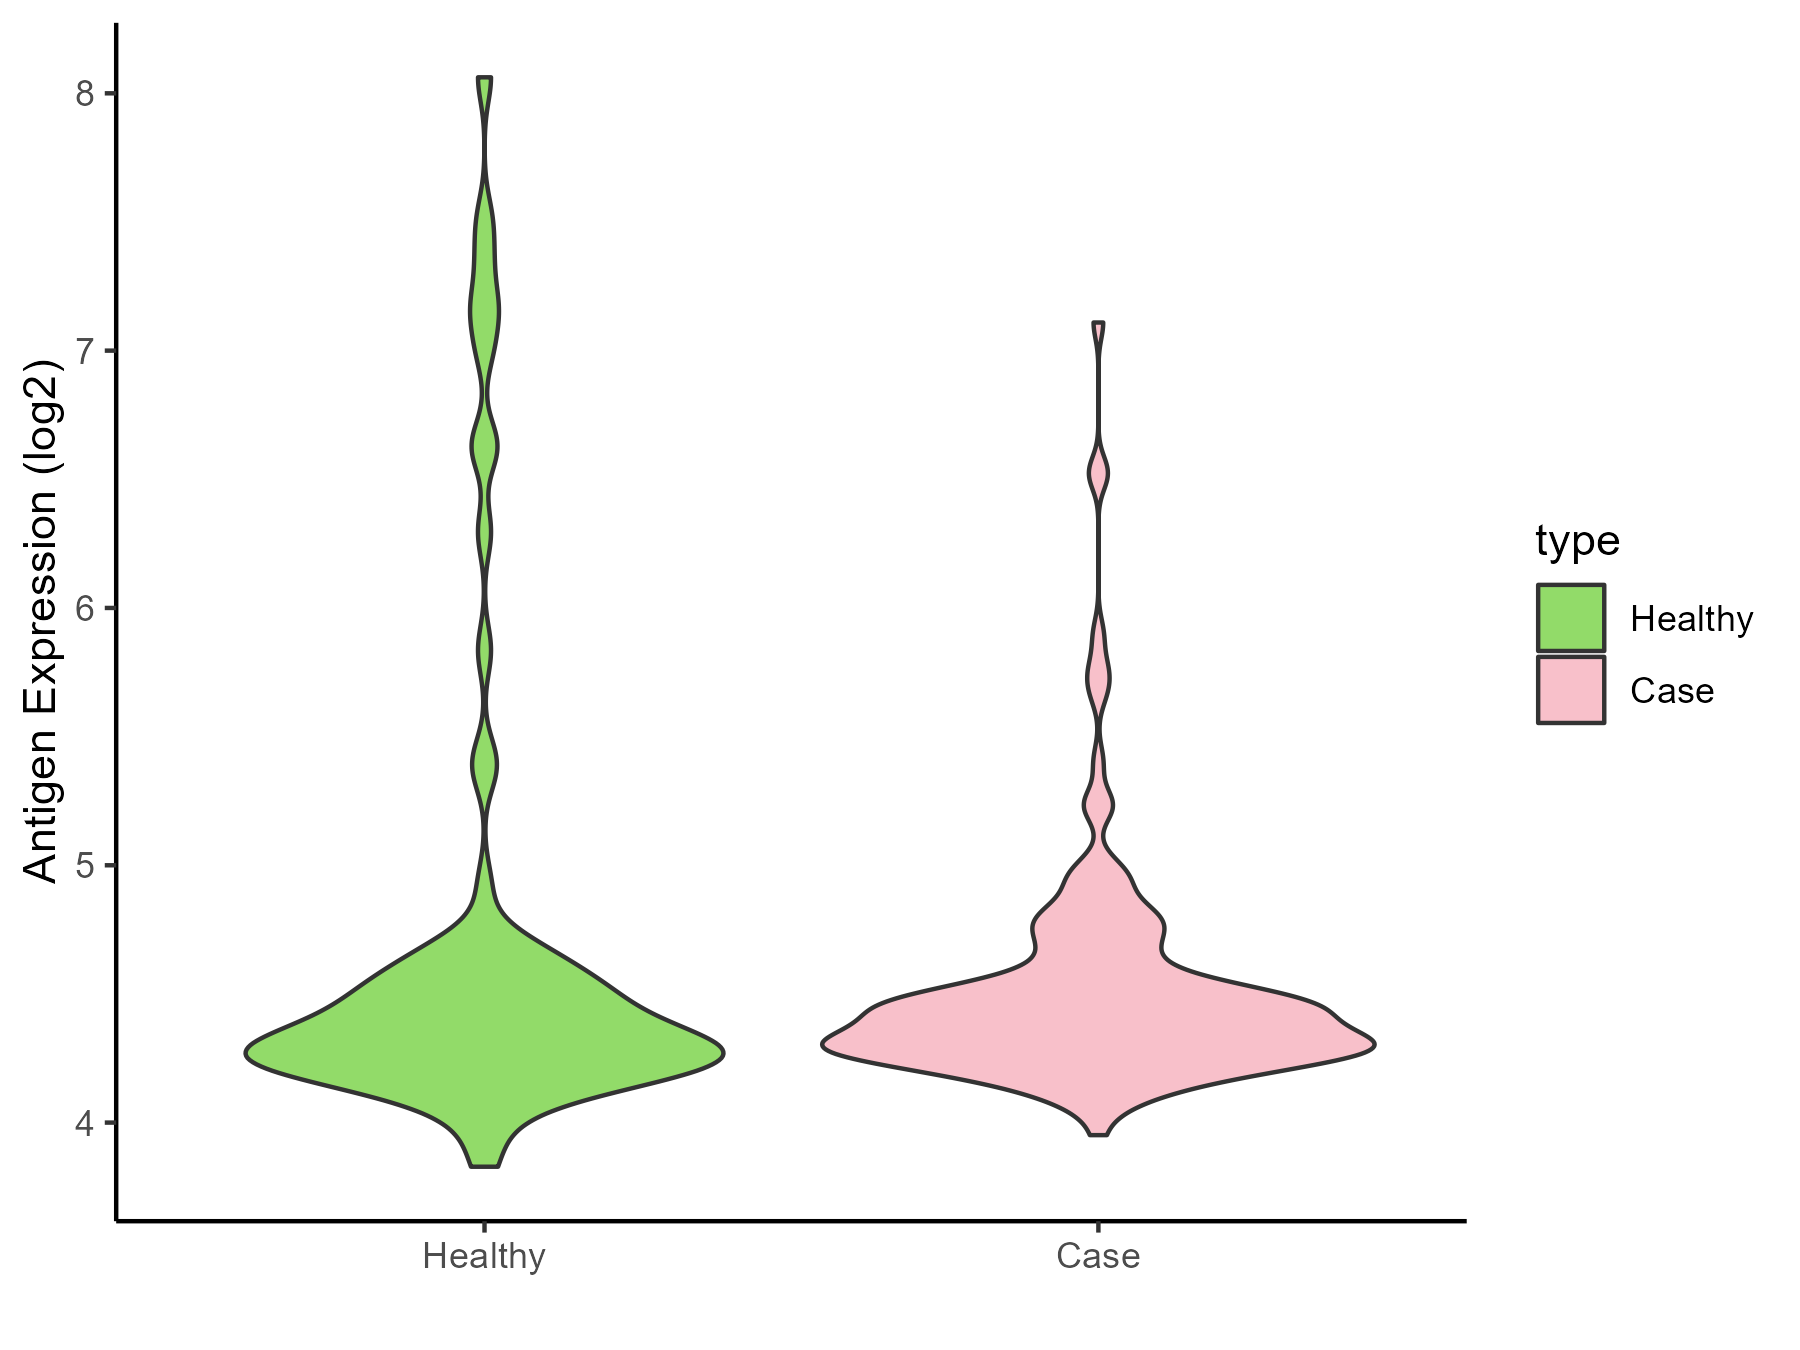
| Differential expression pattern of antigen in diseases | ||
| The Studied Tissue | Head and neck | |
| The Specific Disease | Head and neck cancer | |
| The Expression Level of Disease Section Compare with the Healthy Individual Tissue | p-value: 0.117560111; Fold-change: 0.057835292; Z-score: 0.064501781 | |
| Disease-specific Antigen Abundances |
|
Click to View the Clearer Original Diagram |
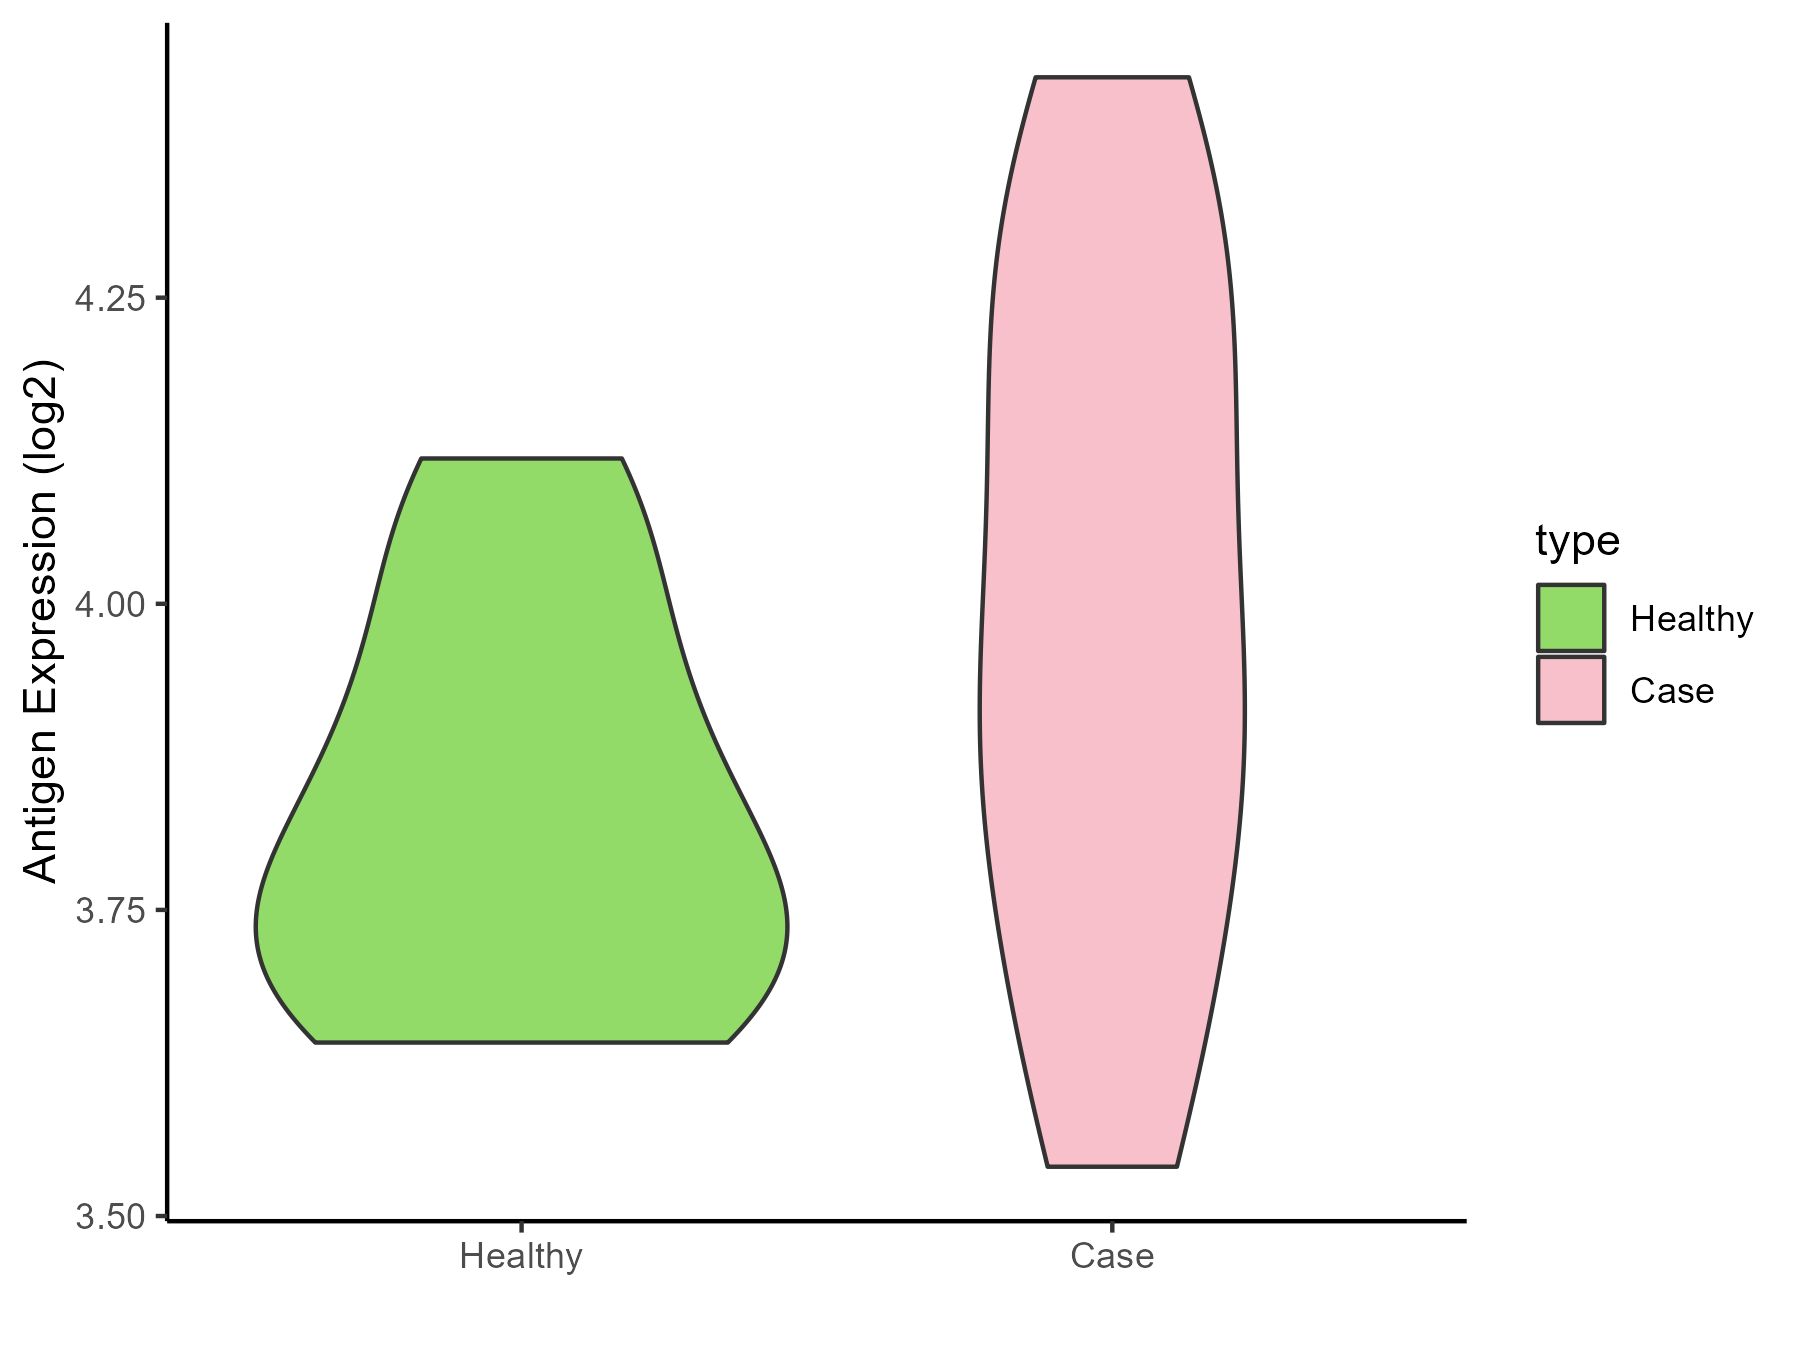
| Differential expression pattern of antigen in diseases | ||
| The Studied Tissue | Pituitary | |
| The Specific Disease | Pituitary gonadotrope tumor | |
| The Expression Level of Disease Section Compare with the Healthy Individual Tissue | p-value: 0.08713732; Fold-change: 0.174074757; Z-score: 1.04846669 | |
| Disease-specific Antigen Abundances |
|
Click to View the Clearer Original Diagram |
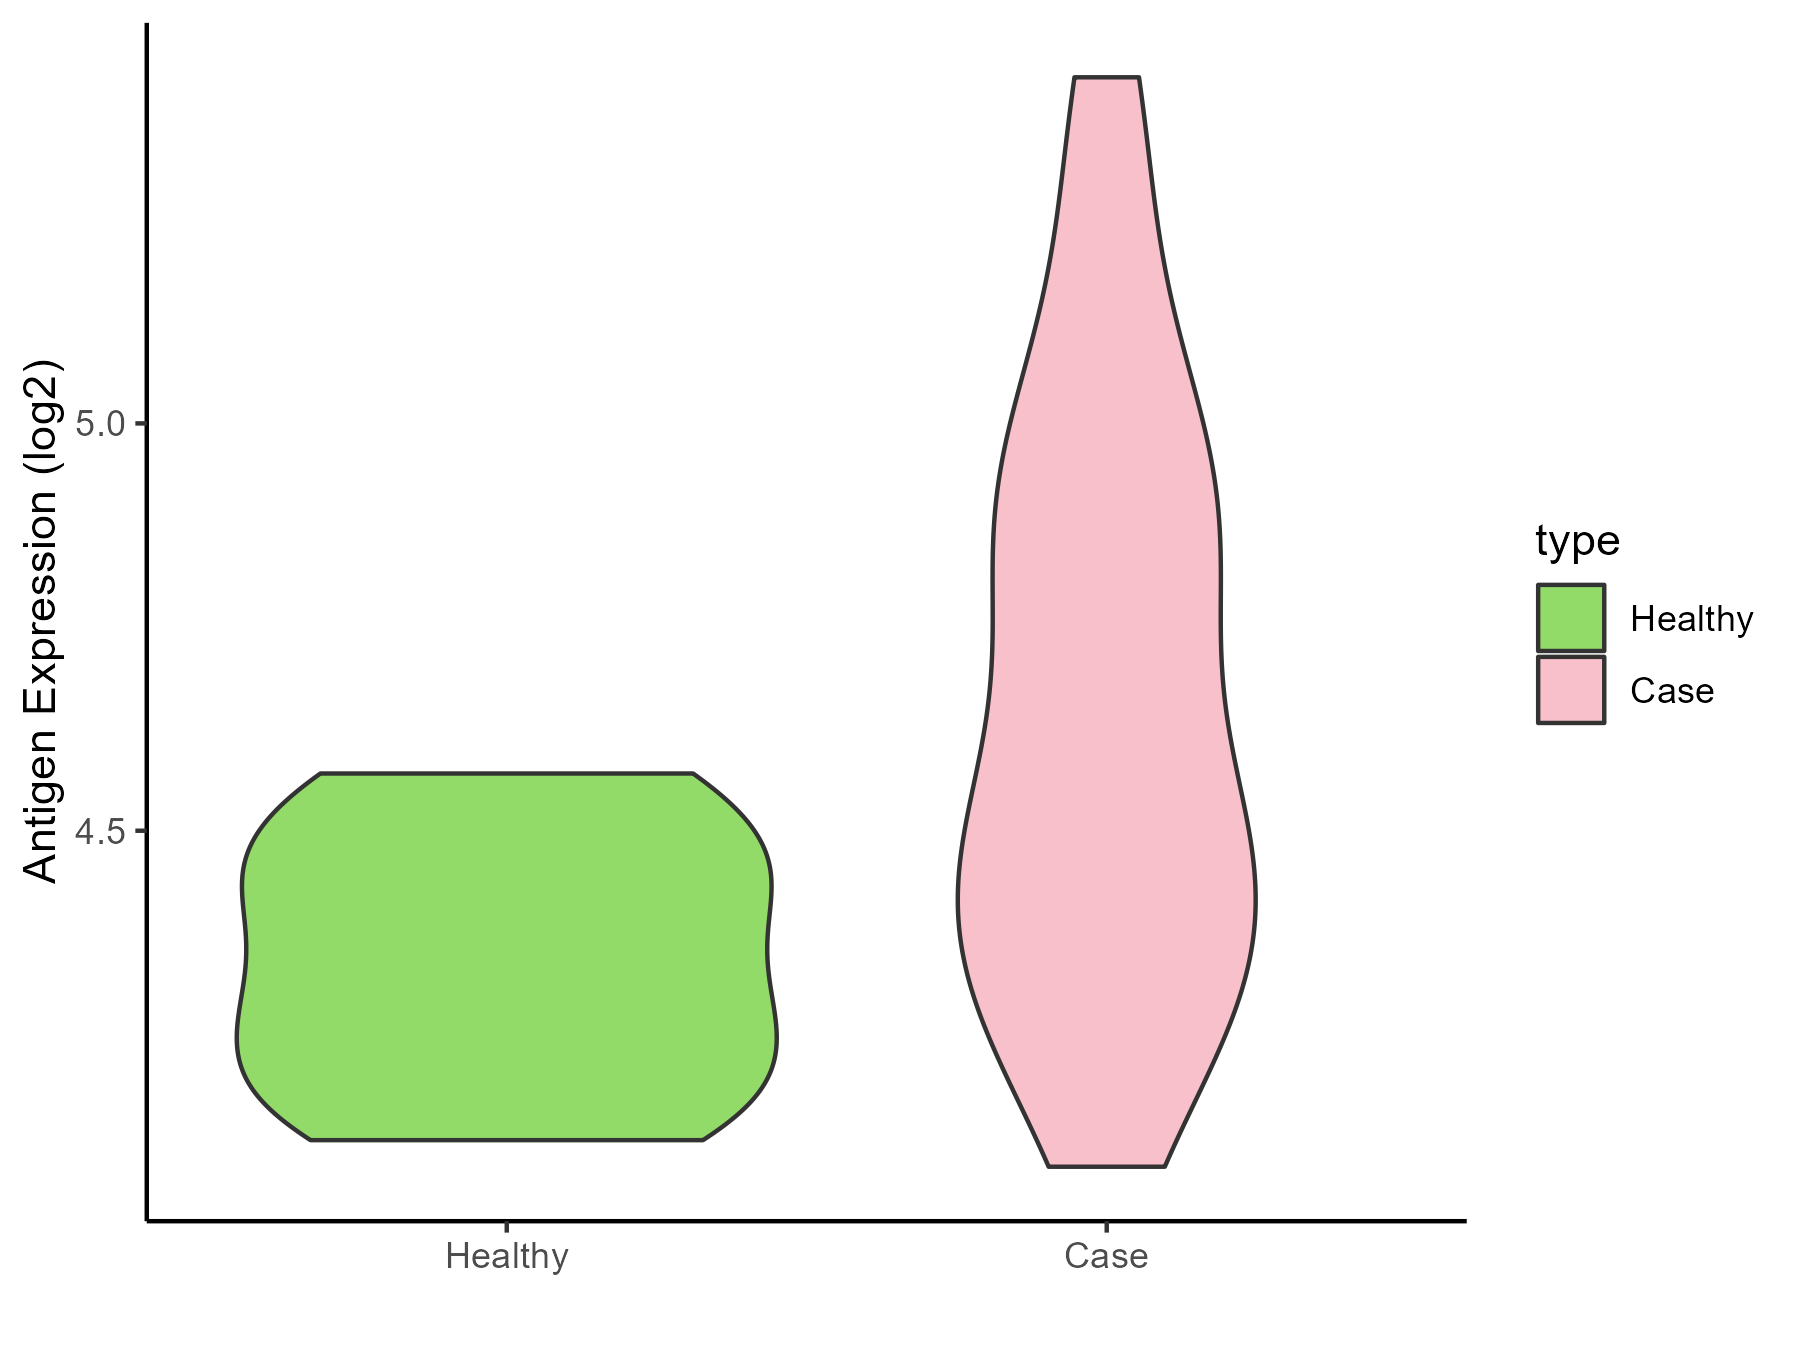
| The Studied Tissue | Pituitary | |
| The Specific Disease | Pituitary cancer | |
| The Expression Level of Disease Section Compare with the Healthy Individual Tissue | p-value: 0.000382027; Fold-change: 0.253658449; Z-score: 1.589521123 | |
| Disease-specific Antigen Abundances |
|
Click to View the Clearer Original Diagram |
ICD Disease Classification 03
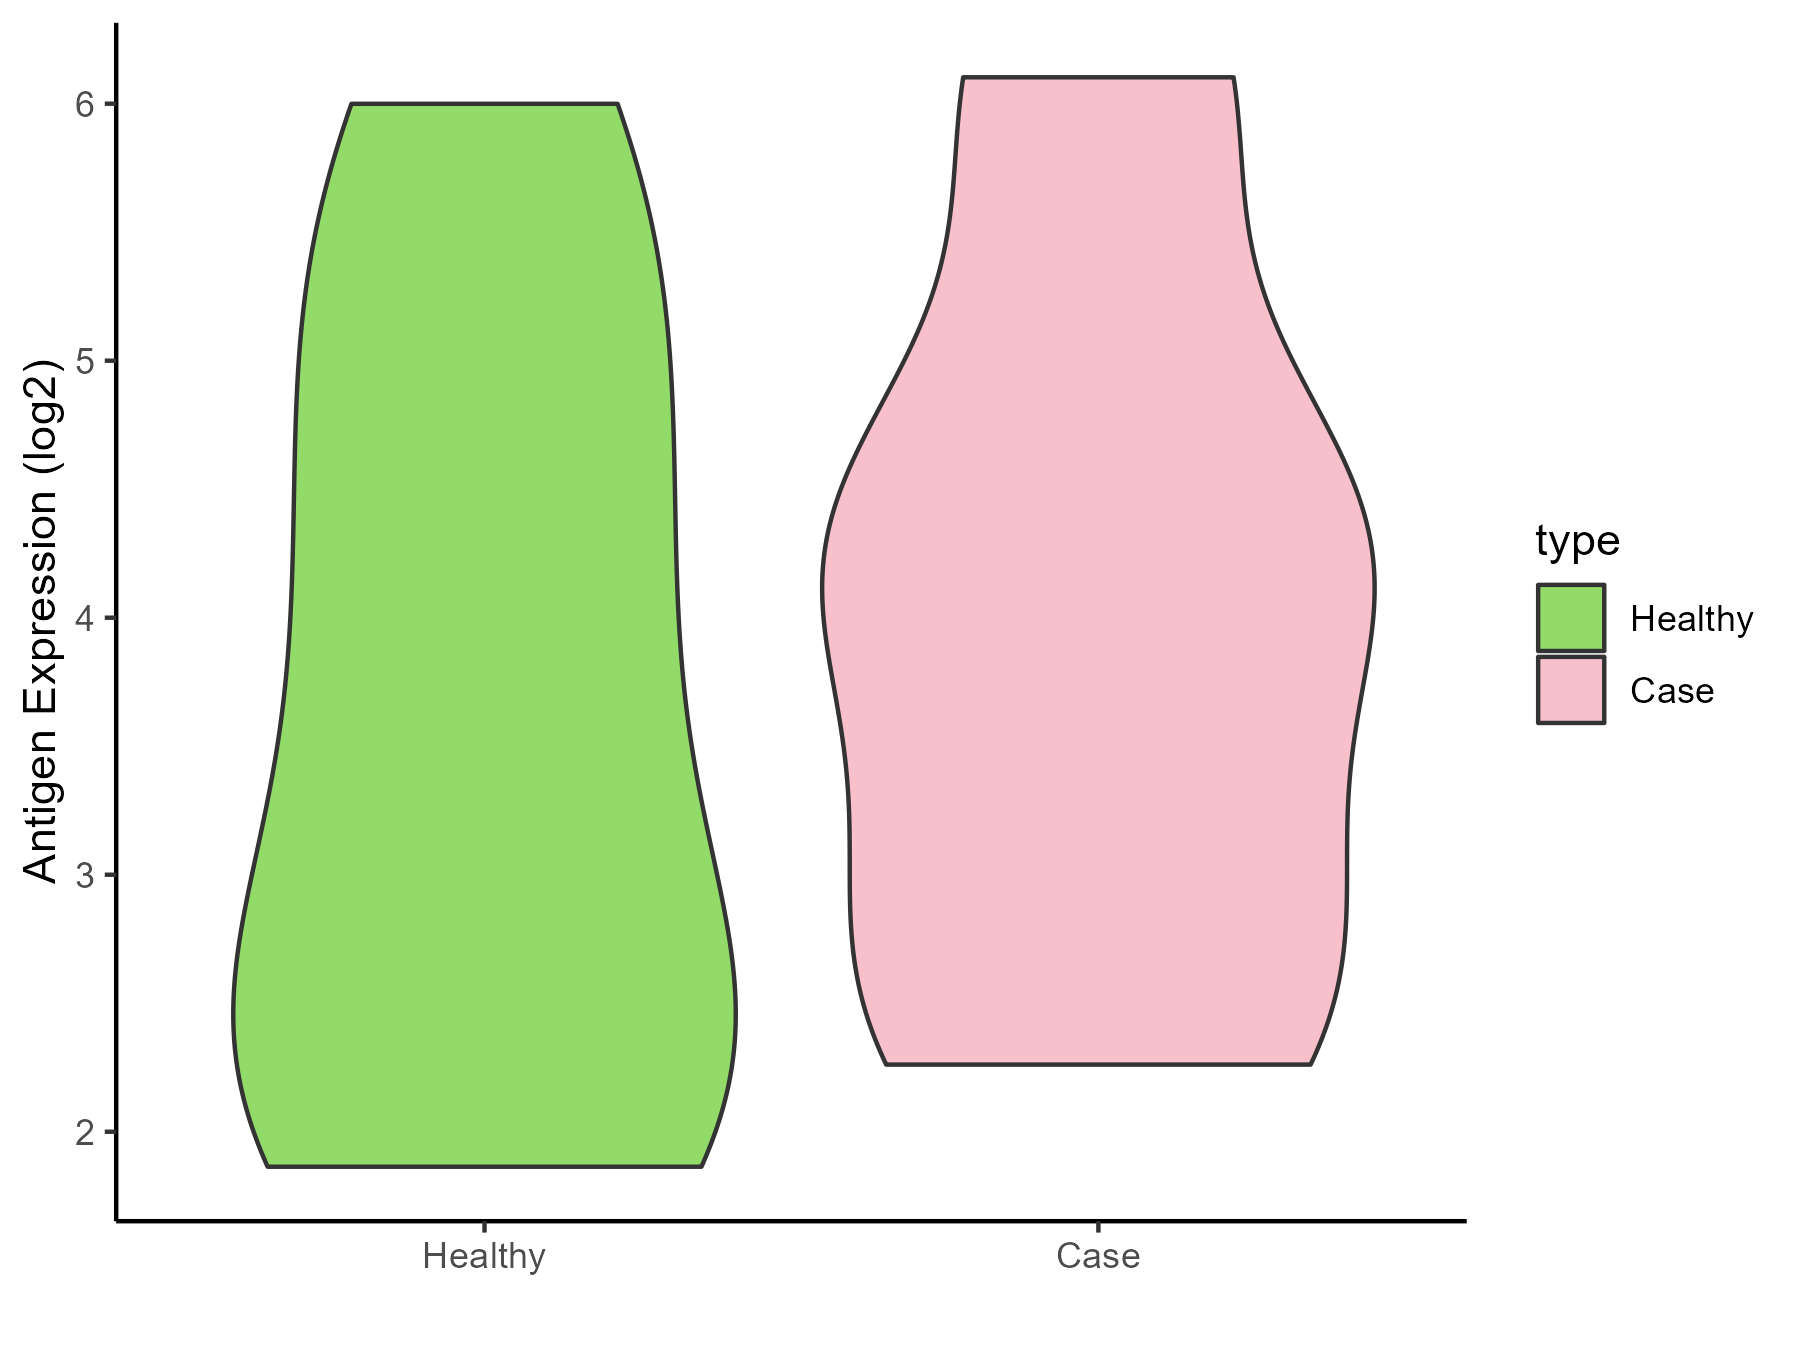
| Differential expression pattern of antigen in diseases | ||
| The Studied Tissue | Whole blood | |
| The Specific Disease | Thrombocytopenia | |
| The Expression Level of Disease Section Compare with the Healthy Individual Tissue | p-value: 0.69048606; Fold-change: 0.675894133; Z-score: 0.44493011 | |
| Disease-specific Antigen Abundances |
|
Click to View the Clearer Original Diagram |
ICD Disease Classification 04
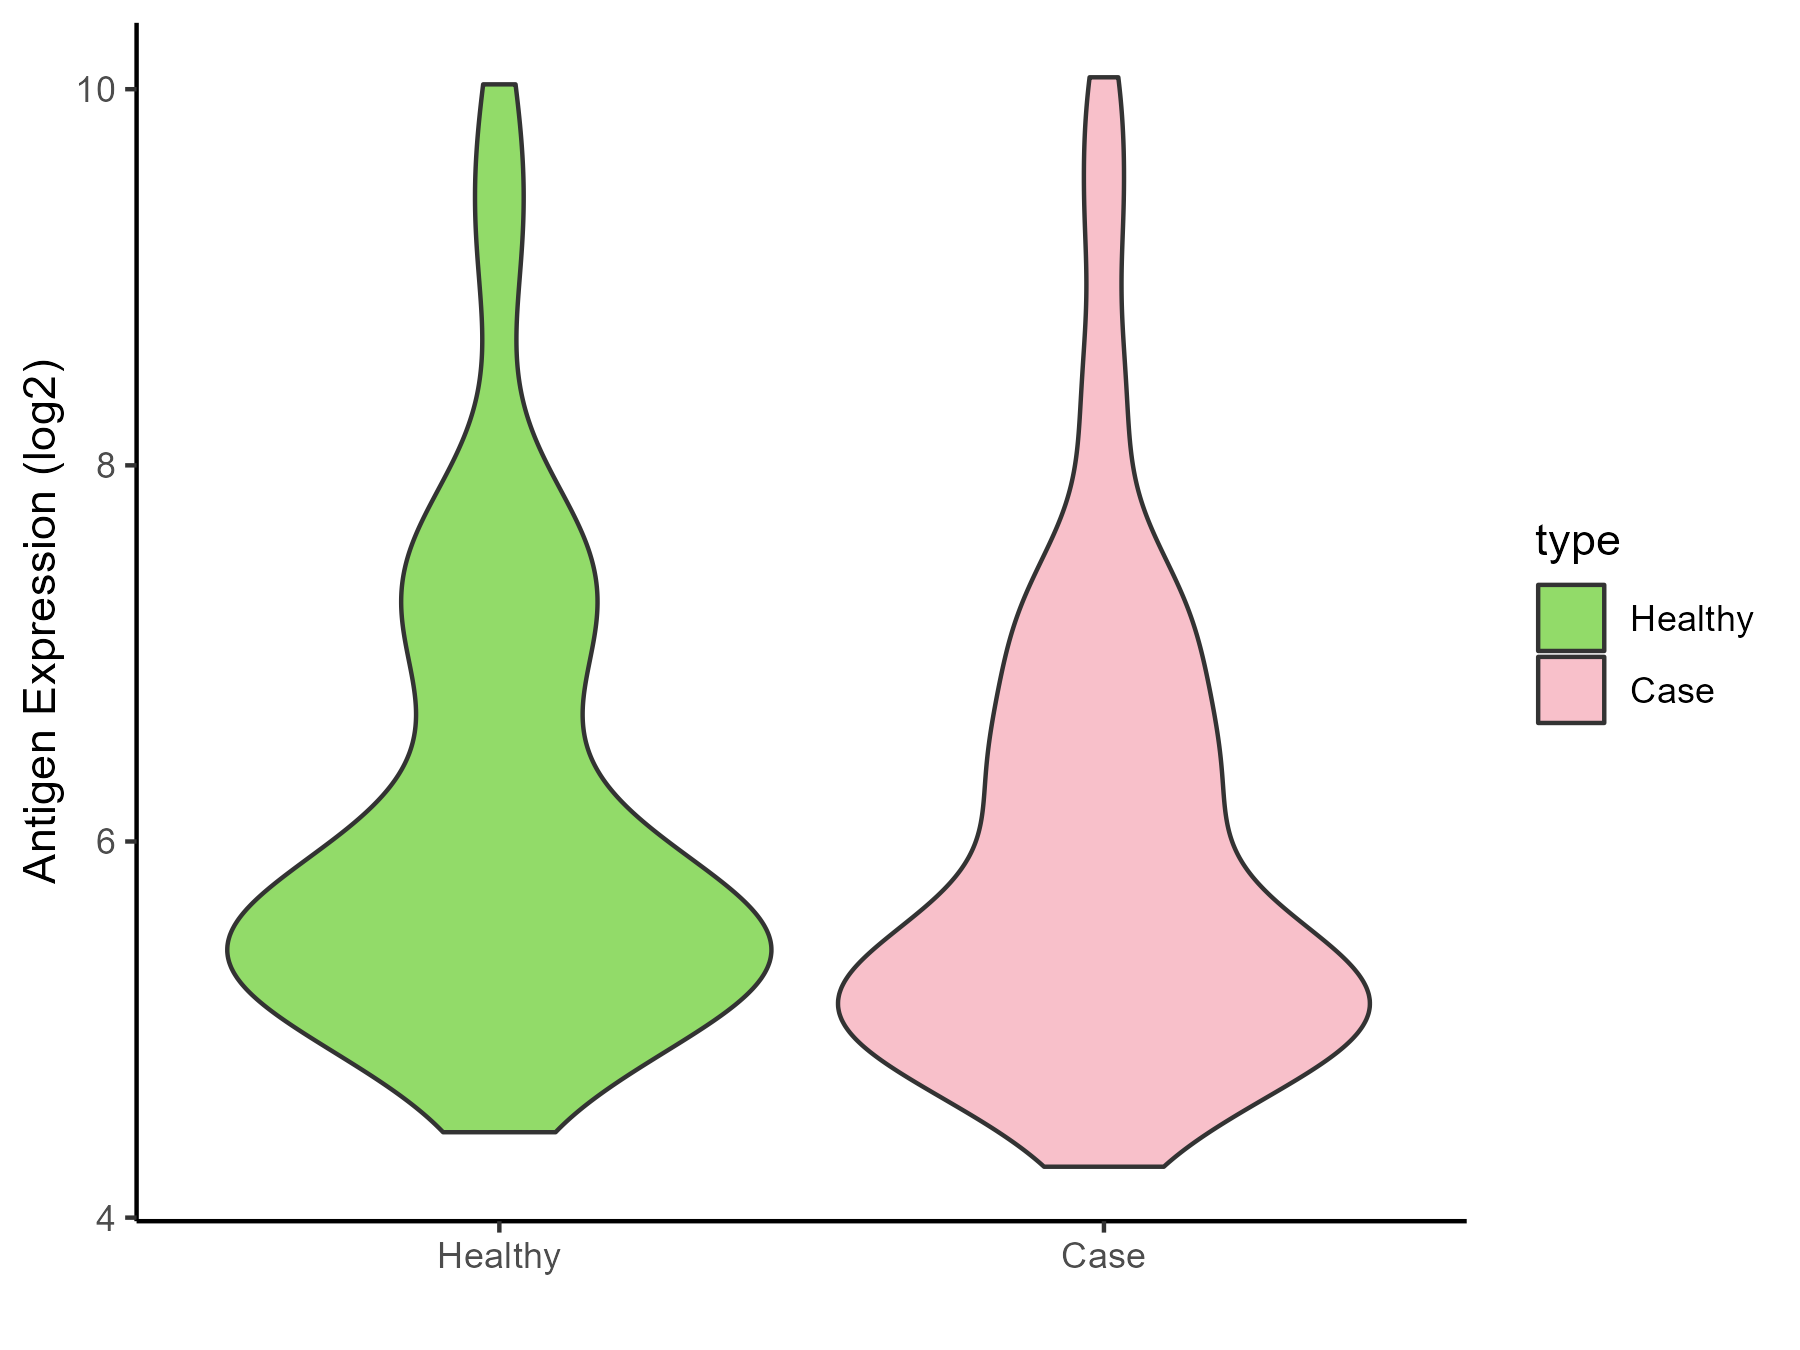
| Differential expression pattern of antigen in diseases | ||
| The Studied Tissue | Whole blood | |
| The Specific Disease | Lupus erythematosus | |
| The Expression Level of Disease Section Compare with the Healthy Individual Tissue | p-value: 0.152285462; Fold-change: -0.092424955; Z-score: -0.074202707 | |
| Disease-specific Antigen Abundances |
|
Click to View the Clearer Original Diagram |
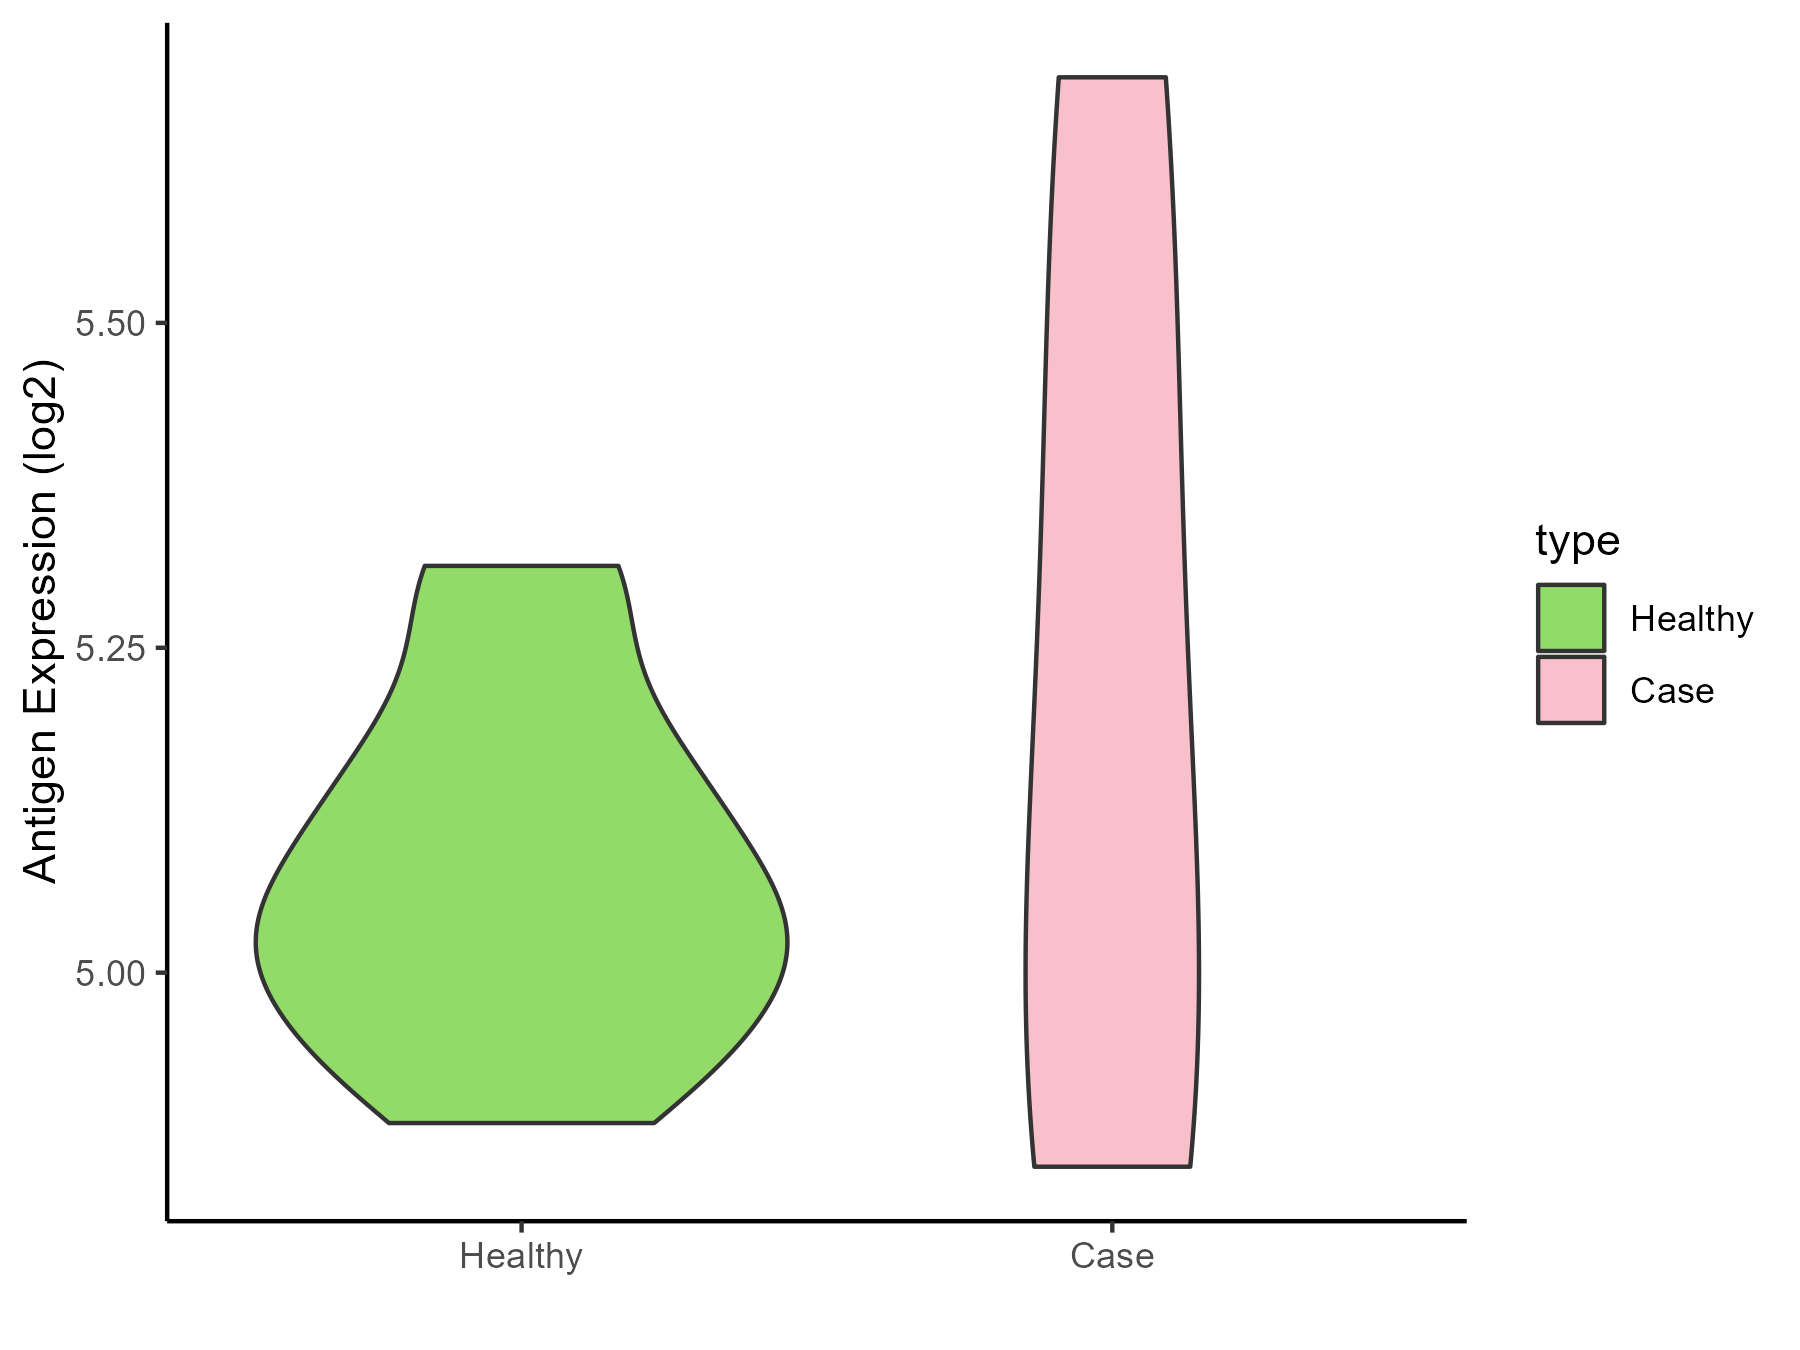
| Differential expression pattern of antigen in diseases | ||
| The Studied Tissue | Peripheral monocyte | |
| The Specific Disease | Autoimmune uveitis | |
| The Expression Level of Disease Section Compare with the Healthy Individual Tissue | p-value: 0.519425825; Fold-change: 0.115577372; Z-score: 0.86827976 | |
| Disease-specific Antigen Abundances |
|
Click to View the Clearer Original Diagram |
ICD Disease Classification 05
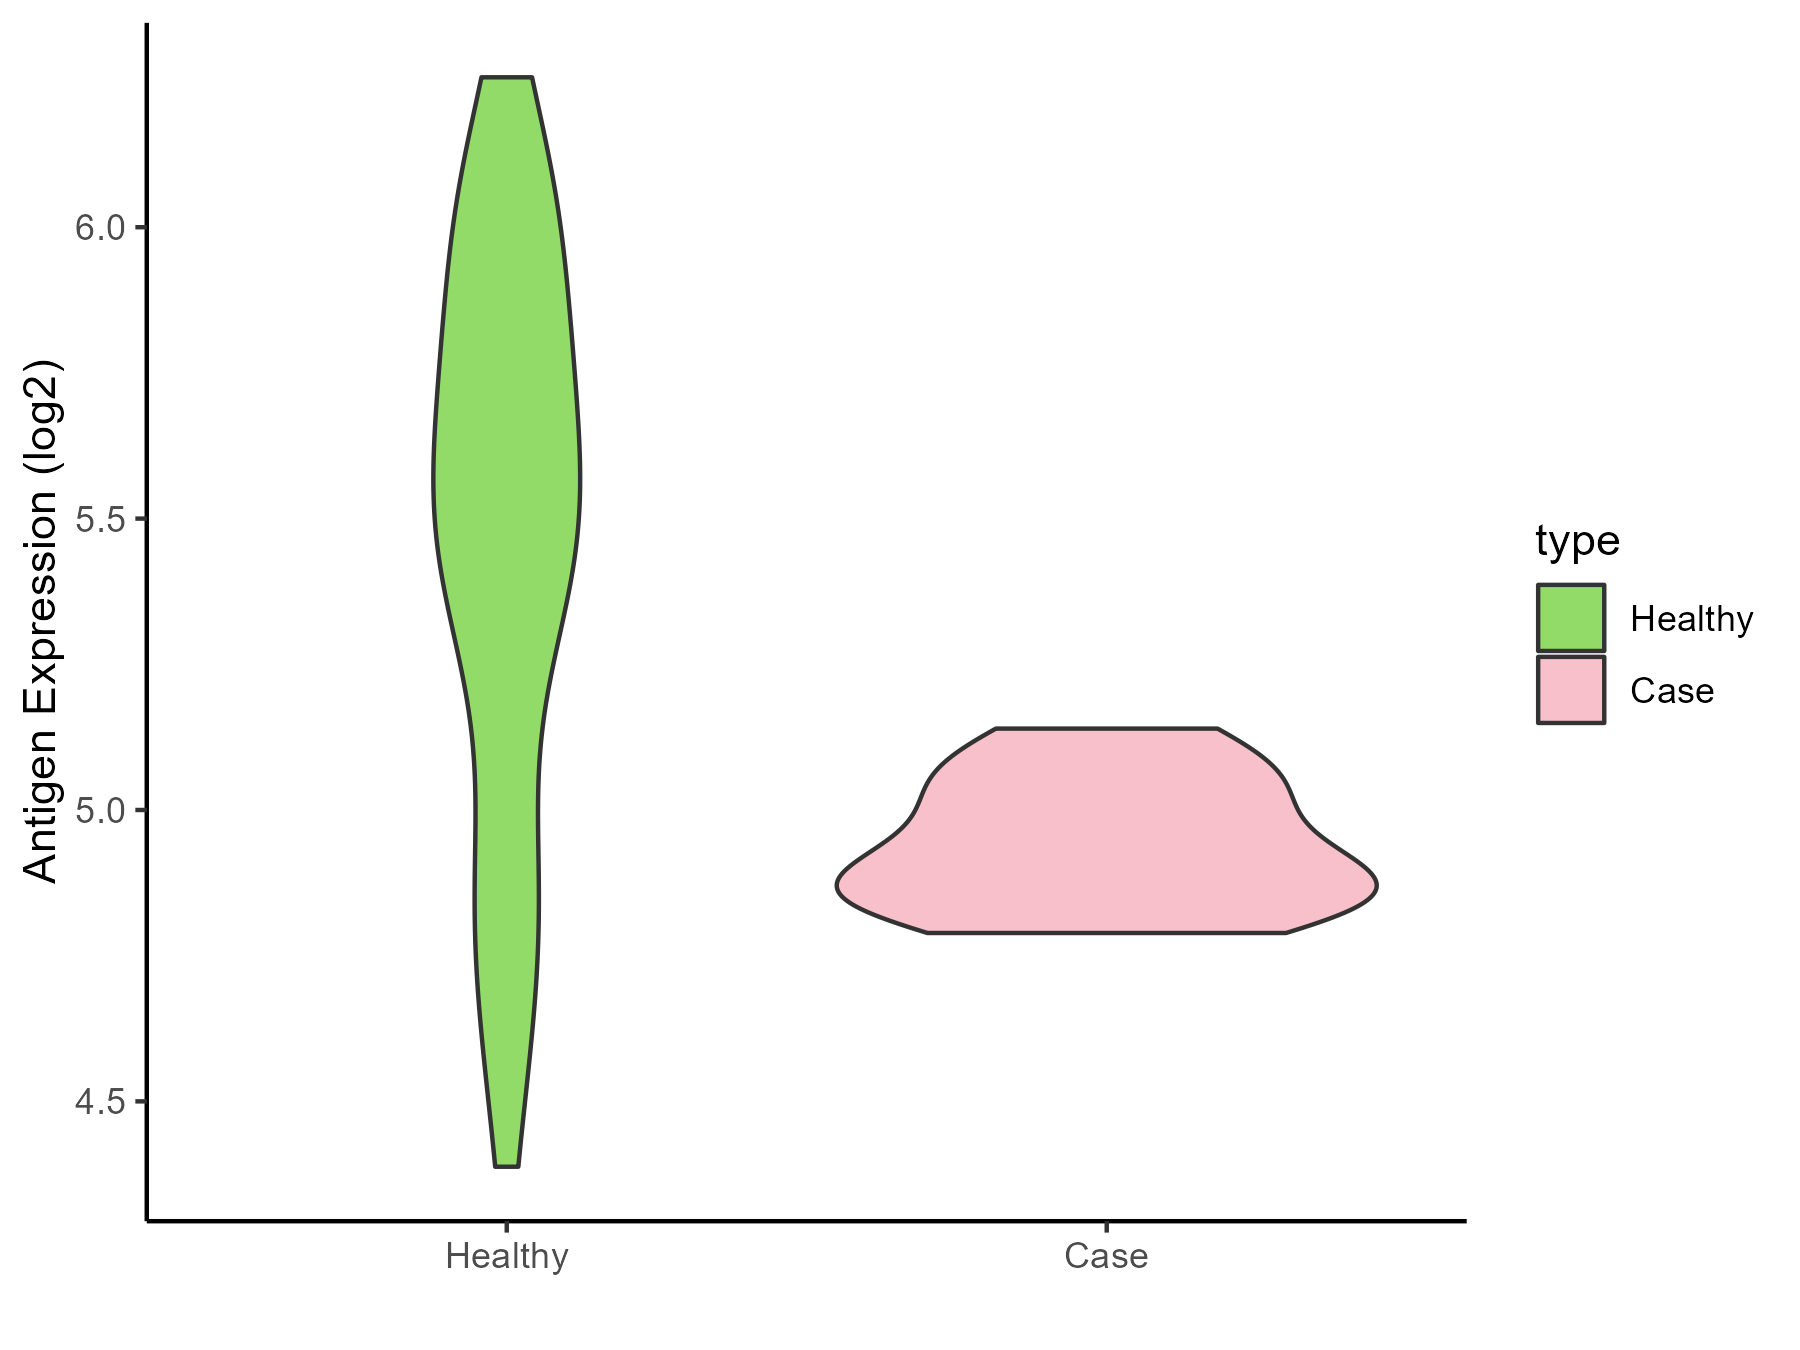
| Differential expression pattern of antigen in diseases | ||
| The Studied Tissue | Whole blood | |
| The Specific Disease | Familial hypercholesterolemia | |
| The Expression Level of Disease Section Compare with the Healthy Individual Tissue | p-value: 3.02E-09; Fold-change: -0.620049282; Z-score: -1.297382947 | |
| Disease-specific Antigen Abundances |
|
Click to View the Clearer Original Diagram |
ICD Disease Classification 06
| Differential expression pattern of antigen in diseases | ||
| The Studied Tissue | Superior temporal cortex | |
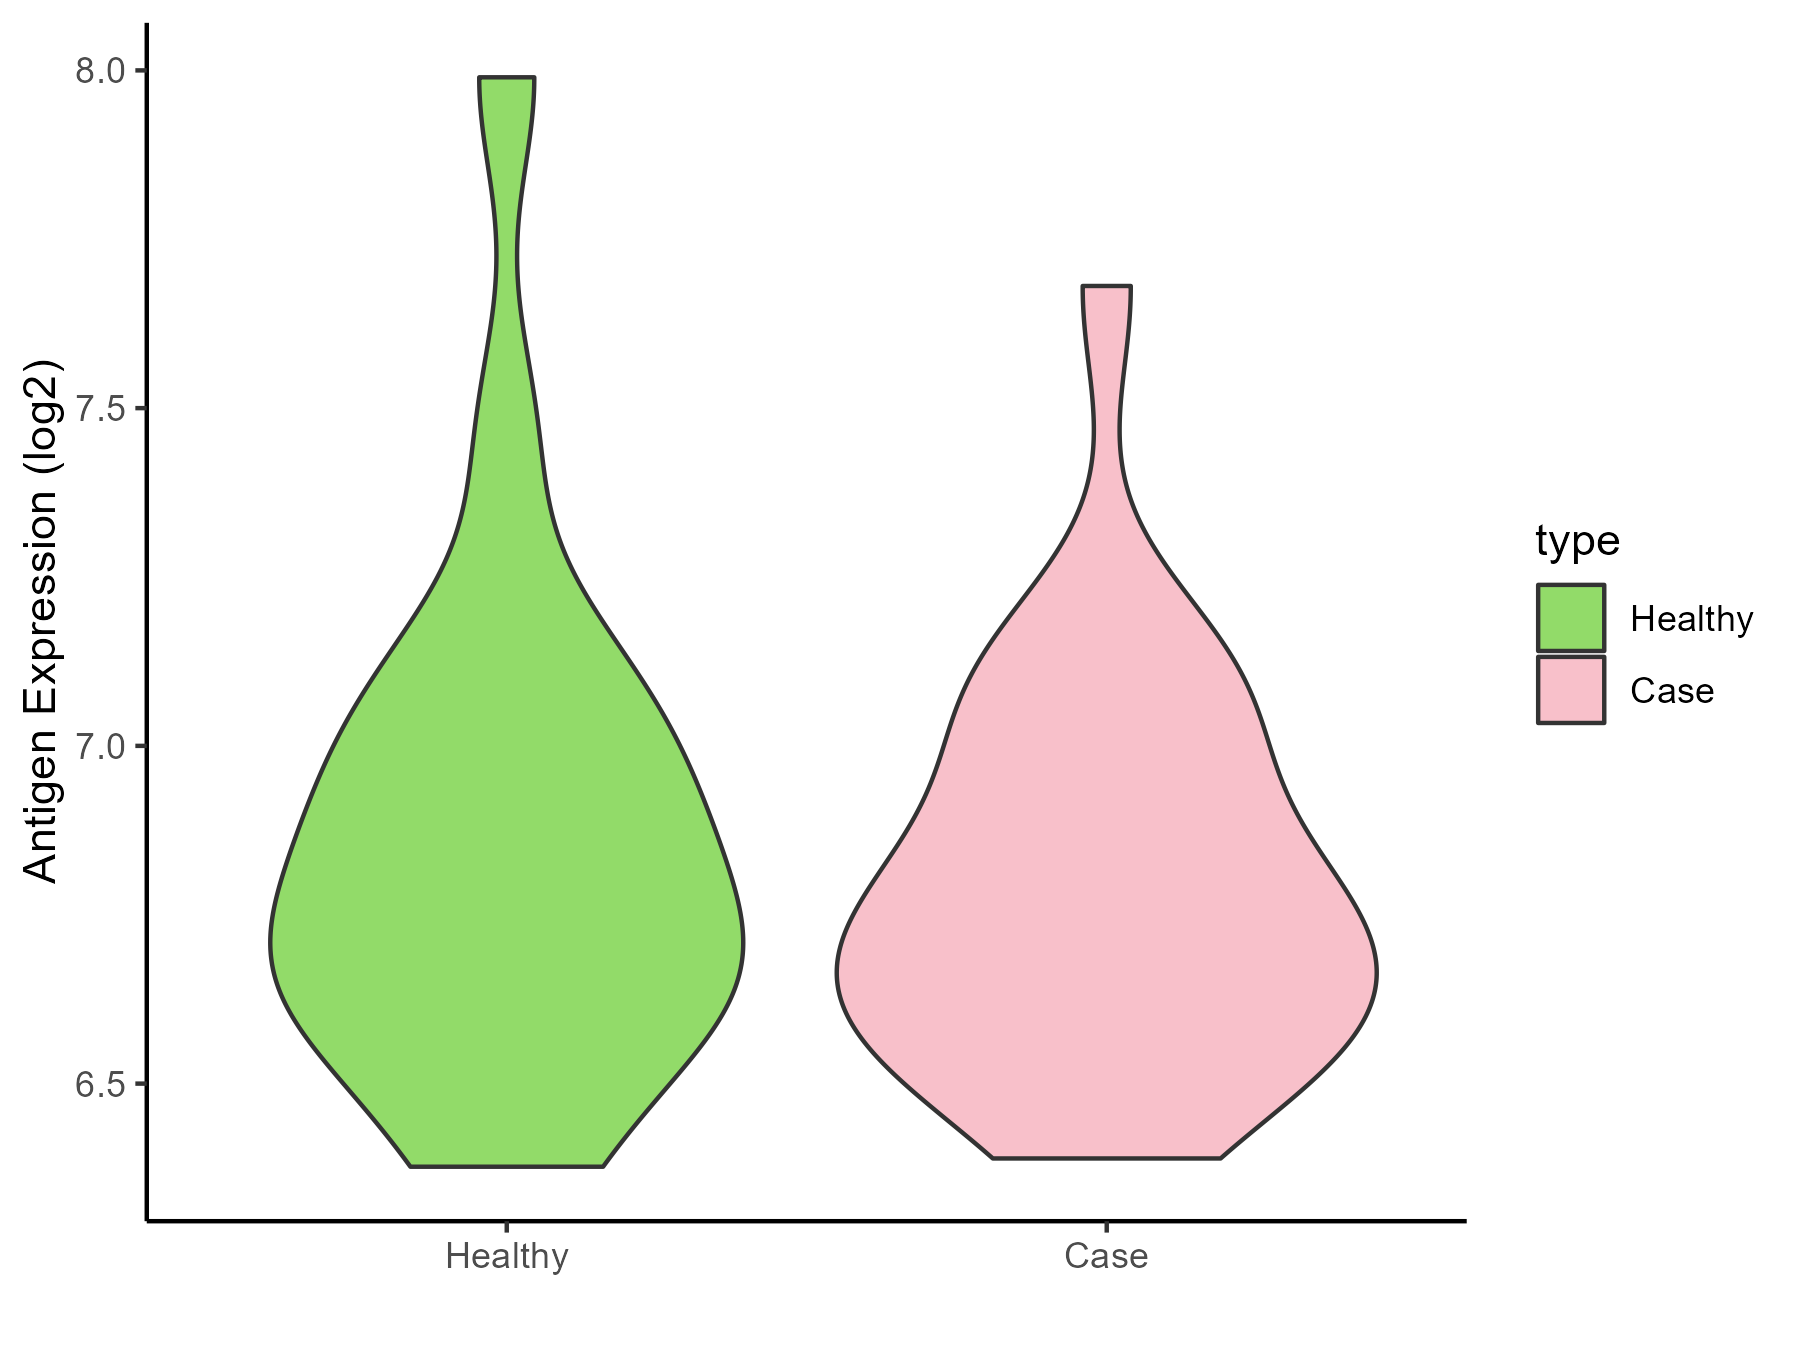
| The Specific Disease | Schizophrenia | |
| The Expression Level of Disease Section Compare with the Healthy Individual Tissue | p-value: 0.557805406; Fold-change: -0.016194209; Z-score: -0.042198067 | |
| Disease-specific Antigen Abundances |
|
Click to View the Clearer Original Diagram |
ICD Disease Classification 08
| Differential expression pattern of antigen in diseases | ||
| The Studied Tissue | Spinal cord | |
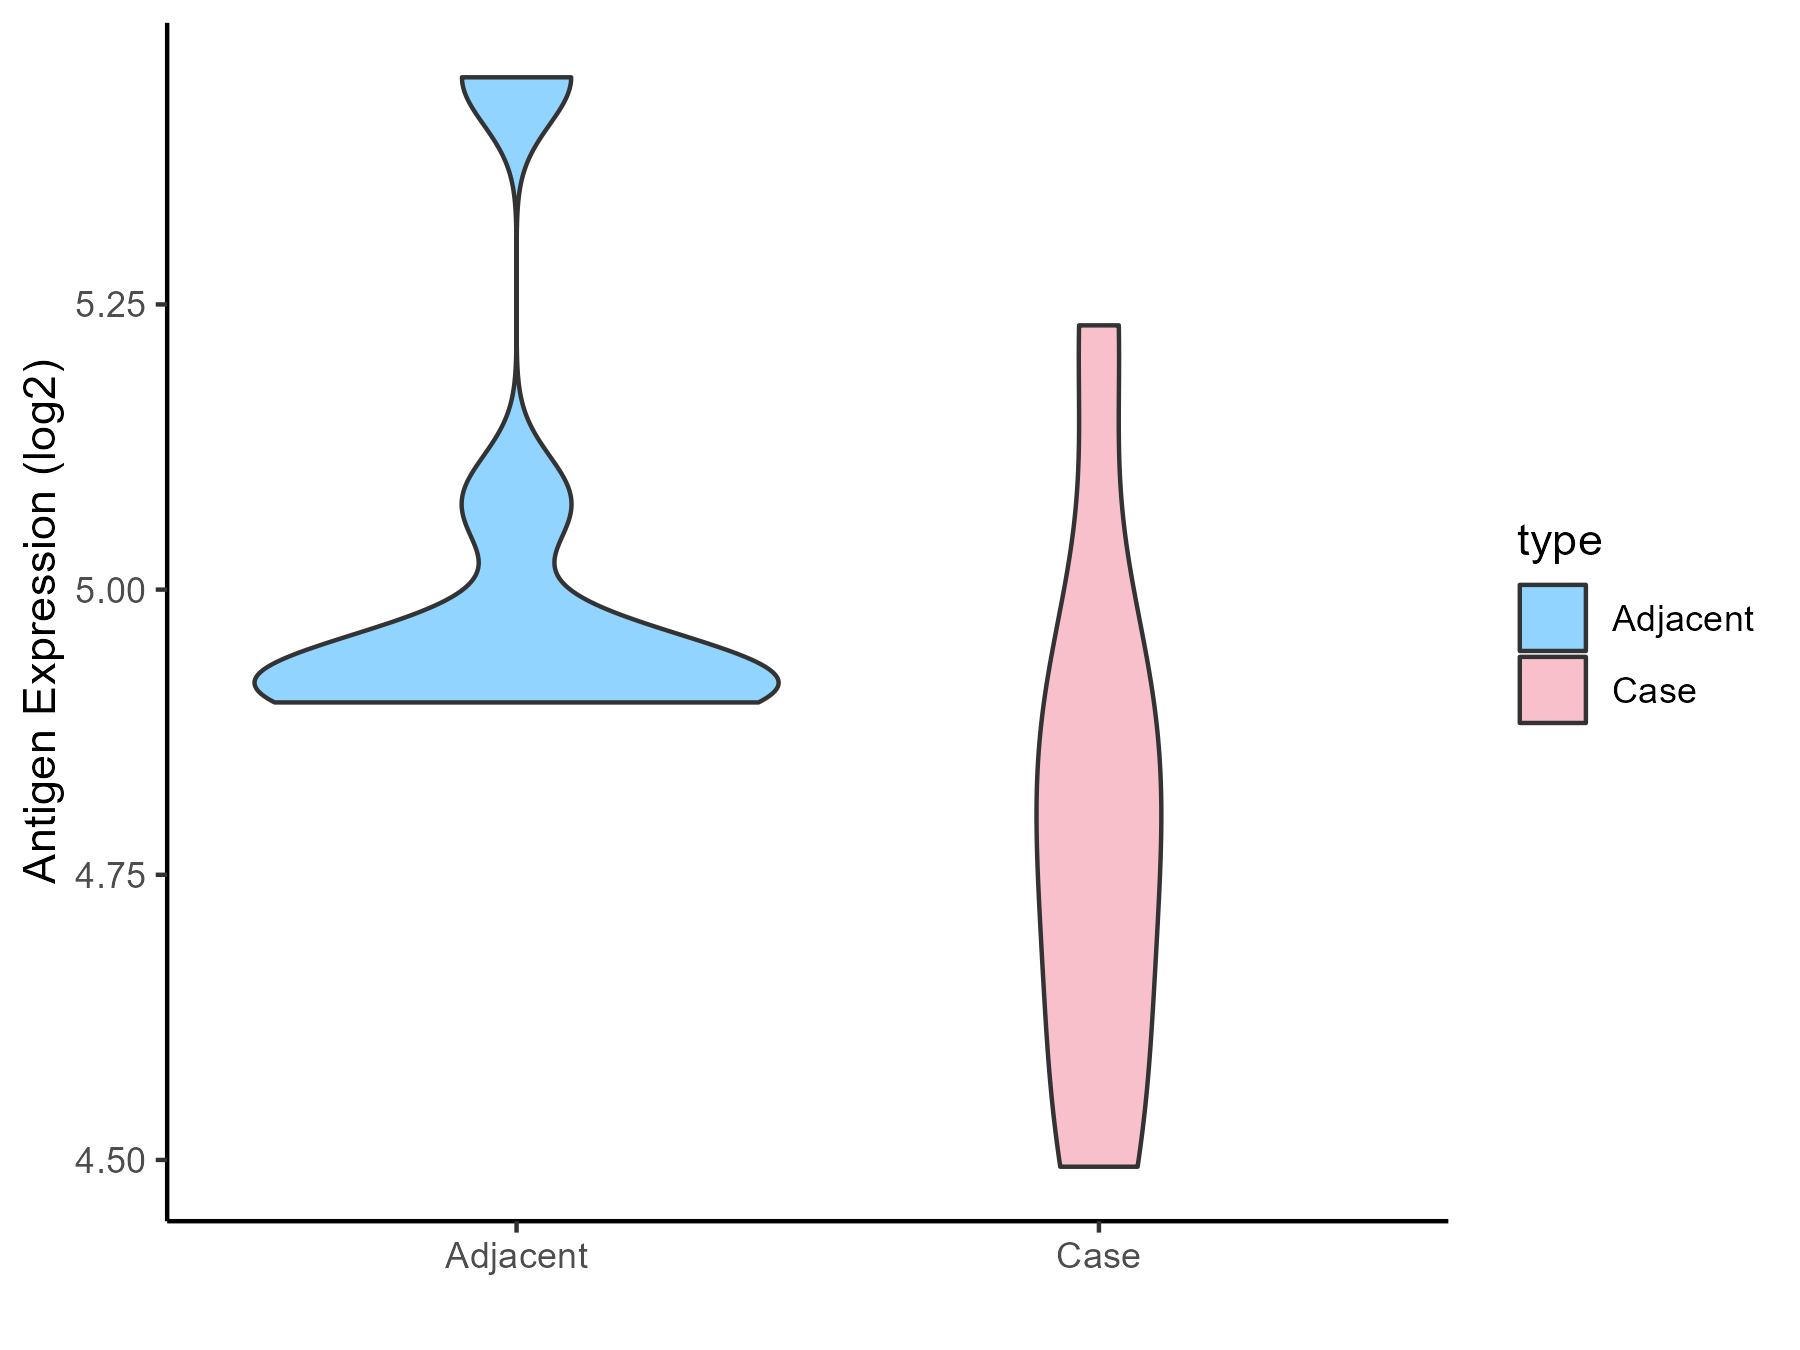
| The Specific Disease | Multiple sclerosis | |
| The Expression Level of Disease Section Compare with the Adjacent Tissue | p-value: 0.096368559; Fold-change: -0.148873039; Z-score: -0.744976572 | |
| Disease-specific Antigen Abundances |
|
Click to View the Clearer Original Diagram |
| The Studied Tissue | Plasmacytoid dendritic cells | |
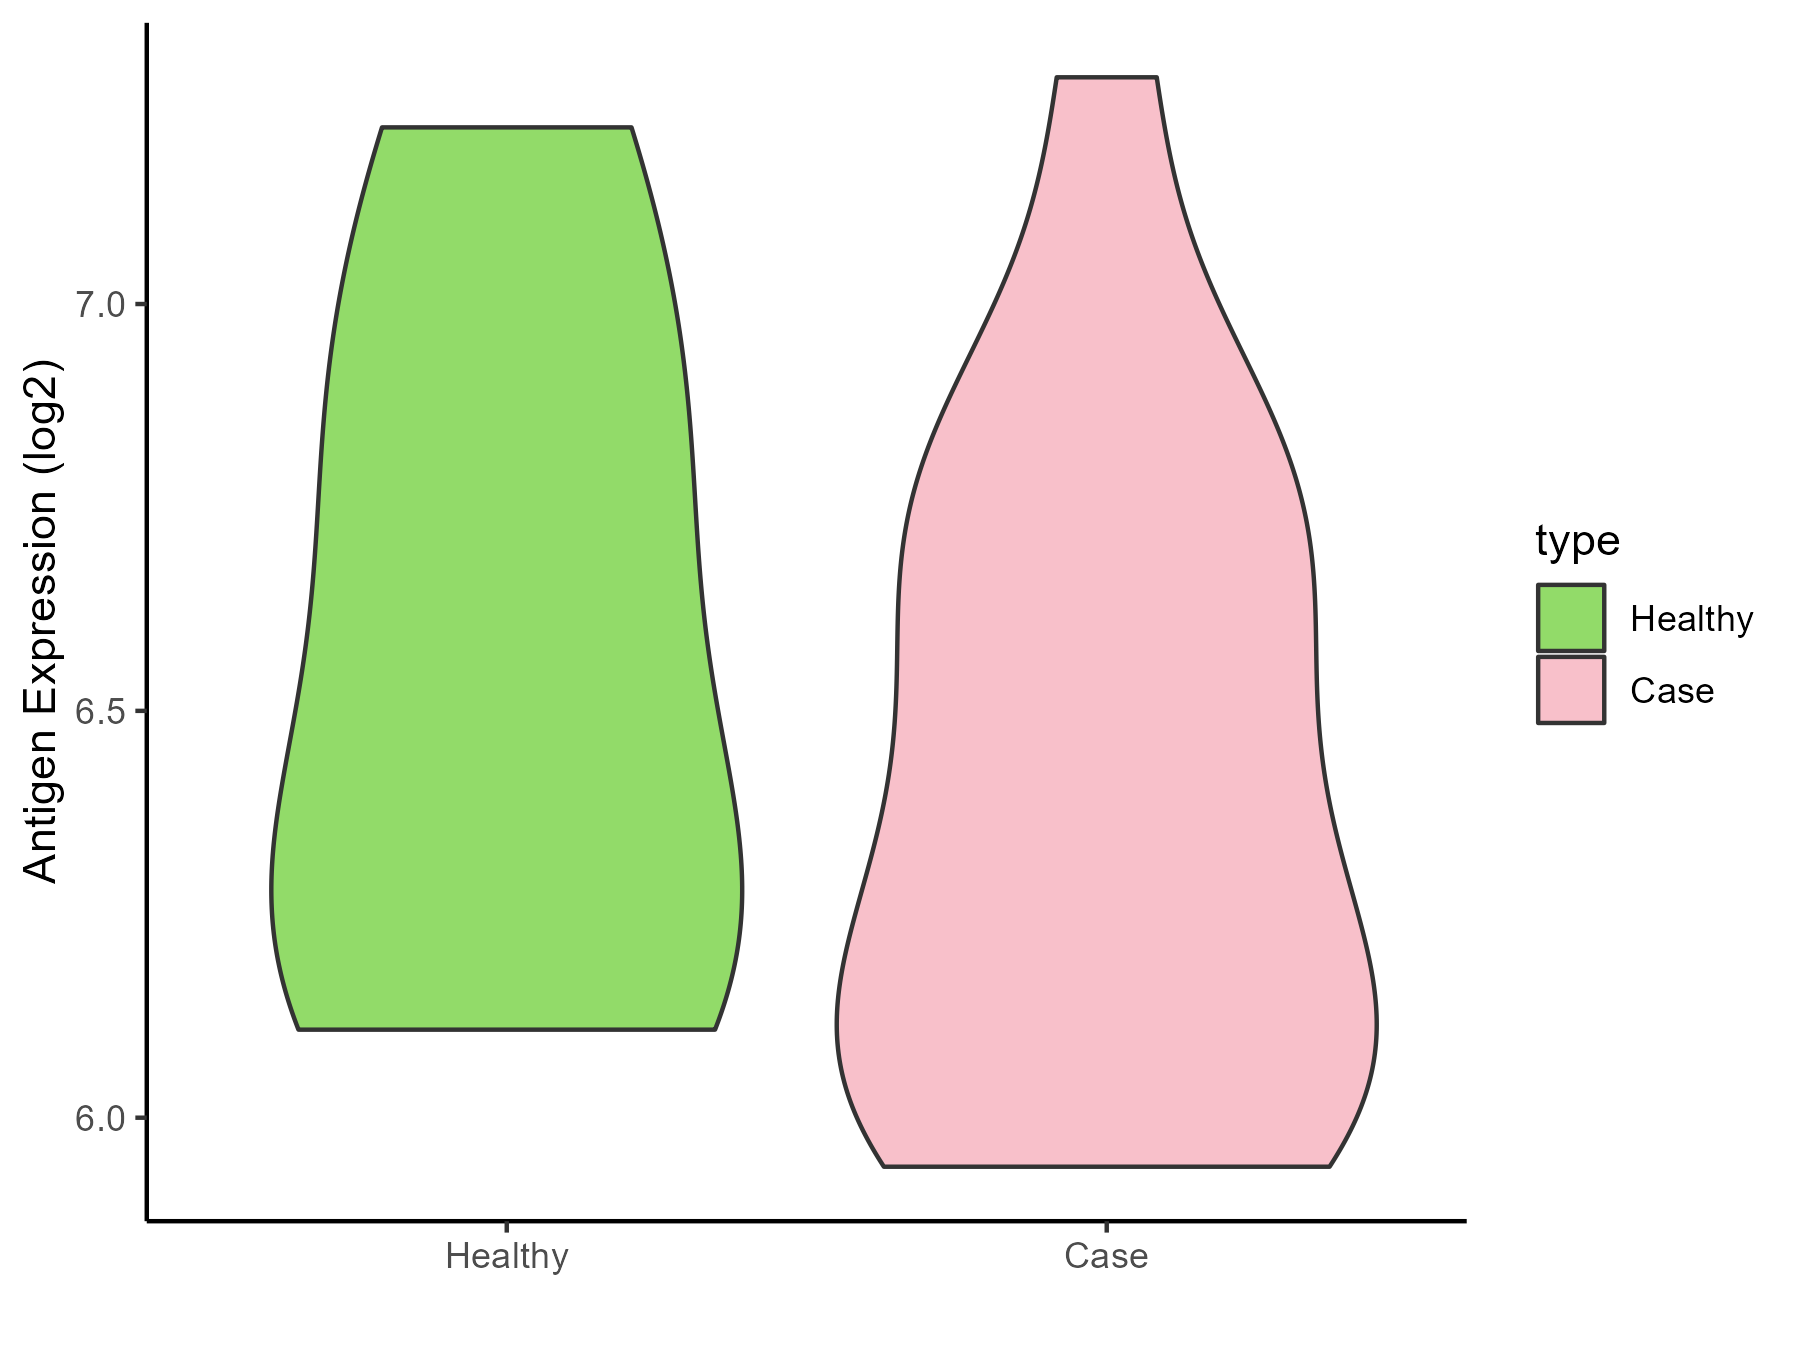
| The Specific Disease | Multiple sclerosis | |
| The Expression Level of Disease Section Compare with the Healthy Individual Tissue | p-value: 0.454123466; Fold-change: -0.187611254; Z-score: -0.429690137 | |
| Disease-specific Antigen Abundances |
|
Click to View the Clearer Original Diagram |
| Differential expression pattern of antigen in diseases | ||
| The Studied Tissue | Peritumoral cortex | |
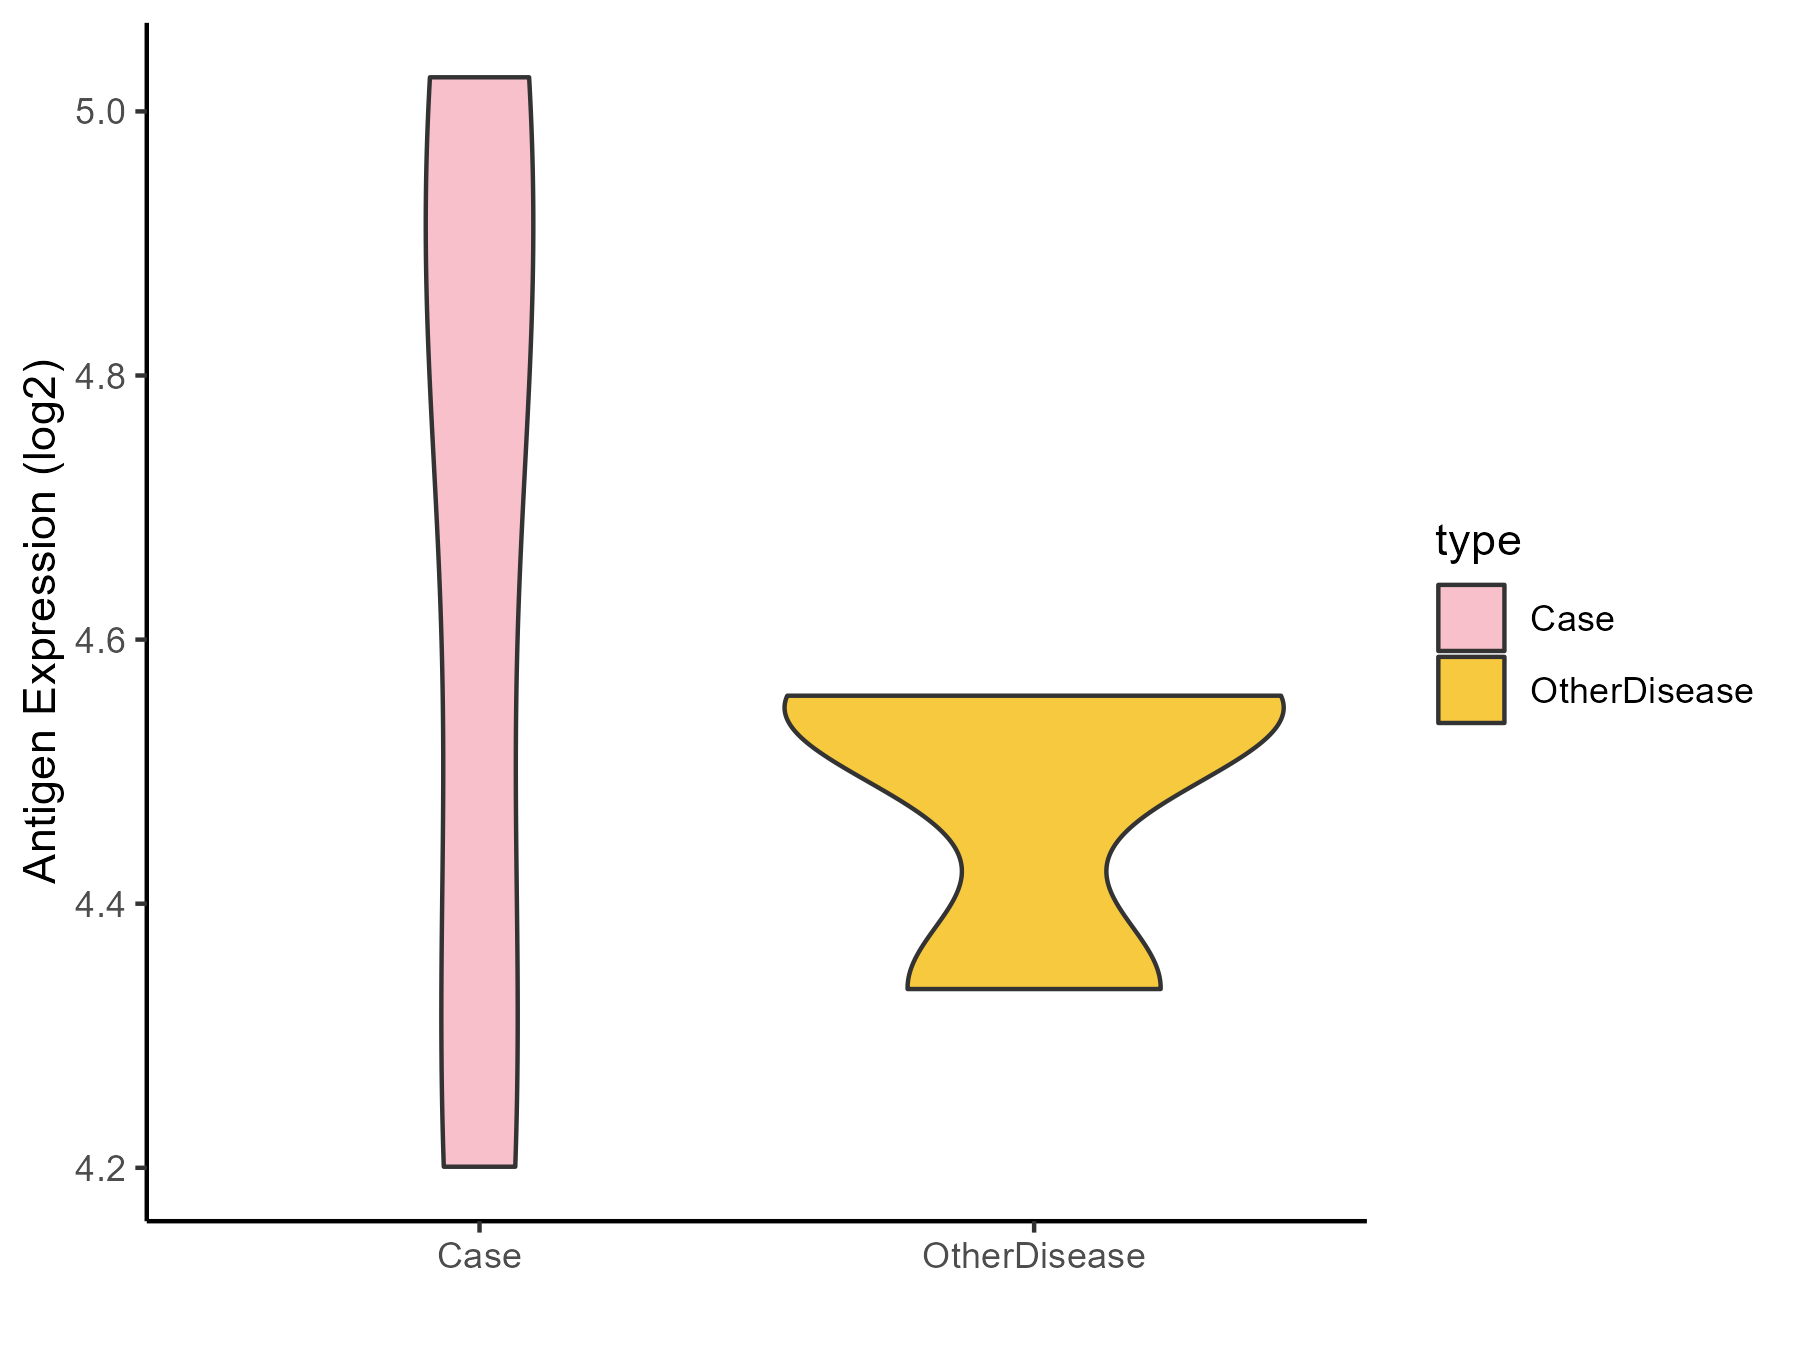
| The Specific Disease | Epilepsy | |
| The Expression Level of Disease Section Compare with the Other Disease Section | p-value: 0.351993043; Fold-change: 0.286822239; Z-score: 2.322835104 | |
| Disease-specific Antigen Abundances |
|
Click to View the Clearer Original Diagram |
| Differential expression pattern of antigen in diseases | ||
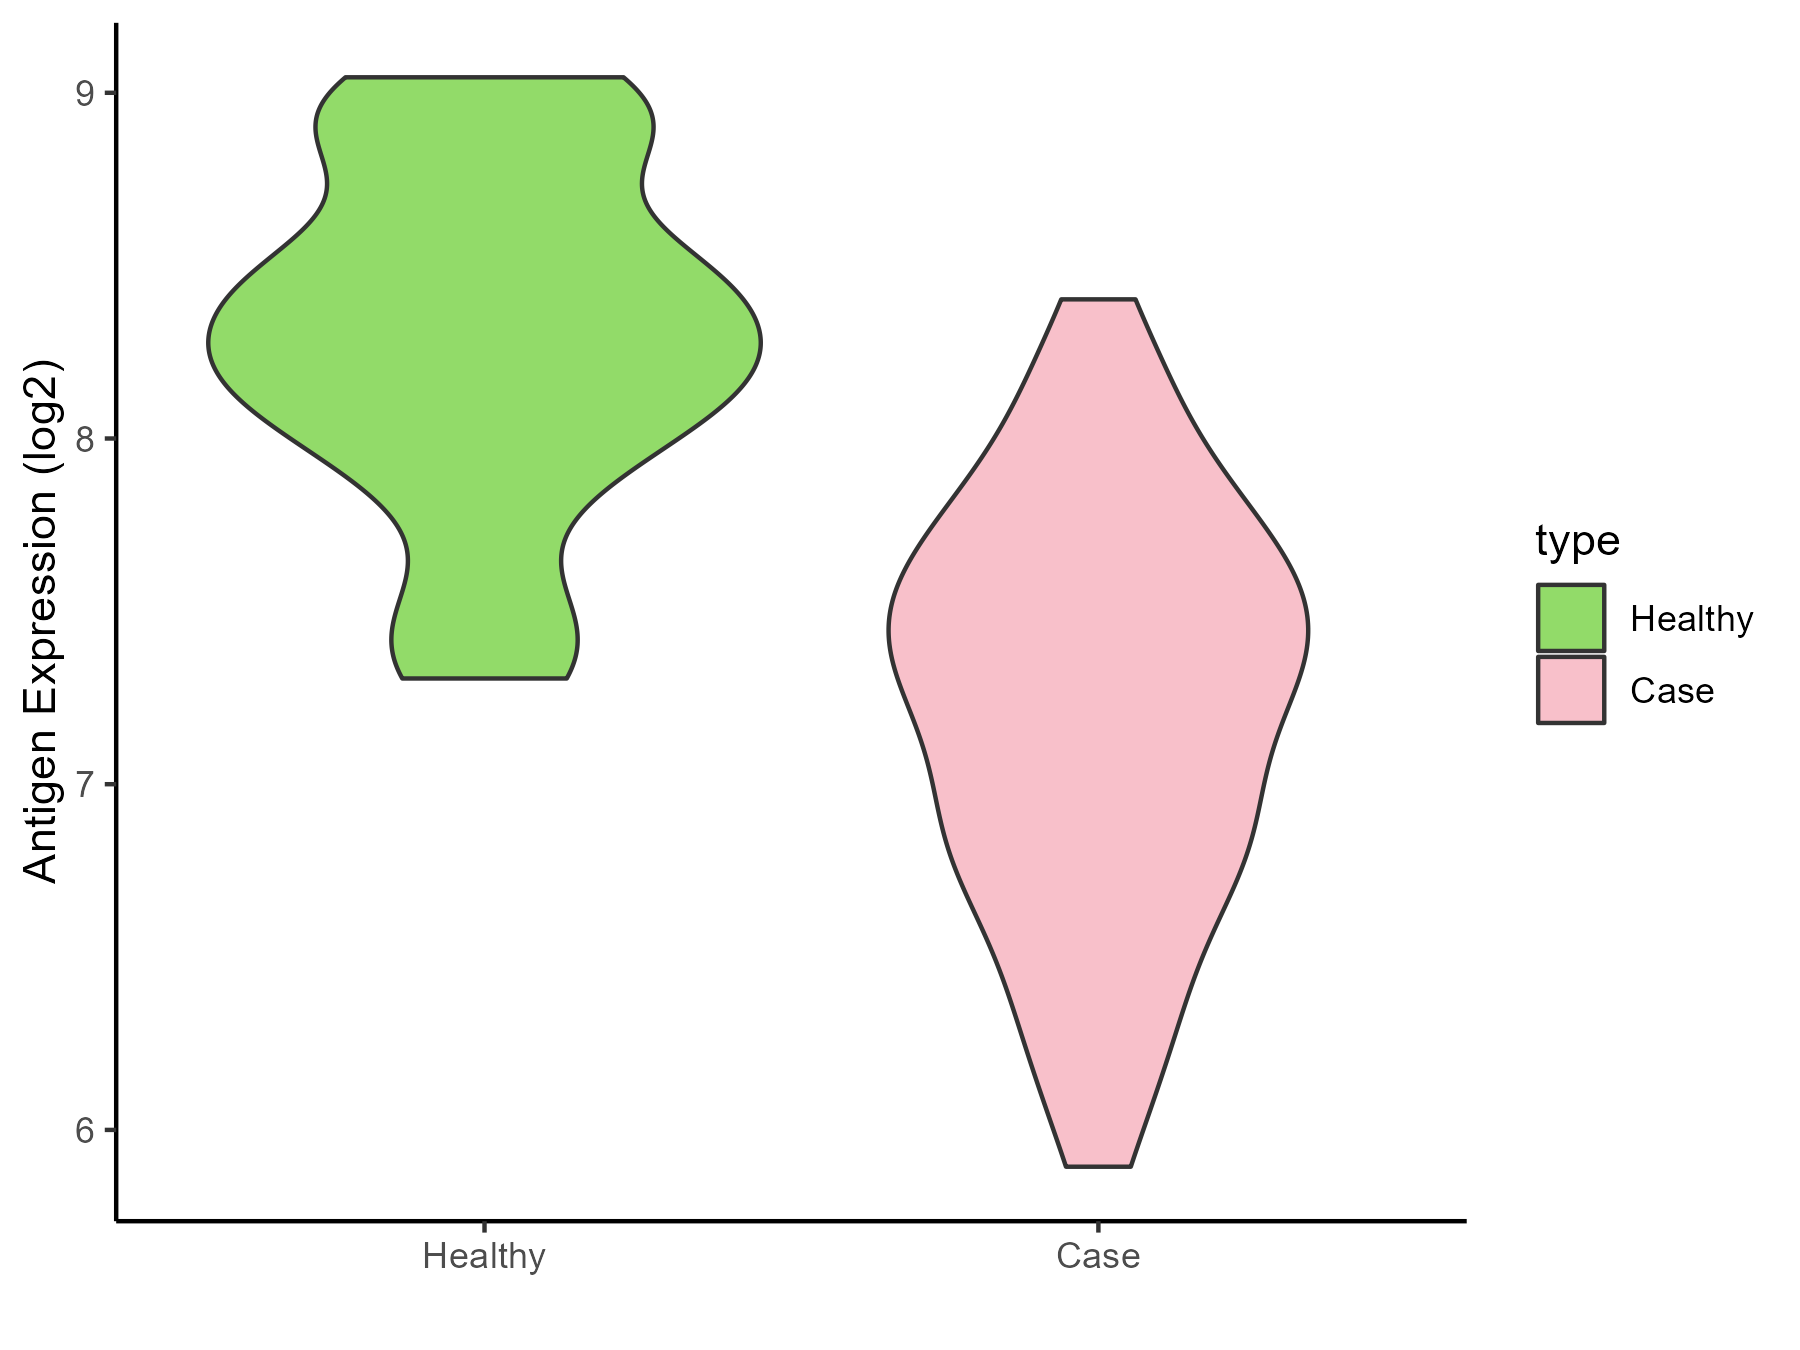
| The Studied Tissue | Whole blood | |
| The Specific Disease | Cardioembolic Stroke | |
| The Expression Level of Disease Section Compare with the Healthy Individual Tissue | p-value: 6.15E-10; Fold-change: -0.966139087; Z-score: -1.917007686 | |
| Disease-specific Antigen Abundances |
|
Click to View the Clearer Original Diagram |
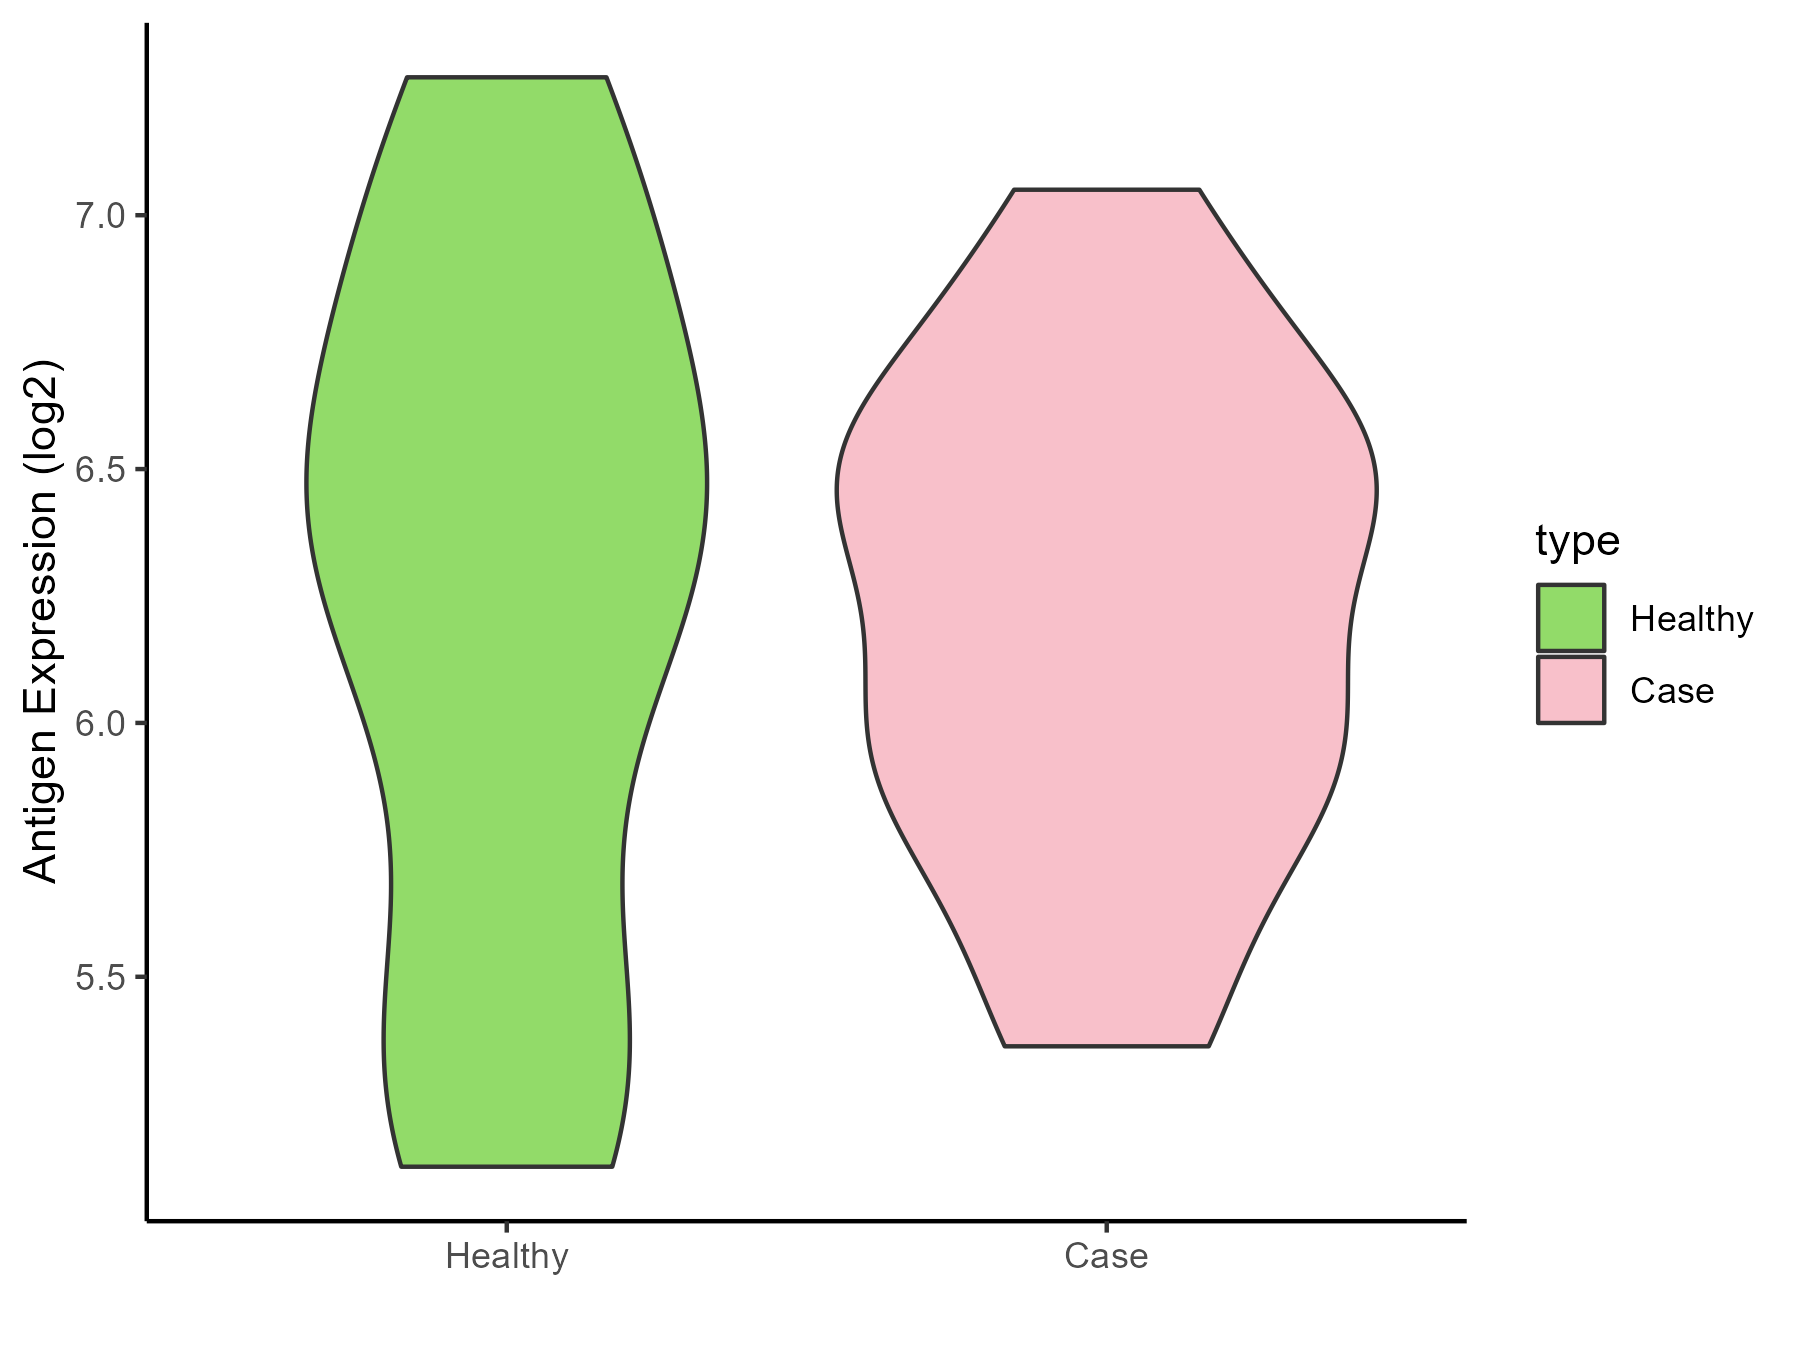
| The Studied Tissue | Peripheral blood | |
| The Specific Disease | Ischemic stroke | |
| The Expression Level of Disease Section Compare with the Healthy Individual Tissue | p-value: 0.892896922; Fold-change: -0.103684962; Z-score: -0.149475872 | |
| Disease-specific Antigen Abundances |
|
Click to View the Clearer Original Diagram |
ICD Disease Classification 1
| Differential expression pattern of antigen in diseases | ||
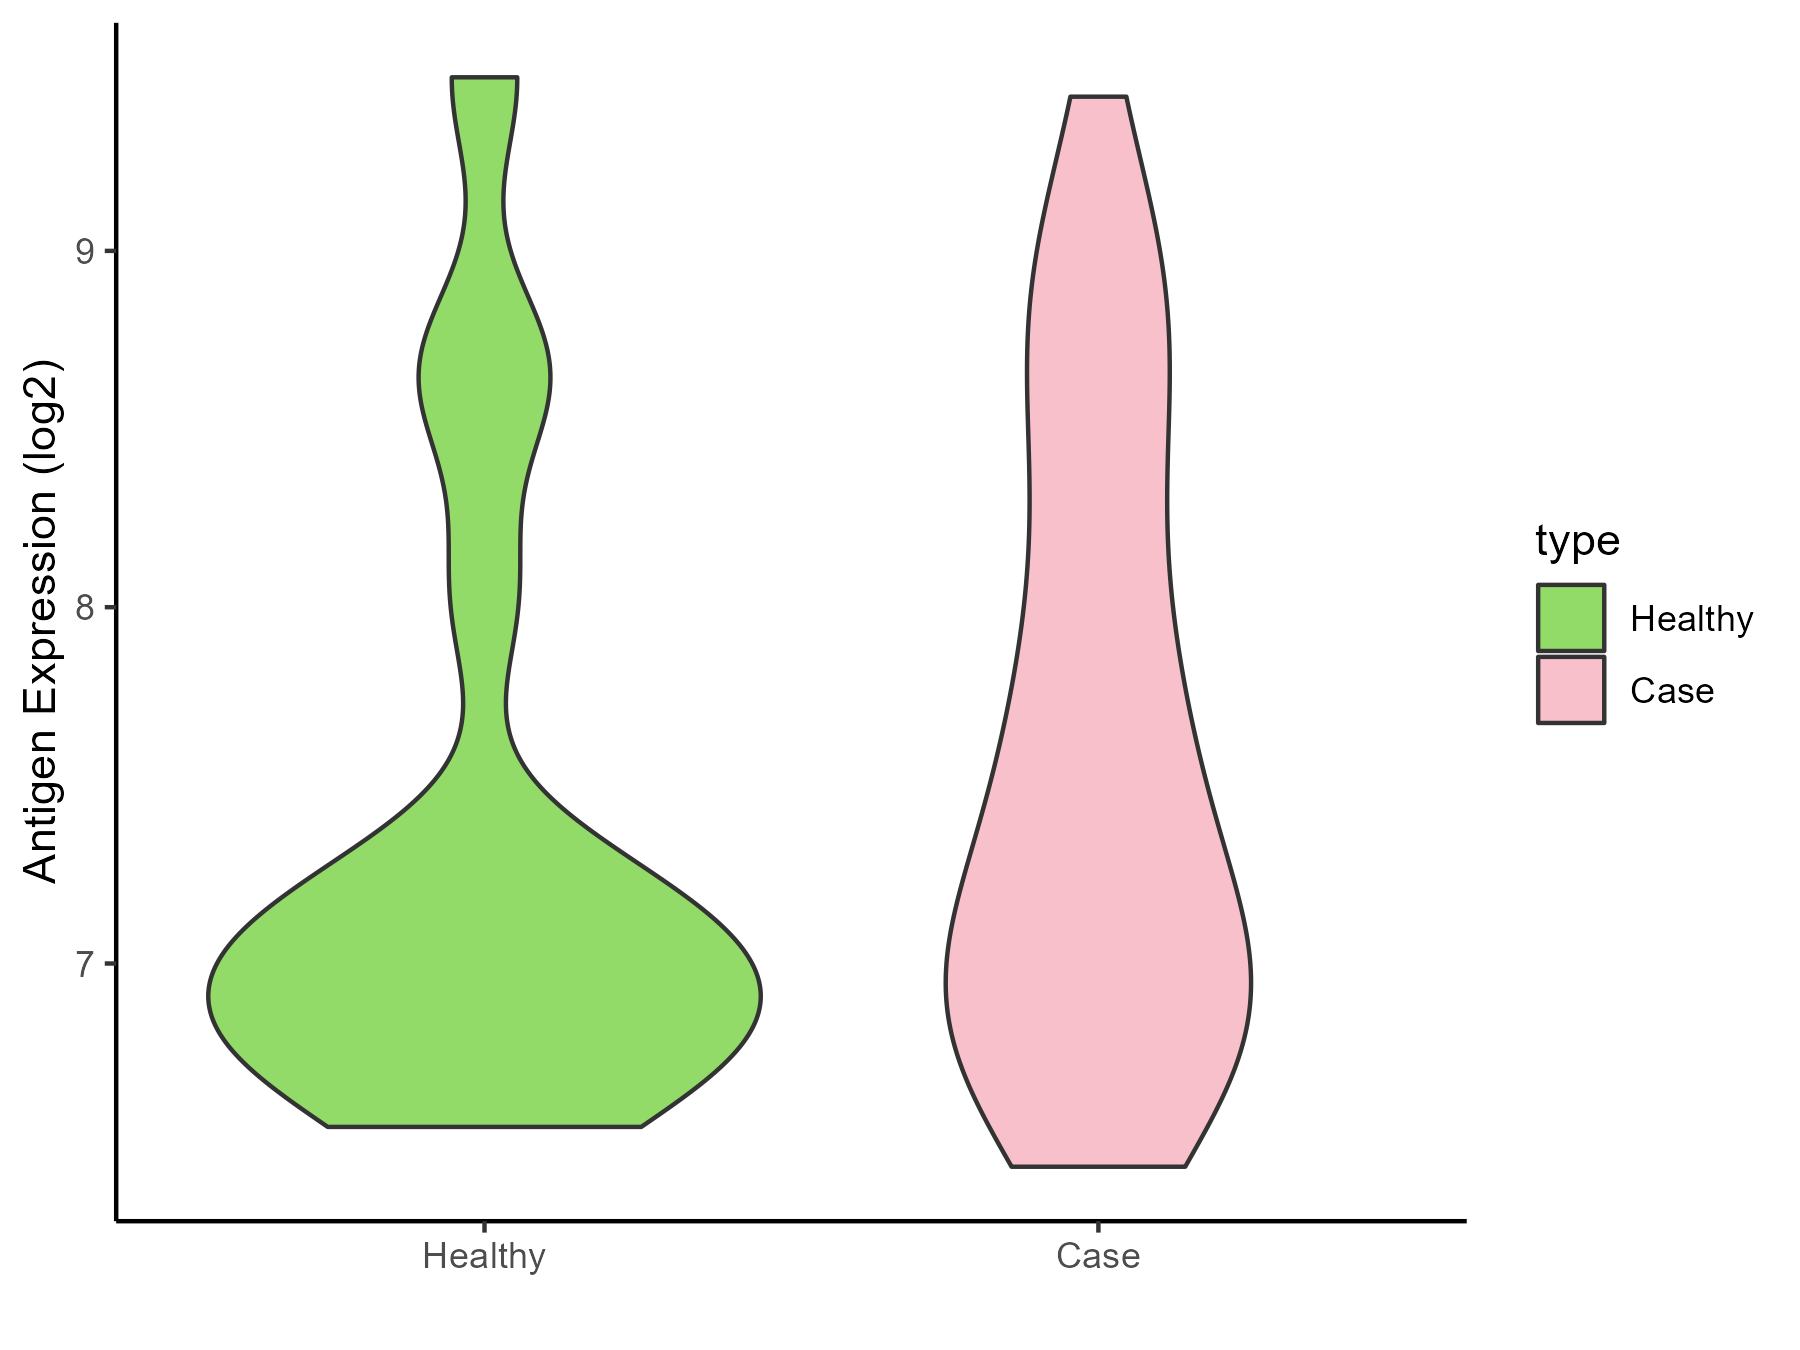
| The Studied Tissue | White matter | |
| The Specific Disease | HIV | |
| The Expression Level of Disease Section Compare with the Healthy Individual Tissue | p-value: 0.389617545; Fold-change: 0.355426889; Z-score: 0.4081668 | |
| Disease-specific Antigen Abundances |
|
Click to View the Clearer Original Diagram |
| Differential expression pattern of antigen in diseases | ||
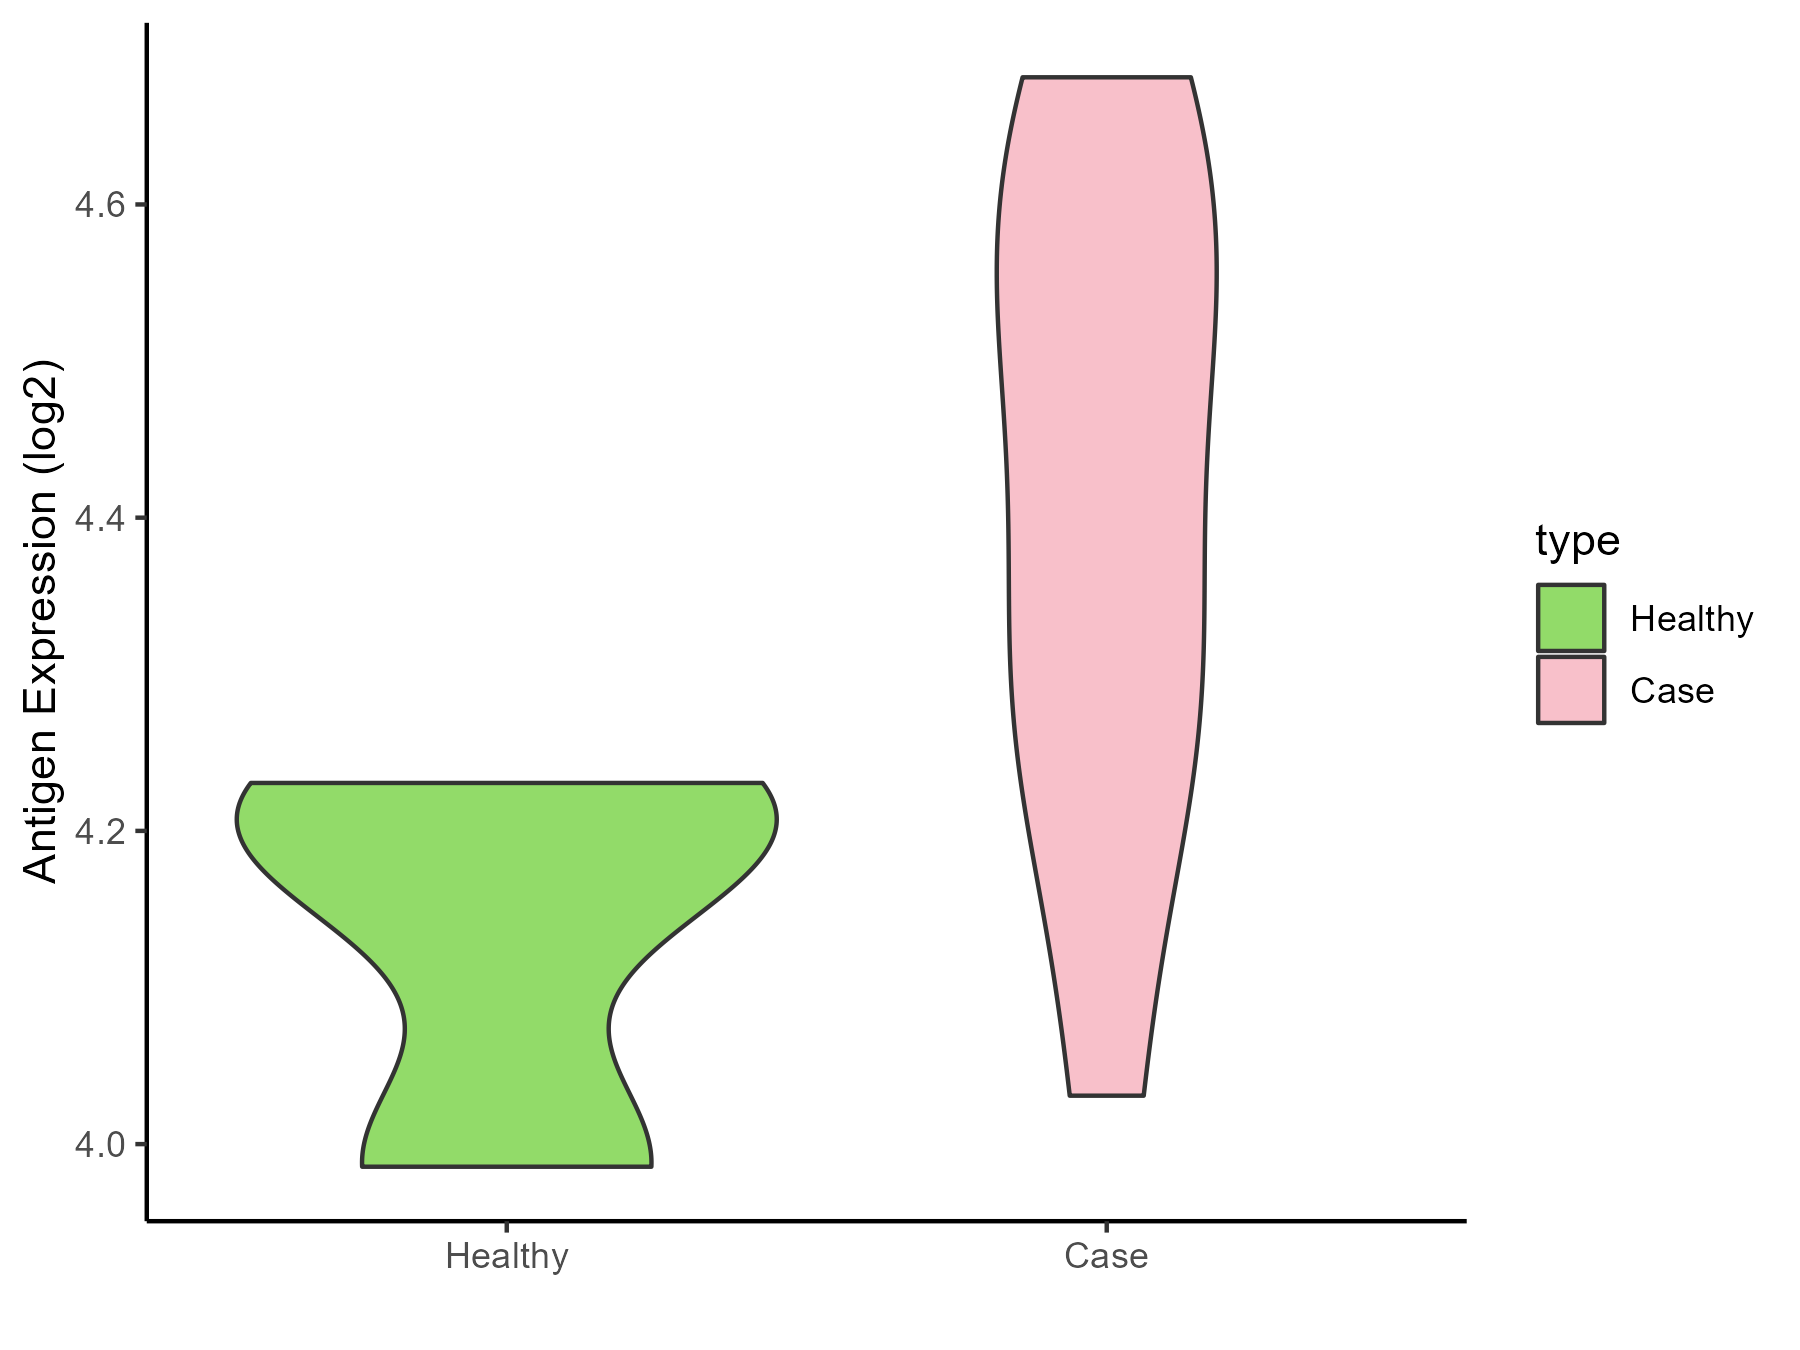
| The Studied Tissue | Whole blood | |
| The Specific Disease | Influenza | |
| The Expression Level of Disease Section Compare with the Healthy Individual Tissue | p-value: 0.035624774; Fold-change: 0.261540542; Z-score: 2.006498399 | |
| Disease-specific Antigen Abundances |
|
Click to View the Clearer Original Diagram |
| Differential expression pattern of antigen in diseases | ||
| The Studied Tissue | Whole blood | |
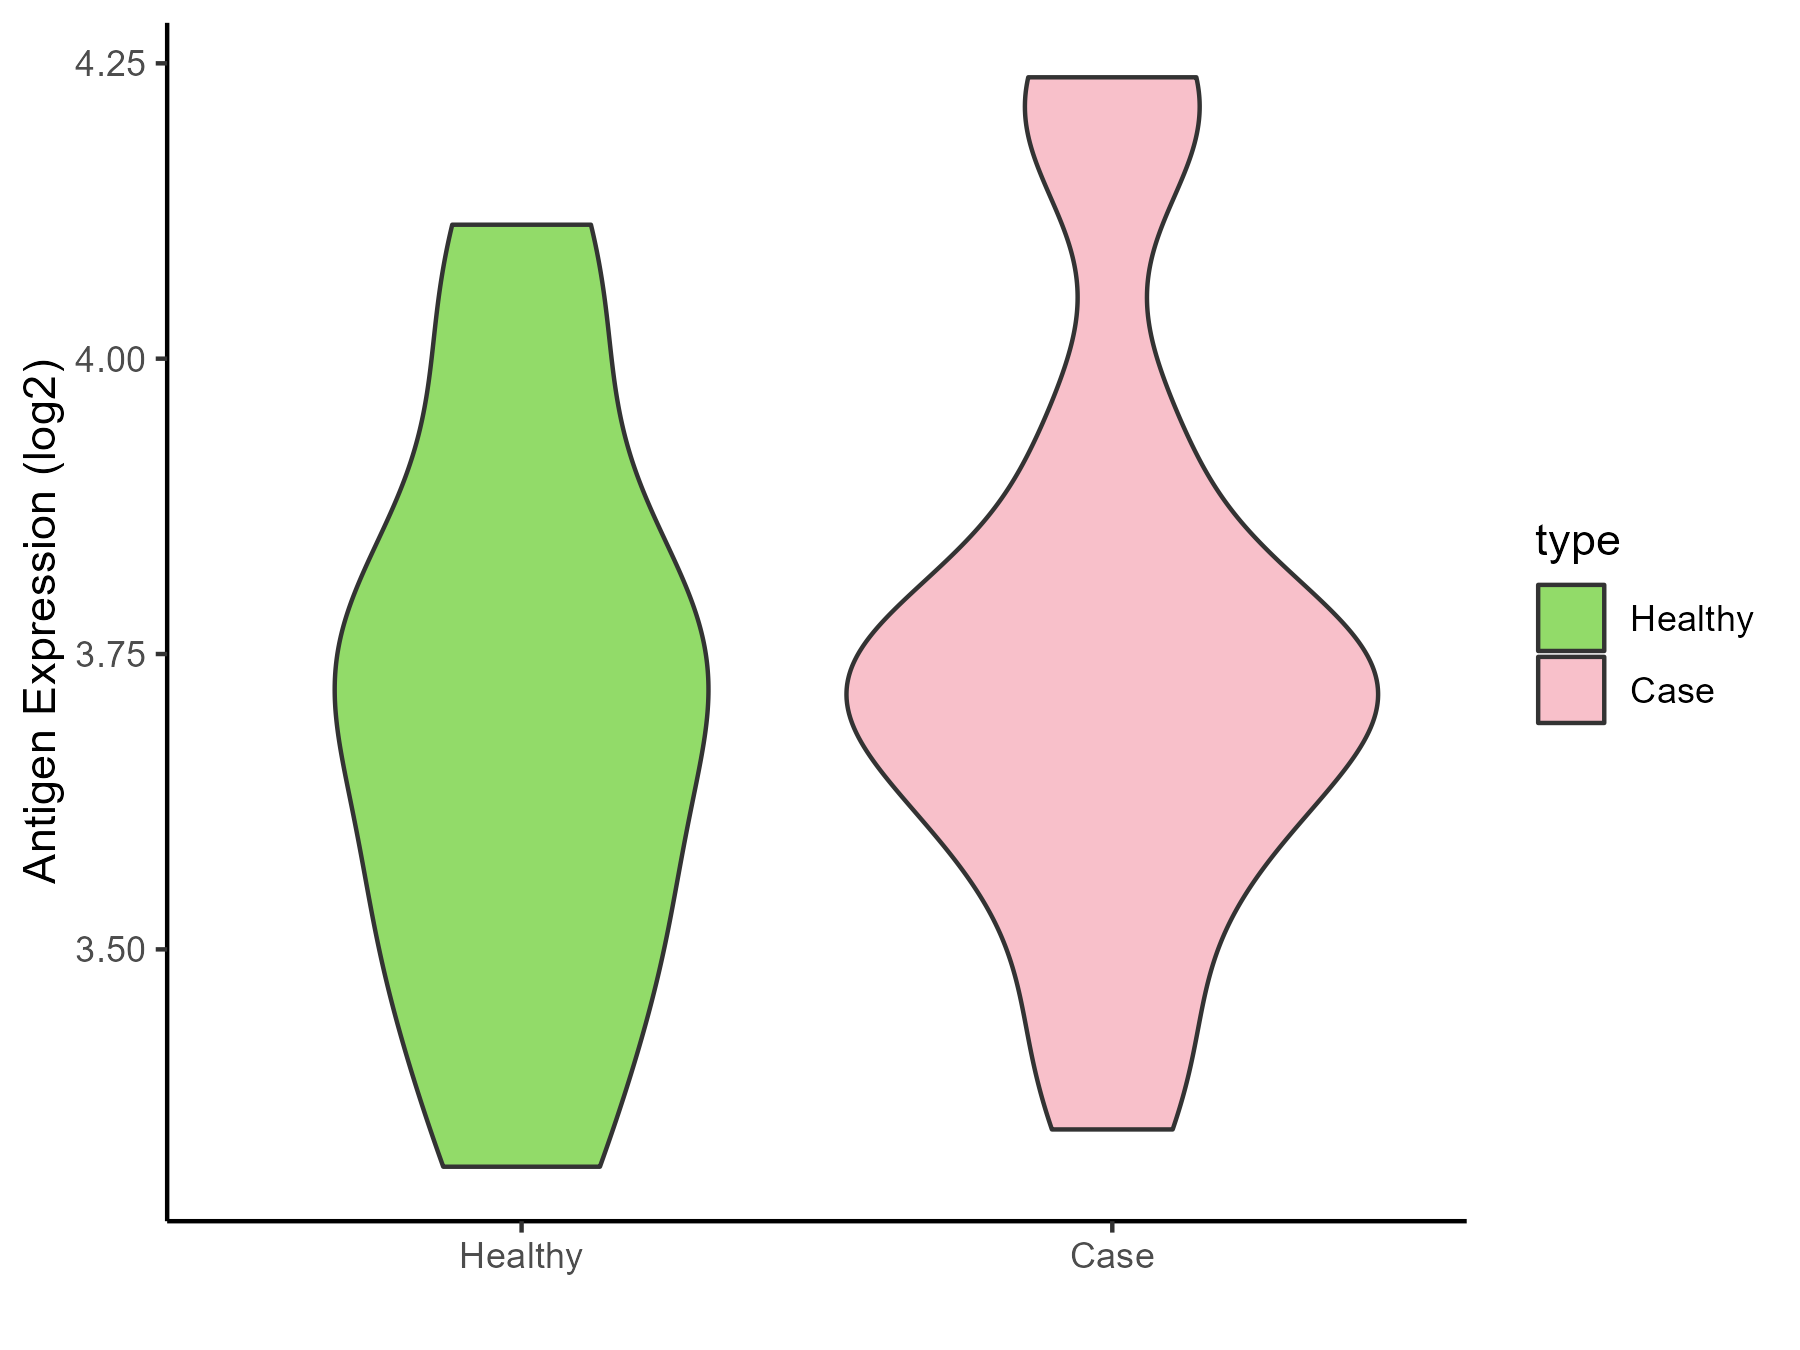
| The Specific Disease | Chronic hepatitis C | |
| The Expression Level of Disease Section Compare with the Healthy Individual Tissue | p-value: 0.537478523; Fold-change: 0.013364507; Z-score: 0.054593223 | |
| Disease-specific Antigen Abundances |
|
Click to View the Clearer Original Diagram |
| Differential expression pattern of antigen in diseases | ||
| The Studied Tissue | Whole blood | |
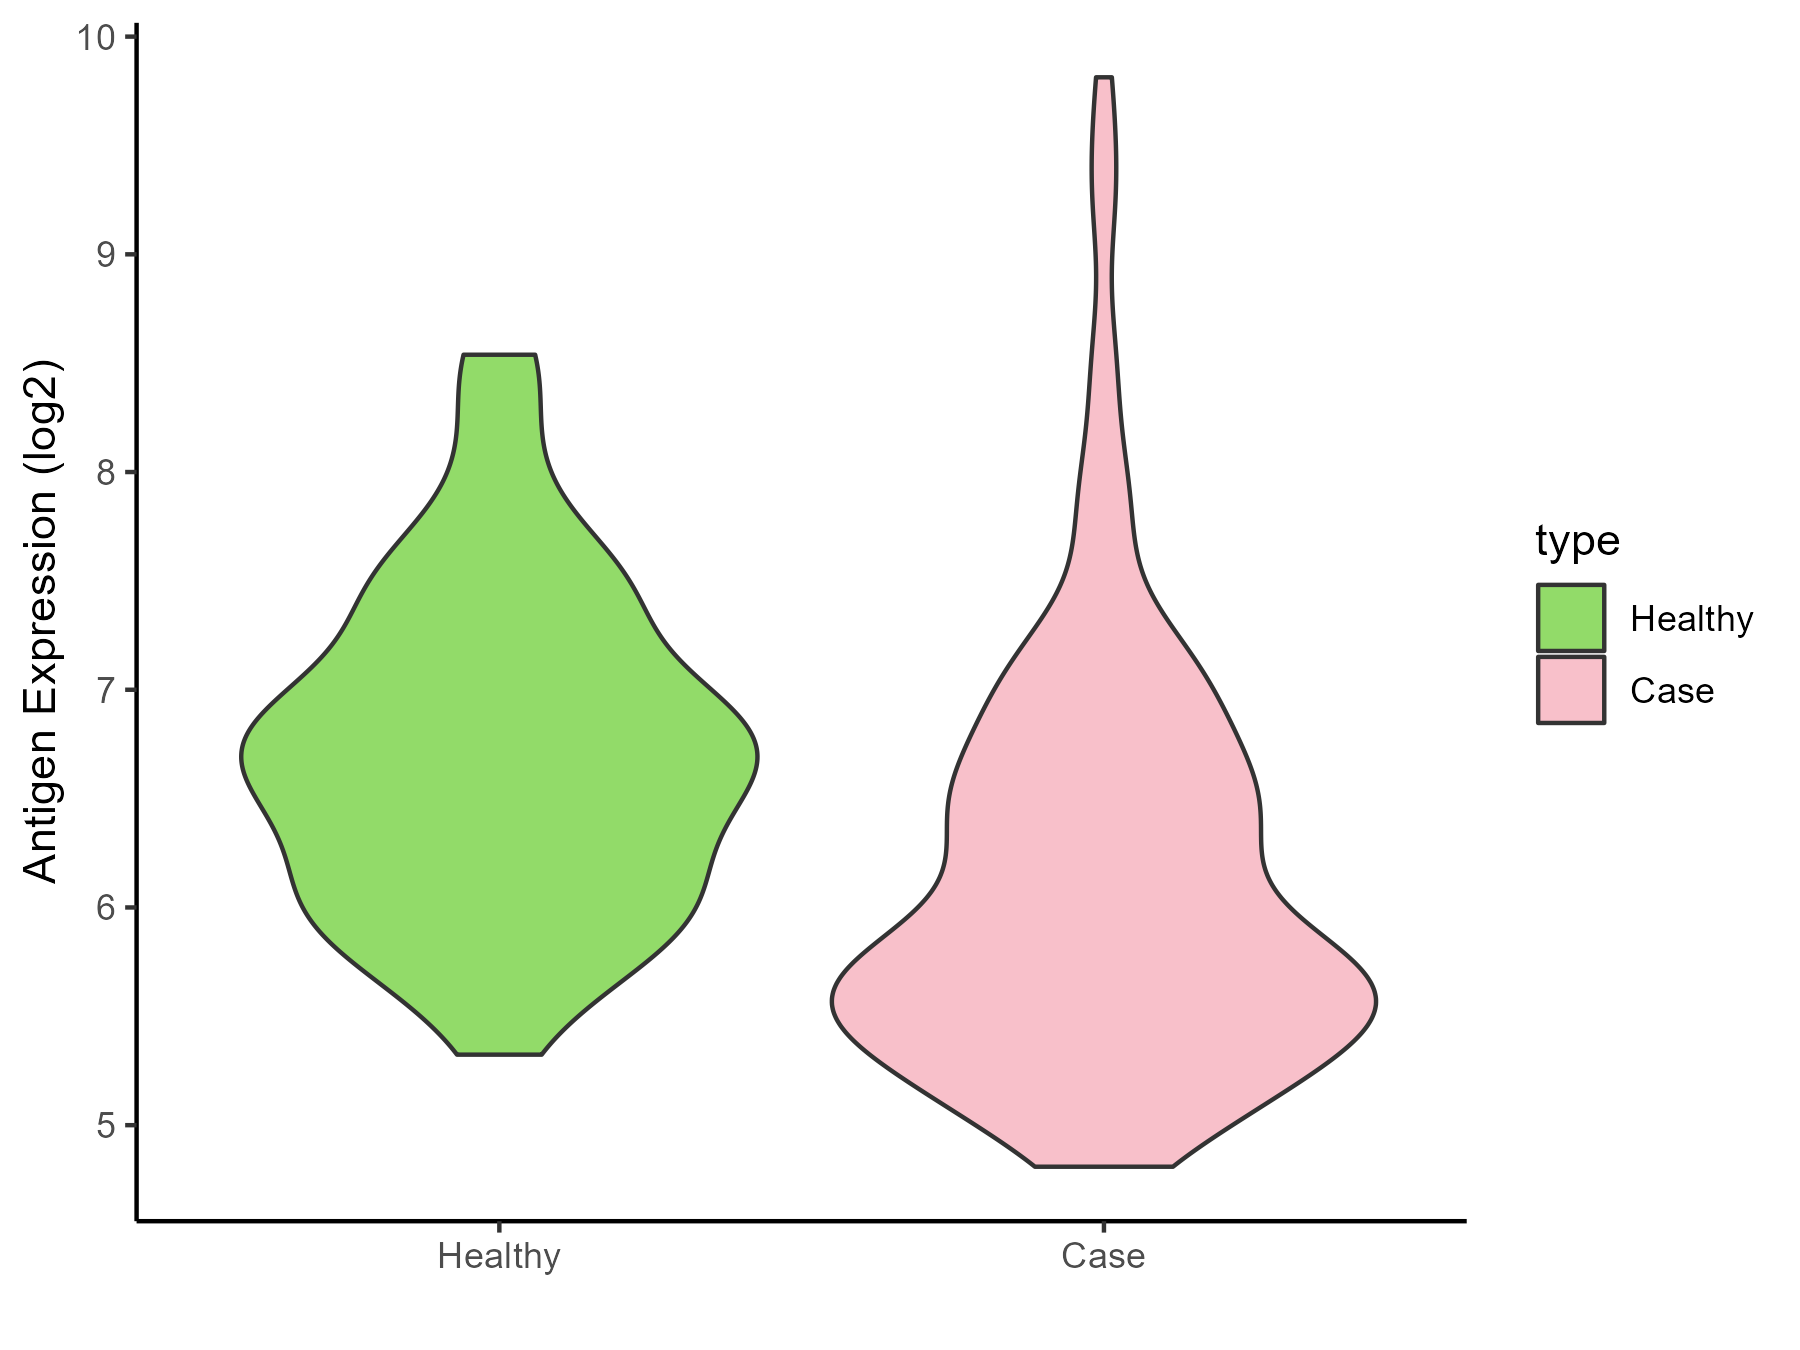
| The Specific Disease | Sepsis | |
| The Expression Level of Disease Section Compare with the Healthy Individual Tissue | p-value: 1.98E-07; Fold-change: -0.85483905; Z-score: -1.162066597 | |
| Disease-specific Antigen Abundances |
|
Click to View the Clearer Original Diagram |
| Differential expression pattern of antigen in diseases | ||
| The Studied Tissue | Whole blood | |
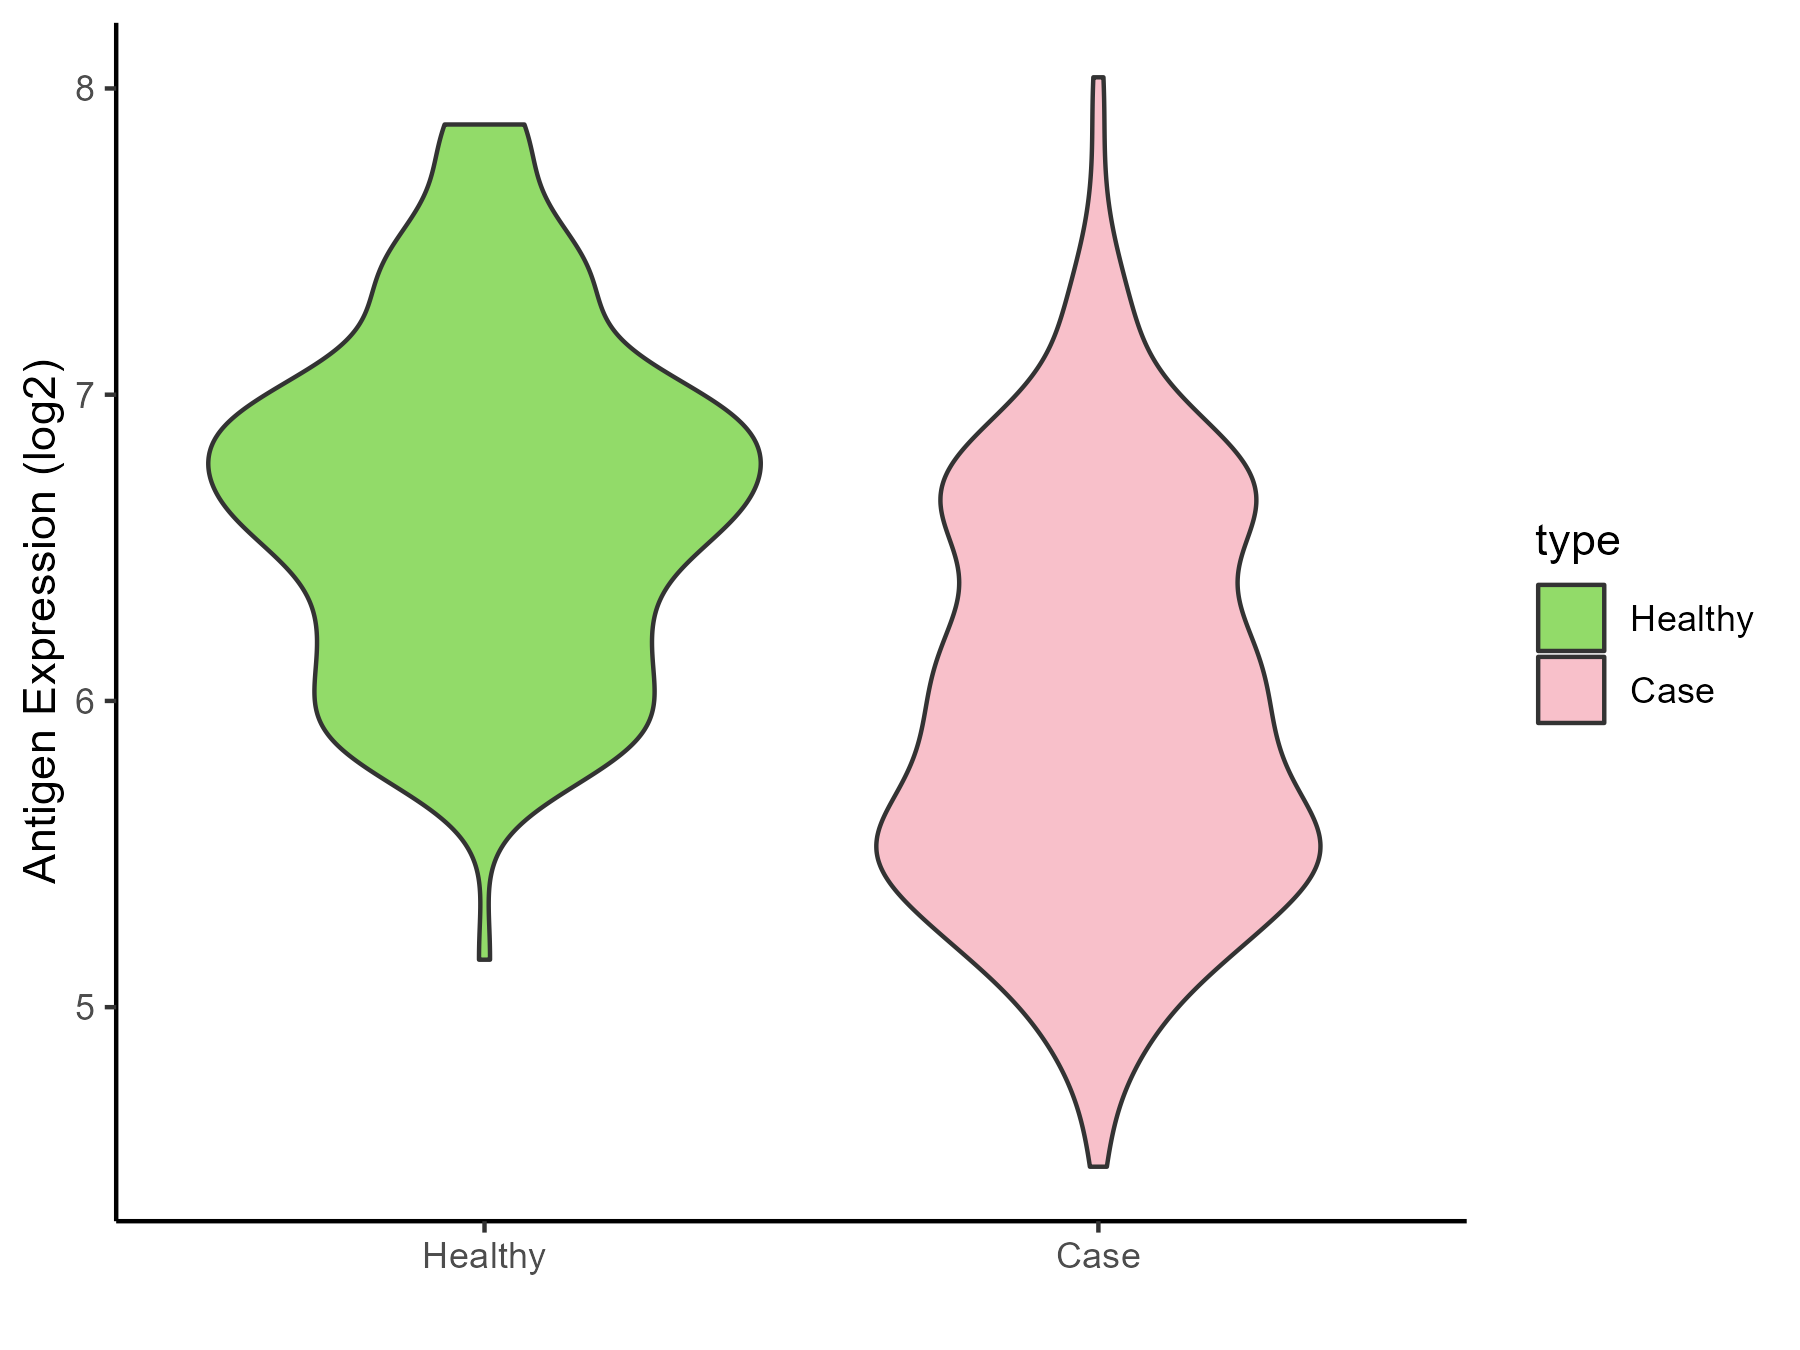
| The Specific Disease | Septic shock | |
| The Expression Level of Disease Section Compare with the Healthy Individual Tissue | p-value: 4.75E-31; Fold-change: -0.745273964; Z-score: -1.367466117 | |
| Disease-specific Antigen Abundances |
|
Click to View the Clearer Original Diagram |
| Differential expression pattern of antigen in diseases | ||
| The Studied Tissue | Peripheral blood | |
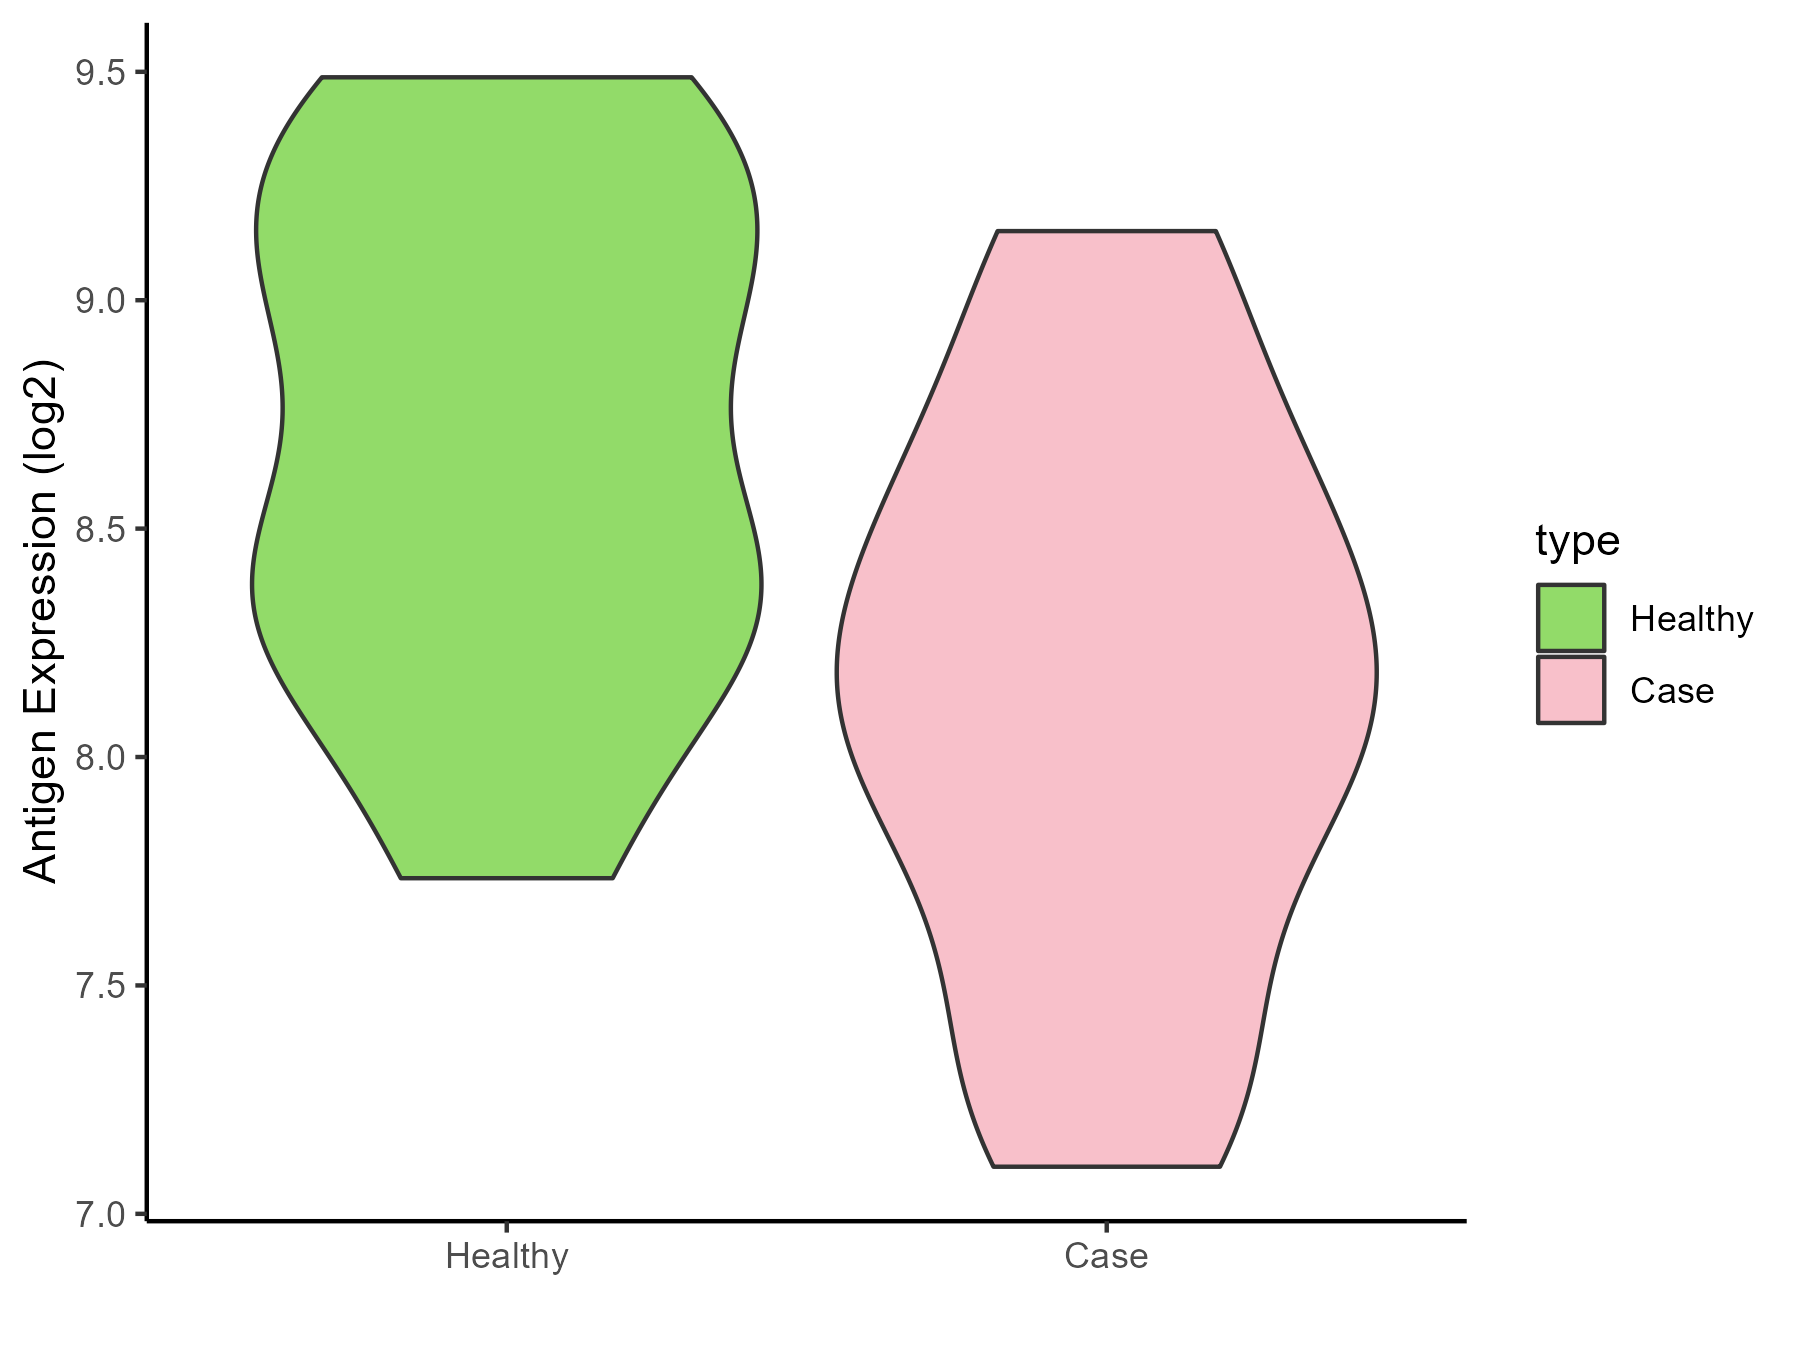
| The Specific Disease | Pediatric respiratory syncytial virus infection | |
| The Expression Level of Disease Section Compare with the Healthy Individual Tissue | p-value: 0.004382864; Fold-change: -0.512112546; Z-score: -0.909155196 | |
| Disease-specific Antigen Abundances |
|
Click to View the Clearer Original Diagram |
ICD Disease Classification 11
| Differential expression pattern of antigen in diseases | ||
| The Studied Tissue | Peripheral blood | |
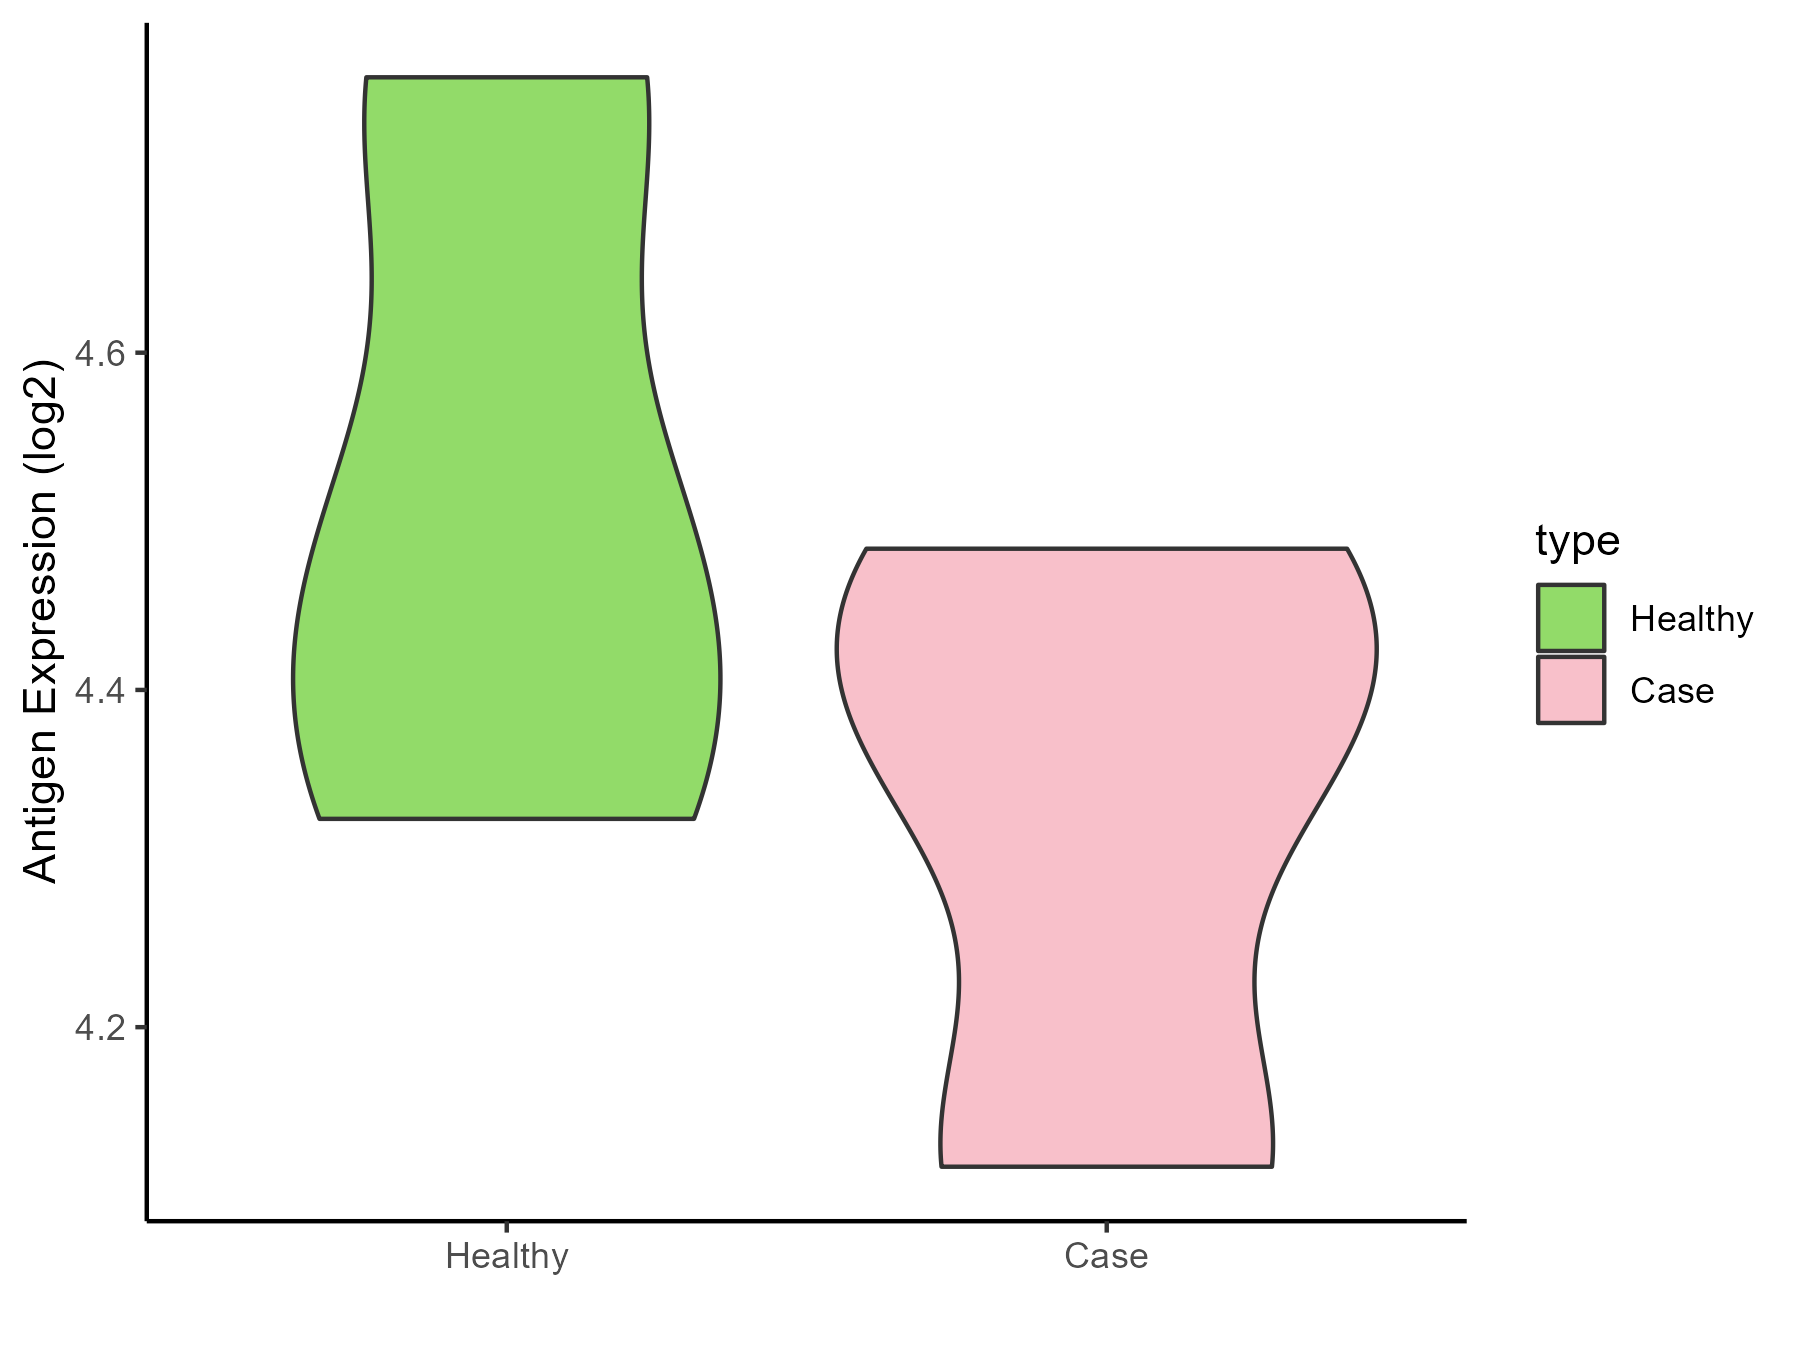
| The Specific Disease | Essential hypertension | |
| The Expression Level of Disease Section Compare with the Healthy Individual Tissue | p-value: 0.30324301; Fold-change: -0.11201689; Z-score: -0.502772557 | |
| Disease-specific Antigen Abundances |
|
Click to View the Clearer Original Diagram |
| Differential expression pattern of antigen in diseases | ||
| The Studied Tissue | Peripheral blood | |
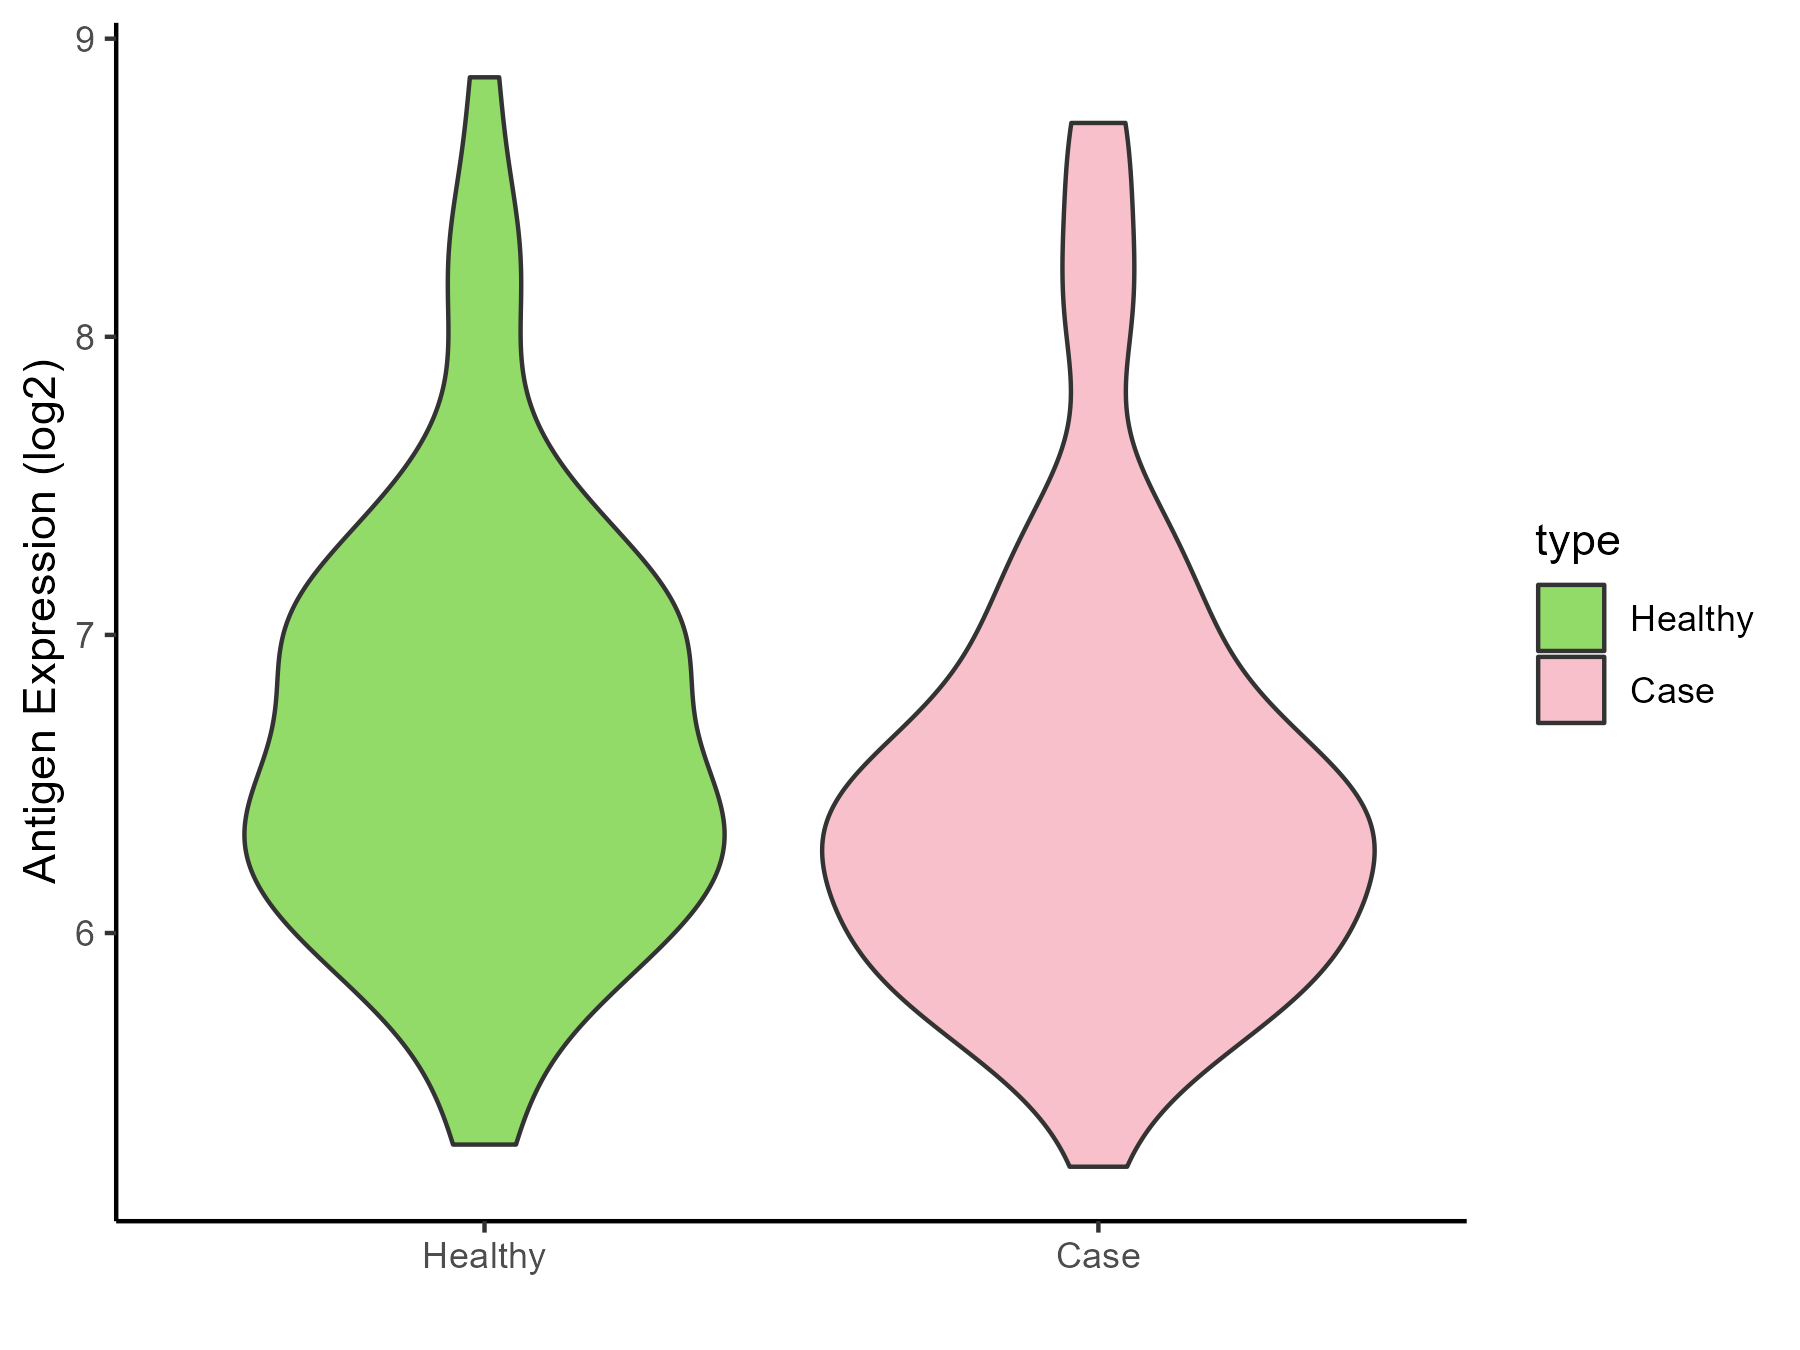
| The Specific Disease | Myocardial infarction | |
| The Expression Level of Disease Section Compare with the Healthy Individual Tissue | p-value: 0.195344505; Fold-change: -0.185263493; Z-score: -0.254222575 | |
| Disease-specific Antigen Abundances |
|
Click to View the Clearer Original Diagram |
| Differential expression pattern of antigen in diseases | ||
| The Studied Tissue | Peripheral blood | |
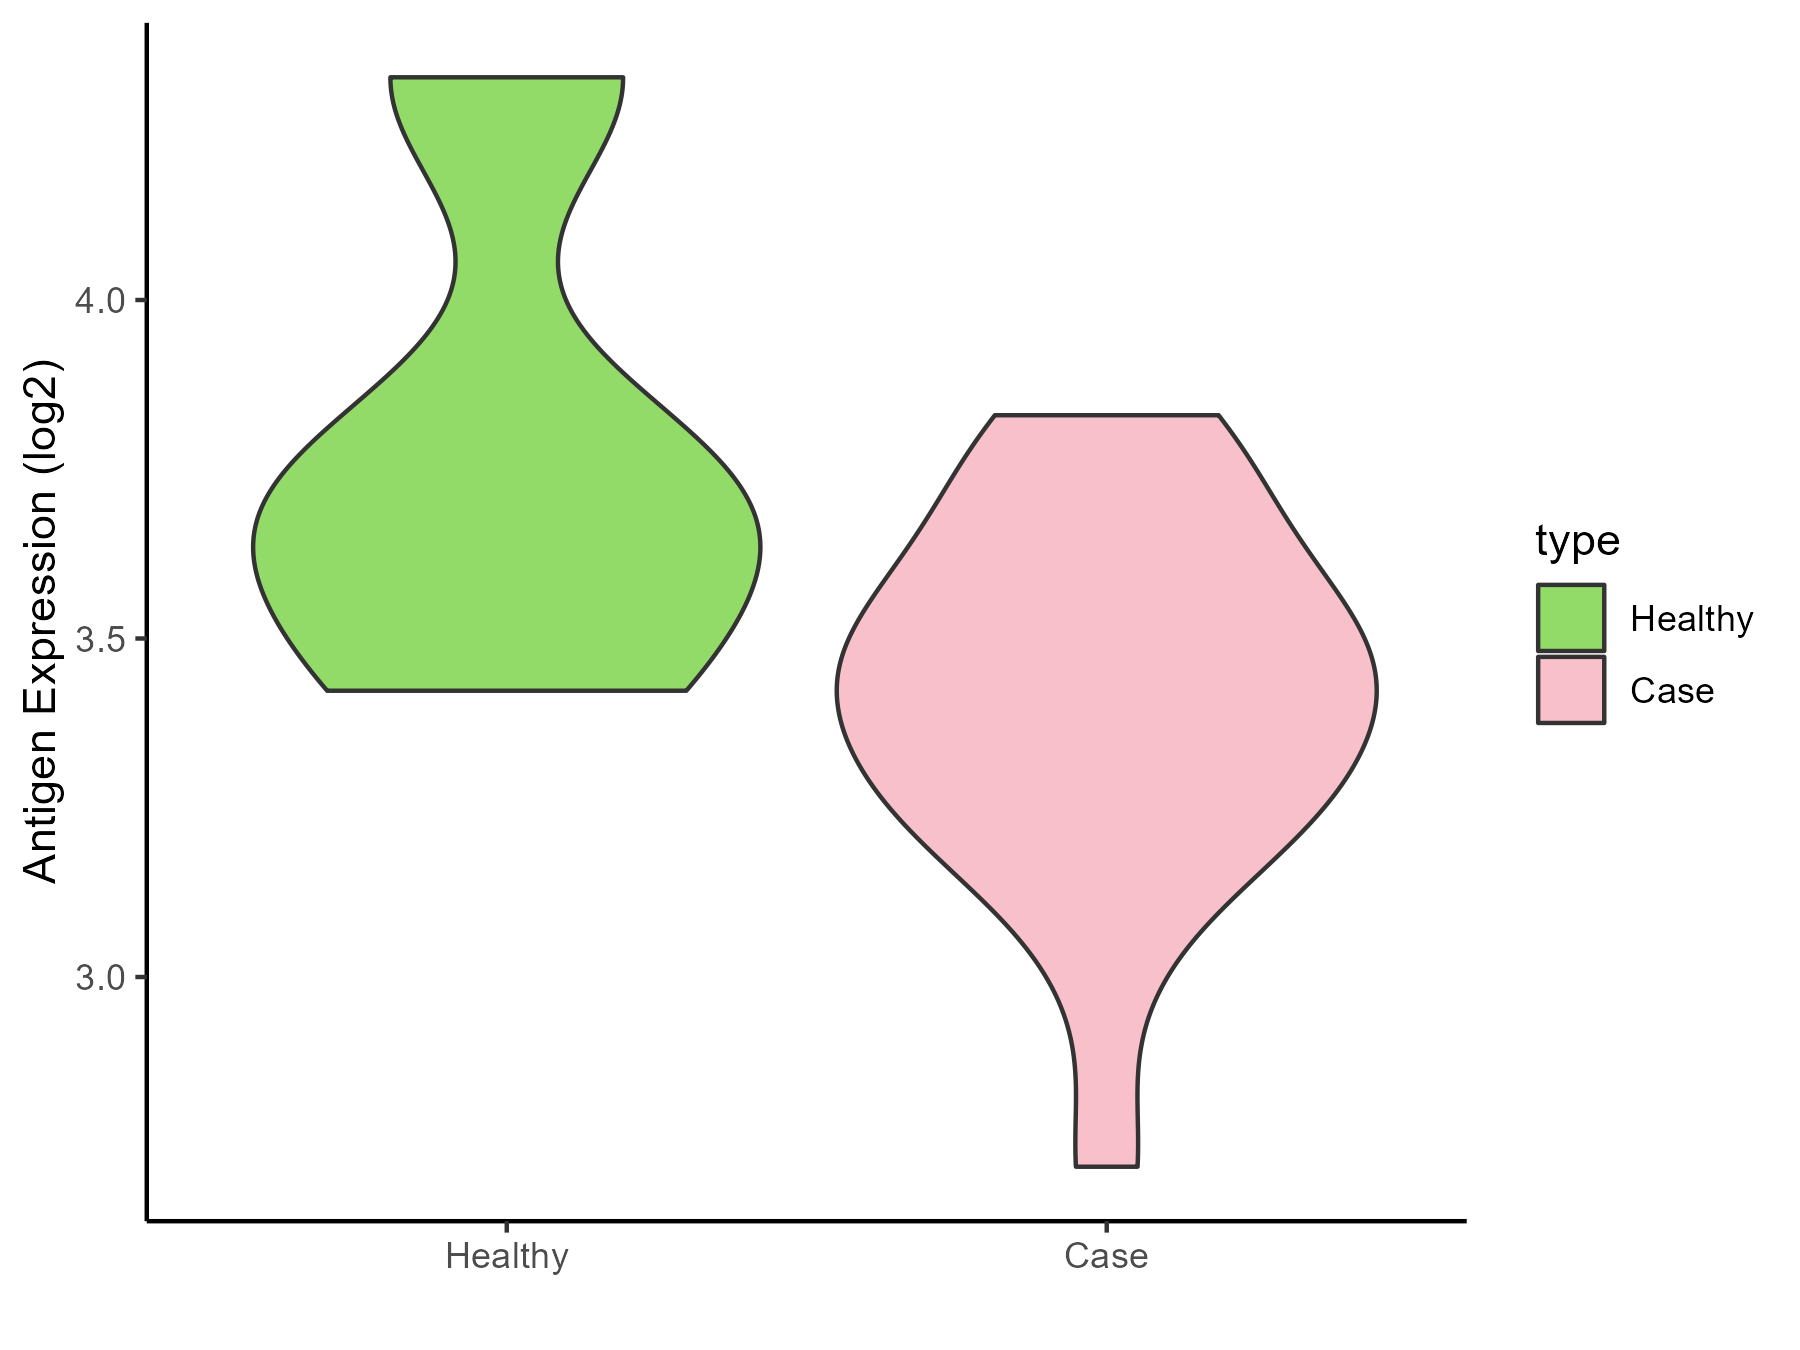
| The Specific Disease | Coronary artery disease | |
| The Expression Level of Disease Section Compare with the Healthy Individual Tissue | p-value: 0.151022523; Fold-change: -0.258463149; Z-score: -0.666672909 | |
| Disease-specific Antigen Abundances |
|
Click to View the Clearer Original Diagram |
| Differential expression pattern of antigen in diseases | ||
| The Studied Tissue | Calcified aortic valve | |
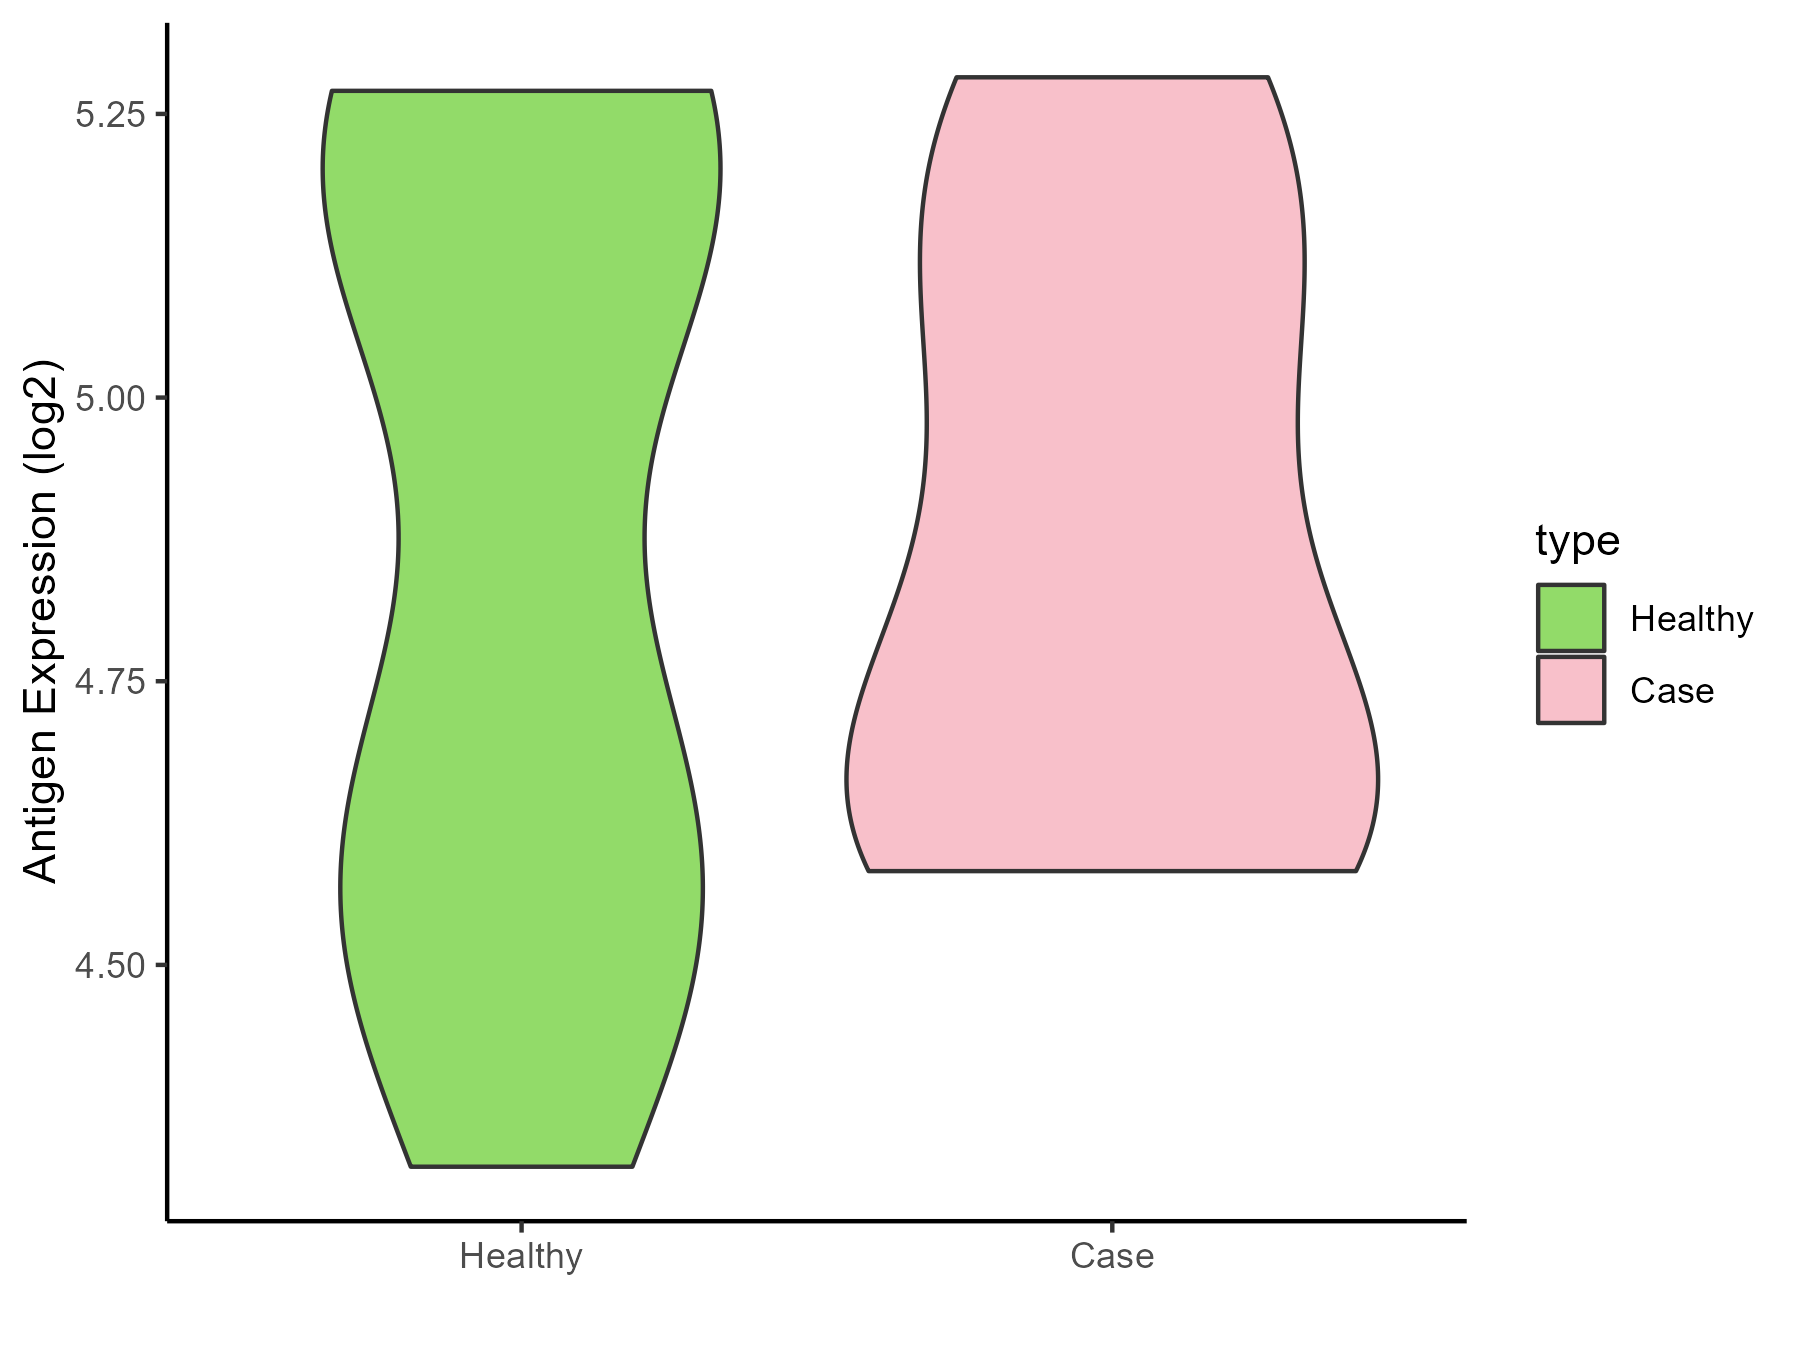
| The Specific Disease | Aortic stenosis | |
| The Expression Level of Disease Section Compare with the Healthy Individual Tissue | p-value: 0.963231054; Fold-change: -0.059155648; Z-score: -0.162002621 | |
| Disease-specific Antigen Abundances |
|
Click to View the Clearer Original Diagram |
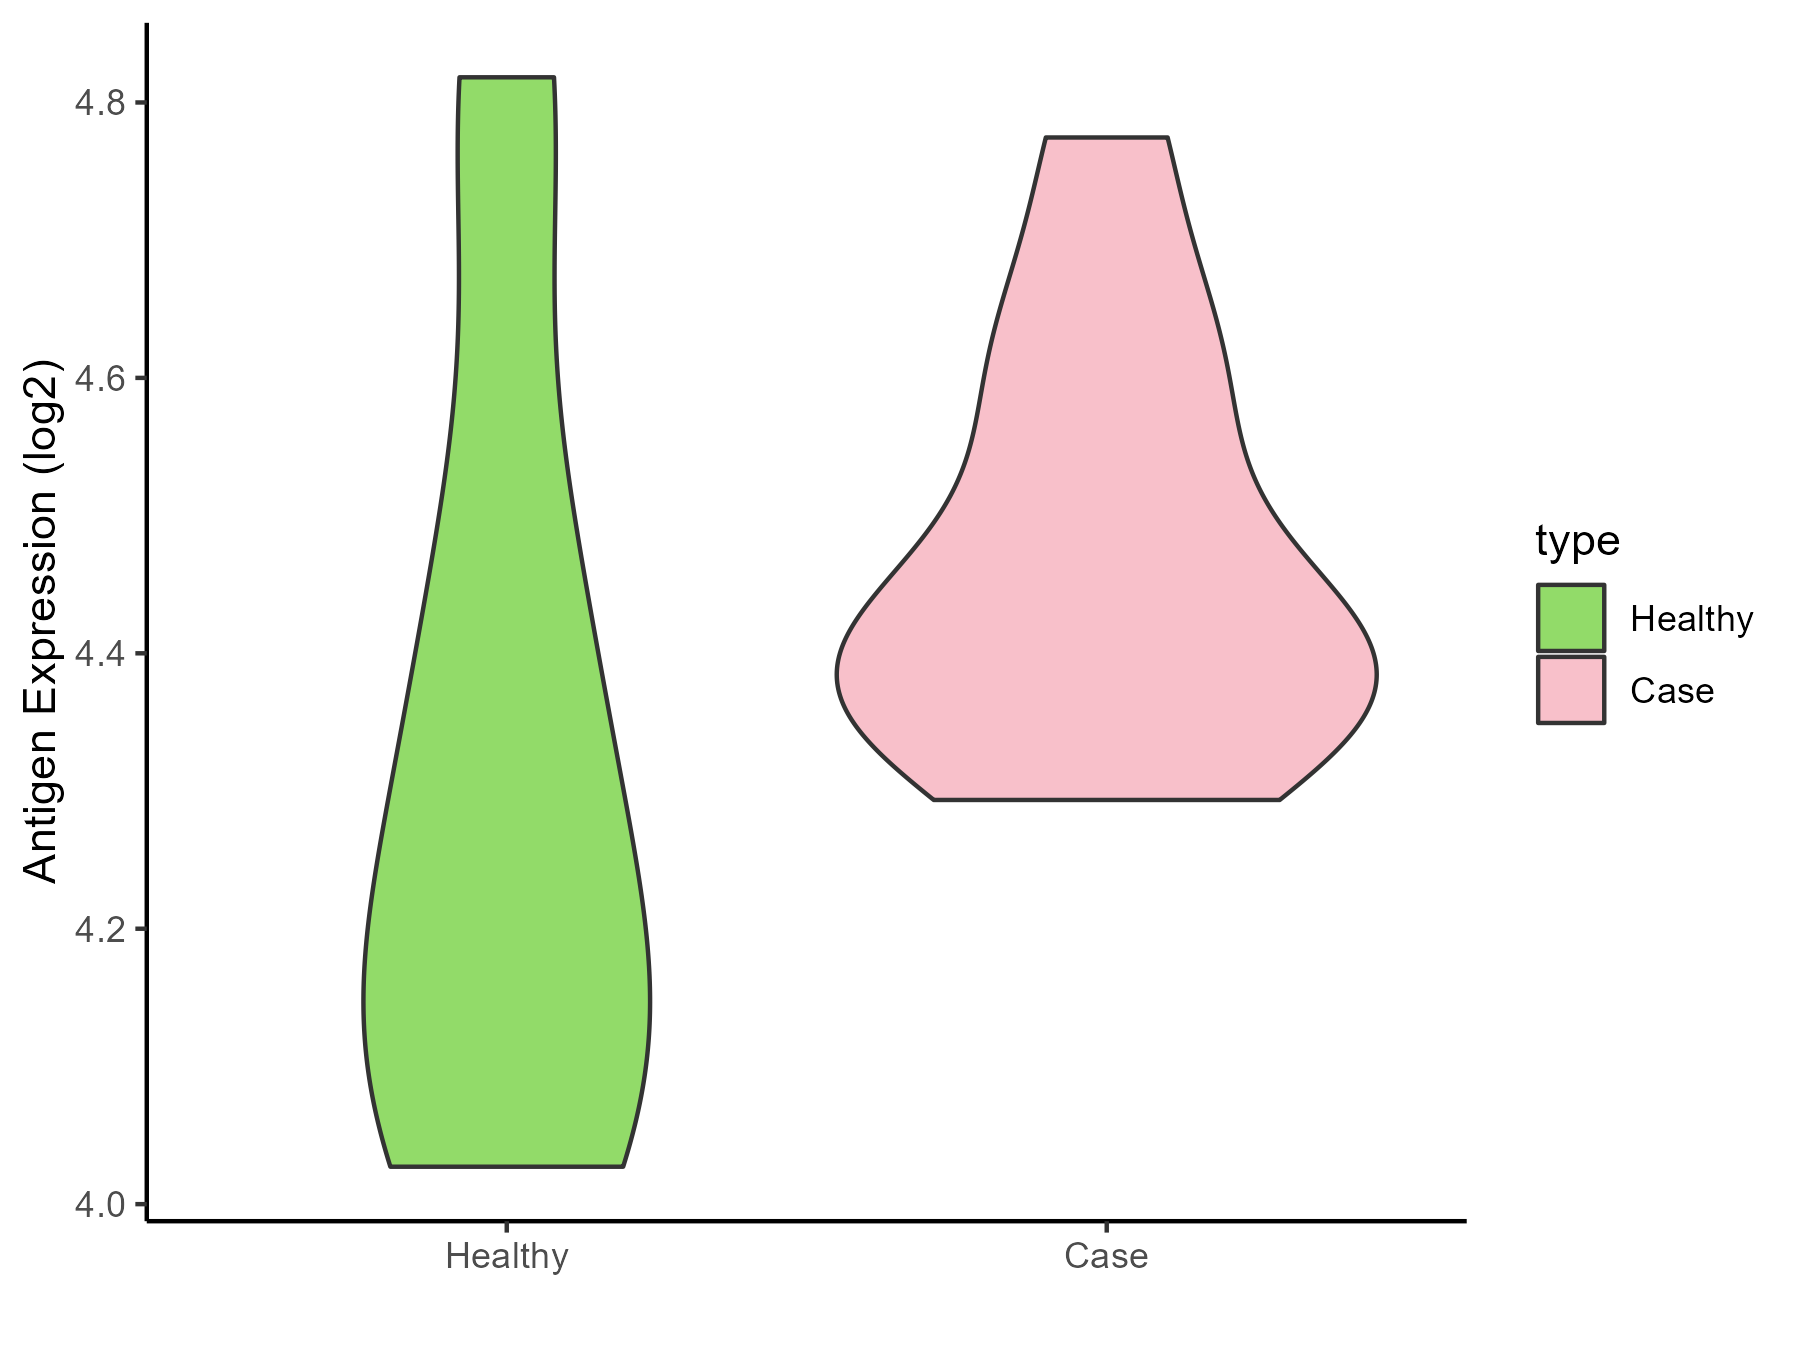
| Differential expression pattern of antigen in diseases | ||
| The Studied Tissue | Peripheral blood | |
| The Specific Disease | Arteriosclerosis | |
| The Expression Level of Disease Section Compare with the Healthy Individual Tissue | p-value: 0.112244314; Fold-change: 0.165733669; Z-score: 0.599715918 | |
| Disease-specific Antigen Abundances |
|
Click to View the Clearer Original Diagram |
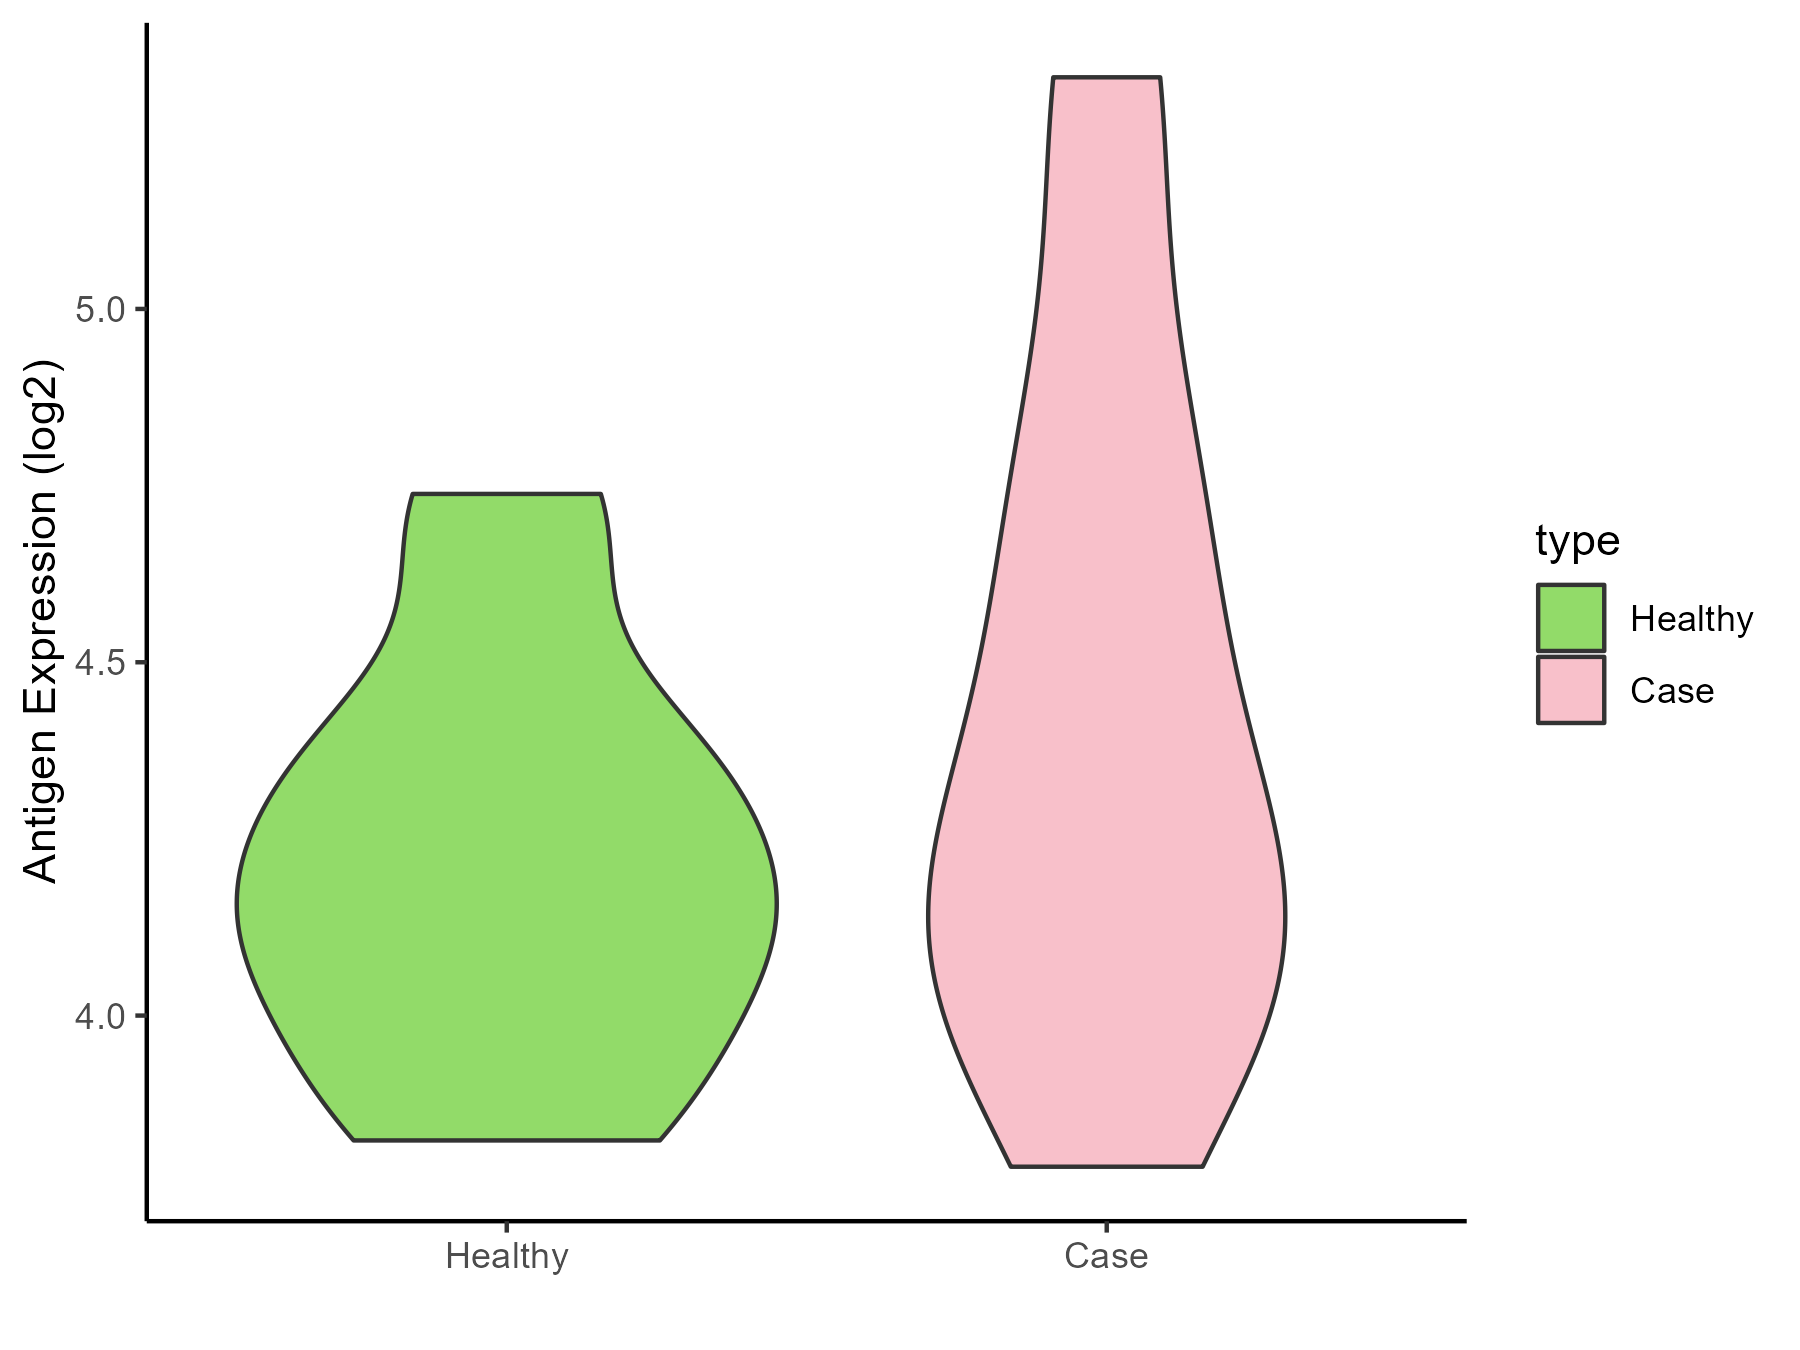
| Differential expression pattern of antigen in diseases | ||
| The Studied Tissue | Intracranial artery | |
| The Specific Disease | Aneurysm | |
| The Expression Level of Disease Section Compare with the Healthy Individual Tissue | p-value: 0.171014457; Fold-change: 0.089143313; Z-score: 0.309628531 | |
| Disease-specific Antigen Abundances |
|
Click to View the Clearer Original Diagram |
ICD Disease Classification 12
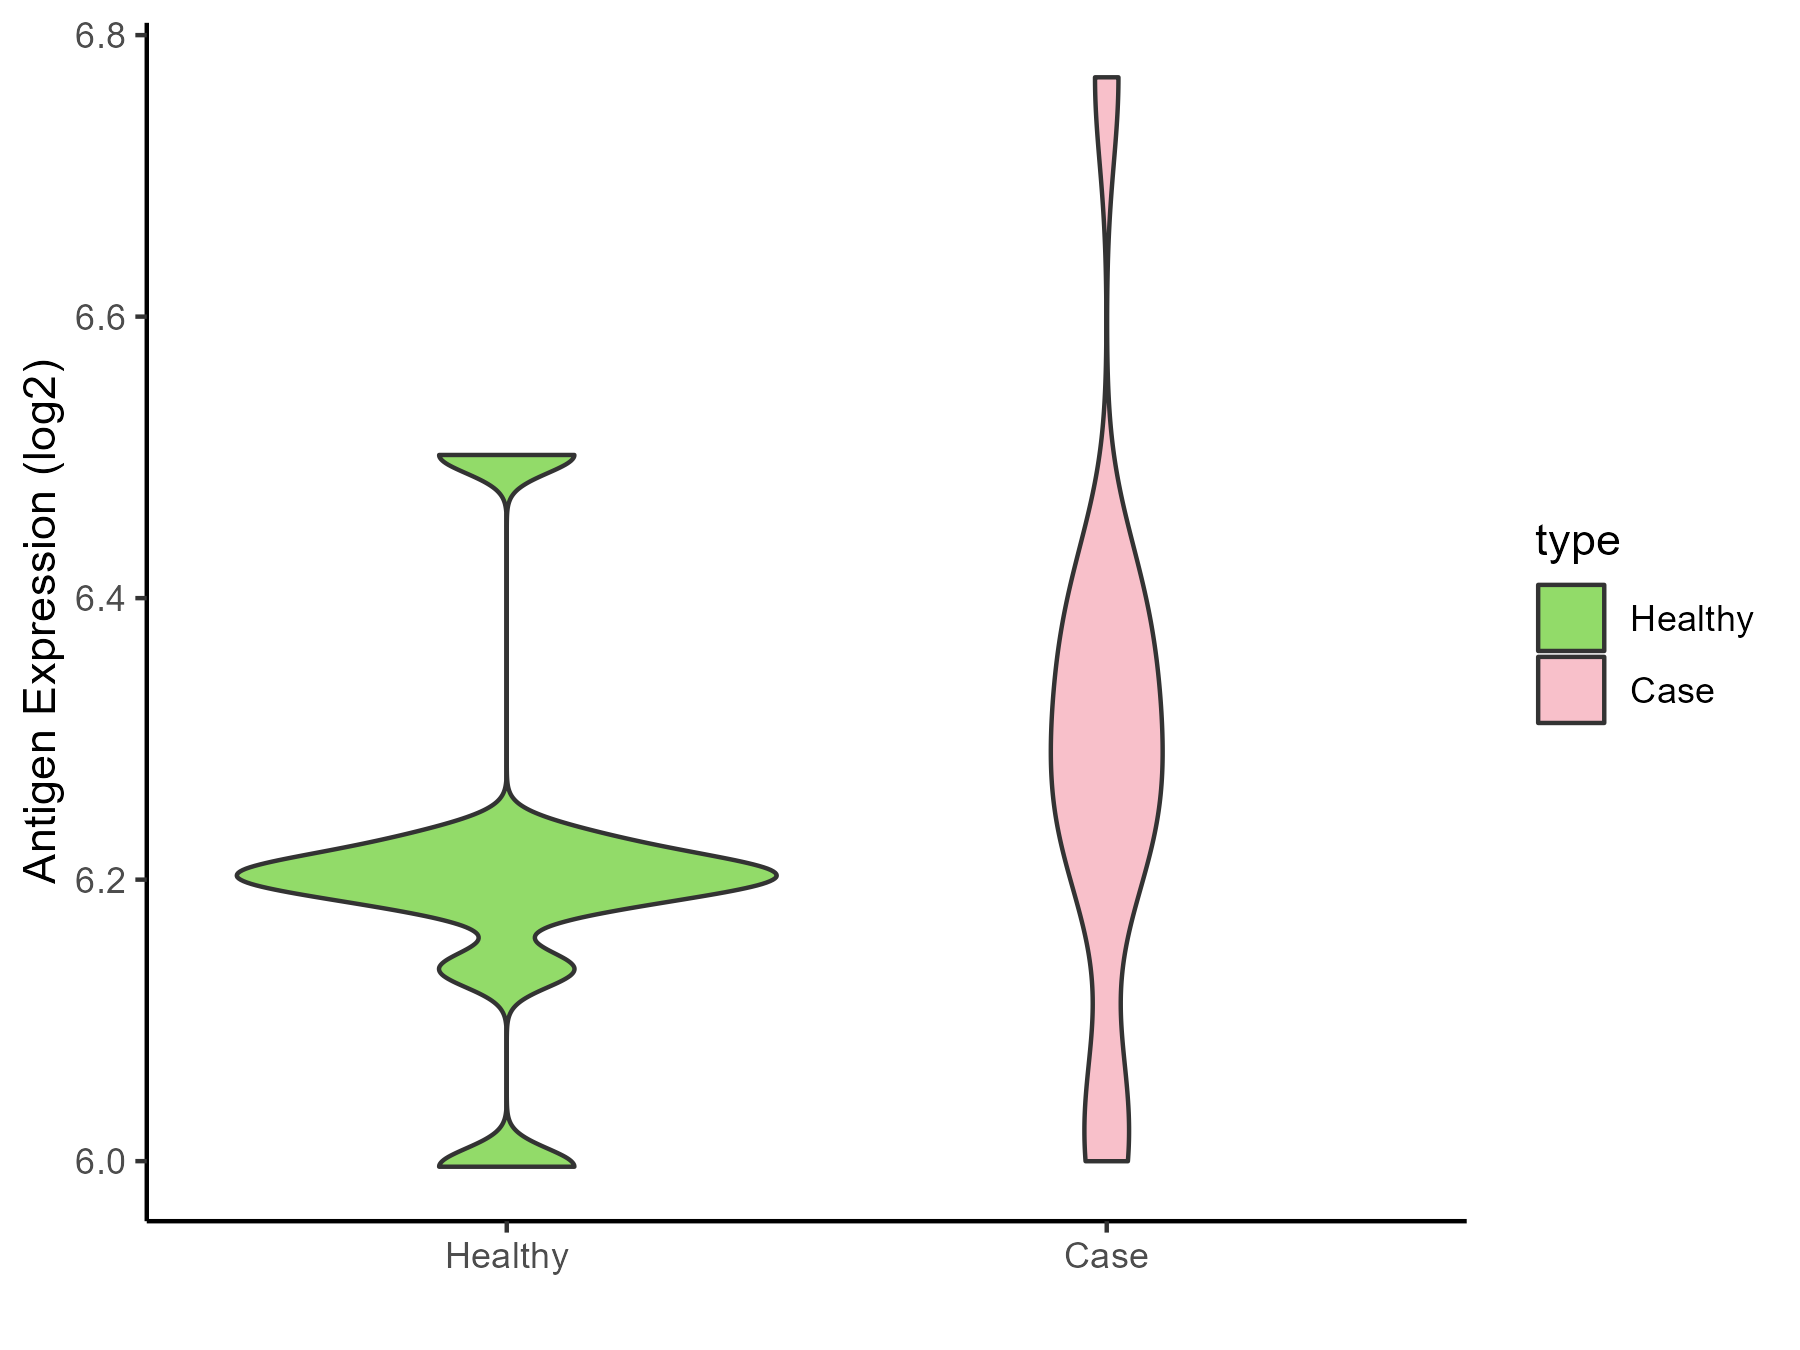
| Differential expression pattern of antigen in diseases | ||
| The Studied Tissue | Peripheral blood | |
| The Specific Disease | Immunodeficiency | |
| The Expression Level of Disease Section Compare with the Healthy Individual Tissue | p-value: 0.248274413; Fold-change: 0.074791057; Z-score: 0.570220459 | |
| Disease-specific Antigen Abundances |
|
Click to View the Clearer Original Diagram |
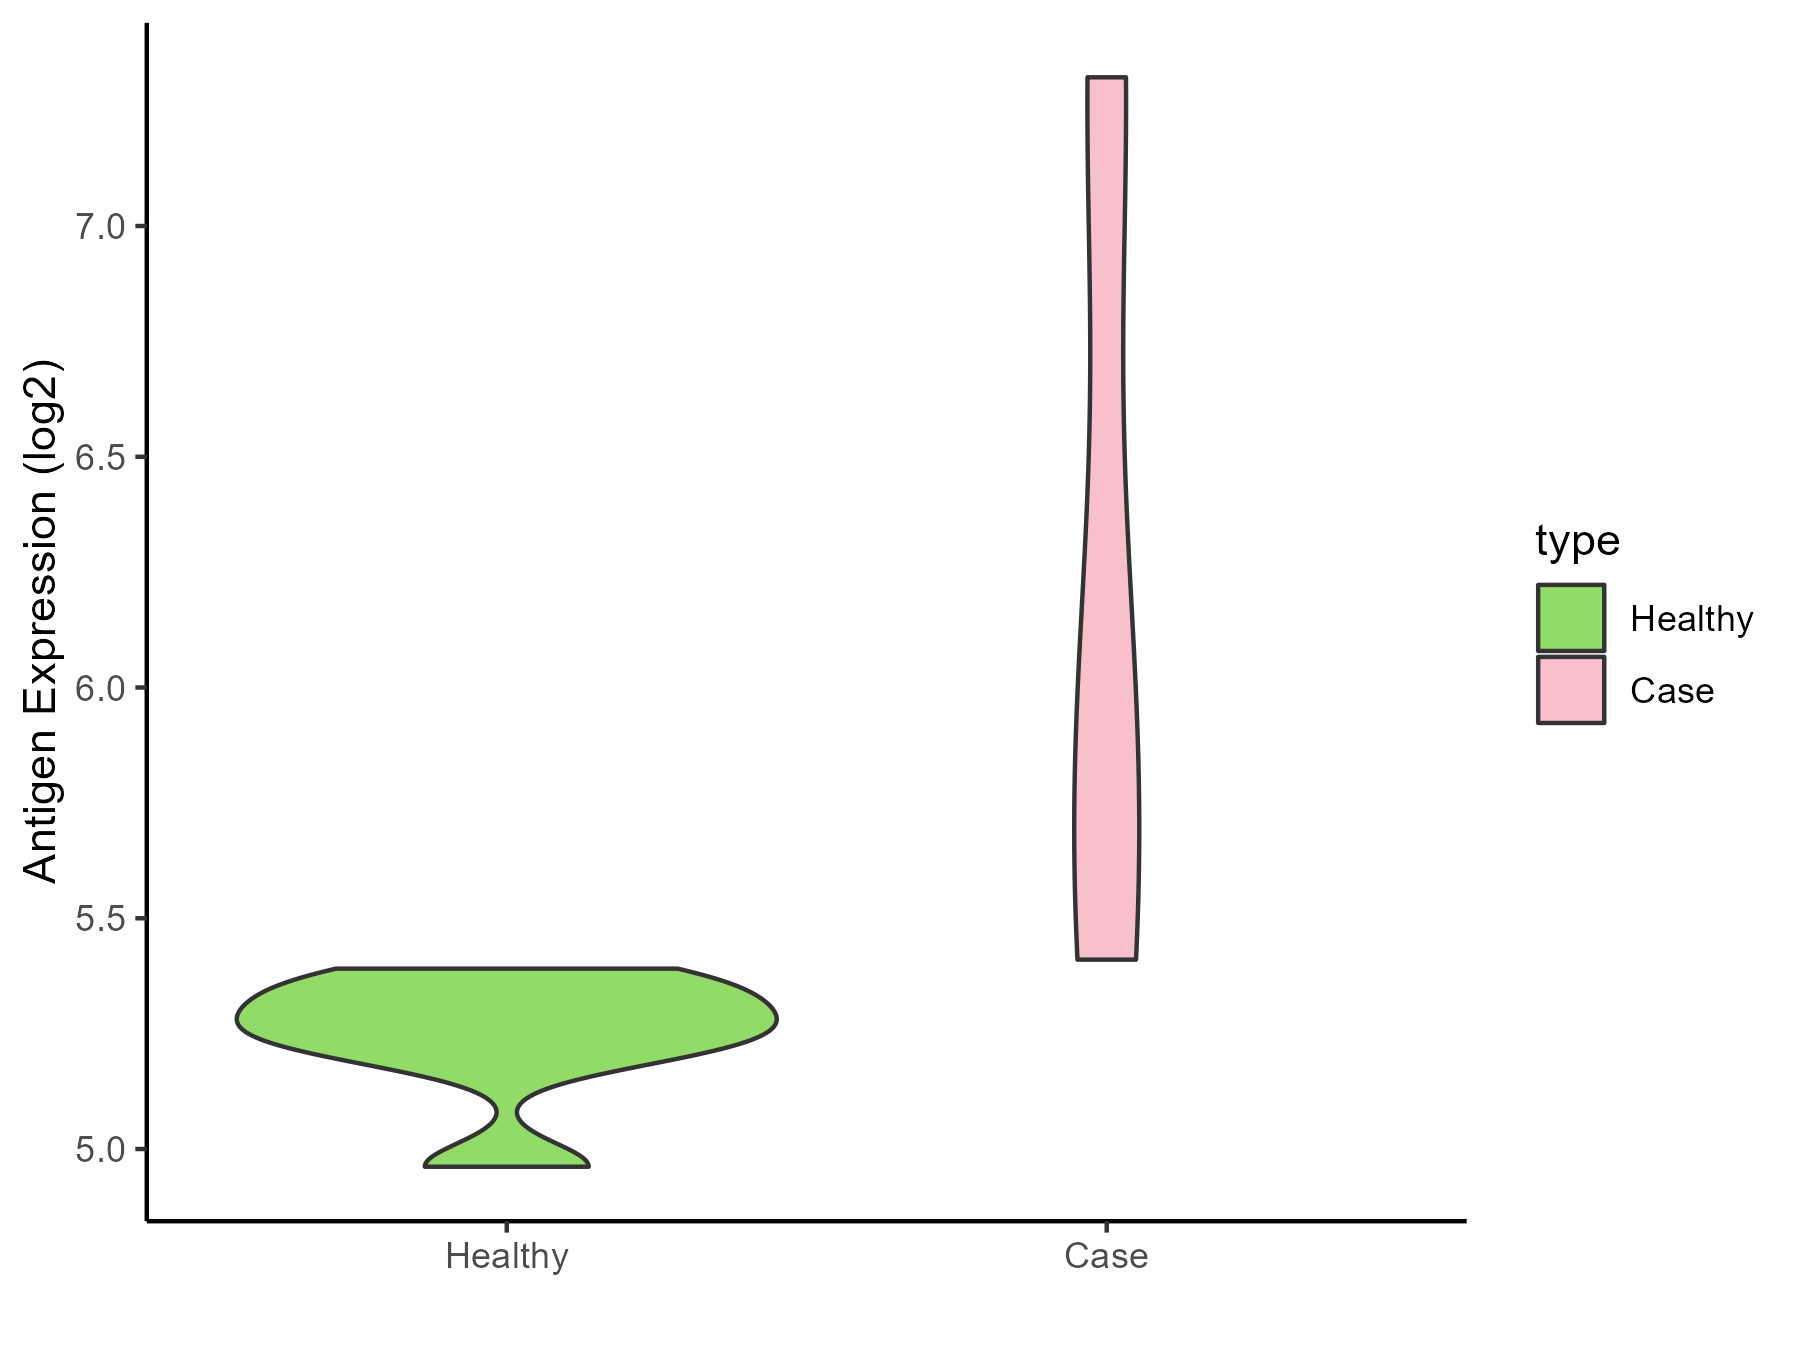
| Differential expression pattern of antigen in diseases | ||
| The Studied Tissue | Hyperplastic tonsil | |
| The Specific Disease | Apnea | |
| The Expression Level of Disease Section Compare with the Healthy Individual Tissue | p-value: 0.224662378; Fold-change: 0.686475785; Z-score: 4.858888285 | |
| Disease-specific Antigen Abundances |
|
Click to View the Clearer Original Diagram |
| Differential expression pattern of antigen in diseases | ||
| The Studied Tissue | Peripheral blood | |
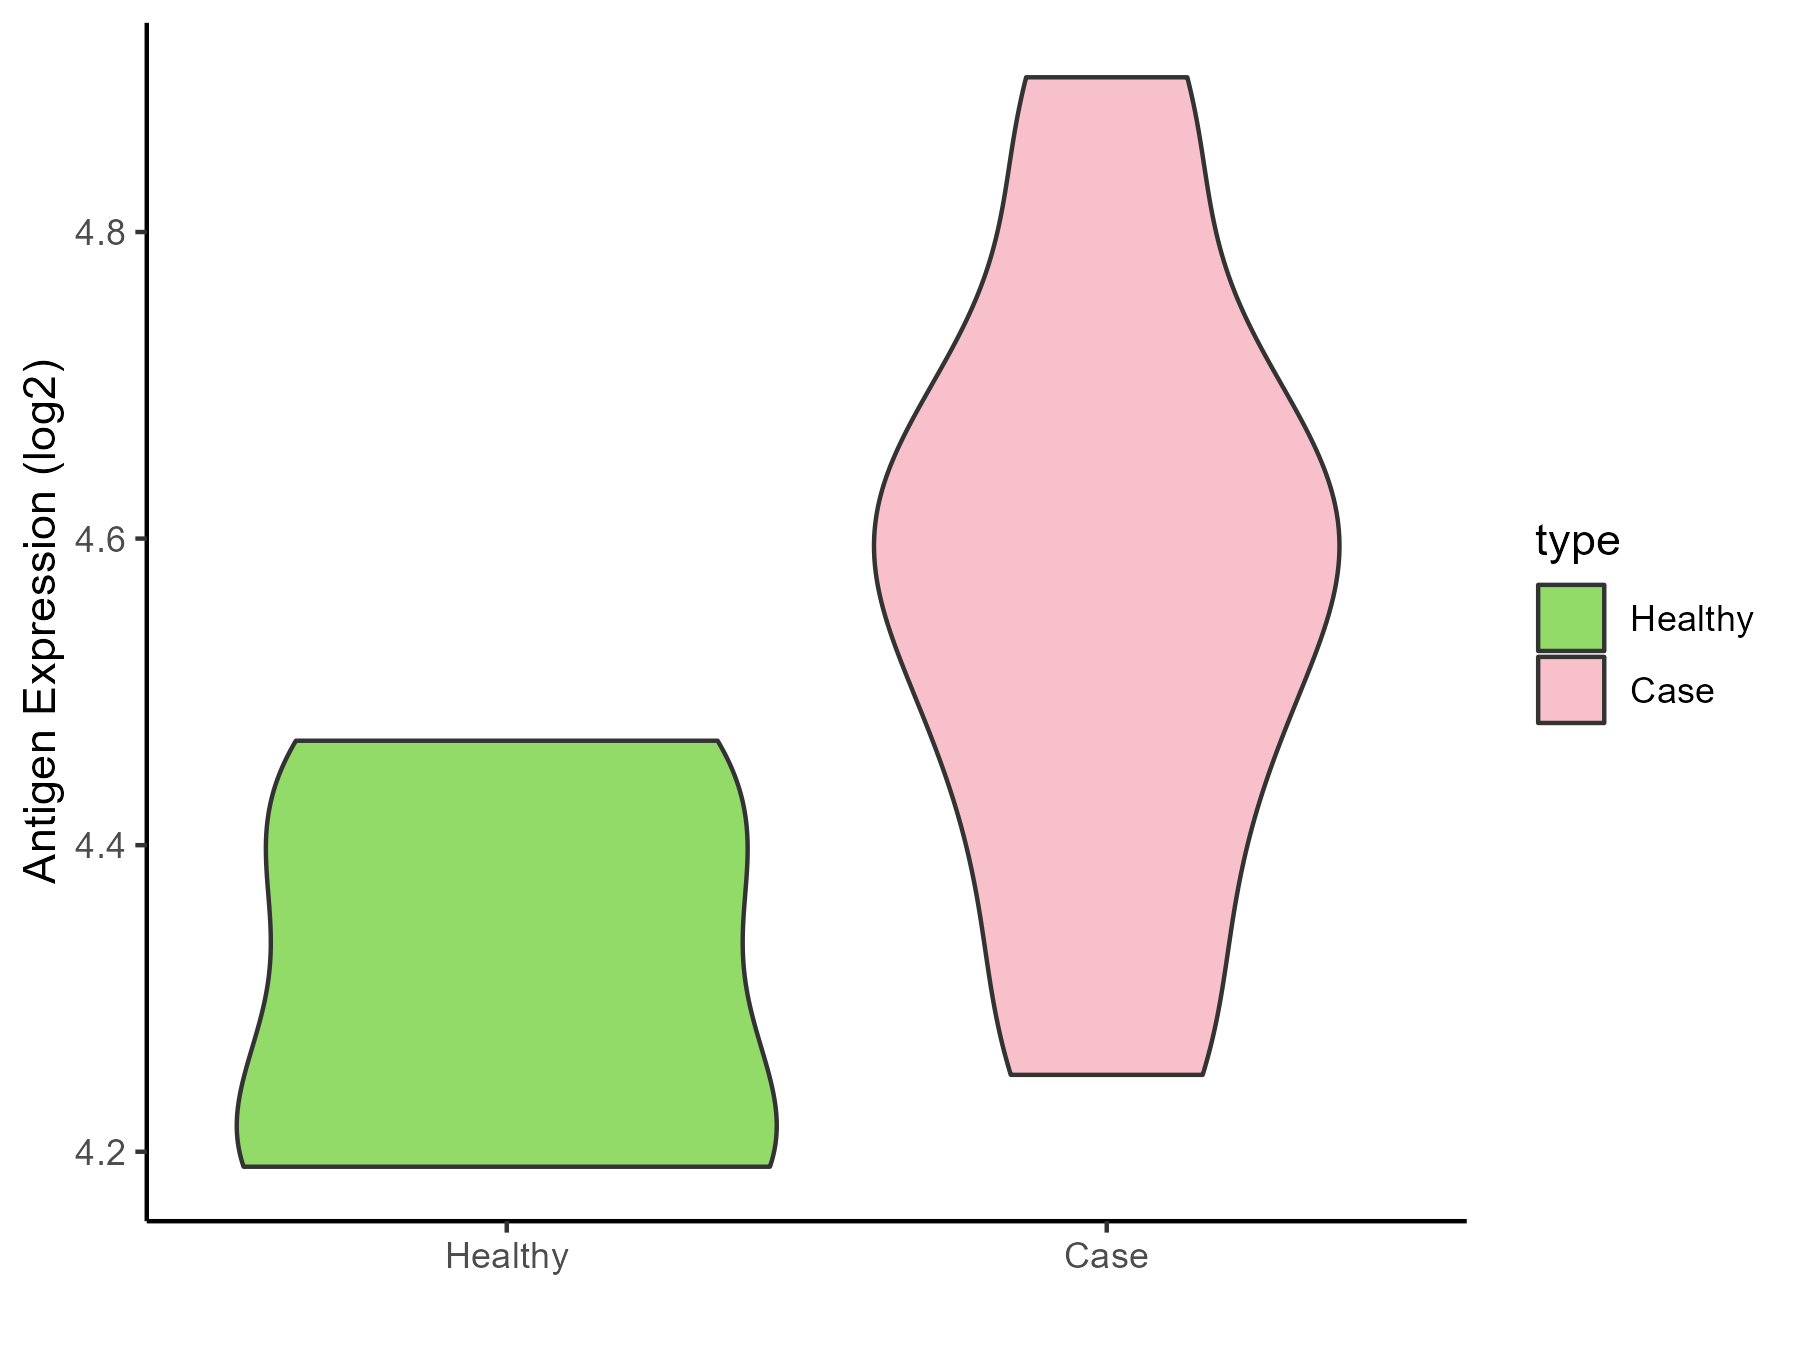
| The Specific Disease | Olive pollen allergy | |
| The Expression Level of Disease Section Compare with the Healthy Individual Tissue | p-value: 0.021088938; Fold-change: 0.288338163; Z-score: 2.098009064 | |
| Disease-specific Antigen Abundances |
|
Click to View the Clearer Original Diagram |
| Differential expression pattern of antigen in diseases | ||
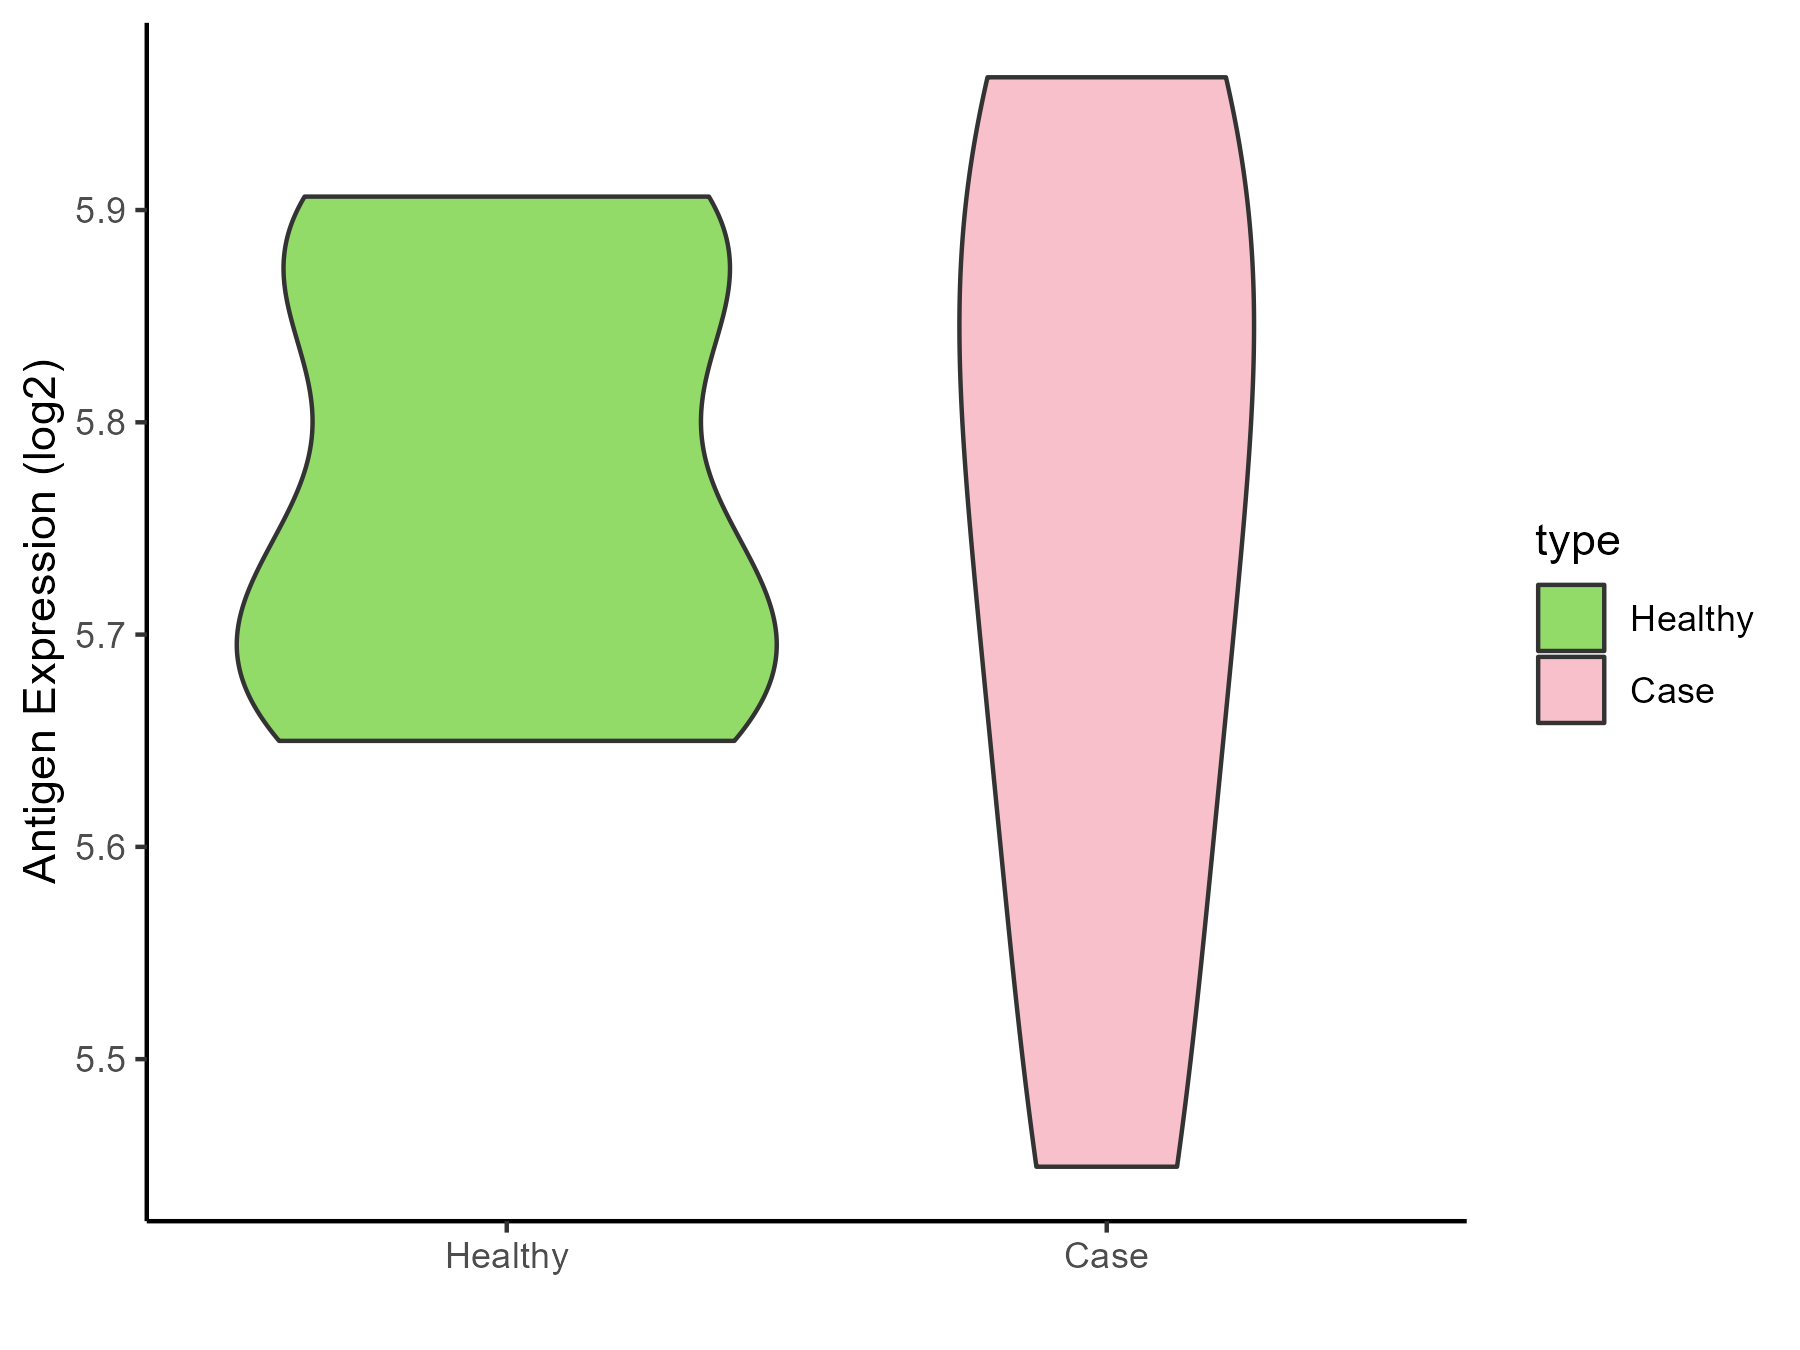
| The Studied Tissue | Sinus mucosa | |
| The Specific Disease | Chronic rhinosinusitis | |
| The Expression Level of Disease Section Compare with the Healthy Individual Tissue | p-value: 0.773004585; Fold-change: 0.030295802; Z-score: 0.291316683 | |
| Disease-specific Antigen Abundances |
|
Click to View the Clearer Original Diagram |
| Differential expression pattern of antigen in diseases | ||
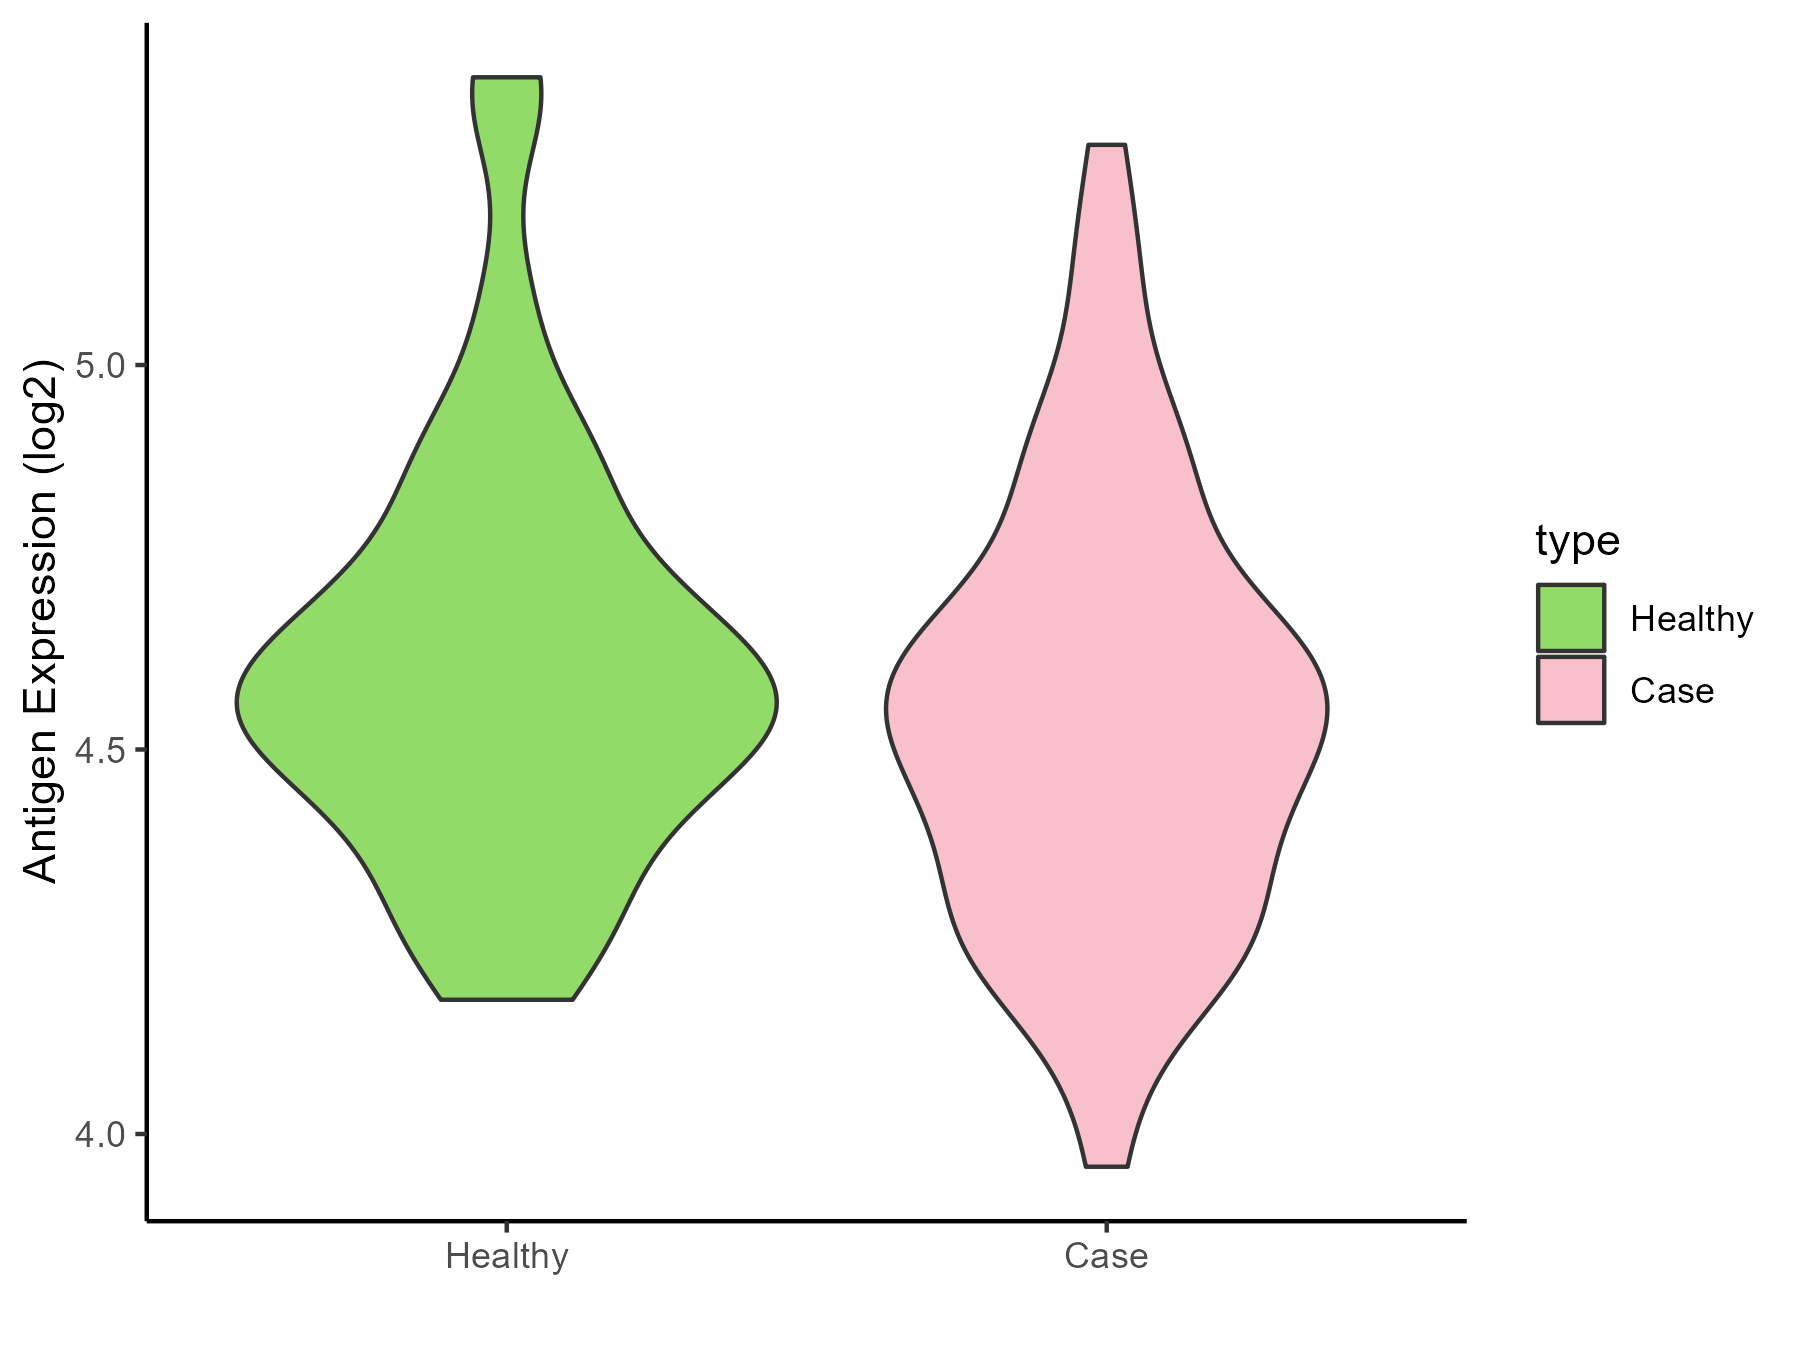
| The Studied Tissue | Lung | |
| The Specific Disease | Chronic obstructive pulmonary disease | |
| The Expression Level of Disease Section Compare with the Healthy Individual Tissue | p-value: 0.234702263; Fold-change: -0.020272862; Z-score: -0.07418088 | |
| Disease-specific Antigen Abundances |
|
Click to View the Clearer Original Diagram |
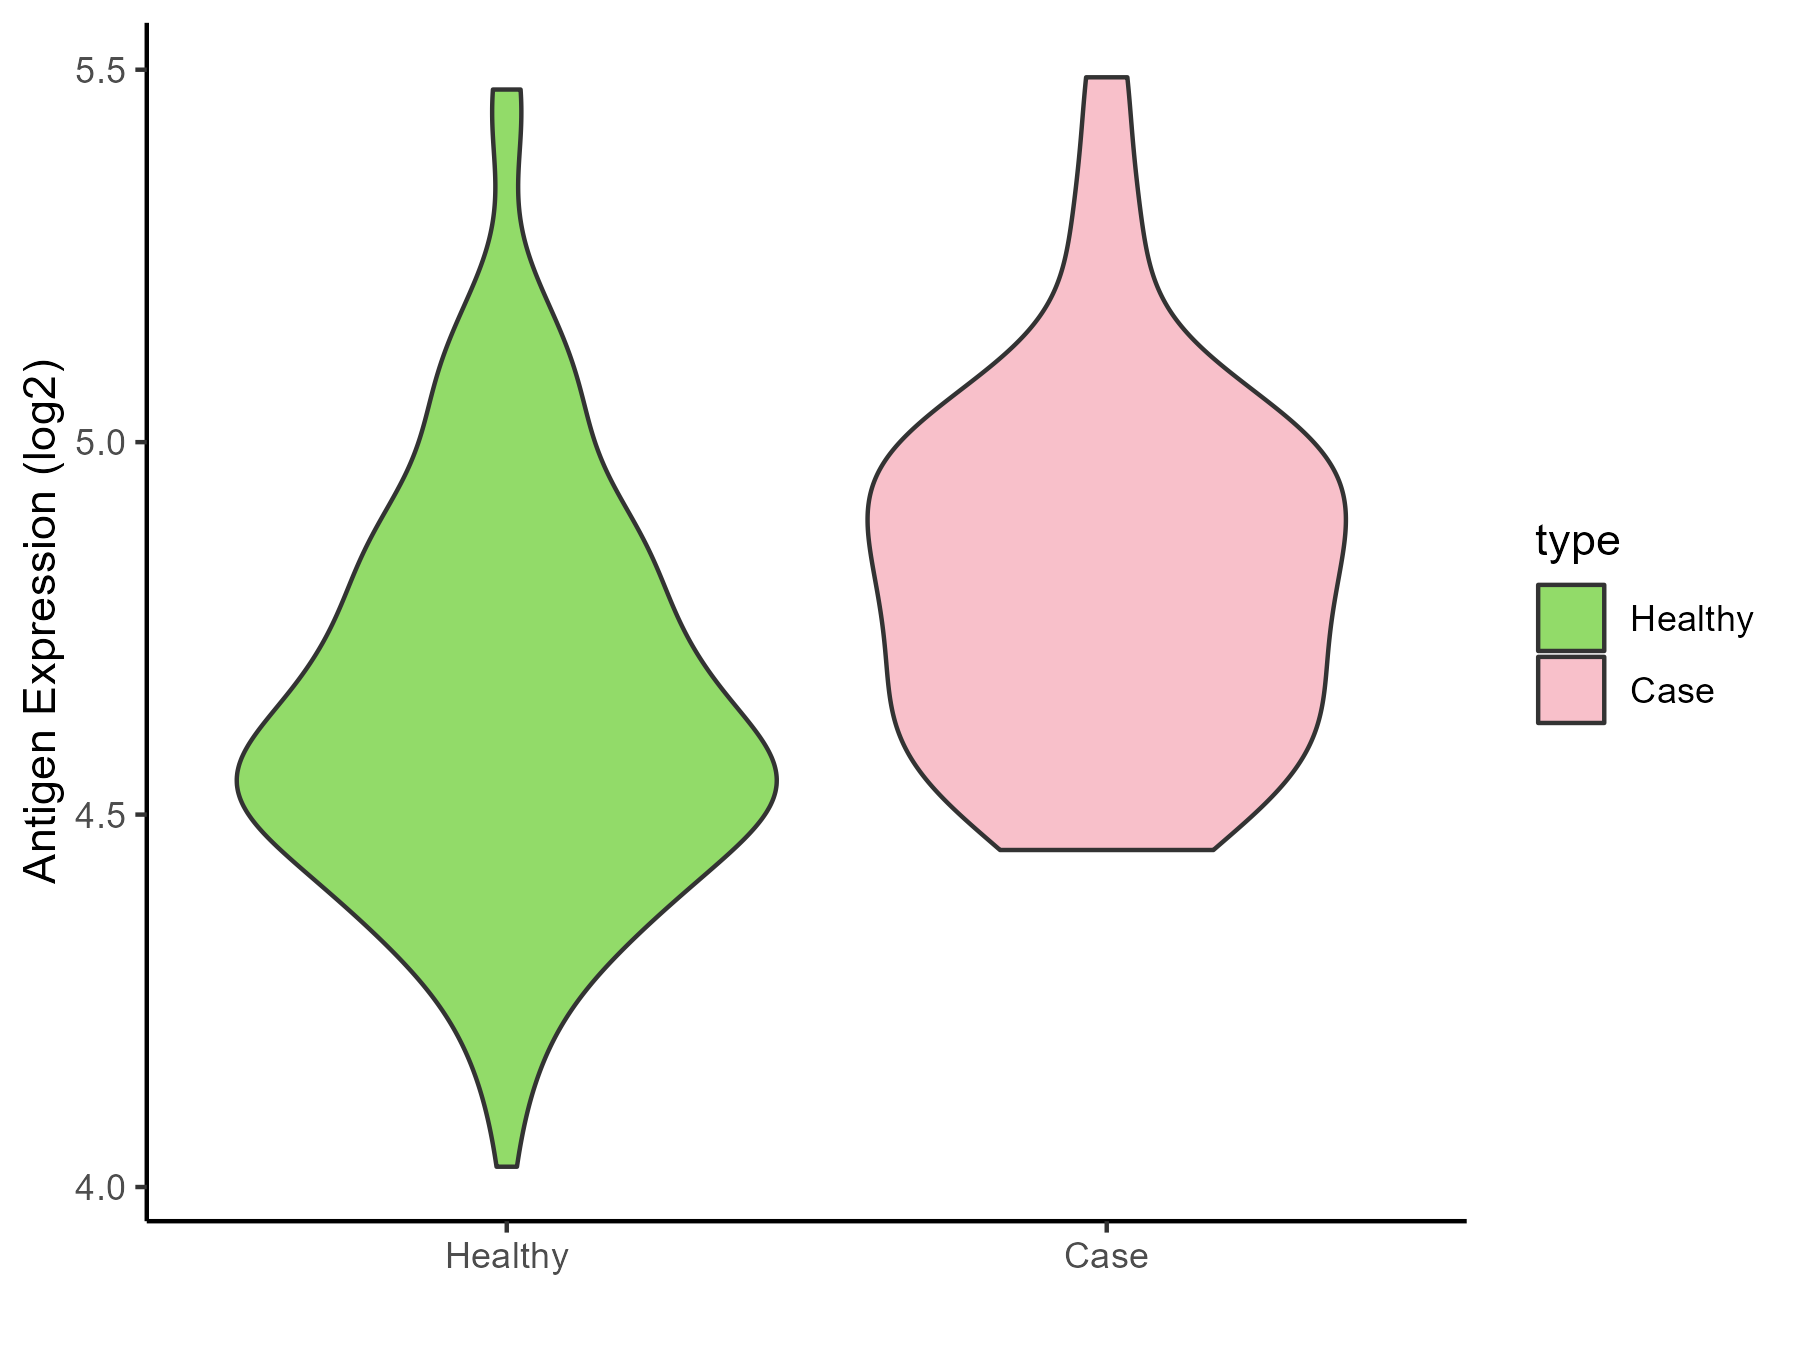
| The Studied Tissue | Small airway epithelium | |
| The Specific Disease | Chronic obstructive pulmonary disease | |
| The Expression Level of Disease Section Compare with the Healthy Individual Tissue | p-value: 0.000197778; Fold-change: 0.214634078; Z-score: 0.806897034 | |
| Disease-specific Antigen Abundances |
|
Click to View the Clearer Original Diagram |
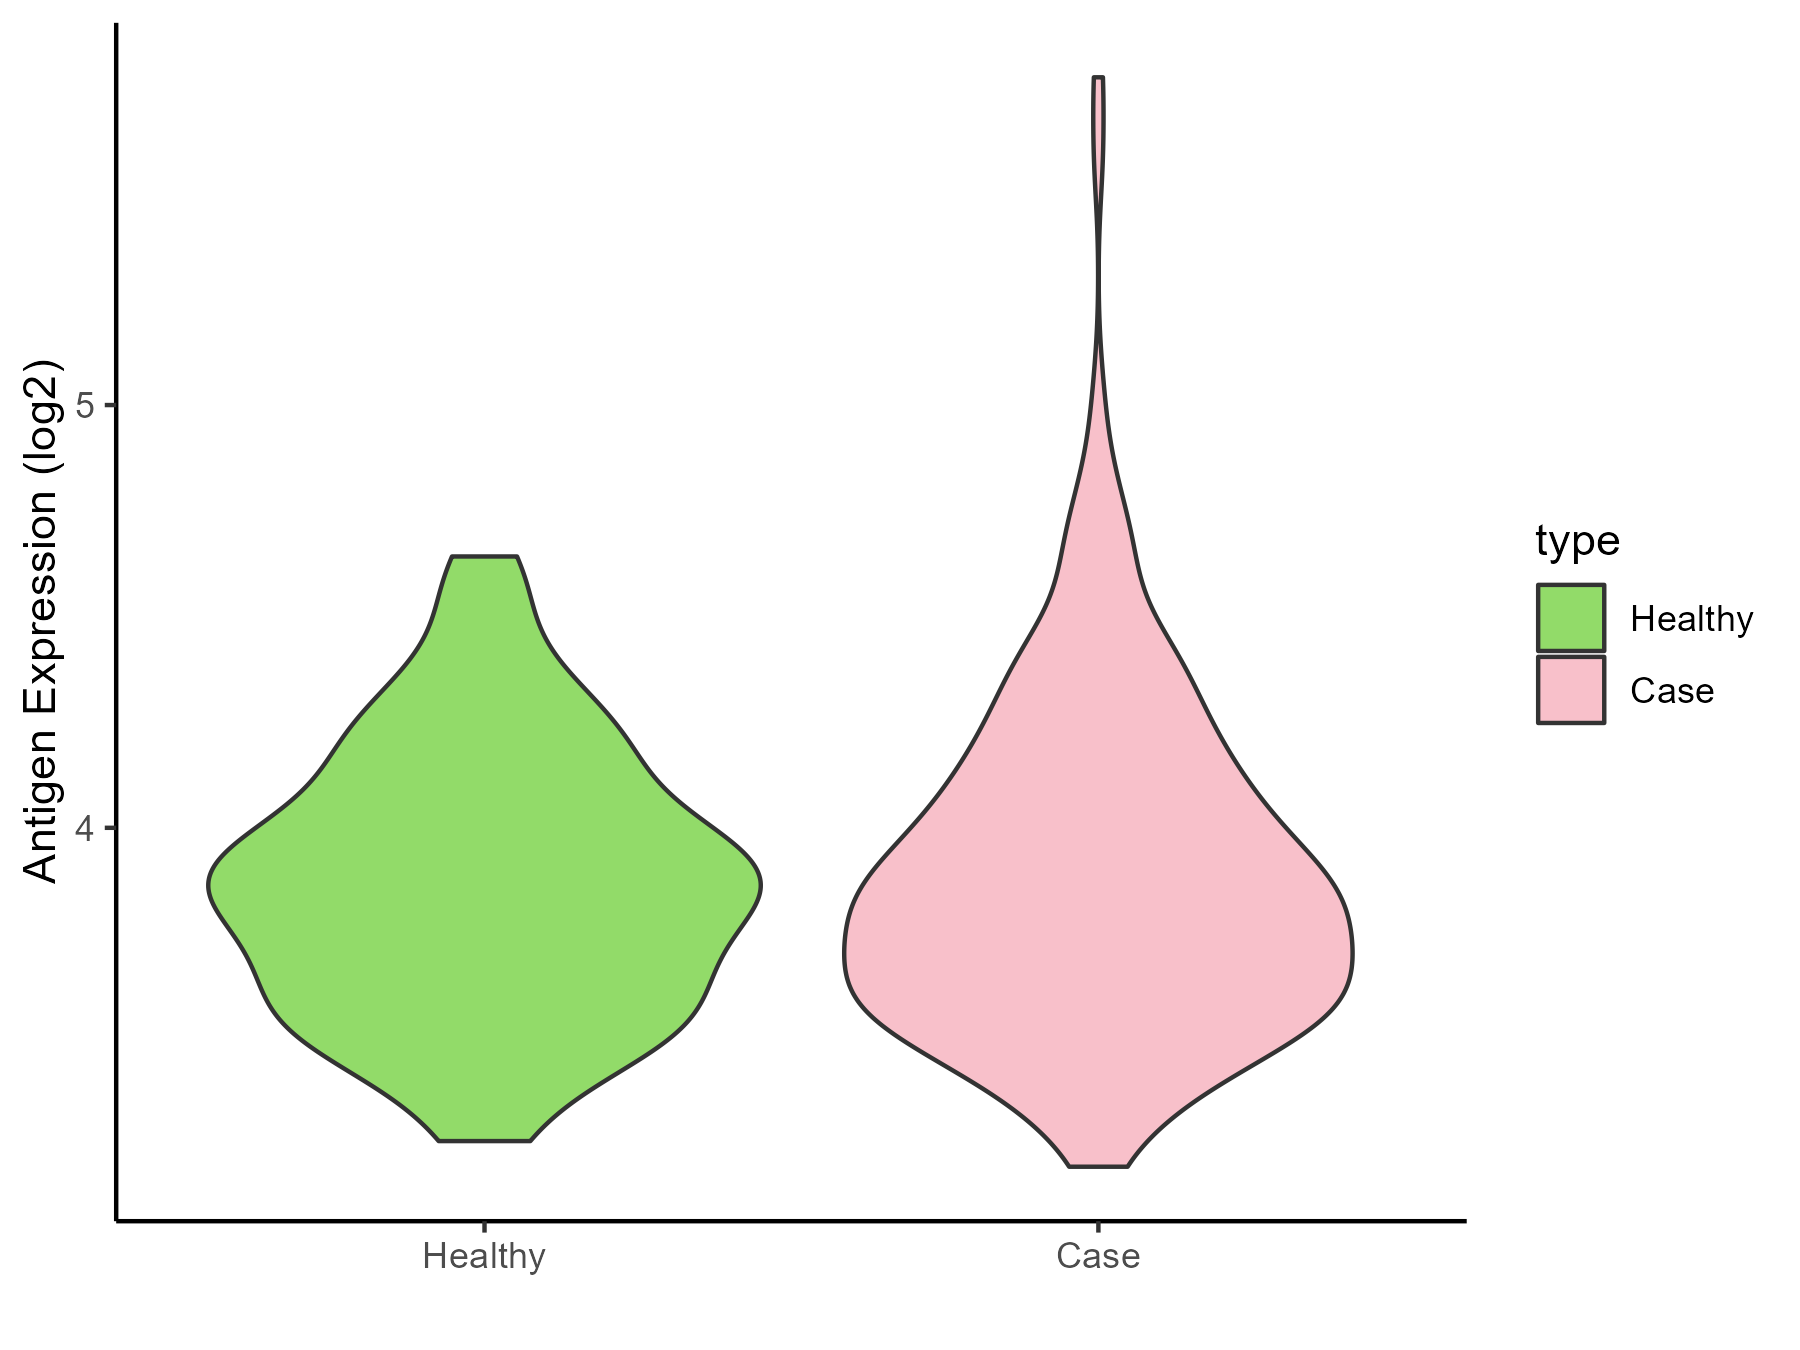
| Differential expression pattern of antigen in diseases | ||
| The Studied Tissue | Nasal and bronchial airway | |
| The Specific Disease | Asthma | |
| The Expression Level of Disease Section Compare with the Healthy Individual Tissue | p-value: 0.558373568; Fold-change: -0.020194019; Z-score: -0.064371631 | |
| Disease-specific Antigen Abundances |
|
Click to View the Clearer Original Diagram |
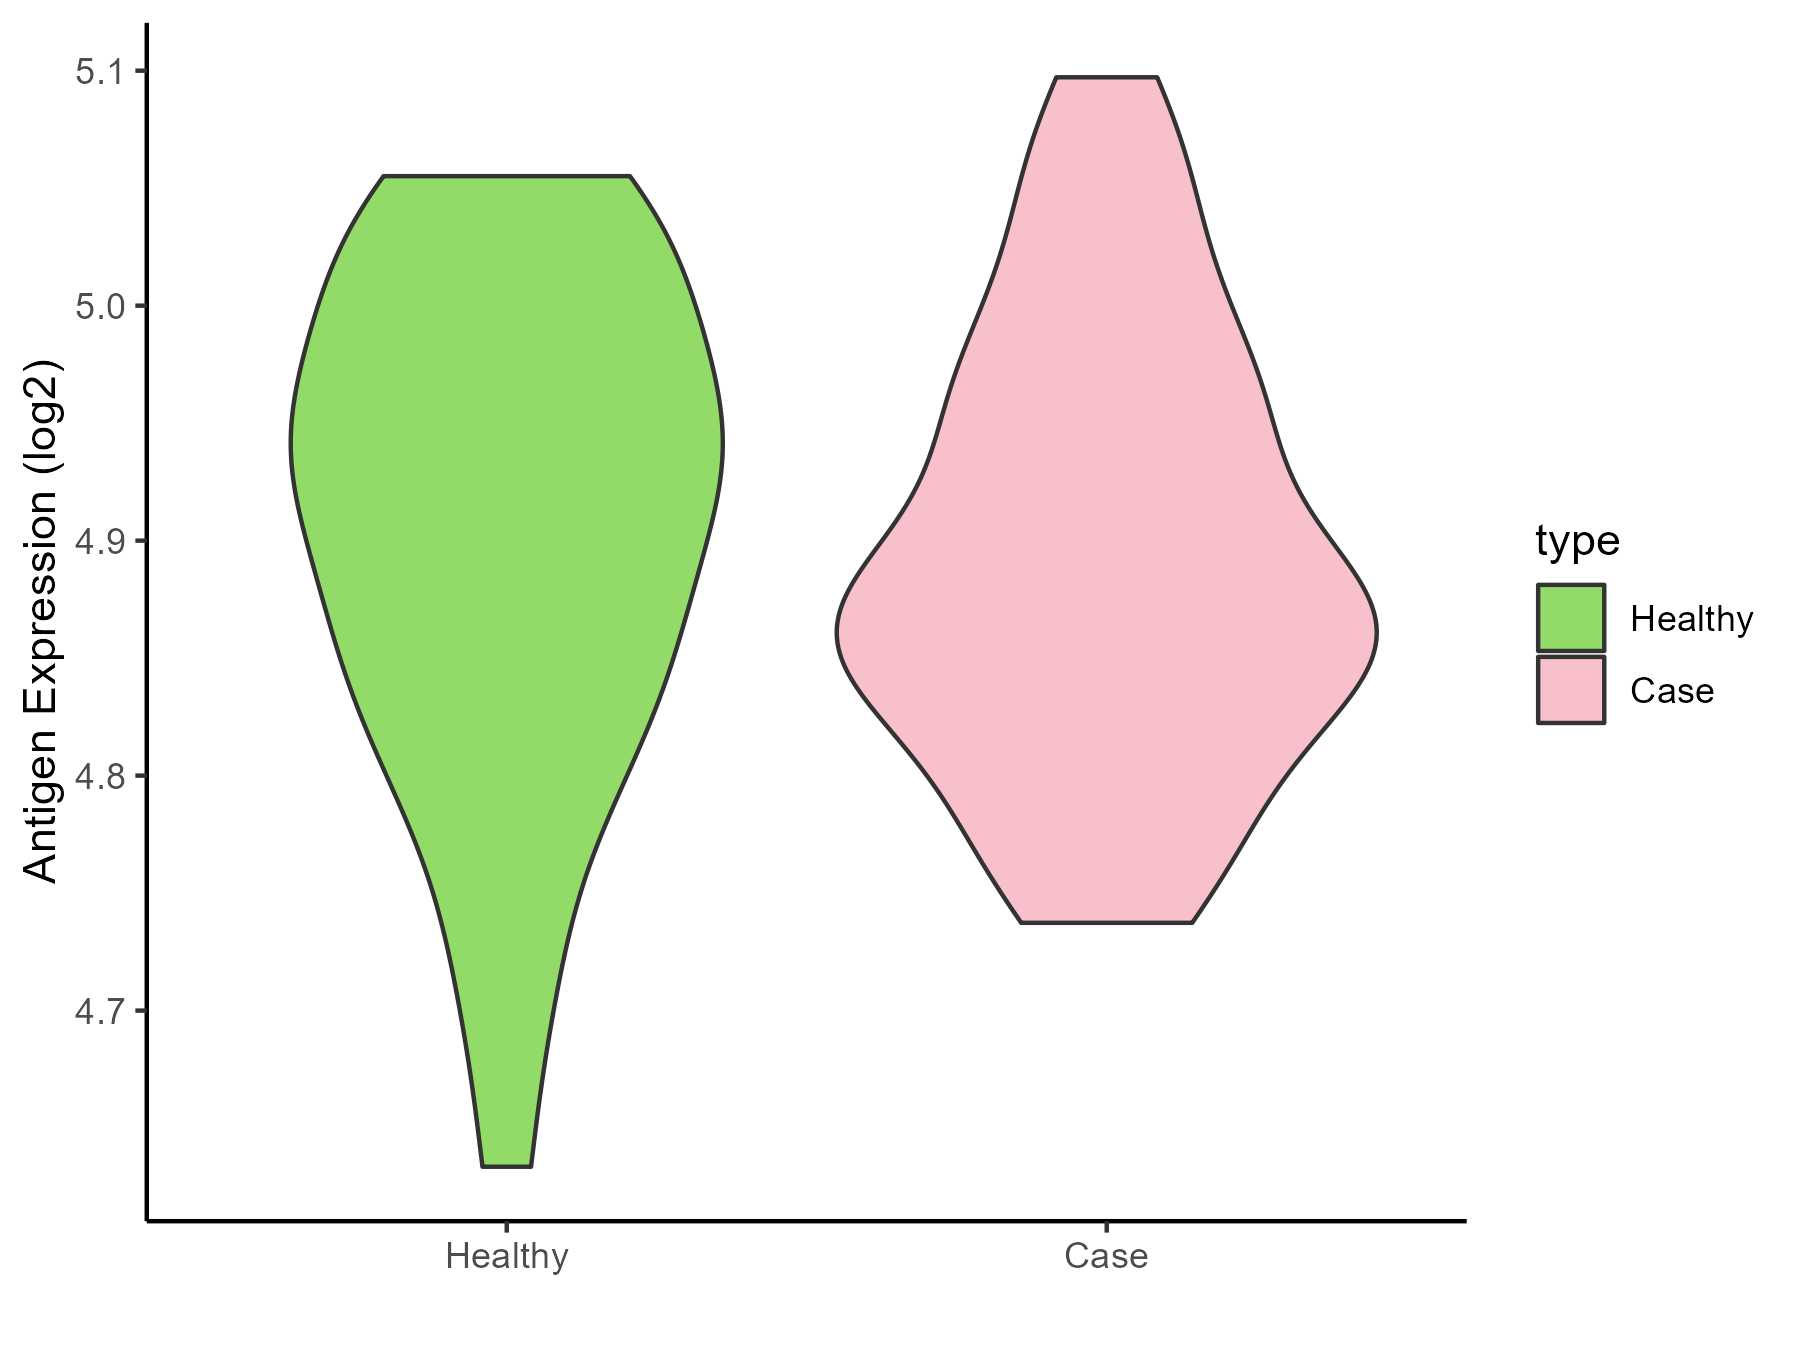
| Differential expression pattern of antigen in diseases | ||
| The Studied Tissue | Nasal Epithelium | |
| The Specific Disease | Human rhinovirus infection | |
| The Expression Level of Disease Section Compare with the Healthy Individual Tissue | p-value: 0.599293673; Fold-change: -0.052142261; Z-score: -0.487903543 | |
| Disease-specific Antigen Abundances |
|
Click to View the Clearer Original Diagram |
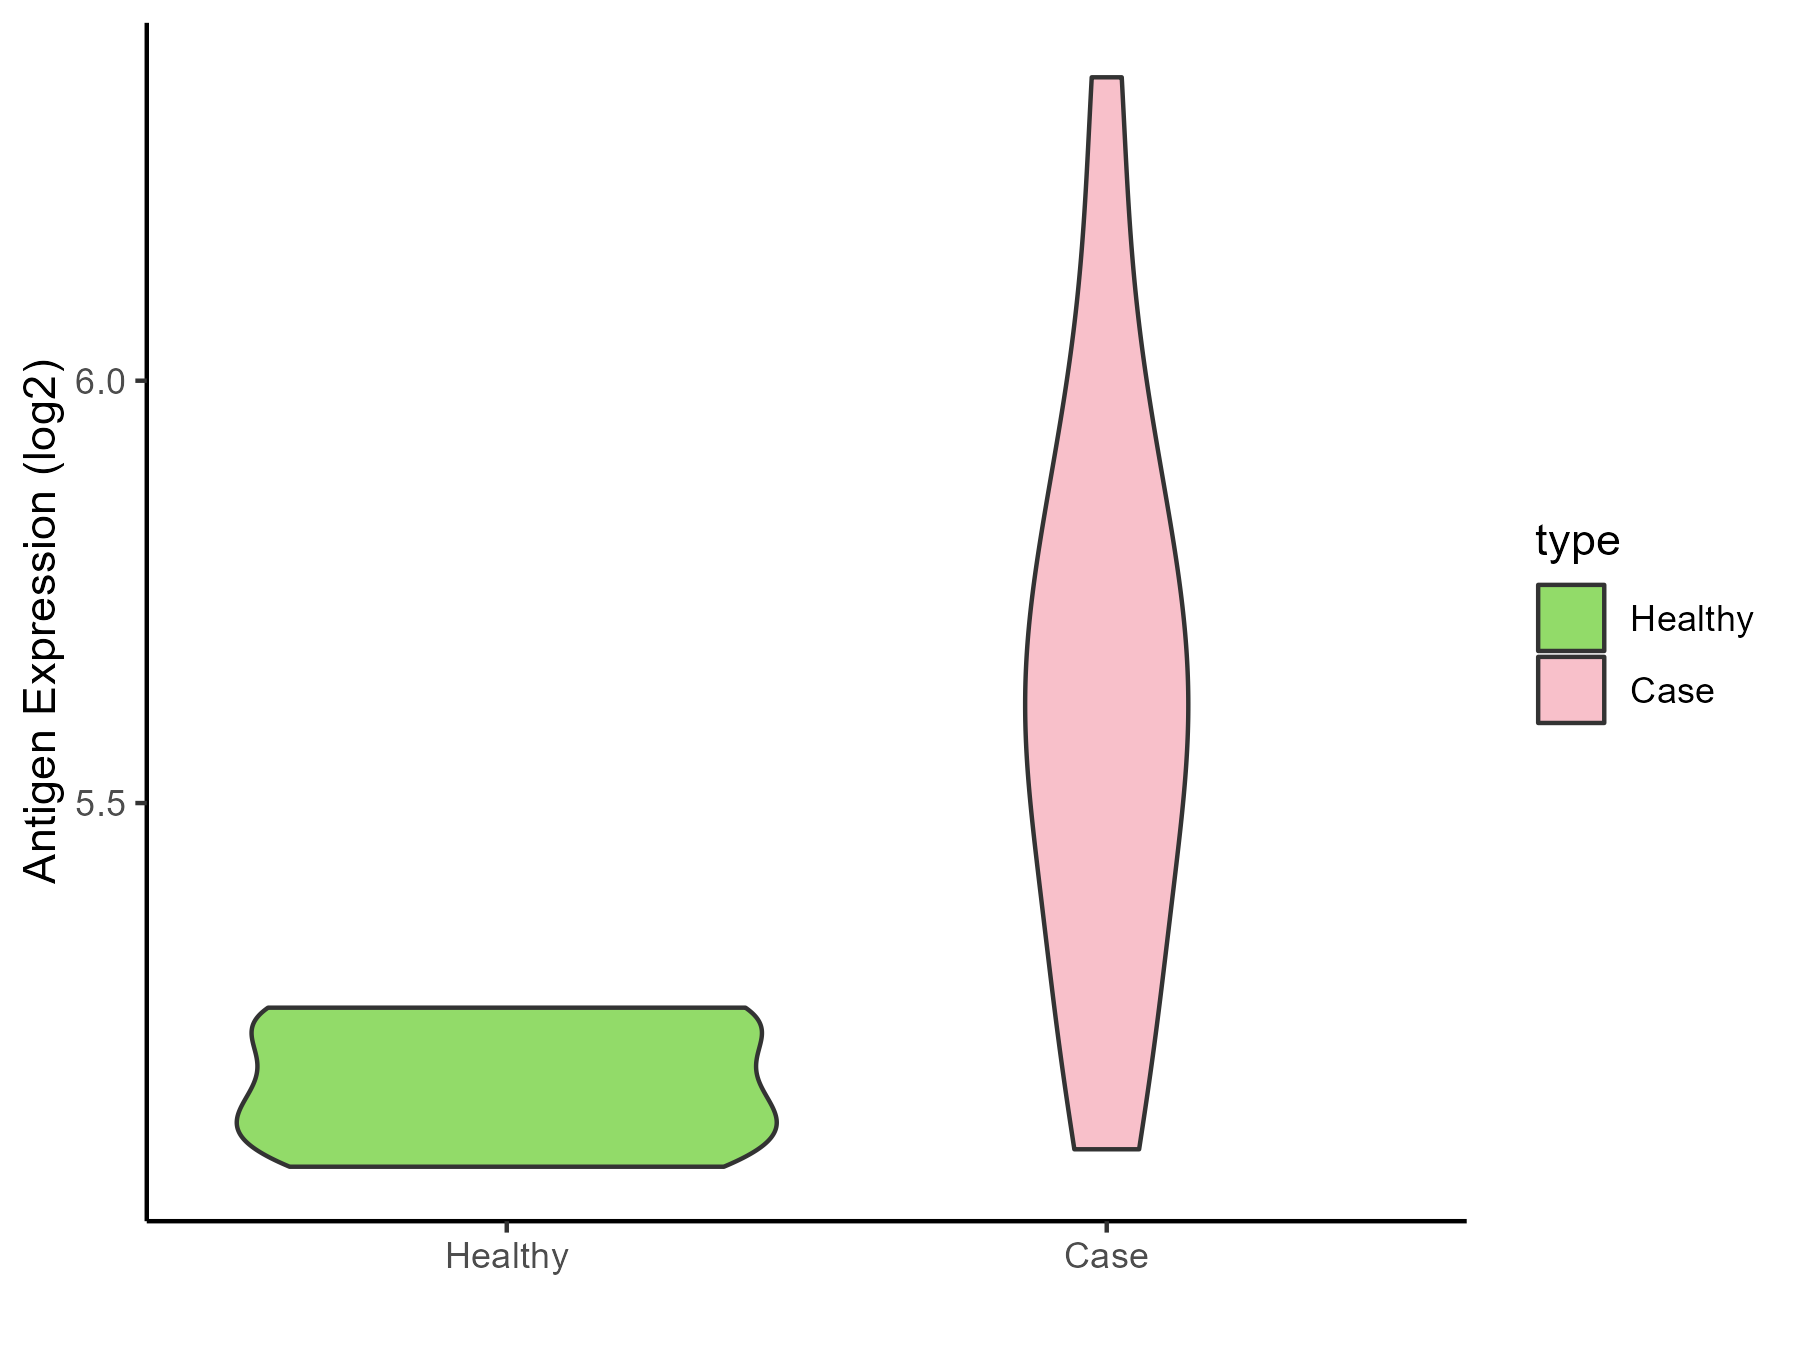
| Differential expression pattern of antigen in diseases | ||
| The Studied Tissue | Lung | |
| The Specific Disease | Idiopathic pulmonary fibrosis | |
| The Expression Level of Disease Section Compare with the Healthy Individual Tissue | p-value: 5.44E-05; Fold-change: 0.432646922; Z-score: 5.218334892 | |
| Disease-specific Antigen Abundances |
|
Click to View the Clearer Original Diagram |
ICD Disease Classification 13
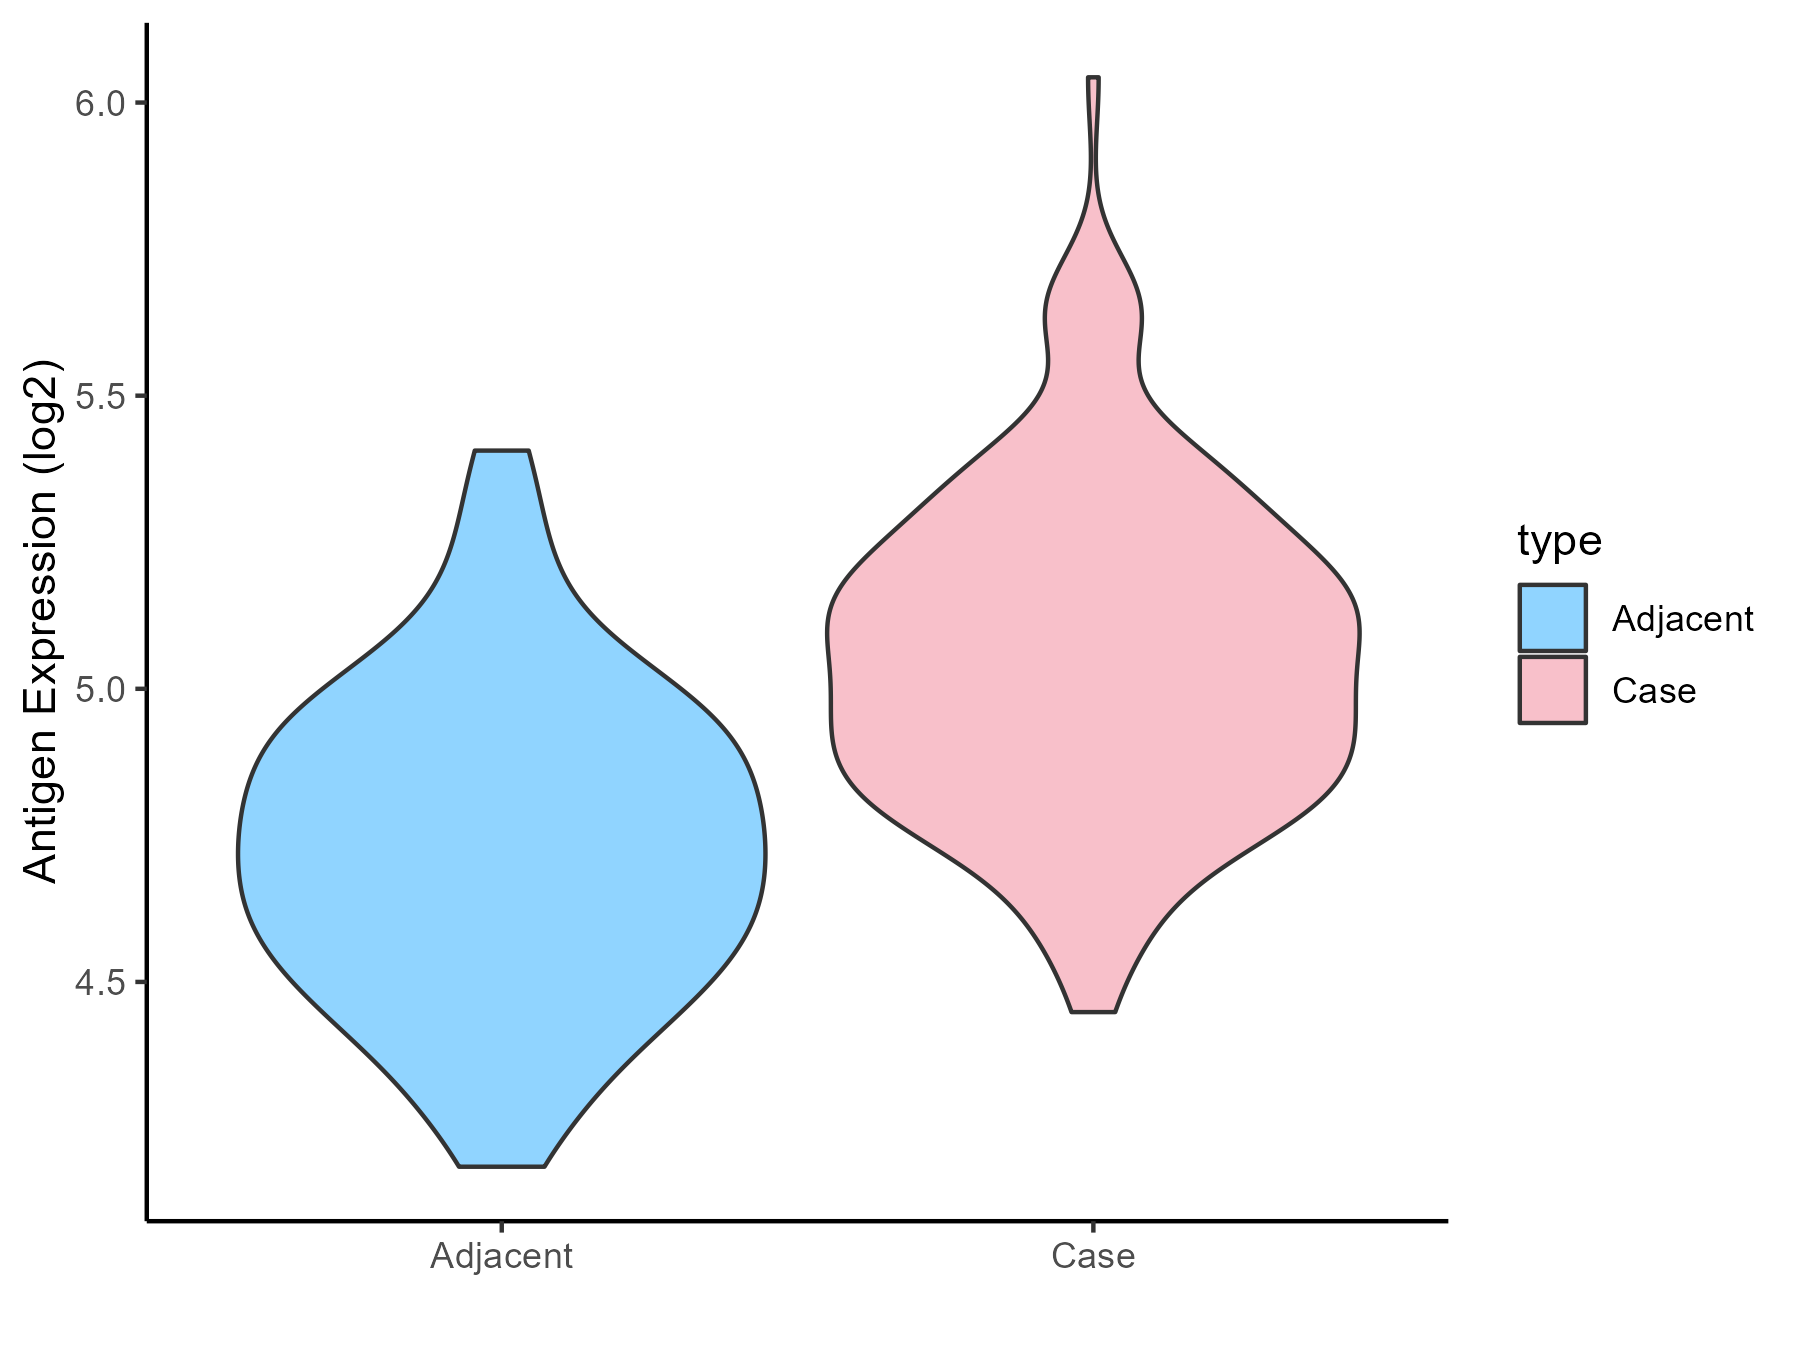
| Differential expression pattern of antigen in diseases | ||
| The Studied Tissue | Gingival | |
| The Specific Disease | Periodontal disease | |
| The Expression Level of Disease Section Compare with the Adjacent Tissue | p-value: 3.74E-12; Fold-change: 0.295838282; Z-score: 1.118095993 | |
| Disease-specific Antigen Abundances |
|
Click to View the Clearer Original Diagram |
| Differential expression pattern of antigen in diseases | ||
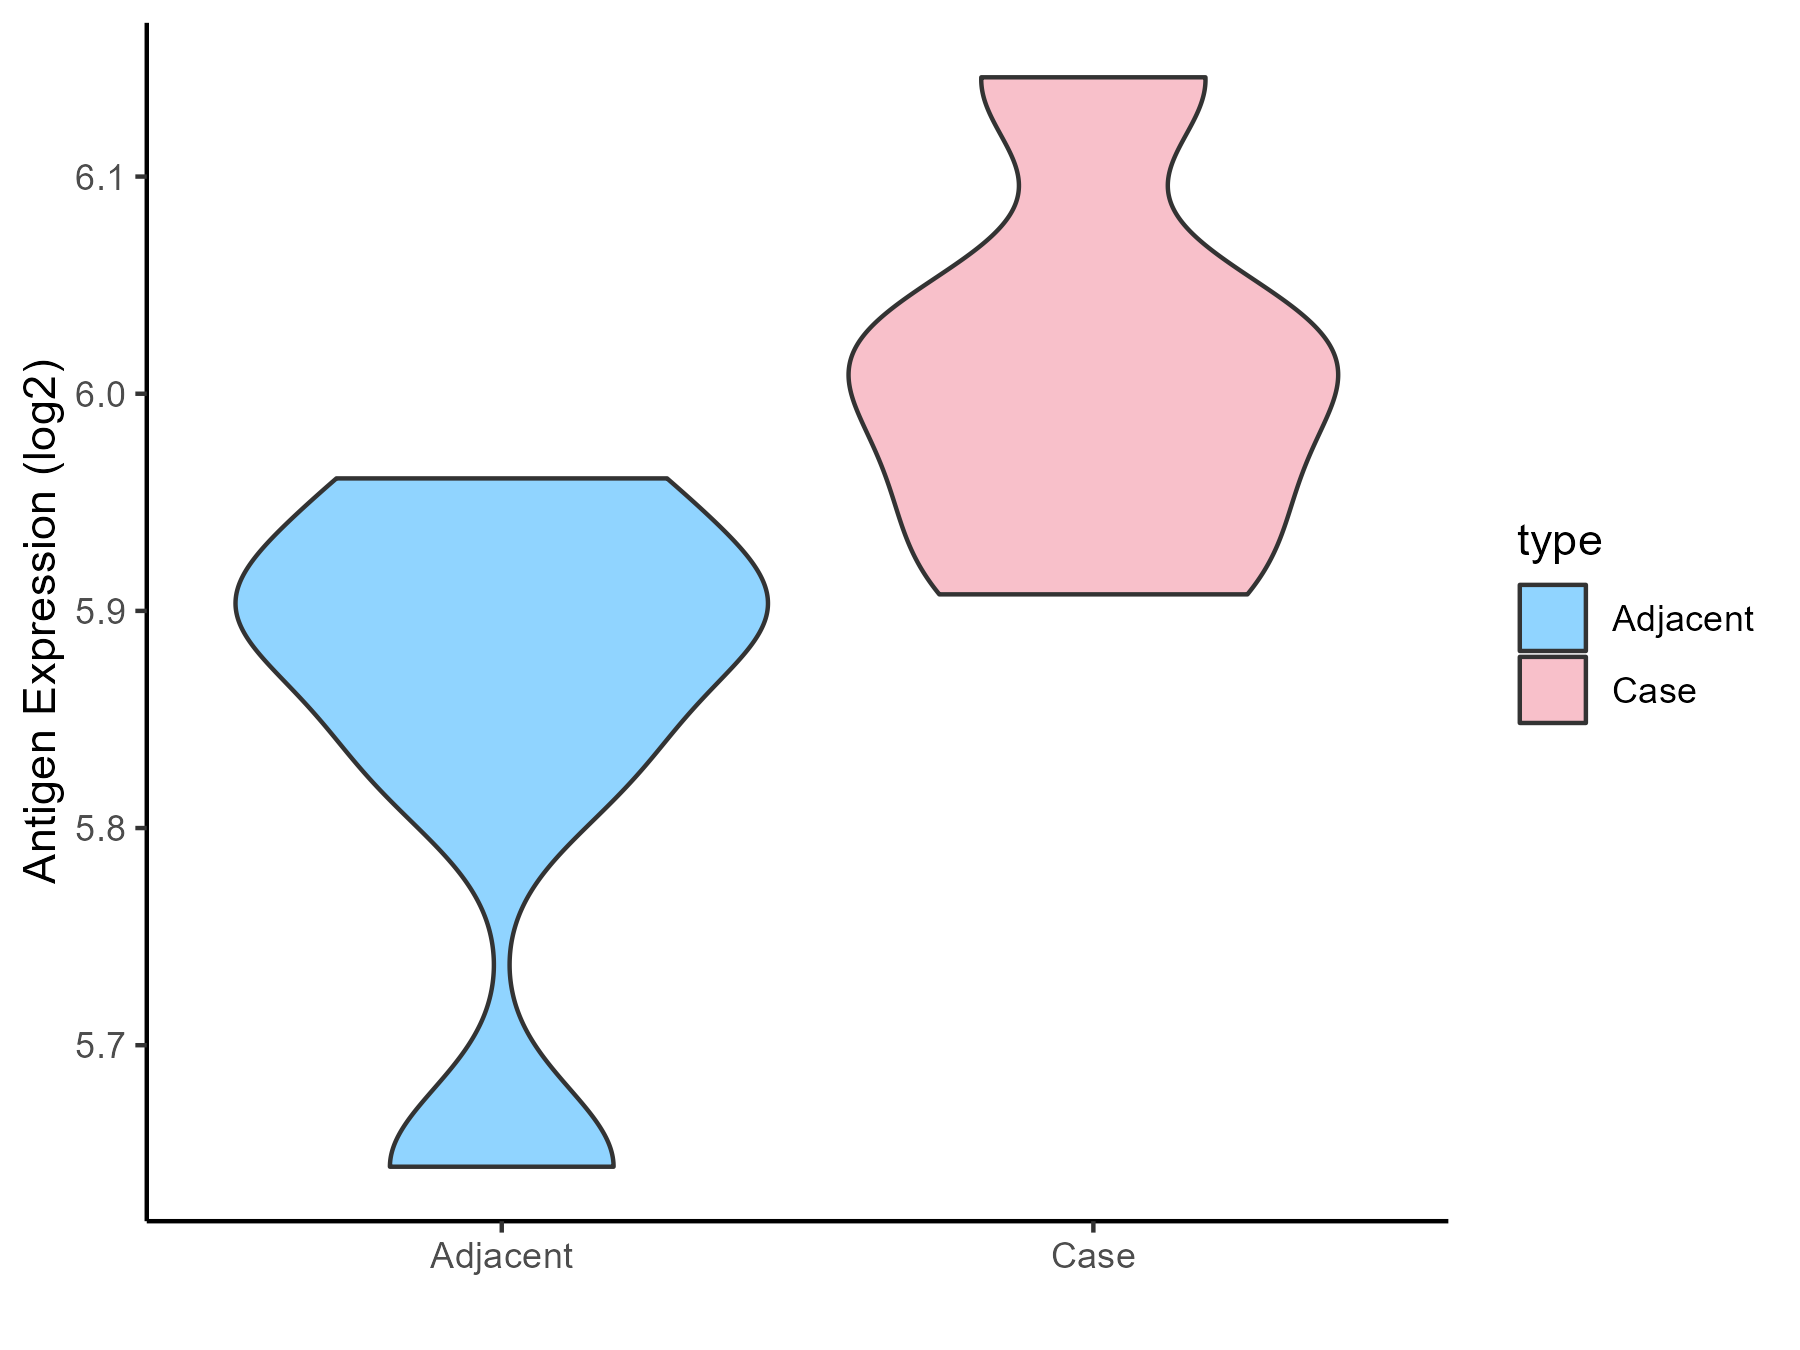
| The Studied Tissue | Gastric antrum | |
| The Specific Disease | Eosinophilic gastritis | |
| The Expression Level of Disease Section Compare with the Adjacent Tissue | p-value: 0.044731656; Fold-change: 0.114279743; Z-score: 0.932177197 | |
| Disease-specific Antigen Abundances |
|
Click to View the Clearer Original Diagram |
| Differential expression pattern of antigen in diseases | ||
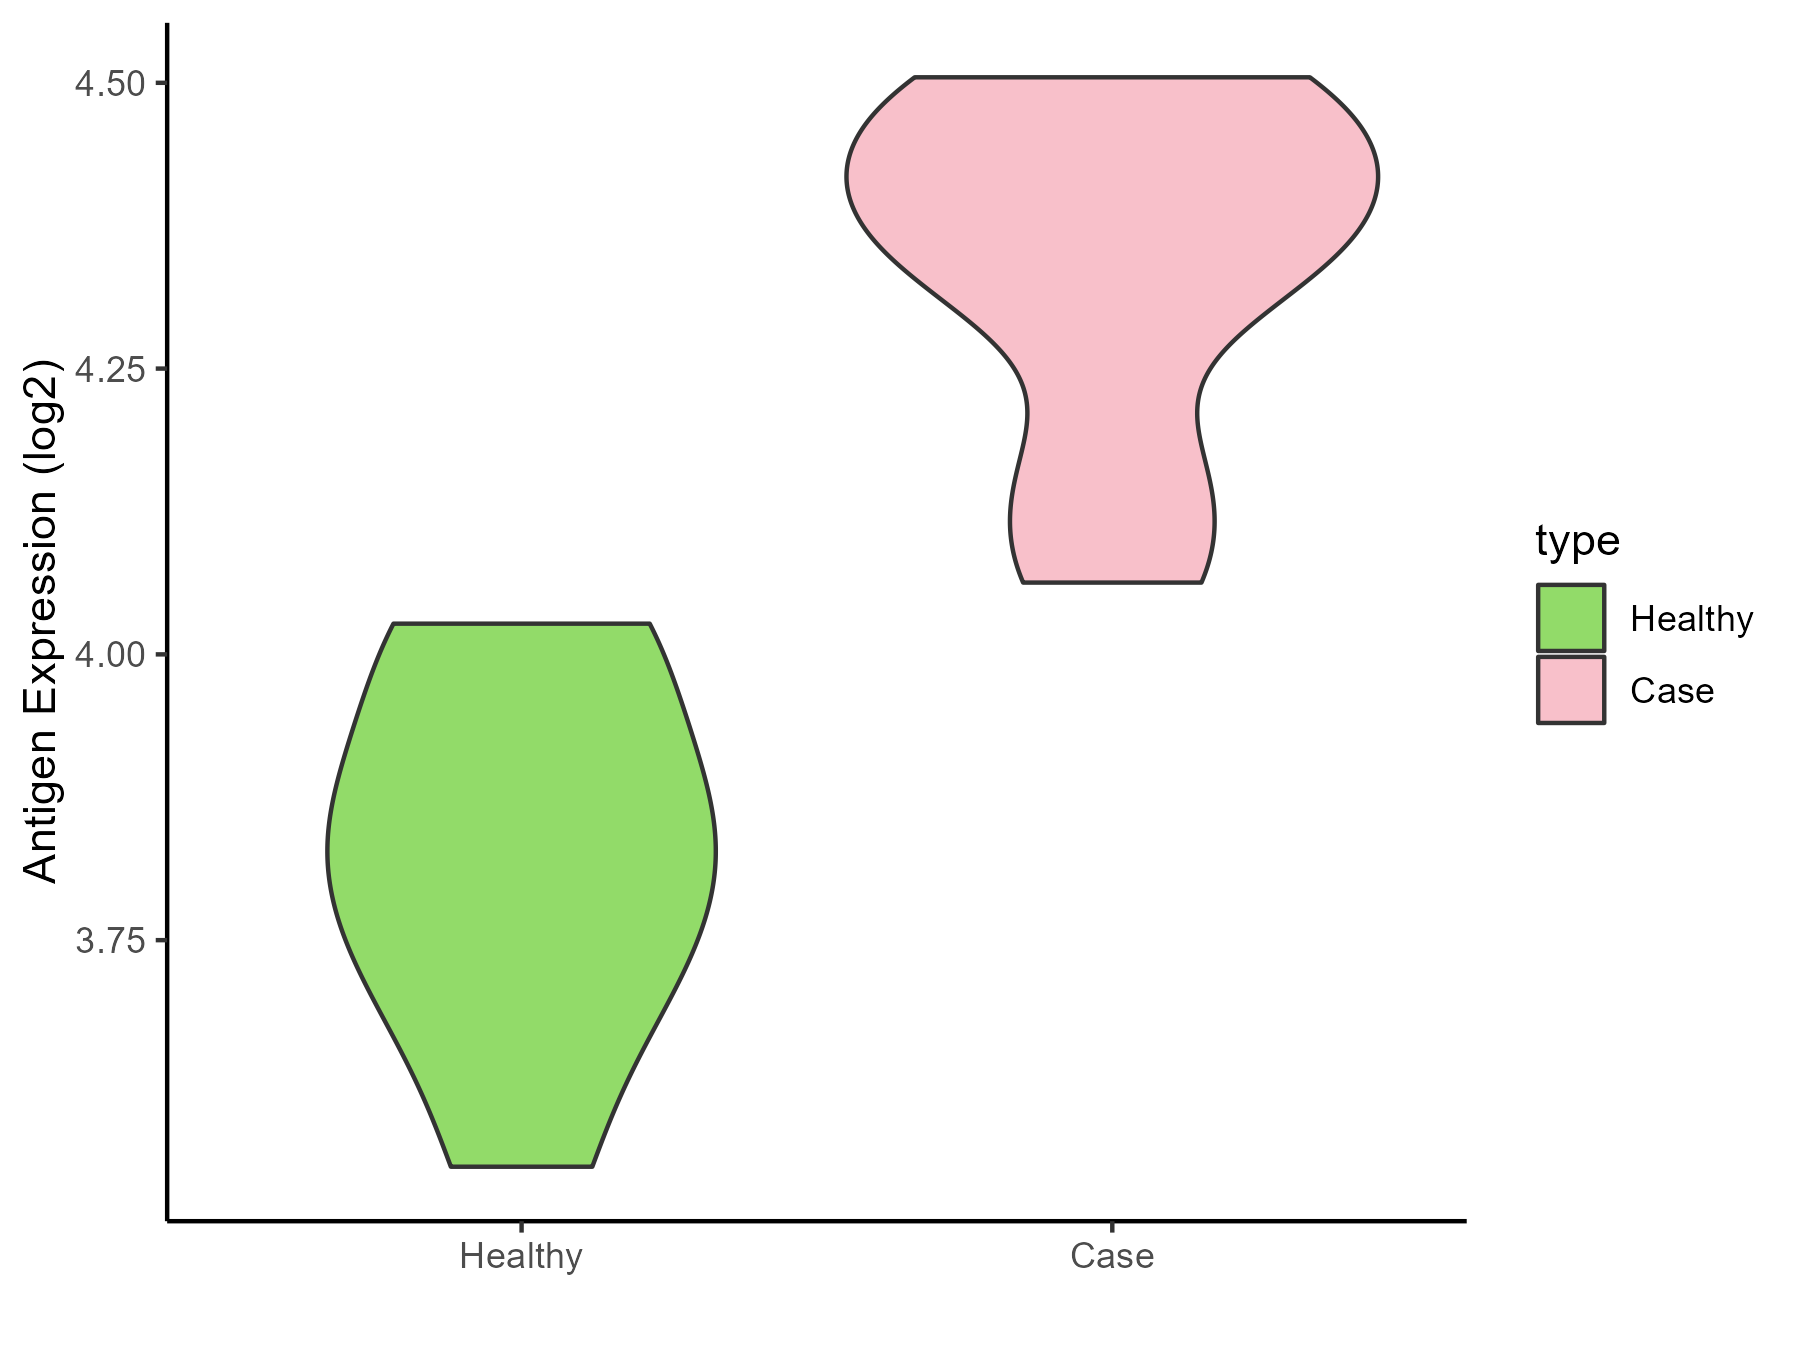
| The Studied Tissue | Liver | |
| The Specific Disease | Liver failure | |
| The Expression Level of Disease Section Compare with the Healthy Individual Tissue | p-value: 1.40E-05; Fold-change: 0.540398212; Z-score: 3.343738473 | |
| Disease-specific Antigen Abundances |
|
Click to View the Clearer Original Diagram |
| Differential expression pattern of antigen in diseases | ||
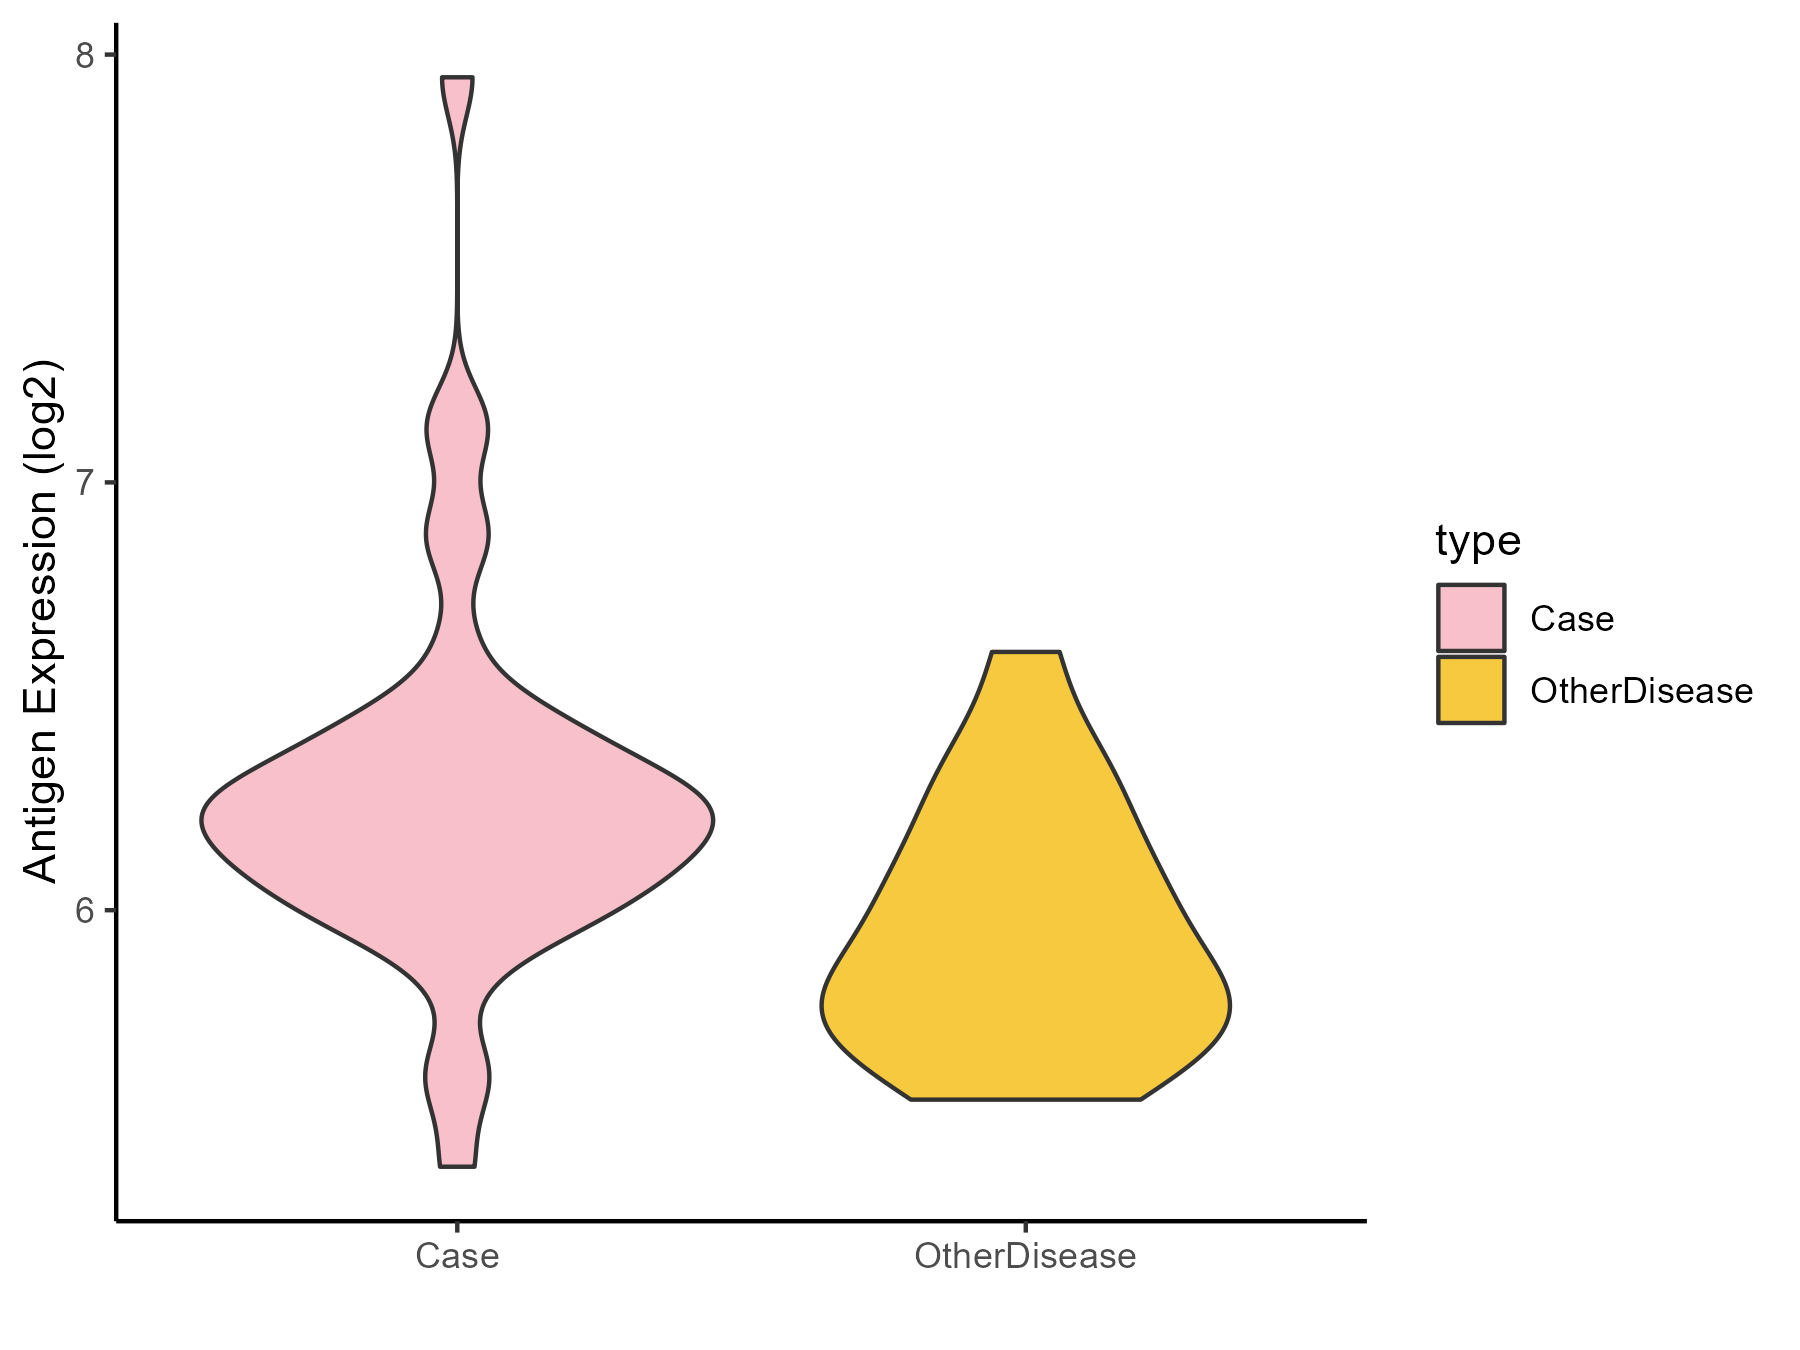
| The Studied Tissue | Colon mucosal | |
| The Specific Disease | Ulcerative colitis | |
| The Expression Level of Disease Section Compare with the Adjacent Tissue | p-value: 0.001448742; Fold-change: 0.359238384; Z-score: 1.233335108 | |
| Disease-specific Antigen Abundances |
|
Click to View the Clearer Original Diagram |
| Differential expression pattern of antigen in diseases | ||
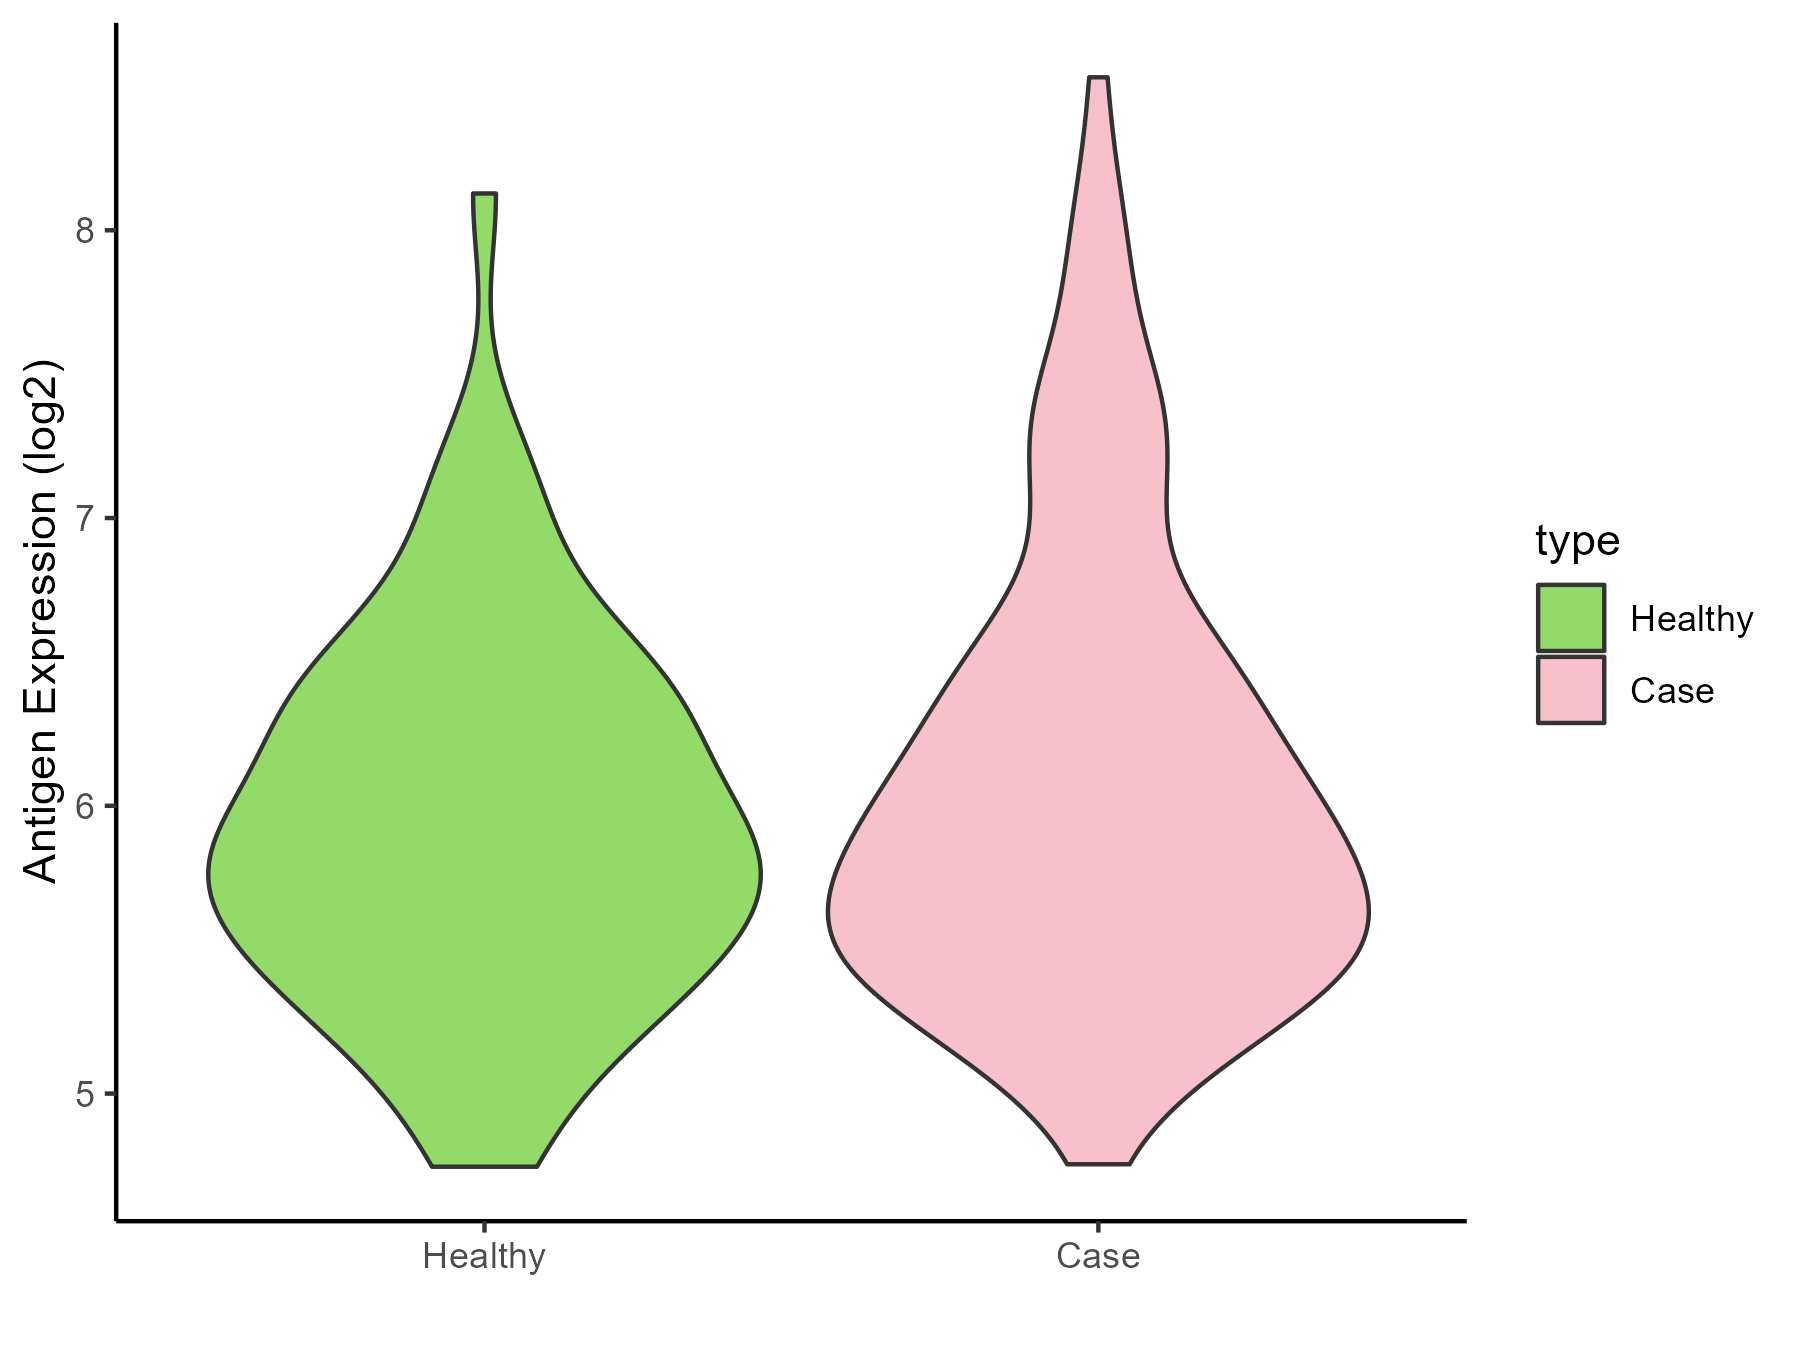
| The Studied Tissue | Rectal colon | |
| The Specific Disease | Irritable bowel syndrome | |
| The Expression Level of Disease Section Compare with the Healthy Individual Tissue | p-value: 0.200205992; Fold-change: 0.04994636; Z-score: 0.077442051 | |
| Disease-specific Antigen Abundances |
|
Click to View the Clearer Original Diagram |
ICD Disease Classification 14
| Differential expression pattern of antigen in diseases | ||
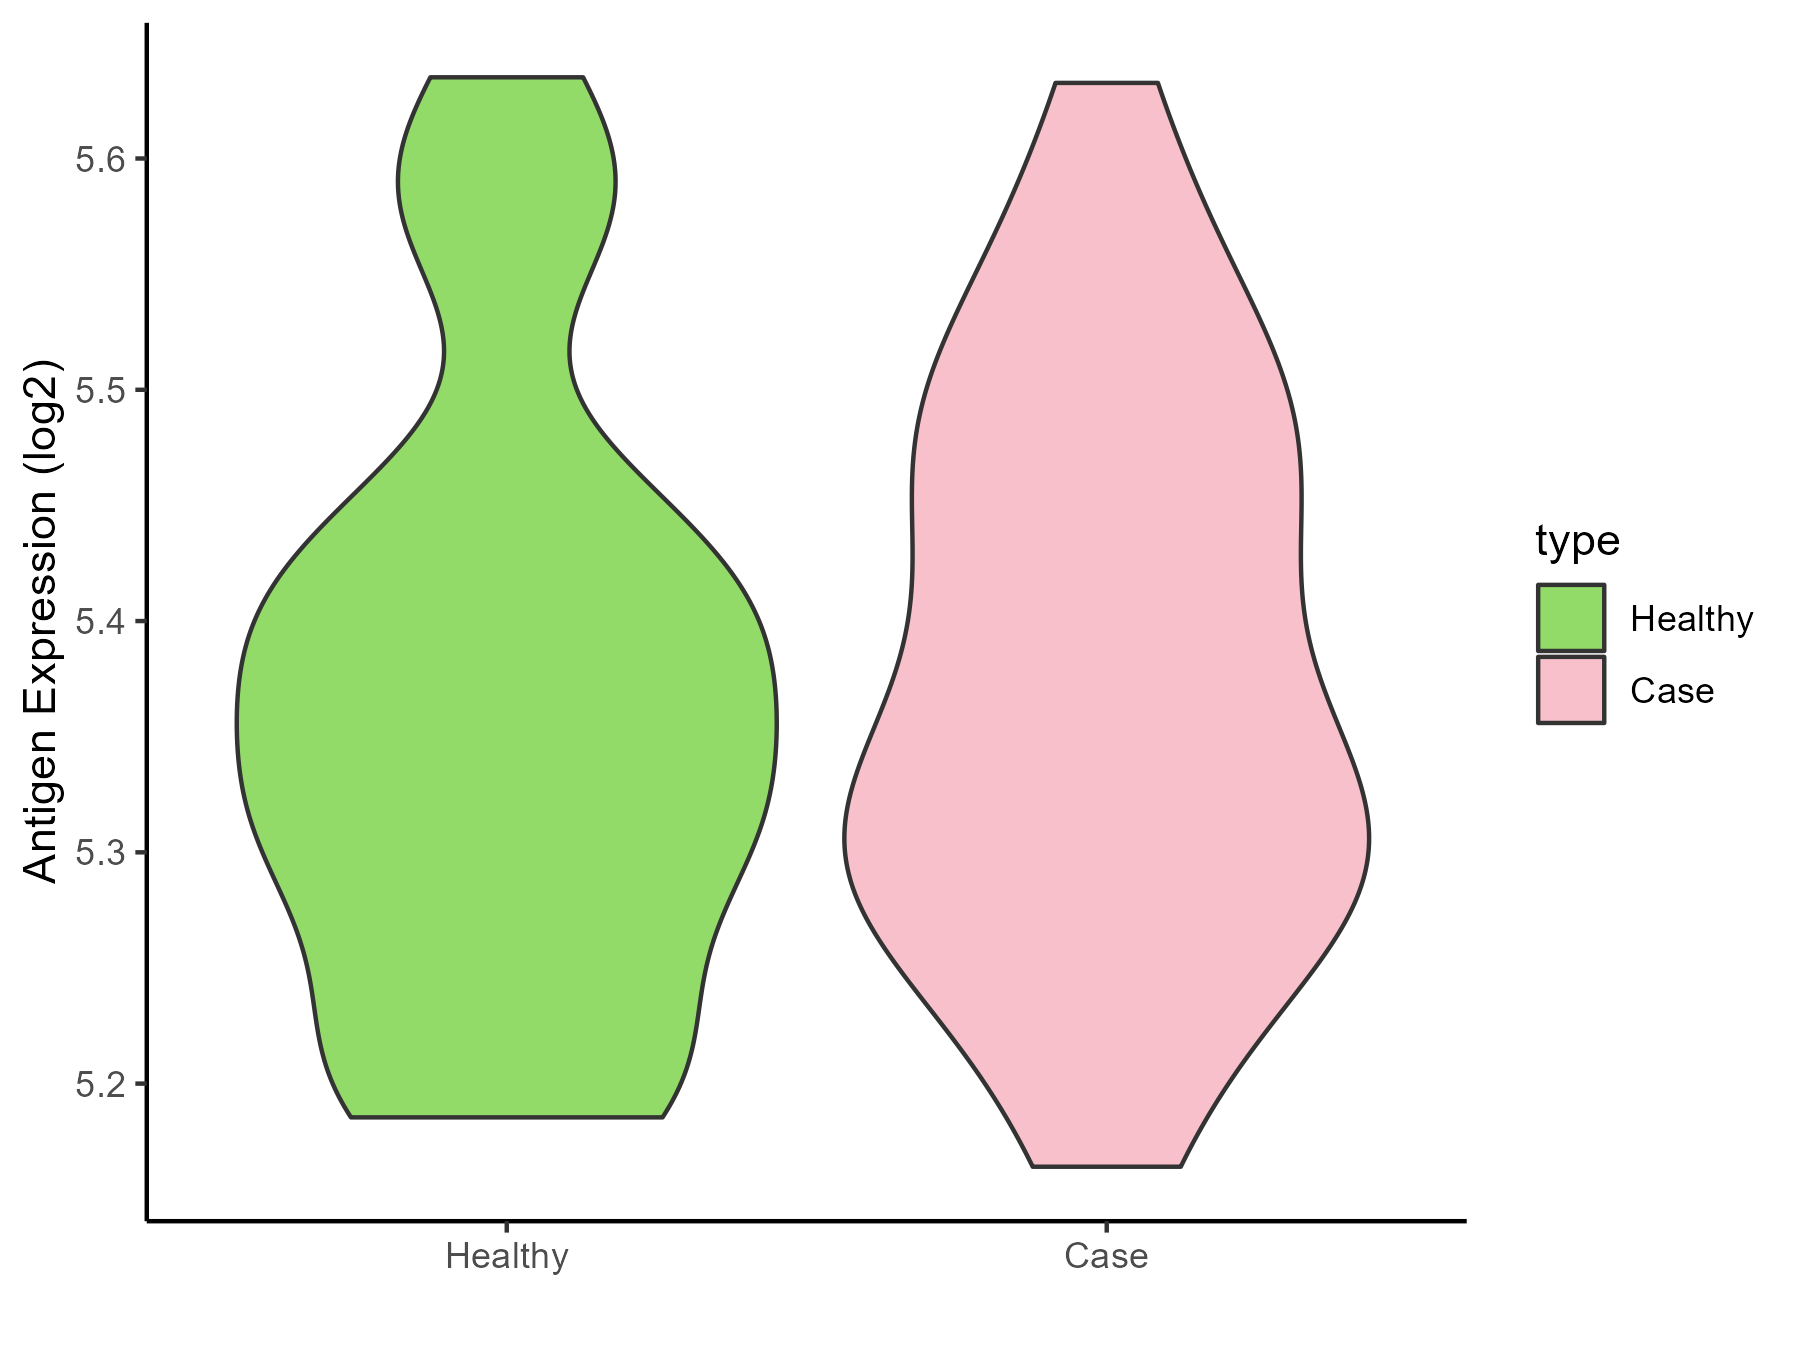
| The Studied Tissue | Skin | |
| The Specific Disease | Atopic dermatitis | |
| The Expression Level of Disease Section Compare with the Healthy Individual Tissue | p-value: 0.679542645; Fold-change: -0.017122442; Z-score: -0.131474548 | |
| Disease-specific Antigen Abundances |
|
Click to View the Clearer Original Diagram |
| Differential expression pattern of antigen in diseases | ||
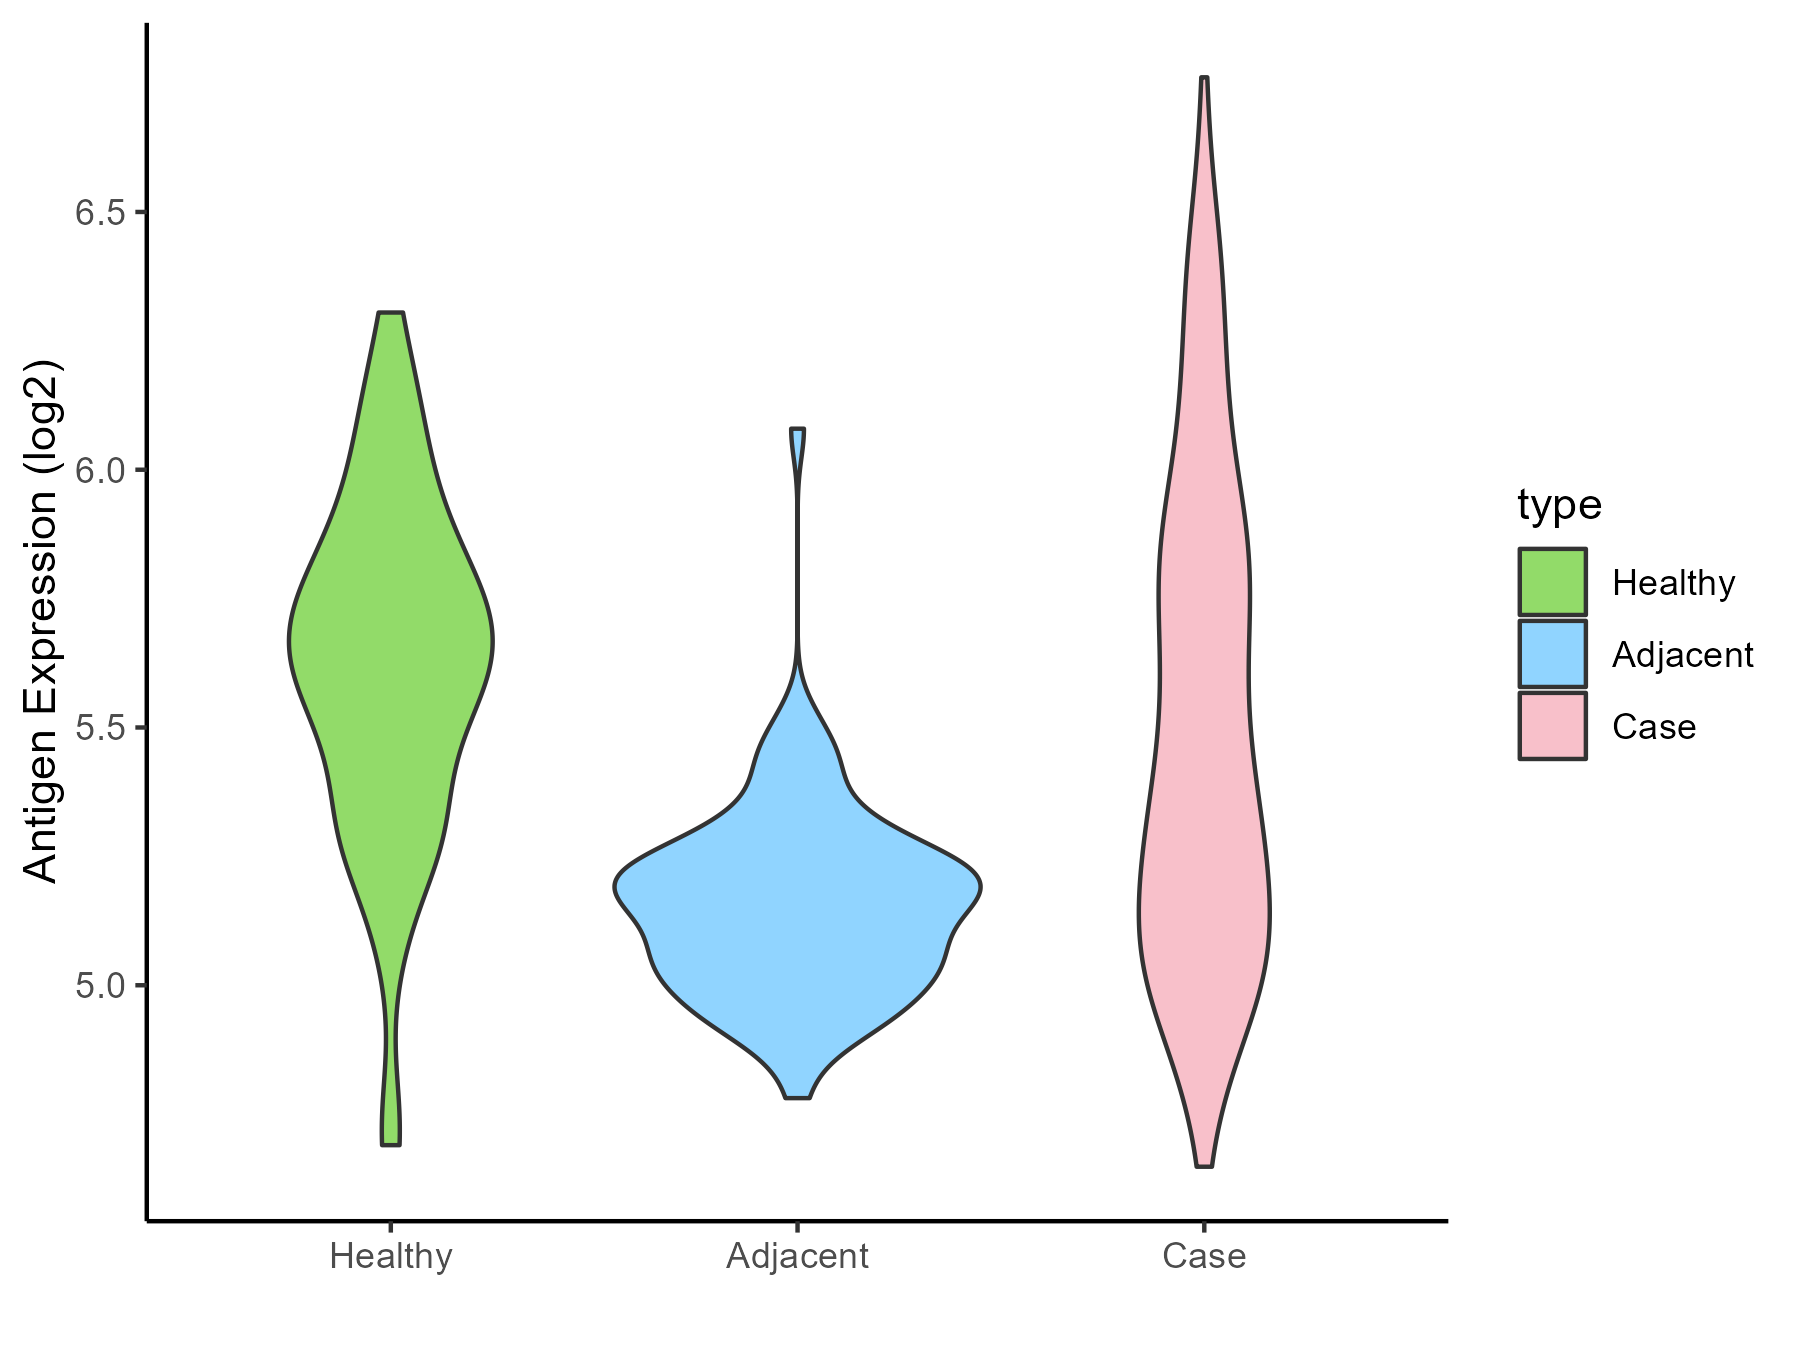
| The Studied Tissue | Skin | |
| The Specific Disease | Psoriasis | |
| The Expression Level of Disease Section Compare with the Healthy Individual Tissue | p-value: 0.013154763; Fold-change: -0.210298101; Z-score: -0.646304127 | |
| The Expression Level of Disease Section Compare with the Adjacent Tissue | p-value: 2.02E-21; Fold-change: 0.271282447; Z-score: 1.454467825 | |
| Disease-specific Antigen Abundances |
|
Click to View the Clearer Original Diagram |
| Differential expression pattern of antigen in diseases | ||
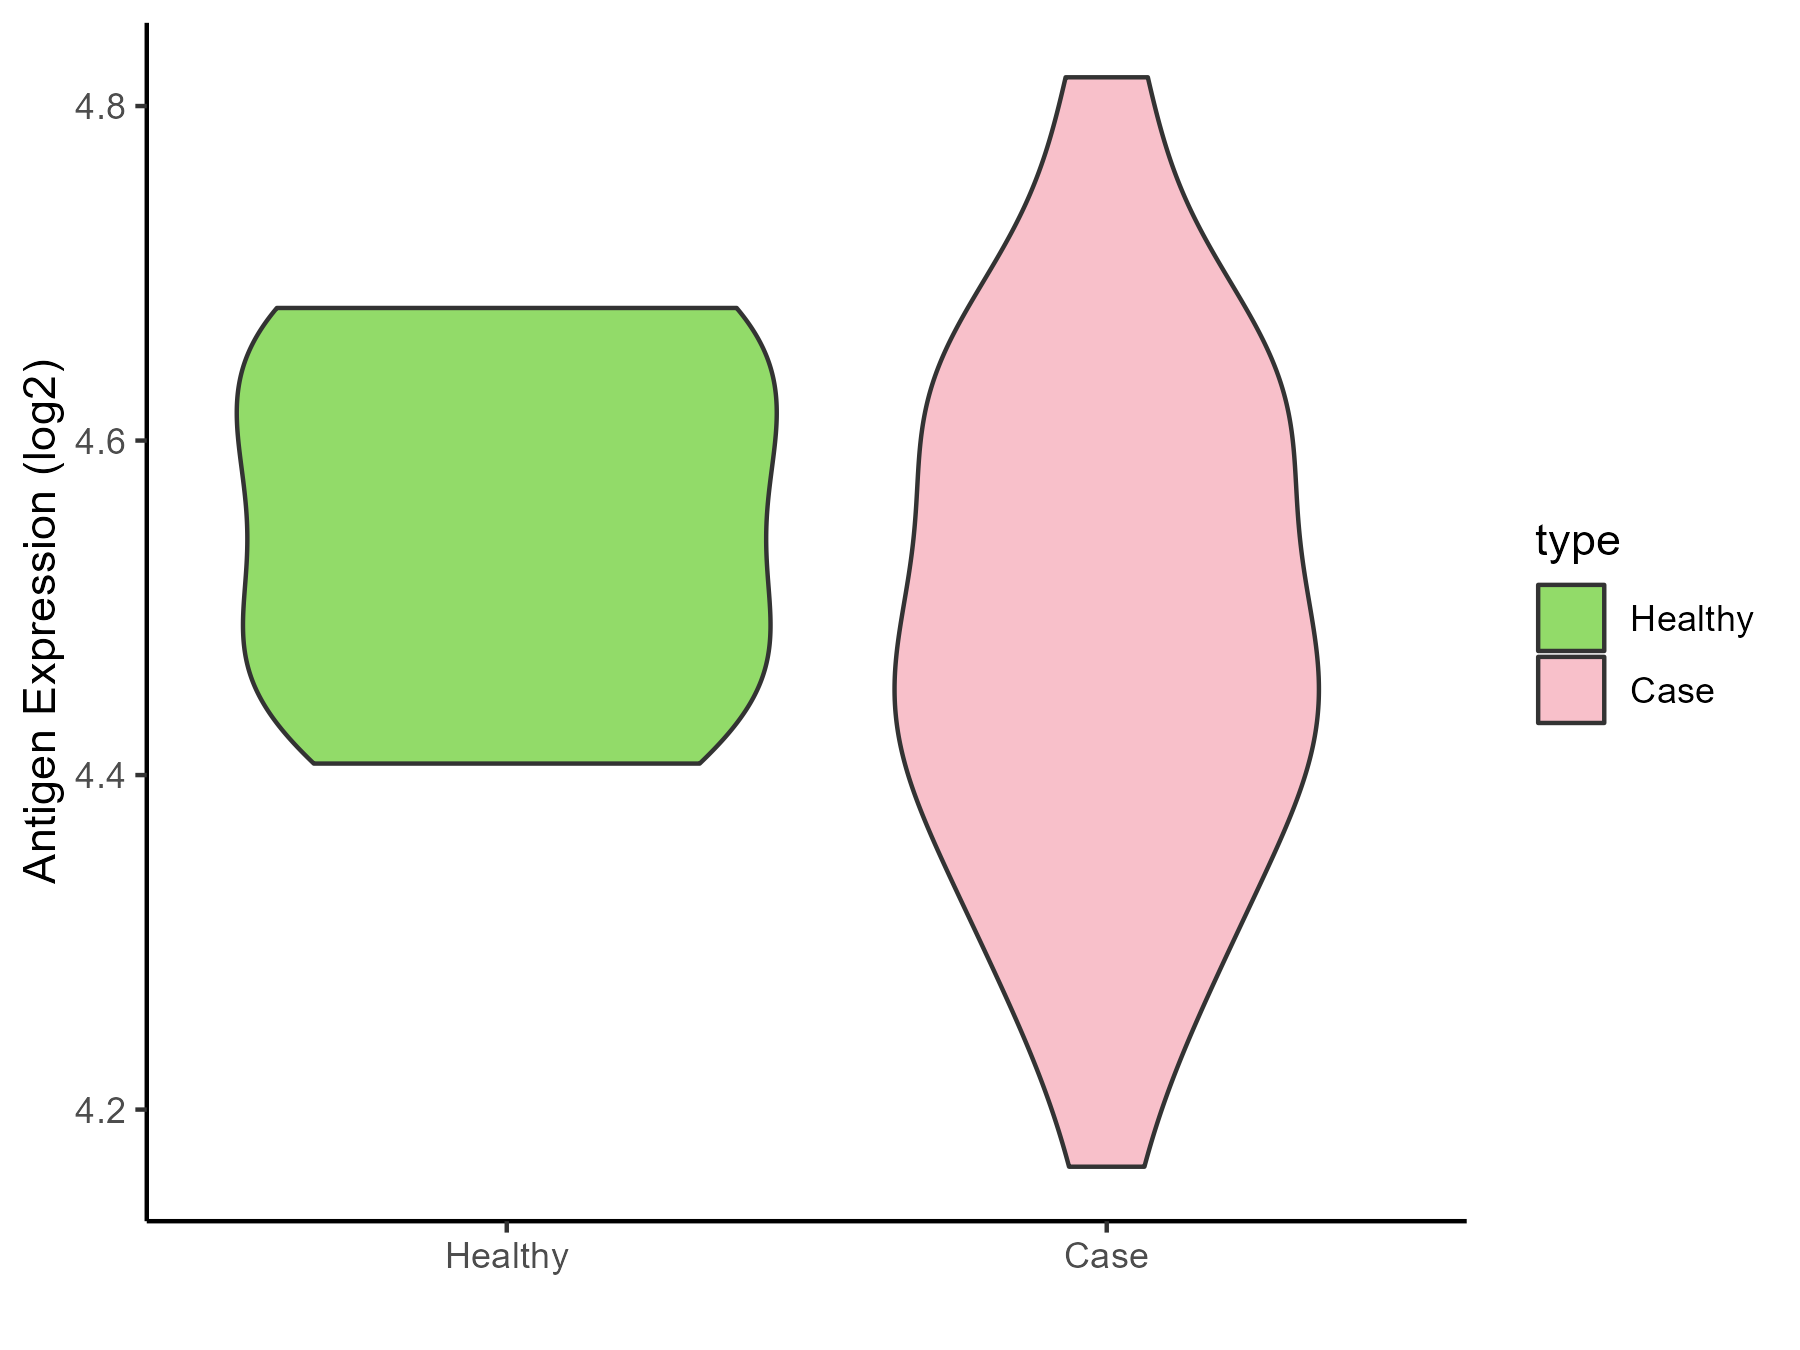
| The Studied Tissue | Skin | |
| The Specific Disease | Vitiligo | |
| The Expression Level of Disease Section Compare with the Healthy Individual Tissue | p-value: 0.254434626; Fold-change: -0.086635319; Z-score: -0.8140312 | |
| Disease-specific Antigen Abundances |
|
Click to View the Clearer Original Diagram |
| Differential expression pattern of antigen in diseases | ||
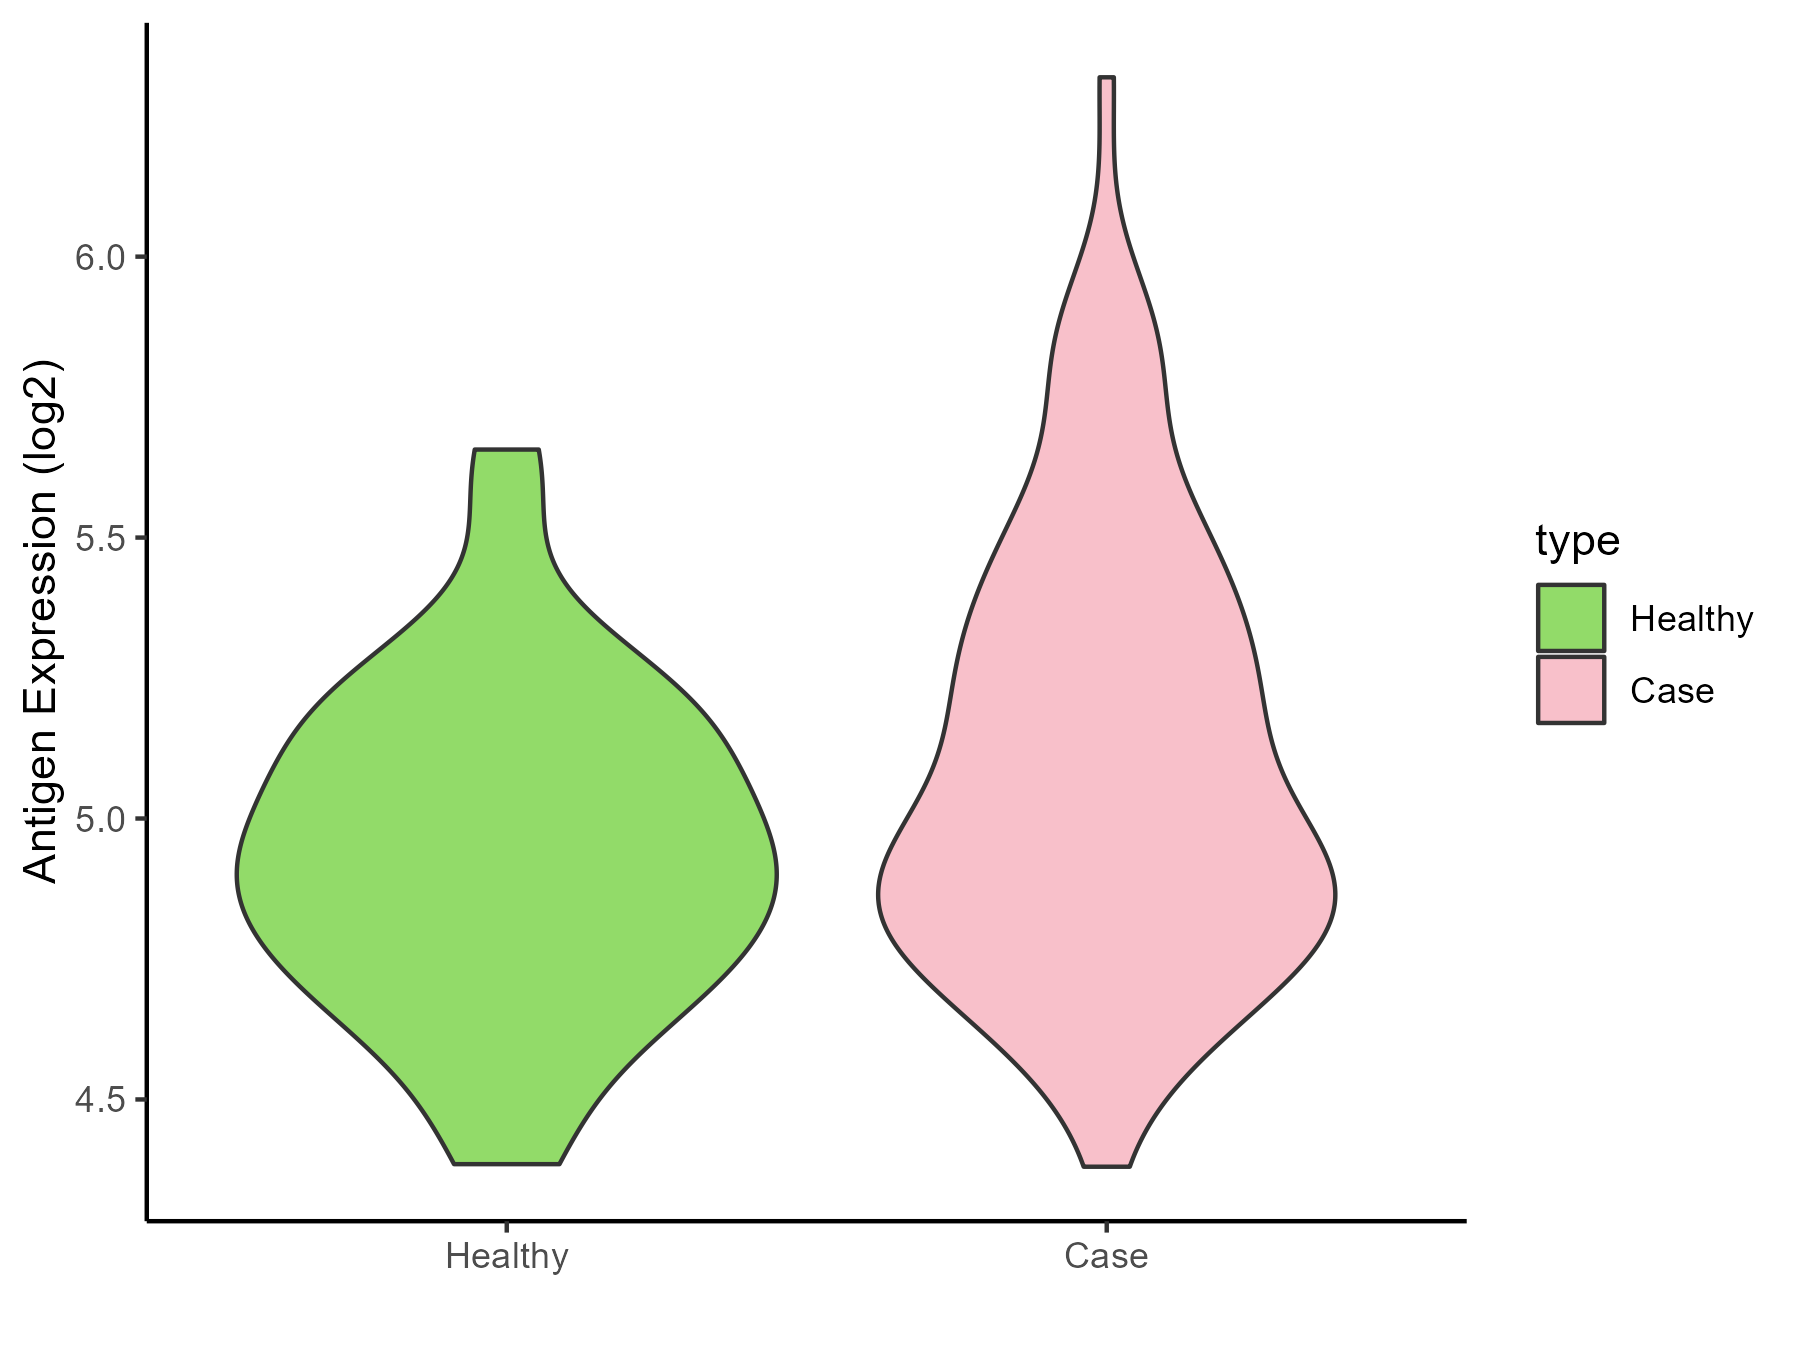
| The Studied Tissue | Skin from scalp | |
| The Specific Disease | Alopecia | |
| The Expression Level of Disease Section Compare with the Healthy Individual Tissue | p-value: 0.010365552; Fold-change: 0.074227608; Z-score: 0.261156528 | |
| Disease-specific Antigen Abundances |
|
Click to View the Clearer Original Diagram |
| Differential expression pattern of antigen in diseases | ||
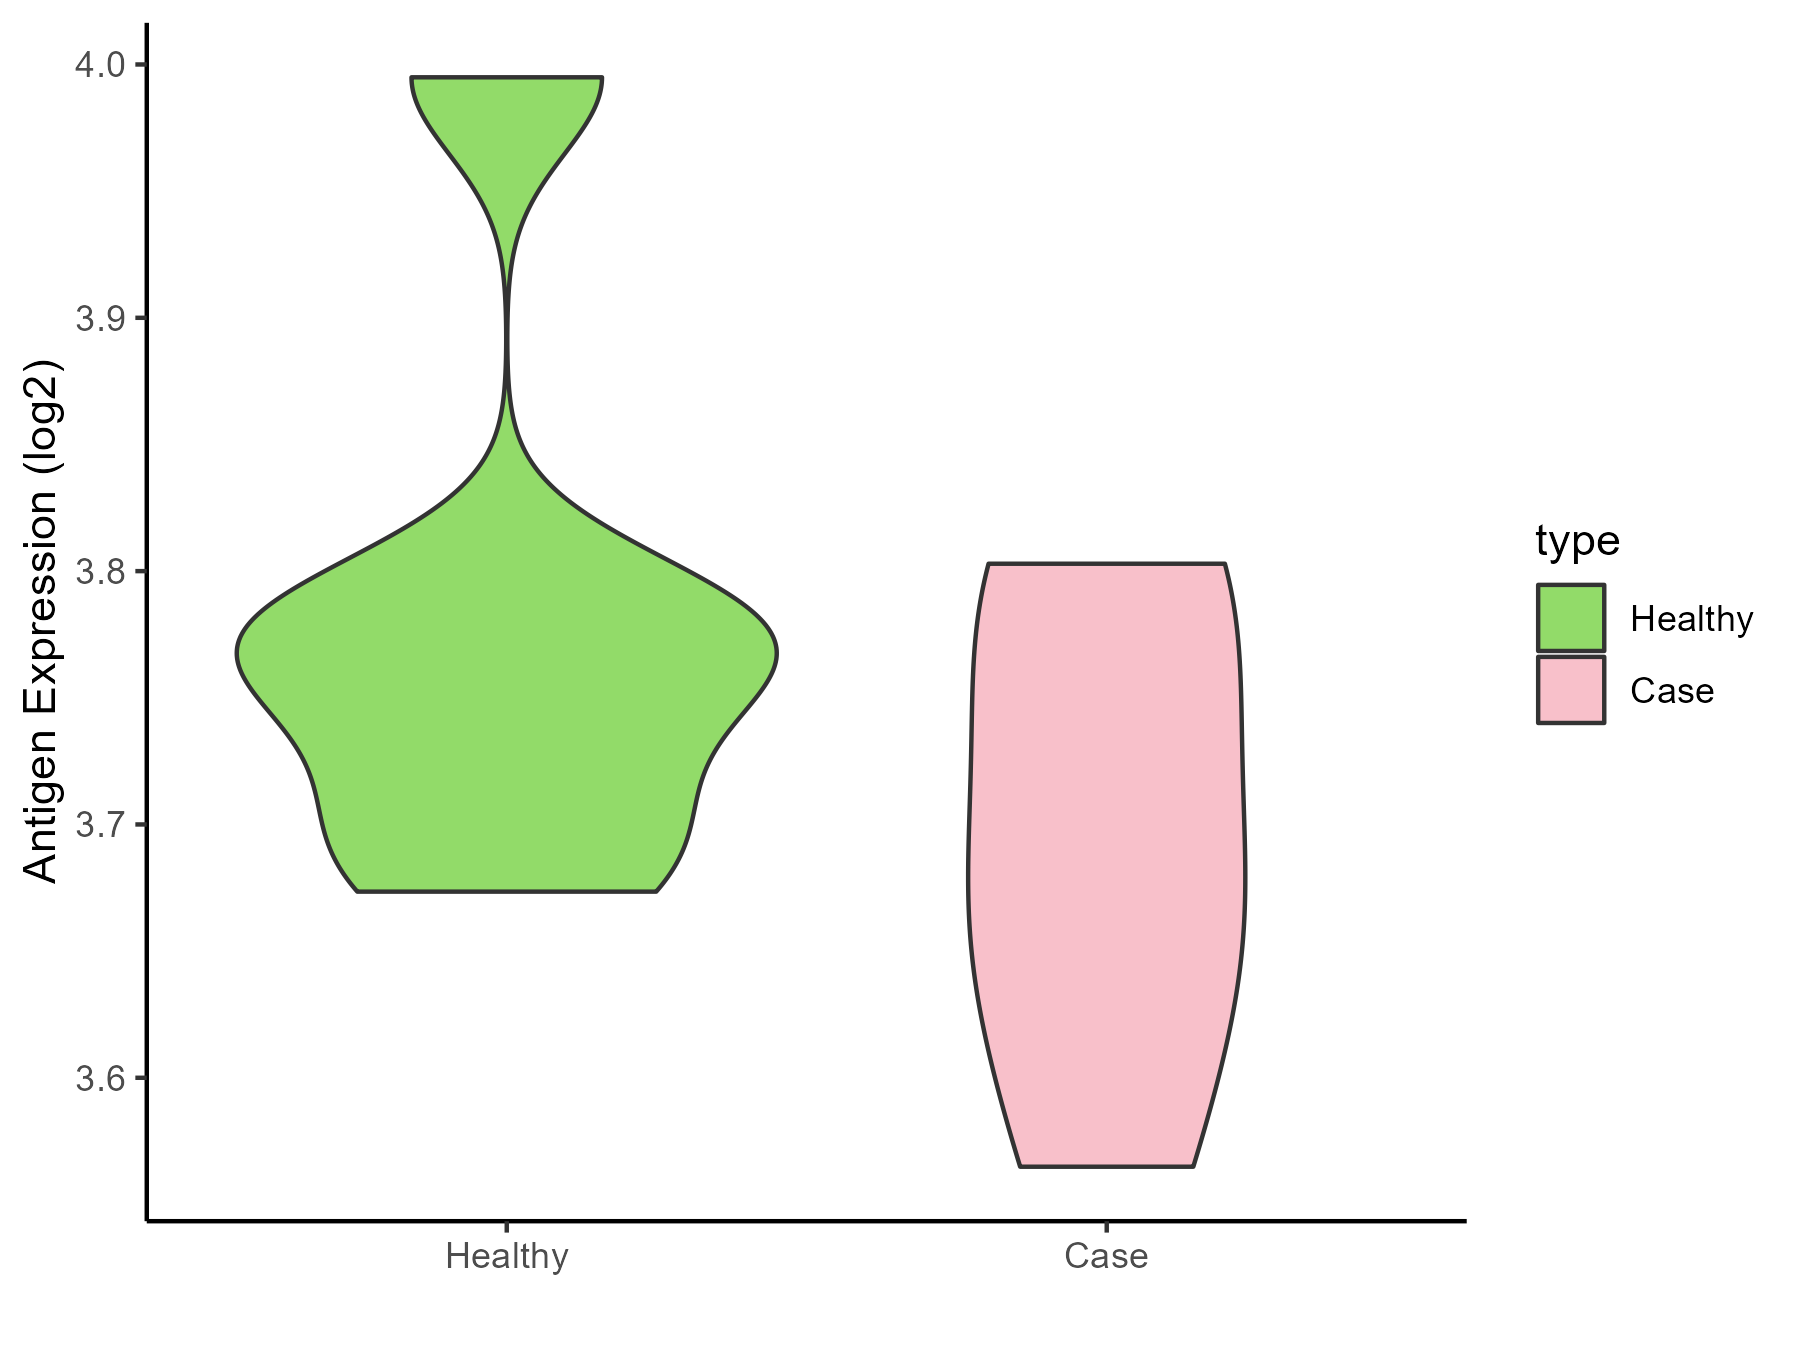
| The Studied Tissue | Skin | |
| The Specific Disease | Sensitive skin | |
| The Expression Level of Disease Section Compare with the Healthy Individual Tissue | p-value: 0.21059204; Fold-change: -0.083078099; Z-score: -0.736637111 | |
| Disease-specific Antigen Abundances |
|
Click to View the Clearer Original Diagram |
ICD Disease Classification 15
| Differential expression pattern of antigen in diseases | ||
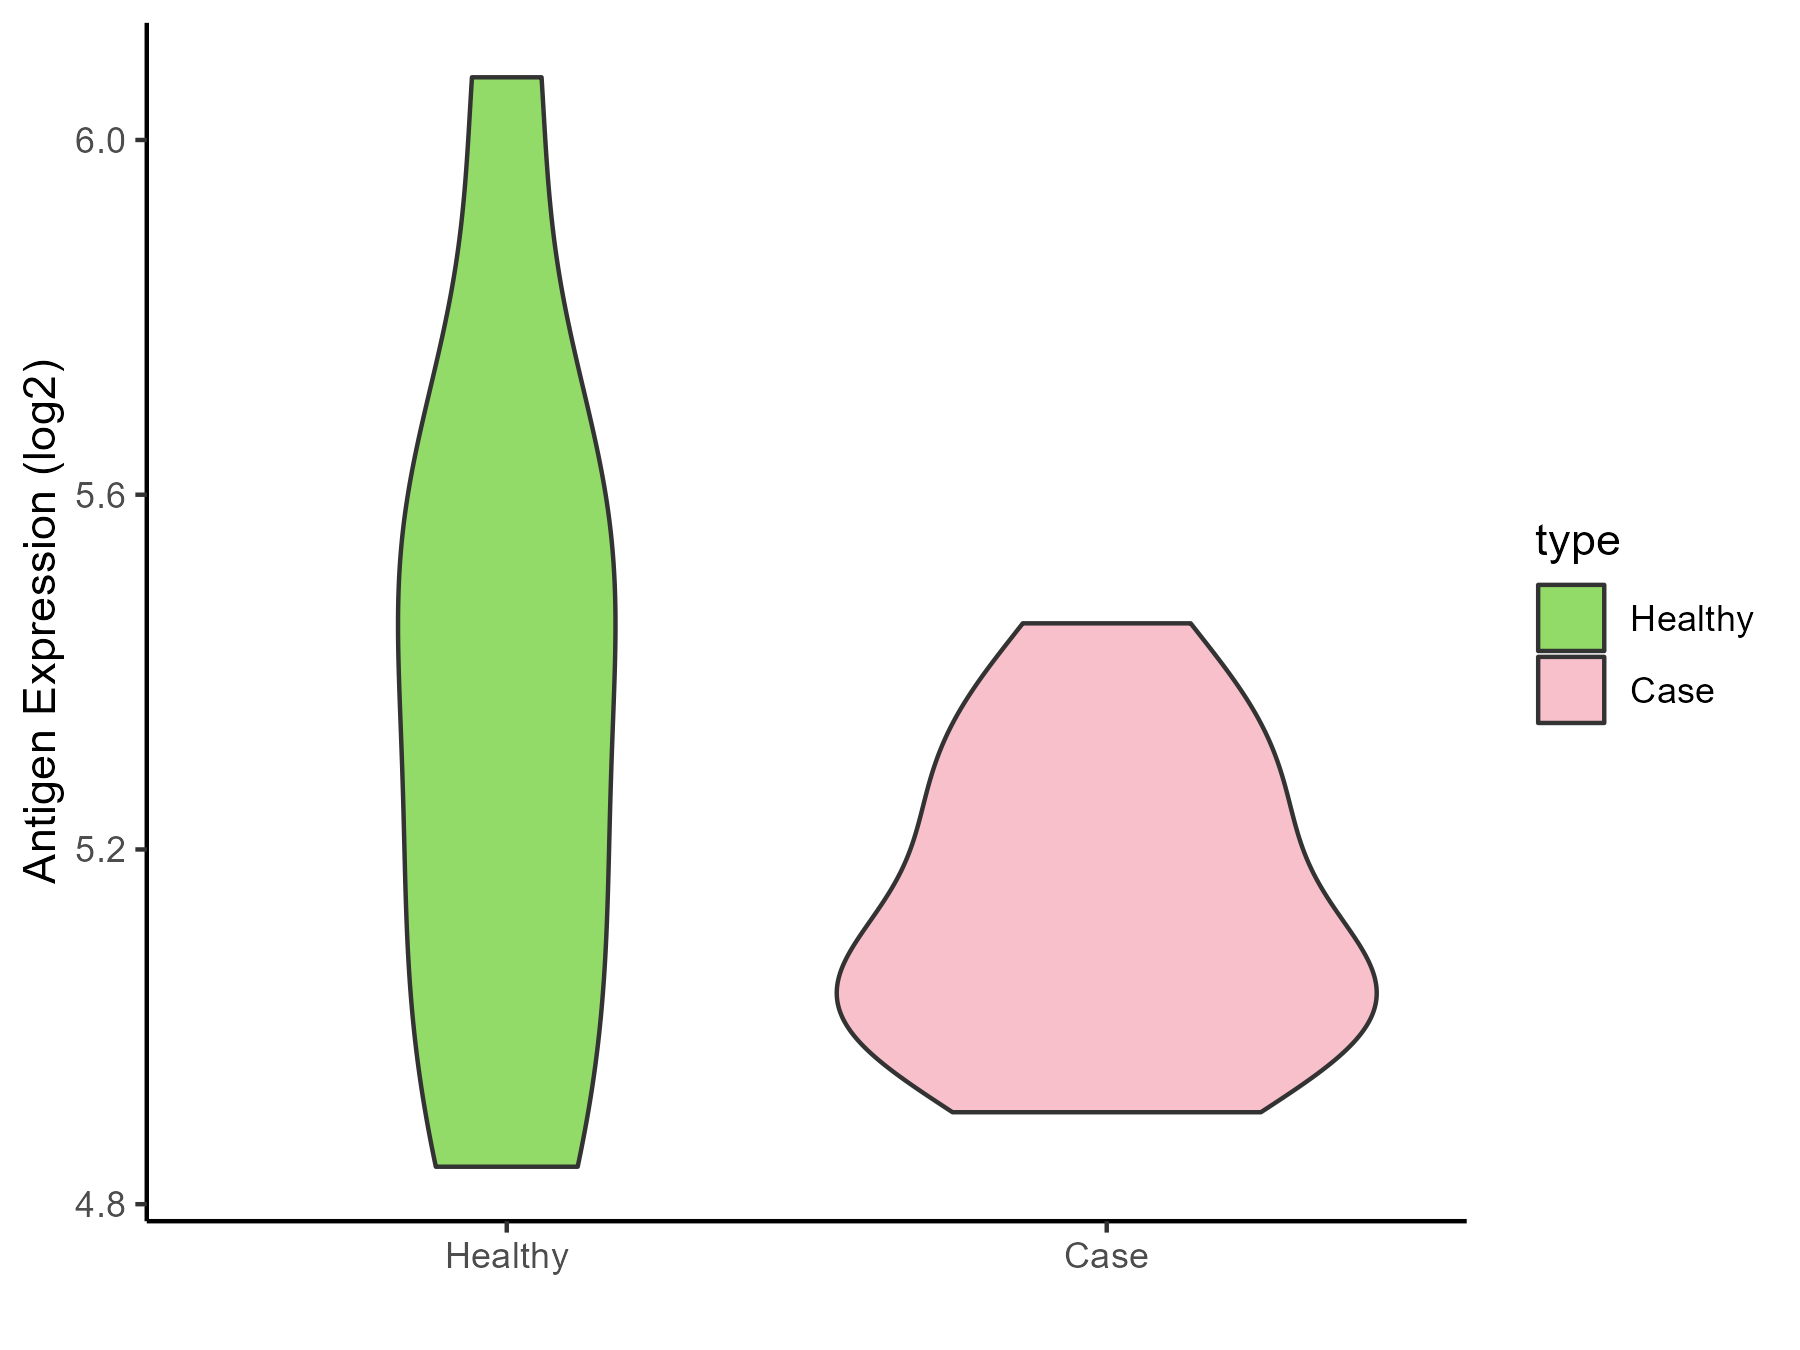
| The Studied Tissue | Synovial | |
| The Specific Disease | Osteoarthritis | |
| The Expression Level of Disease Section Compare with the Healthy Individual Tissue | p-value: 0.159872158; Fold-change: -0.276780885; Z-score: -0.692690657 | |
| Disease-specific Antigen Abundances |
|
Click to View the Clearer Original Diagram |
| Differential expression pattern of antigen in diseases | ||
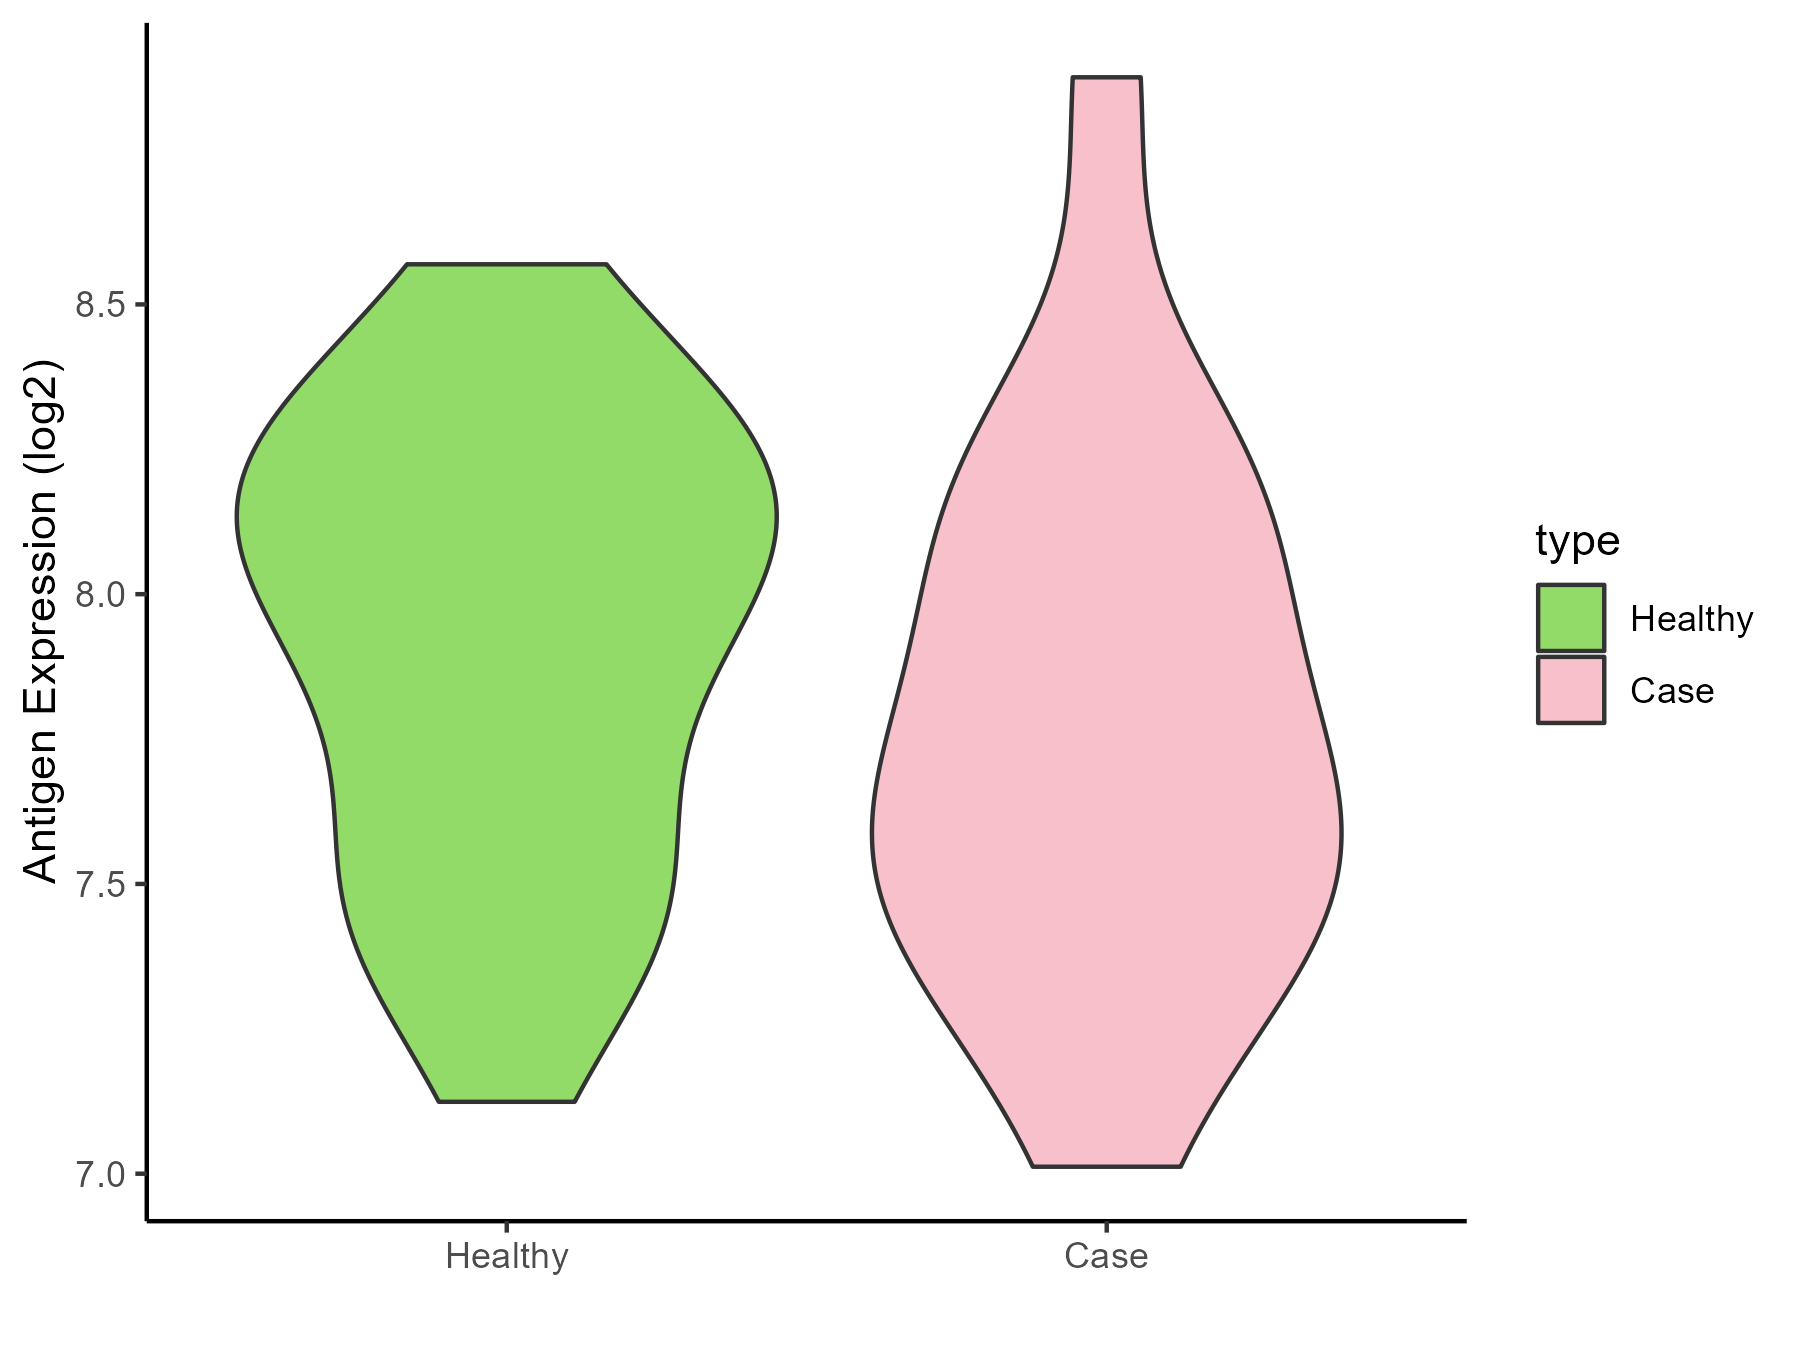
| The Studied Tissue | Peripheral blood | |
| The Specific Disease | Arthropathy | |
| The Expression Level of Disease Section Compare with the Healthy Individual Tissue | p-value: 0.370274148; Fold-change: -0.272280385; Z-score: -0.684289404 | |
| Disease-specific Antigen Abundances |
|
Click to View the Clearer Original Diagram |
| Differential expression pattern of antigen in diseases | ||
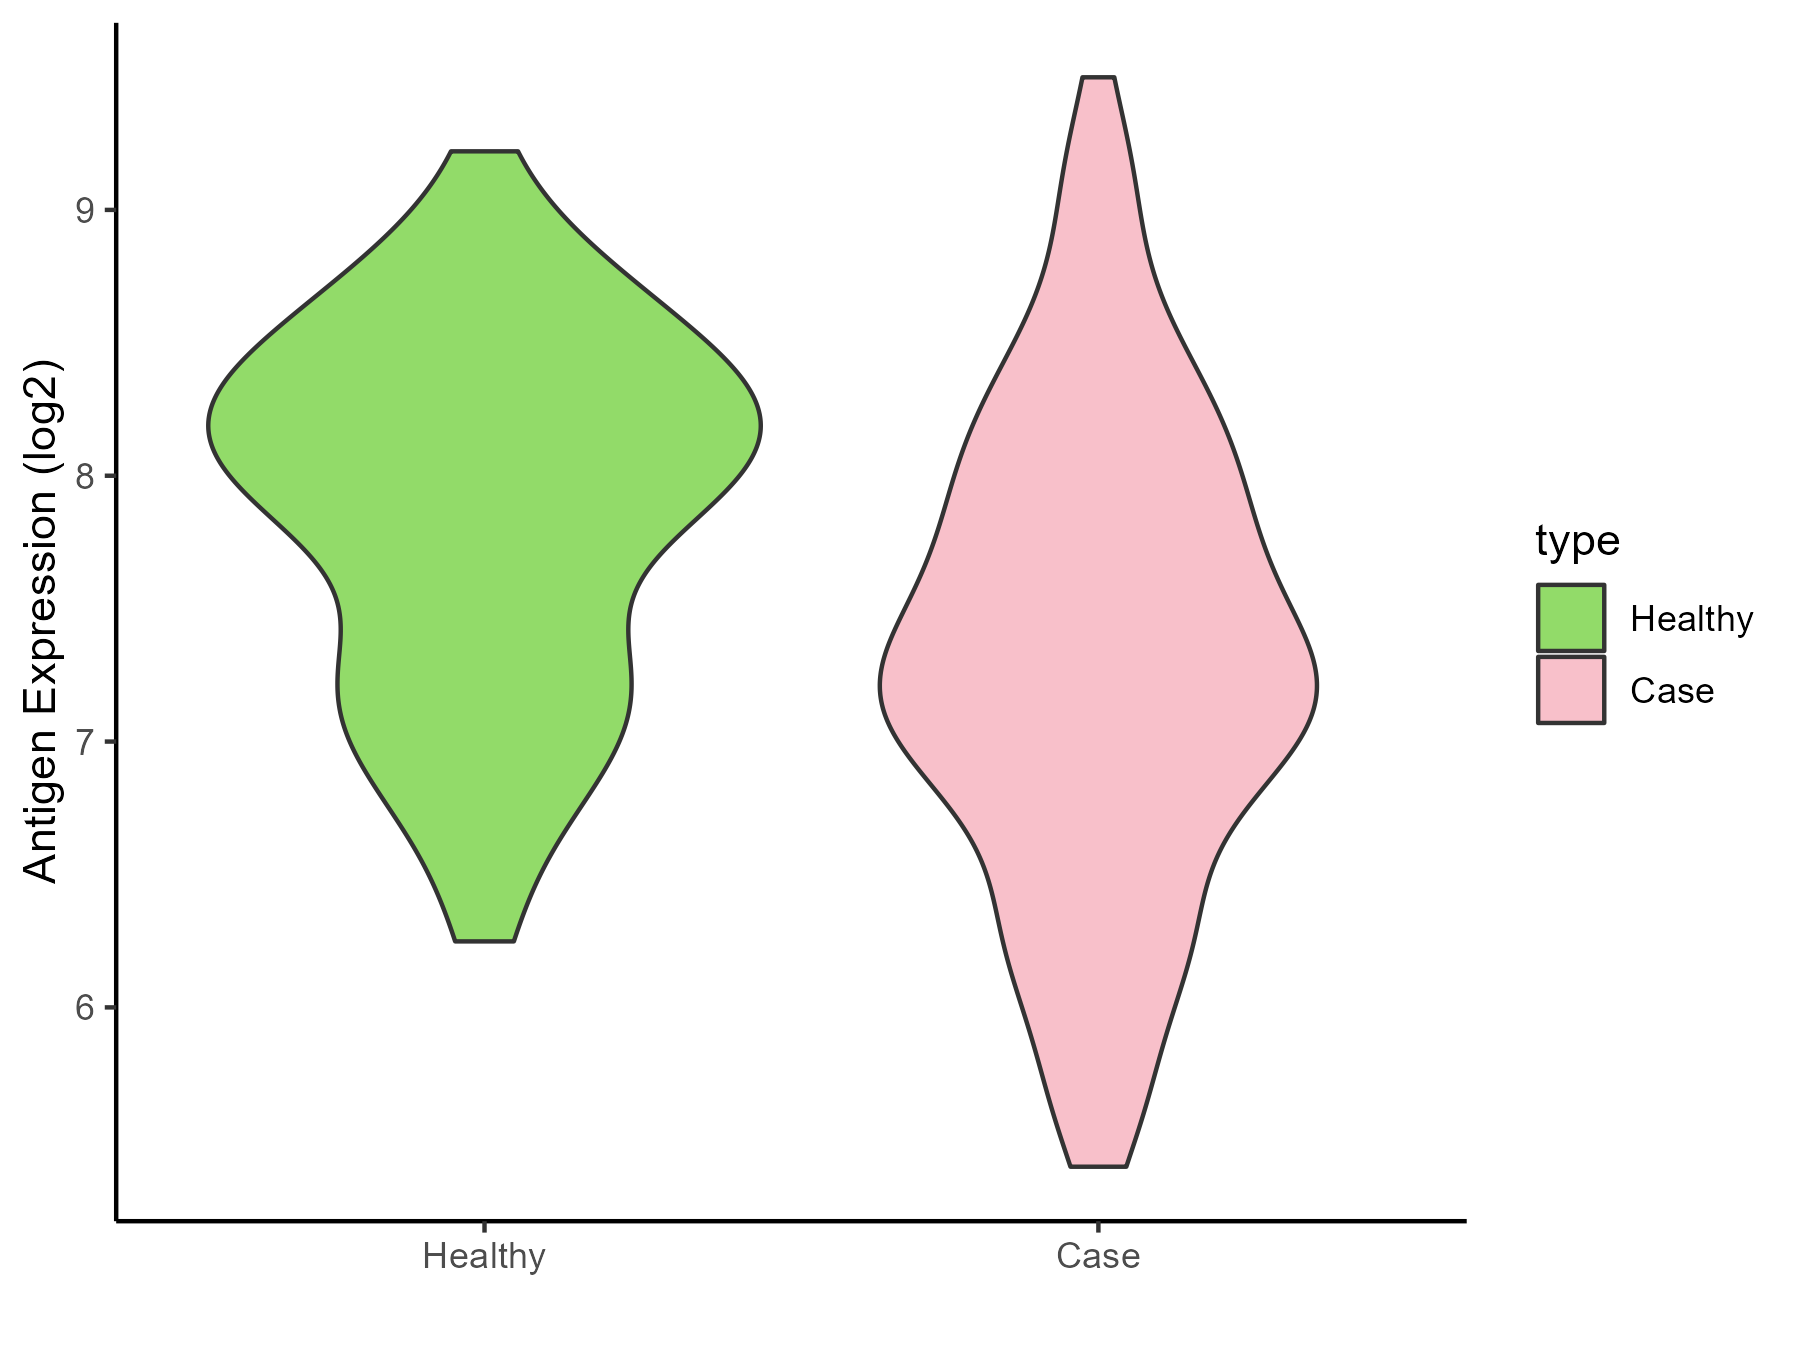
| The Studied Tissue | Peripheral blood | |
| The Specific Disease | Arthritis | |
| The Expression Level of Disease Section Compare with the Healthy Individual Tissue | p-value: 9.61E-07; Fold-change: -0.740385402; Z-score: -1.085507609 | |
| Disease-specific Antigen Abundances |
|
Click to View the Clearer Original Diagram |
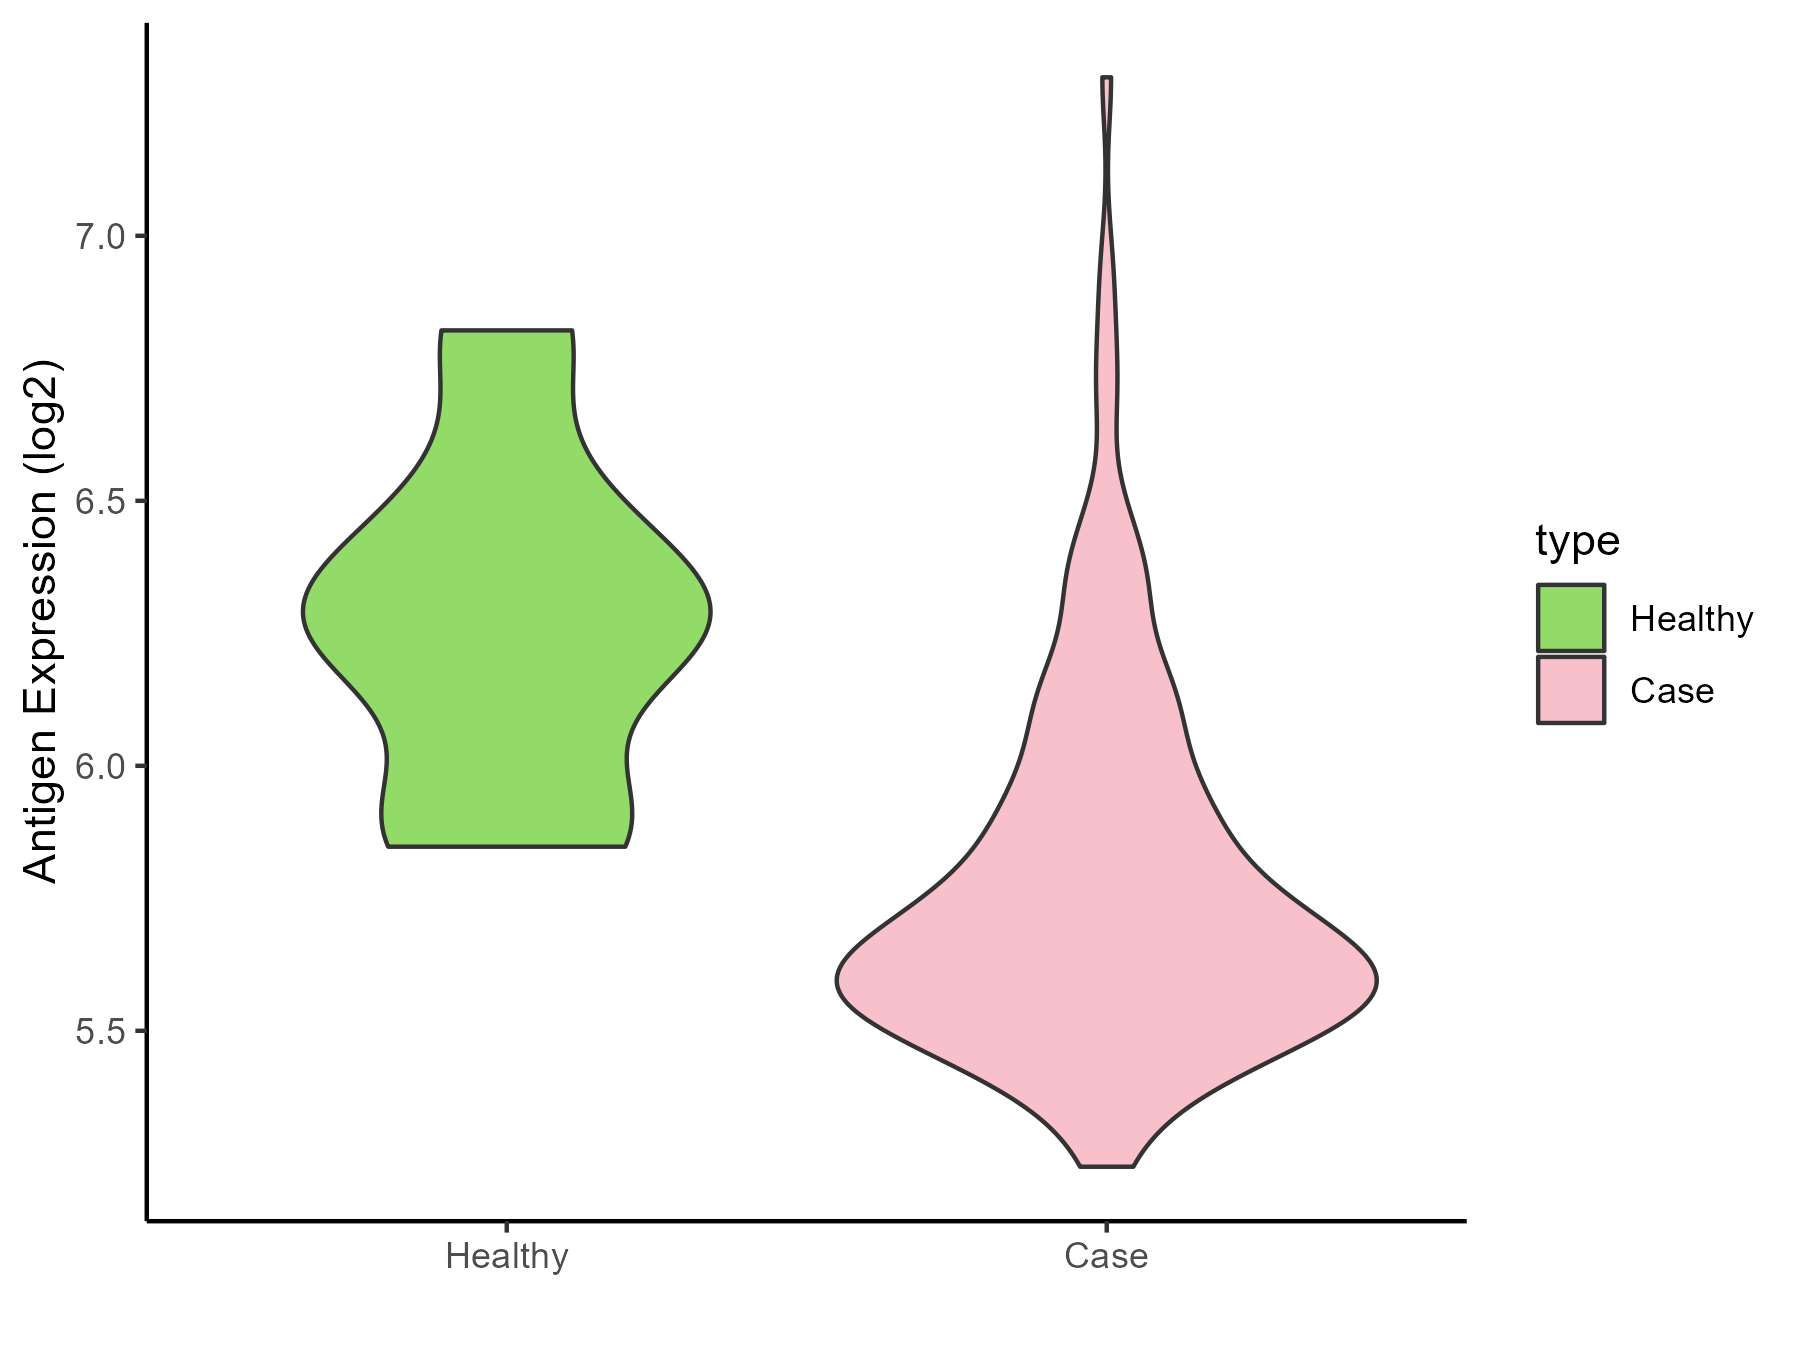
| Differential expression pattern of antigen in diseases | ||
| The Studied Tissue | Synovial | |
| The Specific Disease | Rheumatoid arthritis | |
| The Expression Level of Disease Section Compare with the Healthy Individual Tissue | p-value: 0.007284588; Fold-change: -0.575905418; Z-score: -1.736650742 | |
| Disease-specific Antigen Abundances |
|
Click to View the Clearer Original Diagram |
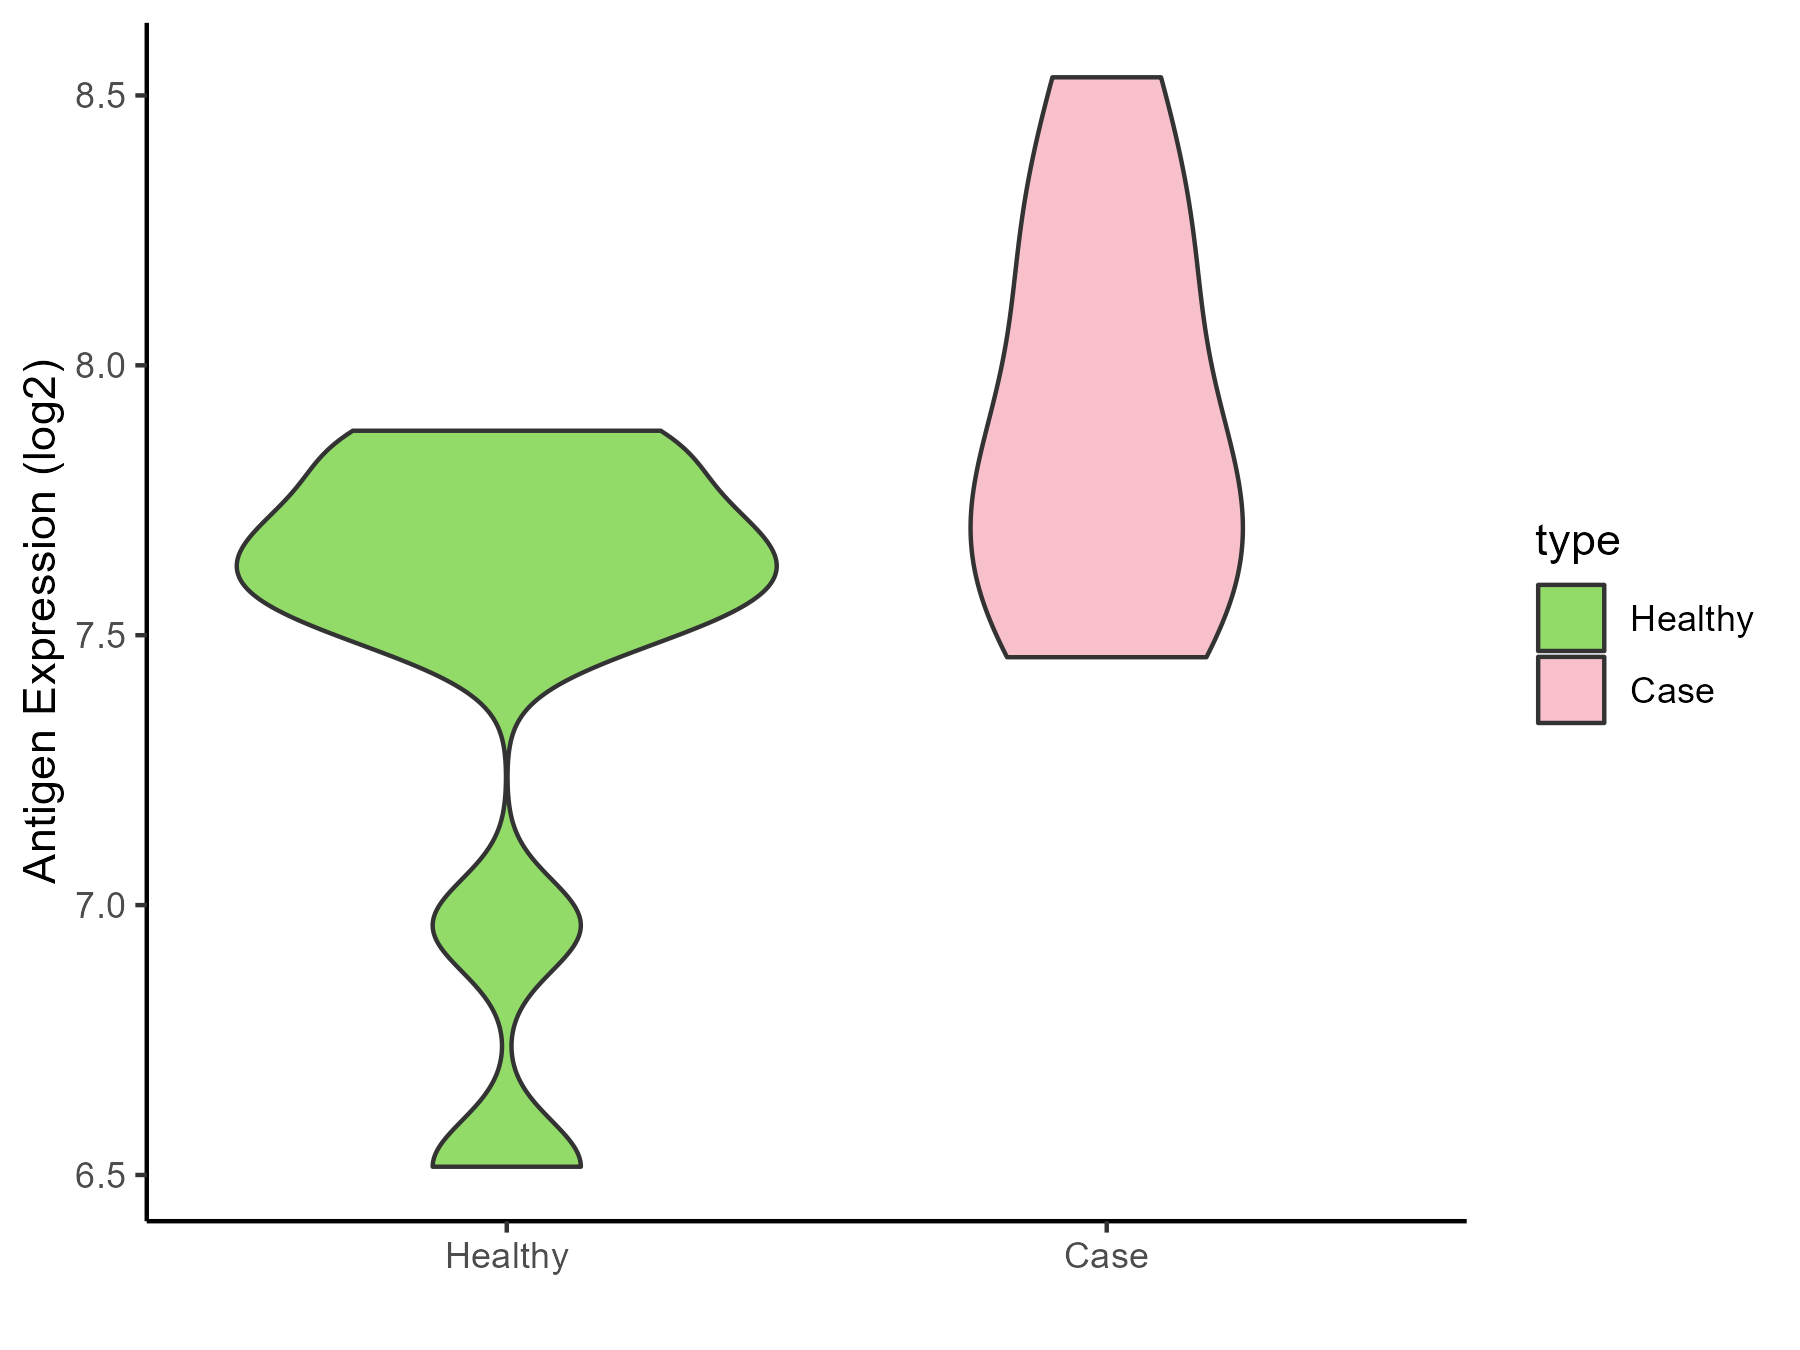
| Differential expression pattern of antigen in diseases | ||
| The Studied Tissue | Pheripheral blood | |
| The Specific Disease | Ankylosing spondylitis | |
| The Expression Level of Disease Section Compare with the Healthy Individual Tissue | p-value: 0.046600225; Fold-change: 0.196516089; Z-score: 0.439312397 | |
| Disease-specific Antigen Abundances |
|
Click to View the Clearer Original Diagram |
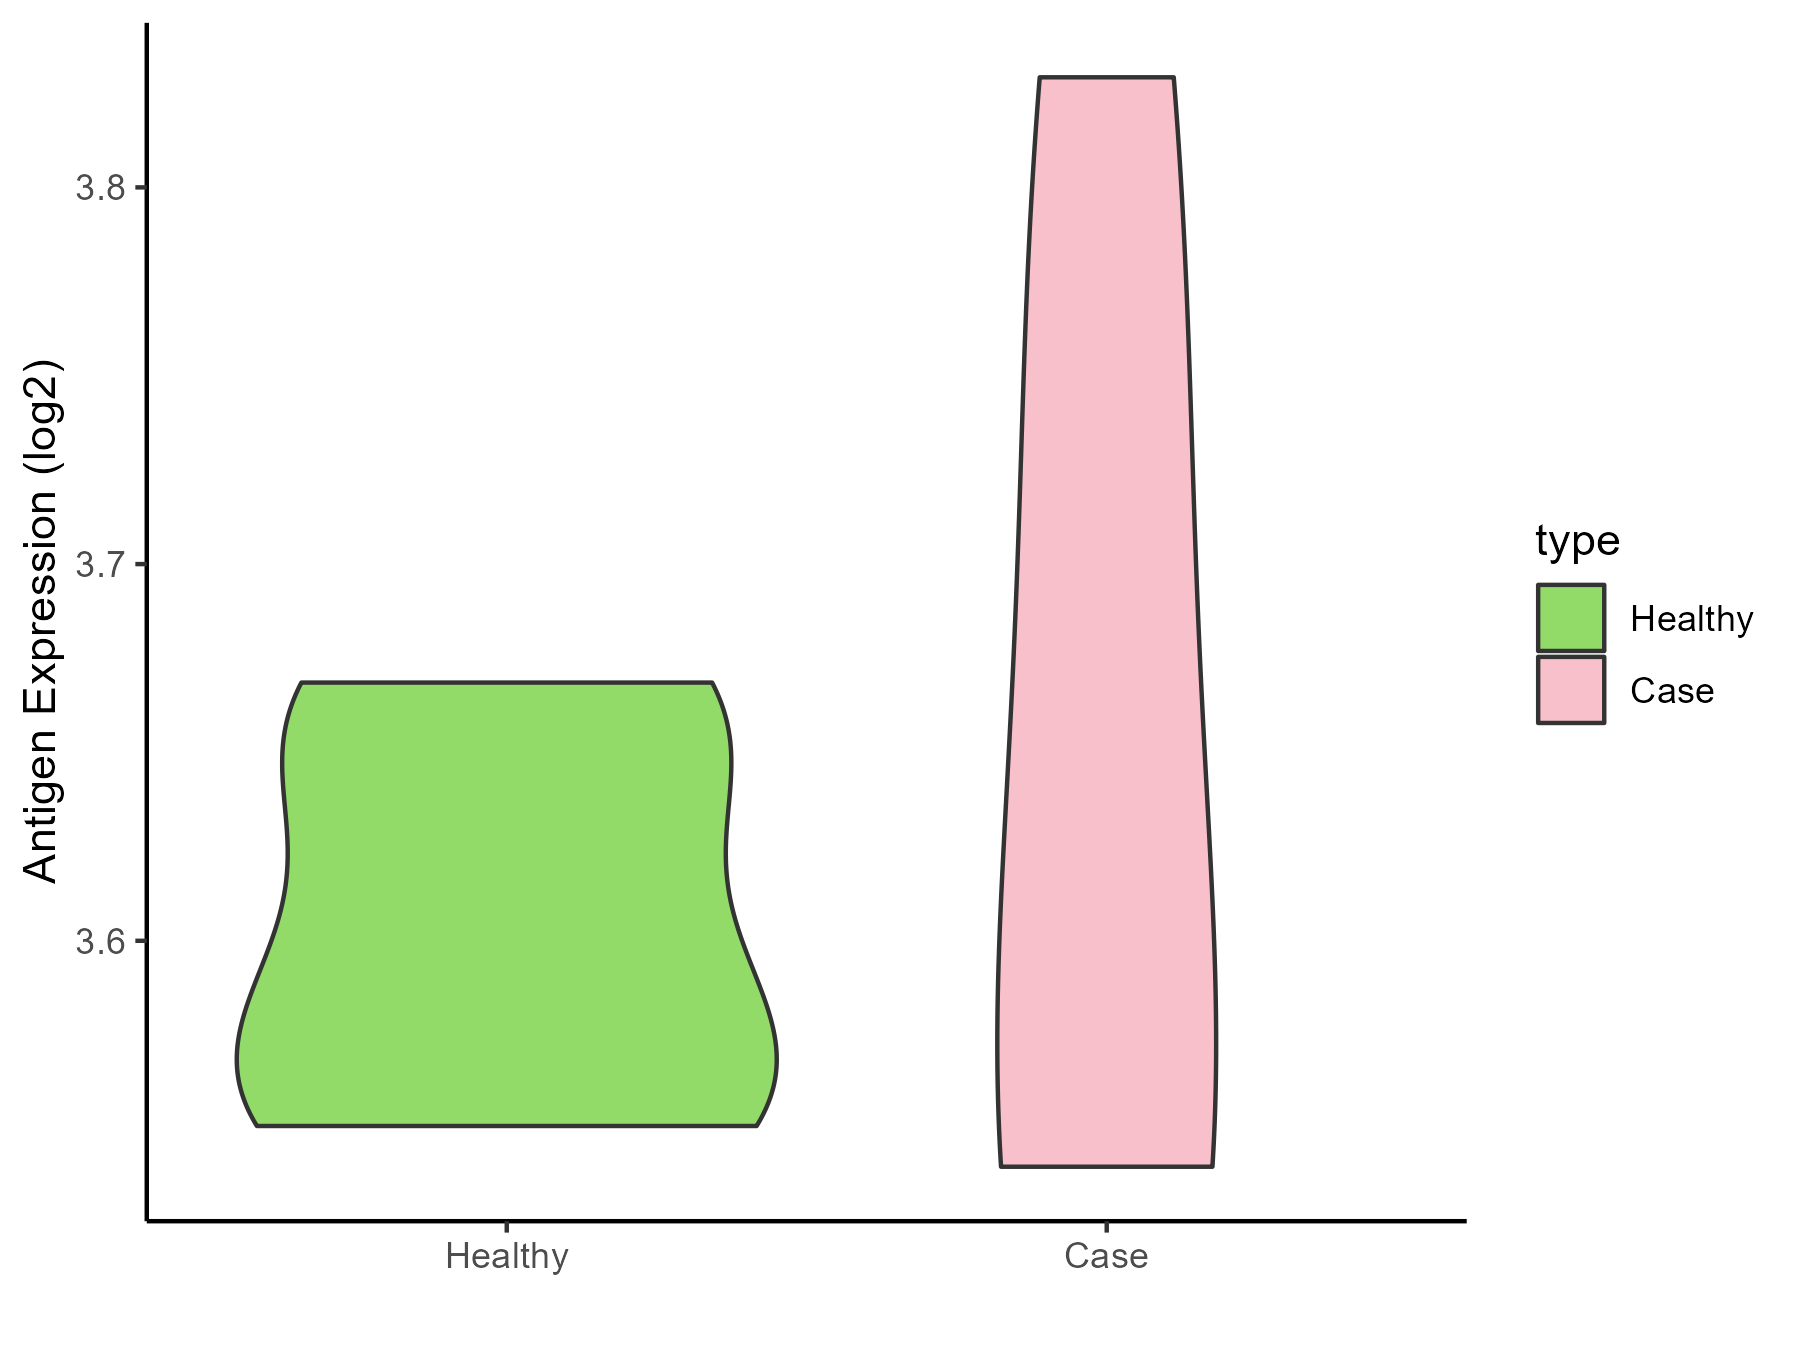
| Differential expression pattern of antigen in diseases | ||
| The Studied Tissue | Bone marrow | |
| The Specific Disease | Osteoporosis | |
| The Expression Level of Disease Section Compare with the Healthy Individual Tissue | p-value: 0.544670802; Fold-change: 0.027909739; Z-score: 0.517252474 | |
| Disease-specific Antigen Abundances |
|
Click to View the Clearer Original Diagram |
ICD Disease Classification 16
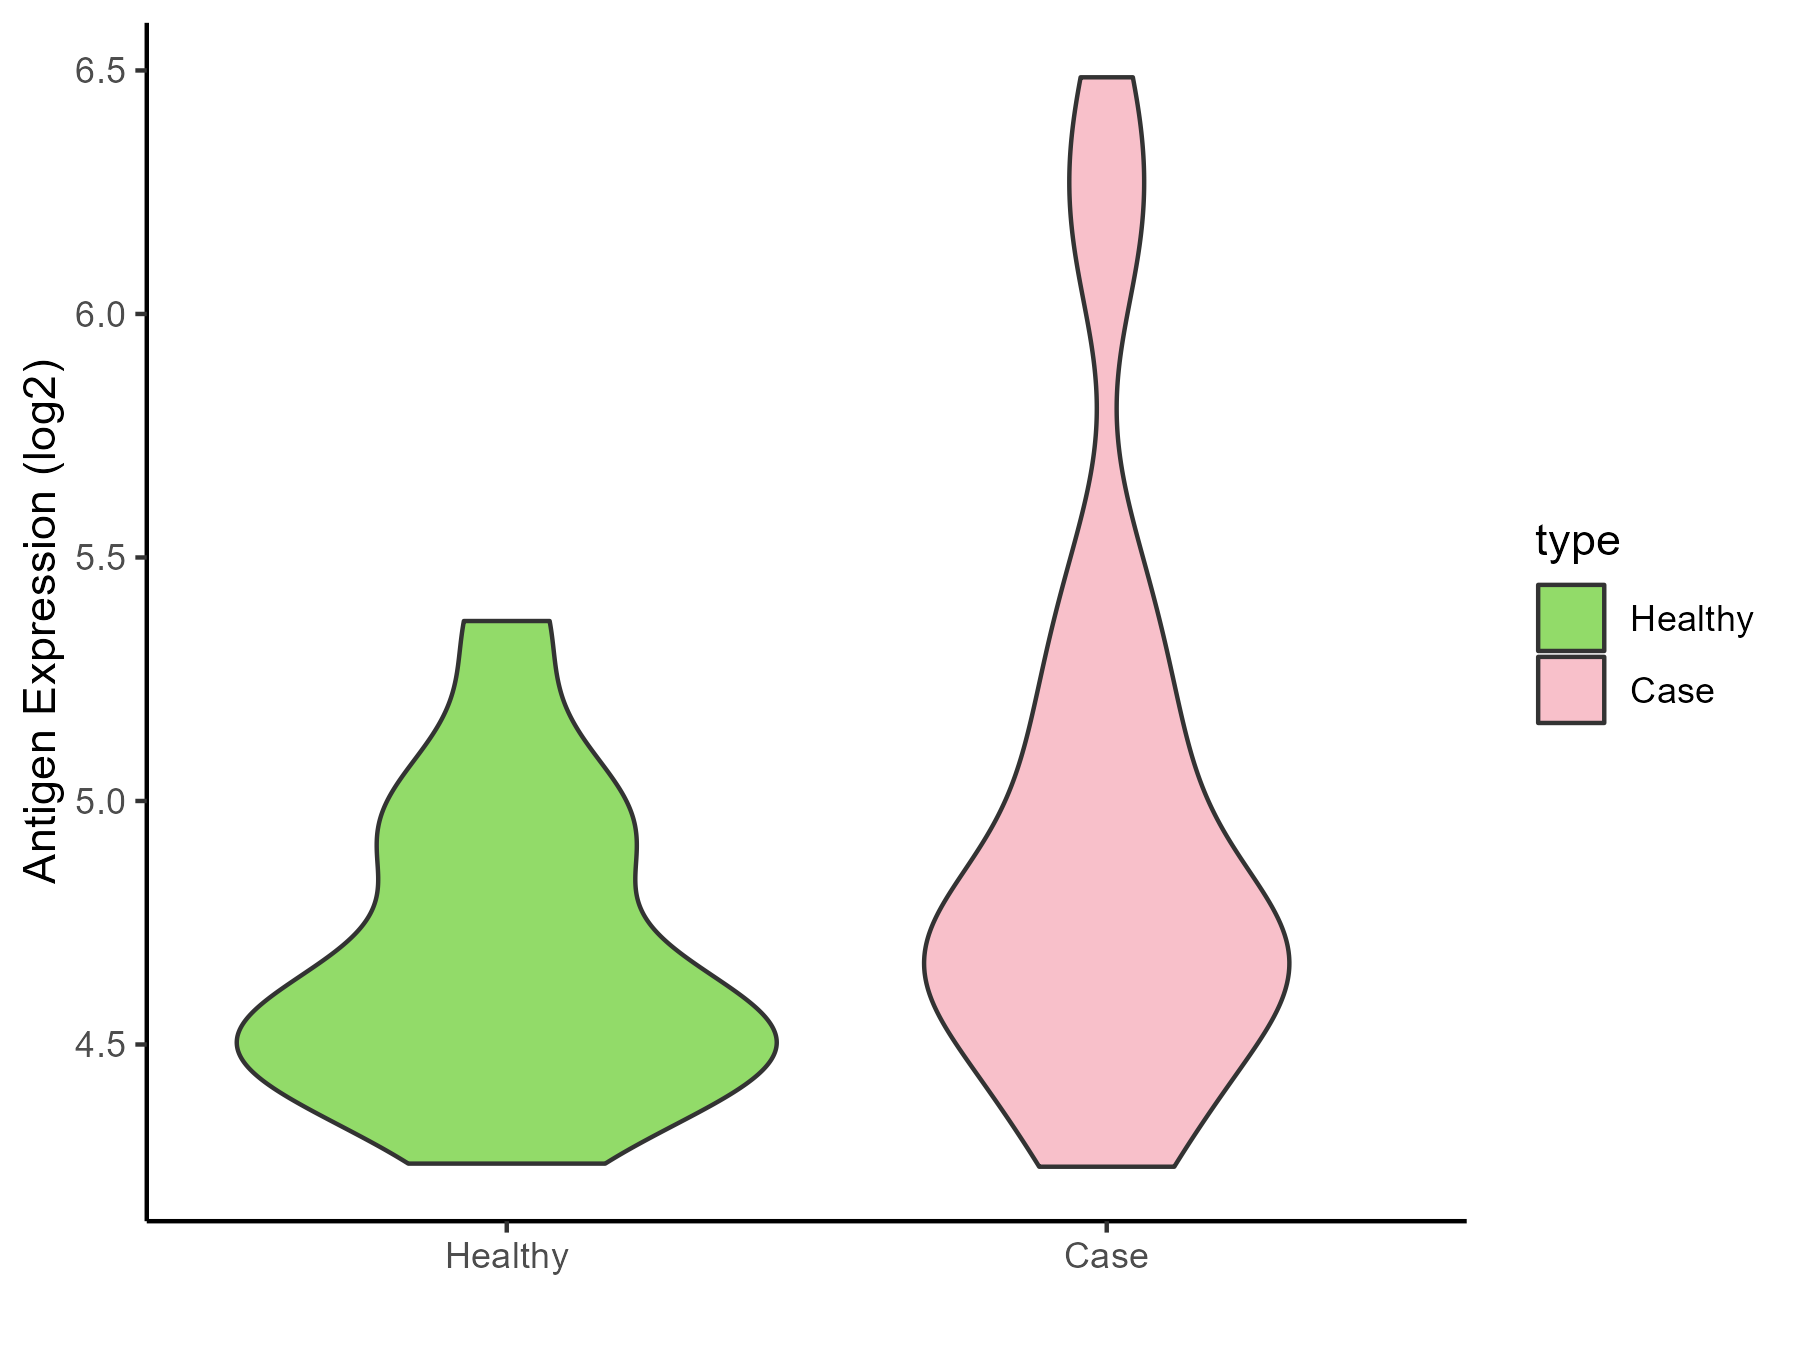
| Differential expression pattern of antigen in diseases | ||
| The Studied Tissue | Endometrium | |
| The Specific Disease | Endometriosis | |
| The Expression Level of Disease Section Compare with the Healthy Individual Tissue | p-value: 0.010461027; Fold-change: 0.149512828; Z-score: 0.497614312 | |
| Disease-specific Antigen Abundances |
|
Click to View the Clearer Original Diagram |
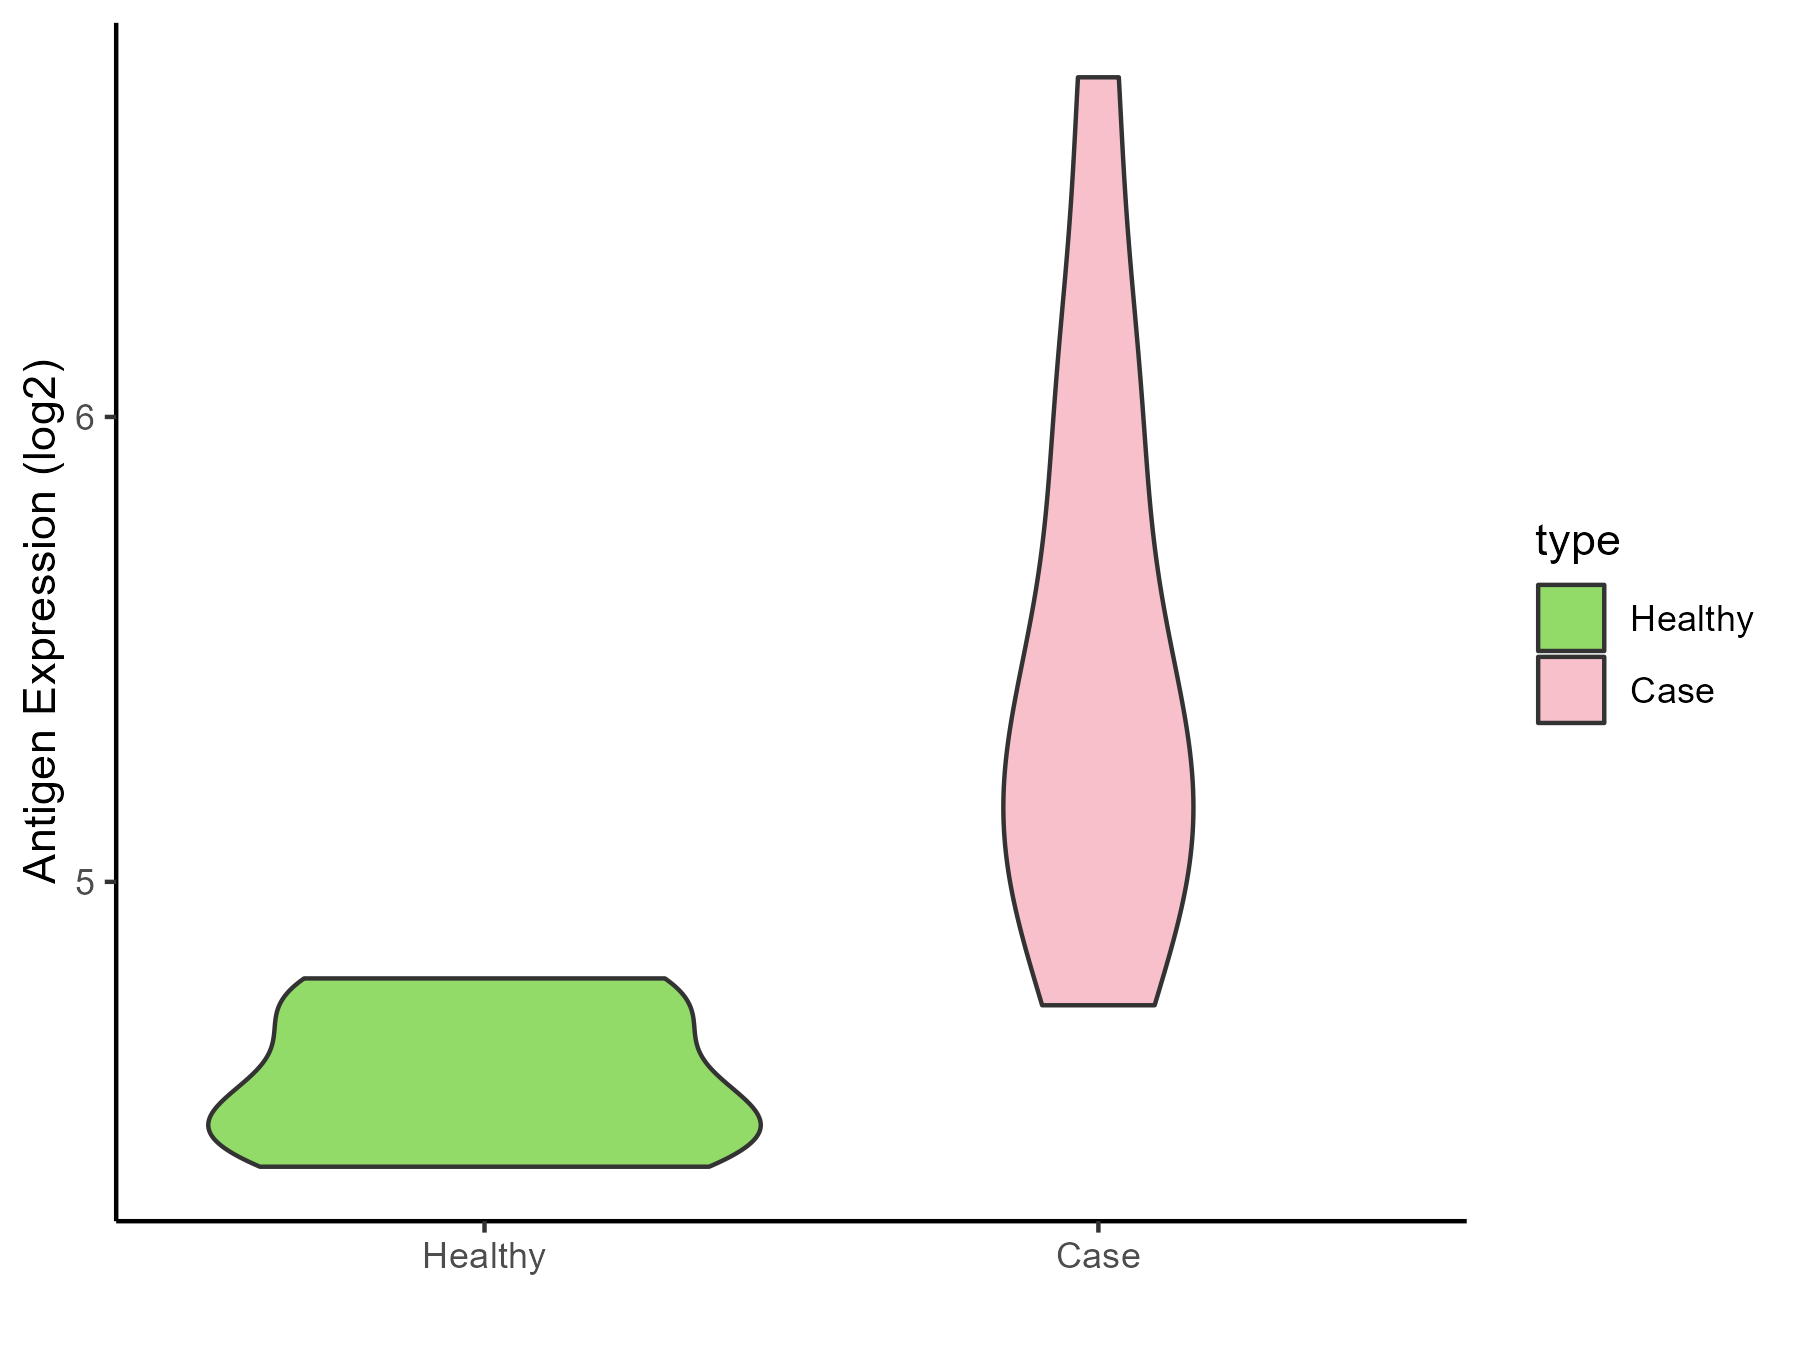
| Differential expression pattern of antigen in diseases | ||
| The Studied Tissue | Bladder | |
| The Specific Disease | Interstitial cystitis | |
| The Expression Level of Disease Section Compare with the Healthy Individual Tissue | p-value: 0.000998895; Fold-change: 0.700684881; Z-score: 4.148670453 | |
| Disease-specific Antigen Abundances |
|
Click to View the Clearer Original Diagram |
ICD Disease Classification 19
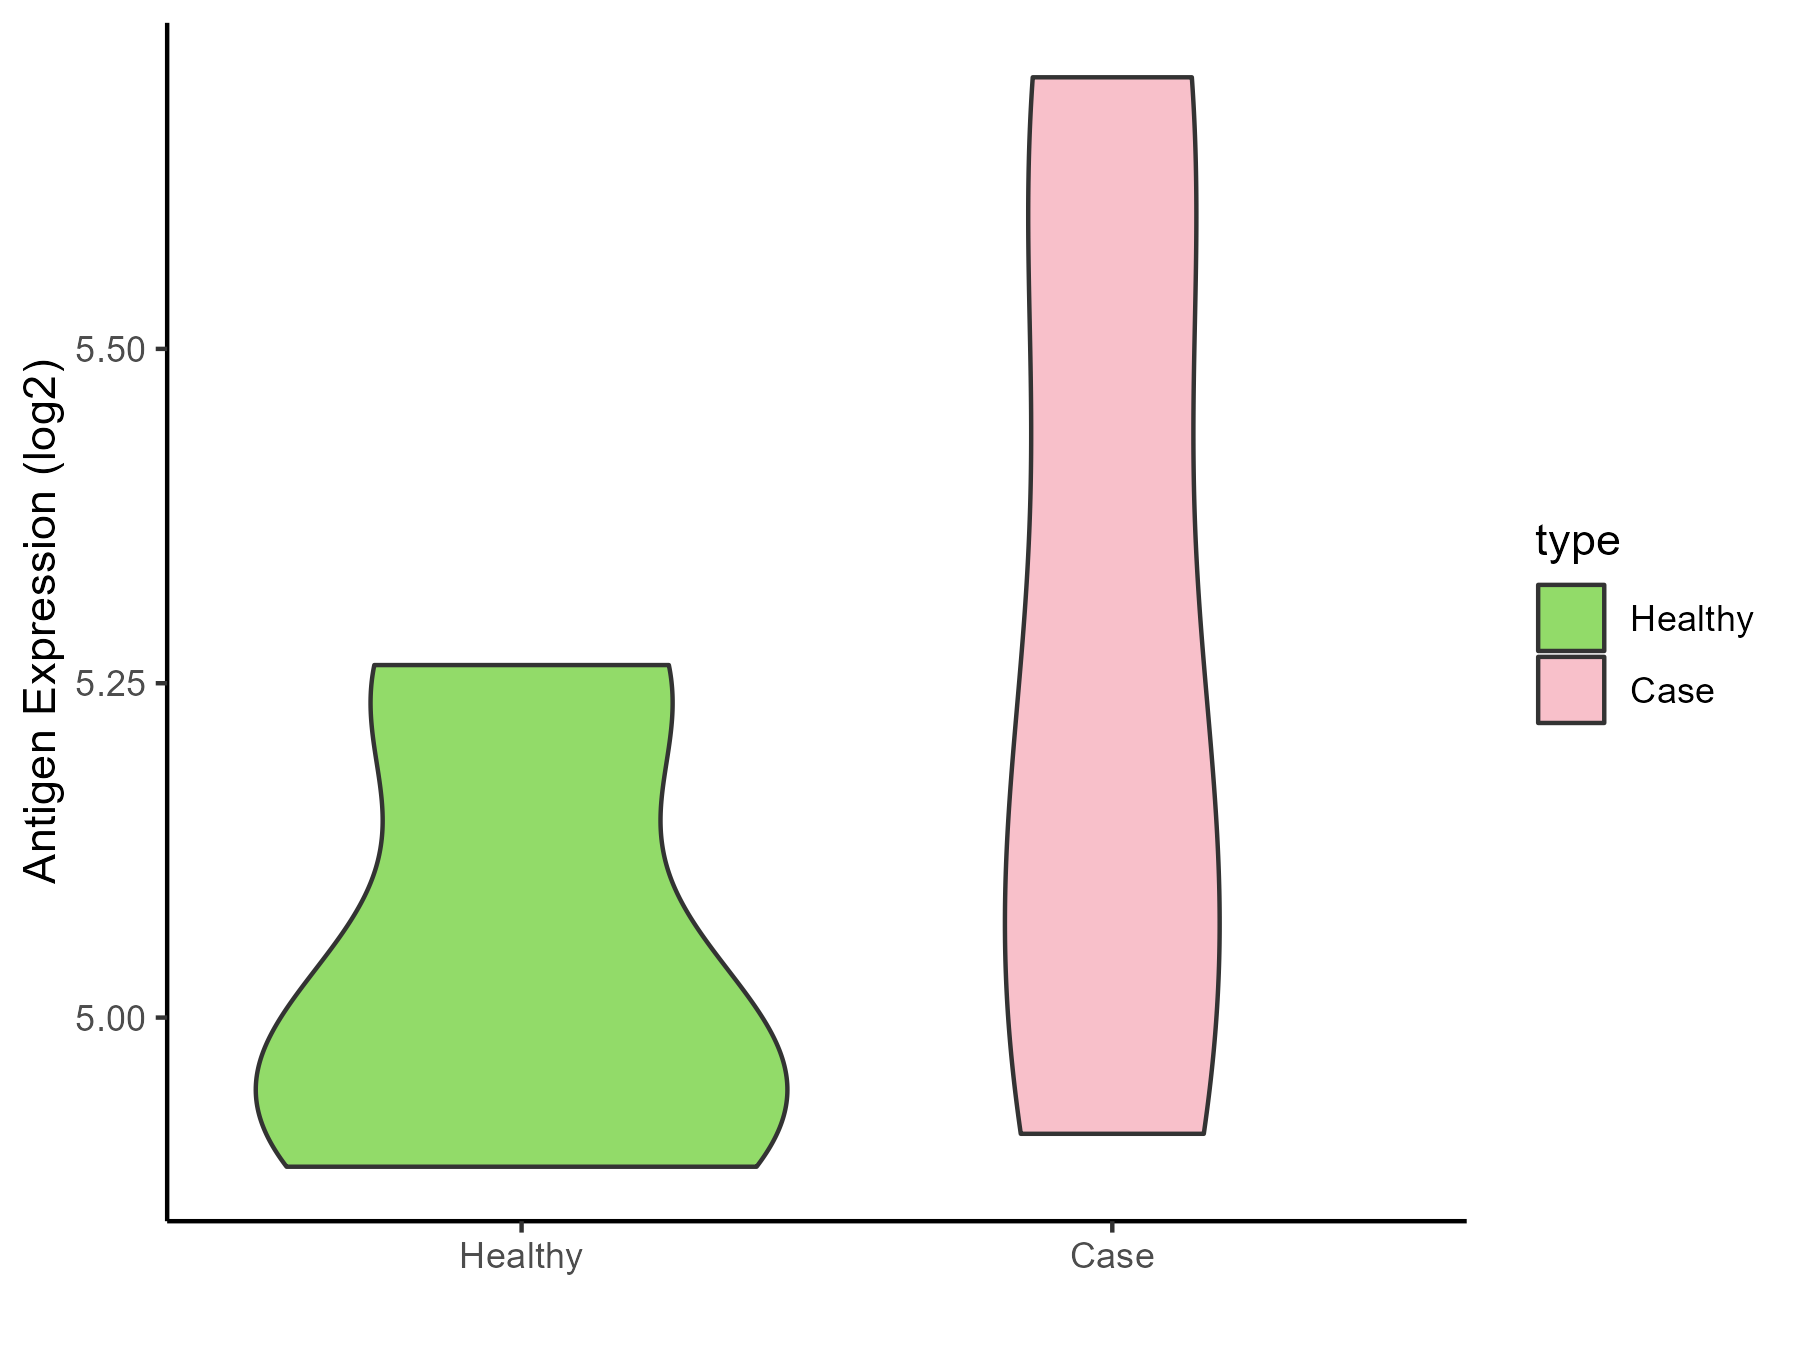
| Differential expression pattern of antigen in diseases | ||
| The Studied Tissue | Myometrium | |
| The Specific Disease | Preterm birth | |
| The Expression Level of Disease Section Compare with the Healthy Individual Tissue | p-value: 0.200999031; Fold-change: 0.197197528; Z-score: 1.203362135 | |
| Disease-specific Antigen Abundances |
|
Click to View the Clearer Original Diagram |
ICD Disease Classification 2
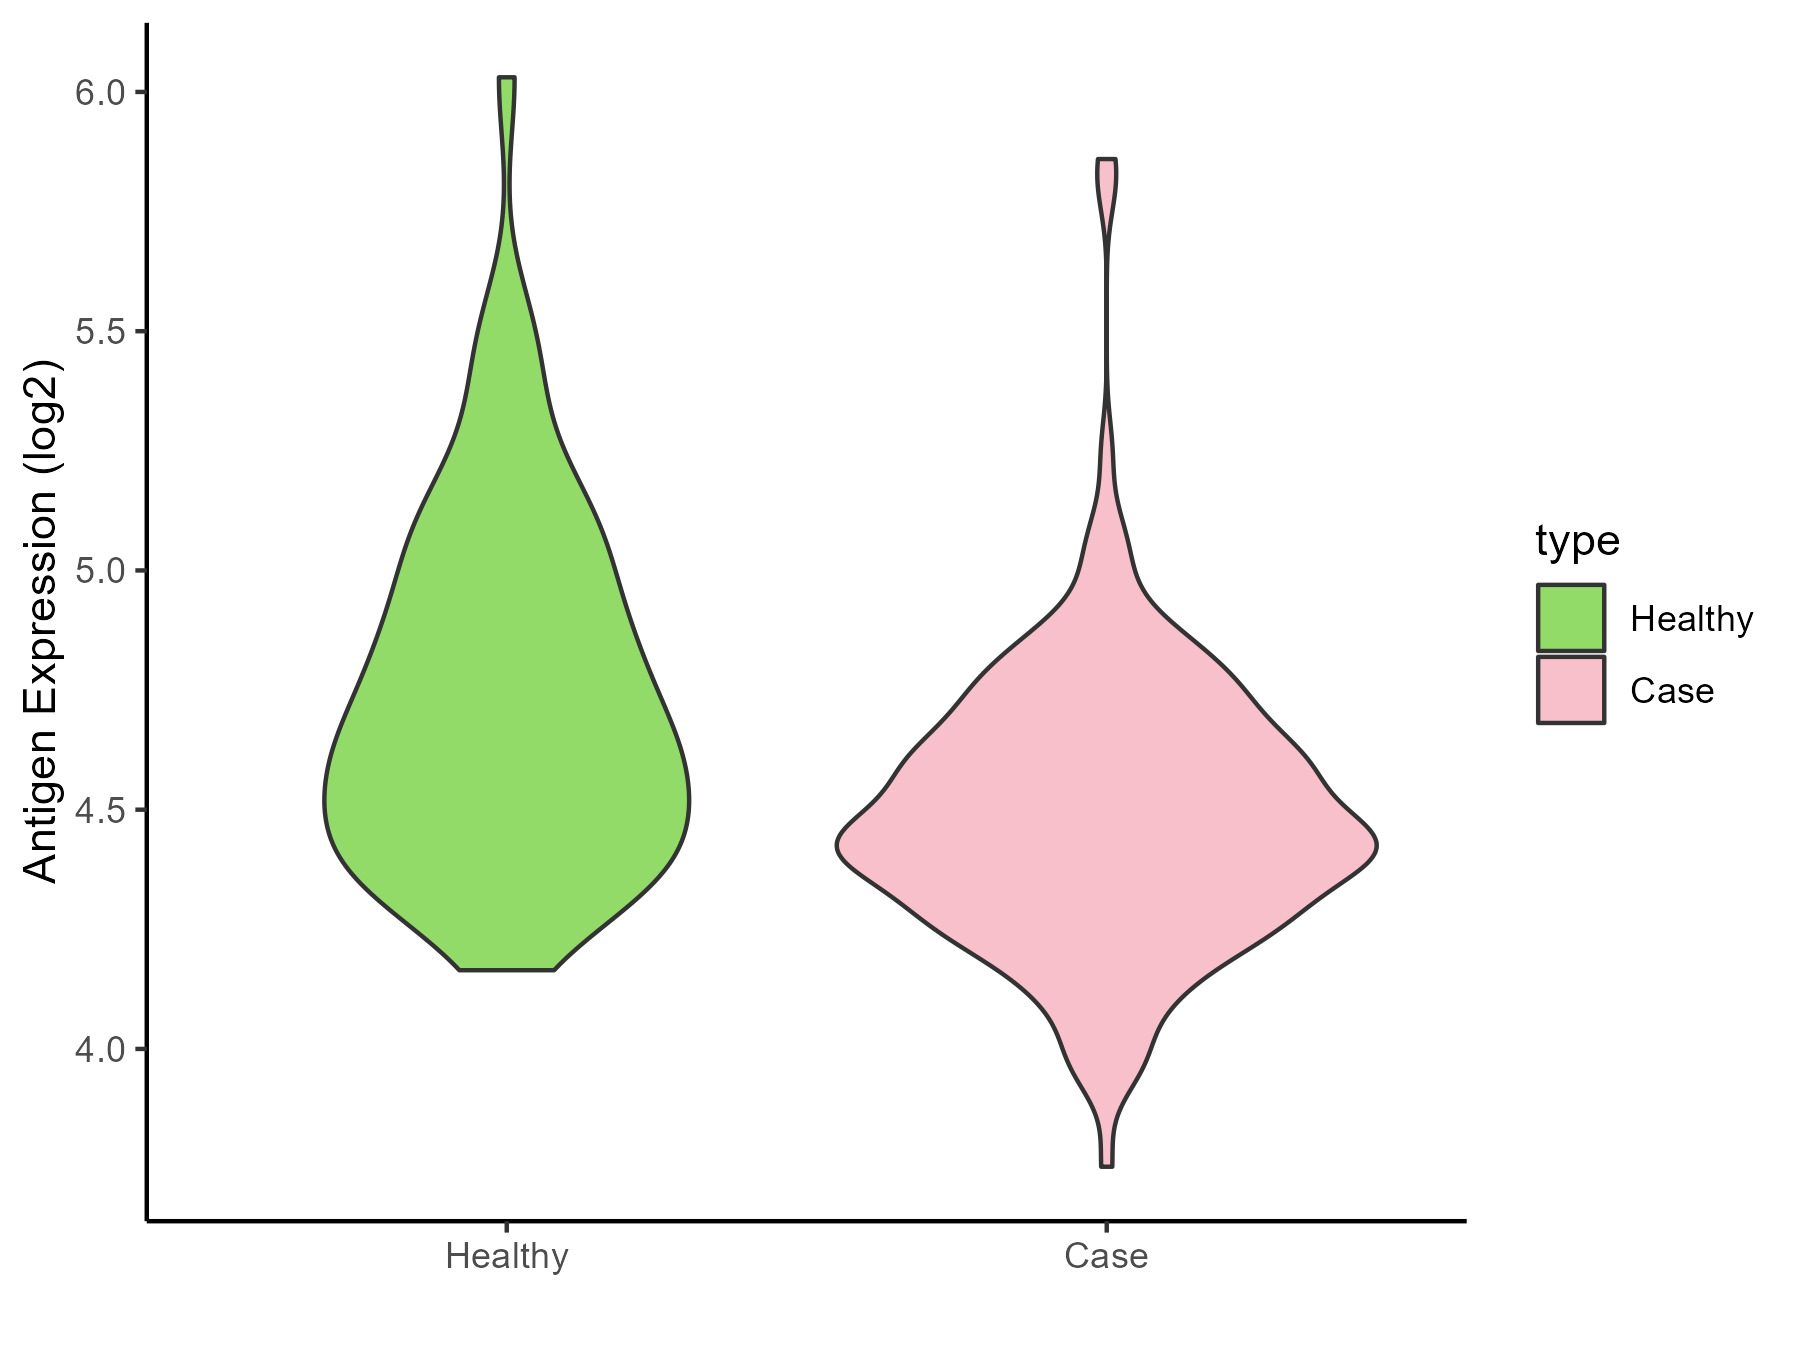
| Differential expression pattern of antigen in diseases | ||
| The Studied Tissue | Bone marrow | |
| The Specific Disease | Acute myelocytic leukemia | |
| The Expression Level of Disease Section Compare with the Healthy Individual Tissue | p-value: 1.89E-11; Fold-change: -0.210620126; Z-score: -0.576256135 | |
| Disease-specific Antigen Abundances |
|
Click to View the Clearer Original Diagram |
| Differential expression pattern of antigen in diseases | ||
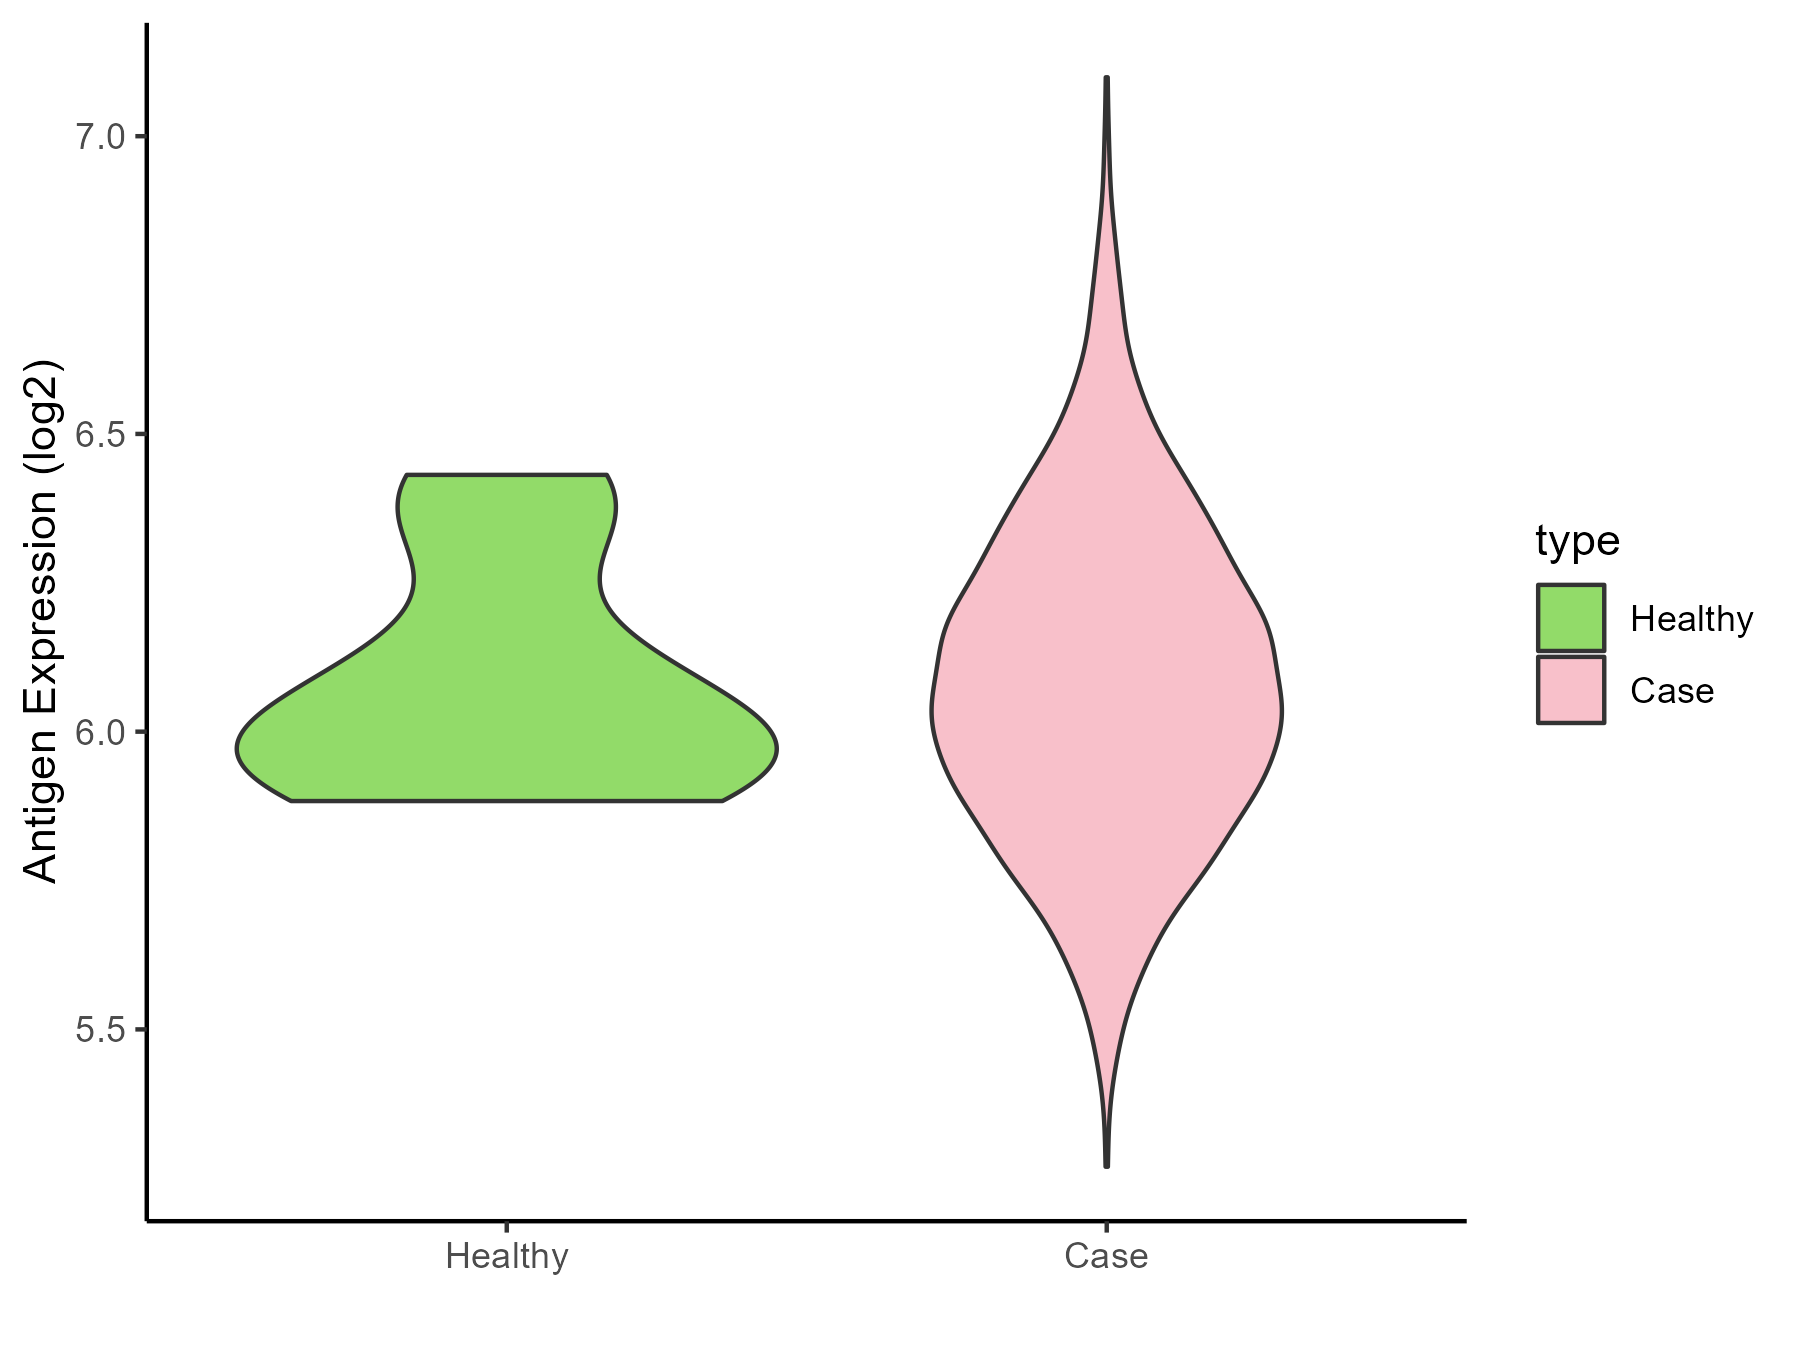
| The Studied Tissue | Bone marrow | |
| The Specific Disease | Myeloma | |
| The Expression Level of Disease Section Compare with the Healthy Individual Tissue | p-value: 0.995792669; Fold-change: 0.054991716; Z-score: 0.271336217 | |
| Disease-specific Antigen Abundances |
|
Click to View the Clearer Original Diagram |
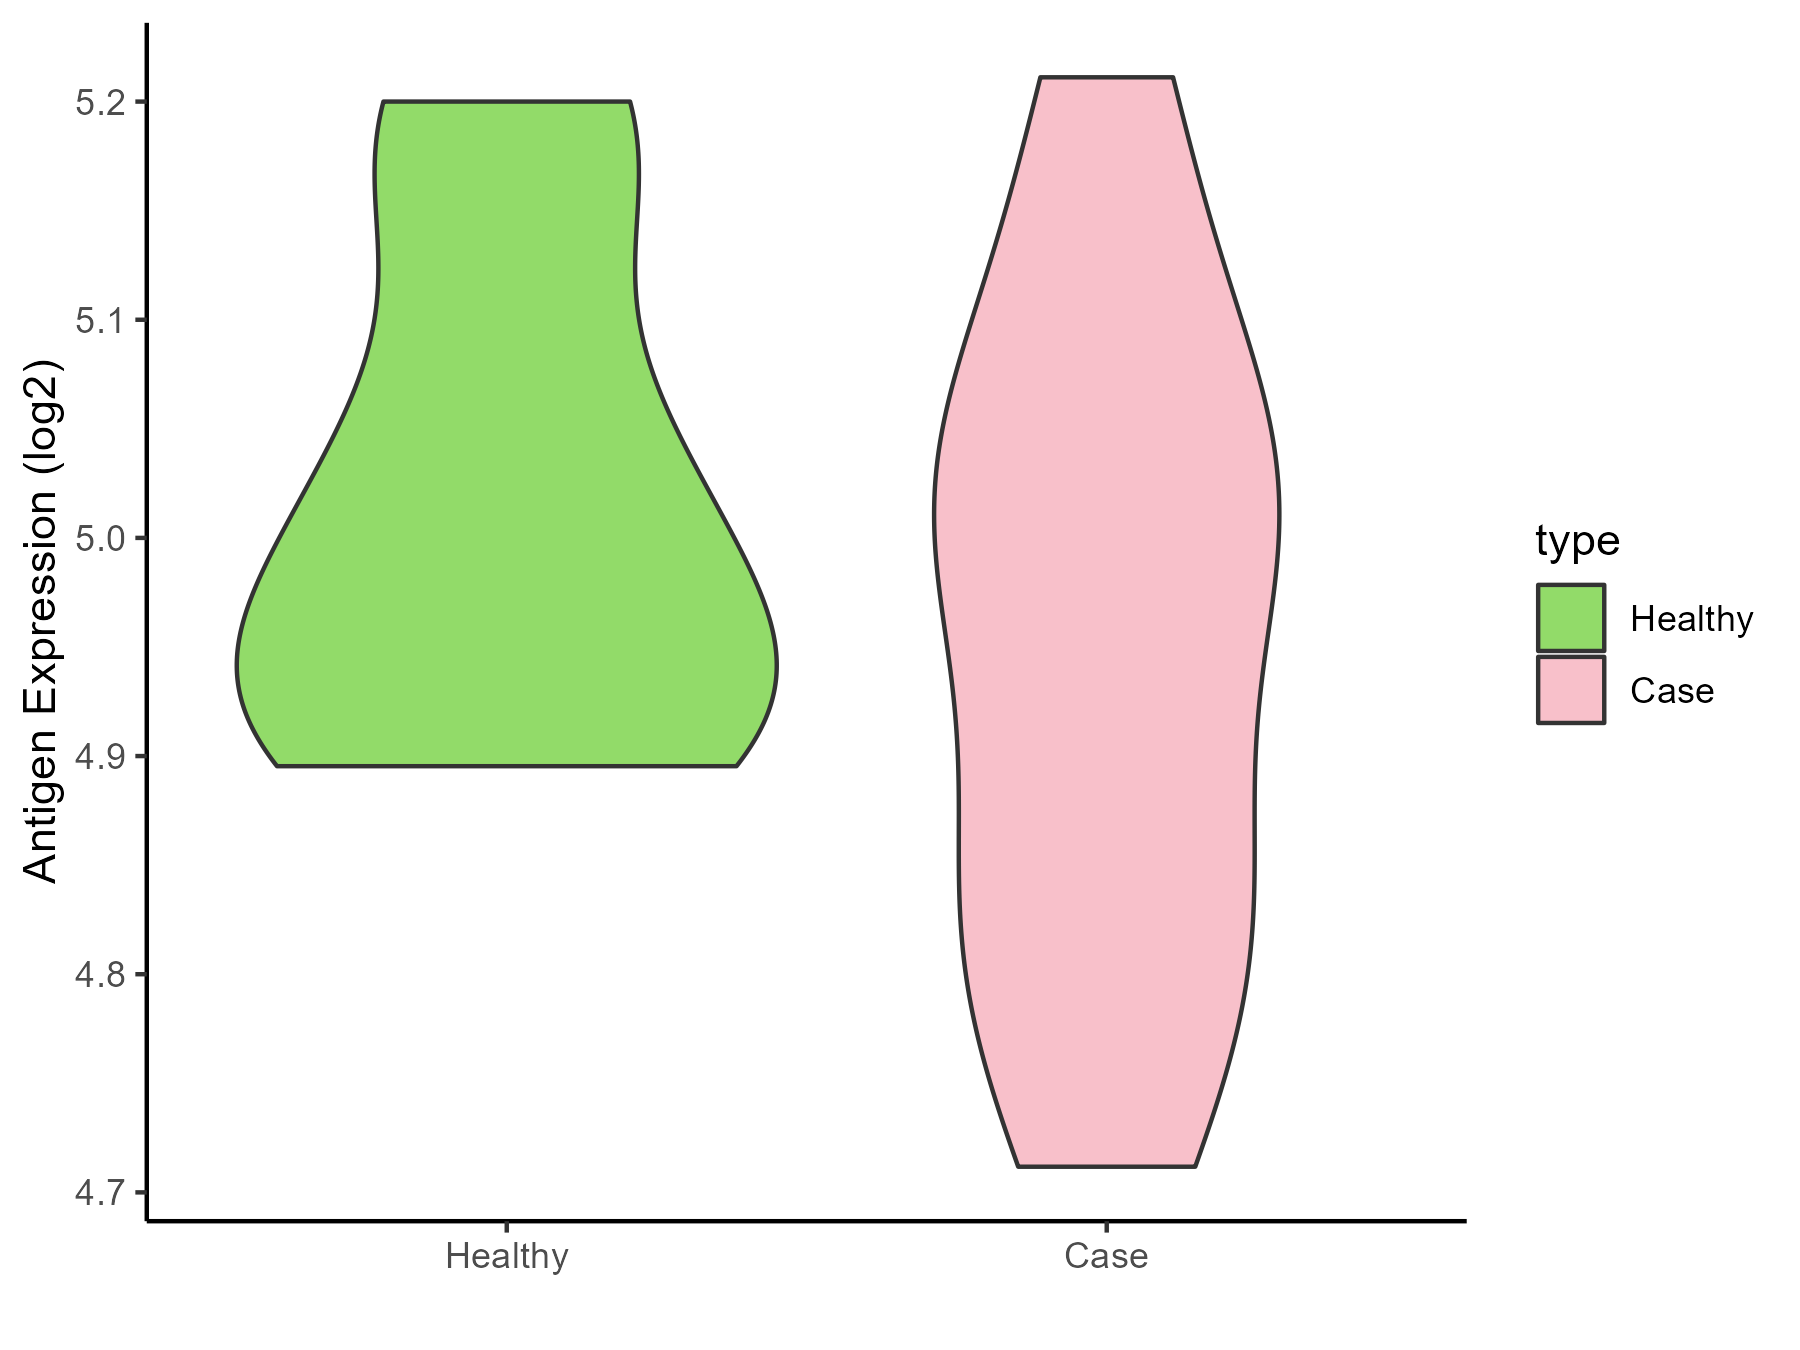
| The Studied Tissue | Peripheral blood | |
| The Specific Disease | Myeloma | |
| The Expression Level of Disease Section Compare with the Healthy Individual Tissue | p-value: 0.220643496; Fold-change: -0.000869259; Z-score: -0.007565259 | |
| Disease-specific Antigen Abundances |
|
Click to View the Clearer Original Diagram |
| Differential expression pattern of antigen in diseases | ||
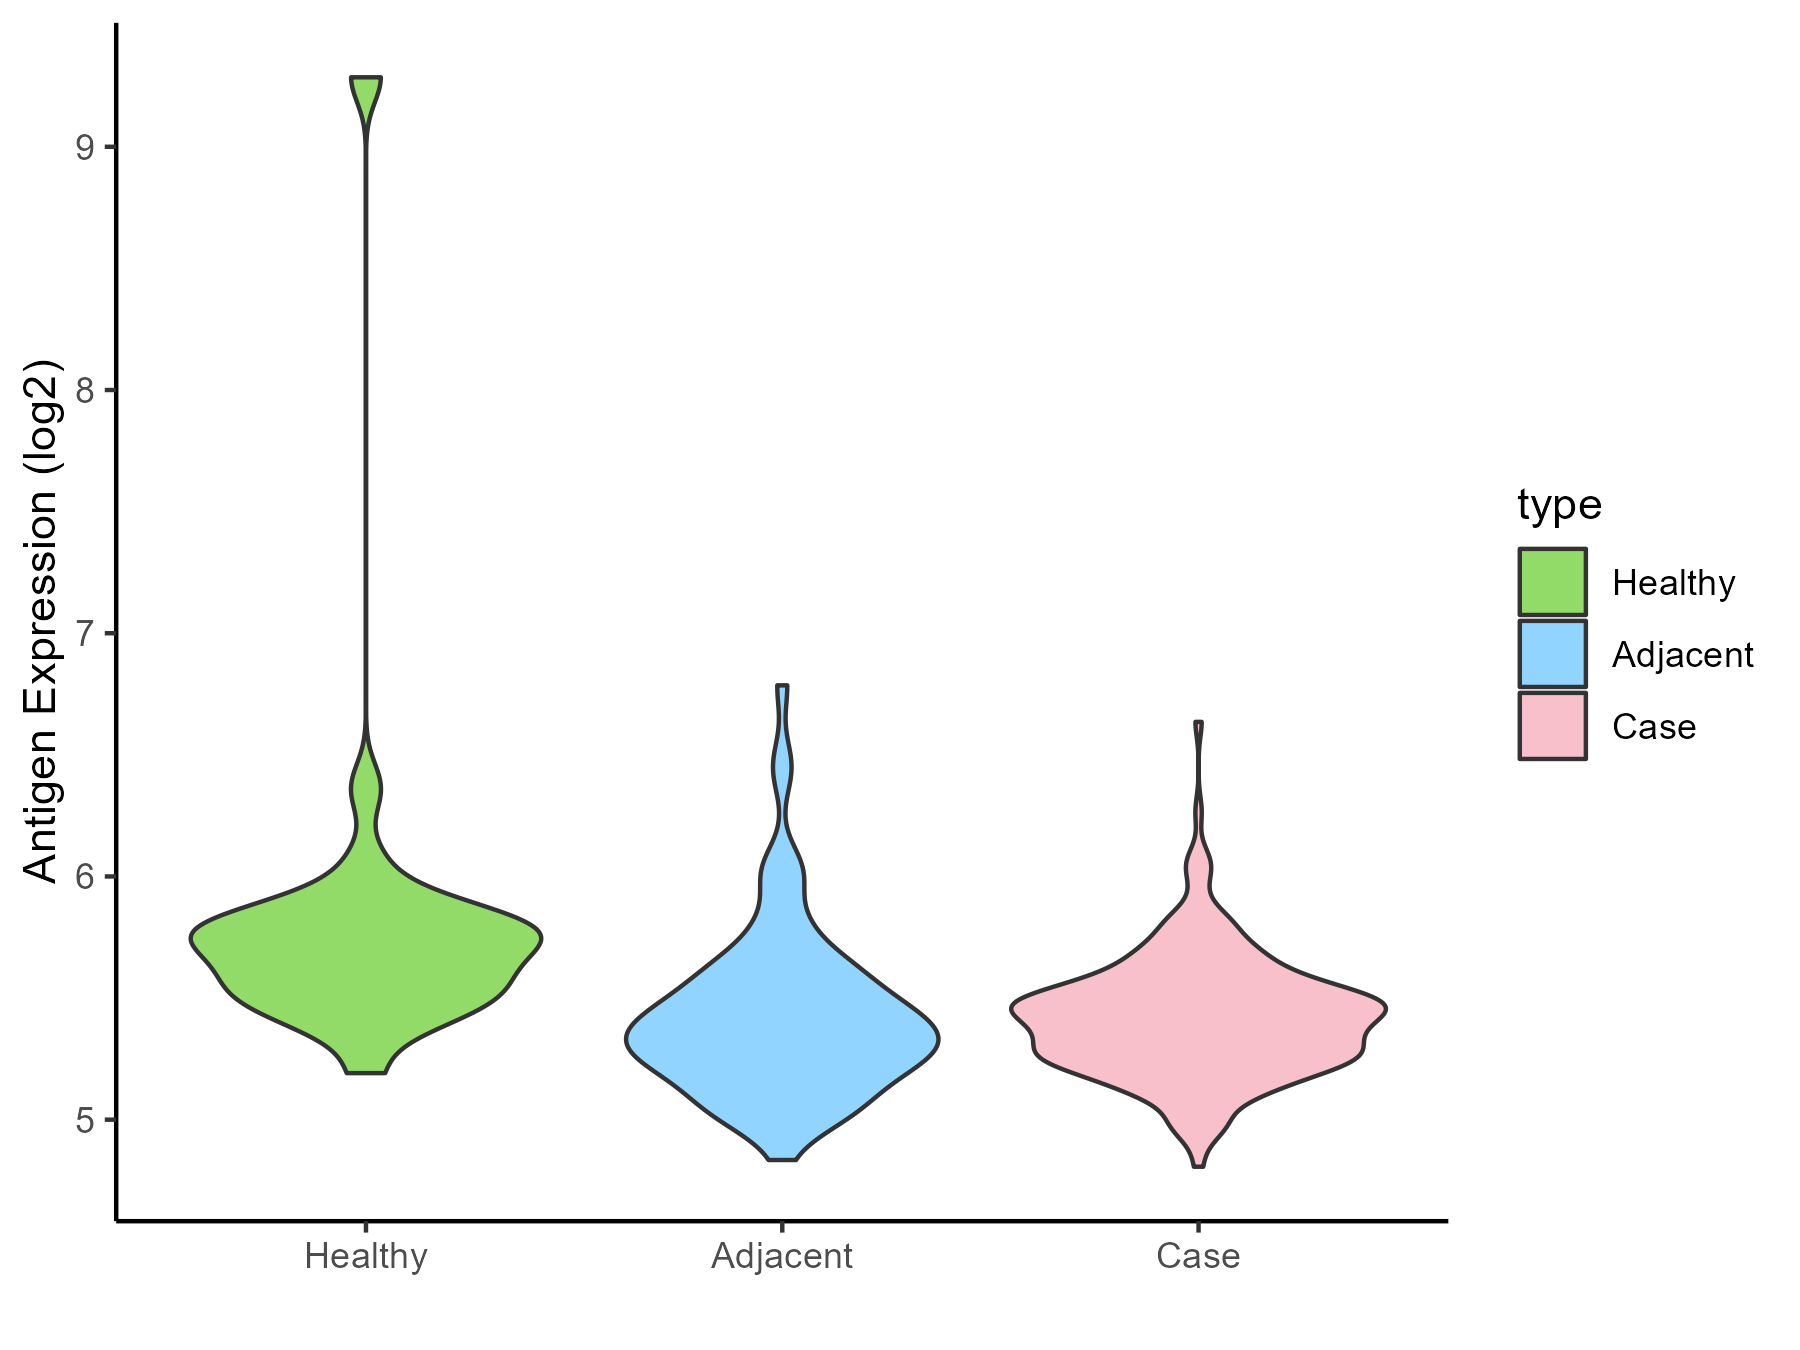
| The Studied Tissue | Oral | |
| The Specific Disease | Oral cancer | |
| The Expression Level of Disease Section Compare with the Healthy Individual Tissue | p-value: 0.008894136; Fold-change: -0.305366511; Z-score: -0.41826501 | |
| The Expression Level of Disease Section Compare with the Adjacent Tissue | p-value: 0.932691817; Fold-change: 0.047405525; Z-score: 0.139682262 | |
| Disease-specific Antigen Abundances |
|
Click to View the Clearer Original Diagram |
| Differential expression pattern of antigen in diseases | ||
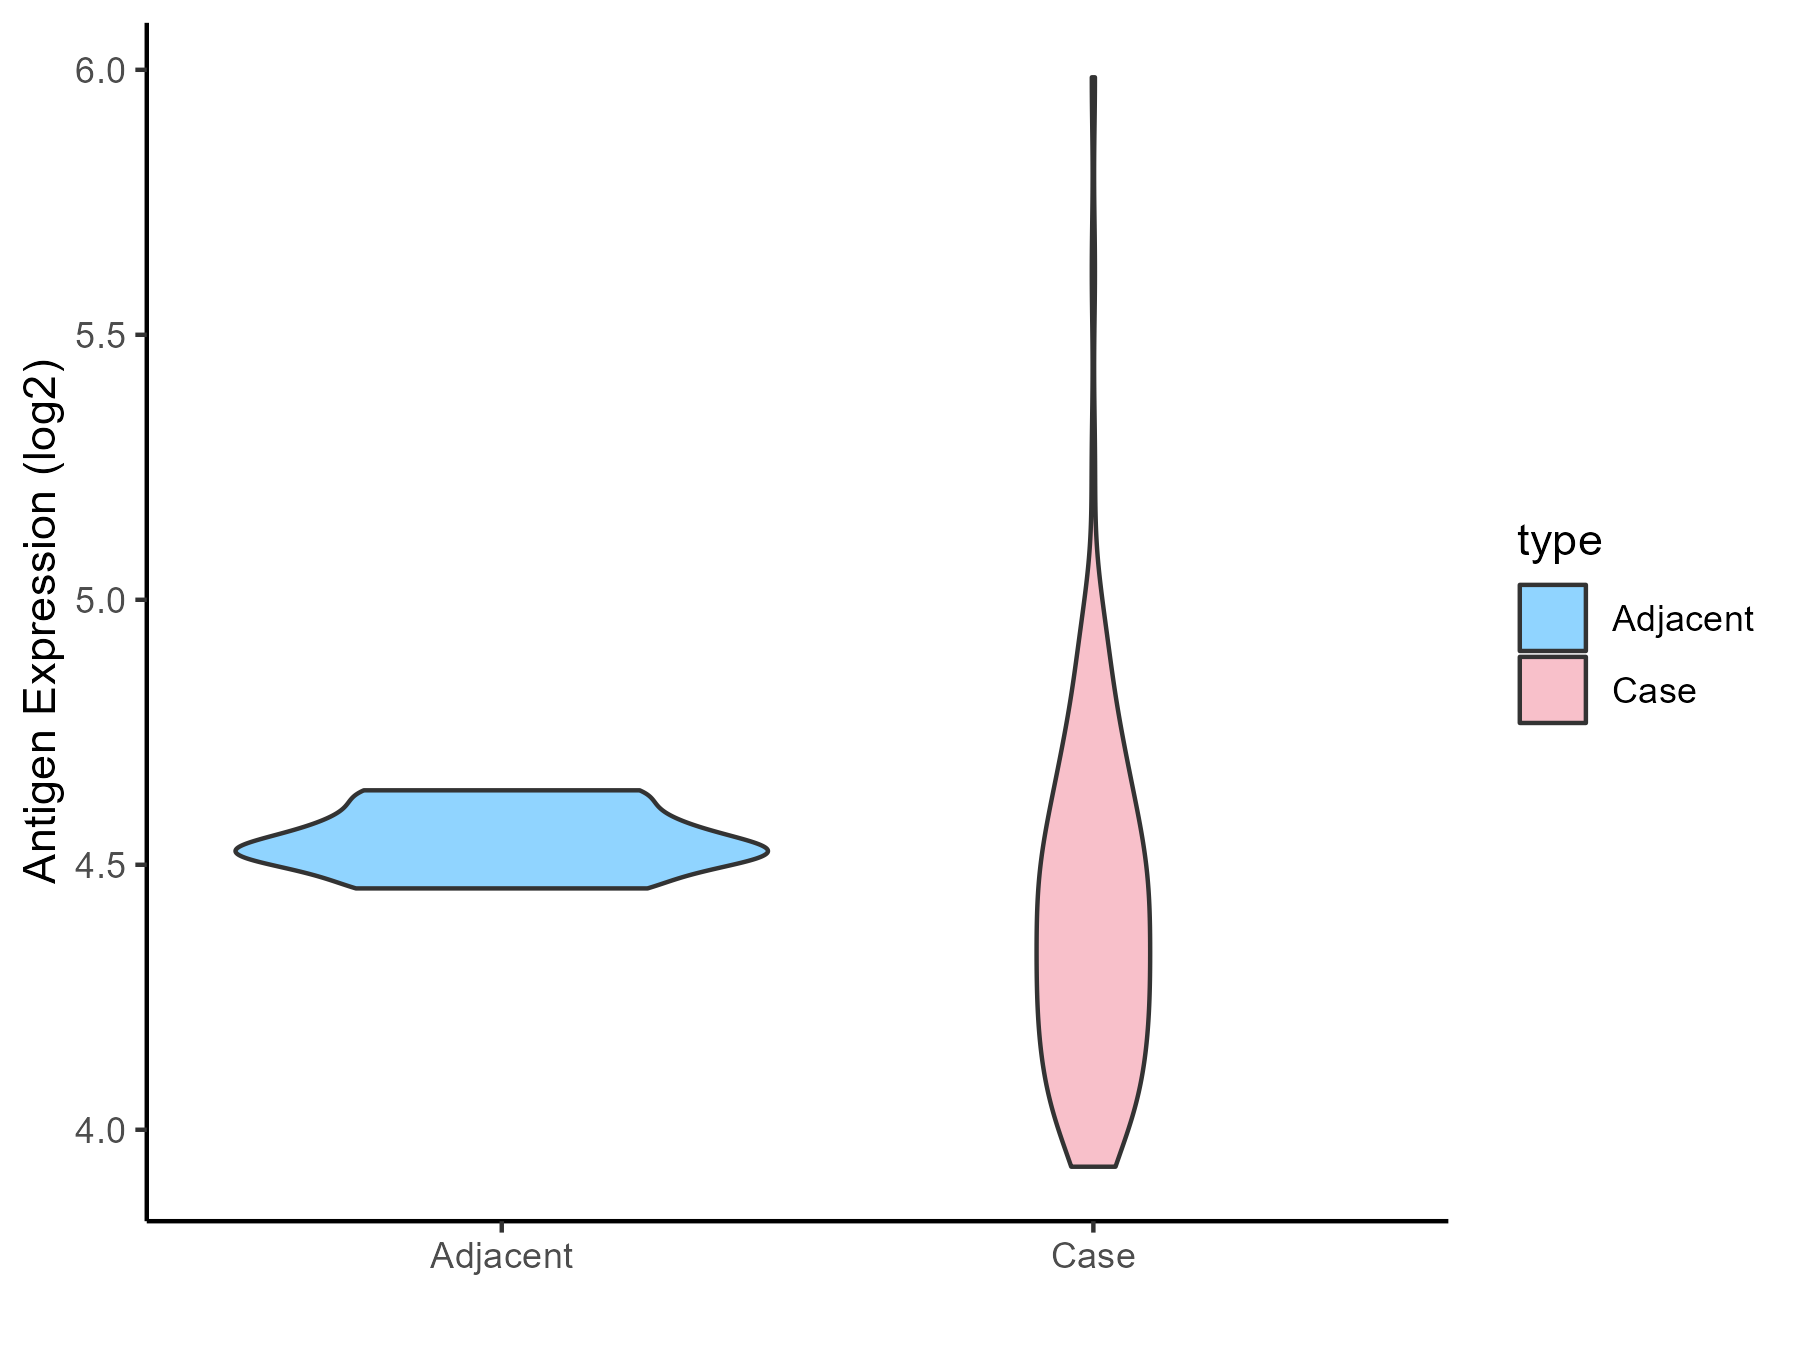
| The Studied Tissue | Esophagus | |
| The Specific Disease | Esophagal cancer | |
| The Expression Level of Disease Section Compare with the Adjacent Tissue | p-value: 0.011681289; Fold-change: -0.143361739; Z-score: -2.05199215 | |
| Disease-specific Antigen Abundances |
|
Click to View the Clearer Original Diagram |
| Differential expression pattern of antigen in diseases | ||
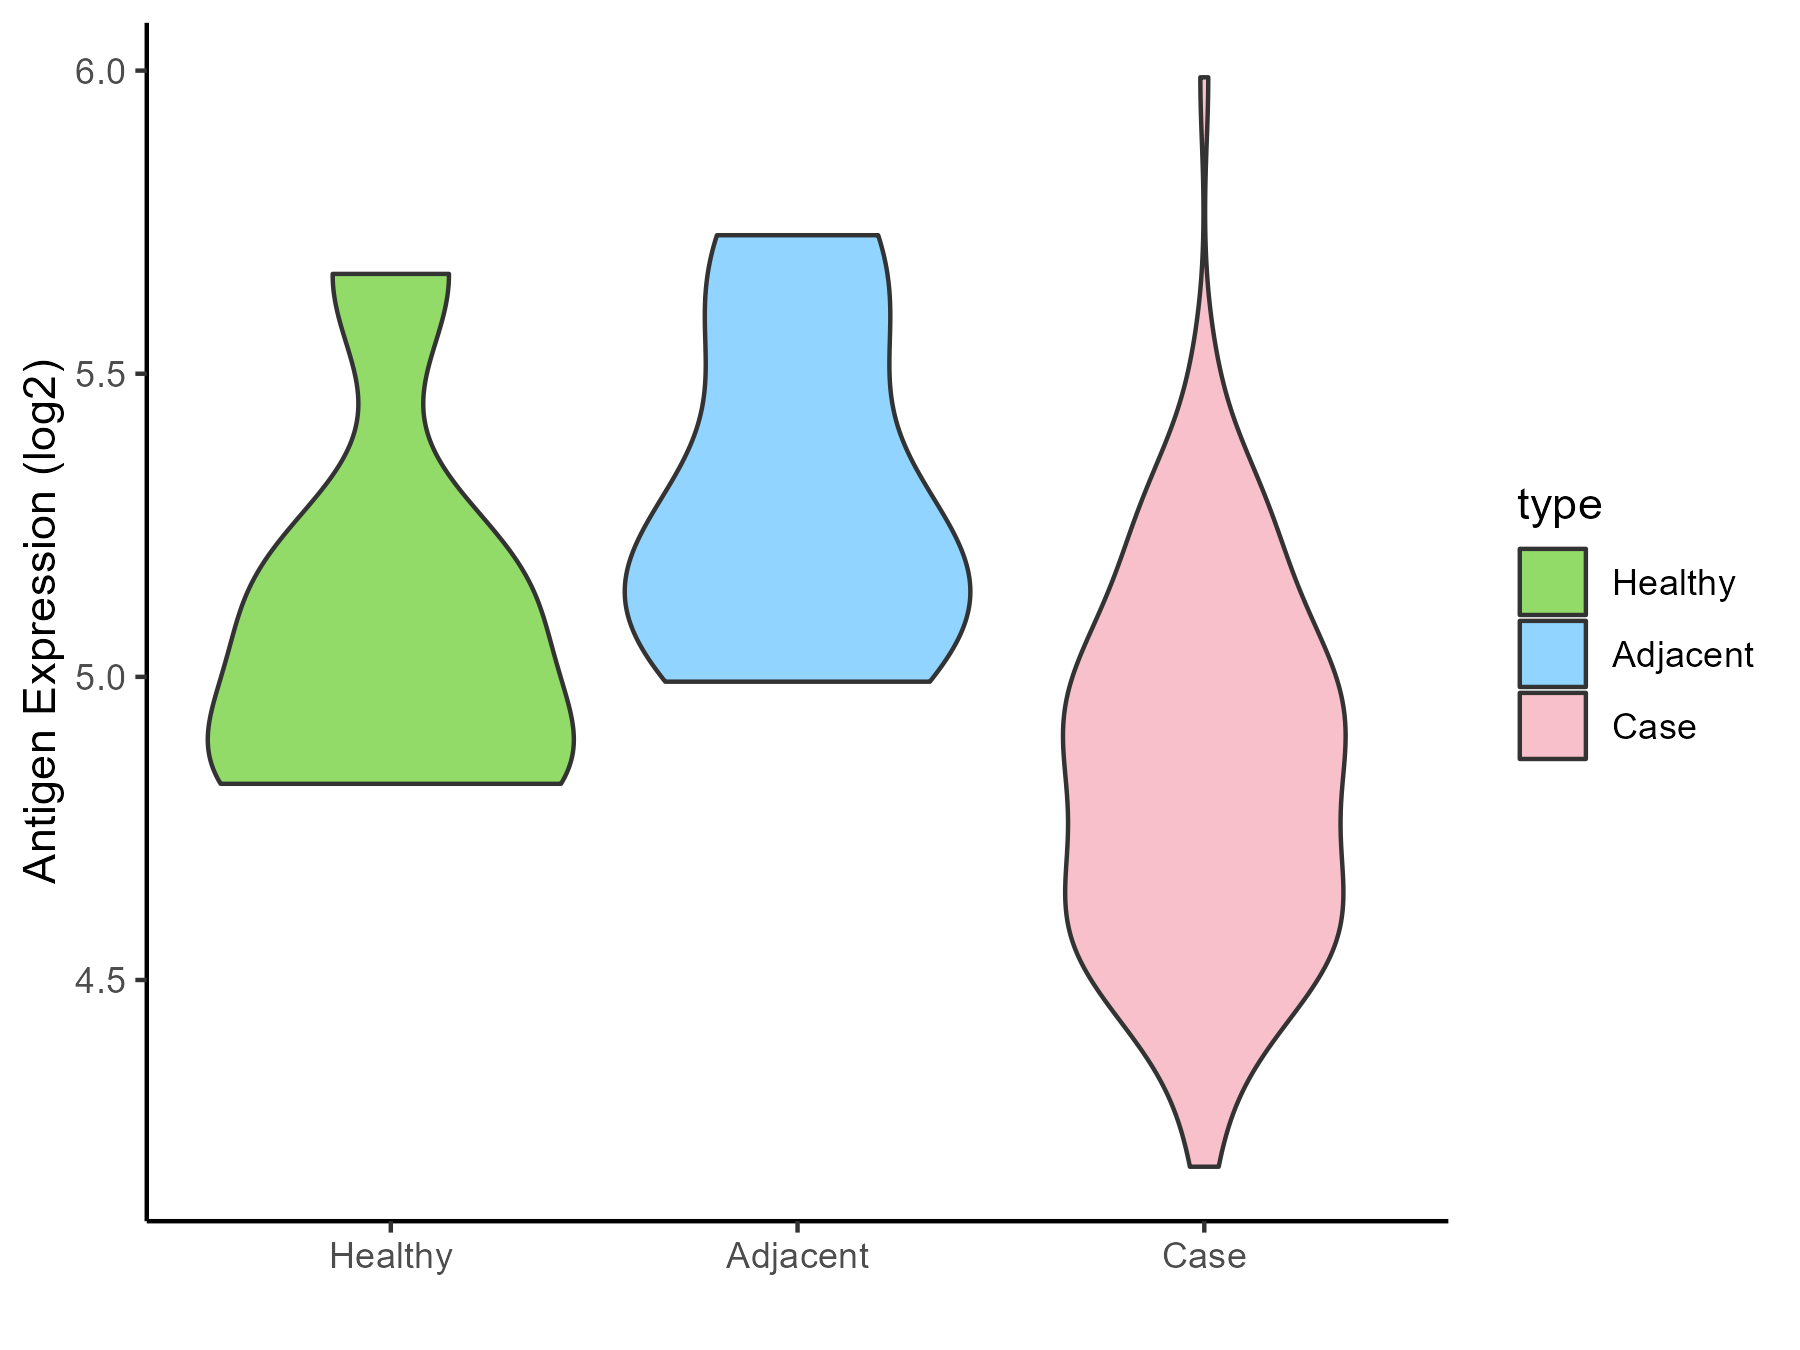
| The Studied Tissue | Rectal colon | |
| The Specific Disease | Rectal cancer | |
| The Expression Level of Disease Section Compare with the Healthy Individual Tissue | p-value: 0.115982058; Fold-change: -0.192461338; Z-score: -0.605027974 | |
| The Expression Level of Disease Section Compare with the Adjacent Tissue | p-value: 0.009833871; Fold-change: -0.362829314; Z-score: -1.275355221 | |
| Disease-specific Antigen Abundances |
|
Click to View the Clearer Original Diagram |
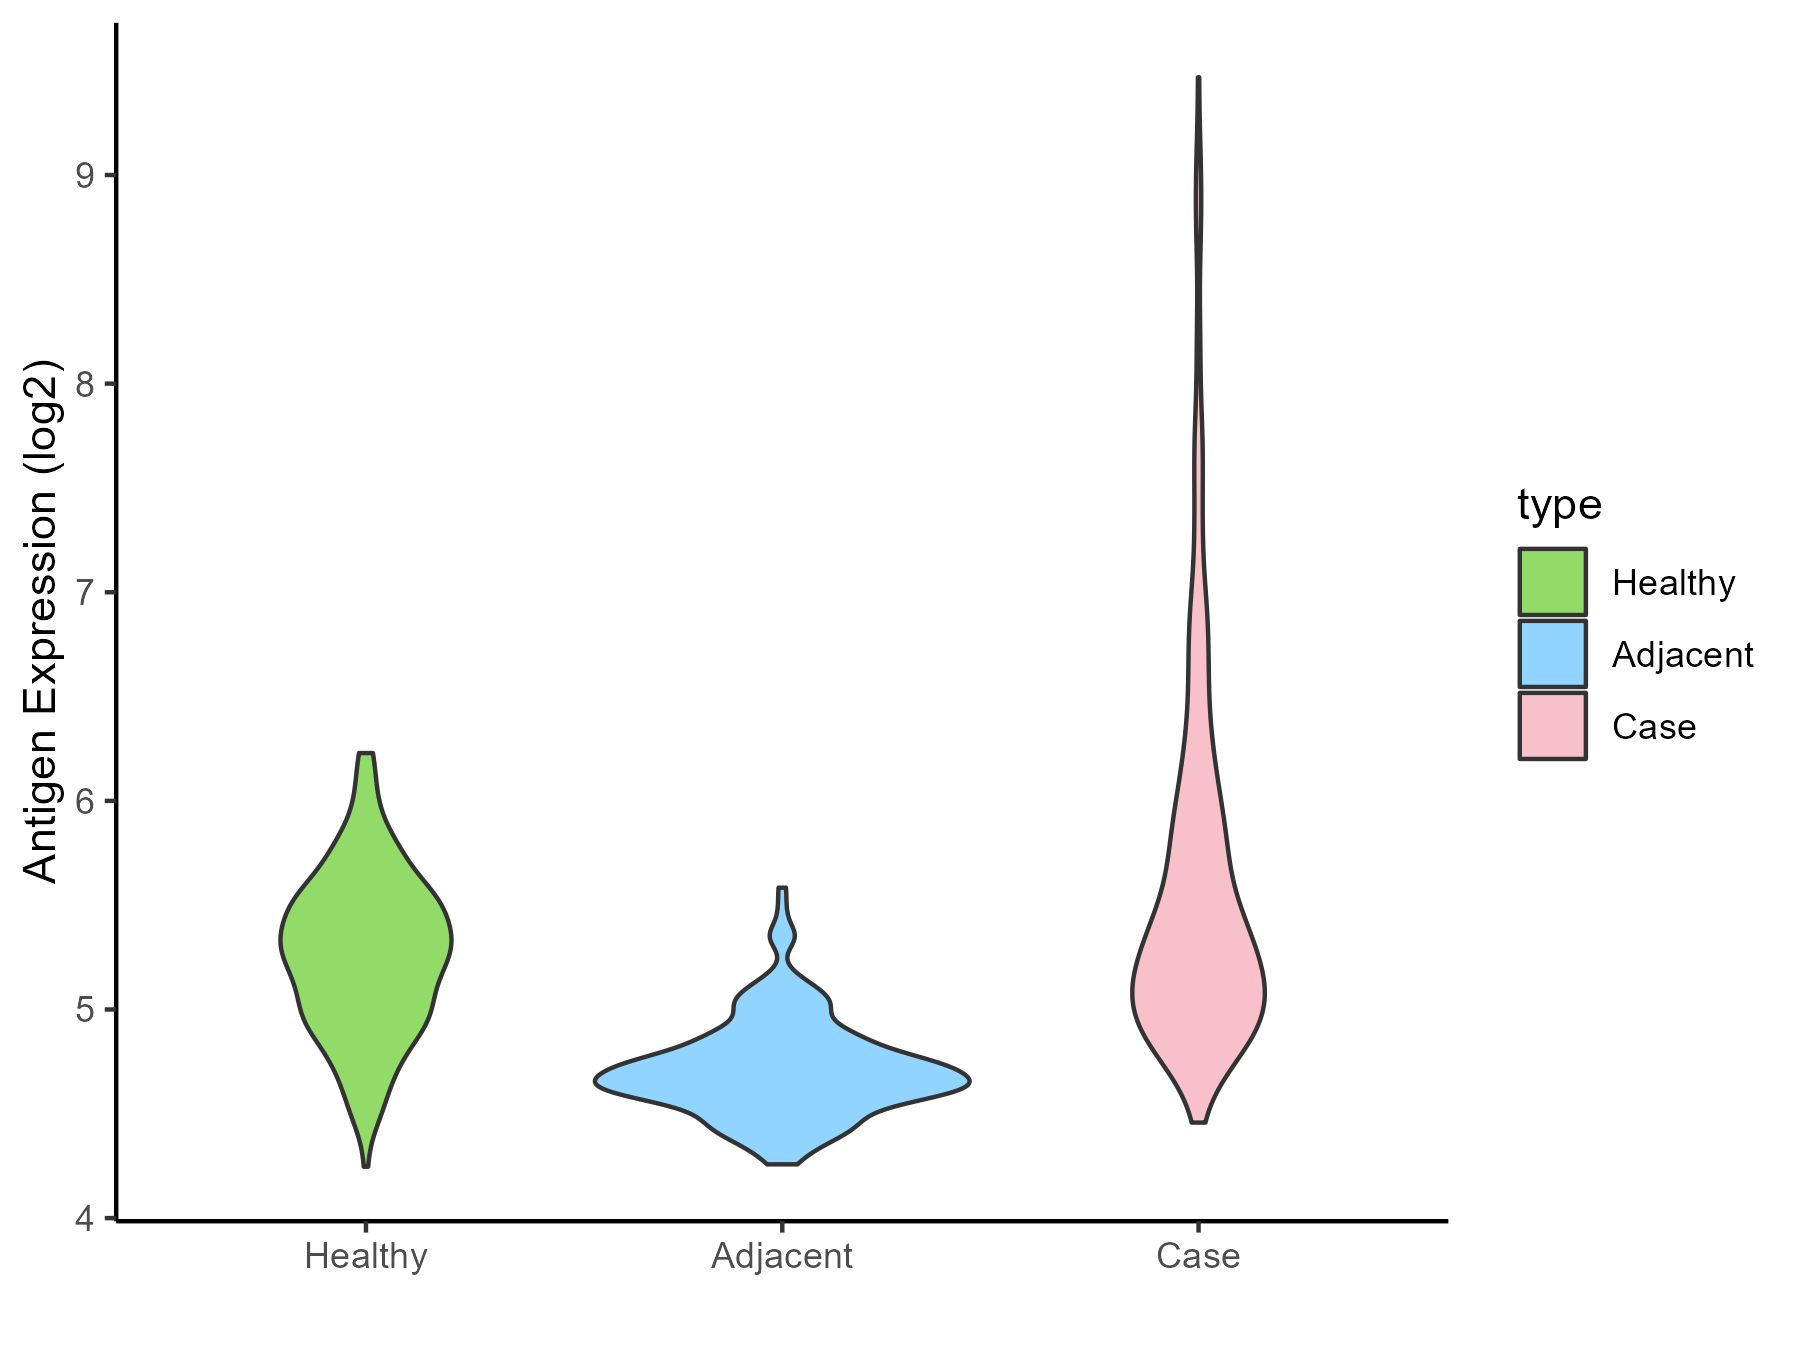
| Differential expression pattern of antigen in diseases | ||
| The Studied Tissue | Skin | |
| The Specific Disease | Skin cancer | |
| The Expression Level of Disease Section Compare with the Healthy Individual Tissue | p-value: 4.16E-11; Fold-change: 0.05329432; Z-score: 0.140194058 | |
| The Expression Level of Disease Section Compare with the Adjacent Tissue | p-value: 2.37E-57; Fold-change: 0.657102779; Z-score: 2.865769141 | |
| Disease-specific Antigen Abundances |
|
Click to View the Clearer Original Diagram |
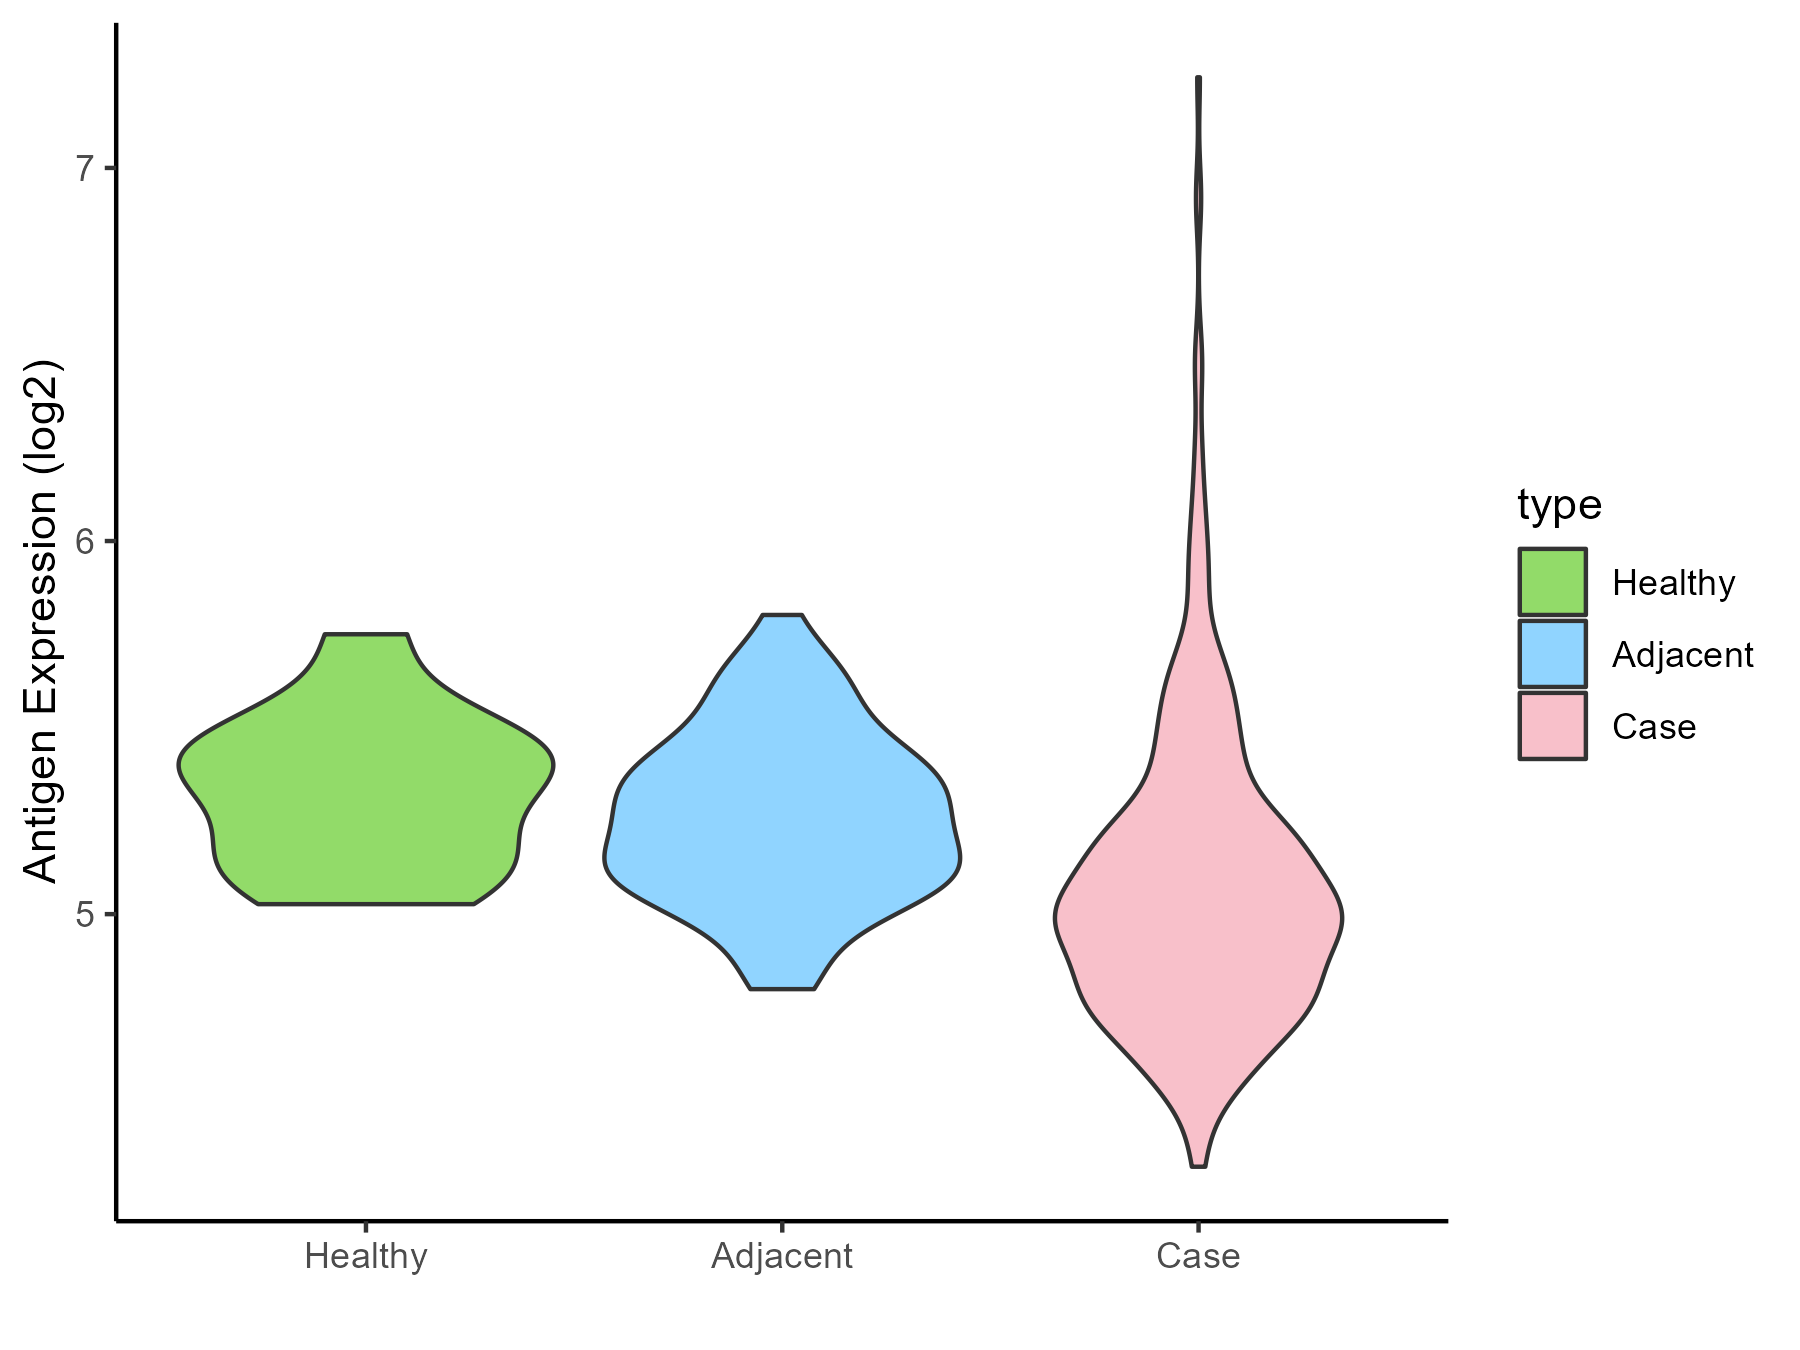
| Differential expression pattern of antigen in diseases | ||
| The Studied Tissue | Kidney | |
| The Specific Disease | Renal cancer | |
| The Expression Level of Disease Section Compare with the Healthy Individual Tissue | p-value: 0.002696093; Fold-change: -0.385599763; Z-score: -1.813905263 | |
| The Expression Level of Disease Section Compare with the Adjacent Tissue | p-value: 1.82E-07; Fold-change: -0.247443928; Z-score: -1.08744492 | |
| Disease-specific Antigen Abundances |
|
Click to View the Clearer Original Diagram |
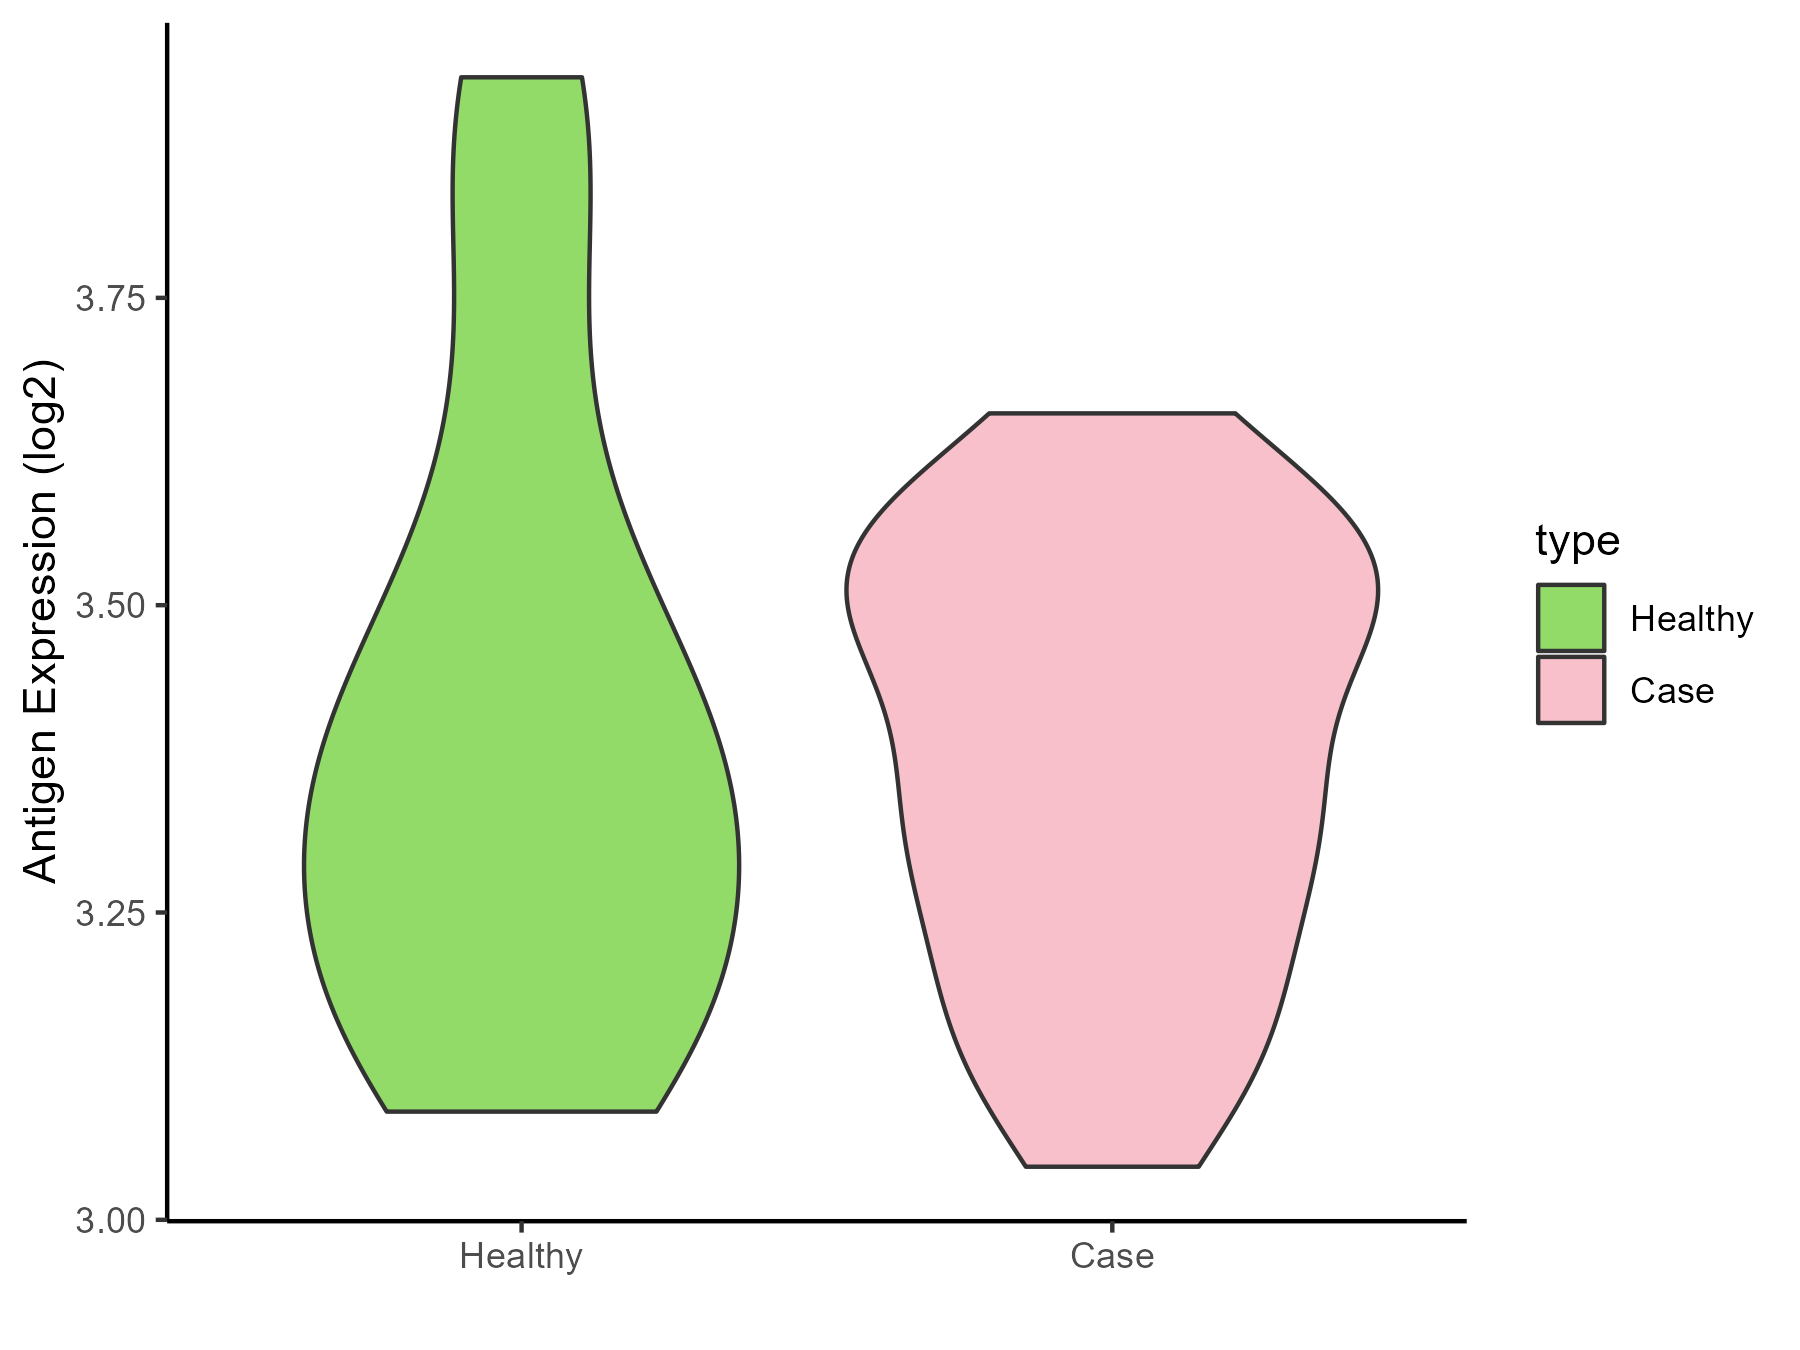
| Differential expression pattern of antigen in diseases | ||
| The Studied Tissue | Urothelium | |
| The Specific Disease | Ureter cancer | |
| The Expression Level of Disease Section Compare with the Healthy Individual Tissue | p-value: 0.715898176; Fold-change: 0.018574313; Z-score: 0.0717893 | |
| Disease-specific Antigen Abundances |
|
Click to View the Clearer Original Diagram |
ICD Disease Classification 20
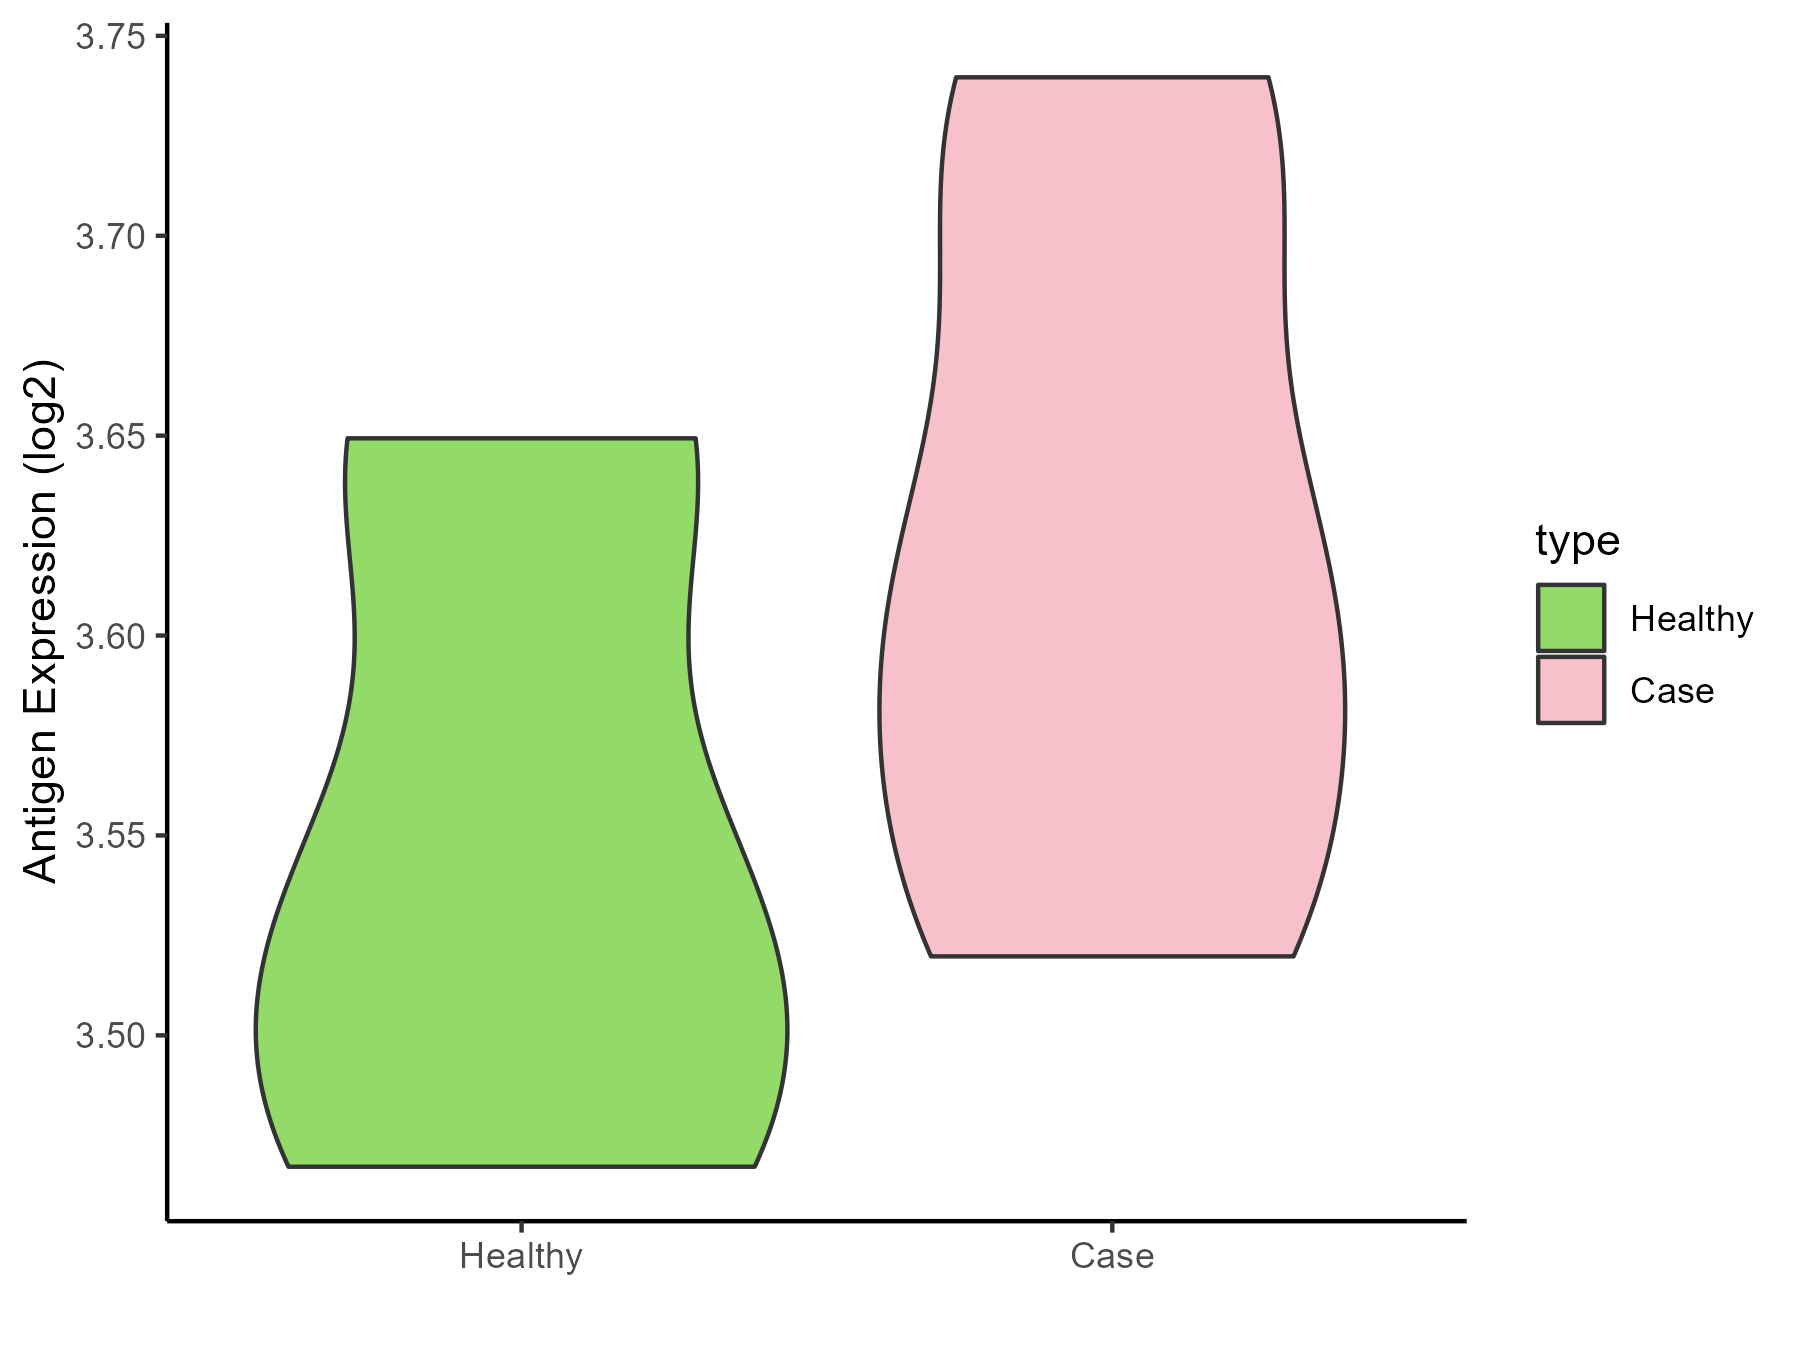
| Differential expression pattern of antigen in diseases | ||
| The Studied Tissue | Adipose | |
| The Specific Disease | Simpson golabi behmel syndrome | |
| The Expression Level of Disease Section Compare with the Healthy Individual Tissue | p-value: 0.30157735; Fold-change: 0.080343795; Z-score: 0.870109979 | |
| Disease-specific Antigen Abundances |
|
Click to View the Clearer Original Diagram |
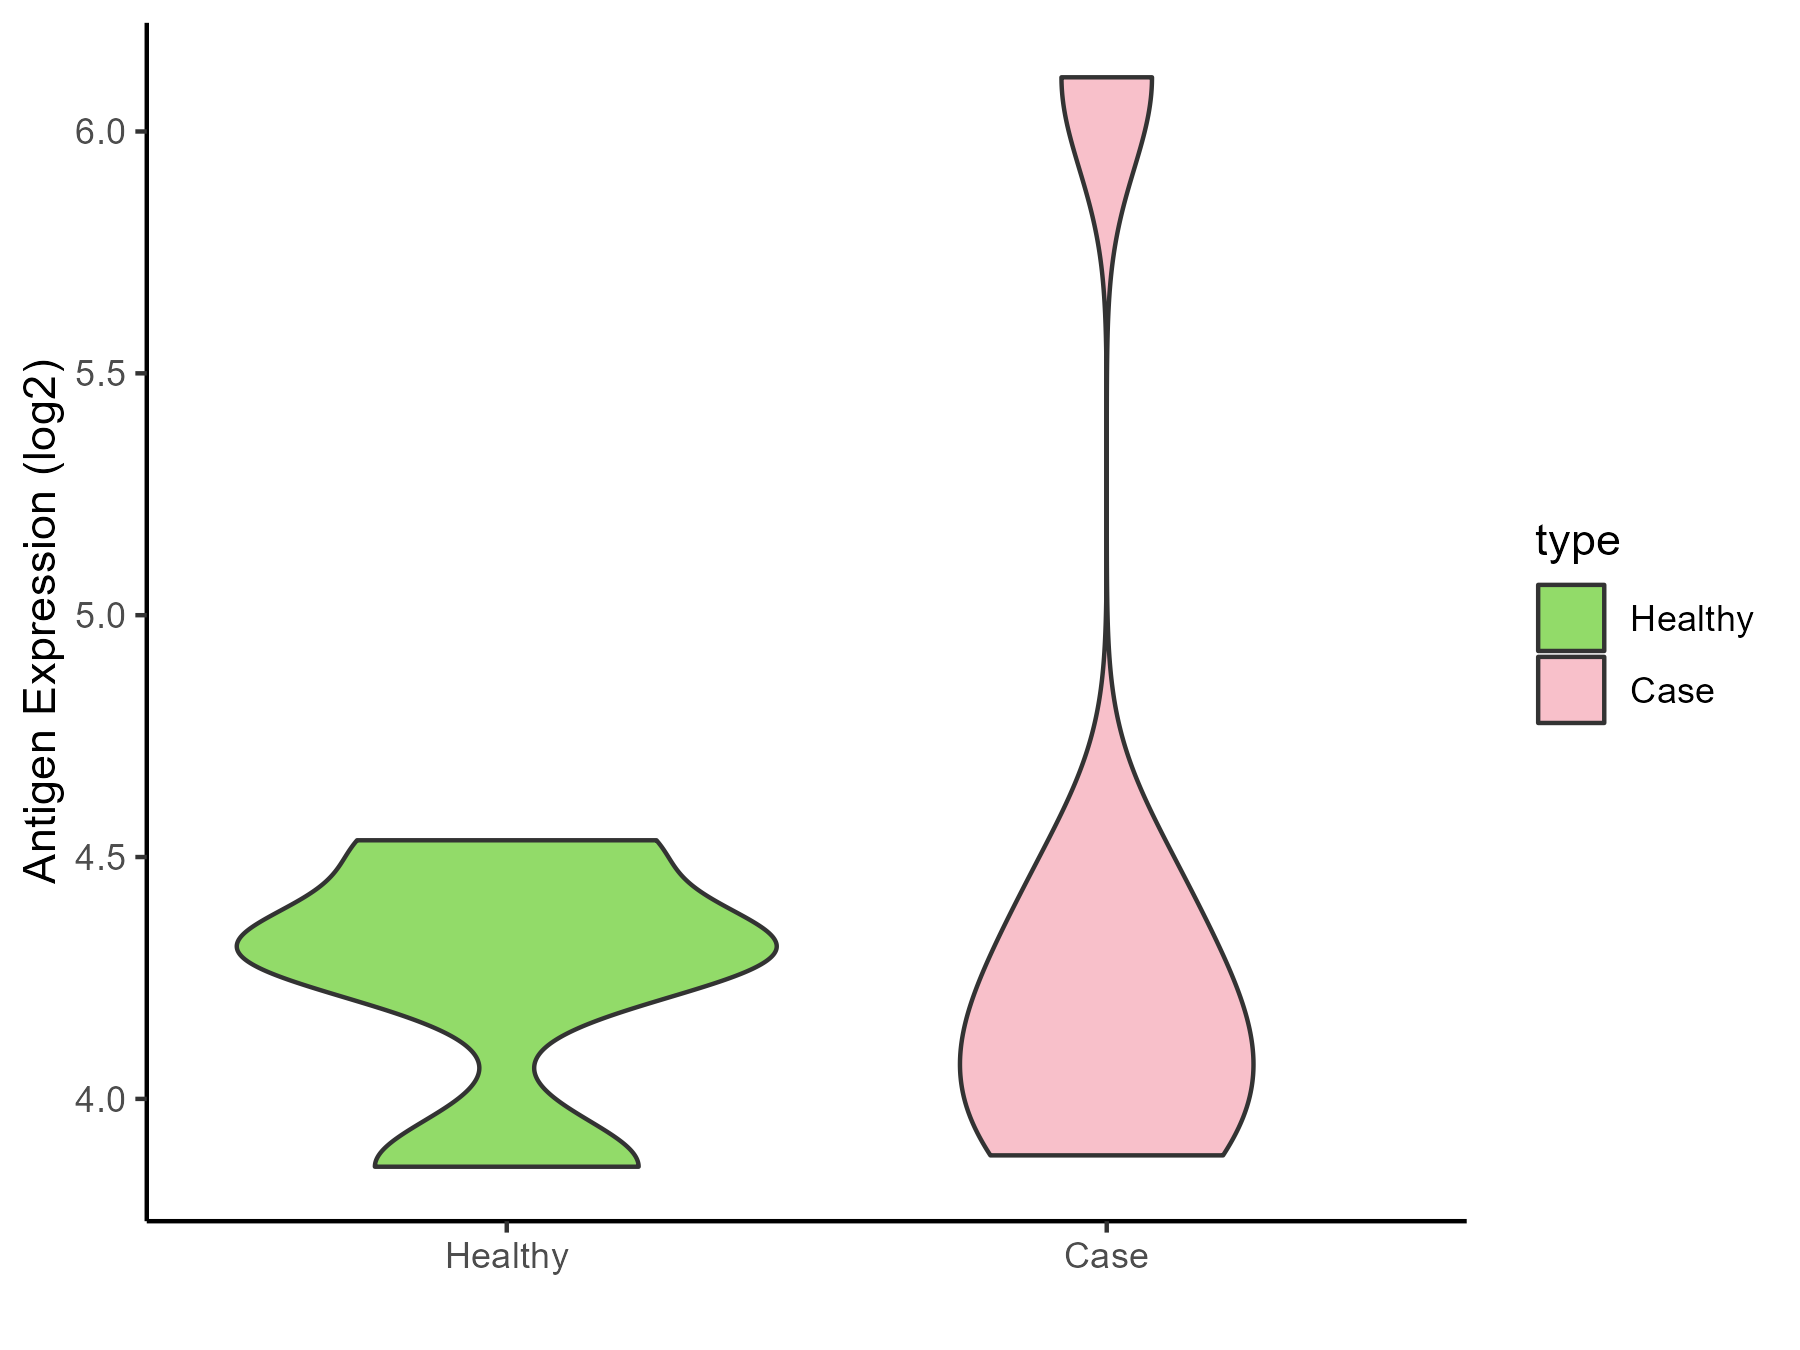
| Differential expression pattern of antigen in diseases | ||
| The Studied Tissue | Perituberal | |
| The Specific Disease | Tuberous sclerosis complex | |
| The Expression Level of Disease Section Compare with the Healthy Individual Tissue | p-value: 0.589735221; Fold-change: -0.130642366; Z-score: -0.461822372 | |
| Disease-specific Antigen Abundances |
|
Click to View the Clearer Original Diagram |
ICD Disease Classification 3
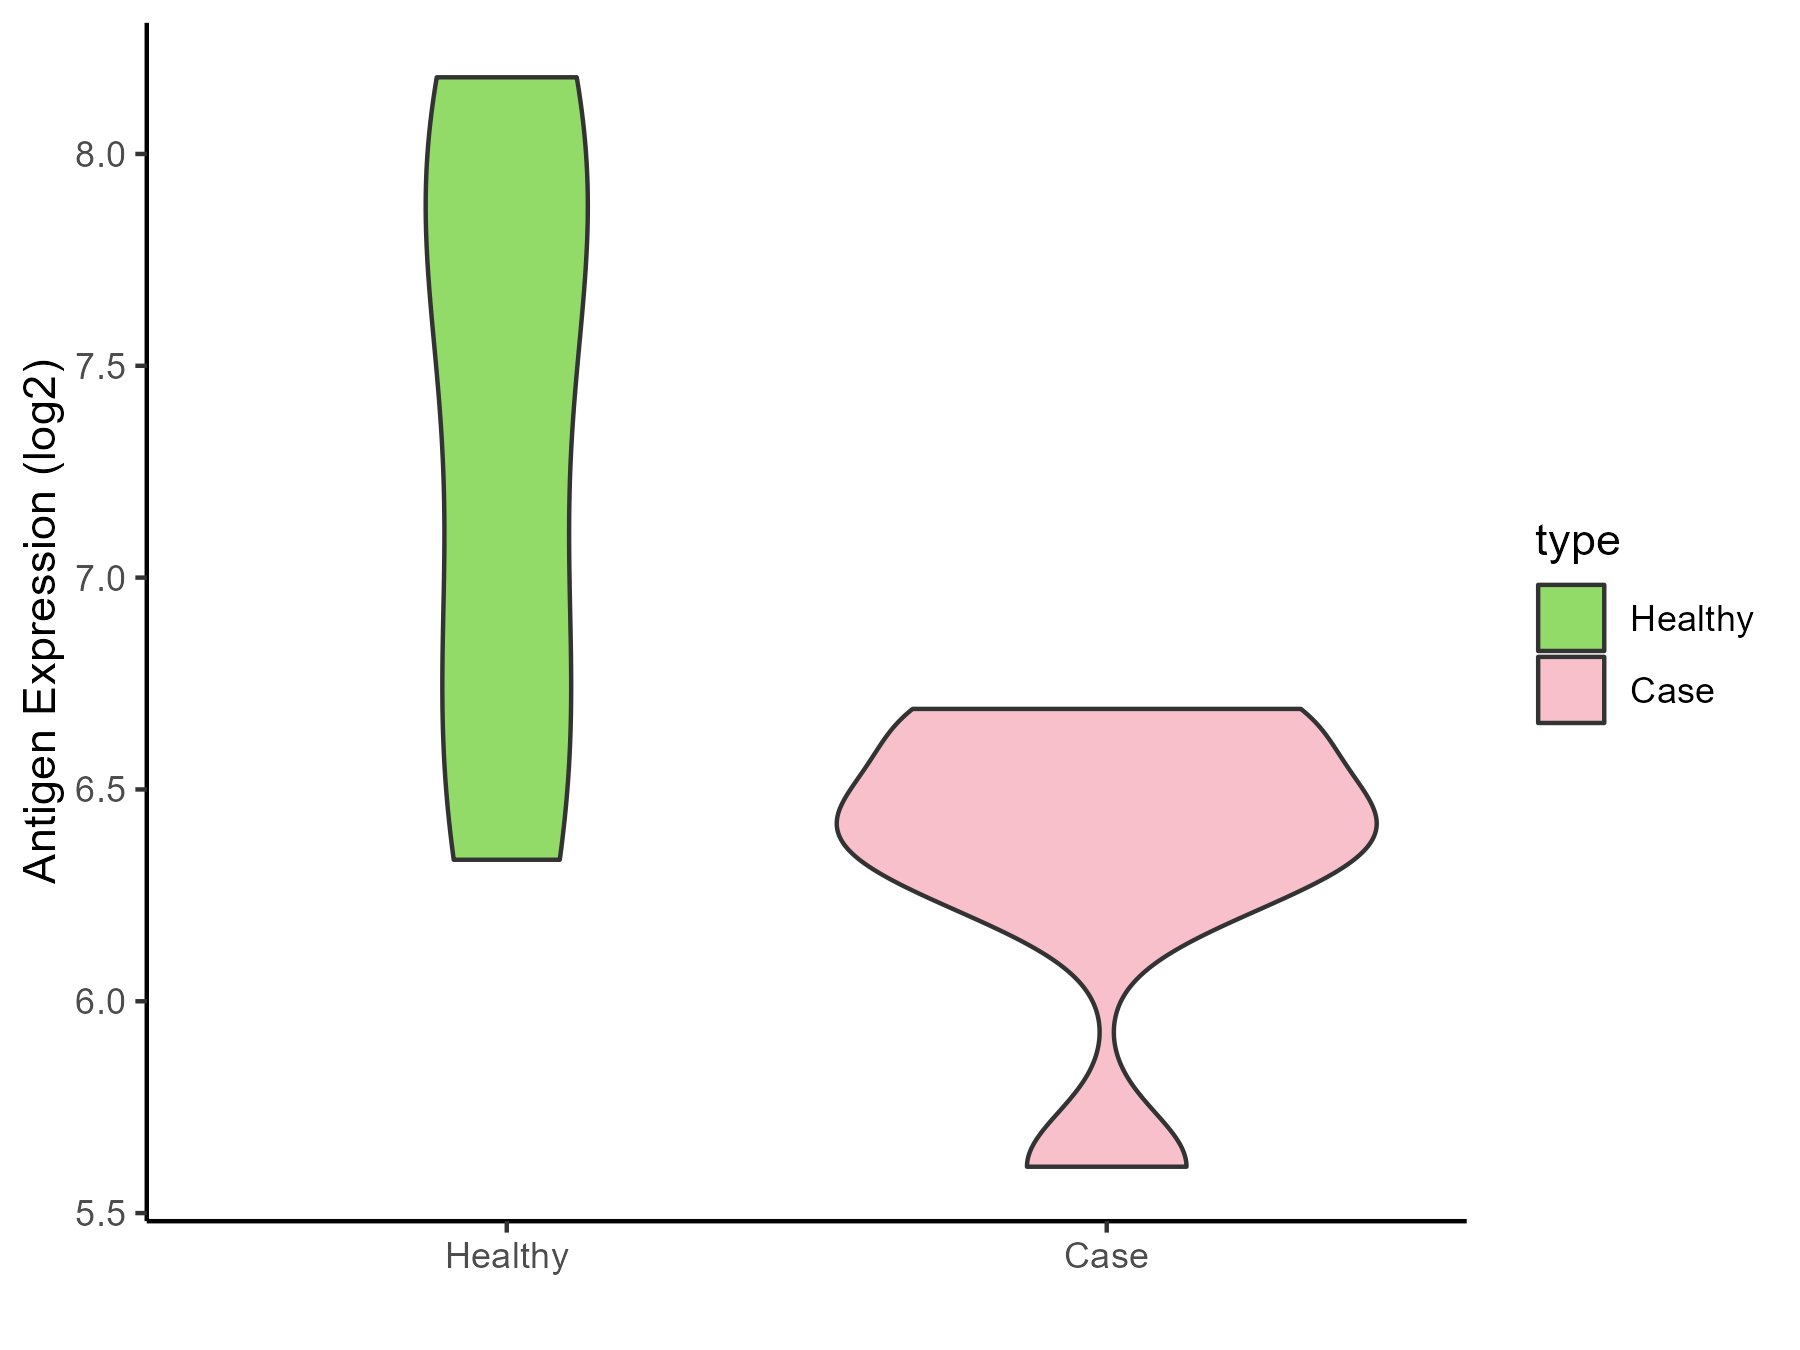
| Differential expression pattern of antigen in diseases | ||
| The Studied Tissue | Bone marrow | |
| The Specific Disease | Anemia | |
| The Expression Level of Disease Section Compare with the Healthy Individual Tissue | p-value: 0.011678271; Fold-change: -1.038480842; Z-score: -1.409852029 | |
| Disease-specific Antigen Abundances |
|
Click to View the Clearer Original Diagram |
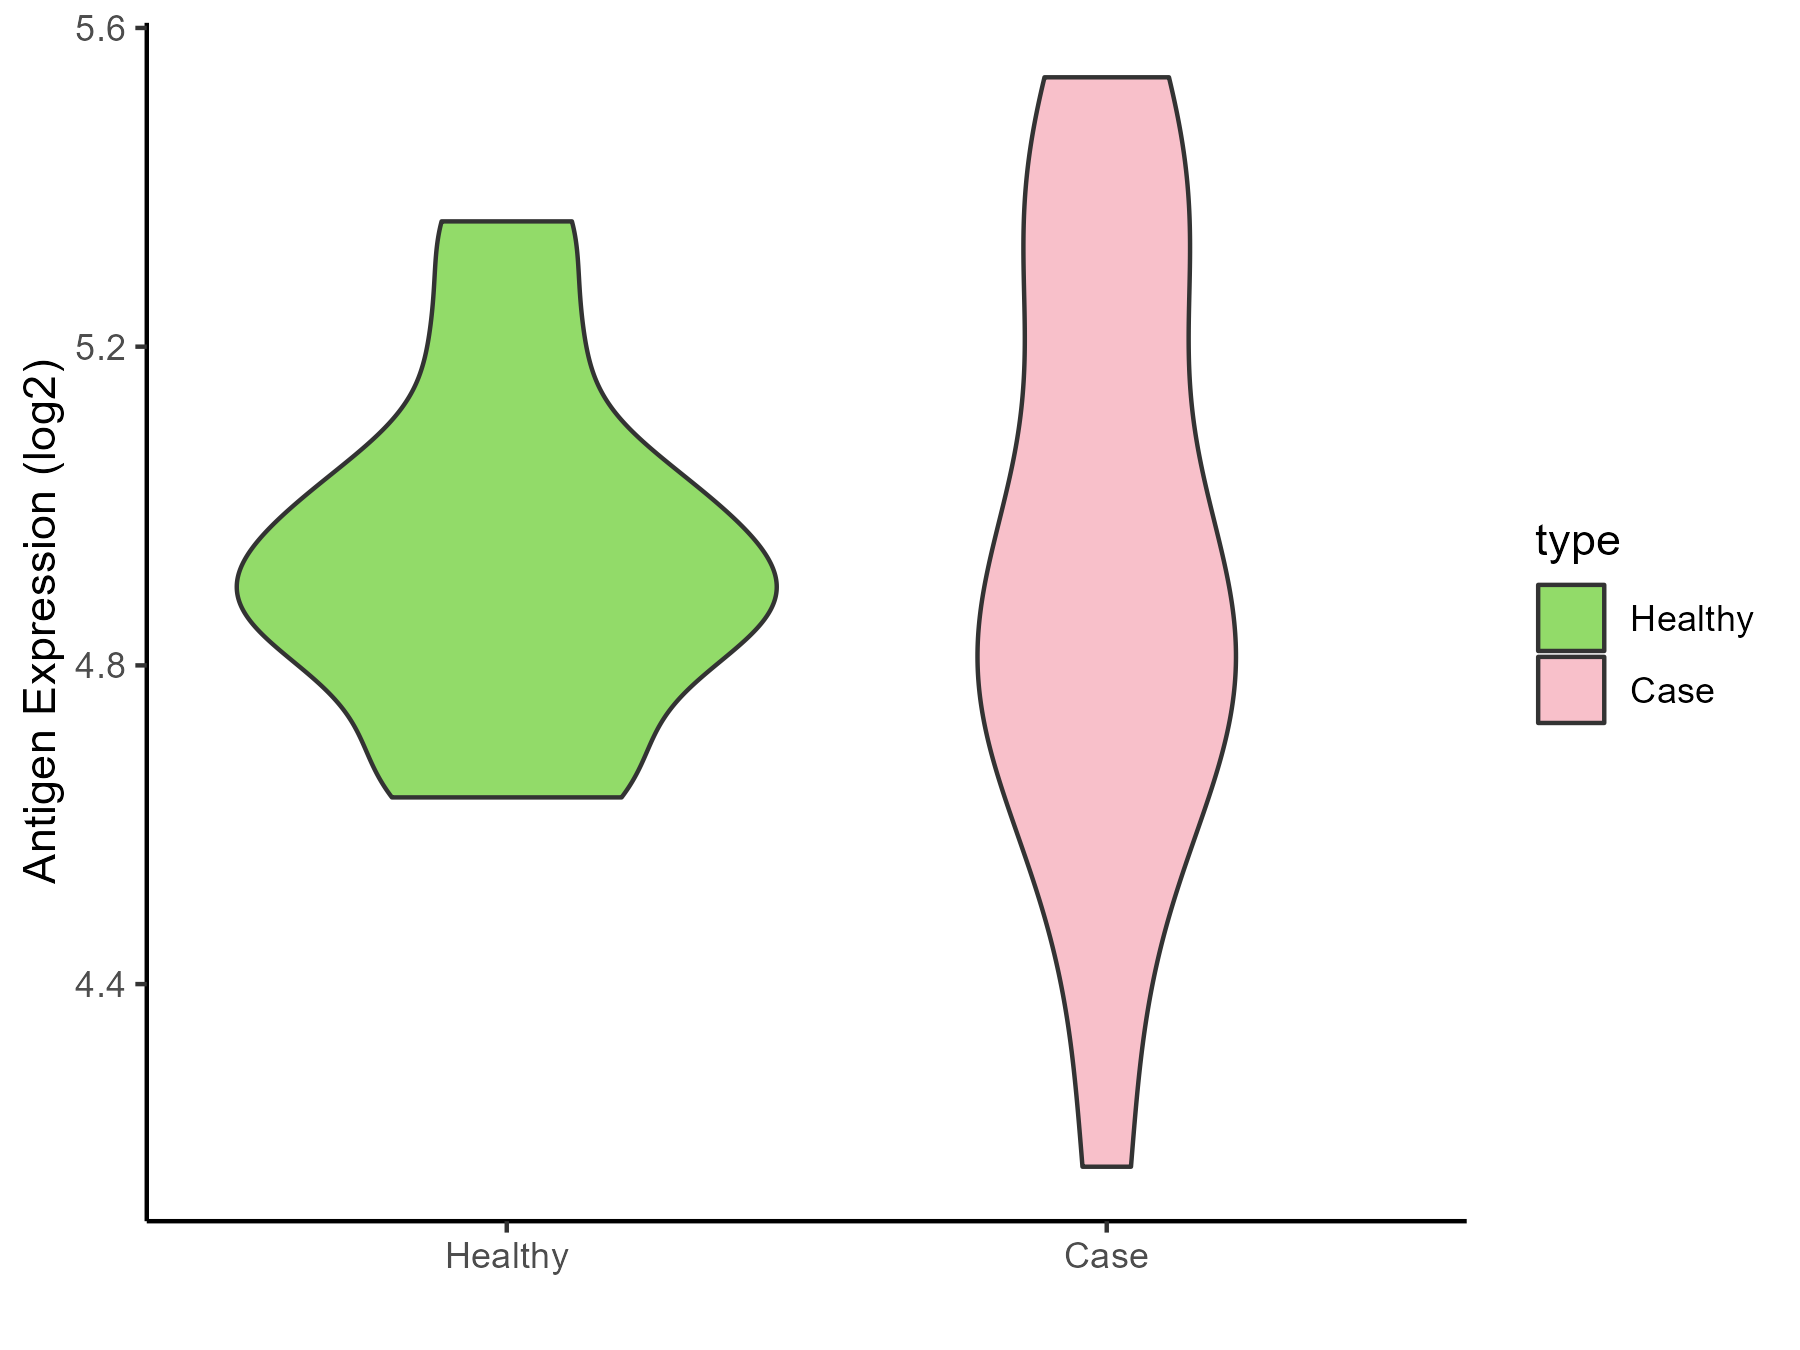
| Differential expression pattern of antigen in diseases | ||
| The Studied Tissue | Peripheral blood | |
| The Specific Disease | Sickle cell disease | |
| The Expression Level of Disease Section Compare with the Healthy Individual Tissue | p-value: 0.954003403; Fold-change: -0.076170795; Z-score: -0.358847672 | |
| Disease-specific Antigen Abundances |
|
Click to View the Clearer Original Diagram |
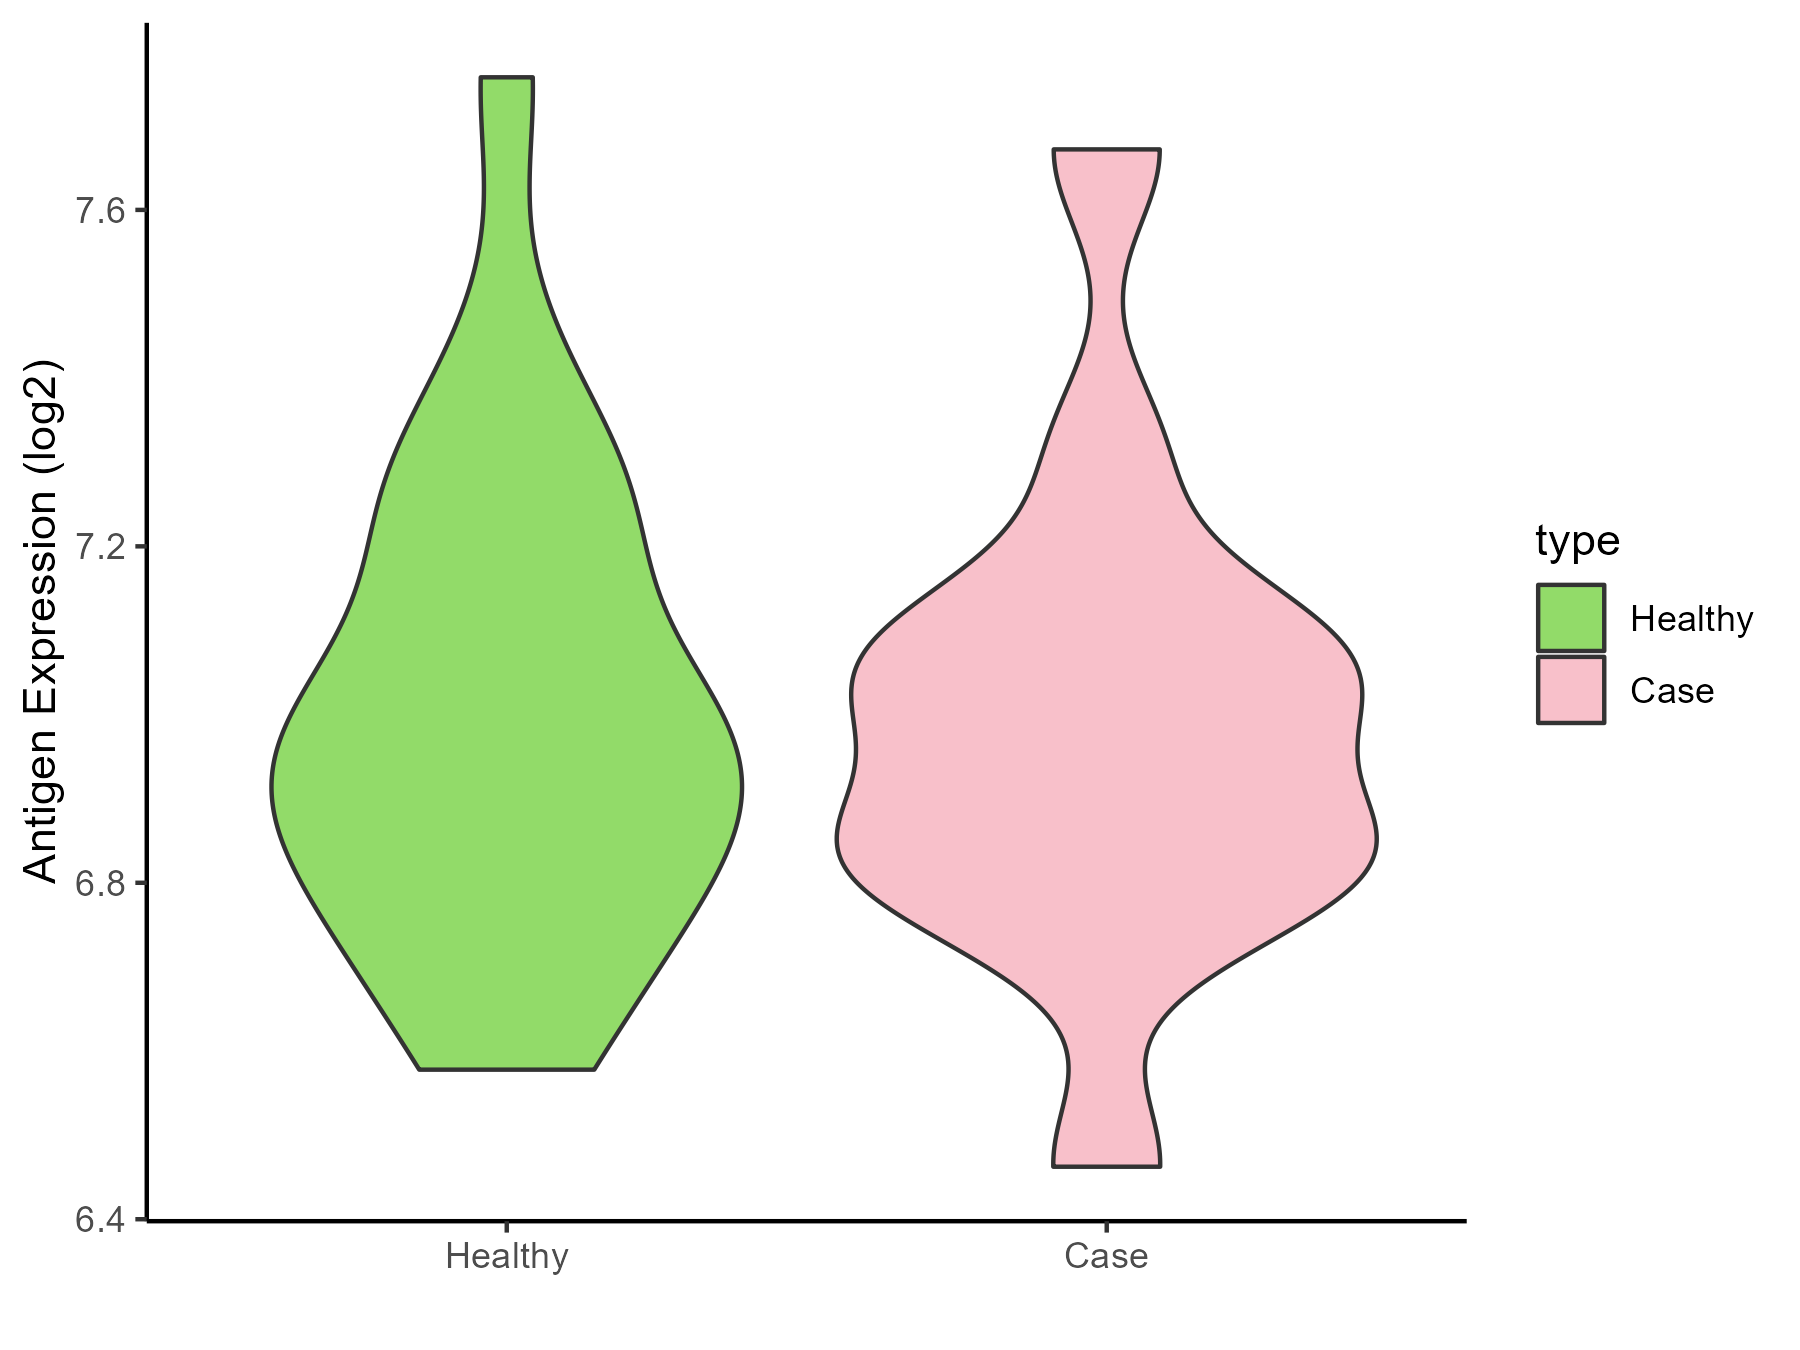
| Differential expression pattern of antigen in diseases | ||
| The Studied Tissue | Whole blood | |
| The Specific Disease | Thrombocythemia | |
| The Expression Level of Disease Section Compare with the Healthy Individual Tissue | p-value: 0.796288098; Fold-change: 0.043568598; Z-score: 0.153472357 | |
| Disease-specific Antigen Abundances |
|
Click to View the Clearer Original Diagram |
ICD Disease Classification 4
| Differential expression pattern of antigen in diseases | ||
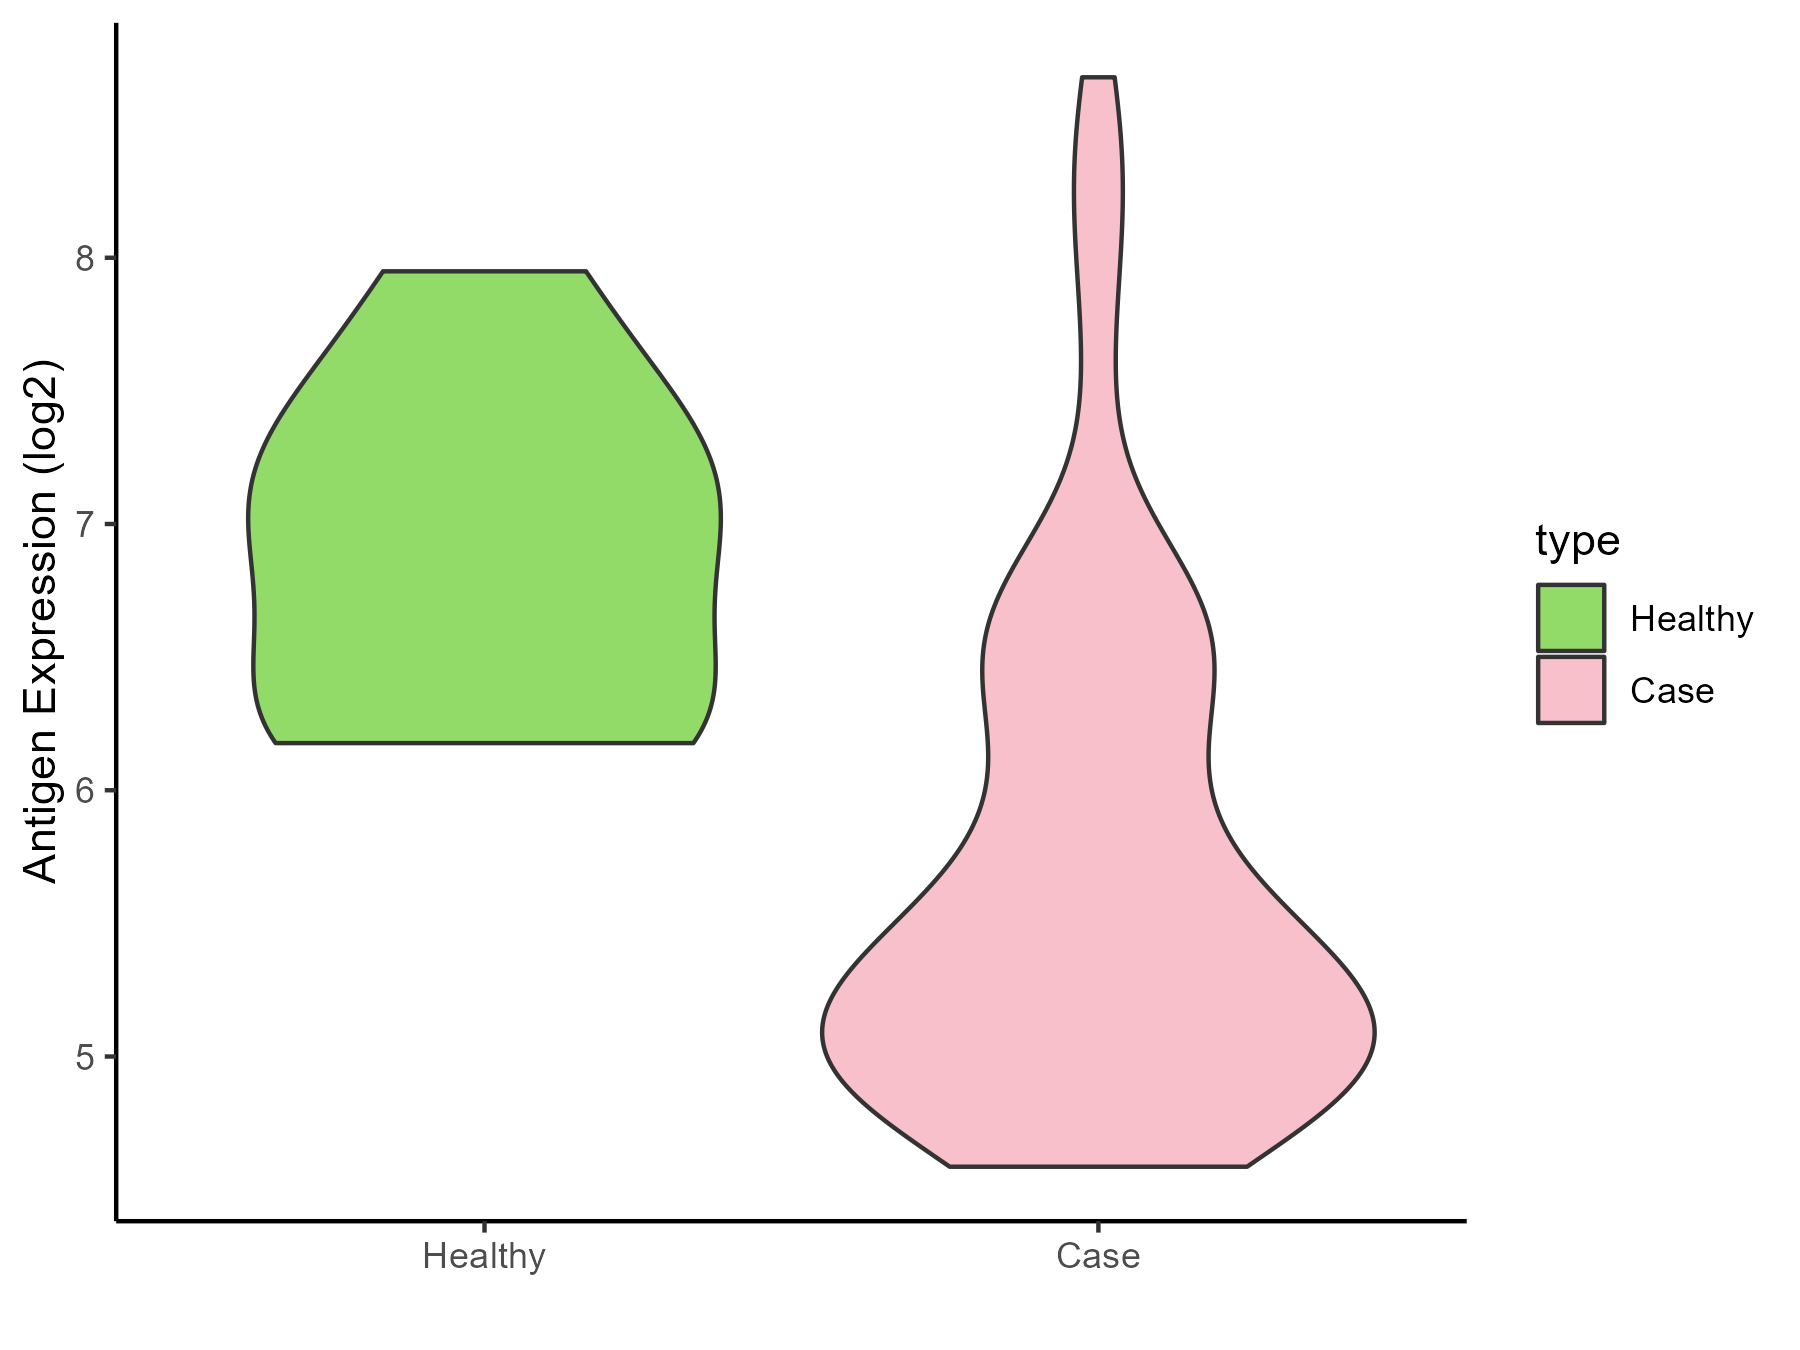
| The Studied Tissue | Whole blood | |
| The Specific Disease | Scleroderma | |
| The Expression Level of Disease Section Compare with the Healthy Individual Tissue | p-value: 0.000220918; Fold-change: -1.53414554; Z-score: -2.442130261 | |
| Disease-specific Antigen Abundances |
|
Click to View the Clearer Original Diagram |
| Differential expression pattern of antigen in diseases | ||
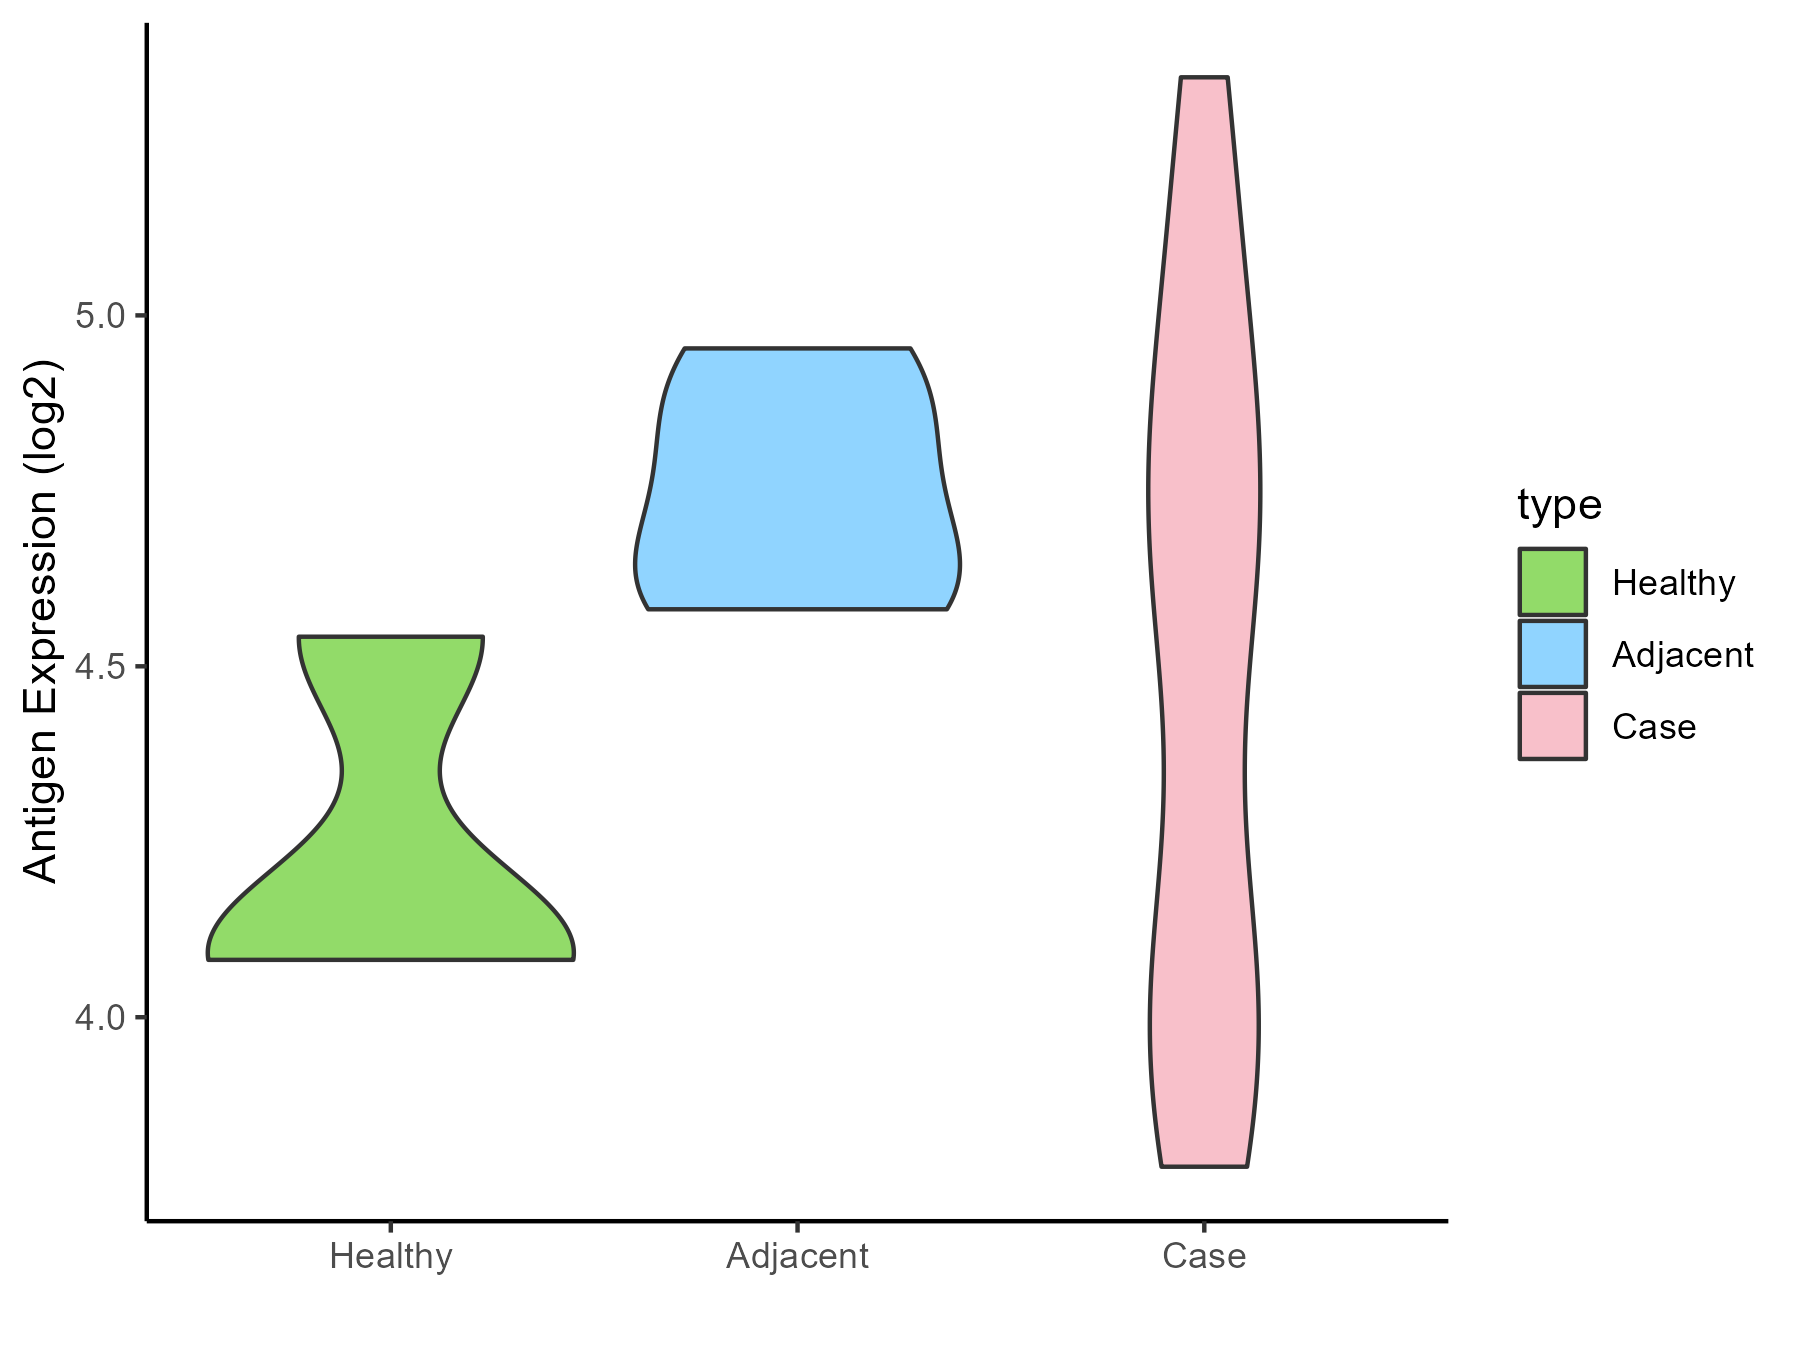
| The Studied Tissue | Salivary gland | |
| The Specific Disease | Sjogren syndrome | |
| The Expression Level of Disease Section Compare with the Healthy Individual Tissue | p-value: 0.257128681; Fold-change: 0.530560403; Z-score: 2.037323377 | |
| The Expression Level of Disease Section Compare with the Adjacent Tissue | p-value: 0.087649725; Fold-change: -0.09372665; Z-score: -0.547240468 | |
| Disease-specific Antigen Abundances |
|
Click to View the Clearer Original Diagram |
| Differential expression pattern of antigen in diseases | ||
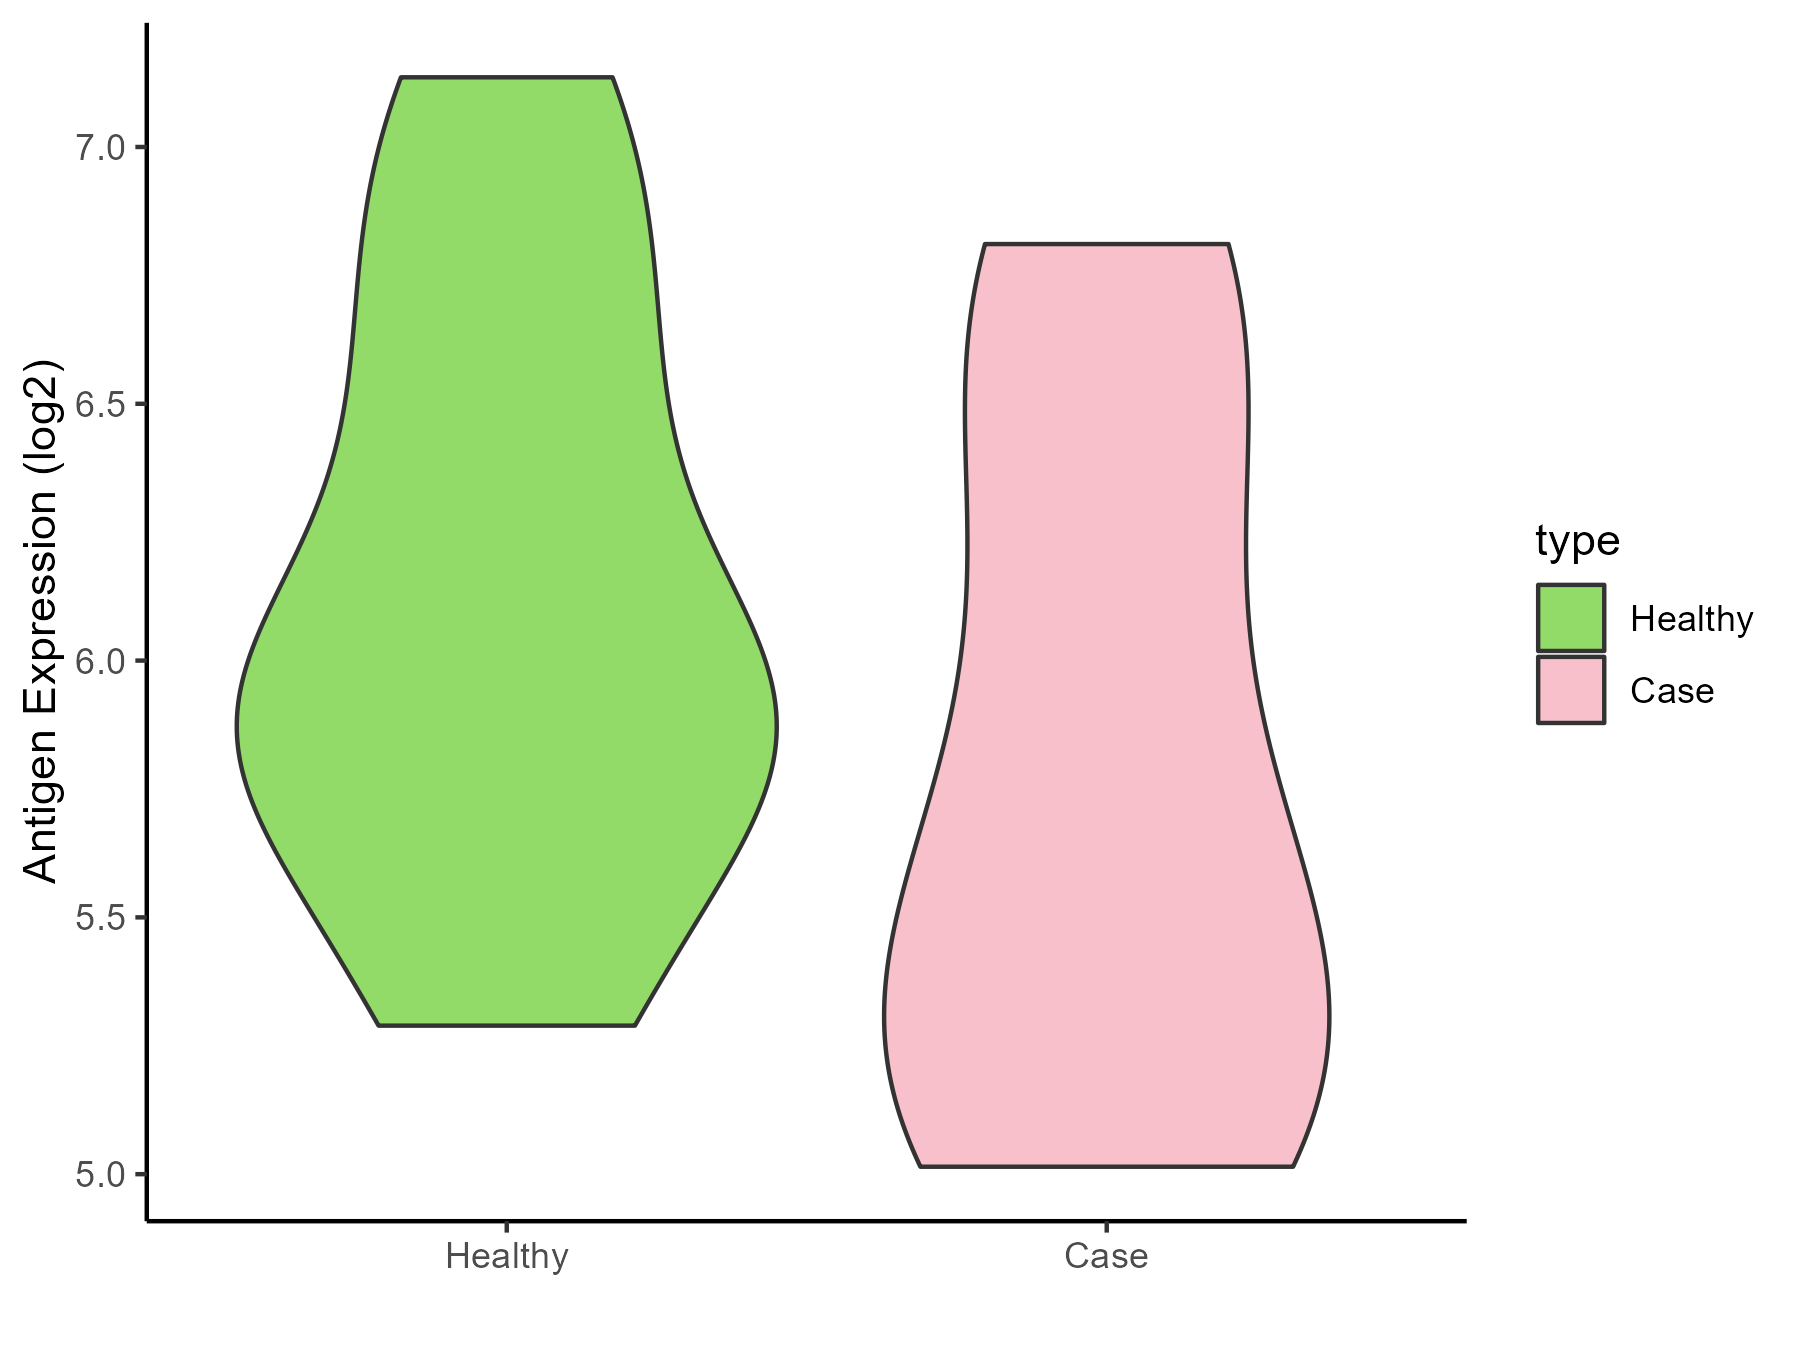
| The Studied Tissue | Peripheral blood | |
| The Specific Disease | Behcet disease | |
| The Expression Level of Disease Section Compare with the Healthy Individual Tissue | p-value: 0.187538405; Fold-change: -0.348626515; Z-score: -0.593534243 | |
| Disease-specific Antigen Abundances |
|
Click to View the Clearer Original Diagram |
| Differential expression pattern of antigen in diseases | ||
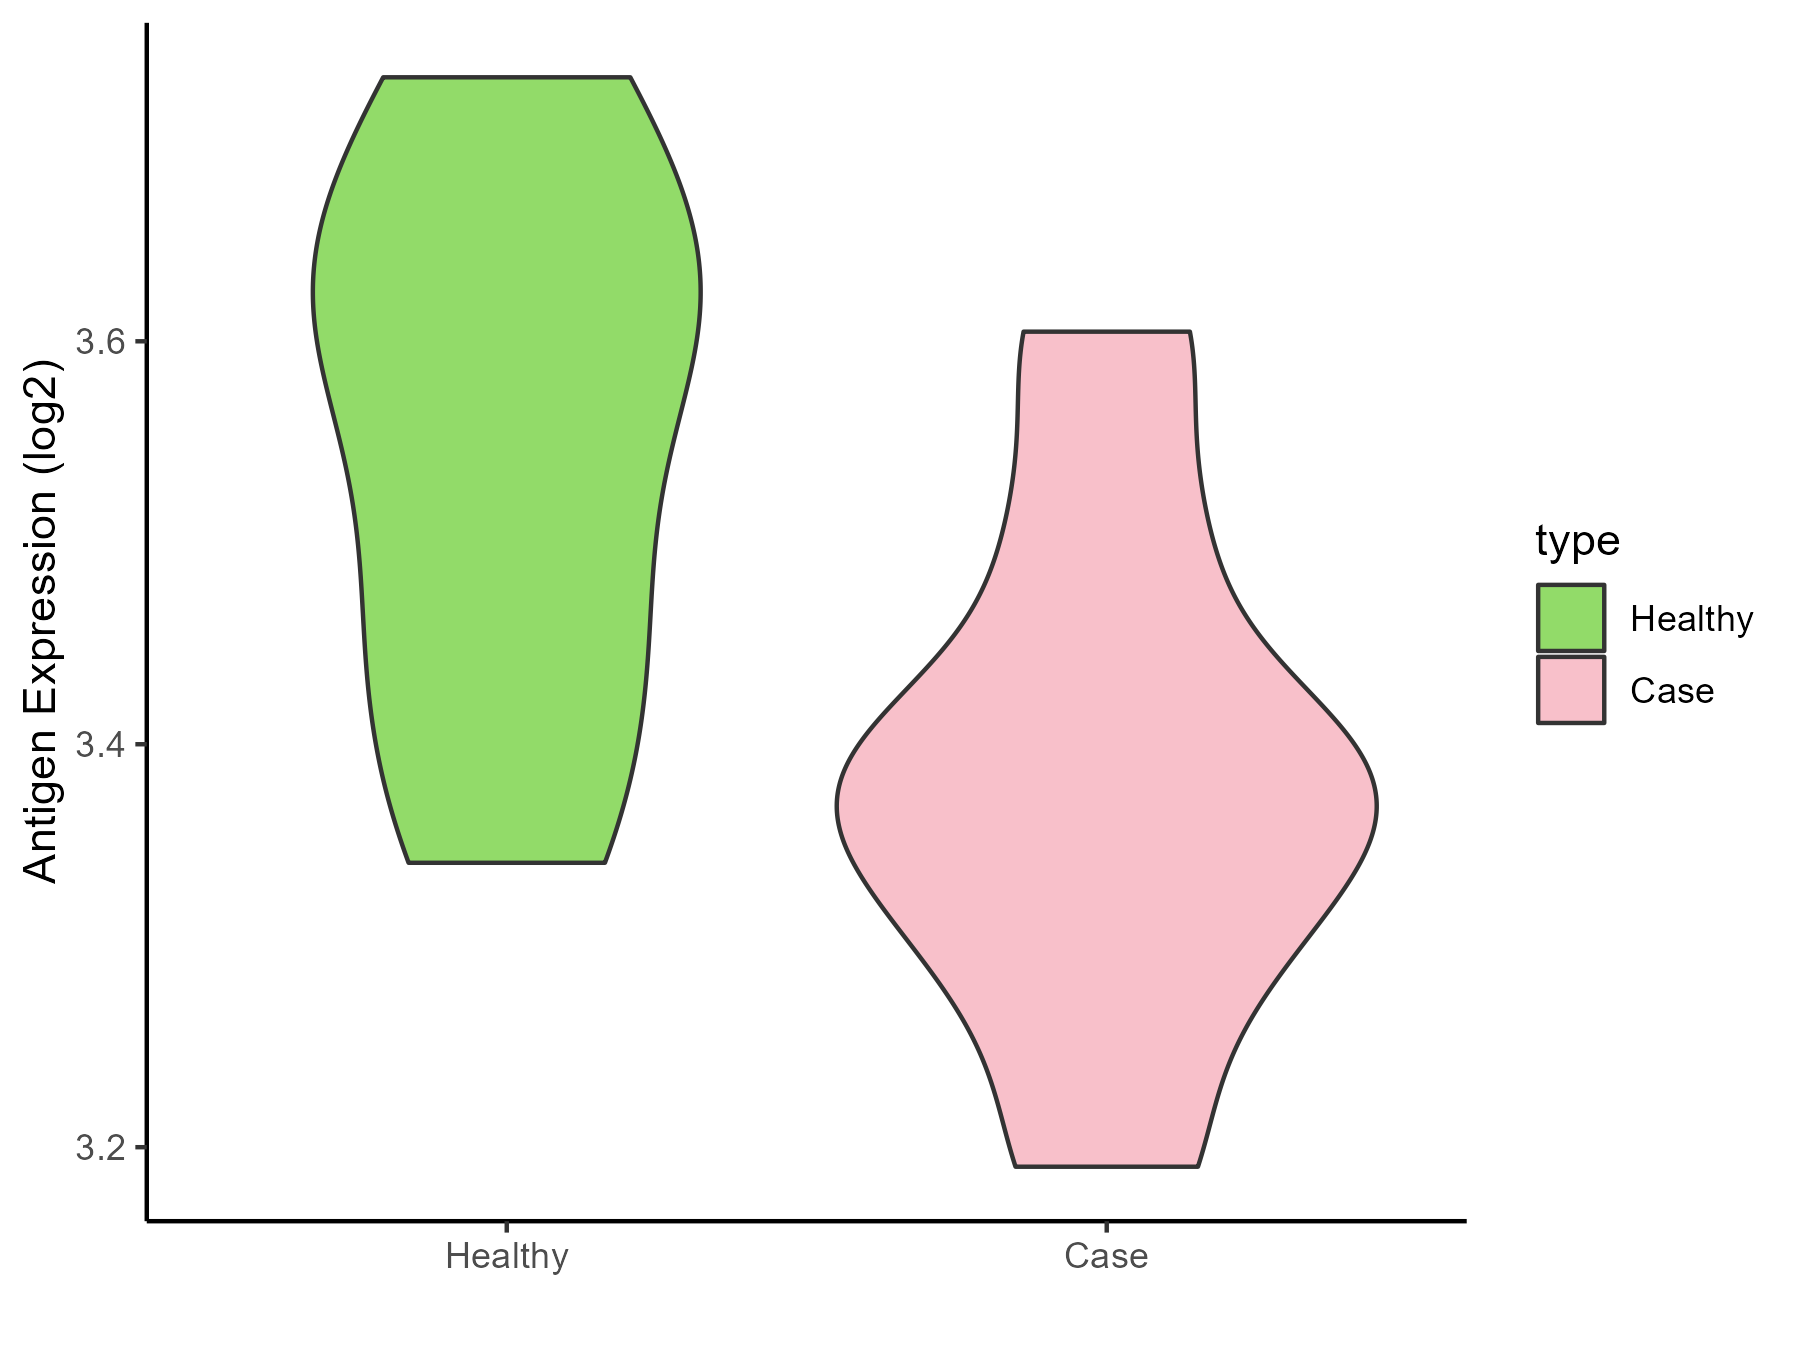
| The Studied Tissue | Whole blood | |
| The Specific Disease | Autosomal dominant monocytopenia | |
| The Expression Level of Disease Section Compare with the Healthy Individual Tissue | p-value: 0.013870954; Fold-change: -0.232051565; Z-score: -1.734945308 | |
| Disease-specific Antigen Abundances |
|
Click to View the Clearer Original Diagram |
ICD Disease Classification 5
| Differential expression pattern of antigen in diseases | ||
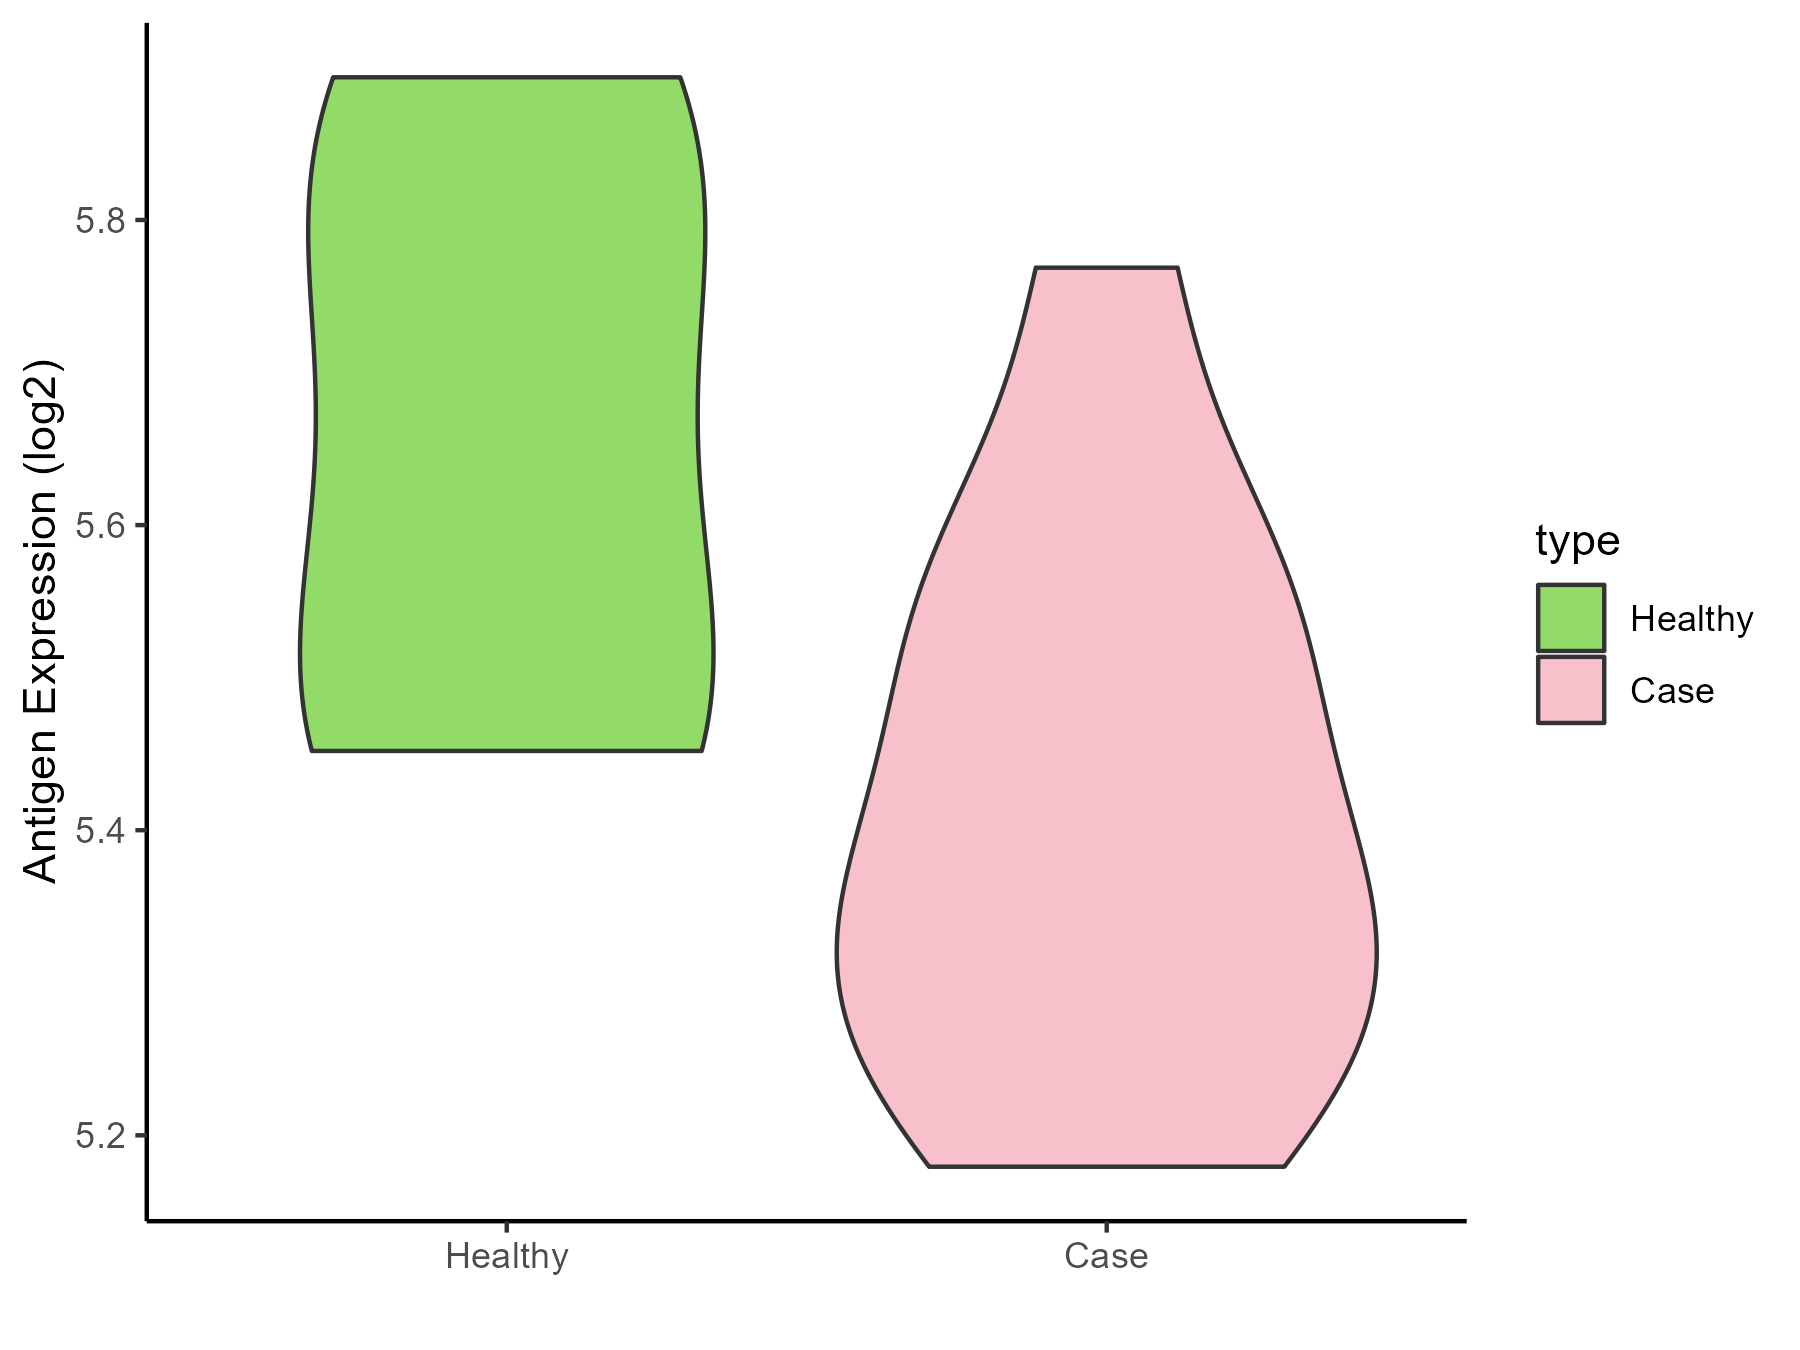
| The Studied Tissue | Liver | |
| The Specific Disease | Type 2 diabetes | |
| The Expression Level of Disease Section Compare with the Healthy Individual Tissue | p-value: 0.05682211; Fold-change: -0.289123252; Z-score: -1.427031917 | |
| Disease-specific Antigen Abundances |
|
Click to View the Clearer Original Diagram |
| Differential expression pattern of antigen in diseases | ||
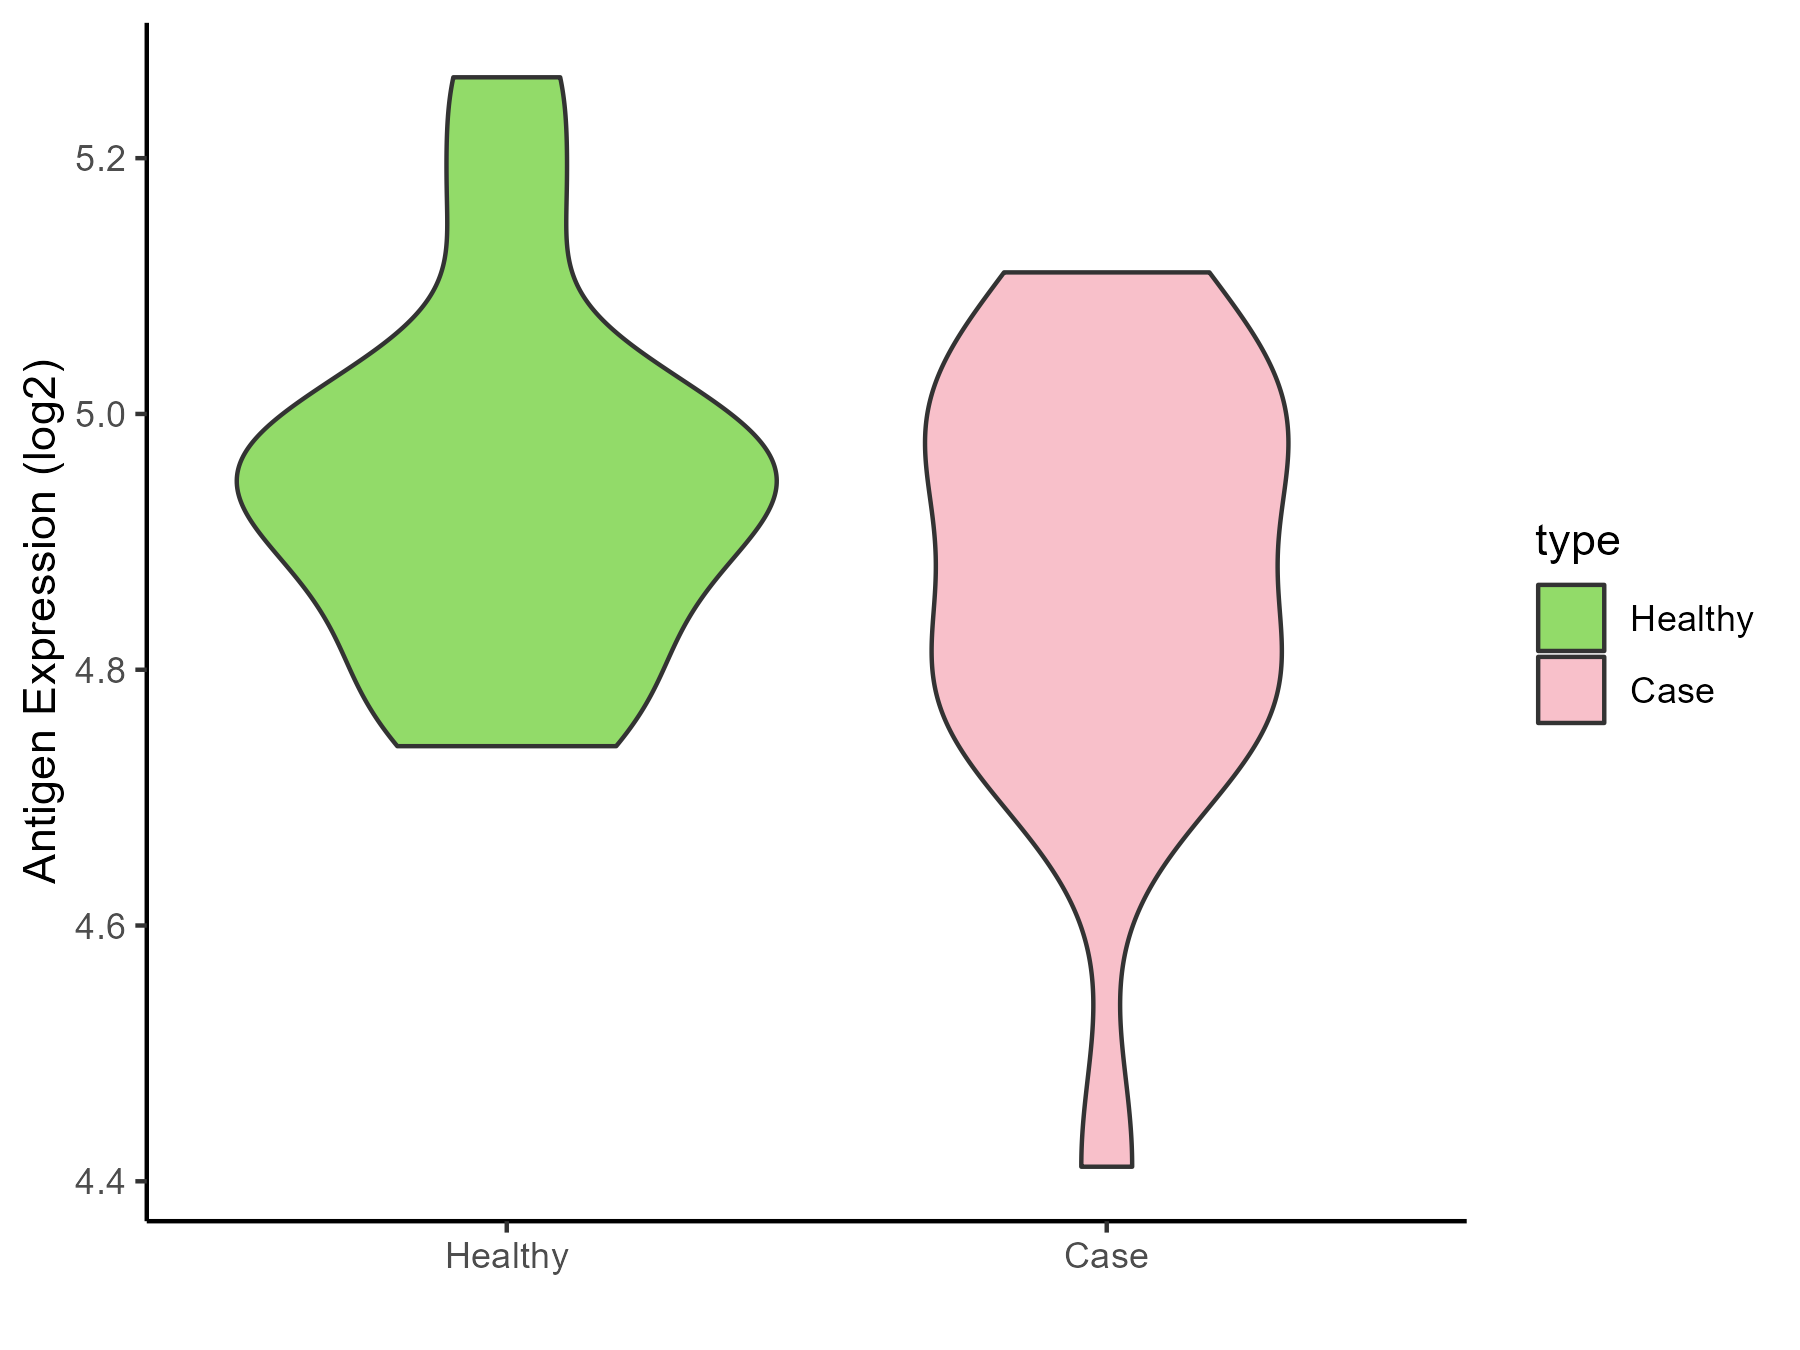
| The Studied Tissue | Vastus lateralis muscle | |
| The Specific Disease | Polycystic ovary syndrome | |
| The Expression Level of Disease Section Compare with the Healthy Individual Tissue | p-value: 0.217640656; Fold-change: -0.061729435; Z-score: -0.424241809 | |
| Disease-specific Antigen Abundances |
|
Click to View the Clearer Original Diagram |
| Differential expression pattern of antigen in diseases | ||
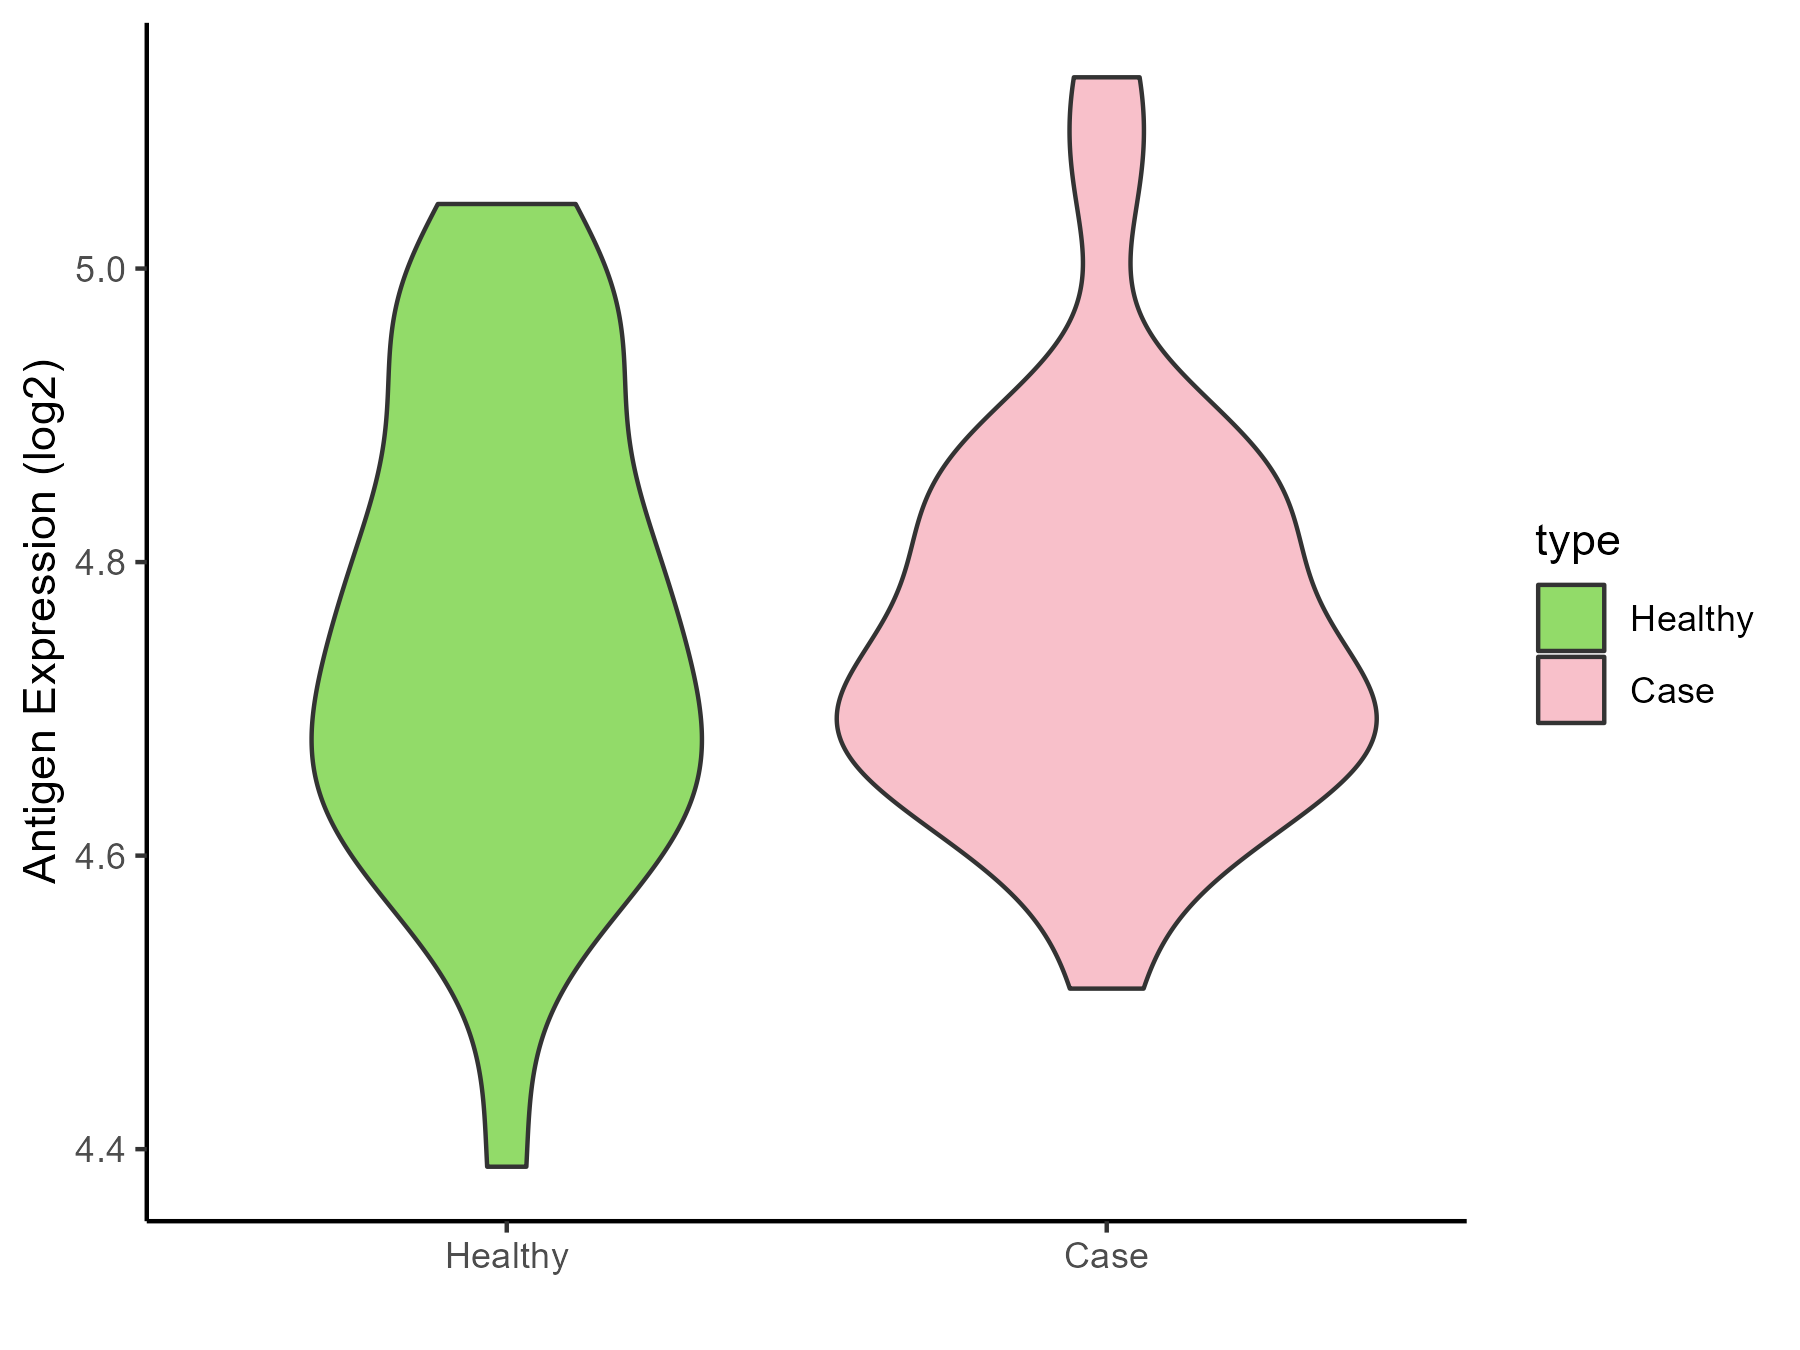
| The Studied Tissue | Subcutaneous Adipose | |
| The Specific Disease | Obesity | |
| The Expression Level of Disease Section Compare with the Healthy Individual Tissue | p-value: 0.937998447; Fold-change: -0.029298665; Z-score: -0.183315985 | |
| Disease-specific Antigen Abundances |
|
Click to View the Clearer Original Diagram |
| Differential expression pattern of antigen in diseases | ||
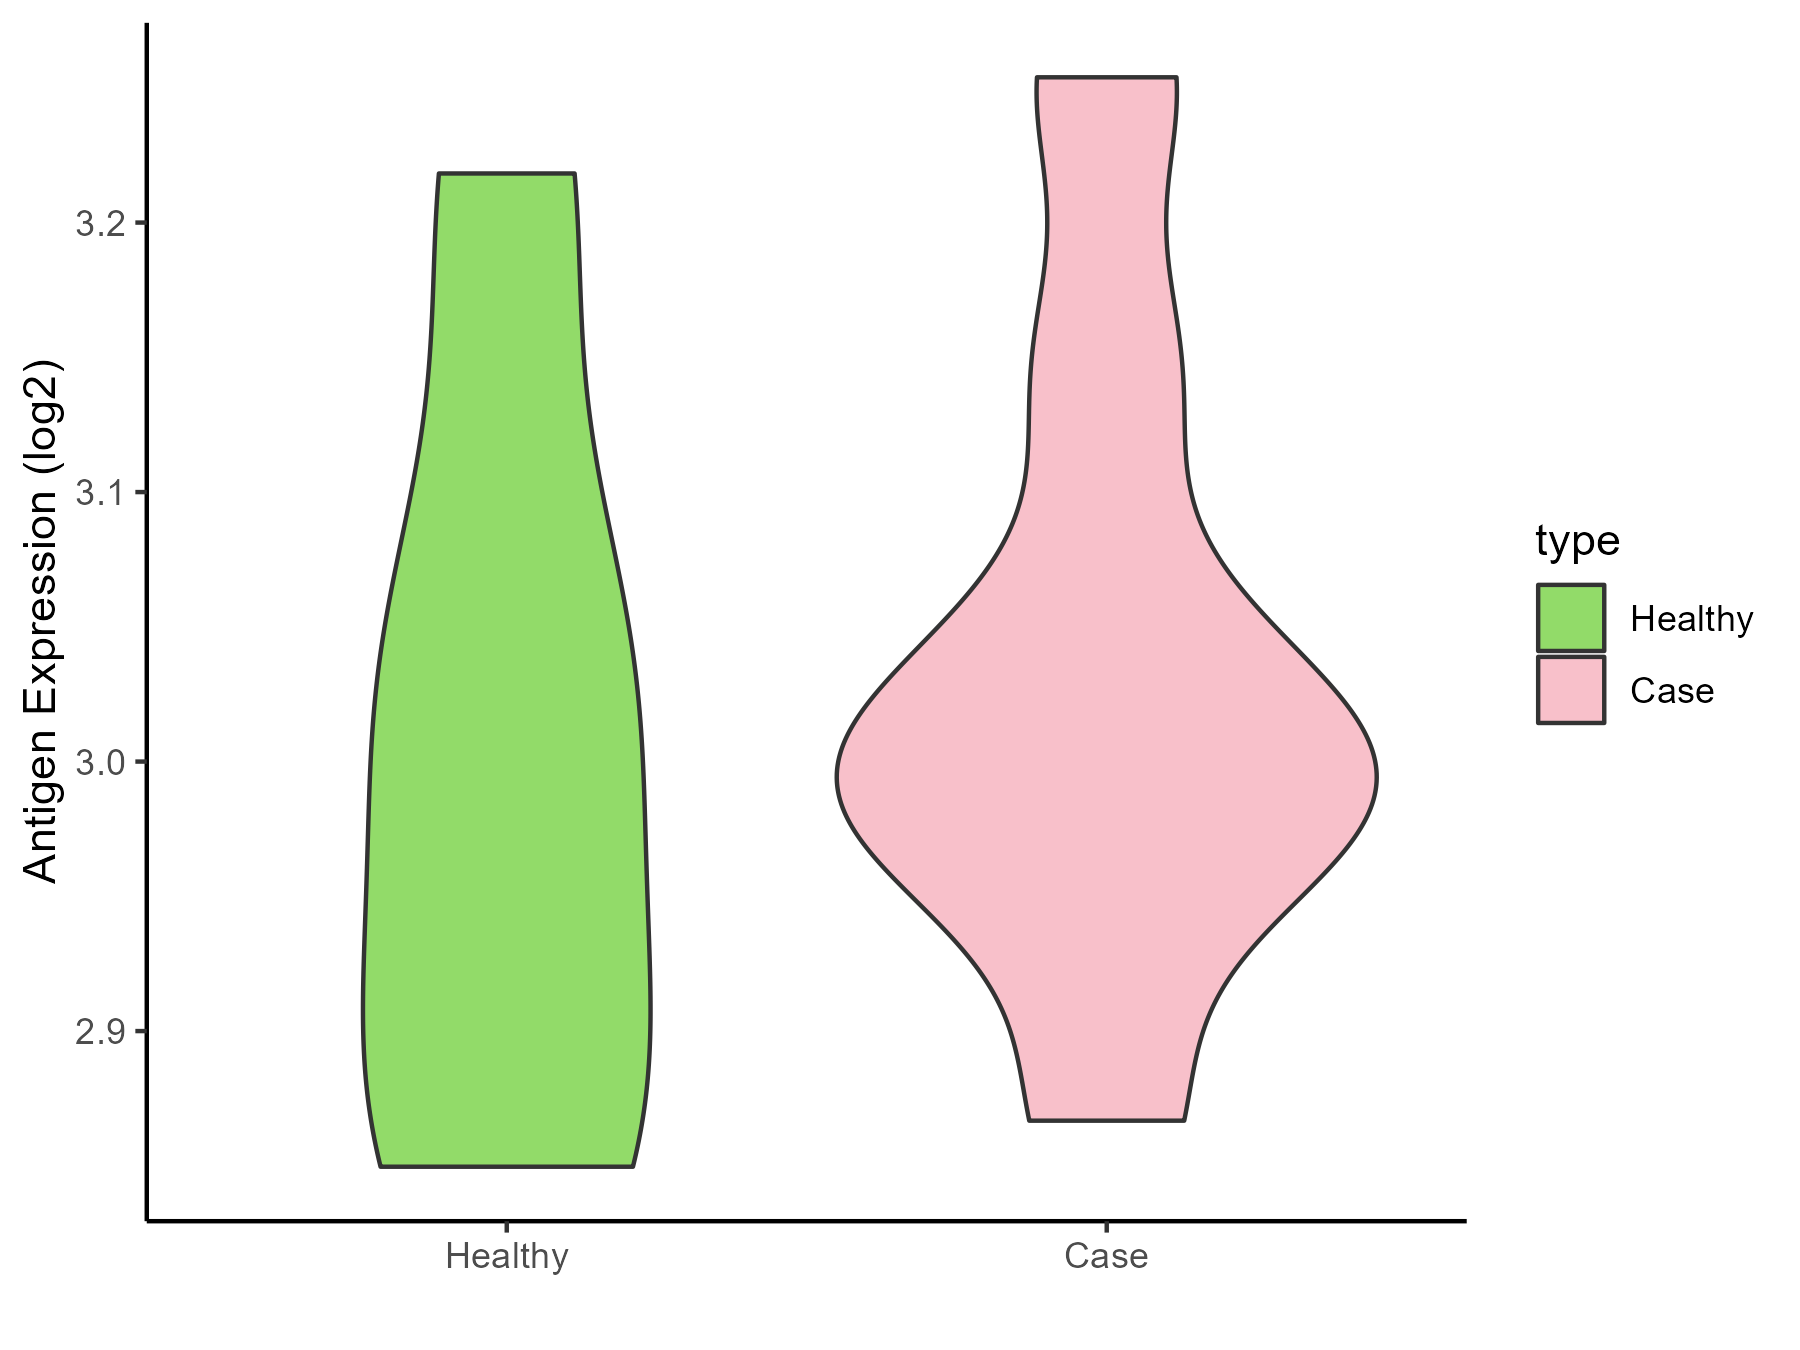
| The Studied Tissue | Biceps muscle | |
| The Specific Disease | Pompe disease | |
| The Expression Level of Disease Section Compare with the Healthy Individual Tissue | p-value: 0.617677672; Fold-change: -0.00148253; Z-score: -0.010824235 | |
| Disease-specific Antigen Abundances |
|
Click to View the Clearer Original Diagram |
| Differential expression pattern of antigen in diseases | ||
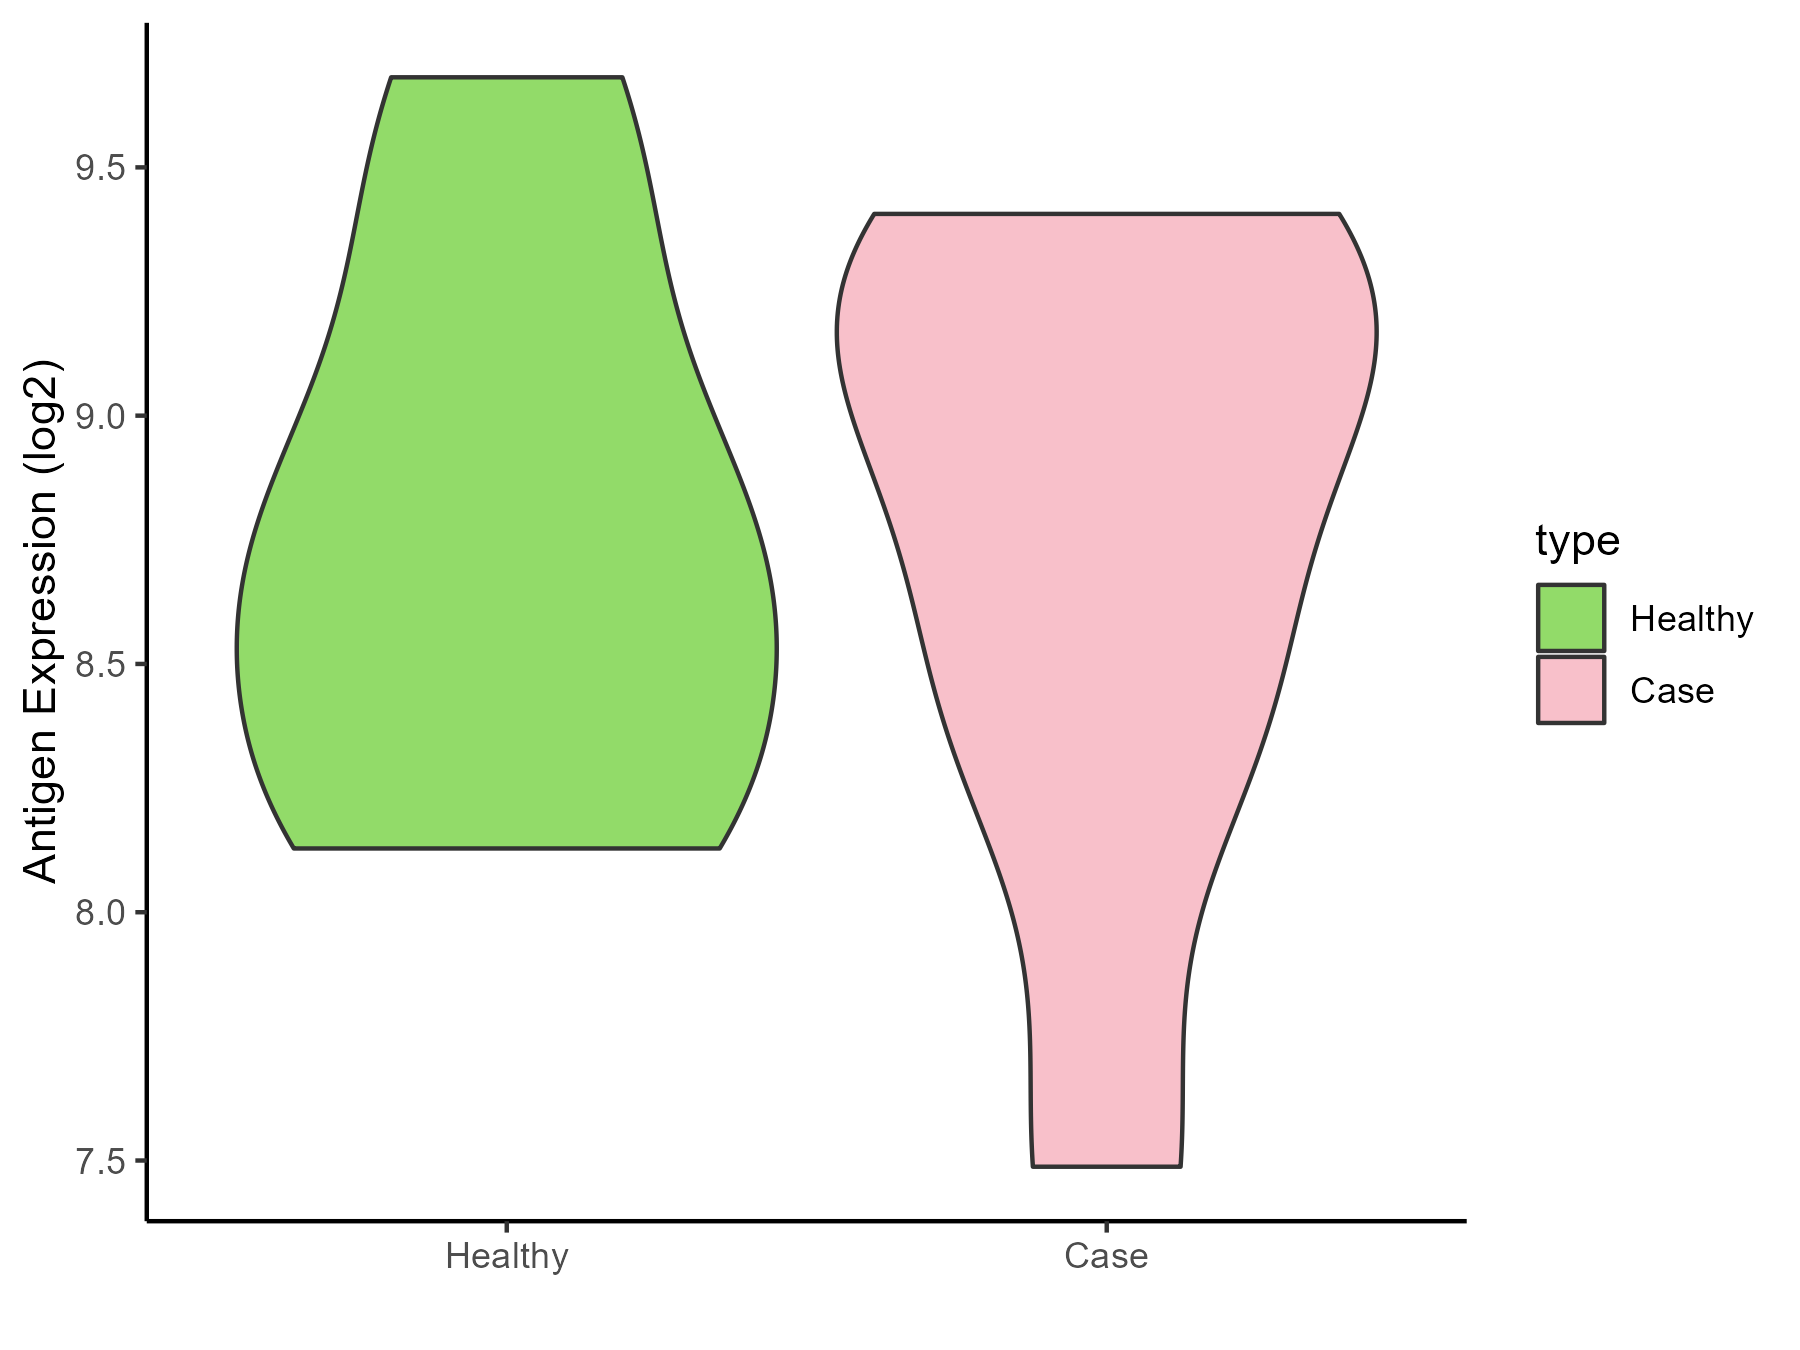
| The Studied Tissue | Whole blood | |
| The Specific Disease | Batten disease | |
| The Expression Level of Disease Section Compare with the Healthy Individual Tissue | p-value: 0.972696587; Fold-change: 0.326518524; Z-score: 0.572466414 | |
| Disease-specific Antigen Abundances |
|
Click to View the Clearer Original Diagram |
ICD Disease Classification 6
| Differential expression pattern of antigen in diseases | ||
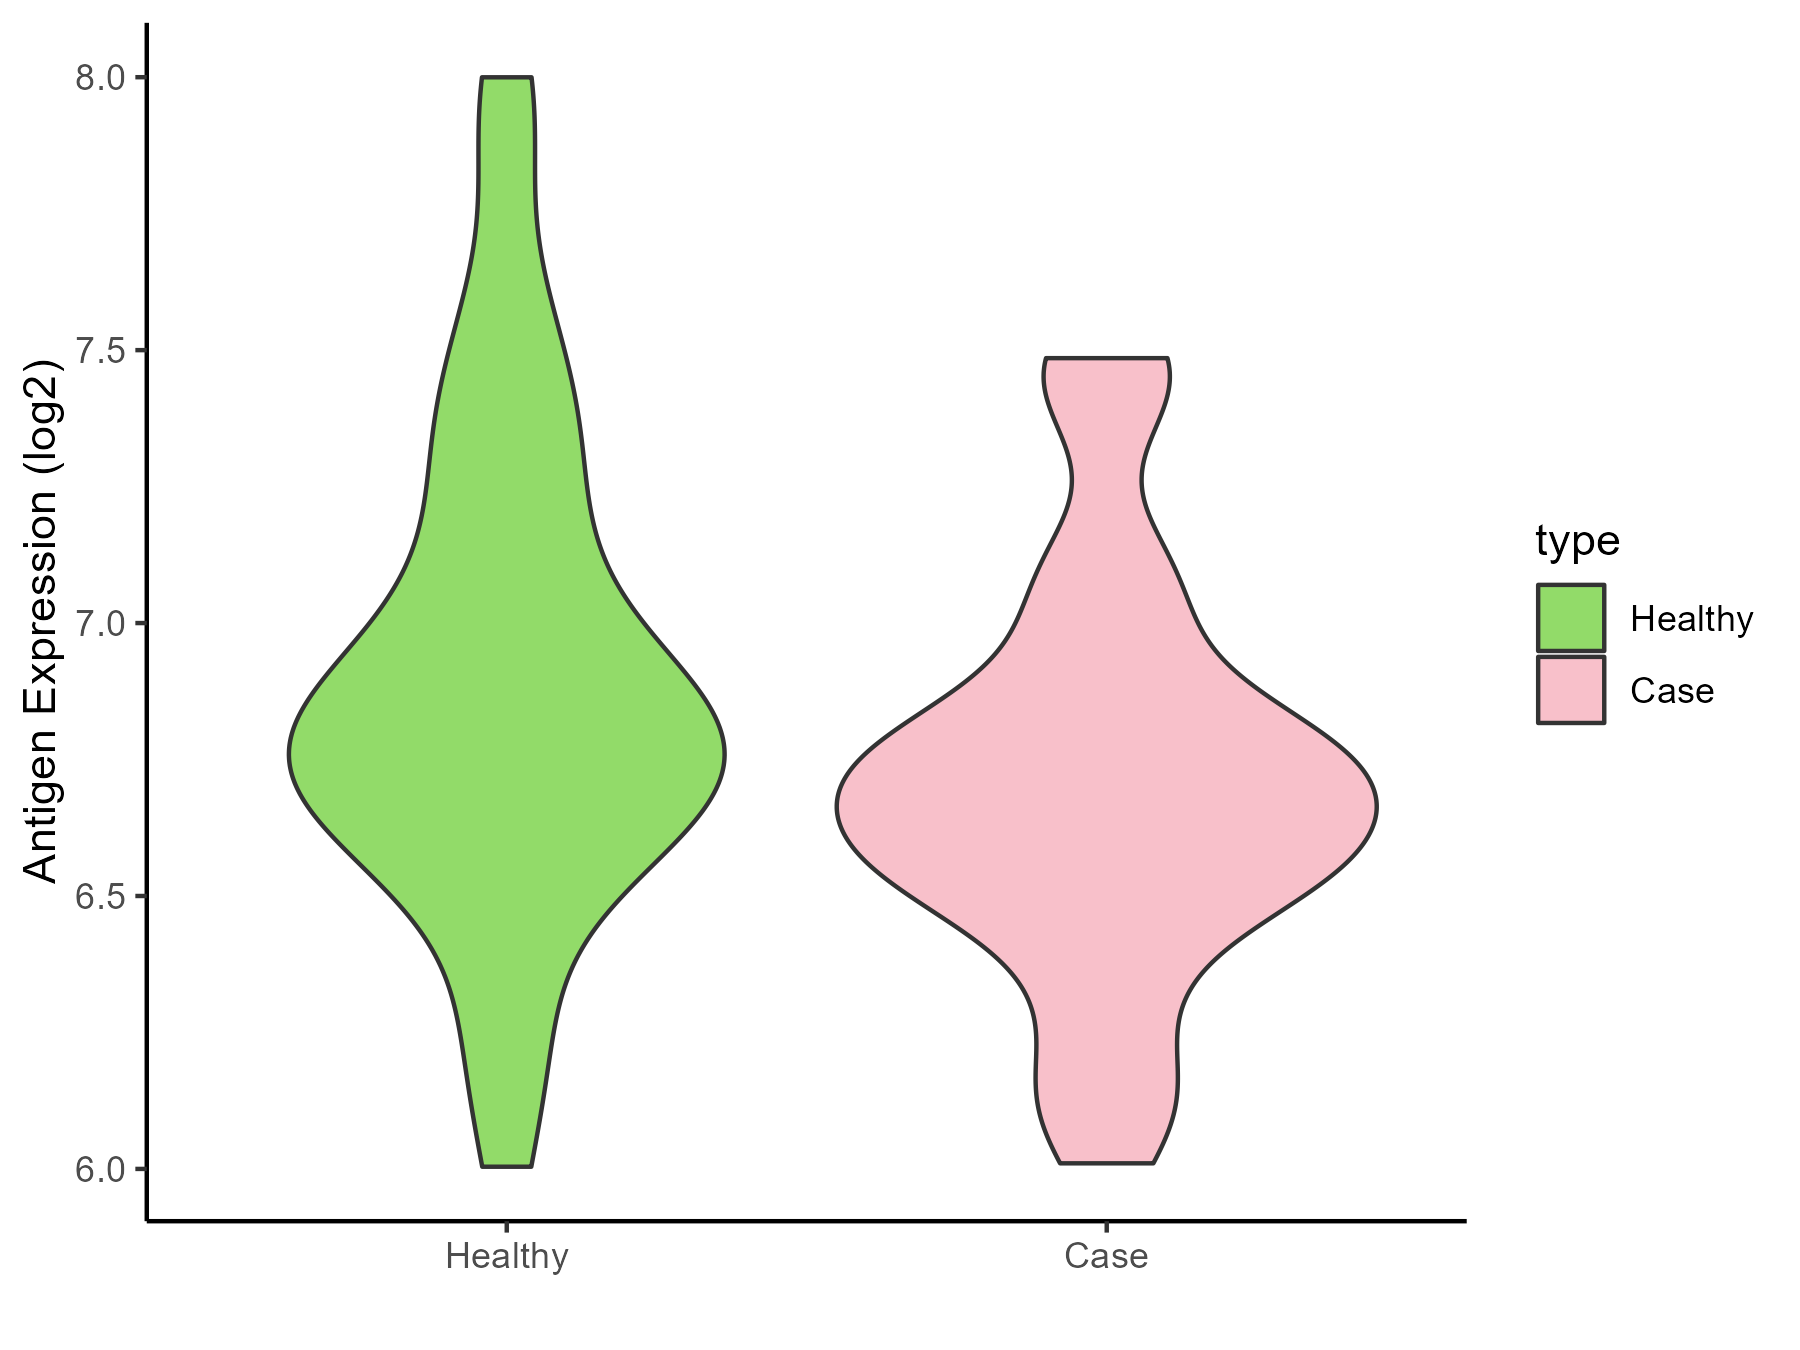
| The Studied Tissue | Whole blood | |
| The Specific Disease | Autism | |
| The Expression Level of Disease Section Compare with the Healthy Individual Tissue | p-value: 0.057236963; Fold-change: -0.149085126; Z-score: -0.33607489 | |
| Disease-specific Antigen Abundances |
|
Click to View the Clearer Original Diagram |
| Differential expression pattern of antigen in diseases | ||
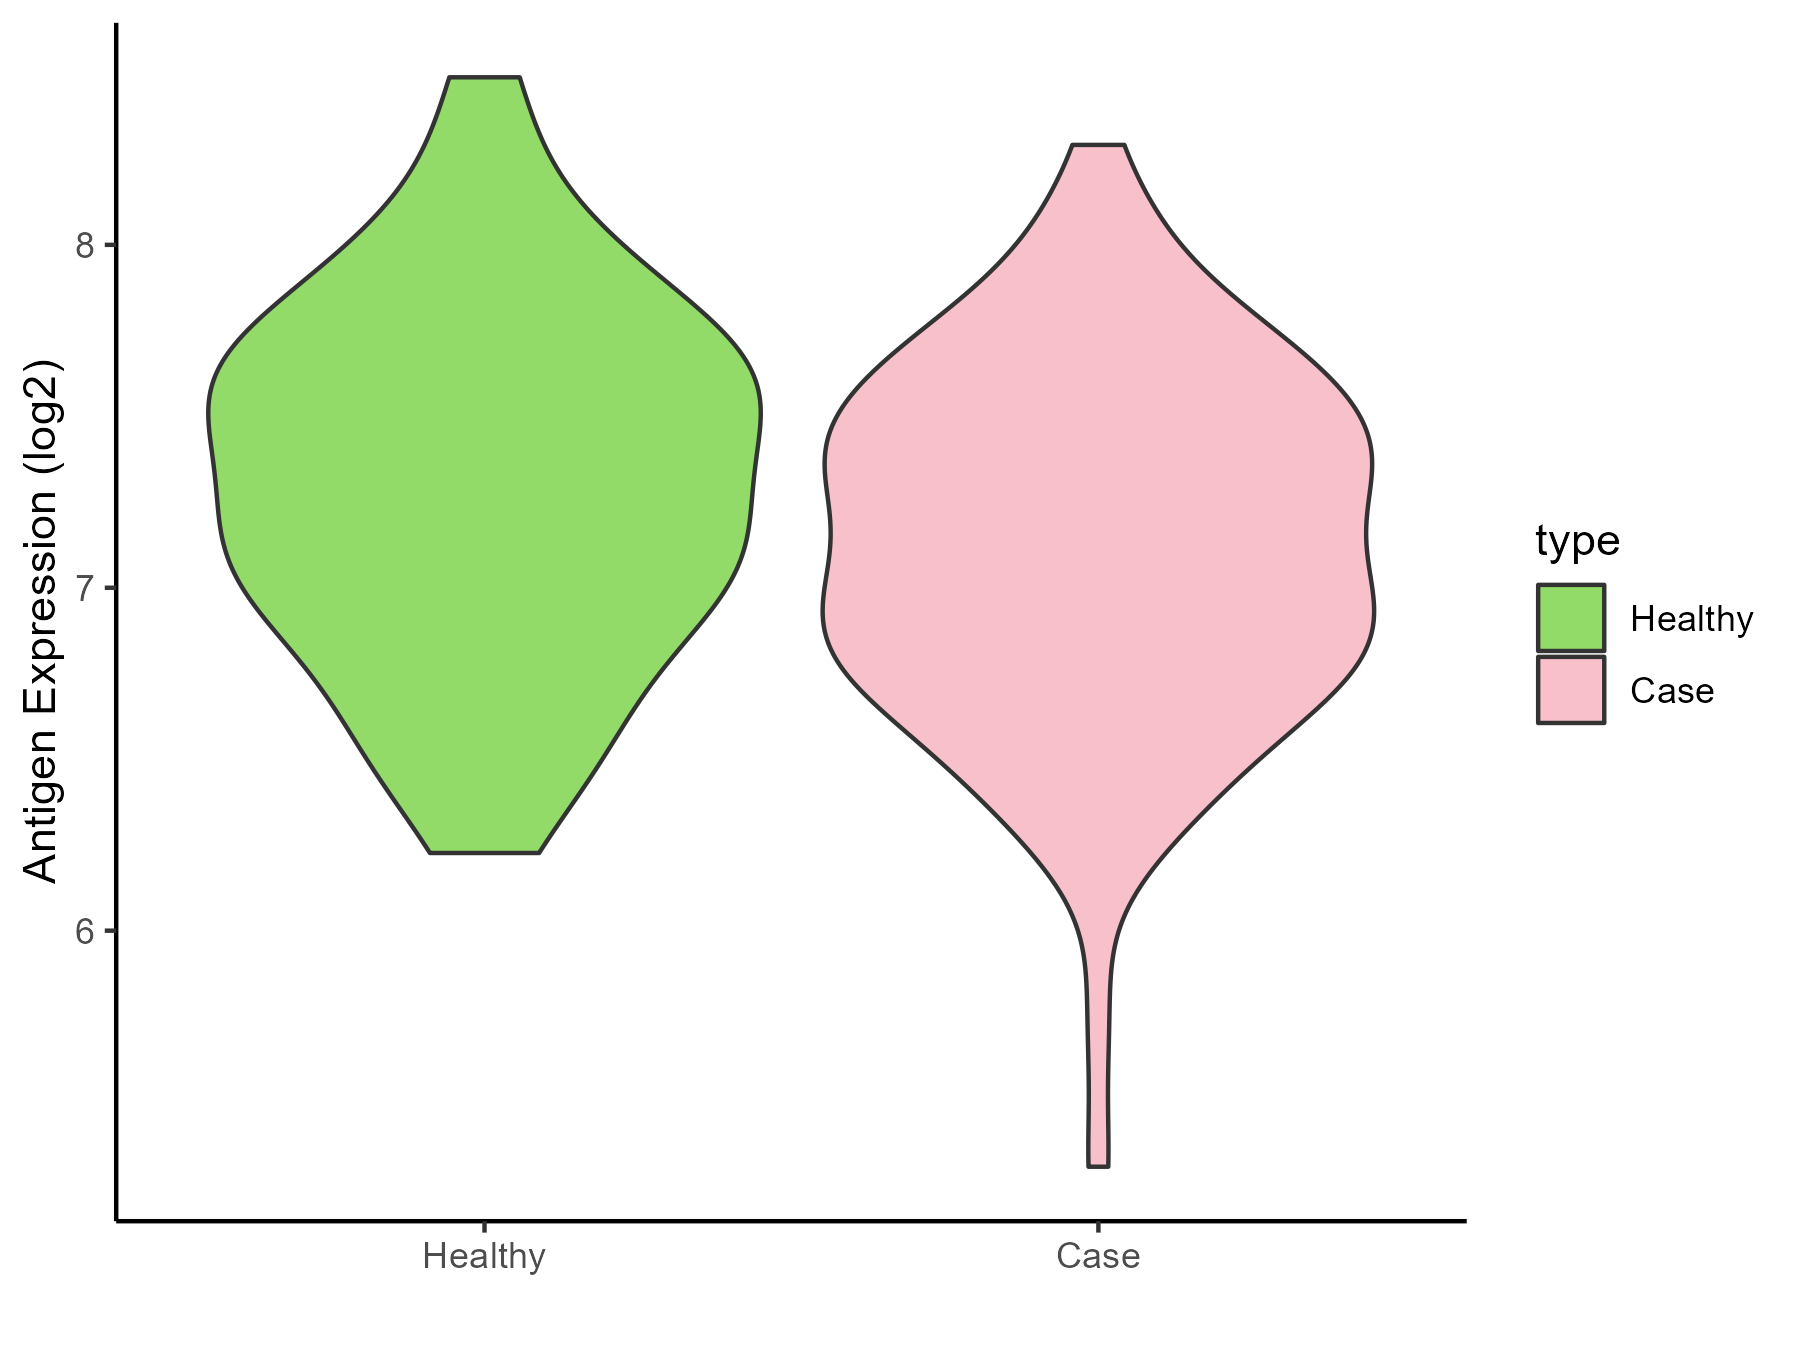
| The Studied Tissue | Whole blood | |
| The Specific Disease | Anxiety disorder | |
| The Expression Level of Disease Section Compare with the Healthy Individual Tissue | p-value: 0.047166228; Fold-change: -0.202223866; Z-score: -0.389533126 | |
| Disease-specific Antigen Abundances |
|
Click to View the Clearer Original Diagram |
ICD Disease Classification 8
| Differential expression pattern of antigen in diseases | ||
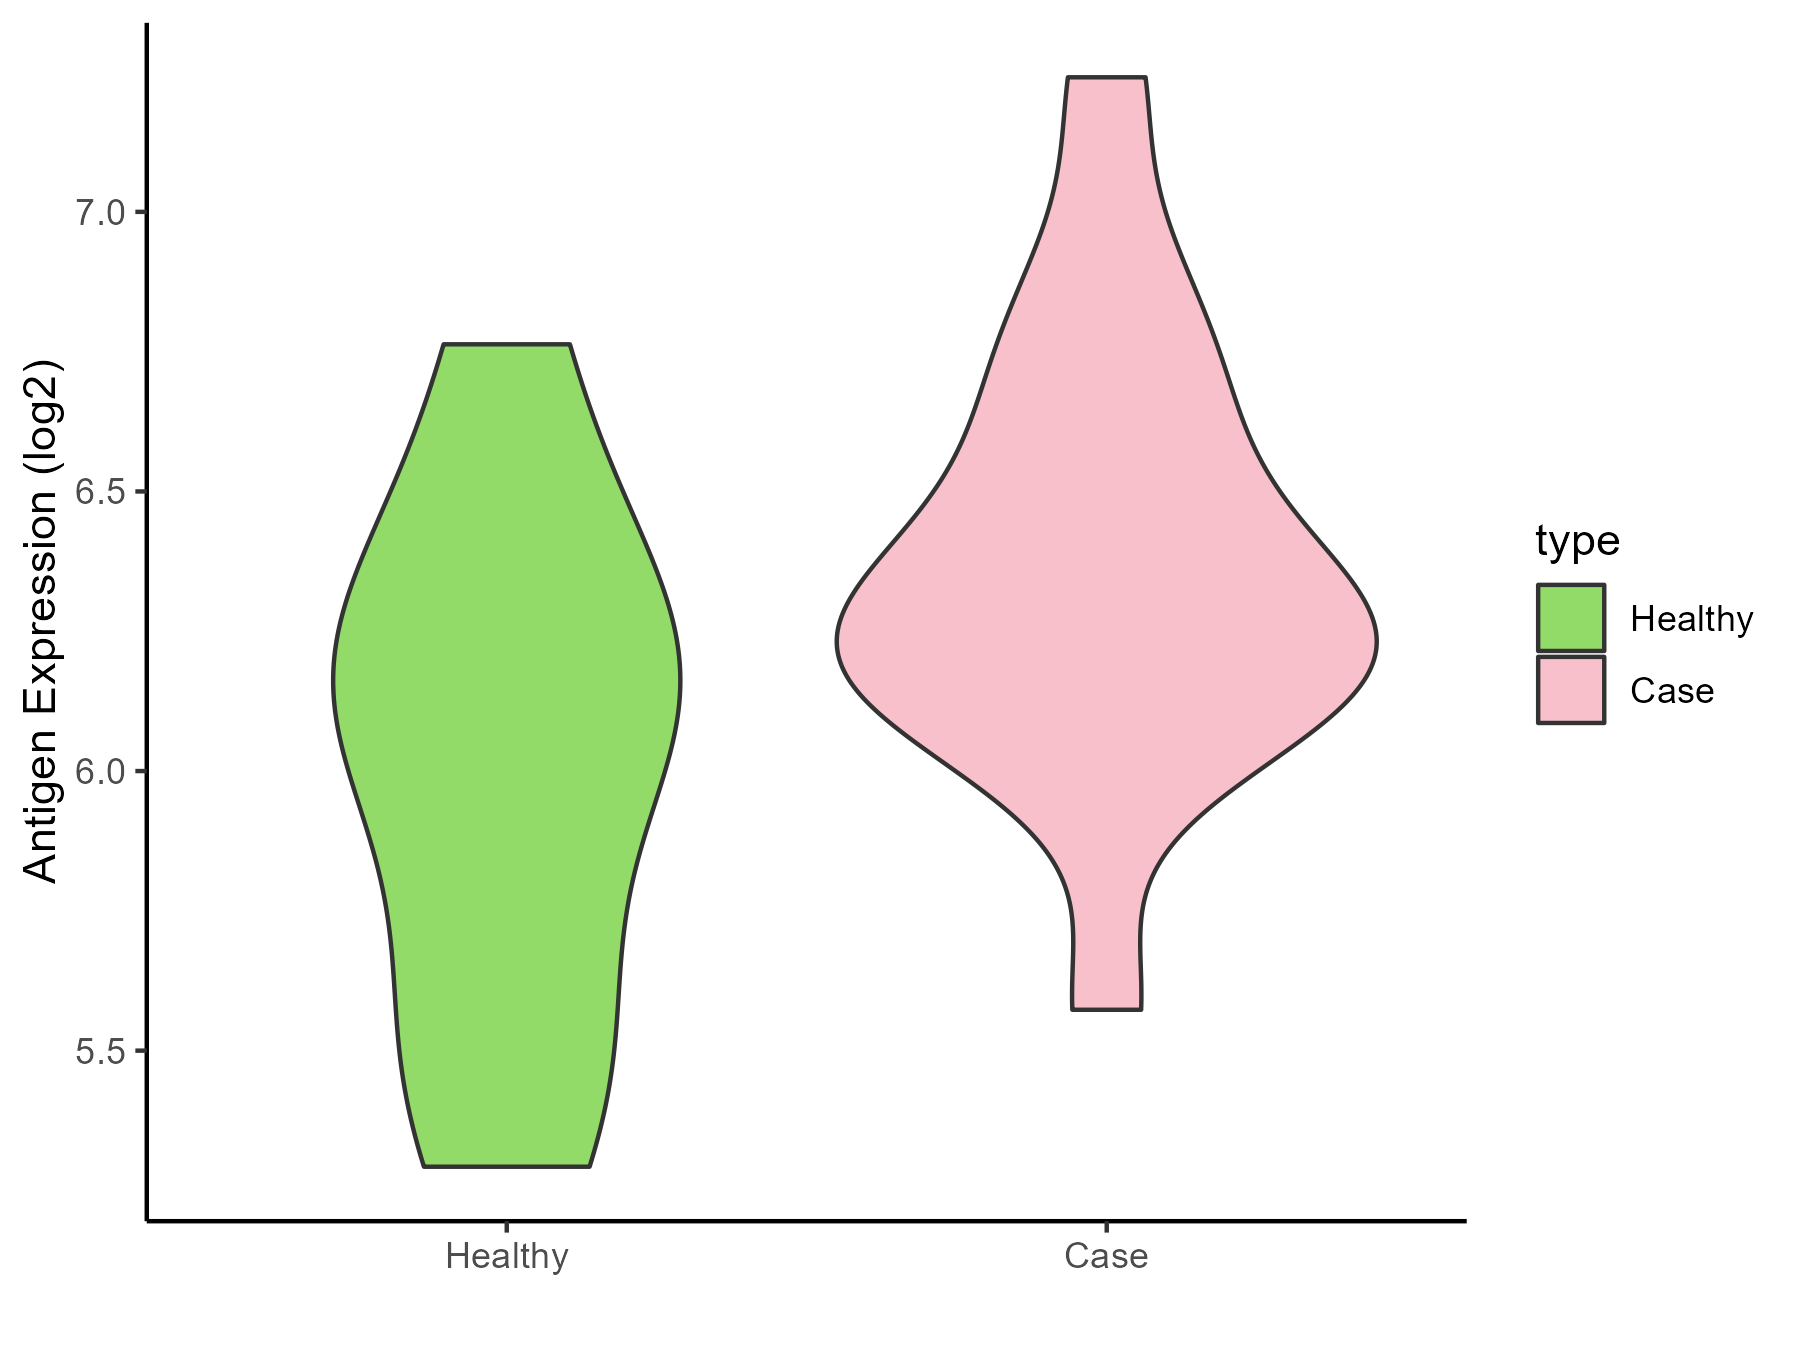
| The Studied Tissue | Substantia nigra | |
| The Specific Disease | Parkinson disease | |
| The Expression Level of Disease Section Compare with the Healthy Individual Tissue | p-value: 0.068536064; Fold-change: 0.204942422; Z-score: 0.439248948 | |
| Disease-specific Antigen Abundances |
|
Click to View the Clearer Original Diagram |
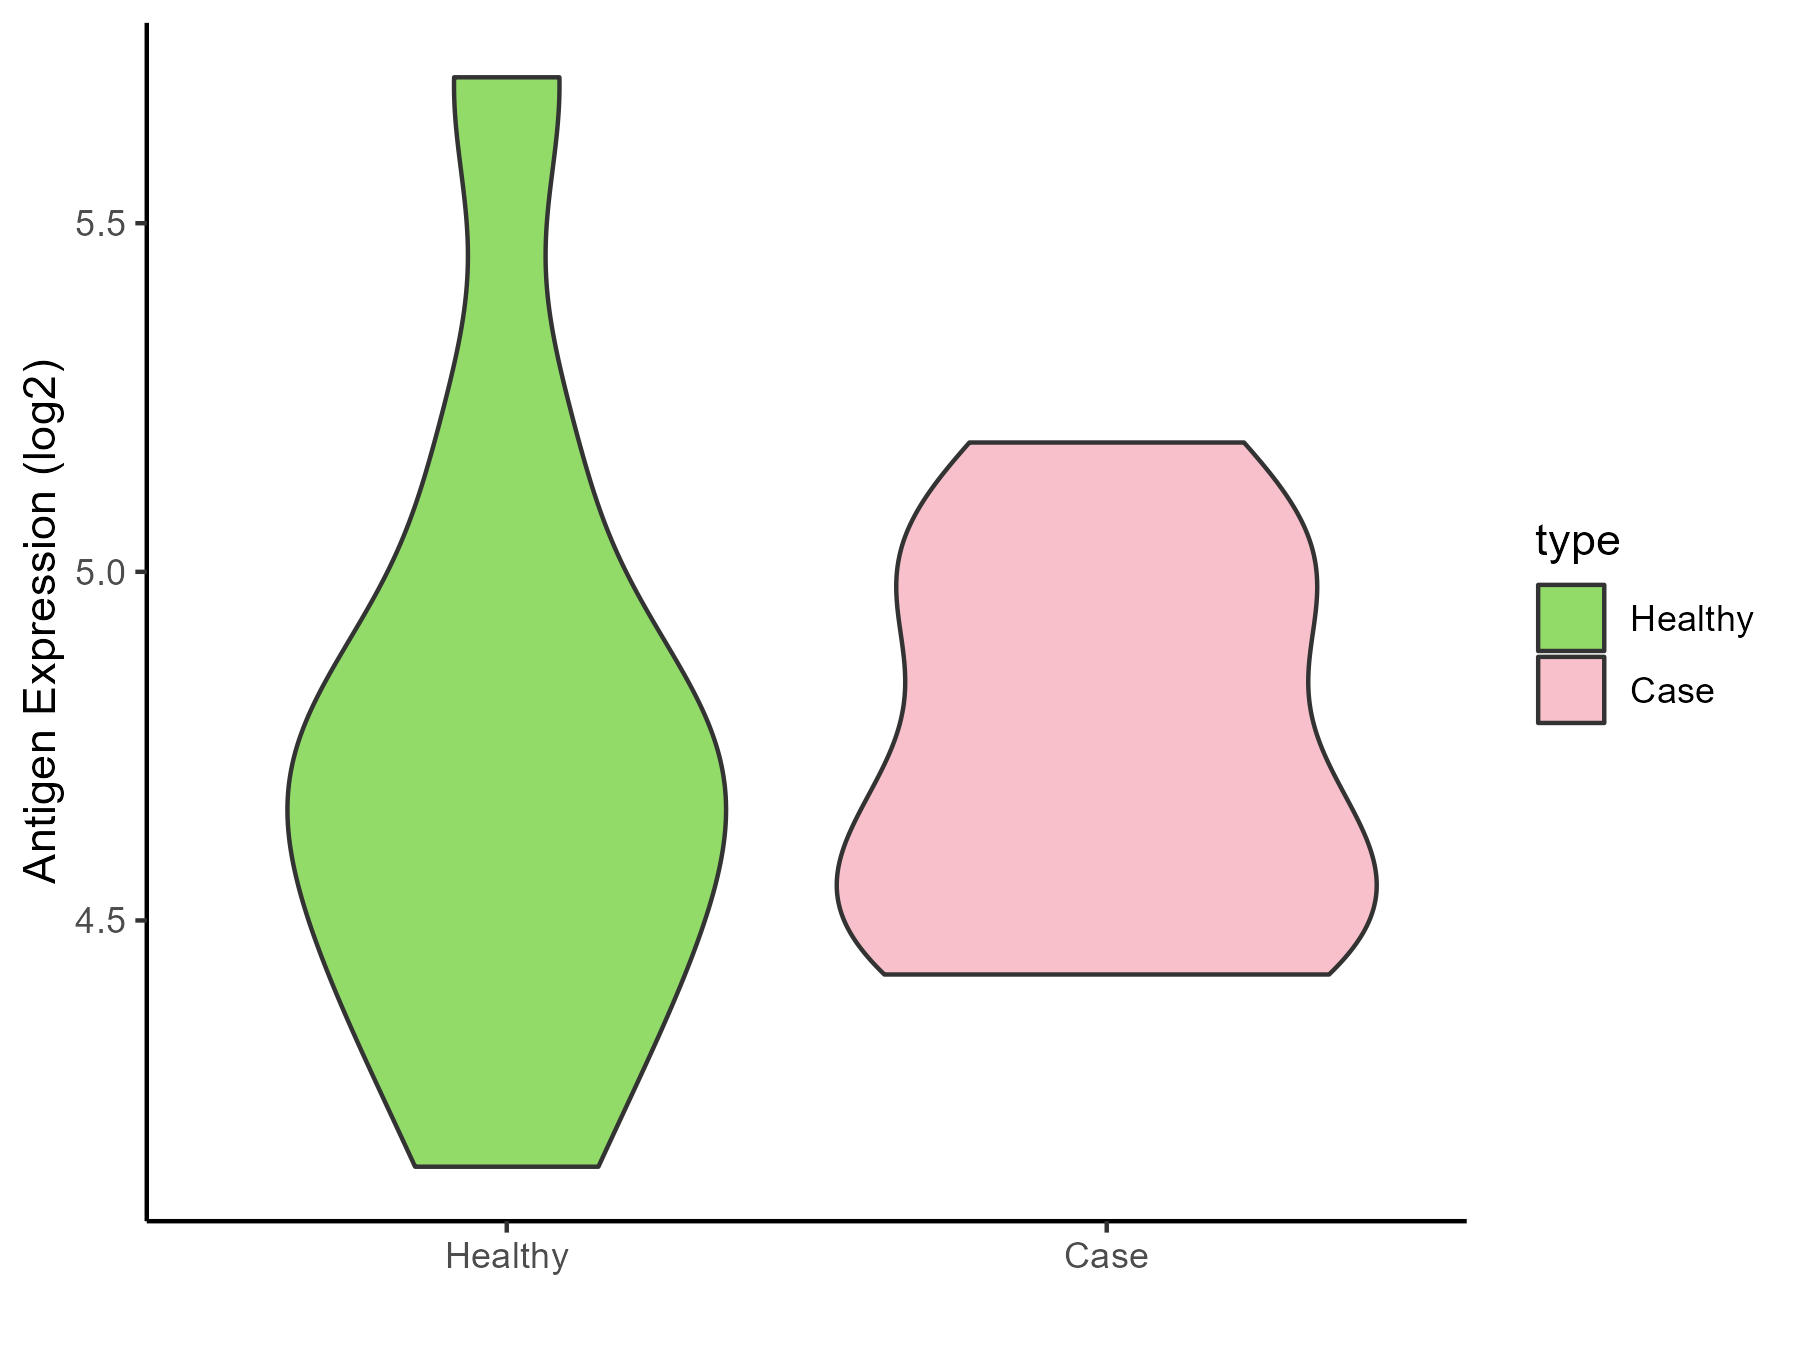
| Differential expression pattern of antigen in diseases | ||
| The Studied Tissue | Whole blood | |
| The Specific Disease | Huntington disease | |
| The Expression Level of Disease Section Compare with the Healthy Individual Tissue | p-value: 0.960746065; Fold-change: -0.029189131; Z-score: -0.0628178 | |
| Disease-specific Antigen Abundances |
|
Click to View the Clearer Original Diagram |
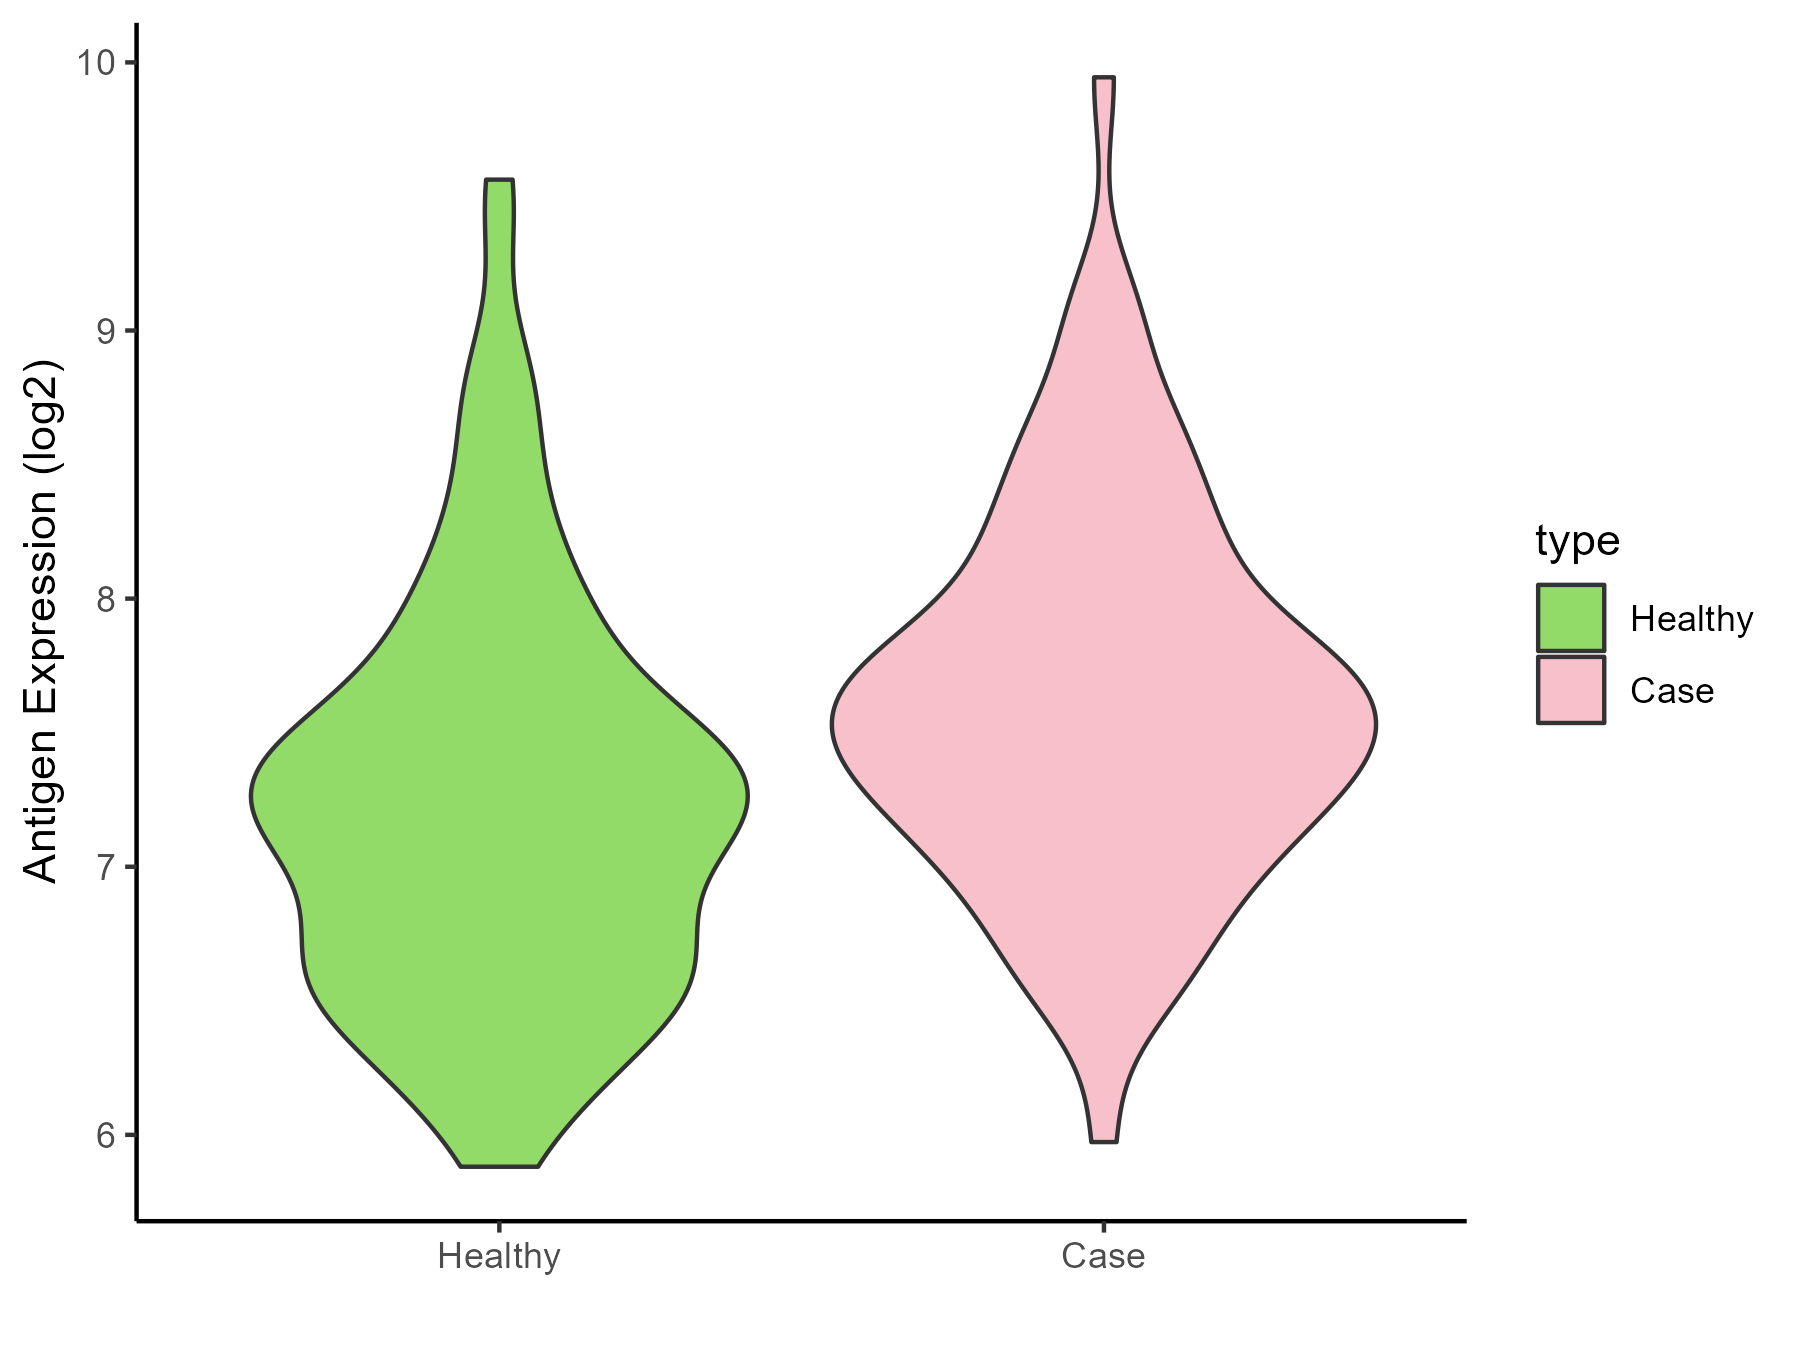
| Differential expression pattern of antigen in diseases | ||
| The Studied Tissue | Entorhinal cortex | |
| The Specific Disease | Alzheimer disease | |
| The Expression Level of Disease Section Compare with the Healthy Individual Tissue | p-value: 0.00011918; Fold-change: 0.382905267; Z-score: 0.517775407 | |
| Disease-specific Antigen Abundances |
|
Click to View the Clearer Original Diagram |
| Differential expression pattern of antigen in diseases | ||
| The Studied Tissue | Whole blood | |
| The Specific Disease | Seizure | |
| The Expression Level of Disease Section Compare with the Healthy Individual Tissue | p-value: 0.798187648; Fold-change: 0.111755665; Z-score: 0.128821752 | |
| Disease-specific Antigen Abundances |

|
Click to View the Clearer Original Diagram |
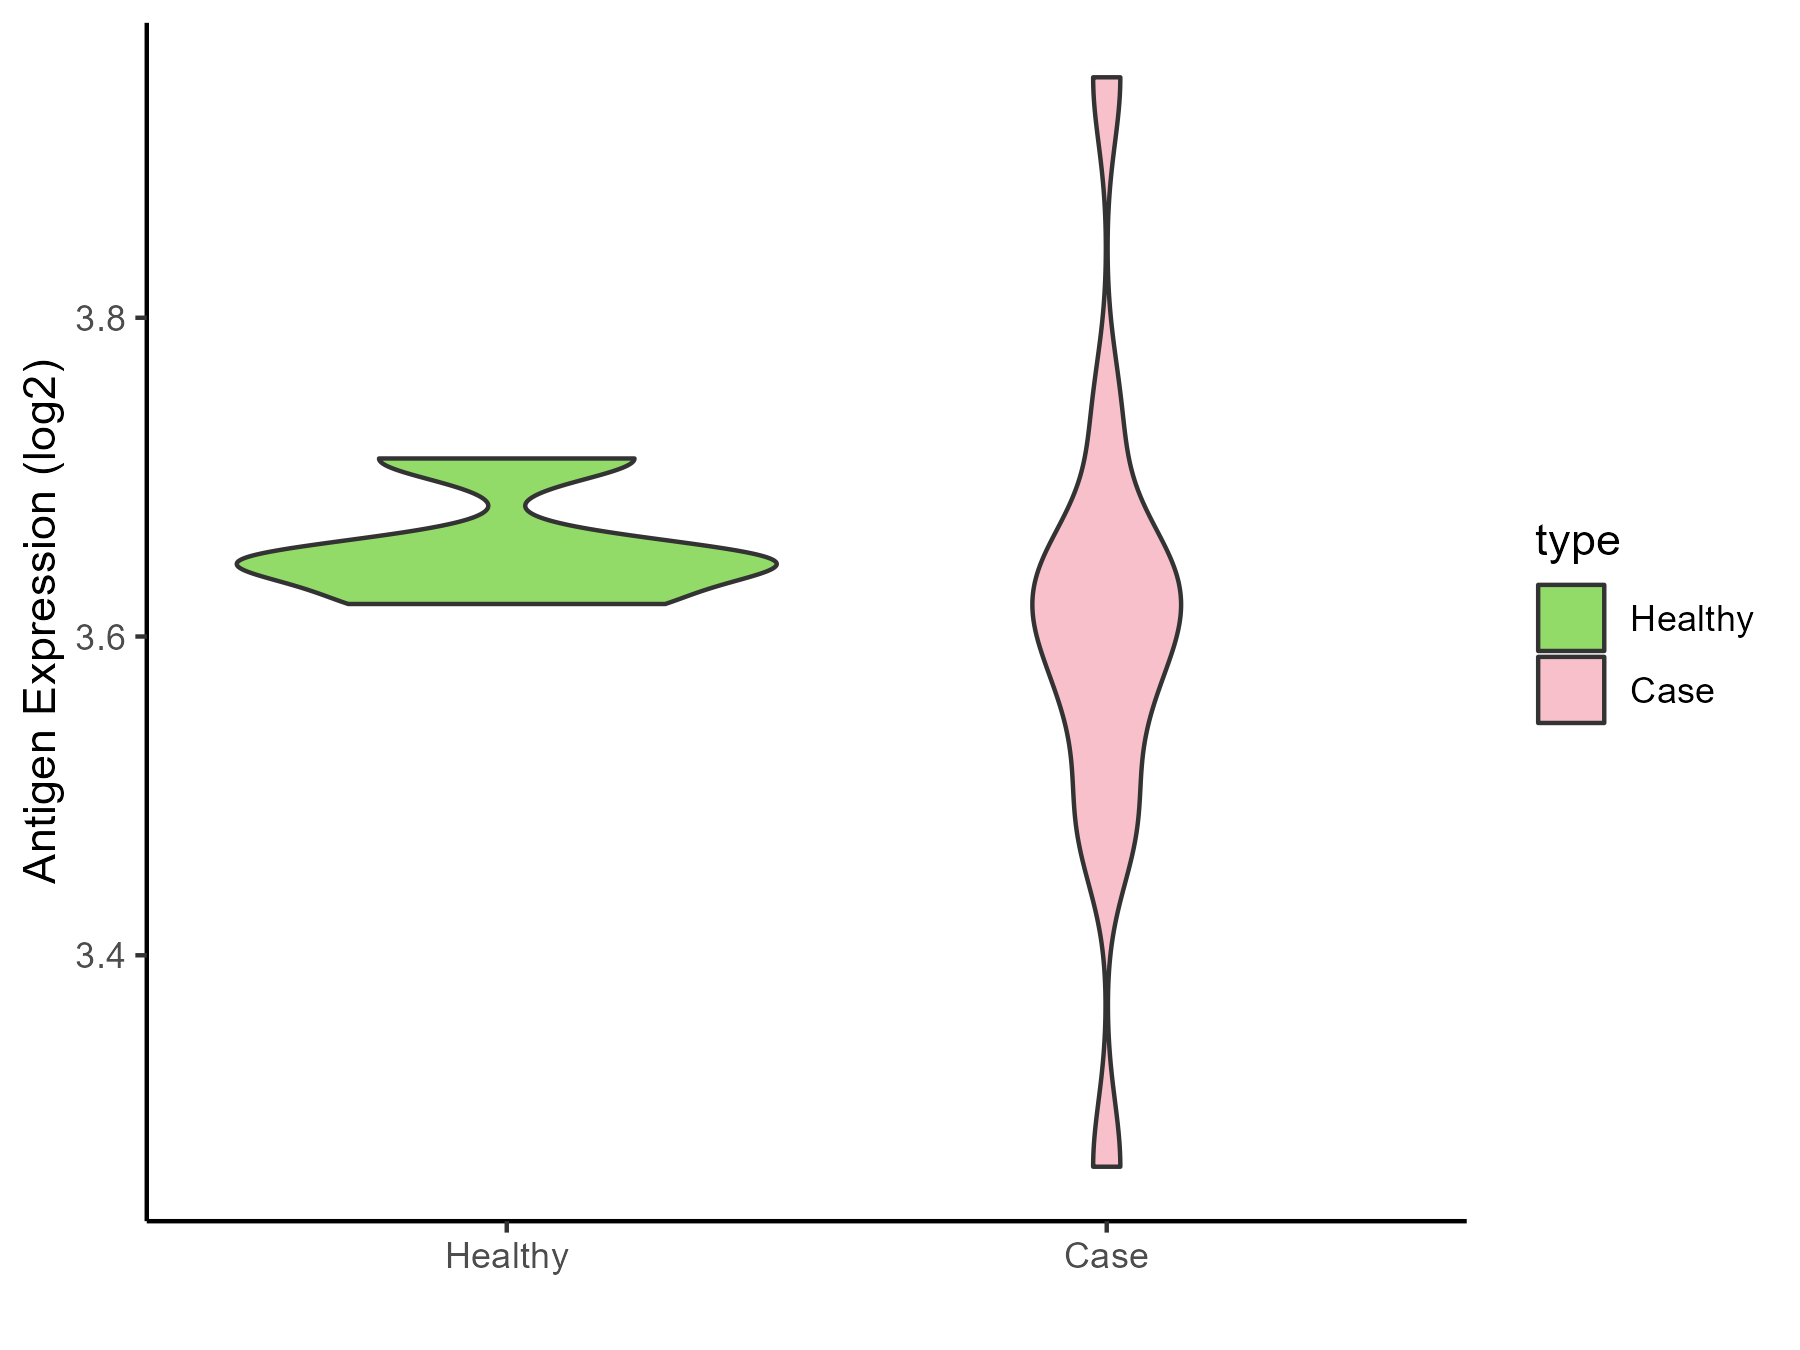
| Differential expression pattern of antigen in diseases | ||
| The Studied Tissue | Skin | |
| The Specific Disease | Lateral sclerosis | |
| The Expression Level of Disease Section Compare with the Healthy Individual Tissue | p-value: 0.281952262; Fold-change: -0.033198721; Z-score: -0.855679488 | |
| Disease-specific Antigen Abundances |
|
Click to View the Clearer Original Diagram |
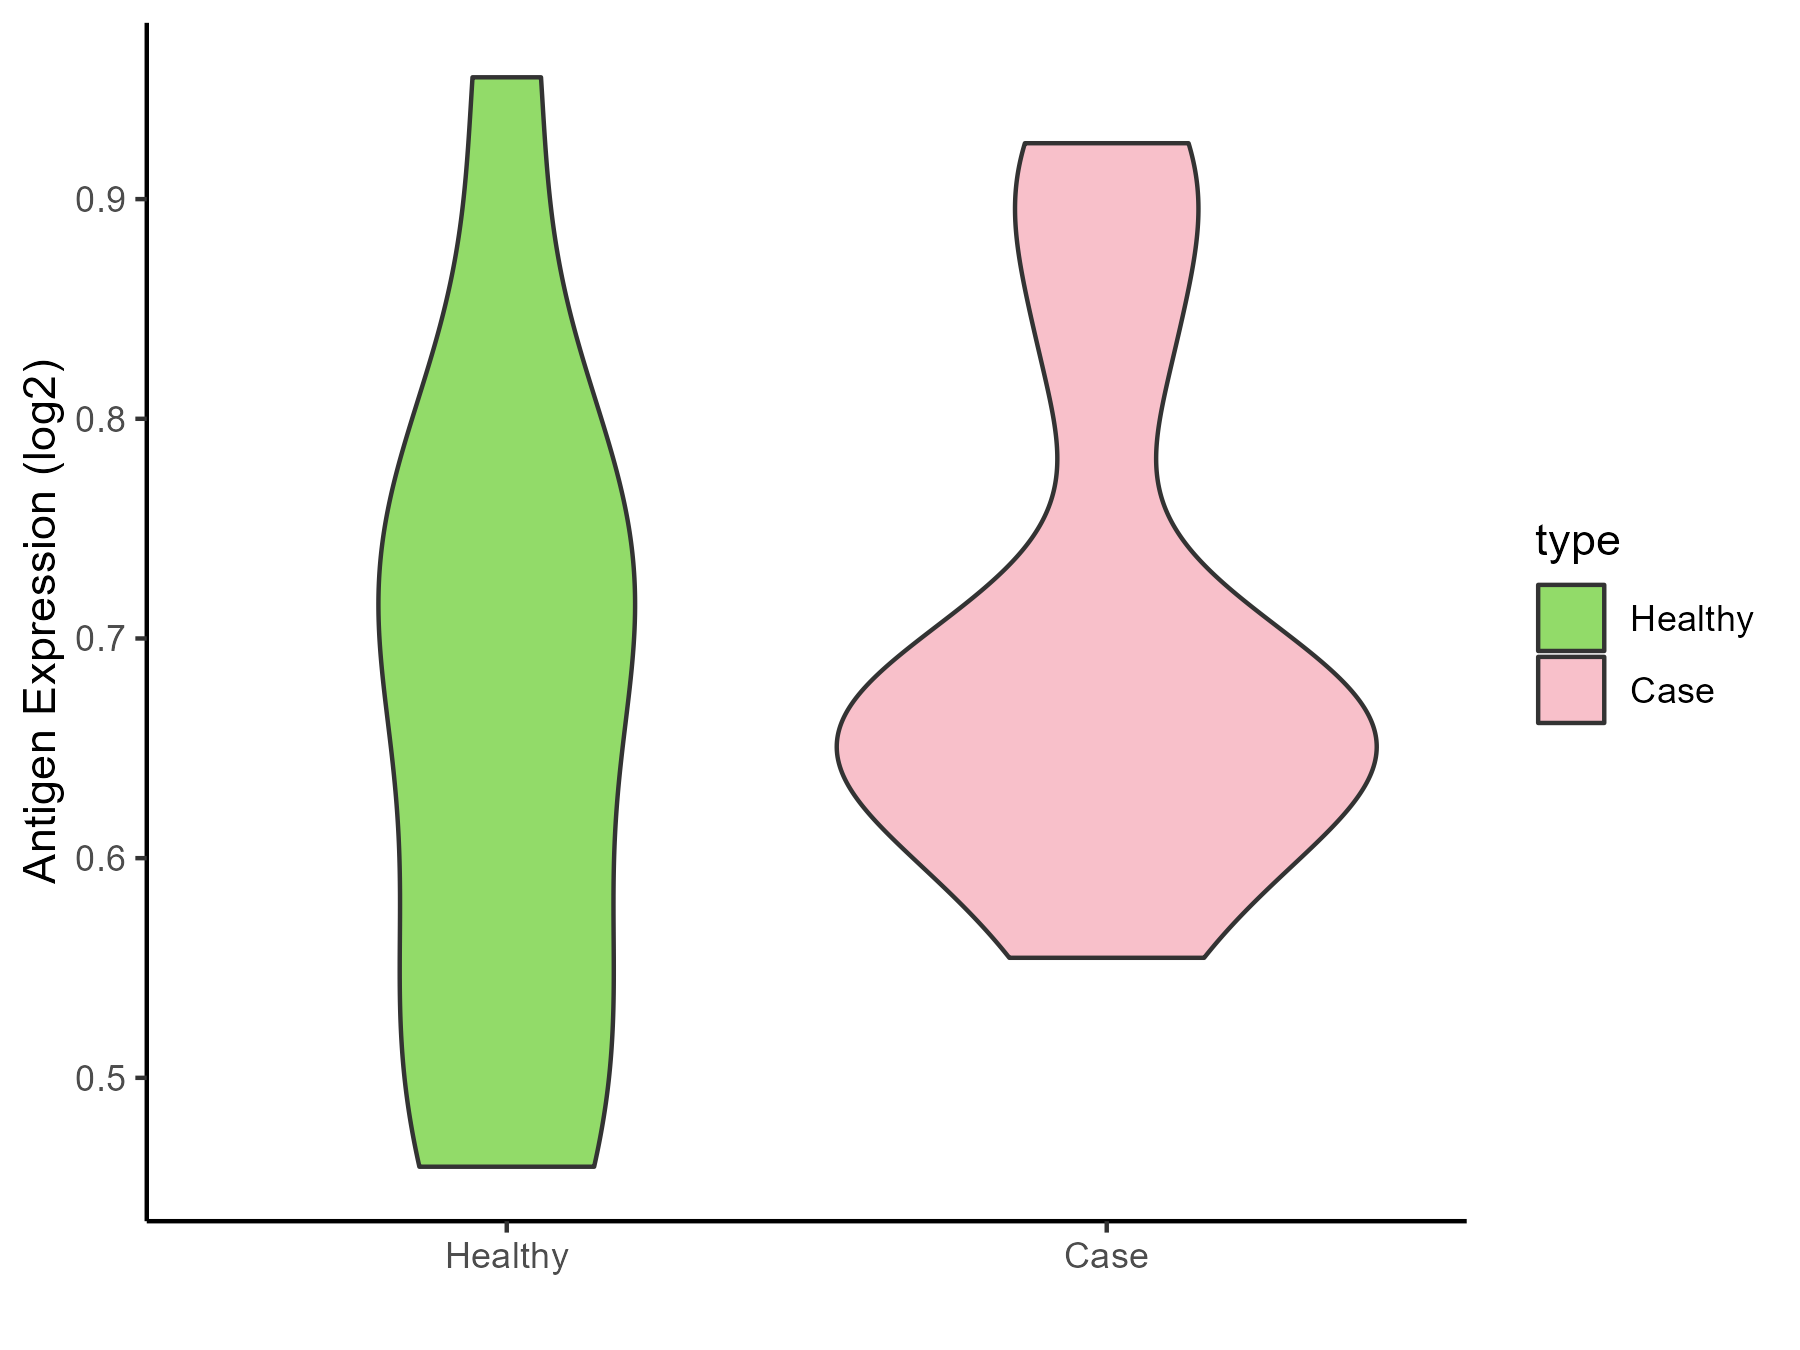
| The Studied Tissue | Cervical spinal cord | |
| The Specific Disease | Lateral sclerosis | |
| The Expression Level of Disease Section Compare with the Healthy Individual Tissue | p-value: 0.512320634; Fold-change: -0.052227862; Z-score: -0.328999621 | |
| Disease-specific Antigen Abundances |
|
Click to View the Clearer Original Diagram |
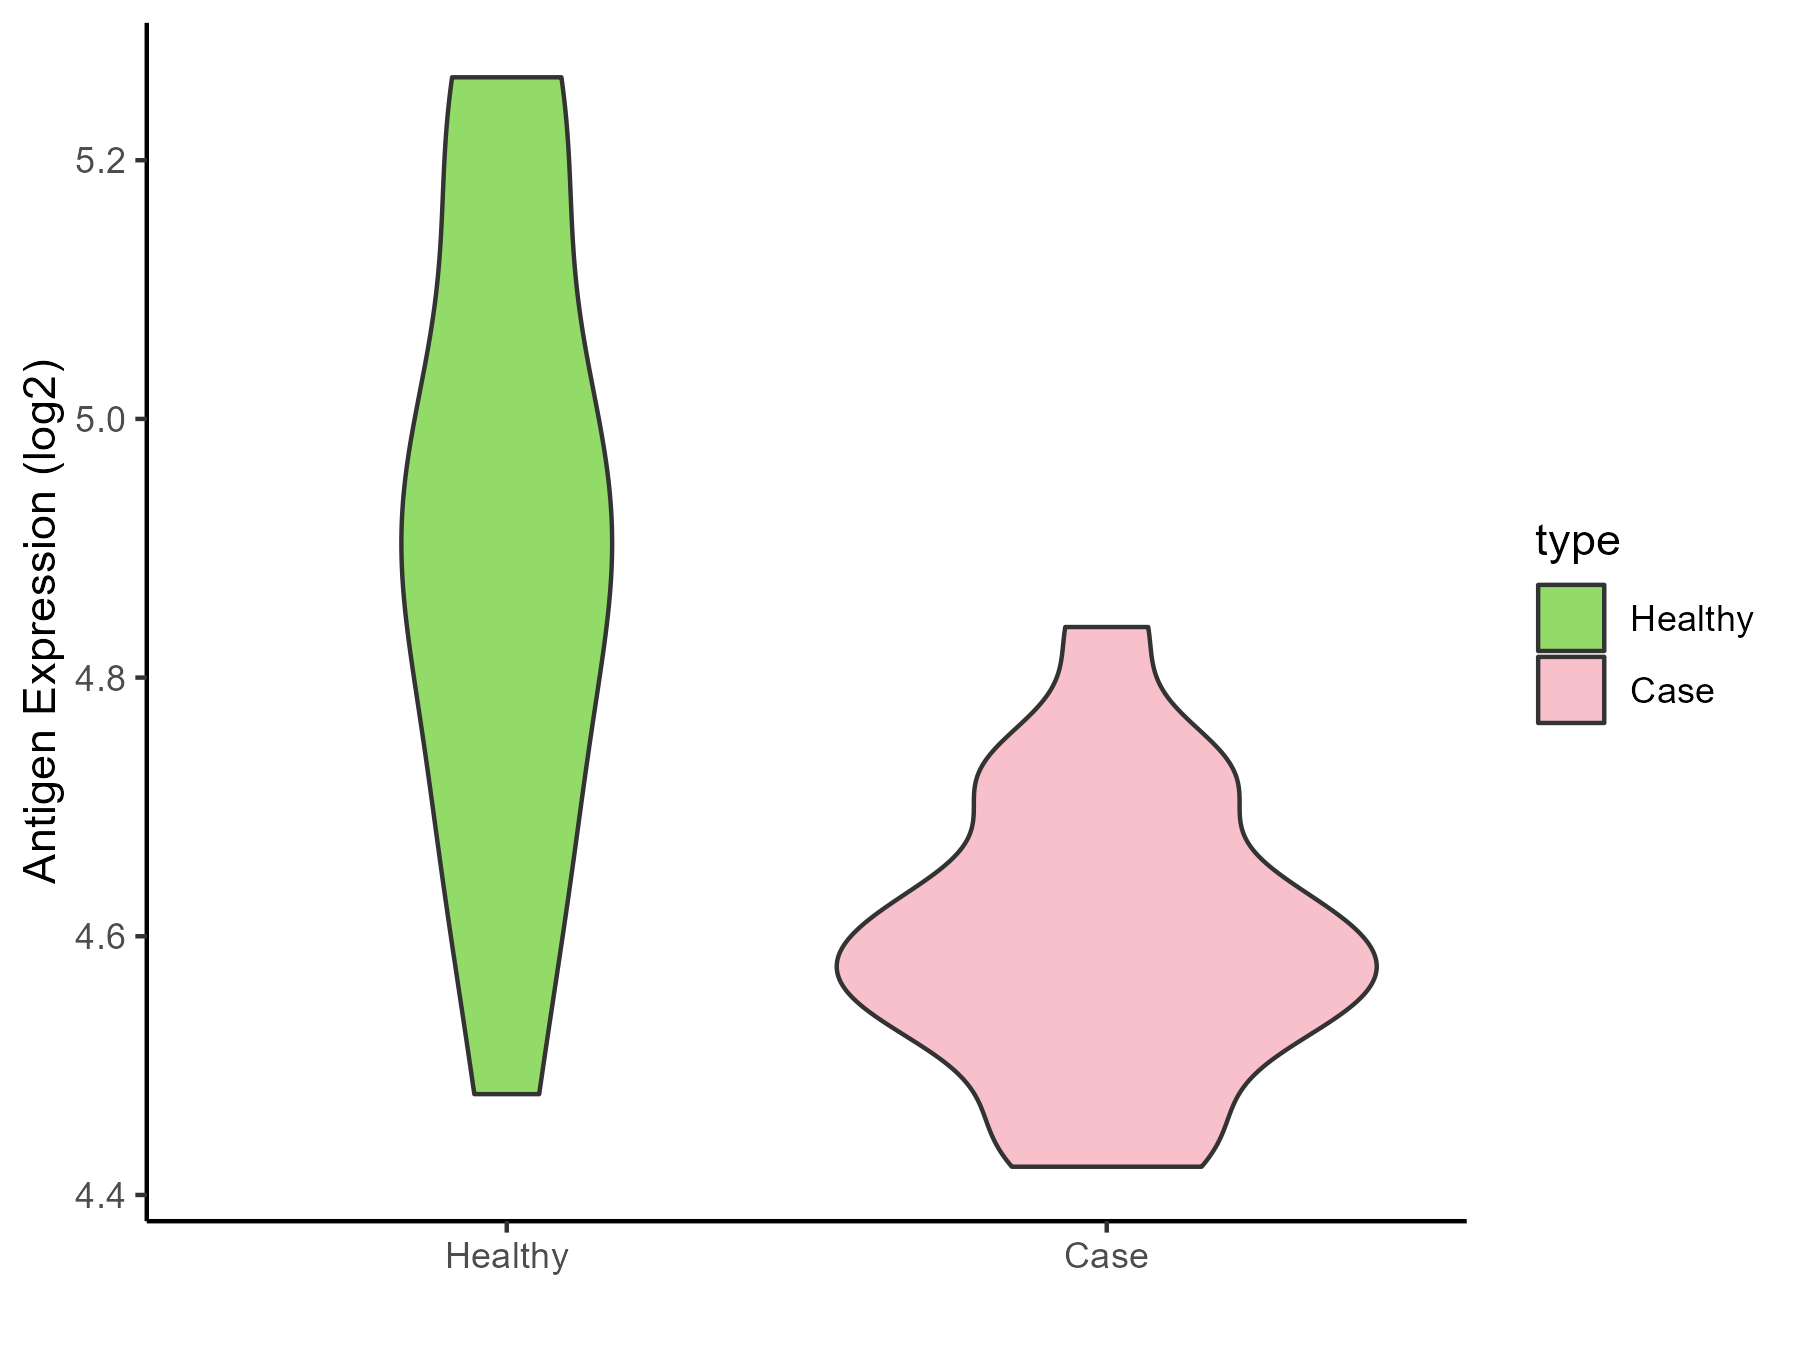
| Differential expression pattern of antigen in diseases | ||
| The Studied Tissue | Muscle | |
| The Specific Disease | Muscular atrophy | |
| The Expression Level of Disease Section Compare with the Healthy Individual Tissue | p-value: 0.000591328; Fold-change: -0.32996056; Z-score: -1.371461848 | |
| Disease-specific Antigen Abundances |
|
Click to View the Clearer Original Diagram |
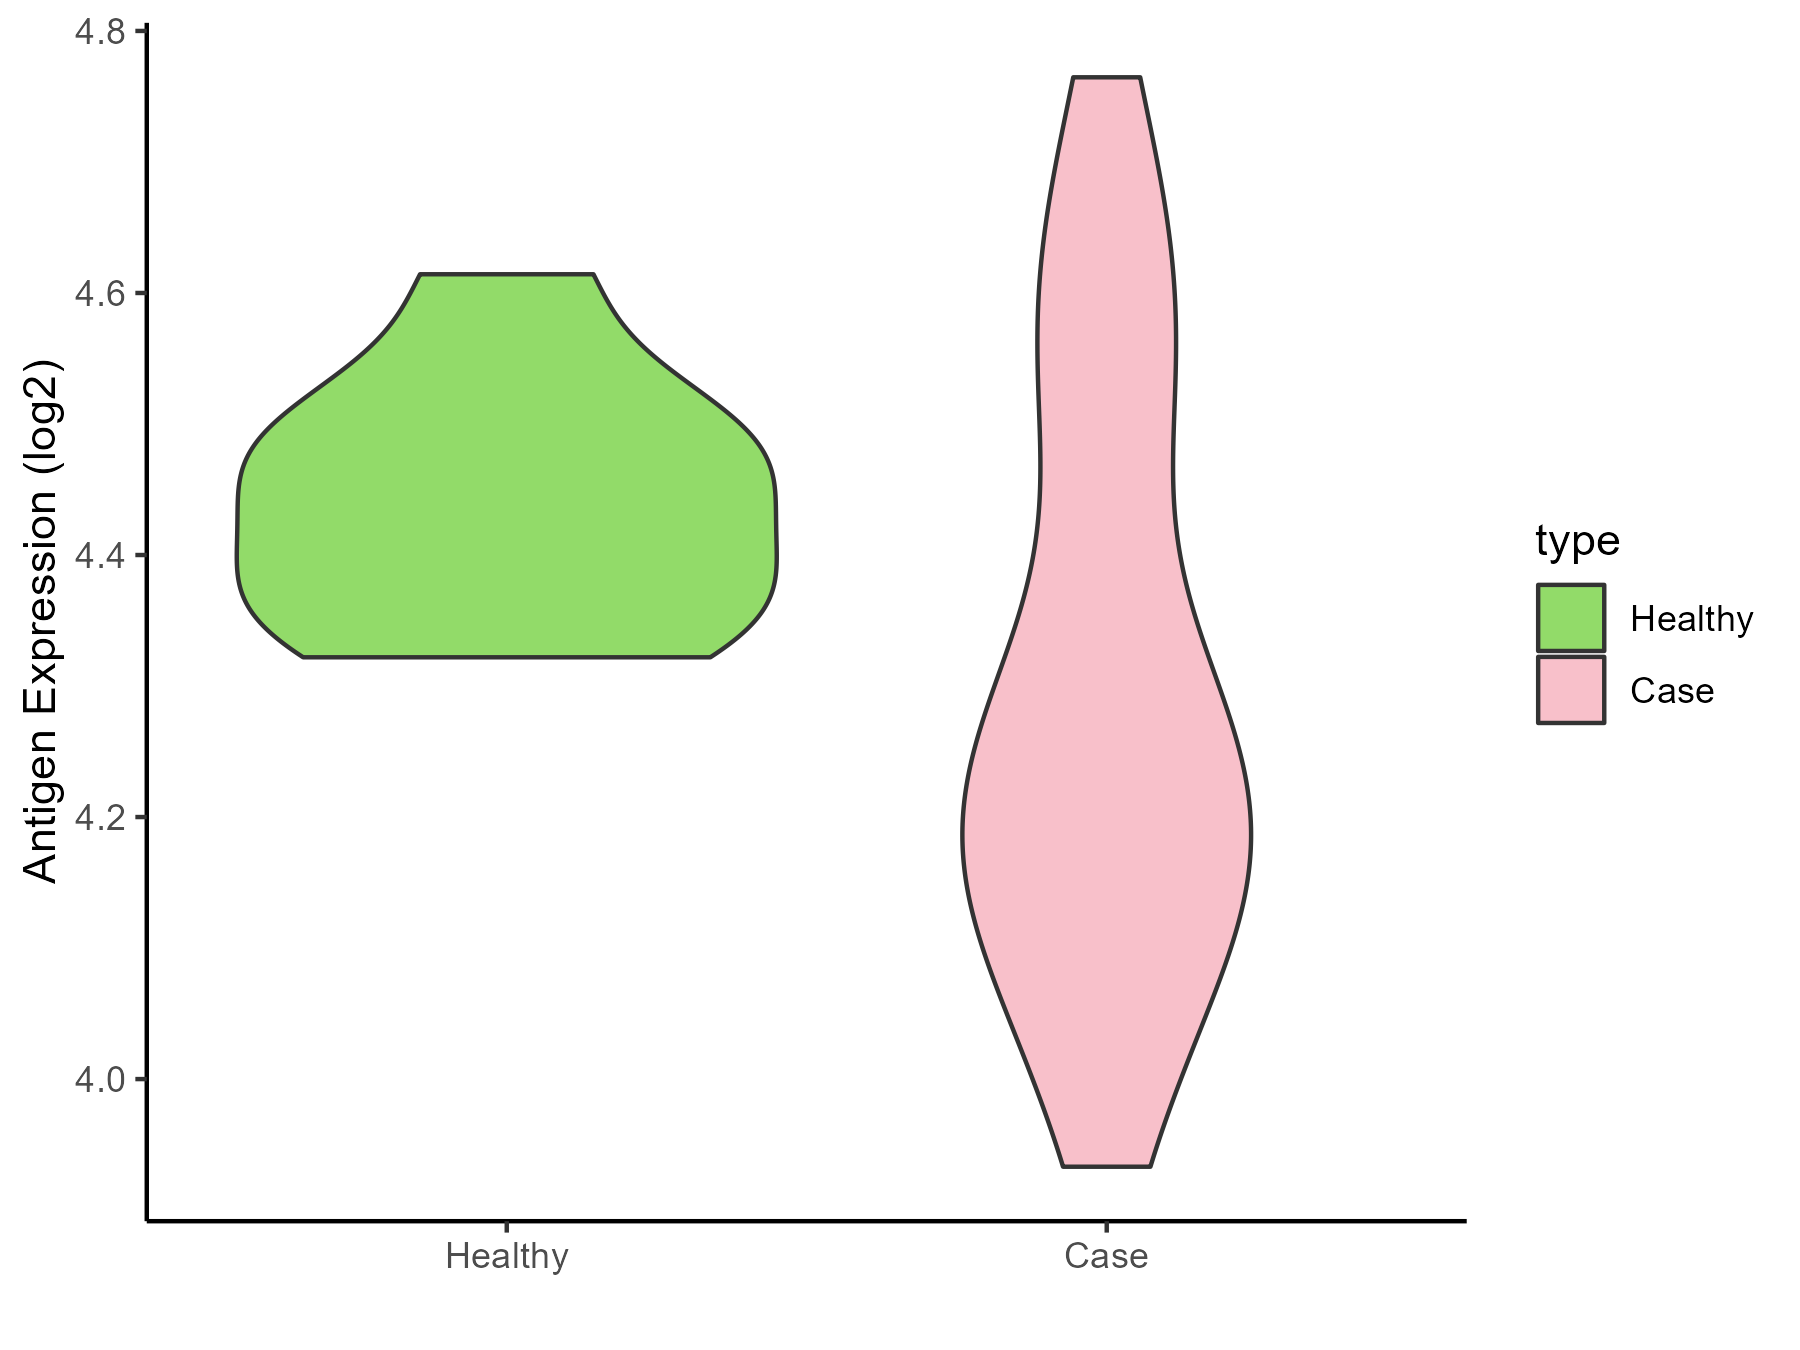
| Differential expression pattern of antigen in diseases | ||
| The Studied Tissue | Muscle | |
| The Specific Disease | Myopathy | |
| The Expression Level of Disease Section Compare with the Healthy Individual Tissue | p-value: 0.012860359; Fold-change: -0.202296893; Z-score: -2.097795202 | |
| Disease-specific Antigen Abundances |
|
Click to View the Clearer Original Diagram |
References
