Antigen Information
General Information of This Antigen
| Antigen ID | TAR0NNHUU |
|||||
|---|---|---|---|---|---|---|
| Antigen Name | Glypican-3 (GPC3) |
|||||
| Gene Name | GPC3 |
|||||
| Gene ID | ||||||
| Synonym | OCI5; GTR2-2;Intestinal protein OCI-5;MXR7 |
|||||
| Sequence |
MAGTVRTACLVVAMLLSLDFPGQAQPPPPPPDATCHQVRSFFQRLQPGLKWVPETPVPGS
DLQVCLPKGPTCCSRKMEEKYQL.LNMEQLLQSASMELKFLIIQNAAVFQEAFEIVVRHA KNYTNAMFKNNYPSLTPQAFEFVGEFFTDVSLYILGSDINVDDMVNELFDSLFPVIYTQL MNPGLPDSALDINECLRGARRDLKVFGNFPKLIMTQVSKSLQVTRIFLQALNLGIEVINT TDHLKFSKDCGRMLTRMWYCSYCQGLMMVKPCGGYCNVVMQGCMAGVVEIDKYWREYILS LEELVNGMYRIYDMENVLLGLFSTIHDSIQYVQKNAGKLTTTIGKLCAHSQQRQYRSAYY PEDLFIDKKVLKVAHVEHEETLSSRRRELIQKLKSFISFYSALPGYICSHSPVAENDTLC WNGQELVERYSQKAARNGMKNQFNLHELKMKGPEPVVSQIIDKLKHINQLLRTMSMPKGR VLDKNLDEEGFESGDCGDDEDECIGGSGDGMIKVKNQLRFLAELAYDLDVDDAPGNSQQA TPKDNEISTFHNLGNVHSPLKLLTSMAISVVCFFFLVH Click to Show/Hide
|
|||||
| Family | Glycosyltransferase 29 family |
|||||
| Function |
Cell surface proteoglycan. Negatively regulates the hedgehog signaling pathway when attached via the GPI- anchor to the cell surface by competing with the hedgehog receptor PTC1 for binding to hedgehog proteins. Binding to the hedgehog protein SHH triggers internalization of the complex by endocytosis and its subsequent lysosomal degradation. Positively regulates the canonical Wnt signaling pathway by binding to the Wnt receptor Frizzled and stimulating the binding of the Frizzled receptor to Wnt ligands. Positively regulates the non-canonical Wnt signaling pathway. Binds to CD81 which decreases the availability of free CD81 for binding to the transcriptional repressor HHEX, resulting in nuclear translocation of HHEX and transcriptional repression. Inhibits the dipeptidyl peptidase activity of DPP4. Plays a role in limb patterning and skeletal development by controlling the cellular response to BMP4. Modulates the effects of growth factors BMP2, BMP7 and FGF7 on renal branching morphogenesis. Required for coronary vascular development. Plays a role in regulating cell movements during gastrulation.
Click to Show/Hide
|
|||||
| Uniprot Entry | ||||||
| HGNC ID | ||||||
| KEGG ID | ||||||
Each Antibody-drug Conjuate AND It's Component Related to This Antigen
Full List of The ADC Related to This Antigen
Adnectins scaffold protein
| ADC Info | ADC Name | Payload | Target | Linker | Ref |
|---|---|---|---|---|---|
Glypican 3 ADC |
Tubulysin analog Tub |
Human Deoxyribonucleic acid (hDNA) |
Mal-EBE-Mal |
[1] |
Anti-GPC3 mAb
| ADC Info | ADC Name | Payload | Target | Linker | Ref |
|---|---|---|---|---|---|
Anti-GPC3 ADC |
Undisclosed |
Undisclosed |
Undisclosed |
[2] |
Anti-GPC3 mAb 4A6
| ADC Info | ADC Name | Payload | Target | Linker | Ref |
|---|---|---|---|---|---|
Anti-GPC3 mAb 4A6-IIIa-01 |
Anti-GPC3 mAb 4A6-IIIa-01 payload |
Undisclosed |
Anti-GPC3 mAb 4A6-IIIa-01 linker |
[3] | |
Anti-GPC3 mAb 4A6-IIIa-02 |
Anti-GPC3 mAb 4A6-IIIa-02 payload |
Undisclosed |
Anti-GPC3 mAb 4A6-IIIa-02 linker |
[3] | |
Anti-GPC3 mAb 4A6-IIIa-03 |
Anti-GPC3 mAb 4A6-IIIa-03 payload |
Undisclosed |
Anti-GPC3 mAb 4A6-IIIa-03 linker |
[3] | |
Anti-GPC3 mAb 4A6-IIIa-04 |
Anti-GPC3 mAb 4A6-IIIa-04 payload |
Undisclosed |
Anti-GPC3 mAb 4A6-IIIa-04 linker |
[3] | |
Anti-GPC3 mAb 4A6-IIIa-05 |
Anti-GPC3 mAb 4A6-IIIa-05 payload |
Undisclosed |
Anti-GPC3 mAb 4A6-IIIa-05 linker |
[3] | |
Anti-GPC3 mAb 4A6-IIIa-06 |
Anti-GPC3 mAb 4A6-IIIa-06 payload |
Undisclosed |
Anti-GPC3 mAb 4A6-IIIa-06 linker |
[3] | |
Anti-GPC3 mAb 4A6-IIIa-07 |
Anti-GPC3 mAb 4A6-IIIa-07 payload |
Undisclosed |
Anti-GPC3 mAb 4A6-IIIa-07 linker |
[3] | |
Anti-GPC3 mAb 4A6-IIIa-08 |
Anti-GPC3 mAb 4A6-IIIa-08 payload |
Undisclosed |
Anti-GPC3 mAb 4A6-IIIa-08 linker |
[3] | |
Anti-GPC3 mAb 4A6-IIIb-01 |
Anti-GPC3 mAb 4A6-IIIb-01 payload |
Undisclosed |
Anti-GPC3 mAb 4A6-IIIb-01 linker |
[3] | |
Anti-GPC3 mAb 4A6-IIIb-02 |
Anti-GPC3 mAb 4A6-IIIb-02 payload |
Undisclosed |
Anti-GPC3 mAb 4A6-IIIb-02 linker |
[3] | |
Anti-GPC3 mAb 4A6-IIIb-03 |
Anti-GPC3 mAb 4A6-IIIb-03 payload |
Undisclosed |
Anti-GPC3 mAb 4A6-IIIb-03 linker |
[3] | |
Anti-GPC3 mAb 4A6-IIIb-04 |
Anti-GPC3 mAb 4A6-IIIb-04 payload |
Undisclosed |
Anti-GPC3 mAb 4A6-IIIb-04 linker |
[3] | |
Anti-GPC3 mAb 4A6-IIIb-05 |
Anti-GPC3 mAb 4A6-IIIb-05 payload |
Undisclosed |
Anti-GPC3 mAb 4A6-IIIb-05 linker |
[3] | |
Anti-GPC3 mAb 4A6-IIIb-06 |
Anti-GPC3 mAb 4A6-IIIb-06 payload |
Undisclosed |
Anti-GPC3 mAb 4A6-IIIb-06 linker |
[3] | |
Anti-GPC3 mAb 4A6-IIIb-07 |
Anti-GPC3 mAb 4A6-IIIb-07 payload |
Undisclosed |
Anti-GPC3 mAb 4A6-IIIb-07 linker |
[3] | |
Anti-GPC3 mAb 4A6-IIIb-08 |
Anti-GPC3 mAb 4A6-IIIb-08 payload |
Undisclosed |
Anti-GPC3 mAb 4A6-IIIb-08 linker |
[3] | |
Anti-GPC3 mAb 4A6-IIIb-09 |
Anti-GPC3 mAb 4A6-IIIb-09 payload |
Undisclosed |
Anti-GPC3 mAb 4A6-IIIb-09 linker |
[3] | |
Anti-GPC3 mAb 4A6-IIIc-01 |
Anti-GPC3 mAb 4A6-IIIc-01 payload |
Undisclosed |
Anti-GPC3 mAb 4A6-IIIc-01 linker |
[3] | |
Anti-GPC3 mAb 4A6-IIIc-02 |
Anti-GPC3 mAb 4A6-IIIc-02 payload |
Undisclosed |
Anti-GPC3 mAb 4A6-IIIc-02 linker |
[3] | |
Anti-GPC3 mAb 4A6-IIIc-03 |
Anti-GPC3 mAb 4A6-IIIc-03 payload |
Undisclosed |
Anti-GPC3 mAb 4A6-IIIc-03 linker |
[3] | |
Anti-GPC3 mAb 4A6-IIIc-04 |
Anti-GPC3 mAb 4A6-IIIc-04 payload |
Undisclosed |
Anti-GPC3 mAb 4A6-IIIc-04 linker |
[3] | |
Anti-GPC3 mAb 4A6-IIIc-05 |
Anti-GPC3 mAb 4A6-IIIc-05 payload |
Undisclosed |
Anti-GPC3 mAb 4A6-IIIc-05 linker |
[3] | |
Anti-GPC3 mAb 4A6-IIIc-06 |
Anti-GPC3 mAb 4A6-IIIc-06 payload |
Undisclosed |
Anti-GPC3 mAb 4A6-IIIc-06 linker |
[3] | |
Anti-GPC3 mAb 4A6-IIIc-07 |
Anti-GPC3 mAb 4A6-IIIc-07 payload |
Undisclosed |
Anti-GPC3 mAb 4A6-IIIc-07 linker |
[3] | |
Anti-GPC3 mAb 4A6-IIIc-08 |
Anti-GPC3 mAb 4A6-IIIc-08 payload |
Undisclosed |
Anti-GPC3 mAb 4A6-IIIc-08 linker |
[3] |
Anti-GPC3 mAb A18
| ADC Info | ADC Name | Payload | Target | Linker | Ref |
|---|---|---|---|---|---|
A18-PE24 |
Pseudomonas exotoxin PE24 |
Eukaryotic elongation factor 2 (EEF2) |
Undisclosed |
[4] |
Anti-GPC3 mAb A43
| ADC Info | ADC Name | Payload | Target | Linker | Ref |
|---|---|---|---|---|---|
A43-PE24 |
Pseudomonas exotoxin PE24 |
Eukaryotic elongation factor 2 (EEF2) |
Undisclosed |
[4] |
Anti-GPC3 mAb A5
| ADC Info | ADC Name | Payload | Target | Linker | Ref |
|---|---|---|---|---|---|
A5-PE24 |
Pseudomonas exotoxin PE24 |
Eukaryotic elongation factor 2 (EEF2) |
Undisclosed |
[4] |
Anti-GPC3 mAb C46
| ADC Info | ADC Name | Payload | Target | Linker | Ref |
|---|---|---|---|---|---|
C46-PE24 |
Pseudomonas exotoxin PE24 |
Eukaryotic elongation factor 2 (EEF2) |
Undisclosed |
[4] |
Anti-GPC3 mAb F5
| ADC Info | ADC Name | Payload | Target | Linker | Ref |
|---|---|---|---|---|---|
F5-PE24 |
Pseudomonas exotoxin PE24 |
Eukaryotic elongation factor 2 (EEF2) |
Undisclosed |
[4] |
Anti-GPC3 mAb F67
| ADC Info | ADC Name | Payload | Target | Linker | Ref |
|---|---|---|---|---|---|
F67-PE24 |
Pseudomonas exotoxin PE24 |
Eukaryotic elongation factor 2 (EEF2) |
Undisclosed |
[4] |
Anti-GPC3 mAb G15
| ADC Info | ADC Name | Payload | Target | Linker | Ref |
|---|---|---|---|---|---|
G15-PE24 |
Pseudomonas exotoxin PE24 |
Eukaryotic elongation factor 2 (EEF2) |
Undisclosed |
[4] |
Anti-GPC3 mAb H49
| ADC Info | ADC Name | Payload | Target | Linker | Ref |
|---|---|---|---|---|---|
H49-PE24 |
Pseudomonas exotoxin PE24 |
Eukaryotic elongation factor 2 (EEF2) |
Undisclosed |
[4] |
Anti-GPC3 mAb HN3
| ADC Info | ADC Name | Payload | Target | Linker | Ref |
|---|---|---|---|---|---|
HN3-PE24 |
Pseudomonas exotoxin PE24 |
Eukaryotic elongation factor 2 (EEF2) |
Undisclosed |
[4] |
Anti-GPC3 mAb I34
| ADC Info | ADC Name | Payload | Target | Linker | Ref |
|---|---|---|---|---|---|
I34-PE24 |
Pseudomonas exotoxin PE24 |
Eukaryotic elongation factor 2 (EEF2) |
Undisclosed |
[4] |
Anti-GPC3 mAb I82
| ADC Info | ADC Name | Payload | Target | Linker | Ref |
|---|---|---|---|---|---|
I82-PE24 |
Pseudomonas exotoxin PE24 |
Eukaryotic elongation factor 2 (EEF2) |
Undisclosed |
[4] |
Anti-GPC3 mAb I88
| ADC Info | ADC Name | Payload | Target | Linker | Ref |
|---|---|---|---|---|---|
I88-PE24 |
Pseudomonas exotoxin PE24 |
Eukaryotic elongation factor 2 (EEF2) |
Undisclosed |
[4] |
Anti-GPC3 mAb J58
| ADC Info | ADC Name | Payload | Target | Linker | Ref |
|---|---|---|---|---|---|
J58-PE24 |
Pseudomonas exotoxin PE24 |
Eukaryotic elongation factor 2 (EEF2) |
Undisclosed |
[4] |
Anti-GPC3 mAb J80A
| ADC Info | ADC Name | Payload | Target | Linker | Ref |
|---|---|---|---|---|---|
J80A-PE24 |
Pseudomonas exotoxin PE24 |
Eukaryotic elongation factor 2 (EEF2) |
Undisclosed |
[4] |
Anti-GPC3 mAb J80B
| ADC Info | ADC Name | Payload | Target | Linker | Ref |
|---|---|---|---|---|---|
J80B-PE24 |
Pseudomonas exotoxin PE24 |
Eukaryotic elongation factor 2 (EEF2) |
Undisclosed |
[4] |
Anti-GPC3 mAb R6
| ADC Info | ADC Name | Payload | Target | Linker | Ref |
|---|---|---|---|---|---|
R6-PE24 |
Pseudomonas exotoxin PE24 |
Eukaryotic elongation factor 2 (EEF2) |
Undisclosed |
[4] |
Humanized Anti-GPC3 IgG1 mAb
| ADC Info | ADC Name | Payload | Target | Linker | Ref |
|---|---|---|---|---|---|
ZW-251 |
ZD06519 |
DNA topoisomerase 1 (TOP1) |
Mc-Gly-Gly-Phe-Gly-AM |
[5] |
Humanized GPC3-specific Anti-ody YP7
| ADC Info | ADC Name | Payload | Target | Linker | Ref |
|---|---|---|---|---|---|
HYP7-DC |
Duocarmycin Sa |
Human Deoxyribonucleic acid (hDNA) |
Mal-PEG4-Val-Cit-PABC-DMAE |
[6] |
Undisclosed
| ADC Info | ADC Name | Payload | Target | Linker | Ref |
|---|---|---|---|---|---|
BMS-986183 |
Tubulysin |
Microtubule (MT) |
Valine-Citrulline |
Tissue/Disease specific Abundances of This Antigen
Tissue specific Abundances of This Antigen
ICD Disease Classification 01
| Differential expression pattern of antigen in diseases | ||
| The Studied Tissue | Gingival | |
| The Specific Disease | Bacterial infection of gingival | |
| The Expression Level of Disease Section Compare with the Healthy Individual Tissue | p-value: 0.938439823; Fold-change: -0.065420416; Z-score: -0.26952202 | |
| Disease-specific Antigen Abundances |
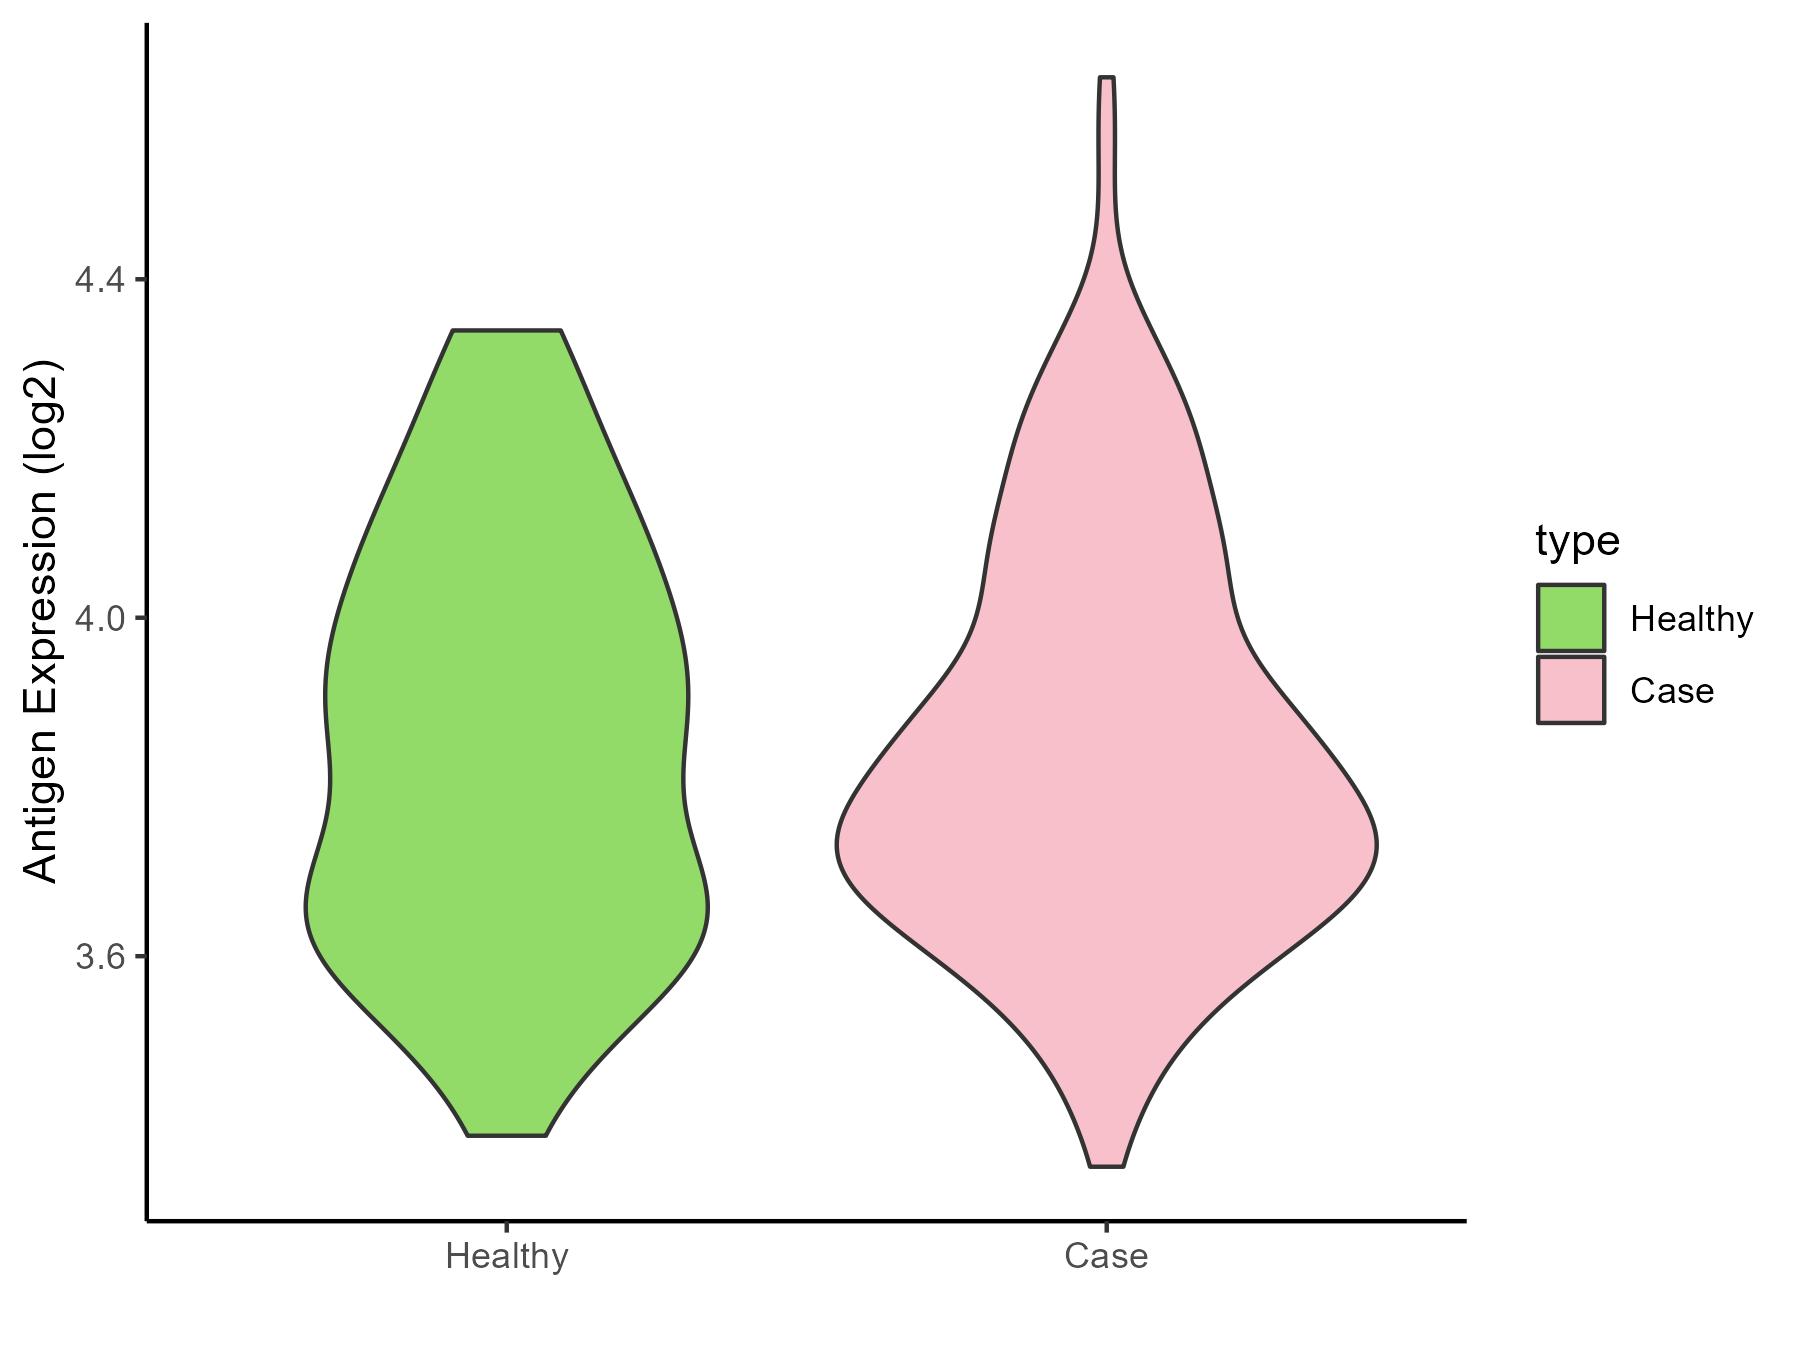
|
Click to View the Clearer Original Diagram |
ICD Disease Classification 02
| Differential expression pattern of antigen in diseases | ||
| The Studied Tissue | Brainstem | |
| The Specific Disease | Glioma | |
| The Expression Level of Disease Section Compare with the Healthy Individual Tissue | p-value: 0.35975789; Fold-change: 0.17811914; Z-score: 0.417428688 | |
| Disease-specific Antigen Abundances |
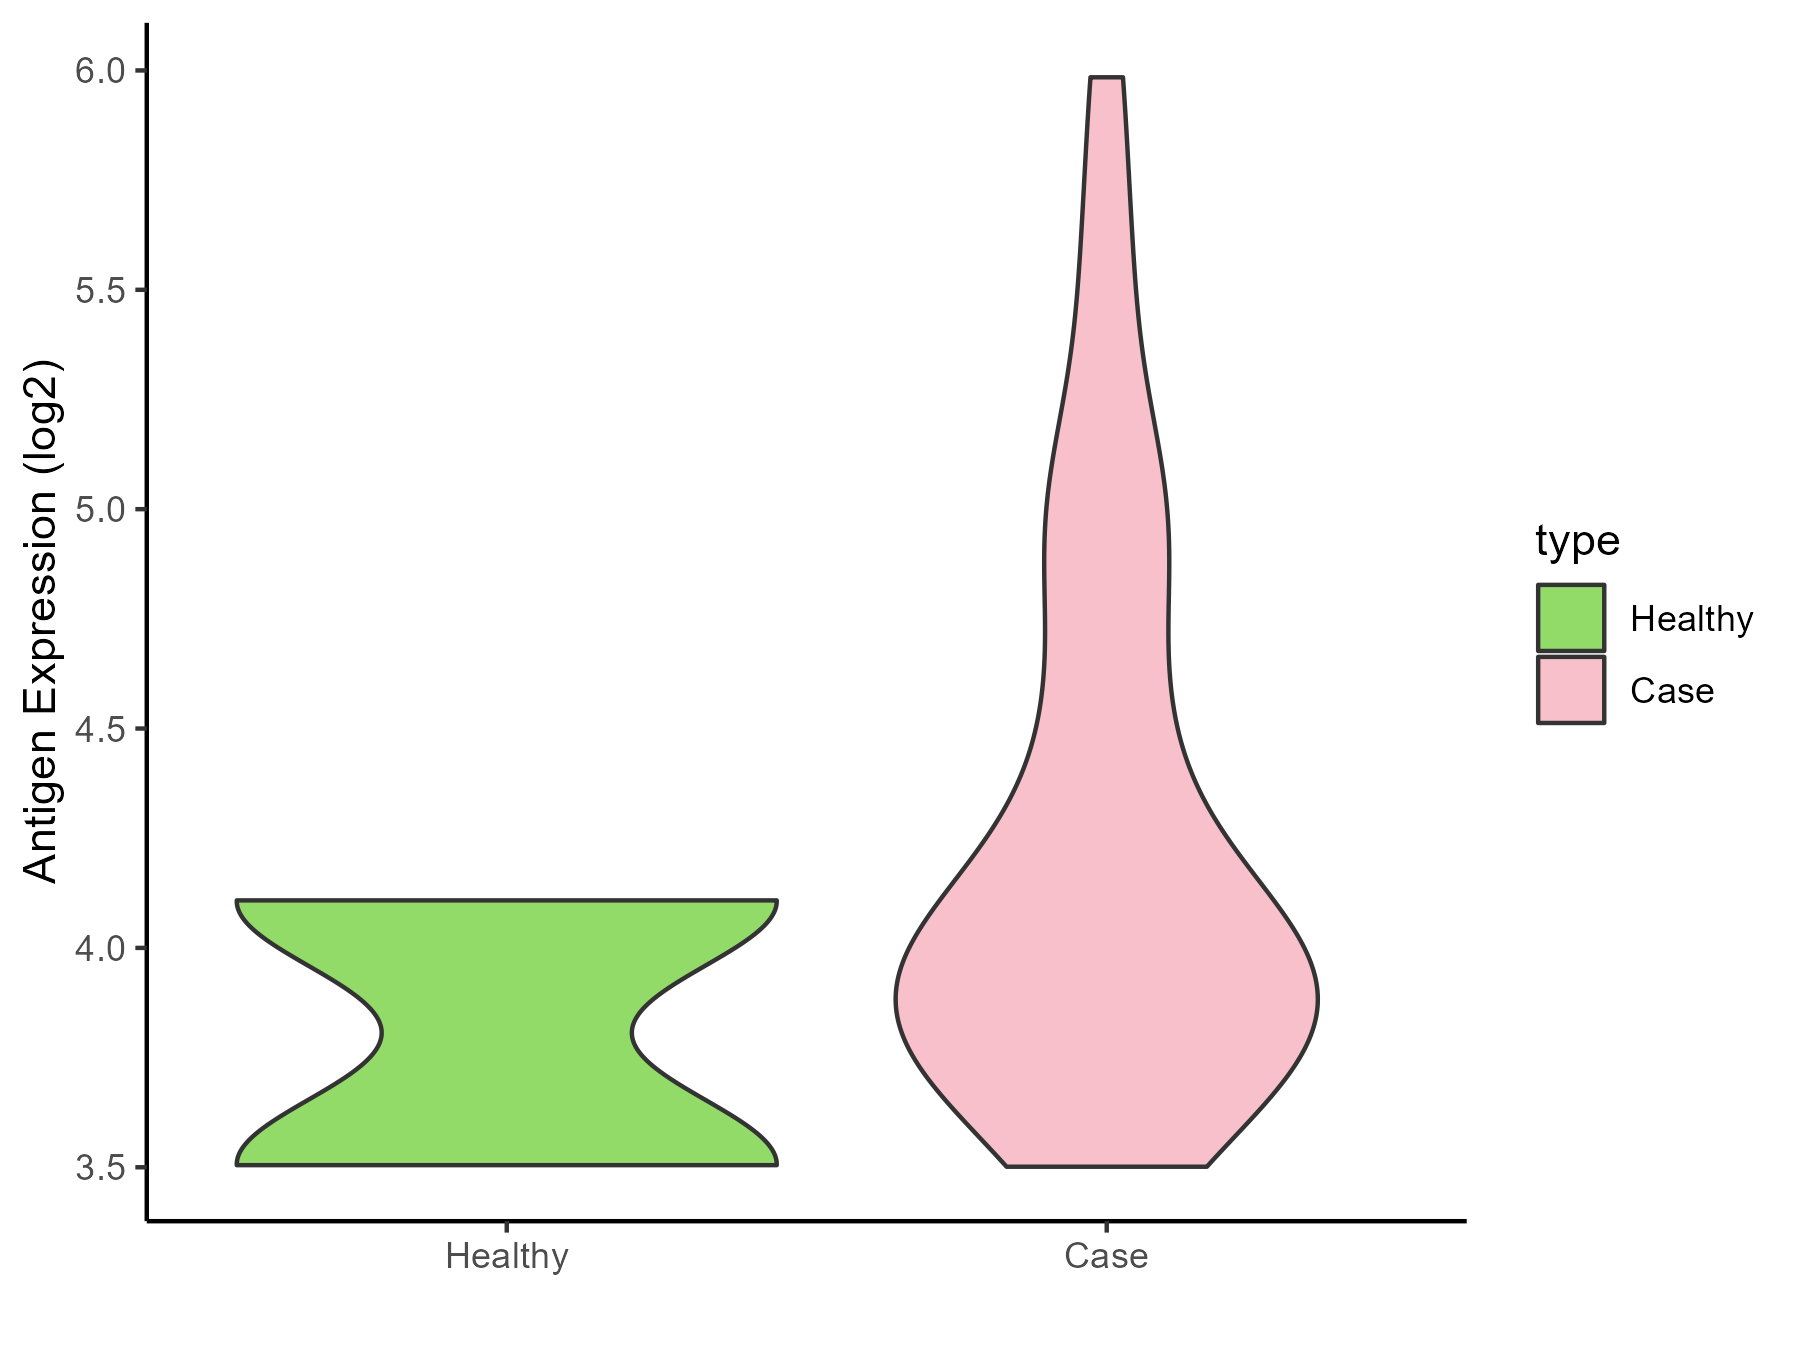
|
Click to View the Clearer Original Diagram |
| The Studied Tissue | White matter | |
| The Specific Disease | Glioma | |
| The Expression Level of Disease Section Compare with the Healthy Individual Tissue | p-value: 0.000361832; Fold-change: -0.289386257; Z-score: -2.031088886 | |
| Disease-specific Antigen Abundances |

|
Click to View the Clearer Original Diagram |
| The Studied Tissue | Brainstem | |
| The Specific Disease | Neuroectodermal tumor | |
| The Expression Level of Disease Section Compare with the Healthy Individual Tissue | p-value: 0.600781583; Fold-change: -0.373694064; Z-score: -1.405296481 | |
| Disease-specific Antigen Abundances |
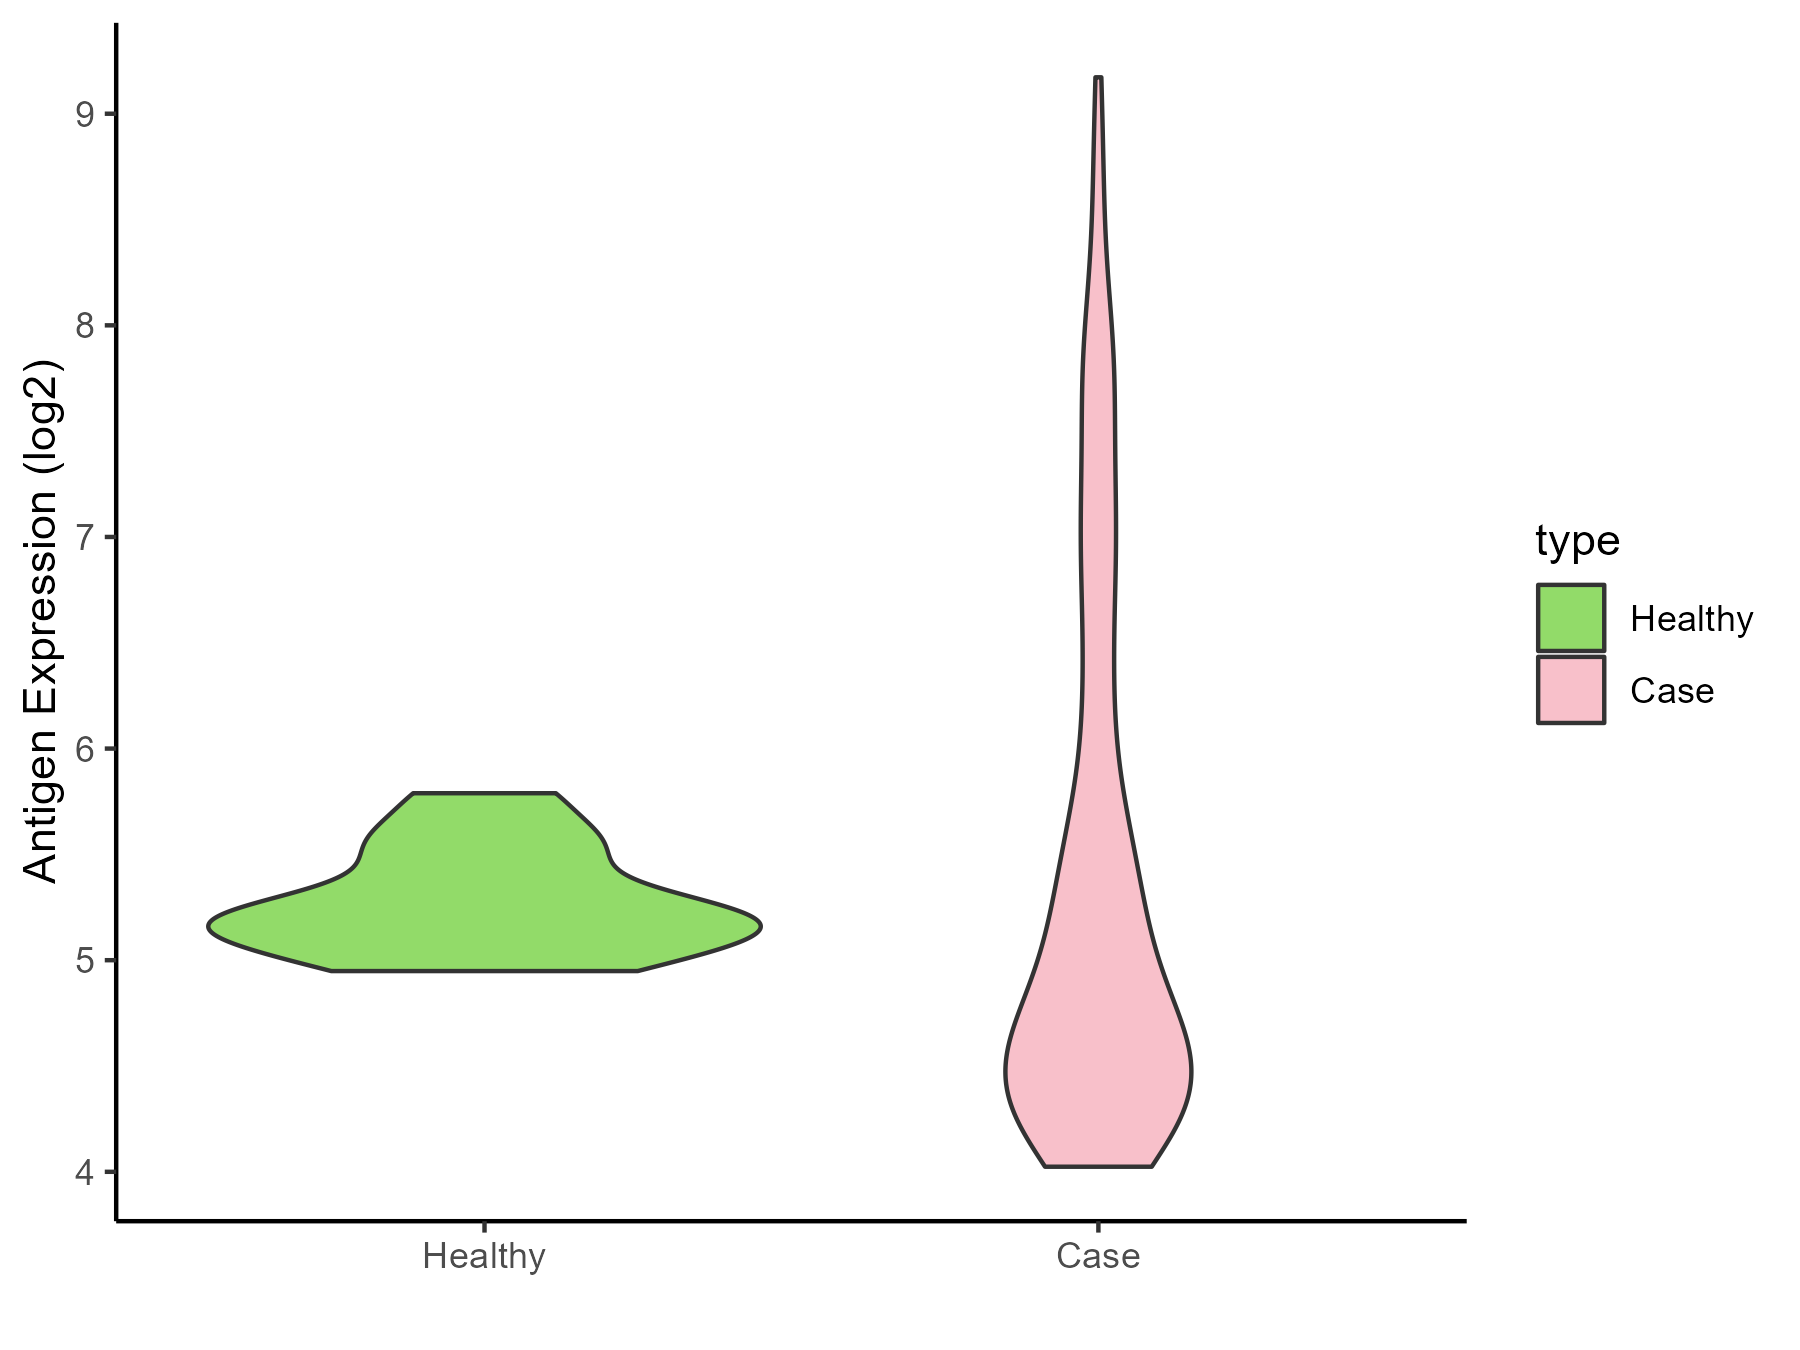
|
Click to View the Clearer Original Diagram |
| The Studied Tissue | Nervous | |
| The Specific Disease | Brain cancer | |
| The Expression Level of Disease Section Compare with the Healthy Individual Tissue | p-value: 1.29E-17; Fold-change: 0.319820564; Z-score: 0.622806264 | |
| Disease-specific Antigen Abundances |
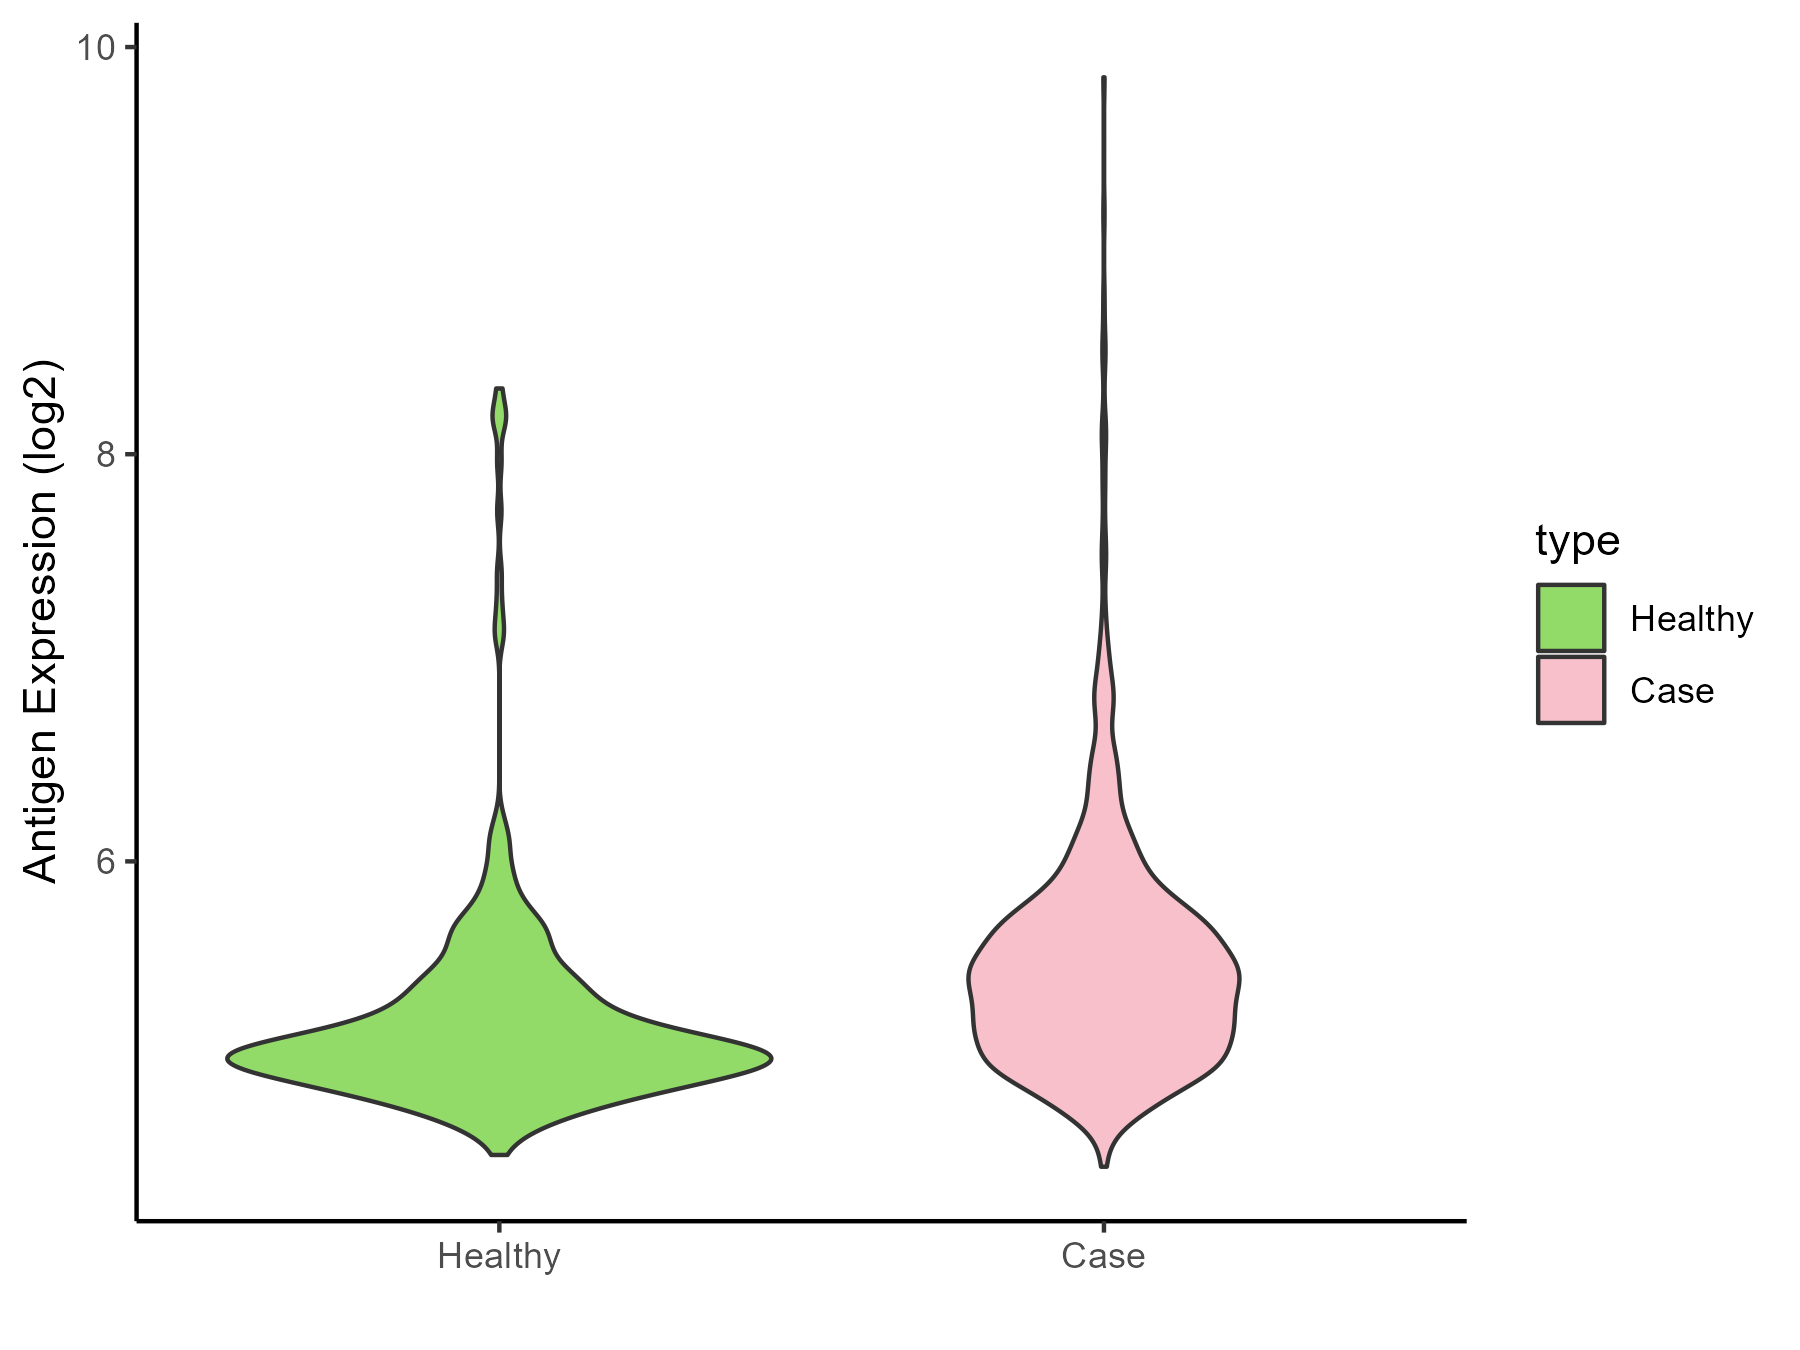
|
Click to View the Clearer Original Diagram |
| Differential expression pattern of antigen in diseases | ||
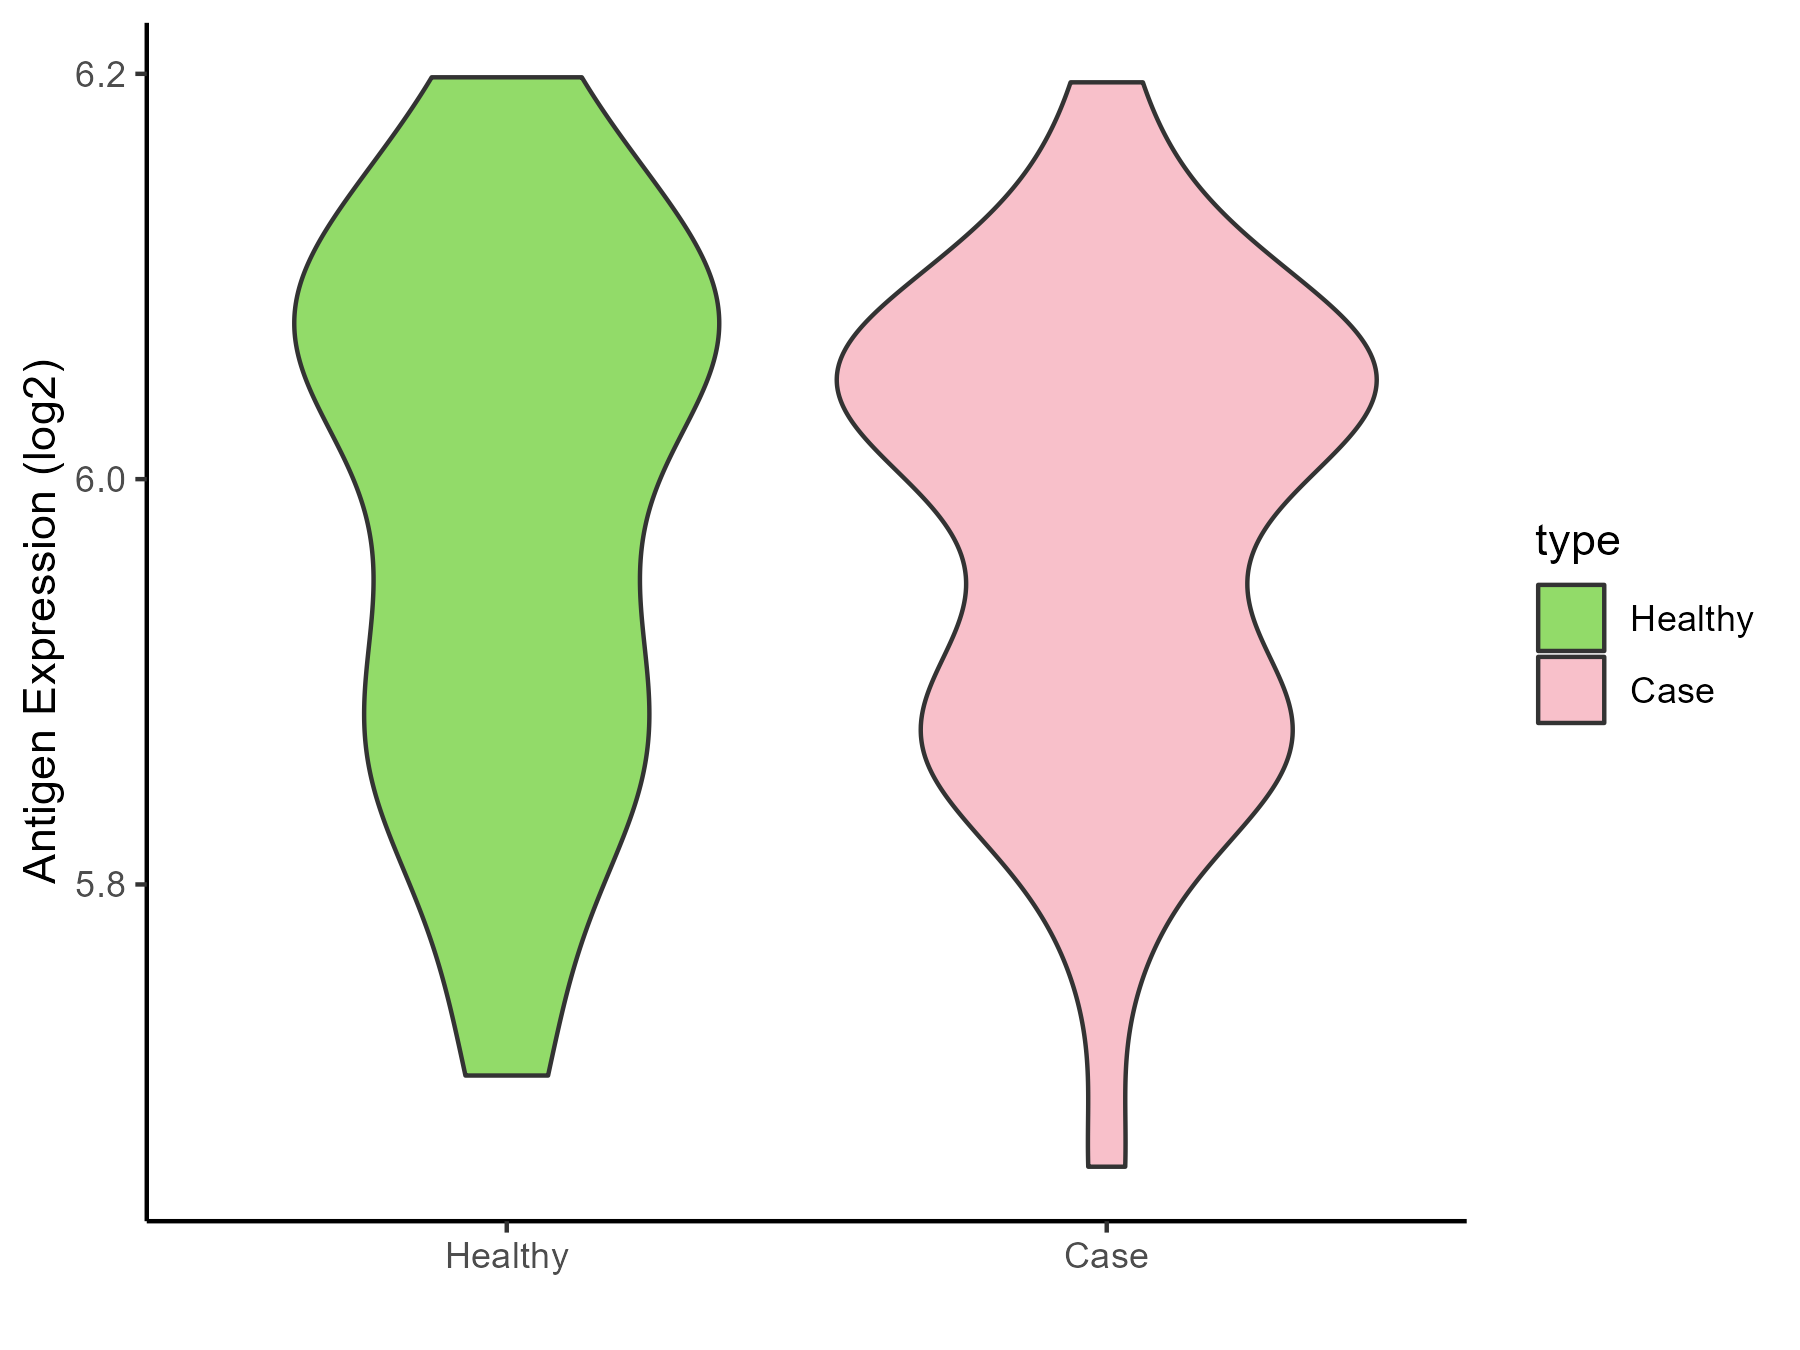
| The Studied Tissue | Whole blood | |
| The Specific Disease | Polycythemia vera | |
| The Expression Level of Disease Section Compare with the Healthy Individual Tissue | p-value: 0.662239268; Fold-change: -0.028440386; Z-score: -0.212670174 | |
| Disease-specific Antigen Abundances |
|
Click to View the Clearer Original Diagram |
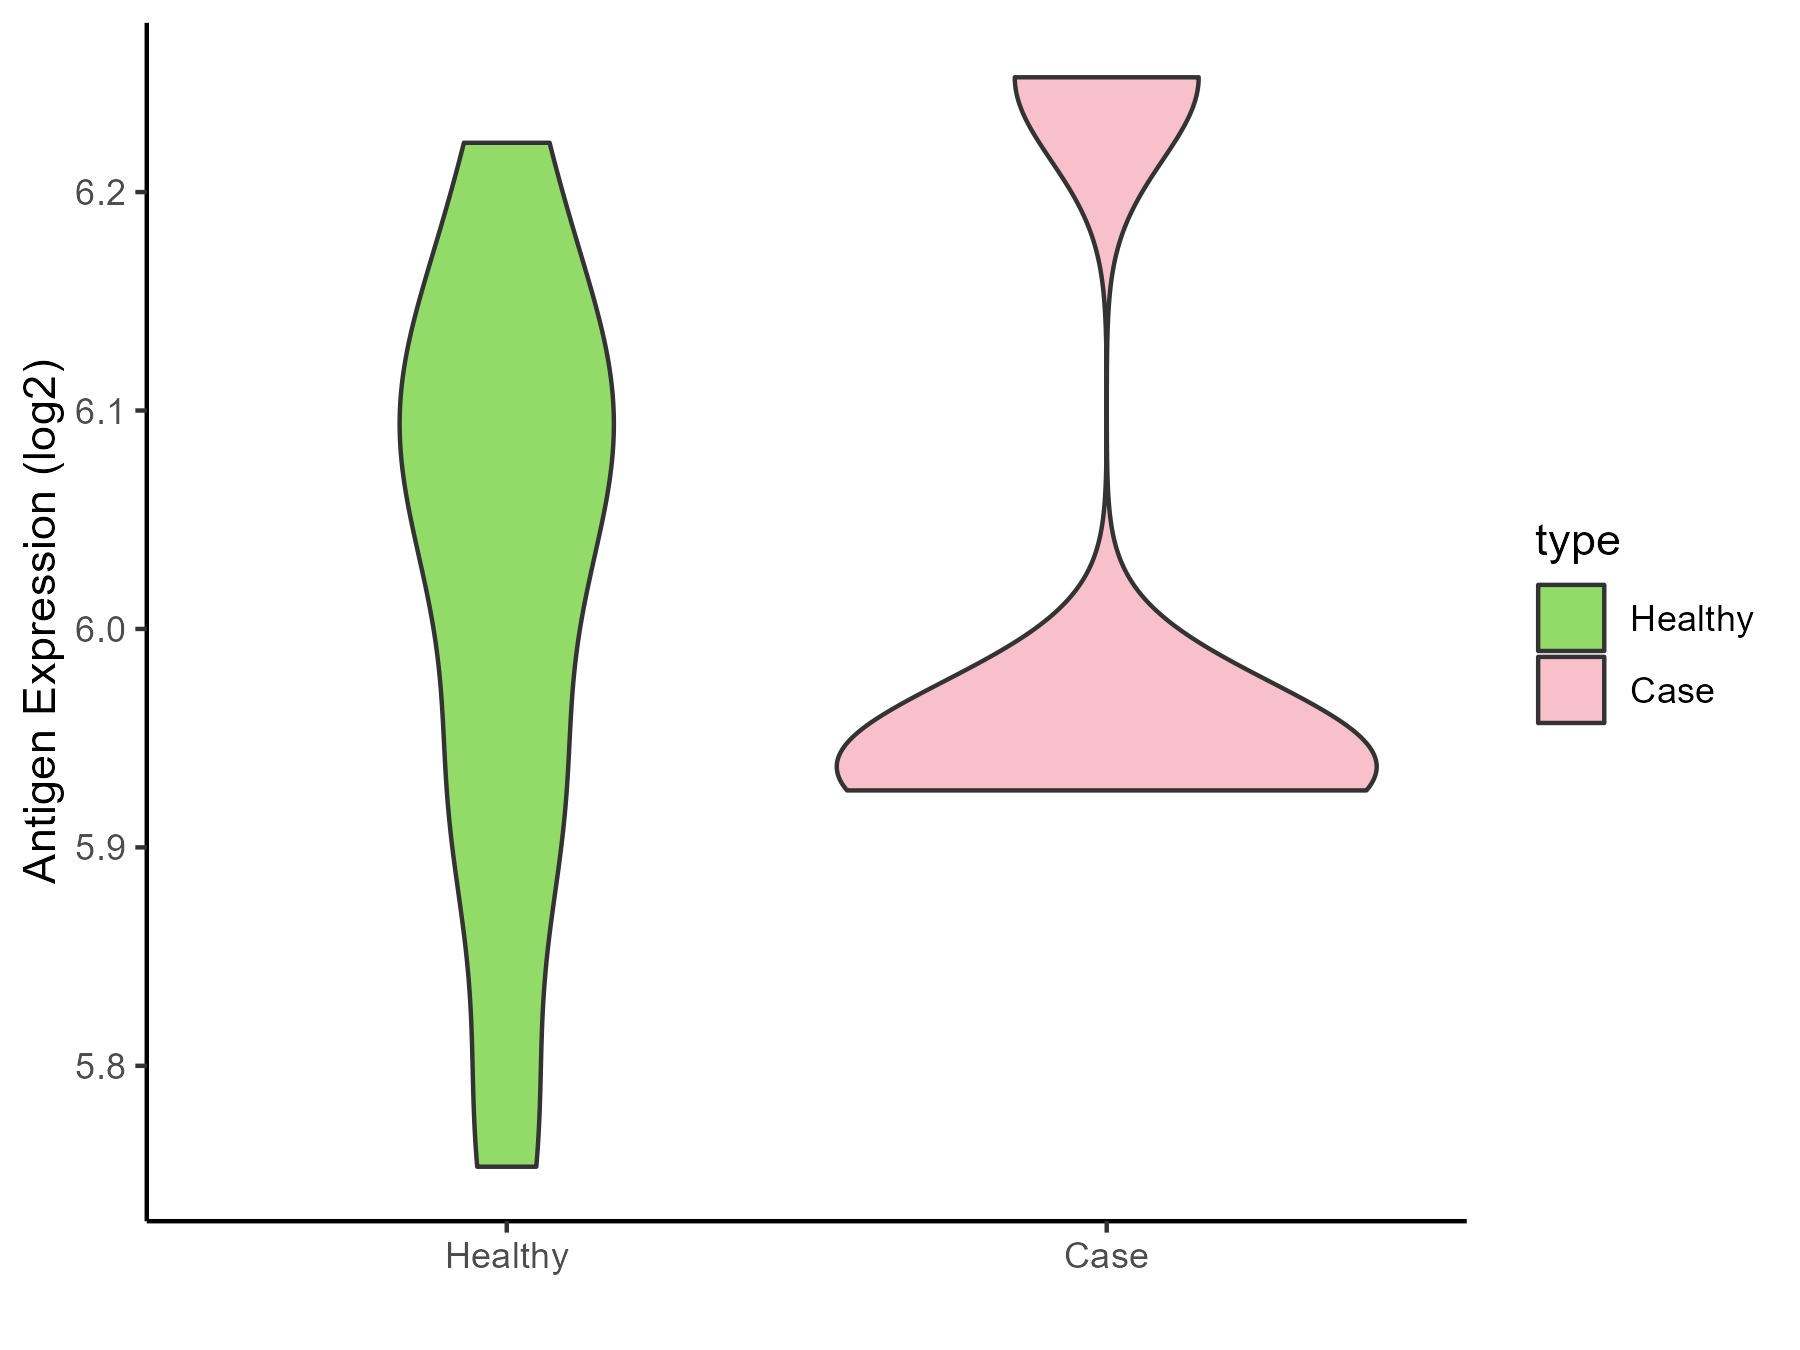
| The Studied Tissue | Whole blood | |
| The Specific Disease | Myelofibrosis | |
| The Expression Level of Disease Section Compare with the Healthy Individual Tissue | p-value: 0.905000646; Fold-change: -0.100432891; Z-score: -0.741220535 | |
| Disease-specific Antigen Abundances |
|
Click to View the Clearer Original Diagram |
| Differential expression pattern of antigen in diseases | ||
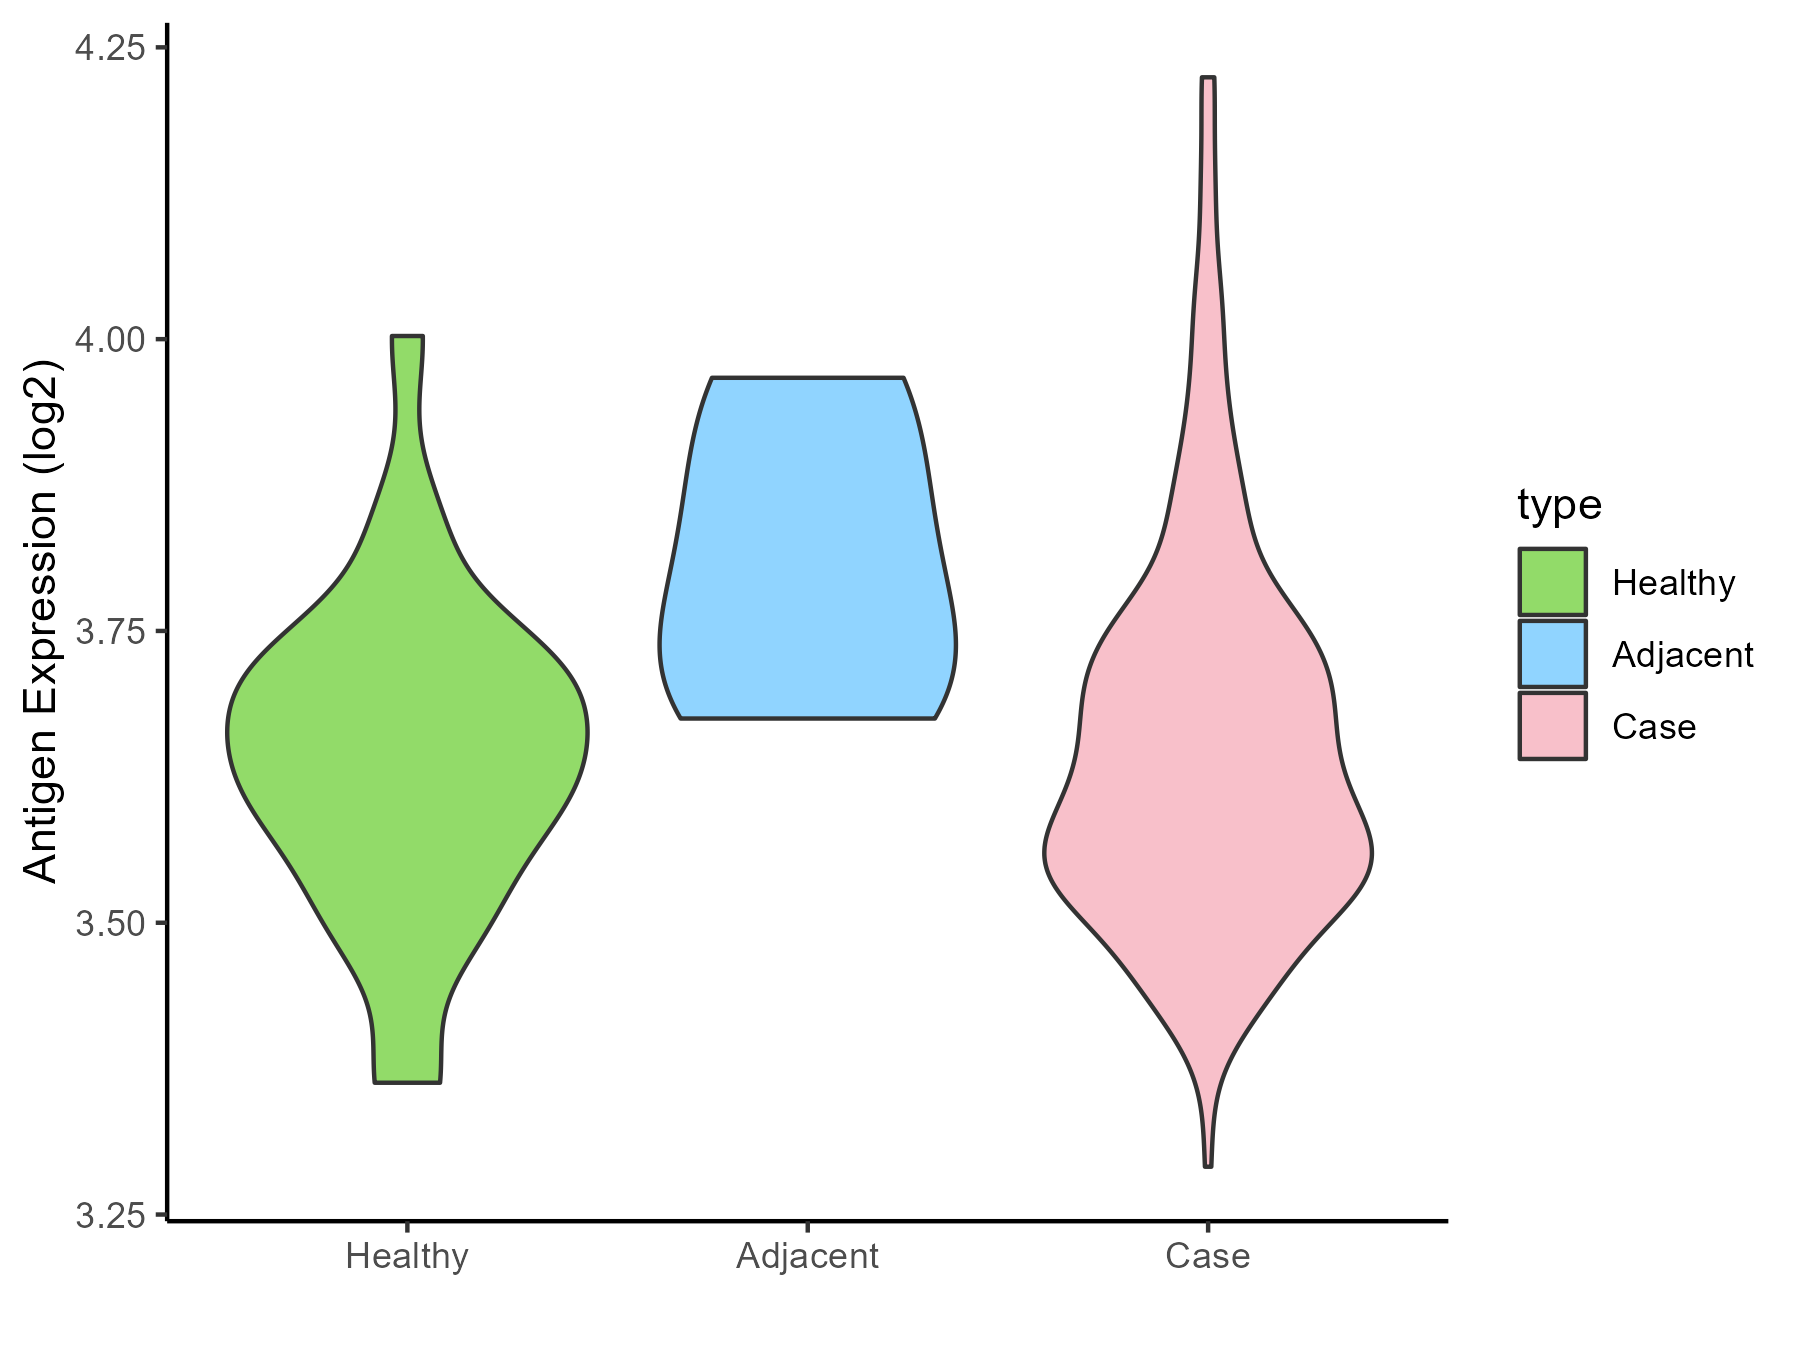
| The Studied Tissue | Bone marrow | |
| The Specific Disease | Myelodysplastic syndromes | |
| The Expression Level of Disease Section Compare with the Healthy Individual Tissue | p-value: 0.688222537; Fold-change: -0.021340038; Z-score: -0.15542351 | |
| The Expression Level of Disease Section Compare with the Adjacent Tissue | p-value: 0.092196686; Fold-change: -0.173766743; Z-score: -1.351422059 | |
| Disease-specific Antigen Abundances |
|
Click to View the Clearer Original Diagram |
| Differential expression pattern of antigen in diseases | ||
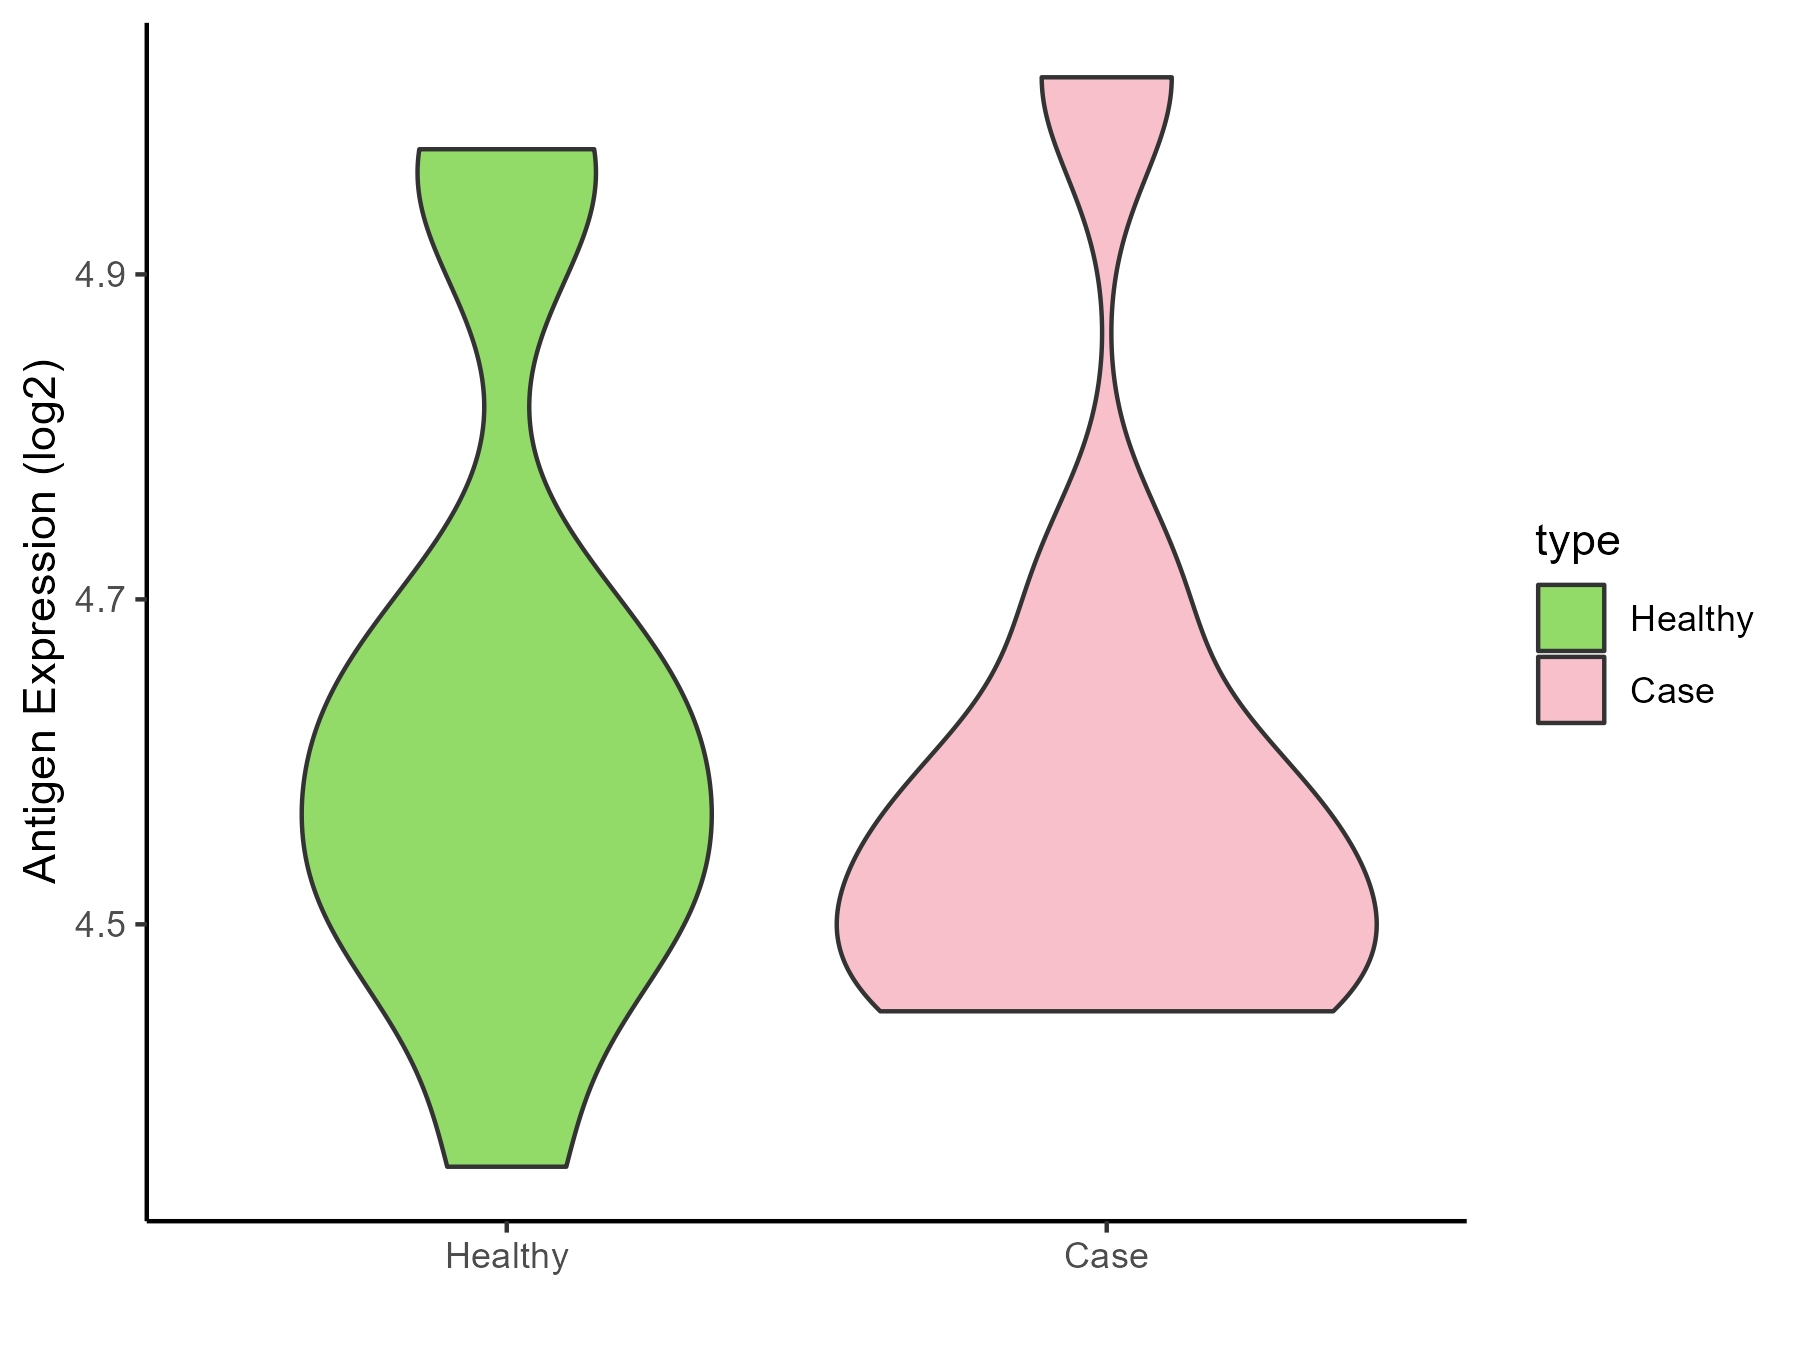
| The Studied Tissue | Tonsil | |
| The Specific Disease | Lymphoma | |
| The Expression Level of Disease Section Compare with the Healthy Individual Tissue | p-value: 0.723235505; Fold-change: -0.050422821; Z-score: -0.253926851 | |
| Disease-specific Antigen Abundances |
|
Click to View the Clearer Original Diagram |
| Differential expression pattern of antigen in diseases | ||
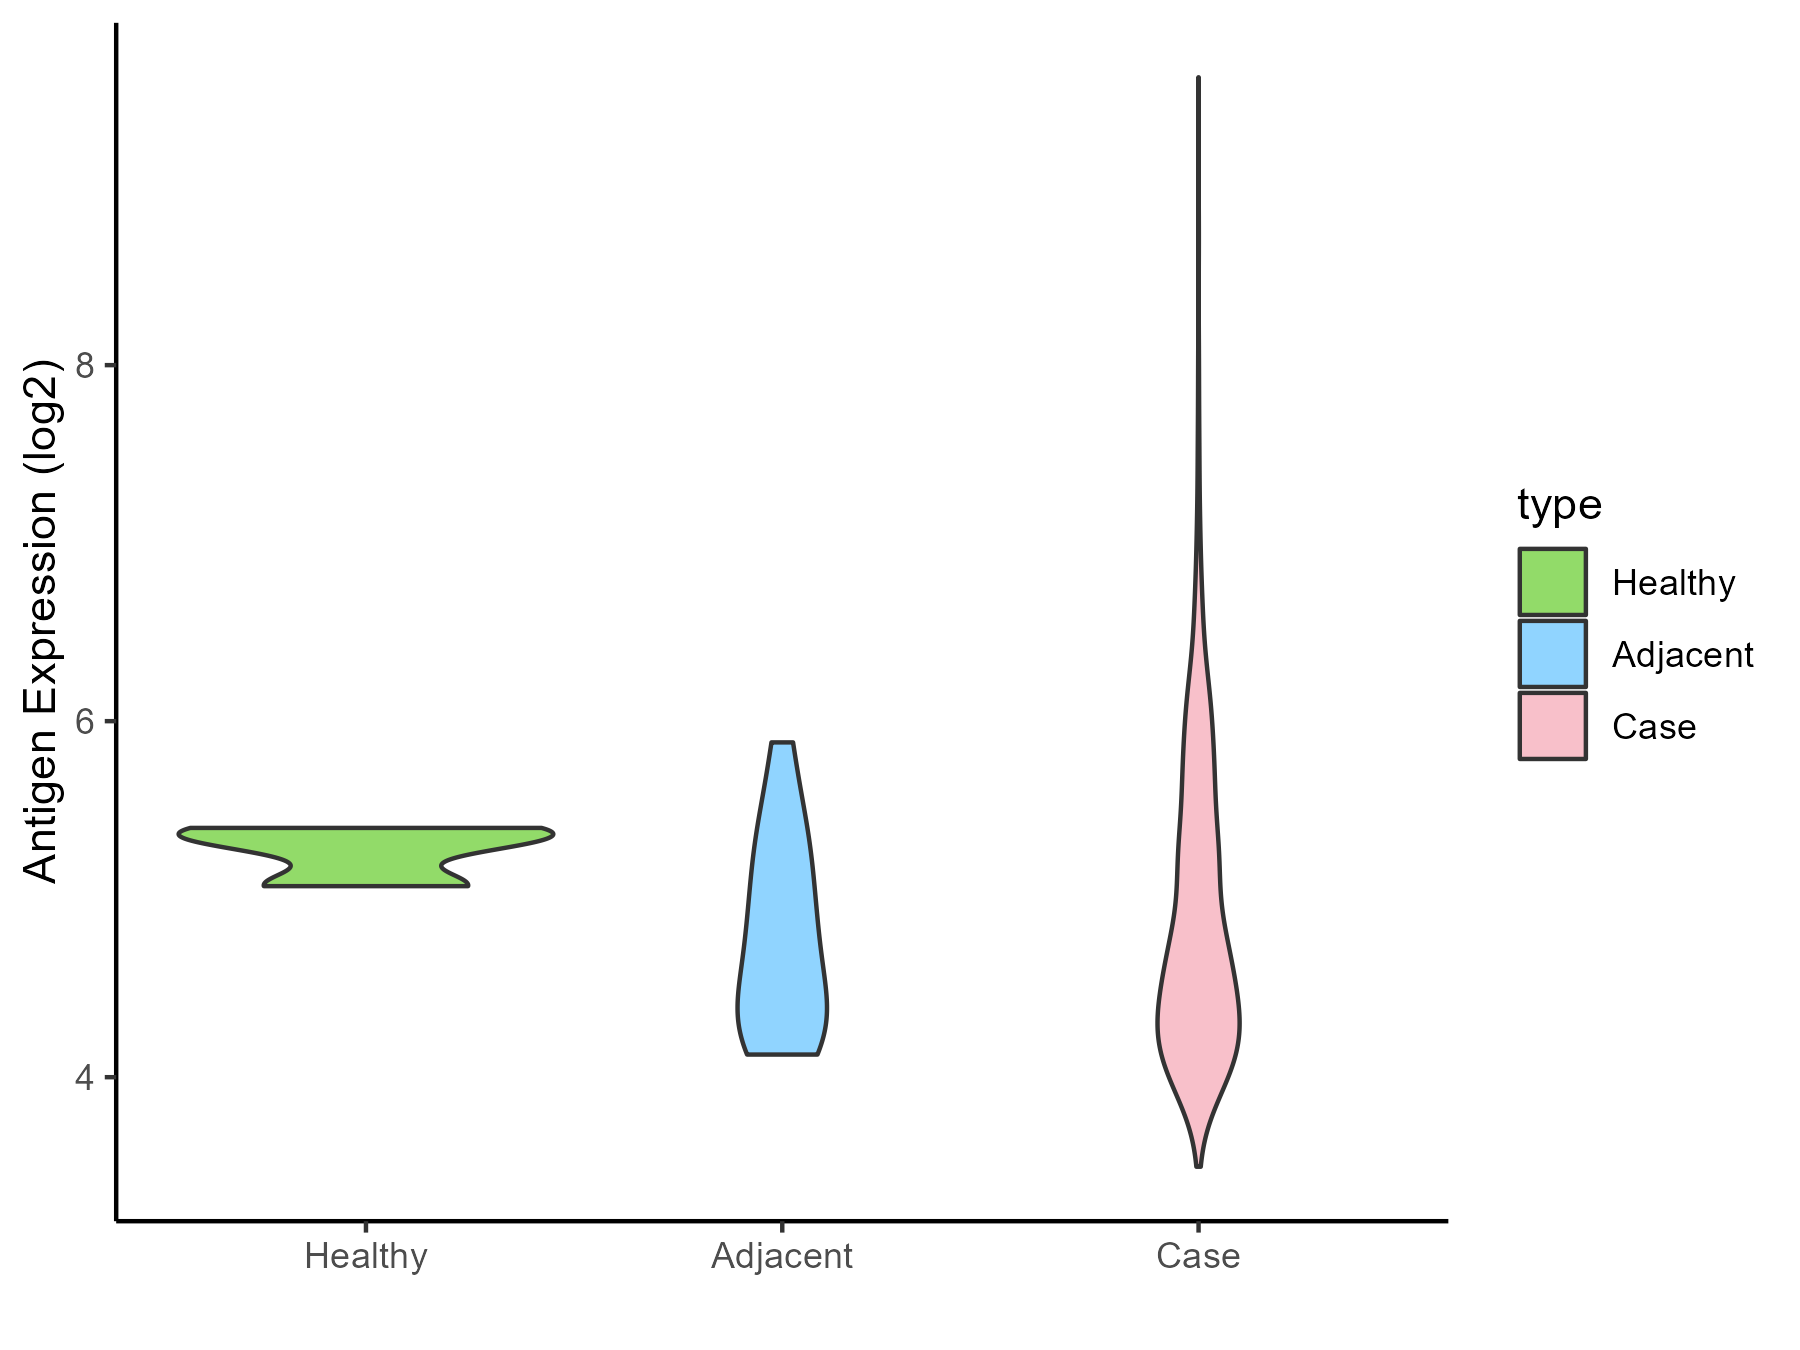
| The Studied Tissue | Gastric | |
| The Specific Disease | Gastric cancer | |
| The Expression Level of Disease Section Compare with the Healthy Individual Tissue | p-value: 0.060428805; Fold-change: -0.650775838; Z-score: -3.770681117 | |
| The Expression Level of Disease Section Compare with the Adjacent Tissue | p-value: 0.336853783; Fold-change: -0.032988295; Z-score: -0.061533113 | |
| Disease-specific Antigen Abundances |
|
Click to View the Clearer Original Diagram |
| Differential expression pattern of antigen in diseases | ||
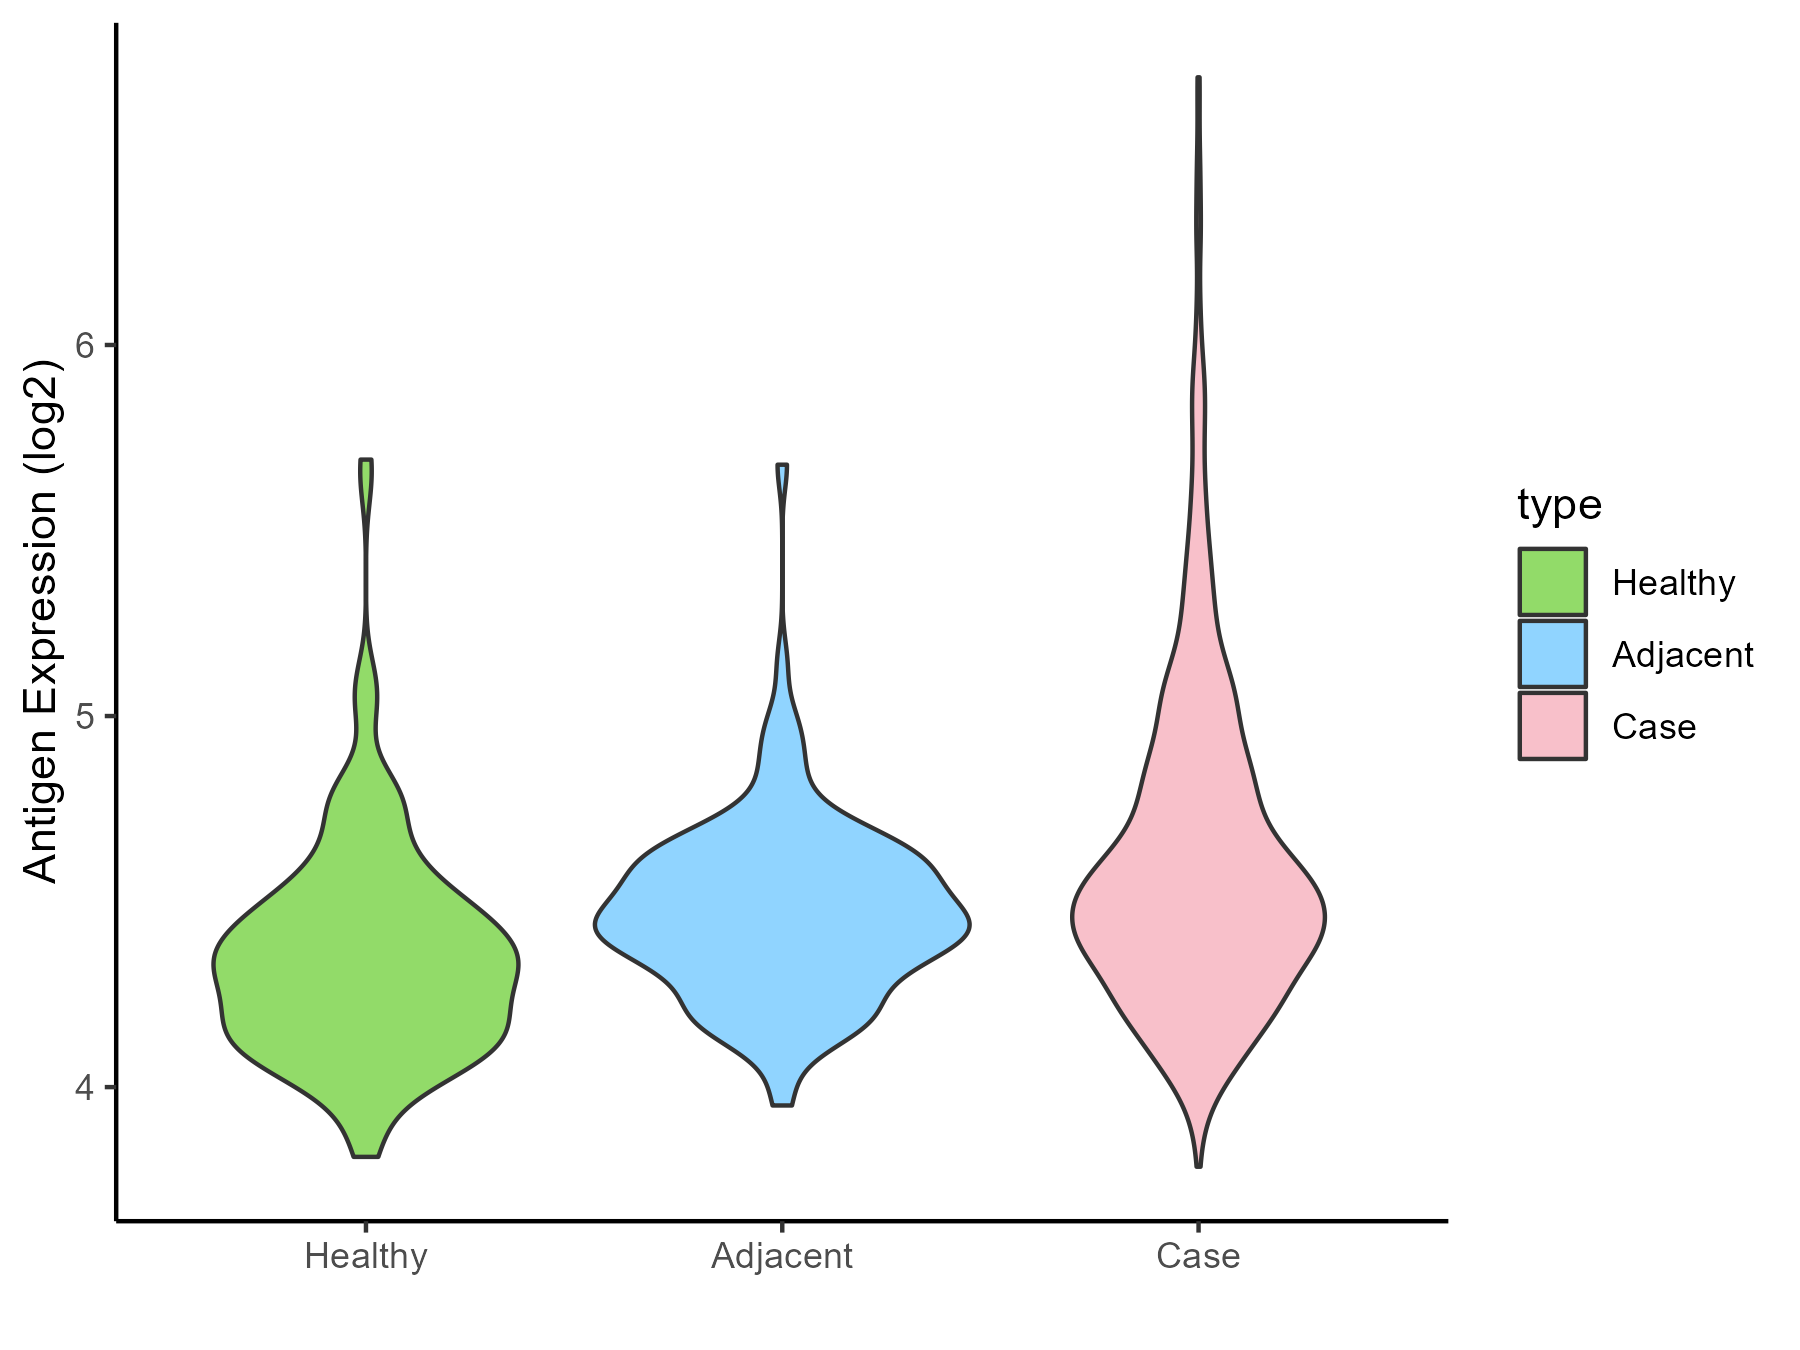
| The Studied Tissue | Colon | |
| The Specific Disease | Colon cancer | |
| The Expression Level of Disease Section Compare with the Healthy Individual Tissue | p-value: 6.60E-20; Fold-change: 0.194888769; Z-score: 0.673059425 | |
| The Expression Level of Disease Section Compare with the Adjacent Tissue | p-value: 9.96E-09; Fold-change: 0.062620548; Z-score: 0.263428126 | |
| Disease-specific Antigen Abundances |
|
Click to View the Clearer Original Diagram |
| Differential expression pattern of antigen in diseases | ||
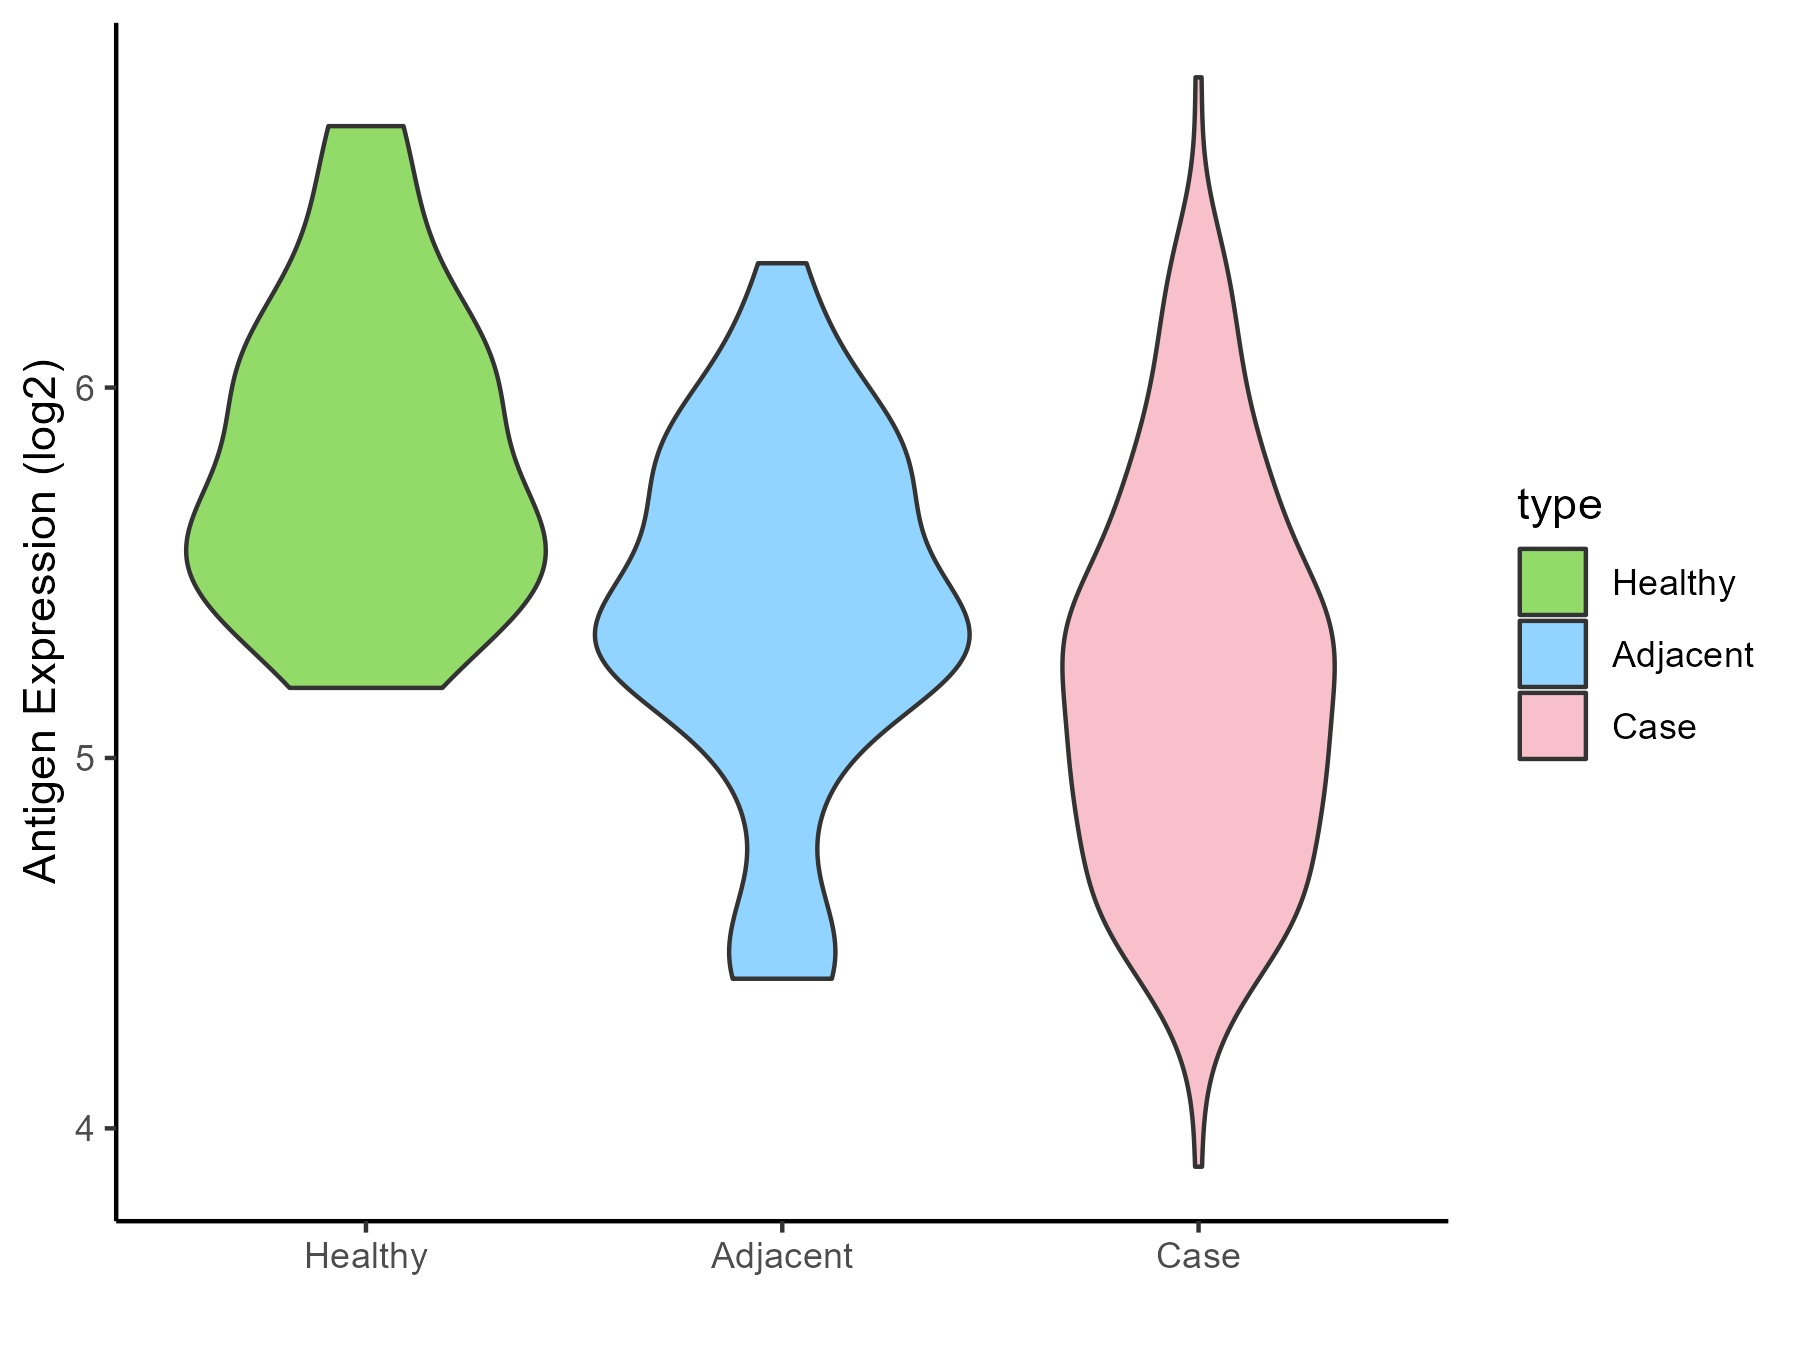
| The Studied Tissue | Pancreas | |
| The Specific Disease | Pancreatic cancer | |
| The Expression Level of Disease Section Compare with the Healthy Individual Tissue | p-value: 2.96E-05; Fold-change: -0.513288955; Z-score: -1.229564347 | |
| The Expression Level of Disease Section Compare with the Adjacent Tissue | p-value: 0.017098426; Fold-change: -0.181240202; Z-score: -0.381718886 | |
| Disease-specific Antigen Abundances |
|
Click to View the Clearer Original Diagram |
| Differential expression pattern of antigen in diseases | ||
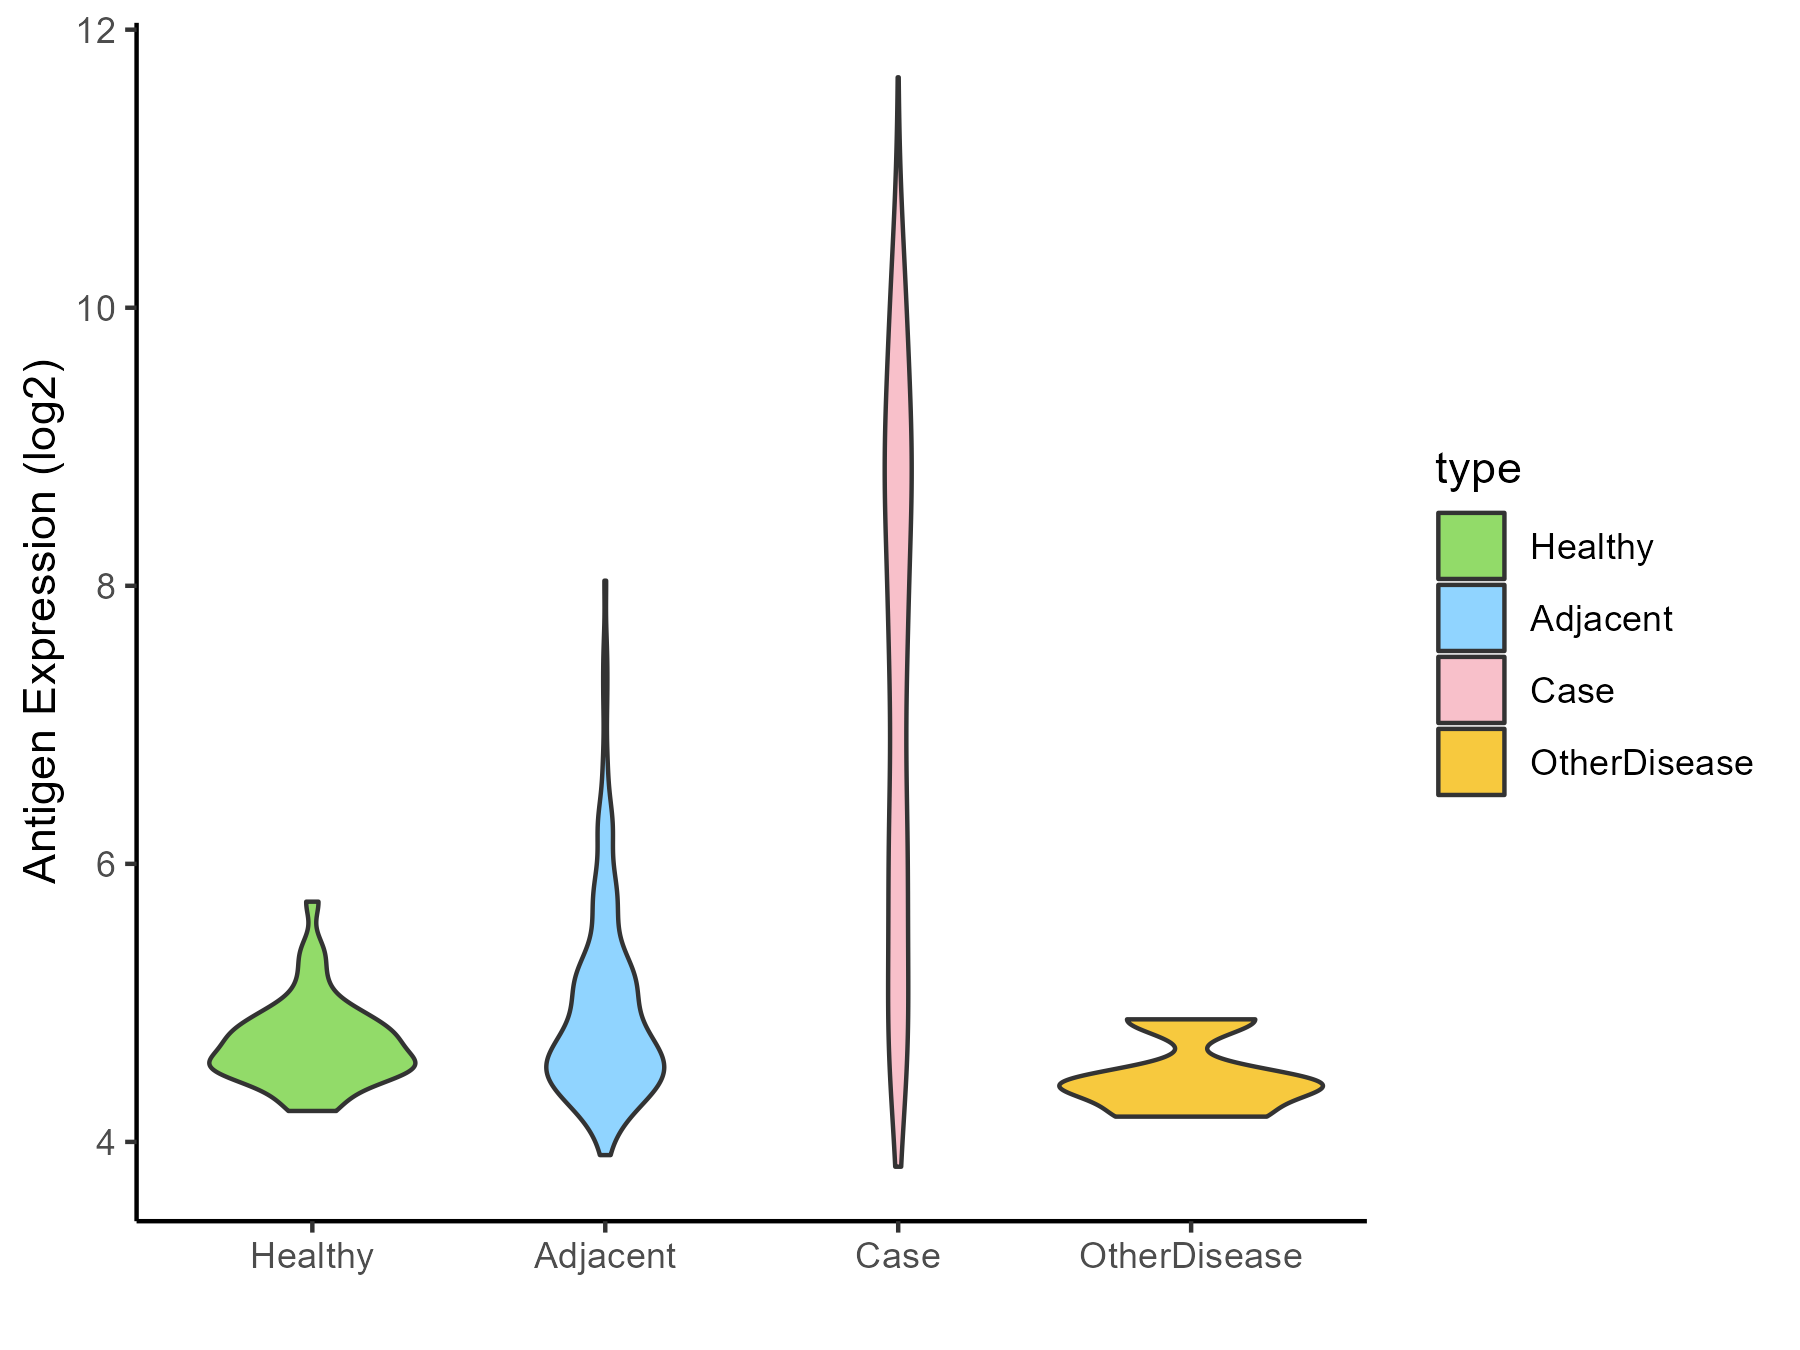
| The Studied Tissue | Liver | |
| The Specific Disease | Liver cancer | |
| The Expression Level of Disease Section Compare with the Healthy Individual Tissue | p-value: 5.54E-86; Fold-change: 3.000632912; Z-score: 9.740175137 | |
| The Expression Level of Disease Section Compare with the Adjacent Tissue | p-value: 2.70E-82; Fold-change: 2.932208456; Z-score: 4.075593289 | |
| The Expression Level of Disease Section Compare with the Other Disease Section | p-value: 2.68E-06; Fold-change: 3.274521248; Z-score: 11.14188921 | |
| Disease-specific Antigen Abundances |
|
Click to View the Clearer Original Diagram |
| Differential expression pattern of antigen in diseases | ||
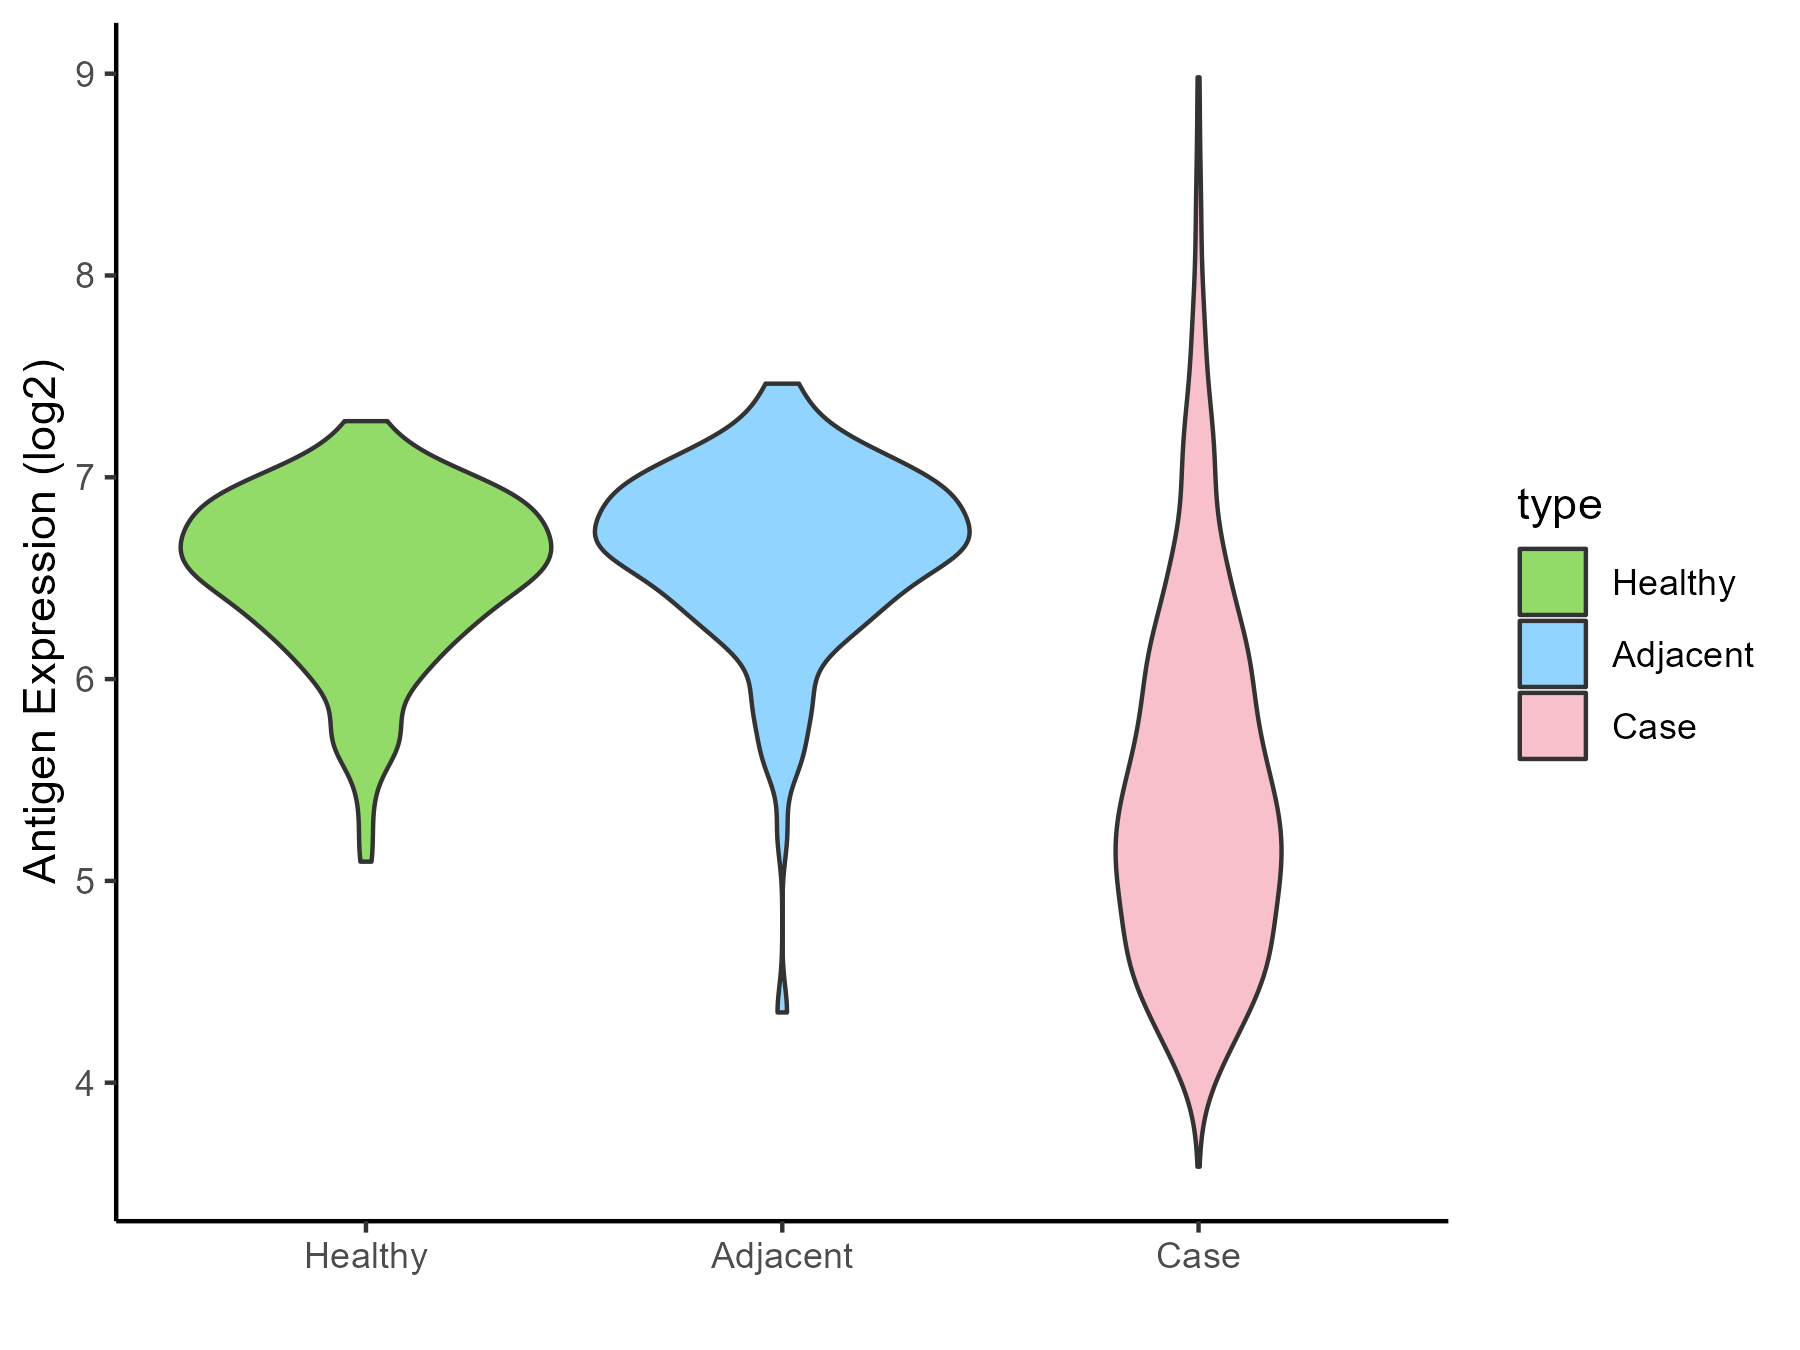
| The Studied Tissue | Lung | |
| The Specific Disease | Lung cancer | |
| The Expression Level of Disease Section Compare with the Healthy Individual Tissue | p-value: 3.52E-92; Fold-change: -1.237593412; Z-score: -3.015870007 | |
| The Expression Level of Disease Section Compare with the Adjacent Tissue | p-value: 2.68E-58; Fold-change: -1.342323674; Z-score: -2.895482485 | |
| Disease-specific Antigen Abundances |
|
Click to View the Clearer Original Diagram |
| Differential expression pattern of antigen in diseases | ||
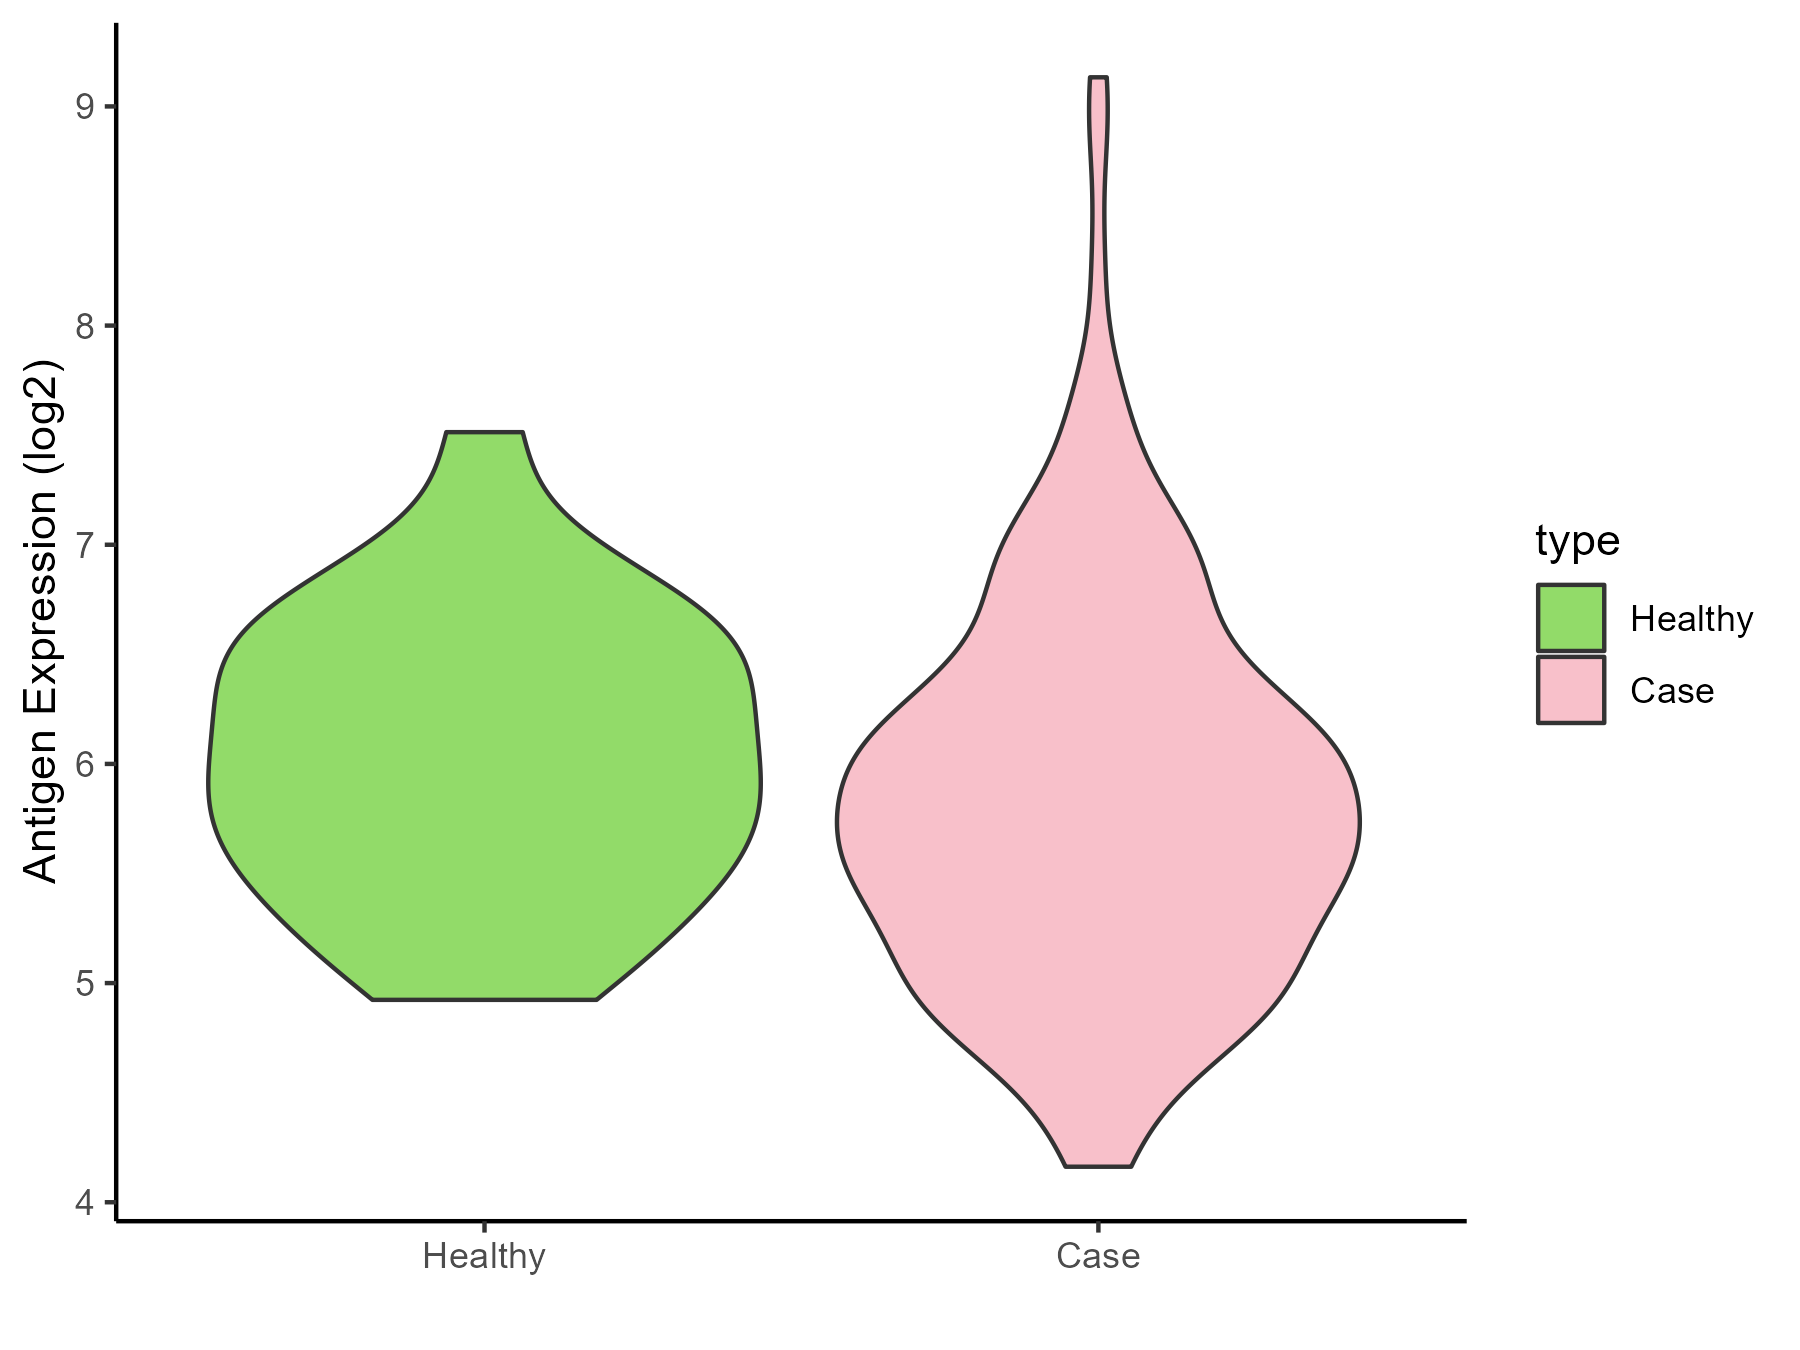
| The Studied Tissue | Skin | |
| The Specific Disease | Melanoma | |
| The Expression Level of Disease Section Compare with the Healthy Individual Tissue | p-value: 0.210330167; Fold-change: -0.323451817; Z-score: -0.496257928 | |
| Disease-specific Antigen Abundances |
|
Click to View the Clearer Original Diagram |
| Differential expression pattern of antigen in diseases | ||
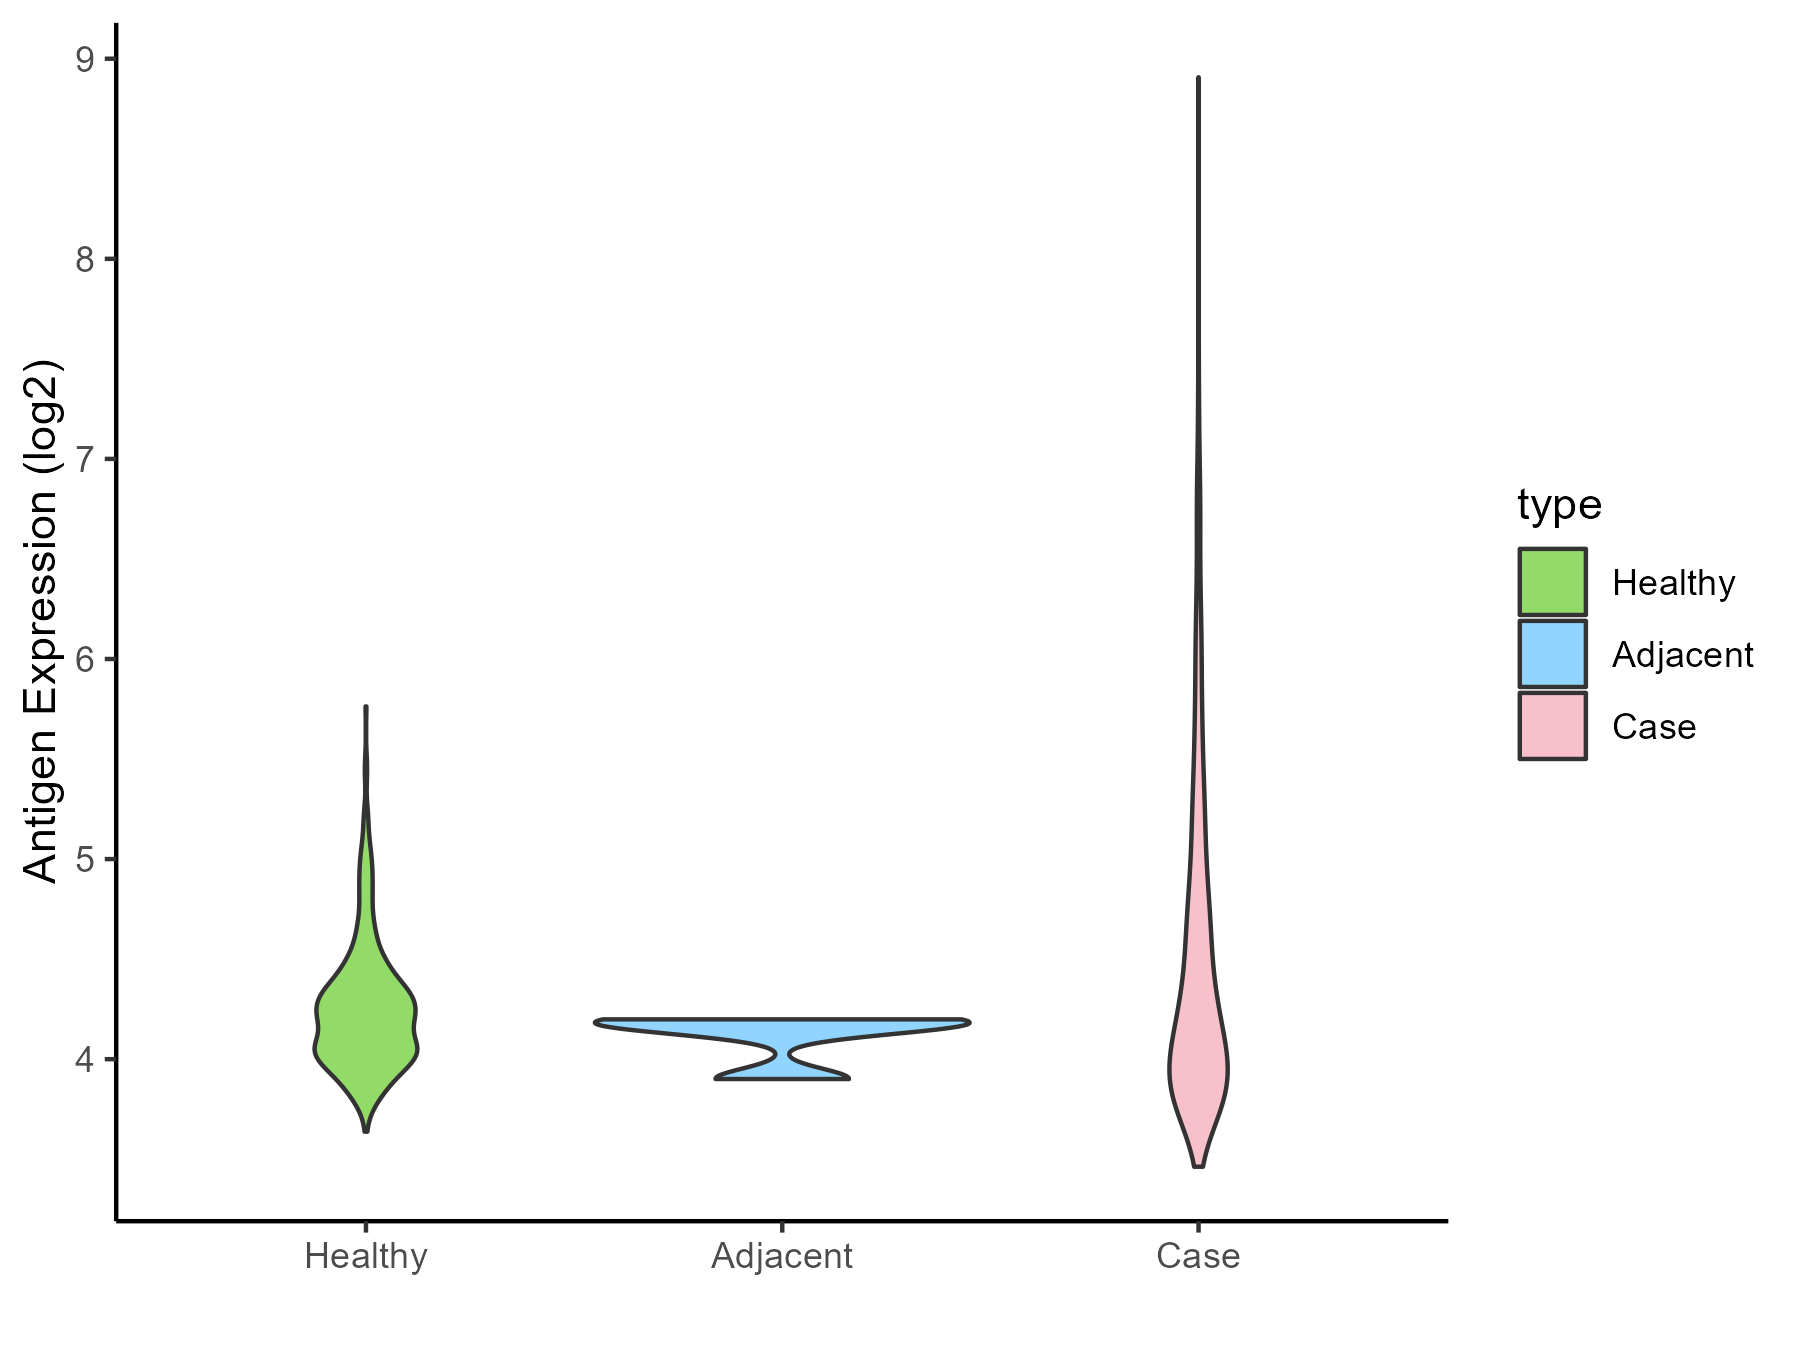
| The Studied Tissue | Muscle | |
| The Specific Disease | Sarcoma | |
| The Expression Level of Disease Section Compare with the Healthy Individual Tissue | p-value: 5.56E-12; Fold-change: 0.028007485; Z-score: 0.088567483 | |
| The Expression Level of Disease Section Compare with the Adjacent Tissue | p-value: 0.004607753; Fold-change: 0.062410622; Z-score: 0.440413231 | |
| Disease-specific Antigen Abundances |
|
Click to View the Clearer Original Diagram |
| Differential expression pattern of antigen in diseases | ||
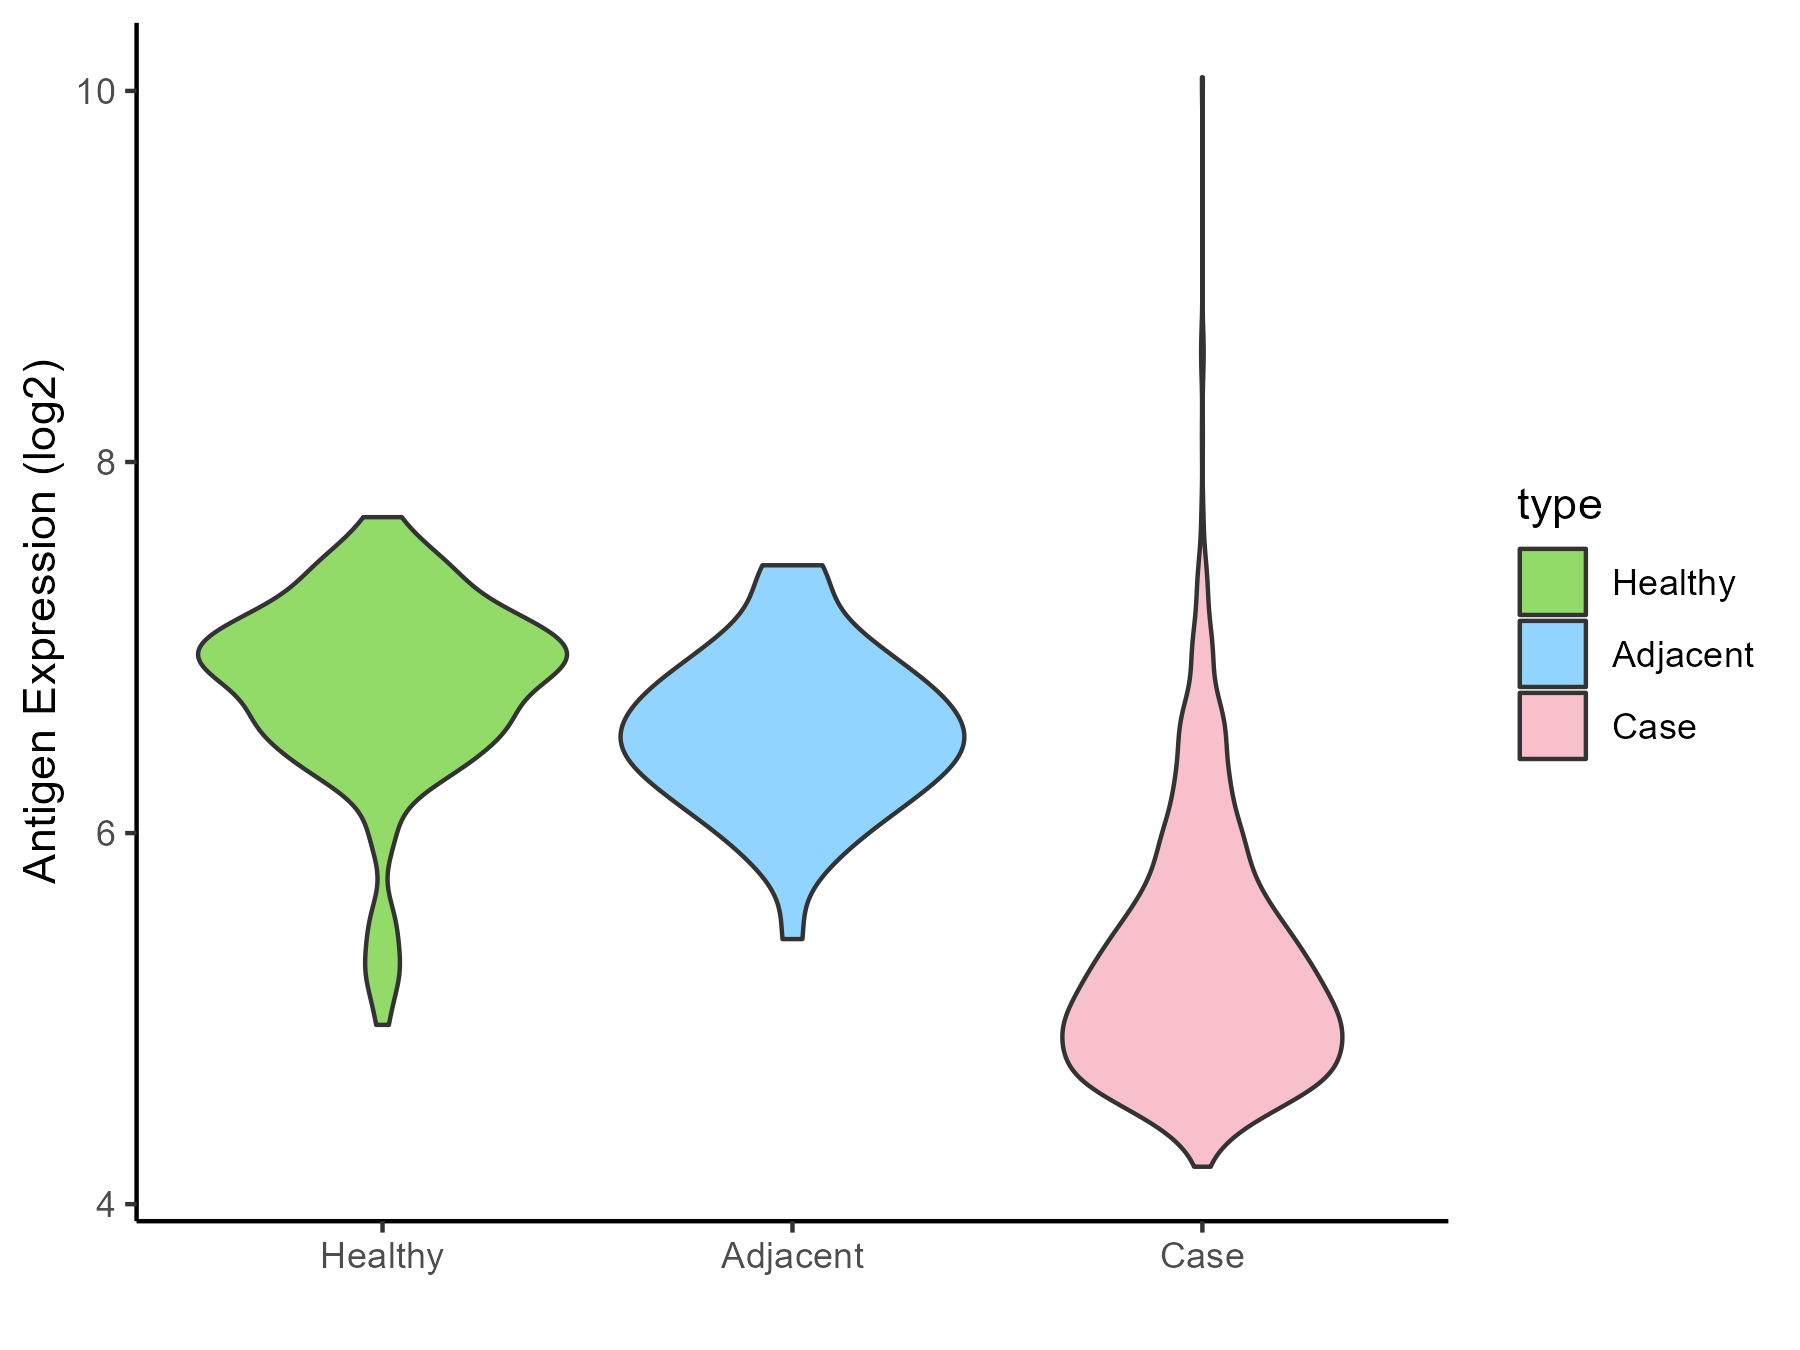
| The Studied Tissue | Breast | |
| The Specific Disease | Breast cancer | |
| The Expression Level of Disease Section Compare with the Healthy Individual Tissue | p-value: 1.62E-157; Fold-change: -1.726463738; Z-score: -3.385294741 | |
| The Expression Level of Disease Section Compare with the Adjacent Tissue | p-value: 1.79E-28; Fold-change: -1.356454806; Z-score: -3.230631668 | |
| Disease-specific Antigen Abundances |
|
Click to View the Clearer Original Diagram |
| Differential expression pattern of antigen in diseases | ||
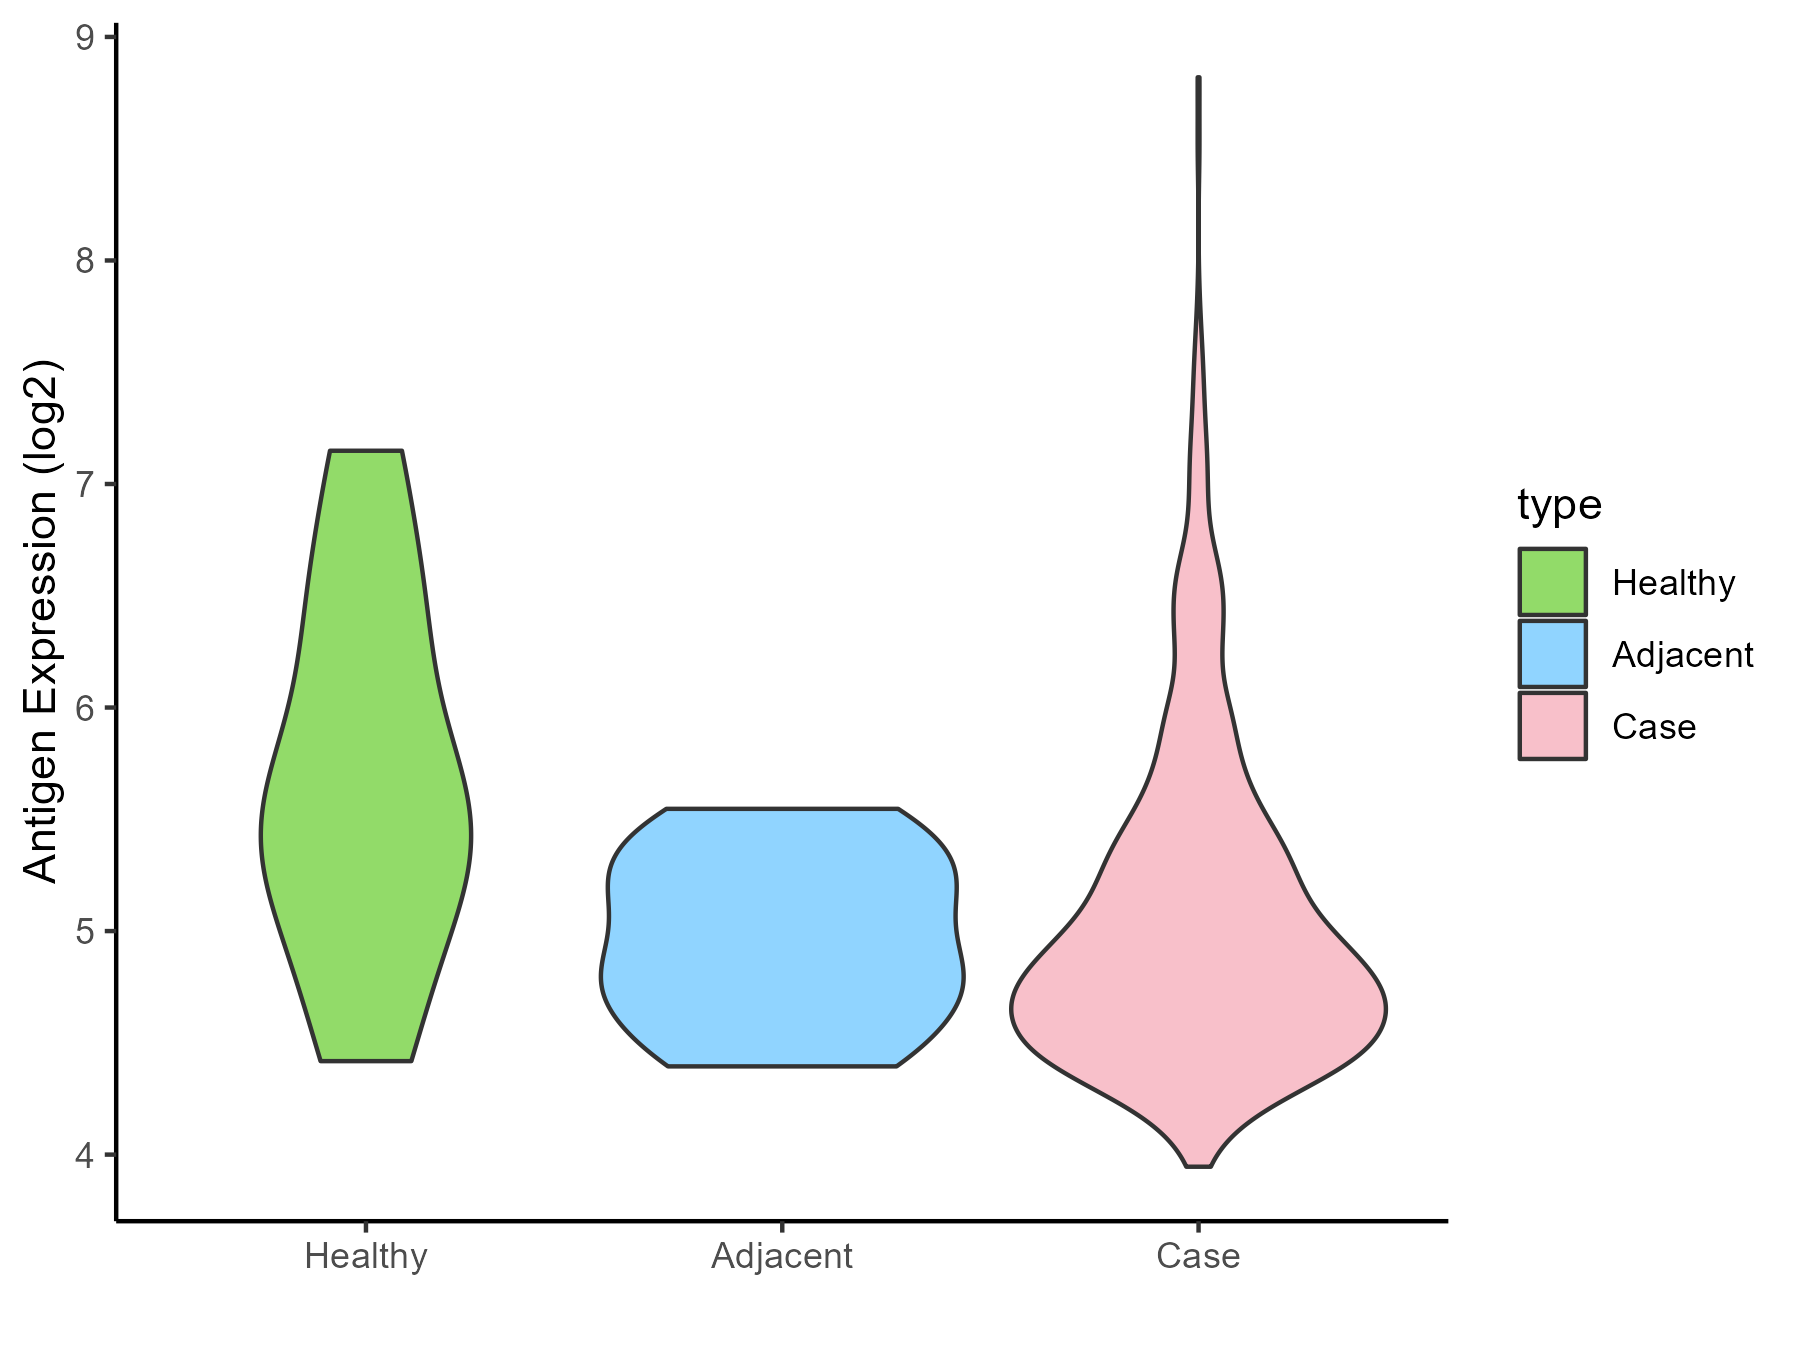
| The Studied Tissue | Ovarian | |
| The Specific Disease | Ovarian cancer | |
| The Expression Level of Disease Section Compare with the Healthy Individual Tissue | p-value: 0.064048106; Fold-change: -0.652024238; Z-score: -0.764495057 | |
| The Expression Level of Disease Section Compare with the Adjacent Tissue | p-value: 0.378832378; Fold-change: -0.062781343; Z-score: -0.161261566 | |
| Disease-specific Antigen Abundances |
|
Click to View the Clearer Original Diagram |
| Differential expression pattern of antigen in diseases | ||
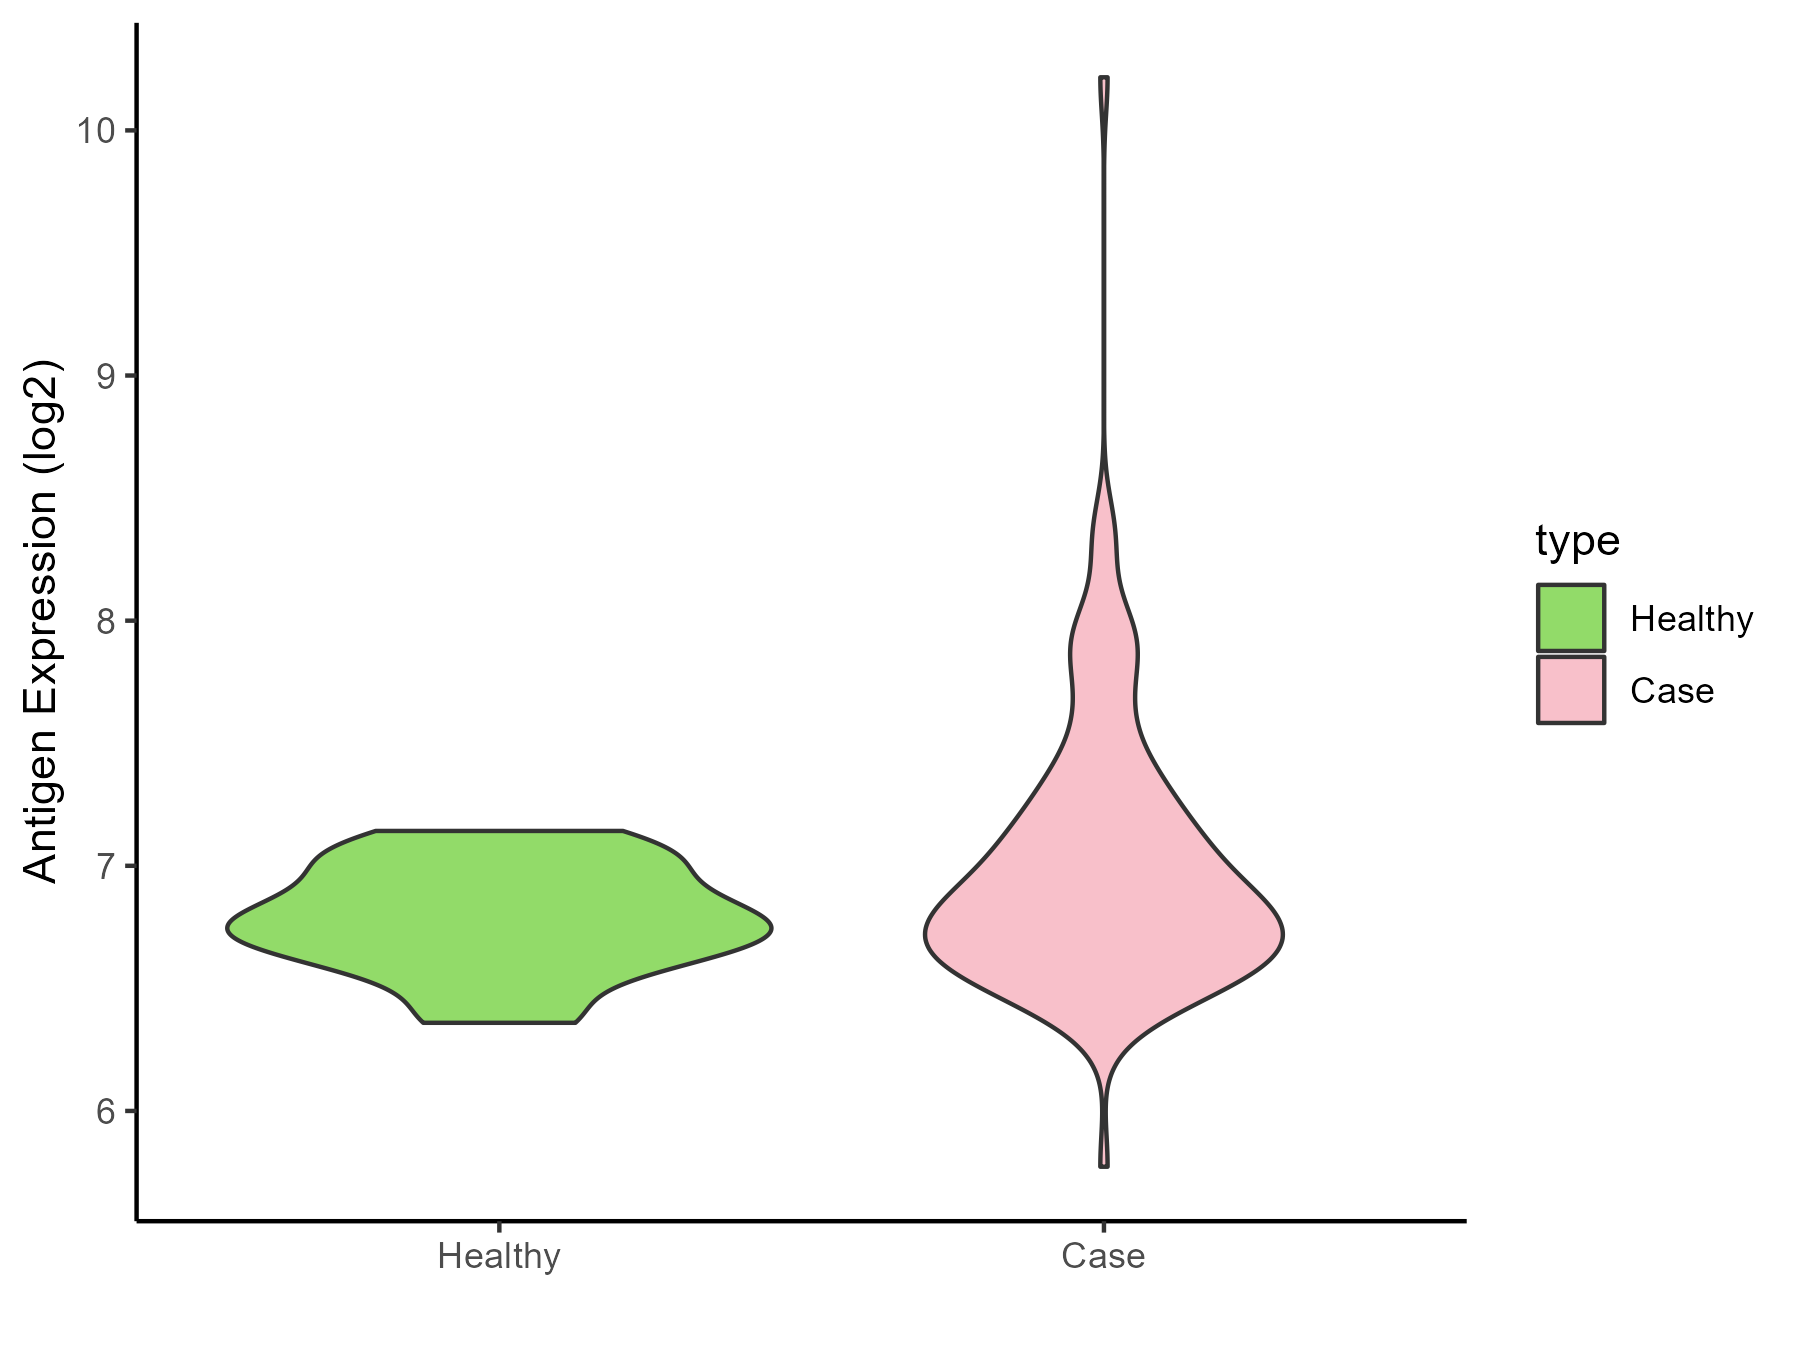
| The Studied Tissue | Cervical | |
| The Specific Disease | Cervical cancer | |
| The Expression Level of Disease Section Compare with the Healthy Individual Tissue | p-value: 0.003367663; Fold-change: 0.071931653; Z-score: 0.318687351 | |
| Disease-specific Antigen Abundances |
|
Click to View the Clearer Original Diagram |
| Differential expression pattern of antigen in diseases | ||
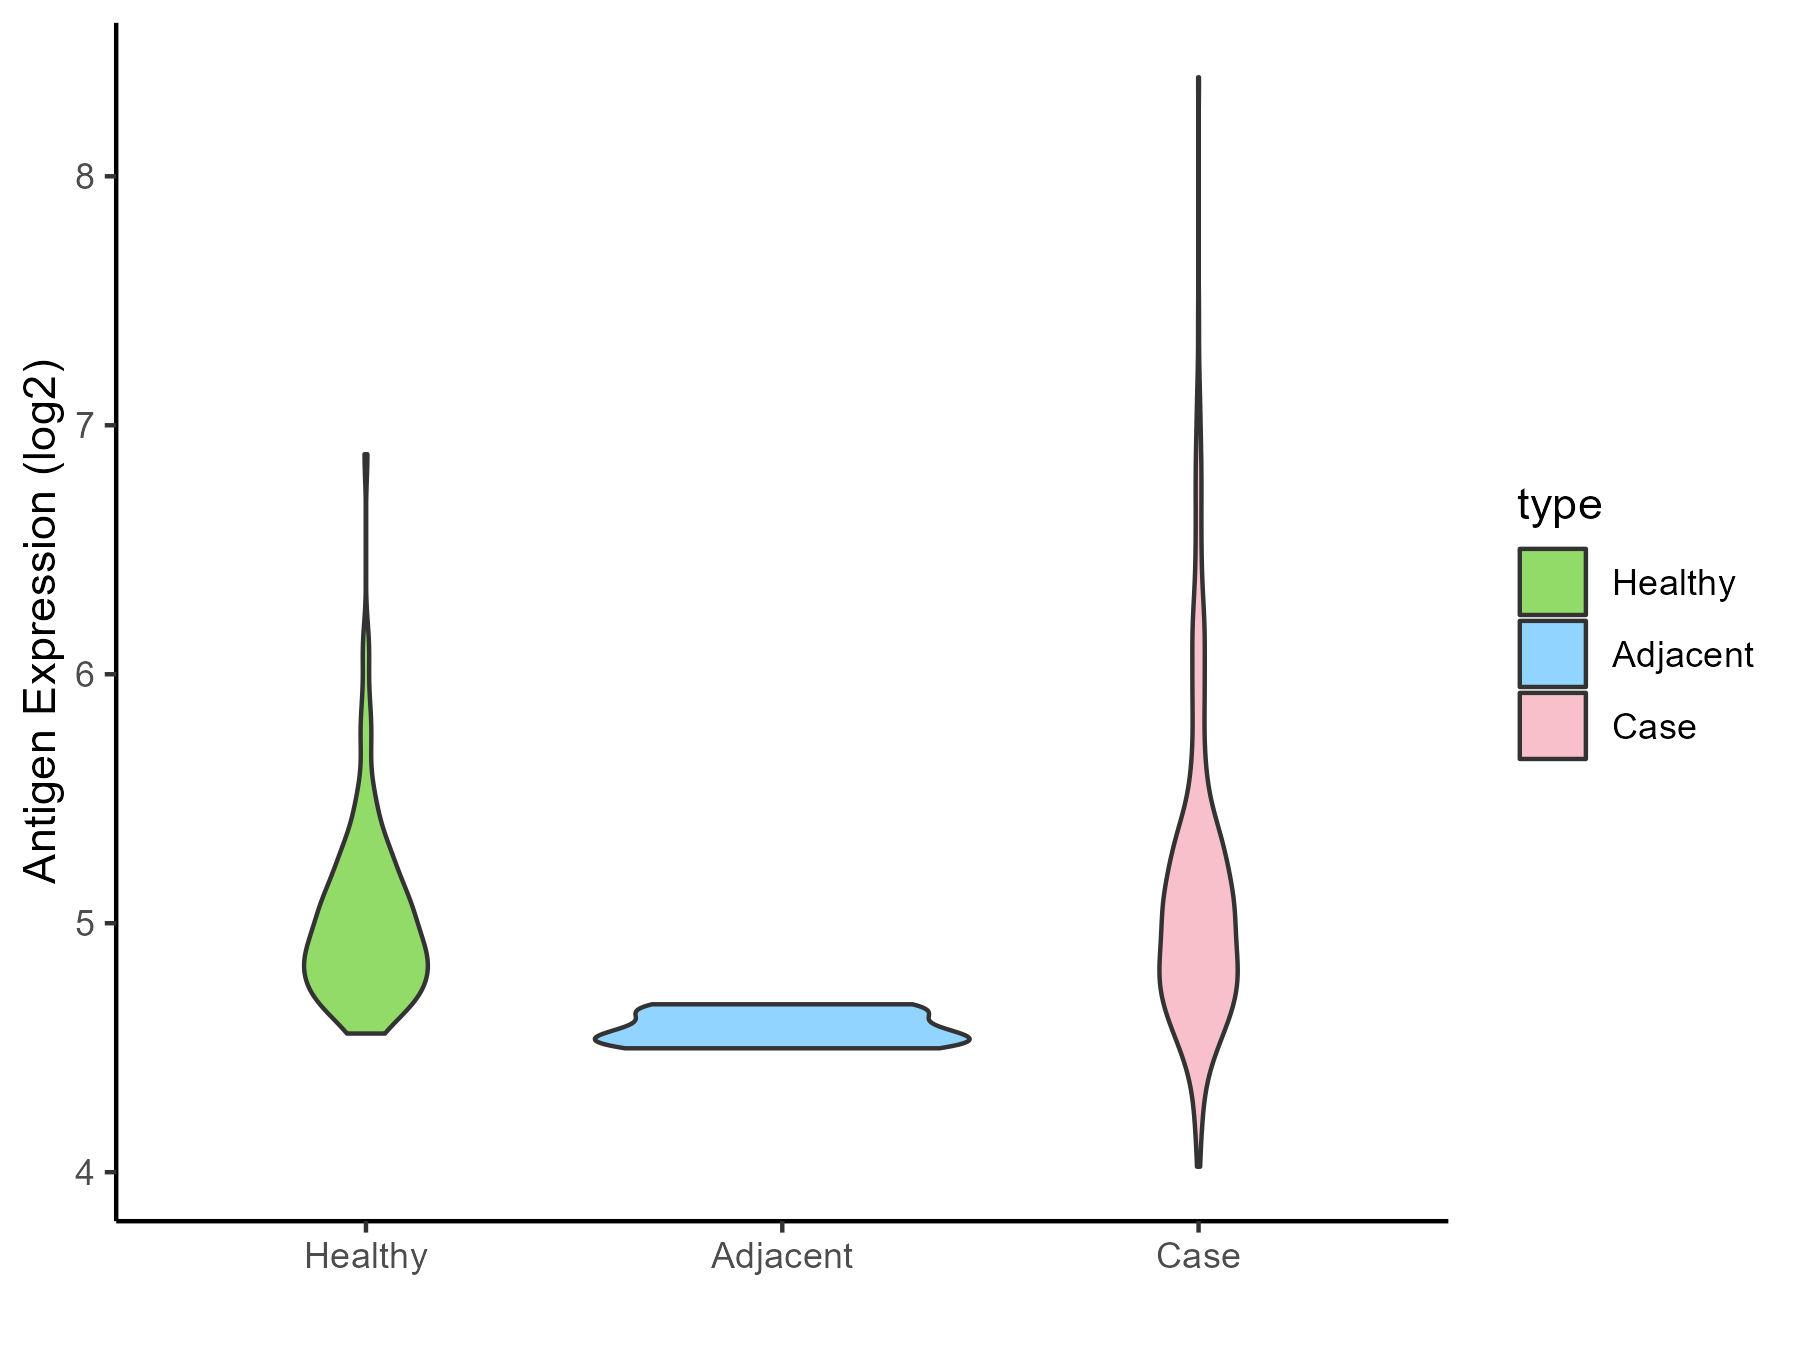
| The Studied Tissue | Endometrium | |
| The Specific Disease | Uterine cancer | |
| The Expression Level of Disease Section Compare with the Healthy Individual Tissue | p-value: 0.011896636; Fold-change: 0.07727215; Z-score: 0.214898973 | |
| The Expression Level of Disease Section Compare with the Adjacent Tissue | p-value: 2.74E-09; Fold-change: 0.453757739; Z-score: 6.01396071 | |
| Disease-specific Antigen Abundances |
|
Click to View the Clearer Original Diagram |
| Differential expression pattern of antigen in diseases | ||
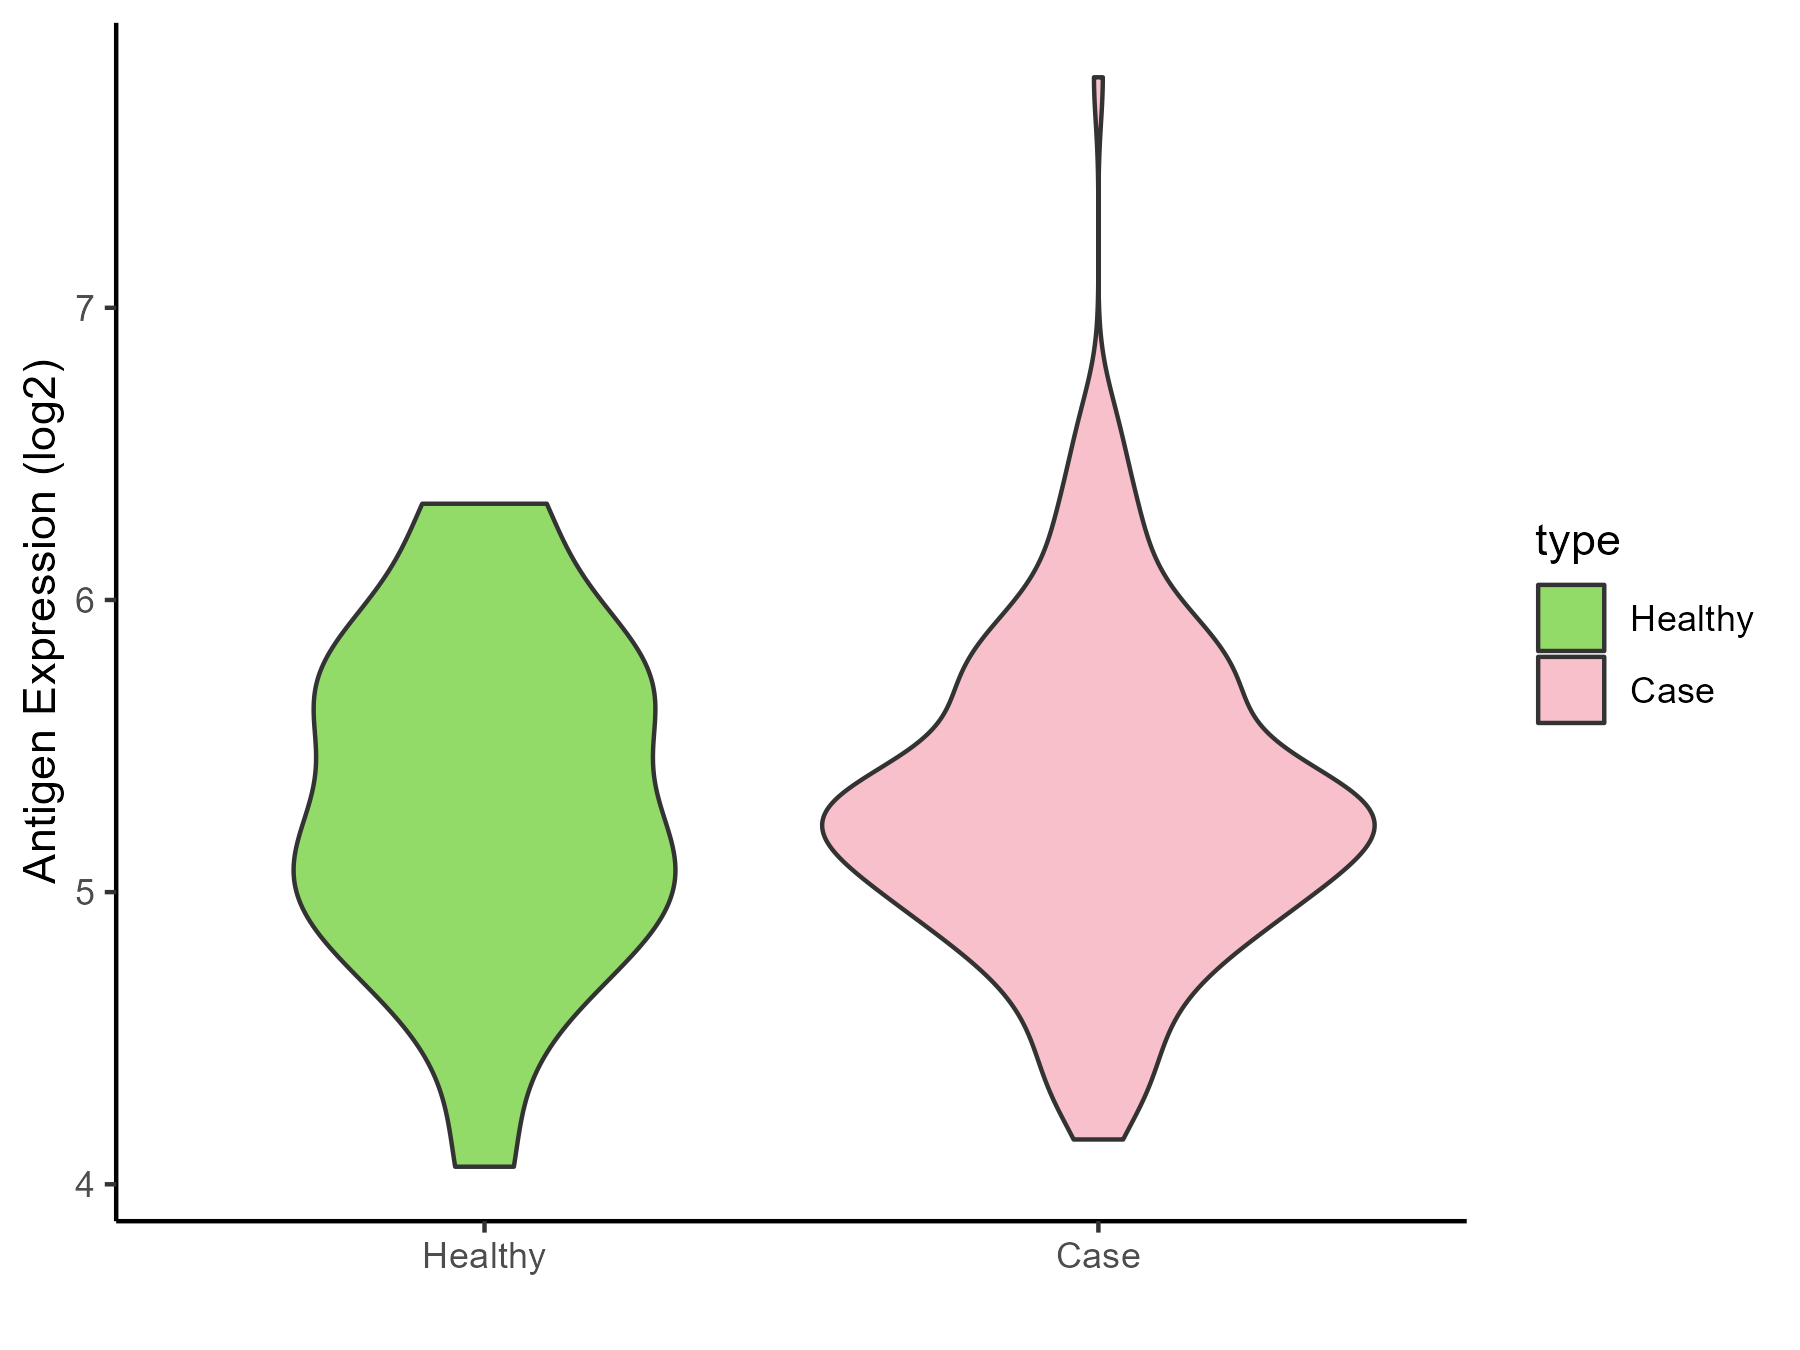
| The Studied Tissue | Prostate | |
| The Specific Disease | Prostate cancer | |
| The Expression Level of Disease Section Compare with the Healthy Individual Tissue | p-value: 0.94108091; Fold-change: -0.000701295; Z-score: -0.001210901 | |
| Disease-specific Antigen Abundances |
|
Click to View the Clearer Original Diagram |
| Differential expression pattern of antigen in diseases | ||
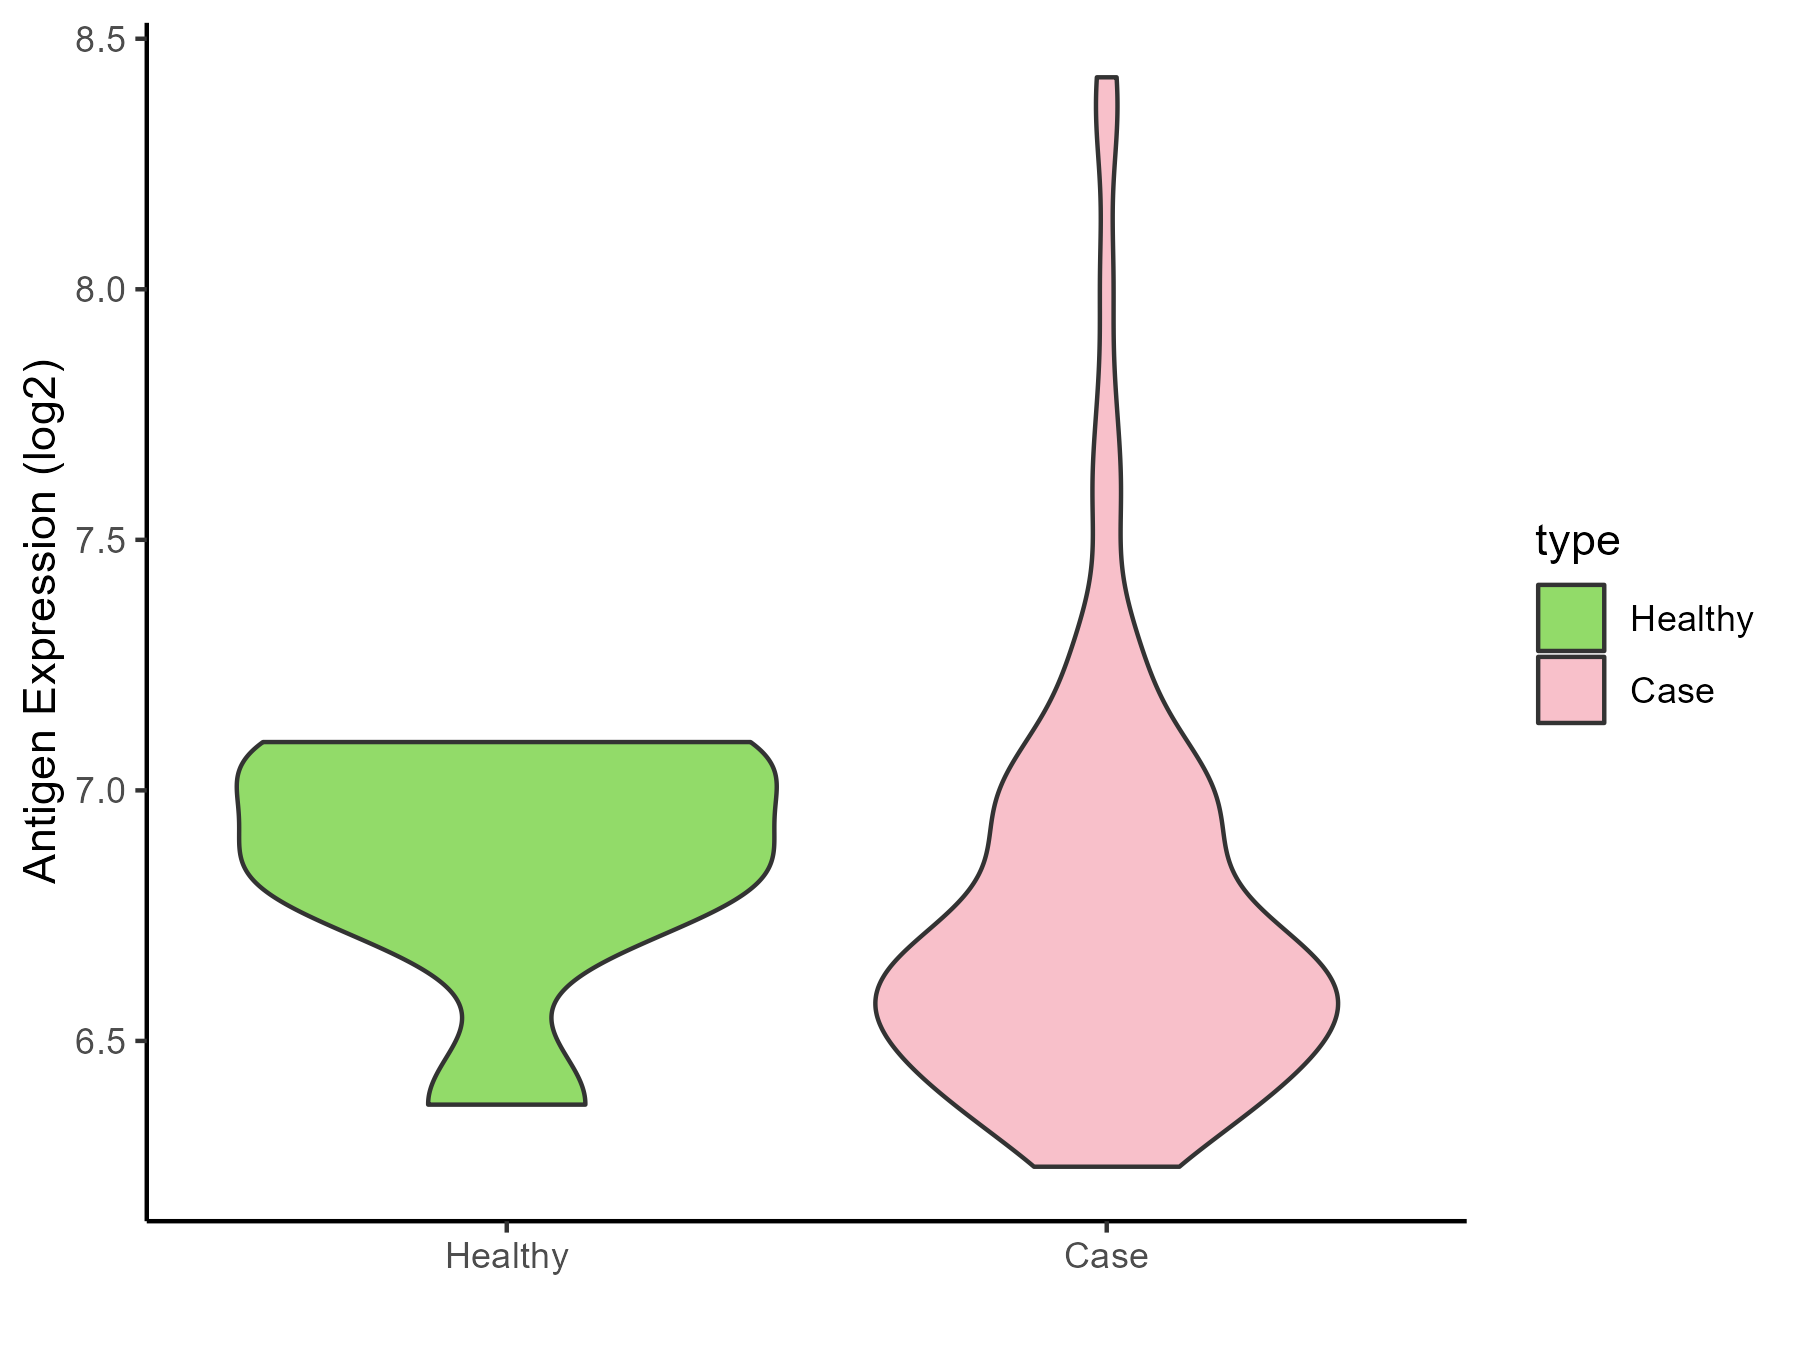
| The Studied Tissue | Bladder | |
| The Specific Disease | Bladder cancer | |
| The Expression Level of Disease Section Compare with the Healthy Individual Tissue | p-value: 0.350740773; Fold-change: -0.214760925; Z-score: -0.850884255 | |
| Disease-specific Antigen Abundances |
|
Click to View the Clearer Original Diagram |
| Differential expression pattern of antigen in diseases | ||
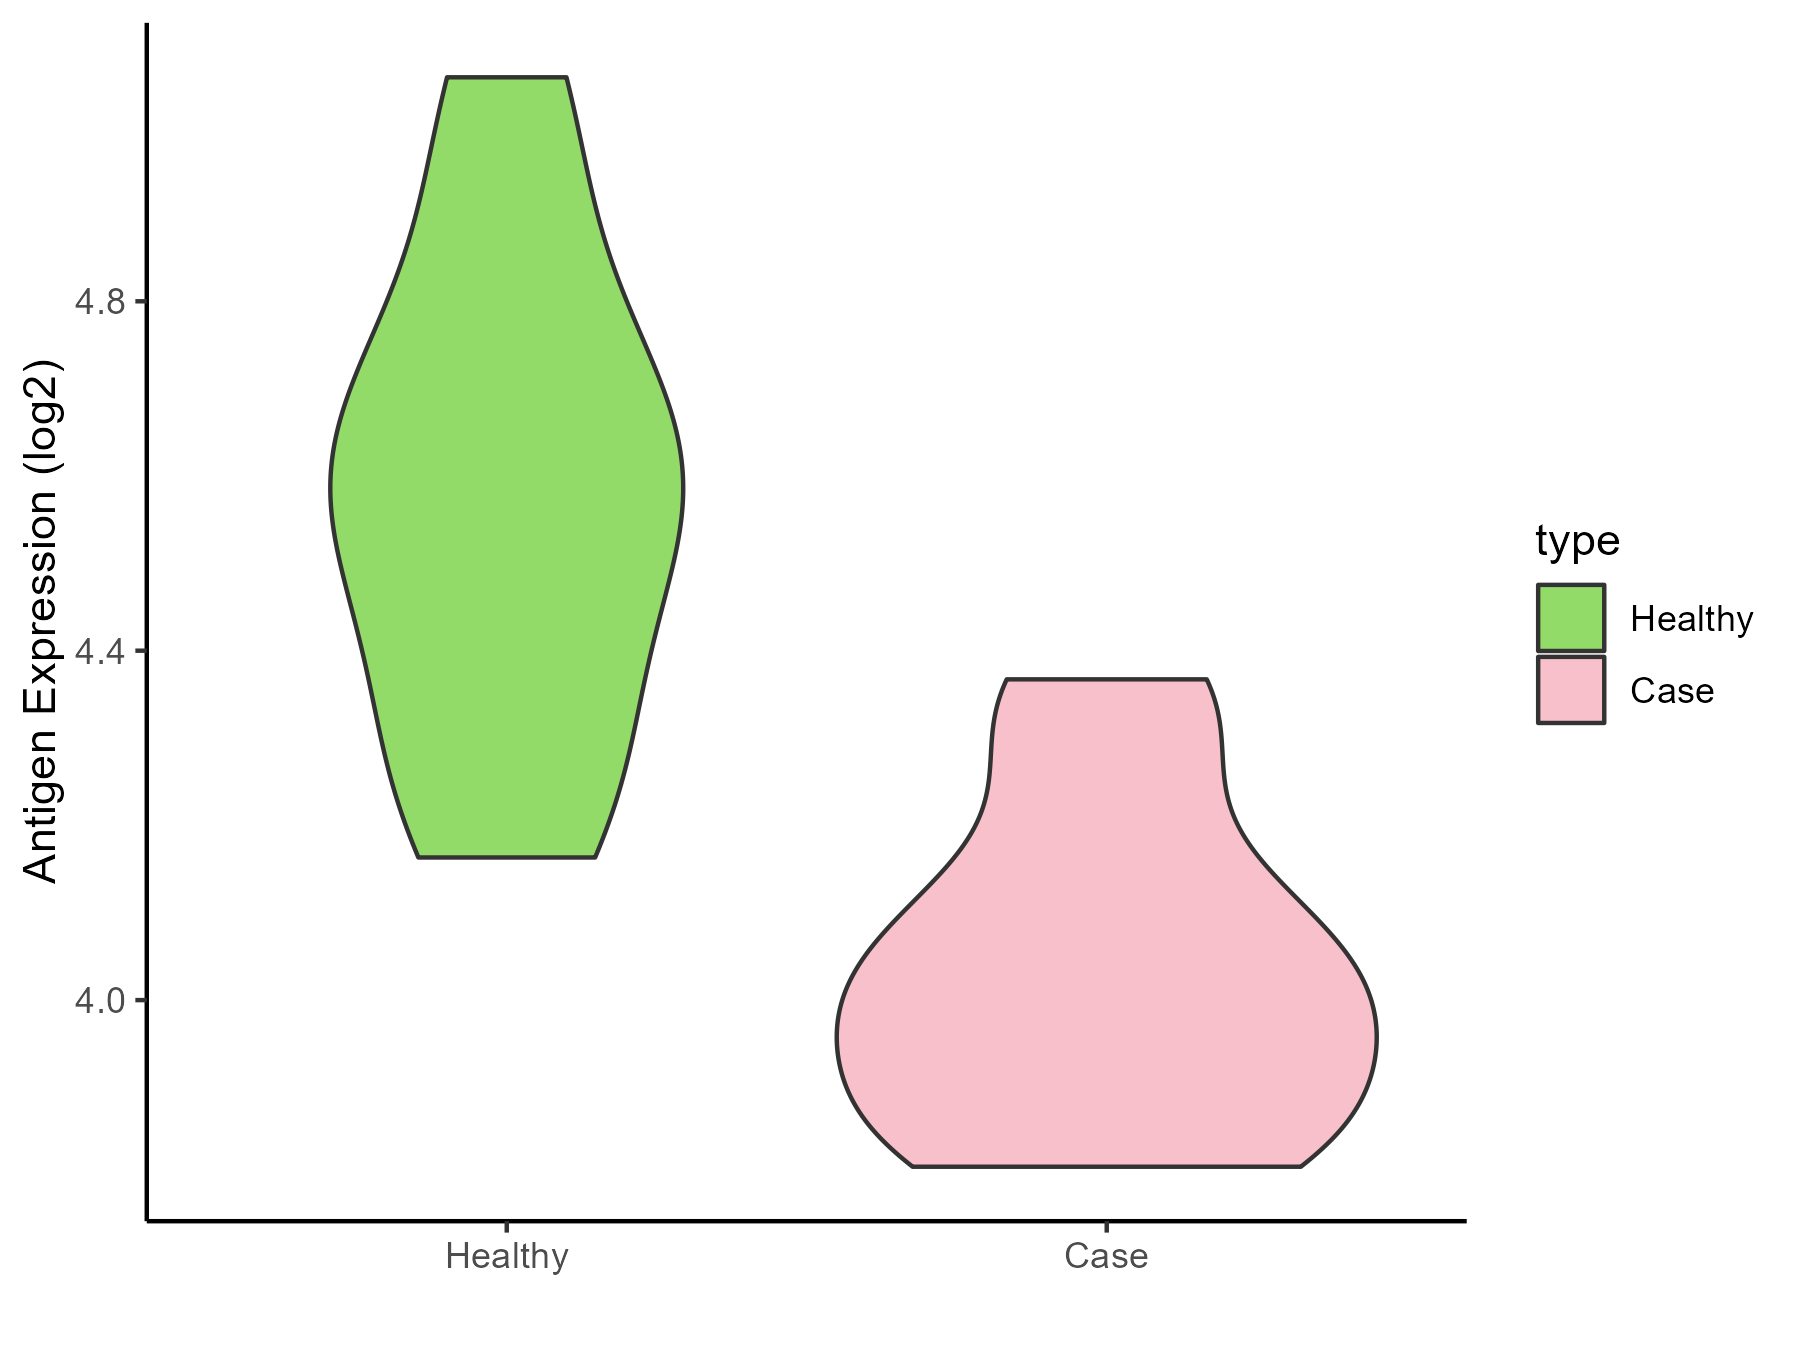
| The Studied Tissue | Uvea | |
| The Specific Disease | Retinoblastoma tumor | |
| The Expression Level of Disease Section Compare with the Healthy Individual Tissue | p-value: 1.35E-05; Fold-change: -0.577790714; Z-score: -2.123811918 | |
| Disease-specific Antigen Abundances |
|
Click to View the Clearer Original Diagram |
| Differential expression pattern of antigen in diseases | ||
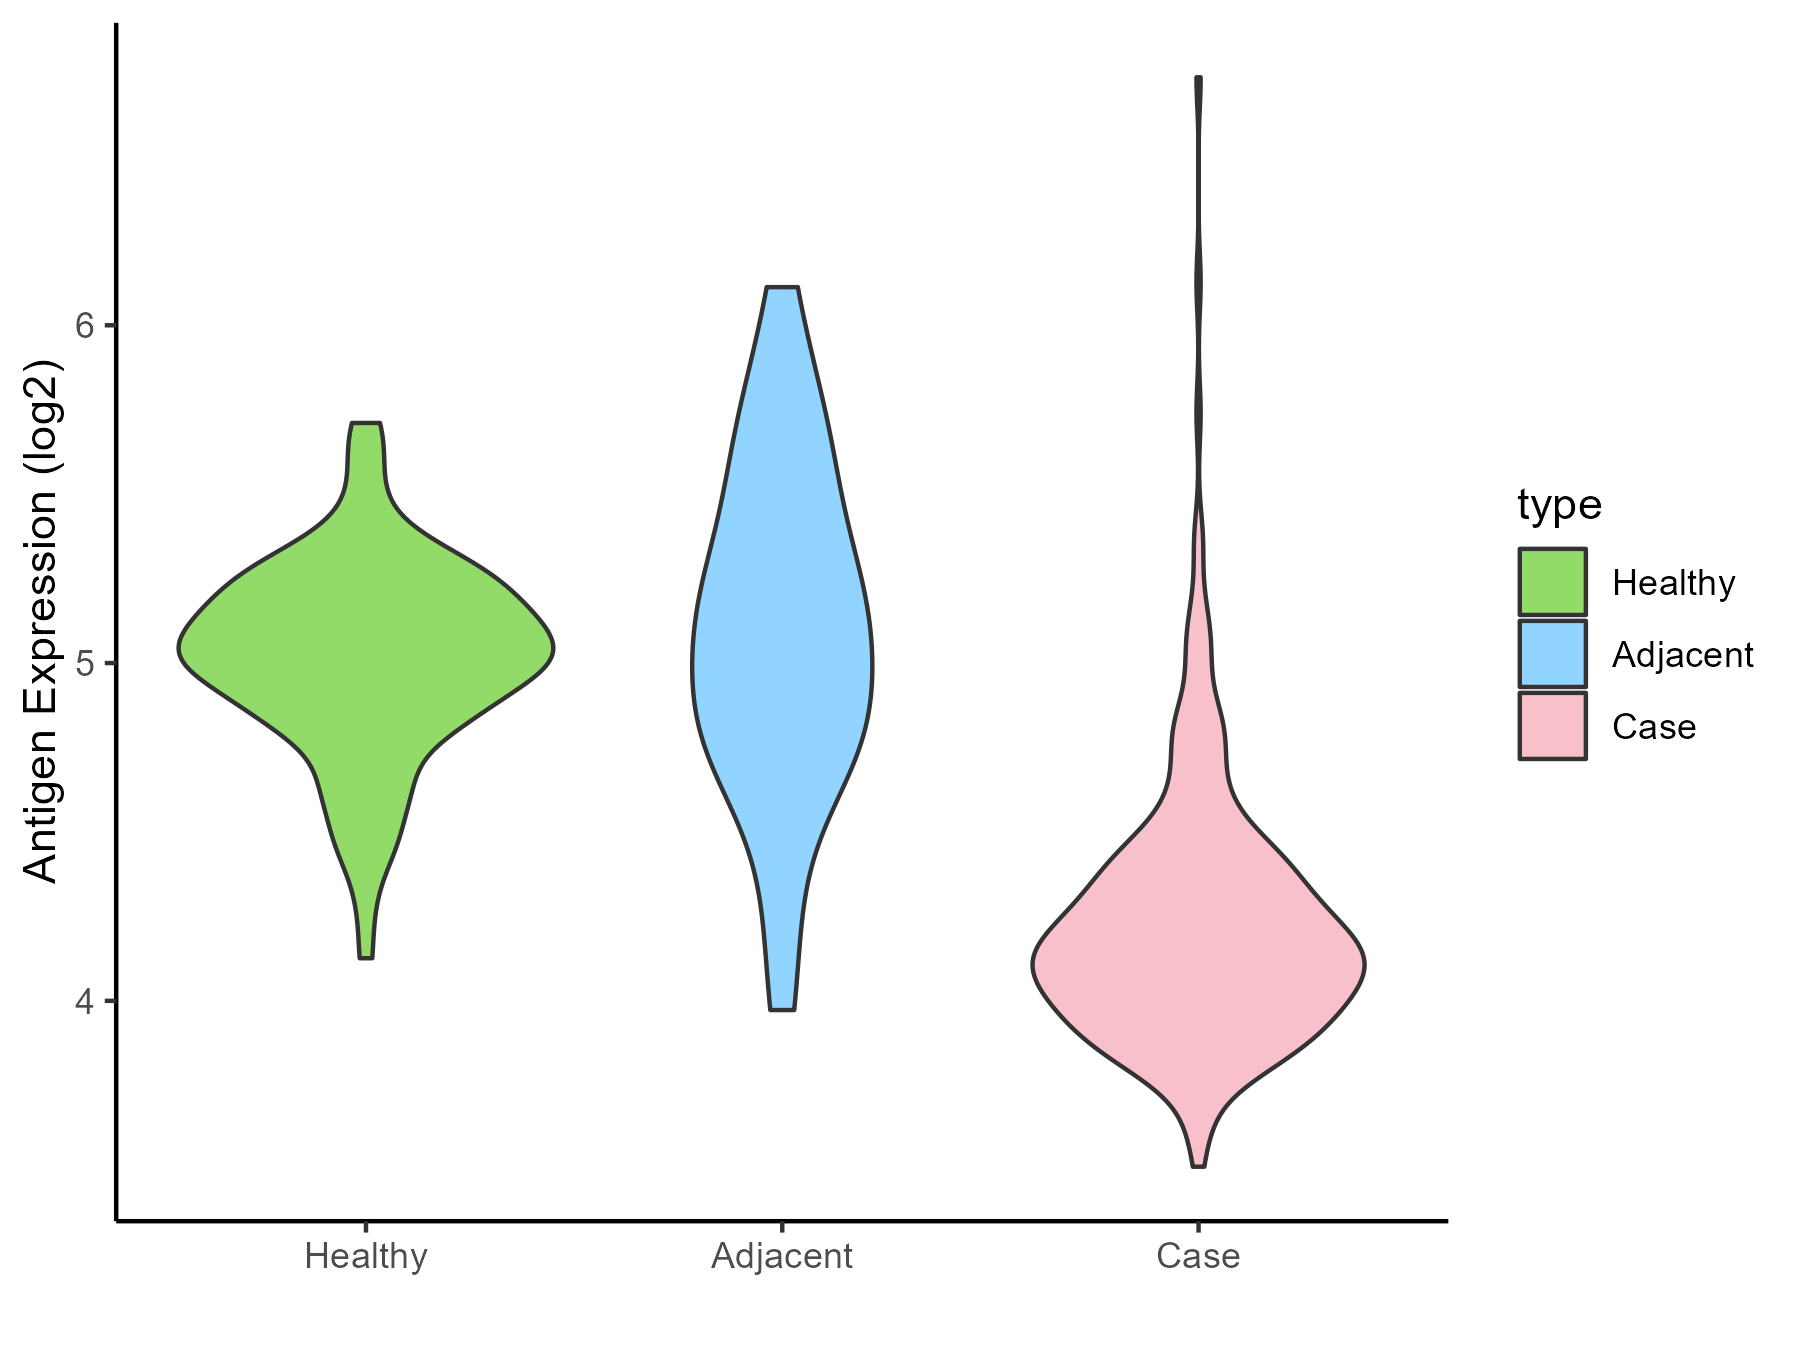
| The Studied Tissue | Thyroid | |
| The Specific Disease | Thyroid cancer | |
| The Expression Level of Disease Section Compare with the Healthy Individual Tissue | p-value: 1.15E-59; Fold-change: -0.866466179; Z-score: -3.045672898 | |
| The Expression Level of Disease Section Compare with the Adjacent Tissue | p-value: 1.50E-14; Fold-change: -0.914899213; Z-score: -1.880409439 | |
| Disease-specific Antigen Abundances |
|
Click to View the Clearer Original Diagram |
| Differential expression pattern of antigen in diseases | ||
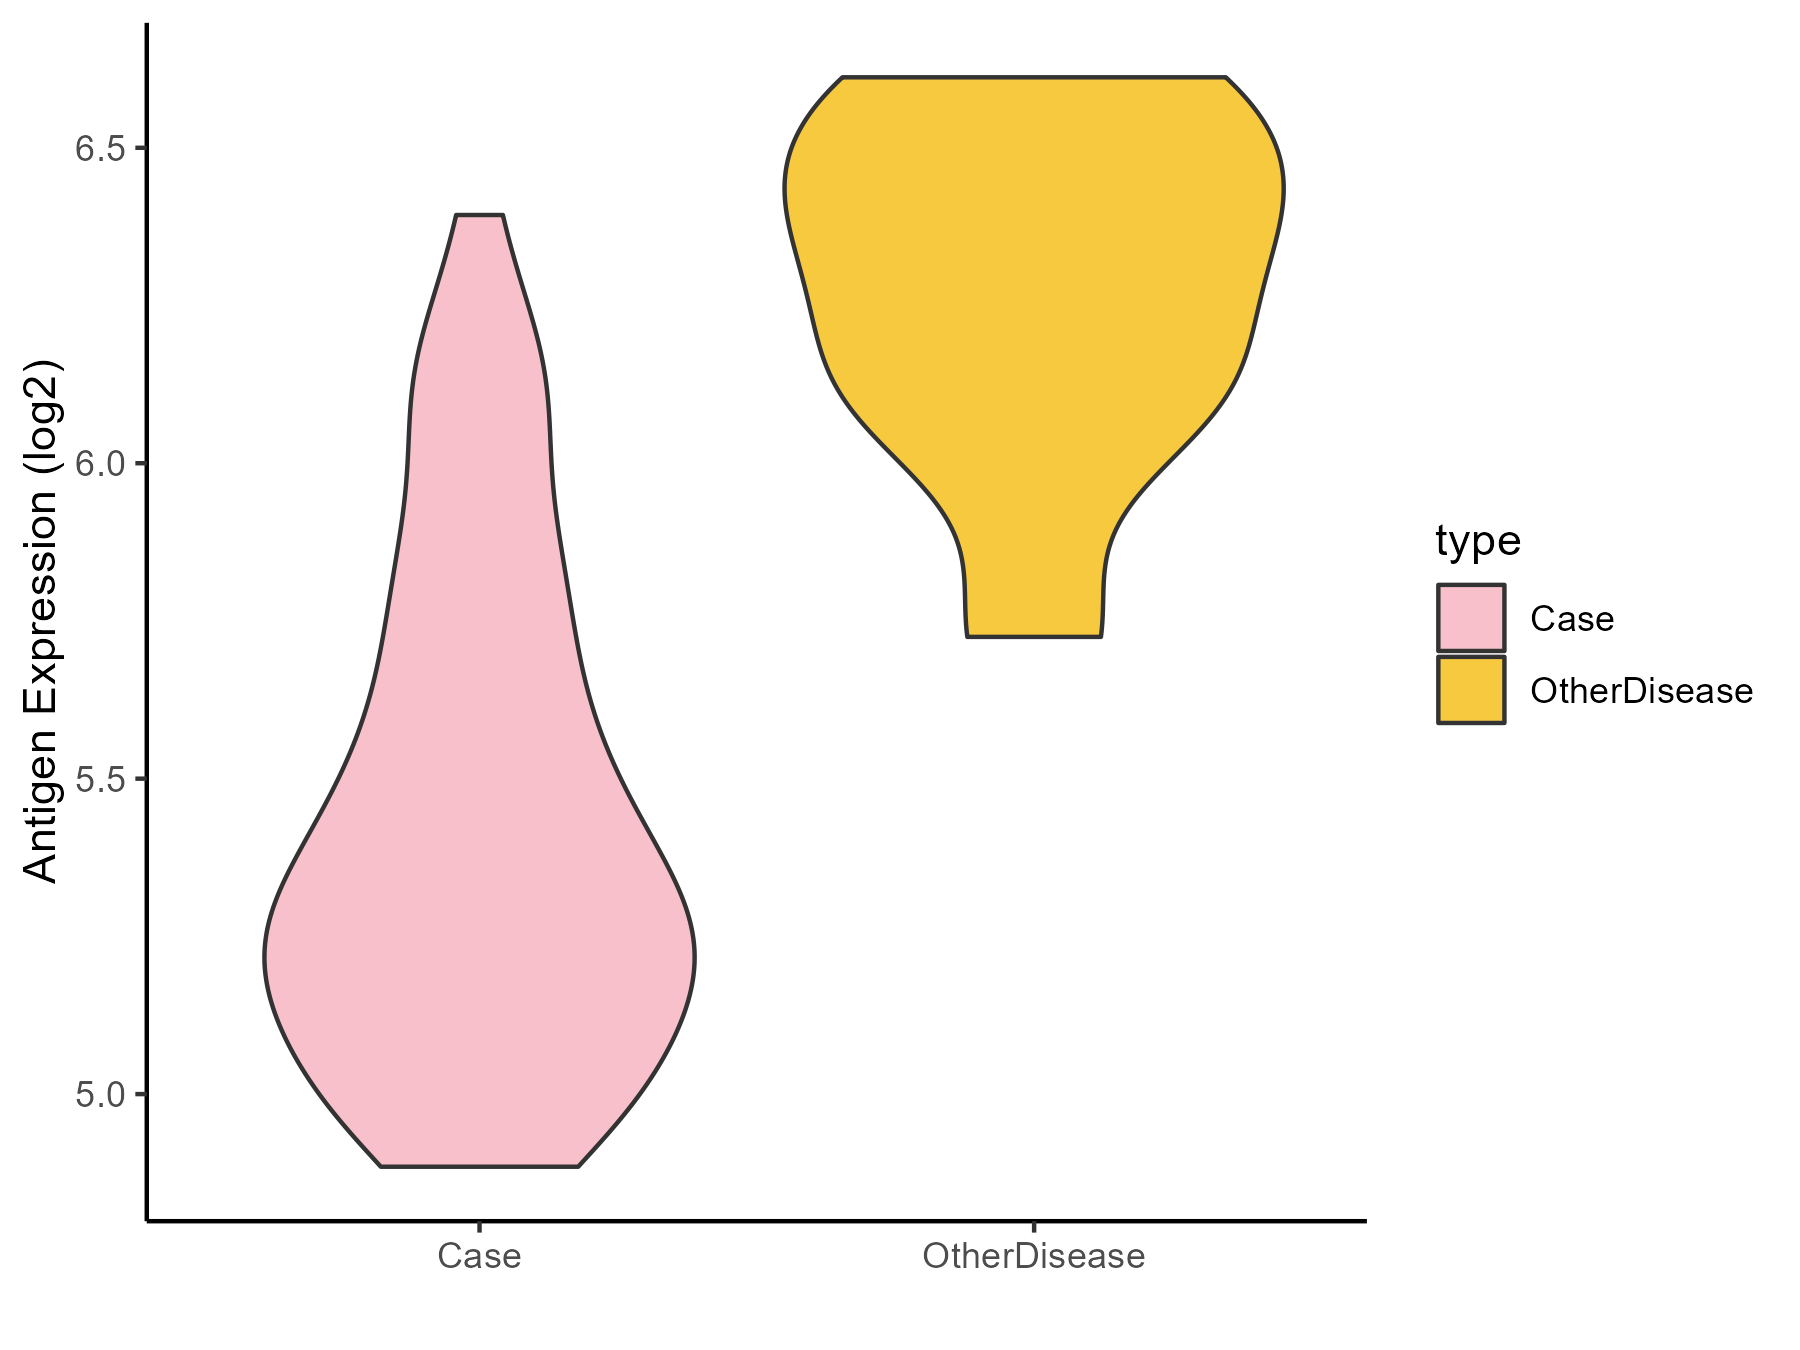
| The Studied Tissue | Adrenal cortex | |
| The Specific Disease | Adrenocortical carcinoma | |
| The Expression Level of Disease Section Compare with the Other Disease Section | p-value: 4.45E-12; Fold-change: -1.005776506; Z-score: -3.606176501 | |
| Disease-specific Antigen Abundances |
|
Click to View the Clearer Original Diagram |
| Differential expression pattern of antigen in diseases | ||
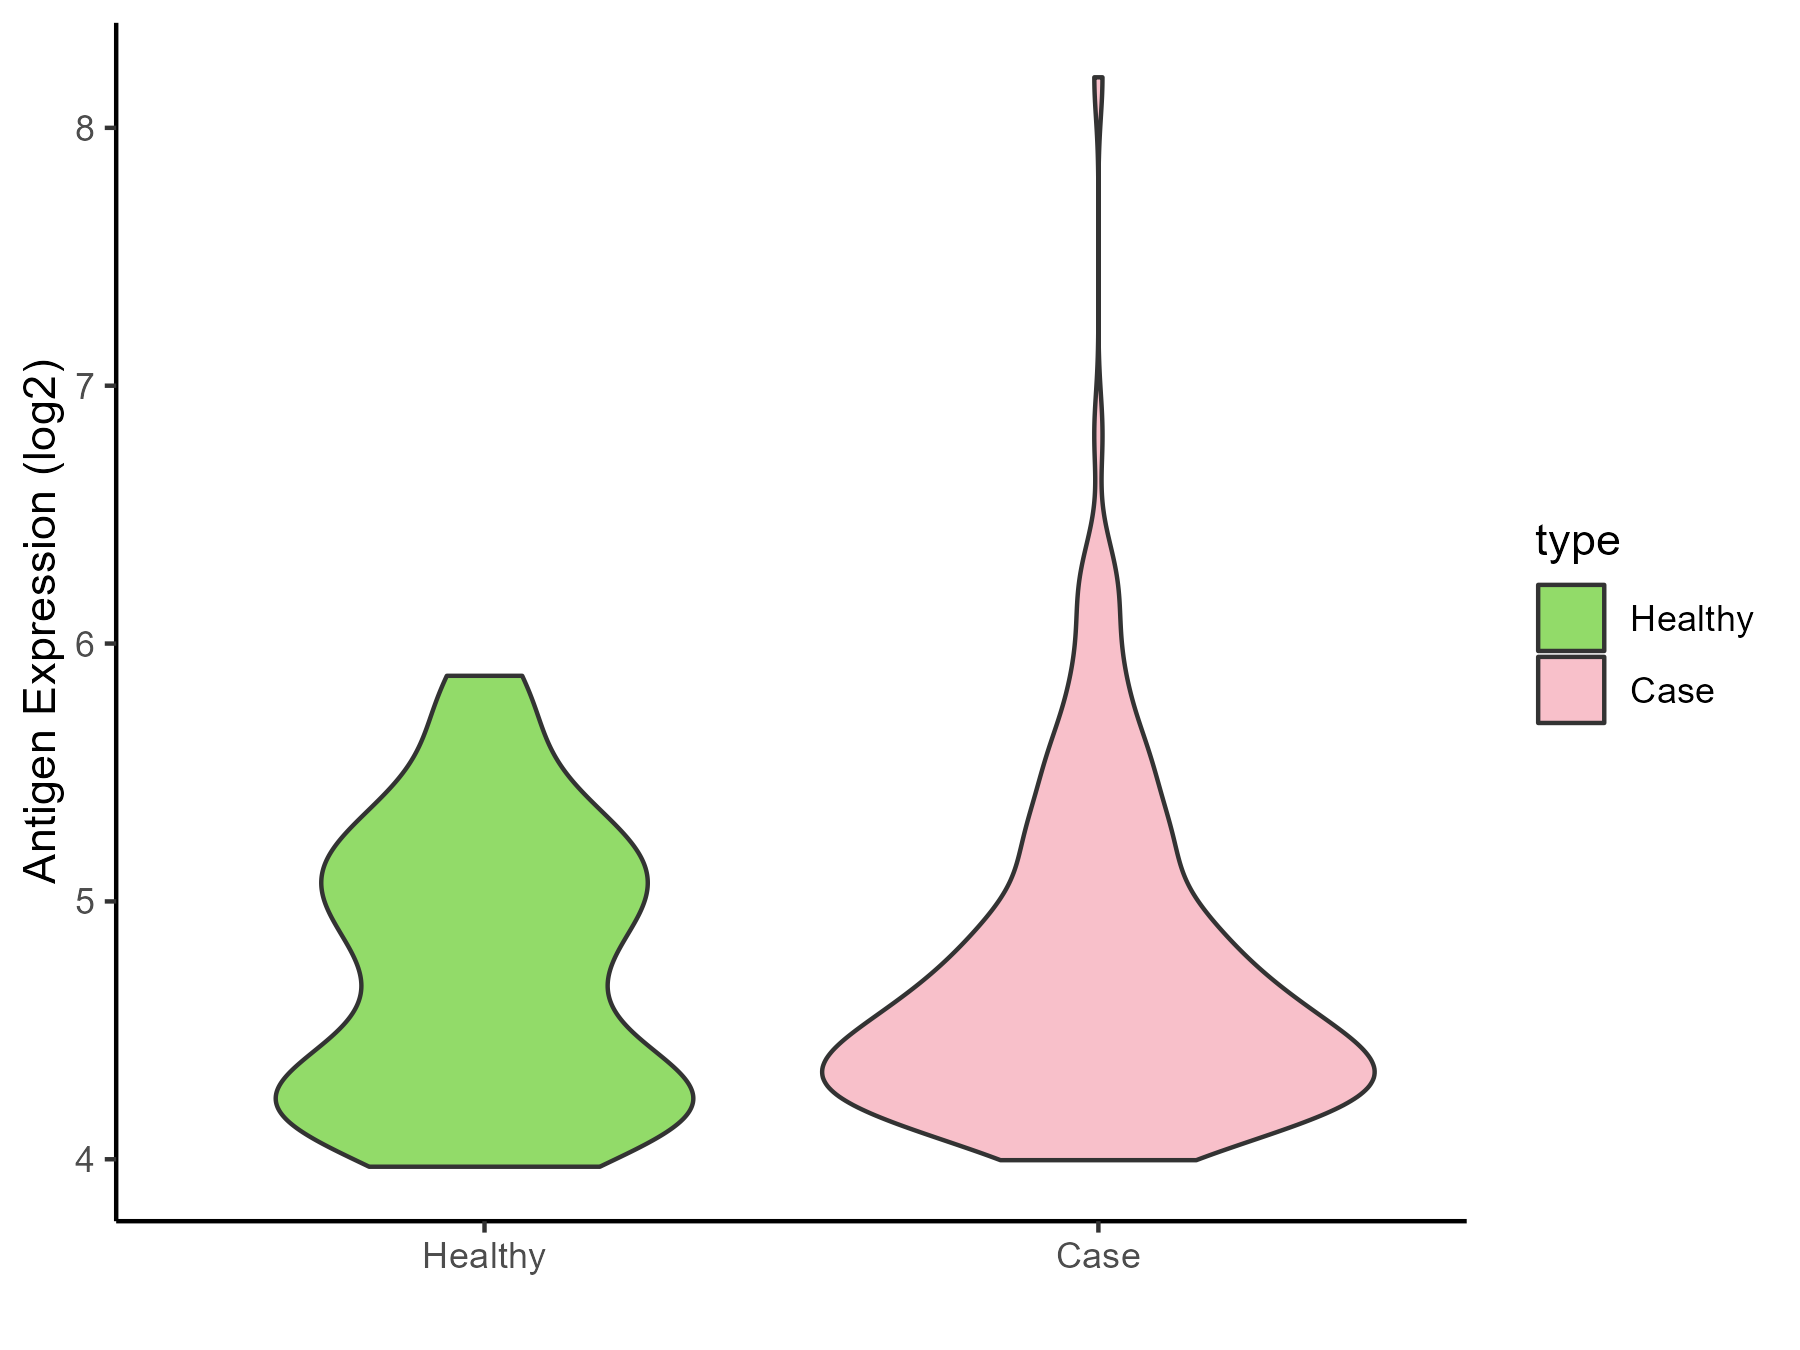
| The Studied Tissue | Head and neck | |
| The Specific Disease | Head and neck cancer | |
| The Expression Level of Disease Section Compare with the Healthy Individual Tissue | p-value: 0.810405306; Fold-change: -0.143593739; Z-score: -0.271550698 | |
| Disease-specific Antigen Abundances |
|
Click to View the Clearer Original Diagram |
| Differential expression pattern of antigen in diseases | ||
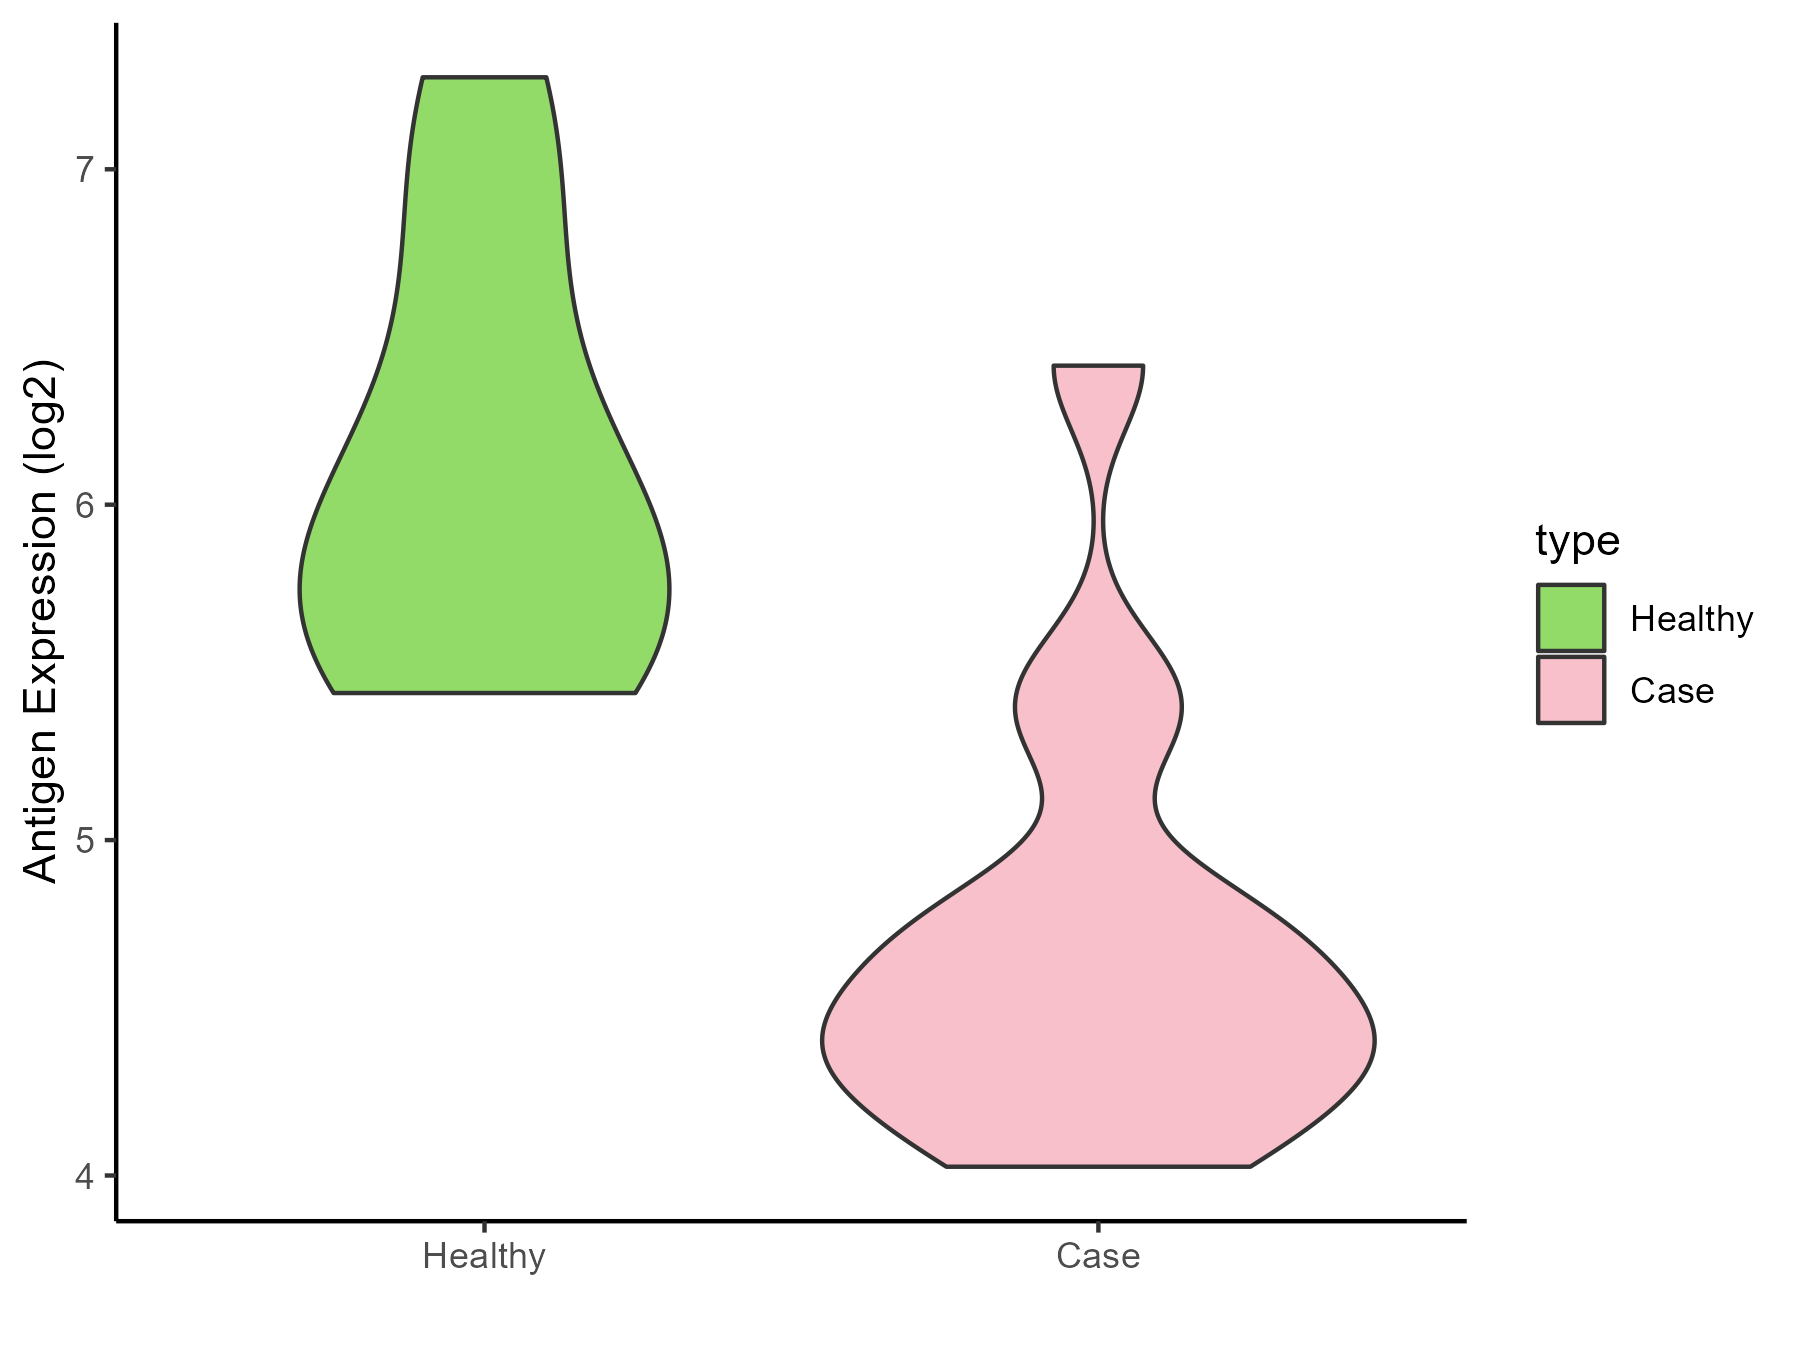
| The Studied Tissue | Pituitary | |
| The Specific Disease | Pituitary gonadotrope tumor | |
| The Expression Level of Disease Section Compare with the Healthy Individual Tissue | p-value: 9.32E-05; Fold-change: -1.369406736; Z-score: -2.112917322 | |
| Disease-specific Antigen Abundances |
|
Click to View the Clearer Original Diagram |
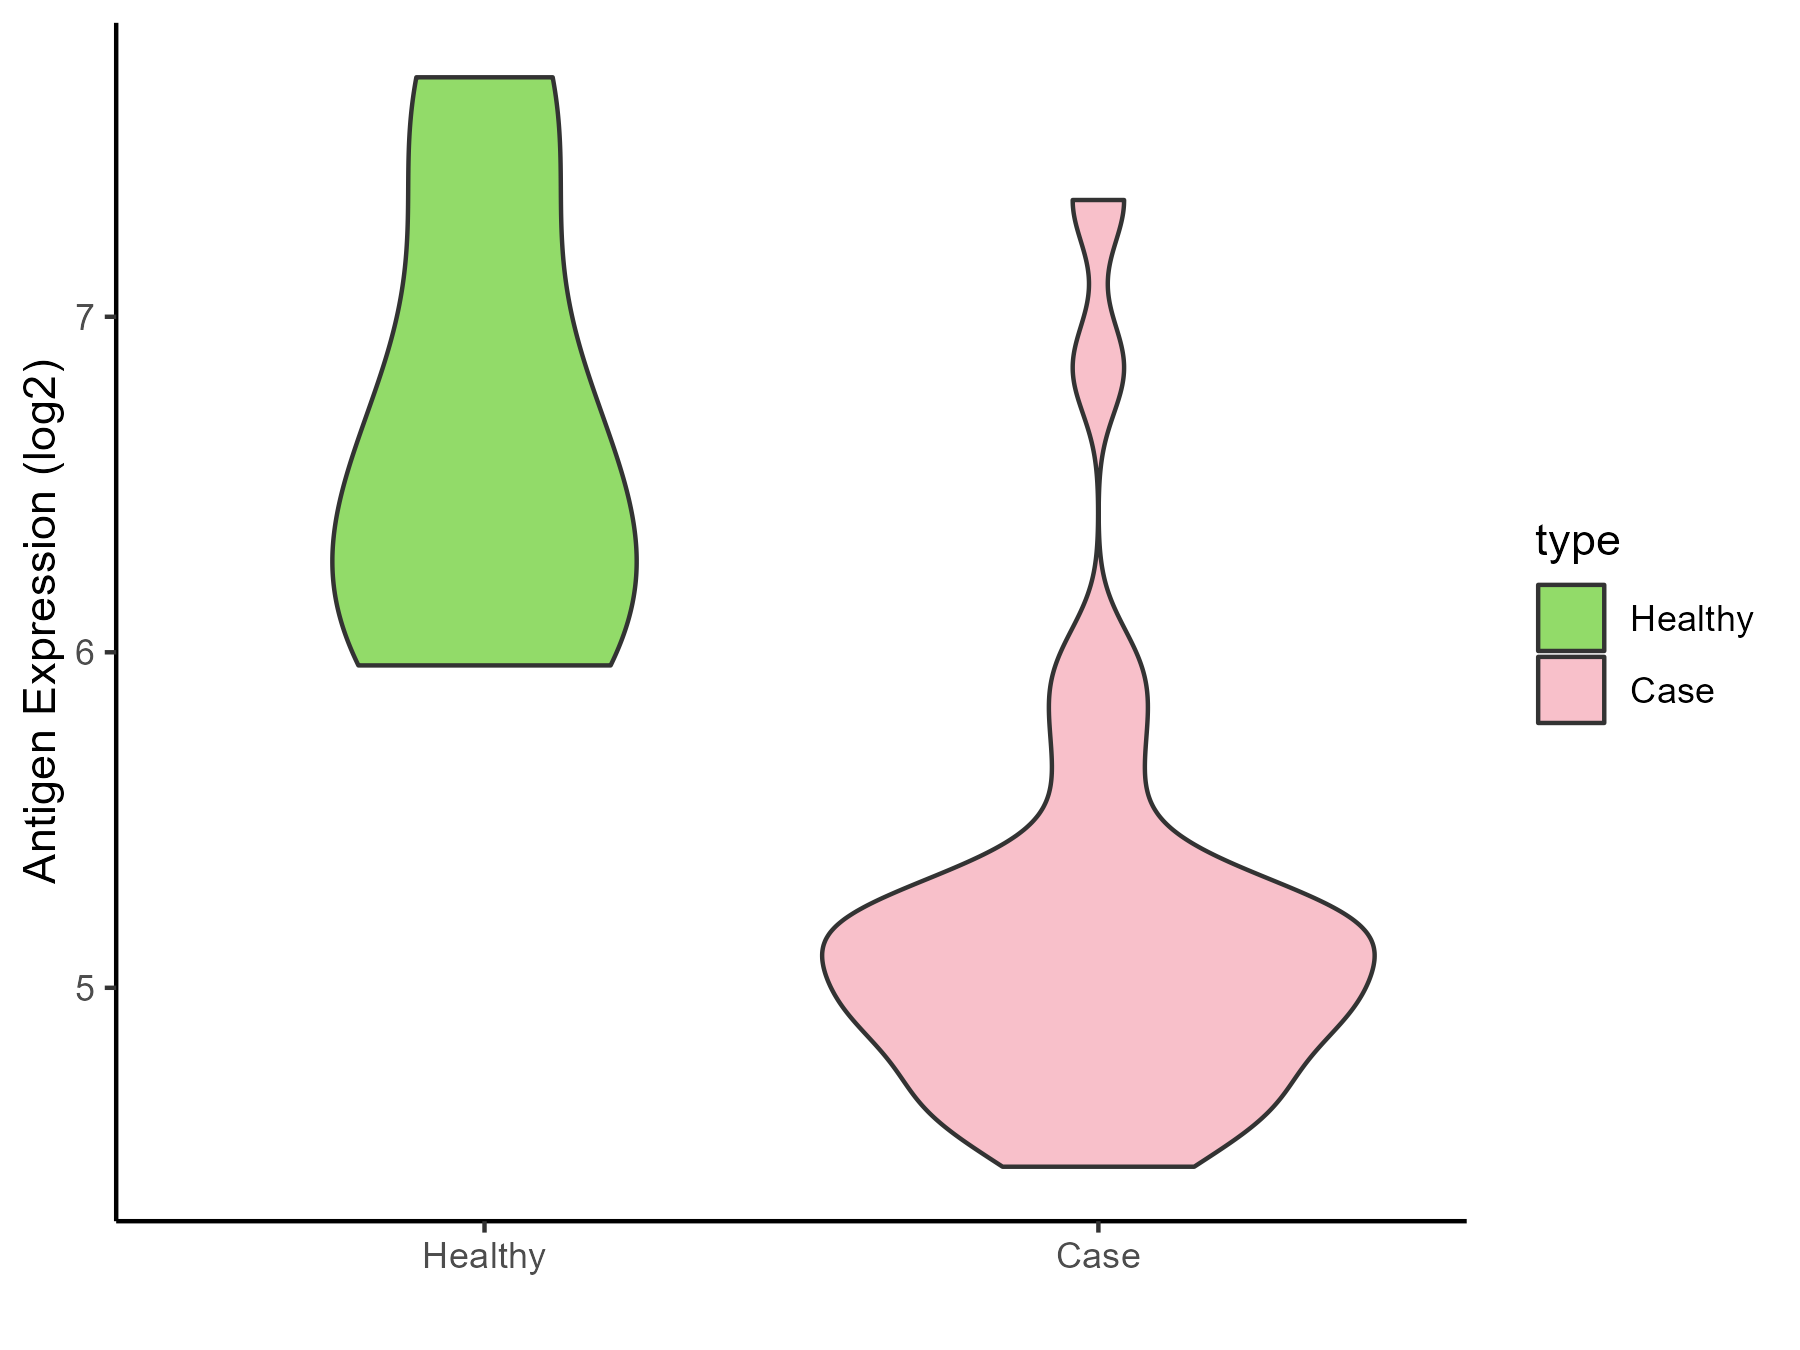
| The Studied Tissue | Pituitary | |
| The Specific Disease | Pituitary cancer | |
| The Expression Level of Disease Section Compare with the Healthy Individual Tissue | p-value: 5.73E-06; Fold-change: -1.437541726; Z-score: -2.189700661 | |
| Disease-specific Antigen Abundances |
|
Click to View the Clearer Original Diagram |
ICD Disease Classification 03
| Differential expression pattern of antigen in diseases | ||
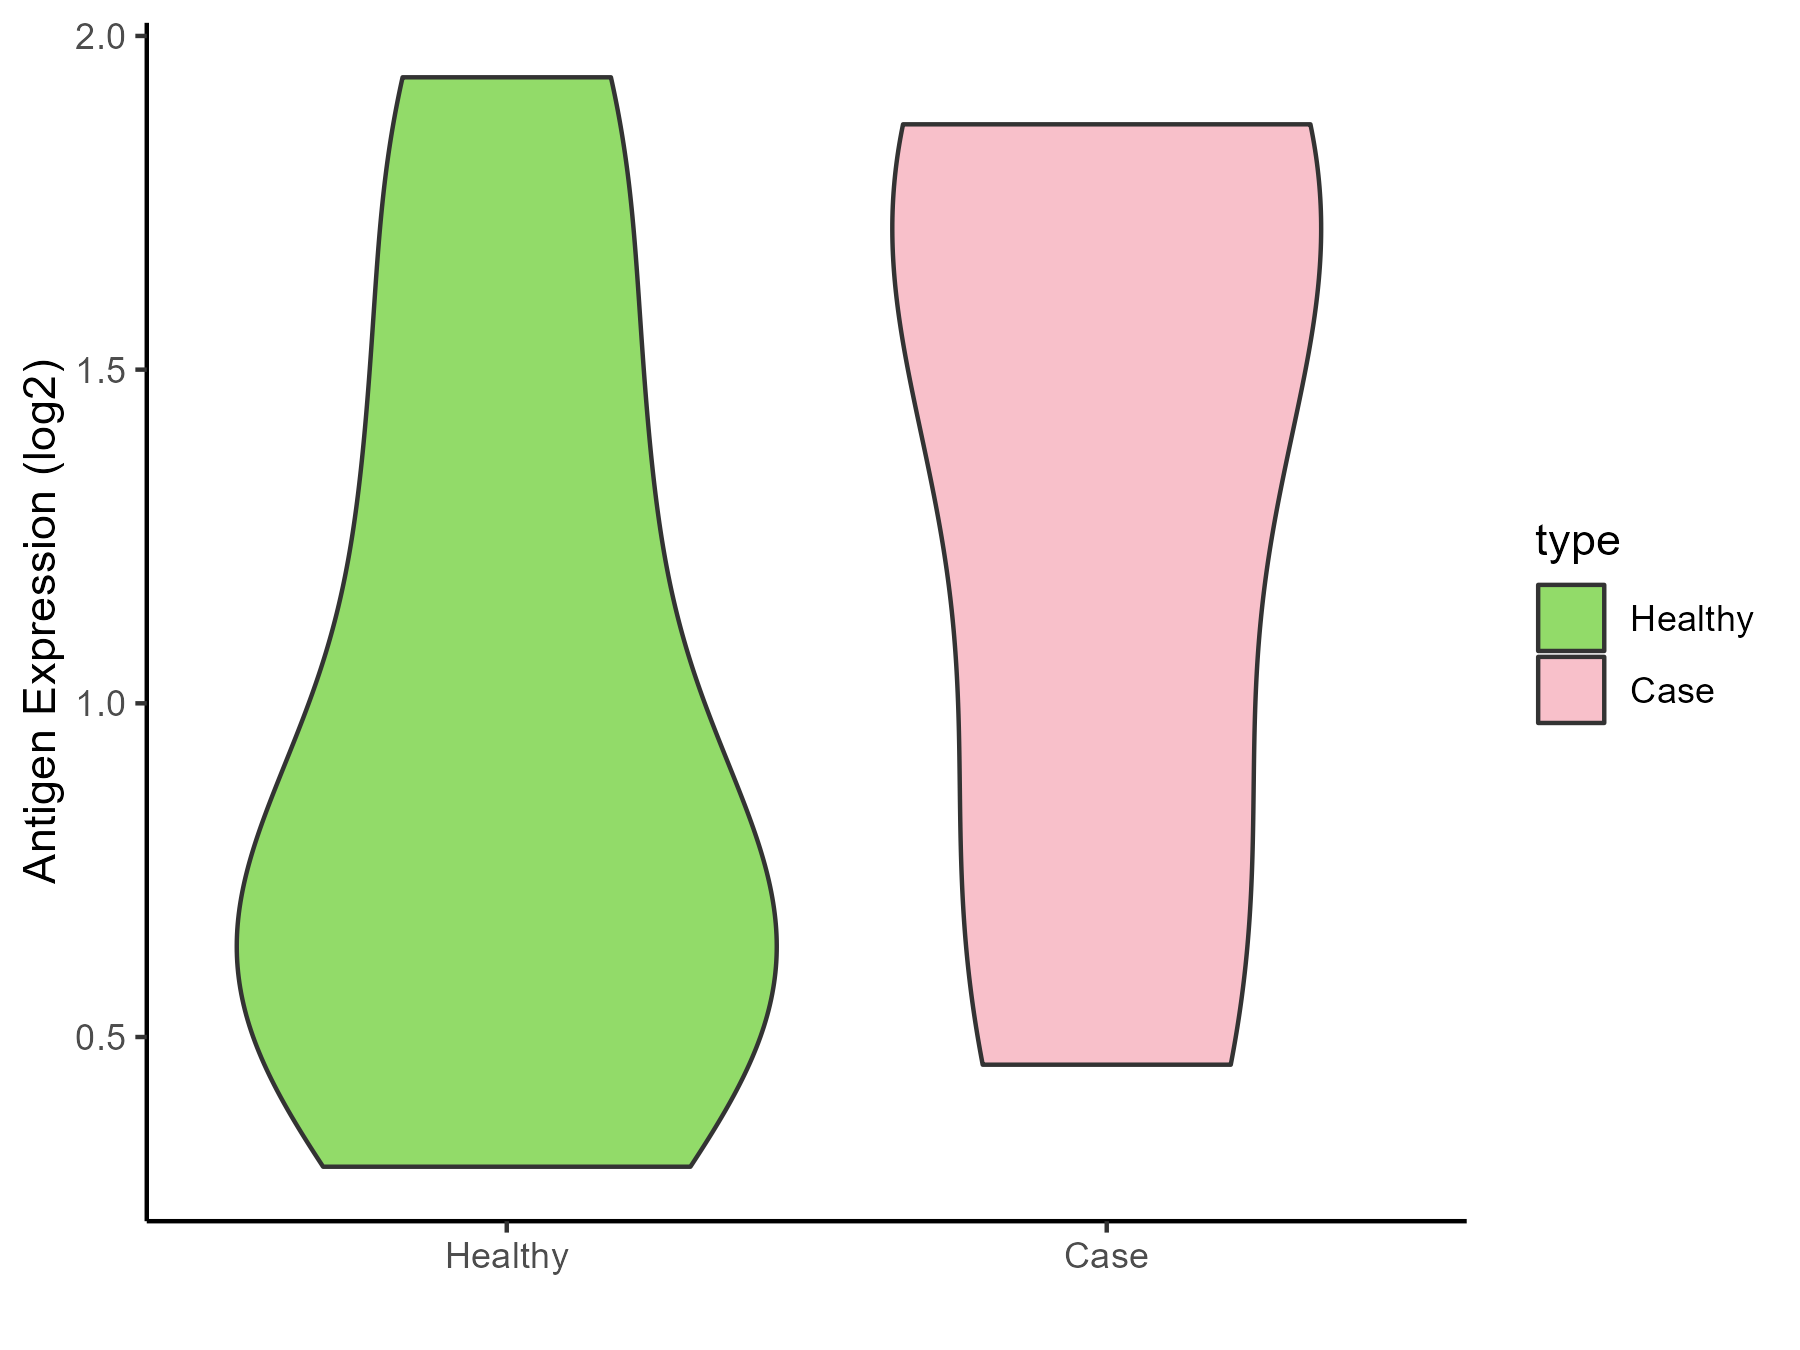
| The Studied Tissue | Whole blood | |
| The Specific Disease | Thrombocytopenia | |
| The Expression Level of Disease Section Compare with the Healthy Individual Tissue | p-value: 0.363690765; Fold-change: 0.761858521; Z-score: 1.360443863 | |
| Disease-specific Antigen Abundances |
|
Click to View the Clearer Original Diagram |
ICD Disease Classification 04
| Differential expression pattern of antigen in diseases | ||
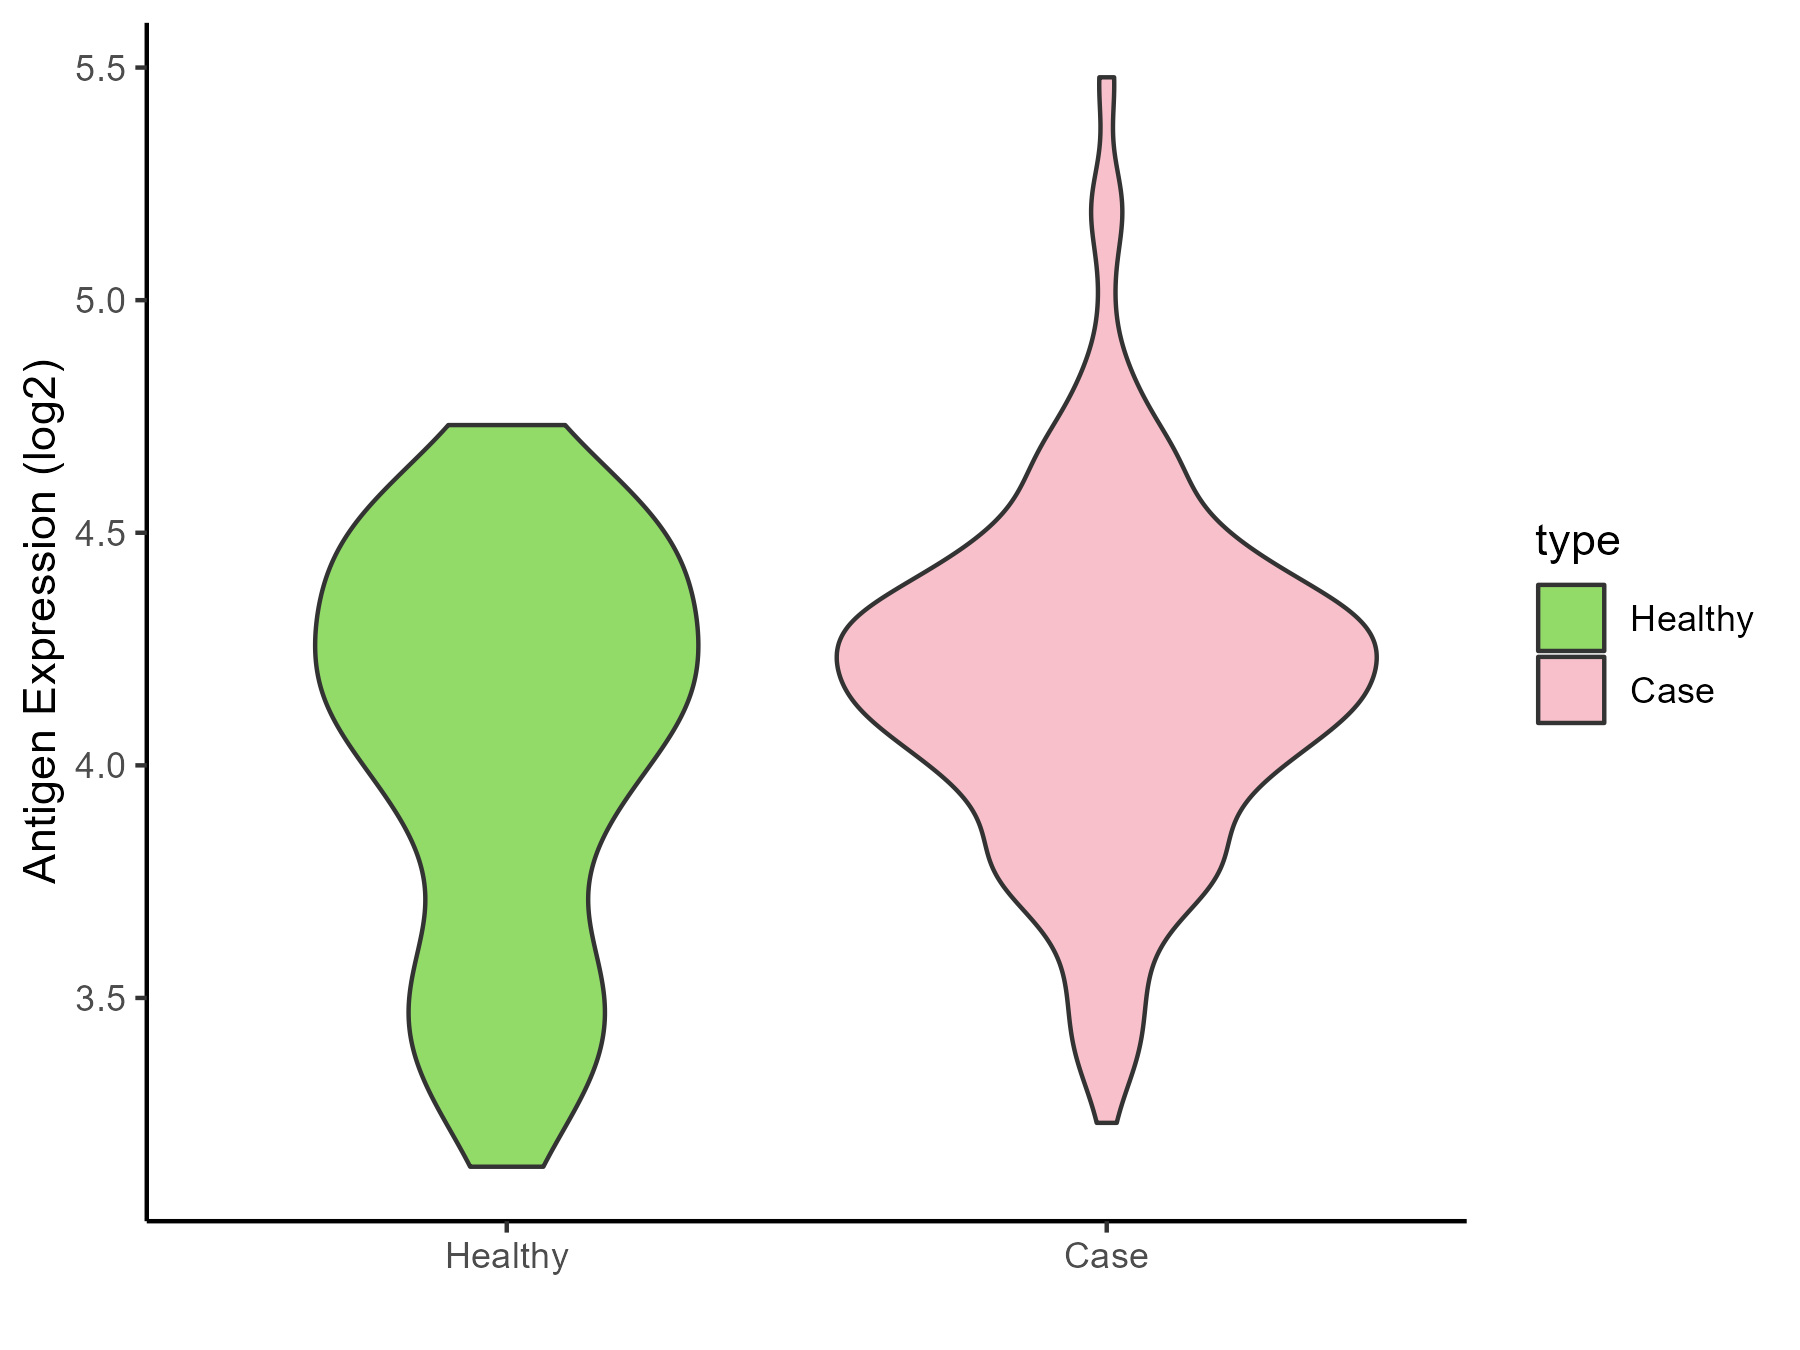
| The Studied Tissue | Whole blood | |
| The Specific Disease | Lupus erythematosus | |
| The Expression Level of Disease Section Compare with the Healthy Individual Tissue | p-value: 0.003337453; Fold-change: 0.044853076; Z-score: 0.106051371 | |
| Disease-specific Antigen Abundances |
|
Click to View the Clearer Original Diagram |
| Differential expression pattern of antigen in diseases | ||
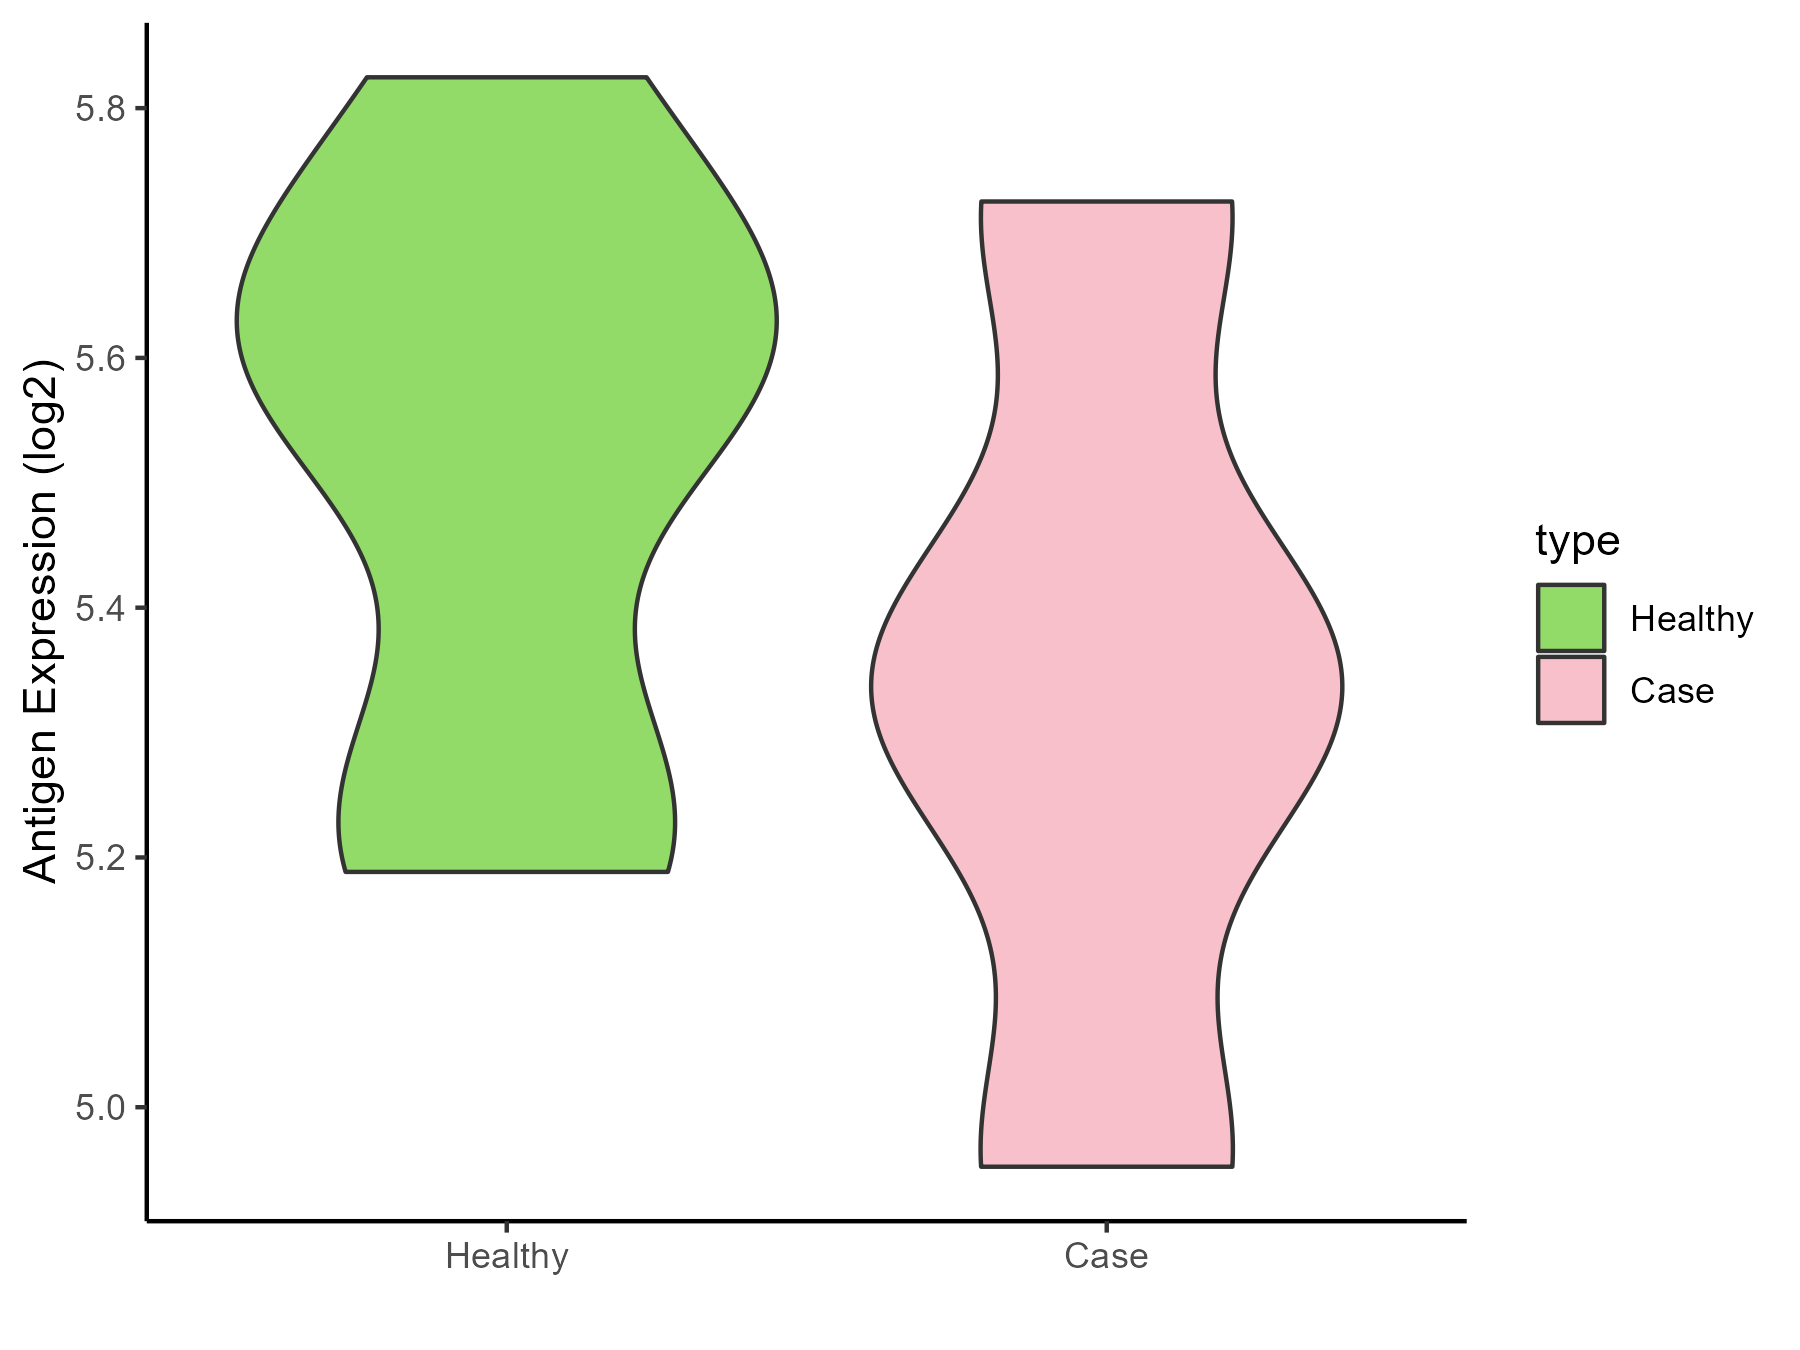
| The Studied Tissue | Peripheral monocyte | |
| The Specific Disease | Autoimmune uveitis | |
| The Expression Level of Disease Section Compare with the Healthy Individual Tissue | p-value: 0.364581589; Fold-change: -0.258260339; Z-score: -1.132845854 | |
| Disease-specific Antigen Abundances |
|
Click to View the Clearer Original Diagram |
ICD Disease Classification 05
| Differential expression pattern of antigen in diseases | ||
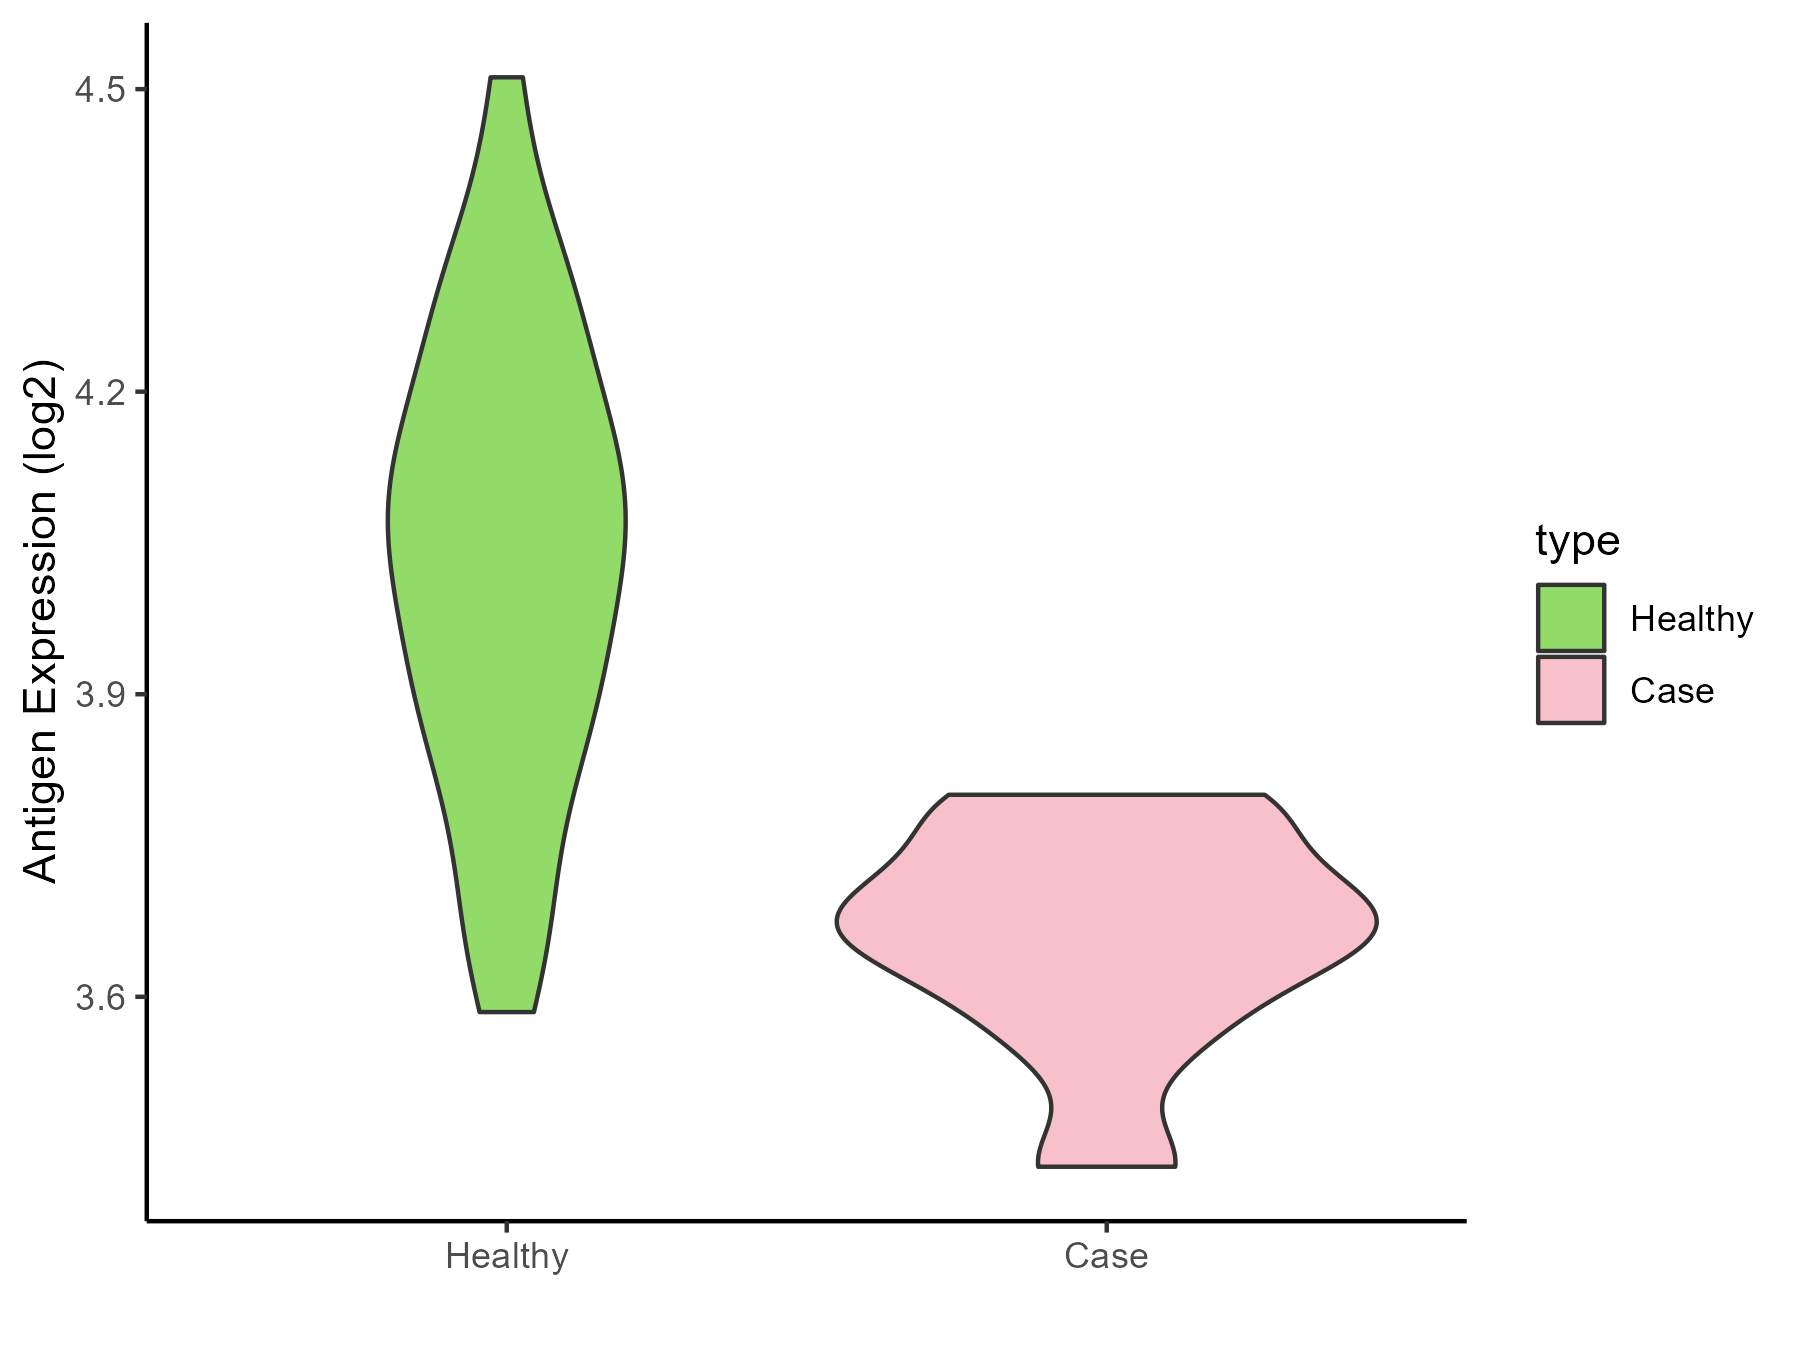
| The Studied Tissue | Whole blood | |
| The Specific Disease | Familial hypercholesterolemia | |
| The Expression Level of Disease Section Compare with the Healthy Individual Tissue | p-value: 2.35E-07; Fold-change: -0.376067697; Z-score: -1.705121623 | |
| Disease-specific Antigen Abundances |
|
Click to View the Clearer Original Diagram |
ICD Disease Classification 06
| Differential expression pattern of antigen in diseases | ||
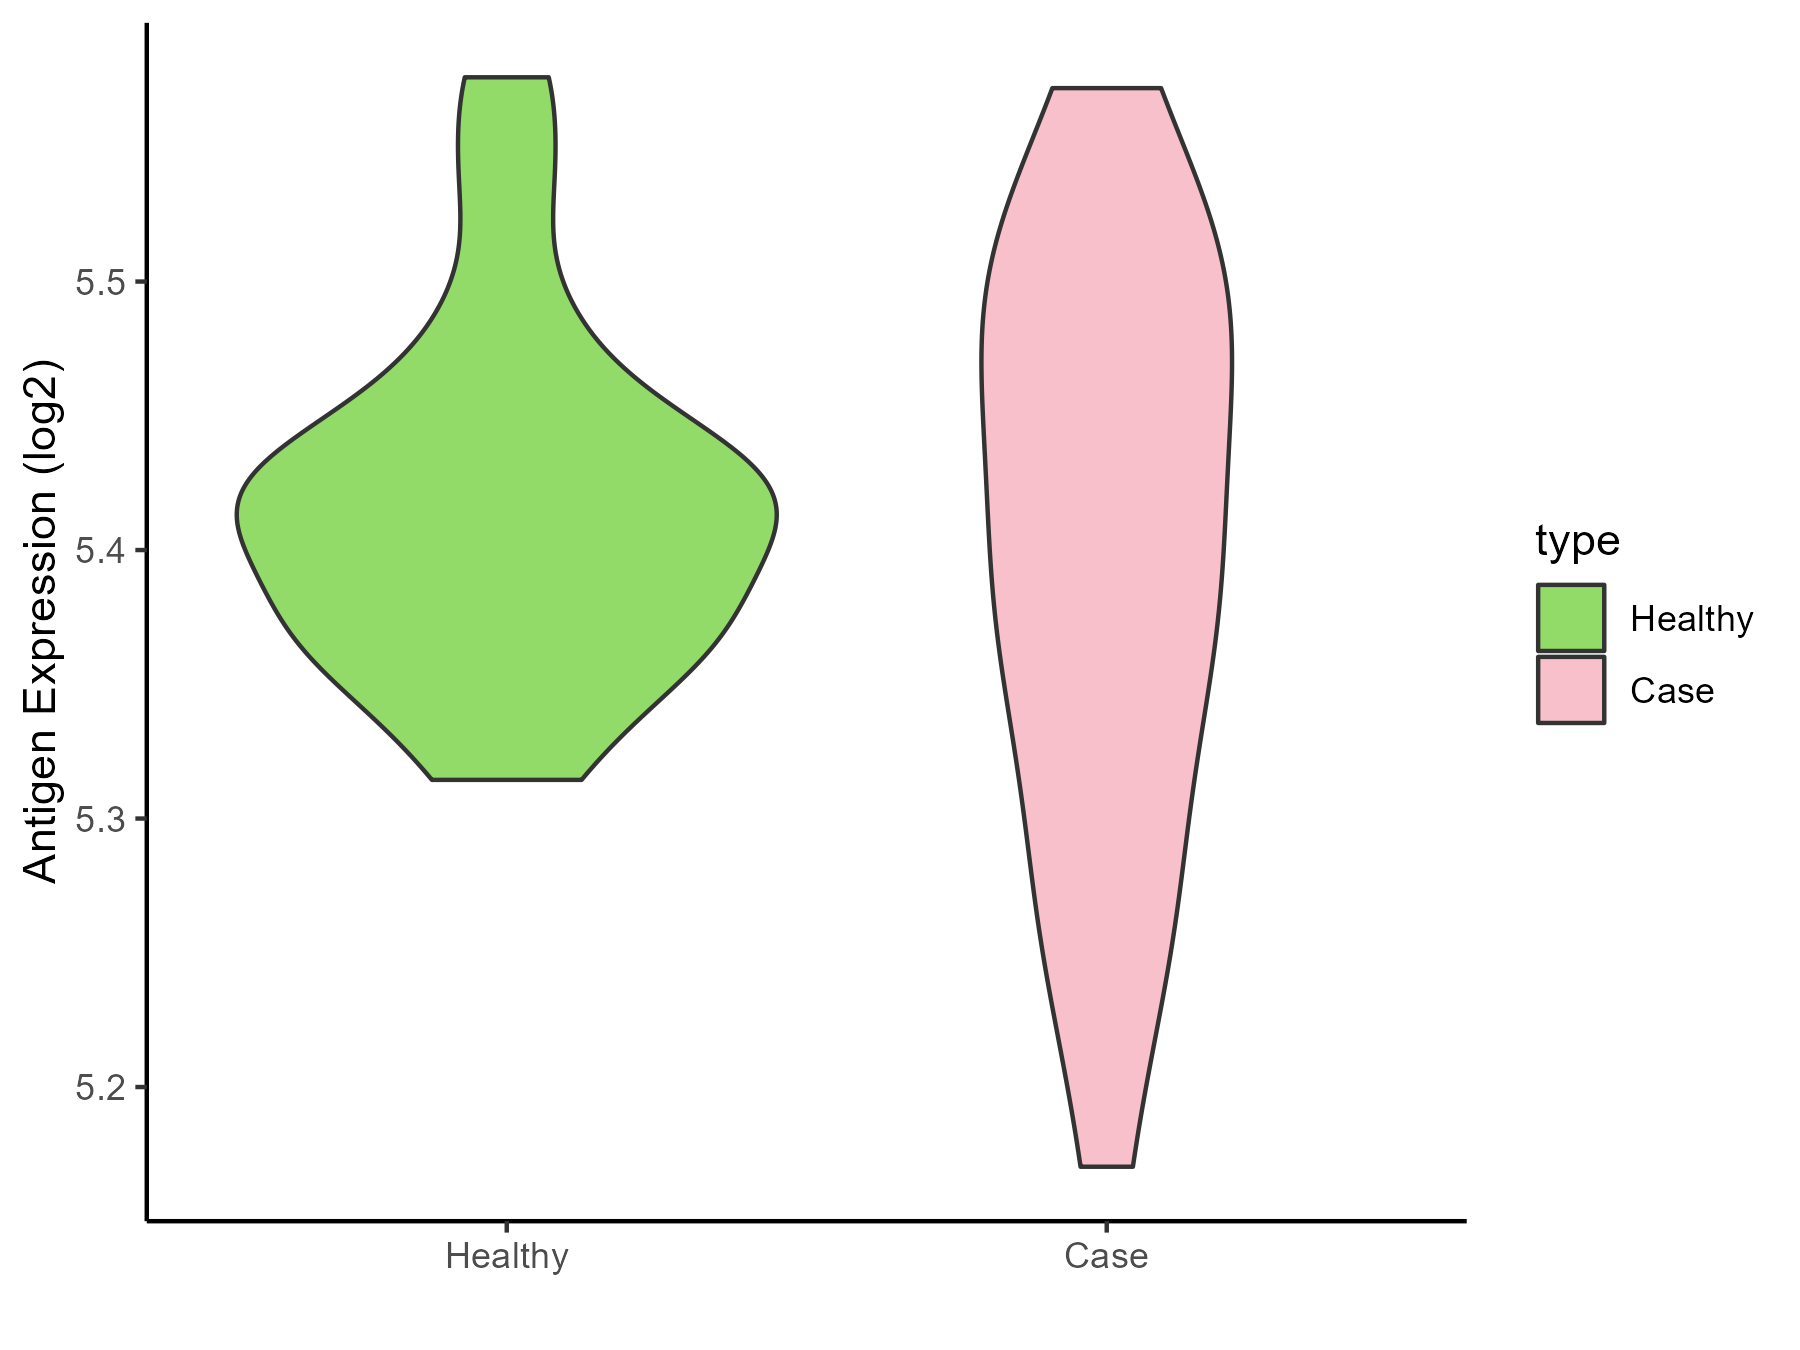
| The Studied Tissue | Superior temporal cortex | |
| The Specific Disease | Schizophrenia | |
| The Expression Level of Disease Section Compare with the Healthy Individual Tissue | p-value: 0.53585878; Fold-change: -0.01036193; Z-score: -0.158734869 | |
| Disease-specific Antigen Abundances |
|
Click to View the Clearer Original Diagram |
ICD Disease Classification 08
| Differential expression pattern of antigen in diseases | ||
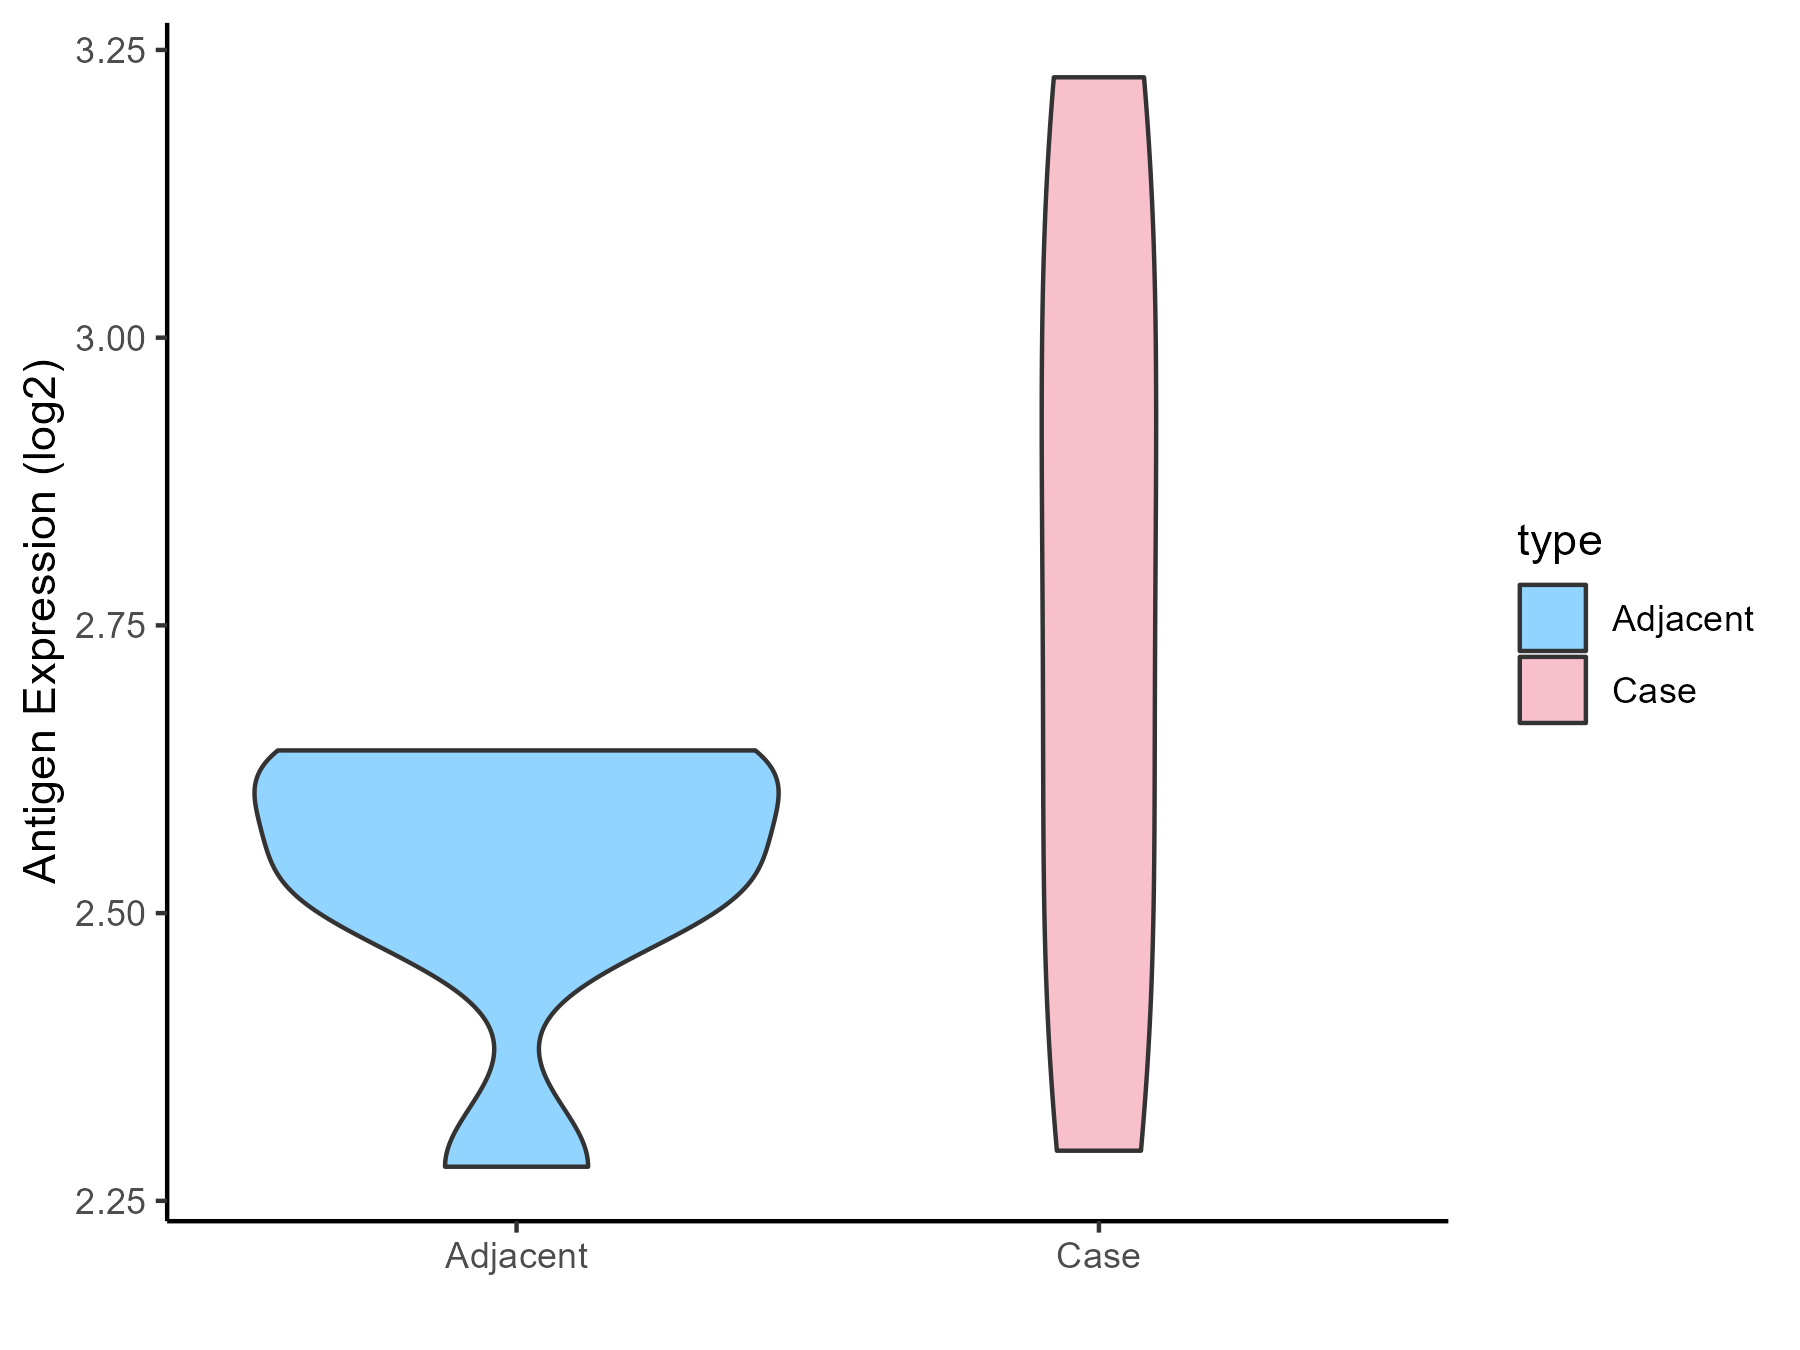
| The Studied Tissue | Spinal cord | |
| The Specific Disease | Multiple sclerosis | |
| The Expression Level of Disease Section Compare with the Adjacent Tissue | p-value: 0.140636851; Fold-change: 0.254976839; Z-score: 2.01229536 | |
| Disease-specific Antigen Abundances |
|
Click to View the Clearer Original Diagram |
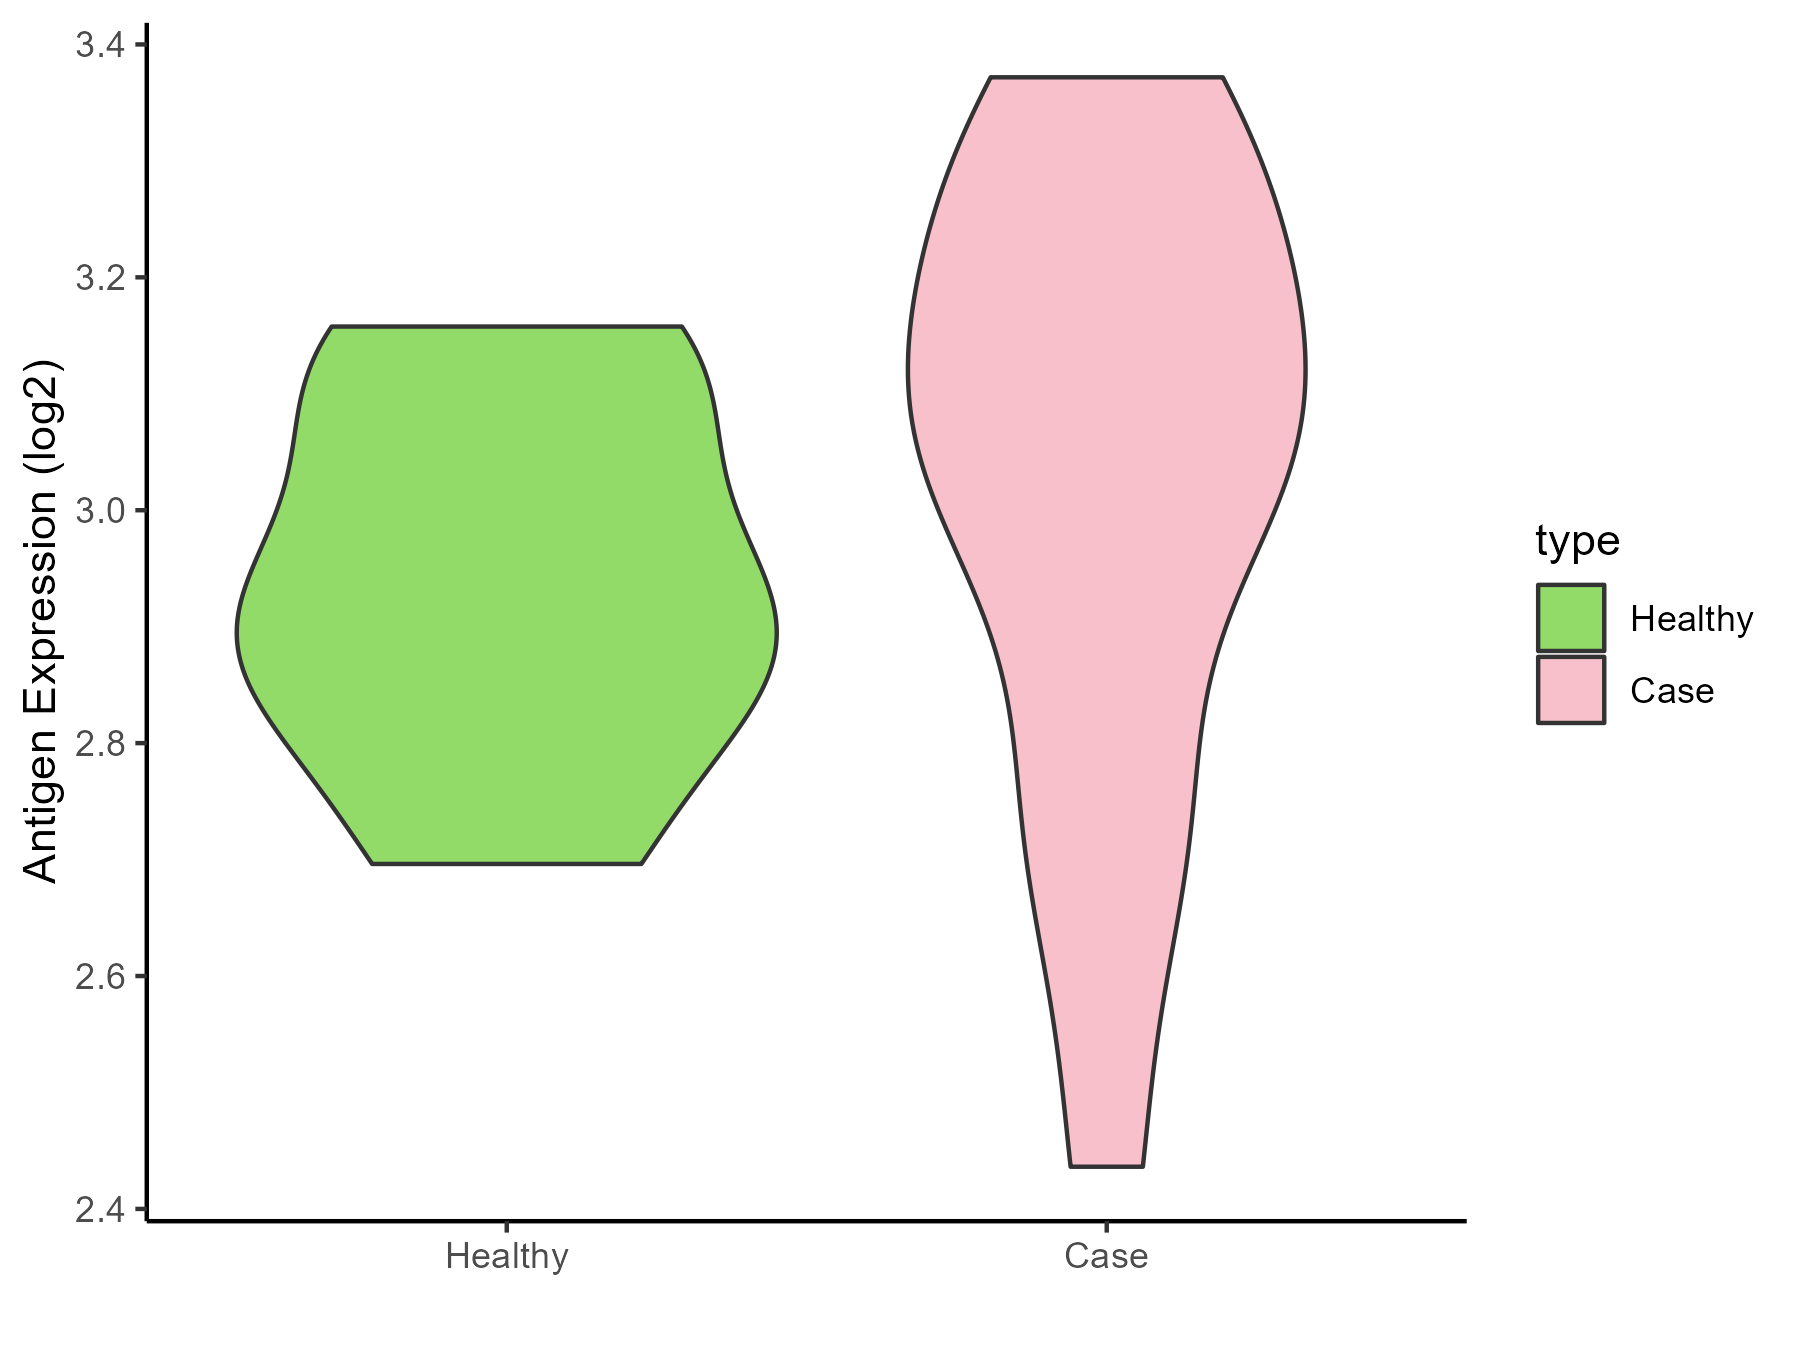
| The Studied Tissue | Plasmacytoid dendritic cells | |
| The Specific Disease | Multiple sclerosis | |
| The Expression Level of Disease Section Compare with the Healthy Individual Tissue | p-value: 0.373105654; Fold-change: 0.148564382; Z-score: 0.879834739 | |
| Disease-specific Antigen Abundances |
|
Click to View the Clearer Original Diagram |
| Differential expression pattern of antigen in diseases | ||
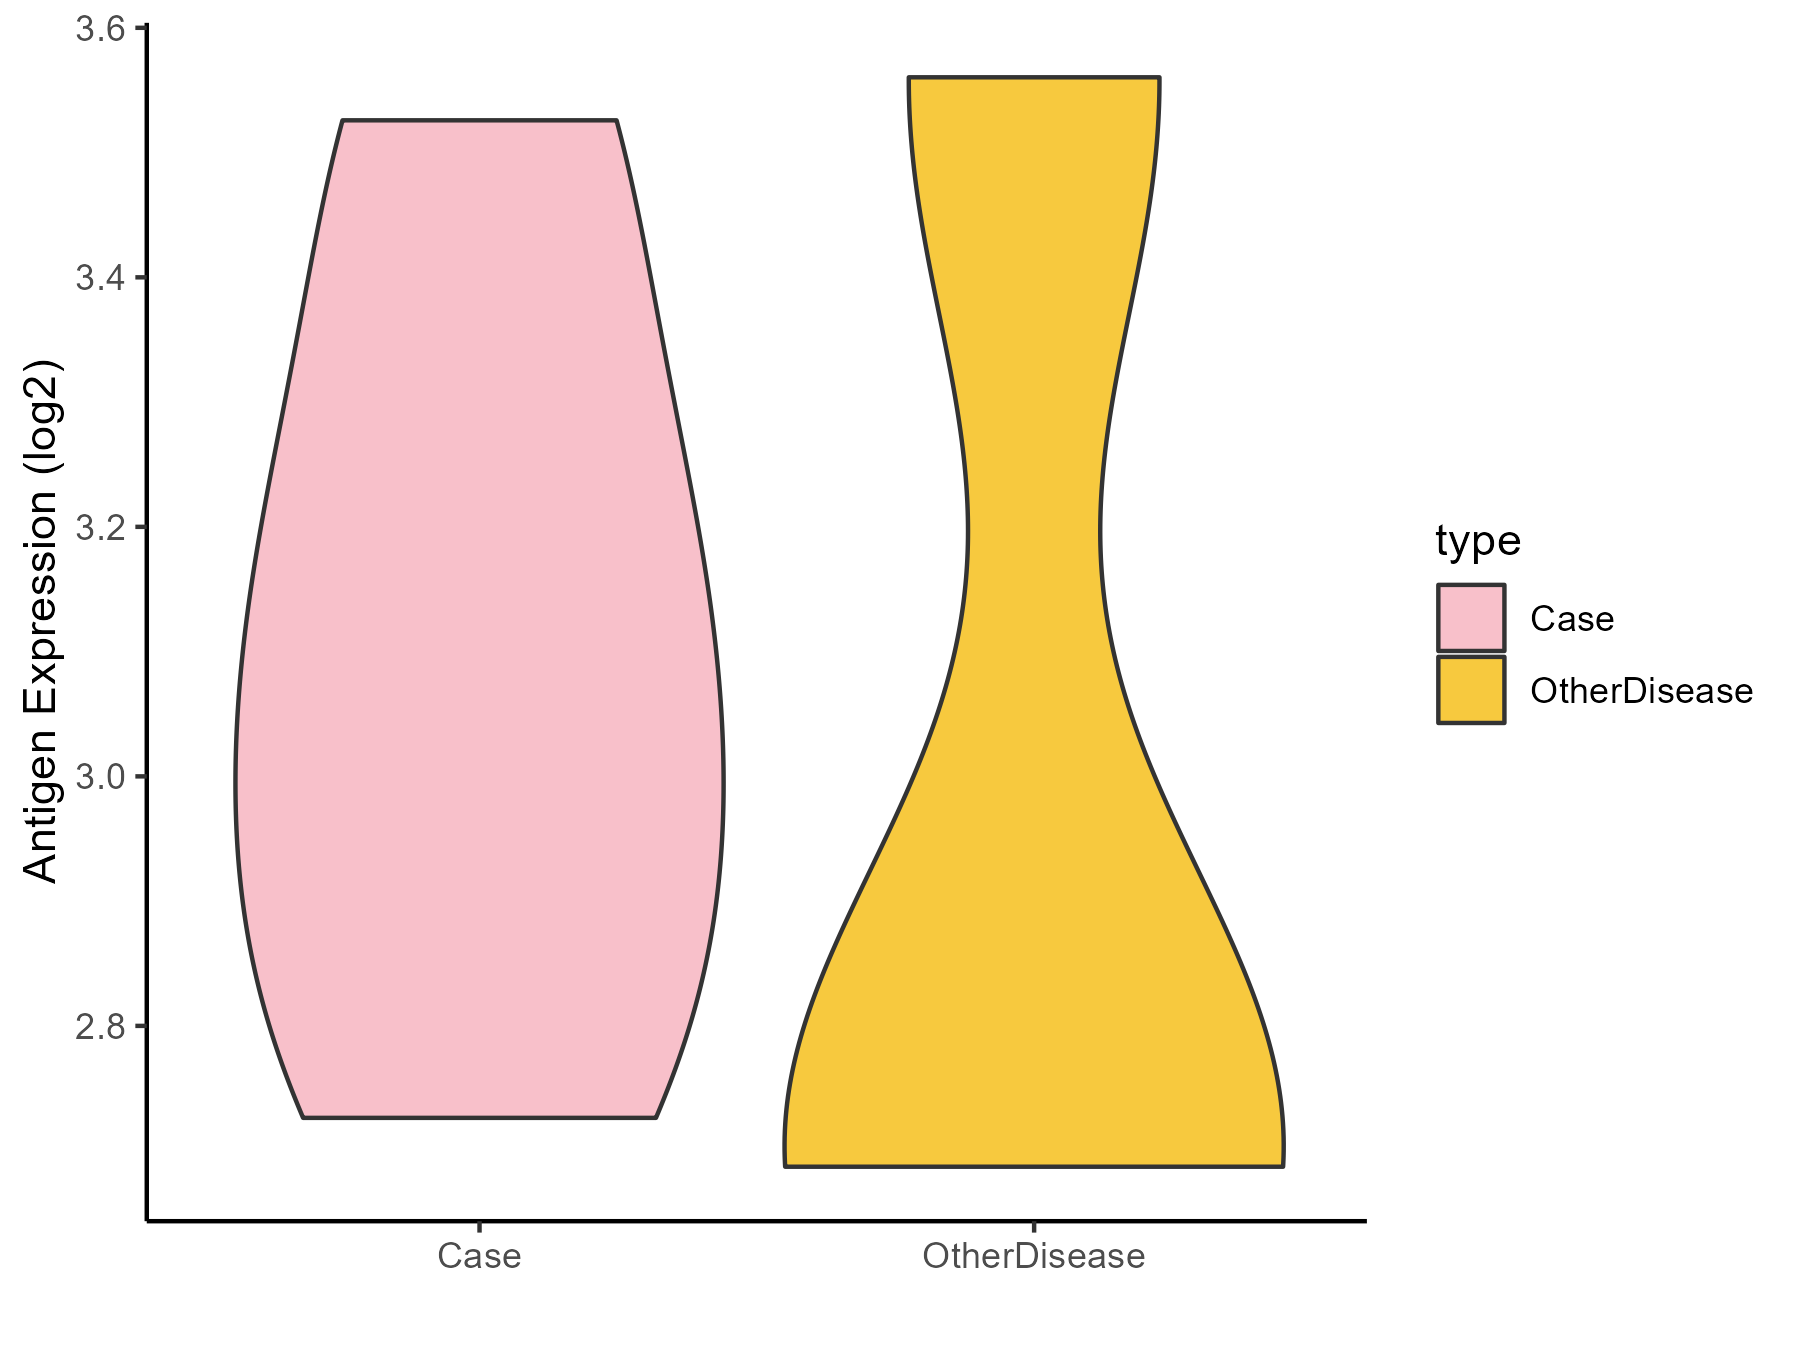
| The Studied Tissue | Peritumoral cortex | |
| The Specific Disease | Epilepsy | |
| The Expression Level of Disease Section Compare with the Other Disease Section | p-value: 0.75341754; Fold-change: 0.356095301; Z-score: 0.719161526 | |
| Disease-specific Antigen Abundances |
|
Click to View the Clearer Original Diagram |
| Differential expression pattern of antigen in diseases | ||
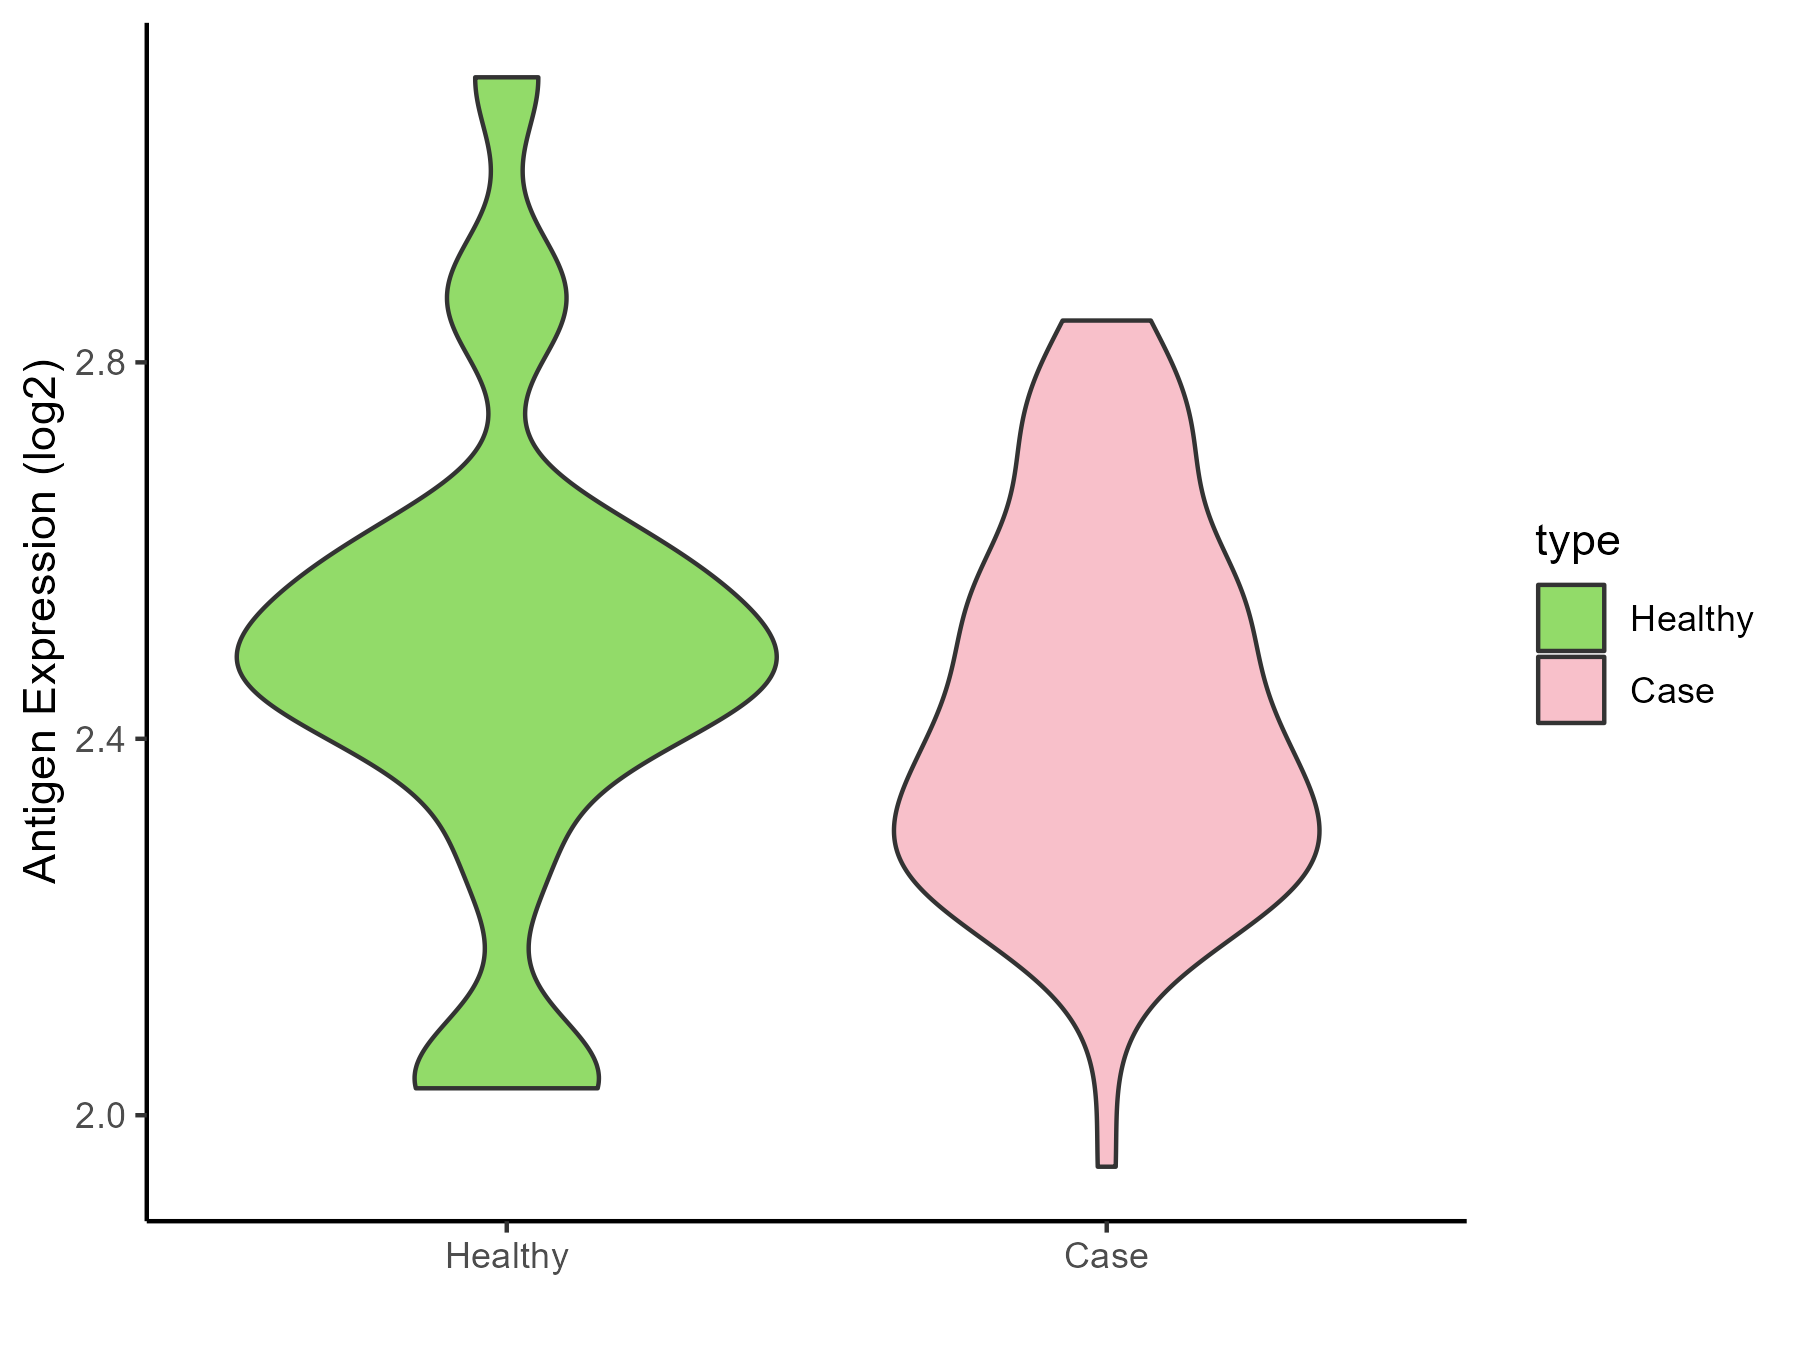
| The Studied Tissue | Whole blood | |
| The Specific Disease | Cardioembolic Stroke | |
| The Expression Level of Disease Section Compare with the Healthy Individual Tissue | p-value: 0.414684568; Fold-change: -0.099174676; Z-score: -0.374500865 | |
| Disease-specific Antigen Abundances |
|
Click to View the Clearer Original Diagram |
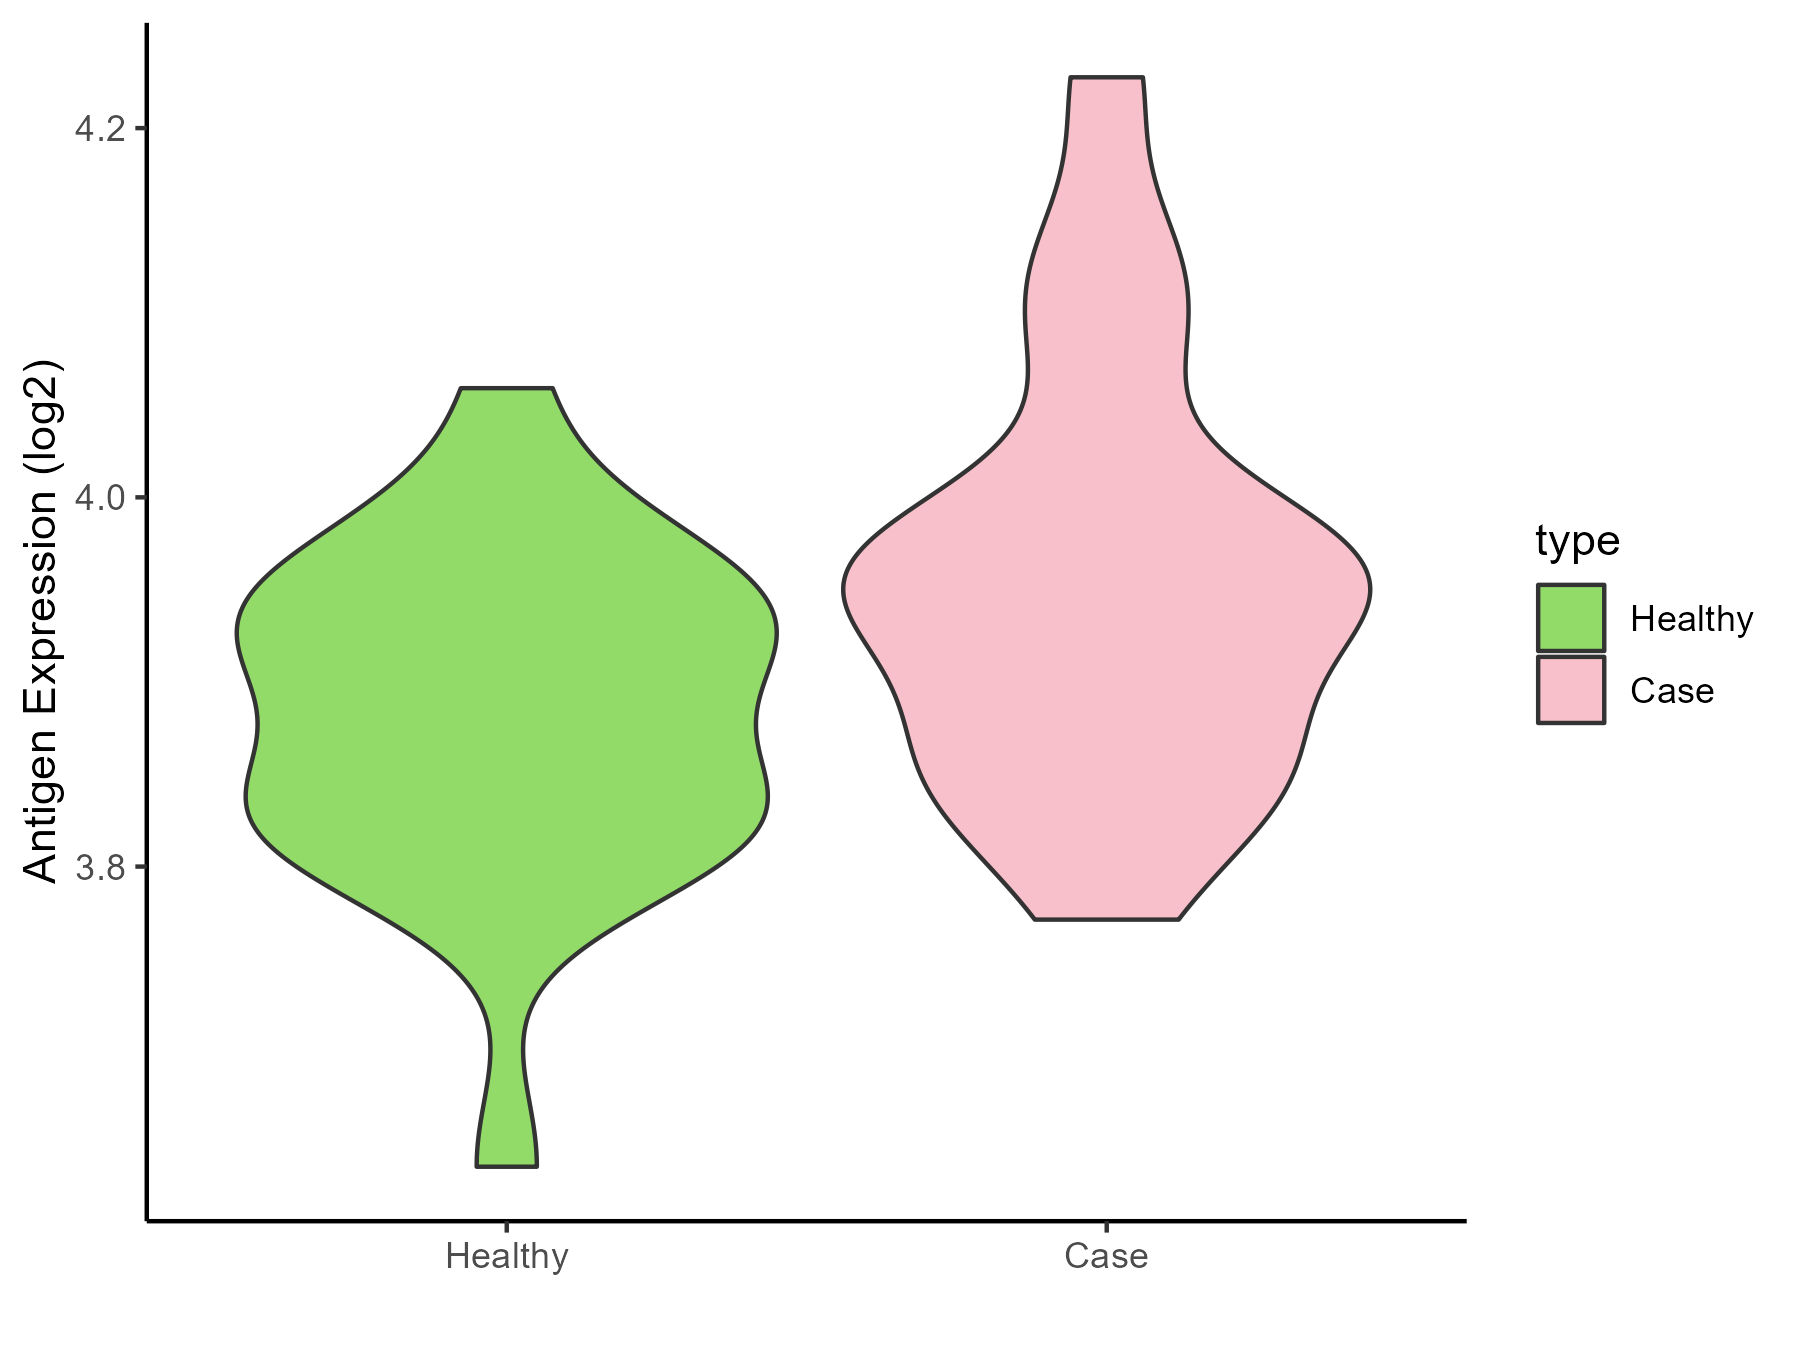
| The Studied Tissue | Peripheral blood | |
| The Specific Disease | Ischemic stroke | |
| The Expression Level of Disease Section Compare with the Healthy Individual Tissue | p-value: 0.041089829; Fold-change: 0.049607163; Z-score: 0.546422629 | |
| Disease-specific Antigen Abundances |
|
Click to View the Clearer Original Diagram |
ICD Disease Classification 1
| Differential expression pattern of antigen in diseases | ||
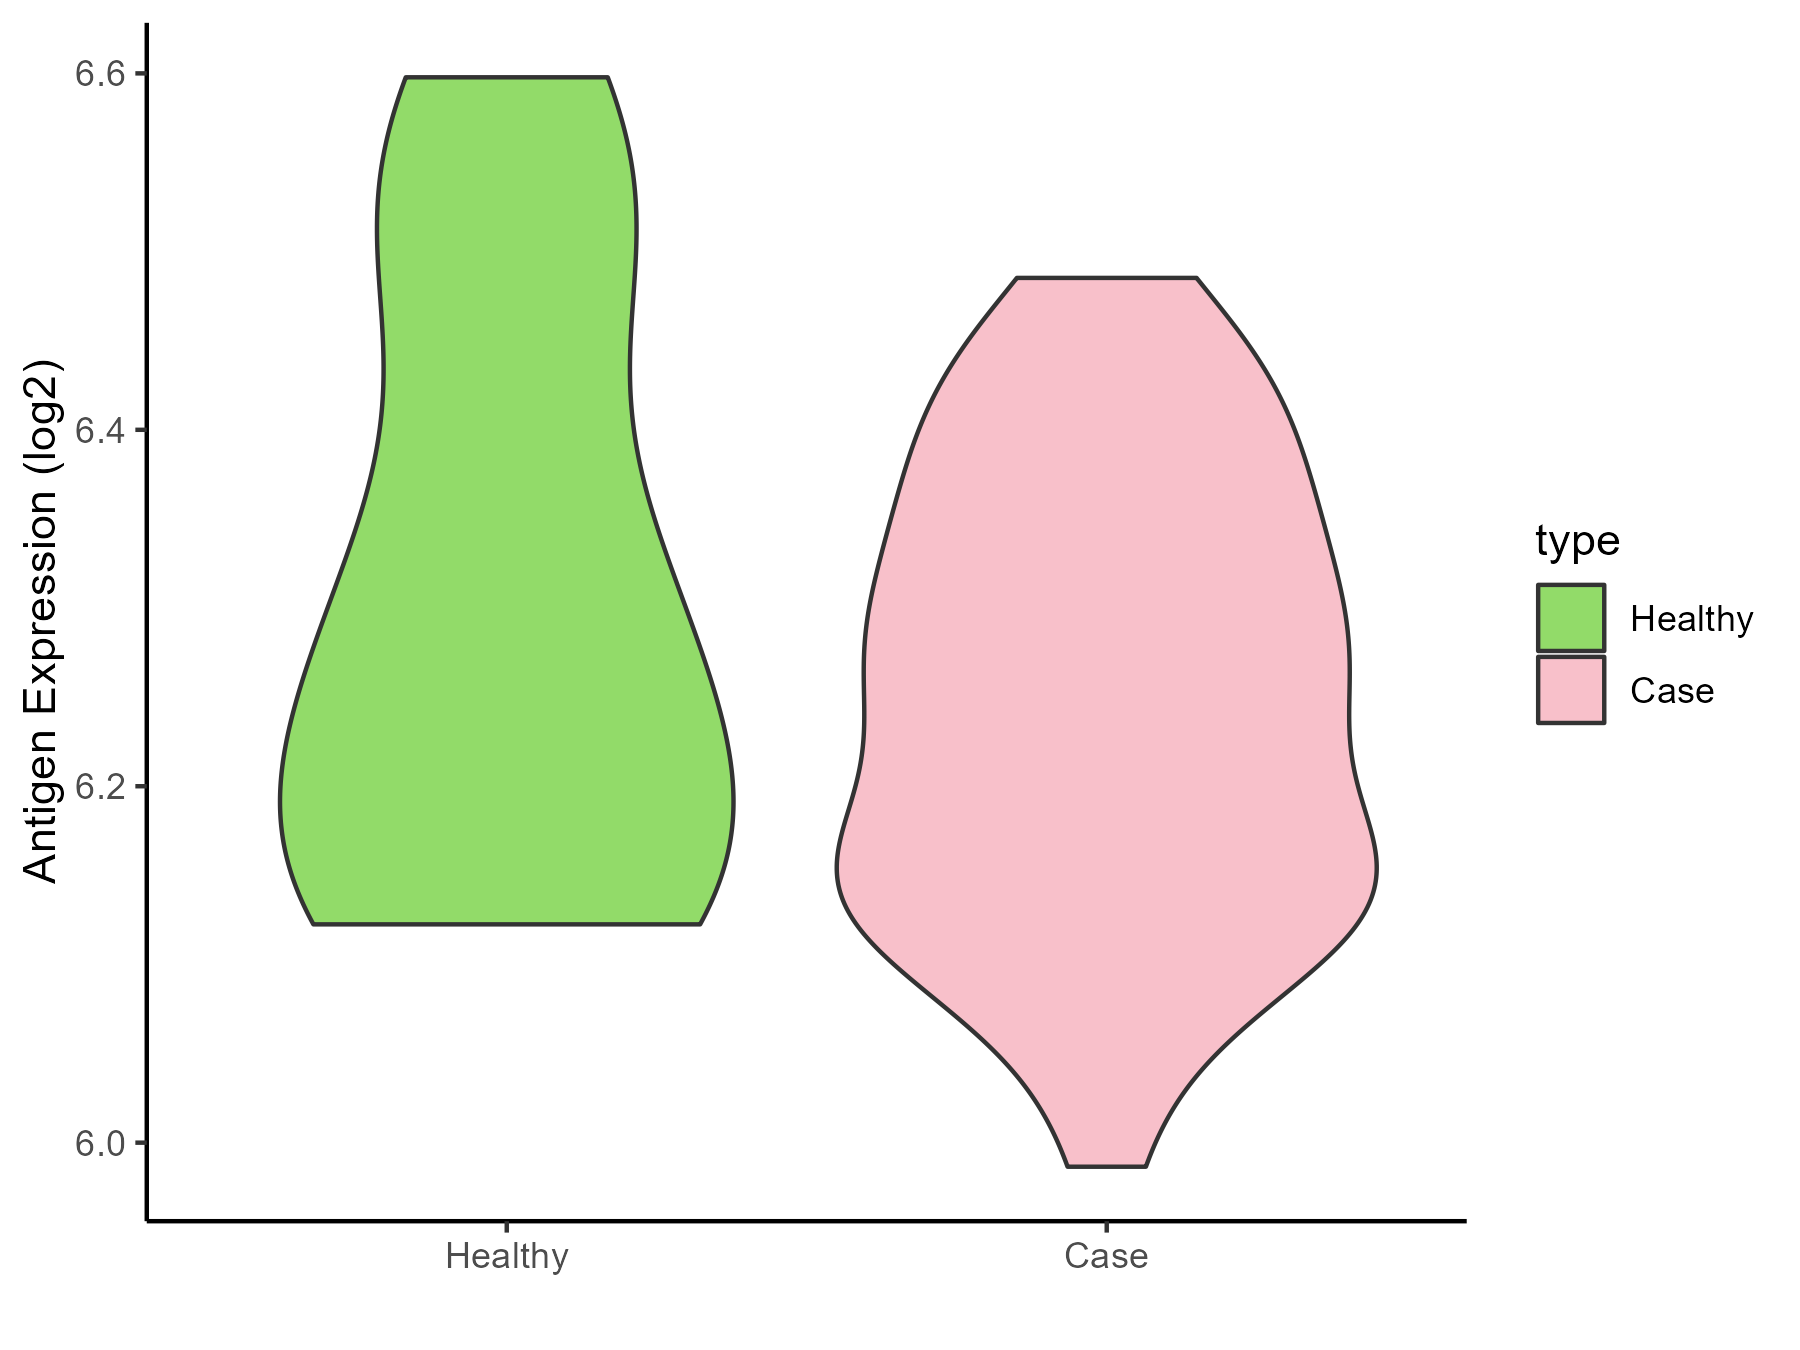
| The Studied Tissue | White matter | |
| The Specific Disease | HIV | |
| The Expression Level of Disease Section Compare with the Healthy Individual Tissue | p-value: 0.214144345; Fold-change: -0.019966852; Z-score: -0.117984851 | |
| Disease-specific Antigen Abundances |
|
Click to View the Clearer Original Diagram |
| Differential expression pattern of antigen in diseases | ||
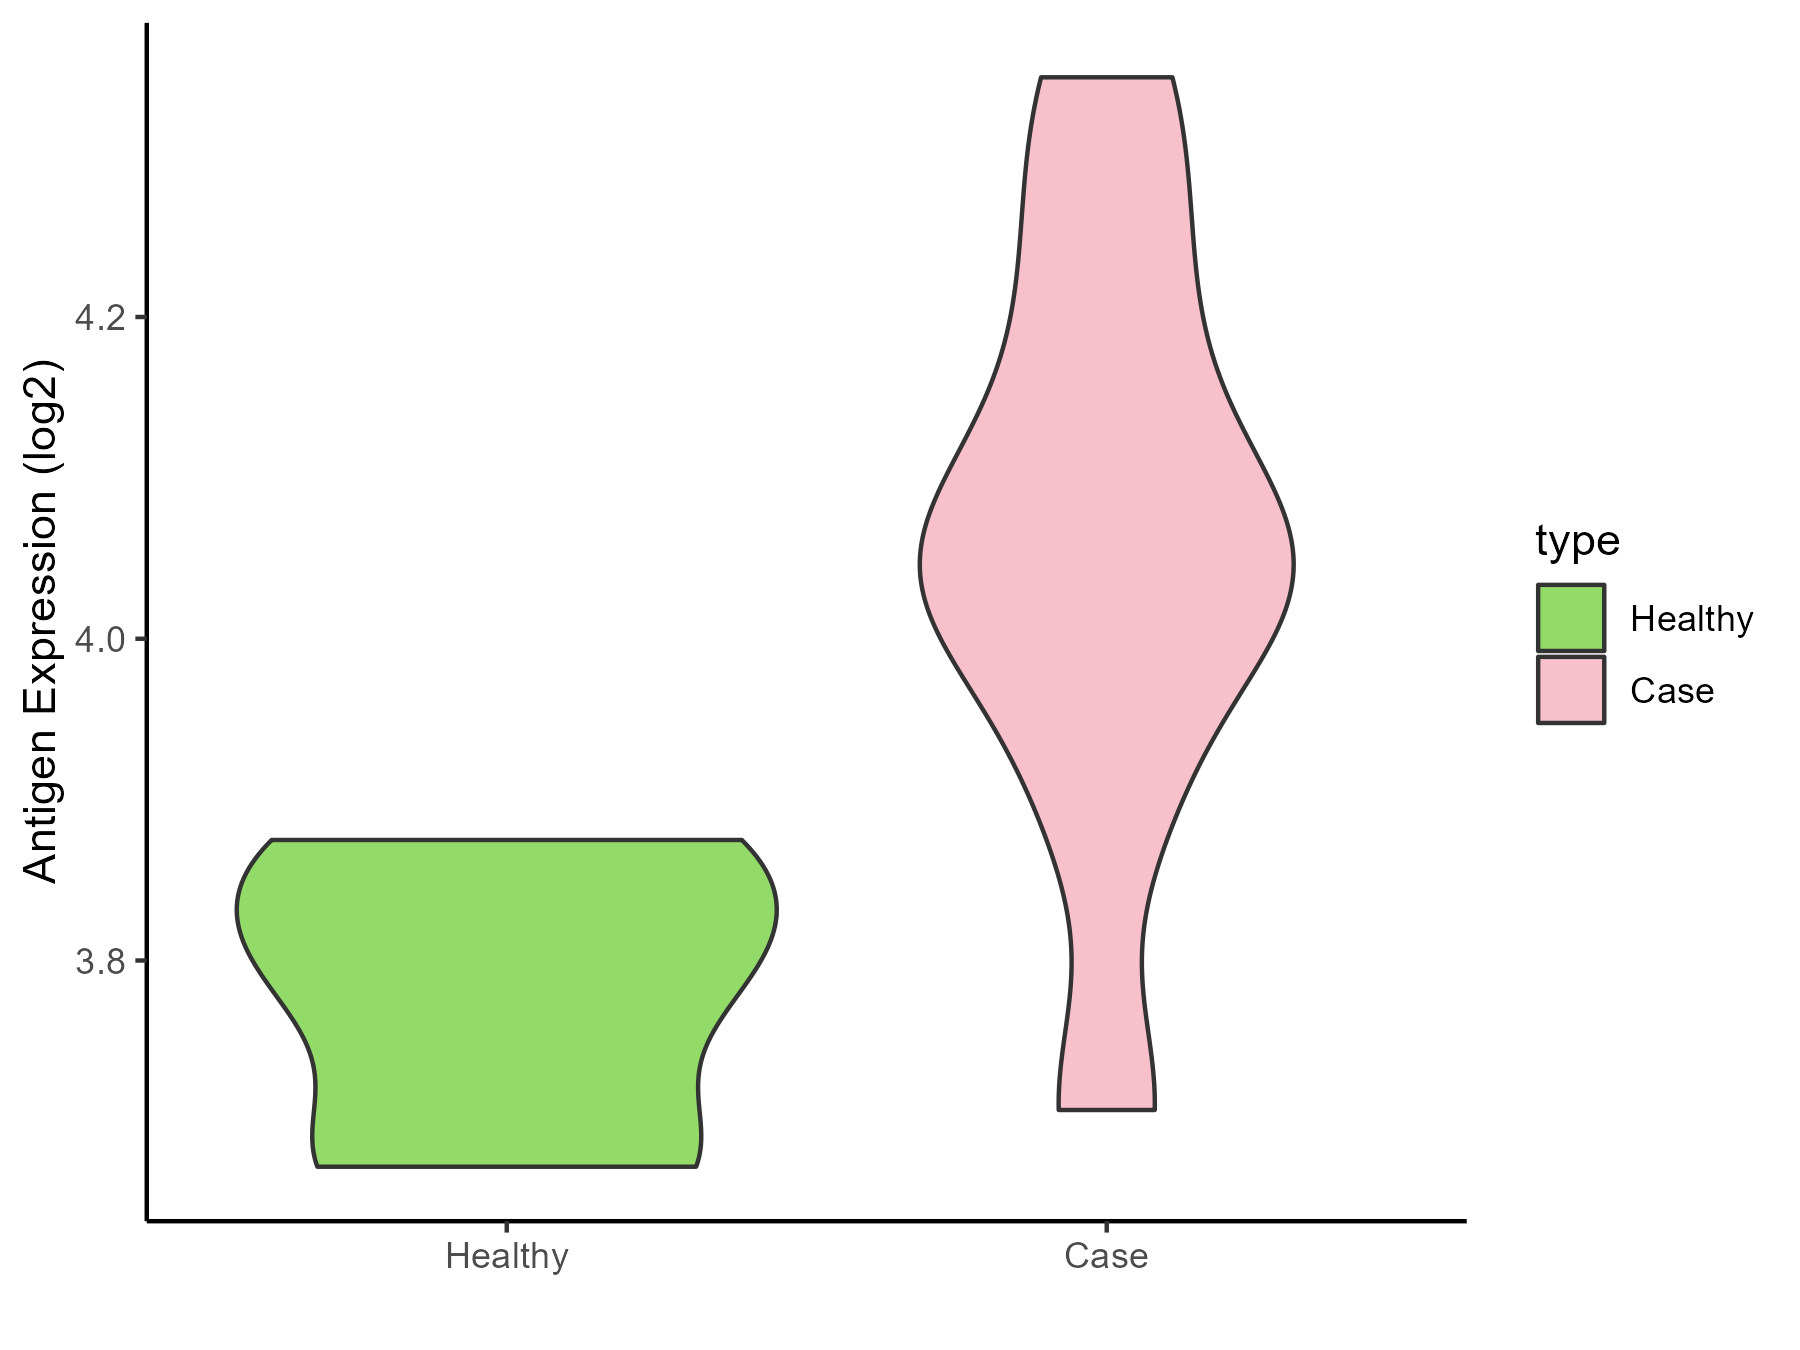
| The Studied Tissue | Whole blood | |
| The Specific Disease | Influenza | |
| The Expression Level of Disease Section Compare with the Healthy Individual Tissue | p-value: 0.01471019; Fold-change: 0.265884324; Z-score: 2.599385559 | |
| Disease-specific Antigen Abundances |
|
Click to View the Clearer Original Diagram |
| Differential expression pattern of antigen in diseases | ||
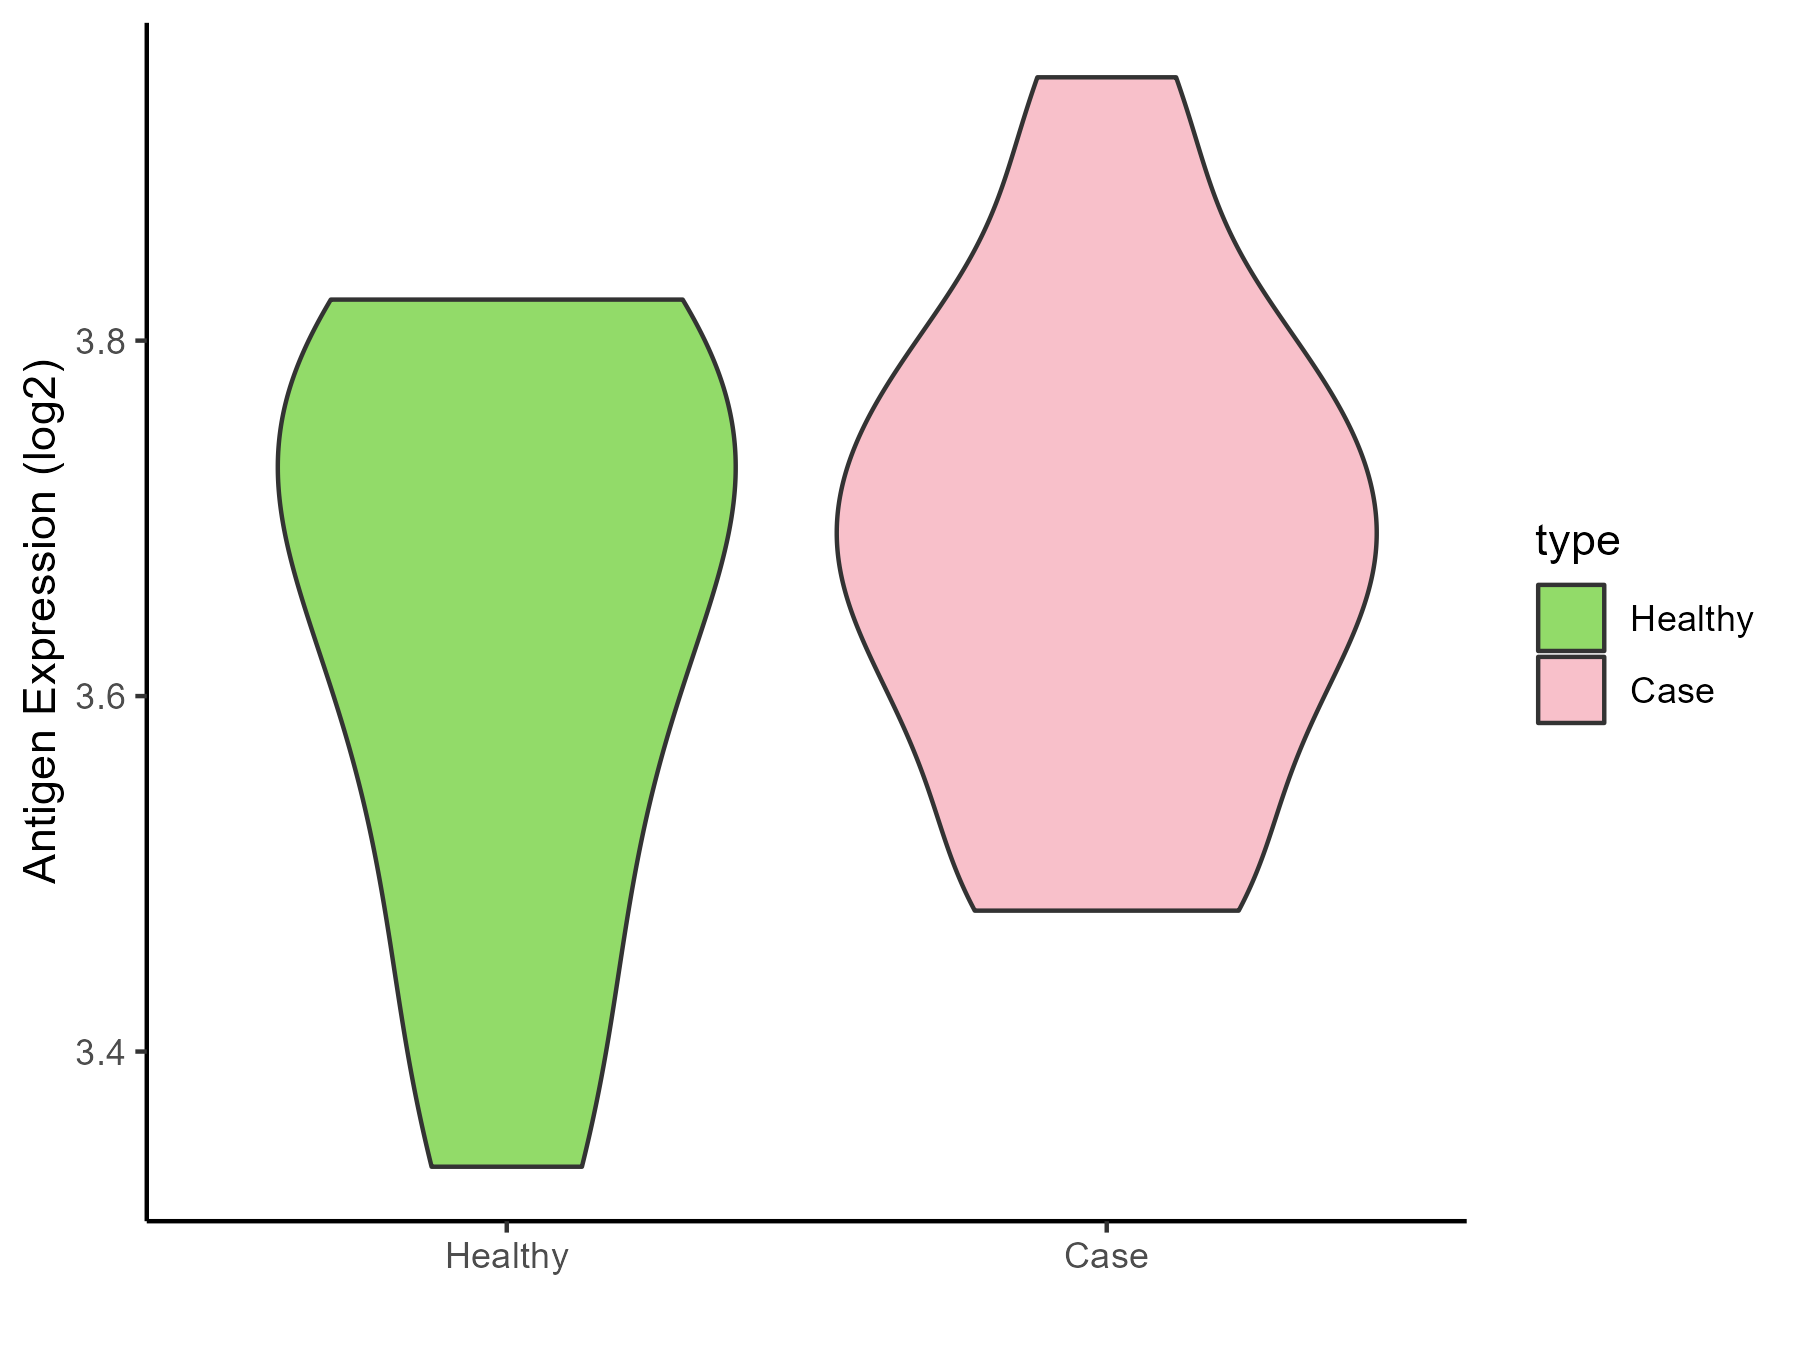
| The Studied Tissue | Whole blood | |
| The Specific Disease | Chronic hepatitis C | |
| The Expression Level of Disease Section Compare with the Healthy Individual Tissue | p-value: 0.434768039; Fold-change: -0.002059406; Z-score: -0.012542333 | |
| Disease-specific Antigen Abundances |
|
Click to View the Clearer Original Diagram |
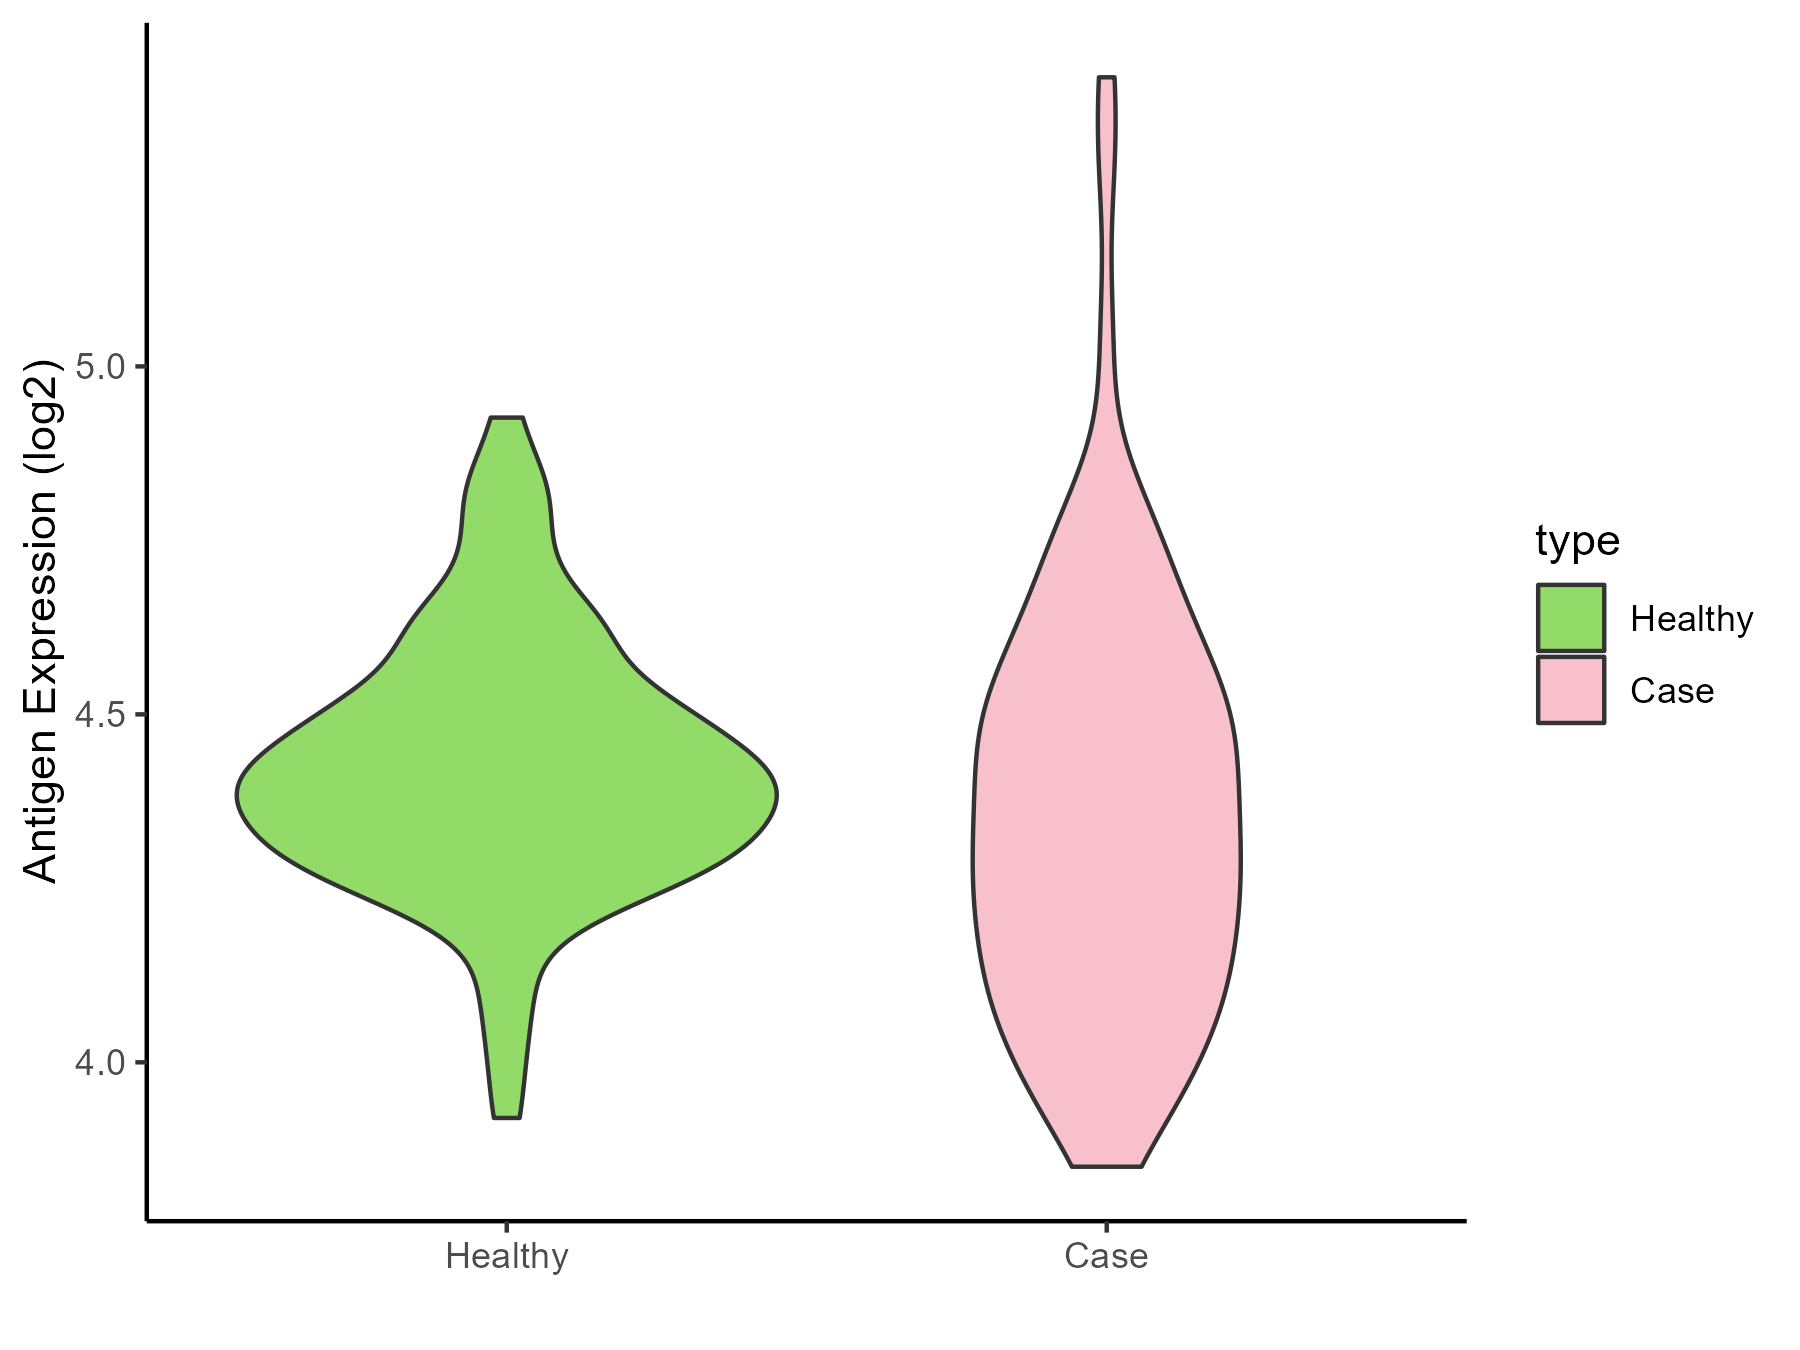
| Differential expression pattern of antigen in diseases | ||
| The Studied Tissue | Whole blood | |
| The Specific Disease | Sepsis | |
| The Expression Level of Disease Section Compare with the Healthy Individual Tissue | p-value: 0.040928385; Fold-change: -0.074926701; Z-score: -0.40564945 | |
| Disease-specific Antigen Abundances |
|
Click to View the Clearer Original Diagram |
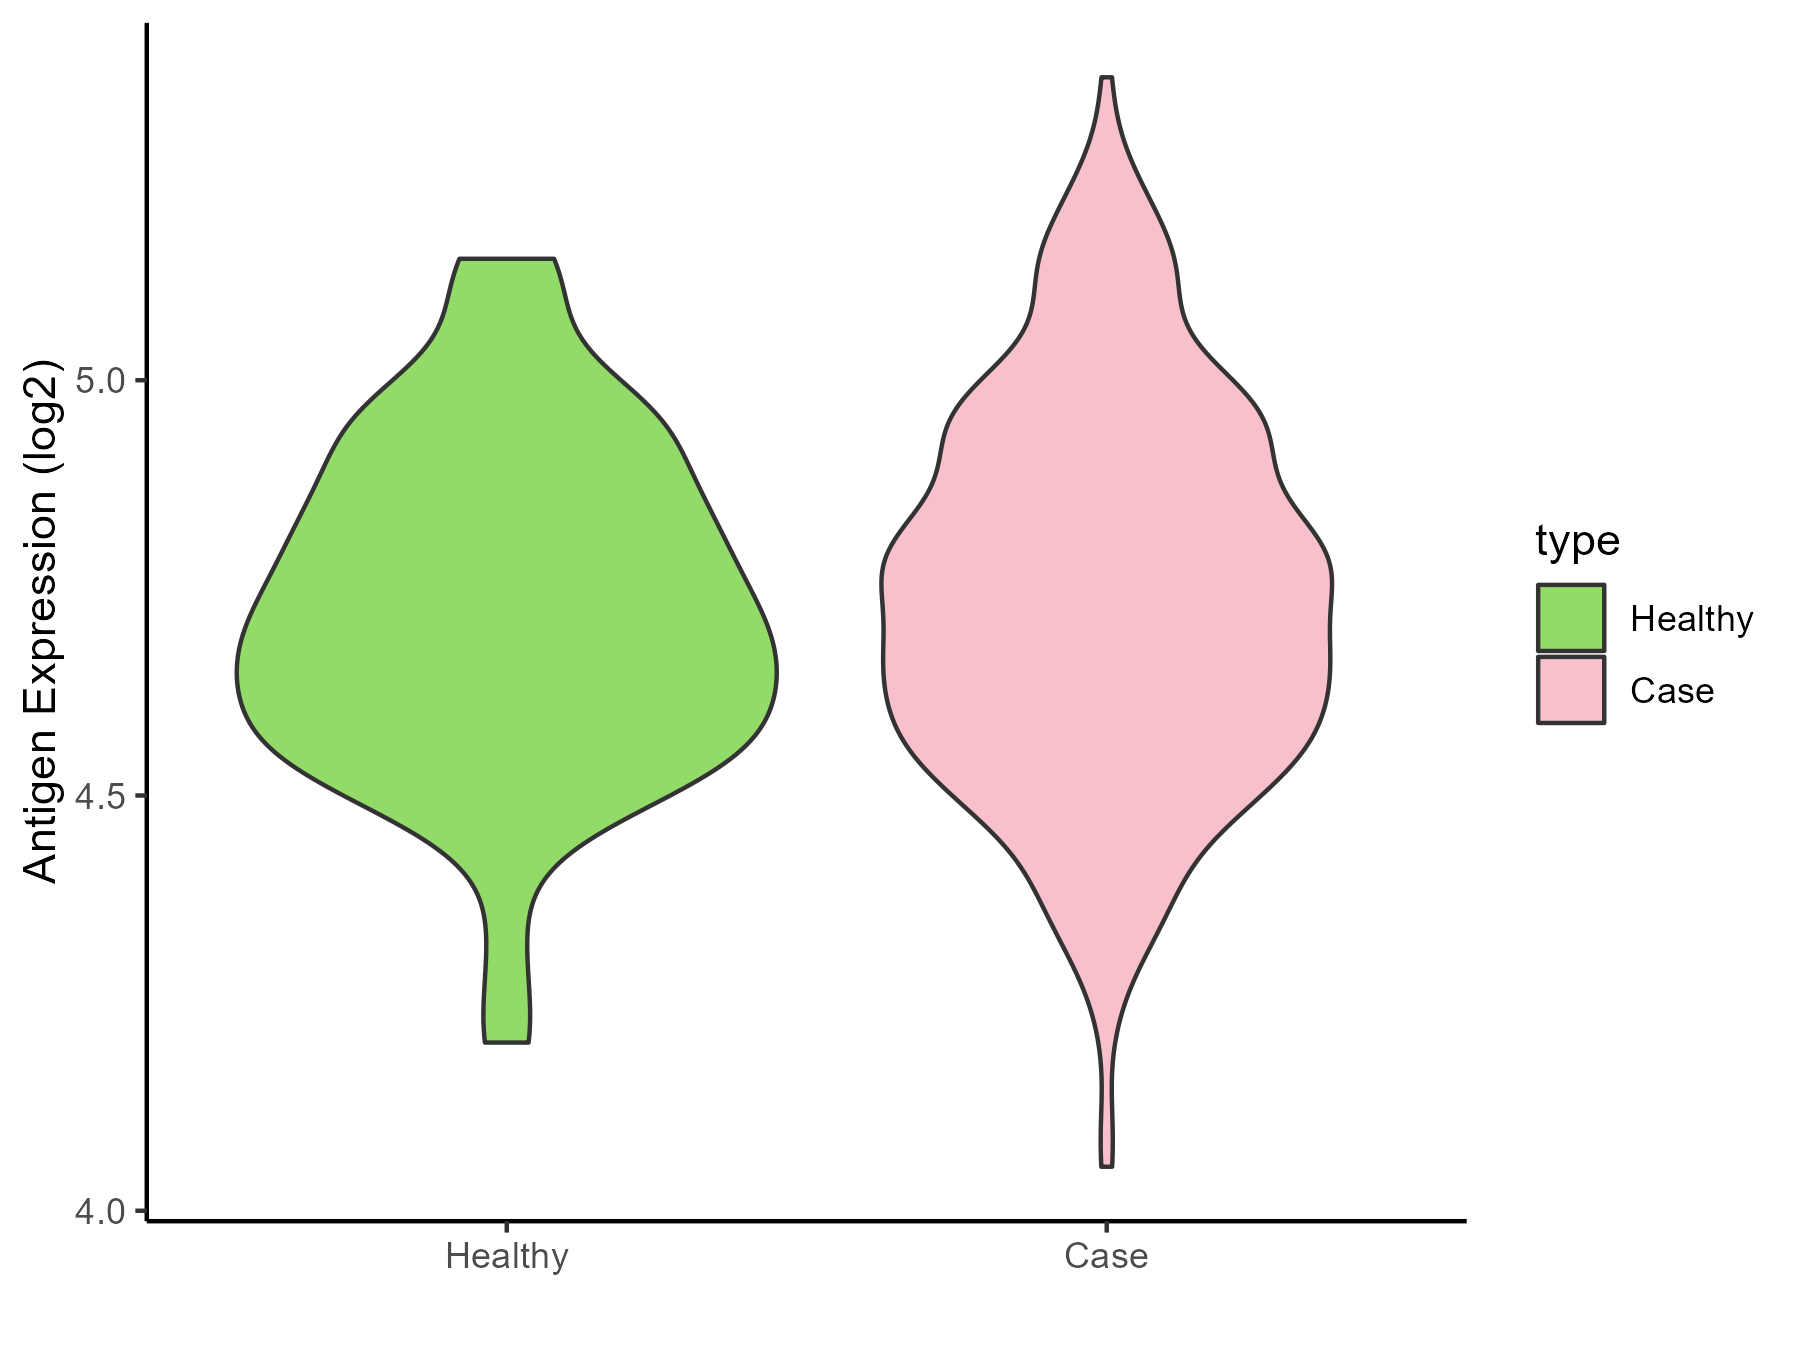
| Differential expression pattern of antigen in diseases | ||
| The Studied Tissue | Whole blood | |
| The Specific Disease | Septic shock | |
| The Expression Level of Disease Section Compare with the Healthy Individual Tissue | p-value: 0.39600599; Fold-change: 0.018681549; Z-score: 0.095308326 | |
| Disease-specific Antigen Abundances |
|
Click to View the Clearer Original Diagram |
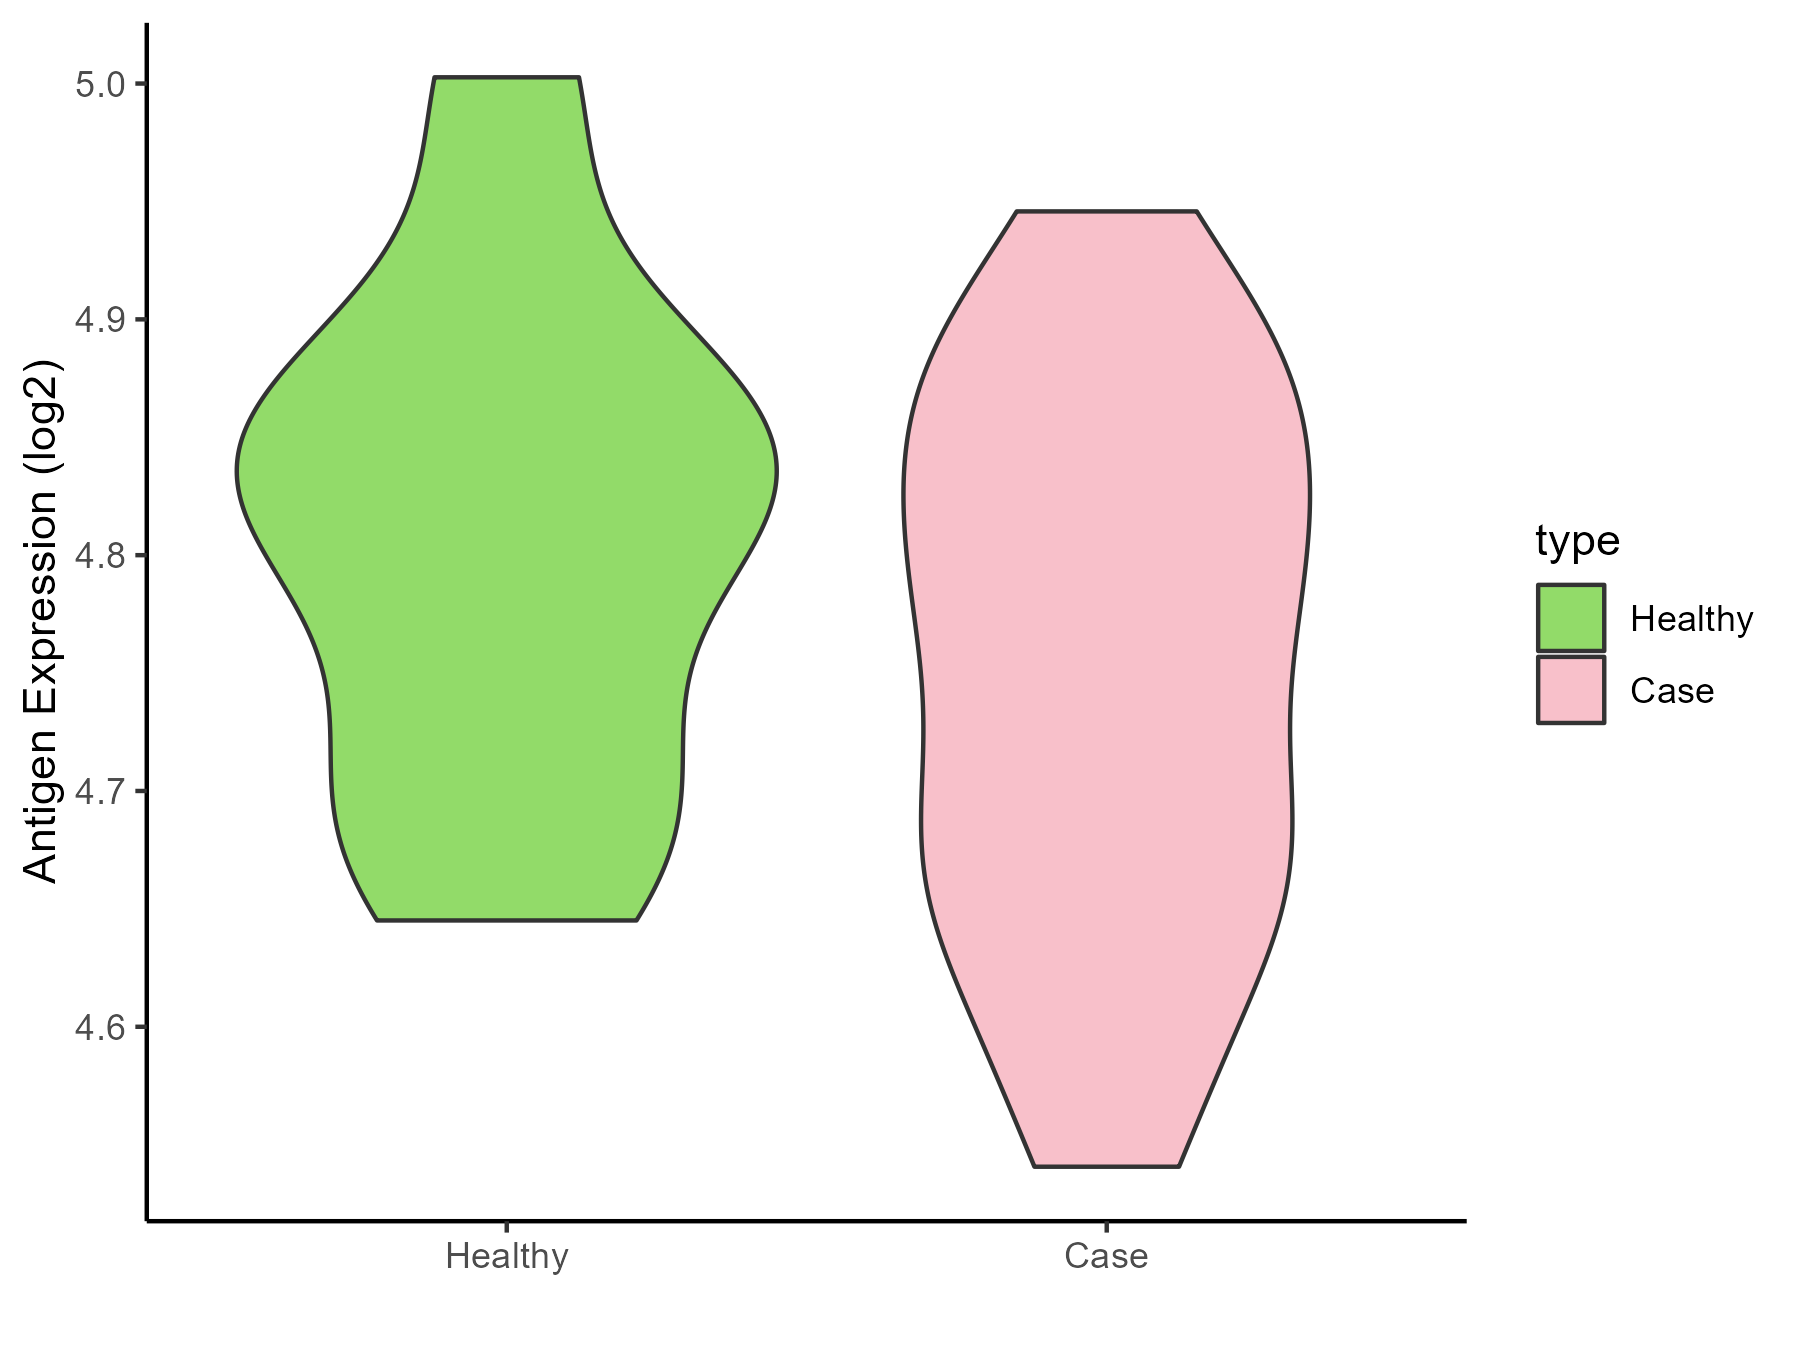
| Differential expression pattern of antigen in diseases | ||
| The Studied Tissue | Peripheral blood | |
| The Specific Disease | Pediatric respiratory syncytial virus infection | |
| The Expression Level of Disease Section Compare with the Healthy Individual Tissue | p-value: 0.119688261; Fold-change: -0.055806225; Z-score: -0.526739164 | |
| Disease-specific Antigen Abundances |
|
Click to View the Clearer Original Diagram |
ICD Disease Classification 11
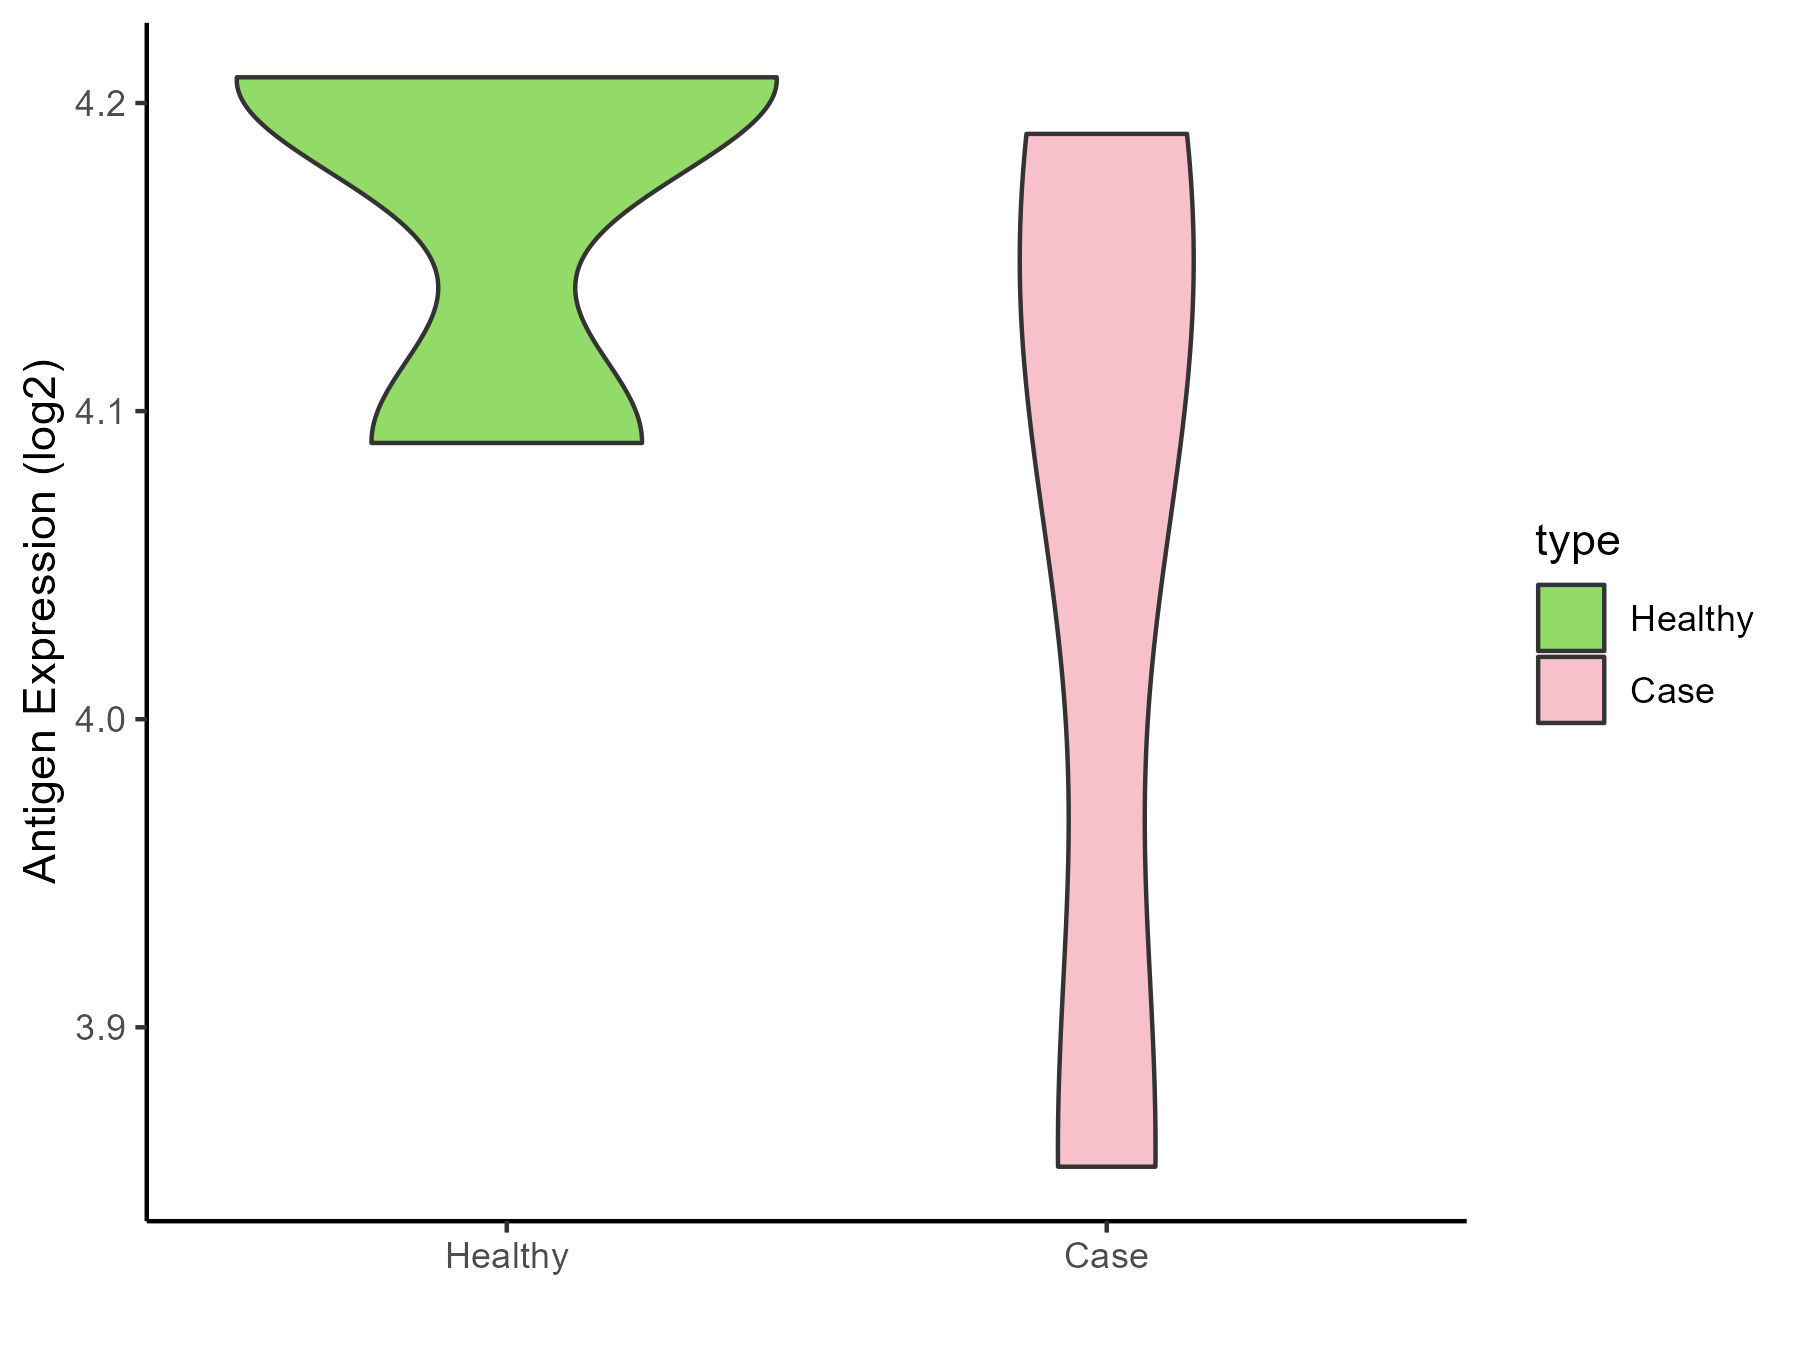
| Differential expression pattern of antigen in diseases | ||
| The Studied Tissue | Peripheral blood | |
| The Specific Disease | Essential hypertension | |
| The Expression Level of Disease Section Compare with the Healthy Individual Tissue | p-value: 0.372352271; Fold-change: -0.096424504; Z-score: -1.416654398 | |
| Disease-specific Antigen Abundances |
|
Click to View the Clearer Original Diagram |
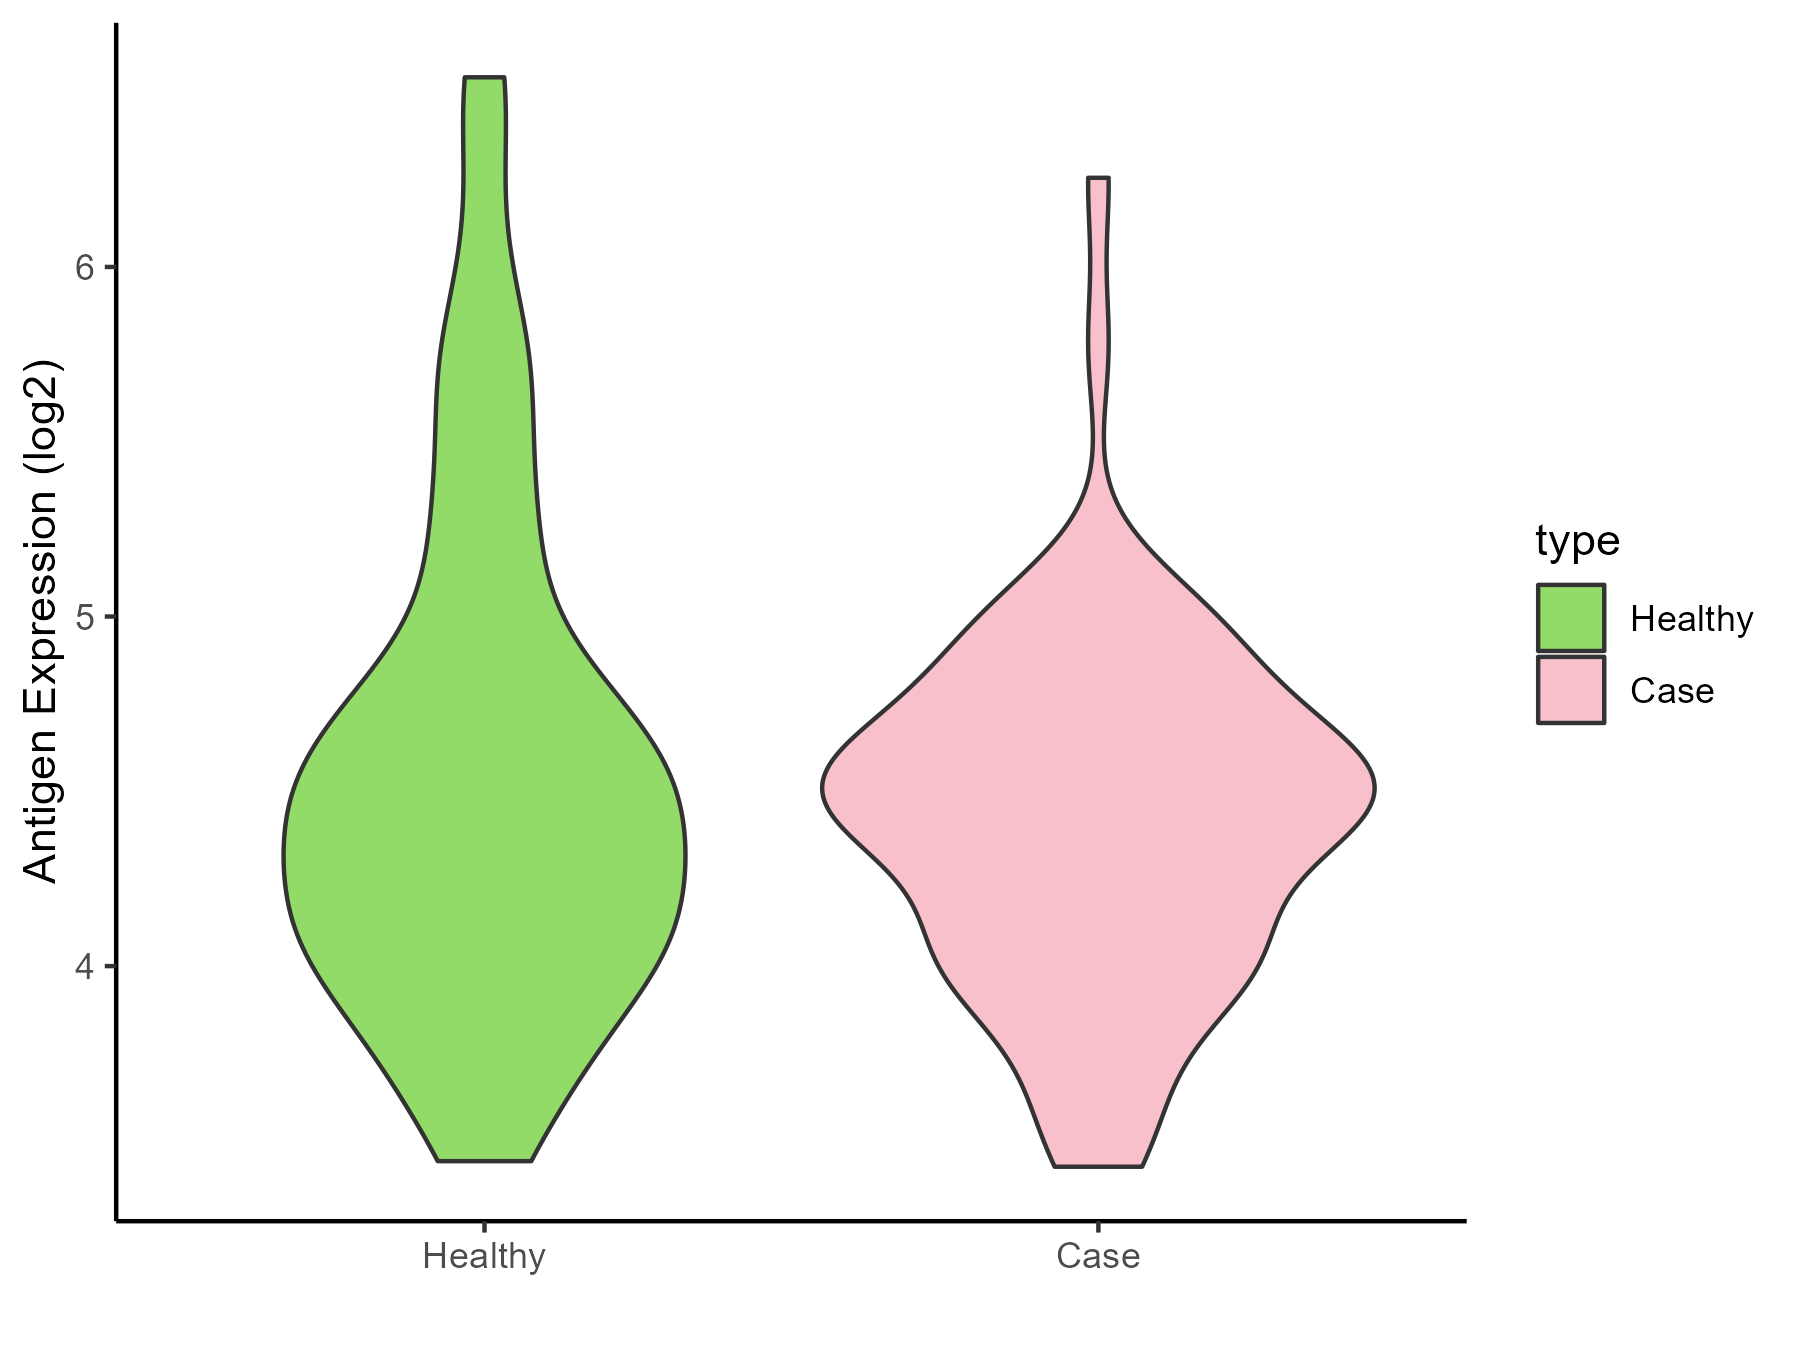
| Differential expression pattern of antigen in diseases | ||
| The Studied Tissue | Peripheral blood | |
| The Specific Disease | Myocardial infarction | |
| The Expression Level of Disease Section Compare with the Healthy Individual Tissue | p-value: 0.254778112; Fold-change: -0.00536928; Z-score: -0.007533543 | |
| Disease-specific Antigen Abundances |
|
Click to View the Clearer Original Diagram |
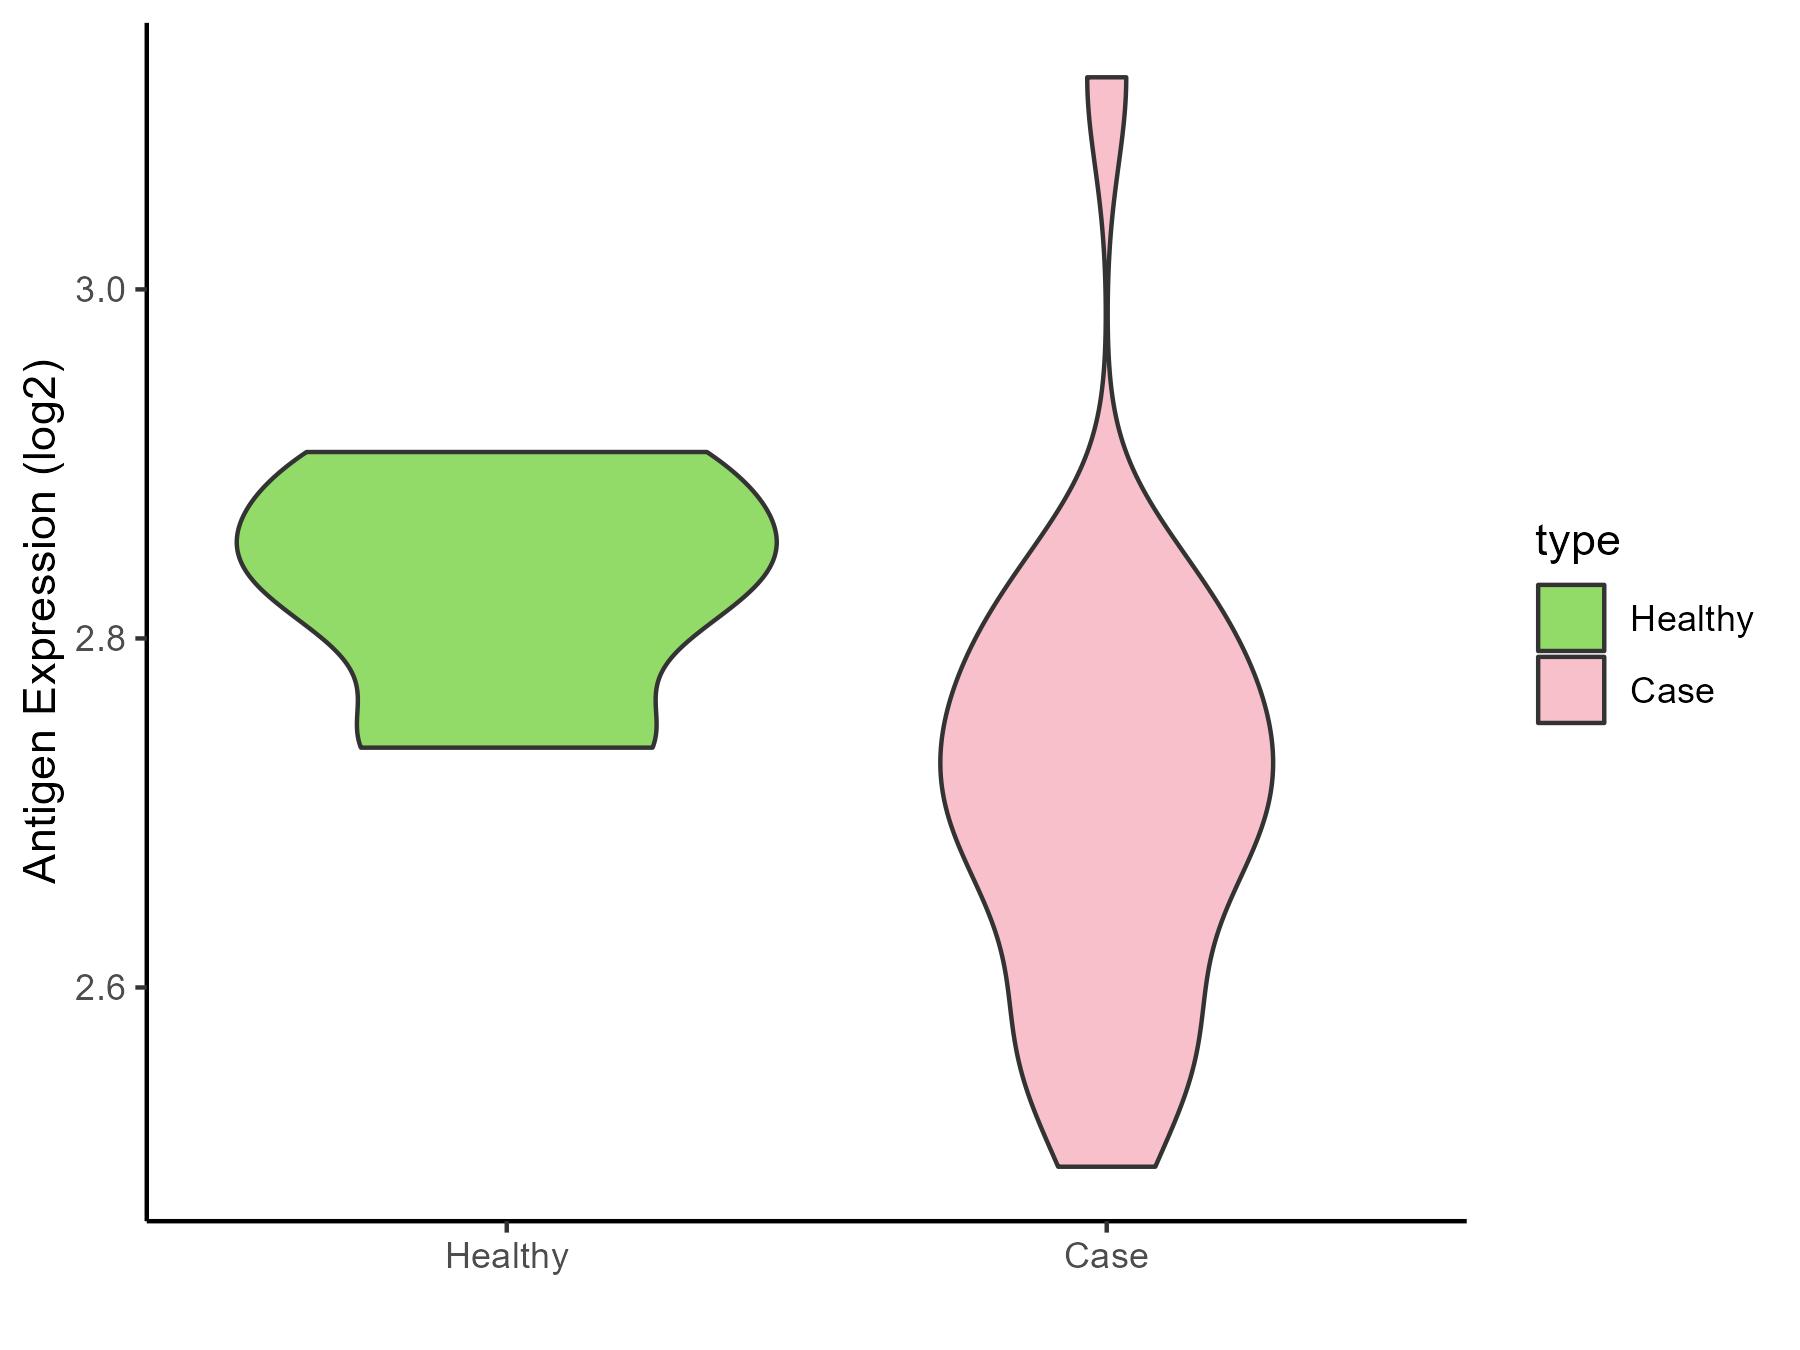
| Differential expression pattern of antigen in diseases | ||
| The Studied Tissue | Peripheral blood | |
| The Specific Disease | Coronary artery disease | |
| The Expression Level of Disease Section Compare with the Healthy Individual Tissue | p-value: 0.038033736; Fold-change: -0.129376391; Z-score: -1.805505919 | |
| Disease-specific Antigen Abundances |
|
Click to View the Clearer Original Diagram |
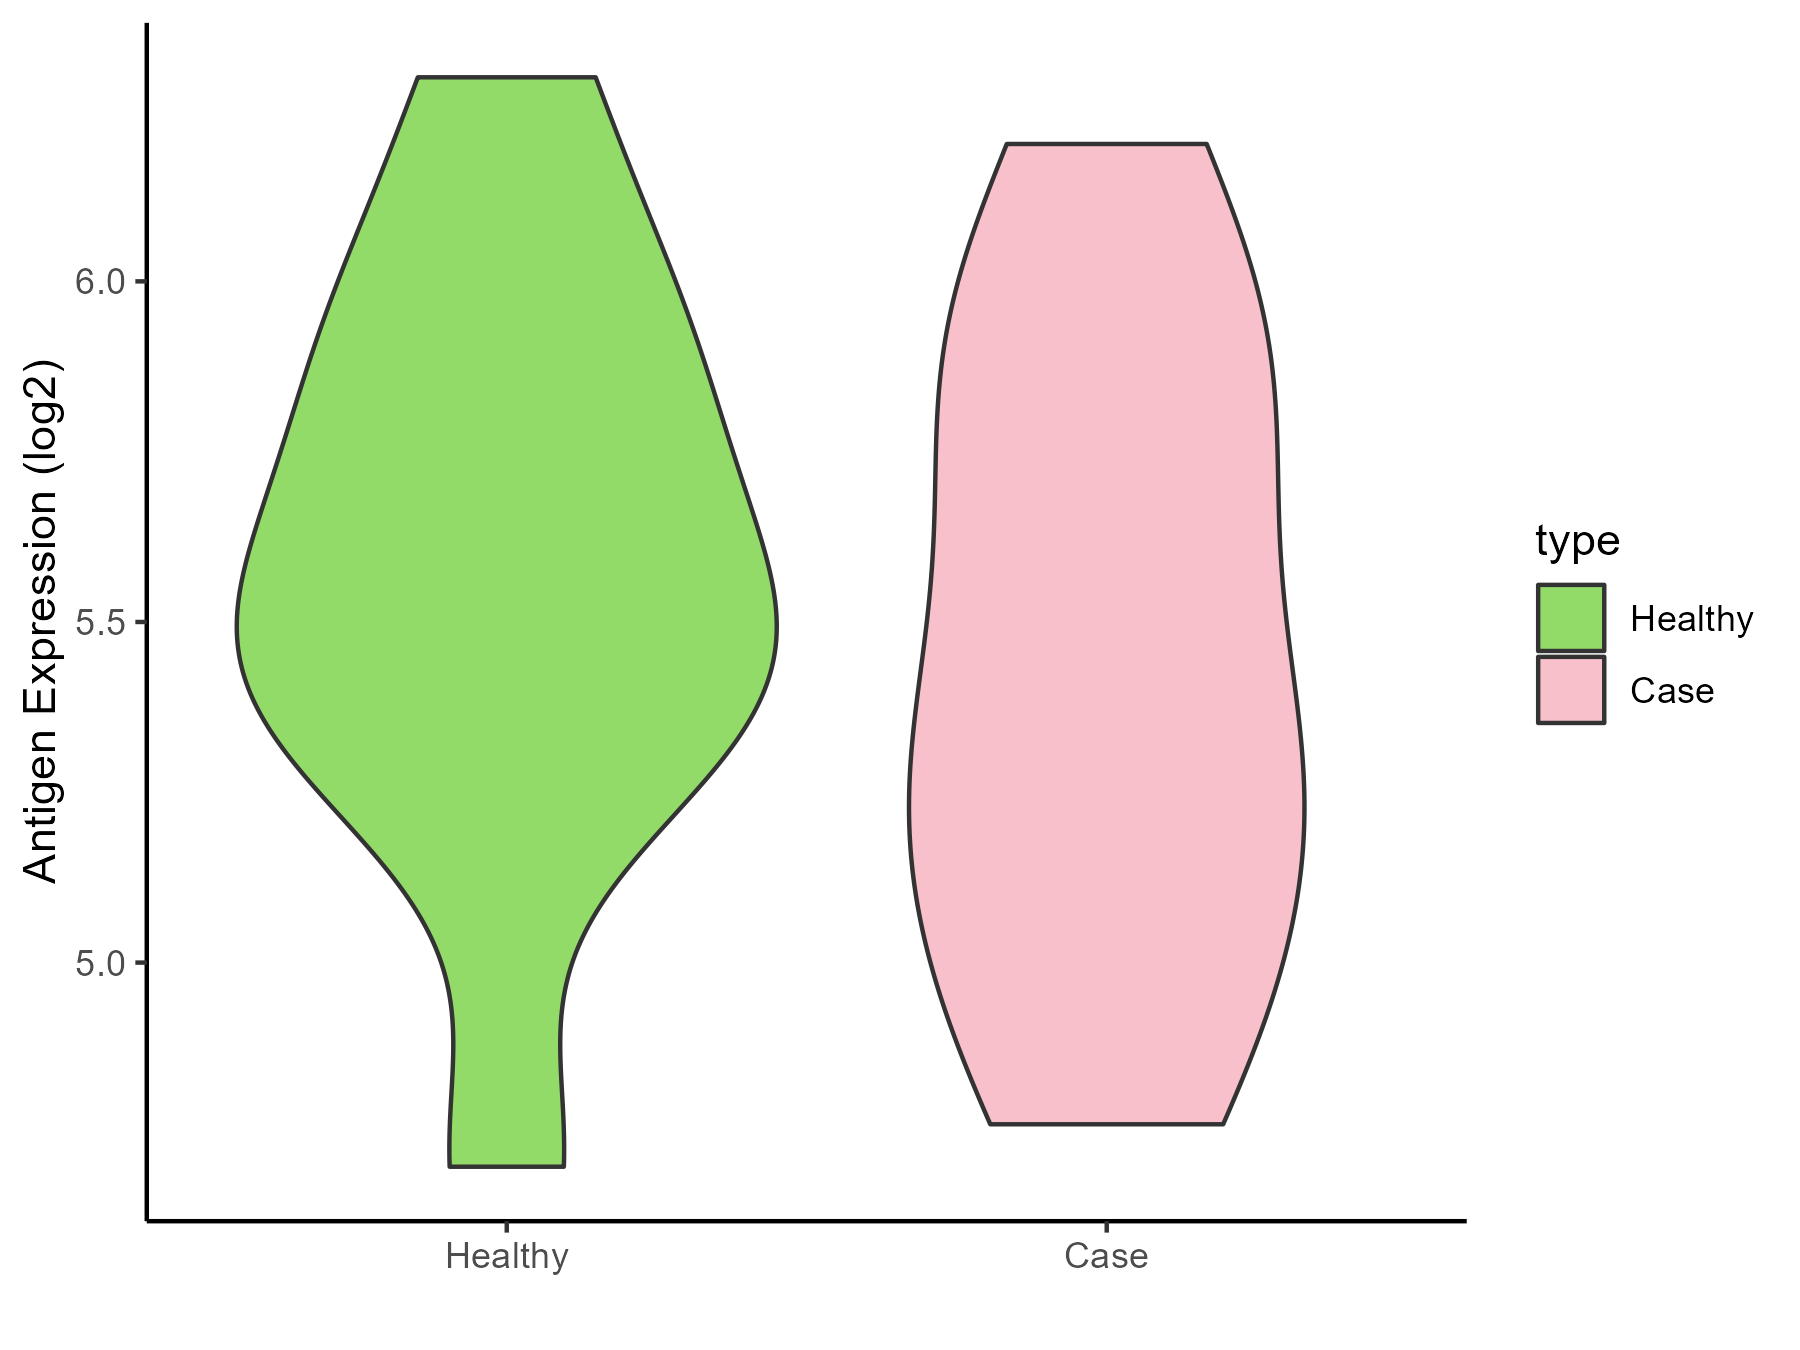
| Differential expression pattern of antigen in diseases | ||
| The Studied Tissue | Calcified aortic valve | |
| The Specific Disease | Aortic stenosis | |
| The Expression Level of Disease Section Compare with the Healthy Individual Tissue | p-value: 0.51843092; Fold-change: -0.16885035; Z-score: -0.379284409 | |
| Disease-specific Antigen Abundances |
|
Click to View the Clearer Original Diagram |
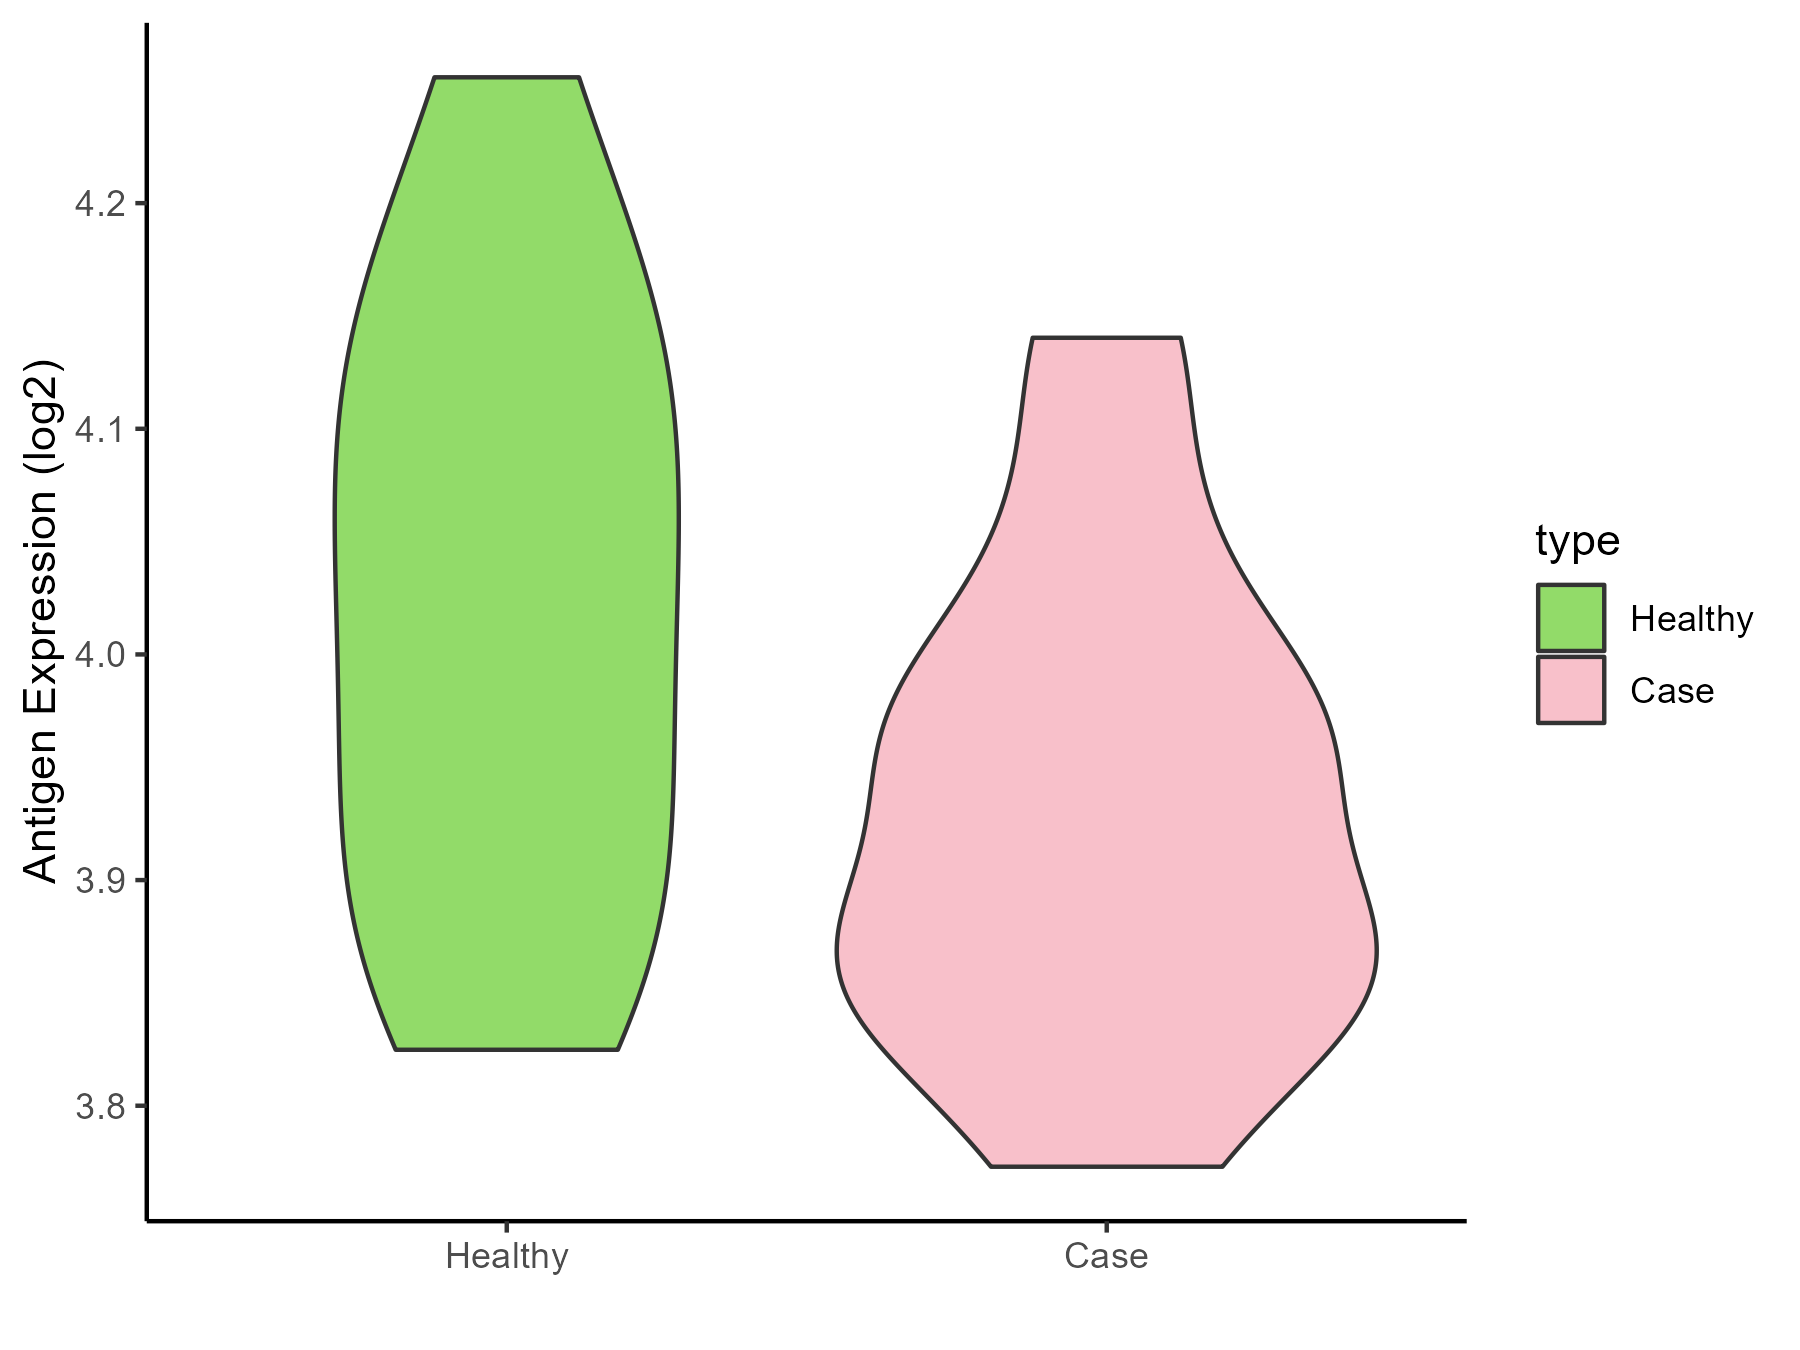
| Differential expression pattern of antigen in diseases | ||
| The Studied Tissue | Peripheral blood | |
| The Specific Disease | Arteriosclerosis | |
| The Expression Level of Disease Section Compare with the Healthy Individual Tissue | p-value: 0.091850851; Fold-change: -0.099377253; Z-score: -0.734988643 | |
| Disease-specific Antigen Abundances |
|
Click to View the Clearer Original Diagram |
| Differential expression pattern of antigen in diseases | ||
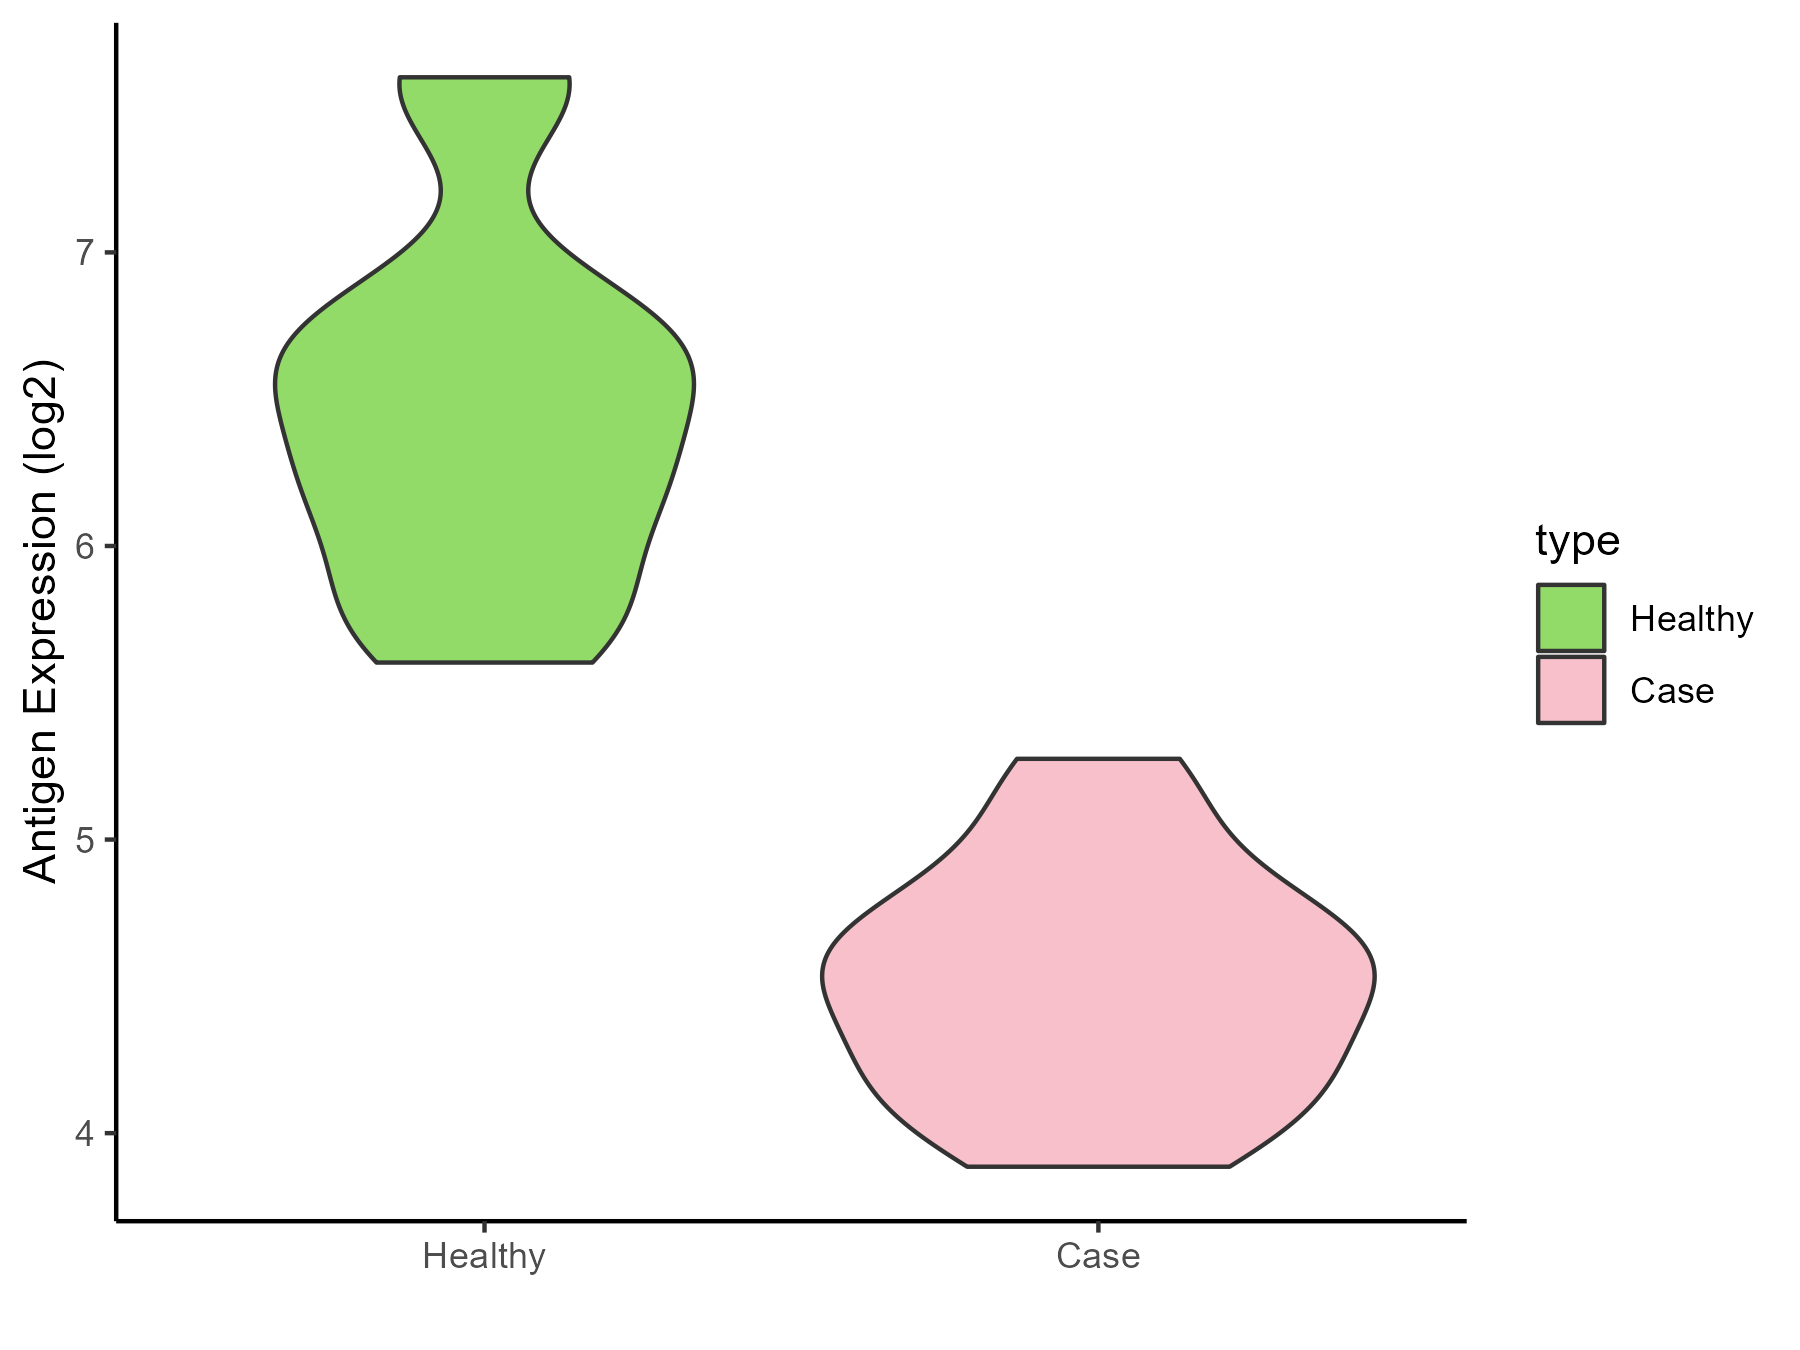
| The Studied Tissue | Intracranial artery | |
| The Specific Disease | Aneurysm | |
| The Expression Level of Disease Section Compare with the Healthy Individual Tissue | p-value: 4.37E-09; Fold-change: -1.933350127; Z-score: -3.119392639 | |
| Disease-specific Antigen Abundances |
|
Click to View the Clearer Original Diagram |
ICD Disease Classification 12
| Differential expression pattern of antigen in diseases | ||
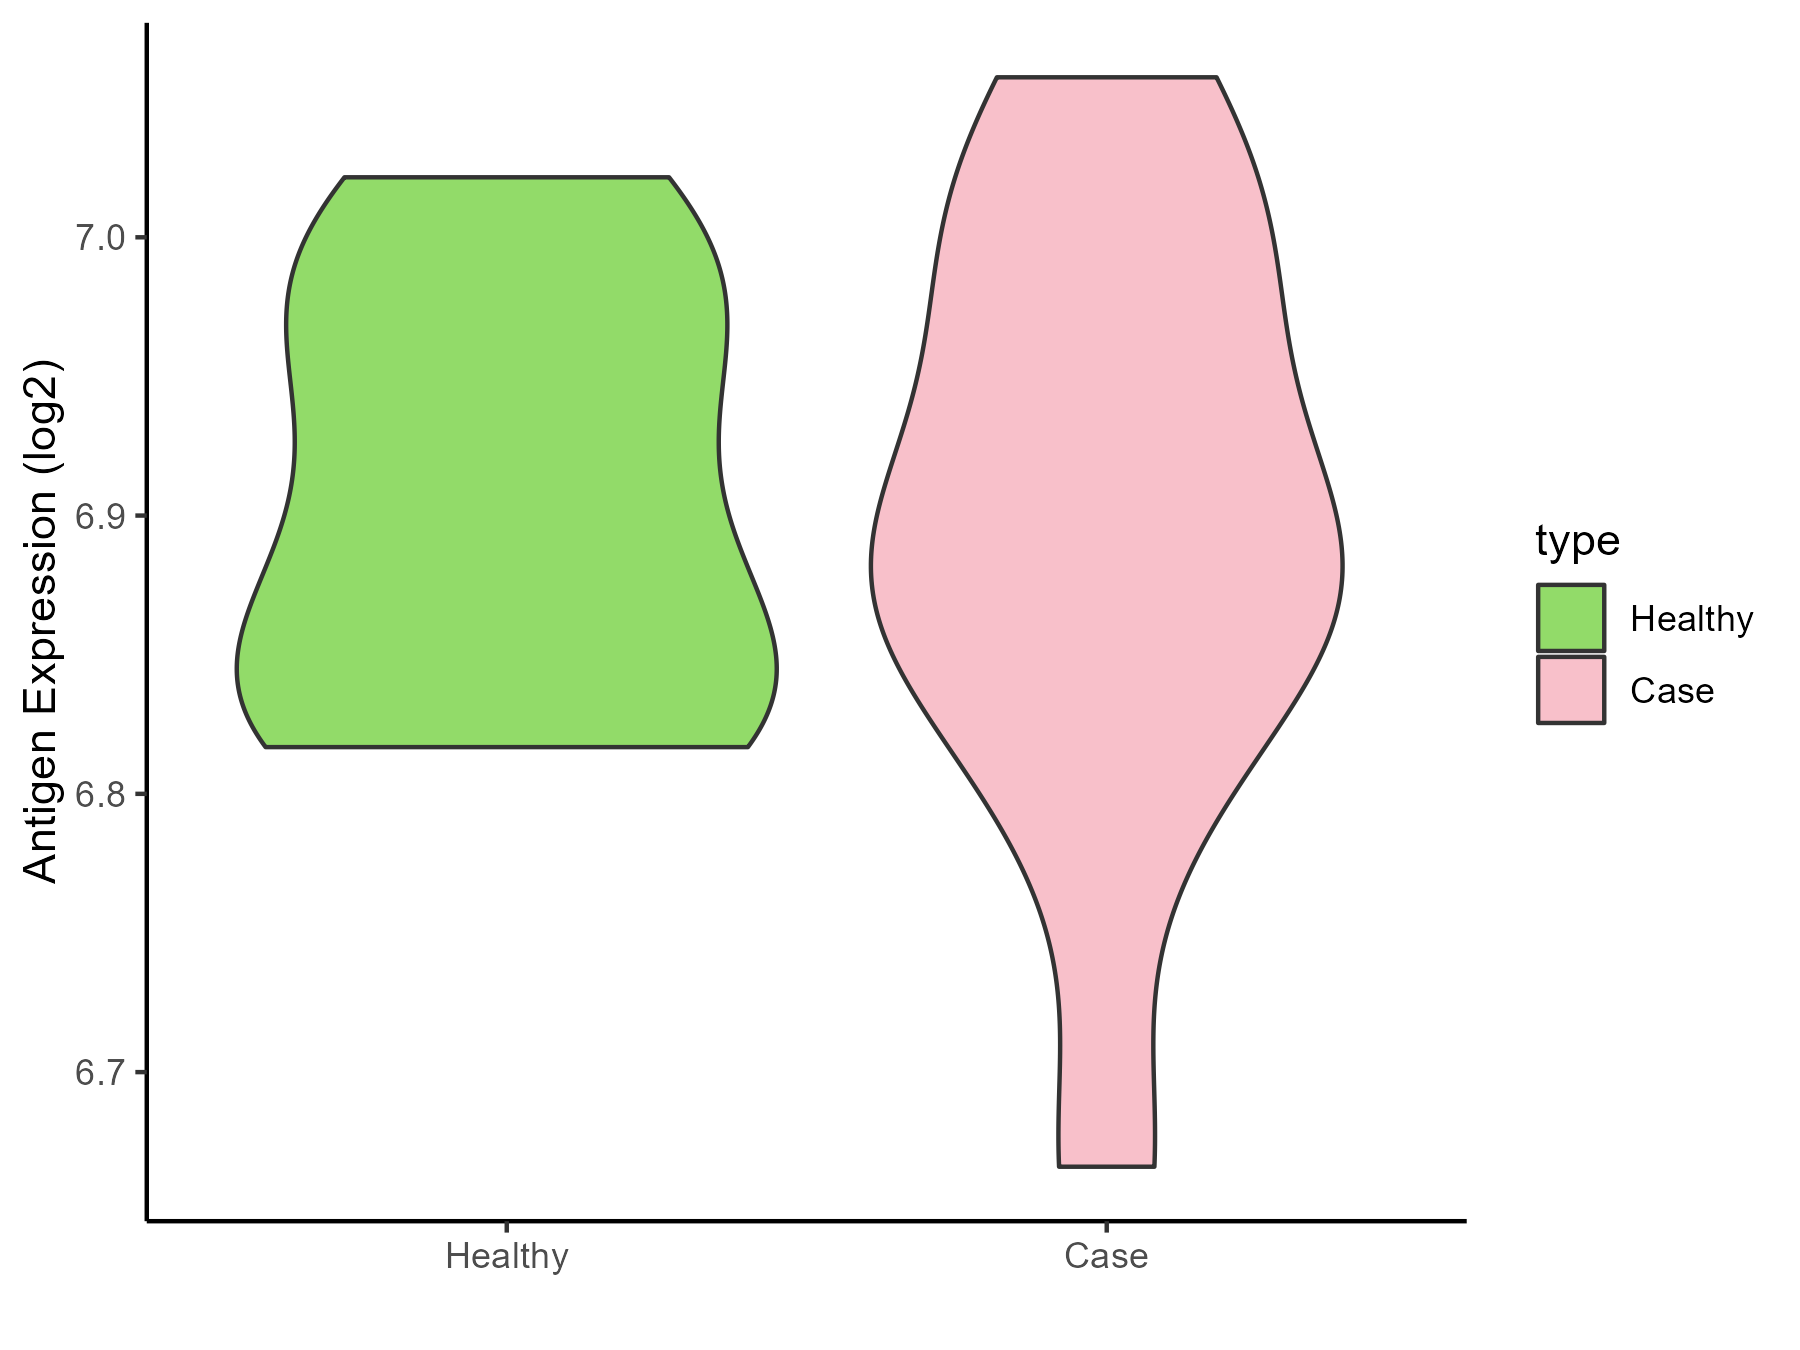
| The Studied Tissue | Peripheral blood | |
| The Specific Disease | Immunodeficiency | |
| The Expression Level of Disease Section Compare with the Healthy Individual Tissue | p-value: 0.866271569; Fold-change: -0.010034114; Z-score: -0.128037707 | |
| Disease-specific Antigen Abundances |
|
Click to View the Clearer Original Diagram |
| Differential expression pattern of antigen in diseases | ||
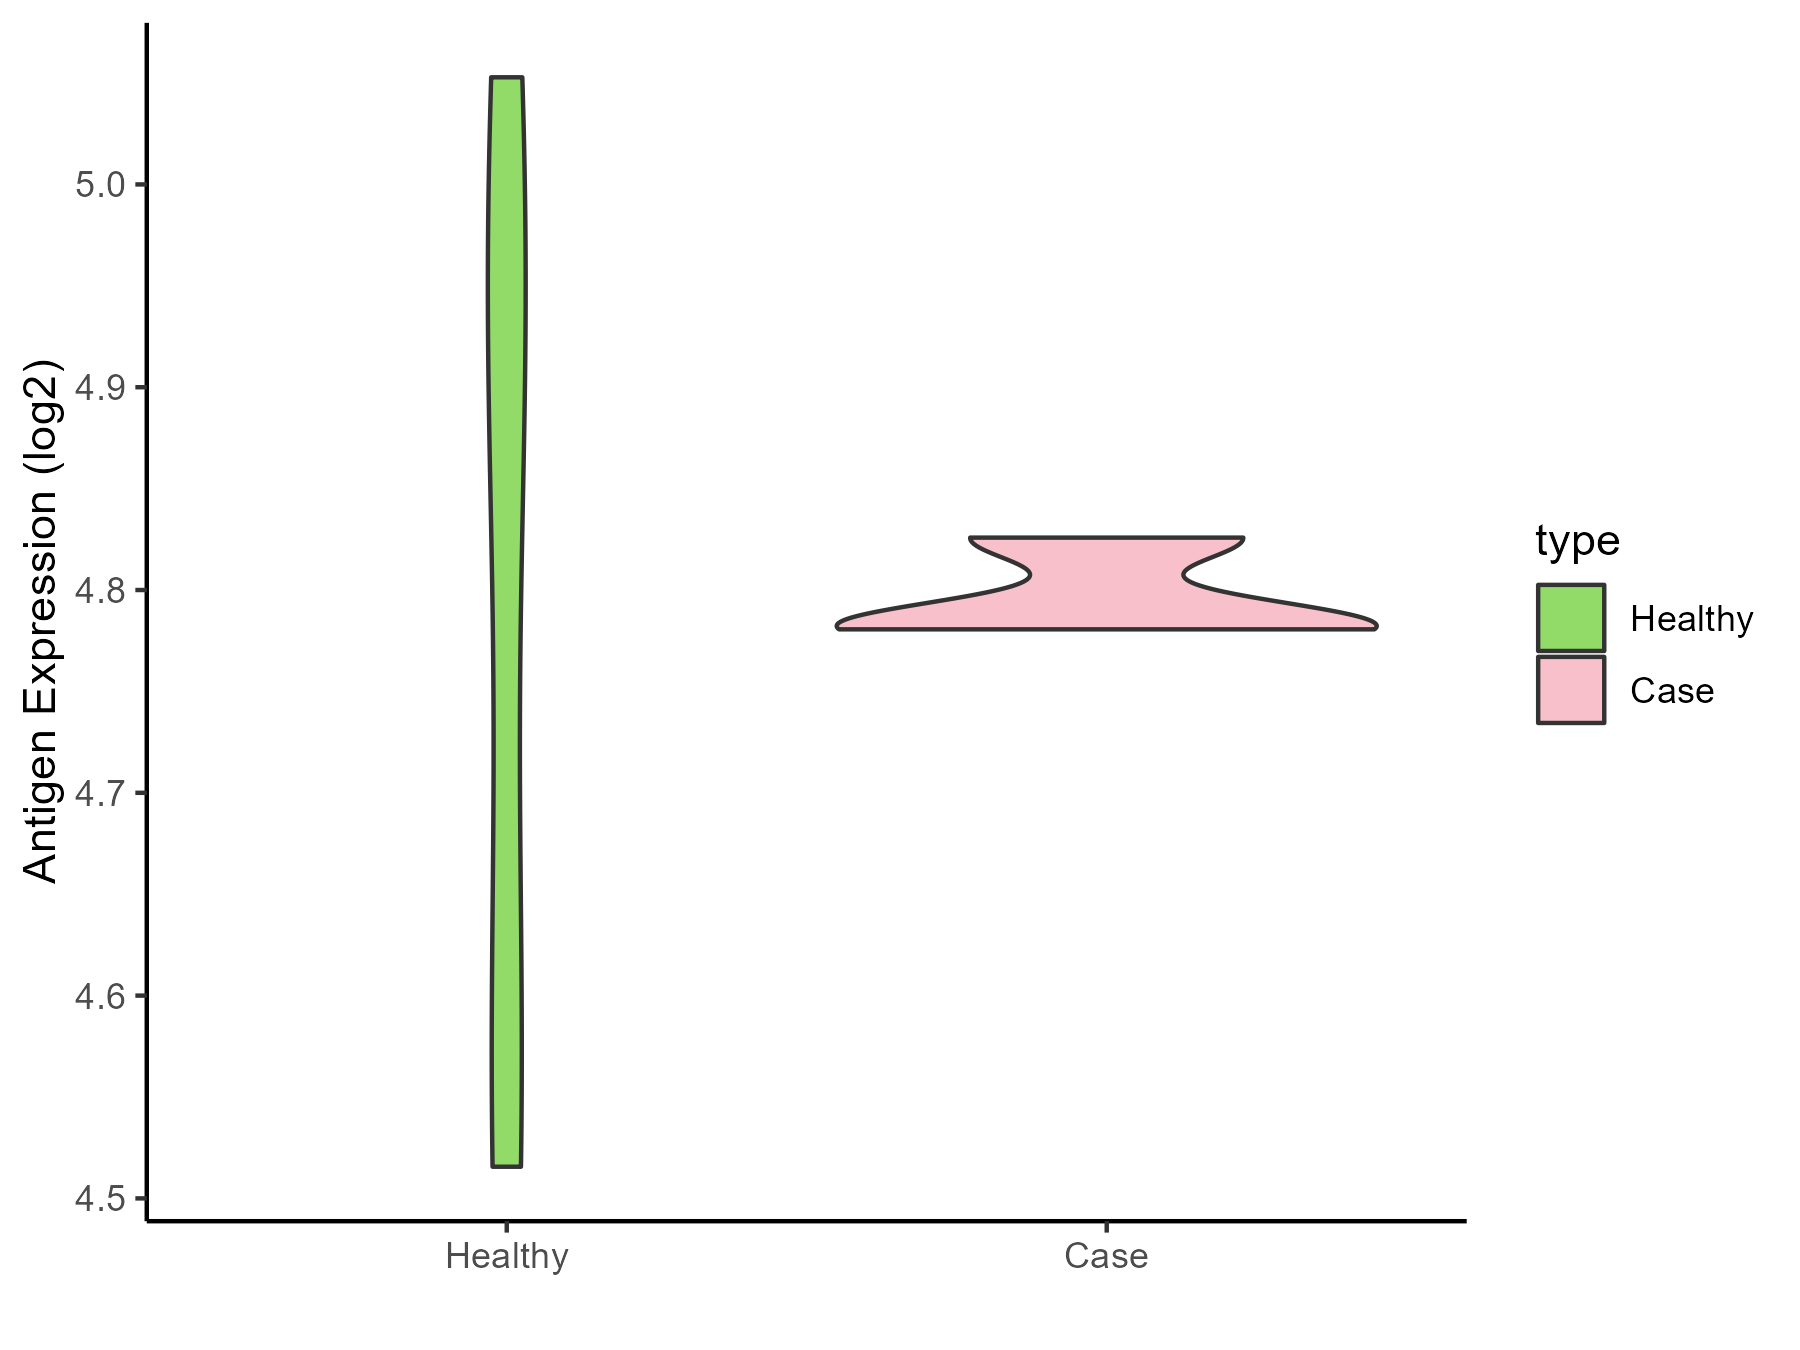
| The Studied Tissue | Hyperplastic tonsil | |
| The Specific Disease | Apnea | |
| The Expression Level of Disease Section Compare with the Healthy Individual Tissue | p-value: 0.928964774; Fold-change: -0.11435625; Z-score: -0.506037397 | |
| Disease-specific Antigen Abundances |
|
Click to View the Clearer Original Diagram |
| Differential expression pattern of antigen in diseases | ||
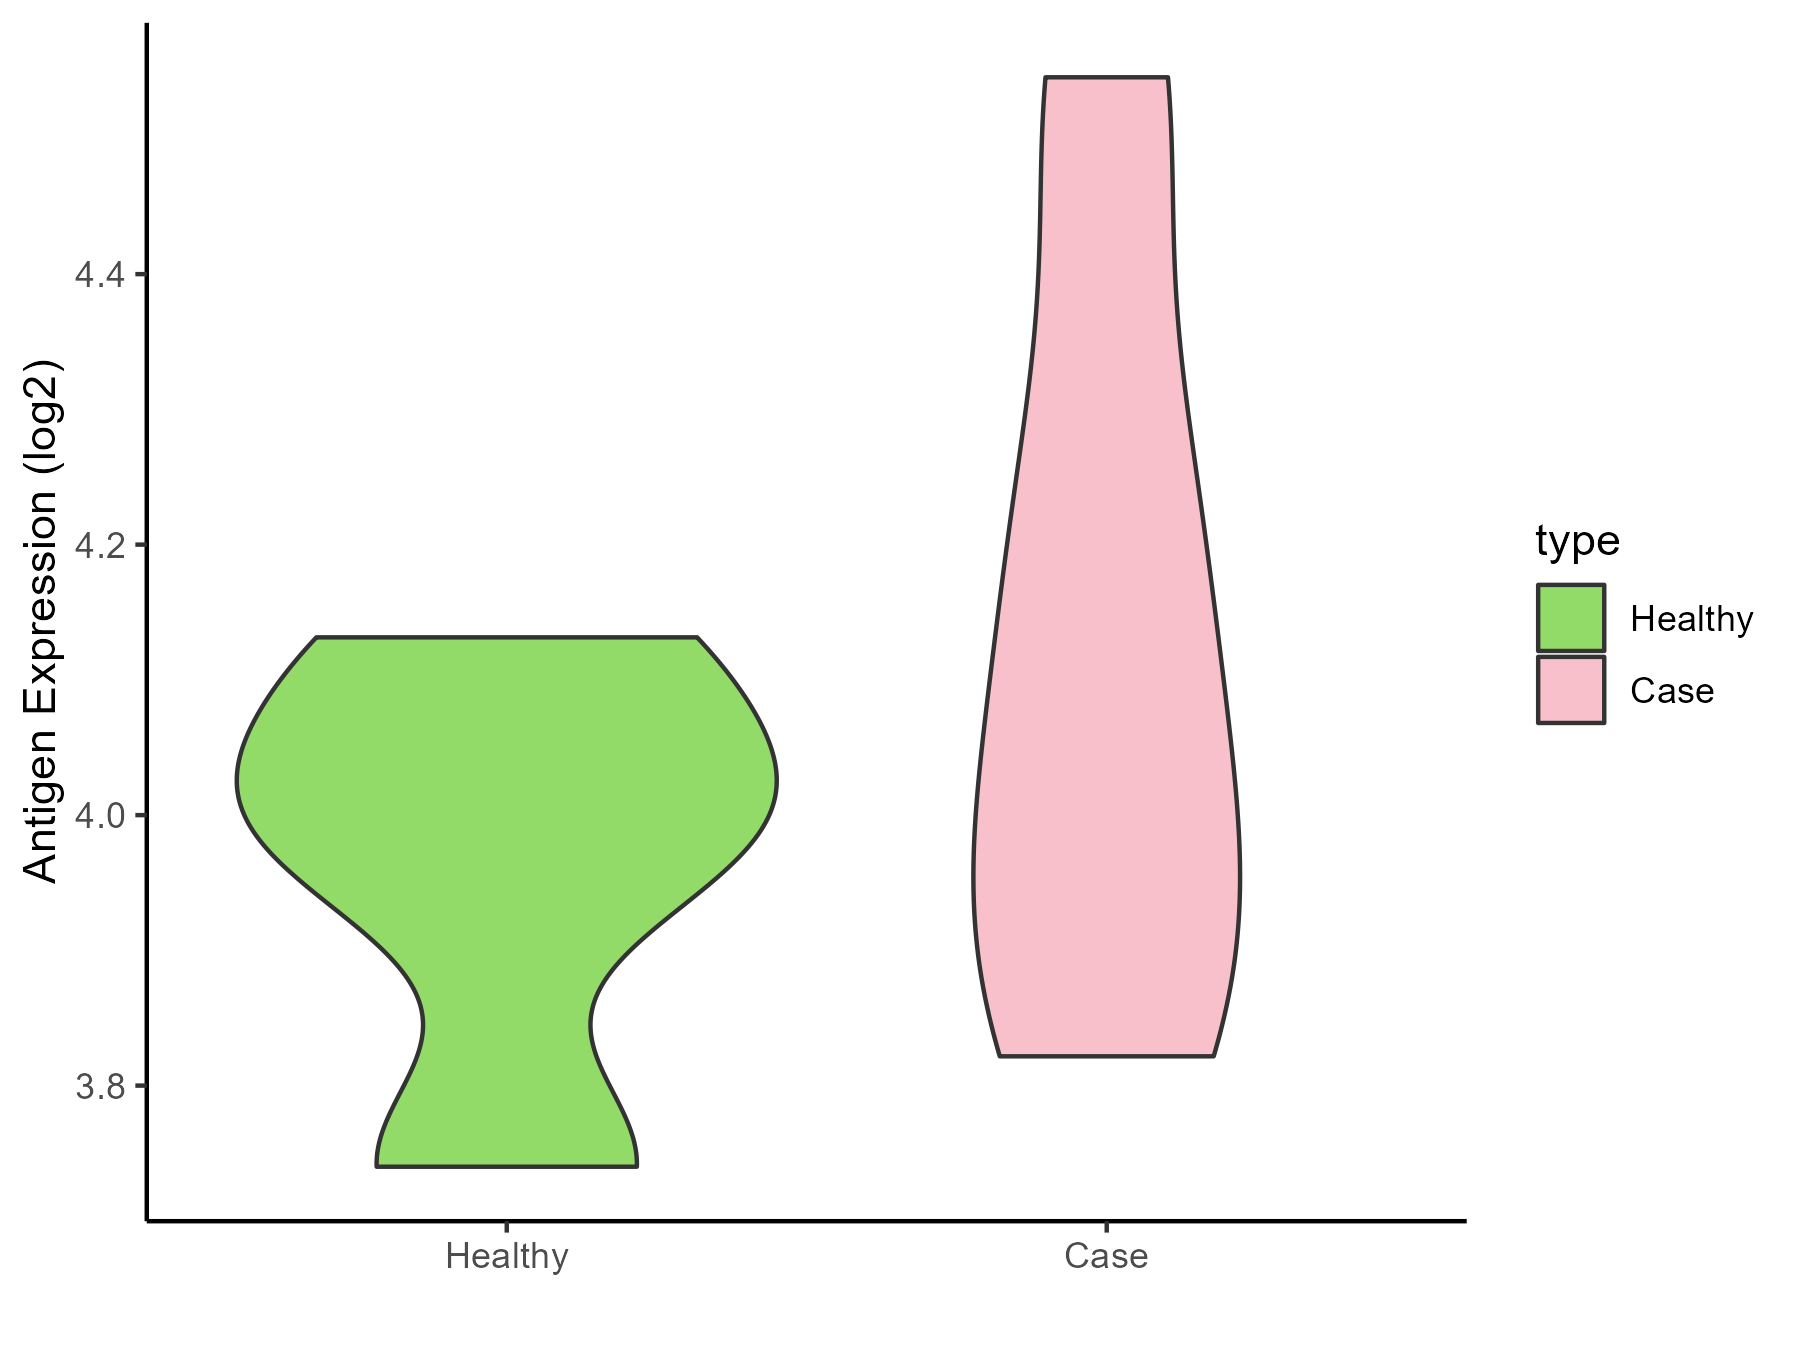
| The Studied Tissue | Peripheral blood | |
| The Specific Disease | Olive pollen allergy | |
| The Expression Level of Disease Section Compare with the Healthy Individual Tissue | p-value: 0.181570665; Fold-change: 0.060082174; Z-score: 0.362131232 | |
| Disease-specific Antigen Abundances |
|
Click to View the Clearer Original Diagram |
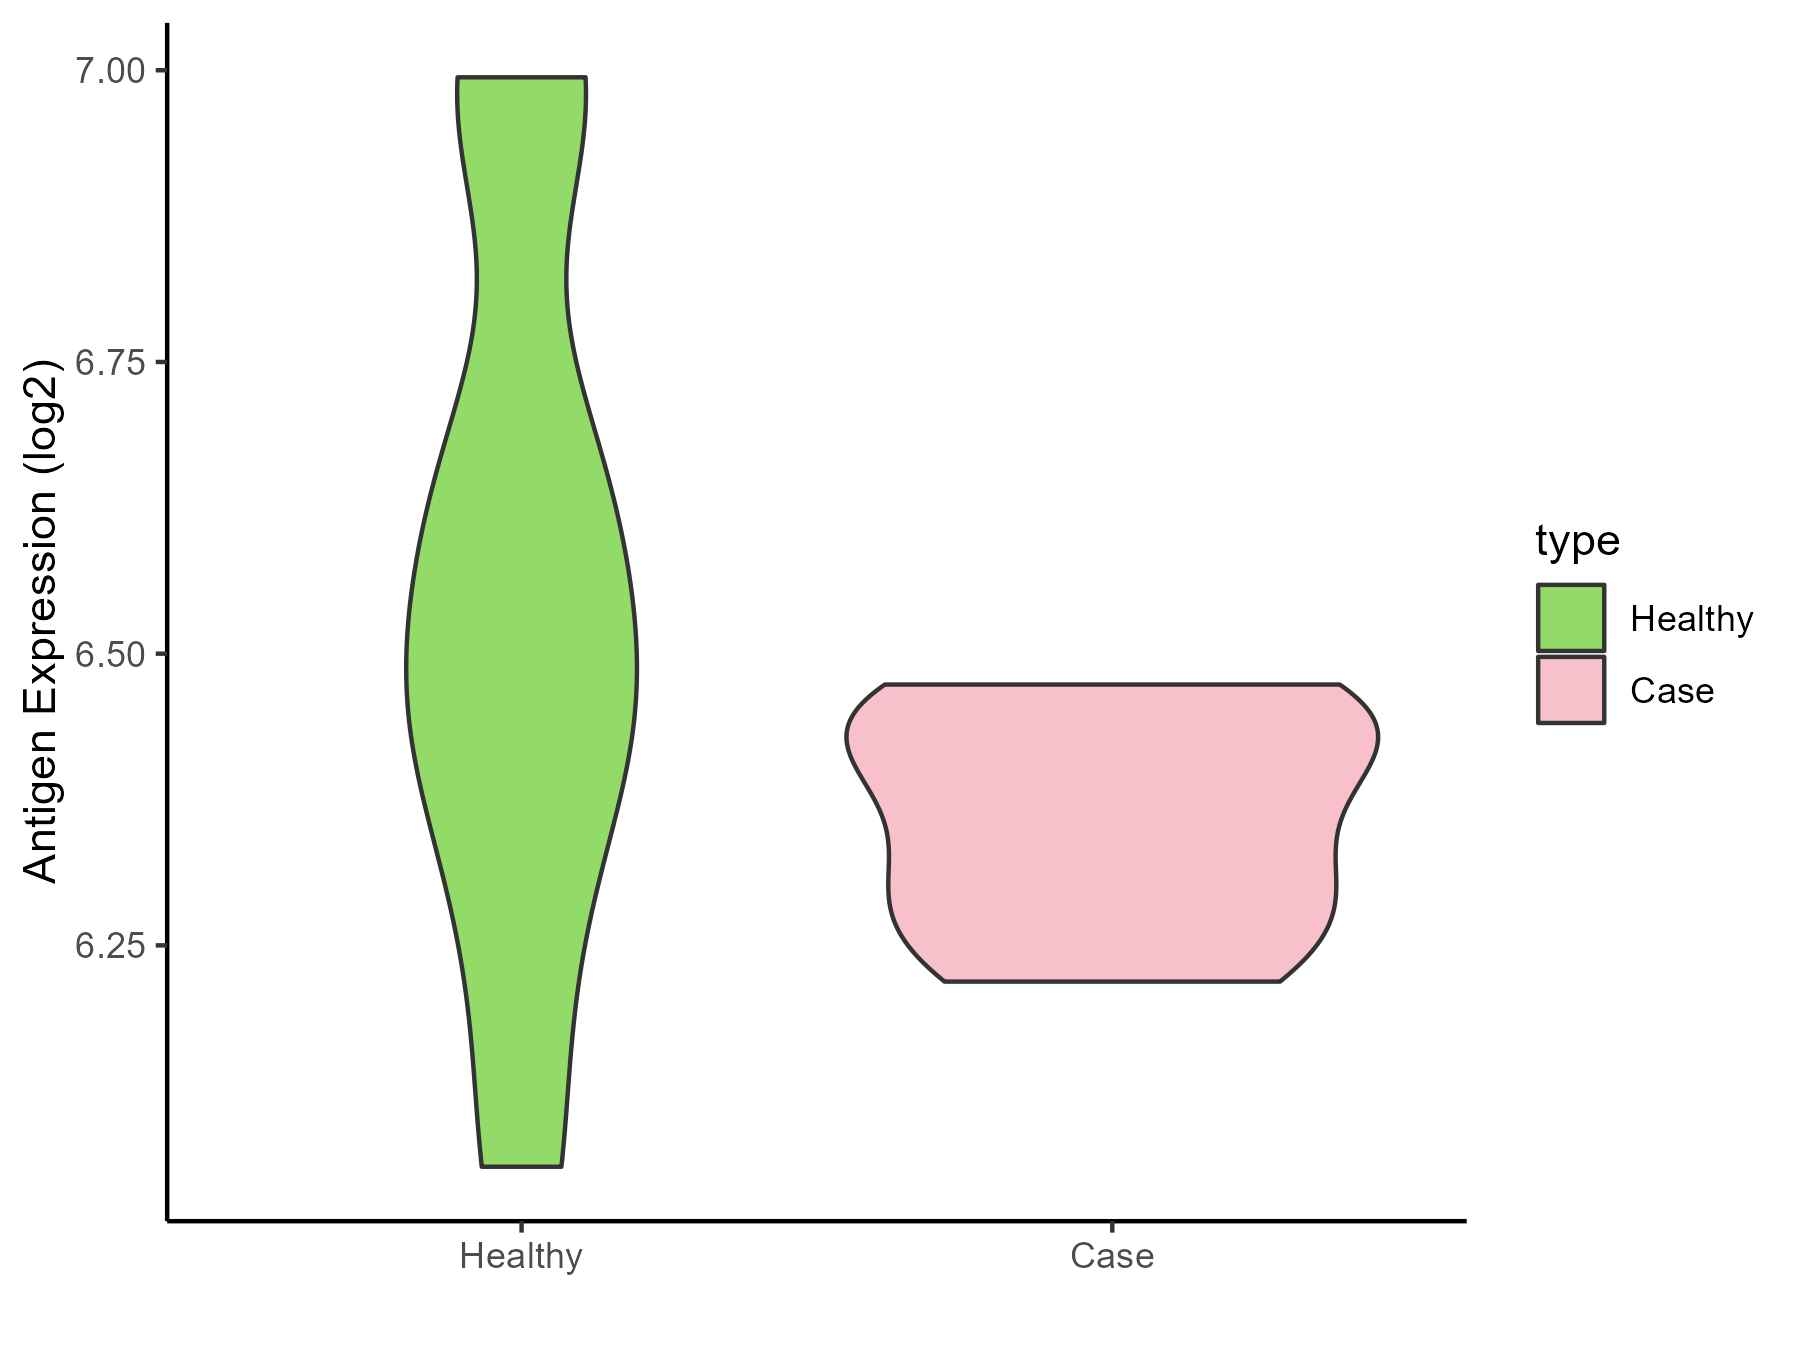
| Differential expression pattern of antigen in diseases | ||
| The Studied Tissue | Sinus mucosa | |
| The Specific Disease | Chronic rhinosinusitis | |
| The Expression Level of Disease Section Compare with the Healthy Individual Tissue | p-value: 0.116213191; Fold-change: -0.12715079; Z-score: -0.412650406 | |
| Disease-specific Antigen Abundances |
|
Click to View the Clearer Original Diagram |
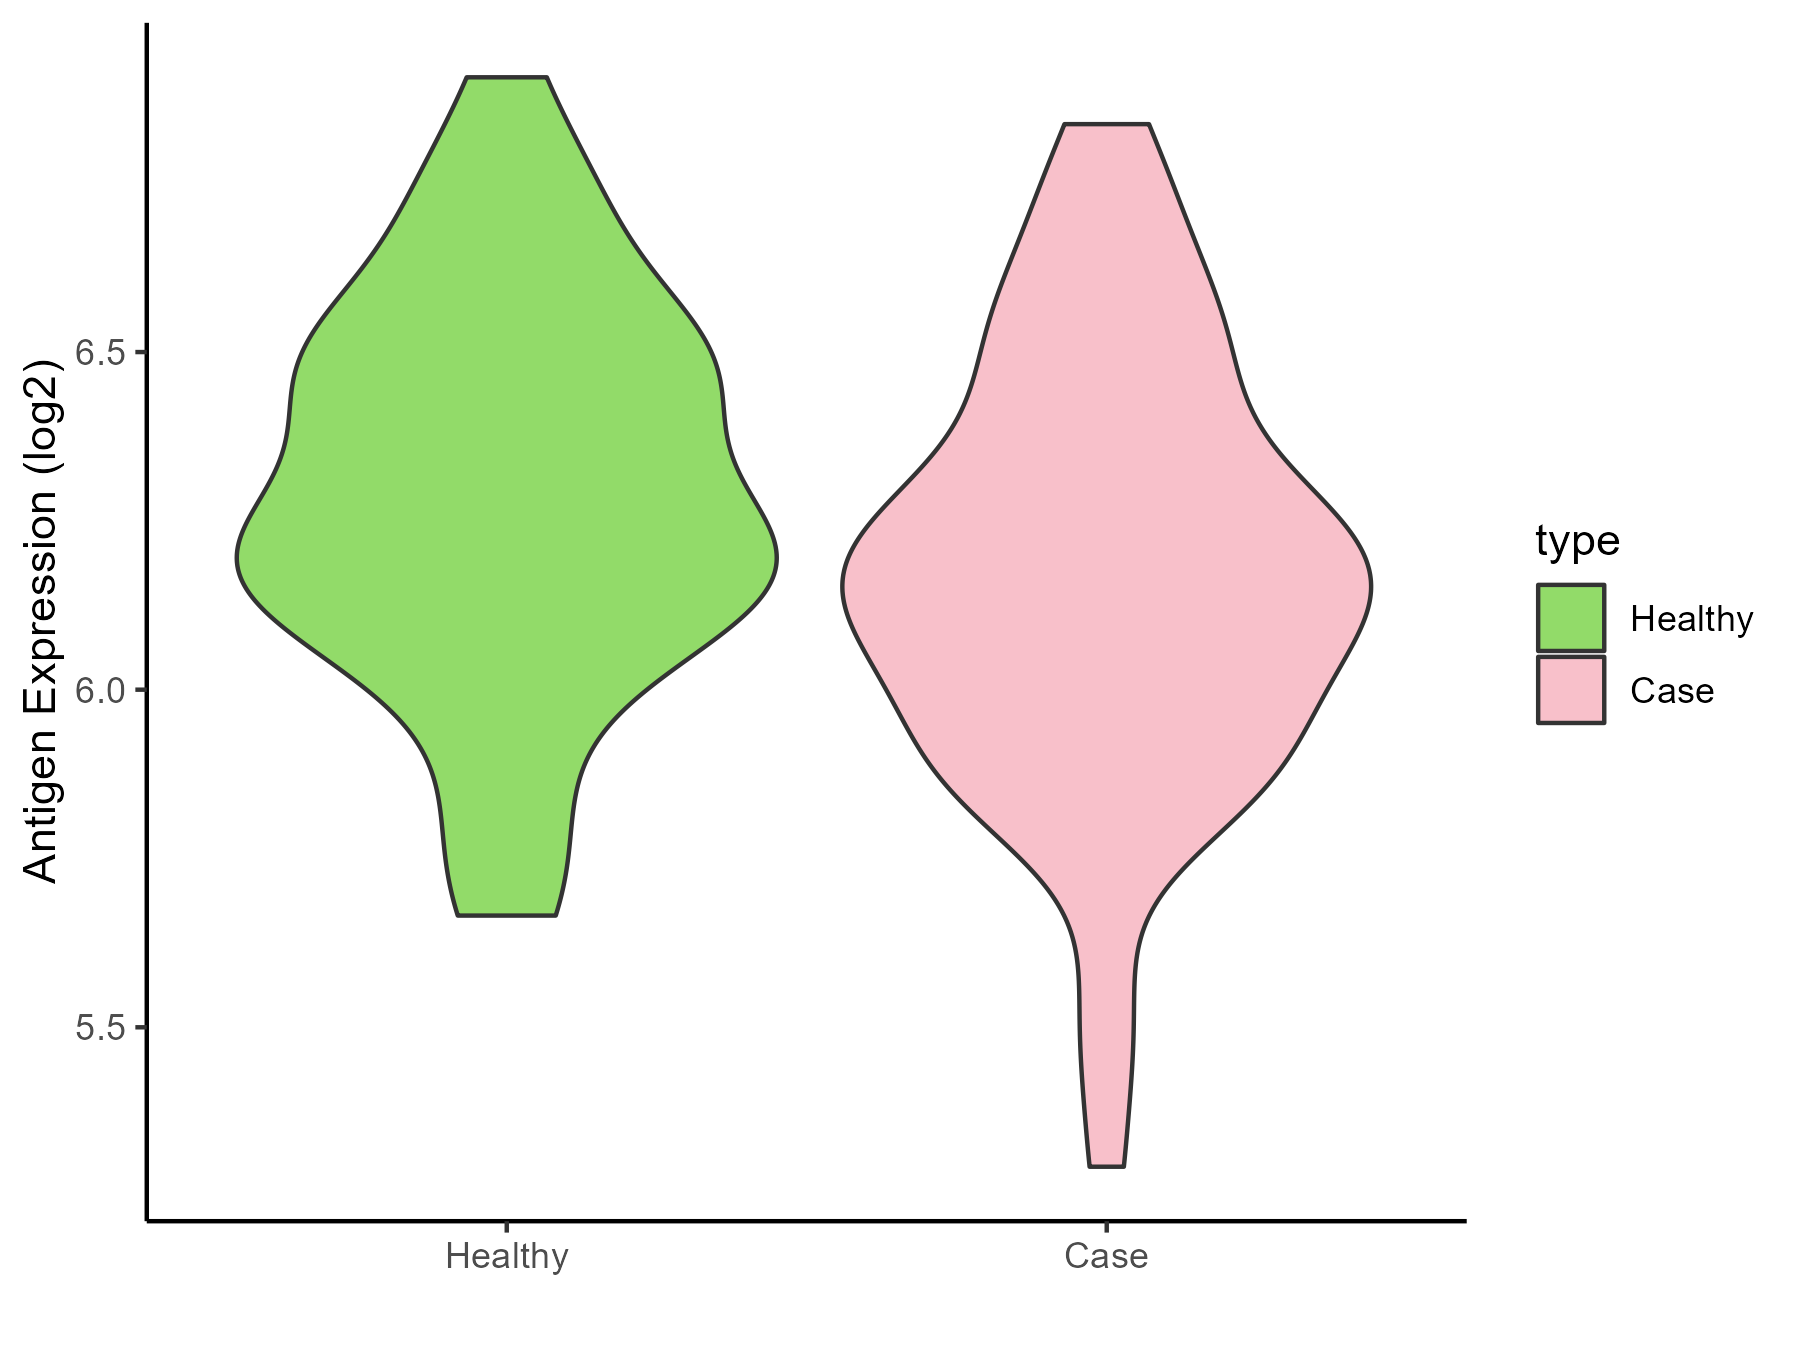
| Differential expression pattern of antigen in diseases | ||
| The Studied Tissue | Lung | |
| The Specific Disease | Chronic obstructive pulmonary disease | |
| The Expression Level of Disease Section Compare with the Healthy Individual Tissue | p-value: 0.056566015; Fold-change: -0.098770006; Z-score: -0.339408549 | |
| Disease-specific Antigen Abundances |
|
Click to View the Clearer Original Diagram |
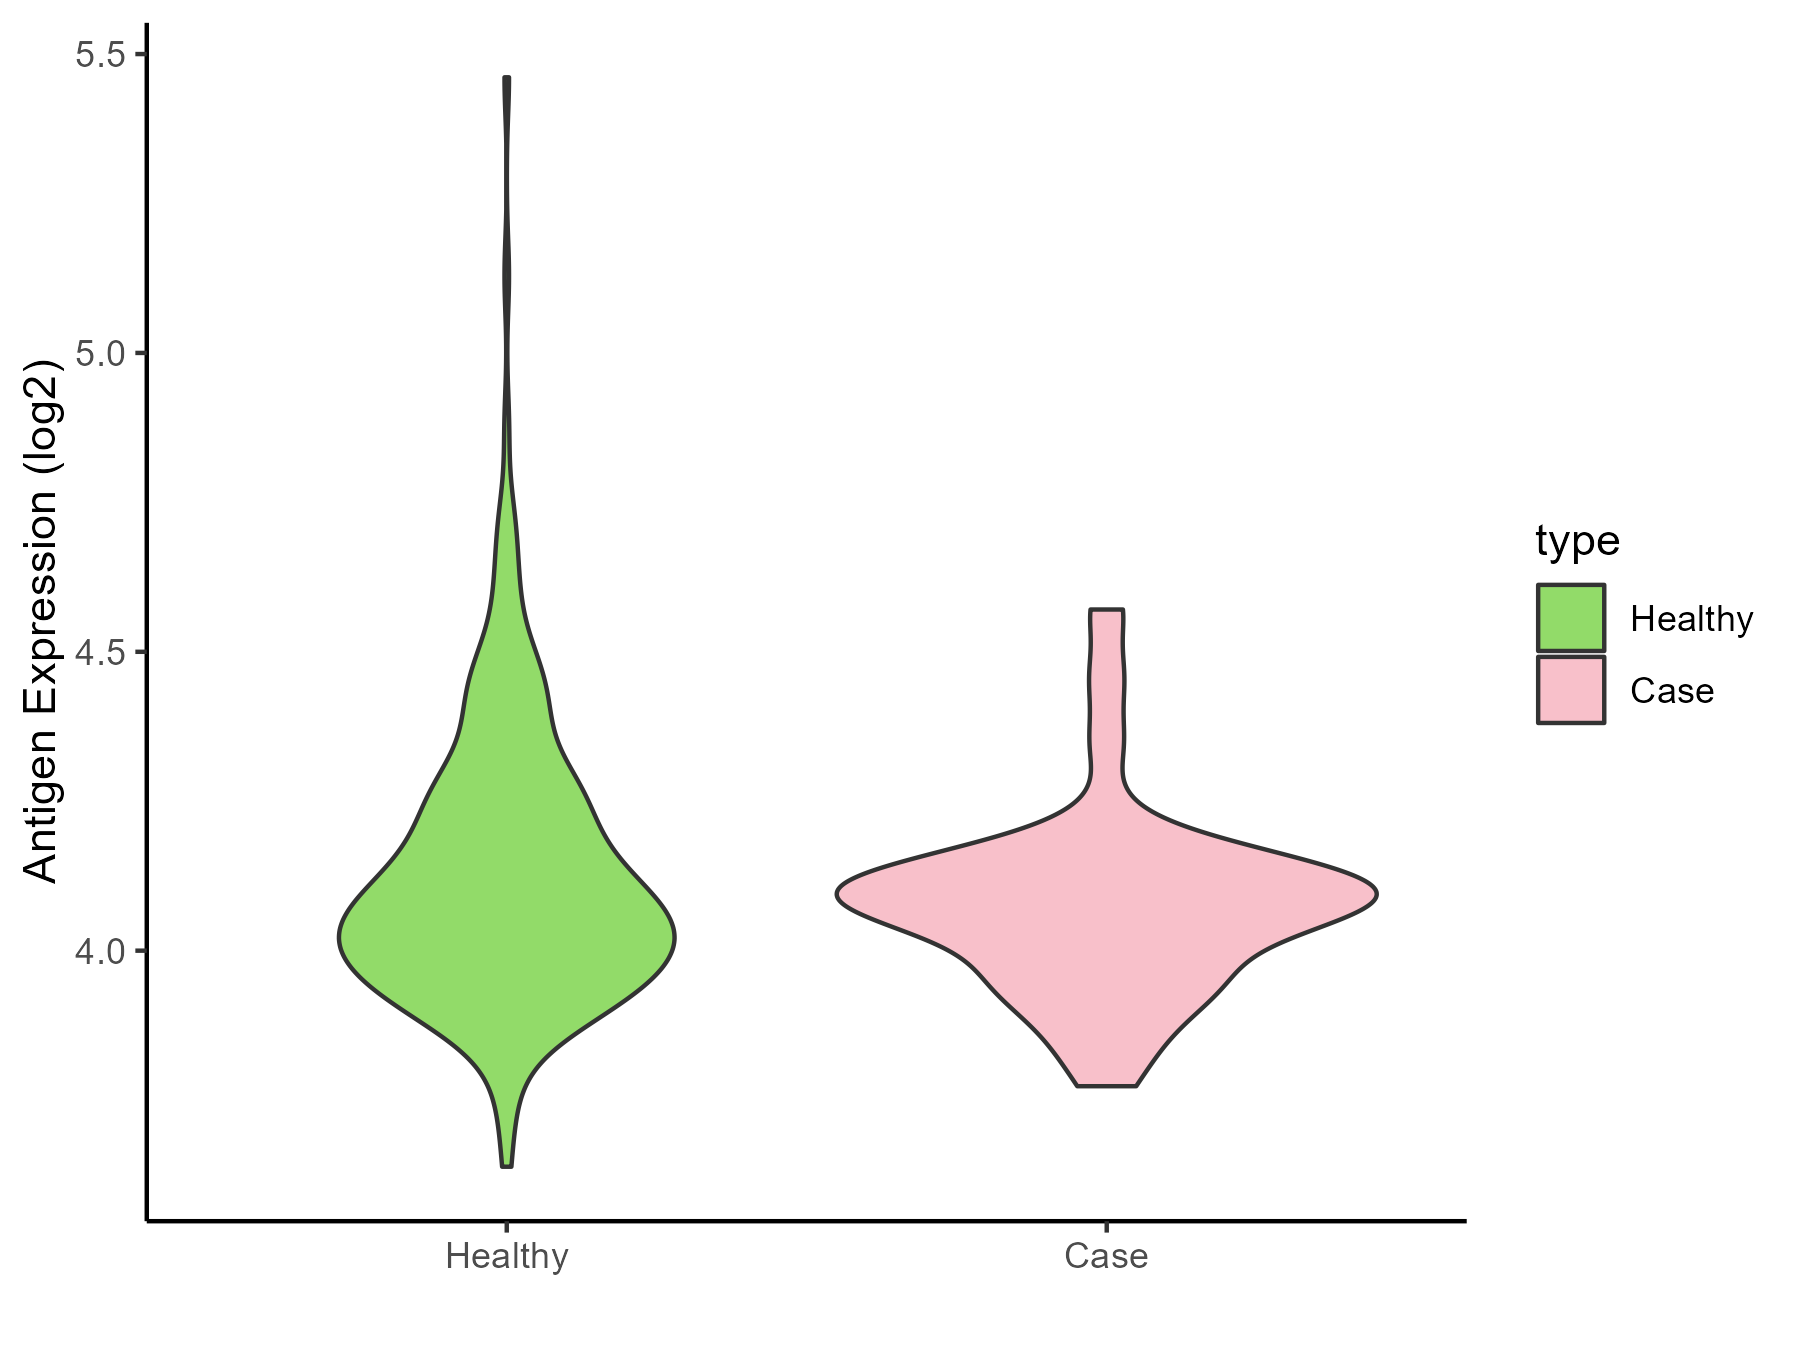
| The Studied Tissue | Small airway epithelium | |
| The Specific Disease | Chronic obstructive pulmonary disease | |
| The Expression Level of Disease Section Compare with the Healthy Individual Tissue | p-value: 0.061415633; Fold-change: 0.002066518; Z-score: 0.008764073 | |
| Disease-specific Antigen Abundances |
|
Click to View the Clearer Original Diagram |
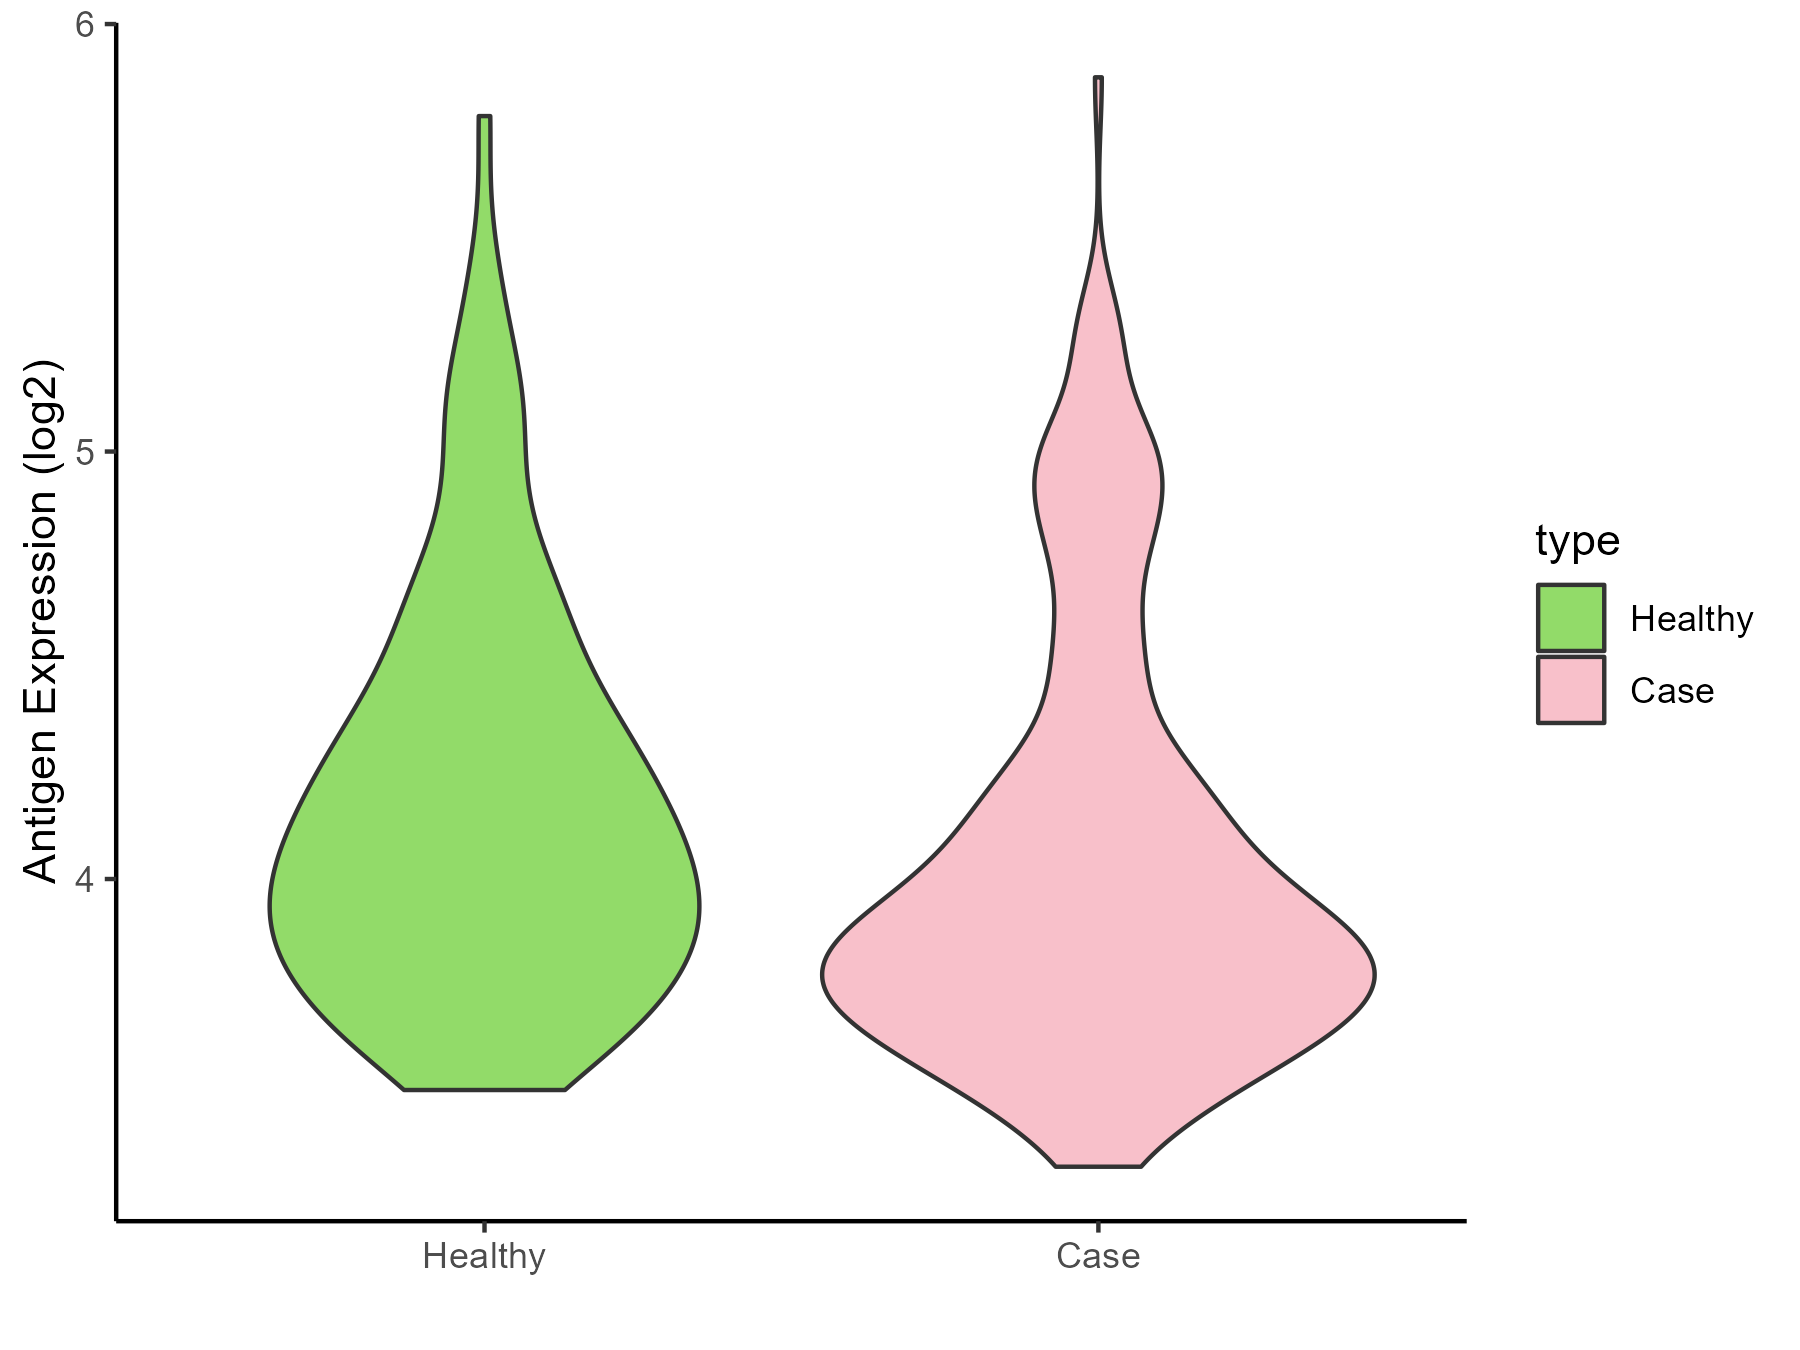
| Differential expression pattern of antigen in diseases | ||
| The Studied Tissue | Nasal and bronchial airway | |
| The Specific Disease | Asthma | |
| The Expression Level of Disease Section Compare with the Healthy Individual Tissue | p-value: 0.013345432; Fold-change: -0.206171838; Z-score: -0.44198305 | |
| Disease-specific Antigen Abundances |
|
Click to View the Clearer Original Diagram |
| Differential expression pattern of antigen in diseases | ||
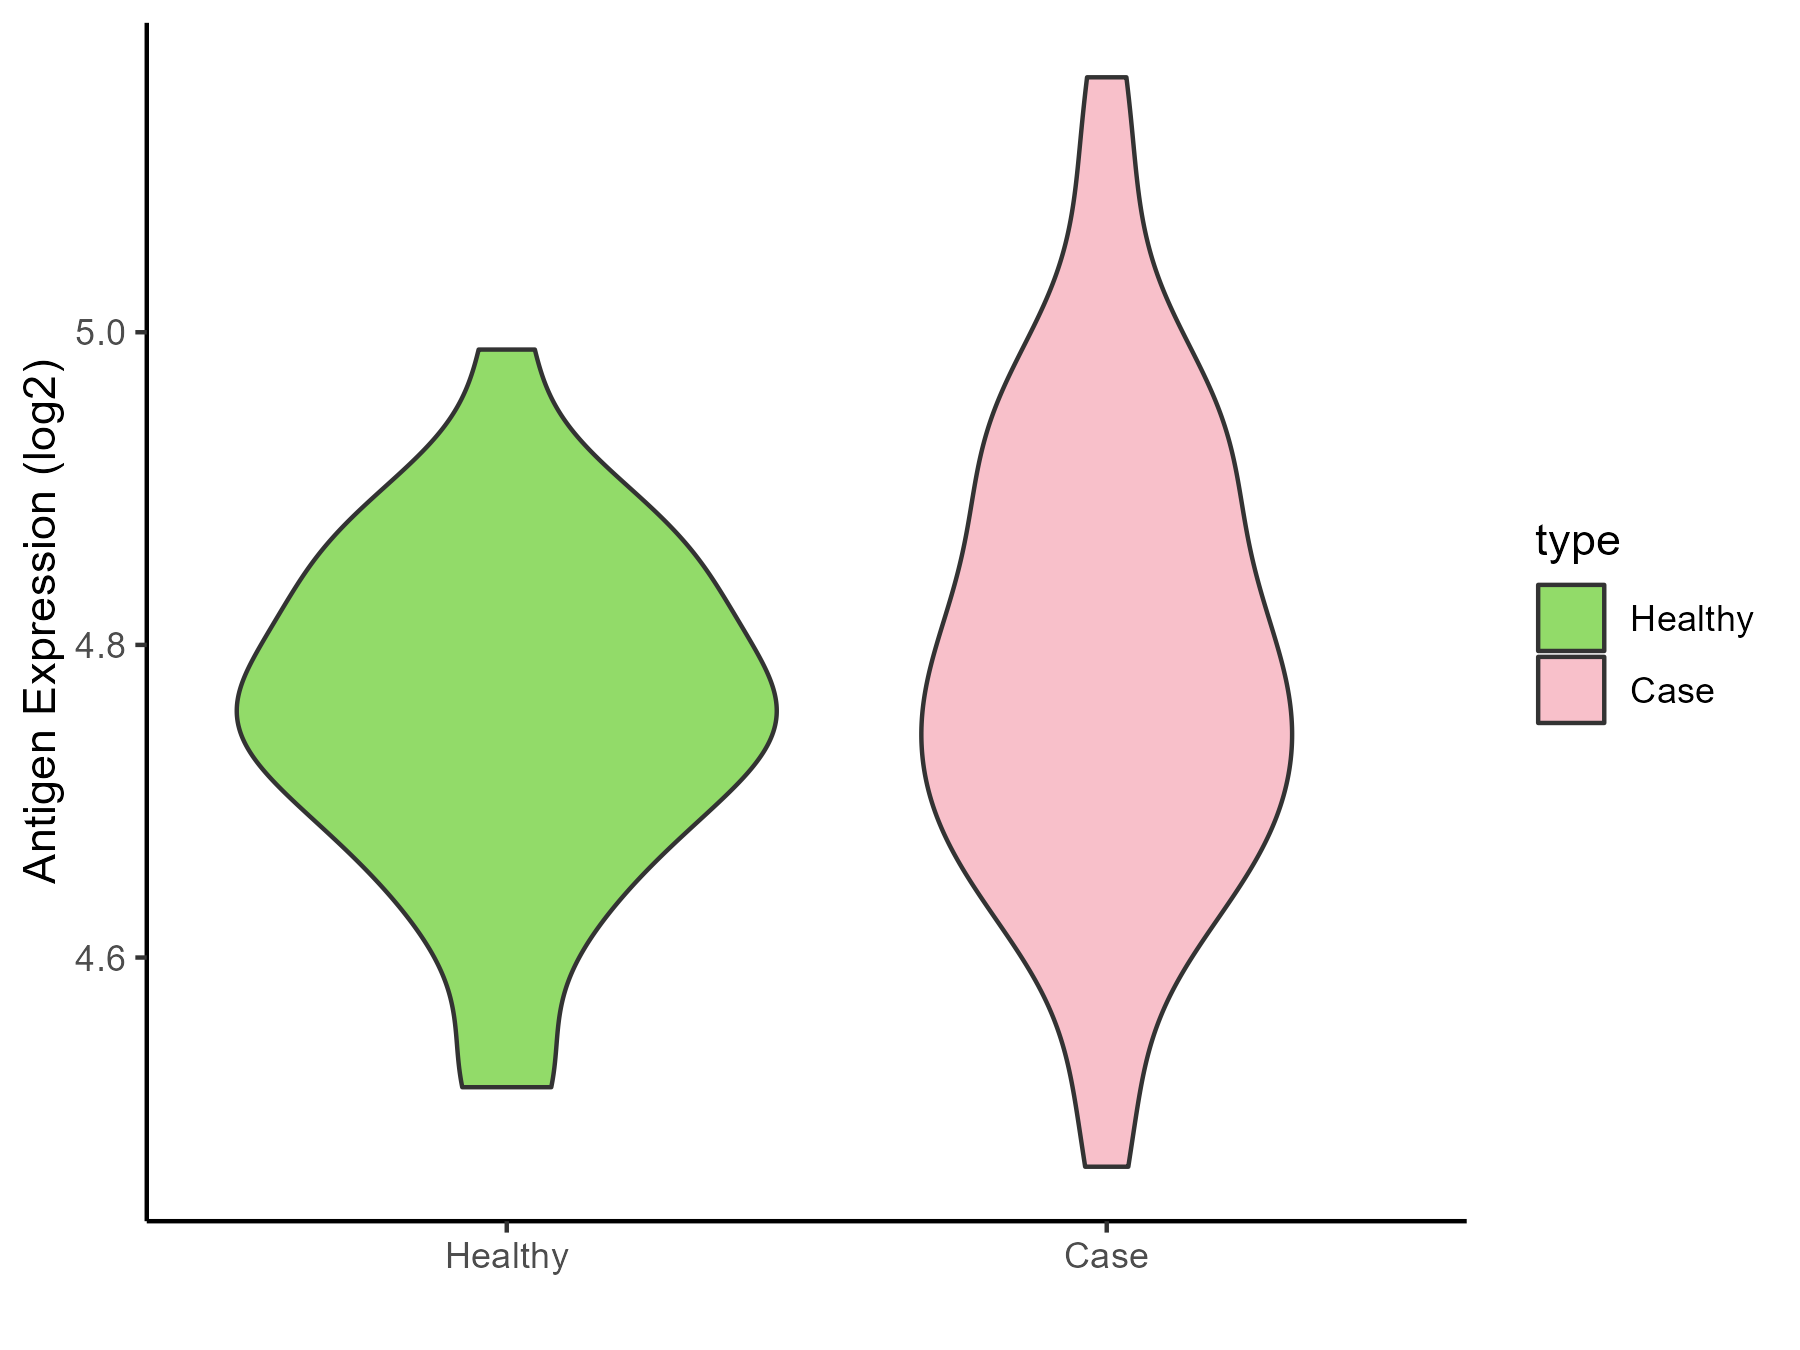
| The Studied Tissue | Nasal Epithelium | |
| The Specific Disease | Human rhinovirus infection | |
| The Expression Level of Disease Section Compare with the Healthy Individual Tissue | p-value: 0.177465693; Fold-change: 0.007800565; Z-score: 0.073229471 | |
| Disease-specific Antigen Abundances |
|
Click to View the Clearer Original Diagram |
| Differential expression pattern of antigen in diseases | ||
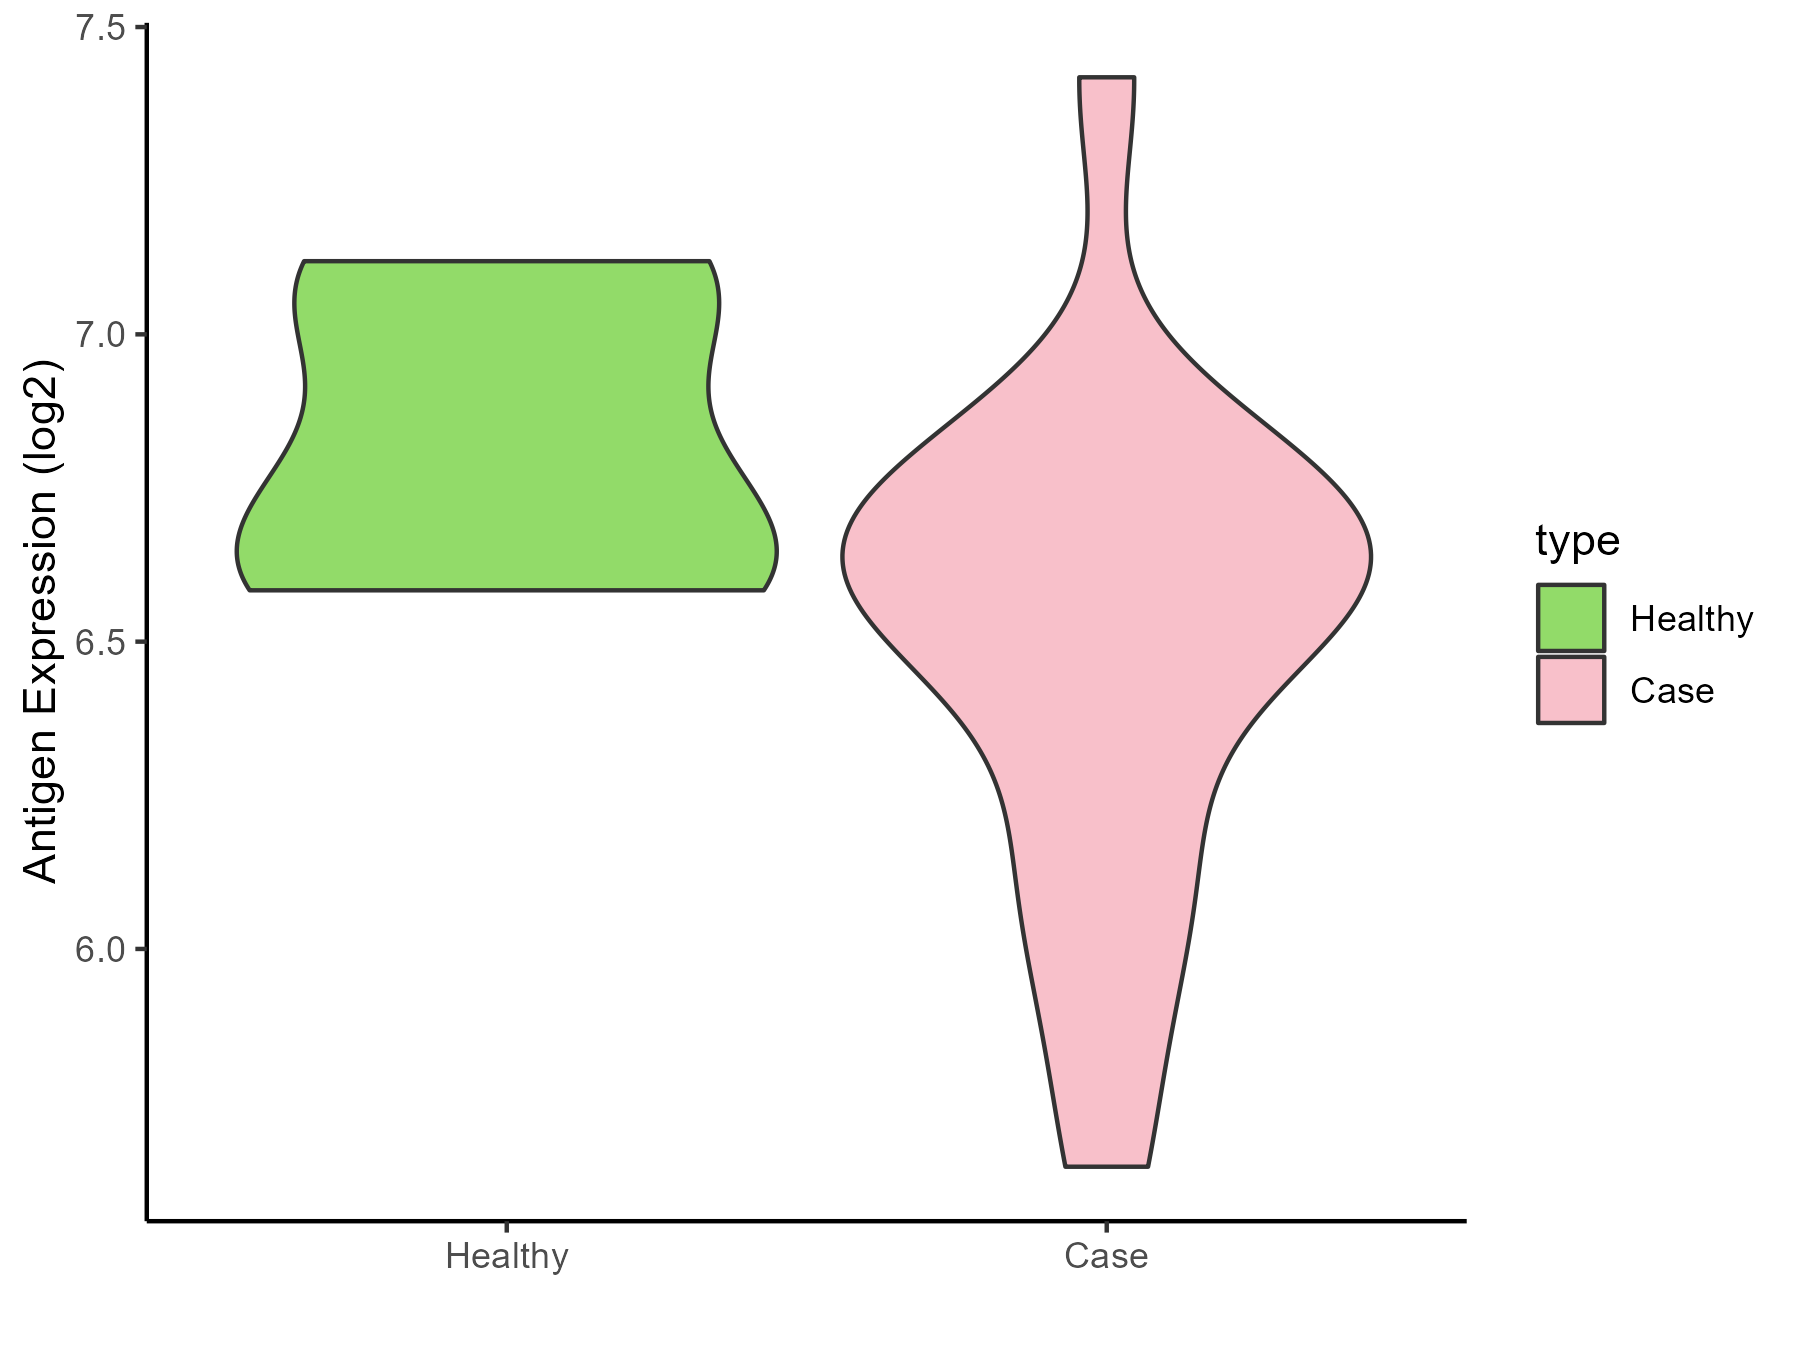
| The Studied Tissue | Lung | |
| The Specific Disease | Idiopathic pulmonary fibrosis | |
| The Expression Level of Disease Section Compare with the Healthy Individual Tissue | p-value: 0.060178129; Fold-change: -0.157759618; Z-score: -0.611242616 | |
| Disease-specific Antigen Abundances |
|
Click to View the Clearer Original Diagram |
ICD Disease Classification 13
| Differential expression pattern of antigen in diseases | ||
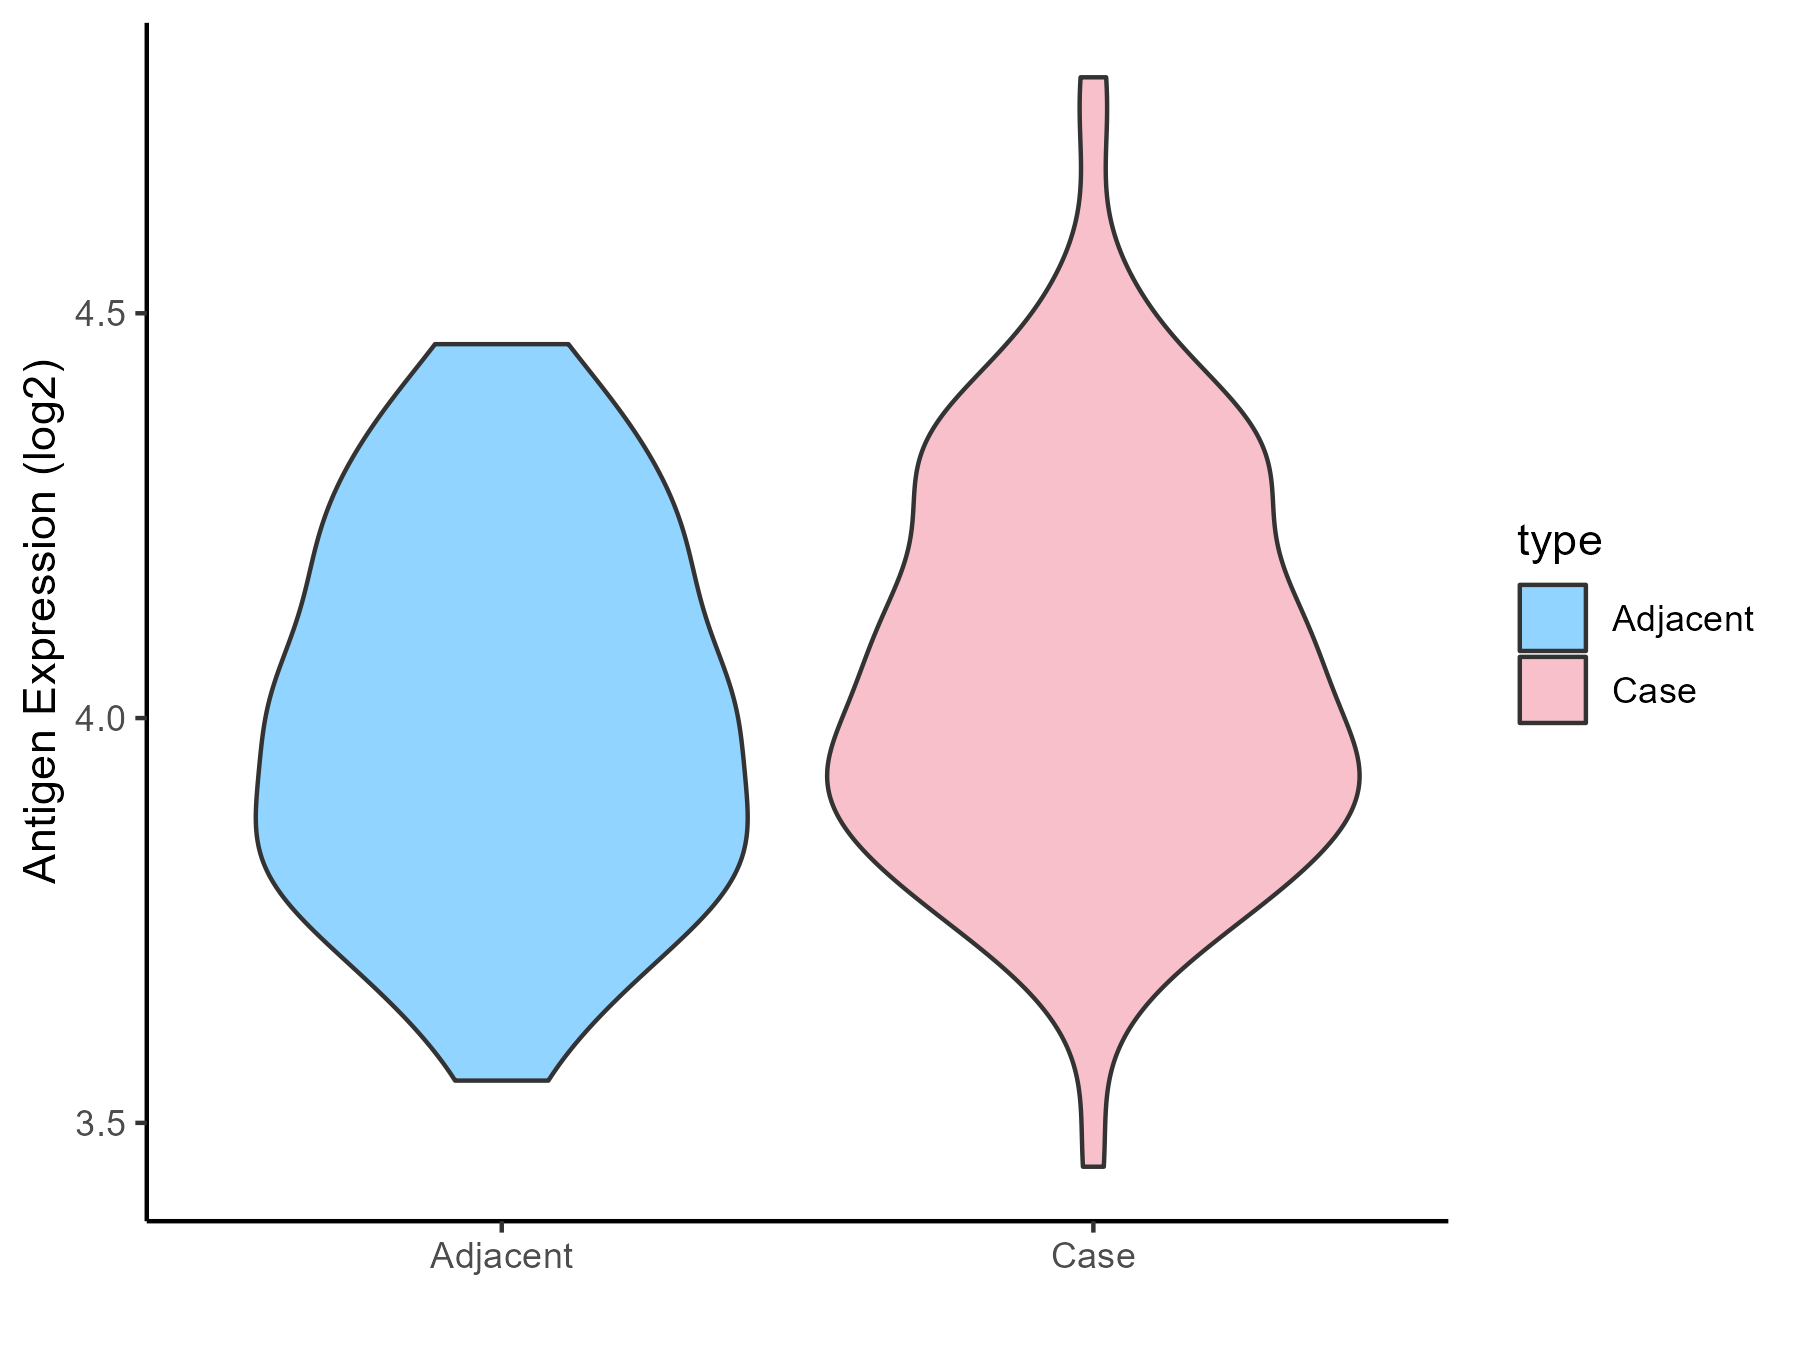
| The Studied Tissue | Gingival | |
| The Specific Disease | Periodontal disease | |
| The Expression Level of Disease Section Compare with the Adjacent Tissue | p-value: 0.104166488; Fold-change: 0.03216993; Z-score: 0.140738066 | |
| Disease-specific Antigen Abundances |
|
Click to View the Clearer Original Diagram |
| Differential expression pattern of antigen in diseases | ||
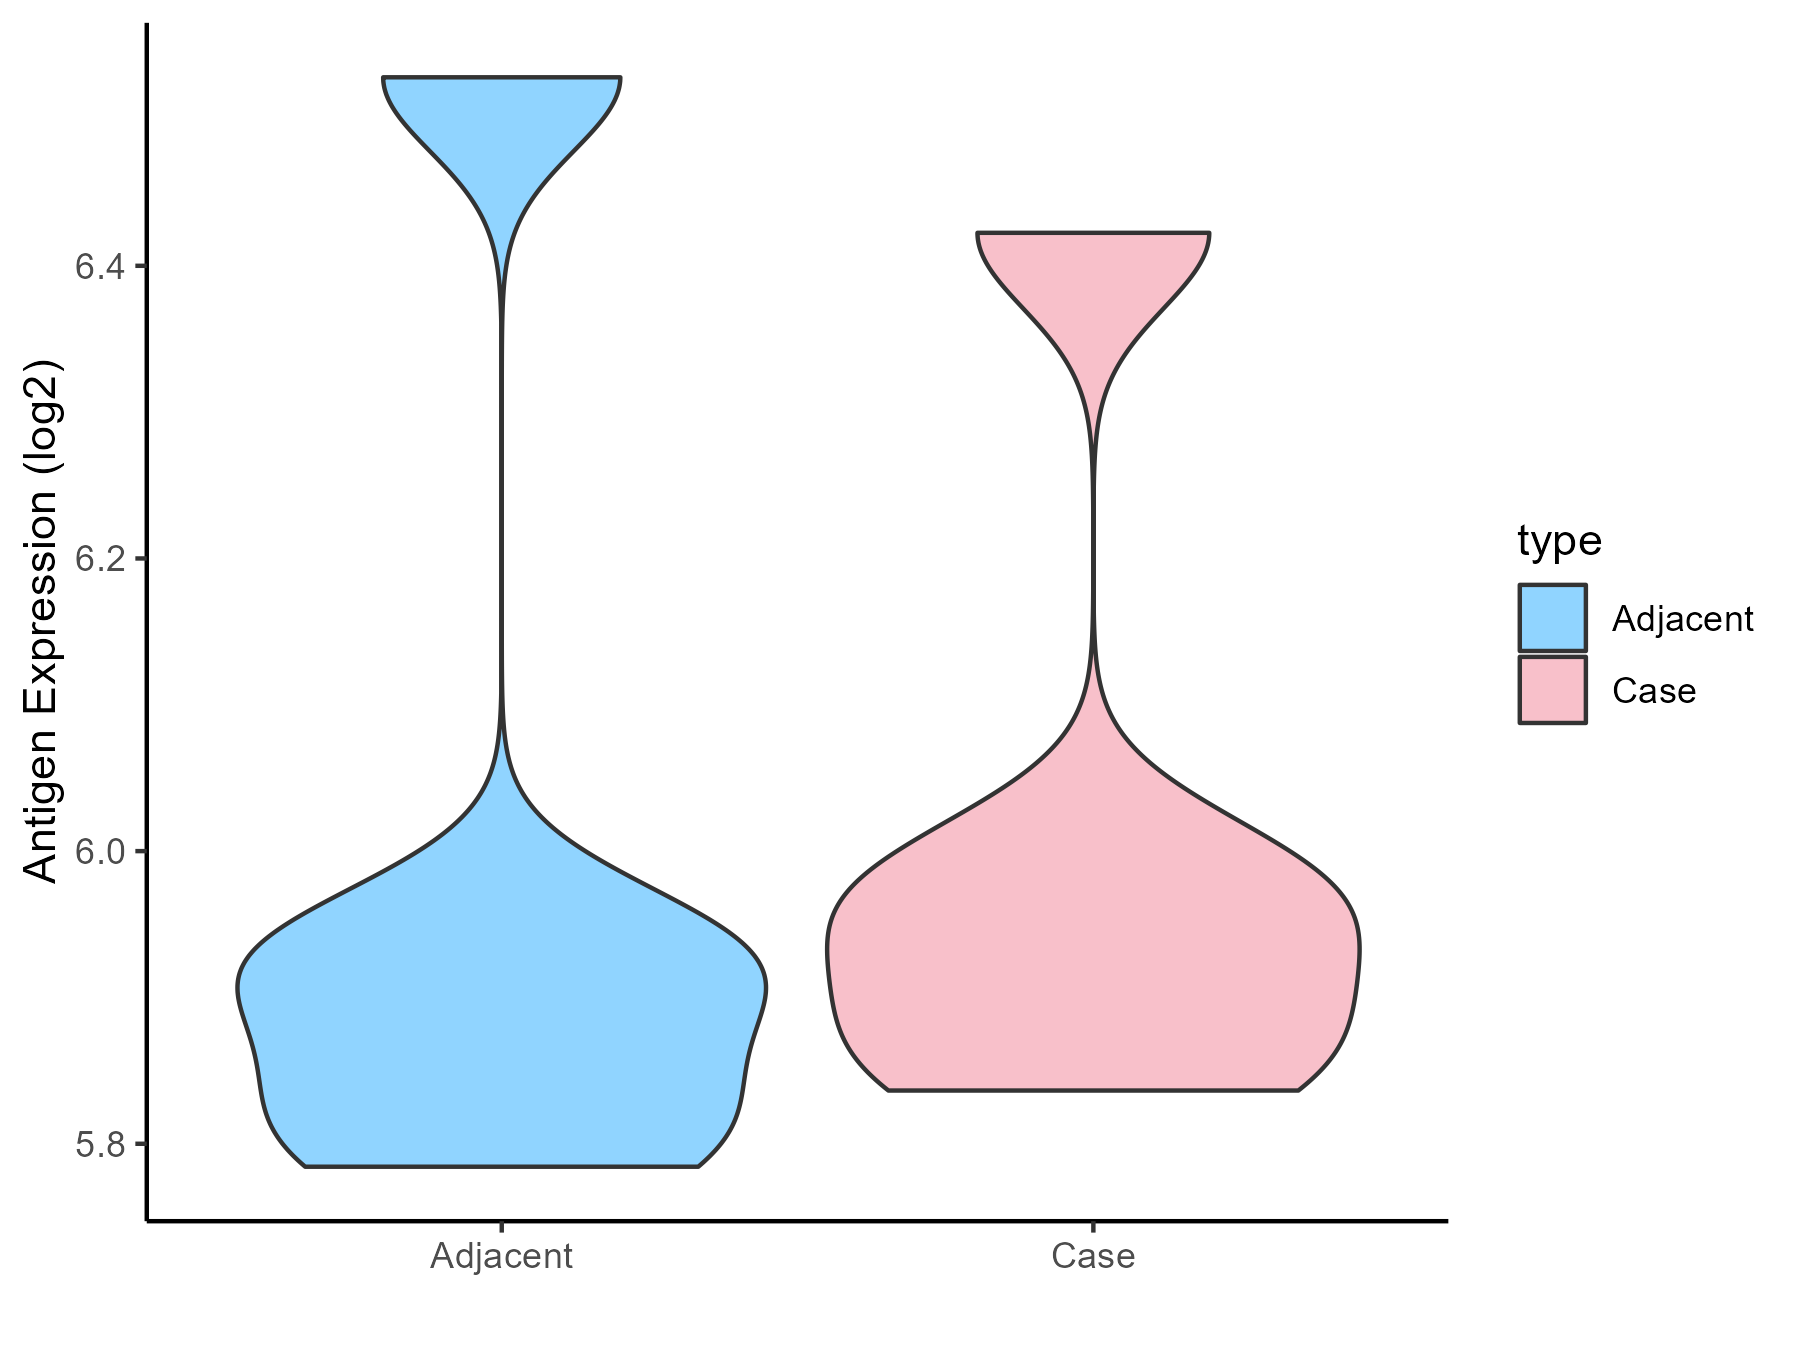
| The Studied Tissue | Gastric antrum | |
| The Specific Disease | Eosinophilic gastritis | |
| The Expression Level of Disease Section Compare with the Adjacent Tissue | p-value: 0.926115418; Fold-change: 0.037713851; Z-score: 0.124865375 | |
| Disease-specific Antigen Abundances |
|
Click to View the Clearer Original Diagram |
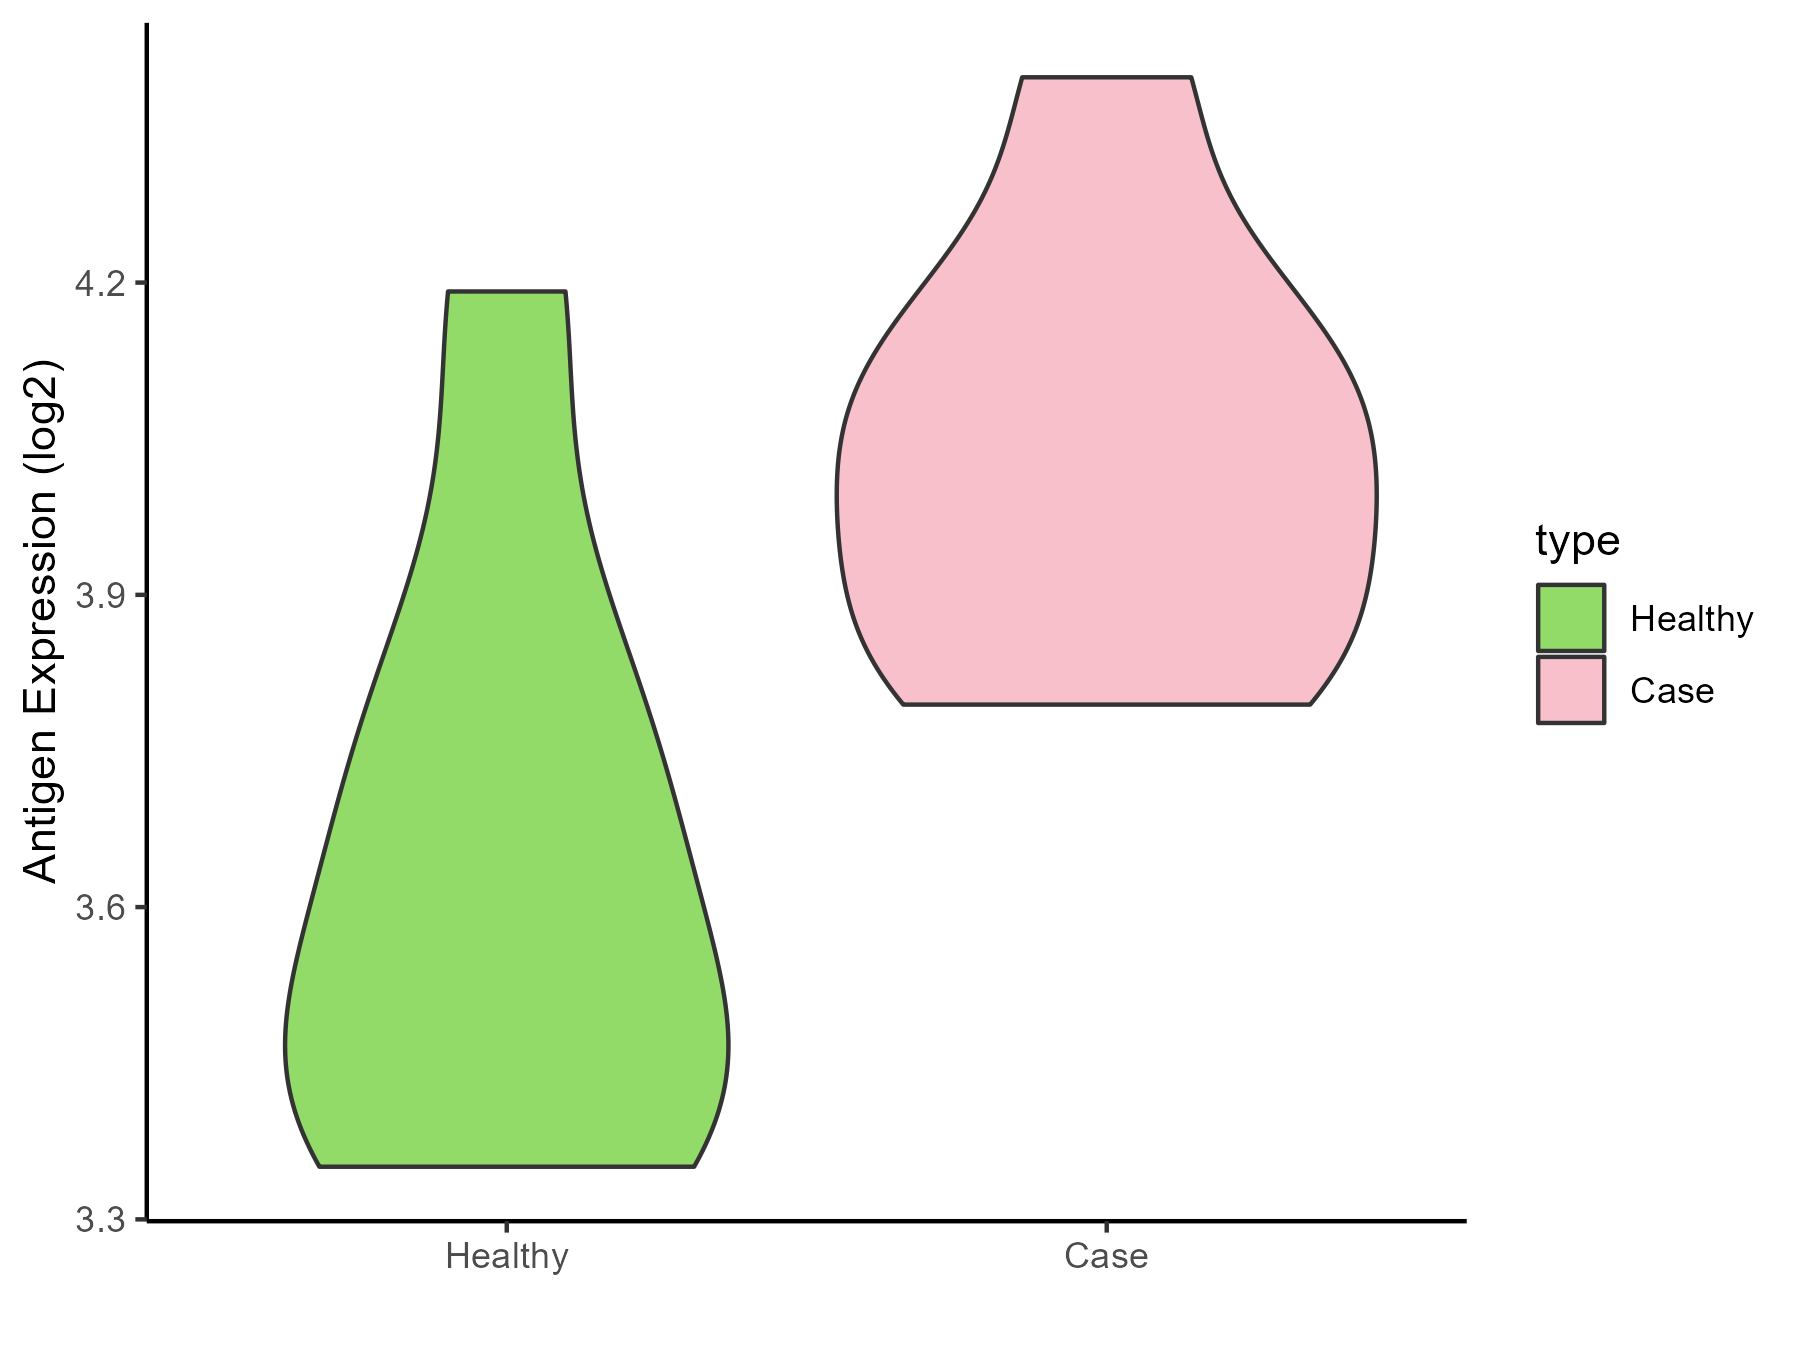
| Differential expression pattern of antigen in diseases | ||
| The Studied Tissue | Liver | |
| The Specific Disease | Liver failure | |
| The Expression Level of Disease Section Compare with the Healthy Individual Tissue | p-value: 0.008107076; Fold-change: 0.435501499; Z-score: 1.516549176 | |
| Disease-specific Antigen Abundances |
|
Click to View the Clearer Original Diagram |
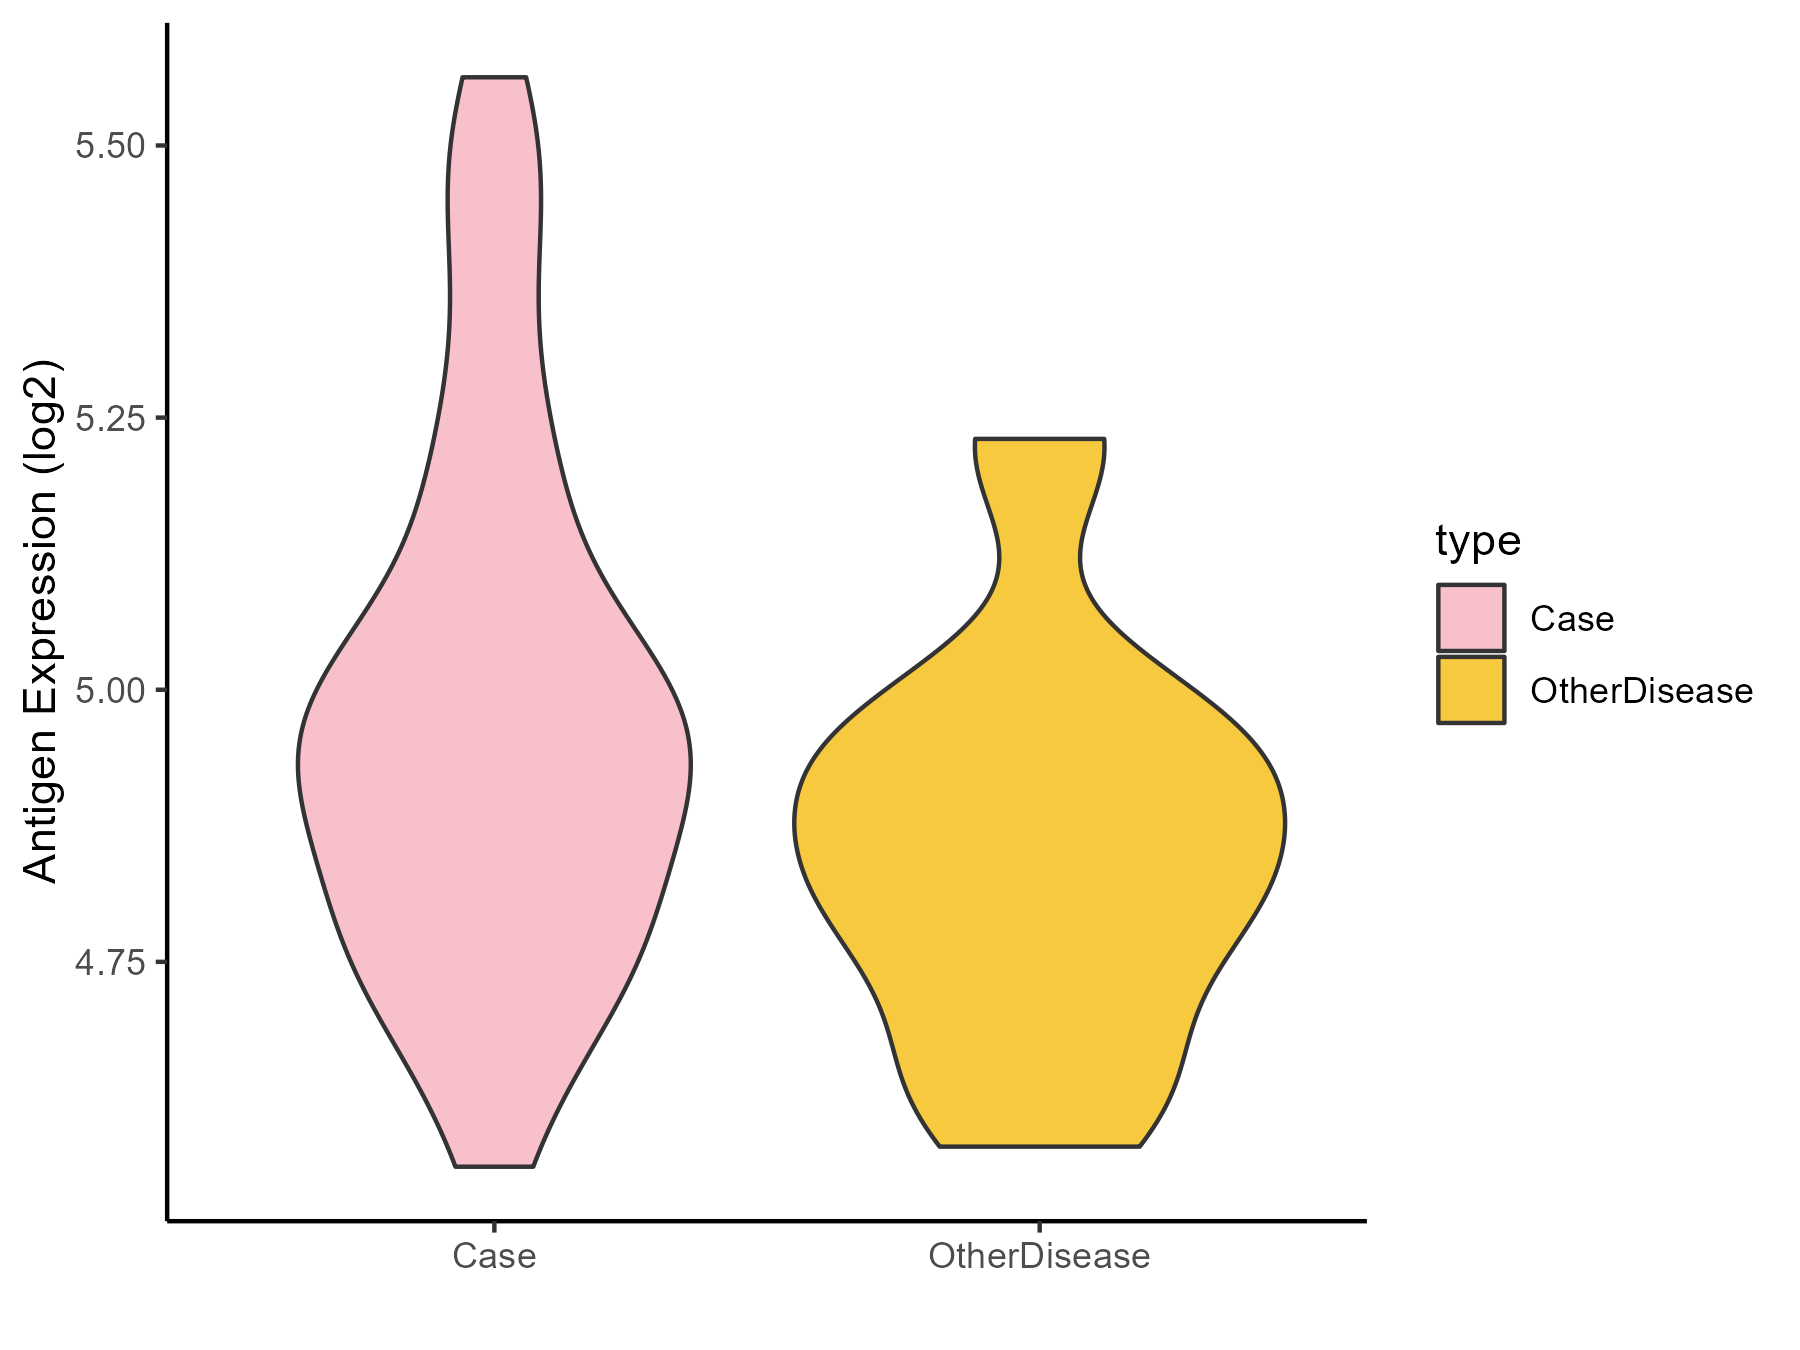
| Differential expression pattern of antigen in diseases | ||
| The Studied Tissue | Colon mucosal | |
| The Specific Disease | Ulcerative colitis | |
| The Expression Level of Disease Section Compare with the Adjacent Tissue | p-value: 0.044107752; Fold-change: 0.088440648; Z-score: 0.488144849 | |
| Disease-specific Antigen Abundances |
|
Click to View the Clearer Original Diagram |
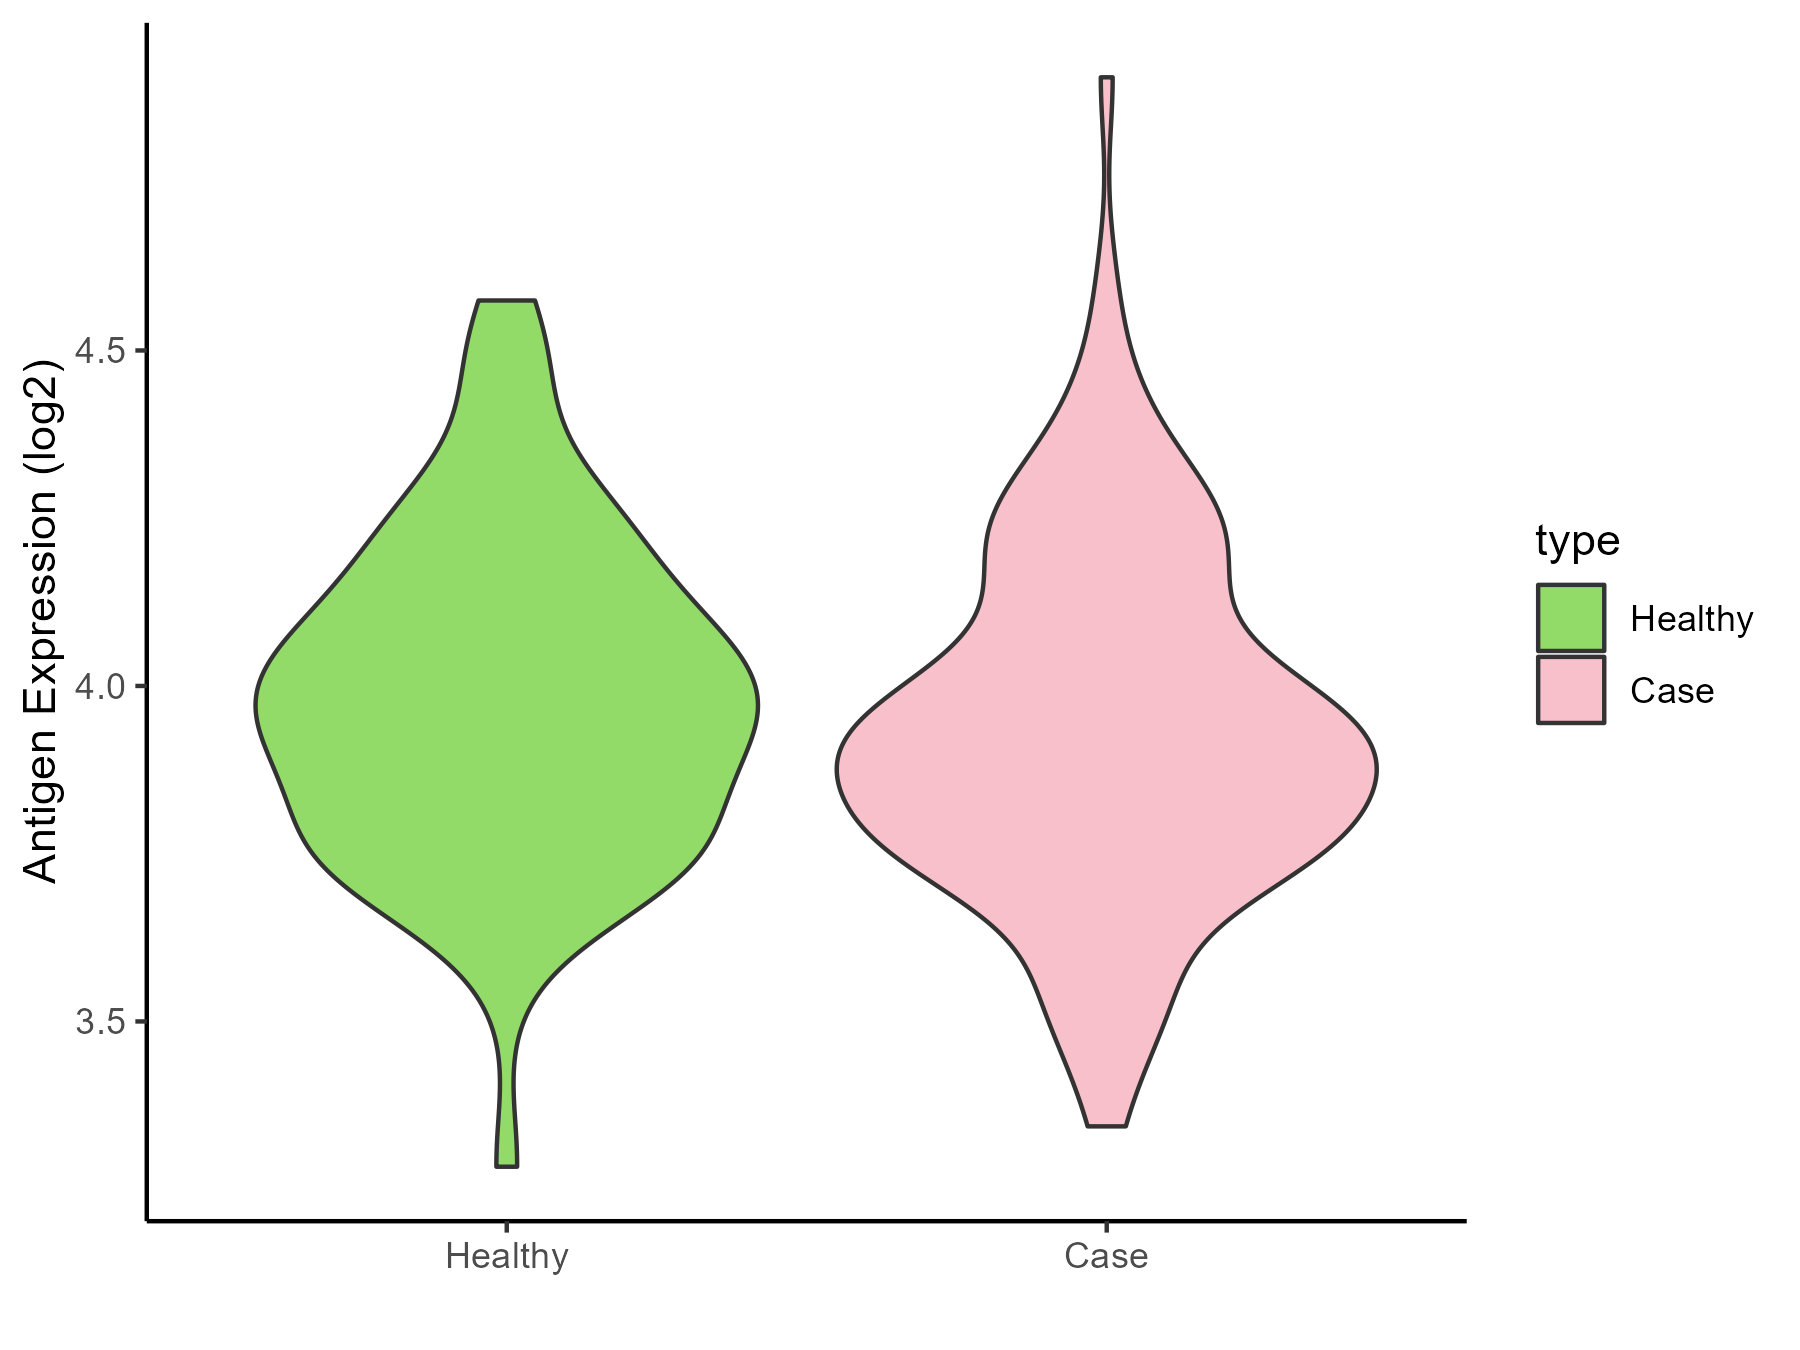
| Differential expression pattern of antigen in diseases | ||
| The Studied Tissue | Rectal colon | |
| The Specific Disease | Irritable bowel syndrome | |
| The Expression Level of Disease Section Compare with the Healthy Individual Tissue | p-value: 0.24884442; Fold-change: -0.047031877; Z-score: -0.196363322 | |
| Disease-specific Antigen Abundances |
|
Click to View the Clearer Original Diagram |
ICD Disease Classification 14
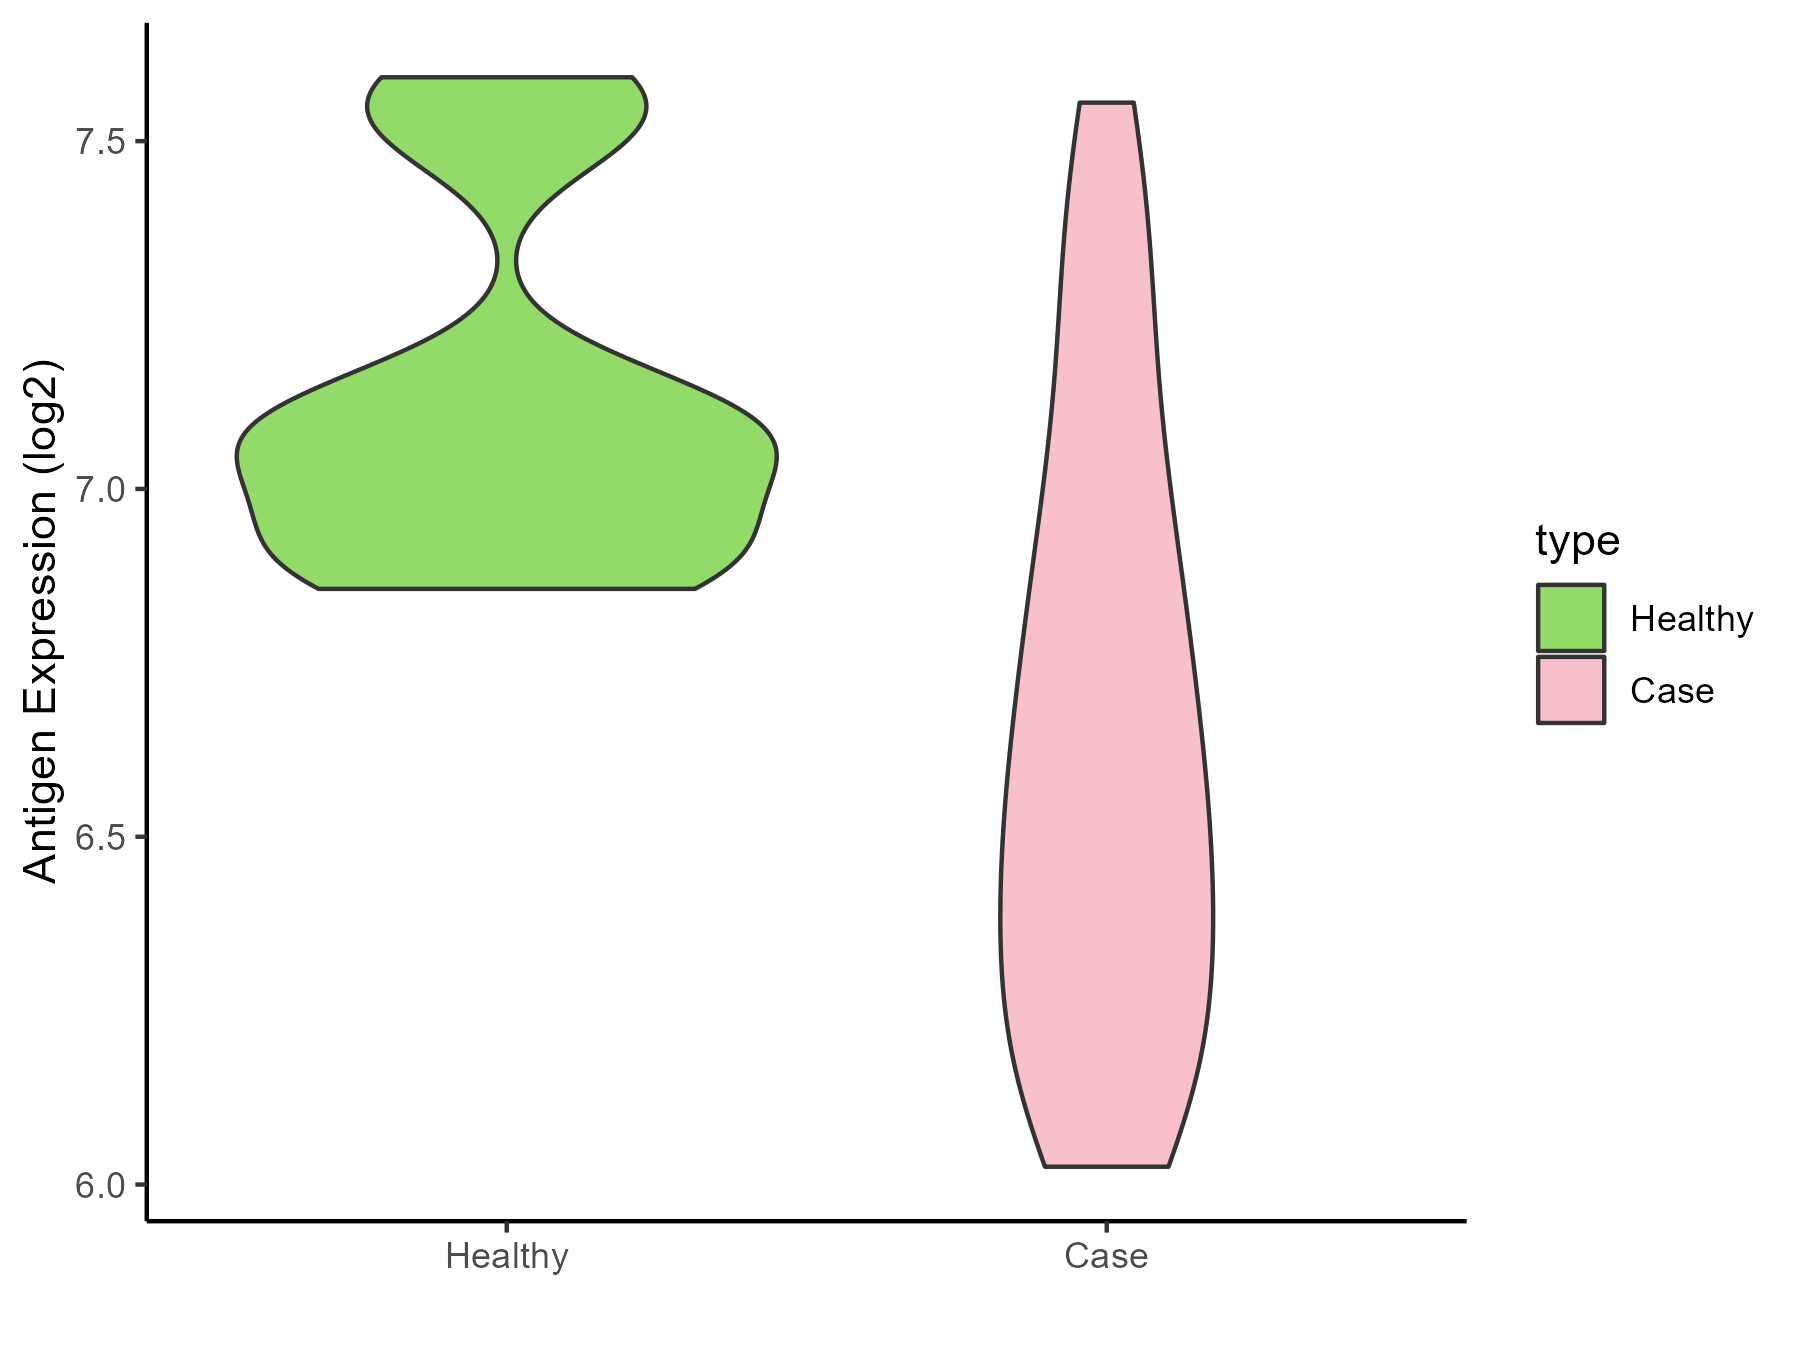
| Differential expression pattern of antigen in diseases | ||
| The Studied Tissue | Skin | |
| The Specific Disease | Atopic dermatitis | |
| The Expression Level of Disease Section Compare with the Healthy Individual Tissue | p-value: 8.88E-07; Fold-change: -0.538595513; Z-score: -2.100786723 | |
| Disease-specific Antigen Abundances |
|
Click to View the Clearer Original Diagram |
| Differential expression pattern of antigen in diseases | ||
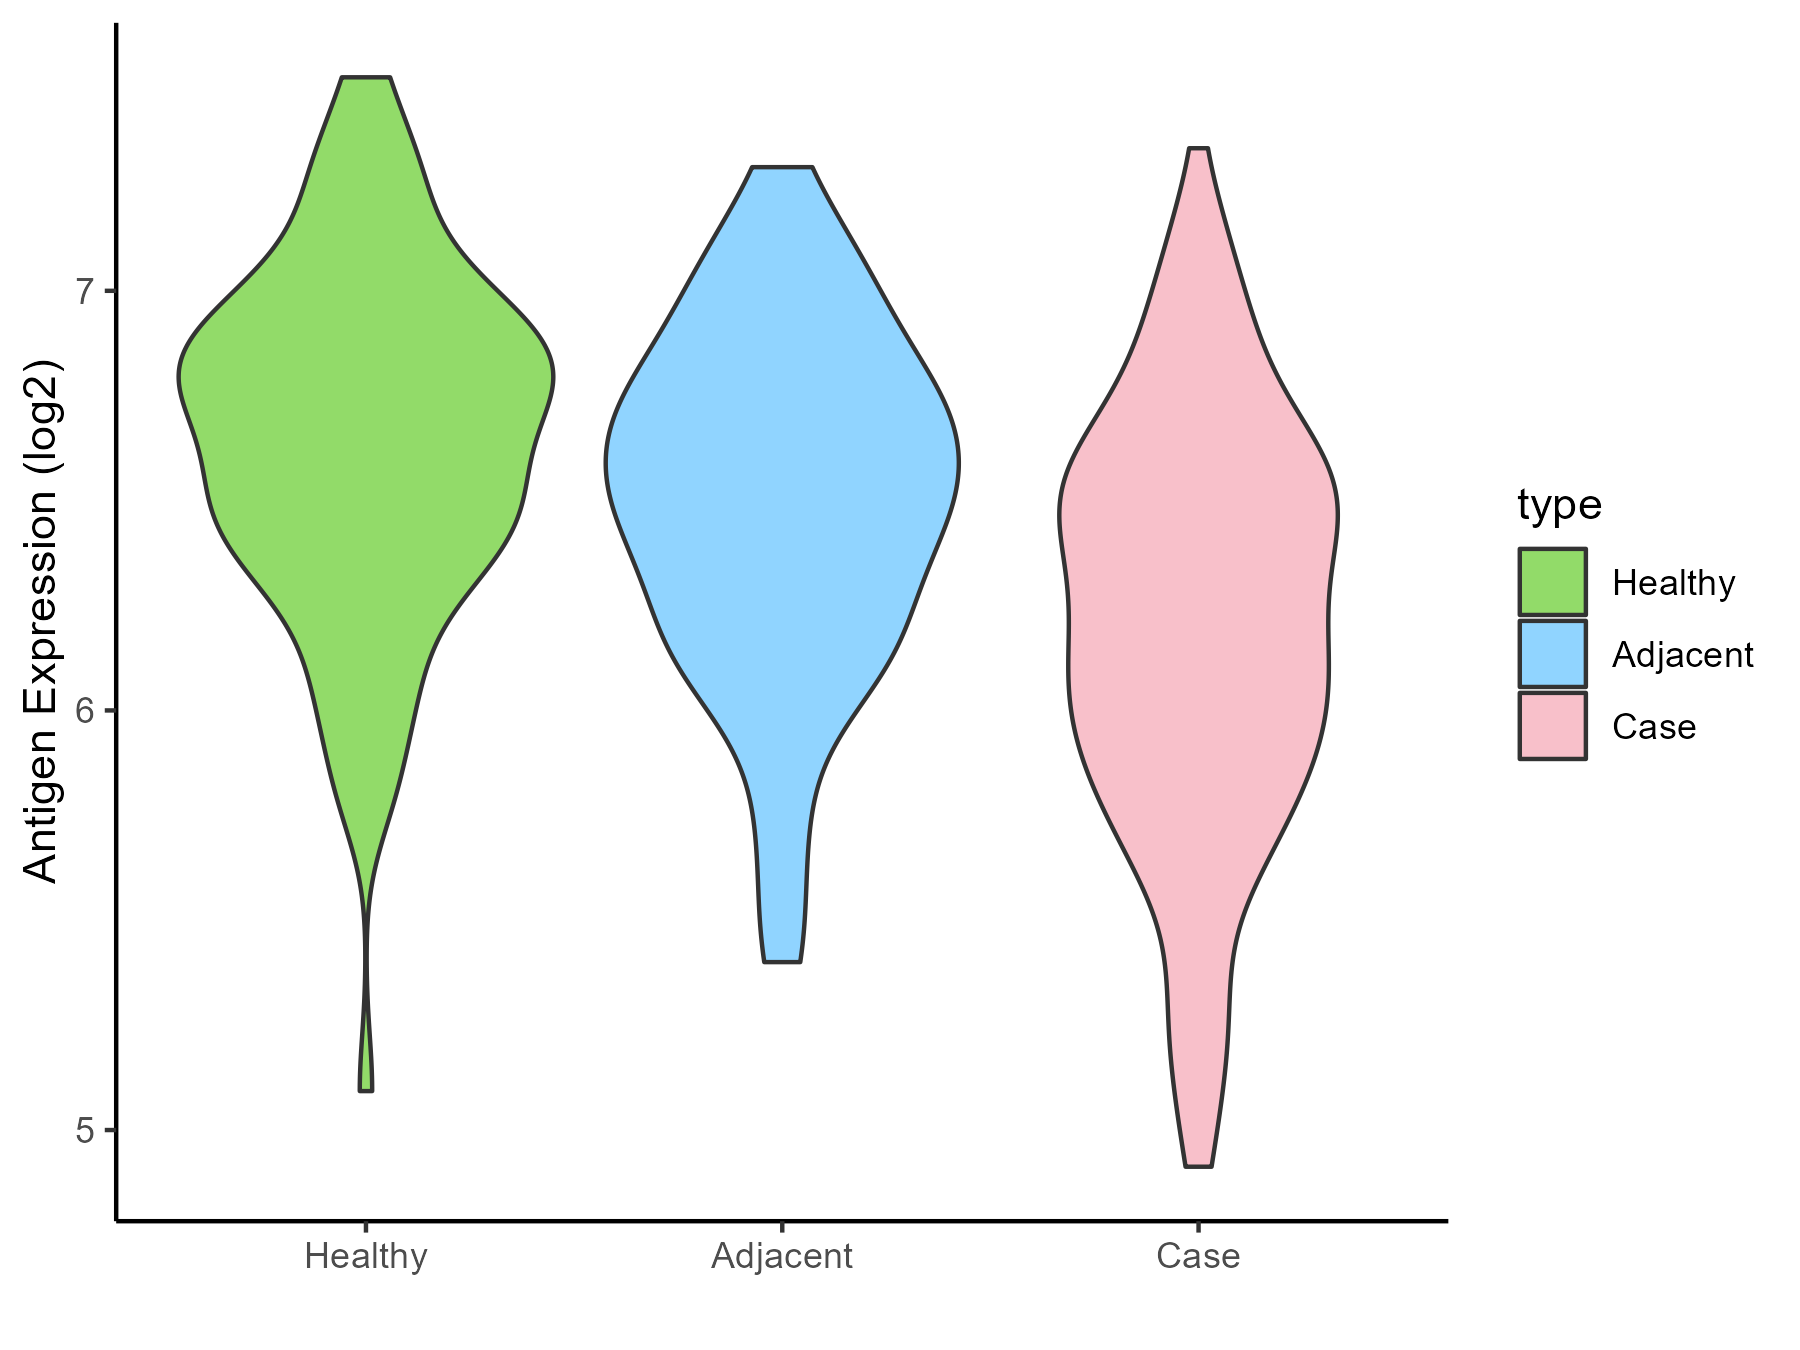
| The Studied Tissue | Skin | |
| The Specific Disease | Psoriasis | |
| The Expression Level of Disease Section Compare with the Healthy Individual Tissue | p-value: 3.84E-14; Fold-change: -0.469708243; Z-score: -1.114791798 | |
| The Expression Level of Disease Section Compare with the Adjacent Tissue | p-value: 1.62E-07; Fold-change: -0.303016765; Z-score: -0.738799249 | |
| Disease-specific Antigen Abundances |
|
Click to View the Clearer Original Diagram |
| Differential expression pattern of antigen in diseases | ||
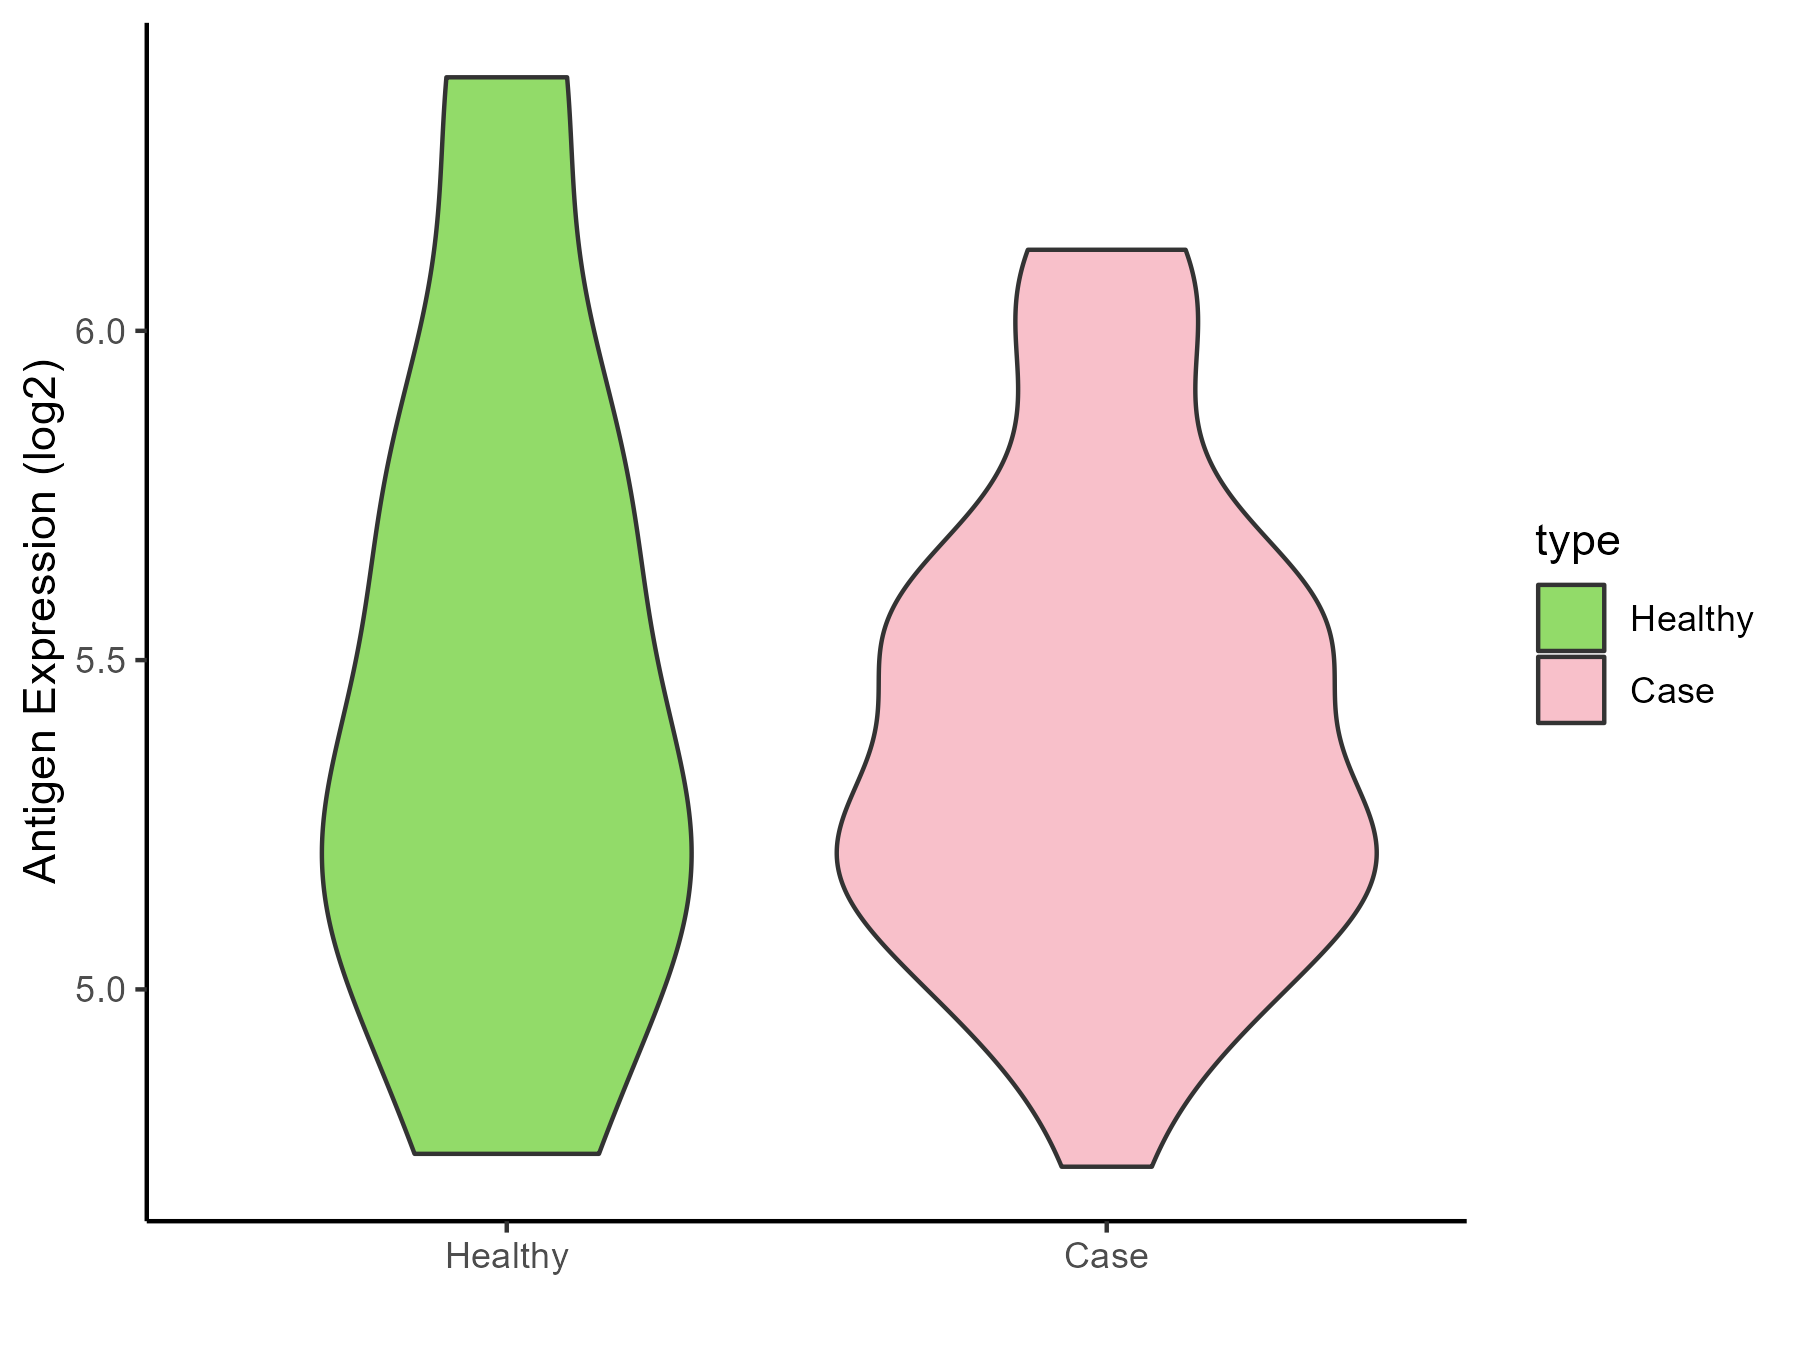
| The Studied Tissue | Skin | |
| The Specific Disease | Vitiligo | |
| The Expression Level of Disease Section Compare with the Healthy Individual Tissue | p-value: 0.802397952; Fold-change: 0.091681692; Z-score: 0.169738297 | |
| Disease-specific Antigen Abundances |
|
Click to View the Clearer Original Diagram |
| Differential expression pattern of antigen in diseases | ||
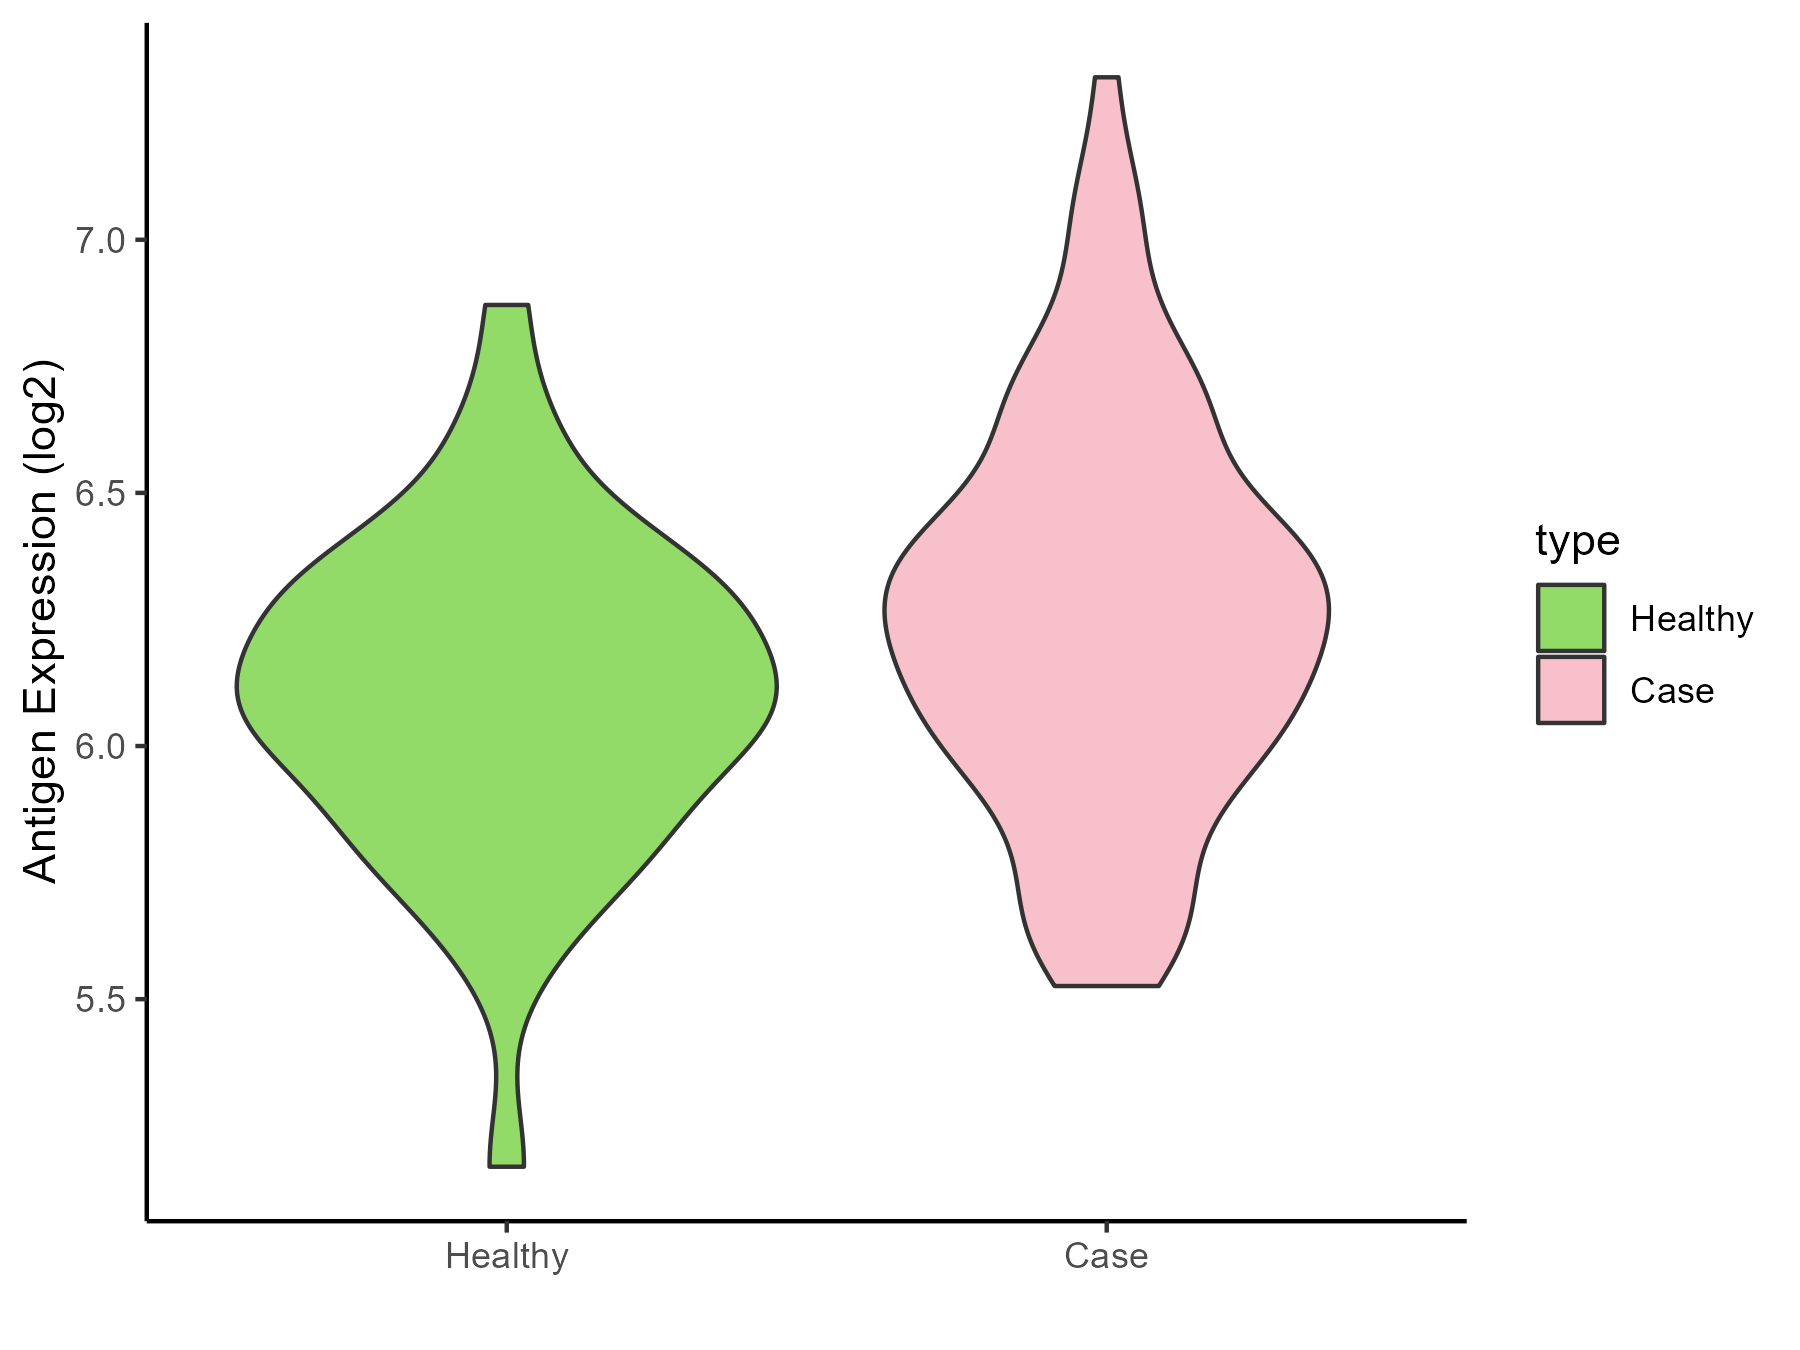
| The Studied Tissue | Skin from scalp | |
| The Specific Disease | Alopecia | |
| The Expression Level of Disease Section Compare with the Healthy Individual Tissue | p-value: 0.019411014; Fold-change: 0.153733163; Z-score: 0.485034179 | |
| Disease-specific Antigen Abundances |
|
Click to View the Clearer Original Diagram |
| Differential expression pattern of antigen in diseases | ||
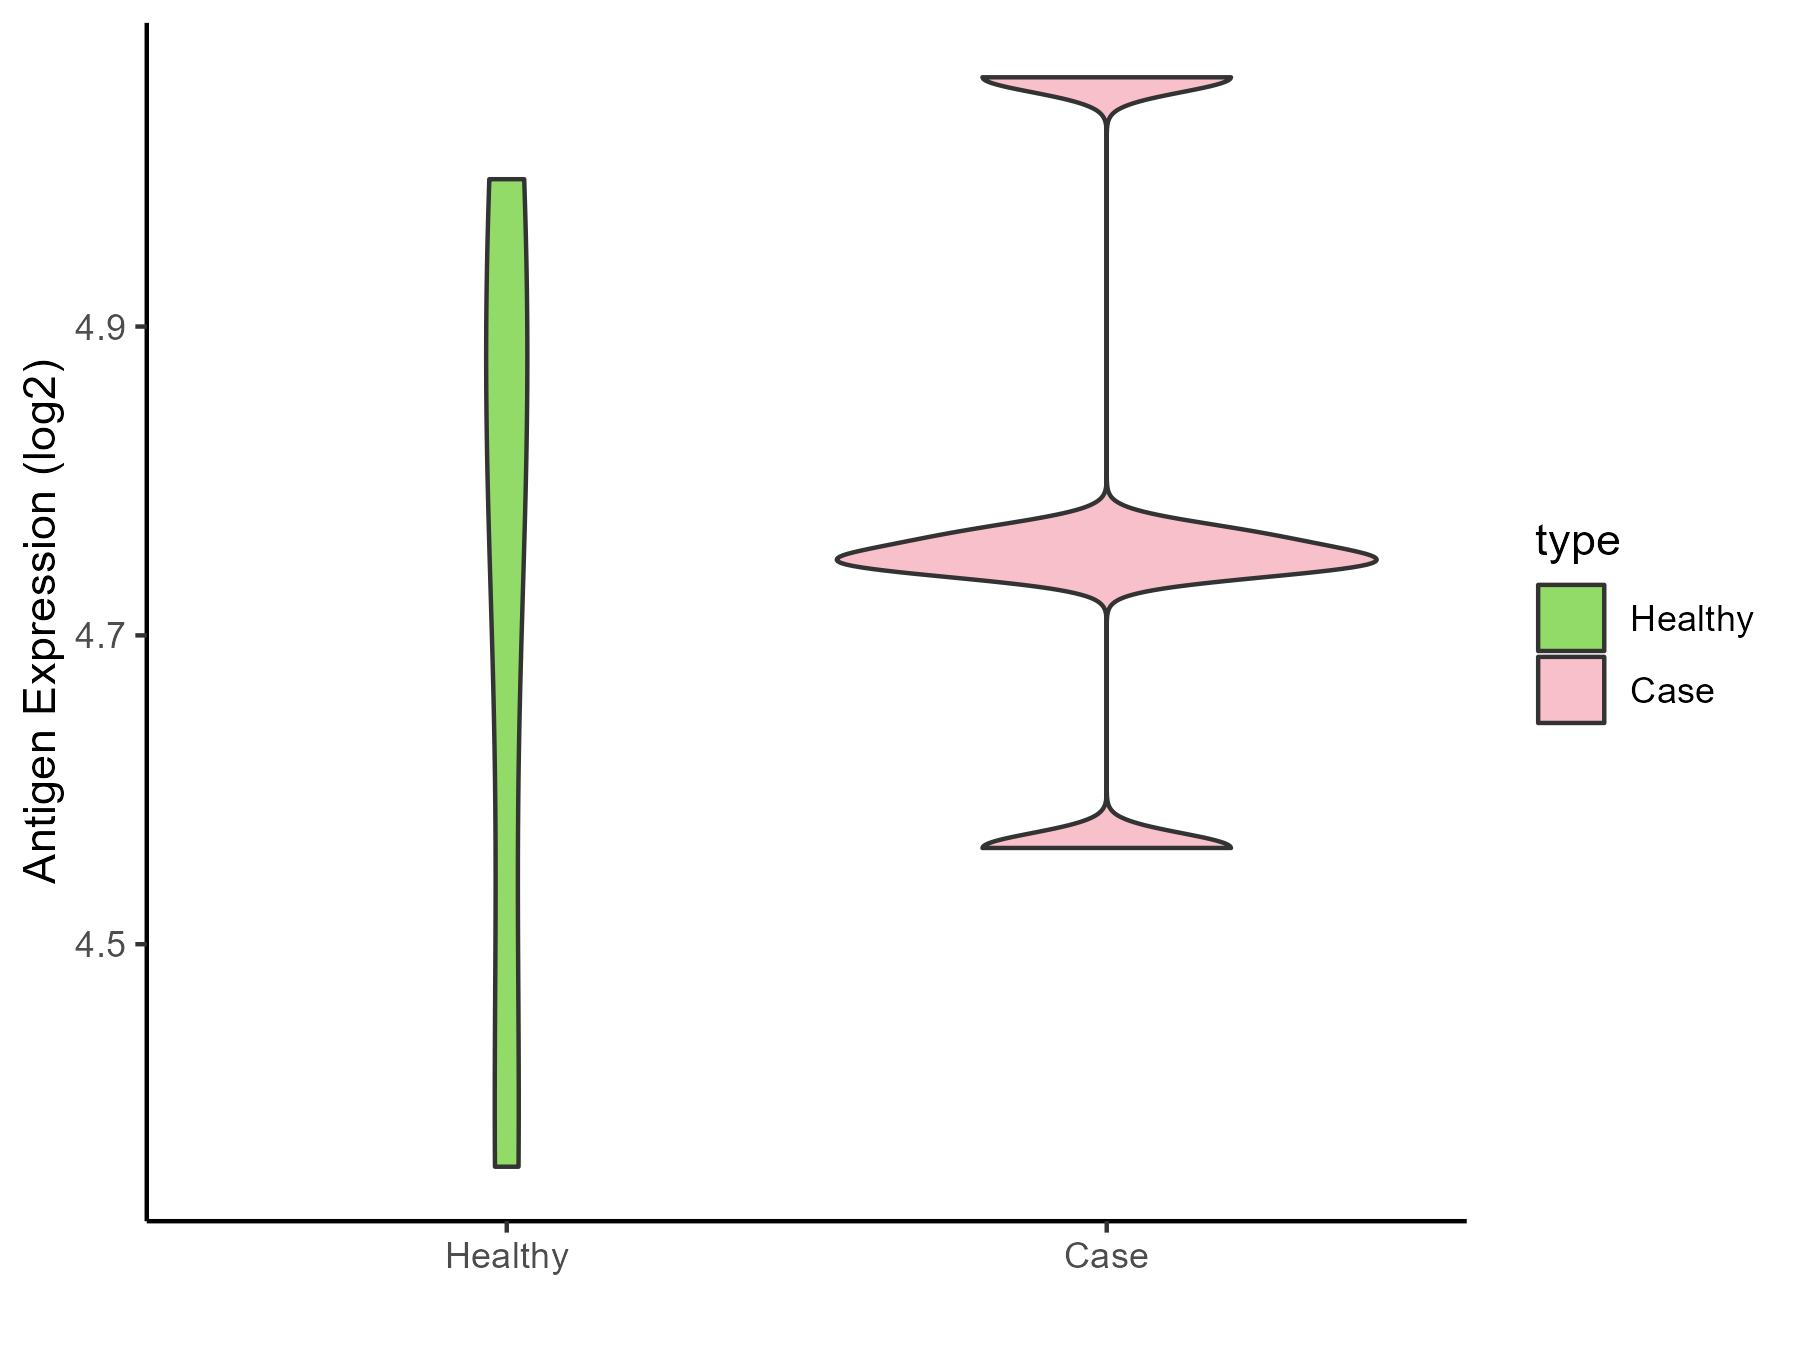
| The Studied Tissue | Skin | |
| The Specific Disease | Sensitive skin | |
| The Expression Level of Disease Section Compare with the Healthy Individual Tissue | p-value: 0.651913486; Fold-change: -0.068714105; Z-score: -0.247624038 | |
| Disease-specific Antigen Abundances |
|
Click to View the Clearer Original Diagram |
ICD Disease Classification 15
| Differential expression pattern of antigen in diseases | ||
| The Studied Tissue | Synovial | |
| The Specific Disease | Osteoarthritis | |
| The Expression Level of Disease Section Compare with the Healthy Individual Tissue | p-value: 0.028406189; Fold-change: -0.261707647; Z-score: -1.491095172 | |
| Disease-specific Antigen Abundances |
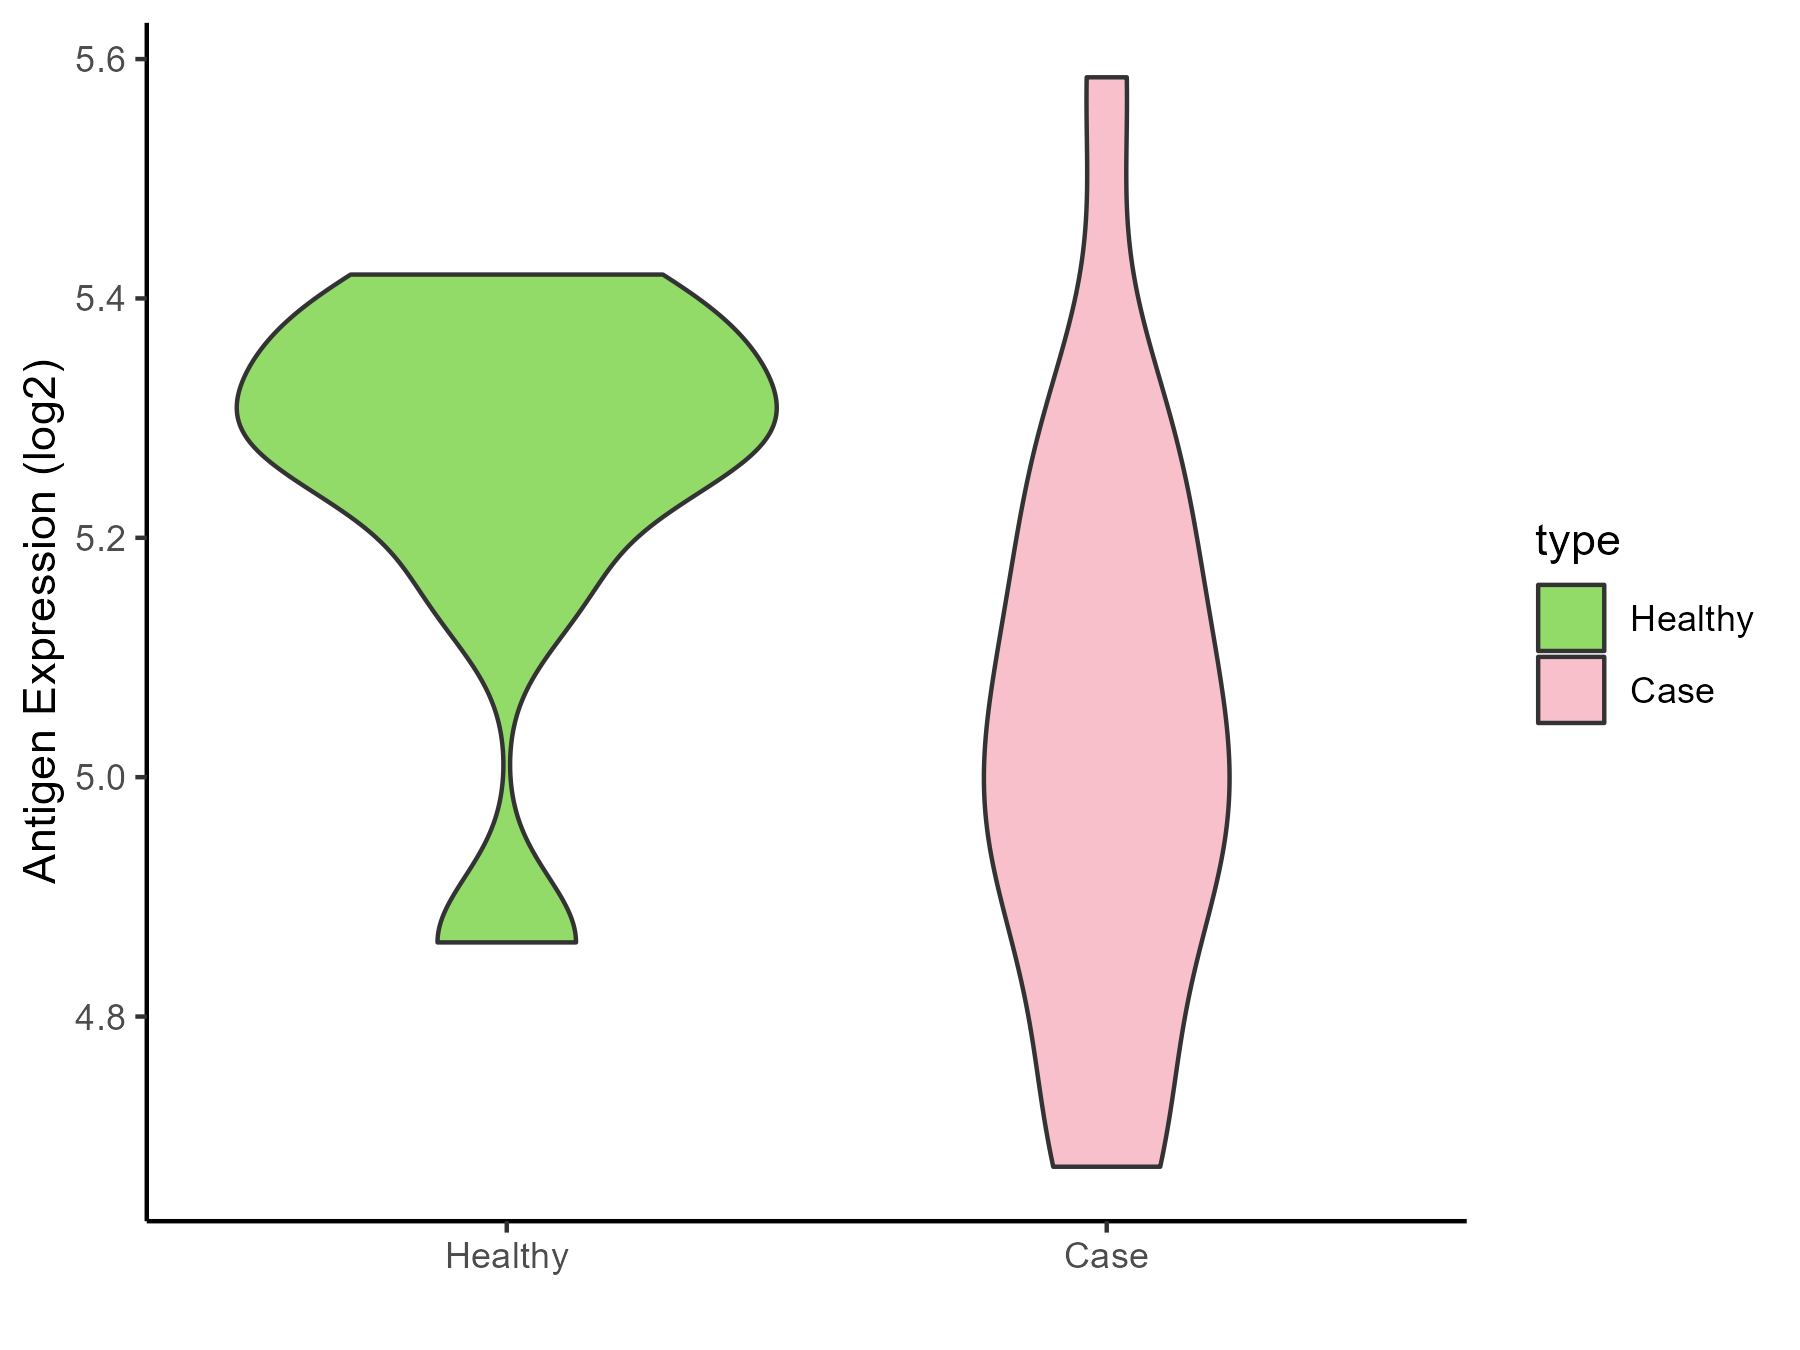
|
Click to View the Clearer Original Diagram |
| Differential expression pattern of antigen in diseases | ||
| The Studied Tissue | Peripheral blood | |
| The Specific Disease | Arthropathy | |
| The Expression Level of Disease Section Compare with the Healthy Individual Tissue | p-value: 0.211453298; Fold-change: 0.04778648; Z-score: 0.437768057 | |
| Disease-specific Antigen Abundances |
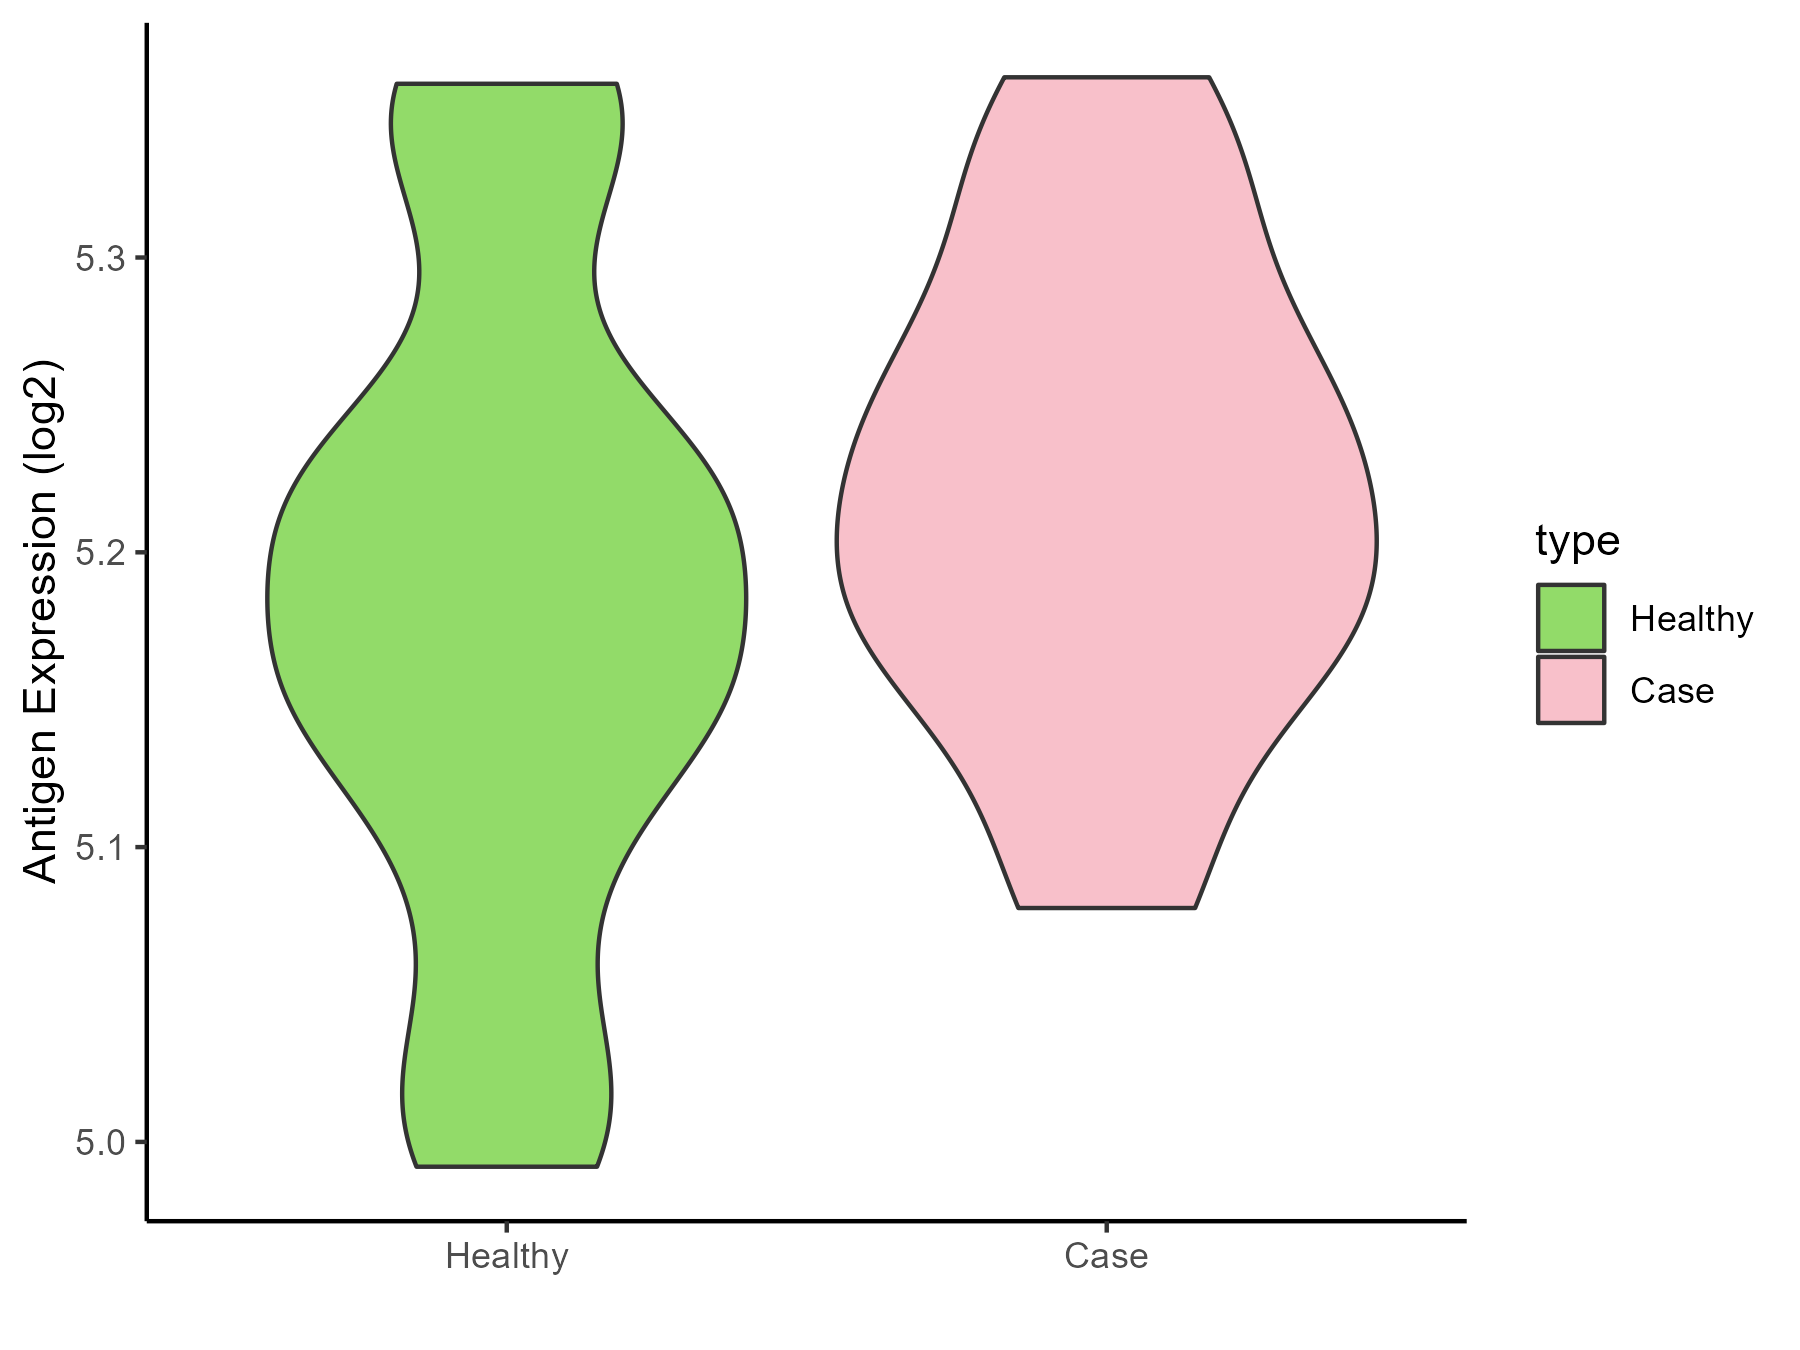
|
Click to View the Clearer Original Diagram |
| Differential expression pattern of antigen in diseases | ||
| The Studied Tissue | Peripheral blood | |
| The Specific Disease | Arthritis | |
| The Expression Level of Disease Section Compare with the Healthy Individual Tissue | p-value: 0.288145407; Fold-change: 0.016924542; Z-score: 0.083798906 | |
| Disease-specific Antigen Abundances |
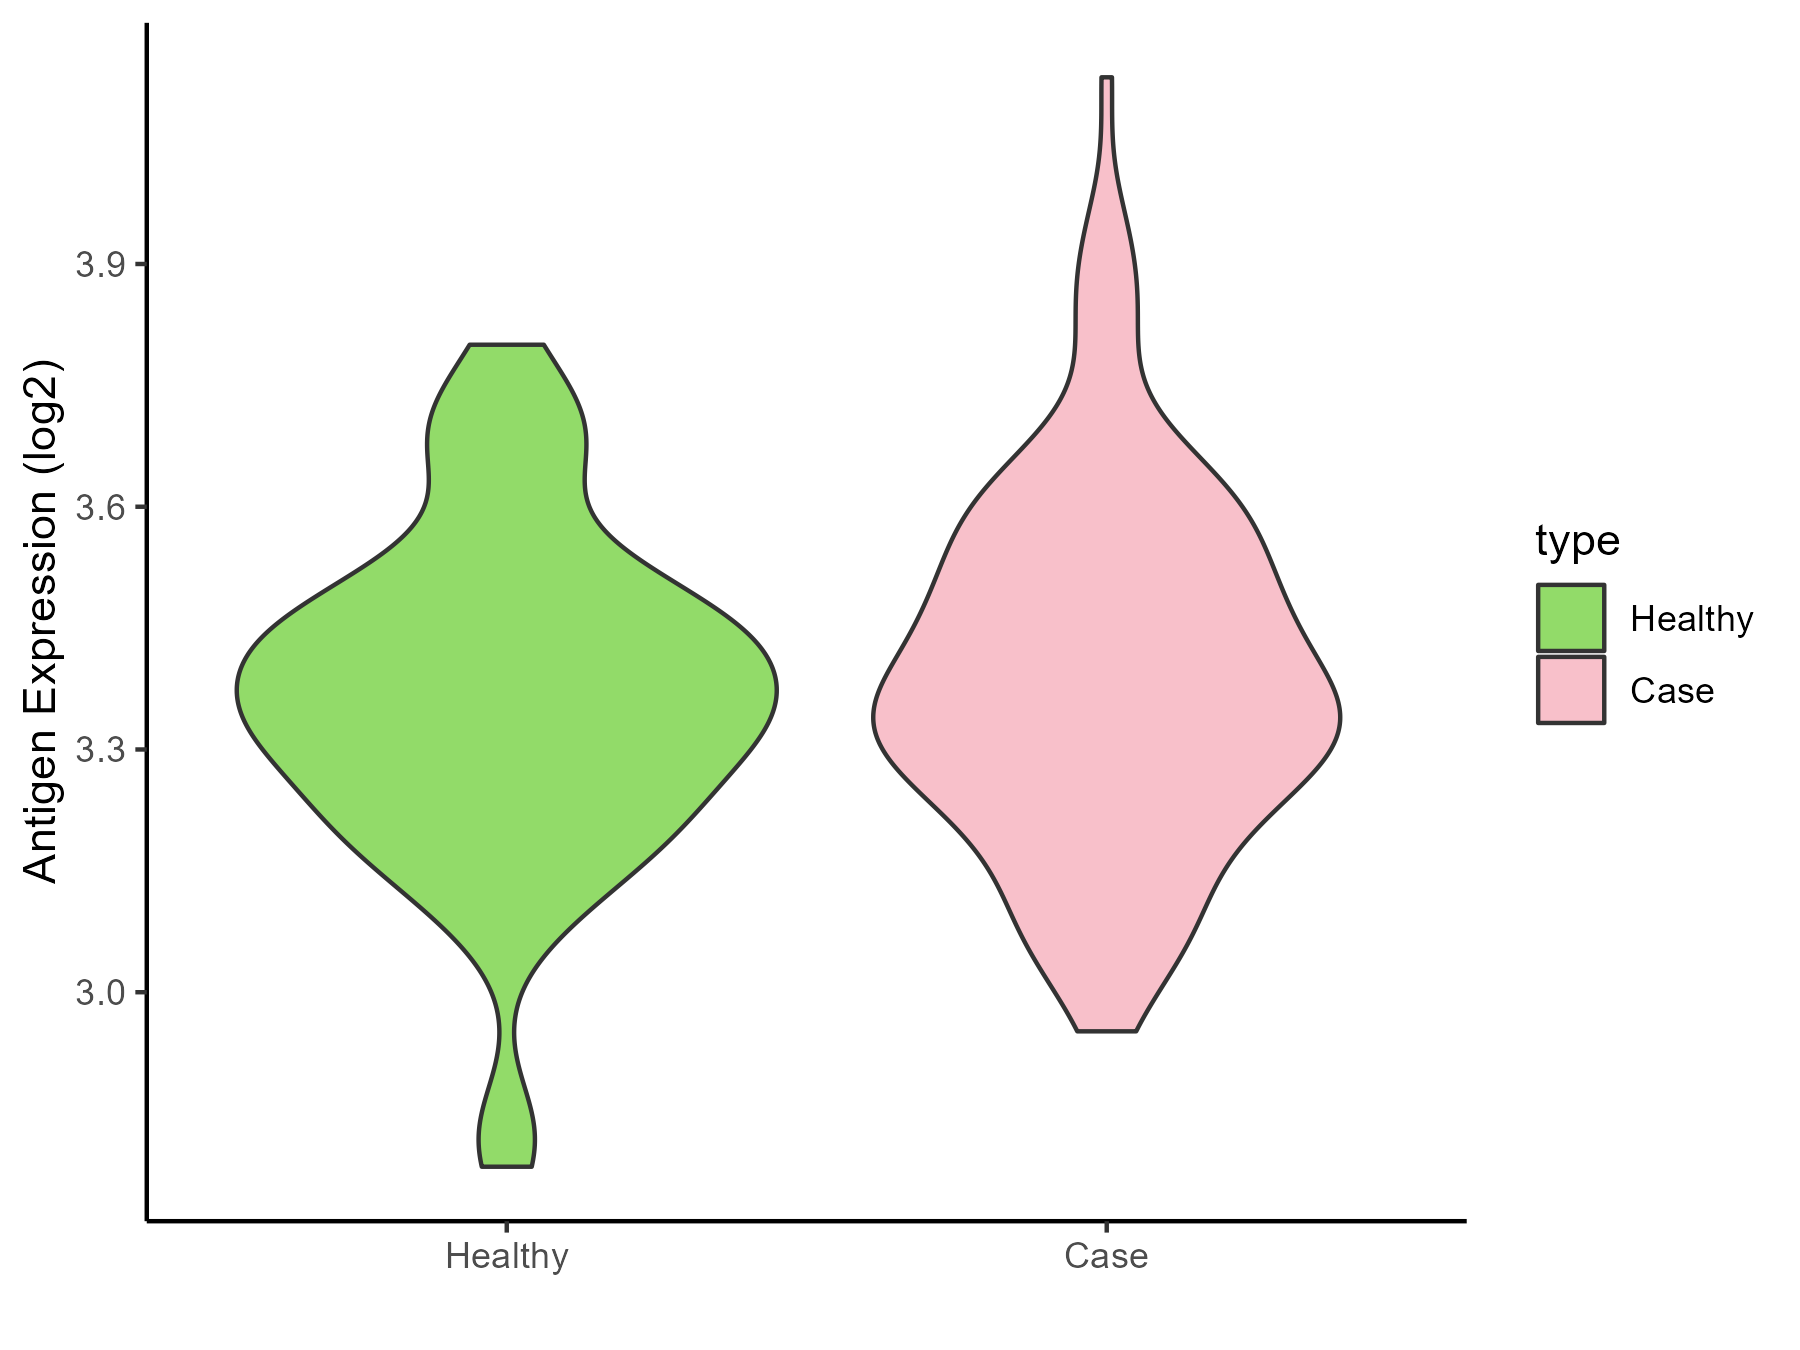
|
Click to View the Clearer Original Diagram |
| Differential expression pattern of antigen in diseases | ||
| The Studied Tissue | Synovial | |
| The Specific Disease | Rheumatoid arthritis | |
| The Expression Level of Disease Section Compare with the Healthy Individual Tissue | p-value: 0.002835308; Fold-change: 0.160408439; Z-score: 1.103550779 | |
| Disease-specific Antigen Abundances |
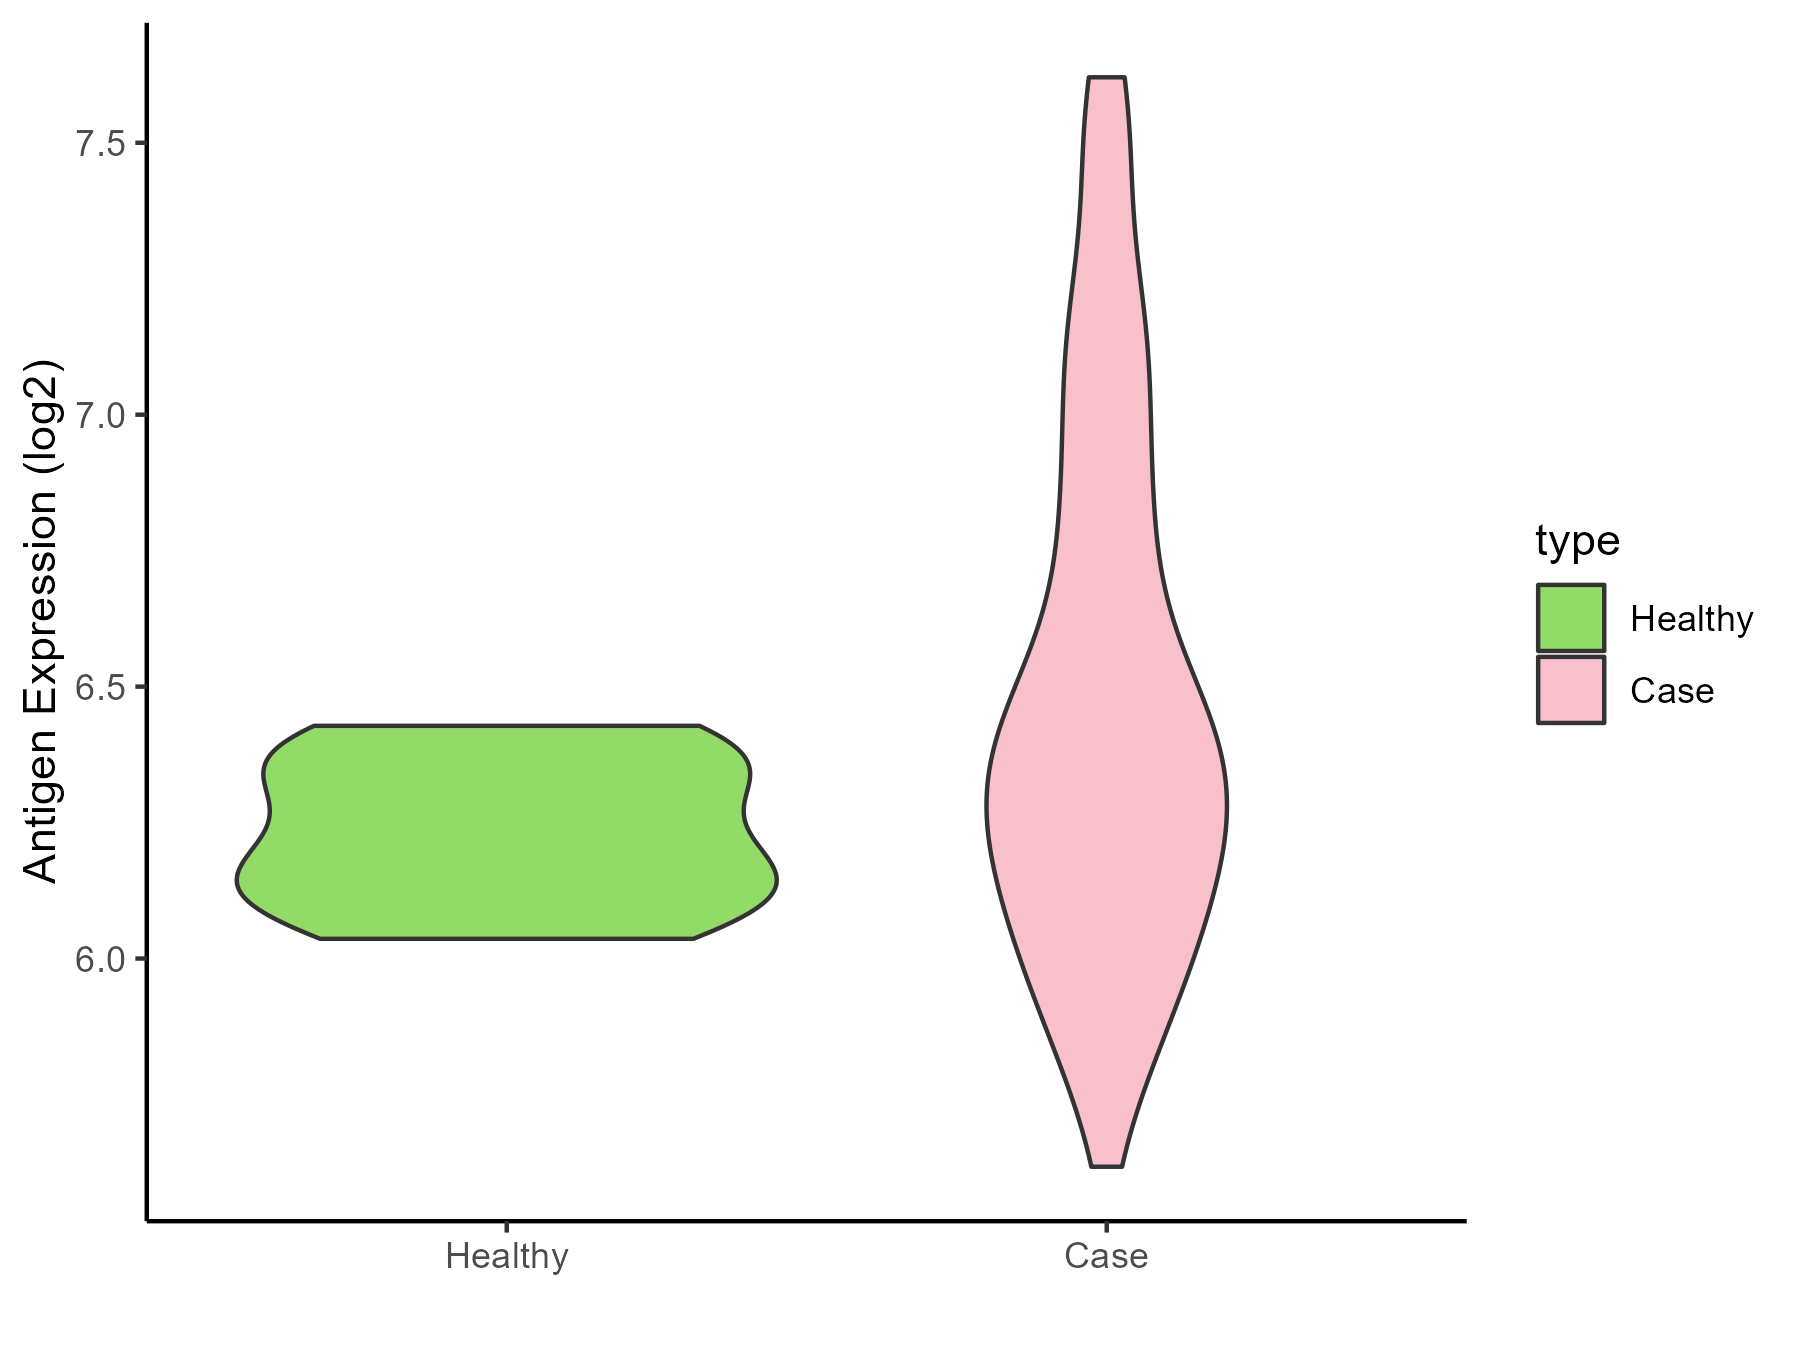
|
Click to View the Clearer Original Diagram |
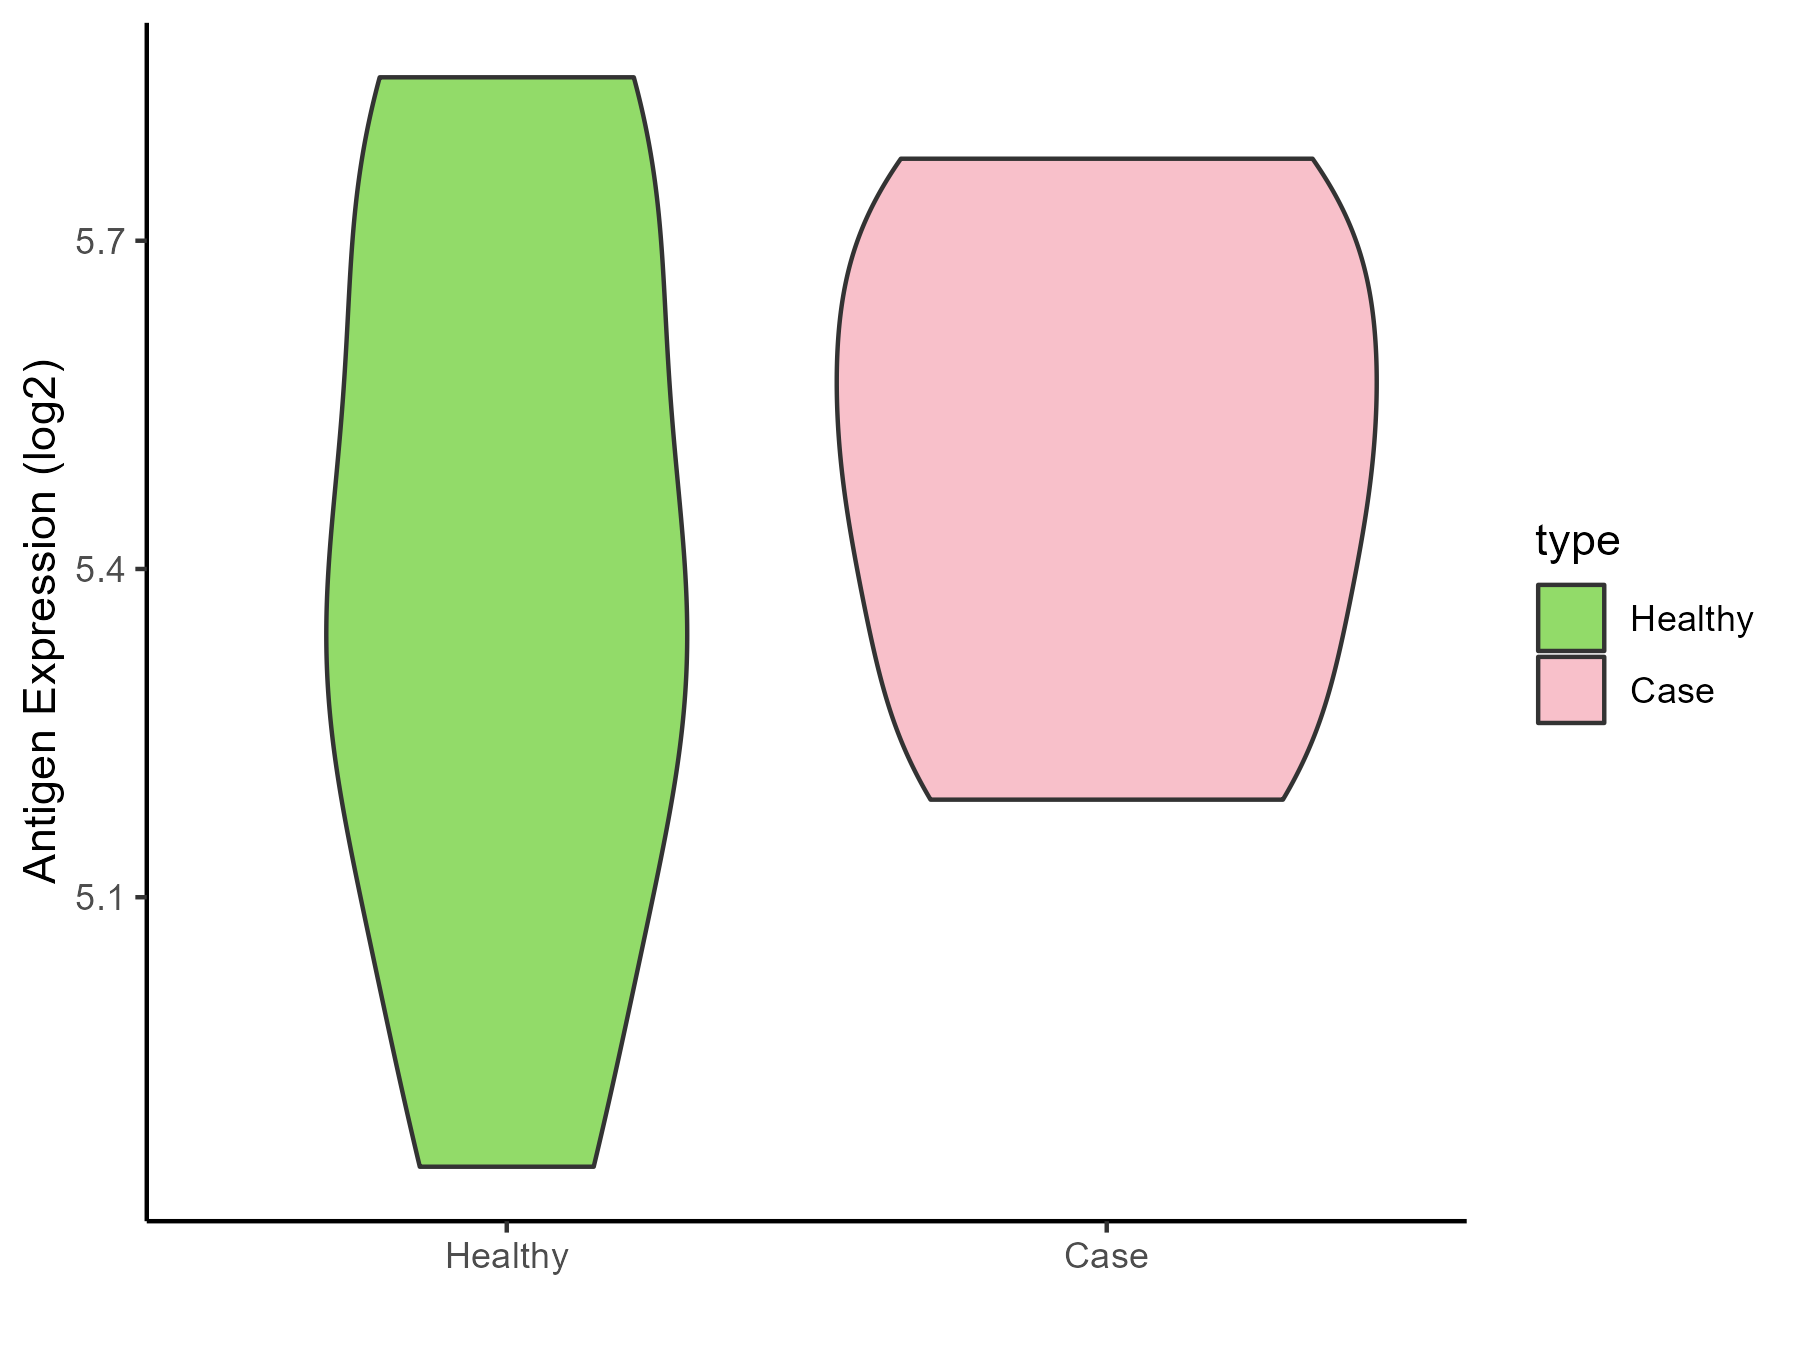
| Differential expression pattern of antigen in diseases | ||
| The Studied Tissue | Pheripheral blood | |
| The Specific Disease | Ankylosing spondylitis | |
| The Expression Level of Disease Section Compare with the Healthy Individual Tissue | p-value: 0.477252215; Fold-change: 0.111231278; Z-score: 0.324436128 | |
| Disease-specific Antigen Abundances |
|
Click to View the Clearer Original Diagram |
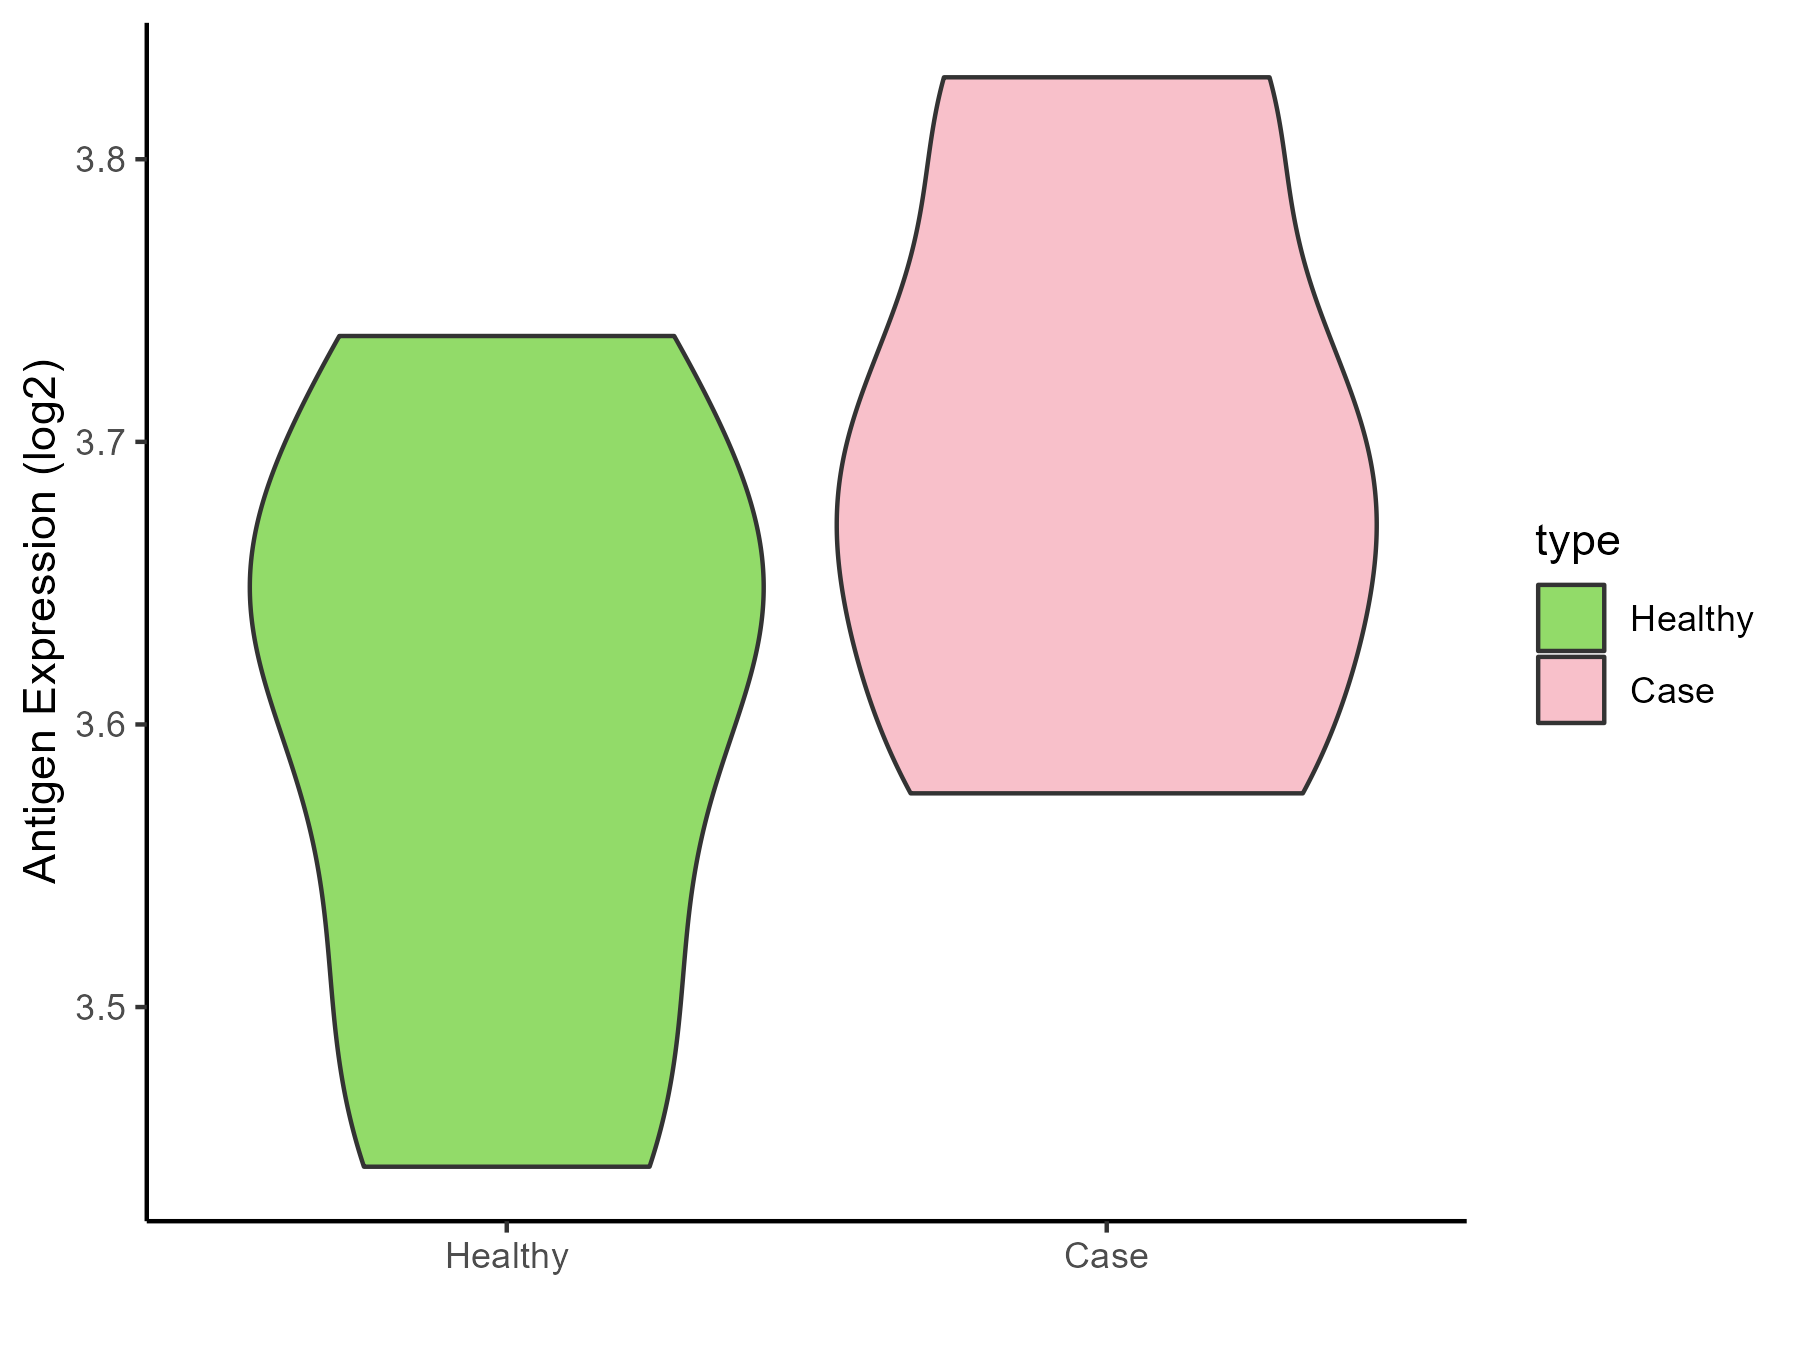
| Differential expression pattern of antigen in diseases | ||
| The Studied Tissue | Bone marrow | |
| The Specific Disease | Osteoporosis | |
| The Expression Level of Disease Section Compare with the Healthy Individual Tissue | p-value: 0.237536116; Fold-change: 0.057332078; Z-score: 0.50296937 | |
| Disease-specific Antigen Abundances |
|
Click to View the Clearer Original Diagram |
ICD Disease Classification 16
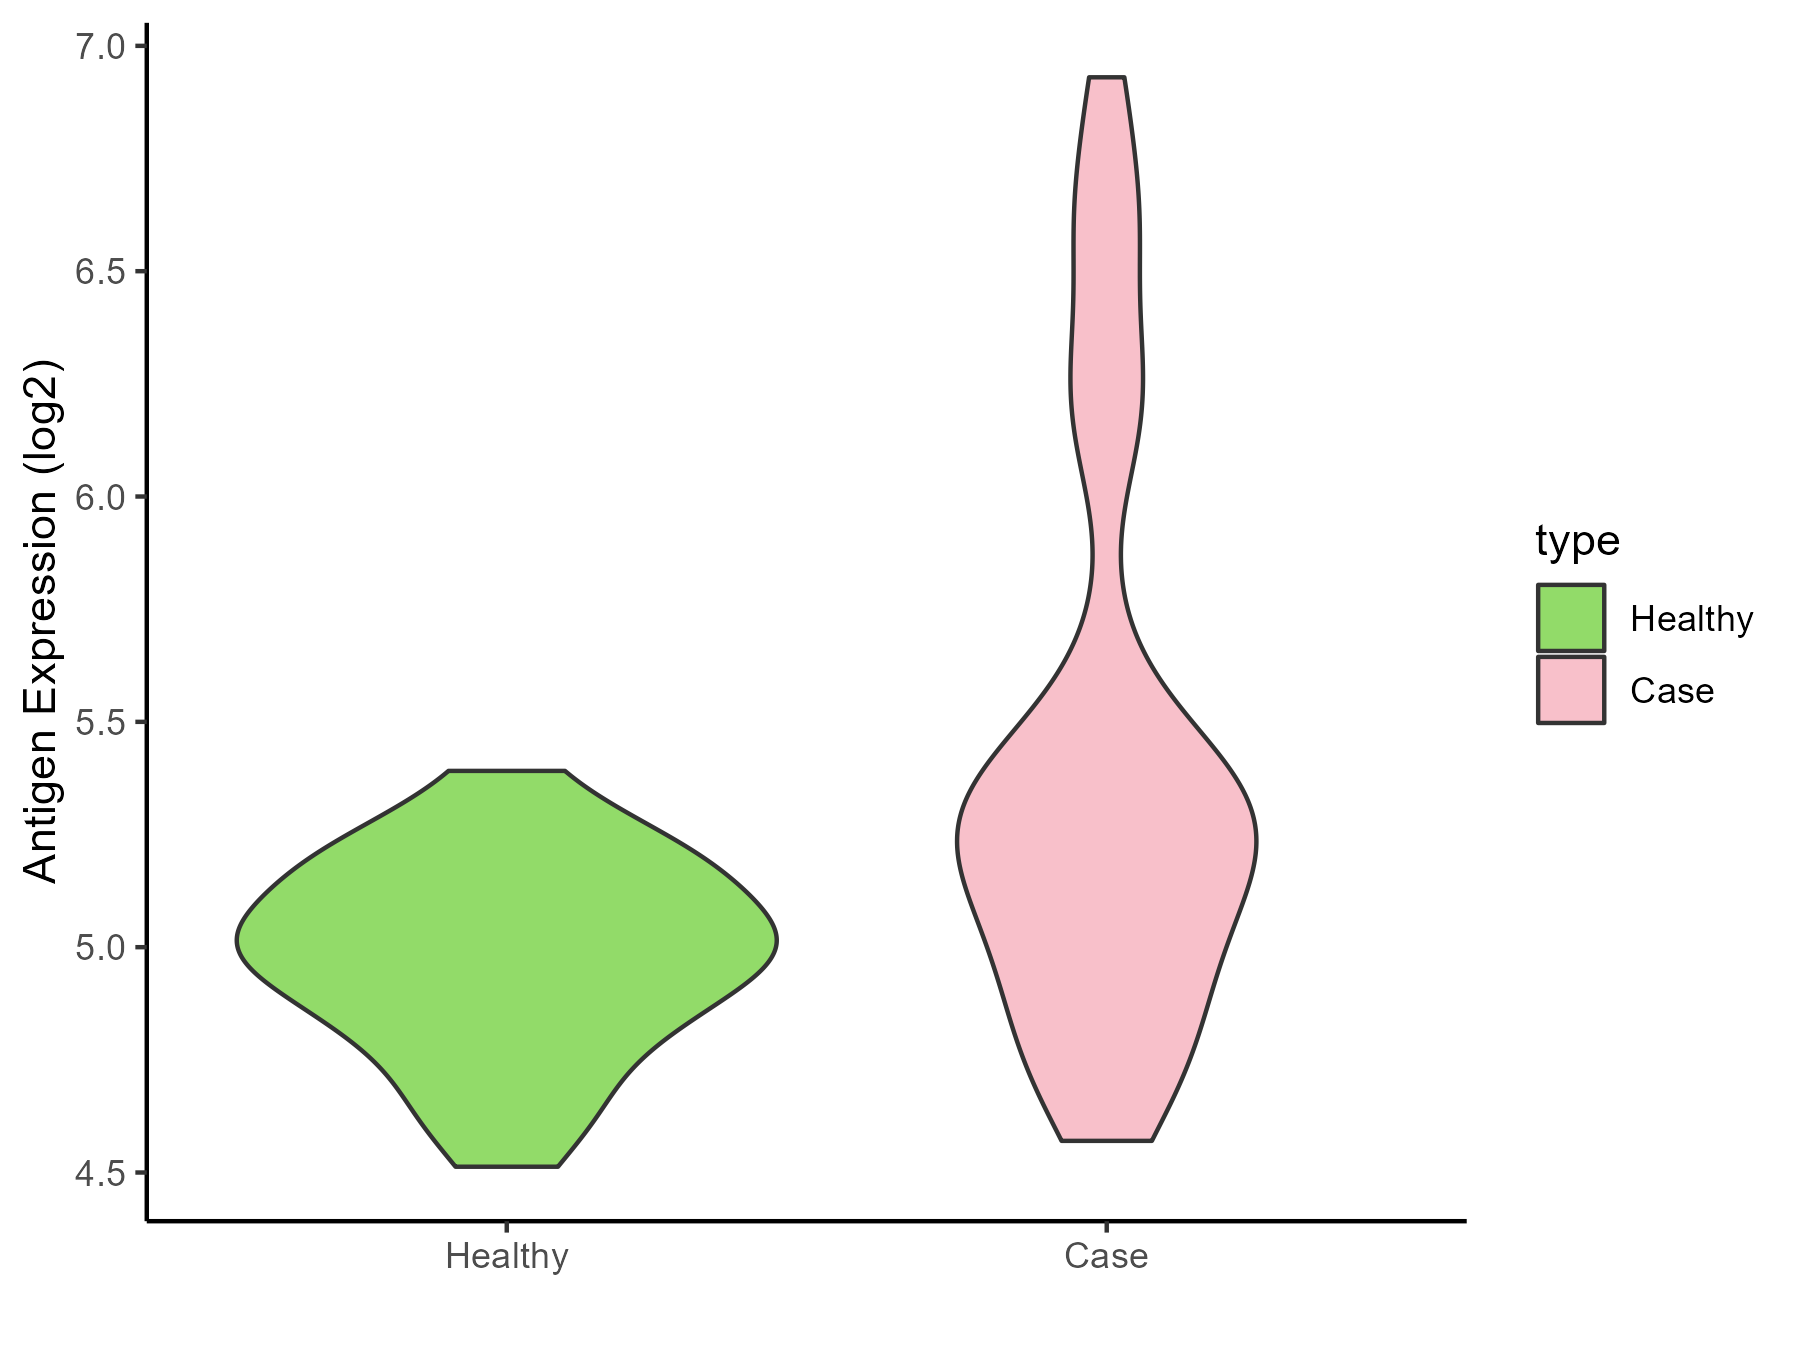
| Differential expression pattern of antigen in diseases | ||
| The Studied Tissue | Endometrium | |
| The Specific Disease | Endometriosis | |
| The Expression Level of Disease Section Compare with the Healthy Individual Tissue | p-value: 8.15E-05; Fold-change: 0.273387953; Z-score: 1.265262698 | |
| Disease-specific Antigen Abundances |
|
Click to View the Clearer Original Diagram |
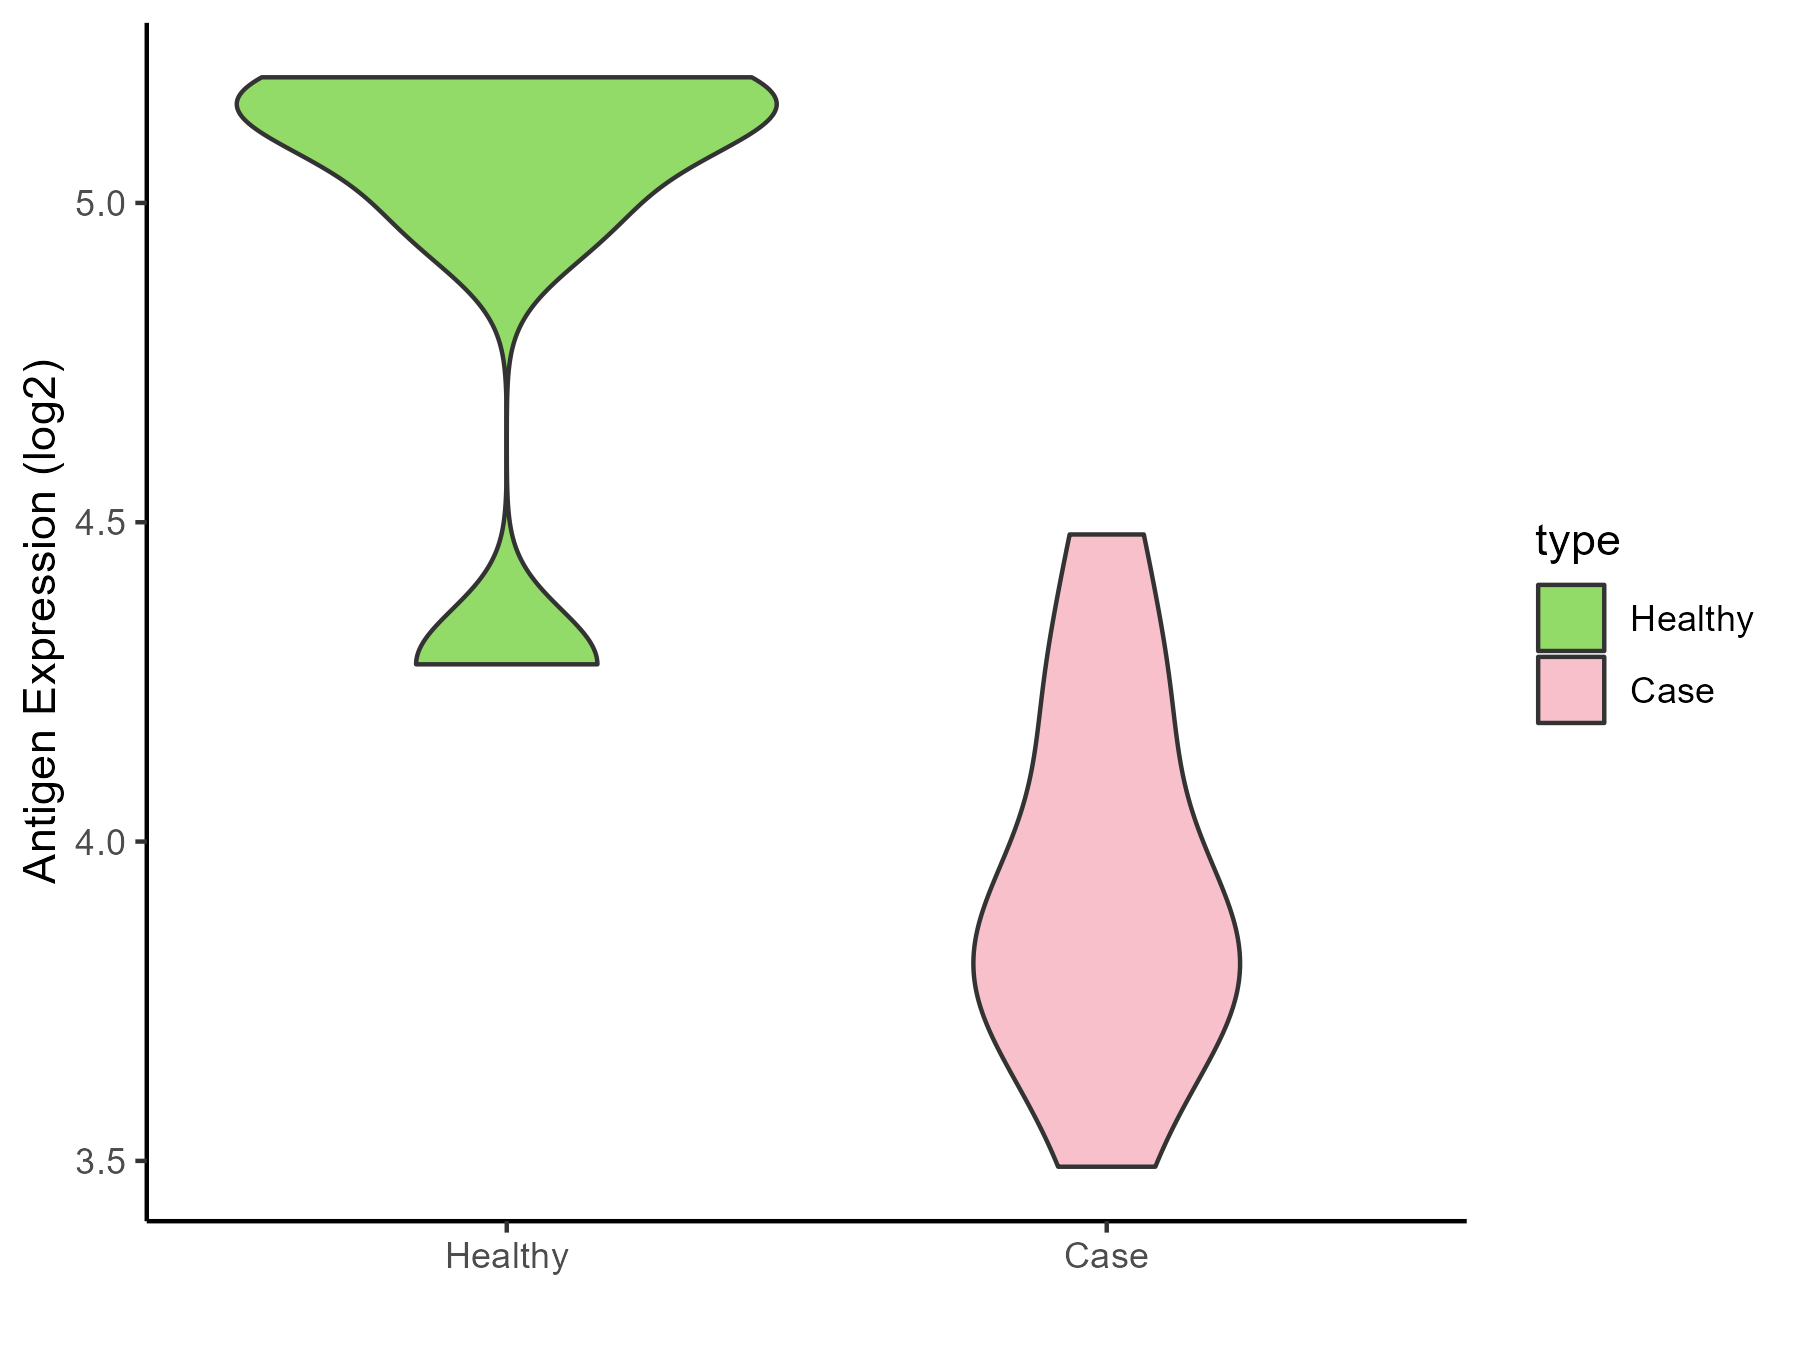
| Differential expression pattern of antigen in diseases | ||
| The Studied Tissue | Bladder | |
| The Specific Disease | Interstitial cystitis | |
| The Expression Level of Disease Section Compare with the Healthy Individual Tissue | p-value: 0.001621438; Fold-change: -1.290848563; Z-score: -3.360810238 | |
| Disease-specific Antigen Abundances |
|
Click to View the Clearer Original Diagram |
ICD Disease Classification 19
| Differential expression pattern of antigen in diseases | ||
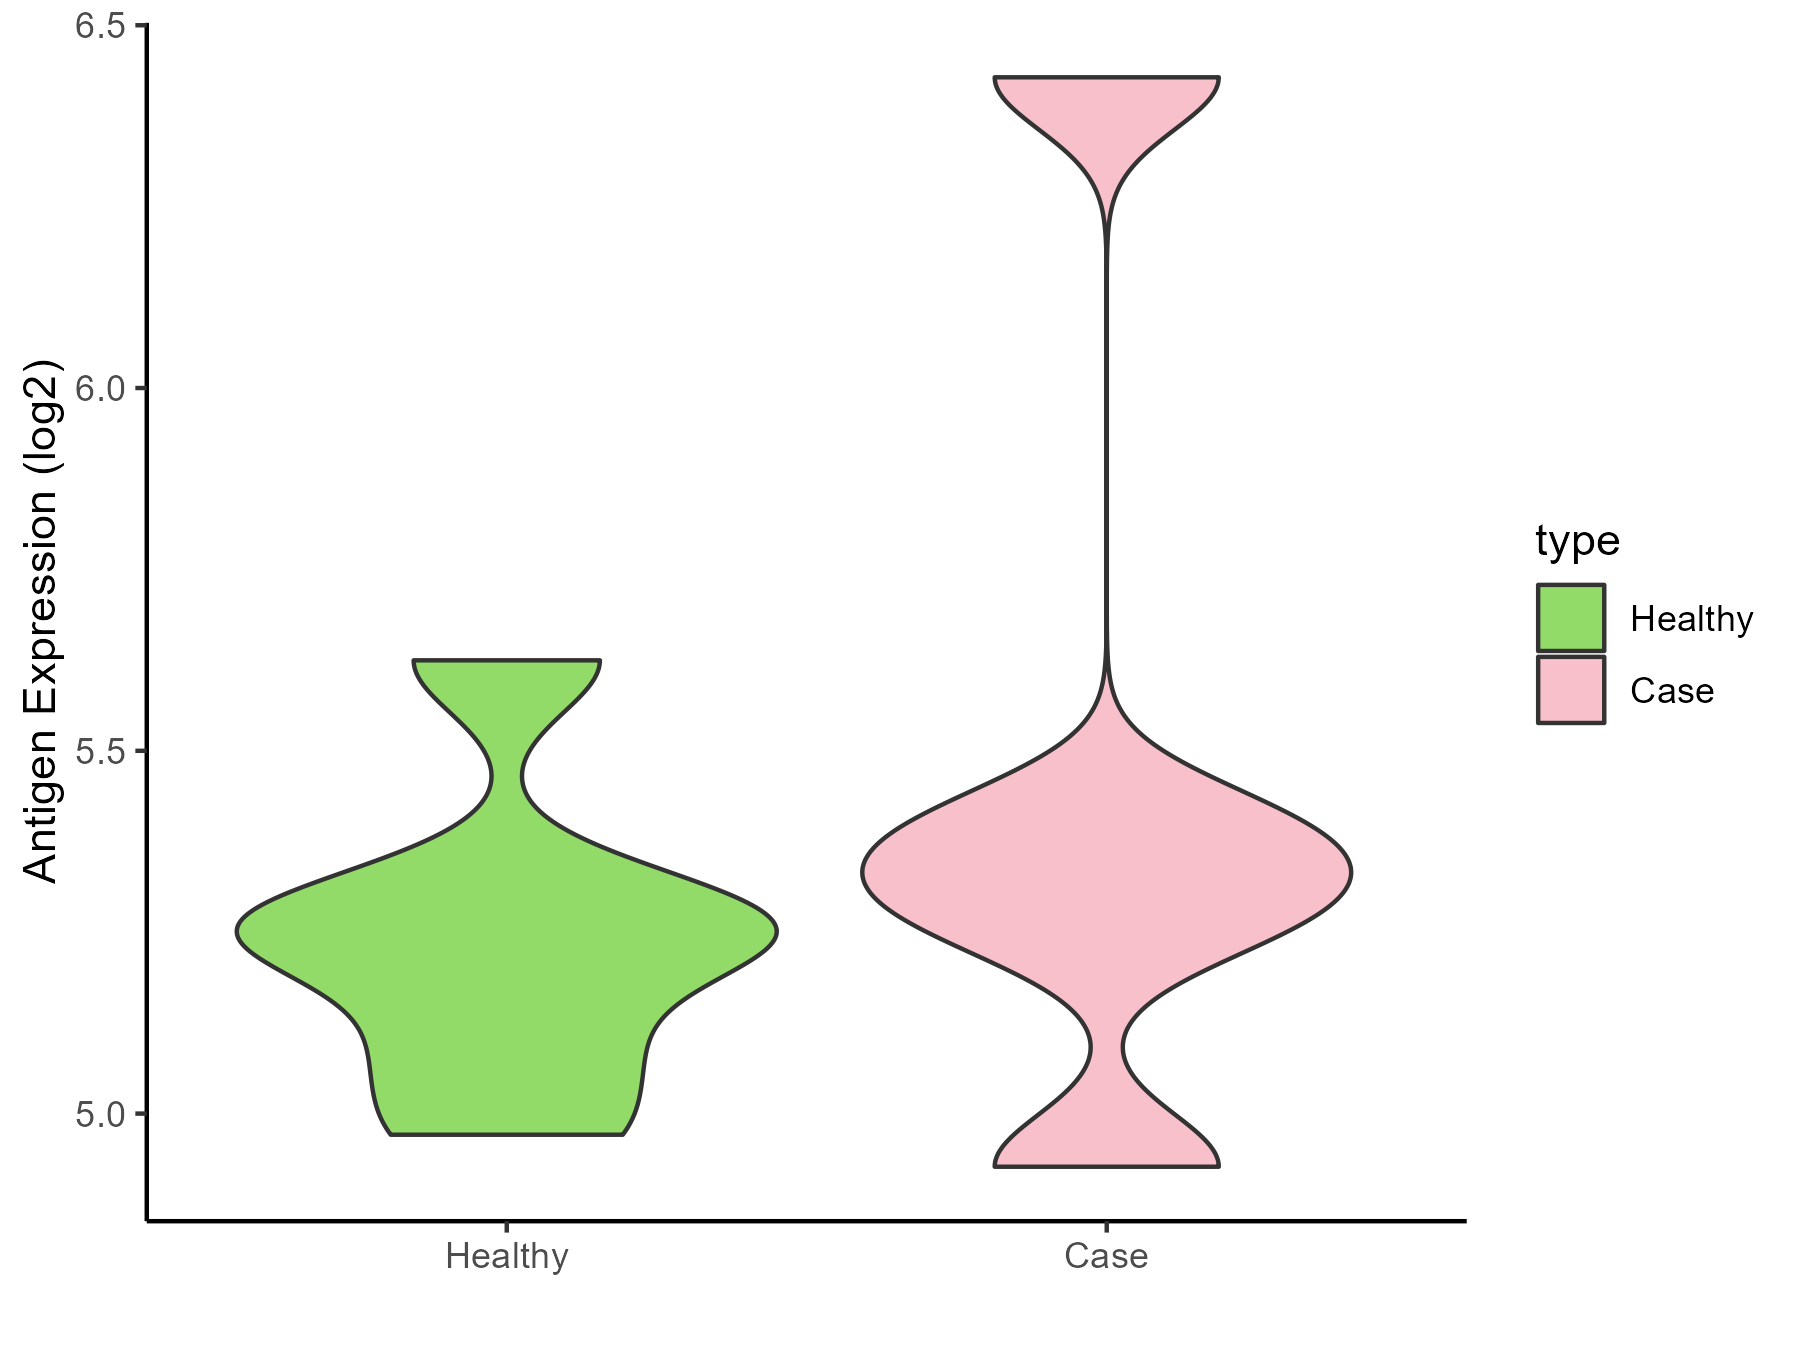
| The Studied Tissue | Myometrium | |
| The Specific Disease | Preterm birth | |
| The Expression Level of Disease Section Compare with the Healthy Individual Tissue | p-value: 0.436358789; Fold-change: 0.092457595; Z-score: 0.417540579 | |
| Disease-specific Antigen Abundances |
|
Click to View the Clearer Original Diagram |
ICD Disease Classification 2
| Differential expression pattern of antigen in diseases | ||
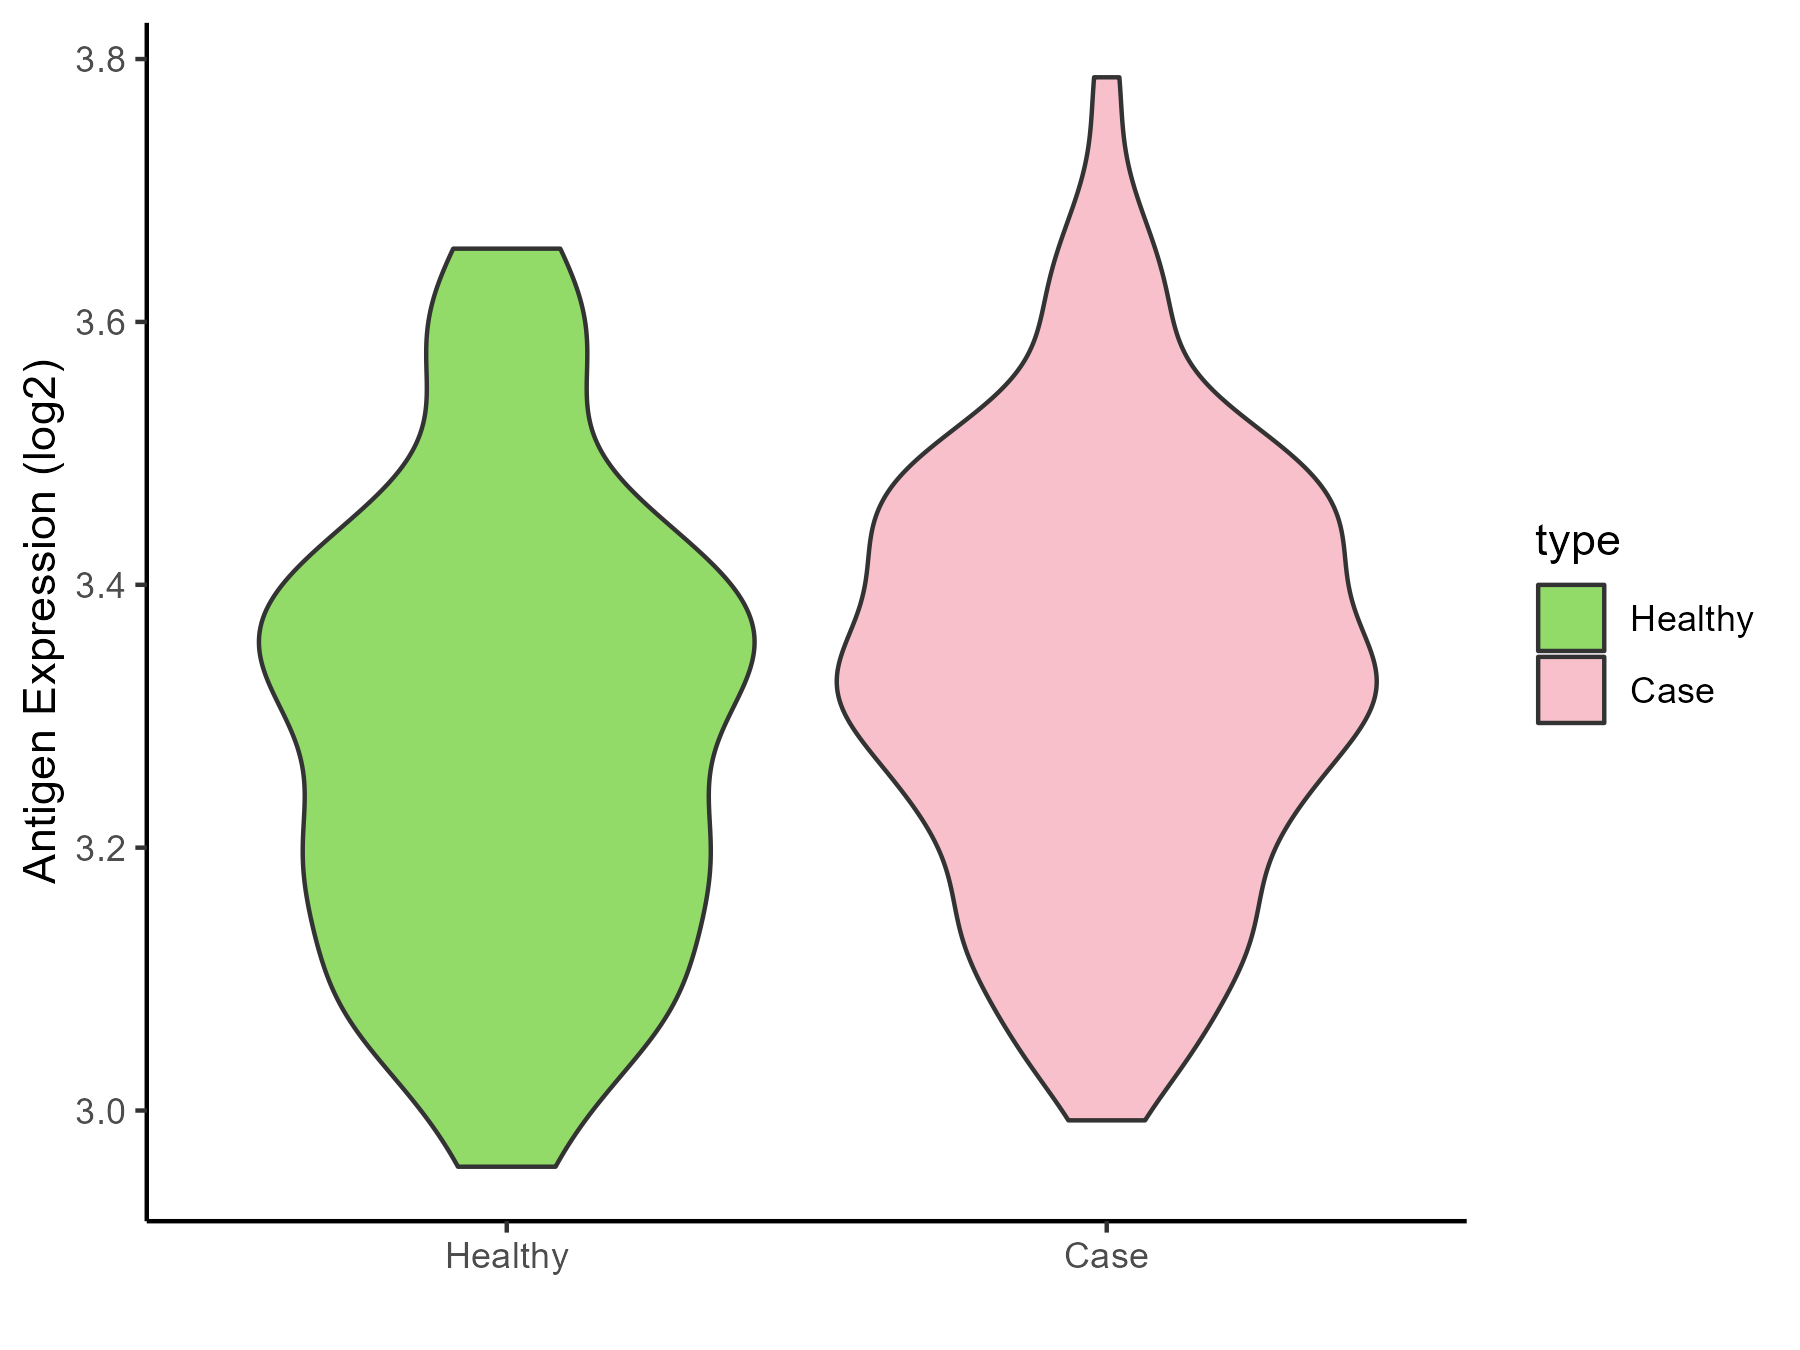
| The Studied Tissue | Bone marrow | |
| The Specific Disease | Acute myelocytic leukemia | |
| The Expression Level of Disease Section Compare with the Healthy Individual Tissue | p-value: 0.006924615; Fold-change: 0.029909101; Z-score: 0.173481444 | |
| Disease-specific Antigen Abundances |
|
Click to View the Clearer Original Diagram |
| Differential expression pattern of antigen in diseases | ||
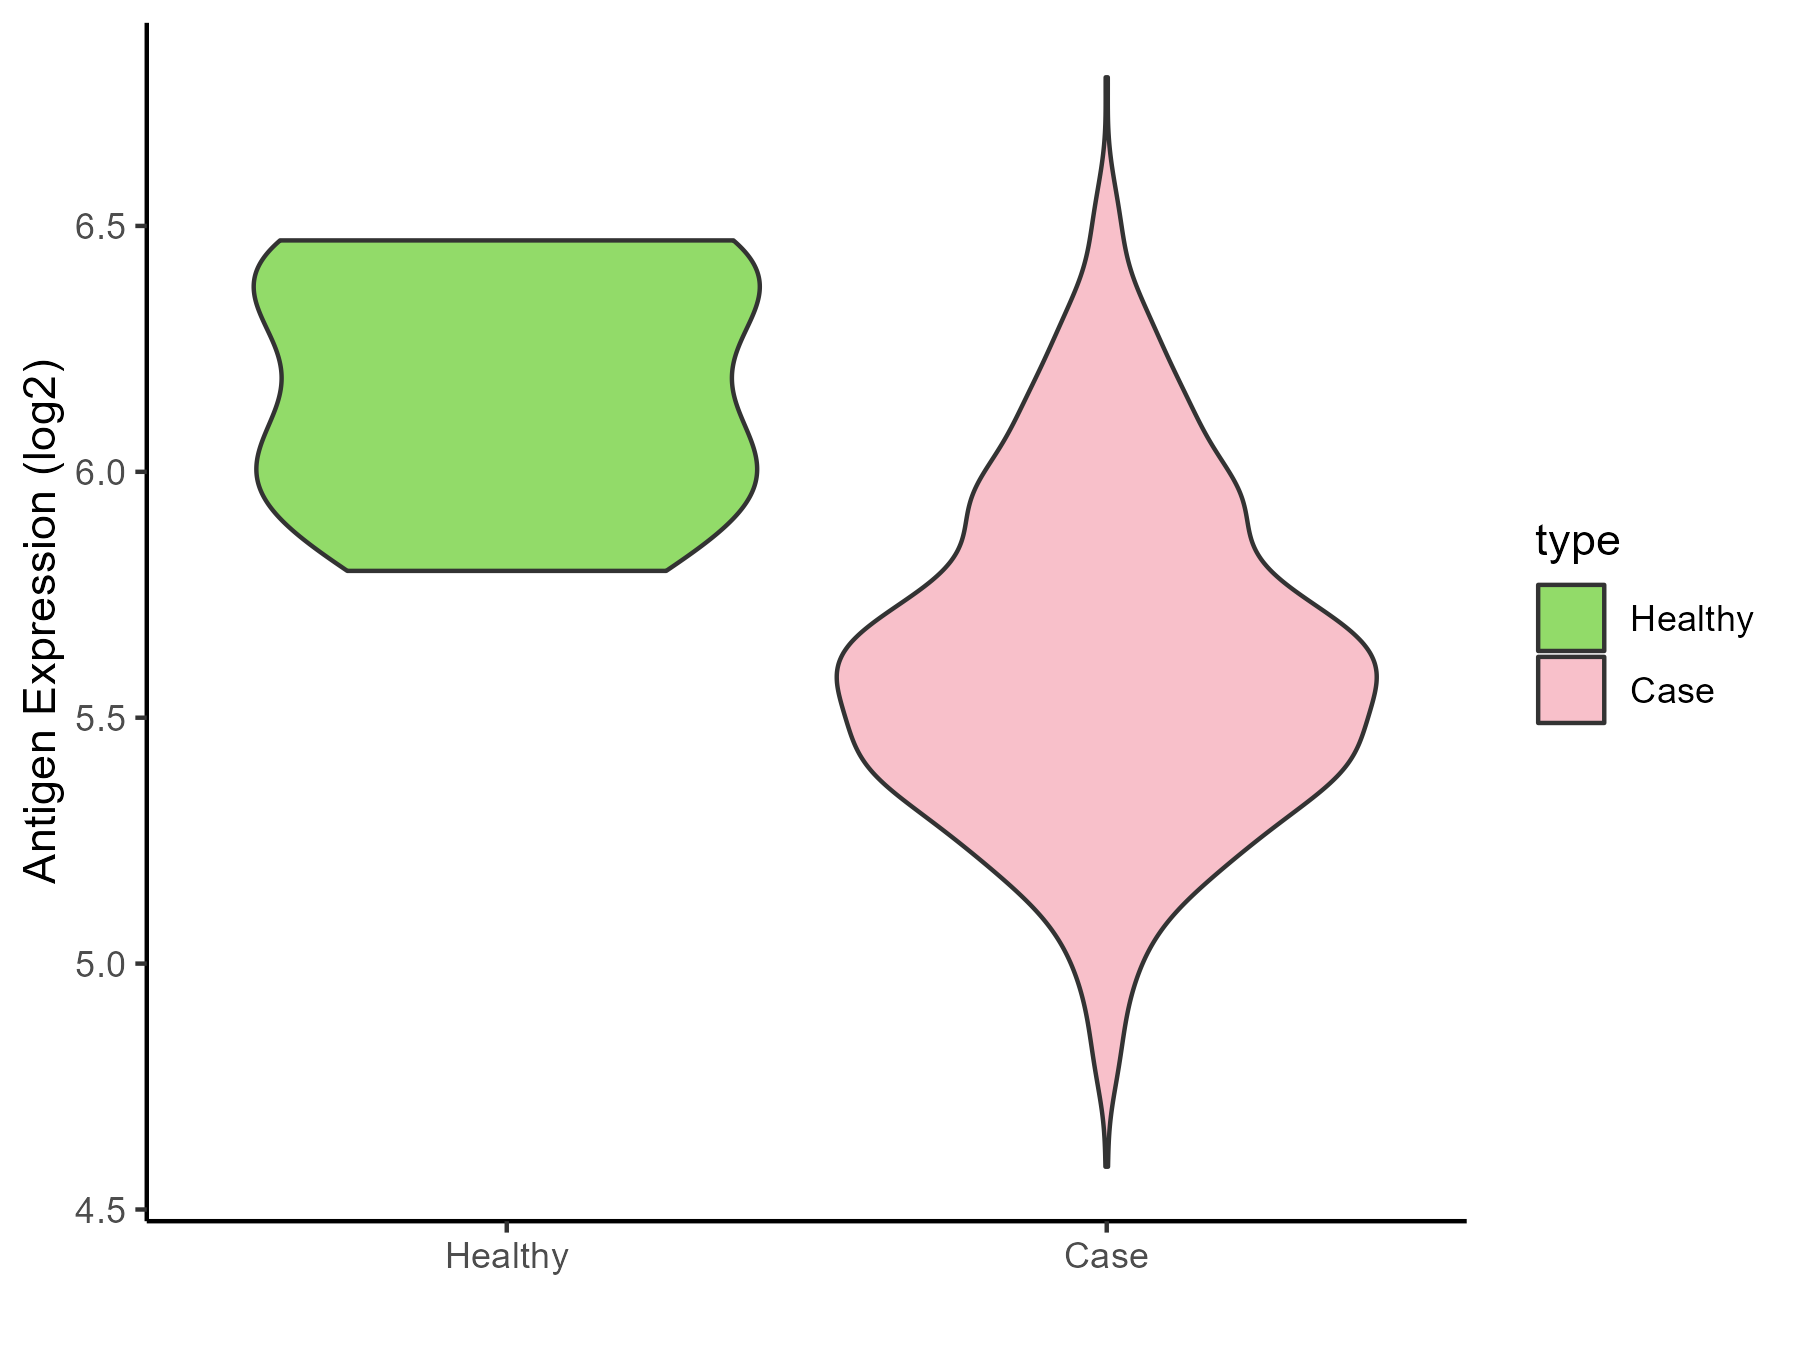
| The Studied Tissue | Bone marrow | |
| The Specific Disease | Myeloma | |
| The Expression Level of Disease Section Compare with the Healthy Individual Tissue | p-value: 0.000467877; Fold-change: -0.559649591; Z-score: -2.198349432 | |
| Disease-specific Antigen Abundances |
|
Click to View the Clearer Original Diagram |
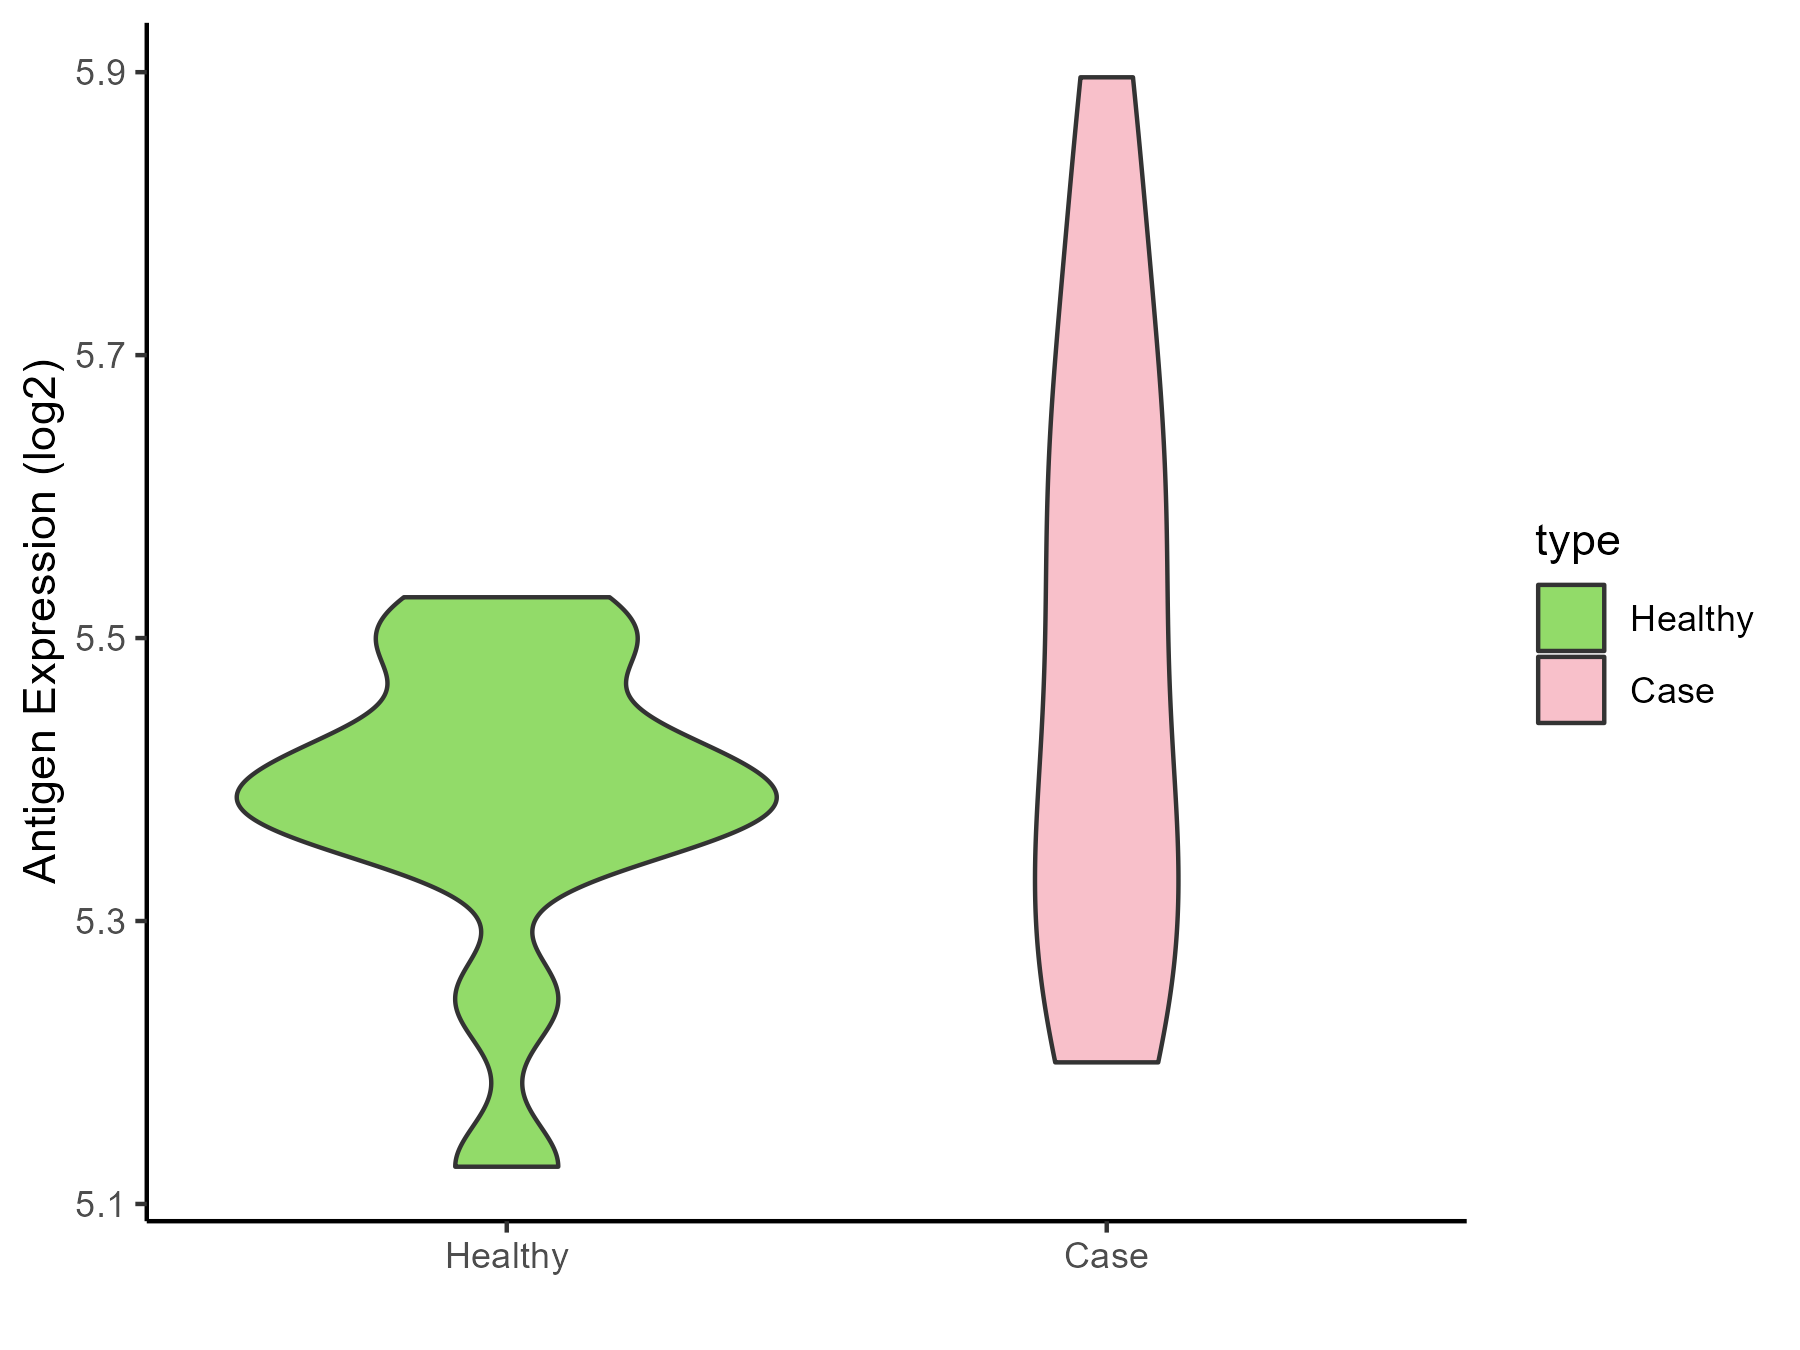
| The Studied Tissue | Peripheral blood | |
| The Specific Disease | Myeloma | |
| The Expression Level of Disease Section Compare with the Healthy Individual Tissue | p-value: 0.113066074; Fold-change: 0.085689185; Z-score: 0.774134242 | |
| Disease-specific Antigen Abundances |
|
Click to View the Clearer Original Diagram |
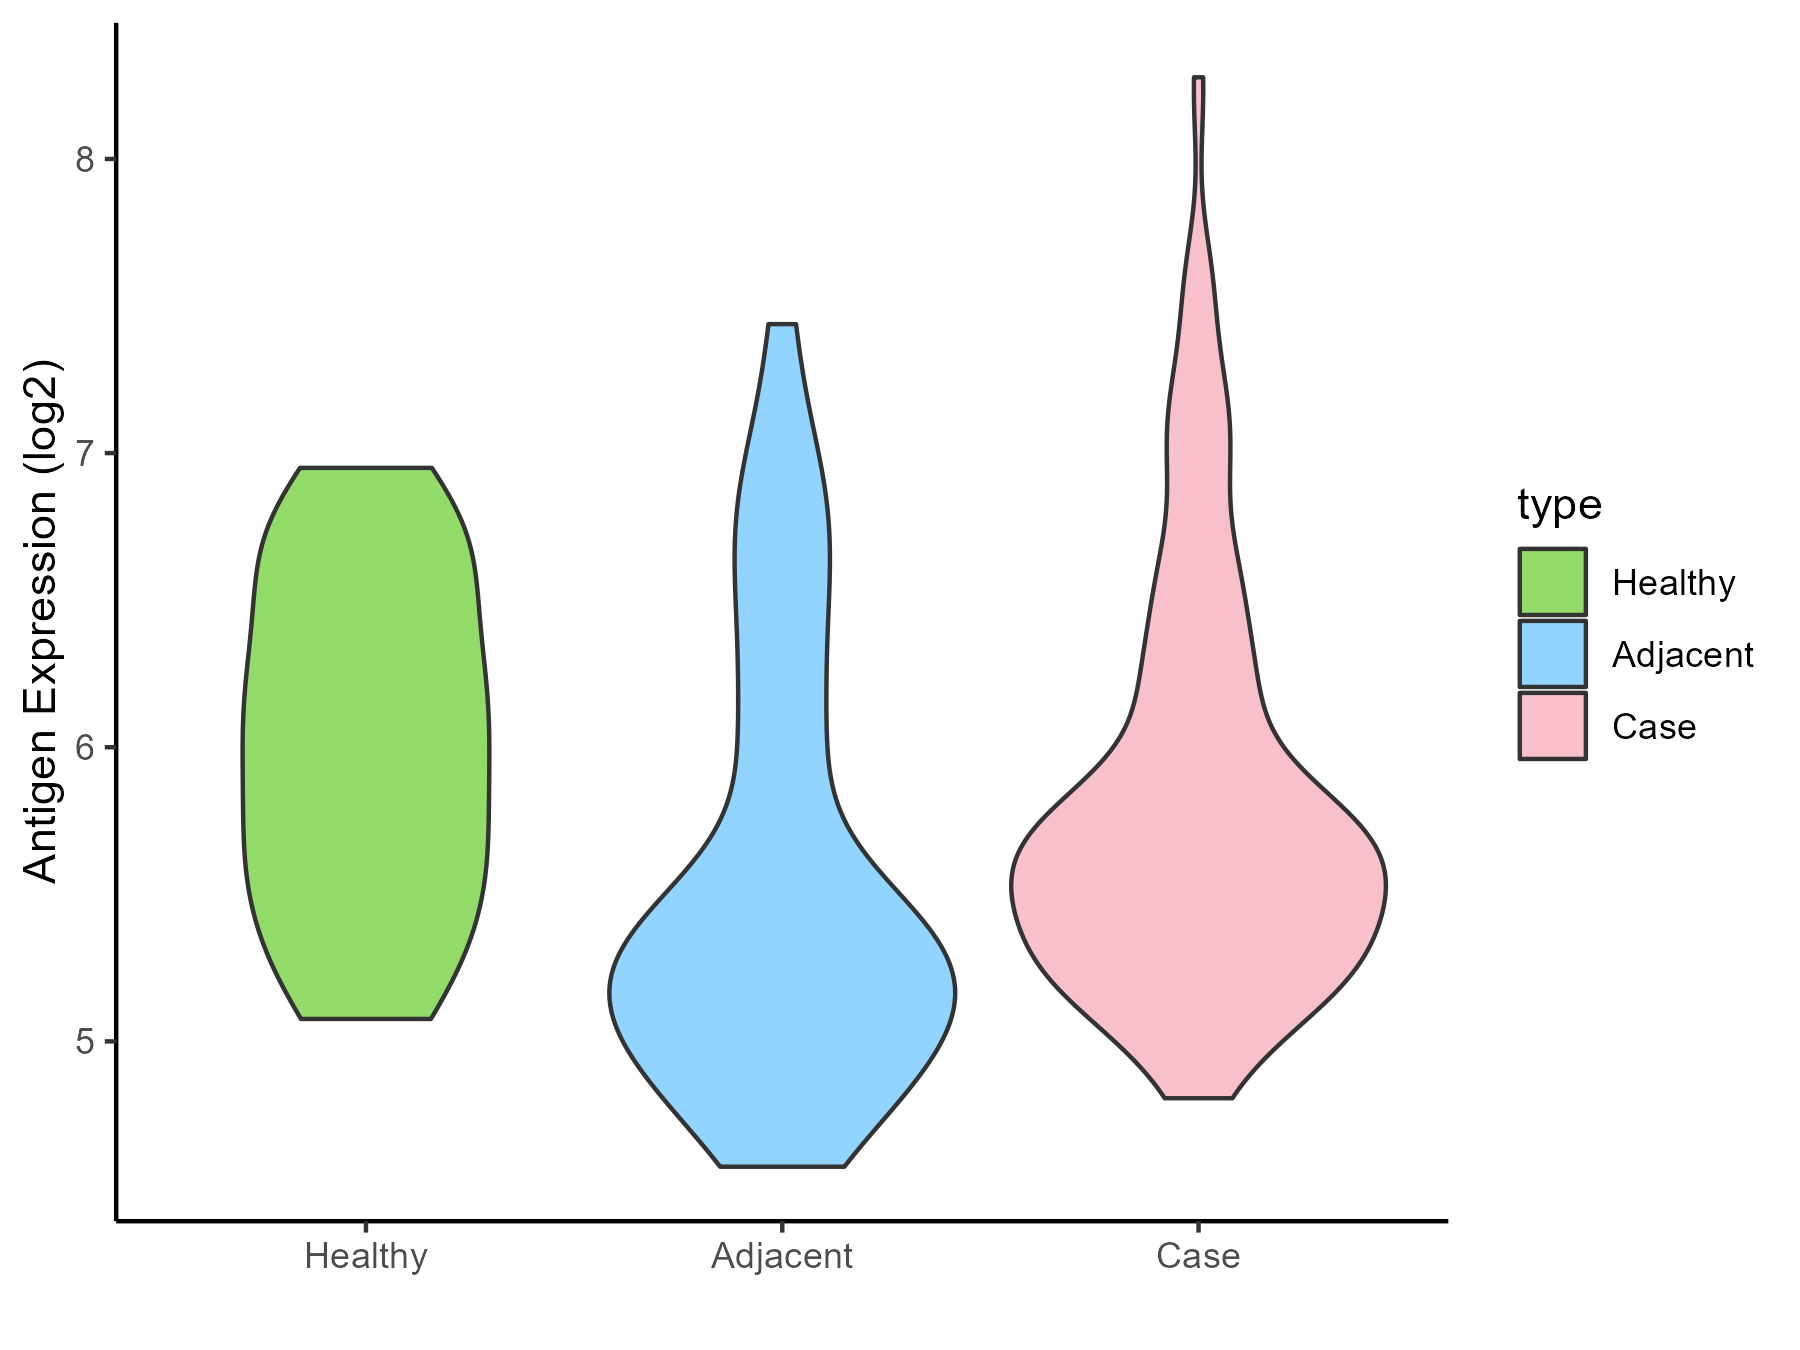
| Differential expression pattern of antigen in diseases | ||
| The Studied Tissue | Oral | |
| The Specific Disease | Oral cancer | |
| The Expression Level of Disease Section Compare with the Healthy Individual Tissue | p-value: 0.098523325; Fold-change: -0.307994356; Z-score: -0.544389137 | |
| The Expression Level of Disease Section Compare with the Adjacent Tissue | p-value: 0.004927587; Fold-change: 0.335934335; Z-score: 0.458319331 | |
| Disease-specific Antigen Abundances |
|
Click to View the Clearer Original Diagram |
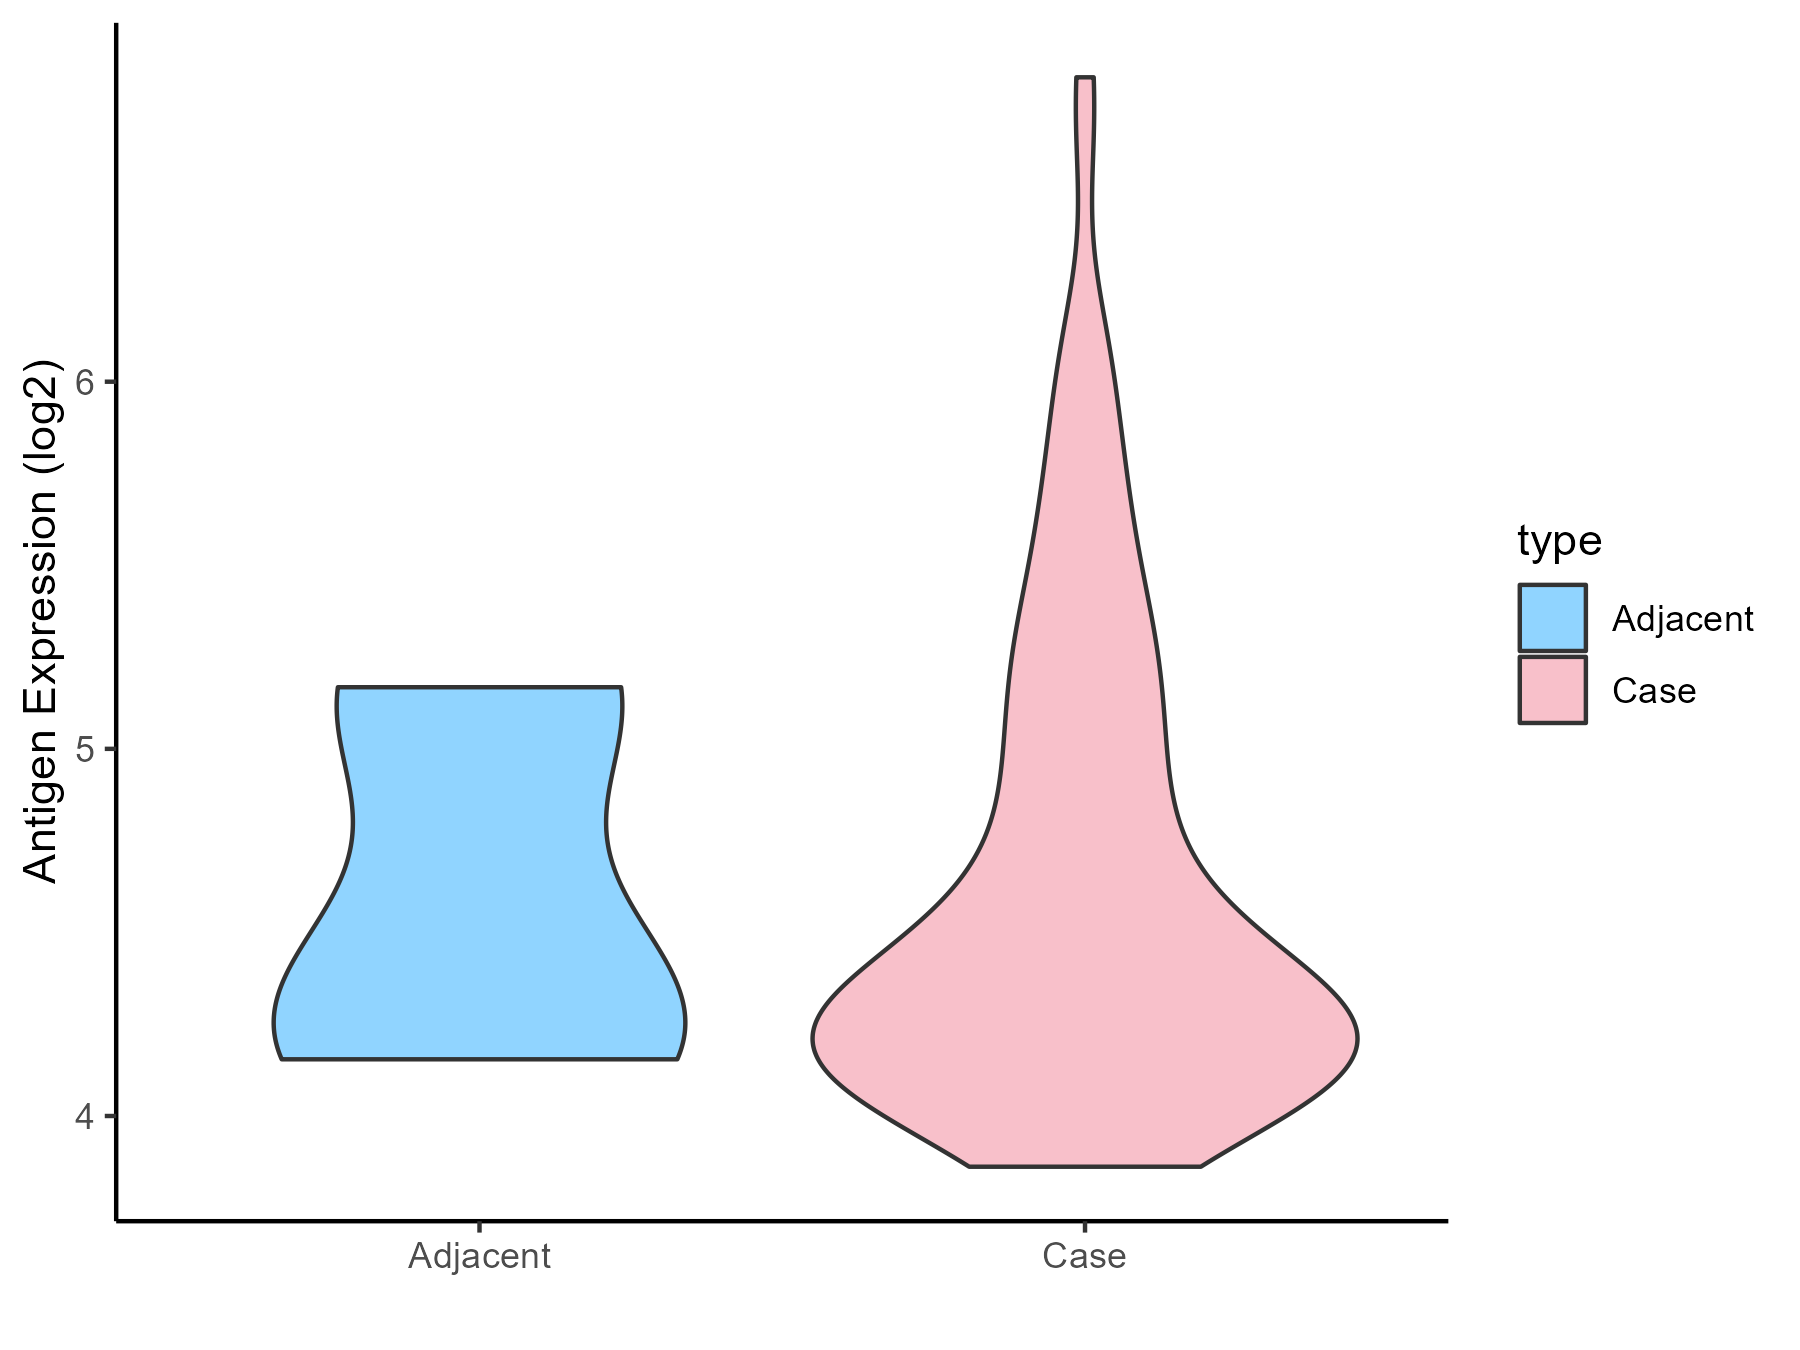
| Differential expression pattern of antigen in diseases | ||
| The Studied Tissue | Esophagus | |
| The Specific Disease | Esophagal cancer | |
| The Expression Level of Disease Section Compare with the Adjacent Tissue | p-value: 0.972561805; Fold-change: 0.059211632; Z-score: 0.116922199 | |
| Disease-specific Antigen Abundances |
|
Click to View the Clearer Original Diagram |
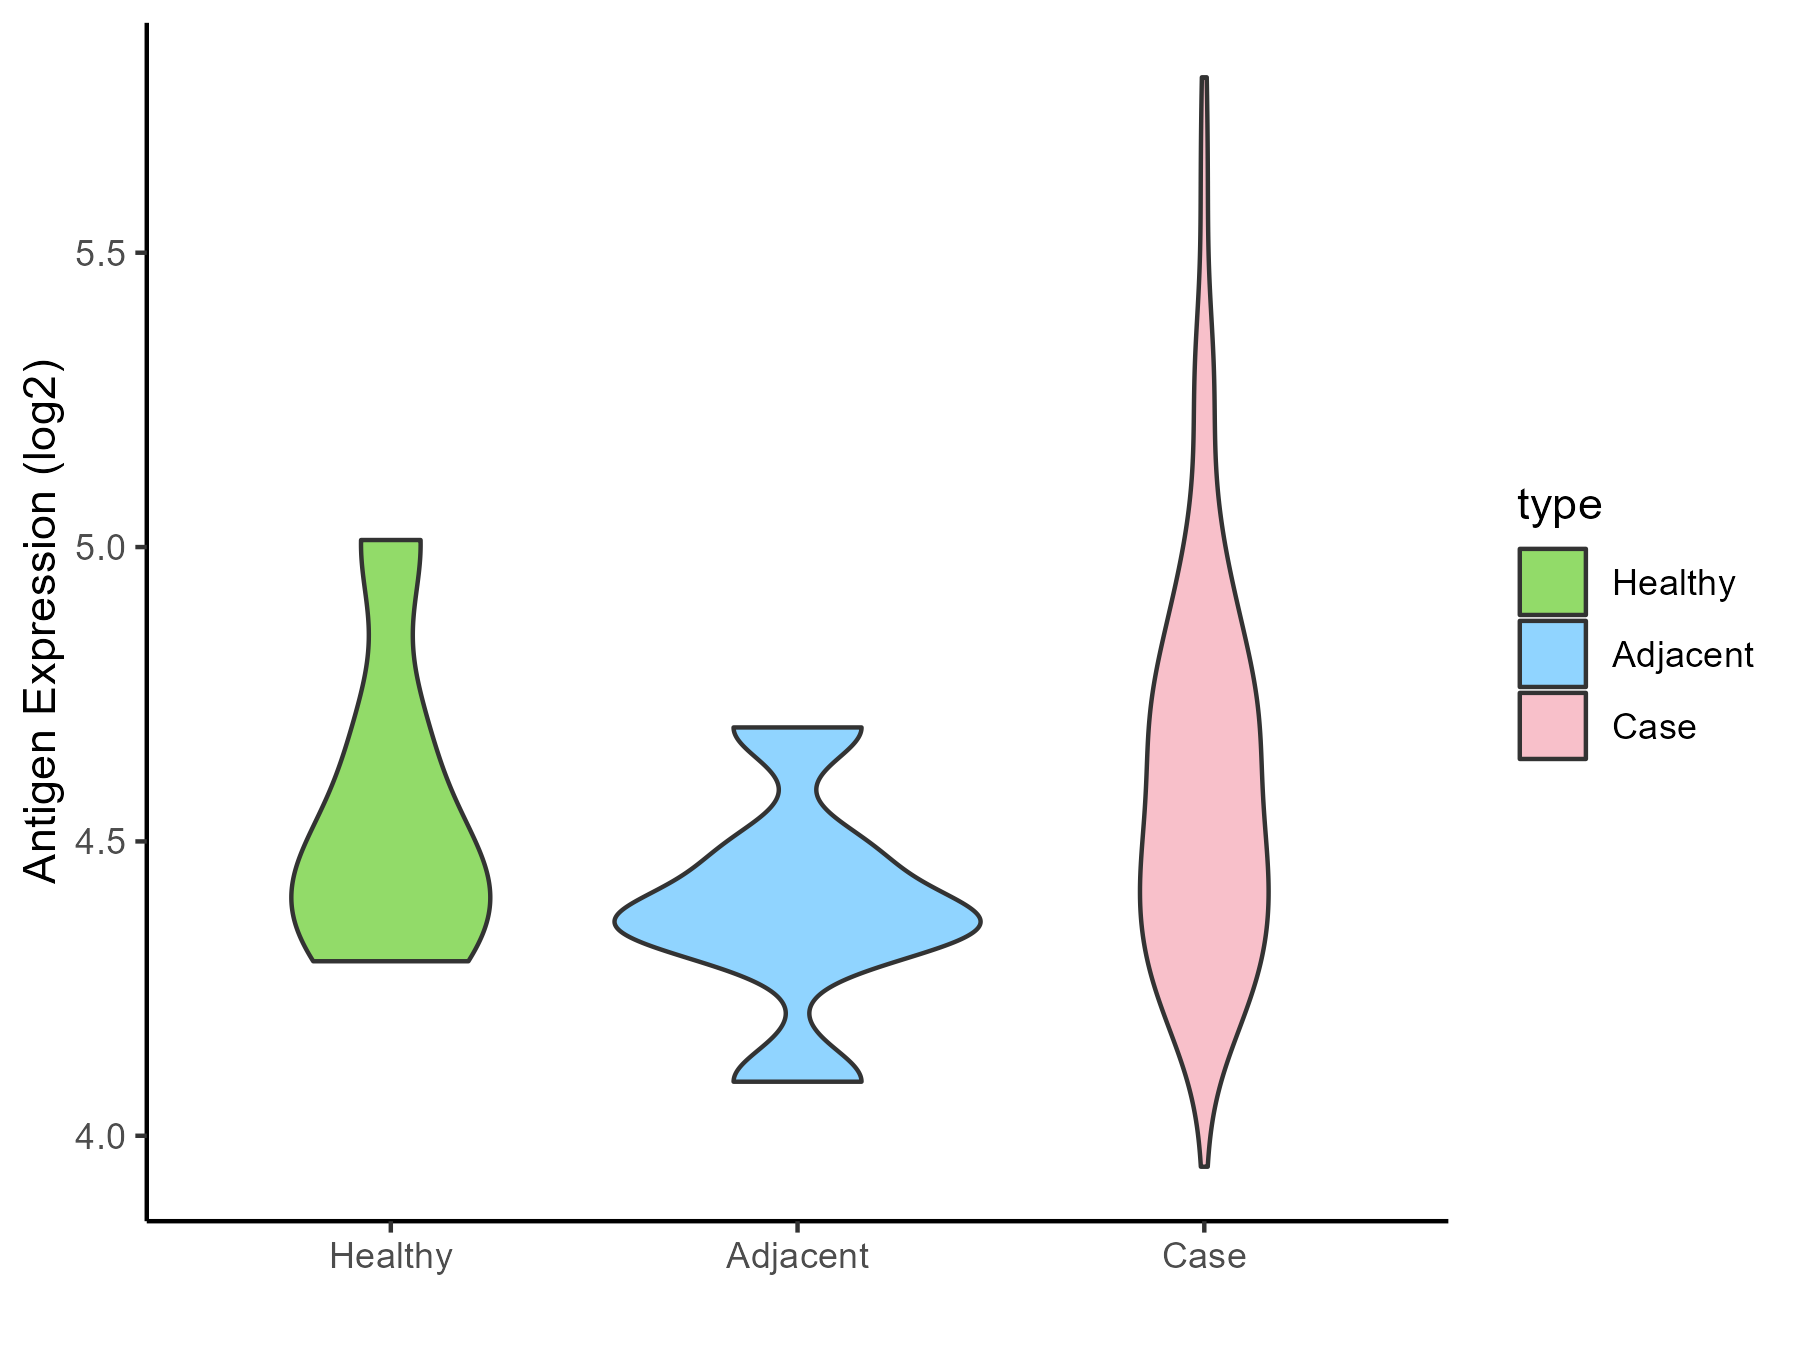
| Differential expression pattern of antigen in diseases | ||
| The Studied Tissue | Rectal colon | |
| The Specific Disease | Rectal cancer | |
| The Expression Level of Disease Section Compare with the Healthy Individual Tissue | p-value: 0.550894878; Fold-change: 0.098762242; Z-score: 0.374111107 | |
| The Expression Level of Disease Section Compare with the Adjacent Tissue | p-value: 0.037350374; Fold-change: 0.191063515; Z-score: 0.971317295 | |
| Disease-specific Antigen Abundances |
|
Click to View the Clearer Original Diagram |
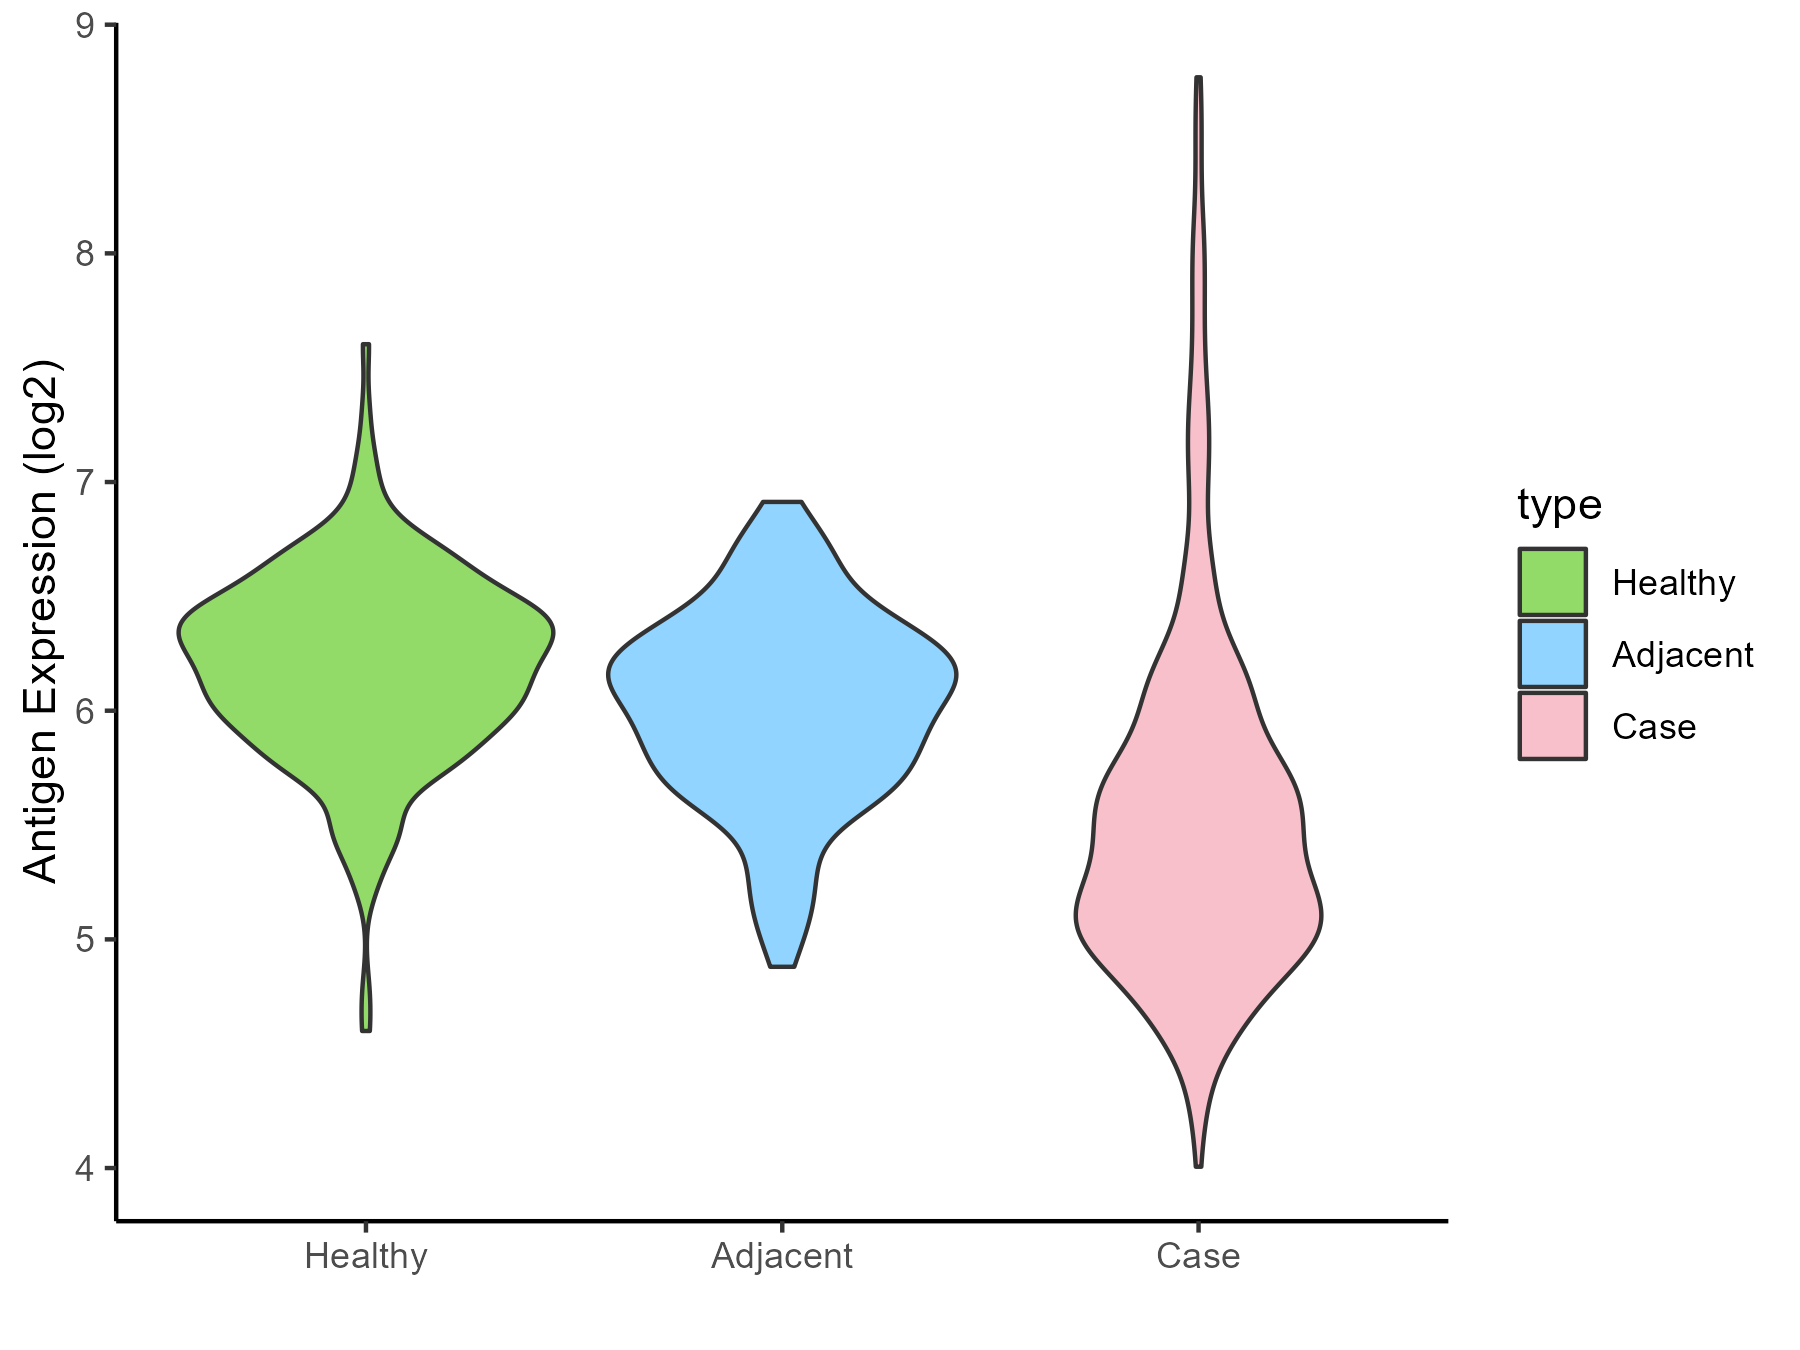
| Differential expression pattern of antigen in diseases | ||
| The Studied Tissue | Skin | |
| The Specific Disease | Skin cancer | |
| The Expression Level of Disease Section Compare with the Healthy Individual Tissue | p-value: 6.72E-36; Fold-change: -0.829024946; Z-score: -2.035090933 | |
| The Expression Level of Disease Section Compare with the Adjacent Tissue | p-value: 5.07E-19; Fold-change: -0.663676392; Z-score: -1.584429941 | |
| Disease-specific Antigen Abundances |
|
Click to View the Clearer Original Diagram |
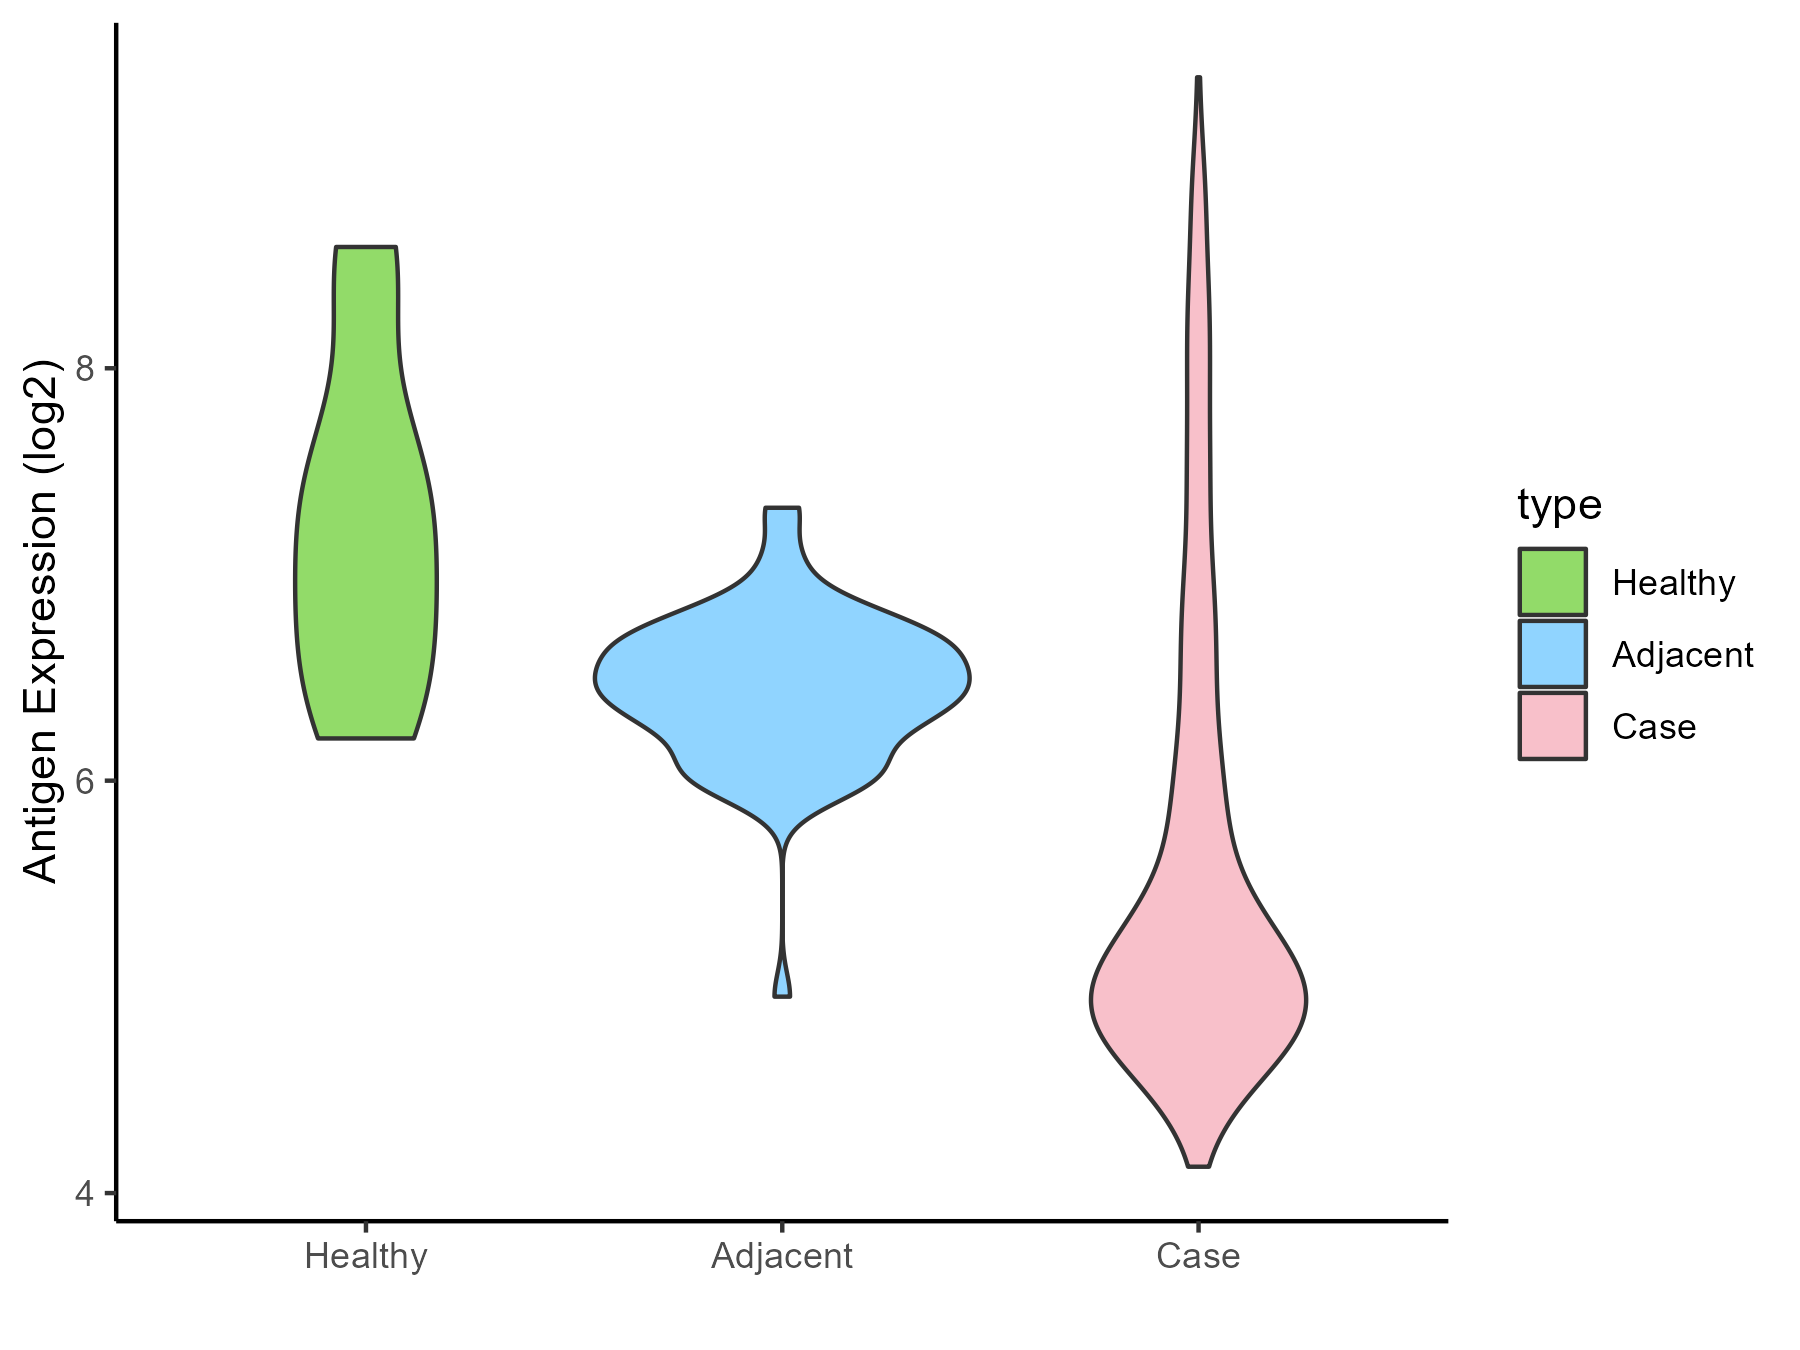
| Differential expression pattern of antigen in diseases | ||
| The Studied Tissue | Kidney | |
| The Specific Disease | Renal cancer | |
| The Expression Level of Disease Section Compare with the Healthy Individual Tissue | p-value: 4.36E-05; Fold-change: -2.0123076; Z-score: -2.527845165 | |
| The Expression Level of Disease Section Compare with the Adjacent Tissue | p-value: 1.69E-25; Fold-change: -1.318518489; Z-score: -3.645184682 | |
| Disease-specific Antigen Abundances |
|
Click to View the Clearer Original Diagram |
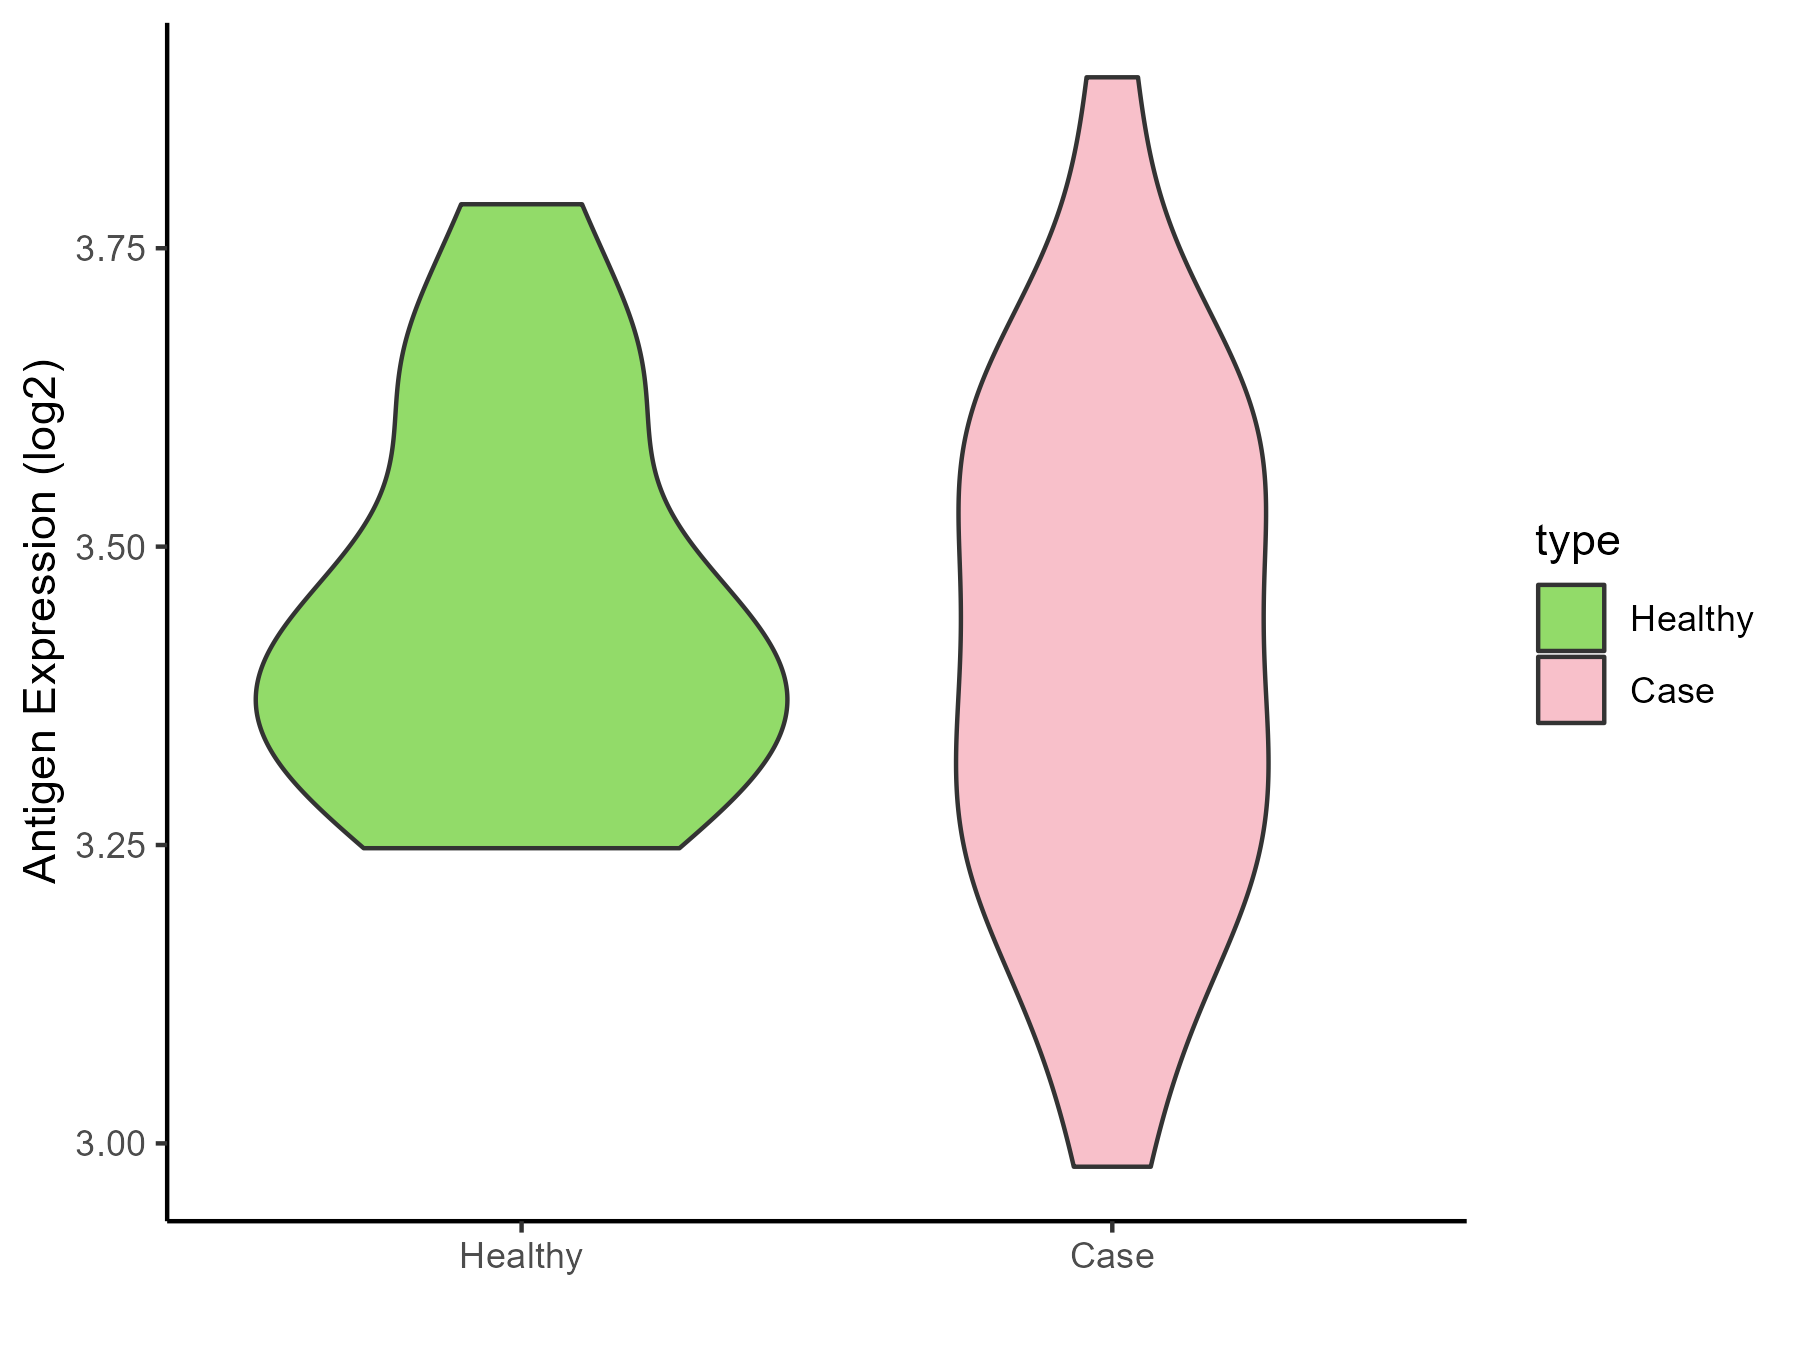
| Differential expression pattern of antigen in diseases | ||
| The Studied Tissue | Urothelium | |
| The Specific Disease | Ureter cancer | |
| The Expression Level of Disease Section Compare with the Healthy Individual Tissue | p-value: 0.5309679; Fold-change: -0.001001563; Z-score: -0.006205982 | |
| Disease-specific Antigen Abundances |
|
Click to View the Clearer Original Diagram |
ICD Disease Classification 20
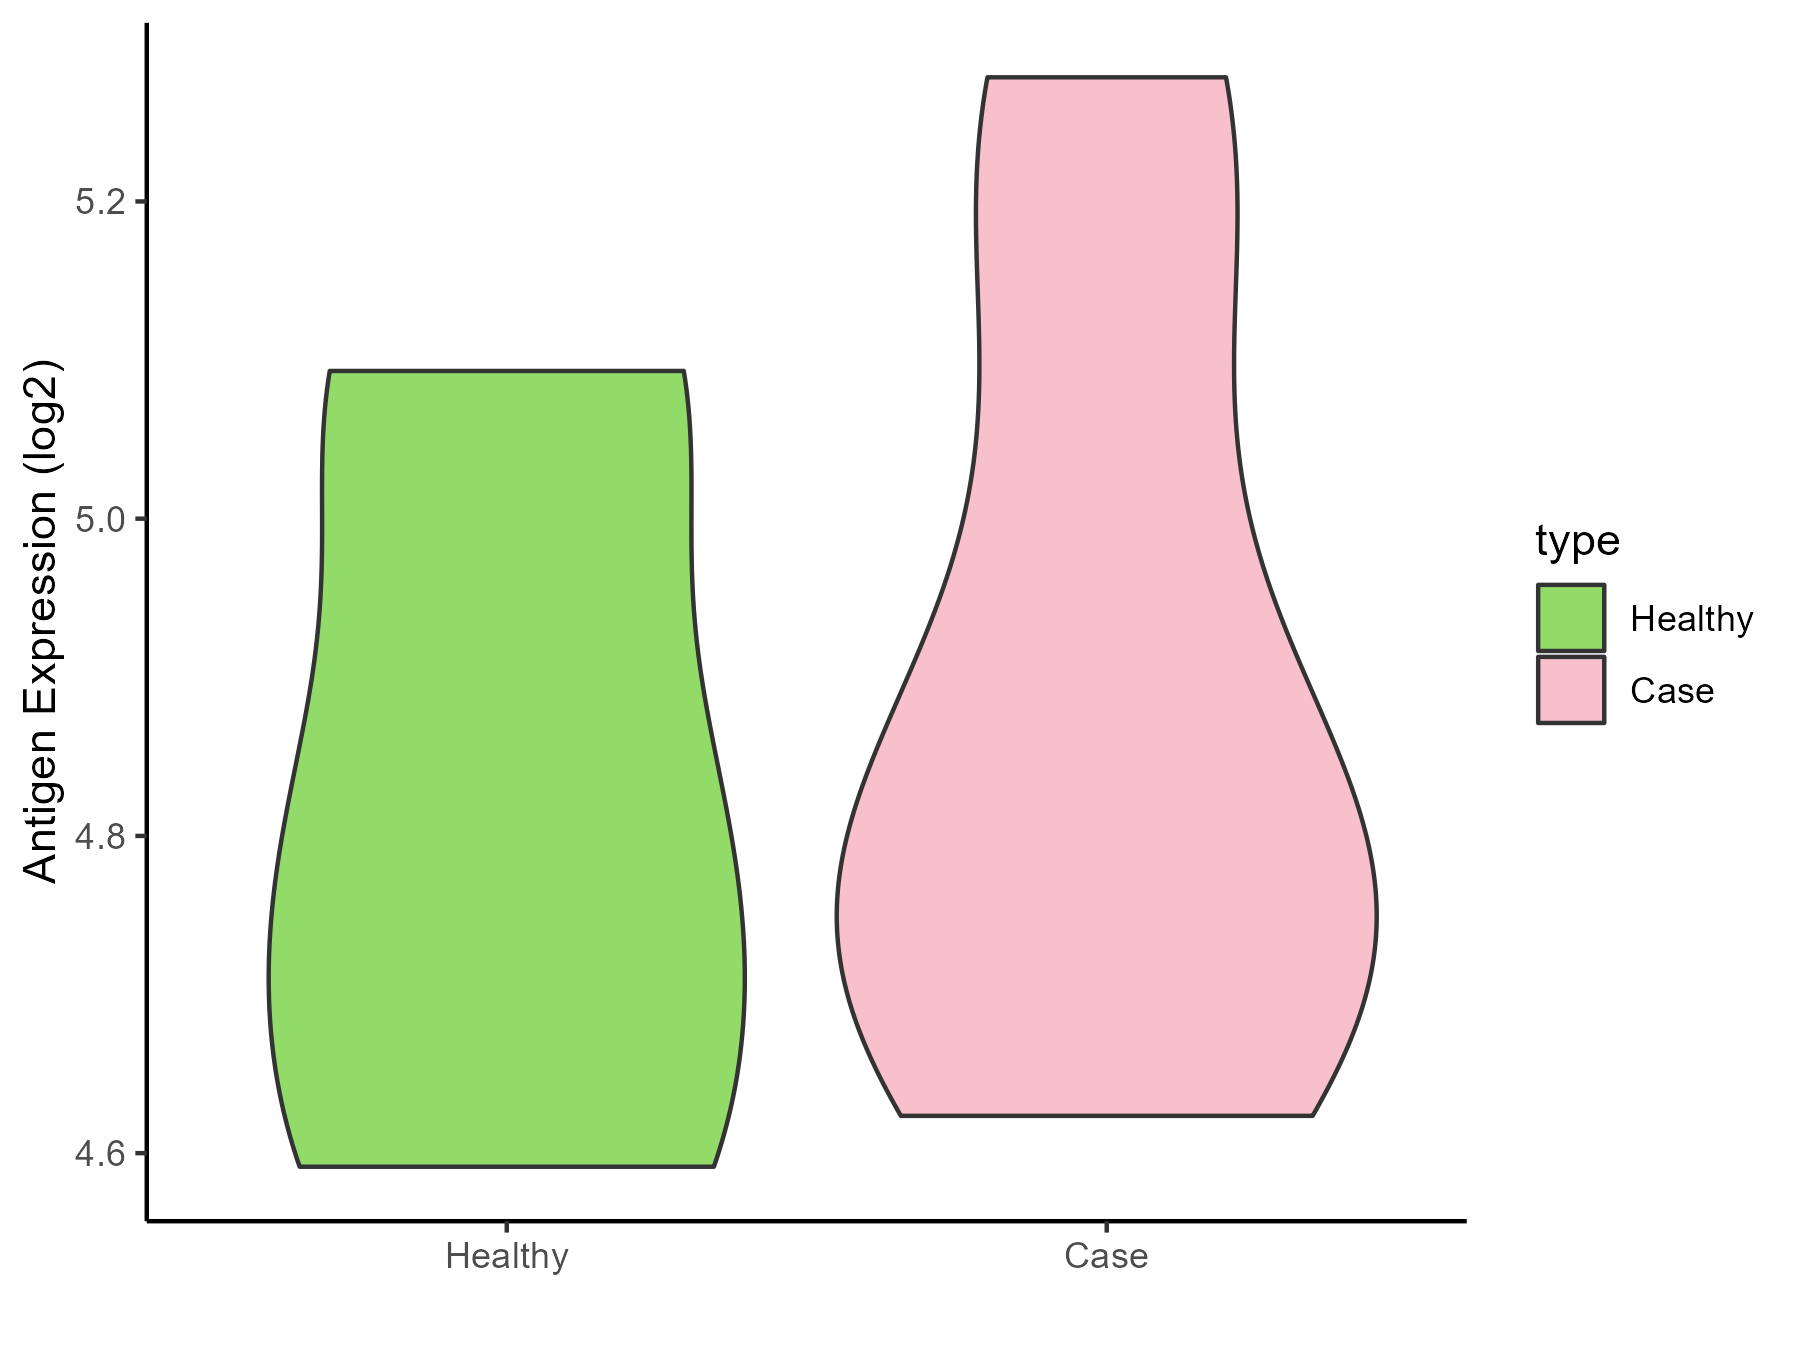
| Differential expression pattern of antigen in diseases | ||
| The Studied Tissue | Adipose | |
| The Specific Disease | Simpson golabi behmel syndrome | |
| The Expression Level of Disease Section Compare with the Healthy Individual Tissue | p-value: 0.725582734; Fold-change: 0.001831977; Z-score: 0.00727565 | |
| Disease-specific Antigen Abundances |
|
Click to View the Clearer Original Diagram |
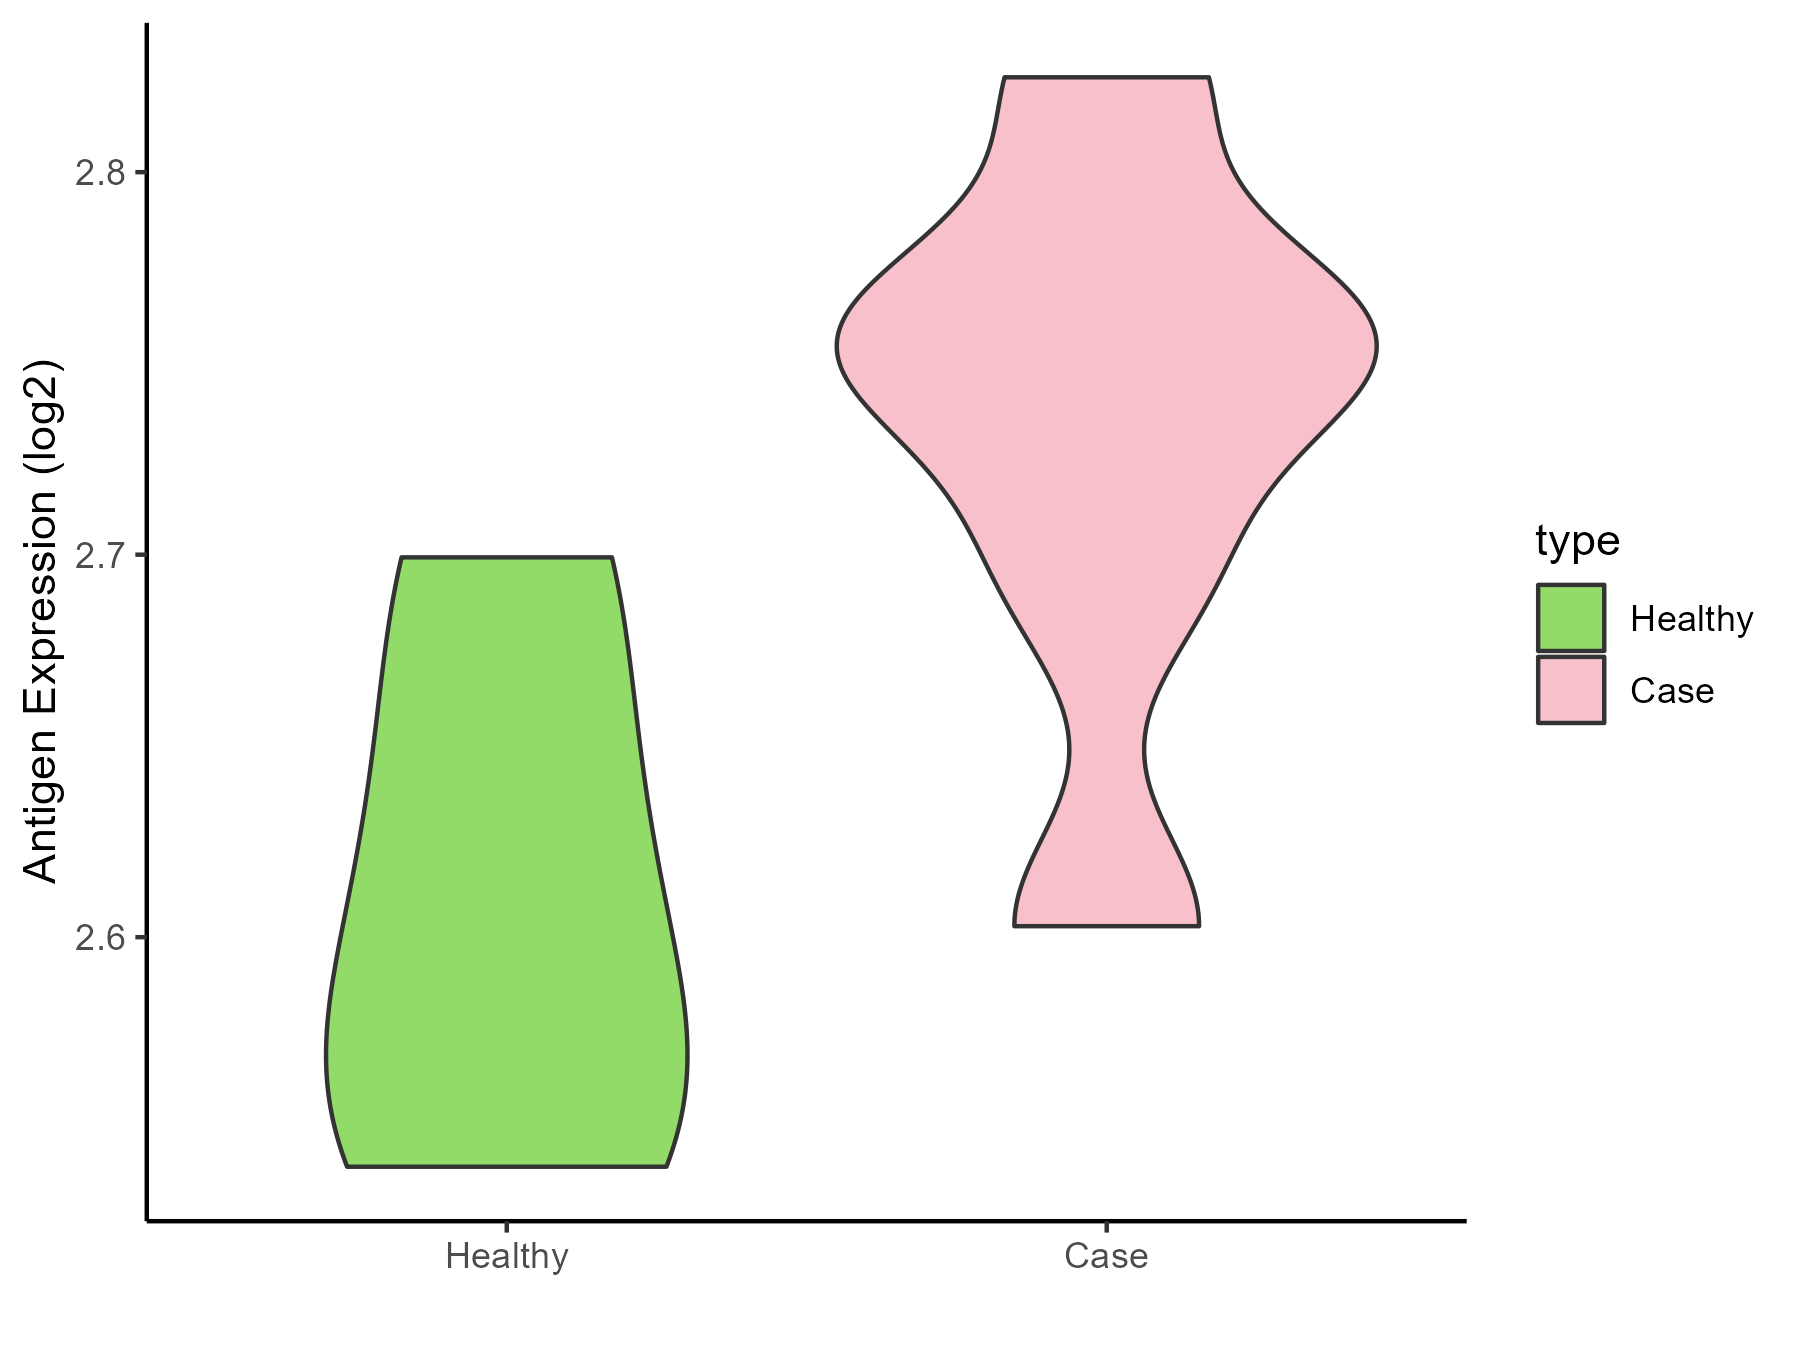
| Differential expression pattern of antigen in diseases | ||
| The Studied Tissue | Perituberal | |
| The Specific Disease | Tuberous sclerosis complex | |
| The Expression Level of Disease Section Compare with the Healthy Individual Tissue | p-value: 0.03524457; Fold-change: 0.152961928; Z-score: 2.160913344 | |
| Disease-specific Antigen Abundances |
|
Click to View the Clearer Original Diagram |
ICD Disease Classification 3
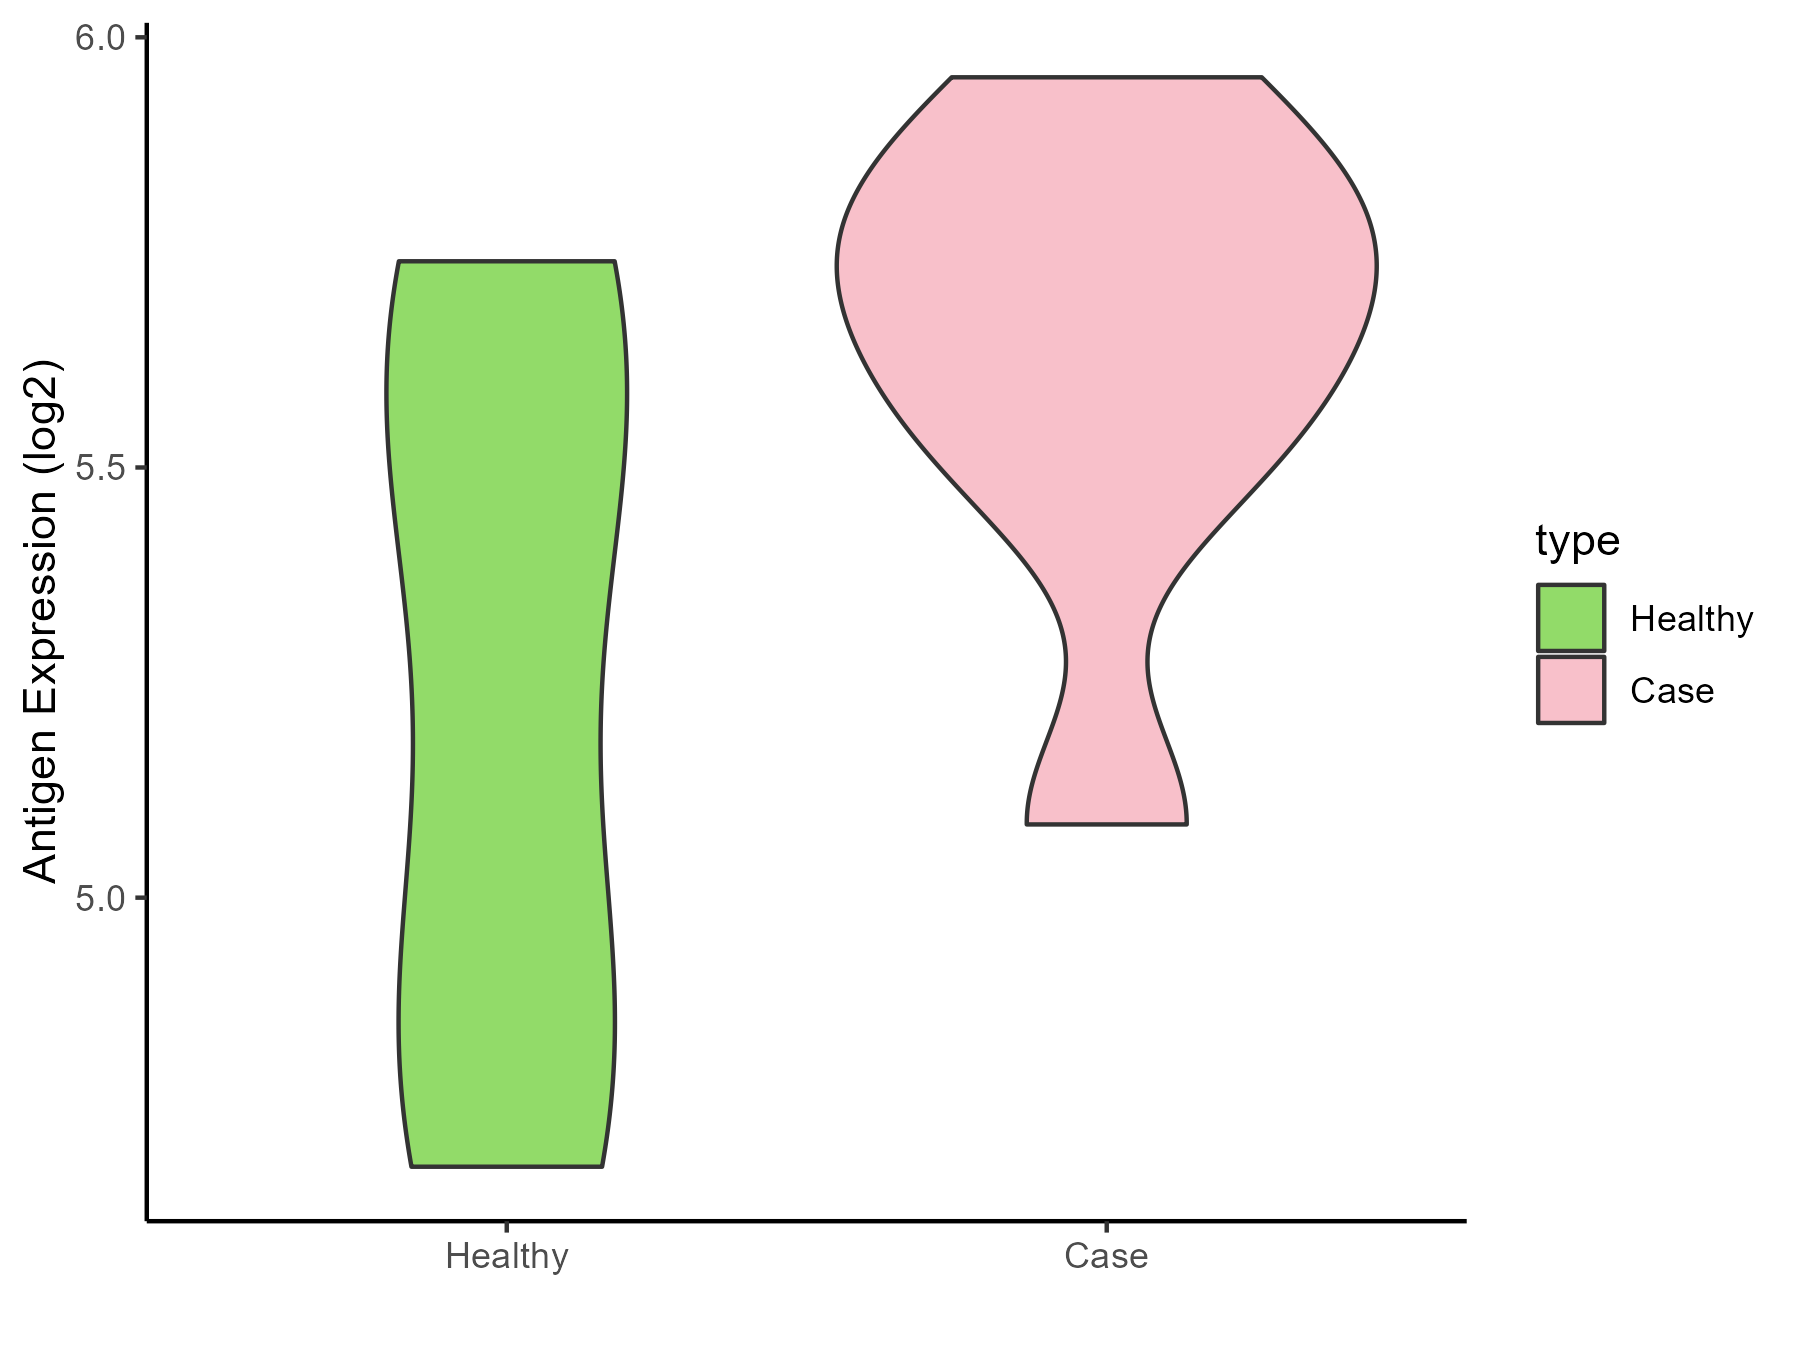
| Differential expression pattern of antigen in diseases | ||
| The Studied Tissue | Bone marrow | |
| The Specific Disease | Anemia | |
| The Expression Level of Disease Section Compare with the Healthy Individual Tissue | p-value: 0.076848674; Fold-change: 0.384237892; Z-score: 0.874228726 | |
| Disease-specific Antigen Abundances |
|
Click to View the Clearer Original Diagram |
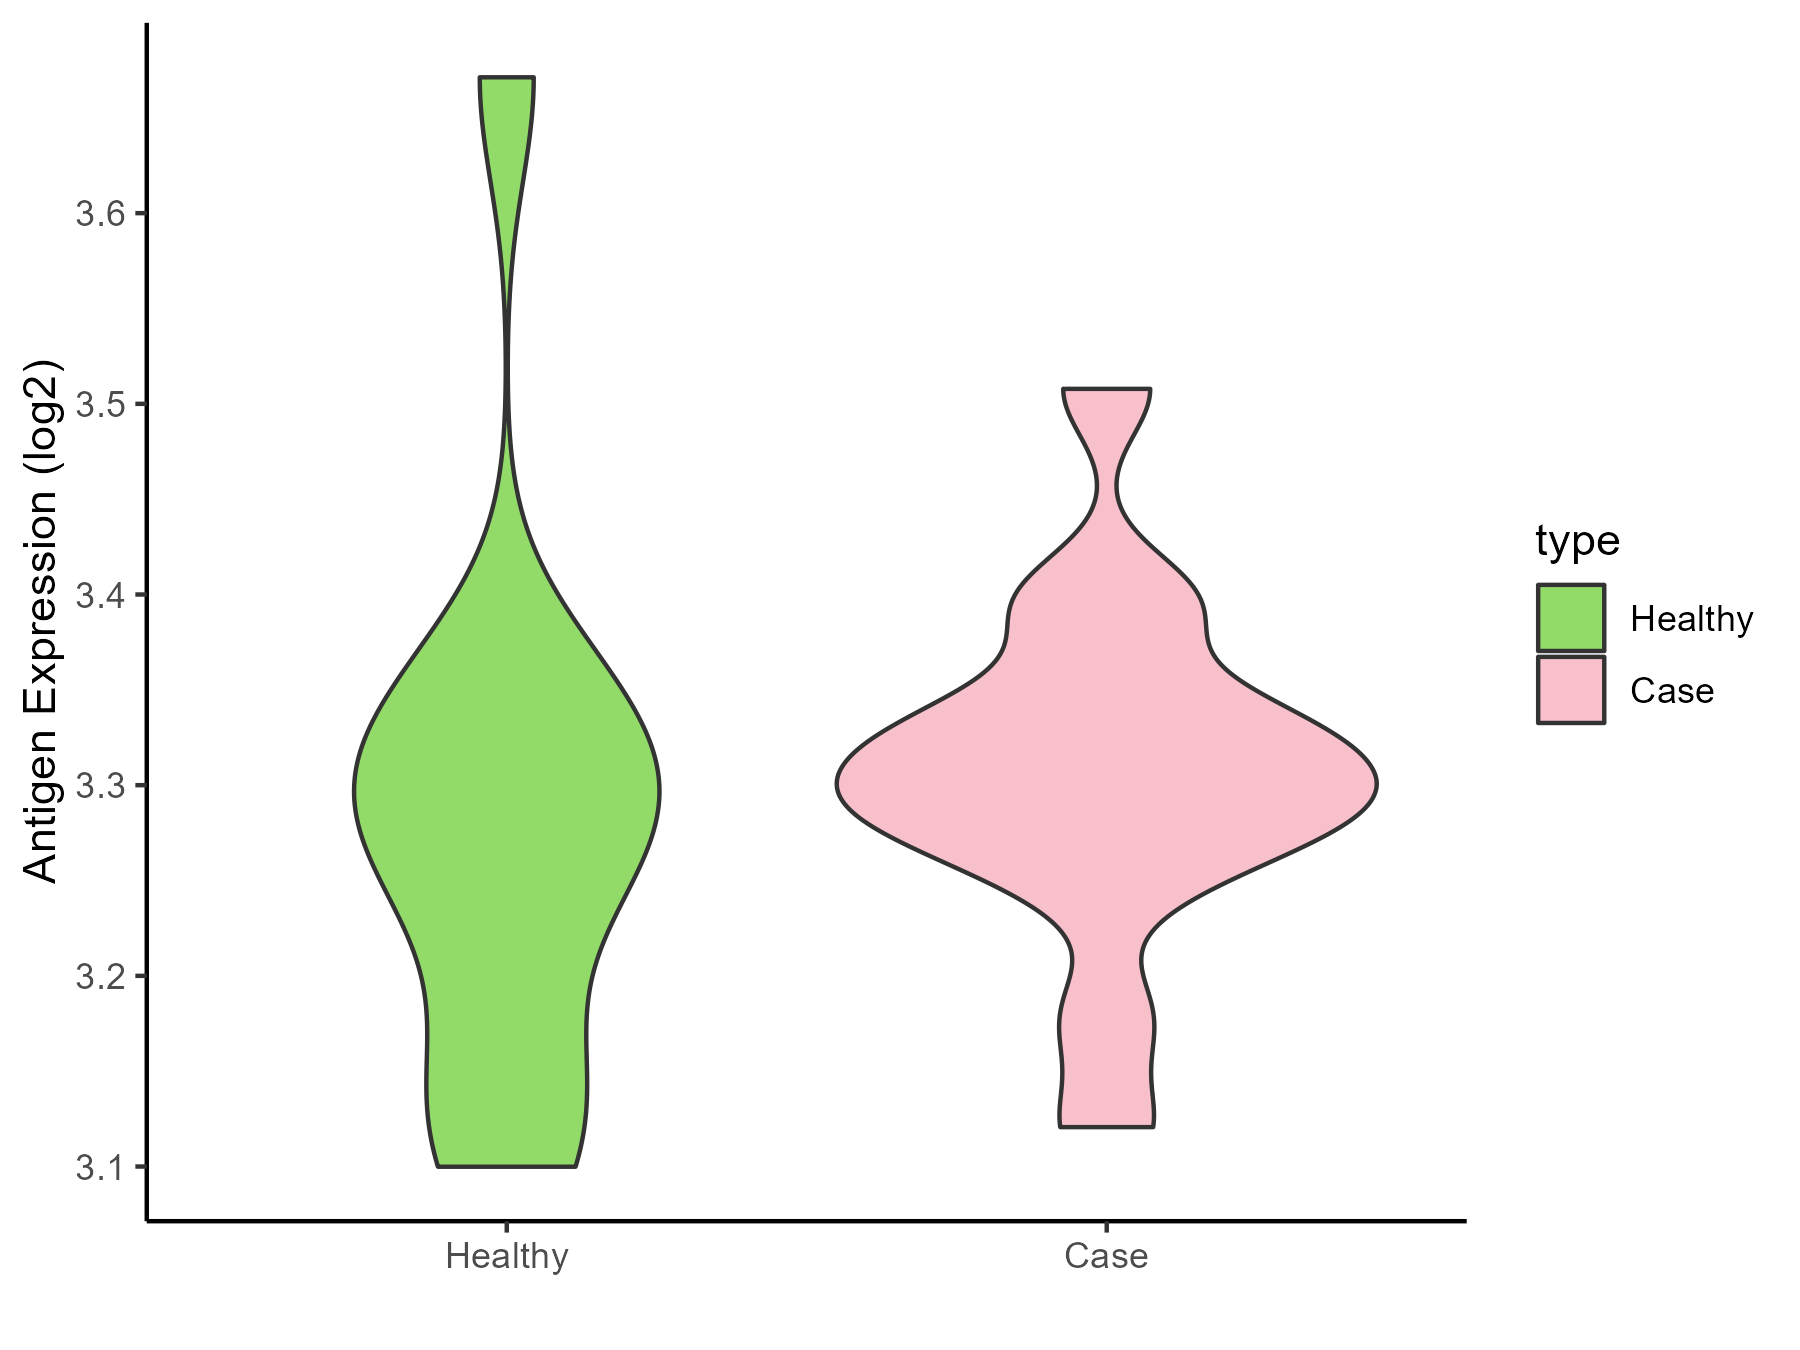
| Differential expression pattern of antigen in diseases | ||
| The Studied Tissue | Peripheral blood | |
| The Specific Disease | Sickle cell disease | |
| The Expression Level of Disease Section Compare with the Healthy Individual Tissue | p-value: 0.697239601; Fold-change: 0.016883379; Z-score: 0.109508691 | |
| Disease-specific Antigen Abundances |
|
Click to View the Clearer Original Diagram |
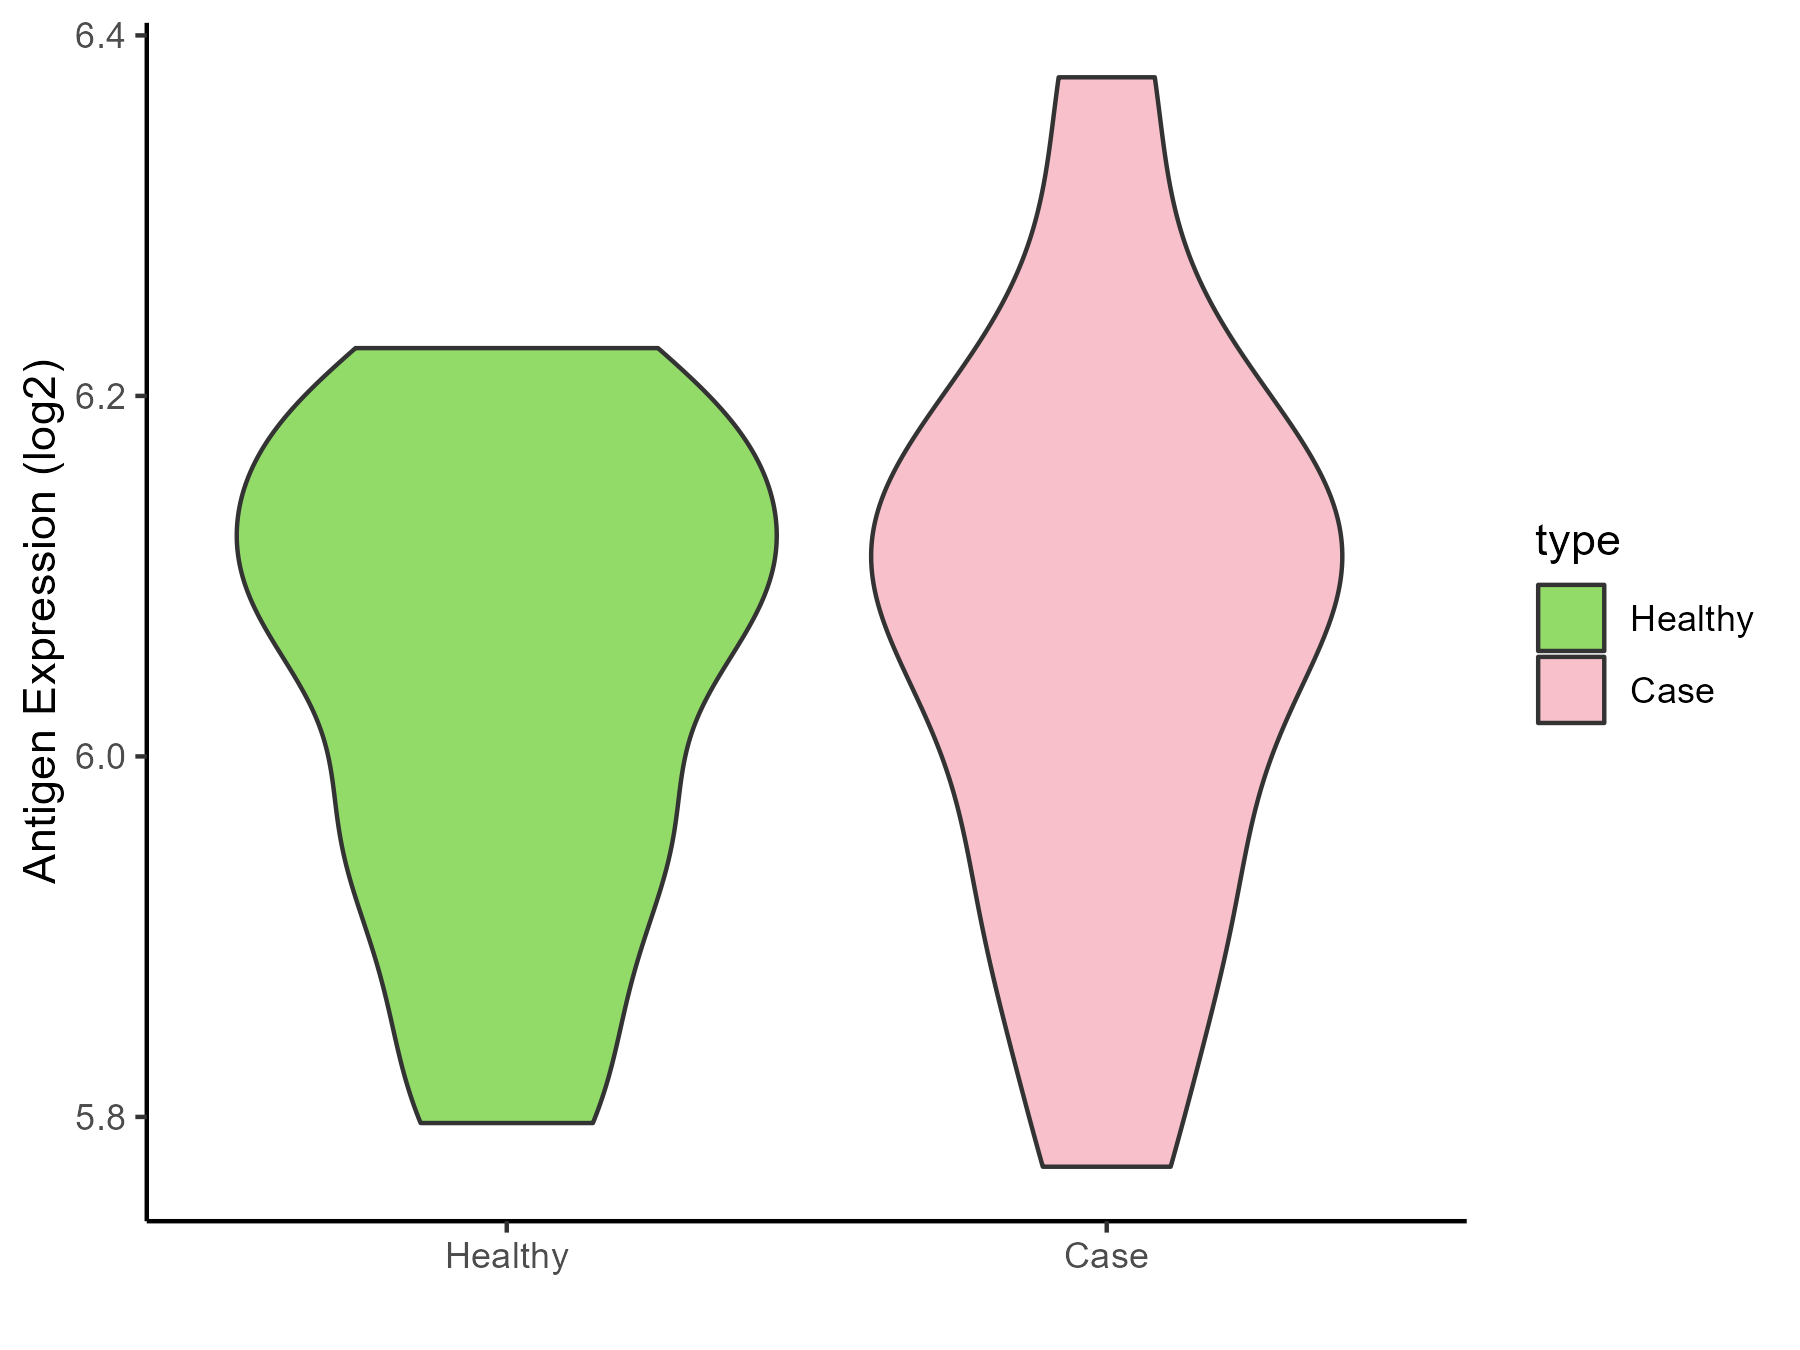
| Differential expression pattern of antigen in diseases | ||
| The Studied Tissue | Whole blood | |
| The Specific Disease | Thrombocythemia | |
| The Expression Level of Disease Section Compare with the Healthy Individual Tissue | p-value: 0.535917238; Fold-change: 0.006731383; Z-score: 0.05199996 | |
| Disease-specific Antigen Abundances |
|
Click to View the Clearer Original Diagram |
ICD Disease Classification 4
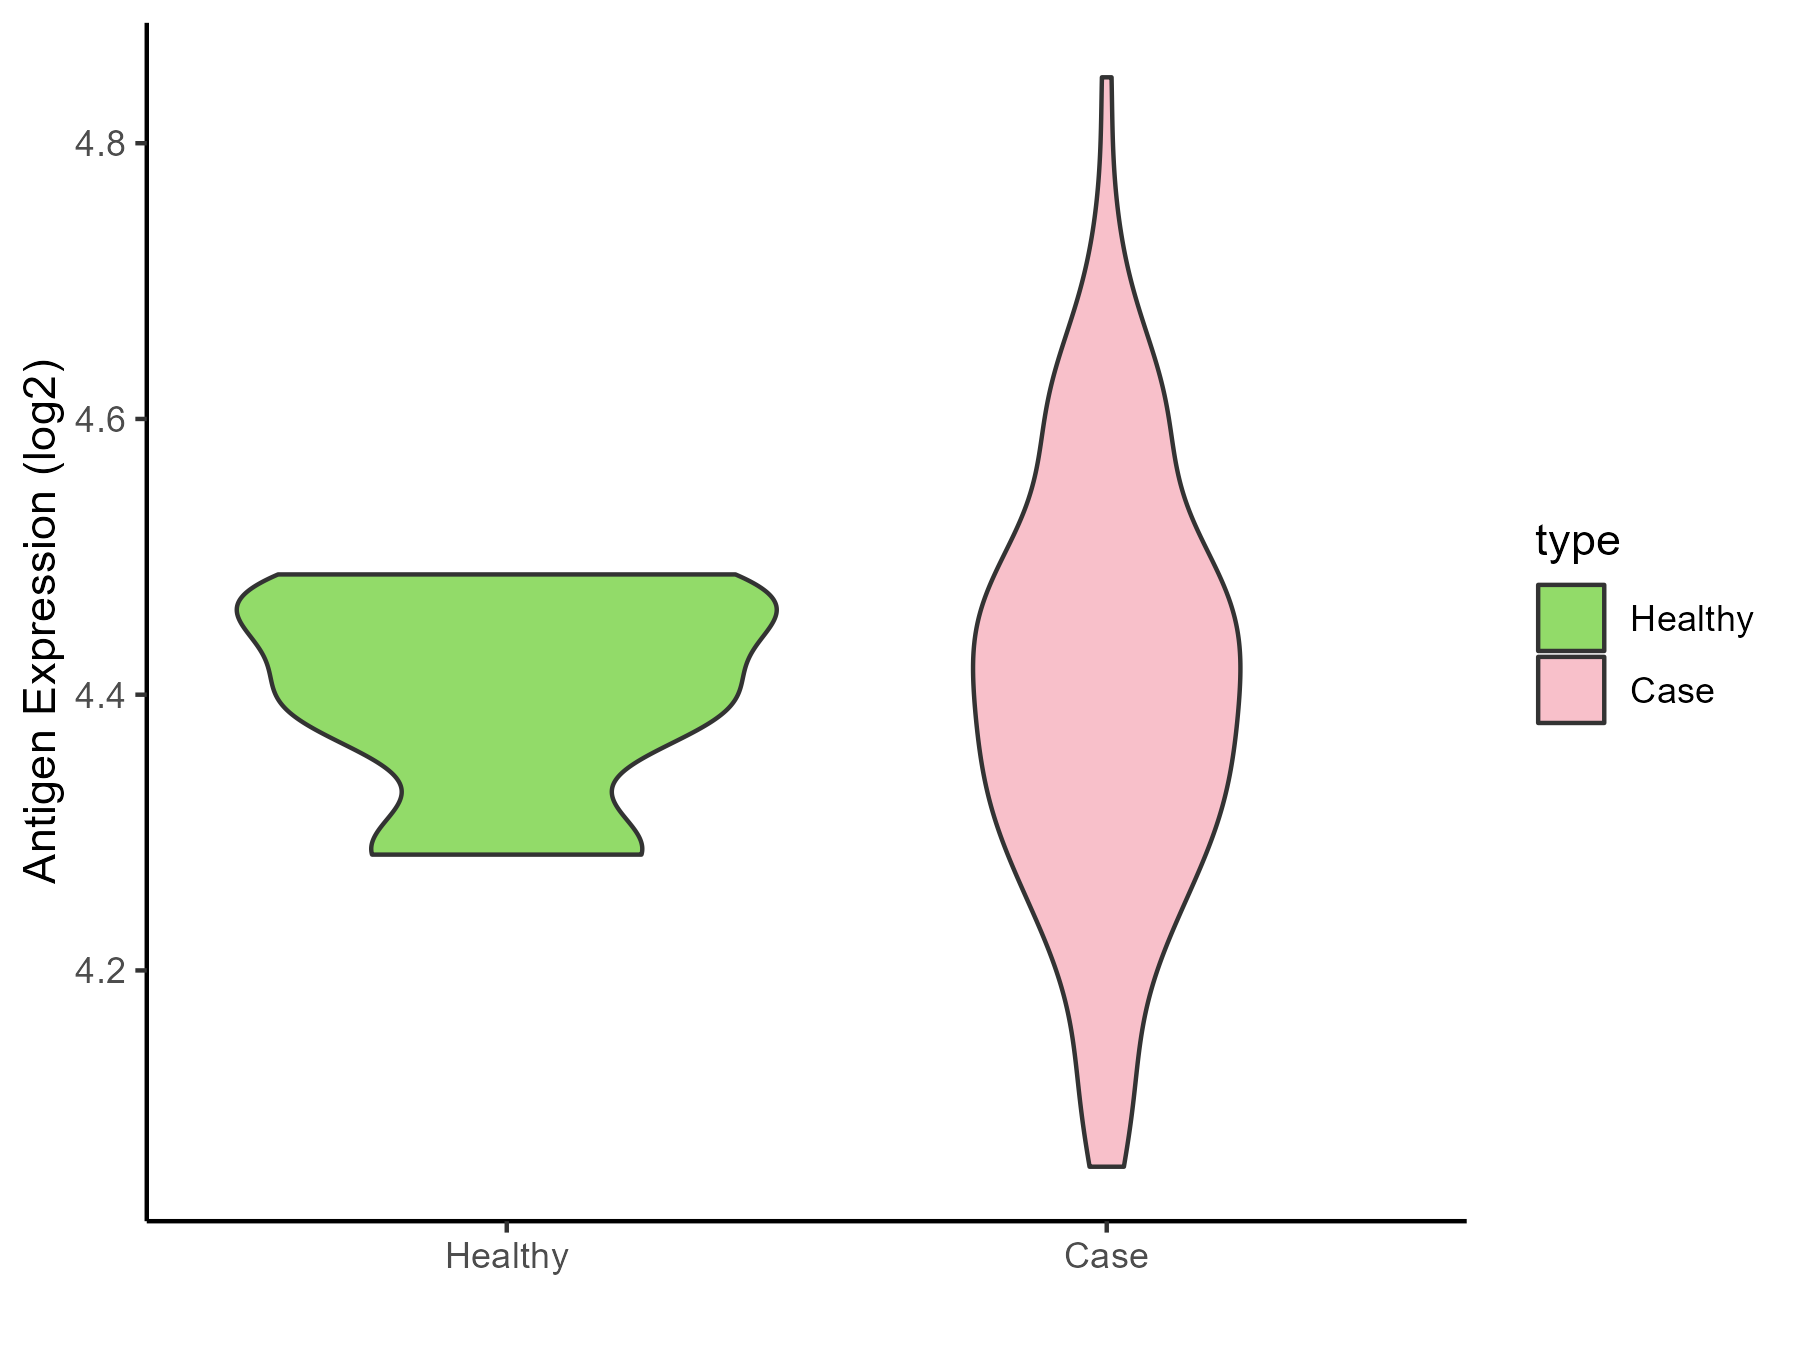
| Differential expression pattern of antigen in diseases | ||
| The Studied Tissue | Whole blood | |
| The Specific Disease | Scleroderma | |
| The Expression Level of Disease Section Compare with the Healthy Individual Tissue | p-value: 0.907276029; Fold-change: 0.003781948; Z-score: 0.049580255 | |
| Disease-specific Antigen Abundances |
|
Click to View the Clearer Original Diagram |
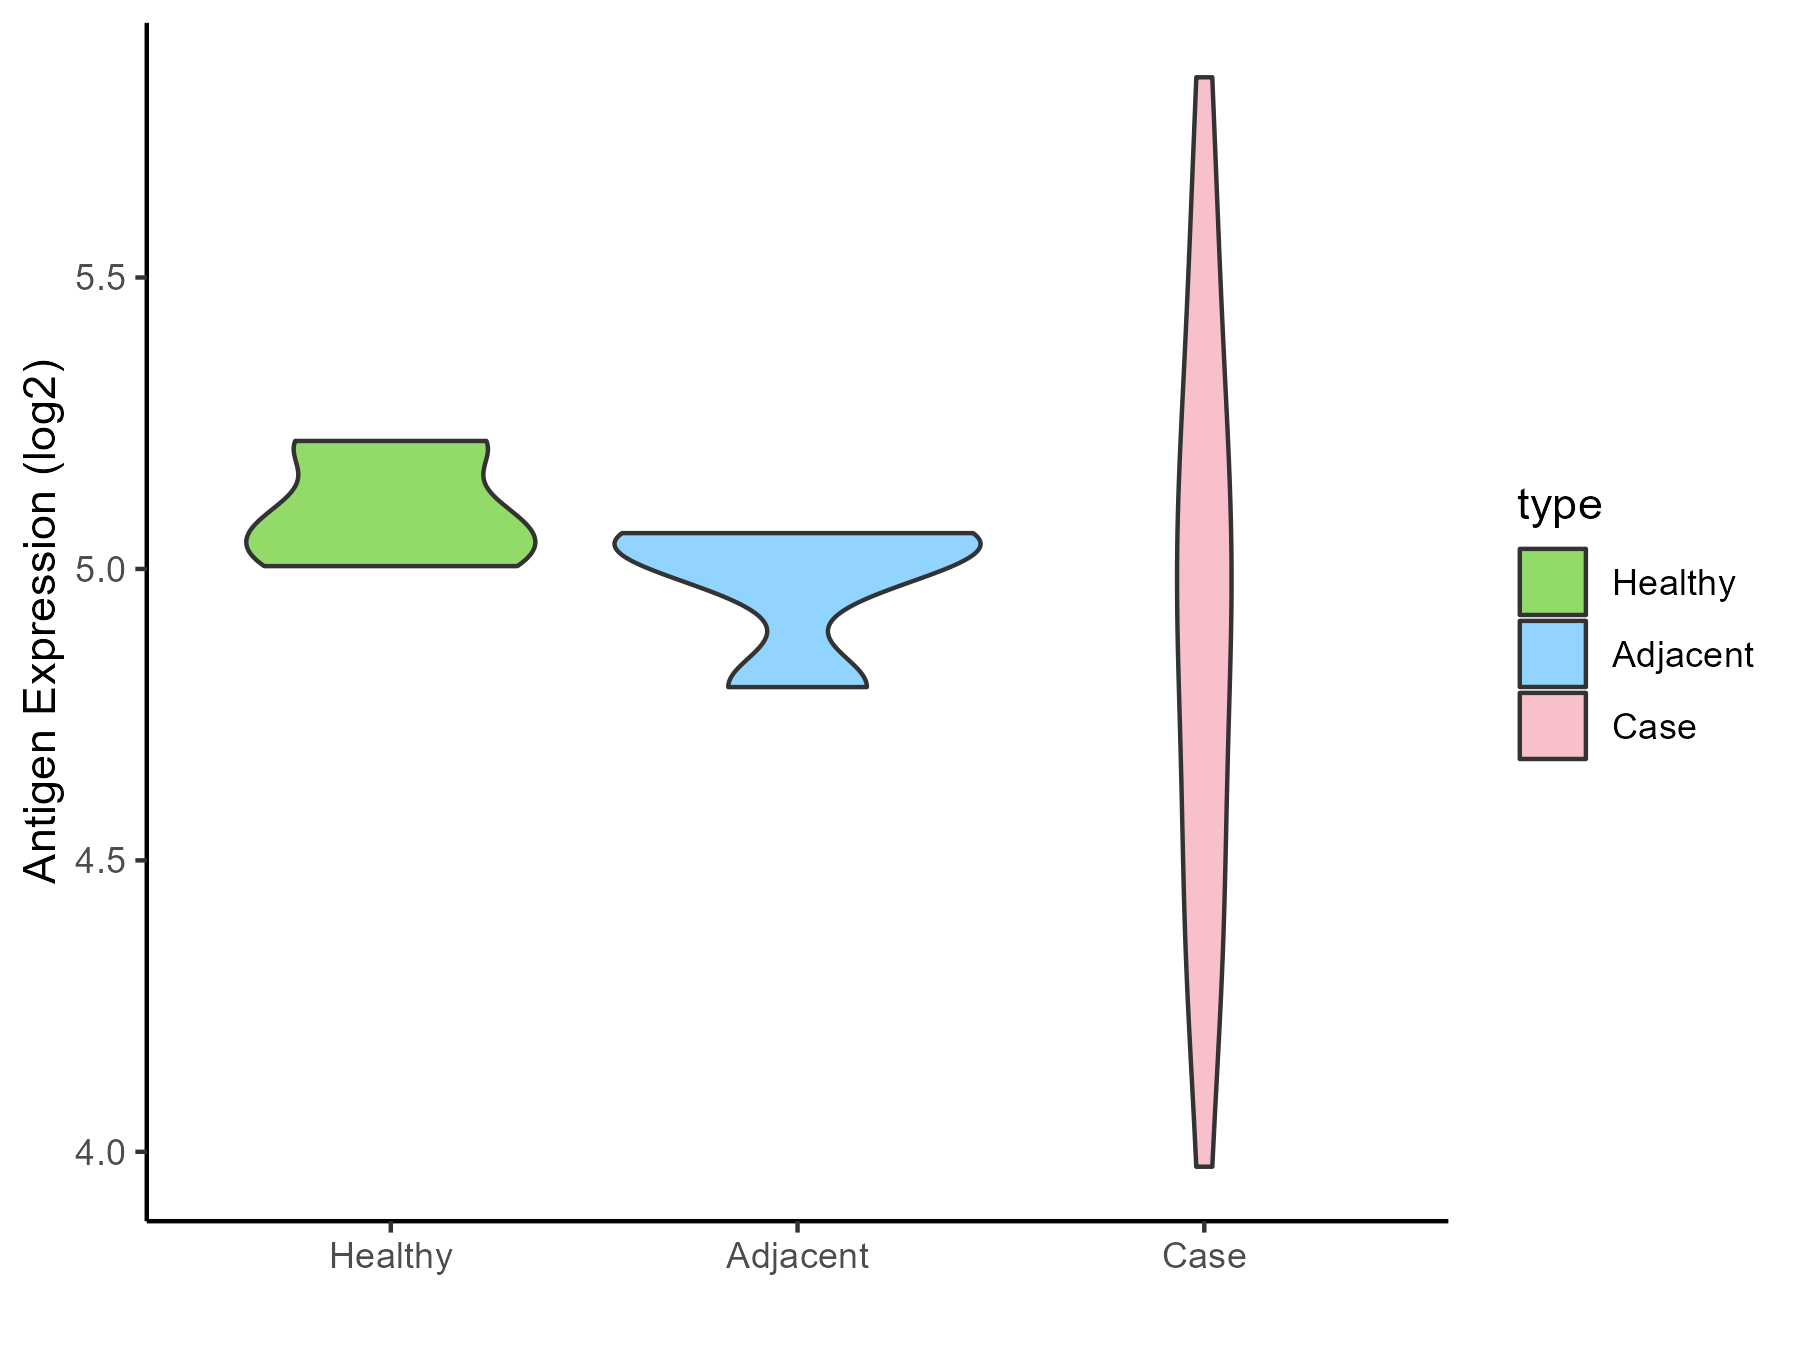
| Differential expression pattern of antigen in diseases | ||
| The Studied Tissue | Salivary gland | |
| The Specific Disease | Sjogren syndrome | |
| The Expression Level of Disease Section Compare with the Healthy Individual Tissue | p-value: 0.149342314; Fold-change: -0.134738526; Z-score: -1.239481615 | |
| The Expression Level of Disease Section Compare with the Adjacent Tissue | p-value: 0.574025879; Fold-change: -0.080543258; Z-score: -0.646748113 | |
| Disease-specific Antigen Abundances |
|
Click to View the Clearer Original Diagram |
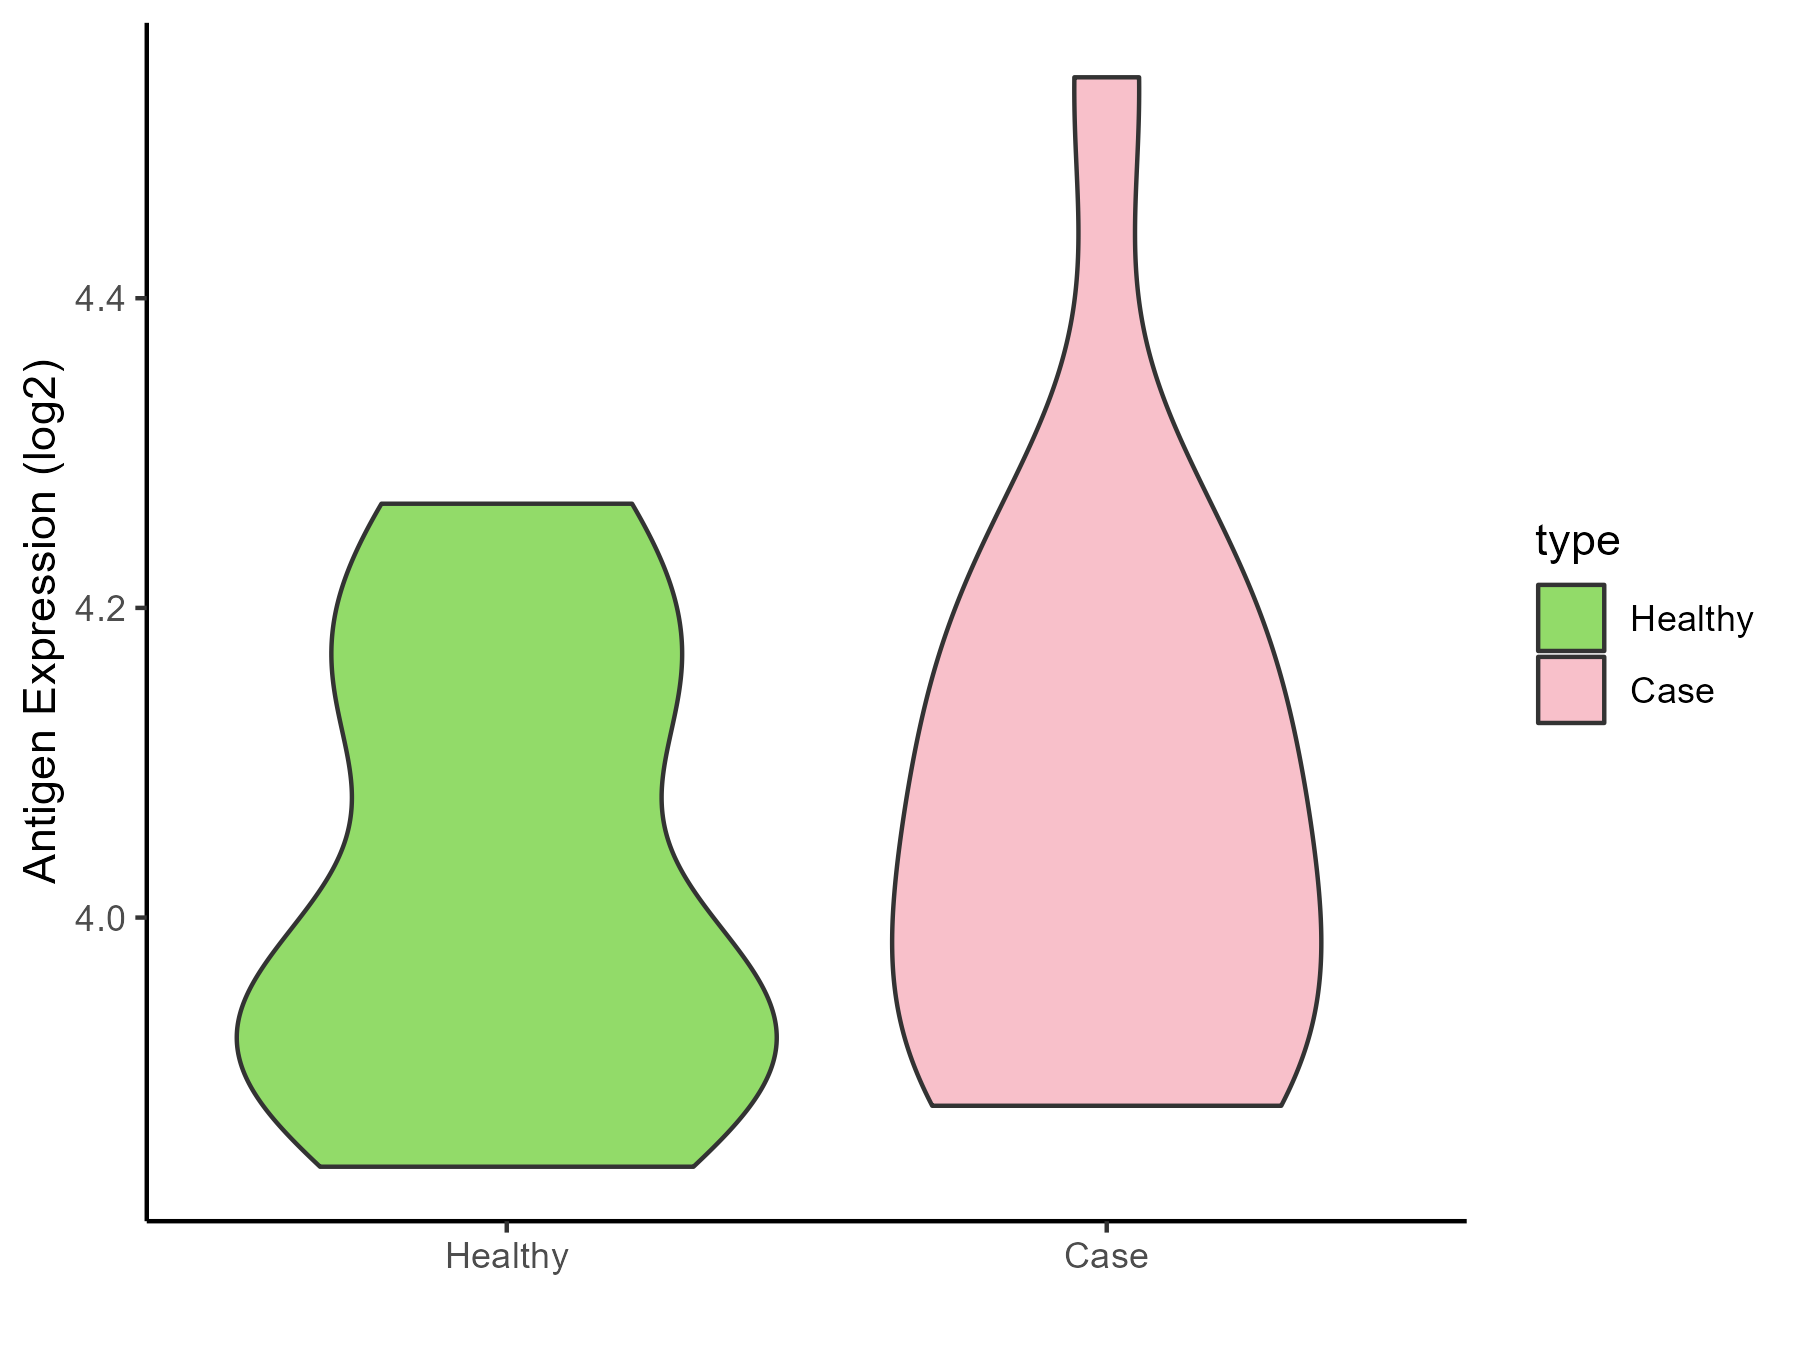
| Differential expression pattern of antigen in diseases | ||
| The Studied Tissue | Peripheral blood | |
| The Specific Disease | Behcet disease | |
| The Expression Level of Disease Section Compare with the Healthy Individual Tissue | p-value: 0.493433518; Fold-change: 0.123920661; Z-score: 0.826504964 | |
| Disease-specific Antigen Abundances |
|
Click to View the Clearer Original Diagram |
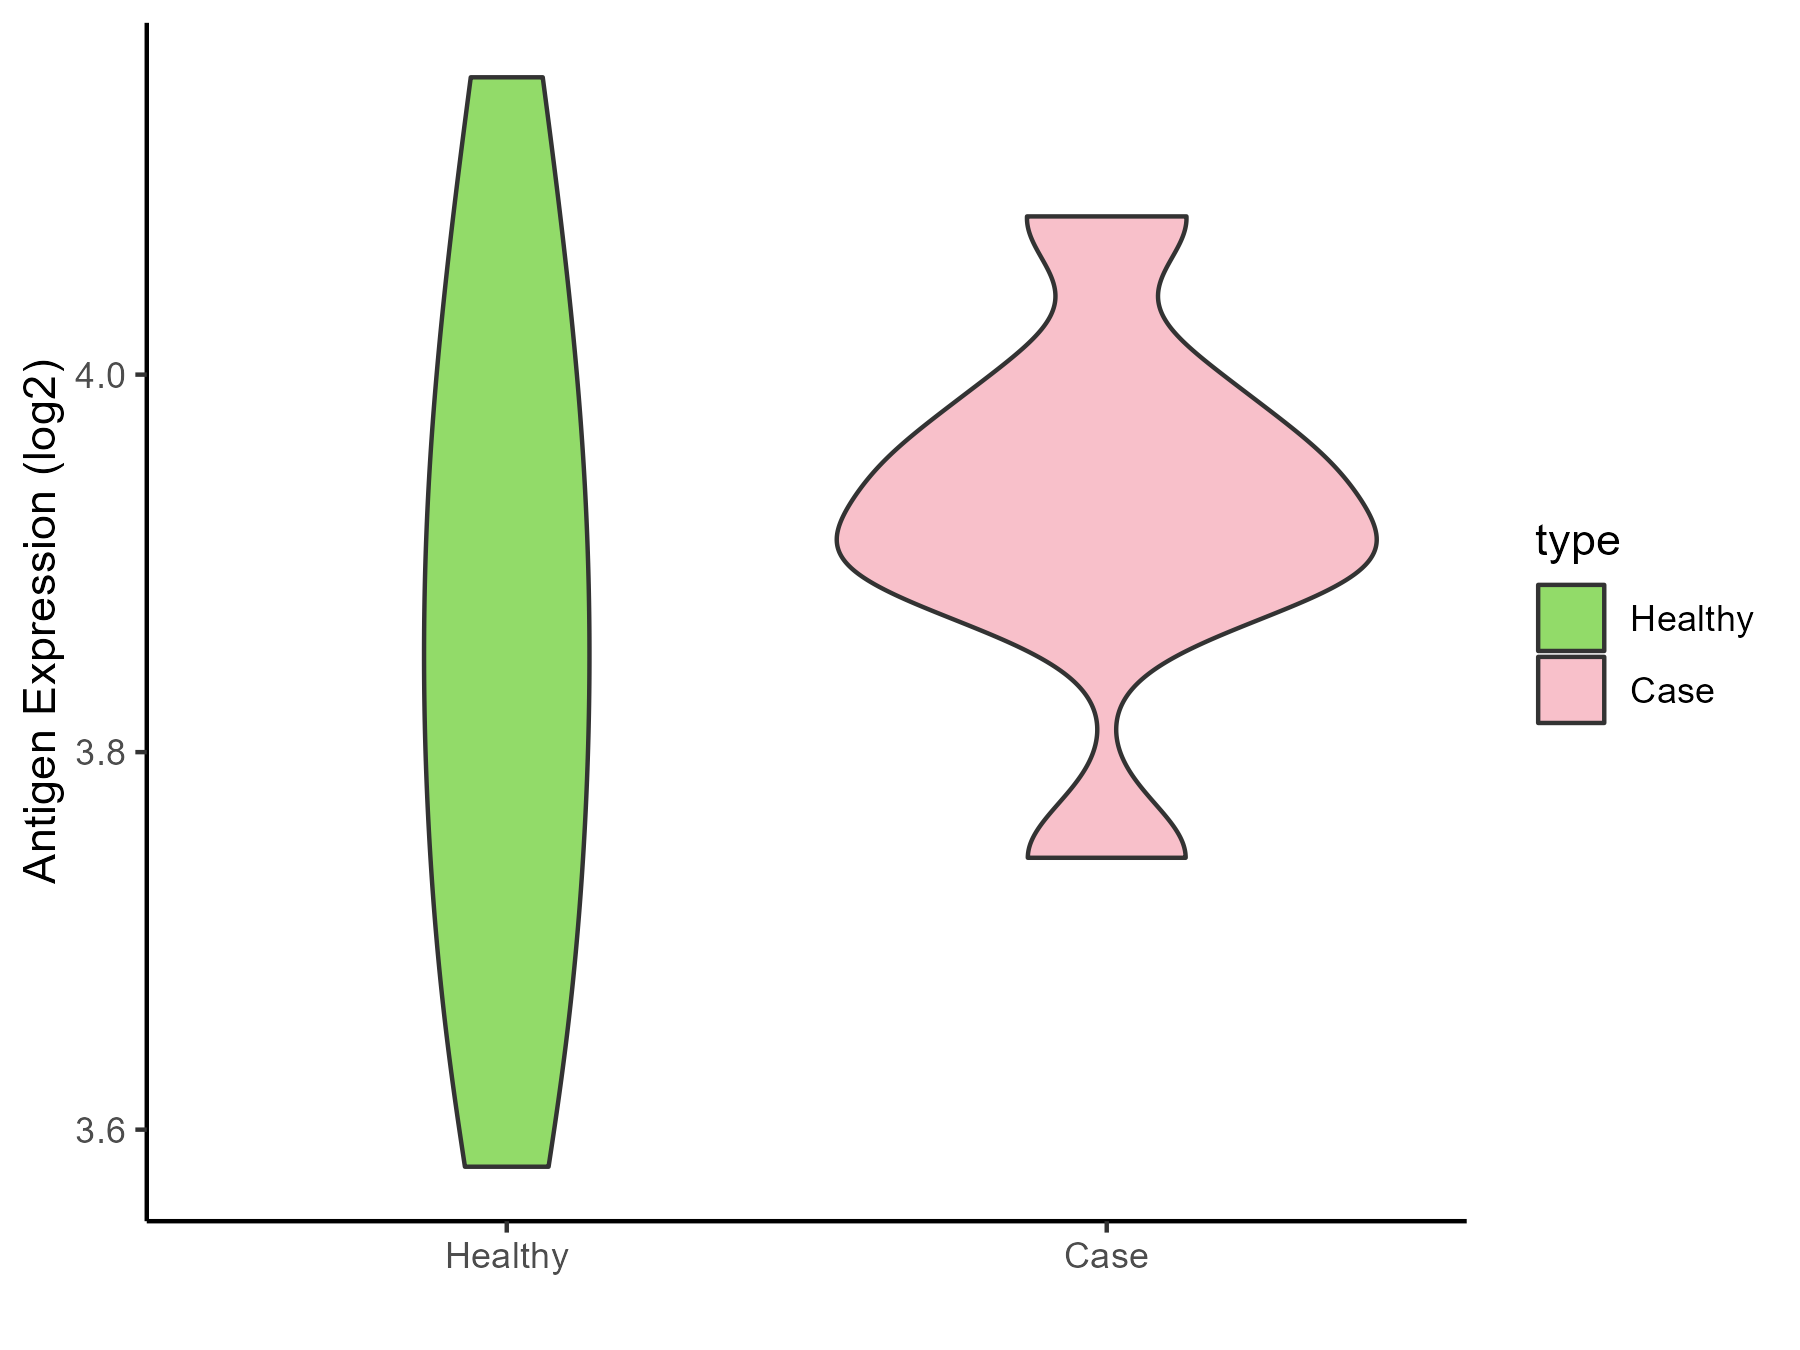
| Differential expression pattern of antigen in diseases | ||
| The Studied Tissue | Whole blood | |
| The Specific Disease | Autosomal dominant monocytopenia | |
| The Expression Level of Disease Section Compare with the Healthy Individual Tissue | p-value: 0.310087984; Fold-change: 0.084687282; Z-score: 0.472870207 | |
| Disease-specific Antigen Abundances |
|
Click to View the Clearer Original Diagram |
ICD Disease Classification 5
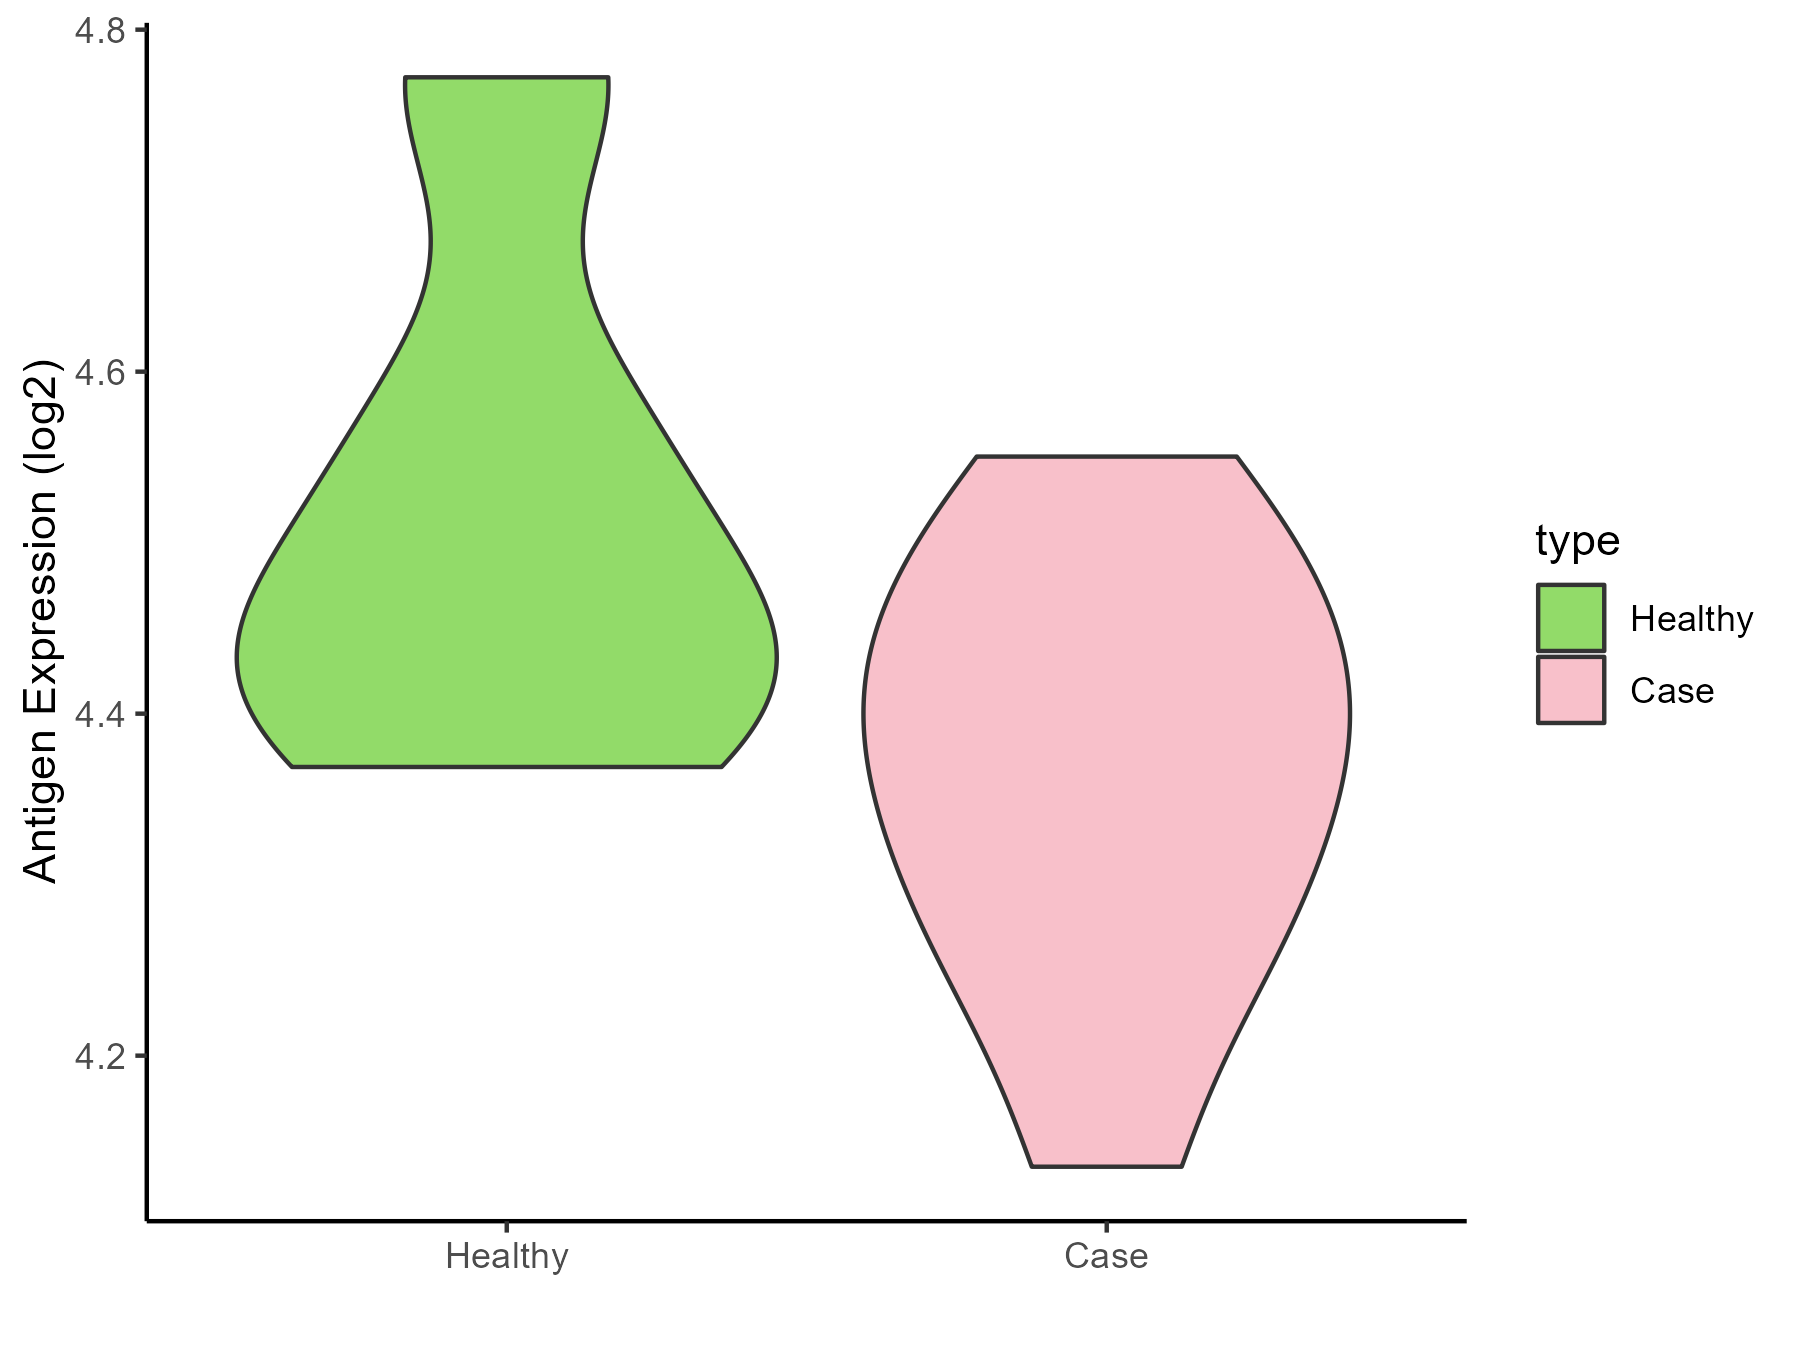
| Differential expression pattern of antigen in diseases | ||
| The Studied Tissue | Liver | |
| The Specific Disease | Type 2 diabetes | |
| The Expression Level of Disease Section Compare with the Healthy Individual Tissue | p-value: 0.105442135; Fold-change: -0.095733643; Z-score: -0.602174236 | |
| Disease-specific Antigen Abundances |
|
Click to View the Clearer Original Diagram |
| Differential expression pattern of antigen in diseases | ||
| The Studied Tissue | Vastus lateralis muscle | |
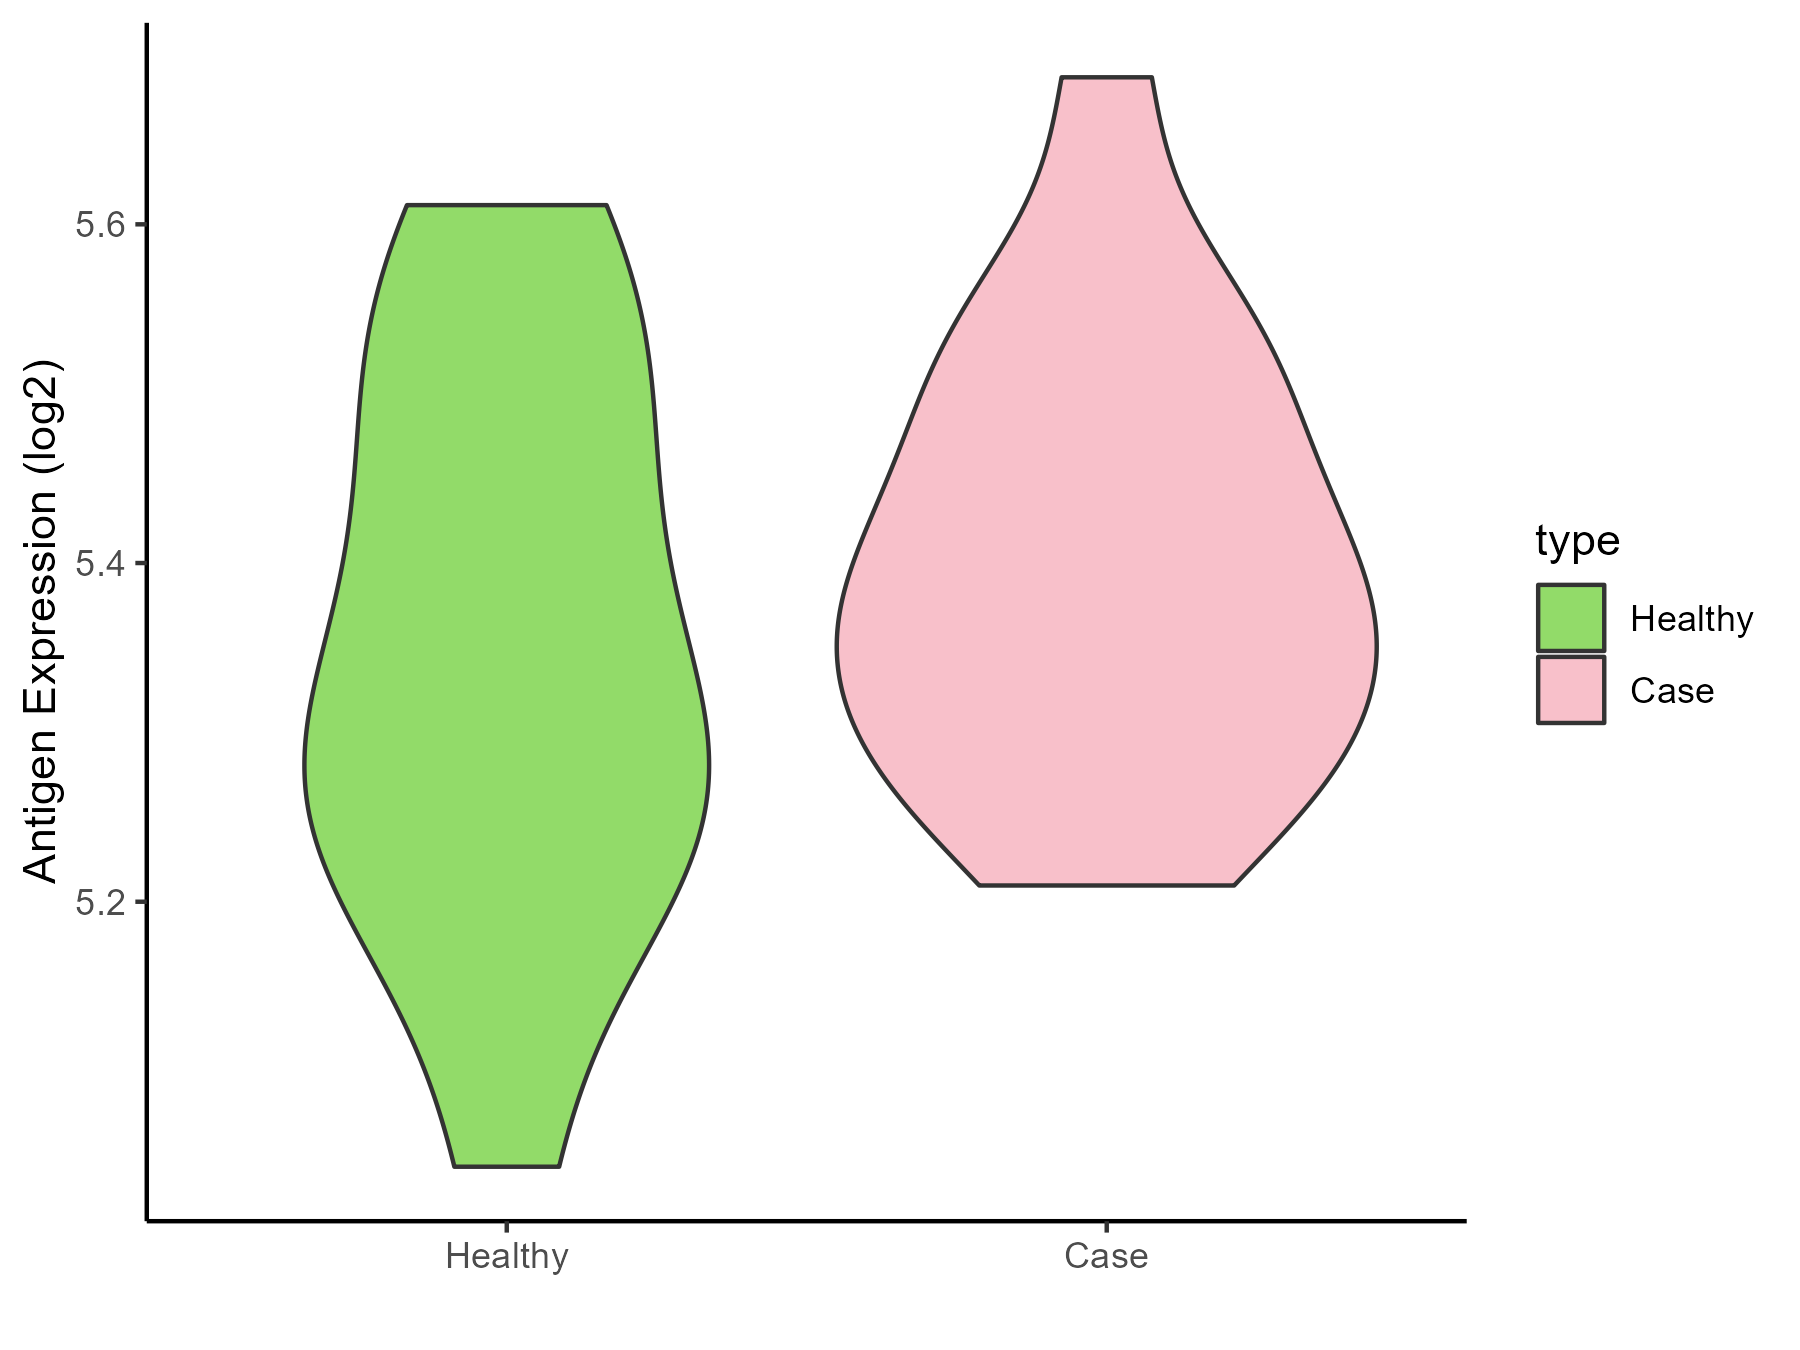
| The Specific Disease | Polycystic ovary syndrome | |
| The Expression Level of Disease Section Compare with the Healthy Individual Tissue | p-value: 0.372719252; Fold-change: 0.070319606; Z-score: 0.422242879 | |
| Disease-specific Antigen Abundances |
|
Click to View the Clearer Original Diagram |
| Differential expression pattern of antigen in diseases | ||
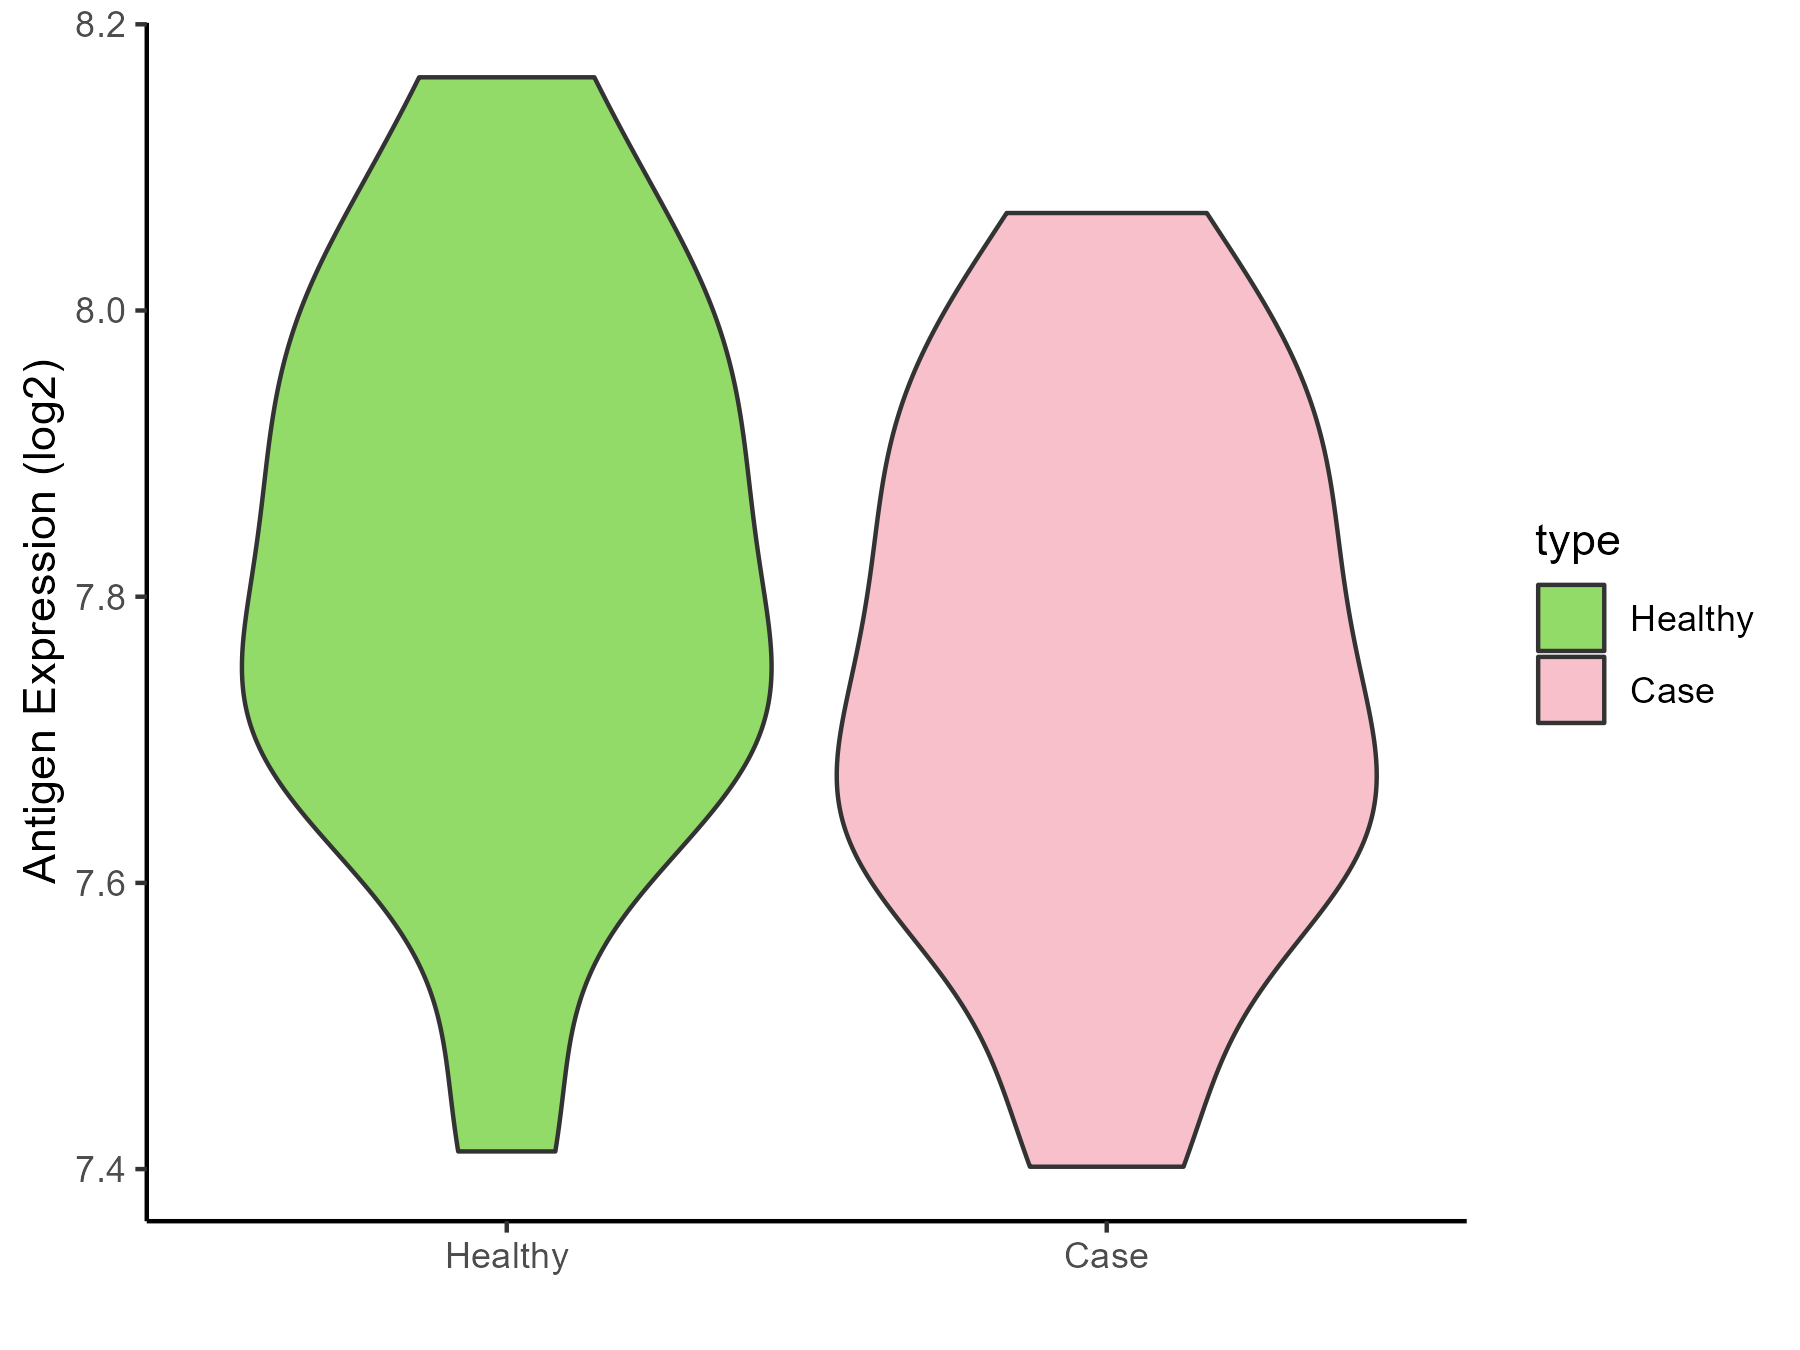
| The Studied Tissue | Subcutaneous Adipose | |
| The Specific Disease | Obesity | |
| The Expression Level of Disease Section Compare with the Healthy Individual Tissue | p-value: 0.133986912; Fold-change: -0.092066633; Z-score: -0.481465666 | |
| Disease-specific Antigen Abundances |
|
Click to View the Clearer Original Diagram |
| Differential expression pattern of antigen in diseases | ||
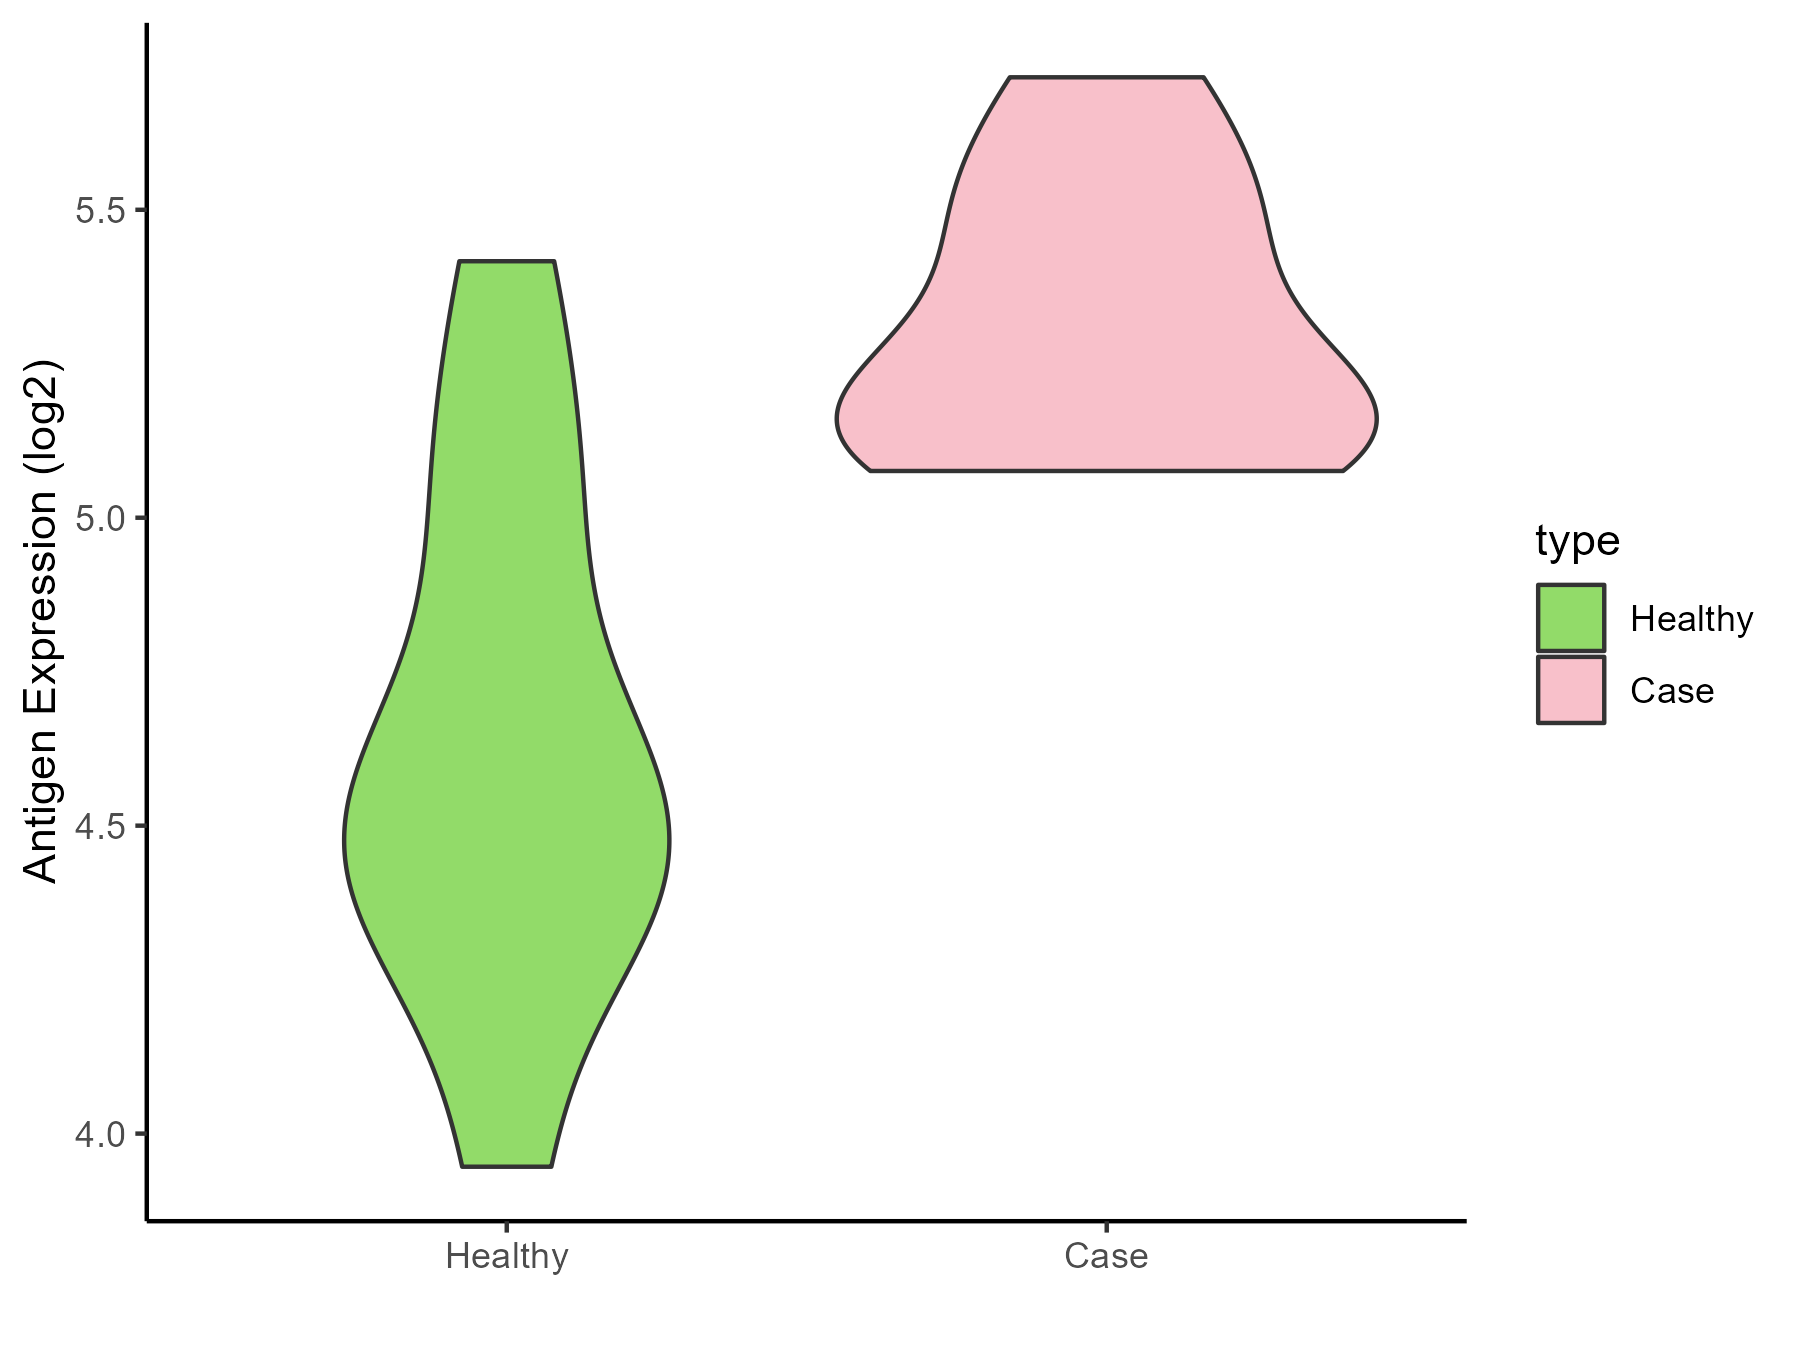
| The Studied Tissue | Biceps muscle | |
| The Specific Disease | Pompe disease | |
| The Expression Level of Disease Section Compare with the Healthy Individual Tissue | p-value: 0.000793896; Fold-change: 0.697957306; Z-score: 1.61765151 | |
| Disease-specific Antigen Abundances |
|
Click to View the Clearer Original Diagram |
| Differential expression pattern of antigen in diseases | ||
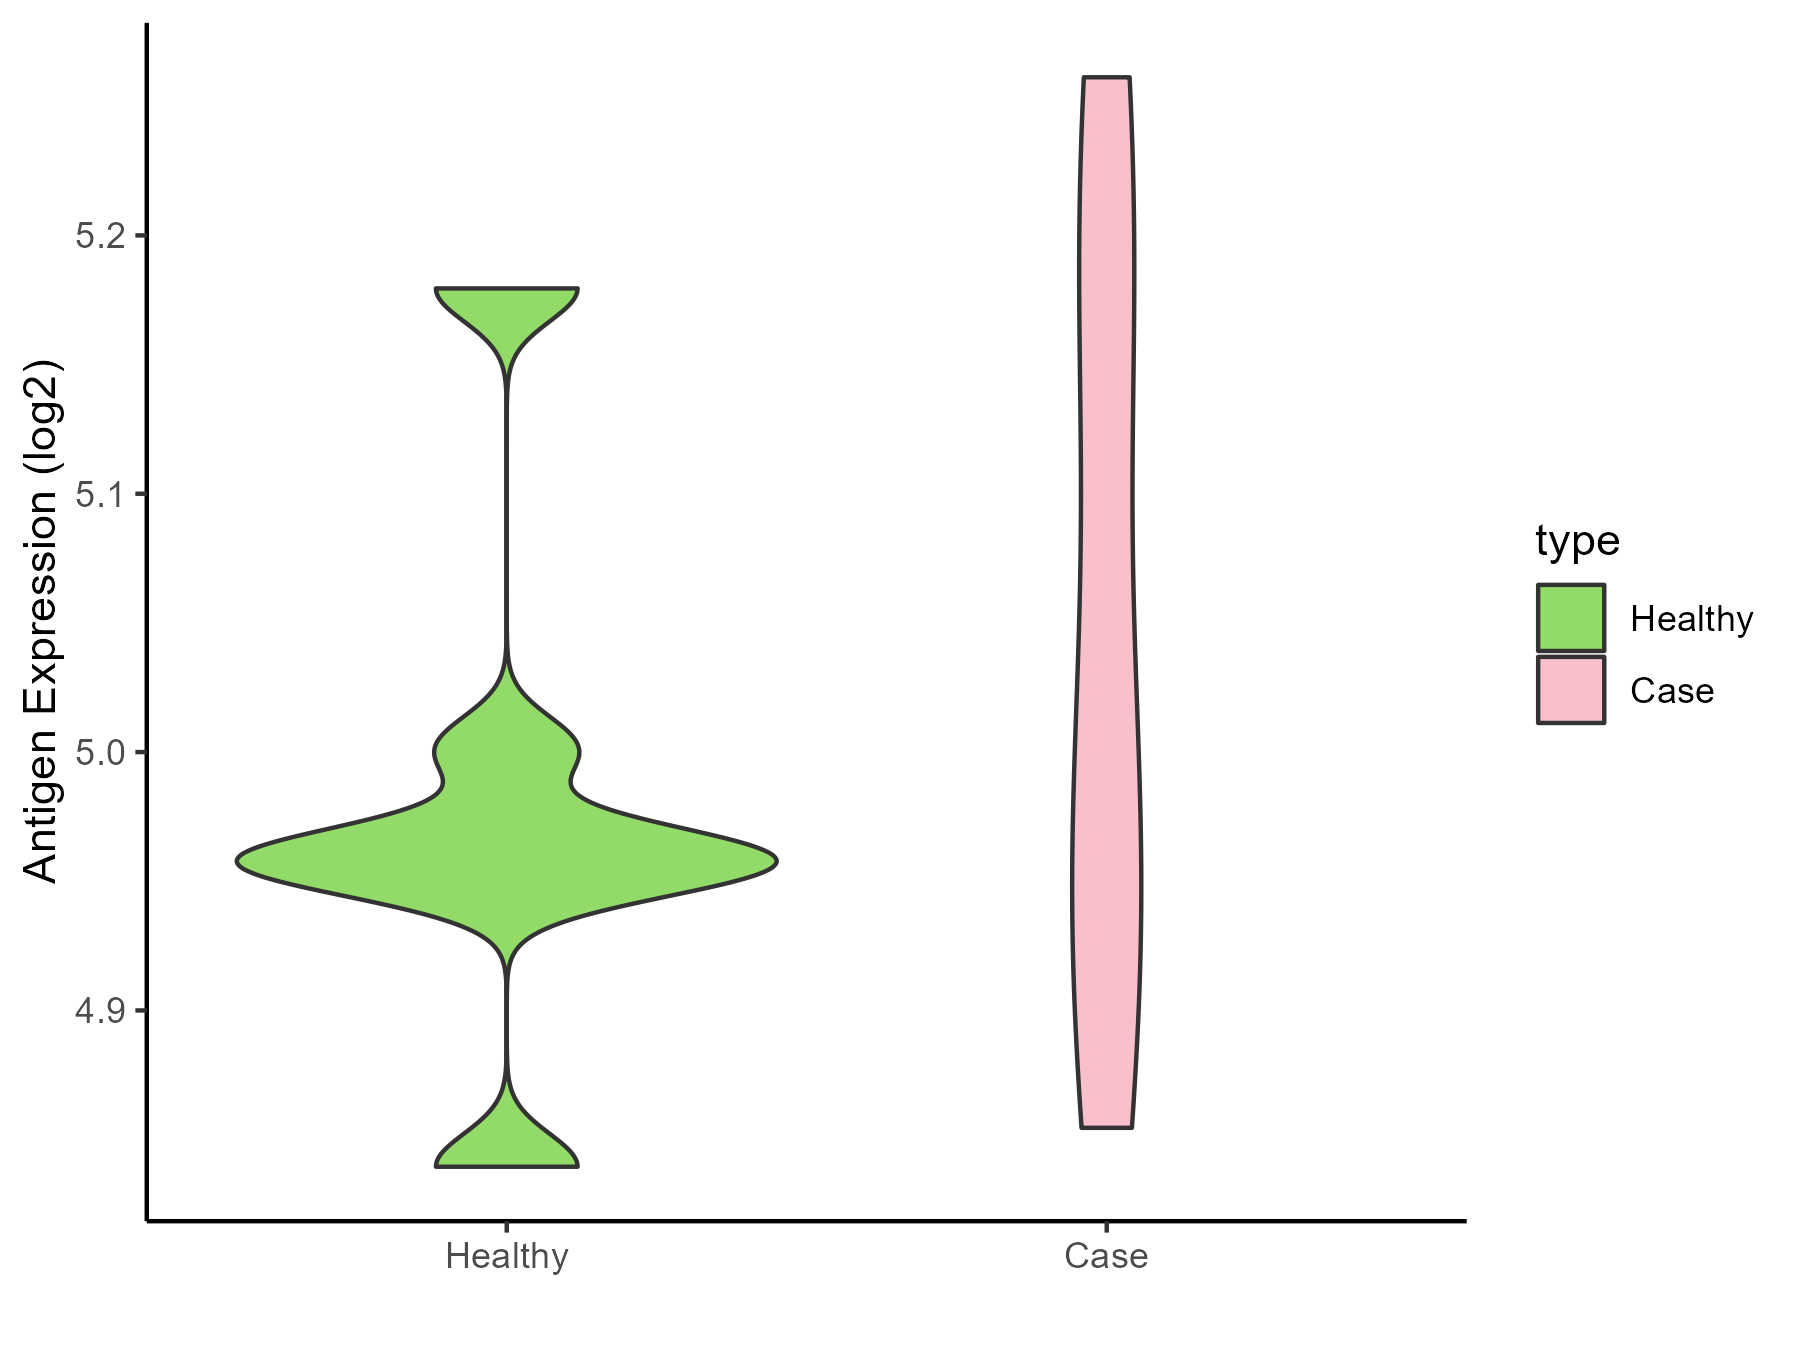
| The Studied Tissue | Whole blood | |
| The Specific Disease | Batten disease | |
| The Expression Level of Disease Section Compare with the Healthy Individual Tissue | p-value: 0.327632015; Fold-change: 0.033515794; Z-score: 0.329764347 | |
| Disease-specific Antigen Abundances |
|
Click to View the Clearer Original Diagram |
ICD Disease Classification 6
| Differential expression pattern of antigen in diseases | ||
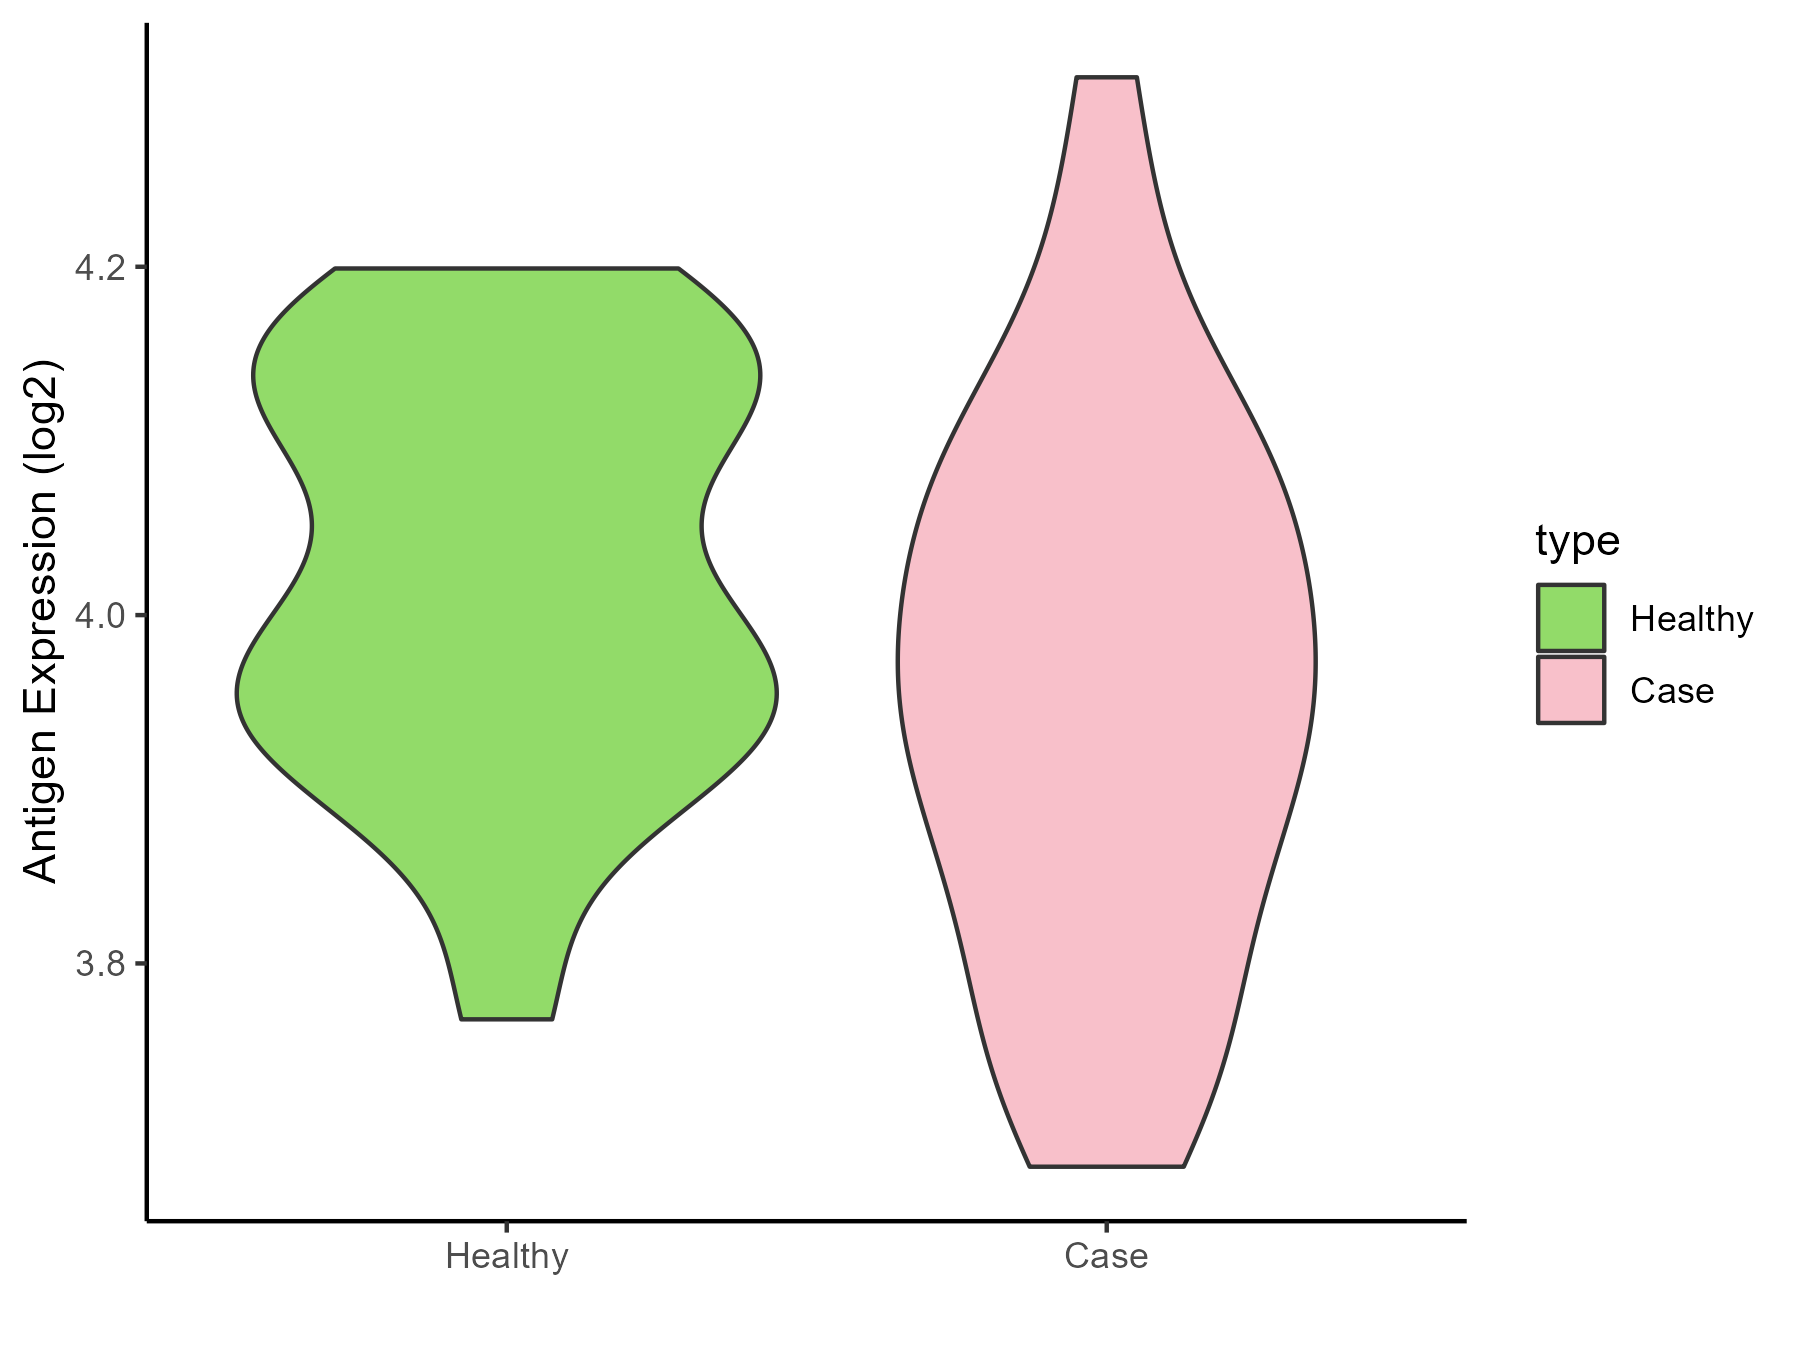
| The Studied Tissue | Whole blood | |
| The Specific Disease | Autism | |
| The Expression Level of Disease Section Compare with the Healthy Individual Tissue | p-value: 0.053014288; Fold-change: -0.042480247; Z-score: -0.35808576 | |
| Disease-specific Antigen Abundances |
|
Click to View the Clearer Original Diagram |
| Differential expression pattern of antigen in diseases | ||
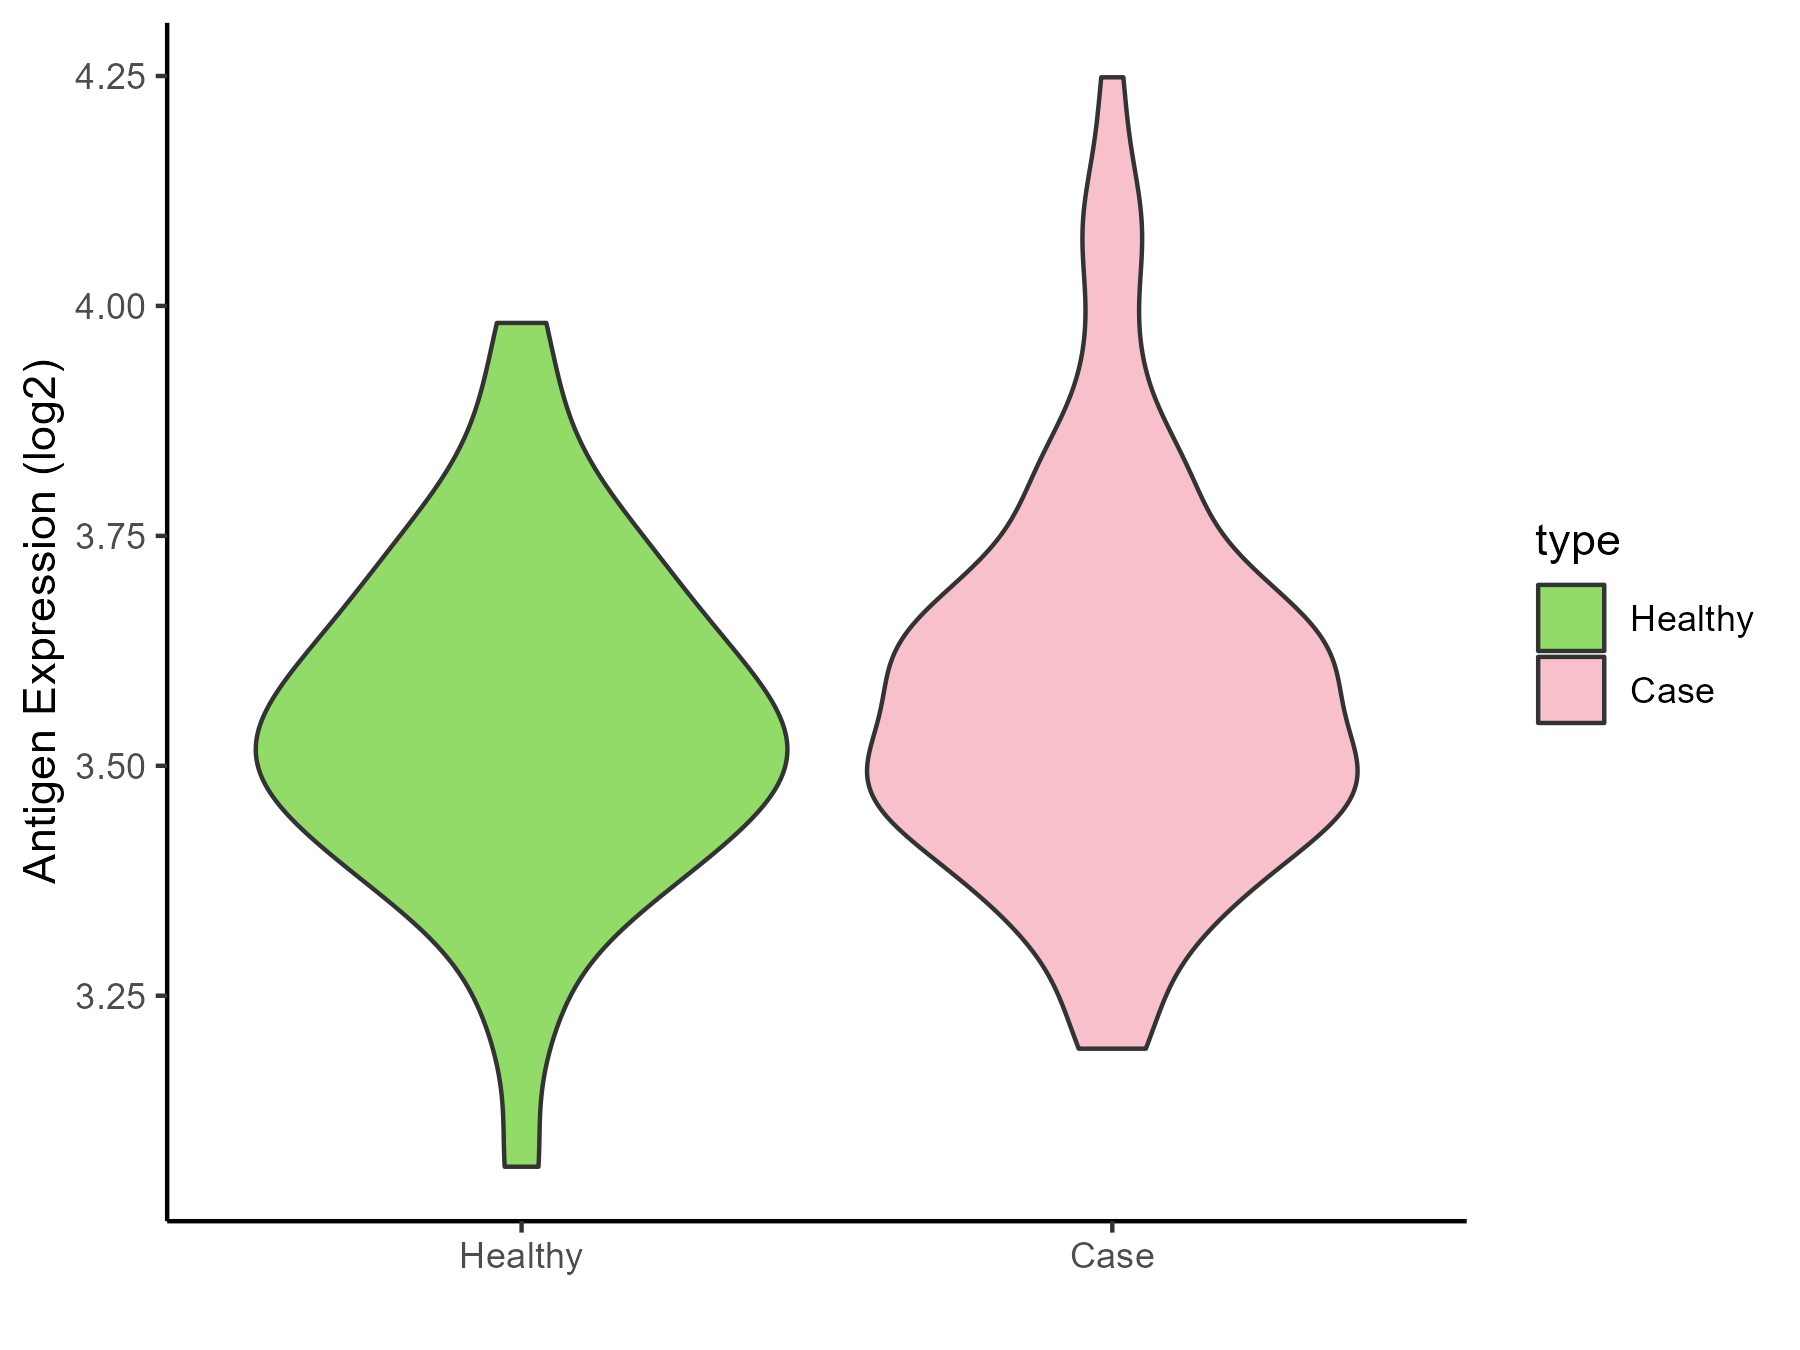
| The Studied Tissue | Whole blood | |
| The Specific Disease | Anxiety disorder | |
| The Expression Level of Disease Section Compare with the Healthy Individual Tissue | p-value: 0.284142446; Fold-change: 0.024161731; Z-score: 0.134896272 | |
| Disease-specific Antigen Abundances |
|
Click to View the Clearer Original Diagram |
ICD Disease Classification 8
| Differential expression pattern of antigen in diseases | ||
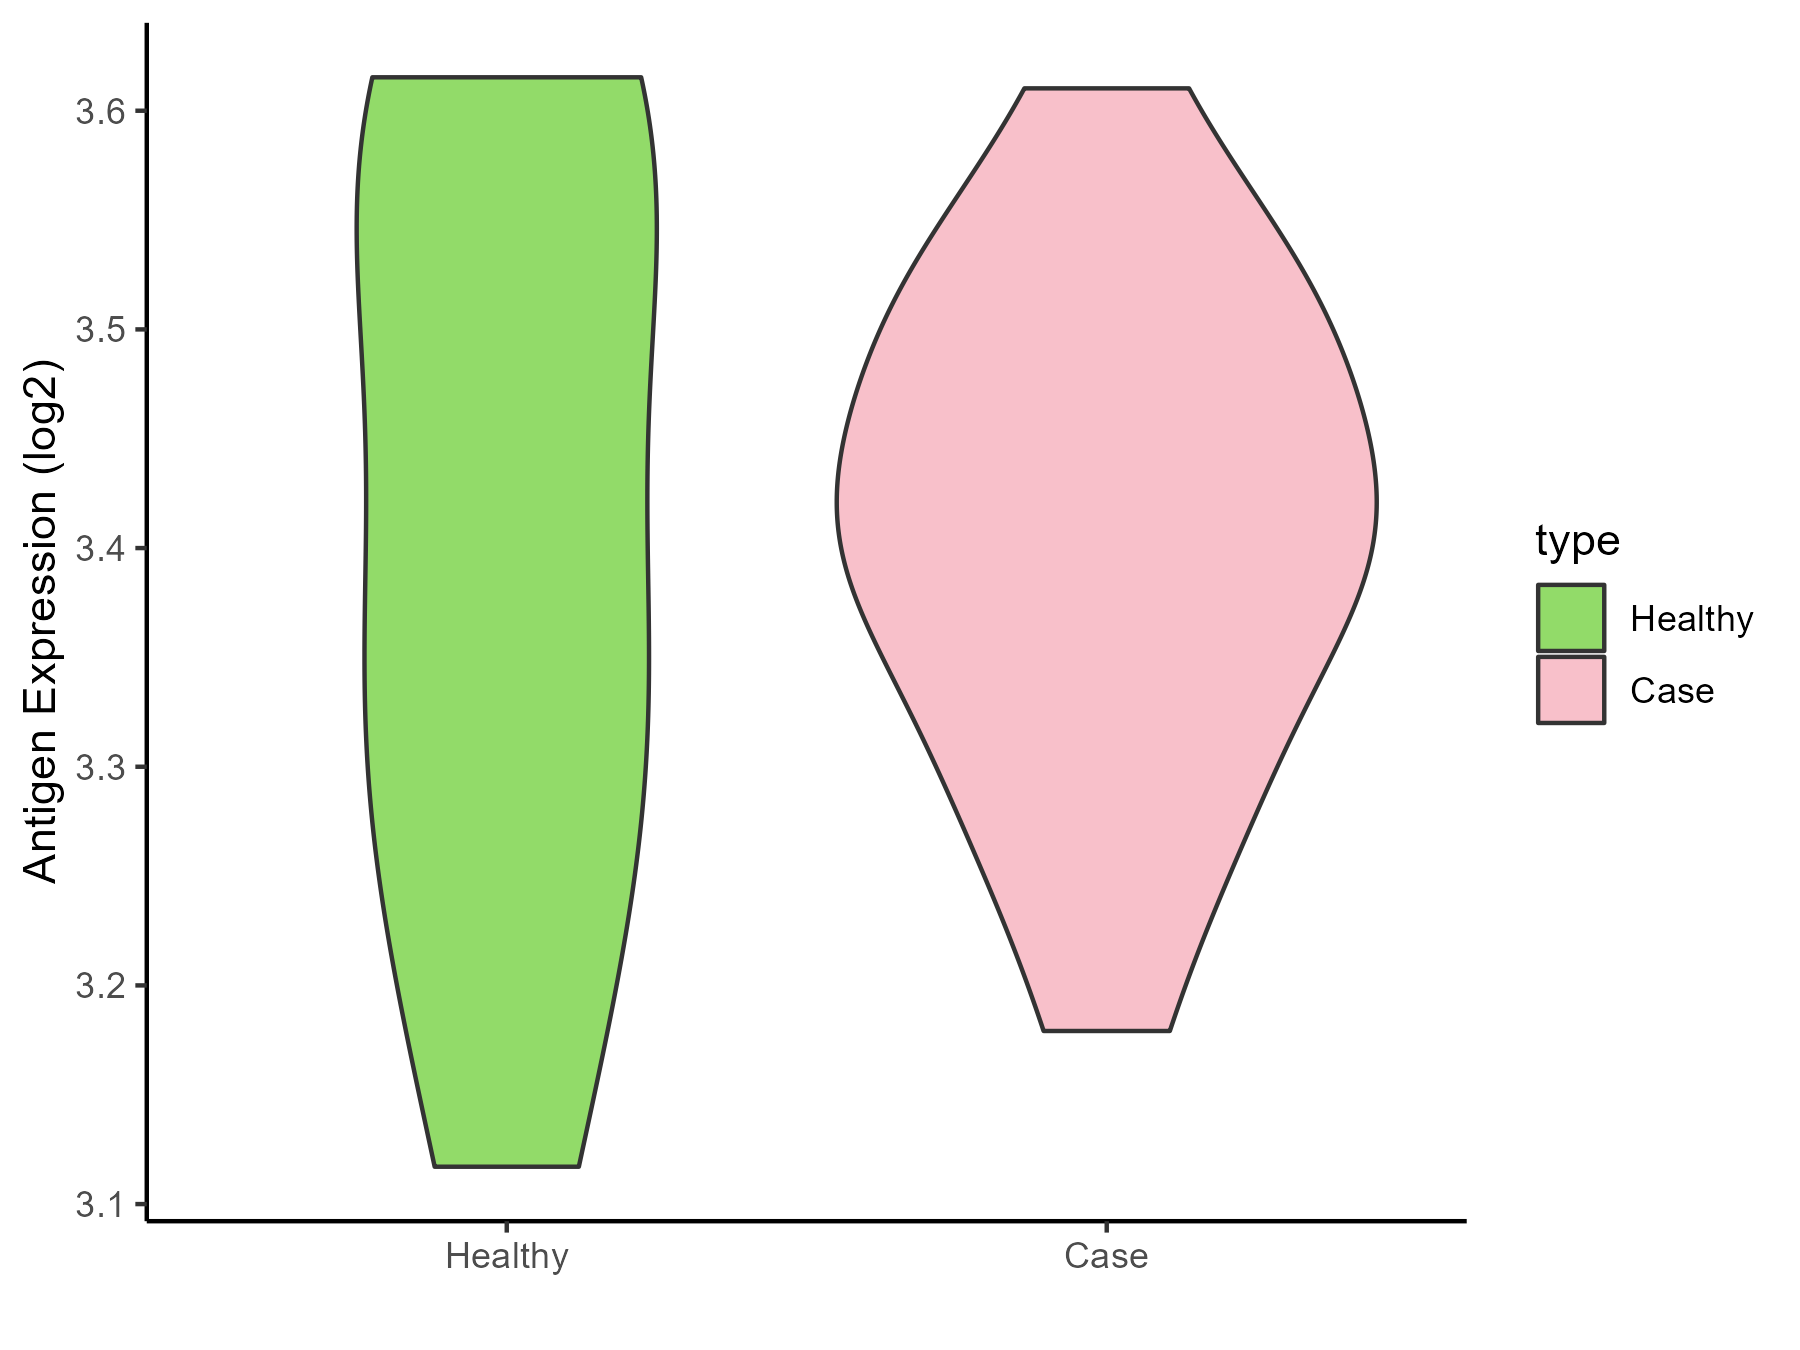
| The Studied Tissue | Substantia nigra | |
| The Specific Disease | Parkinson disease | |
| The Expression Level of Disease Section Compare with the Healthy Individual Tissue | p-value: 0.989387521; Fold-change: 0.024207507; Z-score: 0.135461269 | |
| Disease-specific Antigen Abundances |
|
Click to View the Clearer Original Diagram |
| Differential expression pattern of antigen in diseases | ||
| The Studied Tissue | Whole blood | |
| The Specific Disease | Huntington disease | |
| The Expression Level of Disease Section Compare with the Healthy Individual Tissue | p-value: 0.281038858; Fold-change: 0.061015875; Z-score: 0.667419149 | |
| Disease-specific Antigen Abundances |

|
Click to View the Clearer Original Diagram |
| Differential expression pattern of antigen in diseases | ||
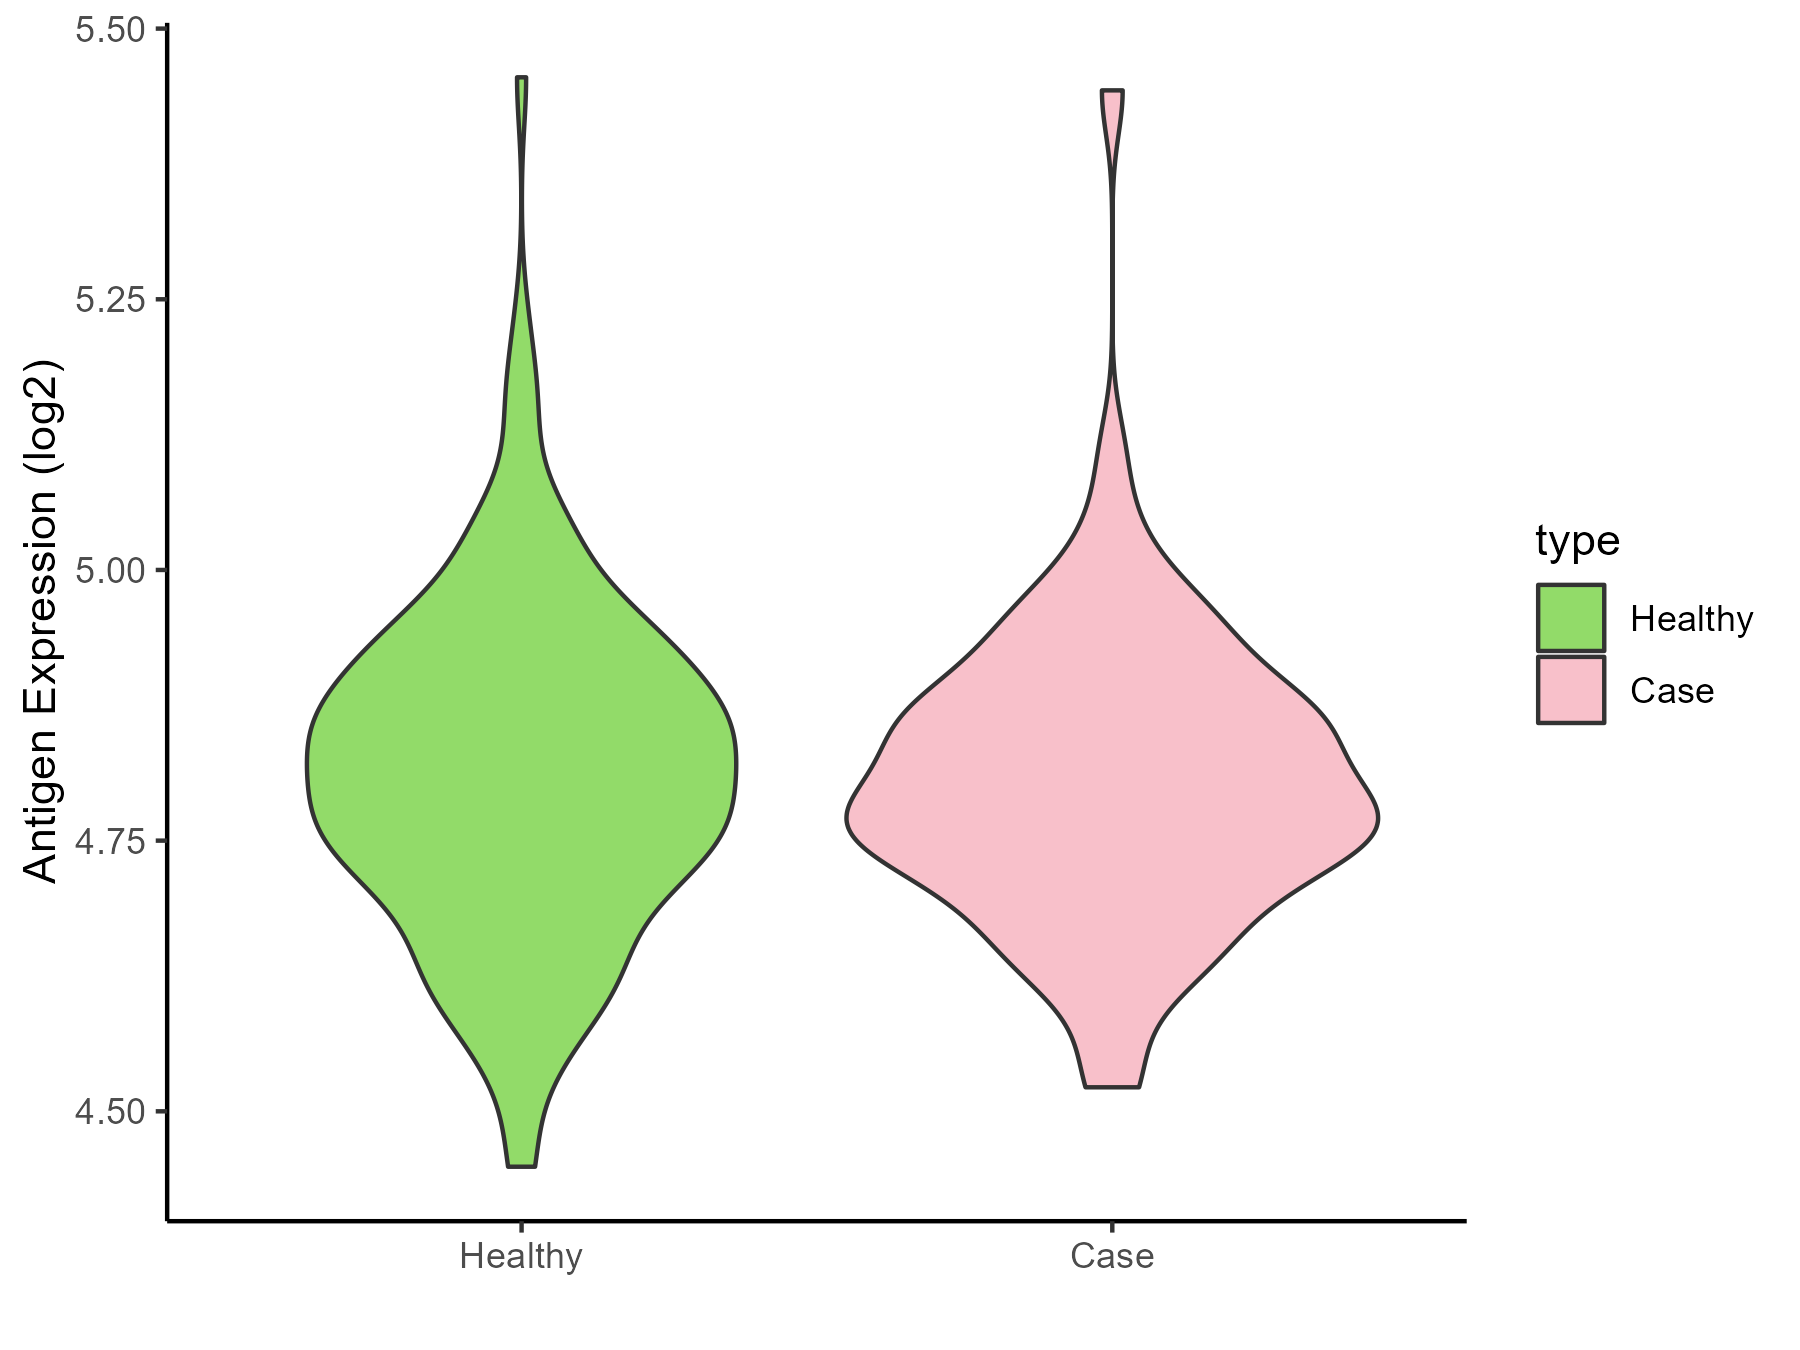
| The Studied Tissue | Entorhinal cortex | |
| The Specific Disease | Alzheimer disease | |
| The Expression Level of Disease Section Compare with the Healthy Individual Tissue | p-value: 0.784144837; Fold-change: -0.017660055; Z-score: -0.116294174 | |
| Disease-specific Antigen Abundances |
|
Click to View the Clearer Original Diagram |
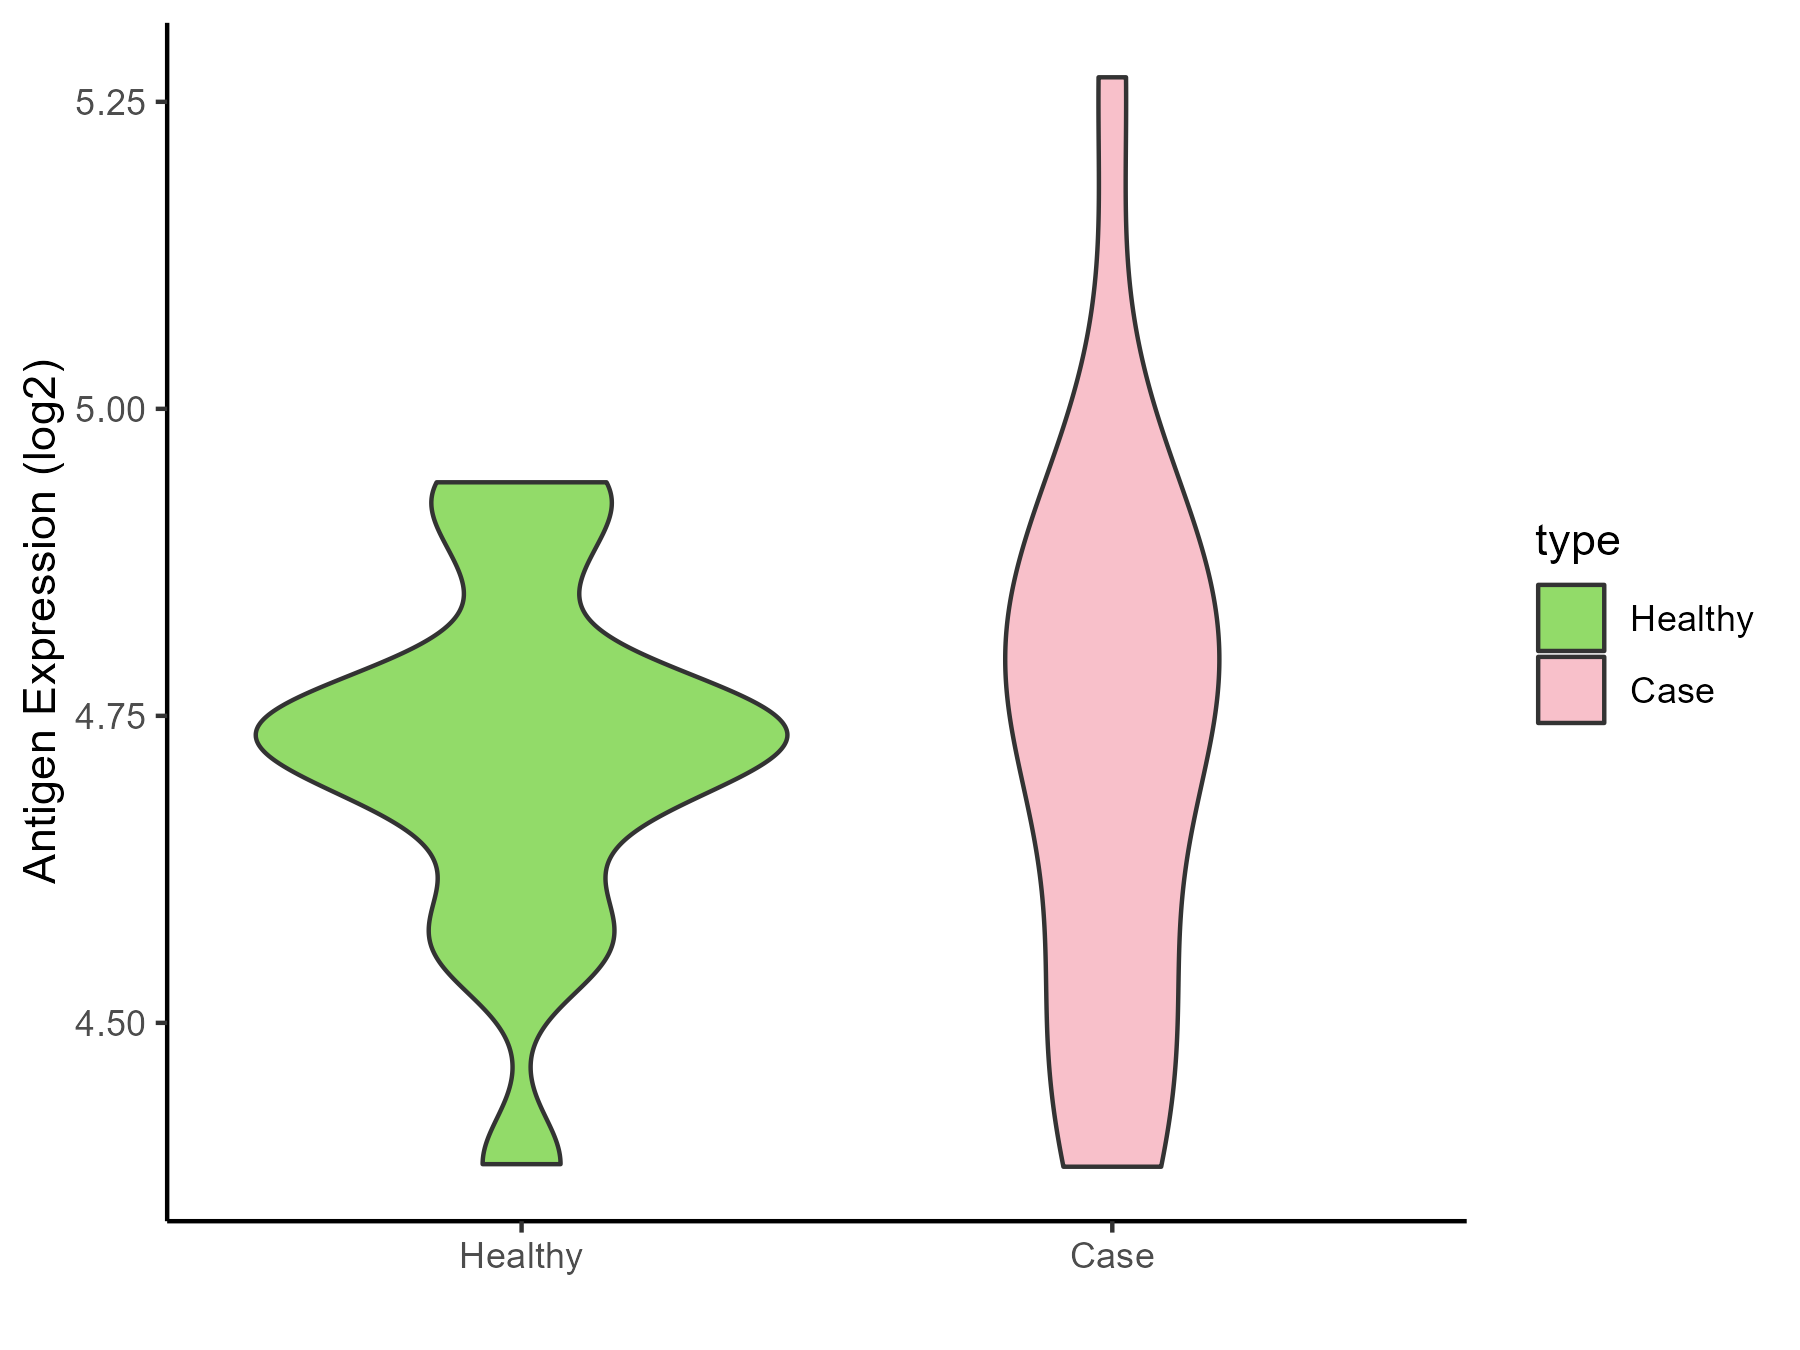
| Differential expression pattern of antigen in diseases | ||
| The Studied Tissue | Whole blood | |
| The Specific Disease | Seizure | |
| The Expression Level of Disease Section Compare with the Healthy Individual Tissue | p-value: 0.849911096; Fold-change: 0.038591511; Z-score: 0.272506063 | |
| Disease-specific Antigen Abundances |
|
Click to View the Clearer Original Diagram |
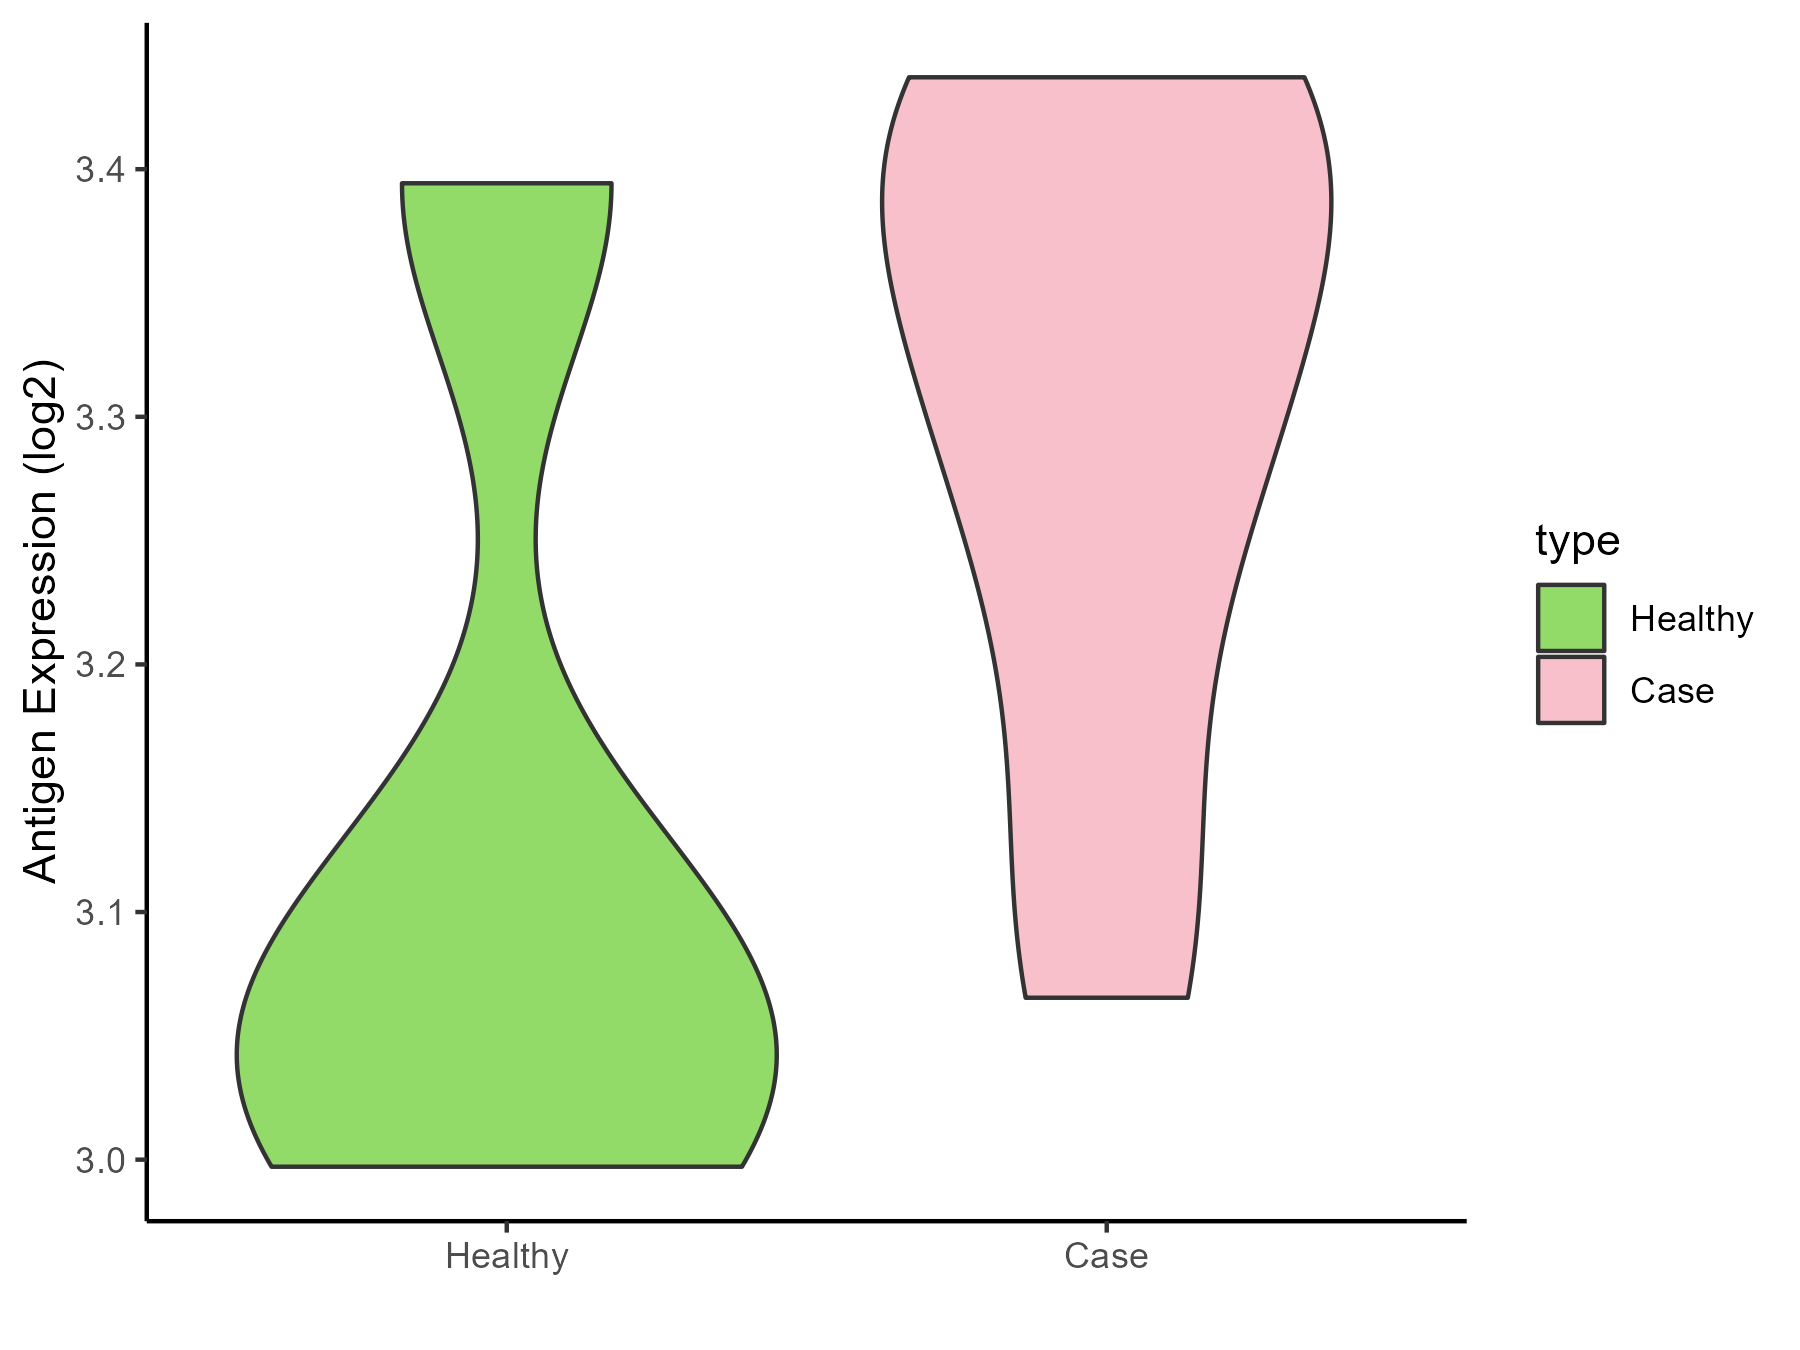
| Differential expression pattern of antigen in diseases | ||
| The Studied Tissue | Skin | |
| The Specific Disease | Lateral sclerosis | |
| The Expression Level of Disease Section Compare with the Healthy Individual Tissue | p-value: 0.151405619; Fold-change: 0.259862496; Z-score: 1.44526157 | |
| Disease-specific Antigen Abundances |
|
Click to View the Clearer Original Diagram |
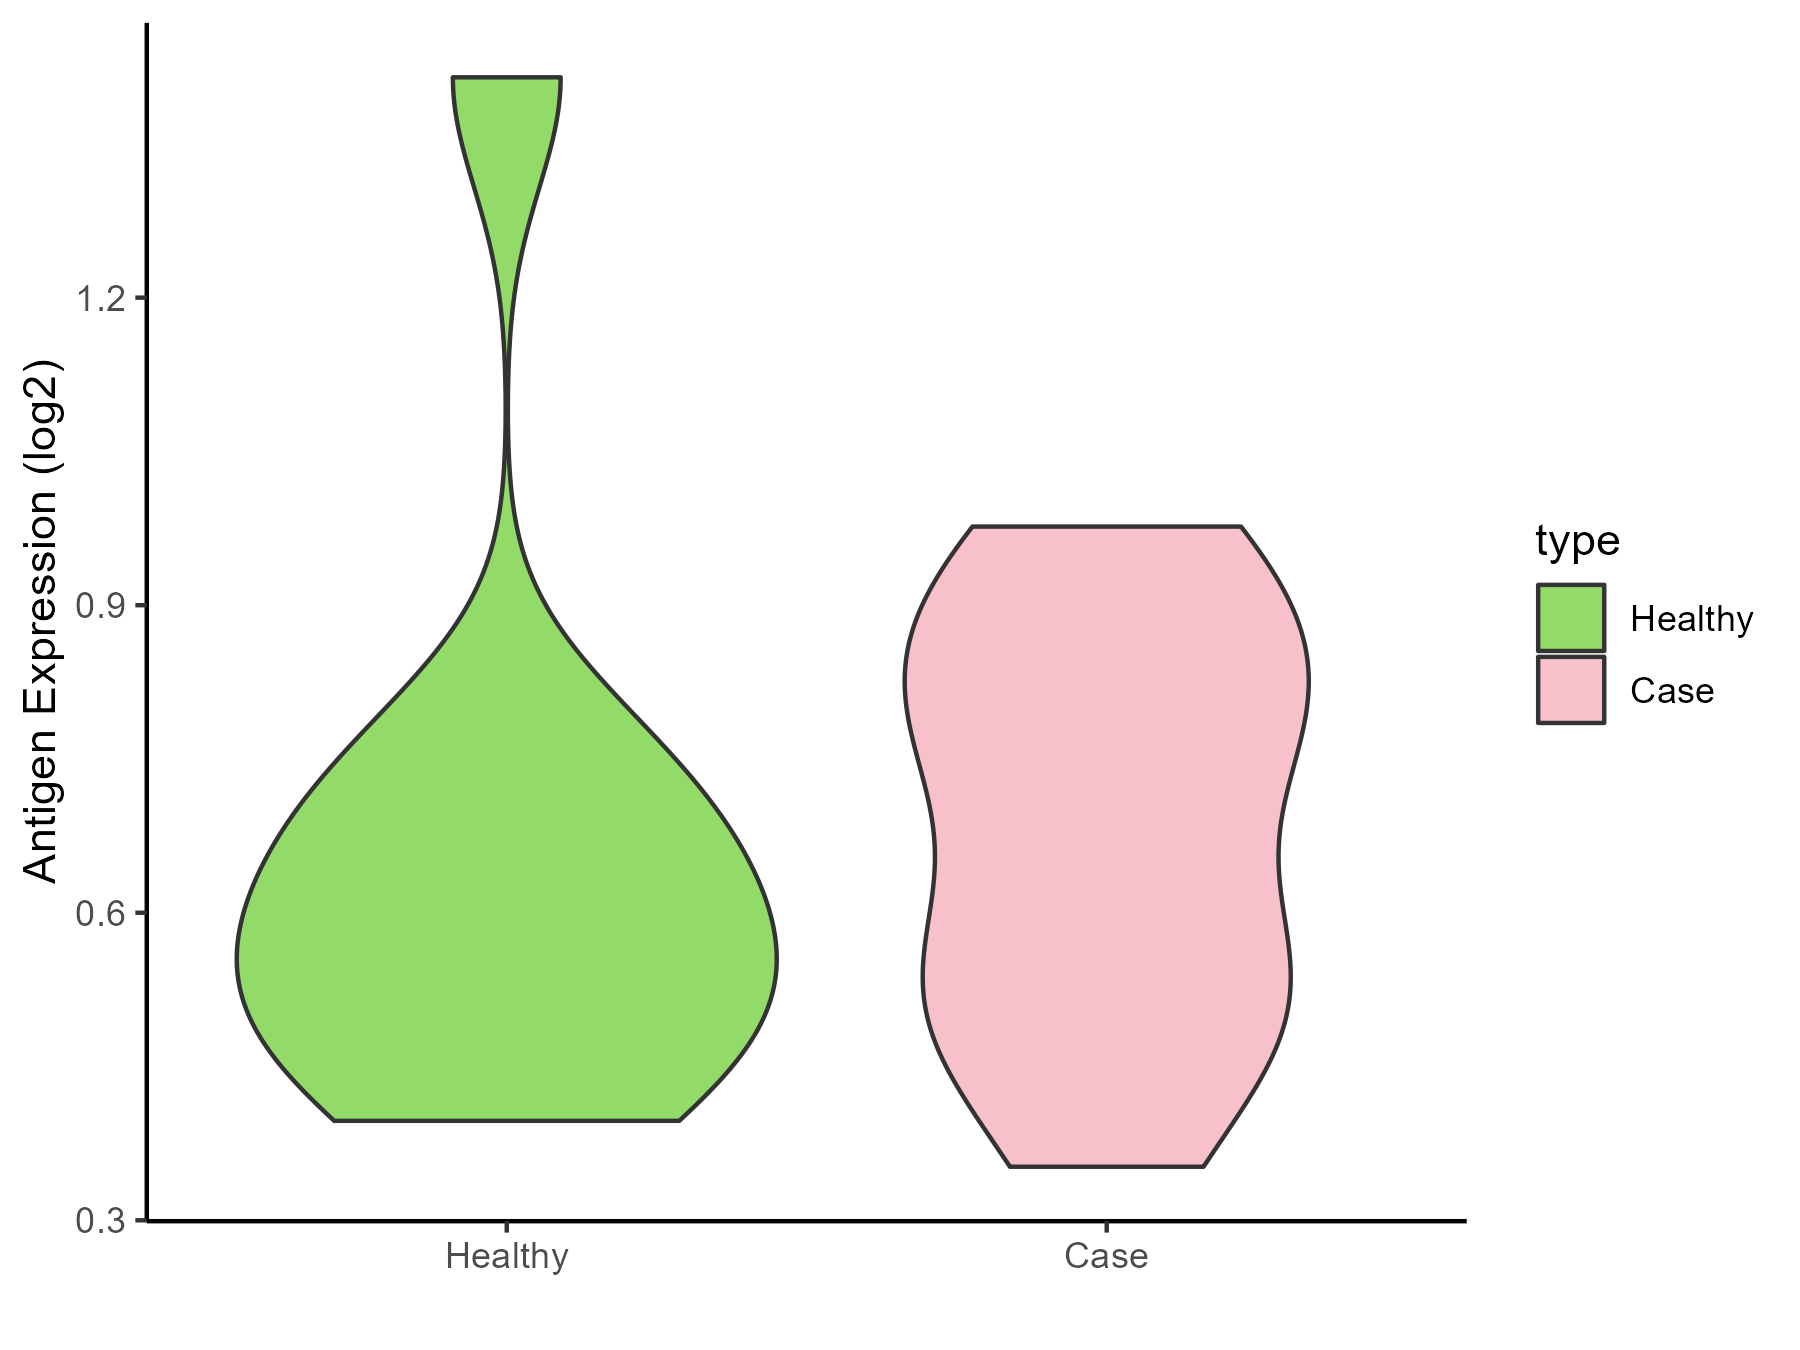
| The Studied Tissue | Cervical spinal cord | |
| The Specific Disease | Lateral sclerosis | |
| The Expression Level of Disease Section Compare with the Healthy Individual Tissue | p-value: 0.876516654; Fold-change: 0.156895919; Z-score: 0.516541347 | |
| Disease-specific Antigen Abundances |
|
Click to View the Clearer Original Diagram |
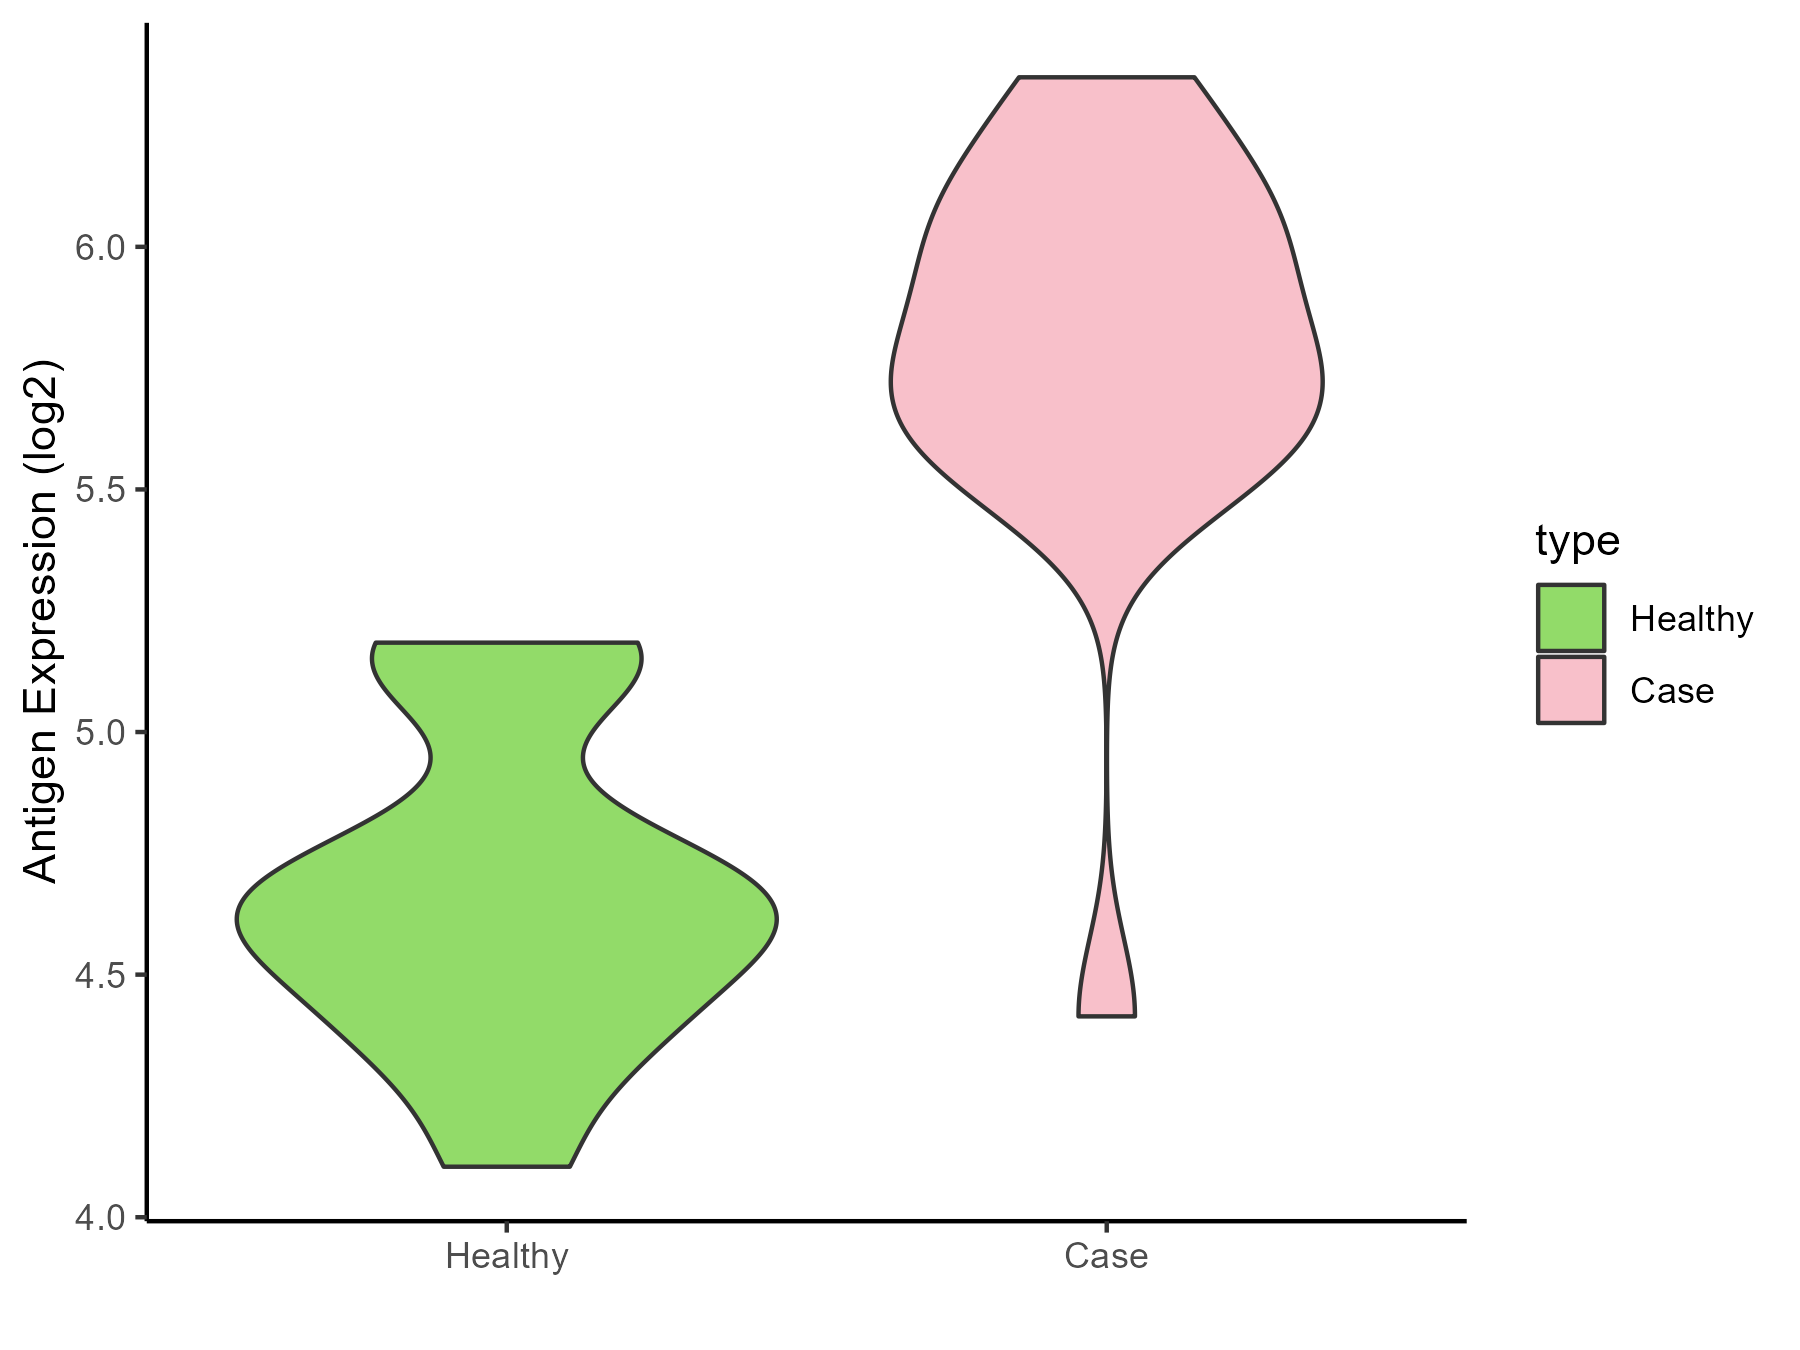
| Differential expression pattern of antigen in diseases | ||
| The Studied Tissue | Muscle | |
| The Specific Disease | Muscular atrophy | |
| The Expression Level of Disease Section Compare with the Healthy Individual Tissue | p-value: 1.10E-08; Fold-change: 1.165444437; Z-score: 3.536709149 | |
| Disease-specific Antigen Abundances |
|
Click to View the Clearer Original Diagram |
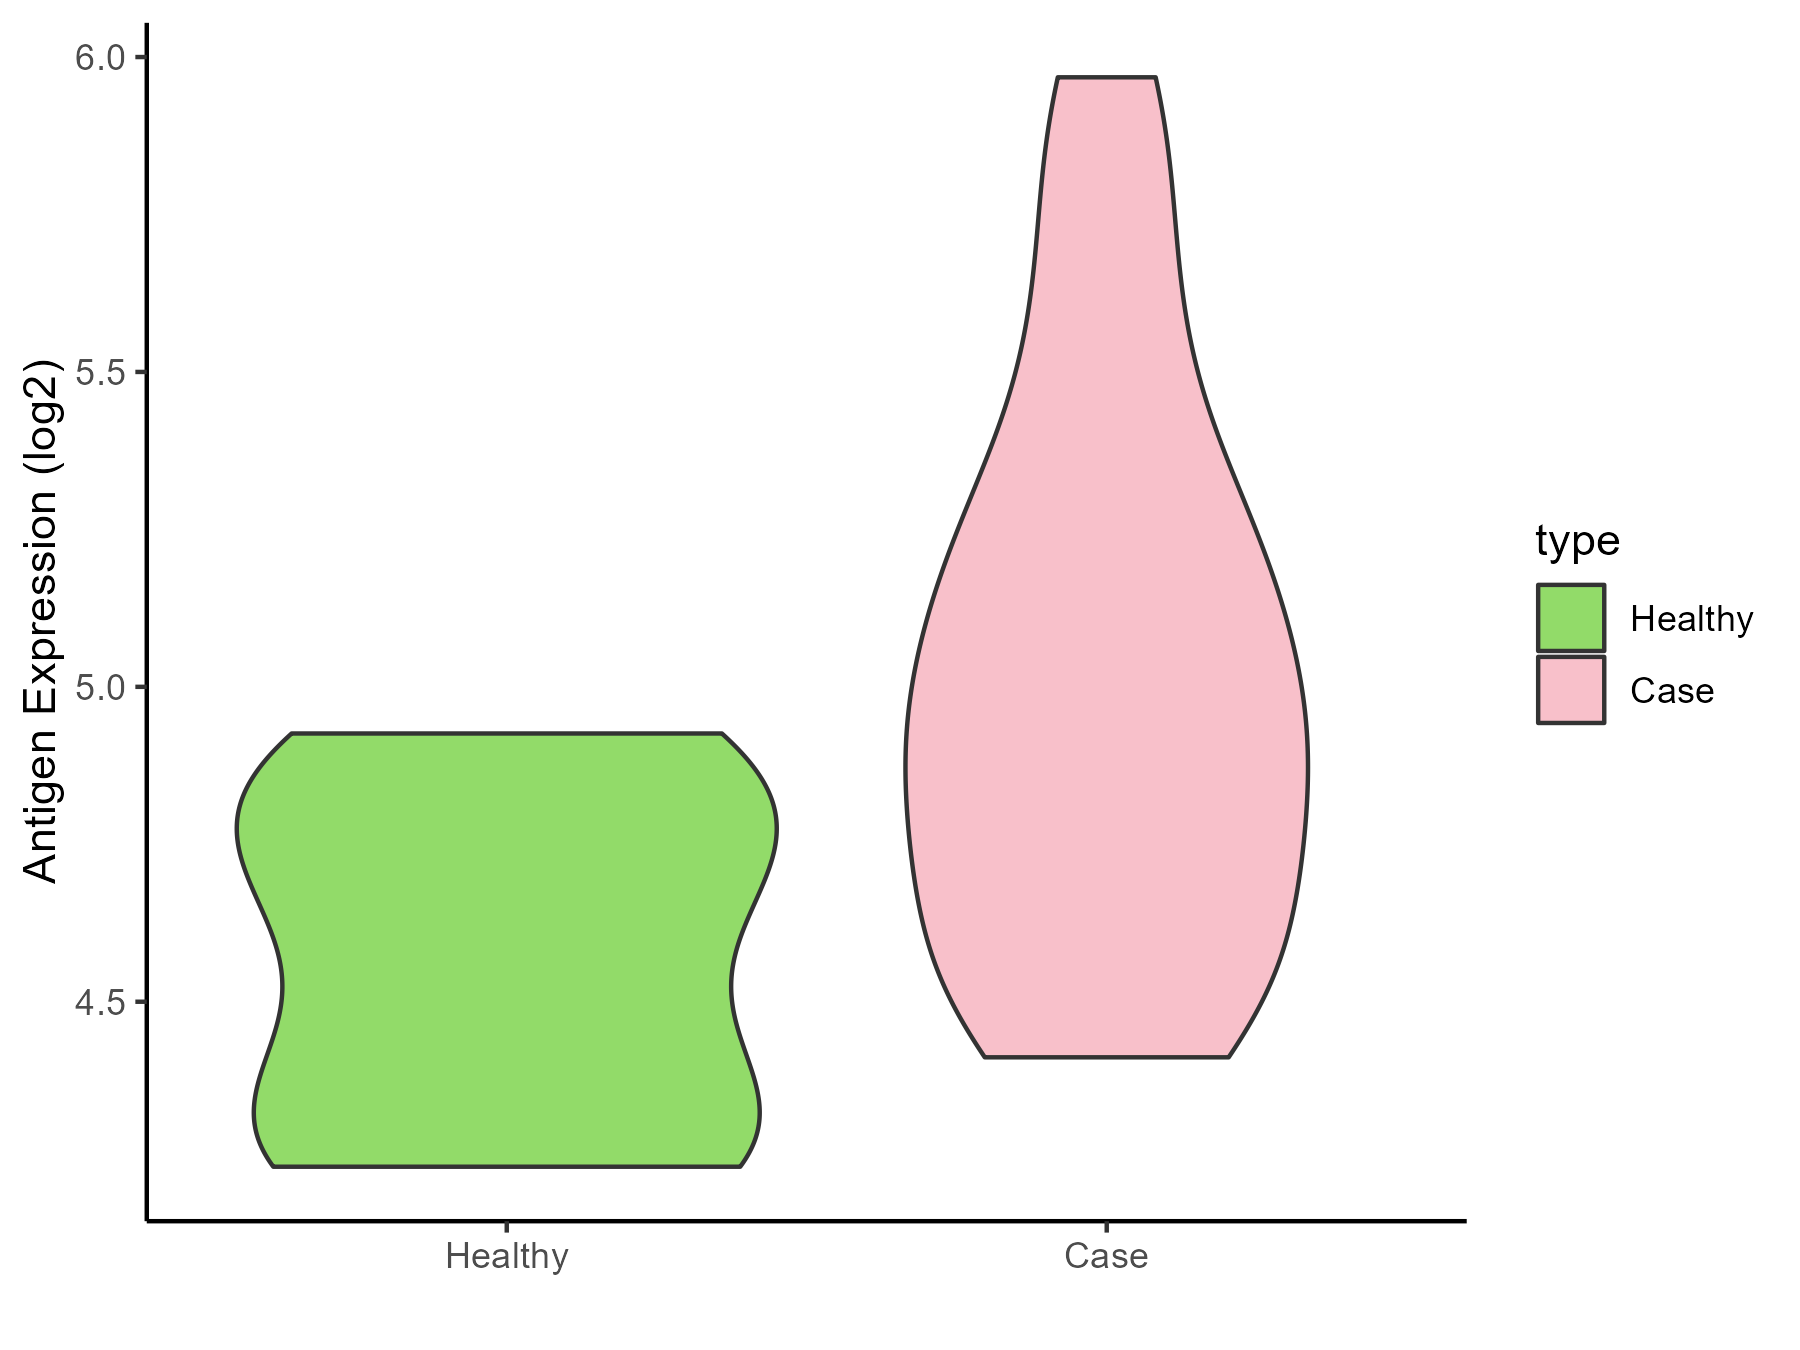
| Differential expression pattern of antigen in diseases | ||
| The Studied Tissue | Muscle | |
| The Specific Disease | Myopathy | |
| The Expression Level of Disease Section Compare with the Healthy Individual Tissue | p-value: 0.002324457; Fold-change: 0.346818154; Z-score: 1.24693553 | |
| Disease-specific Antigen Abundances |
|
Click to View the Clearer Original Diagram |
References
