Antigen Information
General Information of This Antigen
| Antigen ID | TAR0QPCSQ |
|||||
|---|---|---|---|---|---|---|
| Antigen Name | Tumor necrosis factor receptor superfamily member 8 (TNFRSF8) |
|||||
| Gene Name | TNFRSF8 |
|||||
| Gene ID | ||||||
| Synonym | CD30L receptor;Ki-1 antigen;Lymphocyte activation antigen CD30;CD_antigen=CD30 |
|||||
| Sequence |
MRVLLAALGLLFLGALRAFPQDRPFEDTCHGNPSHYYDKAVRRCCYRCPMGLFPTQQCPQ
RPTDCRKQCEPDYYLDEADRCTACVTCSRDDLVEKTPCAWNSSRVCECRPGMFCSTSAVN SCARCFFHSVCPAGMIVKFPGTAQKNTVCEPASPGVSPACASPENCKEPSSGTIPQAKPT PVSPATSSASTMPVRGGTRLAQEAASKLTRAPDSPSSVGRPSSDPGLSPTQPCPEGSGDC RKQCEPDYYLDEAGRCTACVSCSRDDLVEKTPCAWNSSRTCECRPGMICATSATNSCARC VPYPICAAETVTKPQDMAEKDTTFEAPPLGTQPDCNPTPENGEAPASTSPTQSLLVDSQA SKTLPIPTSAPVALSSTGKPVLDAGPVLFWVILVLVVVVGSSAFLLCHRRACRKRIRQKL HLCYPVQTSQPKLELVDSRPRRSSTQLRSGASVTEPVAEERGLMSQPLMETCHSVGAAYL ESLPLQDASPAGGPSSPRDLPEPRVSTEHTNNKIEKIYIMKADTVIVGTVKAELPEGRGL AGPAEPELEEELEADHTPHYPEQETEPPLGSCSDVMLSVEEEGKEDPLPTAASGK Click to Show/Hide
|
|||||
| Family | Tissue factor family |
|||||
| Function |
Receptor for TNFSF8/CD30L. May play a role in the regulation of cellular growth and transformation of activated lymphoblasts. Regulates gene expression through activation of NF-kappa- B.
Click to Show/Hide
|
|||||
| Uniprot Entry | ||||||
| HGNC ID | ||||||
| KEGG ID | ||||||
Each Antibody-drug Conjuate AND It's Component Related to This Antigen
Full List of The ADC Related to This Antigen
Anti-CD30 alphaCD30-vcMMAE mAb
| ADC Info | ADC Name | Payload | Target | Linker | Ref |
|---|---|---|---|---|---|
Alpha-CD30-Val-Cit-MMAE |
Monomethyl auristatin E |
Microtubule (MT) |
Mc-Val-Cit-PABC |
[1] |
Anti-CD30 DAR8-alphaCD30-mDPR-gluc-DMTub mAb
| ADC Info | ADC Name | Payload | Target | Linker | Ref |
|---|---|---|---|---|---|
DAR8-alphaCD30-mDPR-Gluc-DMTub |
DMTub |
Microtubule (MT) |
Quaternary ammonium linker Gluc |
[2] |
Anti-CD30 DAR8-alphaCD30-mDPR-gluc-MMAE mAb
| ADC Info | ADC Name | Payload | Target | Linker | Ref |
|---|---|---|---|---|---|
DAR8-alphaCD30-mDPR-Gluc-MMAE |
Monomethyl auristatin E |
Microtubule (MT) |
Quaternary ammonium linker Gluc |
[2] |
Anti-CD30 DAR8-alphaCD30-mDPR-glucQ-AE mAb
| ADC Info | ADC Name | Payload | Target | Linker | Ref |
|---|---|---|---|---|---|
DAR8-alphaCD30-mDPR-GlucQ-AE |
Auristatin E |
Microtubule (MT) |
Quaternary ammonium linker GlucQ |
[2] |
Anti-CD30 DAR8-alphaCD30-mDPR-glucQ-Tub mAb
| ADC Info | ADC Name | Payload | Target | Linker | Ref |
|---|---|---|---|---|---|
DAR8-alphaCD30-mDPR-GlucQ-Tub |
Tubulysin analogue 3 |
Microtubule (MT) |
Quaternary ammonium linker GlucQ |
[2] |
Anti-CD30 mAb
| ADC Info | ADC Name | Payload | Target | Linker | Ref |
|---|---|---|---|---|---|
Alpha-CD30-7 |
Tubulysin 7 |
Microtubule (MT) |
Glucuronide quaternary ammonium linker 7 |
[3] | |
Alpha-CD30-8 |
Tubulysin 8 |
Microtubule (MT) |
Glucuronide quaternary ammonium linker 8 |
[3] | |
Alpha-CD30-9 |
Tubulysin 9 |
Microtubule (MT) |
Glucuronide quaternary ammonium linker 9 |
[3] |
Anti-CD30 mAb Ber-H2
| ADC Info | ADC Name | Payload | Target | Linker | Ref |
|---|---|---|---|---|---|
Anti-CD30 monoclonal antibody-saporin conjugate |
Saporin |
Microtubule (MT) |
Undisclosed |
[4] |
Anti-CD30 mAb cAC10Q
| ADC Info | ADC Name | Payload | Target | Linker | Ref |
|---|---|---|---|---|---|
CD30-BTG-ADC |
Monomethyl auristatin E |
Microtubule (MT) |
PEG3-benzotriazole-PEG-Val-Cit-PABC |
[5] |
Anti-CD30 mAb h00
| ADC Info | ADC Name | Payload | Target | Linker | Ref |
|---|---|---|---|---|---|
H00-CPT-LA |
Methylenedioxy CPT1 (CPT1) |
DNA topoisomerase 1 (TOP1) |
Mc-PEG4-Val-Lys-Gly |
[6] | |
H00-CPT-LB |
Methylenedioxy CPT2 (CPT2) |
DNA topoisomerase 1 (TOP1) |
Mc-PEG4-Val-Lys-Gly |
[6] | |
H00-CPT-LC |
Methylenedioxy CPT2 (CPT2) |
DNA topoisomerase 1 (TOP1) |
Mc-PEG8-Val-Lys-Gly |
[6] | |
H00-DT |
DX-8951 derivative (DXd) |
DNA topoisomerase 1 (TOP1) |
Mc-Gly-Gly-Phe-Gly |
[6] | |
H00-GT |
Active metabolite of irinotecan SN38 |
DNA topoisomerase 1 (TOP1) |
CL2A |
[7] |
Brentuximab
| ADC Info | ADC Name | Payload | Target | Linker | Ref |
|---|---|---|---|---|---|
Brentuximab vedotin |
Monomethyl auristatin E |
Microtubule (MT) |
Mc-Val-Cit-PABC |
[8] | |
F0002-ADC |
Mertansine DM1 |
Microtubule (MT) |
Succinimidyl-4-(N-maleimidomethyl)cyclohexane-1-carboxylate (SMCC) |
[9] | |
SGN-35T |
Monomethyl auristatin E |
Microtubule (MT) |
D-leucine-alanine-glutamate tripeptide linker |
||
Brentuximab-7 |
Monomethyl auristatin E |
Microtubule (MT) |
Alkyl phosphoramide-PEG12-Val-Cit-PAB |
[10] | |
Brentuximab-8 |
Monomethyl auristatin E |
Microtubule (MT) |
Alkyl phosphoramide-PEG24-Val-Cit-PAB |
[10] | |
Brentuximab-ADC-24-1 |
Brentuximab-ADC-24-1 payload |
Undisclosed |
Brentuximab-ADC-24-1 linker |
[11] | |
Brentuximab-ADC-24-10 |
Brentuximab-ADC-24-10 payload |
Undisclosed |
Brentuximab-ADC-24-10 linker |
[11] | |
Brentuximab-ADC-24-11 |
Brentuximab-ADC-24-11 payload |
Undisclosed |
Brentuximab-ADC-24-11 linker |
[11] | |
Brentuximab-ADC-24-12 |
Brentuximab-ADC-24-12 payload |
Undisclosed |
Brentuximab-ADC-24-12 linker |
[11] | |
Brentuximab-ADC-24-13 |
Brentuximab-ADC-24-13 payload |
Undisclosed |
Brentuximab-ADC-24-13 linker |
[11] | |
Brentuximab-ADC-24-2 |
Brentuximab-ADC-24-2 payload |
Undisclosed |
Brentuximab-ADC-24-2 linker |
[11] | |
Brentuximab-ADC-24-3 |
Brentuximab-ADC-24-3 payload |
Undisclosed |
Brentuximab-ADC-24-3 linker |
[11] | |
Brentuximab-ADC-24-4 |
Brentuximab-ADC-24-4 payload |
Undisclosed |
Brentuximab-ADC-24-4 linker |
[11] | |
Brentuximab-ADC-24-5 |
Brentuximab-ADC-24-5 payload |
Undisclosed |
Brentuximab-ADC-24-5 linker |
[11] | |
Brentuximab-ADC-24-6 |
Brentuximab-ADC-24-6 payload |
Undisclosed |
Brentuximab-ADC-24-6 linker |
[11] | |
Brentuximab-ADC-24-7 |
Brentuximab-ADC-24-7 payload |
Undisclosed |
Brentuximab-ADC-24-7 linker |
[11] | |
Brentuximab-ADC-24-8 |
Brentuximab-ADC-24-8 payload |
Undisclosed |
Brentuximab-ADC-24-8 linker |
[11] | |
Brentuximab-ADC-24-9 |
Brentuximab-ADC-24-9 payload |
Undisclosed |
Brentuximab-ADC-24-9 linker |
[11] | |
Brentuximab-Compound 17 |
Mertansine DM4 |
Microtubule (MT) |
Brentuximab-Compound 17 linker |
[12] | |
Brentuximab-Compound 25 |
Monomethyl auristatin E |
Microtubule (MT) |
Brentuximab-Compound 25 linker |
[12] | |
Brentuximab-Compound 31 |
Auristatin 0101 |
Microtubule (MT) |
Brentuximab-Compound 31 linker |
[12] | |
Brentuximab-Compound 36 |
Monomethyl auristatin E |
Microtubule (MT) |
Brentuximab-Compound 36 linker |
[12] | |
Brentuximab-Compound 43 |
PBD dimer |
Human Deoxyribonucleic acid (hDNA) |
Brentuximab-Compound 43 linker |
[12] | |
Brentuximab-Compound 49 |
PBD dimer |
Human Deoxyribonucleic acid (hDNA) |
Brentuximab-Compound 49 linker |
[12] | |
Brentuximab-Compound 55 |
Mertansine DM1 |
Microtubule (MT) |
Brentuximab-Compound 55 linker |
[12] | |
Brentuximab-Compound 59 |
Mertansine DM4 |
Microtubule (MT) |
Brentuximab-Compound 59 linker |
[12] | |
Brentuximab-Compound 64 |
Monomethyl auristatin E |
Microtubule (MT) |
Brentuximab-Compound 64 linker |
[12] | |
Brentuximab-Compound 69 |
Monomethyl auristatin E |
Microtubule (MT) |
Brentuximab-Compound 69 linker |
[12] | |
Brentuximab-Compound 74 |
PBD dimer |
Human Deoxyribonucleic acid (hDNA) |
Brentuximab-Compound 74 linker |
[12] | |
Brentuximab-Compound 75 |
Monomethyl auristatin E |
Microtubule (MT) |
Brentuximab-Compound 75 linker |
[12] | |
Brentuximab-Compound 76 |
Monomethyl auristatin E |
Microtubule (MT) |
Brentuximab-Compound 76 linker |
[12] | |
Brentuximab-Compound 77 |
Mertansine DM1 |
Microtubule (MT) |
Brentuximab-Compound 77 linker |
[12] | |
Brentuximab-Compound 78 |
Auristatin 0101 |
Microtubule (MT) |
Brentuximab-Compound 78 linker |
[12] | |
Brentuximab-Compound 79 |
Auristatin 0101 |
Microtubule (MT) |
Brentuximab-Compound 79 linker |
[12] | |
Brentuximab-Compound 80 |
Mertansine DM4 |
Microtubule (MT) |
Brentuximab-Compound 80 linker |
[12] | |
Brentuximab-Compound 9 |
Mertansine DM1 |
Microtubule (MT) |
Brentuximab-Compound 9 linker |
[12] | |
Brentuximab-PNUEDAGly5 |
PNU-159682 |
DNA topoisomerase 2-alpha (TOP2A) |
LPETG-Gly5-EDA |
[13] | |
CAC10-CPT-LA |
Methylenedioxy CPT1 (CPT1) |
DNA topoisomerase 1 (TOP1) |
Mc-PEG4-Val-Lys-Gly |
[6] | |
CAC10-CPT-LB |
Methylenedioxy CPT2 (CPT2) |
DNA topoisomerase 1 (TOP1) |
Mc-PEG4-Val-Lys-Gly |
[6] | |
CAC10-CPT-LC |
Methylenedioxy CPT2 (CPT2) |
DNA topoisomerase 1 (TOP1) |
Mc-PEG8-Val-Lys-Gly |
[6] | |
CAC10-DT |
DX-8951 derivative (DXd) |
DNA topoisomerase 1 (TOP1) |
Mc-Gly-Gly-Phe-Gly |
[6] | |
CAC10-Gly5-MAY |
Mertansine DM1 |
Microtubule (MT) |
Gly5 |
[14] | |
CAC10-Gly5-PNU |
PNU-159682 |
DNA topoisomerase 2-alpha (TOP2A) |
Gly5 |
[14] | |
CAC10-GT |
Active metabolite of irinotecan SN38 |
DNA topoisomerase 1 (TOP1) |
CL2A |
[6] | |
Crown Ether ADC 4a |
Monomethyl auristatin E |
Microtubule (MT) |
6-Amino-alpha-cyclodextrin-Val-Cit-PABC |
[15] | |
Crown Ether ADC 4b |
Monomethyl auristatin E |
Microtubule (MT) |
6-Amino-beta-cyclodextrin-Val-Cit-PABC |
[15] | |
Crown Ether ADC 4c |
Monomethyl auristatin E |
Microtubule (MT) |
6-Amino-gama-cyclodextrin-Val-Cit-PABC |
[15] | |
Crown Ether ADC 4d |
Monomethyl auristatin E |
Microtubule (MT) |
3-Amino-alpha-cyclodextrin-Val-Cit-PABC |
[15] | |
Crown Ether ADC 4e |
Monomethyl auristatin E |
Microtubule (MT) |
3-Amino-beta-cyclodextrin-Val-Cit-PABC |
[15] | |
Crown Ether ADC 4f |
Monomethyl auristatin E |
Microtubule (MT) |
3-Amino-gama-cyclodextrin-Val-Cit-PABC |
[15] | |
Crown Ether ADC 5a |
Monomethyl auristatin E |
Microtubule (MT) |
1-Aza-24-crown-8-Val-Cit-PABC |
[15] | |
Crown Ether ADC 5b |
Monomethyl auristatin E |
Microtubule (MT) |
1-Aza-42-crown-14-Val-Cit-PABC |
[15] | |
Crown Ether ADC 6a |
Monomethyl auristatin E |
Microtubule (MT) |
PEG(8u)-Val-Cit-PABC |
[15] | |
Crown Ether ADC 6b |
Monomethyl auristatin E |
Microtubule (MT) |
PEG(24u)-Val-Cit-PABC |
[15] | |
EphA2-targeted mAb ADC B 12 (DAR4) |
EphA2-targeted mAb ADC B 12 (DAR4) payload |
Undisclosed |
EphA2-targeted mAb ADC B 12 (DAR4) linker |
[16] | |
EphA2-targeted mAb ADC B 12 (DAR8) |
EphA2-targeted mAb ADC B 12 (DAR8) payload |
Undisclosed |
EphA2-targeted mAb ADC B 12 (DAR8) linker |
[16] | |
EphA2-targeted mAb ADC B 17 (DAR4) |
EphA2-targeted mAb ADC B 17 (DAR4) payload |
Undisclosed |
EphA2-targeted mAb ADC B 17 (DAR4) linker |
[16] | |
EphA2-targeted mAb ADC B 17 (DAR8) |
EphA2-targeted mAb ADC B 17 (DAR8) payload |
Undisclosed |
EphA2-targeted mAb ADC B 17 (DAR8) linker |
[16] | |
EphA2-targeted mAb ADC B 19 (DAR4) |
EphA2-targeted mAb ADC B 19 (DAR4) payload |
Undisclosed |
EphA2-targeted mAb ADC B 19 (DAR4) linker |
[16] | |
EphA2-targeted mAb ADC B 19 (DAR8) |
EphA2-targeted mAb ADC B 19 (DAR8) payload |
Undisclosed |
EphA2-targeted mAb ADC B 19 (DAR8) linker |
[16] | |
EphA2-targeted mAb ADC B 20 (DAR4) |
EphA2-targeted mAb ADC B 20 (DAR4) payload |
Undisclosed |
EphA2-targeted mAb ADC B 20 (DAR4) linker |
[16] | |
EphA2-targeted mAb ADC B 20 (DAR8) |
EphA2-targeted mAb ADC B 20 (DAR8) payload |
Undisclosed |
EphA2-targeted mAb ADC B 20 (DAR8) linker |
[16] | |
EphA2-targeted mAb ADC B 21 (DAR4) |
EphA2-targeted mAb ADC B 21 (DAR4) payload |
Undisclosed |
EphA2-targeted mAb ADC B 21 (DAR4) linker |
[16] | |
EphA2-targeted mAb ADC B 21 (DAR8) |
EphA2-targeted mAb ADC B 21 (DAR8) payload |
Undisclosed |
EphA2-targeted mAb ADC B 21 (DAR8) linker |
[16] | |
EphA2-targeted mAb ADC B 22 (DAR2) |
EphA2-targeted mAb ADC B 22 (DAR2) payload |
Undisclosed |
EphA2-targeted mAb ADC B 22 (DAR2) linker |
[16] | |
EphA2-targeted mAb ADC B 22 (DAR6) |
EphA2-targeted mAb ADC B 22 (DAR6) payload |
Undisclosed |
EphA2-targeted mAb ADC B 22 (DAR6) linker |
[16] | |
EphA2-targeted mAb ADC B 23 (DAR4) |
EphA2-targeted mAb ADC B 23 (DAR4) payload |
Undisclosed |
EphA2-targeted mAb ADC B 23 (DAR4) linker |
[16] | |
EphA2-targeted mAb ADC B 23 (DAR8) |
EphA2-targeted mAb ADC B 23 (DAR8) payload |
Undisclosed |
EphA2-targeted mAb ADC B 23 (DAR8) linker |
[16] | |
EphA2-targeted mAb ADC B 24 (DAR4) |
EphA2-targeted mAb ADC B 24 (DAR4) payload |
Undisclosed |
EphA2-targeted mAb ADC B 24 (DAR4) linker |
[16] | |
EphA2-targeted mAb ADC B 24 (DAR8) |
EphA2-targeted mAb ADC B 24 (DAR8) payload |
Undisclosed |
EphA2-targeted mAb ADC B 24 (DAR8) linker |
[16] | |
MF-BTX-MMAE |
Monomethyl auristatin E |
Microtubule (MT) |
Dibromomethyl pyridine-Val-Cit-PABC |
[17] | |
WO2007011968A2 cAC10-17 |
Doxorubicin |
DNA topoisomerase 2-alpha (TOP2A) |
WO2007011968A2_cAC10-17 linker |
[18] | |
WO2007011968A2 cAC10-9a |
Monomethyl auristatin E |
Microtubule (MT) |
WO2007011968A2_cAC10-9a linker |
[18] | |
WO2007011968A2 cAC10-9b |
Monomethyl auristatin F |
Microtubule (MT) |
WO2007011968A2_cAC10-9b linker |
[18] | |
WO2015095755A1 cAC10-1.3 |
Monomethyl auristatin E |
Microtubule (MT) |
WO2015095755A1_cAC10-1.3 linker |
[19] | |
WO2015095755A1 cAC10-1006 |
WO2015095755A1_cAC10-1006 payload |
Undisclosed |
WO2015095755A1_cAC10-1006 linker |
[19] | |
WO2015095755A1 cAC10-2.0 |
Monomethyl auristatin E |
Microtubule (MT) |
WO2015095755A1_cAC10-2.0 linker |
[19] | |
WO2015095755A1 cAC10-5.6 |
WO2015095755A1_cAC10-5.6 payload |
Undisclosed |
WO2015095755A1_cAC10-5.6 linker |
[19] | |
WO2015095755A1 cAC10-6.4 |
WO2015095755A1_cAC10-6.4 payload |
Undisclosed |
WO2015095755A1_cAC10-6.4 linker |
[19] | |
WO2015095755A1 cAC10-7.7 |
WO2015095755A1_cAC10-7.7 payload |
Undisclosed |
WO2015095755A1_cAC10-7.7 linker |
[19] |
IRac
| ADC Info | ADC Name | Payload | Target | Linker | Ref |
|---|---|---|---|---|---|
Monoclonal antibody IRac-ricin A conjugate |
Deglycosylated ricin A-chain (dgA) |
Undisclosed |
Undisclosed |
[20] |
Recombinant human CD30Fc fusion protein
| ADC Info | ADC Name | Payload | Target | Linker | Ref |
|---|---|---|---|---|---|
Anti-CD30-LDM |
Lidamycin |
Human Deoxyribonucleic acid (hDNA) |
Uncleavable linker |
[21] |
Undisclosed
| ADC Info | ADC Name | Payload | Target | Linker | Ref |
|---|---|---|---|---|---|
Anti-CD30 antibody drug conjugate (NBE-Therapeutics) |
Undisclosed |
Undisclosed |
Undisclosed |
[22] | |
AVP10 |
Monomethyl auristatin F |
Microtubule (MT) |
Undisclosed |
[23] | |
TUB-010 |
Undisclosed |
Undisclosed |
Undisclosed |
[24] |
Tissue/Disease specific Abundances of This Antigen
Tissue specific Abundances of This Antigen
ICD Disease Classification 01
| Differential expression pattern of antigen in diseases | ||
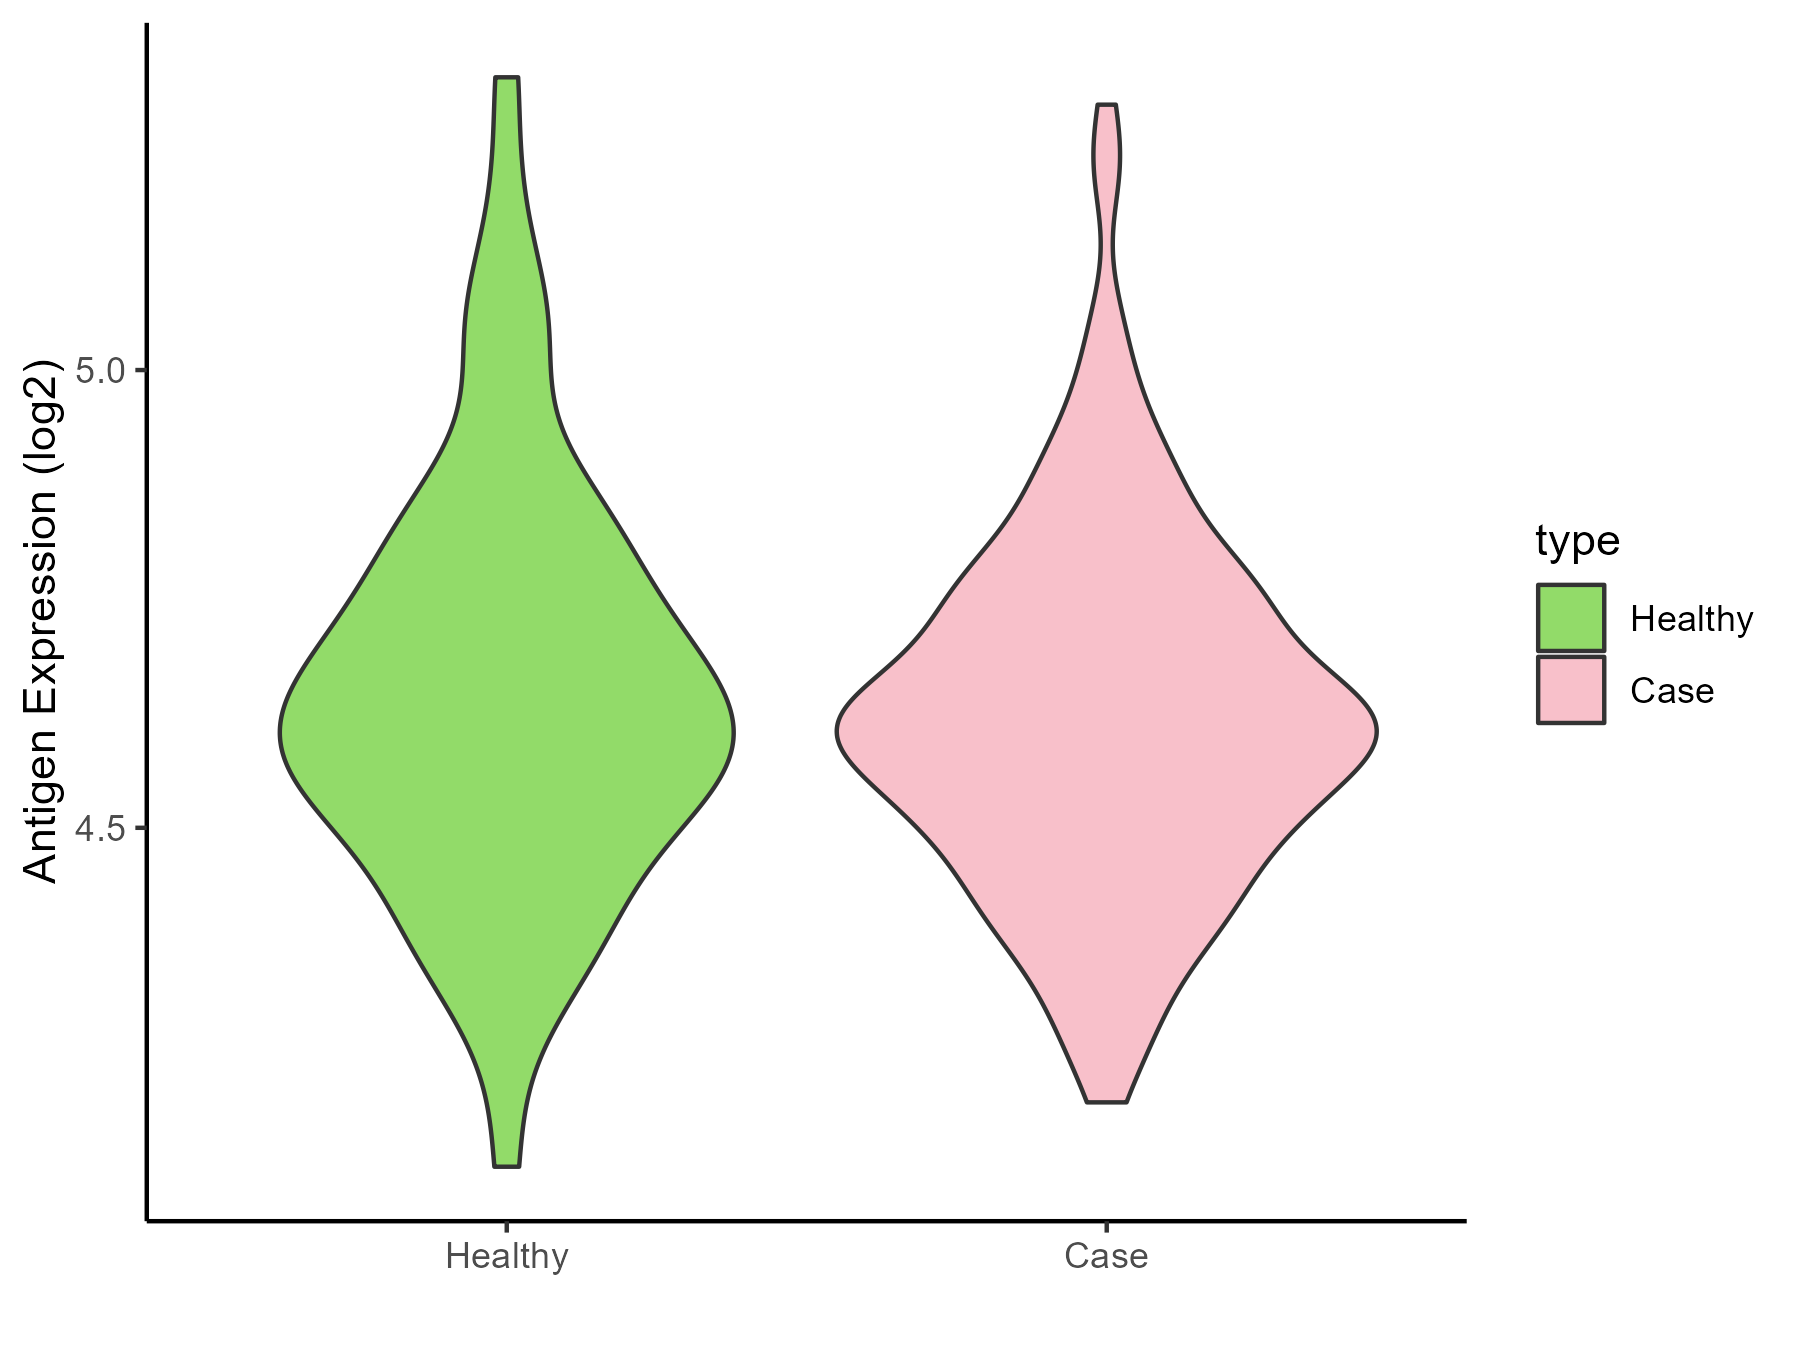
| The Studied Tissue | Gingival | |
| The Specific Disease | Bacterial infection of gingival | |
| The Expression Level of Disease Section Compare with the Healthy Individual Tissue | p-value: 0.400086288; Fold-change: -0.011931585; Z-score: -0.053169615 | |
| Disease-specific Antigen Abundances |
|
Click to View the Clearer Original Diagram |
ICD Disease Classification 02
| Differential expression pattern of antigen in diseases | ||
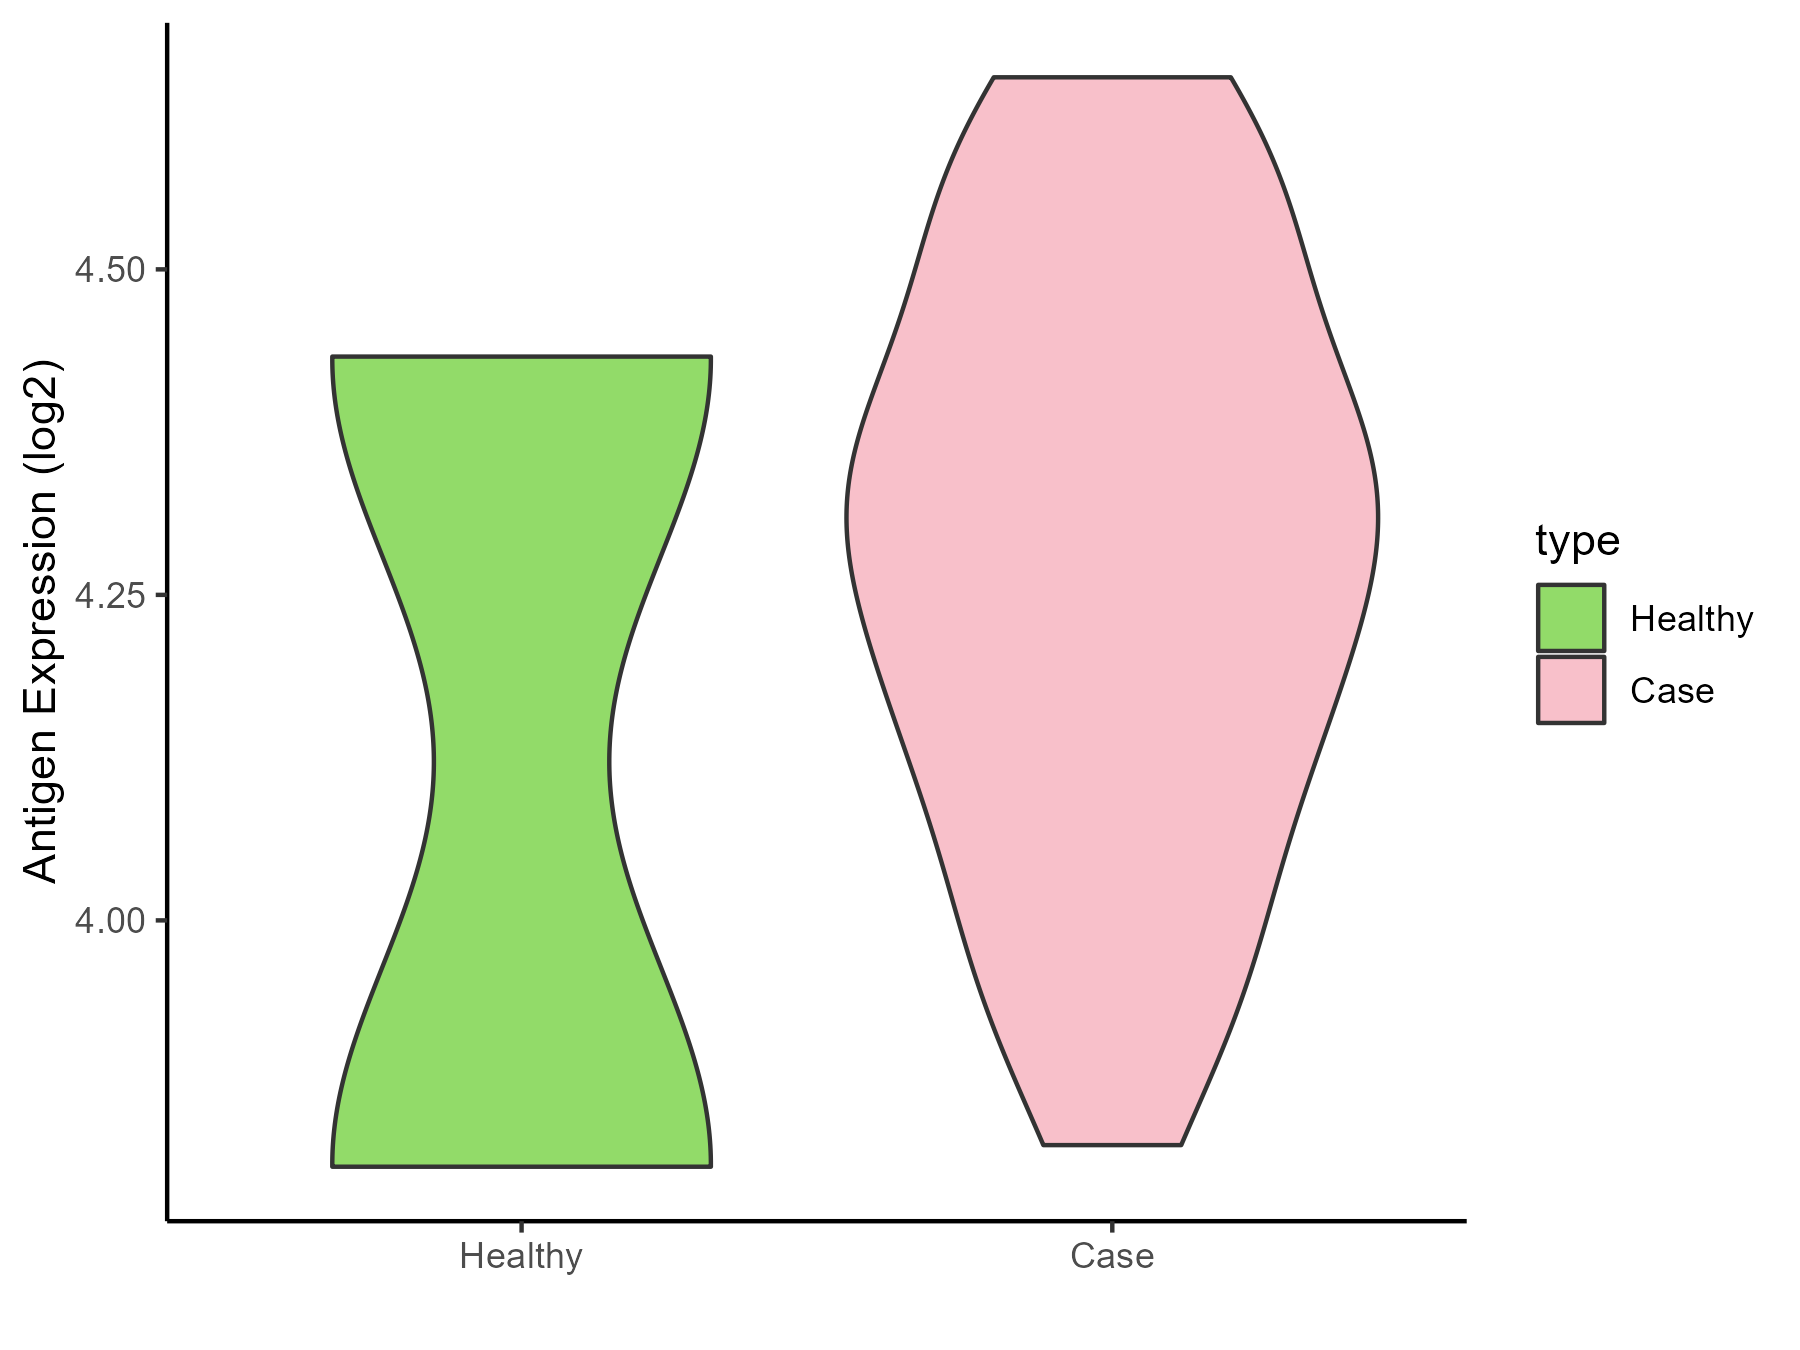
| The Studied Tissue | Brainstem | |
| The Specific Disease | Glioma | |
| The Expression Level of Disease Section Compare with the Healthy Individual Tissue | p-value: 0.704660292; Fold-change: 0.17937956; Z-score: 0.407717895 | |
| Disease-specific Antigen Abundances |
|
Click to View the Clearer Original Diagram |
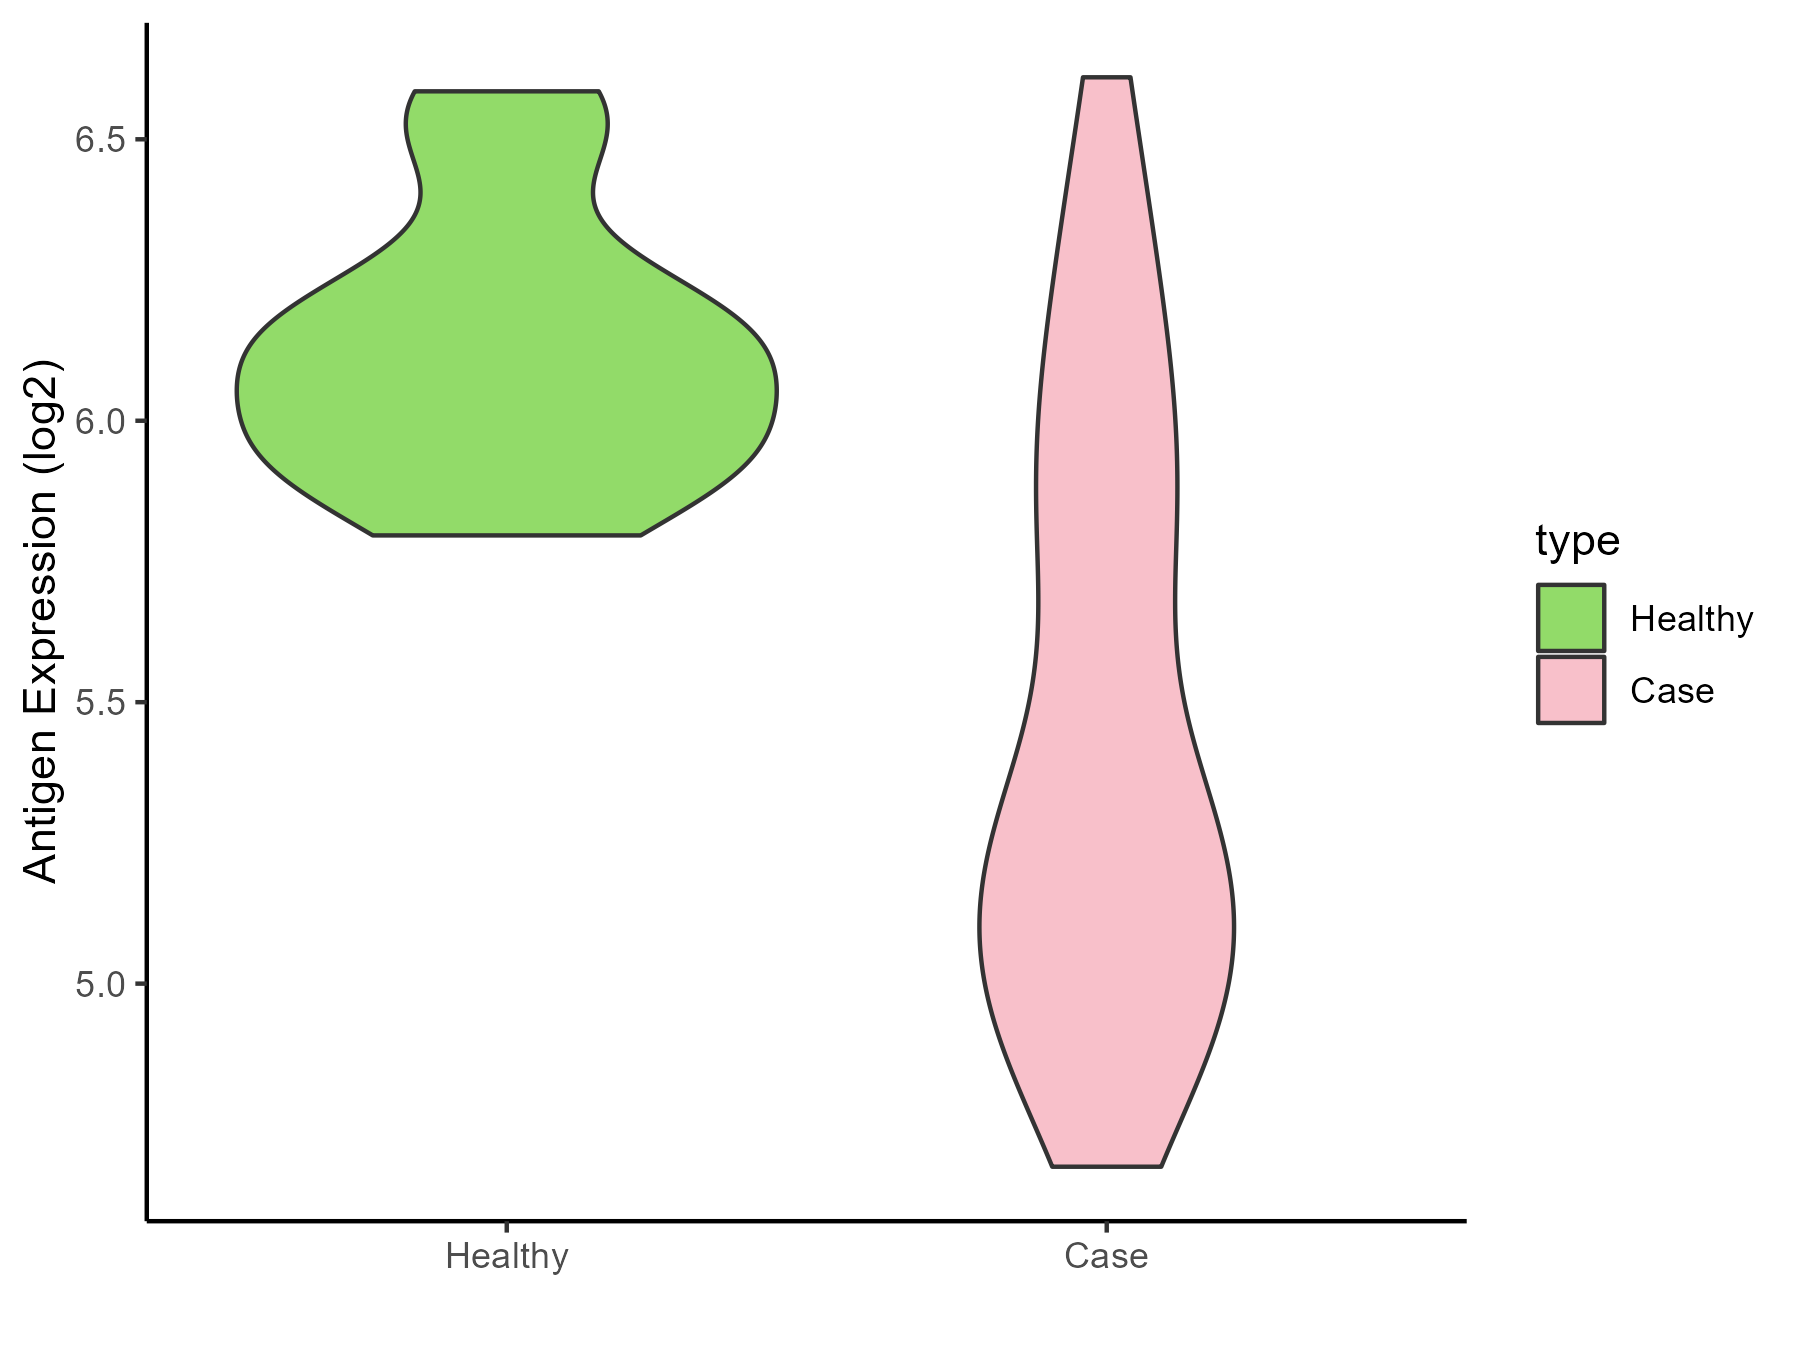
| The Studied Tissue | White matter | |
| The Specific Disease | Glioma | |
| The Expression Level of Disease Section Compare with the Healthy Individual Tissue | p-value: 7.16E-07; Fold-change: -0.826434468; Z-score: -3.39709883 | |
| Disease-specific Antigen Abundances |
|
Click to View the Clearer Original Diagram |
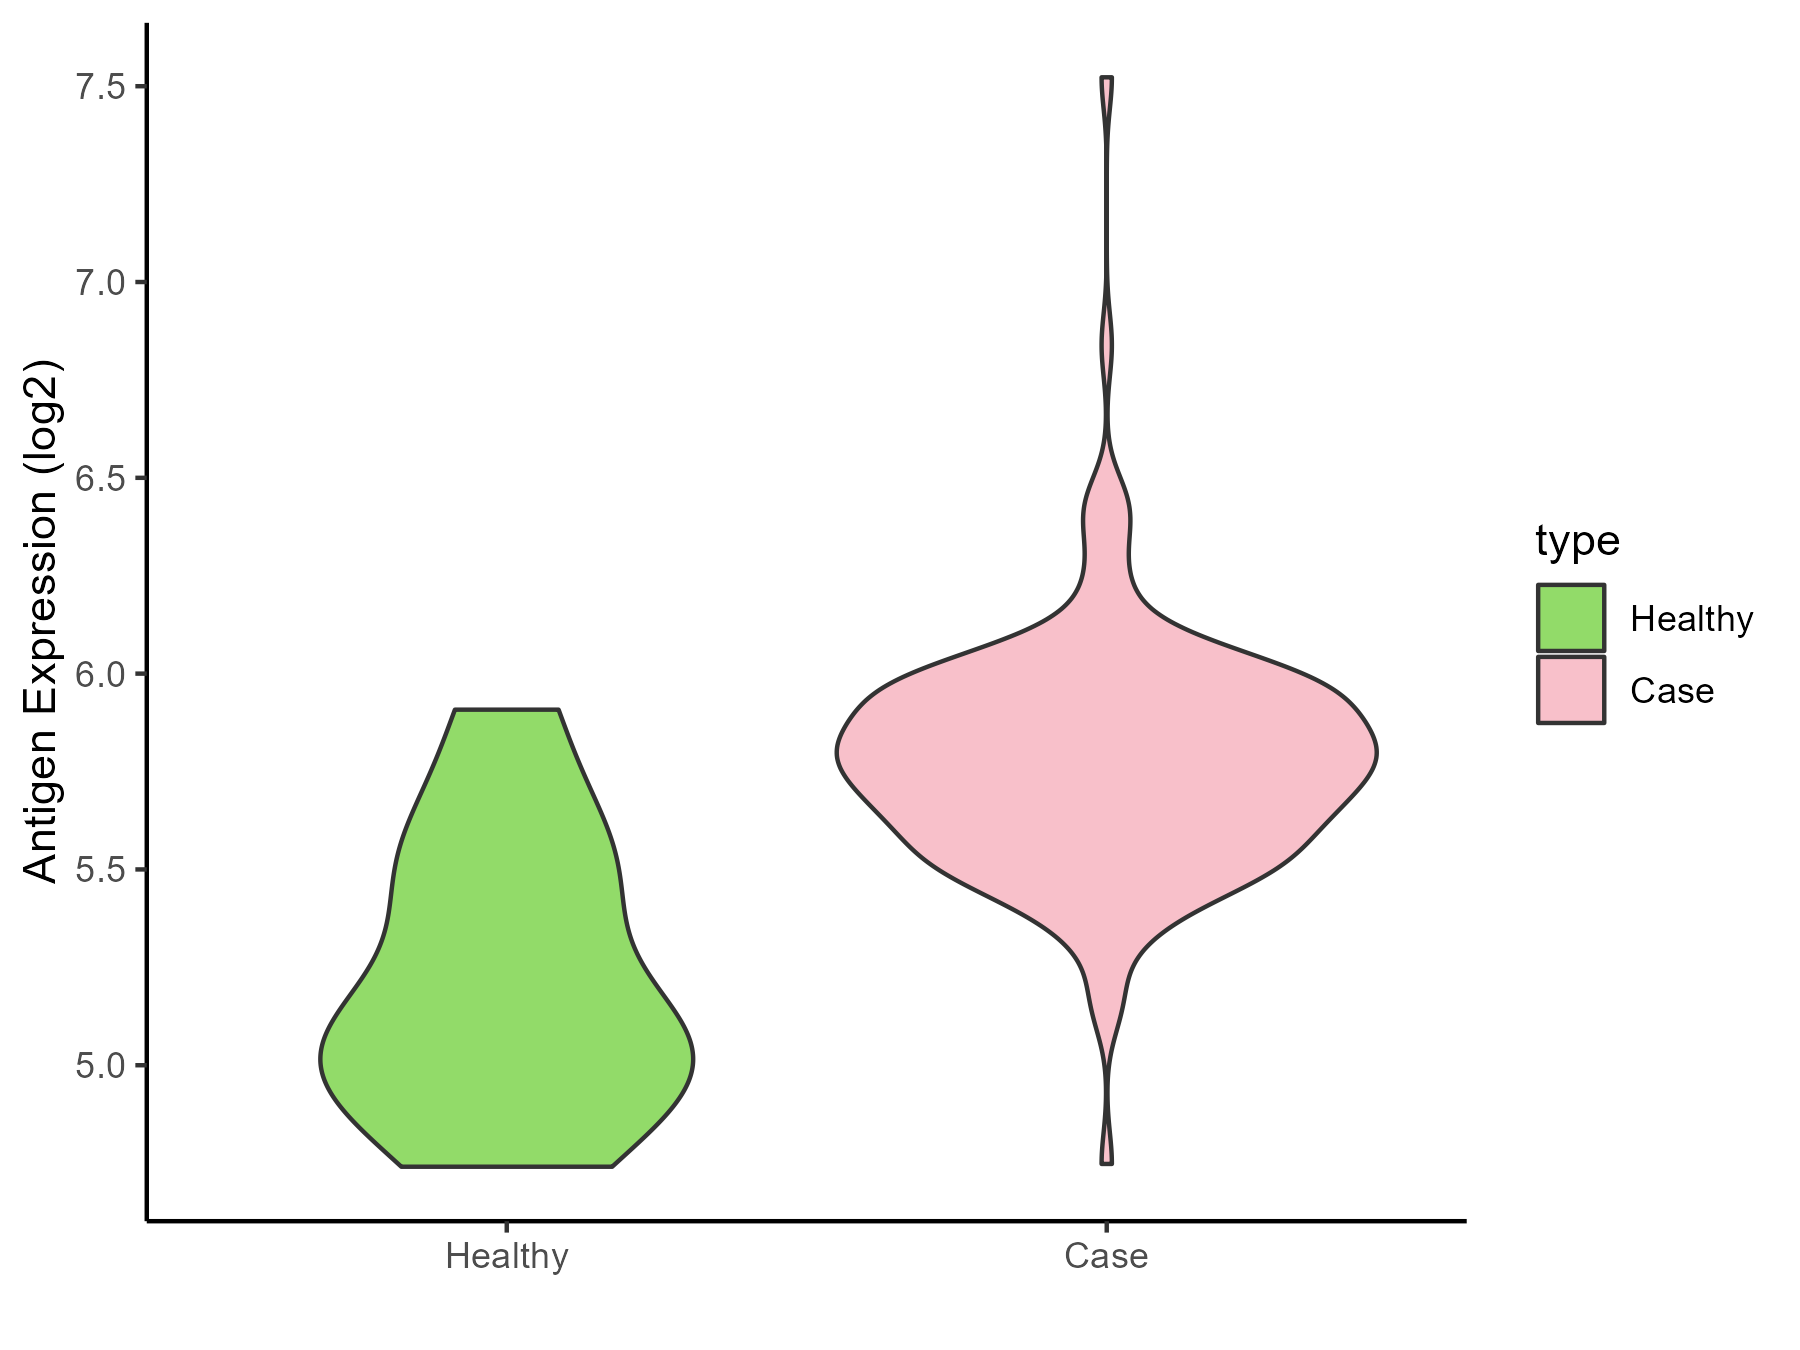
| The Studied Tissue | Brainstem | |
| The Specific Disease | Neuroectodermal tumor | |
| The Expression Level of Disease Section Compare with the Healthy Individual Tissue | p-value: 0.000922392; Fold-change: 0.692920239; Z-score: 1.887775648 | |
| Disease-specific Antigen Abundances |
|
Click to View the Clearer Original Diagram |
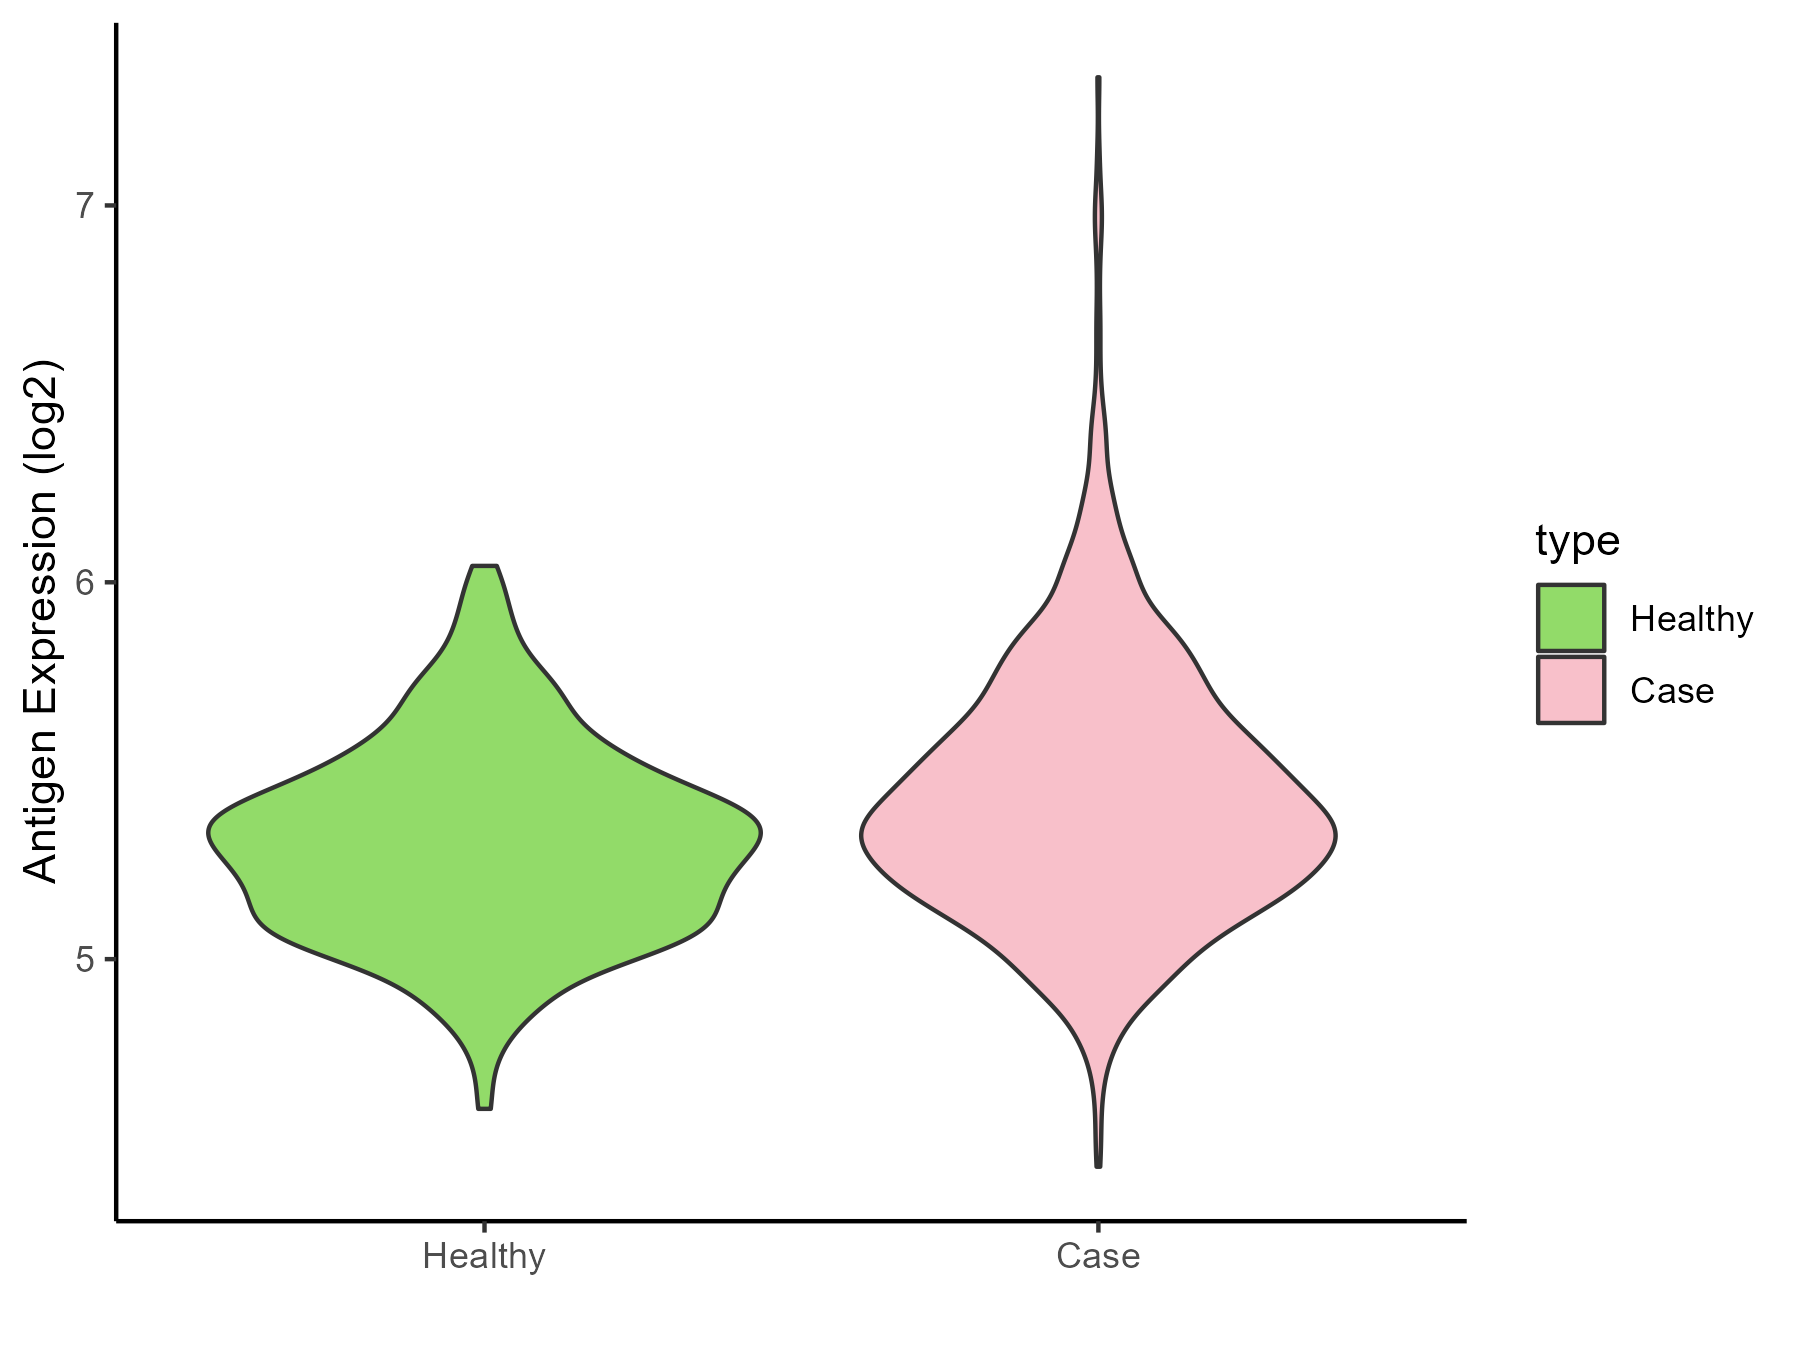
| The Studied Tissue | Nervous | |
| The Specific Disease | Brain cancer | |
| The Expression Level of Disease Section Compare with the Healthy Individual Tissue | p-value: 1.12E-13; Fold-change: 0.087625355; Z-score: 0.346169452 | |
| Disease-specific Antigen Abundances |
|
Click to View the Clearer Original Diagram |
| Differential expression pattern of antigen in diseases | ||
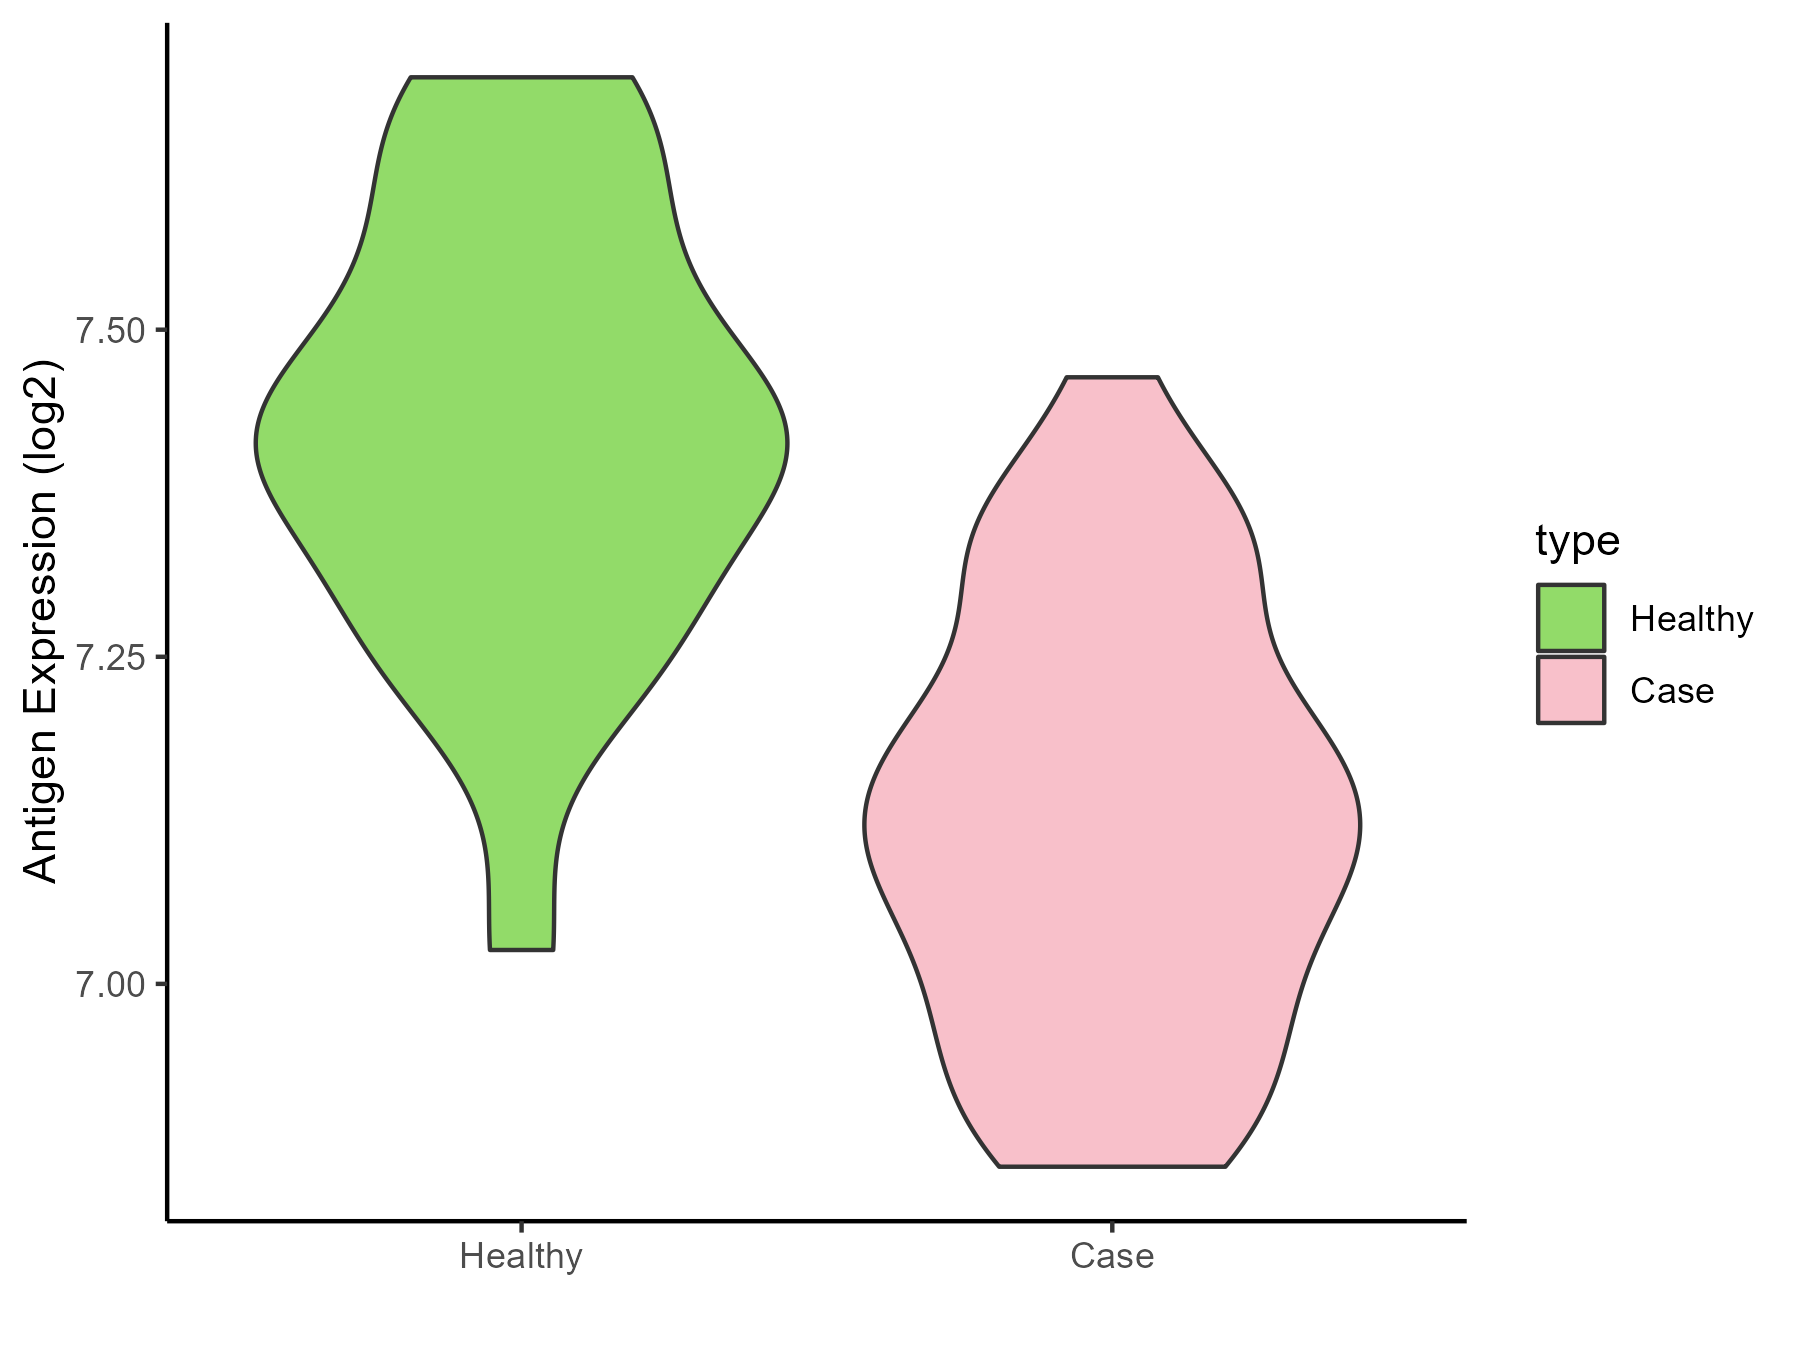
| The Studied Tissue | Whole blood | |
| The Specific Disease | Polycythemia vera | |
| The Expression Level of Disease Section Compare with the Healthy Individual Tissue | p-value: 1.23E-14; Fold-change: -0.313272246; Z-score: -1.872527764 | |
| Disease-specific Antigen Abundances |
|
Click to View the Clearer Original Diagram |
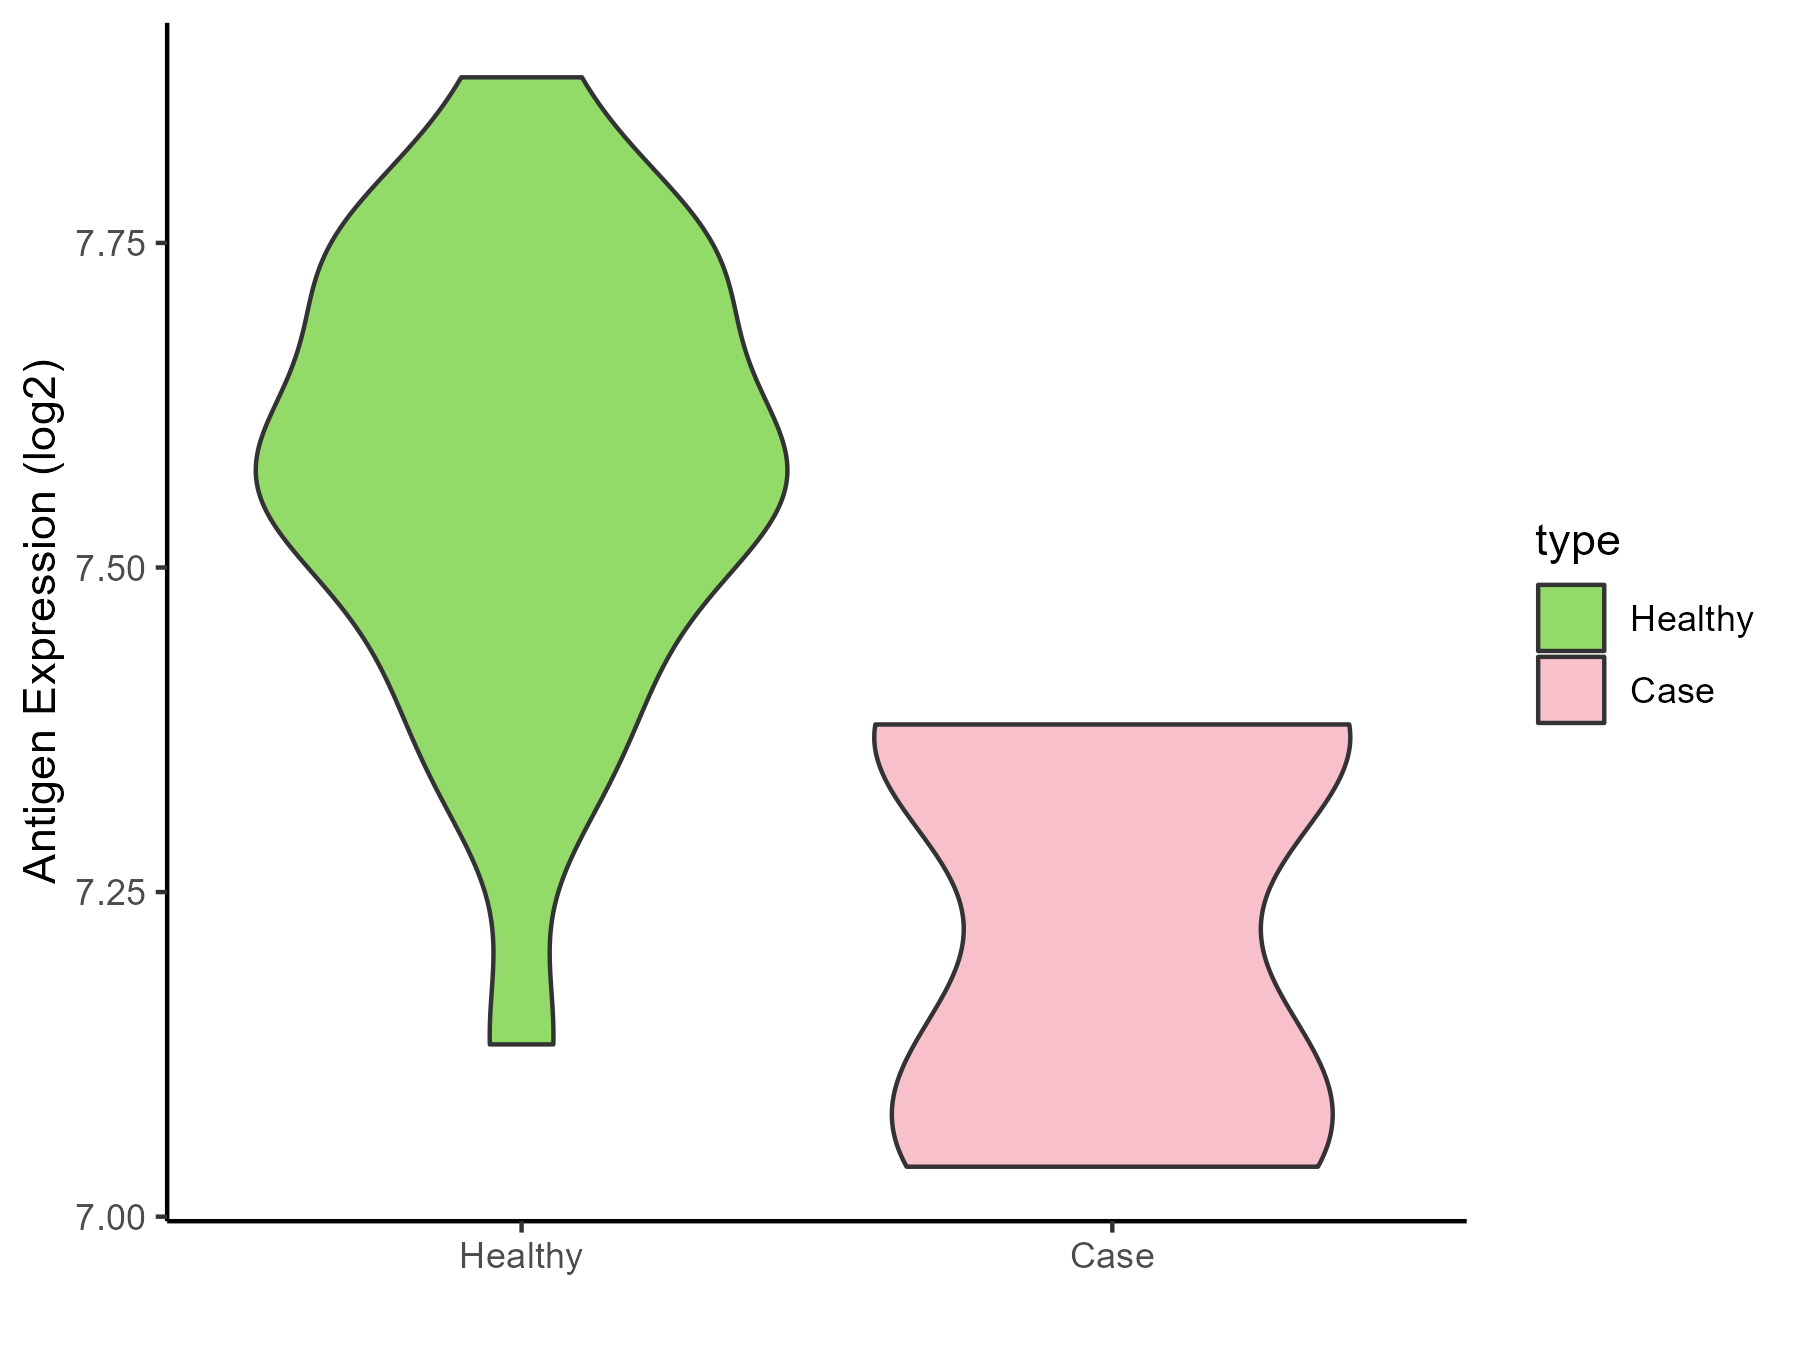
| The Studied Tissue | Whole blood | |
| The Specific Disease | Myelofibrosis | |
| The Expression Level of Disease Section Compare with the Healthy Individual Tissue | p-value: 0.000219574; Fold-change: -0.326933553; Z-score: -1.888508989 | |
| Disease-specific Antigen Abundances |
|
Click to View the Clearer Original Diagram |
| Differential expression pattern of antigen in diseases | ||
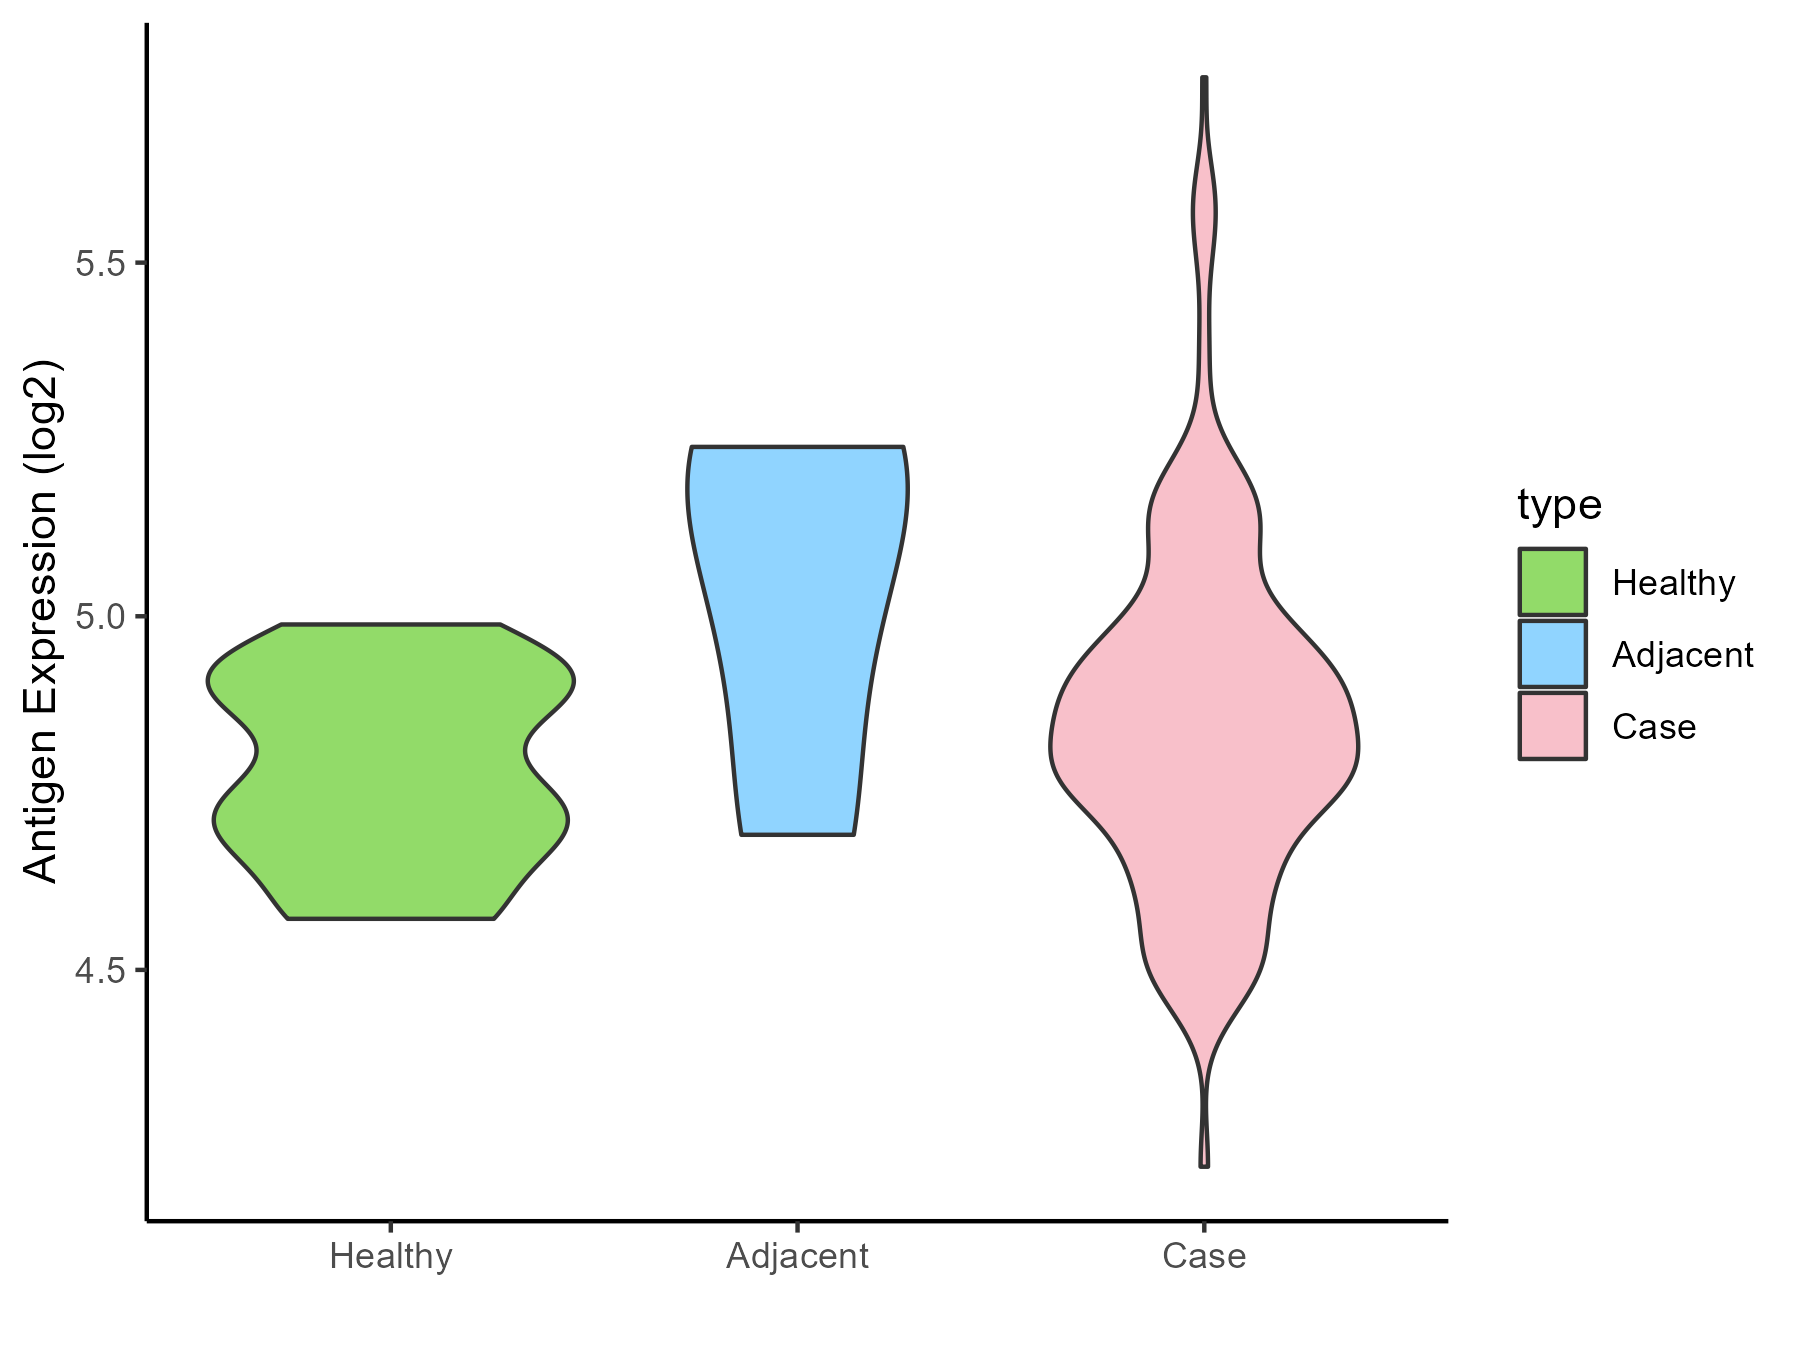
| The Studied Tissue | Bone marrow | |
| The Specific Disease | Myelodysplastic syndromes | |
| The Expression Level of Disease Section Compare with the Healthy Individual Tissue | p-value: 0.019294937; Fold-change: 0.086182001; Z-score: 0.629155767 | |
| The Expression Level of Disease Section Compare with the Adjacent Tissue | p-value: 0.250790442; Fold-change: -0.263361113; Z-score: -1.019802369 | |
| Disease-specific Antigen Abundances |
|
Click to View the Clearer Original Diagram |
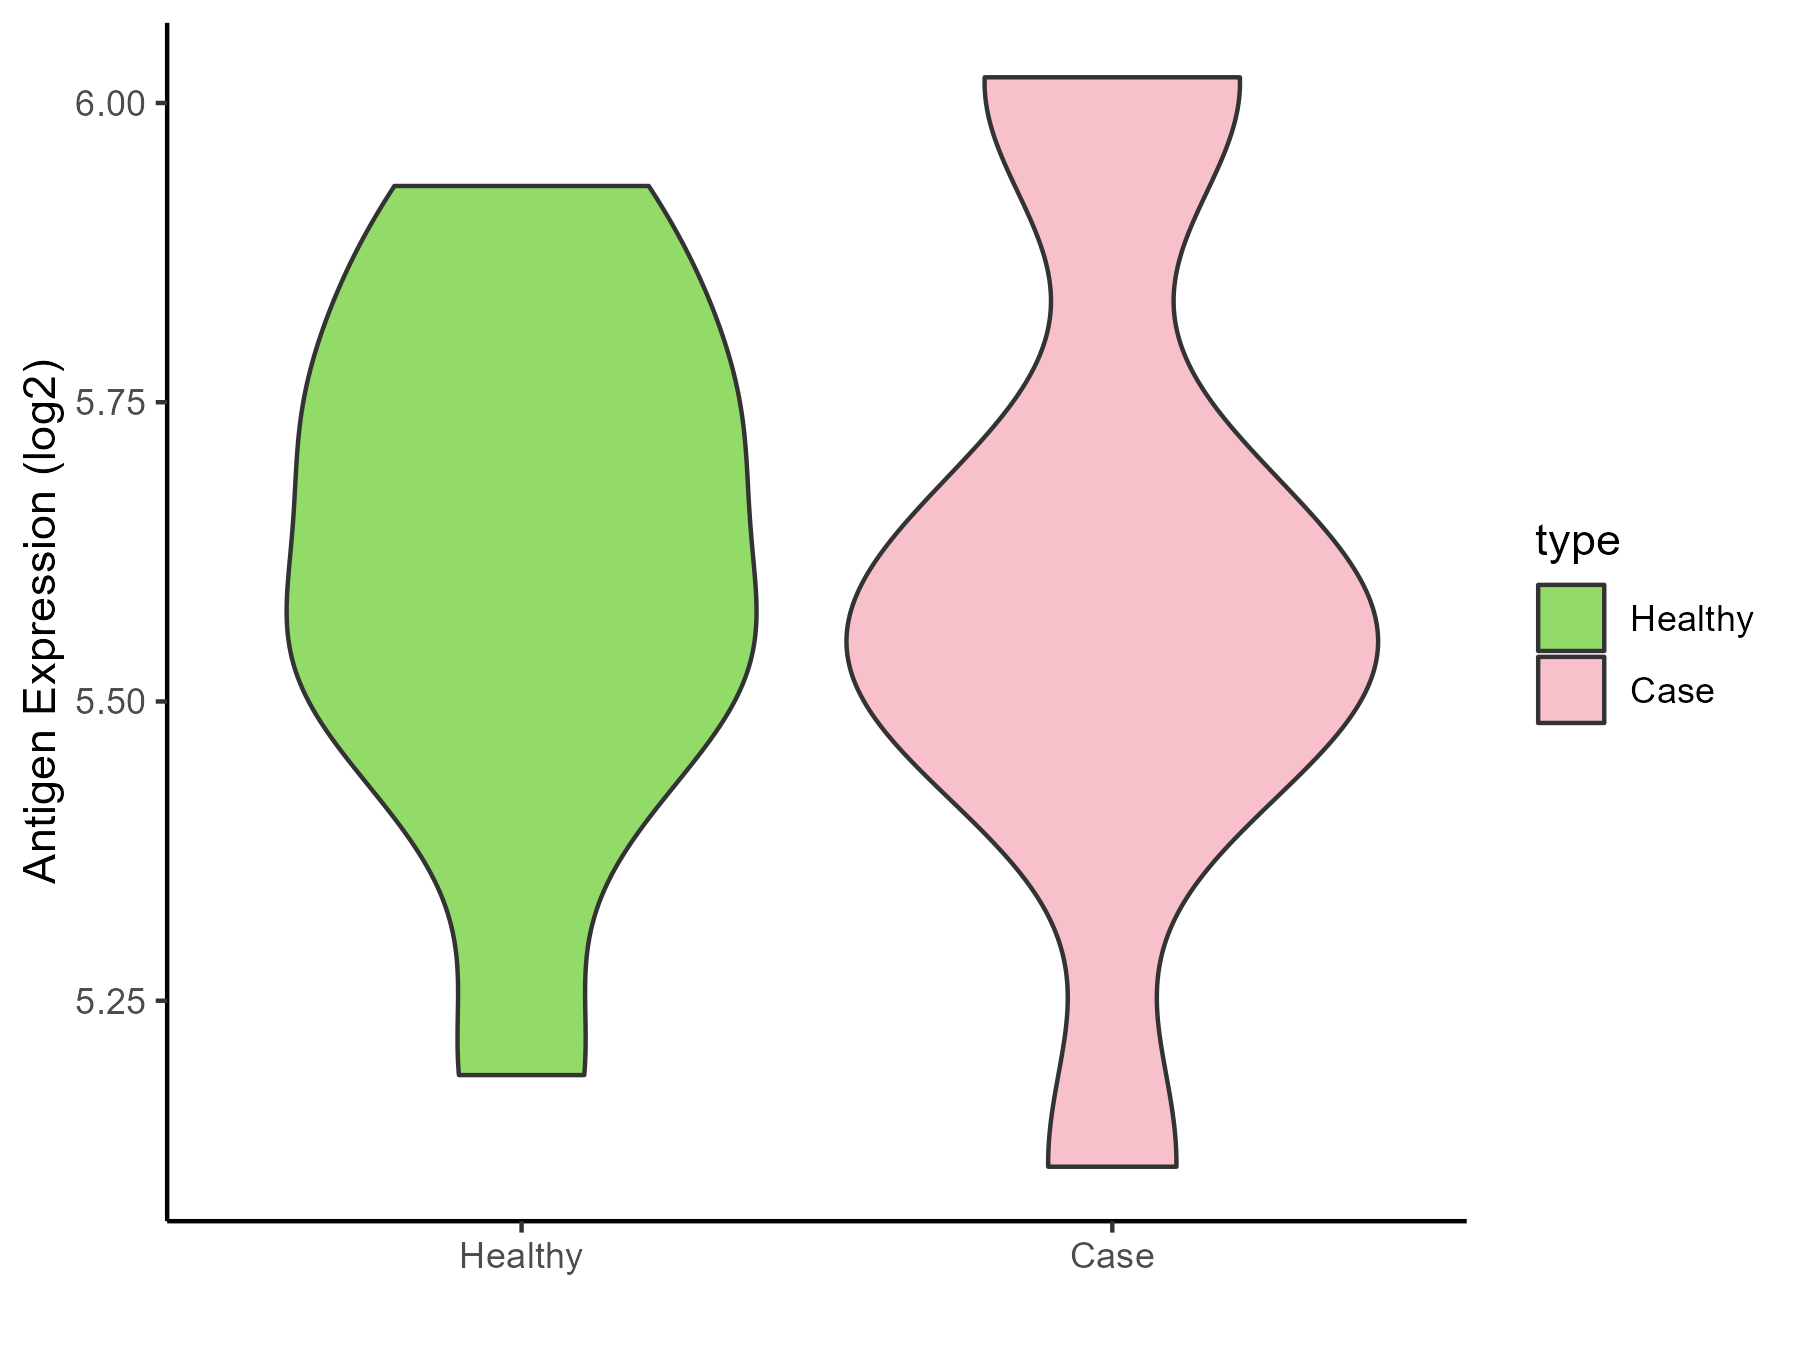
| Differential expression pattern of antigen in diseases | ||
| The Studied Tissue | Tonsil | |
| The Specific Disease | Lymphoma | |
| The Expression Level of Disease Section Compare with the Healthy Individual Tissue | p-value: 0.978093057; Fold-change: -0.05064933; Z-score: -0.22873554 | |
| Disease-specific Antigen Abundances |
|
Click to View the Clearer Original Diagram |
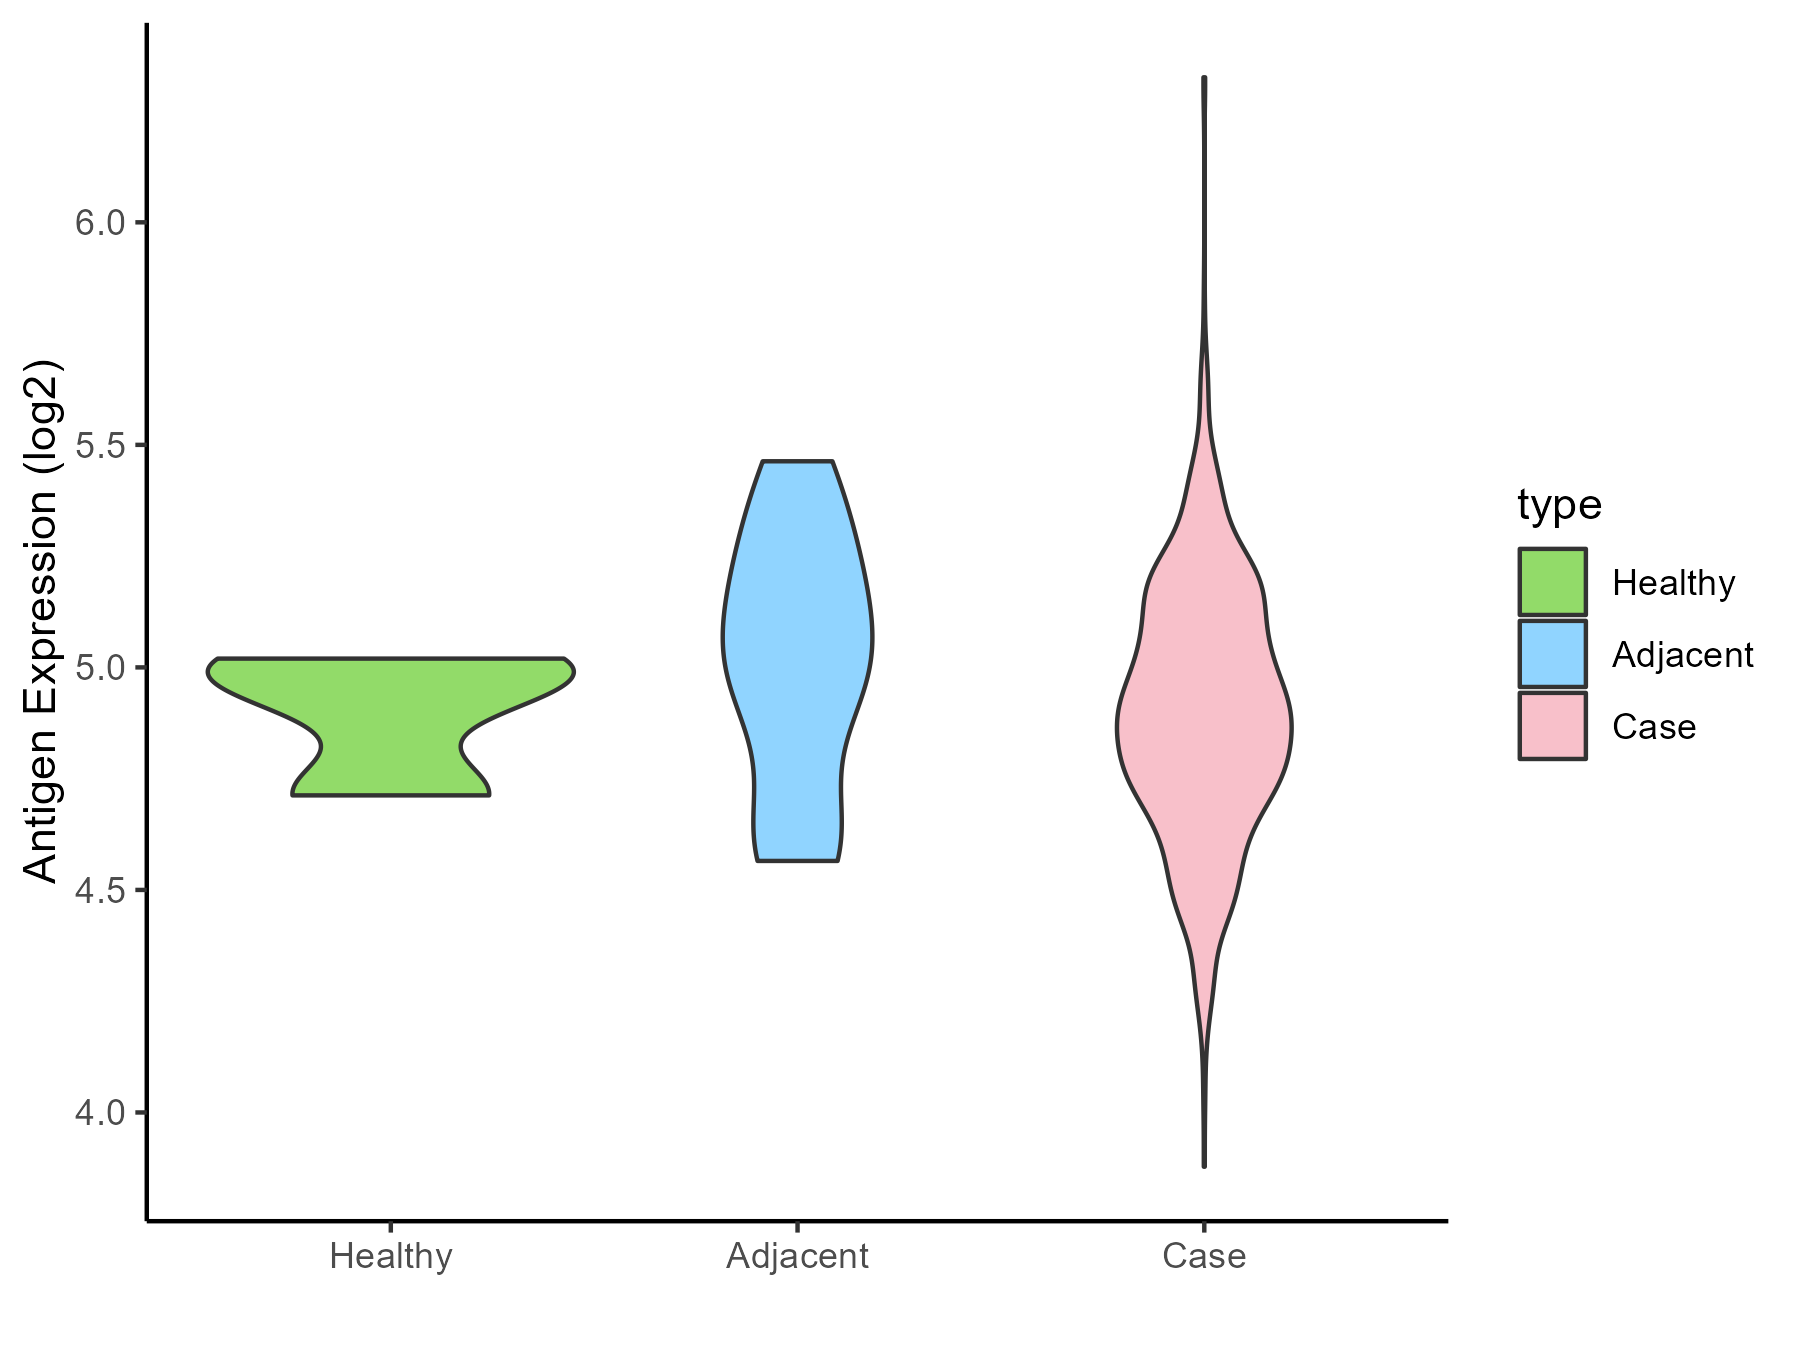
| Differential expression pattern of antigen in diseases | ||
| The Studied Tissue | Gastric | |
| The Specific Disease | Gastric cancer | |
| The Expression Level of Disease Section Compare with the Healthy Individual Tissue | p-value: 0.967169379; Fold-change: -0.065119468; Z-score: -0.398948341 | |
| The Expression Level of Disease Section Compare with the Adjacent Tissue | p-value: 0.12701012; Fold-change: -0.103718457; Z-score: -0.359093798 | |
| Disease-specific Antigen Abundances |
|
Click to View the Clearer Original Diagram |
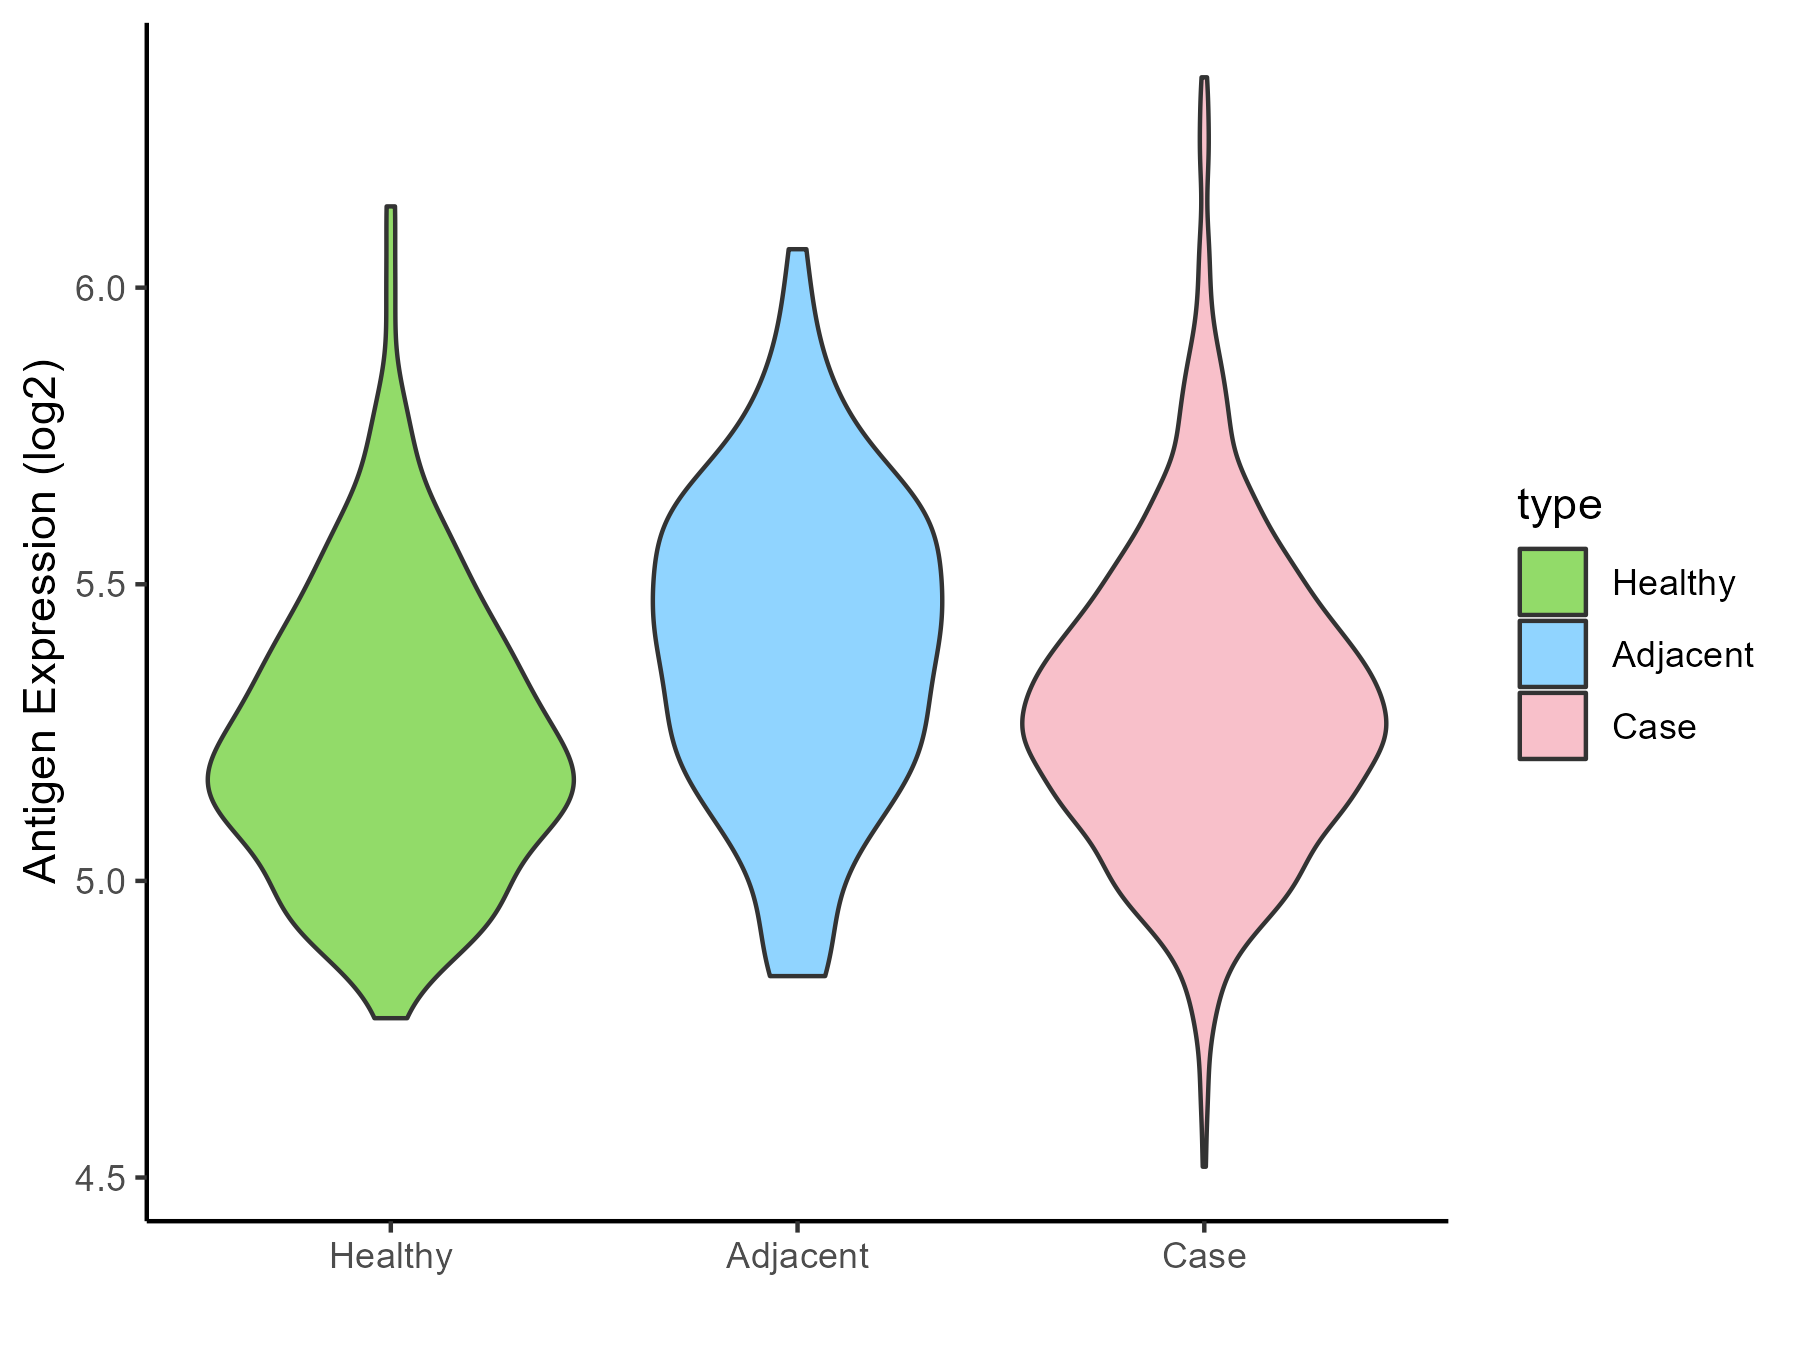
| Differential expression pattern of antigen in diseases | ||
| The Studied Tissue | Colon | |
| The Specific Disease | Colon cancer | |
| The Expression Level of Disease Section Compare with the Healthy Individual Tissue | p-value: 0.004669723; Fold-change: 0.076752432; Z-score: 0.320689643 | |
| The Expression Level of Disease Section Compare with the Adjacent Tissue | p-value: 9.52E-05; Fold-change: -0.140579025; Z-score: -0.541527589 | |
| Disease-specific Antigen Abundances |
|
Click to View the Clearer Original Diagram |
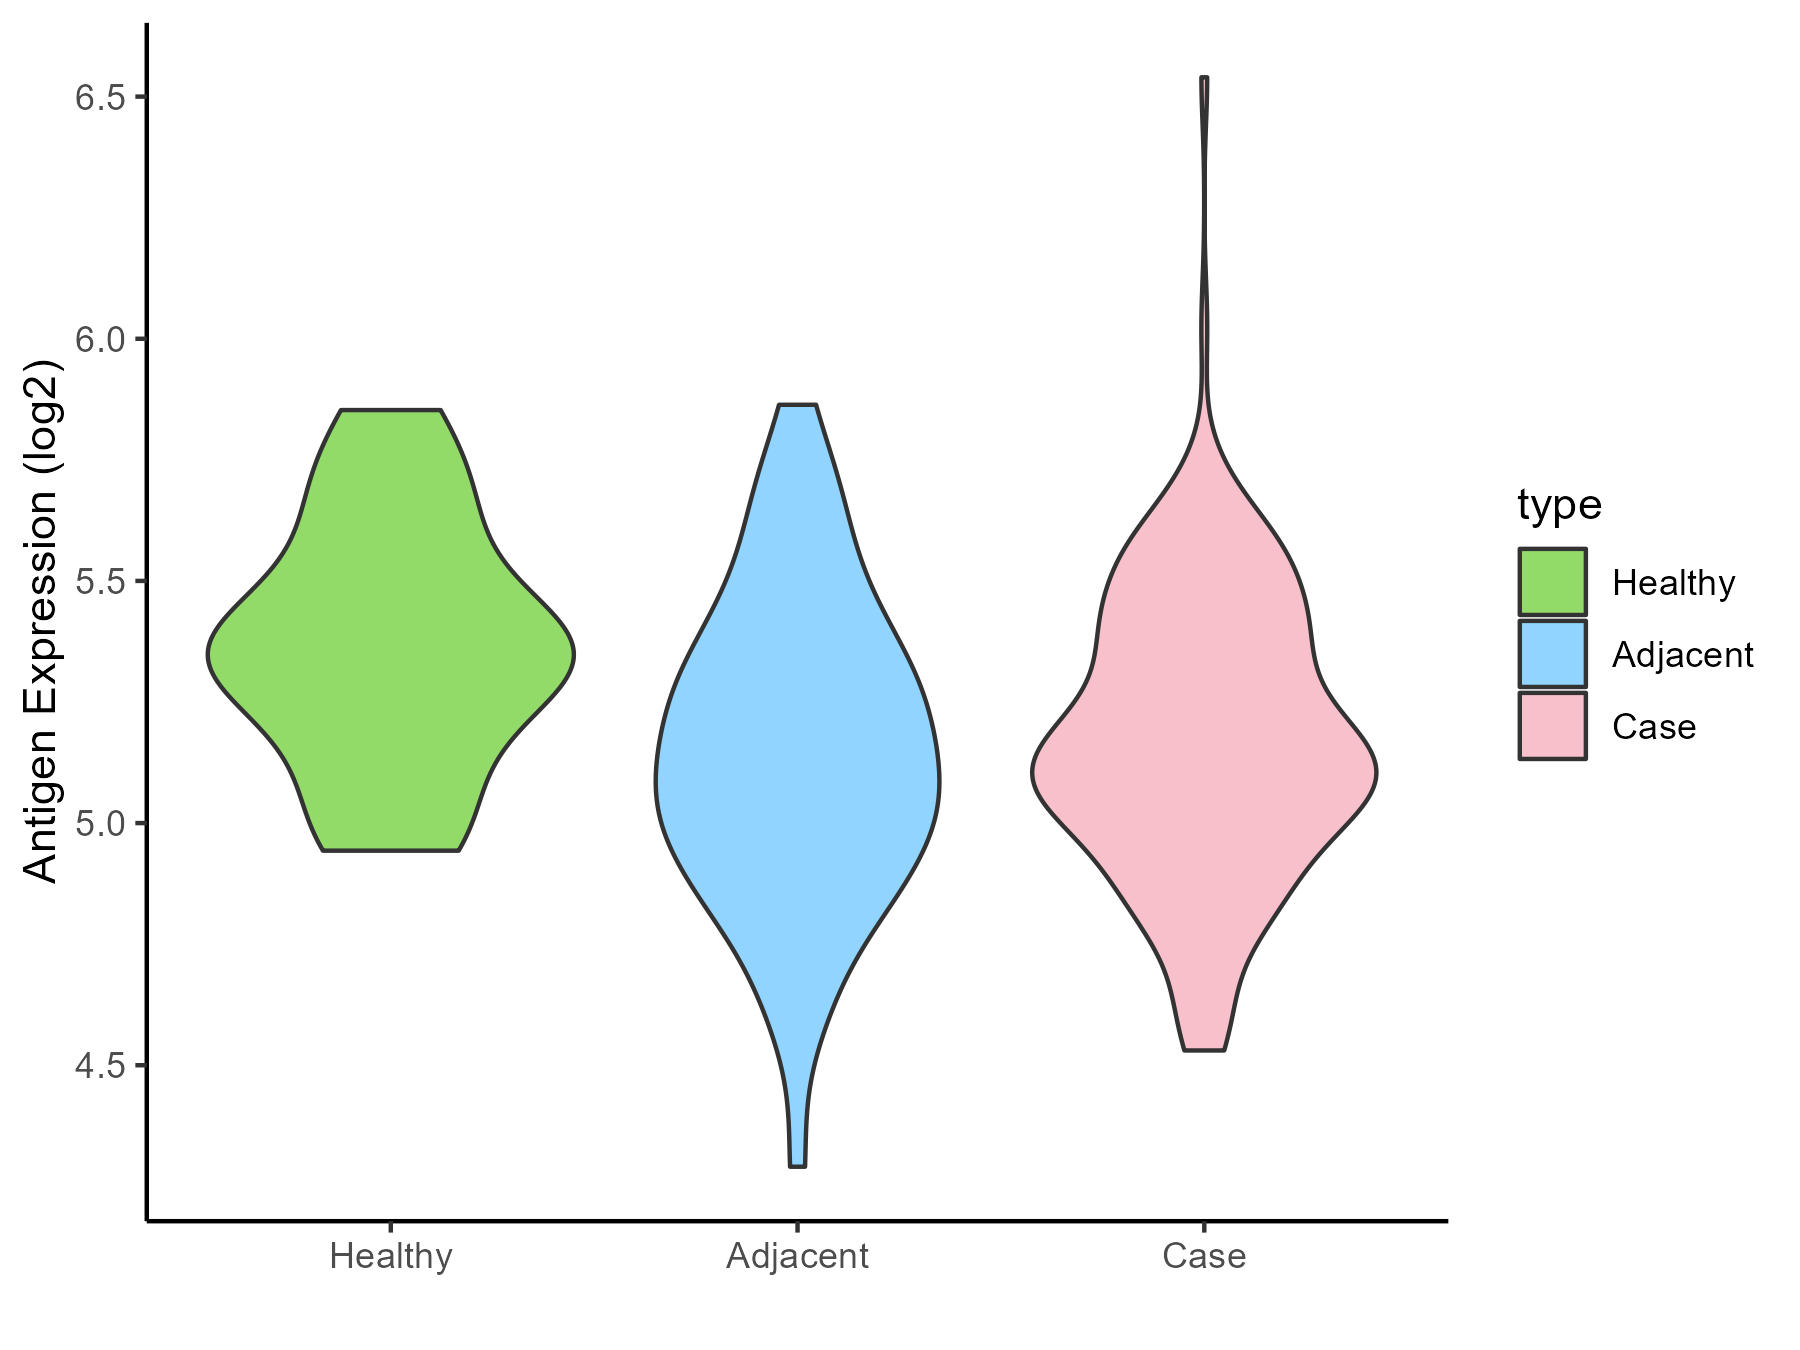
| Differential expression pattern of antigen in diseases | ||
| The Studied Tissue | Pancreas | |
| The Specific Disease | Pancreatic cancer | |
| The Expression Level of Disease Section Compare with the Healthy Individual Tissue | p-value: 0.012966549; Fold-change: -0.219416694; Z-score: -0.843049027 | |
| The Expression Level of Disease Section Compare with the Adjacent Tissue | p-value: 0.528660109; Fold-change: -0.019040539; Z-score: -0.060064828 | |
| Disease-specific Antigen Abundances |
|
Click to View the Clearer Original Diagram |
| Differential expression pattern of antigen in diseases | ||
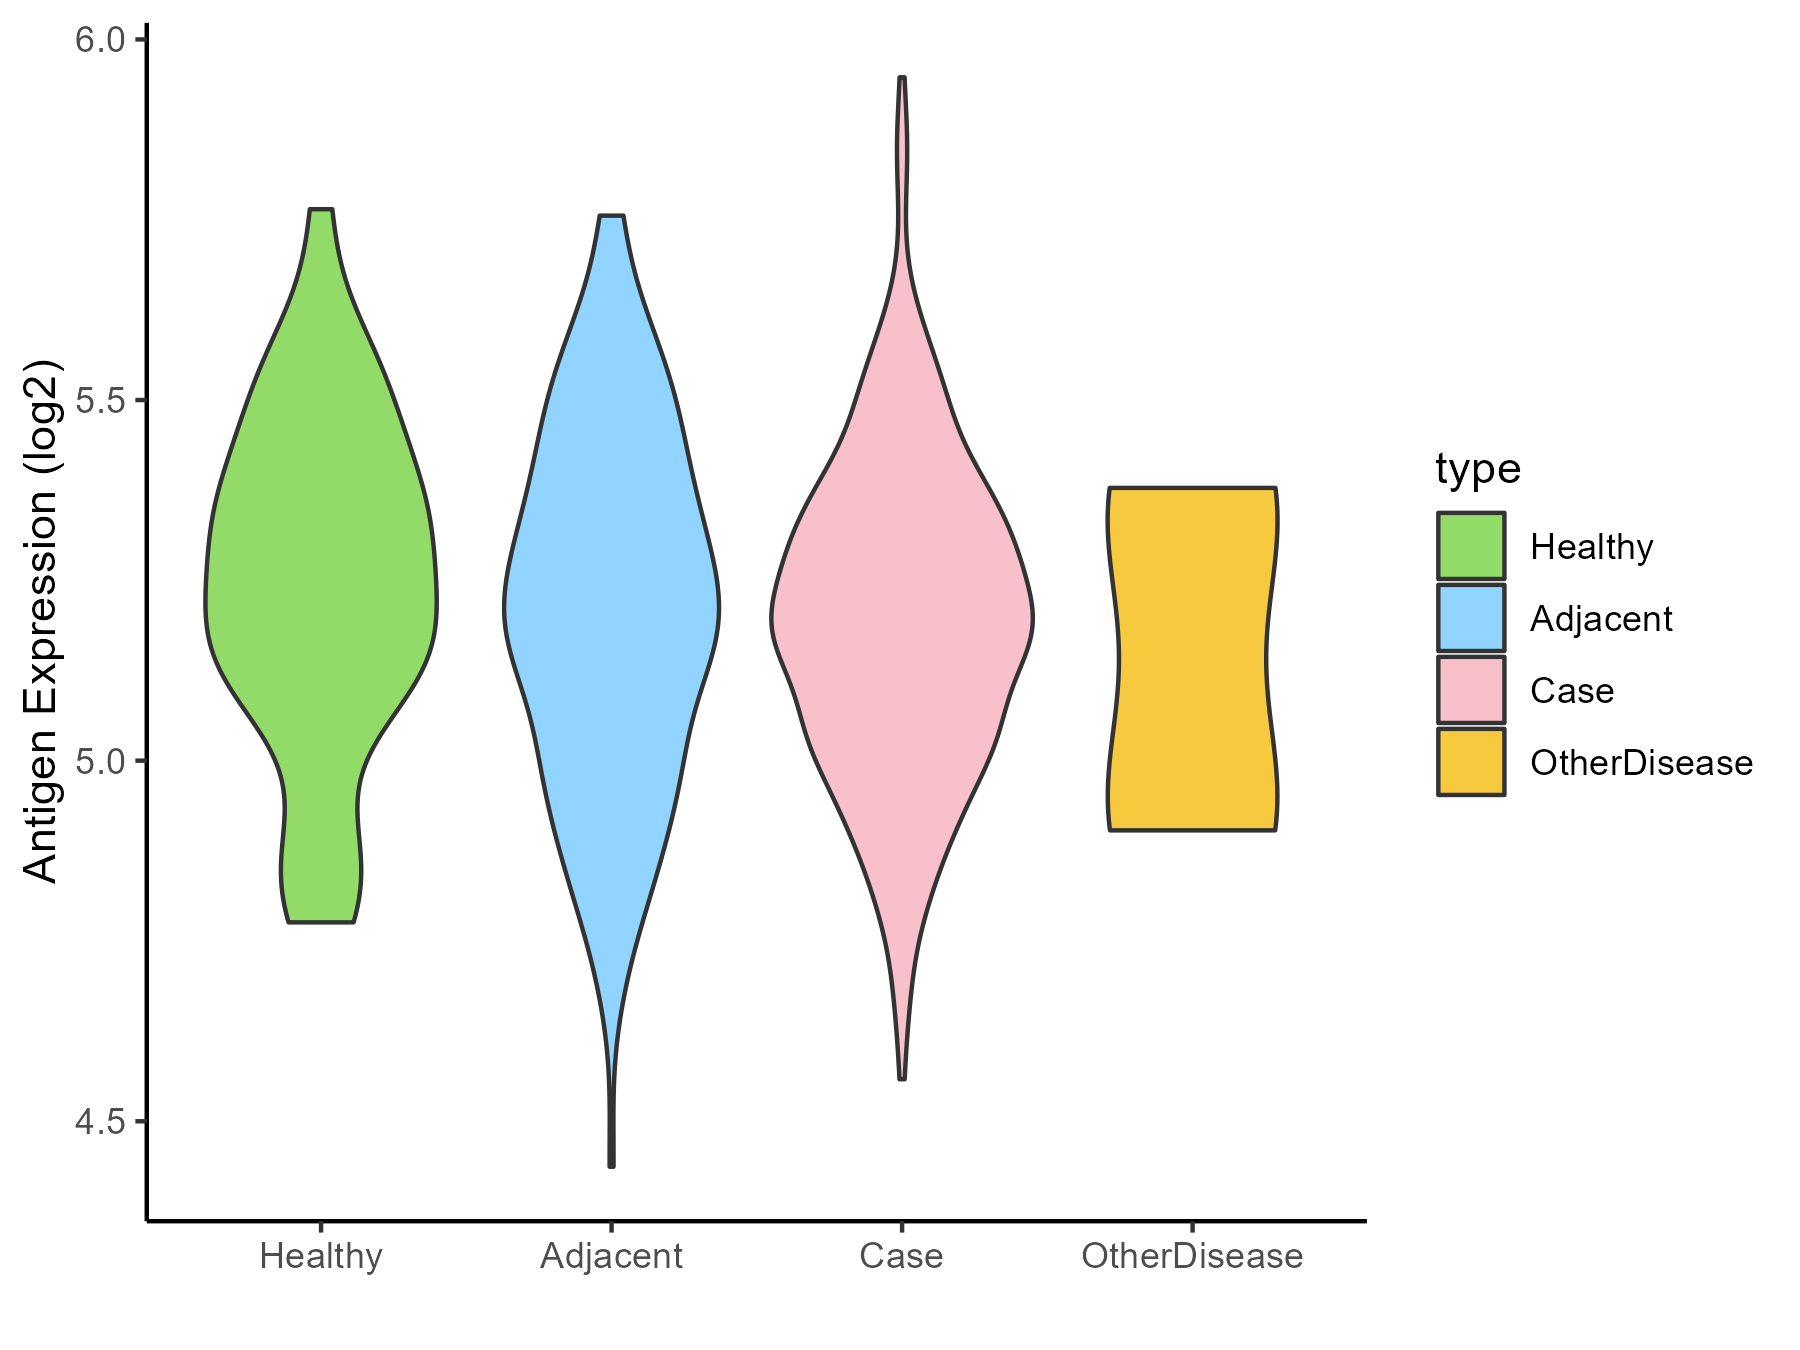
| The Studied Tissue | Liver | |
| The Specific Disease | Liver cancer | |
| The Expression Level of Disease Section Compare with the Healthy Individual Tissue | p-value: 0.162652987; Fold-change: -0.05890579; Z-score: -0.252786231 | |
| The Expression Level of Disease Section Compare with the Adjacent Tissue | p-value: 0.441488482; Fold-change: -0.017139101; Z-score: -0.068876788 | |
| The Expression Level of Disease Section Compare with the Other Disease Section | p-value: 0.704883846; Fold-change: 0.048952918; Z-score: 0.194760877 | |
| Disease-specific Antigen Abundances |
|
Click to View the Clearer Original Diagram |
| Differential expression pattern of antigen in diseases | ||
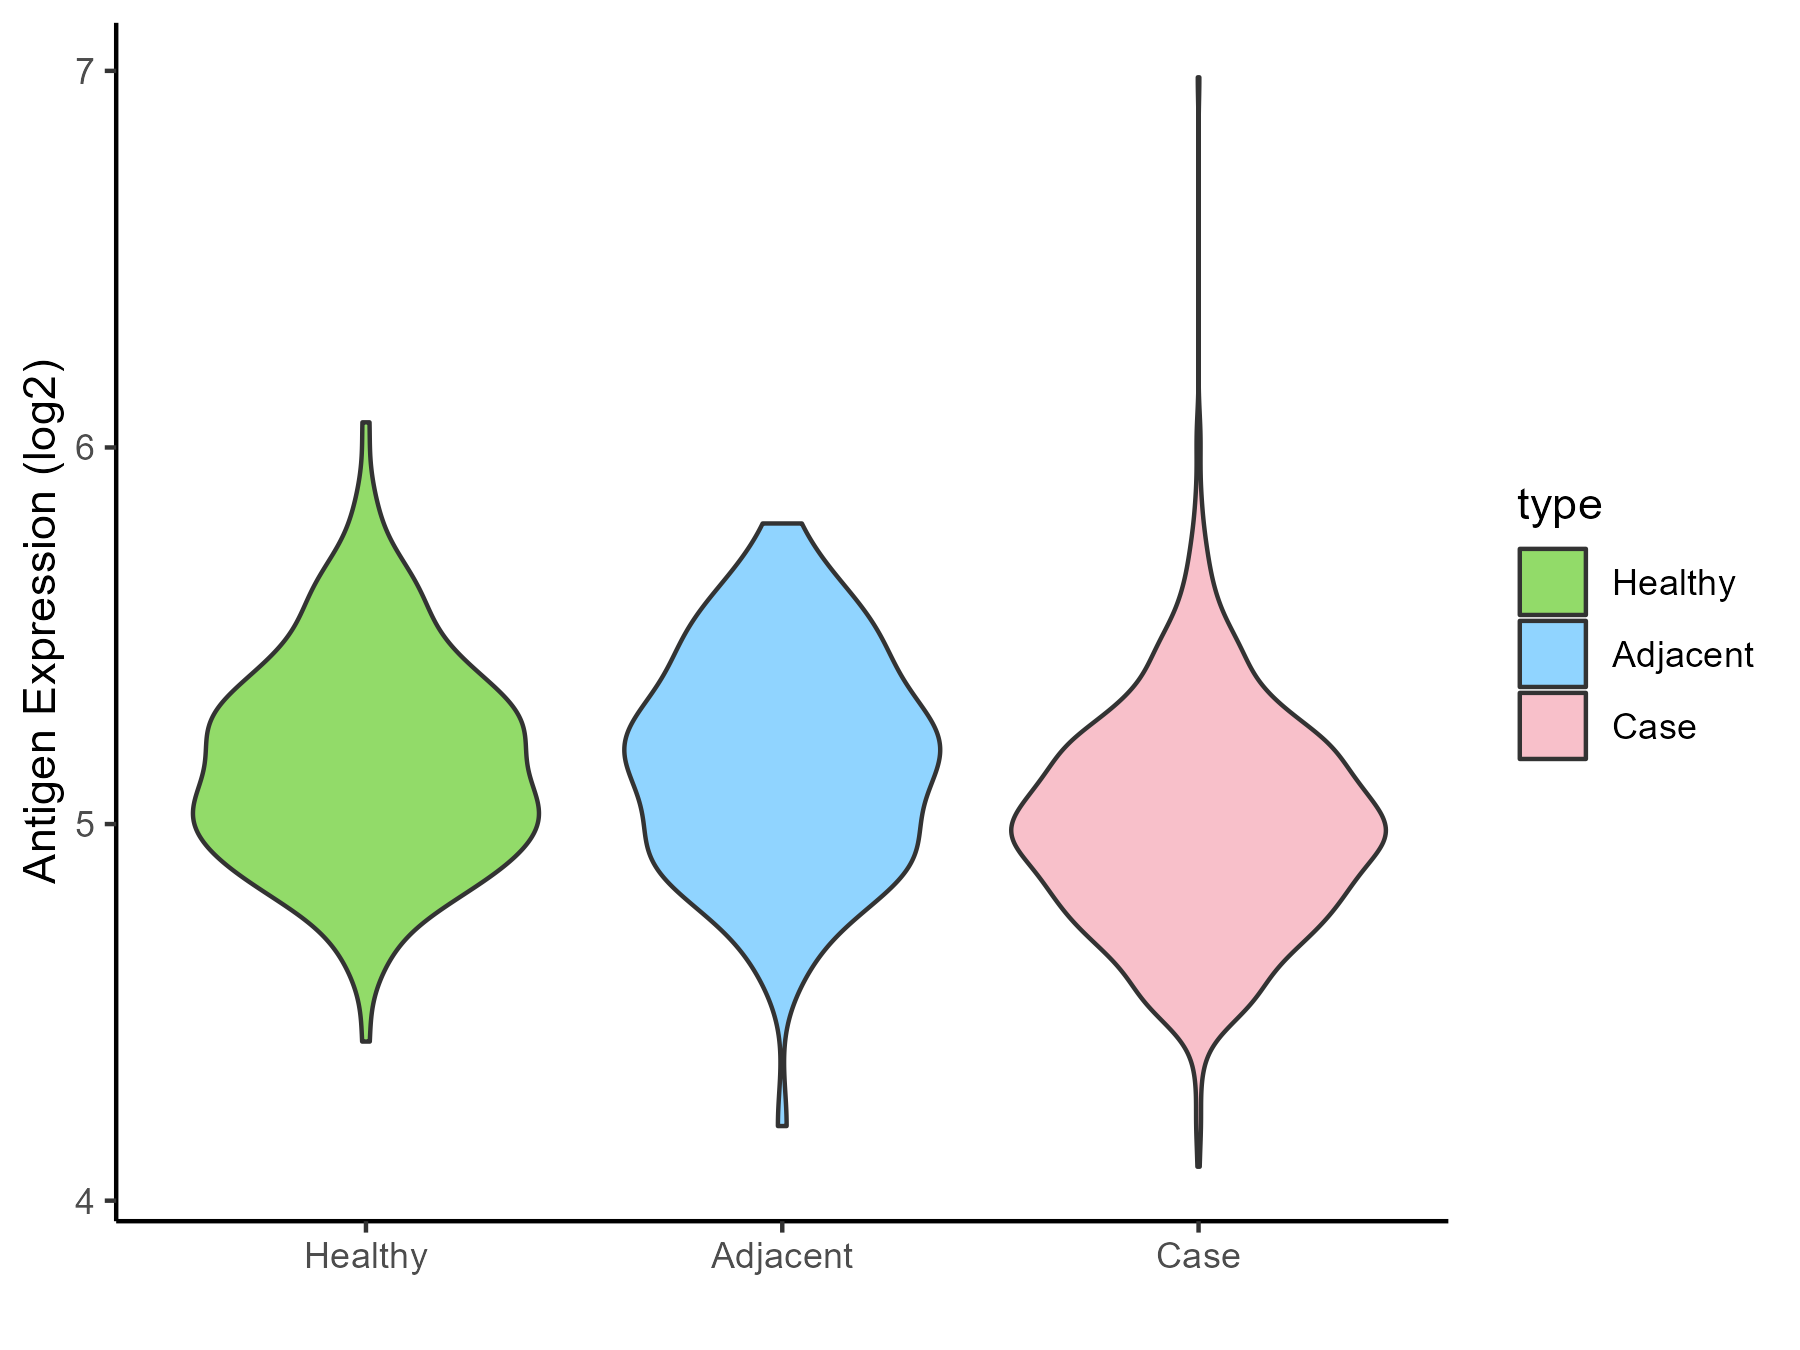
| The Studied Tissue | Lung | |
| The Specific Disease | Lung cancer | |
| The Expression Level of Disease Section Compare with the Healthy Individual Tissue | p-value: 1.13E-12; Fold-change: -0.152861102; Z-score: -0.556958122 | |
| The Expression Level of Disease Section Compare with the Adjacent Tissue | p-value: 4.18E-08; Fold-change: -0.177942344; Z-score: -0.612413638 | |
| Disease-specific Antigen Abundances |
|
Click to View the Clearer Original Diagram |
| Differential expression pattern of antigen in diseases | ||
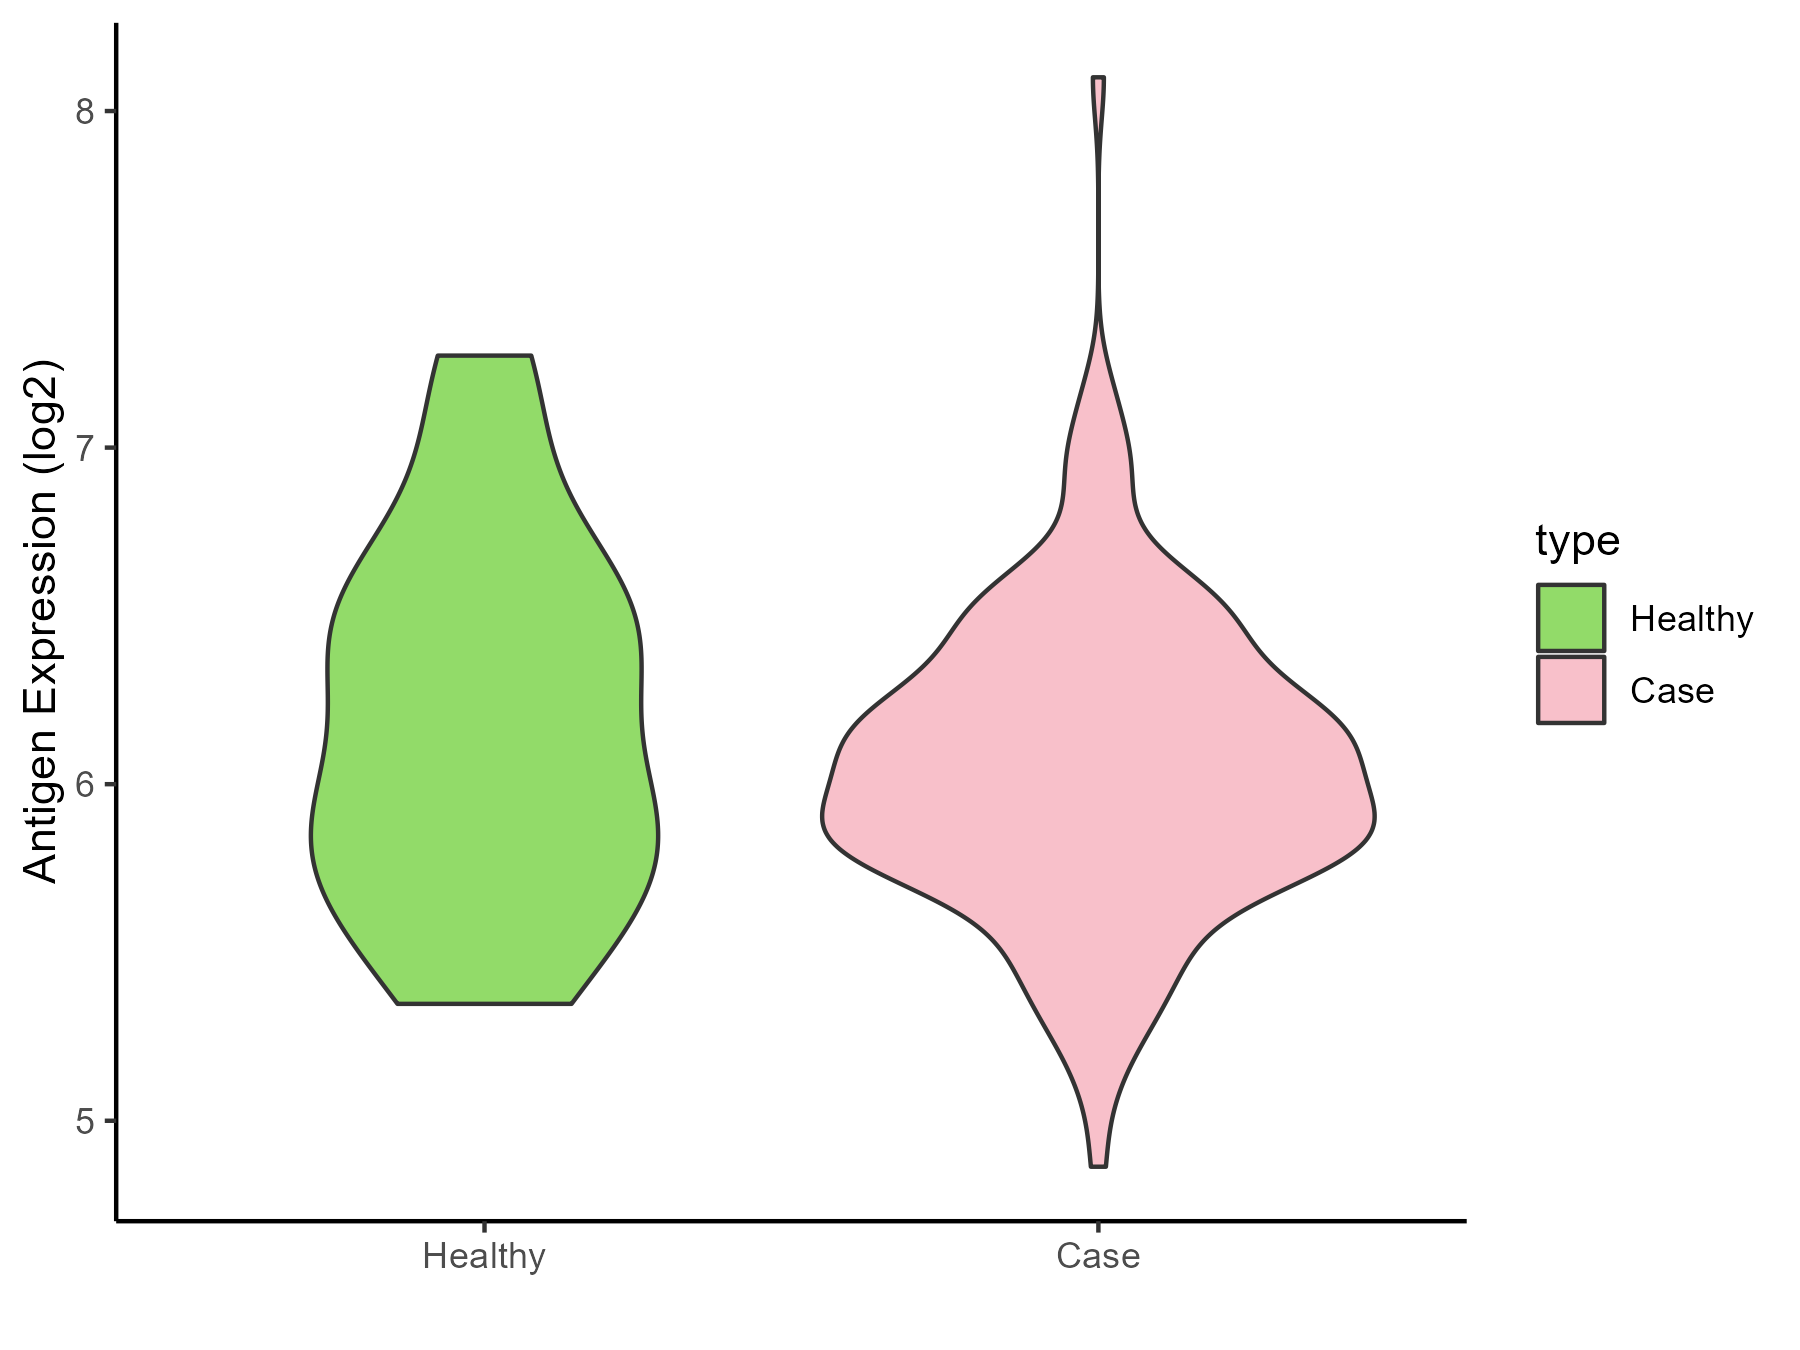
| The Studied Tissue | Skin | |
| The Specific Disease | Melanoma | |
| The Expression Level of Disease Section Compare with the Healthy Individual Tissue | p-value: 0.303627253; Fold-change: -0.044207857; Z-score: -0.081203153 | |
| Disease-specific Antigen Abundances |
|
Click to View the Clearer Original Diagram |
| Differential expression pattern of antigen in diseases | ||
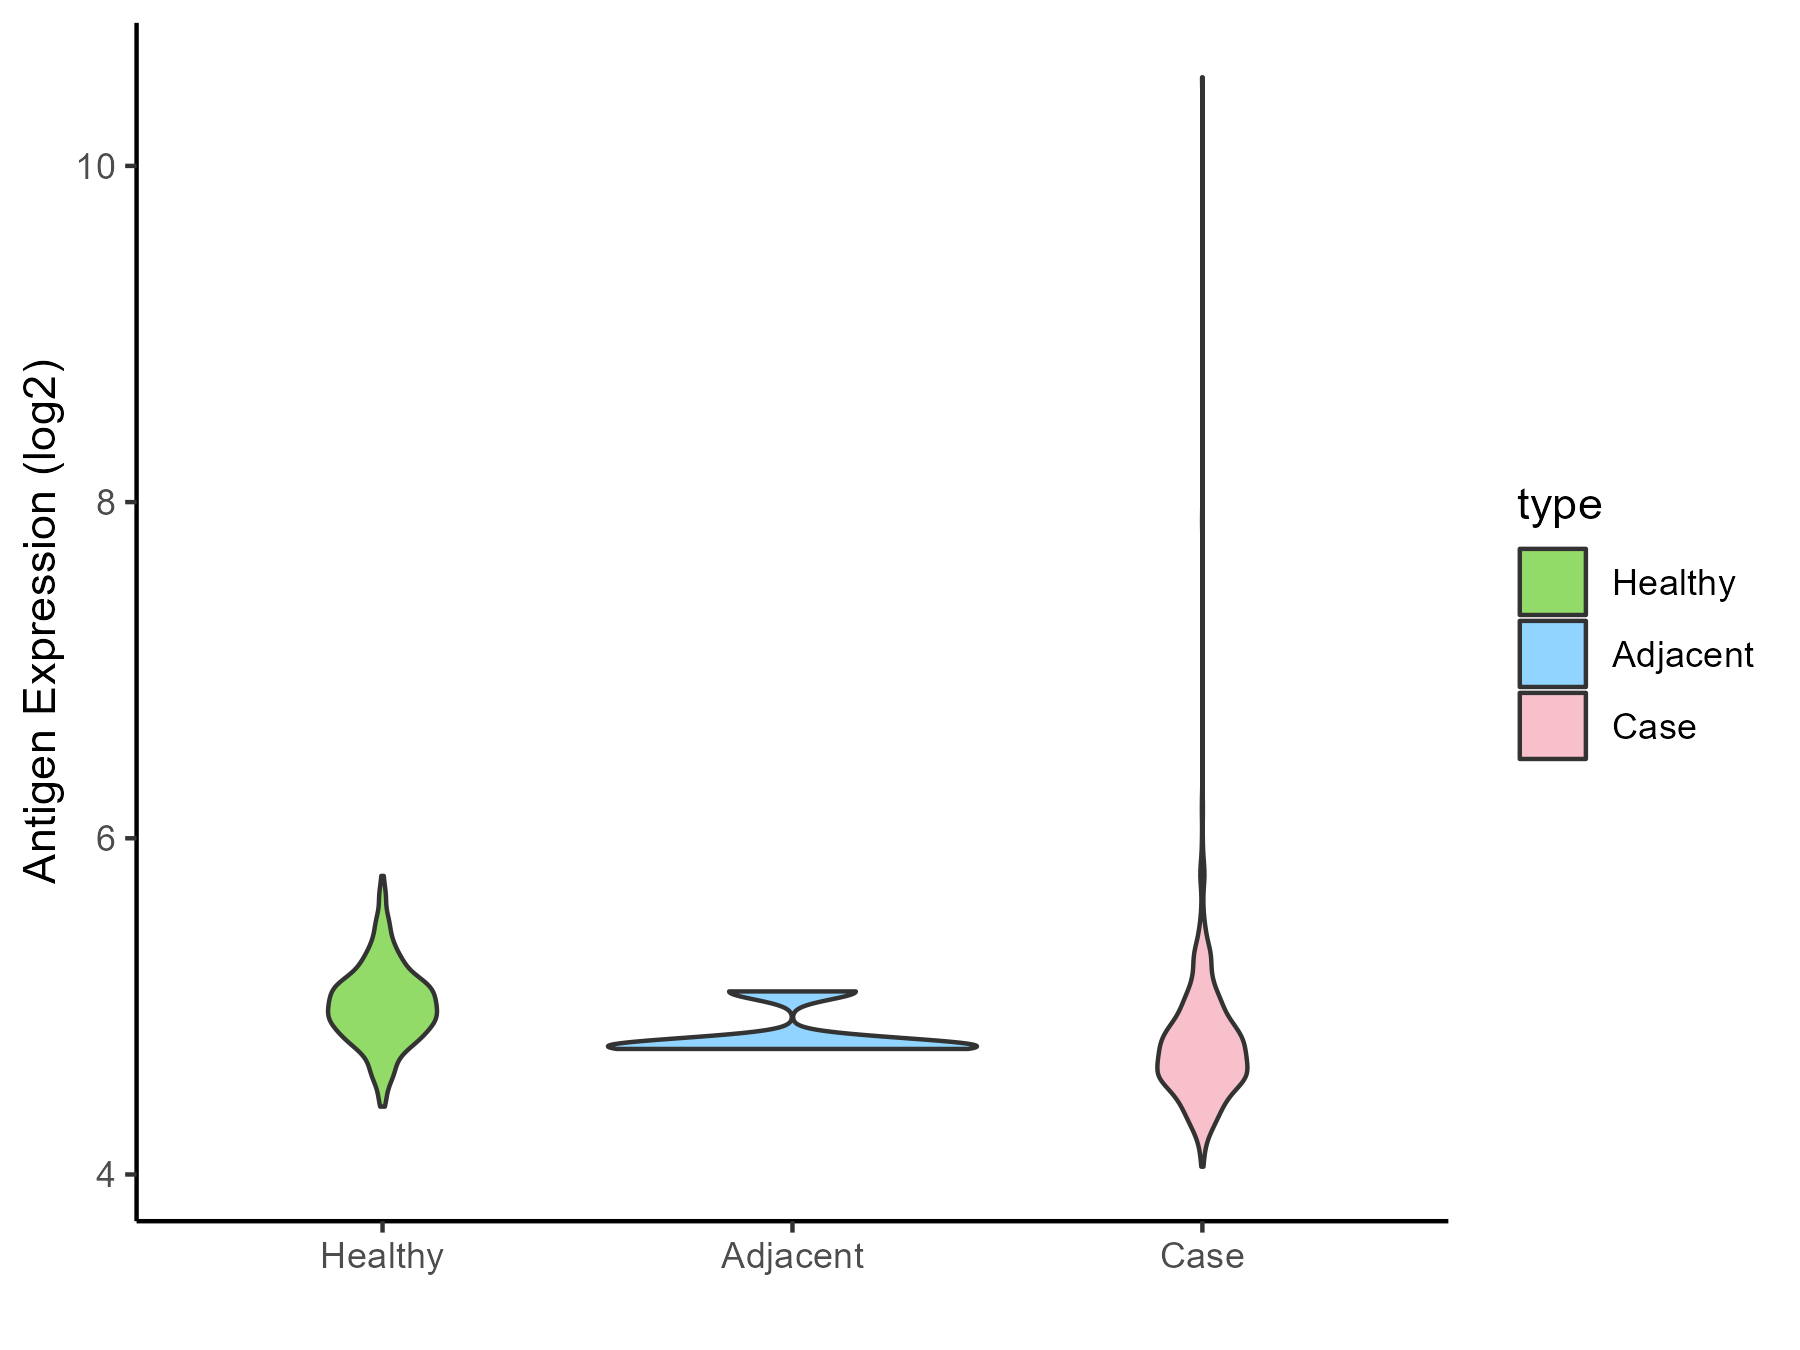
| The Studied Tissue | Muscle | |
| The Specific Disease | Sarcoma | |
| The Expression Level of Disease Section Compare with the Healthy Individual Tissue | p-value: 9.10E-27; Fold-change: -0.275794353; Z-score: -1.165908432 | |
| The Expression Level of Disease Section Compare with the Adjacent Tissue | p-value: 0.49100039; Fold-change: -0.051914848; Z-score: -0.316761624 | |
| Disease-specific Antigen Abundances |
|
Click to View the Clearer Original Diagram |
| Differential expression pattern of antigen in diseases | ||
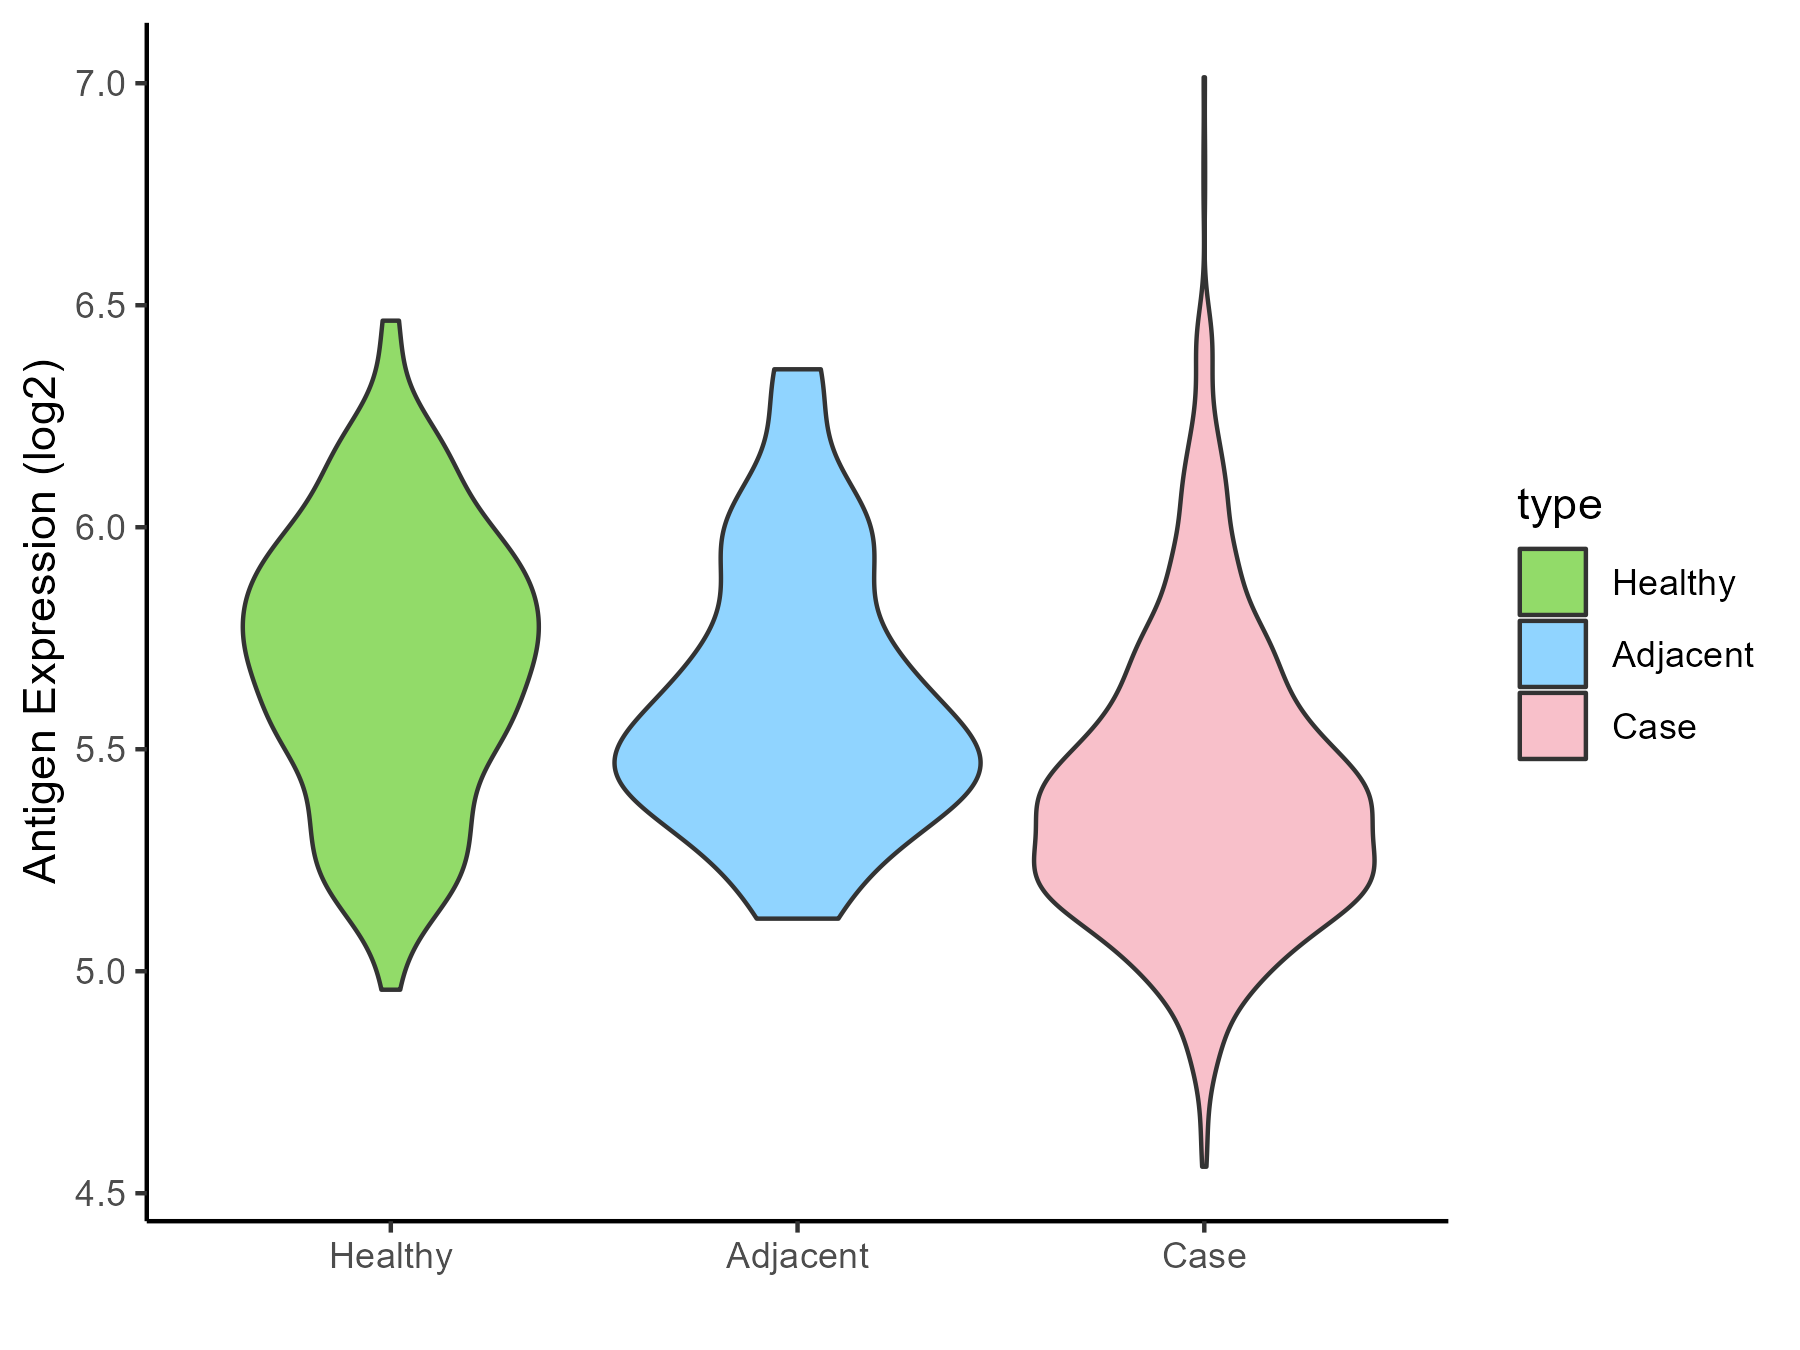
| The Studied Tissue | Breast | |
| The Specific Disease | Breast cancer | |
| The Expression Level of Disease Section Compare with the Healthy Individual Tissue | p-value: 1.19E-33; Fold-change: -0.339449158; Z-score: -1.093399025 | |
| The Expression Level of Disease Section Compare with the Adjacent Tissue | p-value: 1.48E-05; Fold-change: -0.156597256; Z-score: -0.516495598 | |
| Disease-specific Antigen Abundances |
|
Click to View the Clearer Original Diagram |
| Differential expression pattern of antigen in diseases | ||
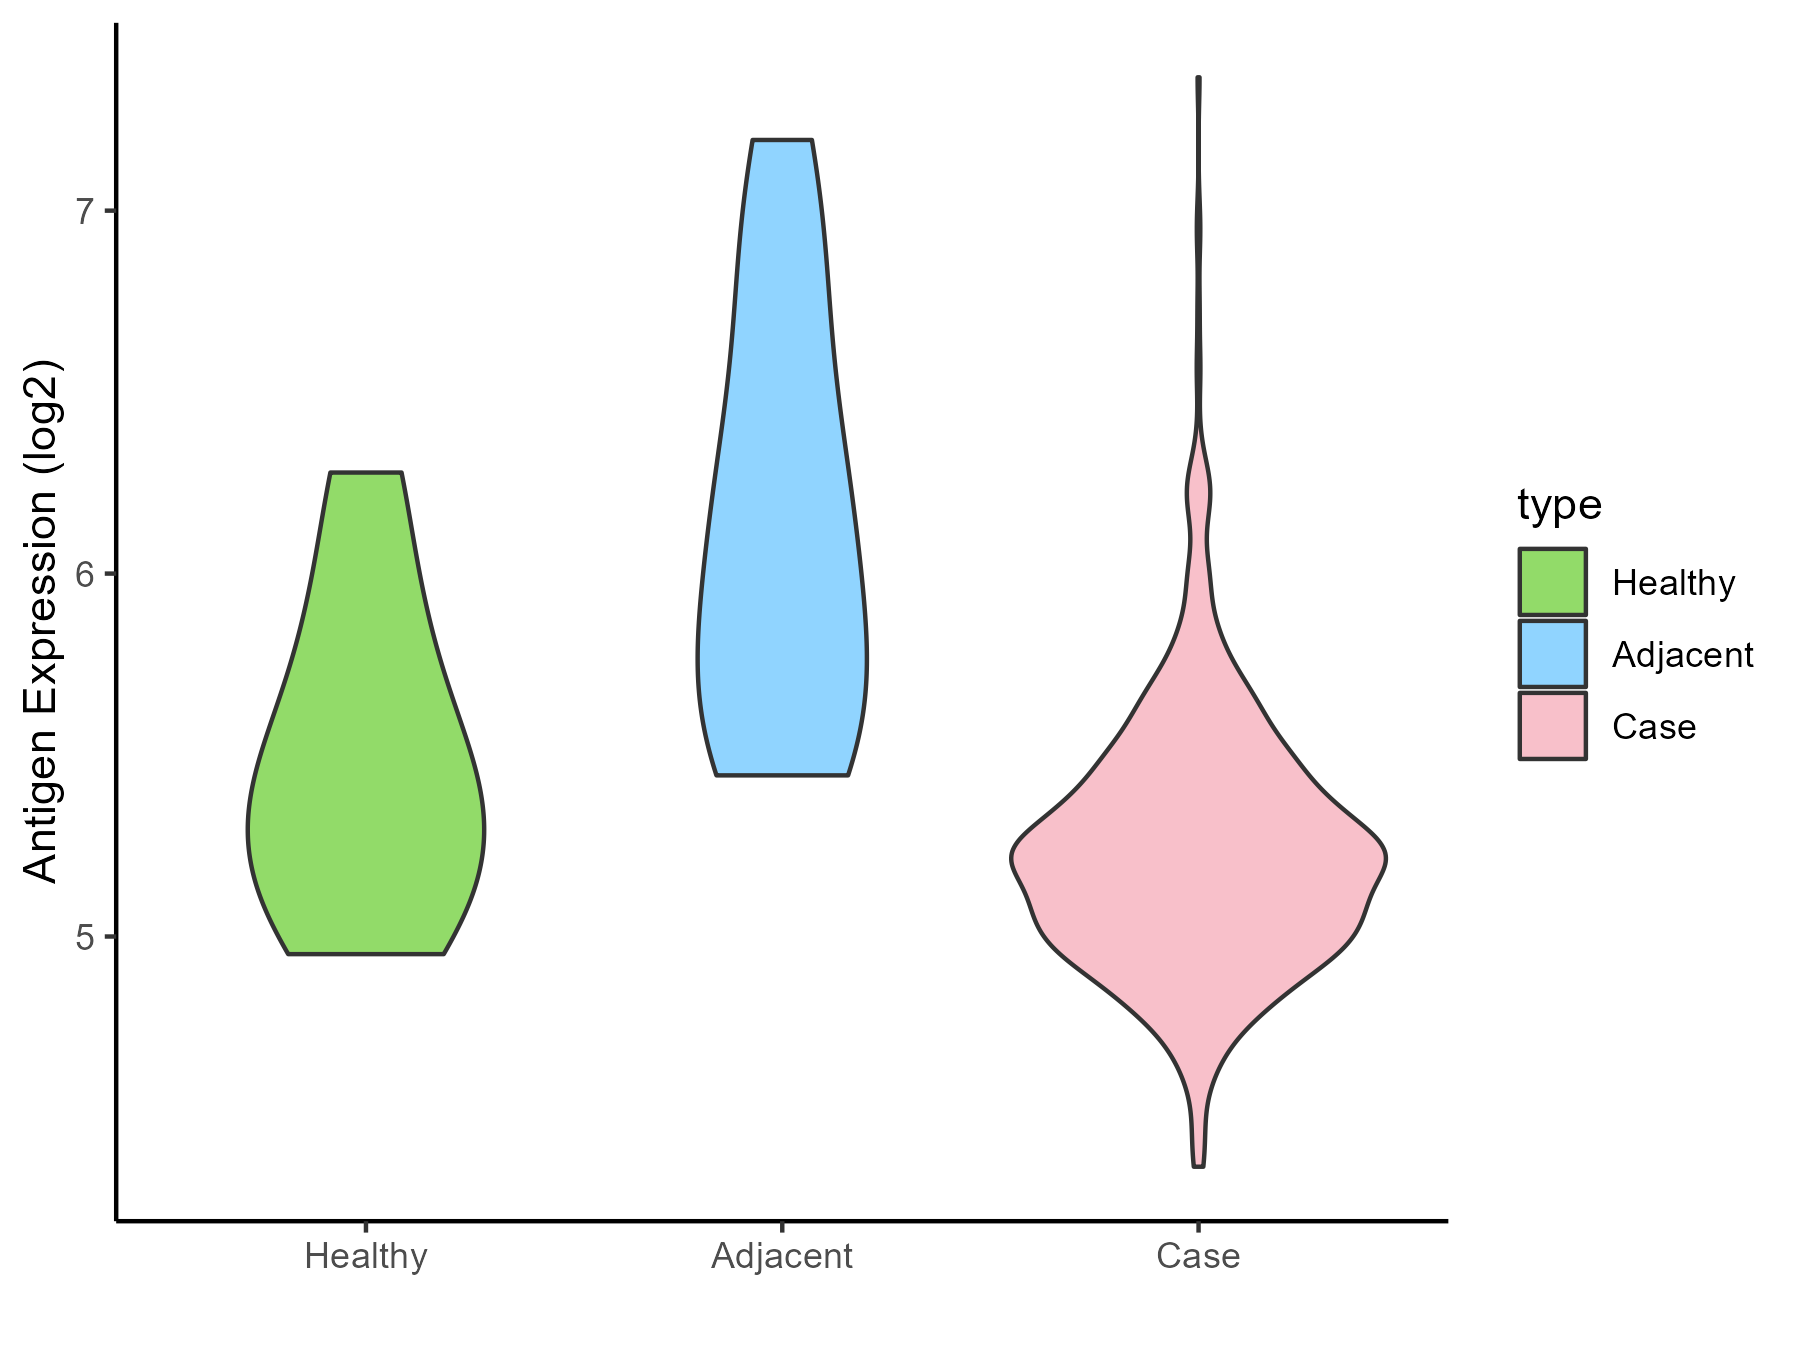
| The Studied Tissue | Ovarian | |
| The Specific Disease | Ovarian cancer | |
| The Expression Level of Disease Section Compare with the Healthy Individual Tissue | p-value: 0.132466265; Fold-change: -0.203634435; Z-score: -0.475774805 | |
| The Expression Level of Disease Section Compare with the Adjacent Tissue | p-value: 5.90E-05; Fold-change: -0.867540294; Z-score: -1.512561858 | |
| Disease-specific Antigen Abundances |
|
Click to View the Clearer Original Diagram |
| Differential expression pattern of antigen in diseases | ||
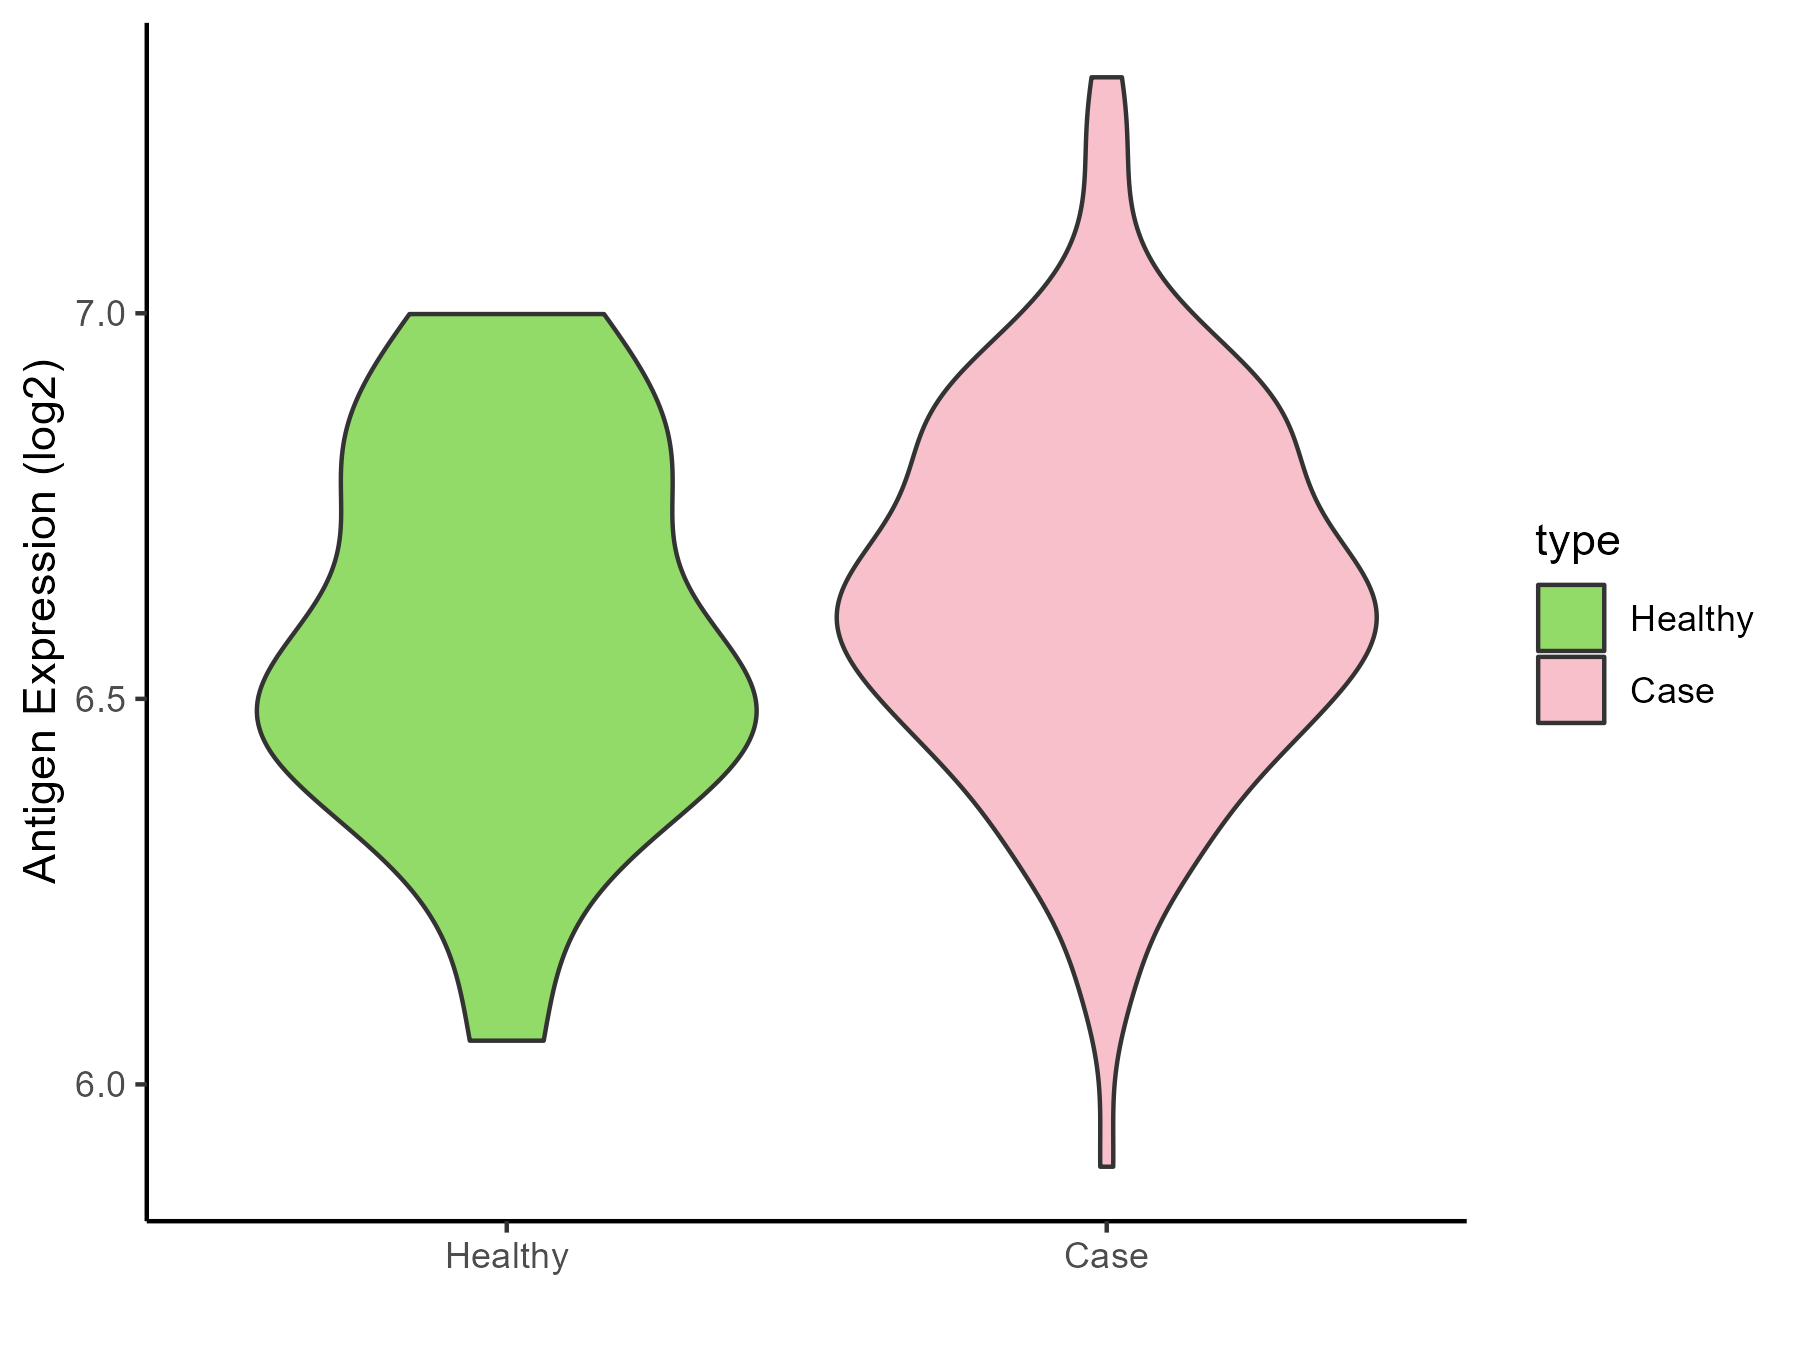
| The Studied Tissue | Cervical | |
| The Specific Disease | Cervical cancer | |
| The Expression Level of Disease Section Compare with the Healthy Individual Tissue | p-value: 0.39978478; Fold-change: 0.106372011; Z-score: 0.427798316 | |
| Disease-specific Antigen Abundances |
|
Click to View the Clearer Original Diagram |
| Differential expression pattern of antigen in diseases | ||
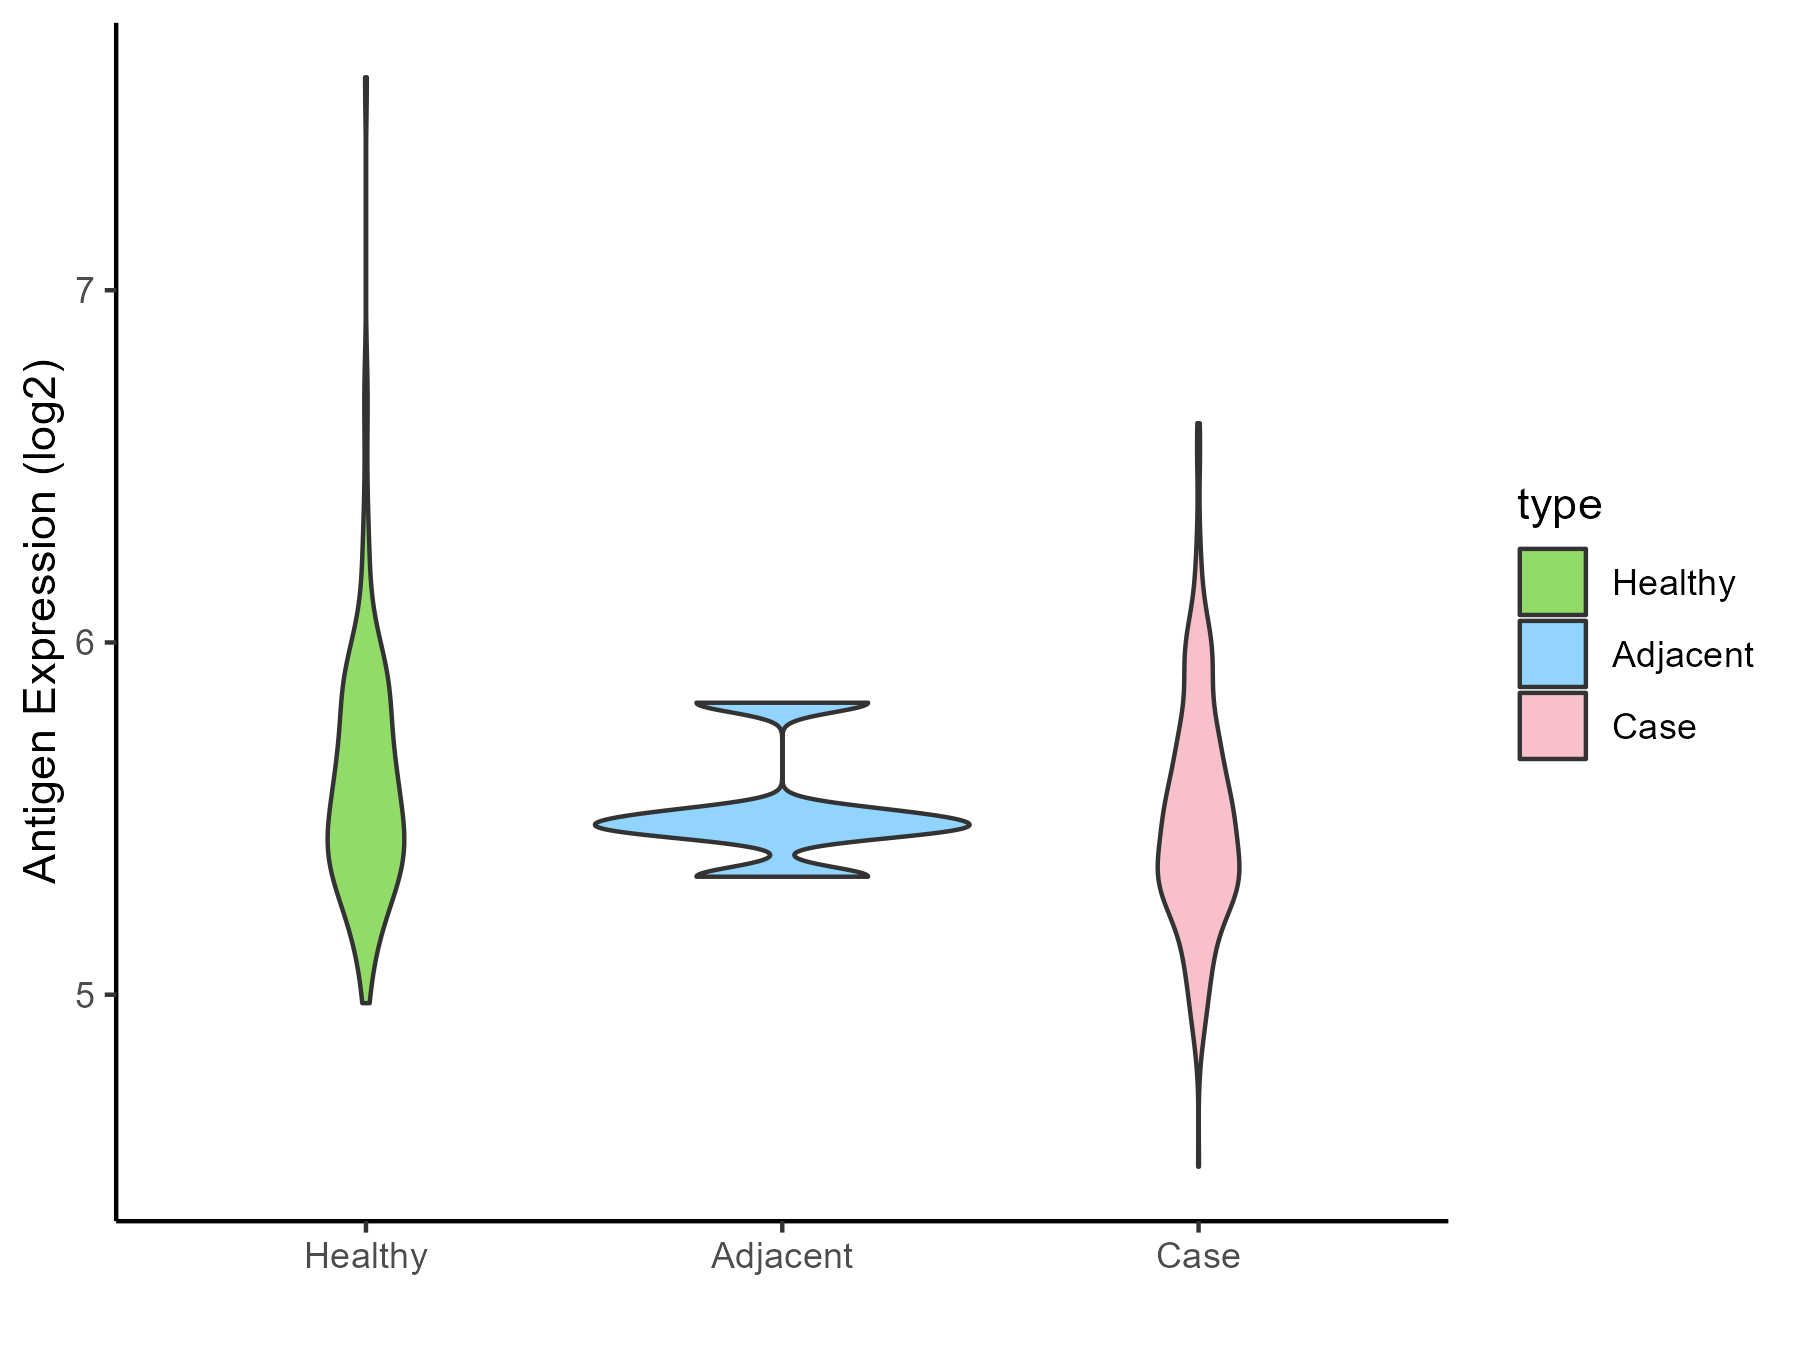
| The Studied Tissue | Endometrium | |
| The Specific Disease | Uterine cancer | |
| The Expression Level of Disease Section Compare with the Healthy Individual Tissue | p-value: 0.002233541; Fold-change: -0.098172738; Z-score: -0.270463761 | |
| The Expression Level of Disease Section Compare with the Adjacent Tissue | p-value: 0.788833232; Fold-change: -0.024185905; Z-score: -0.131855384 | |
| Disease-specific Antigen Abundances |
|
Click to View the Clearer Original Diagram |
| Differential expression pattern of antigen in diseases | ||
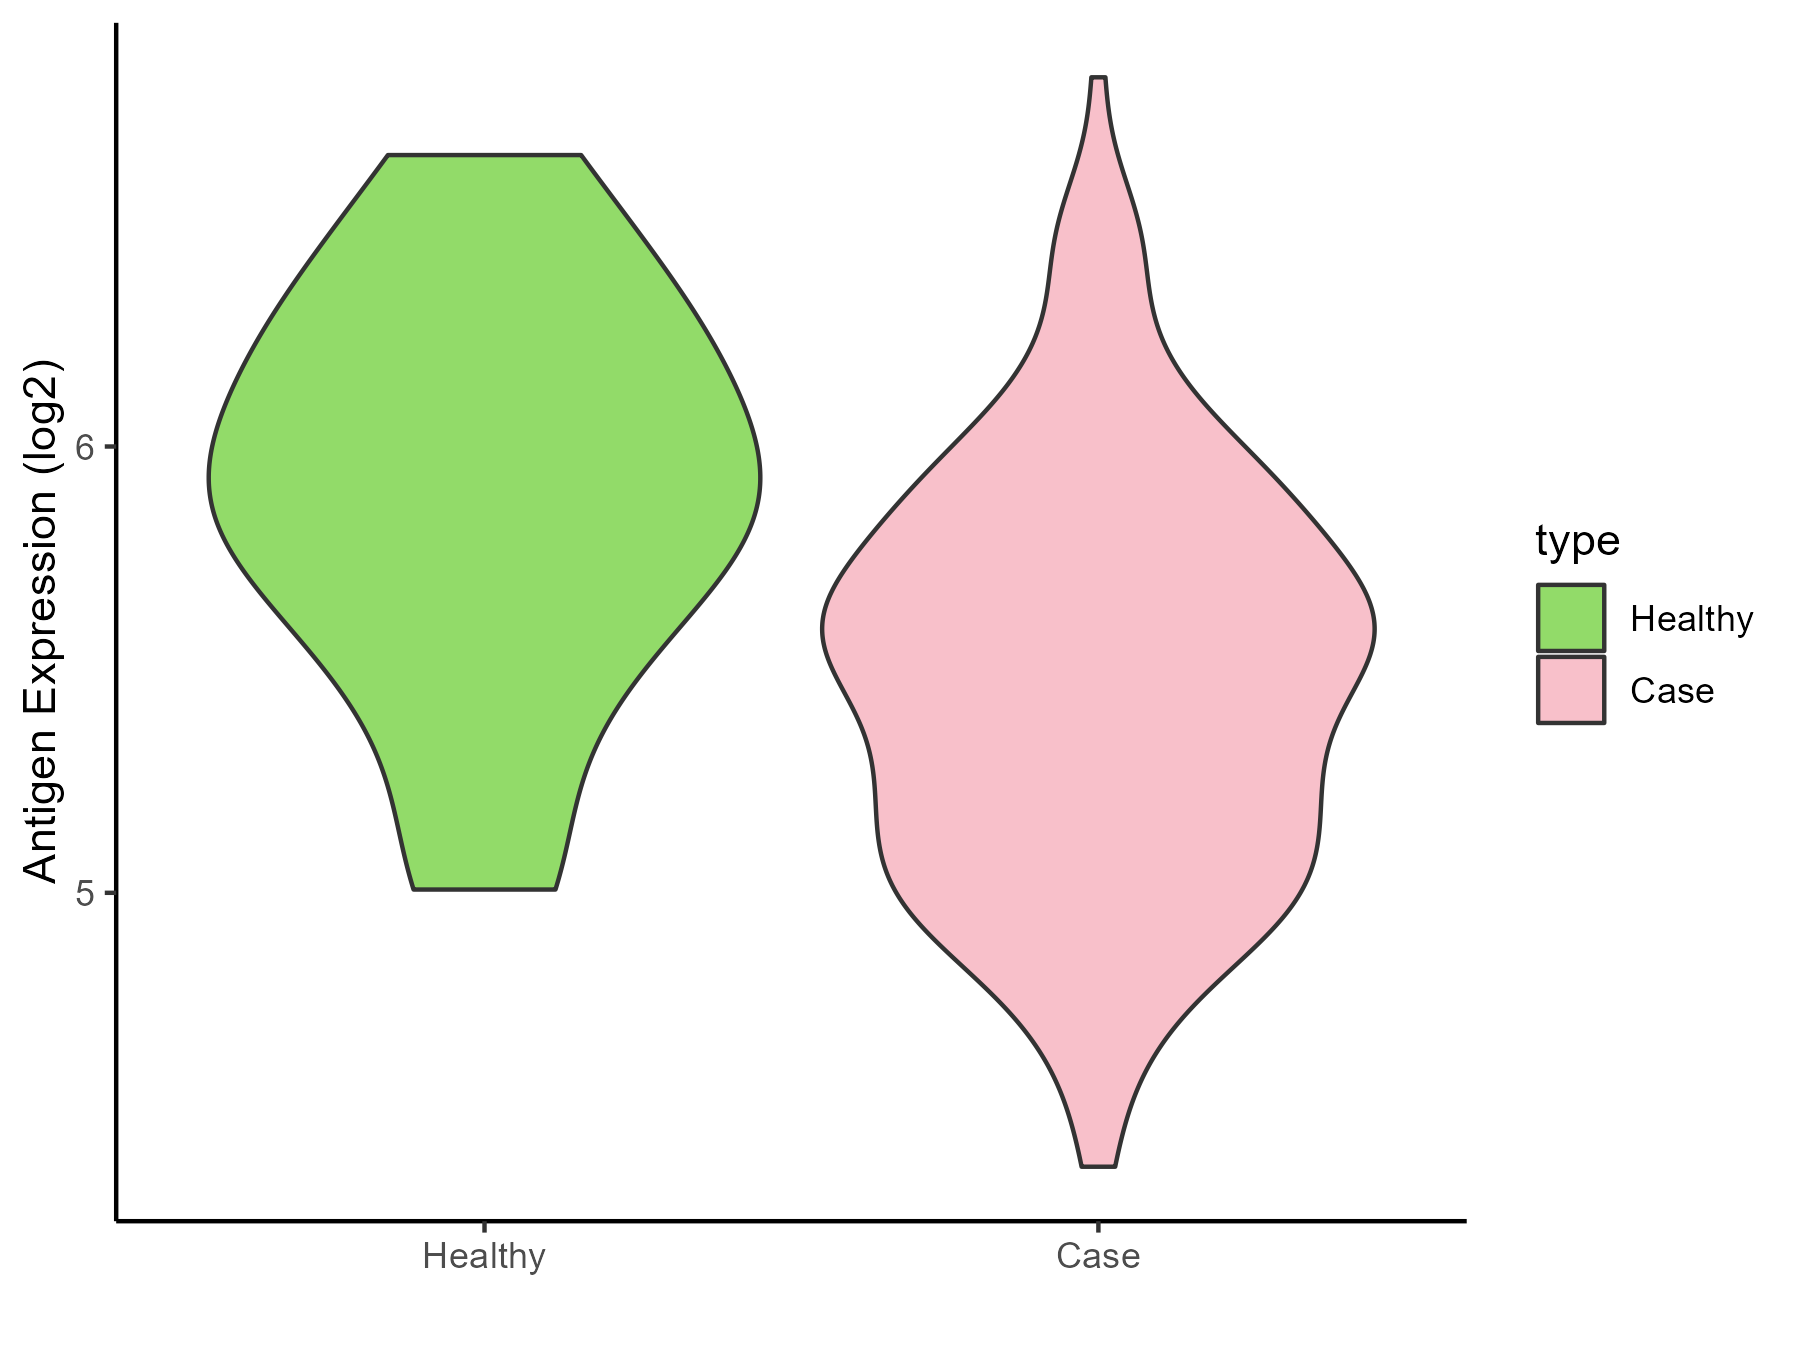
| The Studied Tissue | Prostate | |
| The Specific Disease | Prostate cancer | |
| The Expression Level of Disease Section Compare with the Healthy Individual Tissue | p-value: 0.000400405; Fold-change: -0.382848452; Z-score: -0.851255482 | |
| Disease-specific Antigen Abundances |
|
Click to View the Clearer Original Diagram |
| Differential expression pattern of antigen in diseases | ||
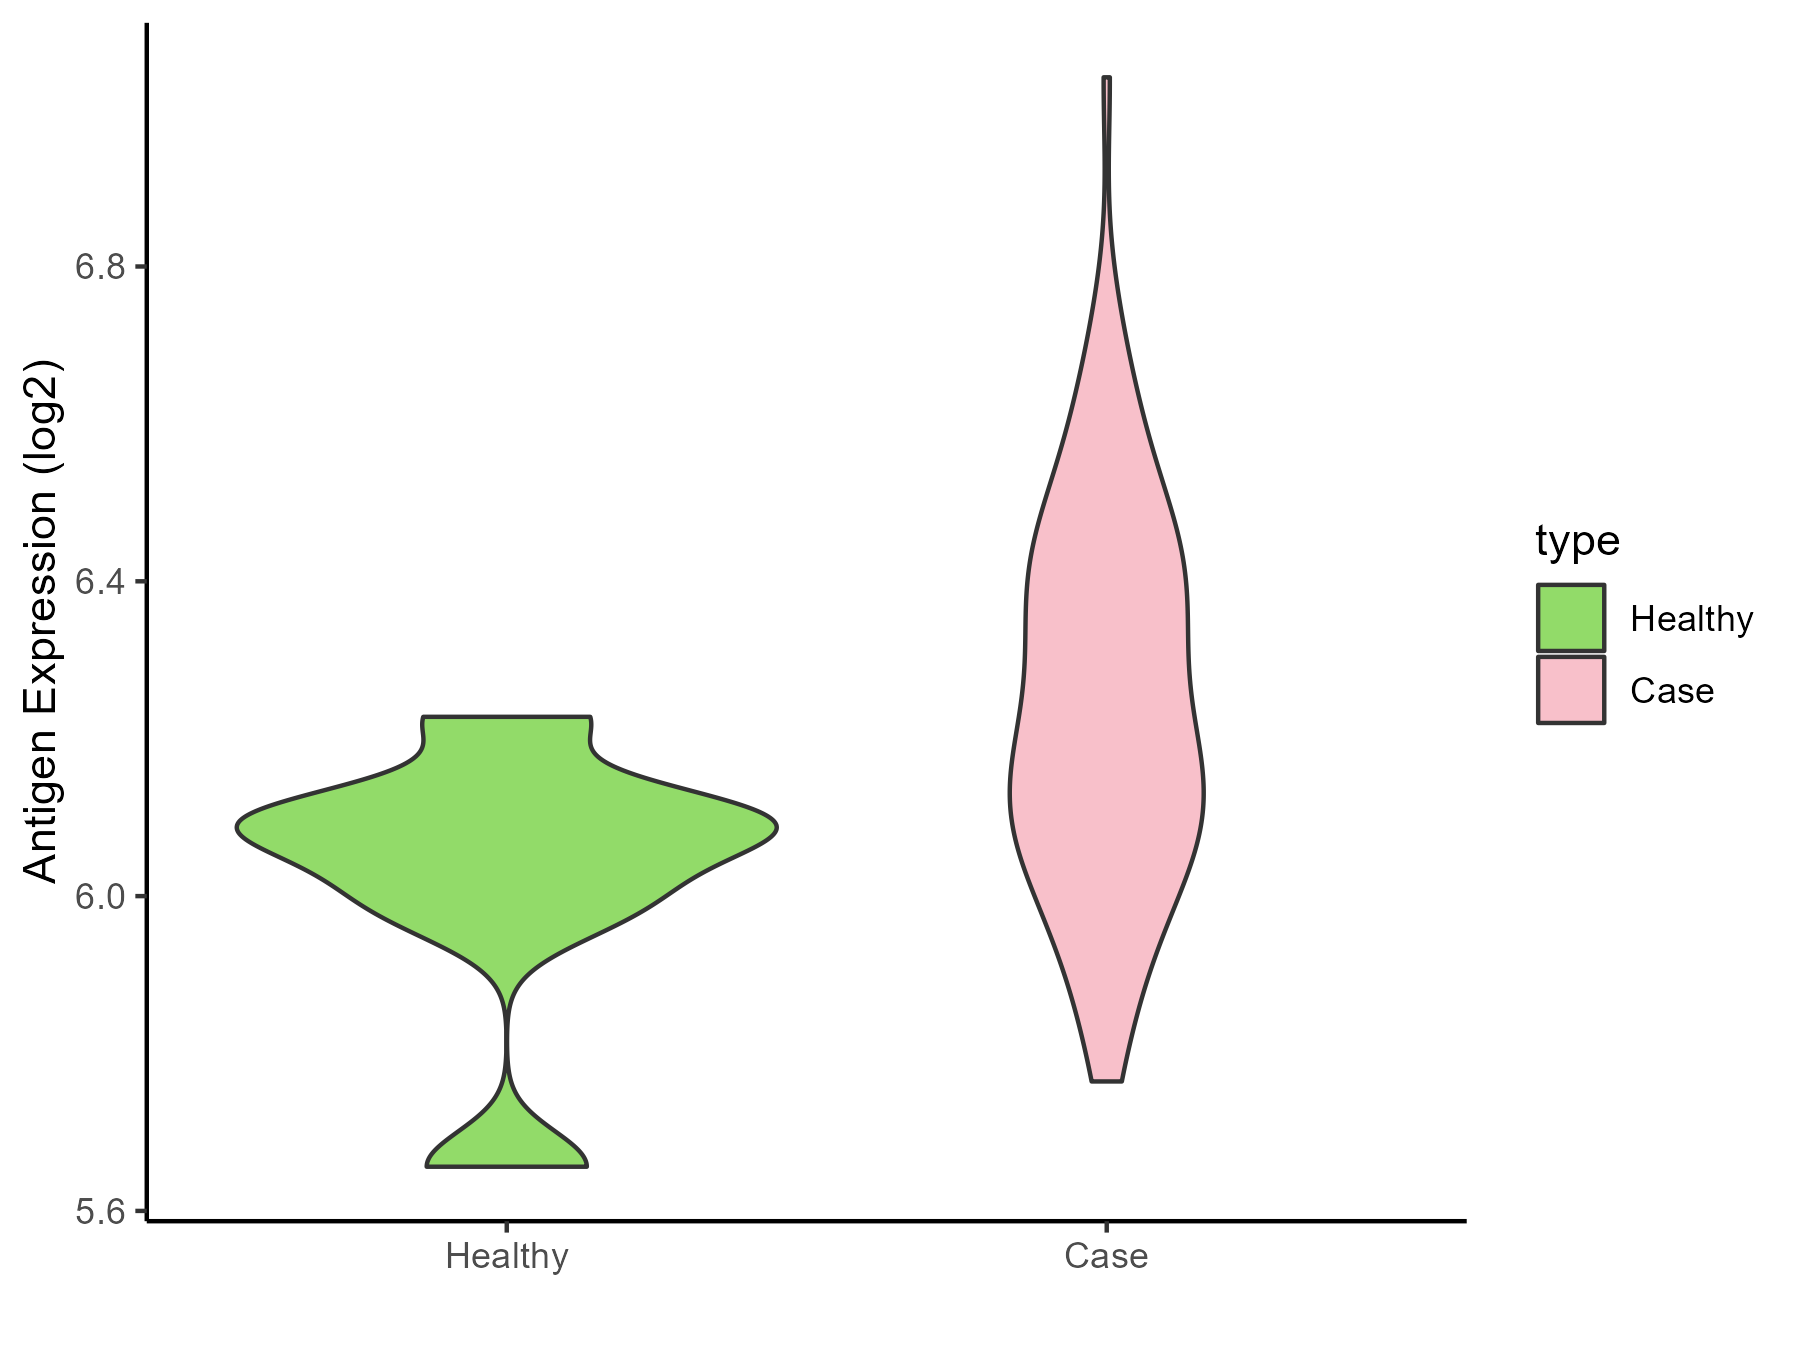
| The Studied Tissue | Bladder | |
| The Specific Disease | Bladder cancer | |
| The Expression Level of Disease Section Compare with the Healthy Individual Tissue | p-value: 0.015560926; Fold-change: 0.122160345; Z-score: 0.677235096 | |
| Disease-specific Antigen Abundances |
|
Click to View the Clearer Original Diagram |
| Differential expression pattern of antigen in diseases | ||
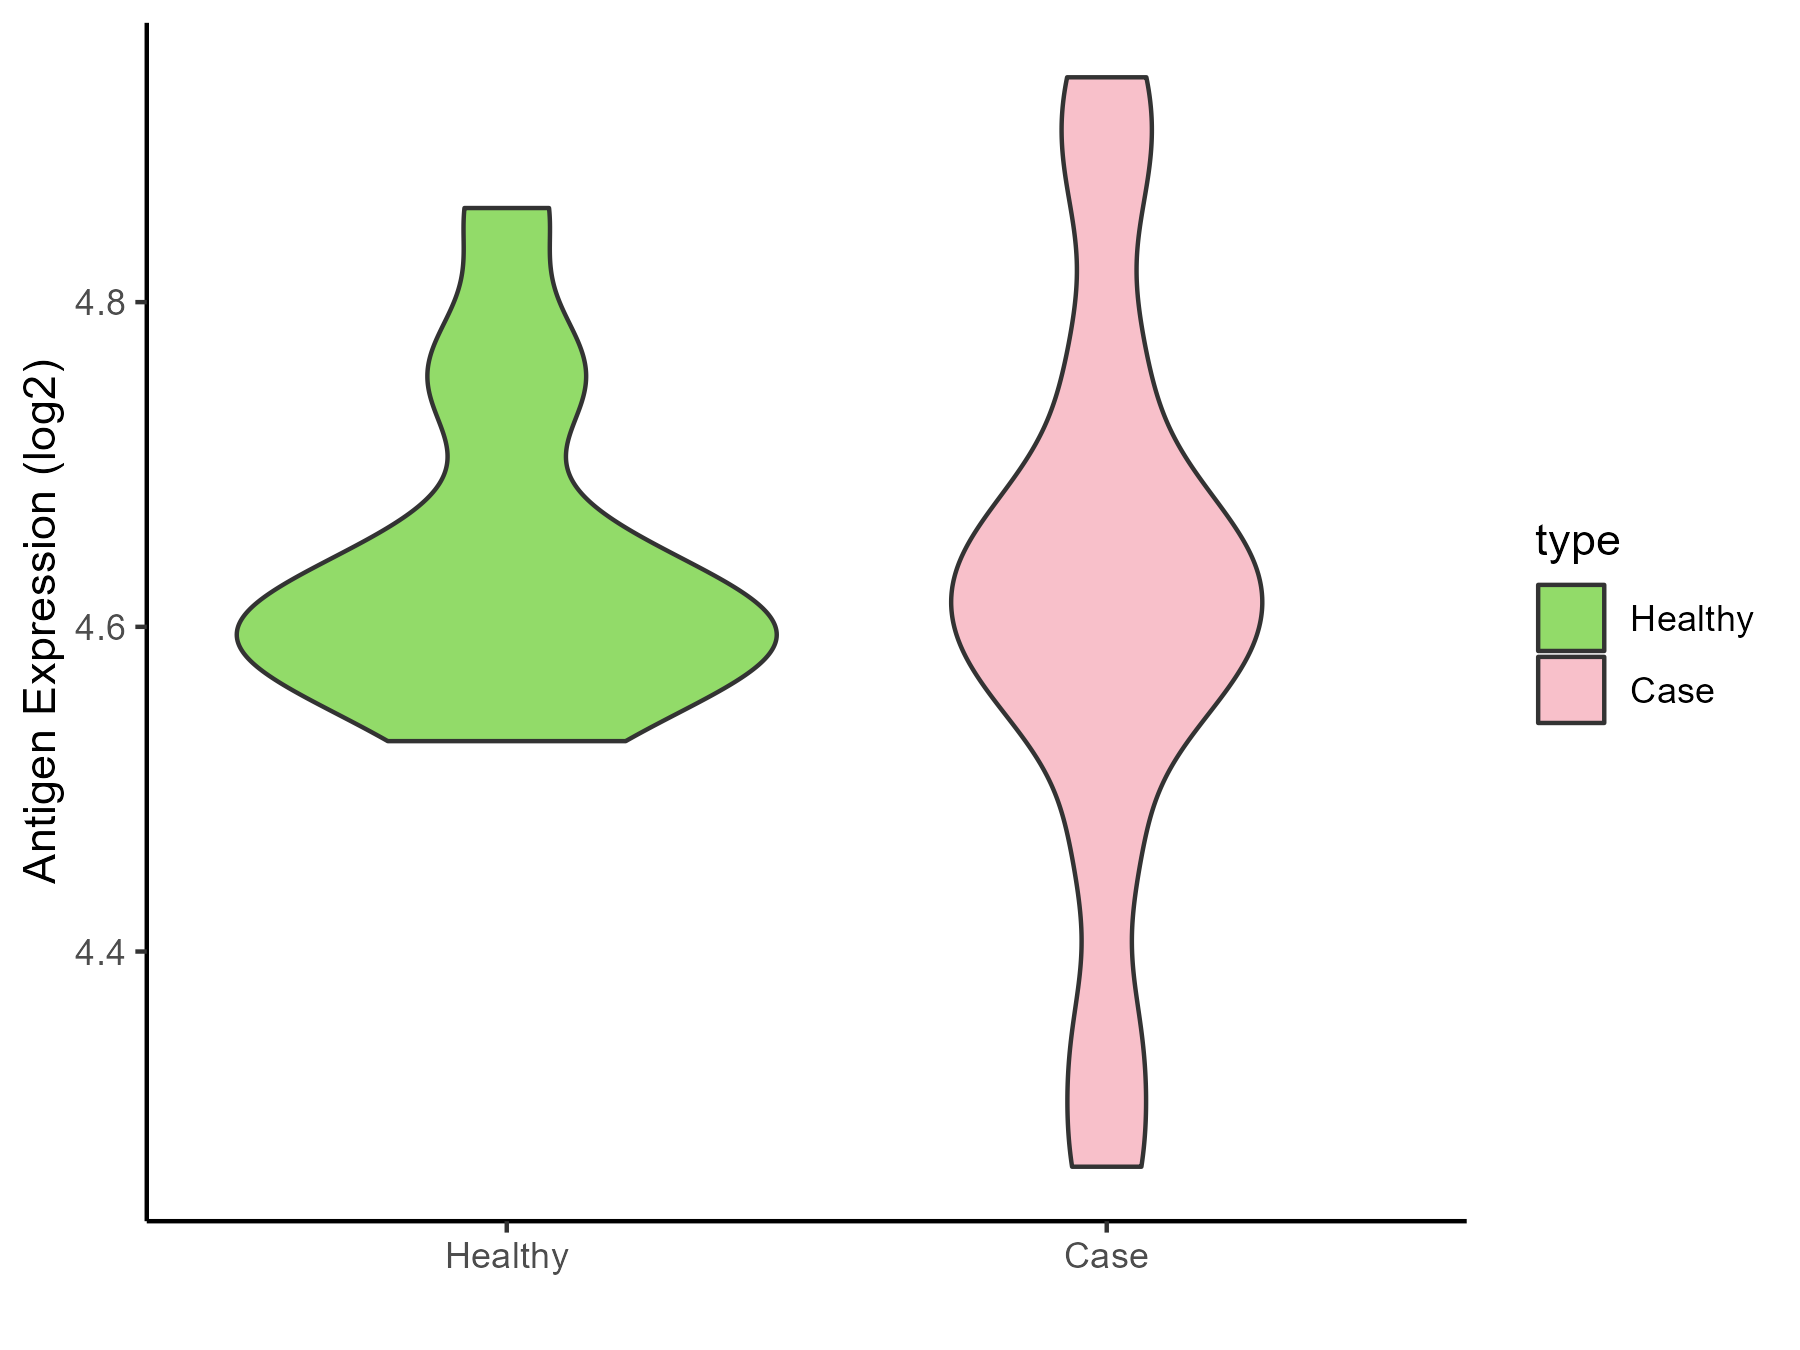
| The Studied Tissue | Uvea | |
| The Specific Disease | Retinoblastoma tumor | |
| The Expression Level of Disease Section Compare with the Healthy Individual Tissue | p-value: 0.615336538; Fold-change: 0.018973746; Z-score: 0.195913525 | |
| Disease-specific Antigen Abundances |
|
Click to View the Clearer Original Diagram |
| Differential expression pattern of antigen in diseases | ||
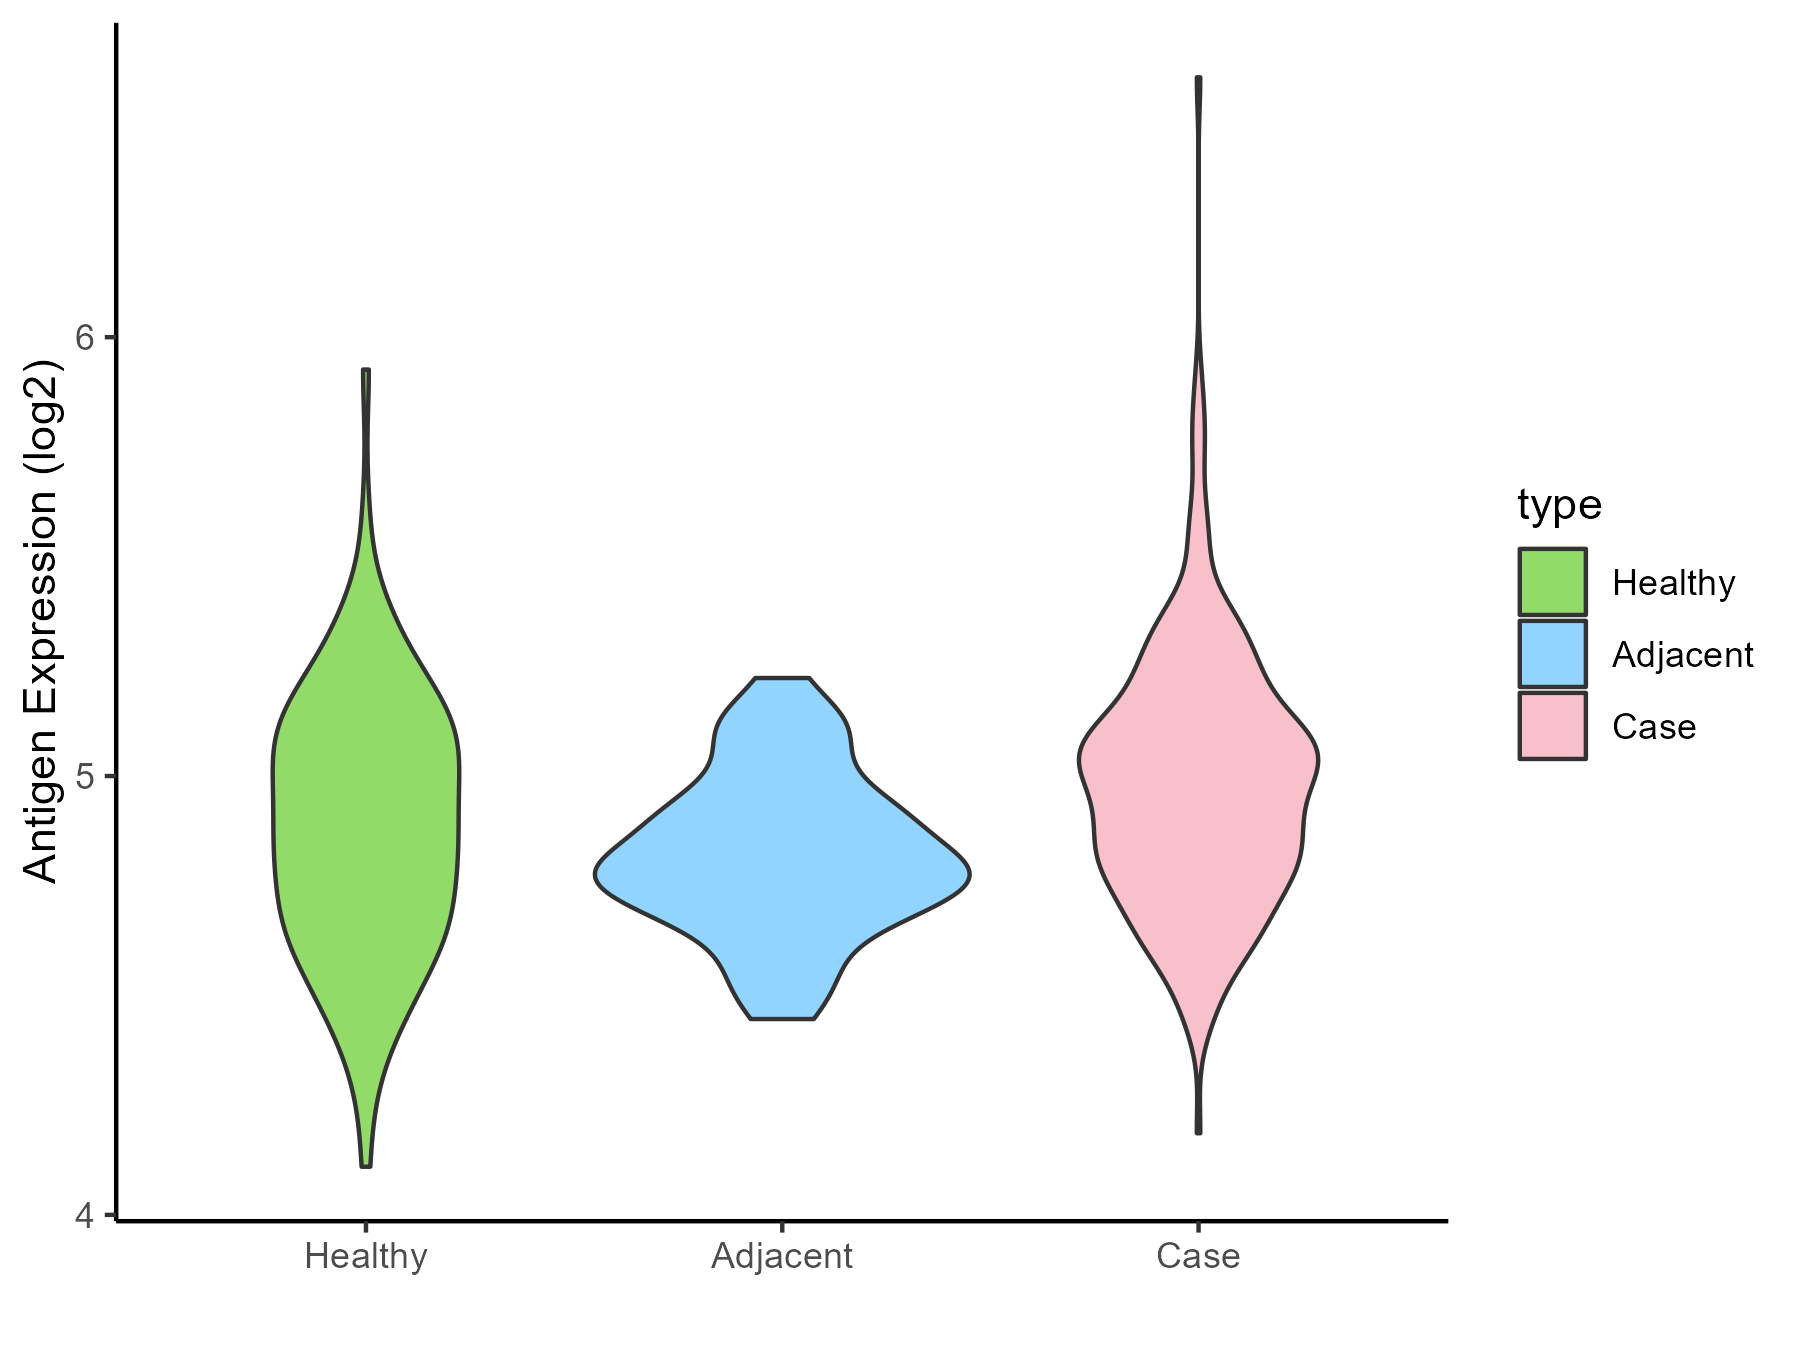
| The Studied Tissue | Thyroid | |
| The Specific Disease | Thyroid cancer | |
| The Expression Level of Disease Section Compare with the Healthy Individual Tissue | p-value: 0.005520942; Fold-change: 0.098838792; Z-score: 0.332043186 | |
| The Expression Level of Disease Section Compare with the Adjacent Tissue | p-value: 8.41E-06; Fold-change: 0.170213352; Z-score: 0.926635333 | |
| Disease-specific Antigen Abundances |
|
Click to View the Clearer Original Diagram |
| Differential expression pattern of antigen in diseases | ||
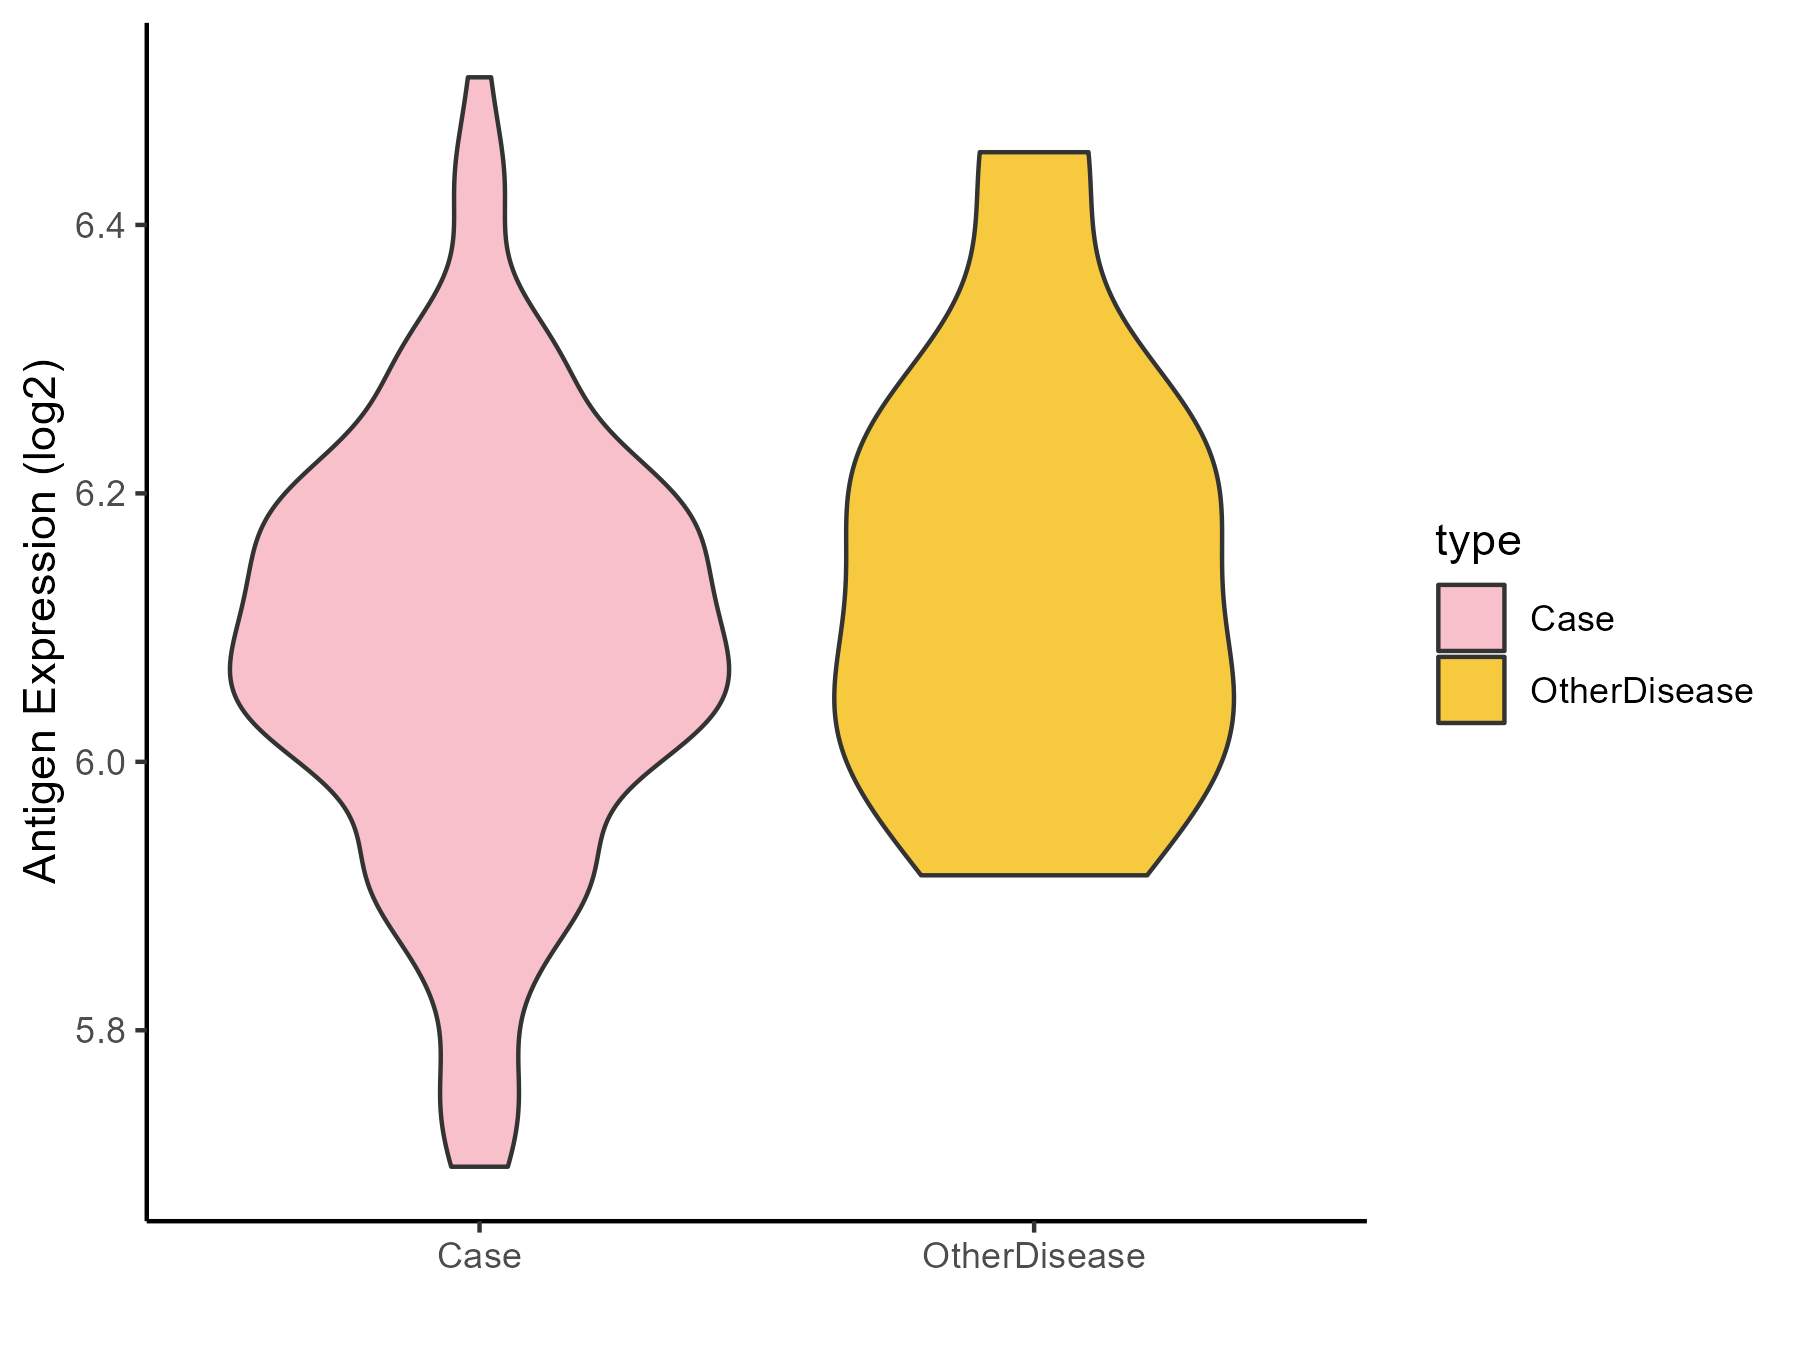
| The Studied Tissue | Adrenal cortex | |
| The Specific Disease | Adrenocortical carcinoma | |
| The Expression Level of Disease Section Compare with the Other Disease Section | p-value: 0.18139428; Fold-change: -0.042296716; Z-score: -0.265556275 | |
| Disease-specific Antigen Abundances |
|
Click to View the Clearer Original Diagram |
| Differential expression pattern of antigen in diseases | ||
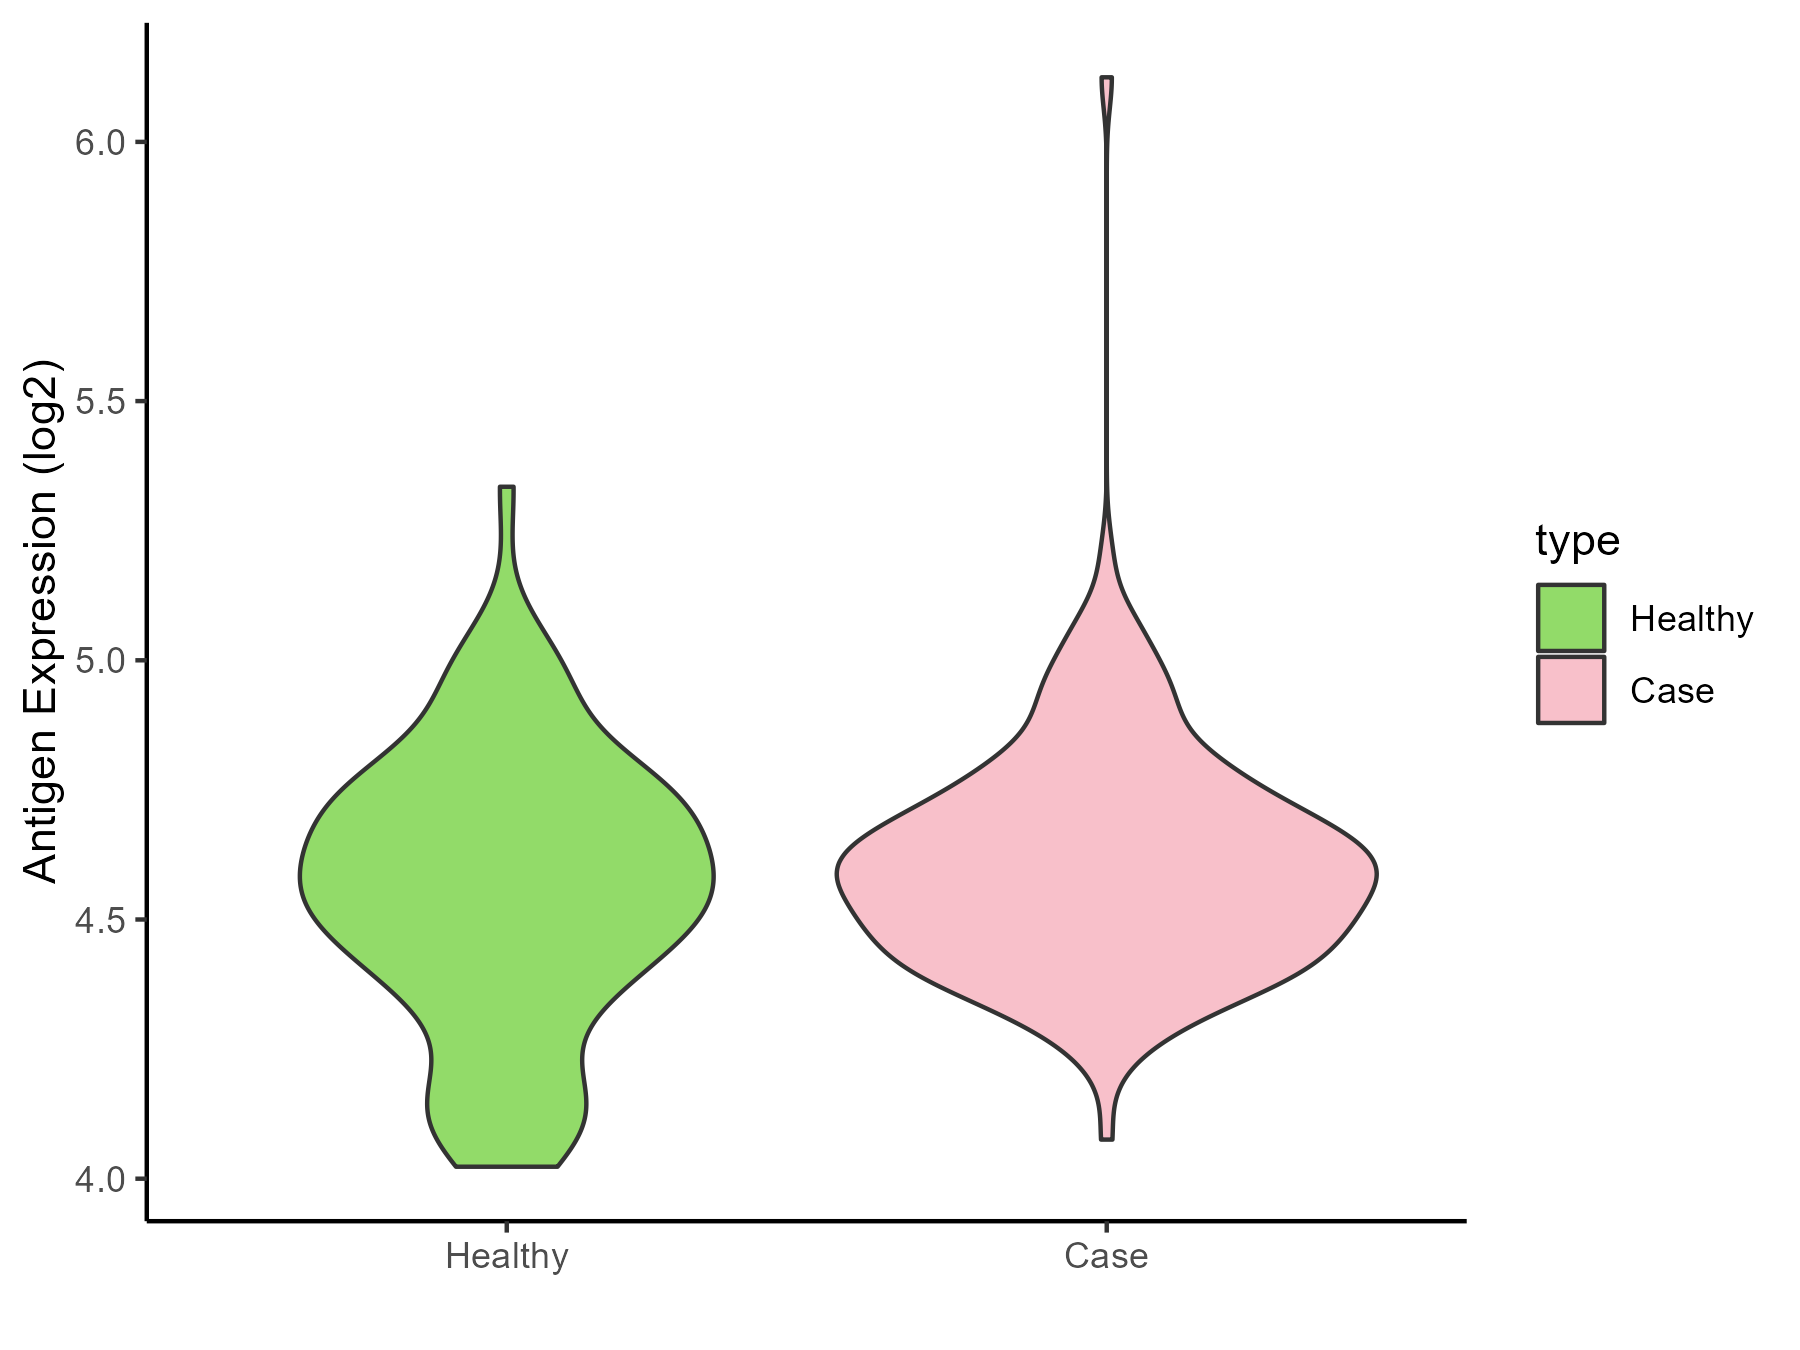
| The Studied Tissue | Head and neck | |
| The Specific Disease | Head and neck cancer | |
| The Expression Level of Disease Section Compare with the Healthy Individual Tissue | p-value: 0.121407312; Fold-change: 0.022441605; Z-score: 0.084482892 | |
| Disease-specific Antigen Abundances |
|
Click to View the Clearer Original Diagram |
| Differential expression pattern of antigen in diseases | ||
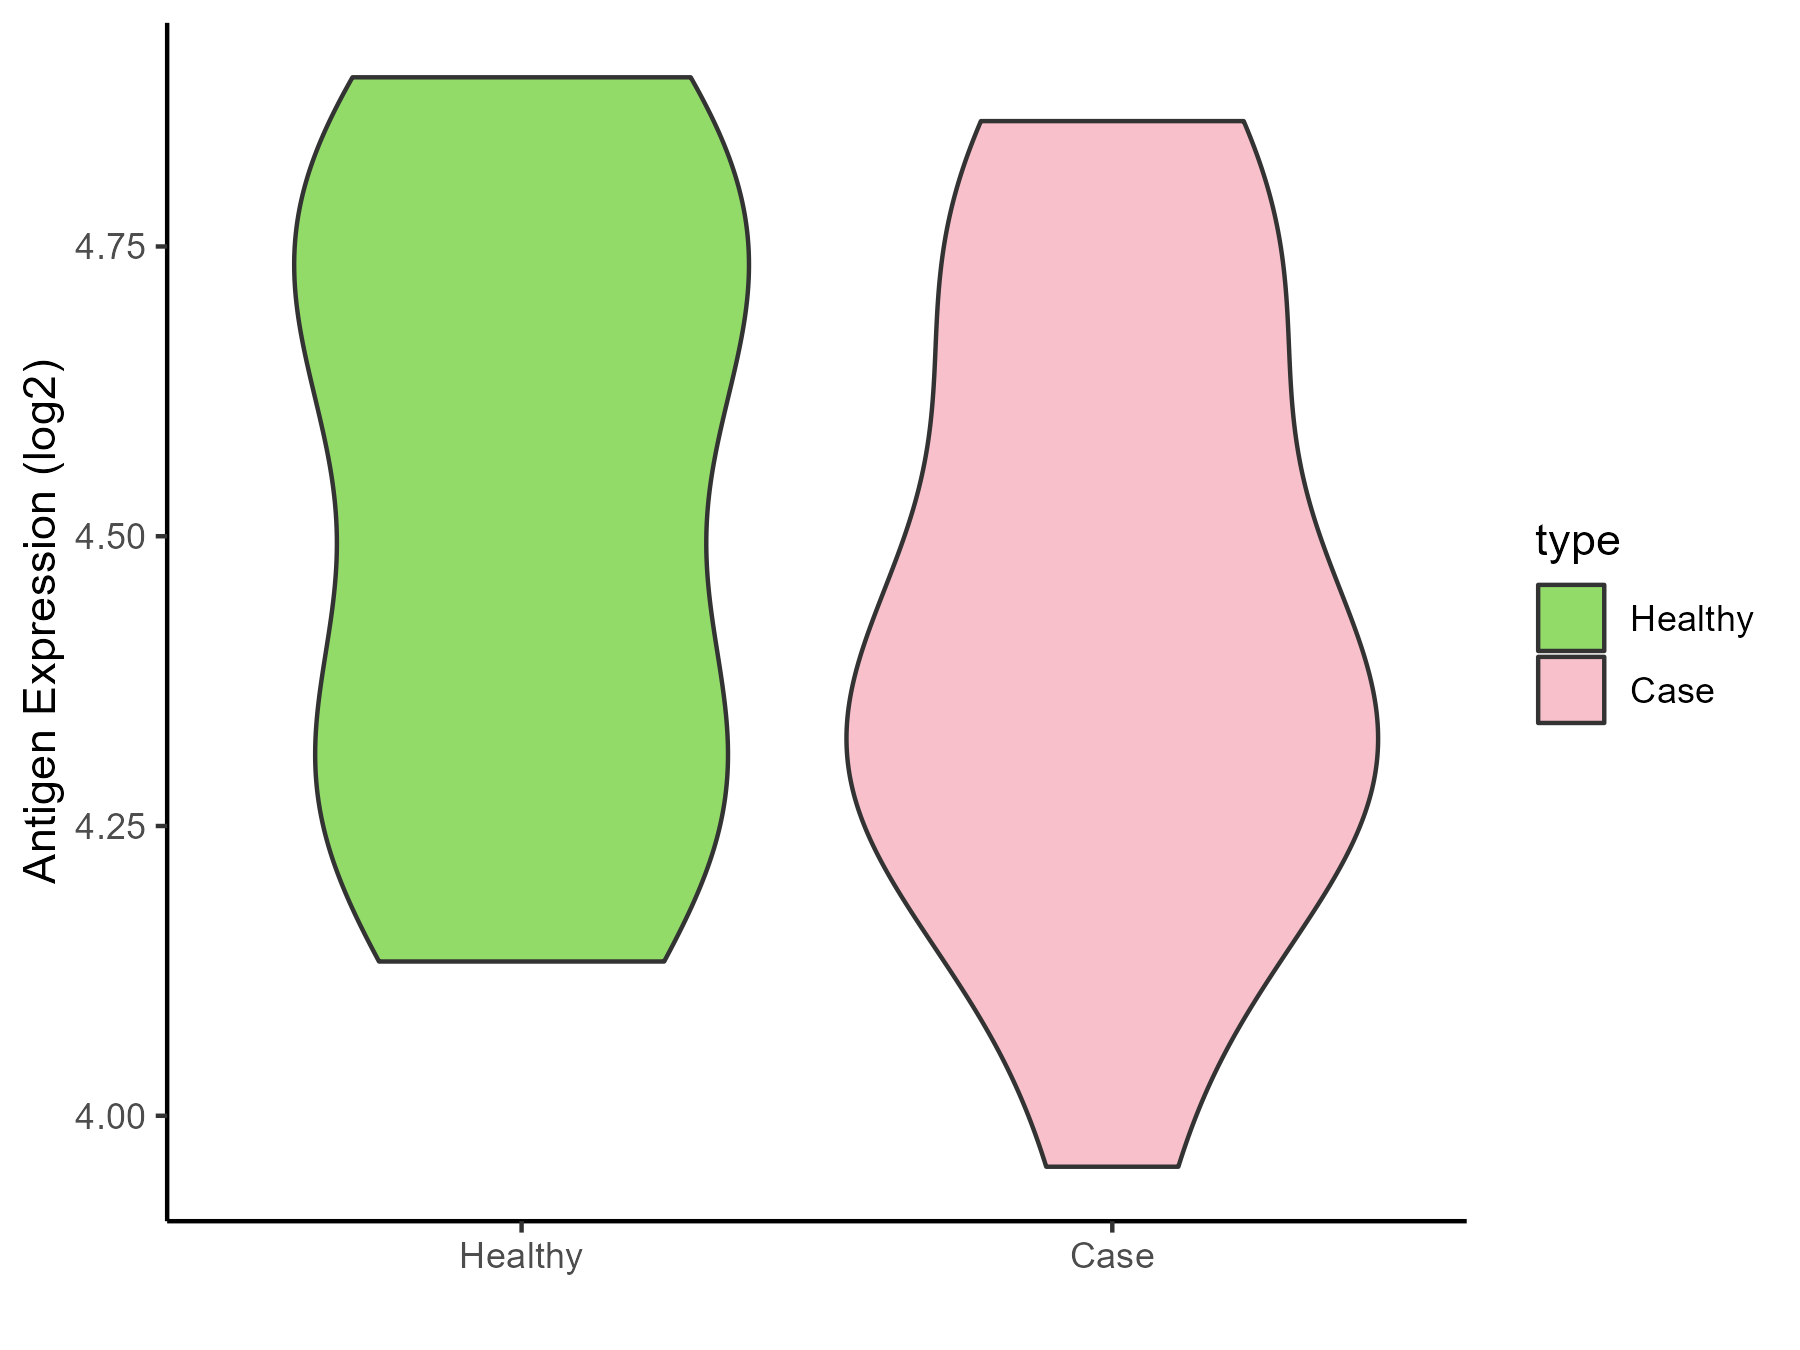
| The Studied Tissue | Pituitary | |
| The Specific Disease | Pituitary gonadotrope tumor | |
| The Expression Level of Disease Section Compare with the Healthy Individual Tissue | p-value: 0.443584254; Fold-change: -0.211644959; Z-score: -0.77726348 | |
| Disease-specific Antigen Abundances |
|
Click to View the Clearer Original Diagram |
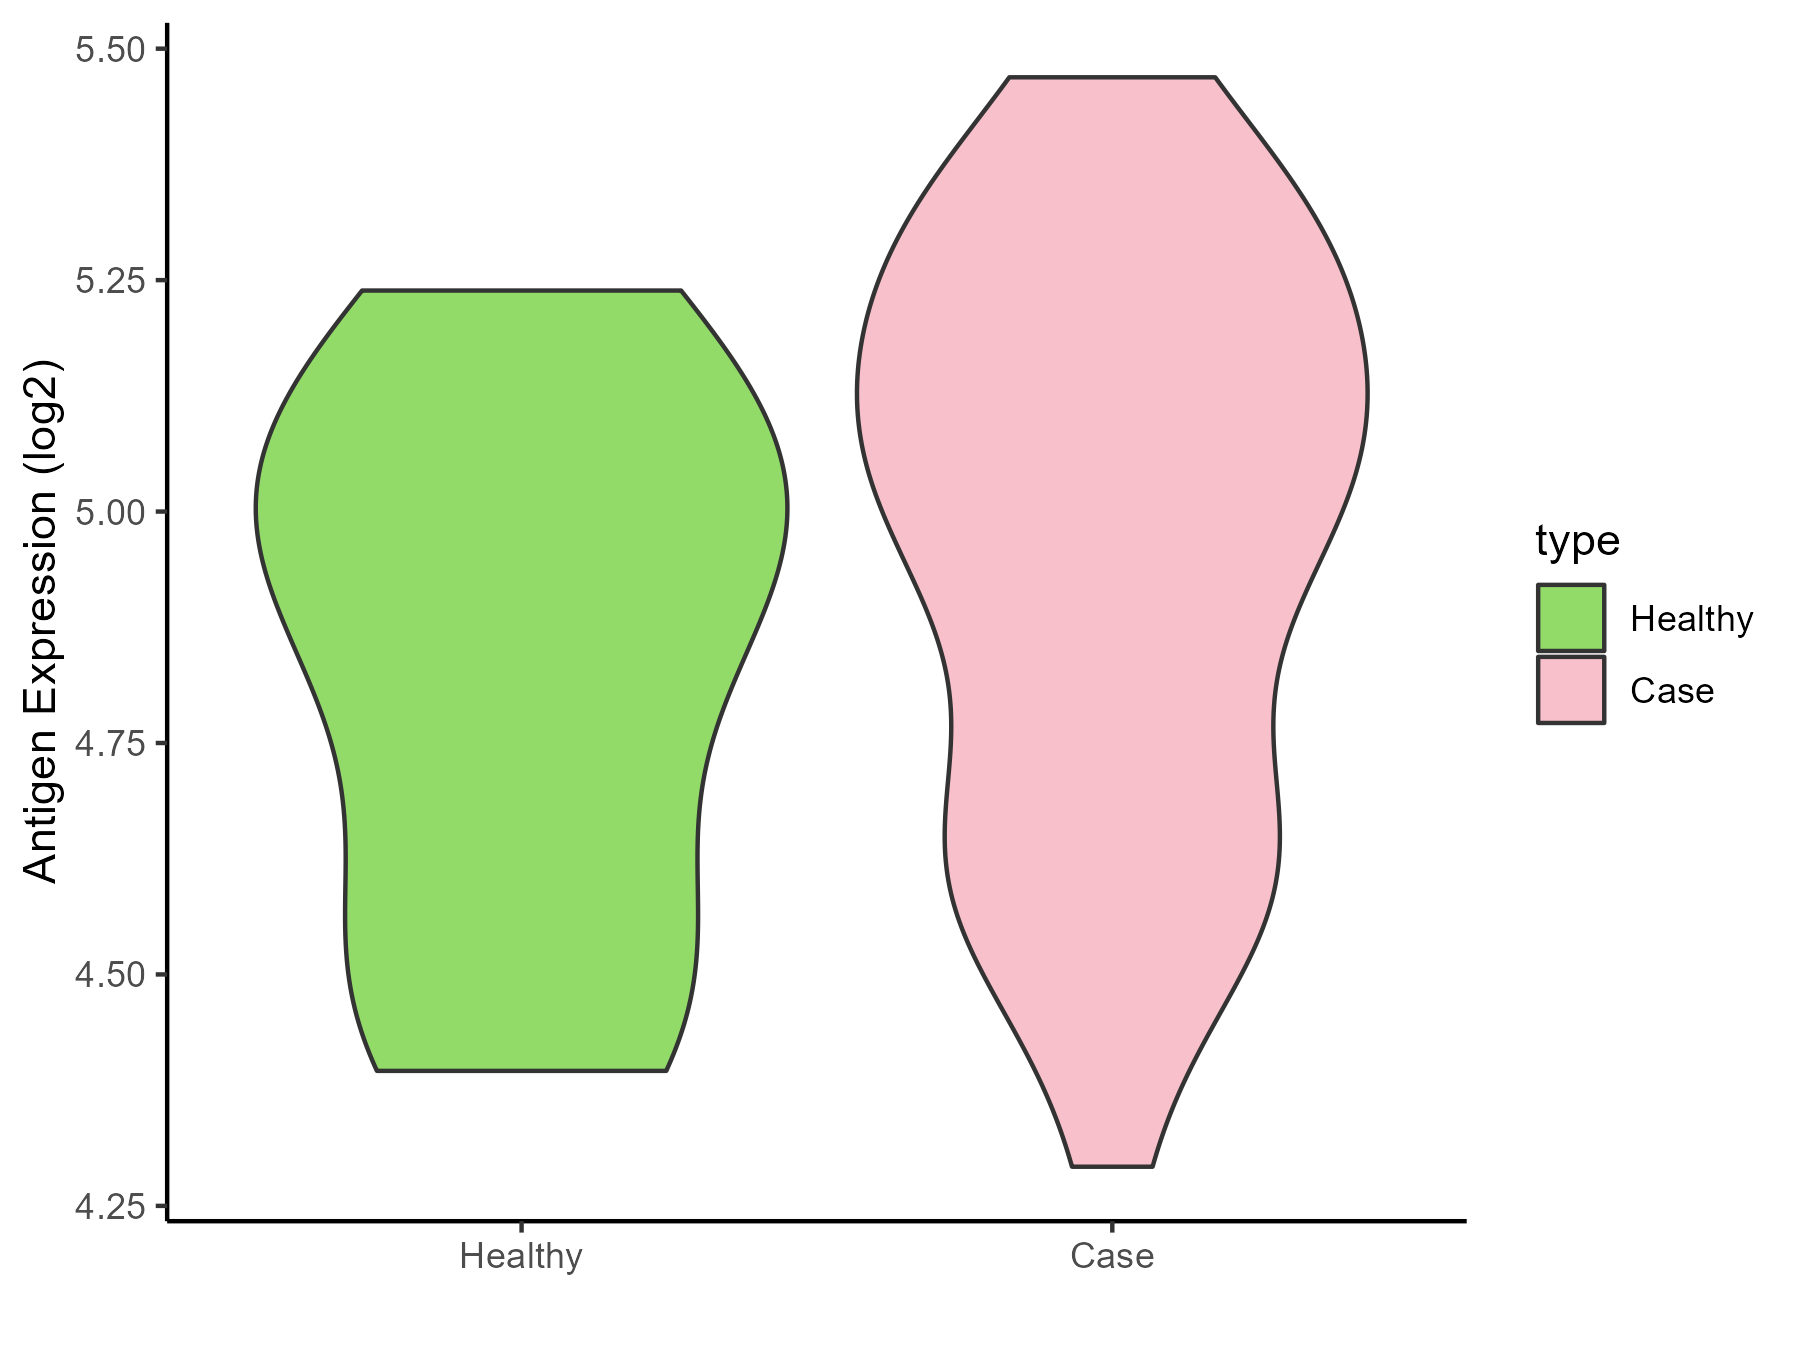
| The Studied Tissue | Pituitary | |
| The Specific Disease | Pituitary cancer | |
| The Expression Level of Disease Section Compare with the Healthy Individual Tissue | p-value: 0.220323174; Fold-change: 0.106012552; Z-score: 0.365357614 | |
| Disease-specific Antigen Abundances |
|
Click to View the Clearer Original Diagram |
ICD Disease Classification 03
| Differential expression pattern of antigen in diseases | ||
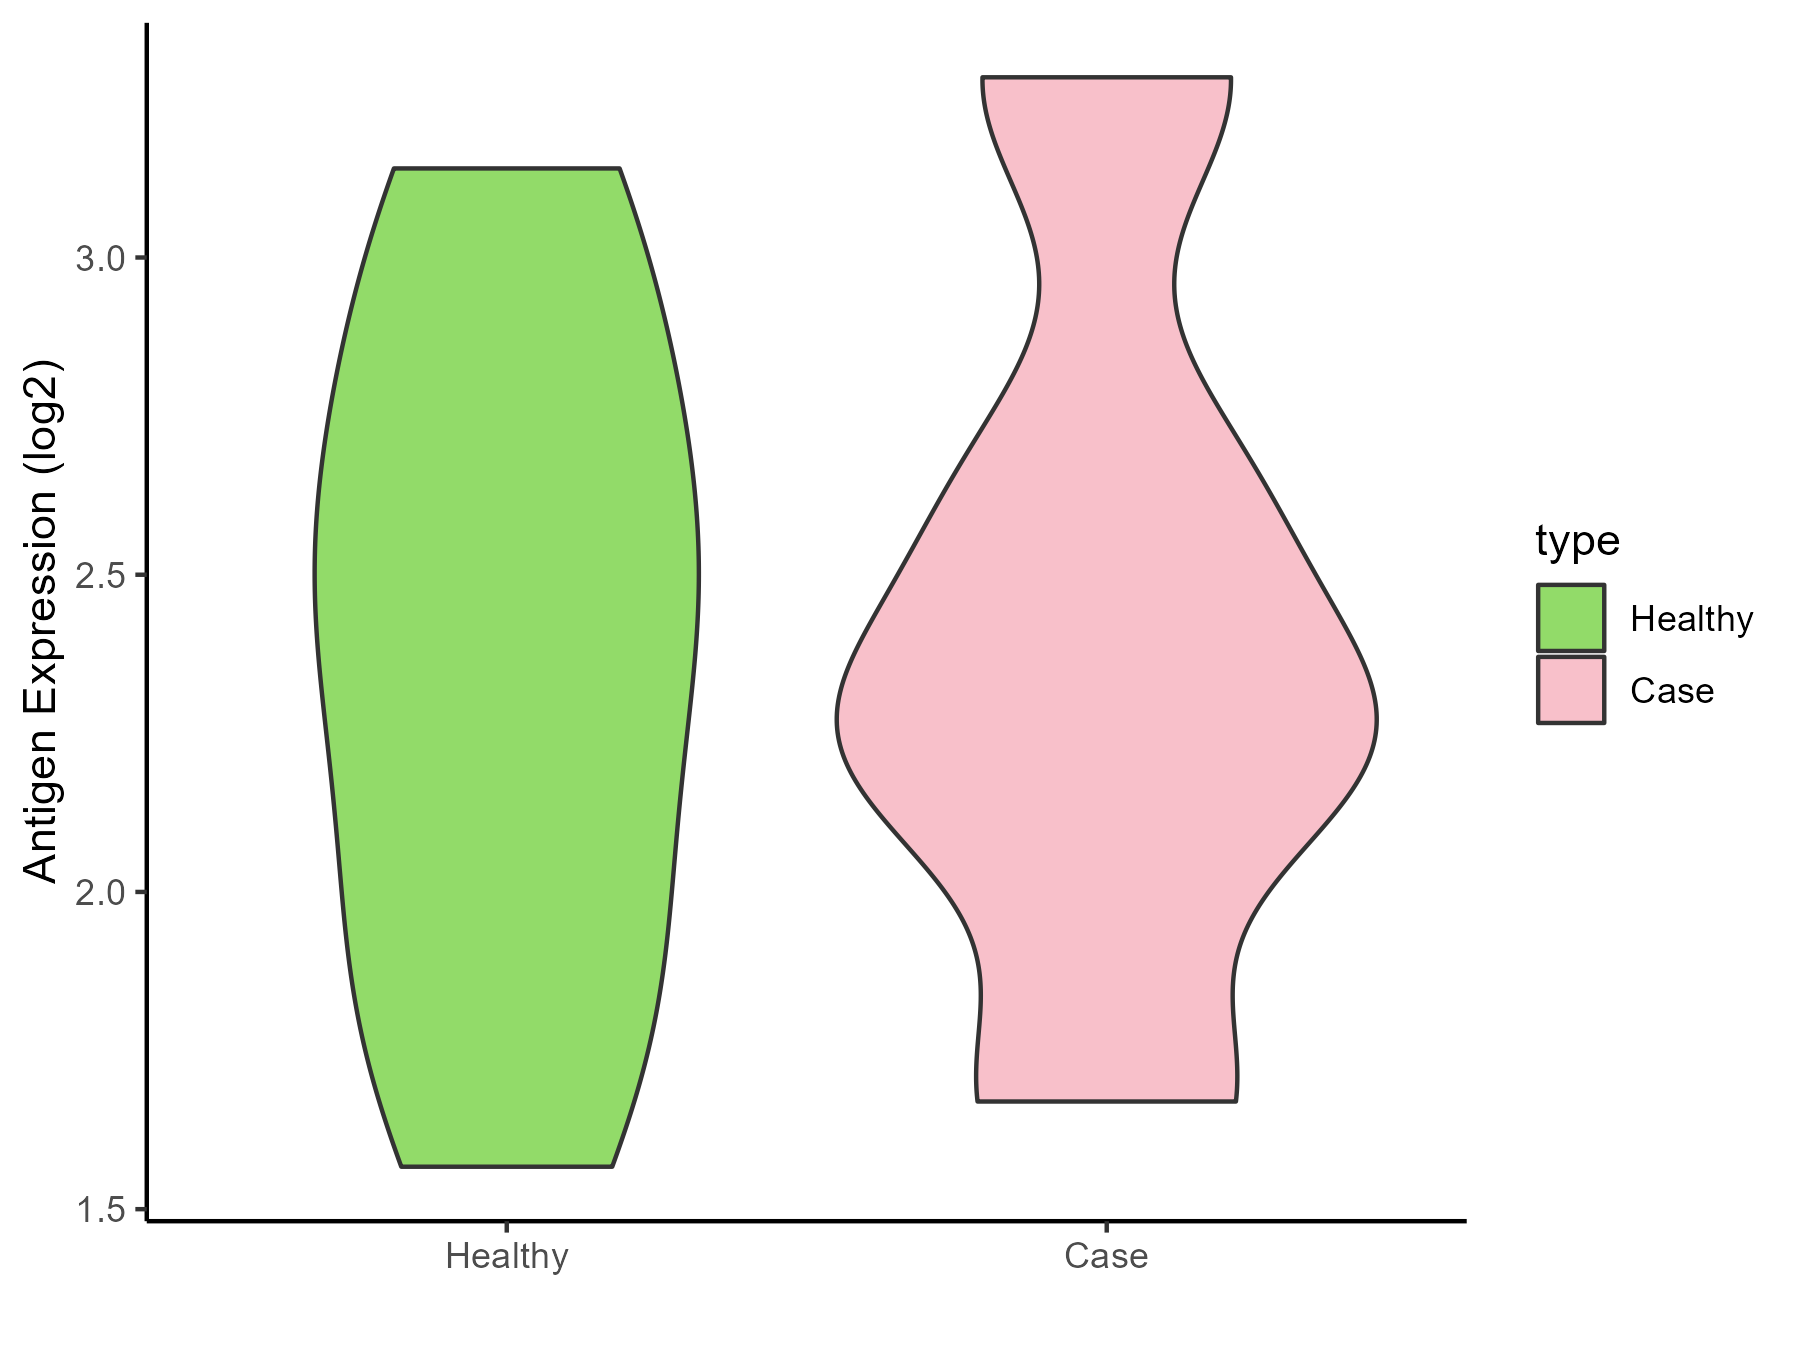
| The Studied Tissue | Whole blood | |
| The Specific Disease | Thrombocytopenia | |
| The Expression Level of Disease Section Compare with the Healthy Individual Tissue | p-value: 0.912674692; Fold-change: -0.175211114; Z-score: -0.334878475 | |
| Disease-specific Antigen Abundances |
|
Click to View the Clearer Original Diagram |
ICD Disease Classification 04
| Differential expression pattern of antigen in diseases | ||
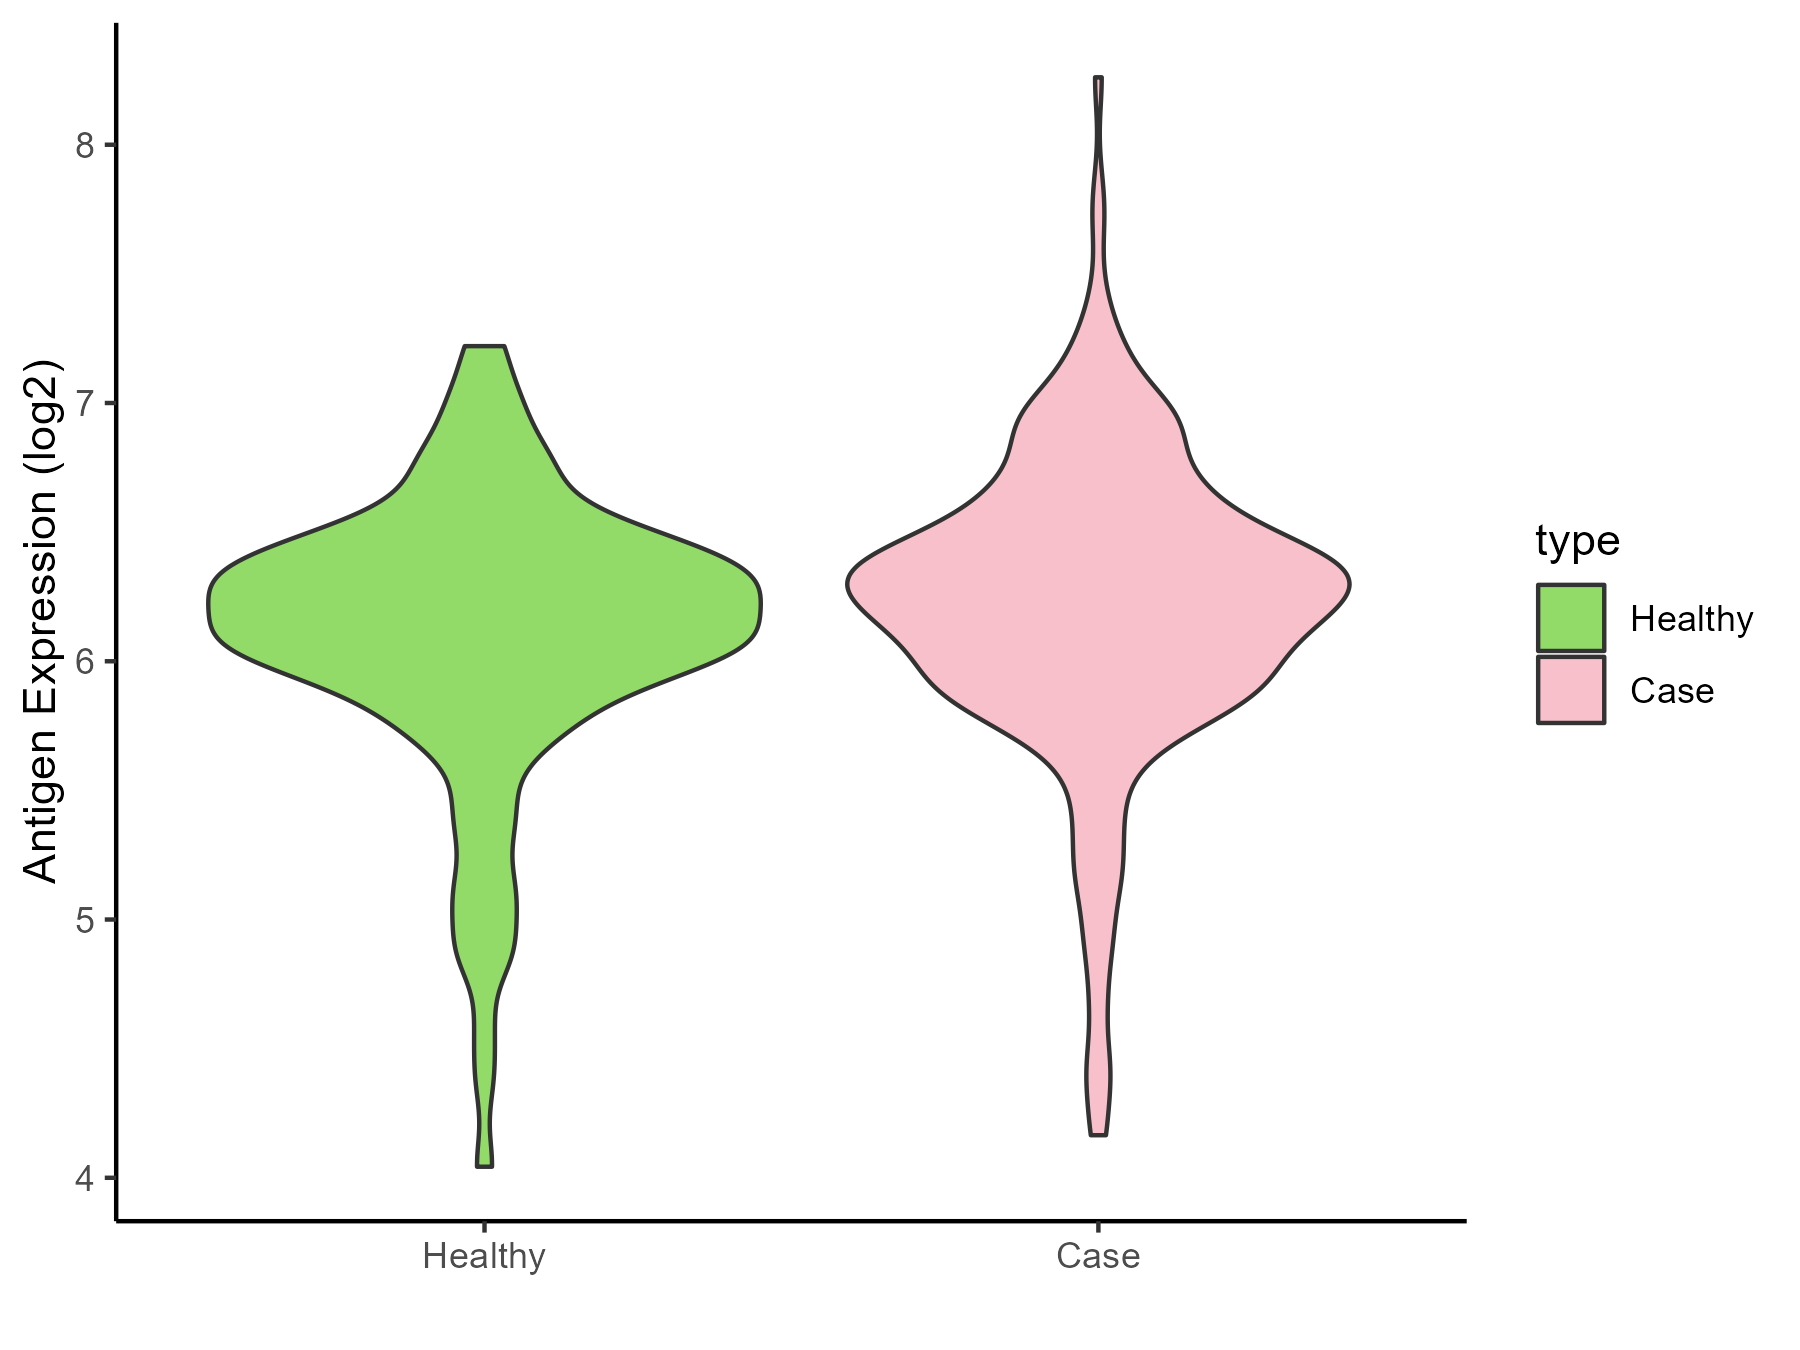
| The Studied Tissue | Whole blood | |
| The Specific Disease | Lupus erythematosus | |
| The Expression Level of Disease Section Compare with the Healthy Individual Tissue | p-value: 0.085195348; Fold-change: 0.074296838; Z-score: 0.137401429 | |
| Disease-specific Antigen Abundances |
|
Click to View the Clearer Original Diagram |
| Differential expression pattern of antigen in diseases | ||
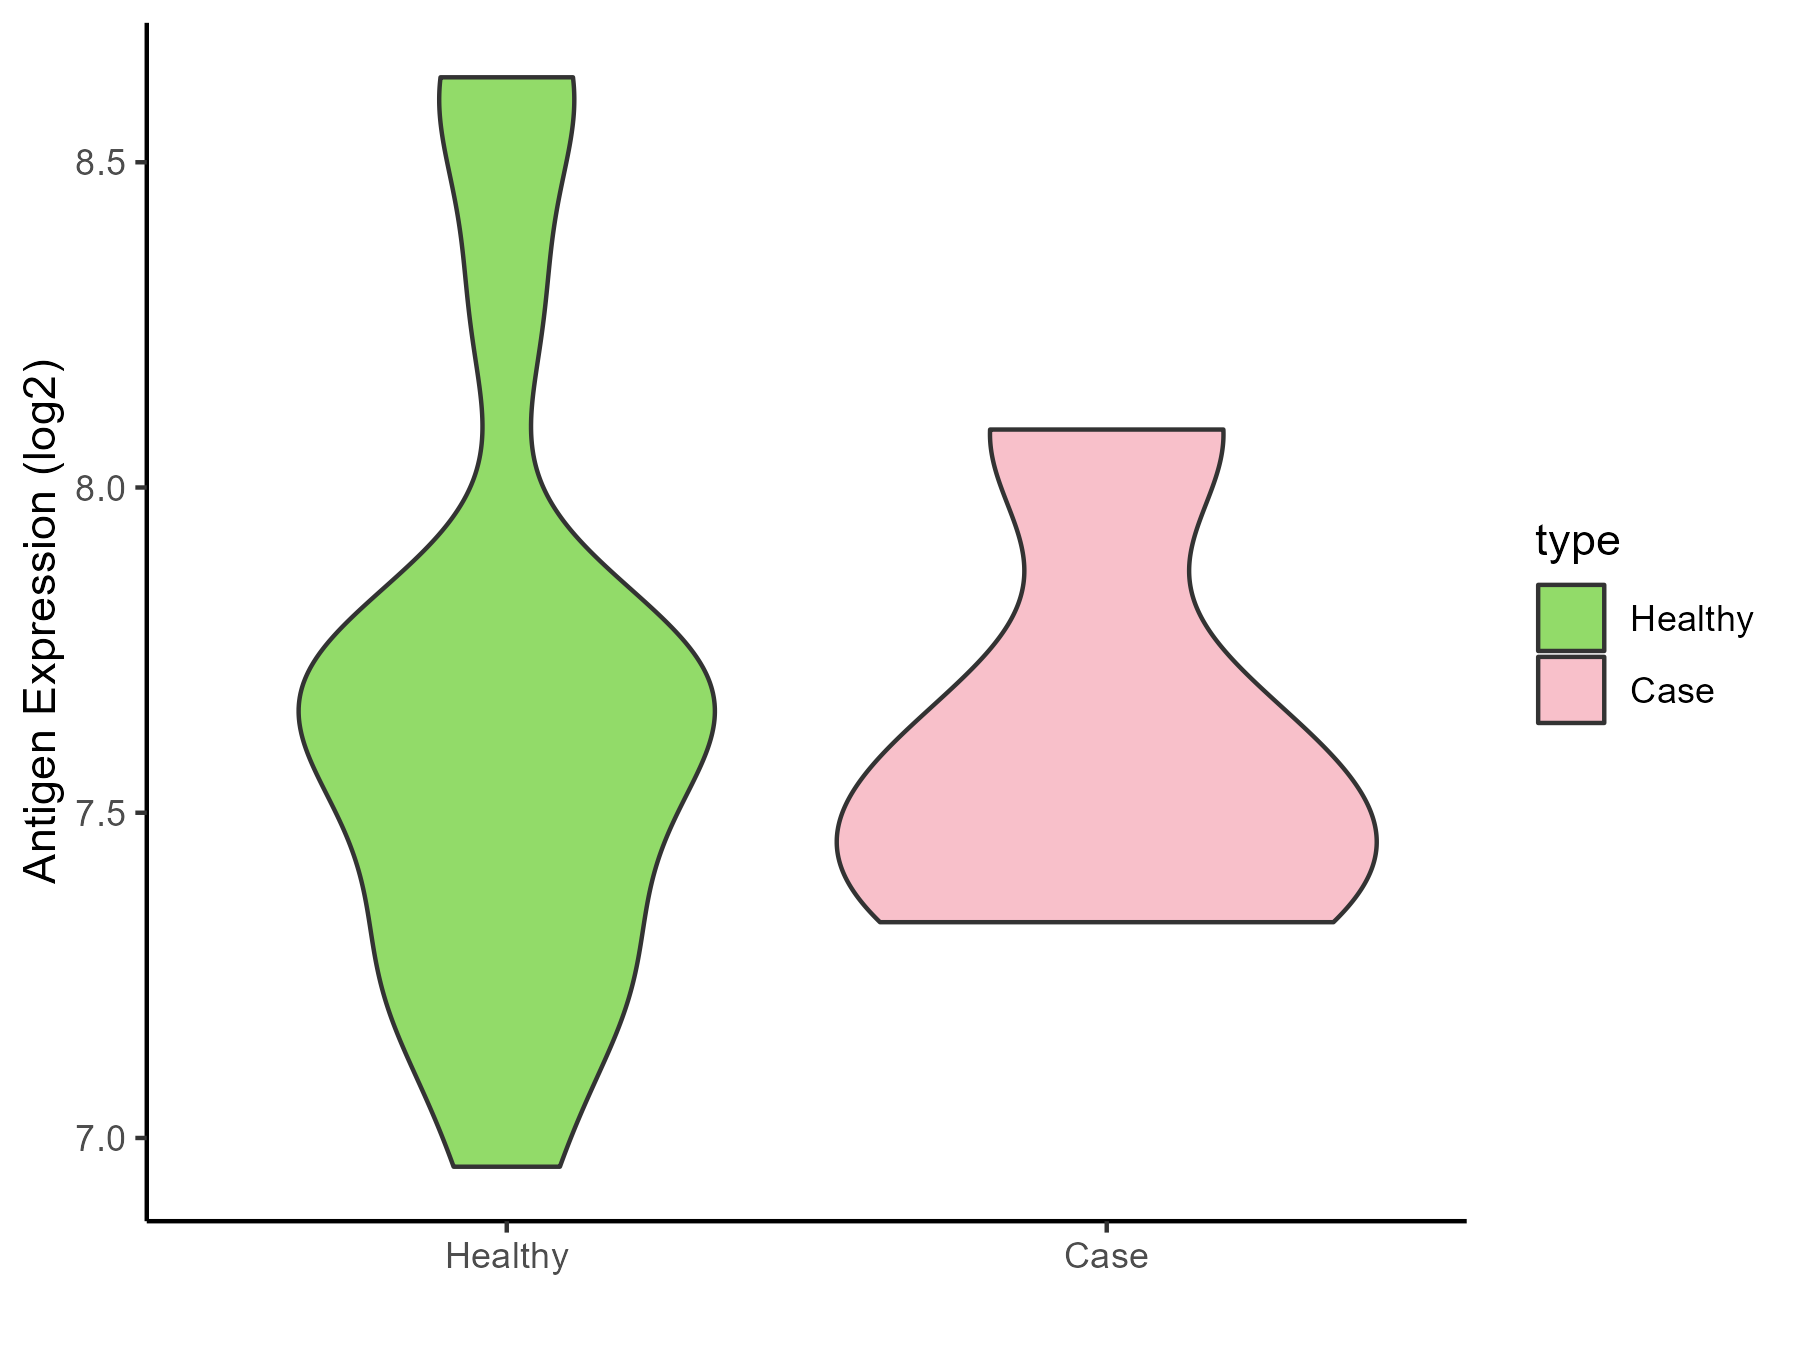
| The Studied Tissue | Peripheral monocyte | |
| The Specific Disease | Autoimmune uveitis | |
| The Expression Level of Disease Section Compare with the Healthy Individual Tissue | p-value: 0.780629696; Fold-change: -0.089012425; Z-score: -0.181888449 | |
| Disease-specific Antigen Abundances |
|
Click to View the Clearer Original Diagram |
ICD Disease Classification 05
| Differential expression pattern of antigen in diseases | ||
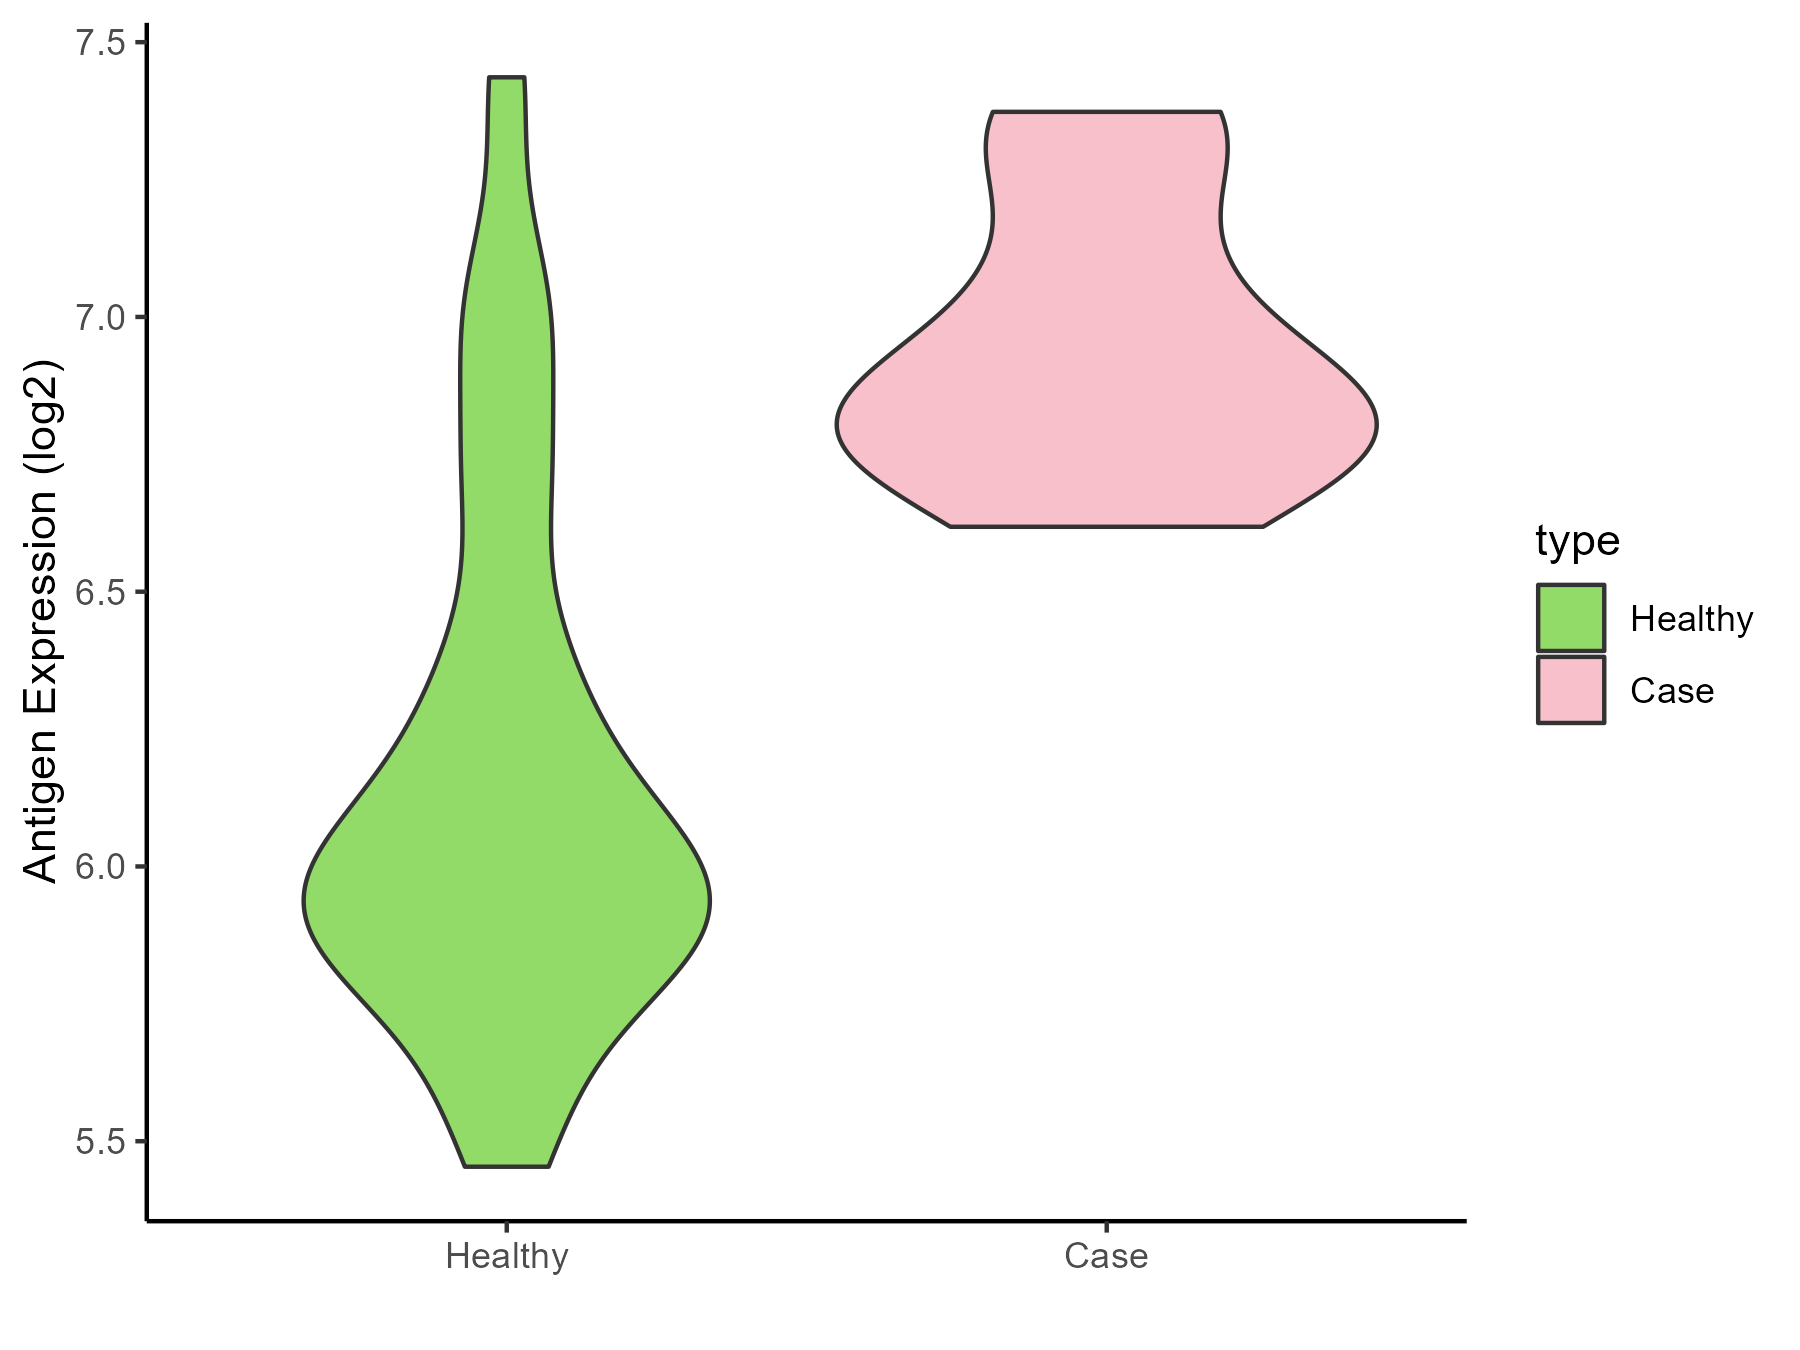
| The Studied Tissue | Whole blood | |
| The Specific Disease | Familial hypercholesterolemia | |
| The Expression Level of Disease Section Compare with the Healthy Individual Tissue | p-value: 1.13E-06; Fold-change: 0.844411239; Z-score: 1.757345281 | |
| Disease-specific Antigen Abundances |
|
Click to View the Clearer Original Diagram |
ICD Disease Classification 06
| Differential expression pattern of antigen in diseases | ||
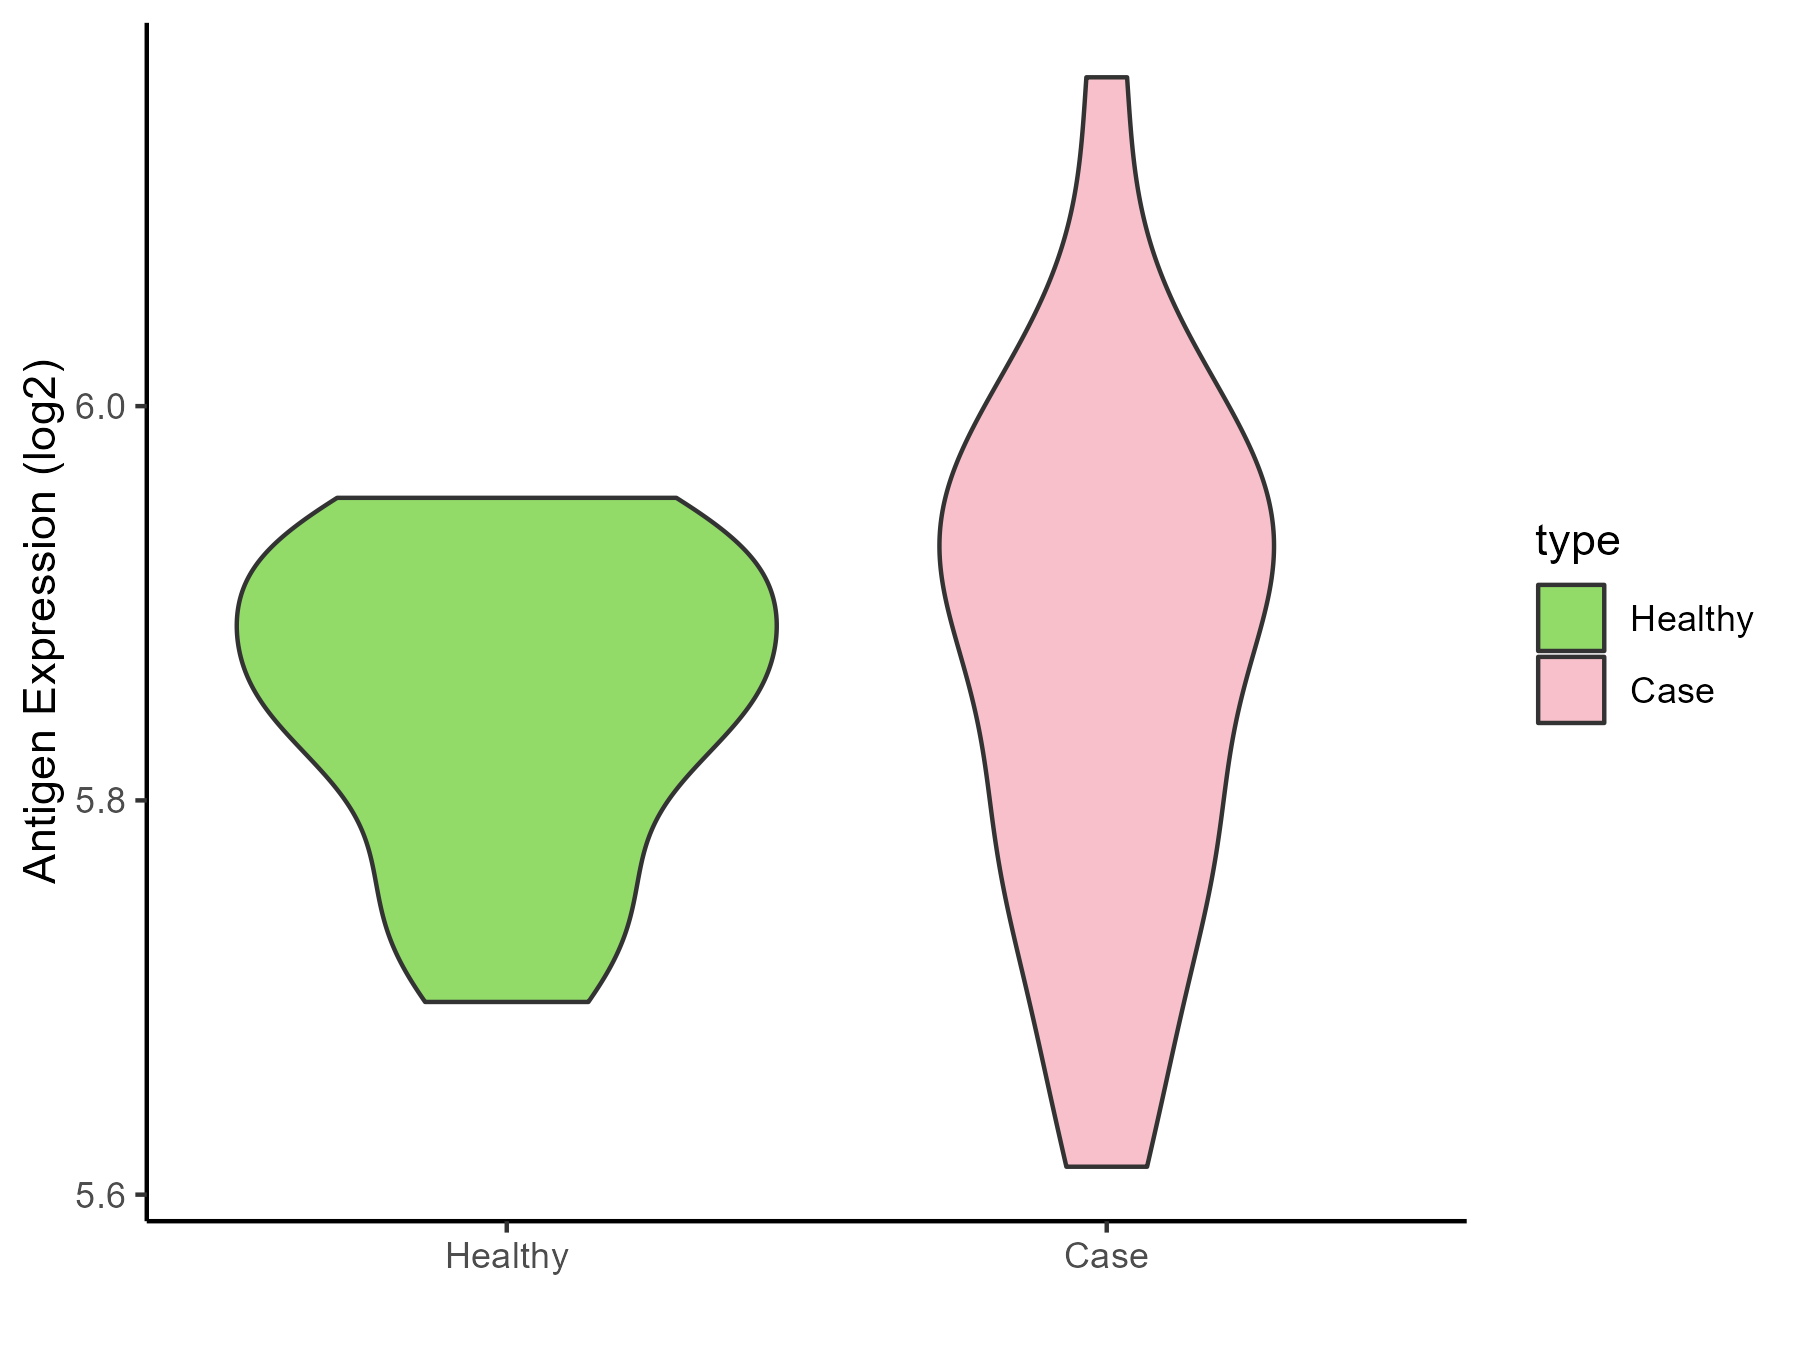
| The Studied Tissue | Superior temporal cortex | |
| The Specific Disease | Schizophrenia | |
| The Expression Level of Disease Section Compare with the Healthy Individual Tissue | p-value: 0.471692133; Fold-change: 0.029134674; Z-score: 0.378217445 | |
| Disease-specific Antigen Abundances |
|
Click to View the Clearer Original Diagram |
ICD Disease Classification 08
| Differential expression pattern of antigen in diseases | ||
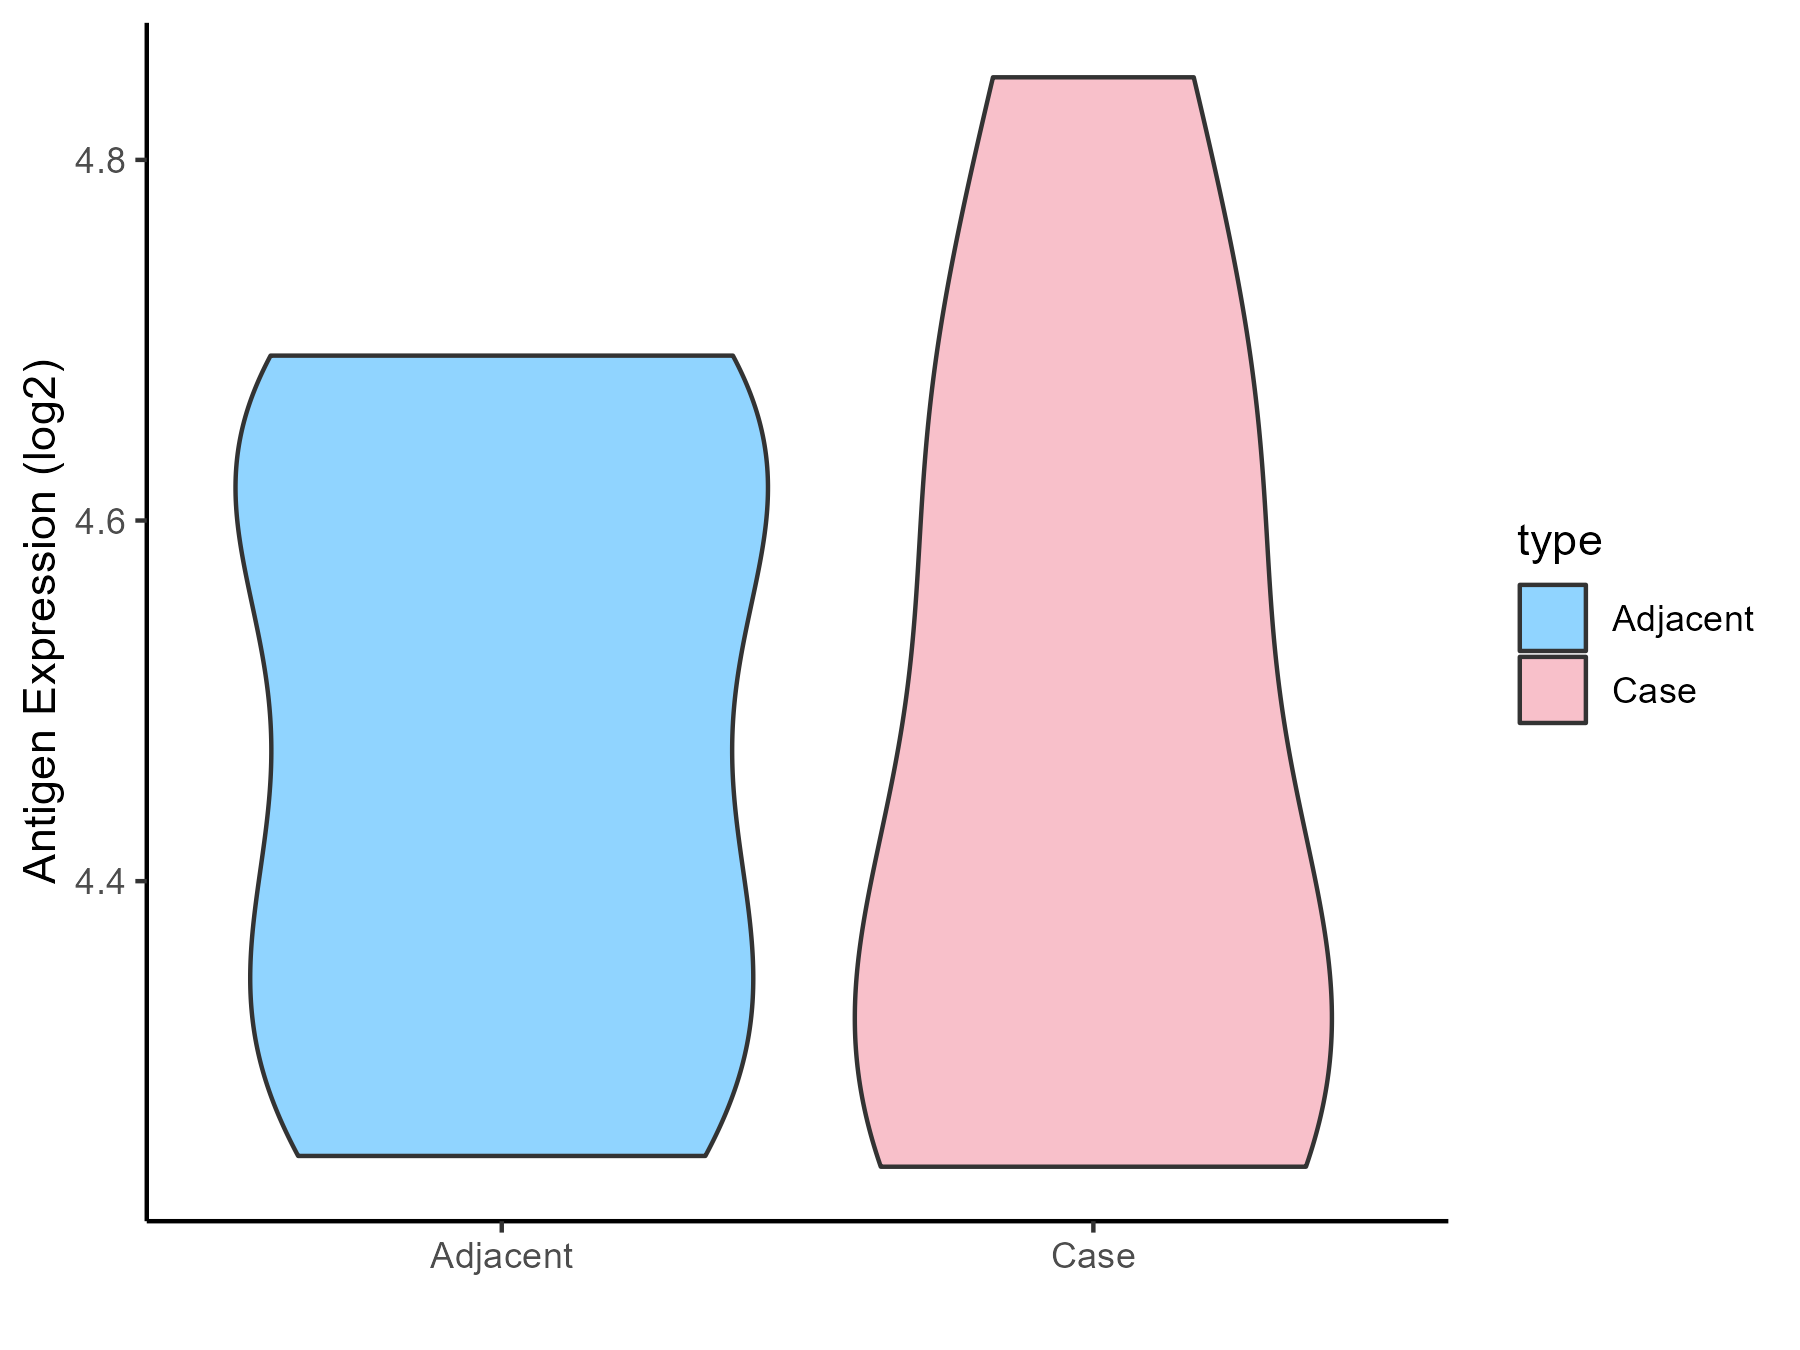
| The Studied Tissue | Spinal cord | |
| The Specific Disease | Multiple sclerosis | |
| The Expression Level of Disease Section Compare with the Adjacent Tissue | p-value: 0.983884578; Fold-change: -0.081330408; Z-score: -0.45980084 | |
| Disease-specific Antigen Abundances |
|
Click to View the Clearer Original Diagram |
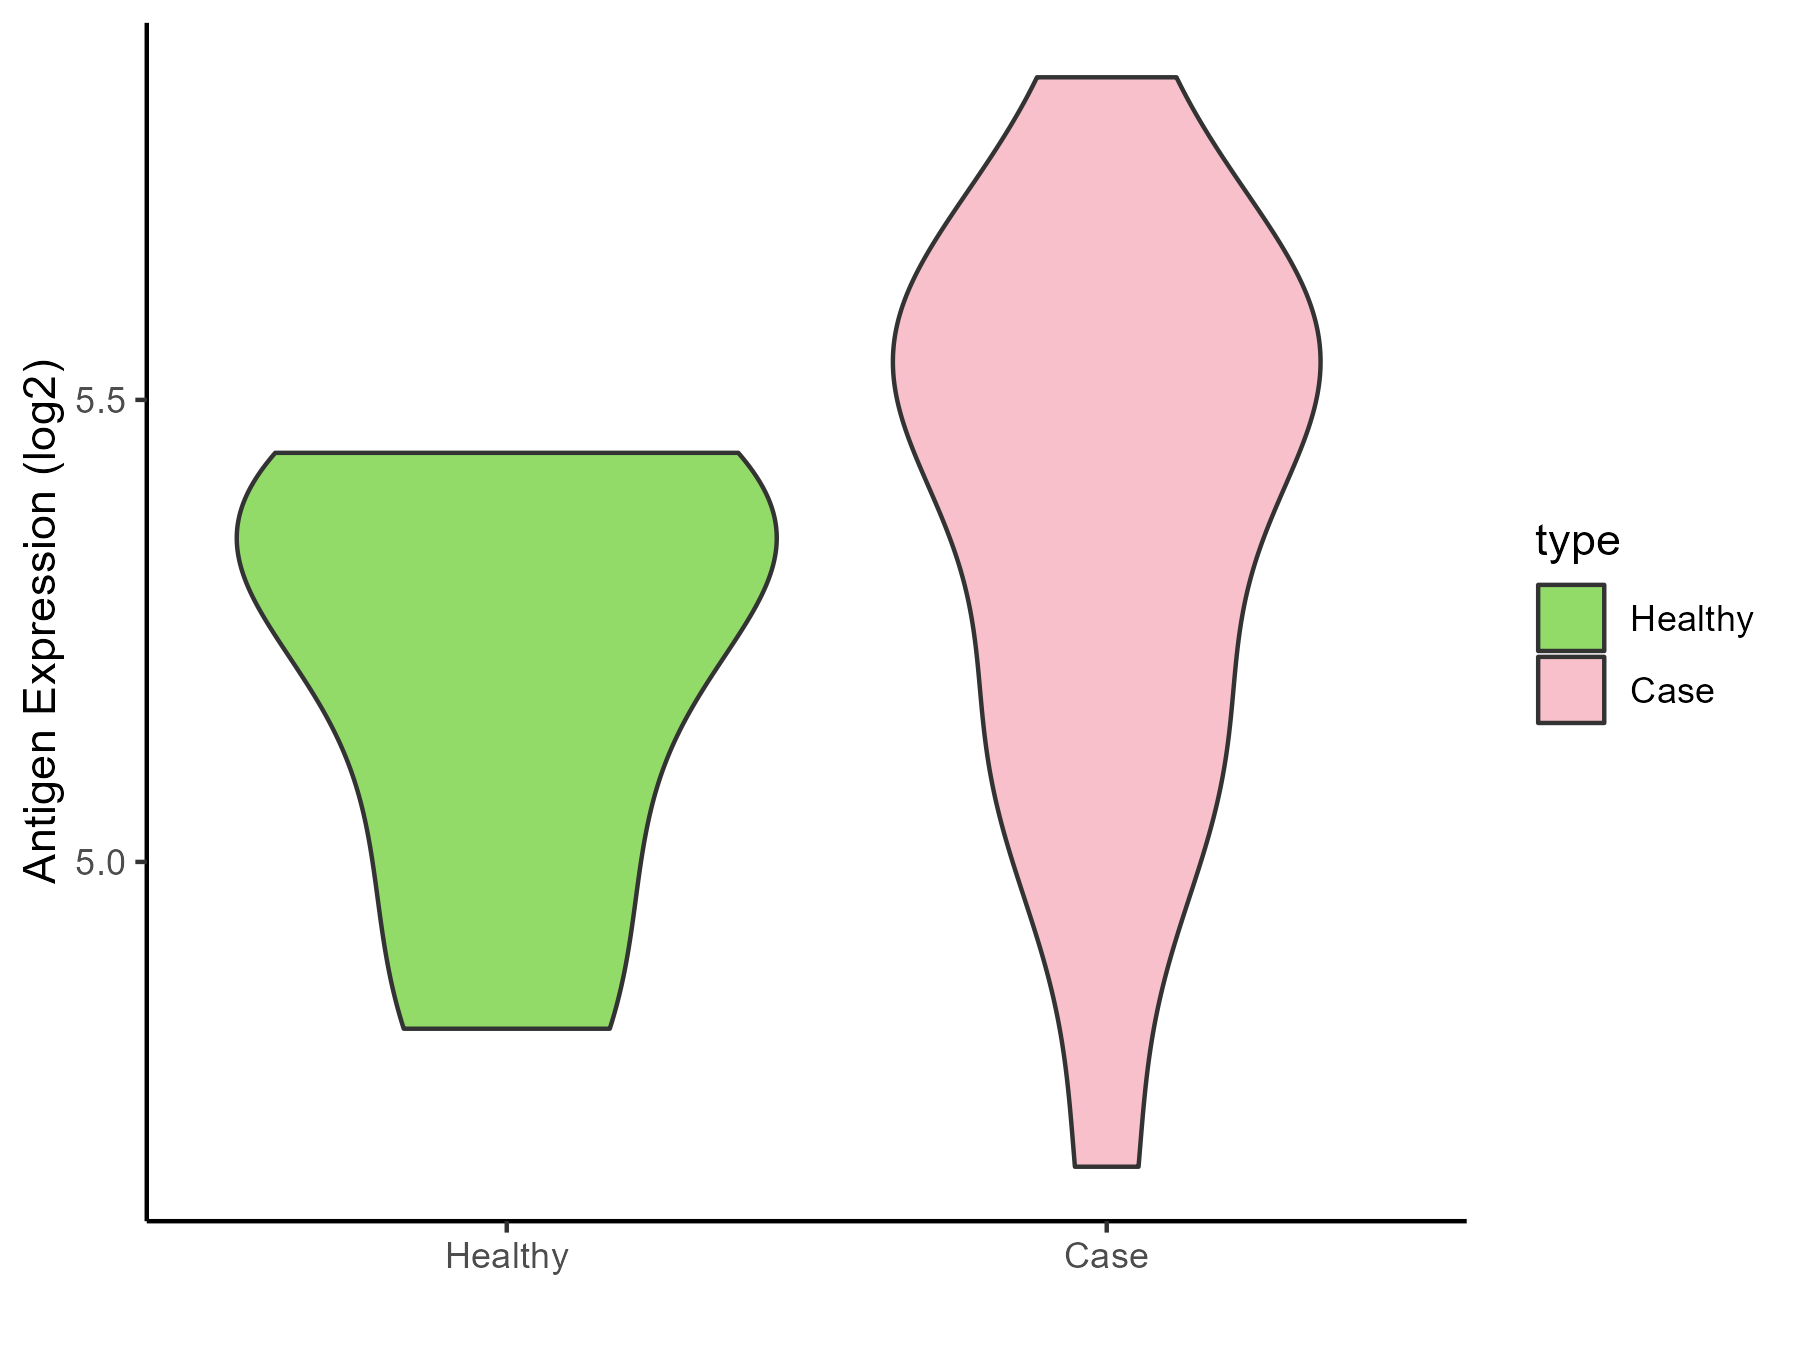
| The Studied Tissue | Plasmacytoid dendritic cells | |
| The Specific Disease | Multiple sclerosis | |
| The Expression Level of Disease Section Compare with the Healthy Individual Tissue | p-value: 0.218594209; Fold-change: 0.227595645; Z-score: 0.94686701 | |
| Disease-specific Antigen Abundances |
|
Click to View the Clearer Original Diagram |
| Differential expression pattern of antigen in diseases | ||
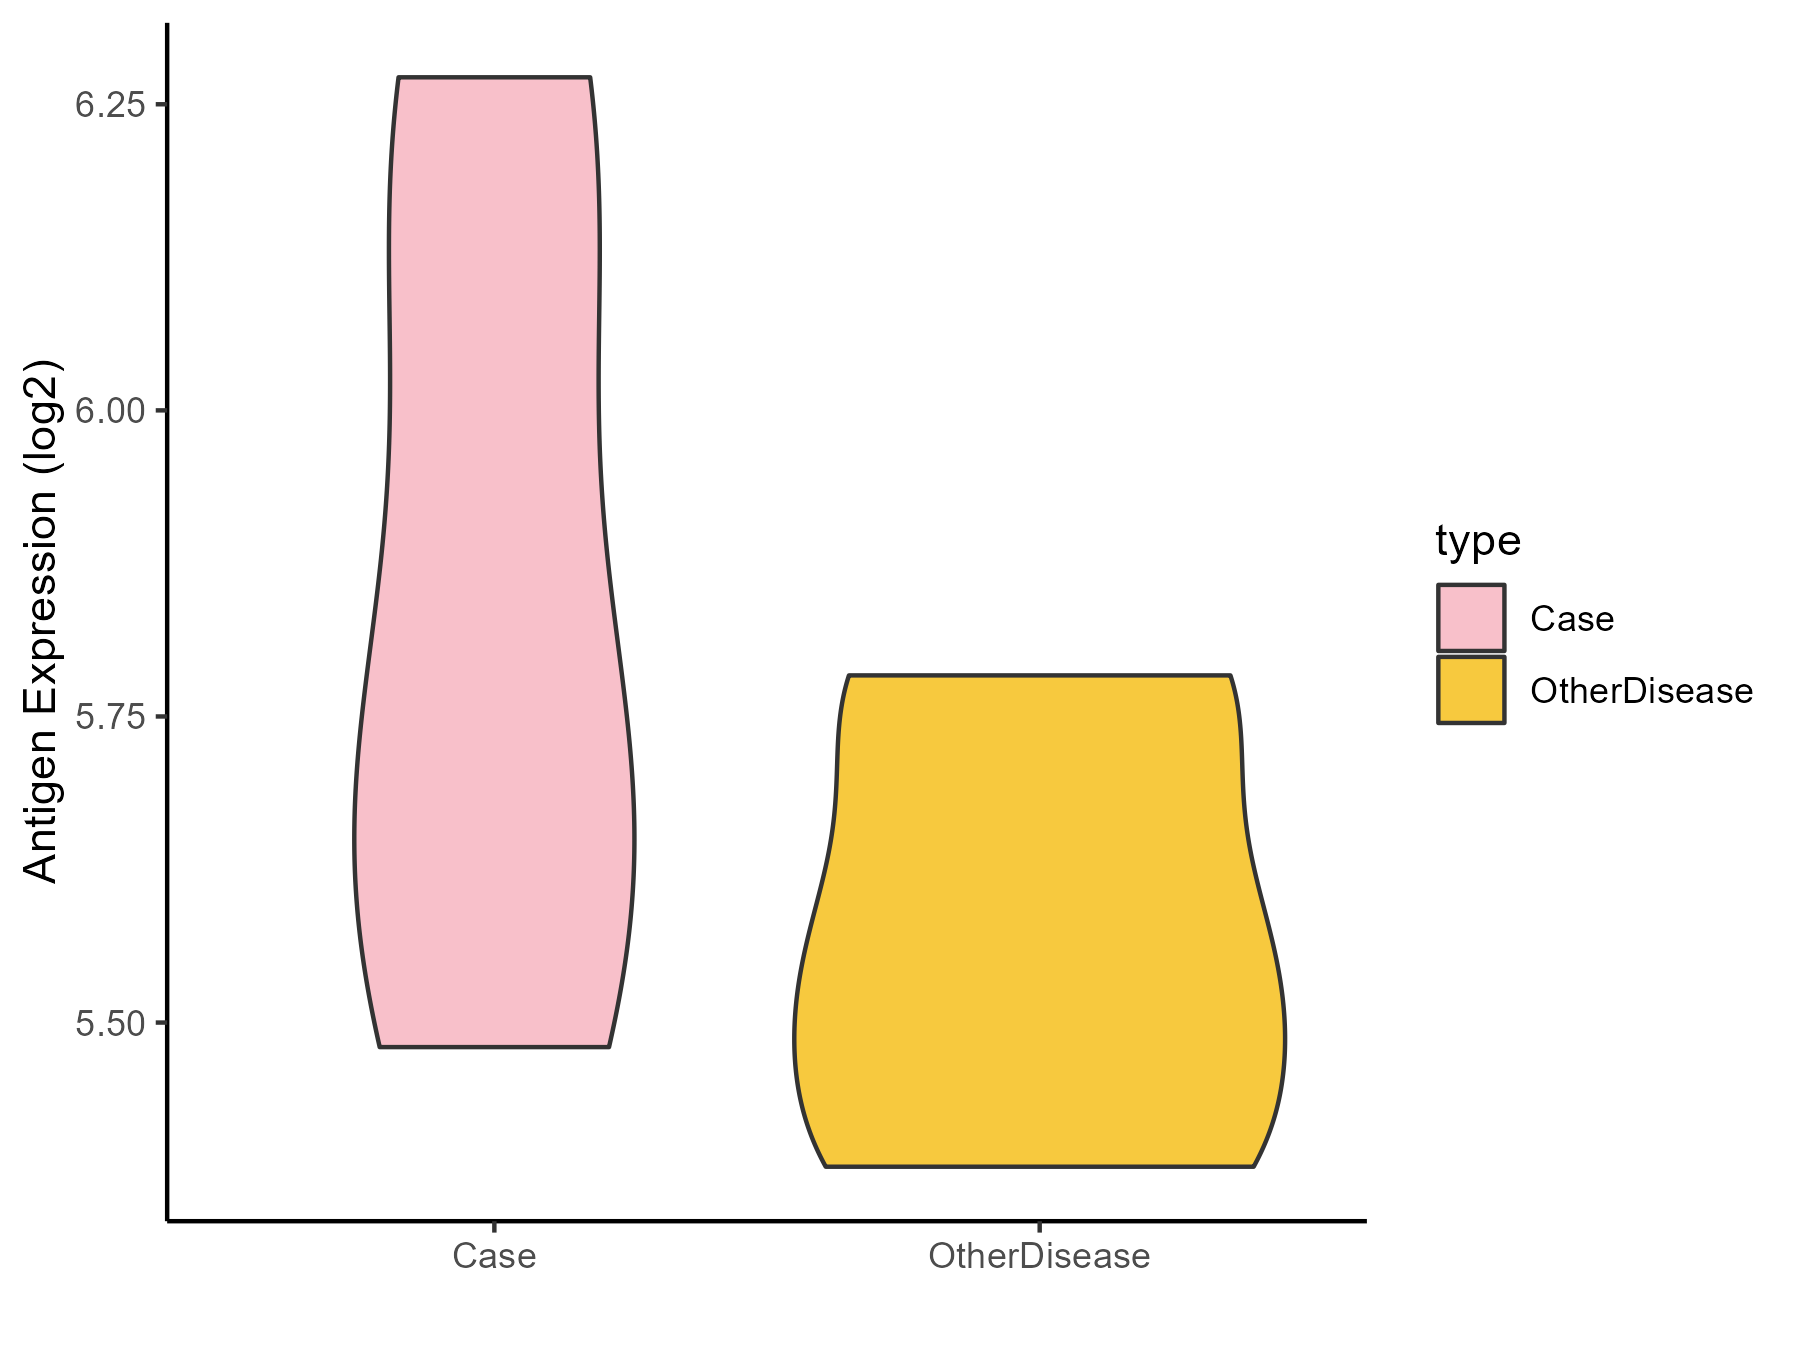
| The Studied Tissue | Peritumoral cortex | |
| The Specific Disease | Epilepsy | |
| The Expression Level of Disease Section Compare with the Other Disease Section | p-value: 0.192974403; Fold-change: 0.159719127; Z-score: 0.794436409 | |
| Disease-specific Antigen Abundances |
|
Click to View the Clearer Original Diagram |
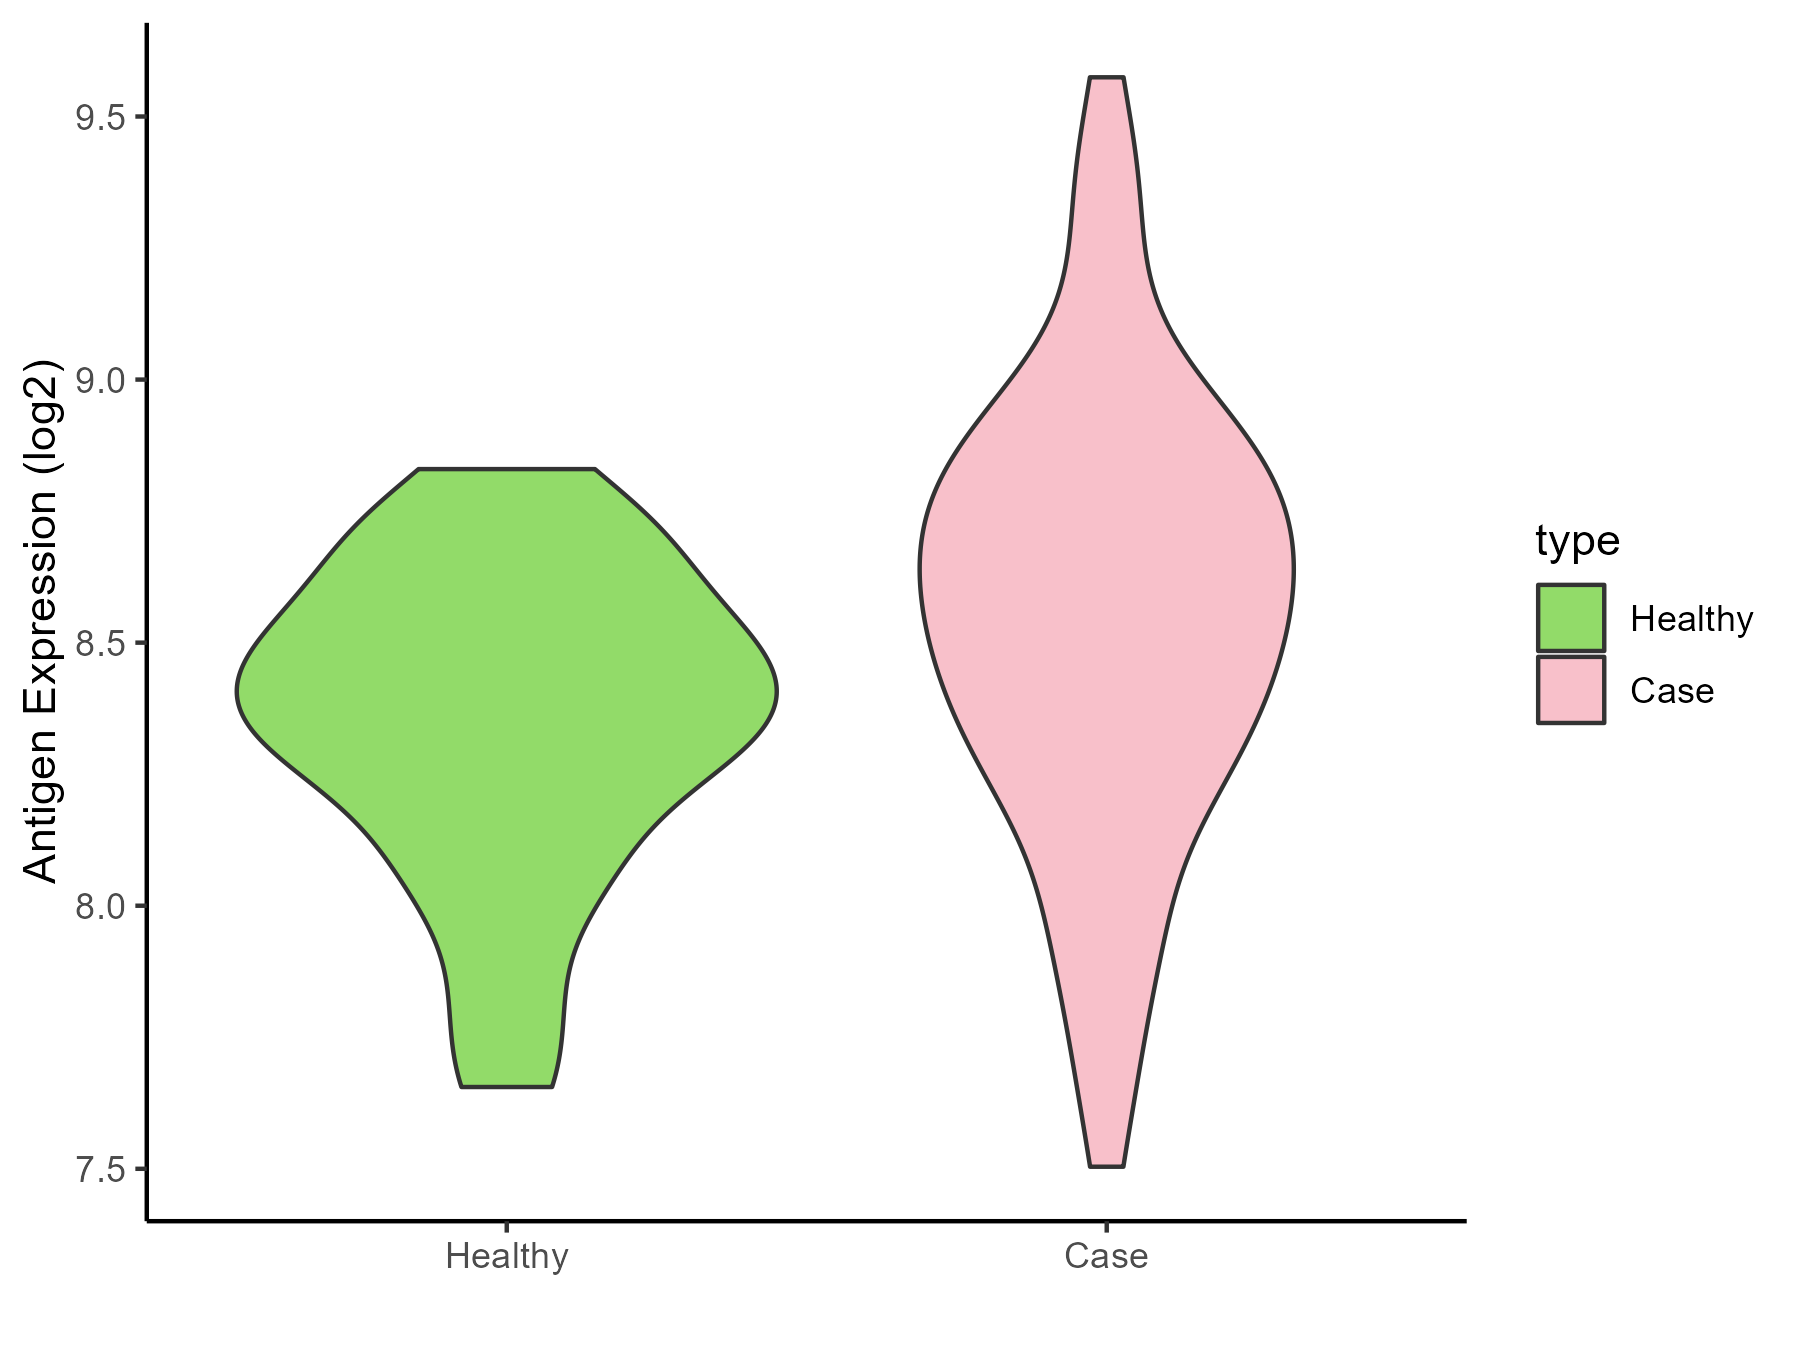
| Differential expression pattern of antigen in diseases | ||
| The Studied Tissue | Whole blood | |
| The Specific Disease | Cardioembolic Stroke | |
| The Expression Level of Disease Section Compare with the Healthy Individual Tissue | p-value: 0.022518307; Fold-change: 0.179308784; Z-score: 0.595488869 | |
| Disease-specific Antigen Abundances |
|
Click to View the Clearer Original Diagram |
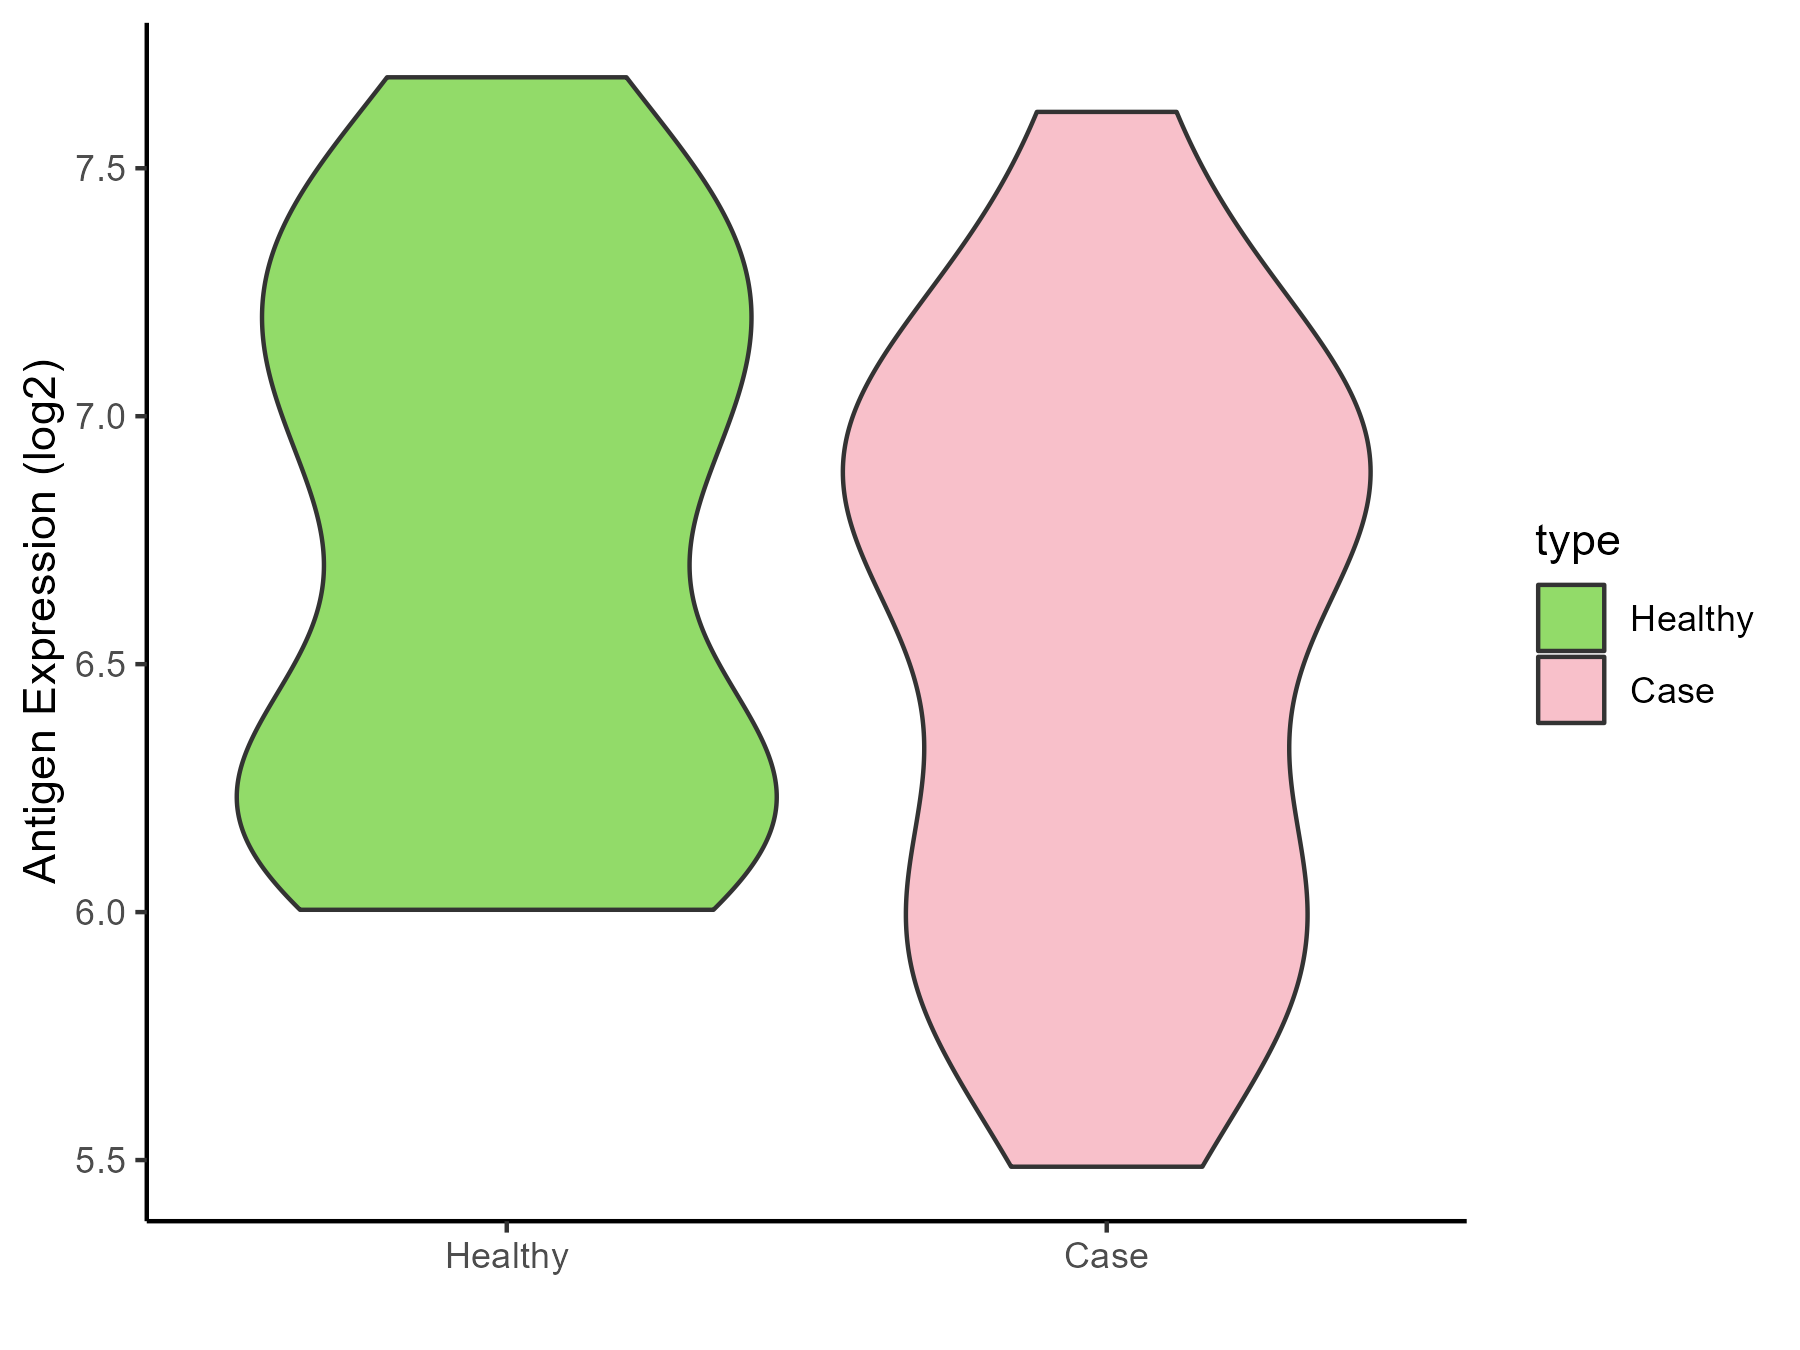
| The Studied Tissue | Peripheral blood | |
| The Specific Disease | Ischemic stroke | |
| The Expression Level of Disease Section Compare with the Healthy Individual Tissue | p-value: 0.226899906; Fold-change: -0.185925481; Z-score: -0.33859267 | |
| Disease-specific Antigen Abundances |
|
Click to View the Clearer Original Diagram |
ICD Disease Classification 1
| Differential expression pattern of antigen in diseases | ||
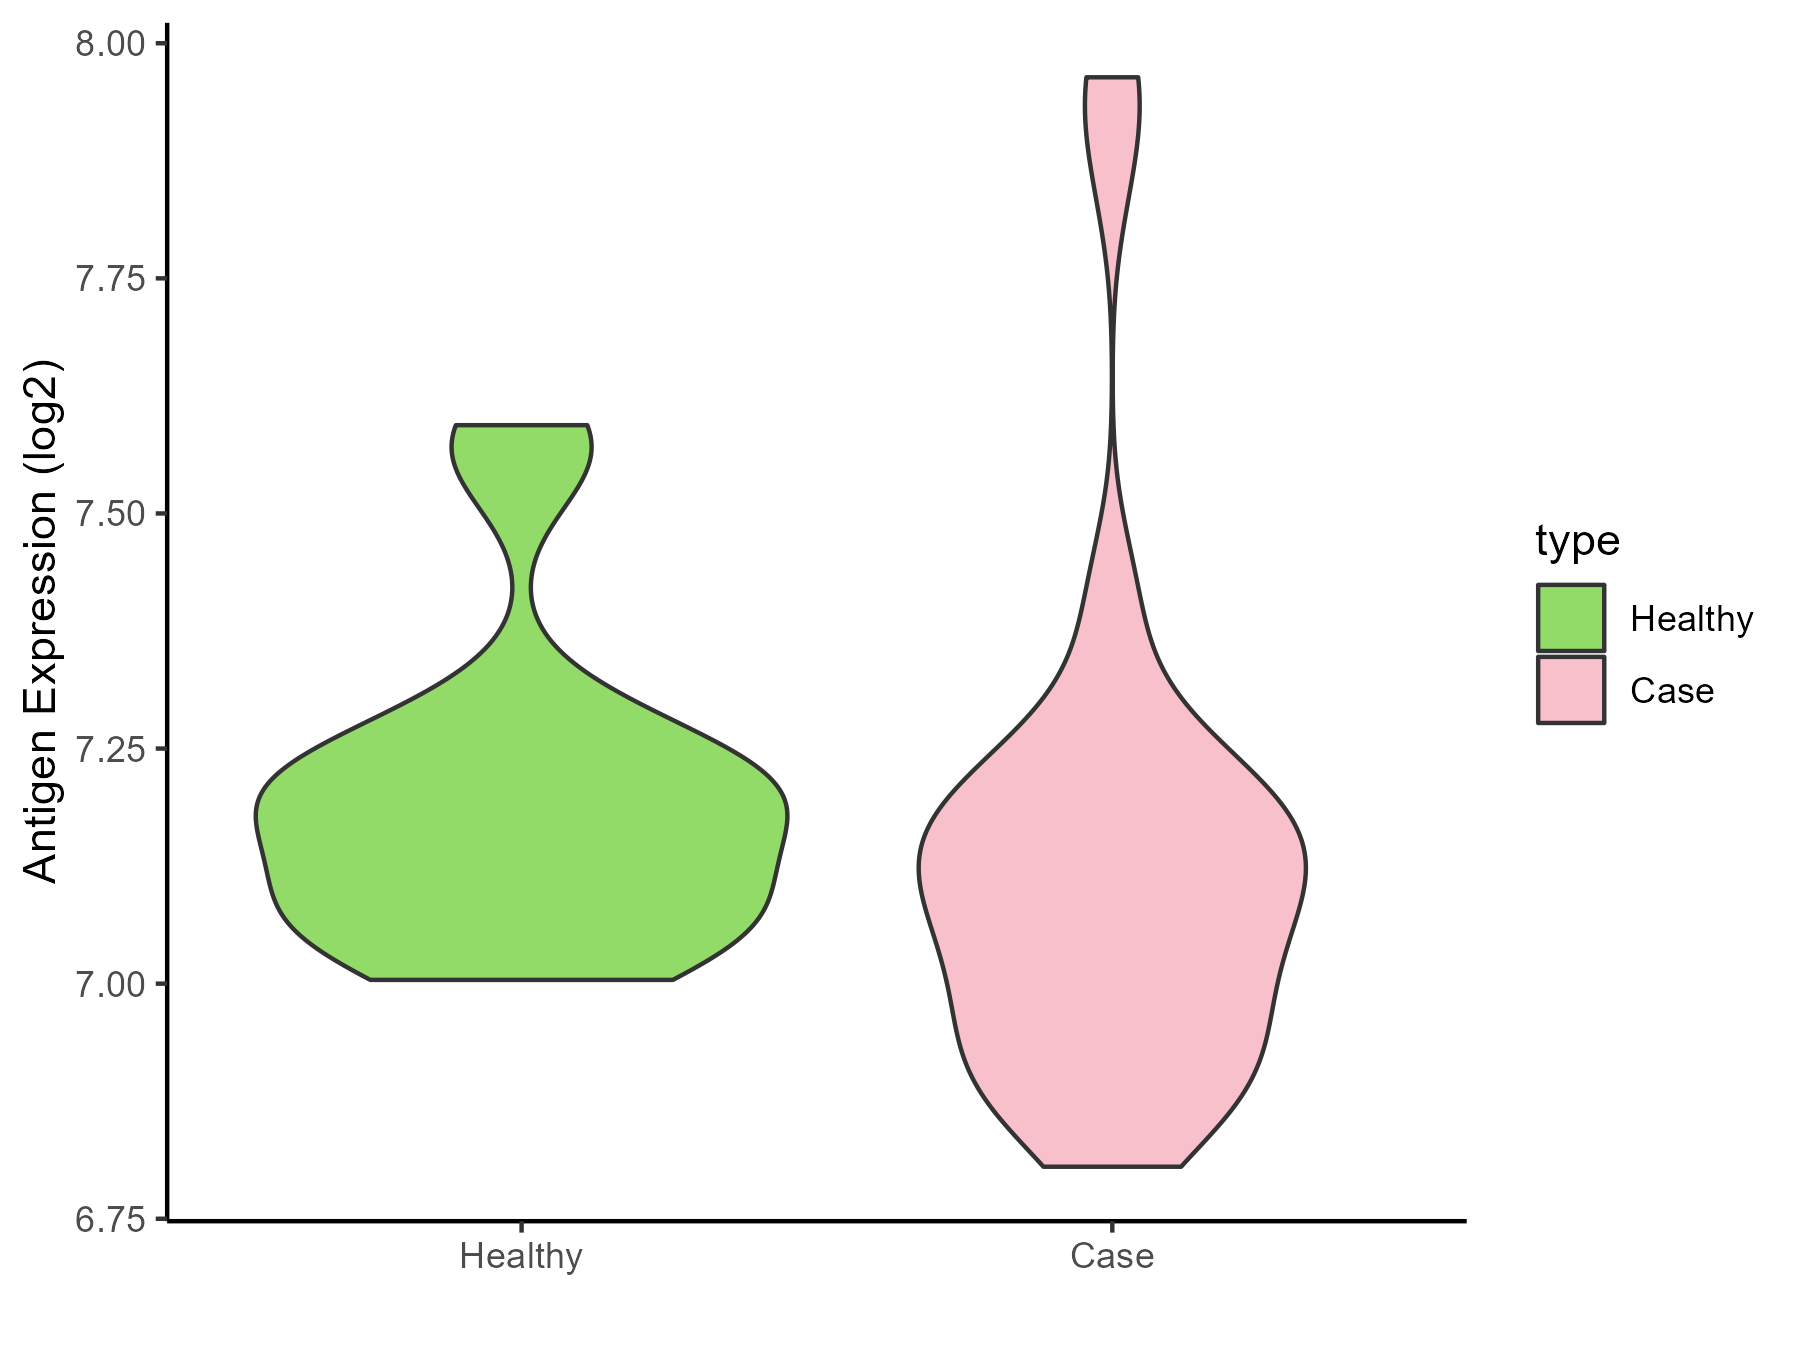
| The Studied Tissue | White matter | |
| The Specific Disease | HIV | |
| The Expression Level of Disease Section Compare with the Healthy Individual Tissue | p-value: 0.257575551; Fold-change: -0.083326754; Z-score: -0.496173287 | |
| Disease-specific Antigen Abundances |
|
Click to View the Clearer Original Diagram |
| Differential expression pattern of antigen in diseases | ||
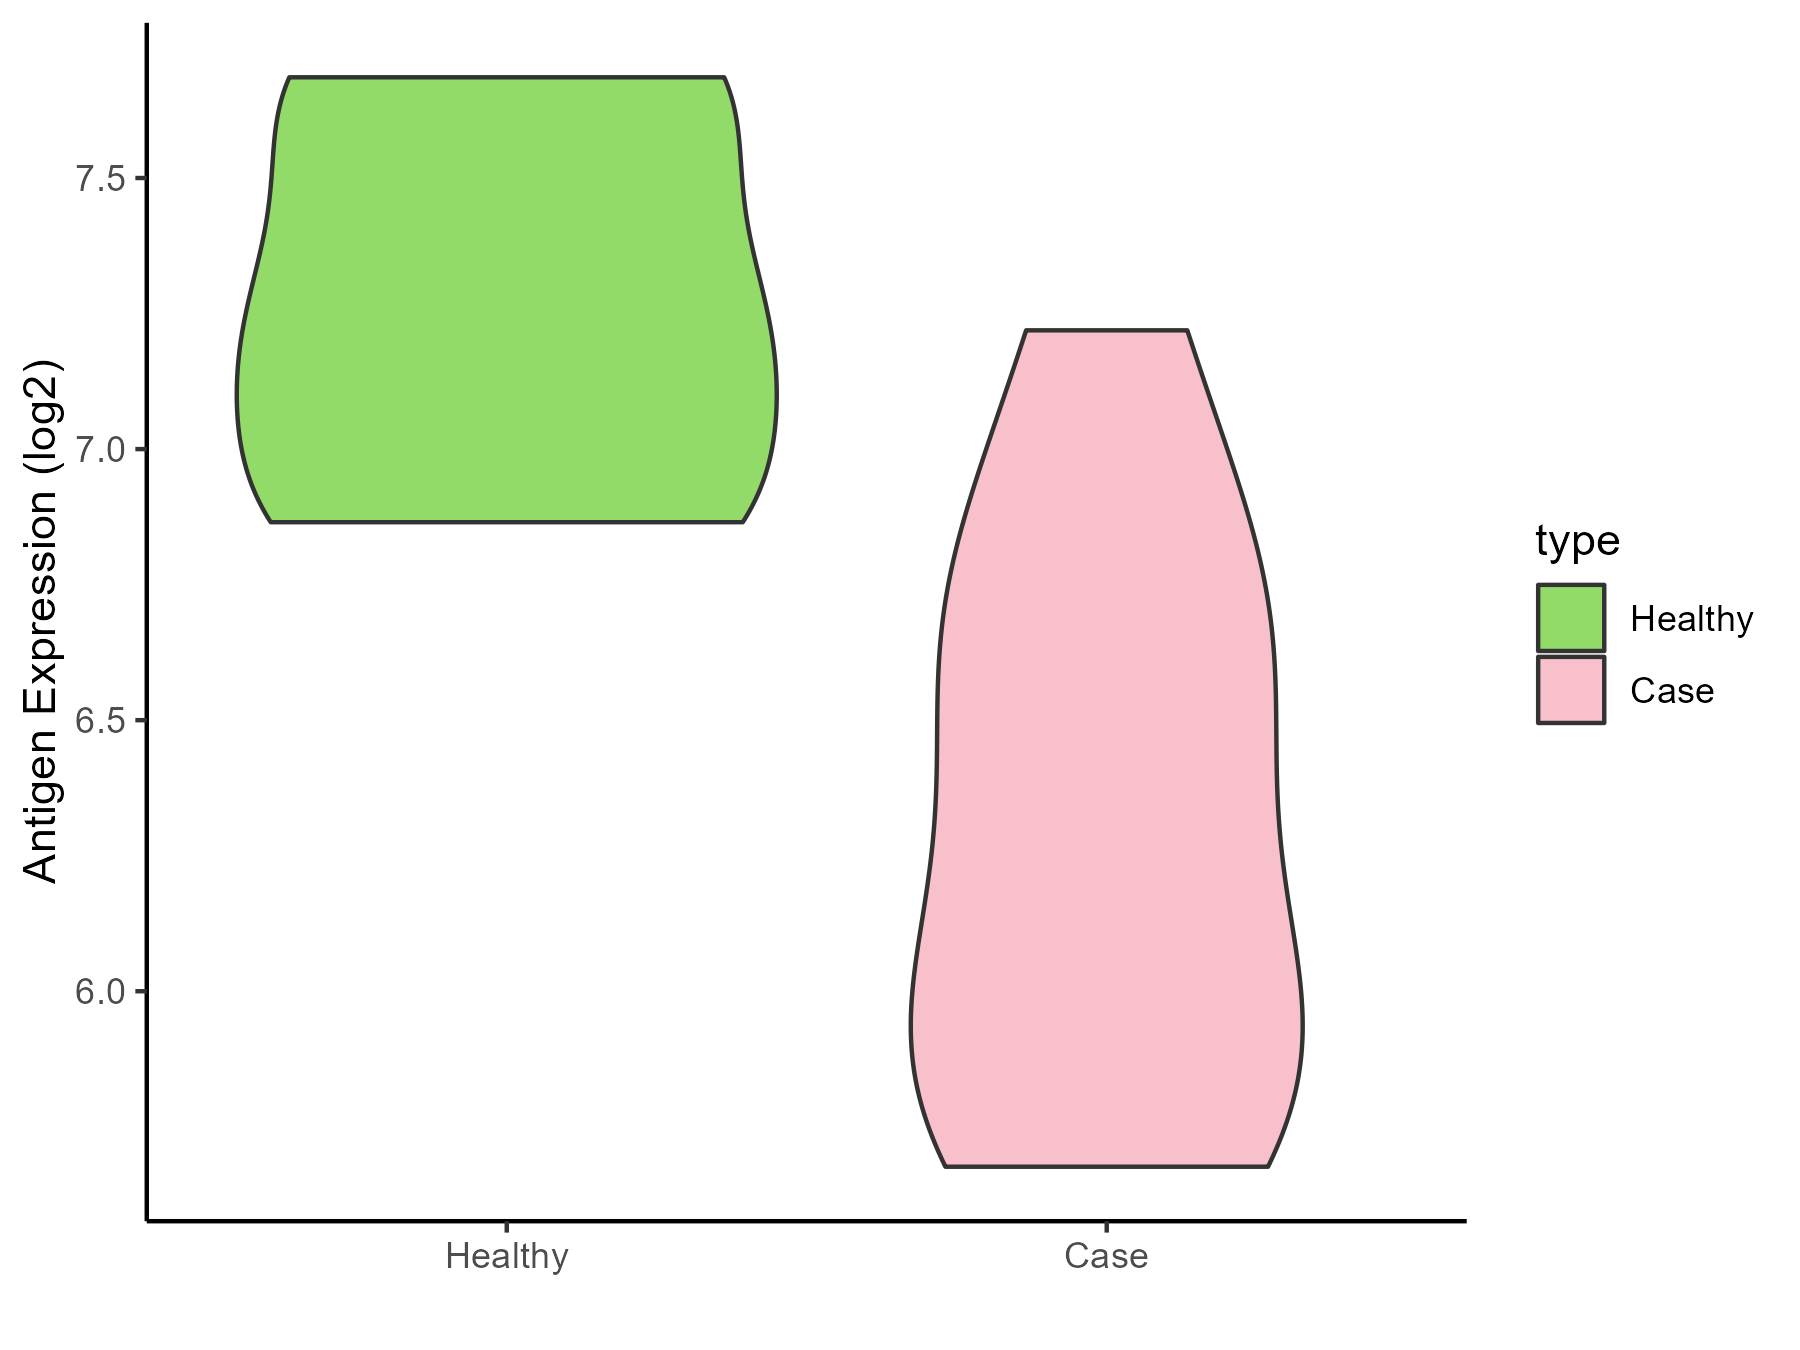
| The Studied Tissue | Whole blood | |
| The Specific Disease | Influenza | |
| The Expression Level of Disease Section Compare with the Healthy Individual Tissue | p-value: 0.027801383; Fold-change: -0.980221121; Z-score: -2.386507795 | |
| Disease-specific Antigen Abundances |
|
Click to View the Clearer Original Diagram |
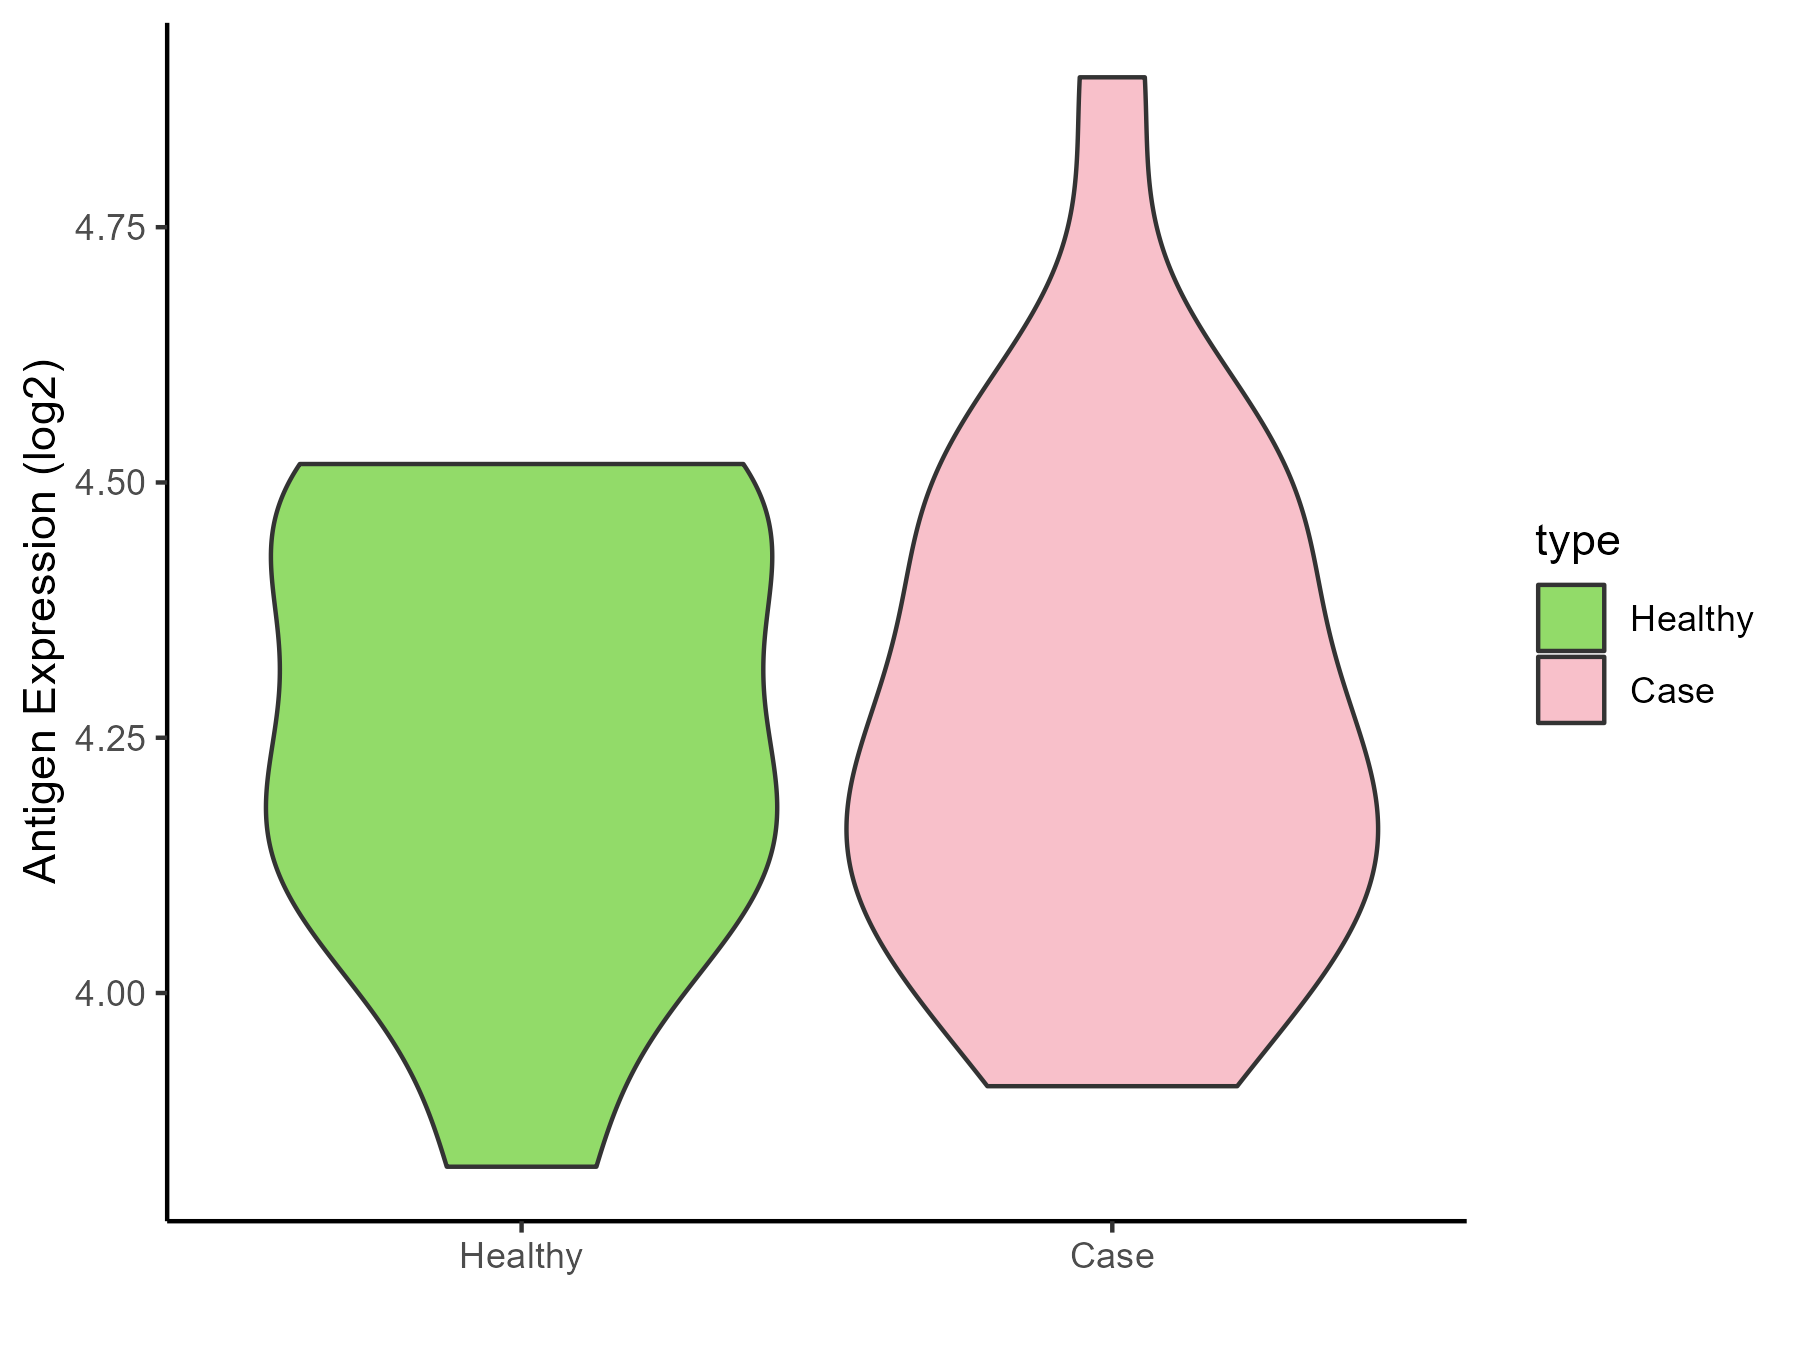
| Differential expression pattern of antigen in diseases | ||
| The Studied Tissue | Whole blood | |
| The Specific Disease | Chronic hepatitis C | |
| The Expression Level of Disease Section Compare with the Healthy Individual Tissue | p-value: 0.807492481; Fold-change: -0.005249554; Z-score: -0.023286916 | |
| Disease-specific Antigen Abundances |
|
Click to View the Clearer Original Diagram |
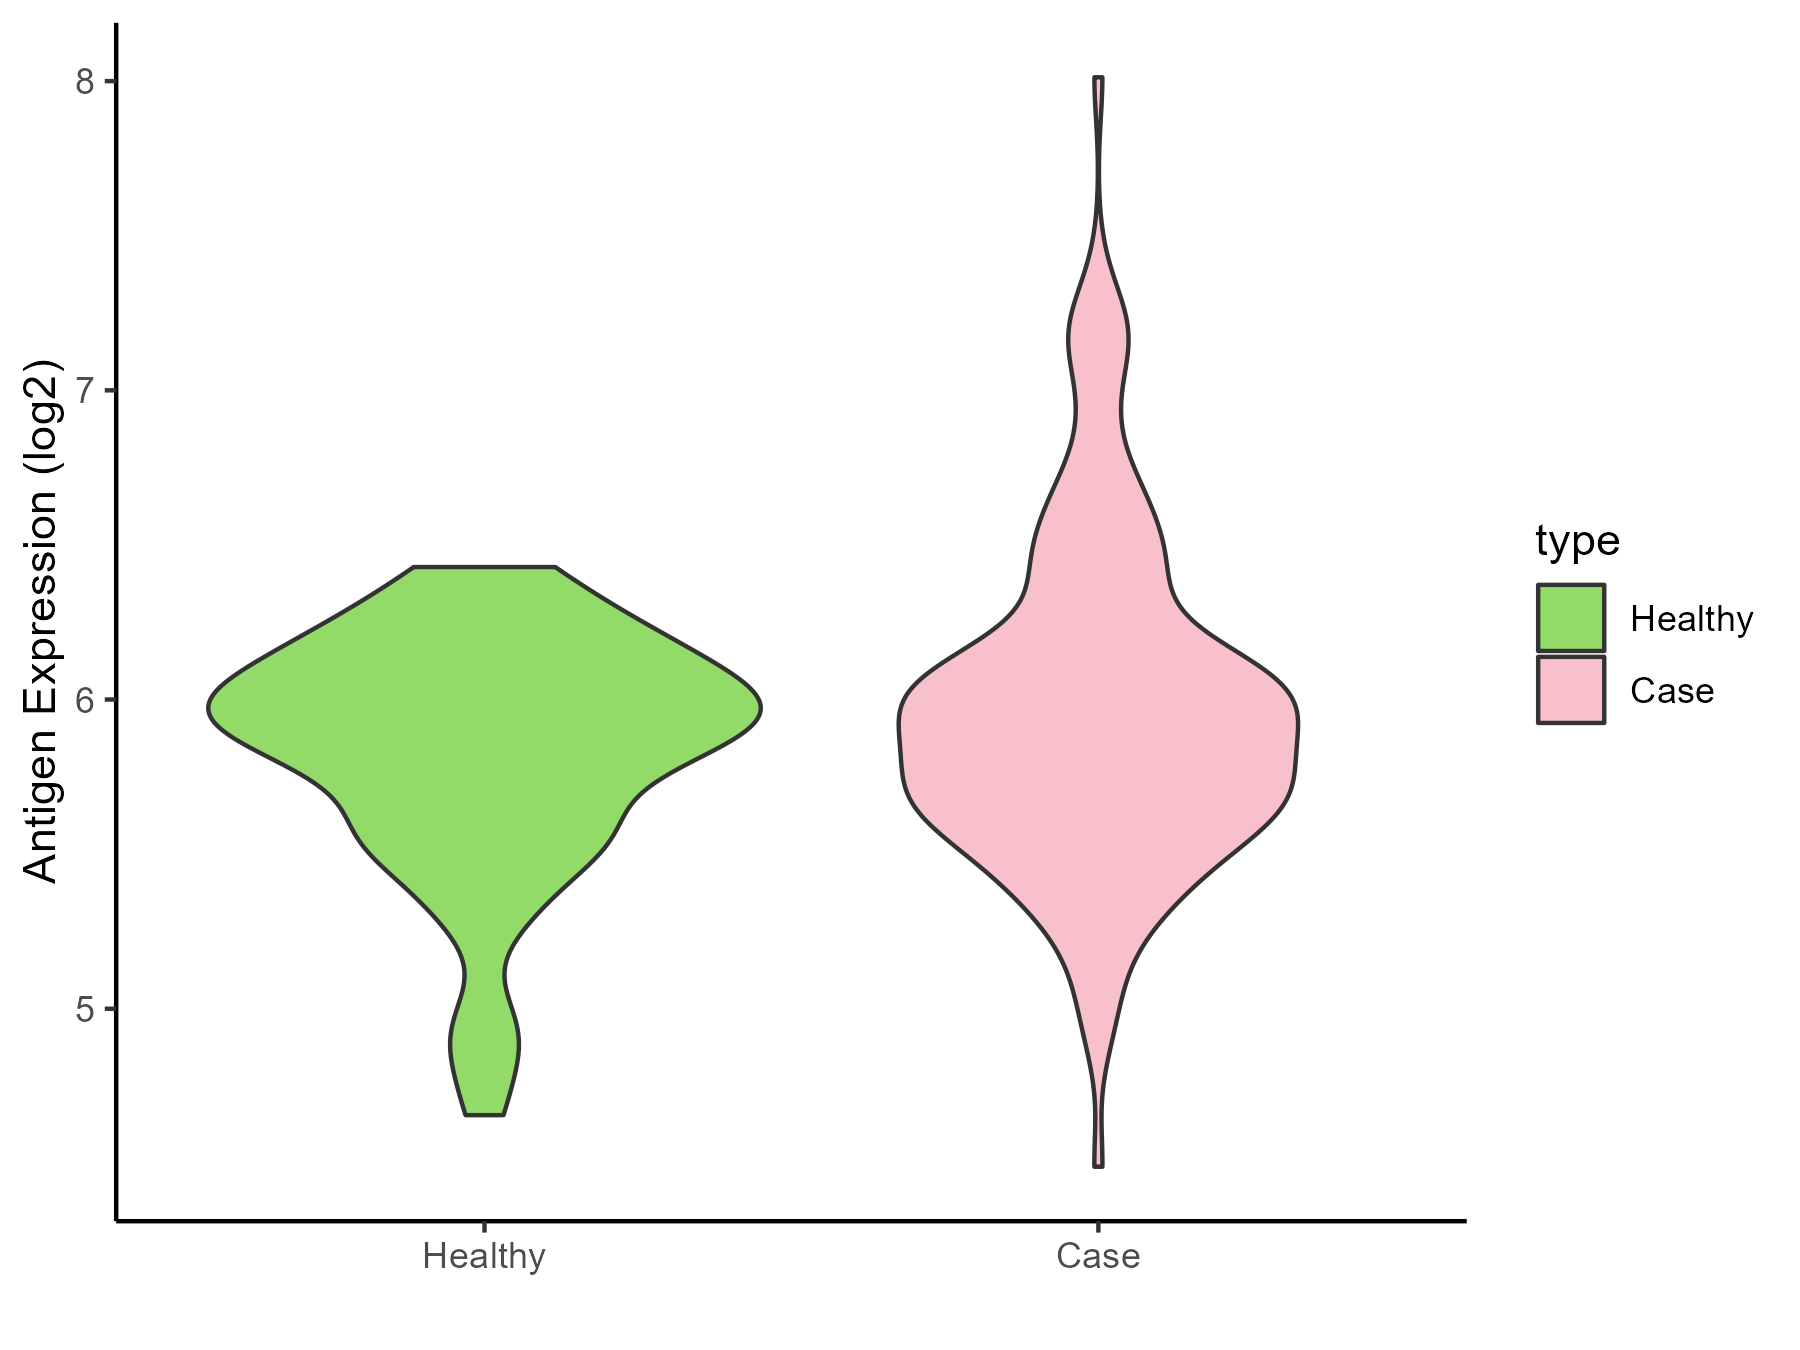
| Differential expression pattern of antigen in diseases | ||
| The Studied Tissue | Whole blood | |
| The Specific Disease | Sepsis | |
| The Expression Level of Disease Section Compare with the Healthy Individual Tissue | p-value: 0.036072041; Fold-change: -0.023856457; Z-score: -0.061589399 | |
| Disease-specific Antigen Abundances |
|
Click to View the Clearer Original Diagram |
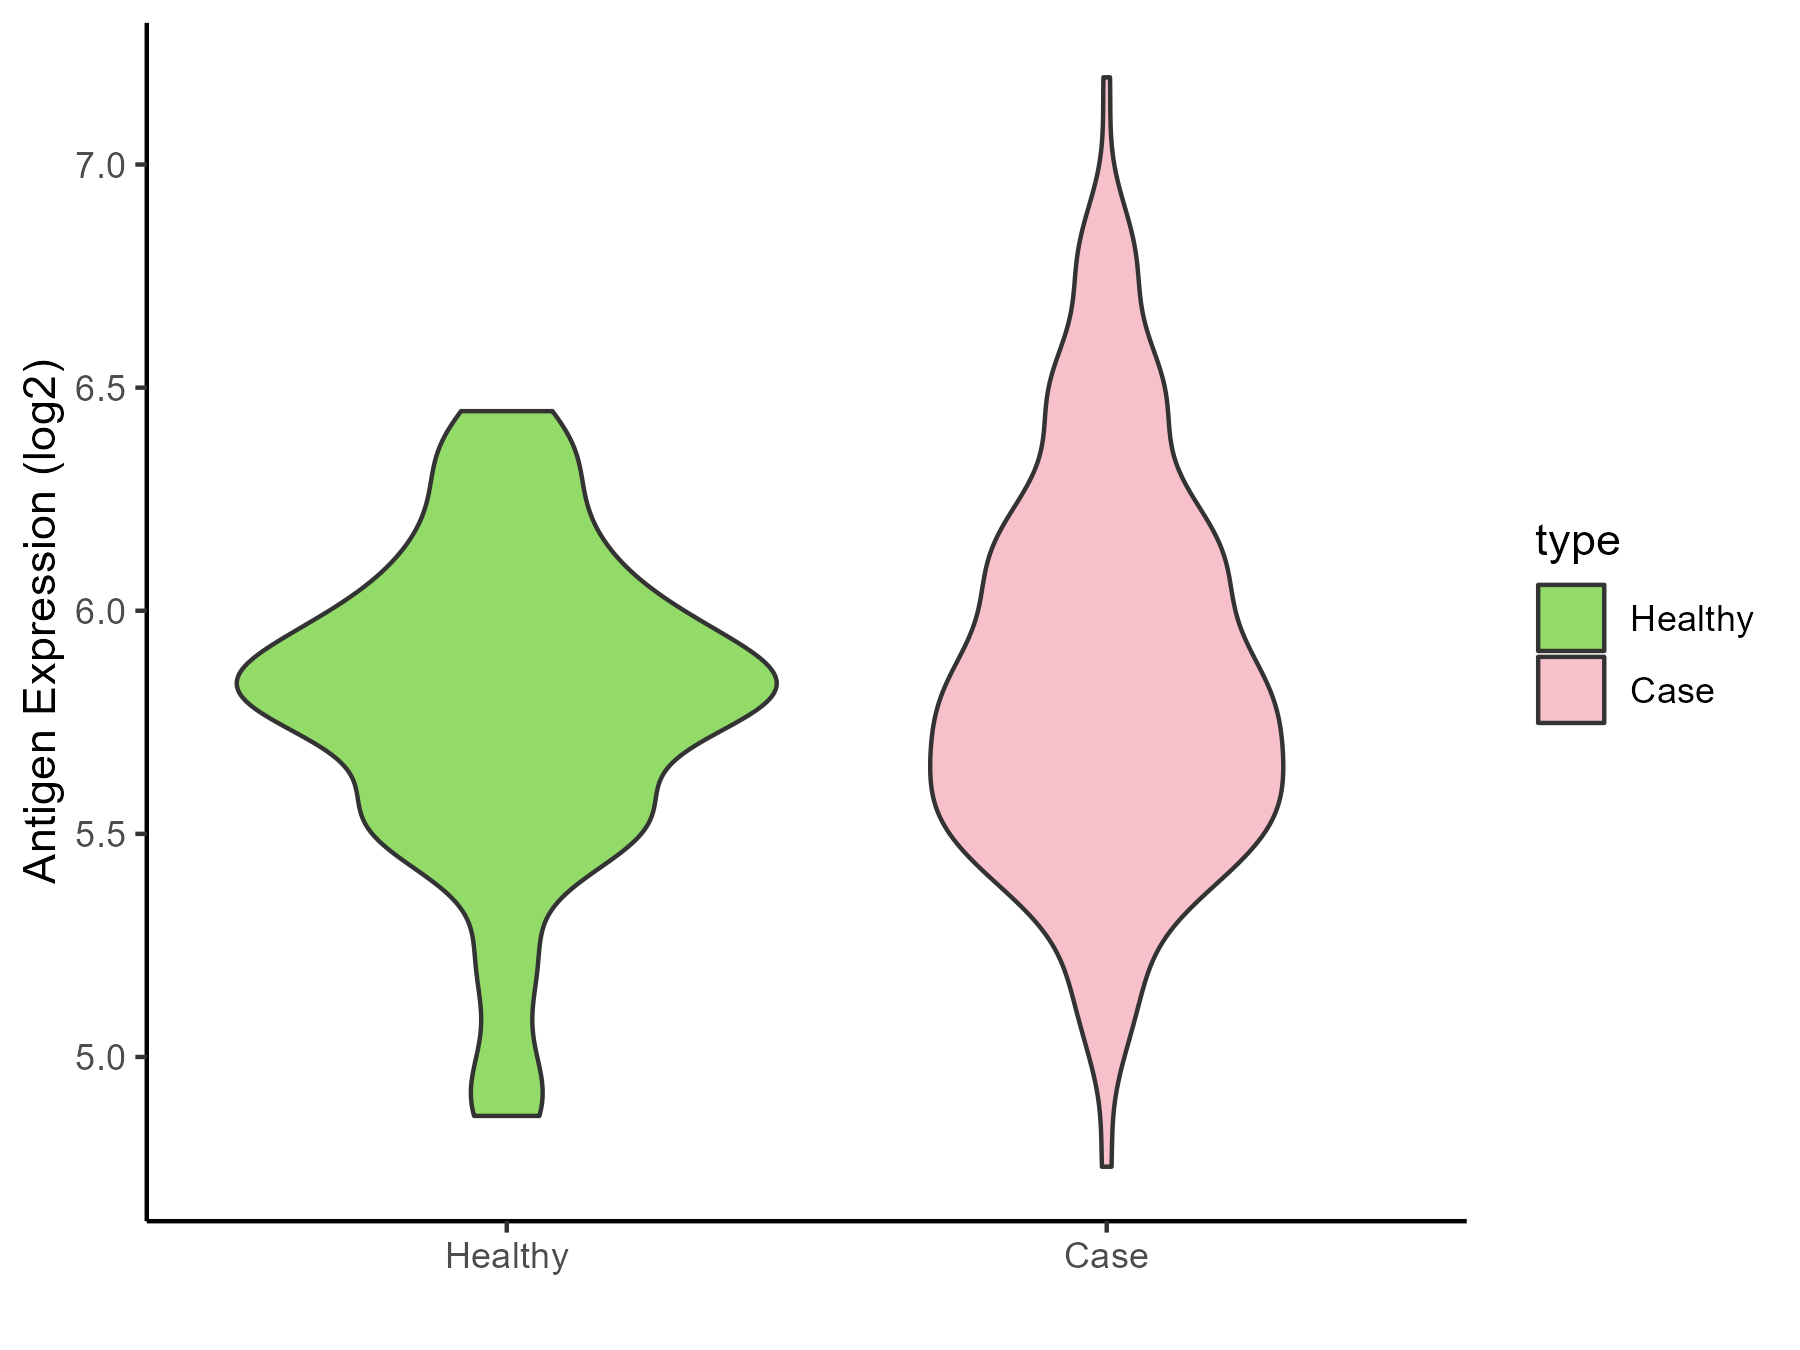
| Differential expression pattern of antigen in diseases | ||
| The Studied Tissue | Whole blood | |
| The Specific Disease | Septic shock | |
| The Expression Level of Disease Section Compare with the Healthy Individual Tissue | p-value: 0.018456227; Fold-change: -0.028909514; Z-score: -0.083377161 | |
| Disease-specific Antigen Abundances |
|
Click to View the Clearer Original Diagram |
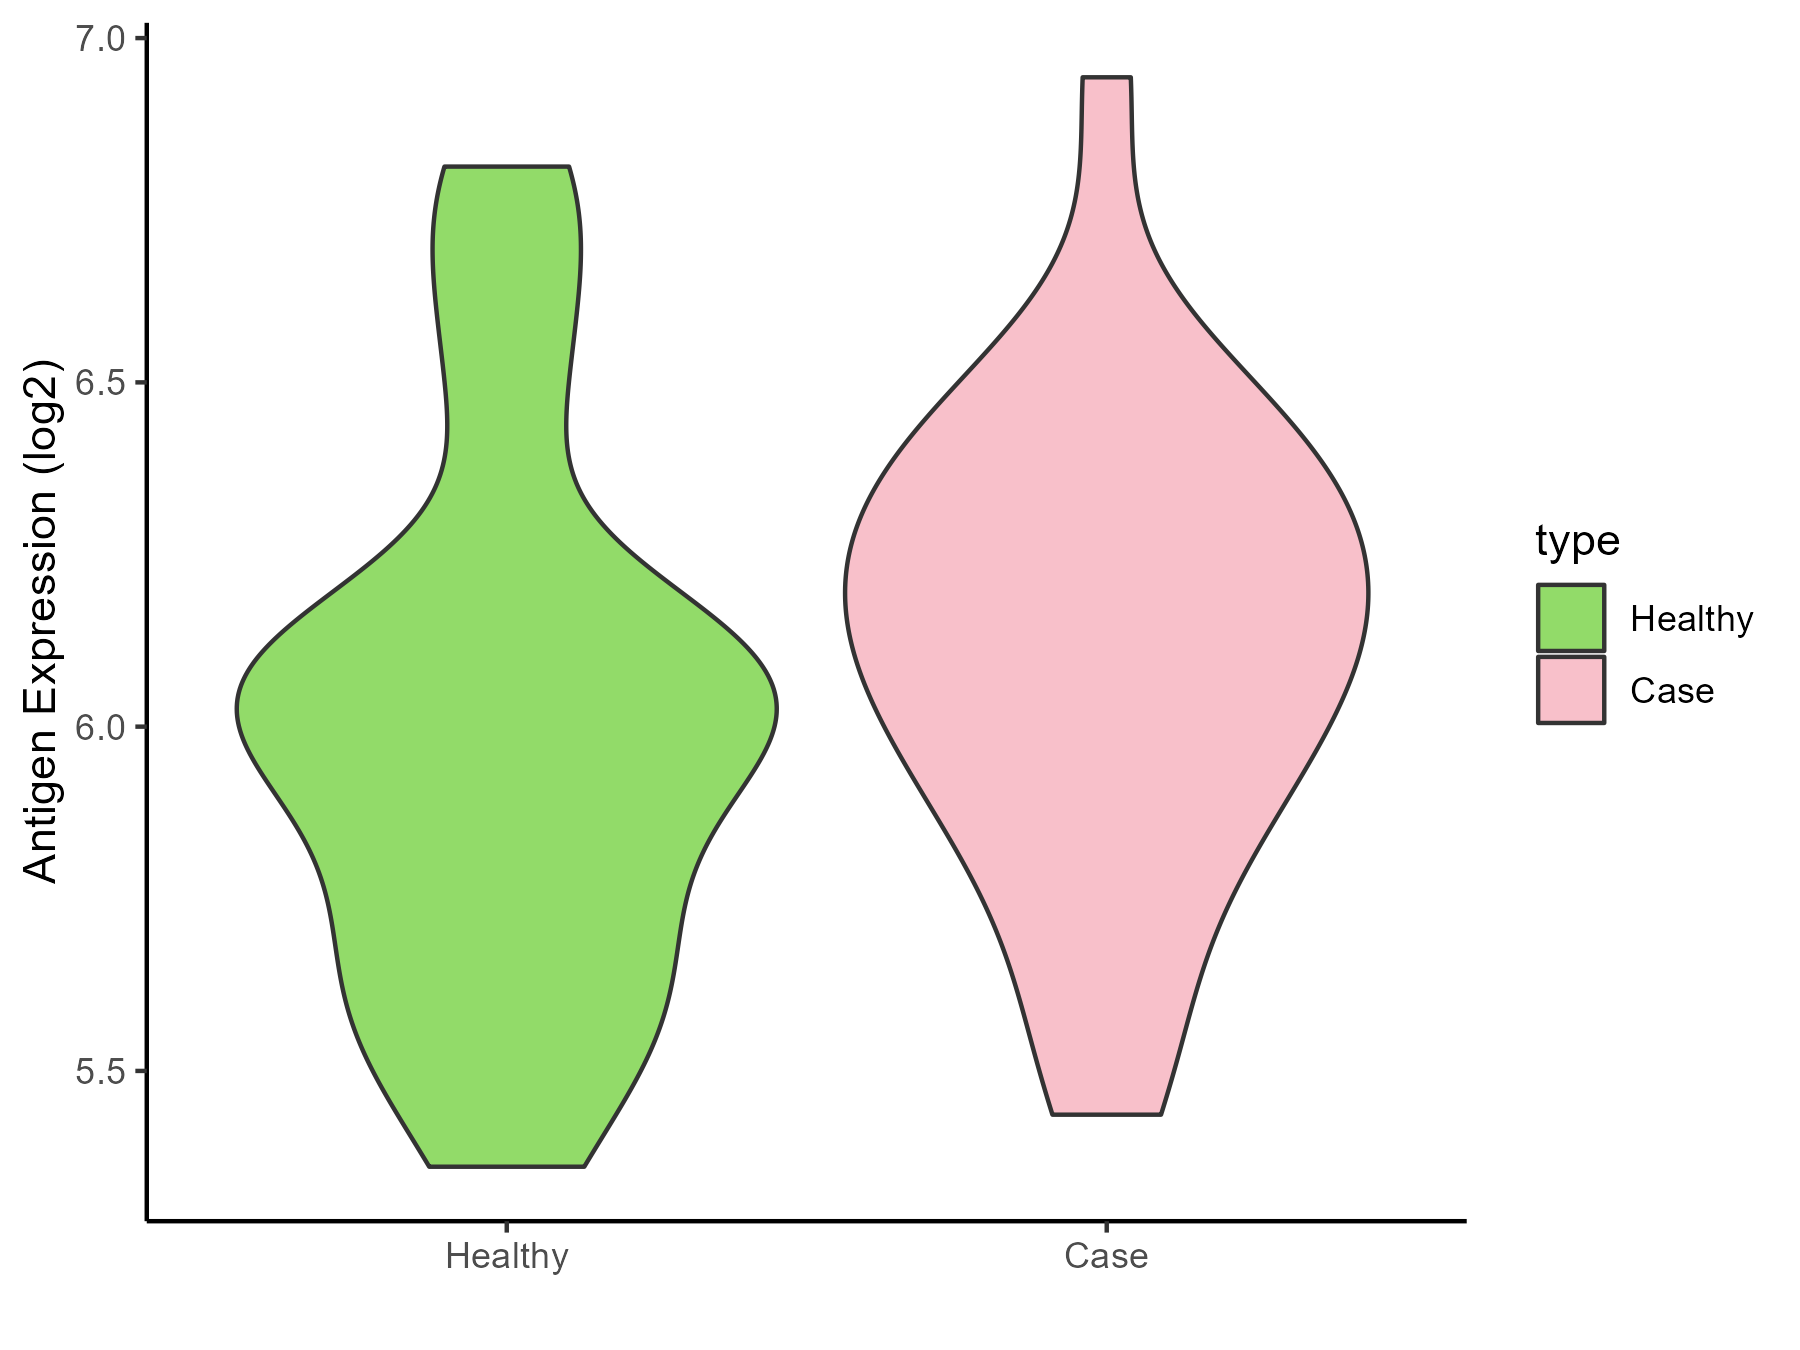
| Differential expression pattern of antigen in diseases | ||
| The Studied Tissue | Peripheral blood | |
| The Specific Disease | Pediatric respiratory syncytial virus infection | |
| The Expression Level of Disease Section Compare with the Healthy Individual Tissue | p-value: 0.266442735; Fold-change: 0.195975034; Z-score: 0.497652481 | |
| Disease-specific Antigen Abundances |
|
Click to View the Clearer Original Diagram |
ICD Disease Classification 11
| Differential expression pattern of antigen in diseases | ||
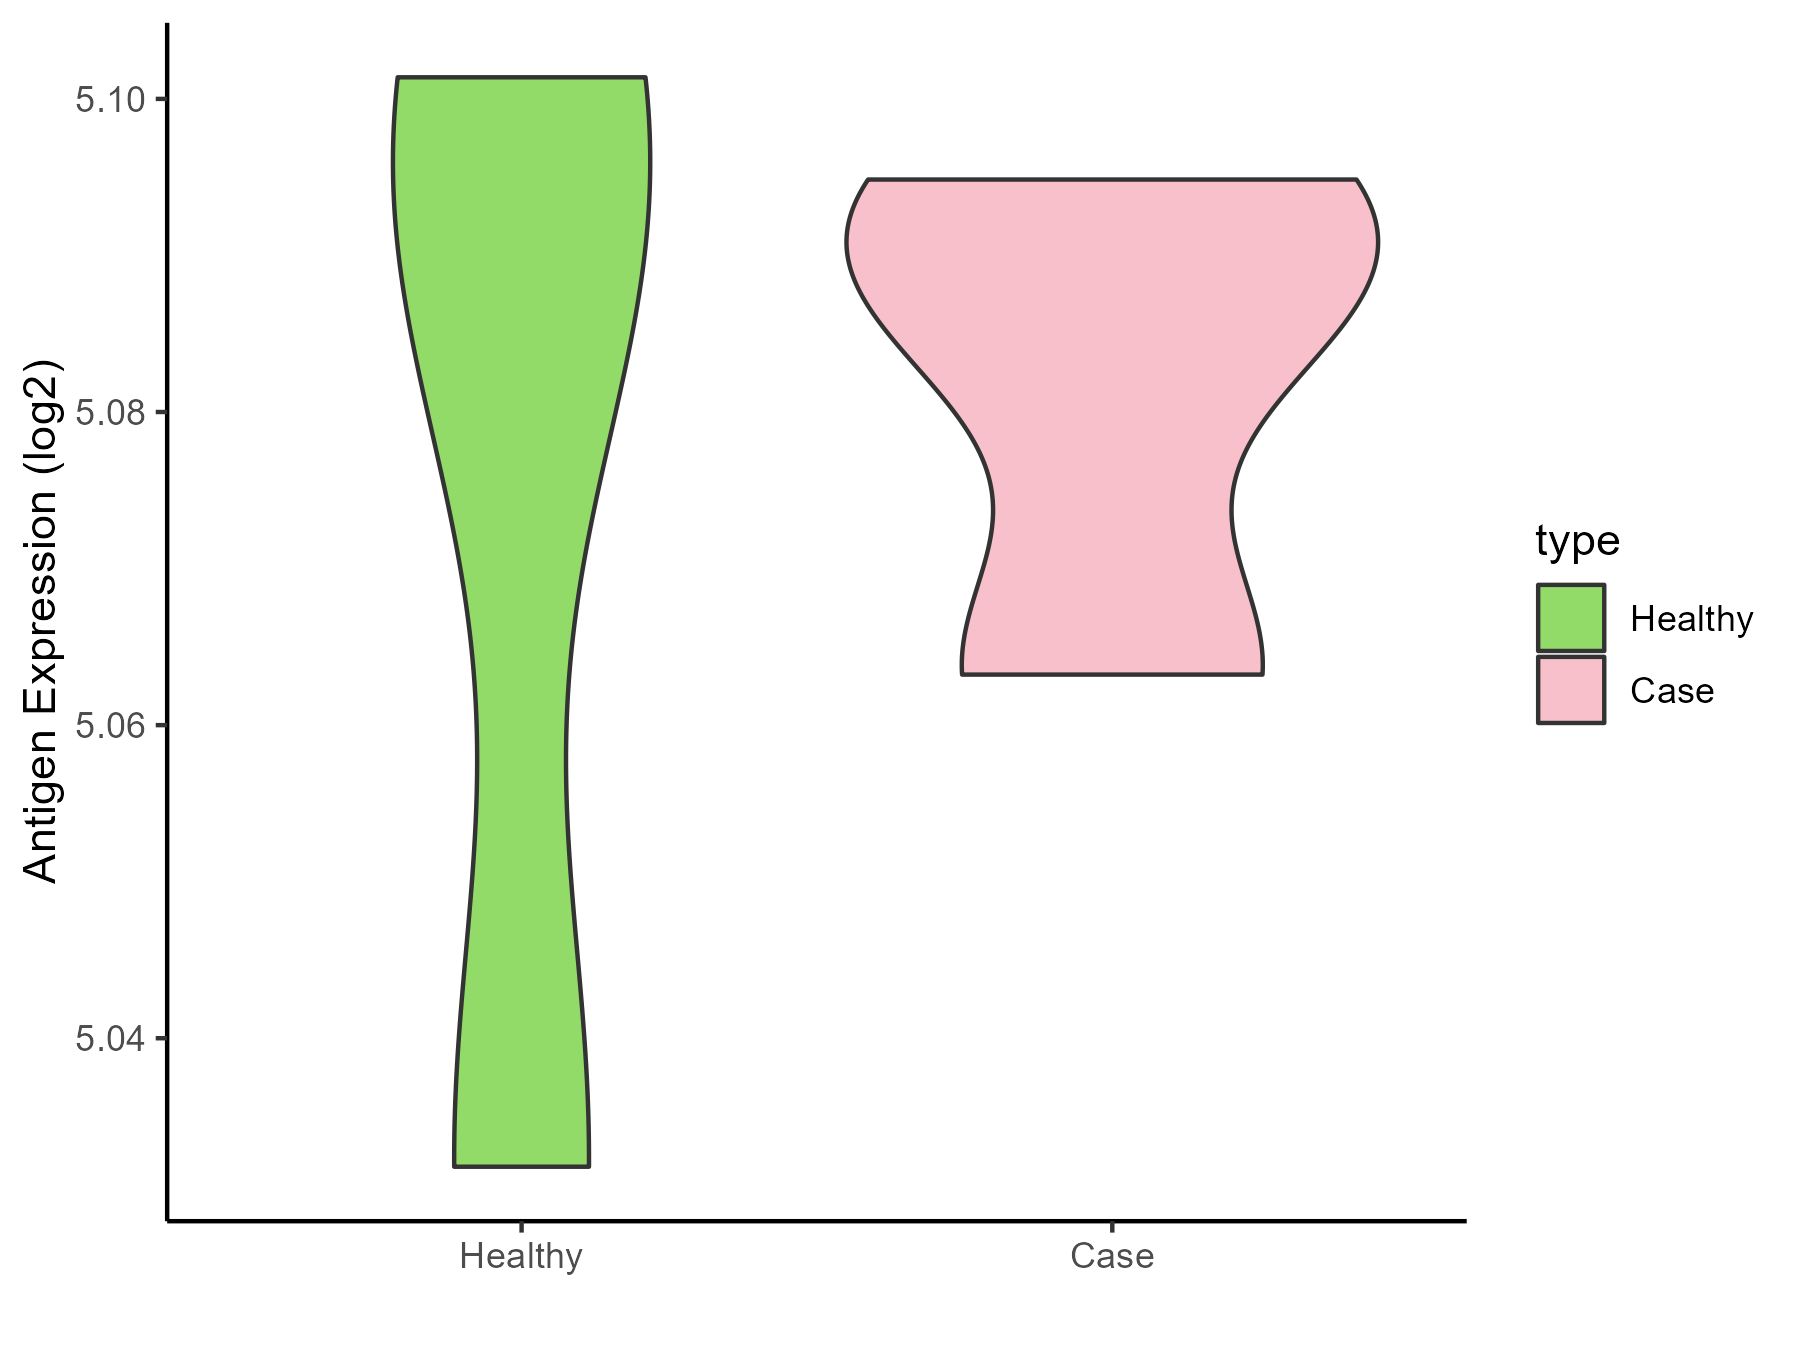
| The Studied Tissue | Peripheral blood | |
| The Specific Disease | Essential hypertension | |
| The Expression Level of Disease Section Compare with the Healthy Individual Tissue | p-value: 0.786409782; Fold-change: -0.003722087; Z-score: -0.099274703 | |
| Disease-specific Antigen Abundances |
|
Click to View the Clearer Original Diagram |
| Differential expression pattern of antigen in diseases | ||
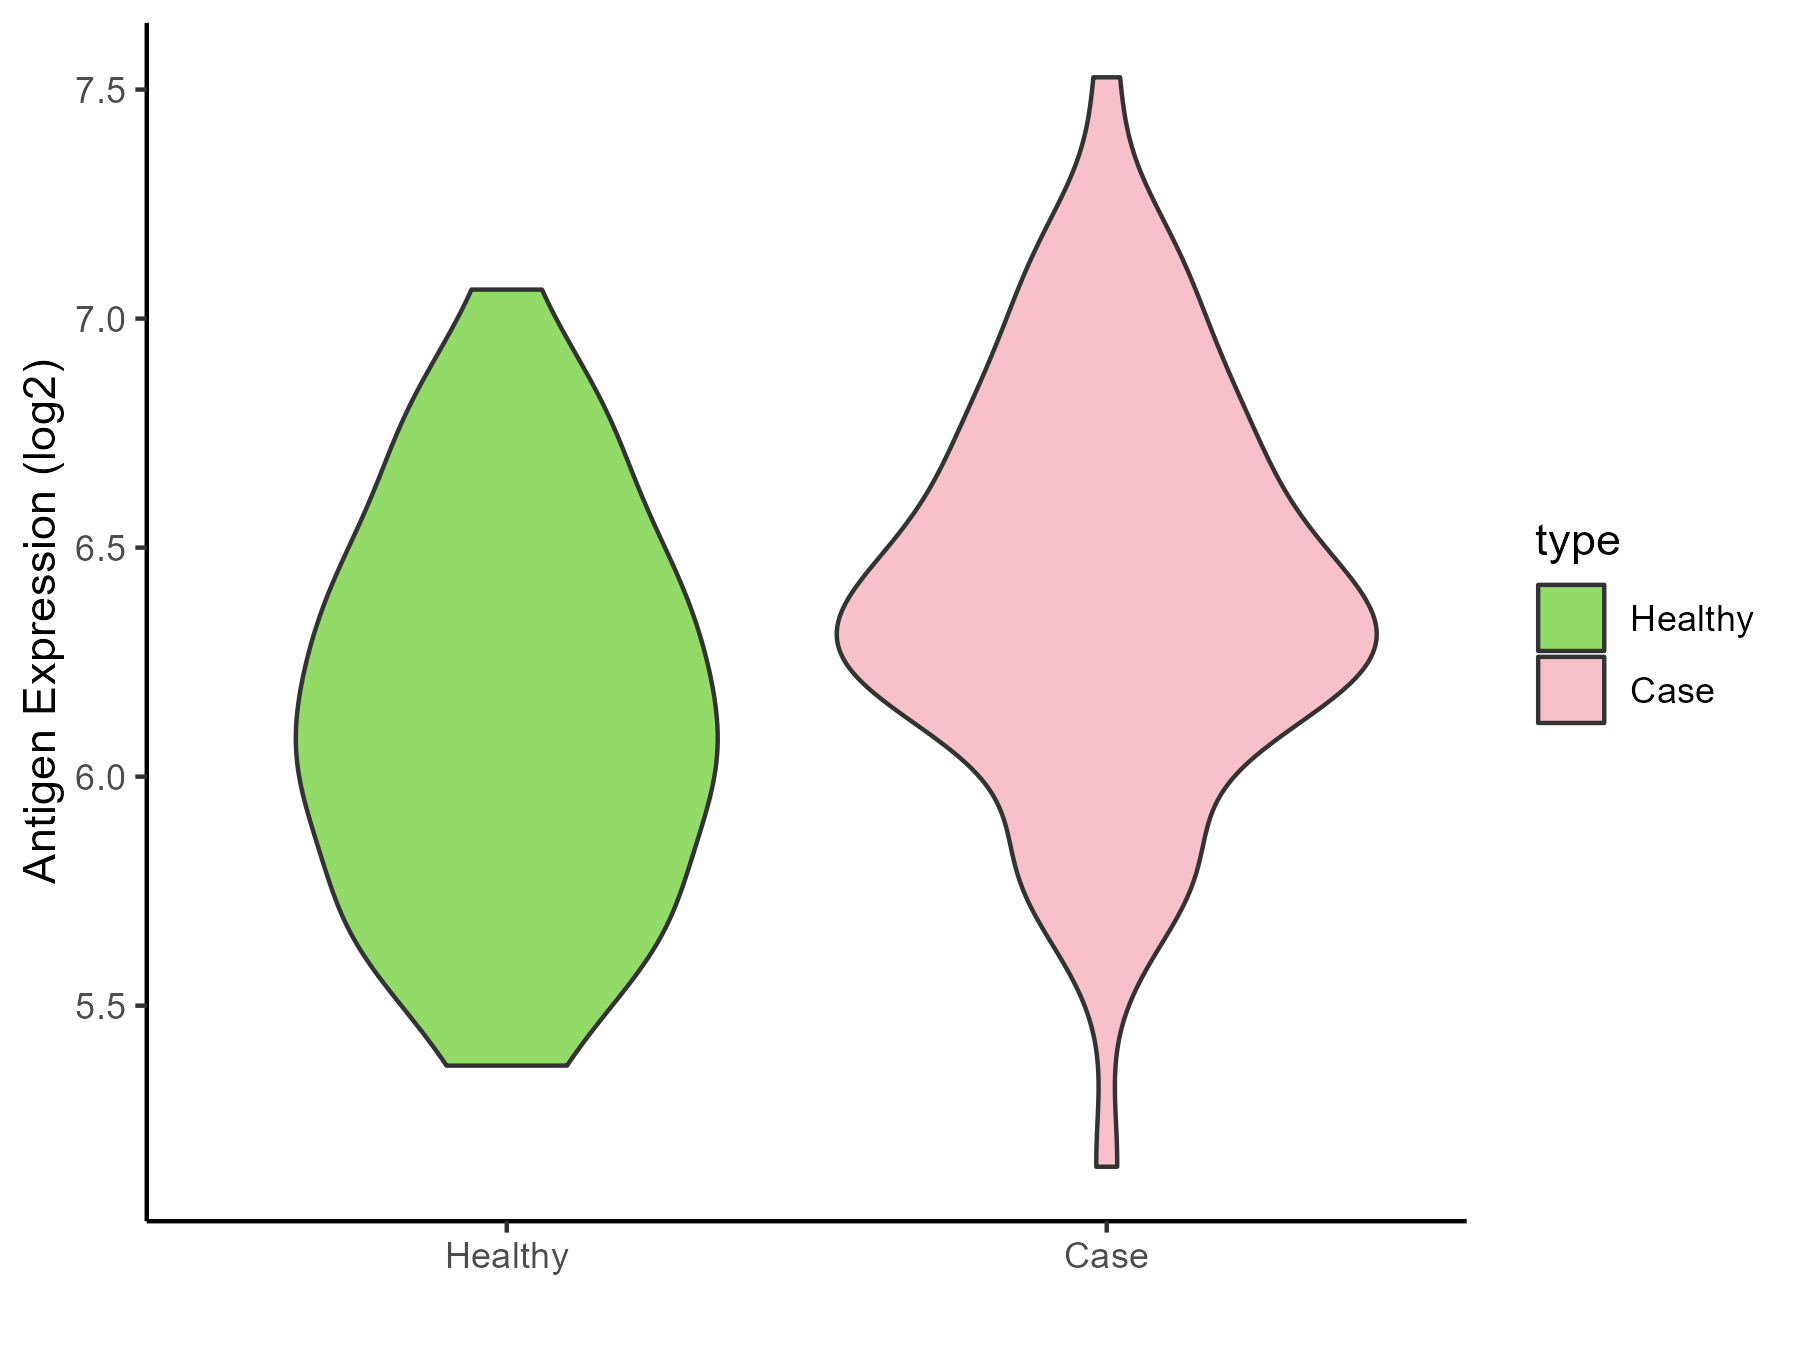
| The Studied Tissue | Peripheral blood | |
| The Specific Disease | Myocardial infarction | |
| The Expression Level of Disease Section Compare with the Healthy Individual Tissue | p-value: 0.000619174; Fold-change: 0.246030832; Z-score: 0.58360698 | |
| Disease-specific Antigen Abundances |
|
Click to View the Clearer Original Diagram |
| Differential expression pattern of antigen in diseases | ||
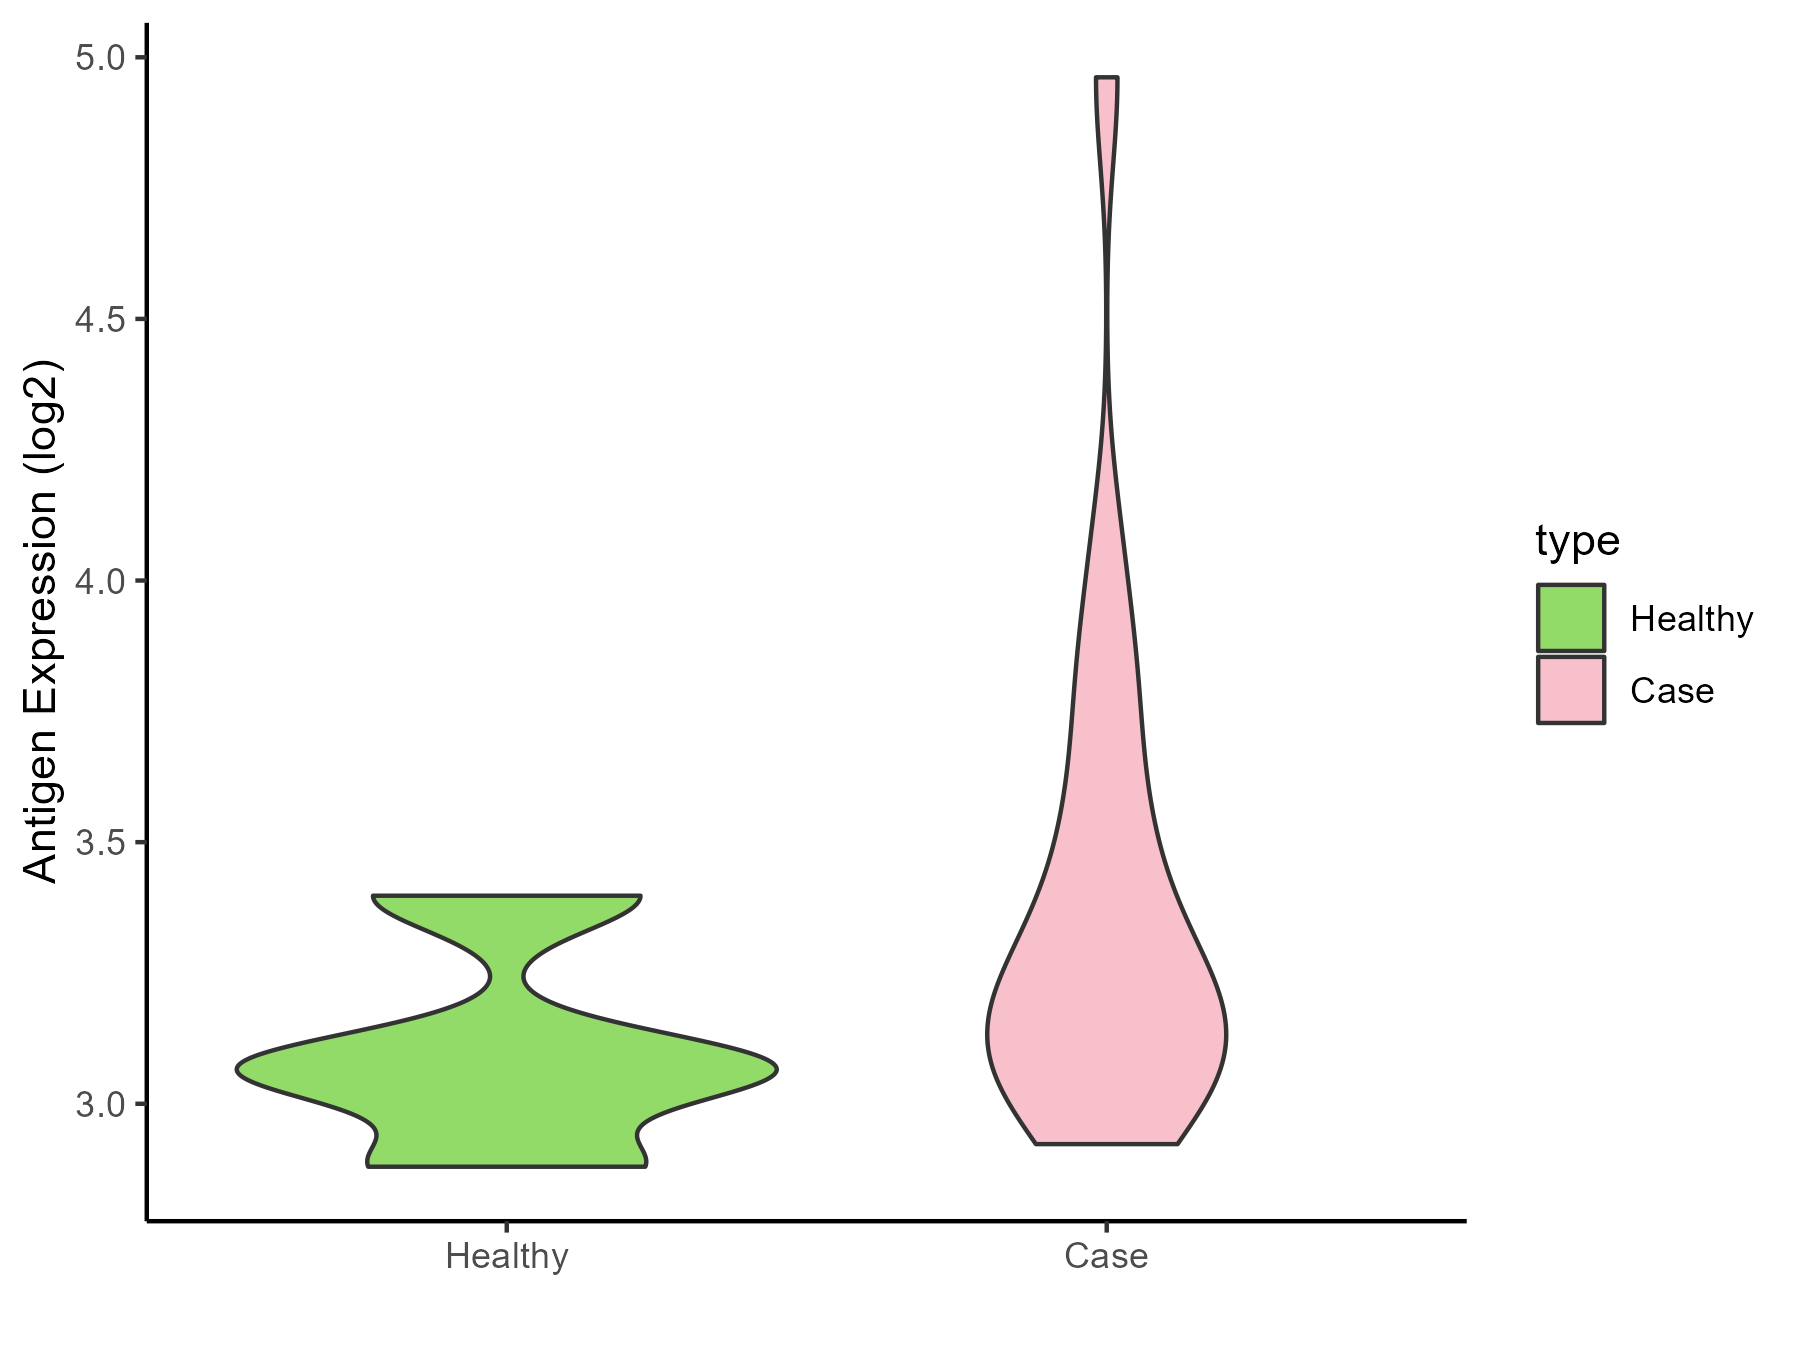
| The Studied Tissue | Peripheral blood | |
| The Specific Disease | Coronary artery disease | |
| The Expression Level of Disease Section Compare with the Healthy Individual Tissue | p-value: 0.090151152; Fold-change: 0.12681423; Z-score: 0.588710083 | |
| Disease-specific Antigen Abundances |
|
Click to View the Clearer Original Diagram |
| Differential expression pattern of antigen in diseases | ||
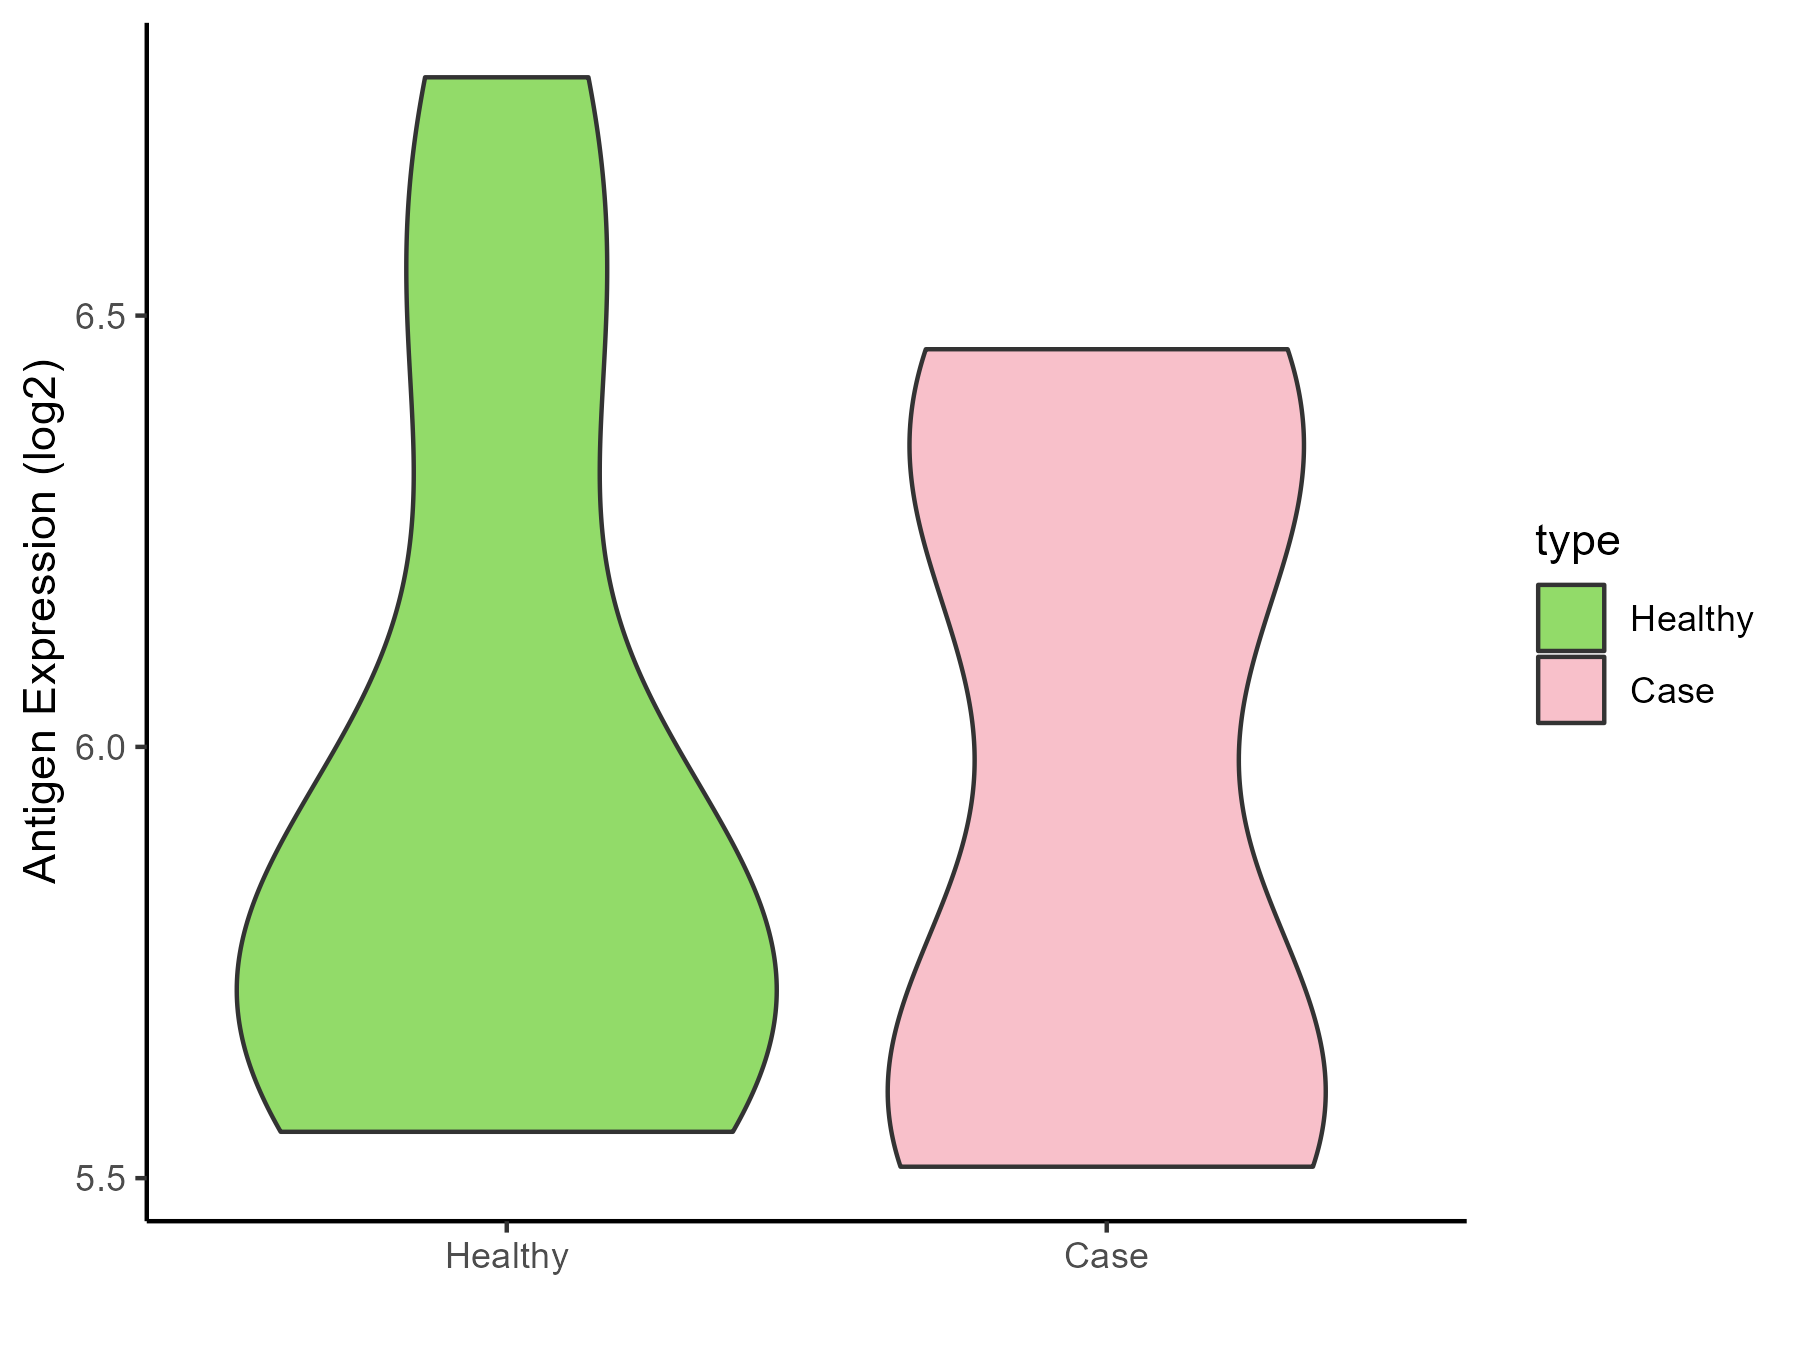
| The Studied Tissue | Calcified aortic valve | |
| The Specific Disease | Aortic stenosis | |
| The Expression Level of Disease Section Compare with the Healthy Individual Tissue | p-value: 0.992282057; Fold-change: 0.113953044; Z-score: 0.260929821 | |
| Disease-specific Antigen Abundances |
|
Click to View the Clearer Original Diagram |
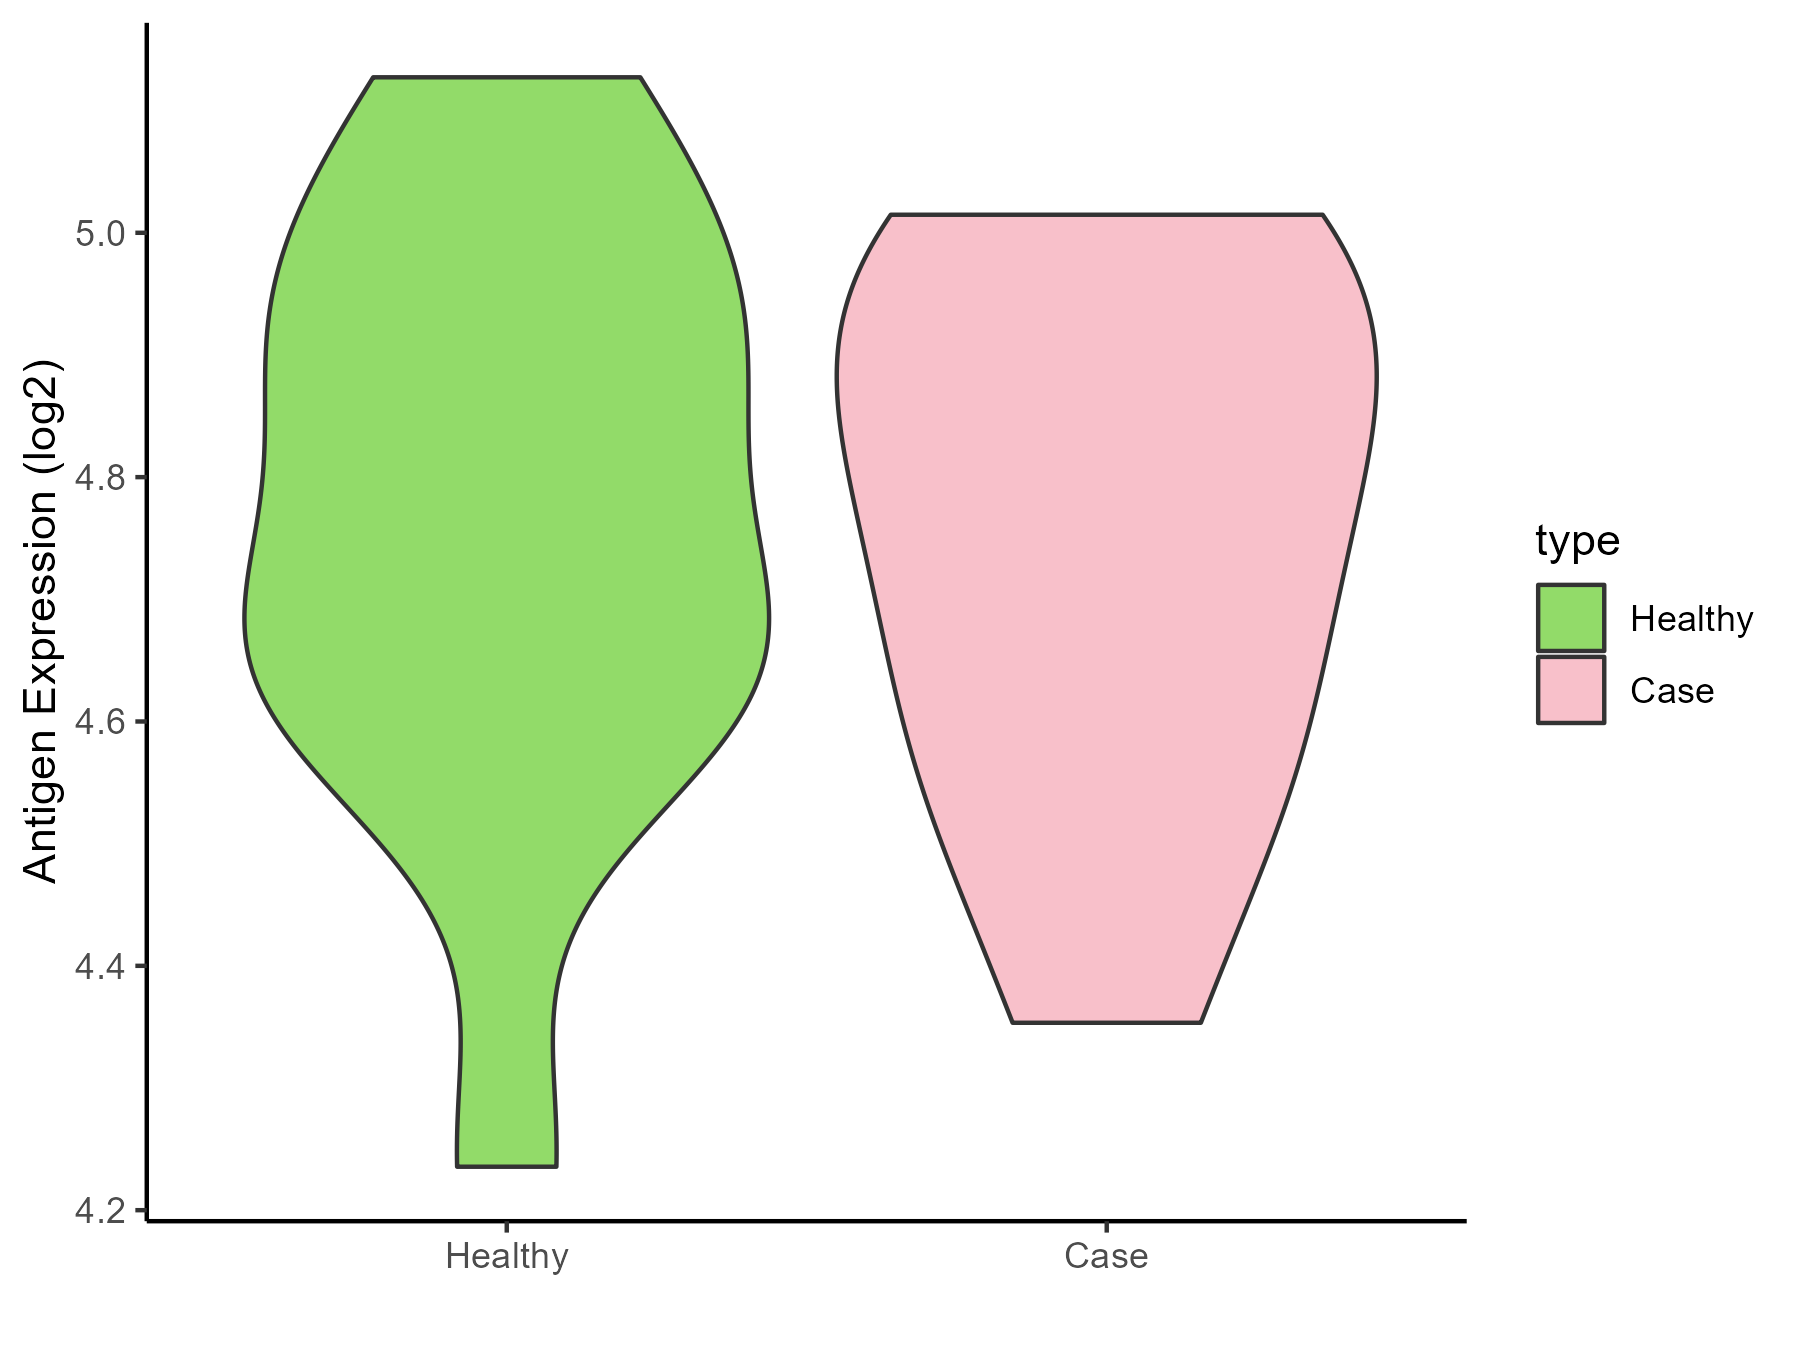
| Differential expression pattern of antigen in diseases | ||
| The Studied Tissue | Peripheral blood | |
| The Specific Disease | Arteriosclerosis | |
| The Expression Level of Disease Section Compare with the Healthy Individual Tissue | p-value: 0.846330434; Fold-change: 0.010176159; Z-score: 0.041365215 | |
| Disease-specific Antigen Abundances |
|
Click to View the Clearer Original Diagram |
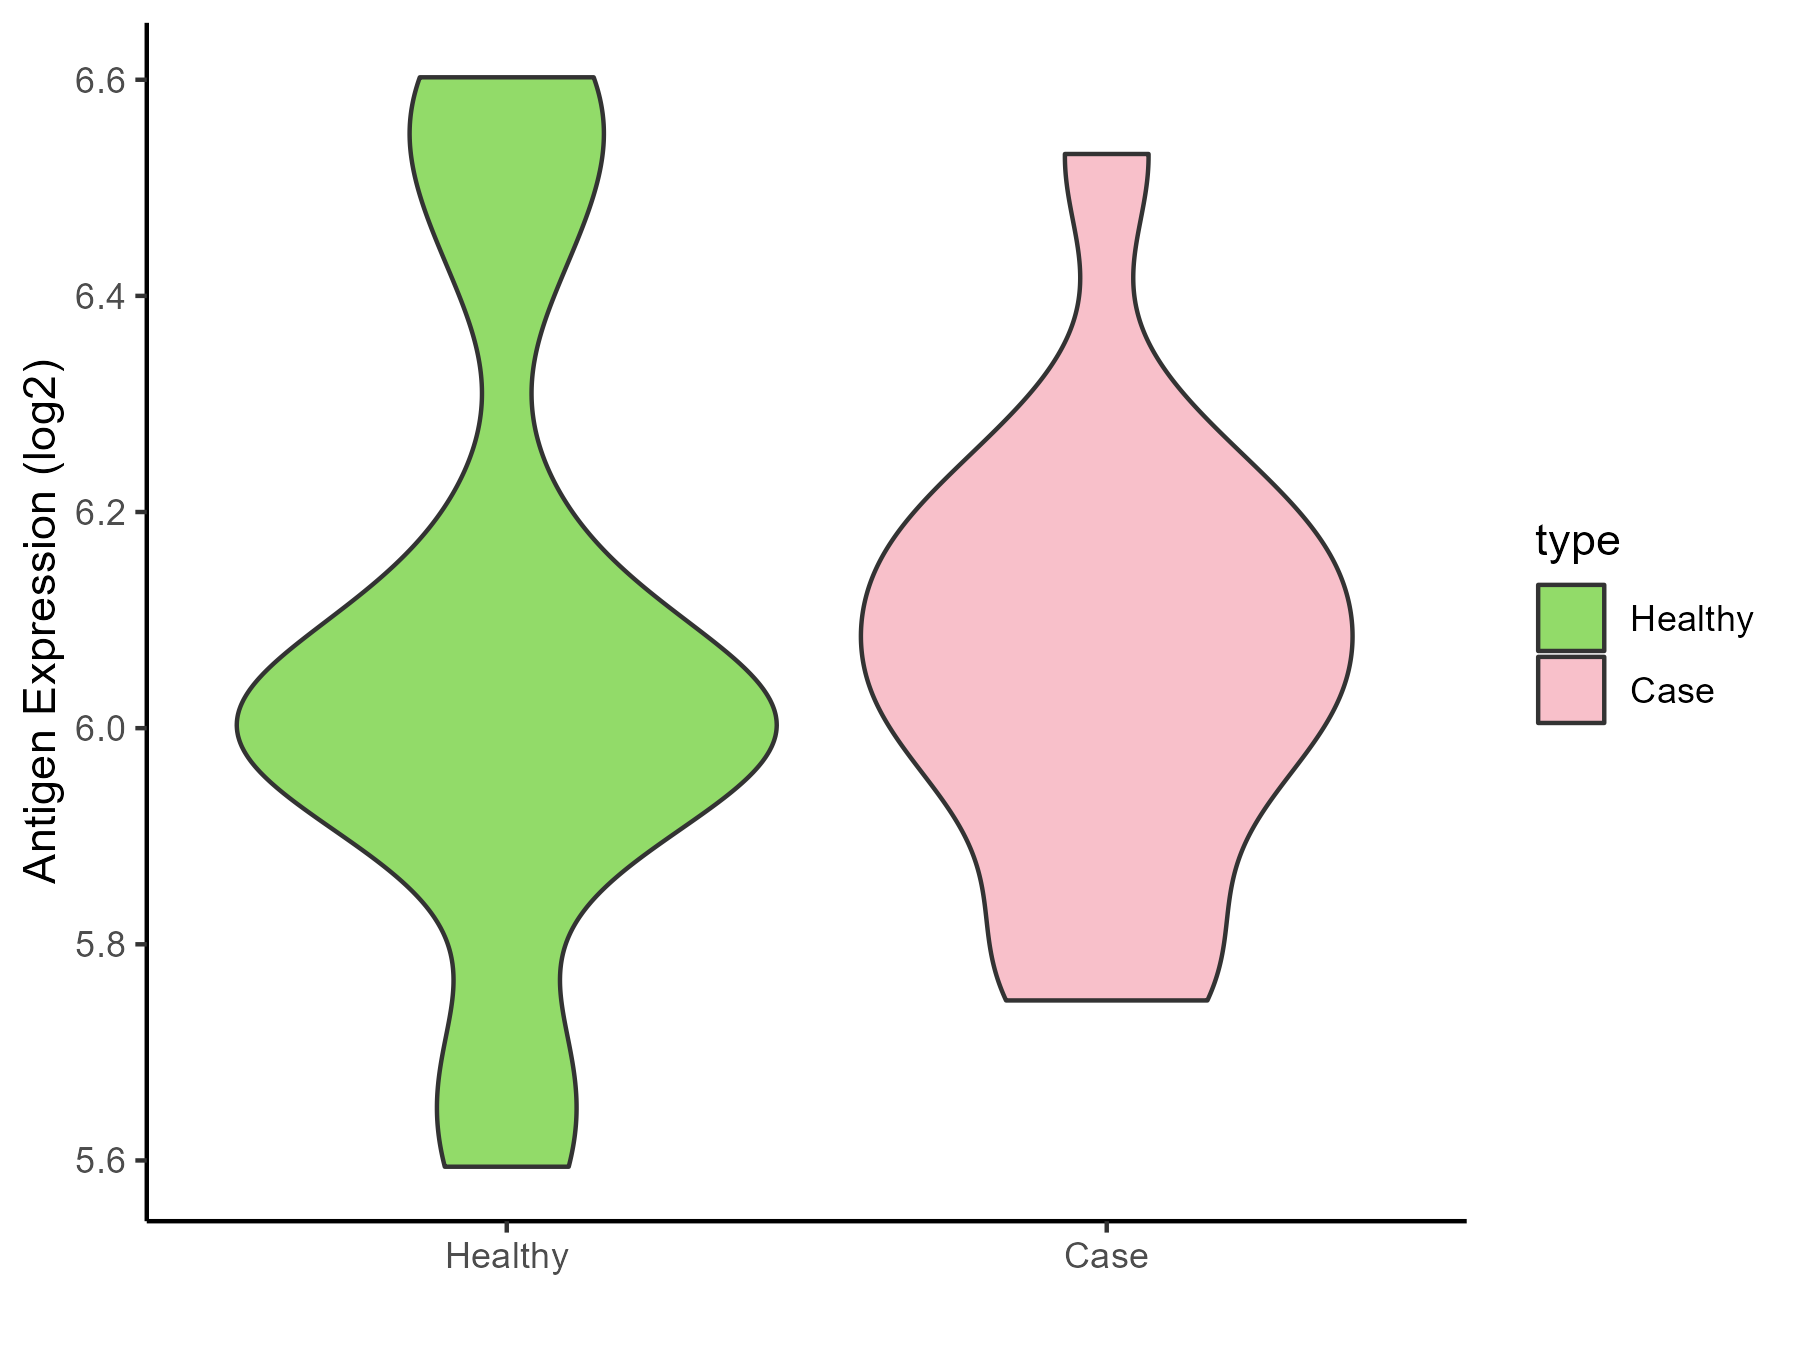
| Differential expression pattern of antigen in diseases | ||
| The Studied Tissue | Intracranial artery | |
| The Specific Disease | Aneurysm | |
| The Expression Level of Disease Section Compare with the Healthy Individual Tissue | p-value: 0.883722522; Fold-change: 0.022561618; Z-score: 0.074853413 | |
| Disease-specific Antigen Abundances |
|
Click to View the Clearer Original Diagram |
ICD Disease Classification 12
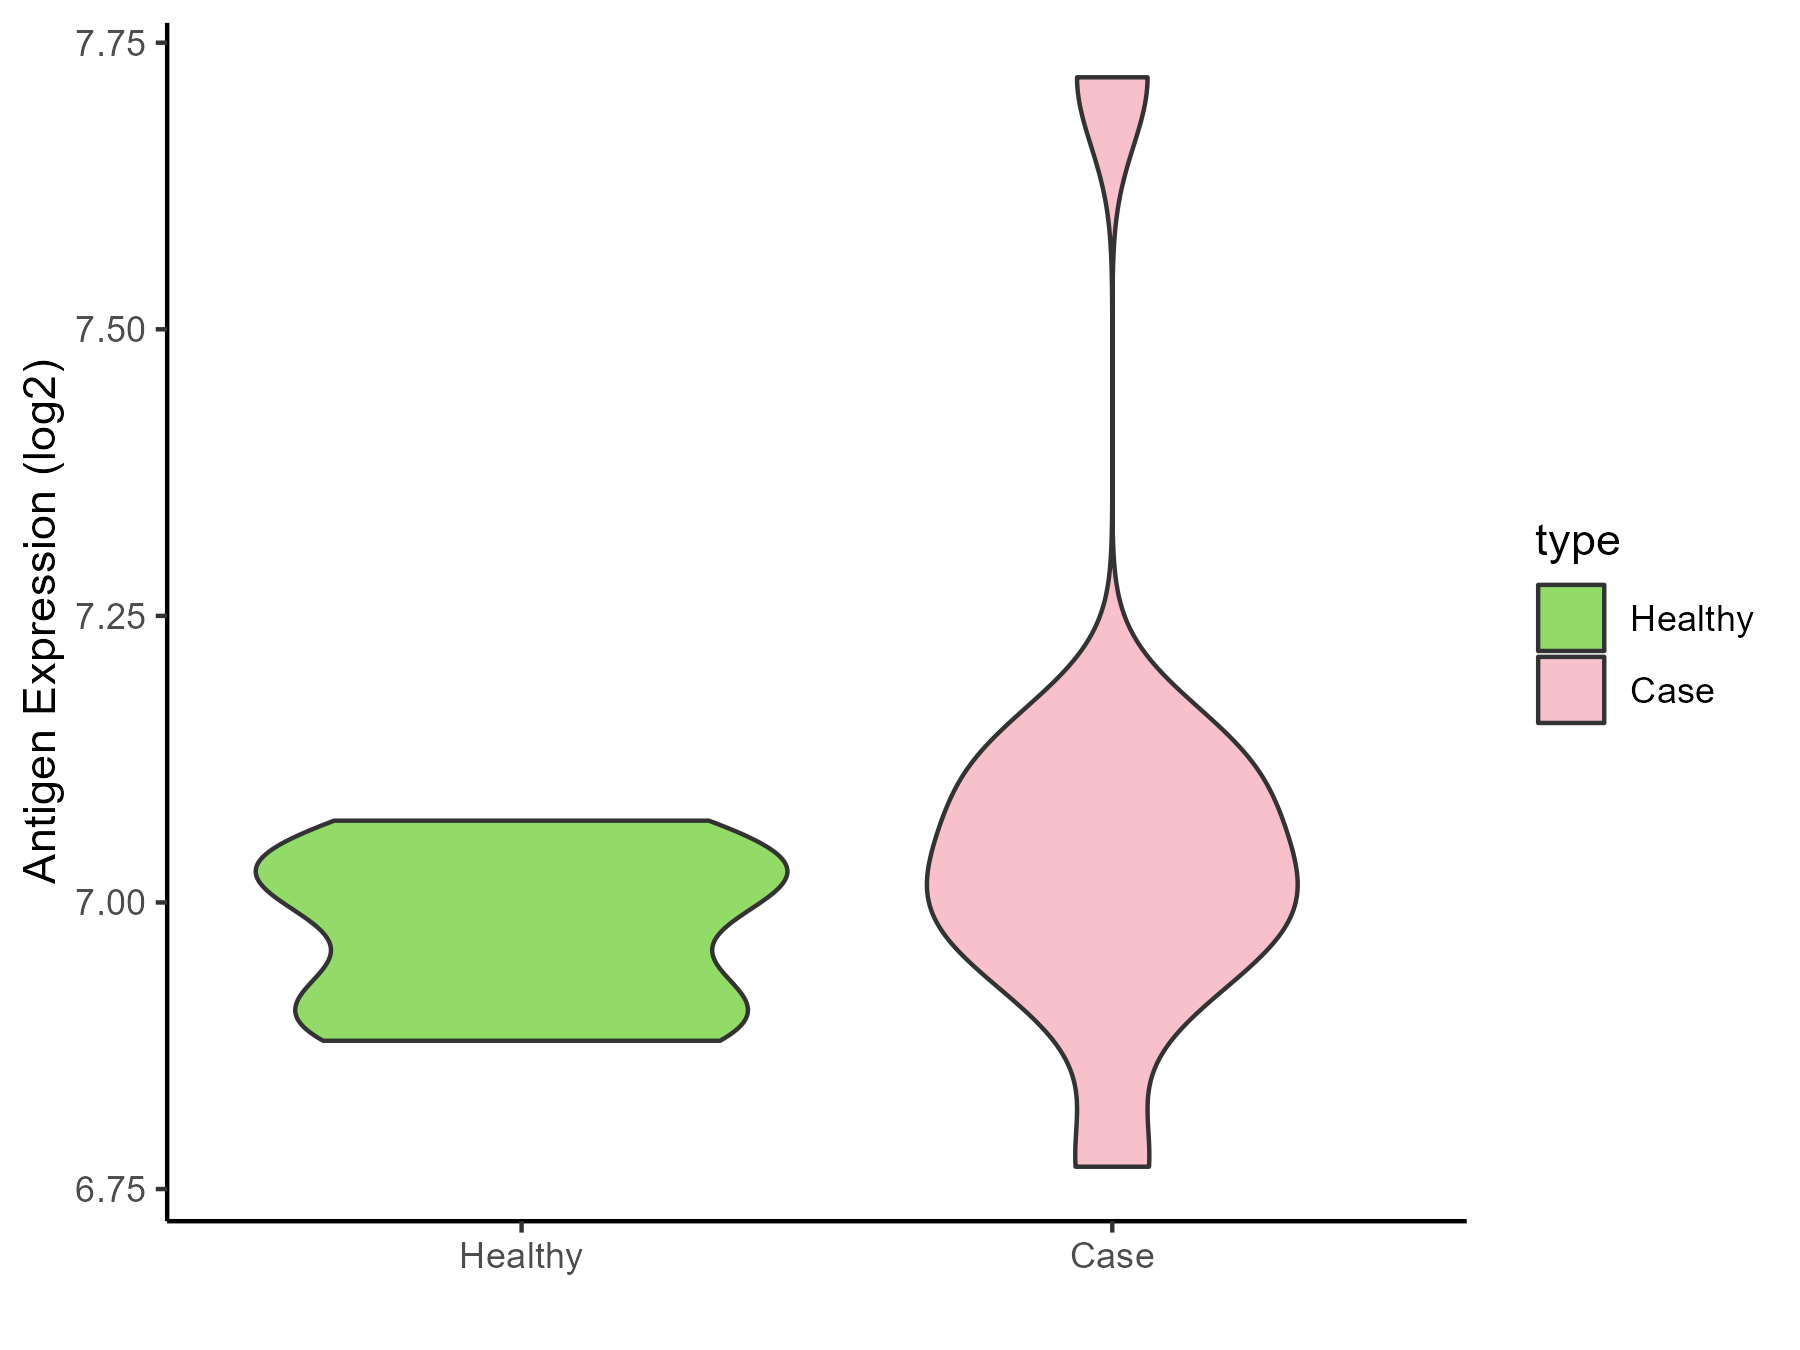
| Differential expression pattern of antigen in diseases | ||
| The Studied Tissue | Peripheral blood | |
| The Specific Disease | Immunodeficiency | |
| The Expression Level of Disease Section Compare with the Healthy Individual Tissue | p-value: 0.209509197; Fold-change: 0.008066105; Z-score: 0.110690503 | |
| Disease-specific Antigen Abundances |
|
Click to View the Clearer Original Diagram |
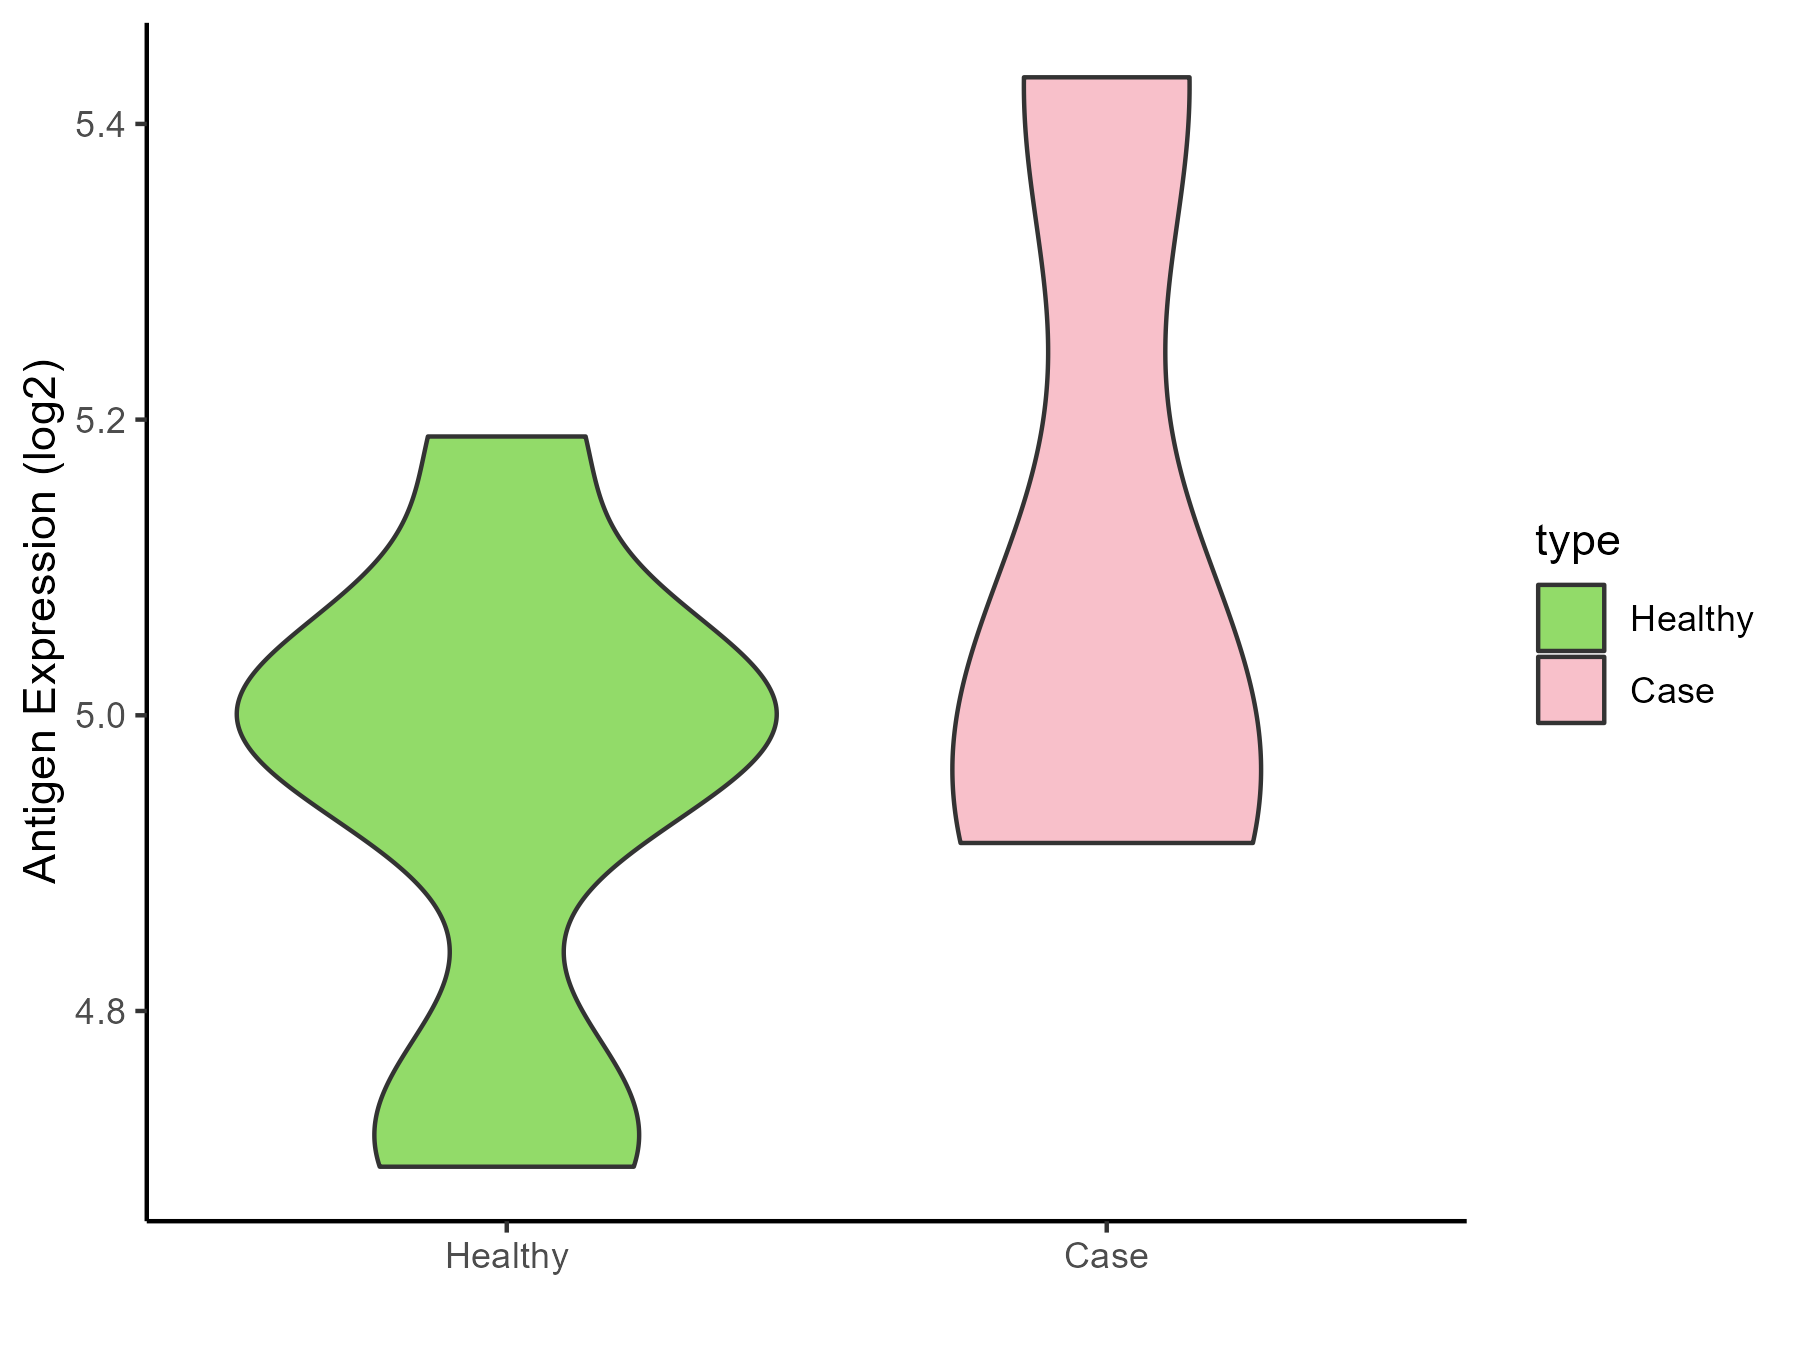
| Differential expression pattern of antigen in diseases | ||
| The Studied Tissue | Hyperplastic tonsil | |
| The Specific Disease | Apnea | |
| The Expression Level of Disease Section Compare with the Healthy Individual Tissue | p-value: 0.395272603; Fold-change: 0.023985659; Z-score: 0.139036806 | |
| Disease-specific Antigen Abundances |
|
Click to View the Clearer Original Diagram |
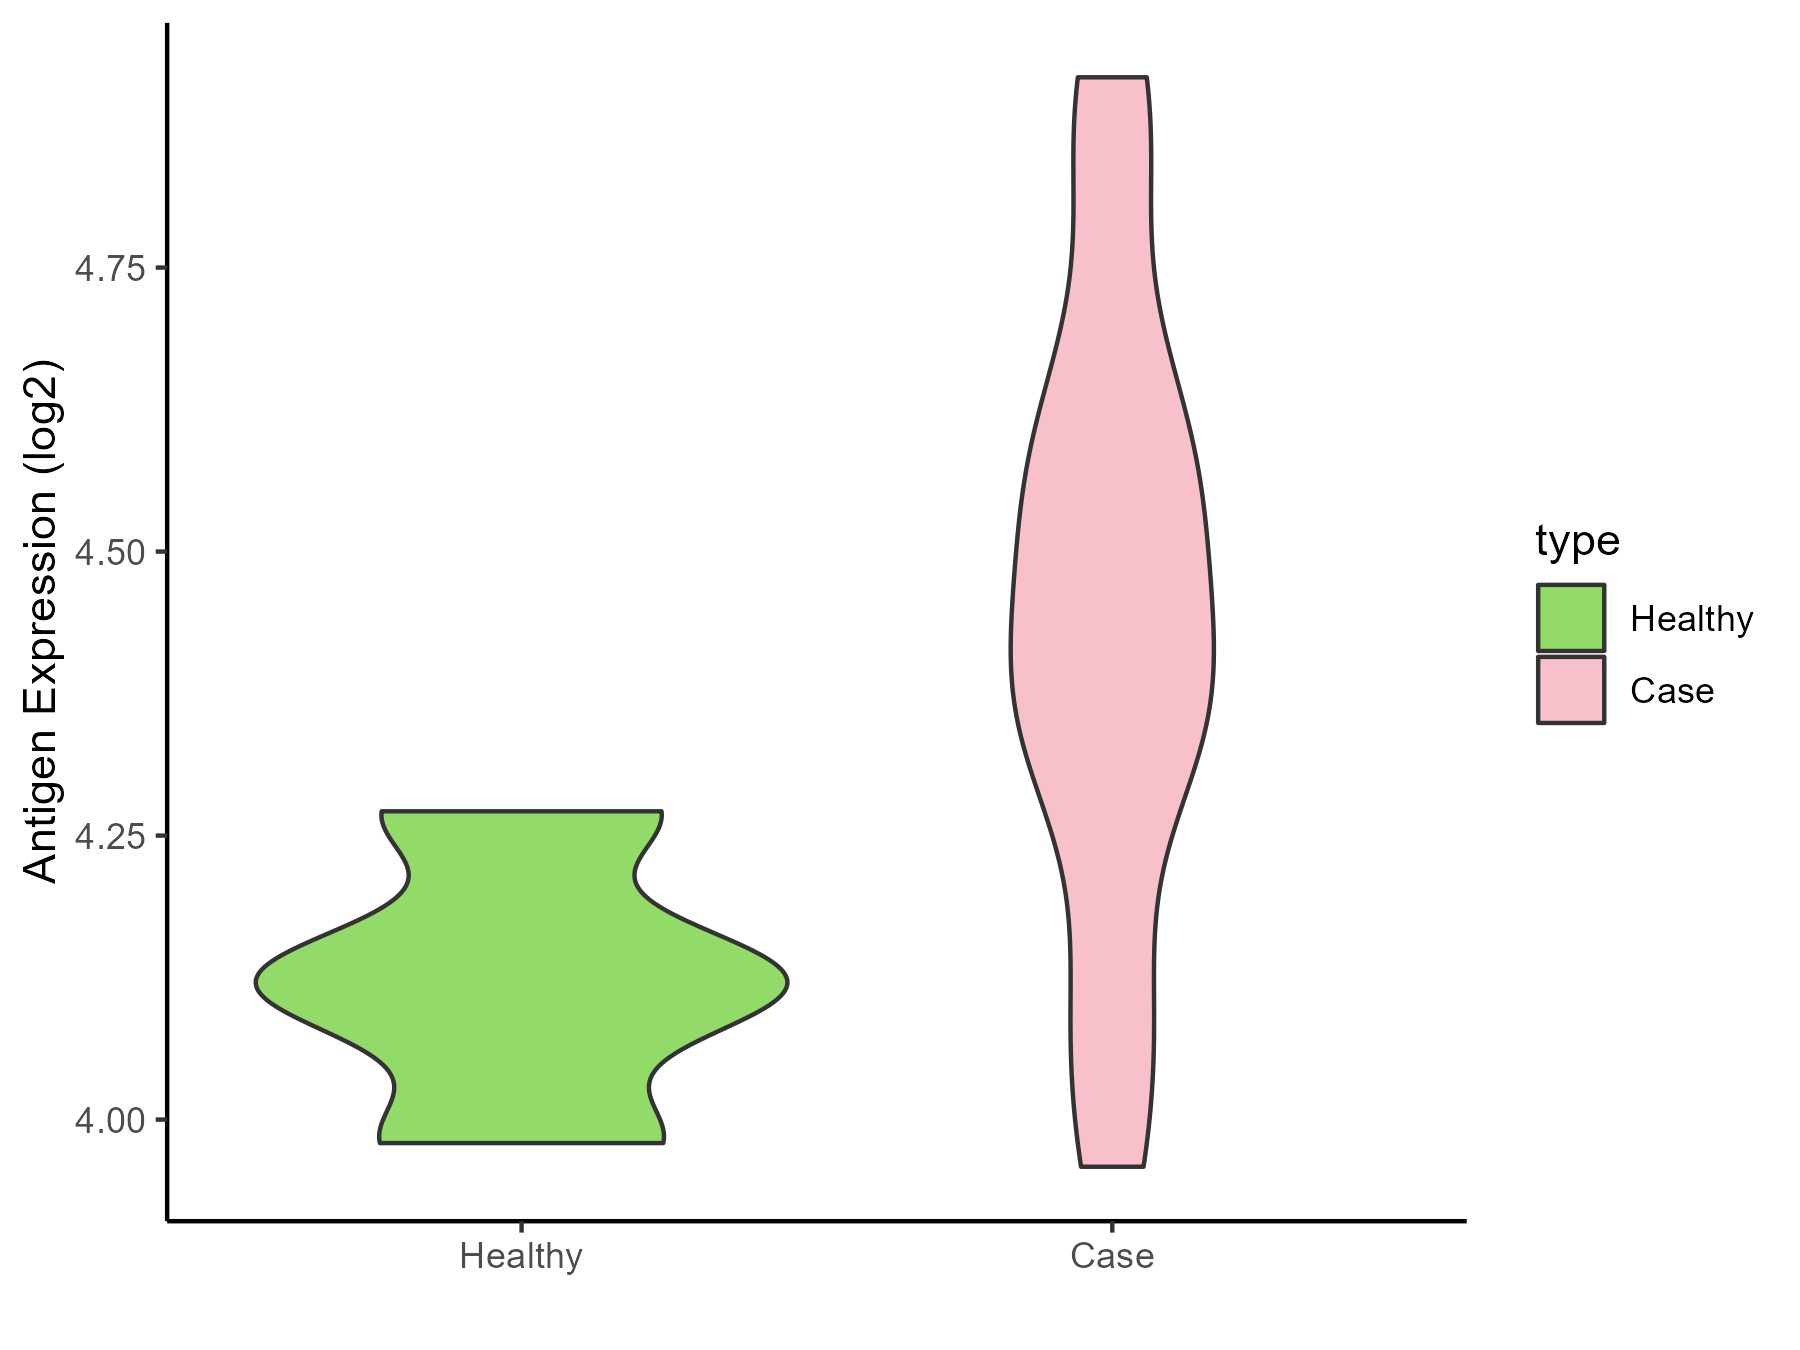
| Differential expression pattern of antigen in diseases | ||
| The Studied Tissue | Peripheral blood | |
| The Specific Disease | Olive pollen allergy | |
| The Expression Level of Disease Section Compare with the Healthy Individual Tissue | p-value: 0.004335033; Fold-change: 0.328222742; Z-score: 2.73985906 | |
| Disease-specific Antigen Abundances |
|
Click to View the Clearer Original Diagram |
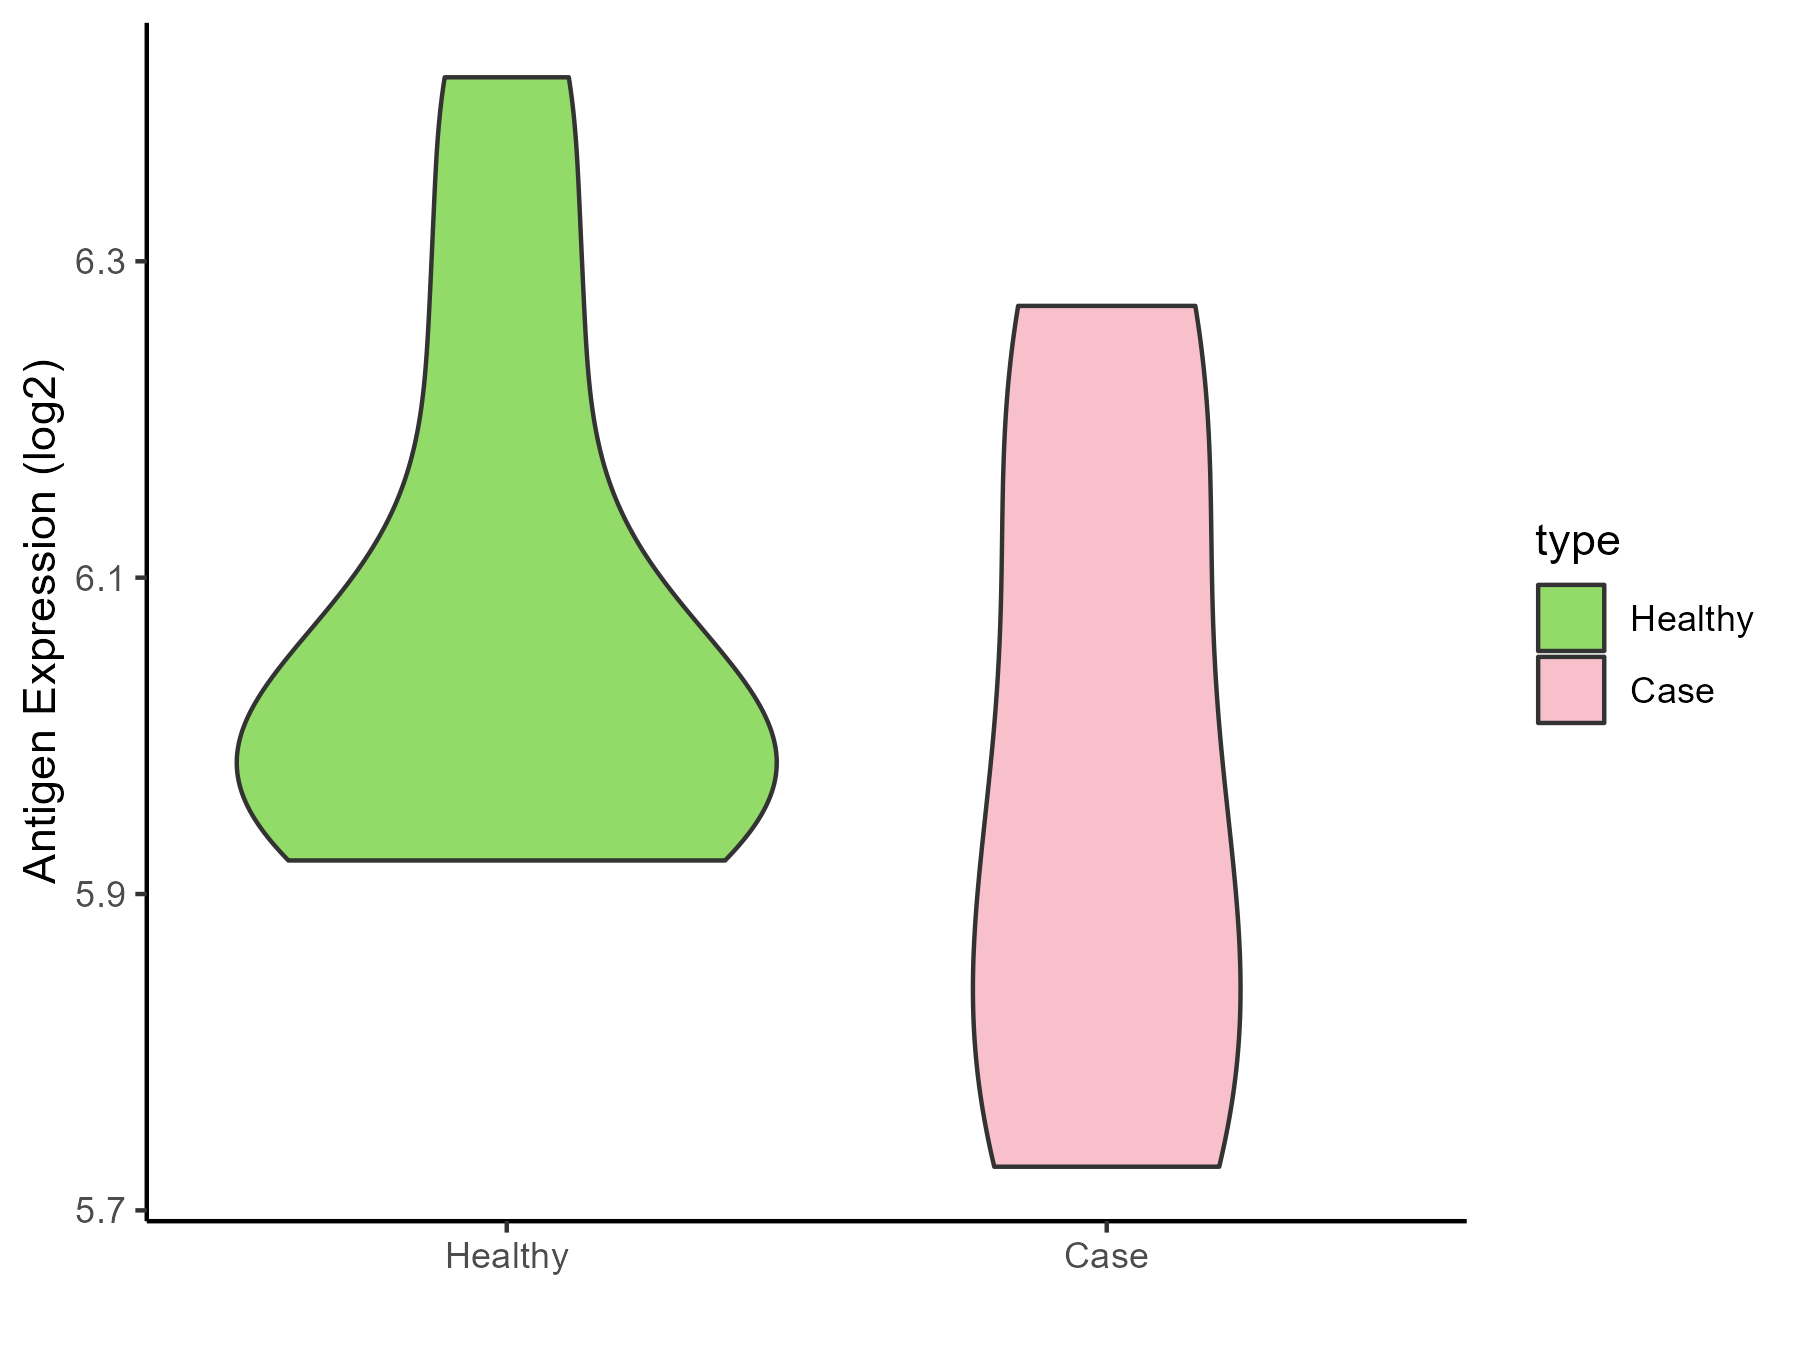
| Differential expression pattern of antigen in diseases | ||
| The Studied Tissue | Sinus mucosa | |
| The Specific Disease | Chronic rhinosinusitis | |
| The Expression Level of Disease Section Compare with the Healthy Individual Tissue | p-value: 0.362133106; Fold-change: -0.088649284; Z-score: -0.523709994 | |
| Disease-specific Antigen Abundances |
|
Click to View the Clearer Original Diagram |
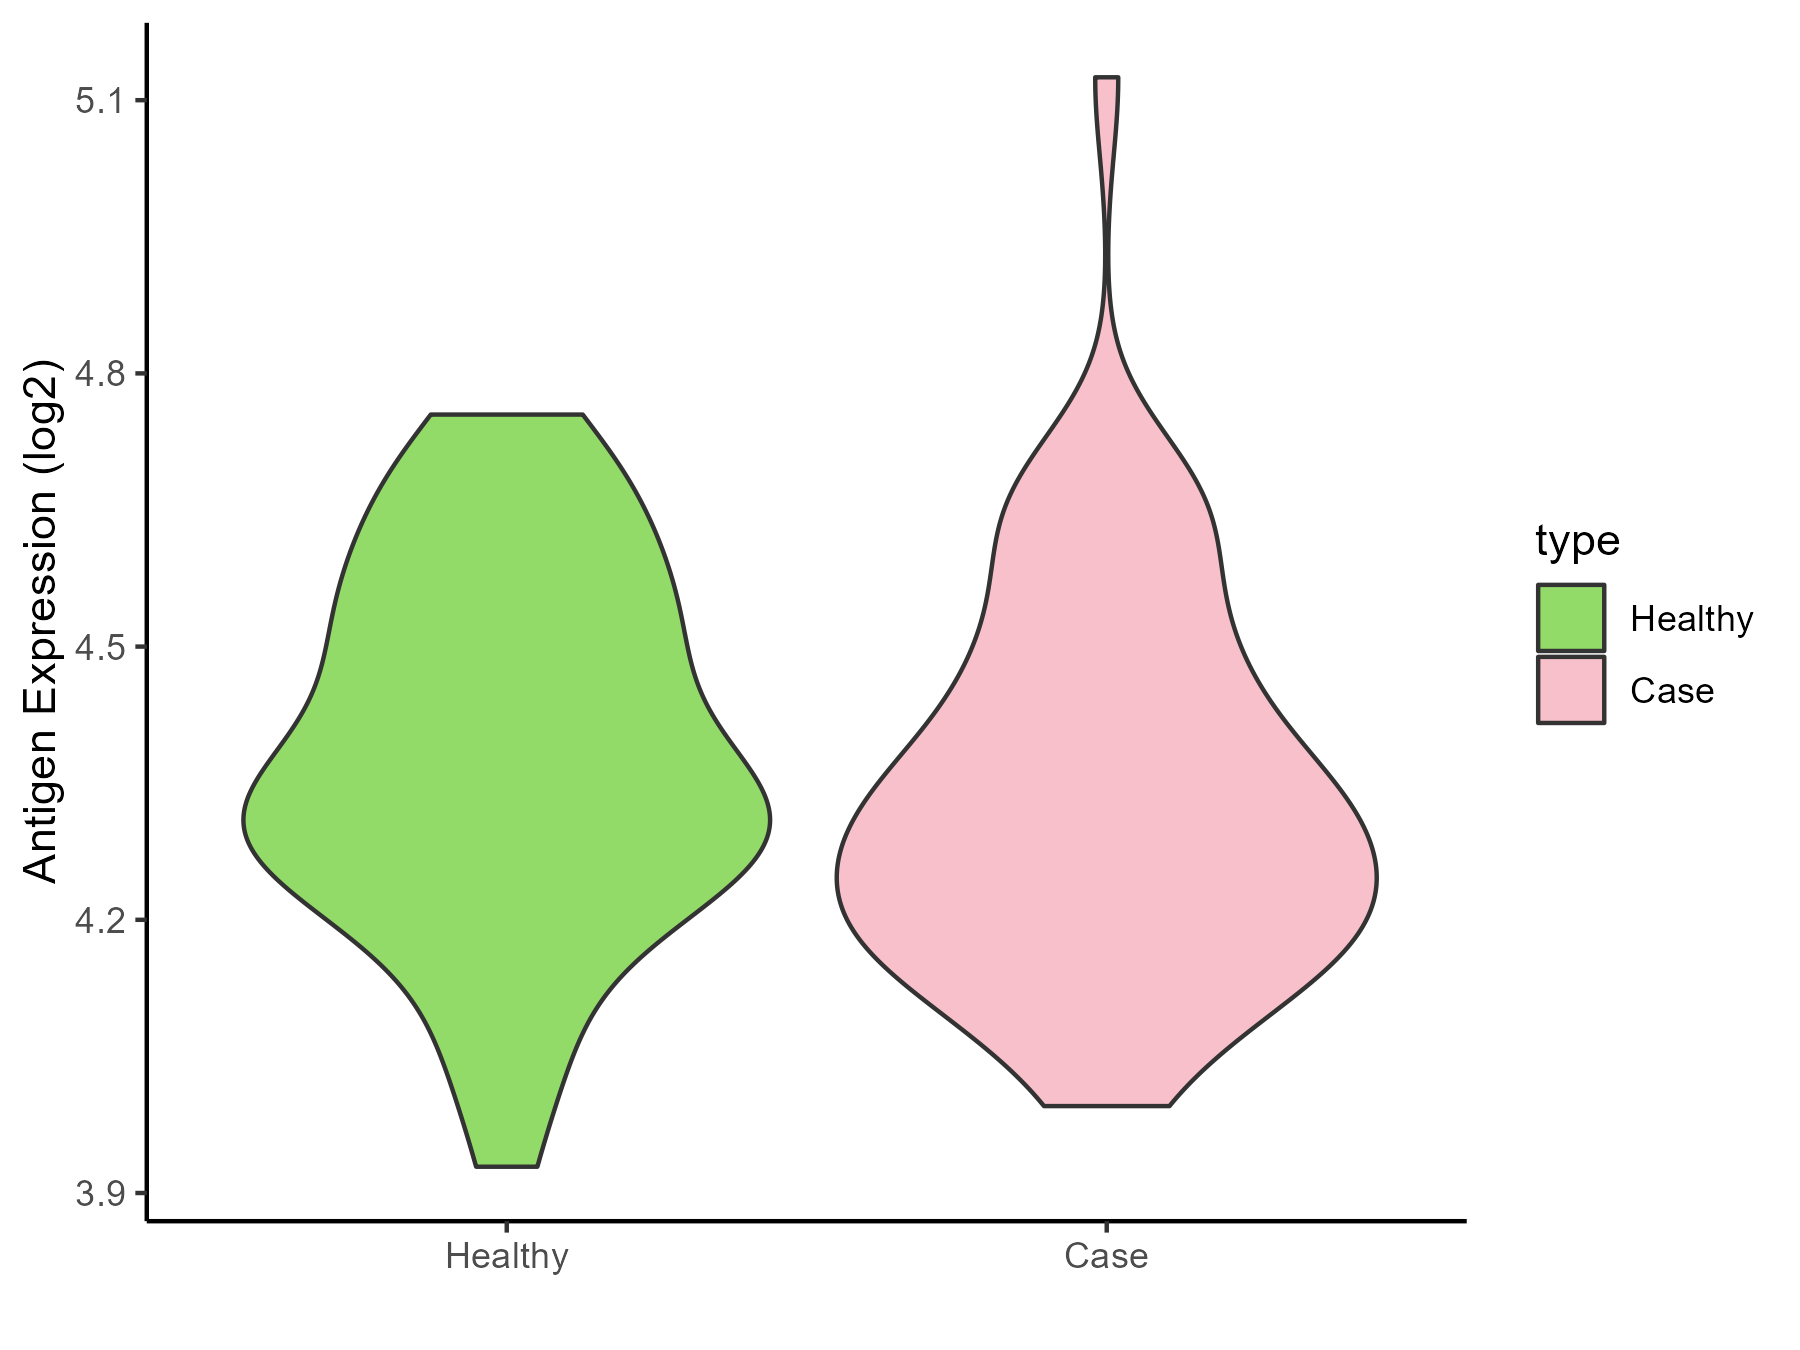
| Differential expression pattern of antigen in diseases | ||
| The Studied Tissue | Lung | |
| The Specific Disease | Chronic obstructive pulmonary disease | |
| The Expression Level of Disease Section Compare with the Healthy Individual Tissue | p-value: 0.326756823; Fold-change: -0.040868407; Z-score: -0.205495184 | |
| Disease-specific Antigen Abundances |
|
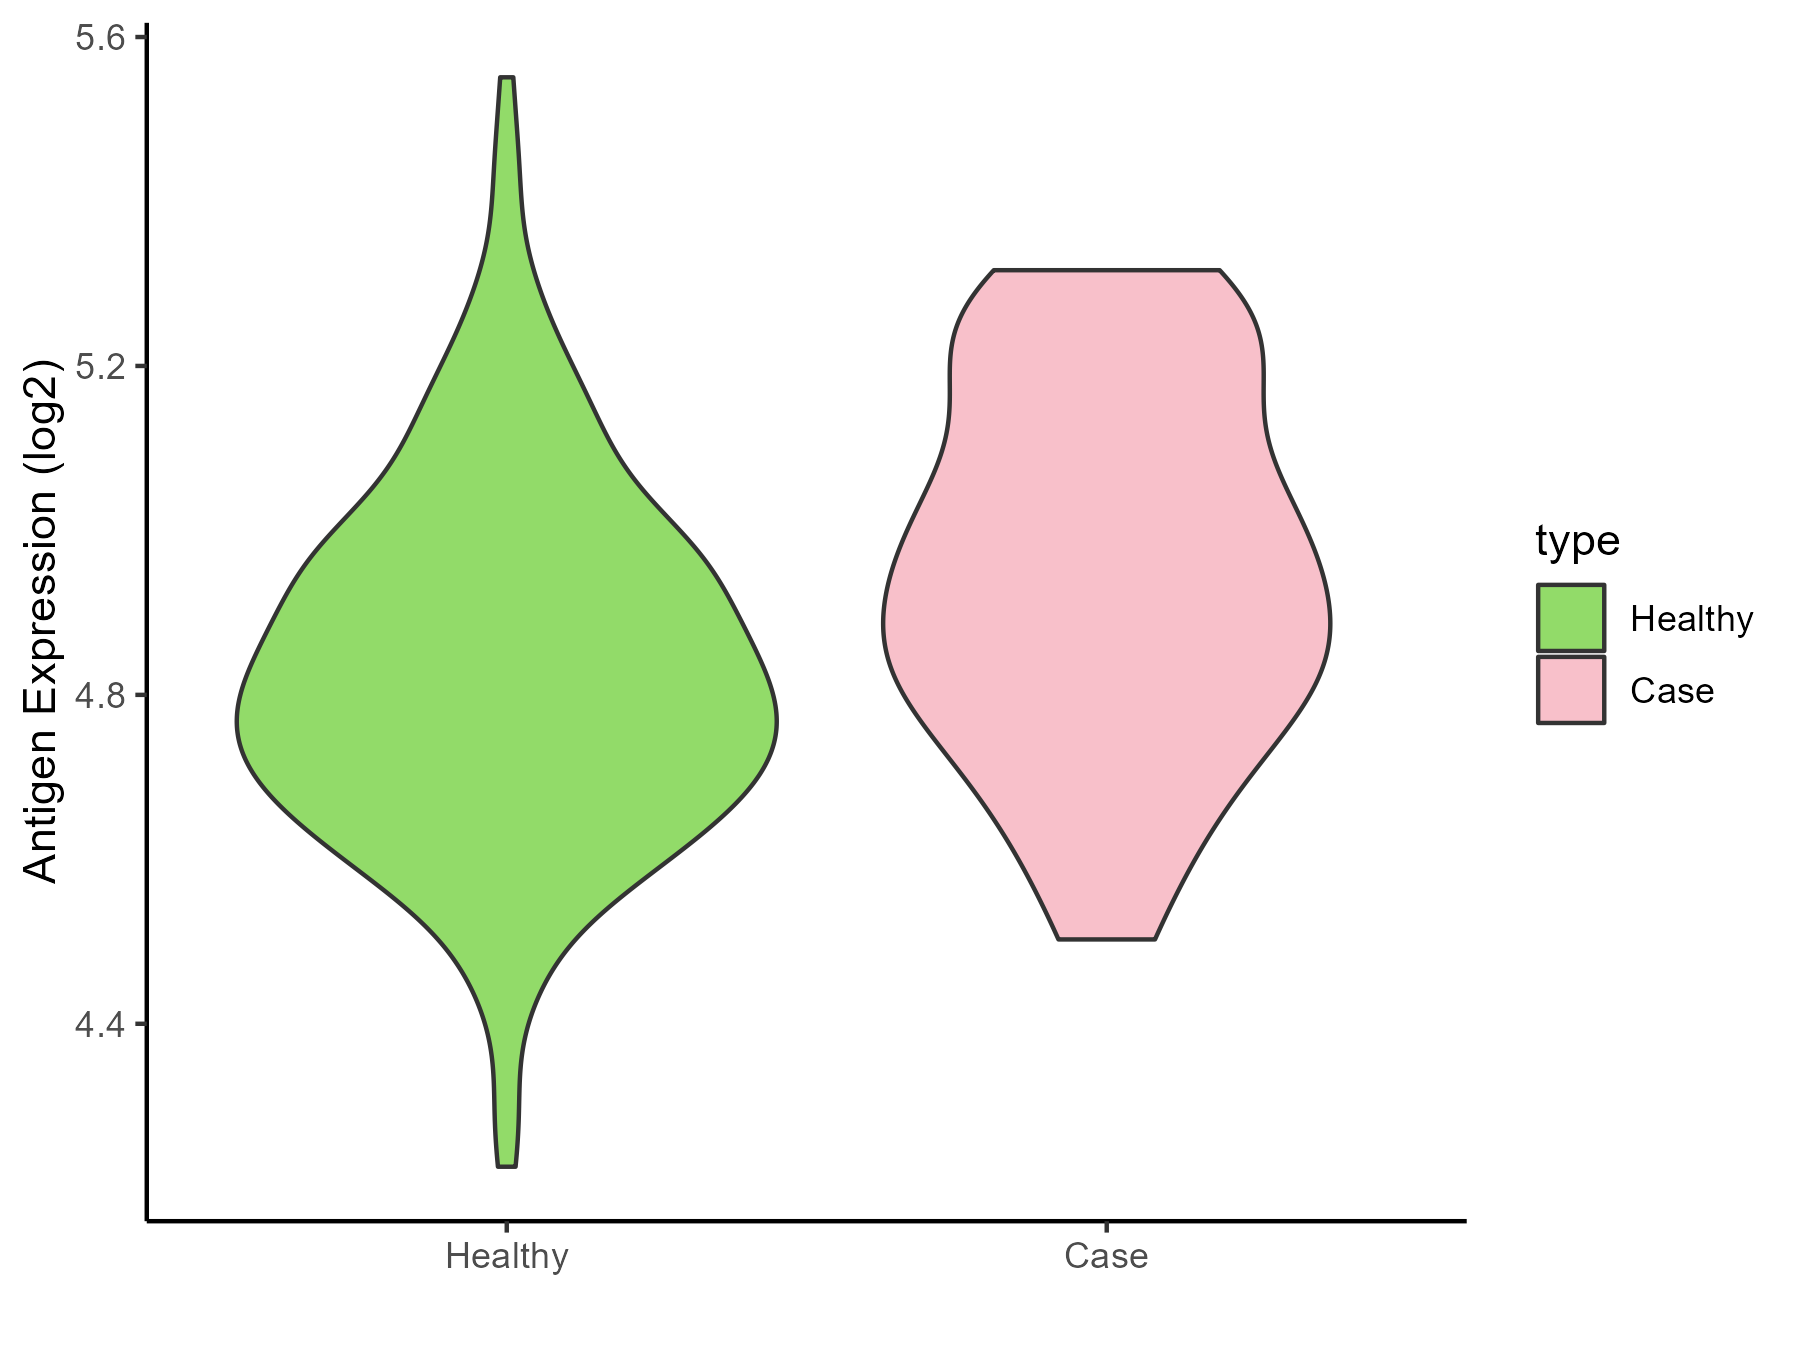
Click to View the Clearer Original Diagram |
| The Studied Tissue | Small airway epithelium | |
| The Specific Disease | Chronic obstructive pulmonary disease | |
| The Expression Level of Disease Section Compare with the Healthy Individual Tissue | p-value: 0.005085998; Fold-change: 0.128423353; Z-score: 0.593661107 | |
| Disease-specific Antigen Abundances |
|
Click to View the Clearer Original Diagram |
| Differential expression pattern of antigen in diseases | ||
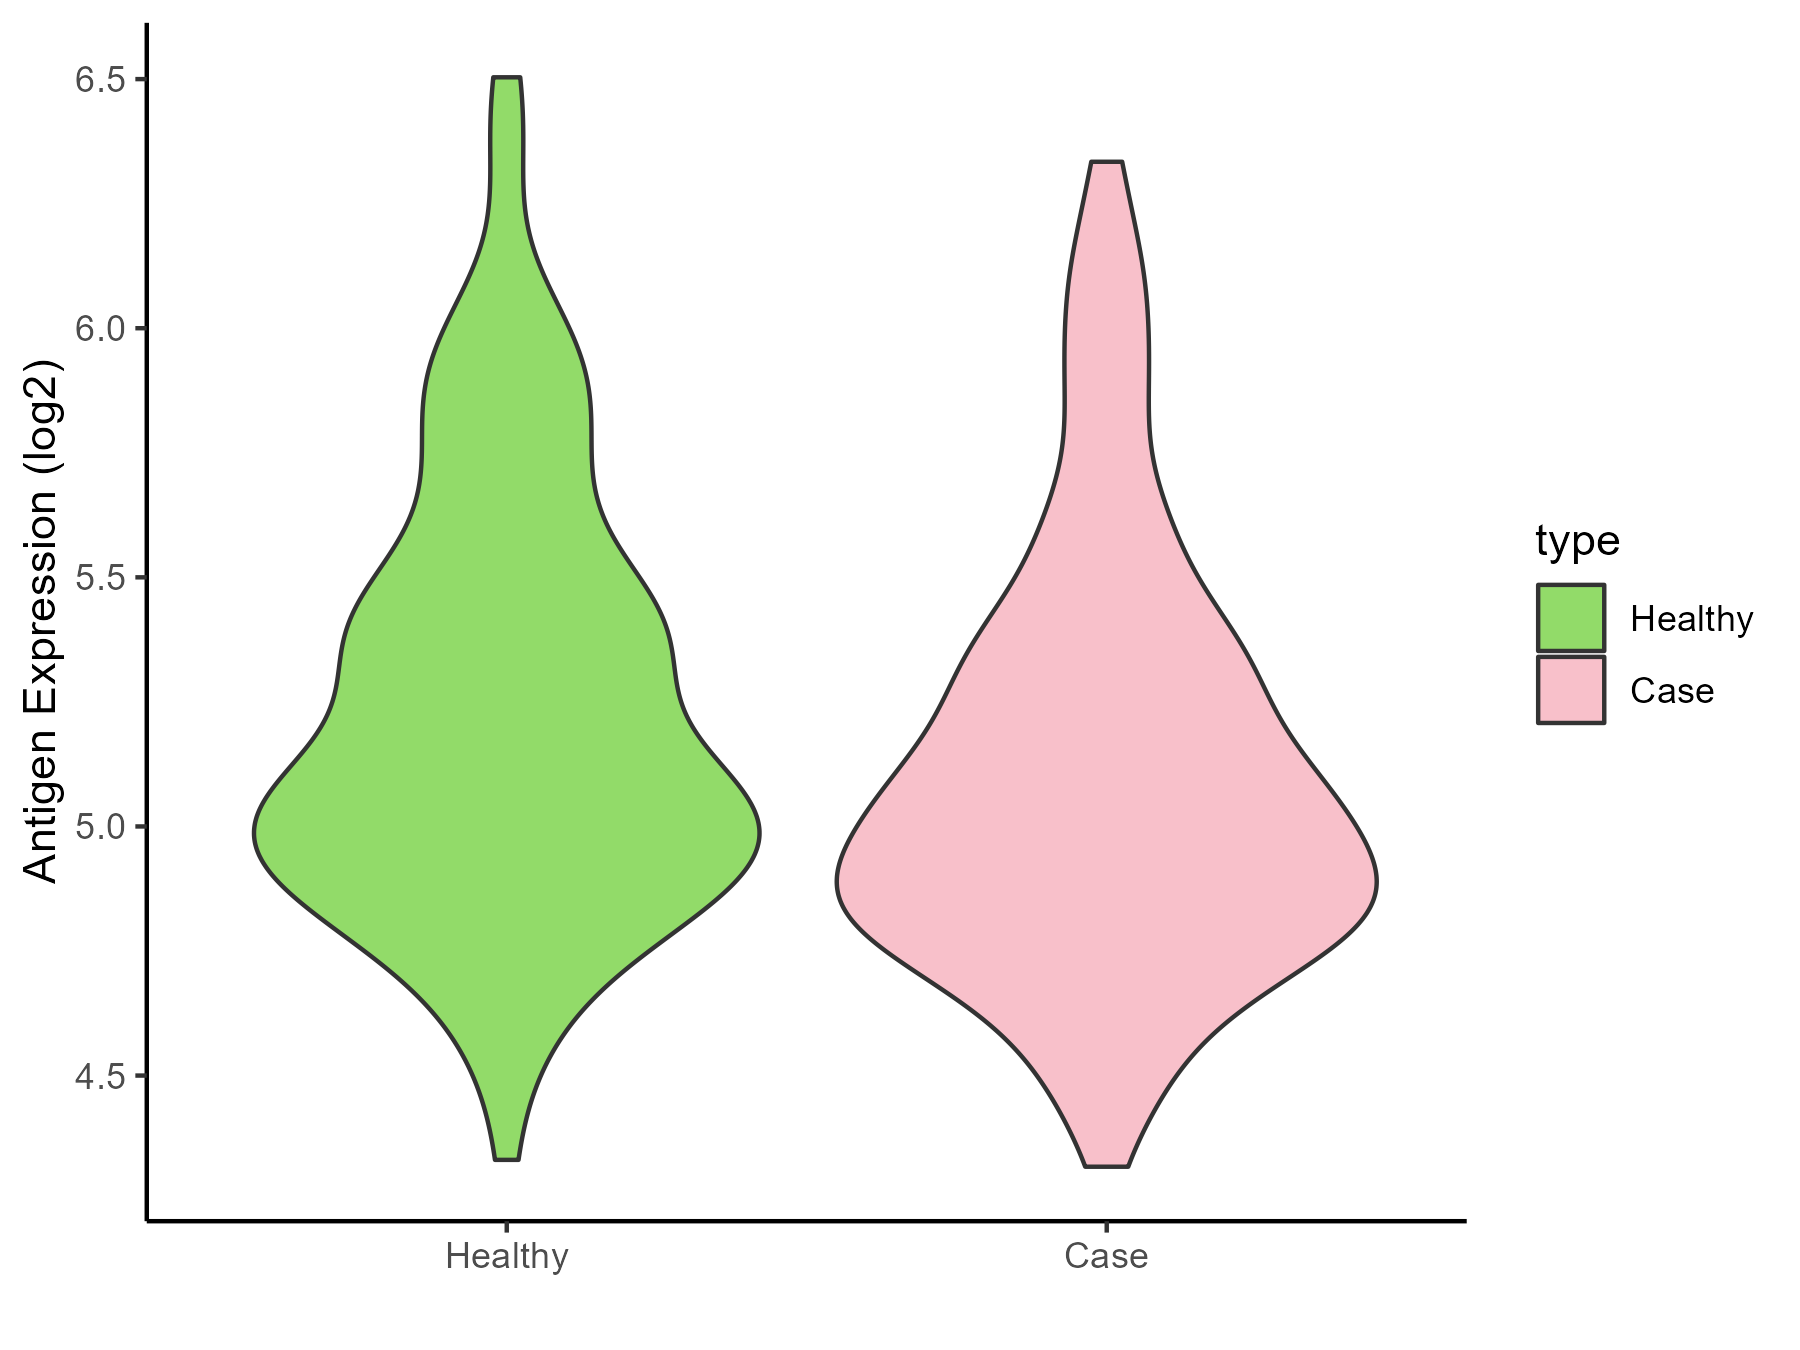
| The Studied Tissue | Nasal and bronchial airway | |
| The Specific Disease | Asthma | |
| The Expression Level of Disease Section Compare with the Healthy Individual Tissue | p-value: 0.007299711; Fold-change: -0.083493737; Z-score: -0.194924967 | |
| Disease-specific Antigen Abundances |
|
Click to View the Clearer Original Diagram |
| Differential expression pattern of antigen in diseases | ||
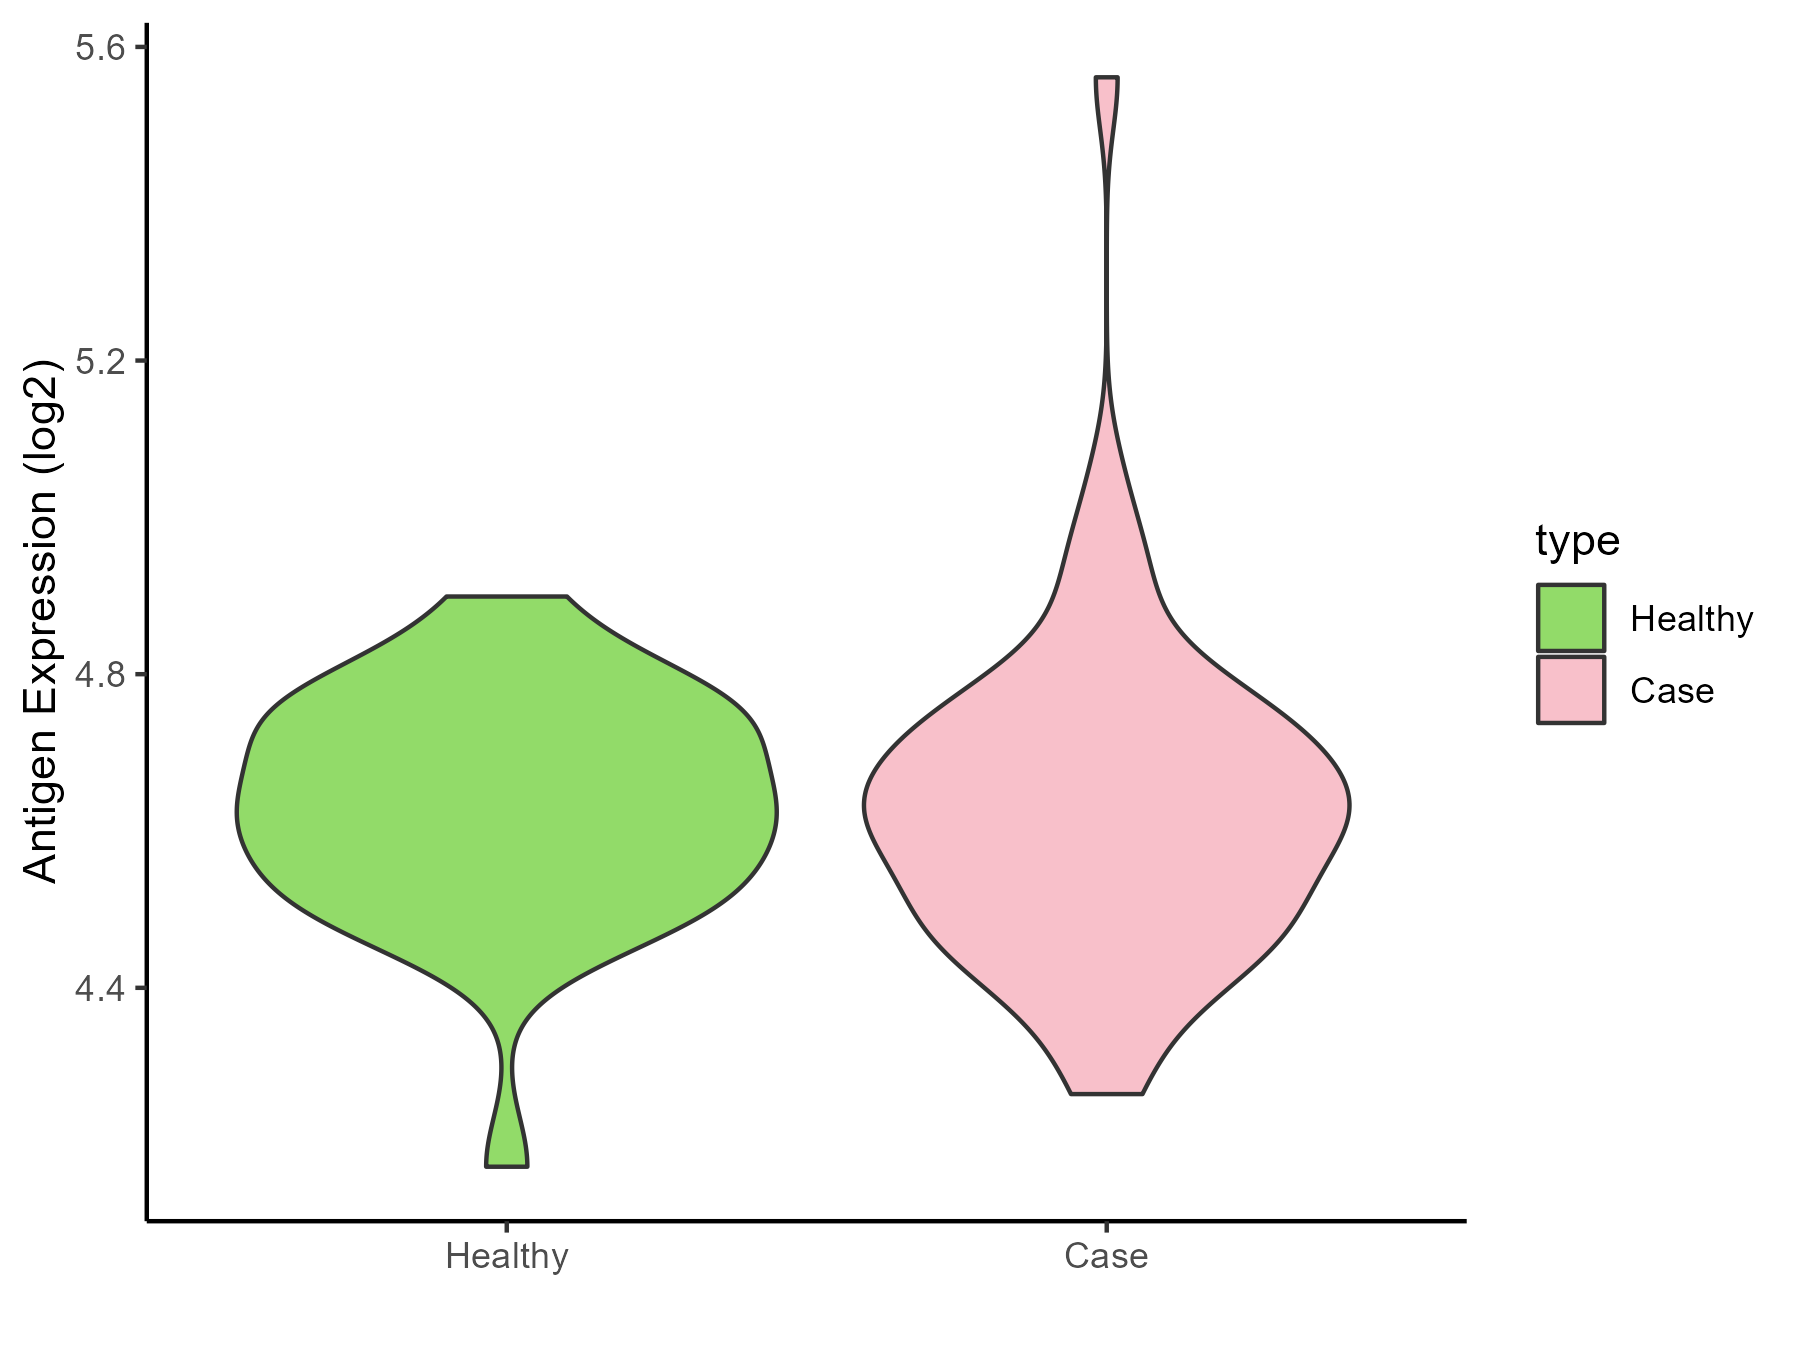
| The Studied Tissue | Nasal Epithelium | |
| The Specific Disease | Human rhinovirus infection | |
| The Expression Level of Disease Section Compare with the Healthy Individual Tissue | p-value: 0.916496482; Fold-change: -0.000598005; Z-score: -0.004142339 | |
| Disease-specific Antigen Abundances |
|
Click to View the Clearer Original Diagram |
| Differential expression pattern of antigen in diseases | ||
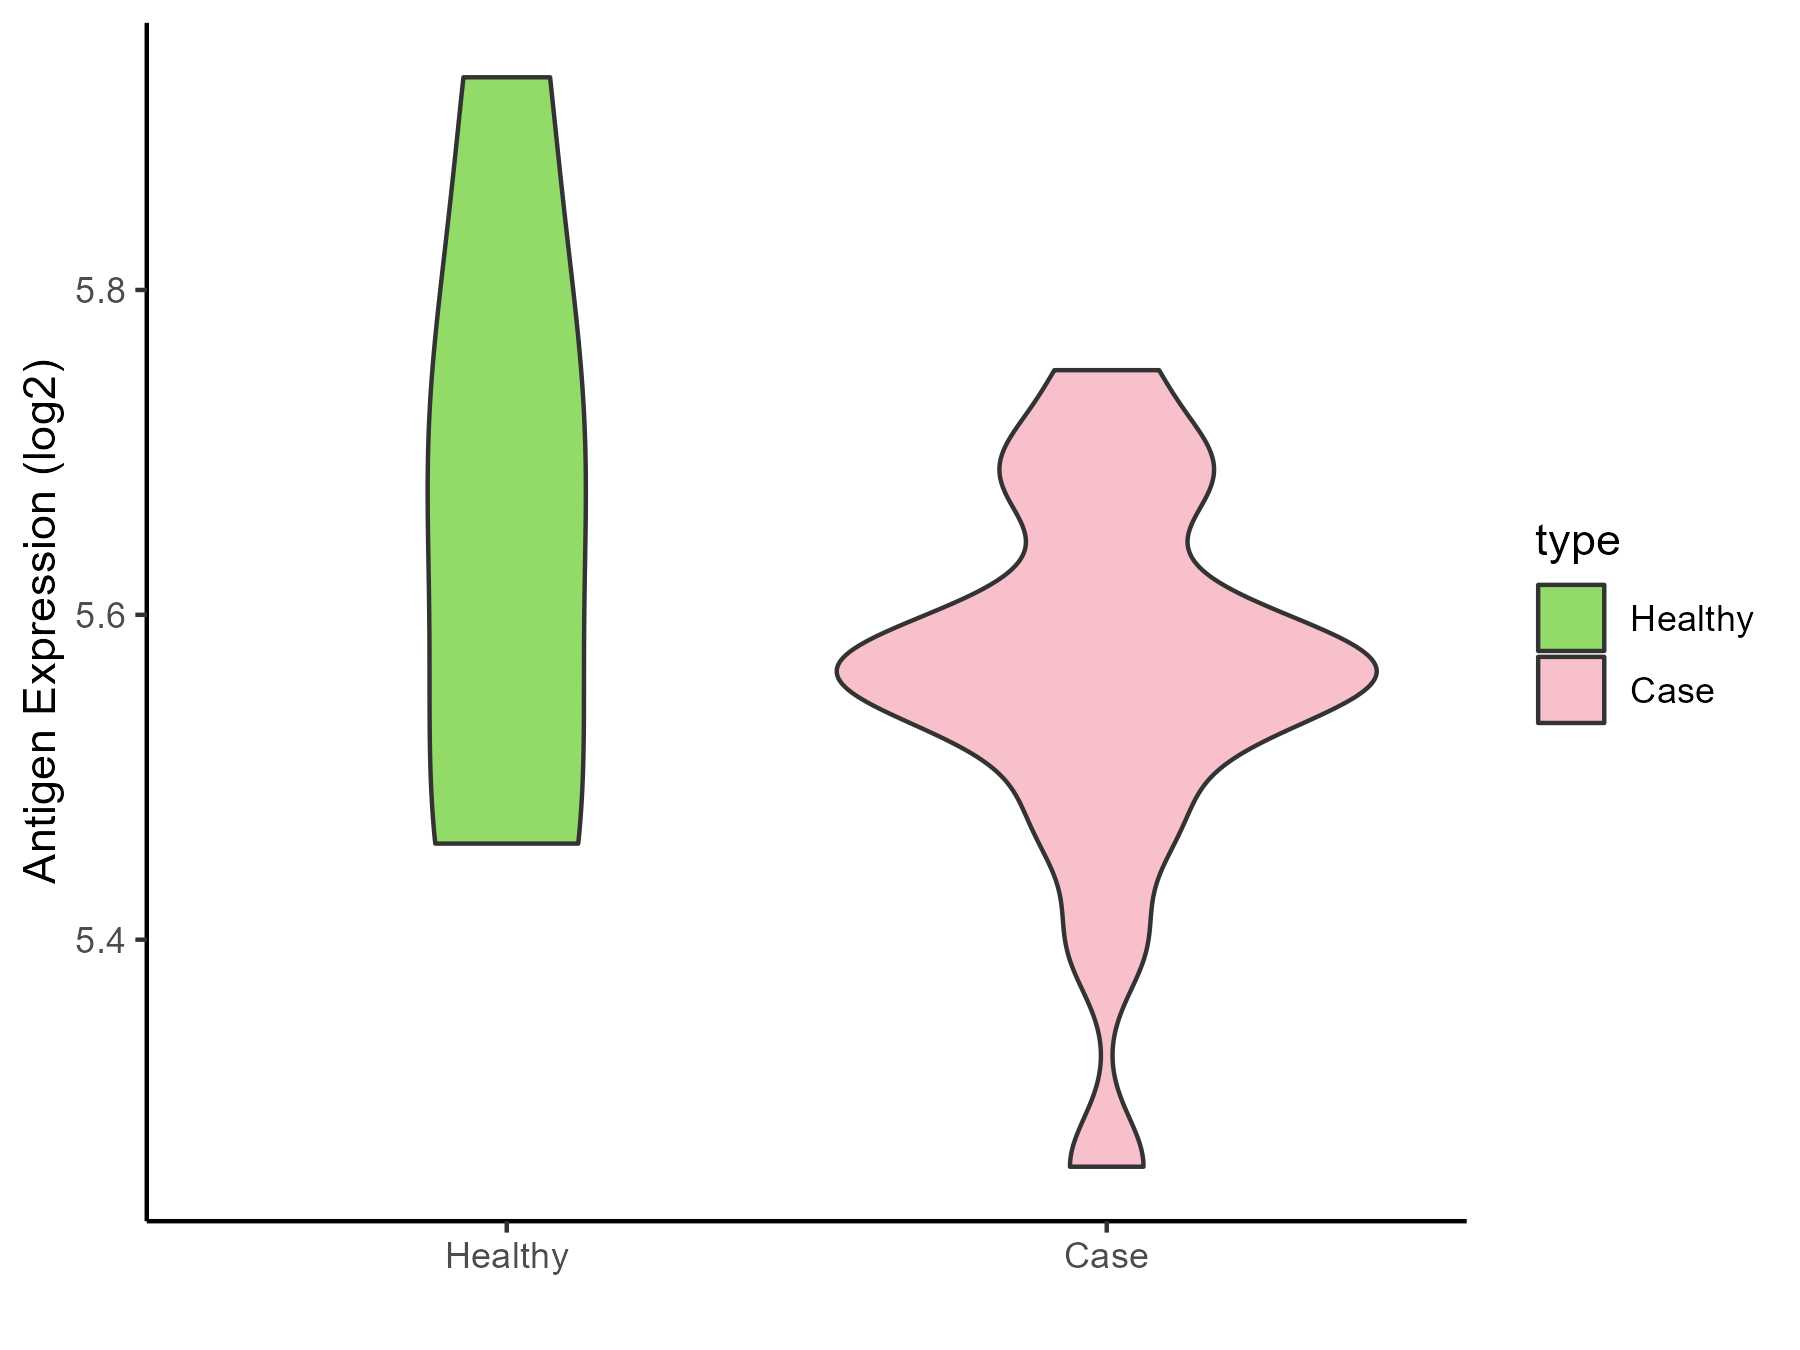
| The Studied Tissue | Lung | |
| The Specific Disease | Idiopathic pulmonary fibrosis | |
| The Expression Level of Disease Section Compare with the Healthy Individual Tissue | p-value: 0.340677325; Fold-change: -0.128438498; Z-score: -0.659753077 | |
| Disease-specific Antigen Abundances |
|
Click to View the Clearer Original Diagram |
ICD Disease Classification 13
| Differential expression pattern of antigen in diseases | ||
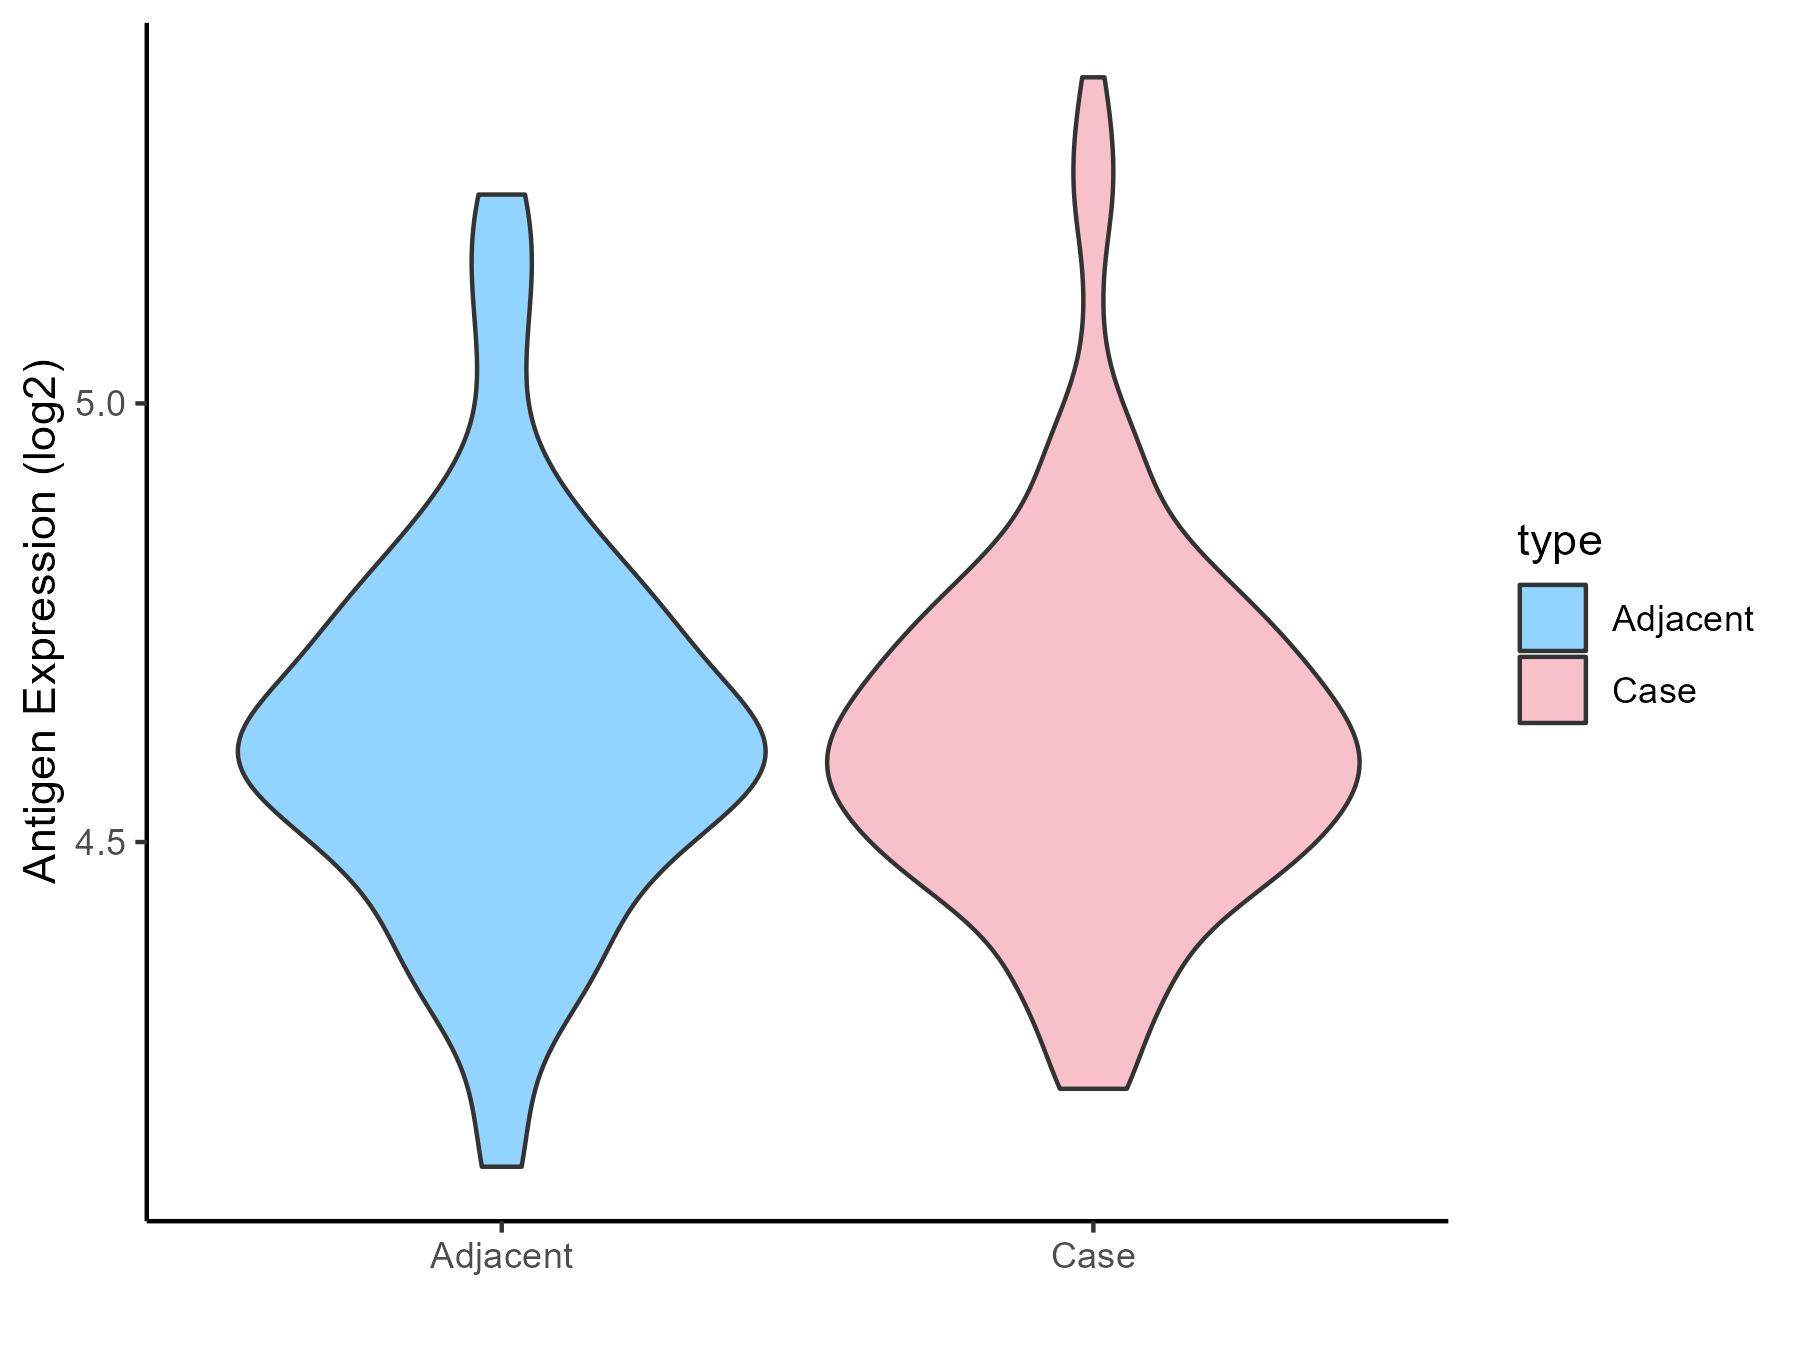
| The Studied Tissue | Gingival | |
| The Specific Disease | Periodontal disease | |
| The Expression Level of Disease Section Compare with the Adjacent Tissue | p-value: 0.941174087; Fold-change: -0.004250223; Z-score: -0.019435021 | |
| Disease-specific Antigen Abundances |
|
Click to View the Clearer Original Diagram |
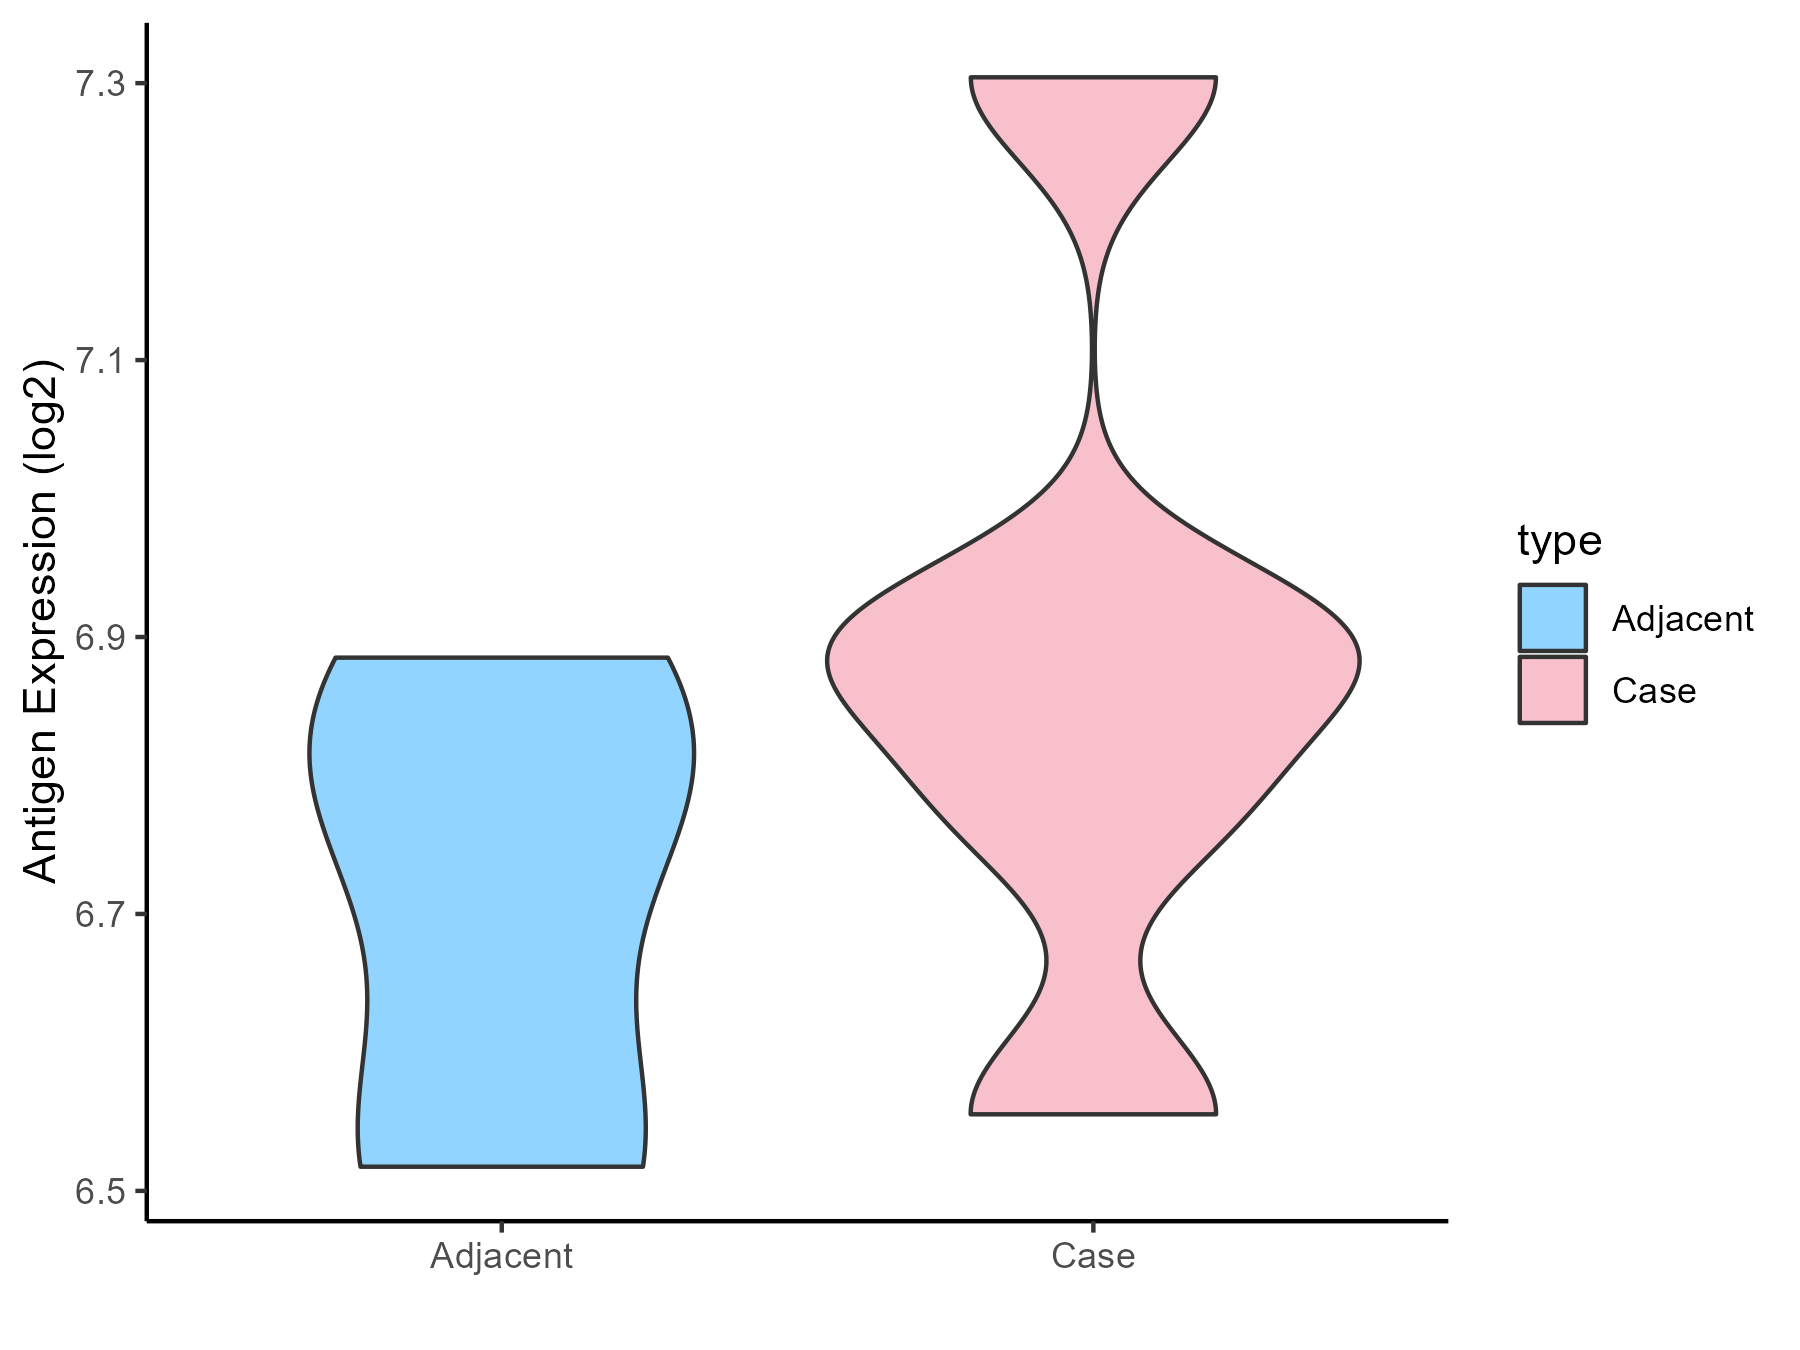
| Differential expression pattern of antigen in diseases | ||
| The Studied Tissue | Gastric antrum | |
| The Specific Disease | Eosinophilic gastritis | |
| The Expression Level of Disease Section Compare with the Adjacent Tissue | p-value: 0.249227853; Fold-change: 0.104000873; Z-score: 0.612748998 | |
| Disease-specific Antigen Abundances |
|
Click to View the Clearer Original Diagram |
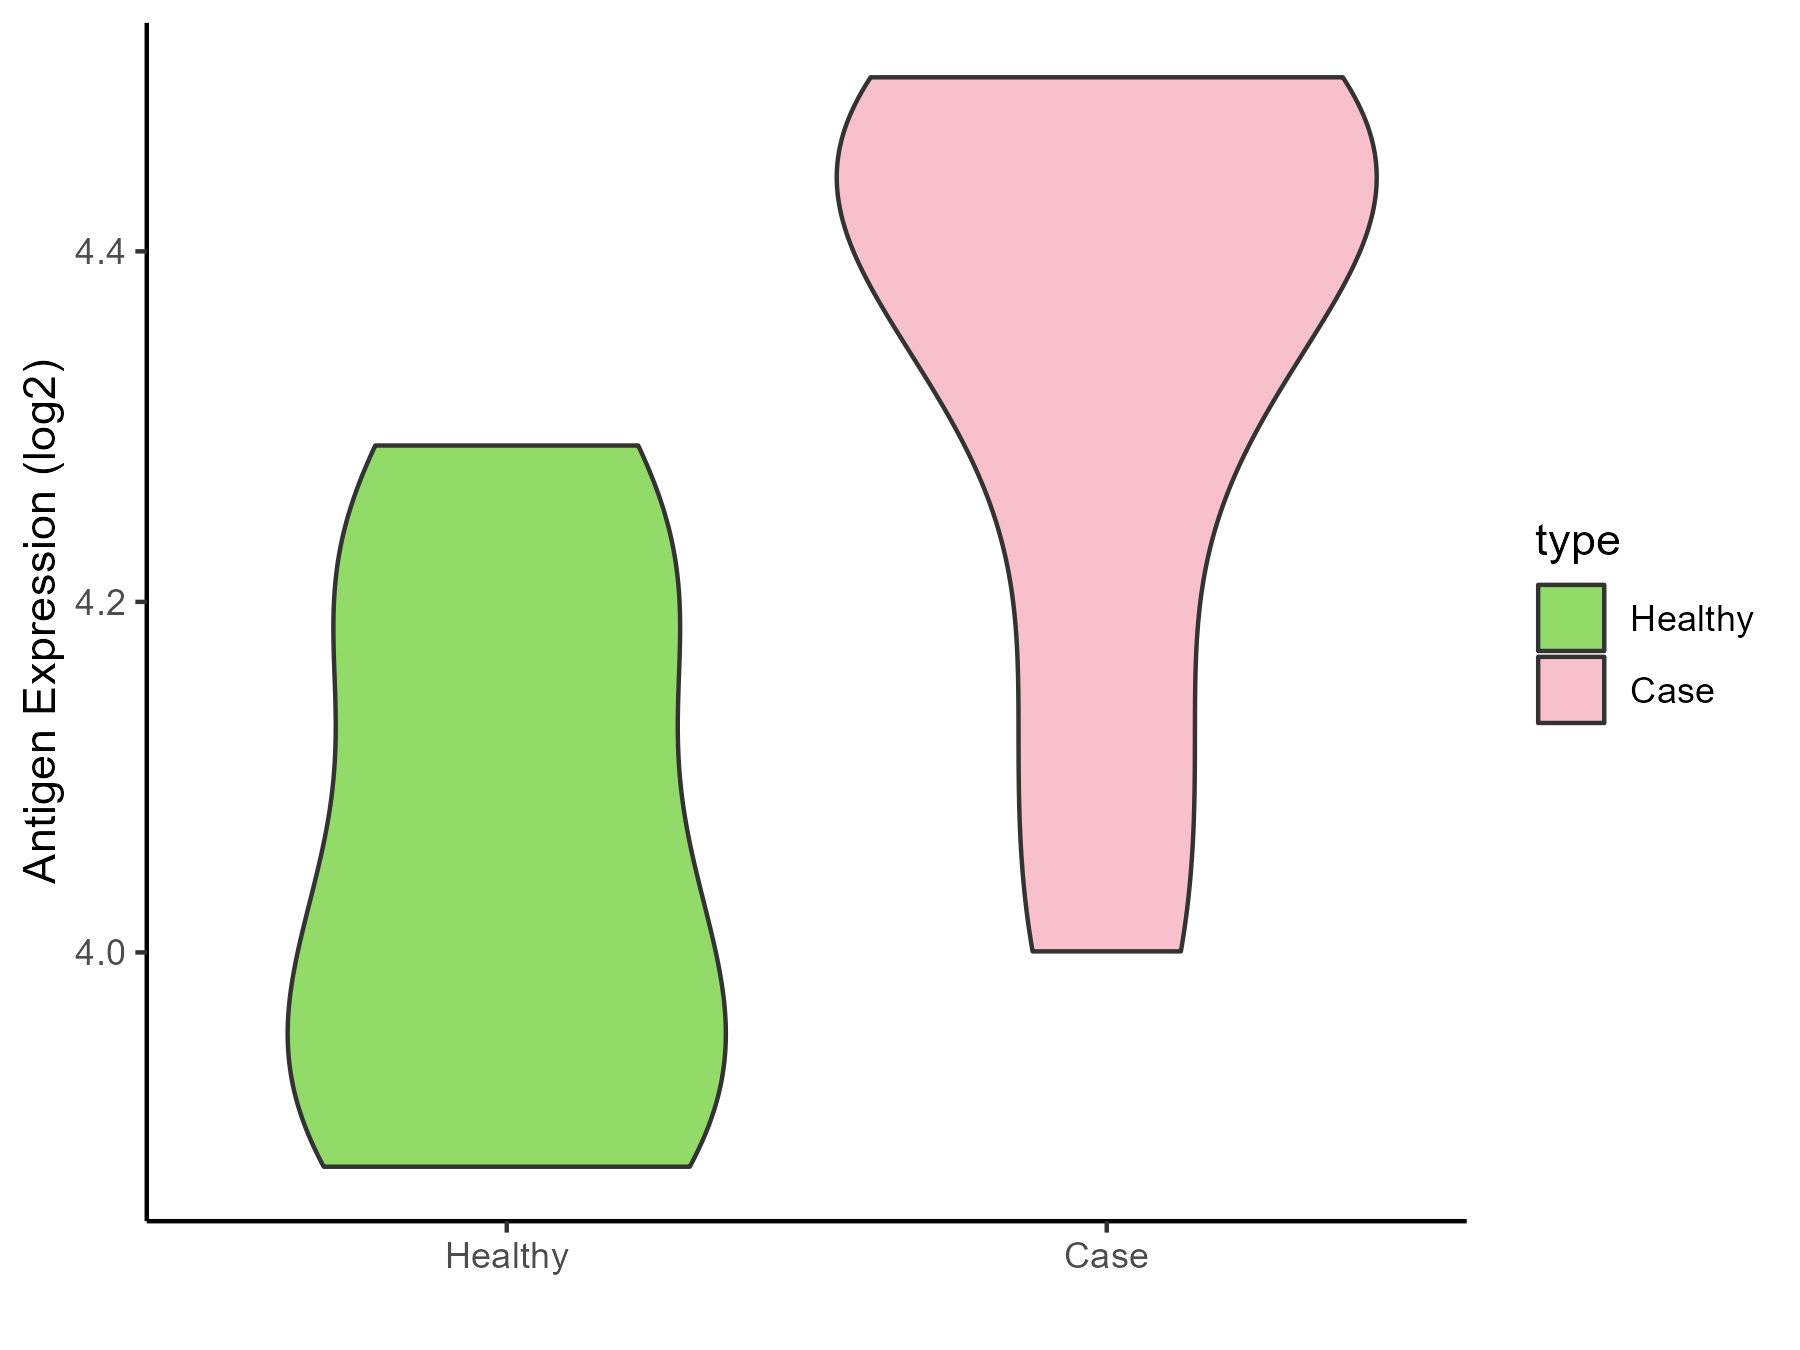
| Differential expression pattern of antigen in diseases | ||
| The Studied Tissue | Liver | |
| The Specific Disease | Liver failure | |
| The Expression Level of Disease Section Compare with the Healthy Individual Tissue | p-value: 0.005511873; Fold-change: 0.370009384; Z-score: 2.373722547 | |
| Disease-specific Antigen Abundances |
|
Click to View the Clearer Original Diagram |
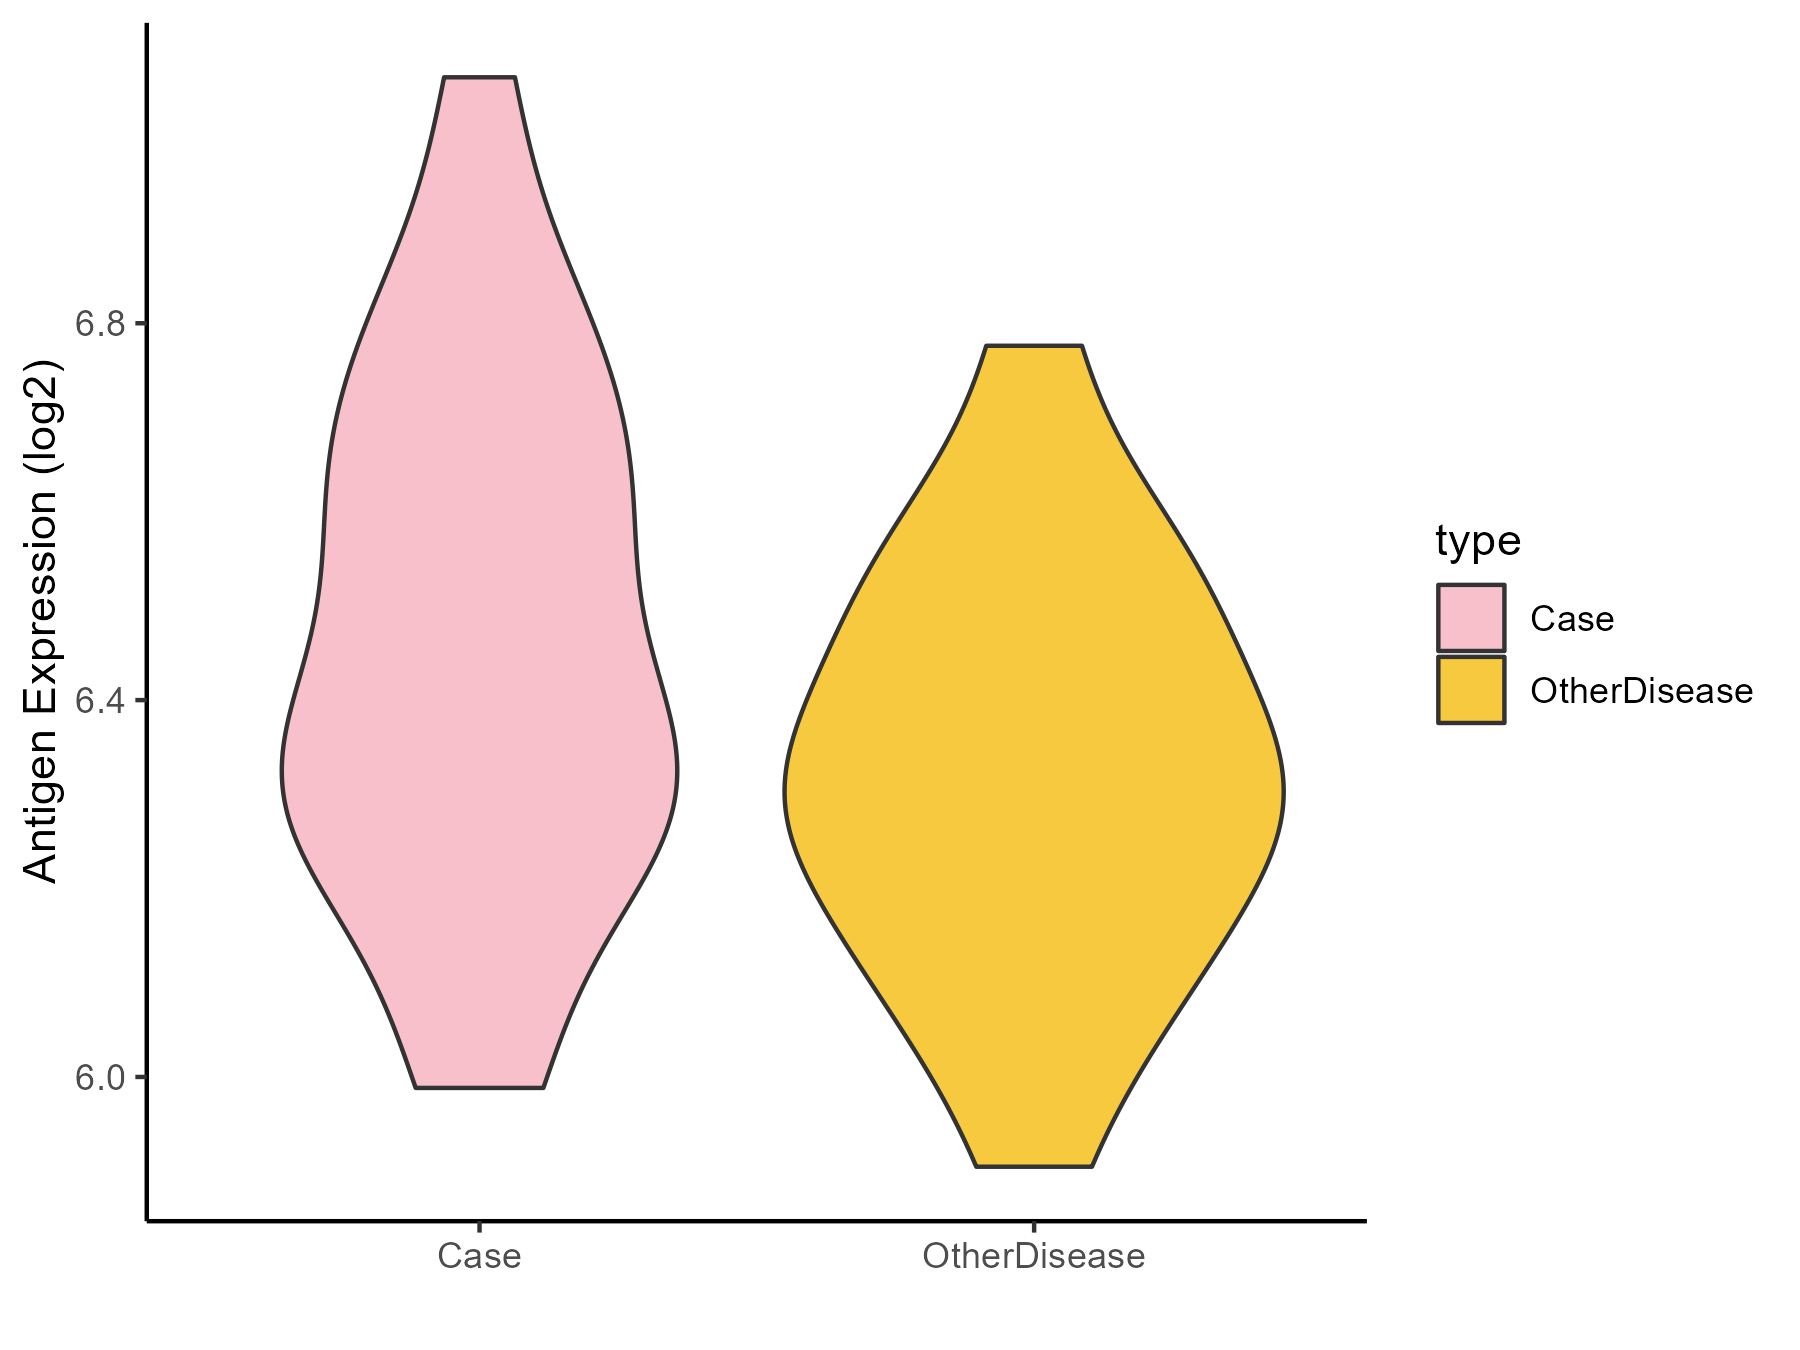
| Differential expression pattern of antigen in diseases | ||
| The Studied Tissue | Colon mucosal | |
| The Specific Disease | Ulcerative colitis | |
| The Expression Level of Disease Section Compare with the Adjacent Tissue | p-value: 0.042616212; Fold-change: 0.107355526; Z-score: 0.490455303 | |
| Disease-specific Antigen Abundances |
|
Click to View the Clearer Original Diagram |
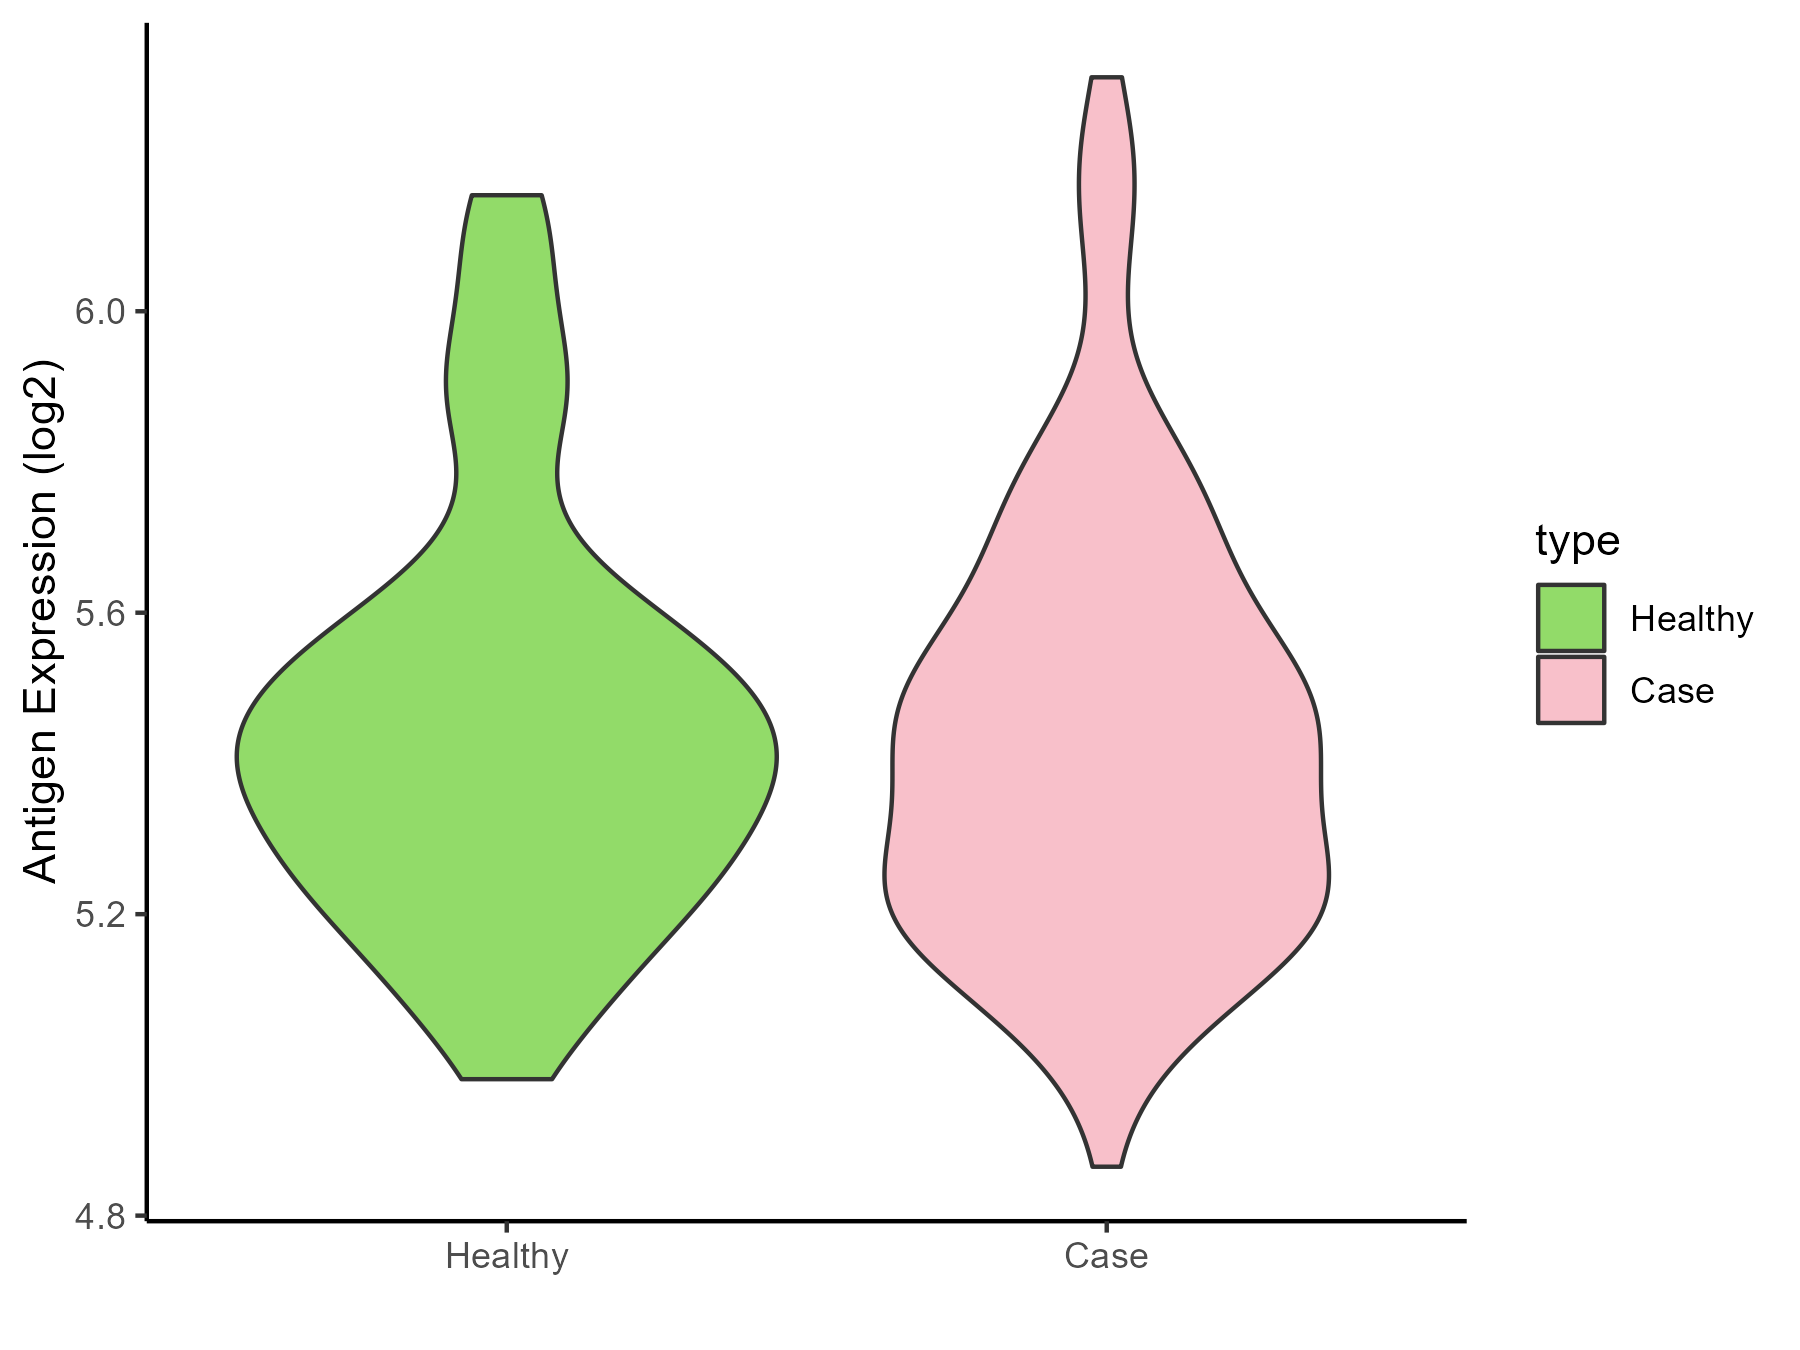
| Differential expression pattern of antigen in diseases | ||
| The Studied Tissue | Rectal colon | |
| The Specific Disease | Irritable bowel syndrome | |
| The Expression Level of Disease Section Compare with the Healthy Individual Tissue | p-value: 0.68679562; Fold-change: -0.008389096; Z-score: -0.030916271 | |
| Disease-specific Antigen Abundances |
|
Click to View the Clearer Original Diagram |
ICD Disease Classification 14
| Differential expression pattern of antigen in diseases | ||
| The Studied Tissue | Skin | |
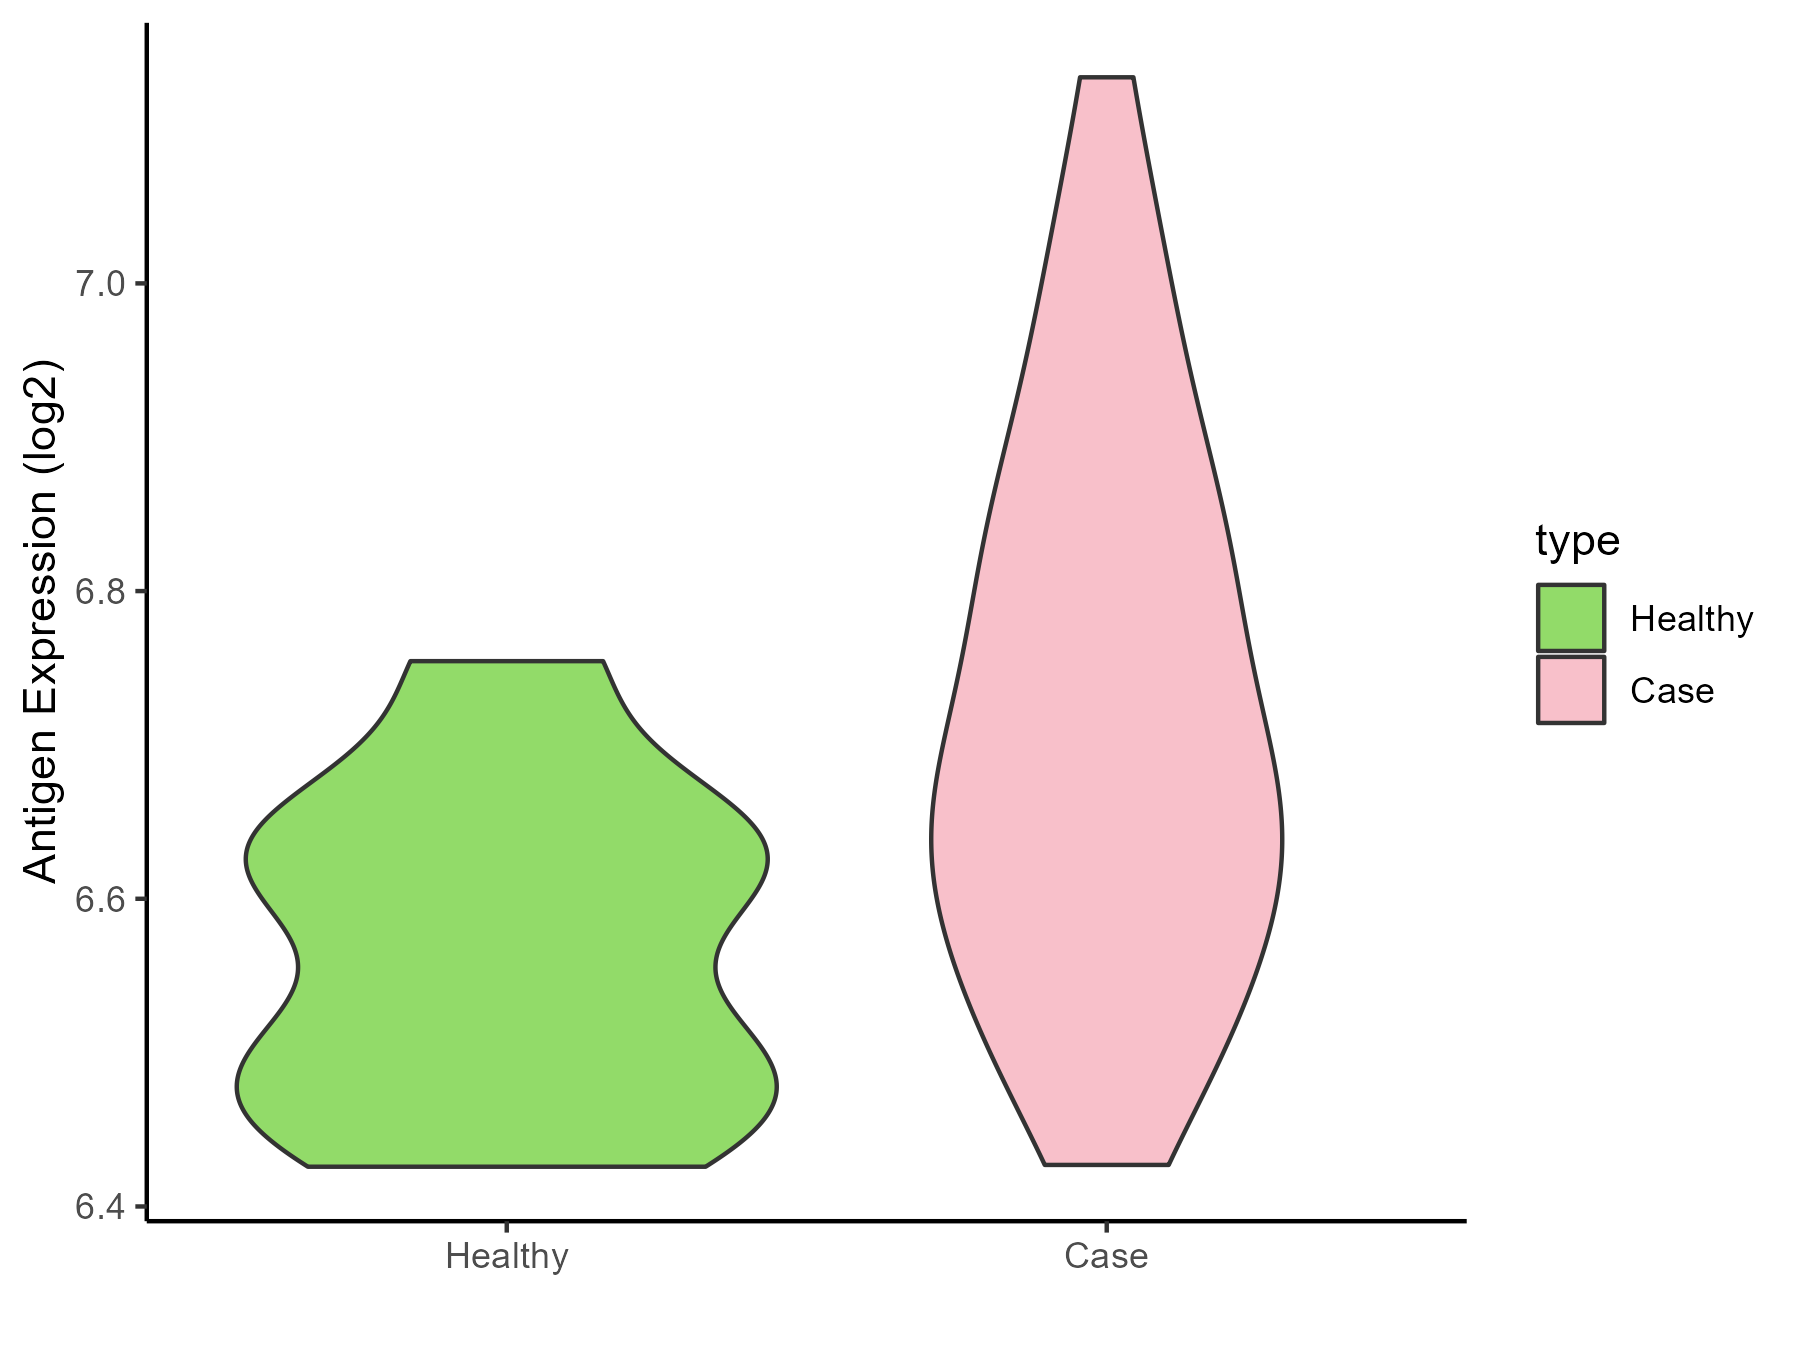
| The Specific Disease | Atopic dermatitis | |
| The Expression Level of Disease Section Compare with the Healthy Individual Tissue | p-value: 9.64E-05; Fold-change: 0.092123742; Z-score: 0.873267631 | |
| Disease-specific Antigen Abundances |
|
Click to View the Clearer Original Diagram |
| Differential expression pattern of antigen in diseases | ||
| The Studied Tissue | Skin | |
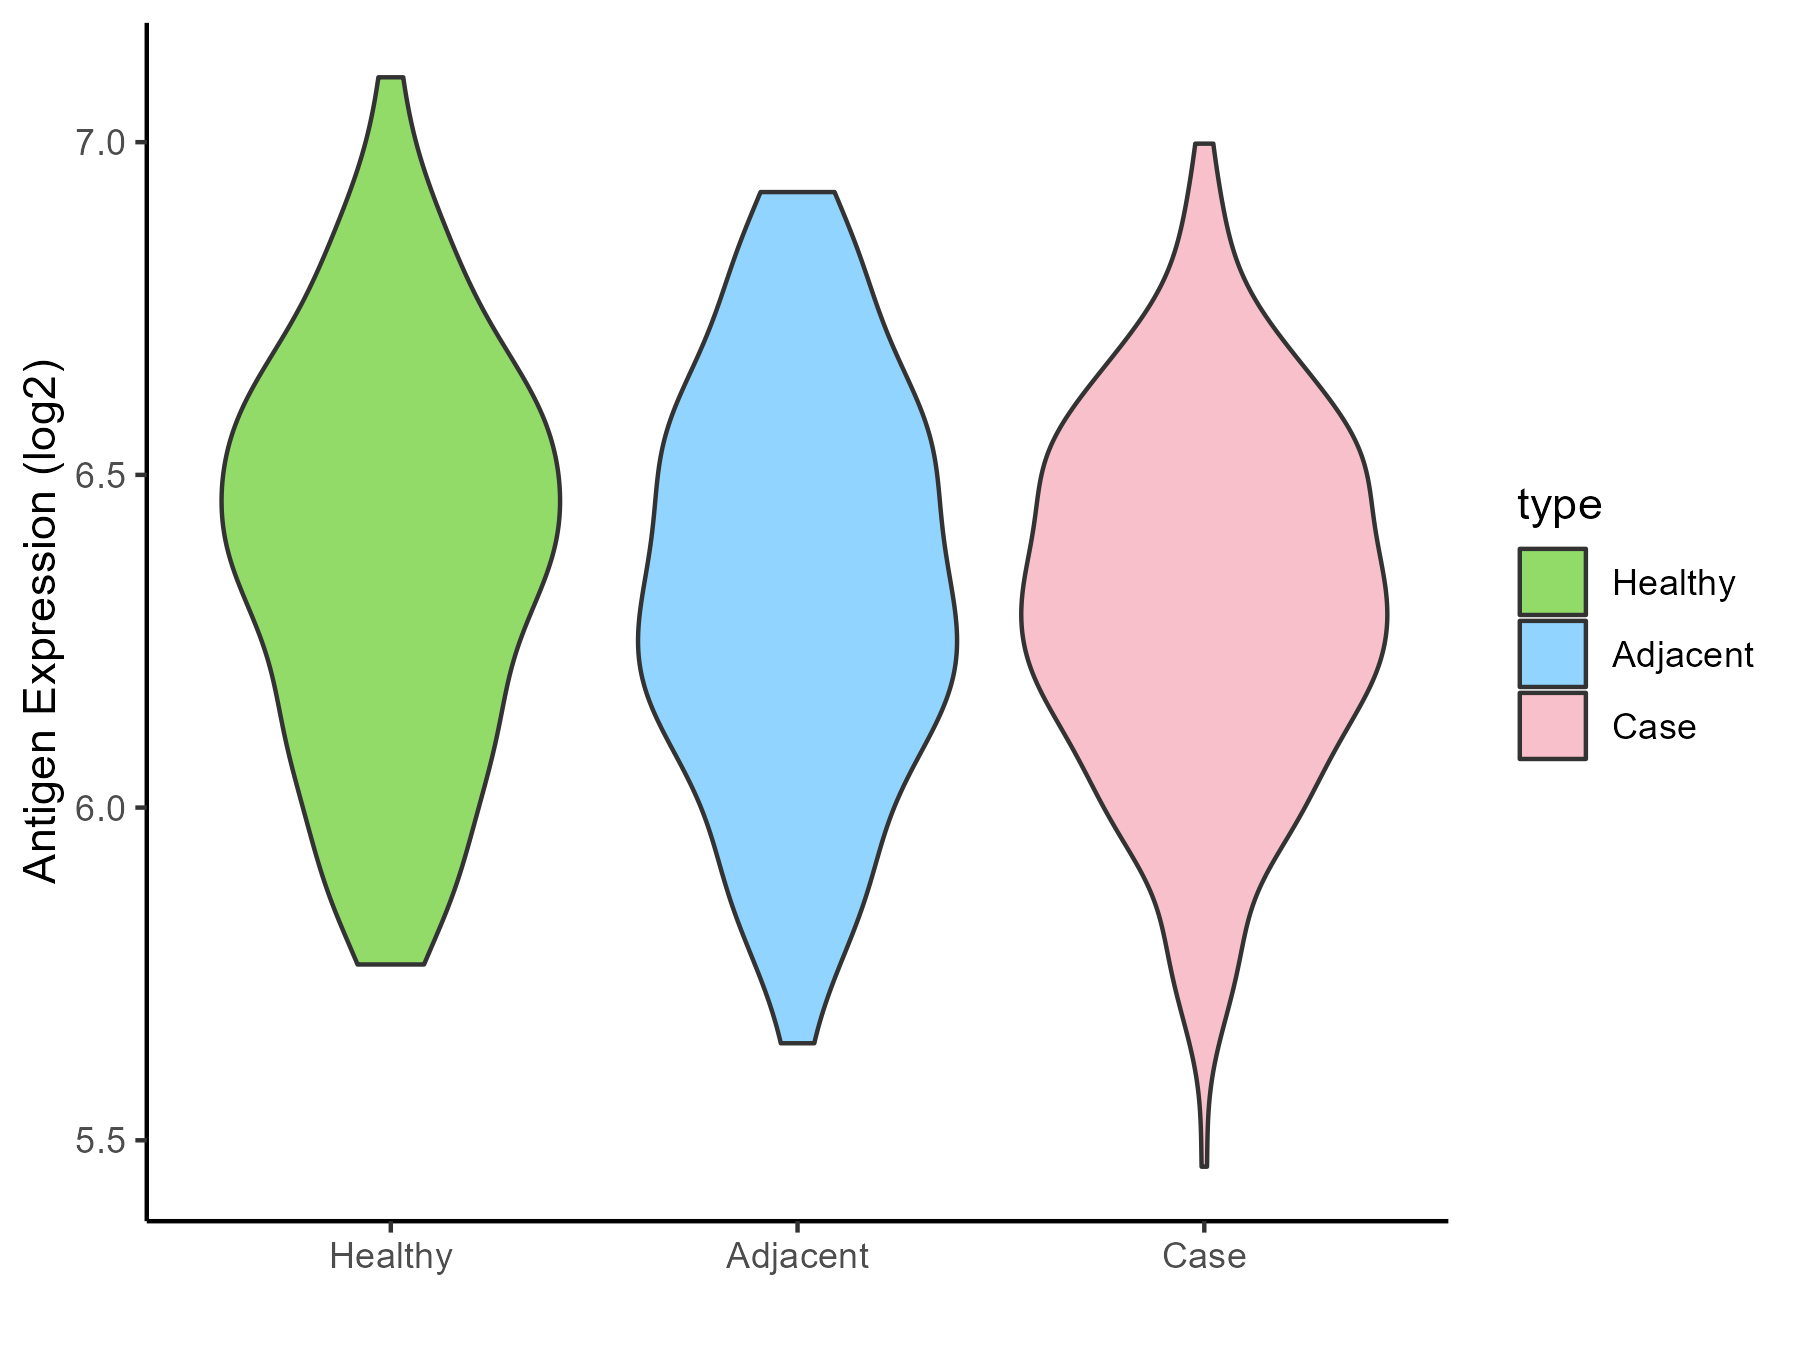
| The Specific Disease | Psoriasis | |
| The Expression Level of Disease Section Compare with the Healthy Individual Tissue | p-value: 0.039305173; Fold-change: -0.078988502; Z-score: -0.265004882 | |
| The Expression Level of Disease Section Compare with the Adjacent Tissue | p-value: 0.613225781; Fold-change: -0.019963654; Z-score: -0.066927588 | |
| Disease-specific Antigen Abundances |
|
Click to View the Clearer Original Diagram |
| Differential expression pattern of antigen in diseases | ||
| The Studied Tissue | Skin | |
| The Specific Disease | Vitiligo | |
| The Expression Level of Disease Section Compare with the Healthy Individual Tissue | p-value: 0.883162099; Fold-change: 0.006782493; Z-score: 0.045556713 | |
| Disease-specific Antigen Abundances |

|
Click to View the Clearer Original Diagram |
| Differential expression pattern of antigen in diseases | ||
| The Studied Tissue | Skin from scalp | |
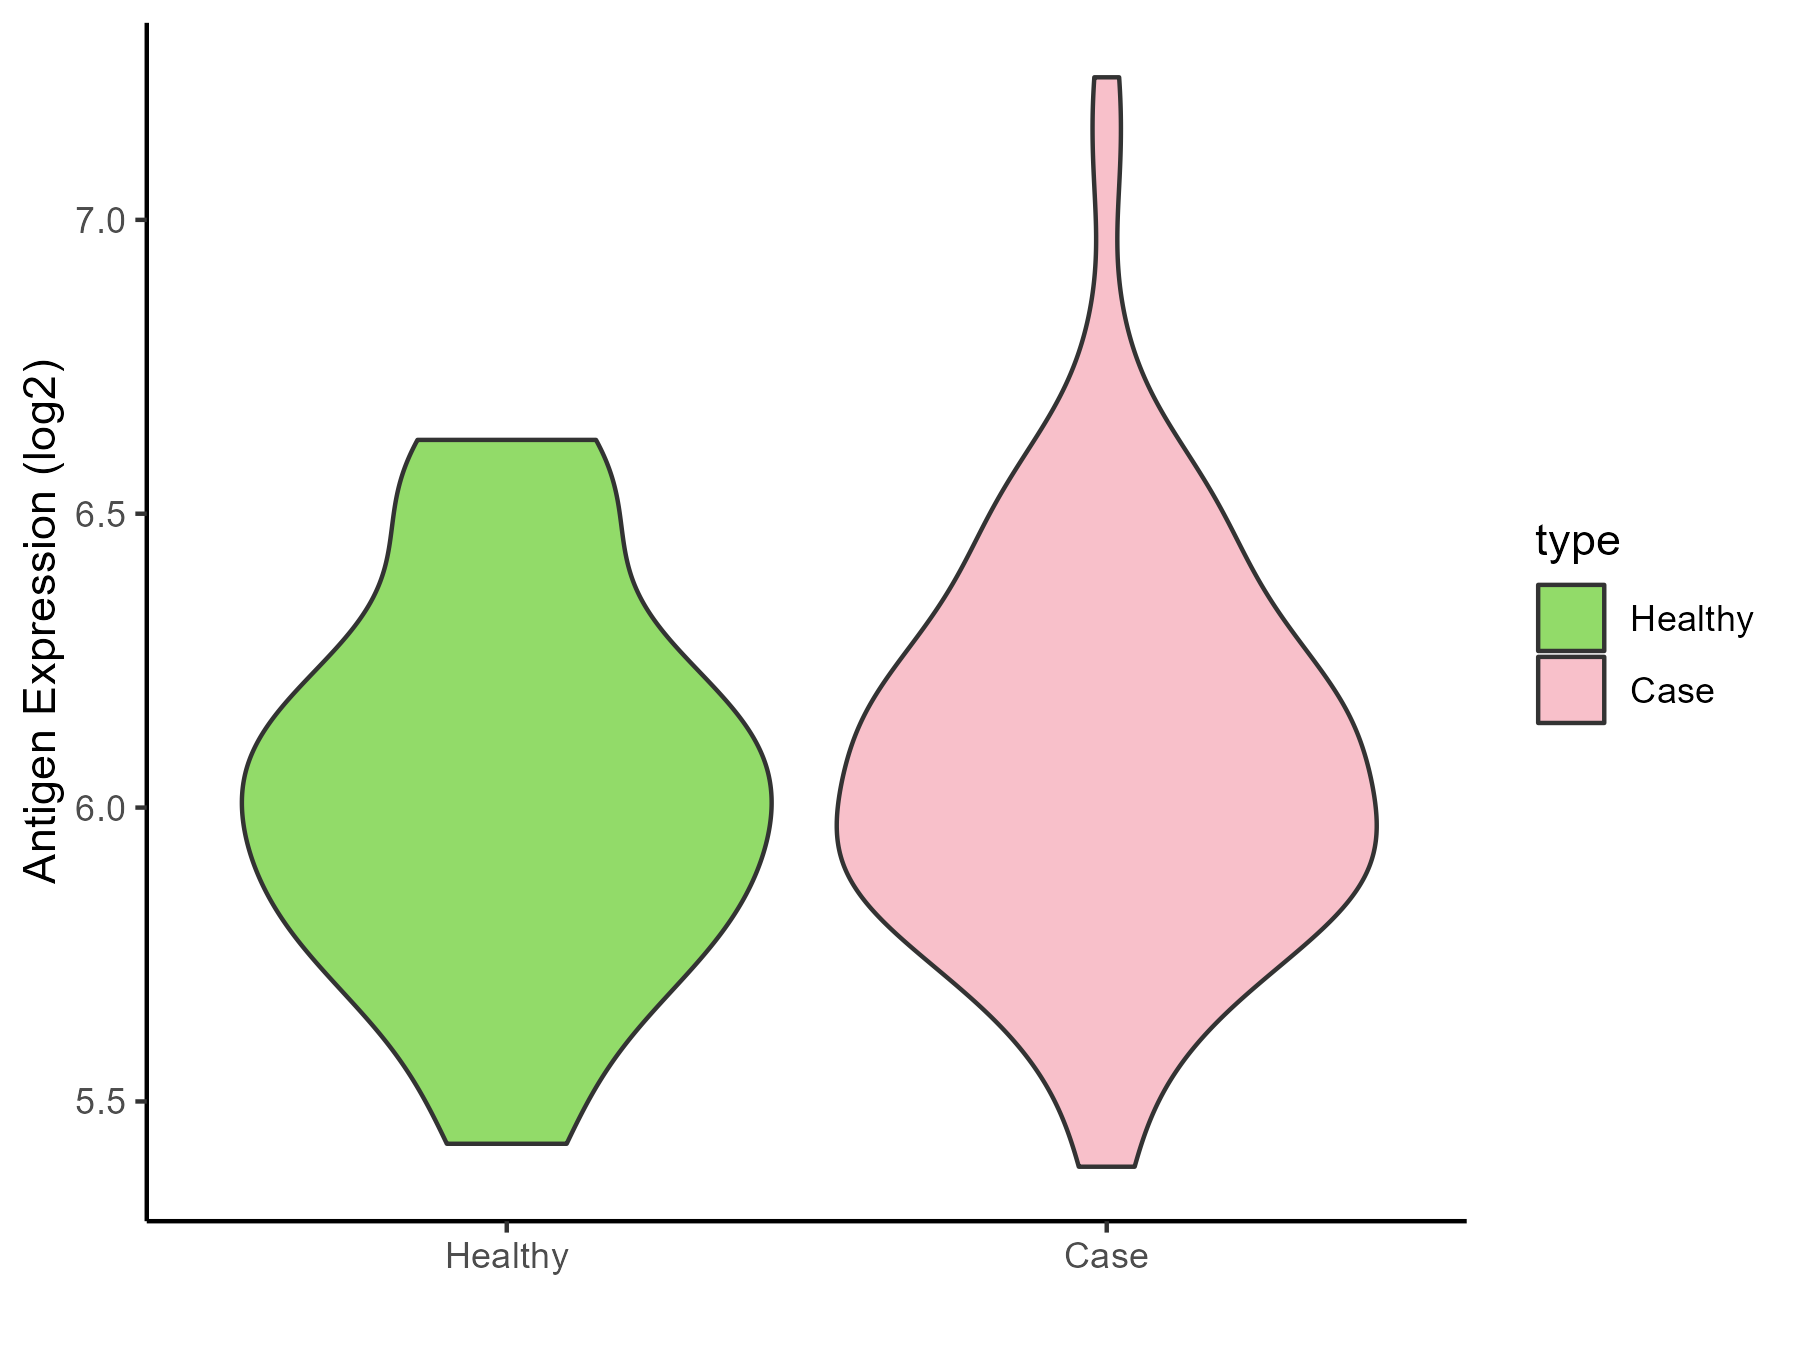
| The Specific Disease | Alopecia | |
| The Expression Level of Disease Section Compare with the Healthy Individual Tissue | p-value: 0.381208916; Fold-change: 0.060442261; Z-score: 0.189849858 | |
| Disease-specific Antigen Abundances |
|
Click to View the Clearer Original Diagram |
| Differential expression pattern of antigen in diseases | ||
| The Studied Tissue | Skin | |
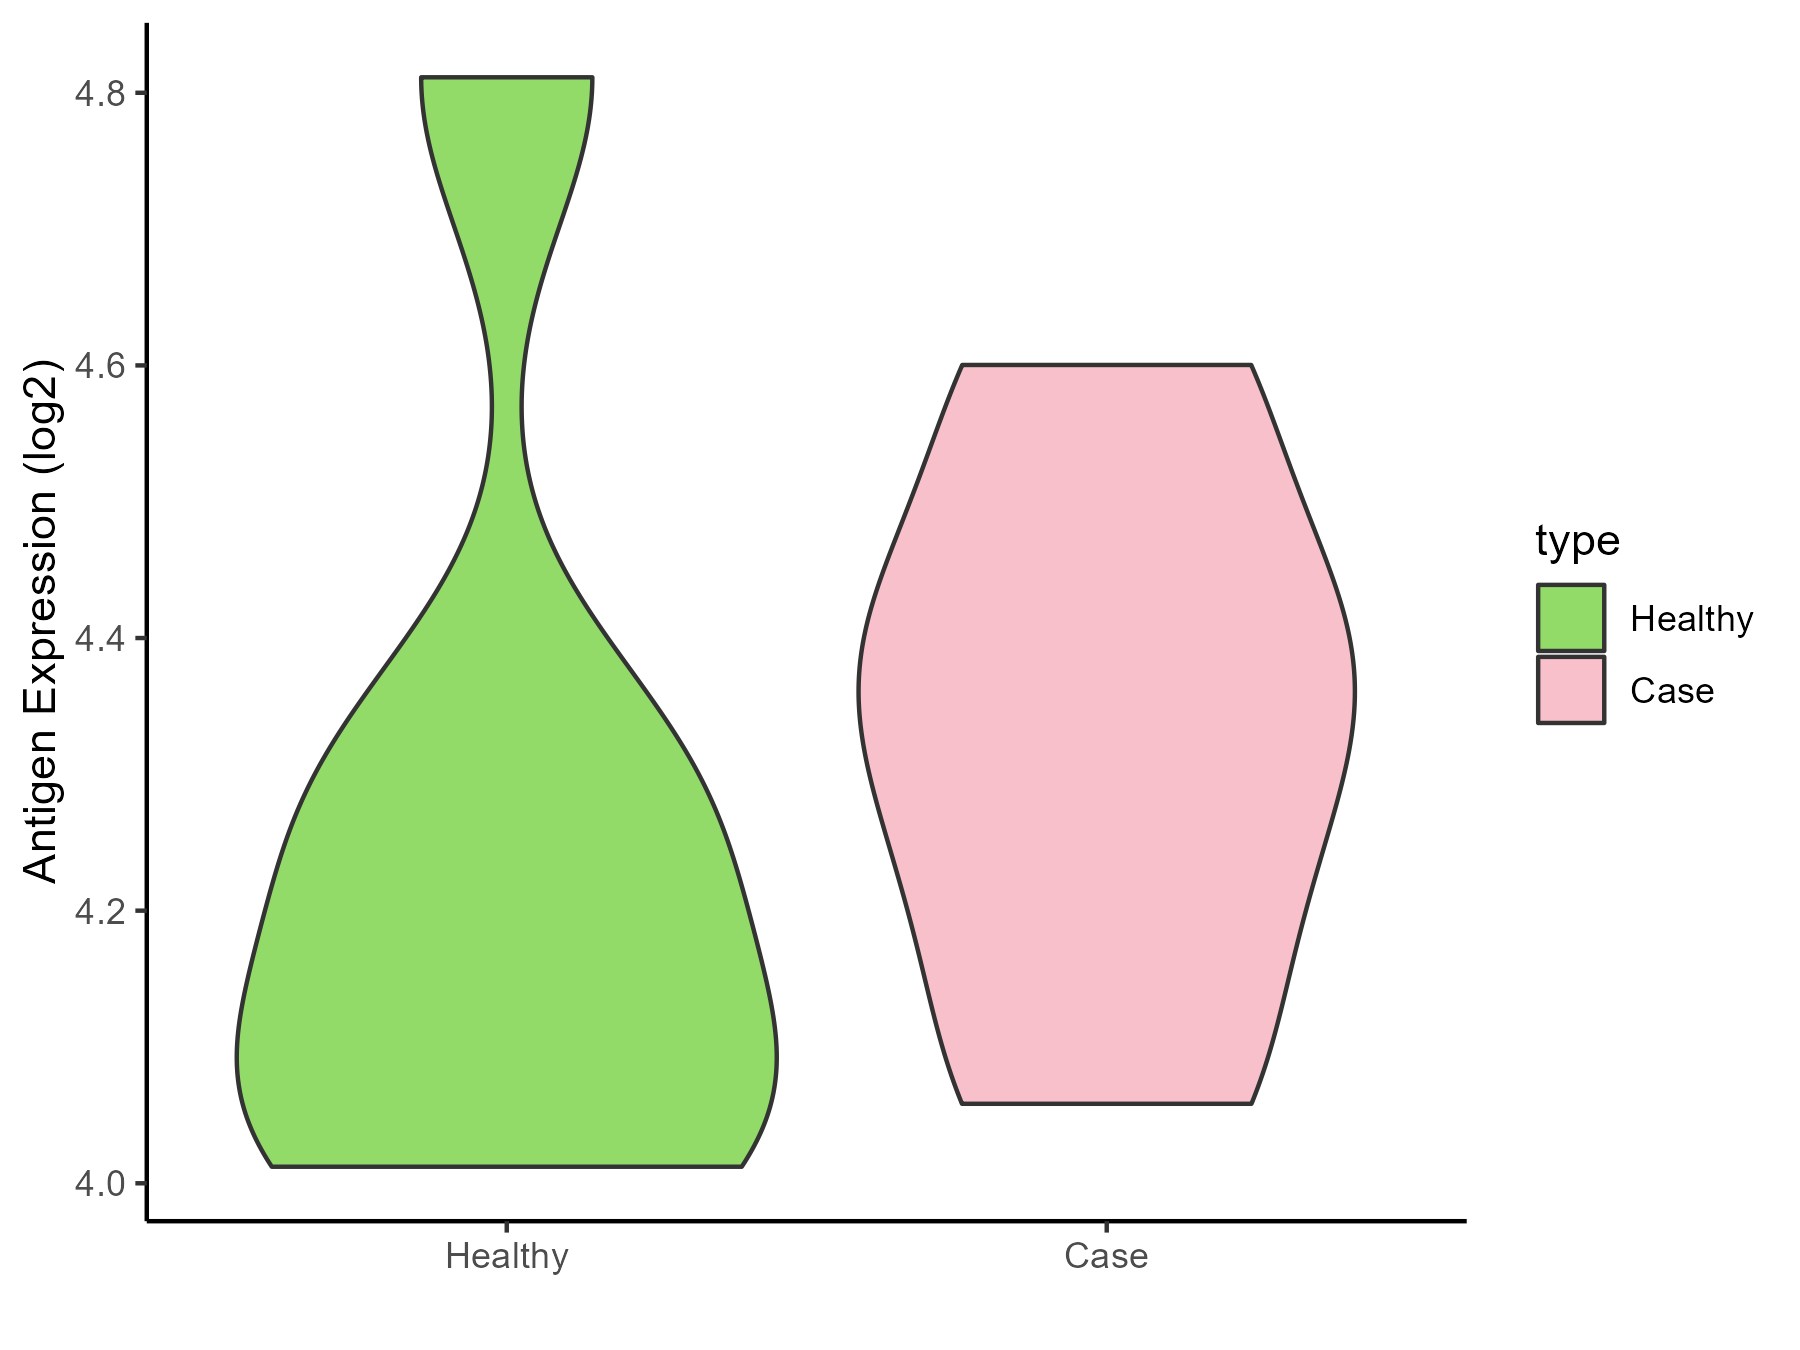
| The Specific Disease | Sensitive skin | |
| The Expression Level of Disease Section Compare with the Healthy Individual Tissue | p-value: 0.636996324; Fold-change: 0.166044243; Z-score: 0.562005631 | |
| Disease-specific Antigen Abundances |
|
Click to View the Clearer Original Diagram |
ICD Disease Classification 15
| Differential expression pattern of antigen in diseases | ||
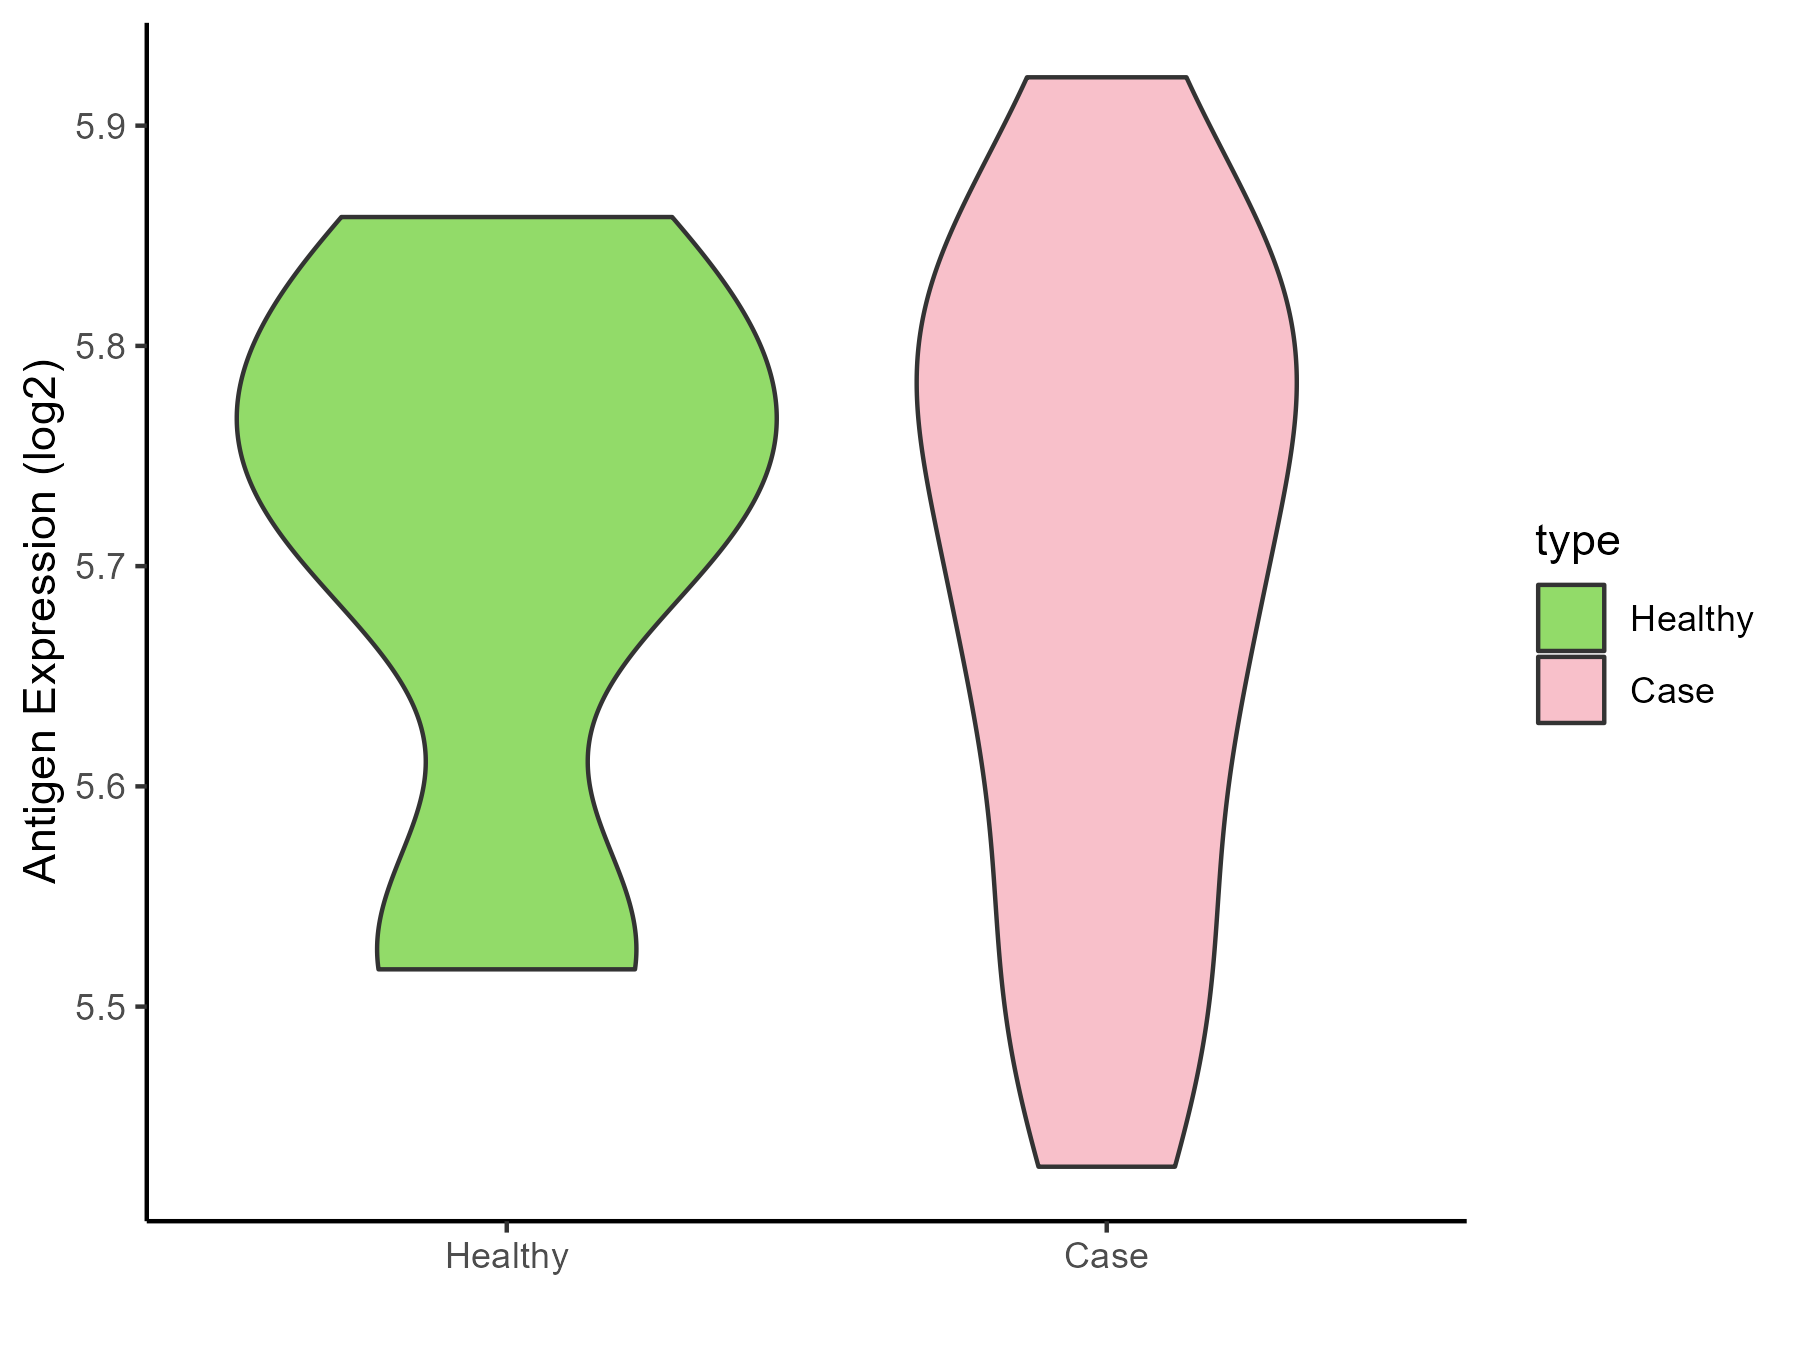
| The Studied Tissue | Synovial | |
| The Specific Disease | Osteoarthritis | |
| The Expression Level of Disease Section Compare with the Healthy Individual Tissue | p-value: 0.778782182; Fold-change: -0.040490231; Z-score: -0.321868282 | |
| Disease-specific Antigen Abundances |
|
Click to View the Clearer Original Diagram |
| Differential expression pattern of antigen in diseases | ||
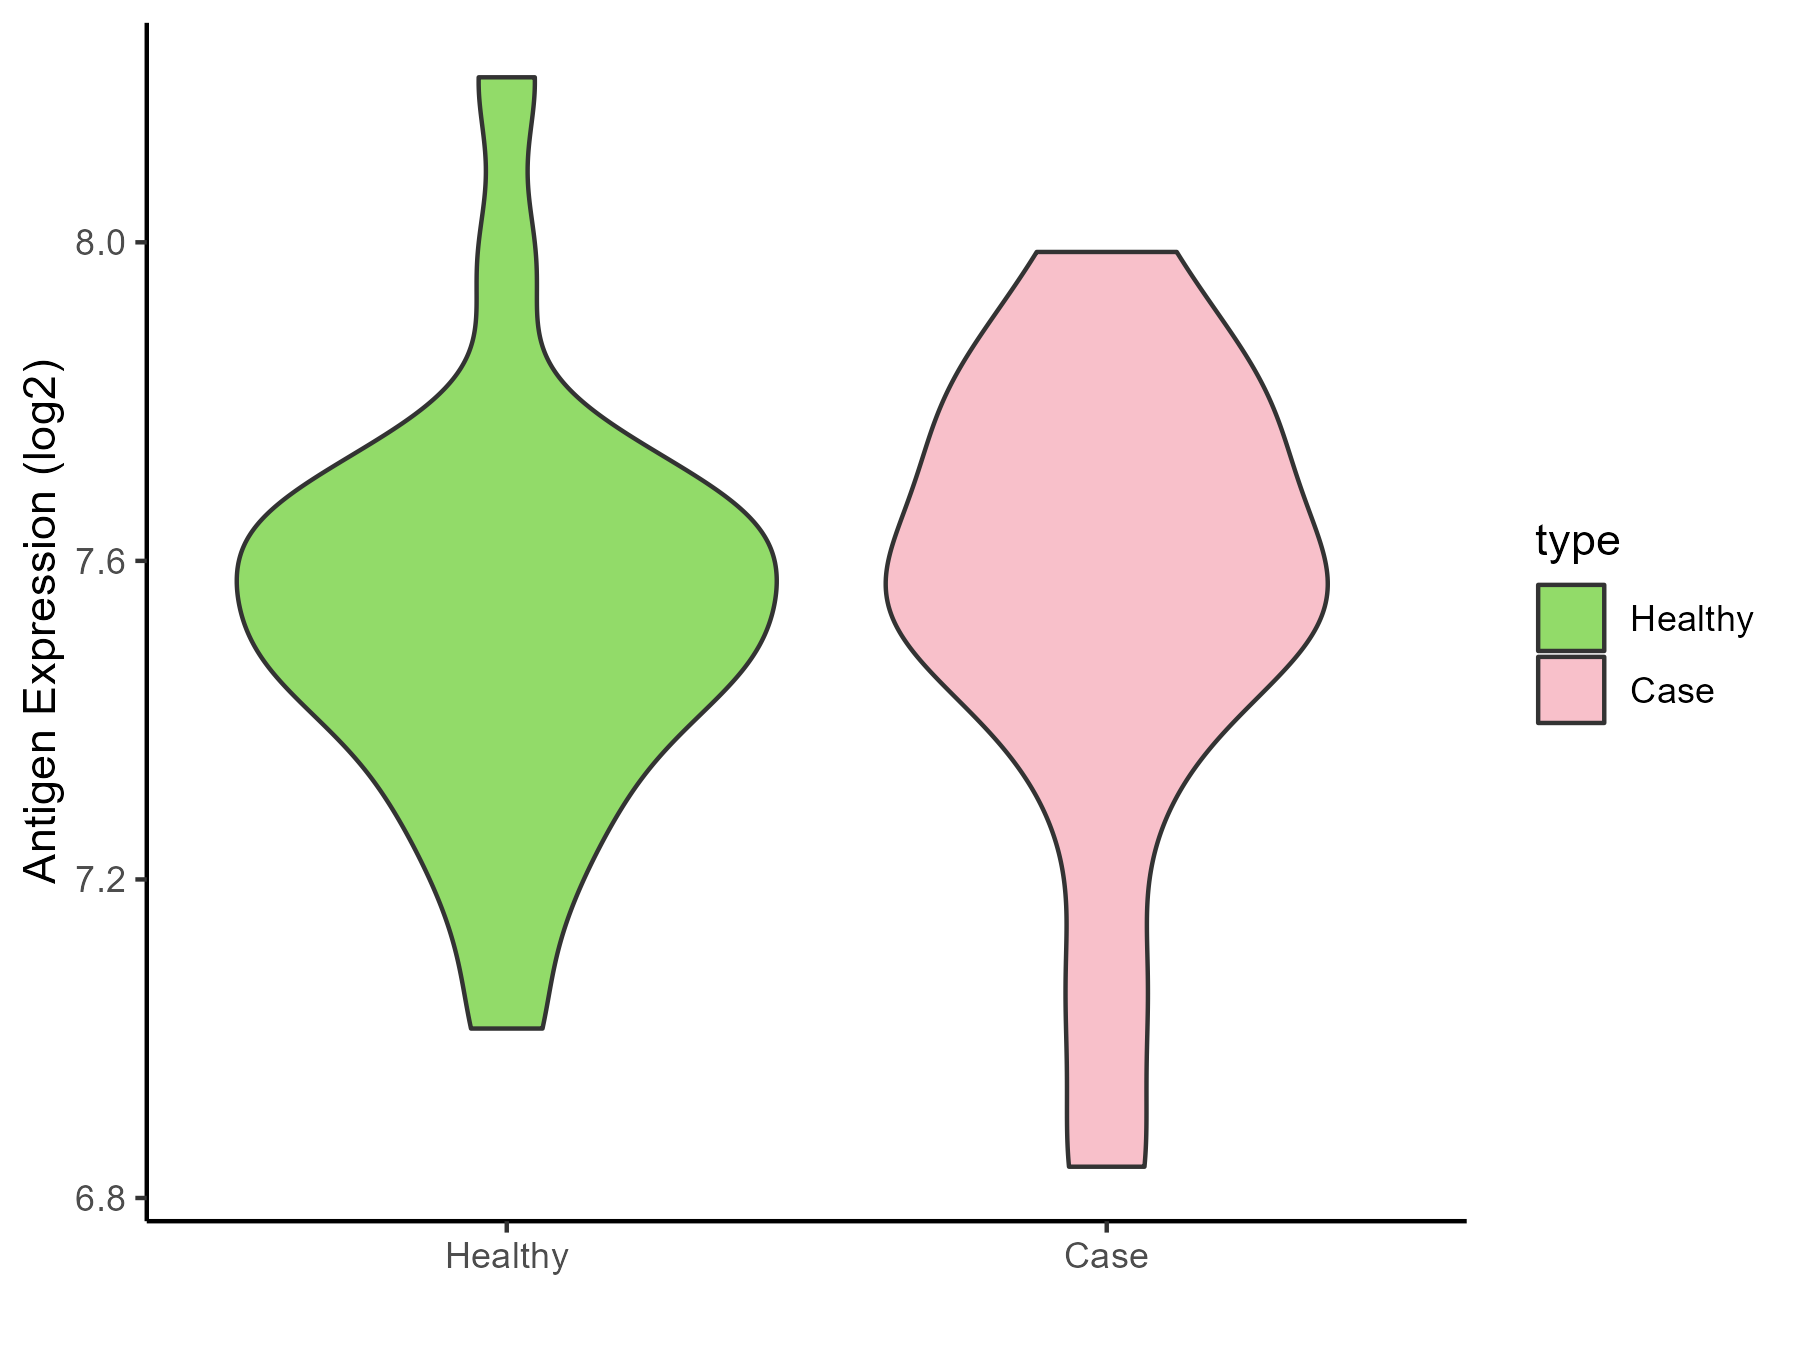
| The Studied Tissue | Peripheral blood | |
| The Specific Disease | Arthropathy | |
| The Expression Level of Disease Section Compare with the Healthy Individual Tissue | p-value: 0.892089363; Fold-change: 0.037811036; Z-score: 0.150491041 | |
| Disease-specific Antigen Abundances |
|
Click to View the Clearer Original Diagram |
| Differential expression pattern of antigen in diseases | ||
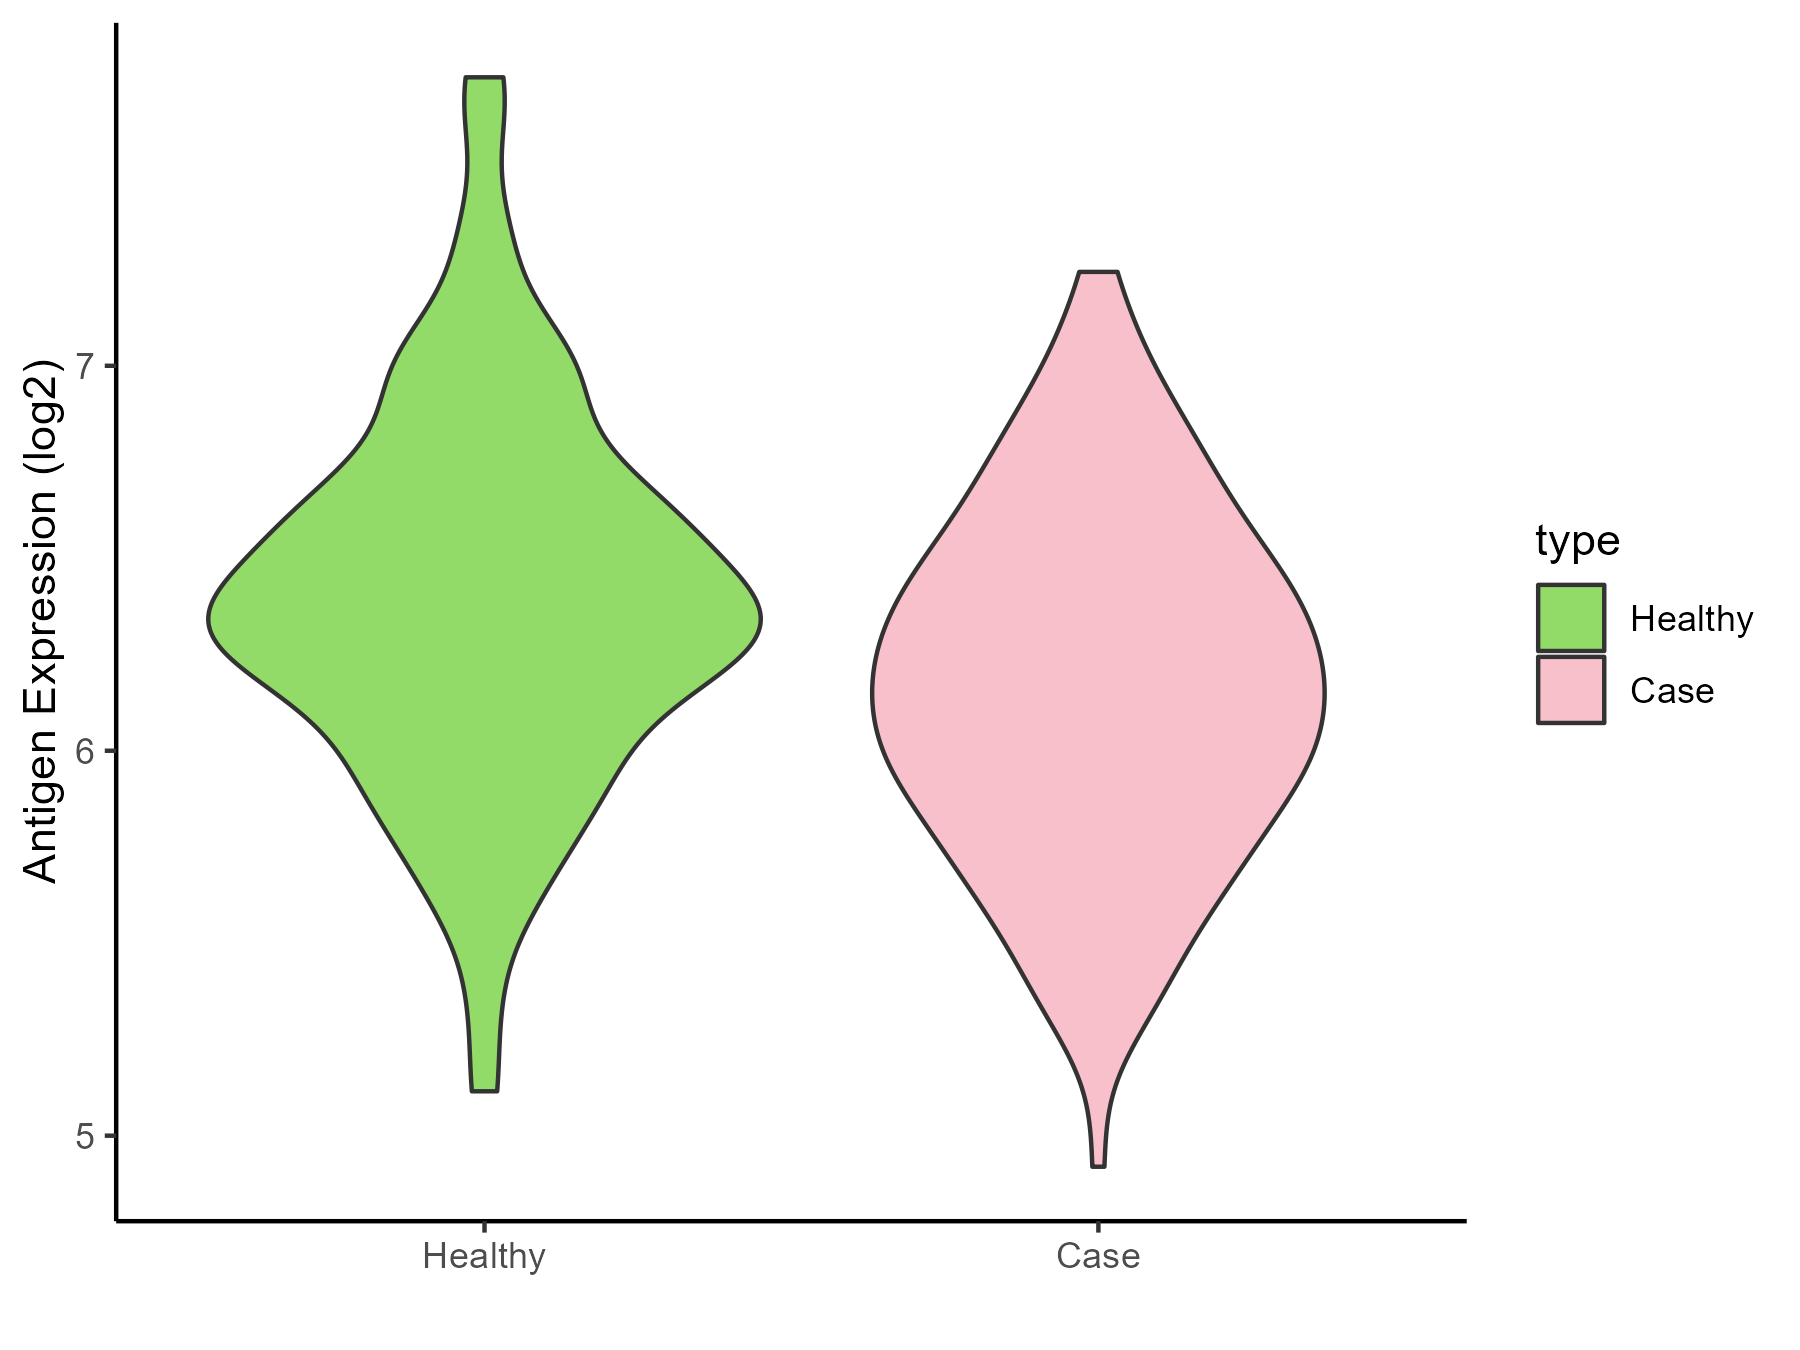
| The Studied Tissue | Peripheral blood | |
| The Specific Disease | Arthritis | |
| The Expression Level of Disease Section Compare with the Healthy Individual Tissue | p-value: 0.000829838; Fold-change: -0.186395495; Z-score: -0.386784642 | |
| Disease-specific Antigen Abundances |
|
Click to View the Clearer Original Diagram |
| Differential expression pattern of antigen in diseases | ||
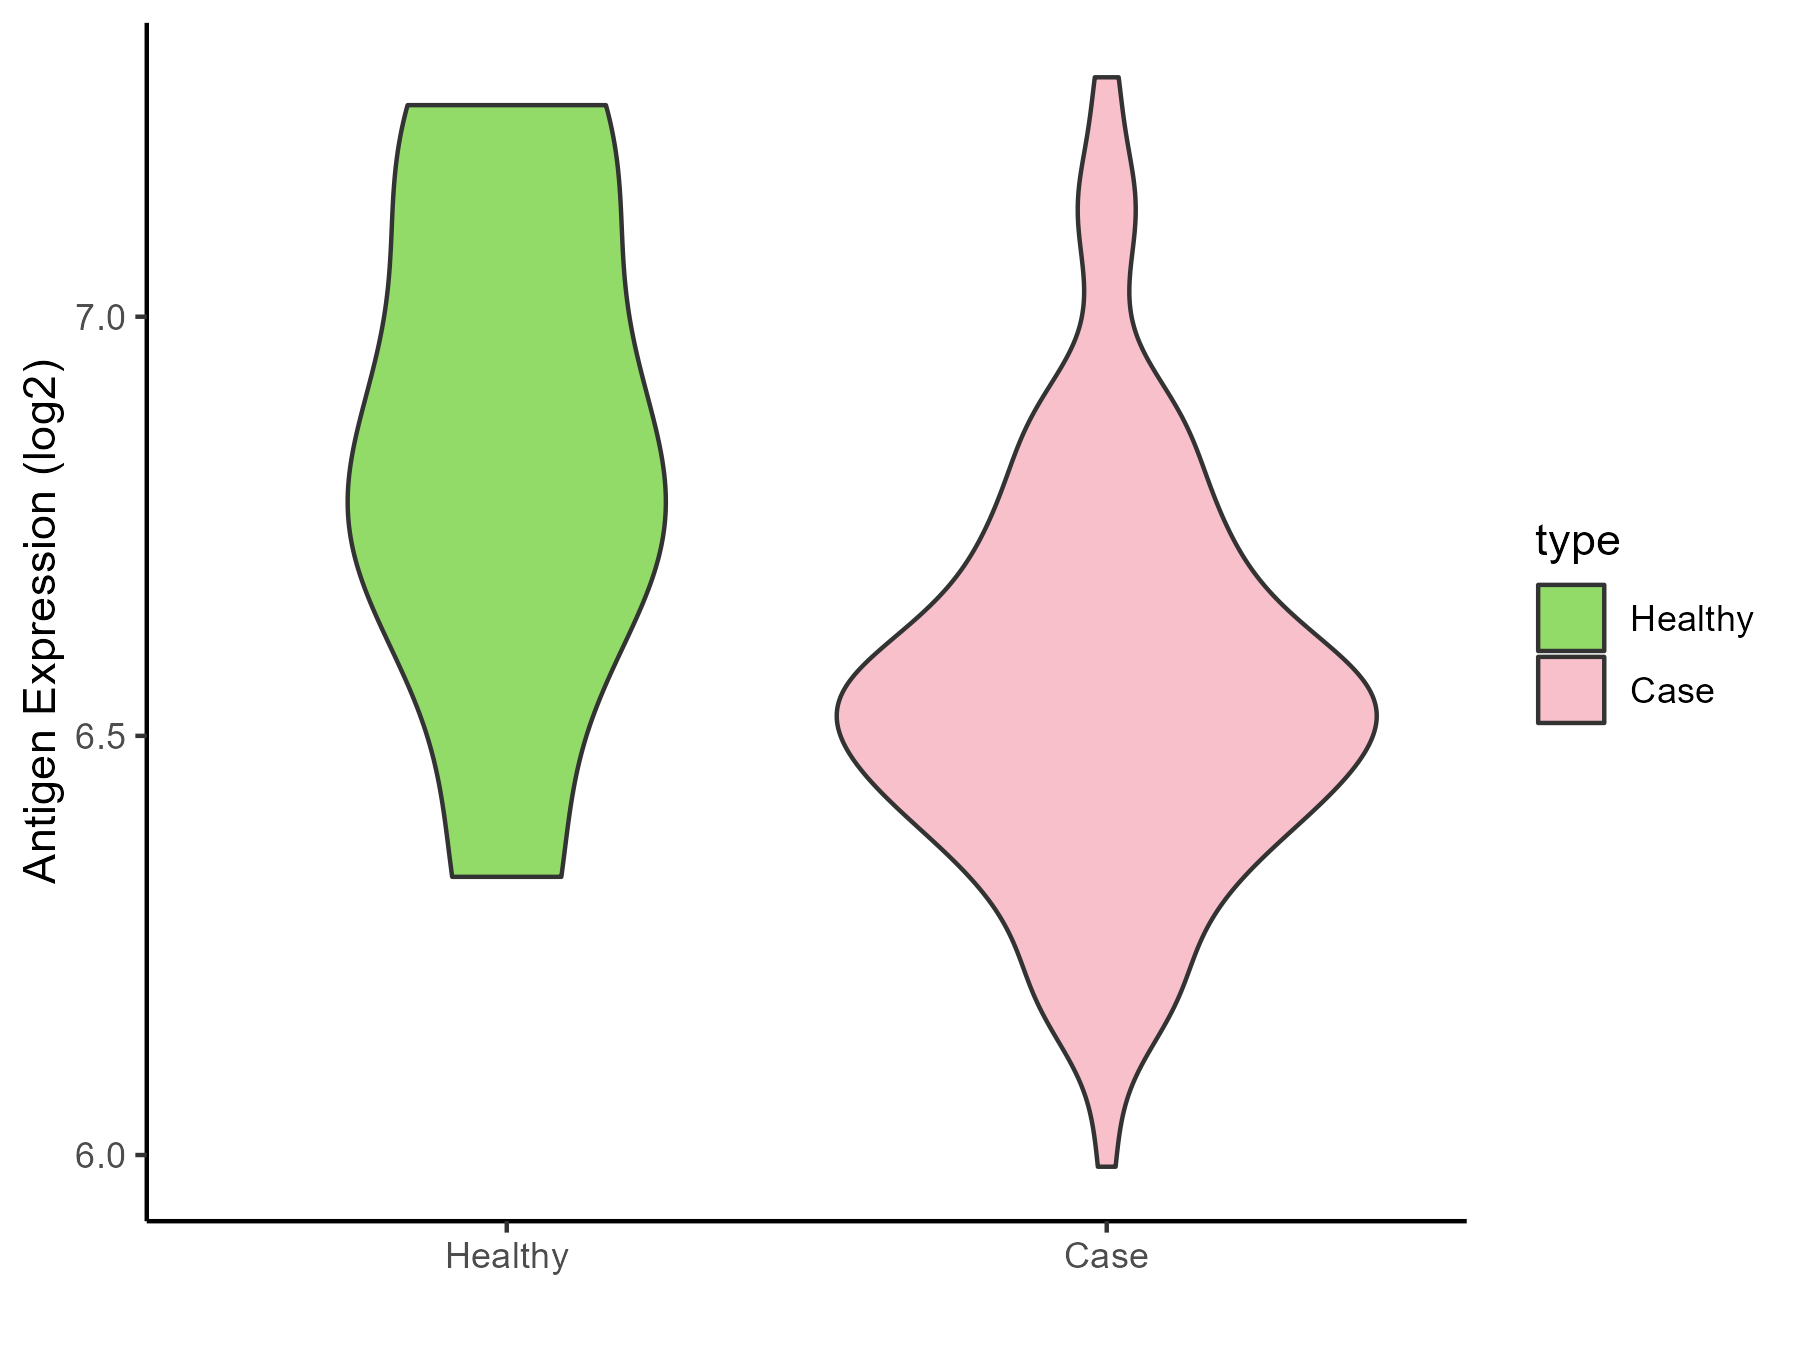
| The Studied Tissue | Synovial | |
| The Specific Disease | Rheumatoid arthritis | |
| The Expression Level of Disease Section Compare with the Healthy Individual Tissue | p-value: 0.052847397; Fold-change: -0.238837613; Z-score: -0.755303112 | |
| Disease-specific Antigen Abundances |
|
Click to View the Clearer Original Diagram |
| Differential expression pattern of antigen in diseases | ||
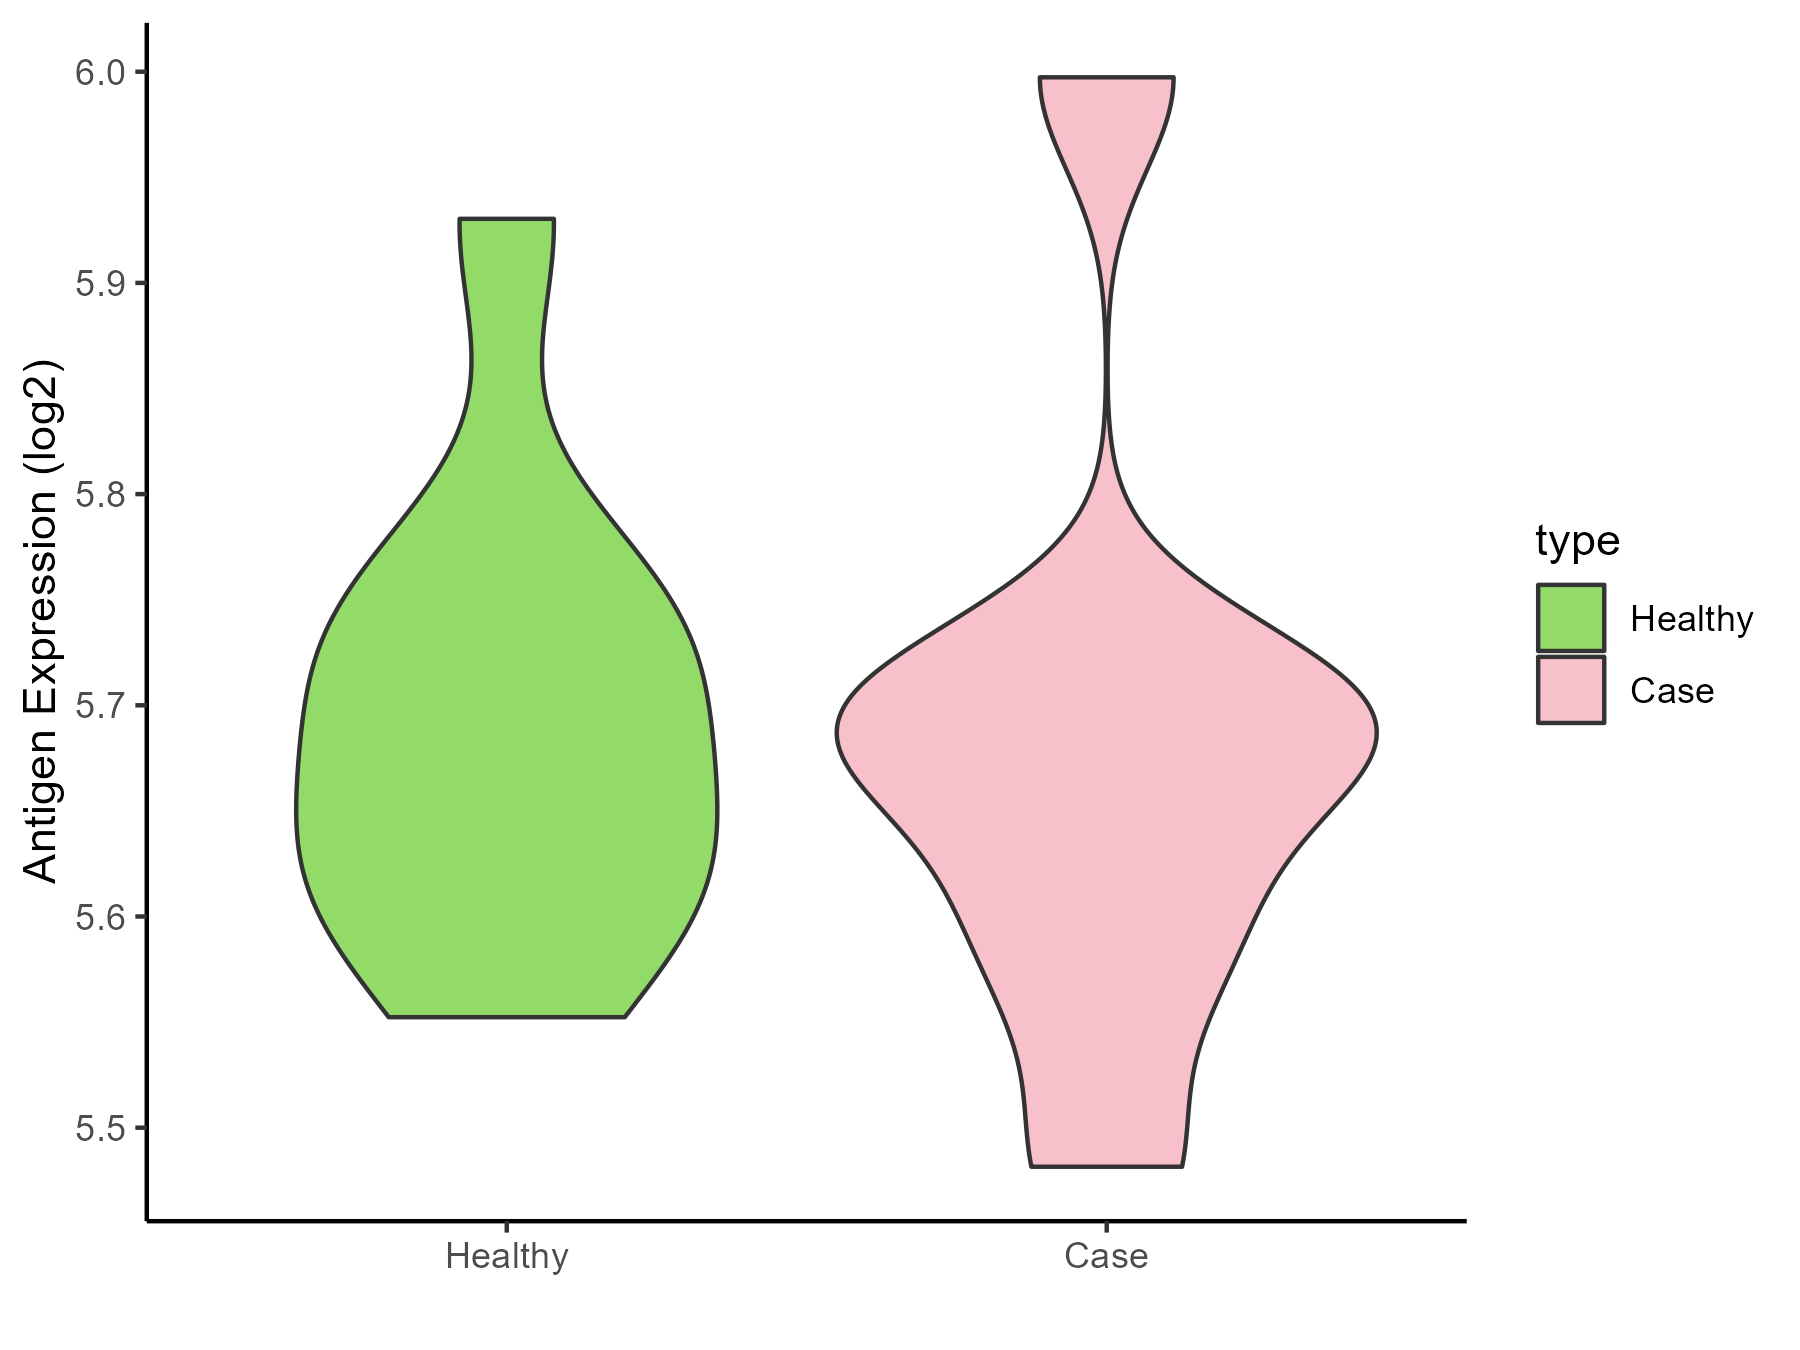
| The Studied Tissue | Pheripheral blood | |
| The Specific Disease | Ankylosing spondylitis | |
| Disease-specific Antigen Abundances |
|
Click to View the Clearer Original Diagram |
| Differential expression pattern of antigen in diseases | ||
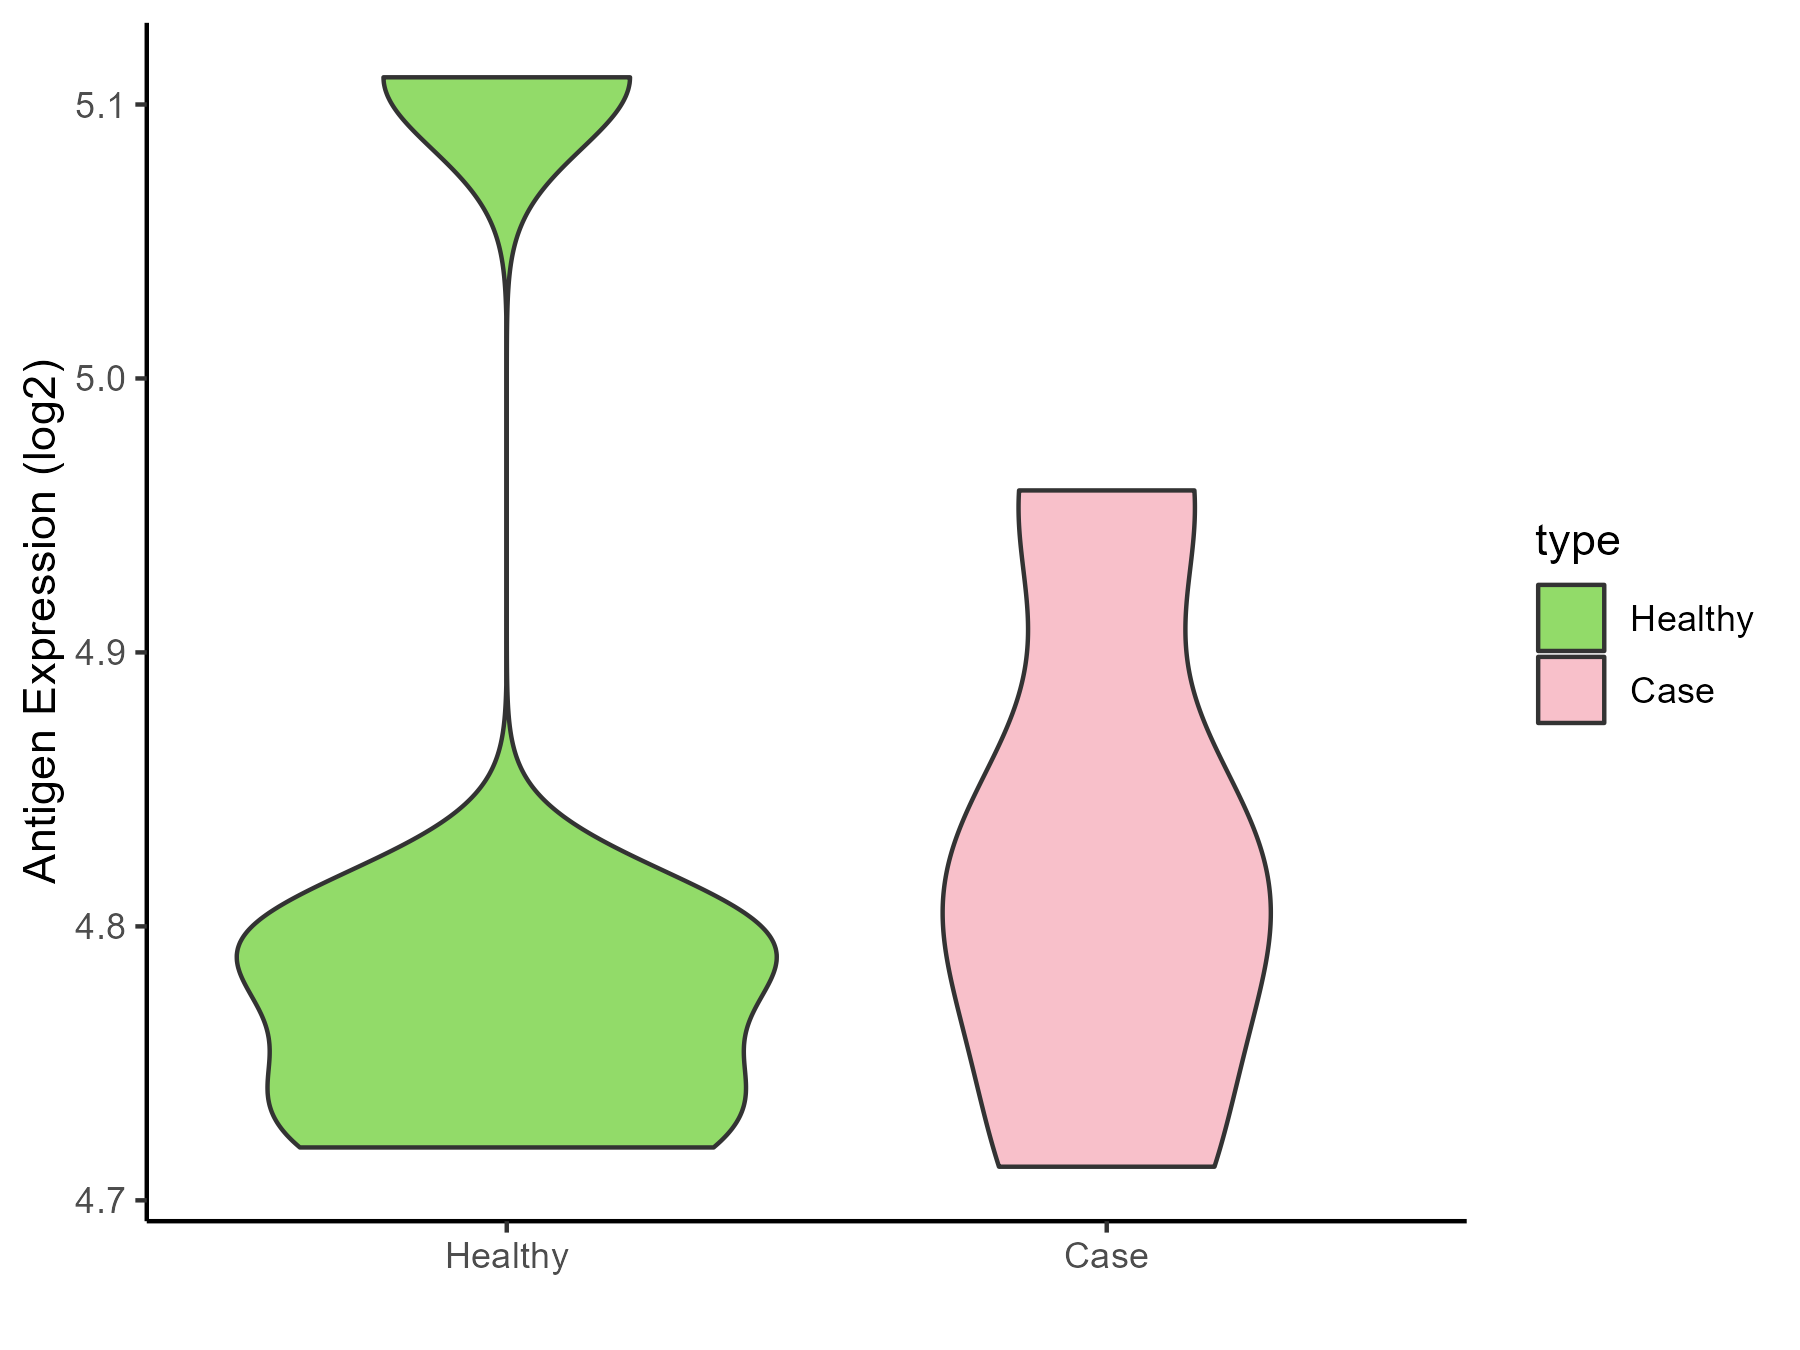
| The Studied Tissue | Bone marrow | |
| The Specific Disease | Osteoporosis | |
| The Expression Level of Disease Section Compare with the Healthy Individual Tissue | p-value: 0.932424825; Fold-change: 0.021218124; Z-score: 0.133882358 | |
| Disease-specific Antigen Abundances |
|
Click to View the Clearer Original Diagram |
ICD Disease Classification 16
| Differential expression pattern of antigen in diseases | ||
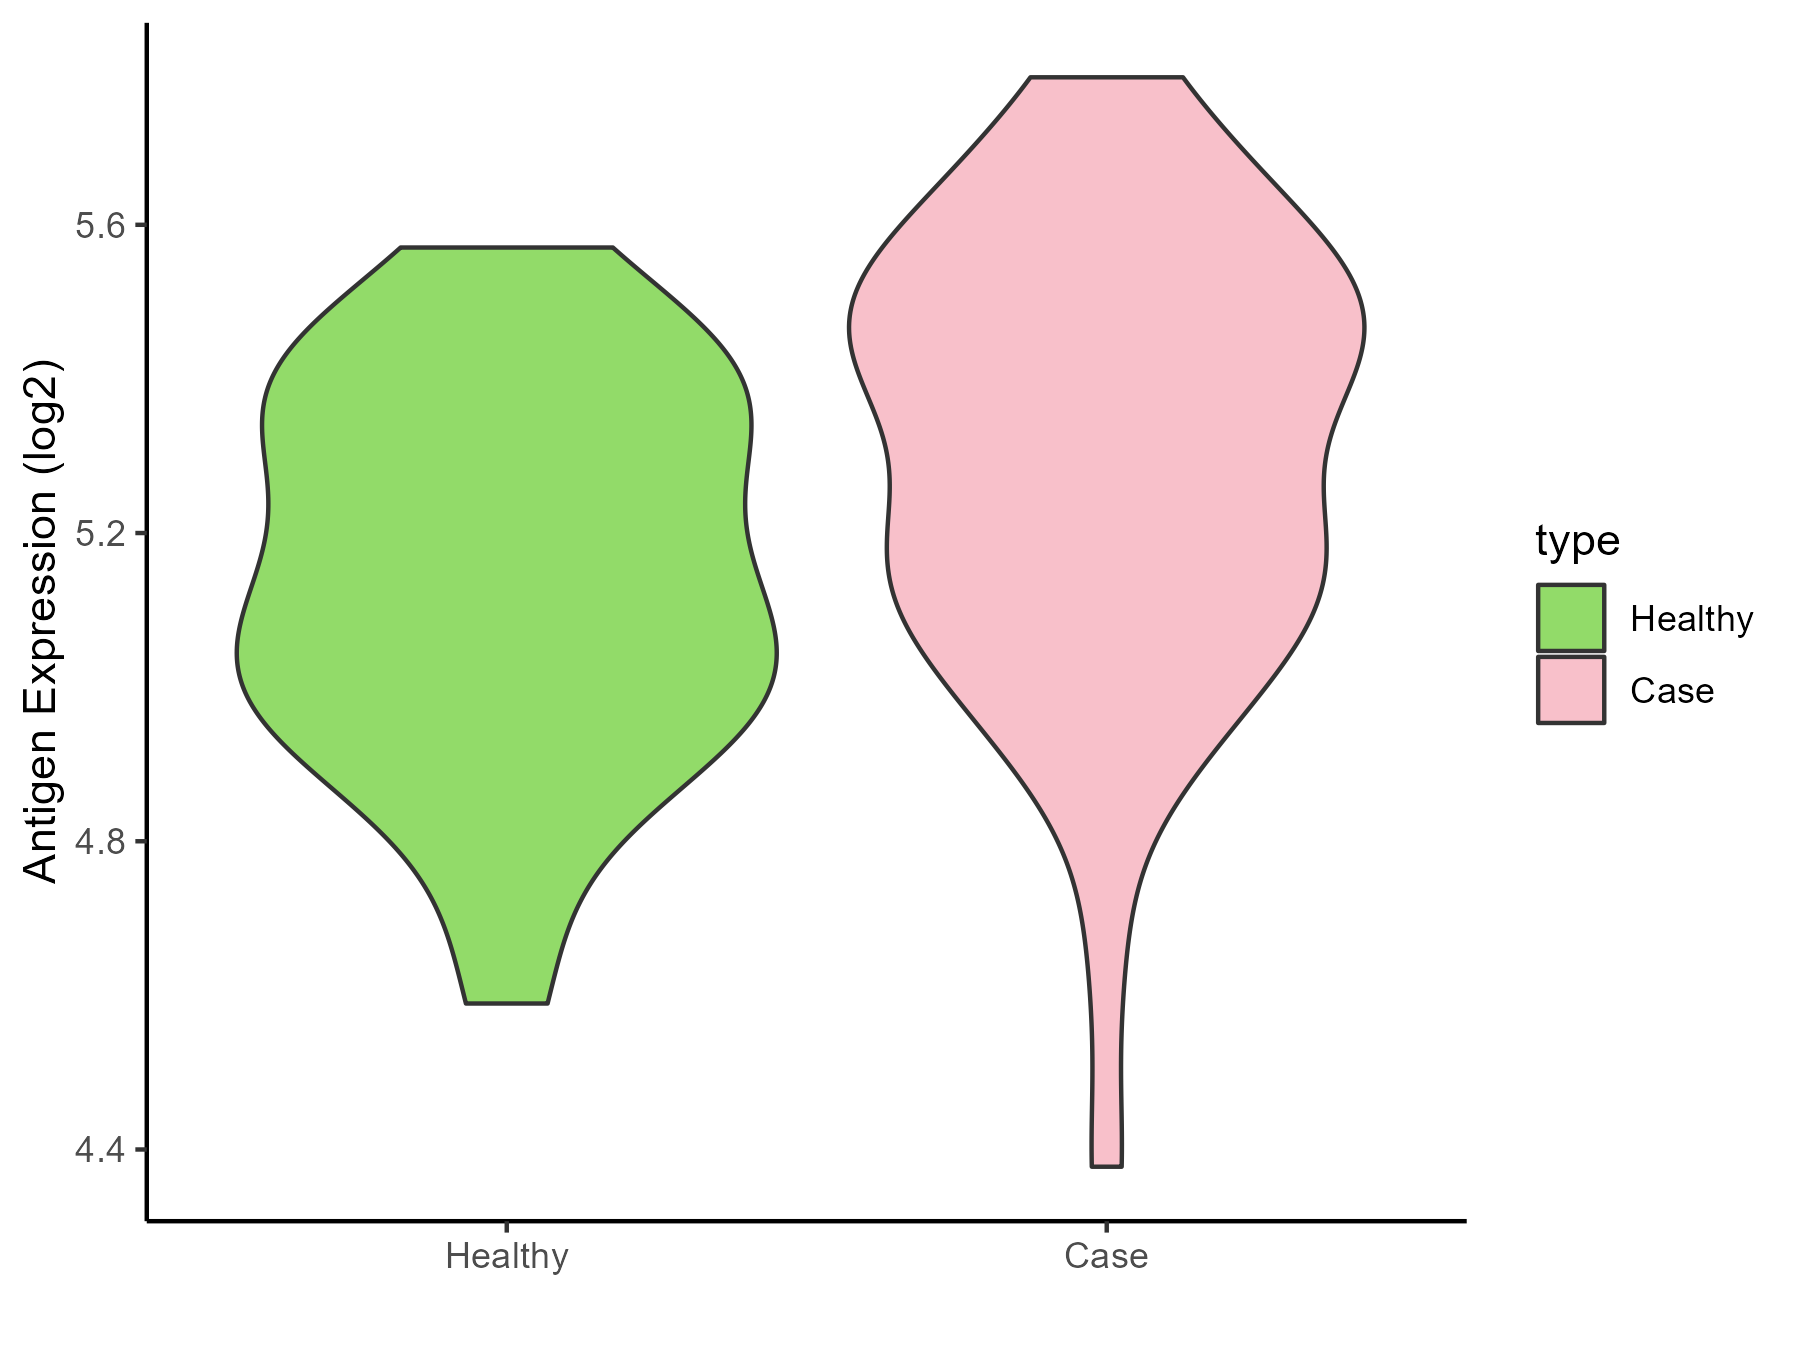
| The Studied Tissue | Endometrium | |
| The Specific Disease | Endometriosis | |
| The Expression Level of Disease Section Compare with the Healthy Individual Tissue | p-value: 0.022898234; Fold-change: 0.218821346; Z-score: 0.886676704 | |
| Disease-specific Antigen Abundances |
|
Click to View the Clearer Original Diagram |
| Differential expression pattern of antigen in diseases | ||
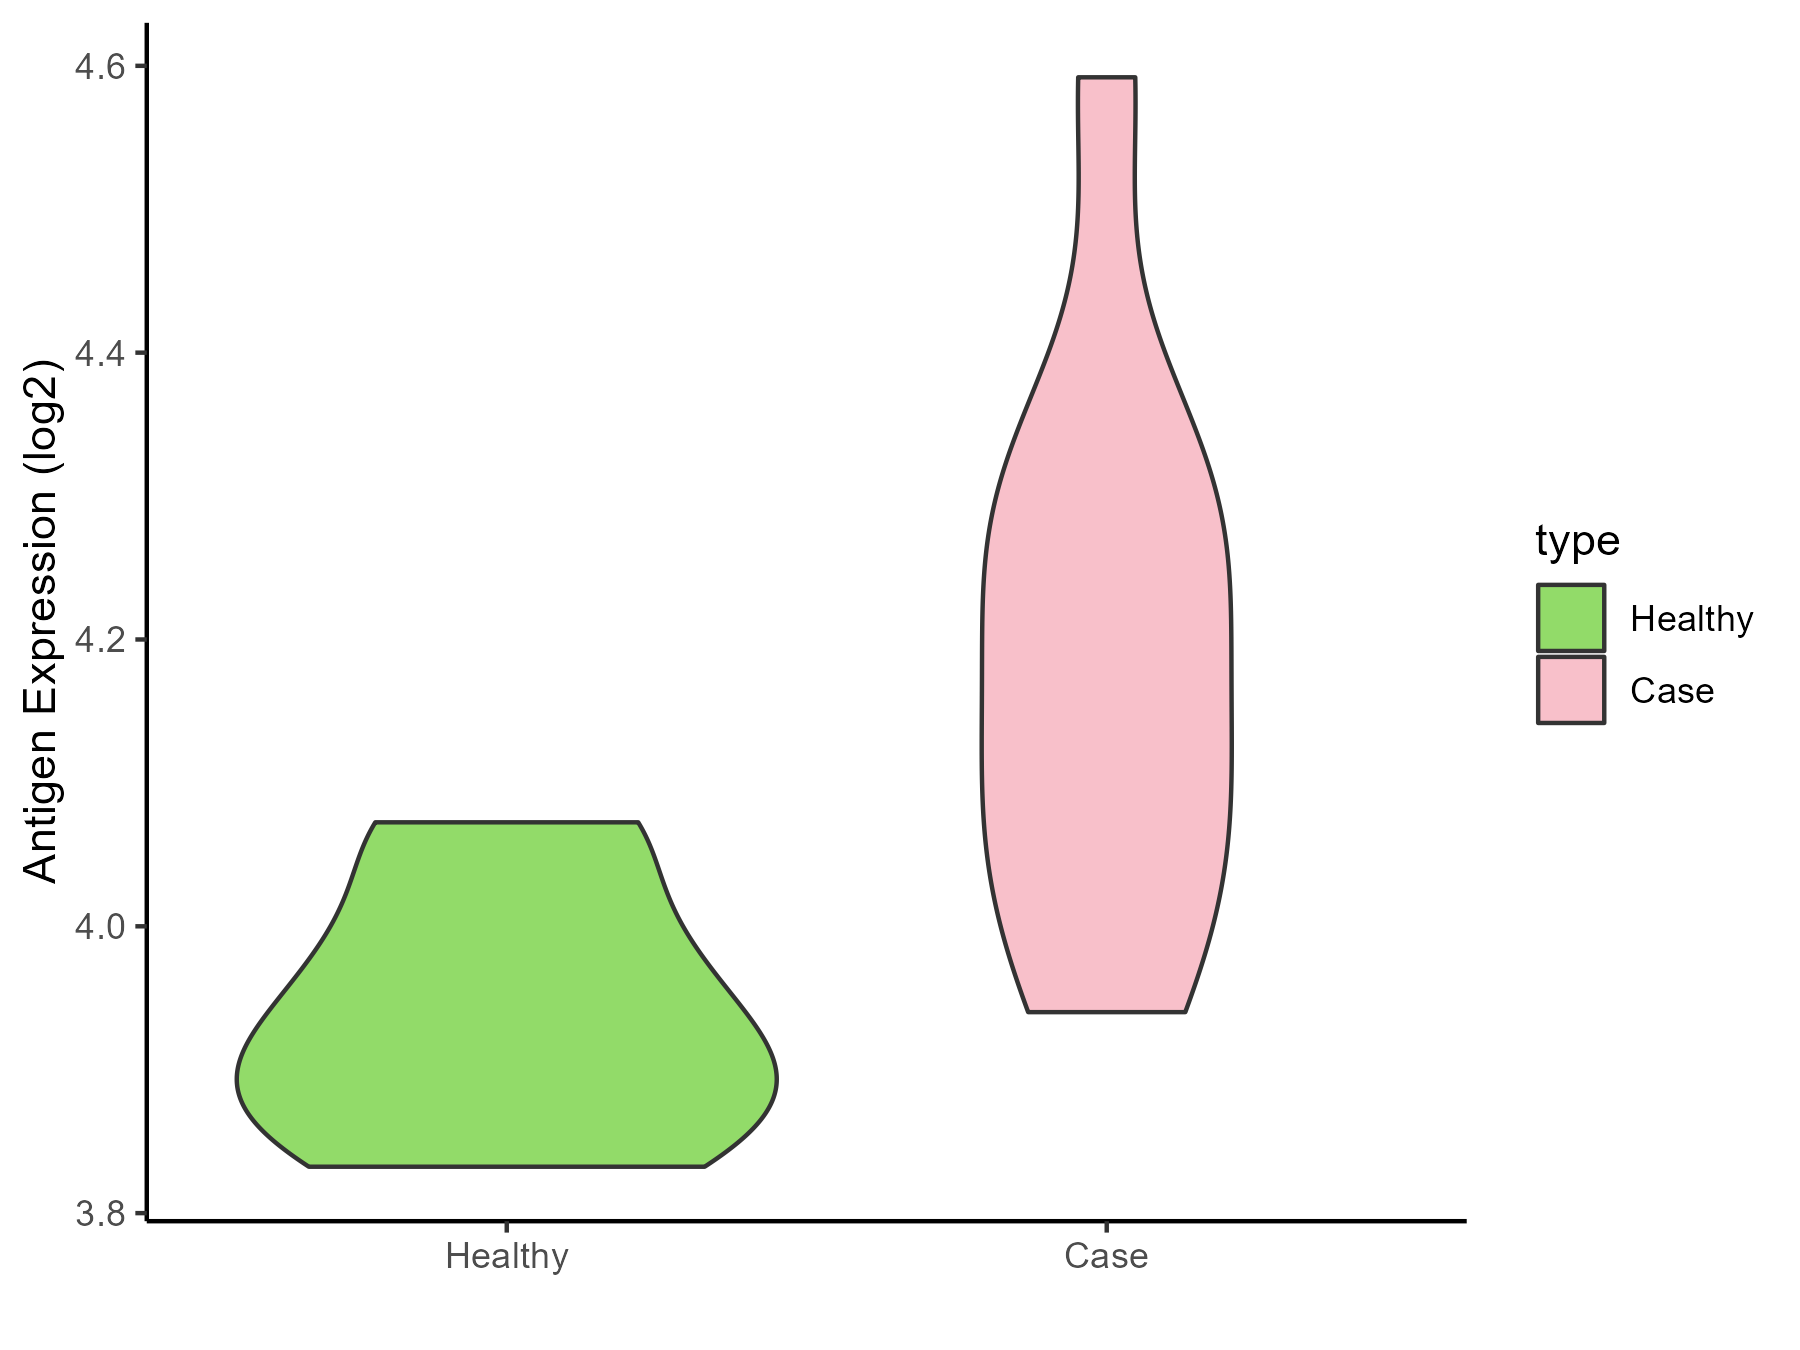
| The Studied Tissue | Bladder | |
| The Specific Disease | Interstitial cystitis | |
| The Expression Level of Disease Section Compare with the Healthy Individual Tissue | p-value: 0.004498651; Fold-change: 0.253946882; Z-score: 2.71723071 | |
| Disease-specific Antigen Abundances |
|
Click to View the Clearer Original Diagram |
ICD Disease Classification 19
| Differential expression pattern of antigen in diseases | ||
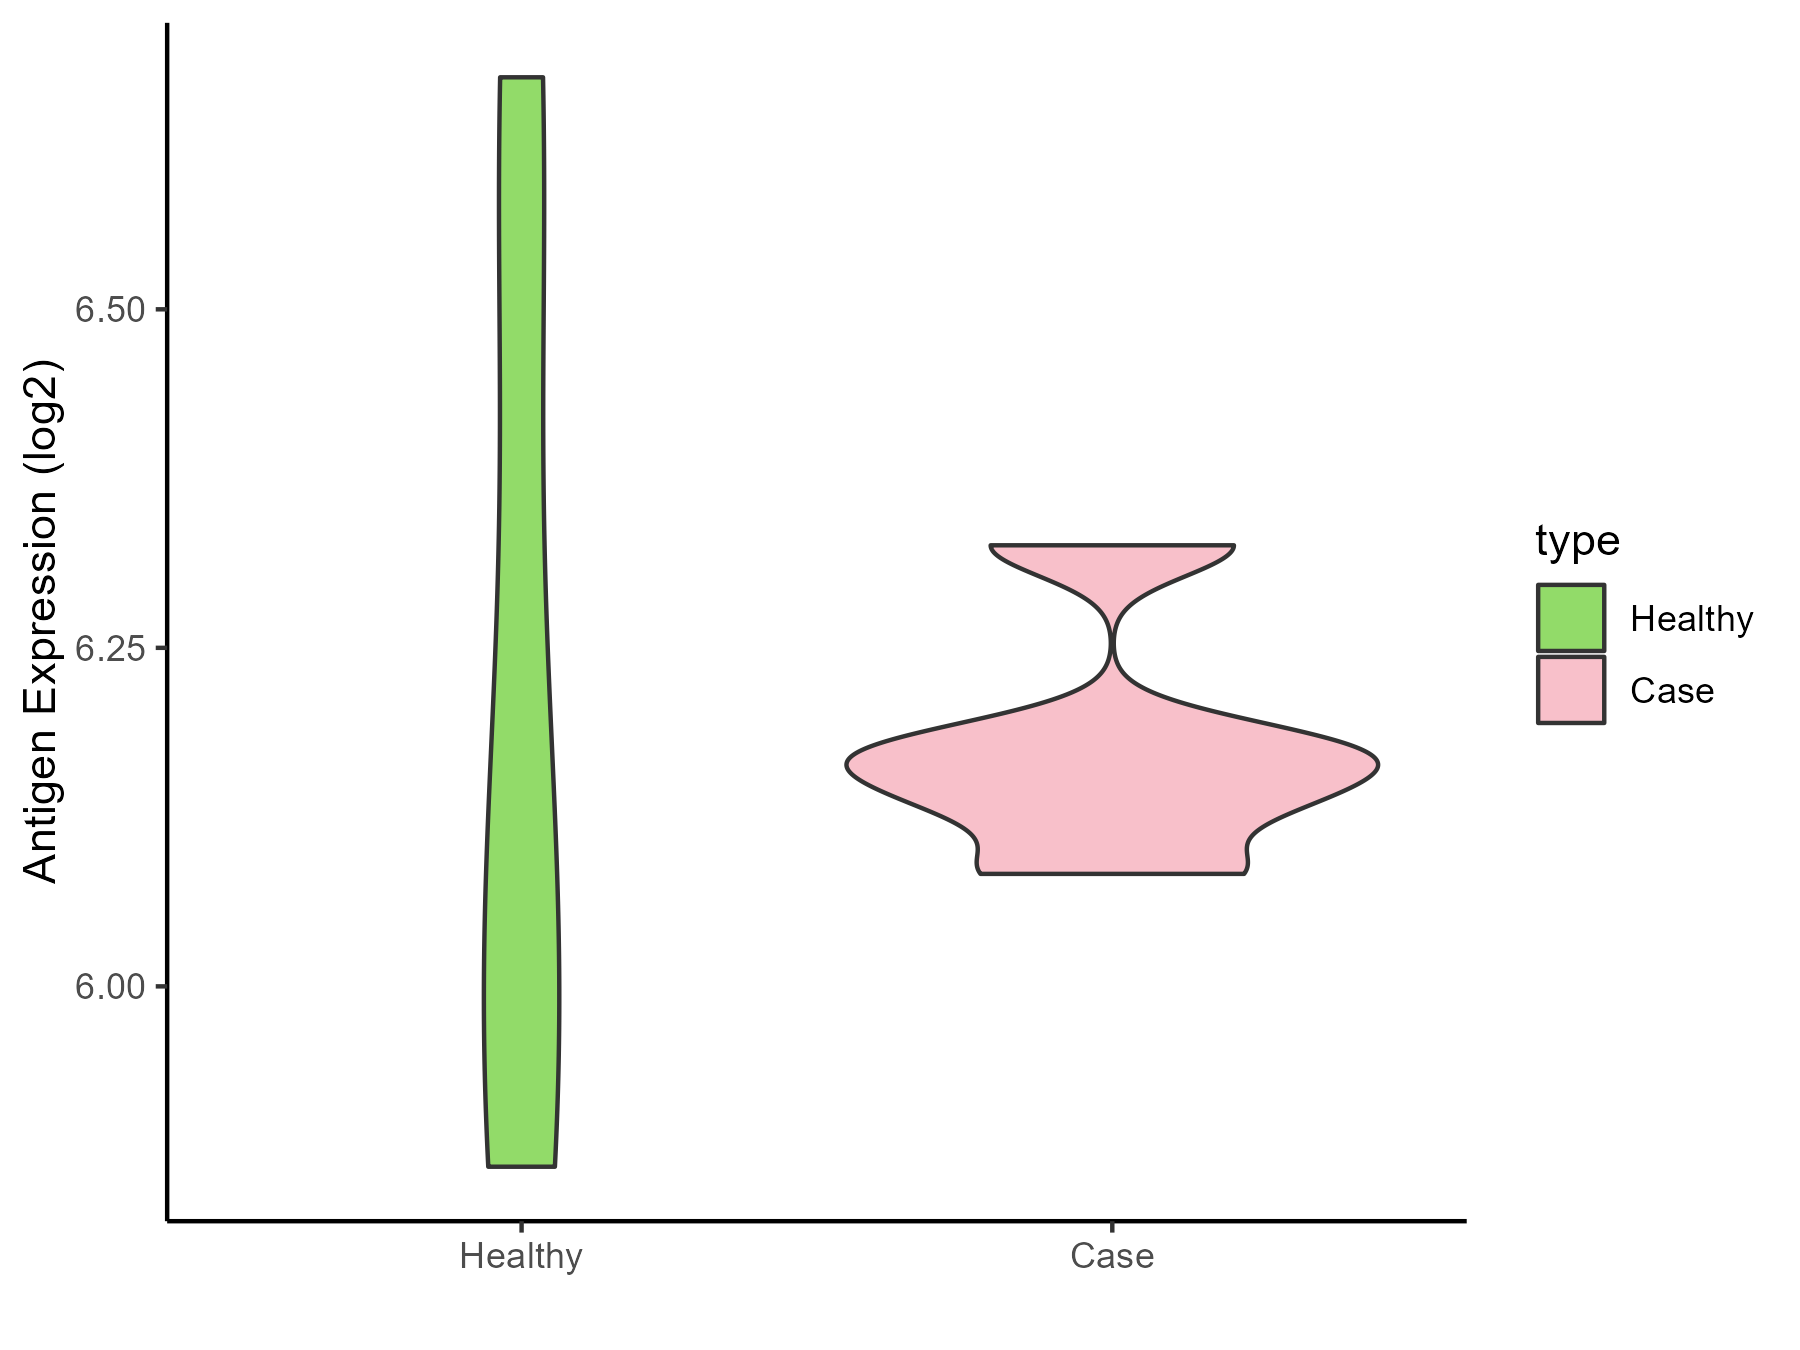
| The Studied Tissue | Myometrium | |
| The Specific Disease | Preterm birth | |
| The Expression Level of Disease Section Compare with the Healthy Individual Tissue | p-value: 0.839524142; Fold-change: 0.081136261; Z-score: 0.235384511 | |
| Disease-specific Antigen Abundances |
|
Click to View the Clearer Original Diagram |
ICD Disease Classification 2
| Differential expression pattern of antigen in diseases | ||
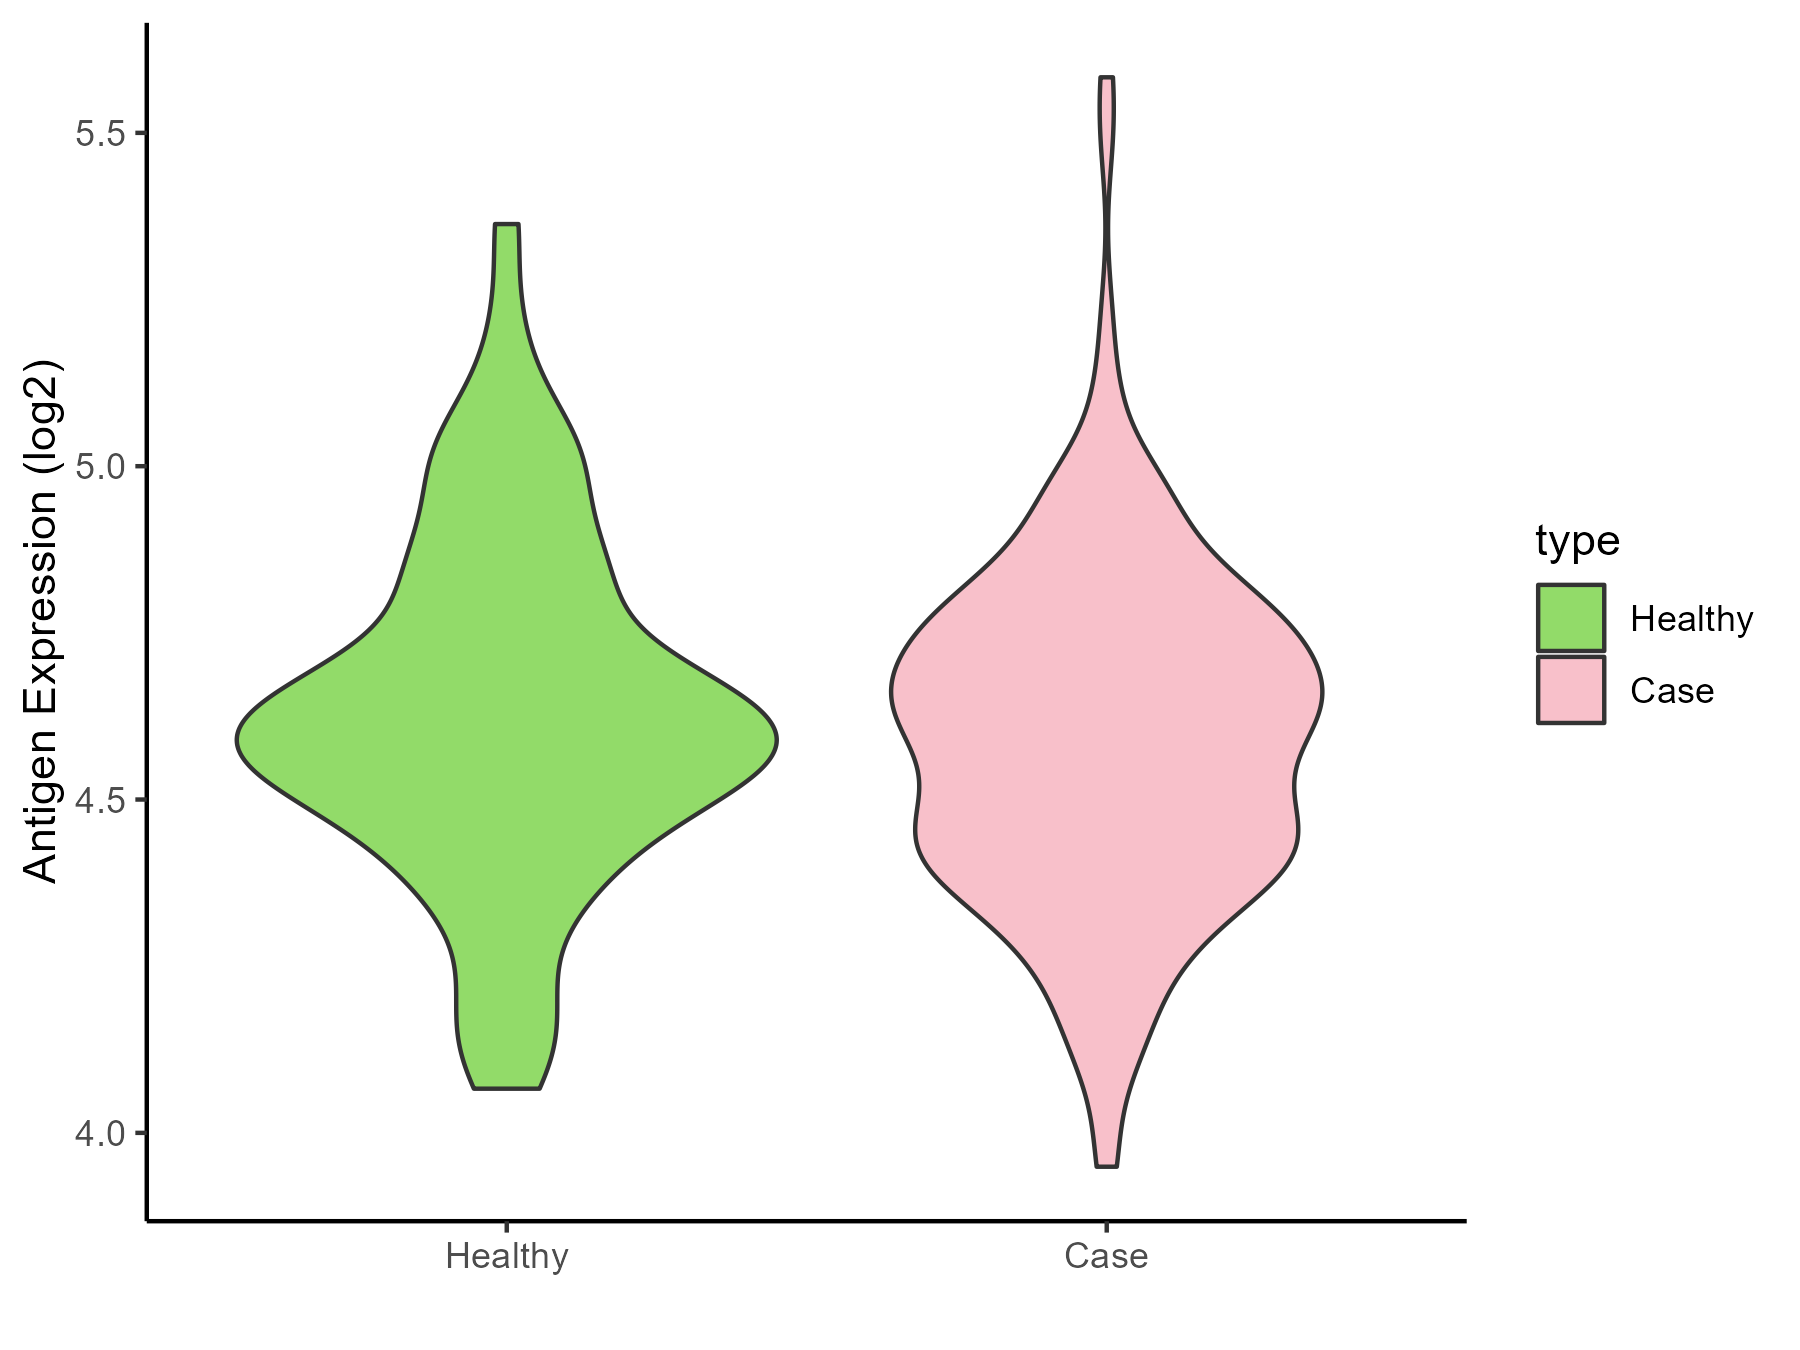
| The Studied Tissue | Bone marrow | |
| The Specific Disease | Acute myelocytic leukemia | |
| The Expression Level of Disease Section Compare with the Healthy Individual Tissue | p-value: 0.128109677; Fold-change: 0.006004097; Z-score: 0.023183487 | |
| Disease-specific Antigen Abundances |
|
Click to View the Clearer Original Diagram |
| Differential expression pattern of antigen in diseases | ||
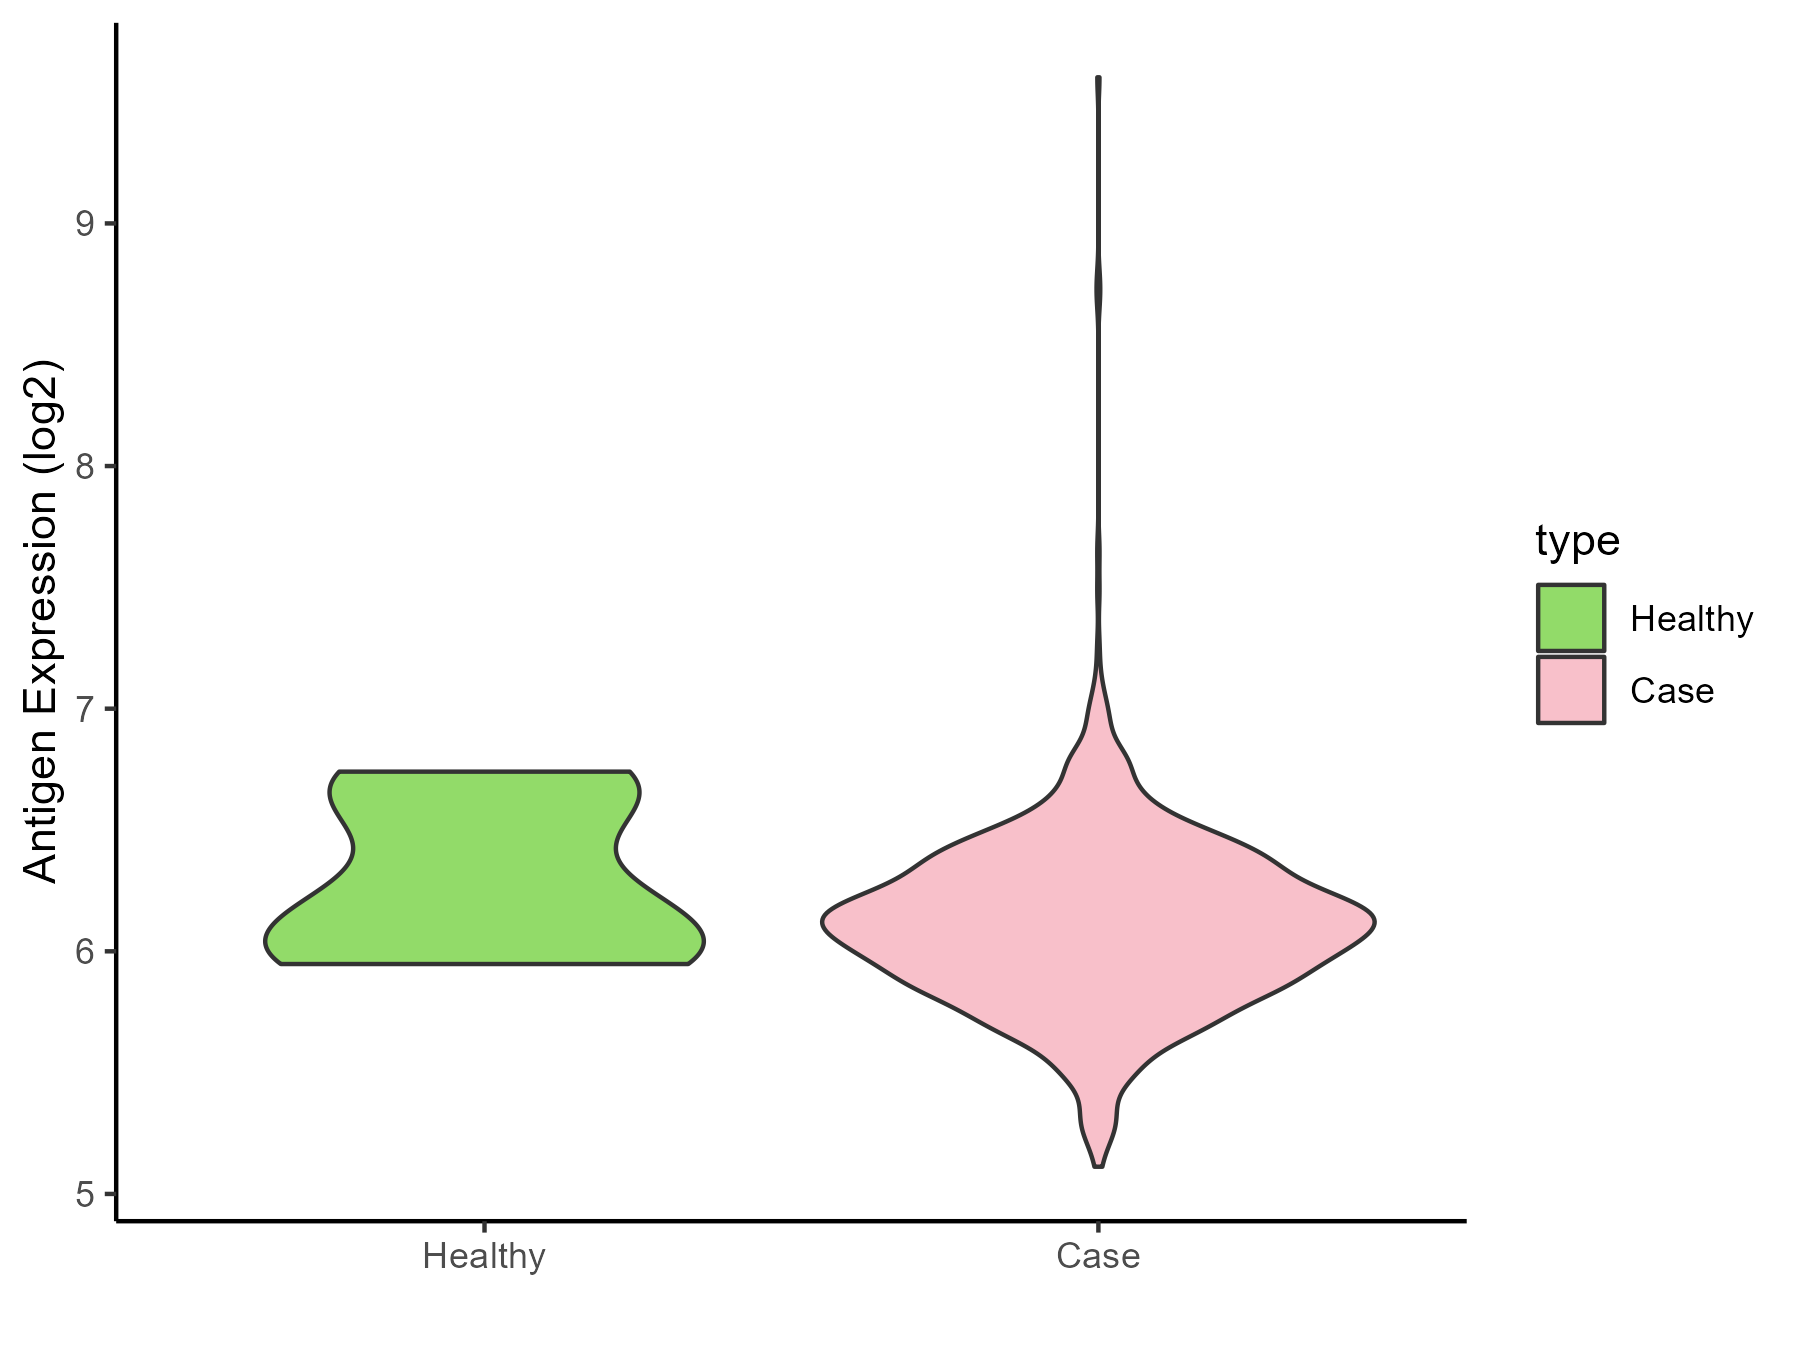
| The Studied Tissue | Bone marrow | |
| The Specific Disease | Myeloma | |
| The Expression Level of Disease Section Compare with the Healthy Individual Tissue | p-value: 0.193605266; Fold-change: -0.079471712; Z-score: -0.231655976 | |
| Disease-specific Antigen Abundances |
|
Click to View the Clearer Original Diagram |
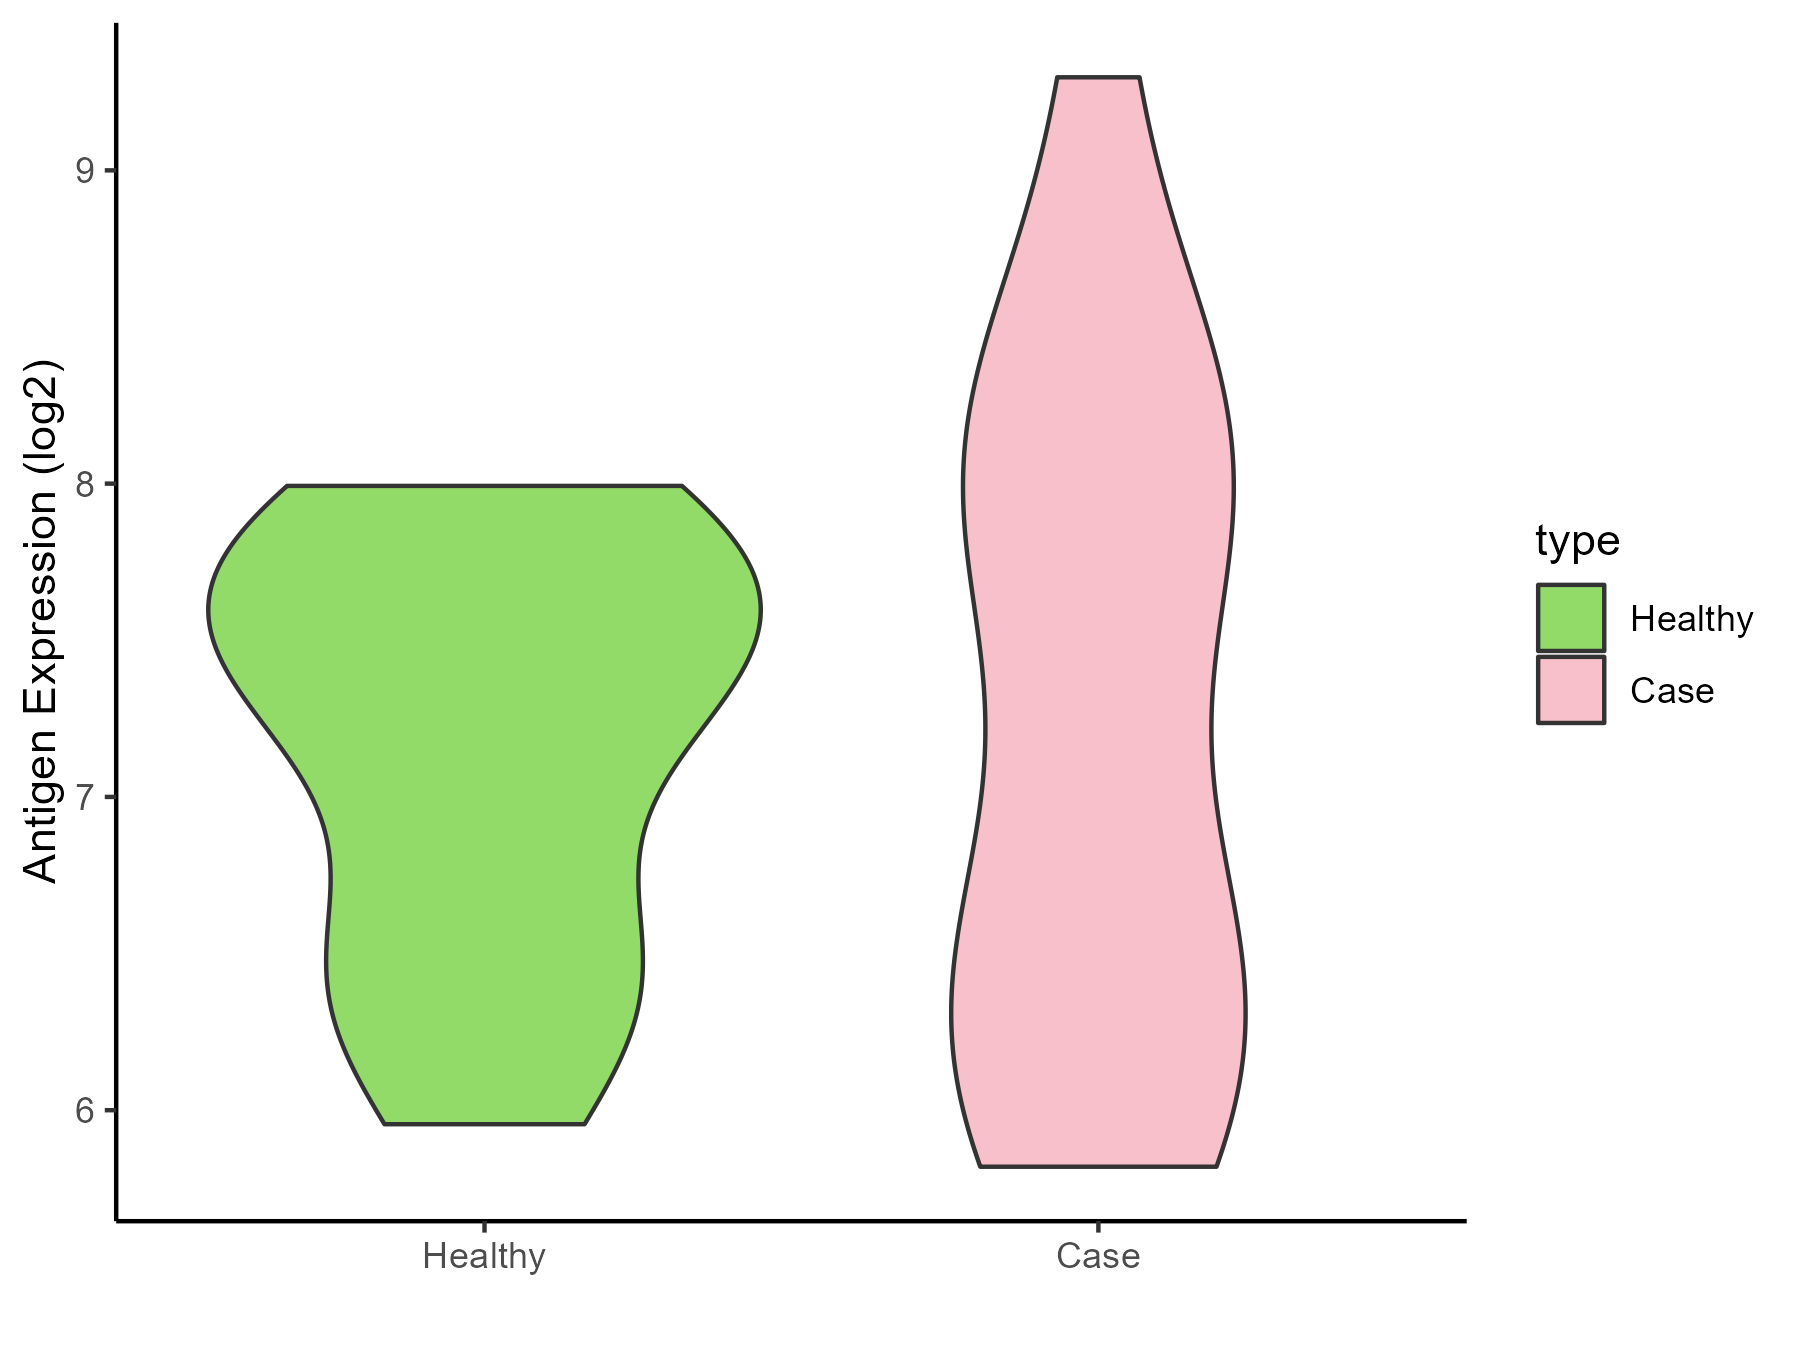
| The Studied Tissue | Peripheral blood | |
| The Specific Disease | Myeloma | |
| The Expression Level of Disease Section Compare with the Healthy Individual Tissue | p-value: 0.87480477; Fold-change: -0.222162379; Z-score: -0.326976682 | |
| Disease-specific Antigen Abundances |
|
Click to View the Clearer Original Diagram |
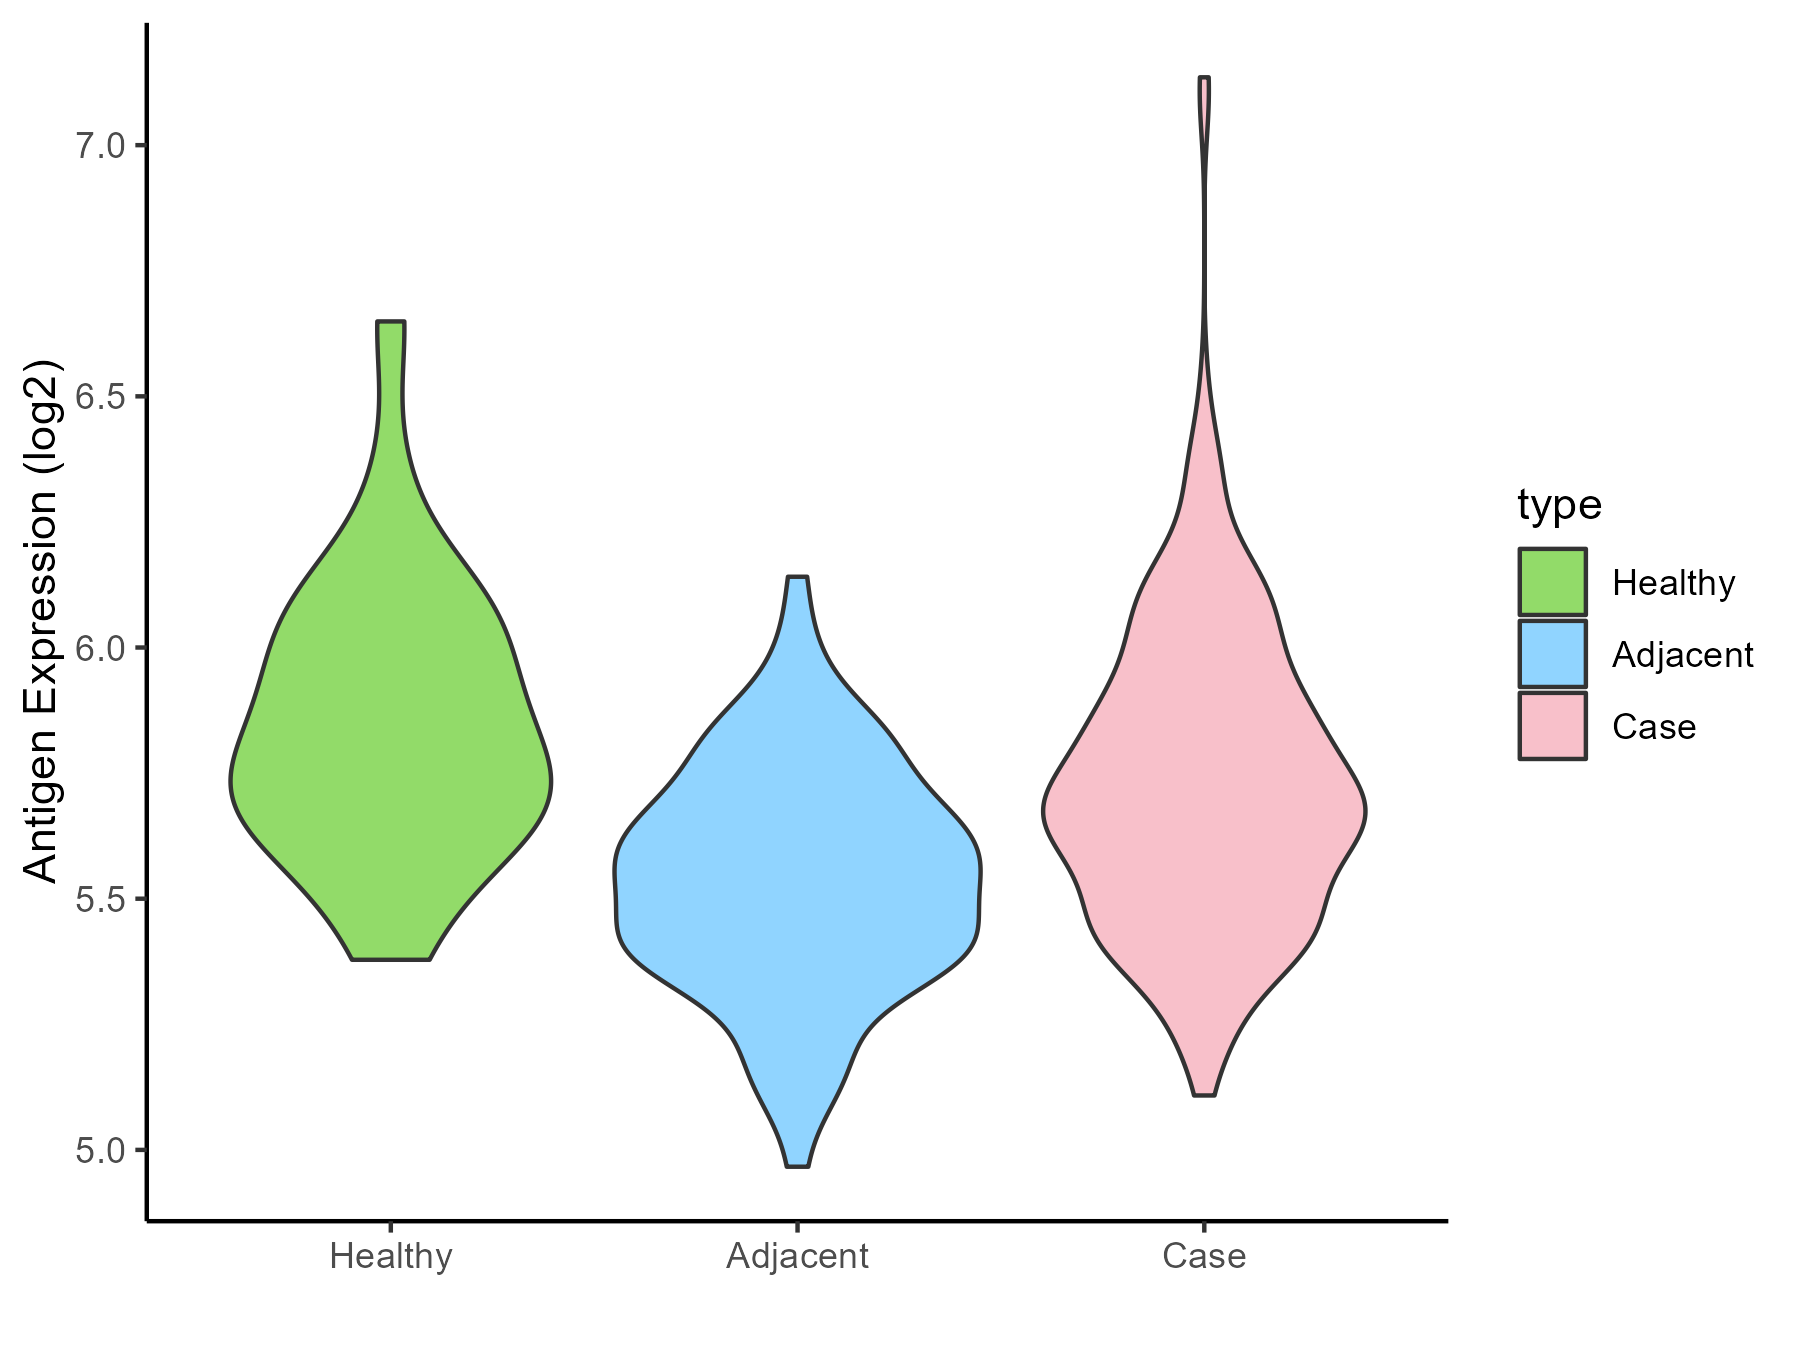
| Differential expression pattern of antigen in diseases | ||
| The Studied Tissue | Oral | |
| The Specific Disease | Oral cancer | |
| The Expression Level of Disease Section Compare with the Healthy Individual Tissue | p-value: 0.047838929; Fold-change: -0.091024338; Z-score: -0.329744543 | |
| The Expression Level of Disease Section Compare with the Adjacent Tissue | p-value: 5.16E-09; Fold-change: 0.147290911; Z-score: 0.656823383 | |
| Disease-specific Antigen Abundances |
|
Click to View the Clearer Original Diagram |
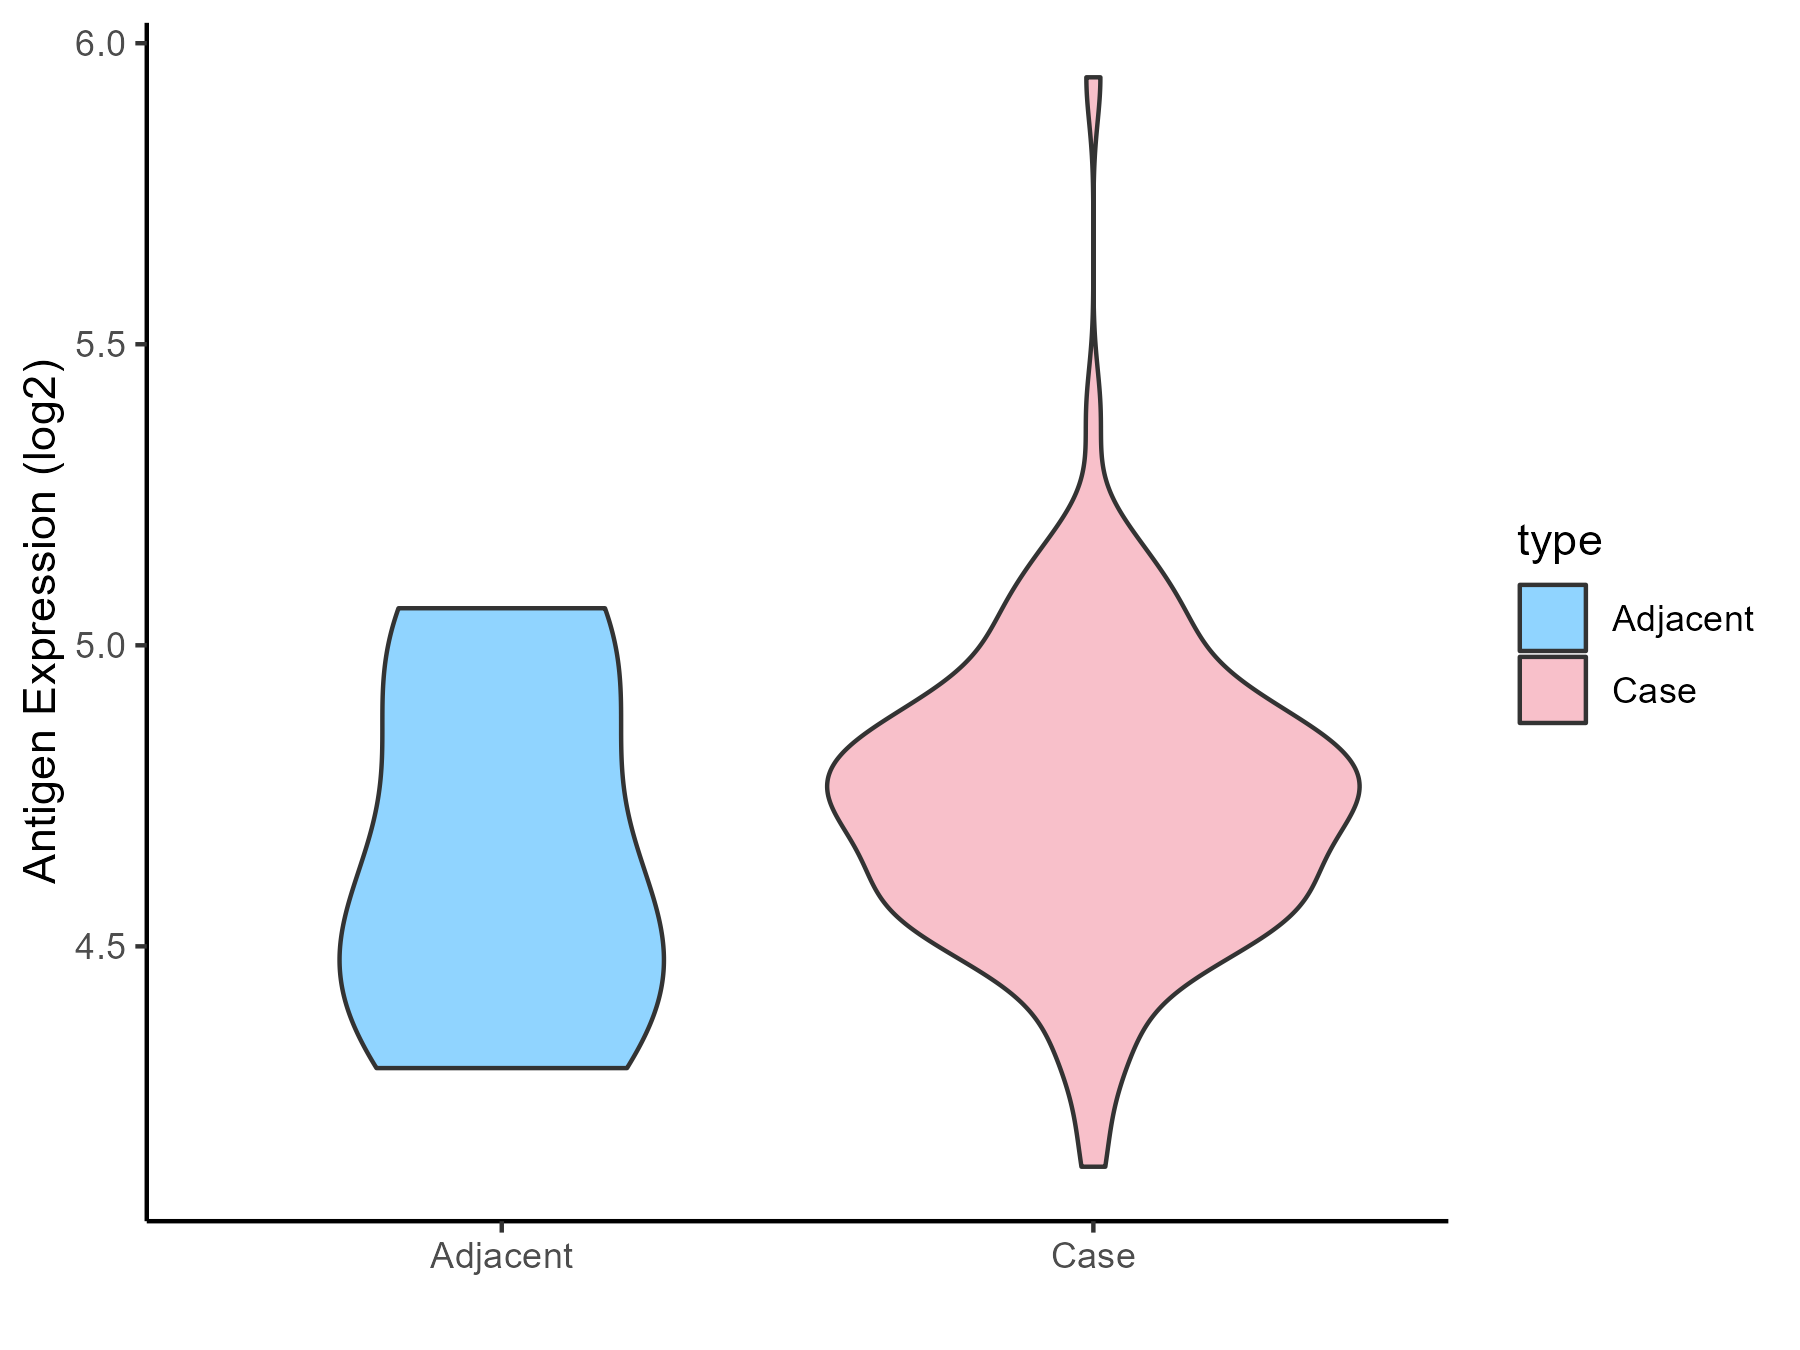
| Differential expression pattern of antigen in diseases | ||
| The Studied Tissue | Esophagus | |
| The Specific Disease | Esophagal cancer | |
| The Expression Level of Disease Section Compare with the Adjacent Tissue | p-value: 0.54341535; Fold-change: 0.212432919; Z-score: 0.678707348 | |
| Disease-specific Antigen Abundances |
|
Click to View the Clearer Original Diagram |
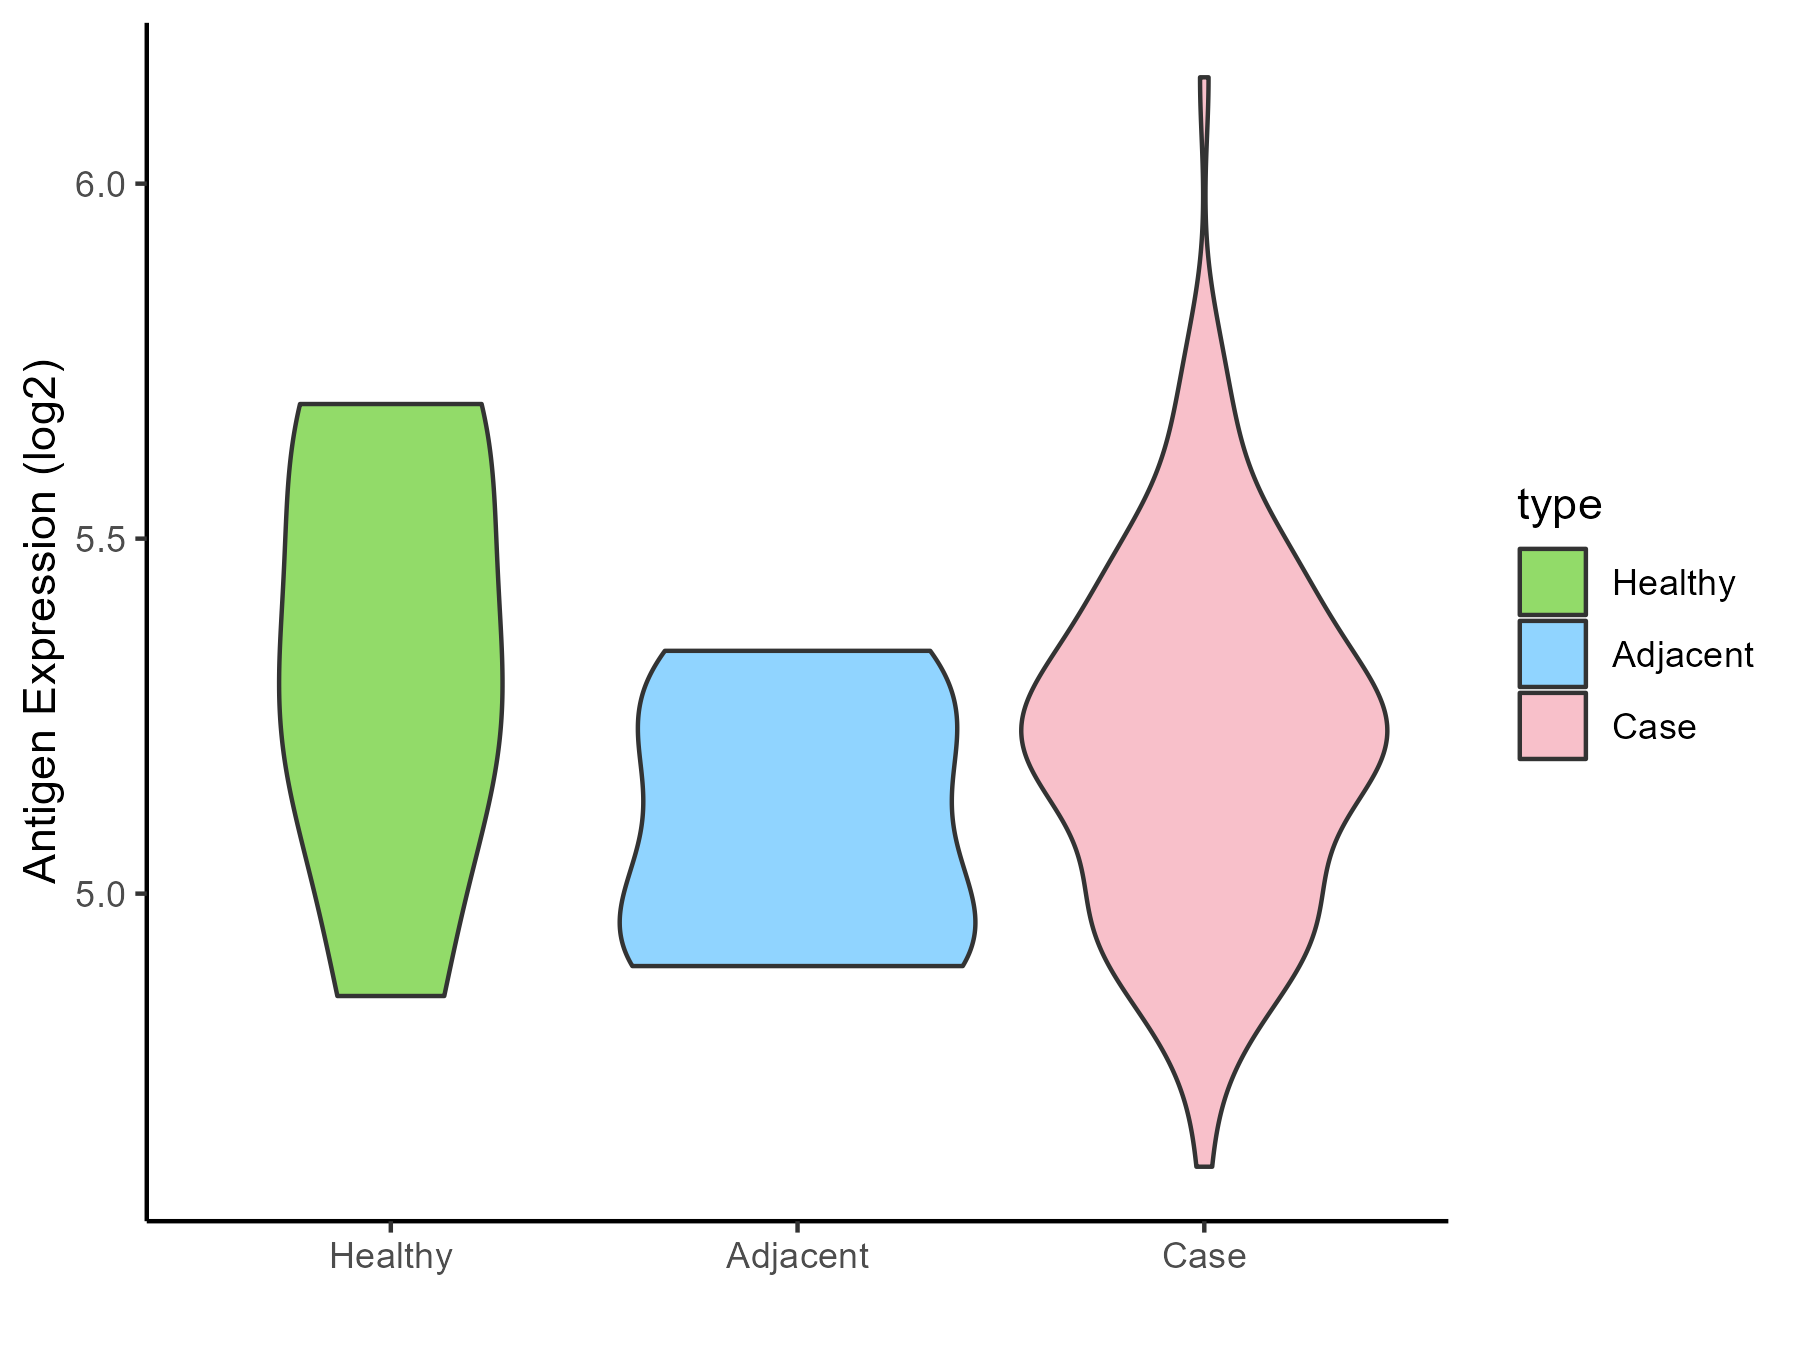
| Differential expression pattern of antigen in diseases | ||
| The Studied Tissue | Rectal colon | |
| The Specific Disease | Rectal cancer | |
| The Expression Level of Disease Section Compare with the Healthy Individual Tissue | p-value: 0.401505969; Fold-change: -0.098796576; Z-score: -0.311608157 | |
| The Expression Level of Disease Section Compare with the Adjacent Tissue | p-value: 0.199490185; Fold-change: 0.127024326; Z-score: 0.665399644 | |
| Disease-specific Antigen Abundances |
|
Click to View the Clearer Original Diagram |
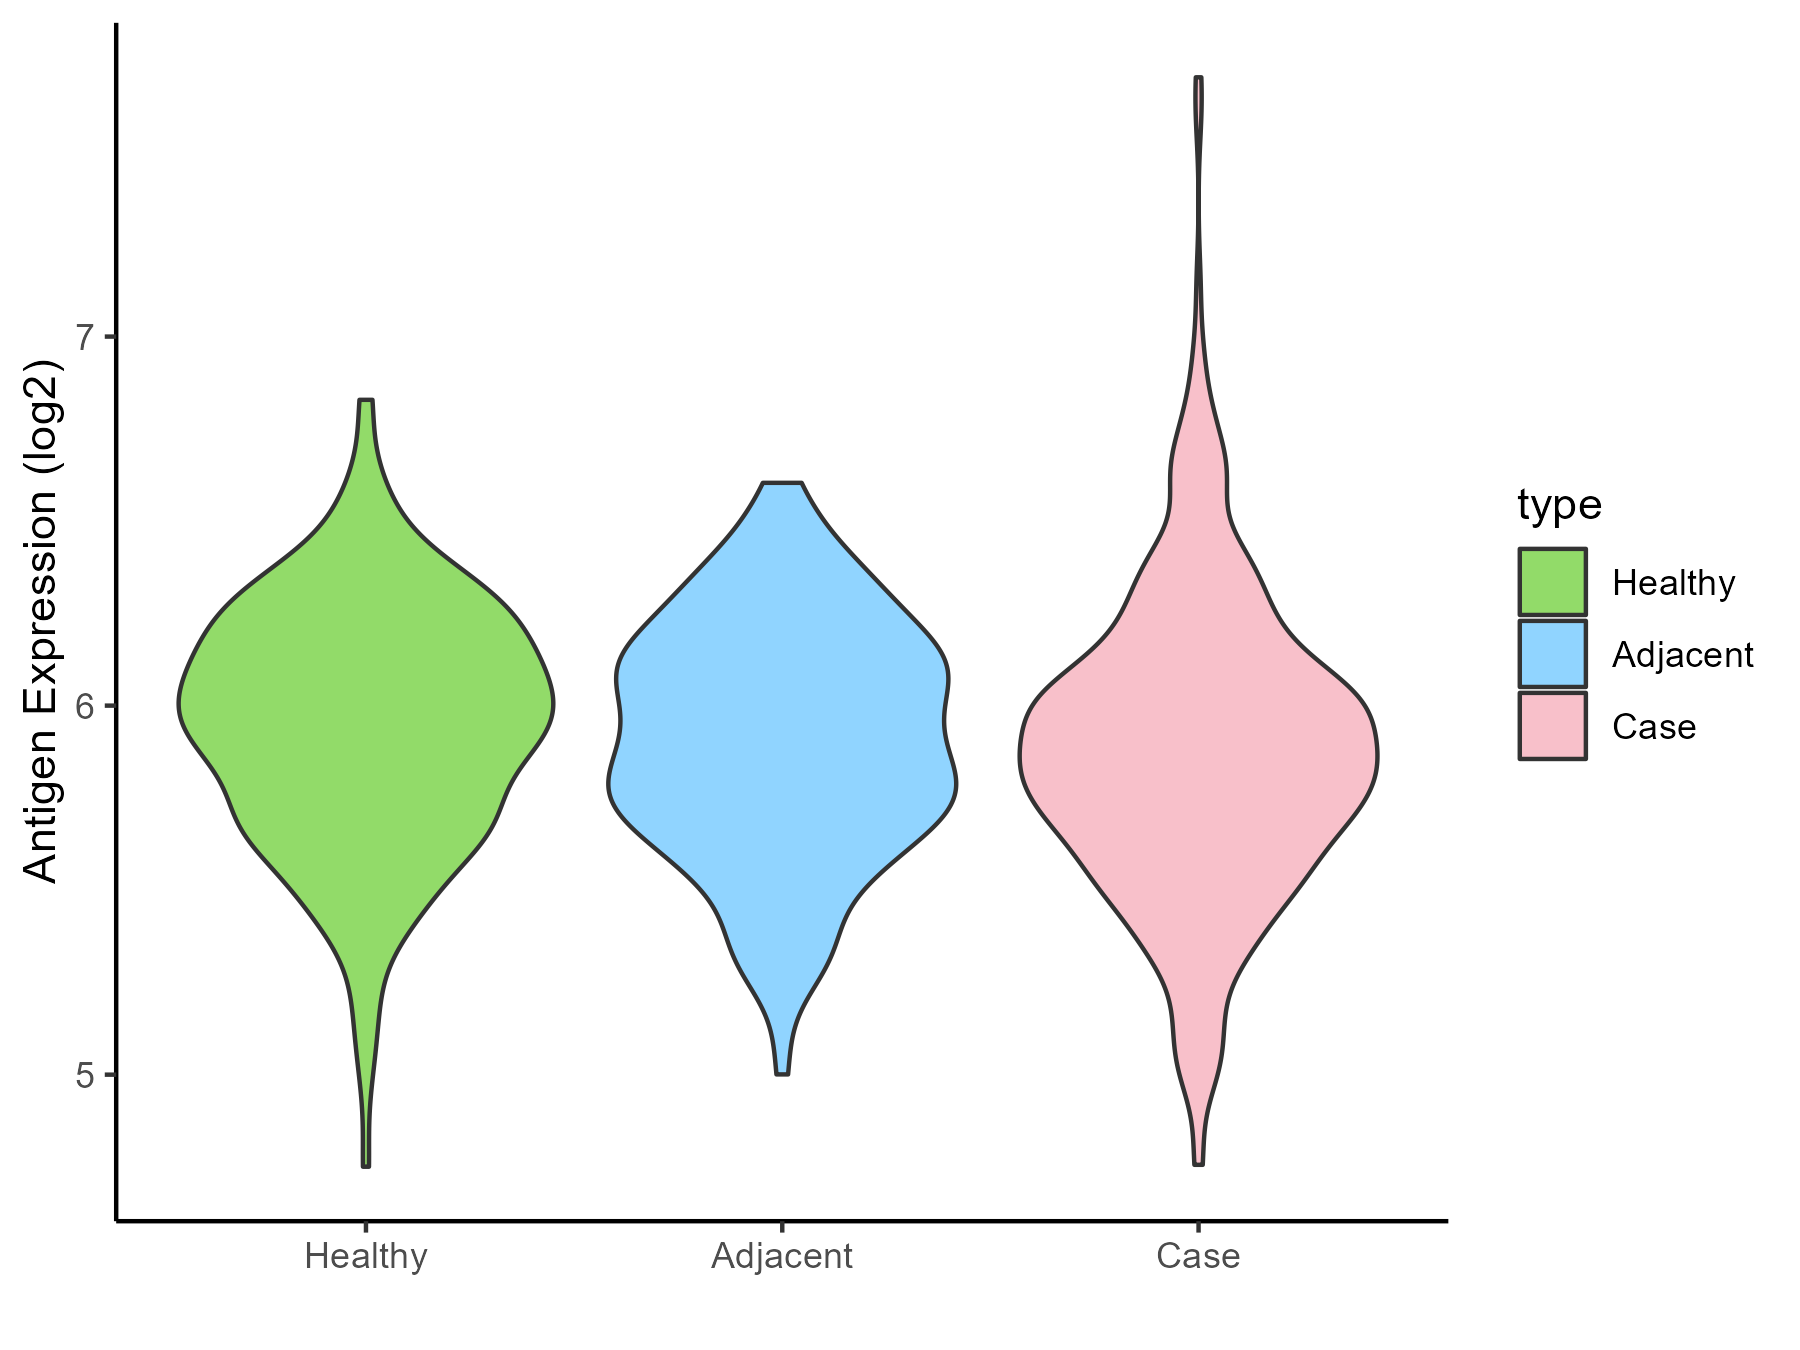
| Differential expression pattern of antigen in diseases | ||
| The Studied Tissue | Skin | |
| The Specific Disease | Skin cancer | |
| The Expression Level of Disease Section Compare with the Healthy Individual Tissue | p-value: 0.020203978; Fold-change: -0.109194409; Z-score: -0.33029258 | |
| The Expression Level of Disease Section Compare with the Adjacent Tissue | p-value: 0.370937053; Fold-change: -0.046331664; Z-score: -0.144799041 | |
| Disease-specific Antigen Abundances |
|
Click to View the Clearer Original Diagram |
| Differential expression pattern of antigen in diseases | ||
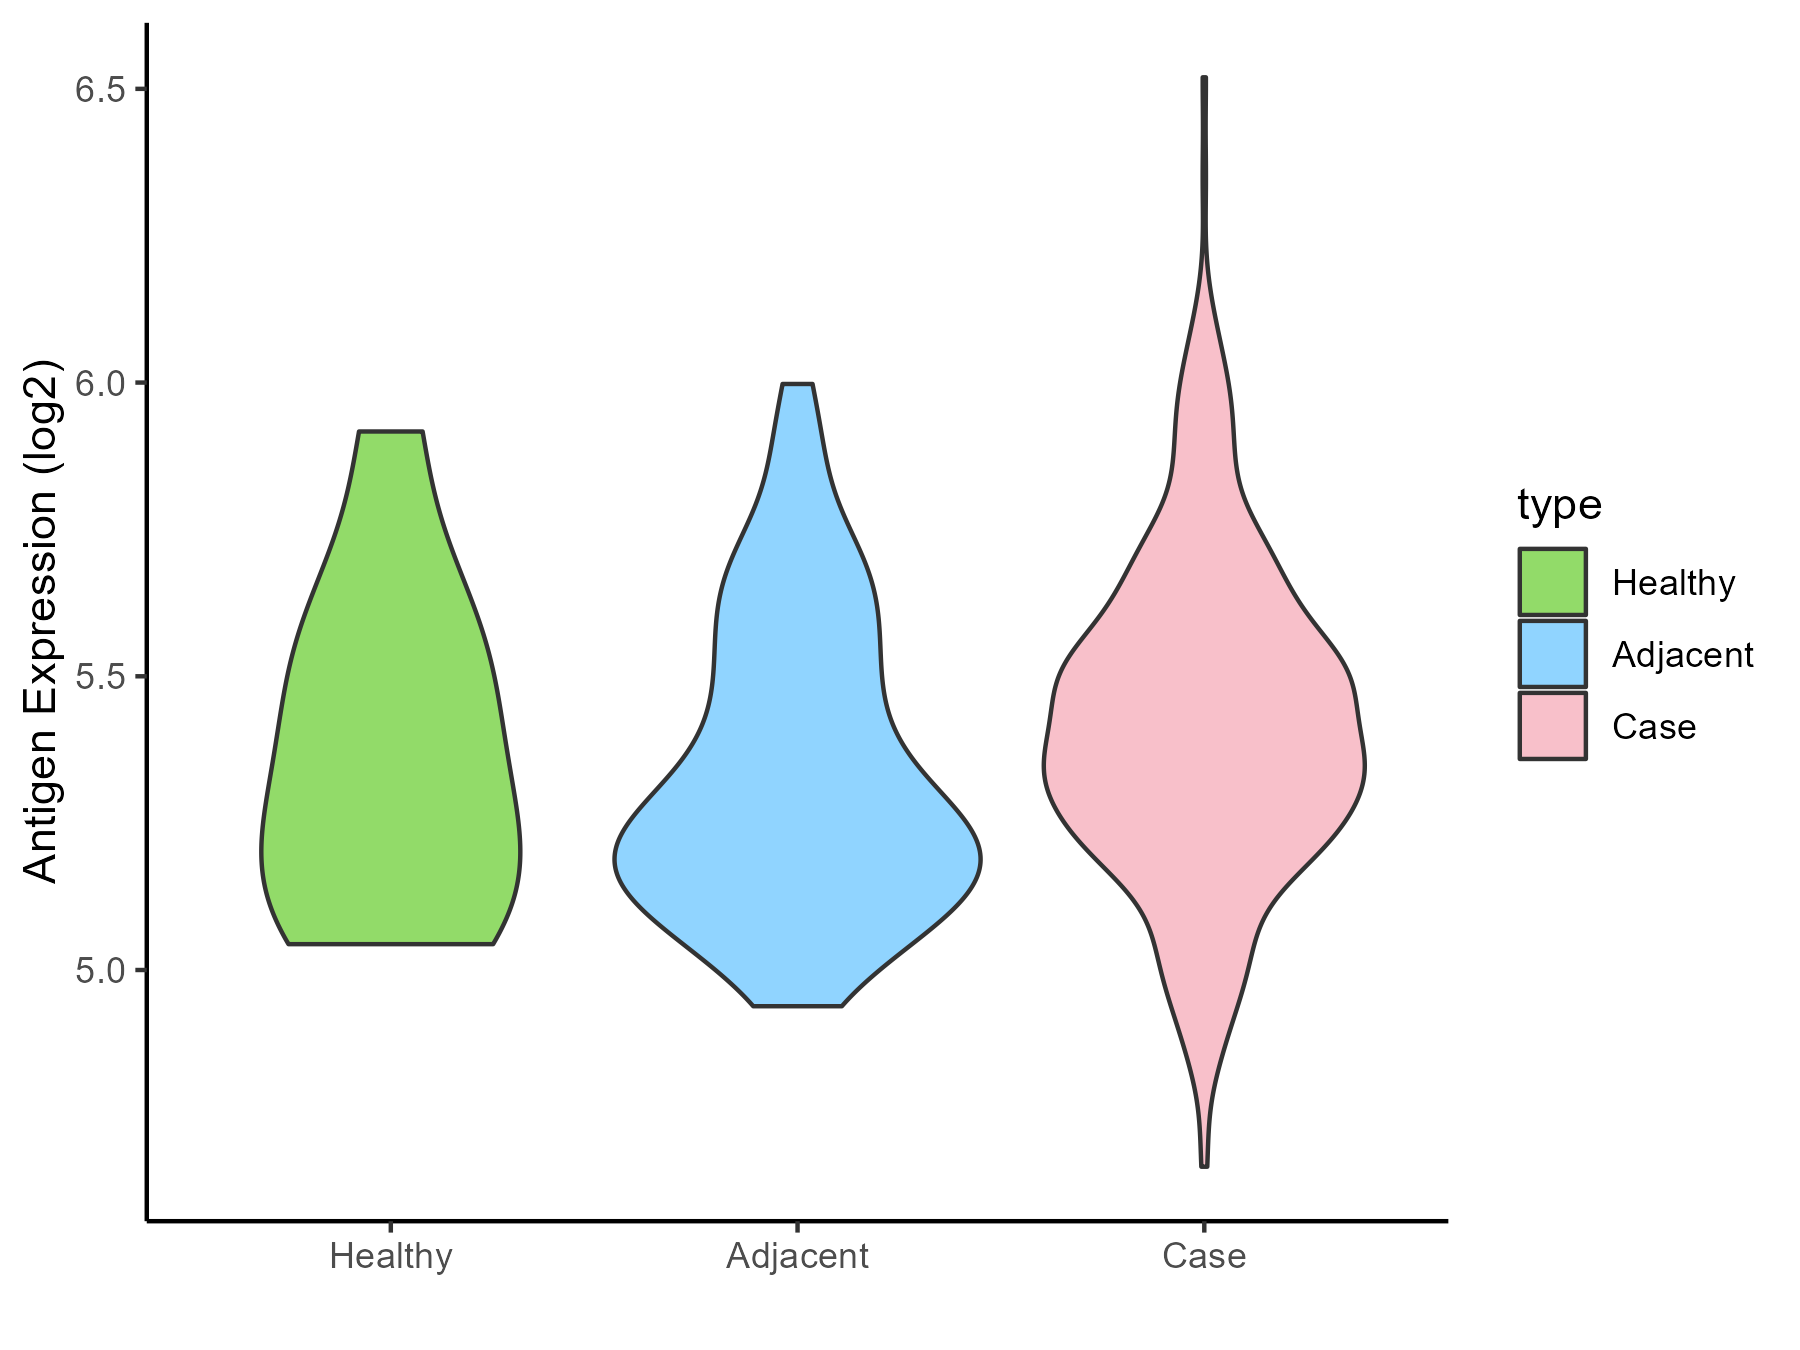
| The Studied Tissue | Kidney | |
| The Specific Disease | Renal cancer | |
| The Expression Level of Disease Section Compare with the Healthy Individual Tissue | p-value: 0.517306926; Fold-change: 0.099714494; Z-score: 0.362052252 | |
| The Expression Level of Disease Section Compare with the Adjacent Tissue | p-value: 0.015486846; Fold-change: 0.148541988; Z-score: 0.593334159 | |
| Disease-specific Antigen Abundances |
|
Click to View the Clearer Original Diagram |
| Differential expression pattern of antigen in diseases | ||
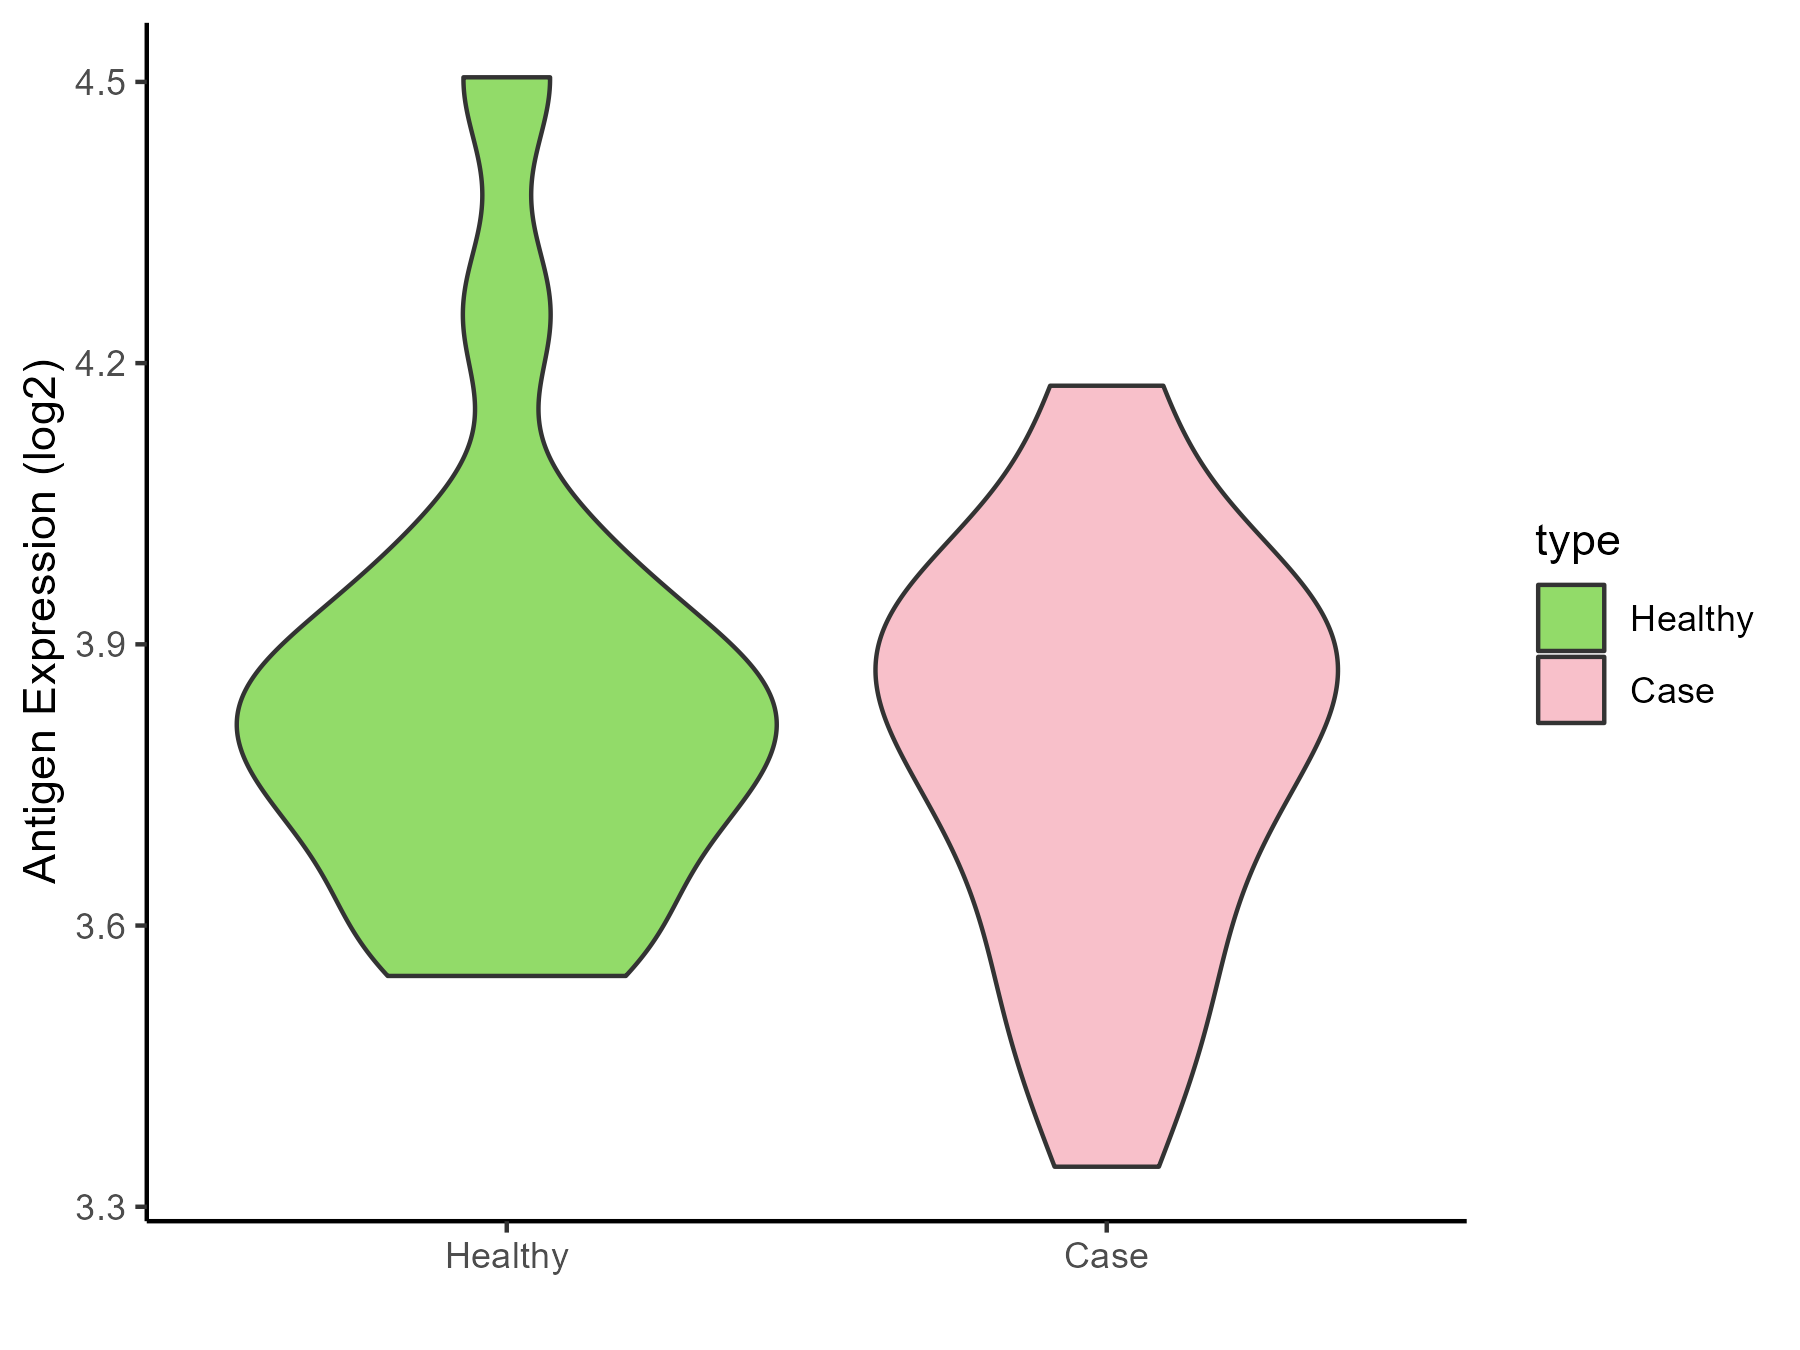
| The Studied Tissue | Urothelium | |
| The Specific Disease | Ureter cancer | |
| The Expression Level of Disease Section Compare with the Healthy Individual Tissue | p-value: 0.378295562; Fold-change: 0.004266959; Z-score: 0.016876422 | |
| Disease-specific Antigen Abundances |
|
Click to View the Clearer Original Diagram |
ICD Disease Classification 20
| Differential expression pattern of antigen in diseases | ||
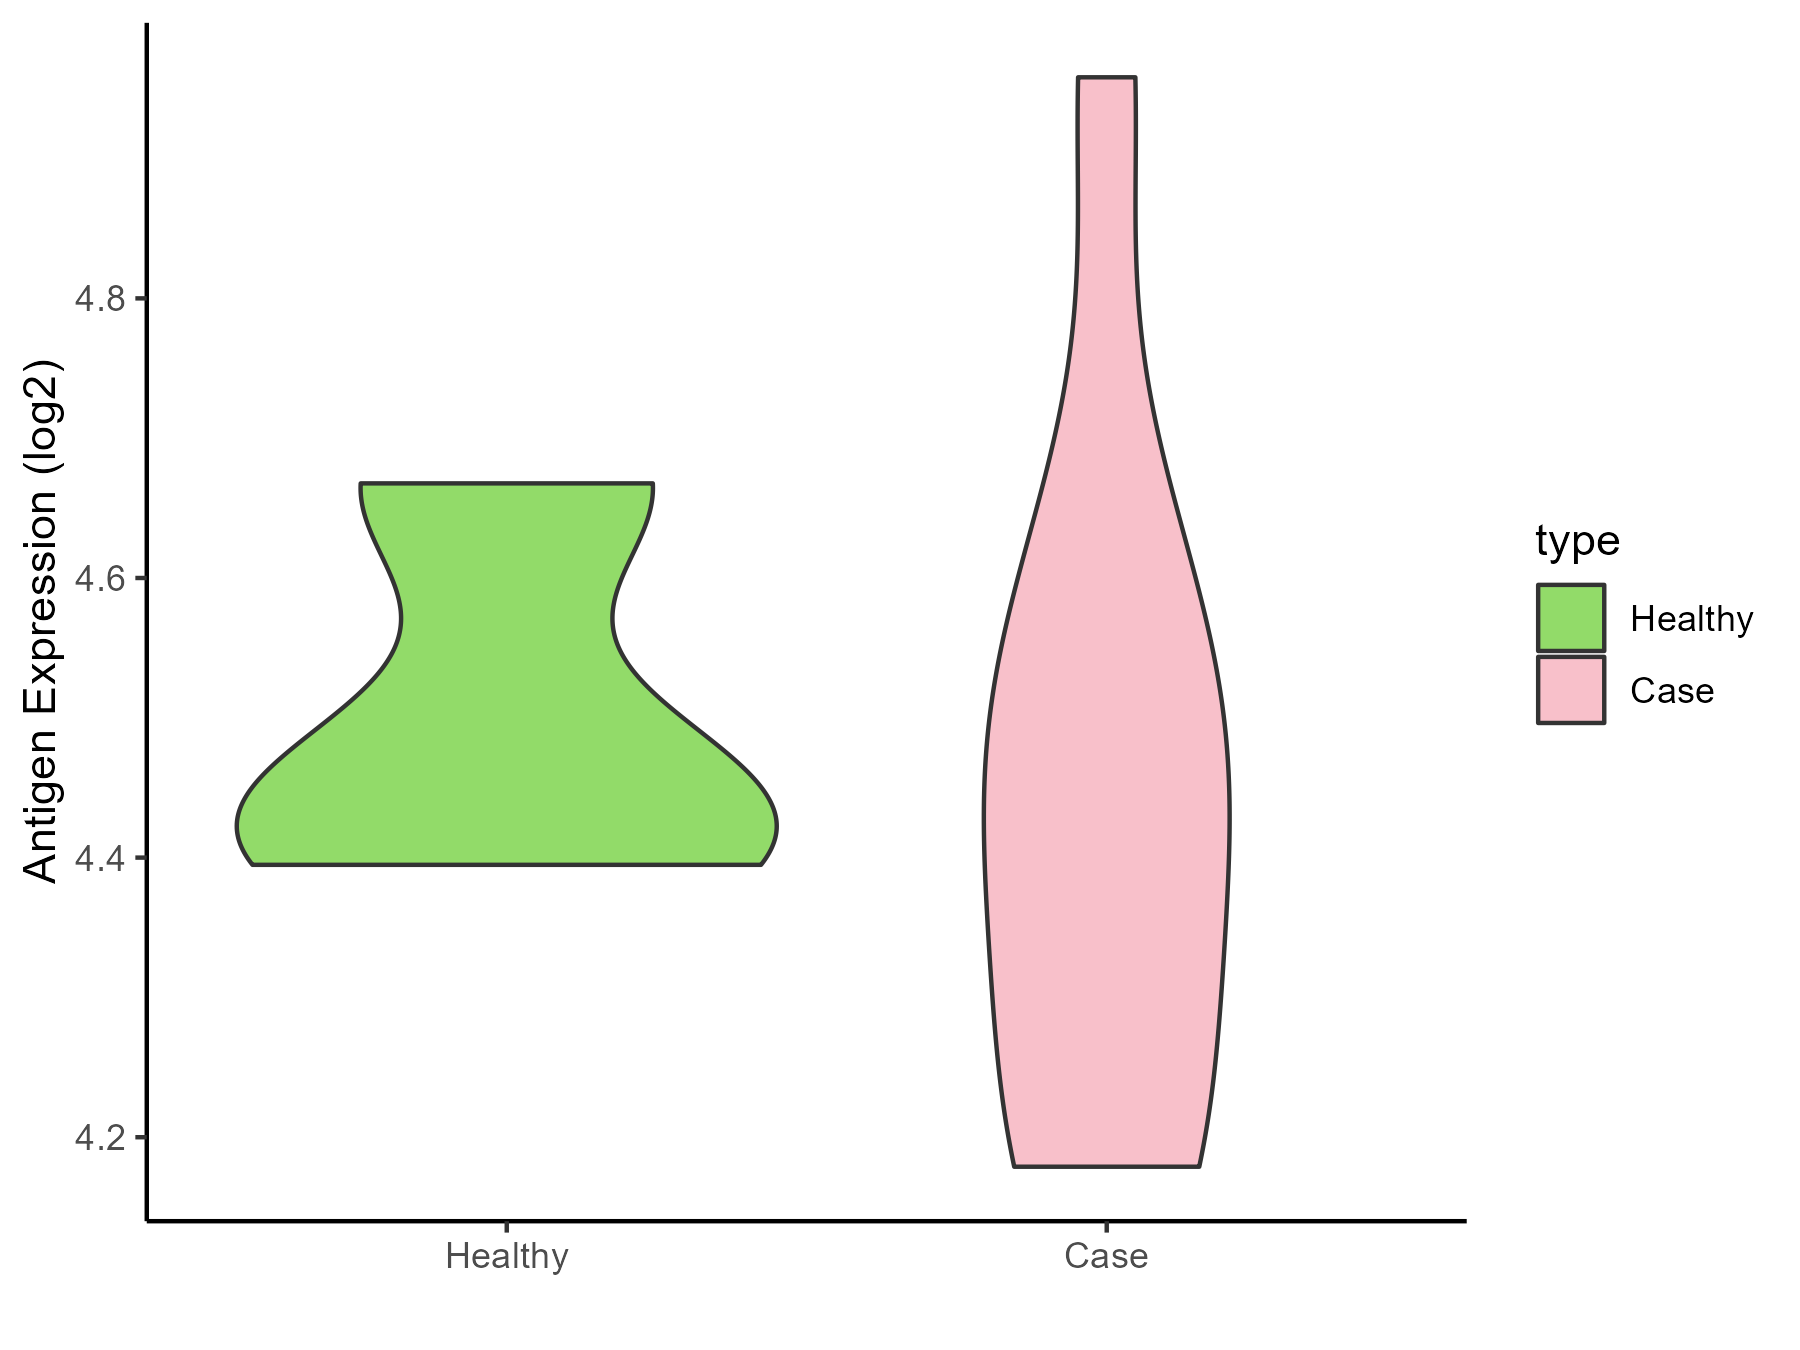
| The Studied Tissue | Adipose | |
| The Specific Disease | Simpson golabi behmel syndrome | |
| The Expression Level of Disease Section Compare with the Healthy Individual Tissue | p-value: 0.65749431; Fold-change: -0.038719532; Z-score: -0.268058287 | |
| Disease-specific Antigen Abundances |
|
Click to View the Clearer Original Diagram |
| Differential expression pattern of antigen in diseases | ||
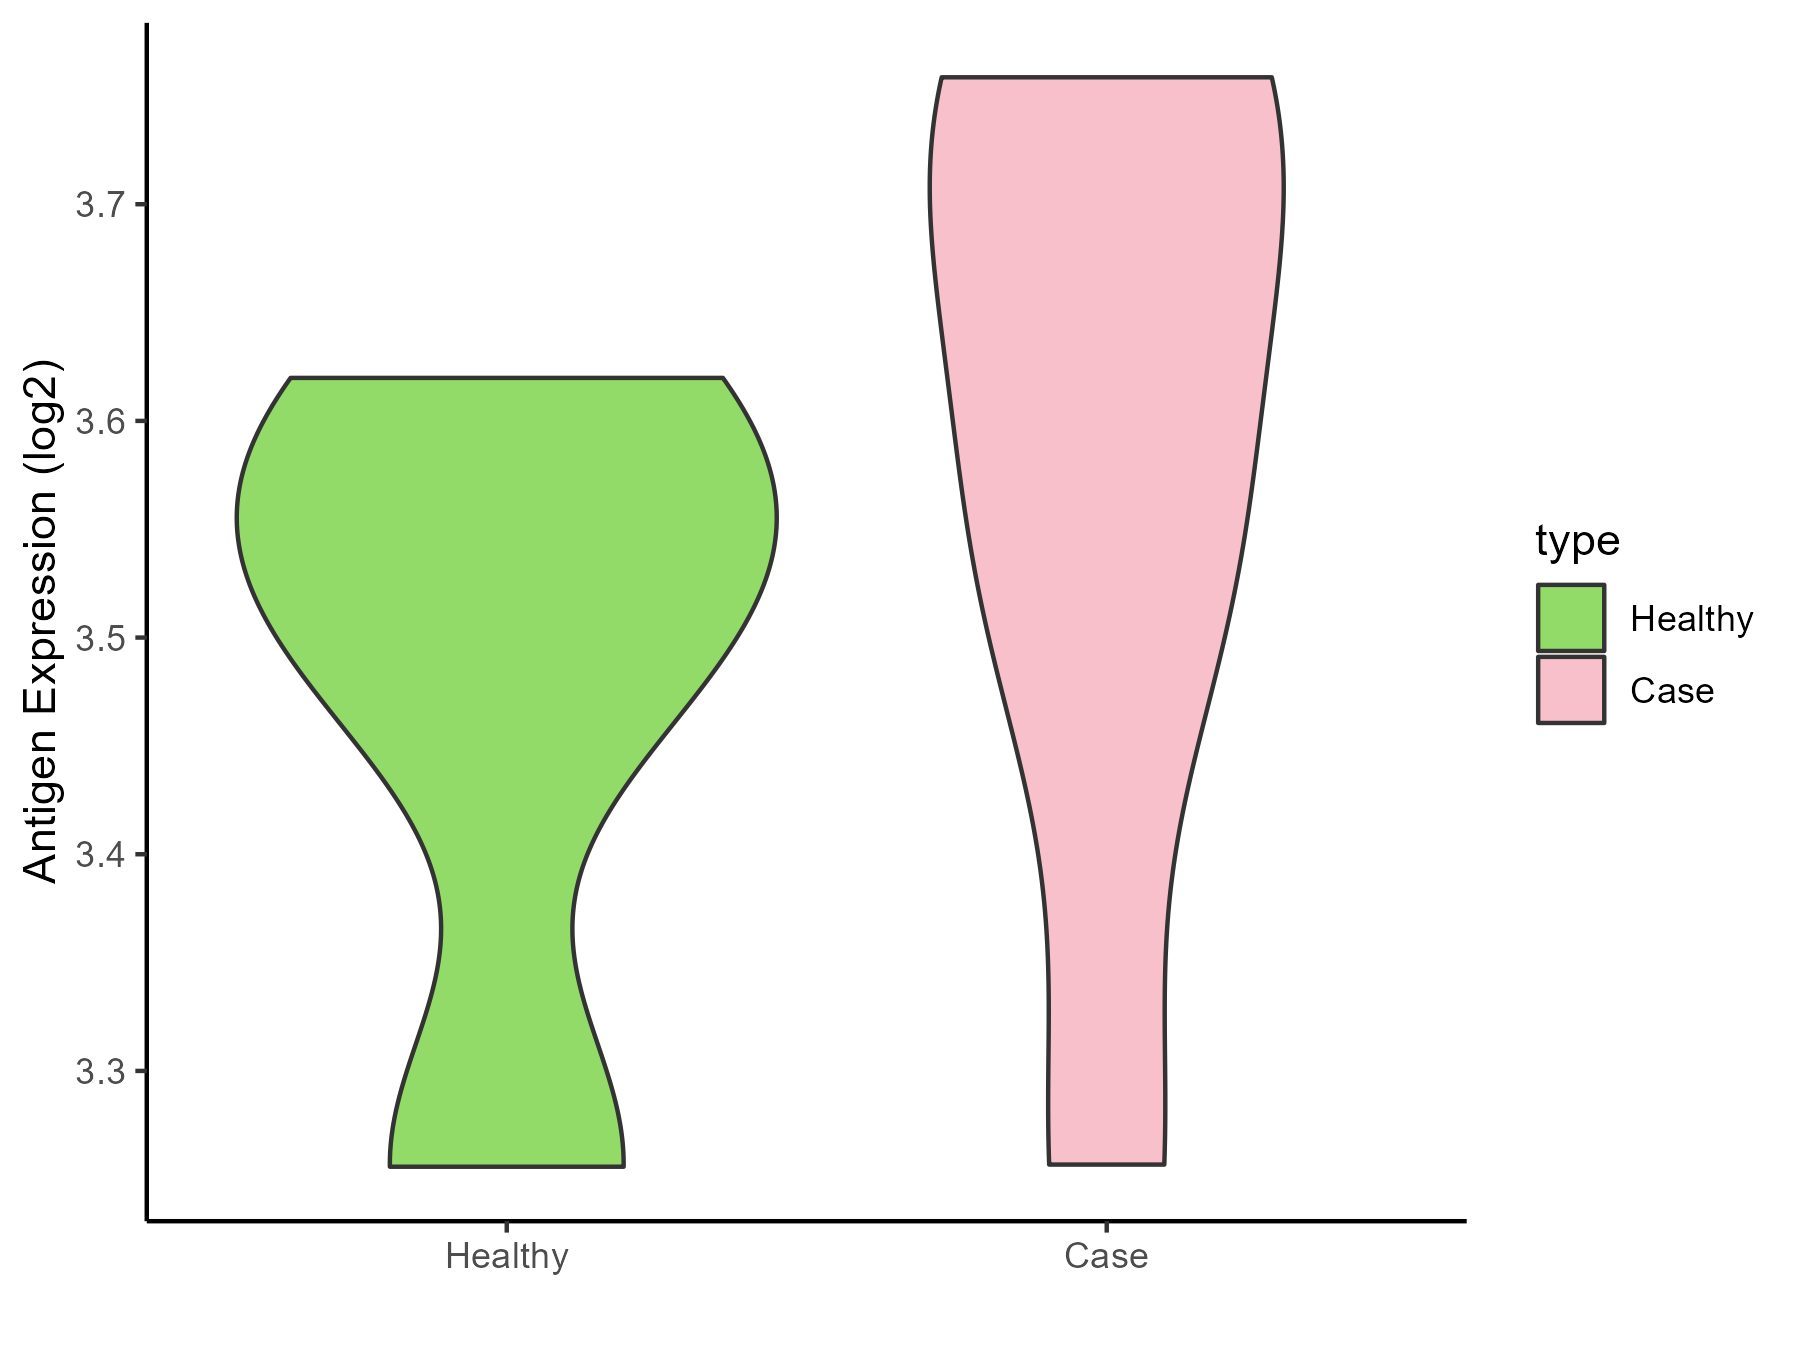
| The Studied Tissue | Perituberal | |
| The Specific Disease | Tuberous sclerosis complex | |
| The Expression Level of Disease Section Compare with the Healthy Individual Tissue | p-value: 0.360186681; Fold-change: 0.102356584; Z-score: 0.644707326 | |
| Disease-specific Antigen Abundances |
|
Click to View the Clearer Original Diagram |
ICD Disease Classification 3
| Differential expression pattern of antigen in diseases | ||
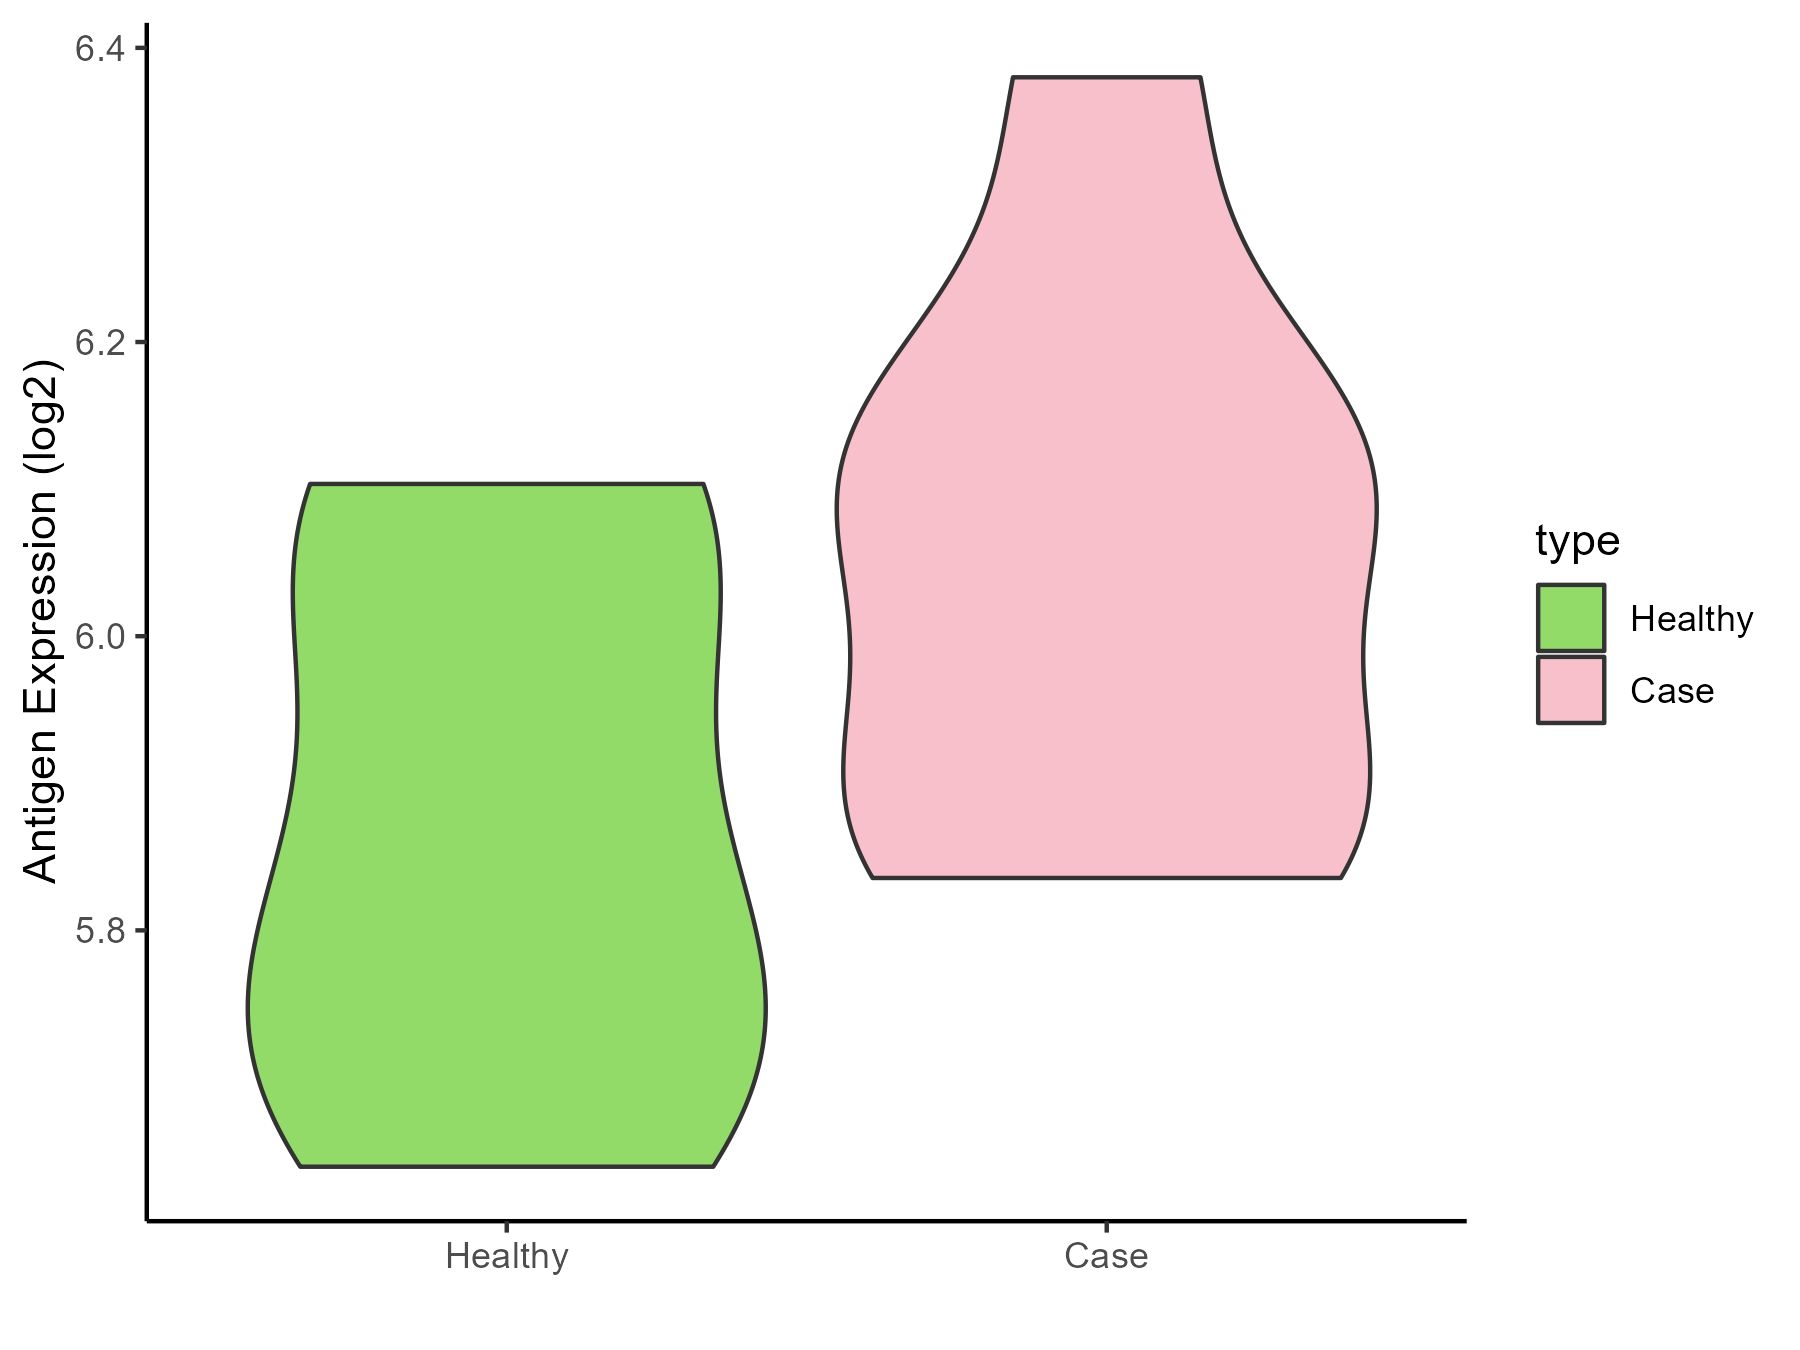
| The Studied Tissue | Bone marrow | |
| The Specific Disease | Anemia | |
| The Expression Level of Disease Section Compare with the Healthy Individual Tissue | p-value: 0.109704656; Fold-change: 0.272521296; Z-score: 1.425219173 | |
| Disease-specific Antigen Abundances |
|
Click to View the Clearer Original Diagram |
| Differential expression pattern of antigen in diseases | ||
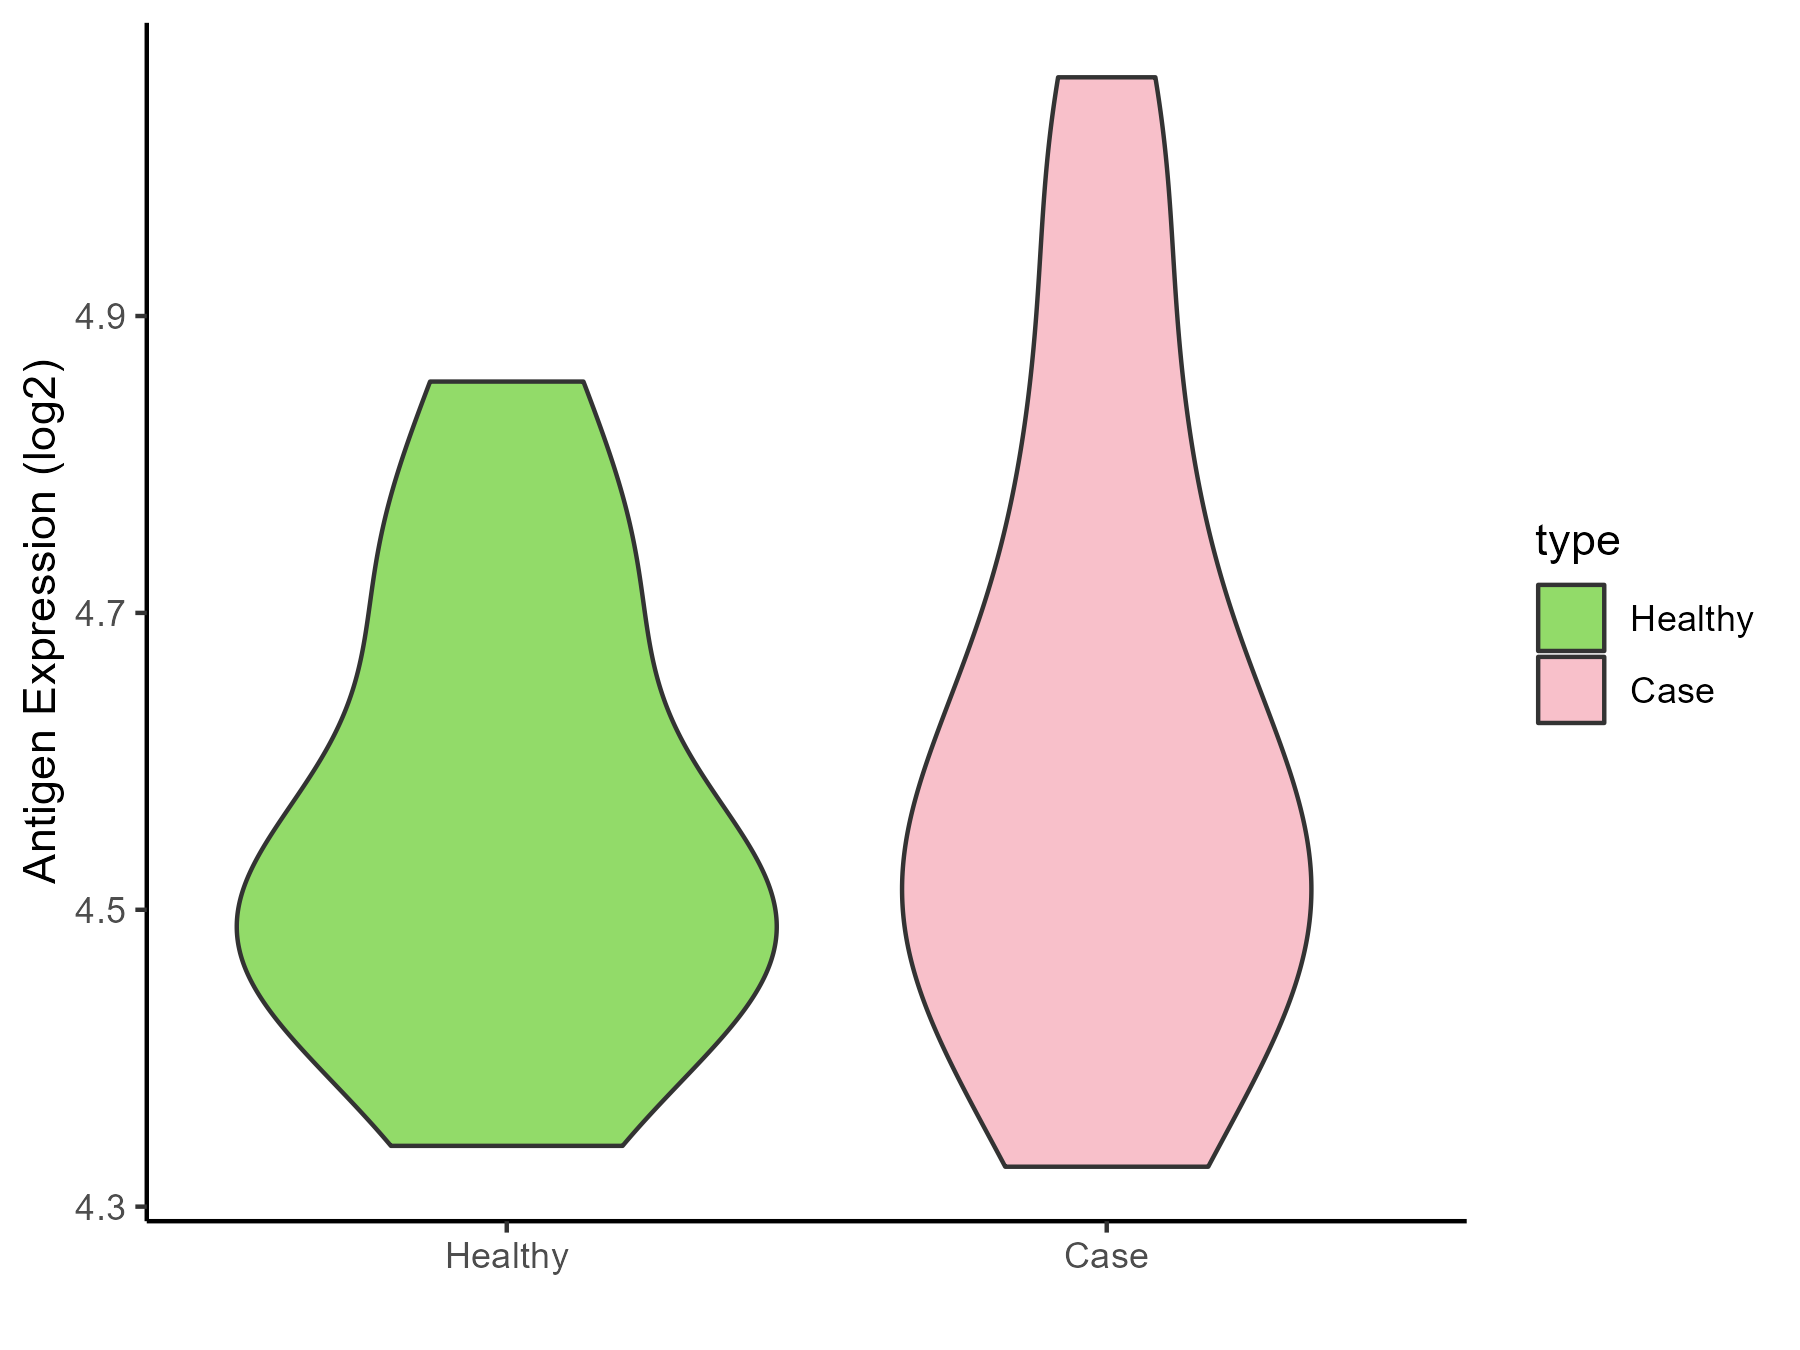
| The Studied Tissue | Peripheral blood | |
| The Specific Disease | Sickle cell disease | |
| The Expression Level of Disease Section Compare with the Healthy Individual Tissue | p-value: 0.488227597; Fold-change: 0.03816999; Z-score: 0.247442167 | |
| Disease-specific Antigen Abundances |
|
Click to View the Clearer Original Diagram |
| Differential expression pattern of antigen in diseases | ||
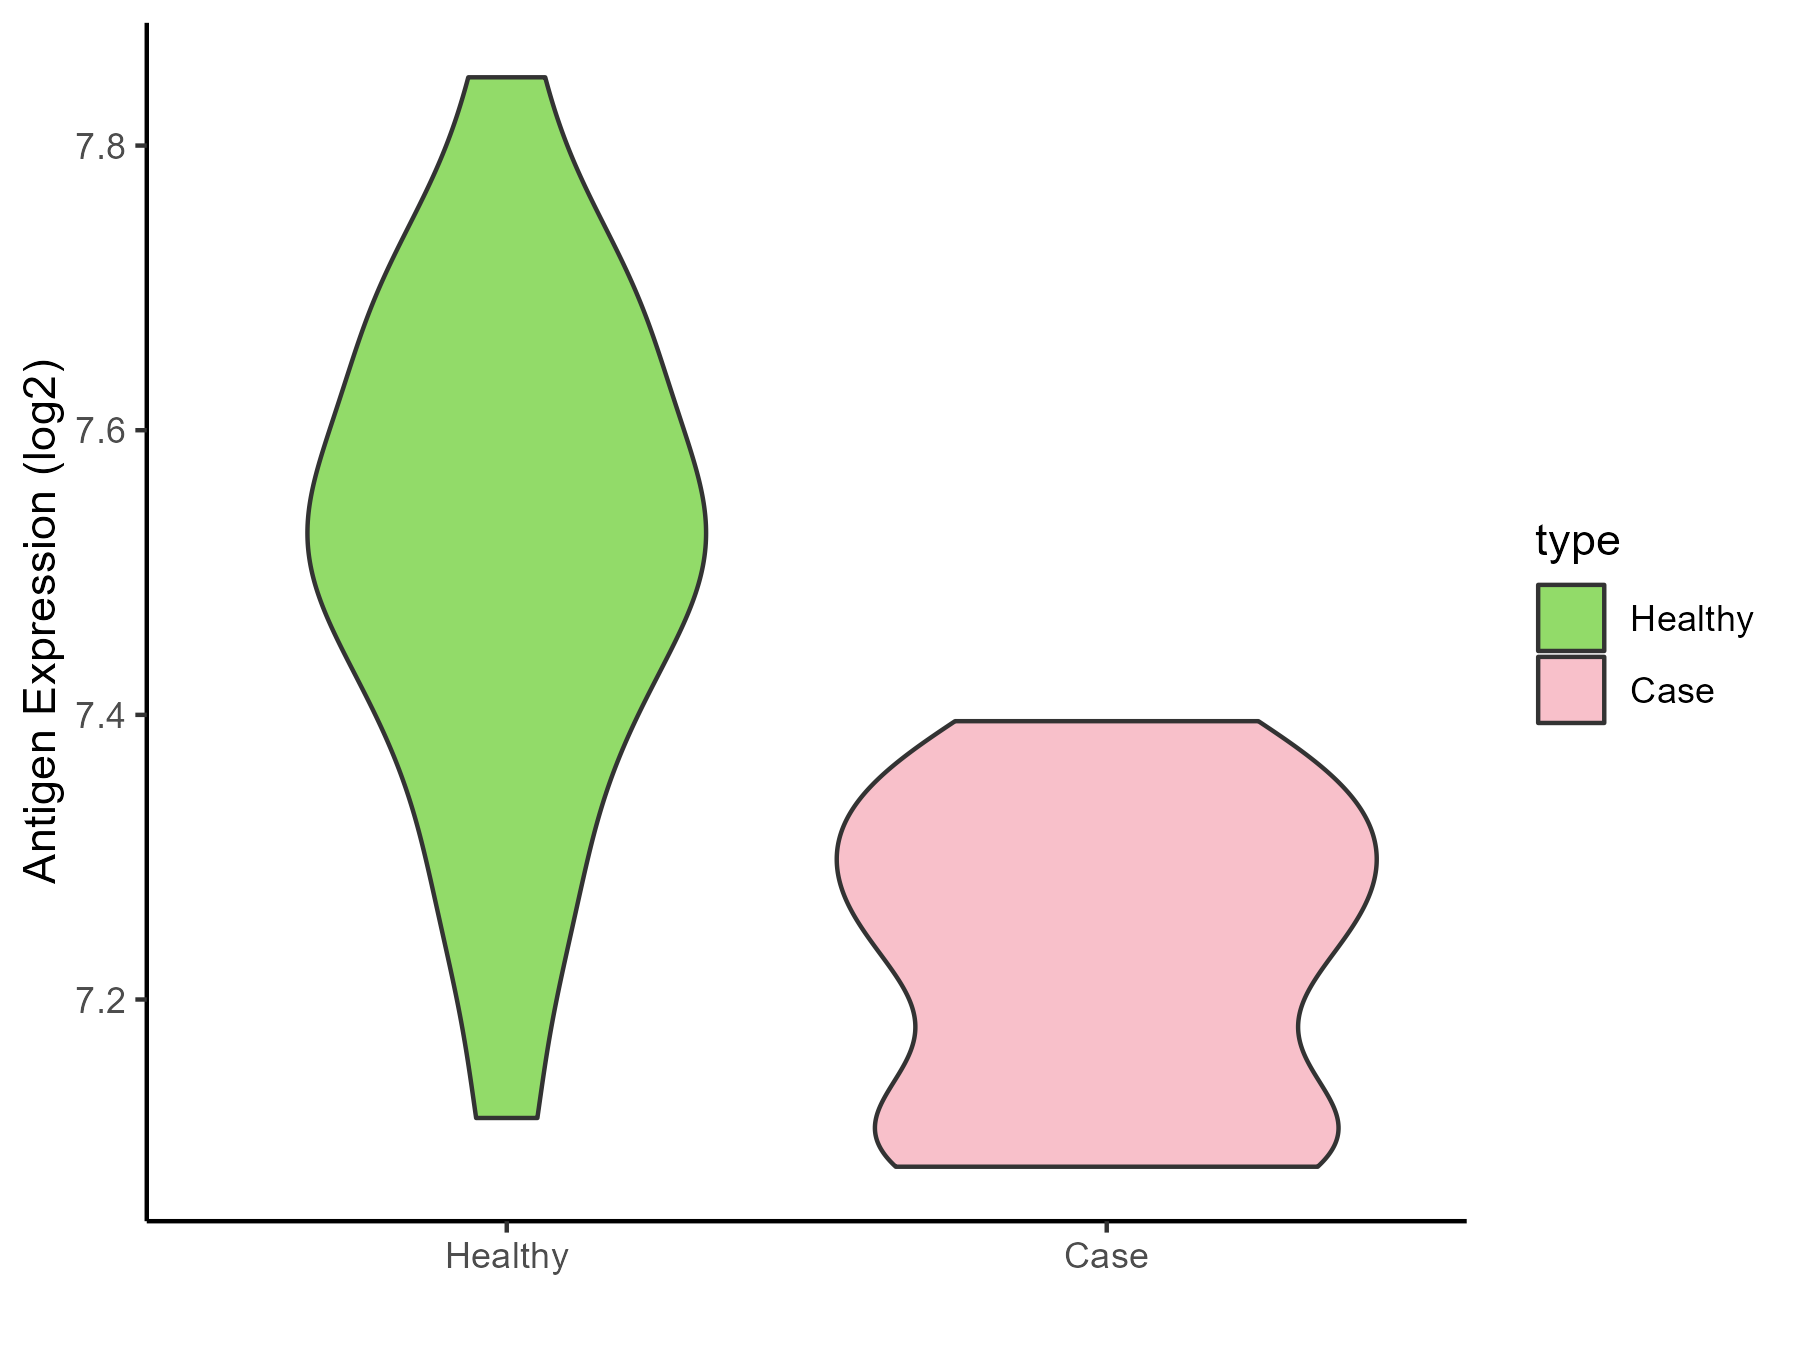
| The Studied Tissue | Whole blood | |
| The Specific Disease | Thrombocythemia | |
| The Expression Level of Disease Section Compare with the Healthy Individual Tissue | p-value: 9.83E-12; Fold-change: -0.284009568; Z-score: -1.615236704 | |
| Disease-specific Antigen Abundances |
|
Click to View the Clearer Original Diagram |
ICD Disease Classification 4
| Differential expression pattern of antigen in diseases | ||
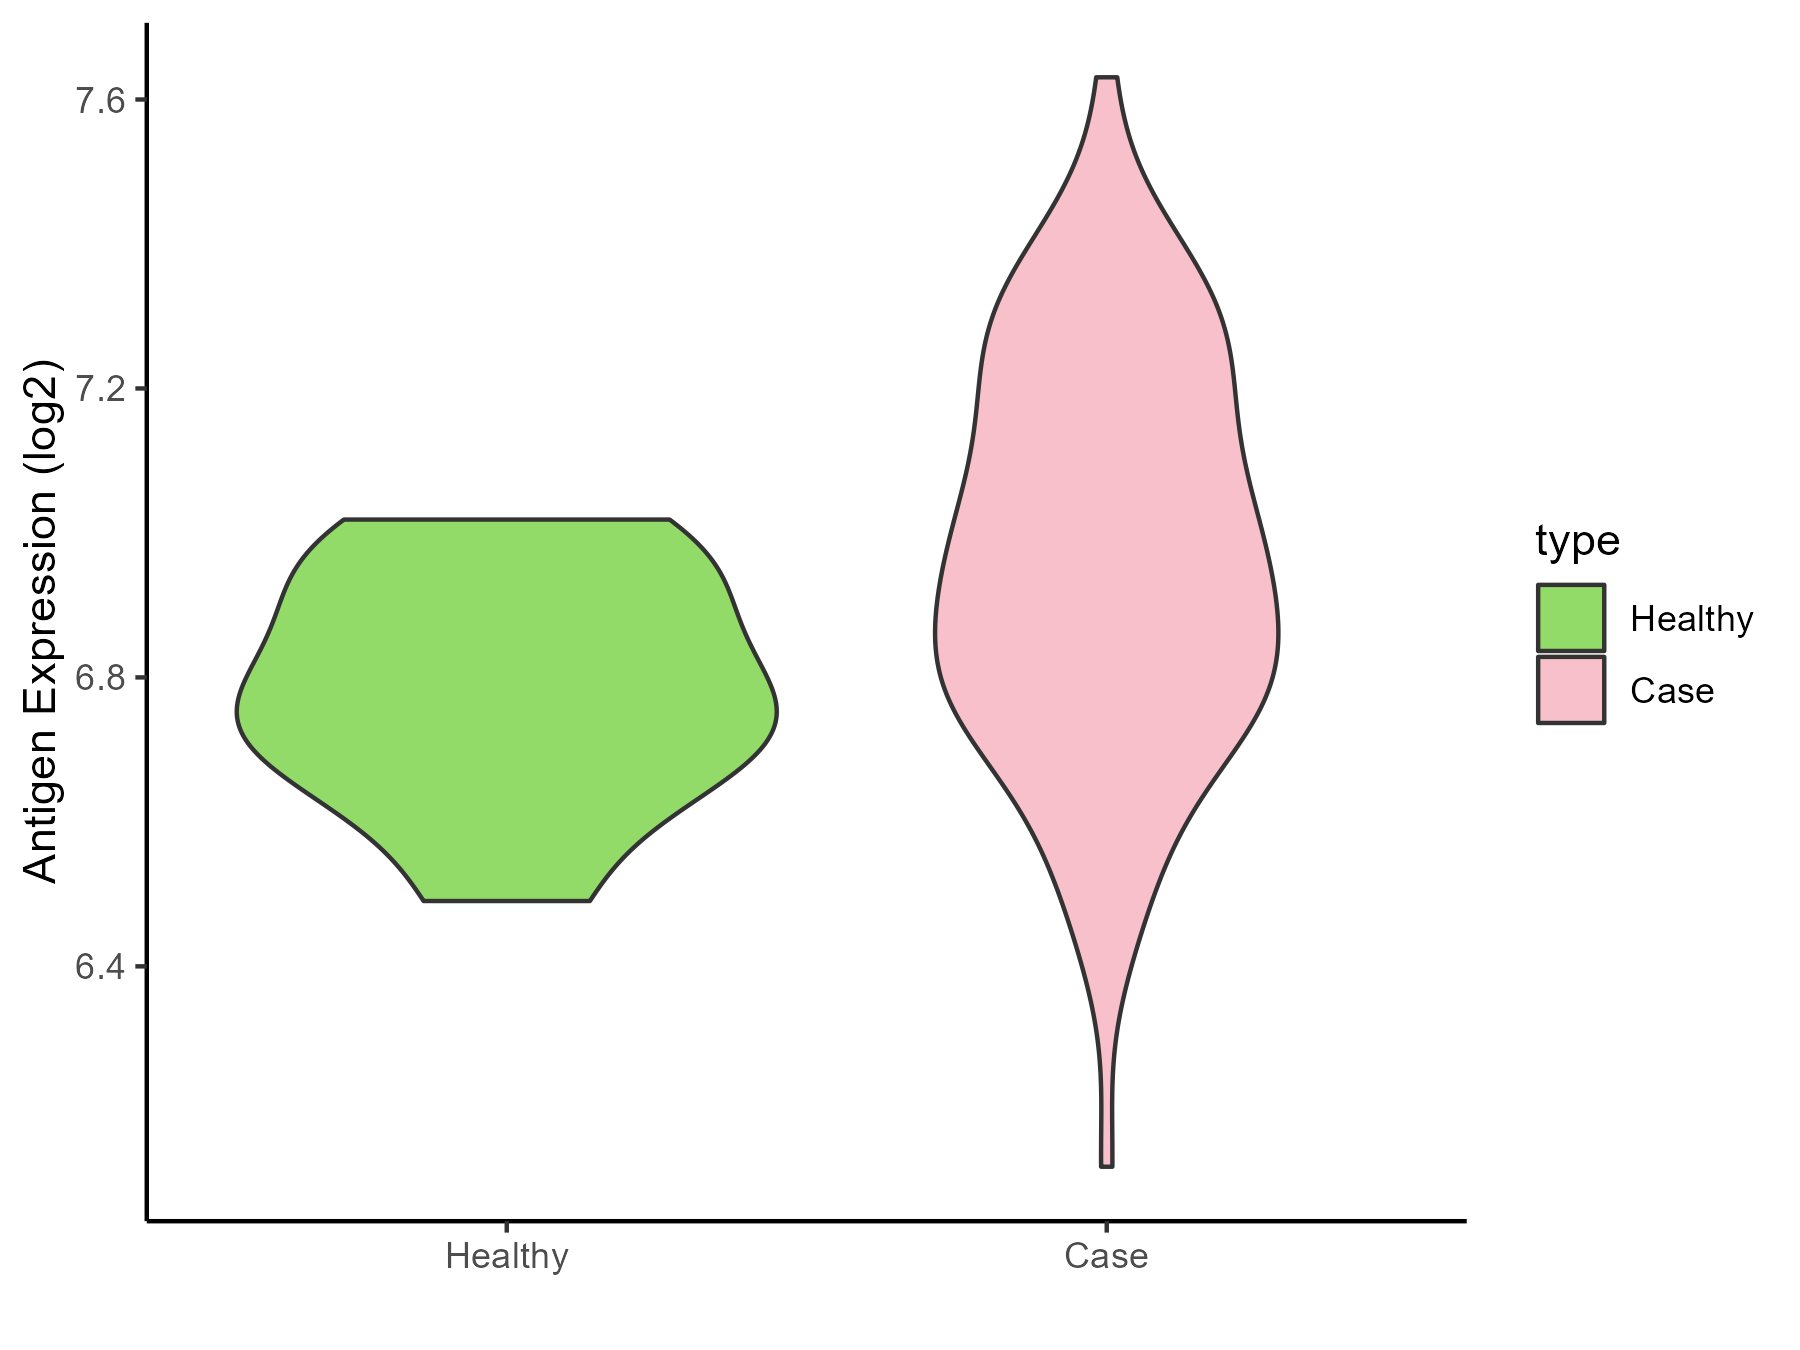
| The Studied Tissue | Whole blood | |
| The Specific Disease | Scleroderma | |
| The Expression Level of Disease Section Compare with the Healthy Individual Tissue | p-value: 0.013144696; Fold-change: 0.187453415; Z-score: 1.125424117 | |
| Disease-specific Antigen Abundances |
|
Click to View the Clearer Original Diagram |
| Differential expression pattern of antigen in diseases | ||
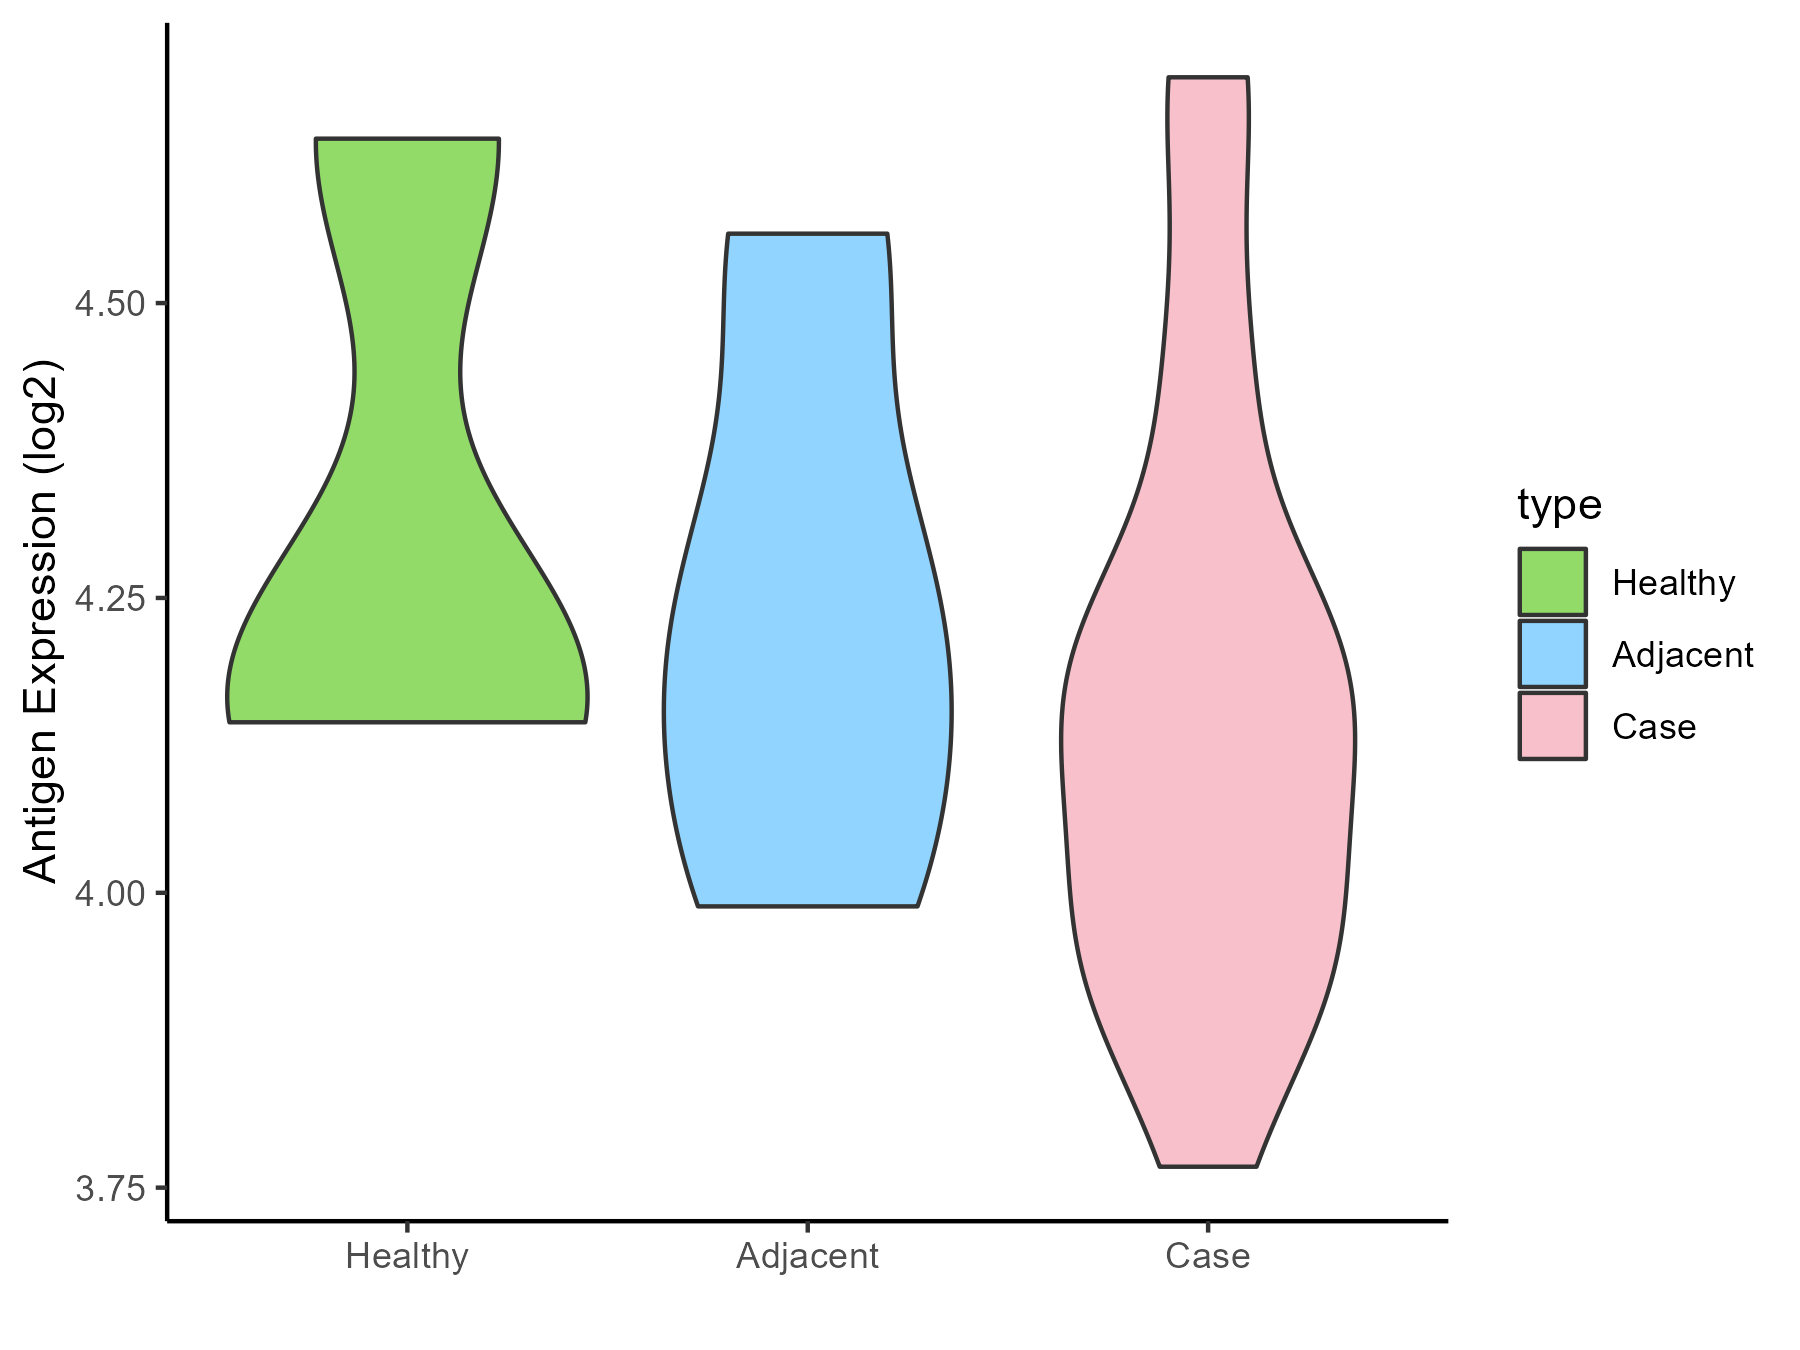
| The Studied Tissue | Salivary gland | |
| The Specific Disease | Sjogren syndrome | |
| The Expression Level of Disease Section Compare with the Healthy Individual Tissue | p-value: 0.41886689; Fold-change: -0.036696632; Z-score: -0.133777534 | |
| The Expression Level of Disease Section Compare with the Adjacent Tissue | p-value: 0.565150435; Fold-change: -0.066686991; Z-score: -0.275237546 | |
| Disease-specific Antigen Abundances |
|
Click to View the Clearer Original Diagram |
| Differential expression pattern of antigen in diseases | ||
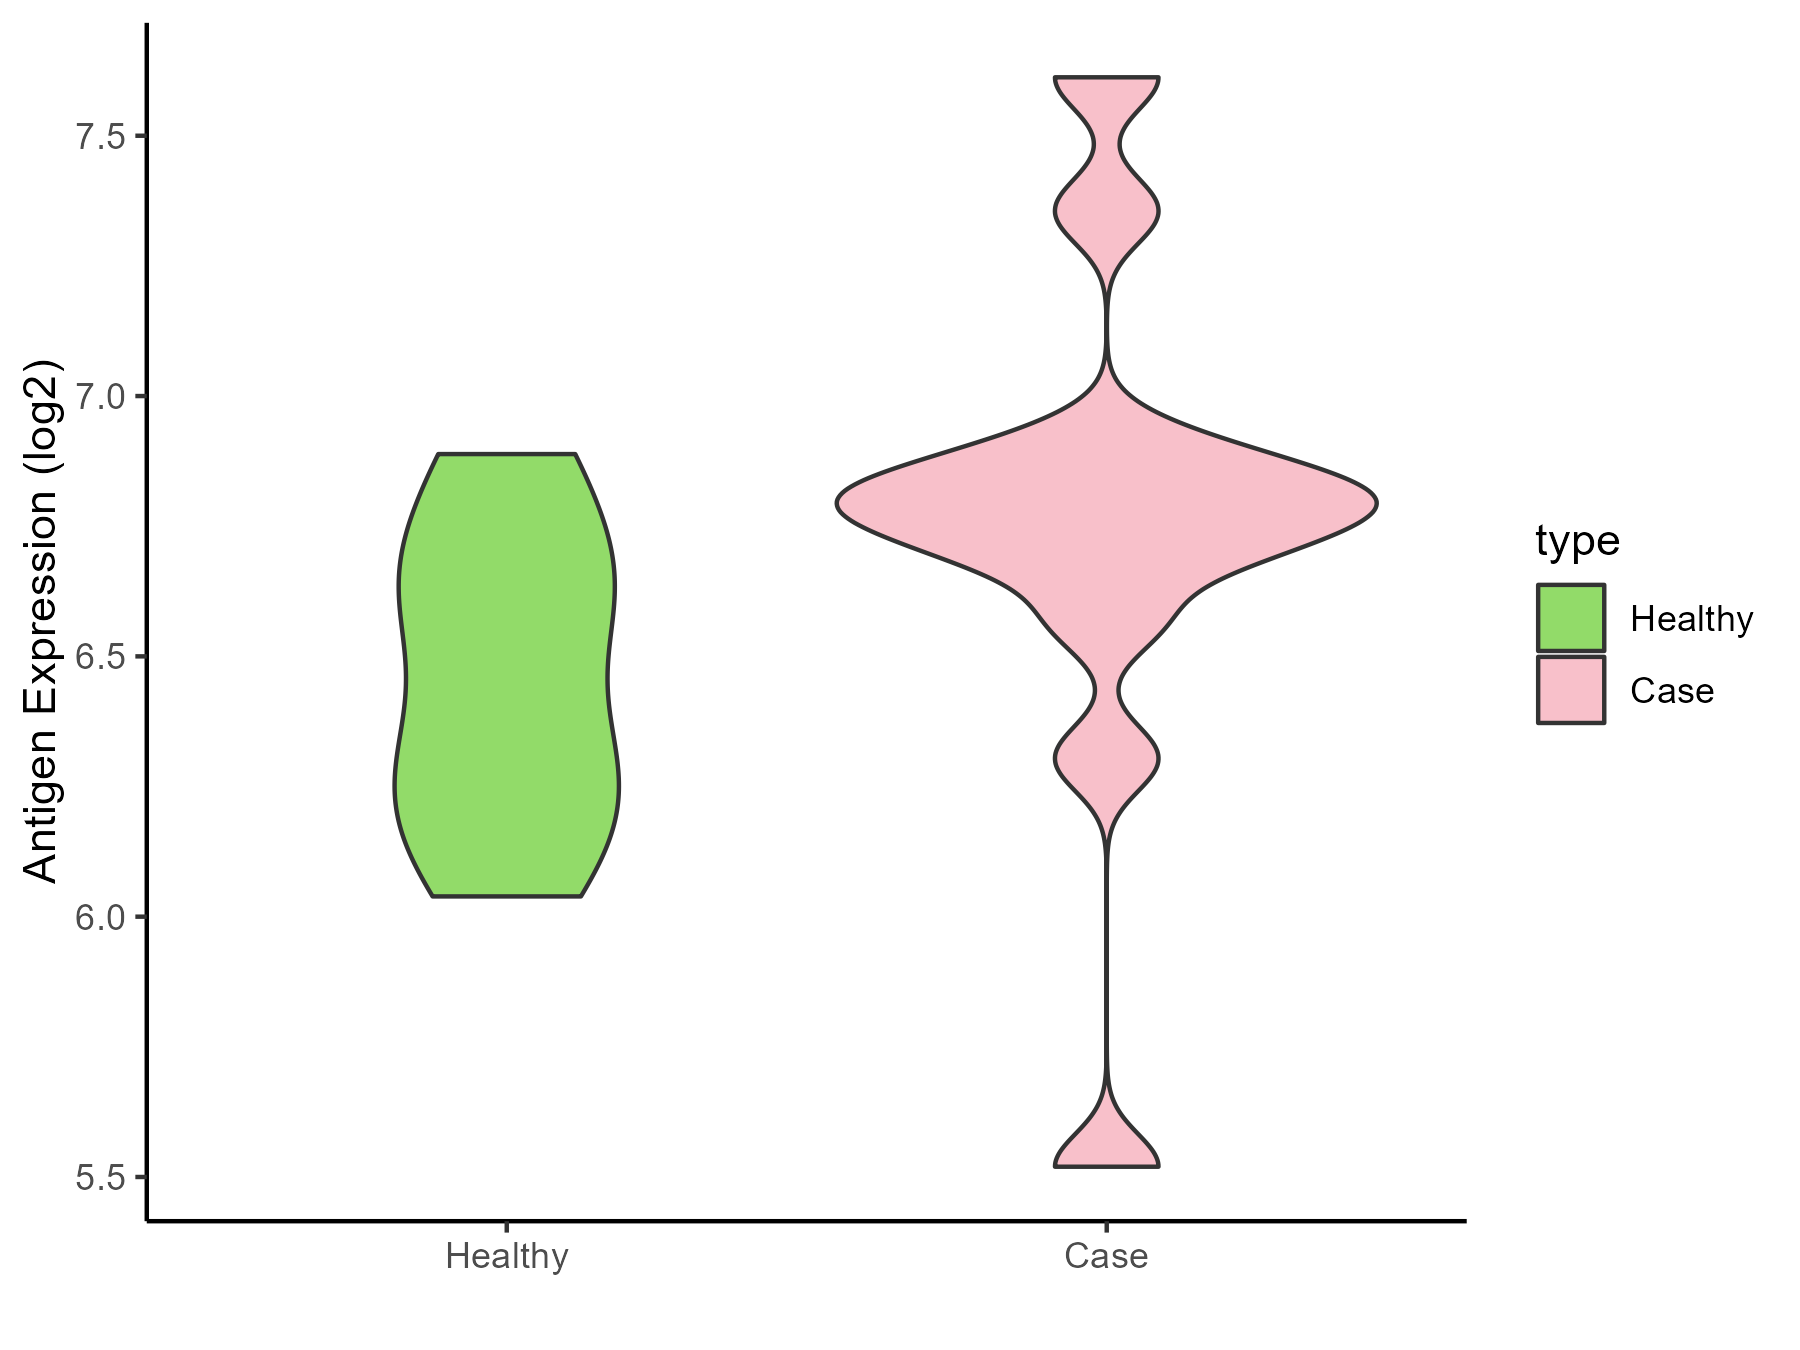
| The Studied Tissue | Peripheral blood | |
| The Specific Disease | Behcet disease | |
| The Expression Level of Disease Section Compare with the Healthy Individual Tissue | p-value: 0.088682767; Fold-change: 0.328882611; Z-score: 1.133004081 | |
| Disease-specific Antigen Abundances |
|
Click to View the Clearer Original Diagram |
| Differential expression pattern of antigen in diseases | ||
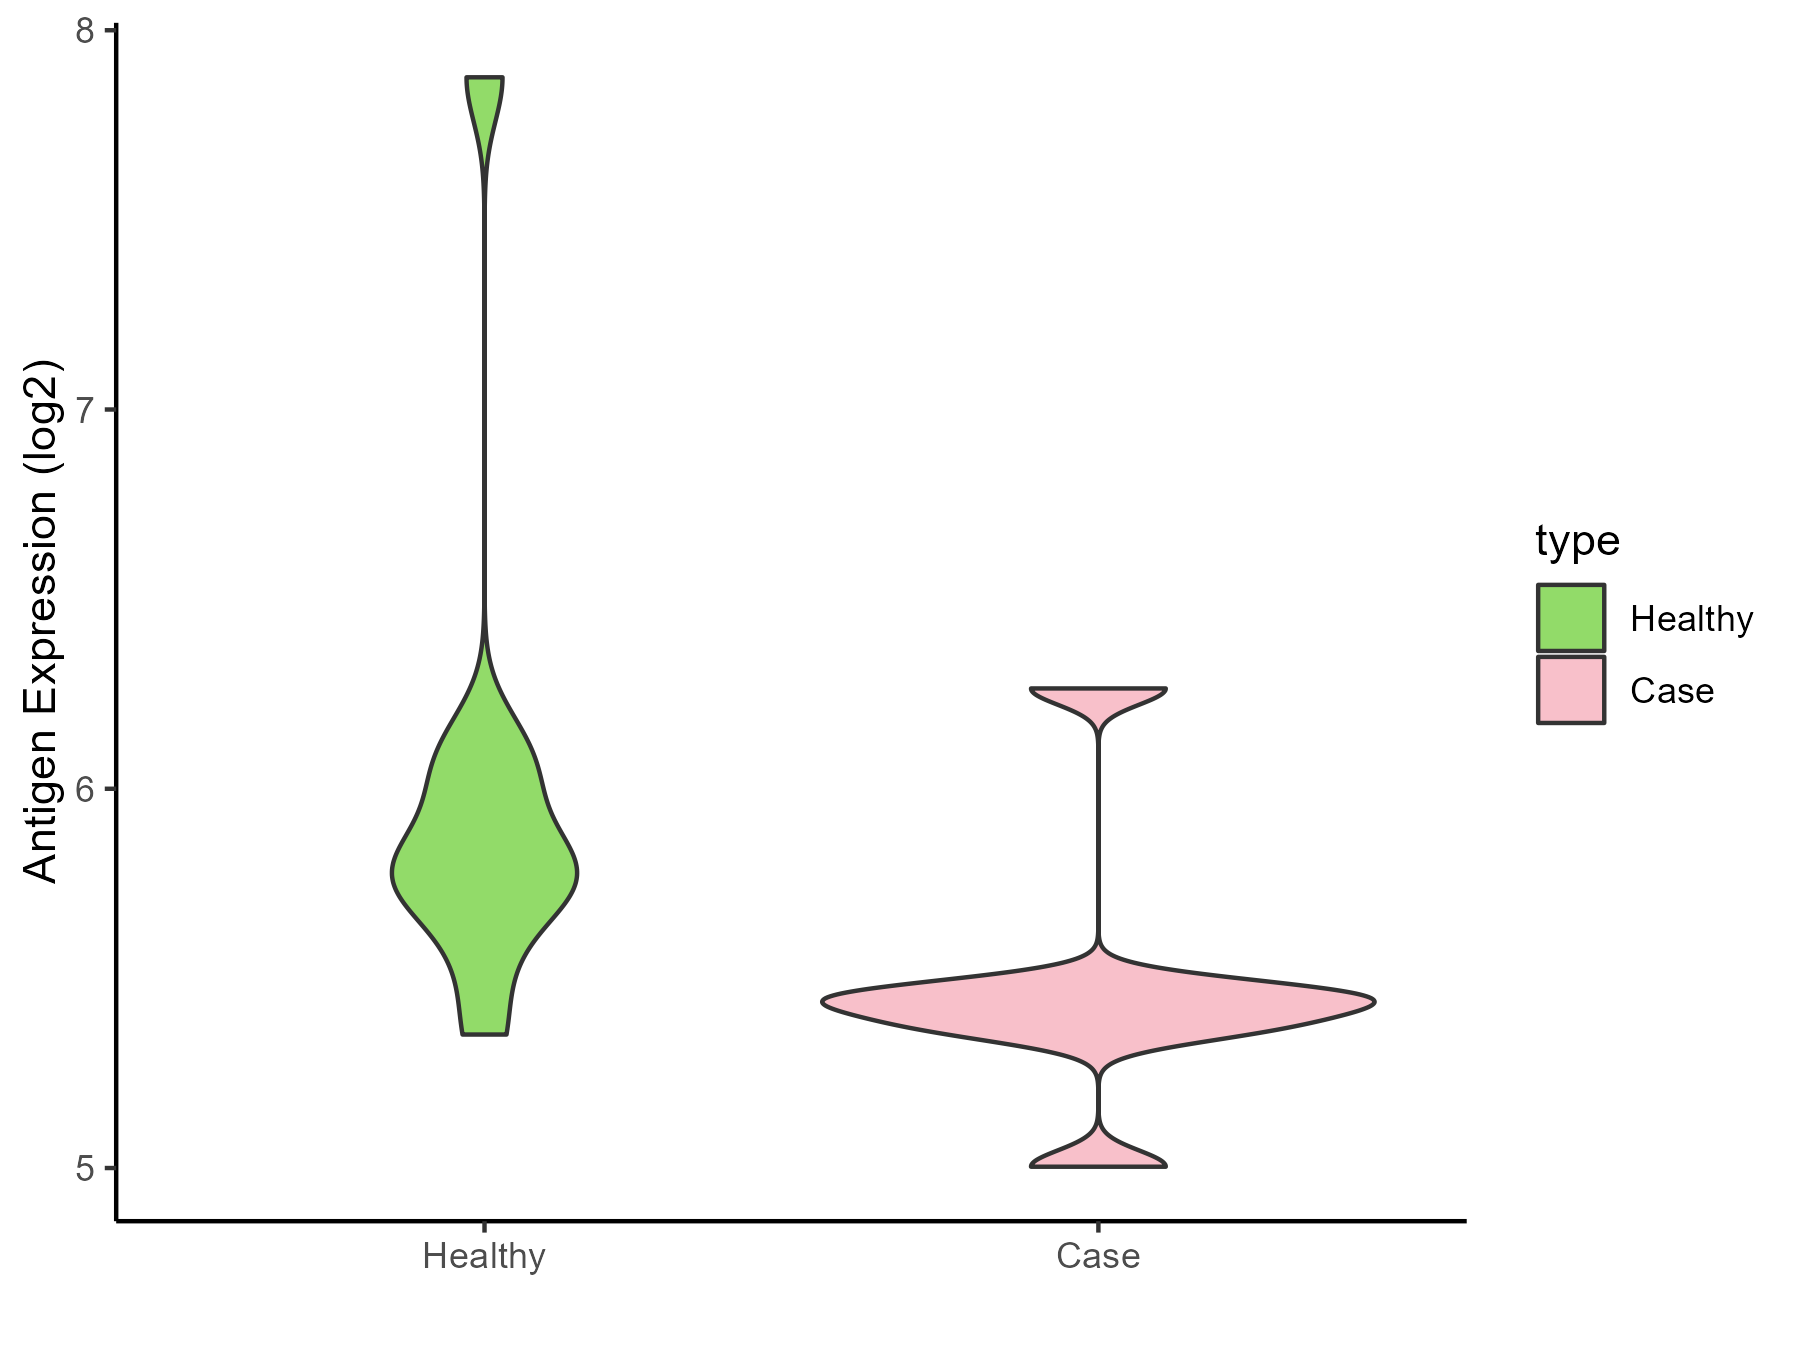
| The Studied Tissue | Whole blood | |
| The Specific Disease | Autosomal dominant monocytopenia | |
| The Expression Level of Disease Section Compare with the Healthy Individual Tissue | p-value: 0.046440867; Fold-change: -0.368176819; Z-score: -0.553994845 | |
| Disease-specific Antigen Abundances |
|
Click to View the Clearer Original Diagram |
ICD Disease Classification 5
| Differential expression pattern of antigen in diseases | ||
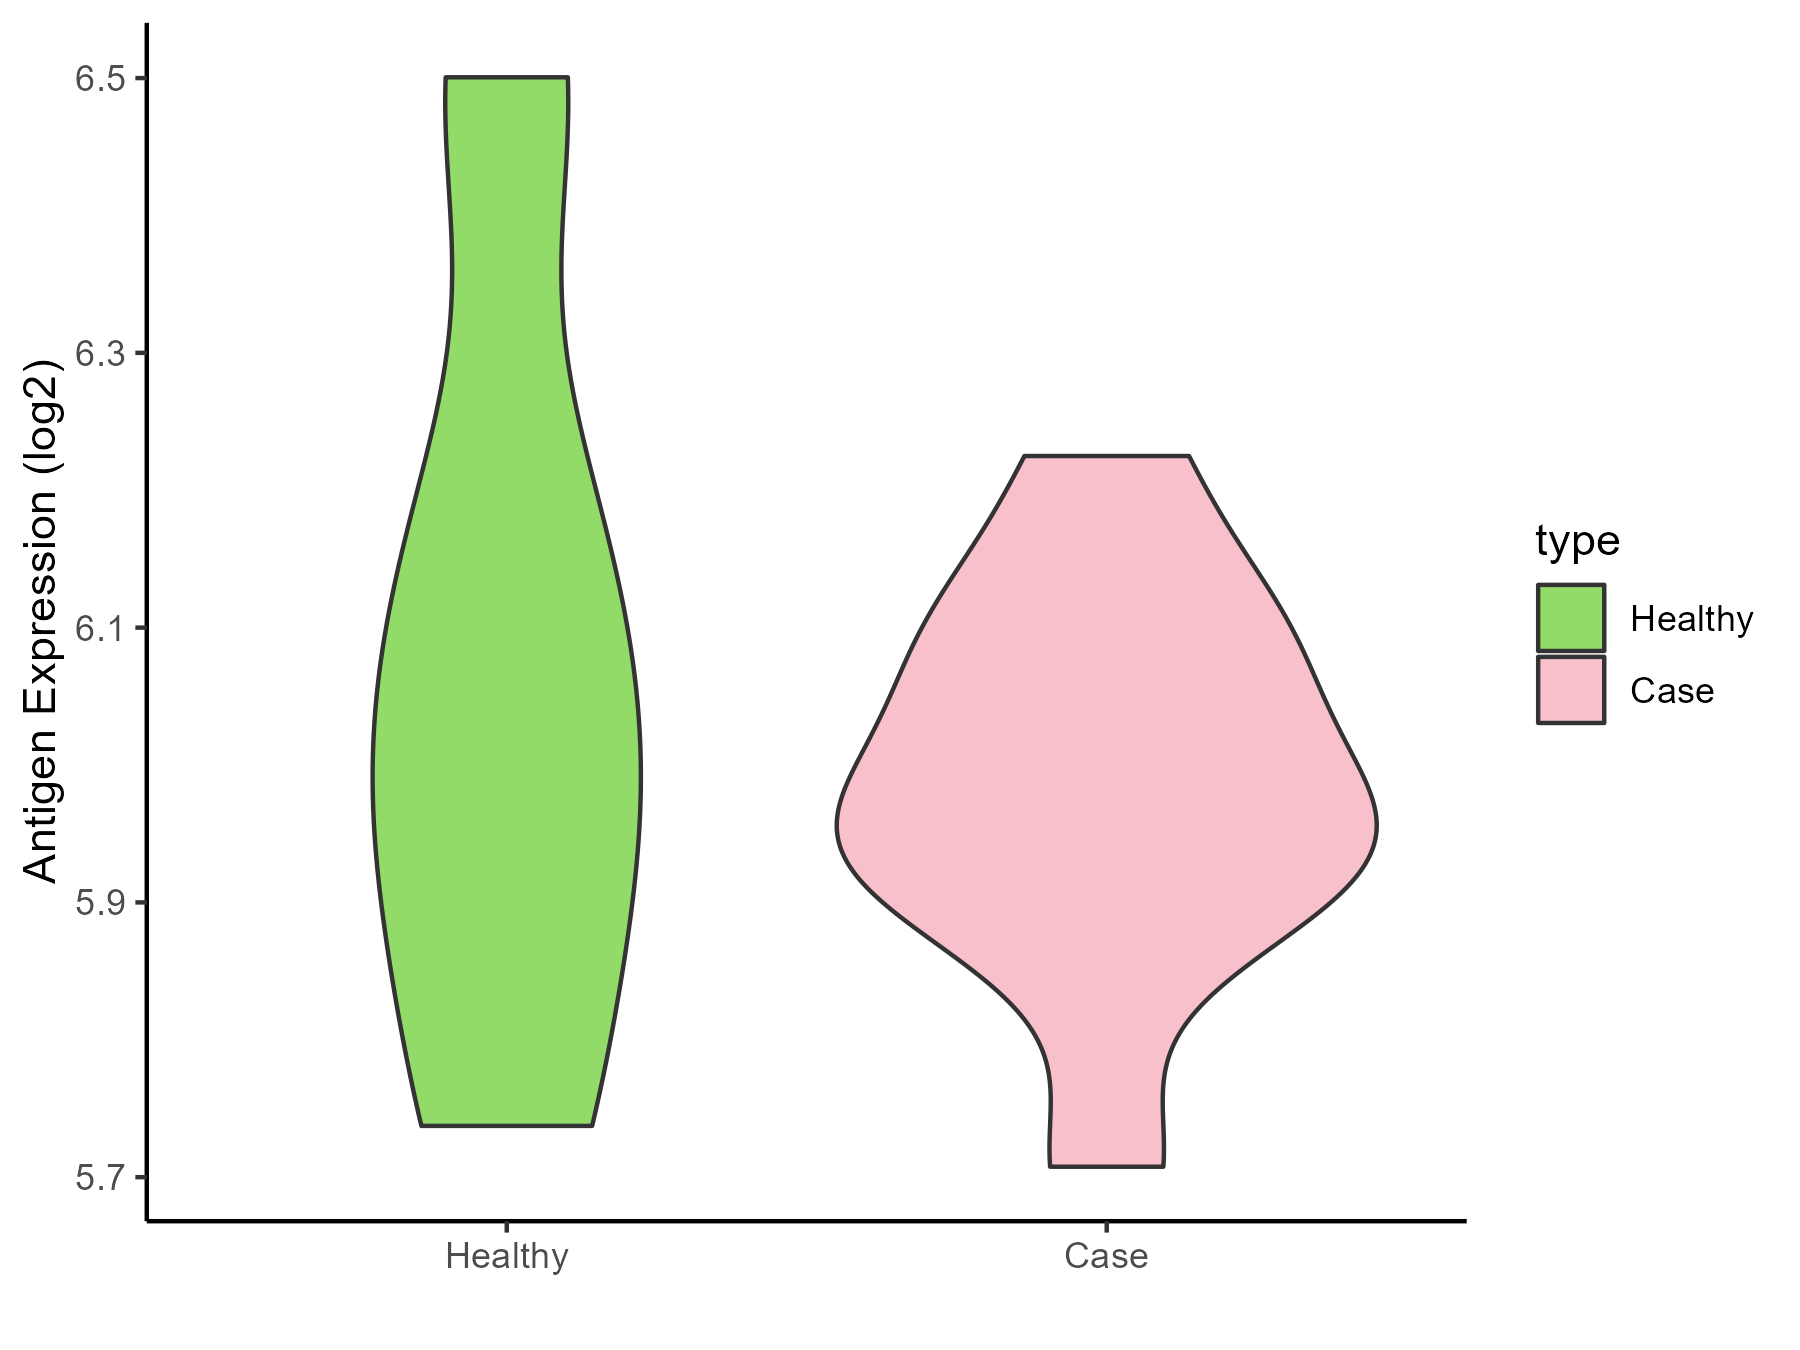
| The Studied Tissue | Liver | |
| The Specific Disease | Type 2 diabetes | |
| The Expression Level of Disease Section Compare with the Healthy Individual Tissue | p-value: 0.573128814; Fold-change: -0.060399684; Z-score: -0.209283304 | |
| Disease-specific Antigen Abundances |
|
Click to View the Clearer Original Diagram |
| Differential expression pattern of antigen in diseases | ||
| The Studied Tissue | Vastus lateralis muscle | |
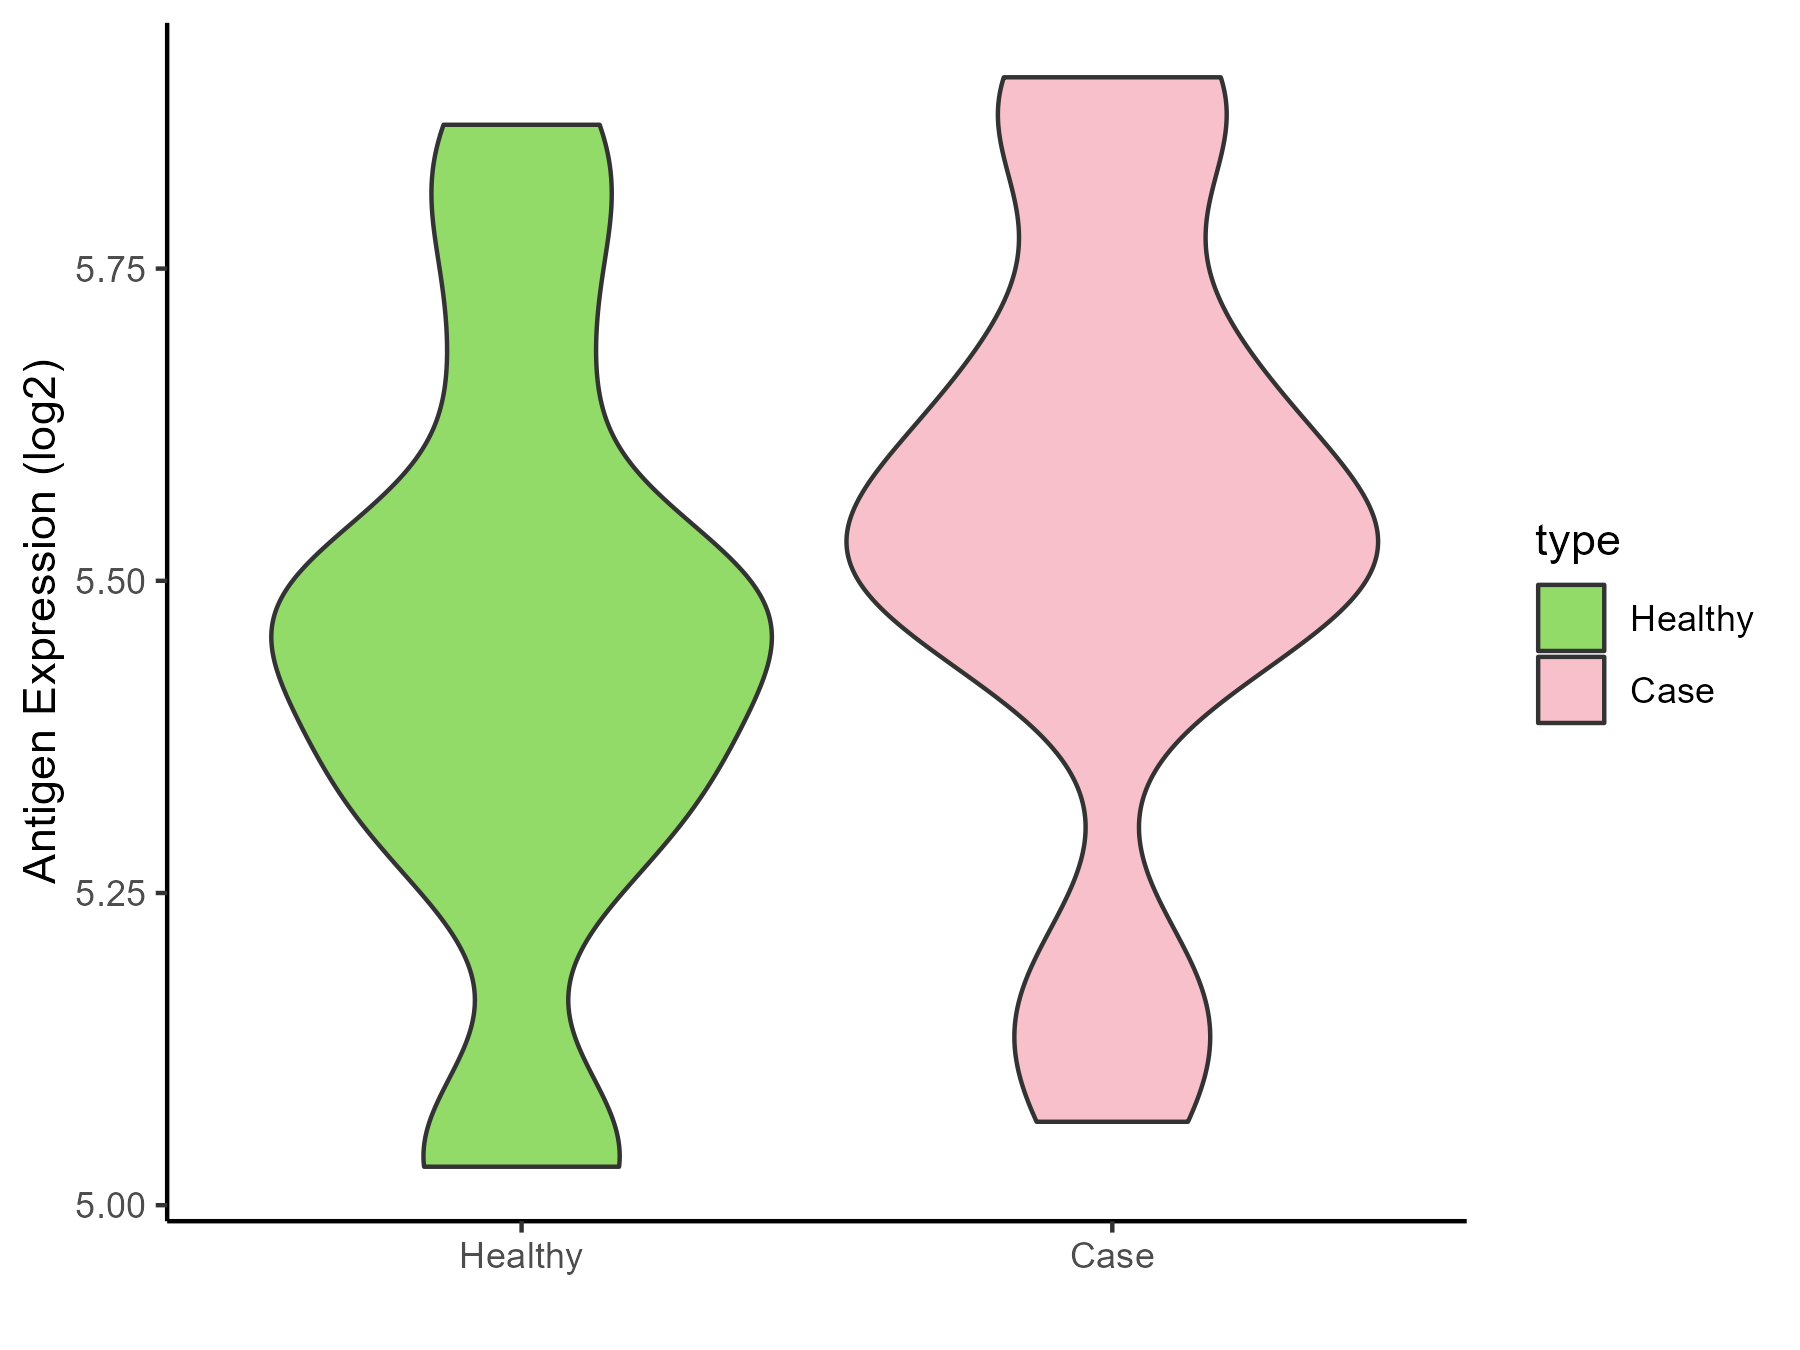
| The Specific Disease | Polycystic ovary syndrome | |
| The Expression Level of Disease Section Compare with the Healthy Individual Tissue | p-value: 0.291197678; Fold-change: 0.068086079; Z-score: 0.276046231 | |
| Disease-specific Antigen Abundances |
|
Click to View the Clearer Original Diagram |
| Differential expression pattern of antigen in diseases | ||
| The Studied Tissue | Subcutaneous Adipose | |
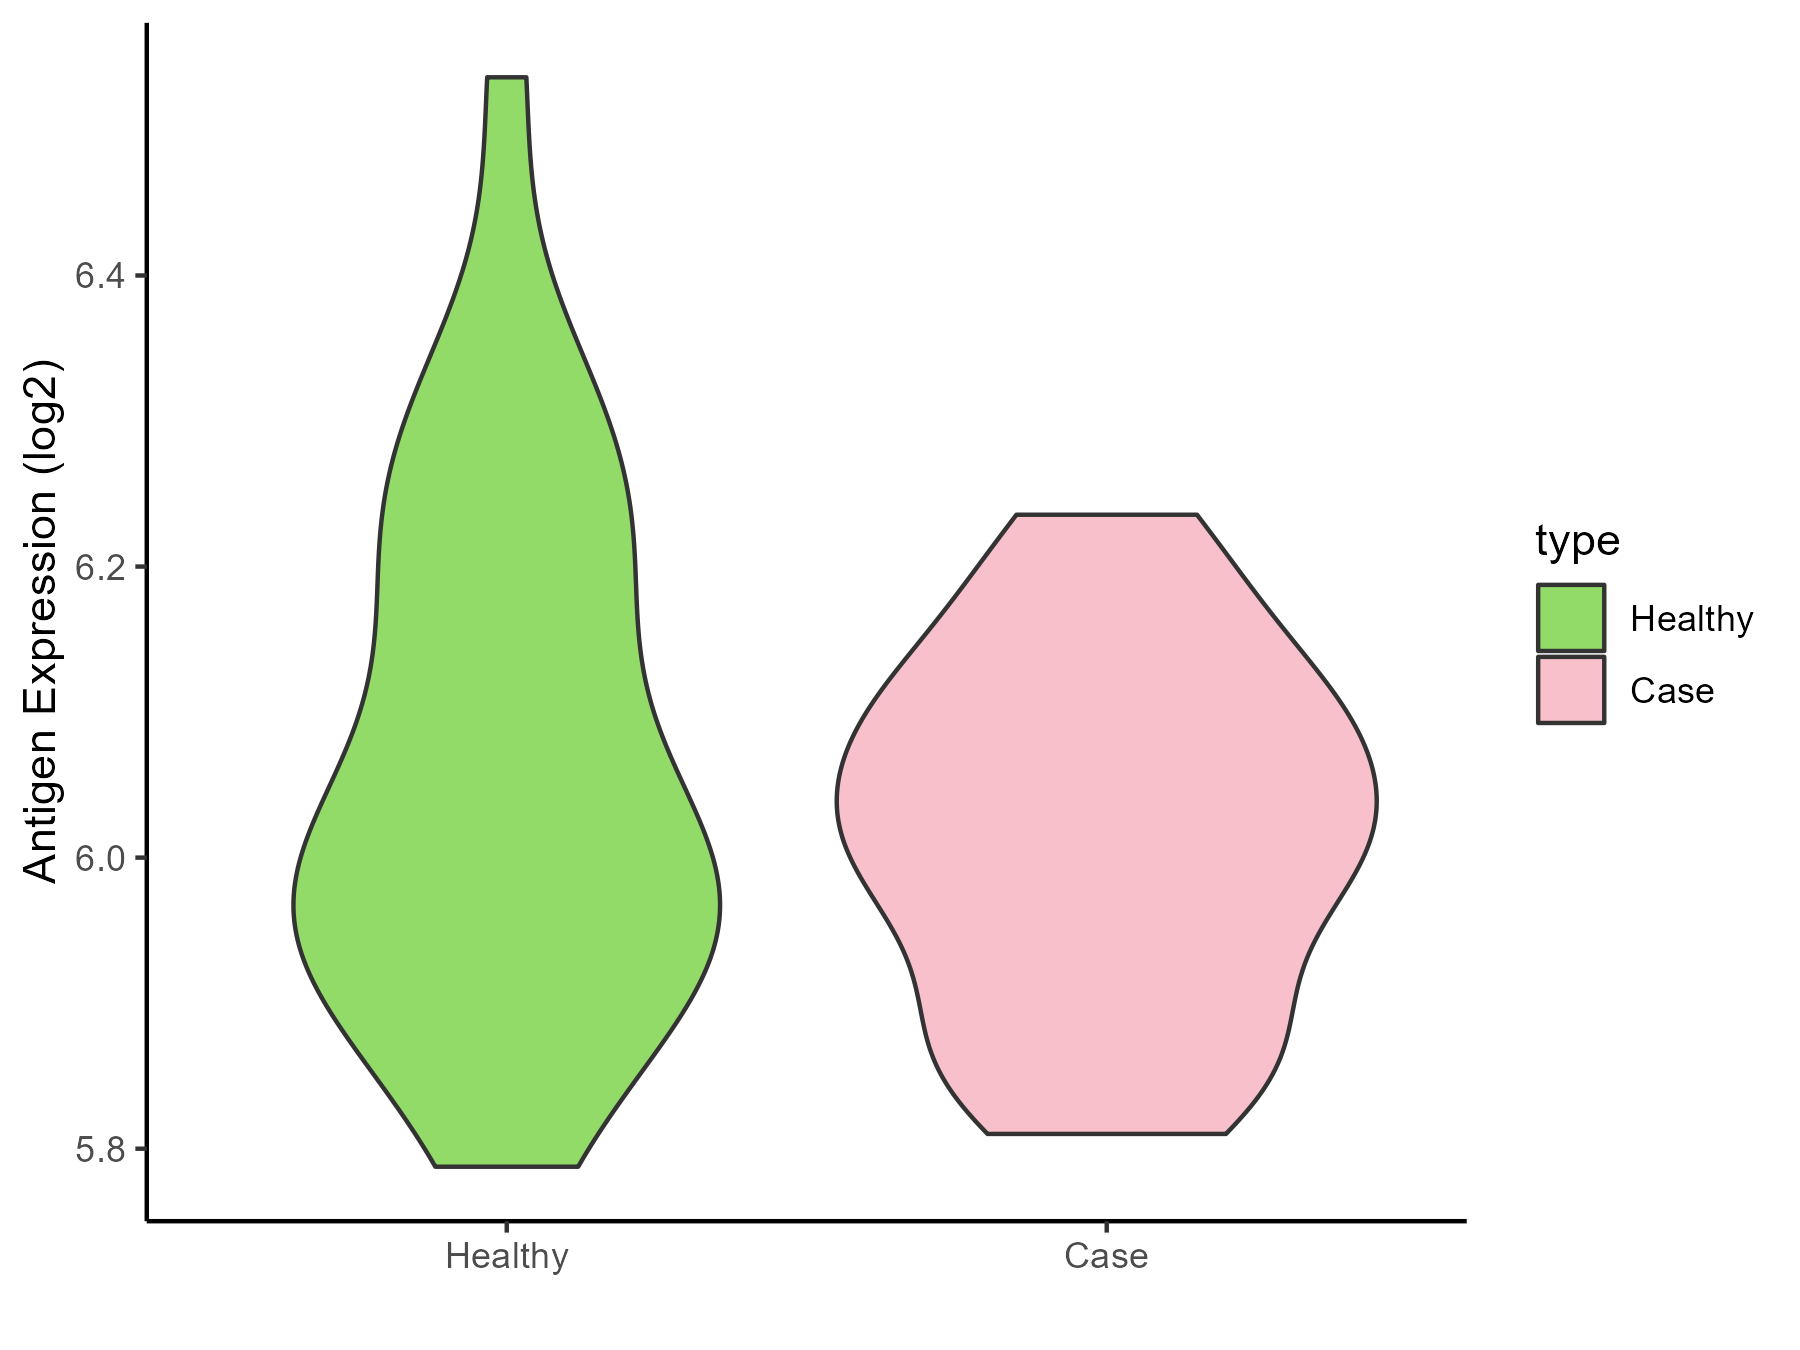
| The Specific Disease | Obesity | |
| The Expression Level of Disease Section Compare with the Healthy Individual Tissue | p-value: 0.2034344; Fold-change: 0.005306277; Z-score: 0.029266669 | |
| Disease-specific Antigen Abundances |
|
Click to View the Clearer Original Diagram |
| Differential expression pattern of antigen in diseases | ||
| The Studied Tissue | Biceps muscle | |
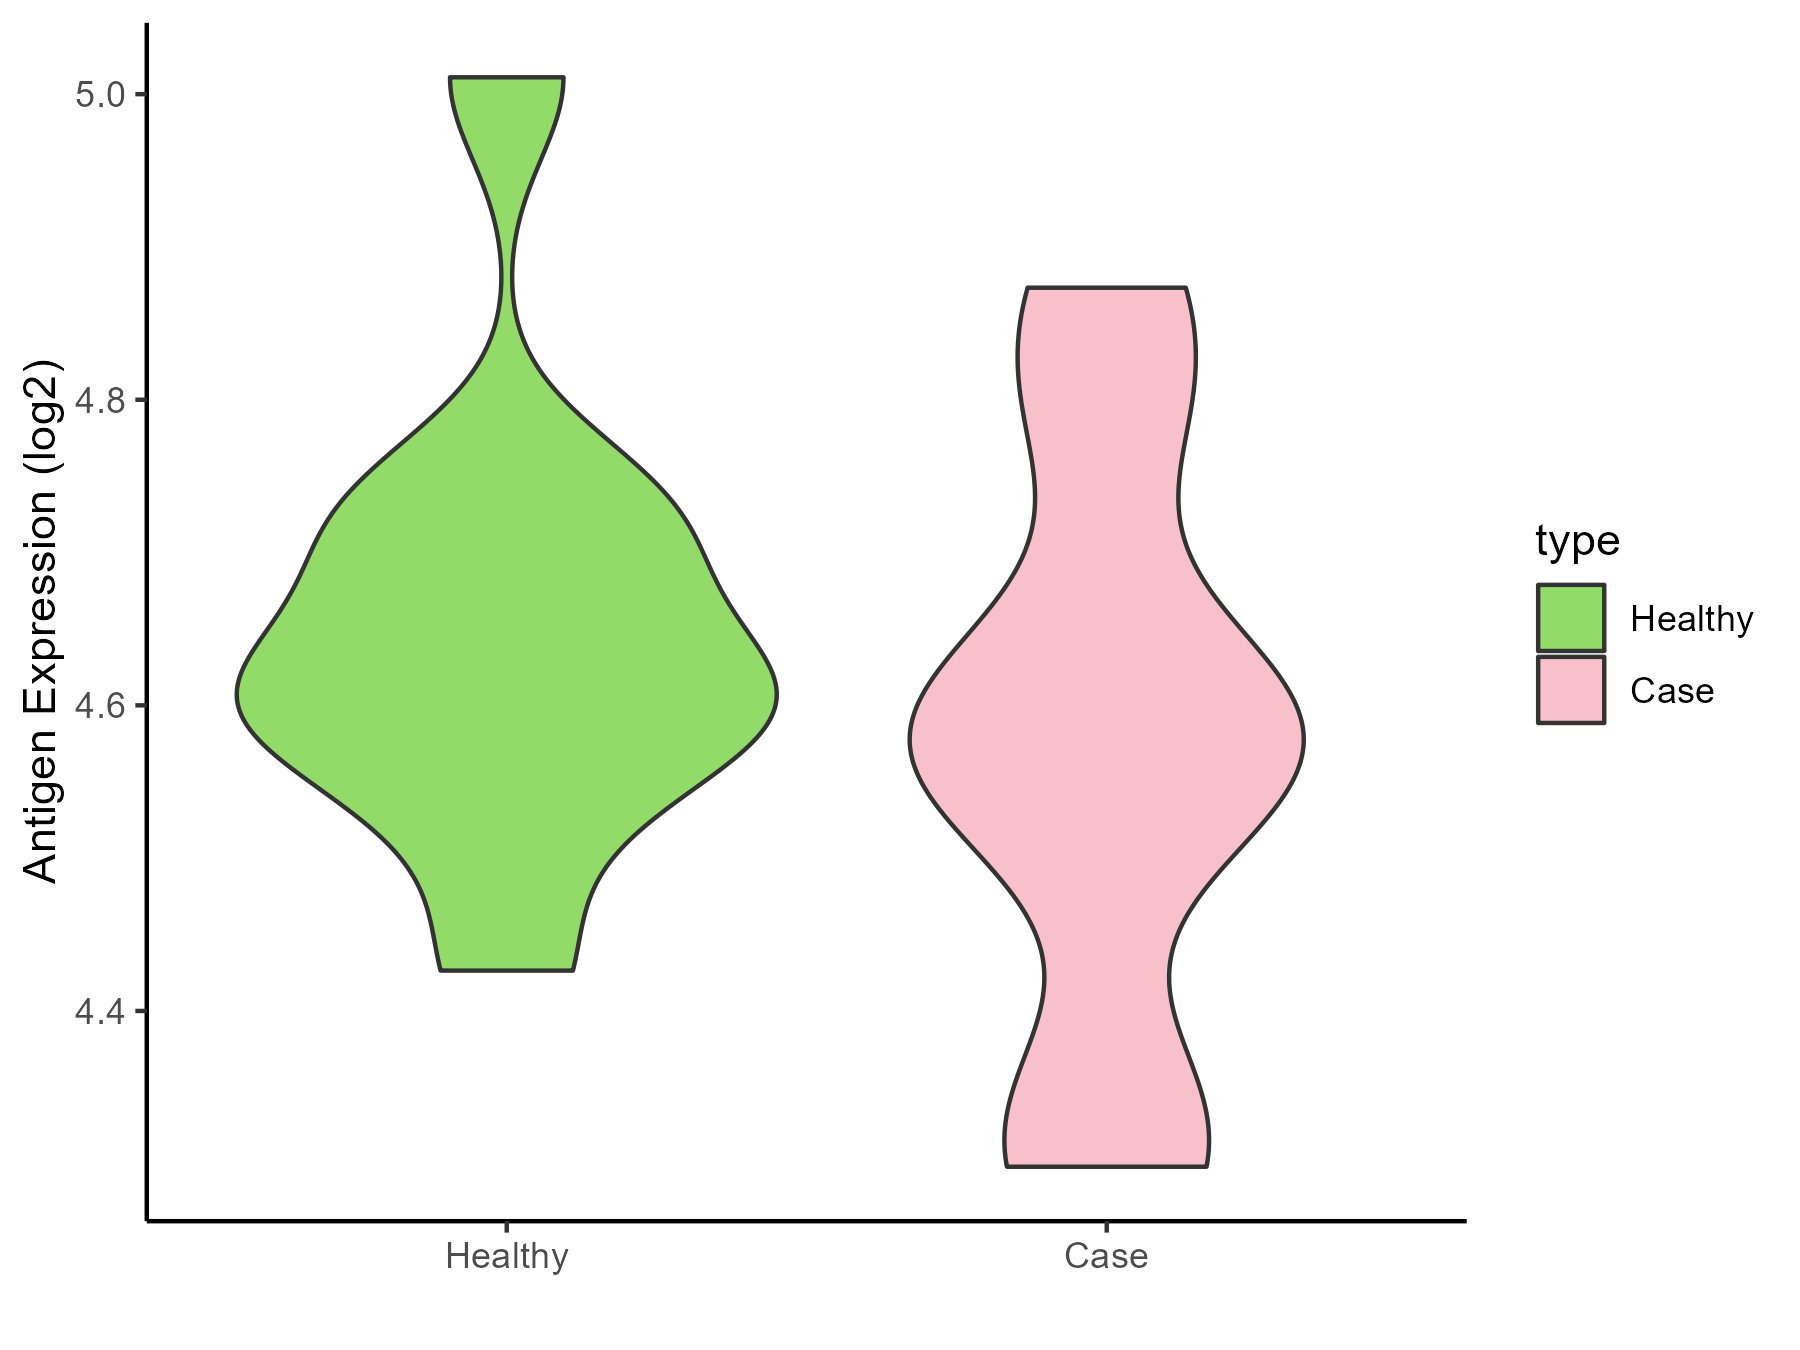
| The Specific Disease | Pompe disease | |
| The Expression Level of Disease Section Compare with the Healthy Individual Tissue | p-value: 0.372979213; Fold-change: -0.030995272; Z-score: -0.199055071 | |
| Disease-specific Antigen Abundances |
|
Click to View the Clearer Original Diagram |
| Differential expression pattern of antigen in diseases | ||
| The Studied Tissue | Whole blood | |
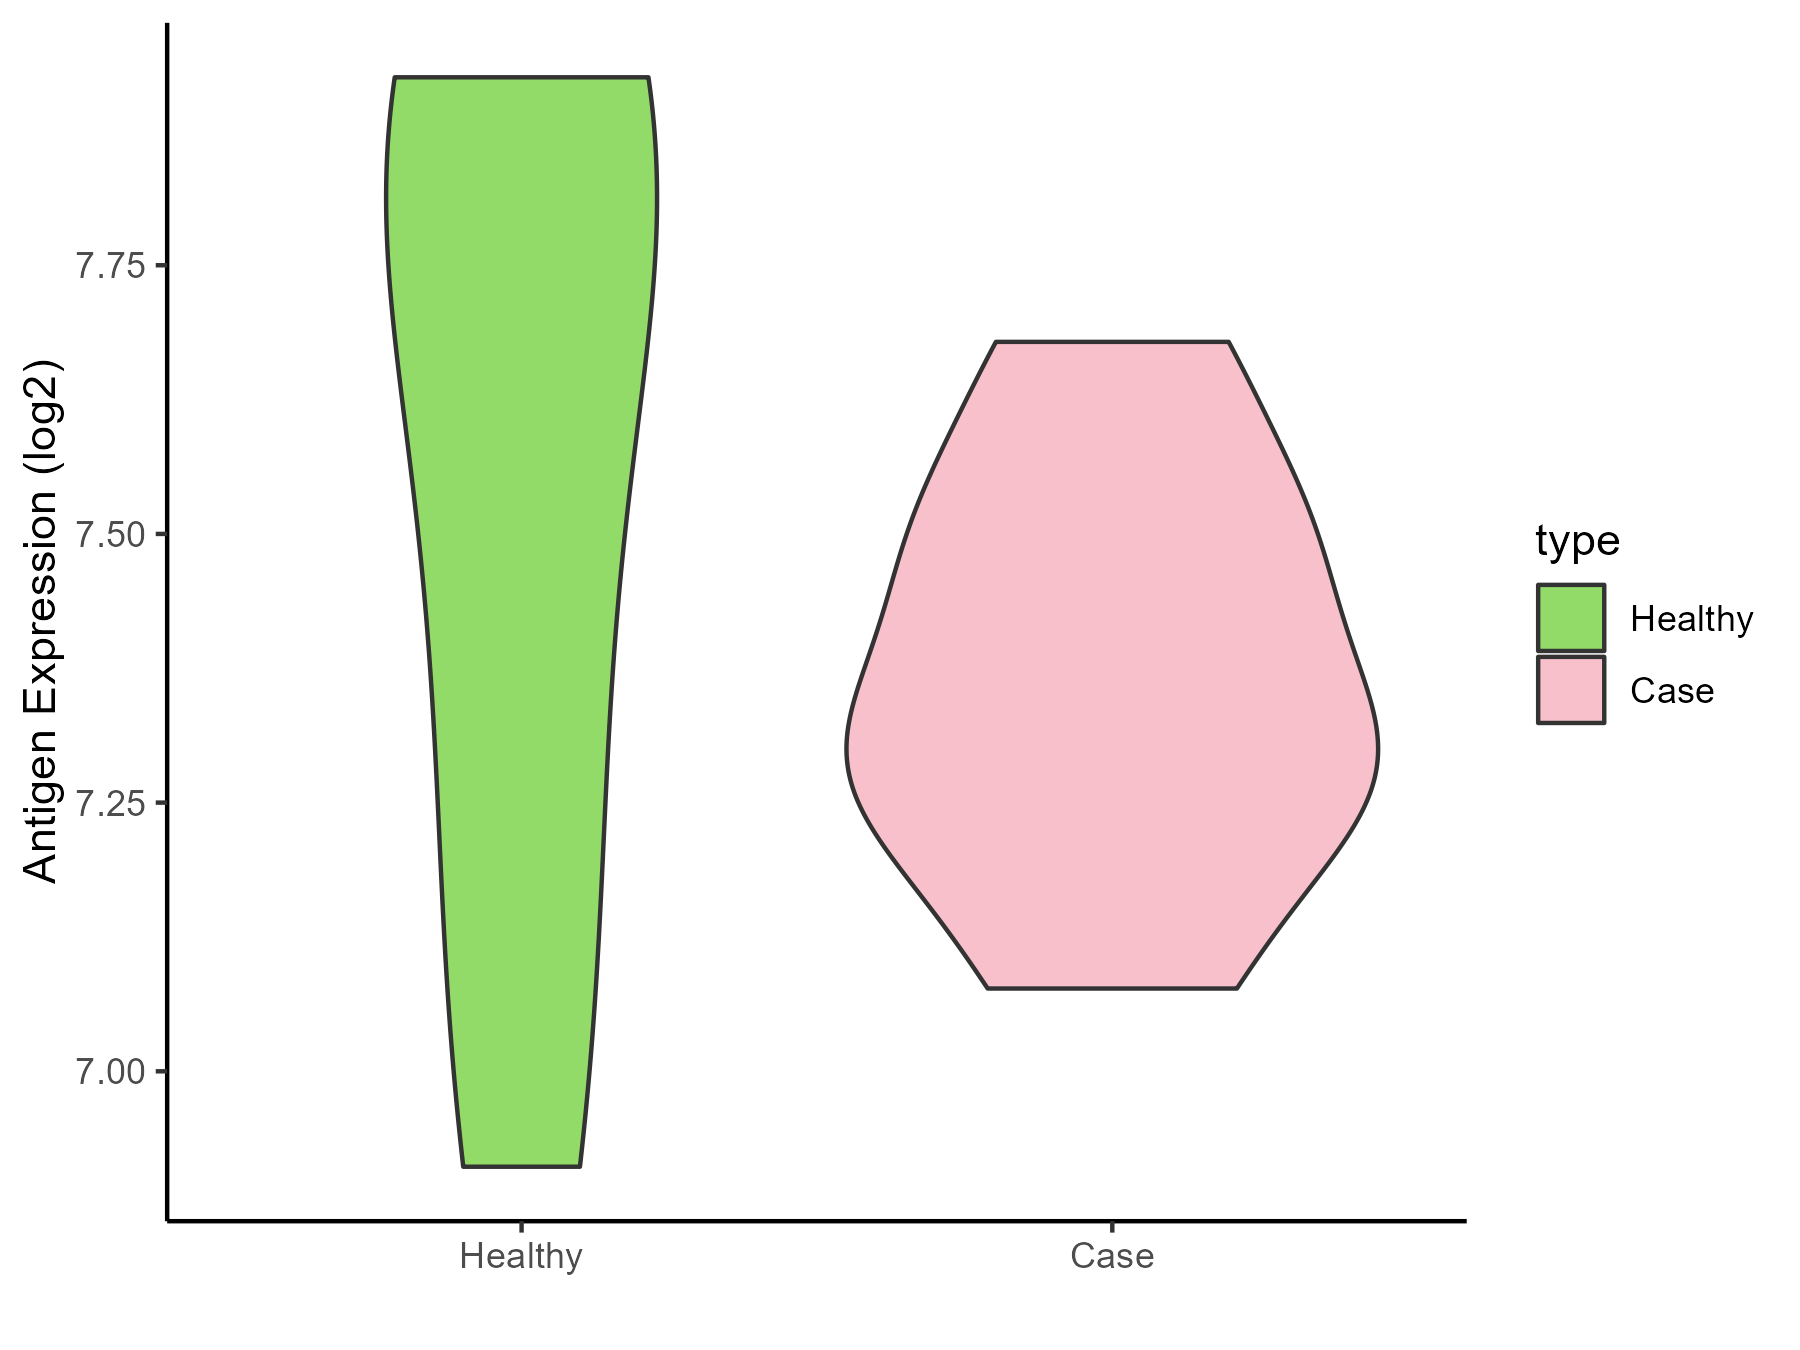
| The Specific Disease | Batten disease | |
| The Expression Level of Disease Section Compare with the Healthy Individual Tissue | p-value: 0.297050366; Fold-change: -0.340645003; Z-score: -0.850792706 | |
| Disease-specific Antigen Abundances |
|
Click to View the Clearer Original Diagram |
ICD Disease Classification 6
| Differential expression pattern of antigen in diseases | ||
| The Studied Tissue | Whole blood | |
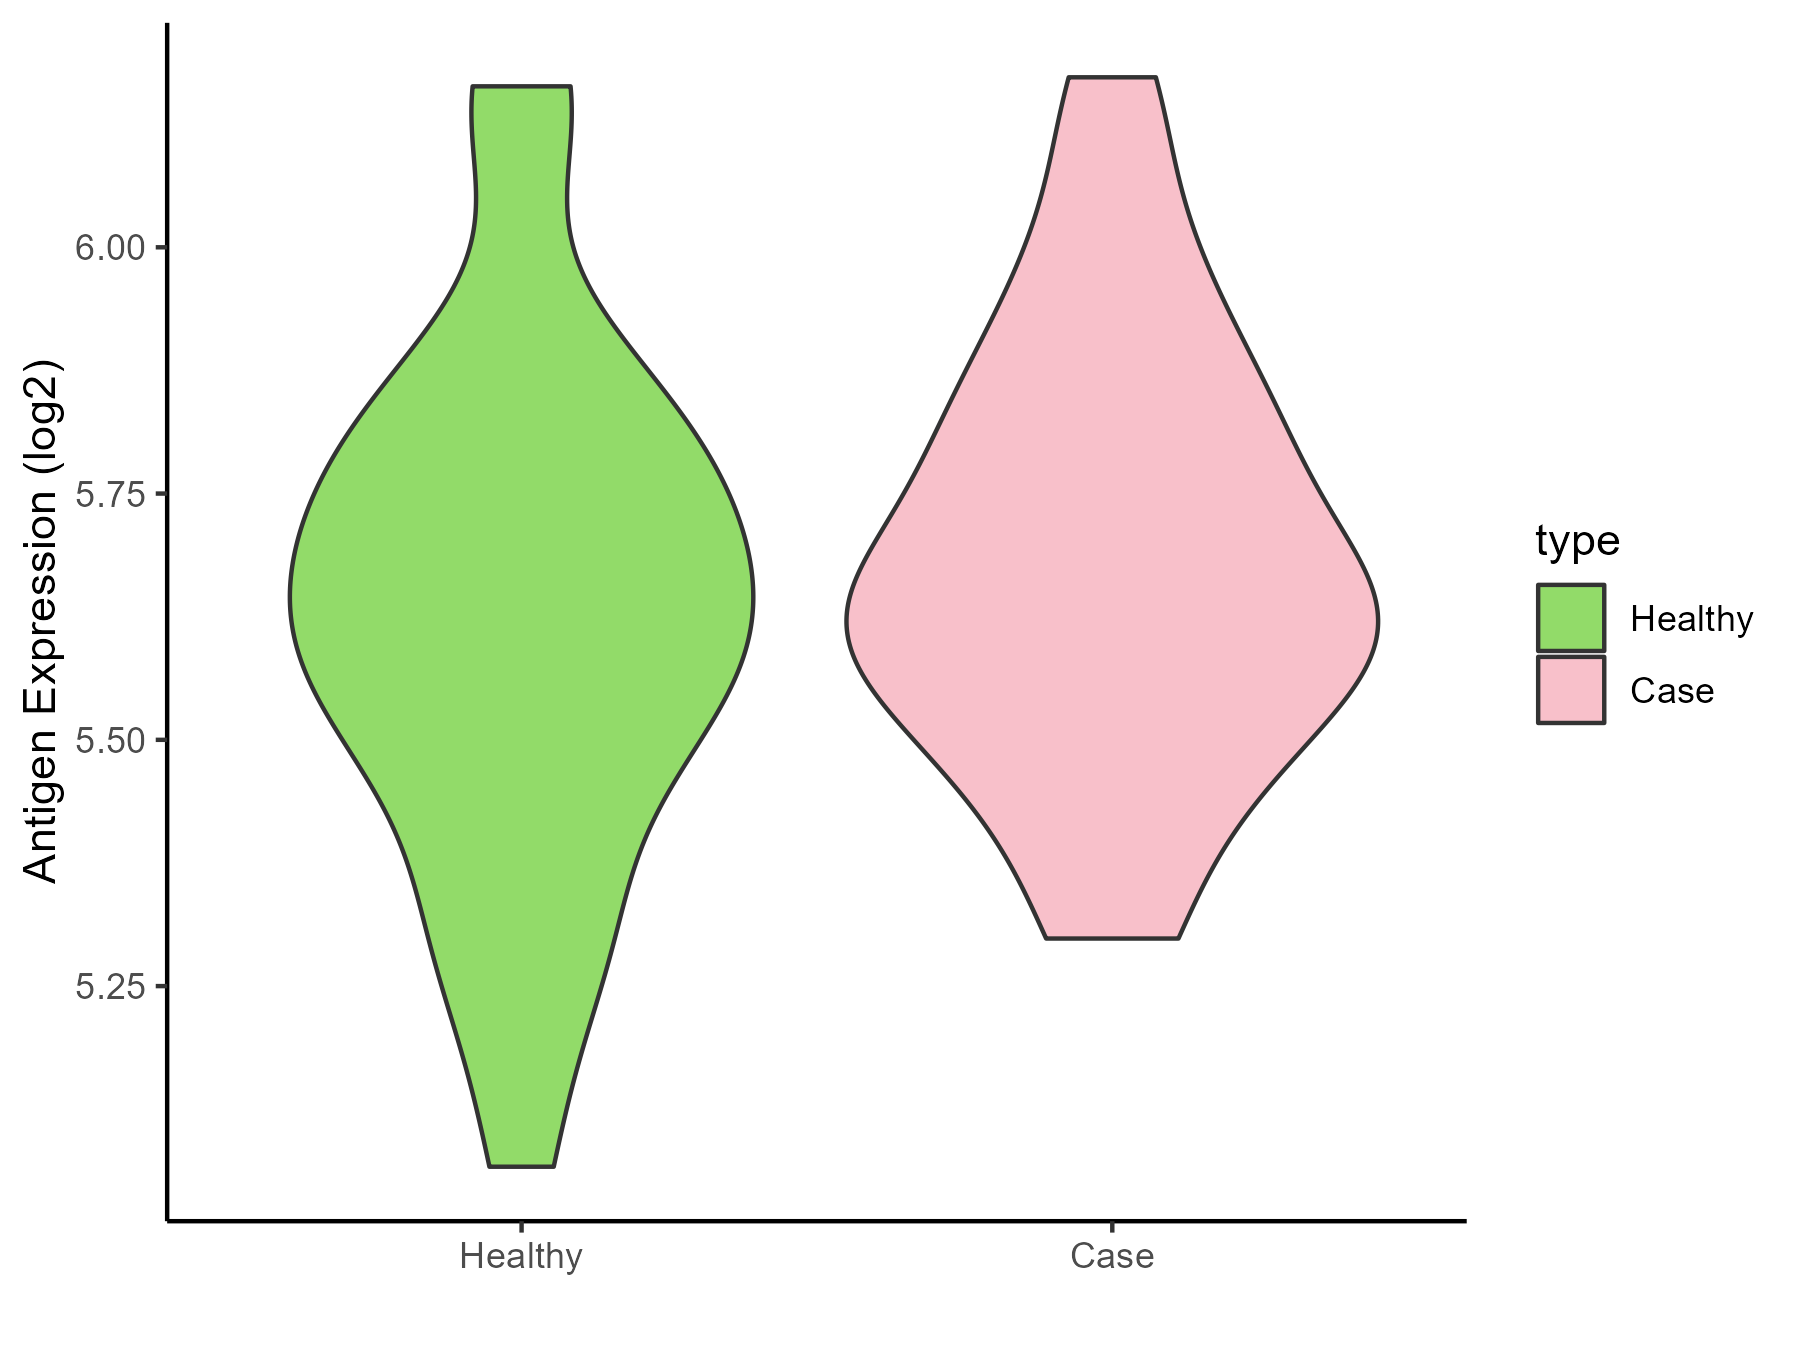
| The Specific Disease | Autism | |
| The Expression Level of Disease Section Compare with the Healthy Individual Tissue | p-value: 0.369714639; Fold-change: -0.003665534; Z-score: -0.014098975 | |
| Disease-specific Antigen Abundances |
|
Click to View the Clearer Original Diagram |
| Differential expression pattern of antigen in diseases | ||
| The Studied Tissue | Whole blood | |
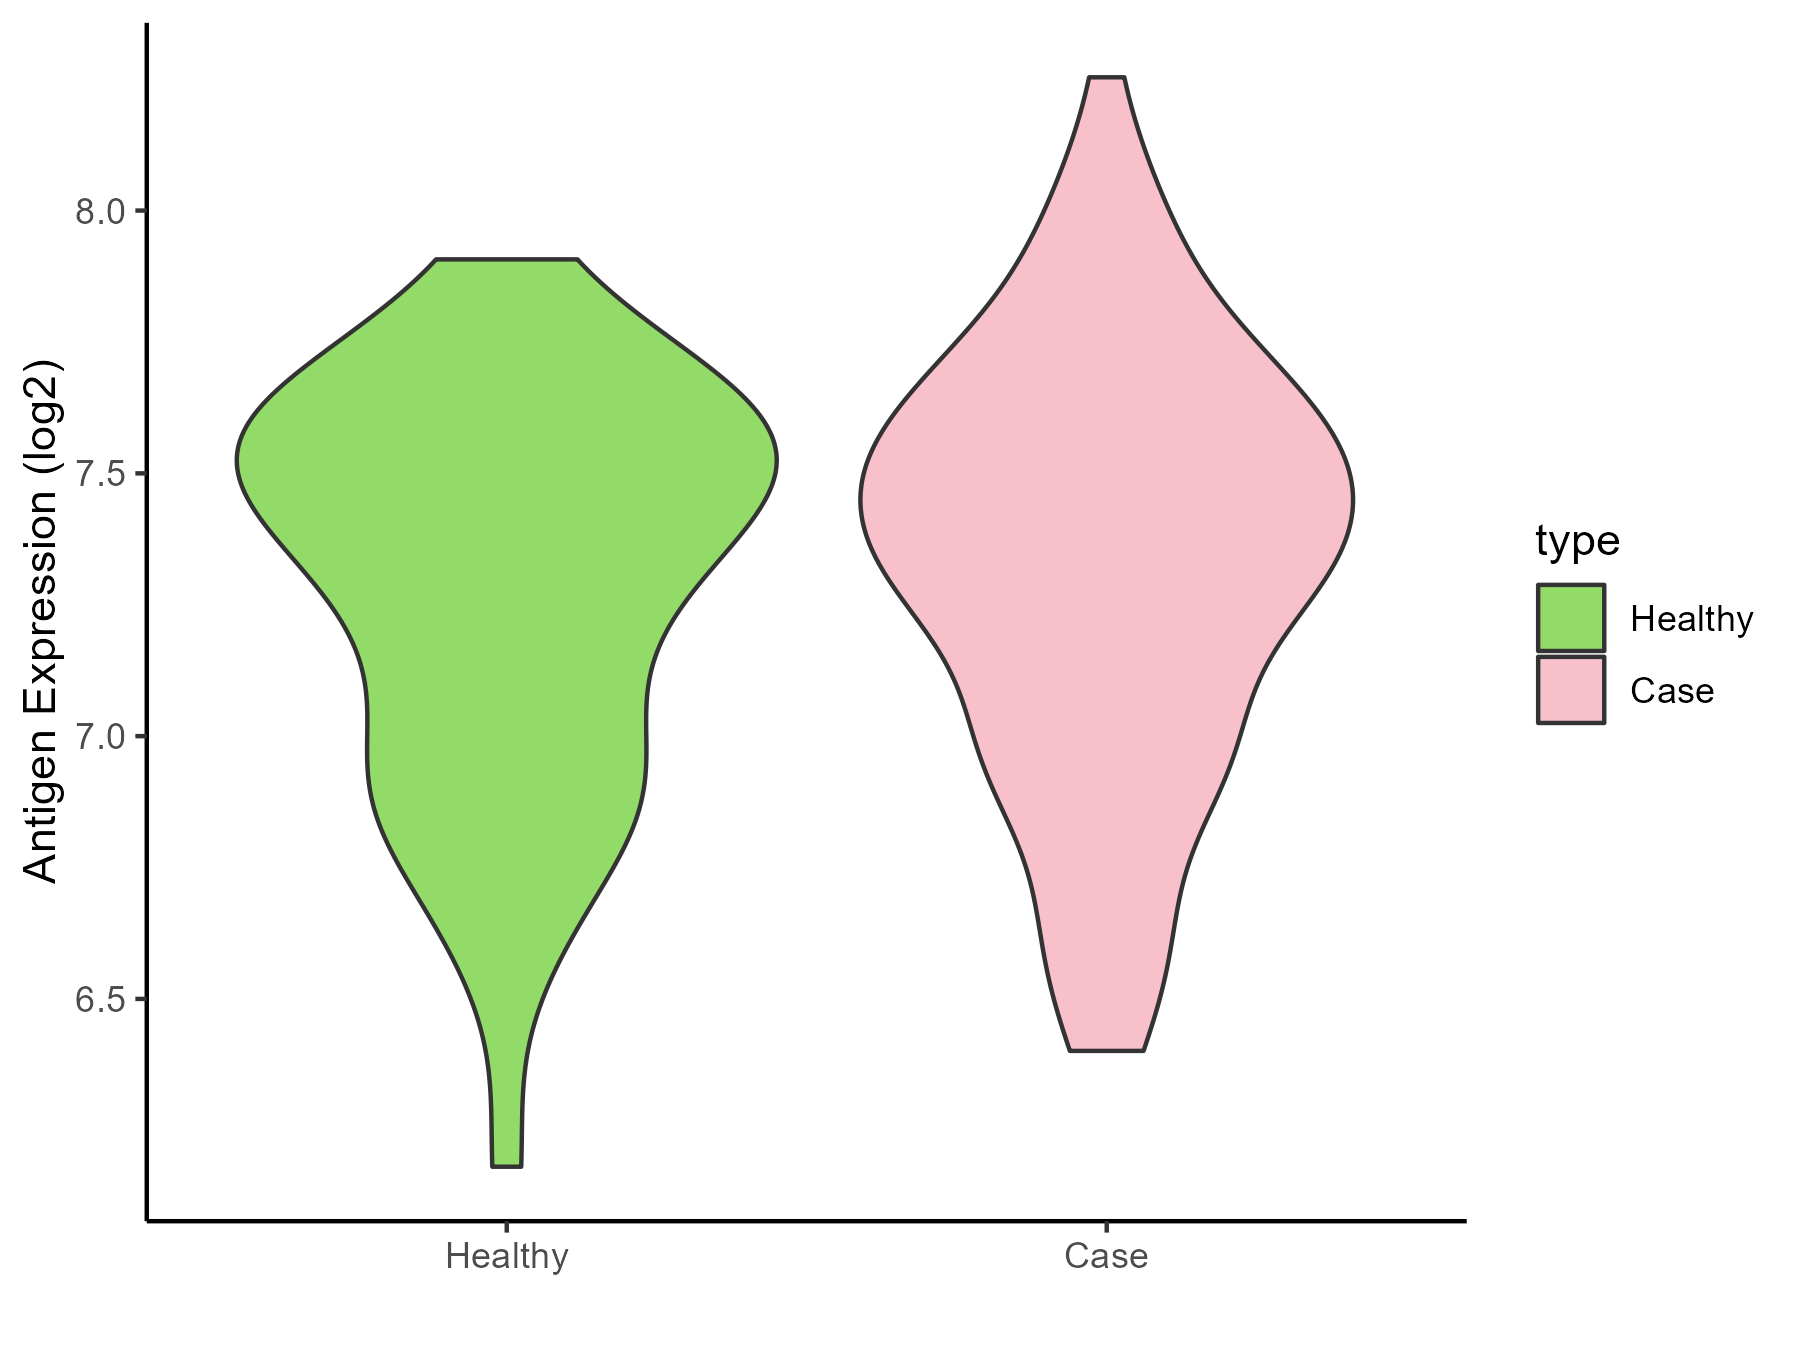
| The Specific Disease | Anxiety disorder | |
| The Expression Level of Disease Section Compare with the Healthy Individual Tissue | p-value: 0.597467251; Fold-change: -0.019240482; Z-score: -0.050224782 | |
| Disease-specific Antigen Abundances |
|
Click to View the Clearer Original Diagram |
ICD Disease Classification 8
| Differential expression pattern of antigen in diseases | ||
| The Studied Tissue | Substantia nigra | |
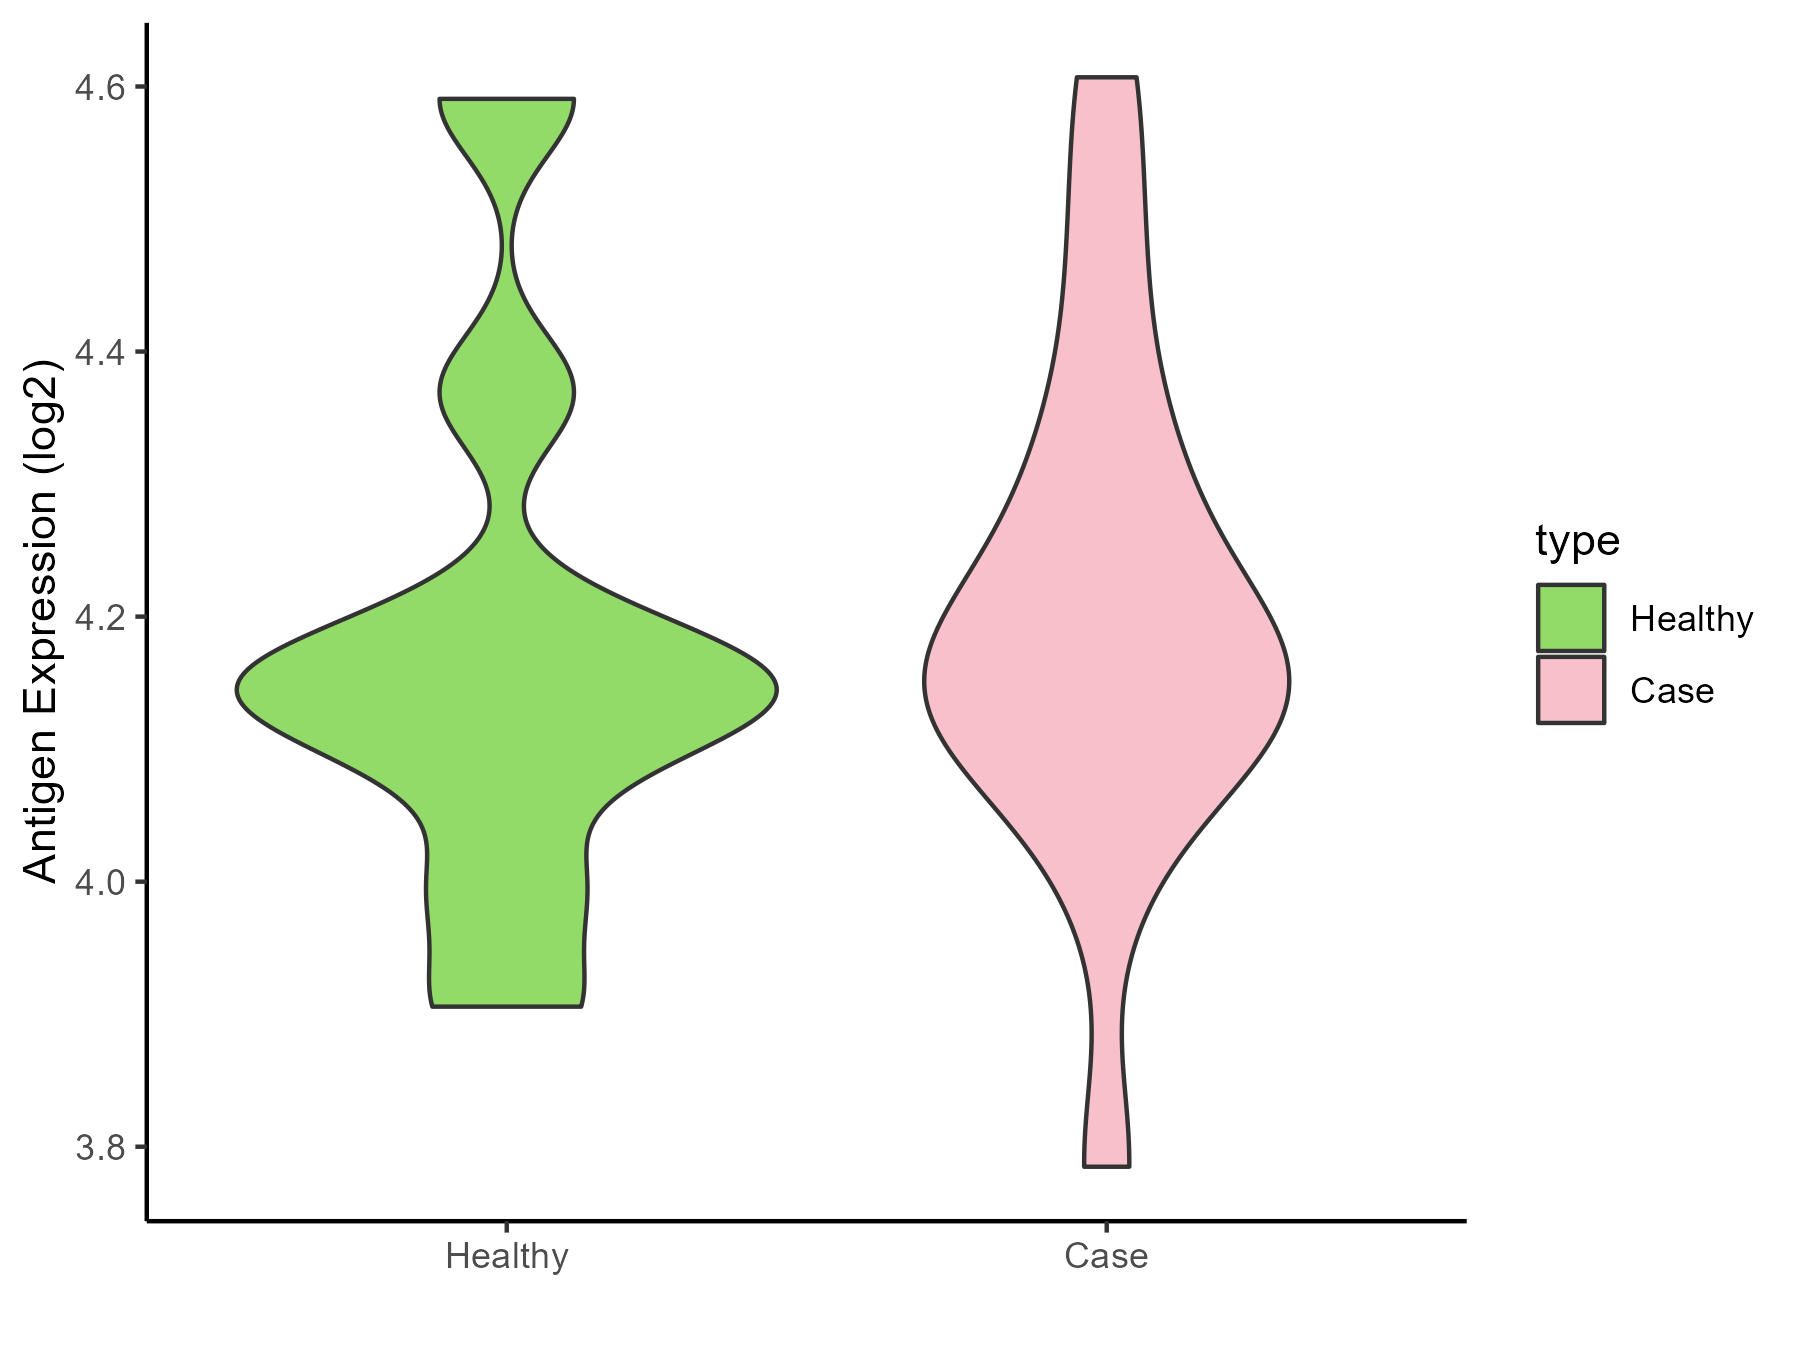
| The Specific Disease | Parkinson disease | |
| The Expression Level of Disease Section Compare with the Healthy Individual Tissue | p-value: 0.742837748; Fold-change: 0.017887332; Z-score: 0.088761654 | |
| Disease-specific Antigen Abundances |
|
Click to View the Clearer Original Diagram |
| Differential expression pattern of antigen in diseases | ||
| The Studied Tissue | Whole blood | |
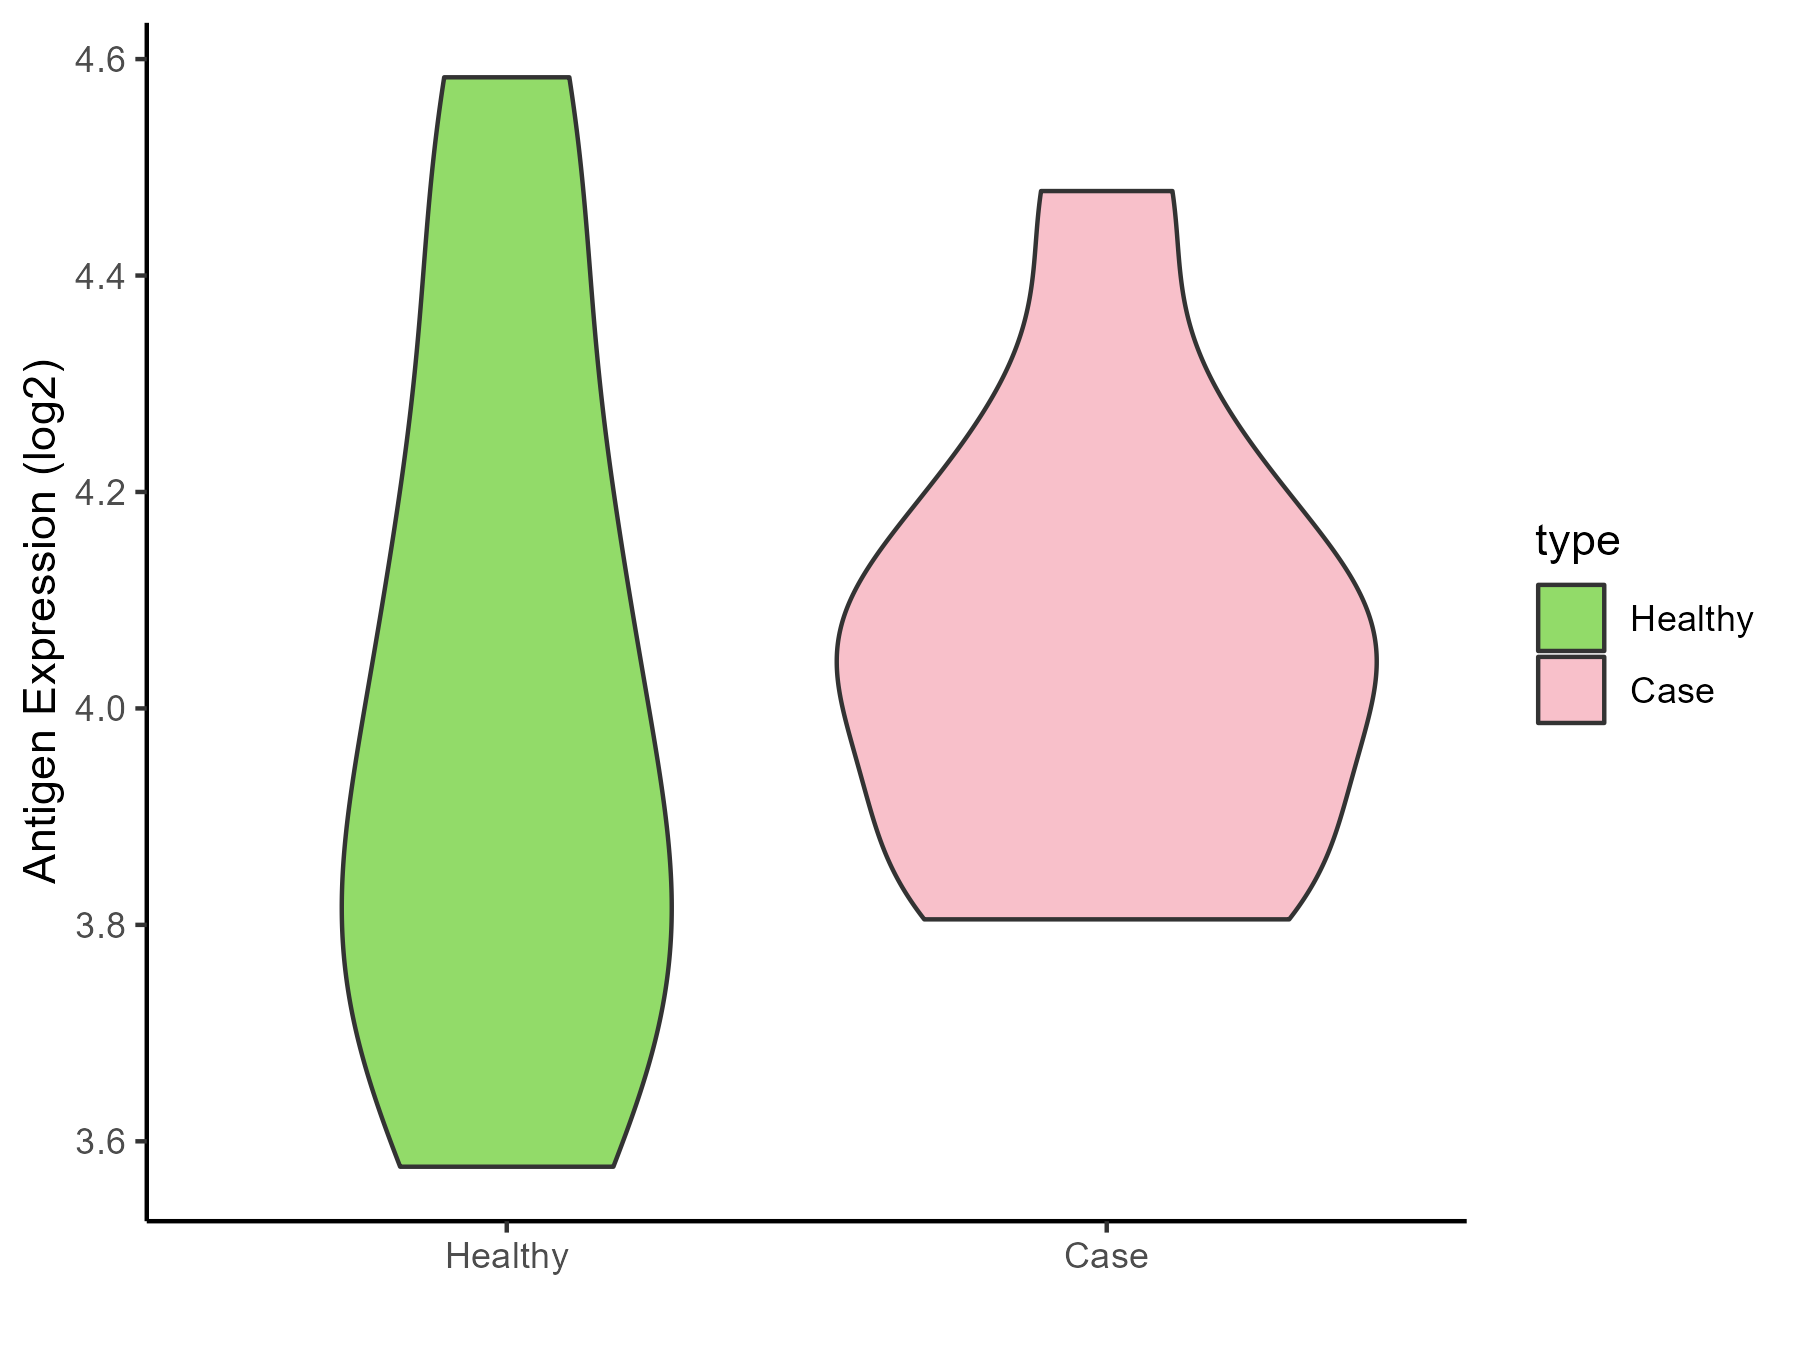
| The Specific Disease | Huntington disease | |
| The Expression Level of Disease Section Compare with the Healthy Individual Tissue | p-value: 0.6839406; Fold-change: 0.179025419; Z-score: 0.533774929 | |
| Disease-specific Antigen Abundances |
|
Click to View the Clearer Original Diagram |
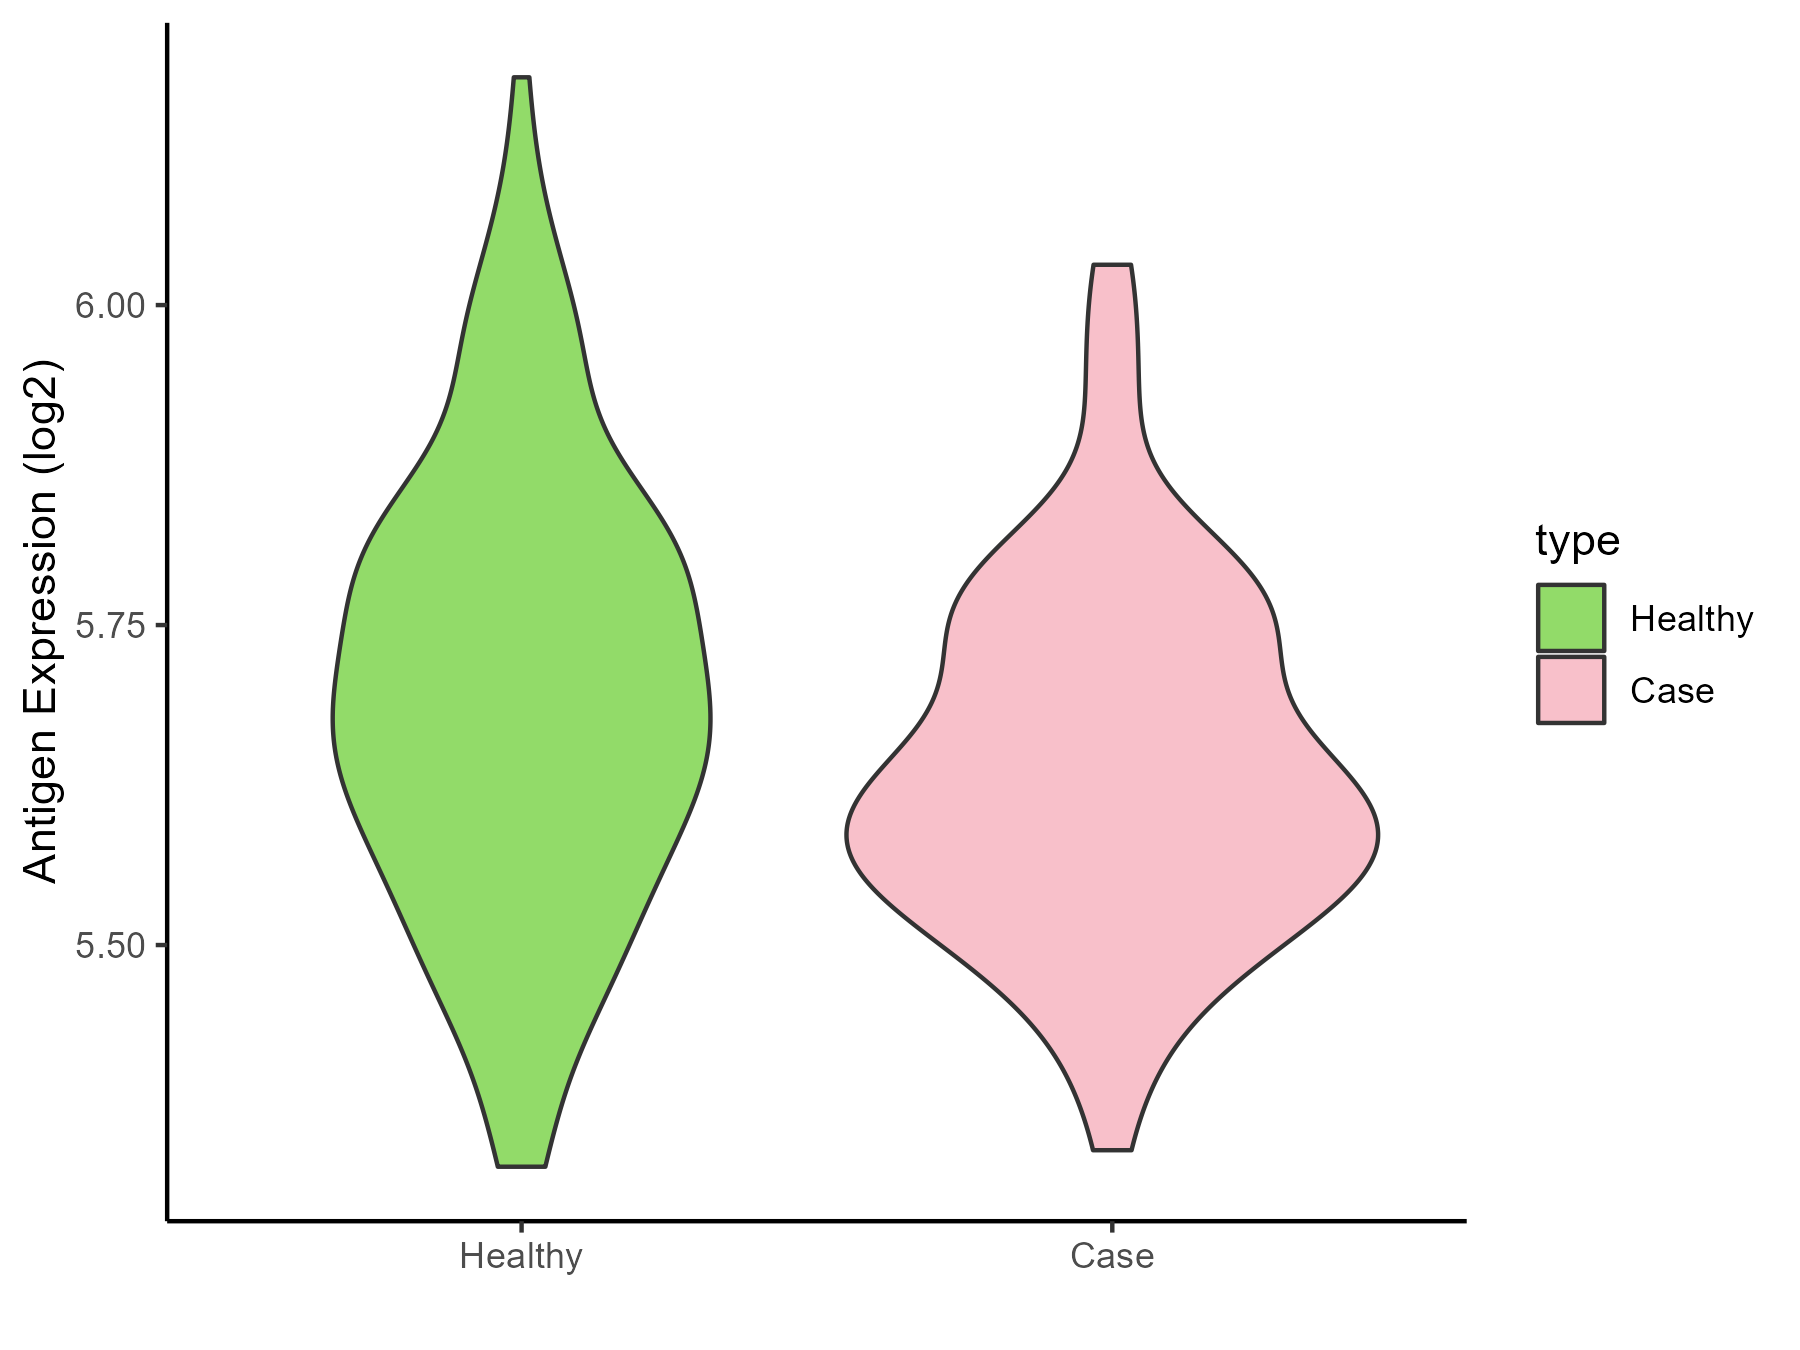
| Differential expression pattern of antigen in diseases | ||
| The Studied Tissue | Entorhinal cortex | |
| The Specific Disease | Alzheimer disease | |
| The Expression Level of Disease Section Compare with the Healthy Individual Tissue | p-value: 0.005520943; Fold-change: -0.071109321; Z-score: -0.4136568 | |
| Disease-specific Antigen Abundances |
|
Click to View the Clearer Original Diagram |
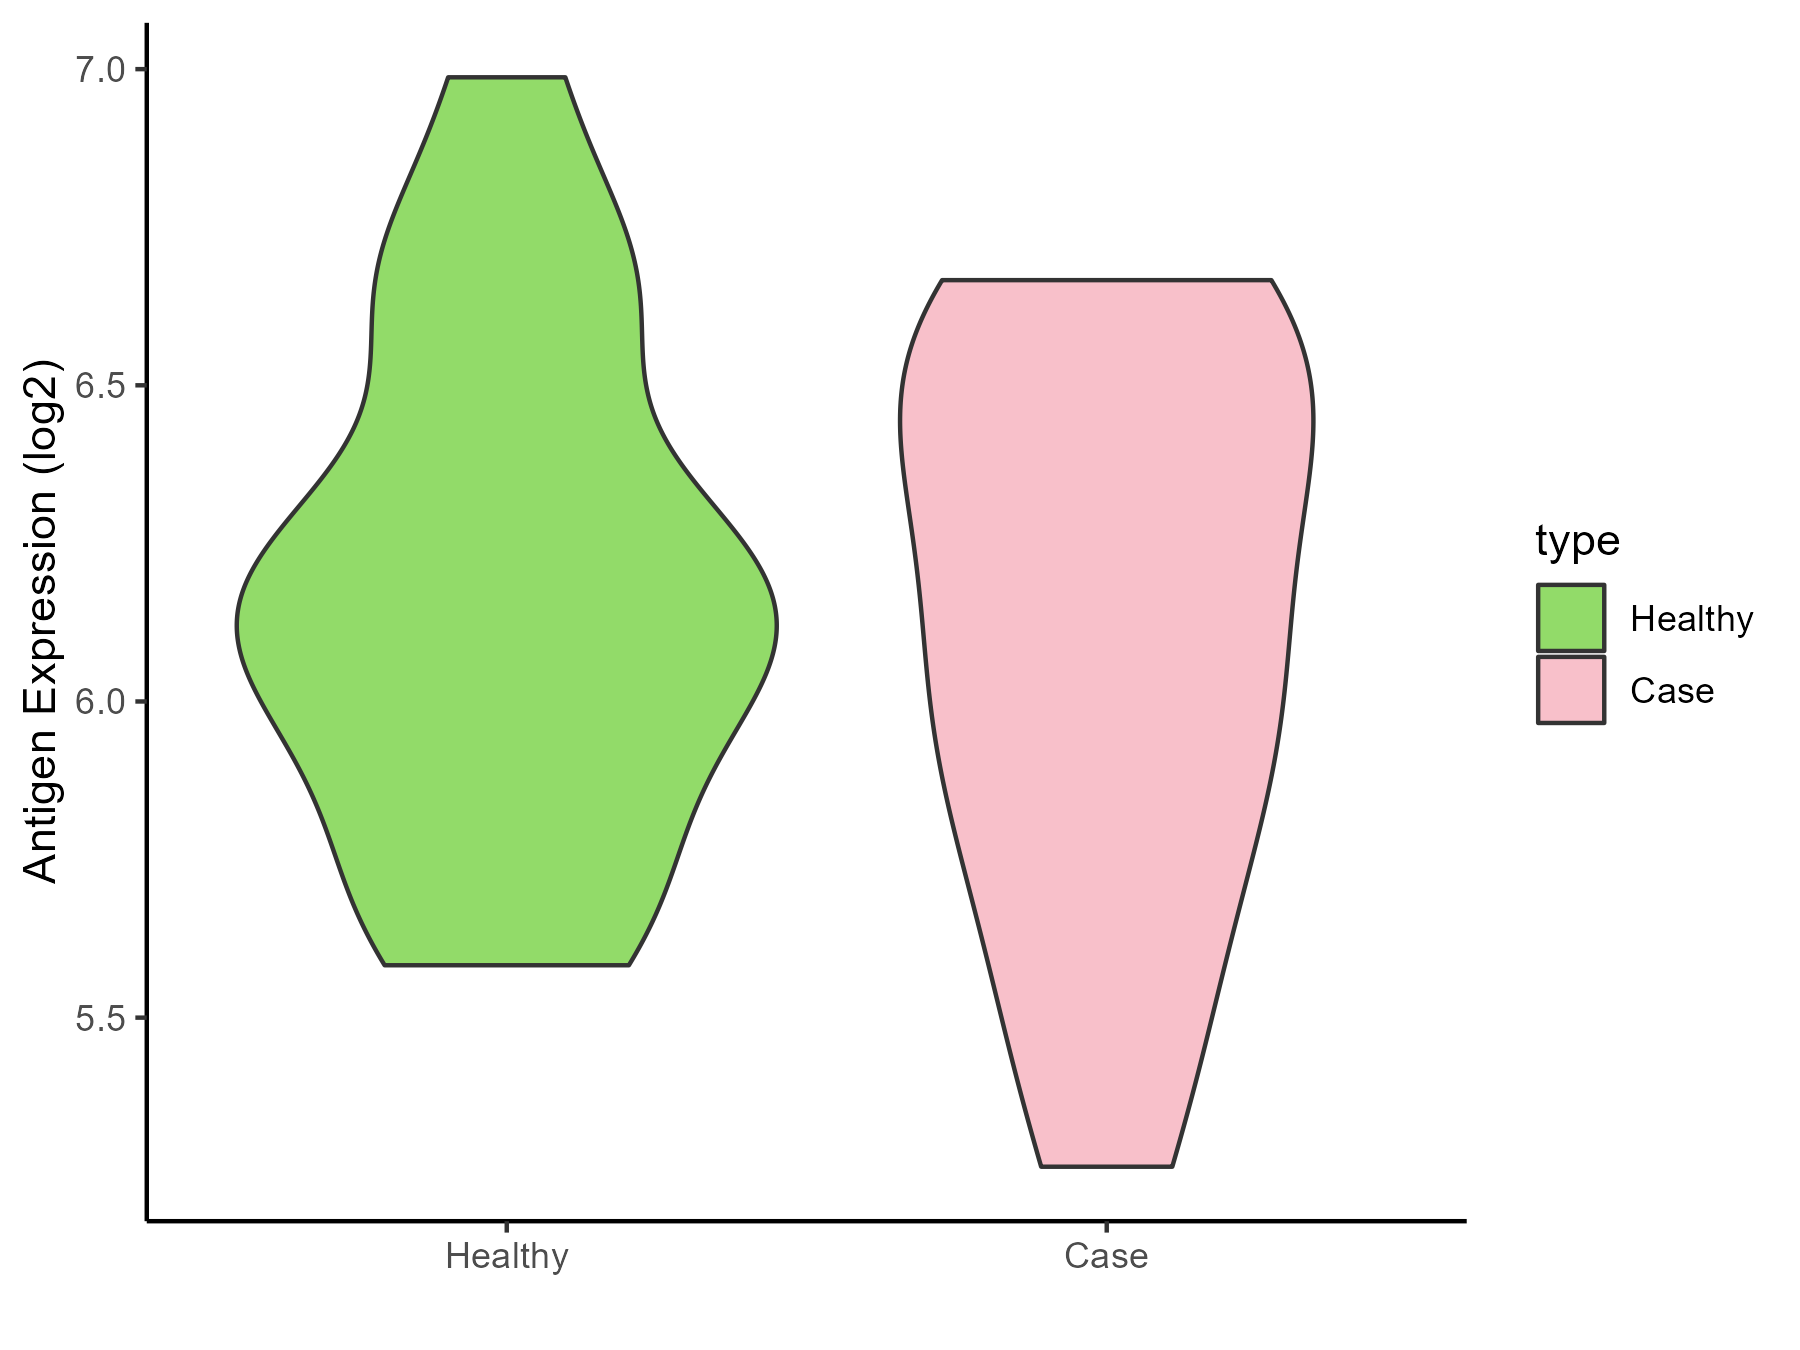
| Differential expression pattern of antigen in diseases | ||
| The Studied Tissue | Whole blood | |
| The Specific Disease | Seizure | |
| The Expression Level of Disease Section Compare with the Healthy Individual Tissue | p-value: 0.67014568; Fold-change: 0.017729083; Z-score: 0.044067523 | |
| Disease-specific Antigen Abundances |
|
Click to View the Clearer Original Diagram |
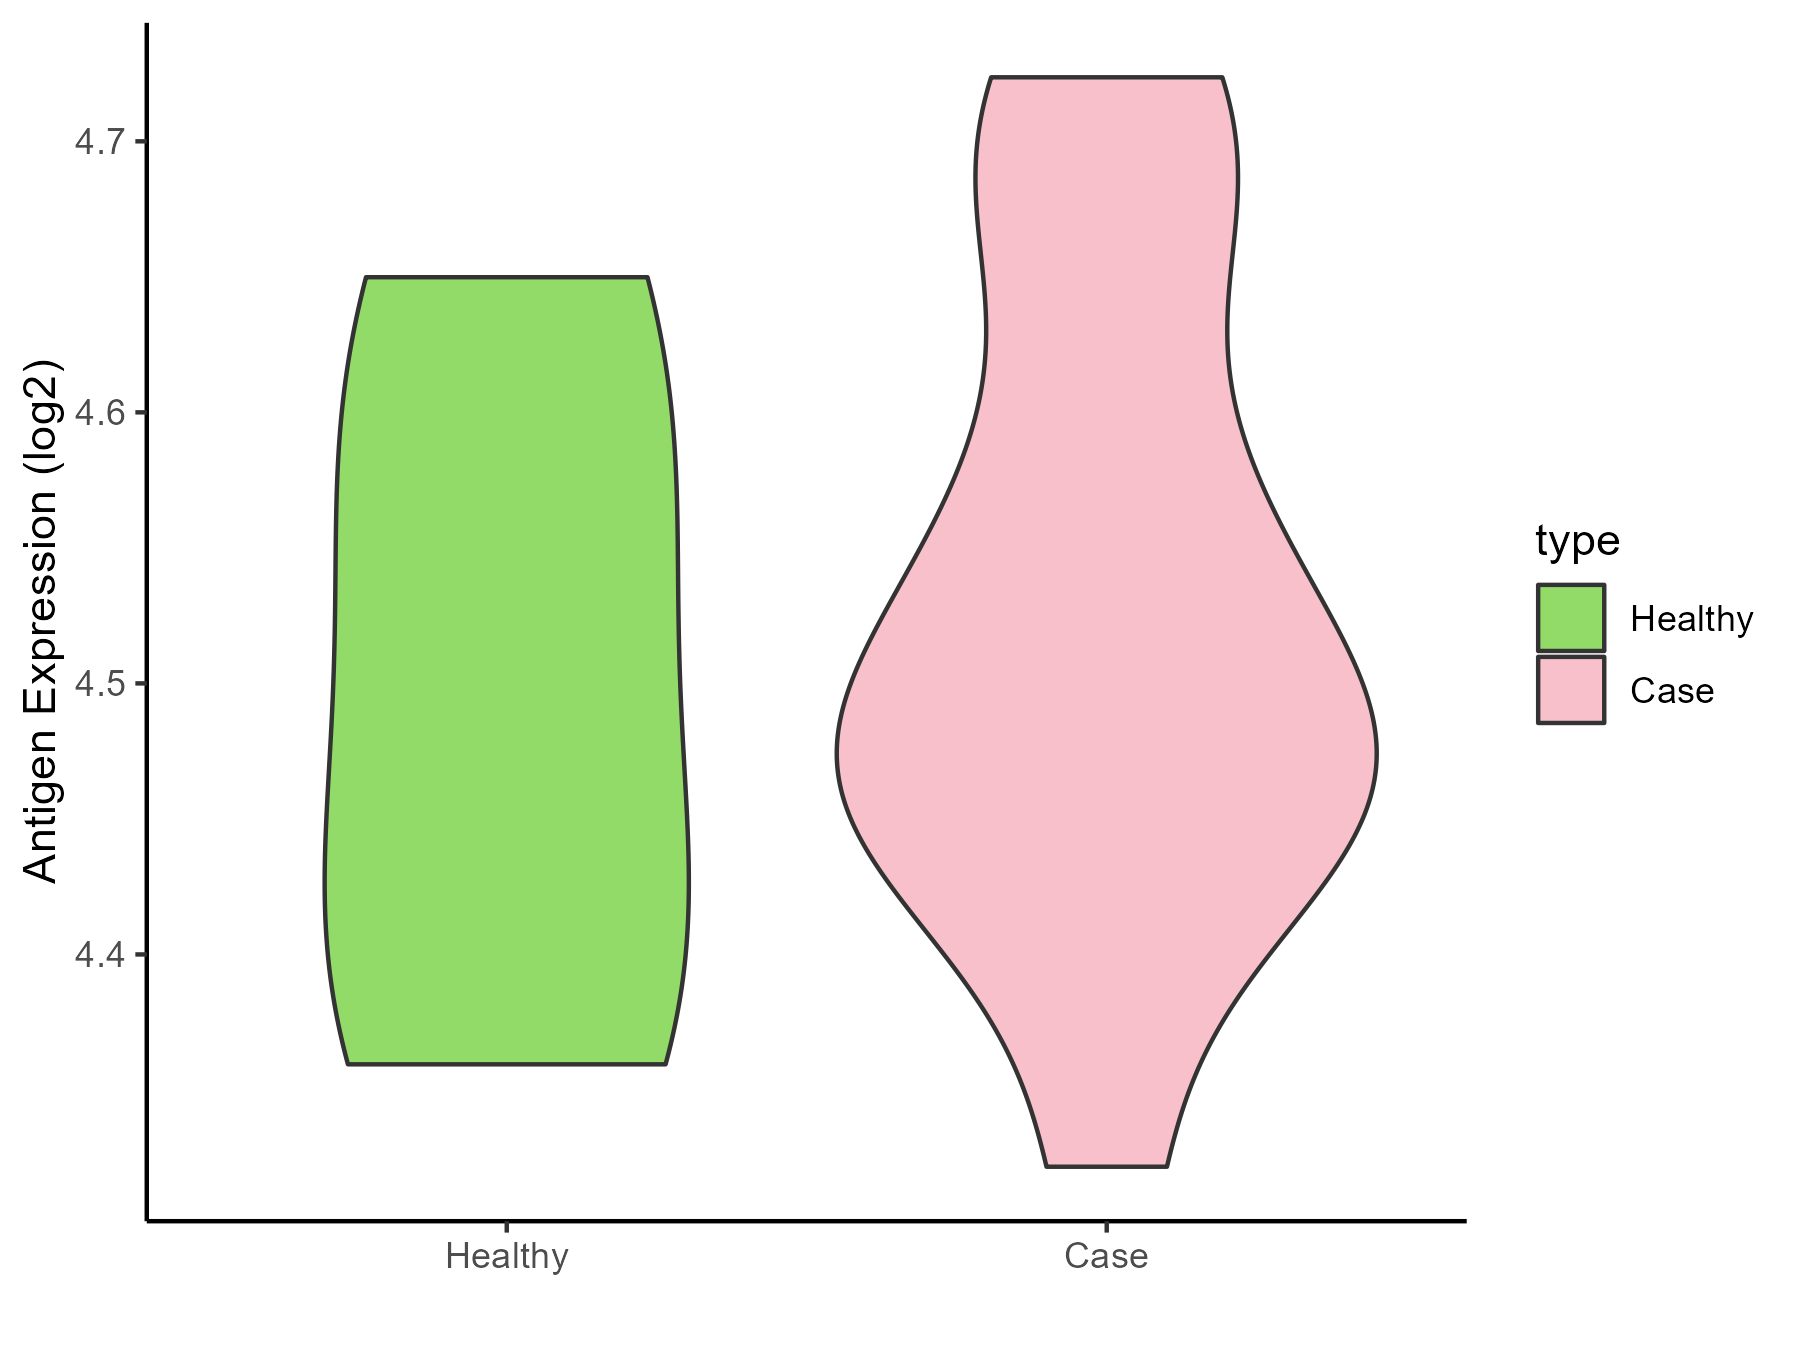
| Differential expression pattern of antigen in diseases | ||
| The Studied Tissue | Skin | |
| The Specific Disease | Lateral sclerosis | |
| The Expression Level of Disease Section Compare with the Healthy Individual Tissue | p-value: 0.70667679; Fold-change: -0.000460051; Z-score: -0.003514891 | |
| Disease-specific Antigen Abundances |
|
Click to View the Clearer Original Diagram |
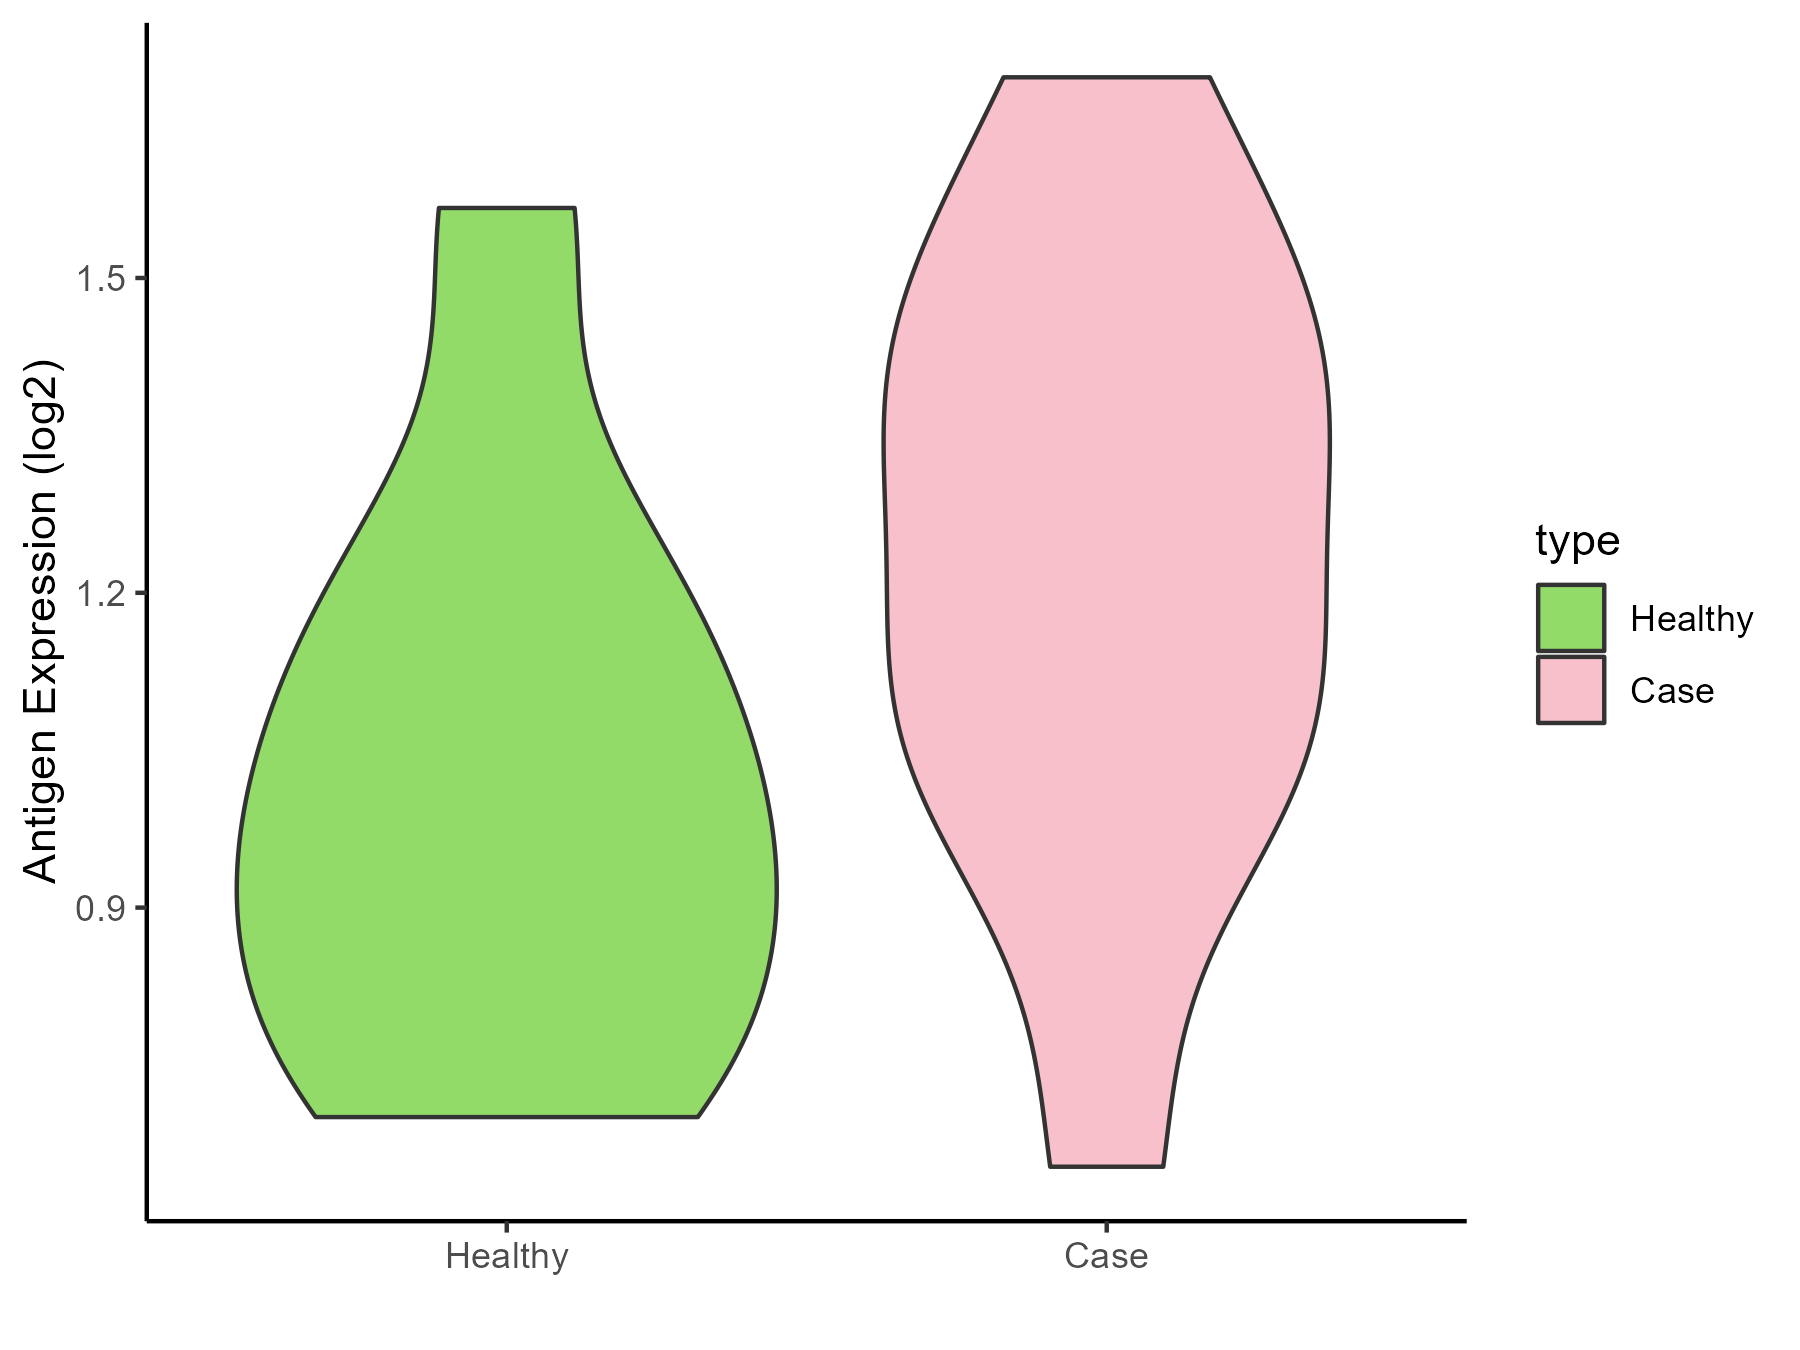
| The Studied Tissue | Cervical spinal cord | |
| The Specific Disease | Lateral sclerosis | |
| The Expression Level of Disease Section Compare with the Healthy Individual Tissue | p-value: 0.116387965; Fold-change: 0.300147544; Z-score: 1.09135371 | |
| Disease-specific Antigen Abundances |
|
Click to View the Clearer Original Diagram |
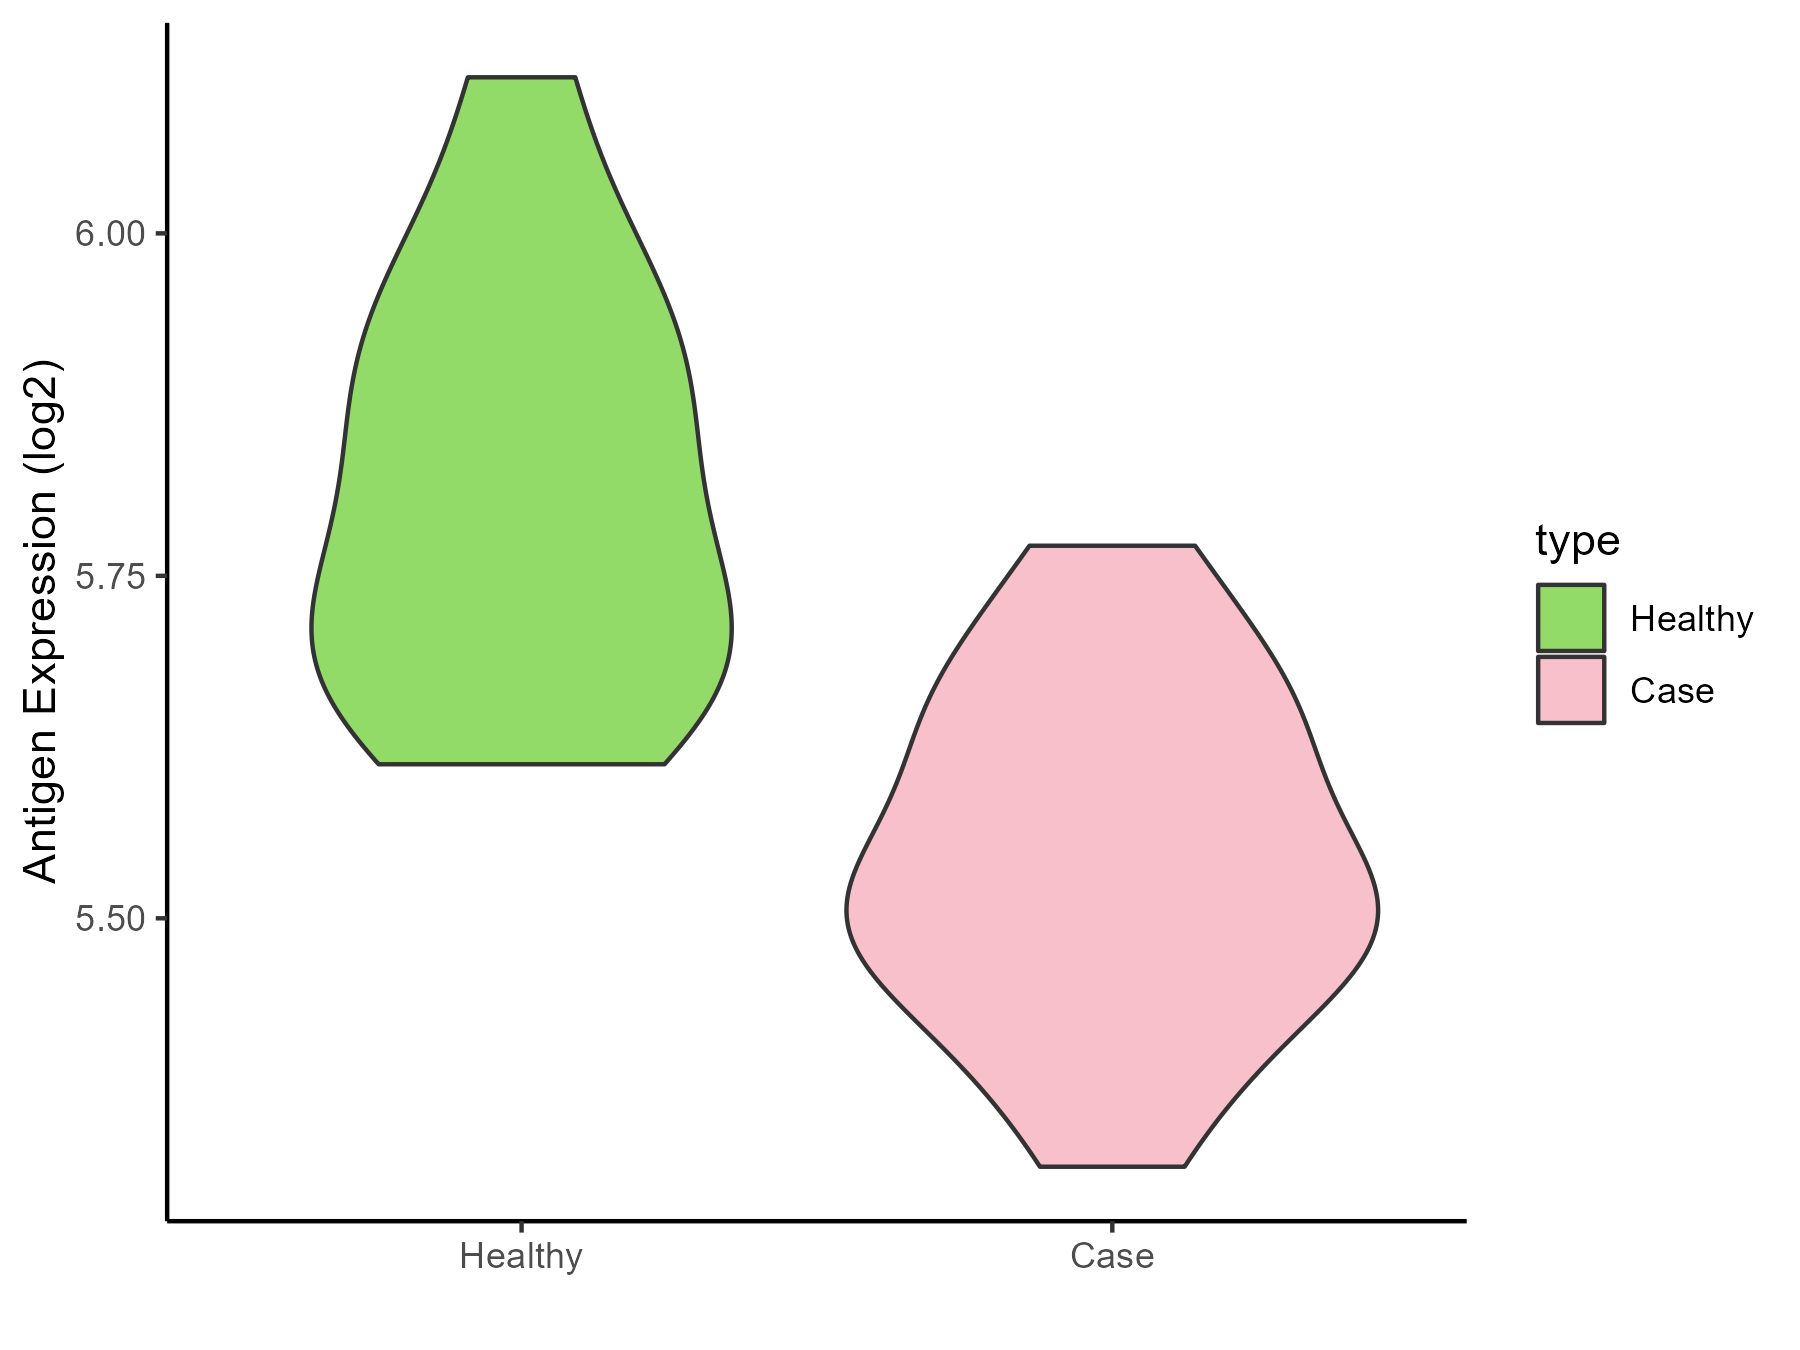
| Differential expression pattern of antigen in diseases | ||
| The Studied Tissue | Muscle | |
| The Specific Disease | Muscular atrophy | |
| The Expression Level of Disease Section Compare with the Healthy Individual Tissue | p-value: 2.94E-05; Fold-change: -0.272955904; Z-score: -1.803002735 | |
| Disease-specific Antigen Abundances |
|
Click to View the Clearer Original Diagram |
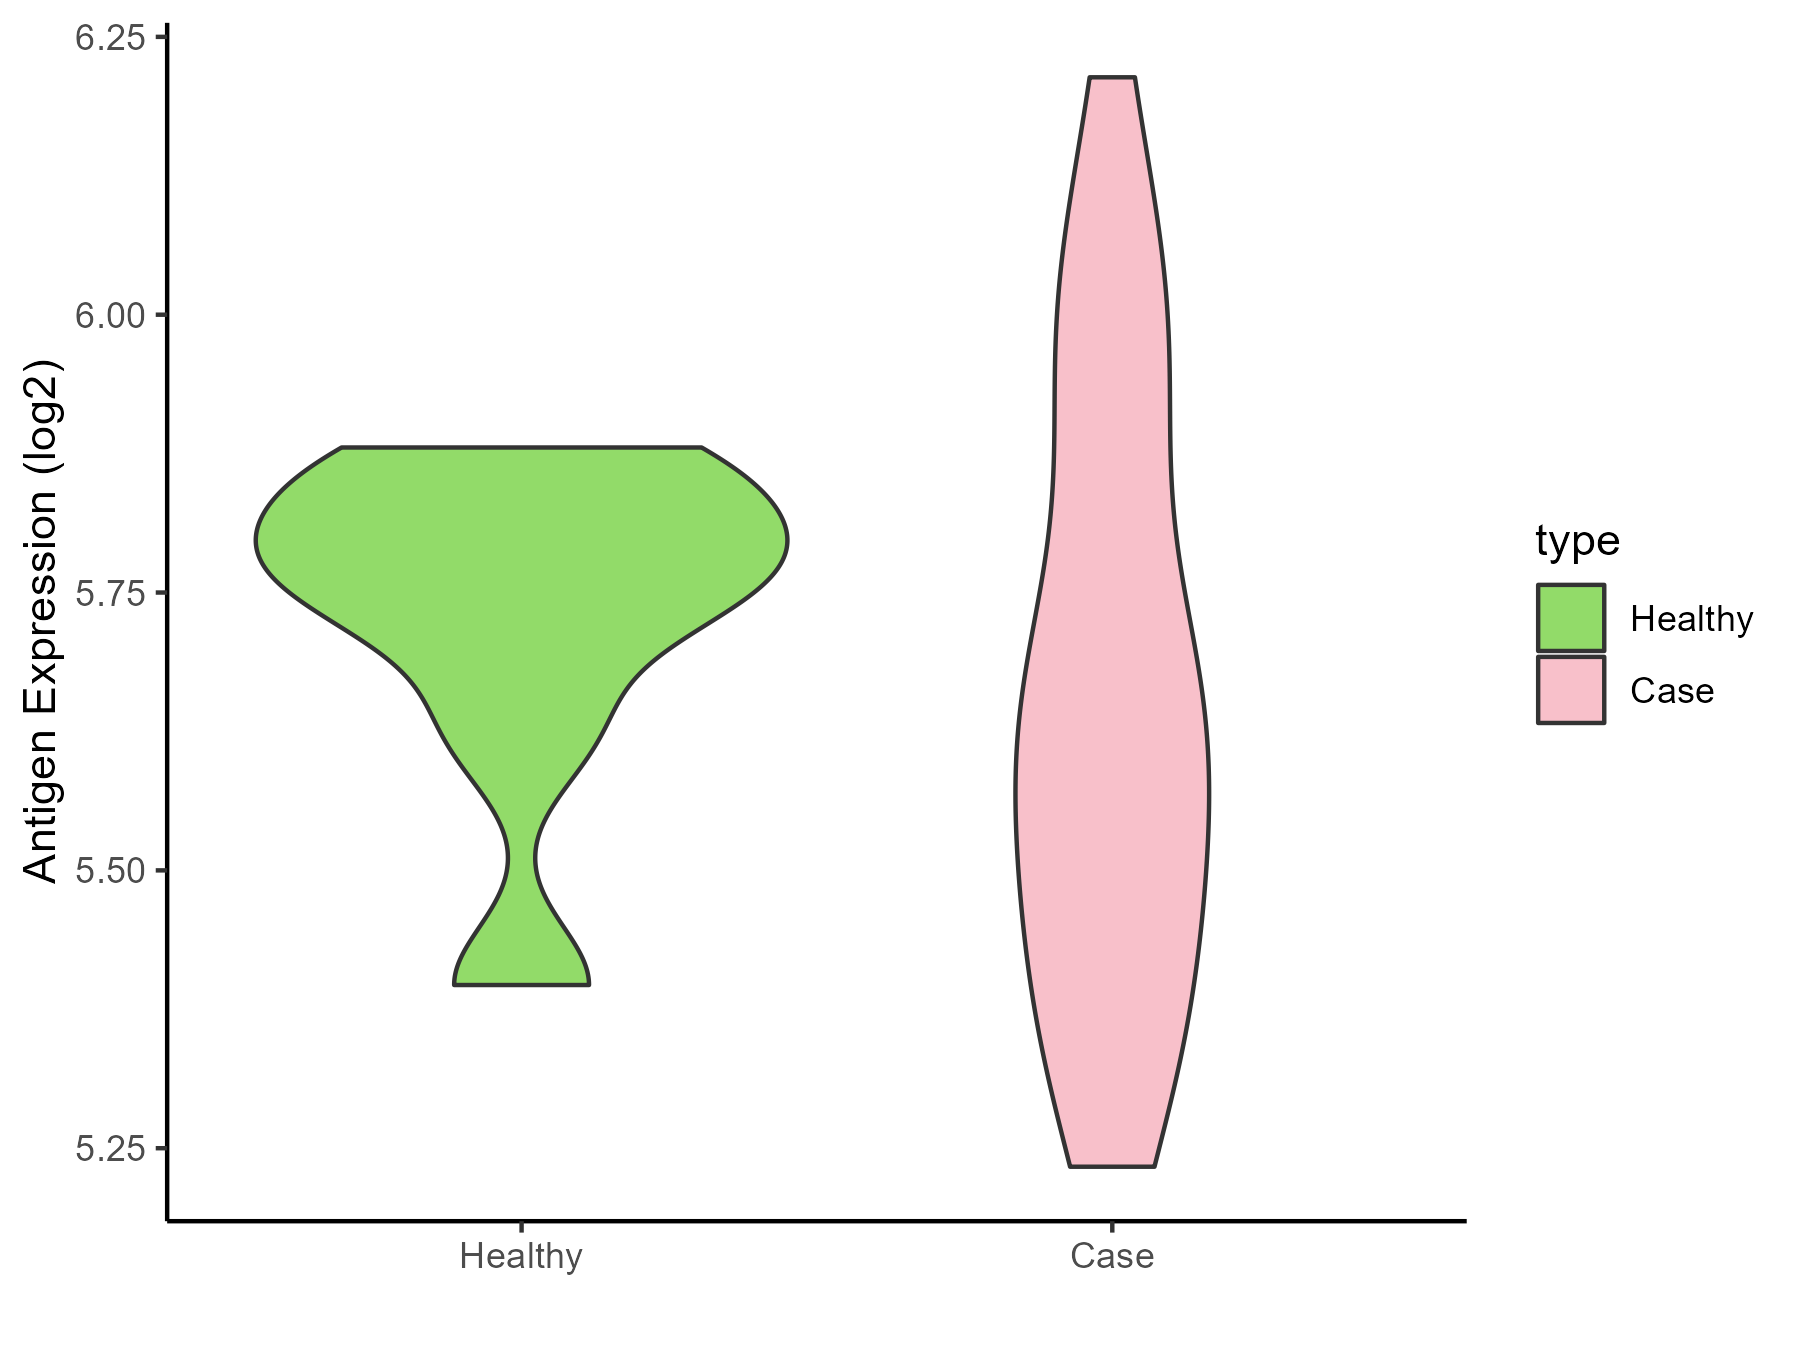
| Differential expression pattern of antigen in diseases | ||
| The Studied Tissue | Muscle | |
| The Specific Disease | Myopathy | |
| The Expression Level of Disease Section Compare with the Healthy Individual Tissue | p-value: 0.341267963; Fold-change: -0.142279671; Z-score: -0.907706293 | |
| Disease-specific Antigen Abundances |
|
Click to View the Clearer Original Diagram |
References
