Antigen Information
General Information of This Antigen
| Antigen ID | TAR0AIJKM |
|||||
|---|---|---|---|---|---|---|
| Antigen Name | Hepatocyte growth factor receptor (MET) |
|||||
| Gene Name | MET |
|||||
| Gene ID | ||||||
| Synonym | HGF/SF receptor;Proto-oncogene c-Met;Scatter factor receptor;Tyrosine-protein kinase Met |
|||||
| Sequence |
MKAPAVLAPGILVLLFTLVQRSNGECKEALAKSEMNVNMKYQLPNFTAETPIQNVILHEH
HIFLGATNYIYVLNEEDLQKVAEYKTGPVLEHPDCFPCQDCSSKANLSGGVWKDNINMAL VVDTYYDDQLISCGSVNRGTCQRHVFPHNHTADIQSEVHCIFSPQIEEPSQCPDCVVSAL GAKVLSSVKDRFINFFVGNTINSSYFPDHPLHSISVRRLKETKDGFMFLTDQSYIDVLPE FRDSYPIKYVHAFESNNFIYFLTVQRETLDAQTFHTRIIRFCSINSGLHSYMEMPLECIL TEKRKKRSTKKEVFNILQAAYVSKPGAQLARQIGASLNDDILFGVFAQSKPDSAEPMDRS AMCAFPIKYVNDFFNKIVNKNNVRCLQHFYGPNHEHCFNRTLLRNSSGCEARRDEYRTEF TTALQRVDLFMGQFSEVLLTSISTFIKGDLTIANLGTSEGRFMQVVVSRSGPSTPHVNFL LDSHPVSPEVIVEHTLNQNGYTLVITGKKITKIPLNGLGCRHFQSCSQCLSAPPFVQCGW CHDKCVRSEECLSGTWTQQICLPAIYKVFPNSAPLEGGTRLTICGWDFGFRRNNKFDLKK TRVLLGNESCTLTLSESTMNTLKCTVGPAMNKHFNMSIIISNGHGTTQYSTFSYVDPVIT SISPKYGPMAGGTLLTLTGNYLNSGNSRHISIGGKTCTLKSVSNSILECYTPAQTISTEF AVKLKIDLANRETSIFSYREDPIVYEIHPTKSFISGGSTITGVGKNLNSVSVPRMVINVH EAGRNFTVACQHRSNSEIICCTTPSLQQLNLQLPLKTKAFFMLDGILSKYFDLIYVHNPV FKPFEKPVMISMGNENVLEIKGNDIDPEAVKGEVLKVGNKSCENIHLHSEAVLCTVPNDL LKLNSELNIEWKQAISSTVLGKVIVQPDQNFTGLIAGVVSISTALLLLLGFFLWLKKRKQ IKDLGSELVRYDARVHTPHLDRLVSARSVSPTTEMVSNESVDYRATFPEDQFPNSSQNGS CRQVQYPLTDMSPILTSGDSDISSPLLQNTVHIDLSALNPELVQAVQHVVIGPSSLIVHF NEVIGRGHFGCVYHGTLLDNDGKKIHCAVKSLNRITDIGEVSQFLTEGIIMKDFSHPNVL SLLGICLRSEGSPLVVLPYMKHGDLRNFIRNETHNPTVKDLIGFGLQVAKGMKYLASKKF VHRDLAARNCMLDEKFTVKVADFGLARDMYDKEYYSVHNKTGAKLPVKWMALESLQTQKF TTKSDVWSFGVLLWELMTRGAPPYPDVNTFDITVYLLQGRRLLQPEYCPDPLYEVMLKCW HPKAEMRPSFSELVSRISAIFSTFIGEHYVHVNATYVNVKCVAPYPSLLSSEDNADDEVD TRPASFWETS Click to Show/Hide
|
|||||
| Family | Tyr protein family |
|||||
| Function |
Receptor tyrosine kinase that transduces signals from the extracellular matrix into the cytoplasm by binding to hepatocyte growth factor/HGF ligand. Regulates many physiological processes including proliferation, scattering, morphogenesis and survival. Ligand binding at the cell surface induces autophosphorylation of MET on its intracellular domain that provides docking sites for downstream signaling molecules. Following activation by ligand, interacts with the PI3-kinase subunit PIK3R1, PLCG1, SRC, GRB2, STAT3 or the adapter GAB1. Recruitment of these downstream effectors by MET leads to the activation of several signaling cascades including the RAS-ERK, PI3 kinase-AKT, or PLCgamma-PKC. The RAS-ERK activation is associated with the morphogenetic effects while PI3K/AKT coordinates prosurvival effects. During embryonic development, MET signaling plays a role in gastrulation, development and migration of neuronal precursors, angiogenesis and kidney formation. During skeletal muscle development, it is crucial for the migration of muscle progenitor cells and for the proliferation of secondary myoblasts. In adults, participates in wound healing as well as organ regeneration and tissue remodeling. Promotes also differentiation and proliferation of hematopoietic cells. May regulate cortical bone osteogenesis.
Click to Show/Hide
|
|||||
| Uniprot Entry | ||||||
| HGNC ID | ||||||
| KEGG ID | ||||||
Each Antibody-drug Conjuate AND It's Component Related to This Antigen
Full List of The ADC Related to This Antigen
A humanised anti-c-MET IgG2 monoclonal antibody
| ADC Info | ADC Name | Payload | Target | Linker | Ref |
|---|---|---|---|---|---|
SHR-A1403 |
SHR152852 |
Microtubule (MT) |
L2-MC |
[1] |
A humanized c-MET-directed IgG2 monoclonal antibody
| ADC Info | ADC Name | Payload | Target | Linker | Ref |
|---|---|---|---|---|---|
SHR-1826 |
9106-IM-2 |
DNA topoisomerase 1 (TOP1) |
Mc-Gly-Gly-Phe-Gly |
AAJ8D6
| ADC Info | ADC Name | Payload | Target | Linker | Ref |
|---|---|---|---|---|---|
AAJ8D6-D07-Val-Cit-PAB-MMAE |
Monomethyl auristatin E |
Microtubule (MT) |
Mc-Val-Cit-PABC |
[2] | |
AAJ8D6-Mc-Val-Cit-MMAE |
Monomethyl auristatin E |
Microtubule (MT) |
Mc-Val-Cit-PABC |
[2] | |
AAJ8D6-PY-Val-Cit-MMAE |
Monomethyl auristatin E |
Microtubule (MT) |
PY-VC-PABC |
[2] |
Anti-MET lgG1
| ADC Info | ADC Name | Payload | Target | Linker | Ref |
|---|---|---|---|---|---|
lgG1-Mc-Val-Cit-MMAE |
Monomethyl auristatin E |
Microtubule (MT) |
Mc-Val-Cit-PABC |
[2] |
Anti-MET mAb
| ADC Info | ADC Name | Payload | Target | Linker | Ref |
|---|---|---|---|---|---|
Anti-c-Met IgG-OXA |
Oxaliplatin |
Human Deoxyribonucleic acid (hDNA) |
Dipeptide-p-amidobenzyl alcohol linker |
[3] |
Anti-MET mAb Ab-10
| ADC Info | ADC Name | Payload | Target | Linker | Ref |
|---|---|---|---|---|---|
CN106188293A ADC-1 |
CN106188293A_ADC-136584232 |
Undisclosed |
CN106188293A_ADC-1LacNAc-based glycosite-specific conjudate through reduced inter-chain cysteines |
[4] | |
CN106188293A ADC-12 |
CN106188293A_ADC-1236584232 |
Undisclosed |
CN106188293A_ADC-12LacNAc-based glycosite-specific conjudate through reduced inter-chain cysteines |
[4] | |
CN106188293A ADC-2 |
CN106188293A_ADC-236584232 |
Undisclosed |
CN106188293A_ADC-2LacNAc-based glycosite-specific conjudate through reduced inter-chain cysteines |
[4] | |
CN106188293A ADC-3 |
CN106188293A_ADC-336584232 |
Undisclosed |
CN106188293A_ADC-3LacNAc-based glycosite-specific conjudate through reduced inter-chain cysteines |
[4] | |
CN106188293A ADC-4 |
CN106188293A_ADC-436584232 |
Undisclosed |
CN106188293A_ADC-4LacNAc-based glycosite-specific conjudate through reduced inter-chain cysteines |
[4] | |
CN106188293A ADC-9 |
CN106188293A_ADC-936584232 |
Undisclosed |
CN106188293A_ADC-9LacNAc-based glycosite-specific conjudate through reduced inter-chain cysteines |
[4] |
Anti-MET mAb Ab-11
| ADC Info | ADC Name | Payload | Target | Linker | Ref |
|---|---|---|---|---|---|
CN106188293A ADC-13 |
CN106188293A_ADC-1336584232 |
Undisclosed |
CN106188293A_ADC-13LacNAc-based glycosite-specific conjudate through reduced inter-chain cysteines |
[4] | |
CN106188293A ADC-14 |
CN106188293A_ADC-1436584232 |
Undisclosed |
CN106188293A_ADC-14LacNAc-based glycosite-specific conjudate through reduced inter-chain cysteines |
[4] | |
CN106188293A ADC-15 |
CN106188293A_ADC-1536584232 |
Undisclosed |
CN106188293A_ADC-15LacNAc-based glycosite-specific conjudate through reduced inter-chain cysteines |
[4] |
Anti-MET mAb Ab-9
| ADC Info | ADC Name | Payload | Target | Linker | Ref |
|---|---|---|---|---|---|
CN106188293A ADC-10 |
CN106188293A_ADC-1036584232 |
Undisclosed |
CN106188293A_ADC-10LacNAc-based glycosite-specific conjudate through reduced inter-chain cysteines |
[4] | |
CN106188293A ADC-11 |
CN106188293A_ADC-1136584232 |
Undisclosed |
CN106188293A_ADC-11LacNAc-based glycosite-specific conjudate through reduced inter-chain cysteines |
[4] | |
CN106188293A ADC-5 |
CN106188293A_ADC-536584232 |
Undisclosed |
CN106188293A_ADC-5LacNAc-based glycosite-specific conjudate through reduced inter-chain cysteines |
[4] | |
CN106188293A ADC-6 |
CN106188293A_ADC-636584232 |
Undisclosed |
CN106188293A_ADC-6LacNAc-based glycosite-specific conjudate through reduced inter-chain cysteines |
[4] | |
CN106188293A ADC-7 |
CN106188293A_ADC-736584232 |
Undisclosed |
CN106188293A_ADC-7LacNAc-based glycosite-specific conjudate through reduced inter-chain cysteines |
[4] | |
CN106188293A ADC-8 |
CN106188293A_ADC-836584232 |
Undisclosed |
CN106188293A_ADC-8LacNAc-based glycosite-specific conjudate through reduced inter-chain cysteines |
[4] |
Anti-MET mAb cIRCR201
| ADC Info | ADC Name | Payload | Target | Linker | Ref |
|---|---|---|---|---|---|
CIRCR201-dPBD |
Glucuronide-dPBD |
Human Deoxyribonucleic acid (hDNA) |
Iso-PEG5-beta-glucuronide |
[5] |
Anti-MET mAb hD12
| ADC Info | ADC Name | Payload | Target | Linker | Ref |
|---|---|---|---|---|---|
HD12-SG3227 |
PBD dimer SG3227 |
Human Deoxyribonucleic acid (hDNA) |
Mal-PEG8-Val-Ala-PABC |
[6] | |
HD12-SG3246 |
PBD dimer SG3246 |
Human Deoxyribonucleic acid (hDNA) |
Mal-PEG8-Val-Ala-PABC |
[6] | |
HD12-SG3249 |
PBD dimer SG3249 |
Human Deoxyribonucleic acid (hDNA) |
Mal-PEG8-Val-Ala-PABC |
[6] | |
HD12-SG3259 |
PBD dimer SG3259 |
Human Deoxyribonucleic acid (hDNA) |
Mal-PEG8-Val-Ala-PABC |
[6] | |
HD12-SG3315 |
PBD dimer SG3315 |
Human Deoxyribonucleic acid (hDNA) |
Mal-PEG8-Val-Ala-PABC |
[6] |
Emibetuzumab
| ADC Info | ADC Name | Payload | Target | Linker | Ref |
|---|---|---|---|---|---|
LY3343544 |
Monomethyl auristatin E |
Microtubule (MT) |
Undisclosed |
[7] | |
Emibetuzumab-ADC-24-1 |
Emibetuzumab-ADC-24-1 payload |
Undisclosed |
Emibetuzumab-ADC-24-1 linker |
[8] | |
Emibetuzumab-ADC-24-10 |
Emibetuzumab-ADC-24-10 payload |
Undisclosed |
Emibetuzumab-ADC-24-10 linker |
[8] | |
Emibetuzumab-ADC-24-11 |
Emibetuzumab-ADC-24-11 payload |
Undisclosed |
Emibetuzumab-ADC-24-11 linker |
[8] | |
Emibetuzumab-ADC-24-12 |
Emibetuzumab-ADC-24-12 payload |
Undisclosed |
Emibetuzumab-ADC-24-12 linker |
[8] | |
Emibetuzumab-ADC-24-13 |
Emibetuzumab-ADC-24-13 payload |
Undisclosed |
Emibetuzumab-ADC-24-13 linker |
[8] | |
Emibetuzumab-ADC-24-2 |
Emibetuzumab-ADC-24-2 payload |
Undisclosed |
Emibetuzumab-ADC-24-2 linker |
[8] | |
Emibetuzumab-ADC-24-3 |
Emibetuzumab-ADC-24-3 payload |
Undisclosed |
Emibetuzumab-ADC-24-3 linker |
[8] | |
Emibetuzumab-ADC-24-4 |
Emibetuzumab-ADC-24-4 payload |
Undisclosed |
Emibetuzumab-ADC-24-4 linker |
[8] | |
Emibetuzumab-ADC-24-5 |
Emibetuzumab-ADC-24-5 payload |
Undisclosed |
Emibetuzumab-ADC-24-5 linker |
[8] | |
Emibetuzumab-ADC-24-6 |
Emibetuzumab-ADC-24-6 payload |
Undisclosed |
Emibetuzumab-ADC-24-6 linker |
[8] | |
Emibetuzumab-ADC-24-7 |
Emibetuzumab-ADC-24-7 payload |
Undisclosed |
Emibetuzumab-ADC-24-7 linker |
[8] | |
Emibetuzumab-ADC-24-8 |
Emibetuzumab-ADC-24-8 payload |
Undisclosed |
Emibetuzumab-ADC-24-8 linker |
[8] | |
Emibetuzumab-ADC-24-9 |
Emibetuzumab-ADC-24-9 payload |
Undisclosed |
Emibetuzumab-ADC-24-9 linker |
[8] |
hD12
| ADC Info | ADC Name | Payload | Target | Linker | Ref |
|---|---|---|---|---|---|
TR1801-ADC |
SG3199 |
Human Deoxyribonucleic acid (hDNA) |
Mal-PEG8-Val-Ala-PABC |
[9] |
PCM-MET01
| ADC Info | ADC Name | Payload | Target | Linker | Ref |
|---|---|---|---|---|---|
PCM-MET01-MMAE |
Monomethyl auristatin E |
Microtubule (MT) |
Mc-Val-Cit-PABC |
[10] |
pH-dependent antic-MET antibody
| ADC Info | ADC Name | Payload | Target | Linker | Ref |
|---|---|---|---|---|---|
MYTX-011 |
Monomethyl auristatin E |
Microtubule (MT) |
Mc-Val-Cit-PABC |
[11] |
REGN5093
| ADC Info | ADC Name | Payload | Target | Linker | Ref |
|---|---|---|---|---|---|
REGN5093-M114 |
Maytansine derivative M24 |
Microtubule (MT) |
Valeramide-Val-Cit-PABC |
[12] |
STI-D0606
| ADC Info | ADC Name | Payload | Target | Linker | Ref |
|---|---|---|---|---|---|
C-met monoclonal antibody-drug conjugate |
Mertansine DM1 |
Microtubule (MT) |
Undisclosed |
[13] |
Telisotuzumab
| ADC Info | ADC Name | Payload | Target | Linker | Ref |
|---|---|---|---|---|---|
Telisotuzumab vedotin |
Monomethyl auristatin E |
Microtubule (MT) |
Mc-Val-Cit-PABC |
[14] | |
ABBV-400 |
DNA topoisomerase-I inhibitor |
DNA topoisomerase 1 (TOP1) |
Valine-alanine linker |
||
ABT-700 (S238C)-PBD |
PBD dimer |
Human Deoxyribonucleic acid (hDNA) |
Mc-Val-Ala |
[15] | |
ABT-700-Mc-Val-Cit-MMAE |
Monomethyl auristatin E |
Microtubule (MT) |
Mc-Val-Cit-PABC |
[2] |
Undisclosed
| ADC Info | ADC Name | Payload | Target | Linker | Ref |
|---|---|---|---|---|---|
RC-108 |
Monomethyl auristatin E |
Microtubule (MT) |
Mc-Val-Cit-PABC |
[16] | |
BYON-3521 |
seco-DUBA |
Human Deoxyribonucleic acid (hDNA) |
Mc-Val-Cit-PABC |
[17] | |
YL-211 |
YL0010014 |
DNA topoisomerase 1 (TOP1) |
Tumor microenviroment activable tripeptide linker |
||
C-MET 0174 |
Undisclosed |
Undisclosed |
Undisclosed |
[18] | |
Hu-cMet 27Gv1.3 Hinge-L-DM21 |
Undisclosed |
Undisclosed |
Undisclosed |
[19] | |
SAB-Y14 |
Undisclosed |
Undisclosed |
Undisclosed |
[20] | |
APS-3010 |
Undisclosed |
Undisclosed |
Undisclosed |
[21] |
Tissue/Disease specific Abundances of This Antigen
Tissue specific Abundances of This Antigen
ICD Disease Classification 01
| Differential expression pattern of antigen in diseases | ||
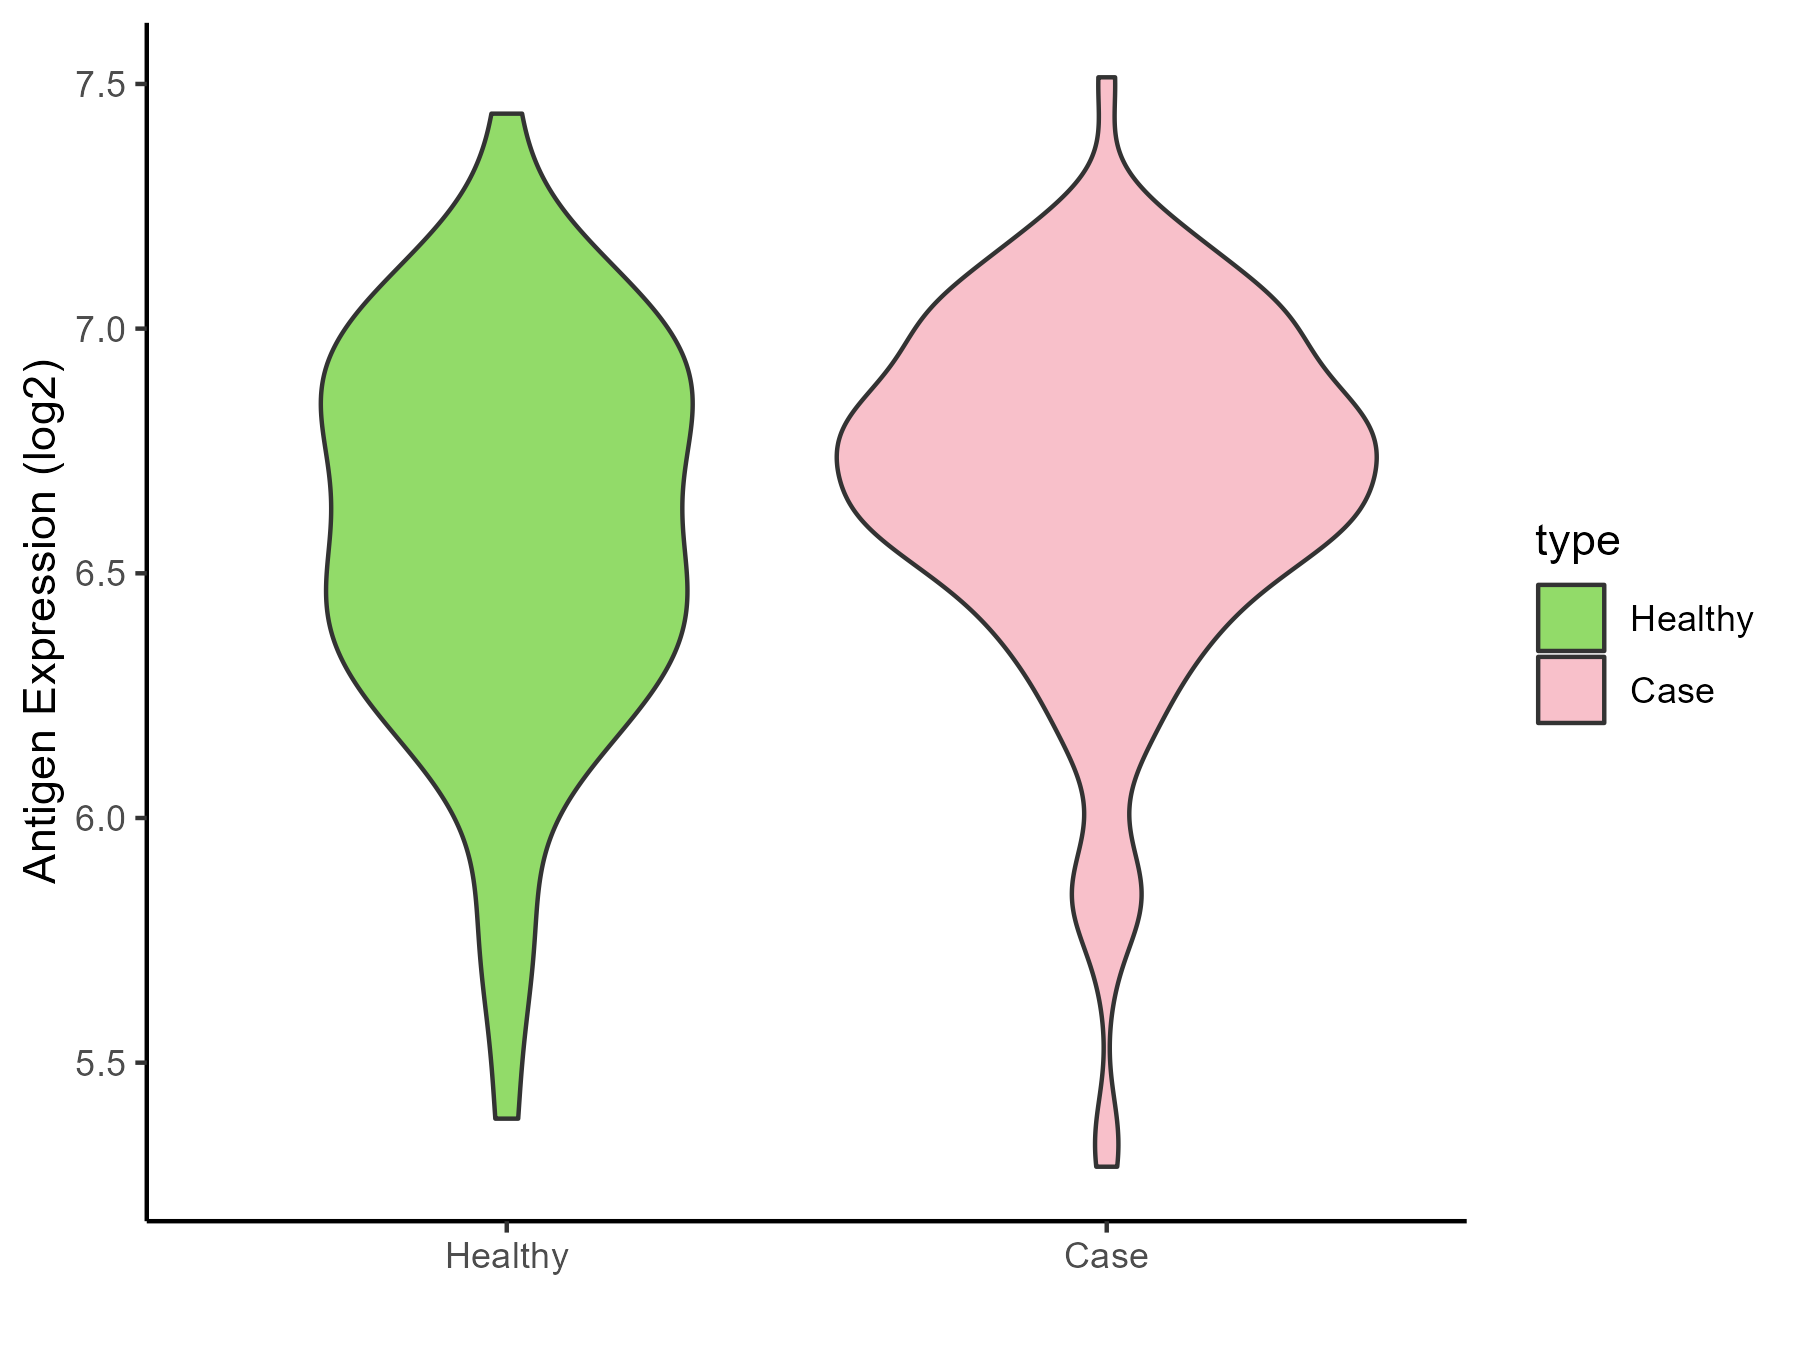
| The Studied Tissue | Gingival | |
| The Specific Disease | Bacterial infection of gingival | |
| The Expression Level of Disease Section Compare with the Healthy Individual Tissue | p-value: 0.113362283; Fold-change: 0.10288011; Z-score: 0.256367938 | |
| Disease-specific Antigen Abundances |
|
Click to View the Clearer Original Diagram |
ICD Disease Classification 02
| Differential expression pattern of antigen in diseases | ||
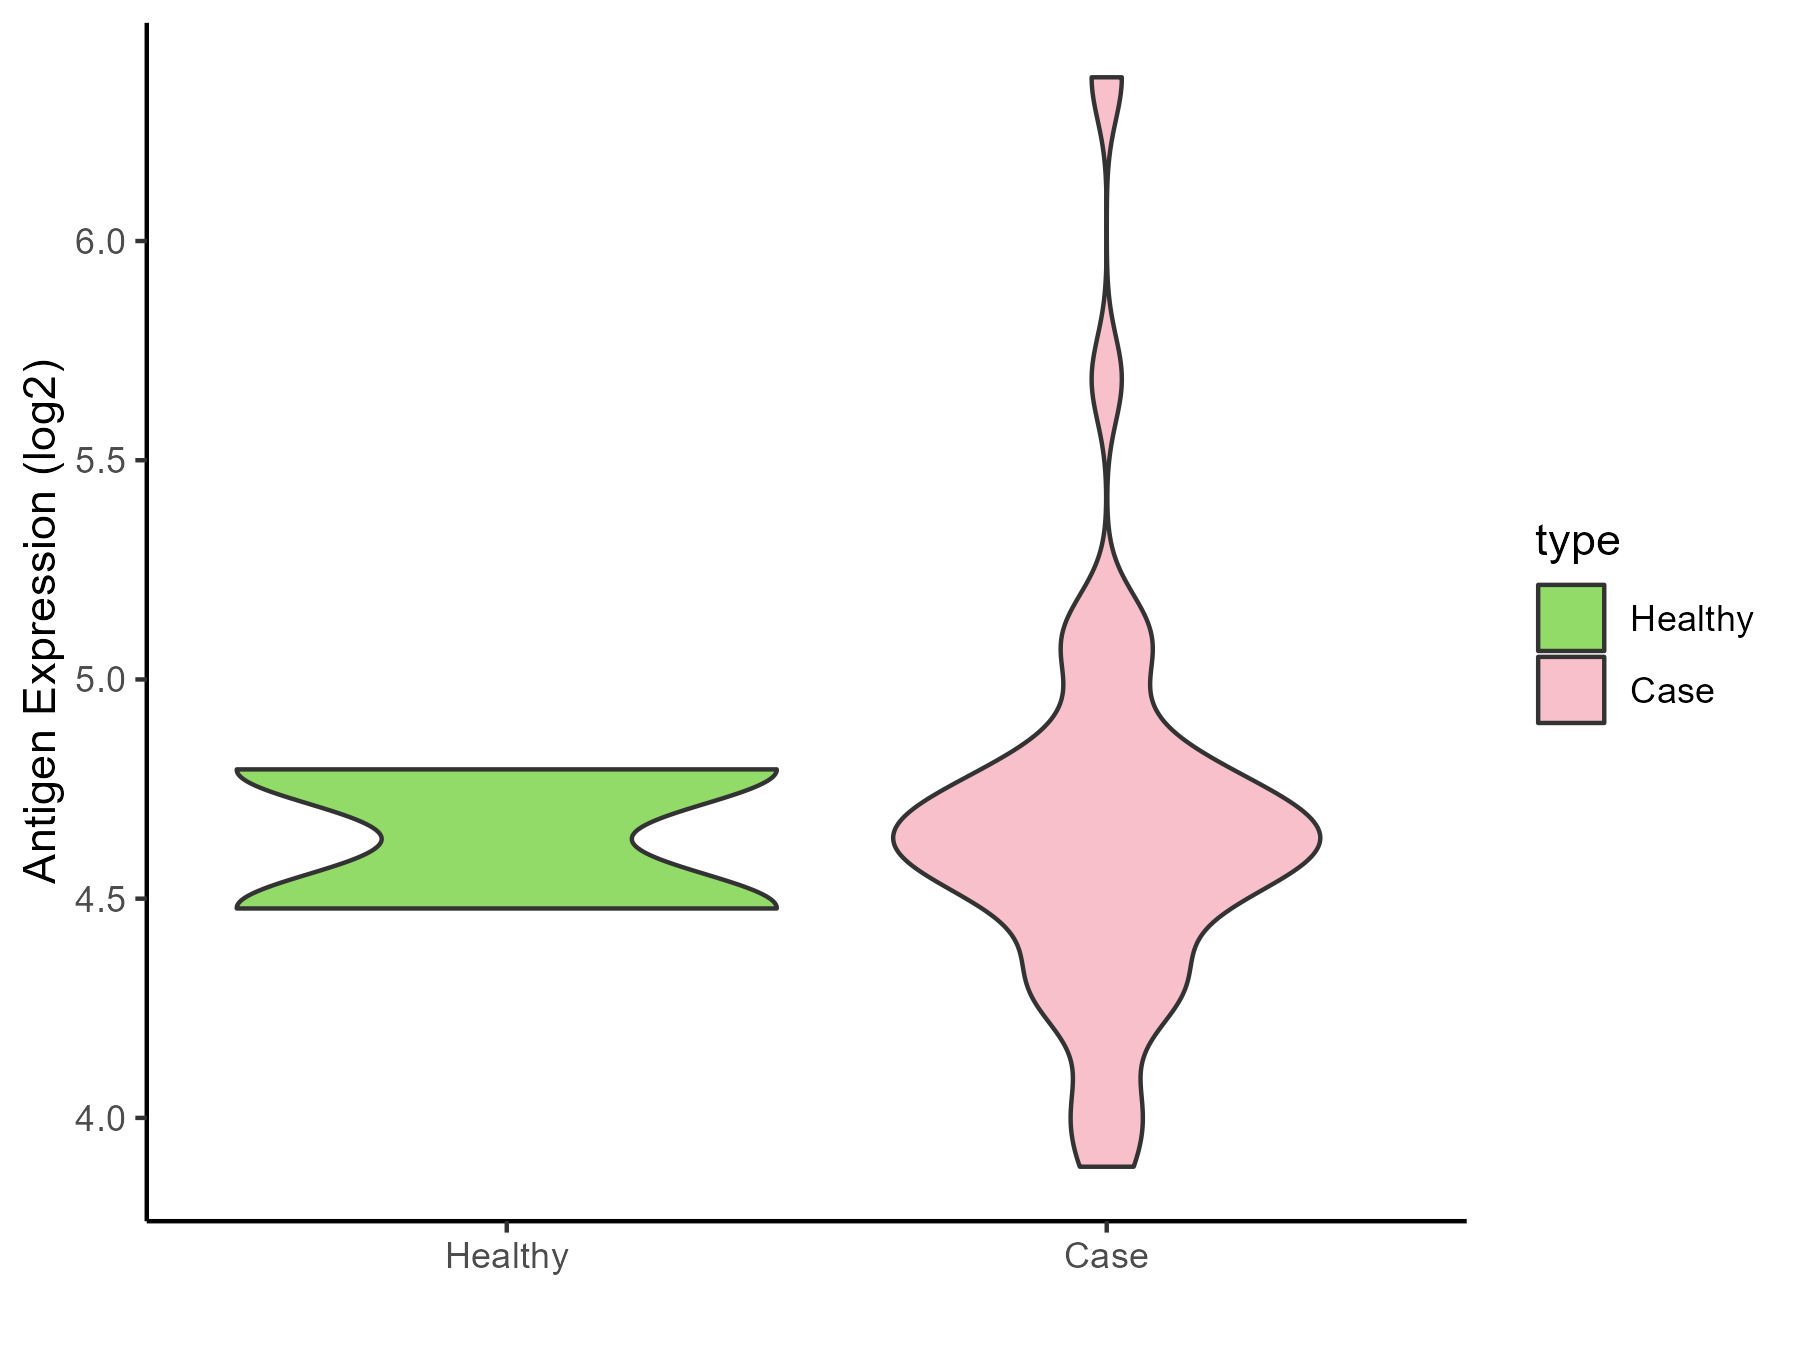
| The Studied Tissue | Brainstem | |
| The Specific Disease | Glioma | |
| The Expression Level of Disease Section Compare with the Healthy Individual Tissue | p-value: 0.899624056; Fold-change: -0.007779226; Z-score: -0.034680677 | |
| Disease-specific Antigen Abundances |
|
Click to View the Clearer Original Diagram |
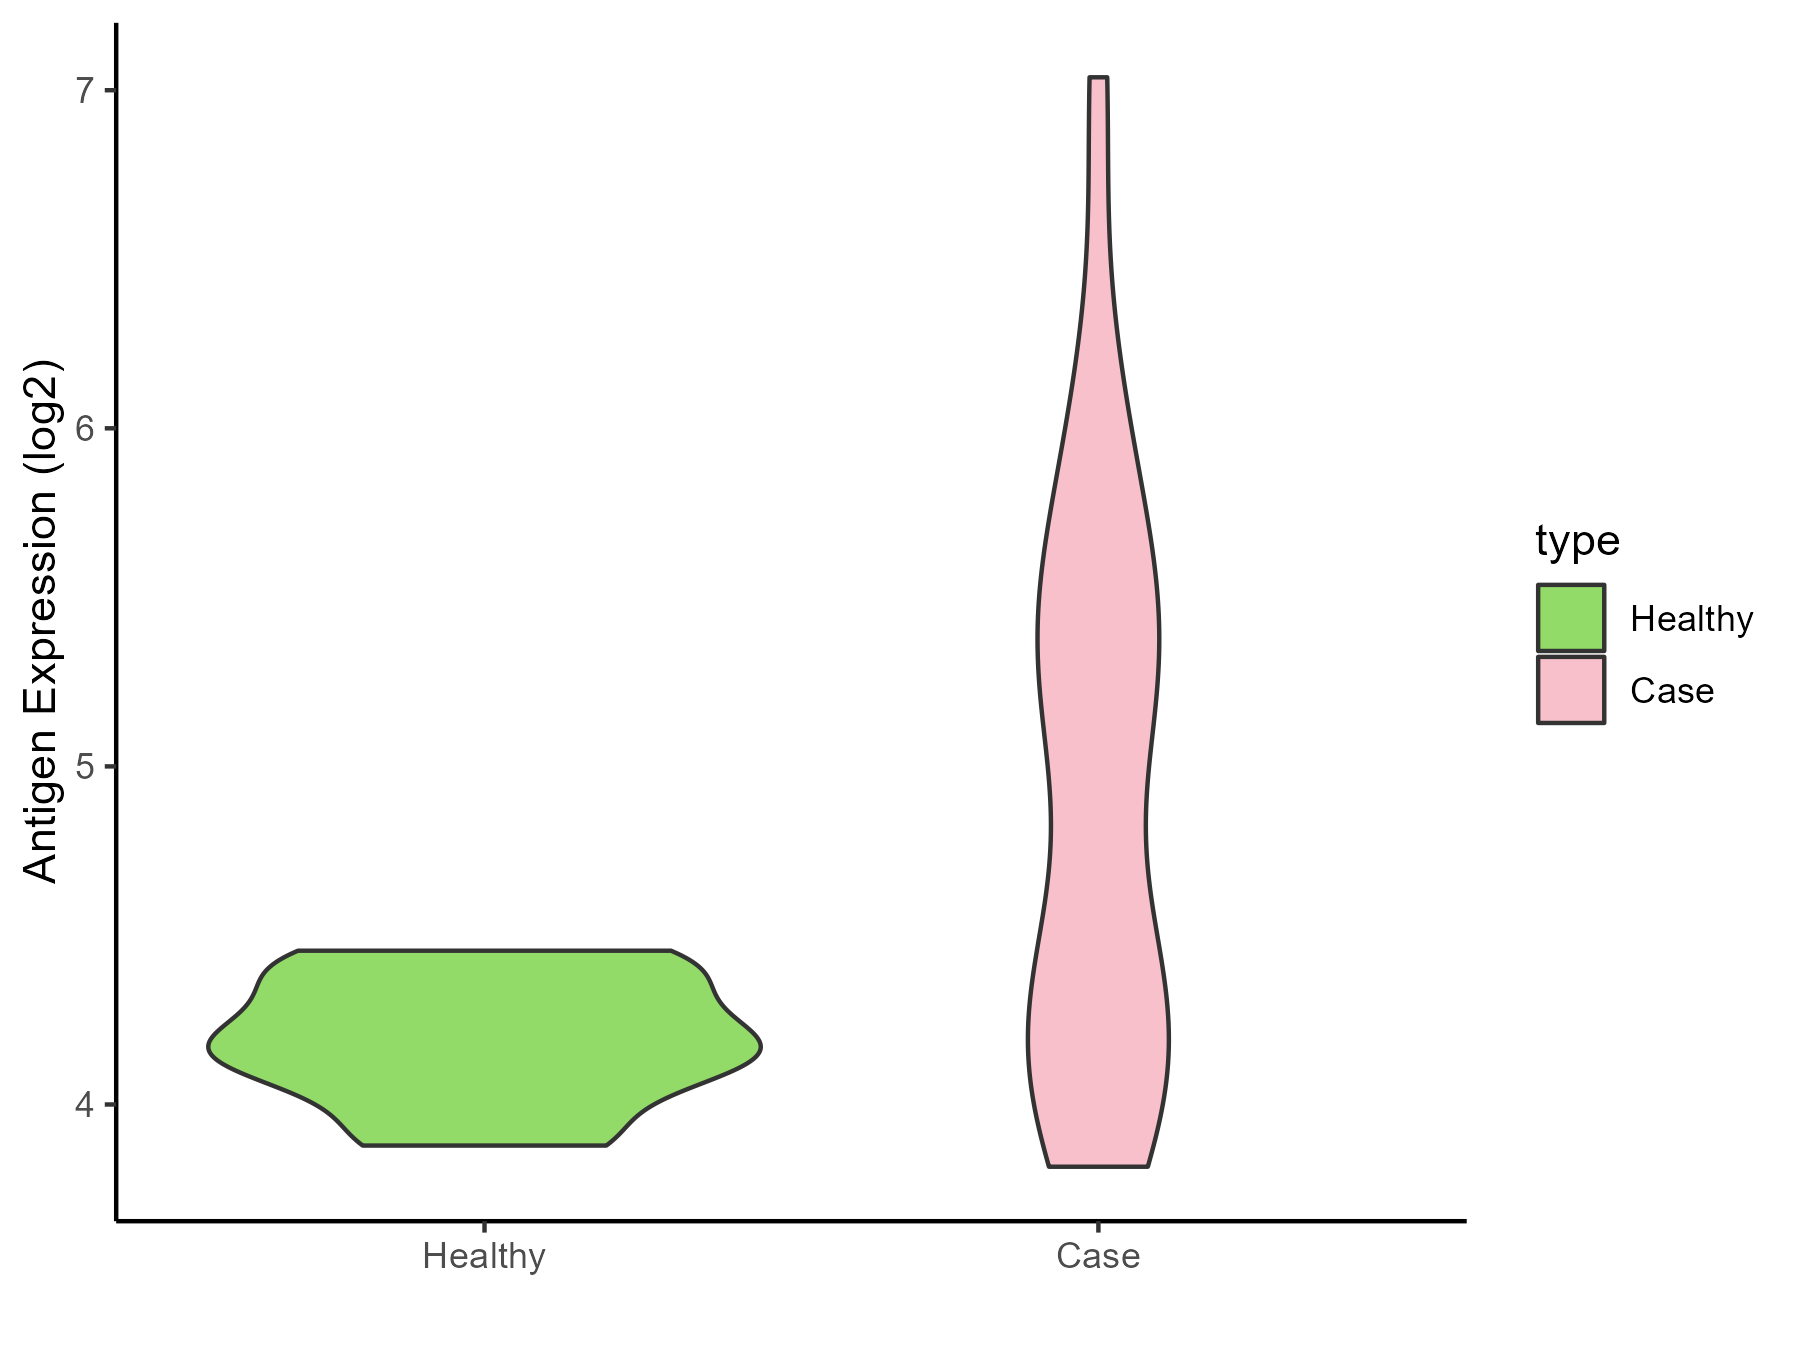
| The Studied Tissue | White matter | |
| The Specific Disease | Glioma | |
| The Expression Level of Disease Section Compare with the Healthy Individual Tissue | p-value: 6.55E-06; Fold-change: 0.918615351; Z-score: 4.677161223 | |
| Disease-specific Antigen Abundances |
|
Click to View the Clearer Original Diagram |
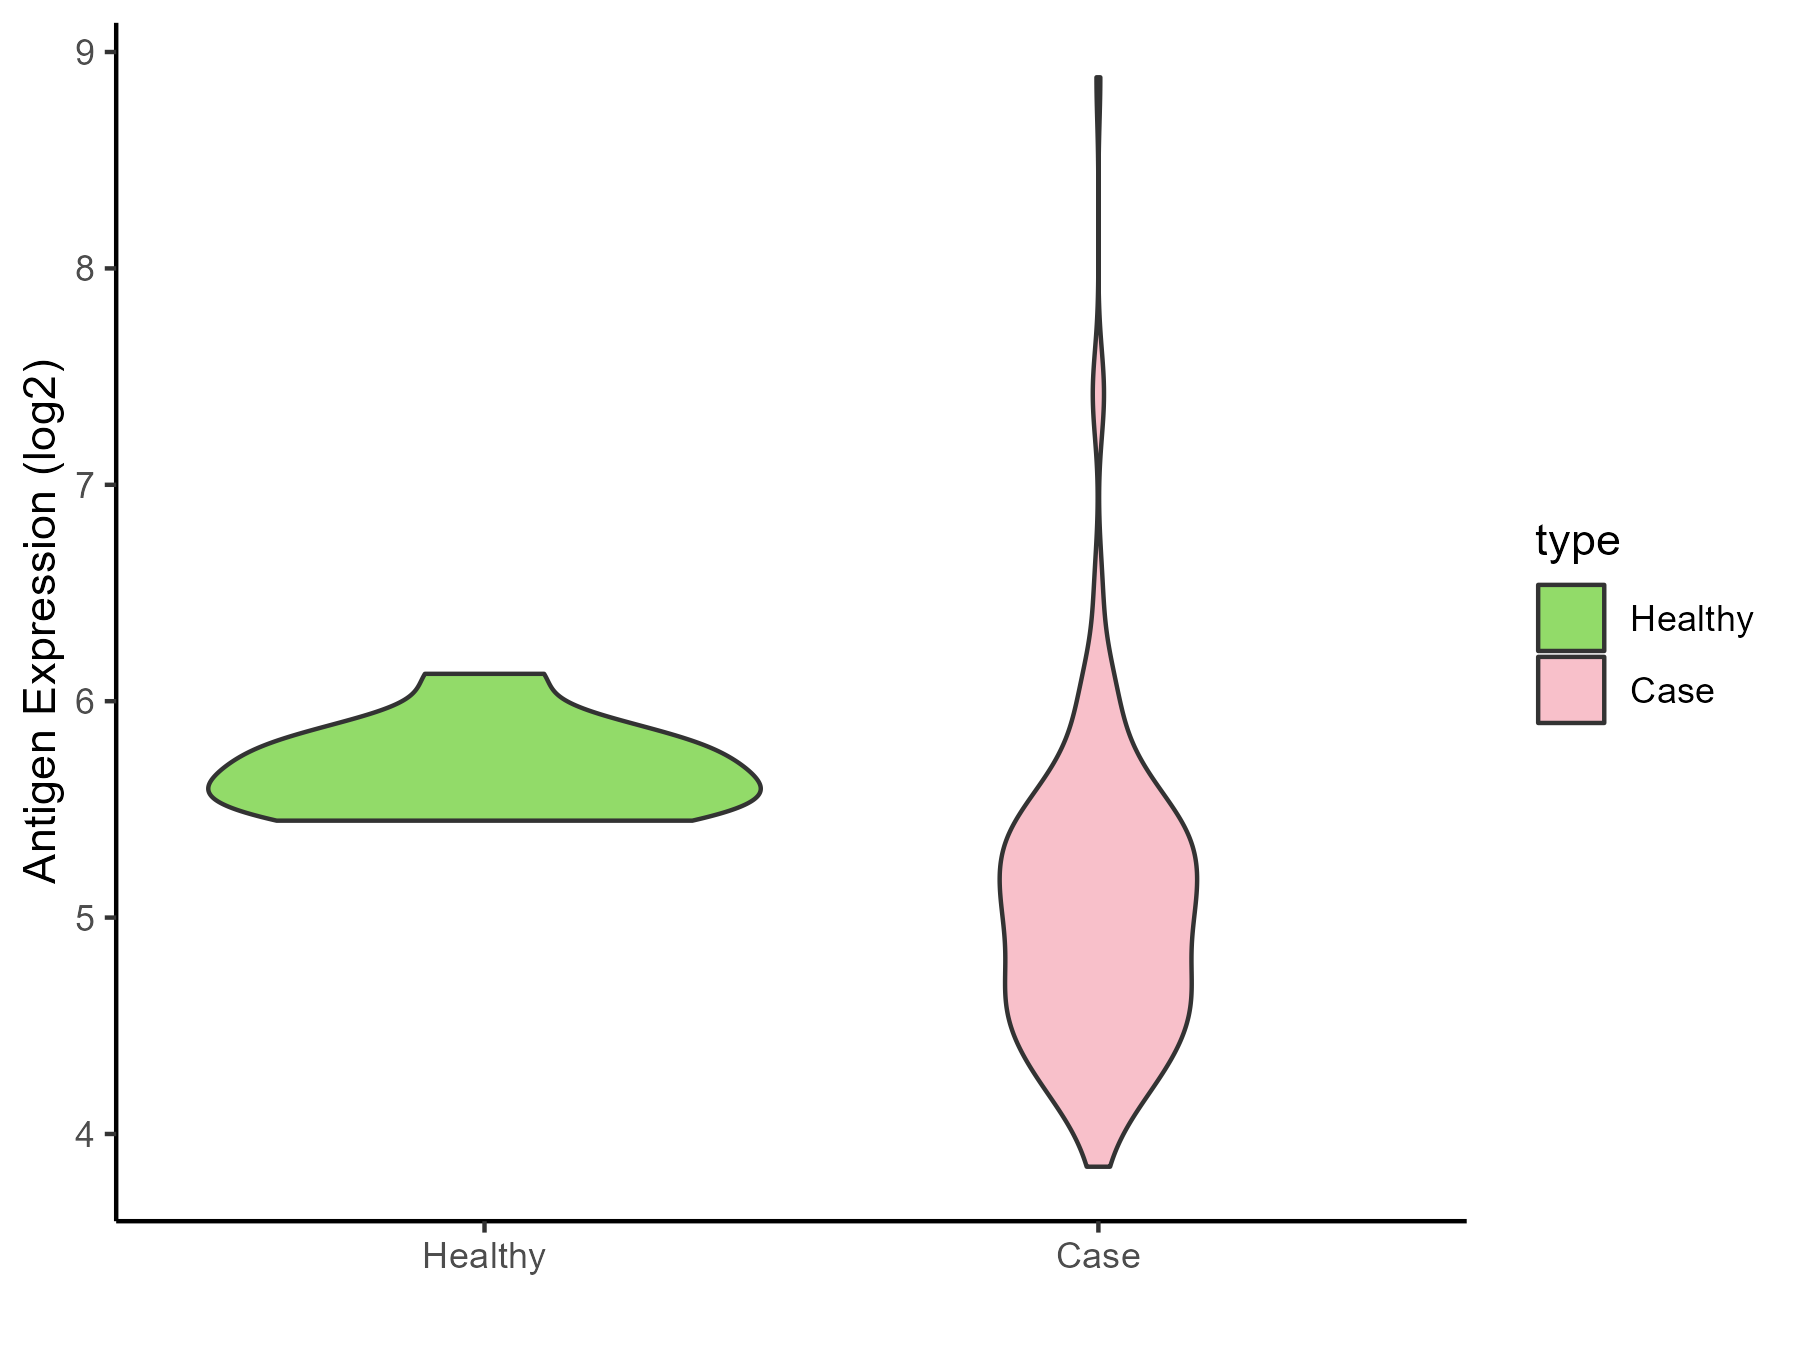
| The Studied Tissue | Brainstem | |
| The Specific Disease | Neuroectodermal tumor | |
| The Expression Level of Disease Section Compare with the Healthy Individual Tissue | p-value: 1.12E-07; Fold-change: -0.635173864; Z-score: -3.028638219 | |
| Disease-specific Antigen Abundances |
|
Click to View the Clearer Original Diagram |
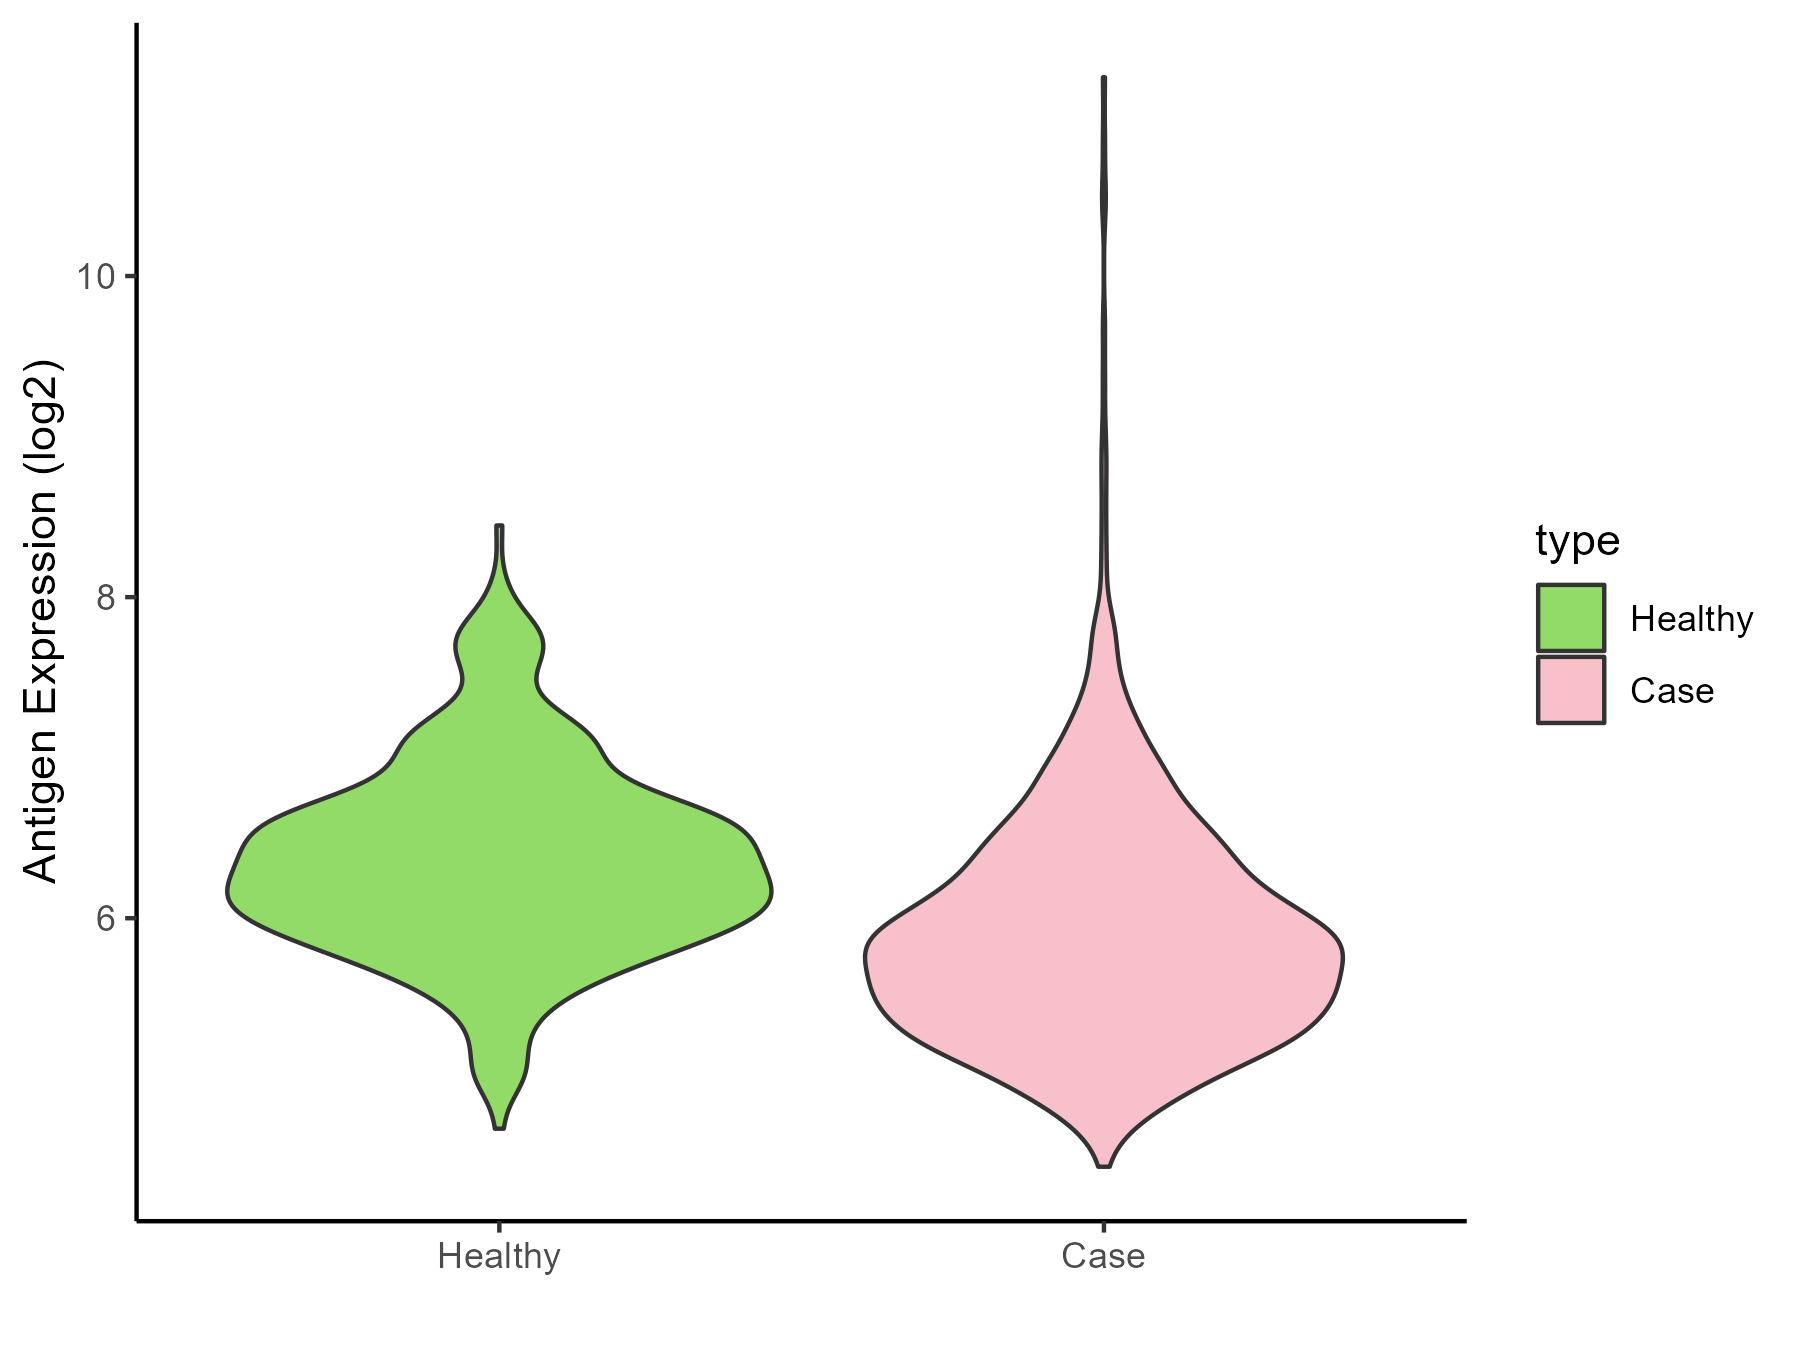
| The Studied Tissue | Nervous | |
| The Specific Disease | Brain cancer | |
| The Expression Level of Disease Section Compare with the Healthy Individual Tissue | p-value: 6.31E-30; Fold-change: -0.501100573; Z-score: -0.831750032 | |
| Disease-specific Antigen Abundances |
|
Click to View the Clearer Original Diagram |
| Differential expression pattern of antigen in diseases | ||
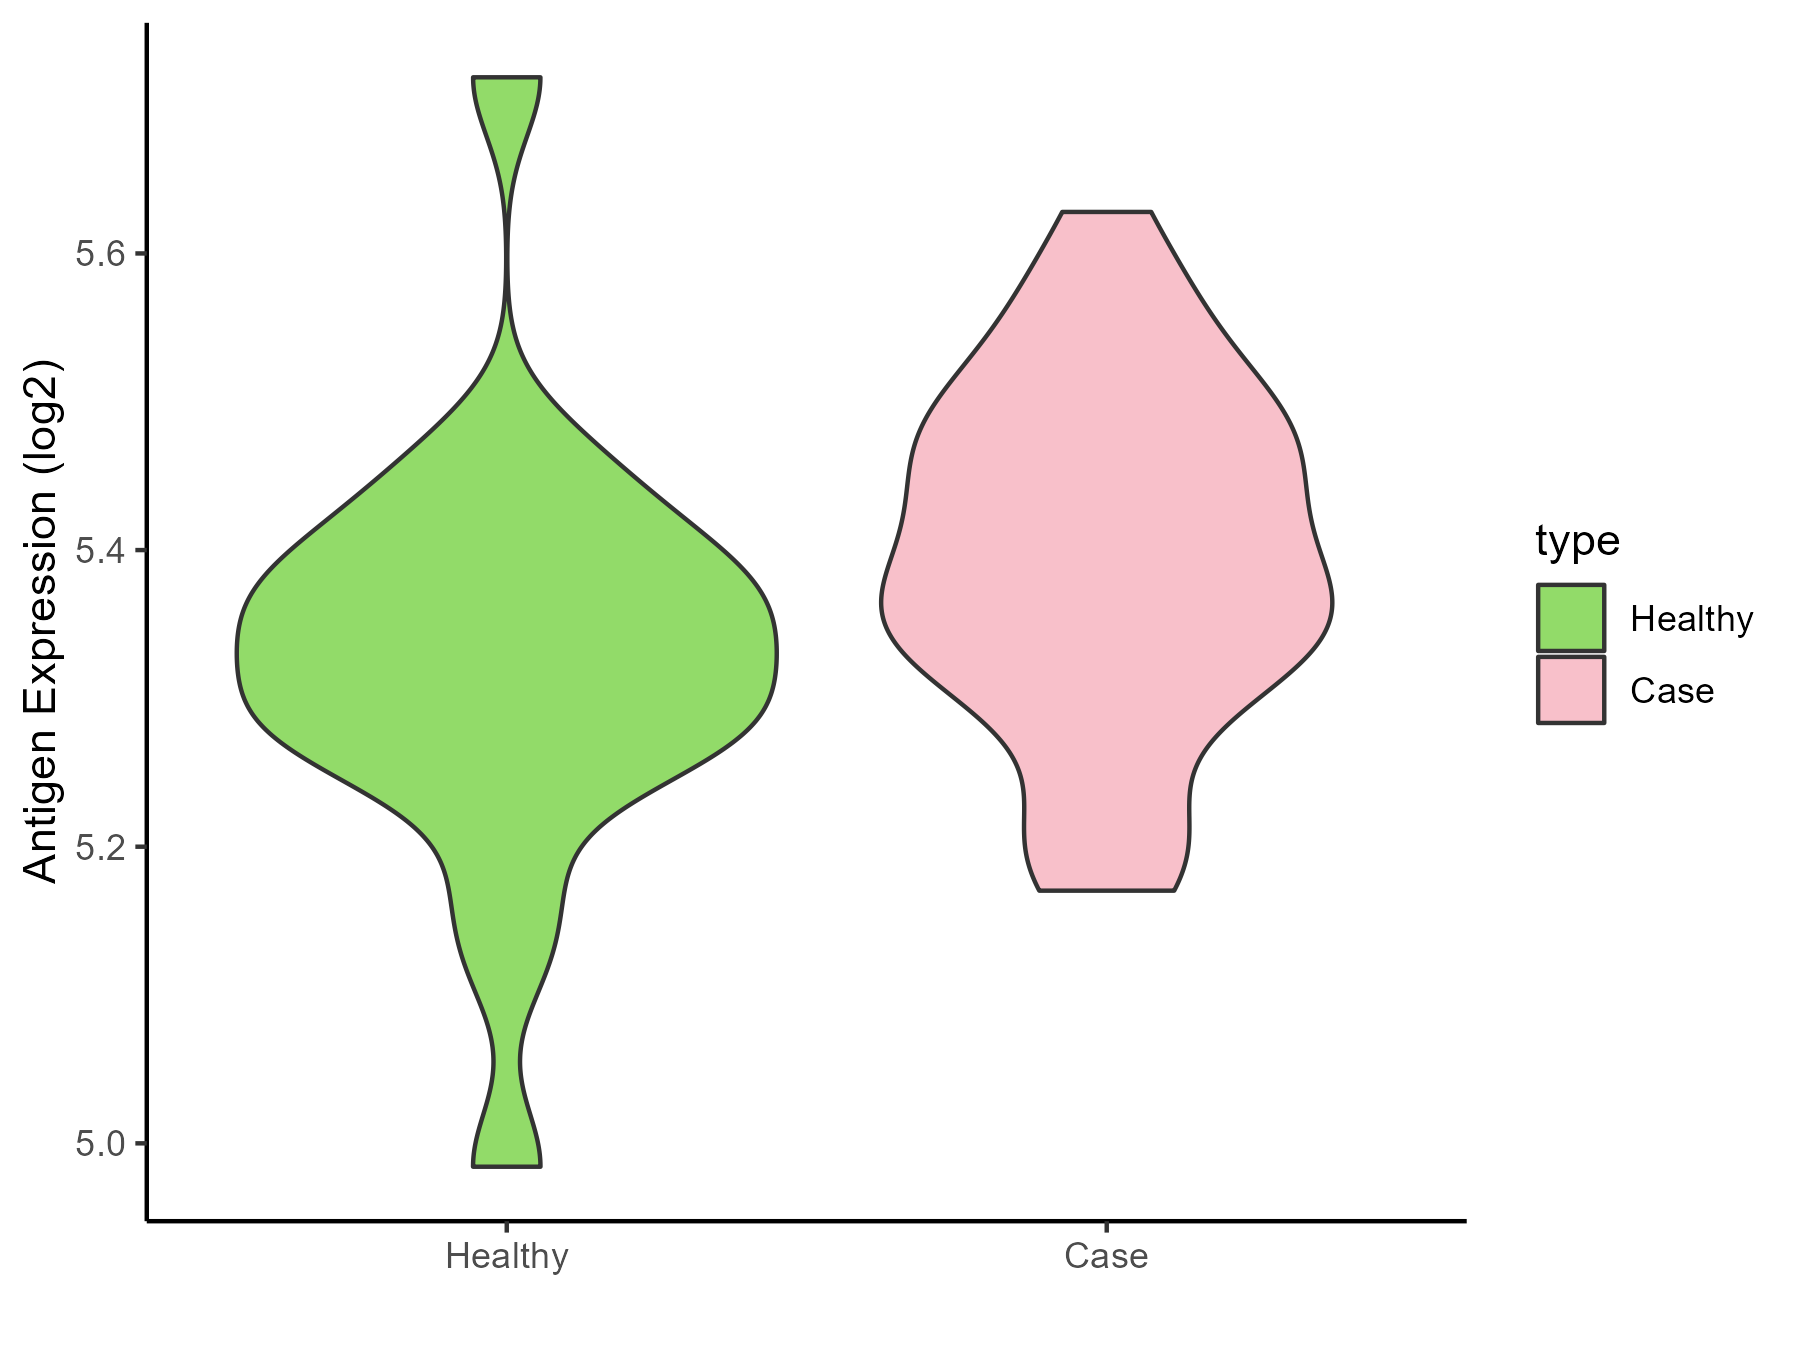
| The Studied Tissue | Whole blood | |
| The Specific Disease | Polycythemia vera | |
| The Expression Level of Disease Section Compare with the Healthy Individual Tissue | p-value: 0.009748382; Fold-change: 0.056135988; Z-score: 0.398800292 | |
| Disease-specific Antigen Abundances |
|
Click to View the Clearer Original Diagram |
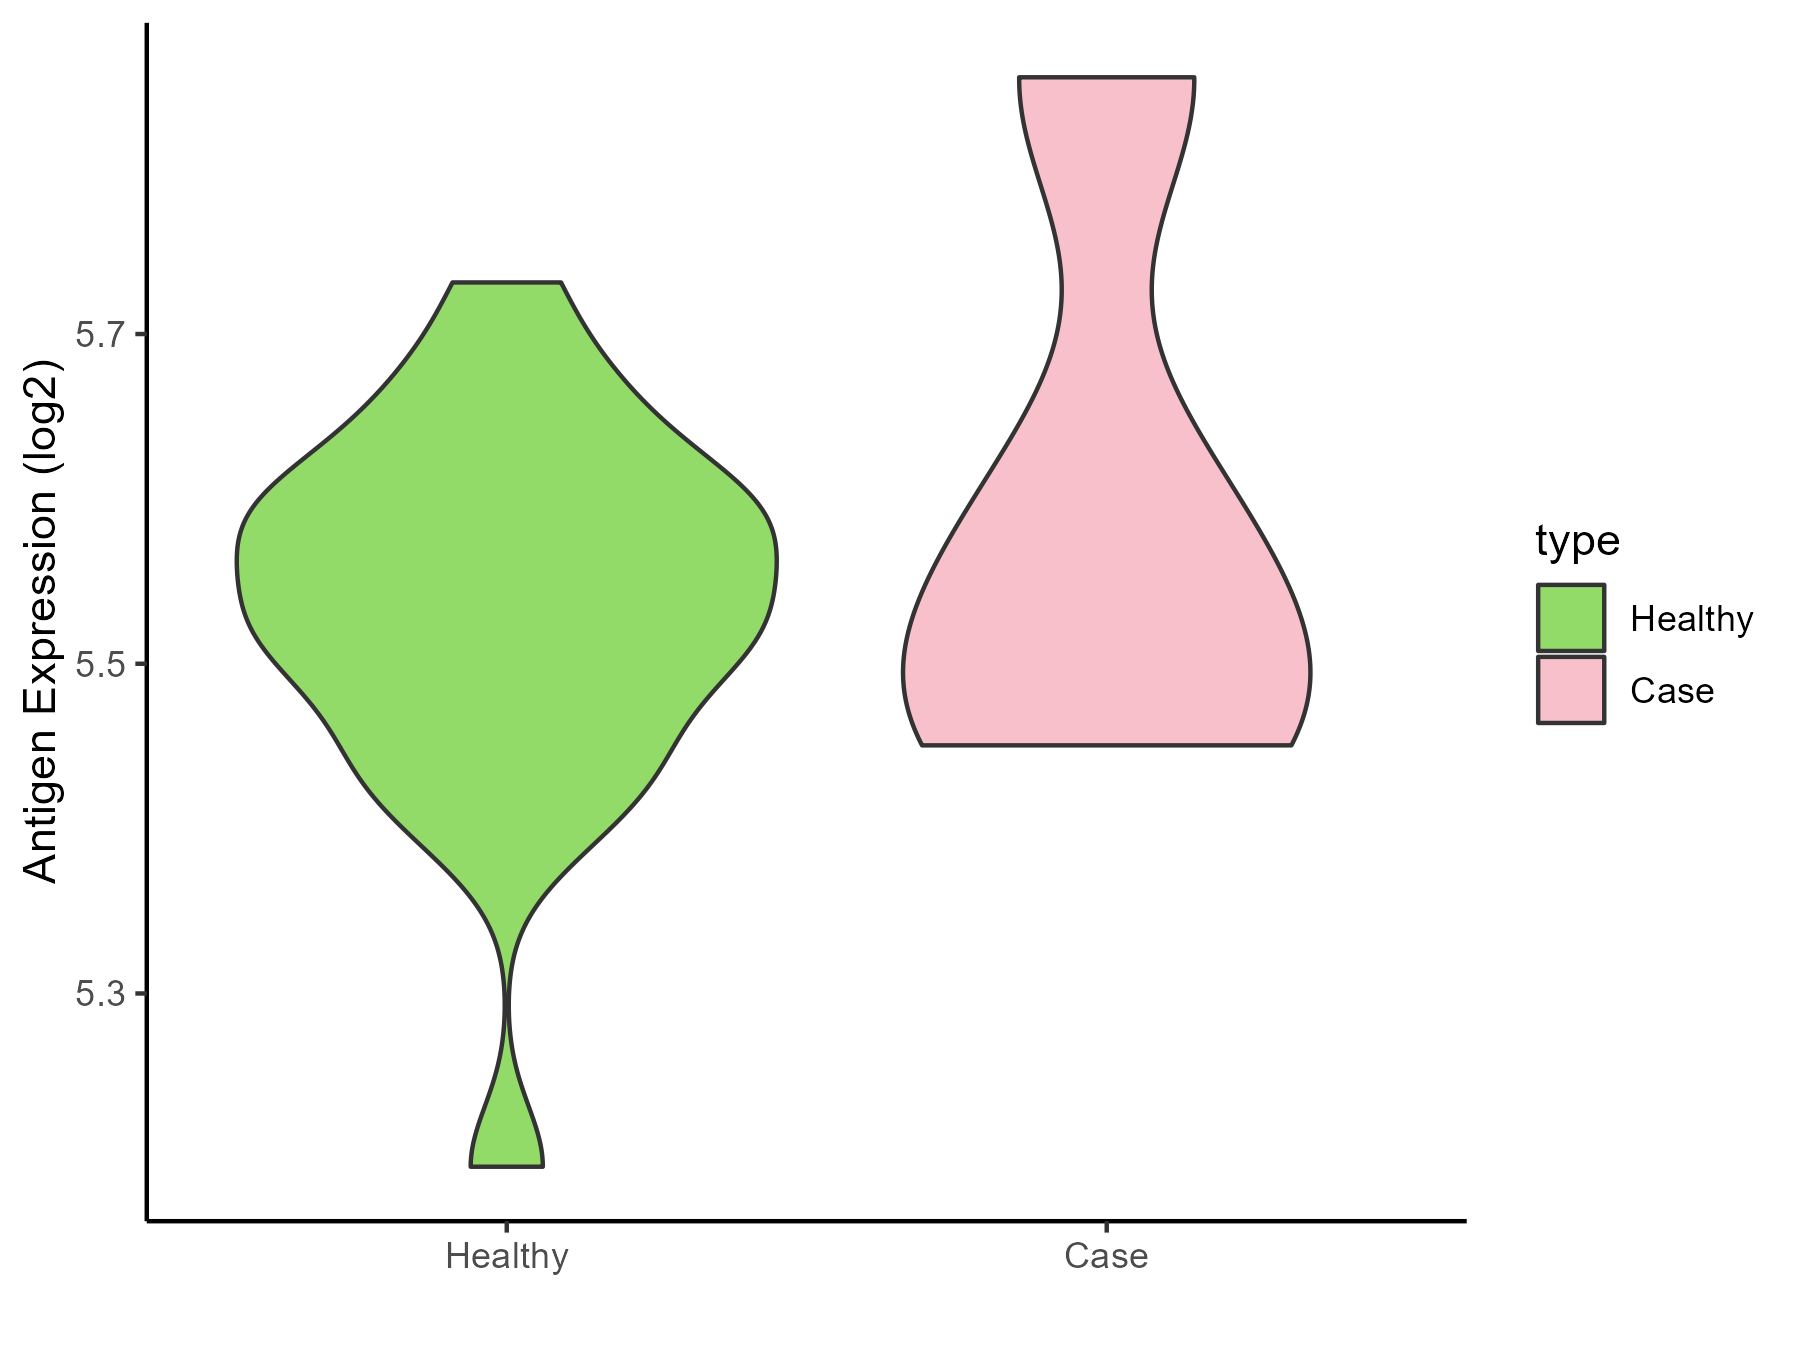
| The Studied Tissue | Whole blood | |
| The Specific Disease | Myelofibrosis | |
| The Expression Level of Disease Section Compare with the Healthy Individual Tissue | p-value: 0.344472079; Fold-change: 0.002445927; Z-score: 0.021323454 | |
| Disease-specific Antigen Abundances |
|
Click to View the Clearer Original Diagram |
| Differential expression pattern of antigen in diseases | ||
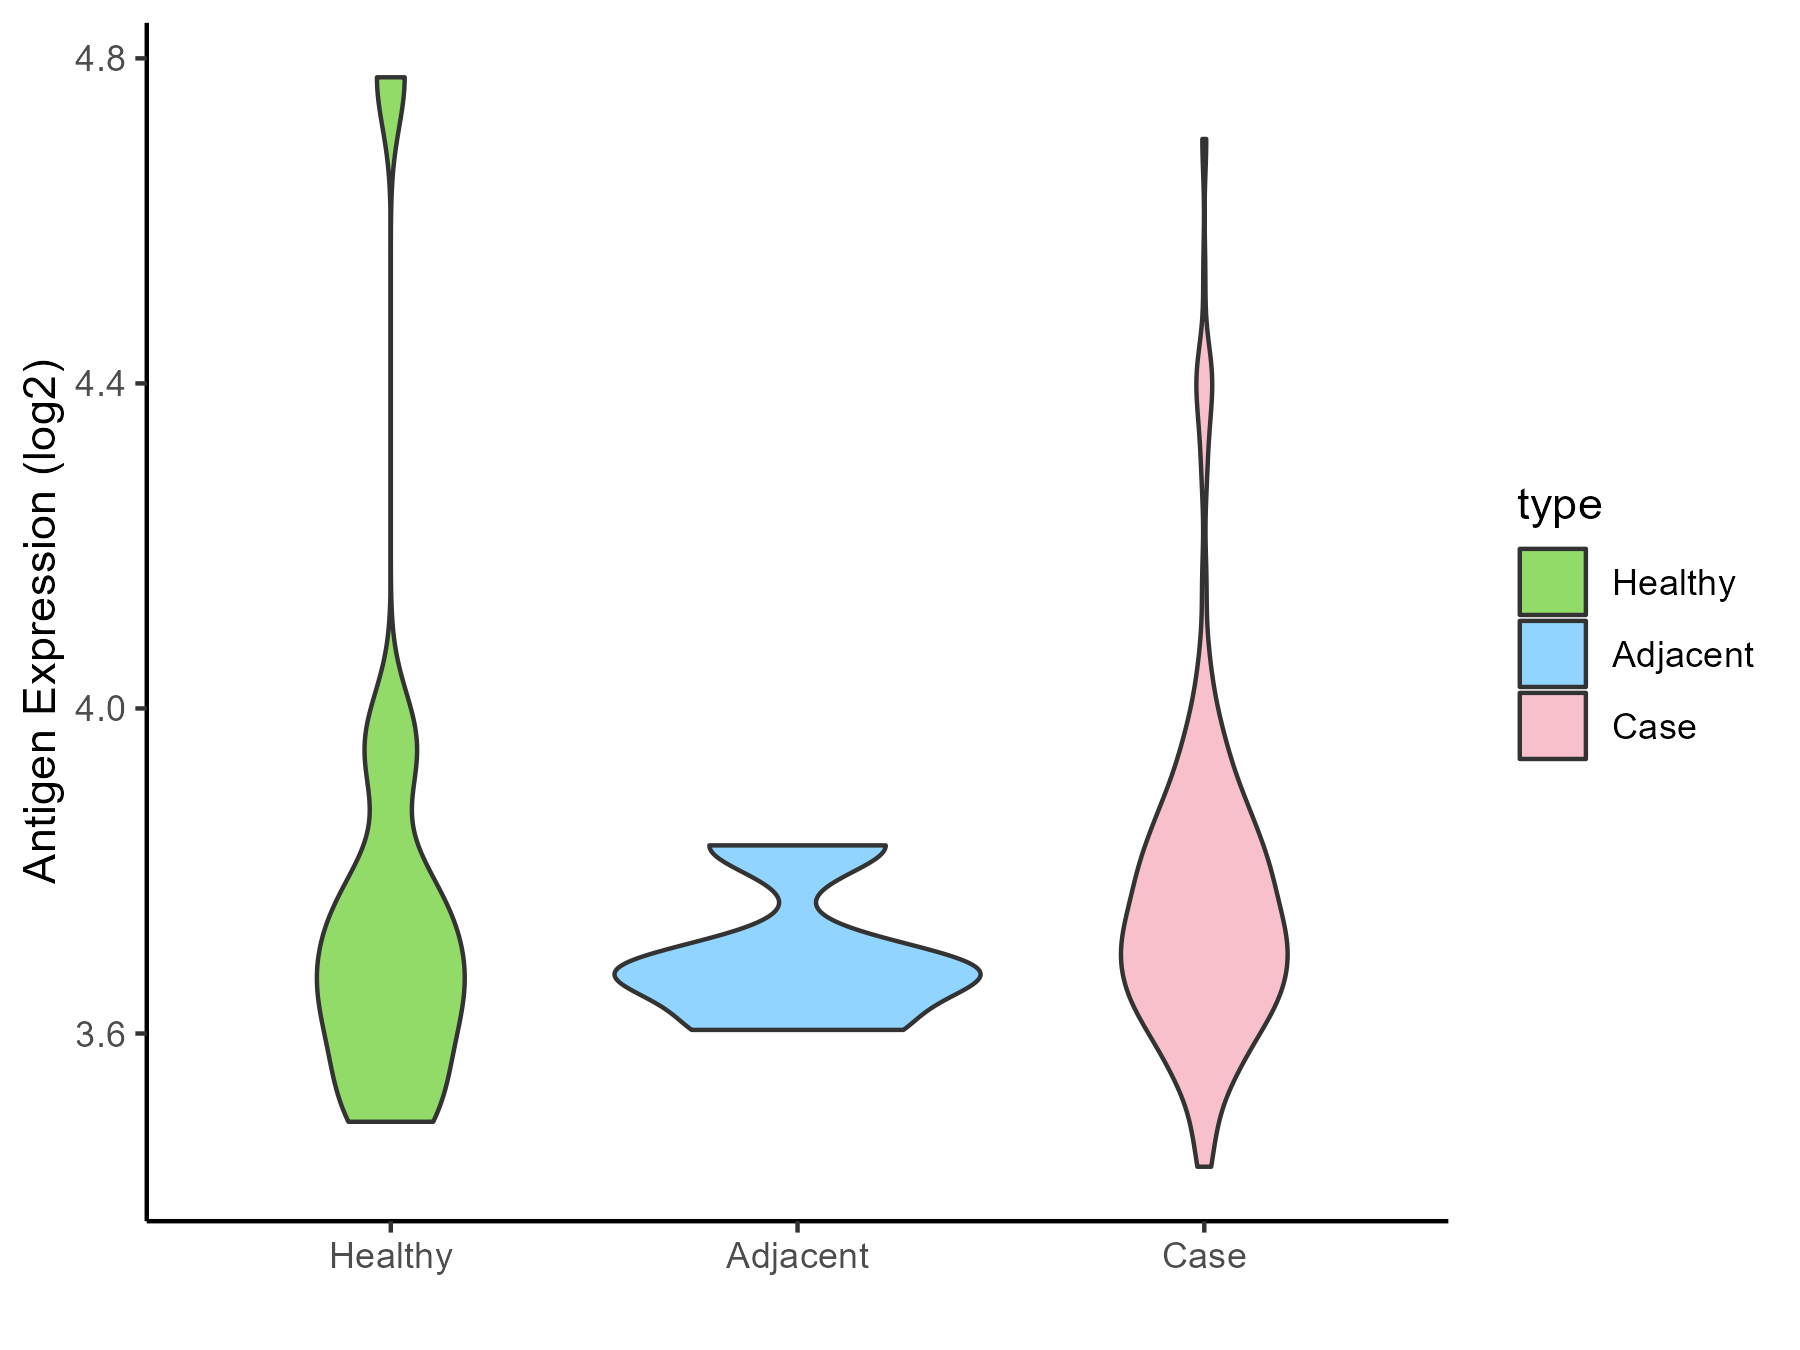
| The Studied Tissue | Bone marrow | |
| The Specific Disease | Myelodysplastic syndromes | |
| The Expression Level of Disease Section Compare with the Healthy Individual Tissue | p-value: 0.933434753; Fold-change: 0.036244506; Z-score: 0.114068213 | |
| The Expression Level of Disease Section Compare with the Adjacent Tissue | p-value: 0.219206498; Fold-change: 0.057631057; Z-score: 0.601955218 | |
| Disease-specific Antigen Abundances |
|
Click to View the Clearer Original Diagram |
| Differential expression pattern of antigen in diseases | ||
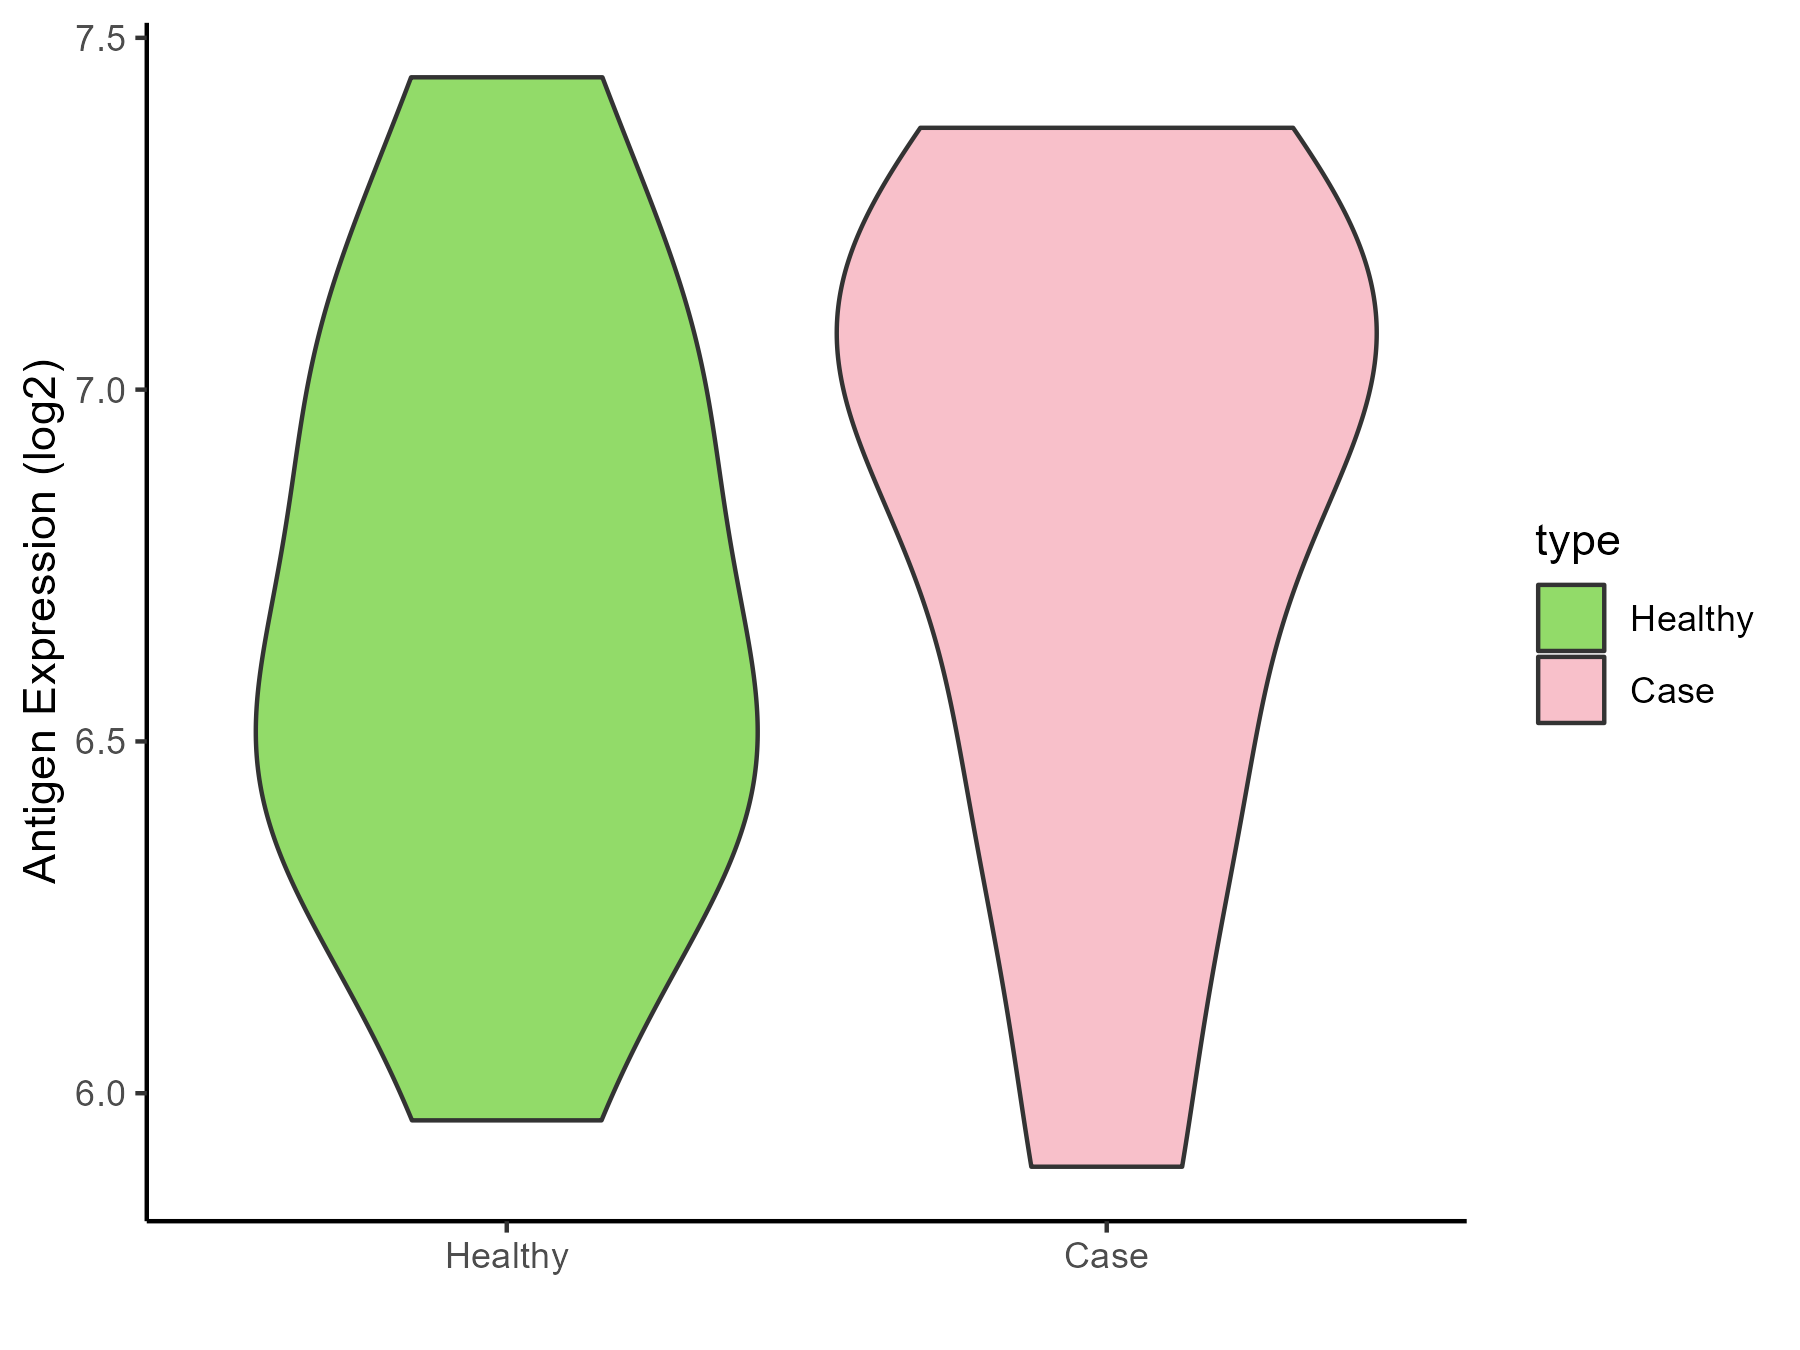
| The Studied Tissue | Tonsil | |
| The Specific Disease | Lymphoma | |
| The Expression Level of Disease Section Compare with the Healthy Individual Tissue | p-value: 0.609609367; Fold-change: 0.381114081; Z-score: 0.858482891 | |
| Disease-specific Antigen Abundances |
|
Click to View the Clearer Original Diagram |
| Differential expression pattern of antigen in diseases | ||
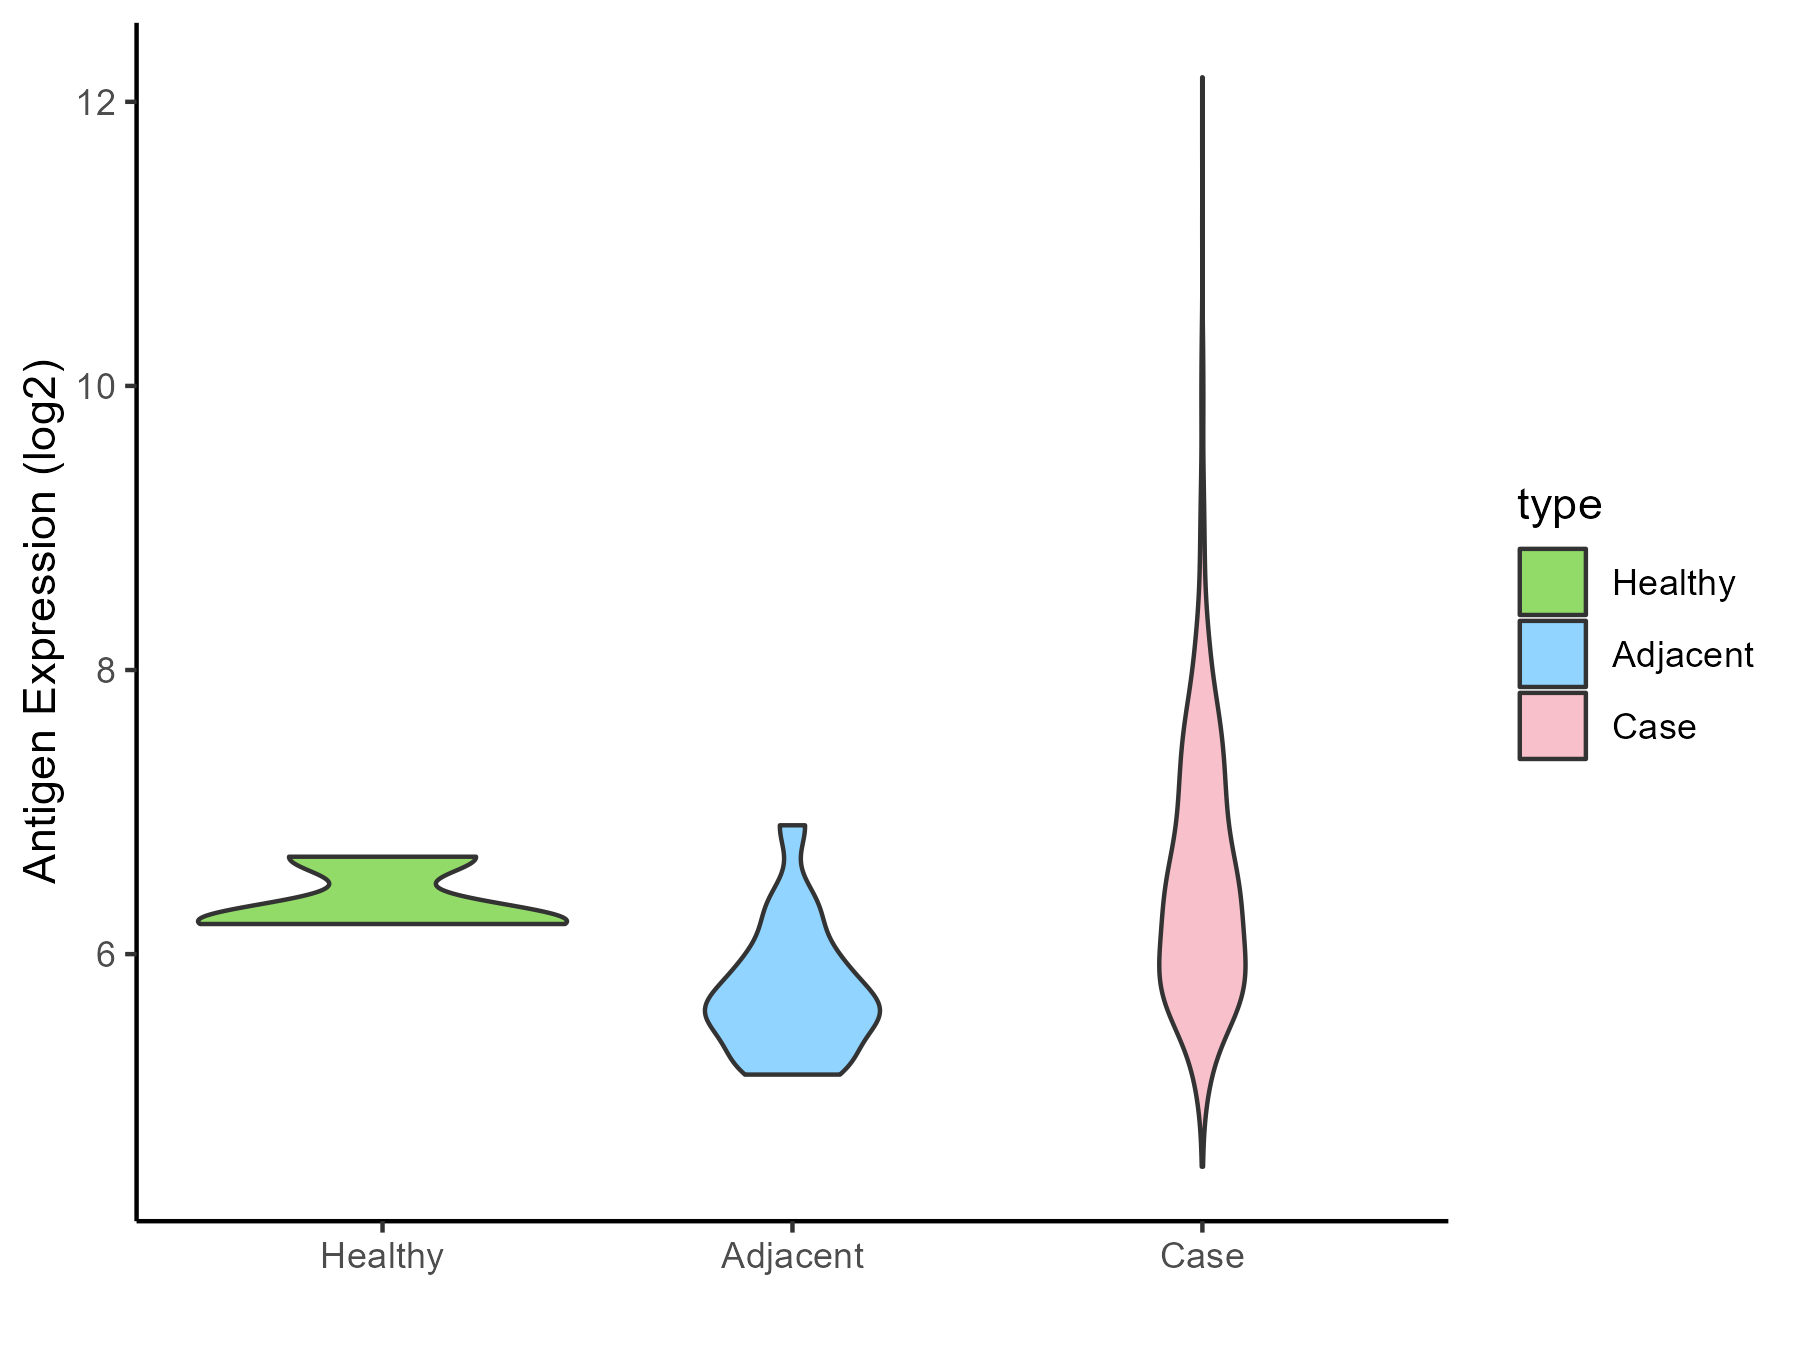
| The Studied Tissue | Gastric | |
| The Specific Disease | Gastric cancer | |
| The Expression Level of Disease Section Compare with the Healthy Individual Tissue | p-value: 0.356664397; Fold-change: 0.148555621; Z-score: 0.564028931 | |
| The Expression Level of Disease Section Compare with the Adjacent Tissue | p-value: 1.14E-06; Fold-change: 0.732907803; Z-score: 1.581303825 | |
| Disease-specific Antigen Abundances |
|
Click to View the Clearer Original Diagram |
| Differential expression pattern of antigen in diseases | ||
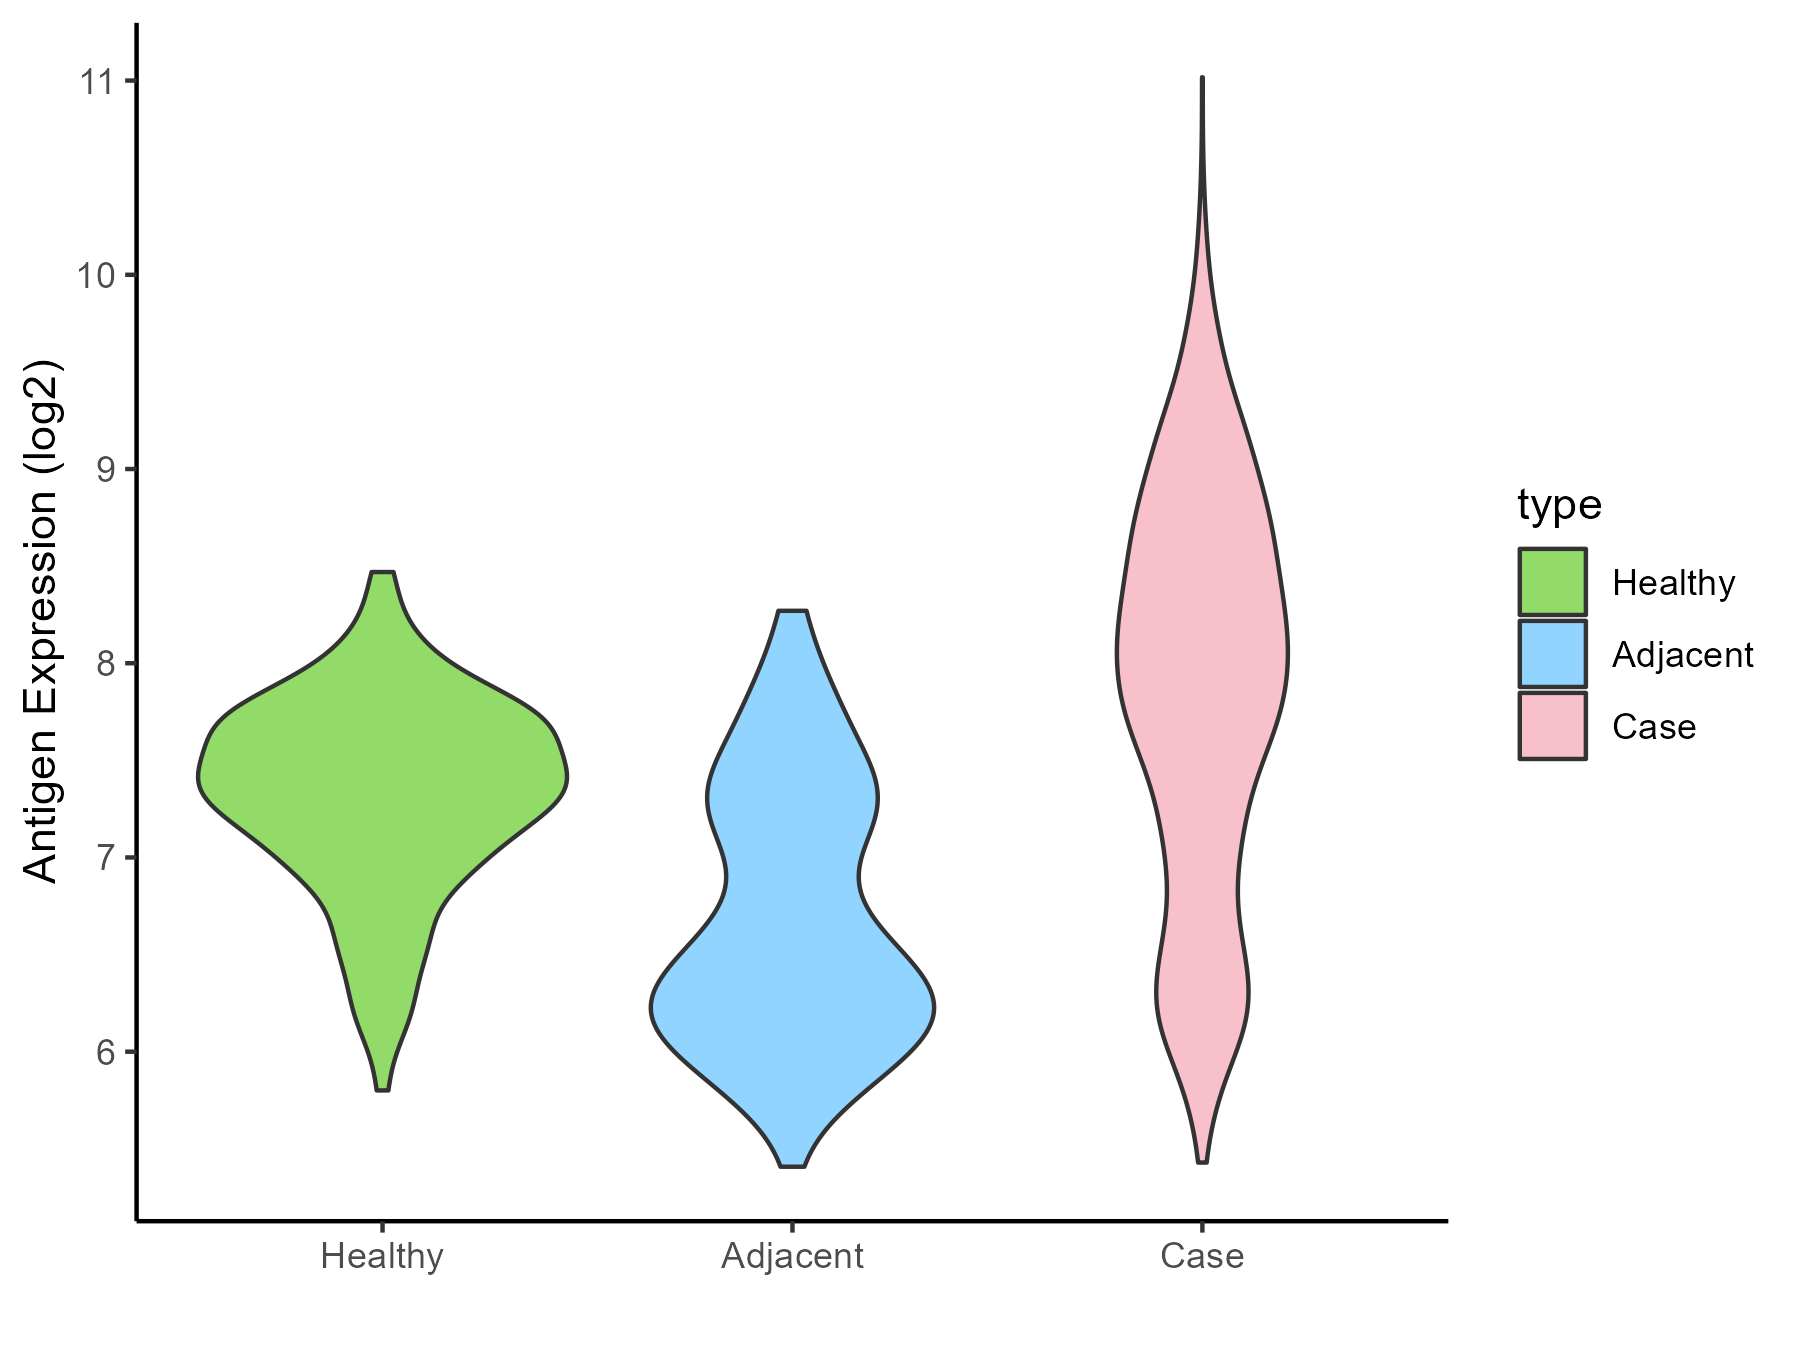
| The Studied Tissue | Colon | |
| The Specific Disease | Colon cancer | |
| The Expression Level of Disease Section Compare with the Healthy Individual Tissue | p-value: 7.33E-23; Fold-change: 0.57042165; Z-score: 1.136392538 | |
| The Expression Level of Disease Section Compare with the Adjacent Tissue | p-value: 1.56E-40; Fold-change: 1.464794268; Z-score: 2.180978753 | |
| Disease-specific Antigen Abundances |
|
Click to View the Clearer Original Diagram |
| Differential expression pattern of antigen in diseases | ||
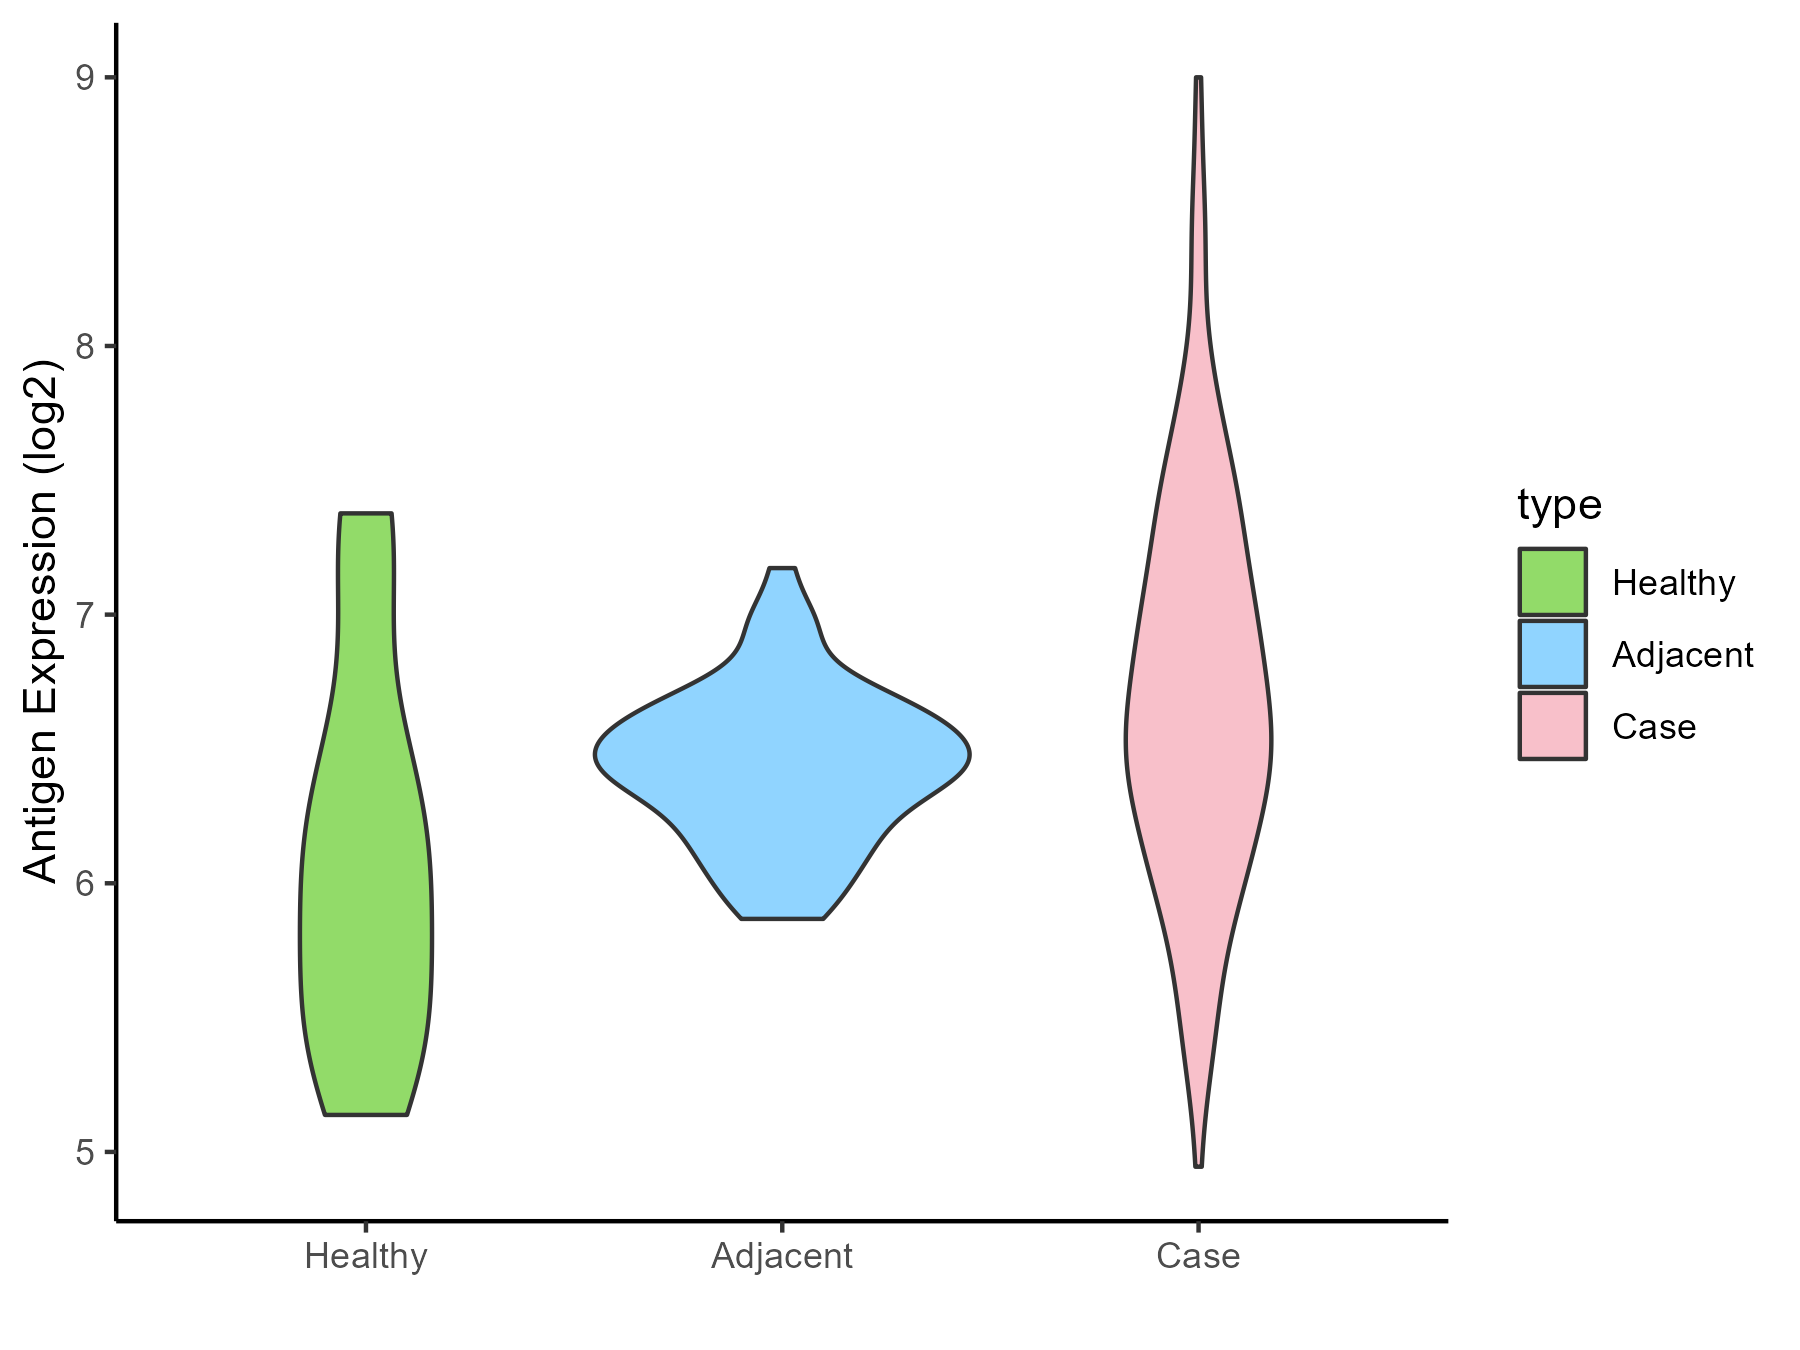
| The Studied Tissue | Pancreas | |
| The Specific Disease | Pancreatic cancer | |
| The Expression Level of Disease Section Compare with the Healthy Individual Tissue | p-value: 0.003971371; Fold-change: 0.609950105; Z-score: 0.861523878 | |
| The Expression Level of Disease Section Compare with the Adjacent Tissue | p-value: 6.88E-05; Fold-change: 0.195543016; Z-score: 0.679899207 | |
| Disease-specific Antigen Abundances |
|
Click to View the Clearer Original Diagram |
| Differential expression pattern of antigen in diseases | ||
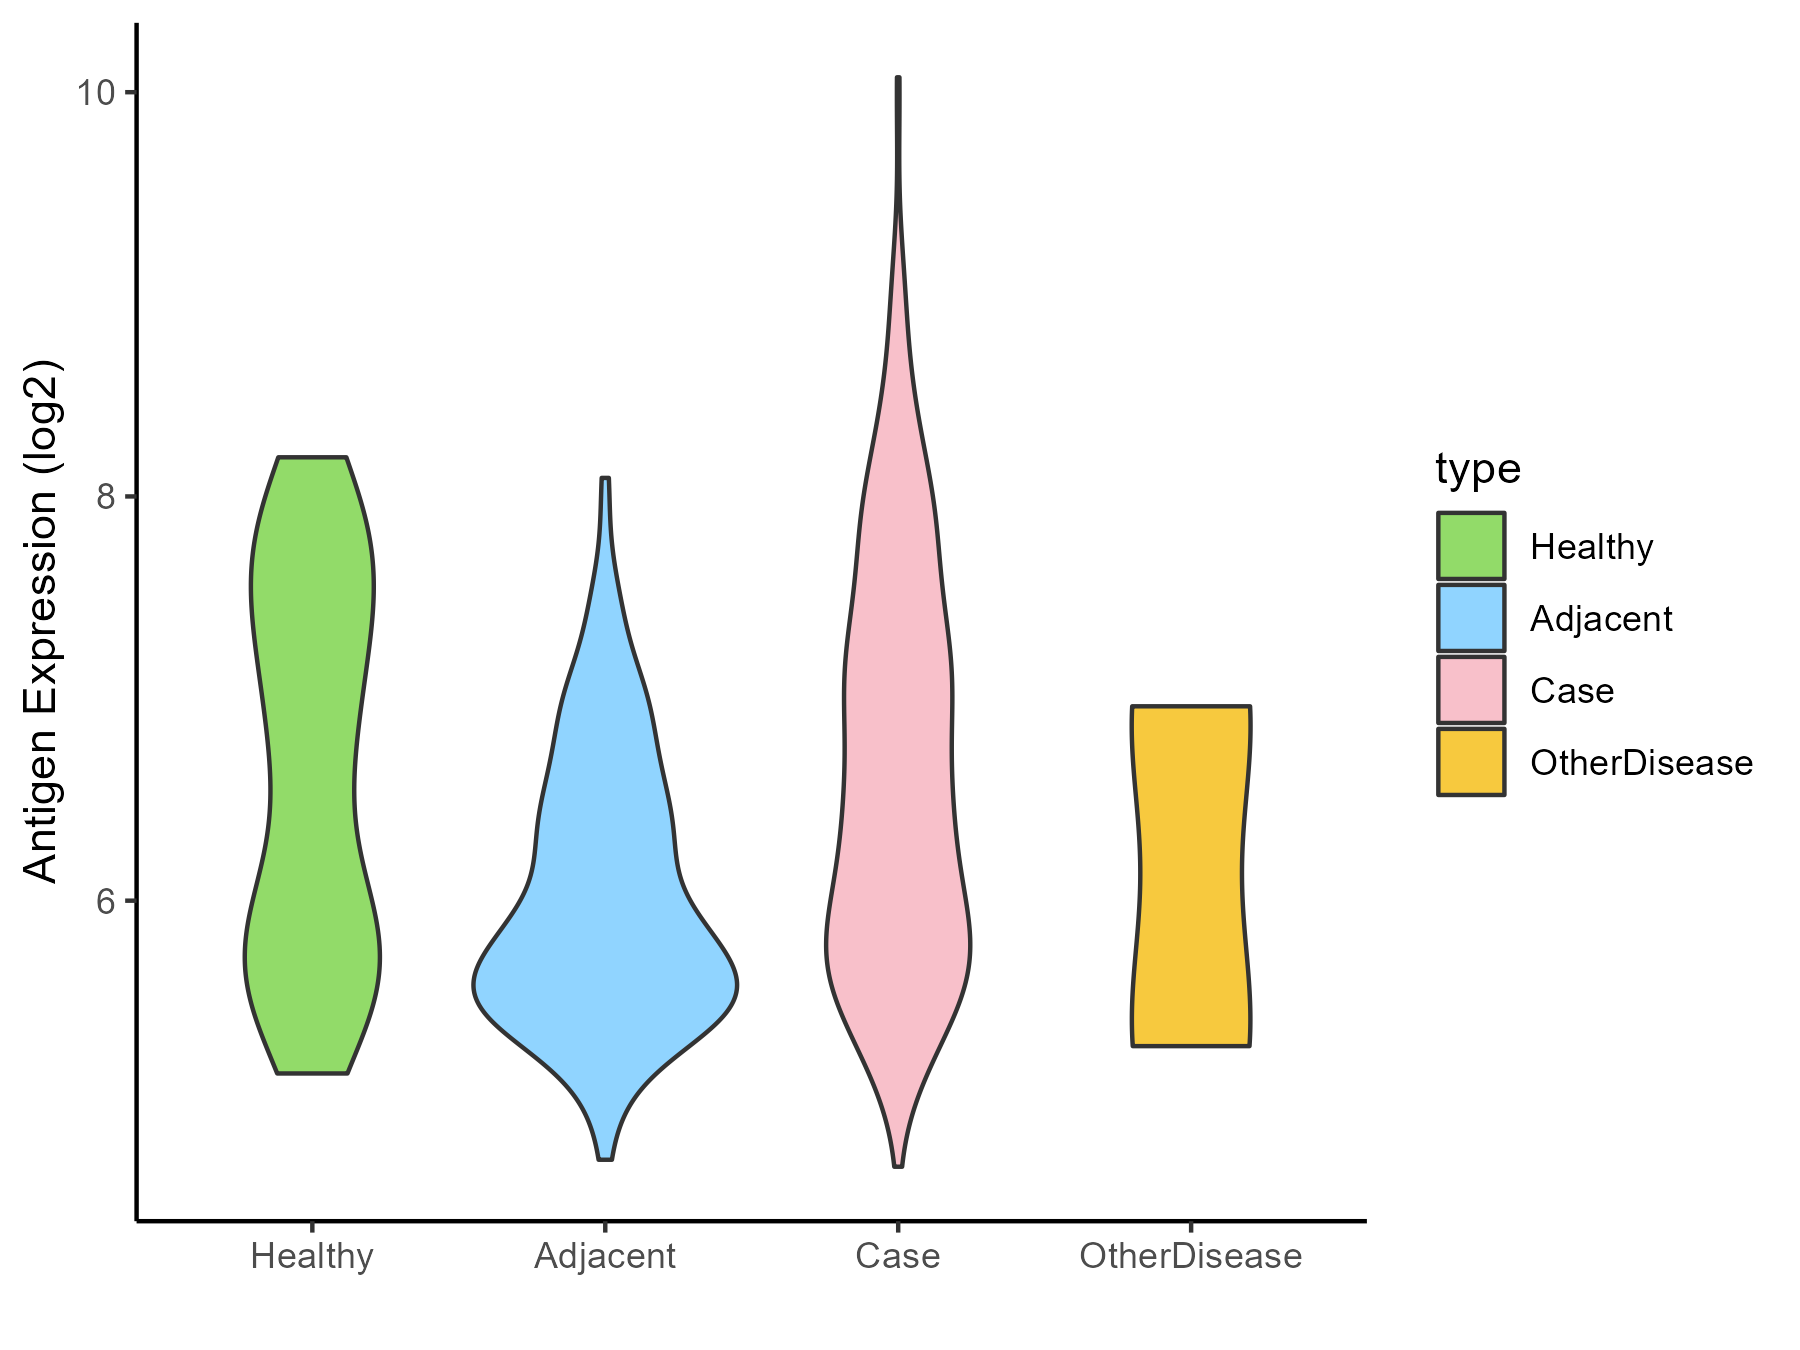
| The Studied Tissue | Liver | |
| The Specific Disease | Liver cancer | |
| The Expression Level of Disease Section Compare with the Healthy Individual Tissue | p-value: 0.923839495; Fold-change: -0.079681317; Z-score: -0.083542481 | |
| The Expression Level of Disease Section Compare with the Adjacent Tissue | p-value: 1.28E-18; Fold-change: 0.693378461; Z-score: 1.054179996 | |
| The Expression Level of Disease Section Compare with the Other Disease Section | p-value: 0.341838868; Fold-change: 0.388163117; Z-score: 0.412320017 | |
| Disease-specific Antigen Abundances |
|
Click to View the Clearer Original Diagram |
| Differential expression pattern of antigen in diseases | ||
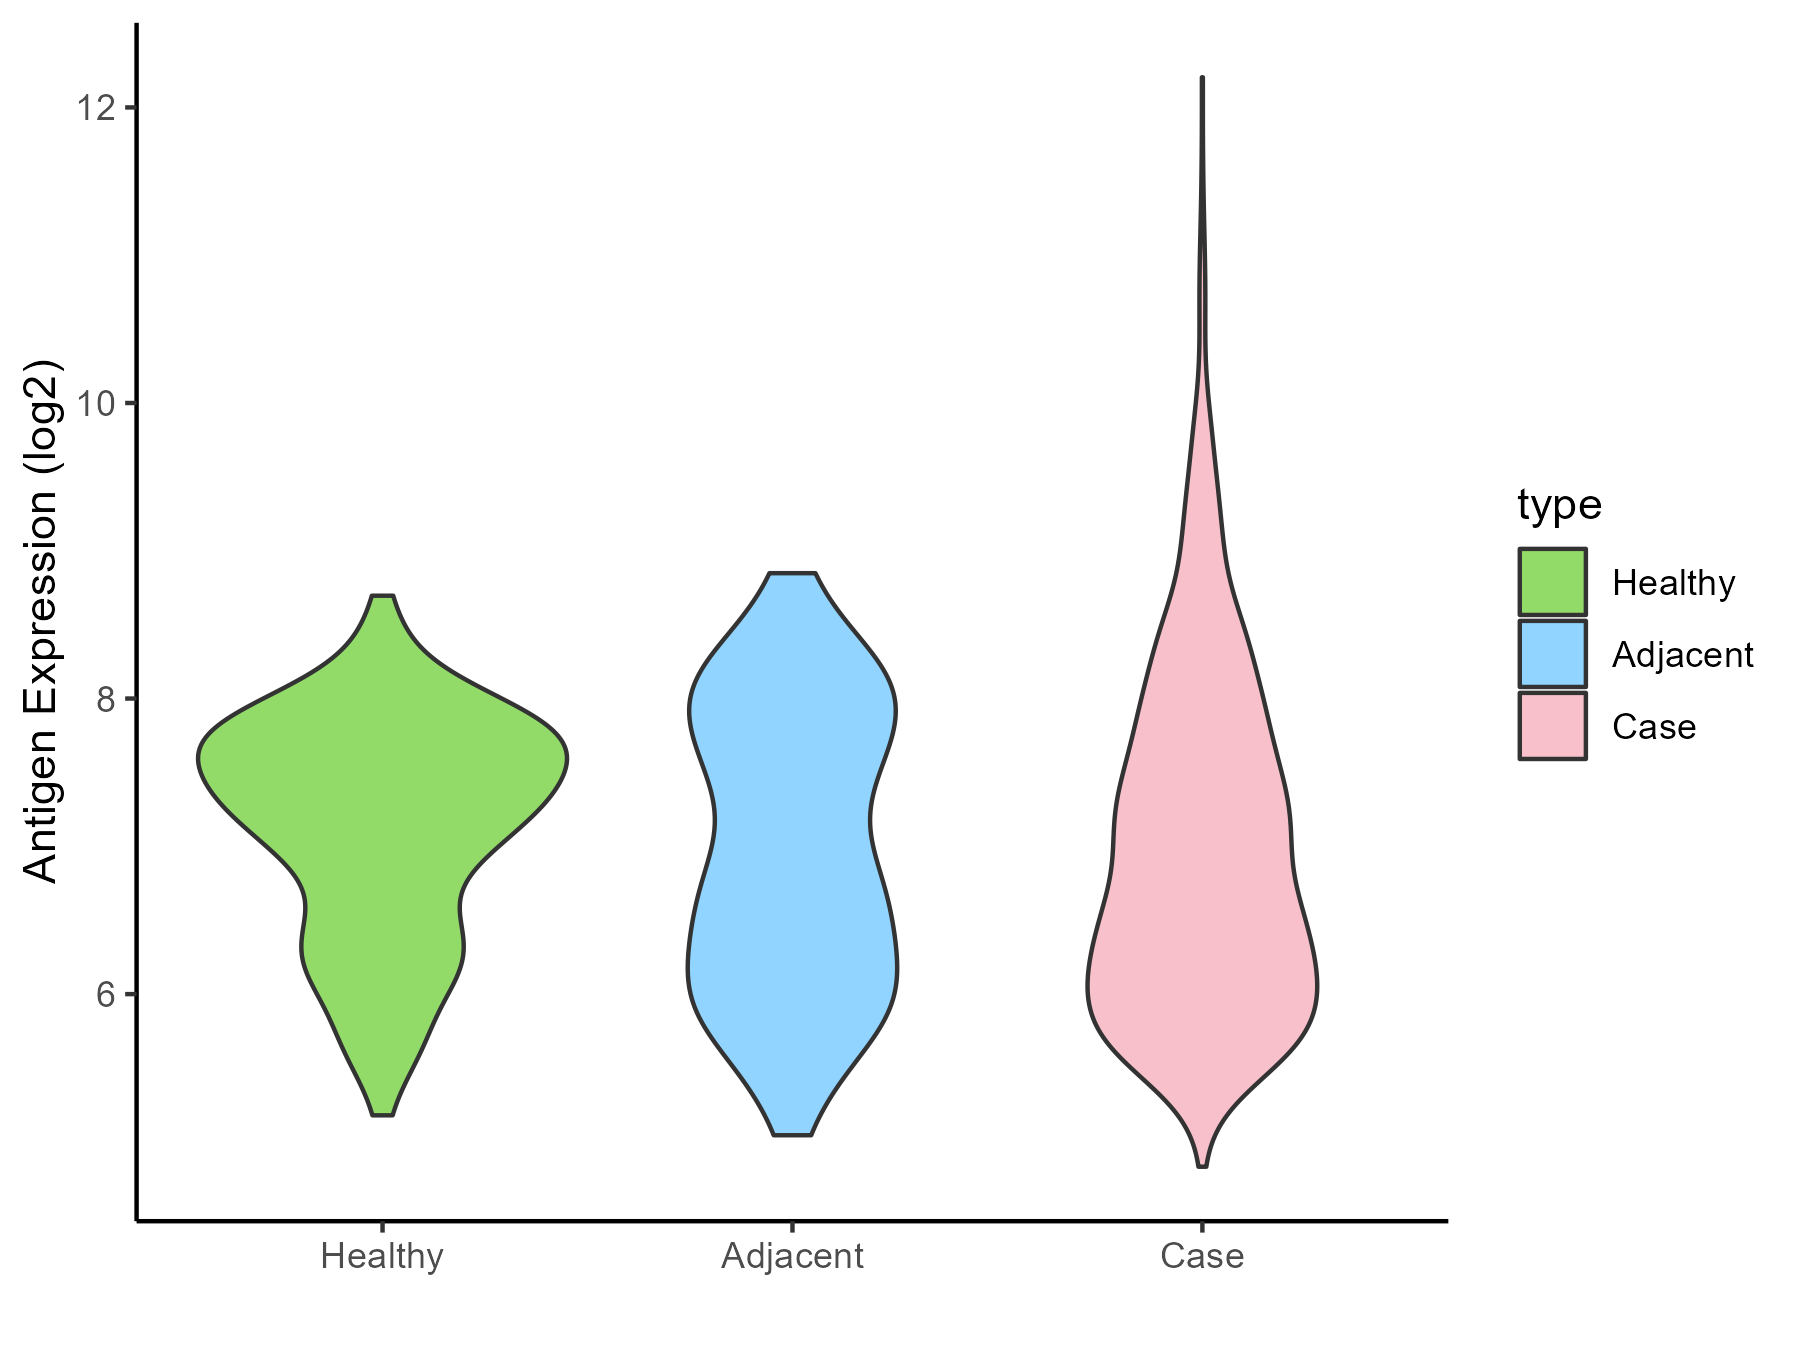
| The Studied Tissue | Lung | |
| The Specific Disease | Lung cancer | |
| The Expression Level of Disease Section Compare with the Healthy Individual Tissue | p-value: 0.024818605; Fold-change: -0.514455997; Z-score: -0.688491461 | |
| The Expression Level of Disease Section Compare with the Adjacent Tissue | p-value: 0.862496199; Fold-change: -0.089686009; Z-score: -0.092419918 | |
| Disease-specific Antigen Abundances |
|
Click to View the Clearer Original Diagram |
| Differential expression pattern of antigen in diseases | ||
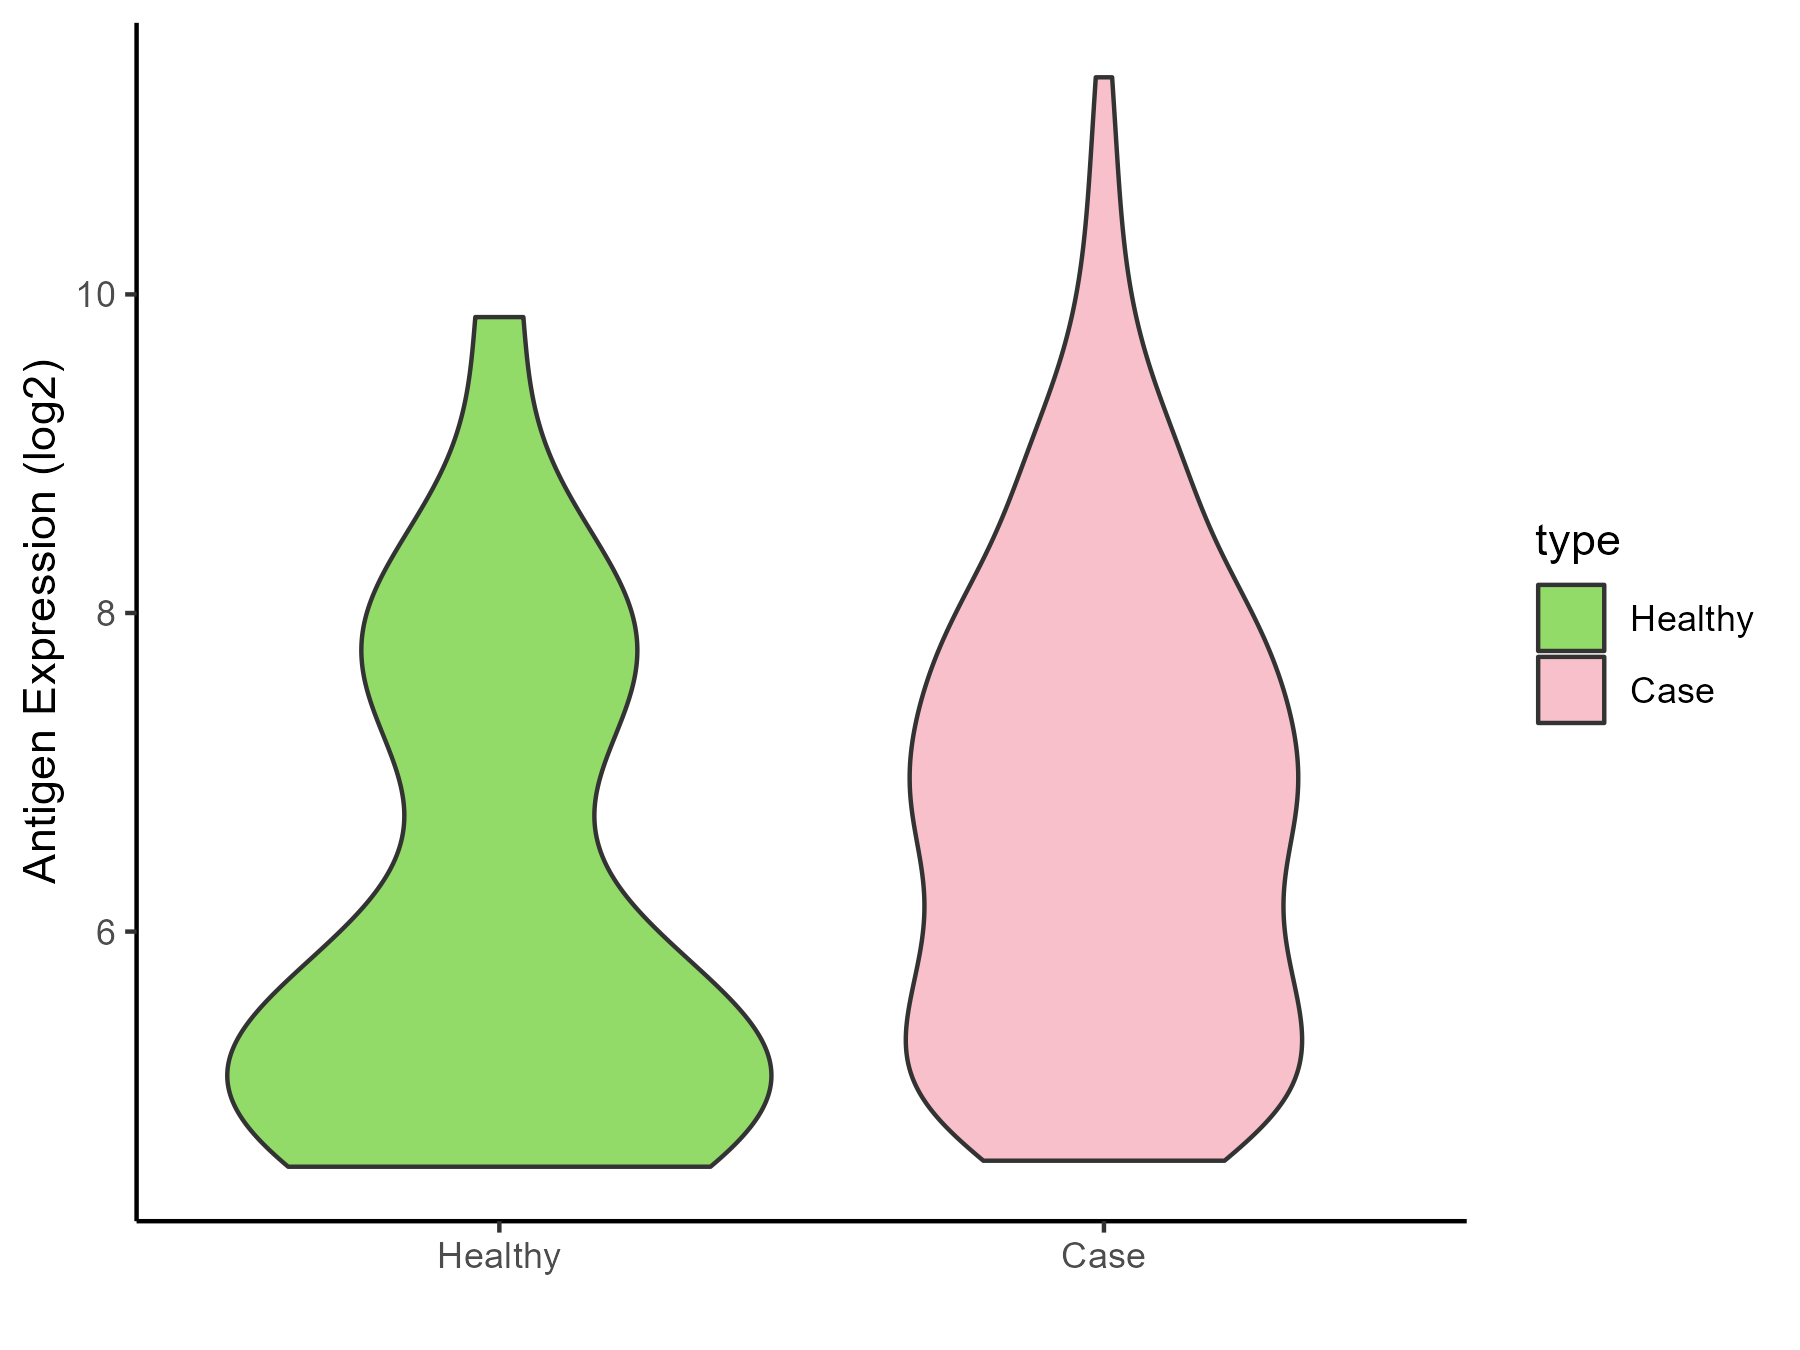
| The Studied Tissue | Skin | |
| The Specific Disease | Melanoma | |
| The Expression Level of Disease Section Compare with the Healthy Individual Tissue | p-value: 0.081056202; Fold-change: 1.307299049; Z-score: 0.862024478 | |
| Disease-specific Antigen Abundances |
|
Click to View the Clearer Original Diagram |
| Differential expression pattern of antigen in diseases | ||
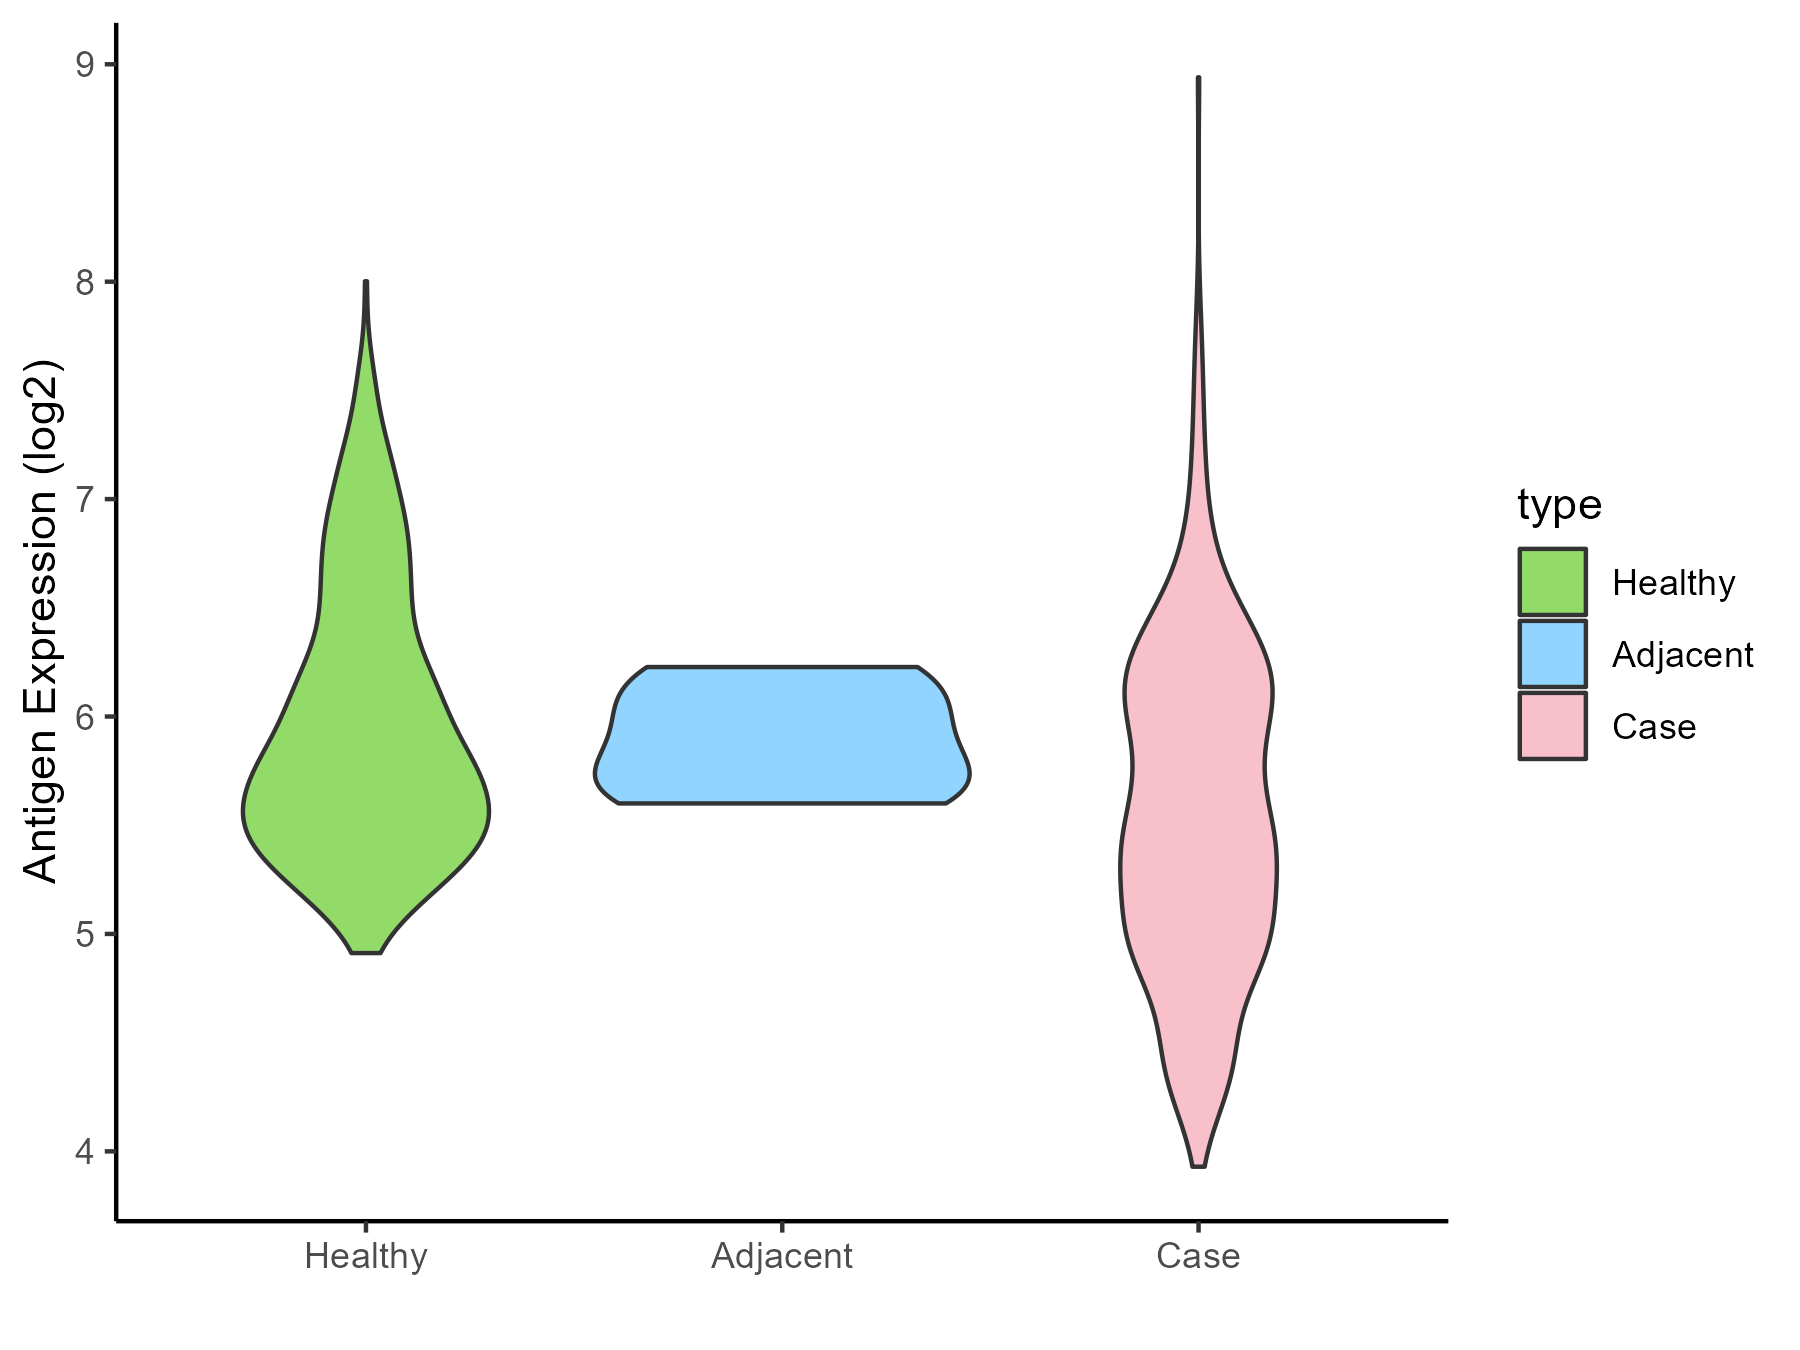
| The Studied Tissue | Muscle | |
| The Specific Disease | Sarcoma | |
| The Expression Level of Disease Section Compare with the Healthy Individual Tissue | p-value: 1.33E-20; Fold-change: -0.310434713; Z-score: -0.504249002 | |
| The Expression Level of Disease Section Compare with the Adjacent Tissue | p-value: 0.098218549; Fold-change: -0.372023621; Z-score: -1.324581457 | |
| Disease-specific Antigen Abundances |
|
Click to View the Clearer Original Diagram |
| Differential expression pattern of antigen in diseases | ||
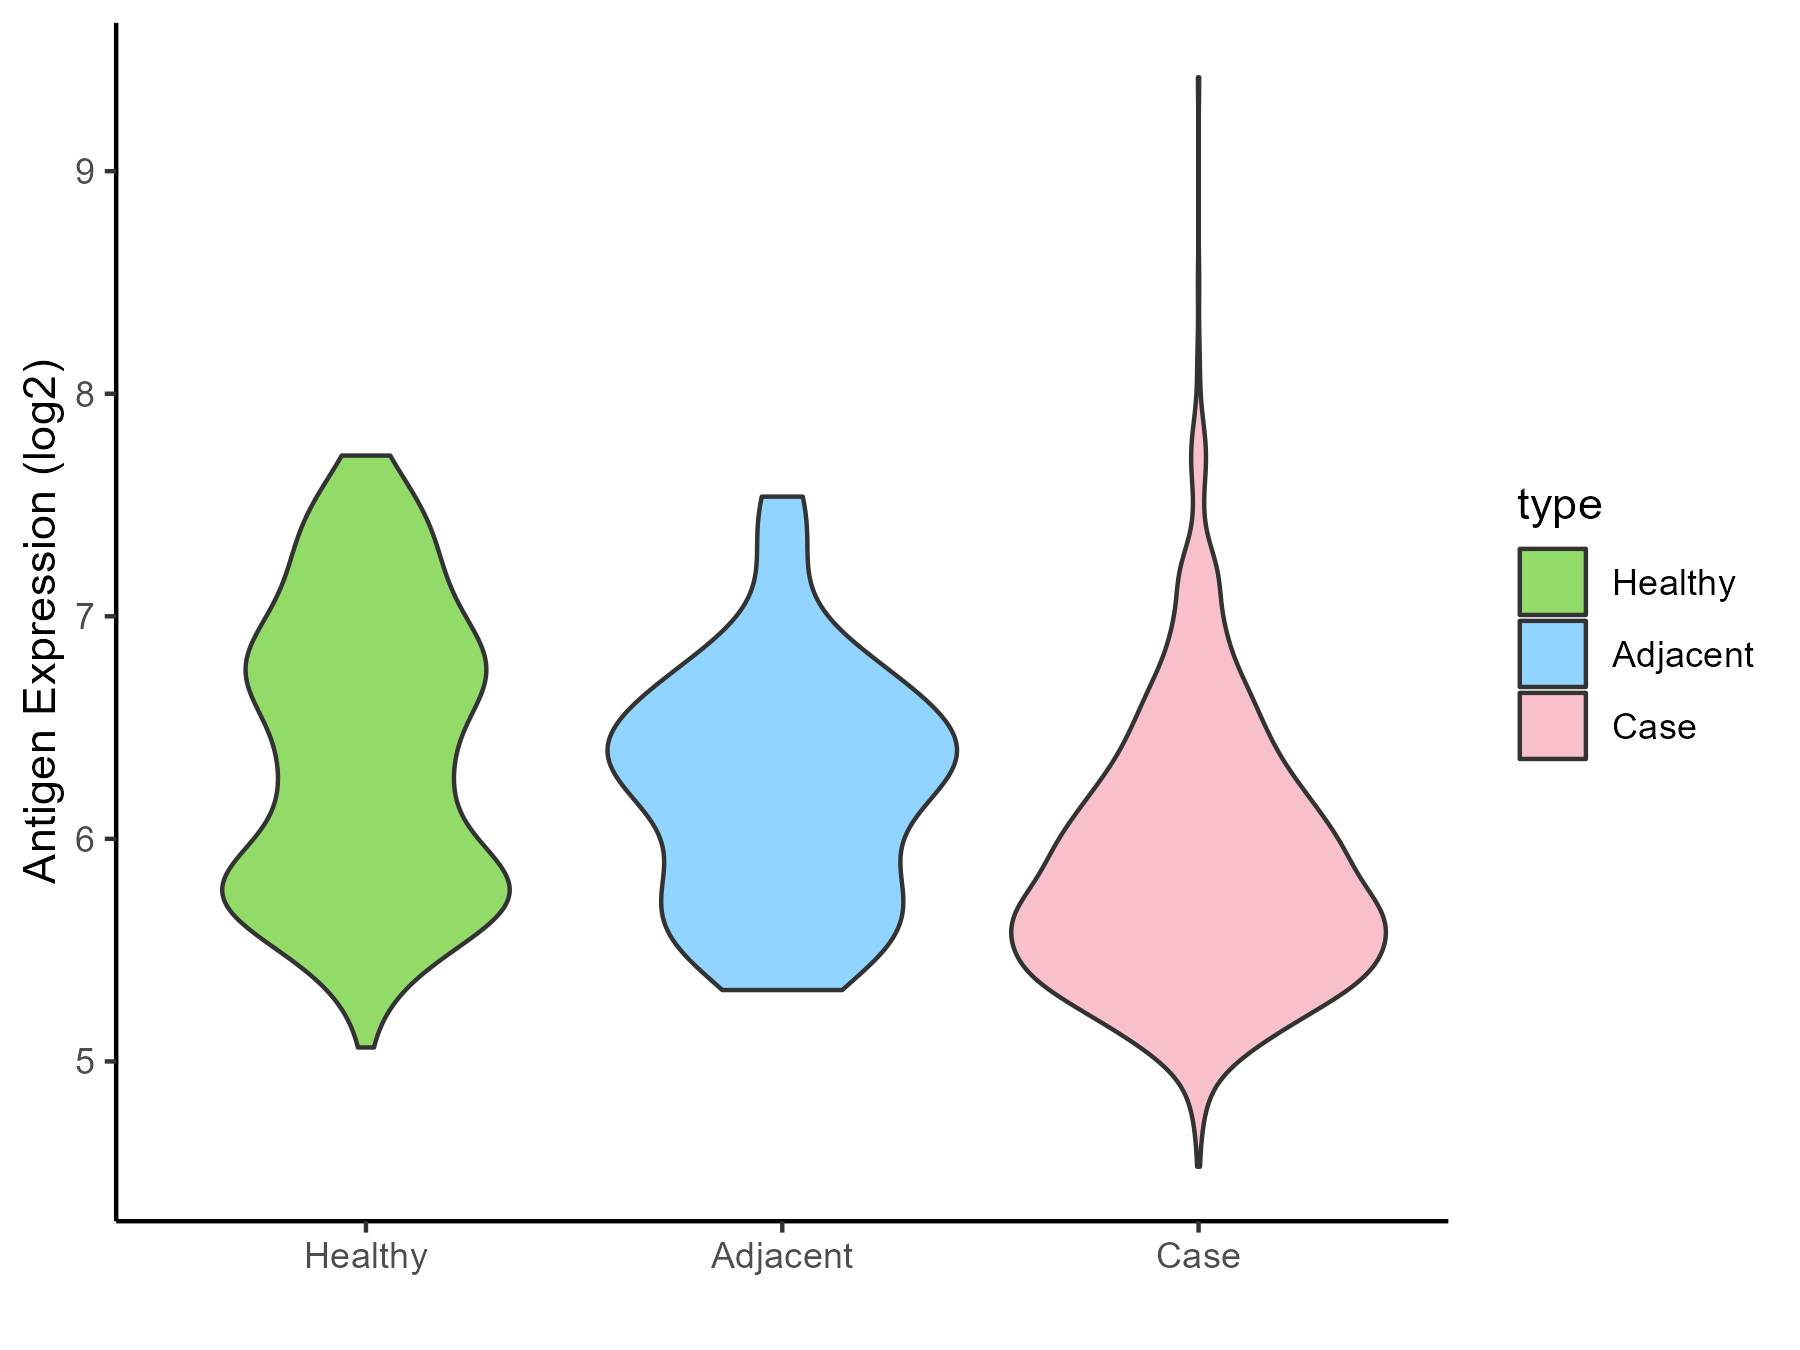
| The Studied Tissue | Breast | |
| The Specific Disease | Breast cancer | |
| The Expression Level of Disease Section Compare with the Healthy Individual Tissue | p-value: 6.27E-29; Fold-change: -0.621911521; Z-score: -0.97108526 | |
| The Expression Level of Disease Section Compare with the Adjacent Tissue | p-value: 2.42E-05; Fold-change: -0.541473624; Z-score: -1.030628746 | |
| Disease-specific Antigen Abundances |
|
Click to View the Clearer Original Diagram |
| Differential expression pattern of antigen in diseases | ||
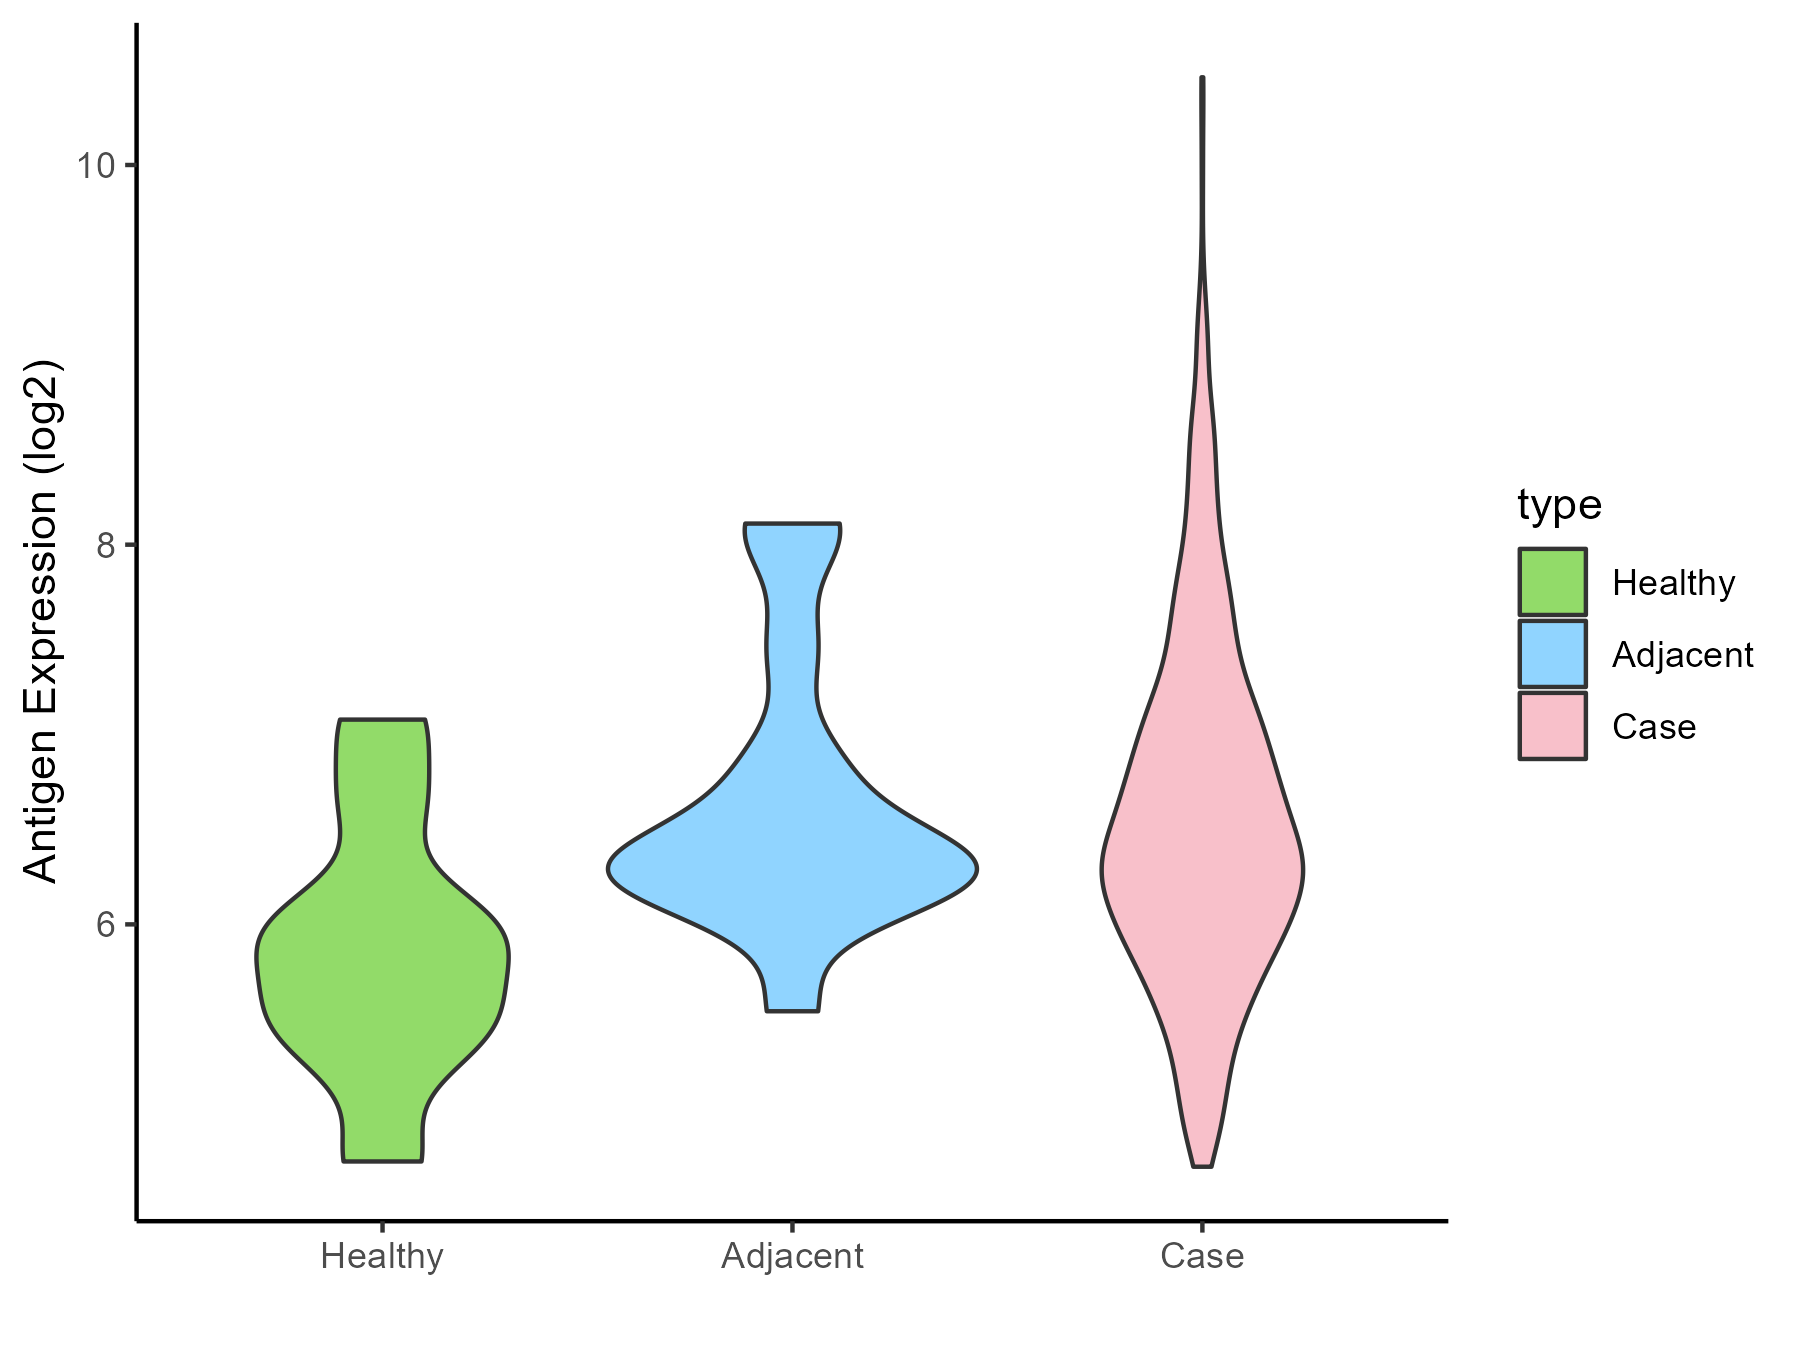
| The Studied Tissue | Ovarian | |
| The Specific Disease | Ovarian cancer | |
| The Expression Level of Disease Section Compare with the Healthy Individual Tissue | p-value: 0.015939222; Fold-change: 0.553795574; Z-score: 0.795045431 | |
| The Expression Level of Disease Section Compare with the Adjacent Tissue | p-value: 0.715604341; Fold-change: 0.097856914; Z-score: 0.131548622 | |
| Disease-specific Antigen Abundances |
|
Click to View the Clearer Original Diagram |
| Differential expression pattern of antigen in diseases | ||
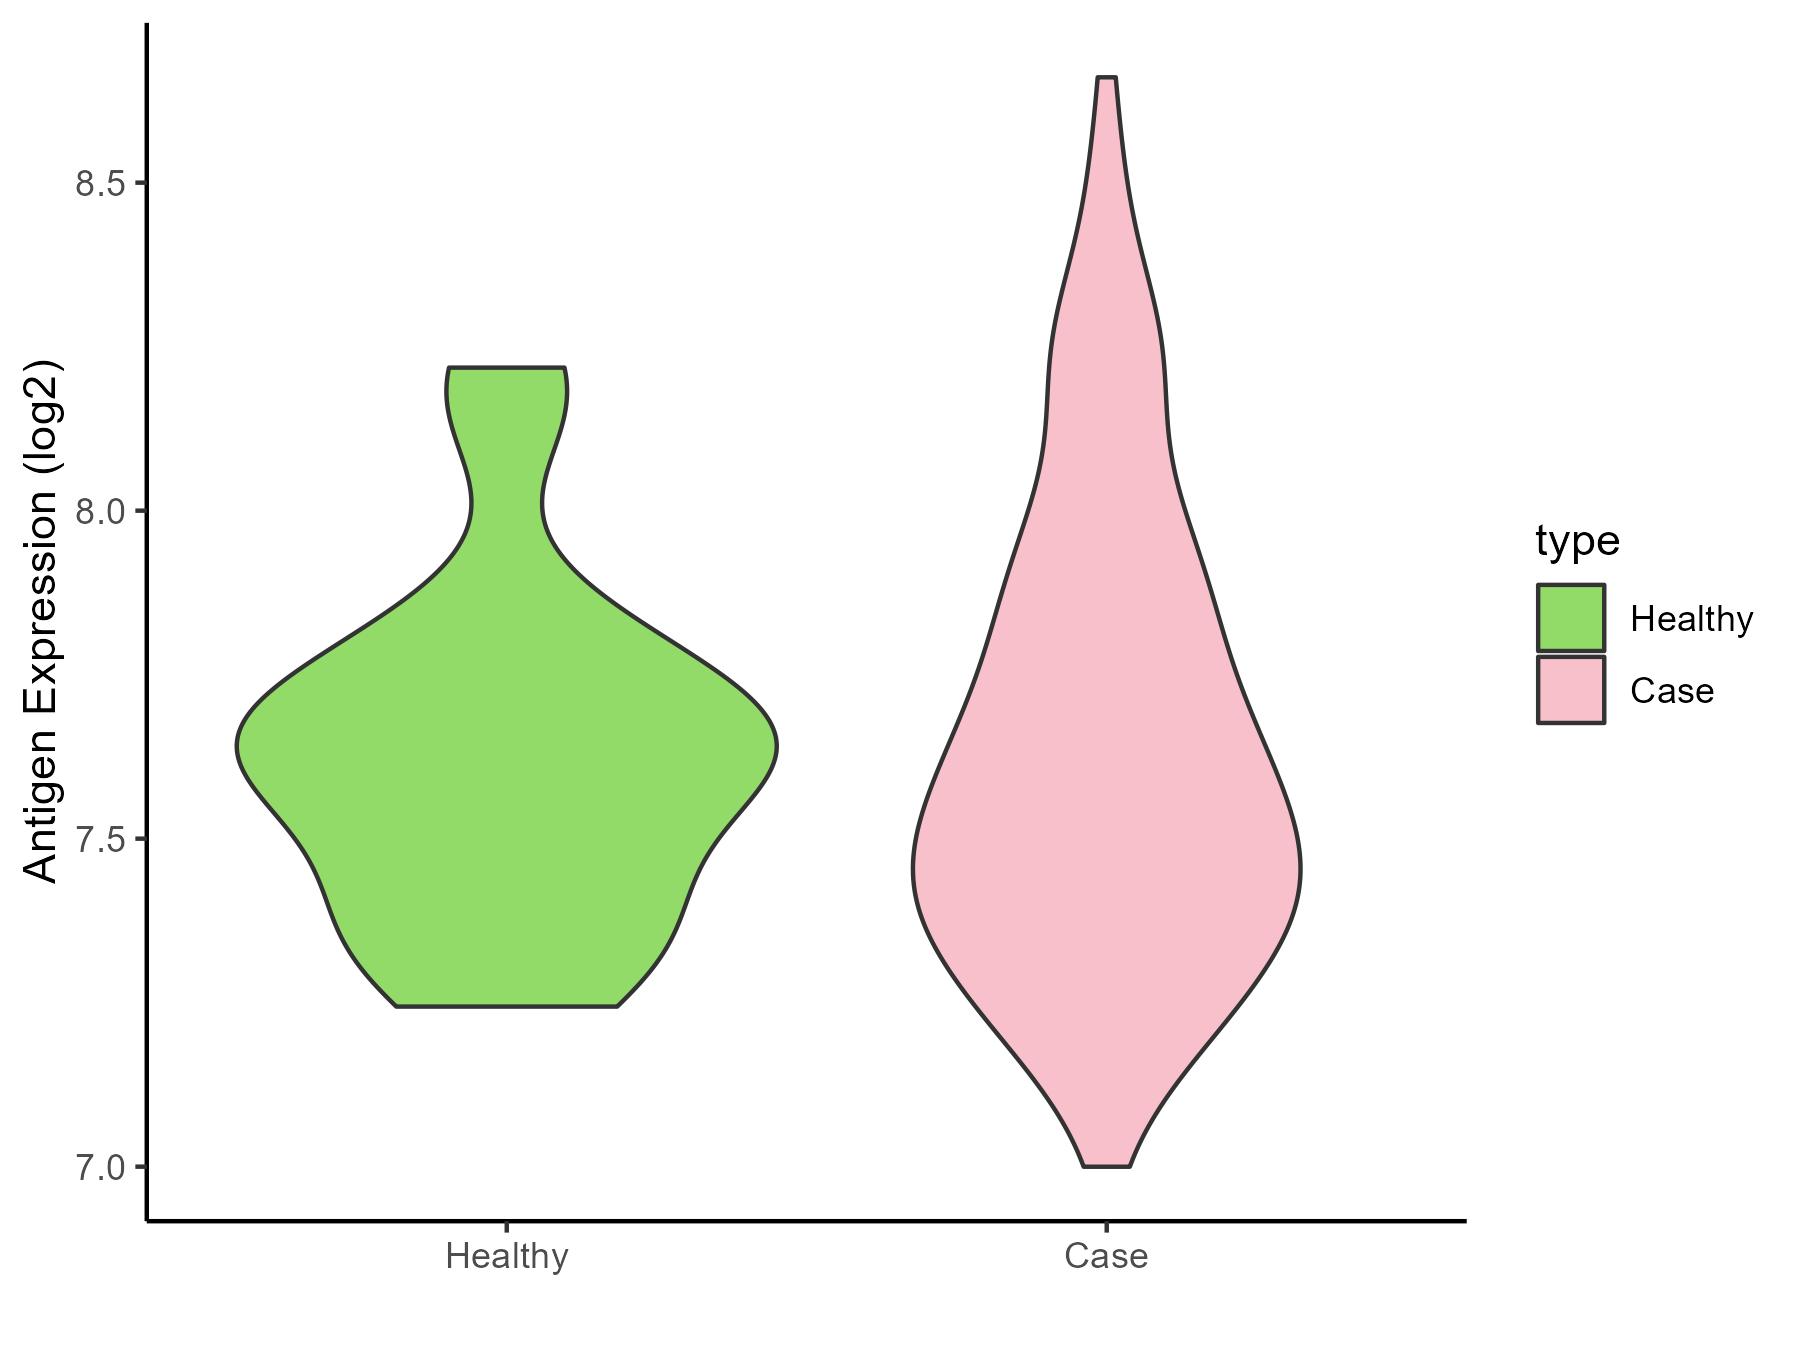
| The Studied Tissue | Cervical | |
| The Specific Disease | Cervical cancer | |
| The Expression Level of Disease Section Compare with the Healthy Individual Tissue | p-value: 0.777563562; Fold-change: -0.040191957; Z-score: -0.153009318 | |
| Disease-specific Antigen Abundances |
|
Click to View the Clearer Original Diagram |
| Differential expression pattern of antigen in diseases | ||
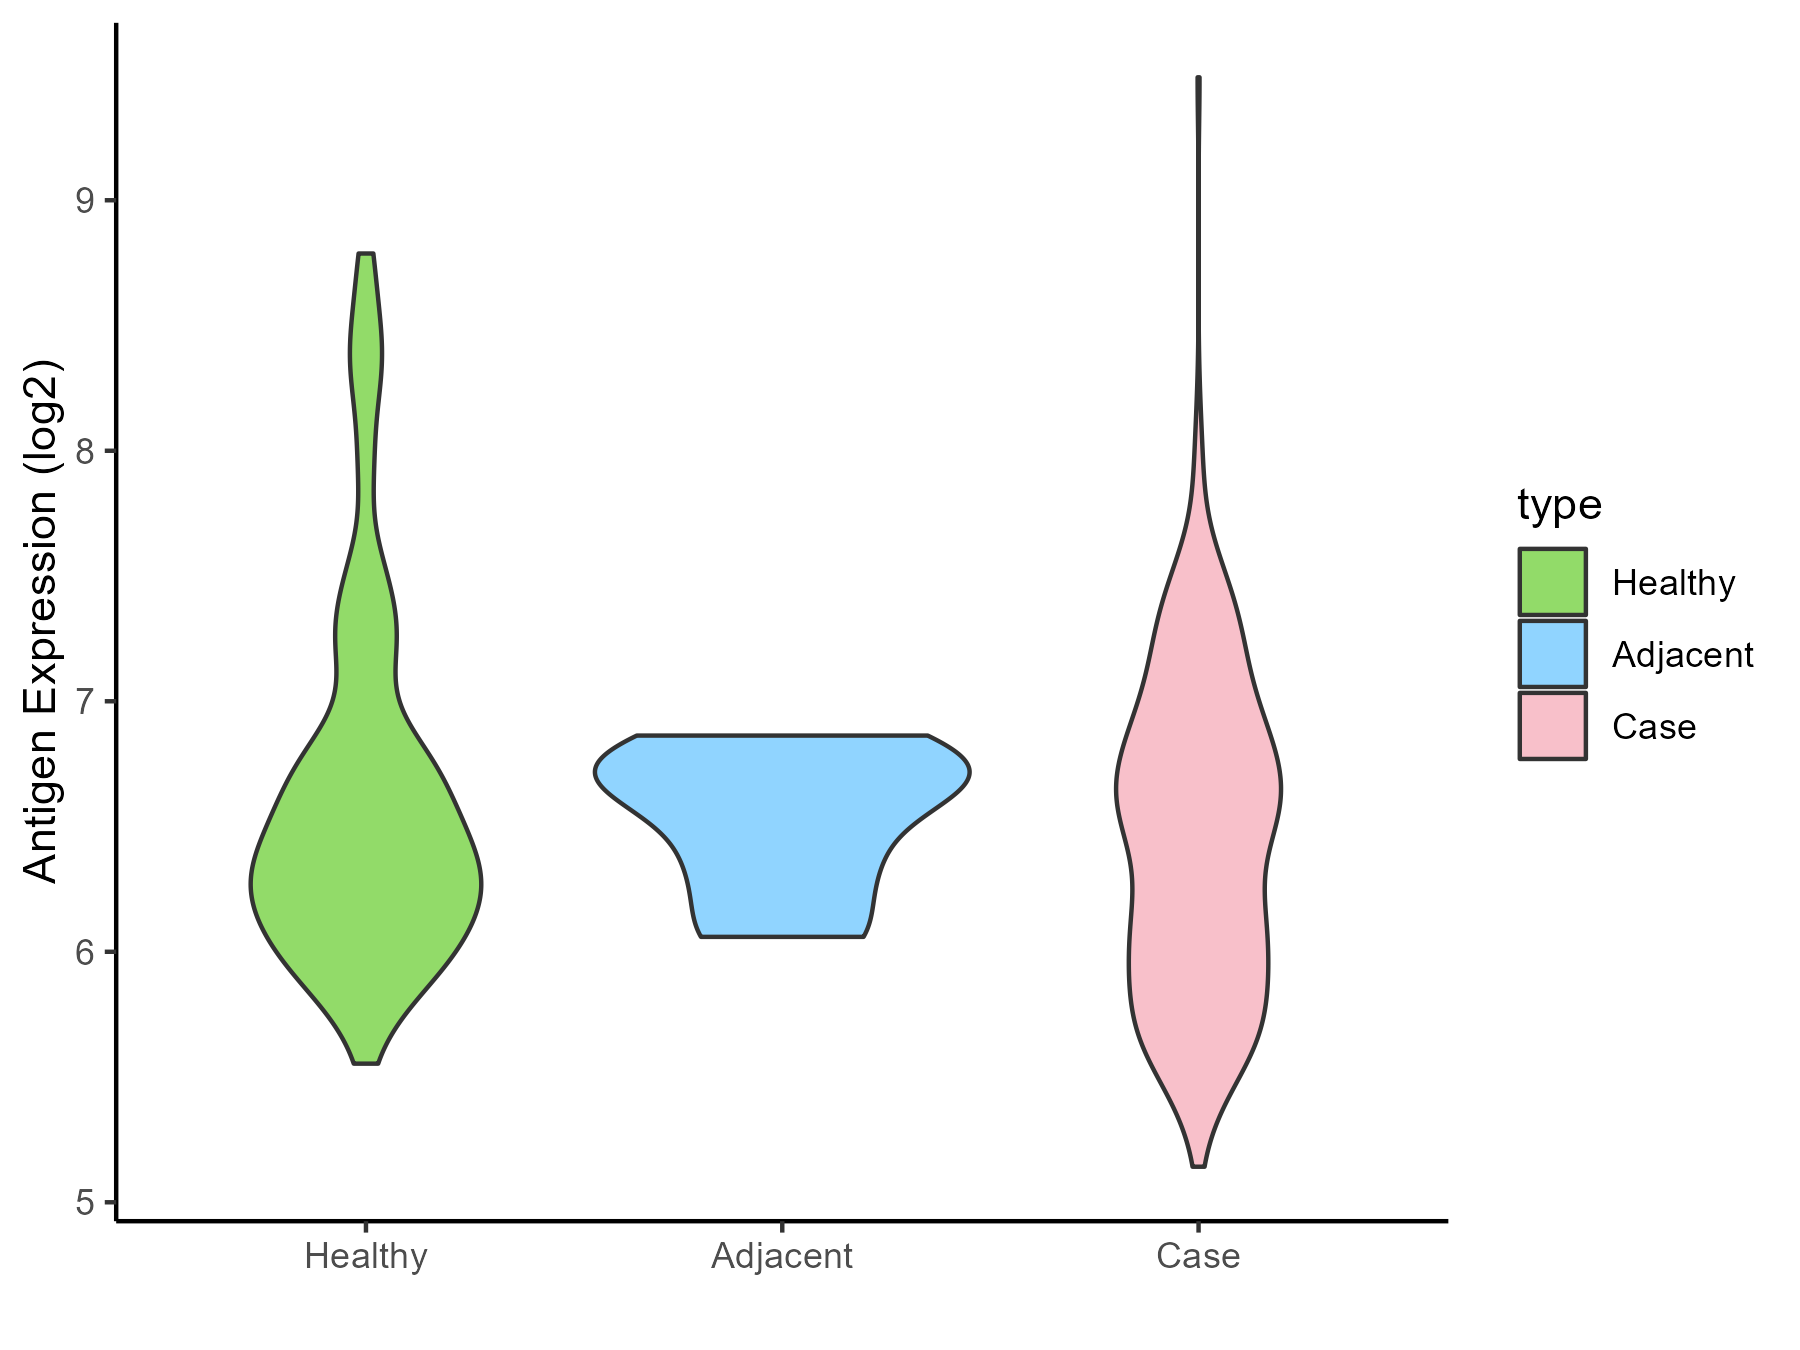
| The Studied Tissue | Endometrium | |
| The Specific Disease | Uterine cancer | |
| The Expression Level of Disease Section Compare with the Healthy Individual Tissue | p-value: 0.030424097; Fold-change: 0.06420923; Z-score: 0.090845207 | |
| The Expression Level of Disease Section Compare with the Adjacent Tissue | p-value: 0.661818776; Fold-change: -0.177504548; Z-score: -0.555506502 | |
| Disease-specific Antigen Abundances |
|
Click to View the Clearer Original Diagram |
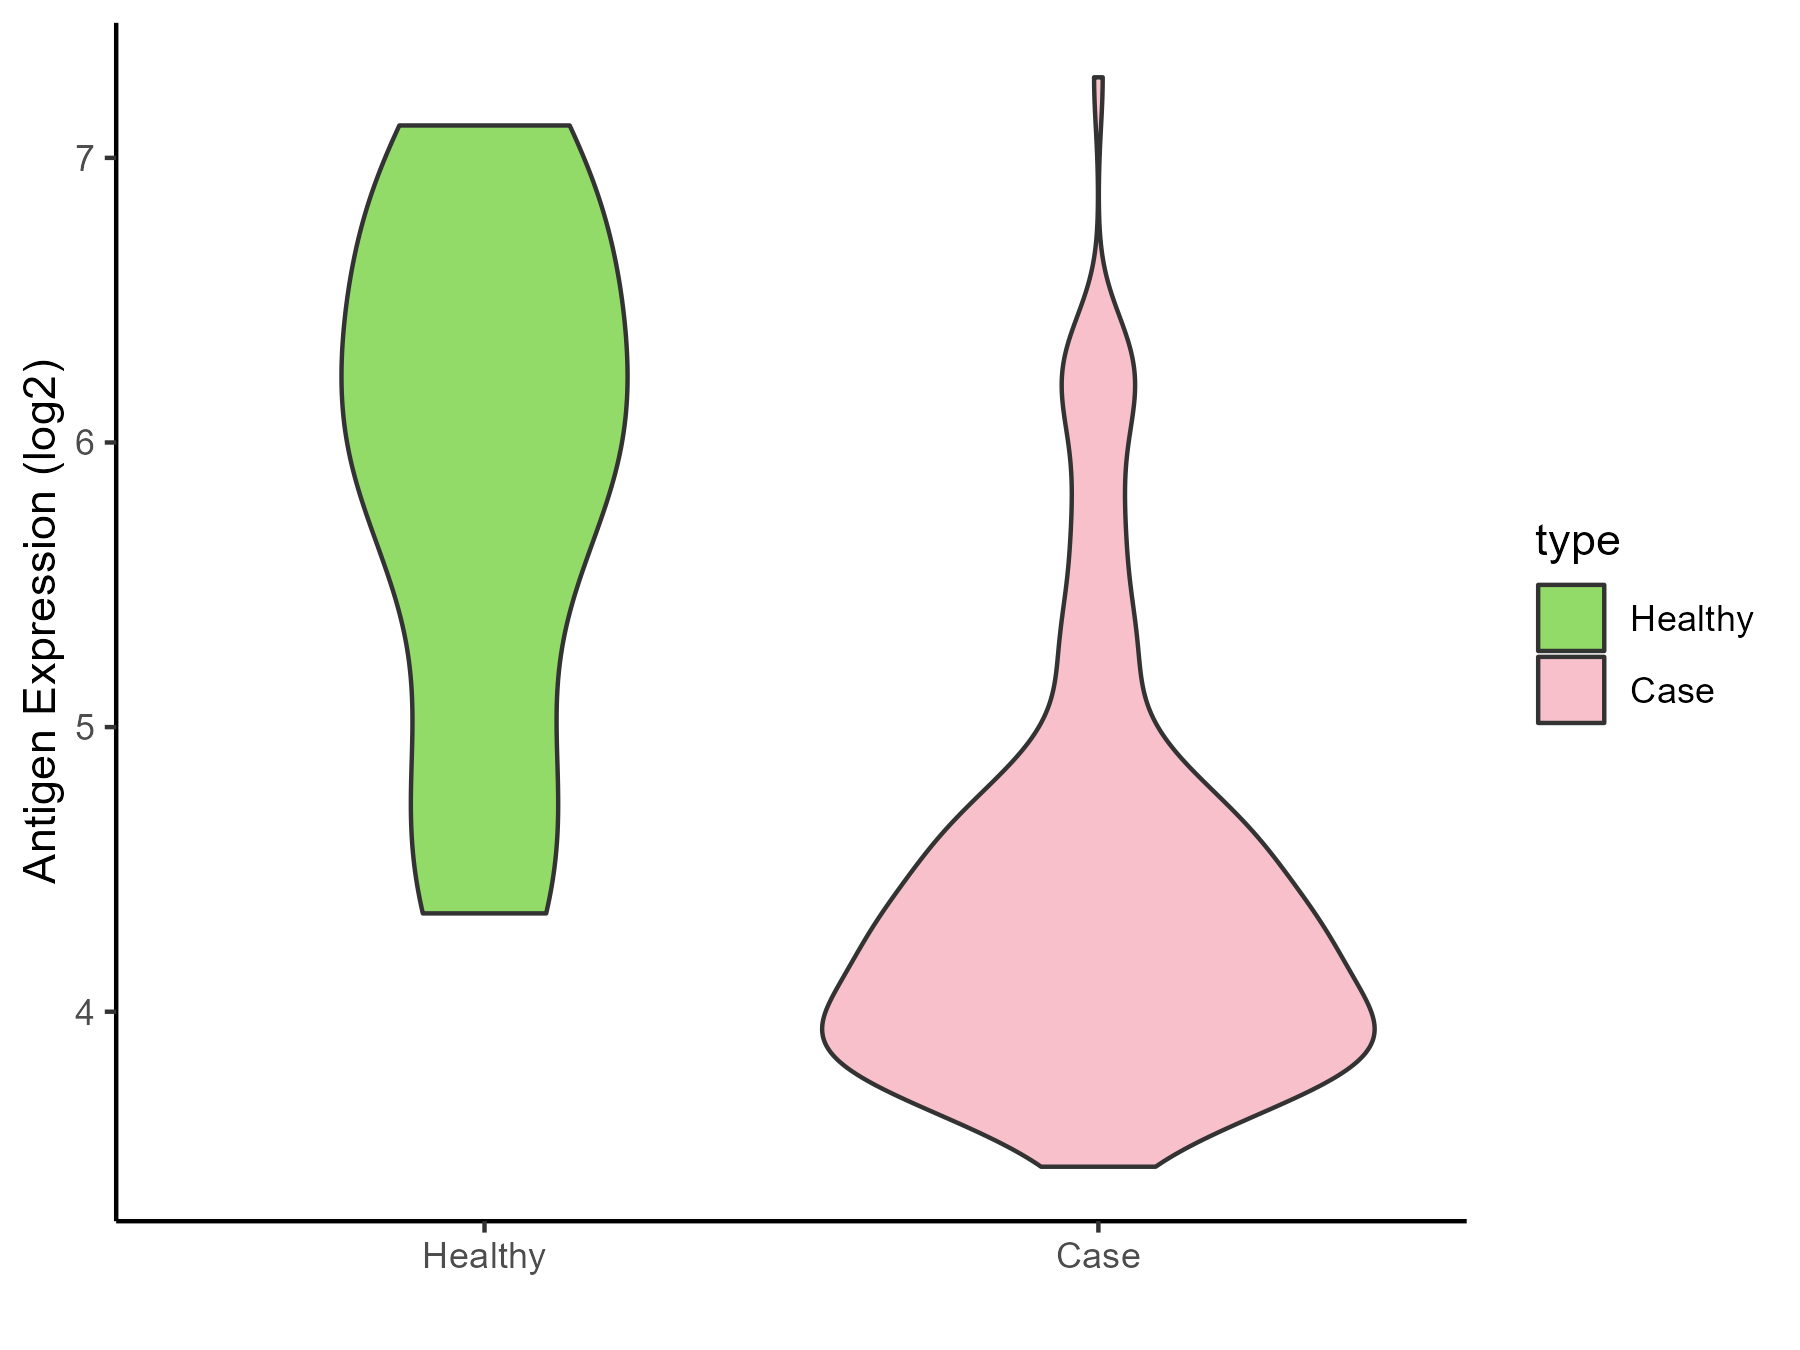
| Differential expression pattern of antigen in diseases | ||
| The Studied Tissue | Prostate | |
| The Specific Disease | Prostate cancer | |
| The Expression Level of Disease Section Compare with the Healthy Individual Tissue | p-value: 1.47E-07; Fold-change: -1.669097248; Z-score: -1.881925679 | |
| Disease-specific Antigen Abundances |
|
Click to View the Clearer Original Diagram |
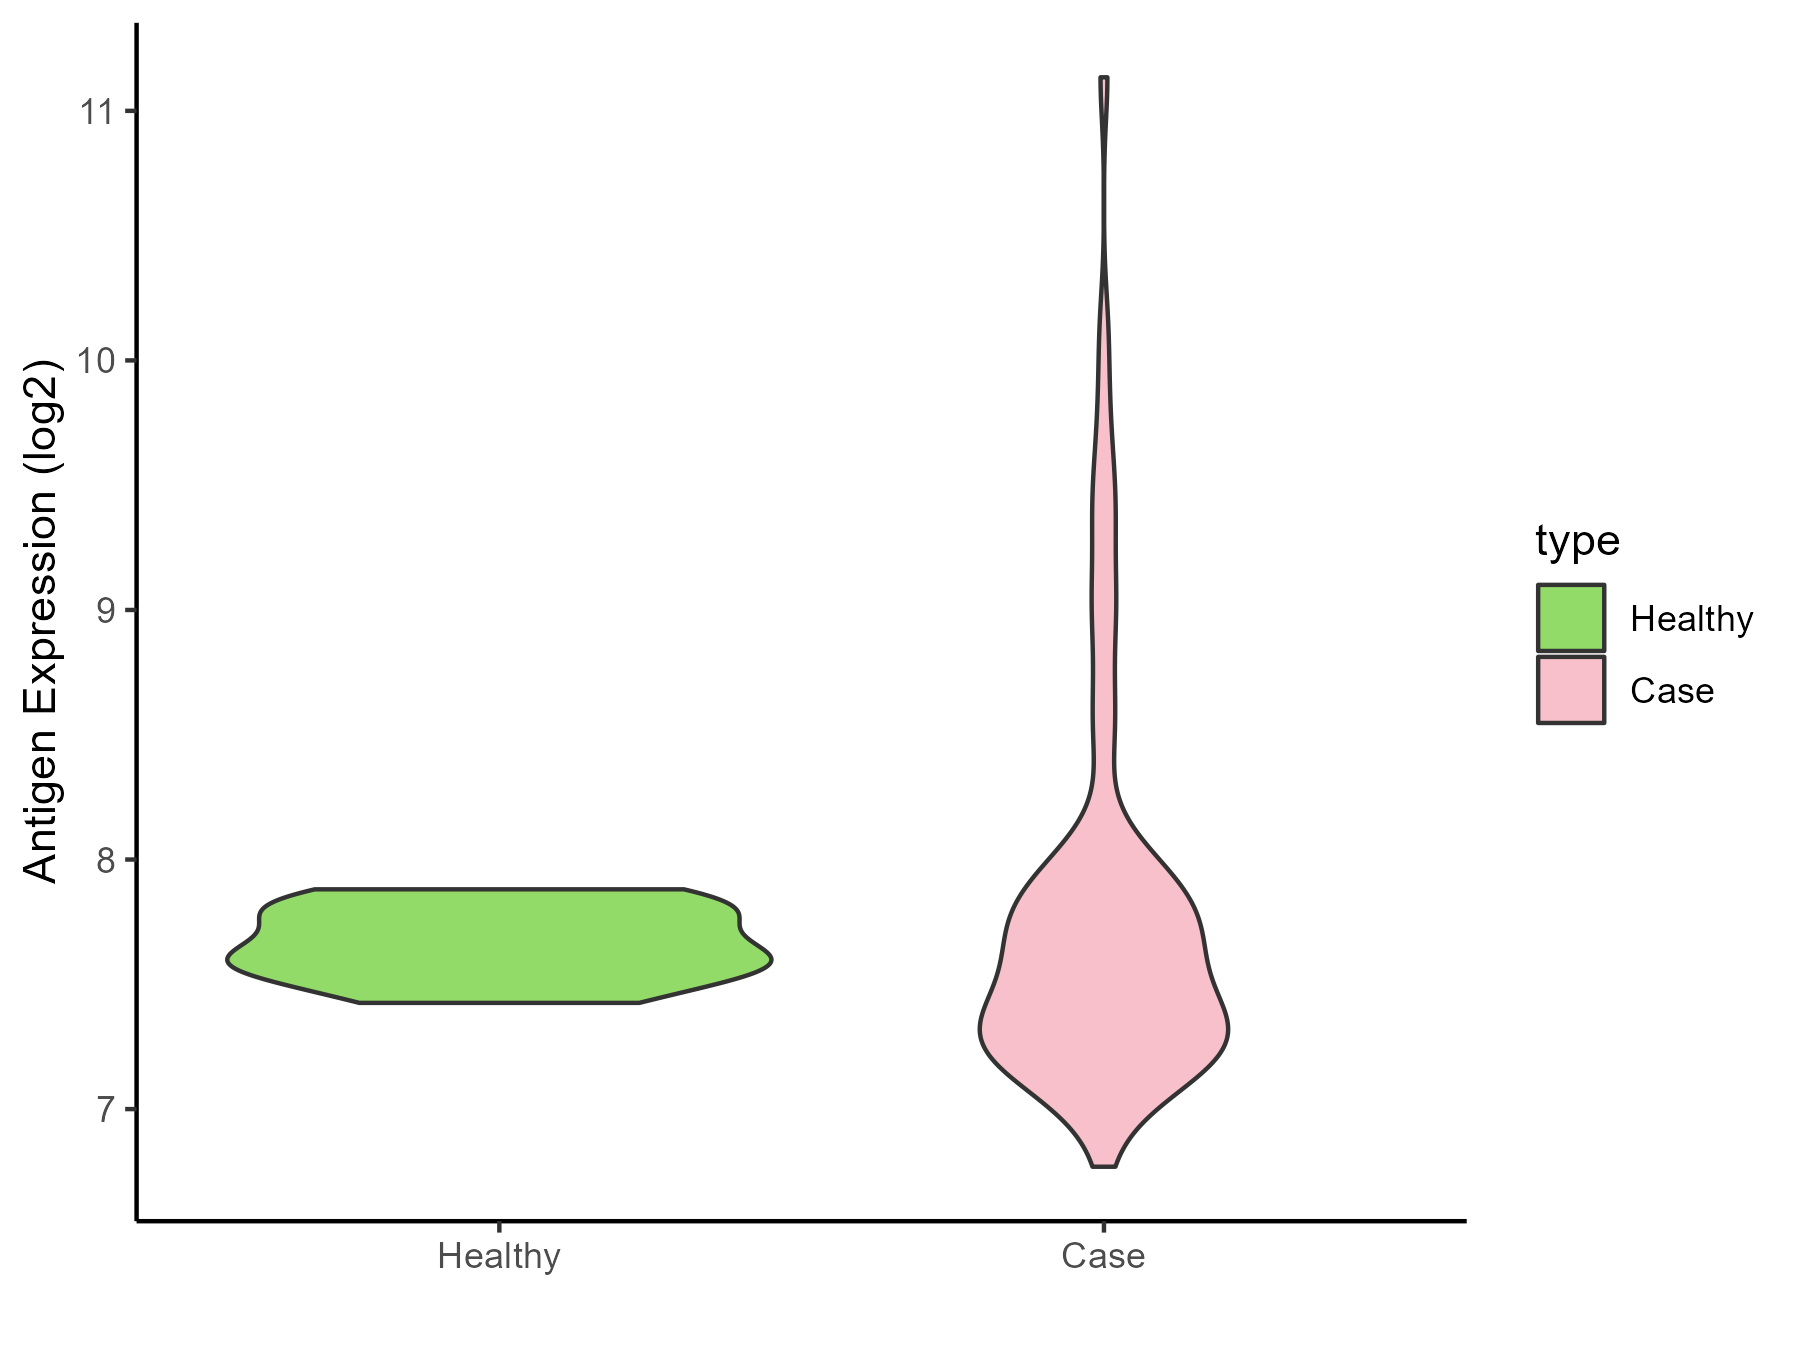
| Differential expression pattern of antigen in diseases | ||
| The Studied Tissue | Bladder | |
| The Specific Disease | Bladder cancer | |
| The Expression Level of Disease Section Compare with the Healthy Individual Tissue | p-value: 0.316700642; Fold-change: -0.050963114; Z-score: -0.317859629 | |
| Disease-specific Antigen Abundances |
|
Click to View the Clearer Original Diagram |
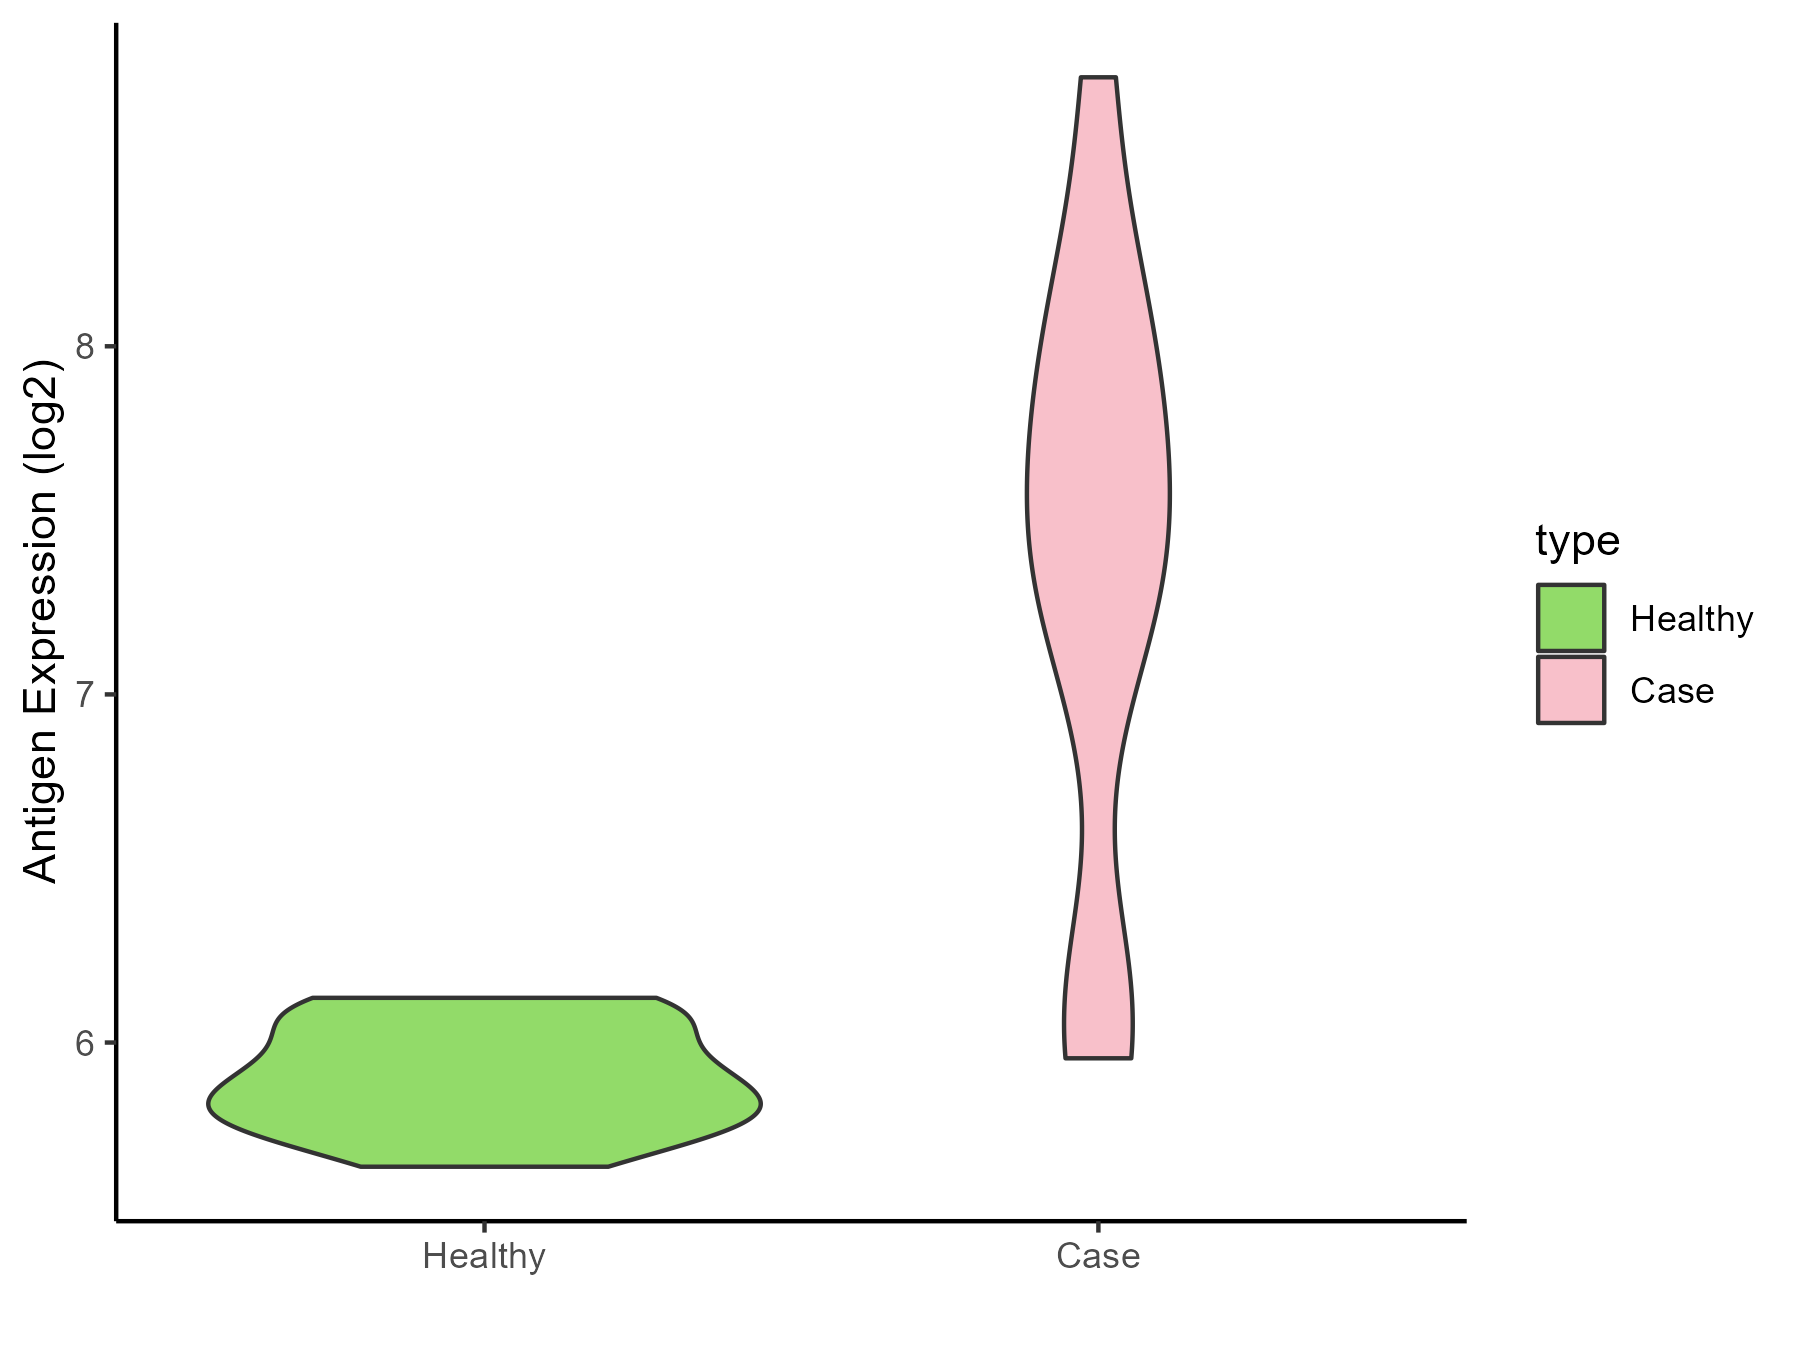
| Differential expression pattern of antigen in diseases | ||
| The Studied Tissue | Uvea | |
| The Specific Disease | Retinoblastoma tumor | |
| The Expression Level of Disease Section Compare with the Healthy Individual Tissue | p-value: 1.59E-05; Fold-change: 1.575752837; Z-score: 9.929458904 | |
| Disease-specific Antigen Abundances |
|
Click to View the Clearer Original Diagram |
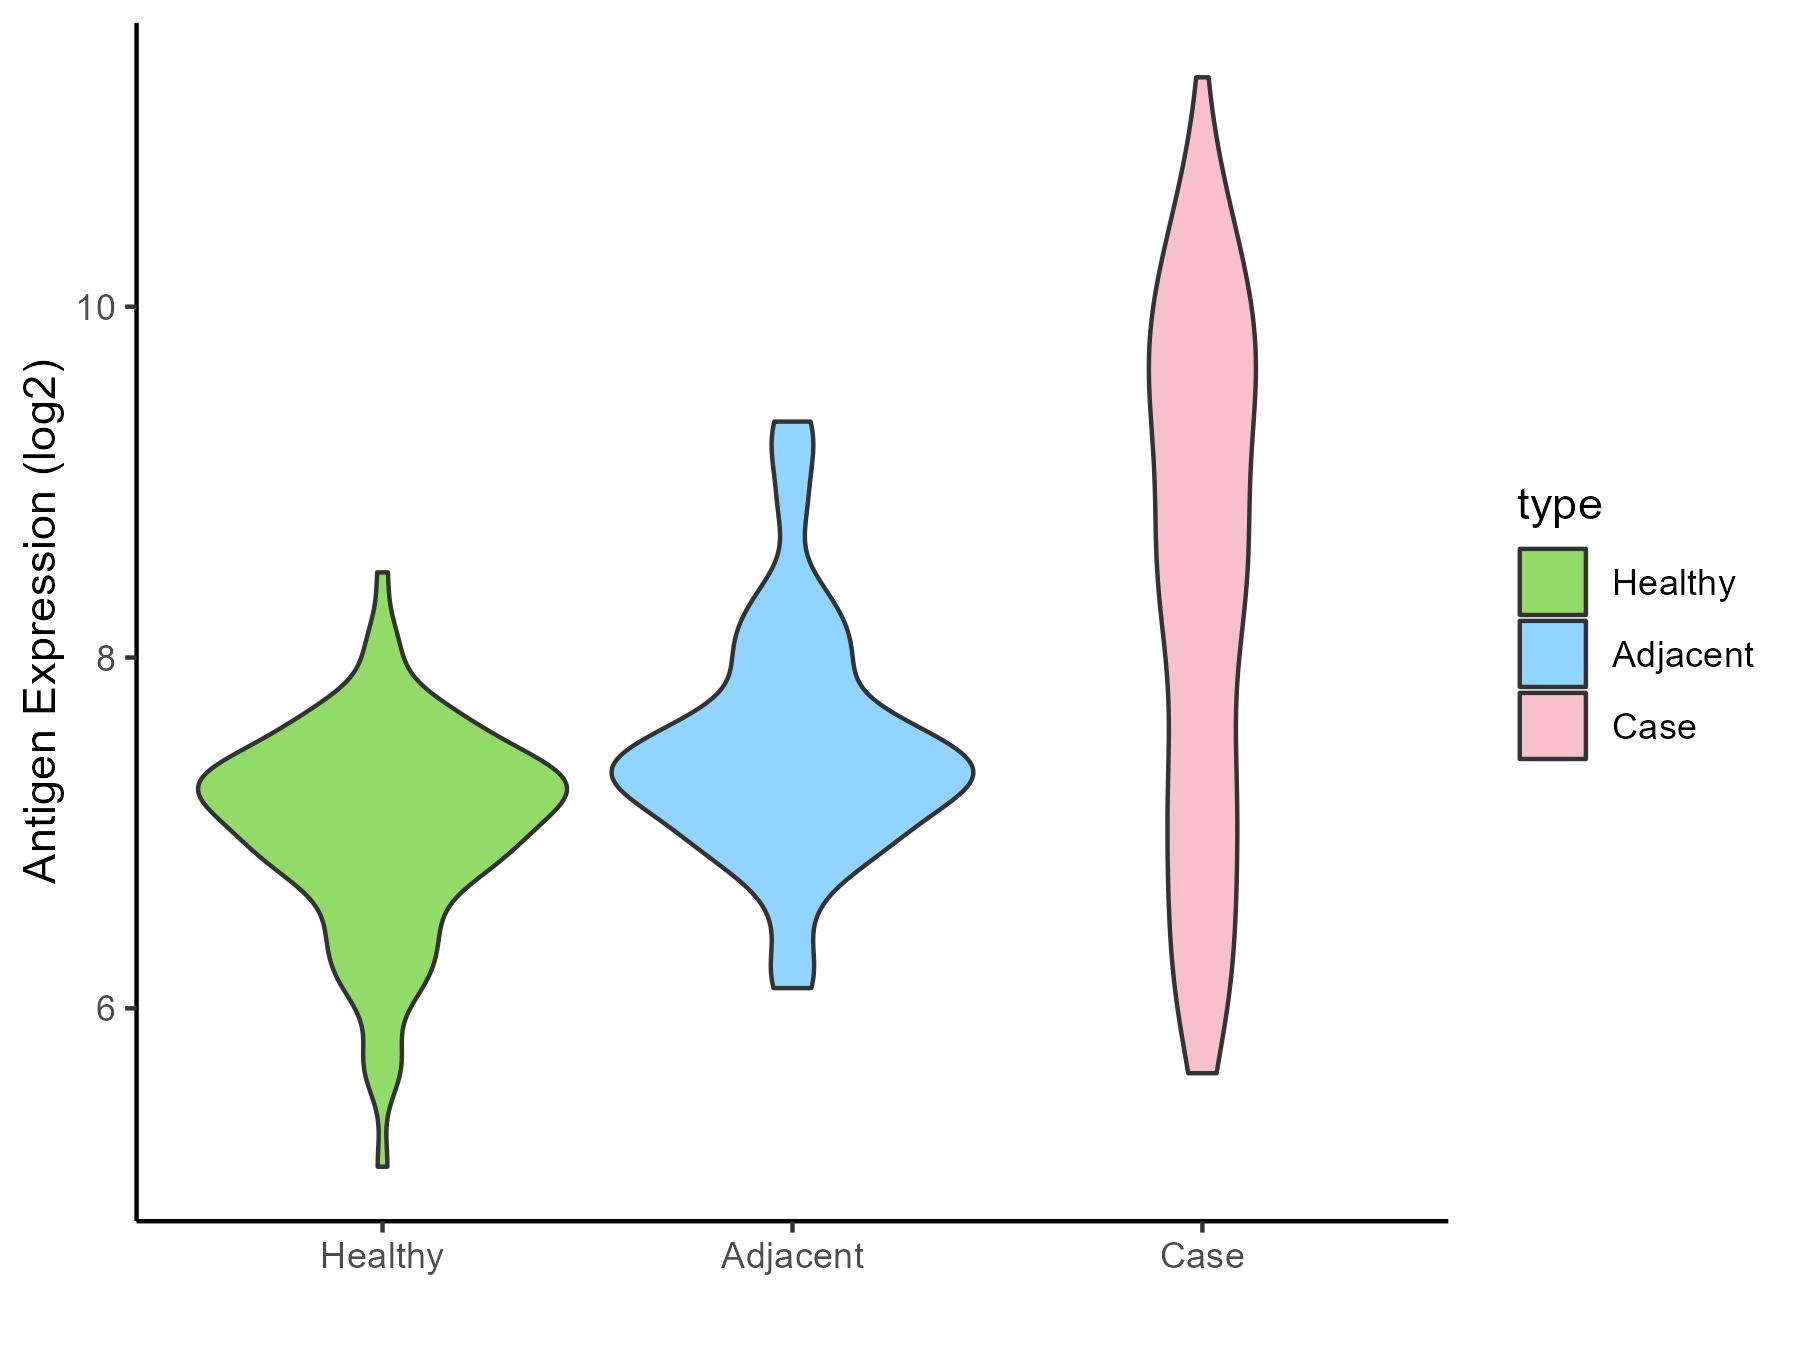
| Differential expression pattern of antigen in diseases | ||
| The Studied Tissue | Thyroid | |
| The Specific Disease | Thyroid cancer | |
| The Expression Level of Disease Section Compare with the Healthy Individual Tissue | p-value: 2.71E-34; Fold-change: 1.521614722; Z-score: 2.667907025 | |
| The Expression Level of Disease Section Compare with the Adjacent Tissue | p-value: 1.39E-10; Fold-change: 1.274420242; Z-score: 1.893946811 | |
| Disease-specific Antigen Abundances |
|
Click to View the Clearer Original Diagram |
| Differential expression pattern of antigen in diseases | ||
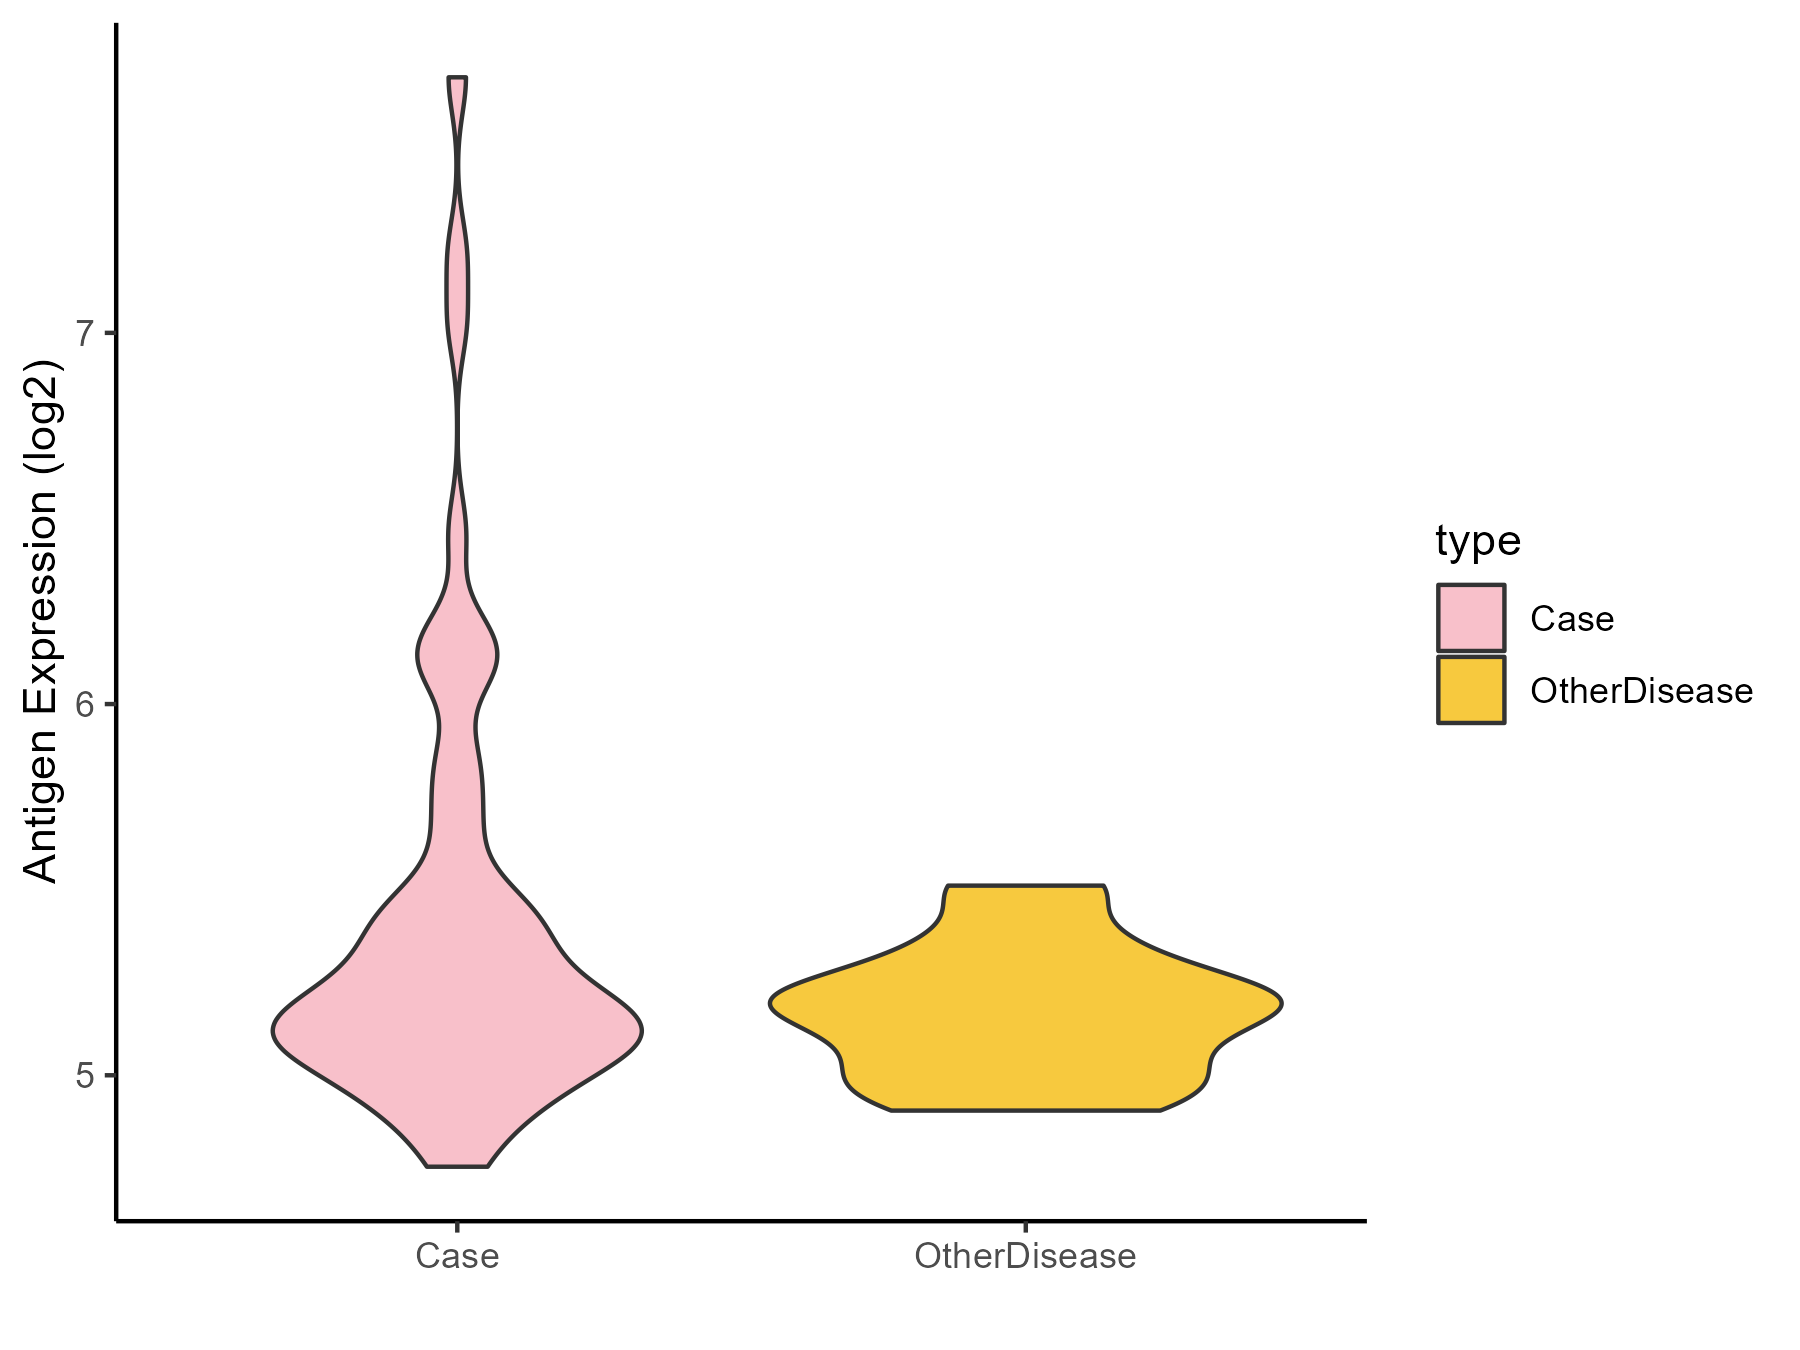
| The Studied Tissue | Adrenal cortex | |
| The Specific Disease | Adrenocortical carcinoma | |
| The Expression Level of Disease Section Compare with the Other Disease Section | p-value: 0.000683507; Fold-change: 0.016335317; Z-score: 0.088889895 | |
| Disease-specific Antigen Abundances |
|
Click to View the Clearer Original Diagram |
| Differential expression pattern of antigen in diseases | ||
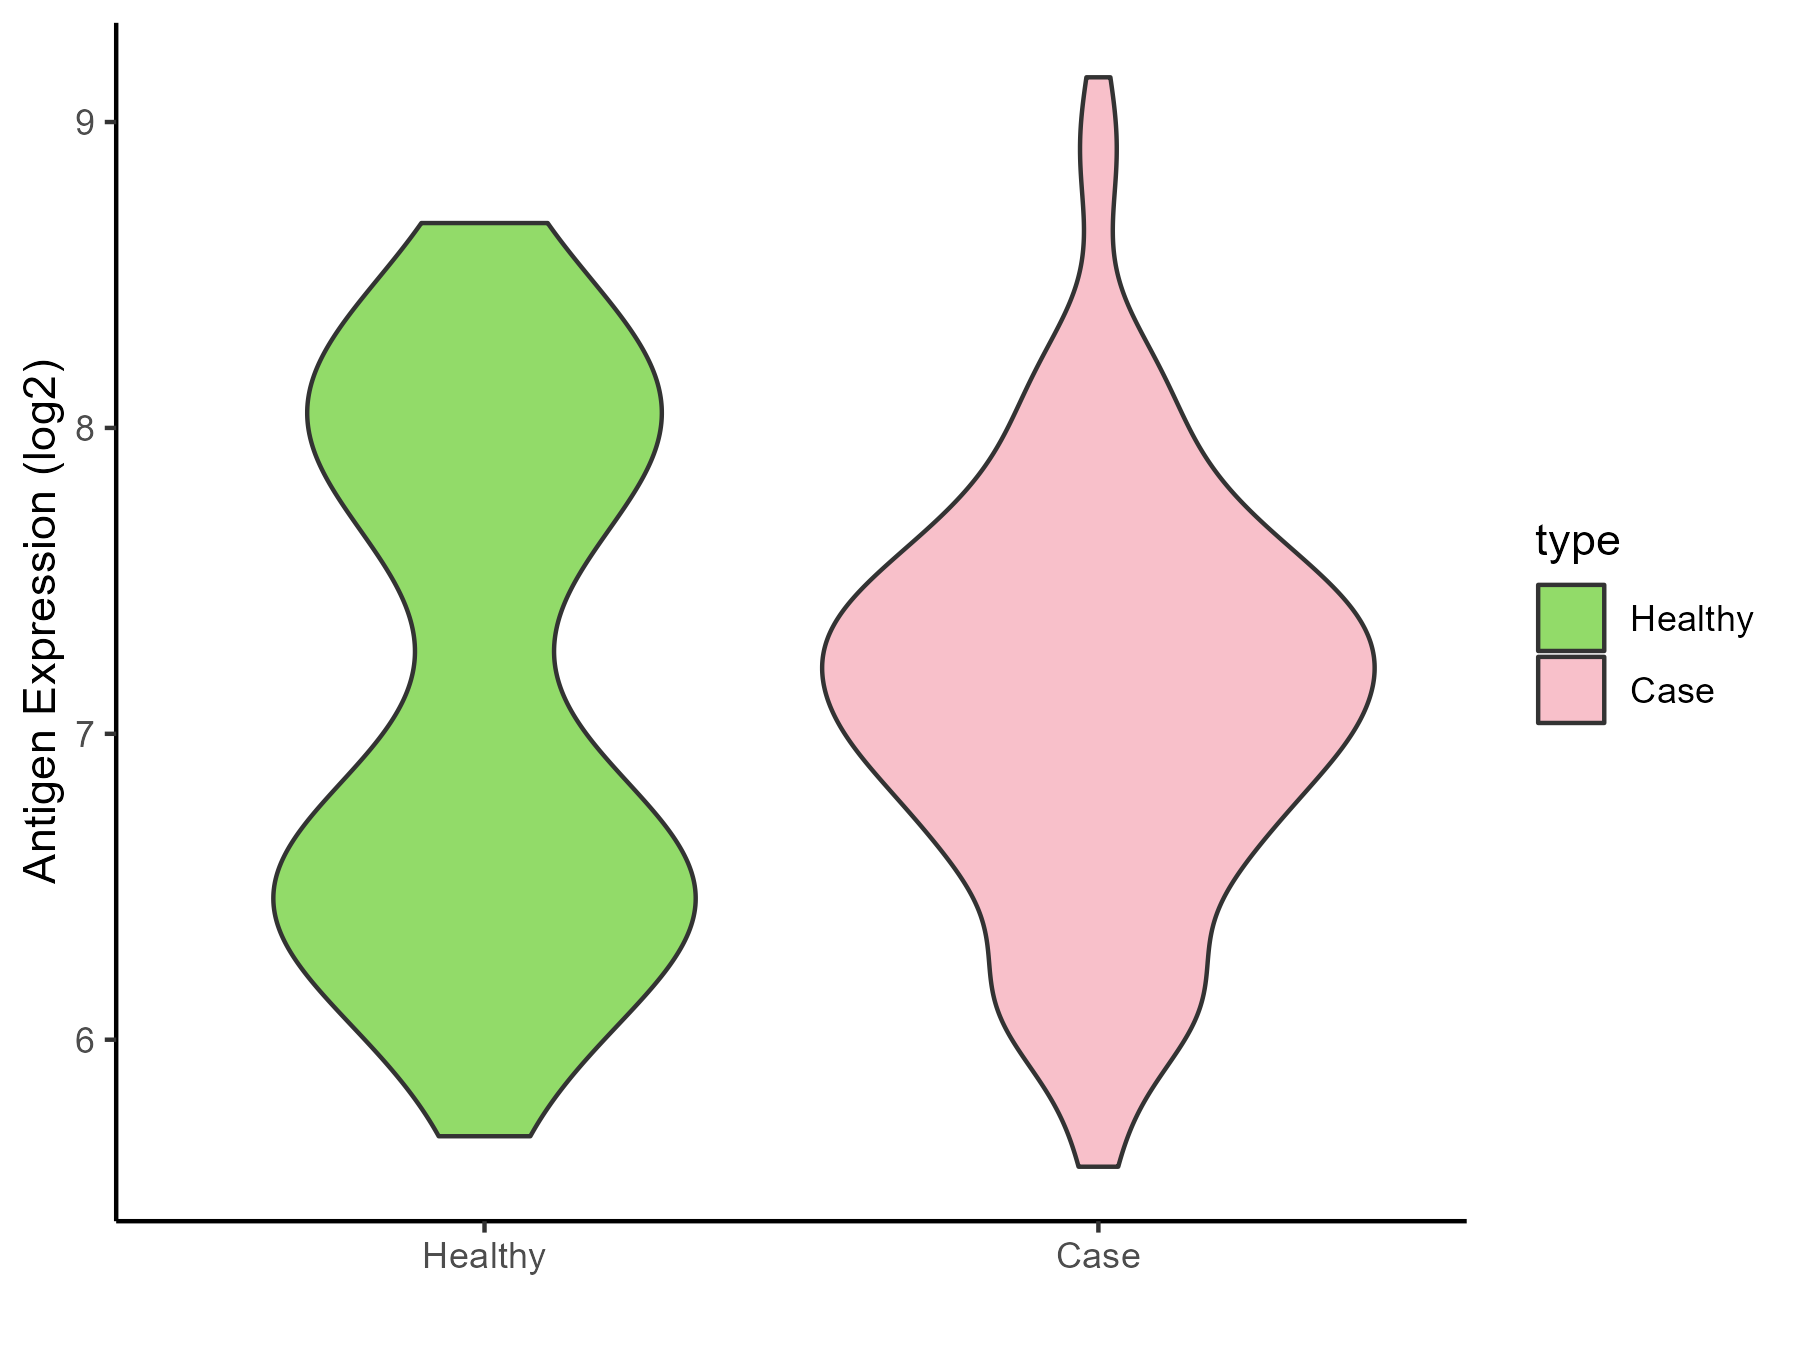
| The Studied Tissue | Head and neck | |
| The Specific Disease | Head and neck cancer | |
| The Expression Level of Disease Section Compare with the Healthy Individual Tissue | p-value: 0.61609304; Fold-change: 0.314; Z-score: 0.367006956 | |
| Disease-specific Antigen Abundances |
|
Click to View the Clearer Original Diagram |
| Differential expression pattern of antigen in diseases | ||
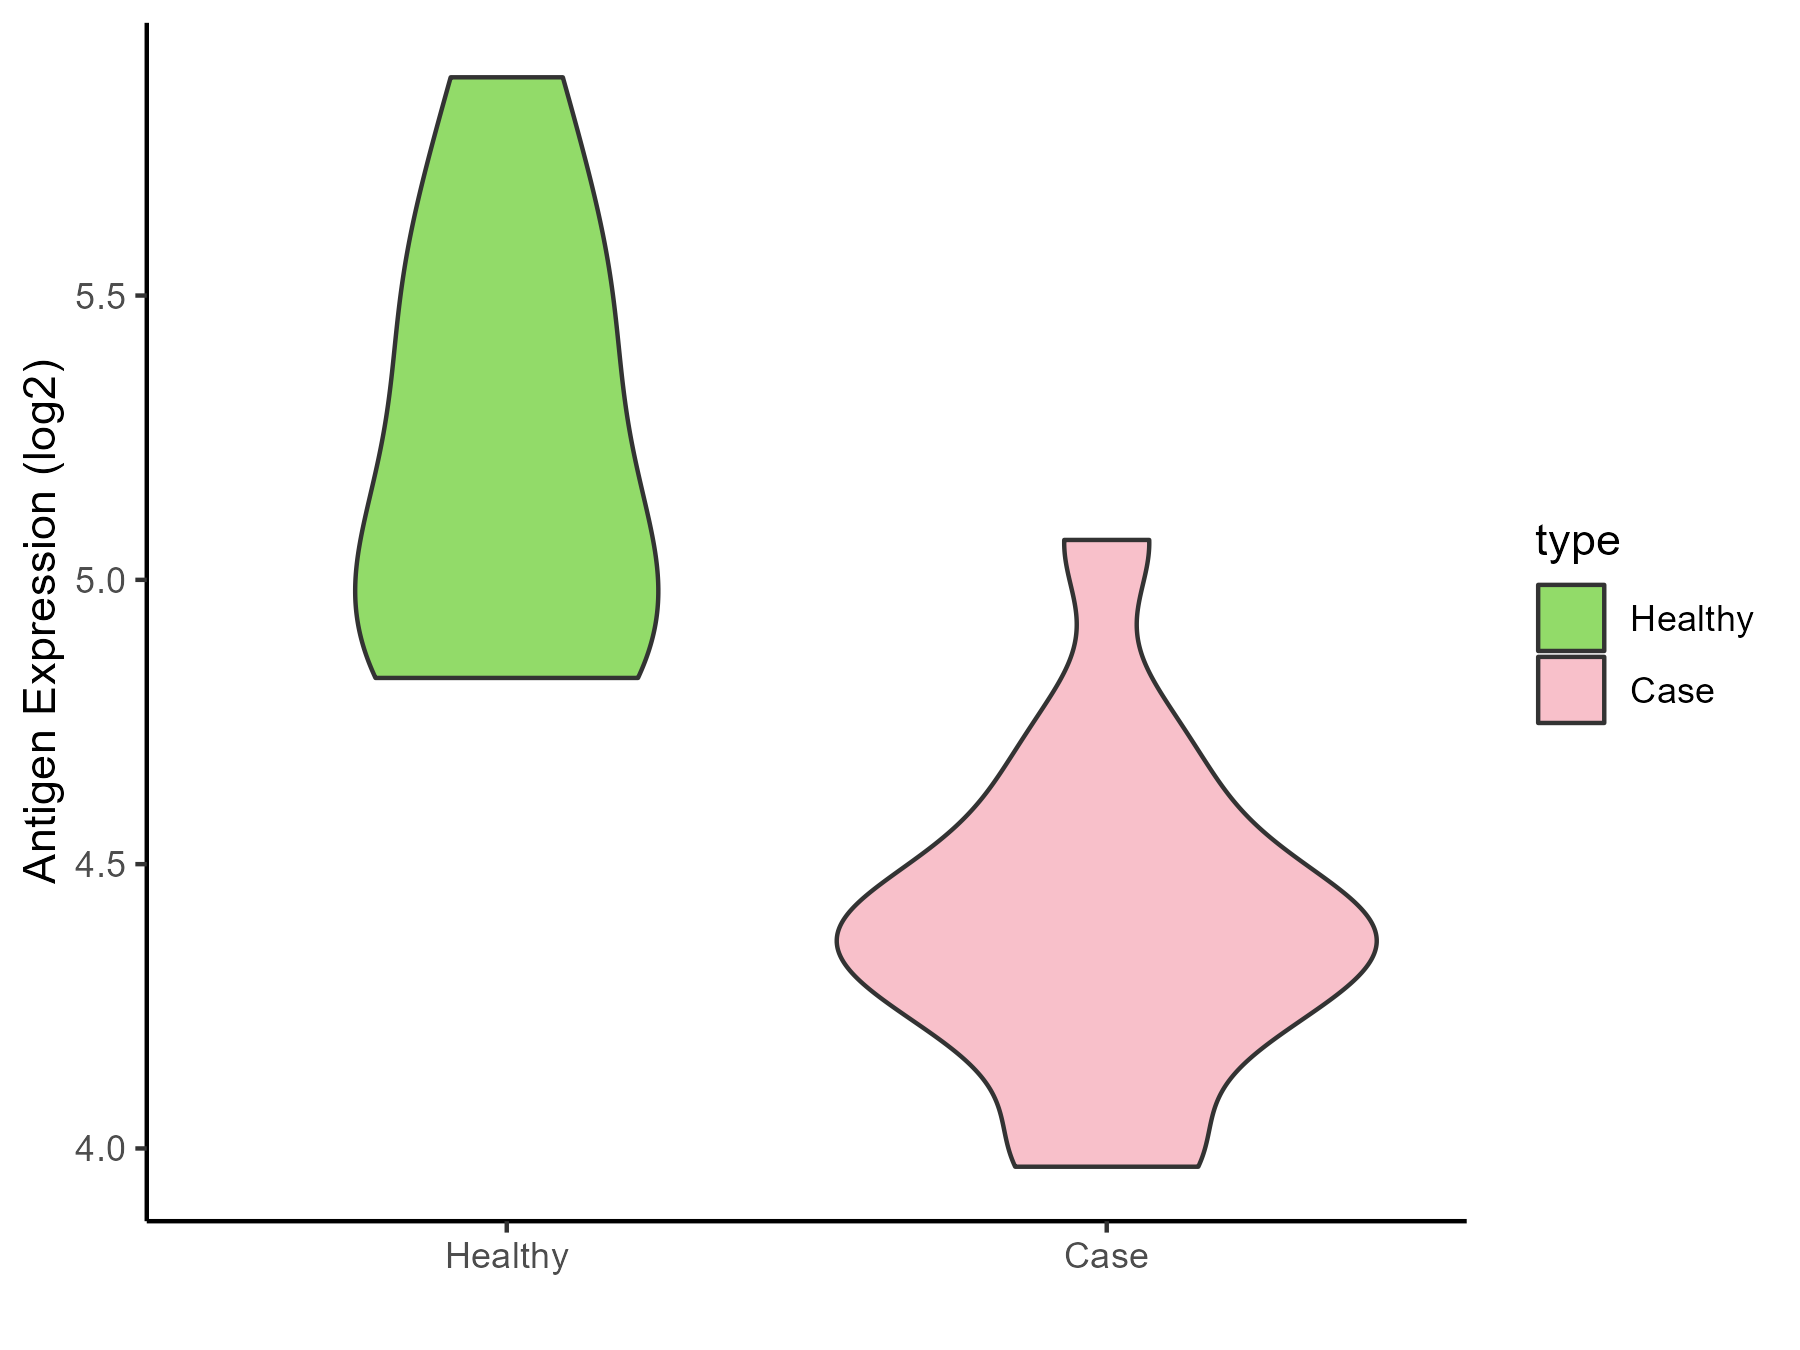
| The Studied Tissue | Pituitary | |
| The Specific Disease | Pituitary gonadotrope tumor | |
| The Expression Level of Disease Section Compare with the Healthy Individual Tissue | p-value: 5.60E-05; Fold-change: -0.756462256; Z-score: -2.025673726 | |
| Disease-specific Antigen Abundances |
|
Click to View the Clearer Original Diagram |
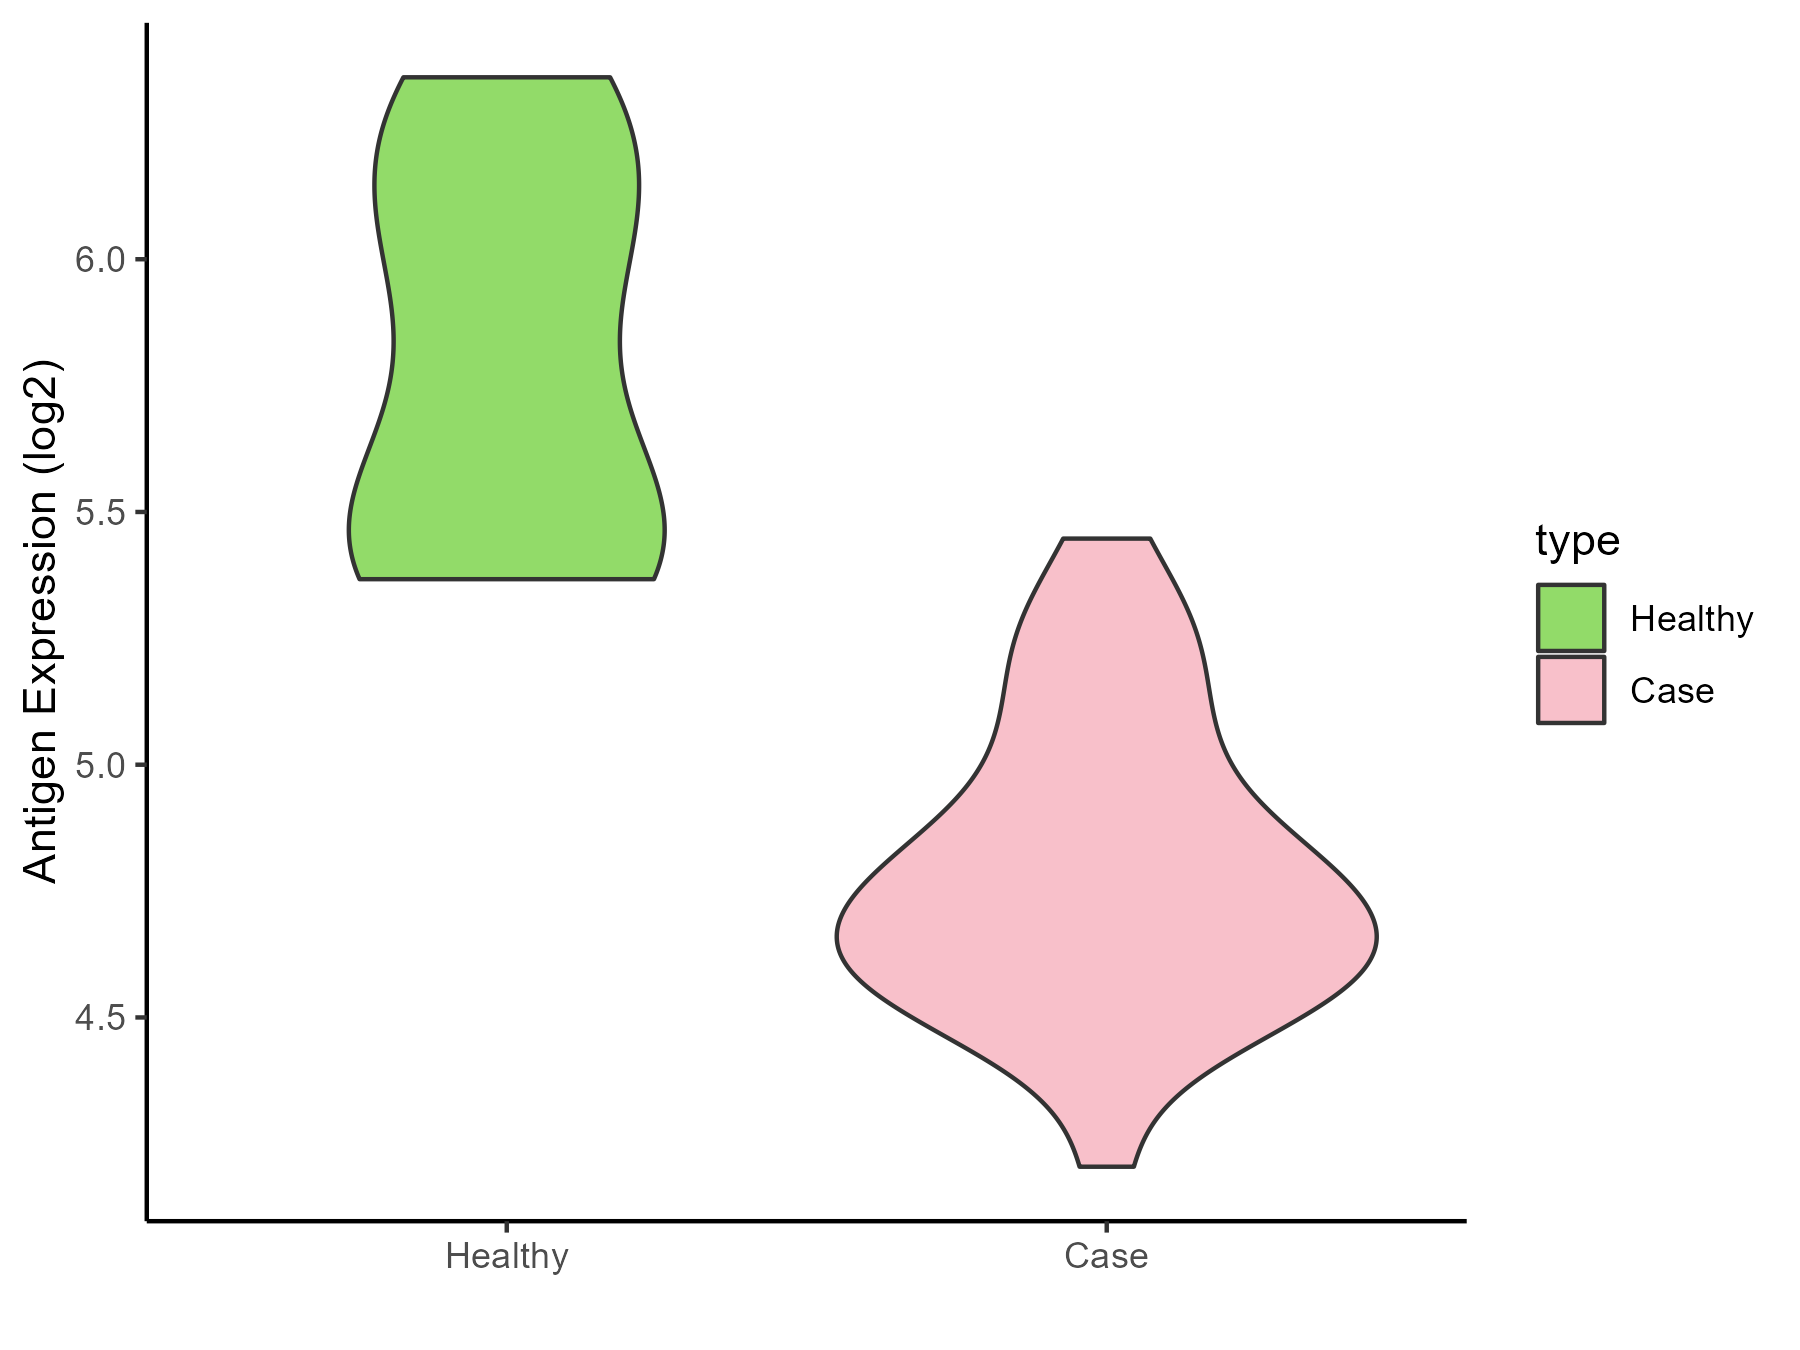
| The Studied Tissue | Pituitary | |
| The Specific Disease | Pituitary cancer | |
| The Expression Level of Disease Section Compare with the Healthy Individual Tissue | p-value: 1.62E-06; Fold-change: -1.018634162; Z-score: -2.605419737 | |
| Disease-specific Antigen Abundances |
|
Click to View the Clearer Original Diagram |
ICD Disease Classification 03
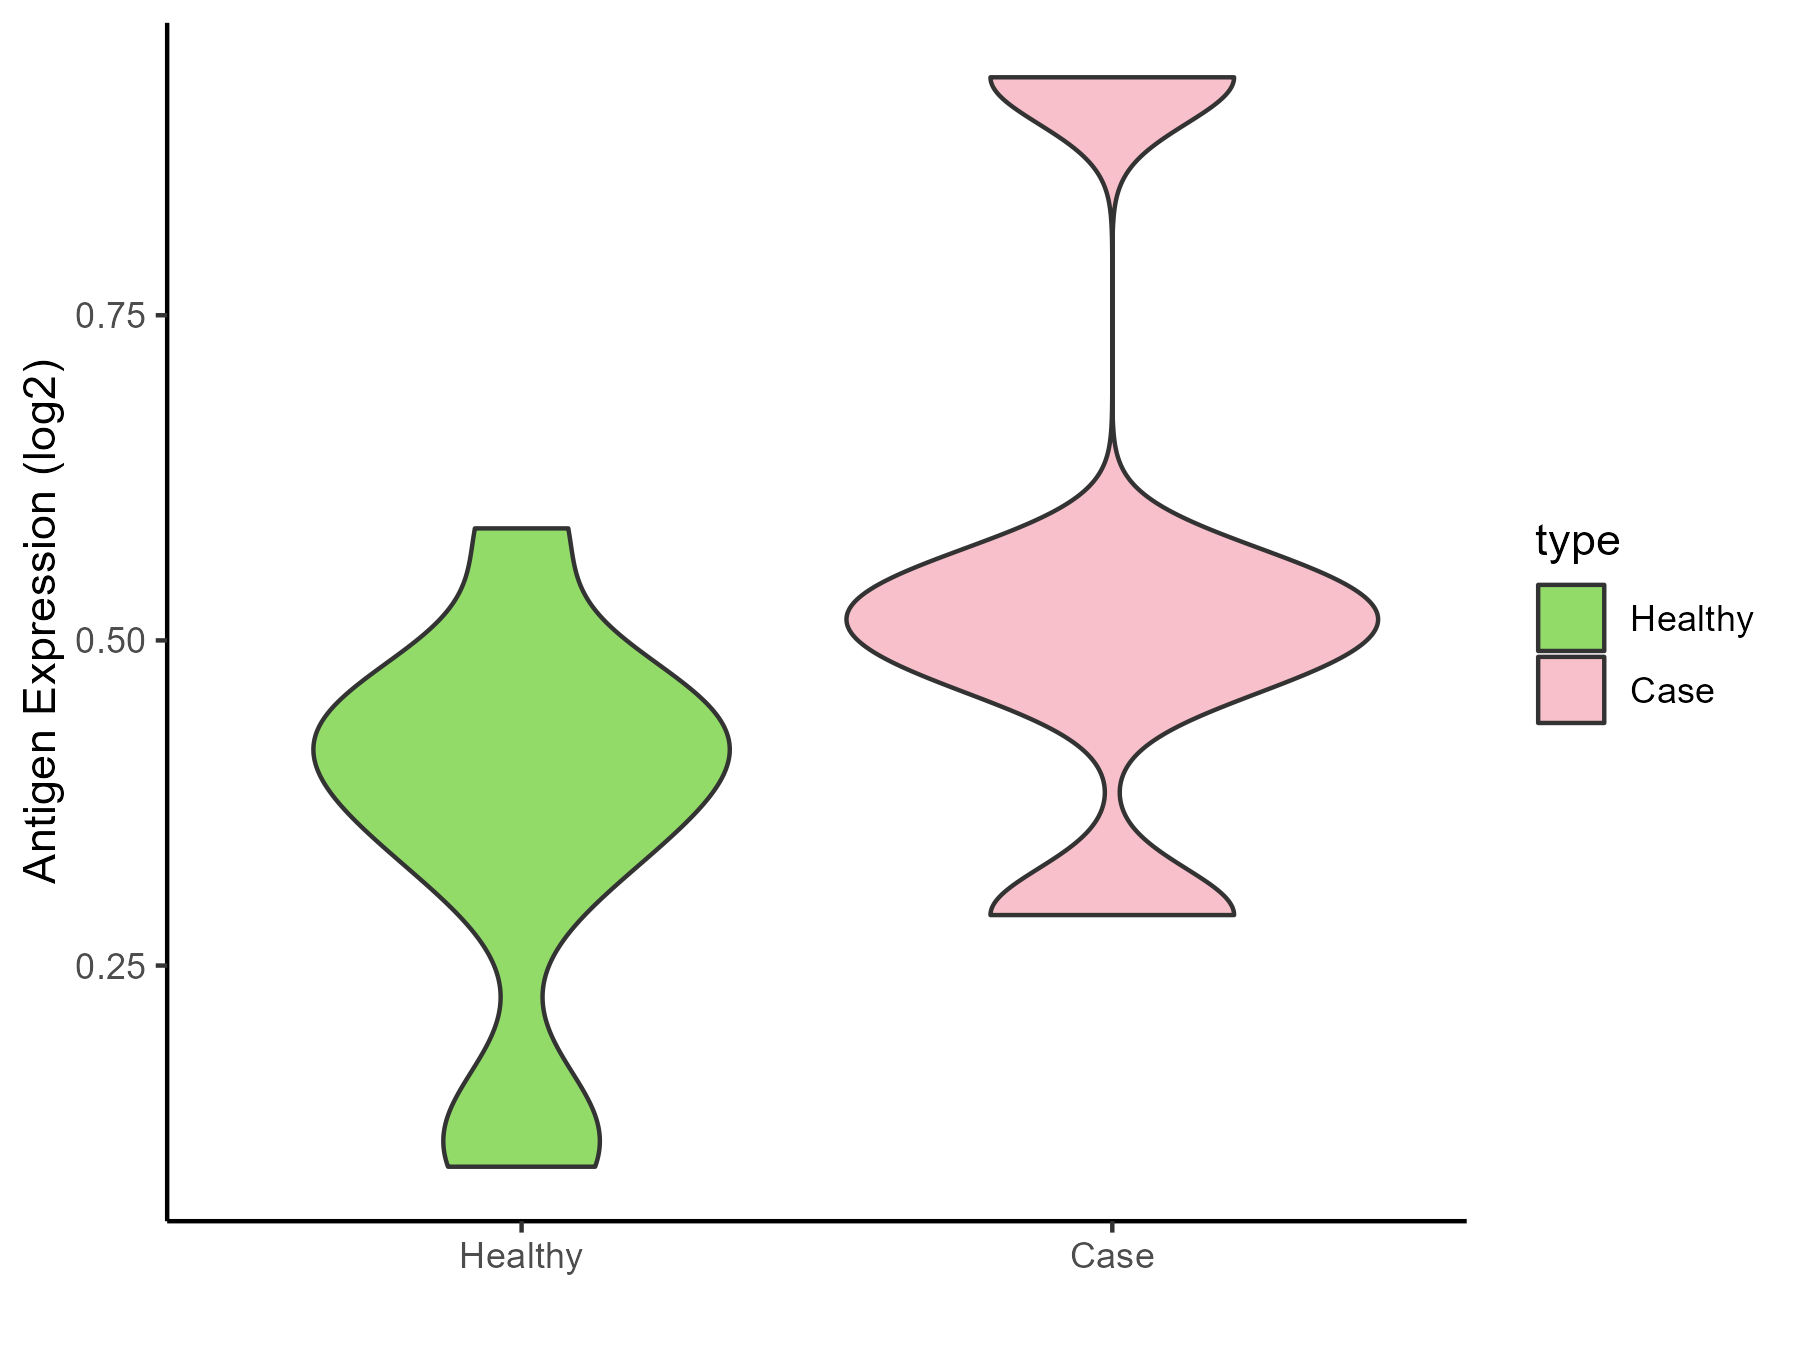
| Differential expression pattern of antigen in diseases | ||
| The Studied Tissue | Whole blood | |
| The Specific Disease | Thrombocytopenia | |
| The Expression Level of Disease Section Compare with the Healthy Individual Tissue | p-value: 0.154794958; Fold-change: 0.119041478; Z-score: 0.795438808 | |
| Disease-specific Antigen Abundances |
|
Click to View the Clearer Original Diagram |
ICD Disease Classification 04
| Differential expression pattern of antigen in diseases | ||
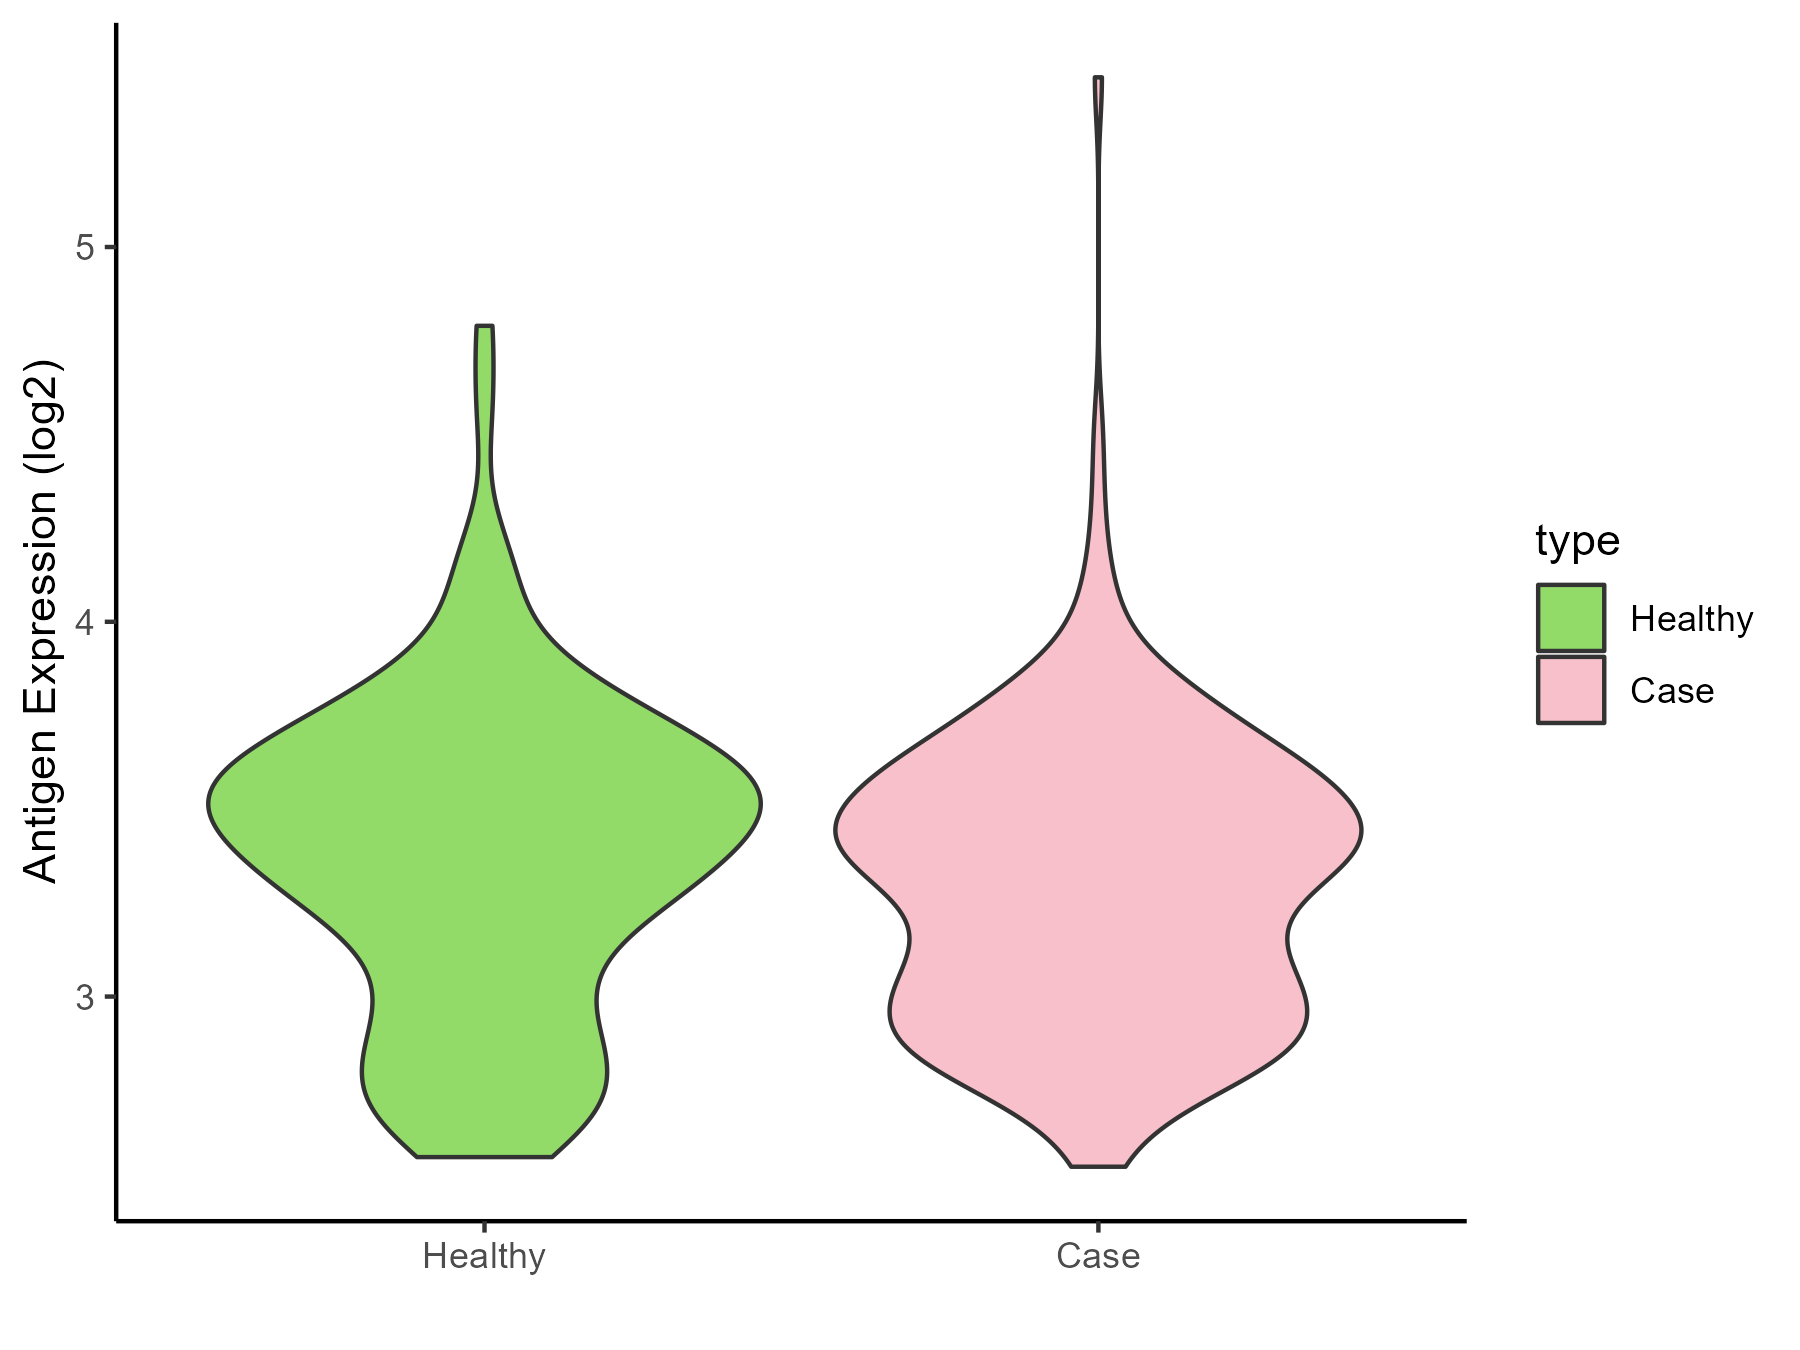
| The Studied Tissue | Whole blood | |
| The Specific Disease | Lupus erythematosus | |
| The Expression Level of Disease Section Compare with the Healthy Individual Tissue | p-value: 0.134597057; Fold-change: -0.101698164; Z-score: -0.243656529 | |
| Disease-specific Antigen Abundances |
|
Click to View the Clearer Original Diagram |
| Differential expression pattern of antigen in diseases | ||
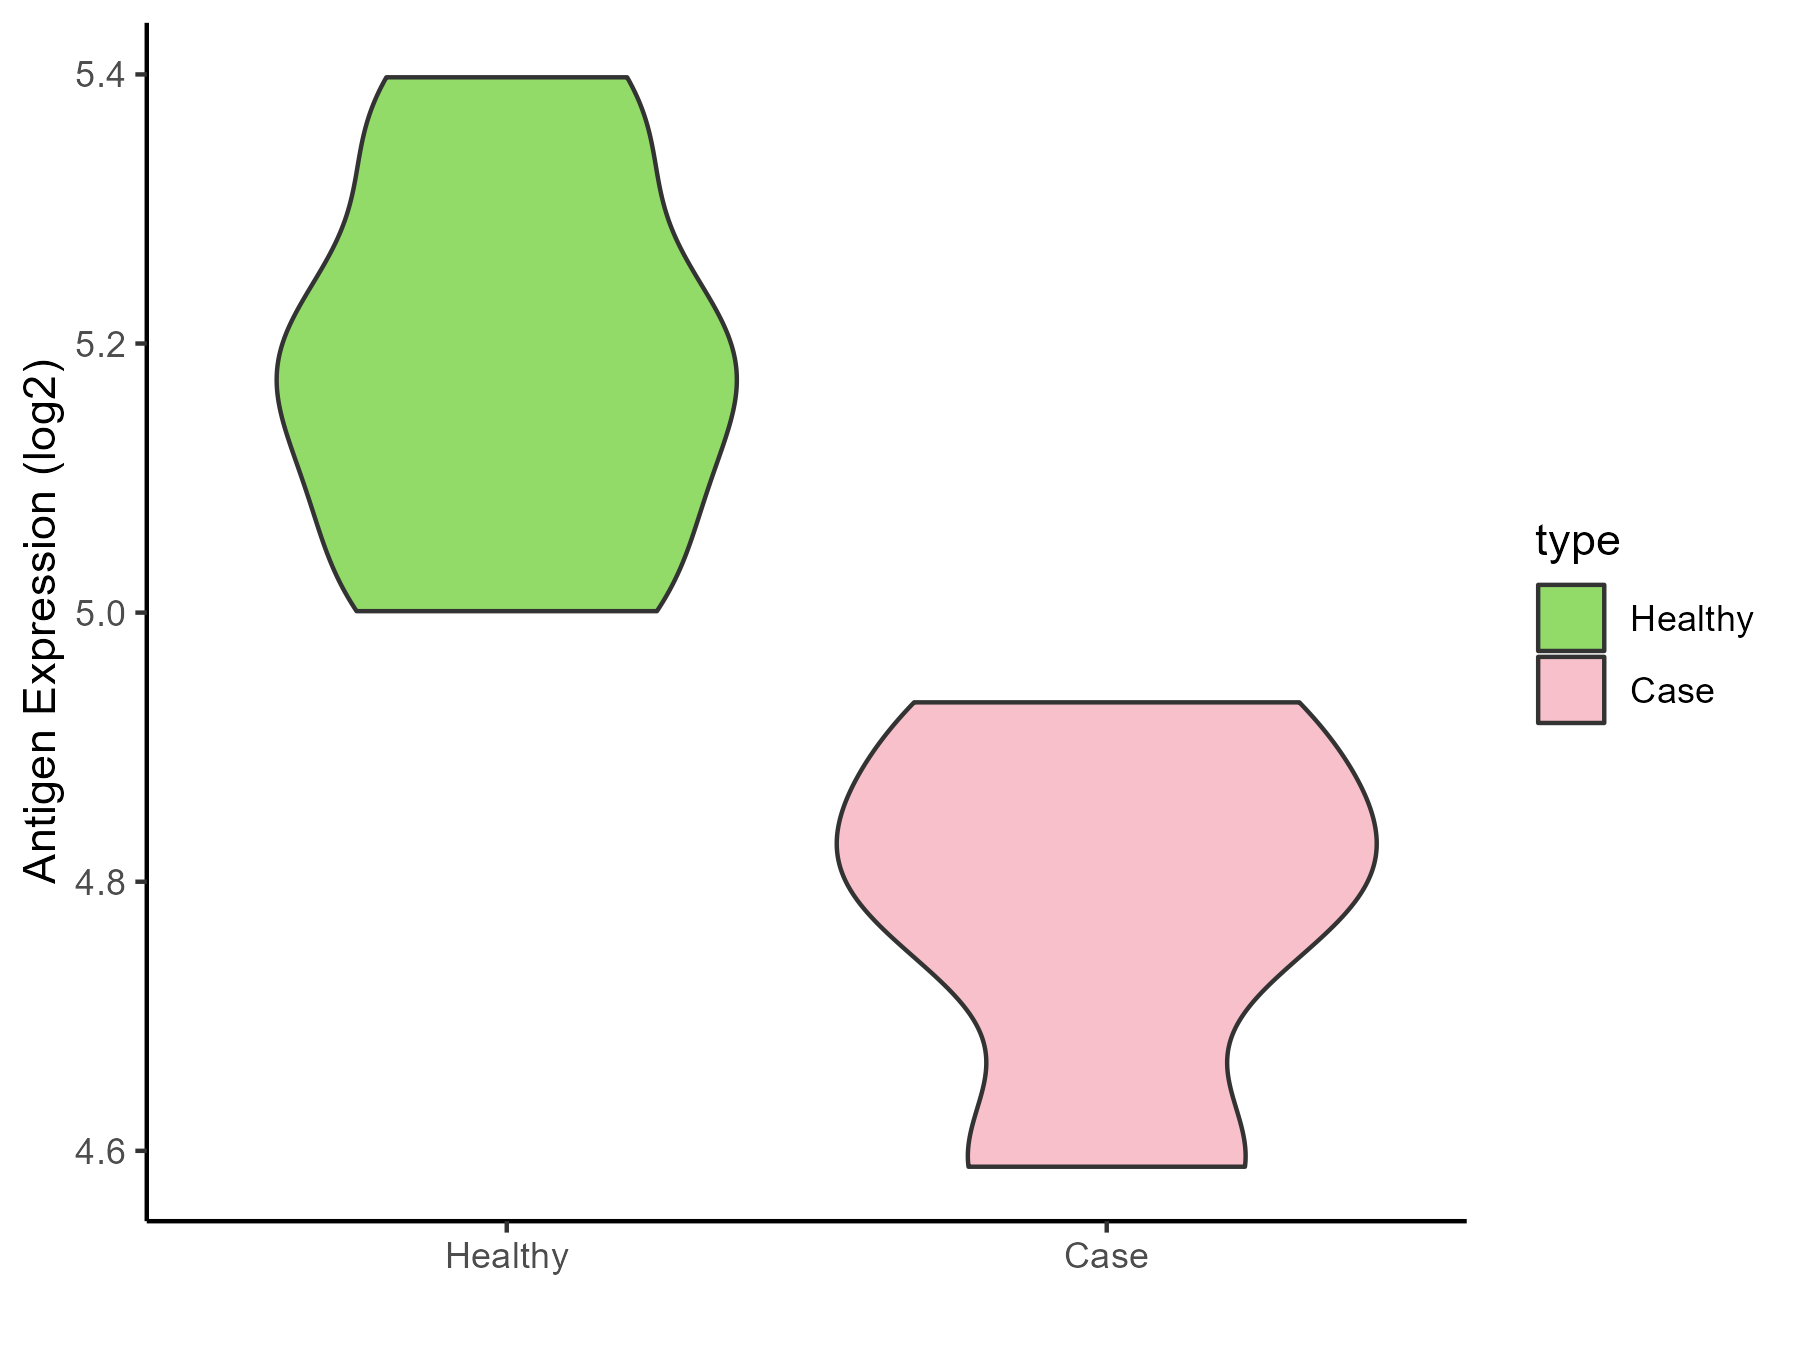
| The Studied Tissue | Peripheral monocyte | |
| The Specific Disease | Autoimmune uveitis | |
| The Expression Level of Disease Section Compare with the Healthy Individual Tissue | p-value: 0.005531972; Fold-change: -0.391423184; Z-score: -2.86394114 | |
| Disease-specific Antigen Abundances |
|
Click to View the Clearer Original Diagram |
ICD Disease Classification 05
| Differential expression pattern of antigen in diseases | ||
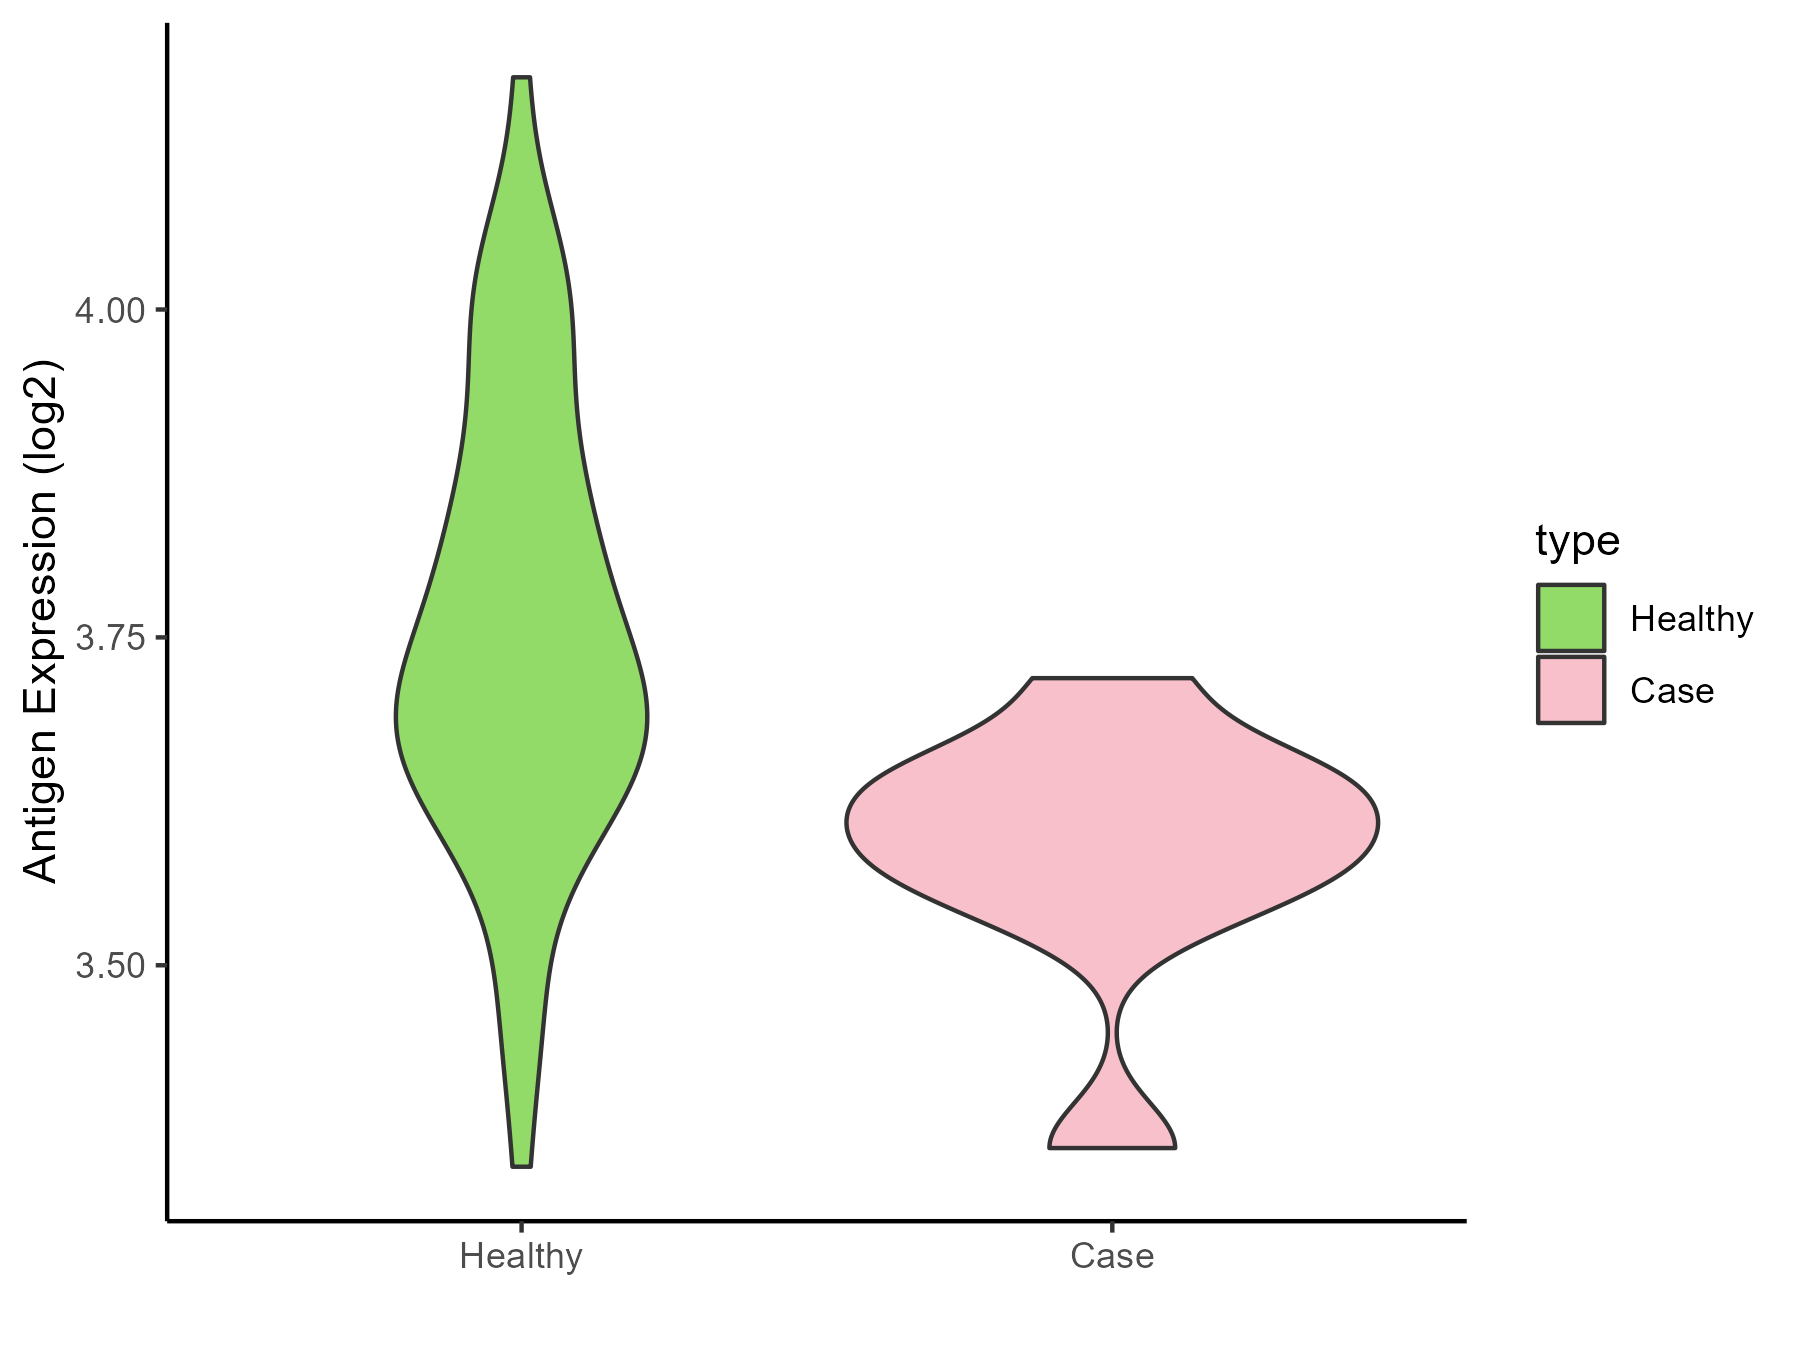
| The Studied Tissue | Whole blood | |
| The Specific Disease | Familial hypercholesterolemia | |
| The Expression Level of Disease Section Compare with the Healthy Individual Tissue | p-value: 0.00067453; Fold-change: -0.120649735; Z-score: -0.70247158 | |
| Disease-specific Antigen Abundances |
|
Click to View the Clearer Original Diagram |
ICD Disease Classification 06
| Differential expression pattern of antigen in diseases | ||
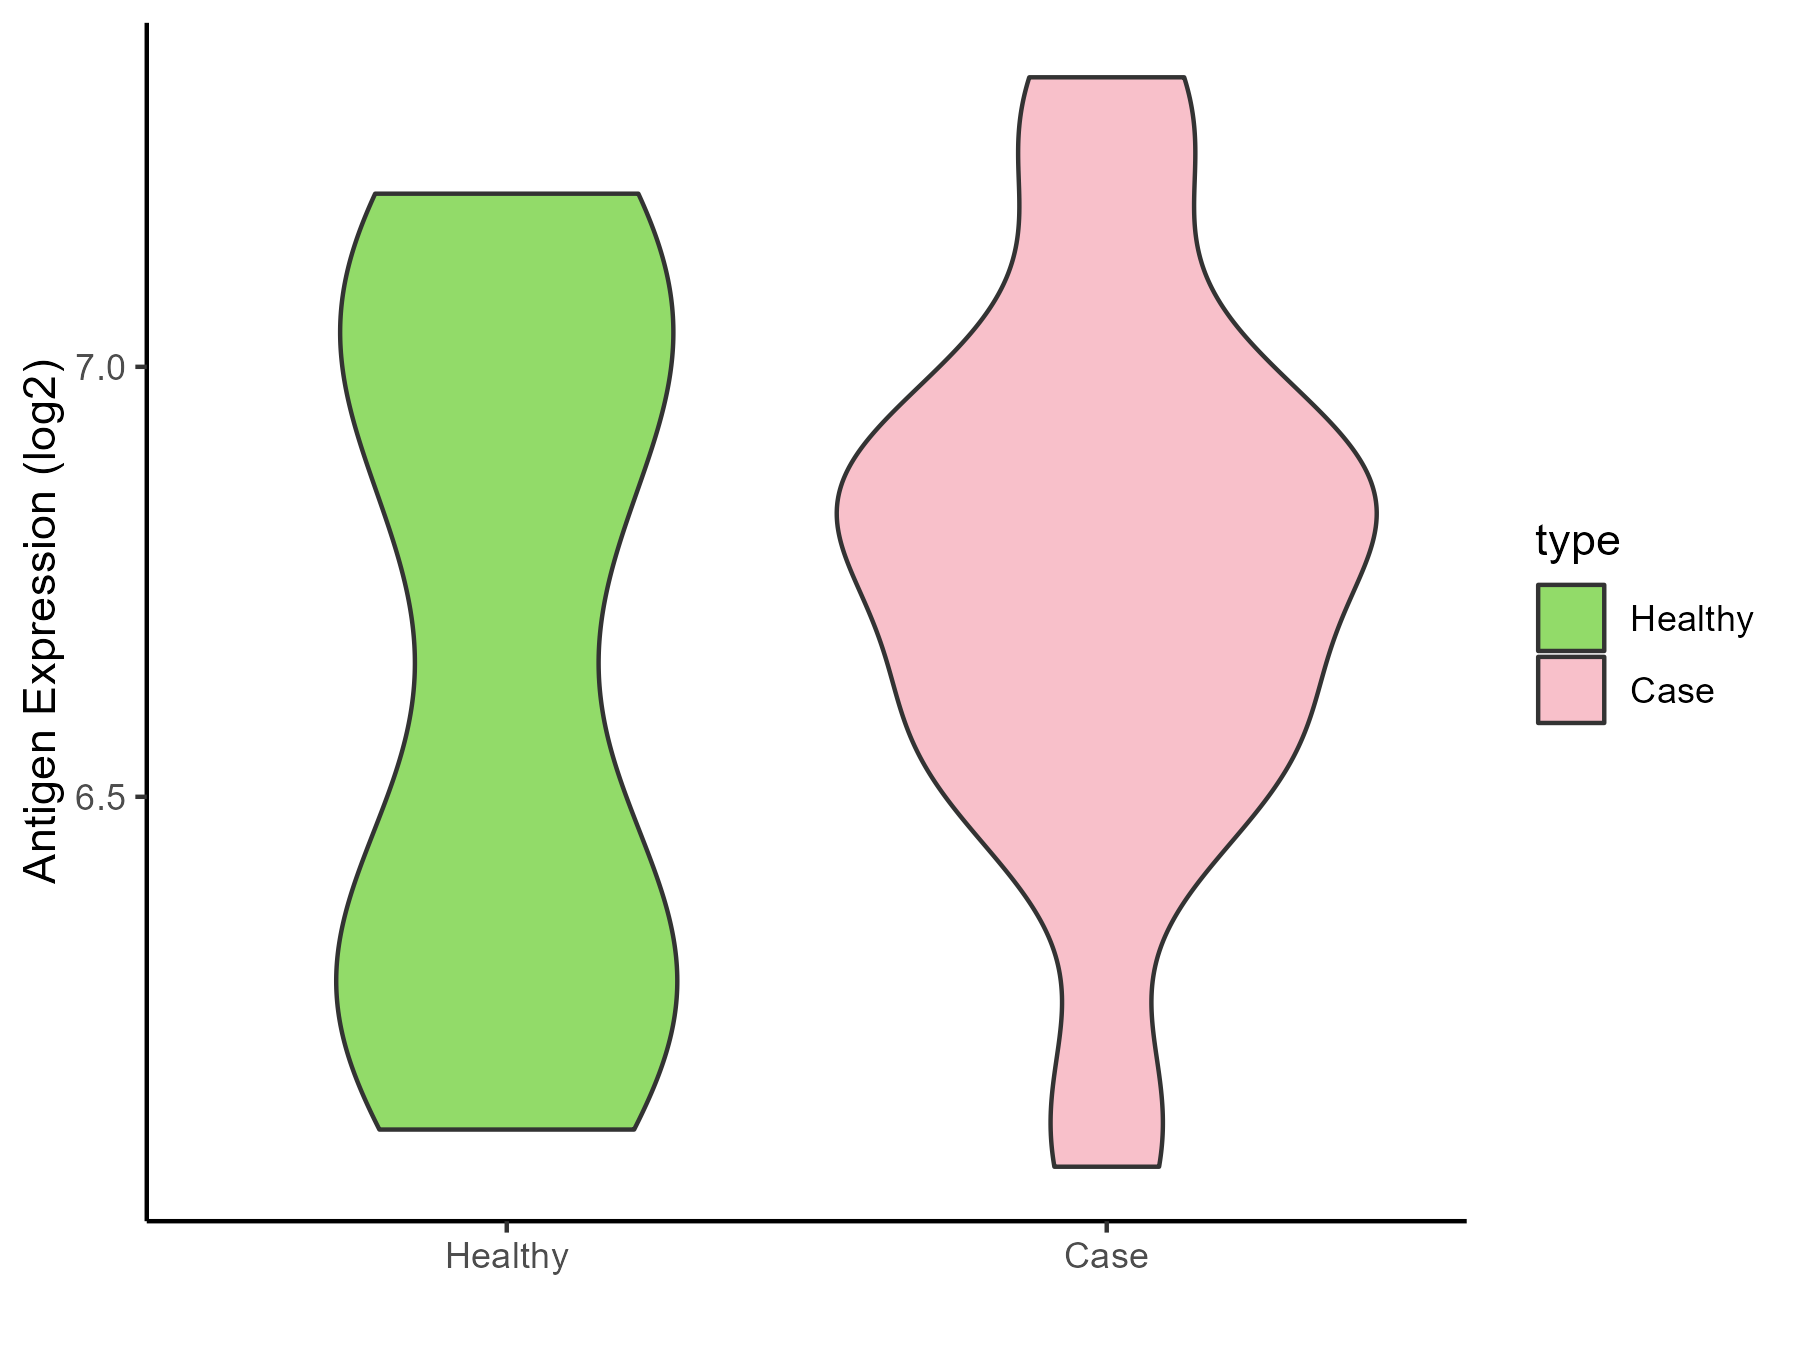
| The Studied Tissue | Superior temporal cortex | |
| The Specific Disease | Schizophrenia | |
| The Expression Level of Disease Section Compare with the Healthy Individual Tissue | p-value: 0.380616787; Fold-change: 0.079291951; Z-score: 0.198698462 | |
| Disease-specific Antigen Abundances |
|
Click to View the Clearer Original Diagram |
ICD Disease Classification 08
| Differential expression pattern of antigen in diseases | ||
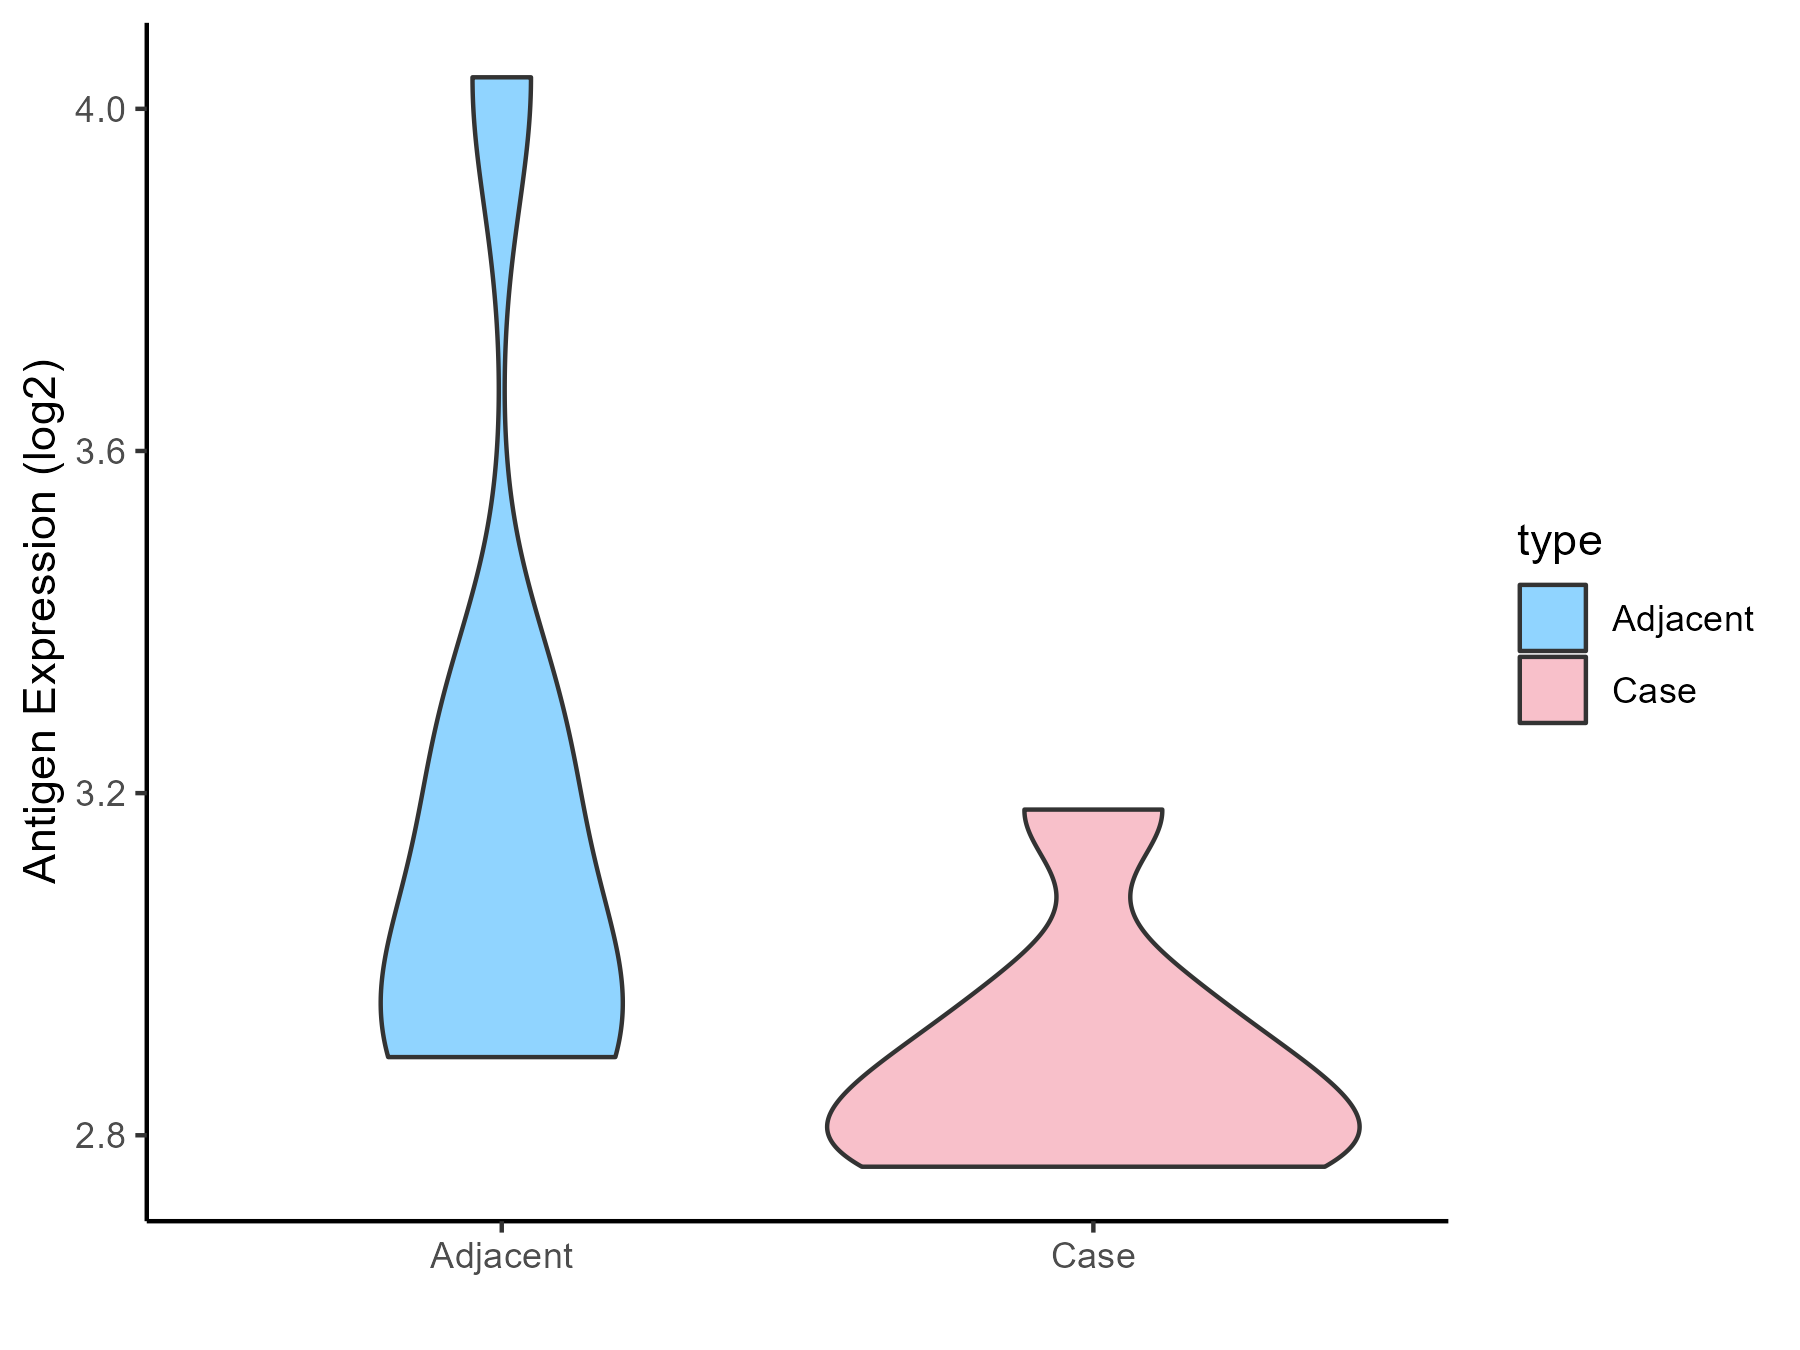
| The Studied Tissue | Spinal cord | |
| The Specific Disease | Multiple sclerosis | |
| The Expression Level of Disease Section Compare with the Adjacent Tissue | p-value: 0.115244022; Fold-change: -0.122269327; Z-score: -0.299701486 | |
| Disease-specific Antigen Abundances |
|
Click to View the Clearer Original Diagram |
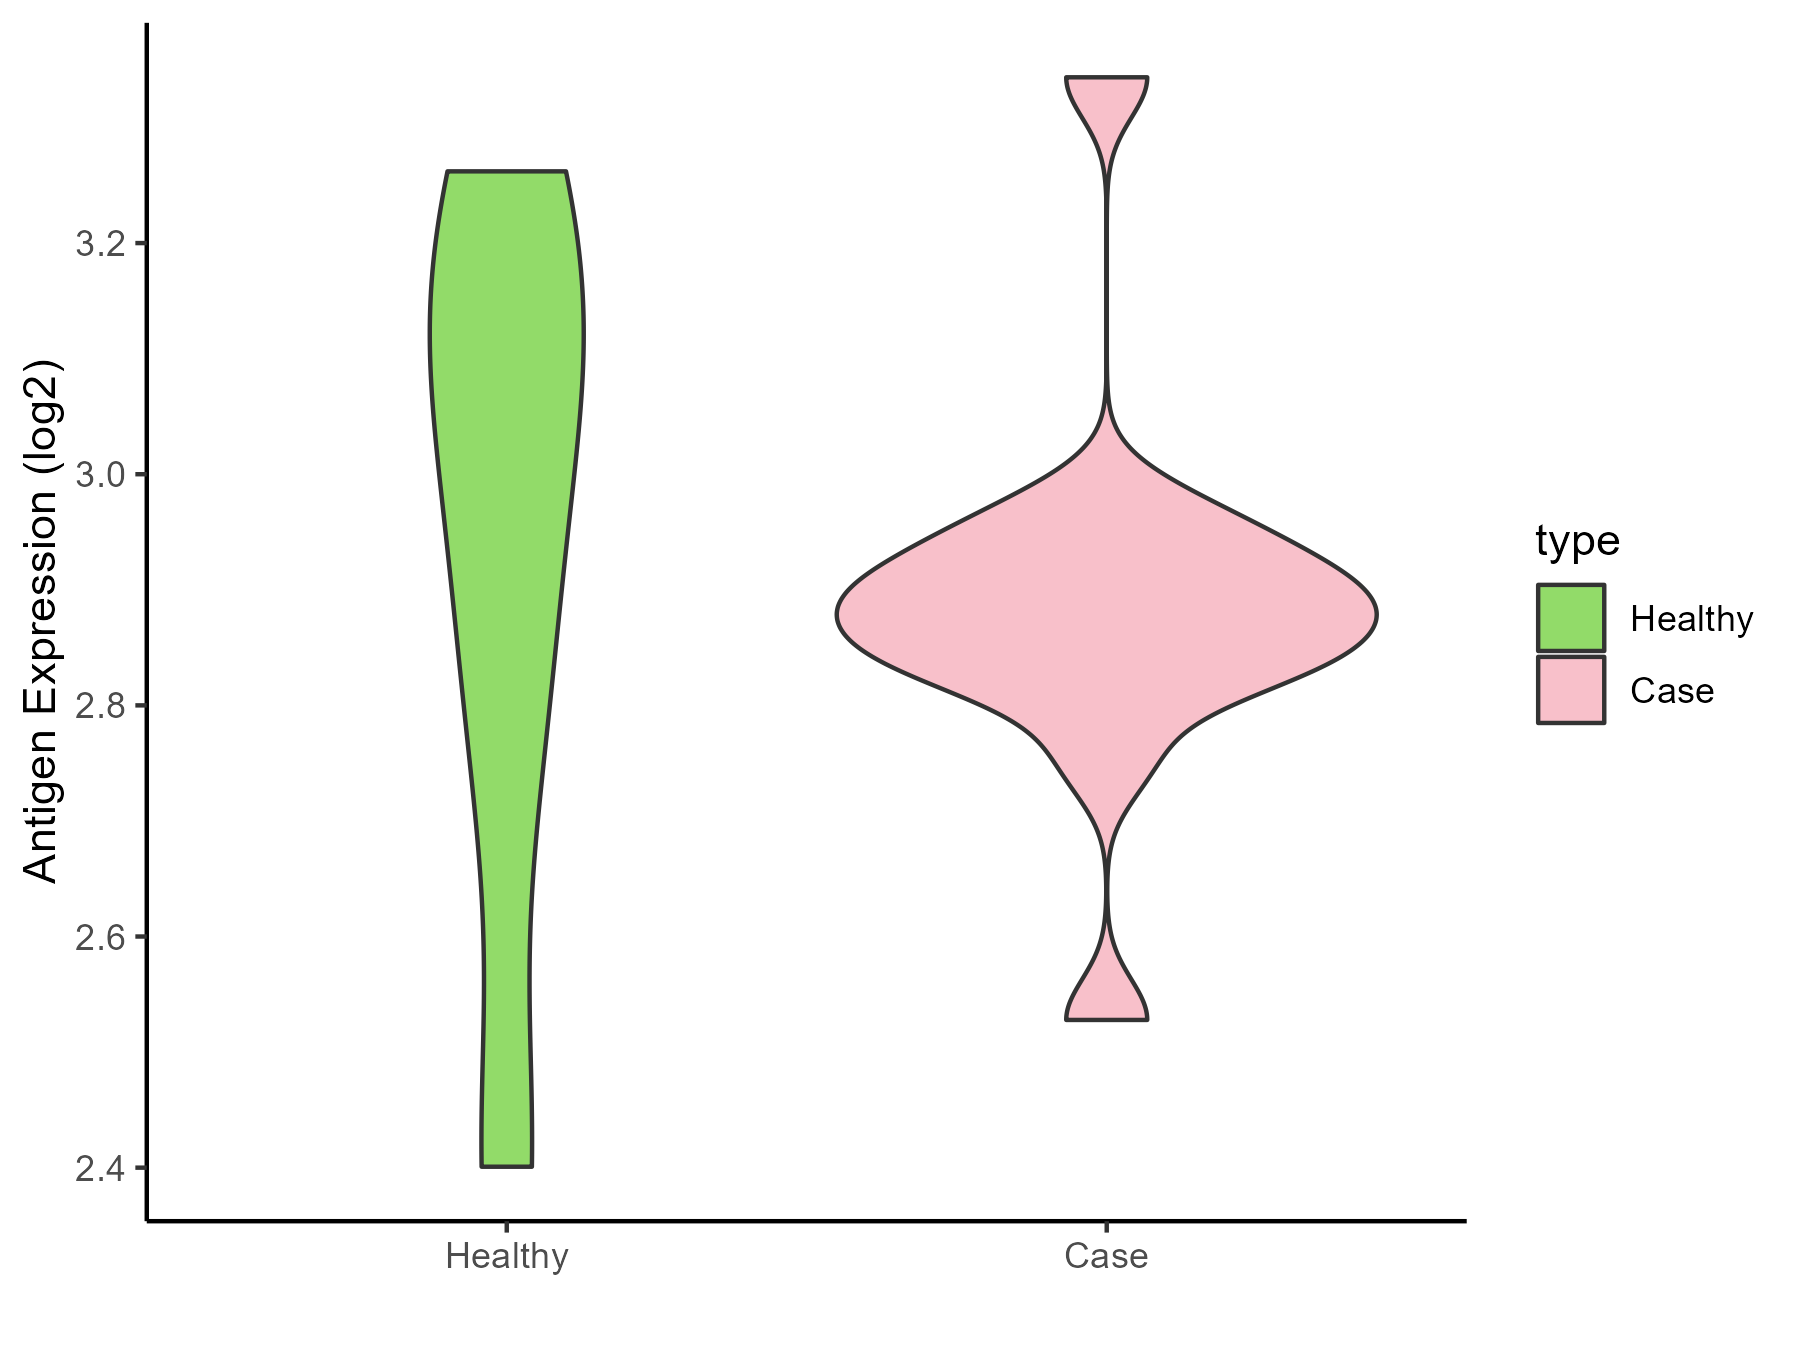
| The Studied Tissue | Plasmacytoid dendritic cells | |
| The Specific Disease | Multiple sclerosis | |
| The Expression Level of Disease Section Compare with the Healthy Individual Tissue | p-value: 0.694409878; Fold-change: -0.150703461; Z-score: -0.478805569 | |
| Disease-specific Antigen Abundances |
|
Click to View the Clearer Original Diagram |
| Differential expression pattern of antigen in diseases | ||
| The Studied Tissue | Peritumoral cortex | |
| The Specific Disease | Epilepsy | |
| The Expression Level of Disease Section Compare with the Other Disease Section | p-value: 0.41873538; Fold-change: -1.197394385; Z-score: -0.919261436 | |
| Disease-specific Antigen Abundances |

|
Click to View the Clearer Original Diagram |
| Differential expression pattern of antigen in diseases | ||
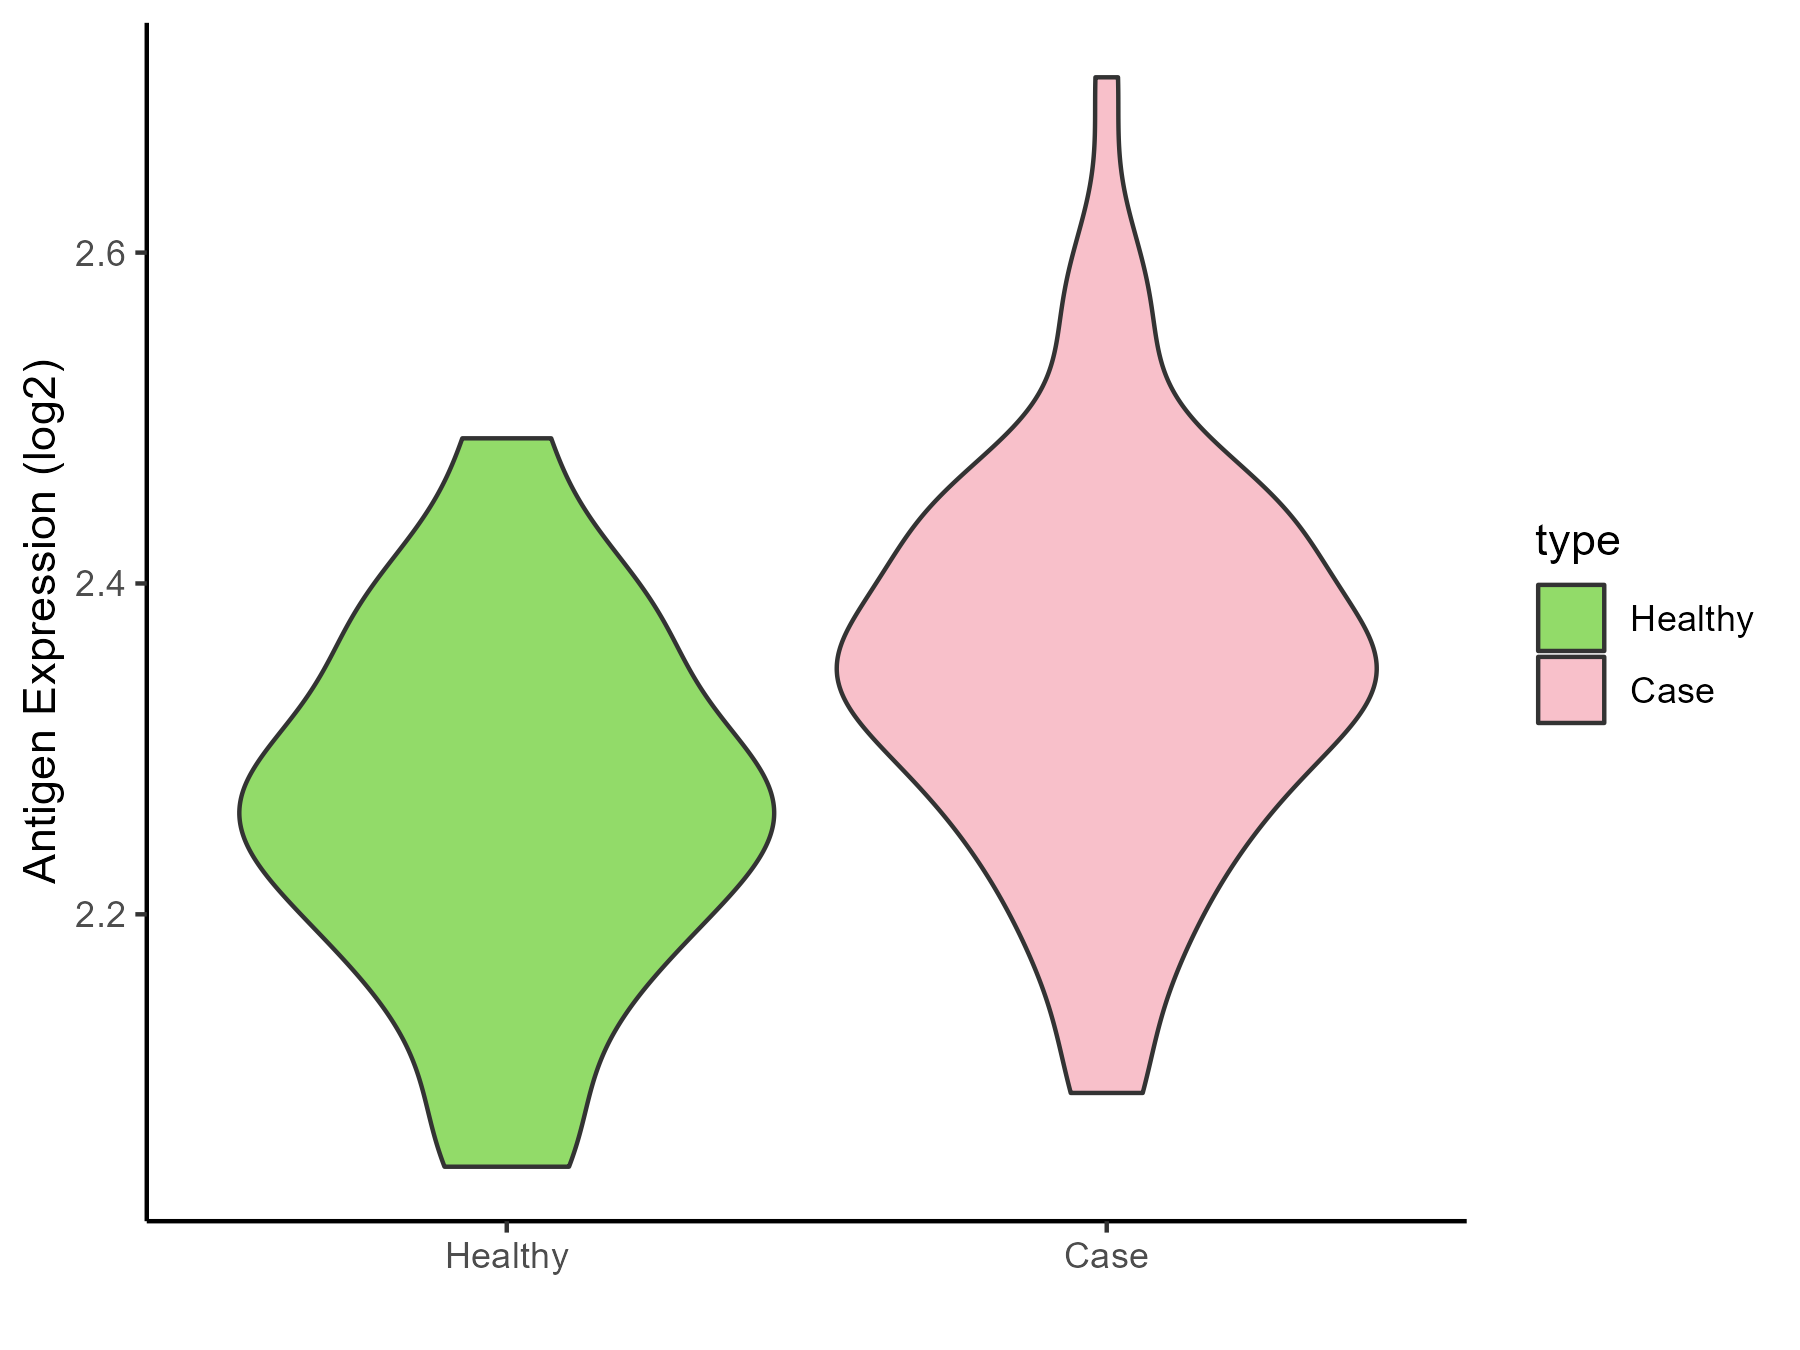
| The Studied Tissue | Whole blood | |
| The Specific Disease | Cardioembolic Stroke | |
| The Expression Level of Disease Section Compare with the Healthy Individual Tissue | p-value: 0.003758385; Fold-change: 0.075077287; Z-score: 0.680571337 | |
| Disease-specific Antigen Abundances |
|
Click to View the Clearer Original Diagram |
| The Studied Tissue | Peripheral blood | |
| The Specific Disease | Ischemic stroke | |
| The Expression Level of Disease Section Compare with the Healthy Individual Tissue | p-value: 0.689340813; Fold-change: 0.046616167; Z-score: 0.241532297 | |
| Disease-specific Antigen Abundances |
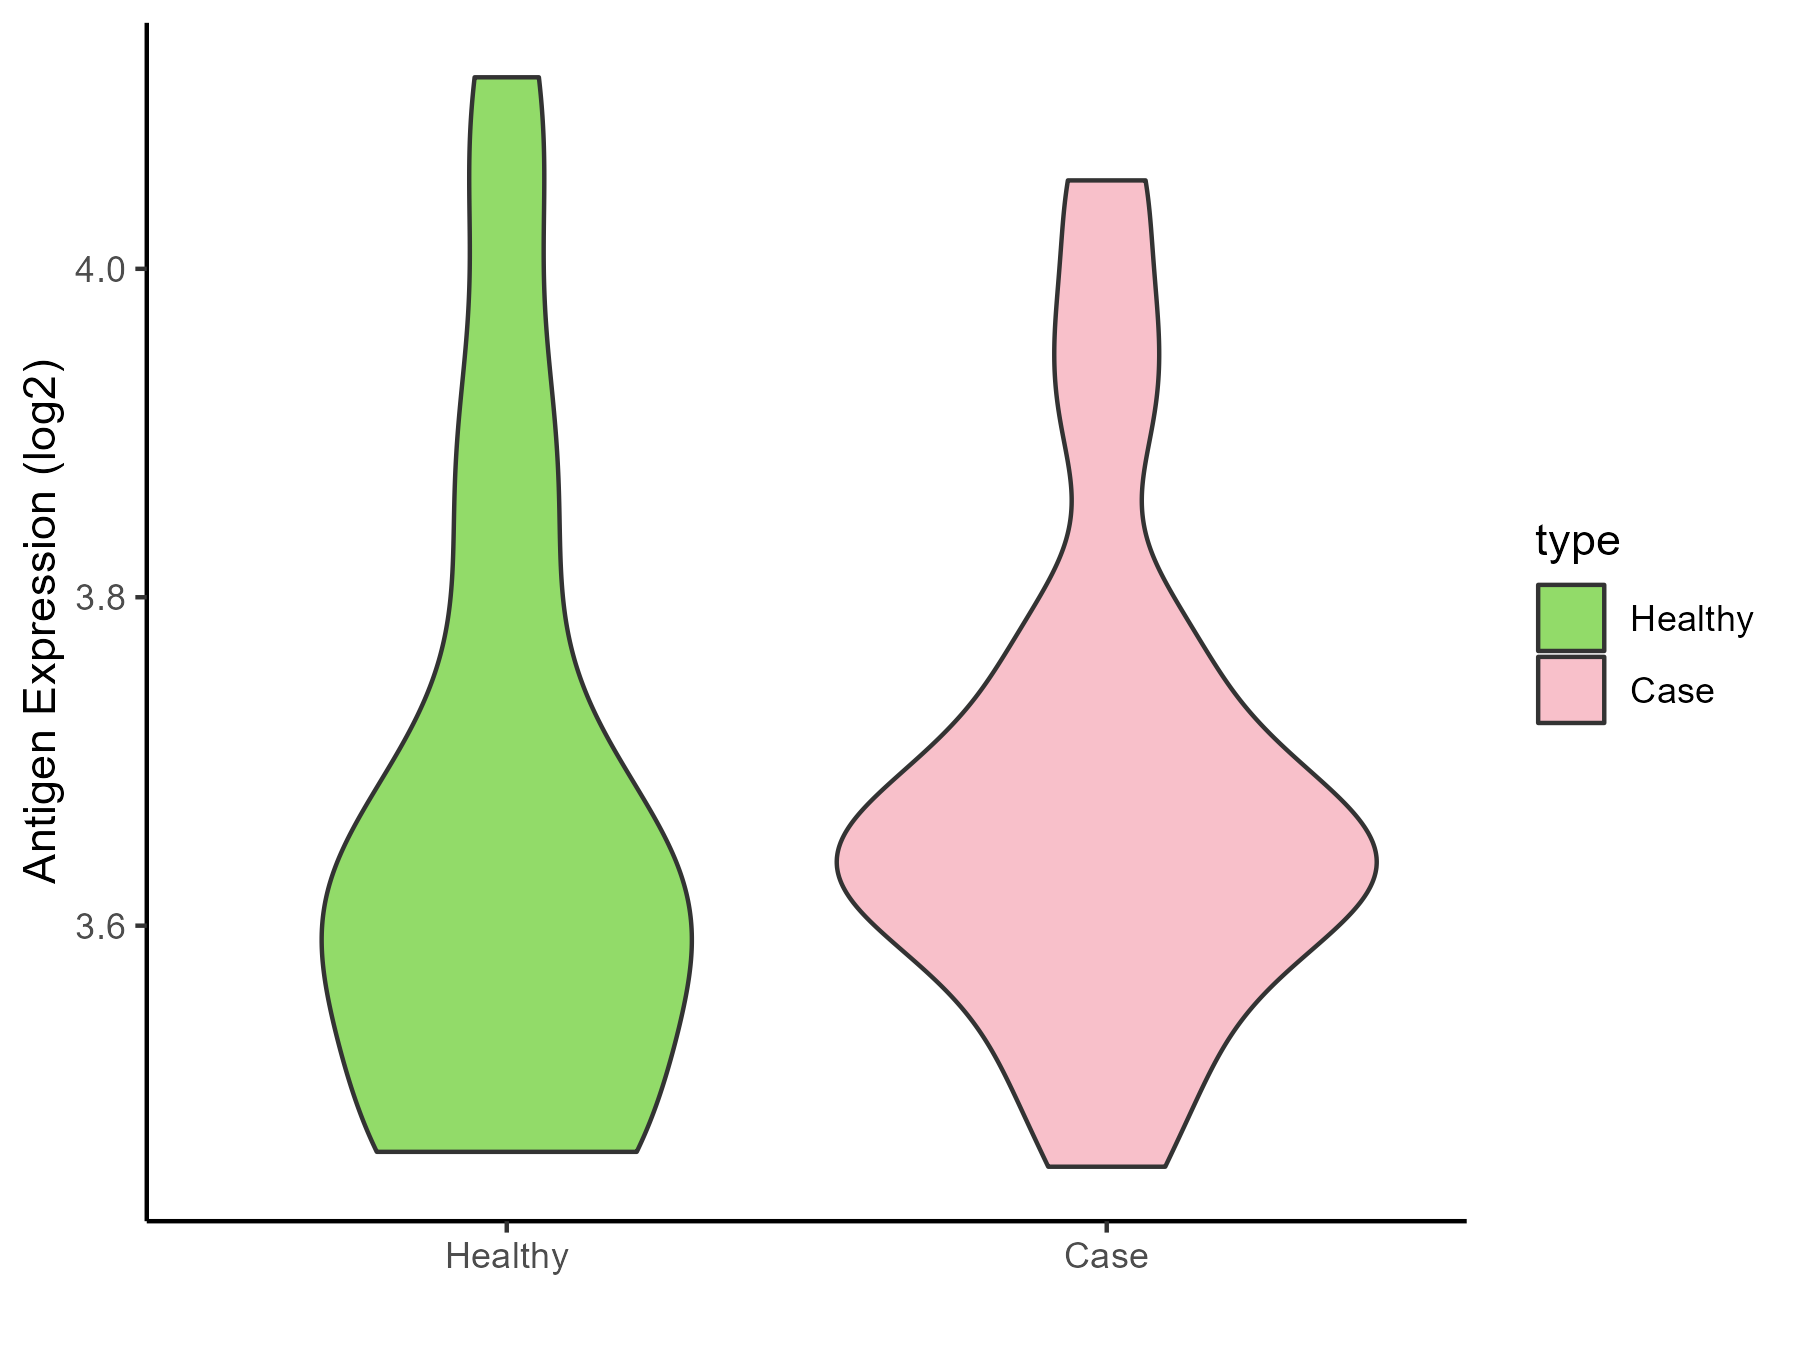
|
Click to View the Clearer Original Diagram |
ICD Disease Classification 1
| Differential expression pattern of antigen in diseases | ||
| The Studied Tissue | White matter | |
| The Specific Disease | HIV | |
| The Expression Level of Disease Section Compare with the Healthy Individual Tissue | p-value: 0.058583575; Fold-change: -0.125845019; Z-score: -0.564866076 | |
| Disease-specific Antigen Abundances |
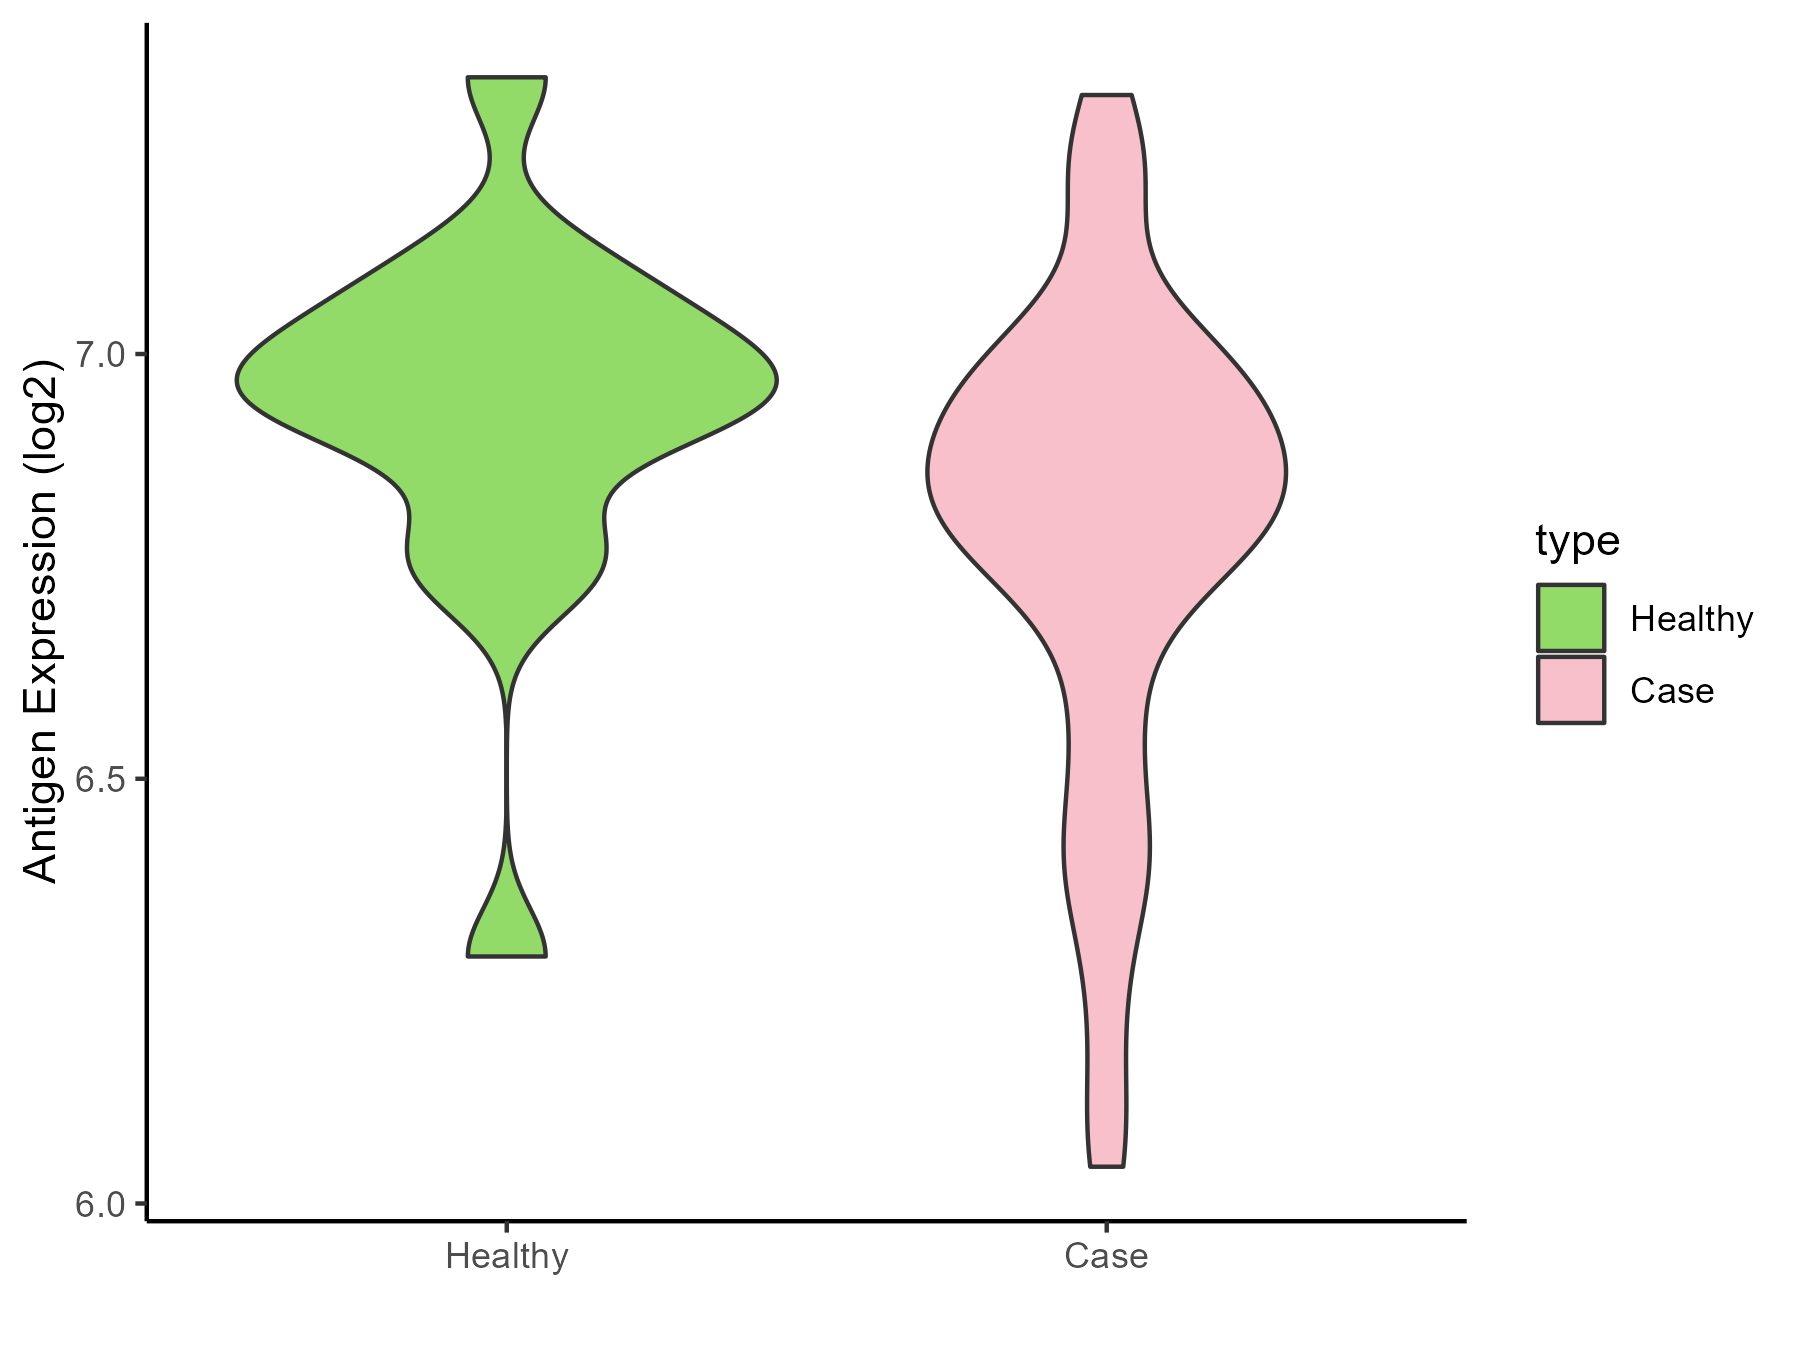
|
Click to View the Clearer Original Diagram |
| Differential expression pattern of antigen in diseases | ||
| The Studied Tissue | Whole blood | |
| The Specific Disease | Influenza | |
| The Expression Level of Disease Section Compare with the Healthy Individual Tissue | p-value: 0.236006311; Fold-change: -0.986363295; Z-score: -1.430304338 | |
| Disease-specific Antigen Abundances |
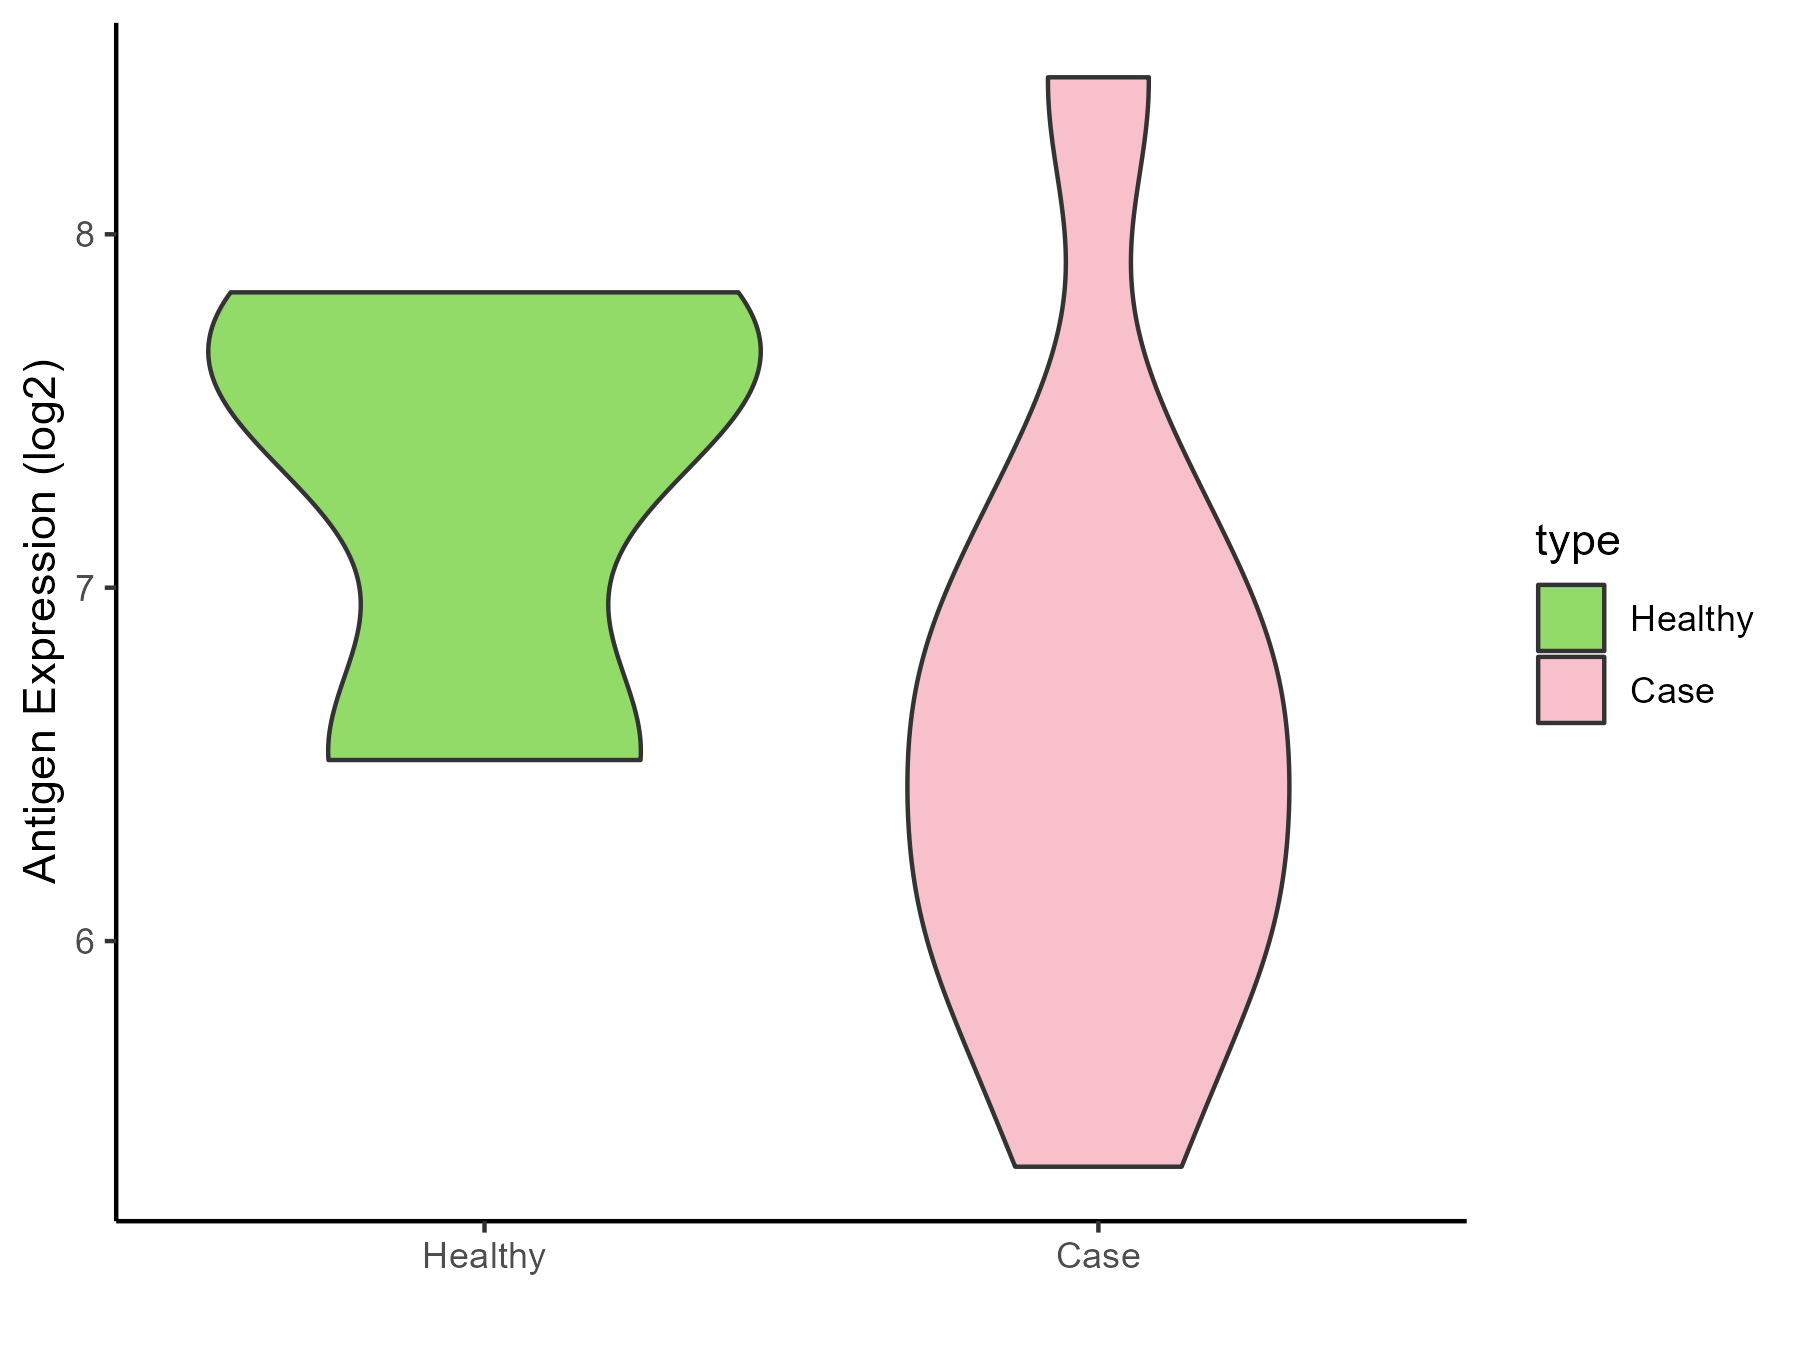
|
Click to View the Clearer Original Diagram |
| Differential expression pattern of antigen in diseases | ||
| The Studied Tissue | Whole blood | |
| The Specific Disease | Chronic hepatitis C | |
| The Expression Level of Disease Section Compare with the Healthy Individual Tissue | p-value: 0.208231837; Fold-change: 0.100982364; Z-score: 0.352763505 | |
| Disease-specific Antigen Abundances |
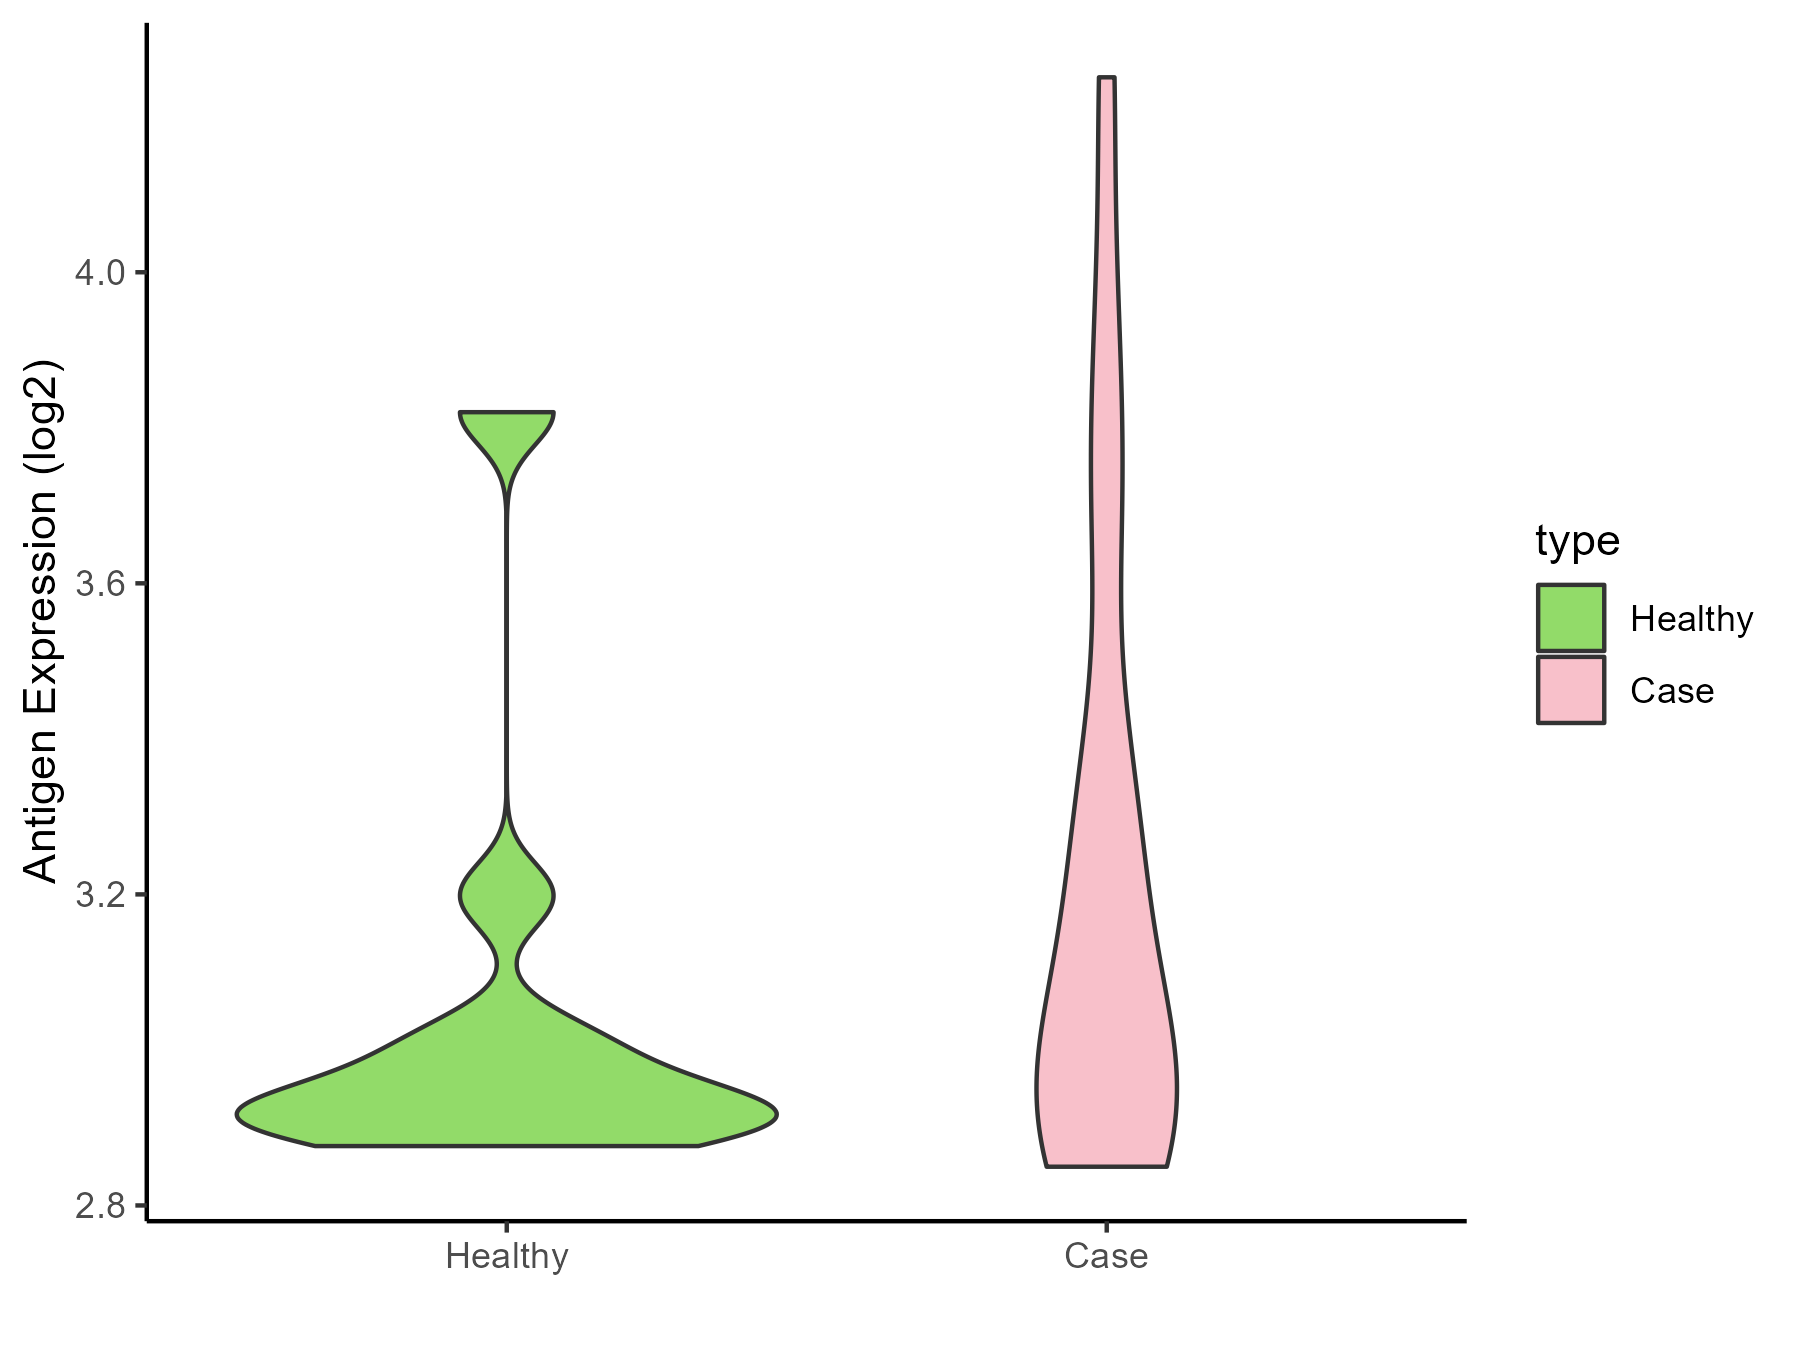
|
Click to View the Clearer Original Diagram |
| Differential expression pattern of antigen in diseases | ||
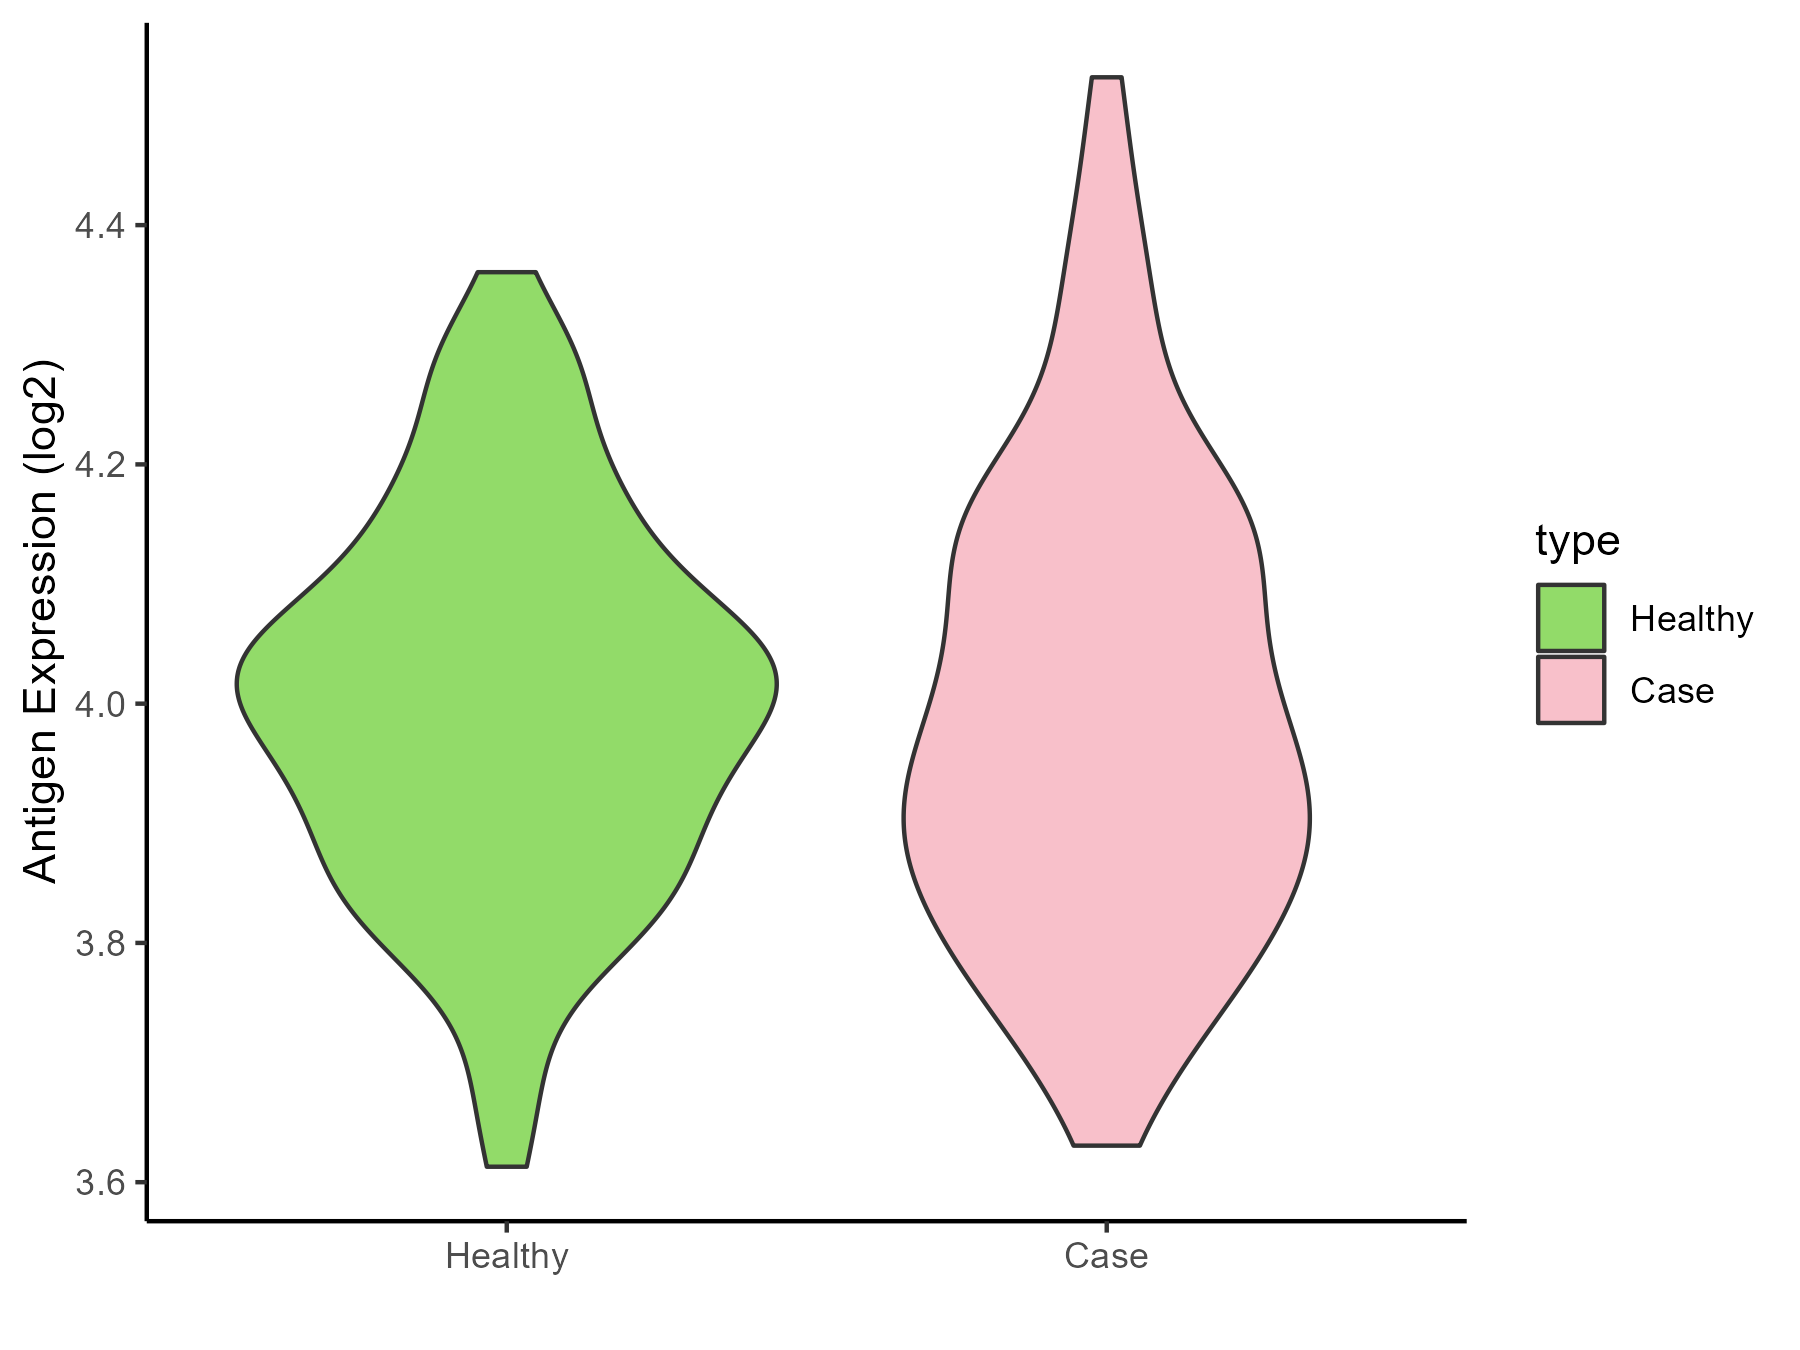
| The Studied Tissue | Whole blood | |
| The Specific Disease | Sepsis | |
| The Expression Level of Disease Section Compare with the Healthy Individual Tissue | p-value: 0.892425988; Fold-change: -0.036079093; Z-score: -0.230914551 | |
| Disease-specific Antigen Abundances |
|
Click to View the Clearer Original Diagram |
| Differential expression pattern of antigen in diseases | ||
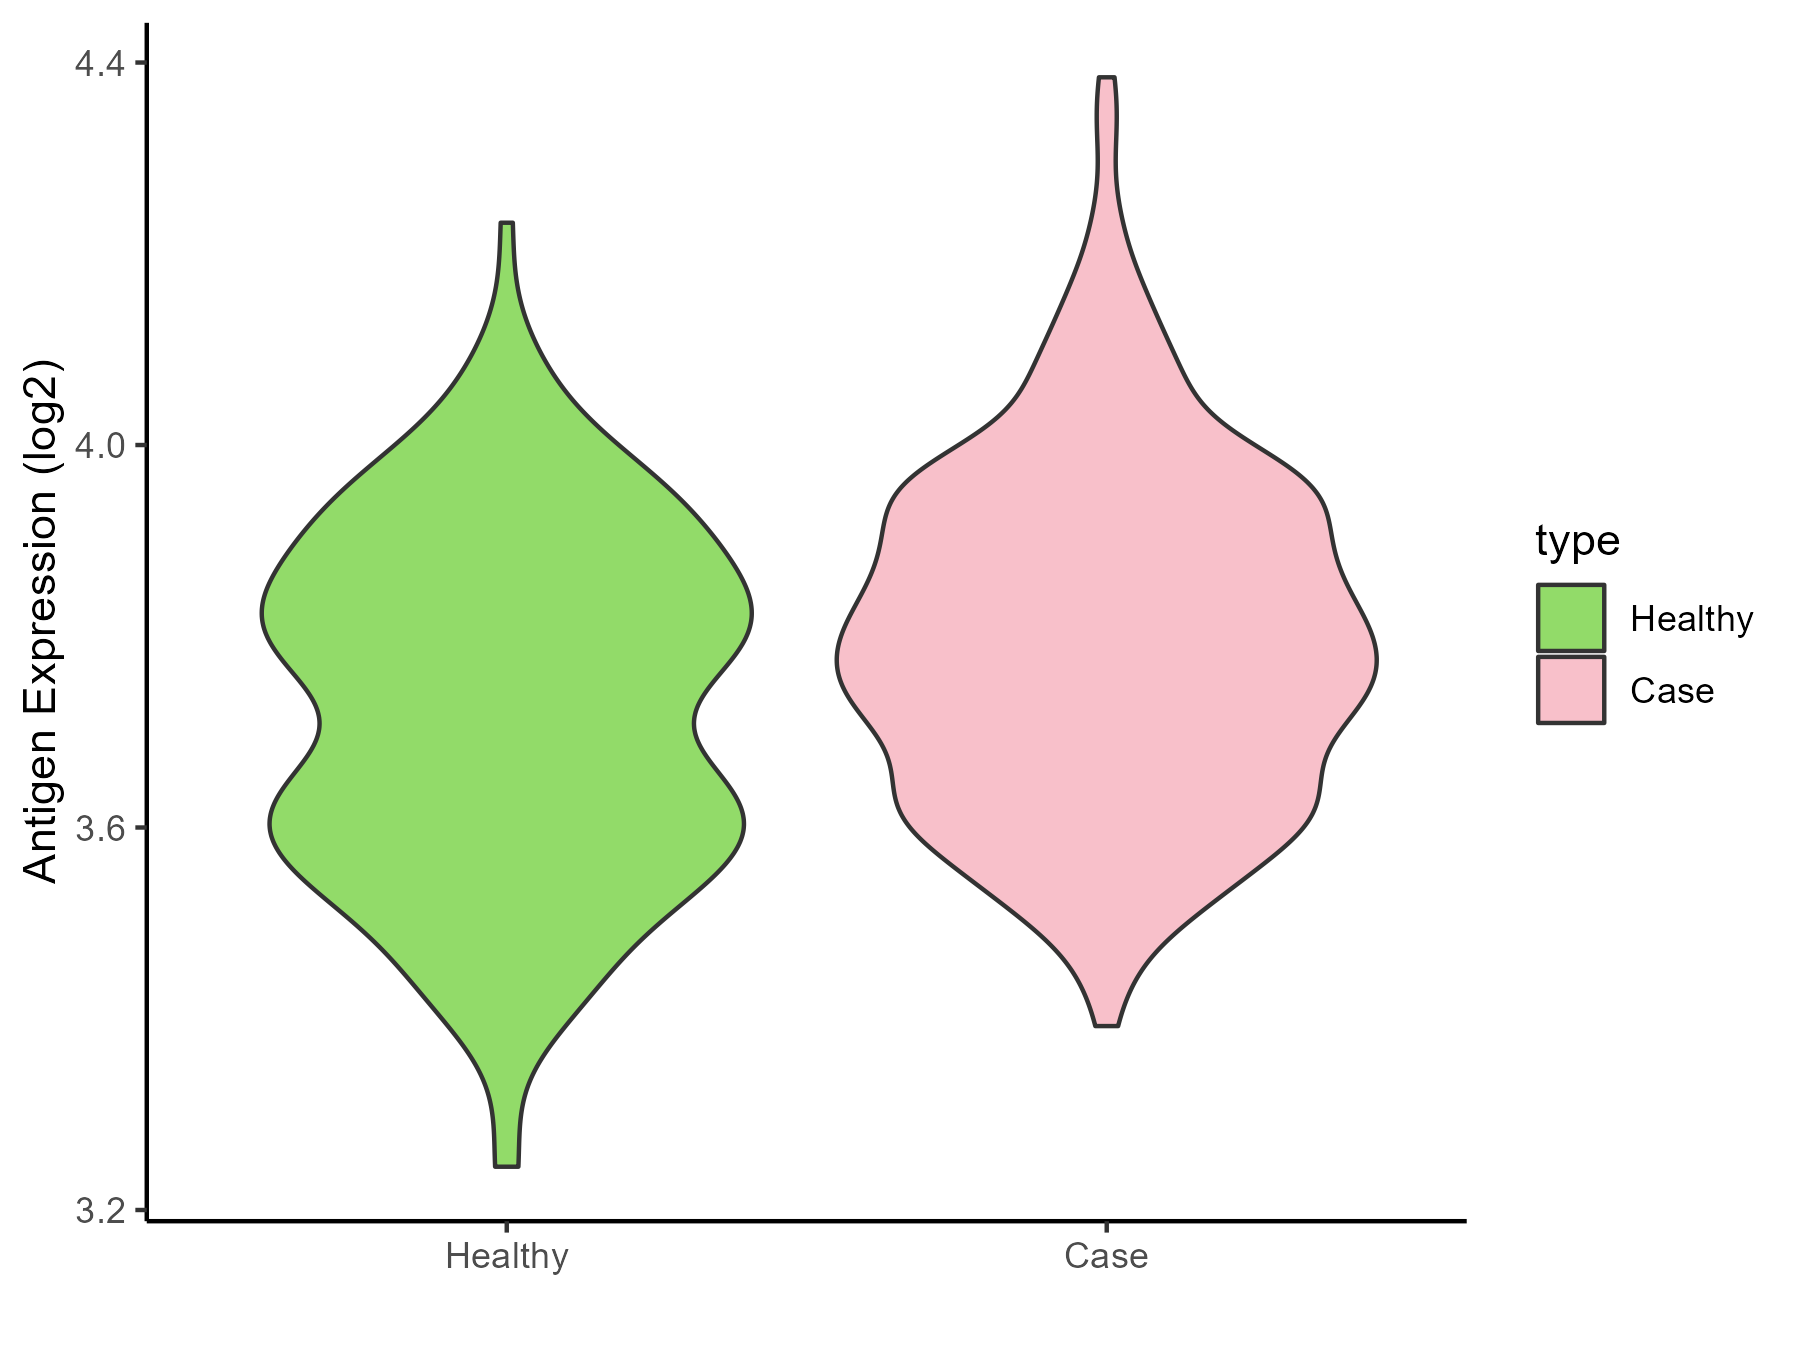
| The Studied Tissue | Whole blood | |
| The Specific Disease | Septic shock | |
| The Expression Level of Disease Section Compare with the Healthy Individual Tissue | p-value: 1.32E-05; Fold-change: 0.041028825; Z-score: 0.224116193 | |
| Disease-specific Antigen Abundances |
|
Click to View the Clearer Original Diagram |
| Differential expression pattern of antigen in diseases | ||
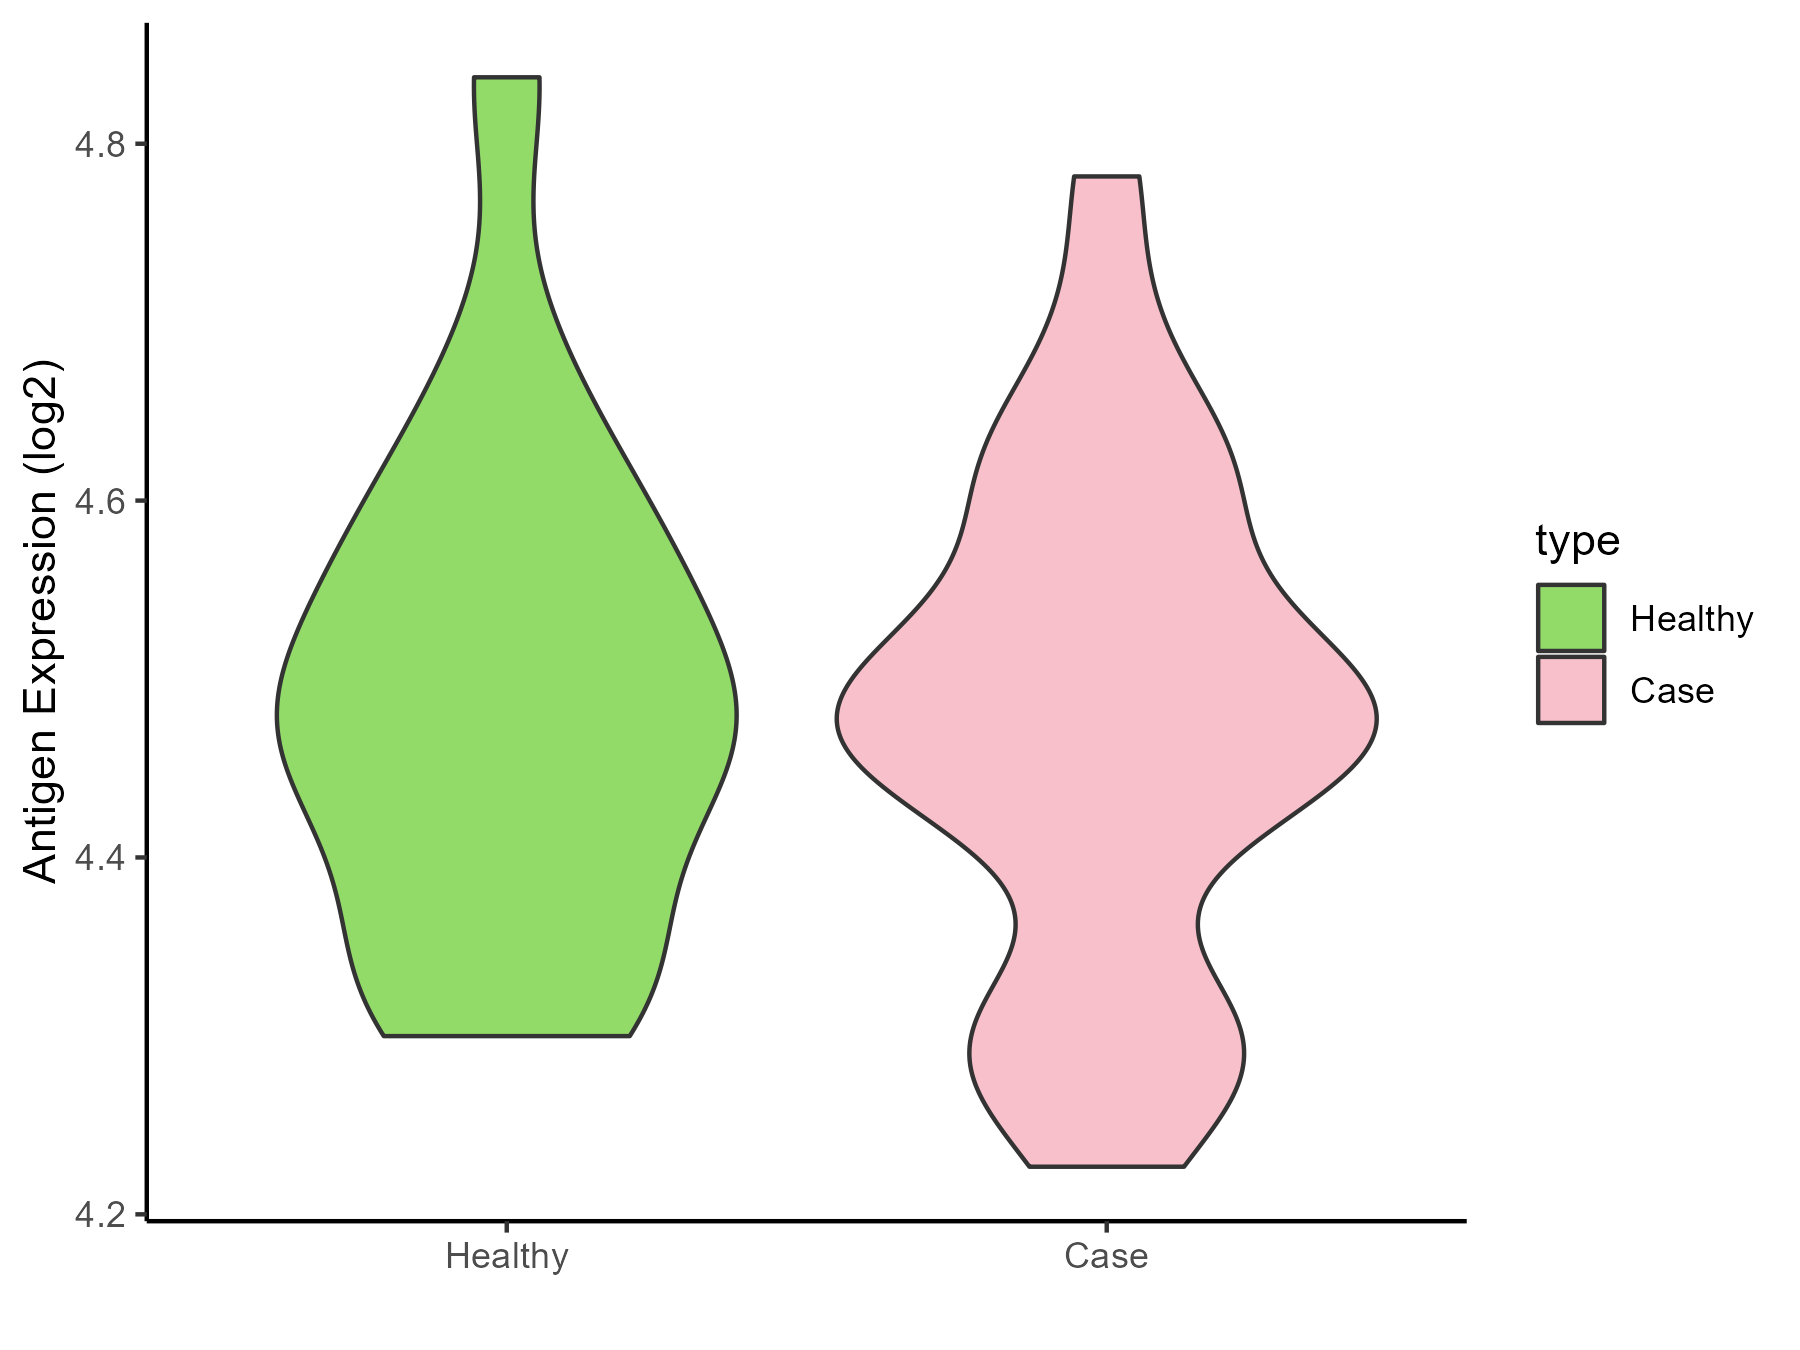
| The Studied Tissue | Peripheral blood | |
| The Specific Disease | Pediatric respiratory syncytial virus infection | |
| The Expression Level of Disease Section Compare with the Healthy Individual Tissue | p-value: 0.715393705; Fold-change: 0.013270958; Z-score: 0.094743196 | |
| Disease-specific Antigen Abundances |
|
Click to View the Clearer Original Diagram |
ICD Disease Classification 11
| Differential expression pattern of antigen in diseases | ||
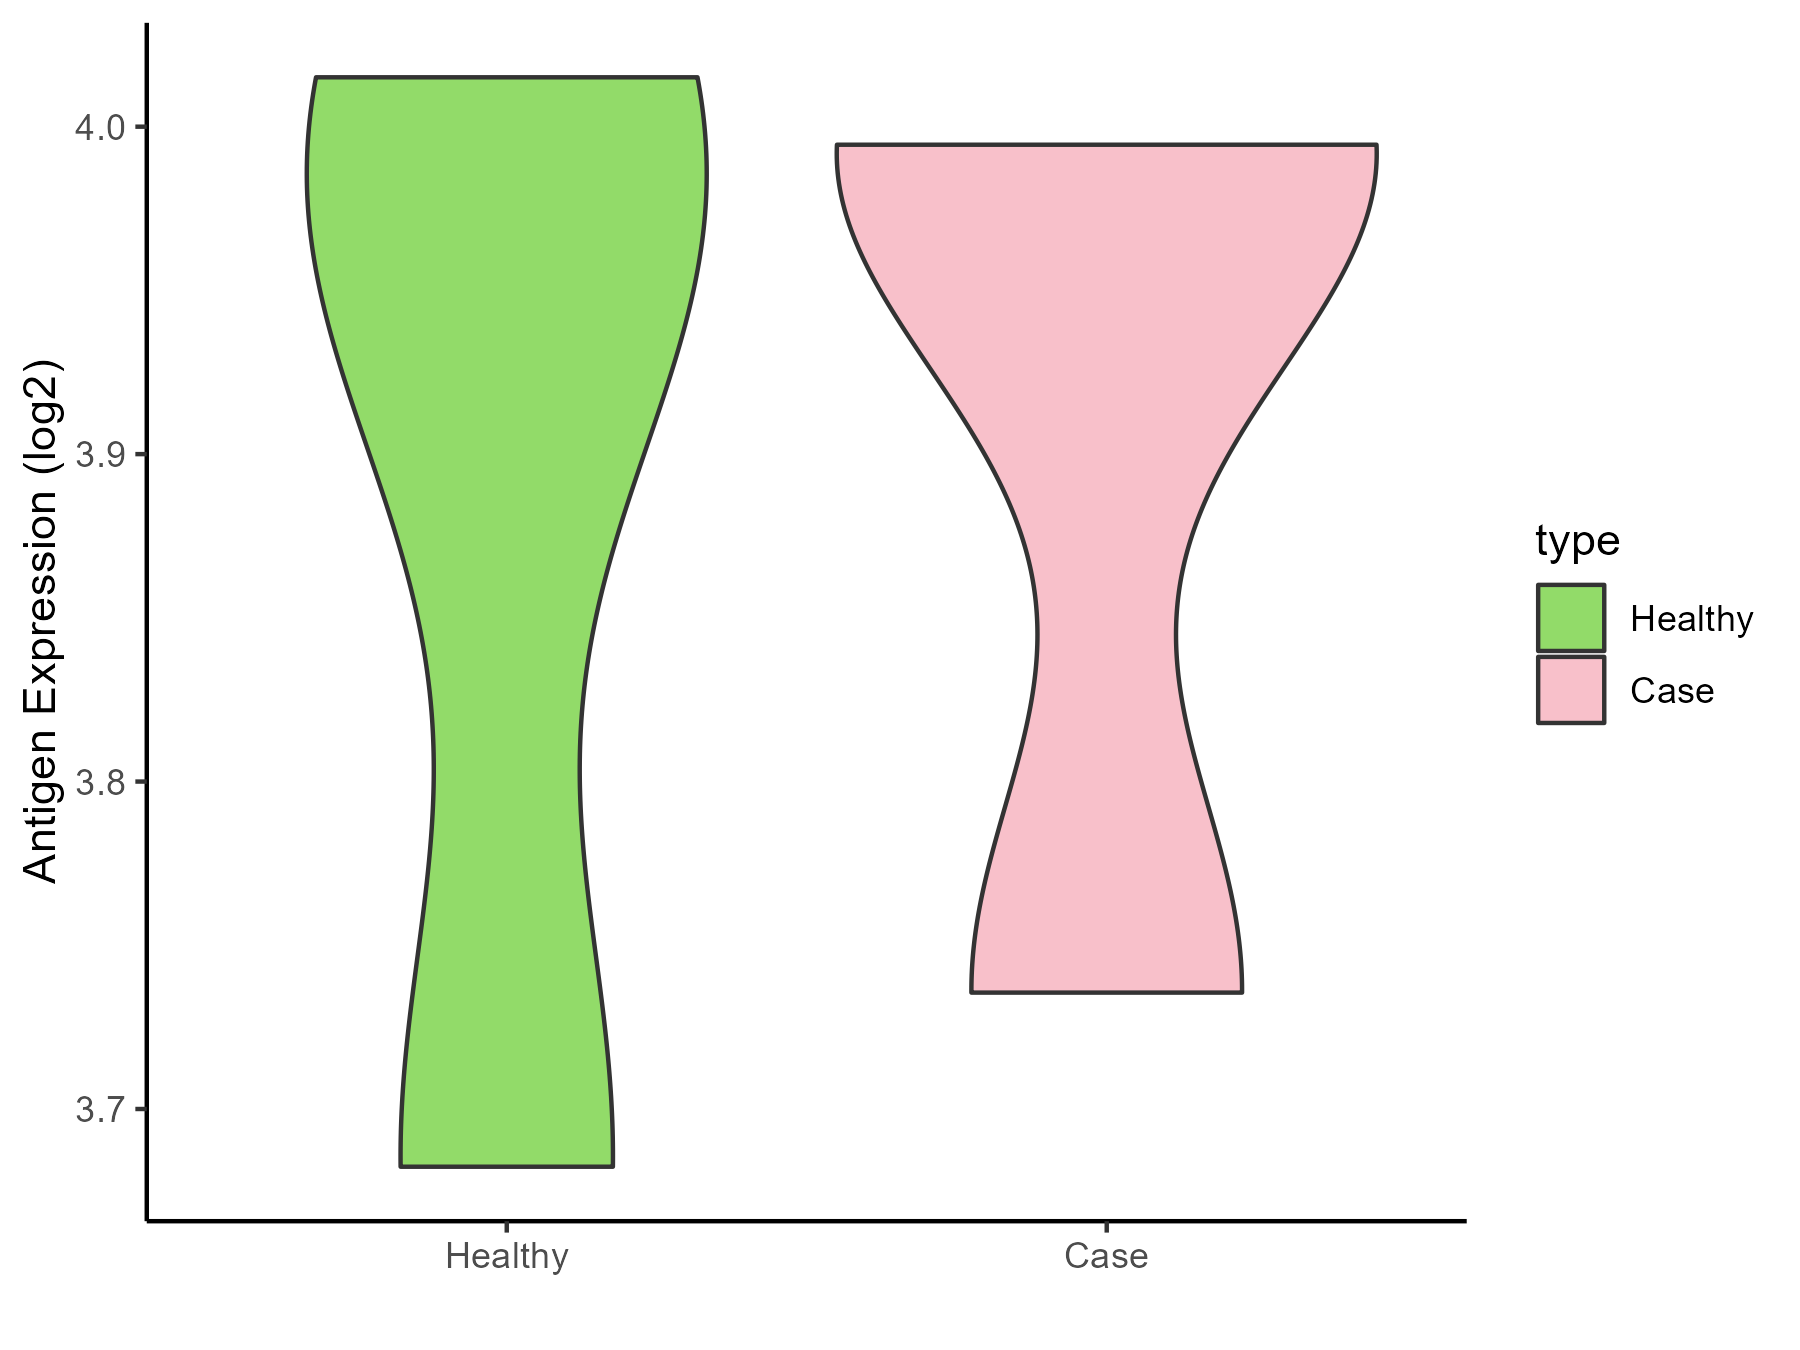
| The Studied Tissue | Peripheral blood | |
| The Specific Disease | Essential hypertension | |
| The Expression Level of Disease Section Compare with the Healthy Individual Tissue | p-value: 0.880307221; Fold-change: 0.031848665; Z-score: 0.179110268 | |
| Disease-specific Antigen Abundances |
|
Click to View the Clearer Original Diagram |
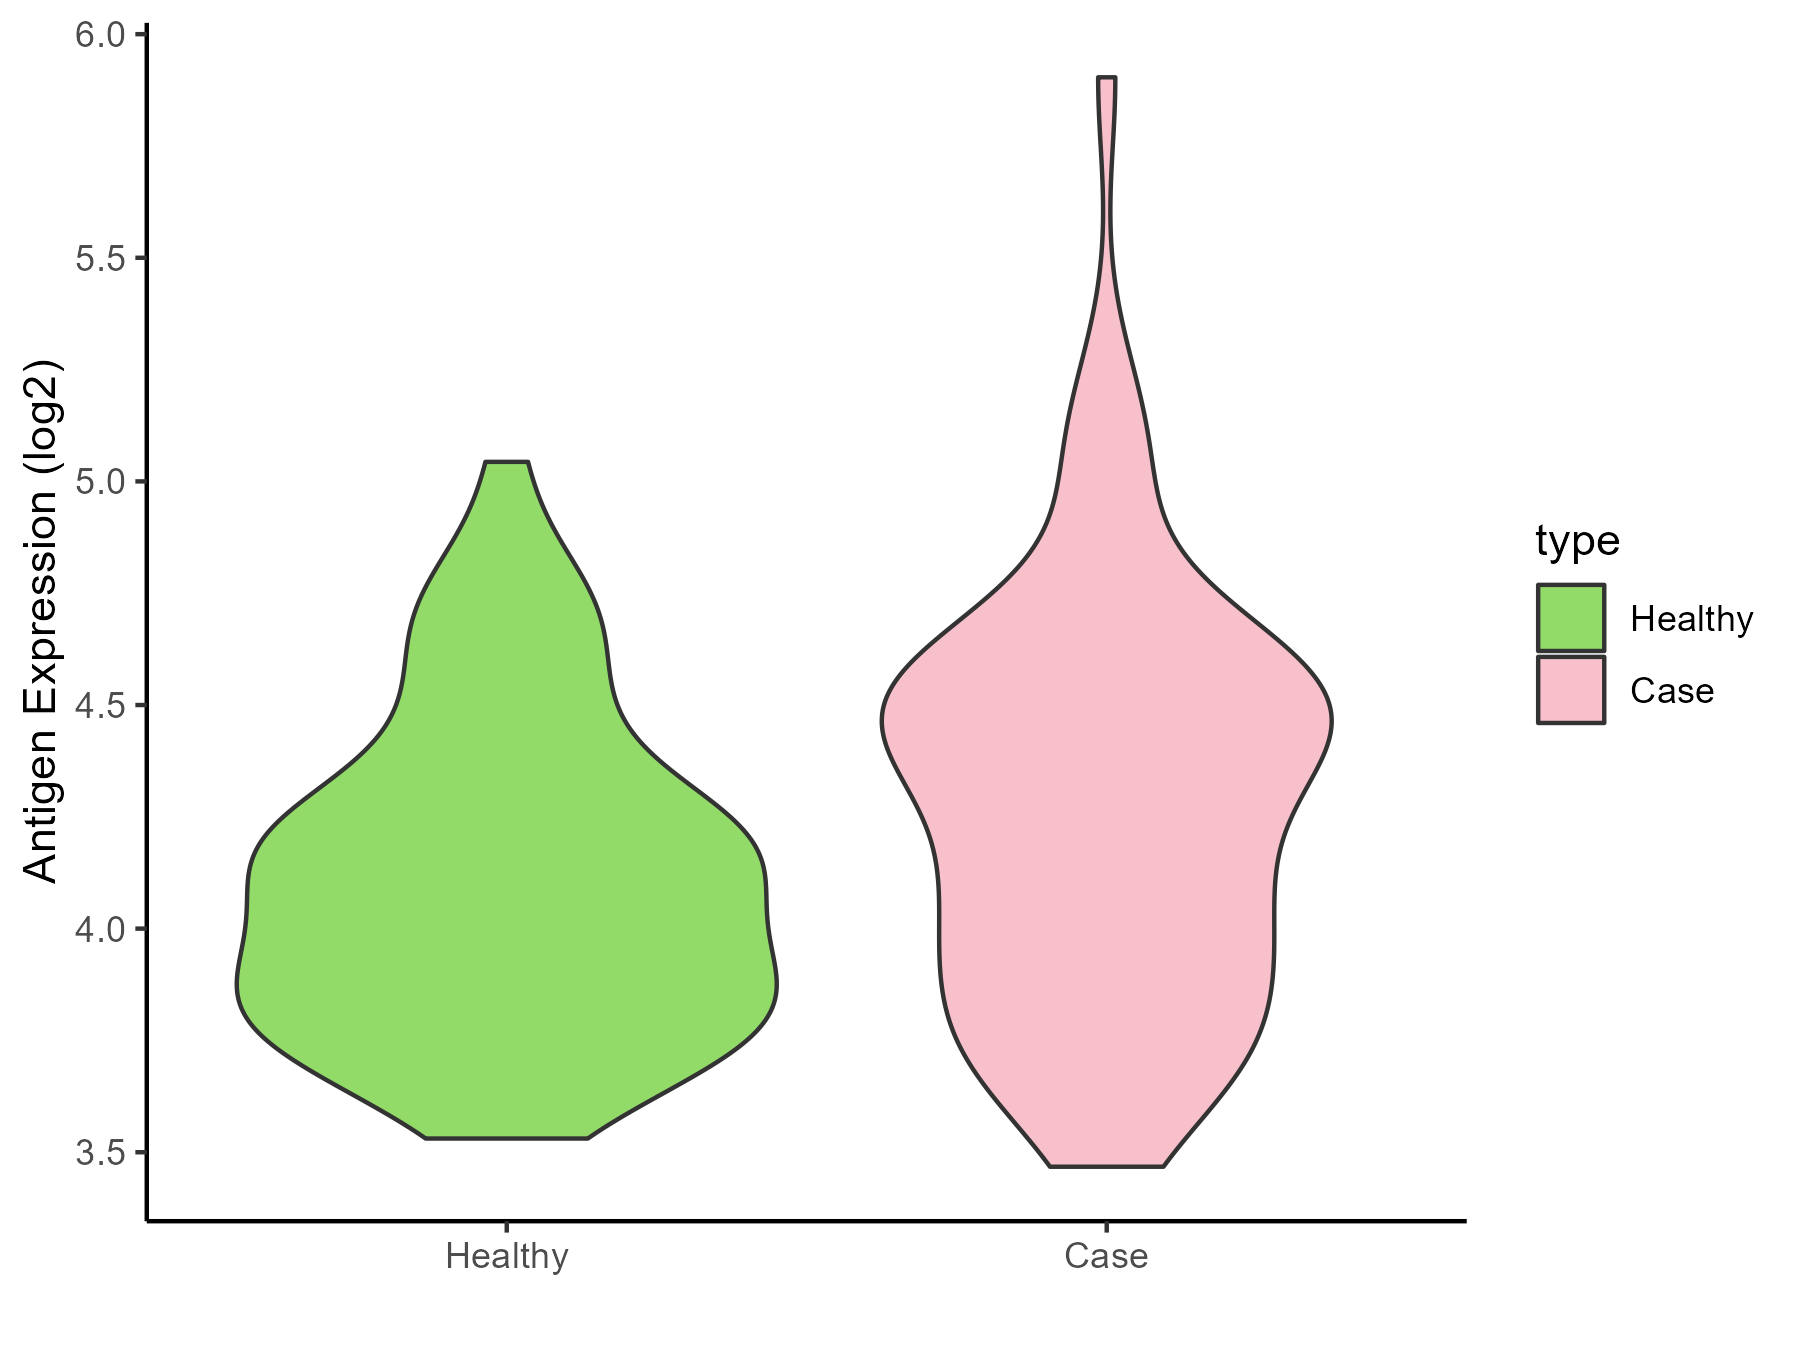
| Differential expression pattern of antigen in diseases | ||
| The Studied Tissue | Peripheral blood | |
| The Specific Disease | Myocardial infarction | |
| The Expression Level of Disease Section Compare with the Healthy Individual Tissue | p-value: 0.021259985; Fold-change: 0.226222463; Z-score: 0.64214181 | |
| Disease-specific Antigen Abundances |
|
Click to View the Clearer Original Diagram |
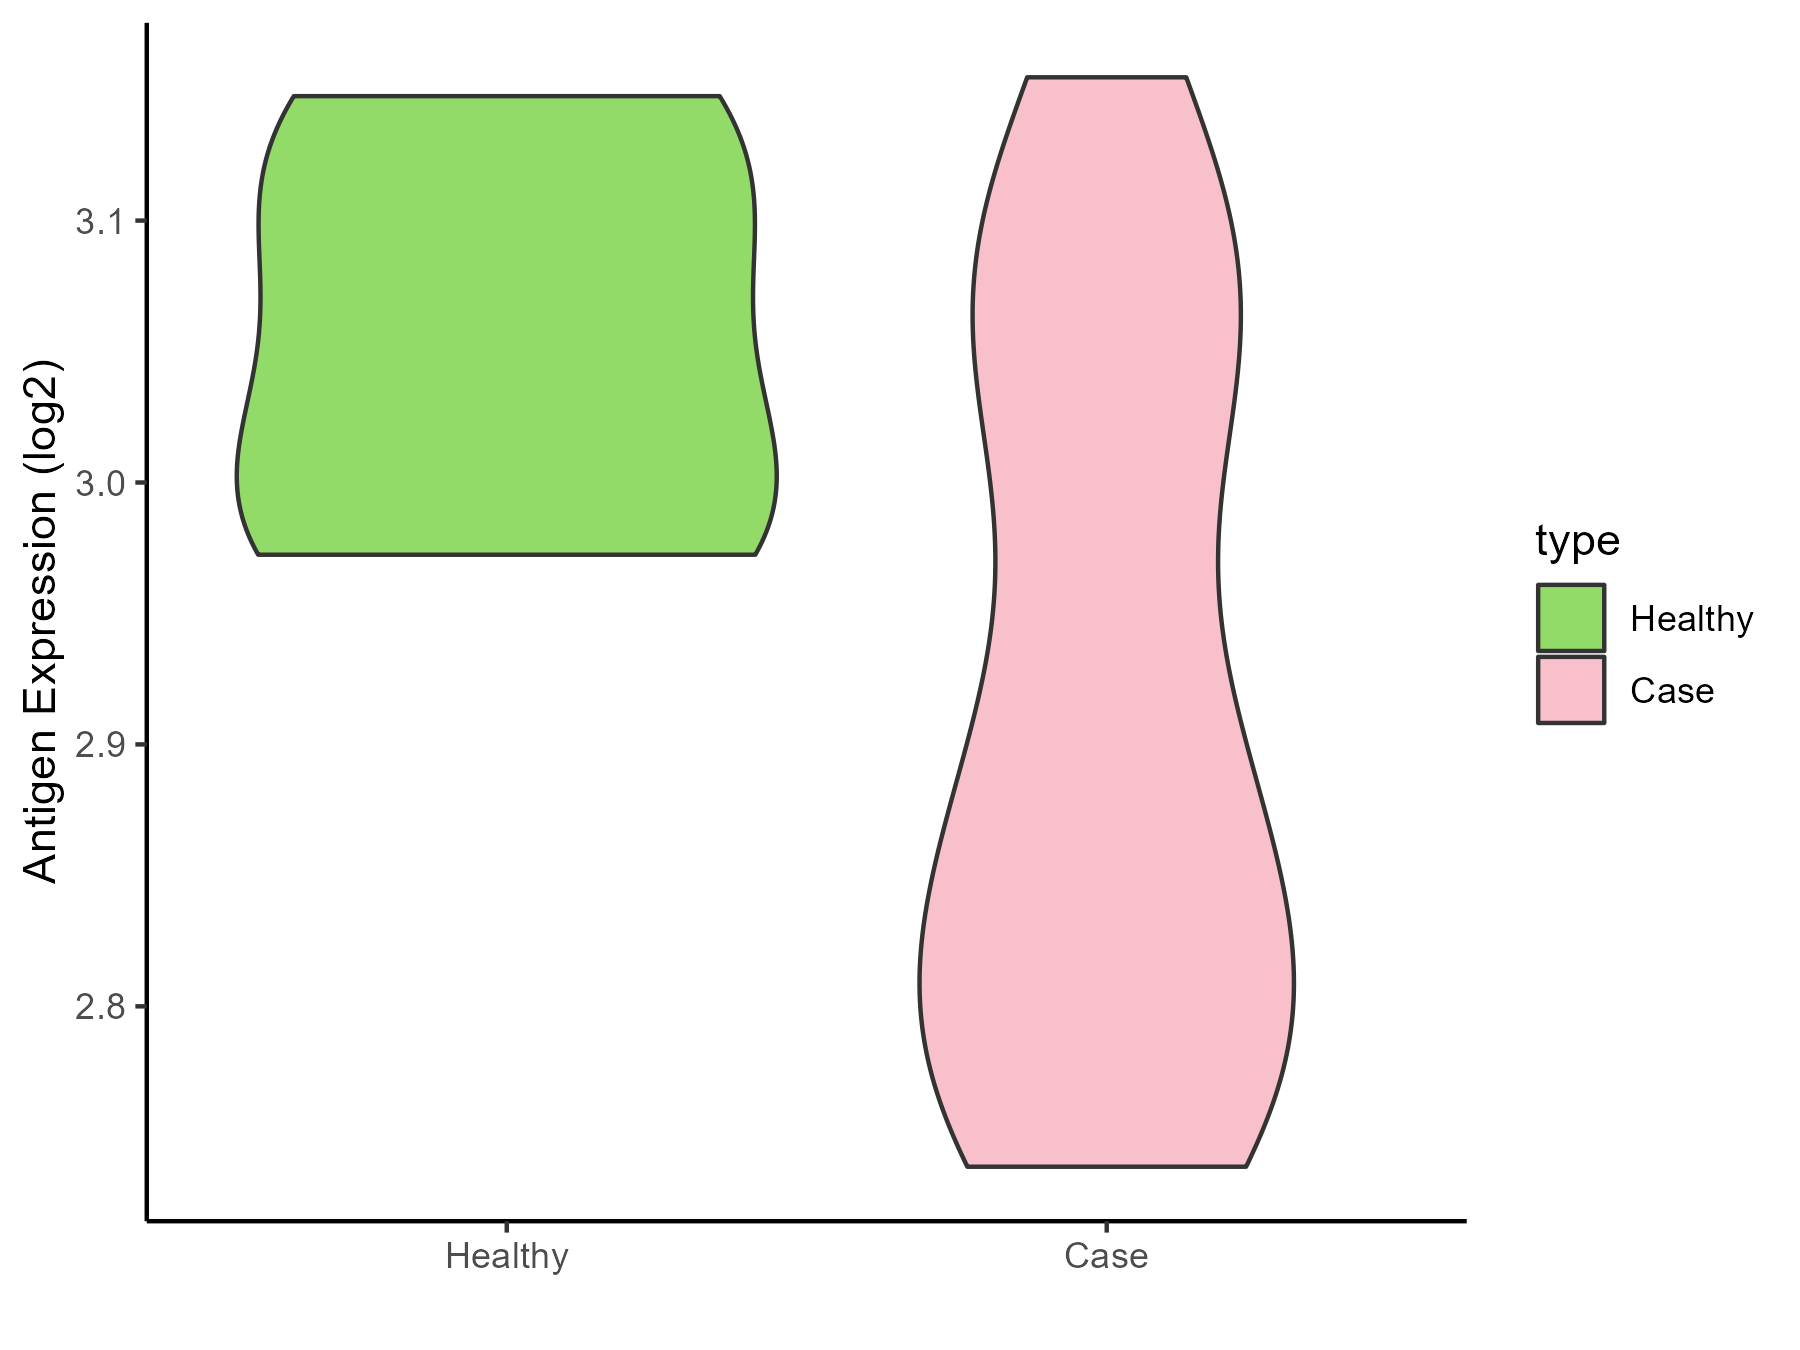
| Differential expression pattern of antigen in diseases | ||
| The Studied Tissue | Peripheral blood | |
| The Specific Disease | Coronary artery disease | |
| The Expression Level of Disease Section Compare with the Healthy Individual Tissue | p-value: 0.030877456; Fold-change: -0.161510571; Z-score: -1.977617785 | |
| Disease-specific Antigen Abundances |
|
Click to View the Clearer Original Diagram |
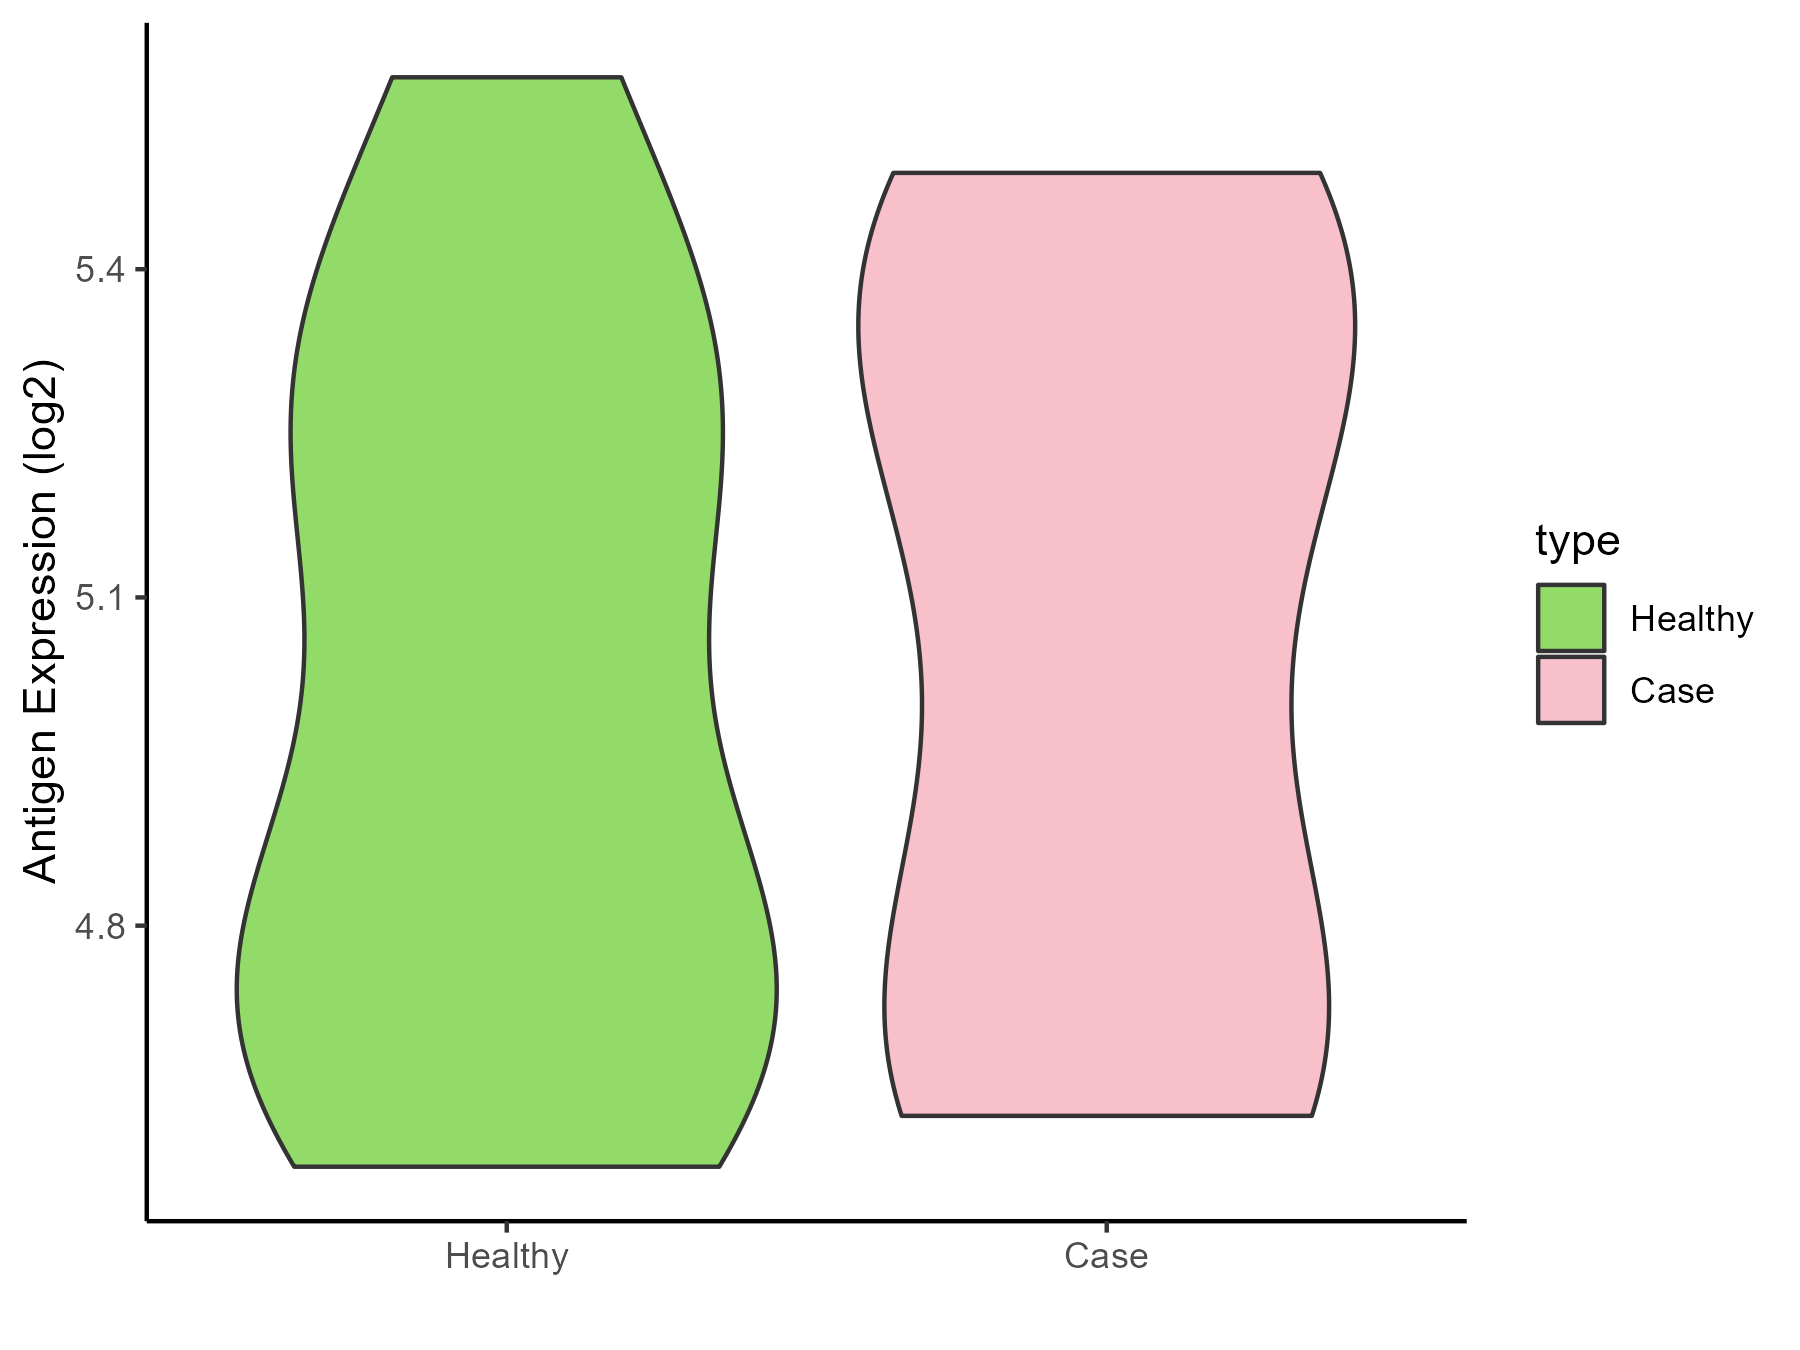
| Differential expression pattern of antigen in diseases | ||
| The Studied Tissue | Calcified aortic valve | |
| The Specific Disease | Aortic stenosis | |
| The Expression Level of Disease Section Compare with the Healthy Individual Tissue | p-value: 0.719062841; Fold-change: 0.169721969; Z-score: 0.497206752 | |
| Disease-specific Antigen Abundances |
|
Click to View the Clearer Original Diagram |
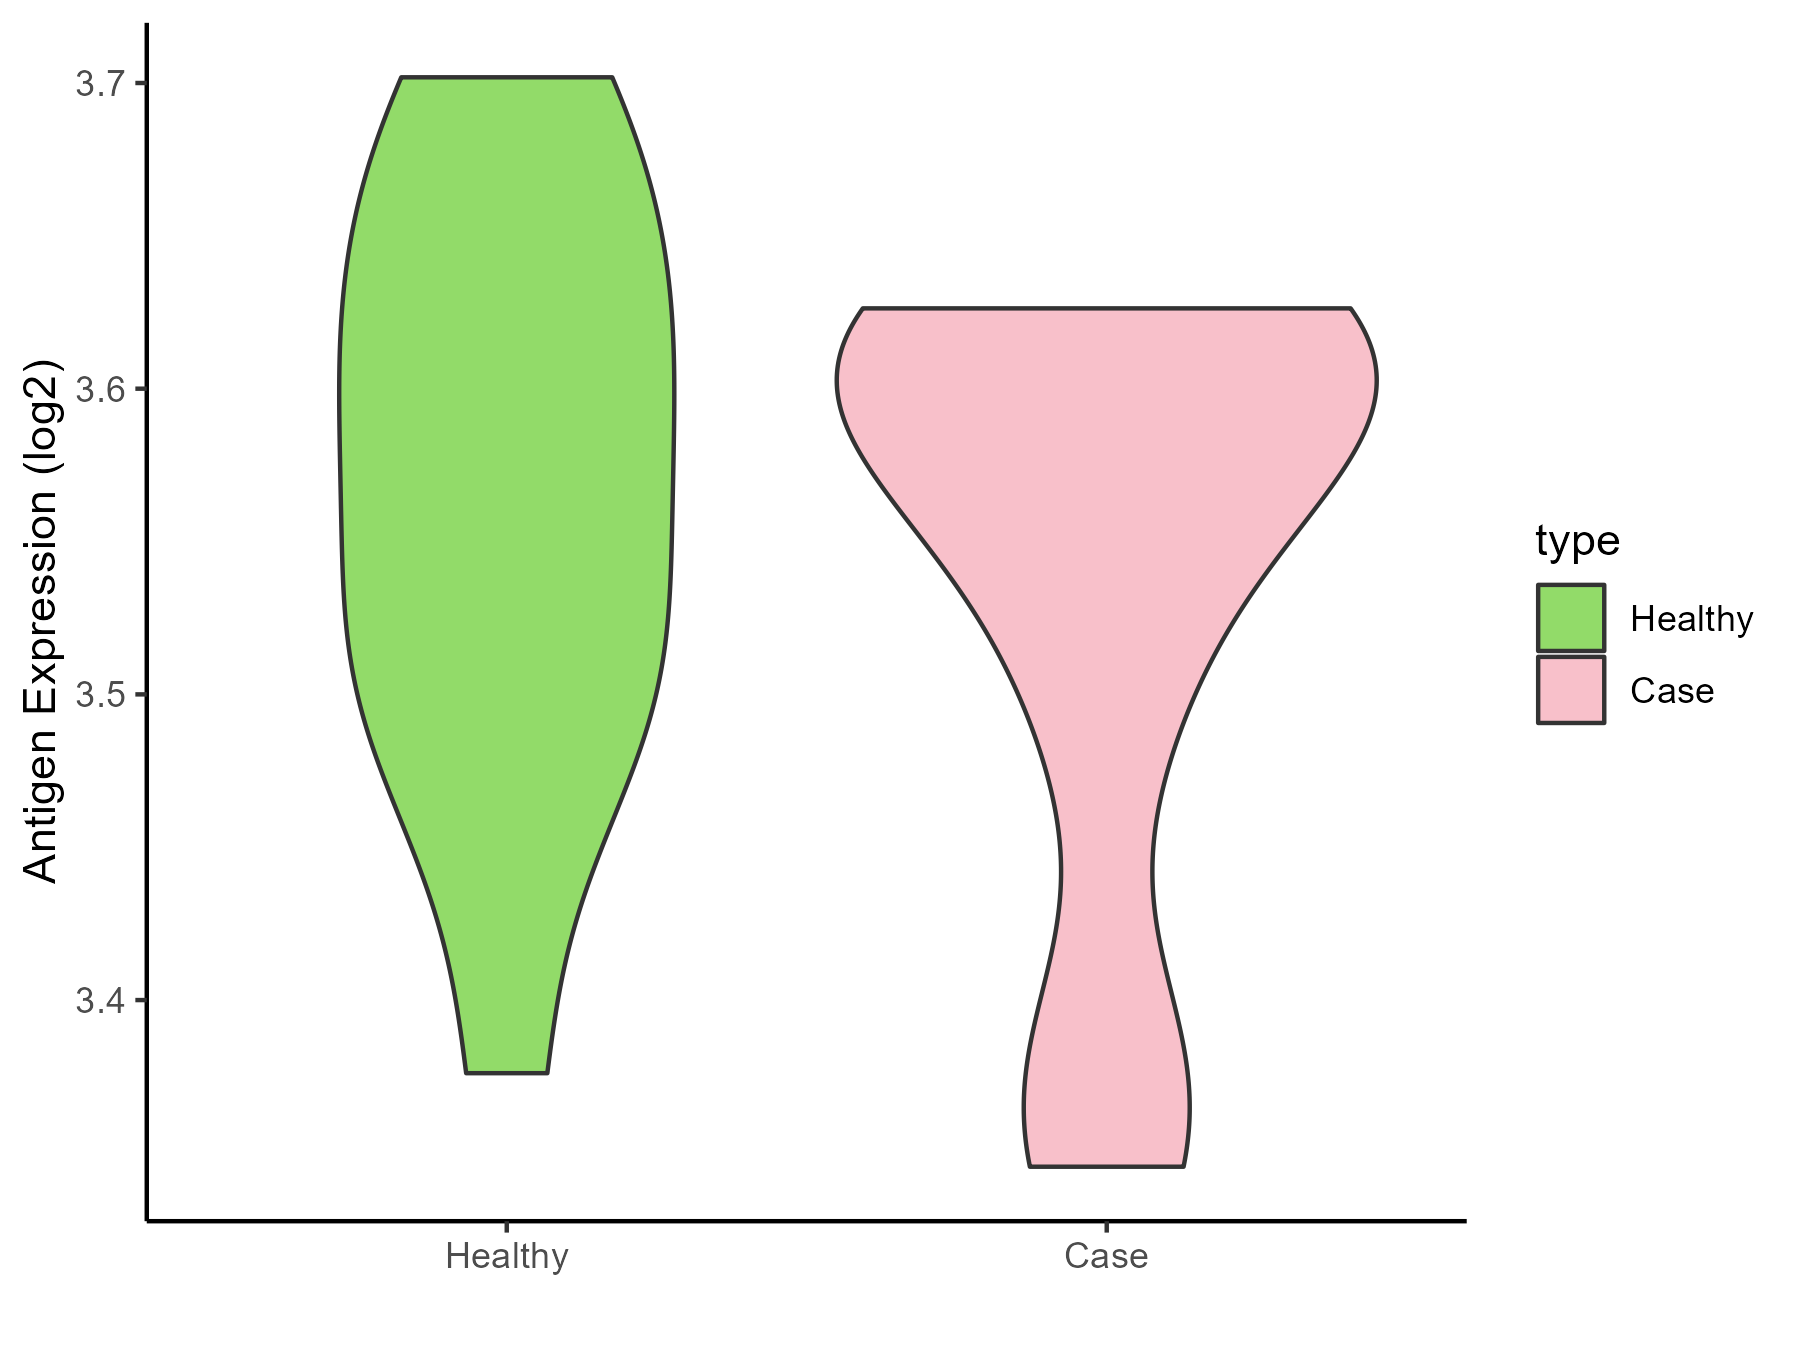
| Differential expression pattern of antigen in diseases | ||
| The Studied Tissue | Peripheral blood | |
| The Specific Disease | Arteriosclerosis | |
| The Expression Level of Disease Section Compare with the Healthy Individual Tissue | p-value: 0.561338194; Fold-change: 0.000981123; Z-score: 0.010244499 | |
| Disease-specific Antigen Abundances |
|
Click to View the Clearer Original Diagram |
| Differential expression pattern of antigen in diseases | ||
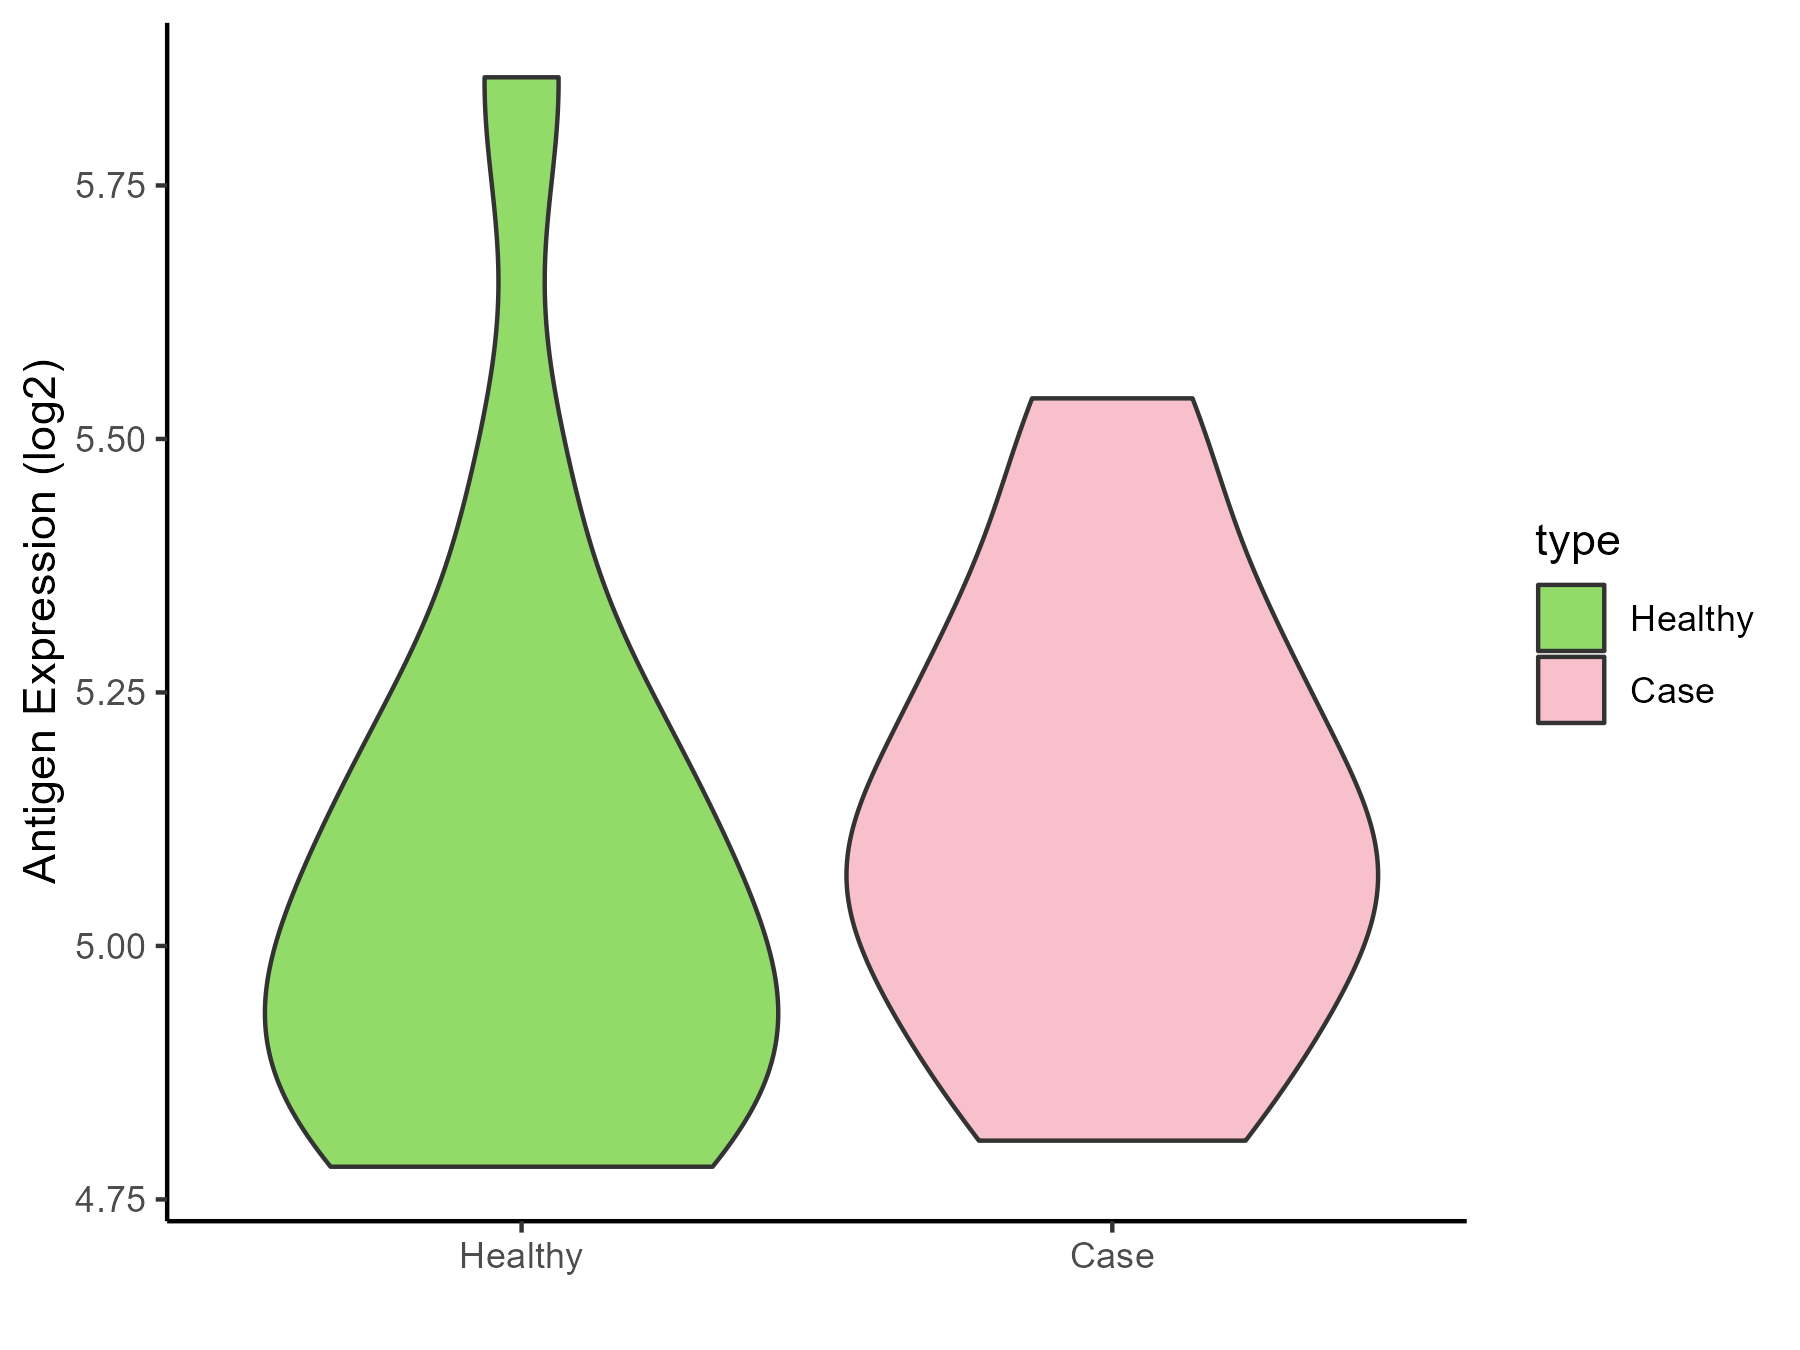
| The Studied Tissue | Intracranial artery | |
| The Specific Disease | Aneurysm | |
| The Expression Level of Disease Section Compare with the Healthy Individual Tissue | p-value: 0.646855684; Fold-change: 0.127859819; Z-score: 0.423366599 | |
| Disease-specific Antigen Abundances |
|
Click to View the Clearer Original Diagram |
ICD Disease Classification 12
| Differential expression pattern of antigen in diseases | ||
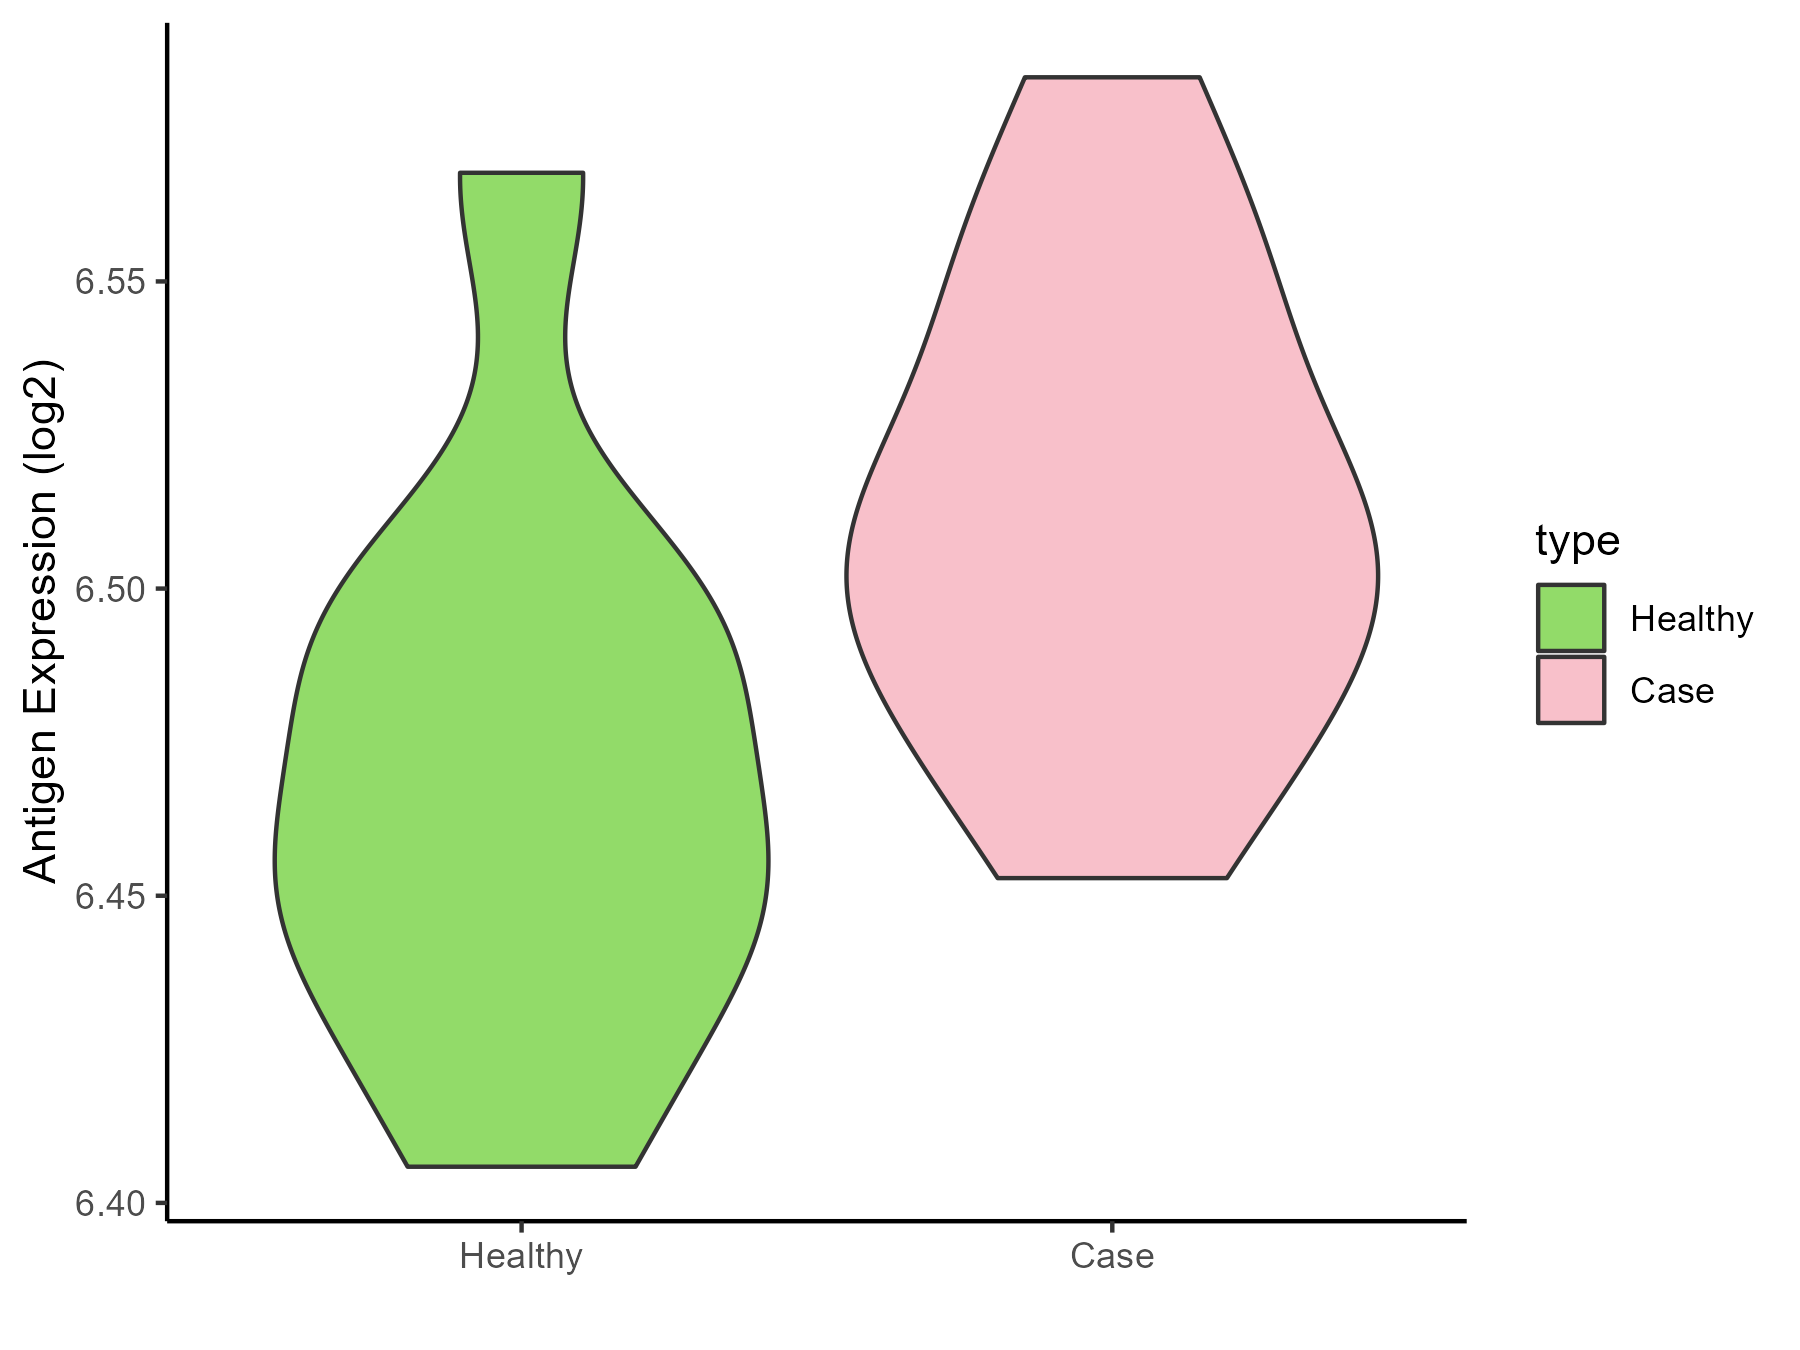
| The Studied Tissue | Peripheral blood | |
| The Specific Disease | Immunodeficiency | |
| The Expression Level of Disease Section Compare with the Healthy Individual Tissue | p-value: 0.048984164; Fold-change: 0.048537357; Z-score: 1.019096734 | |
| Disease-specific Antigen Abundances |
|
Click to View the Clearer Original Diagram |
| Differential expression pattern of antigen in diseases | ||
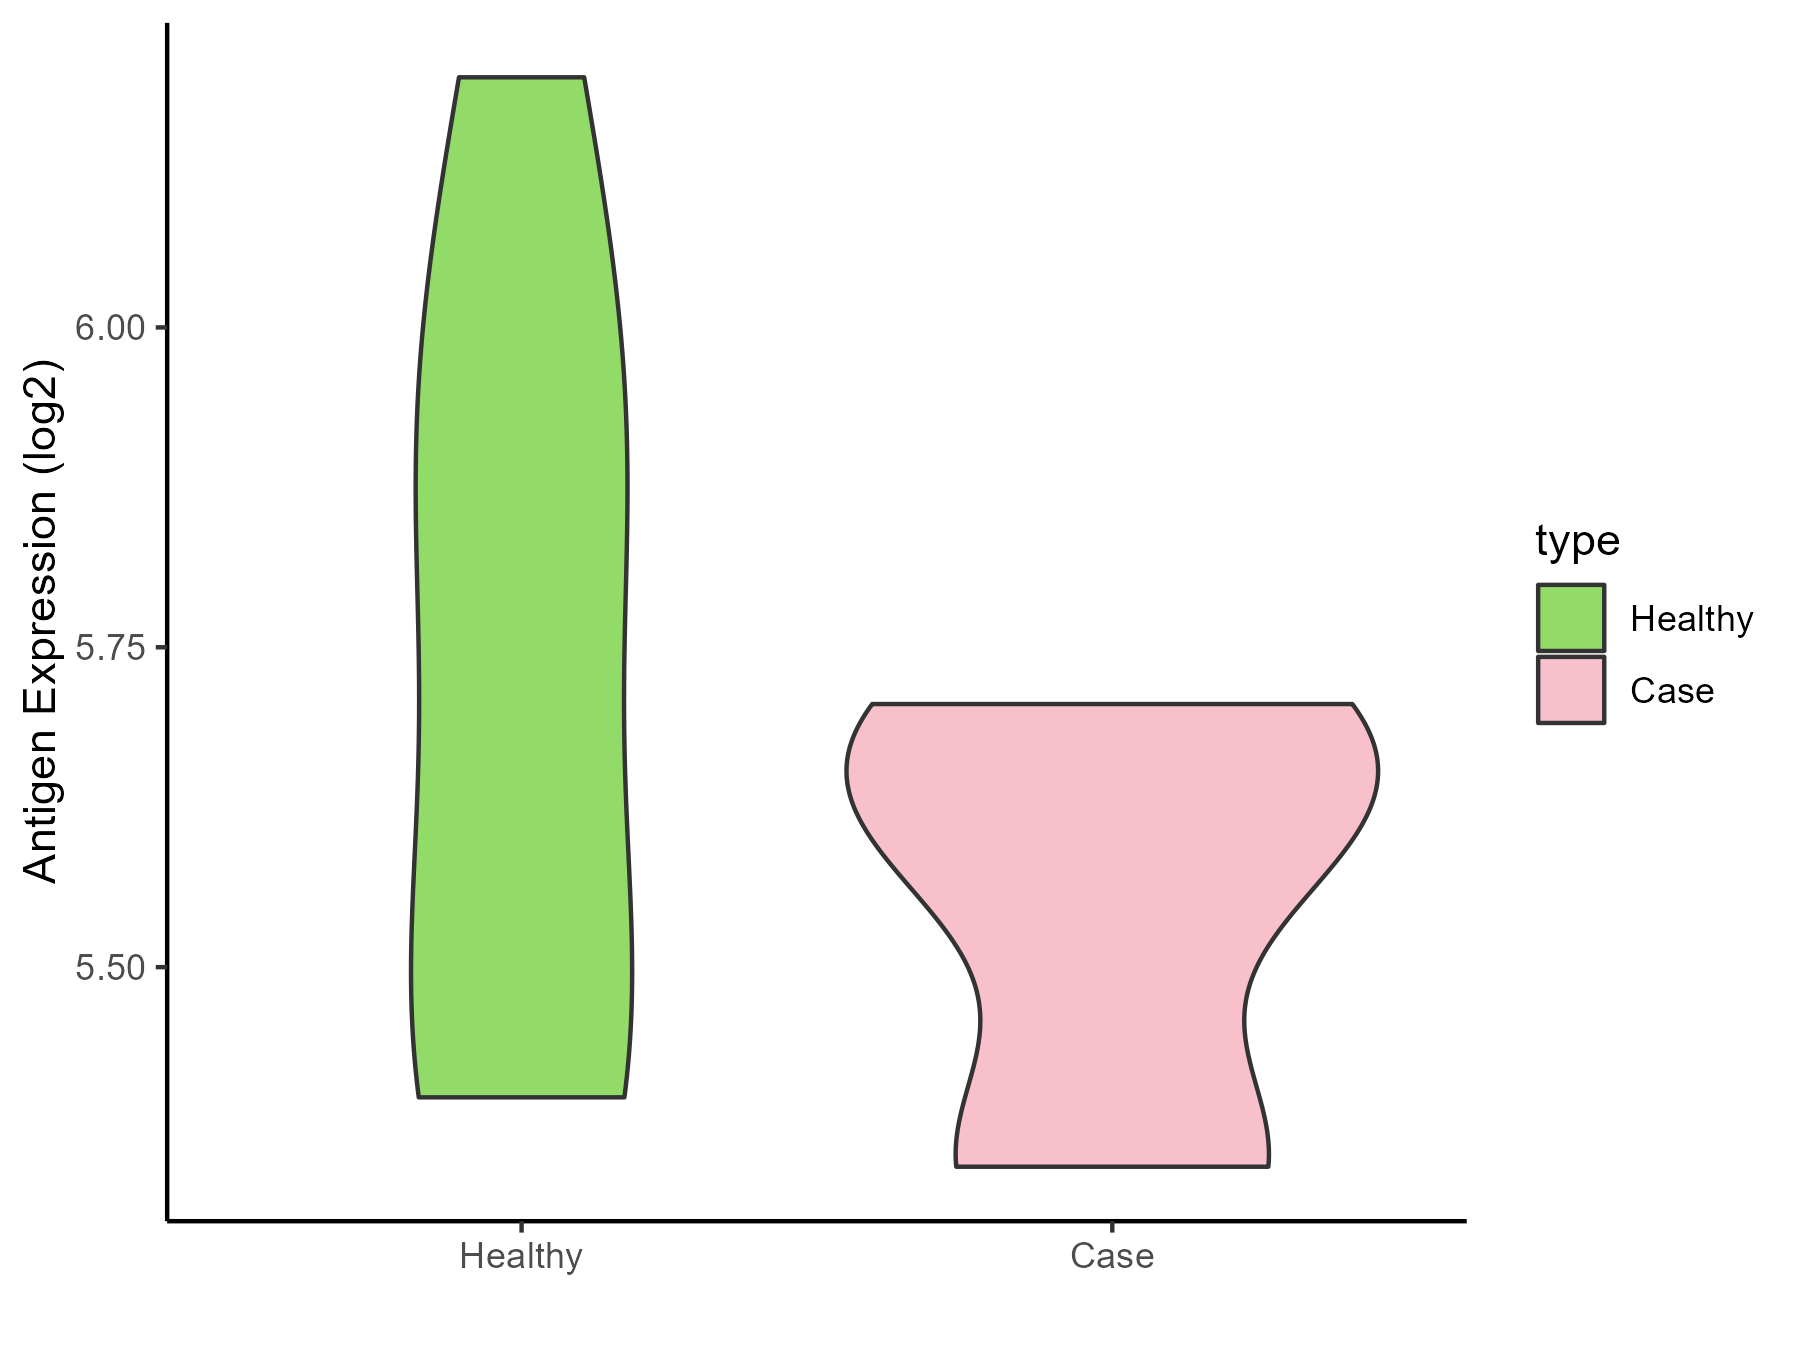
| The Studied Tissue | Hyperplastic tonsil | |
| The Specific Disease | Apnea | |
| The Expression Level of Disease Section Compare with the Healthy Individual Tissue | p-value: 0.292755252; Fold-change: -0.149187025; Z-score: -0.482805815 | |
| Disease-specific Antigen Abundances |
|
Click to View the Clearer Original Diagram |
| Differential expression pattern of antigen in diseases | ||
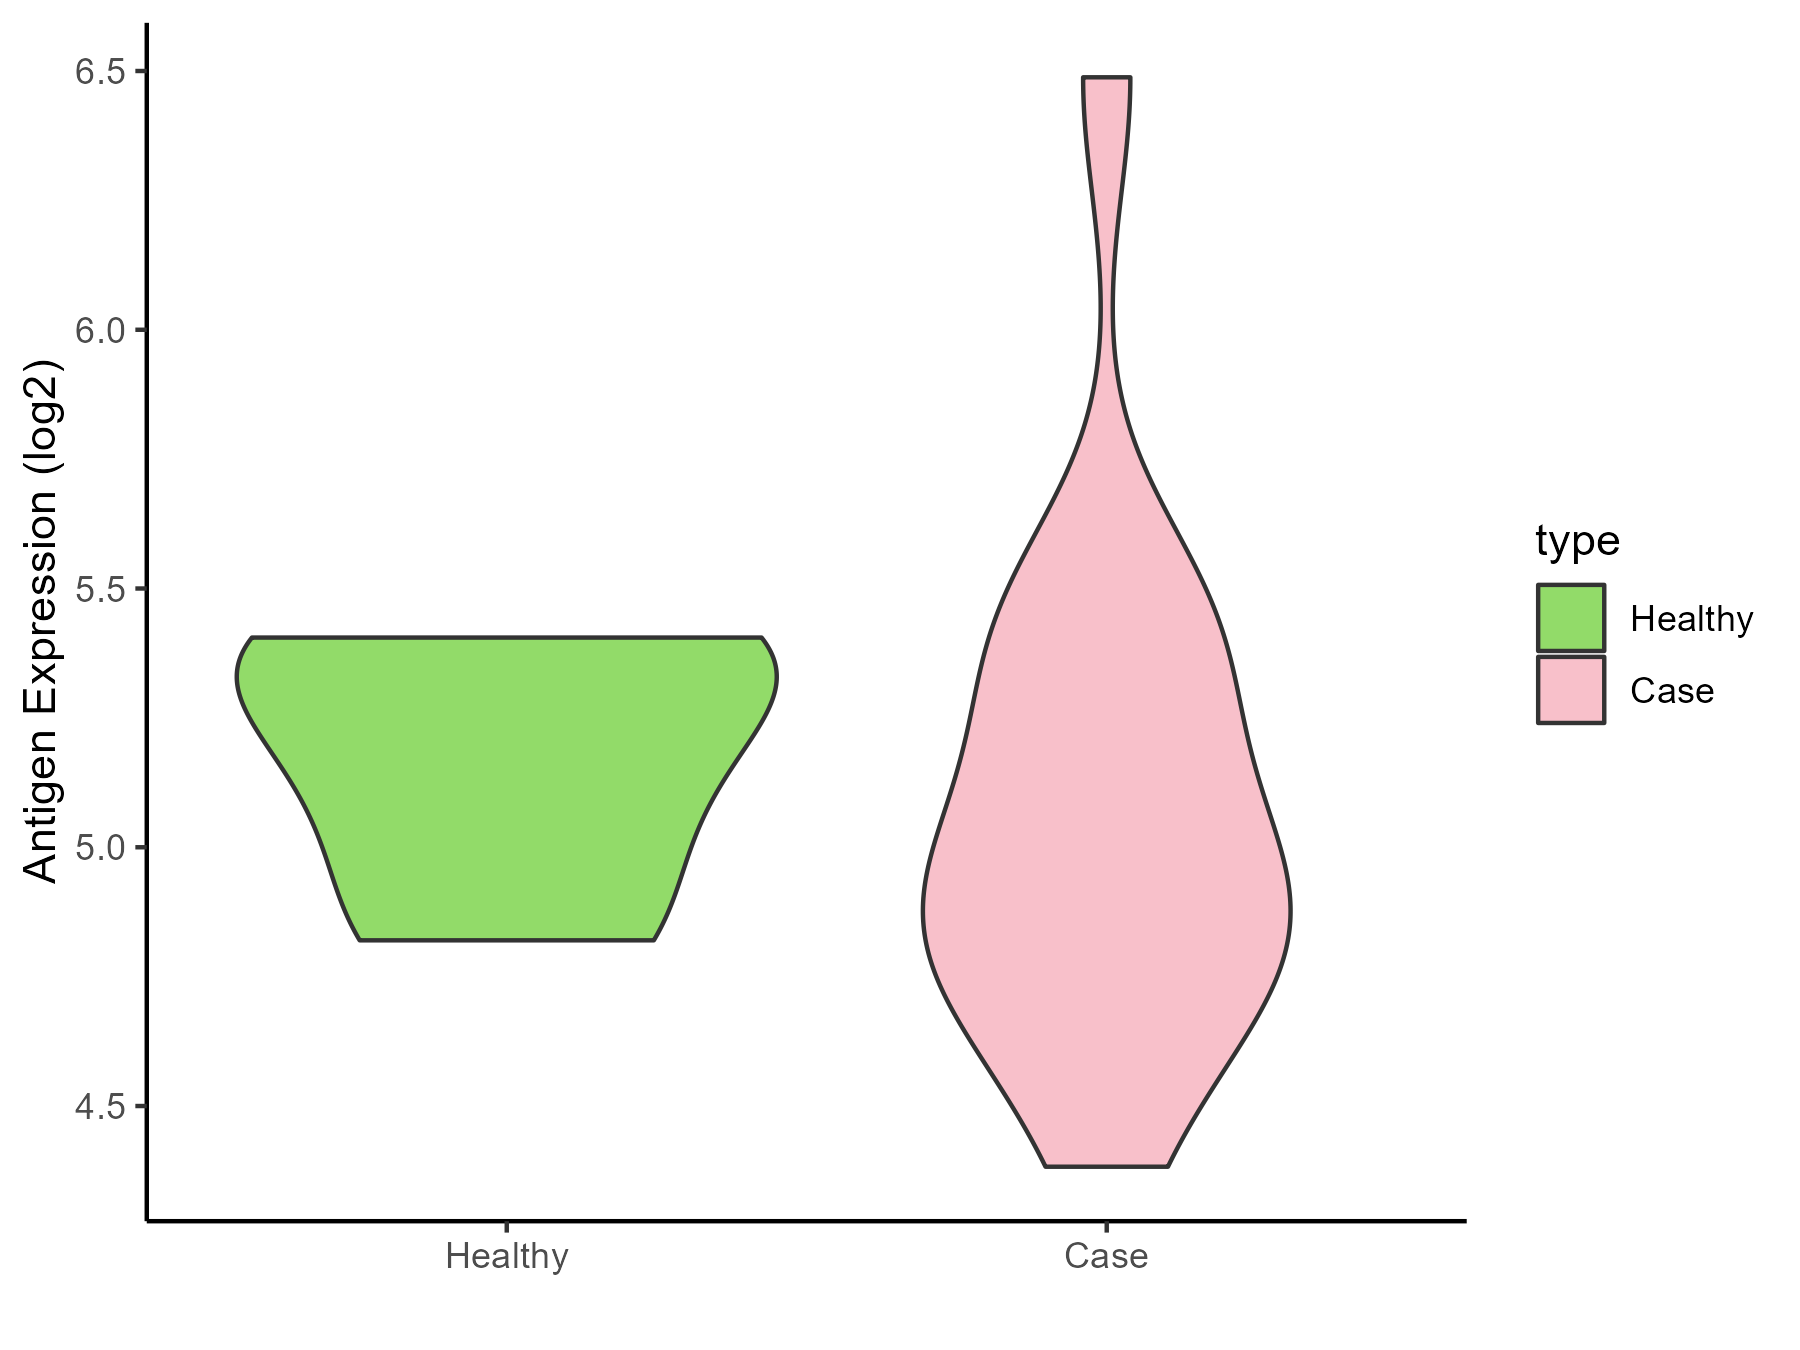
| The Studied Tissue | Peripheral blood | |
| The Specific Disease | Olive pollen allergy | |
| The Expression Level of Disease Section Compare with the Healthy Individual Tissue | p-value: 0.659145721; Fold-change: -0.296259891; Z-score: -1.092607159 | |
| Disease-specific Antigen Abundances |
|
Click to View the Clearer Original Diagram |
| Differential expression pattern of antigen in diseases | ||
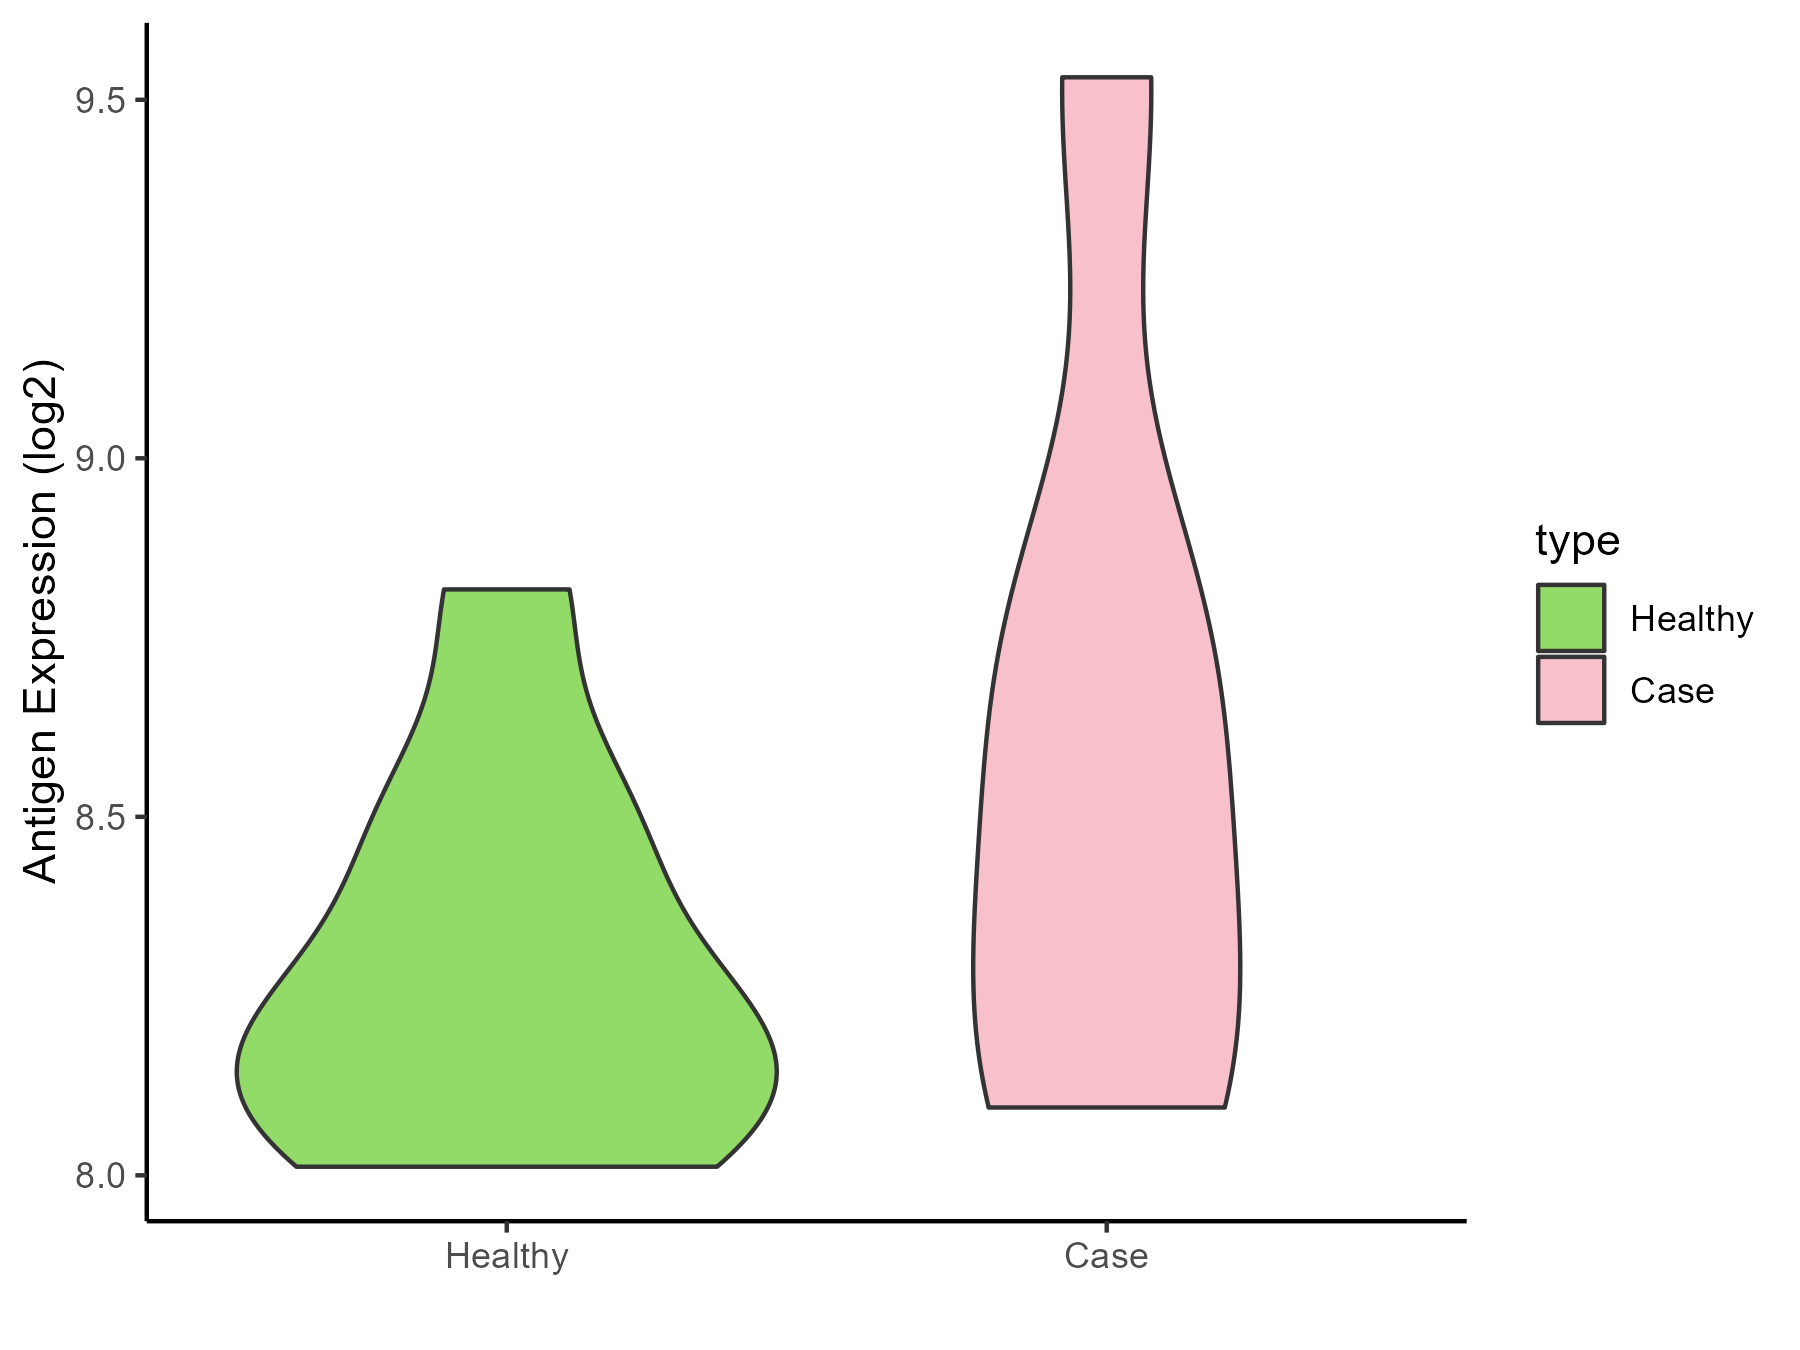
| The Studied Tissue | Sinus mucosa | |
| The Specific Disease | Chronic rhinosinusitis | |
| The Expression Level of Disease Section Compare with the Healthy Individual Tissue | p-value: 0.235596475; Fold-change: 0.314413047; Z-score: 1.181958123 | |
| Disease-specific Antigen Abundances |
|
Click to View the Clearer Original Diagram |
| Differential expression pattern of antigen in diseases | ||
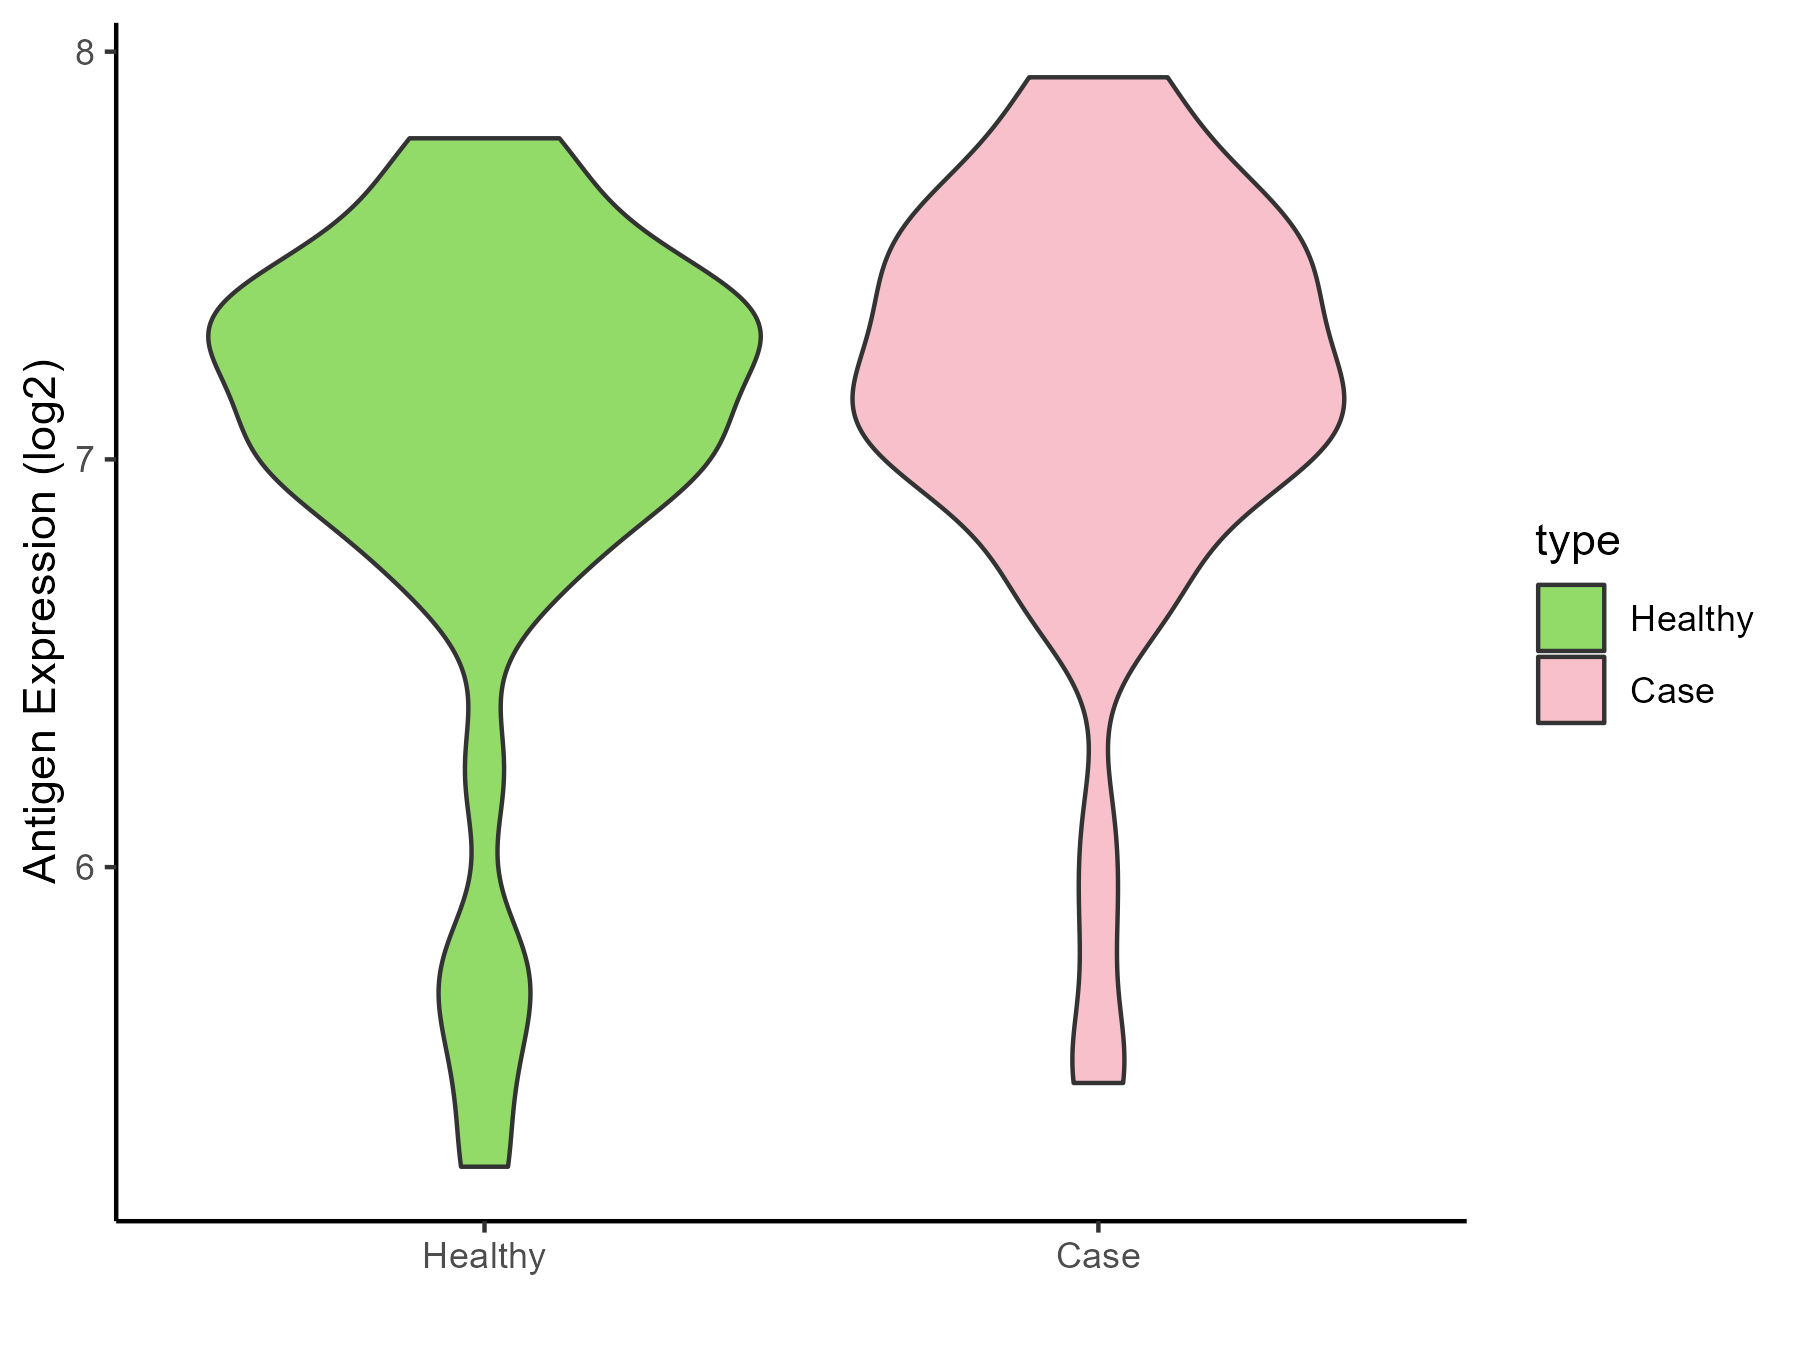
| The Studied Tissue | Lung | |
| The Specific Disease | Chronic obstructive pulmonary disease | |
| The Expression Level of Disease Section Compare with the Healthy Individual Tissue | p-value: 0.257337983; Fold-change: 0.045979111; Z-score: 0.076743364 | |
| Disease-specific Antigen Abundances |
|
Click to View the Clearer Original Diagram |
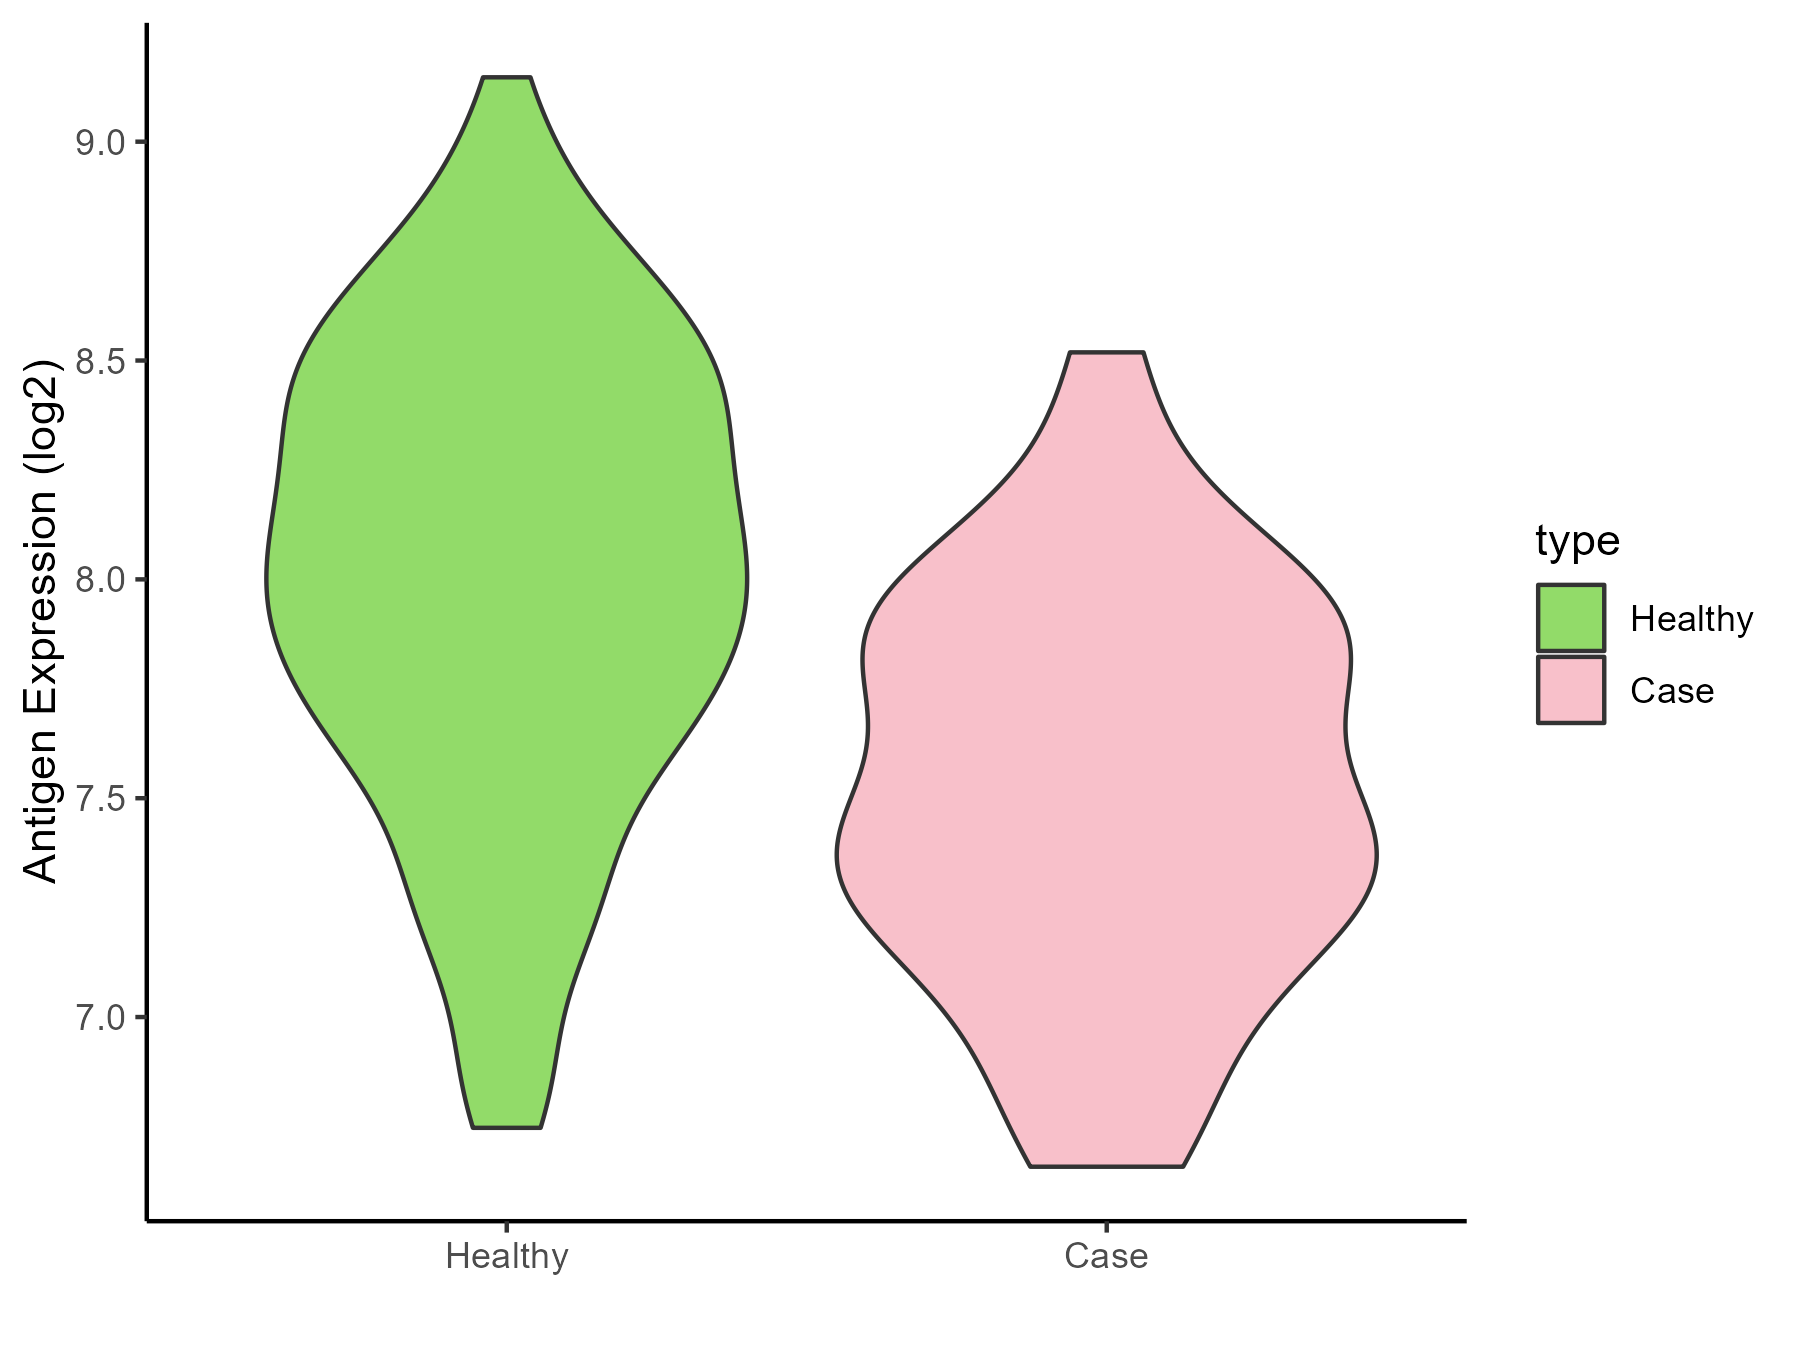
| The Studied Tissue | Small airway epithelium | |
| The Specific Disease | Chronic obstructive pulmonary disease | |
| The Expression Level of Disease Section Compare with the Healthy Individual Tissue | p-value: 1.42E-07; Fold-change: -0.573427327; Z-score: -1.081542857 | |
| Disease-specific Antigen Abundances |
|
Click to View the Clearer Original Diagram |
| Differential expression pattern of antigen in diseases | ||
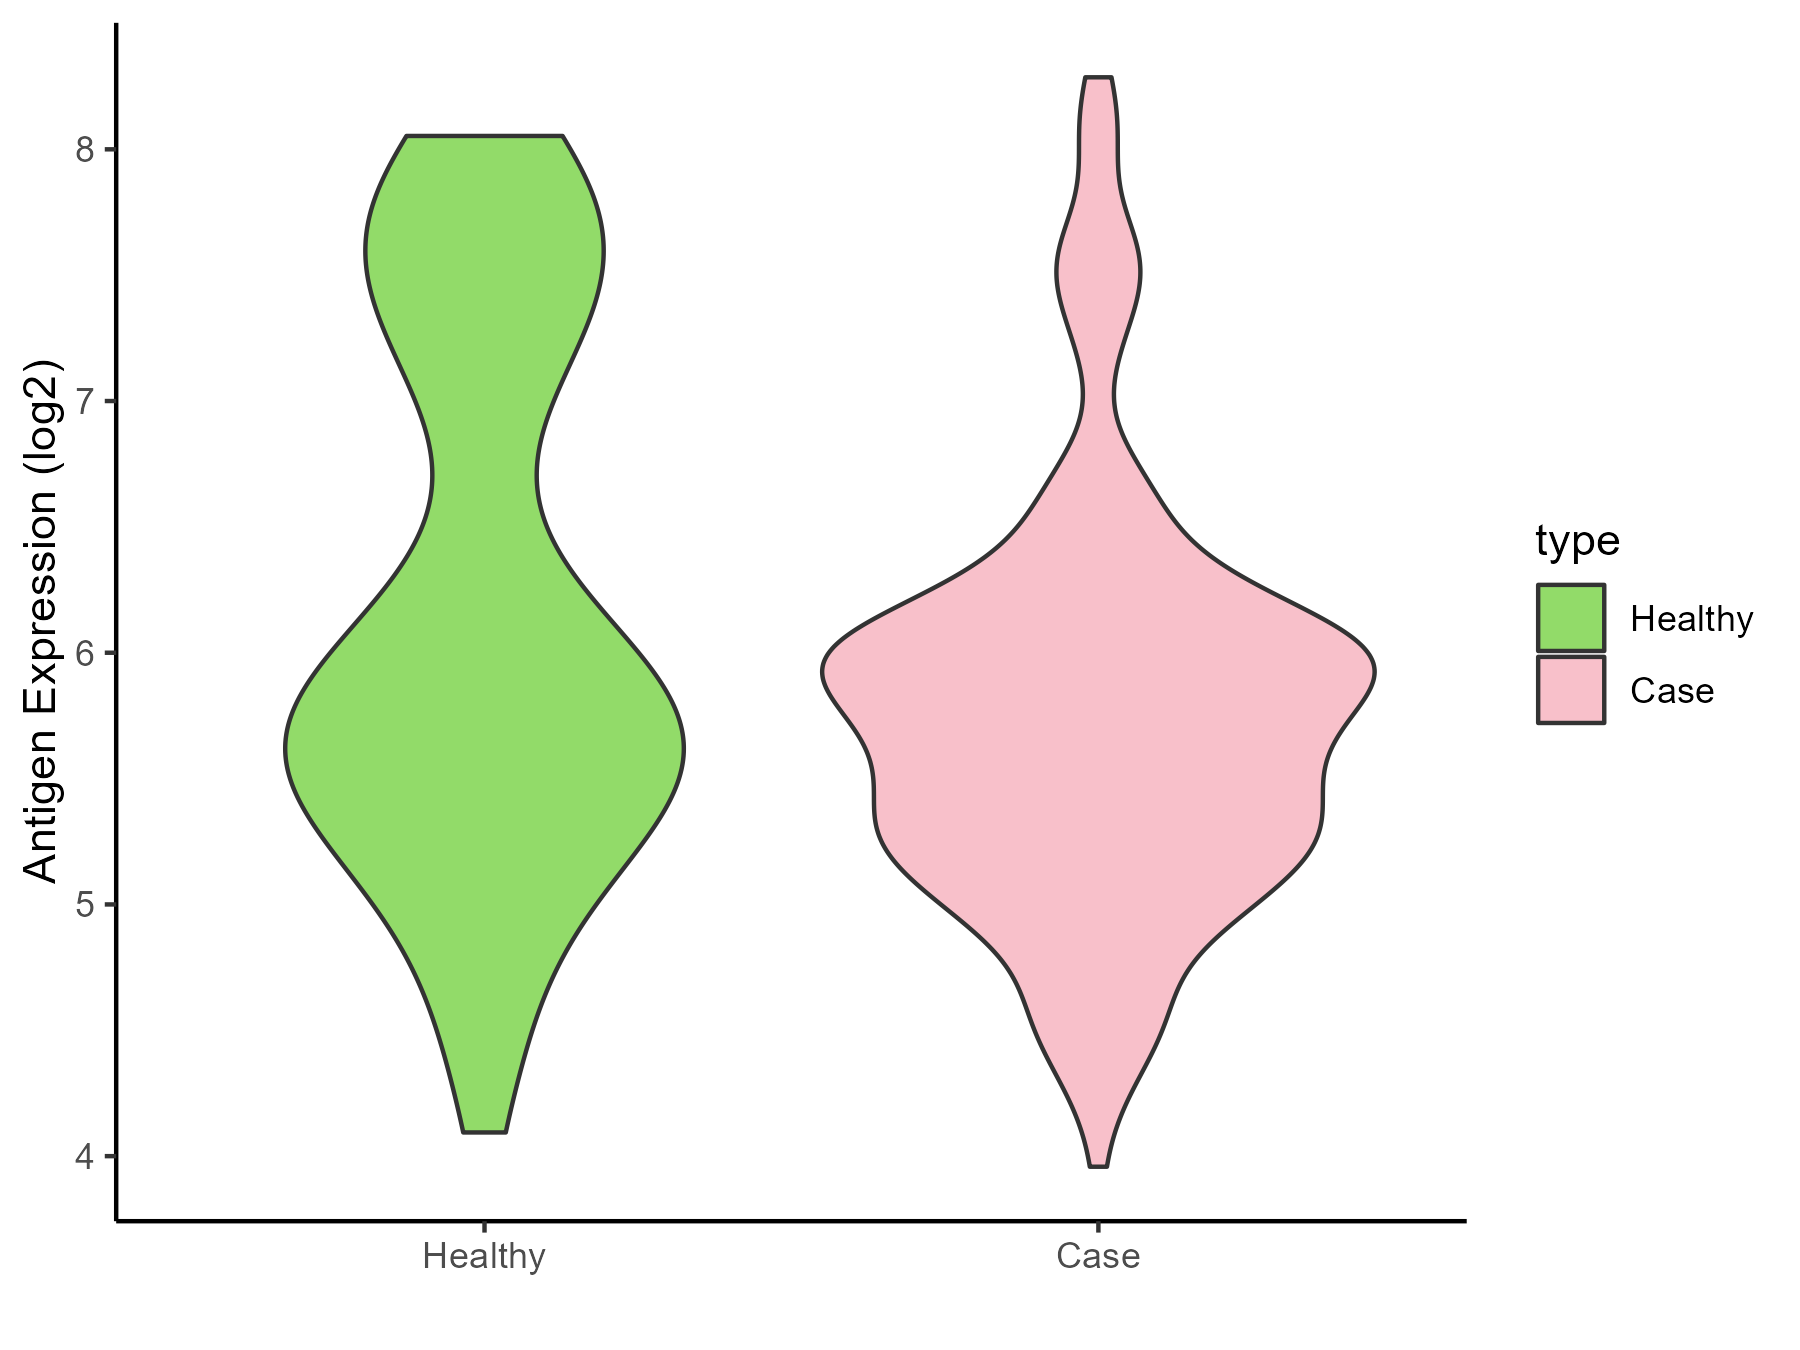
| The Studied Tissue | Nasal and bronchial airway | |
| The Specific Disease | Asthma | |
| The Expression Level of Disease Section Compare with the Healthy Individual Tissue | p-value: 0.000118924; Fold-change: -0.119342085; Z-score: -0.111073351 | |
| Disease-specific Antigen Abundances |
|
Click to View the Clearer Original Diagram |
| Differential expression pattern of antigen in diseases | ||
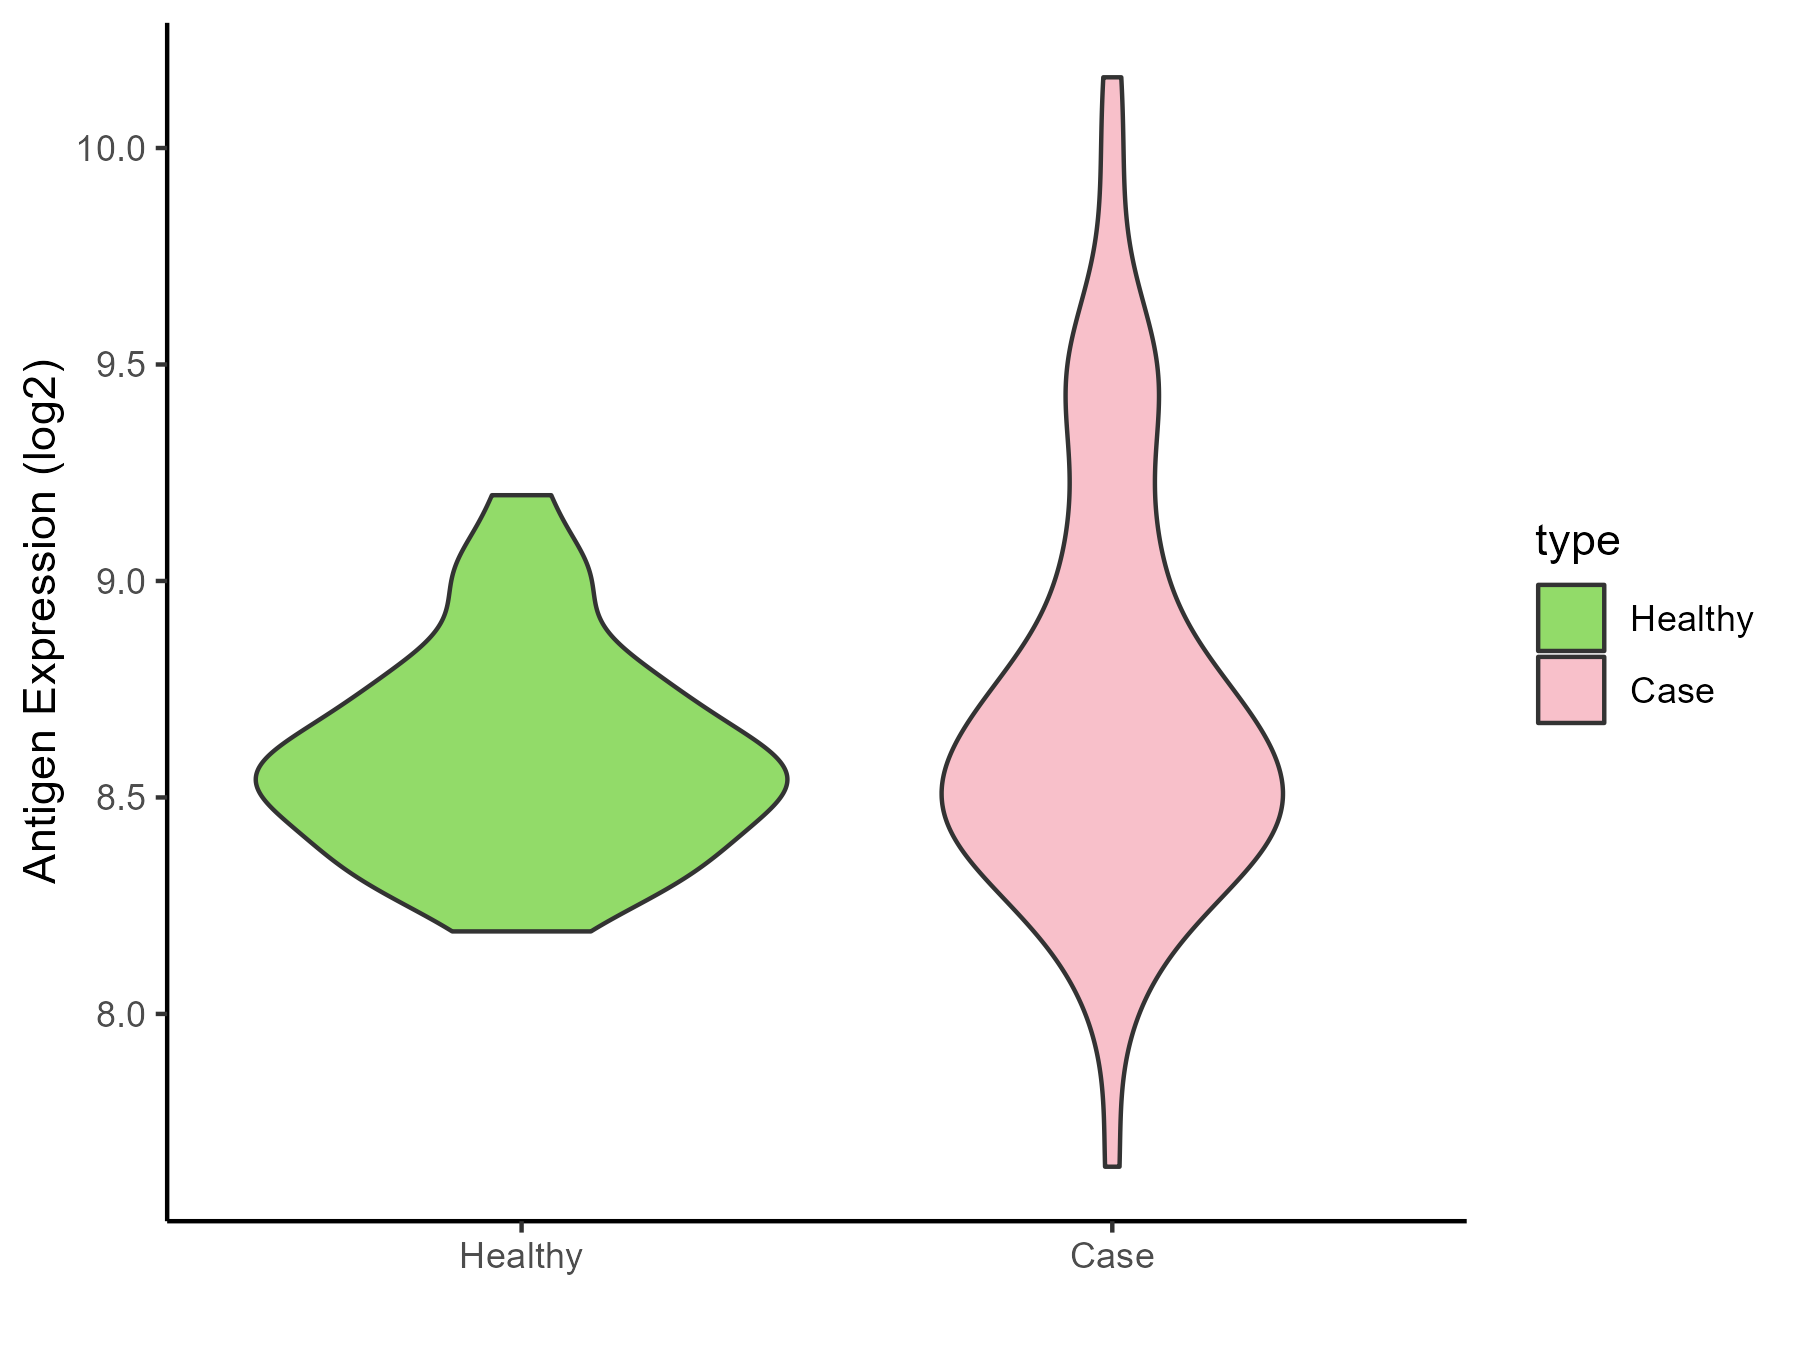
| The Studied Tissue | Nasal Epithelium | |
| The Specific Disease | Human rhinovirus infection | |
| The Expression Level of Disease Section Compare with the Healthy Individual Tissue | p-value: 0.085512103; Fold-change: 0.063139673; Z-score: 0.262965118 | |
| Disease-specific Antigen Abundances |
|
Click to View the Clearer Original Diagram |
| Differential expression pattern of antigen in diseases | ||
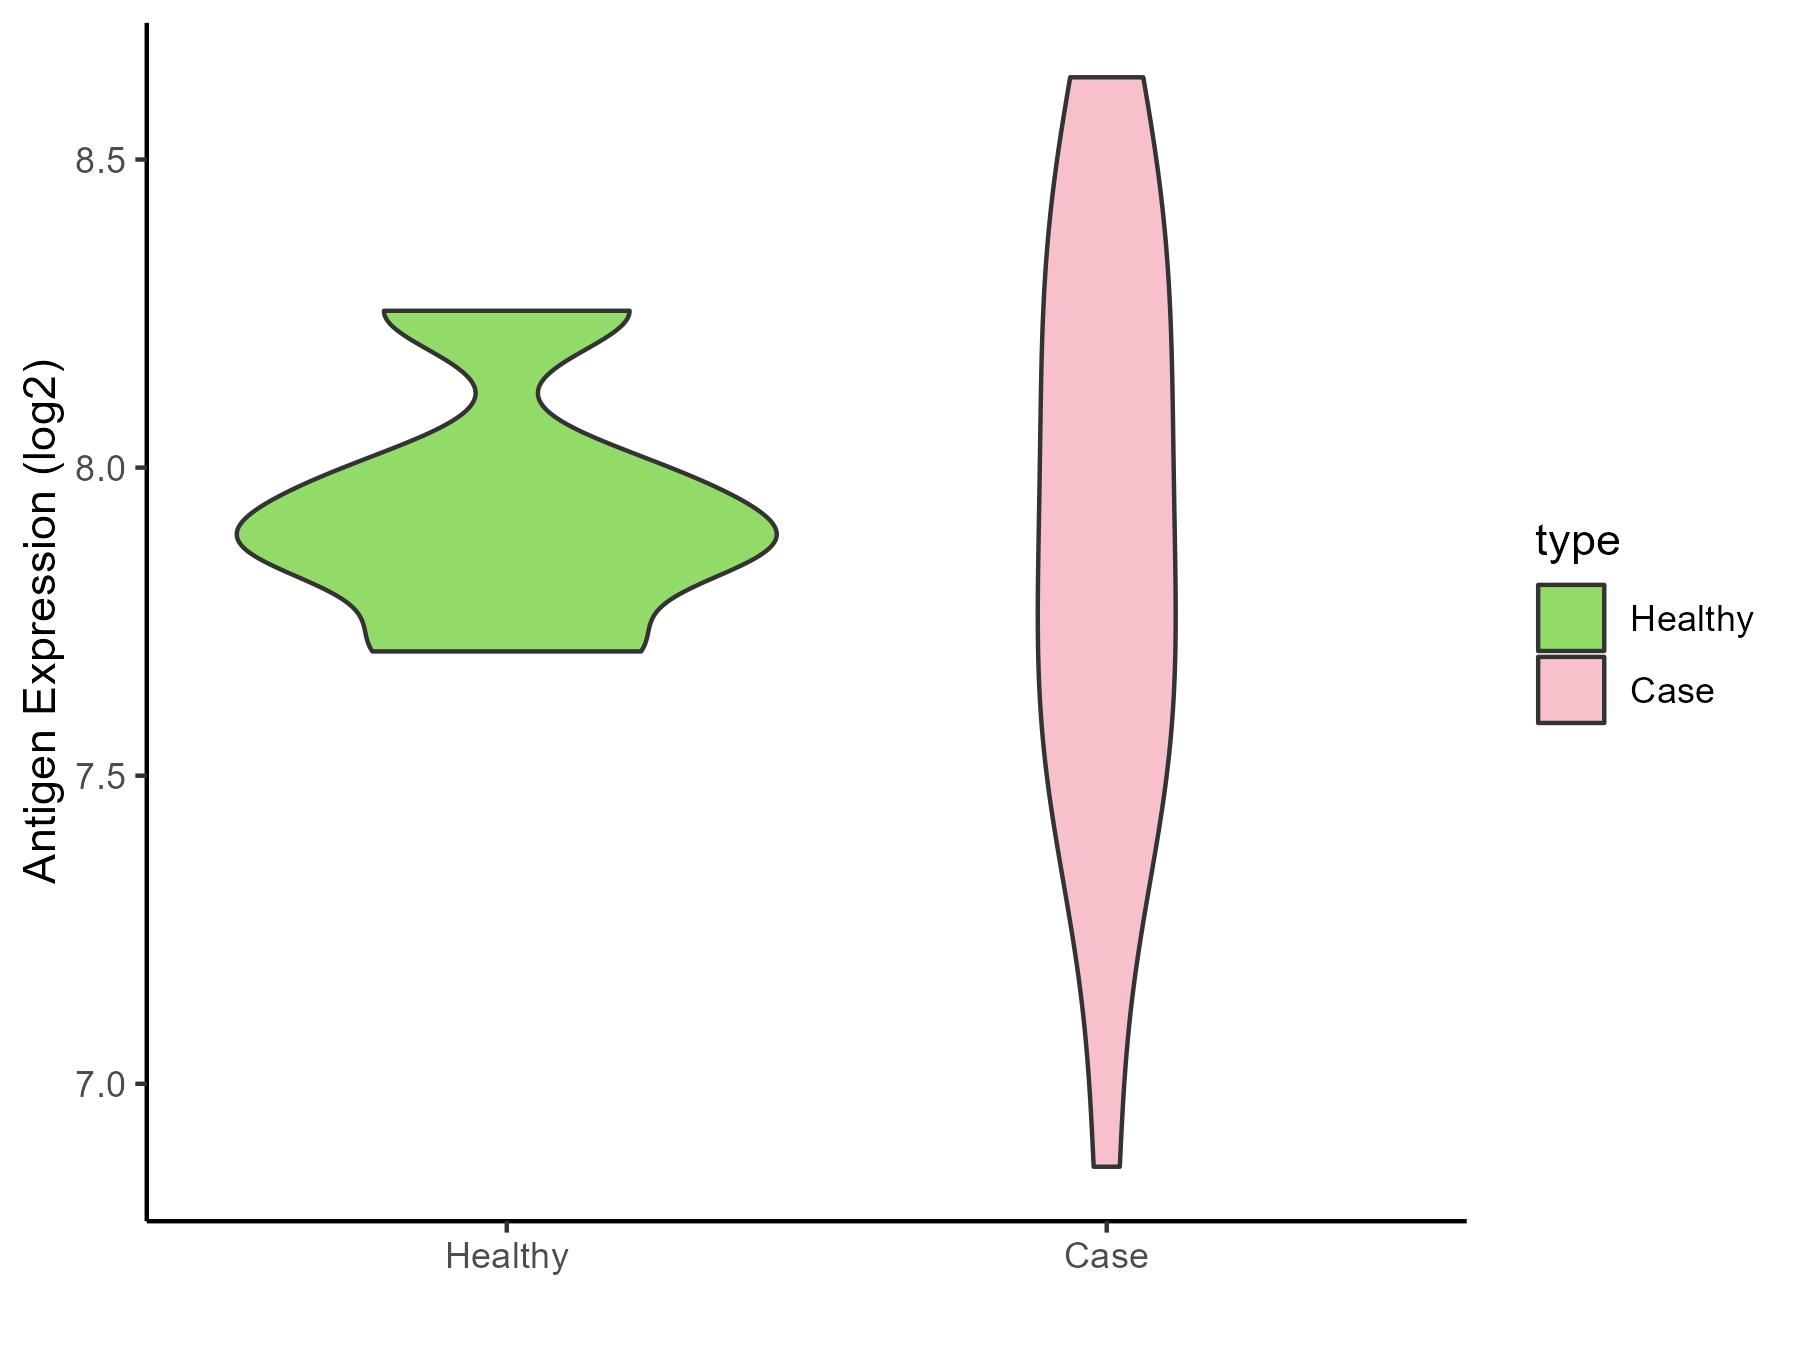
| The Studied Tissue | Lung | |
| The Specific Disease | Idiopathic pulmonary fibrosis | |
| The Expression Level of Disease Section Compare with the Healthy Individual Tissue | p-value: 0.76856135; Fold-change: -0.014880327; Z-score: -0.072631257 | |
| Disease-specific Antigen Abundances |
|
Click to View the Clearer Original Diagram |
ICD Disease Classification 13
| Differential expression pattern of antigen in diseases | ||
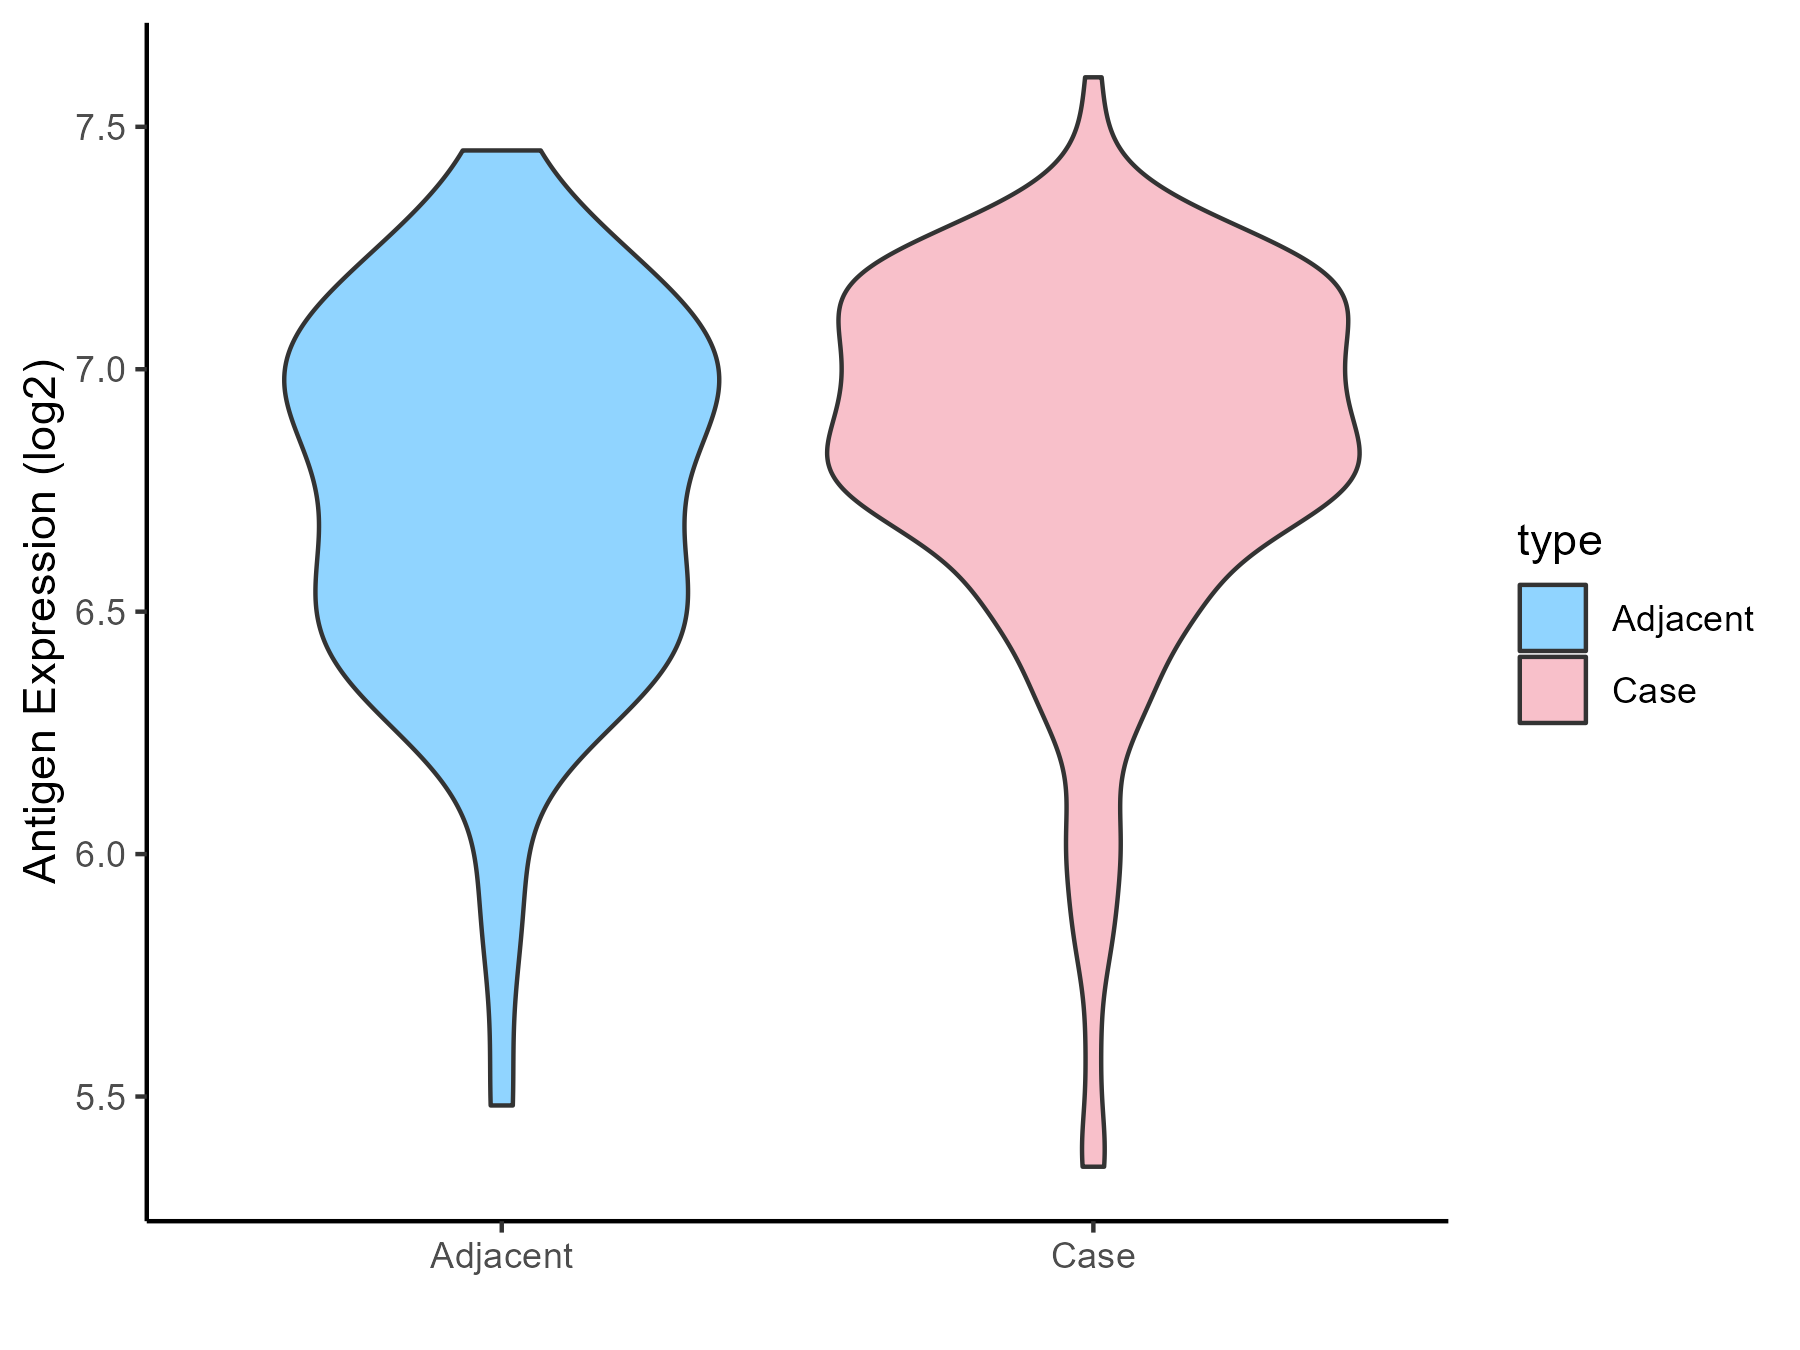
| The Studied Tissue | Gingival | |
| The Specific Disease | Periodontal disease | |
| The Expression Level of Disease Section Compare with the Adjacent Tissue | p-value: 0.111213329; Fold-change: 0.110586257; Z-score: 0.284636617 | |
| Disease-specific Antigen Abundances |
|
Click to View the Clearer Original Diagram |
| Differential expression pattern of antigen in diseases | ||
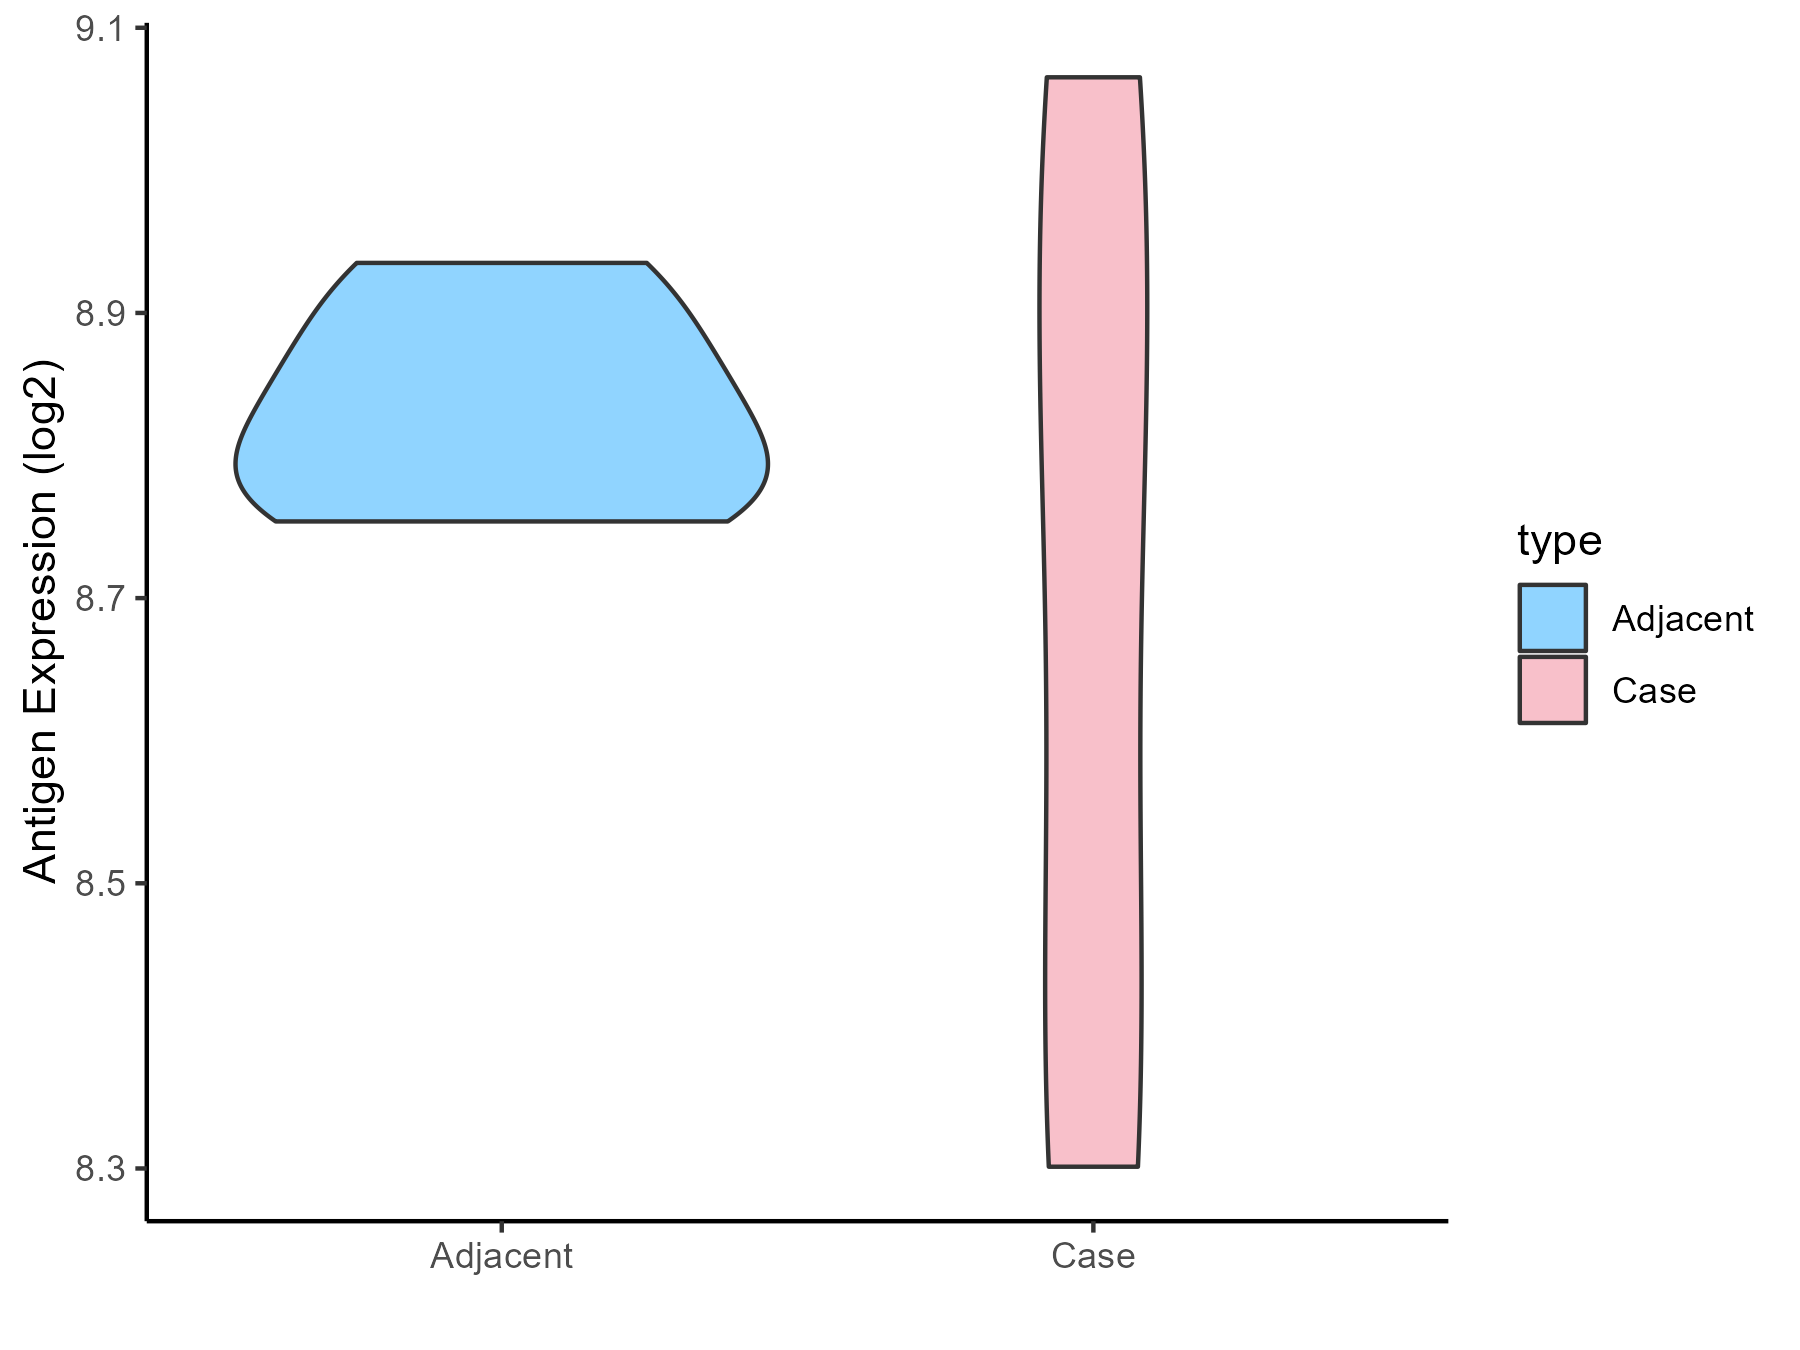
| The Studied Tissue | Gastric antrum | |
| The Specific Disease | Eosinophilic gastritis | |
| The Expression Level of Disease Section Compare with the Adjacent Tissue | p-value: 0.395568175; Fold-change: -0.093180281; Z-score: -1.262606746 | |
| Disease-specific Antigen Abundances |
|
Click to View the Clearer Original Diagram |
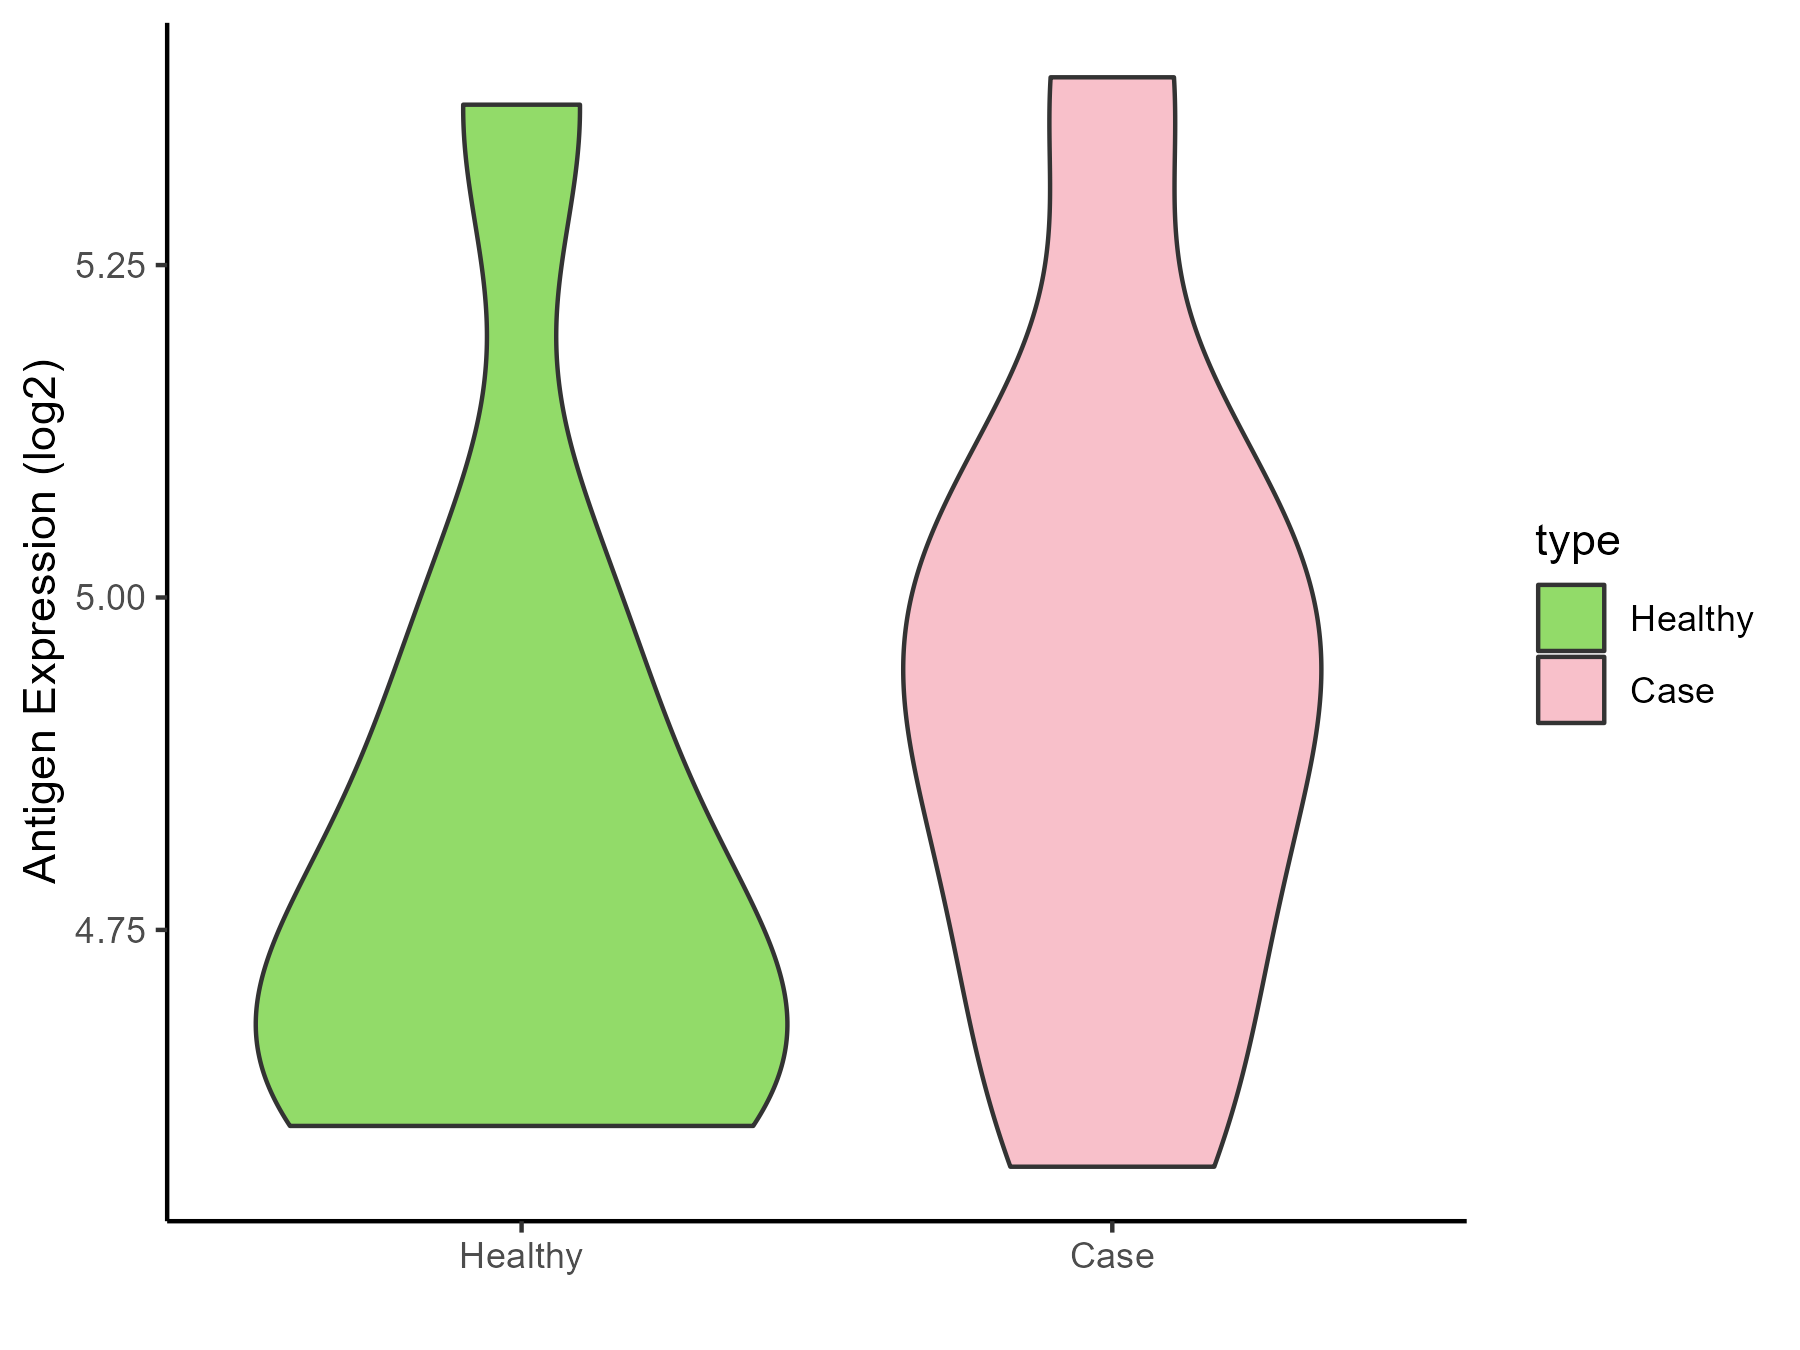
| Differential expression pattern of antigen in diseases | ||
| The Studied Tissue | Liver | |
| The Specific Disease | Liver failure | |
| The Expression Level of Disease Section Compare with the Healthy Individual Tissue | p-value: 0.424489758; Fold-change: 0.196190832; Z-score: 0.75340056 | |
| Disease-specific Antigen Abundances |
|
Click to View the Clearer Original Diagram |
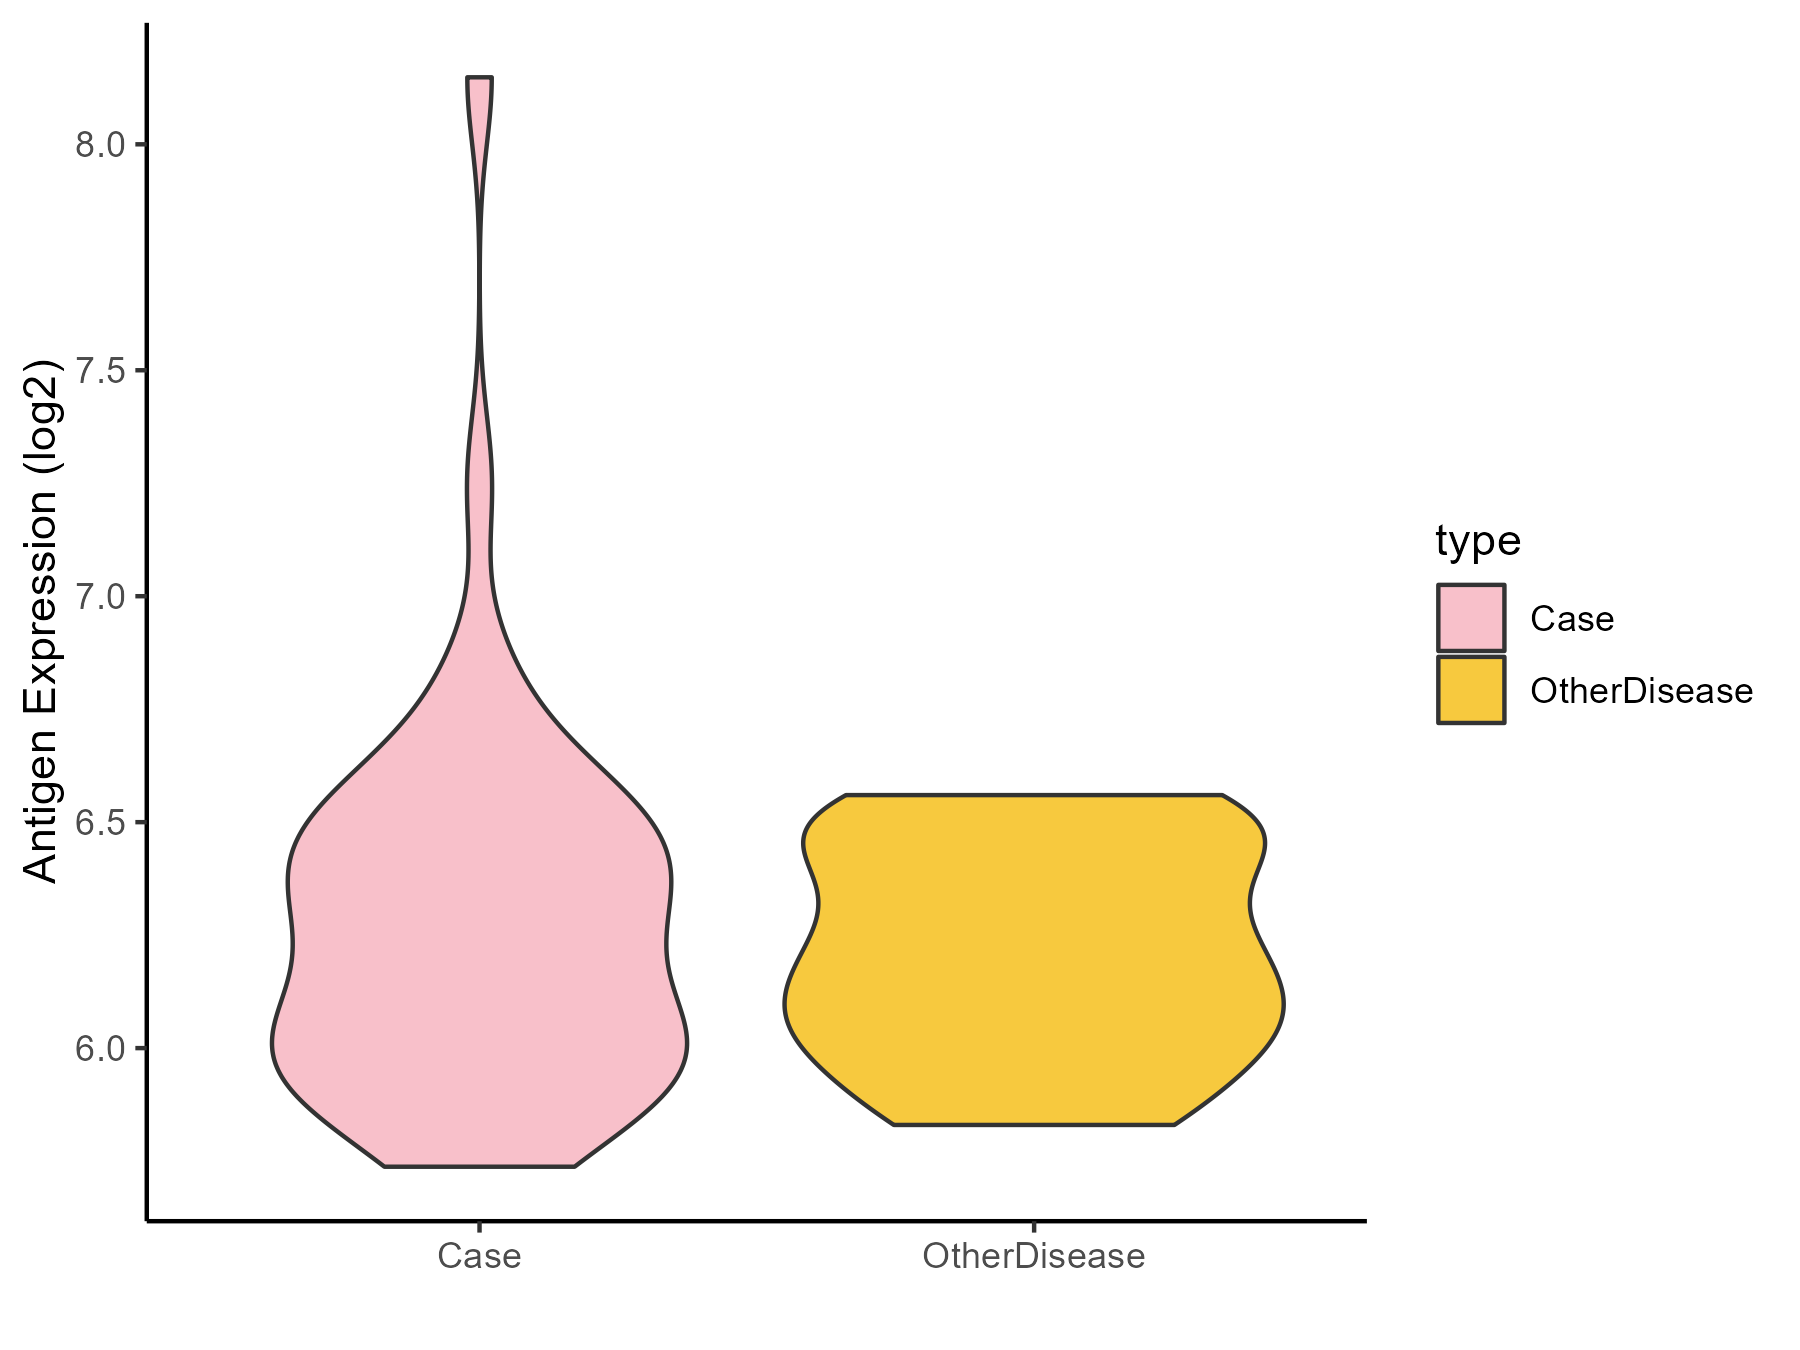
| Differential expression pattern of antigen in diseases | ||
| The Studied Tissue | Colon mucosal | |
| The Specific Disease | Ulcerative colitis | |
| The Expression Level of Disease Section Compare with the Adjacent Tissue | p-value: 0.40061042; Fold-change: 0.026139043; Z-score: 0.106500306 | |
| Disease-specific Antigen Abundances |
|
Click to View the Clearer Original Diagram |
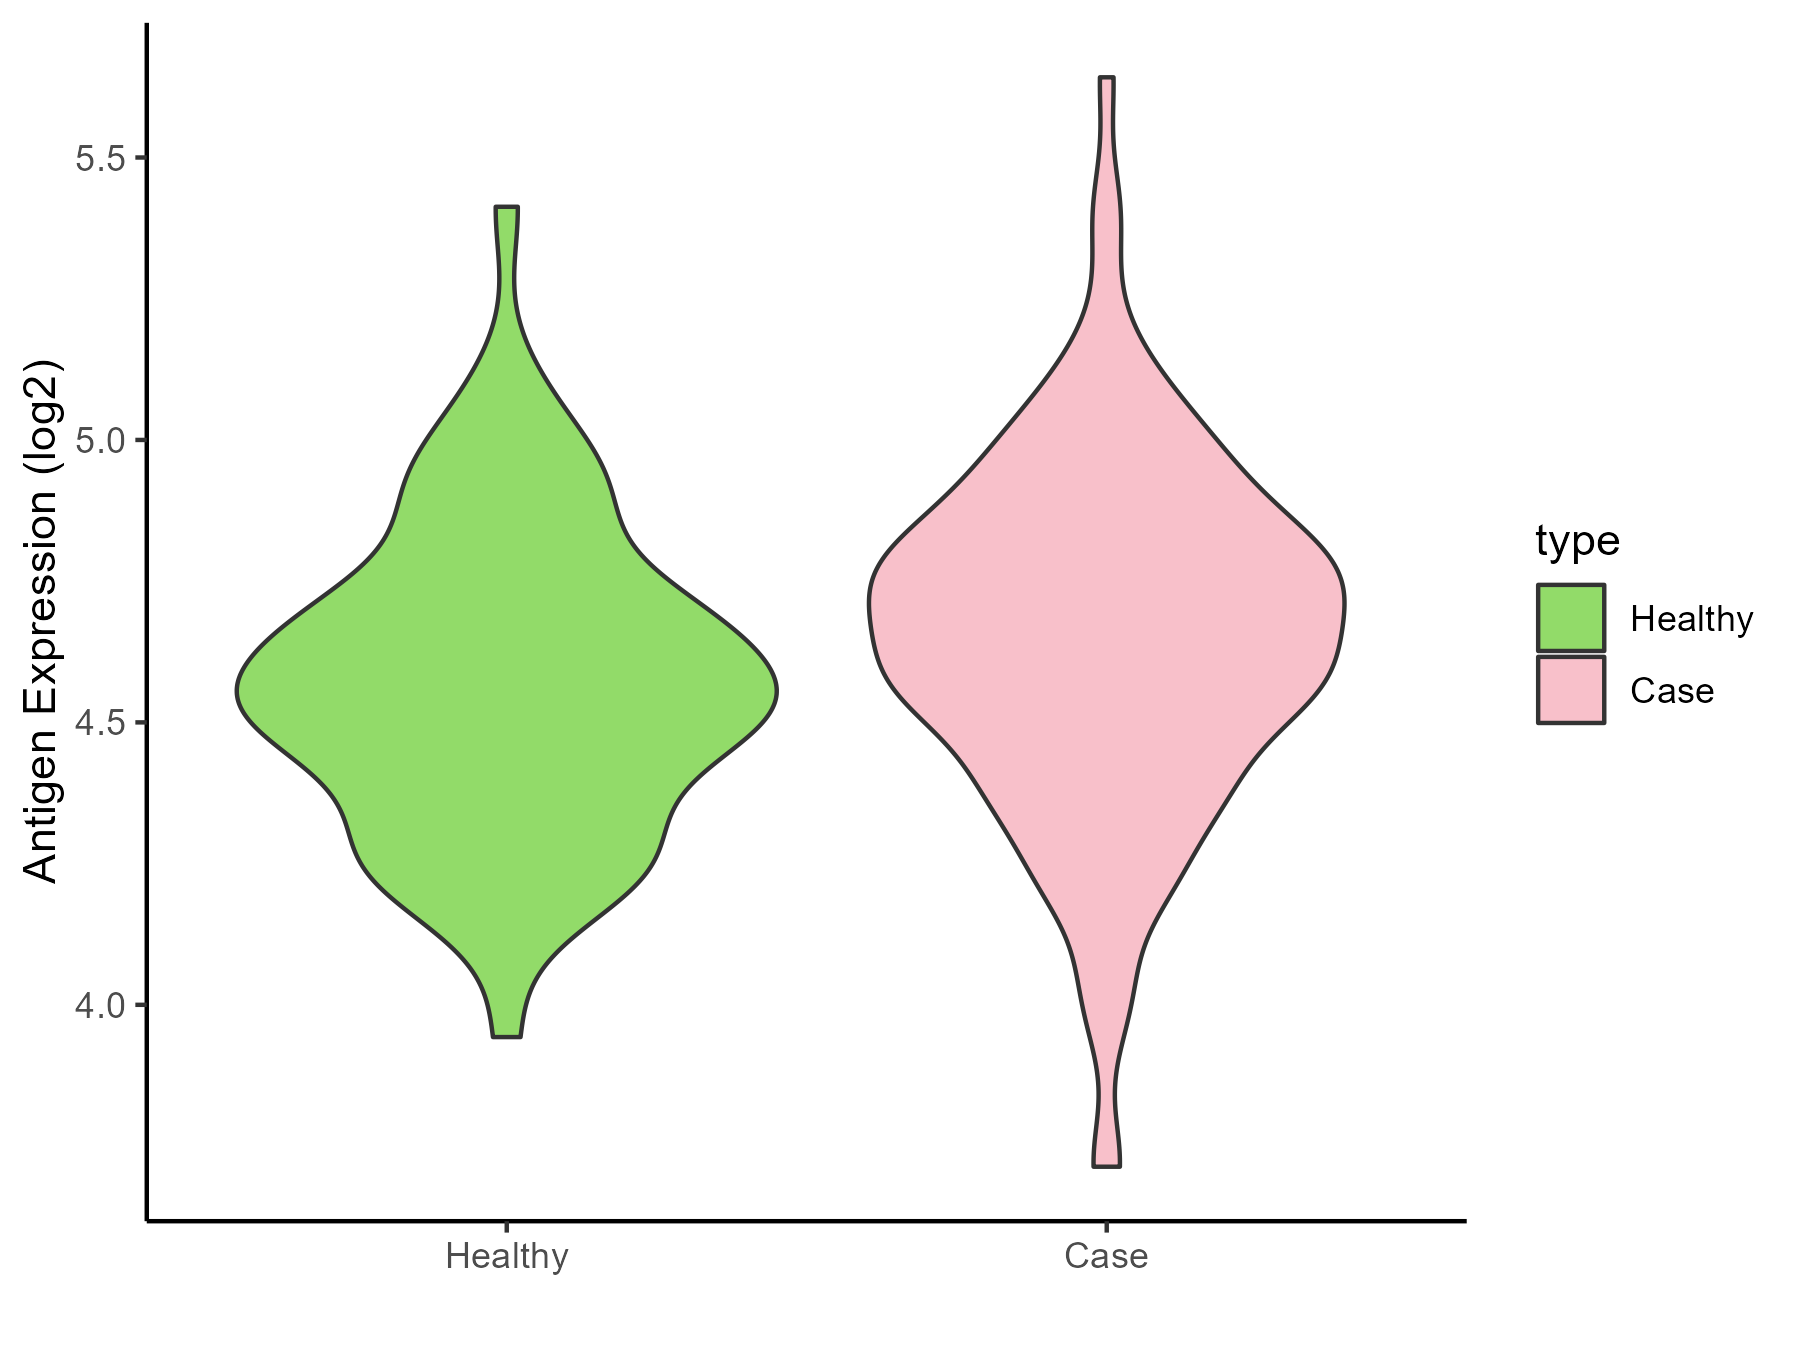
| Differential expression pattern of antigen in diseases | ||
| The Studied Tissue | Rectal colon | |
| The Specific Disease | Irritable bowel syndrome | |
| The Expression Level of Disease Section Compare with the Healthy Individual Tissue | p-value: 0.07272325; Fold-change: 0.104721807; Z-score: 0.389295373 | |
| Disease-specific Antigen Abundances |
|
Click to View the Clearer Original Diagram |
ICD Disease Classification 14
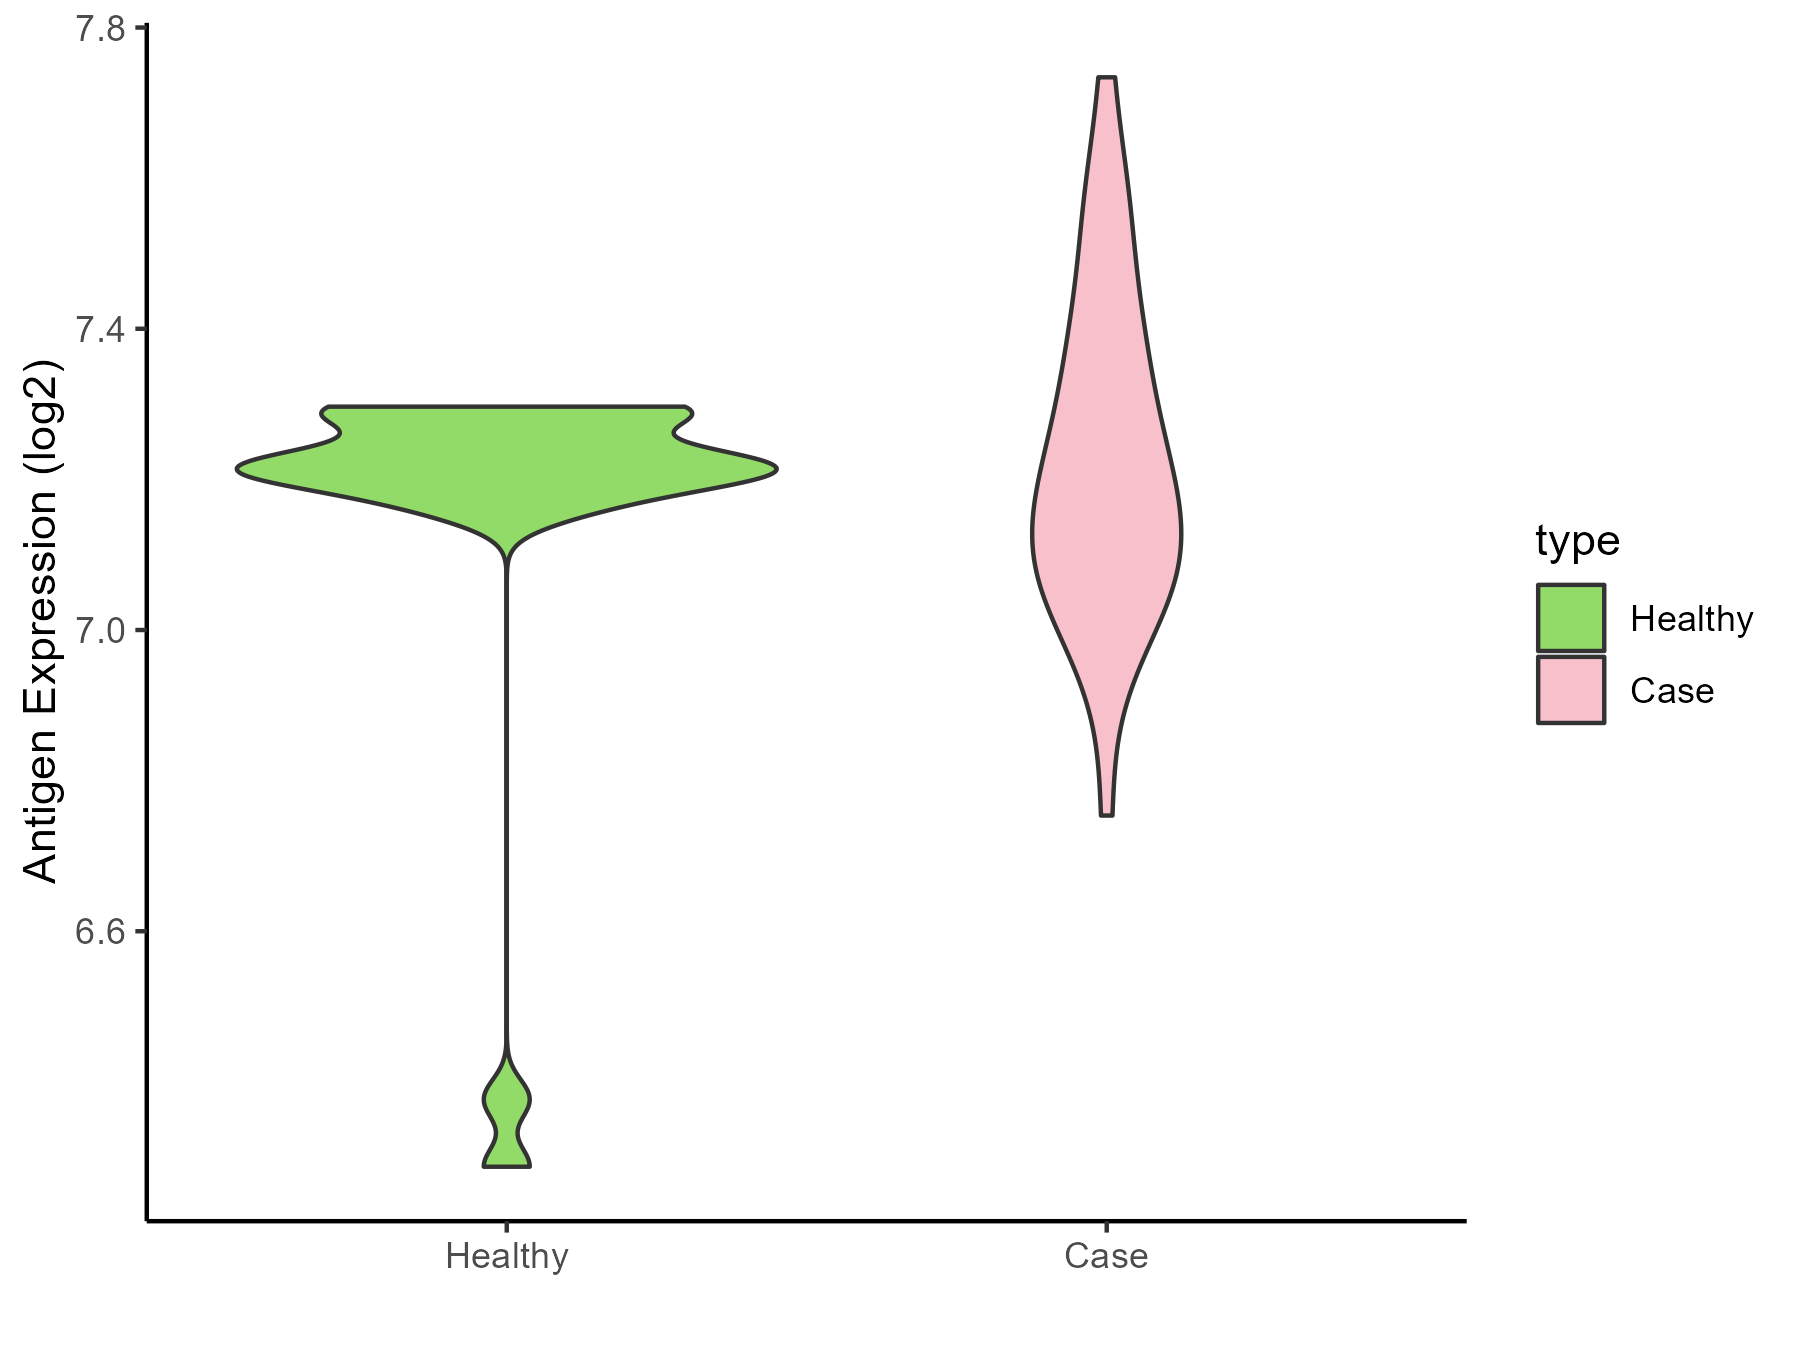
| Differential expression pattern of antigen in diseases | ||
| The Studied Tissue | Skin | |
| The Specific Disease | Atopic dermatitis | |
| The Expression Level of Disease Section Compare with the Healthy Individual Tissue | p-value: 0.32008292; Fold-change: -0.016642974; Z-score: -0.065463972 | |
| Disease-specific Antigen Abundances |
|
Click to View the Clearer Original Diagram |
| Differential expression pattern of antigen in diseases | ||
| The Studied Tissue | Skin | |
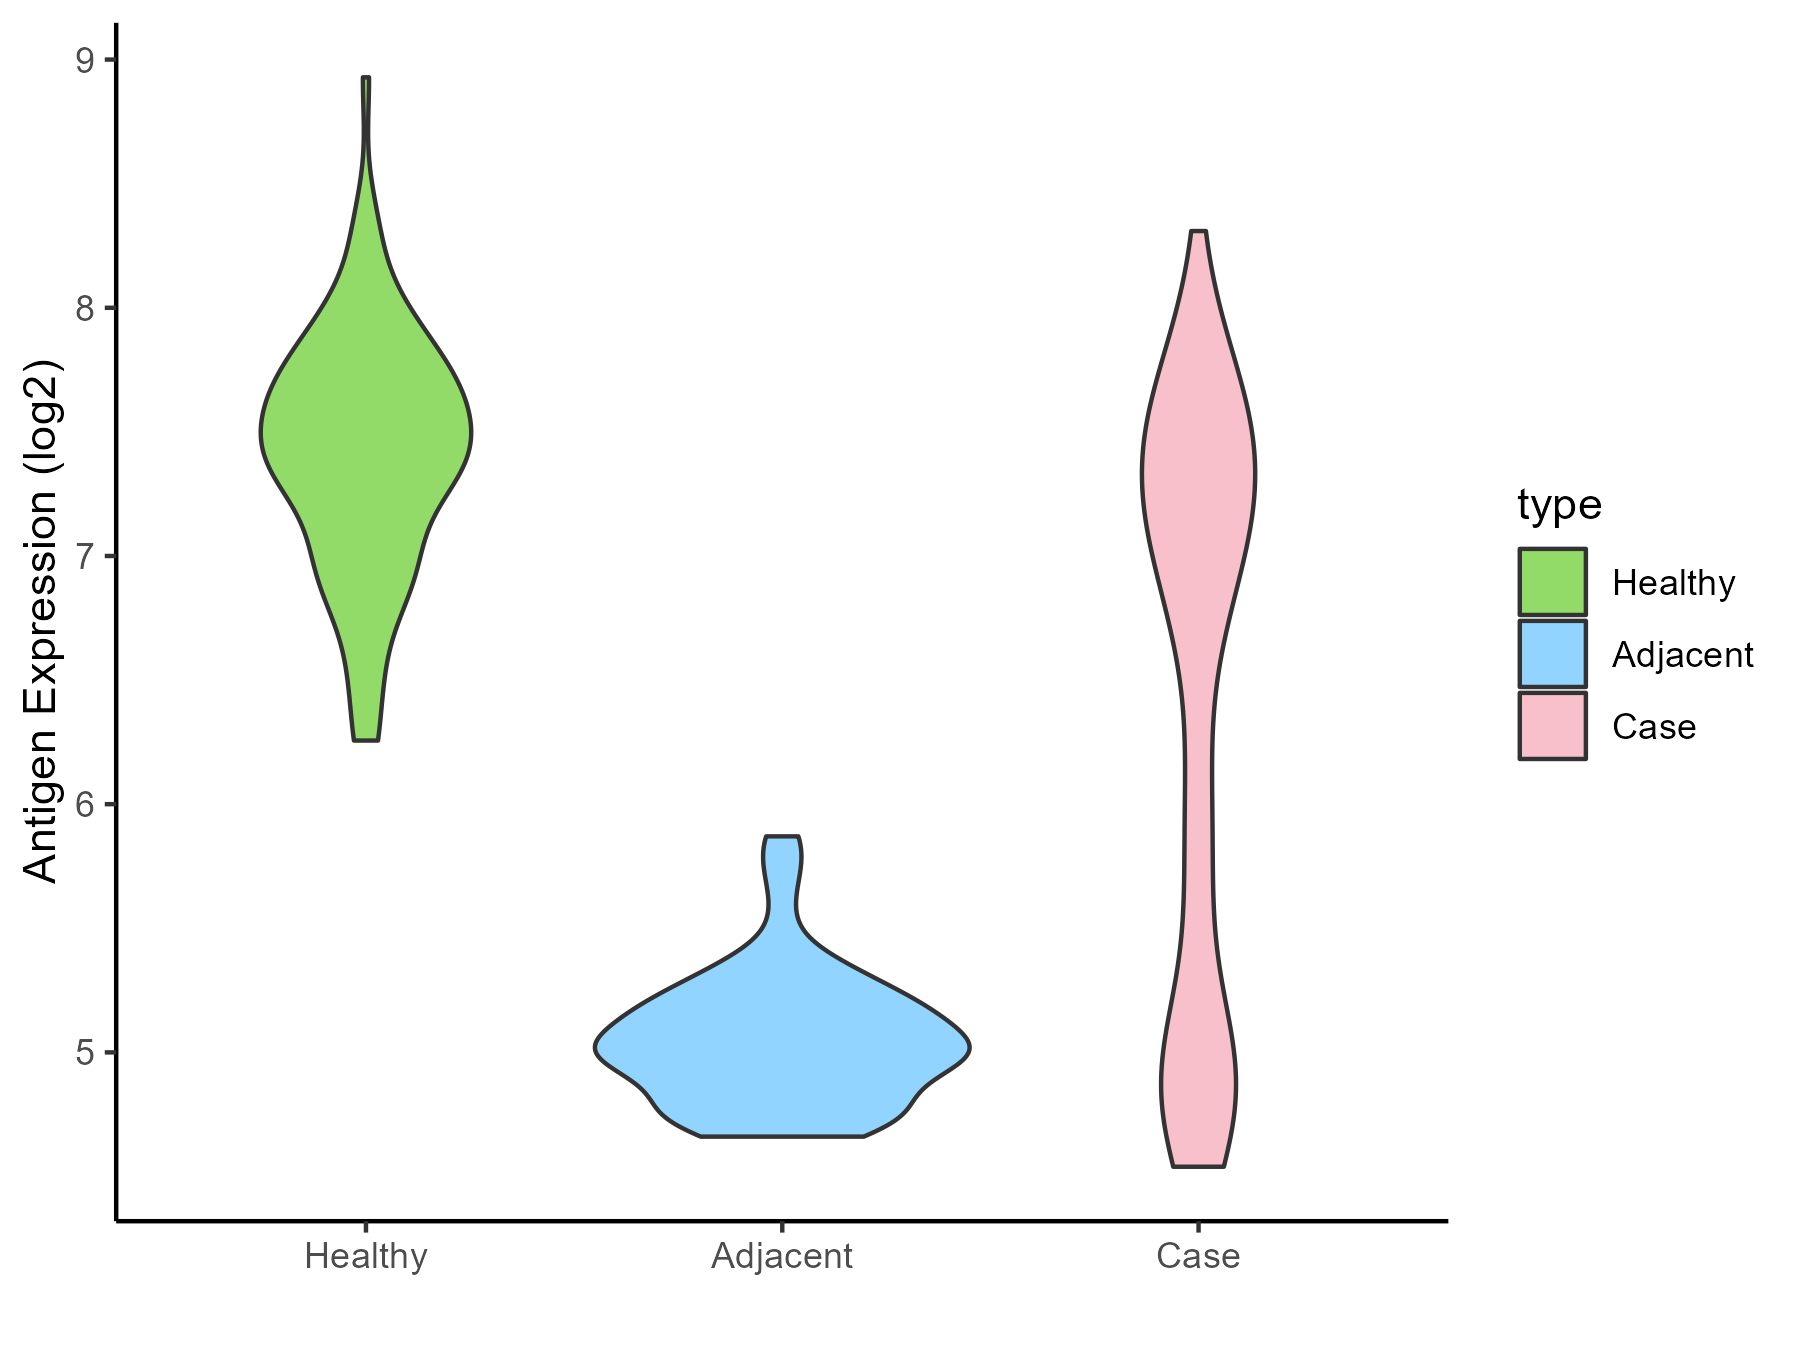
| The Specific Disease | Psoriasis | |
| The Expression Level of Disease Section Compare with the Healthy Individual Tissue | p-value: 1.51E-25; Fold-change: -0.511608187; Z-score: -1.056777327 | |
| The Expression Level of Disease Section Compare with the Adjacent Tissue | p-value: 3.52E-55; Fold-change: 1.92183309; Z-score: 7.207087516 | |
| Disease-specific Antigen Abundances |
|
Click to View the Clearer Original Diagram |
| Differential expression pattern of antigen in diseases | ||
| The Studied Tissue | Skin | |
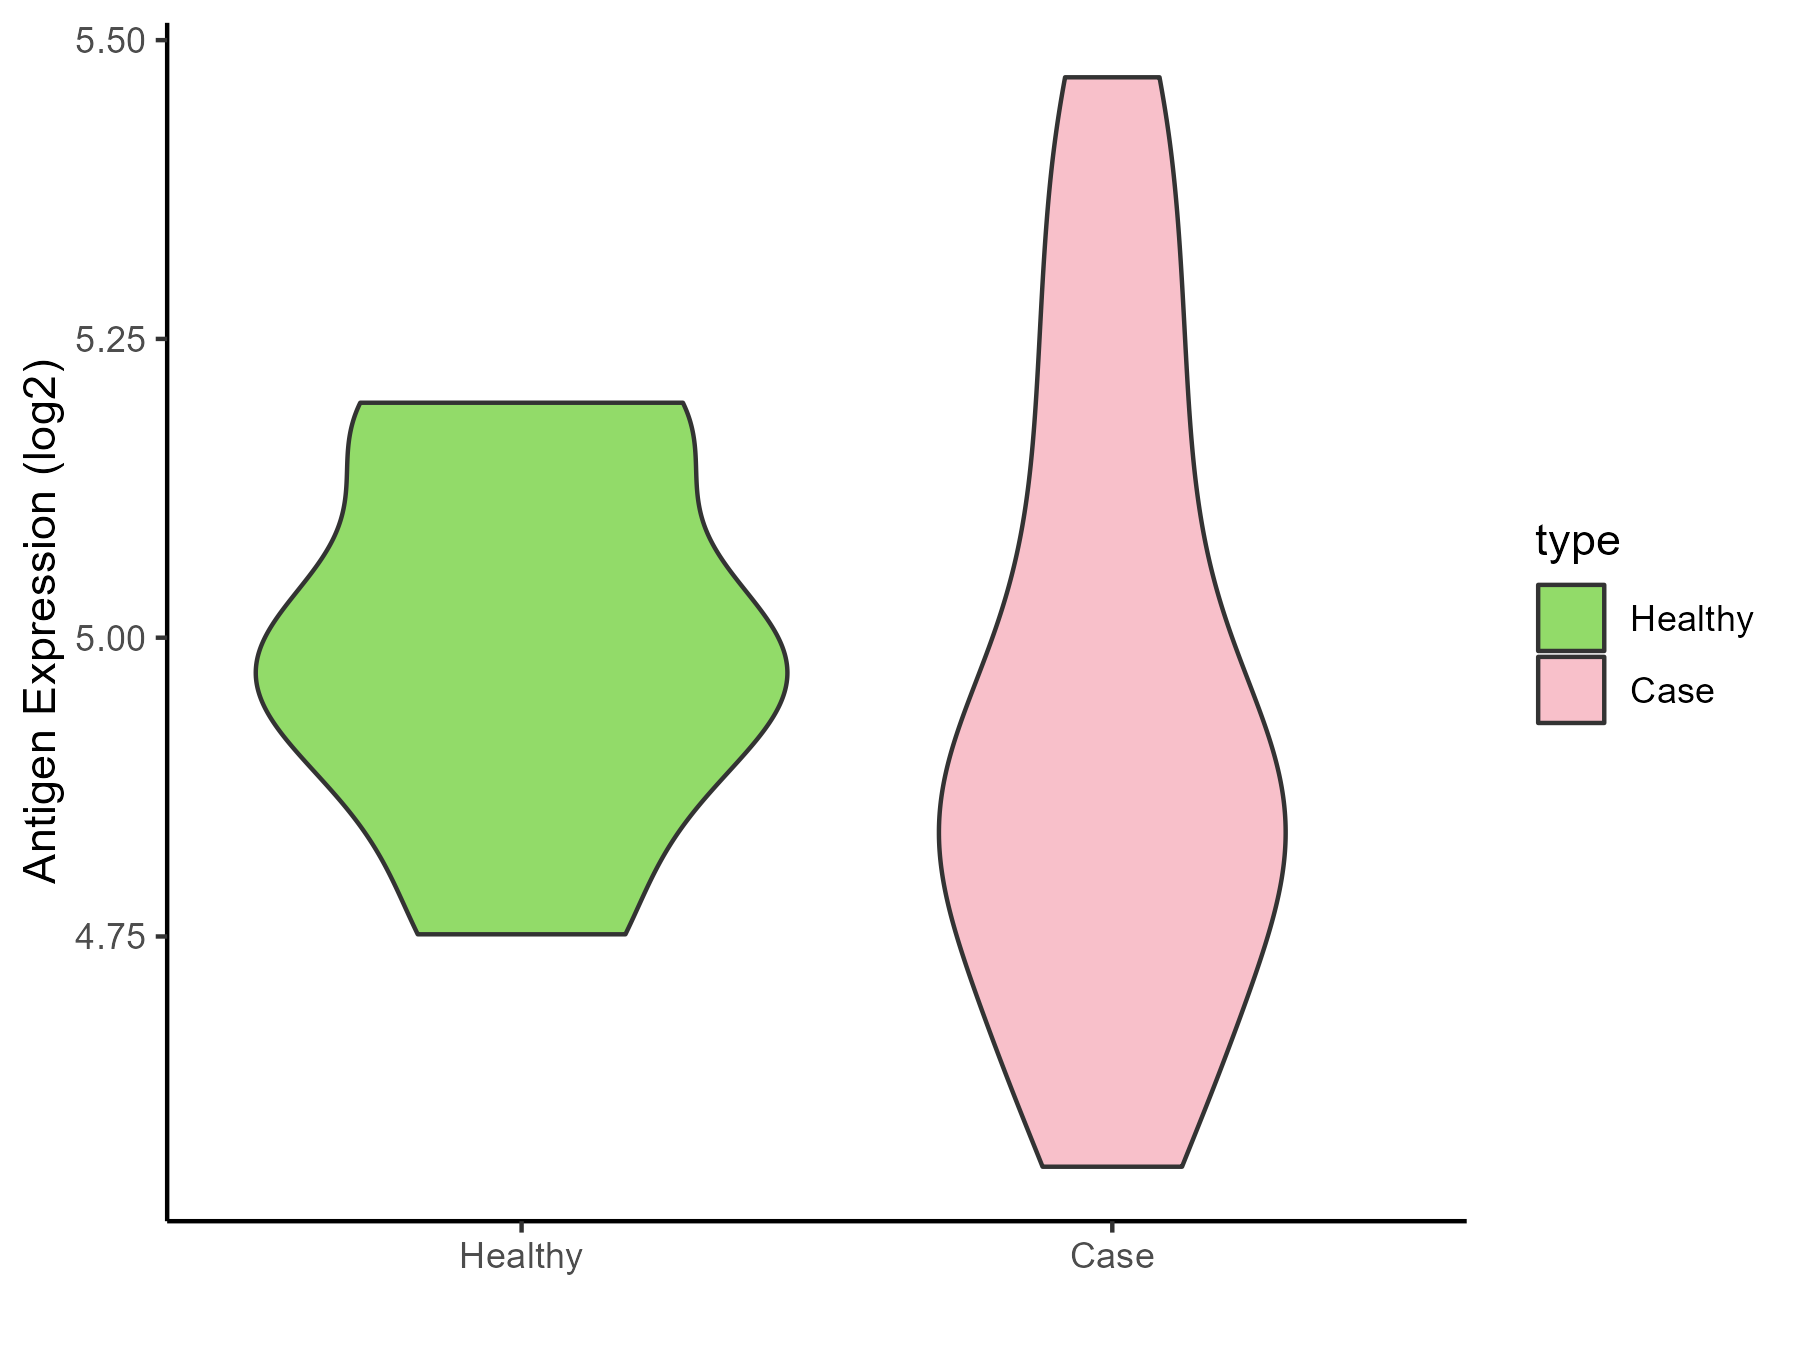
| The Specific Disease | Vitiligo | |
| The Expression Level of Disease Section Compare with the Healthy Individual Tissue | p-value: 0.554762221; Fold-change: -0.105794413; Z-score: -0.677485486 | |
| Disease-specific Antigen Abundances |
|
Click to View the Clearer Original Diagram |
| Differential expression pattern of antigen in diseases | ||
| The Studied Tissue | Skin from scalp | |
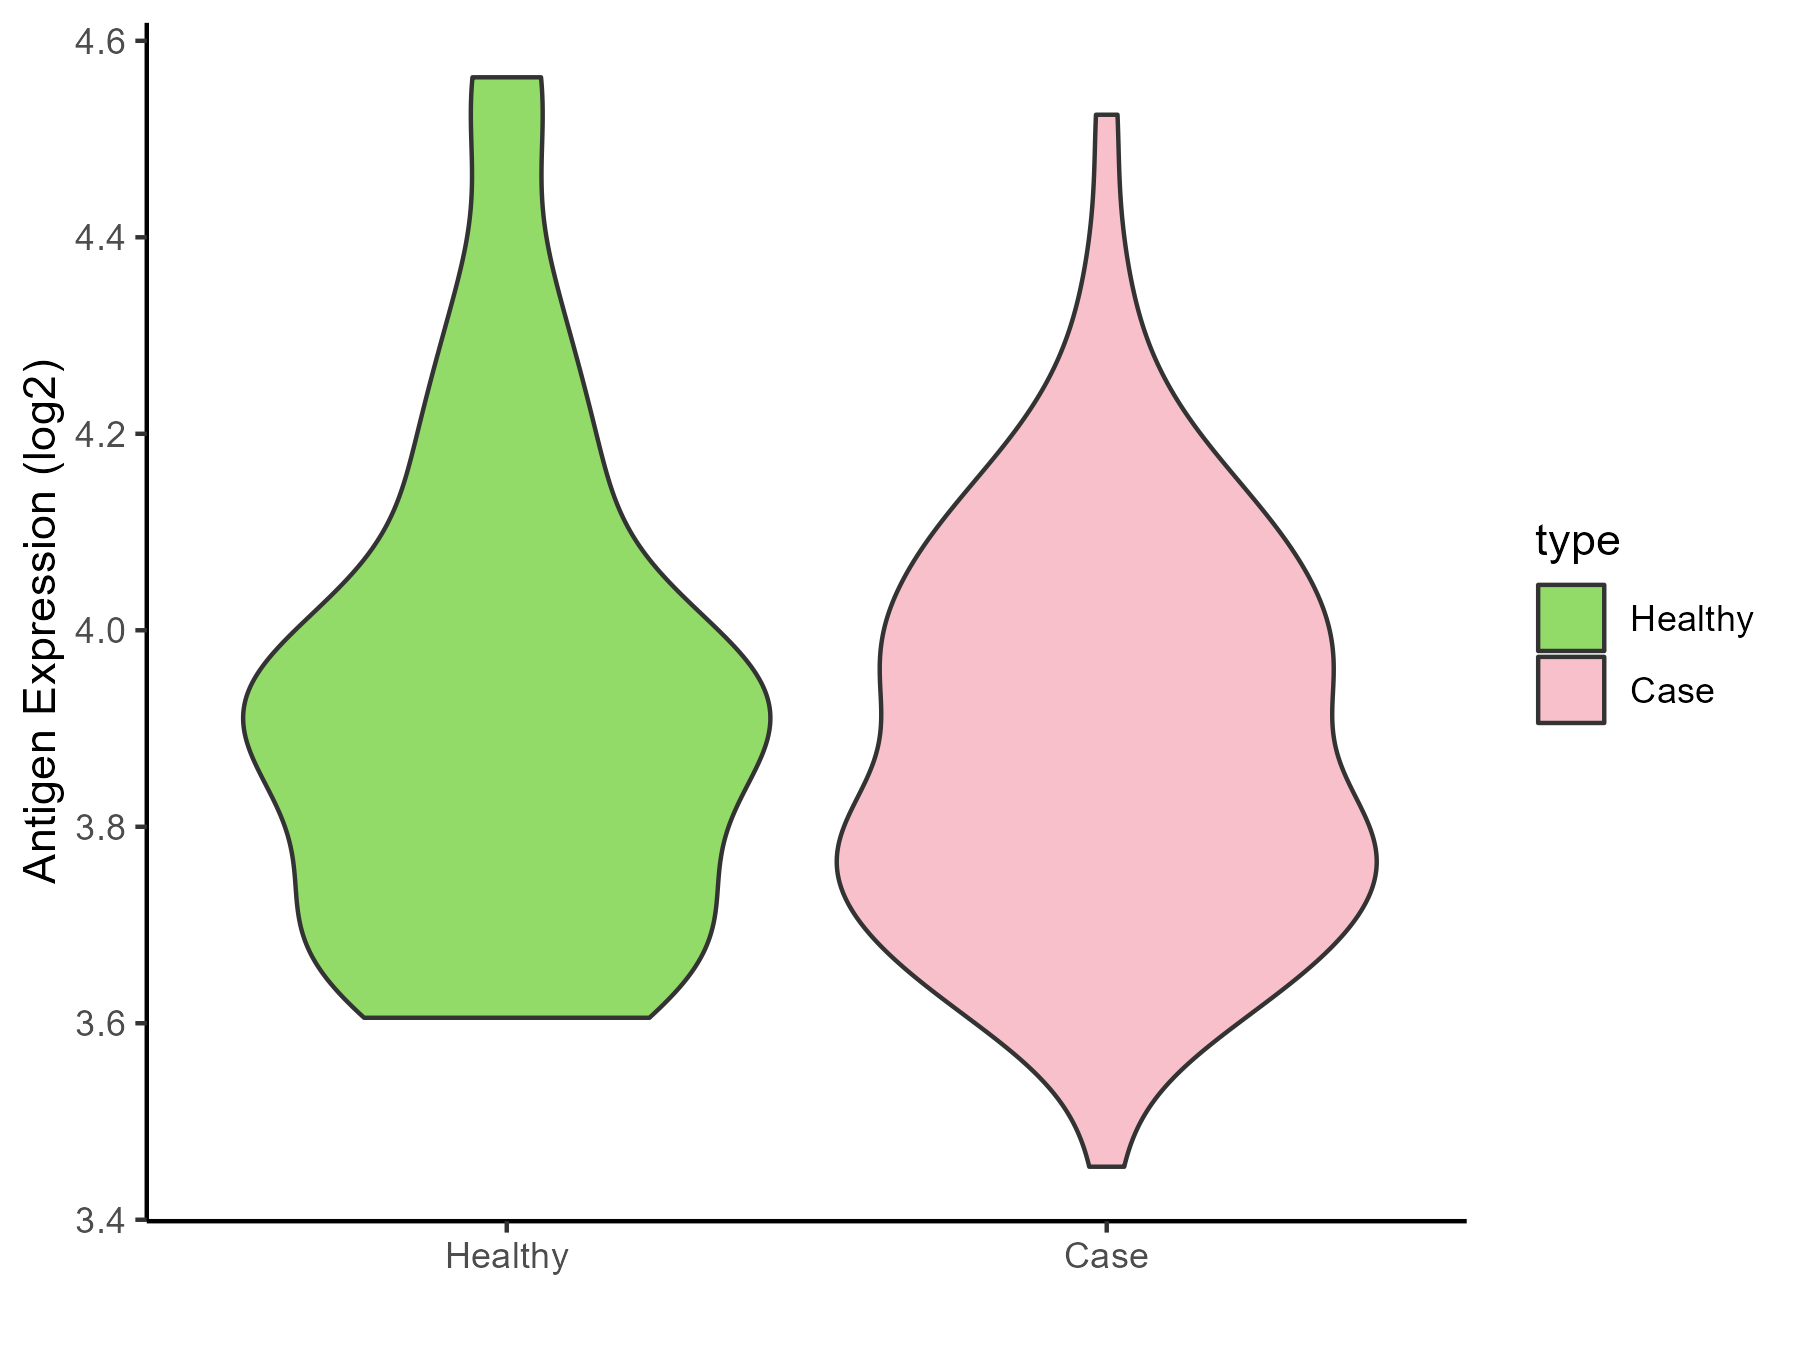
| The Specific Disease | Alopecia | |
| The Expression Level of Disease Section Compare with the Healthy Individual Tissue | p-value: 0.385929288; Fold-change: -0.040363012; Z-score: -0.166033066 | |
| Disease-specific Antigen Abundances |
|
Click to View the Clearer Original Diagram |
| Differential expression pattern of antigen in diseases | ||
| The Studied Tissue | Skin | |
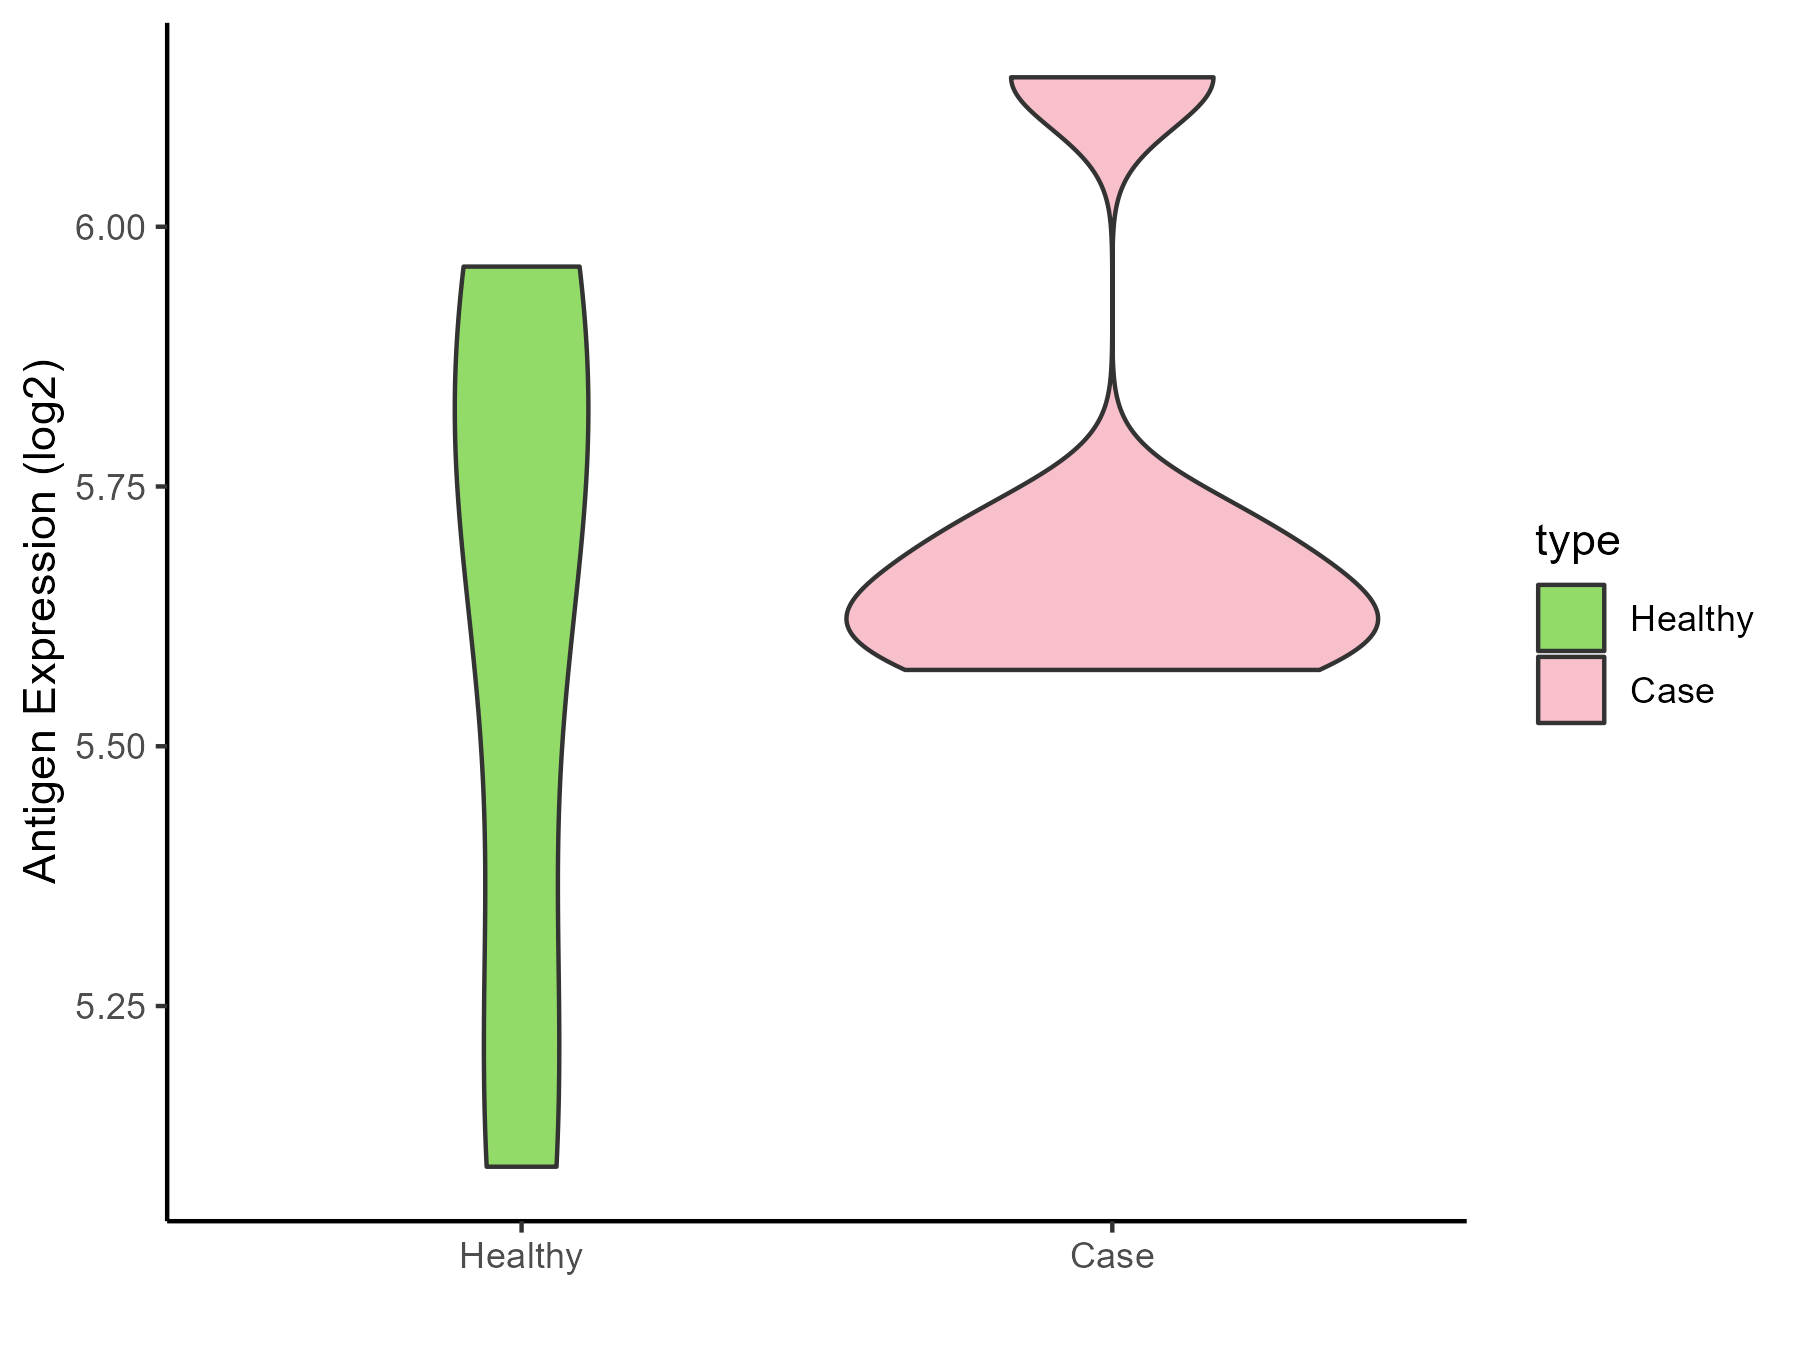
| The Specific Disease | Sensitive skin | |
| The Expression Level of Disease Section Compare with the Healthy Individual Tissue | p-value: 0.475429528; Fold-change: -0.098766895; Z-score: -0.274461933 | |
| Disease-specific Antigen Abundances |
|
Click to View the Clearer Original Diagram |
ICD Disease Classification 15
| Differential expression pattern of antigen in diseases | ||
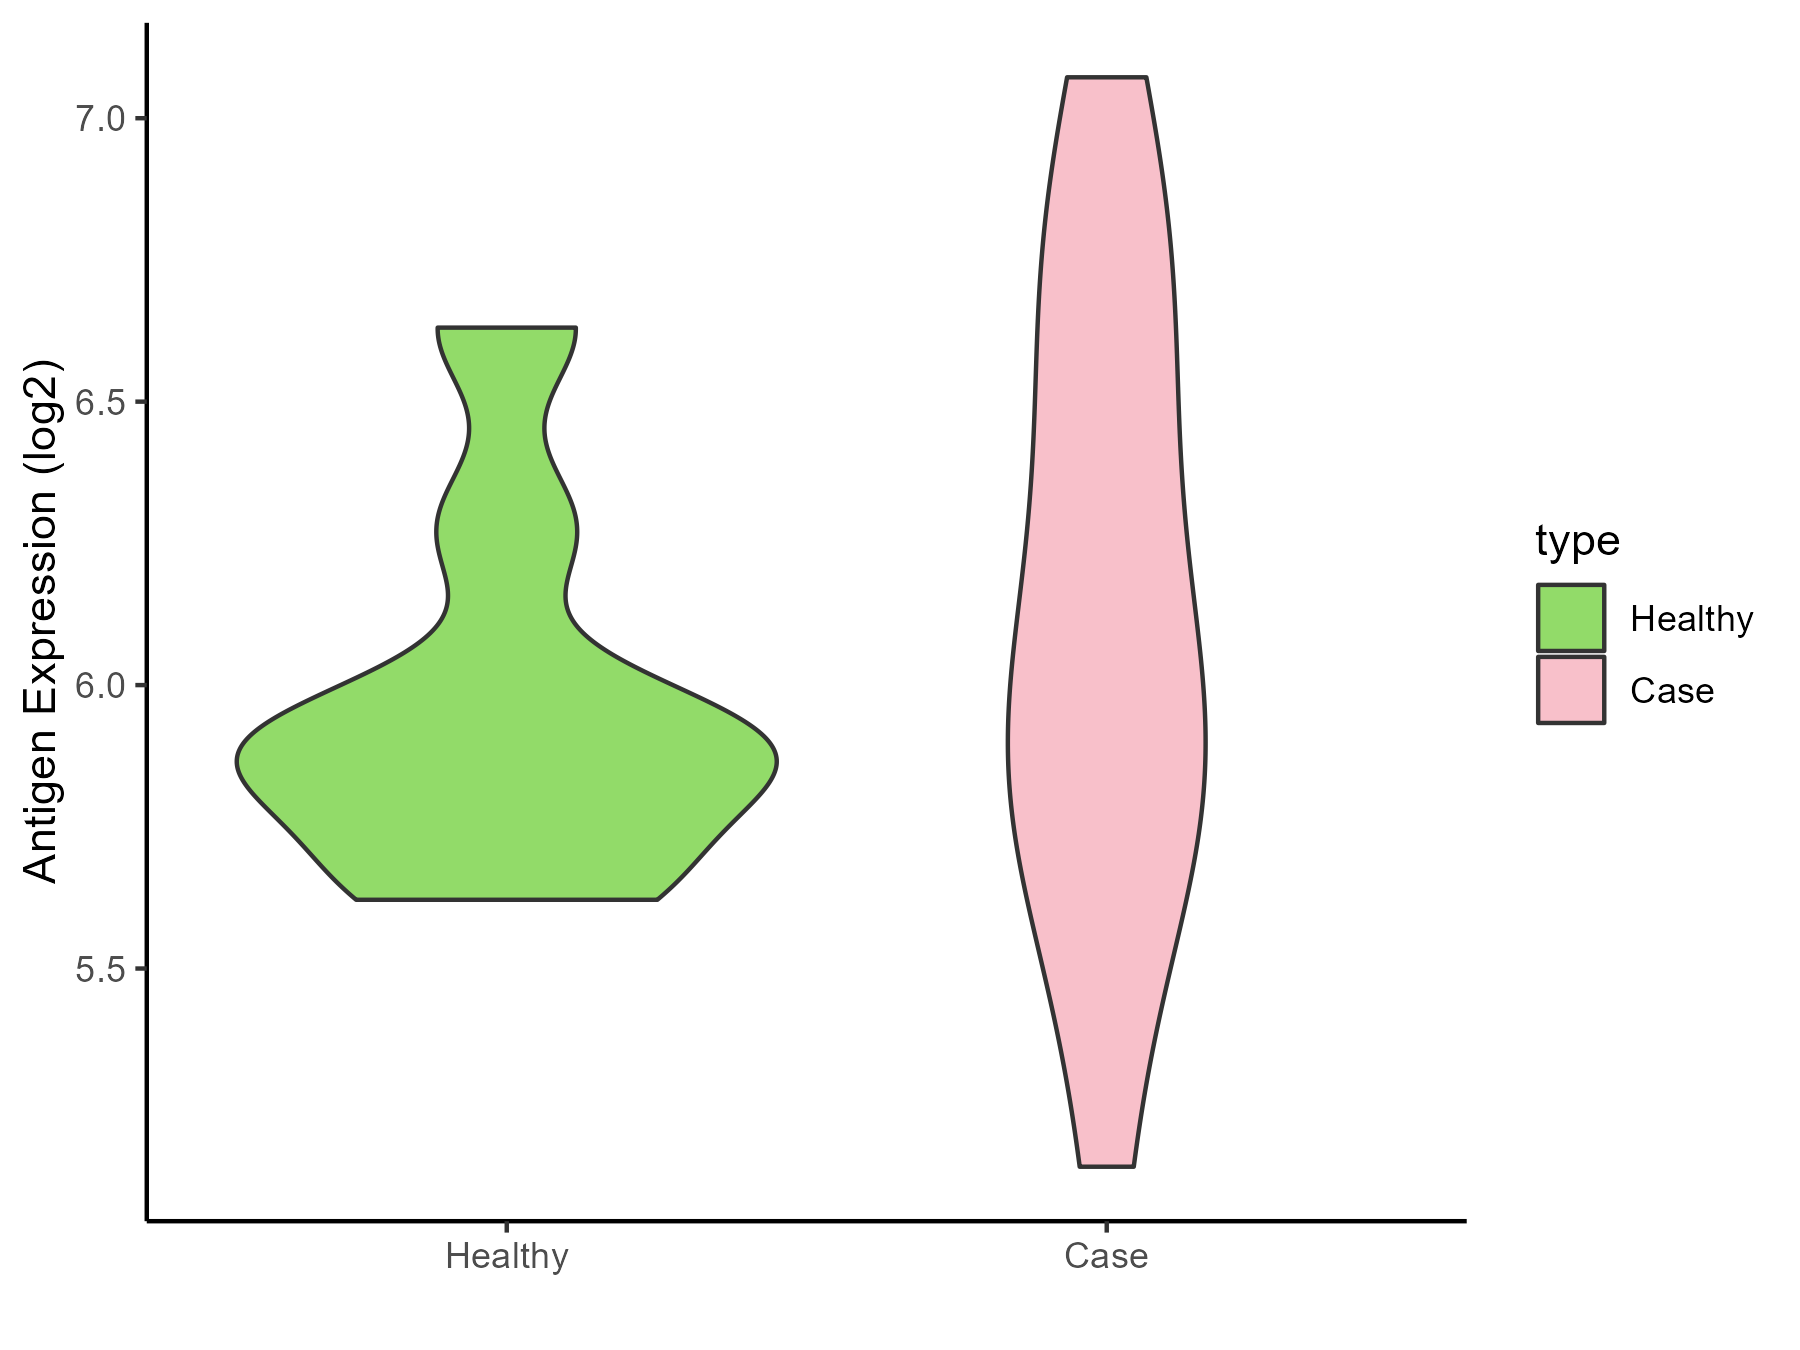
| The Studied Tissue | Synovial | |
| The Specific Disease | Osteoarthritis | |
| The Expression Level of Disease Section Compare with the Healthy Individual Tissue | p-value: 0.370797249; Fold-change: 0.118125144; Z-score: 0.355263447 | |
| Disease-specific Antigen Abundances |
|
Click to View the Clearer Original Diagram |
| Differential expression pattern of antigen in diseases | ||
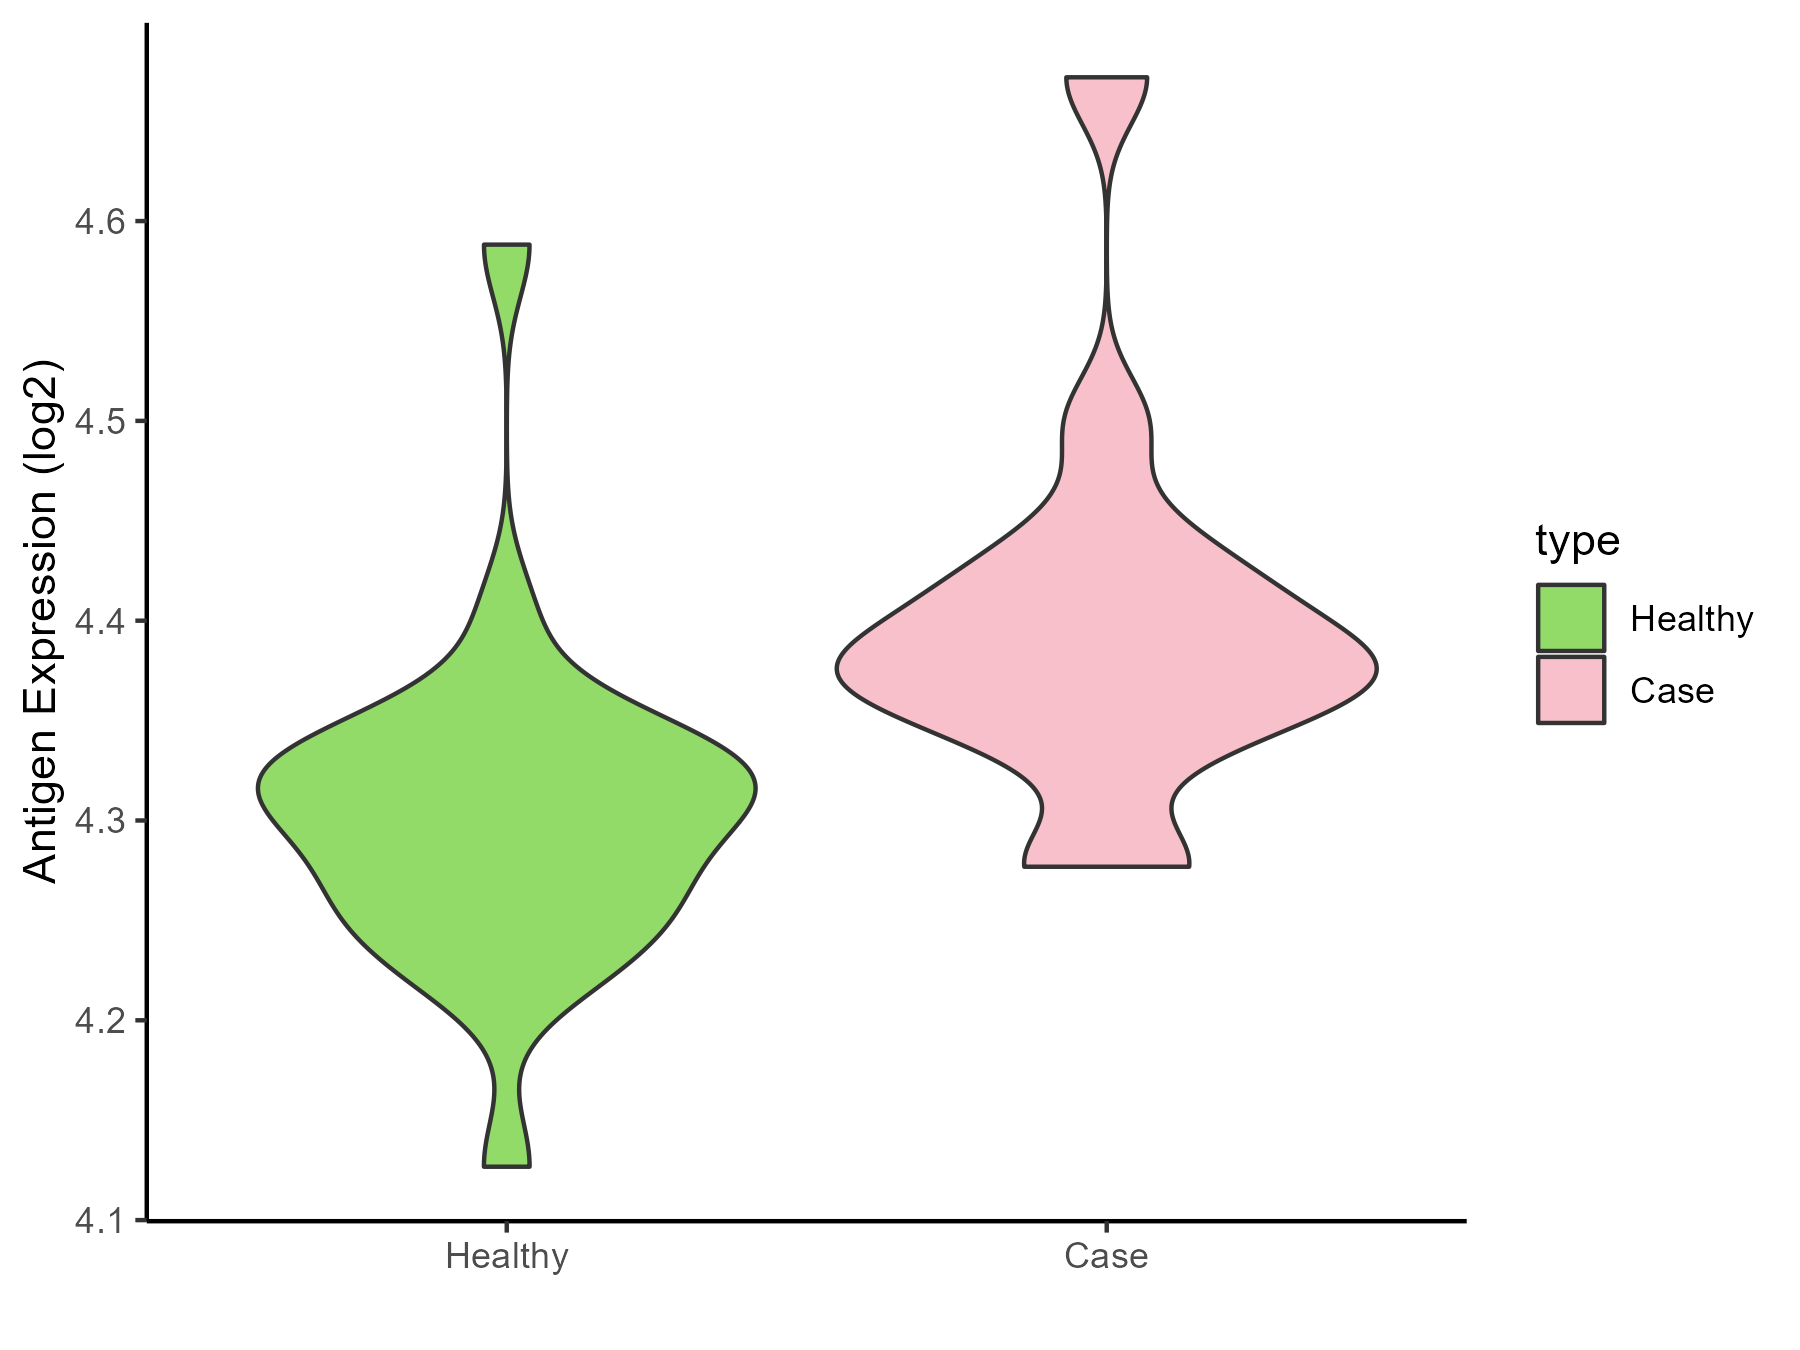
| The Studied Tissue | Peripheral blood | |
| The Specific Disease | Arthropathy | |
| The Expression Level of Disease Section Compare with the Healthy Individual Tissue | p-value: 0.004107359; Fold-change: 0.07075017; Z-score: 0.85206146 | |
| Disease-specific Antigen Abundances |
|
Click to View the Clearer Original Diagram |
| Differential expression pattern of antigen in diseases | ||
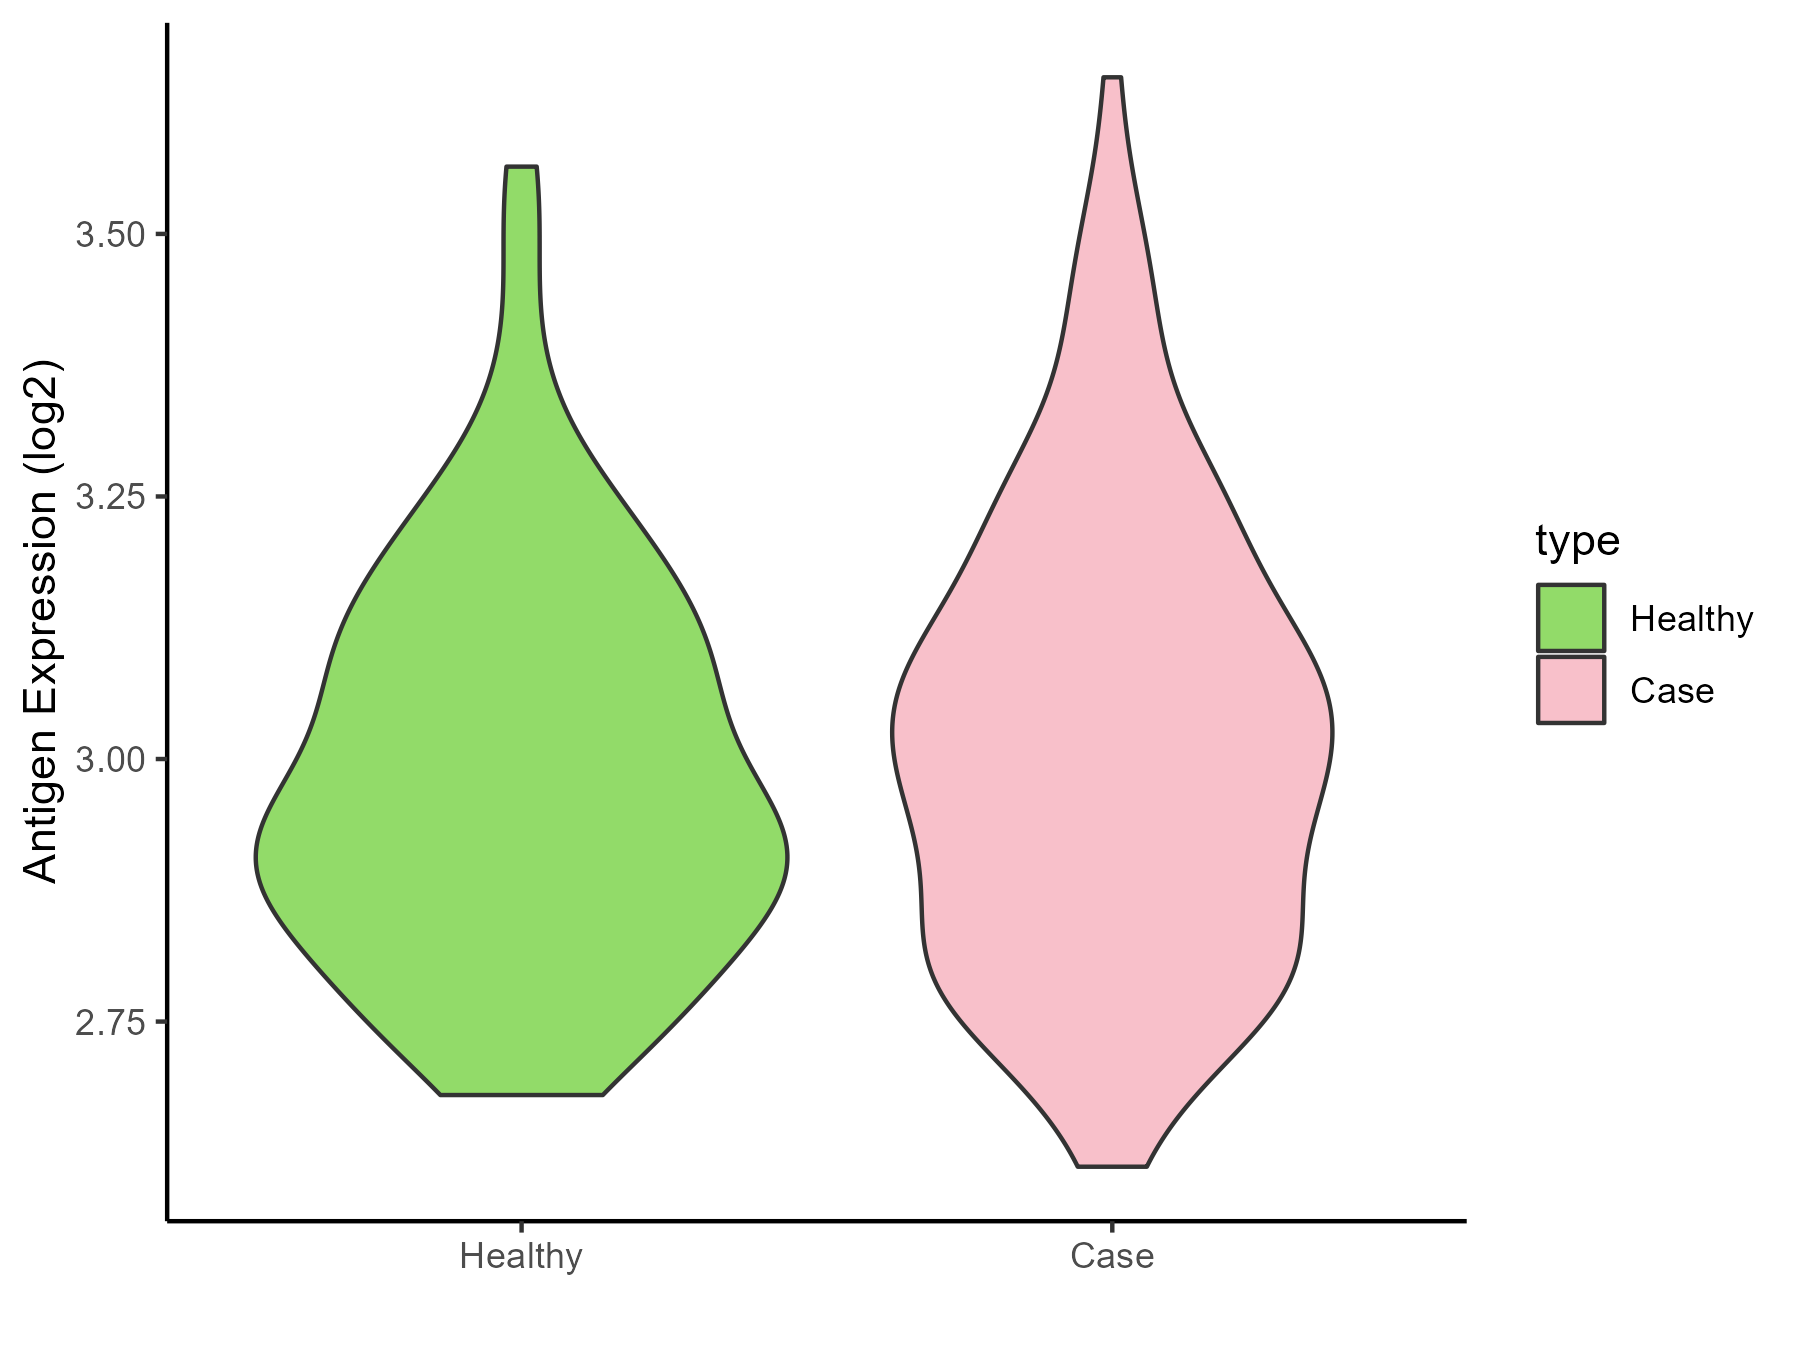
| The Studied Tissue | Peripheral blood | |
| The Specific Disease | Arthritis | |
| The Expression Level of Disease Section Compare with the Healthy Individual Tissue | p-value: 0.278680838; Fold-change: 0.0501455; Z-score: 0.270019099 | |
| Disease-specific Antigen Abundances |
|
Click to View the Clearer Original Diagram |
| Differential expression pattern of antigen in diseases | ||
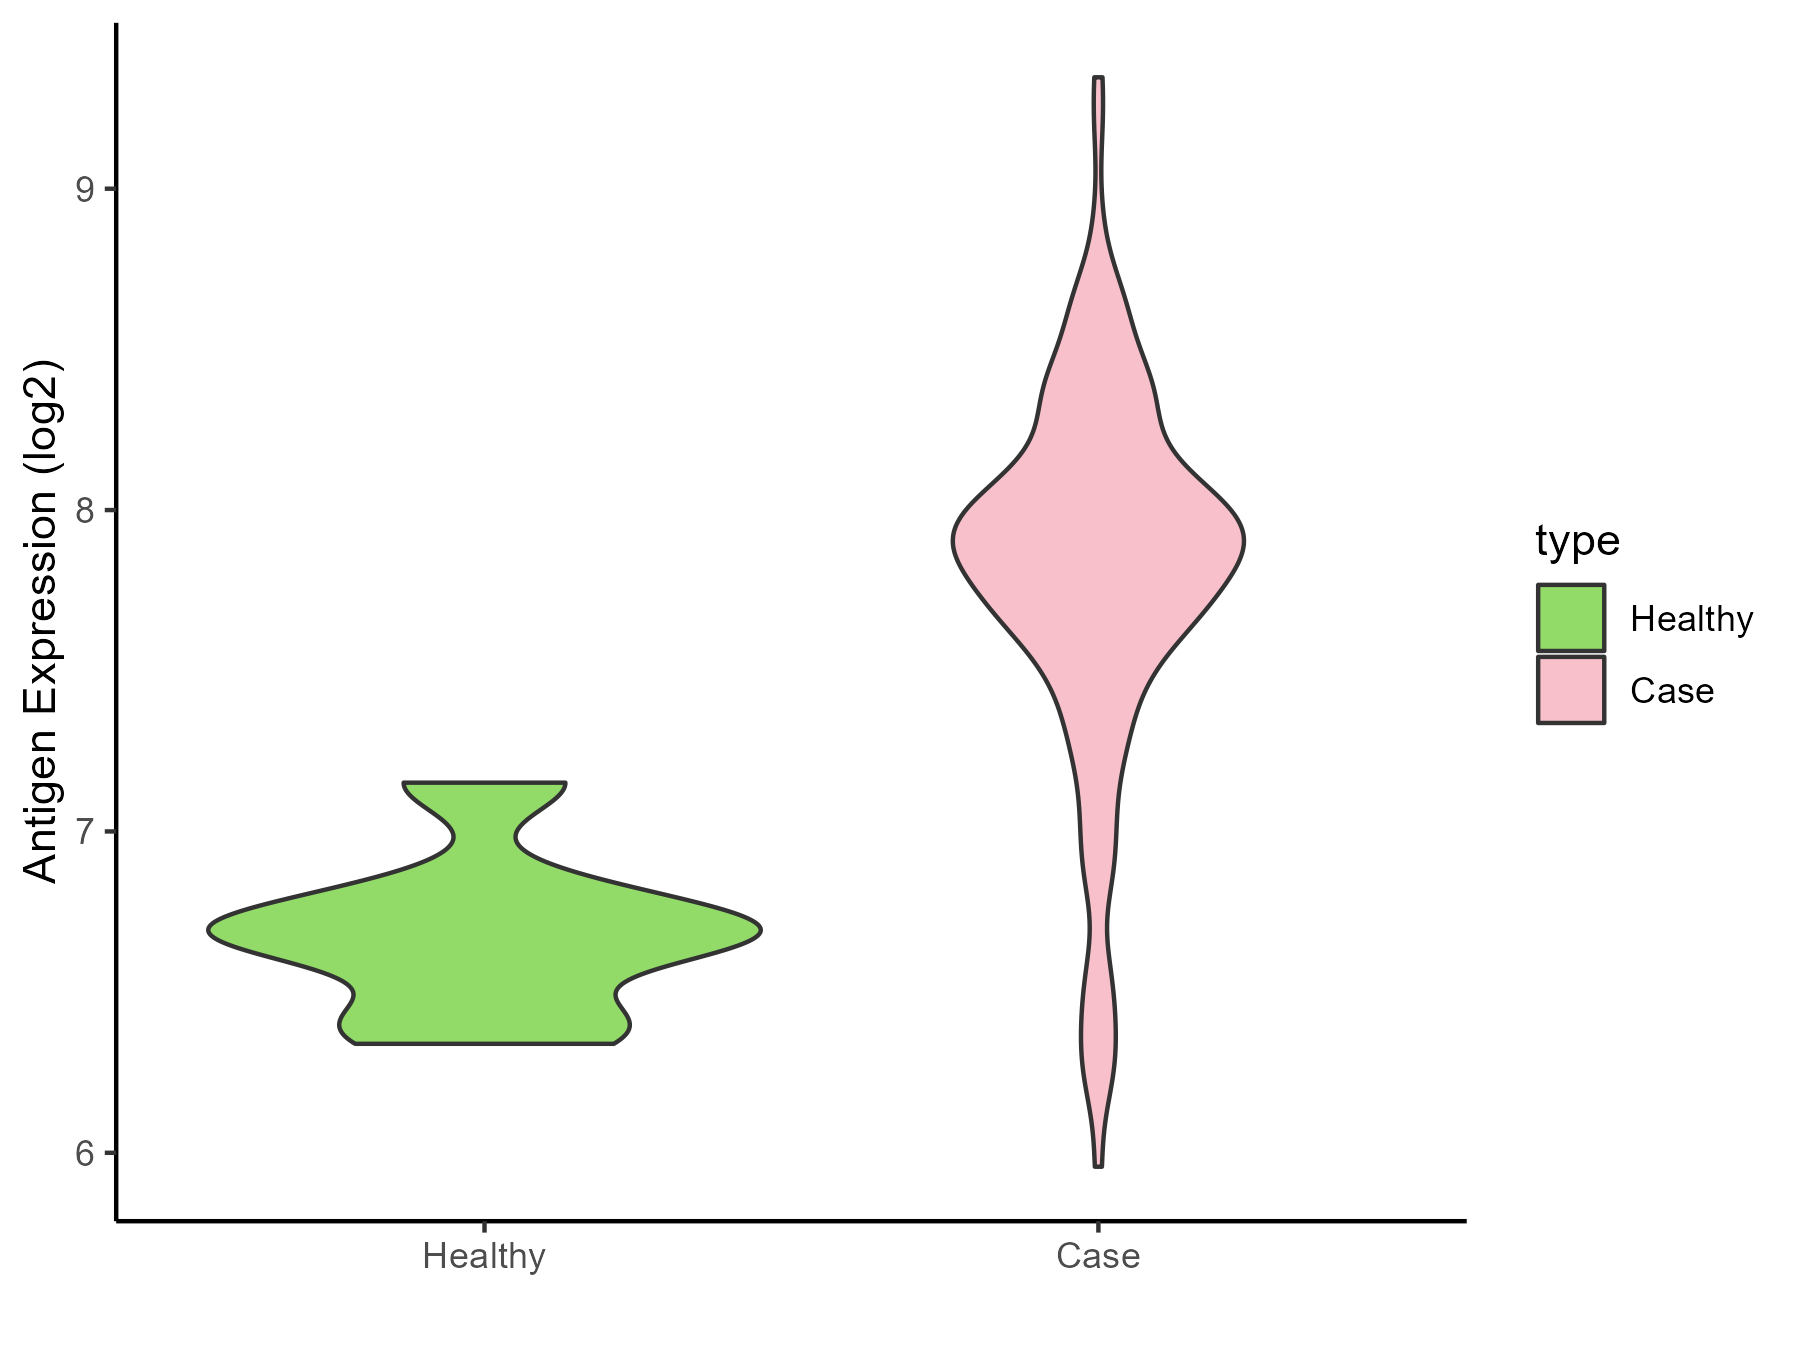
| The Studied Tissue | Synovial | |
| The Specific Disease | Rheumatoid arthritis | |
| The Expression Level of Disease Section Compare with the Healthy Individual Tissue | p-value: 3.41E-06; Fold-change: 1.217529852; Z-score: 4.633463186 | |
| Disease-specific Antigen Abundances |
|
Click to View the Clearer Original Diagram |
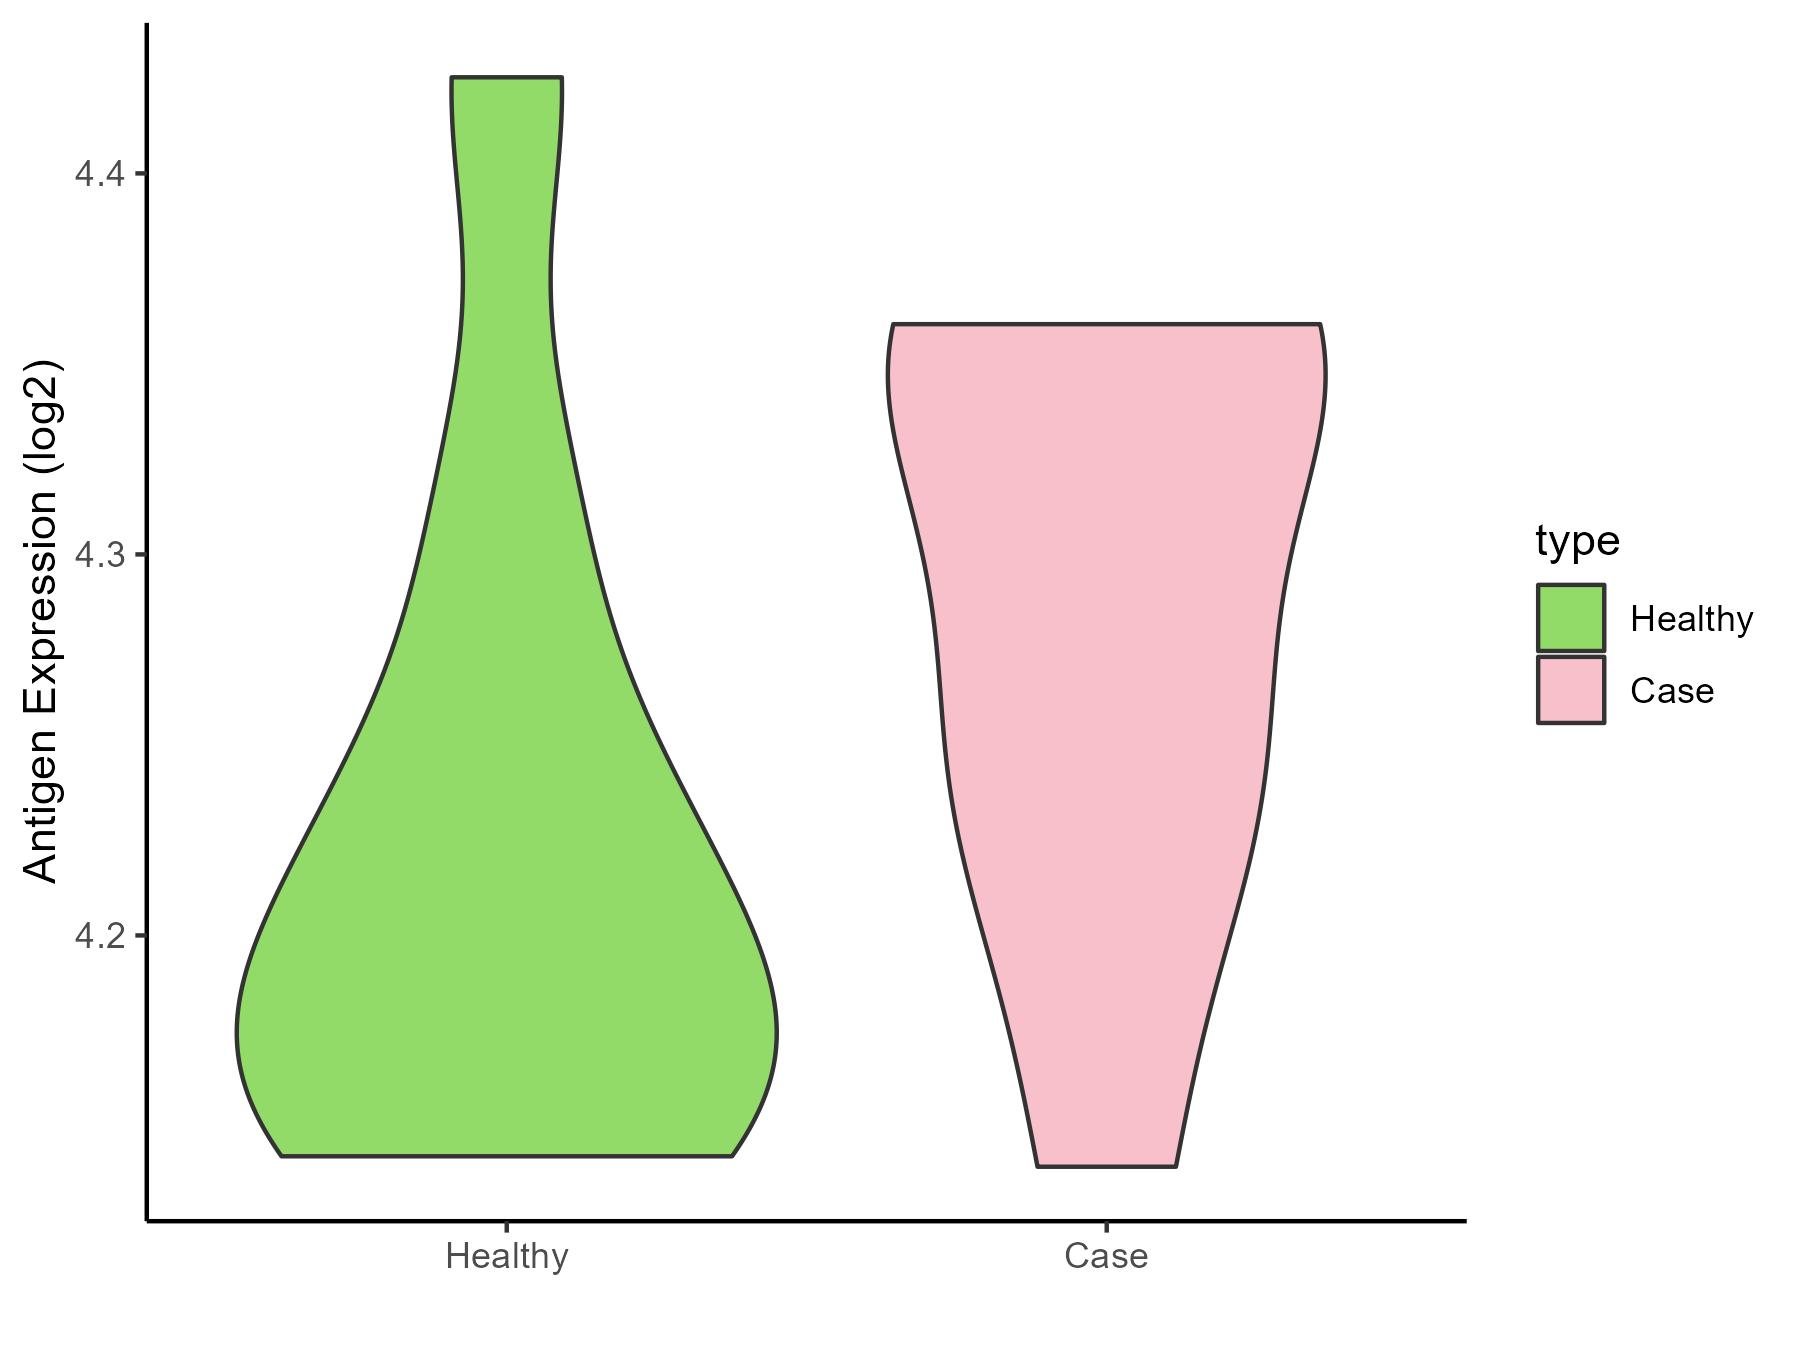
| Differential expression pattern of antigen in diseases | ||
| The Studied Tissue | Pheripheral blood | |
| The Specific Disease | Ankylosing spondylitis | |
| The Expression Level of Disease Section Compare with the Healthy Individual Tissue | p-value: 0.167914213; Fold-change: 0.120426729; Z-score: 1.296820113 | |
| Disease-specific Antigen Abundances |
|
Click to View the Clearer Original Diagram |
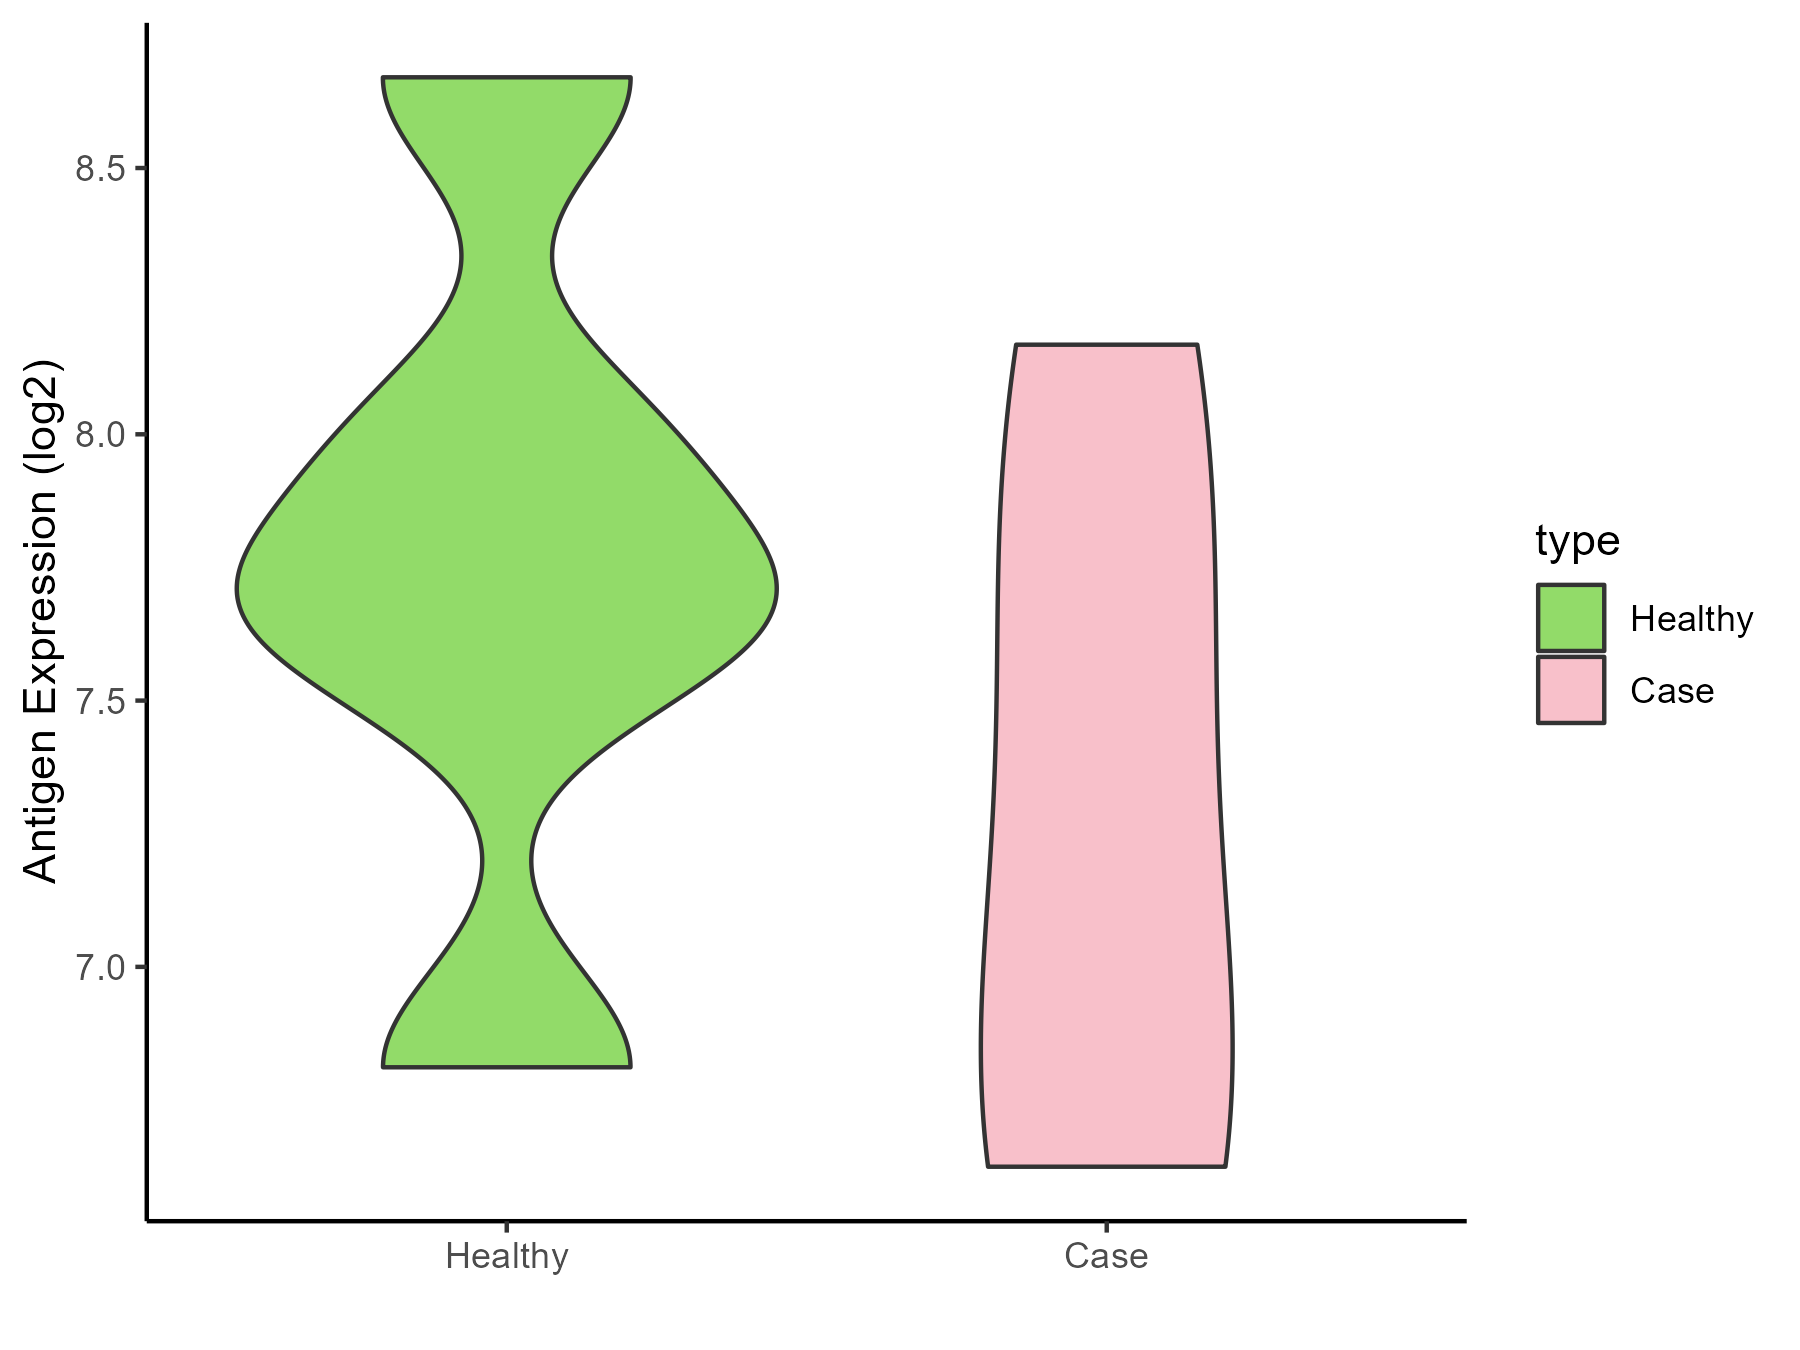
| Differential expression pattern of antigen in diseases | ||
| The Studied Tissue | Bone marrow | |
| The Specific Disease | Osteoporosis | |
| The Expression Level of Disease Section Compare with the Healthy Individual Tissue | p-value: 0.368328846; Fold-change: -0.495586357; Z-score: -0.737499692 | |
| Disease-specific Antigen Abundances |
|
Click to View the Clearer Original Diagram |
ICD Disease Classification 16
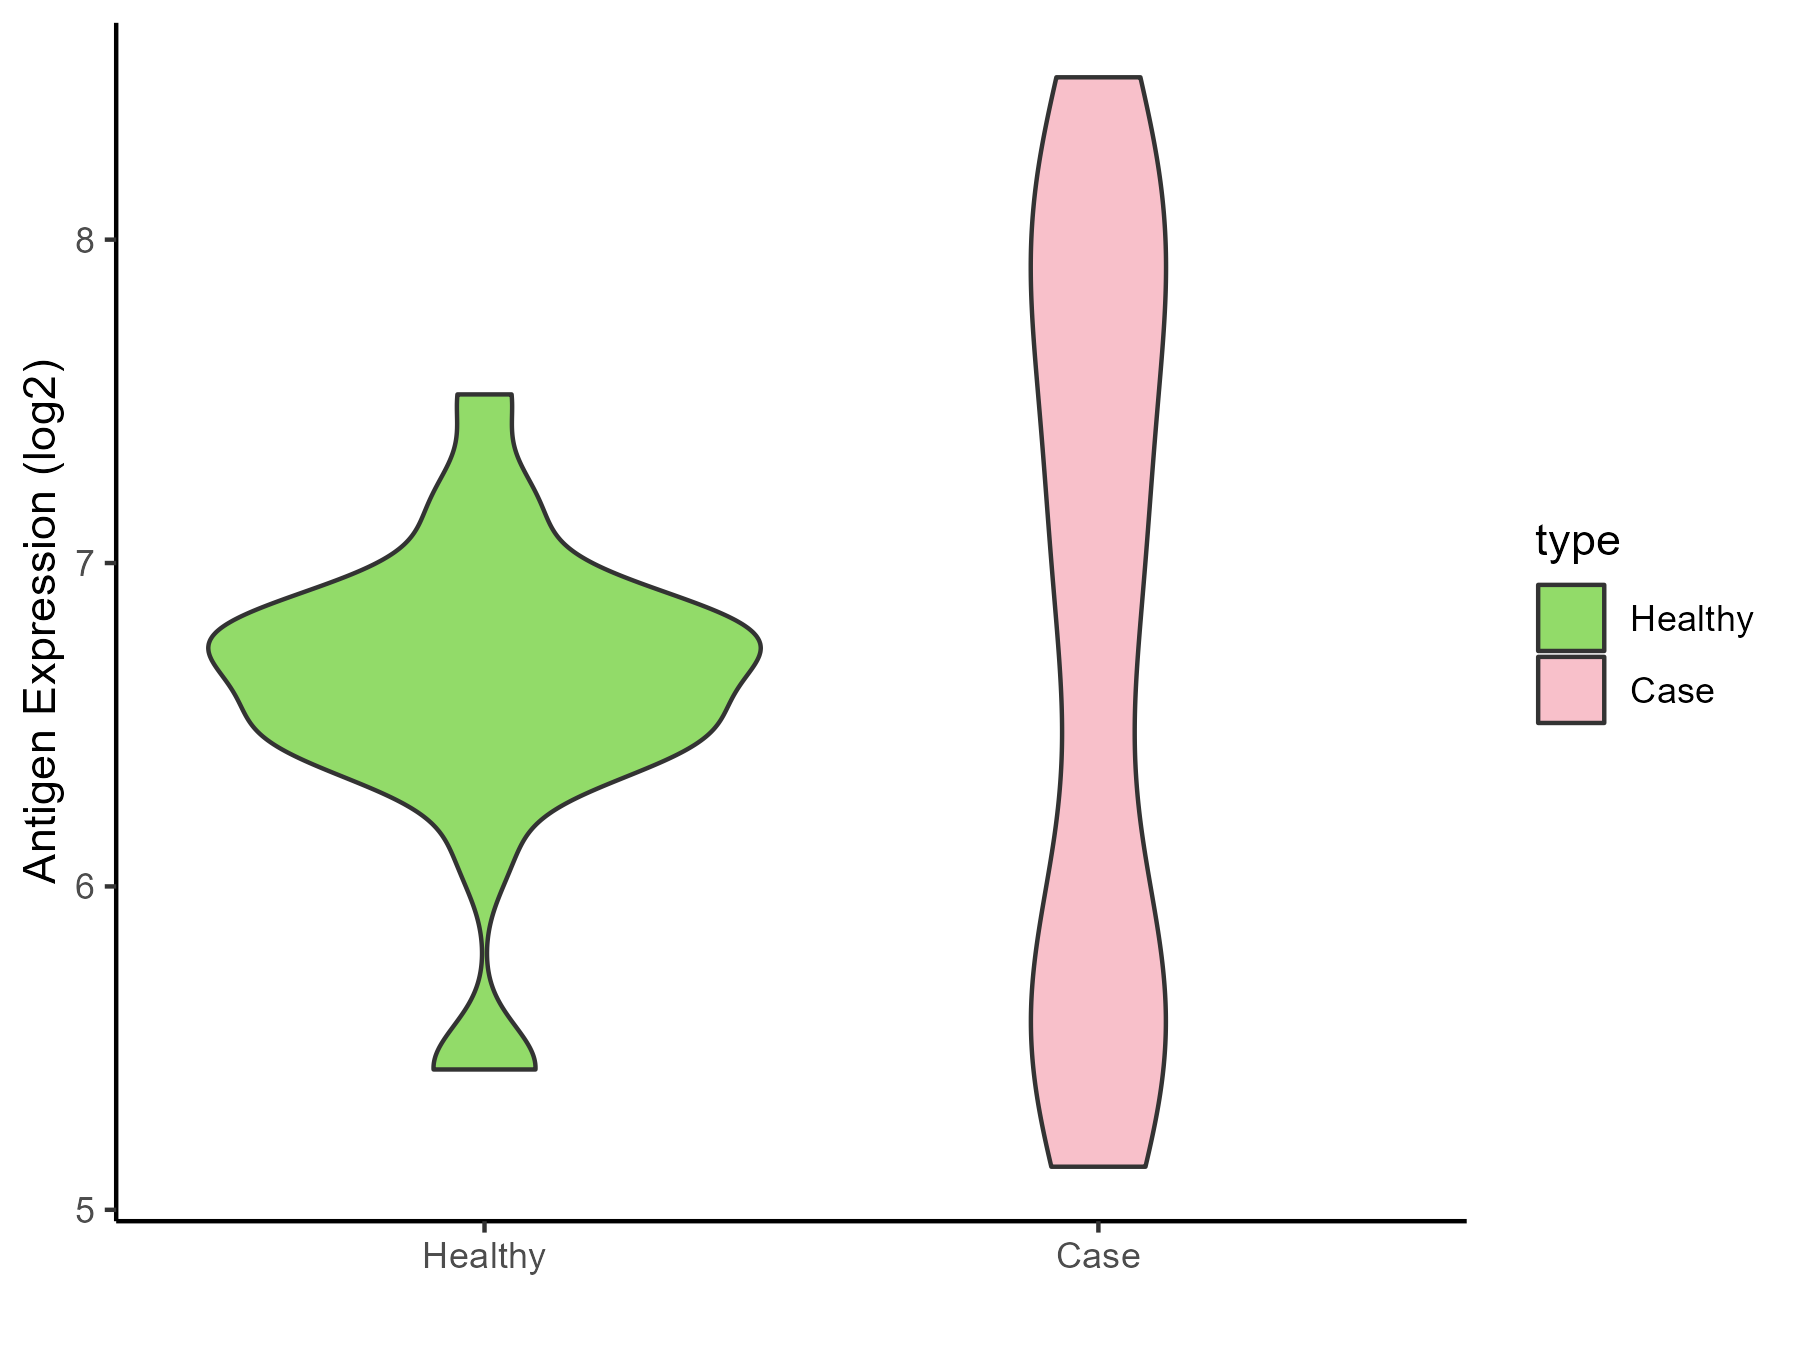
| Differential expression pattern of antigen in diseases | ||
| The Studied Tissue | Endometrium | |
| The Specific Disease | Endometriosis | |
| The Expression Level of Disease Section Compare with the Healthy Individual Tissue | p-value: 0.271100147; Fold-change: 0.22297765; Z-score: 0.495592722 | |
| Disease-specific Antigen Abundances |
|
Click to View the Clearer Original Diagram |
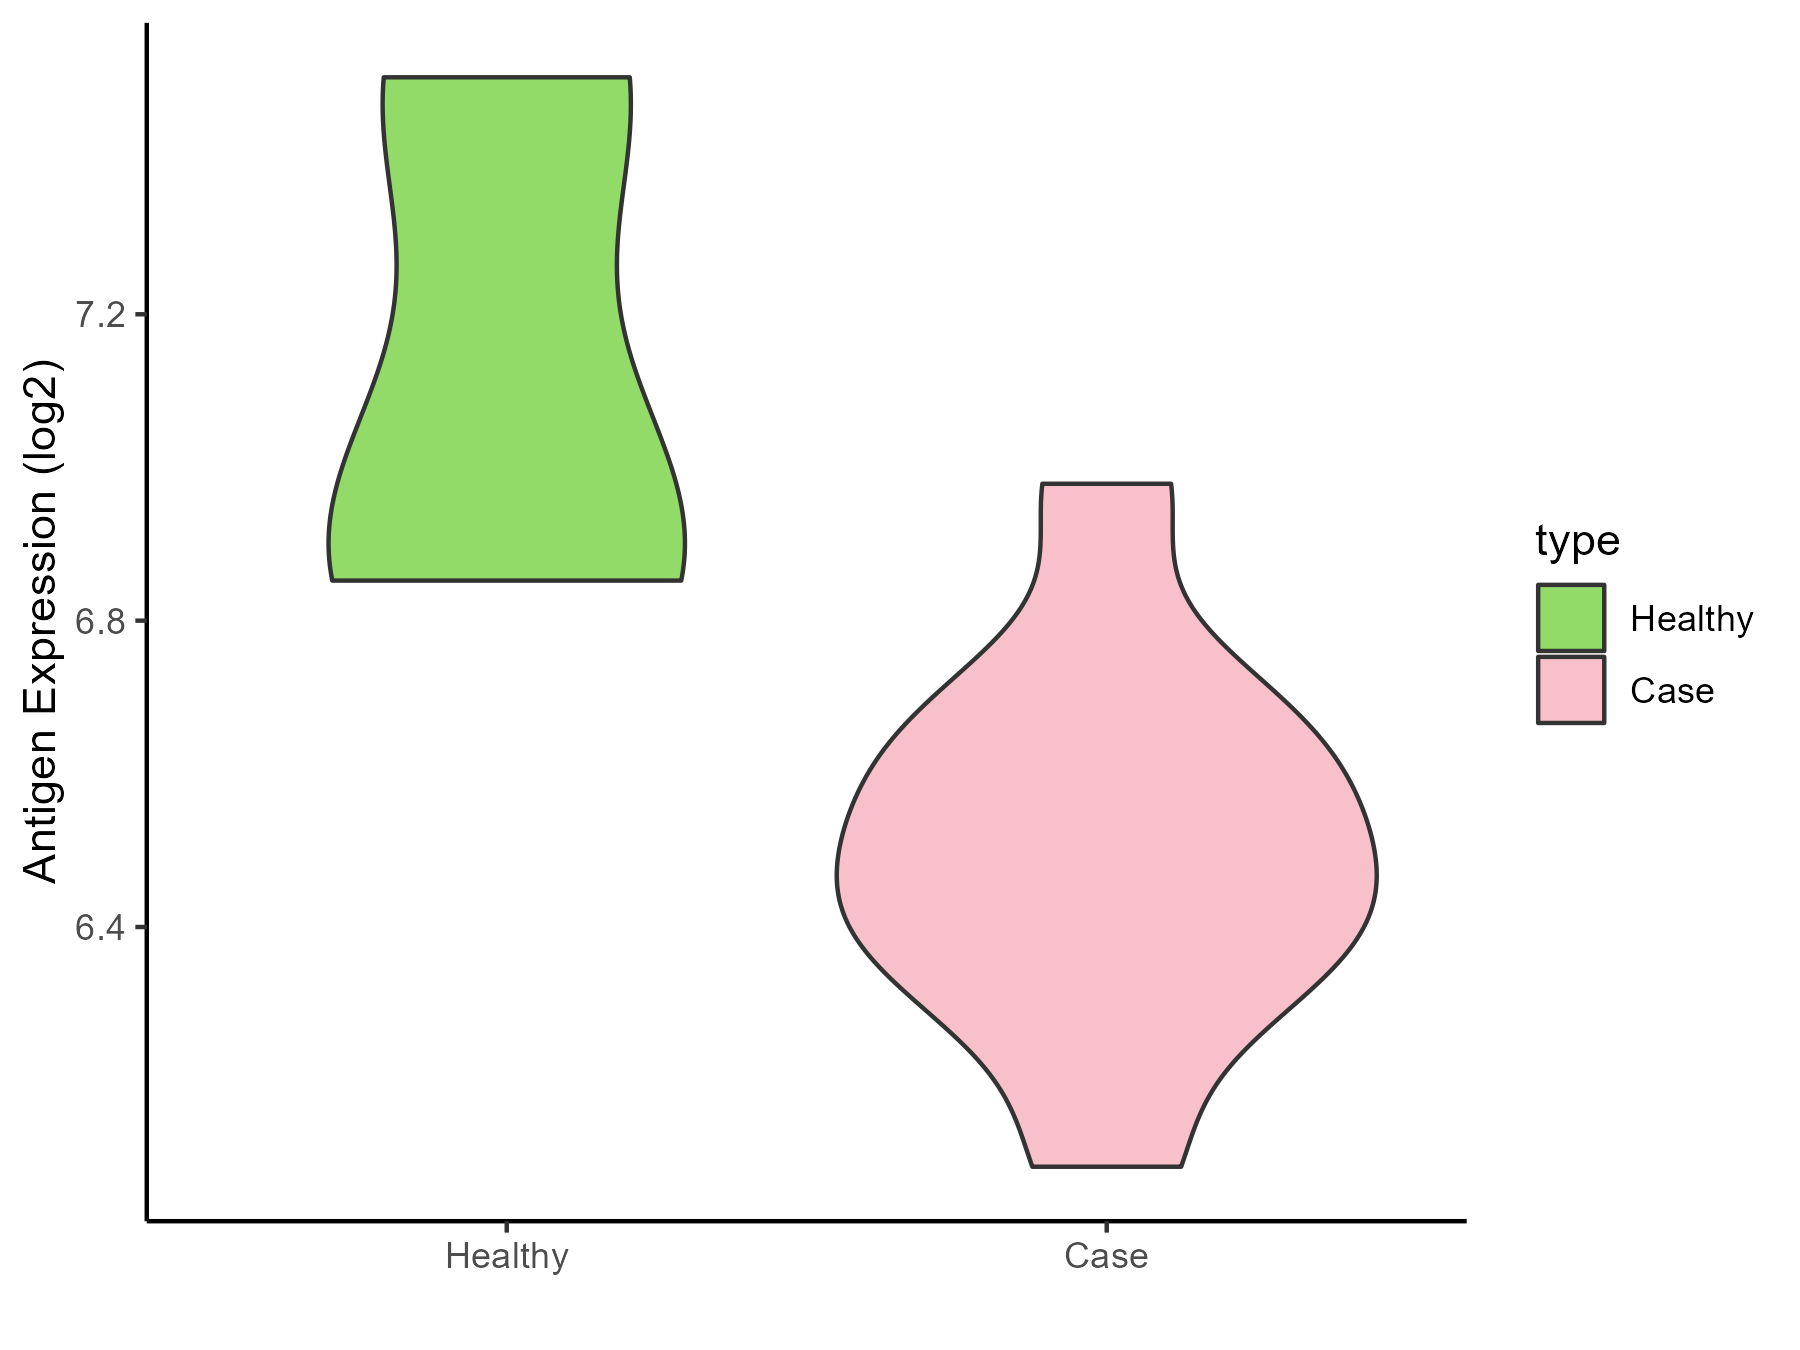
| Differential expression pattern of antigen in diseases | ||
| The Studied Tissue | Bladder | |
| The Specific Disease | Interstitial cystitis | |
| The Expression Level of Disease Section Compare with the Healthy Individual Tissue | p-value: 0.009232582; Fold-change: -0.459921401; Z-score: -1.365282735 | |
| Disease-specific Antigen Abundances |
|
Click to View the Clearer Original Diagram |
ICD Disease Classification 19
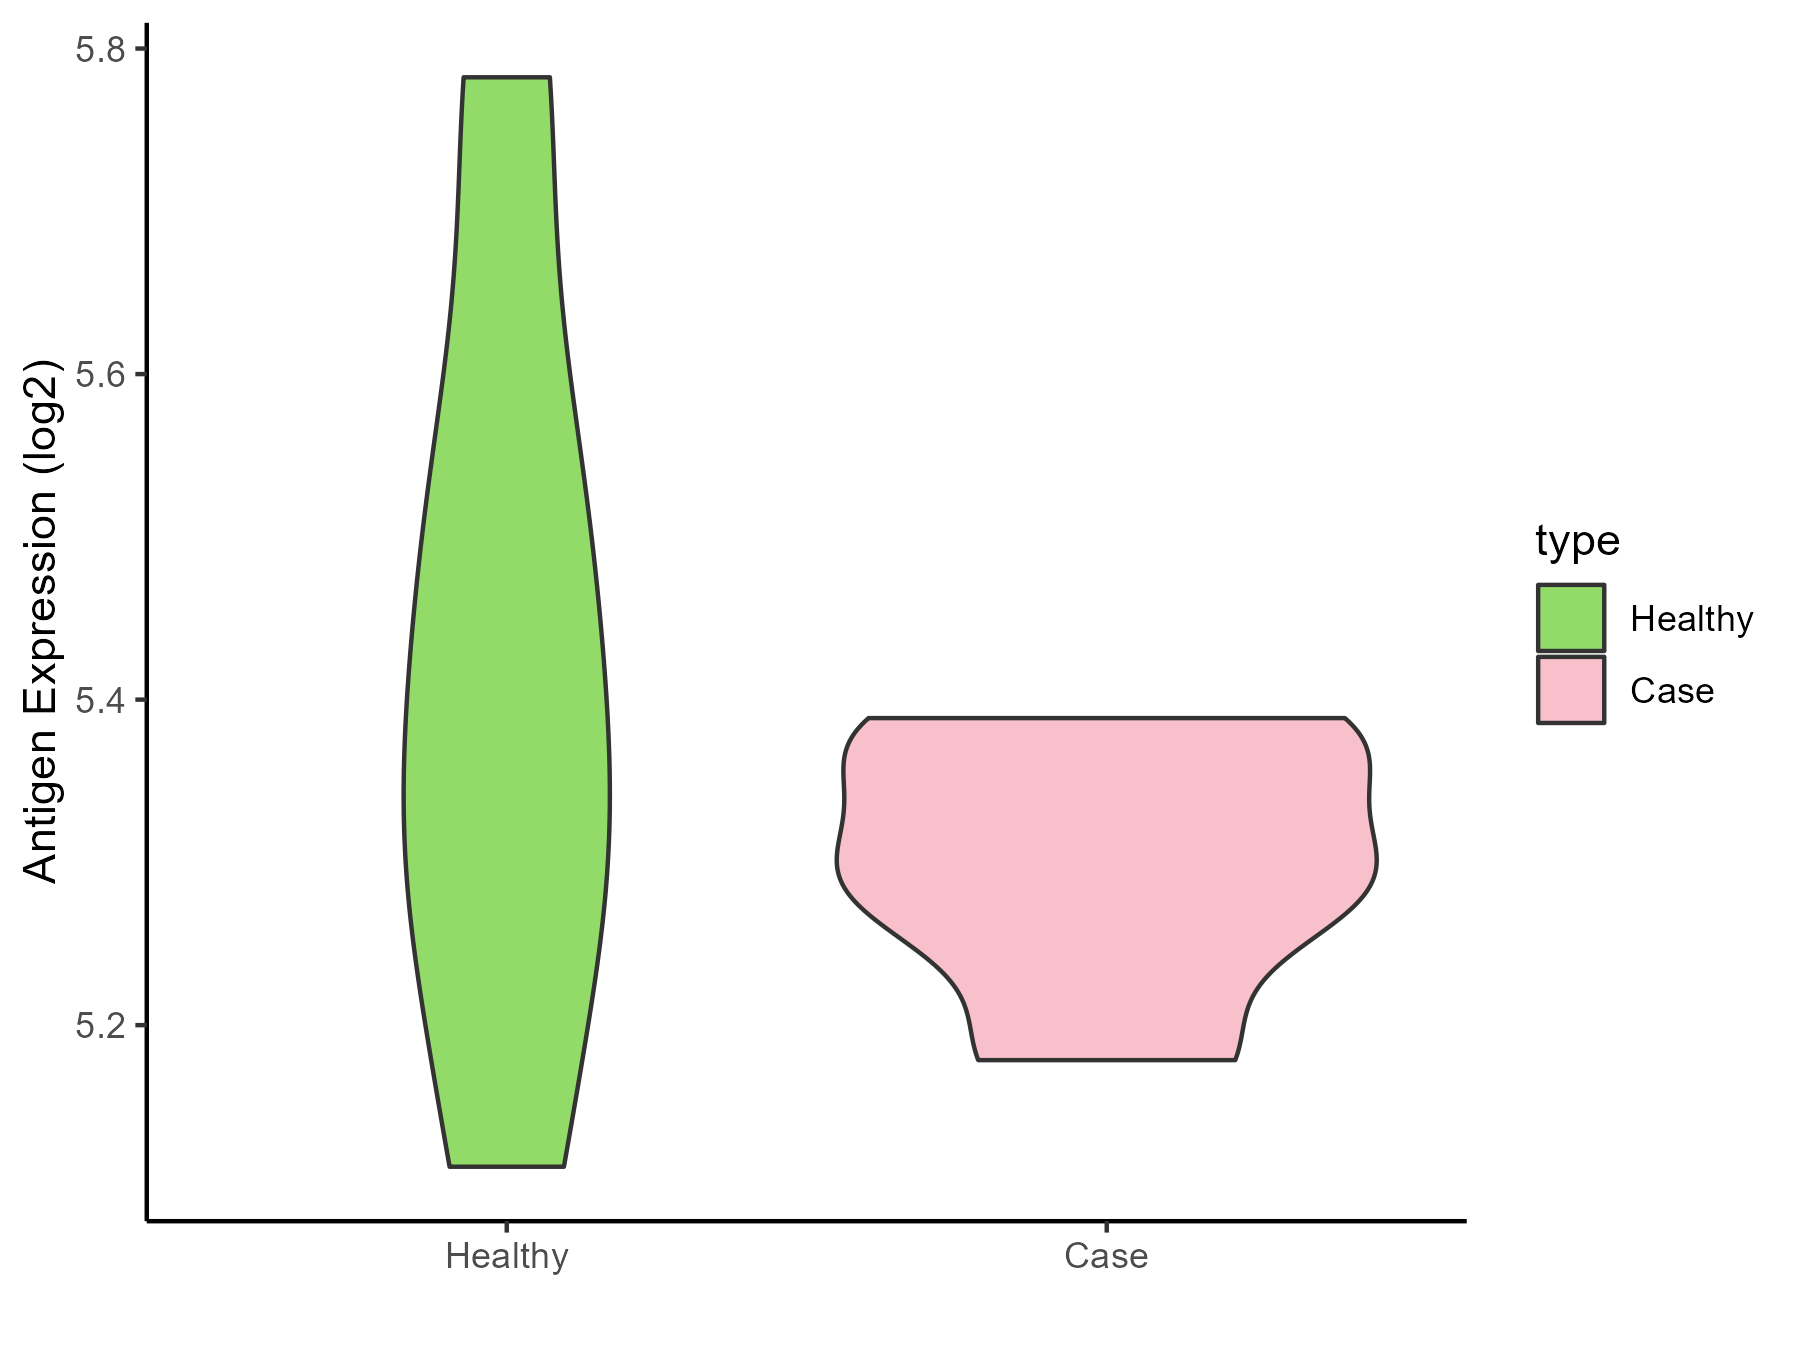
| Differential expression pattern of antigen in diseases | ||
| The Studied Tissue | Myometrium | |
| The Specific Disease | Preterm birth | |
| The Expression Level of Disease Section Compare with the Healthy Individual Tissue | p-value: 0.298870551; Fold-change: -0.095175576; Z-score: -0.405908407 | |
| Disease-specific Antigen Abundances |
|
Click to View the Clearer Original Diagram |
ICD Disease Classification 2
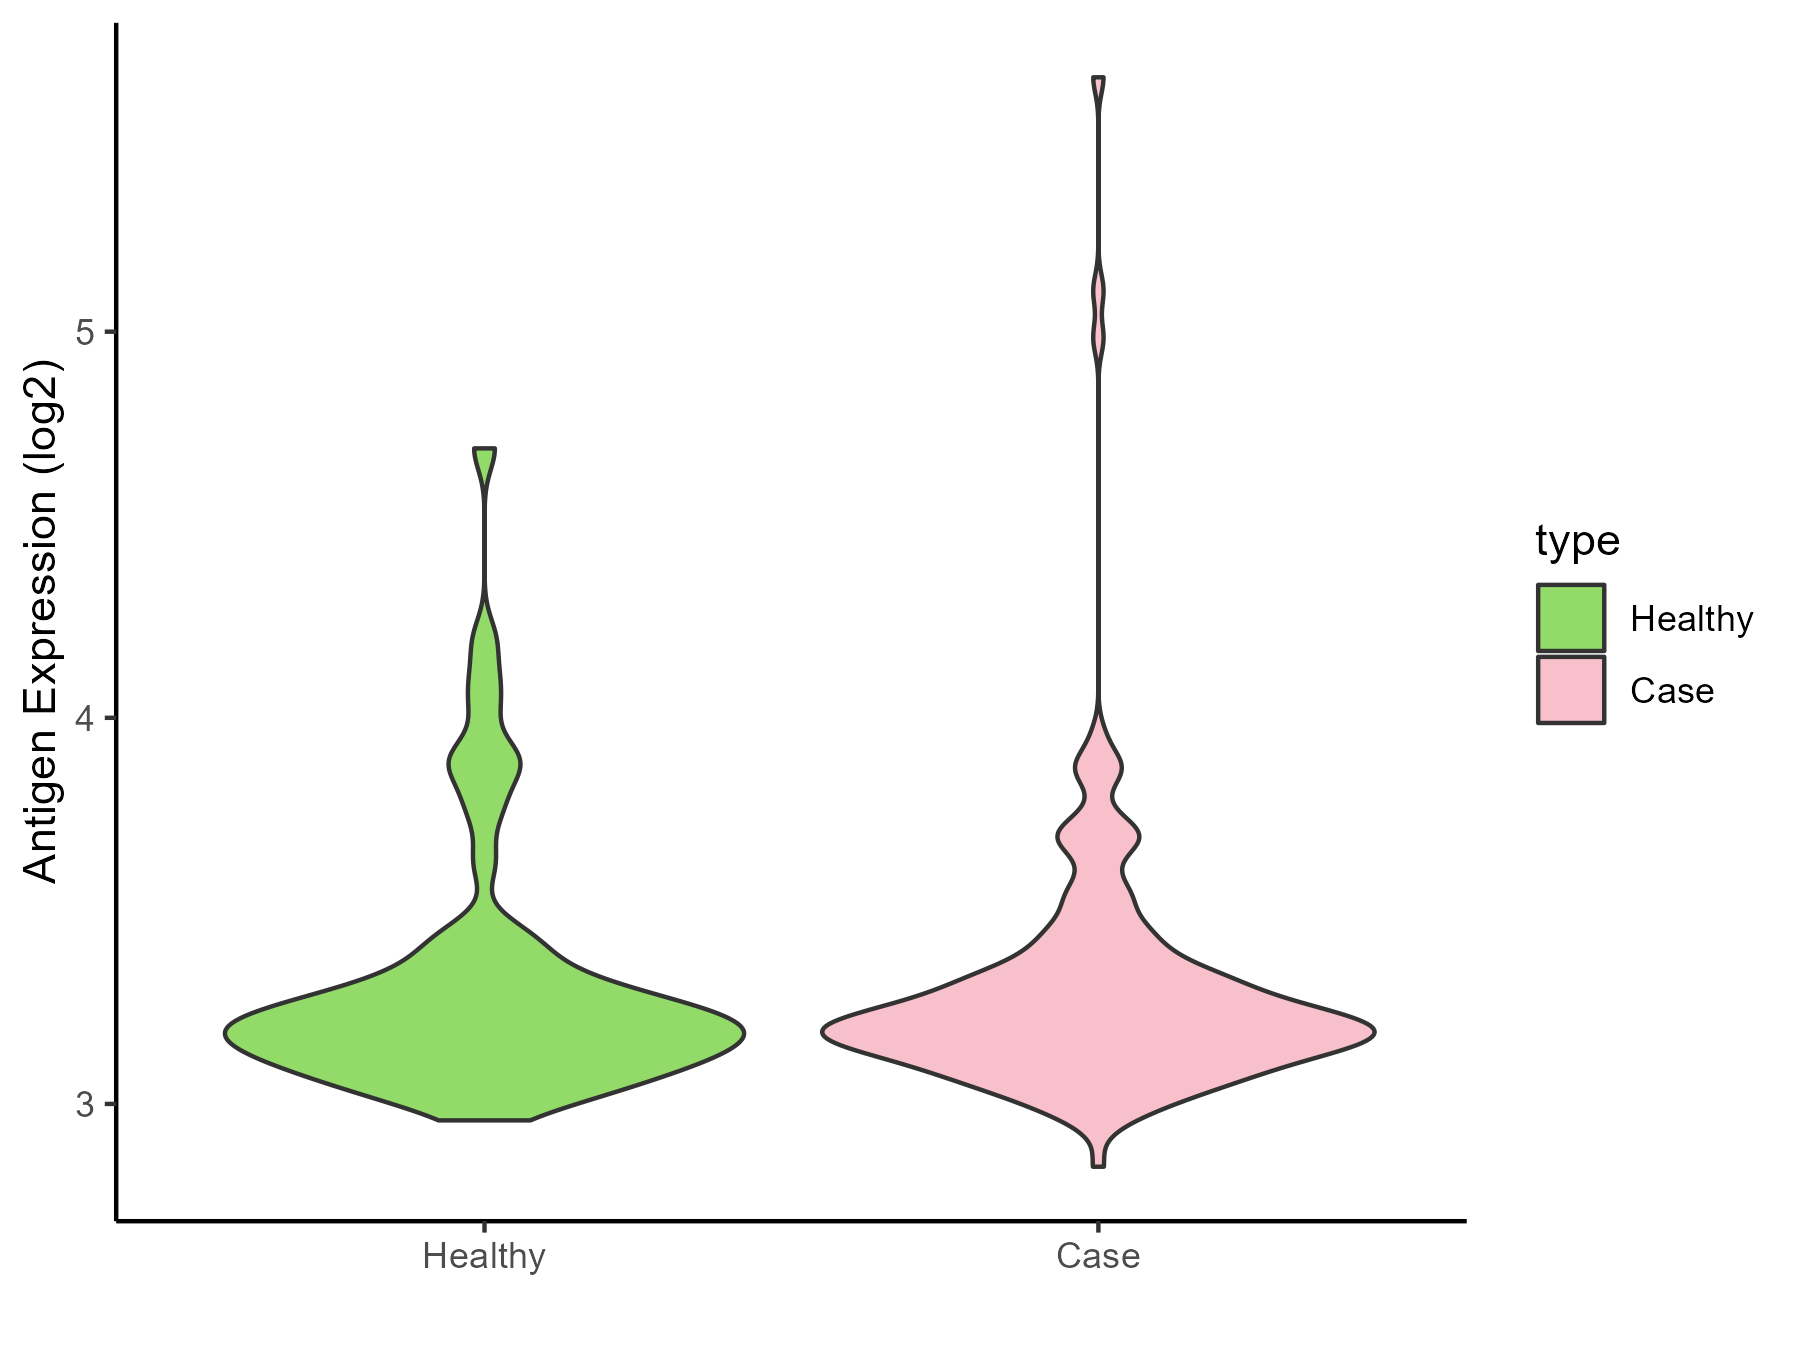
| Differential expression pattern of antigen in diseases | ||
| The Studied Tissue | Bone marrow | |
| The Specific Disease | Acute myelocytic leukemia | |
| The Expression Level of Disease Section Compare with the Healthy Individual Tissue | p-value: 0.68965086; Fold-change: 0.006292021; Z-score: 0.019320424 | |
| Disease-specific Antigen Abundances |
|
Click to View the Clearer Original Diagram |
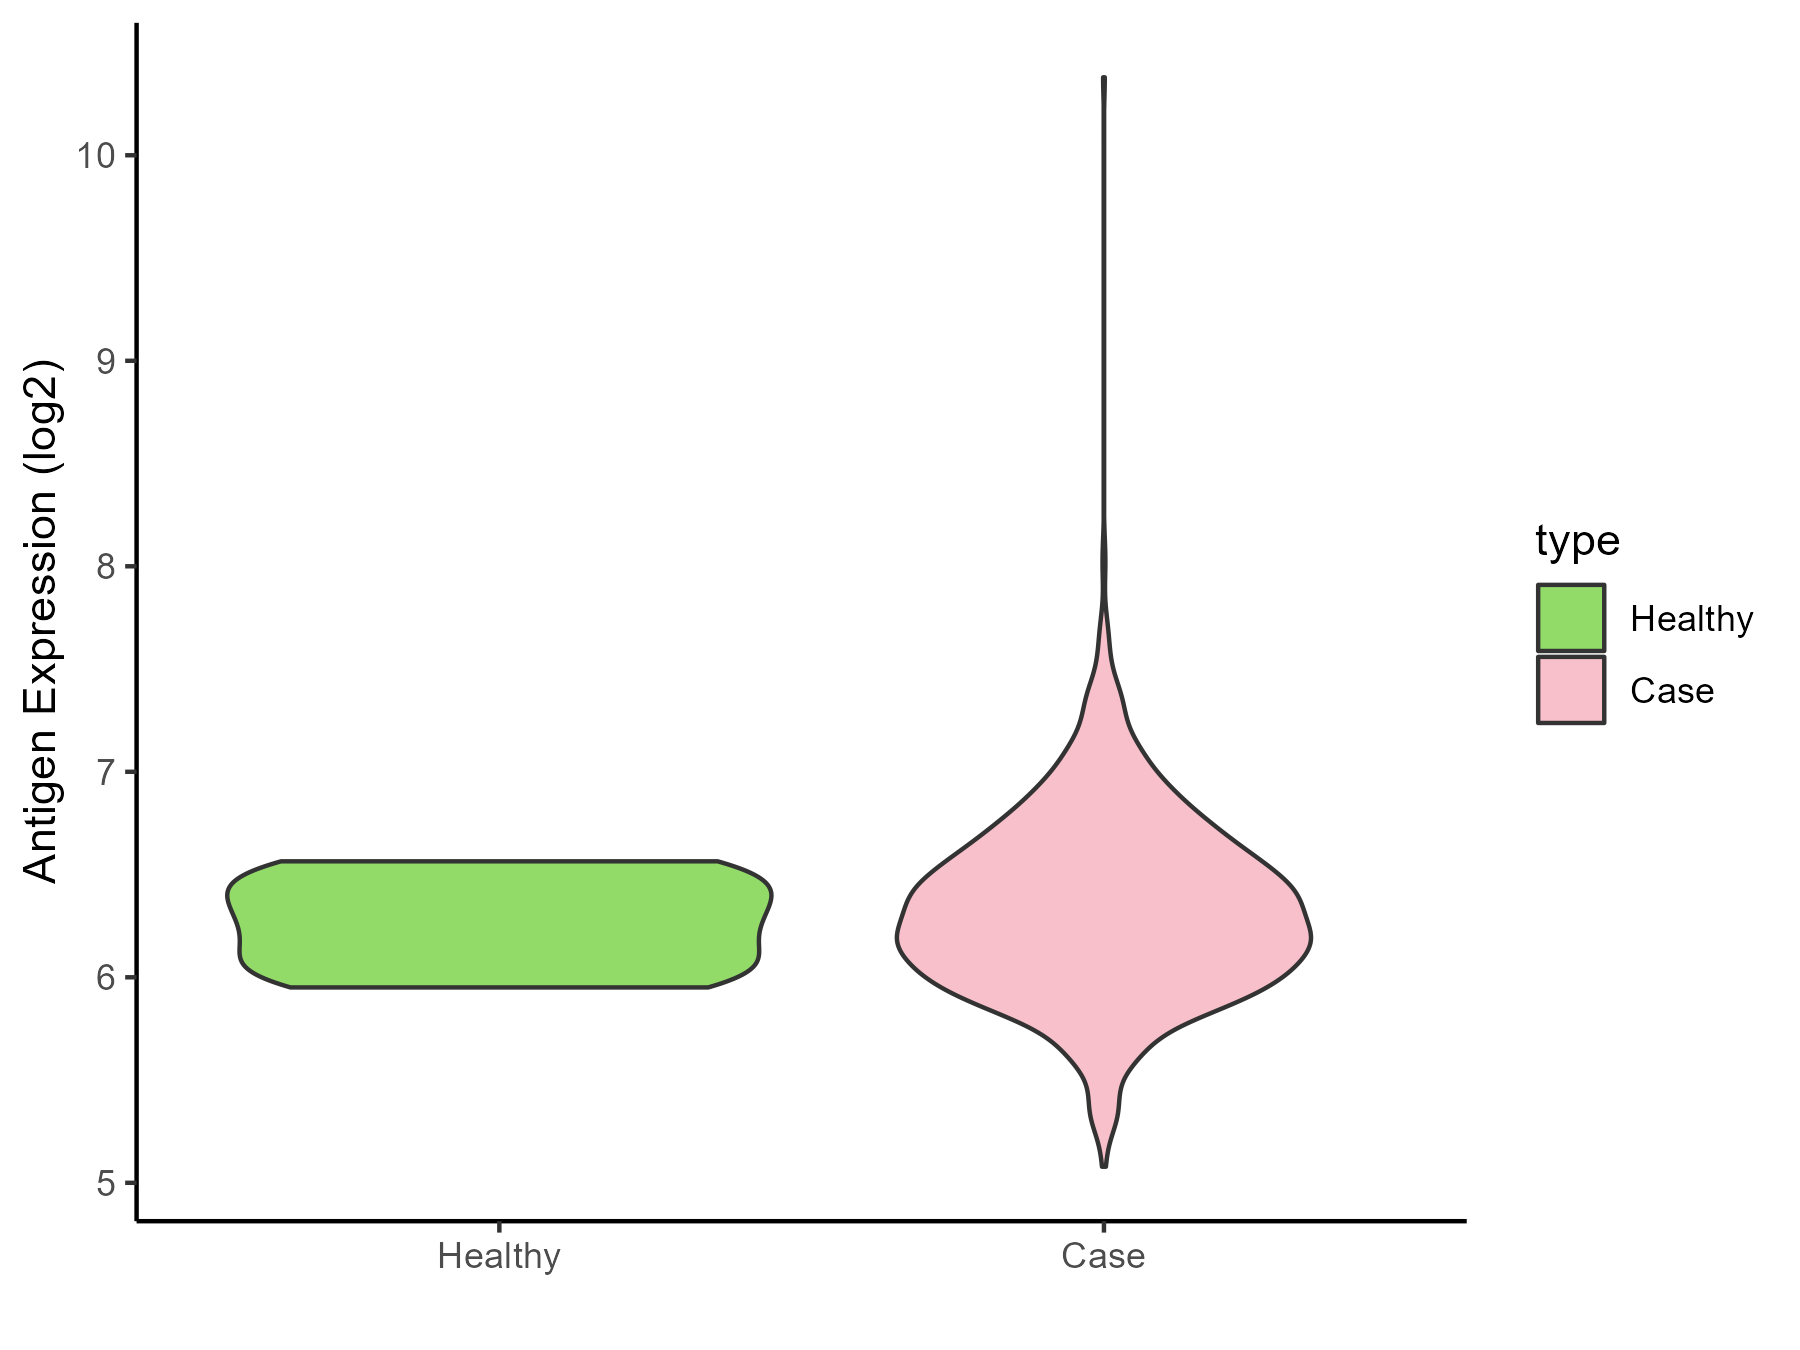
| Differential expression pattern of antigen in diseases | ||
| The Studied Tissue | Bone marrow | |
| The Specific Disease | Myeloma | |
| The Expression Level of Disease Section Compare with the Healthy Individual Tissue | p-value: 0.402563216; Fold-change: 0.029433549; Z-score: 0.124612656 | |
| Disease-specific Antigen Abundances |
|
Click to View the Clearer Original Diagram |
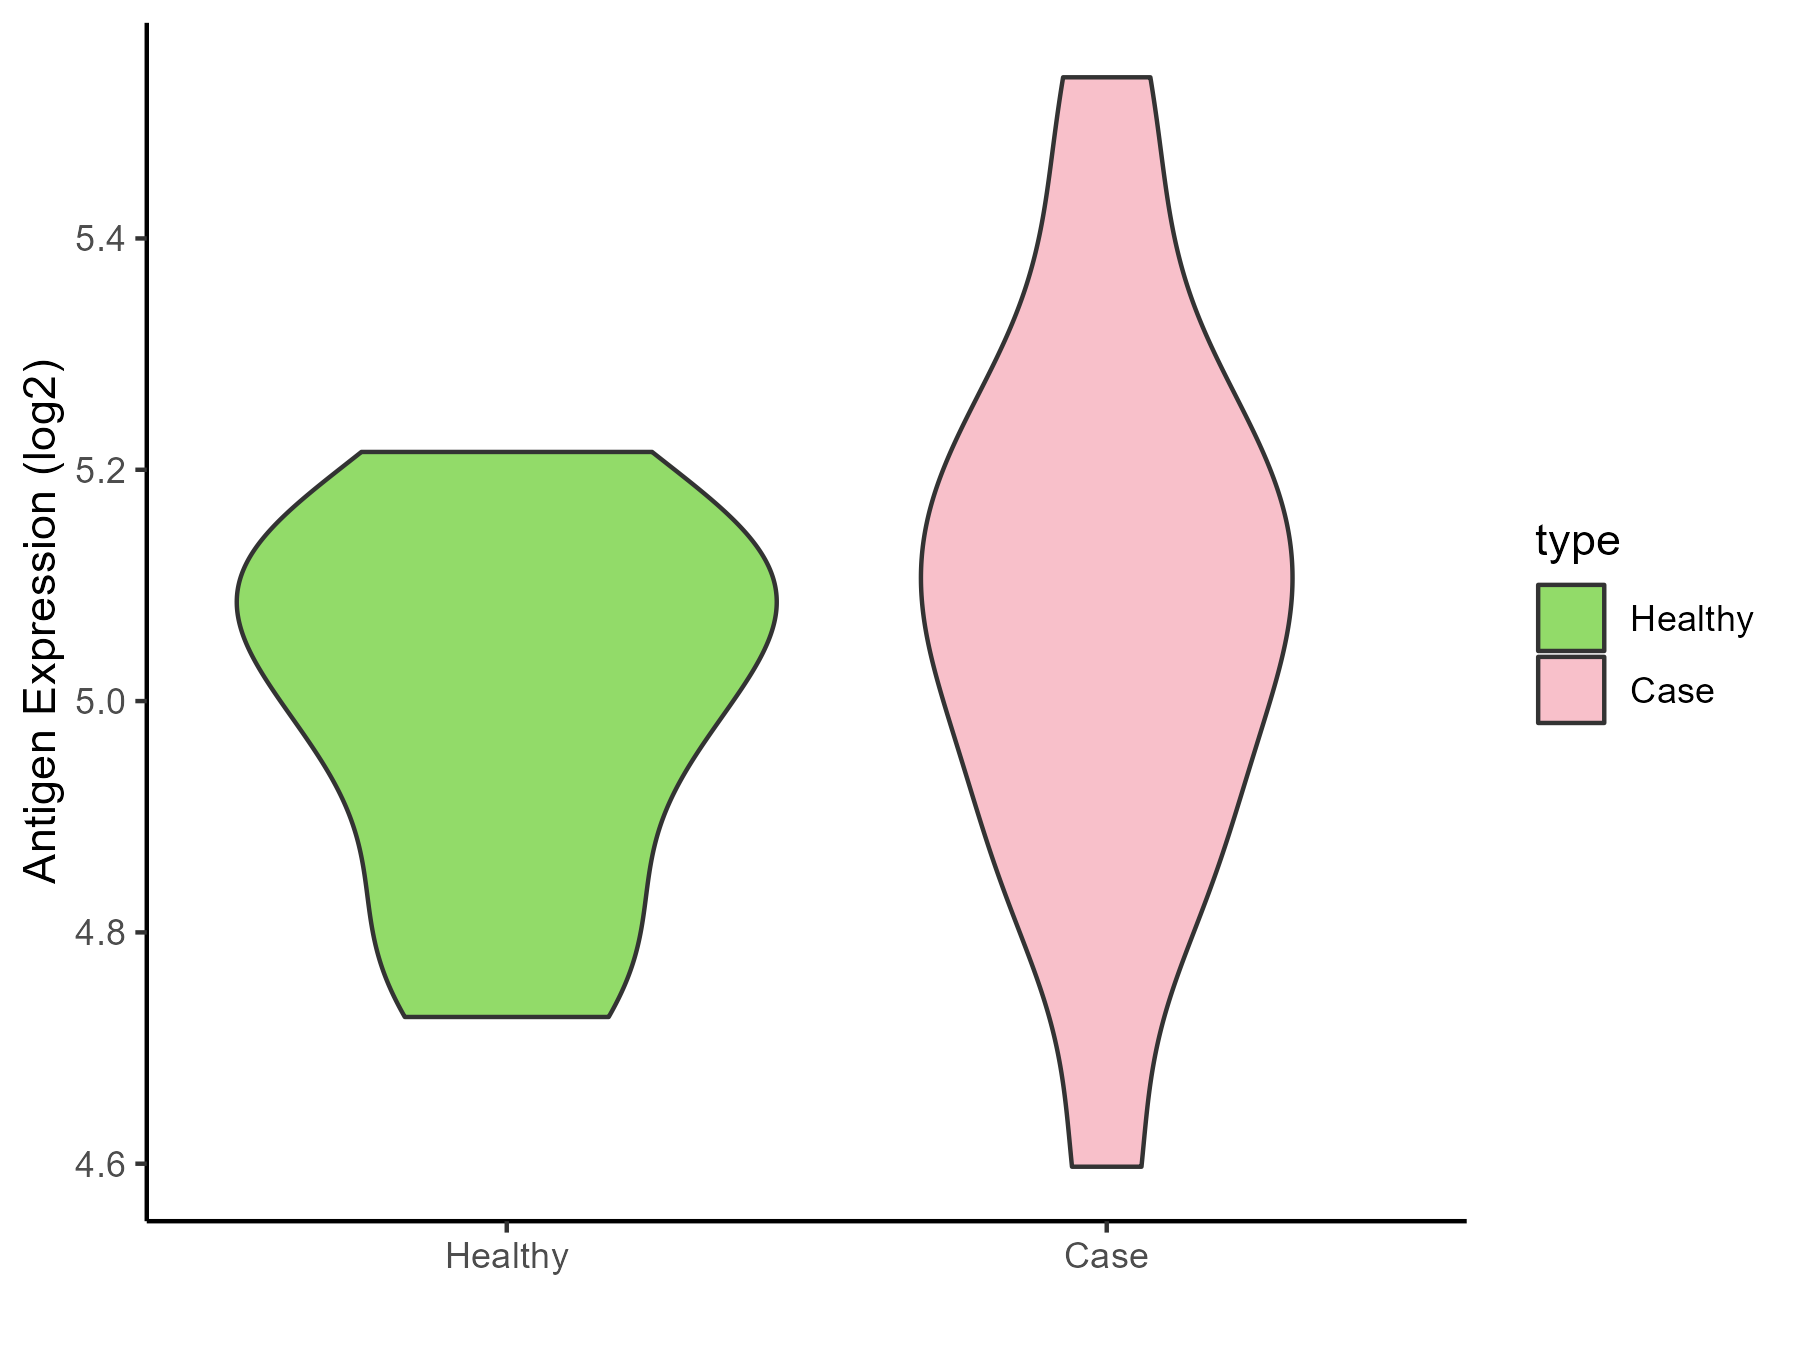
| The Studied Tissue | Peripheral blood | |
| The Specific Disease | Myeloma | |
| The Expression Level of Disease Section Compare with the Healthy Individual Tissue | p-value: 0.313734116; Fold-change: 0.038182995; Z-score: 0.247061911 | |
| Disease-specific Antigen Abundances |
|
Click to View the Clearer Original Diagram |
| Differential expression pattern of antigen in diseases | ||
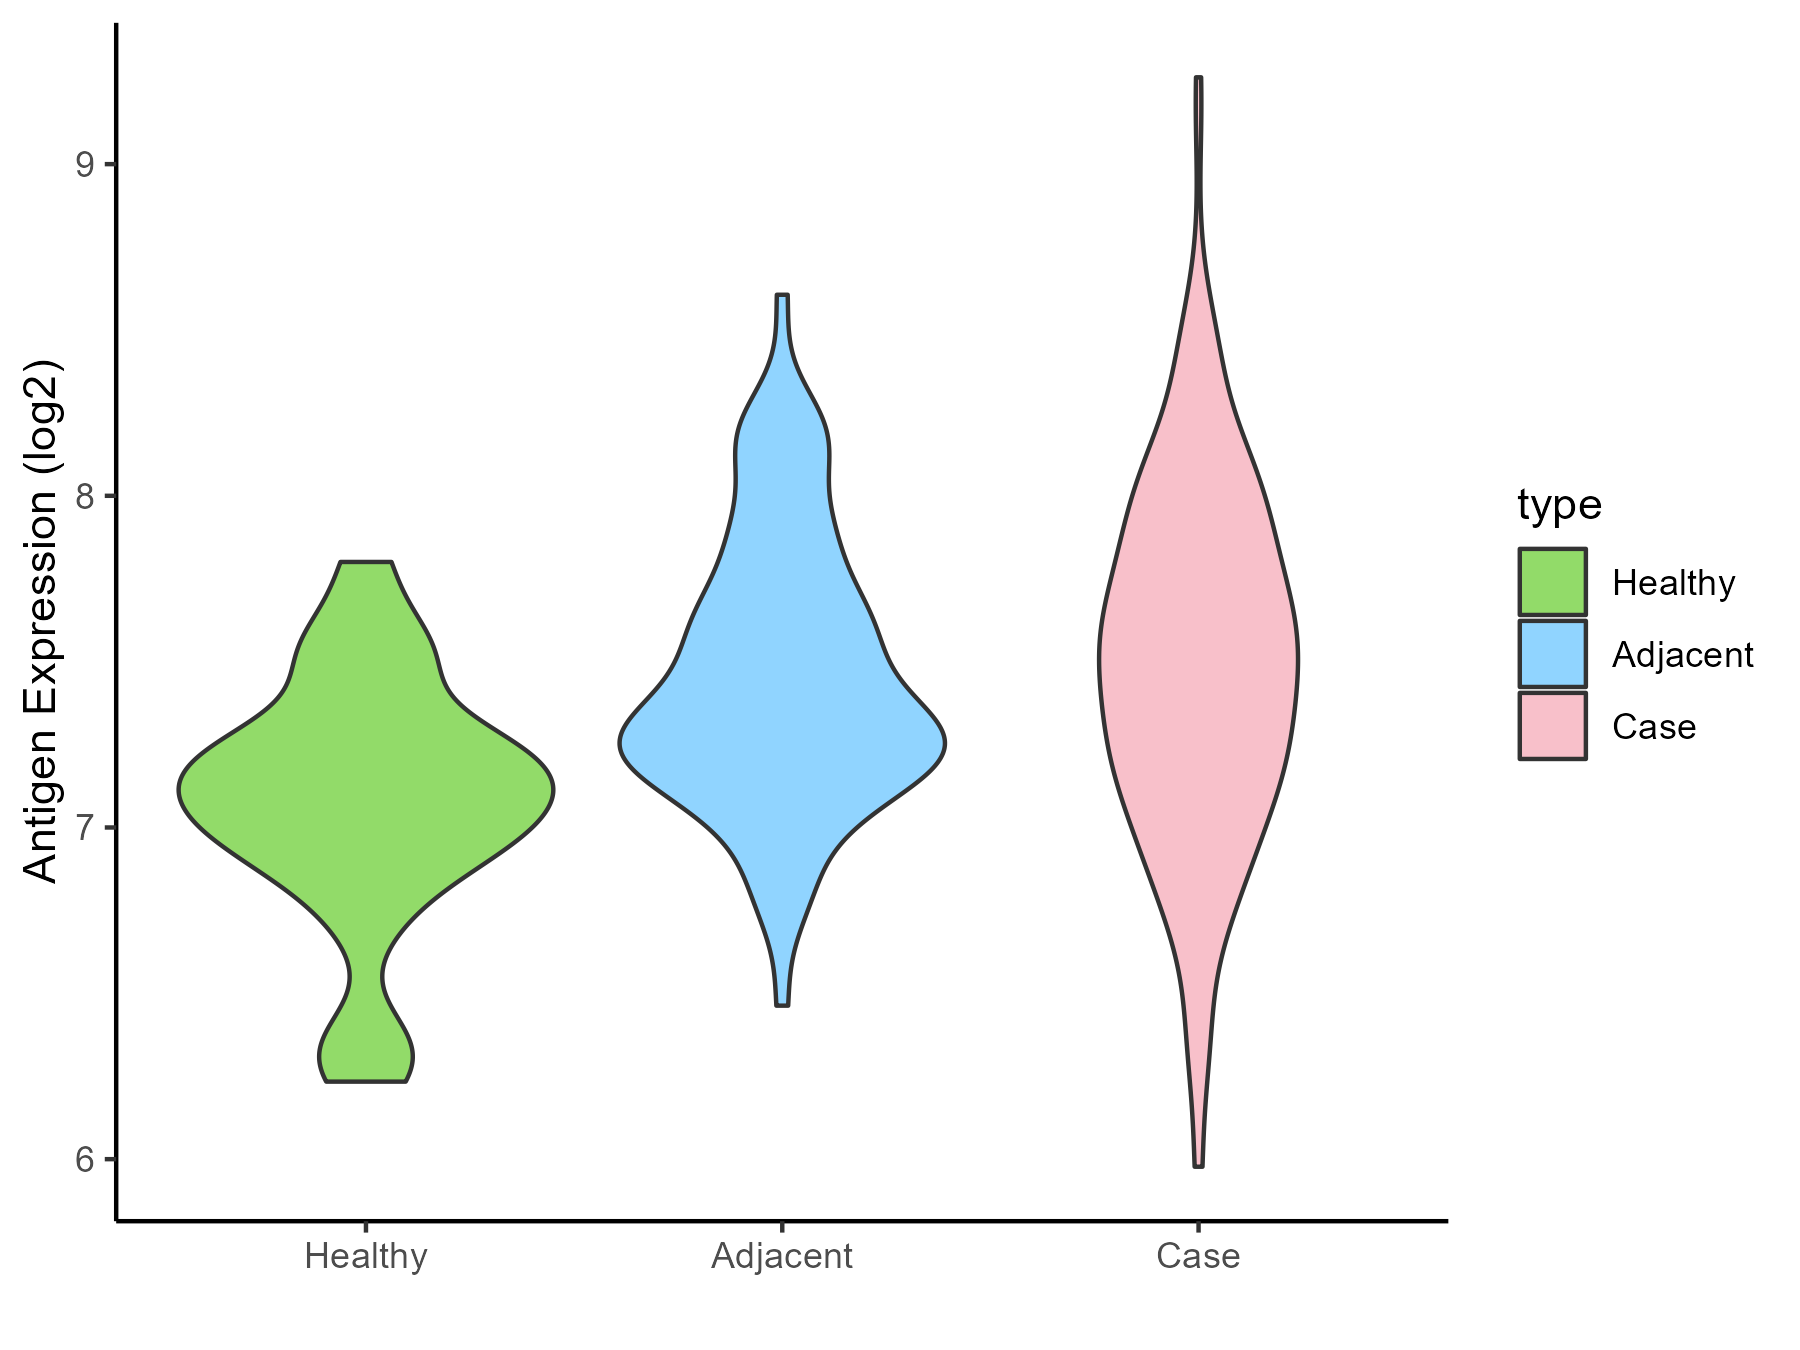
| The Studied Tissue | Oral | |
| The Specific Disease | Oral cancer | |
| The Expression Level of Disease Section Compare with the Healthy Individual Tissue | p-value: 8.65E-06; Fold-change: 0.386657523; Z-score: 1.030877618 | |
| The Expression Level of Disease Section Compare with the Adjacent Tissue | p-value: 0.517367753; Fold-change: 0.132406771; Z-score: 0.323764213 | |
| Disease-specific Antigen Abundances |
|
Click to View the Clearer Original Diagram |
| Differential expression pattern of antigen in diseases | ||
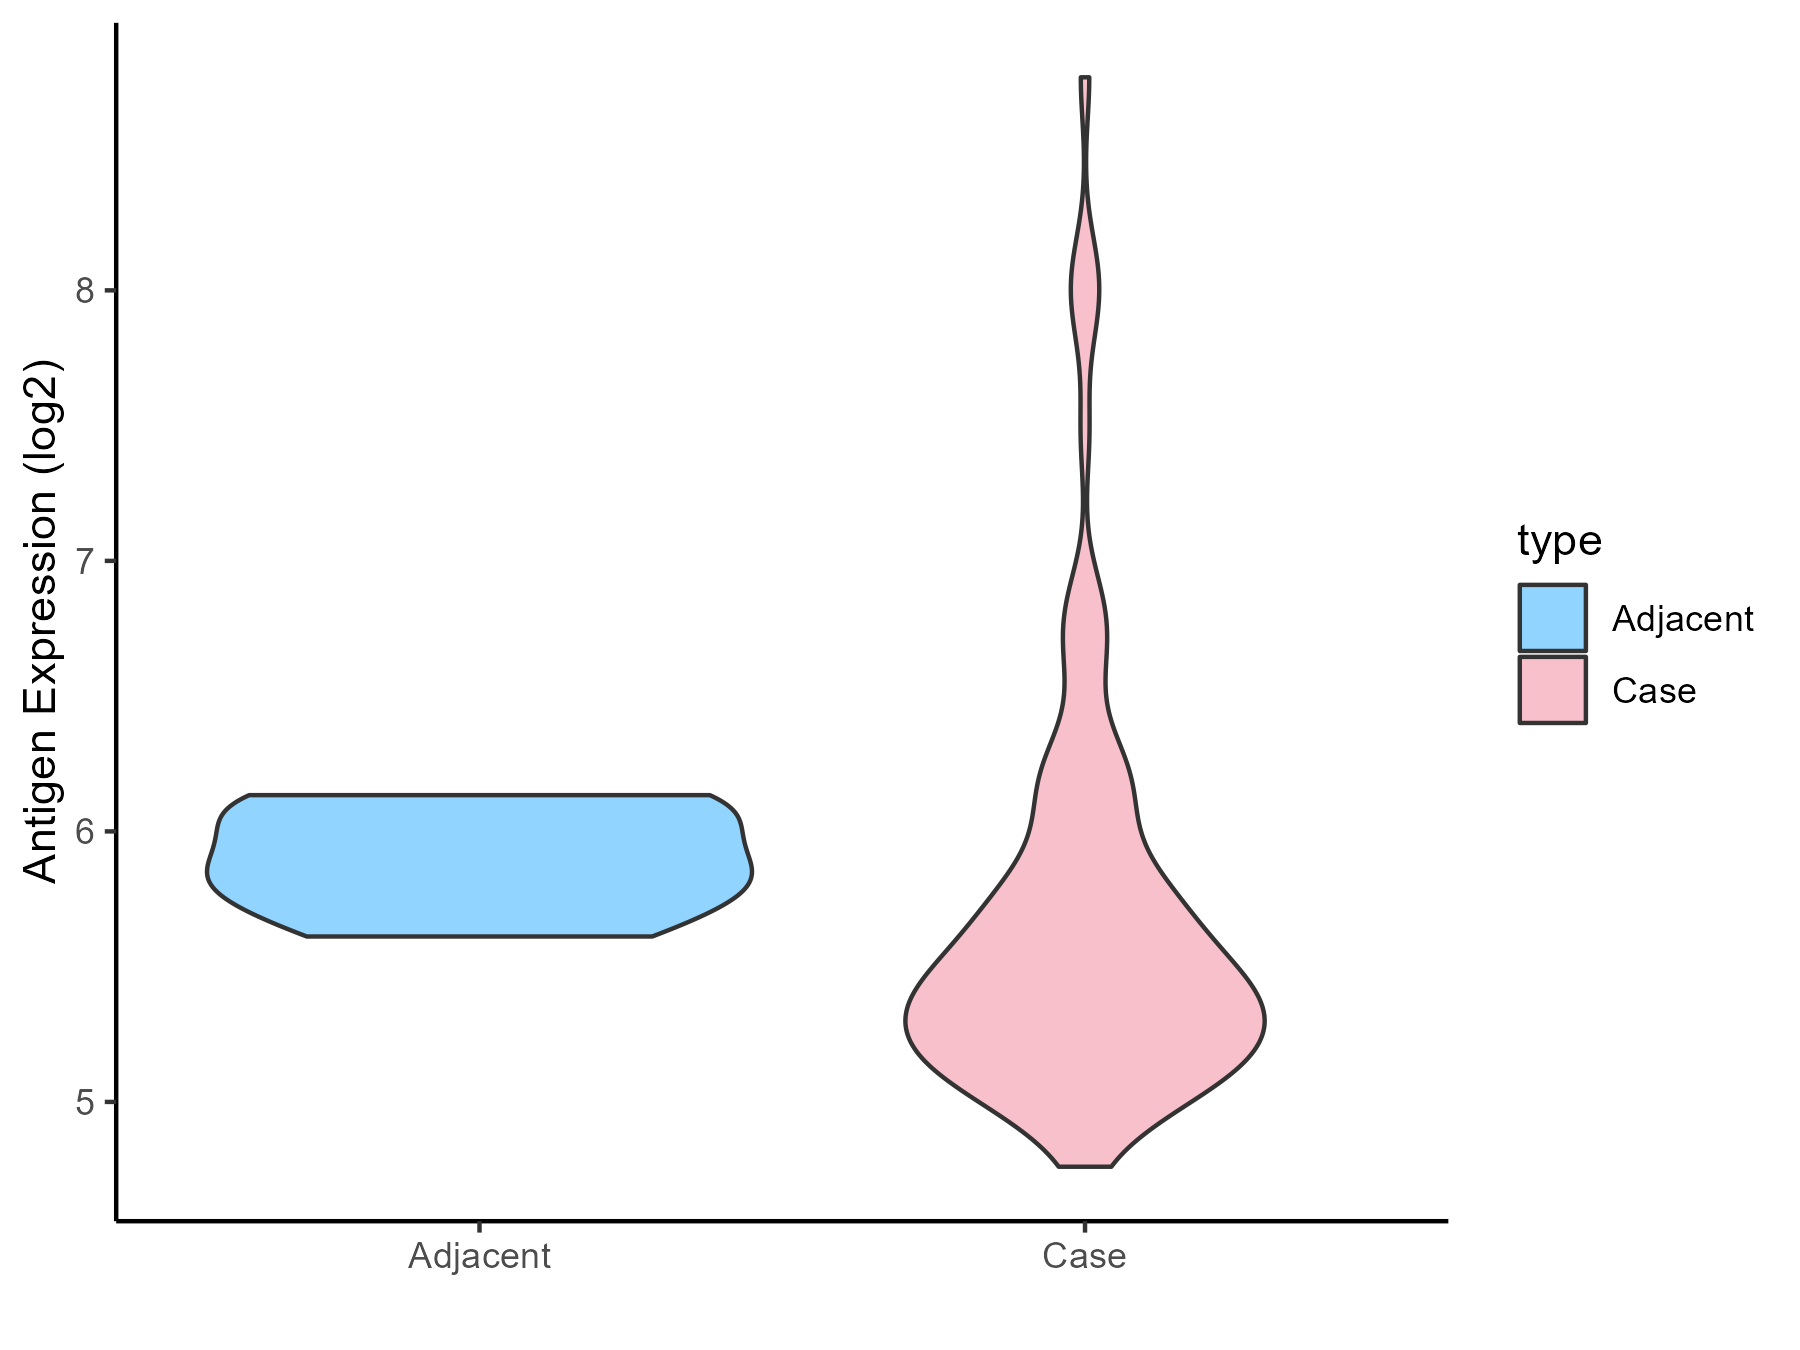
| The Studied Tissue | Esophagus | |
| The Specific Disease | Esophagal cancer | |
| The Expression Level of Disease Section Compare with the Adjacent Tissue | p-value: 0.091147502; Fold-change: -0.408649046; Z-score: -1.909602421 | |
| Disease-specific Antigen Abundances |
|
Click to View the Clearer Original Diagram |
| Differential expression pattern of antigen in diseases | ||
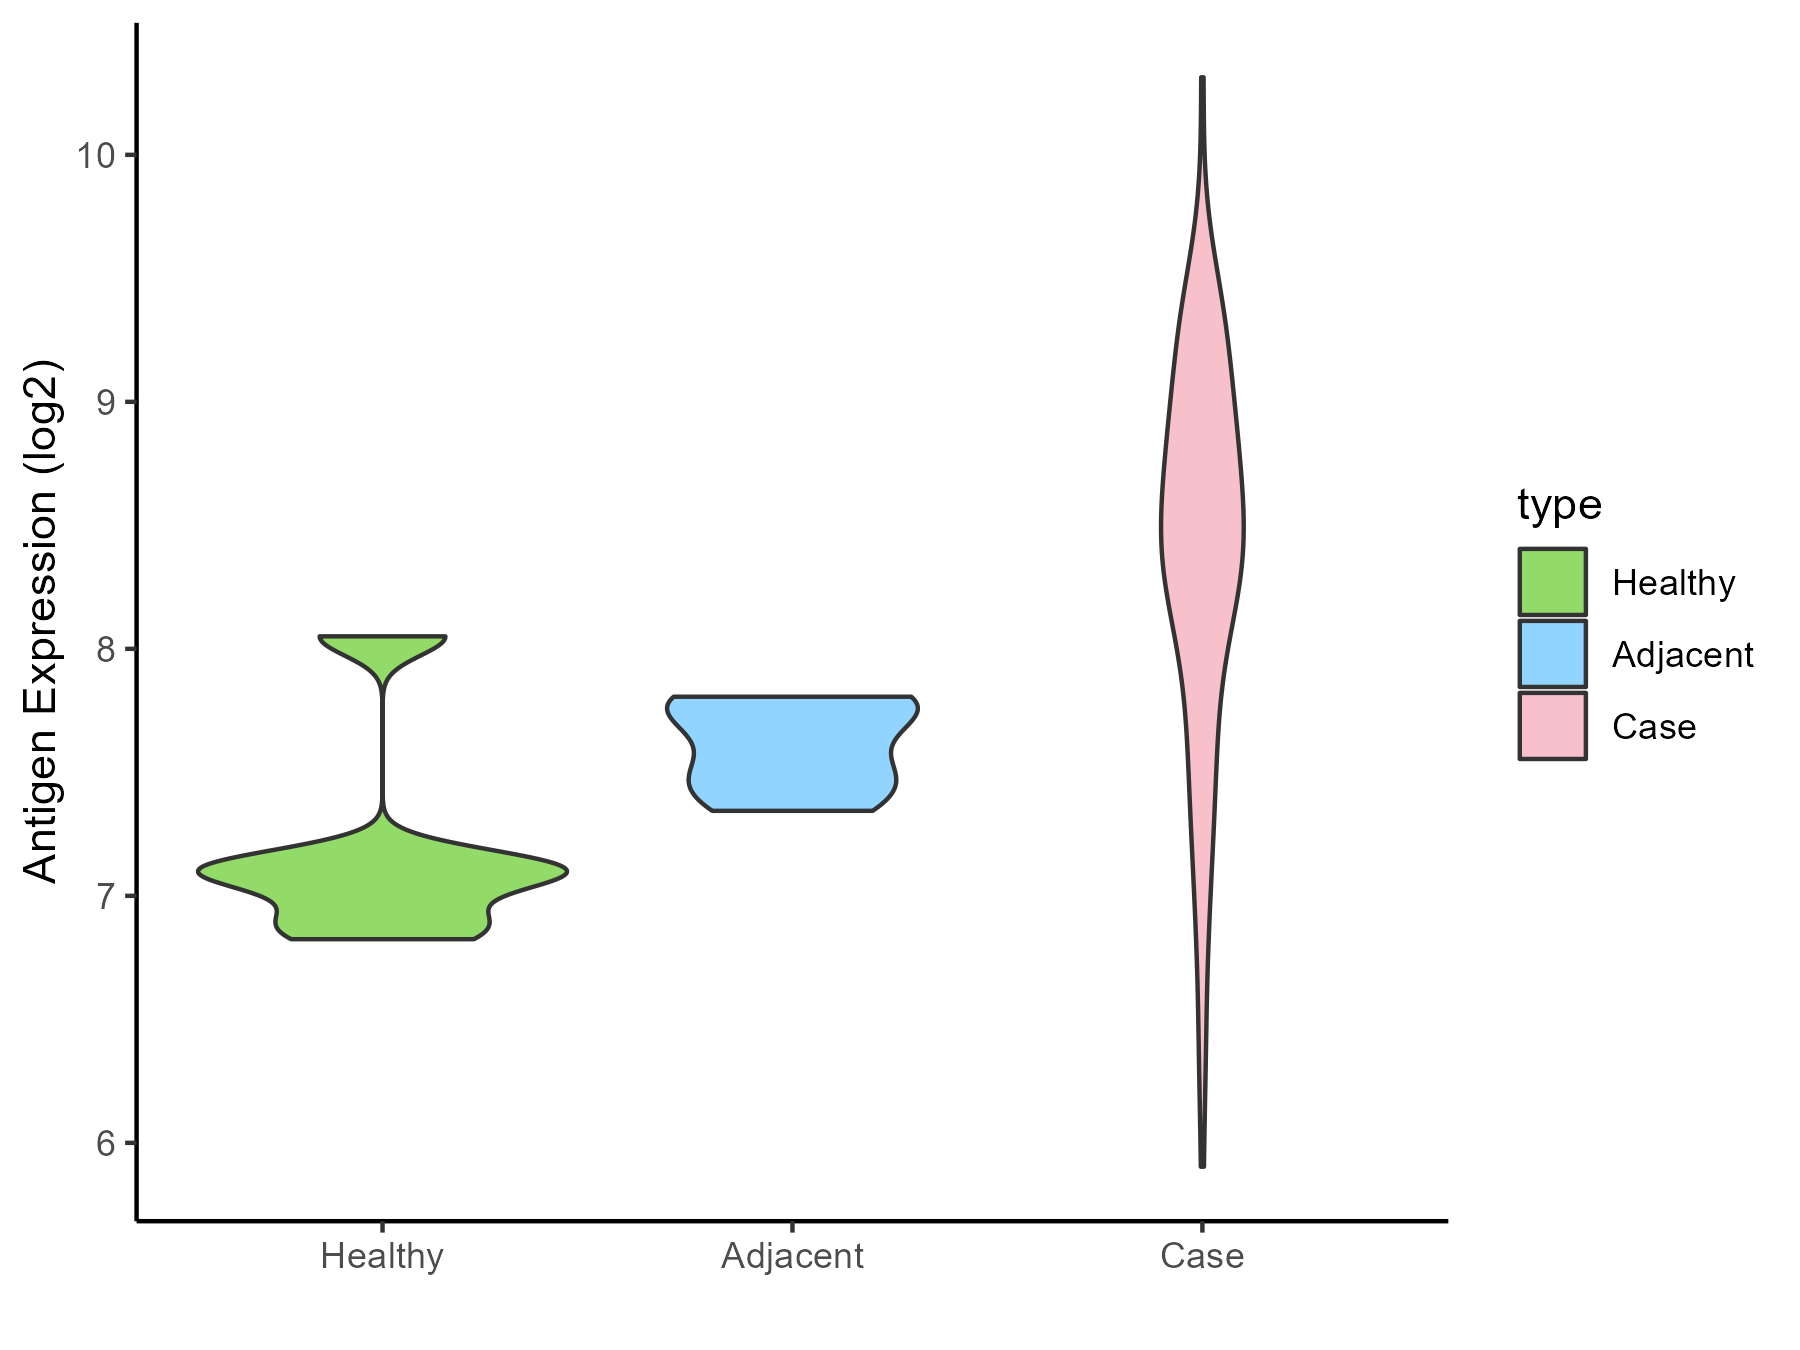
| The Studied Tissue | Rectal colon | |
| The Specific Disease | Rectal cancer | |
| The Expression Level of Disease Section Compare with the Healthy Individual Tissue | p-value: 0.000492139; Fold-change: 1.385523096; Z-score: 3.147098868 | |
| The Expression Level of Disease Section Compare with the Adjacent Tissue | p-value: 1.51E-06; Fold-change: 0.830662068; Z-score: 4.278279424 | |
| Disease-specific Antigen Abundances |
|
Click to View the Clearer Original Diagram |
| Differential expression pattern of antigen in diseases | ||
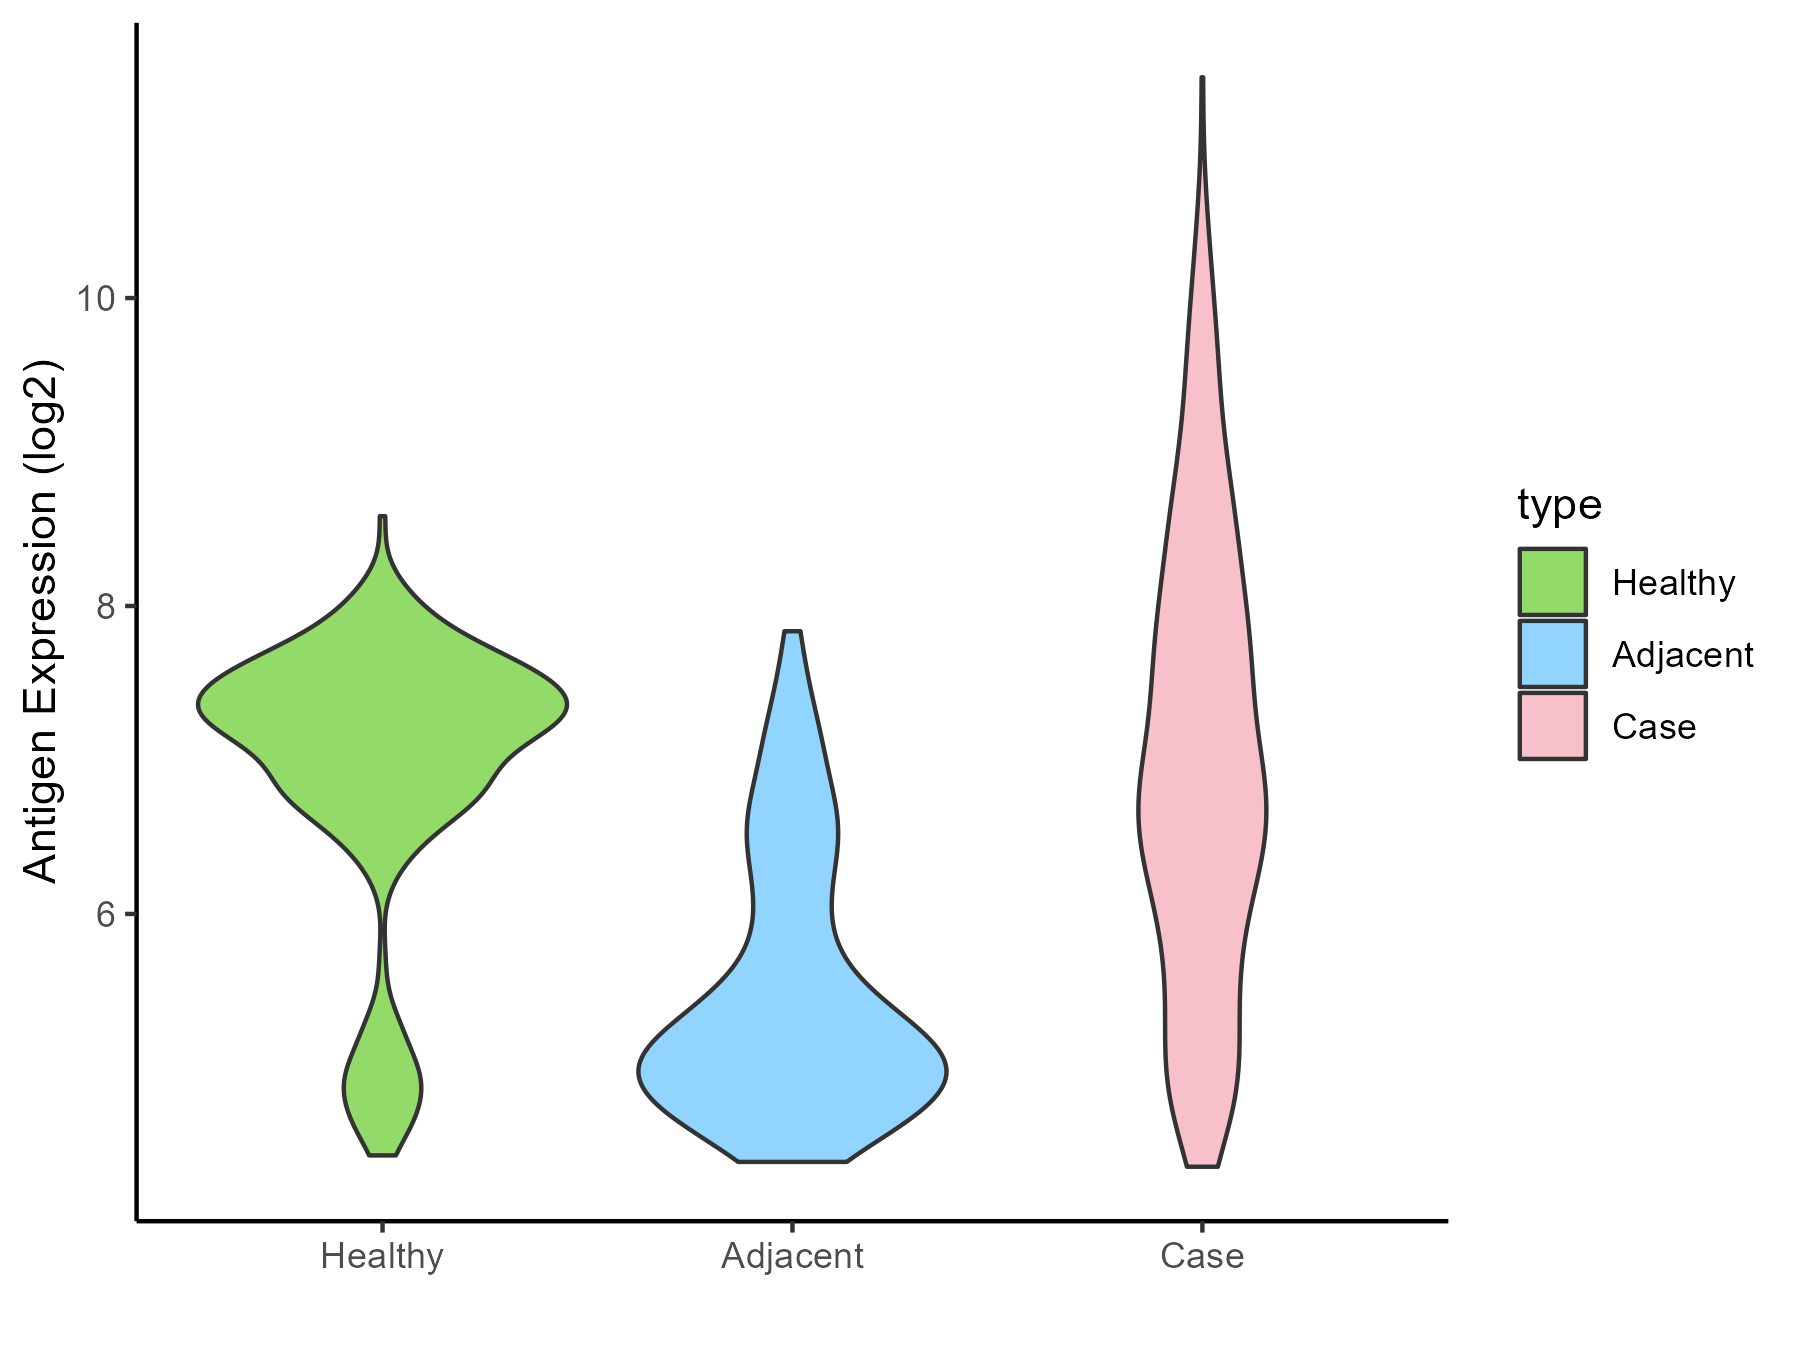
| The Studied Tissue | Skin | |
| The Specific Disease | Skin cancer | |
| The Expression Level of Disease Section Compare with the Healthy Individual Tissue | p-value: 0.495862942; Fold-change: -0.367969819; Z-score: -0.409952995 | |
| The Expression Level of Disease Section Compare with the Adjacent Tissue | p-value: 1.21E-45; Fold-change: 1.668097812; Z-score: 1.97421435 | |
| Disease-specific Antigen Abundances |
|
Click to View the Clearer Original Diagram |
| Differential expression pattern of antigen in diseases | ||
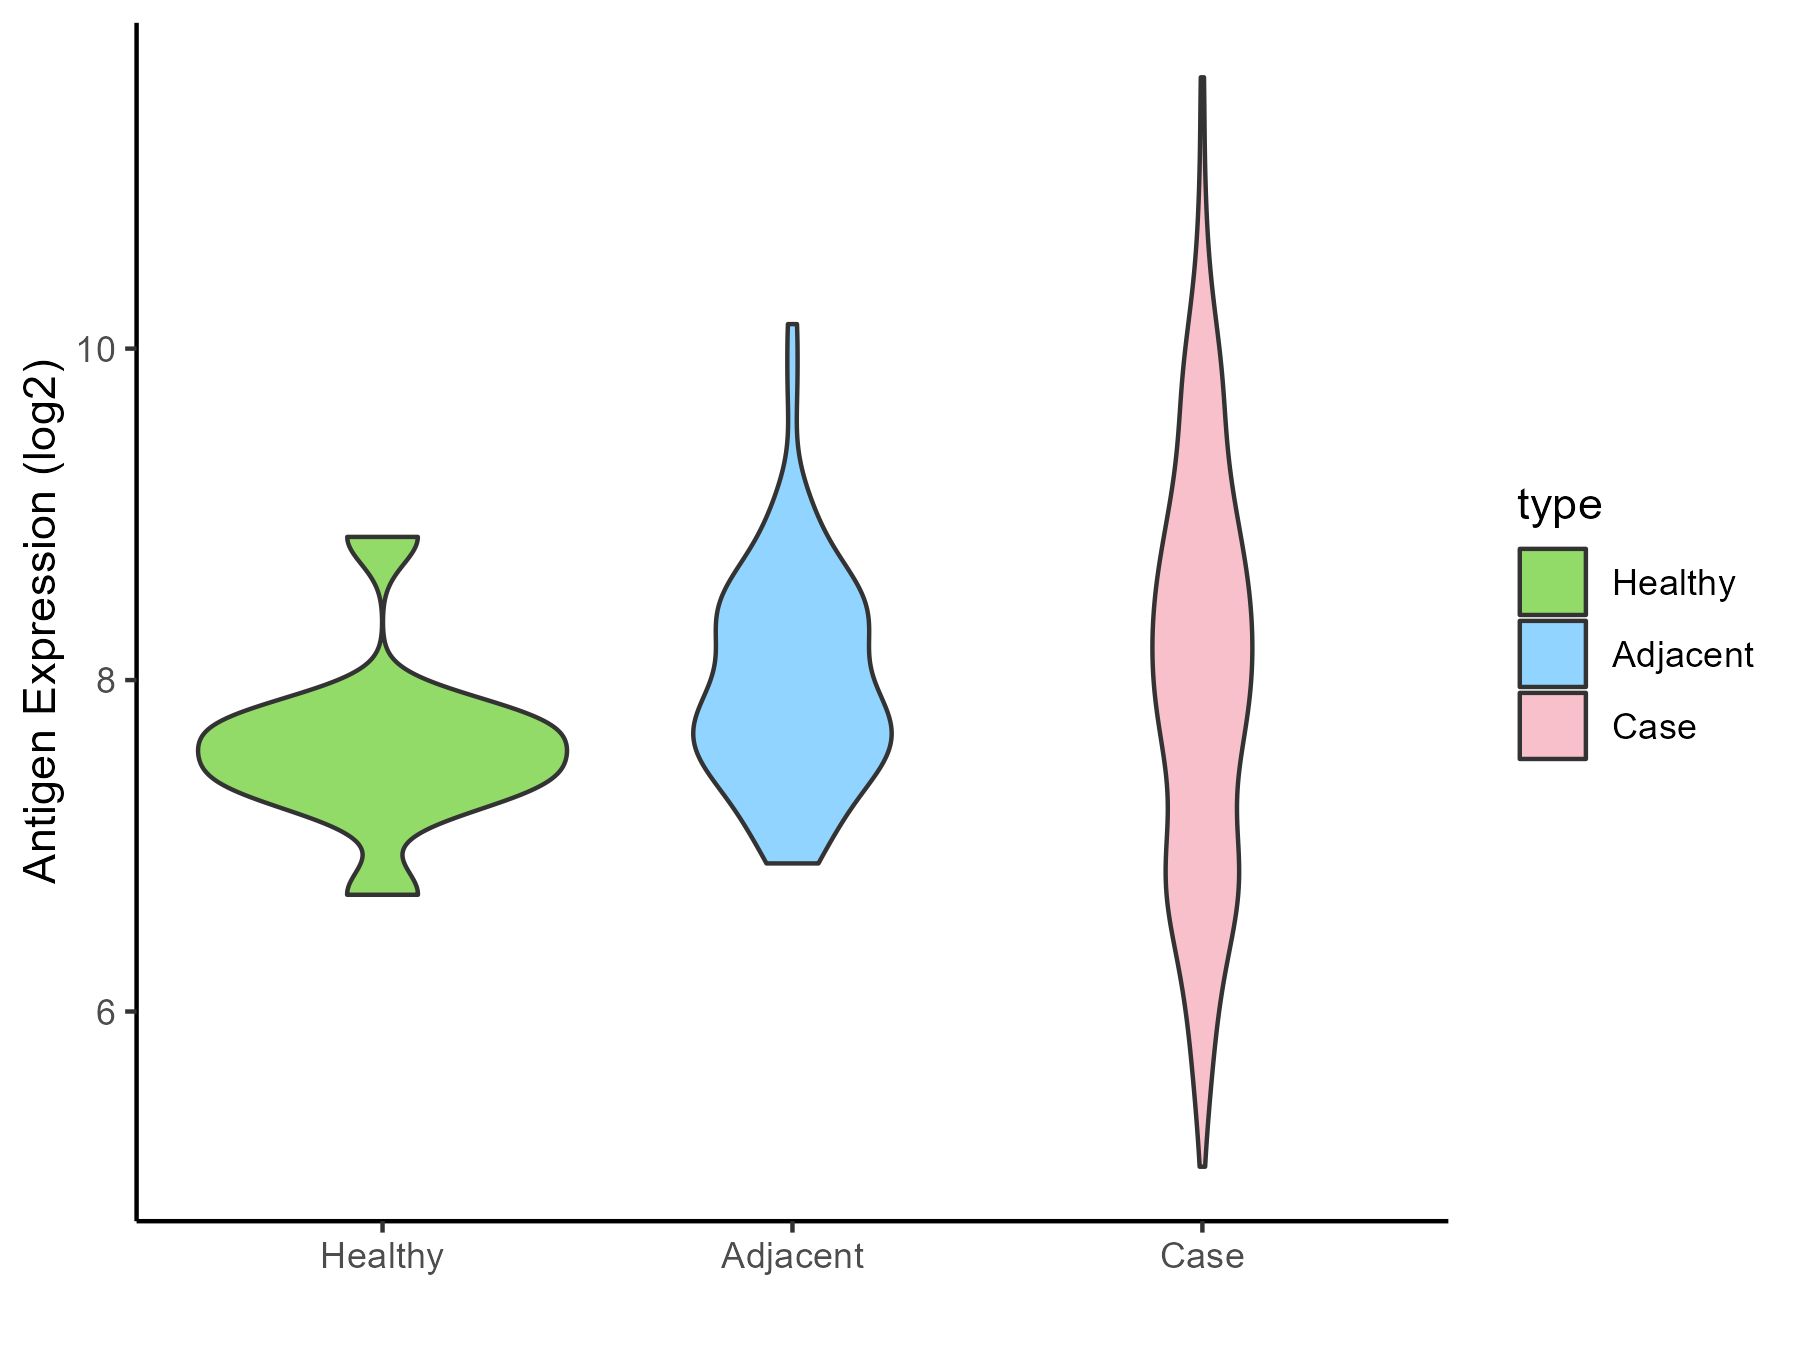
| The Studied Tissue | Kidney | |
| The Specific Disease | Renal cancer | |
| The Expression Level of Disease Section Compare with the Healthy Individual Tissue | p-value: 0.02880893; Fold-change: 0.505490089; Z-score: 0.96696137 | |
| The Expression Level of Disease Section Compare with the Adjacent Tissue | p-value: 0.798862873; Fold-change: 0.181768757; Z-score: 0.284895101 | |
| Disease-specific Antigen Abundances |
|
Click to View the Clearer Original Diagram |
| Differential expression pattern of antigen in diseases | ||
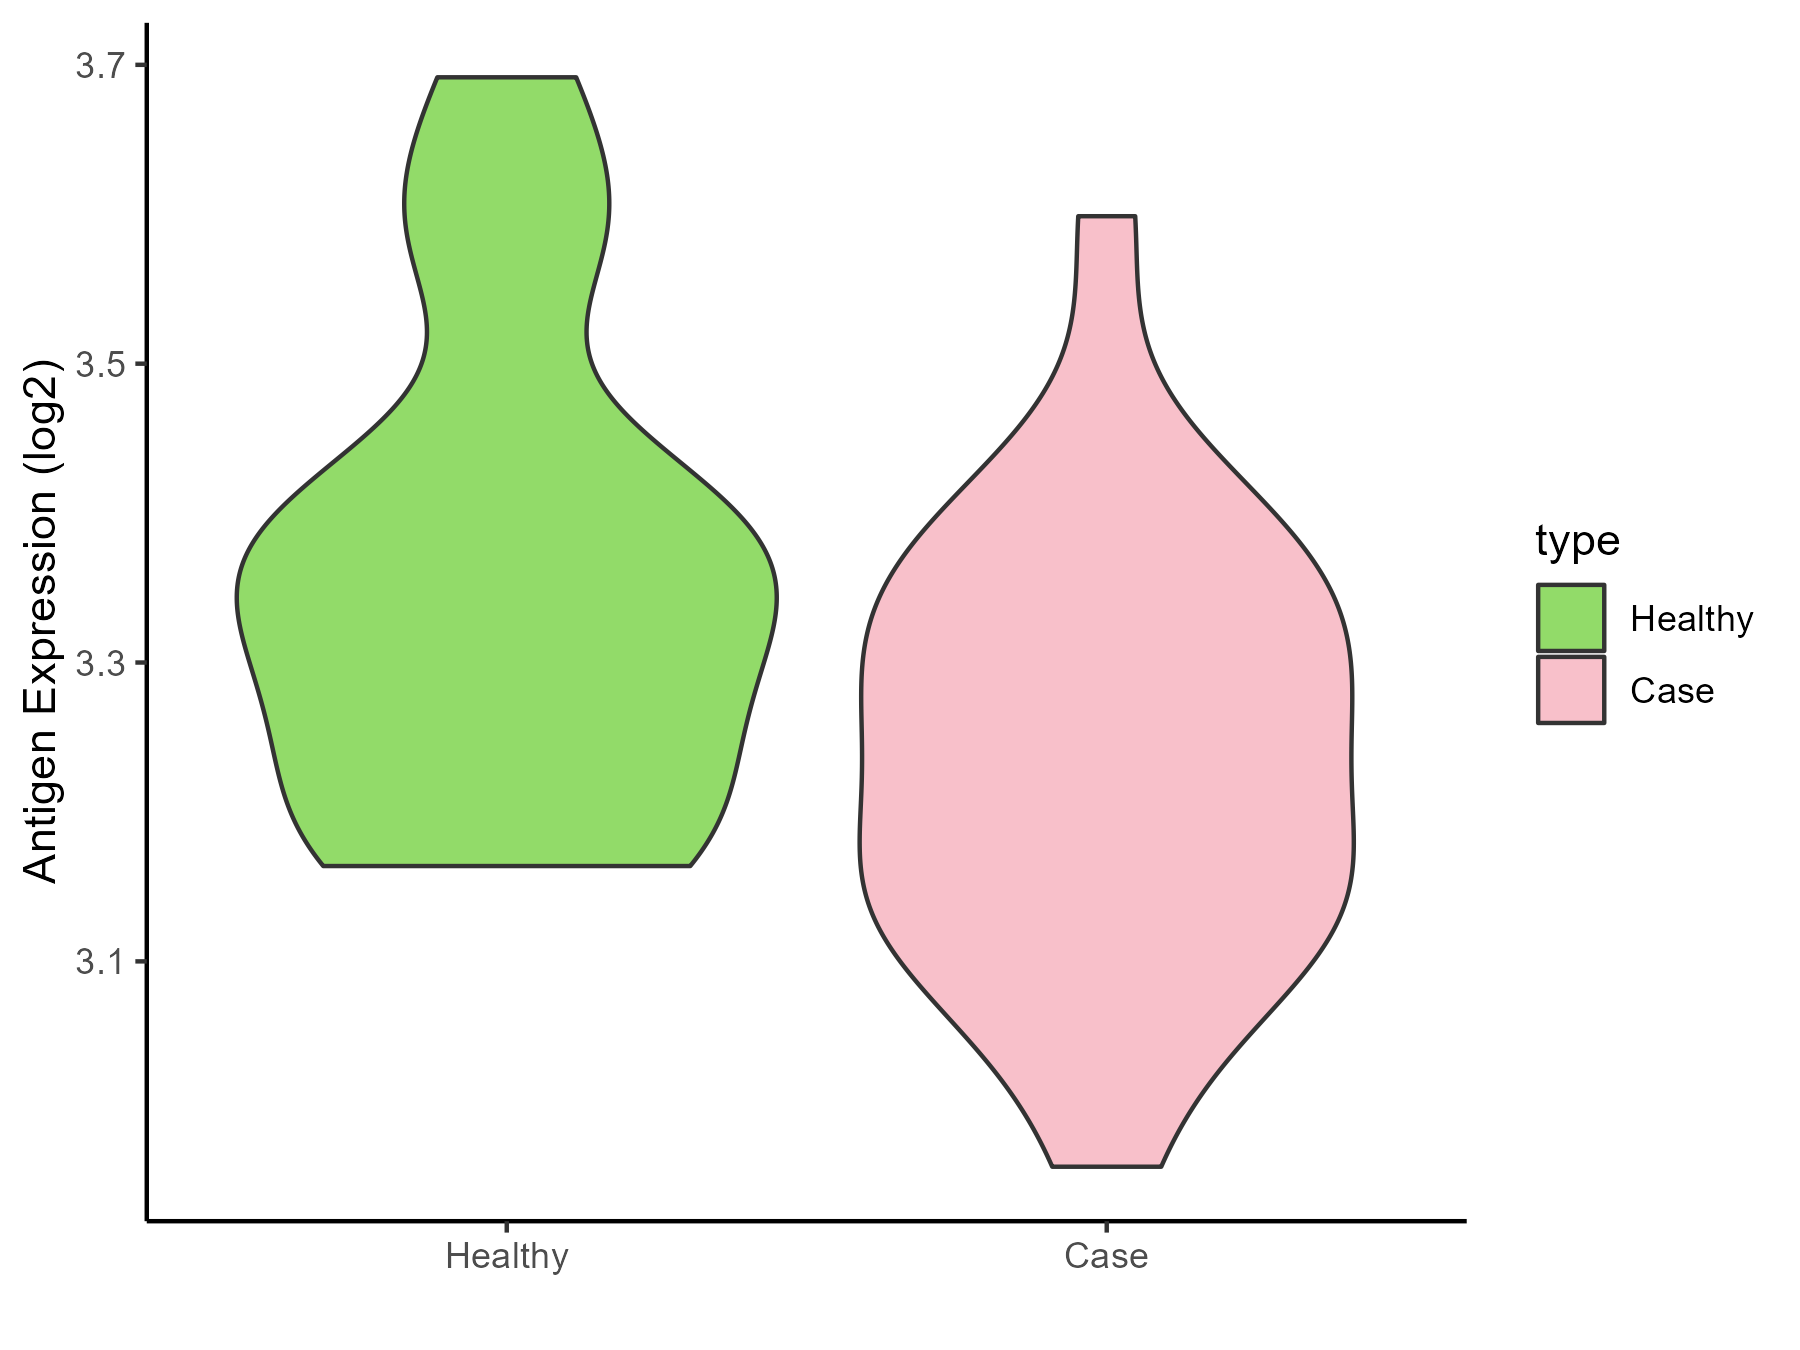
| The Studied Tissue | Urothelium | |
| The Specific Disease | Ureter cancer | |
| The Expression Level of Disease Section Compare with the Healthy Individual Tissue | p-value: 0.031593816; Fold-change: -0.089240886; Z-score: -0.549200717 | |
| Disease-specific Antigen Abundances |
|
Click to View the Clearer Original Diagram |
ICD Disease Classification 20
| Differential expression pattern of antigen in diseases | ||
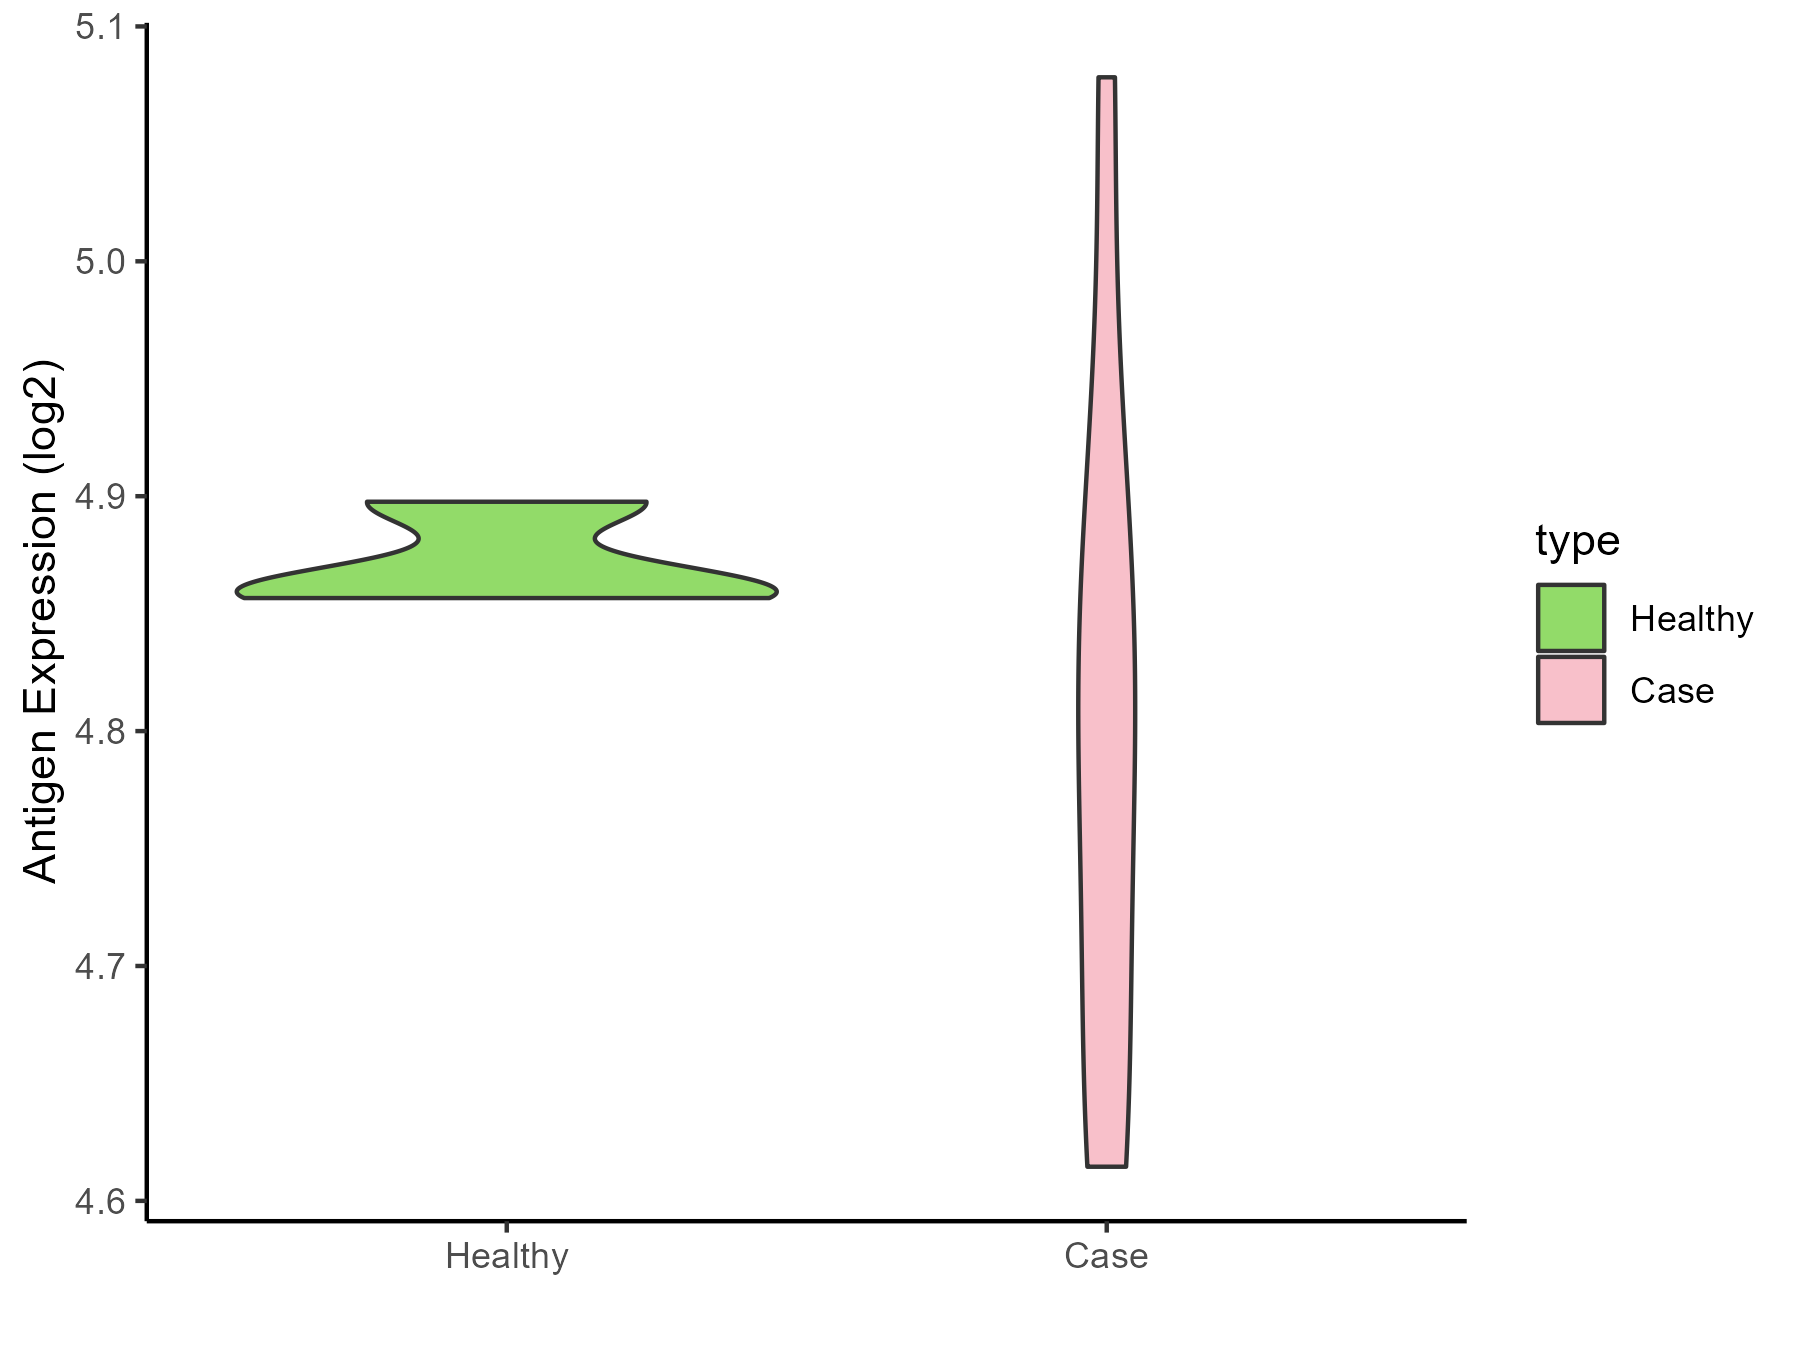
| The Studied Tissue | Adipose | |
| The Specific Disease | Simpson golabi behmel syndrome | |
| The Expression Level of Disease Section Compare with the Healthy Individual Tissue | p-value: 0.196051613; Fold-change: -0.046078787; Z-score: -2.066450378 | |
| Disease-specific Antigen Abundances |
|
Click to View the Clearer Original Diagram |
| Differential expression pattern of antigen in diseases | ||
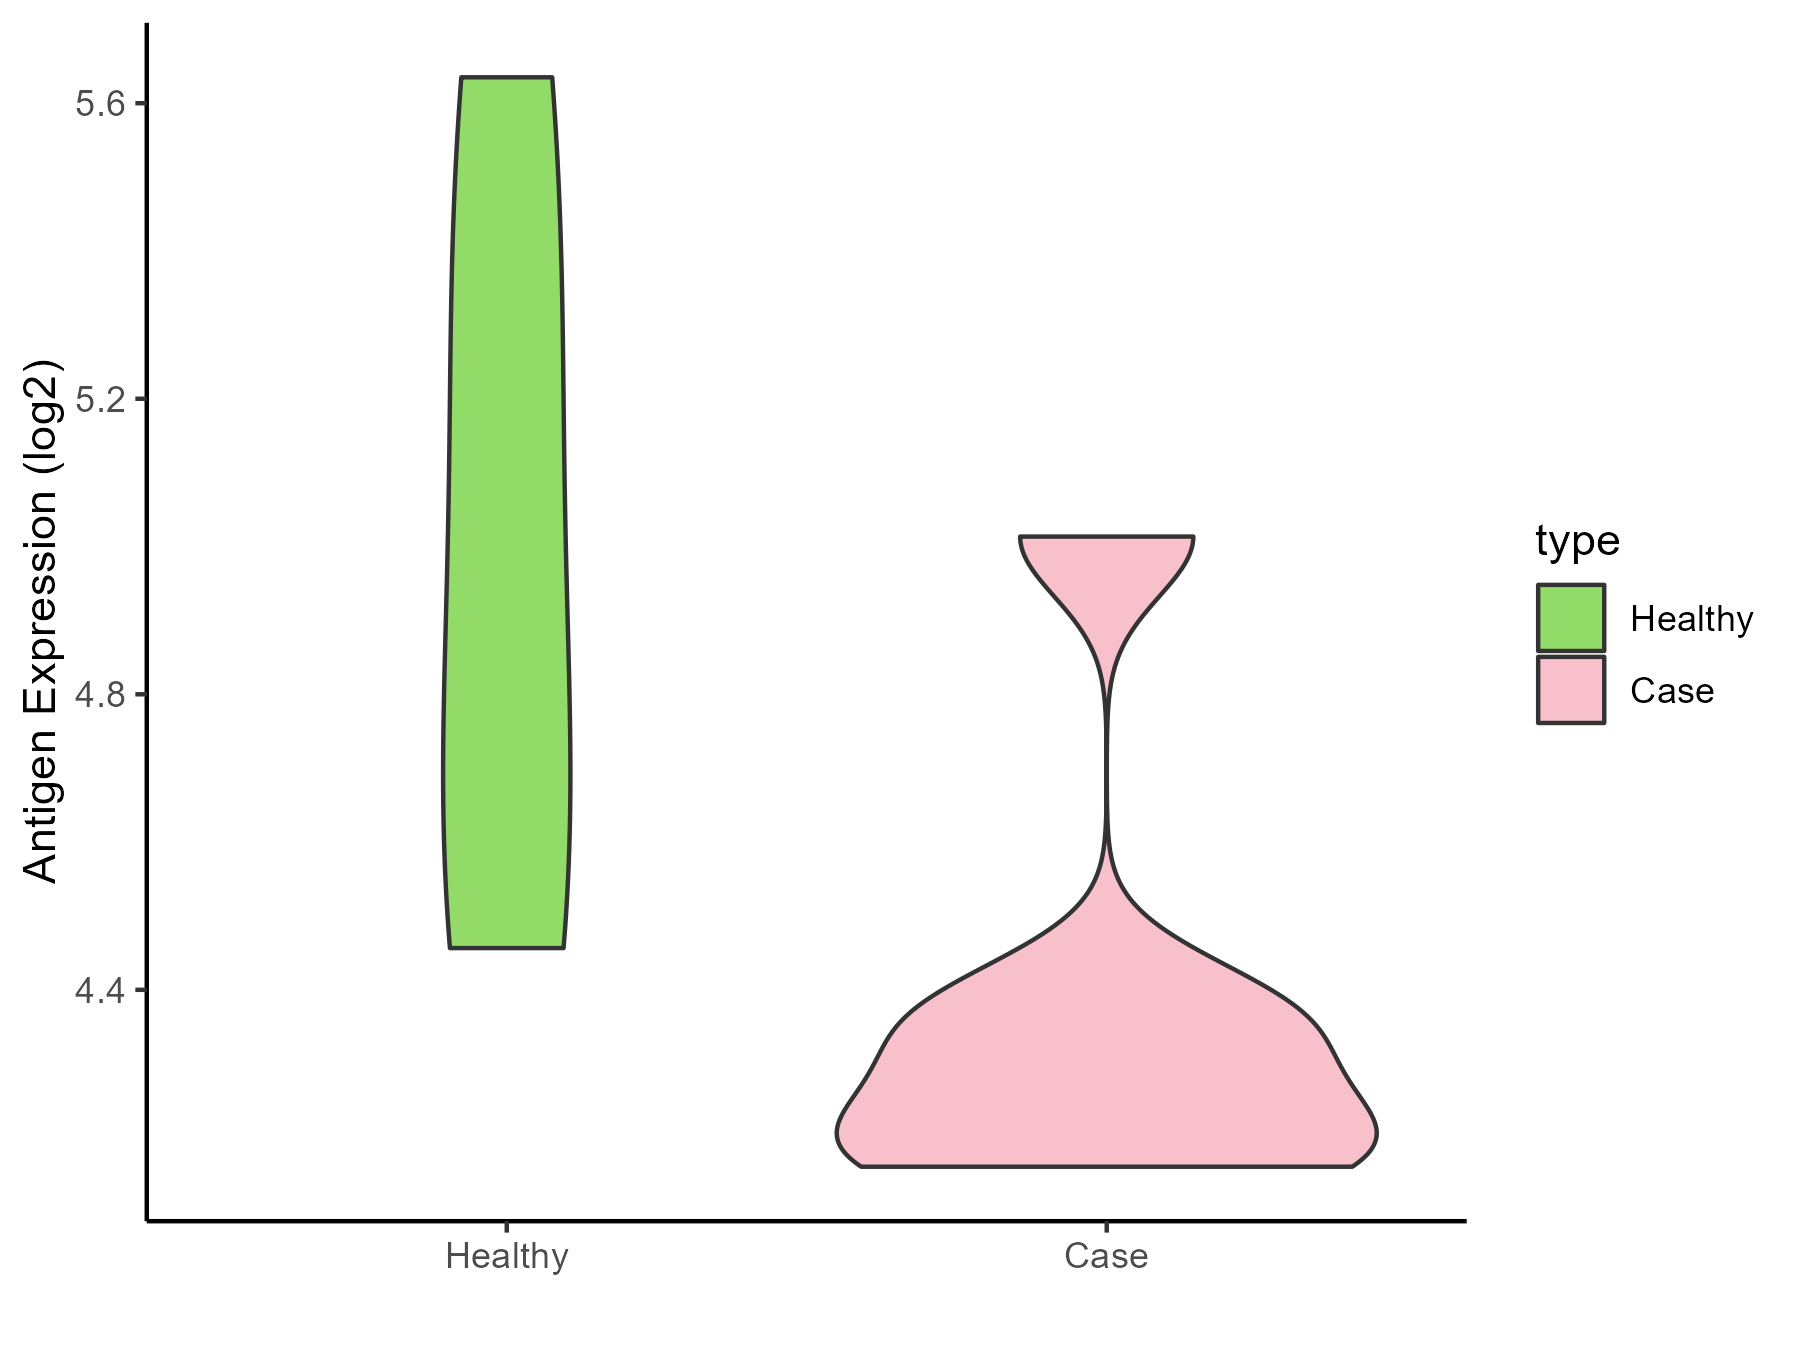
| The Studied Tissue | Perituberal | |
| The Specific Disease | Tuberous sclerosis complex | |
| The Expression Level of Disease Section Compare with the Healthy Individual Tissue | p-value: 0.100305425; Fold-change: -0.660472208; Z-score: -1.237243288 | |
| Disease-specific Antigen Abundances |
|
Click to View the Clearer Original Diagram |
ICD Disease Classification 3
| Differential expression pattern of antigen in diseases | ||
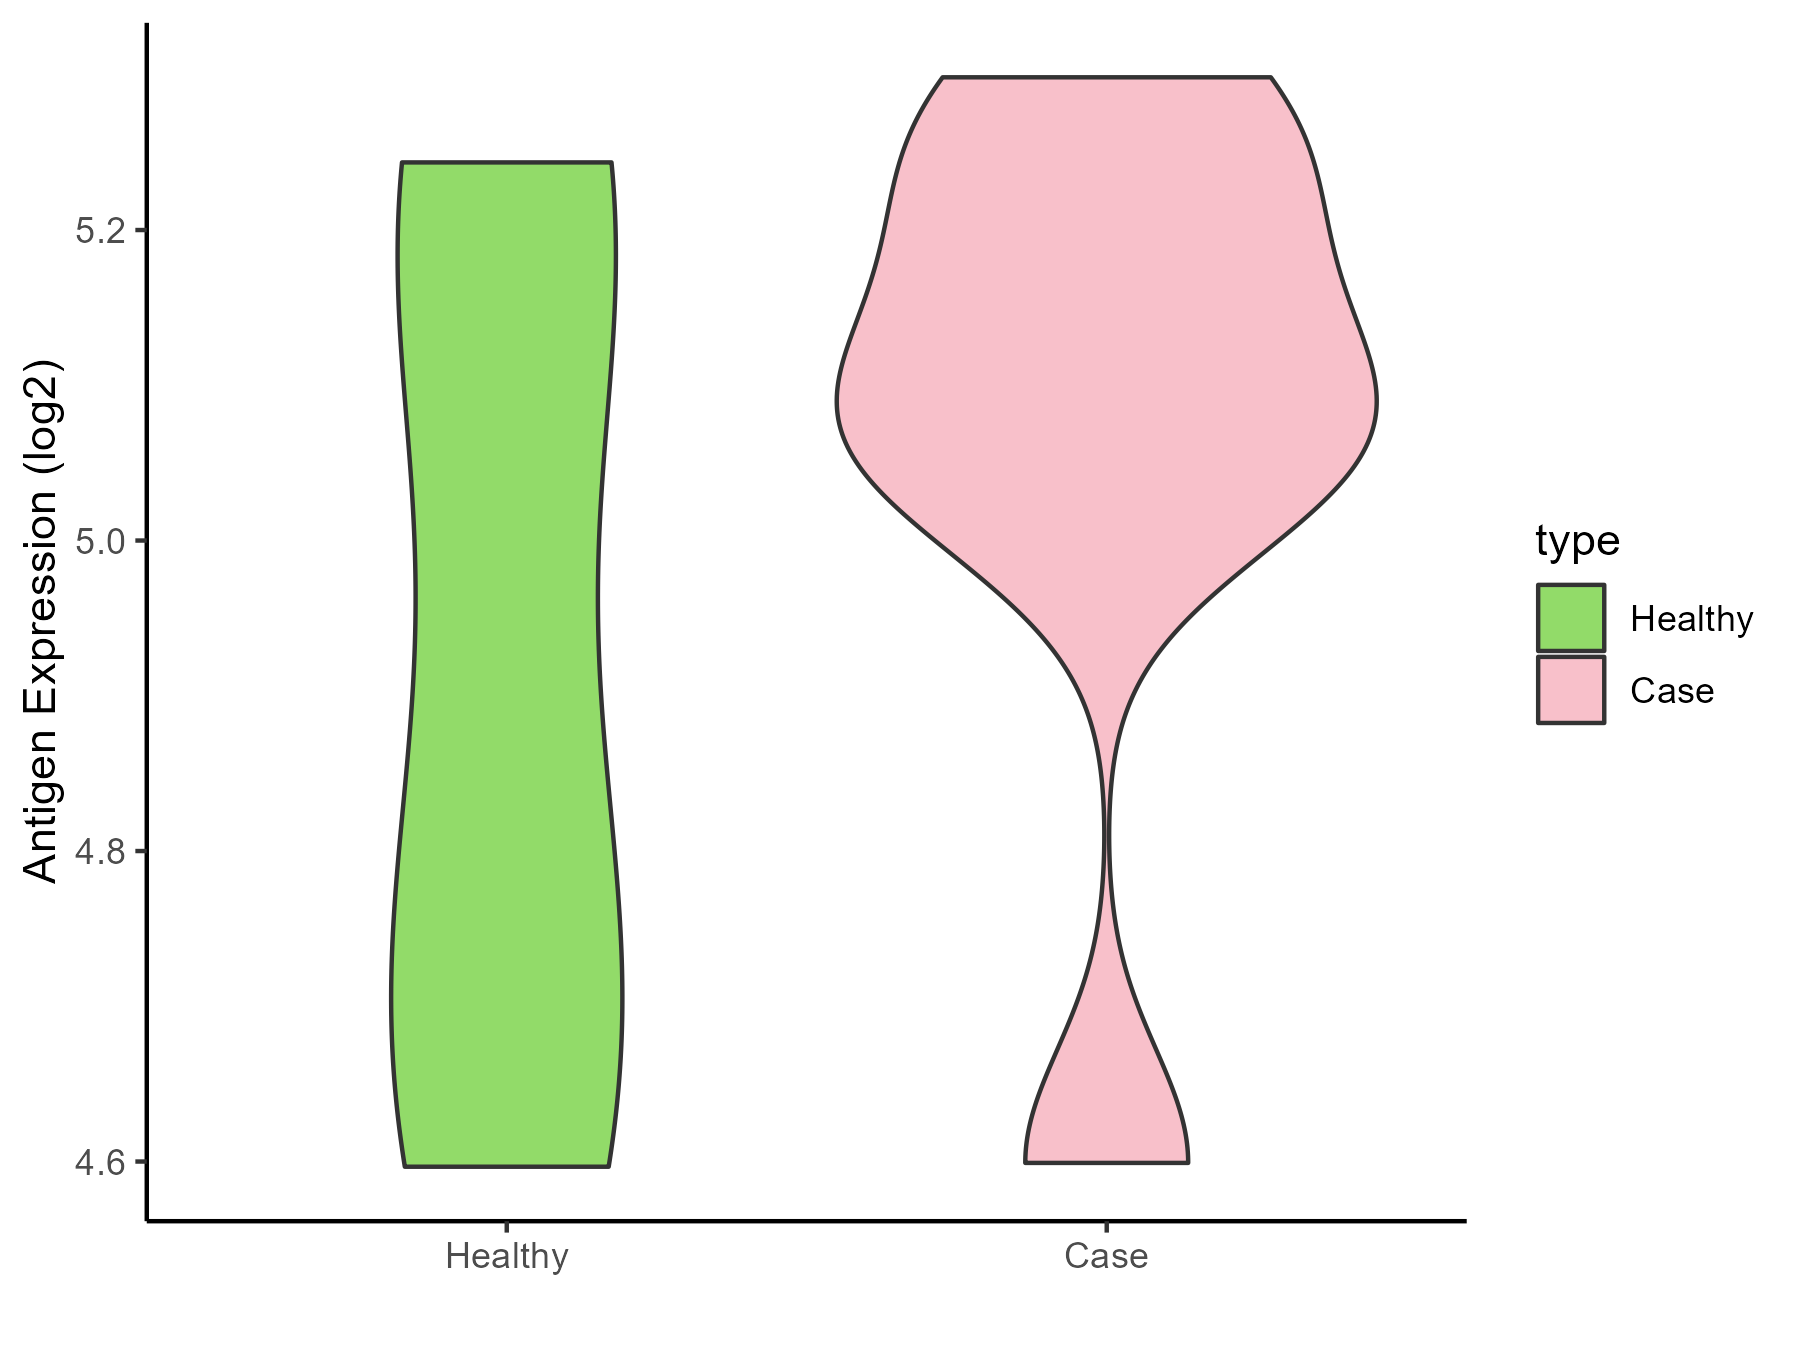
| The Studied Tissue | Bone marrow | |
| The Specific Disease | Anemia | |
| The Expression Level of Disease Section Compare with the Healthy Individual Tissue | p-value: 0.32205302; Fold-change: 0.201414754; Z-score: 0.70940632 | |
| Disease-specific Antigen Abundances |
|
Click to View the Clearer Original Diagram |
| Differential expression pattern of antigen in diseases | ||
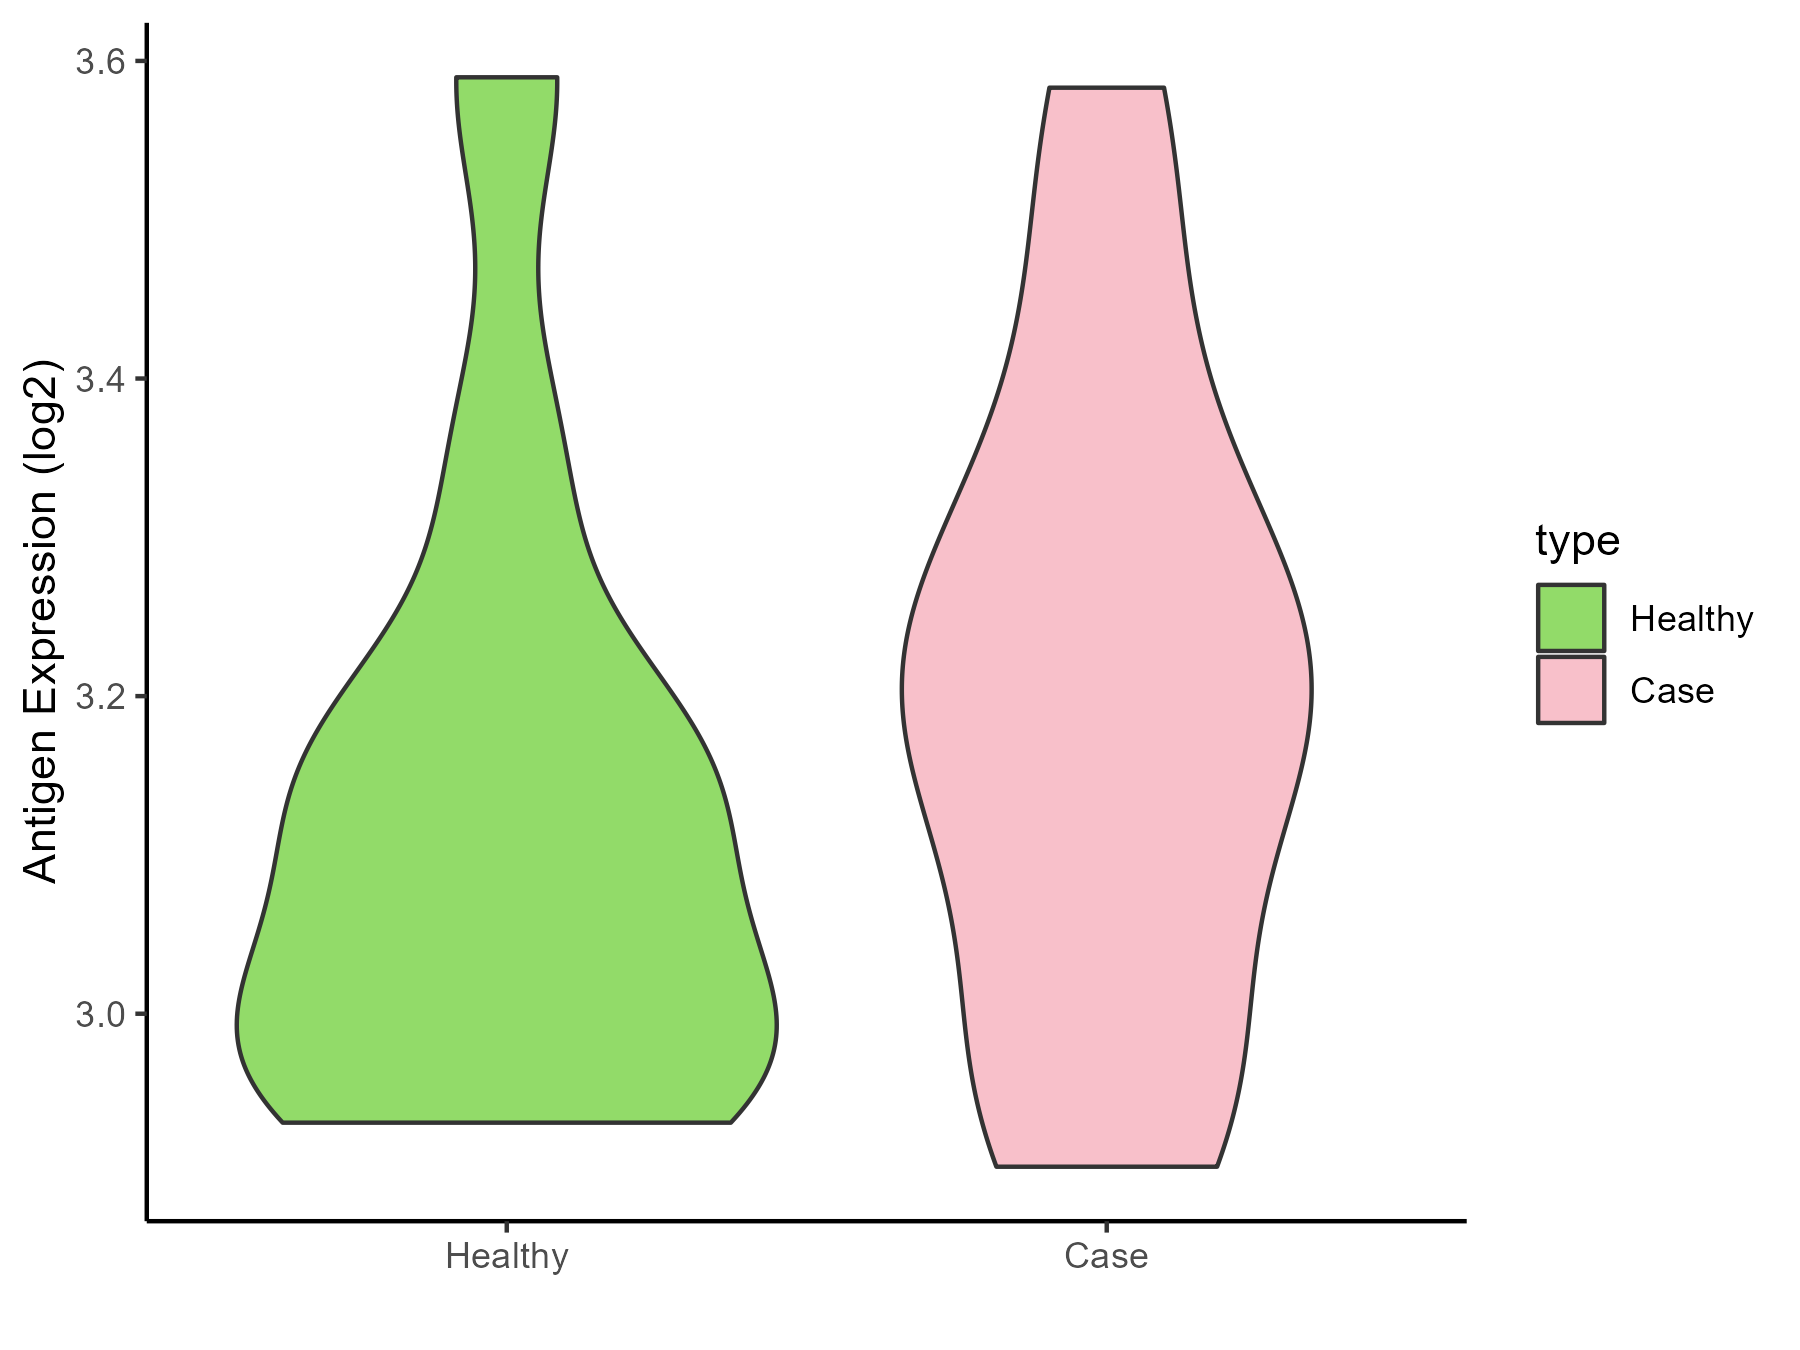
| The Studied Tissue | Peripheral blood | |
| The Specific Disease | Sickle cell disease | |
| The Expression Level of Disease Section Compare with the Healthy Individual Tissue | p-value: 0.385458491; Fold-change: 0.085117658; Z-score: 0.429220768 | |
| Disease-specific Antigen Abundances |
|
Click to View the Clearer Original Diagram |
| Differential expression pattern of antigen in diseases | ||
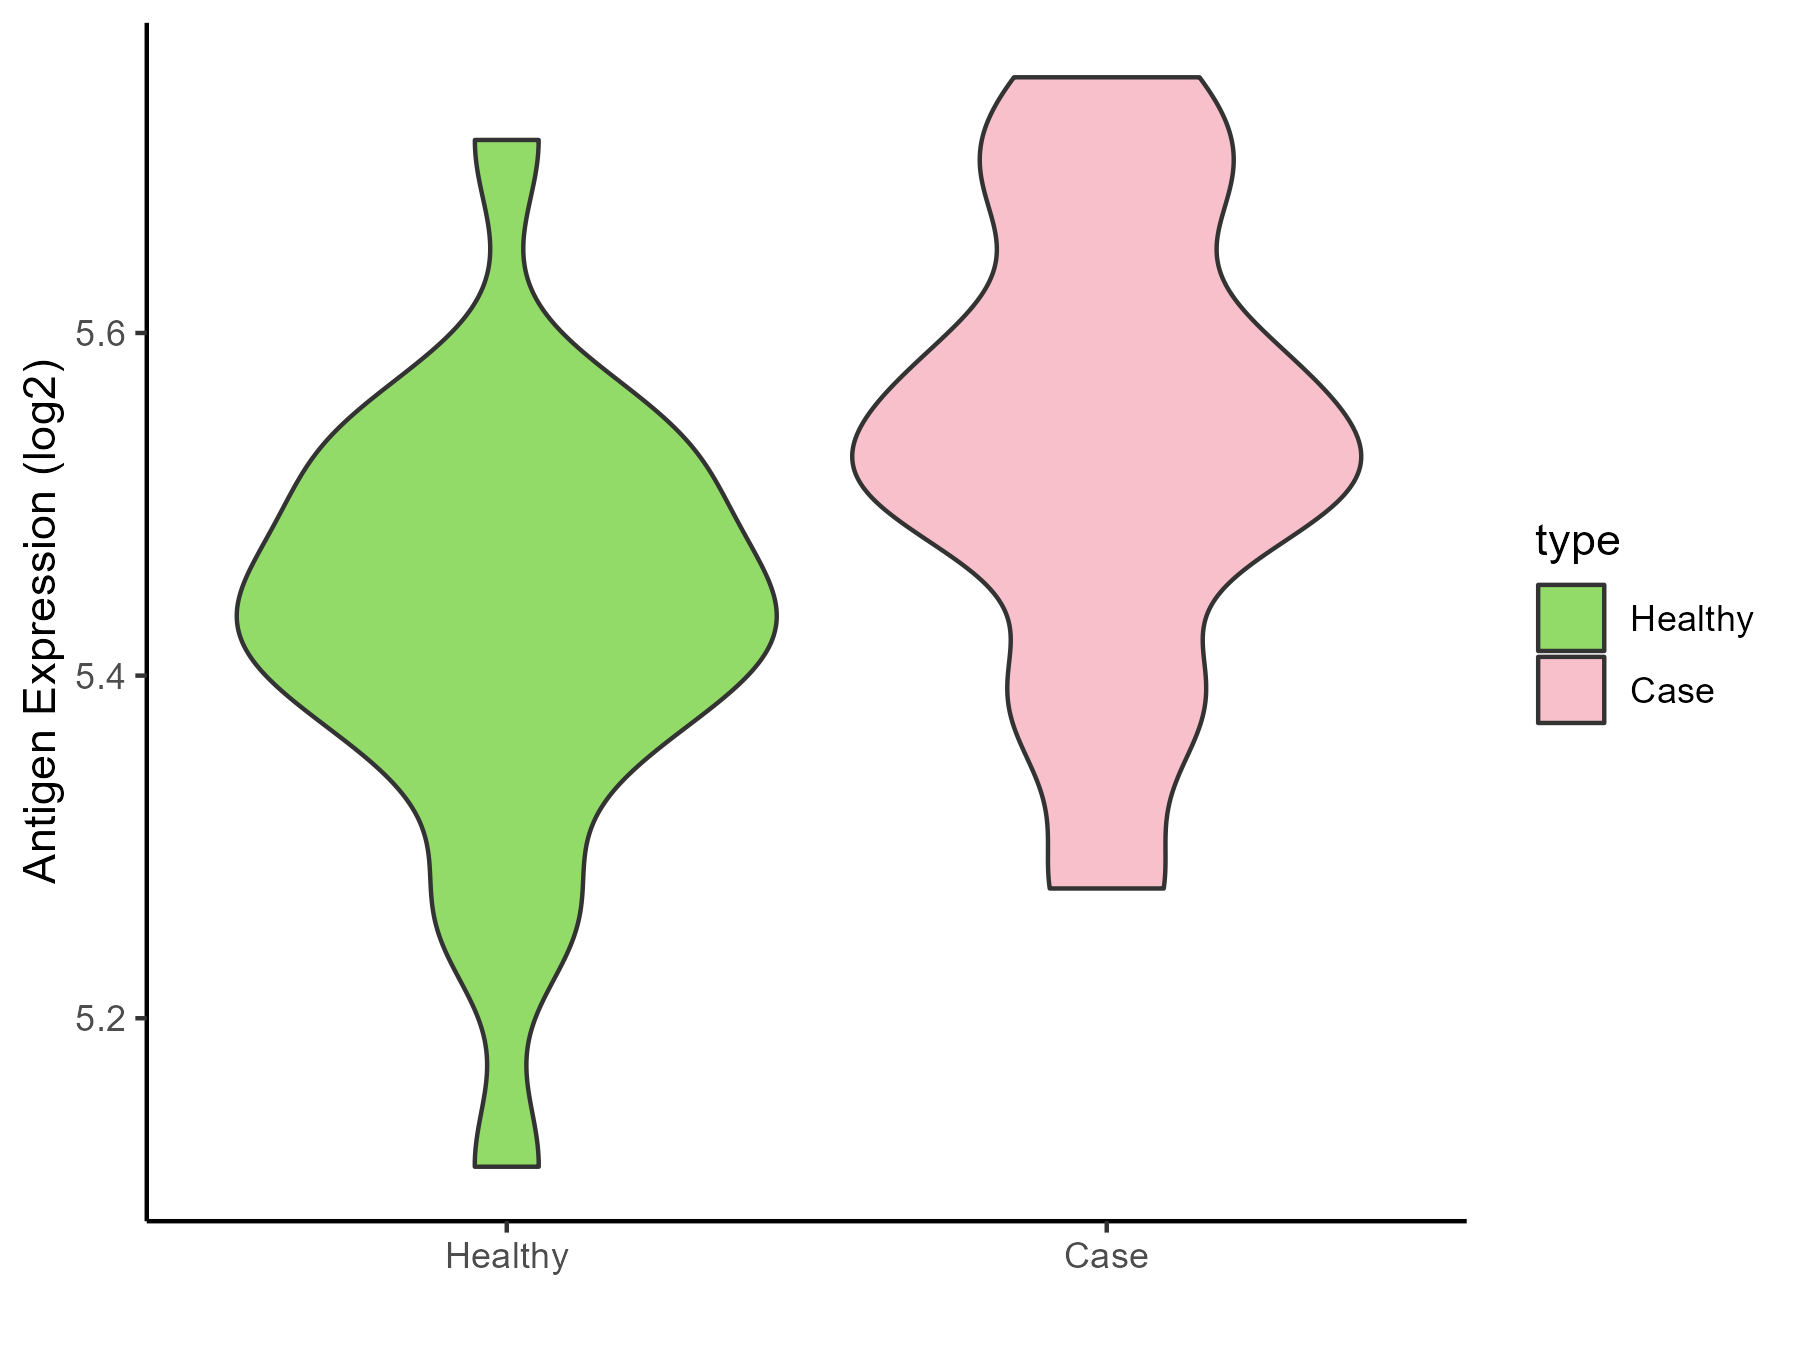
| The Studied Tissue | Whole blood | |
| The Specific Disease | Thrombocythemia | |
| The Expression Level of Disease Section Compare with the Healthy Individual Tissue | p-value: 0.002157268; Fold-change: 0.096328754; Z-score: 0.769338841 | |
| Disease-specific Antigen Abundances |
|
Click to View the Clearer Original Diagram |
ICD Disease Classification 4
| Differential expression pattern of antigen in diseases | ||
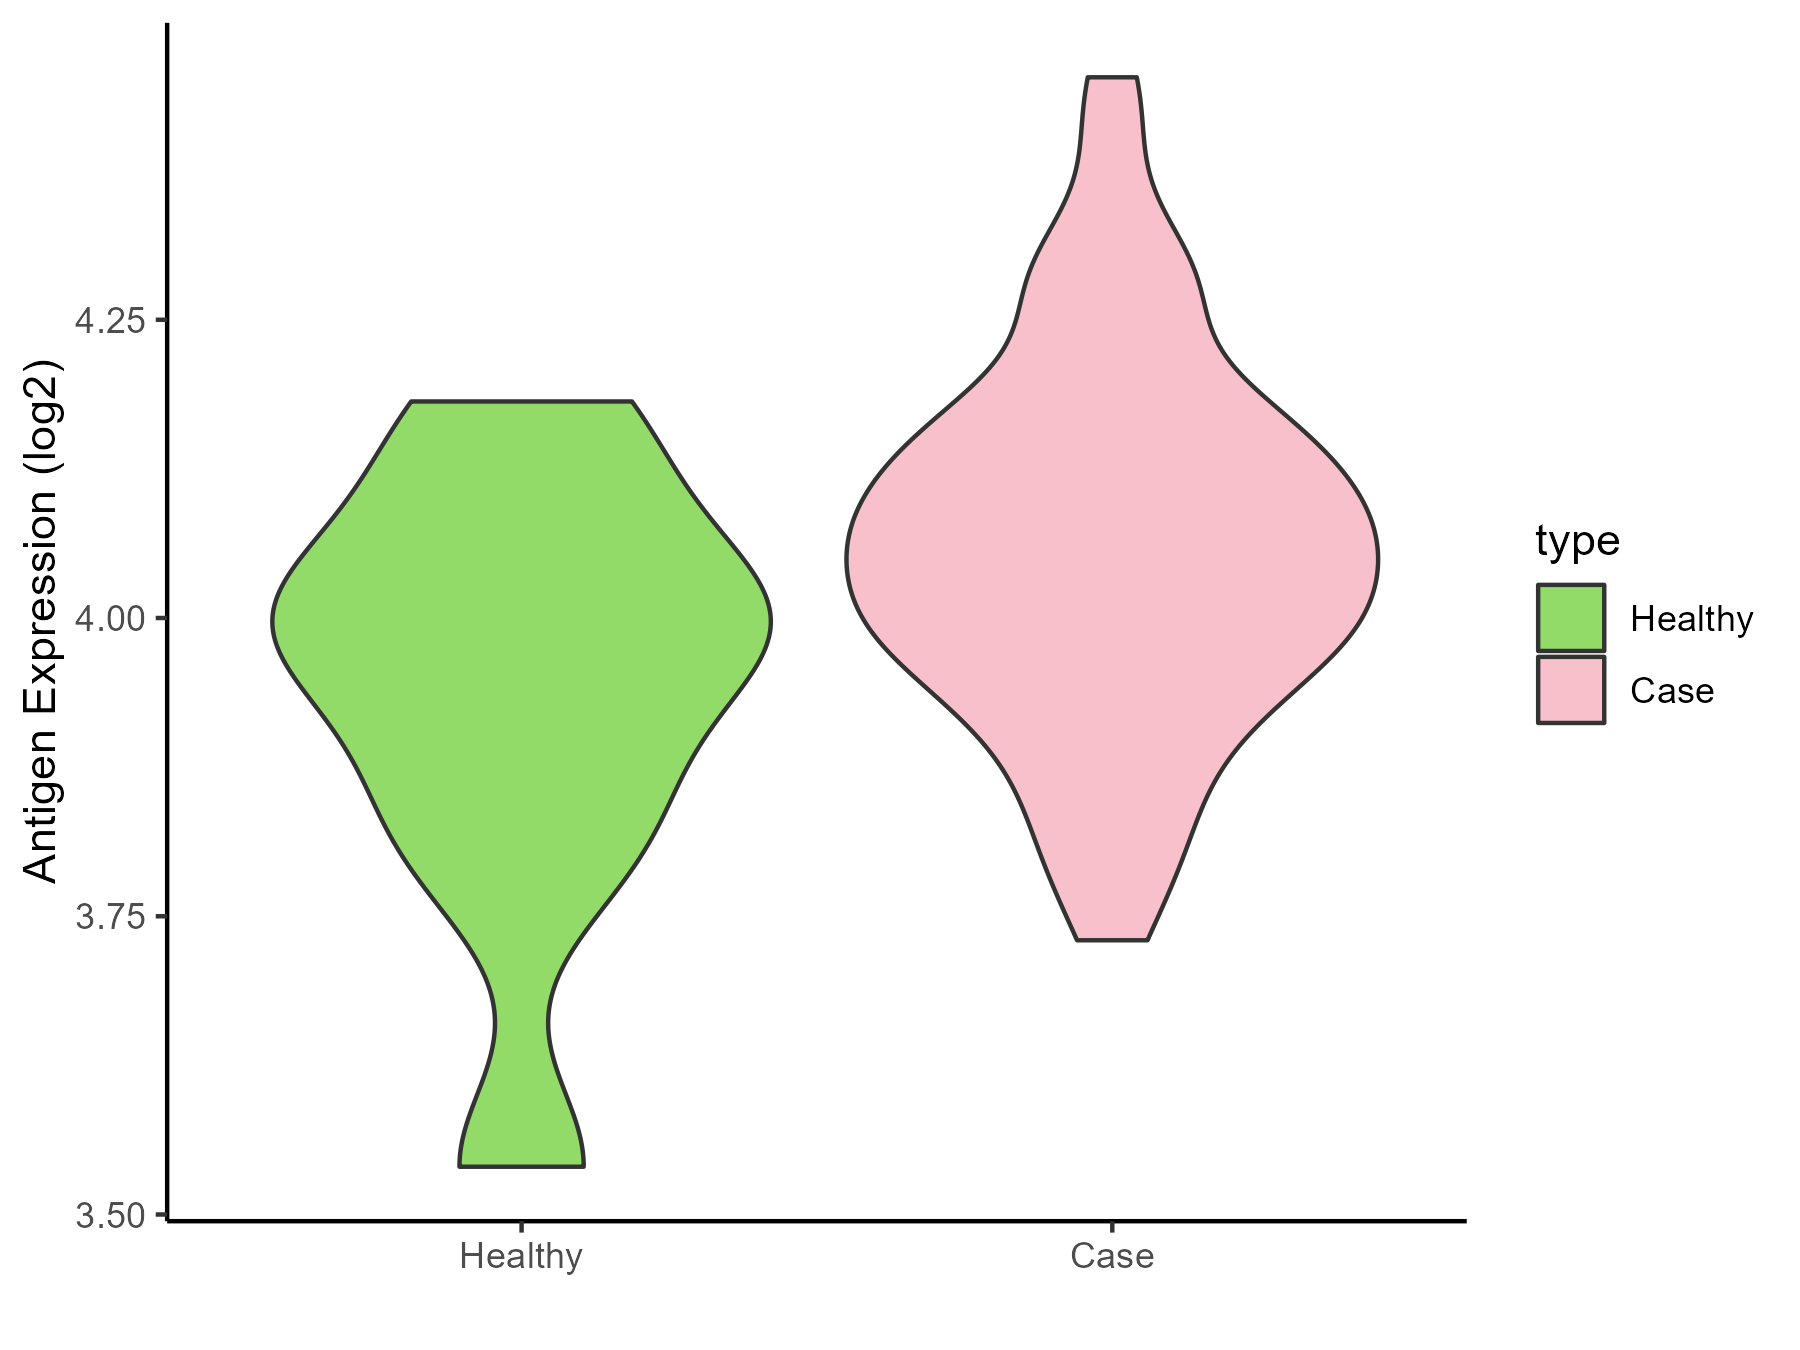
| The Studied Tissue | Whole blood | |
| The Specific Disease | Scleroderma | |
| The Expression Level of Disease Section Compare with the Healthy Individual Tissue | p-value: 0.093528338; Fold-change: 0.068898025; Z-score: 0.360561363 | |
| Disease-specific Antigen Abundances |
|
Click to View the Clearer Original Diagram |
| Differential expression pattern of antigen in diseases | ||
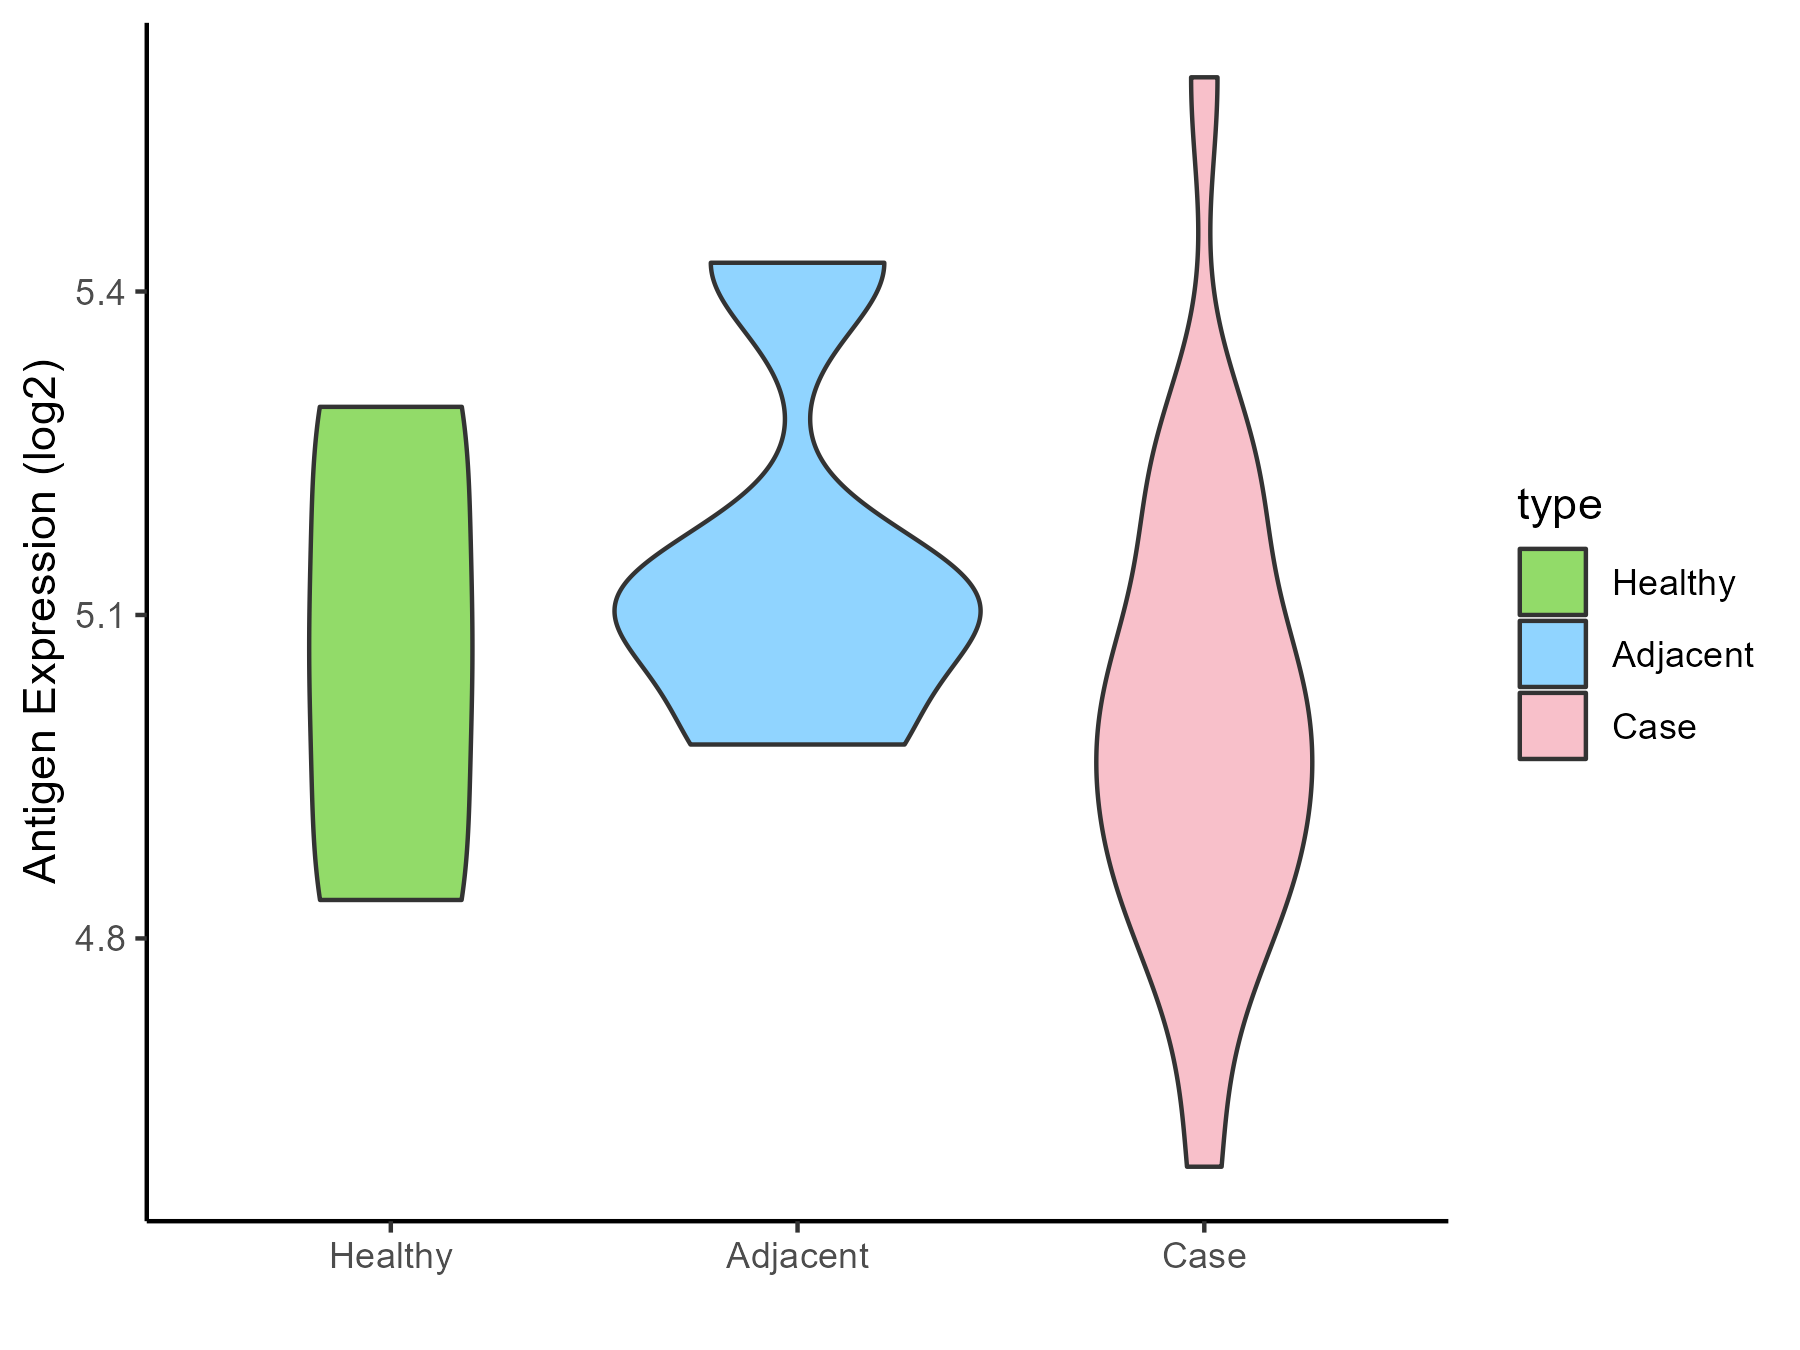
| The Studied Tissue | Salivary gland | |
| The Specific Disease | Sjogren syndrome | |
| The Expression Level of Disease Section Compare with the Healthy Individual Tissue | p-value: 0.733294484; Fold-change: -0.05471058; Z-score: -0.239248125 | |
| The Expression Level of Disease Section Compare with the Adjacent Tissue | p-value: 0.230600313; Fold-change: -0.103348971; Z-score: -0.544630443 | |
| Disease-specific Antigen Abundances |
|
Click to View the Clearer Original Diagram |
| Differential expression pattern of antigen in diseases | ||
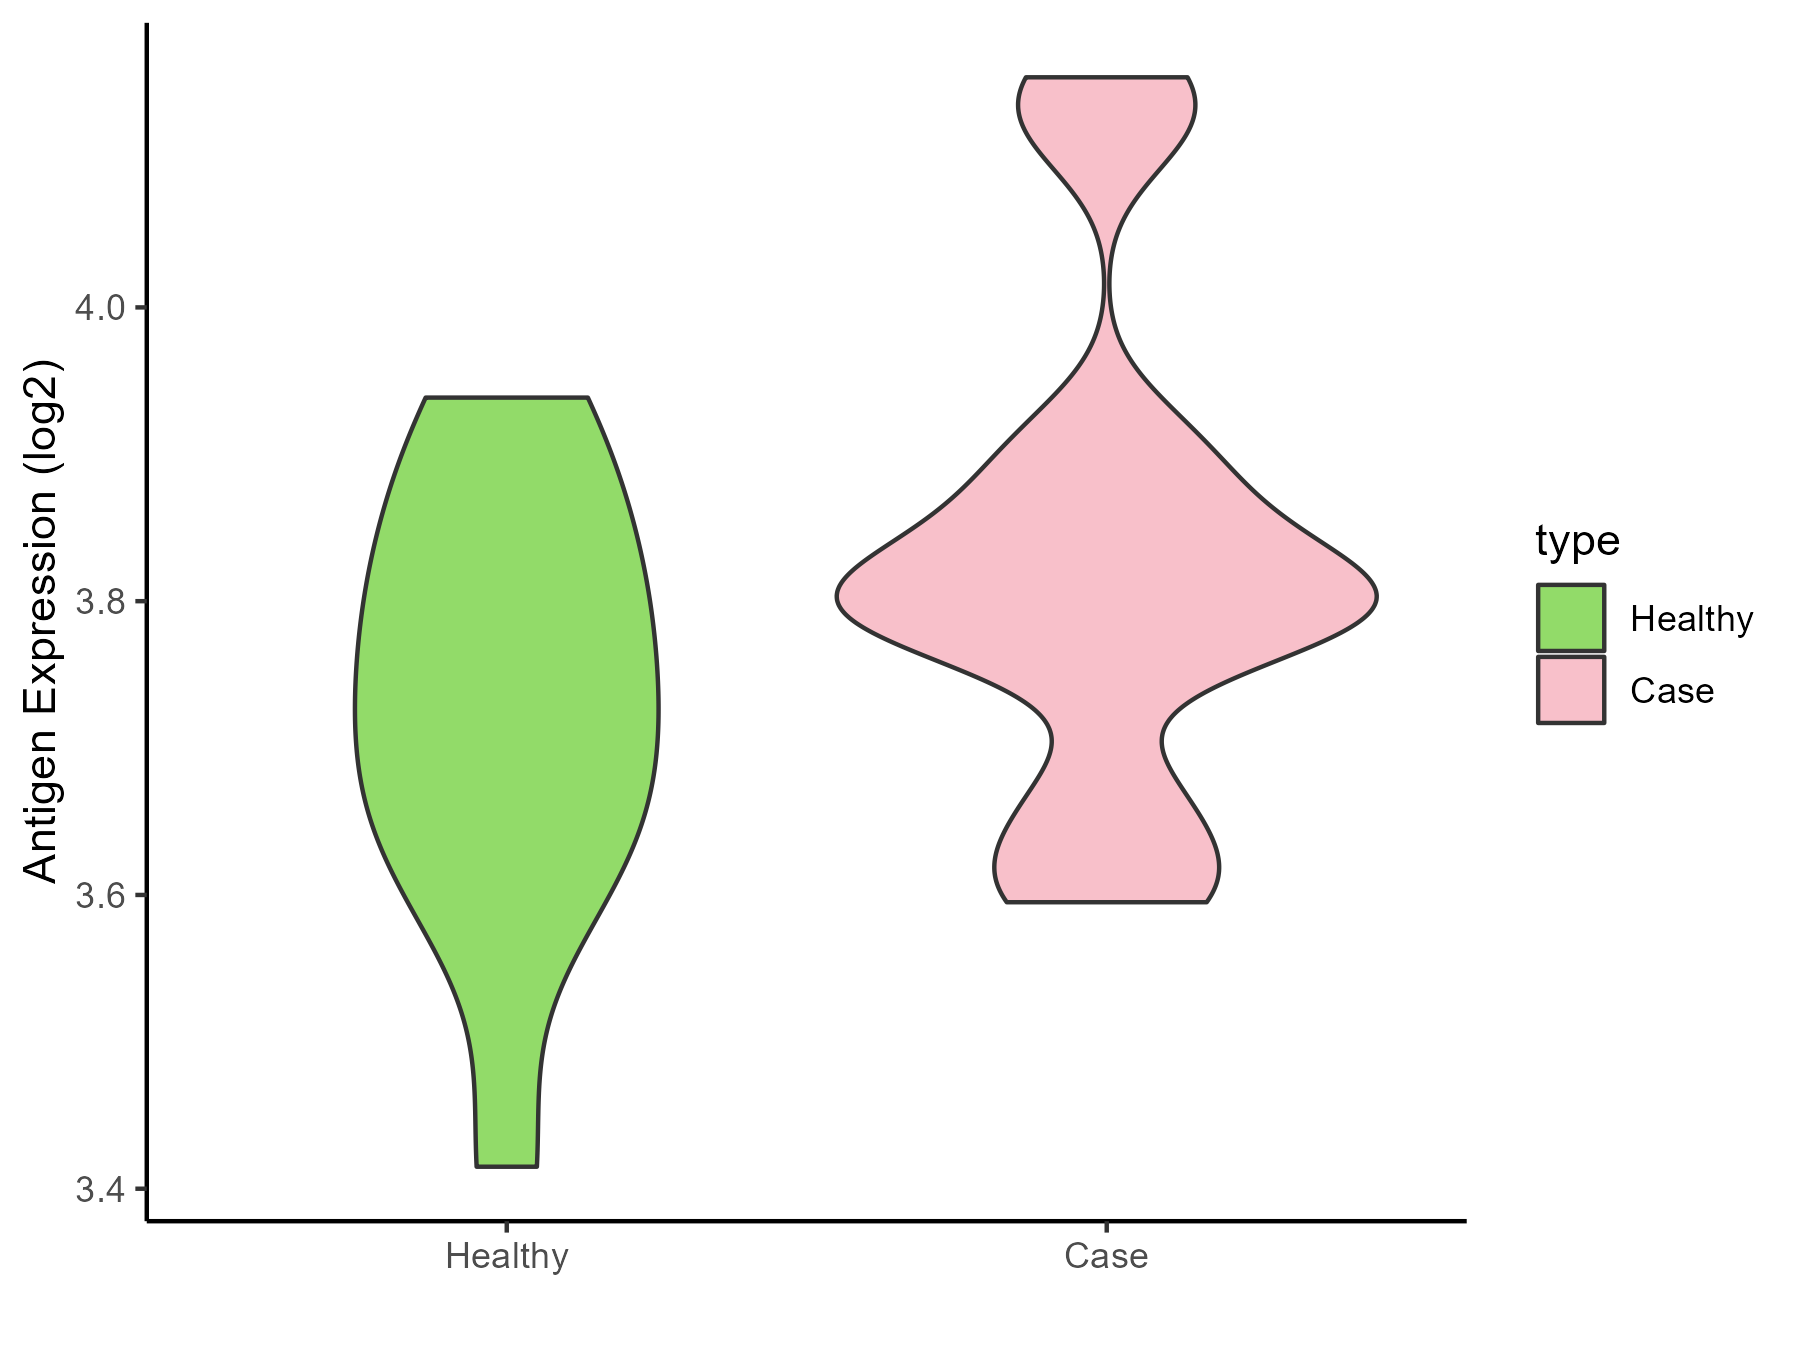
| The Studied Tissue | Peripheral blood | |
| The Specific Disease | Behcet disease | |
| The Expression Level of Disease Section Compare with the Healthy Individual Tissue | p-value: 0.134346705; Fold-change: 0.071683228; Z-score: 0.484602609 | |
| Disease-specific Antigen Abundances |
|
Click to View the Clearer Original Diagram |
| Differential expression pattern of antigen in diseases | ||
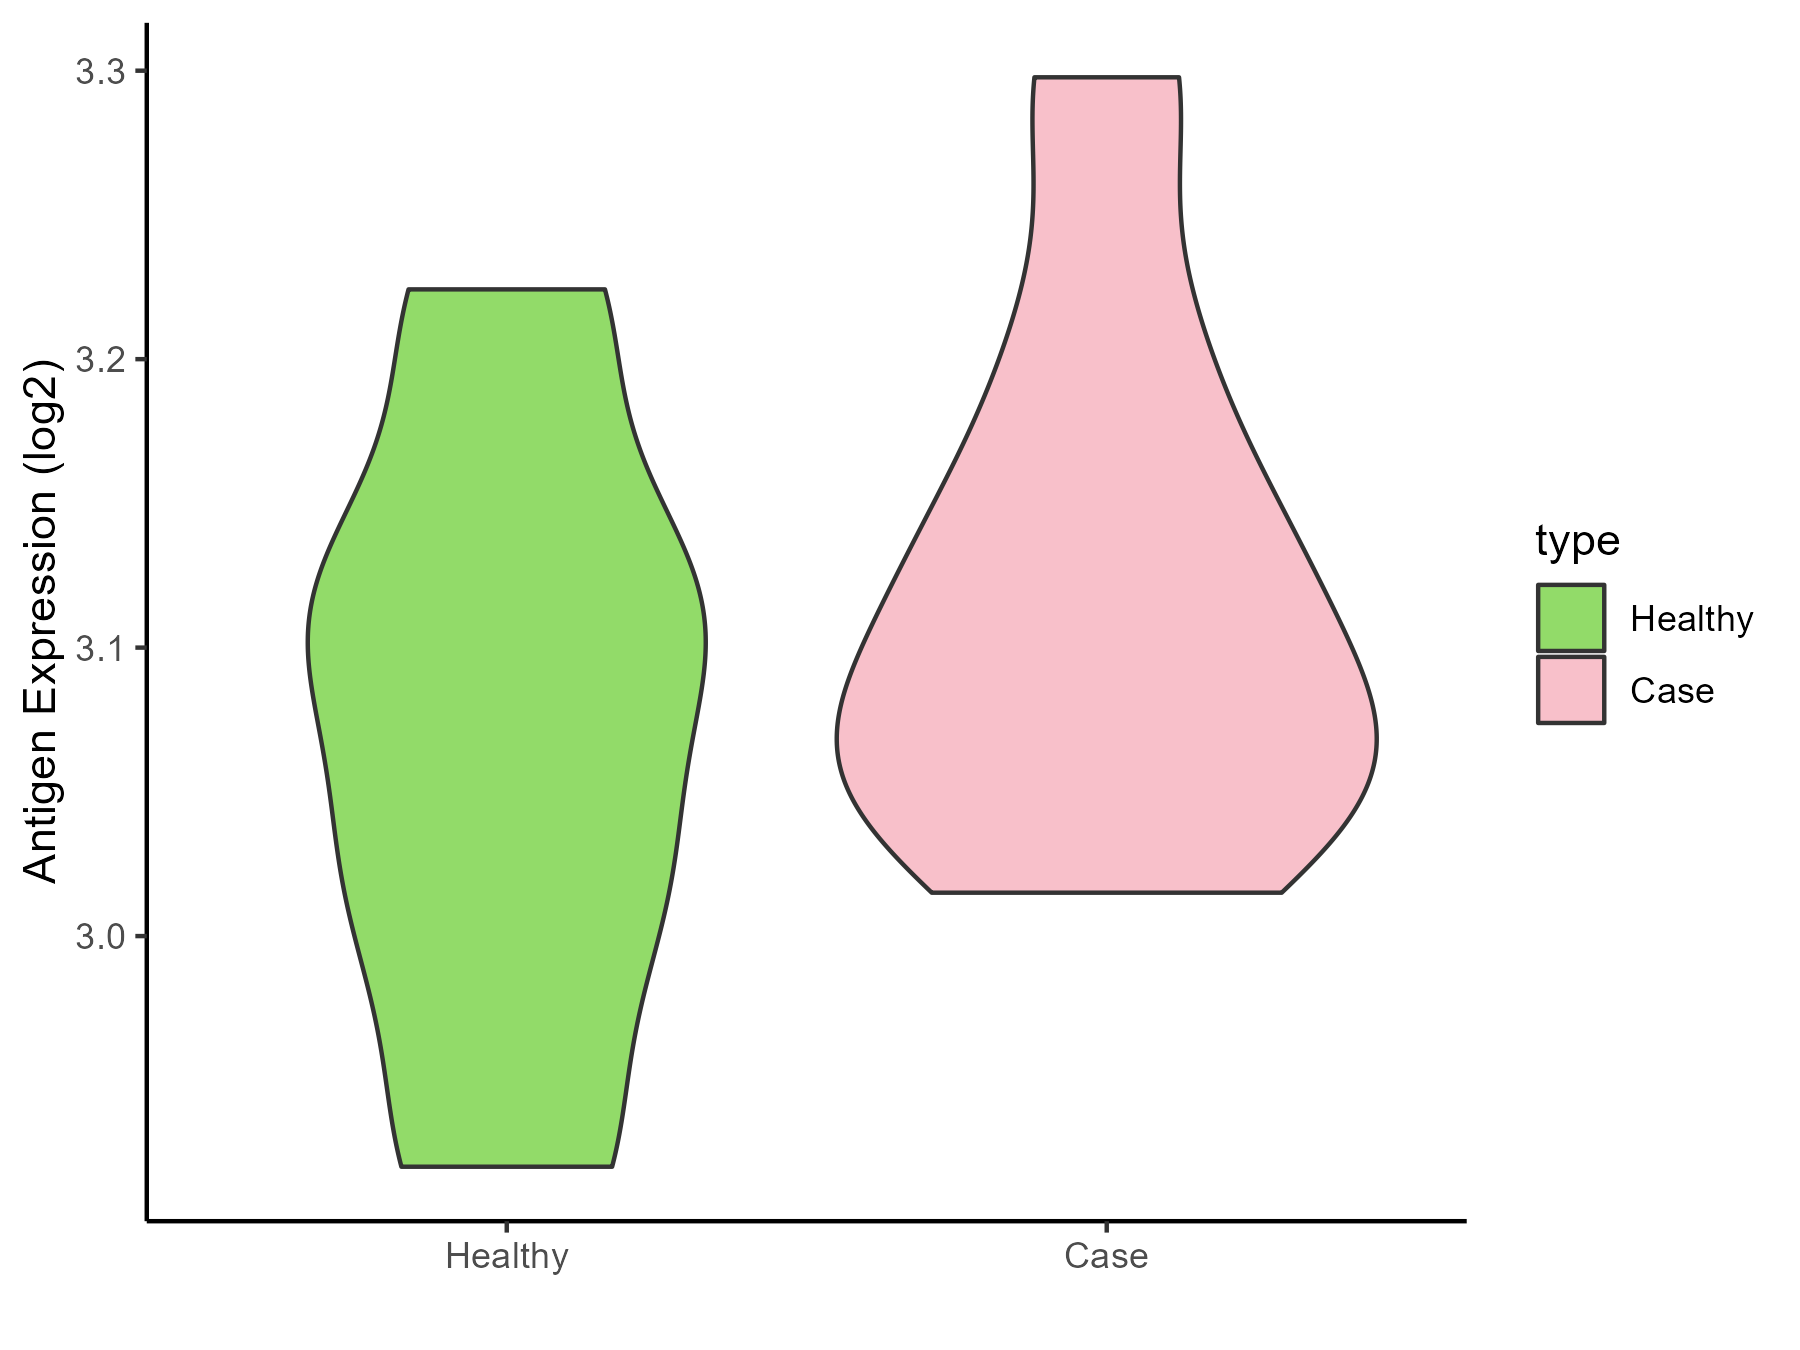
| The Studied Tissue | Whole blood | |
| The Specific Disease | Autosomal dominant monocytopenia | |
| The Expression Level of Disease Section Compare with the Healthy Individual Tissue | p-value: 0.27926816; Fold-change: 0.007764694; Z-score: 0.076197788 | |
| Disease-specific Antigen Abundances |
|
Click to View the Clearer Original Diagram |
ICD Disease Classification 5
| Differential expression pattern of antigen in diseases | ||
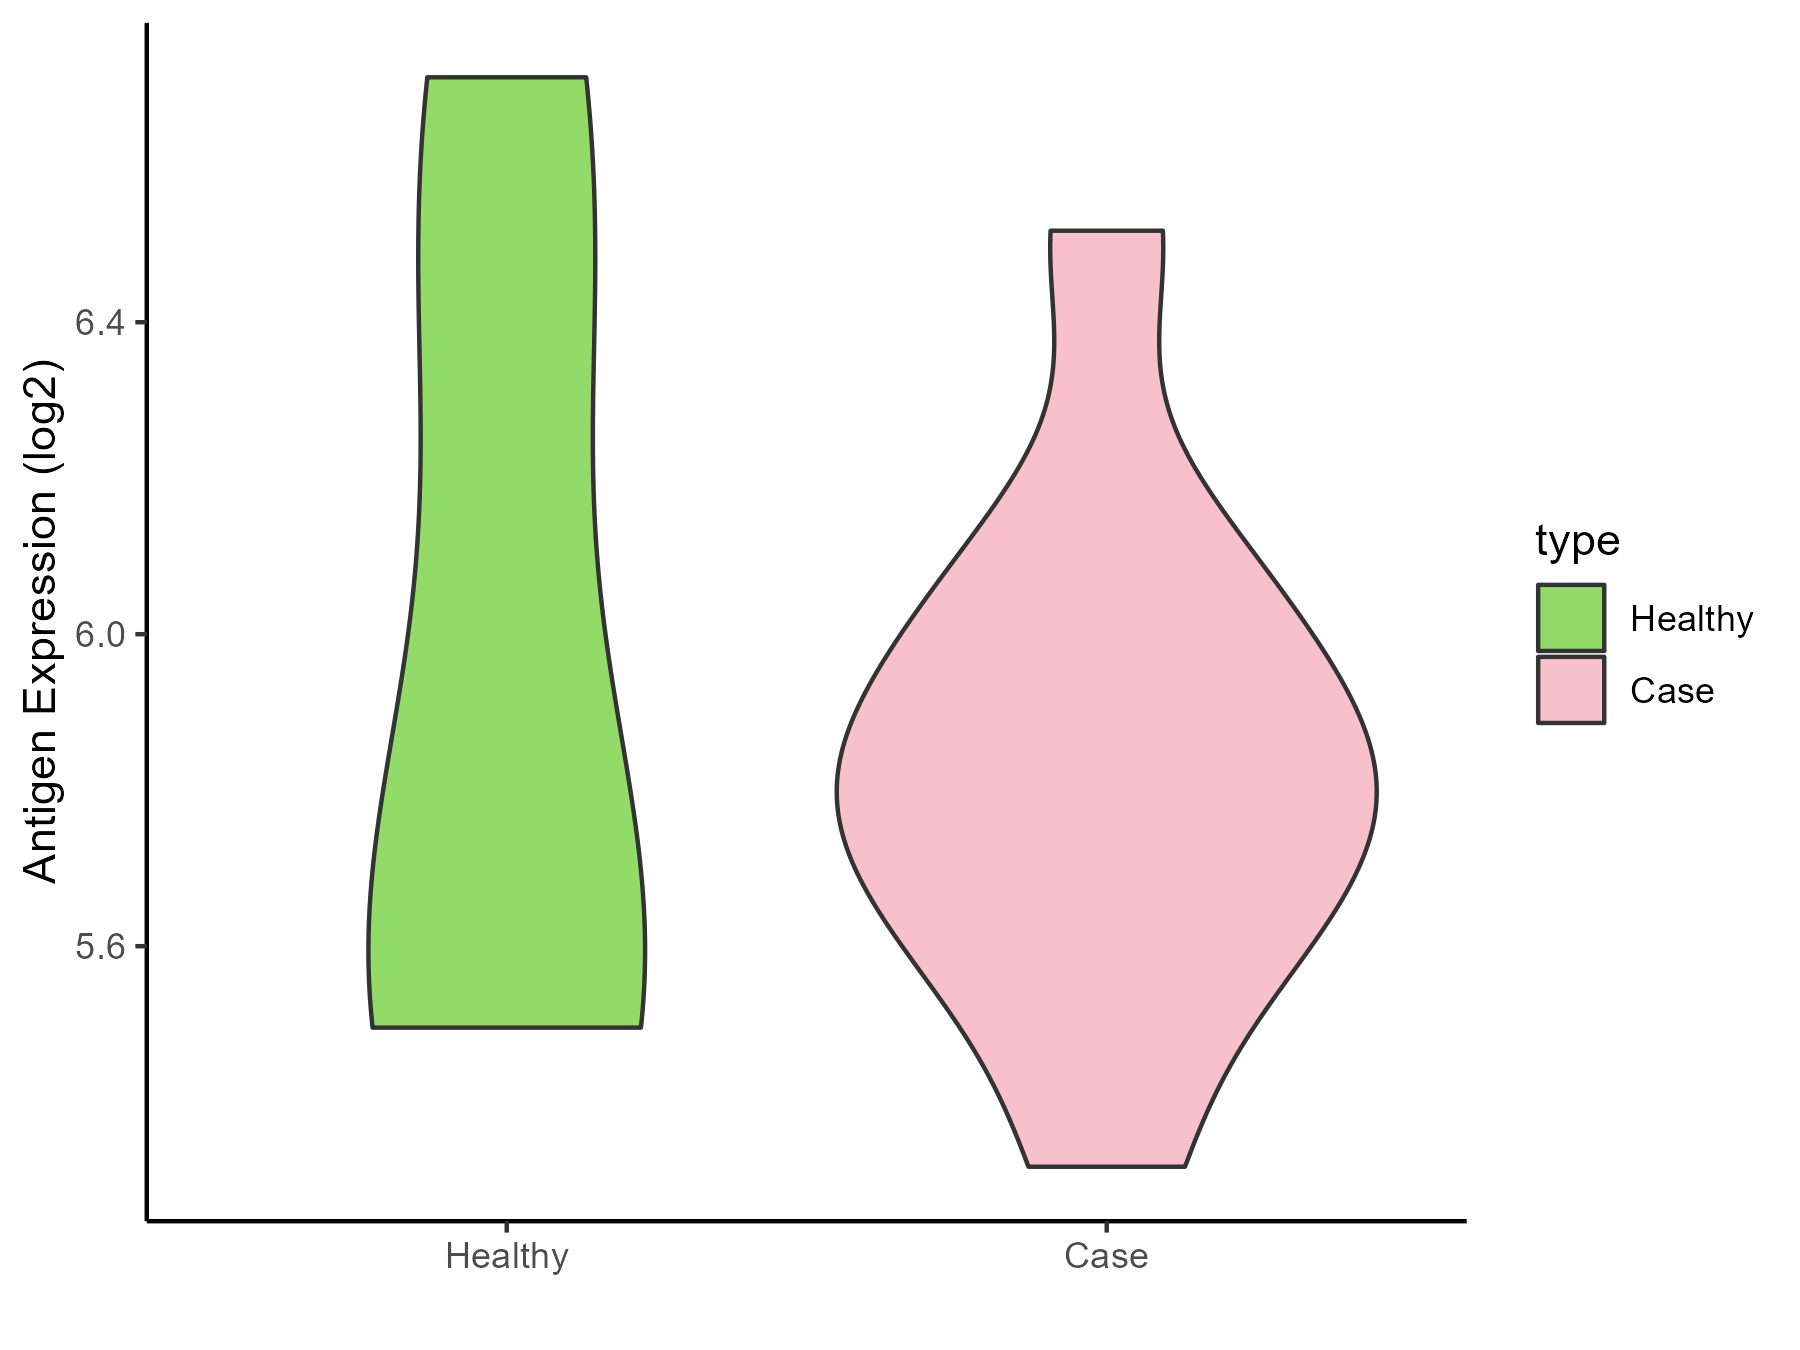
| The Studied Tissue | Liver | |
| The Specific Disease | Type 2 diabetes | |
| The Expression Level of Disease Section Compare with the Healthy Individual Tissue | p-value: 0.661761377; Fold-change: 0.165914955; Z-score: 0.296828443 | |
| Disease-specific Antigen Abundances |
|
Click to View the Clearer Original Diagram |
| Differential expression pattern of antigen in diseases | ||
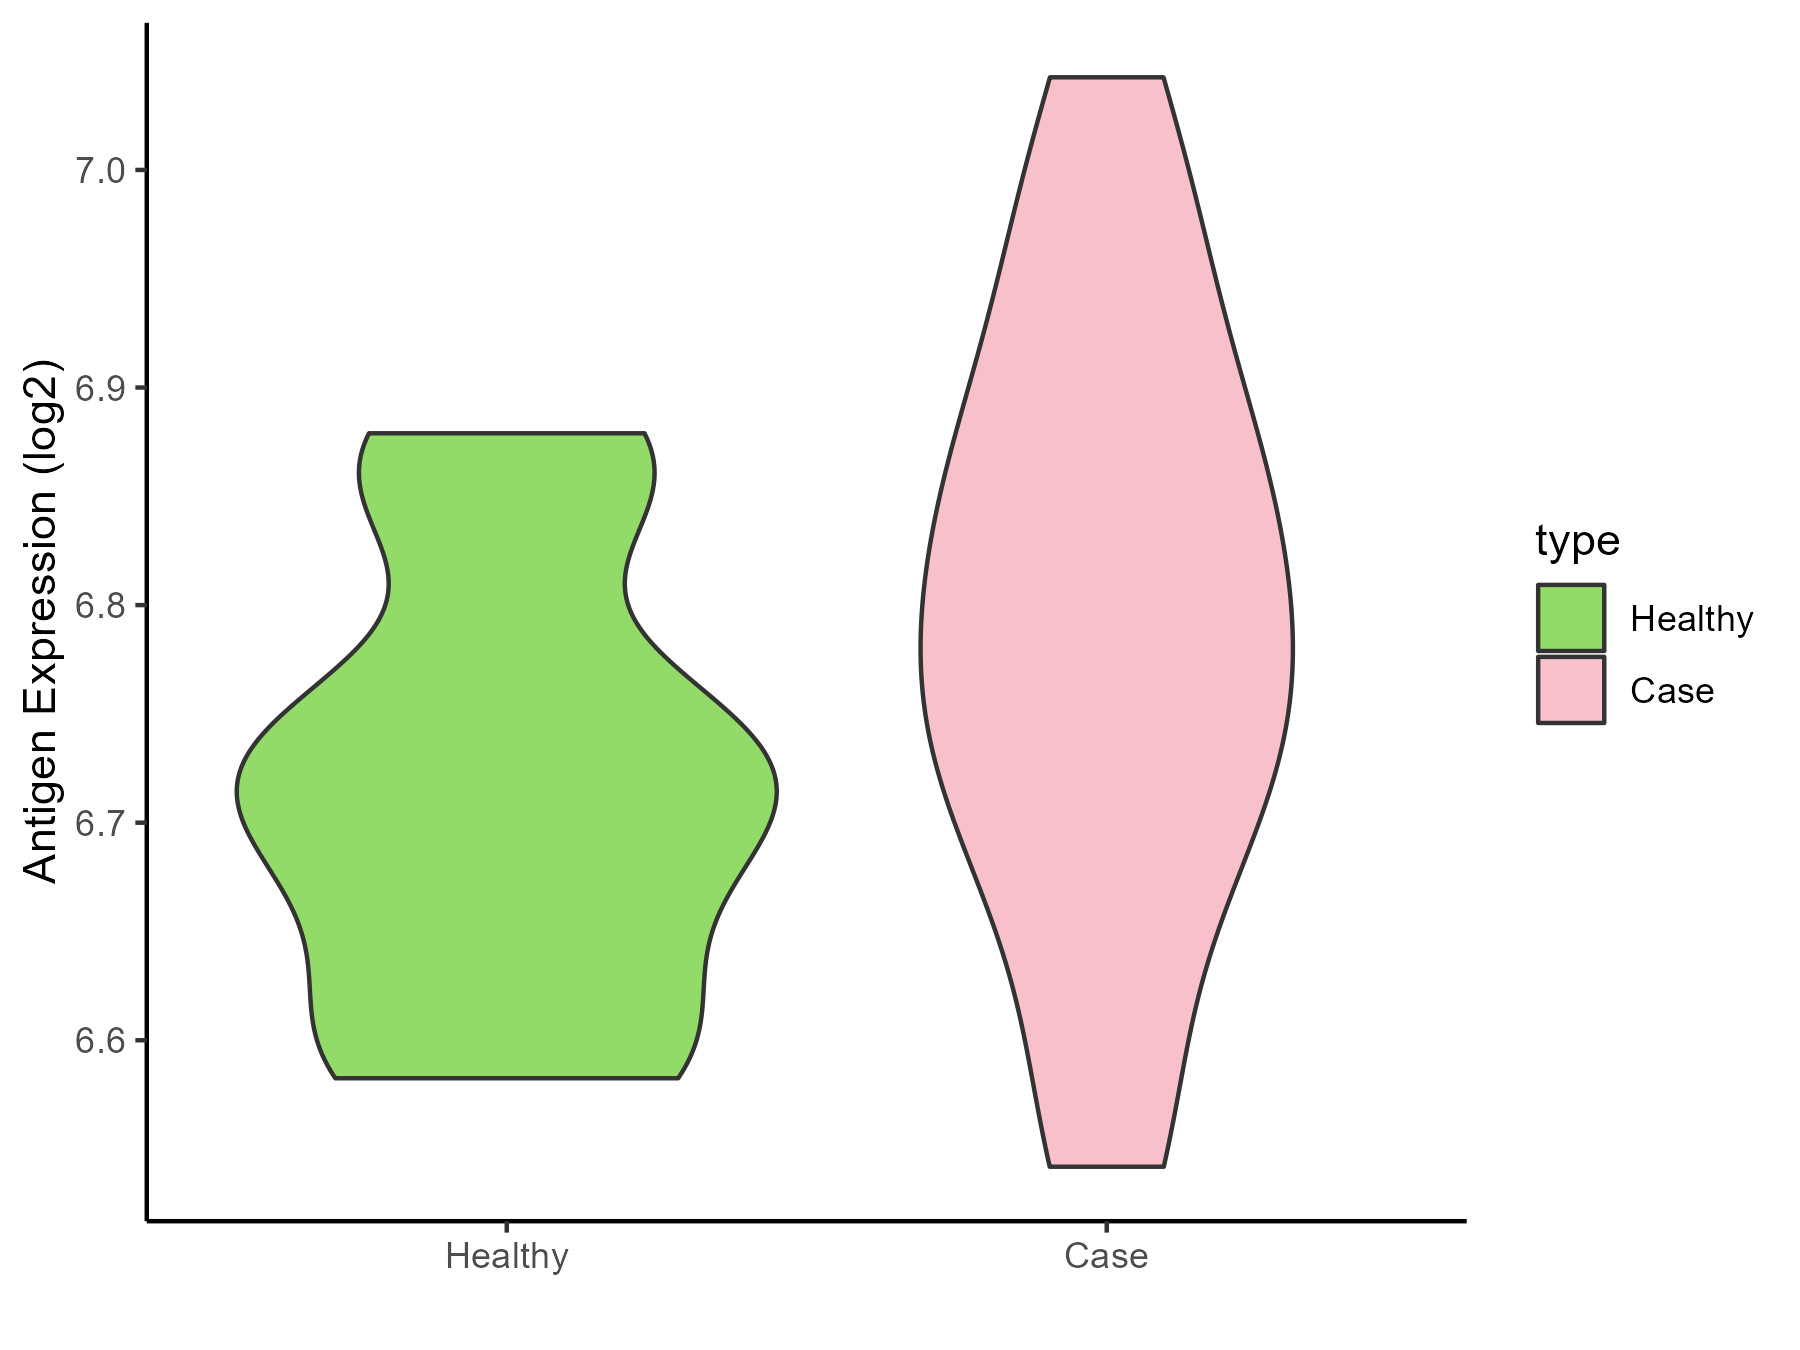
| The Studied Tissue | Vastus lateralis muscle | |
| The Specific Disease | Polycystic ovary syndrome | |
| The Expression Level of Disease Section Compare with the Healthy Individual Tissue | p-value: 0.098352012; Fold-change: 0.069436918; Z-score: 0.682973867 | |
| Disease-specific Antigen Abundances |
|
Click to View the Clearer Original Diagram |
| Differential expression pattern of antigen in diseases | ||
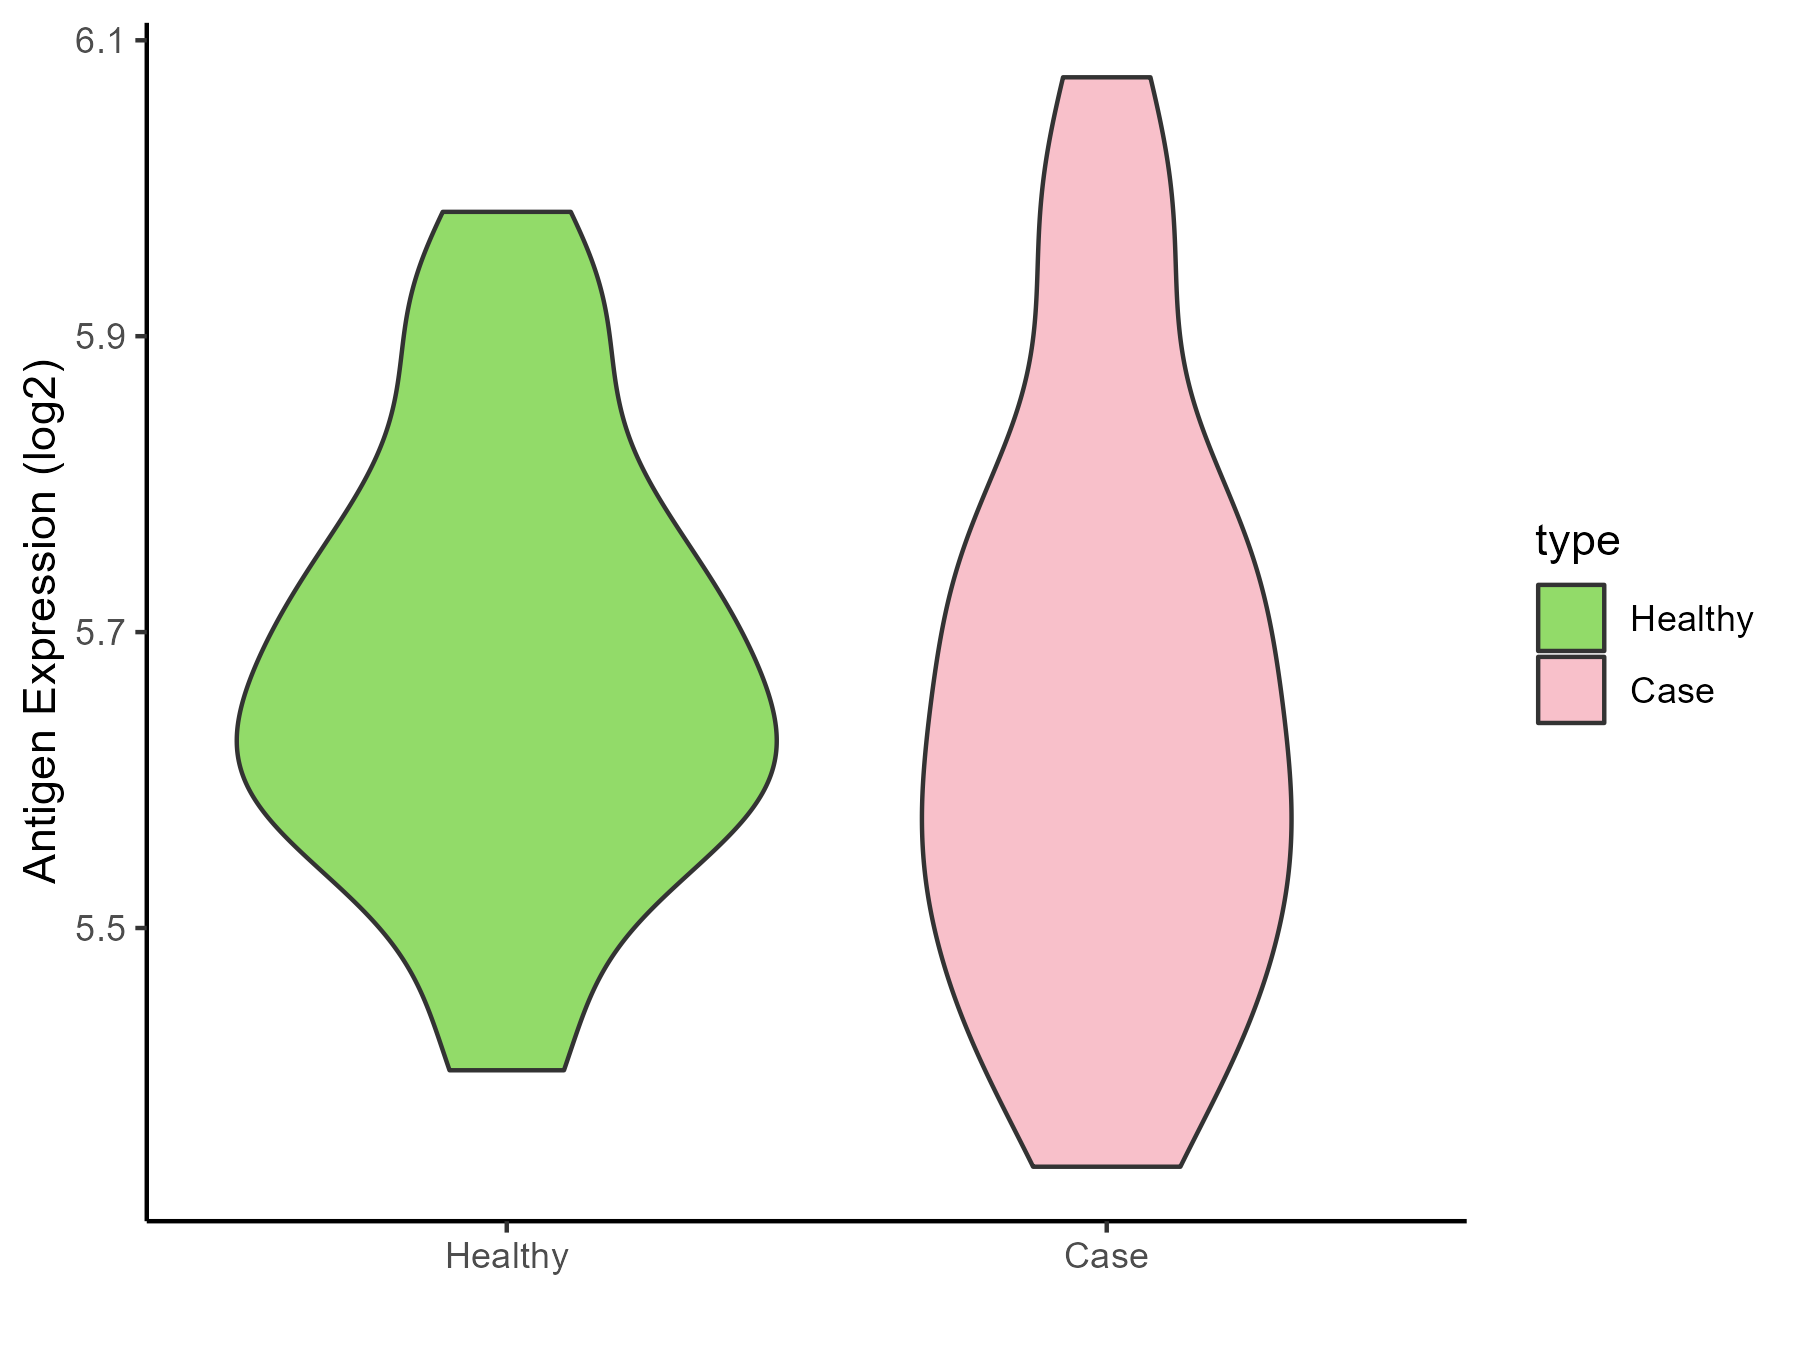
| The Studied Tissue | Subcutaneous Adipose | |
| The Specific Disease | Obesity | |
| The Expression Level of Disease Section Compare with the Healthy Individual Tissue | p-value: 0.553237622; Fold-change: -0.053335537; Z-score: -0.360130669 | |
| Disease-specific Antigen Abundances |
|
Click to View the Clearer Original Diagram |
| Differential expression pattern of antigen in diseases | ||
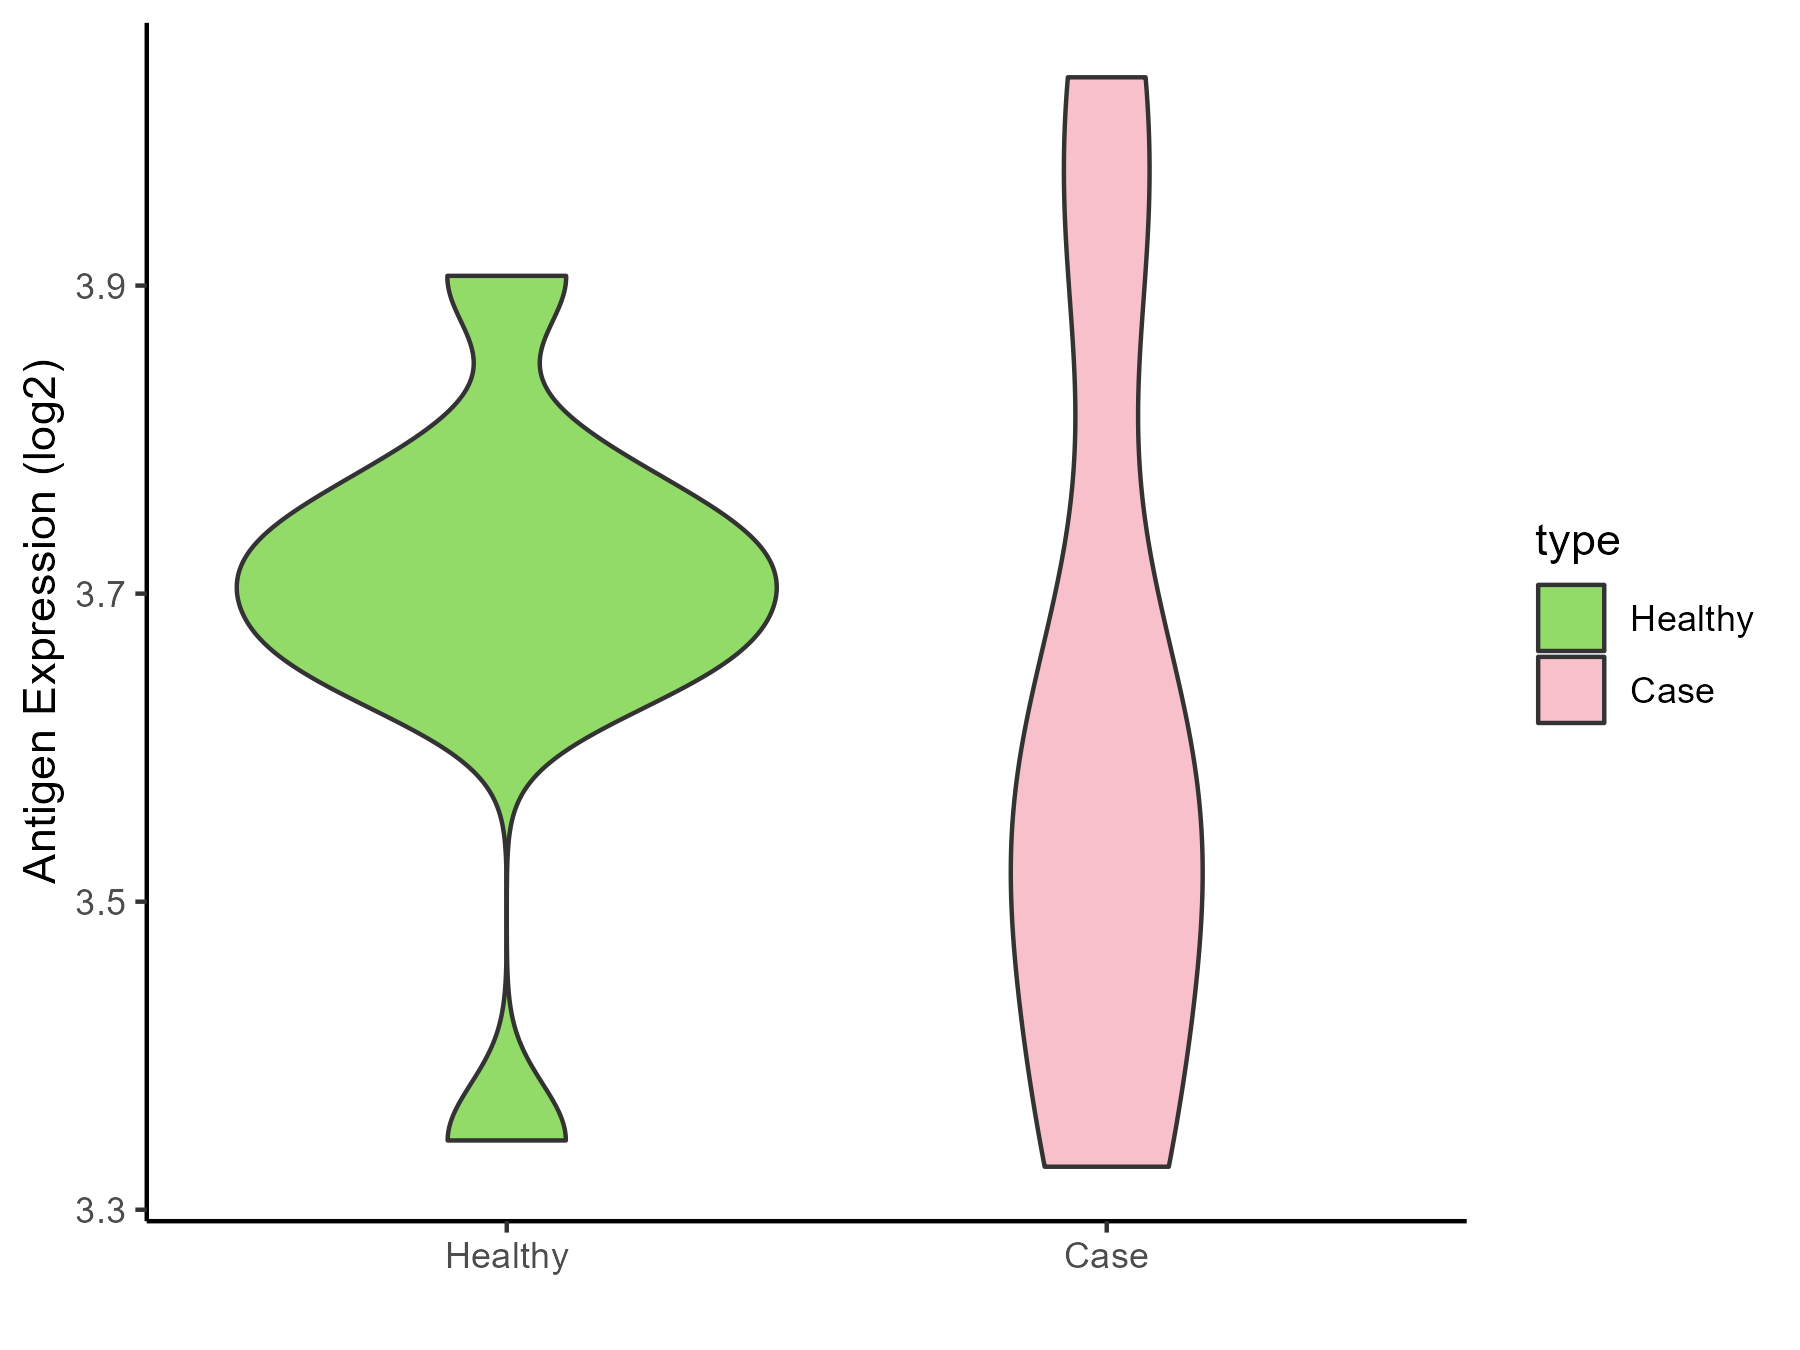
| The Studied Tissue | Biceps muscle | |
| The Specific Disease | Pompe disease | |
| The Expression Level of Disease Section Compare with the Healthy Individual Tissue | p-value: 0.45770282; Fold-change: -0.150555468; Z-score: -1.04991008 | |
| Disease-specific Antigen Abundances |
|
Click to View the Clearer Original Diagram |
| Differential expression pattern of antigen in diseases | ||
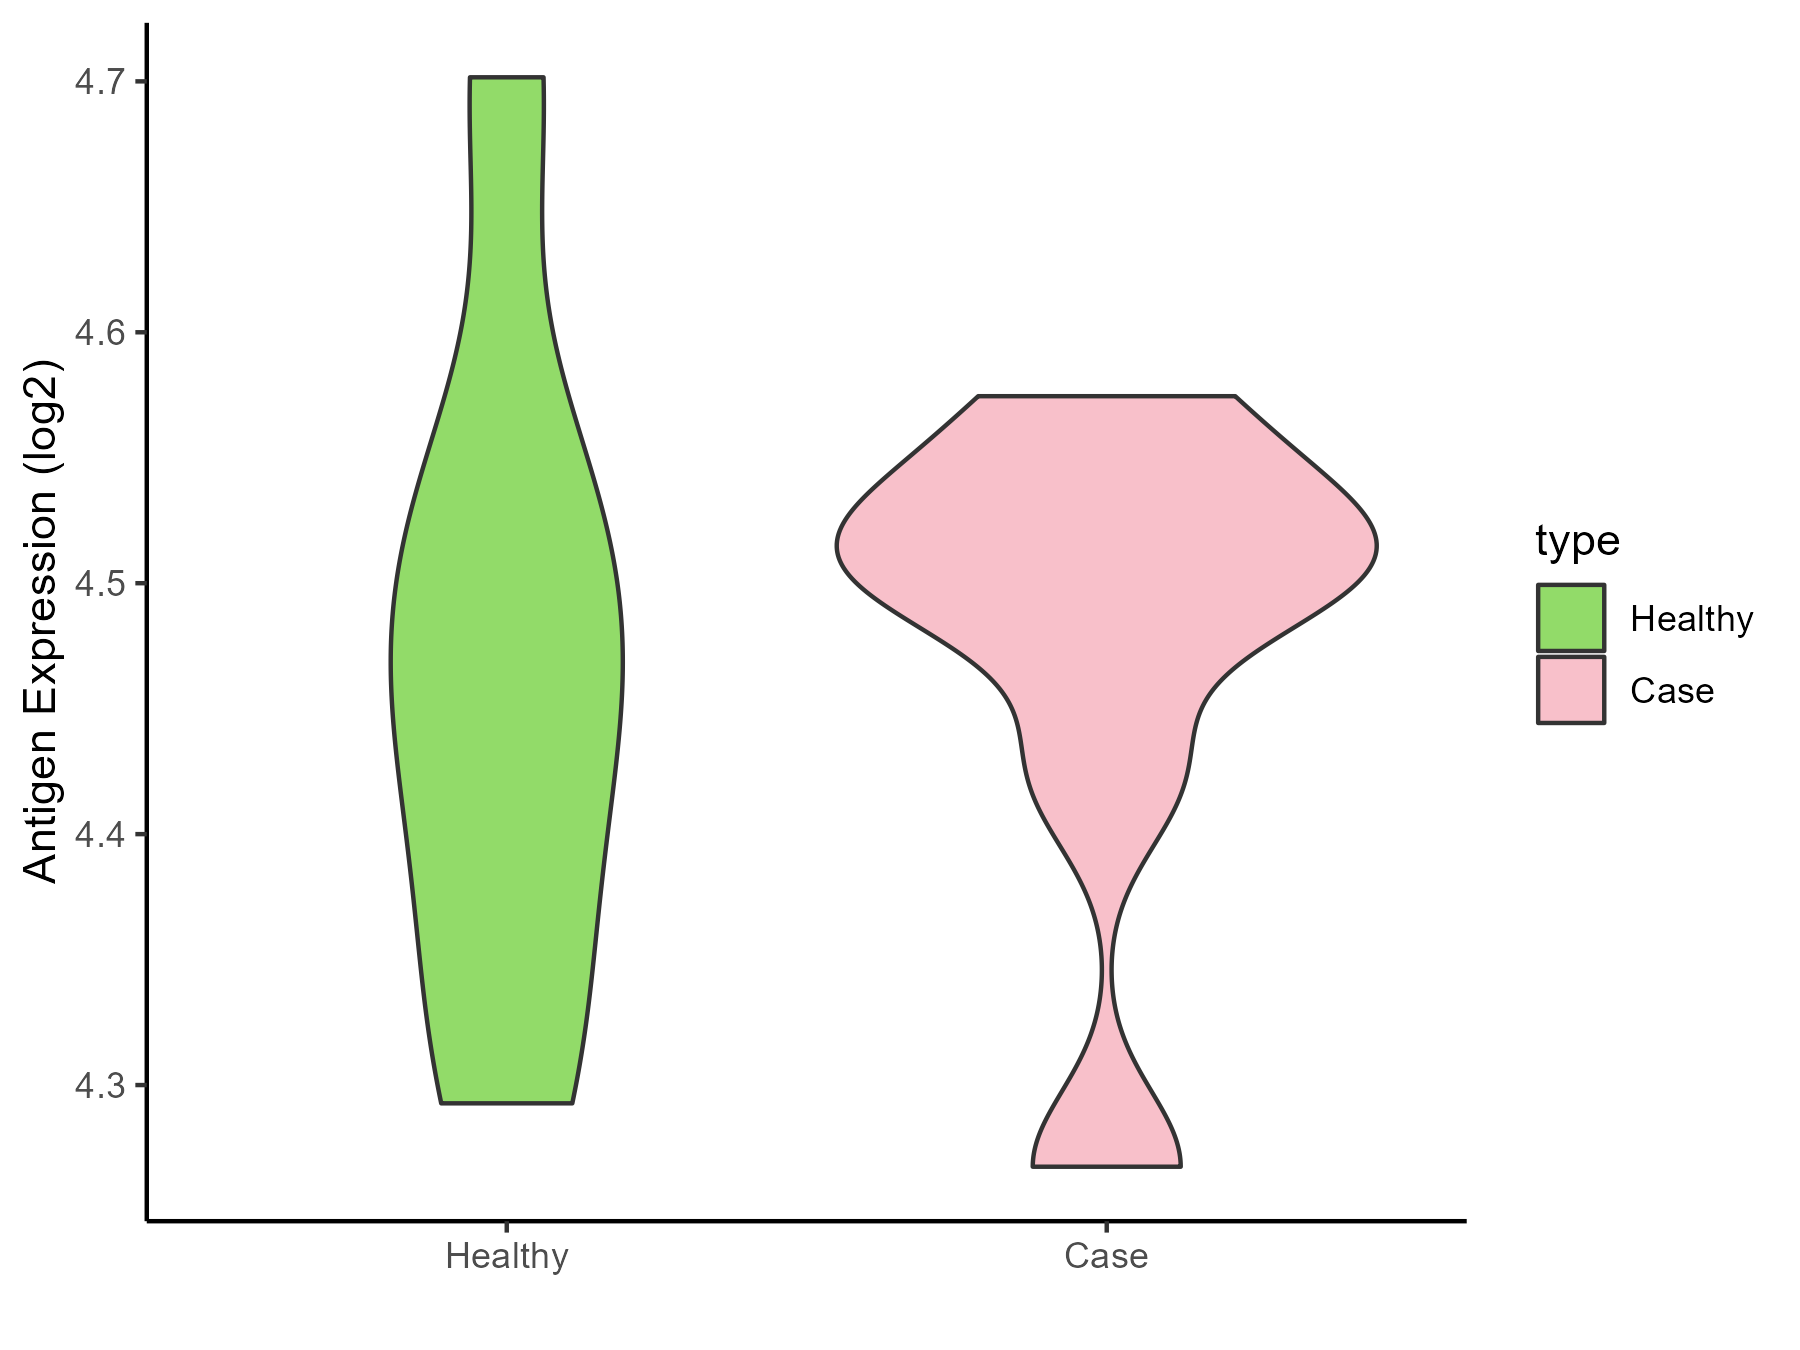
| The Studied Tissue | Whole blood | |
| The Specific Disease | Batten disease | |
| The Expression Level of Disease Section Compare with the Healthy Individual Tissue | p-value: 0.898477365; Fold-change: 0.04803612; Z-score: 0.356570299 | |
| Disease-specific Antigen Abundances |
|
Click to View the Clearer Original Diagram |
ICD Disease Classification 6
| Differential expression pattern of antigen in diseases | ||
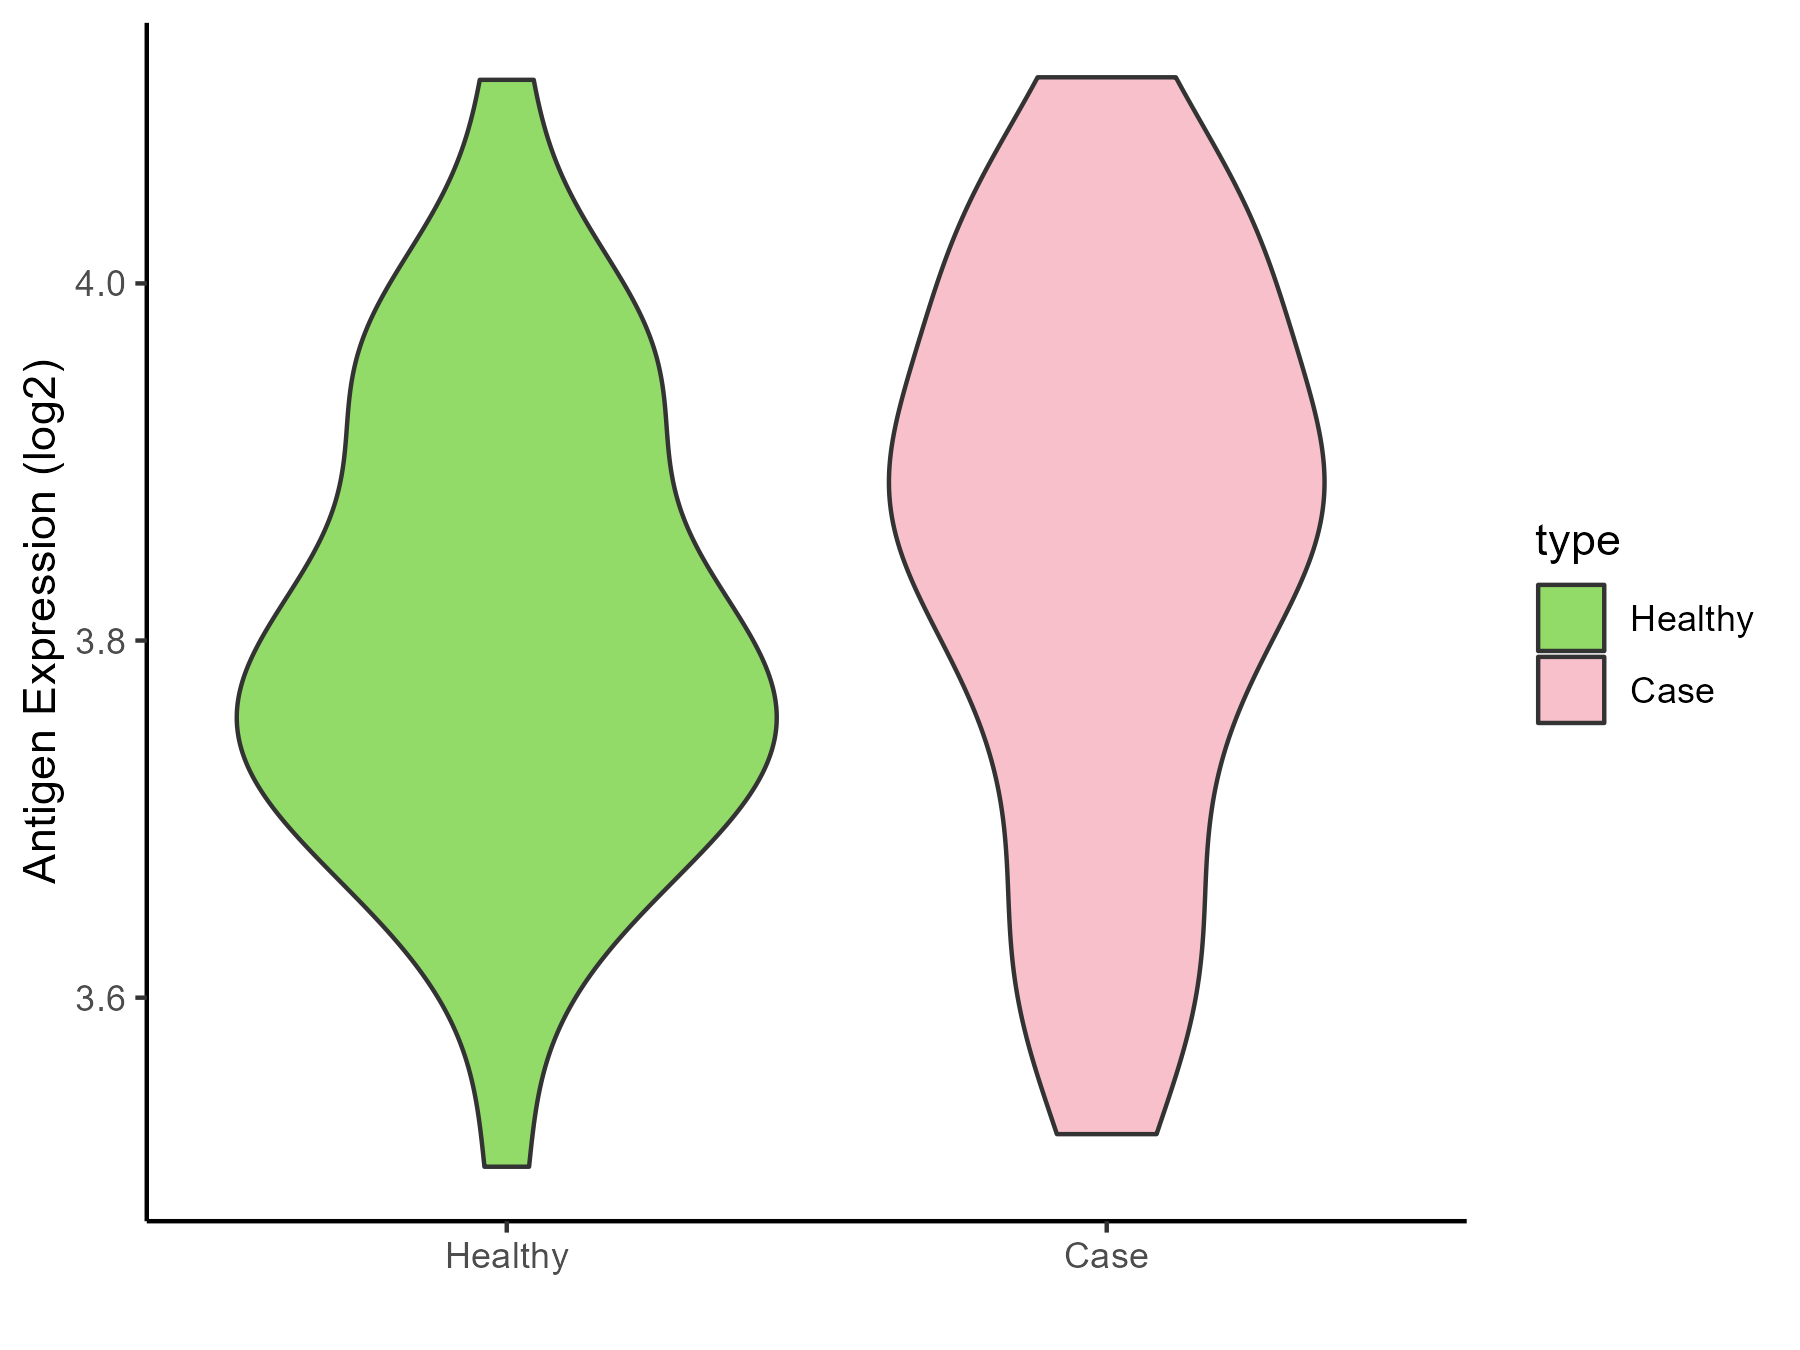
| The Studied Tissue | Whole blood | |
| The Specific Disease | Autism | |
| The Expression Level of Disease Section Compare with the Healthy Individual Tissue | p-value: 0.238867175; Fold-change: 0.092397027; Z-score: 0.707771334 | |
| Disease-specific Antigen Abundances |
|
Click to View the Clearer Original Diagram |
| Differential expression pattern of antigen in diseases | ||
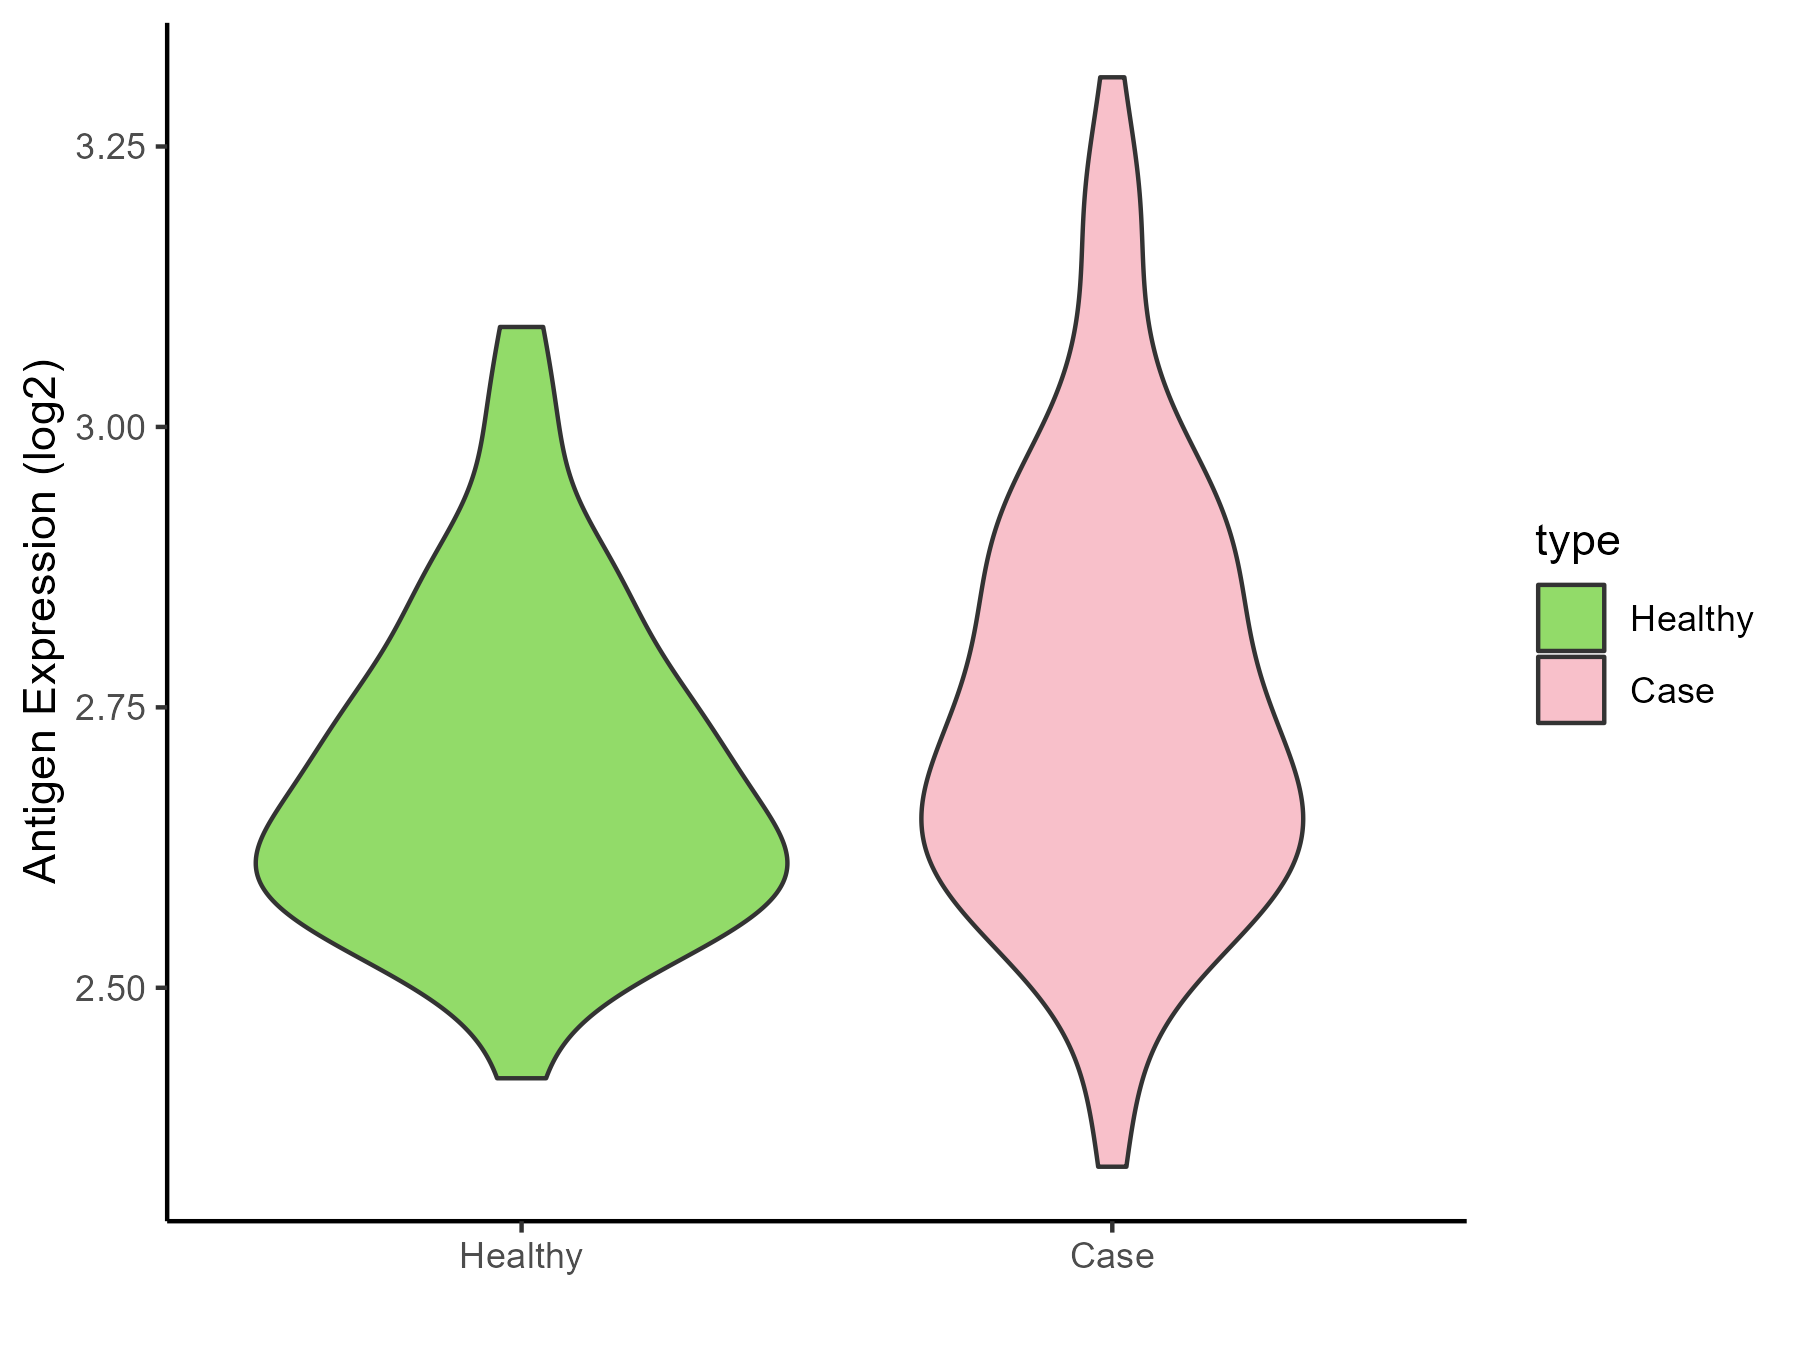
| The Studied Tissue | Whole blood | |
| The Specific Disease | Anxiety disorder | |
| The Expression Level of Disease Section Compare with the Healthy Individual Tissue | p-value: 0.02844717; Fold-change: 0.056721126; Z-score: 0.40020658 | |
| Disease-specific Antigen Abundances |
|
Click to View the Clearer Original Diagram |
ICD Disease Classification 8
| Differential expression pattern of antigen in diseases | ||
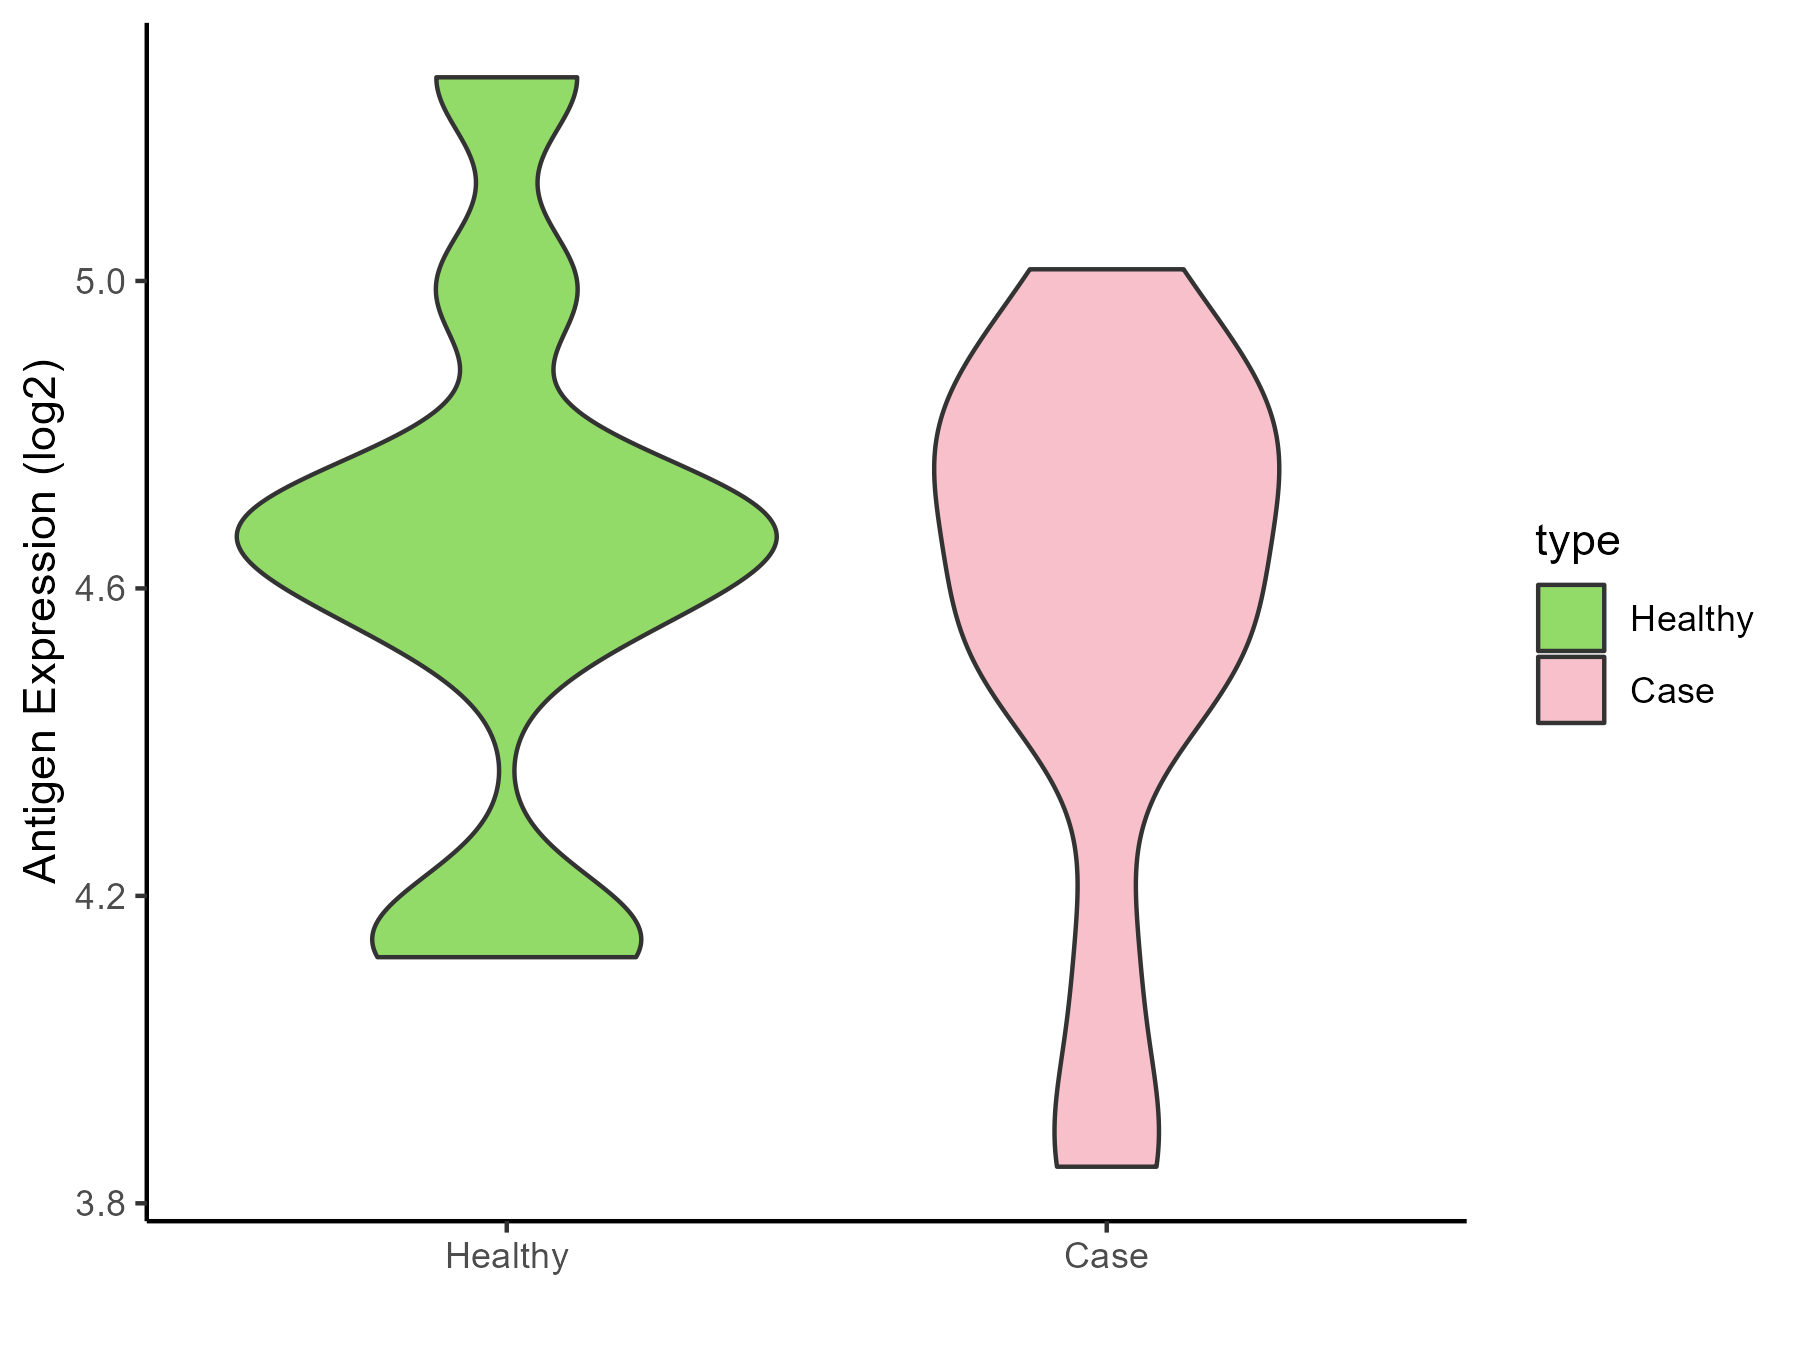
| The Studied Tissue | Substantia nigra | |
| The Specific Disease | Parkinson disease | |
| The Expression Level of Disease Section Compare with the Healthy Individual Tissue | p-value: 0.614778749; Fold-change: -0.015913062; Z-score: -0.04439037 | |
| Disease-specific Antigen Abundances |
|
Click to View the Clearer Original Diagram |
| Differential expression pattern of antigen in diseases | ||
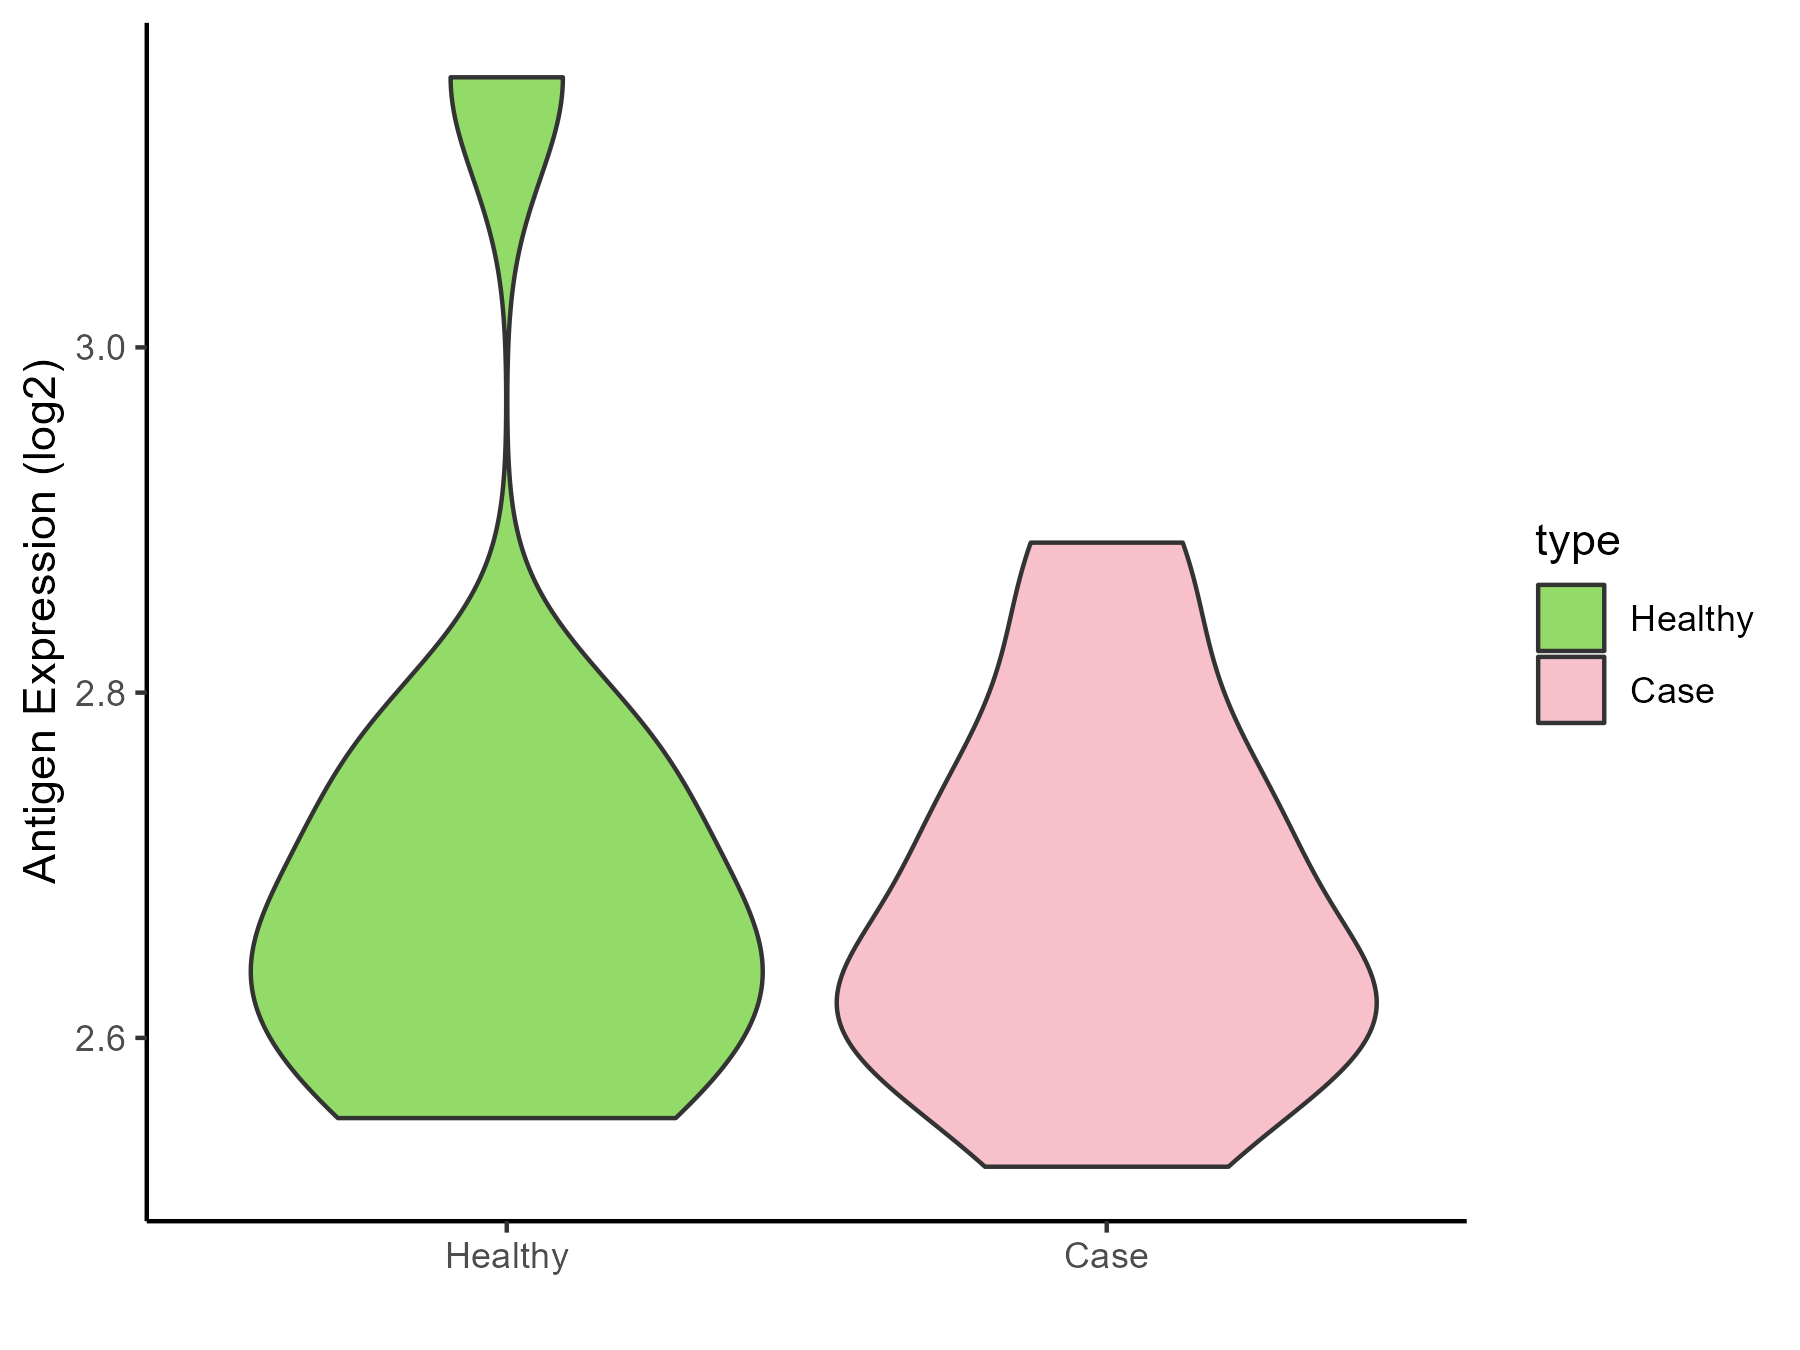
| The Studied Tissue | Whole blood | |
| The Specific Disease | Huntington disease | |
| The Expression Level of Disease Section Compare with the Healthy Individual Tissue | p-value: 0.619135853; Fold-change: -0.005325456; Z-score: -0.029289553 | |
| Disease-specific Antigen Abundances |
|
Click to View the Clearer Original Diagram |
| Differential expression pattern of antigen in diseases | ||
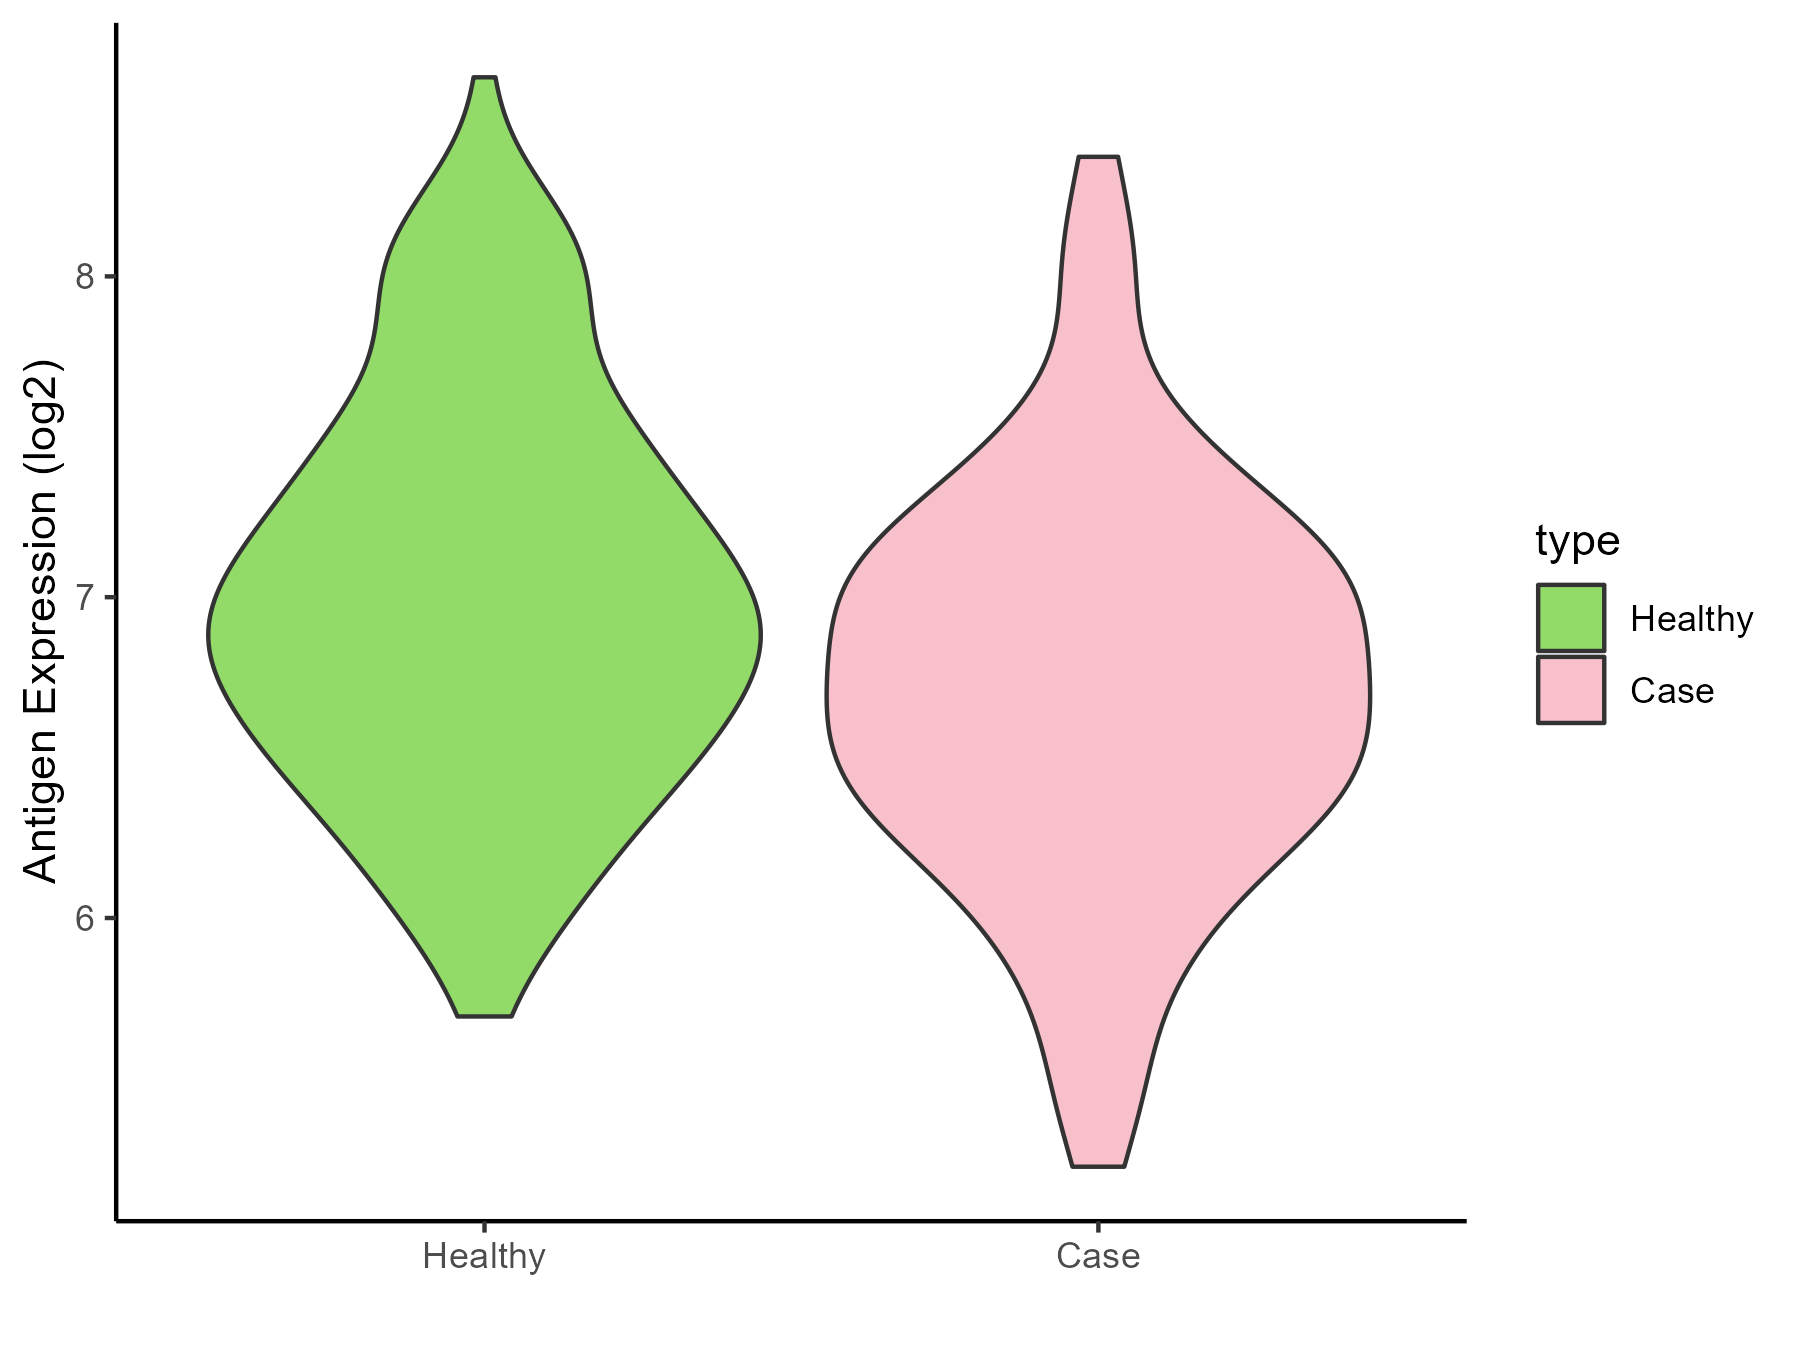
| The Studied Tissue | Entorhinal cortex | |
| The Specific Disease | Alzheimer disease | |
| The Expression Level of Disease Section Compare with the Healthy Individual Tissue | p-value: 0.001082598; Fold-change: -0.244065864; Z-score: -0.399707674 | |
| Disease-specific Antigen Abundances |
|
Click to View the Clearer Original Diagram |
| Differential expression pattern of antigen in diseases | ||
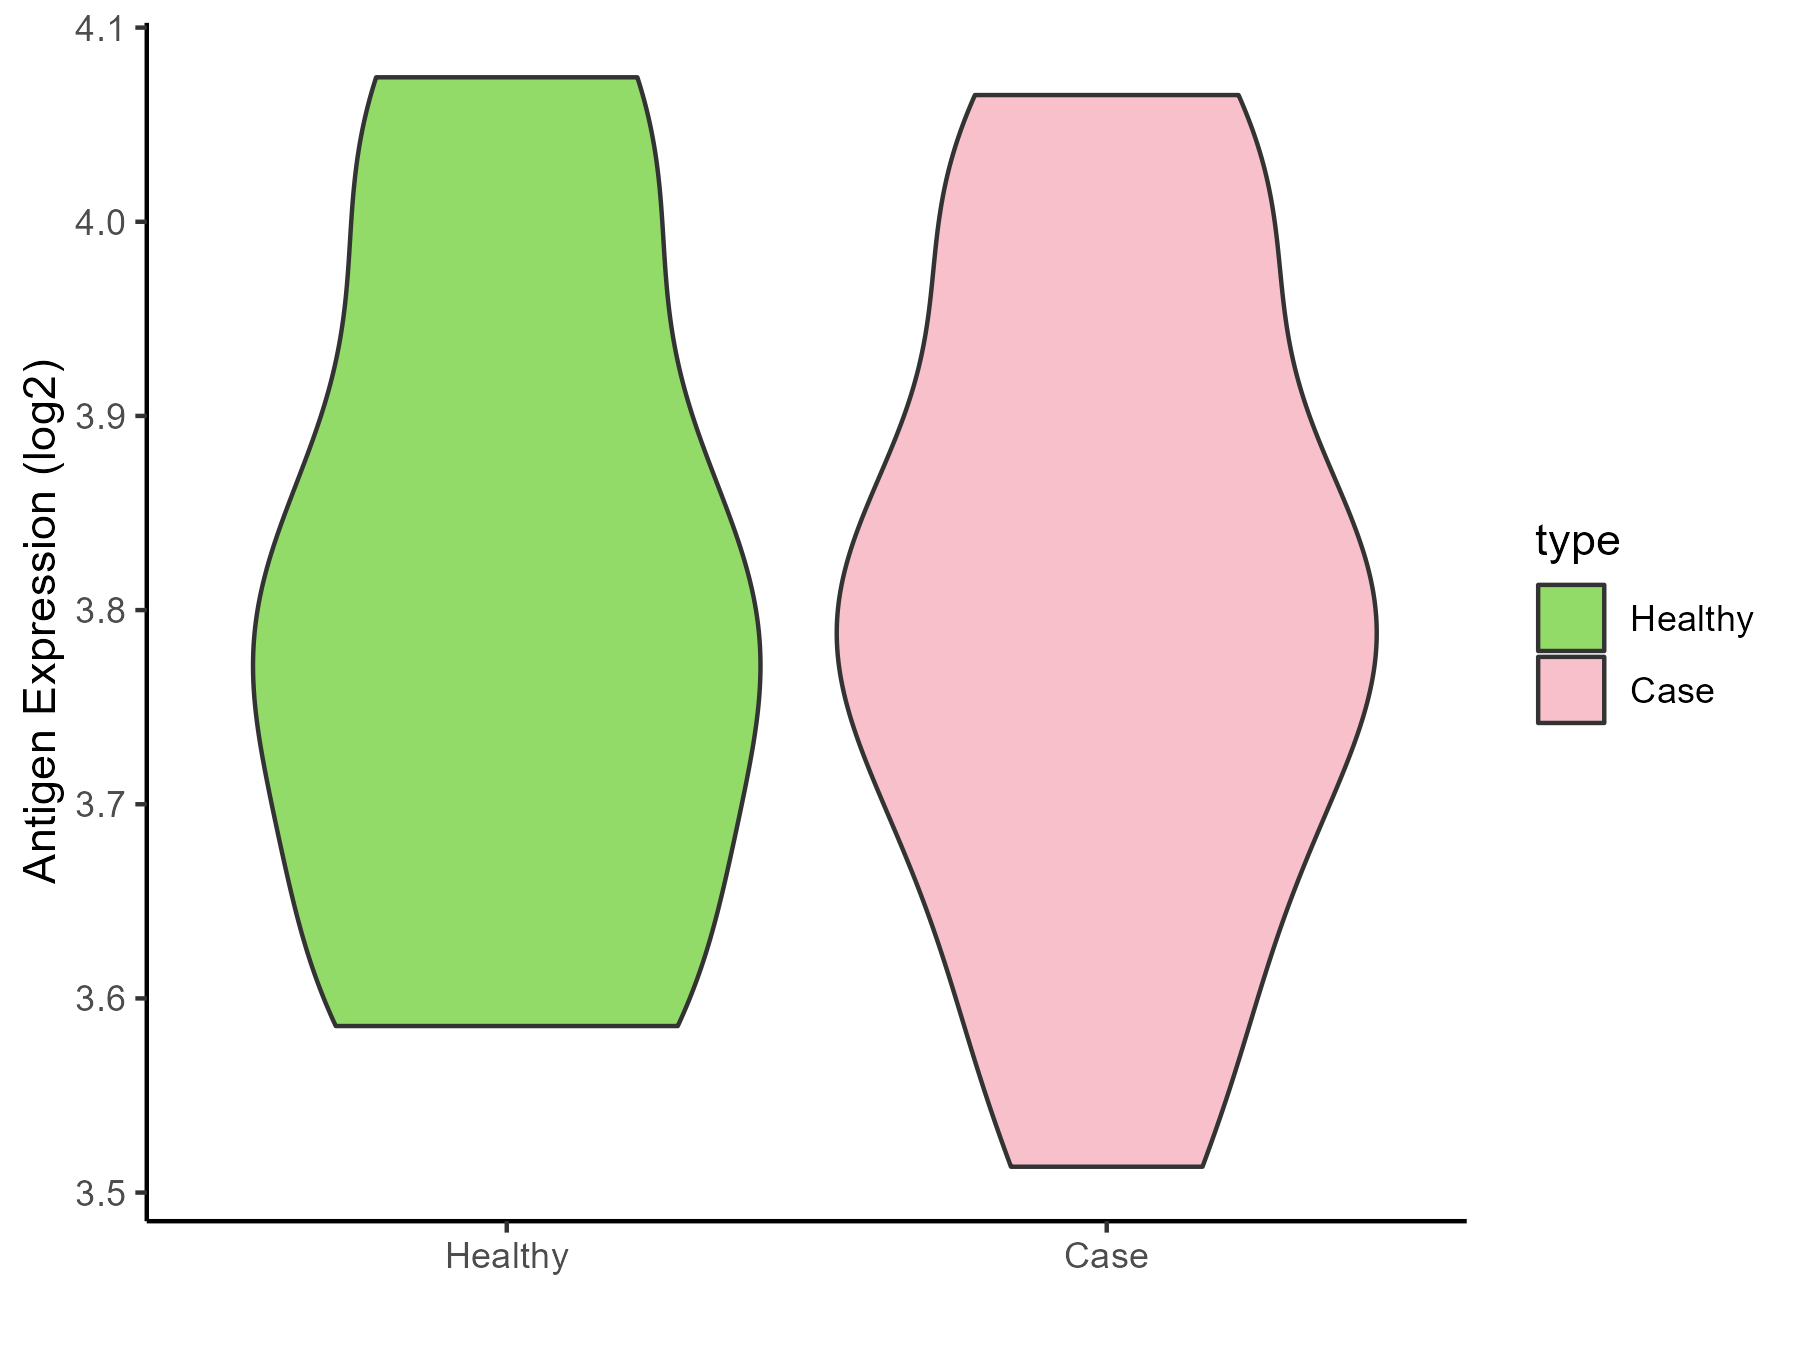
| The Studied Tissue | Whole blood | |
| The Specific Disease | Seizure | |
| The Expression Level of Disease Section Compare with the Healthy Individual Tissue | p-value: 0.939885533; Fold-change: 0.022516796; Z-score: 0.133931478 | |
| Disease-specific Antigen Abundances |
|
Click to View the Clearer Original Diagram |
| Differential expression pattern of antigen in diseases | ||
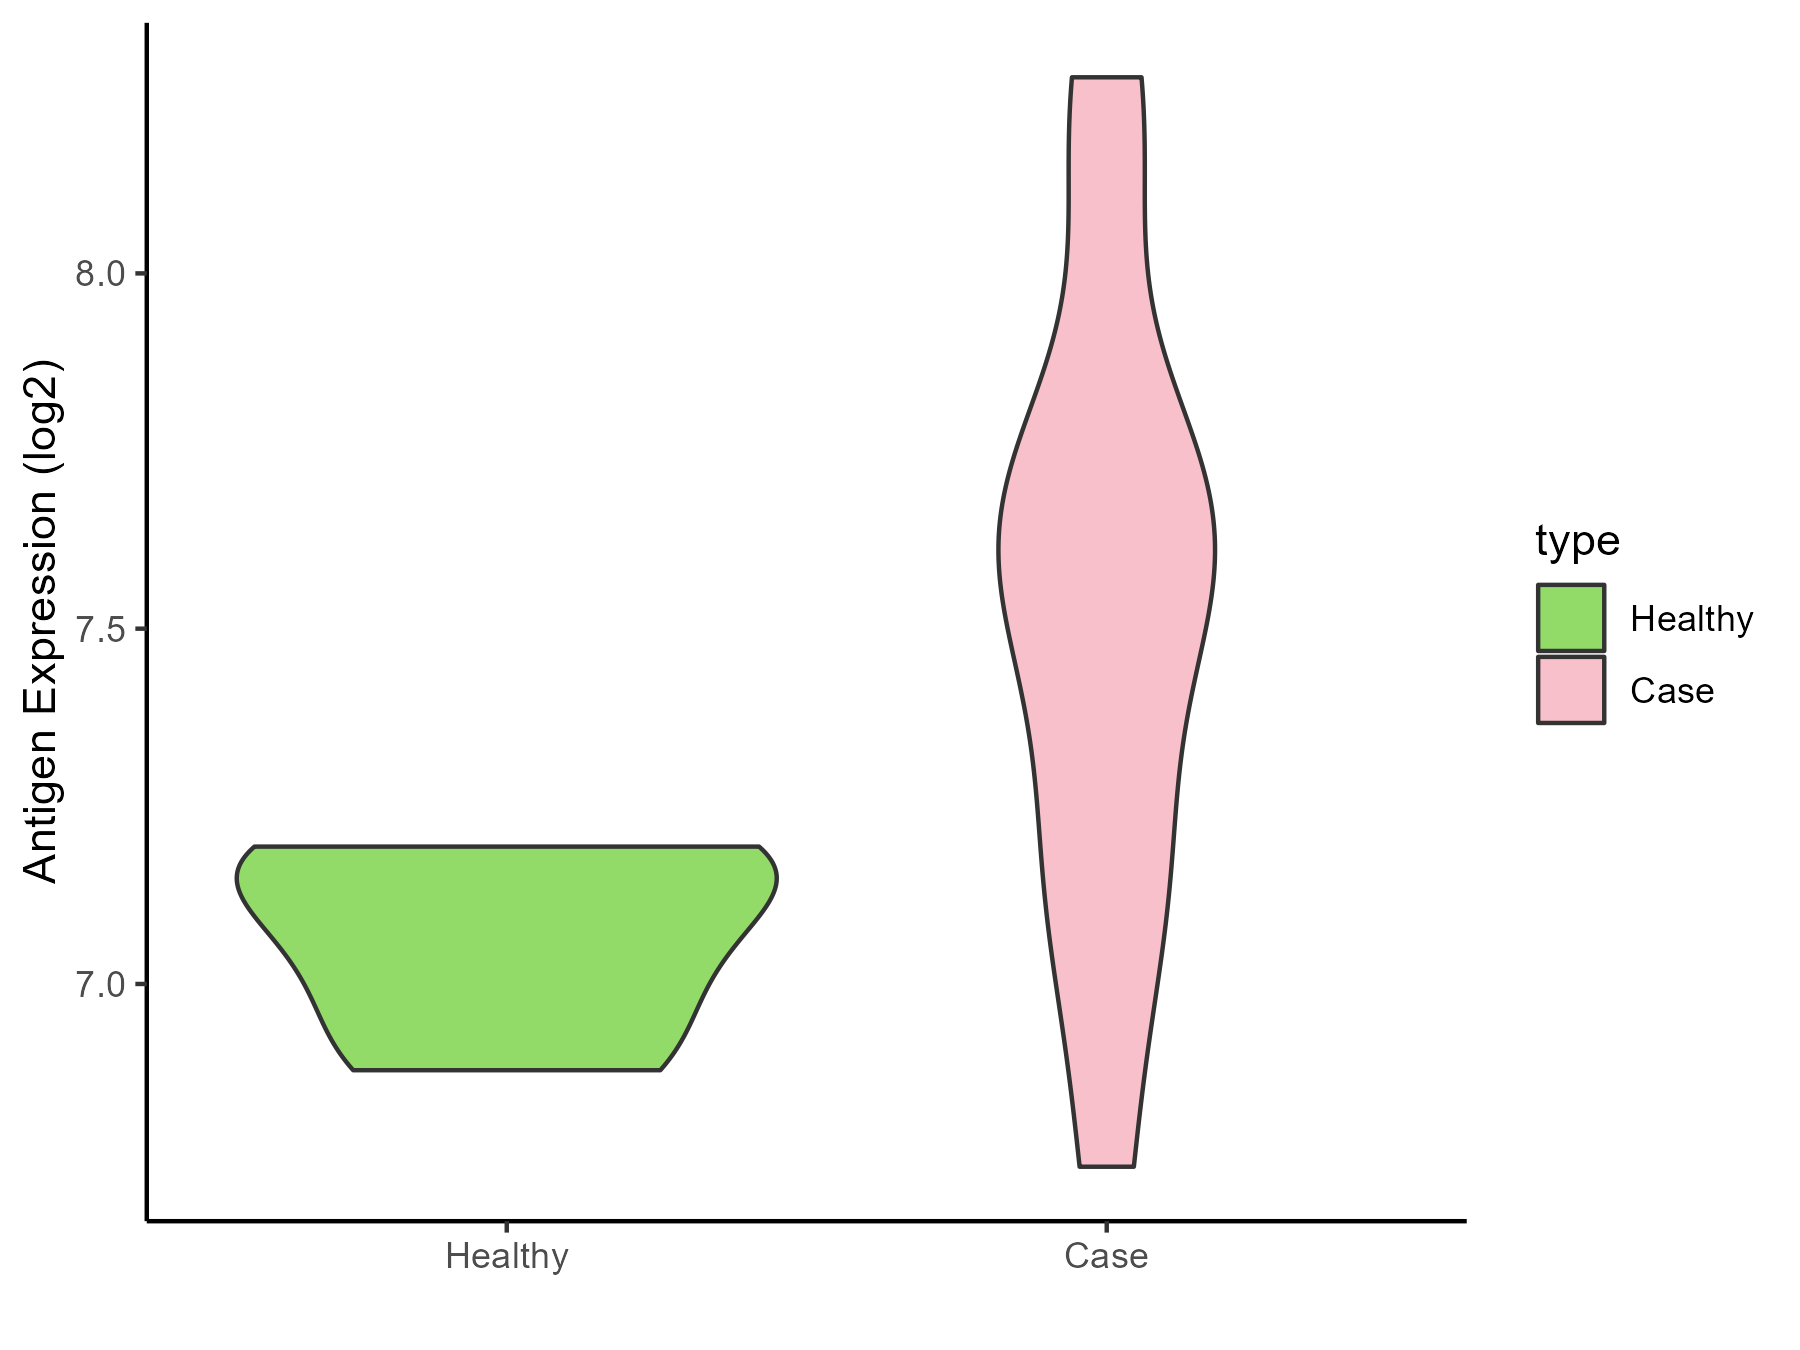
| The Studied Tissue | Skin | |
| The Specific Disease | Lateral sclerosis | |
| The Expression Level of Disease Section Compare with the Healthy Individual Tissue | p-value: 0.006899351; Fold-change: 0.518291952; Z-score: 3.578640551 | |
| Disease-specific Antigen Abundances |
|
Click to View the Clearer Original Diagram |
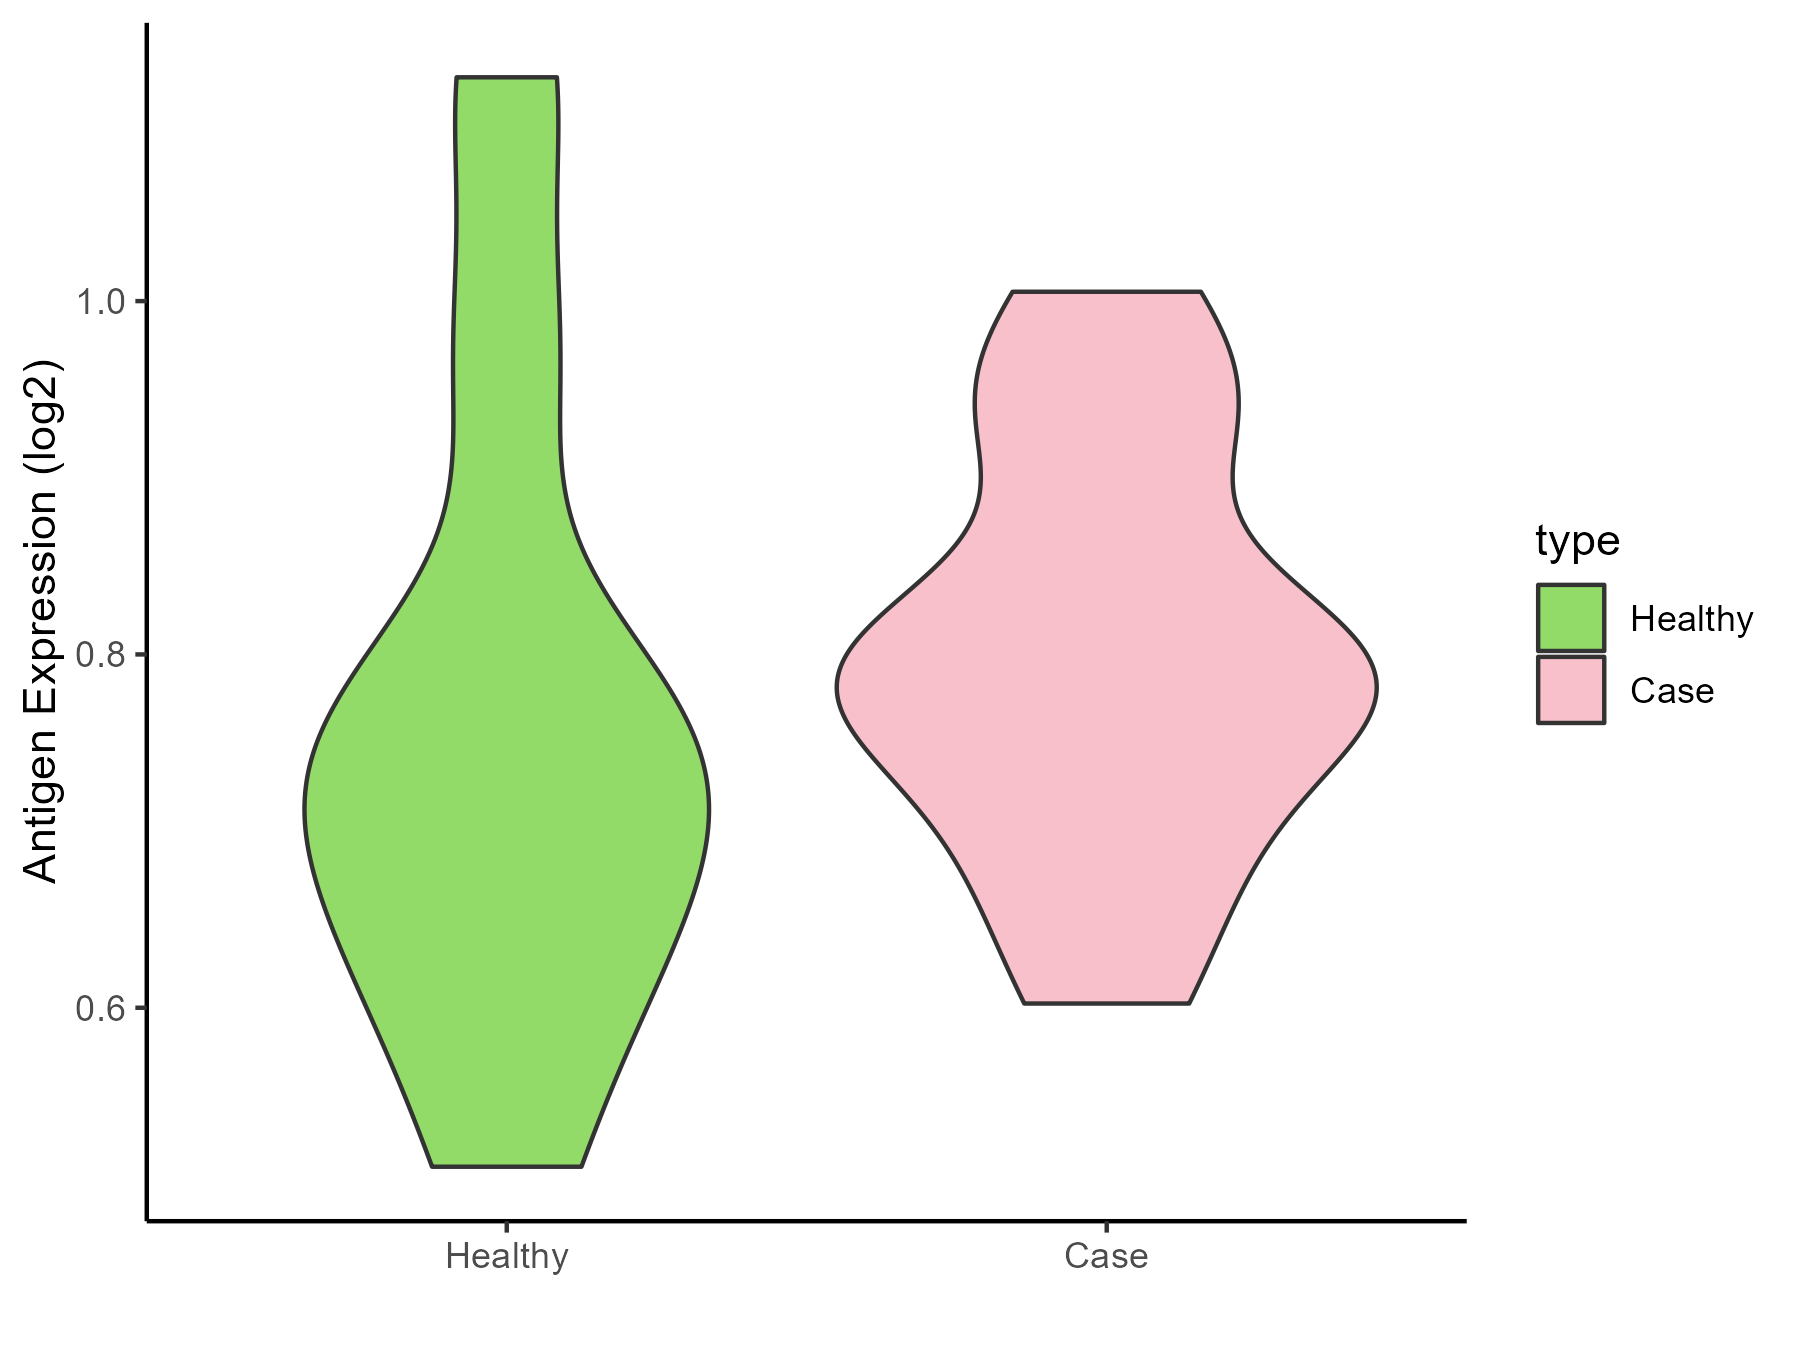
| The Studied Tissue | Cervical spinal cord | |
| The Specific Disease | Lateral sclerosis | |
| The Expression Level of Disease Section Compare with the Healthy Individual Tissue | p-value: 0.577077697; Fold-change: 0.071537796; Z-score: 0.381754374 | |
| Disease-specific Antigen Abundances |
|
Click to View the Clearer Original Diagram |
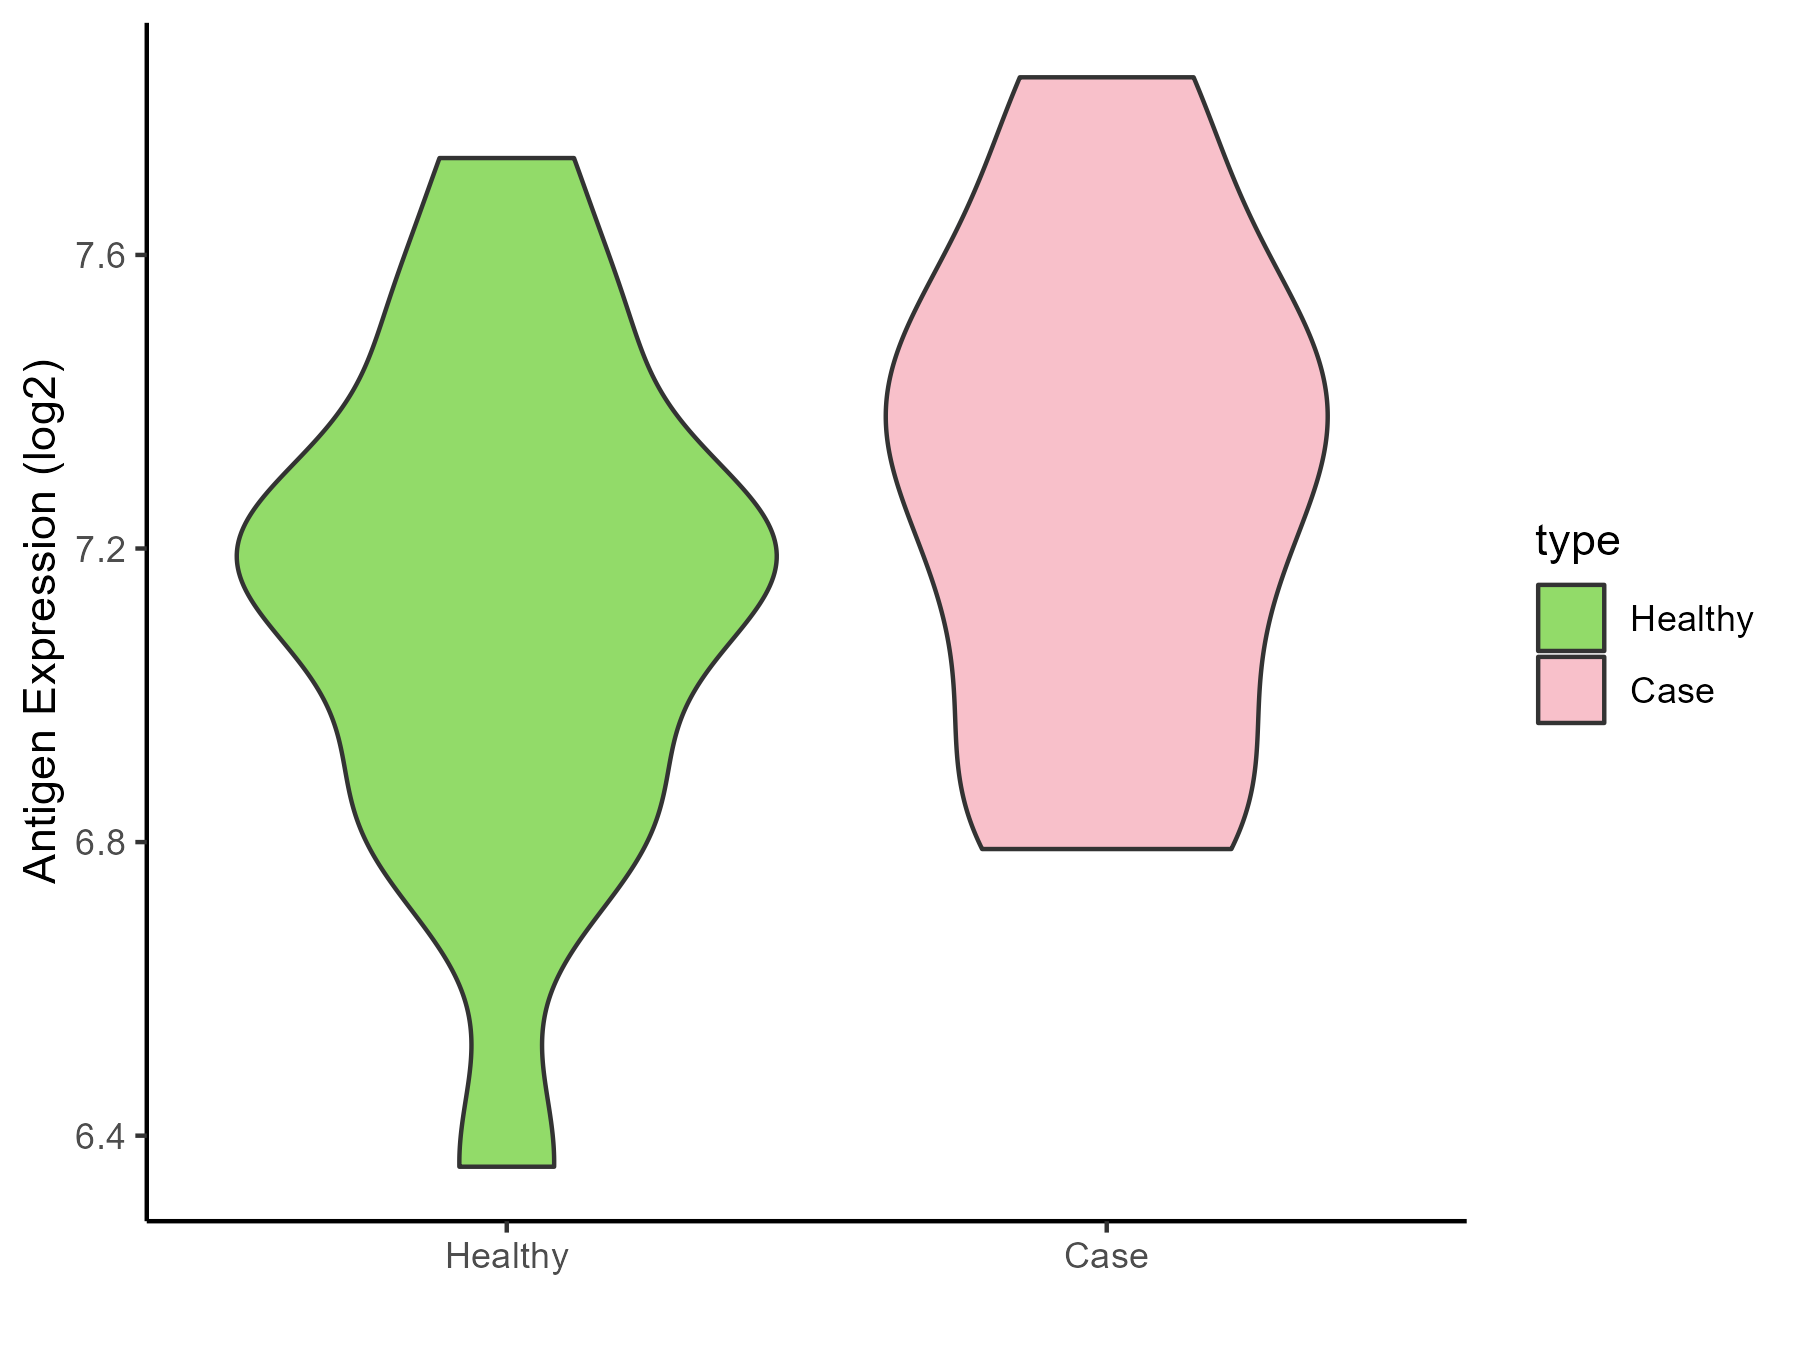
| Differential expression pattern of antigen in diseases | ||
| The Studied Tissue | Muscle | |
| The Specific Disease | Muscular atrophy | |
| The Expression Level of Disease Section Compare with the Healthy Individual Tissue | p-value: 0.212351037; Fold-change: 0.124207231; Z-score: 0.346886356 | |
| Disease-specific Antigen Abundances |
|
Click to View the Clearer Original Diagram |
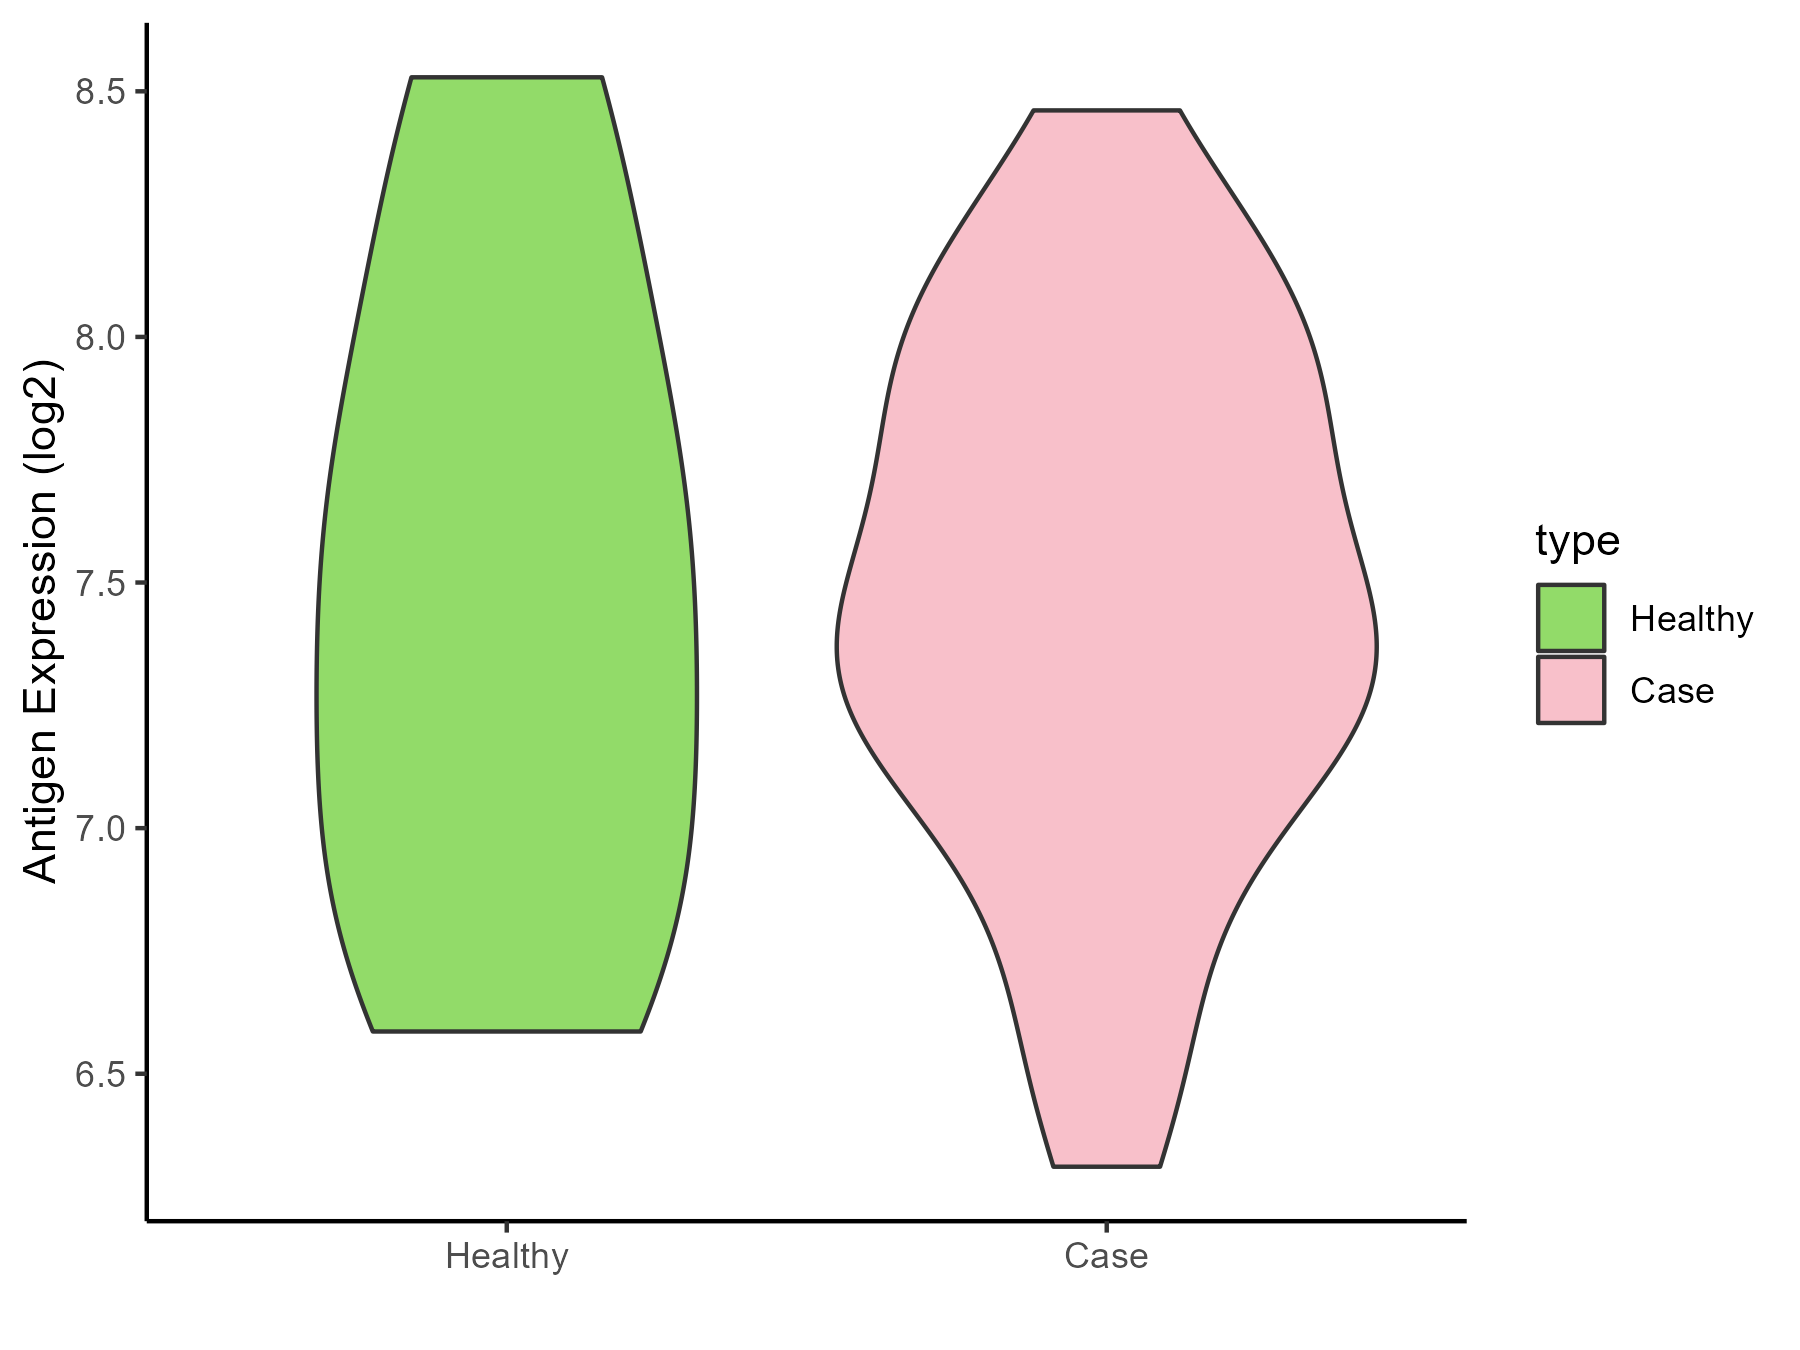
| Differential expression pattern of antigen in diseases | ||
| The Studied Tissue | Muscle | |
| The Specific Disease | Myopathy | |
| The Expression Level of Disease Section Compare with the Healthy Individual Tissue | p-value: 0.99537877; Fold-change: -0.072763304; Z-score: -0.108206062 | |
| Disease-specific Antigen Abundances |
|
Click to View the Clearer Original Diagram |
References
