
Antibody-drug Conjugate Information
General Information of This Antibody-drug Conjugate (ID: DRG0OAWRK)
| ADC Name |
SHR-A1403
|
|||||
|---|---|---|---|---|---|---|
| Synonyms |
SHR-A1403; HTI-1403; HTI-1066
Click to Show/Hide
|
|||||
| Organization |
Jiangsu Hengrui Pharmaceuticals (Originator)
|
|||||
| Drug Status |
Phase 1 (discontinued)
|
|||||
| Drug-to-Antibody Ratio |
2
|
|||||
| Structure |
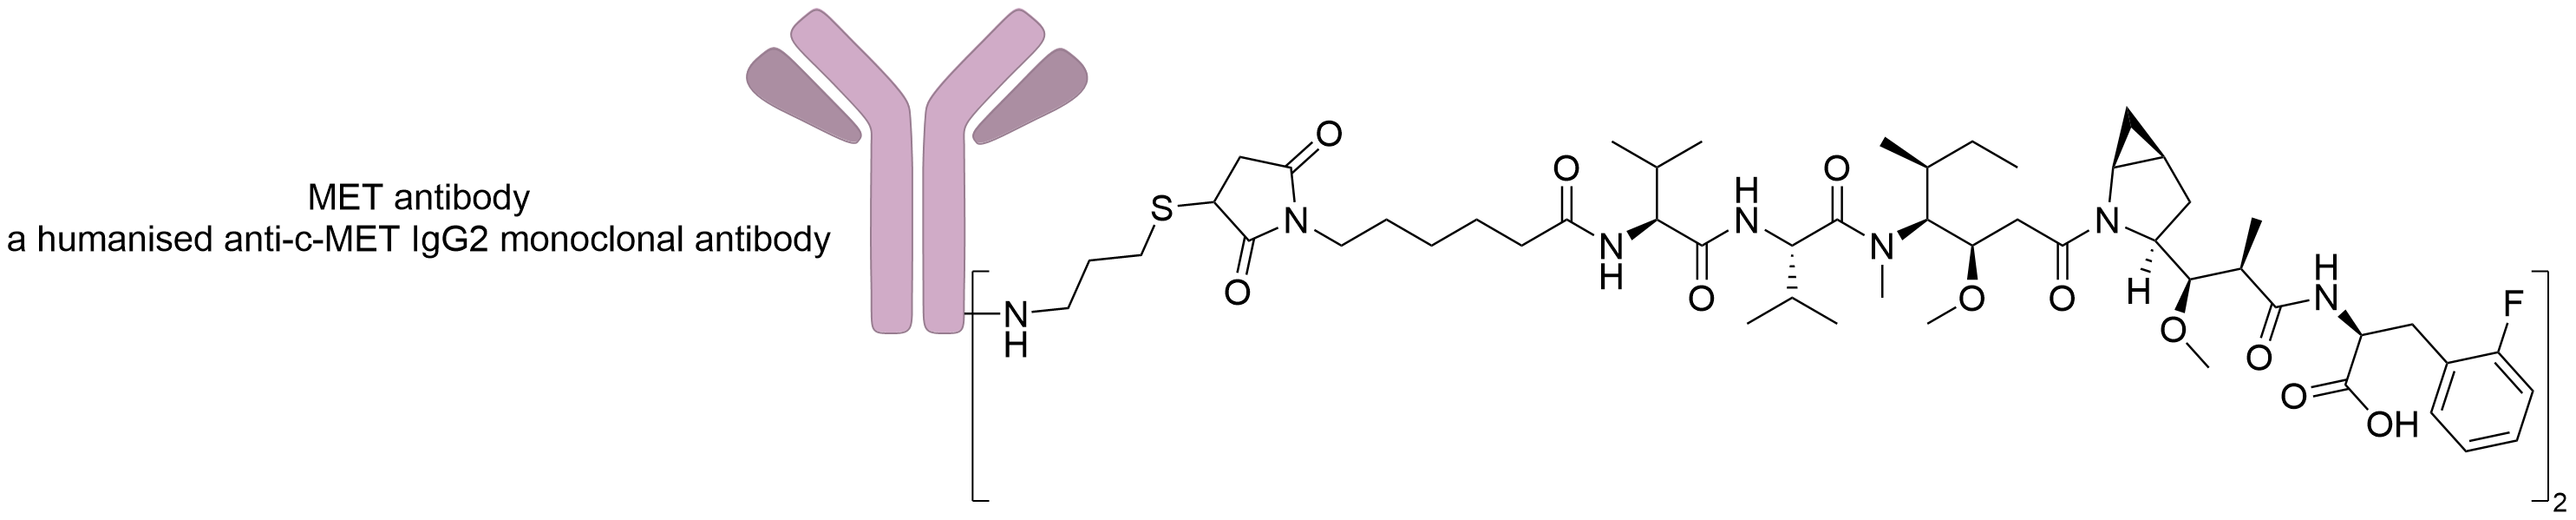
|
|||||
| Antibody Name |
Anti-c-MET IgG2 mAb
|
Antibody Info | ||||
| Antigen Name |
Hepatocyte growth factor receptor (MET)
|
Antigen Info | ||||
| Payload Name |
SHR152852
|
Payload Info | ||||
| Payload Target |
Microtubule (MT)
|
Target Info | ||||
| Linker Name |
L2-MC
|
Linker Info | ||||
| Conjugate Type |
Undisclosed
|
|||||
2027 Update
The disease landscape of This ADC
2027 Update
The clinical trial pipelines of This ADC
| Indication | Phase 1 | Phase 2 | Phase 3 | Approved | |||
|---|---|---|---|---|---|---|---|
| Unspecific solid tumor |
2 Trials
|
2027 Update
ADC-specific functional property
2027 Update
General Information of The ADMET Data Related to This ADC
Absorption
| Standard Type | Value | Units | Description | Reference |
|---|---|---|---|---|
| Maximum Observed Concentration (Cmax) | 14.08 | ug/mL |
Serum exposure of SHR-A1403 in MKN-45 xenograft mice model following single intravenous injection, 1 mg/kg.
|
[1] |
| Area Under the Concentration-Time Curve (AUC) | 937.72 | ug·h/mL |
Serum exposure of SHR-A1403 in MKN-45 xenograft mice model following single intravenous injection, 1 mg/kg, AUC0-168h.
|
[1] |
| Maximum Observed Concentration (Cmax) | 49.93 | ug/mL |
Serum exposure of SHR-A1403 in MKN-45 xenograft mice model following single intravenous injection, 3 mg/kg.
|
[1] |
| Area Under the Concentration-Time Curve (AUC) | 2663.07 | ug·h/mL |
Serum exposure of SHR-A1403 in MKN-45 xenograft mice model following single intravenous injection, 3 mg/kg, AUC0-168h.
|
[1] |
| Maximum Observed Concentration (Cmax) | 11.9±4.18 | ug/mL |
PK parameters of ADC in mice receiving single intravenous administration of SHR-A1403, 1 mg/kg.
|
[2] |
| Maximum Observed Concentration (Cmax) | 49.8±6.65 | ug/mL |
PK parameters of ADC in mice receiving single intravenous administration of SHR-A1403, 3 mg/kg.
|
[2] |
| Maximum Observed Concentration (Cmax) | 19.6±1.88 | ug/mL |
PK parameters of ADC in rat receiving single intravenous administration of SHR-A1403, 1 mg/kg.
|
[2] |
| Maximum Observed Concentration (Cmax) | 59.5±4.00 | ug/mL |
PK parameters of ADC in rat receiving single intravenous administration of SHR-A1403, 3 mg/kg.
|
[2] |
| Maximum Observed Concentration (Cmax) | 162±18.6 | ug/mL |
PK parameters of ADC in rat receiving single intravenous administration of SHR-A1403, 9 mg/kg.
|
[2] |
| Maximum Observed Concentration (Cmax) | 6.46±1.44 | ug/mL |
PK parameters of ADC in monkey receiving single intravenous administration of SHR-A1403, 0.3 mg/kg.
|
[2] |
| Maximum Observed Concentration (Cmax) | 28.3±2.20 | ug/mL |
PK parameters of ADC in monkey receiving single intravenous administration of SHR-A1403, 1 mg/kg.
|
[2] |
| Maximum Observed Concentration (Cmax) | 80.1±7.58 | ug/mL |
PK parameters of ADC in monkey receiving single intravenous administration of SHR-A1403, 3 mg/kg.
|
[2] |
| Area Under the Concentration-Time Curve (AUC) | 953±65 | ug·h/mL |
PK parameters of ADC in mice receiving single intravenous administration of SHR-A1403, 1 mg/kg, AUC0-t.
|
[2] |
| Area Under the Concentration-Time Curve (AUC) | 2686±218 | ug·h/mL |
PK parameters of ADC in mice receiving single intravenous administration of SHR-A1403, 3 mg/kg, AUC0-t.
|
[2] |
| Area Under the Concentration-Time Curve (AUC) | 2050±152 | ug·h/mL |
PK parameters of ADC in rat receiving single intravenous administration of SHR-A1403, 1 mg/kg, AUC0-t.
|
[2] |
| Area Under the Concentration-Time Curve (AUC) | 6390±889 | ug·h/mL |
PK parameters of ADC in rat receiving single intravenous administration of SHR-A1403, 3 mg/kg, AUC0-t.
|
[2] |
| Area Under the Concentration-Time Curve (AUC) | 17500±1890 | ug·h/mL |
PK parameters of ADC in rat receiving single intravenous administration of SHR-A1403, 9 mg/kg, AUC0-t.
|
[2] |
| Area Under the Concentration-Time Curve (AUC) | 423±131 | ug·h/mL |
PK parameters of ADC in monkey receiving single intravenous administration of SHR-A1403, 0.3 mg/kg, AUC0-t.
|
[2] |
| Area Under the Concentration-Time Curve (AUC) | 2640±554 | ug·h/mL |
PK parameters of ADC in monkey receiving single intravenous administration of SHR-A1403, 1 mg/kg, AUC0-t.
|
[2] |
| Area Under the Concentration-Time Curve (AUC) | 9220±1120 | ug·h/mL |
PK parameters of ADC in monkey receiving single intravenous administration of SHR-A1403, 3 mg/kg, AUC0-t.
|
[2] |
| Maximum Observed Concentration (Cmax) | 28.1 | ug/mL |
Individual PK parameters in monkeys receiving SHR-A1403 (DAR=2) at 1 mg/kg, monkey 201.
|
[2] |
| Maximum Observed Concentration (Cmax) | 24.6 | ug/mL |
Individual PK parameters in monkeys receiving SHR-A1403 (DAR=2) at 1 mg/kg, monkey 202.
|
[2] |
| Maximum Observed Concentration (Cmax) | 30.4 | ug/mL |
Individual PK parameters in monkeys receiving SHR-A1403 (DAR=2) at 1 mg/kg, monkey 203.
|
[2] |
| Maximum Observed Concentration (Cmax) | 29.8 | ug/mL |
Individual PK parameters in monkeys receiving SHR-A1403 (DAR=2) at 1 mg/kg, monkey 211.
|
[2] |
| Maximum Observed Concentration (Cmax) | 26.9 | ug/mL |
Individual PK parameters in monkeys receiving SHR-A1403 (DAR=2) at 1 mg/kg, monkey 212.
|
[2] |
| Maximum Observed Concentration (Cmax) | 29.7 | ug/mL |
Individual PK parameters in monkeys receiving SHR-A1403 (DAR=2) at 1 mg/kg, monkey 213.
|
[2] |
| Maximum Observed Concentration (Cmax) | 71.6 | ug/mL |
Individual PK parameters in monkeys receiving SHR-A1403 (DAR=2) at 1 mg/kg, monkey 301.
|
[2] |
| Maximum Observed Concentration (Cmax) | 75.9 | ug/mL |
Individual PK parameters in monkeys receiving SHR-A1403 (DAR=2) at 1 mg/kg, monkey 302.
|
[2] |
| Maximum Observed Concentration (Cmax) | 91.1 | ug/mL |
Individual PK parameters in monkeys receiving SHR-A1403 (DAR=2) at 1 mg/kg, monkey 303.
|
[2] |
| Maximum Observed Concentration (Cmax) | 84.2 | ug/mL |
Individual PK parameters in monkeys receiving SHR-A1403 (DAR=2) at 1 mg/kg, monkey 311.
|
[2] |
| Maximum Observed Concentration (Cmax) | 73.5 | ug/mL |
Individual PK parameters in monkeys receiving SHR-A1403 (DAR=2) at 1 mg/kg, monkey 312.
|
[2] |
| Maximum Observed Concentration (Cmax) | 84.1 | ug/mL |
Individual PK parameters in monkeys receiving SHR-A1403 (DAR=2) at 1 mg/kg, monkey 313.
|
[2] |
| Area Under the Concentration-Time Curve (AUC) | 2320 | ug·h/mL |
Individual PK parameters in monkeys receiving SHR-A1403 (DAR=2) at 1 mg/kg, monkey 201, AUC0-t.
|
[2] |
| Area Under the Concentration-Time Curve (AUC) | 1720 | ug·h/mL |
Individual PK parameters in monkeys receiving SHR-A1403 (DAR=2) at 1 mg/kg, monkey 202, AUC0-t.
|
[2] |
| Area Under the Concentration-Time Curve (AUC) | 2520 | ug·h/mL |
Individual PK parameters in monkeys receiving SHR-A1403 (DAR=2) at 1 mg/kg, monkey 203, AUC0-t.
|
[2] |
| Area Under the Concentration-Time Curve (AUC) | 3210 | ug·h/mL |
Individual PK parameters in monkeys receiving SHR-A1403 (DAR=2) at 1 mg/kg, monkey 211, AUC0-t.
|
[2] |
| Area Under the Concentration-Time Curve (AUC) | 2820 | ug·h/mL |
Individual PK parameters in monkeys receiving SHR-A1403 (DAR=2) at 1 mg/kg, monkey 212, AUC0-t.
|
[2] |
| Area Under the Concentration-Time Curve (AUC) | 2920 | ug·h/mL |
Individual PK parameters in monkeys receiving SHR-A1403 (DAR=2) at 1 mg/kg, monkey 213, AUC0-t.
|
[2] |
| Area Under the Concentration-Time Curve (AUC) | 8450 | ug·h/mL |
Individual PK parameters in monkeys receiving SHR-A1403 (DAR=2) at 1 mg/kg, monkey 301, AUC0-t.
|
[2] |
| Area Under the Concentration-Time Curve (AUC) | 9450 | ug·h/mL |
Individual PK parameters in monkeys receiving SHR-A1403 (DAR=2) at 1 mg/kg, monkey 302, AUC0-t.
|
[2] |
| Area Under the Concentration-Time Curve (AUC) | 11000 | ug·h/mL |
Individual PK parameters in monkeys receiving SHR-A1403 (DAR=2) at 1 mg/kg, monkey 303, AUC0-t.
|
[2] |
| Area Under the Concentration-Time Curve (AUC) | 7850 | ug·h/mL |
Individual PK parameters in monkeys receiving SHR-A1403 (DAR=2) at 1 mg/kg, monkey 311, AUC0-t.
|
[2] |
| Area Under the Concentration-Time Curve (AUC) | 8850 | ug·h/mL |
Individual PK parameters in monkeys receiving SHR-A1403 (DAR=2) at 1 mg/kg, monkey 312, AUC0-t.
|
[2] |
| Area Under the Concentration-Time Curve (AUC) | 8890 | ug·h/mL |
Individual PK parameters in monkeys receiving SHR-A1403 (DAR=2) at 1 mg/kg, monkey 313, AUC0-t.
|
[2] |
| Time to Maximum Concentration (Tmax) | 0.5 | h |
Preliminary Pharmacokinetic Parameters of ABBV-011 ADC Following IV Infusion of ABBV-011 1 mg/kg in Cycle 1 (n=40)
|
[3] |
| Maximum Observed Concentration (Cmax) | 24.2 | ug/mL |
Preliminary Pharmacokinetic Parameters of ABBV-011 ADC Following IV Infusion of ABBV-011 1 mg/kg in Cycle 1 (n=40)
|
[3] |
| Area Under the Concentration-Time Curve (AUC) | 92.2 | day·ug/mL |
Preliminary Pharmacokinetic Parameters of ABBV-011 ADC Following IV Infusion of ABBV-011 1 mg/kg in Cycle 1 (n=40), AUC21d.
|
[3] |
Excretion
| Standard Type | Value | Units | Description | Reference |
|---|---|---|---|---|
| Clearance (CL) | 0.647 | mL/h/kg |
PK parameters of ADC in mice receiving single intravenous administration of SHR-A1403, 1 mg/kg.
|
[2] |
| Clearance (CL) | 0.587 | mL/h/kg |
PK parameters of ADC in mice receiving single intravenous administration of SHR-A1403, 3 mg/kg.
|
[2] |
| Clearance (CL) | 0.491±0.034 | mL/h/kg |
PK parameters of ADC in rat receiving single intravenous administration of SHR-A1403, 1 mg/kg.
|
[2] |
| Clearance (CL) | 0.478±0.072 | mL/h/kg |
PK parameters of ADC in rat receiving single intravenous administration of SHR-A1403, 3 mg/kg.
|
[2] |
| Clearance (CL) | 0.520±0.059 | mL/h/kg |
PK parameters of ADC in rat receiving single intravenous administration of SHR-A1403, 9 mg/kg.
|
[2] |
| Clearance (CL) | 0.822±0.452 | mL/h/kg |
PK parameters of ADC in monkey receiving single intravenous administration of SHR-A1403, 0.3 mg/kg.
|
[2] |
| Clearance (CL) | 0.396±0.097 | mL/h/kg |
PK parameters of ADC in monkey receiving single intravenous administration of SHR-A1403, 1 mg/kg.
|
[2] |
| Clearance (CL) | 0.329±0.037 | mL/h/kg |
PK parameters of ADC in monkey receiving single intravenous administration of SHR-A1403, 3 mg/kg.
|
[2] |
| Elimination Half-Life (t1/2) | 132 | h |
PK parameters of ADC in mice receiving single intravenous administration of SHR-A1403, 1 mg/kg.
|
[2] |
| Elimination Half-Life (t1/2) | 165 | h |
PK parameters of ADC in mice receiving single intravenous administration of SHR-A1403, 3 mg/kg.
|
[2] |
| Elimination Half-Life (t1/2) | 259±29.9 | h |
PK parameters of ADC in rat receiving single intravenous administration of SHR-A1403, 1 mg/kg.
|
[2] |
| Elimination Half-Life (t1/2) | 259±39.9 | h |
PK parameters of ADC in rat receiving single intravenous administration of SHR-A1403, 3 mg/kg.
|
[2] |
| Elimination Half-Life (t1/2) | 270±23.6 | h |
PK parameters of ADC in rat receiving single intravenous administration of SHR-A1403, 9 mg/kg.
|
[2] |
| Elimination Half-Life (t1/2) | 111±39.3 | h |
PK parameters of ADC in monkey receiving single intravenous administration of SHR-A1403, 0.3 mg/kg.
|
[2] |
| Elimination Half-Life (t1/2) | 139±48.8 | h |
PK parameters of ADC in monkey receiving single intravenous administration of SHR-A1403, 1 mg/kg.
|
[2] |
| Elimination Half-Life (t1/2) | 156±29.5 | h |
PK parameters of ADC in monkey receiving single intravenous administration of SHR-A1403, 3 mg/kg.
|
[2] |
| Elimination Half-Life (t1/2) | 136 | h |
Individual PK parameters in monkeys receiving SHR-A1403 (DAR=2) at 1 mg/kg, monkey 201.
|
[2] |
| Elimination Half-Life (t1/2) | 67 | h |
Individual PK parameters in monkeys receiving SHR-A1403 (DAR=2) at 1 mg/kg, monkey 202.
|
[2] |
| Elimination Half-Life (t1/2) | 104 | h |
Individual PK parameters in monkeys receiving SHR-A1403 (DAR=2) at 1 mg/kg, monkey 203.
|
[2] |
| Elimination Half-Life (t1/2) | 201 | h |
Individual PK parameters in monkeys receiving SHR-A1403 (DAR=2) at 1 mg/kg, monkey 211.
|
[2] |
| Elimination Half-Life (t1/2) | 179 | h |
Individual PK parameters in monkeys receiving SHR-A1403 (DAR=2) at 1 mg/kg, monkey 212.
|
[2] |
| Elimination Half-Life (t1/2) | 145 | h |
Individual PK parameters in monkeys receiving SHR-A1403 (DAR=2) at 1 mg/kg, monkey 213.
|
[2] |
| Elimination Half-Life (t1/2) | 187 | h |
Individual PK parameters in monkeys receiving SHR-A1403 (DAR=2) at 1 mg/kg, monkey 301.
|
[2] |
| Elimination Half-Life (t1/2) | 138 | h |
Individual PK parameters in monkeys receiving SHR-A1403 (DAR=2) at 1 mg/kg, monkey 302.
|
[2] |
| Elimination Half-Life (t1/2) | 176 | h |
Individual PK parameters in monkeys receiving SHR-A1403 (DAR=2) at 1 mg/kg, monkey 303.
|
[2] |
| Elimination Half-Life (t1/2) | 107 | h |
Individual PK parameters in monkeys receiving SHR-A1403 (DAR=2) at 1 mg/kg, monkey 311.
|
[2] |
| Elimination Half-Life (t1/2) | 172 | h |
Individual PK parameters in monkeys receiving SHR-A1403 (DAR=2) at 1 mg/kg, monkey 312.
|
[2] |
| Elimination Half-Life (t1/2) | 154 | h |
Individual PK parameters in monkeys receiving SHR-A1403 (DAR=2) at 1 mg/kg, monkey 313.
|
[2] |
General Information of The Activity Data Related to This ADC
Identified from the Human Clinical Data
Discovered Using Patient-derived Xenograft Model
Discovered Using Cell Line-derived Xenograft Model
Revealed Based on the Cell Line Data
Full List of Activity Data of This Antibody-drug Conjugate
Identified from the Human Clinical Data
| Experiment 1 Reporting the Activity Date of This ADC | [4] | ||||
| Patients Enrolled |
Eligible patients have ECOG 0-1, life expectancy ≥12 weeks, measurable advanced/metastatic solid tumors, and adequate organ function. Exclusions include prior ADC/hypersensitivity, unresolved toxicities (>G1), active CNS metastases, NYHA II-IV cardiac disease, HBV/HCV/HIV positivity, or conditions hindering compliance. Contraception is mandatory for 6 months post-treatment.
Click to Show/Hide
|
||||
| Administration Dosage |
SHR-A1403 is a humanized anti C-Met immunoglobulin G2 (IgG2) monoclonal antibody conjugated with microtubule inhibitor. SHR-A1403 is provided as the lyophilized powder,40 mg/vial.SHR-A1403 was given intravenously per 3 weeks at the day 1.Intravenous infusion over 30 min
|
||||
| Related Clinical Trial | |||||
| NCT Number | NCT03856541 | Clinical Status | PHASE1 | ||
| Clinical Description | A Phase I, Open Label, Dose Escalation Study to Evaluate the Safety, Tolerability and Pharmacokinetics of SHR-A1403 With Intravenous Infusion in Patients With Advanced Solid Tumors | ||||
| Primary Endpoint |
The study assesses treatment-related AEs of SHR-A1403 in advanced solid tumor patients over 24 months, evaluating incidence, severity (NCI CTCAE), and DLTs during cycle 1, with MTD determined as the highest dose below/close to 30% toxicity probability.
|
||||
| Other Endpoint |
Pharmacokinetic analysis includes Tmax, Cmax, T1/2, CL/F, Vd/F, AUC, Rac, and ADA assessment over 24 months. Efficacy is measured via RECIST v1.1, with C-Met expression explored in blood/tissue. RP2D will be determined based on safety using CTCAE v4.03 criteria.
|
||||
| Experiment 2 Reporting the Activity Date of This ADC | [5] | ||||
| Related Clinical Trial | |||||
| NCT Number | NCT03856541 | Clinical Status | Phase 1 | ||
| Clinical Description | A phase 1, open label, dose escalation study to evaluate the safety, tolerability and pharmacokinetics of SHR-a1403 with intravenous infusion in patients with advanced solid tumors. | ||||
Discovered Using Patient-derived Xenograft Model
| Experiment 1 Reporting the Activity Date of This ADC | [6] | ||||
| Efficacy Data | Tumor Growth Inhibition value (TGI) | ≈ 95.50% | High MET expression (MET+++) | ||
| Method Description |
HCC tumor cells derived from patients (passage 5) were implanted subcutaneously in BALB/c nude mice at an initial tumor size of approximately 30 mm3. In this model,tumor-bearing mice were given vehicle,SHR-A1403 (1 mg/kg),or SHR-A1403 mAb (10 mg/kg) via twice-weekly intravenous injection for two consecutive weeks.
|
||||
| In Vivo Model | Hepatic cancer PDX model (PDX: HCC) | ||||
| Experiment 2 Reporting the Activity Date of This ADC | [6] | ||||
| Efficacy Data | Tumor Growth Inhibition value (TGI) | ≈ 98.30% | High MET expression (MET+++) | ||
| Method Description |
HCC tumor cells derived from patients (passage 5) were implanted subcutaneously in BALB/c nude mice at an initial tumor size of approximately 30 mm3. In this model,tumor-bearing mice were given vehicle,SHR-A1403 (3 mg/kg),or SHR-A1403 mAb (10 mg/kg) via twice-weekly intravenous injection for two consecutive weeks.
|
||||
| In Vivo Model | Hepatic cancer PDX model (PDX: HCC) | ||||
| Experiment 3 Reporting the Activity Date of This ADC | [6] | ||||
| Efficacy Data | Tumor Growth Inhibition value (TGI) | ≈ 98.50% | High MET expression (MET+++) | ||
| Method Description |
HCC tumor cells derived from patients (passage 5) were implanted subcutaneously in BALB/c nude mice at an initial tumor size of approximately 30 mm3. In this model,tumor-bearing mice were given vehicle,SHR-A1403 (10 mg/kg),or SHR-A1403 mAb (10 mg/kg) via twice-weekly intravenous injection for two consecutive weeks.
|
||||
| In Vivo Model | Hepatic cancer PDX model (PDX: HCC) | ||||
Discovered Using Cell Line-derived Xenograft Model
| Experiment 1 Reporting the Activity Date of This ADC | [7] | ||||
| Efficacy Data | Tumor Growth Inhibition value (TGI) | ≈ 0% | Negative MET expression (MET-) | ||
| Method Description |
Effects of SHR-A1403 were further determined in vivo by assessing the growth of HCC827 and HA1 xenograft tumors. Tumor-bearing mice,established by s.c. inoculation of HCC827 and HA1 cells,were randomized into vehicle,AZD9291 (3 mg/kg single dose,i.g.) and SHR-A1403 (10 mg/kg single dose,i.v.) treatment groups when average tumor volumes reached approximately 100-200 mm3.
Click to Show/Hide
|
||||
| In Vivo Model | Non-small cell lung cancer HCC827 CDX model (CDX: HA1; Afatinib resistant) | ||||
| In Vitro Model | Lung adenocarcinoma | HCC827 cells (Afatinib resistant; HA1) | CVCL_2063 | ||
| Experiment 2 Reporting the Activity Date of This ADC | [6] | ||||
| Efficacy Data | Tumor Growth Inhibition value (TGI) | ≈ 34.50% | High MET expression (MET+++) | ||
| Method Description |
SHR-A1403 was evaluated in xenograft mice bearing cancer cells with high c-Met expression,including hepatic cancer HCCLM3,lung cancer NCI-H1993,and gastric cancer MKN-45 cells,and the effects were compared with the effects of SHR-A1403 mAb,the free toxin,or their combination. In the HCCLM3 xenograft model,SHR-A1403 was administered at a single dose of 1 mg/kg.
Click to Show/Hide
|
||||
| In Vivo Model | Hepatic cancer CDX model | ||||
| In Vitro Model | Adult hepatocellular carcinoma | HCCLM3 cells | CVCL_6832 | ||
| Experiment 3 Reporting the Activity Date of This ADC | [6] | ||||
| Efficacy Data | Tumor Growth Inhibition value (TGI) | ≈ 41.80% | High MET expression (MET+++) | ||
| Method Description |
SHR-A1403 was evaluated in xenograft mice bearing cancer cells with high c-Met expression,including hepatic cancer HCCLM3,lung cancer NCI-H1993,and gastric cancer MKN-45 cells,and the effects were compared with the effects of SHR-A1403 mAb,the free toxin,or their combination. In the NCI-H1993 xenograft model,SHR-A1403 was administered at a single dose of 1 mg/kg.
Click to Show/Hide
|
||||
| In Vivo Model | Lung cancer CDX model | ||||
| In Vitro Model | Lung cancer | Lung cancer cells | Homo sapiens | ||
| Experiment 4 Reporting the Activity Date of This ADC | [6] | ||||
| Efficacy Data | Tumor Growth Inhibition value (TGI) | ≈ 42.80% | High MET expression (MET+++) | ||
| Method Description |
SHR-A1403 was evaluated in xenograft mice bearing cancer cells with high c-Met expression,including hepatic cancer HCCLM3,lung cancer NCI-H1993,and gastric cancer MKN-45 cells,and the effects were compared with the effects of SHR-A1403 mAb,the free toxin,or their combination. In the MKN-45 xenograft model,SHR-A1403 was administered at a single dose of 1 mg/kg.
Click to Show/Hide
|
||||
| In Vivo Model | Gastric cancer CDX model | ||||
| In Vitro Model | Gastric cancer | Gastric cancer cells | Homo sapiens | ||
| Experiment 5 Reporting the Activity Date of This ADC | [6] | ||||
| Efficacy Data | Tumor Growth Inhibition value (TGI) | ≈ 59.30% | High MET expression (MET+++) | ||
| Method Description |
SHR-A1403 was evaluated in xenograft mice bearing cancer cells with high c-Met expression,including hepatic cancer HCCLM3,lung cancer NCI-H1993,and gastric cancer MKN-45 cells,and the effects were compared with the effects of SHR-A1403 mAb,the free toxin,or their combination. In the NCI-H1993 xenograft model,SHR-A1403 was administered at a single dose of 3 mg/kg.
Click to Show/Hide
|
||||
| In Vivo Model | Lung cancer CDX model | ||||
| In Vitro Model | Lung cancer | Lung cancer cells | Homo sapiens | ||
| Experiment 6 Reporting the Activity Date of This ADC | [6] | ||||
| Efficacy Data | Tumor Growth Inhibition value (TGI) | ≈ 83.30% | High MET expression (MET+++) | ||
| Method Description |
SHR-A1403 was evaluated in xenograft mice bearing cancer cells with high c-Met expression,including hepatic cancer HCCLM3,lung cancer NCI-H1993,and gastric cancer MKN-45 cells,and the effects were compared with the effects of SHR-A1403 mAb,the free toxin,or their combination. In the HCCLM3 xenograft model,SHR-A1403 was administered at a single dose of 3 mg/kg.
Click to Show/Hide
|
||||
| In Vivo Model | Hepatic cancer CDX model | ||||
| In Vitro Model | Adult hepatocellular carcinoma | HCCLM3 cells | CVCL_6832 | ||
| Experiment 7 Reporting the Activity Date of This ADC | [6] | ||||
| Efficacy Data | Tumor Growth Inhibition value (TGI) | ≈ 84.60% | High MET expression (MET+++) | ||
| Method Description |
SHR-A1403 was evaluated in xenograft mice bearing cancer cells with high c-Met expression,including hepatic cancer HCCLM3,lung cancer NCI-H1993,and gastric cancer MKN-45 cells,and the effects were compared with the effects of SHR-A1403 mAb,the free toxin,or their combination. In the MKN-45 xenograft model,SHR-A1403 was administered at a single dose of 3 mg/kg.
Click to Show/Hide
|
||||
| In Vivo Model | Gastric cancer CDX model | ||||
| In Vitro Model | Gastric adenocarcinoma | MKN45 cells | CVCL_0434 | ||
| Experiment 8 Reporting the Activity Date of This ADC | [6] | ||||
| Efficacy Data | Tumor Growth Inhibition value (TGI) | ≈ 89.90% | High MET expression (MET+++) | ||
| Method Description |
SHR-A1403 was evaluated in xenograft mice bearing cancer cells with high c-Met expression,including hepatic cancer HCCLM3,lung cancer NCI-H1993,and gastric cancer MKN-45 cells,and the effects were compared with the effects of SHR-A1403 mAb,the free toxin,or their combination. In the MKN-45 xenograft model,SHR-A1403 was administered at a single dose of 10 mg/kg.
Click to Show/Hide
|
||||
| In Vivo Model | Gastric cancer CDX model | ||||
| In Vitro Model | Gastric adenocarcinoma | MKN45 cells | CVCL_0434 | ||
| Experiment 9 Reporting the Activity Date of This ADC | [6] | ||||
| Efficacy Data | Tumor Growth Inhibition value (TGI) | ≈ 91.60% | High MET expression (MET+++) | ||
| Method Description |
SHR-A1403 was evaluated in xenograft mice bearing cancer cells with high c-Met expression,including hepatic cancer HCCLM3,lung cancer NCI-H1993,and gastric cancer MKN-45 cells,and the effects were compared with the effects of SHR-A1403 mAb,the free toxin,or their combination. In the NCI-H1993 xenograft model,SHR-A1403 was administered at a single dose of 10 mg/kg.
Click to Show/Hide
|
||||
| In Vivo Model | Lung cancer CDX model | ||||
| In Vitro Model | Lung adenocarcinoma | NCI-H1993 cells | CVCL_1512 | ||
| Experiment 10 Reporting the Activity Date of This ADC | [7] | ||||
| Efficacy Data | Tumor Growth Inhibition value (TGI) | ≈ 92.80% | High MET expression (MET+++) | ||
| Method Description |
Effects of SHR-A1403 were further determined in vivo by assessing the growth of HCC827 and HA1 xenograft tumors. Tumor-bearing mice,established by s.c. inoculation of HCC827 and HA1 cells,were randomized into vehicle,AZD9291 (3 mg/kg single dose,i.g.) and SHR-A1403 (10 mg/kg single dose,i.v.) treatment groups when average tumor volumes reached approximately 100-200 mm3.
Click to Show/Hide
|
||||
| In Vivo Model | Non-small cell lung cancer CDX model | ||||
| In Vitro Model | Lung adenocarcinoma | HCC827 cells | CVCL_2063 | ||
| Experiment 11 Reporting the Activity Date of This ADC | [6] | ||||
| Efficacy Data | Tumor Growth Inhibition value (TGI) | ≈ 98.80% | High MET expression (MET+++) | ||
| Method Description |
SHR-A1403 was evaluated in xenograft mice bearing cancer cells with high c-Met expression,including hepatic cancer HCCLM3,lung cancer NCI-H1993,and gastric cancer MKN-45 cells,and the effects were compared with the effects of SHR-A1403 mAb,the free toxin,or their combination. In the HCCLM3 xenograft model,SHR-A1403 was administered at a single dose of 10 mg/kg.
Click to Show/Hide
|
||||
| In Vivo Model | Hepatic cancer CDX model | ||||
| In Vitro Model | Adult hepatocellular carcinoma | HCCLM3 cells | CVCL_6832 | ||
Revealed Based on the Cell Line Data
| Experiment 1 Reporting the Activity Date of This ADC | [6] | ||||
| Efficacy Data | Half Maximal Inhibitory Concentration (IC50) | 3.2 ng/mL | High MET expression (MET+++; IHC 3+) | ||
| Method Description |
The effects of SHR-A1403 on the proliferation of various types of human cancer cells were evaluated and compared with the effects of SHR-A1403 mAb and the free toxin SHR152852.
|
||||
| In Vitro Model | Adult hepatocellular carcinoma | HCCLM3 cells | CVCL_6832 | ||
| Experiment 2 Reporting the Activity Date of This ADC | [6] | ||||
| Efficacy Data | Half Maximal Inhibitory Concentration (IC50) | 7.8 ng/mL | Negative MET expression (MET-) | ||
| Method Description |
The effects of SHR-A1403 on the proliferation of various types of human cancer cells were evaluated and compared with the effects of SHR-A1403 mAb and the free toxin SHR152852.
|
||||
| In Vitro Model | Gastric adenocarcinoma | MKN45 cells | CVCL_0434 | ||
| Experiment 3 Reporting the Activity Date of This ADC | [7] | ||||
| Efficacy Data | Half Maximal Inhibitory Concentration (IC50) | 11.8 ng/mL | Moderate MET expression (MET++) | ||
| Method Description |
To establish the EGFR inhibitor-resistant NSCLC cells,HCC827 cells were grown initially in medium containing 10 nmol/L gefitinib or afatinib. To exam the ability of the ADC,SHR-A1403,to overcome AZD9291 resistance. Human tumor xenografts were established by s.c. inoculation of nude mice with HCC827,HA1 or HG3 cells. Tumor-bearing mice were randomized into groups and treated with vehicle,AZD9291 intragastric administration (i.g.) or SHR-A1403 intravenous injection (i.v.) when average tumor volume reached approximately 100-200 mm3. Resistance ratio = IC50 (resistant cells)/IC50 (HCC827).
Click to Show/Hide
|
||||
| In Vitro Model | Lung adenocarcinoma | HCC827 cells (Afatinib resistant; HA1) | CVCL_2063 | ||
| Experiment 4 Reporting the Activity Date of This ADC | [6] | ||||
| Efficacy Data | Half Maximal Inhibitory Concentration (IC50) | 16.3 ng/mL | High MET expression (MET+++) | ||
| Method Description |
The effects of SHR-A1403 on the proliferation of various types of human cancer cells were evaluated and compared with the effects of SHR-A1403 mAb and the free toxin SHR152852.
|
||||
| In Vitro Model | Lung adenocarcinoma | NCI-H1993 cells | CVCL_1512 | ||
| Experiment 5 Reporting the Activity Date of This ADC | [7] | ||||
| Efficacy Data | Half Maximal Inhibitory Concentration (IC50) | 17.8 ng/mL | High MET expression (MET+++) | ||
| Method Description |
To establish the EGFR inhibitor-resistant NSCLC cells,HCC827 cells were grown initially in medium containing 10 nmol/L gefitinib or afatinib. To exam the ability of the ADC,SHR-A1403,to overcome AZD9291 resistance. Human tumor xenografts were established by s.c. inoculation of nude mice with HCC827,HA1 or HG3 cells. Tumor-bearing mice were randomized into groups and treated with vehicle,AZD9291 intragastric administration (i.g.) or SHR-A1403 intravenous injection (i.v.) when average tumor volume reached approximately 100-200 mm3. Resistance ratio = IC50 (resistant cells)/IC50 (HCC827).
Click to Show/Hide
|
||||
| In Vitro Model | Lung adenocarcinoma | HCC827 cells (Gefitinib resistant) | CVCL_2063 | ||
| Experiment 6 Reporting the Activity Date of This ADC | [7] | ||||
| Efficacy Data | Half Maximal Inhibitory Concentration (IC50) | 26.6 ng/mL | Negative MET expression (MET-) | ||
| Method Description |
To establish the EGFR inhibitor-resistant NSCLC cells,HCC827 cells were grown initially in medium containing 10 nmol/L gefitinib or afatinib. To exam the ability of the ADC,SHR-A1403,to overcome AZD9291 resistance. Human tumor xenografts were established by s.c. inoculation of nude mice with HCC827,HA1 or HG3 cells. Tumor-bearing mice were randomized into groups and treated with vehicle,AZD9291 intragastric administration (i.g.) or SHR-A1403 intravenous injection (i.v.) when average tumor volume reached approximately 100-200 mm3. Resistance ratio = IC50 (resistant cells)/IC50 (HCC827).
Click to Show/Hide
|
||||
| In Vitro Model | Lung adenocarcinoma | HCC827 cells (Gefitinib resistant) | CVCL_2063 | ||
| Experiment 7 Reporting the Activity Date of This ADC | [6] | ||||
| Efficacy Data | Half Maximal Inhibitory Concentration (IC50) | 46.7 ng/mL | Moderate MET expression (MET++) | ||
| Method Description |
The effects of SHR-A1403 on the proliferation of various types of human cancer cells were evaluated and compared with the effects of SHR-A1403 mAb and the free toxin SHR152852.
|
||||
| In Vitro Model | Lung papillary adenocarcinoma | NCI-H441 cells | CVCL_1561 | ||
| Experiment 8 Reporting the Activity Date of This ADC | [6] | ||||
| Efficacy Data | Half Maximal Inhibitory Concentration (IC50) | 53.9 ng/mL | High MET expression (MET+++; IHC 3+) | ||
| Method Description |
The effects of SHR-A1403 on the proliferation of various types of human cancer cells were evaluated and compared with the effects of SHR-A1403 mAb and the free toxin SHR152852.
|
||||
| In Vitro Model | Invasive breast carcinoma | Hs 578T cells | CVCL_0332 | ||
| Experiment 9 Reporting the Activity Date of This ADC | [6] | ||||
| Efficacy Data | Half Maximal Inhibitory Concentration (IC50) | 78.2 ng/mL | High MET expression (MET+++) | ||
| Method Description |
The effects of SHR-A1403 on the proliferation of various types of human cancer cells were evaluated and compared with the effects of SHR-A1403 mAb and the free toxin SHR152852.
|
||||
| In Vitro Model | Prostate carcinoma | PC-3 cells | CVCL_0035 | ||
| Experiment 10 Reporting the Activity Date of This ADC | [7] | ||||
| Efficacy Data | Half Maximal Inhibitory Concentration (IC50) | 99.4 ng/mL | Moderate MET expression (MET++) | ||
| Method Description |
To establish the EGFR inhibitor-resistant NSCLC cells,HCC827 cells were grown initially in medium containing 10 nmol/L gefitinib or afatinib. To exam the ability of the ADC,SHR-A1403,to overcome AZD9291 resistance. Human tumor xenografts were established by s.c. inoculation of nude mice with HCC827,HA1 or HG3 cells. Tumor-bearing mice were randomized into groups and treated with vehicle,AZD9291 intragastric administration (i.g.) or SHR-A1403 intravenous injection (i.v.) when average tumor volume reached approximately 100-200 mm3. Resistance ratio = IC50 (resistant cells)/IC50 (HCC827).
Click to Show/Hide
|
||||
| In Vitro Model | Lung adenocarcinoma | HCC827 cells (Gefitinib resistant) | CVCL_2063 | ||
| Experiment 11 Reporting the Activity Date of This ADC | [7] | ||||
| Efficacy Data | Half Maximal Inhibitory Concentration (IC50) | 130.8 ng/mL | High MET expression (MET+++) | ||
| Method Description |
To establish the EGFR inhibitor-resistant NSCLC cells,HCC827 cells were grown initially in medium containing 10 nmol/L gefitinib or afatinib. To exam the ability of the ADC,SHR-A1403,to overcome AZD9291 resistance. Human tumor xenografts were established by s.c. inoculation of nude mice with HCC827,HA1 or HG3 cells. Tumor-bearing mice were randomized into groups and treated with vehicle,AZD9291 intragastric administration (i.g.) or SHR-A1403 intravenous injection (i.v.) when average tumor volume reached approximately 100-200 mm3. Resistance ratio = IC50 (resistant cells)/IC50 (HCC827).
Click to Show/Hide
|
||||
| In Vitro Model | Lung adenocarcinoma | HCC827 cells (Gefitinib resistant) | CVCL_2063 | ||
| Experiment 12 Reporting the Activity Date of This ADC | [6] | ||||
| Efficacy Data | Half Maximal Inhibitory Concentration (IC50) | 214.8 ng/mL | Moderate MET expression (MET++) | ||
| Method Description |
The effects of SHR-A1403 on the proliferation of various types of human cancer cells were evaluated and compared with the effects of SHR-A1403 mAb and the free toxin SHR152852.
|
||||
| In Vitro Model | Clear cell renal cell carcinoma | Caki-1 cells | CVCL_0234 | ||
| Experiment 13 Reporting the Activity Date of This ADC | [7] | ||||
| Efficacy Data | Half Maximal Inhibitory Concentration (IC50) | 918.9 ng/mL | Moderate MET expression (MET++) | ||
| Method Description |
To establish the EGFR inhibitor-resistant NSCLC cells,HCC827 cells were grown initially in medium containing 10 nmol/L gefitinib or afatinib. To exam the ability of the ADC,SHR-A1403,to overcome AZD9291 resistance. Human tumor xenografts were established by s.c. inoculation of nude mice with HCC827,HA1 or HG3 cells. Tumor-bearing mice were randomized into groups and treated with vehicle,AZD9291 intragastric administration (i.g.) or SHR-A1403 intravenous injection (i.v.) when average tumor volume reached approximately 100-200 mm3. Resistance ratio = IC50 (resistant cells)/IC50 (HCC827).
Click to Show/Hide
|
||||
| In Vitro Model | Lung adenocarcinoma | HCC827 cells | CVCL_2063 | ||
| Experiment 14 Reporting the Activity Date of This ADC | [6] | ||||
| Efficacy Data | Half Maximal Inhibitory Concentration (IC50) | 1987.5 ng/mL | High MET expression (MET+++; IHC 3+) | ||
| Method Description |
The effects of SHR-A1403 on the proliferation of various types of human cancer cells were evaluated and compared with the effects of SHR-A1403 mAb and the free toxin SHR152852.
|
||||
| In Vitro Model | Lung adenocarcinoma | A-549 cells | CVCL_0023 | ||
| Experiment 15 Reporting the Activity Date of This ADC | [6] | ||||
| Efficacy Data | Half Maximal Inhibitory Concentration (IC50) | > 10 ug/mL | High MET expression (MET+++) | ||
| Method Description |
The effects of SHR-A1403 on the proliferation of various types of human cancer cells were evaluated and compared with the effects of SHR-A1403 mAb and the free toxin SHR152852.
|
||||
| In Vitro Model | Gastric tubular adenocarcinoma | NCI-N87 cells | CVCL_1603 | ||
| Experiment 16 Reporting the Activity Date of This ADC | [7] | ||||
| Efficacy Data | Half Maximal Inhibitory Concentration (IC50) | > 30 ug/mL | Negative MET expression (MET-) | ||
| Method Description |
To establish the EGFR inhibitor-resistant NSCLC cells,HCC827 cells were grown initially in medium containing 10 nmol/L gefitinib or afatinib. To exam the ability of the ADC,SHR-A1403,to overcome AZD9291 resistance. Human tumor xenografts were established by s.c. inoculation of nude mice with HCC827,HA1 or HG3 cells. Tumor-bearing mice were randomized into groups and treated with vehicle,AZD9291 intragastric administration (i.g.) or SHR-A1403 intravenous injection (i.v.) when average tumor volume reached approximately 100-200 mm3. Resistance ratio = IC50 (resistant cells)/IC50 (HCC827).
Click to Show/Hide
|
||||
| In Vitro Model | Lung adenocarcinoma | HCC827 cells (Afatinib resistant; HA2) | CVCL_2063 | ||
References