
Antigen Information
General Information of This Antigen
| Antigen ID | TAR0GIFMP |
|||||
|---|---|---|---|---|---|---|
| Antigen Name | G-protein coupled receptor 20 (GPR20) |
|||||
| Gene Name | GPR20 |
|||||
| Gene ID | ||||||
| Sequence |
MPSVSPAGPSAGAVPNATAVTTVRTNASGLEVPLFHLFARLDEELHGTFPGLWLALMAVH
GAIFLAGLVLNGLALYVFCCRTRAKTPSVIYTINLVVTDLLVGLSLPTRFAVYYGARGCL RCAFPHVLGYFLNMHCSILFLTCICVDRYLAIVRPEGSRRCRQPACARAVCAFVWLAAGA VTLSVLGVTGSRPCCRVFALTVLEFLLPLLVISVFTGRIMCALSRPGLLHQGRQRRVRAM QLLLTVLIIFLVCFTPFHARQVAVALWPDMPHHTSLVVYHVAVTLSSLNSCMDPIVYCFV TSGFQATVRGLFGQHGEREPSSGDVVSMHRSSKGSGRHHILSAGPHALTQALANGPEA Click to Show/Hide
|
|||||
| Family | G-protein coupled receptor 1 family |
|||||
| Function |
Orphan receptor with constitutive G(i) signaling activity that activate cyclic AMP.
Click to Show/Hide
|
|||||
| Uniprot Entry | ||||||
| HGNC ID | ||||||
| KEGG ID | ||||||
Each Antibody-drug Conjuate AND It's Component Related to This Antigen
Full List of The ADC Related to This Antigen
04-046Ch
| ADC Info | ADC Name | Payload | Target | Linker | Ref |
|---|---|---|---|---|---|
WO2018135501A1 ADC-1 |
WO2018135501A1_ADC-1 payload |
Undisclosed |
WO2018135501A1_ADC-1 linker |
[1] | |
WO2018135501A1 ADC-2 |
WO2018135501A1_ADC-2 payload |
Undisclosed |
WO2018135501A1_ADC-2 linker |
[1] |
h046-H10/L1
| ADC Info | ADC Name | Payload | Target | Linker | Ref |
|---|---|---|---|---|---|
WO2018135501A1 ADC-11 |
WO2018135501A1_ADC-11 payload |
Undisclosed |
WO2018135501A1_ADC-11 linker |
[1] |
h046-H10/L6
| ADC Info | ADC Name | Payload | Target | Linker | Ref |
|---|---|---|---|---|---|
WO2018135501A1 ADC-12 |
WO2018135501A1_ADC-12 payload |
Undisclosed |
WO2018135501A1_ADC-12 linker |
[1] |
h046-H4b/L7
| ADC Info | ADC Name | Payload | Target | Linker | Ref |
|---|---|---|---|---|---|
WO2018135501A1 ADC-3 |
WO2018135501A1_ADC-3 payload |
Undisclosed |
WO2018135501A1_ADC-3 linker |
[1] | |
WO2018135501A1 ADC-4 |
WO2018135501A1_ADC-4 payload |
Undisclosed |
WO2018135501A1_ADC-4 linker |
[1] | |
WO2018135501A1 ADC-7 |
WO2018135501A1_ADC-7 payload |
Undisclosed |
WO2018135501A1_ADC-7 linker |
[1] |
h046-H4e/L7
| ADC Info | ADC Name | Payload | Target | Linker | Ref |
|---|---|---|---|---|---|
WO2018135501A1 ADC-13 |
WO2018135501A1_ADC-13 payload |
Undisclosed |
WO2018135501A1_ADC-13 linker |
[1] | |
WO2018135501A1 ADC-14 |
WO2018135501A1_ADC-14 payload |
Undisclosed |
WO2018135501A1_ADC-14 linker |
[1] |
h046-H5b/L2
| ADC Info | ADC Name | Payload | Target | Linker | Ref |
|---|---|---|---|---|---|
WO2018135501A1 ADC-5 |
WO2018135501A1_ADC-5 payload |
Undisclosed |
WO2018135501A1_ADC-5 linker |
[1] | |
WO2018135501A1 ADC-8 |
WO2018135501A1_ADC-8 payload |
Undisclosed |
WO2018135501A1_ADC-8 linker |
[1] |
h046-H8/L1
| ADC Info | ADC Name | Payload | Target | Linker | Ref |
|---|---|---|---|---|---|
WO2018135501A1 ADC-10 |
WO2018135501A1_ADC-10 payload |
Undisclosed |
WO2018135501A1_ADC-10 linker |
[1] |
h046-Hwt/L6
| ADC Info | ADC Name | Payload | Target | Linker | Ref |
|---|---|---|---|---|---|
WO2018135501A1 ADC-6 |
WO2018135501A1_ADC-6 payload |
Undisclosed |
WO2018135501A1_ADC-6 linker |
[1] | |
WO2018135501A1 ADC-9 |
WO2018135501A1_ADC-9 payload |
Undisclosed |
WO2018135501A1_ADC-9 linker |
[1] |
Undisclosed
| ADC Info | ADC Name | Payload | Target | Linker | Ref |
|---|---|---|---|---|---|
DS-6157a |
DX-8951 derivative (DXd) |
DNA topoisomerase 1 (TOP1) |
Mc-Gly-Gly-Phe-Gly |
[2] |
Tissue/Disease specific Abundances of This Antigen
Tissue specific Abundances of This Antigen
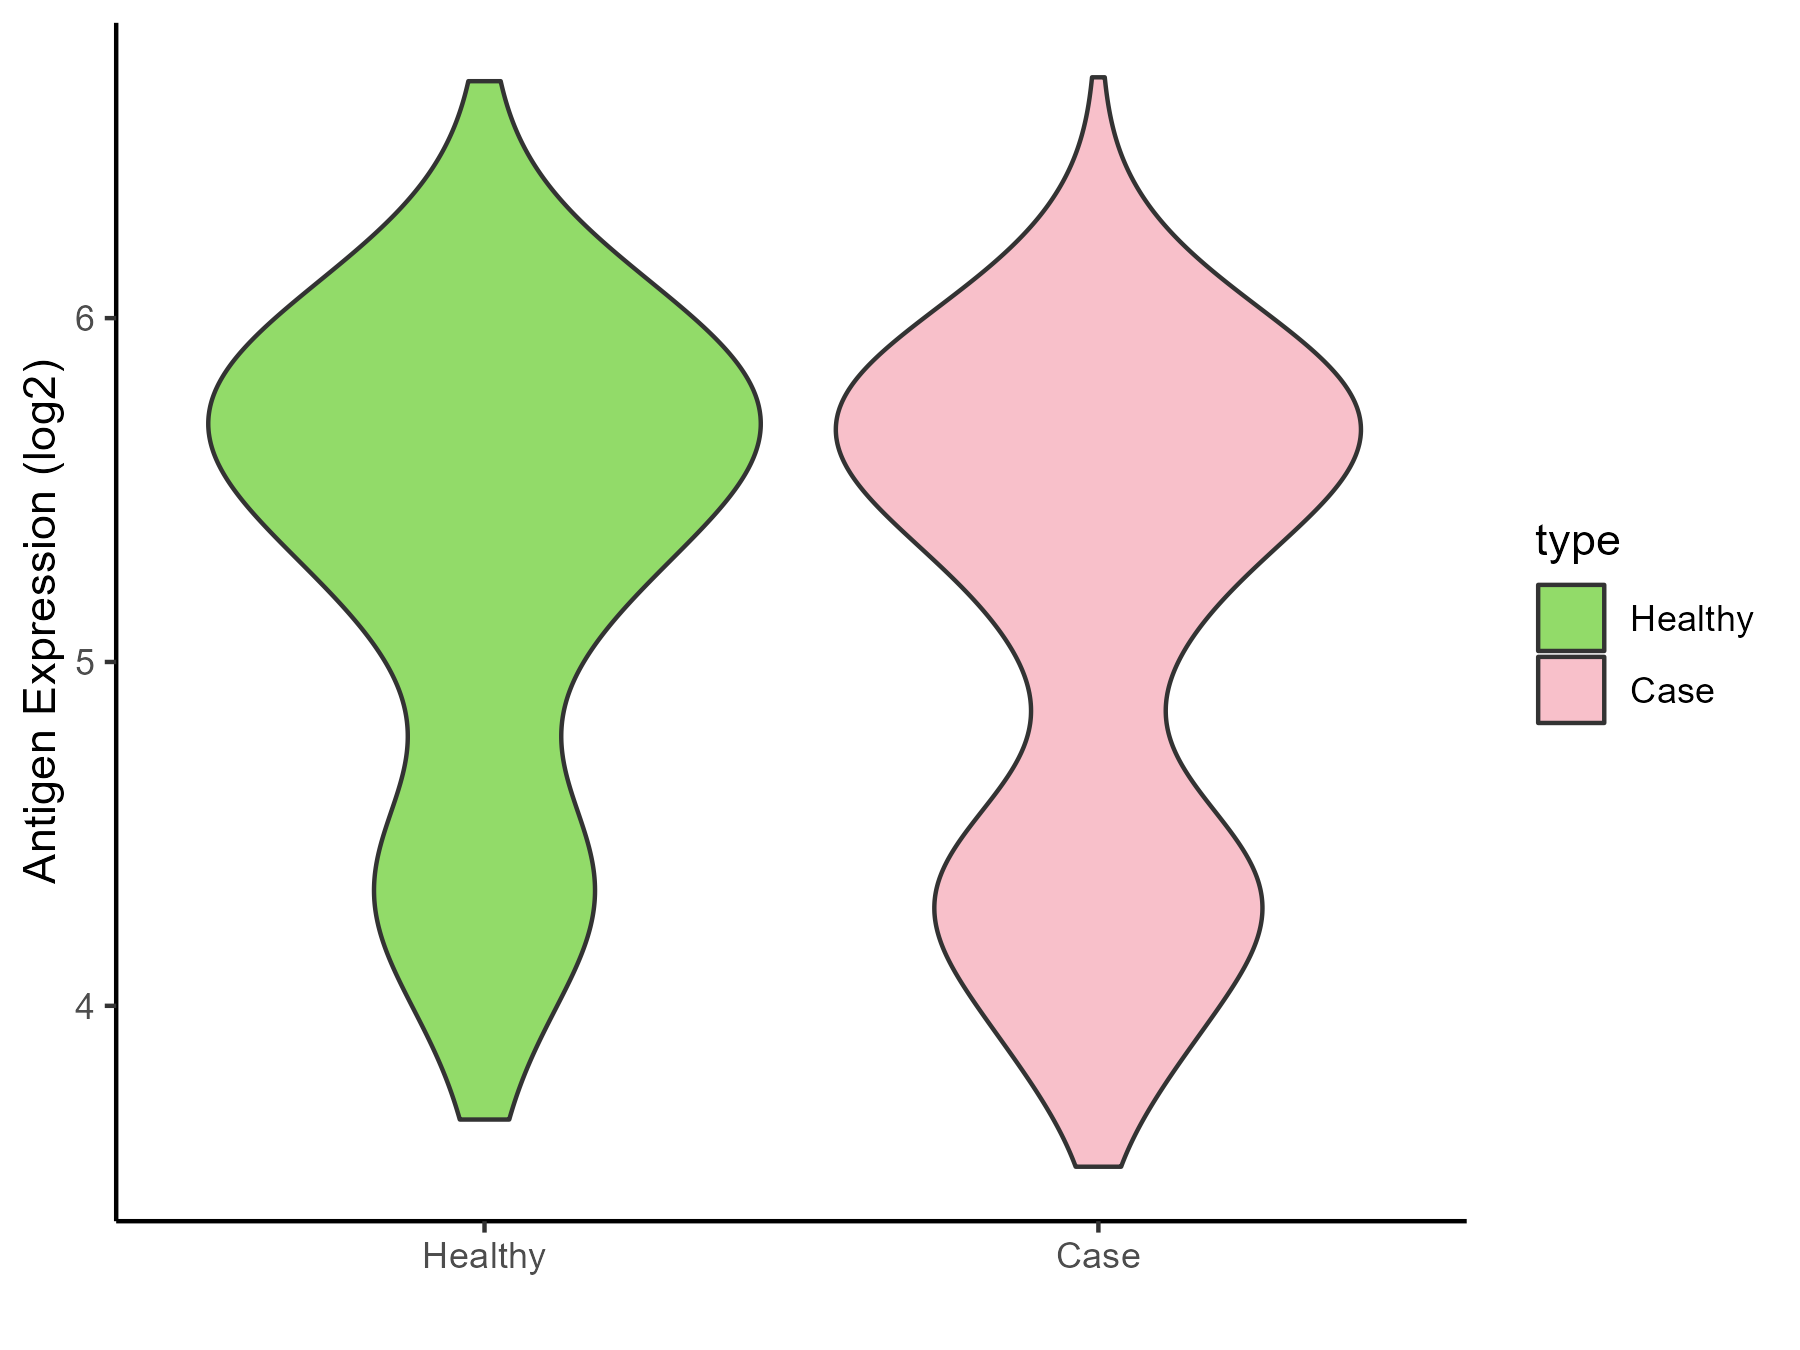
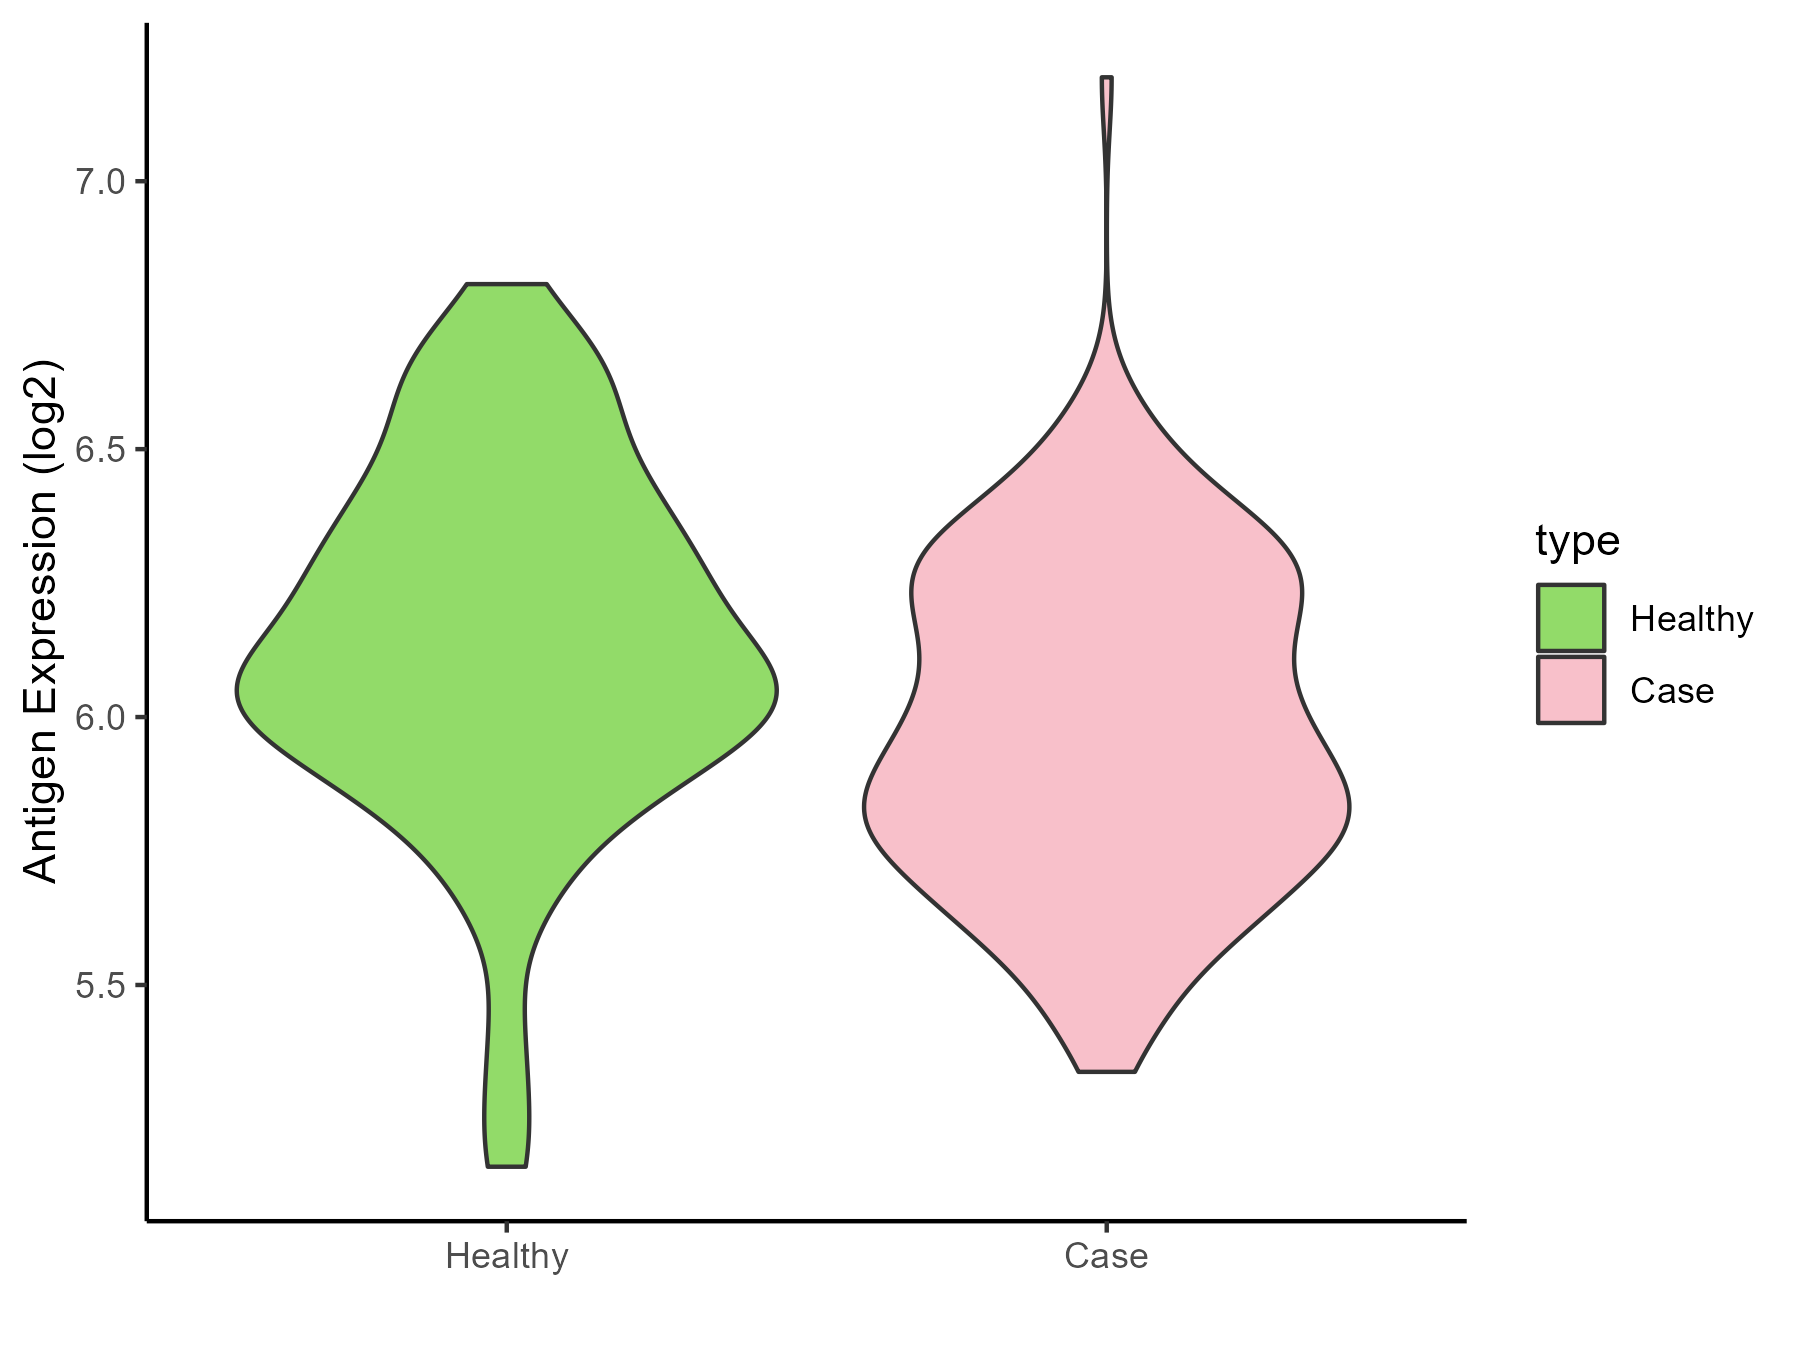
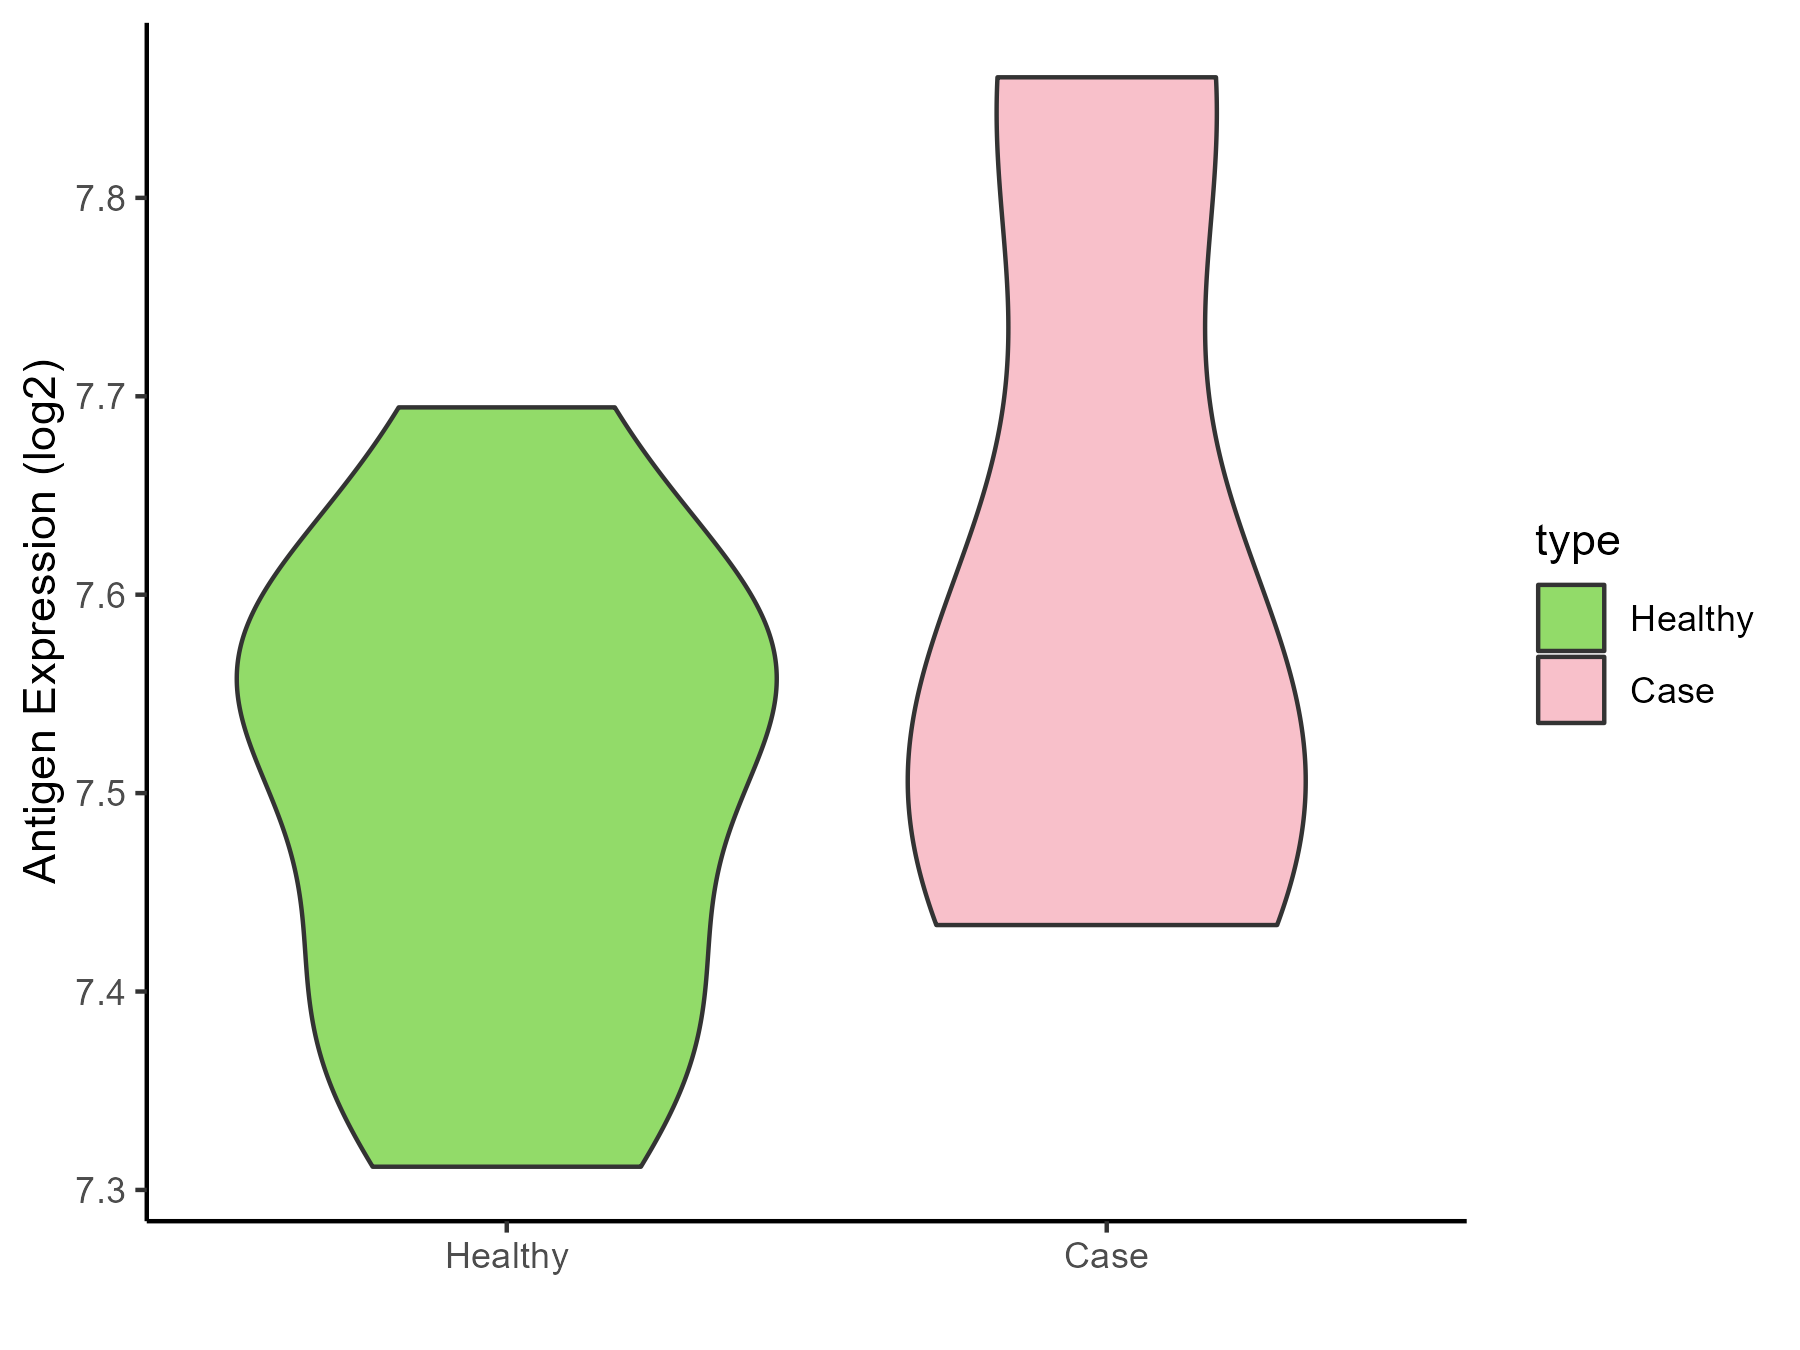
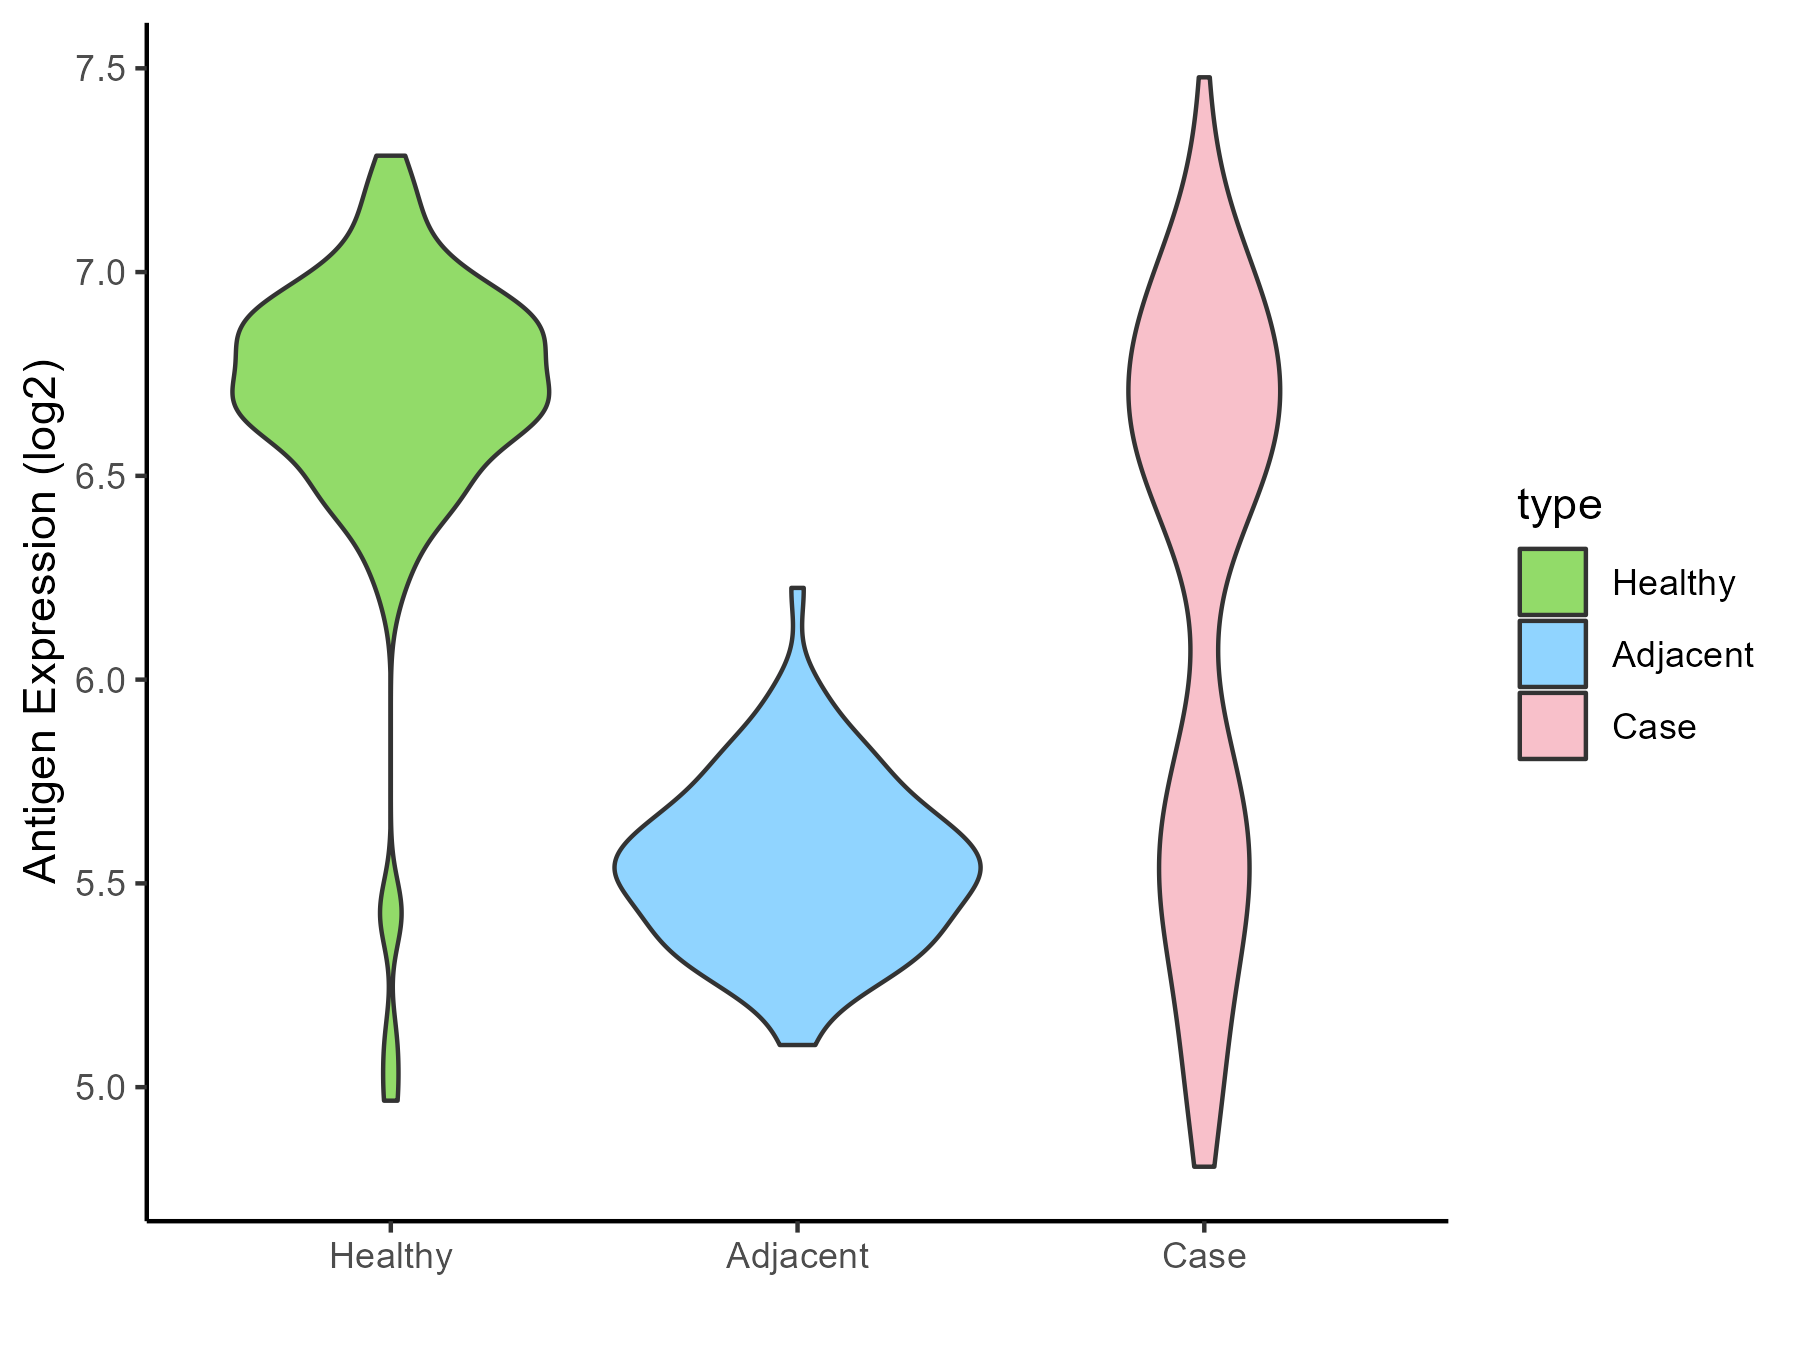
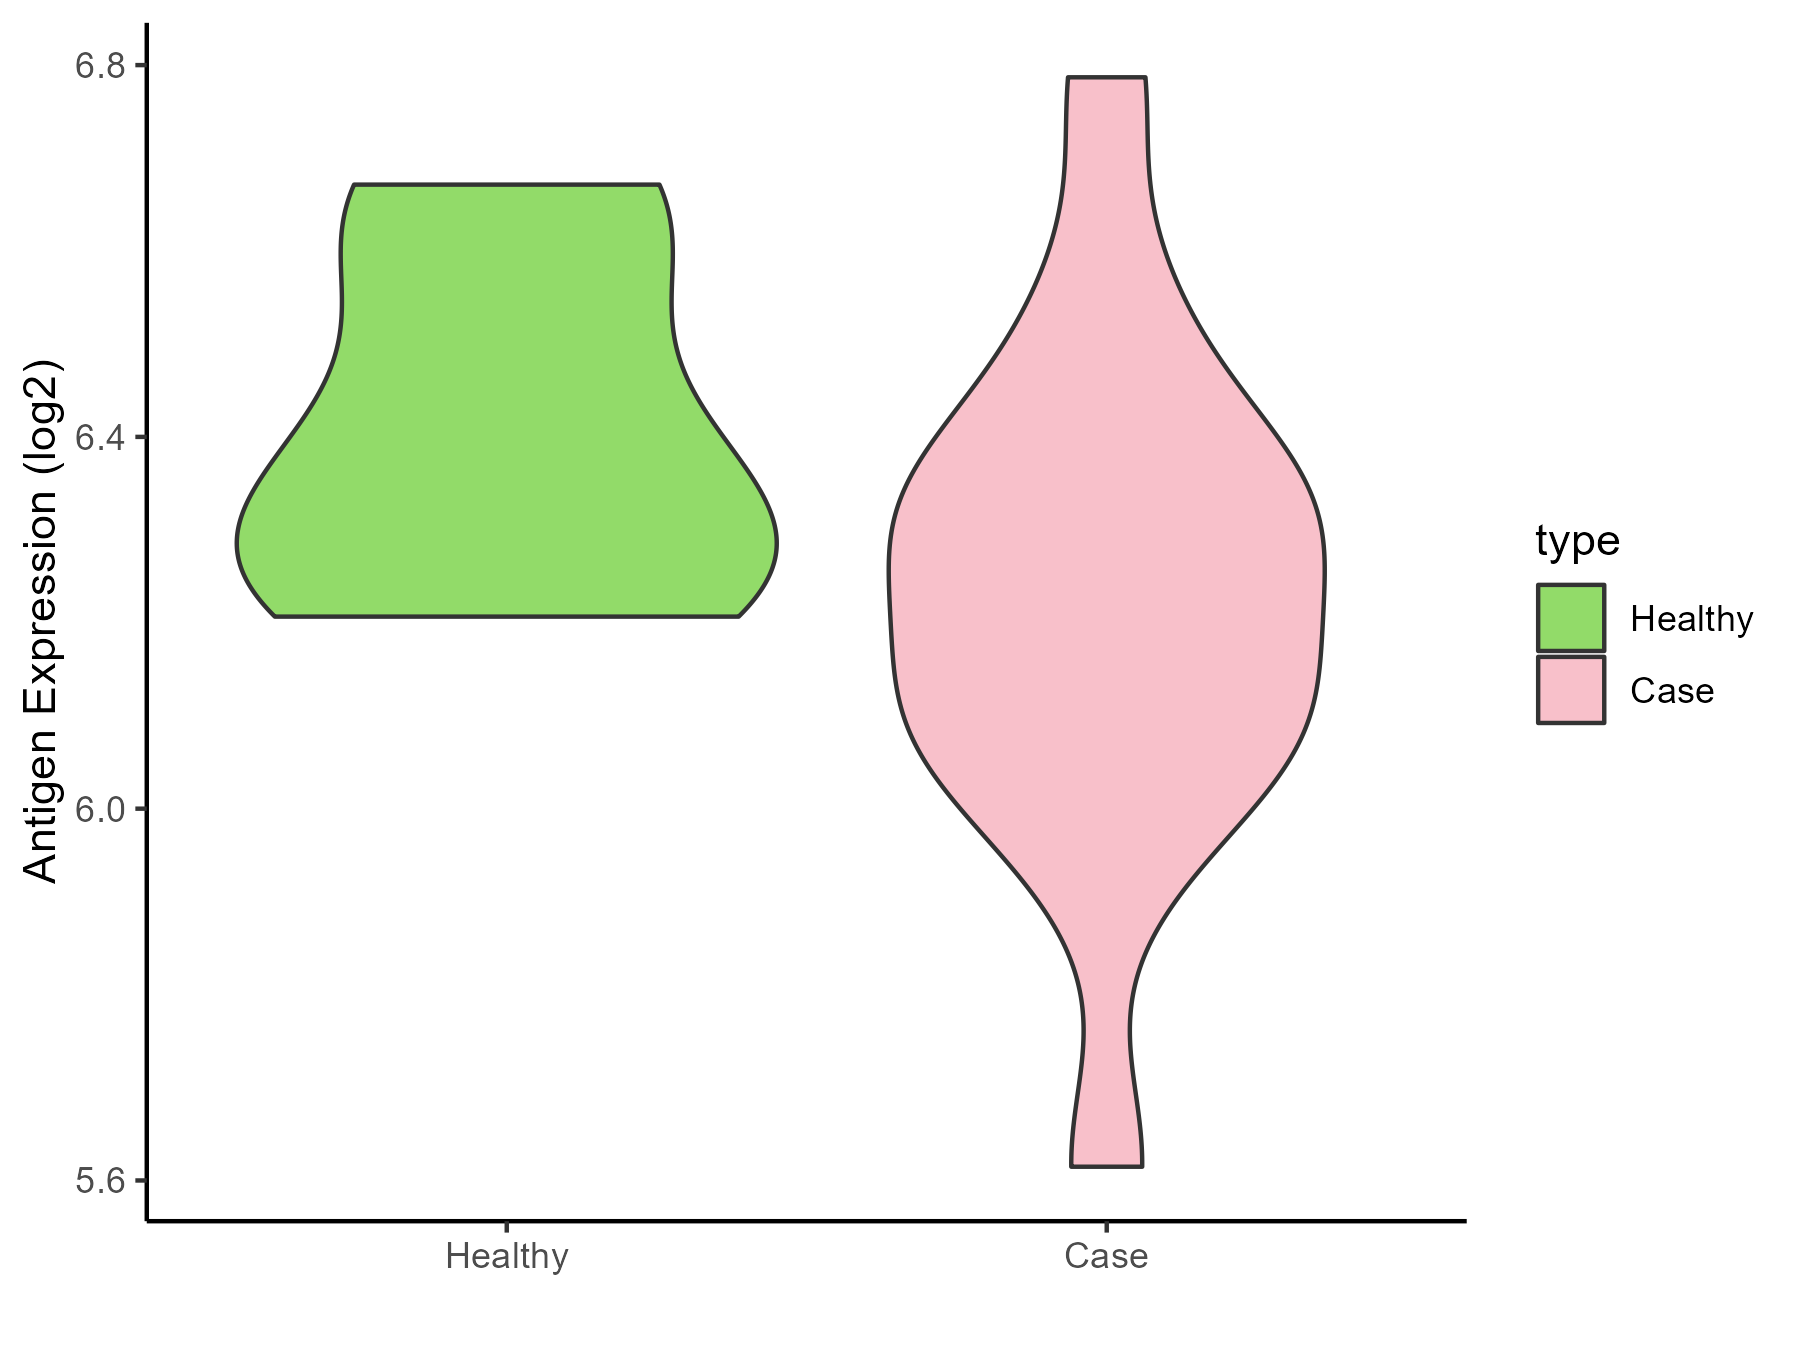
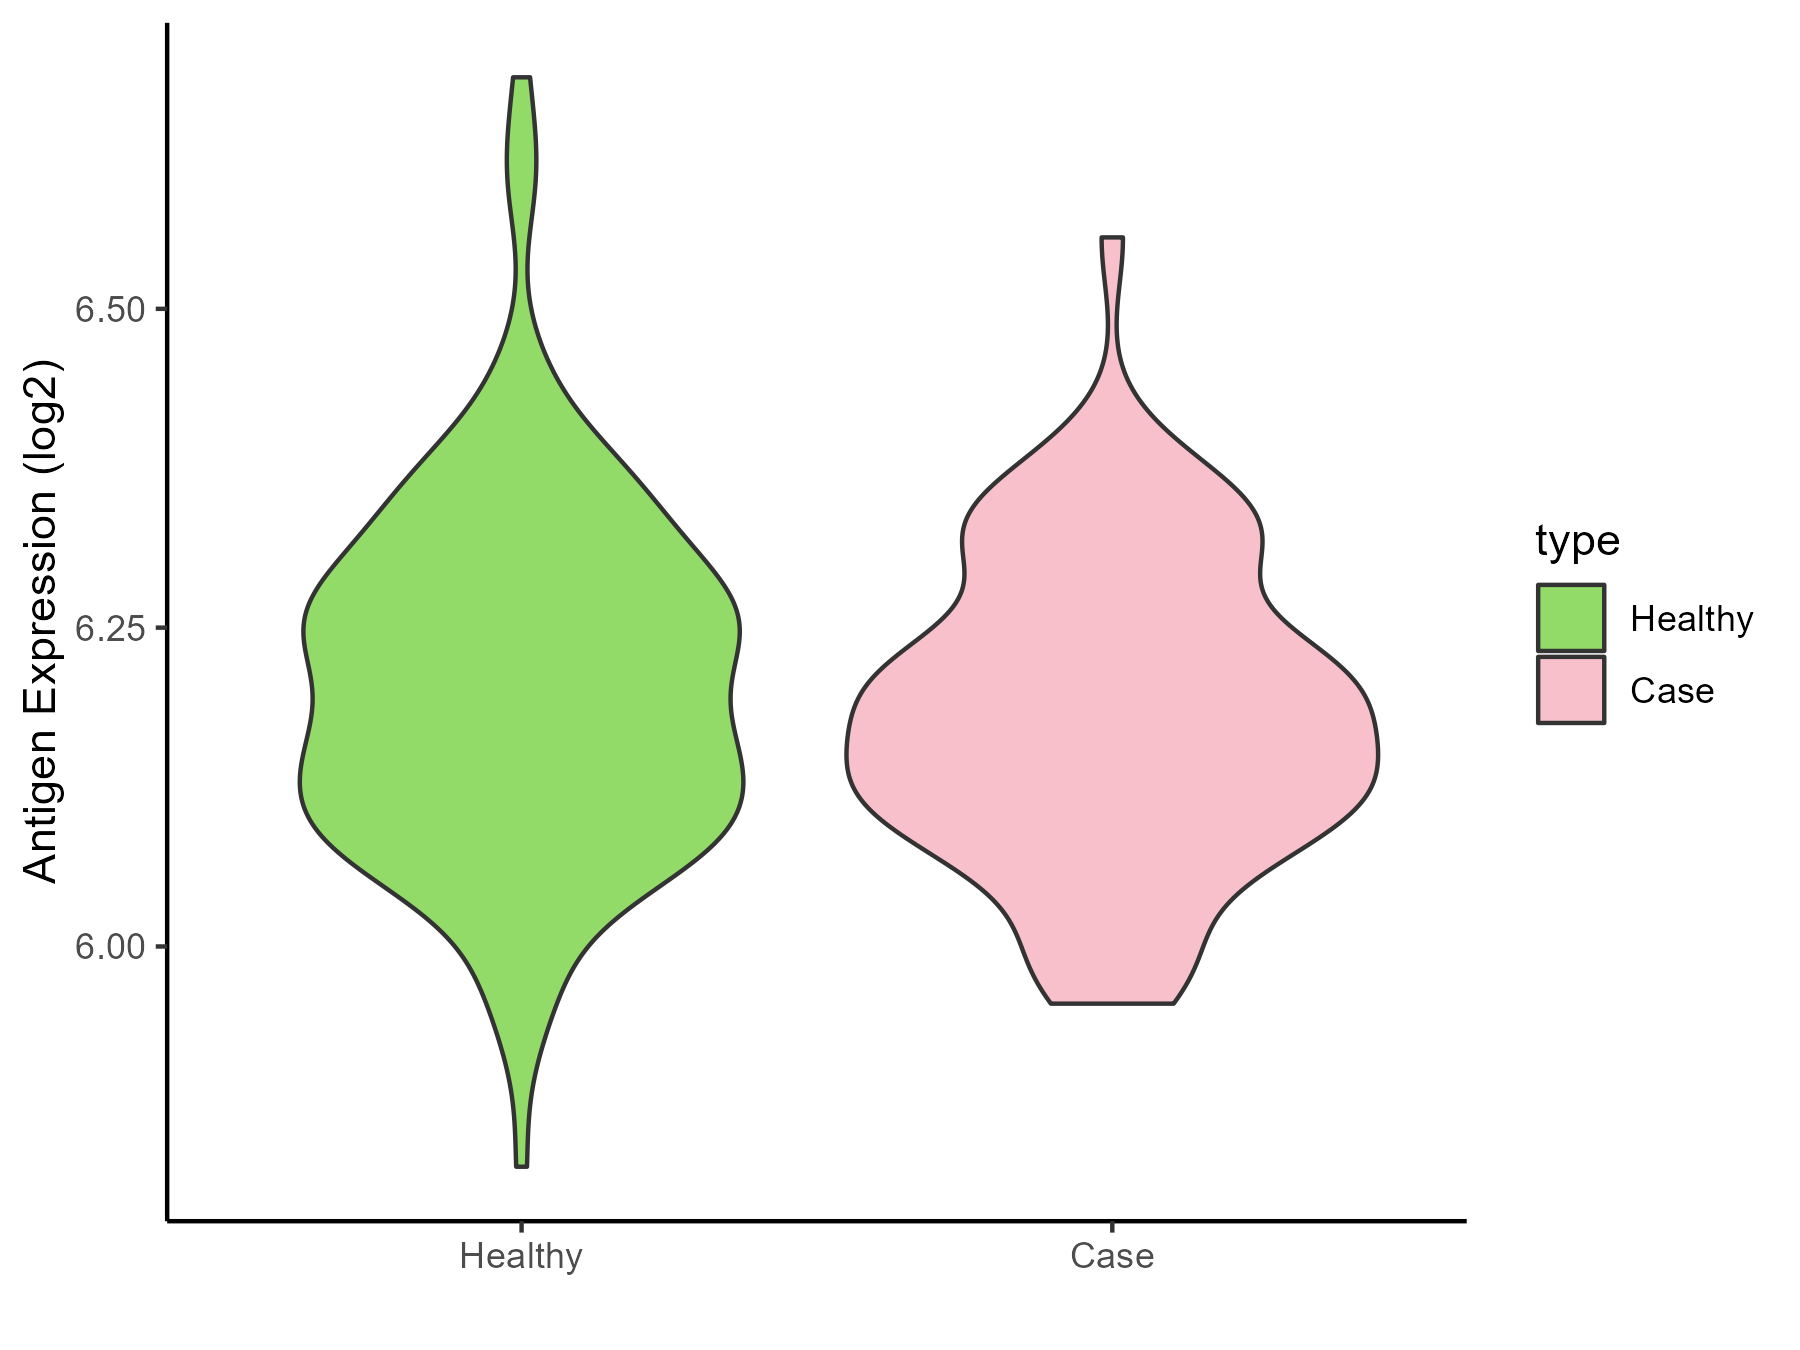
ICD Disease Classification 01
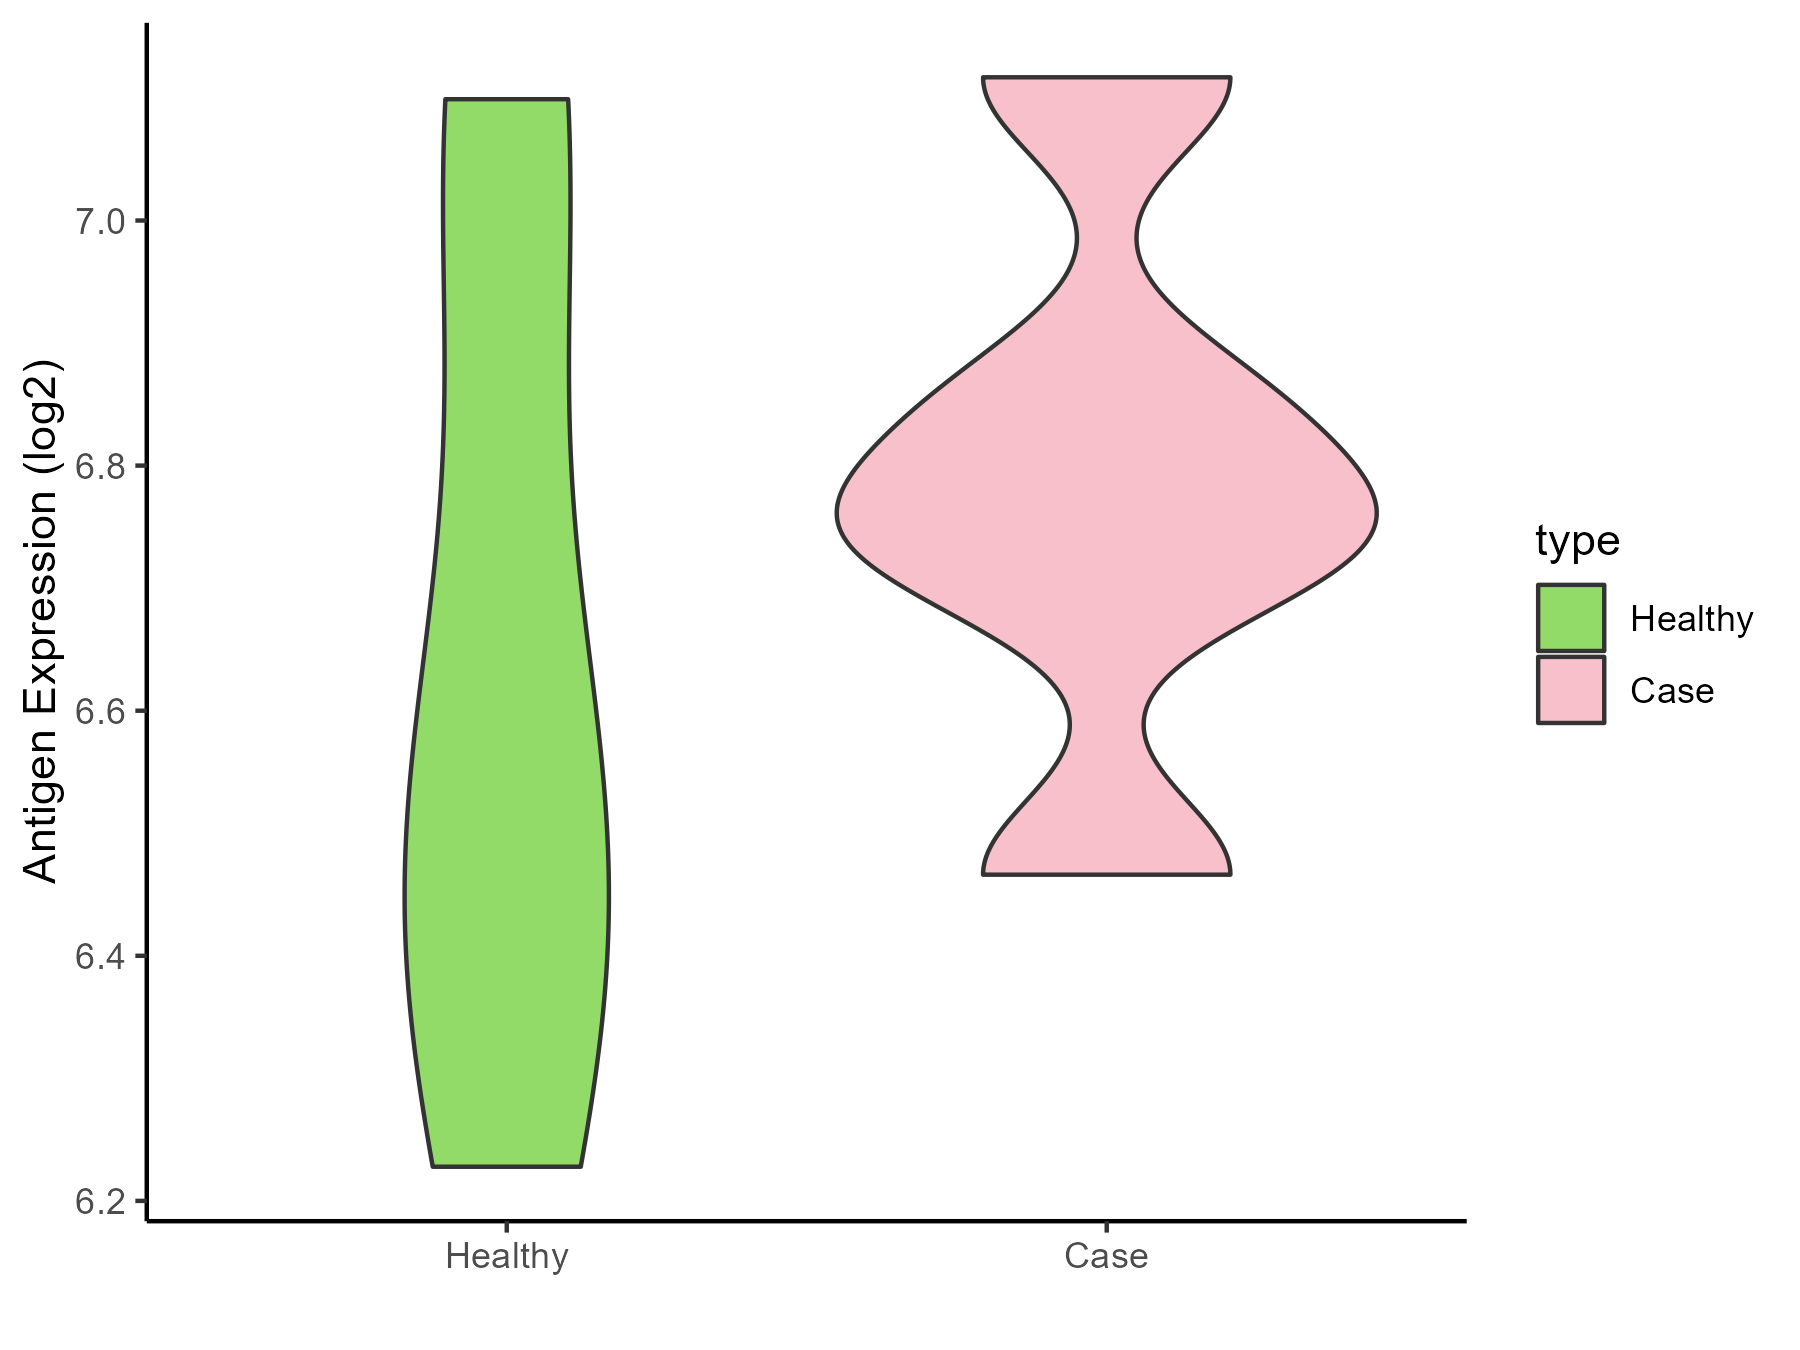
| Differential expression pattern of antigen in diseases | ||
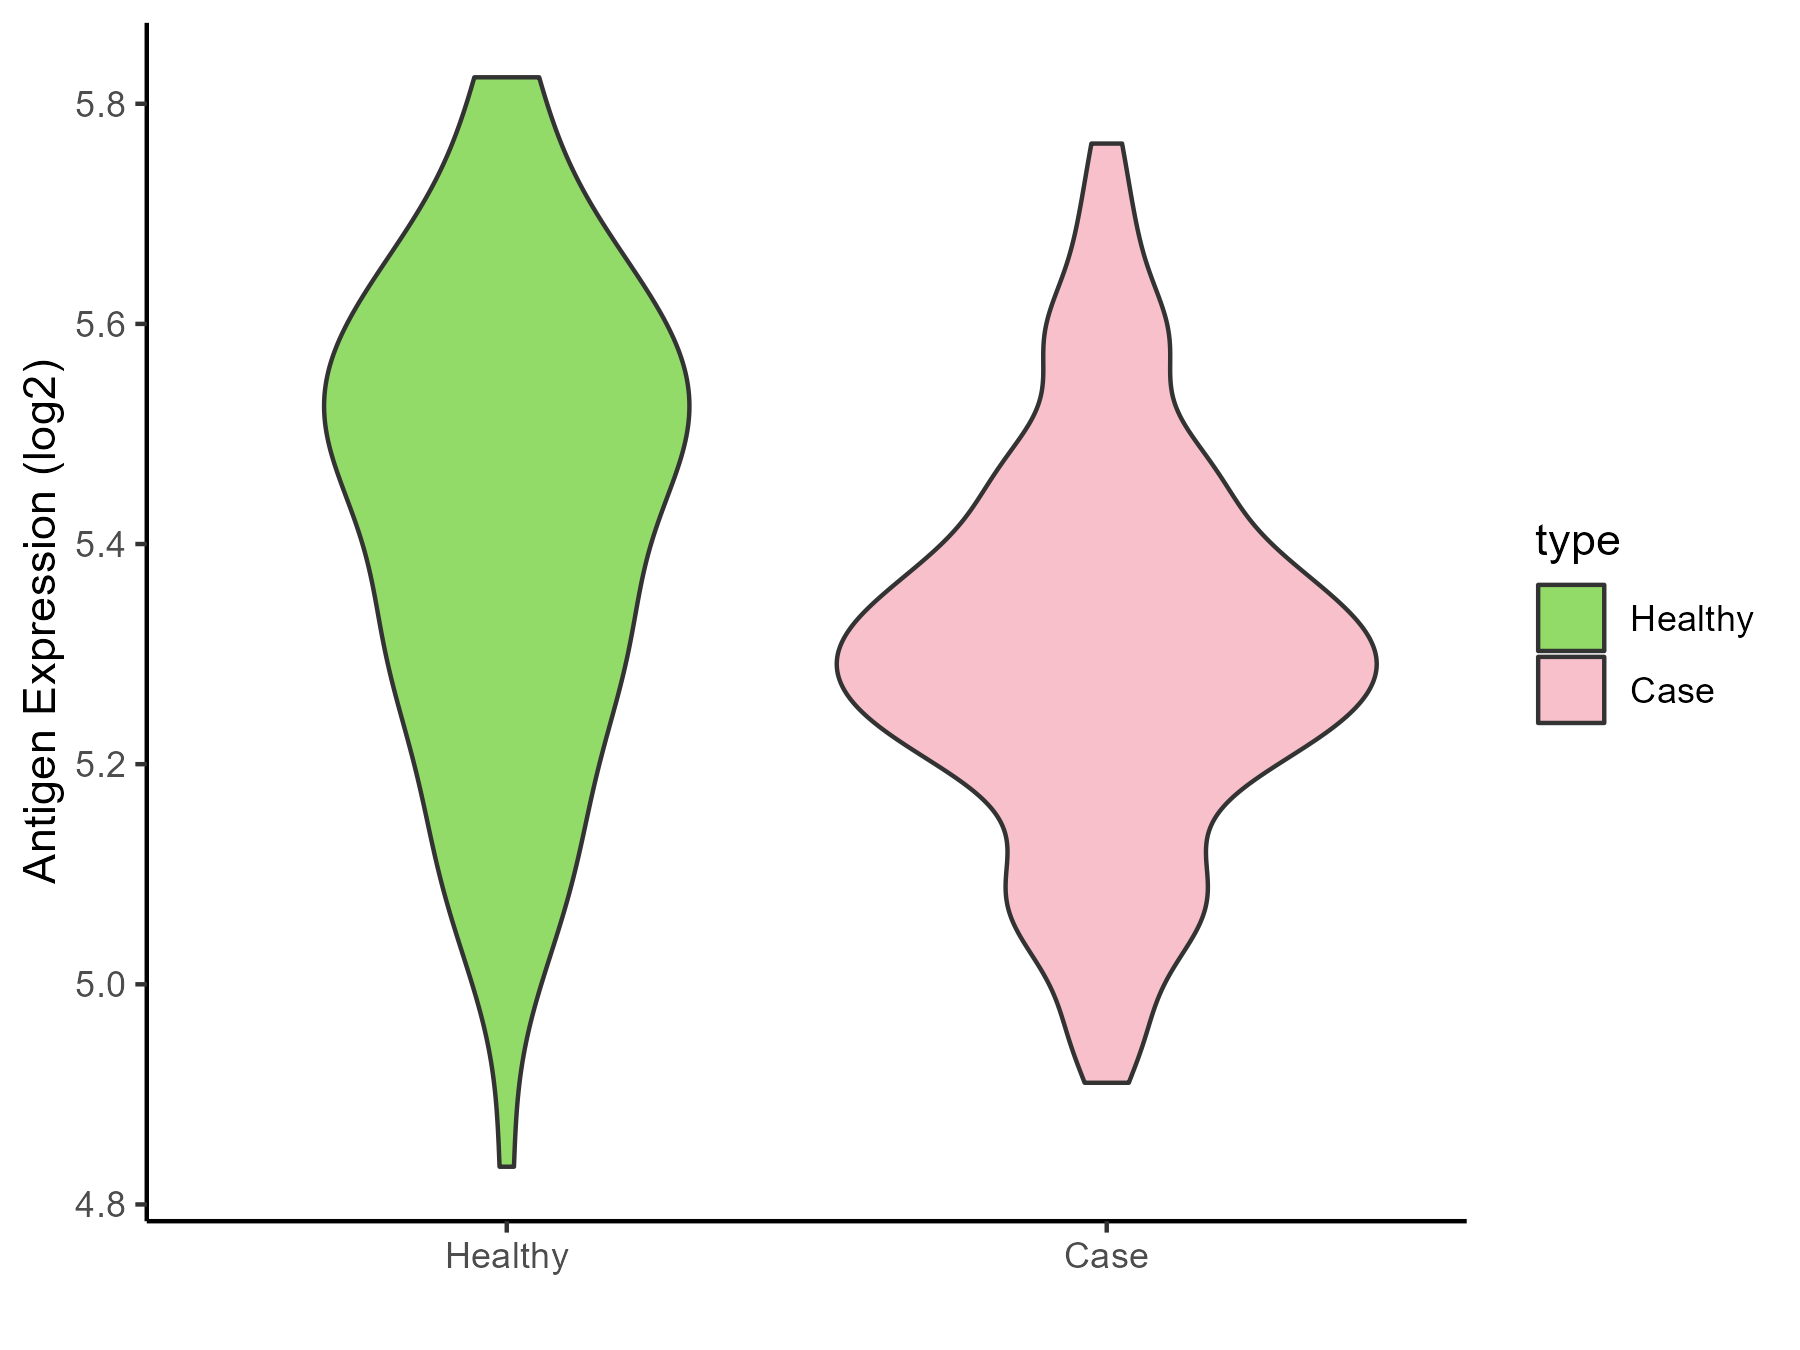
| The Studied Tissue | Gingival | |
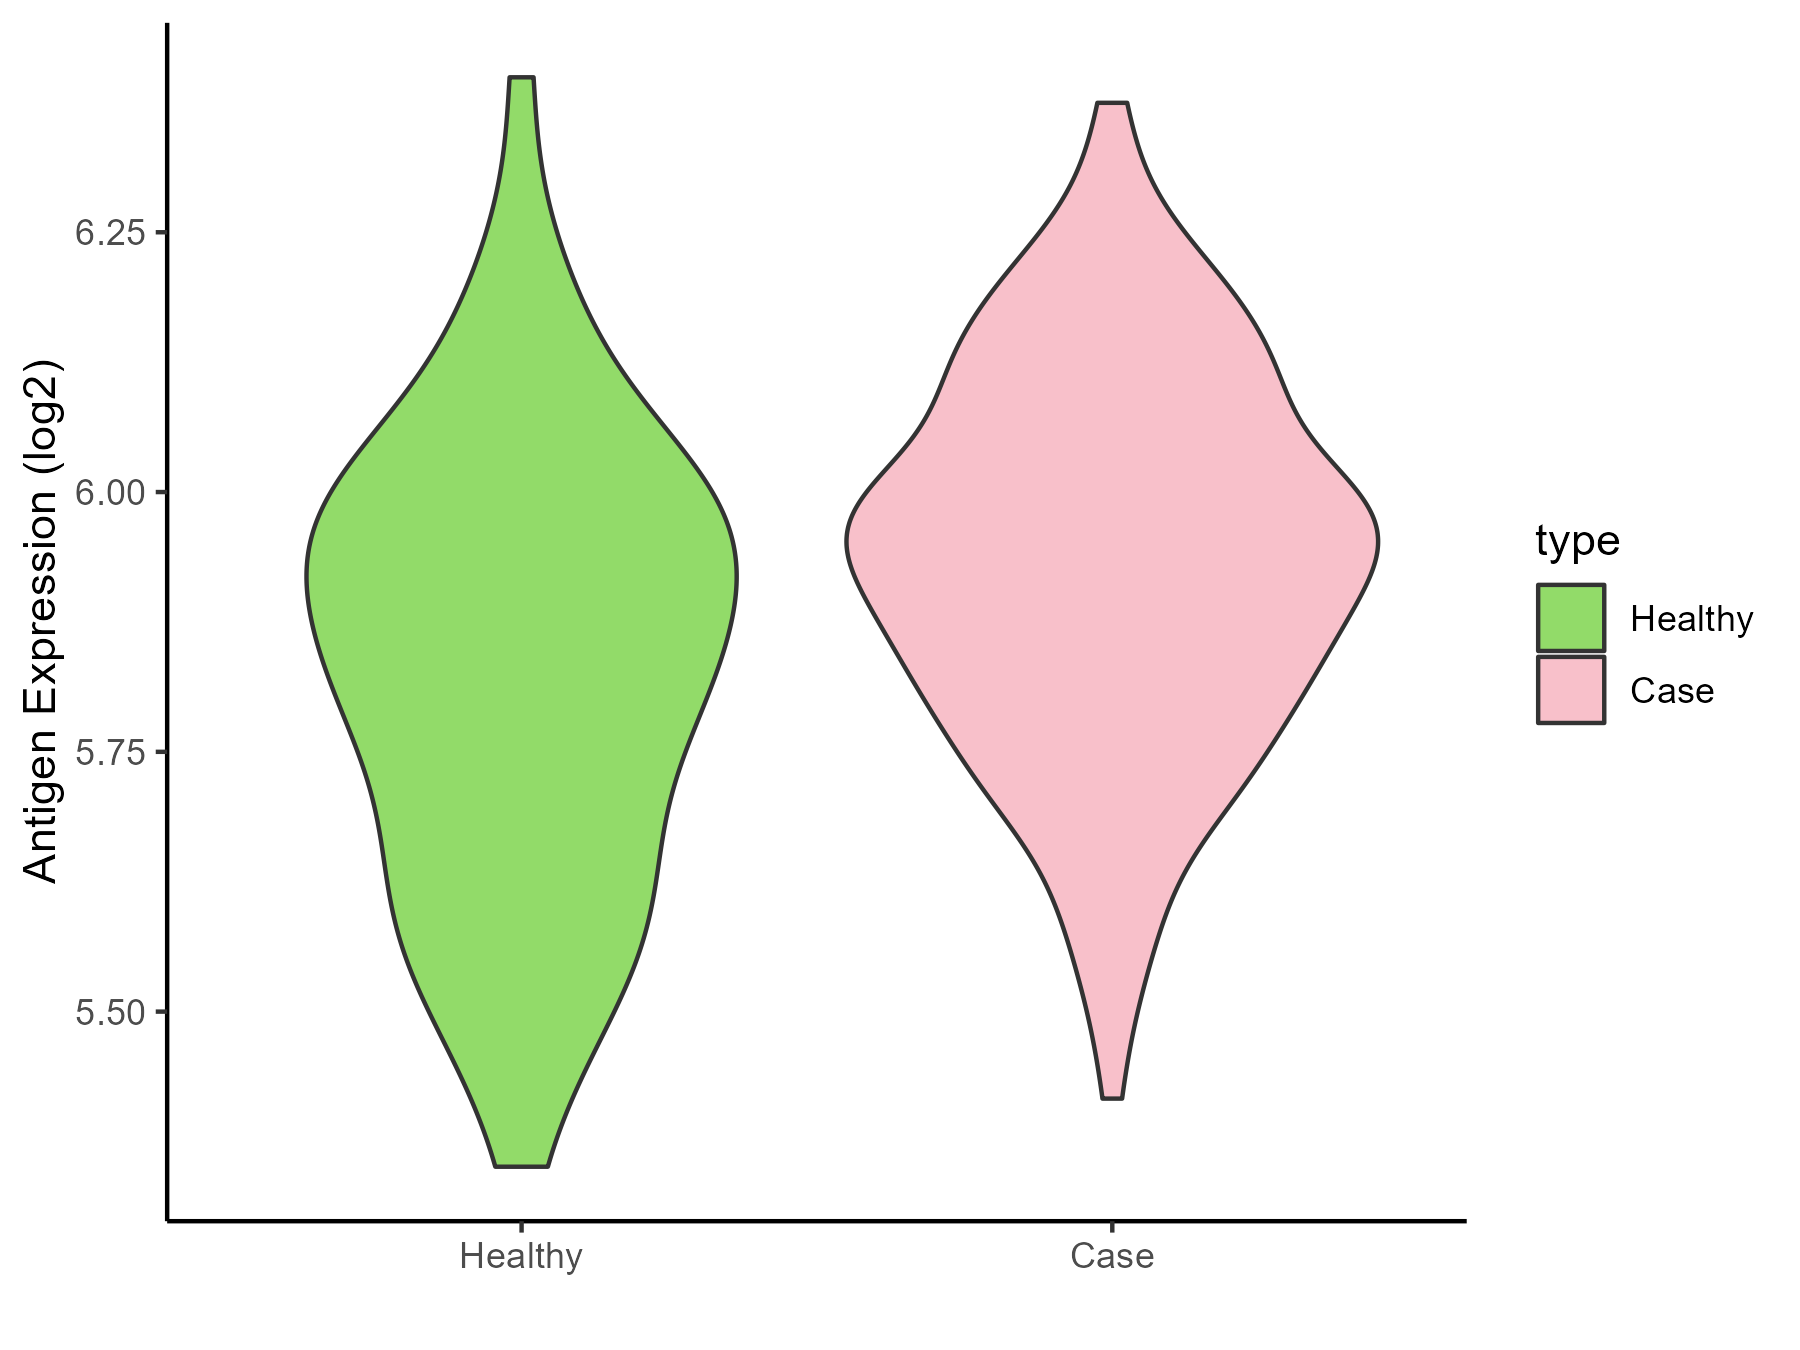
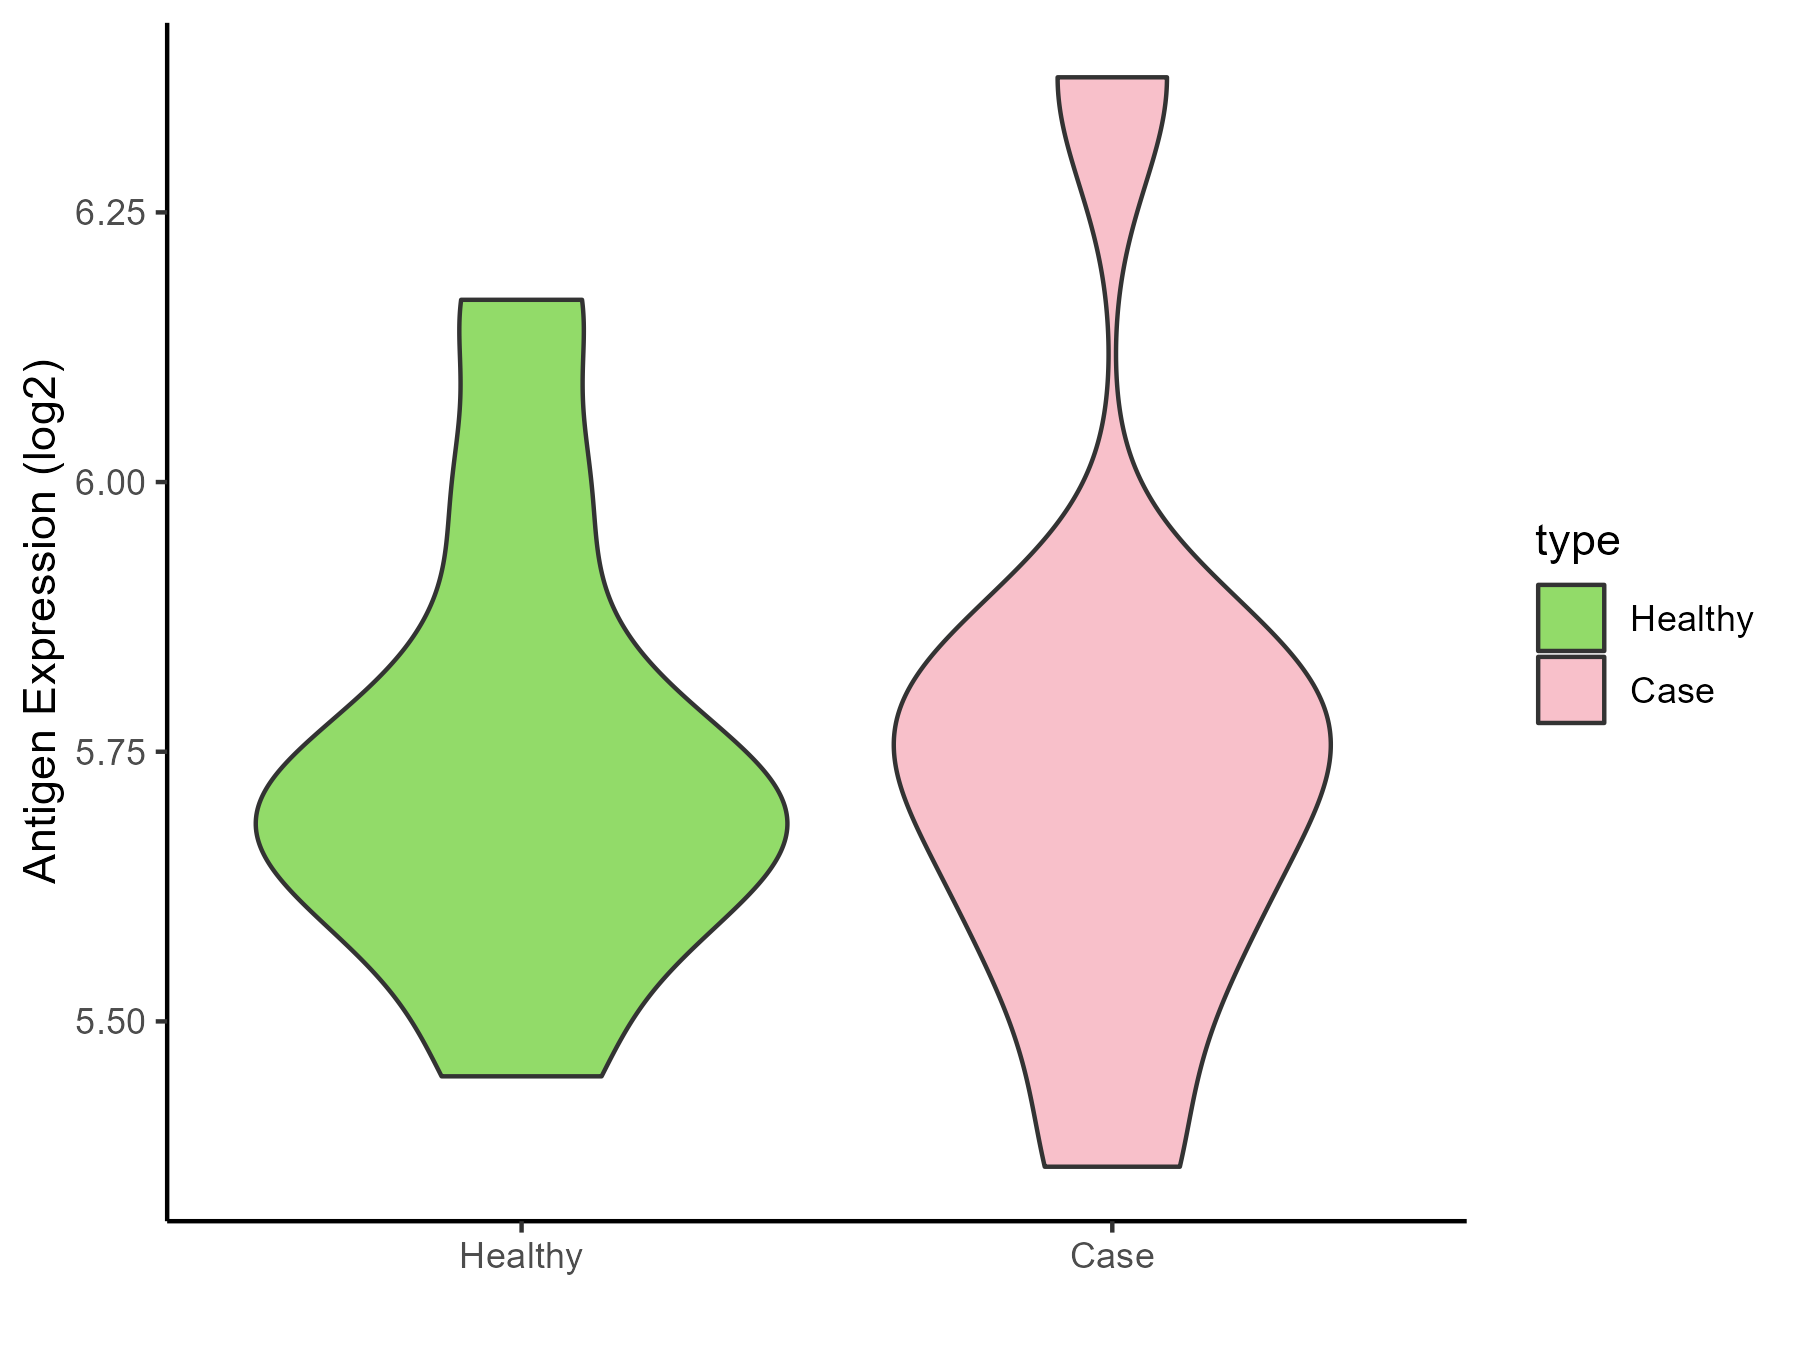
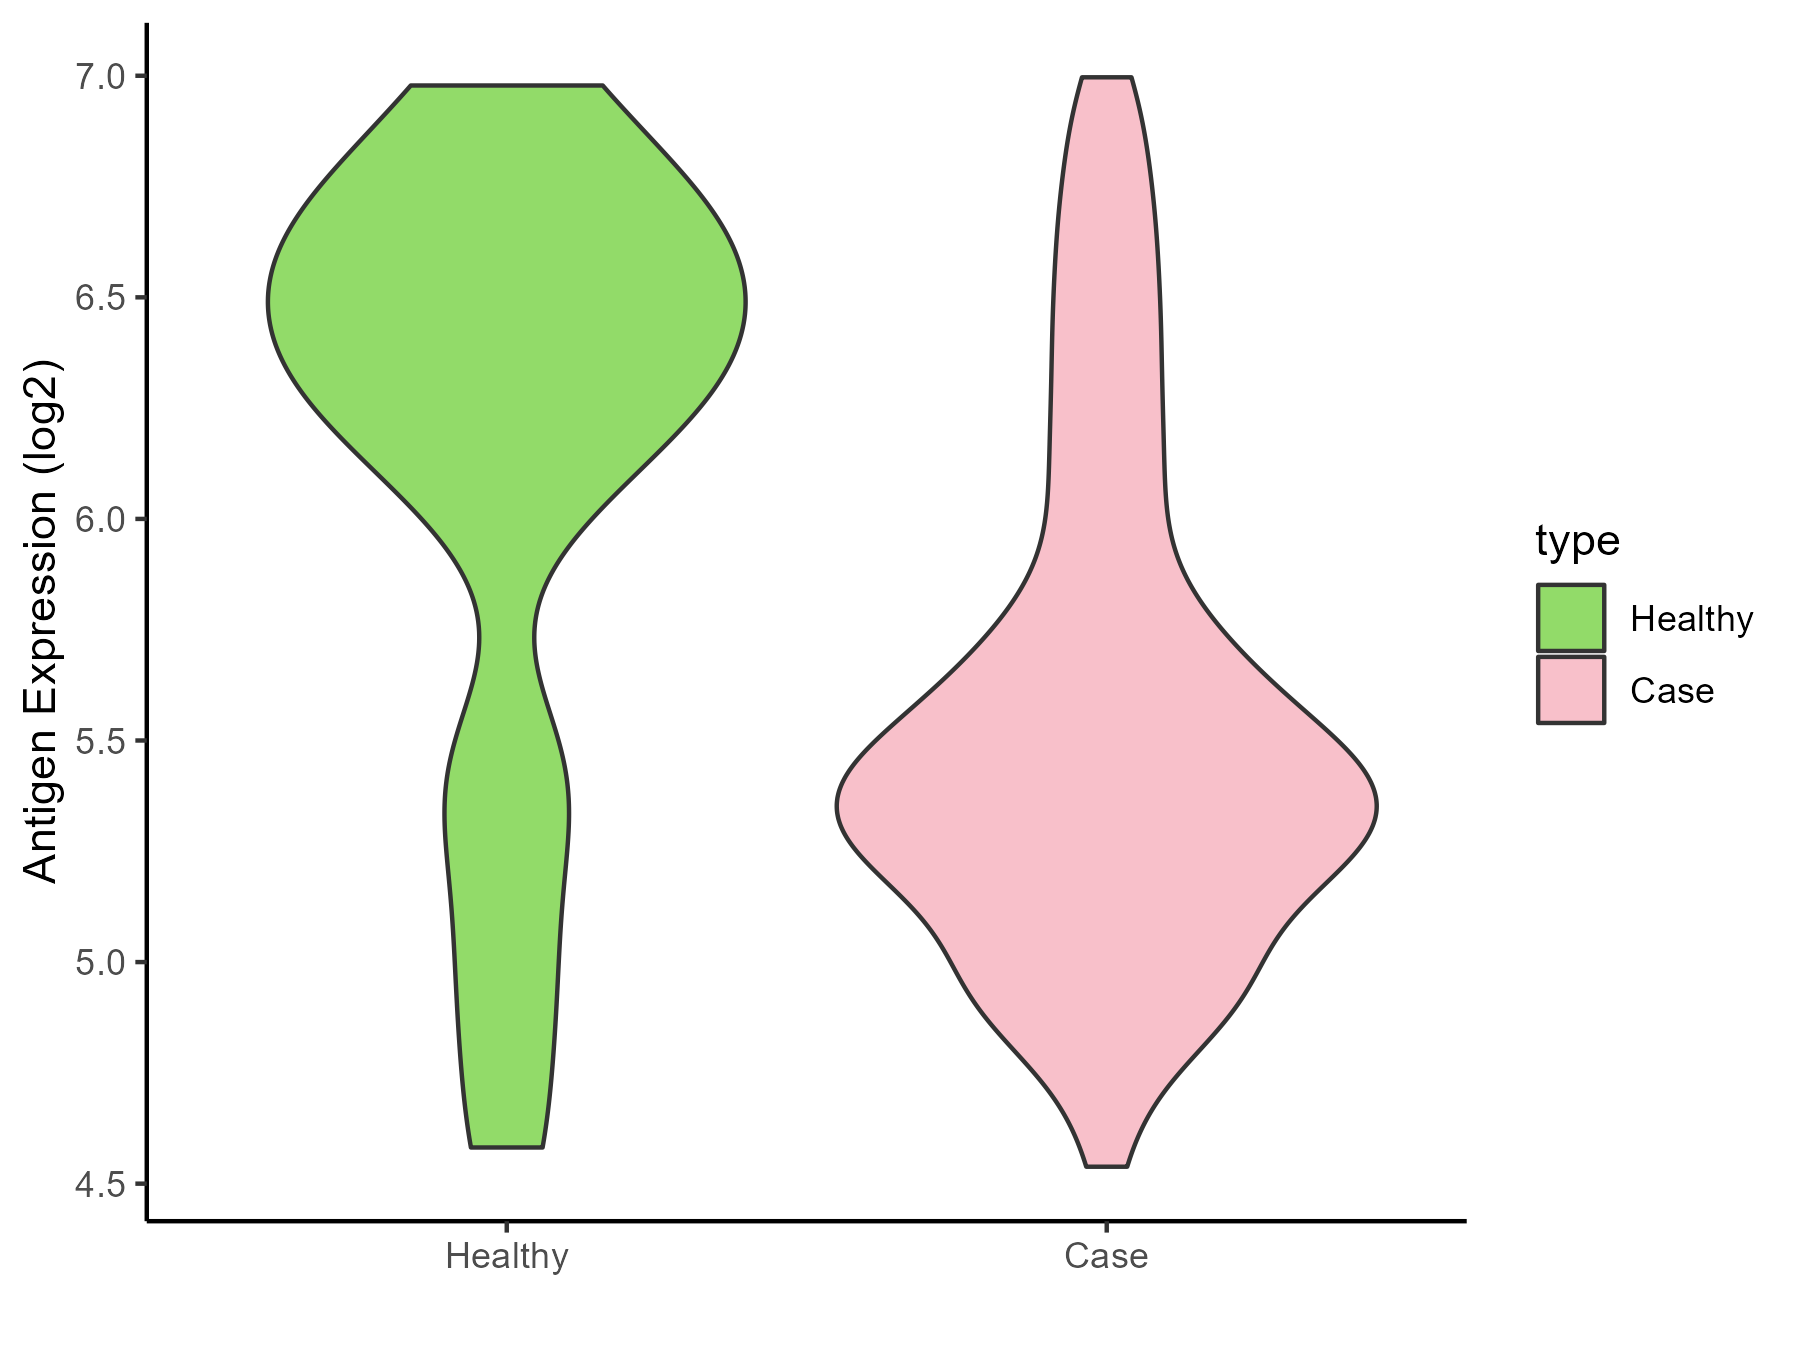
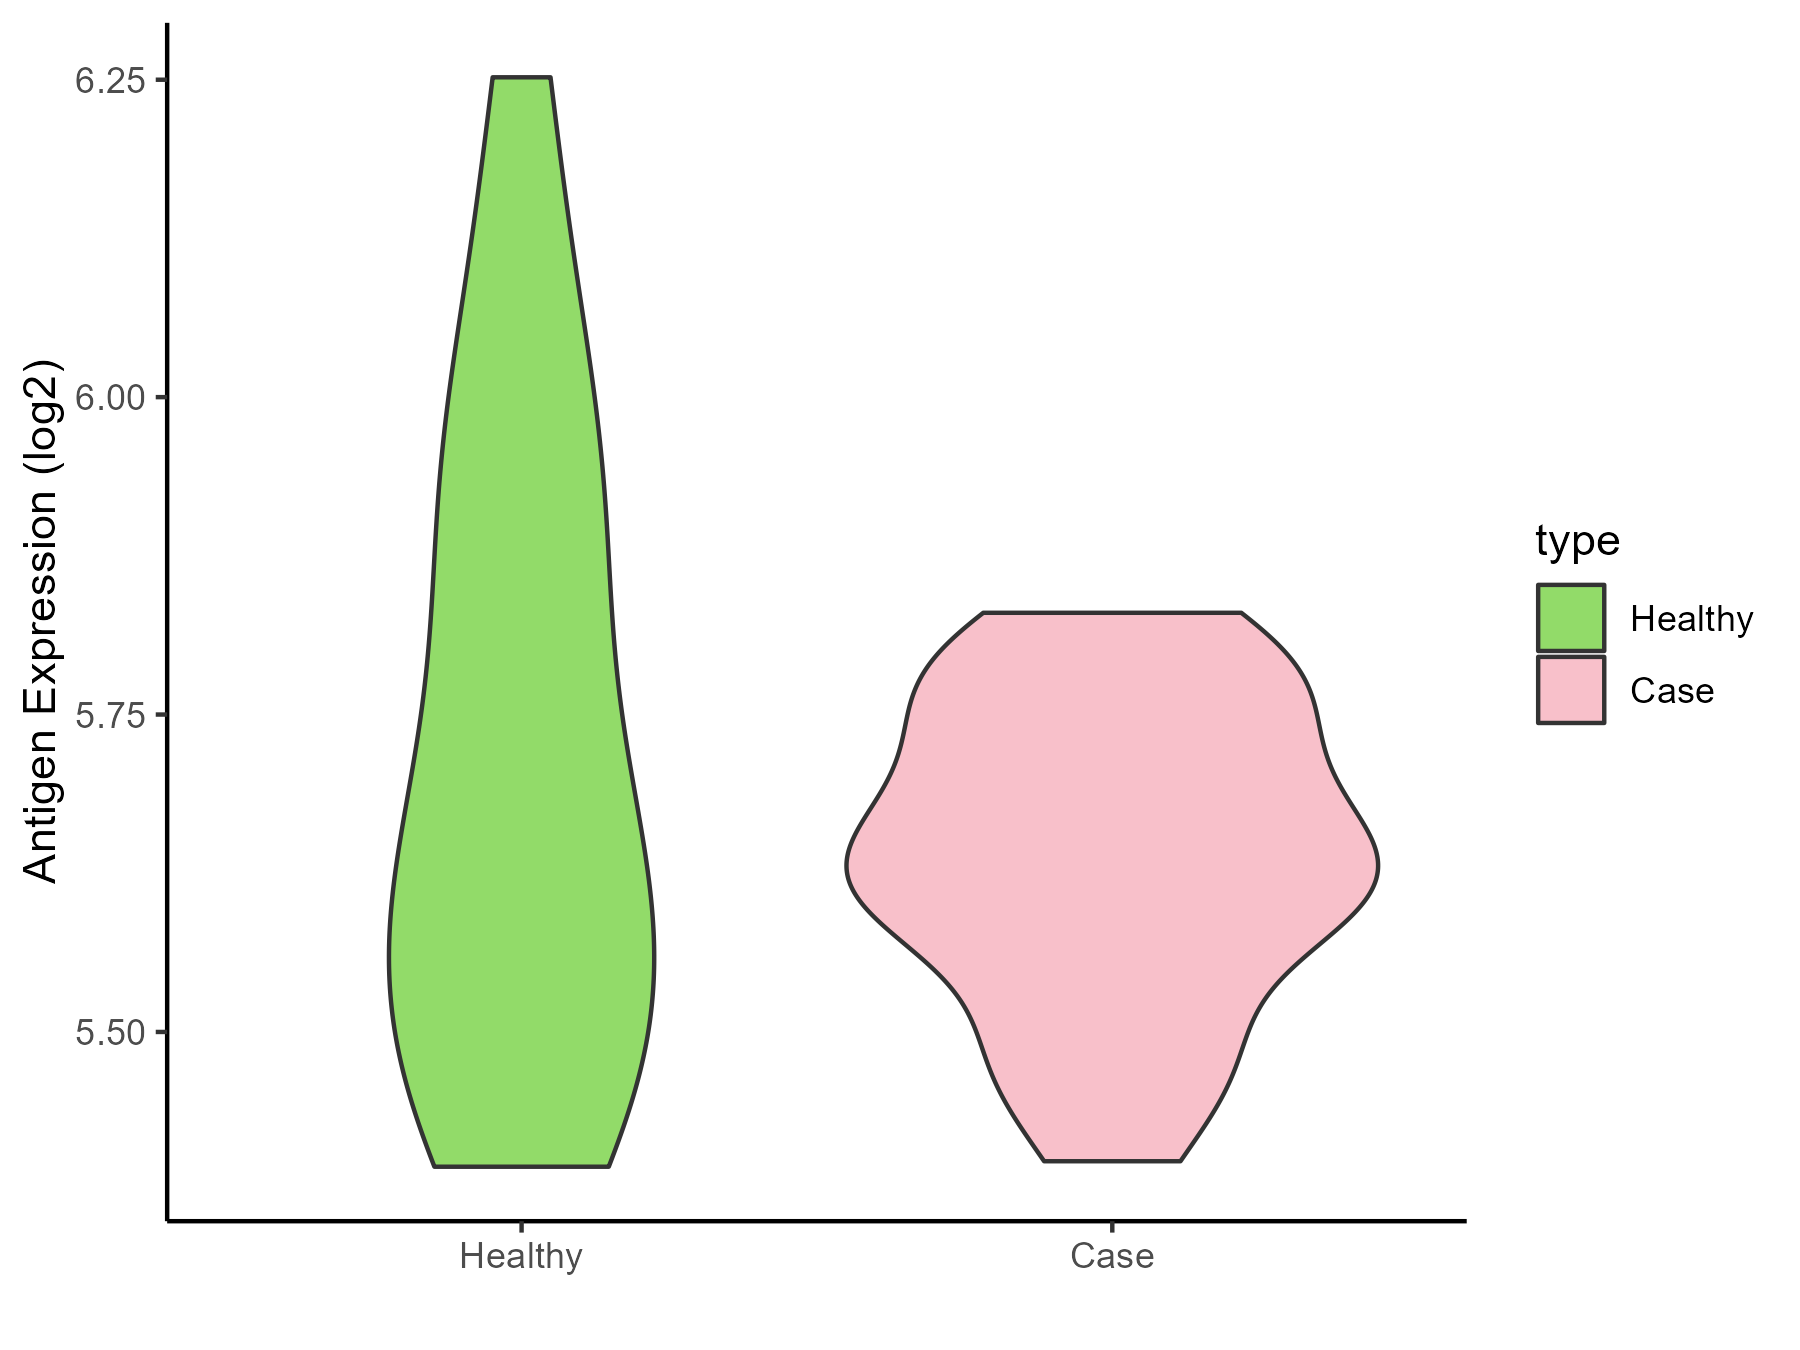
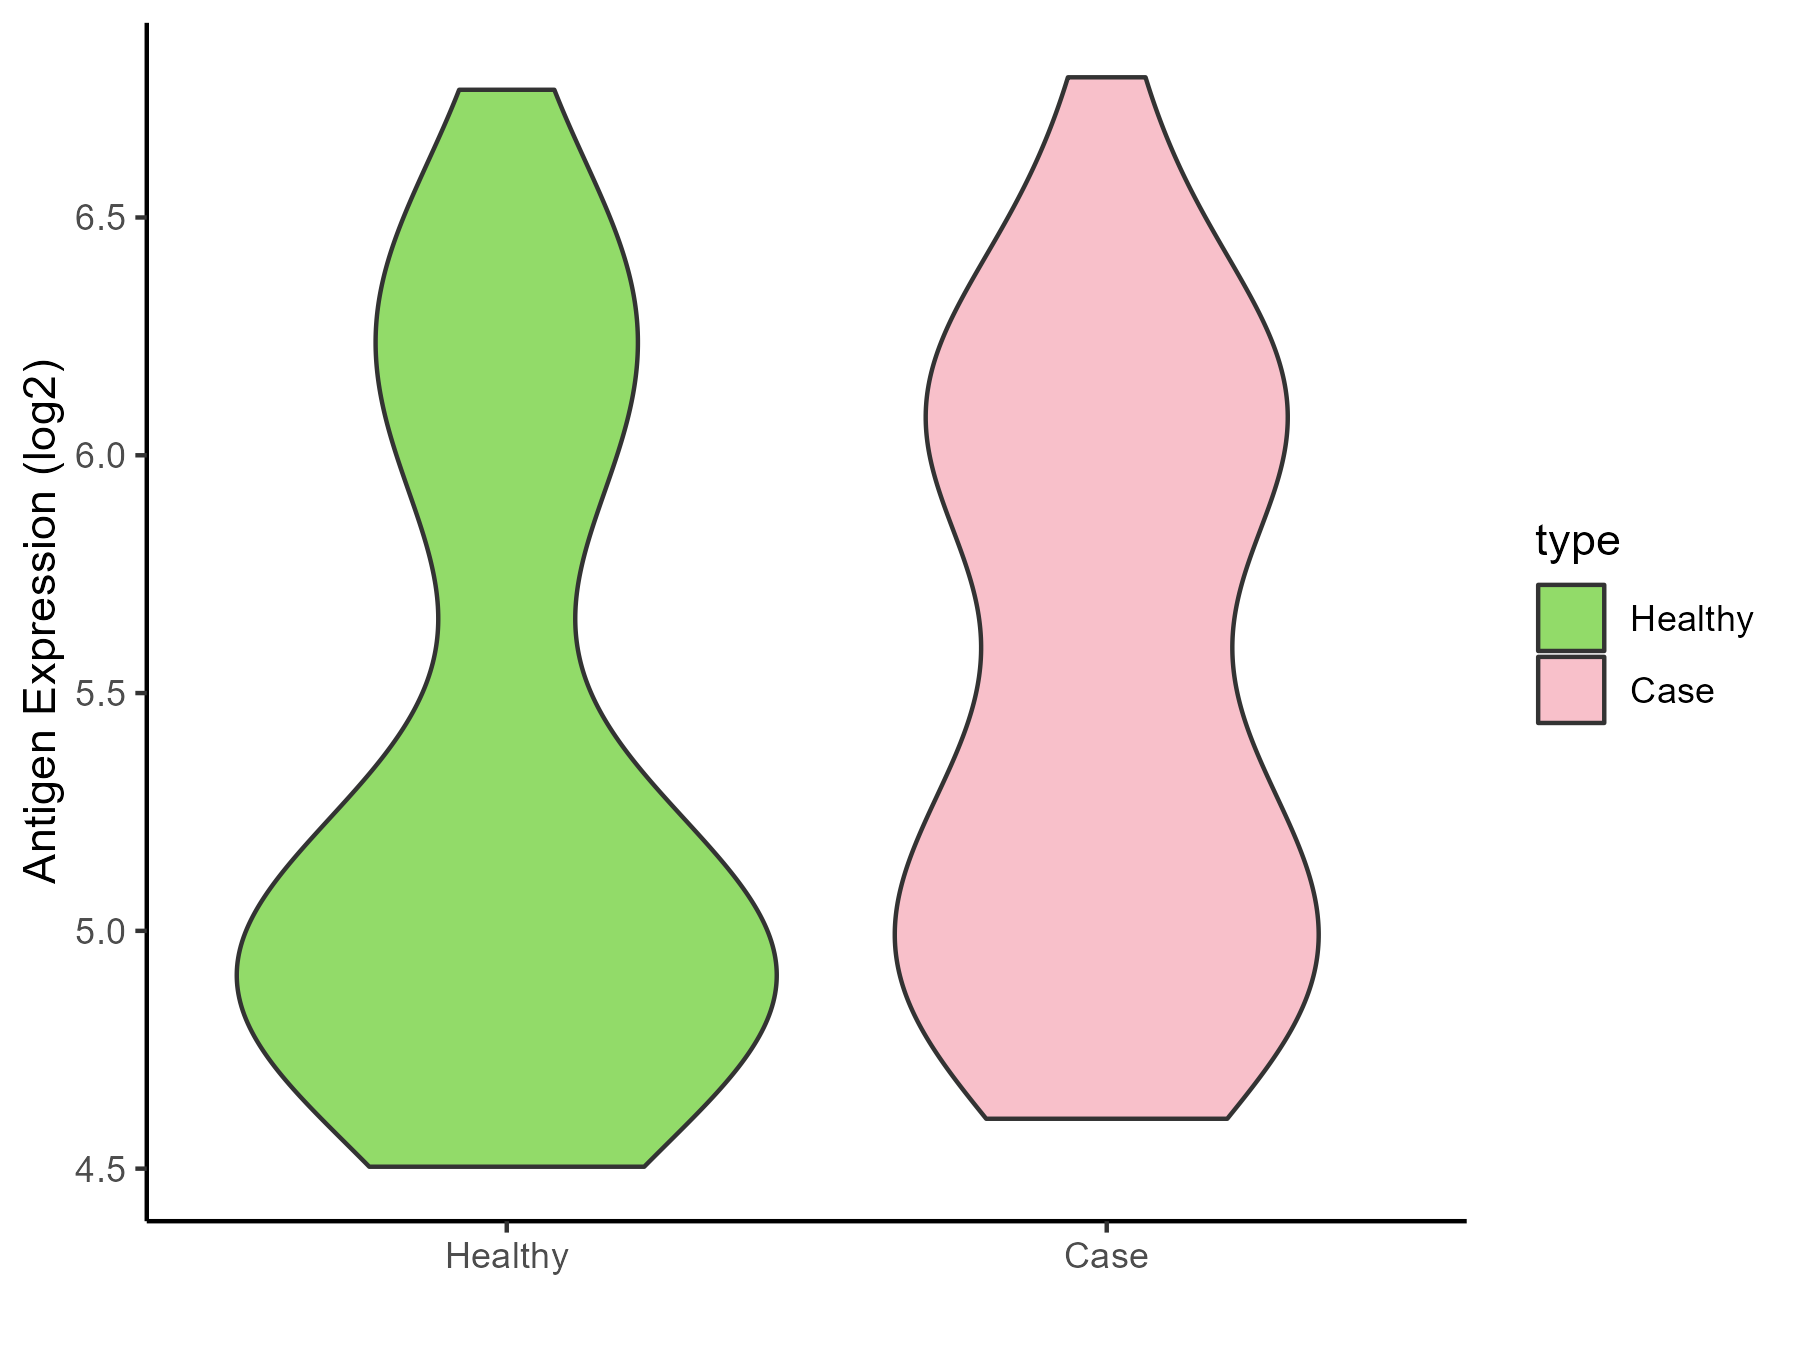
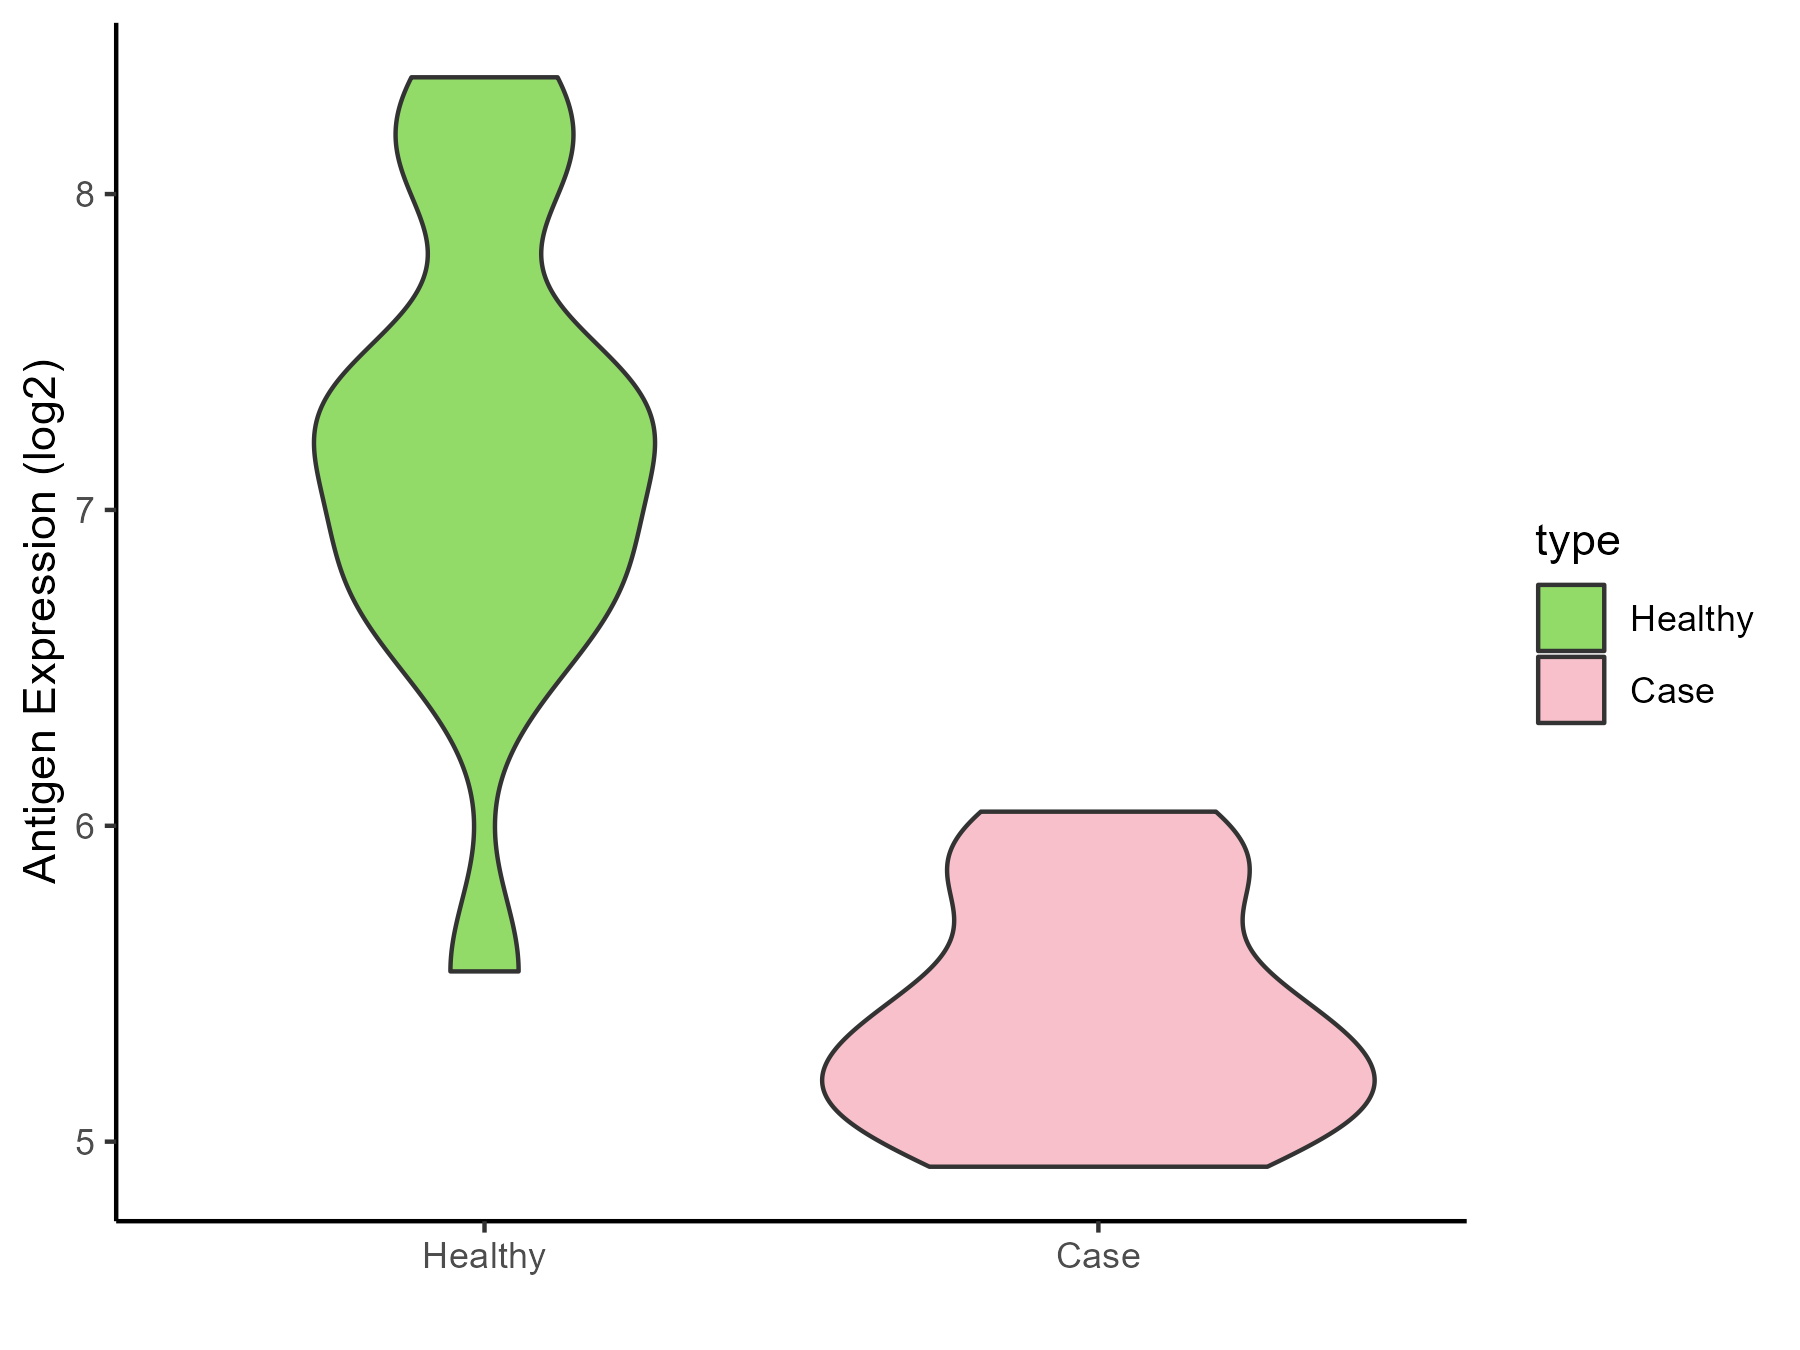
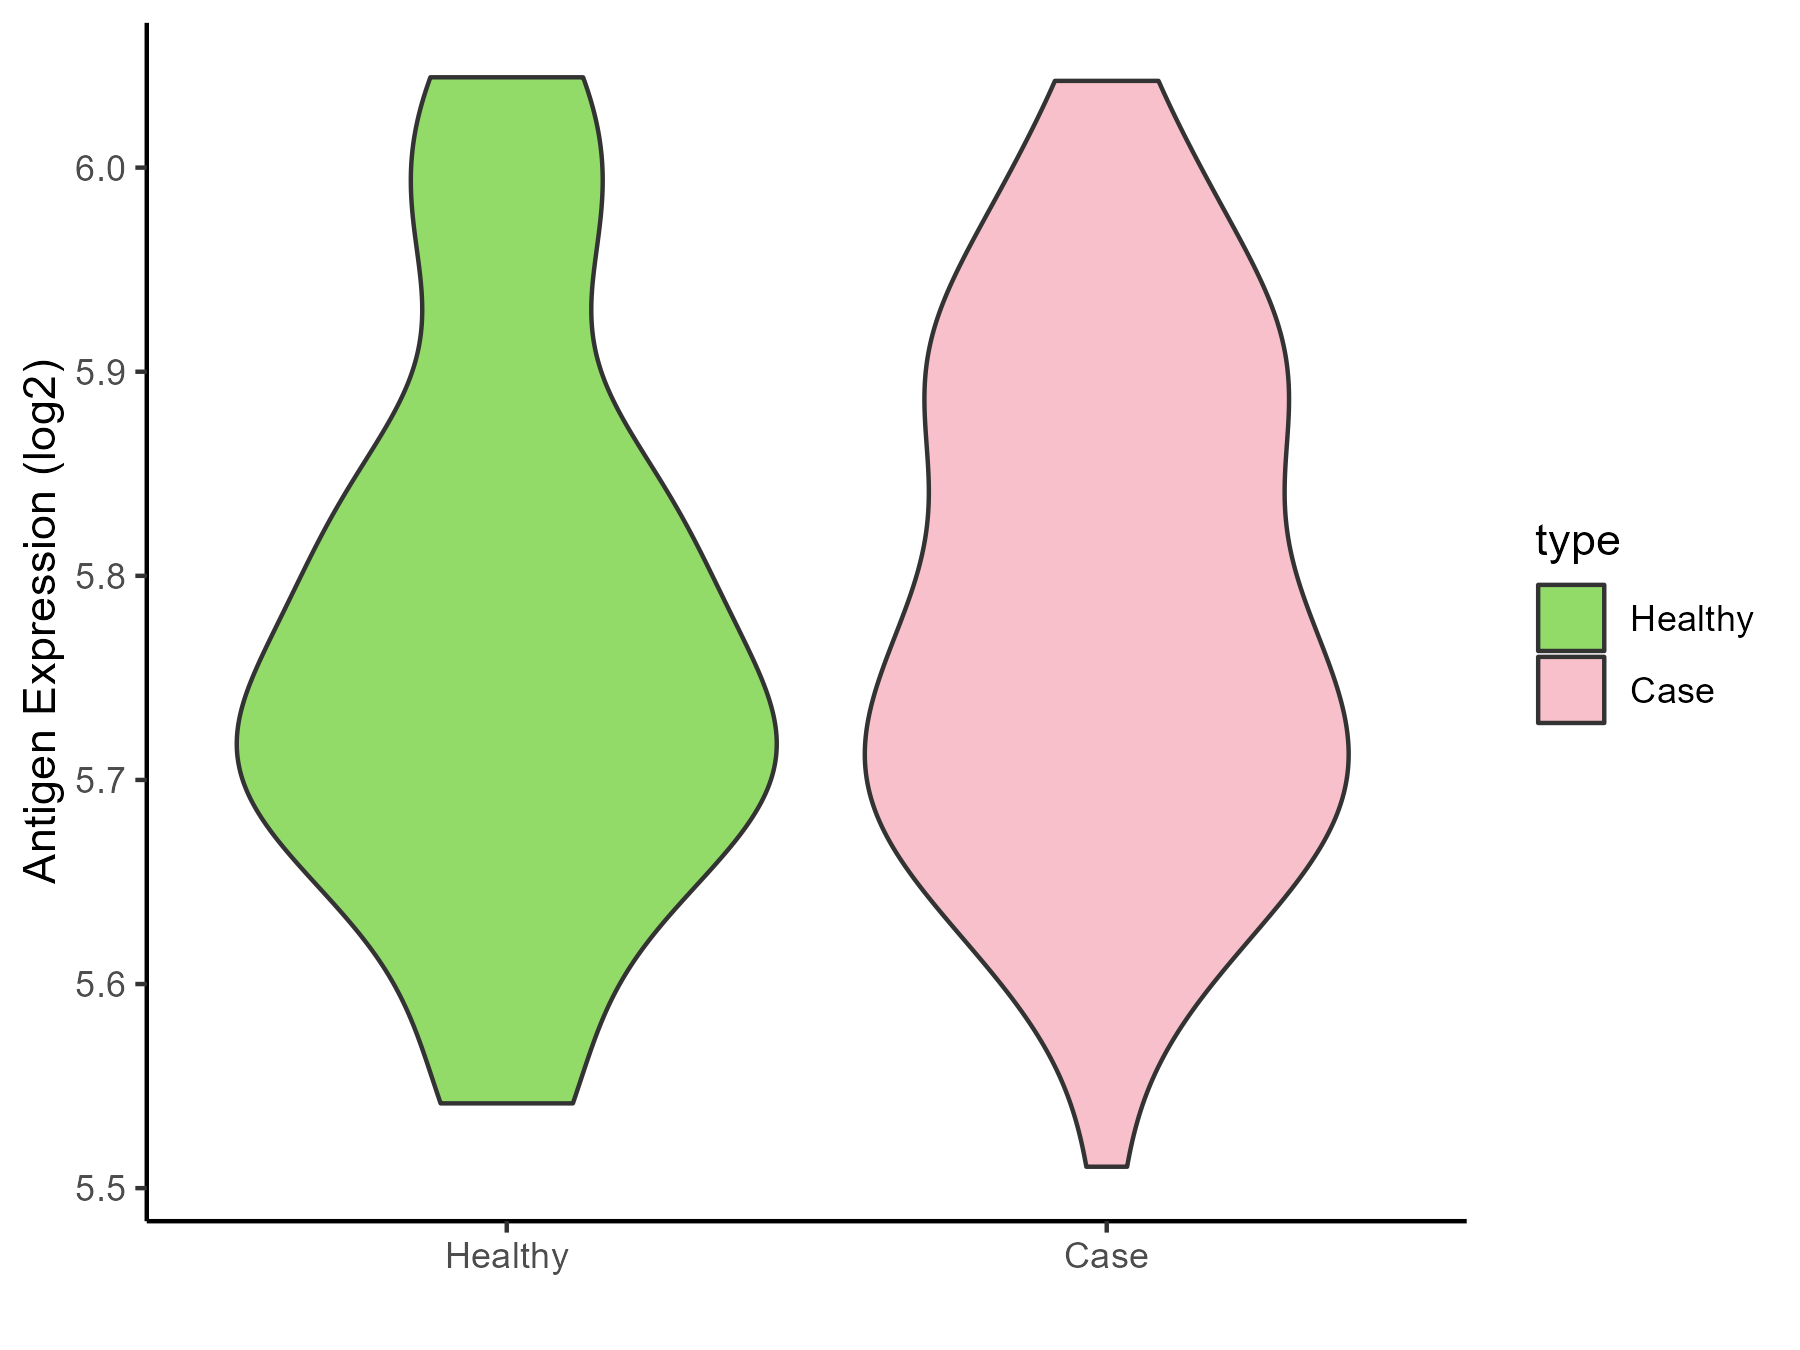
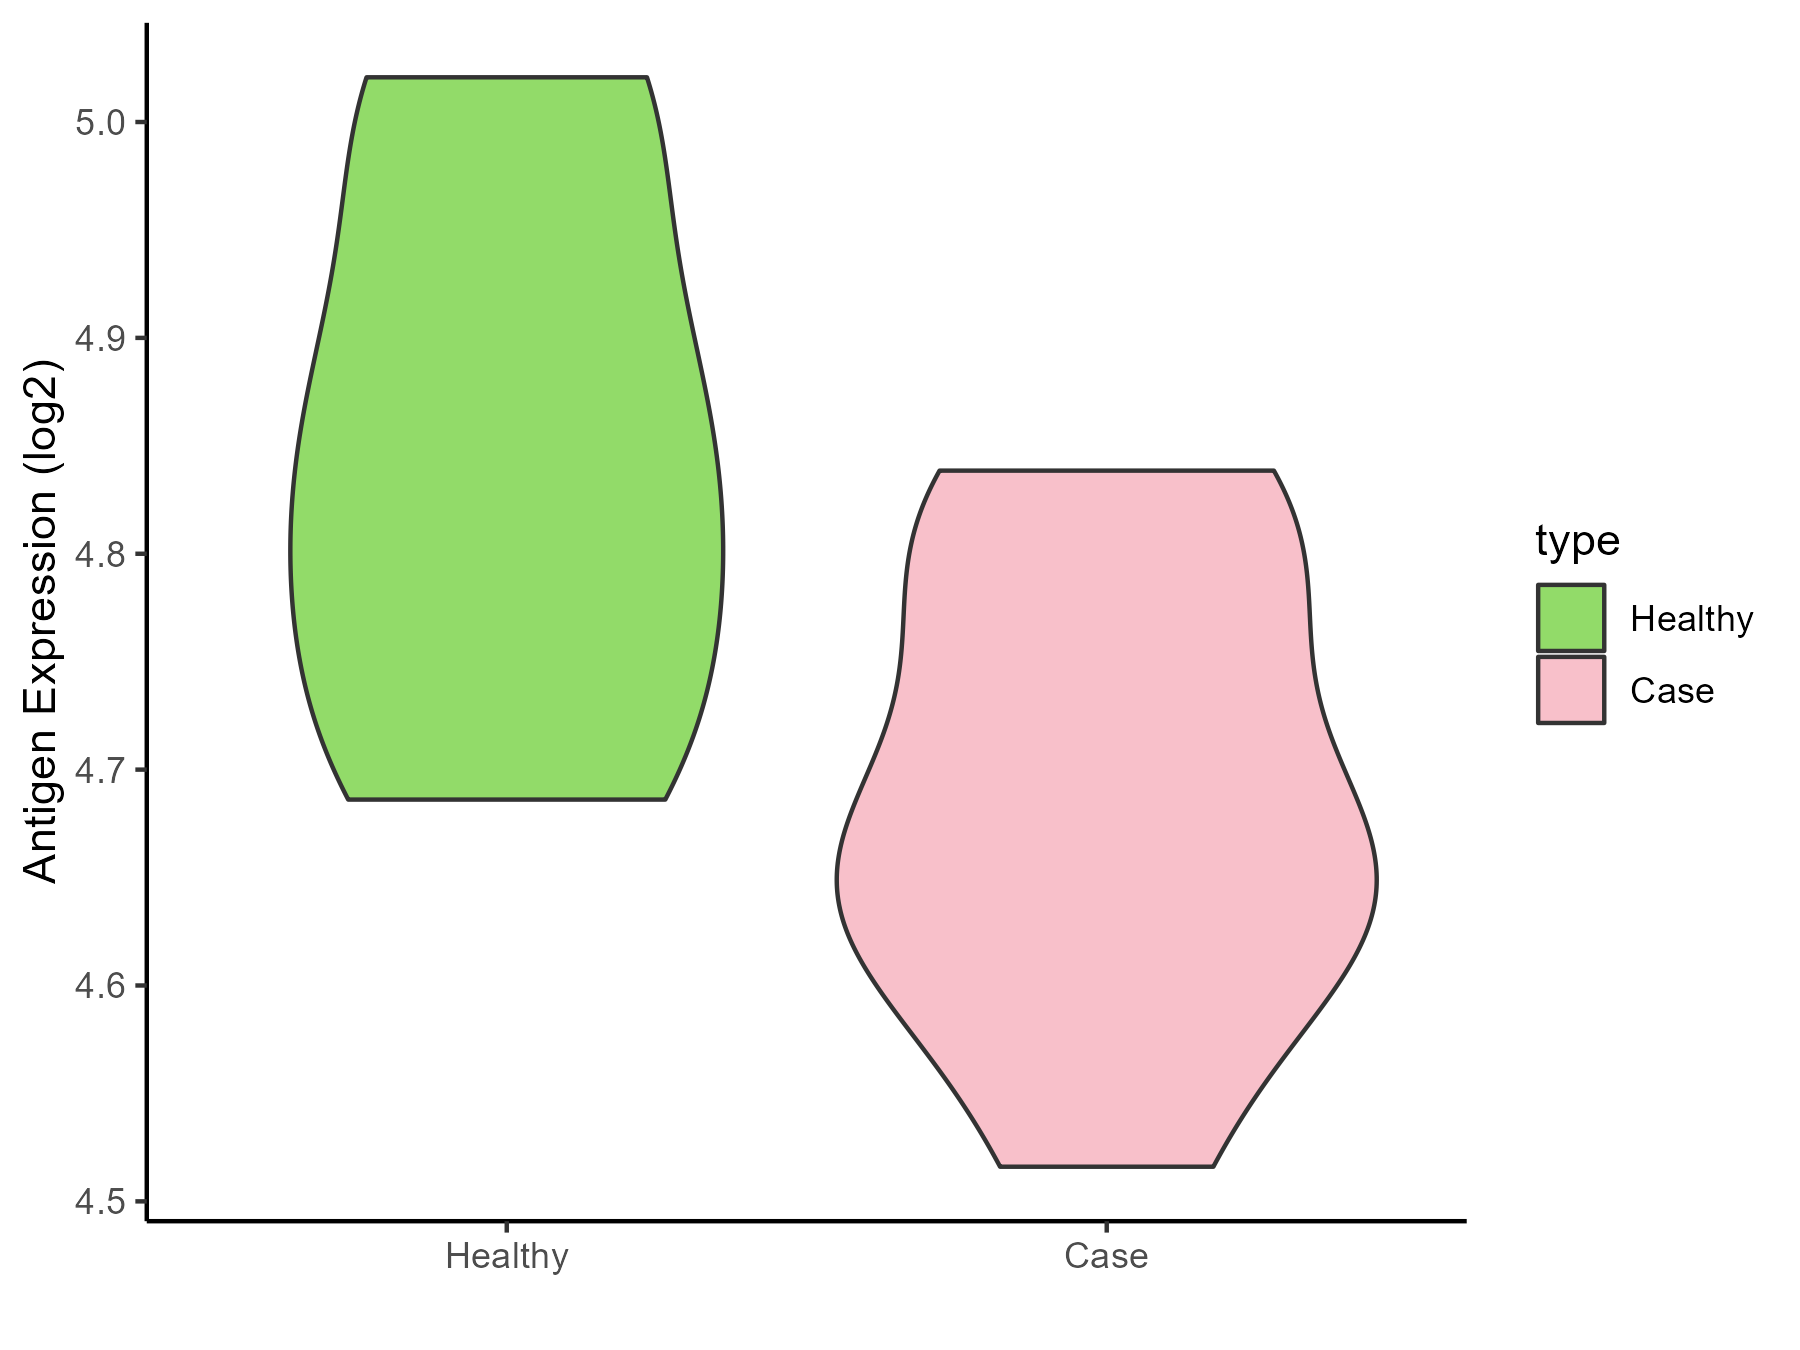
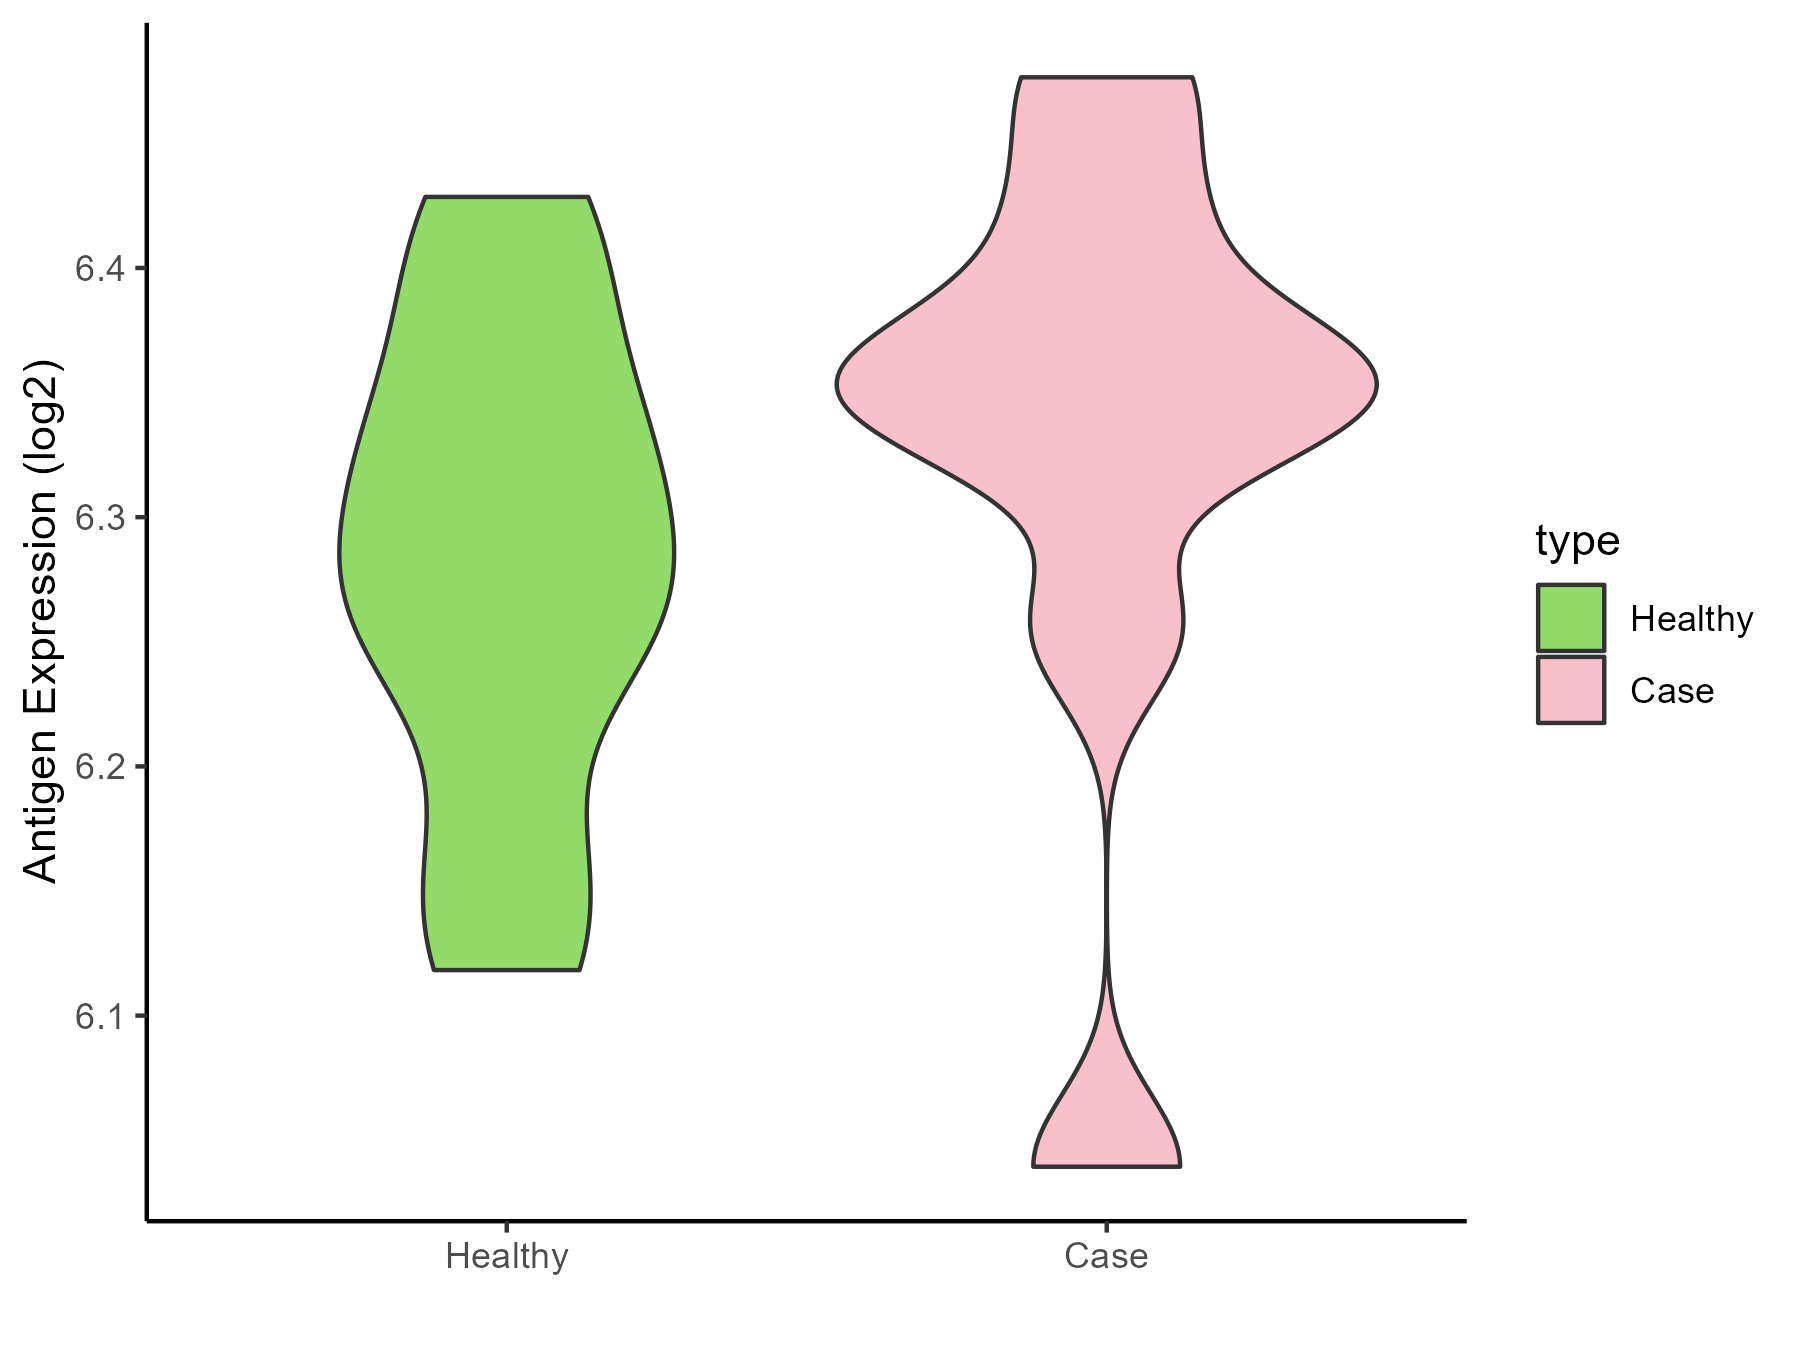
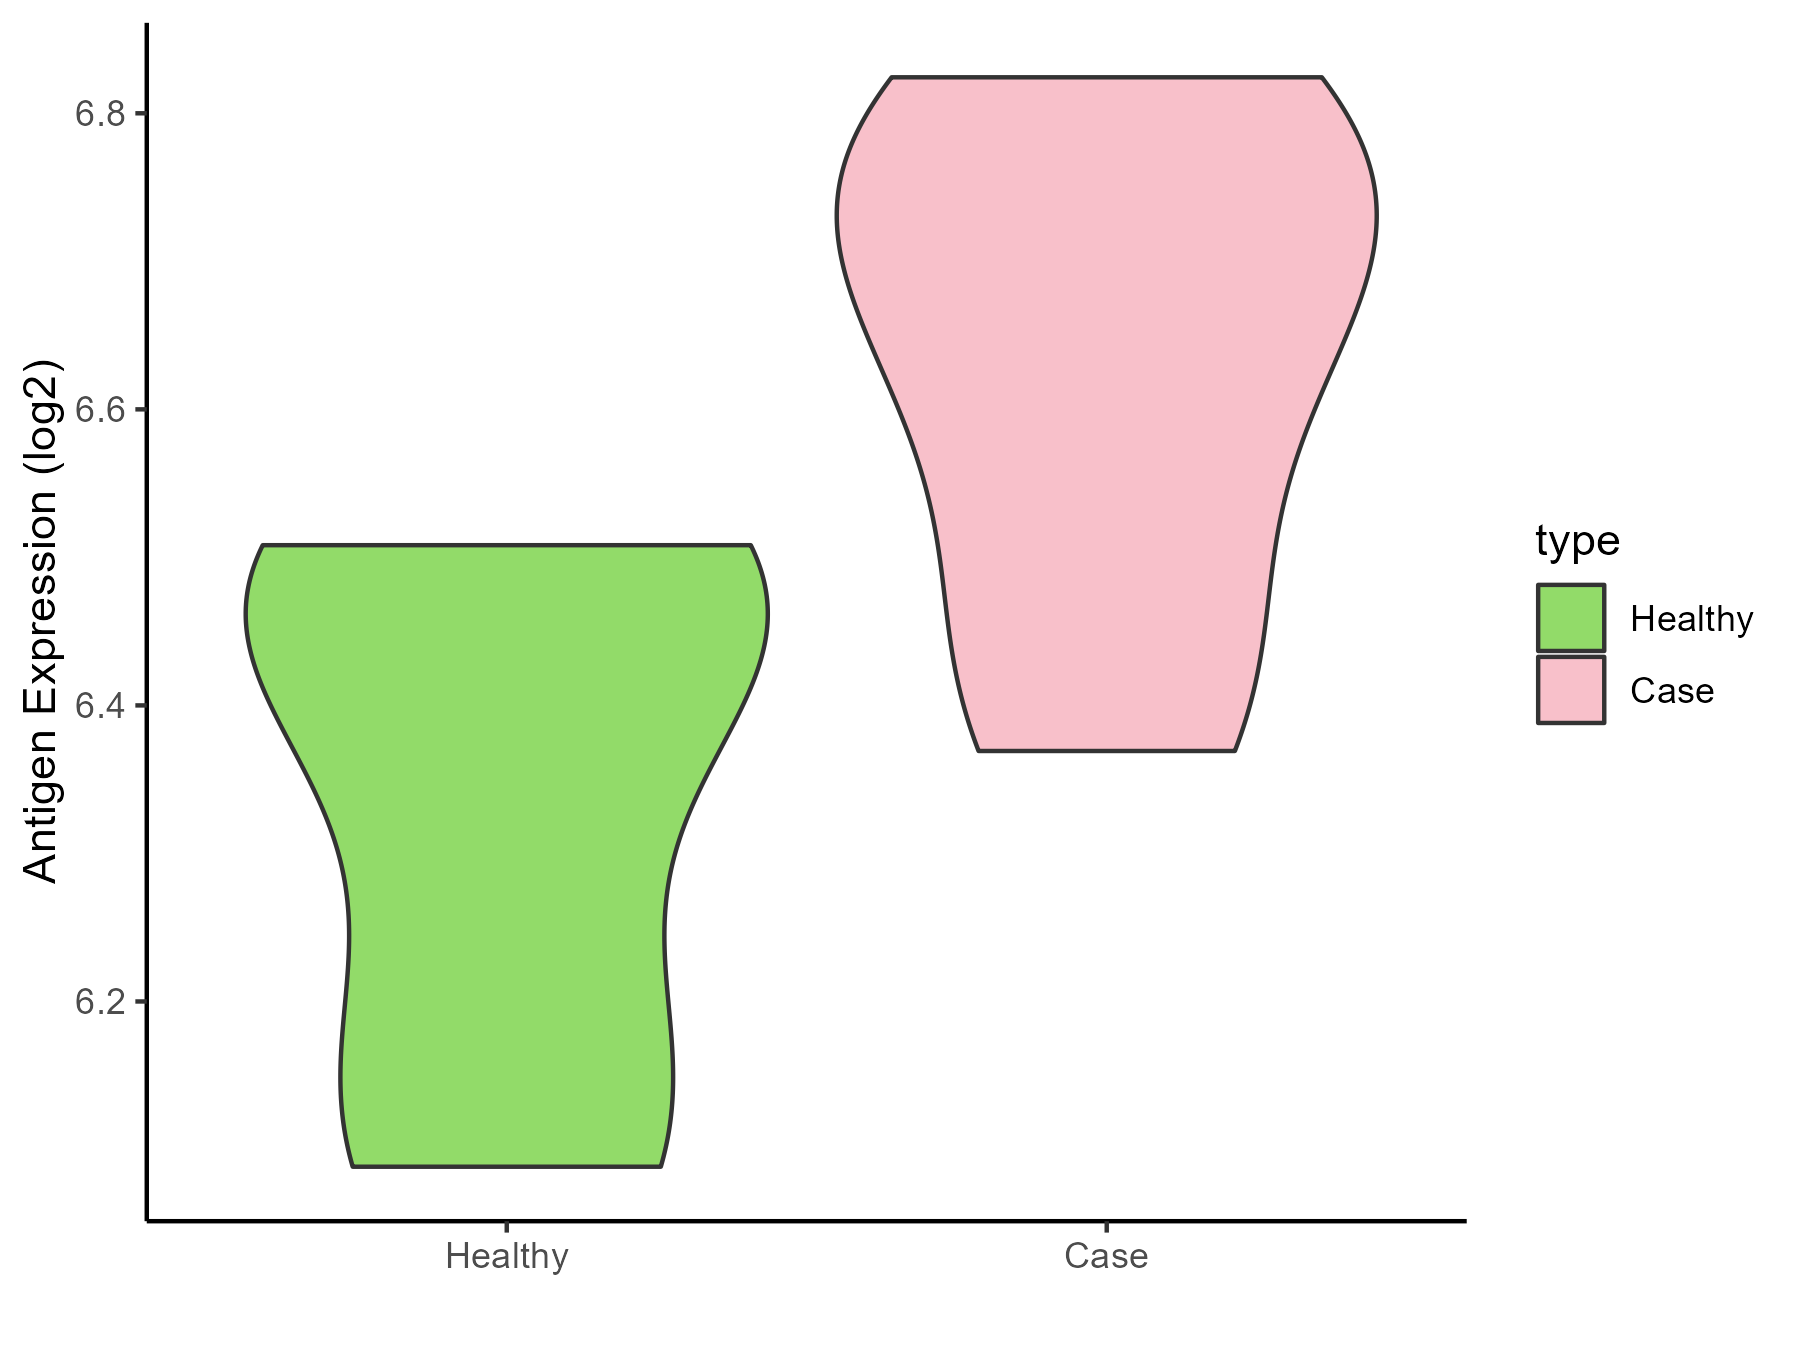
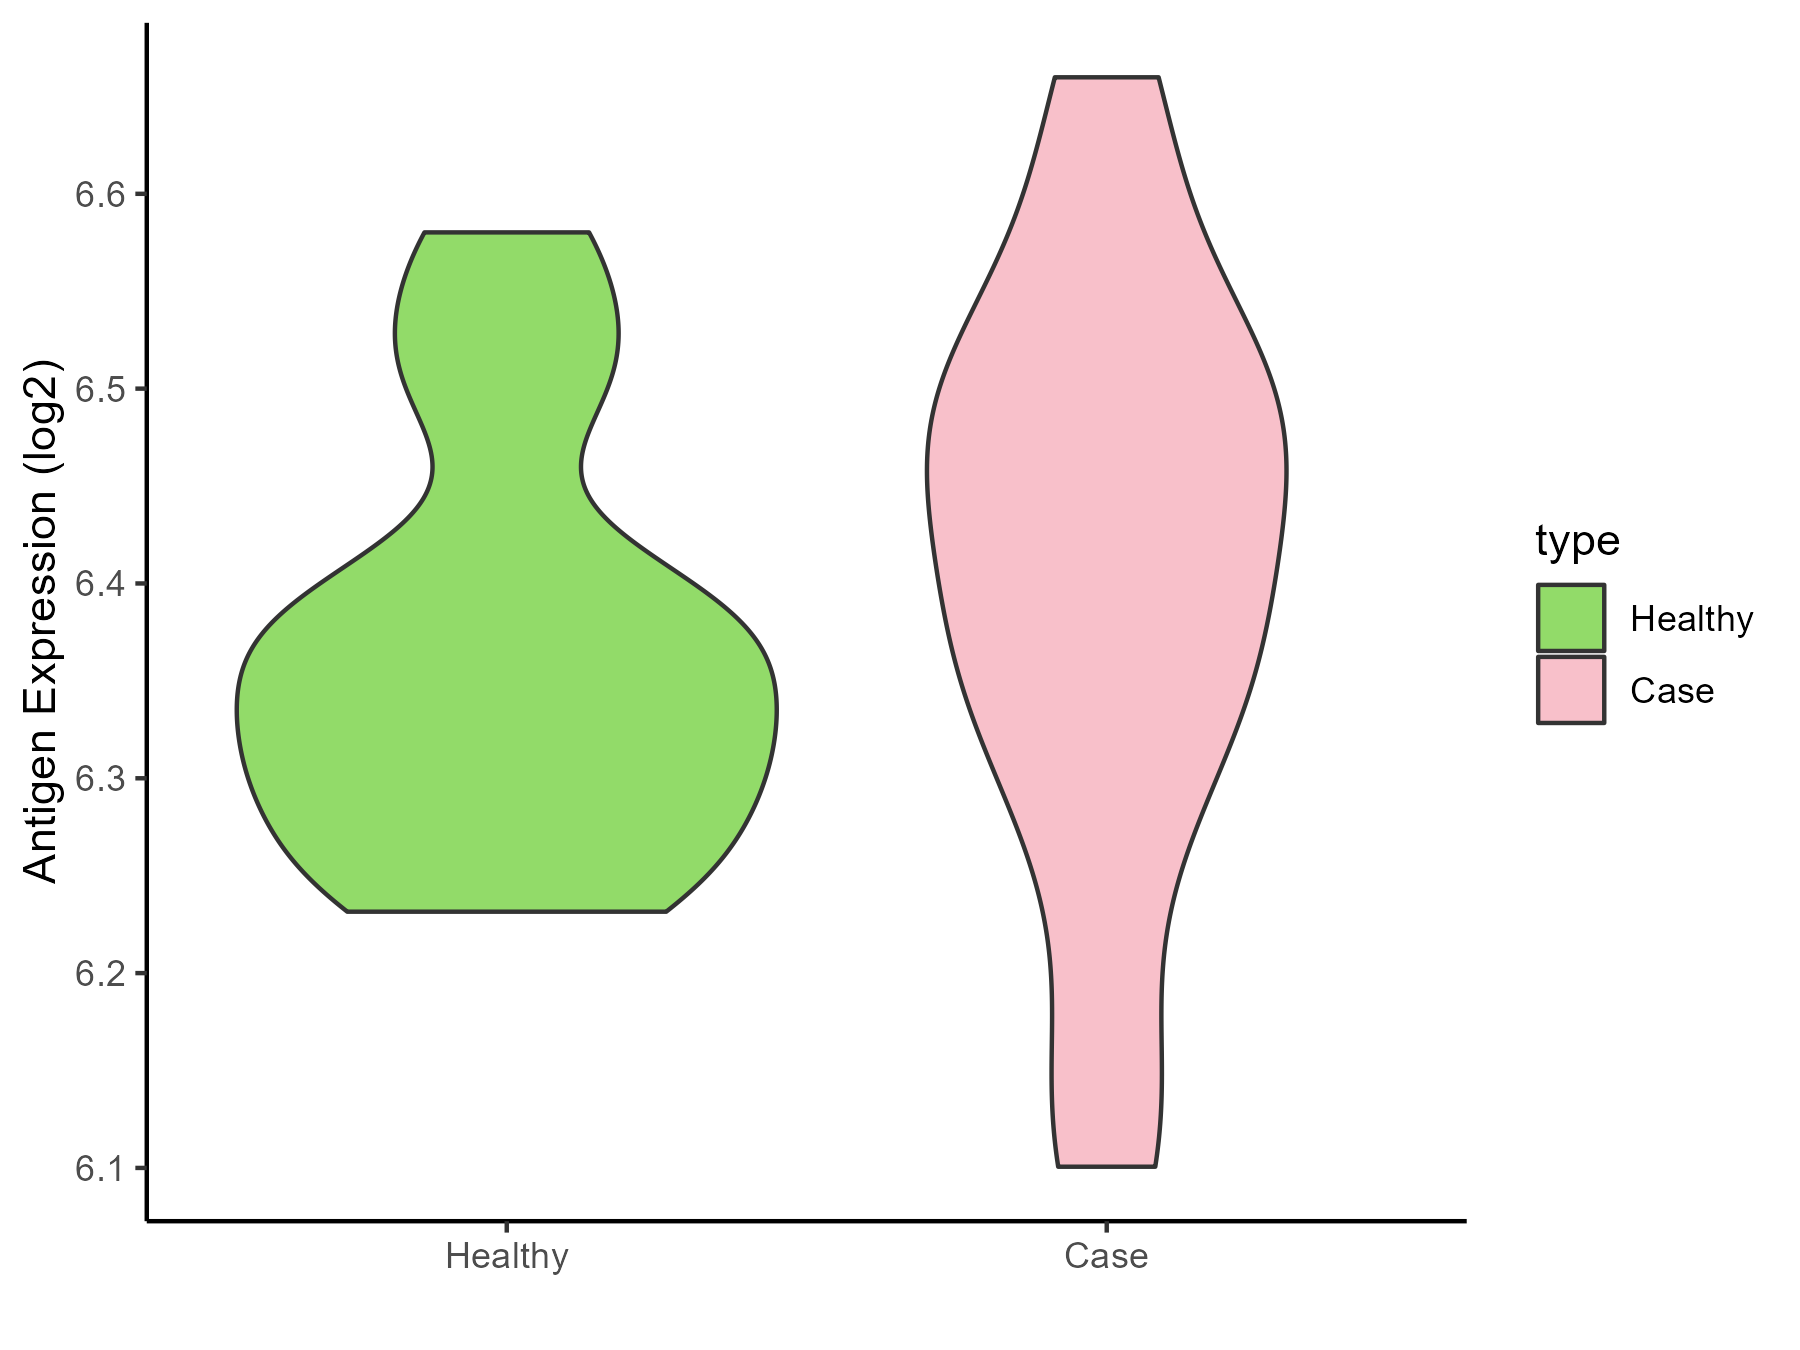
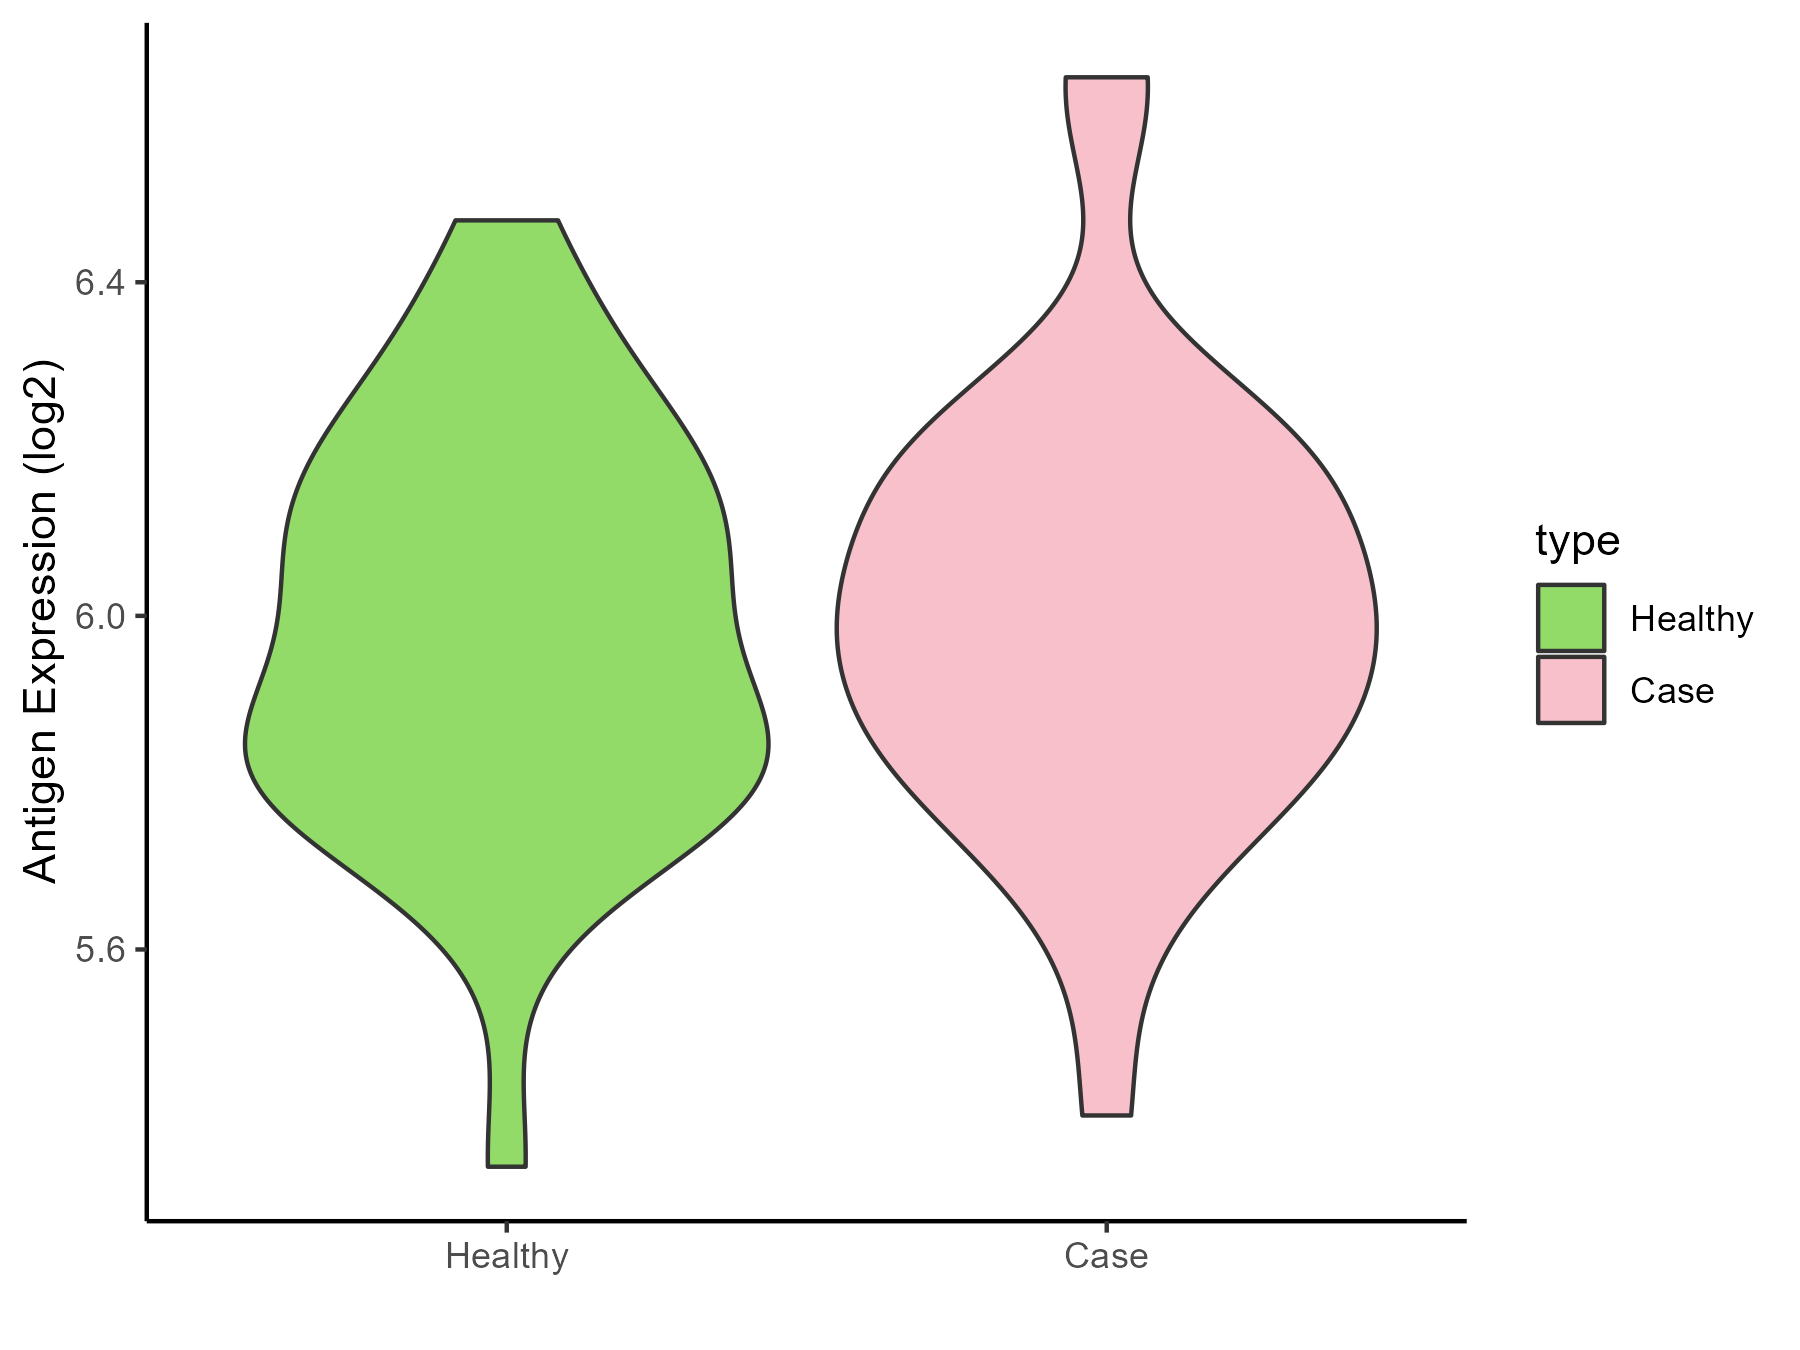
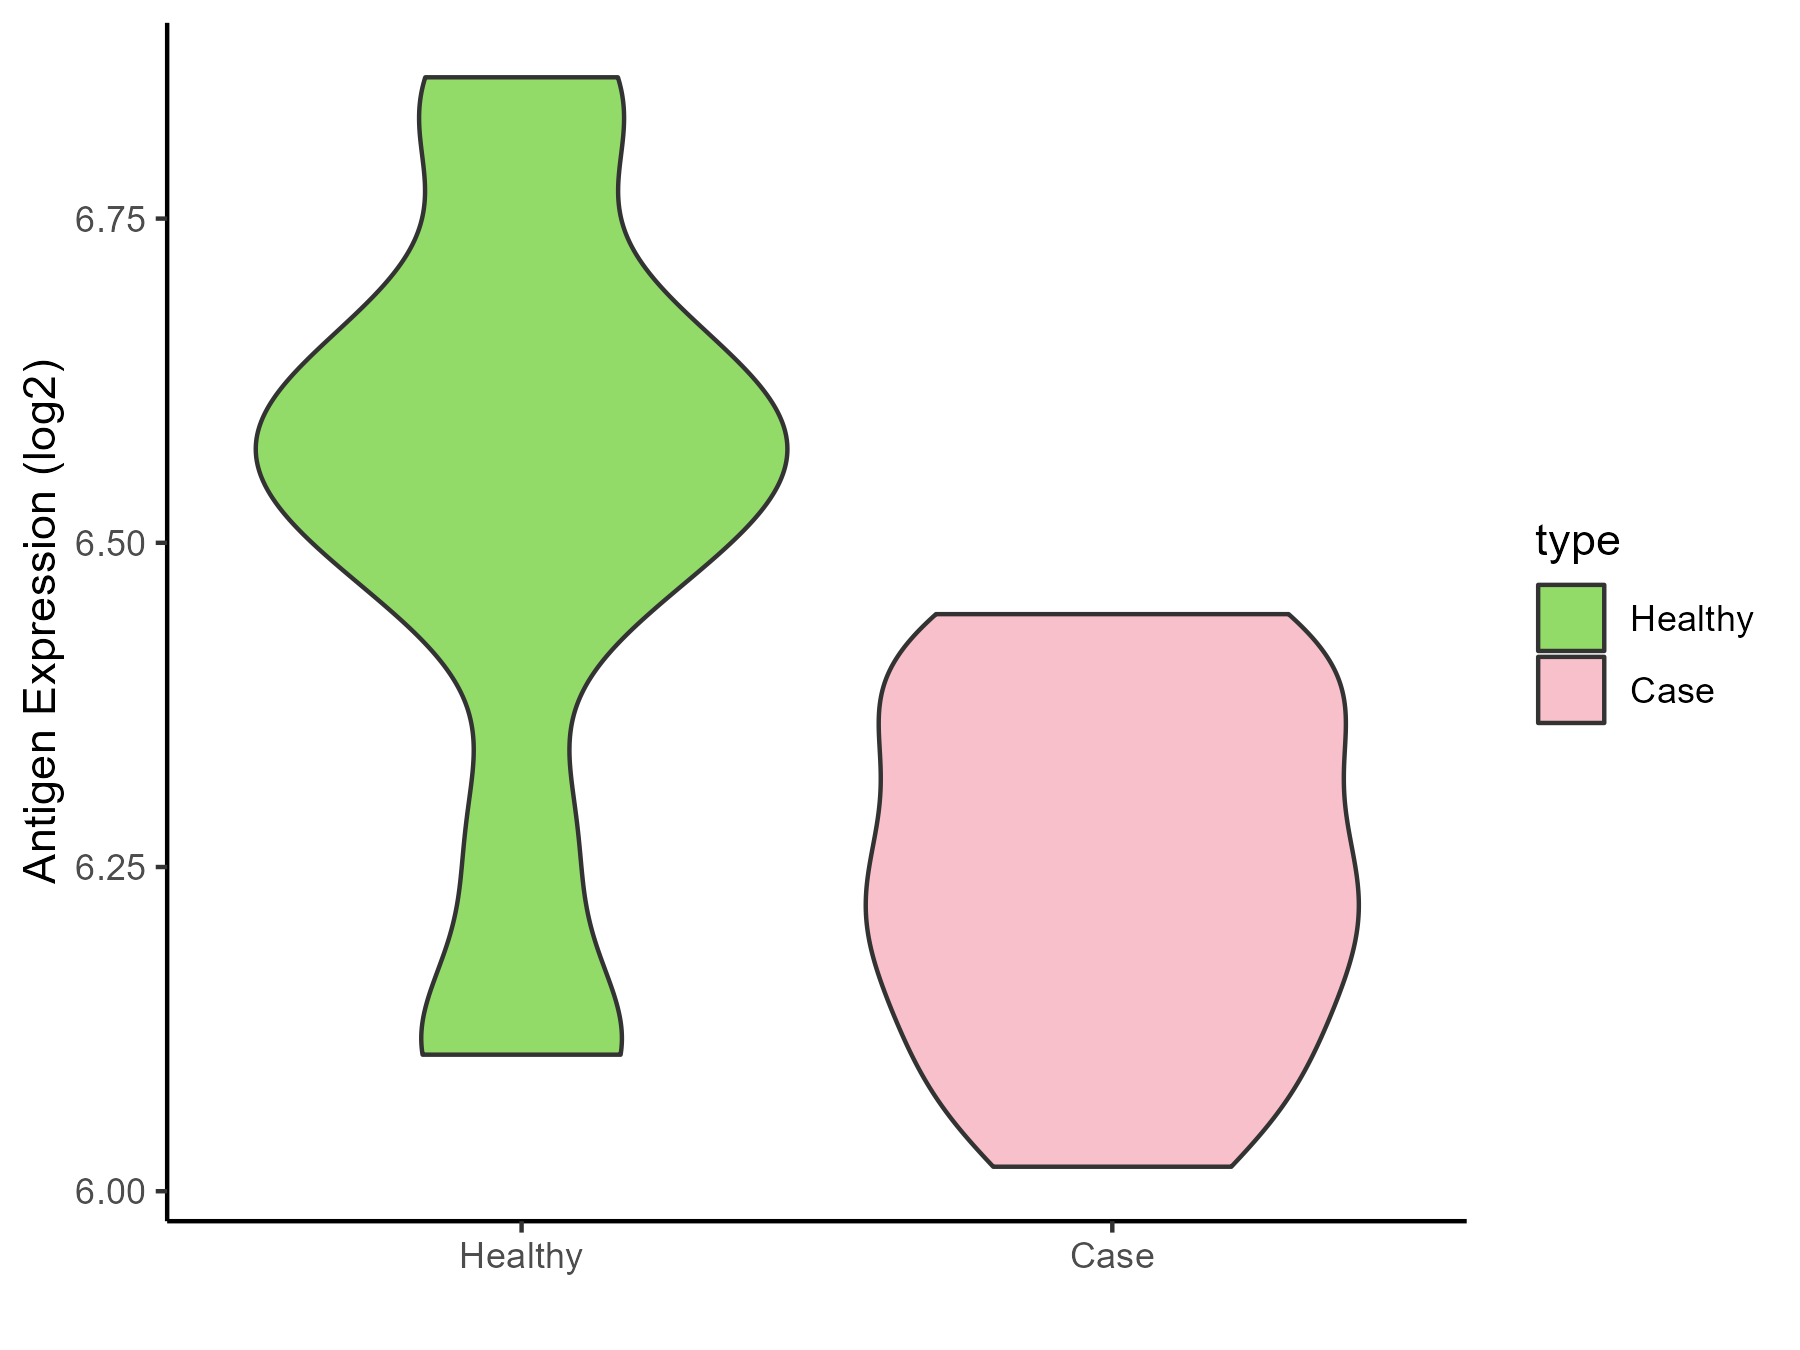
| The Specific Disease | Bacterial infection of gingival | |
| The Expression Level of Disease Section Compare with the Healthy Individual Tissue | p-value: 0.001968762; Fold-change: 0.079838485; Z-score: 0.36685638 | |
| Disease-specific Antigen Abundances |
|
Click to View the Clearer Original Diagram |
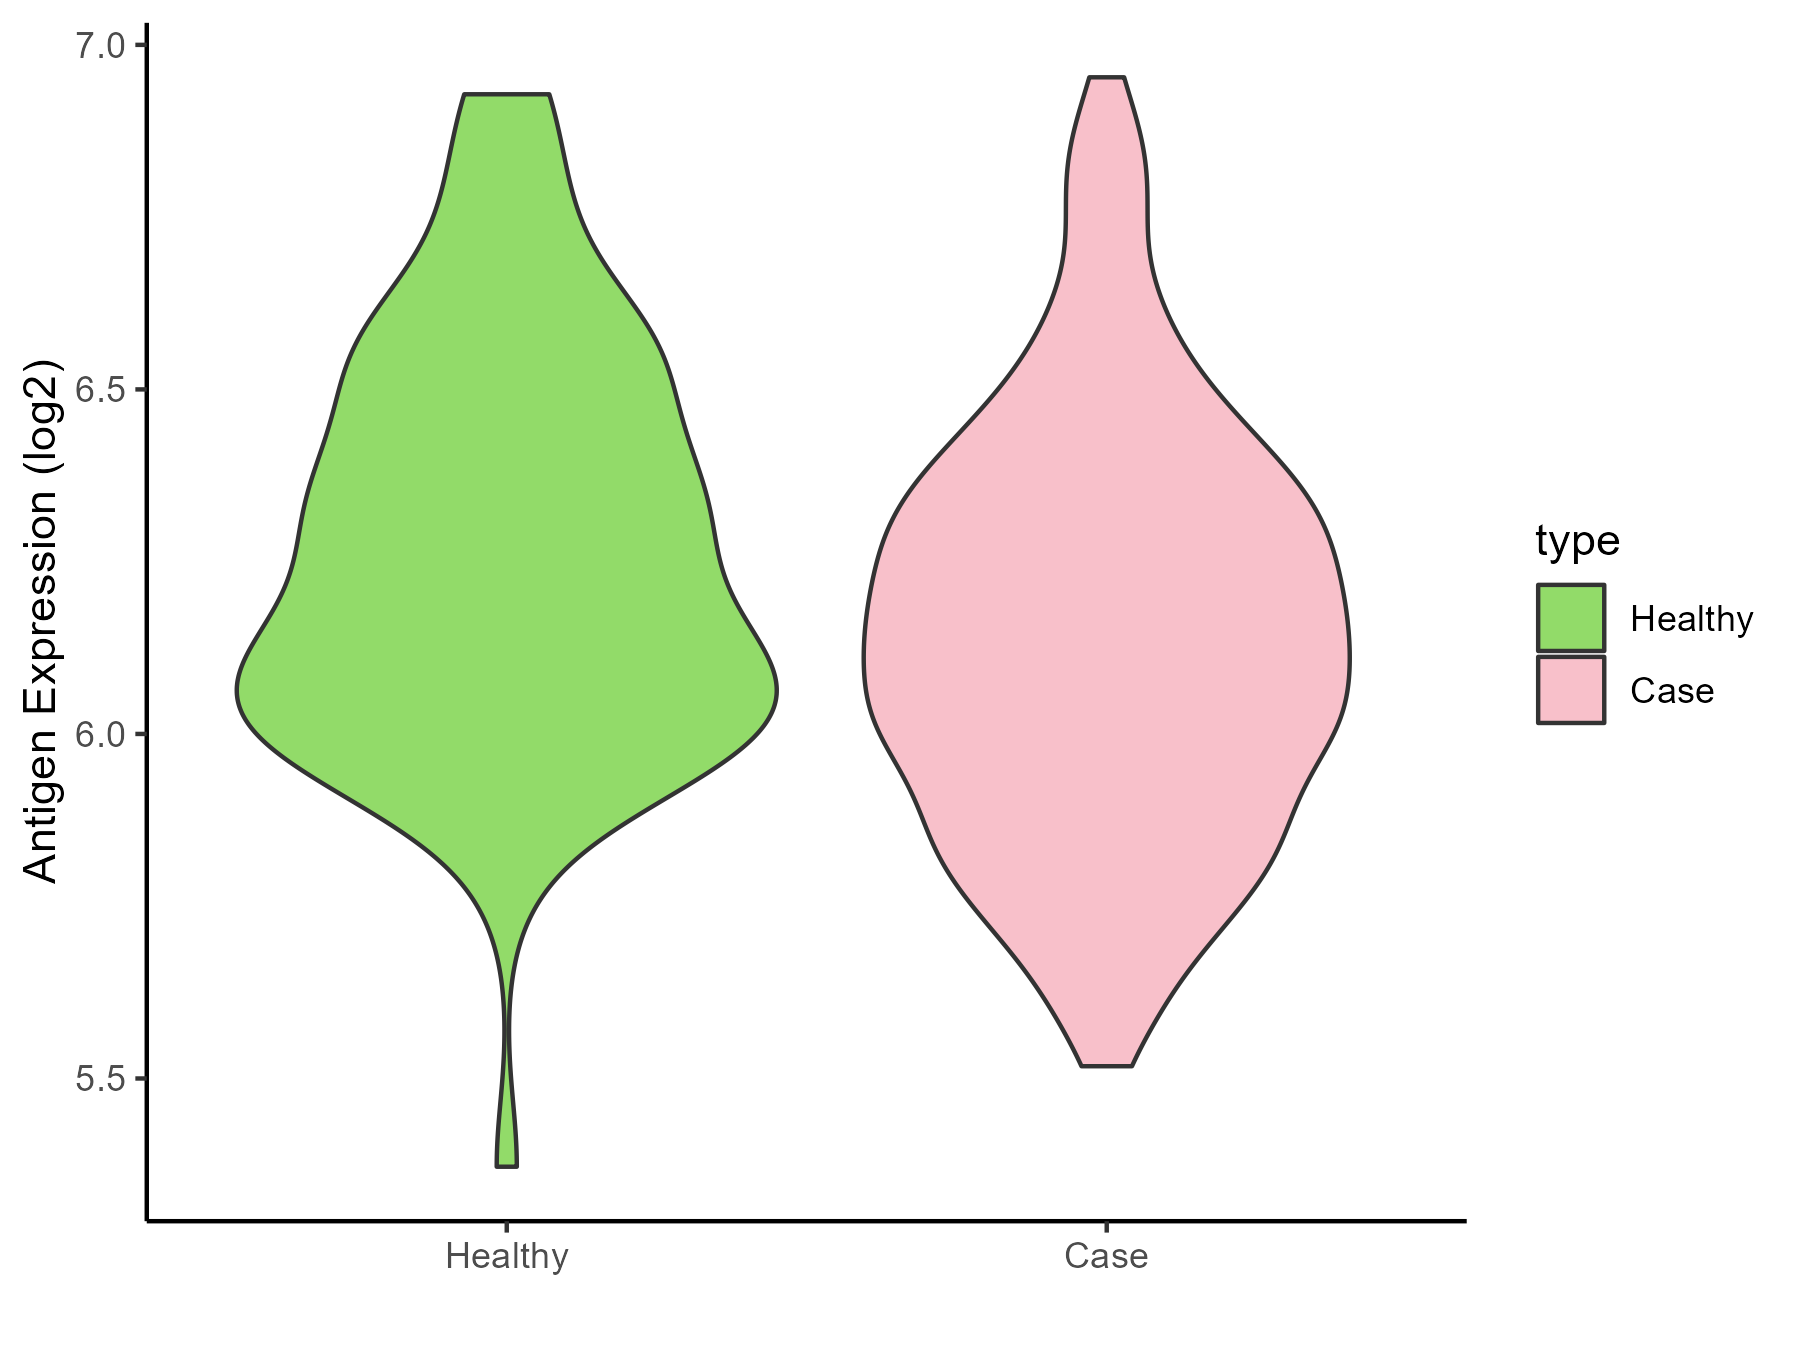
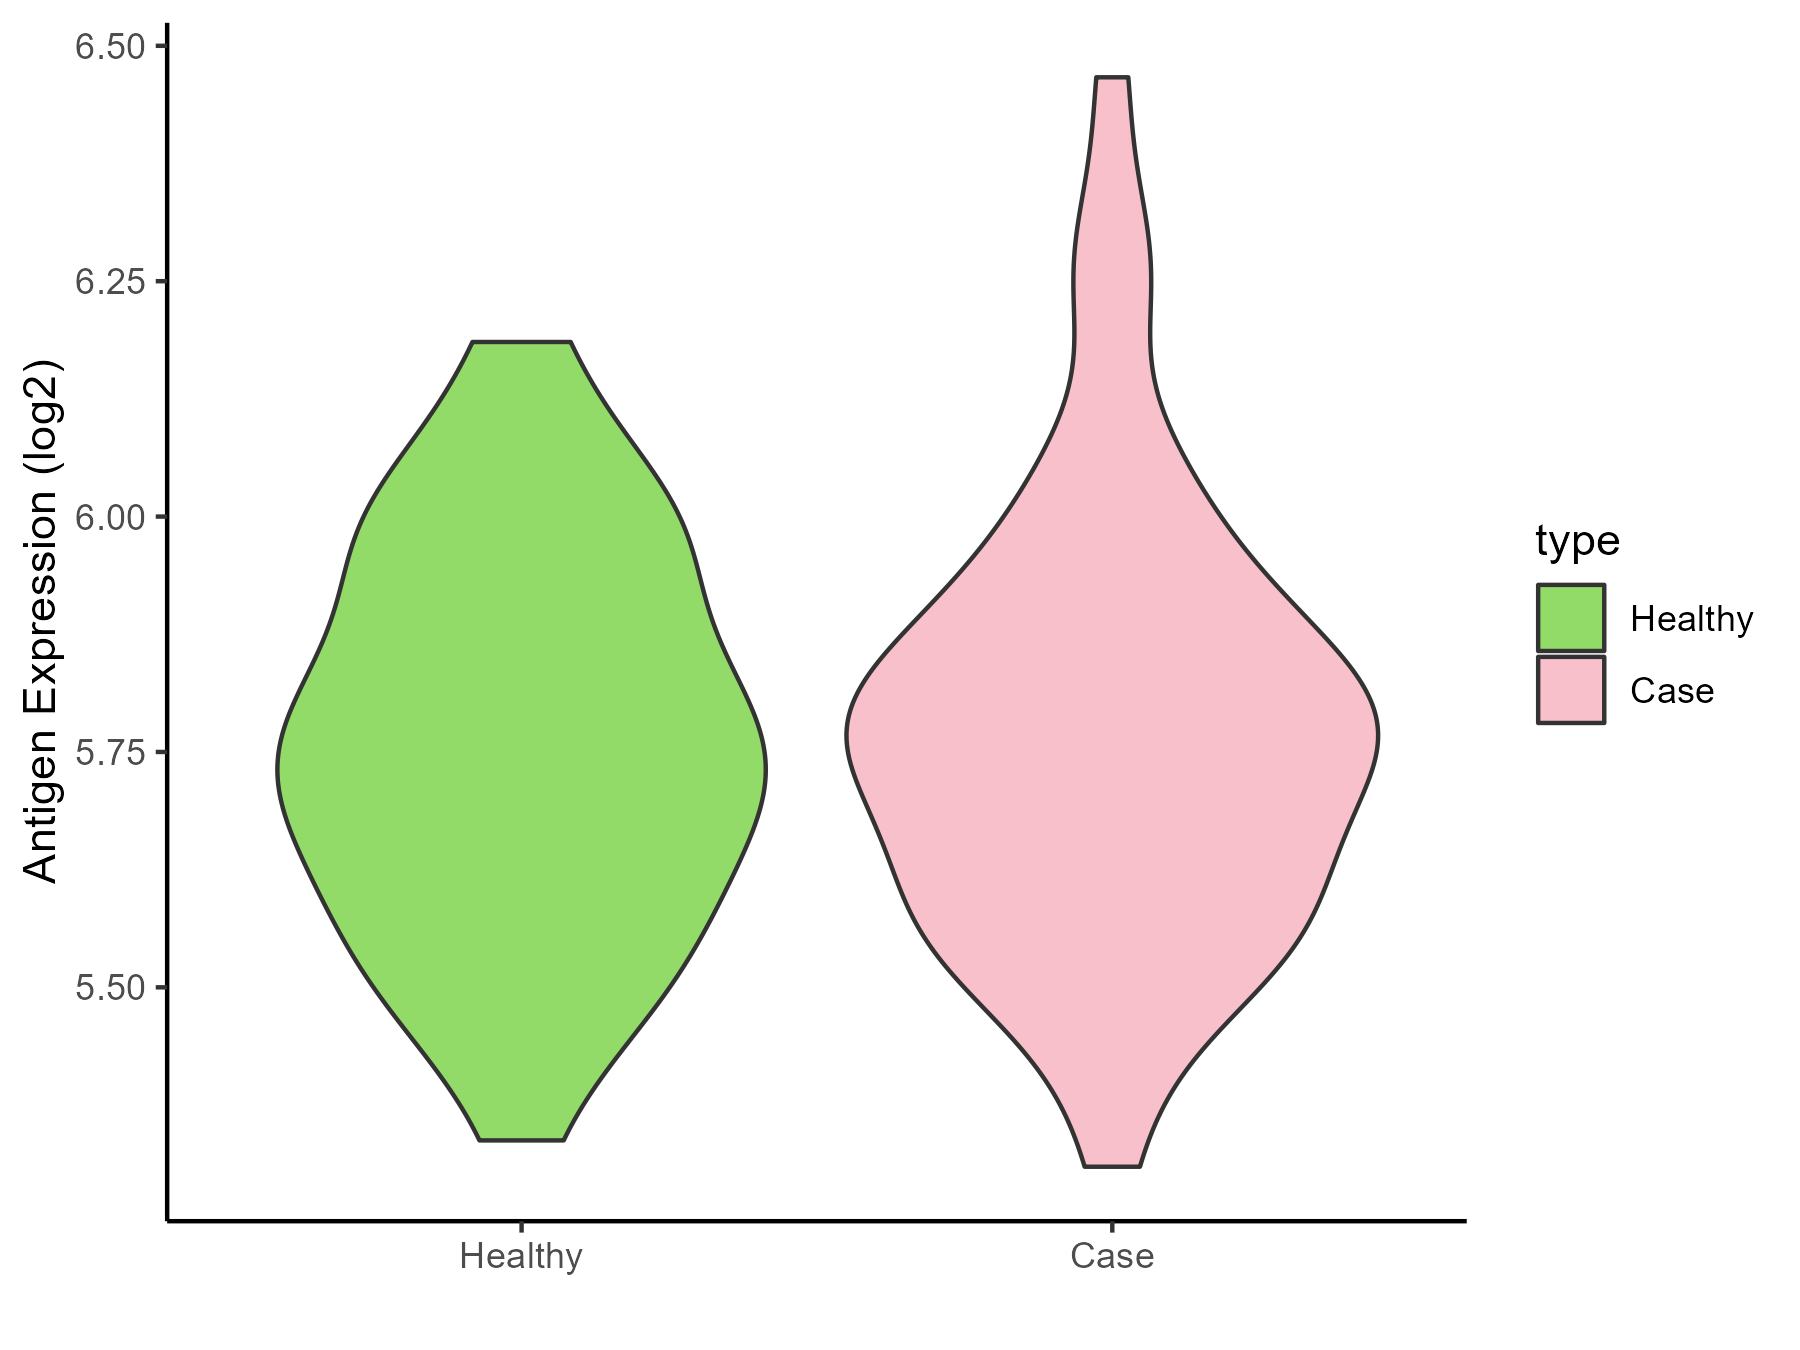
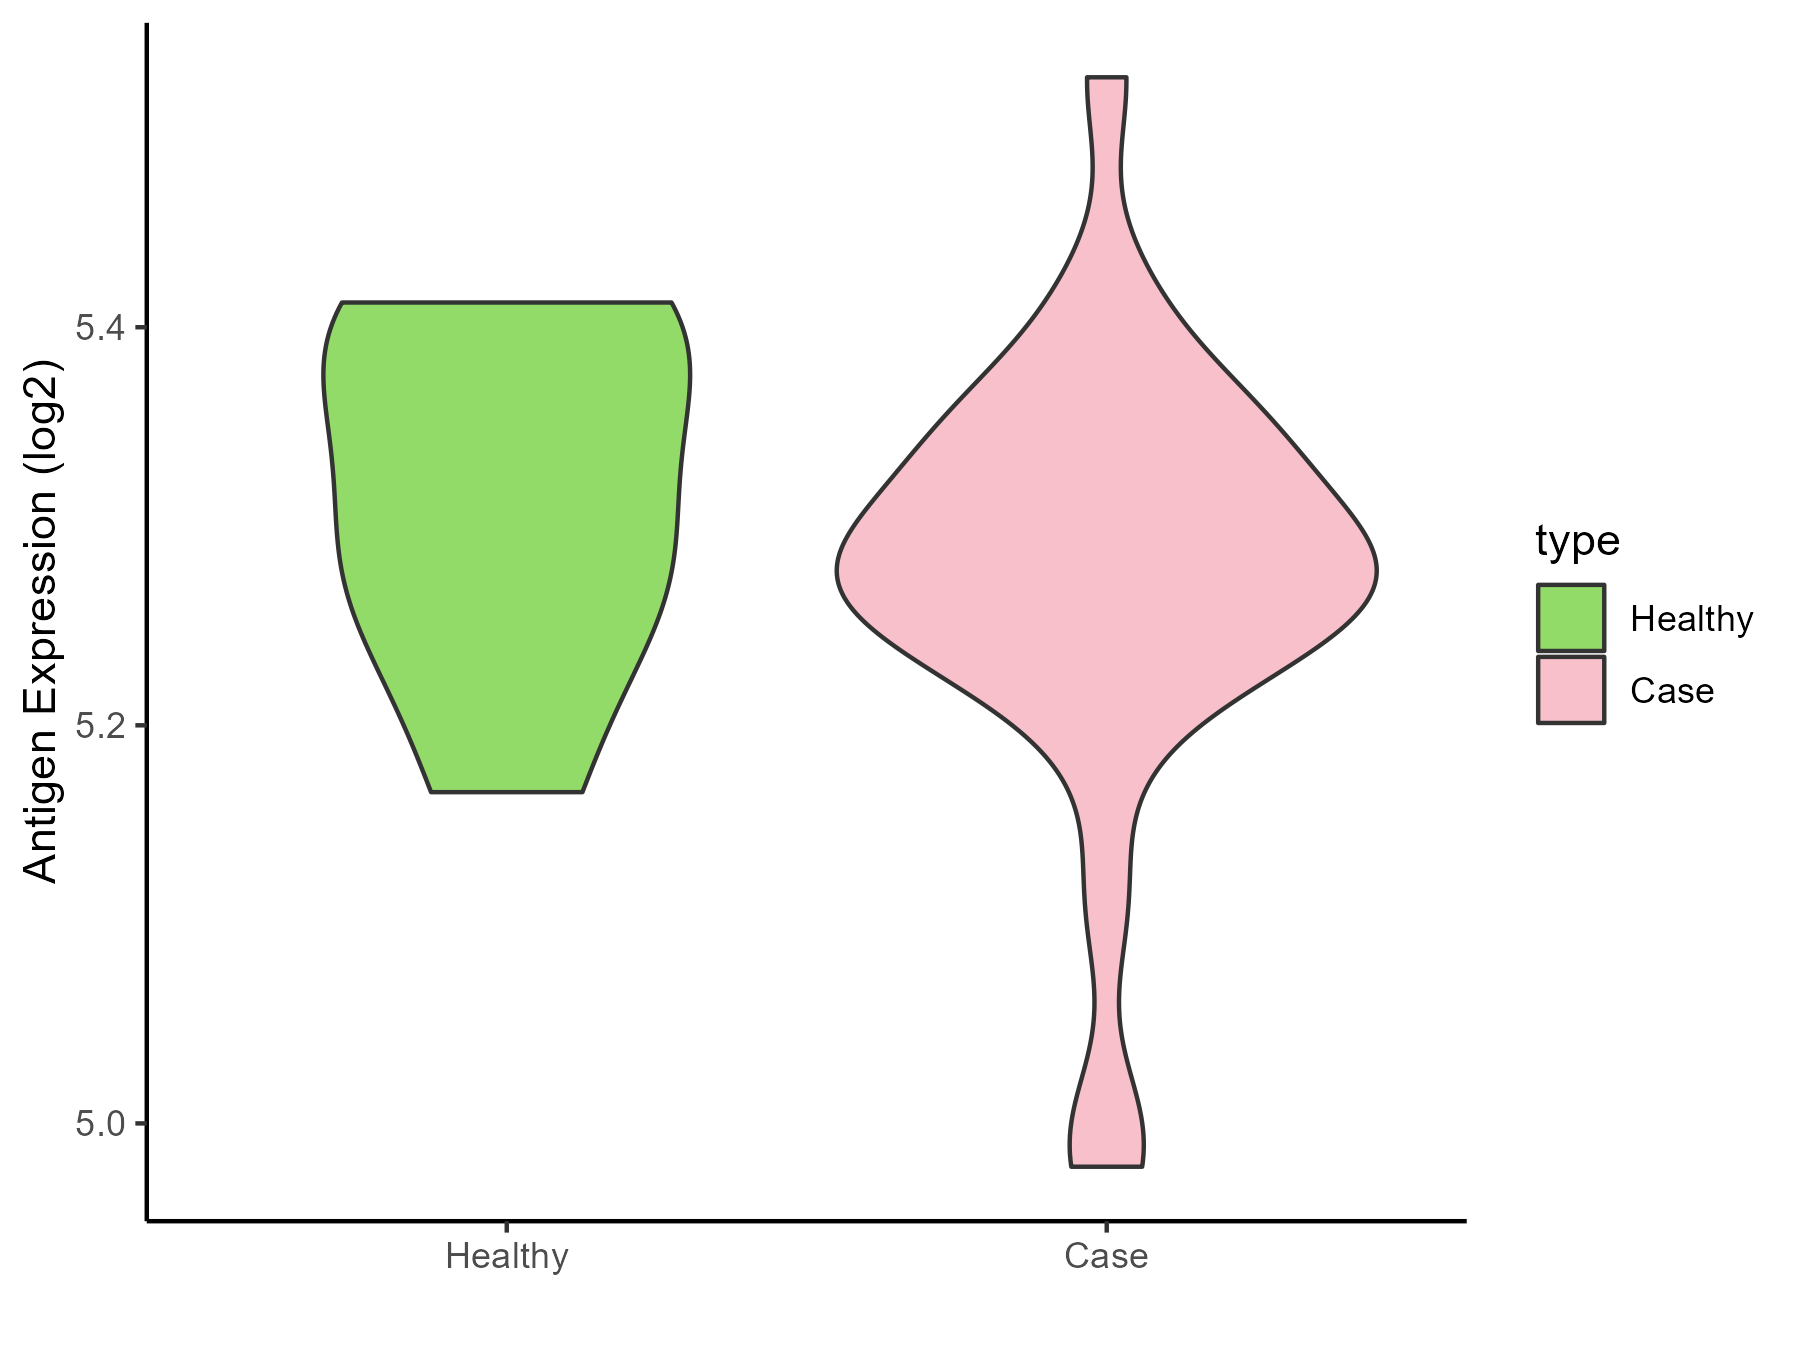
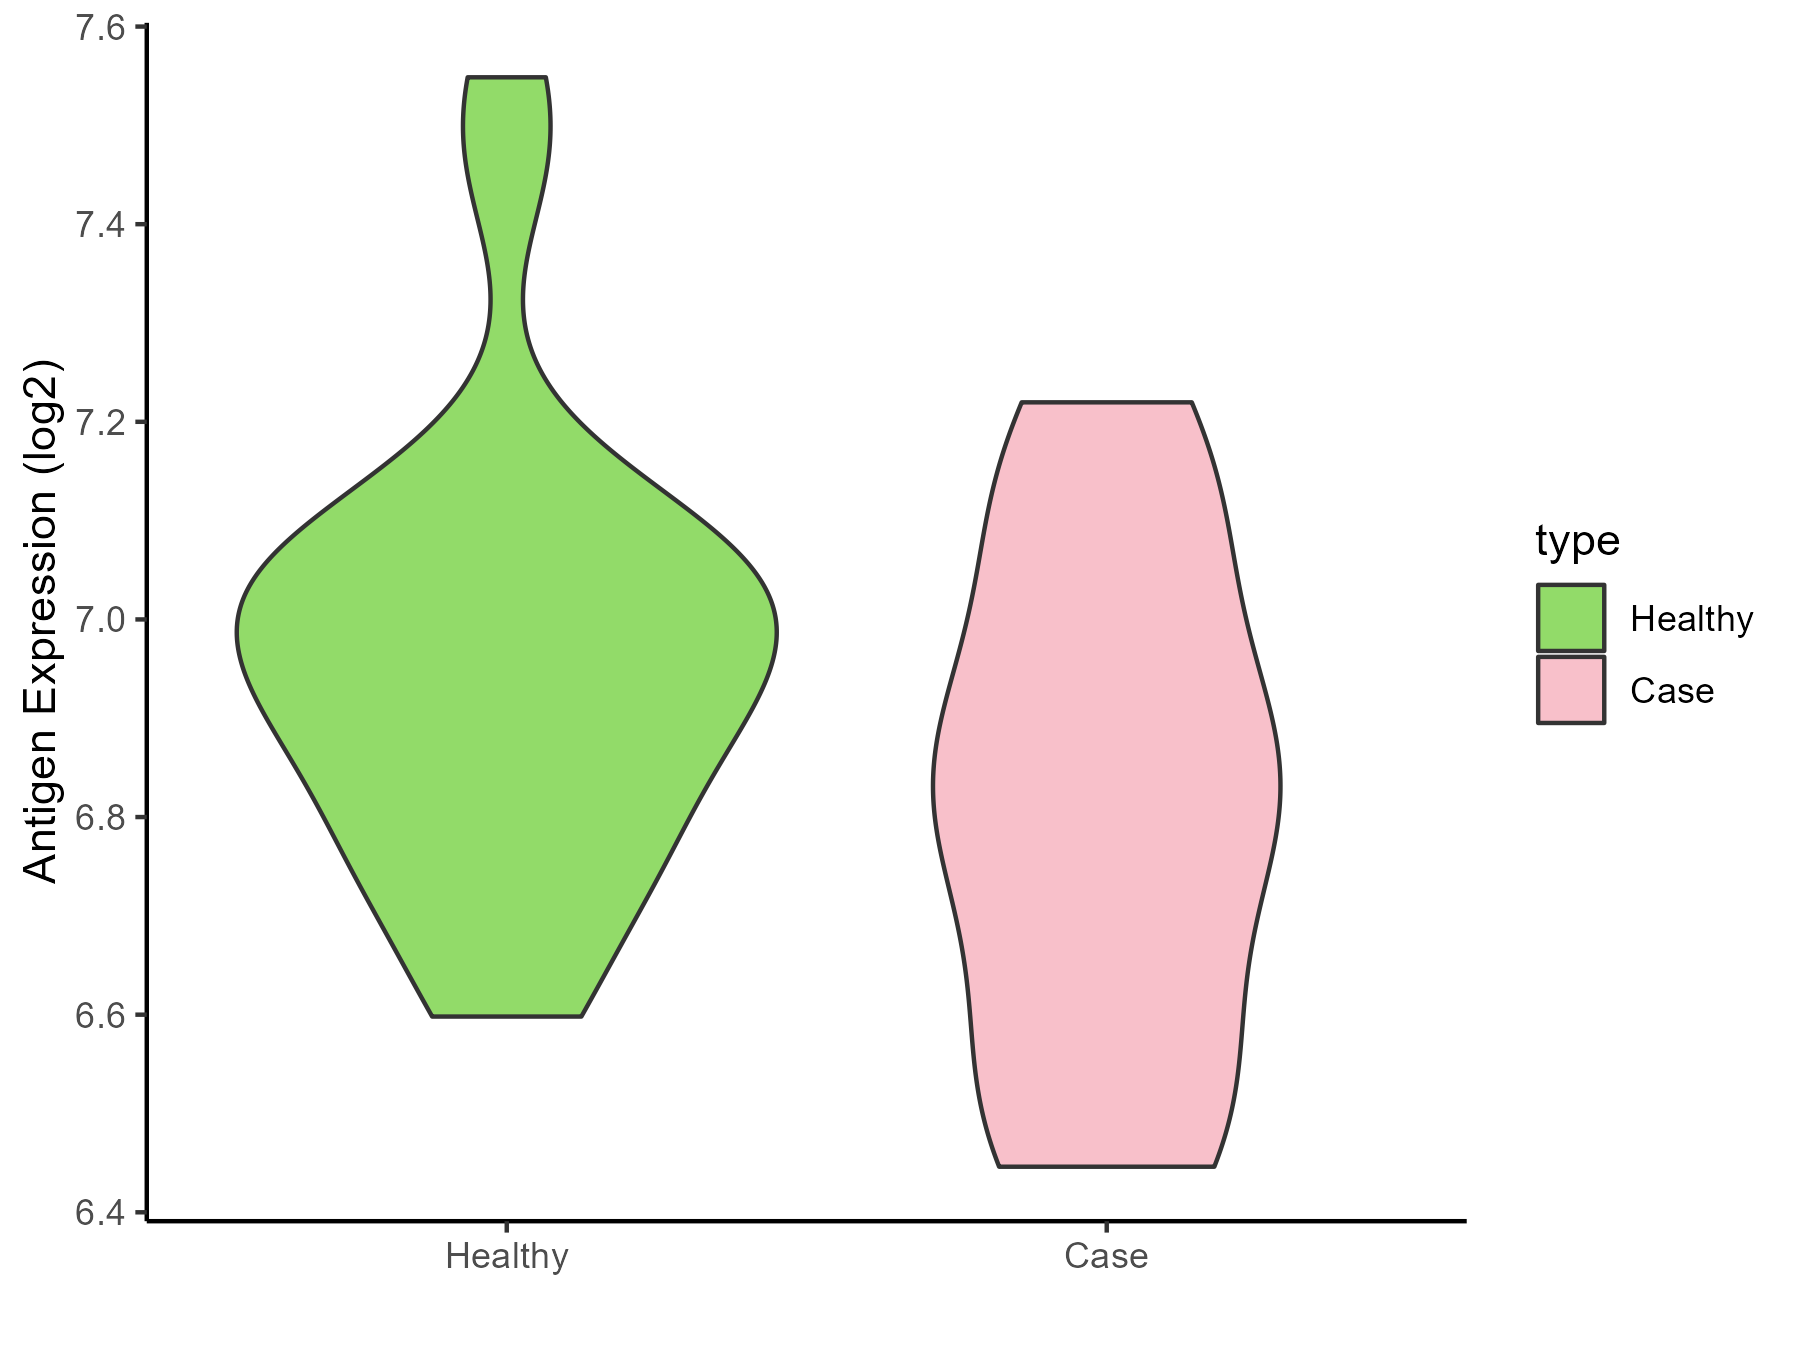
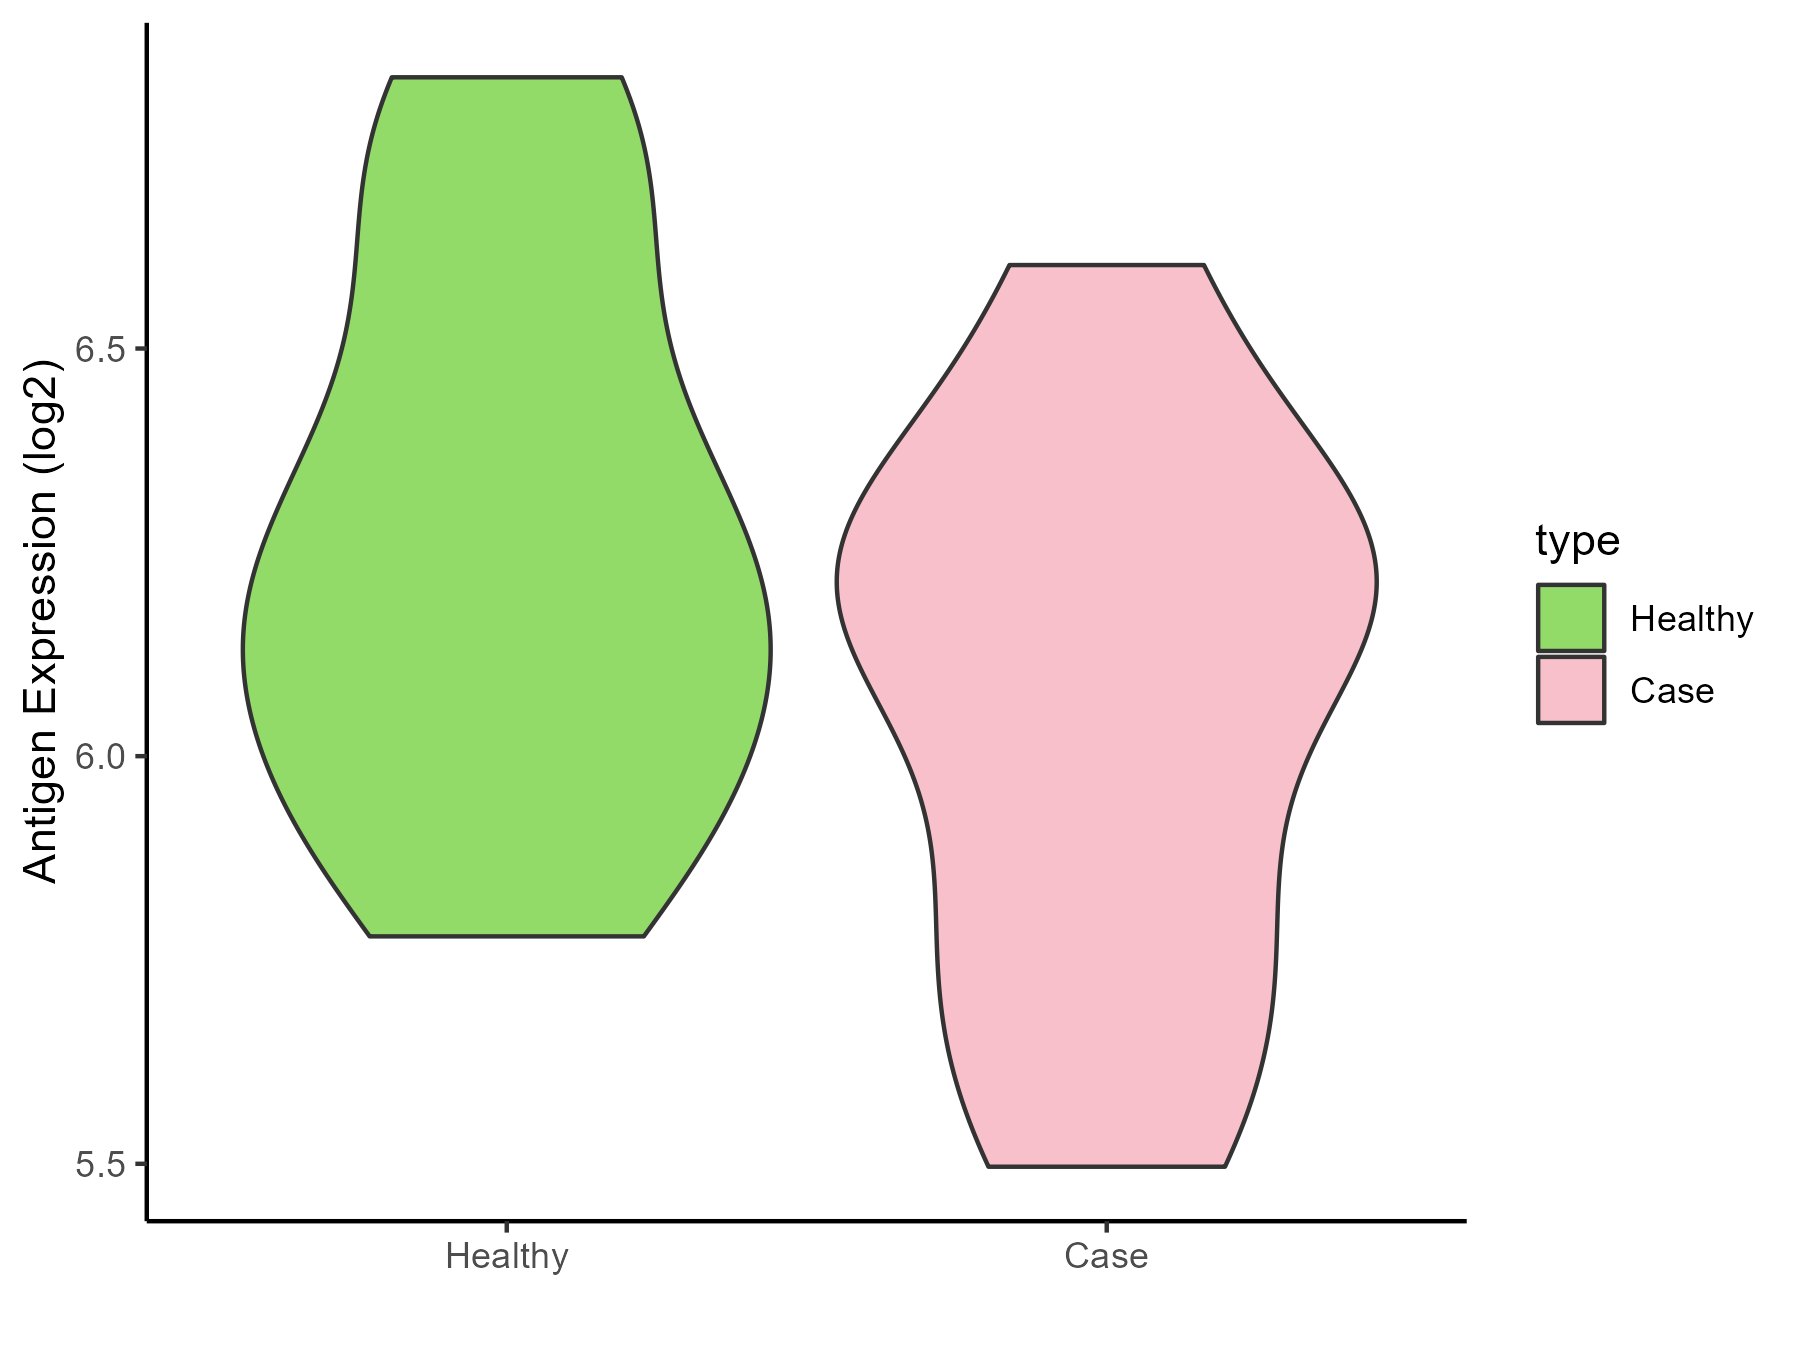
ICD Disease Classification 02
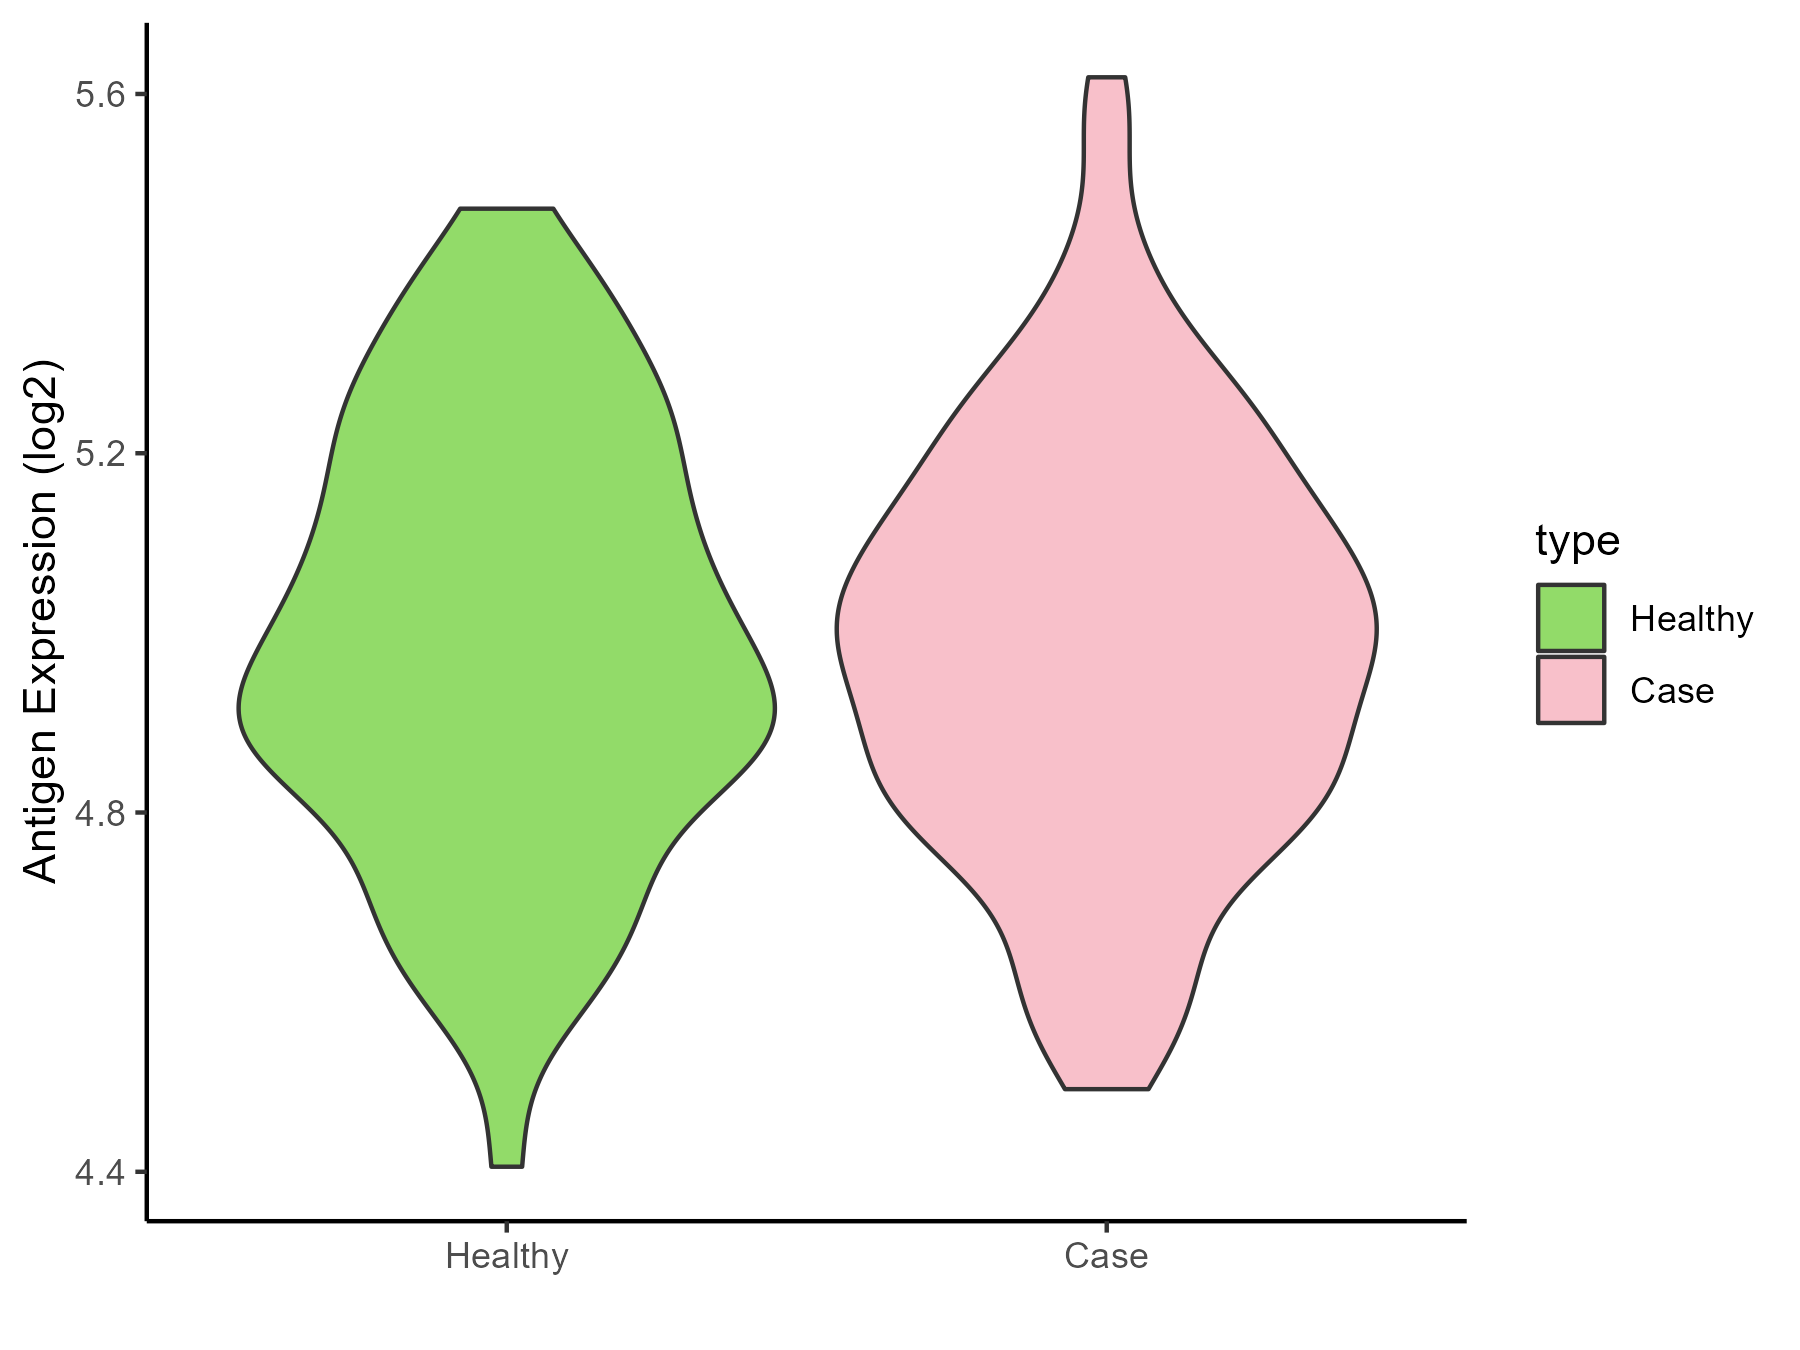
| Differential expression pattern of antigen in diseases | ||
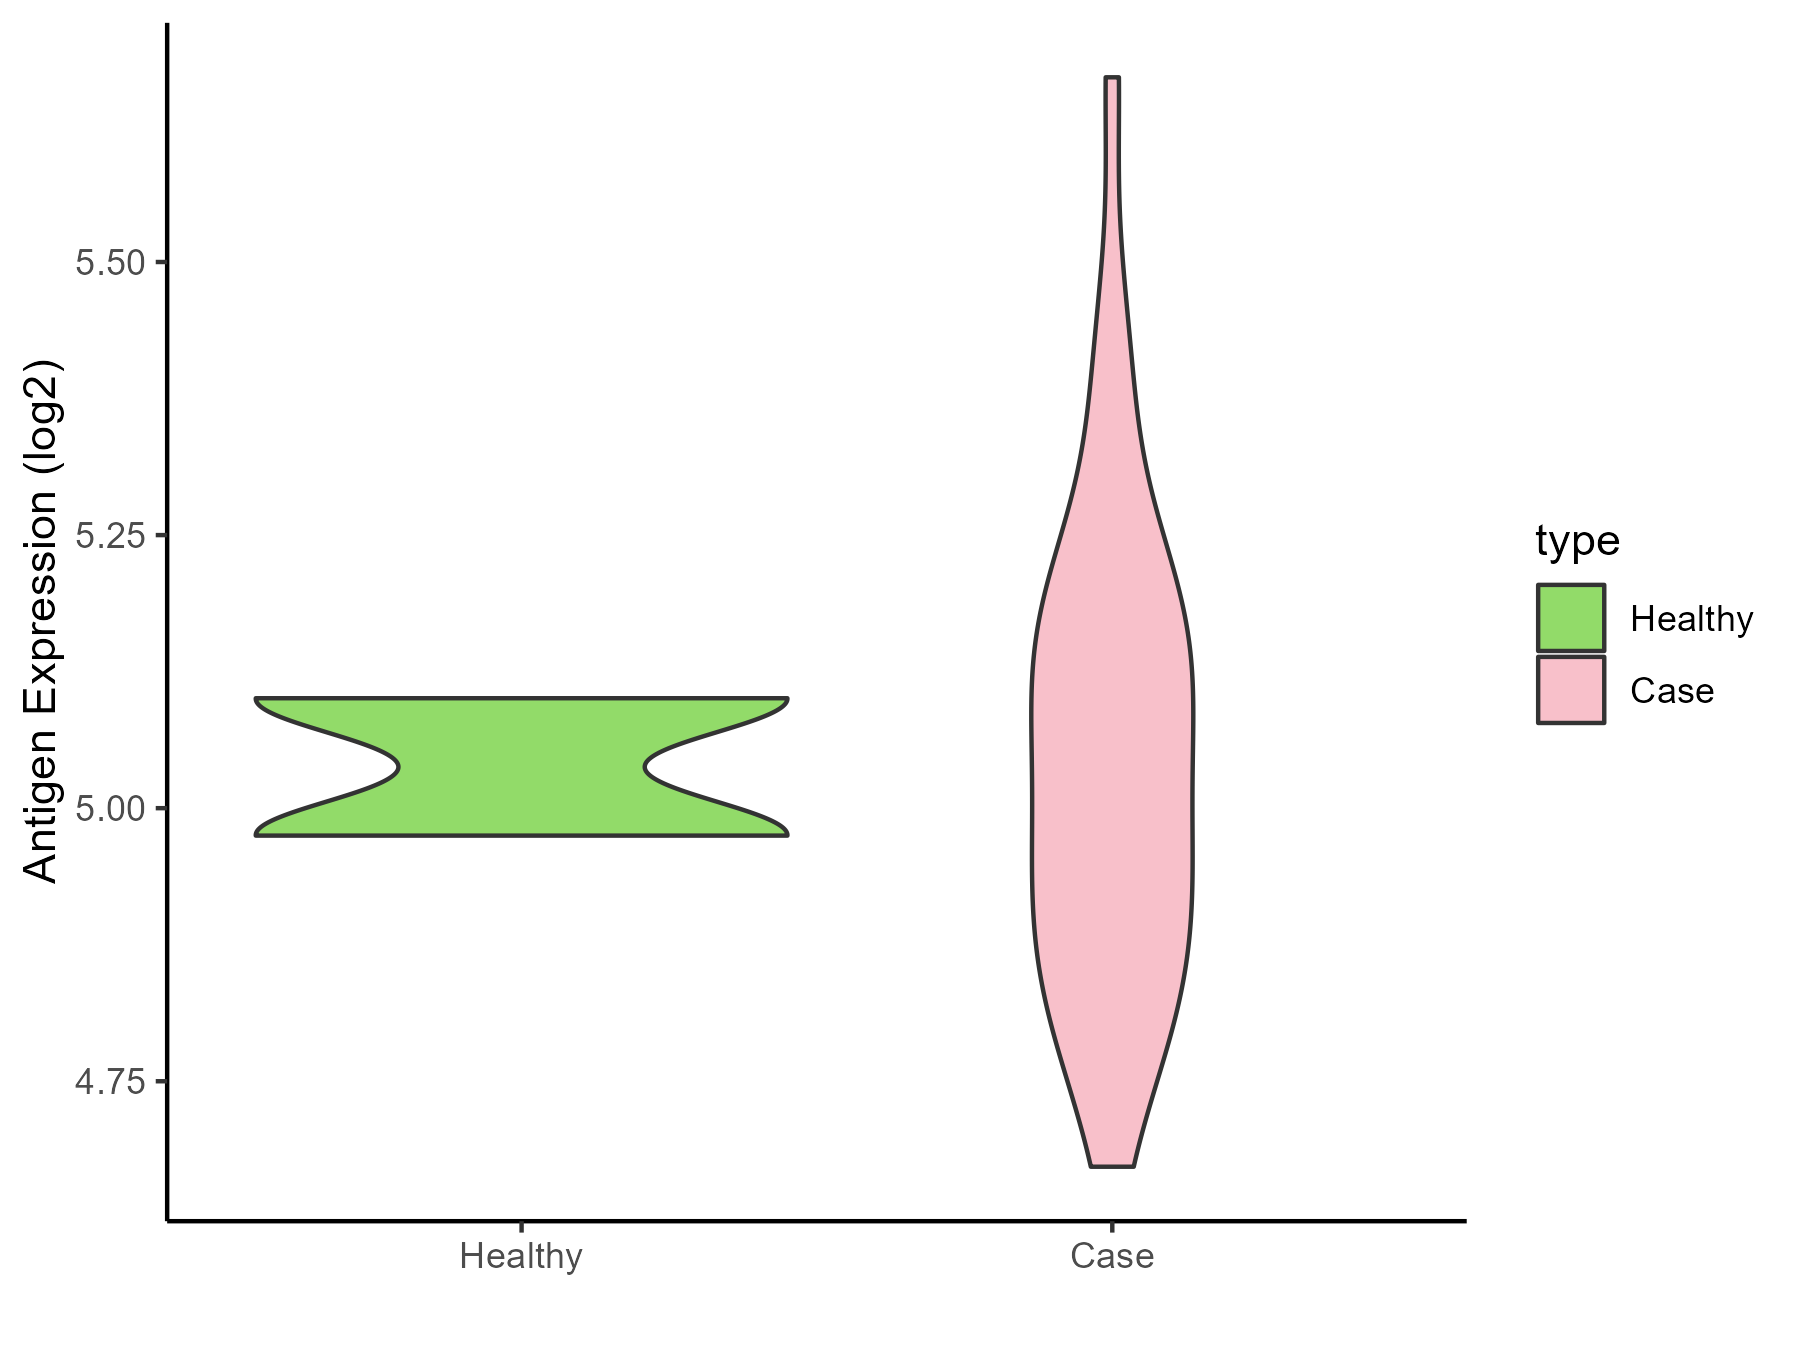
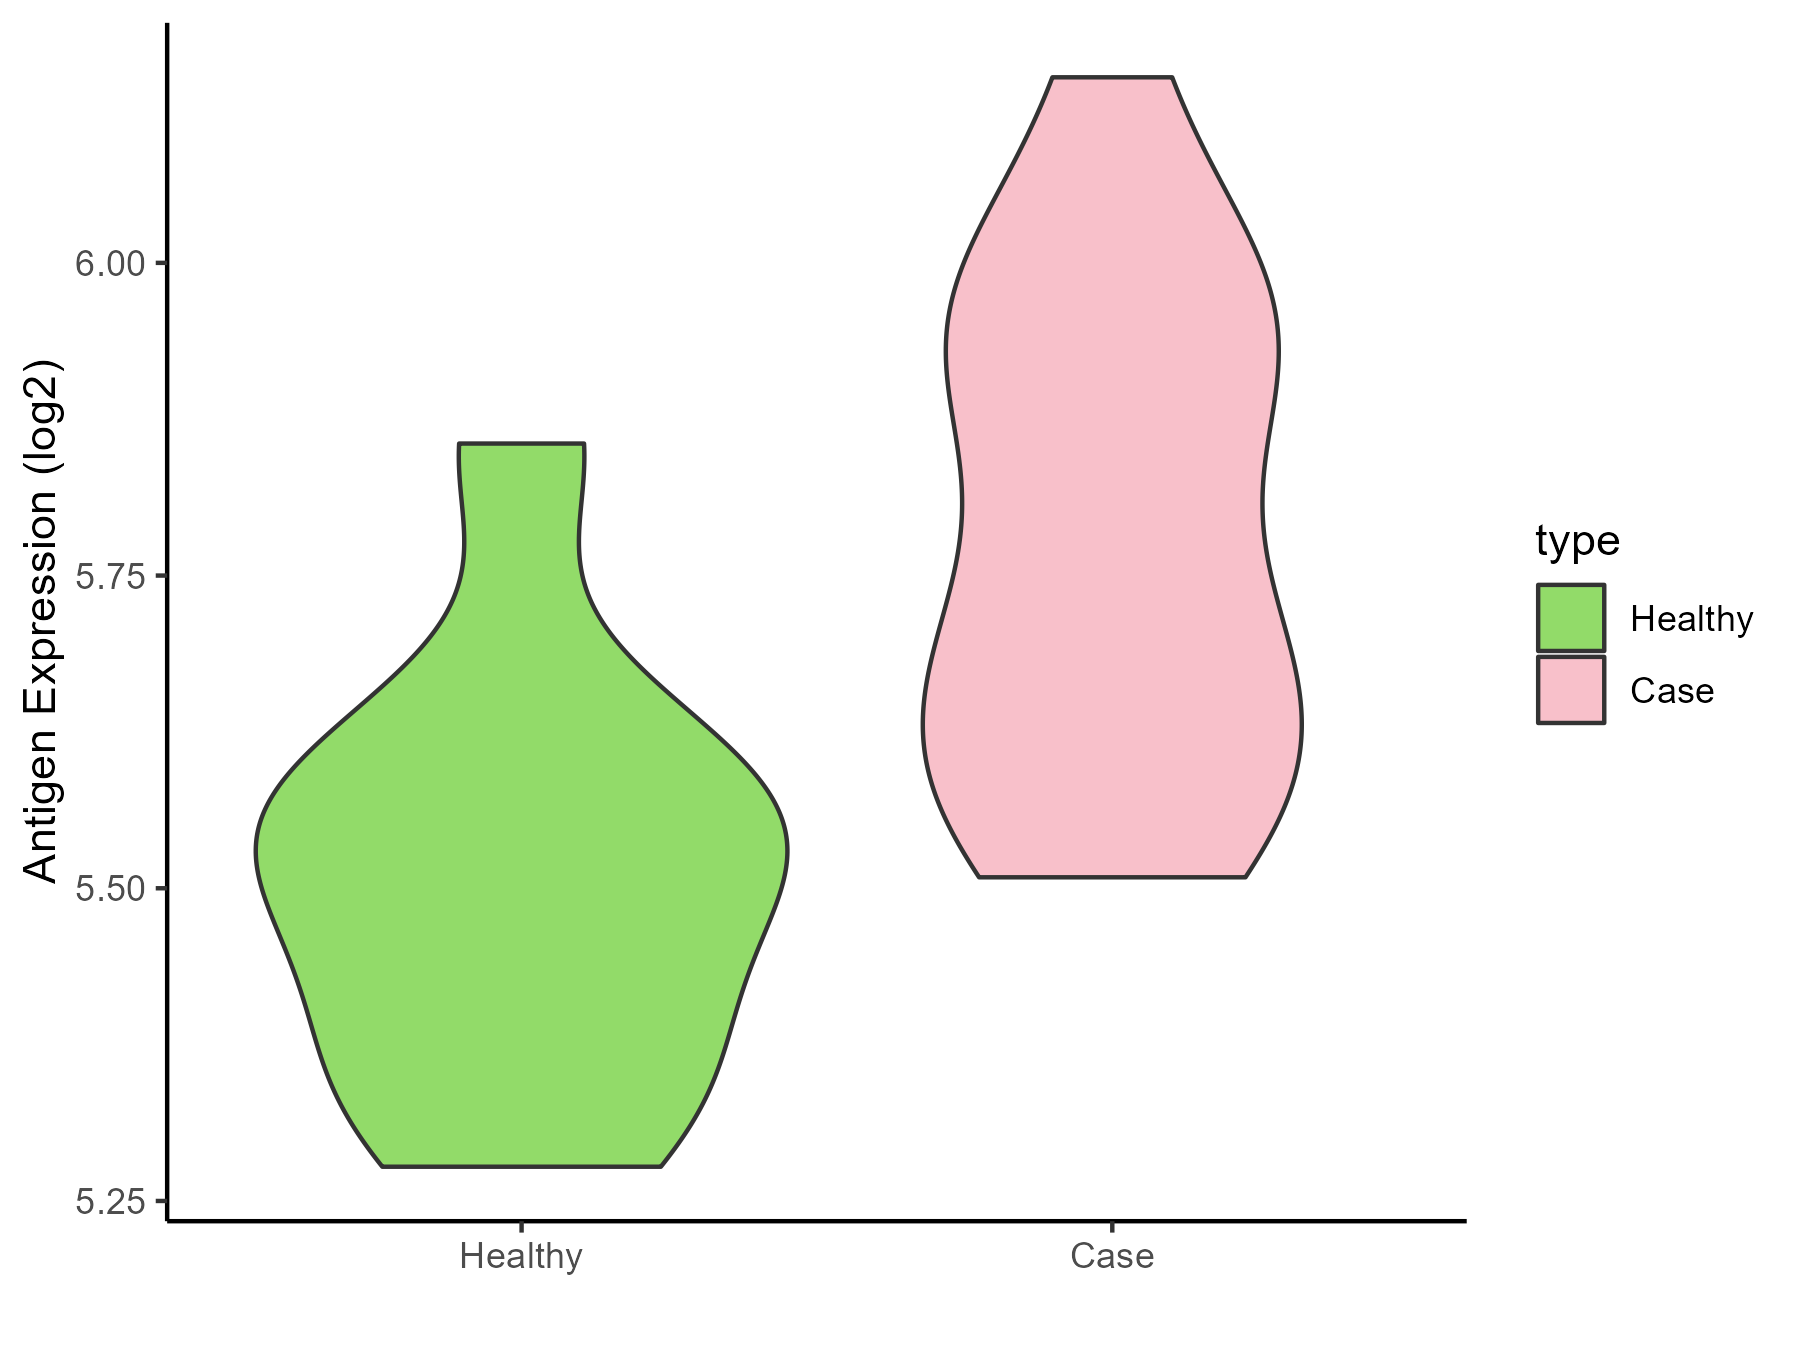
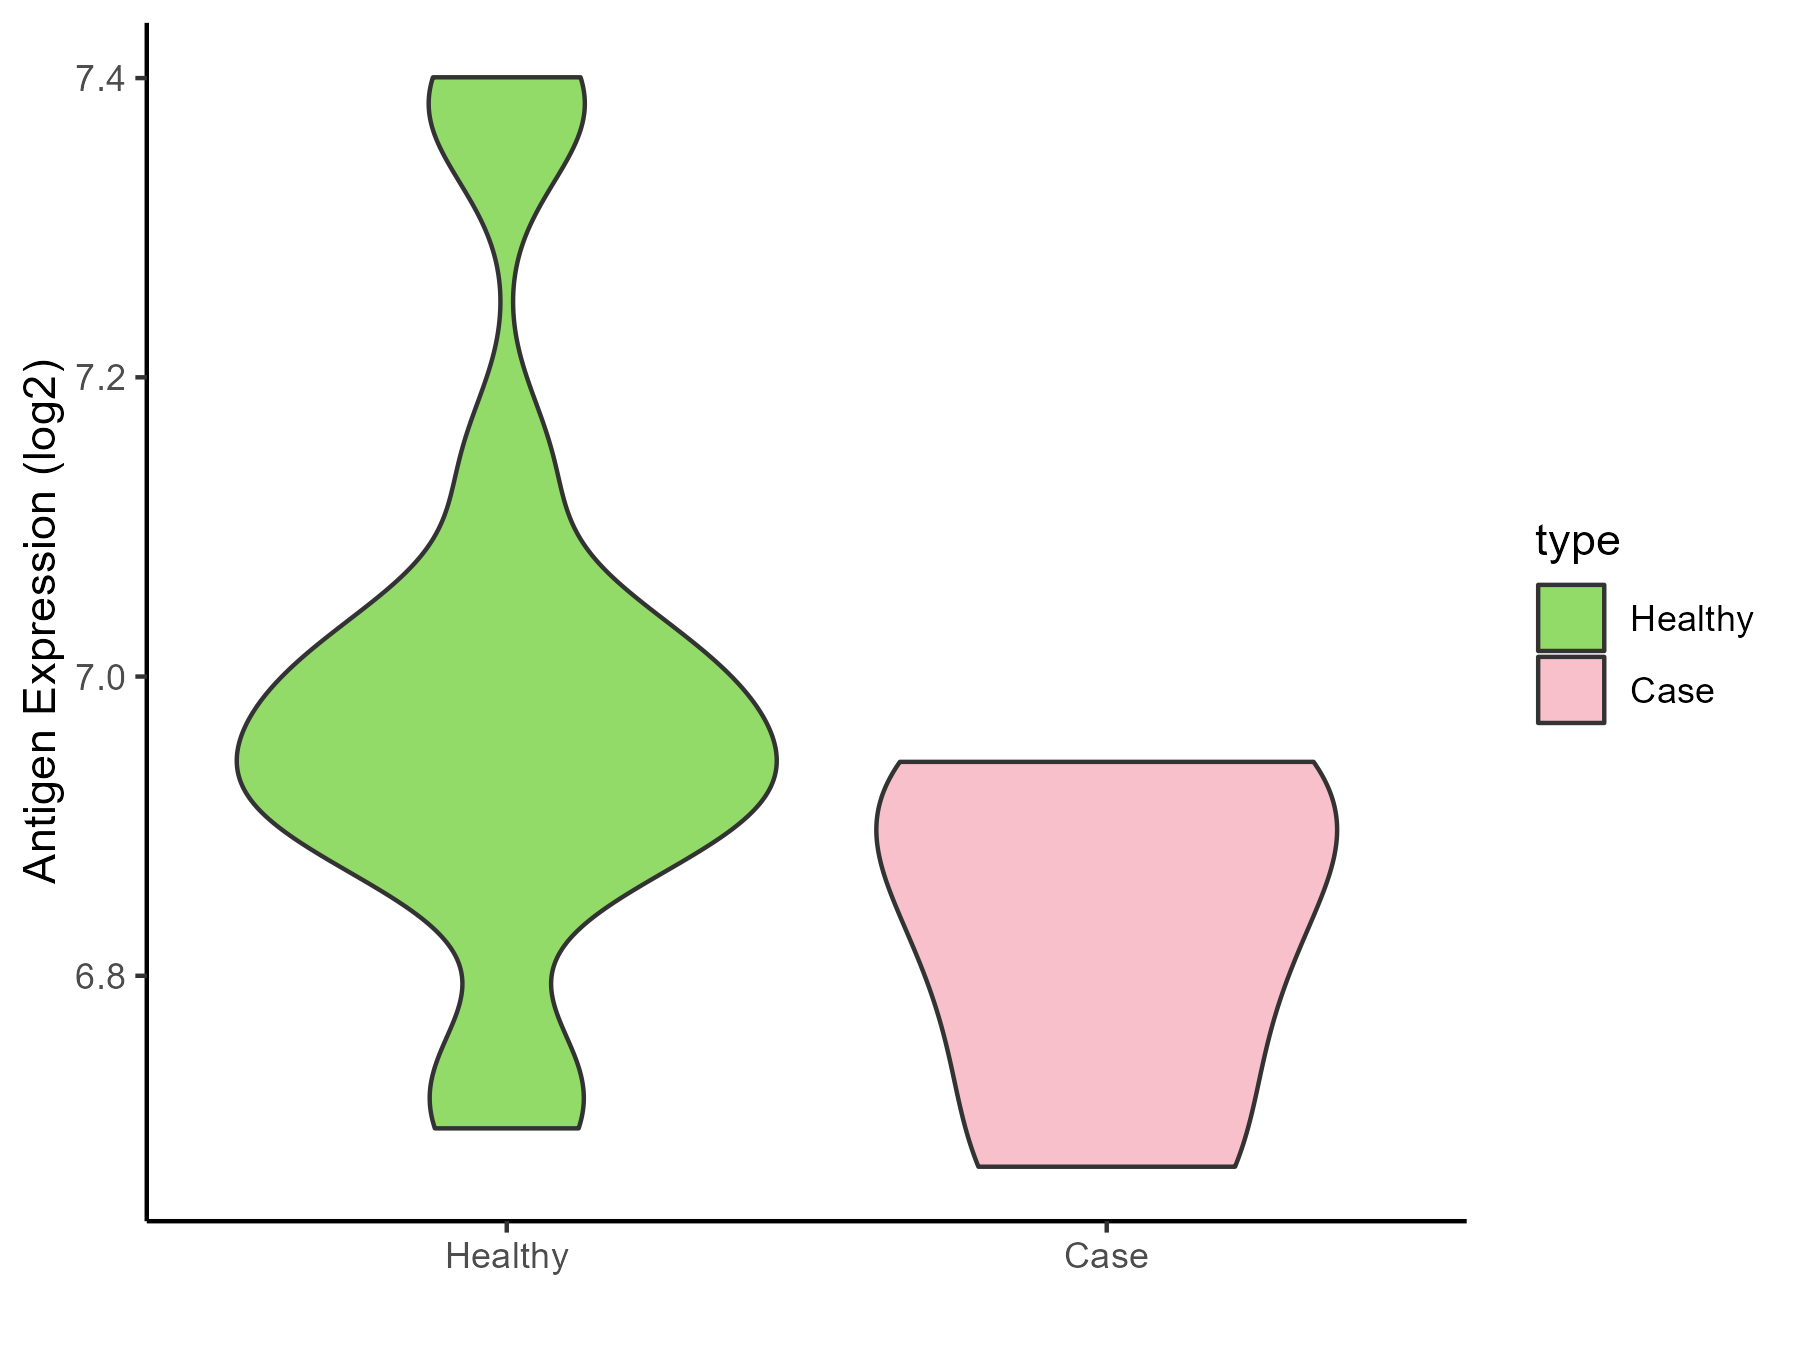
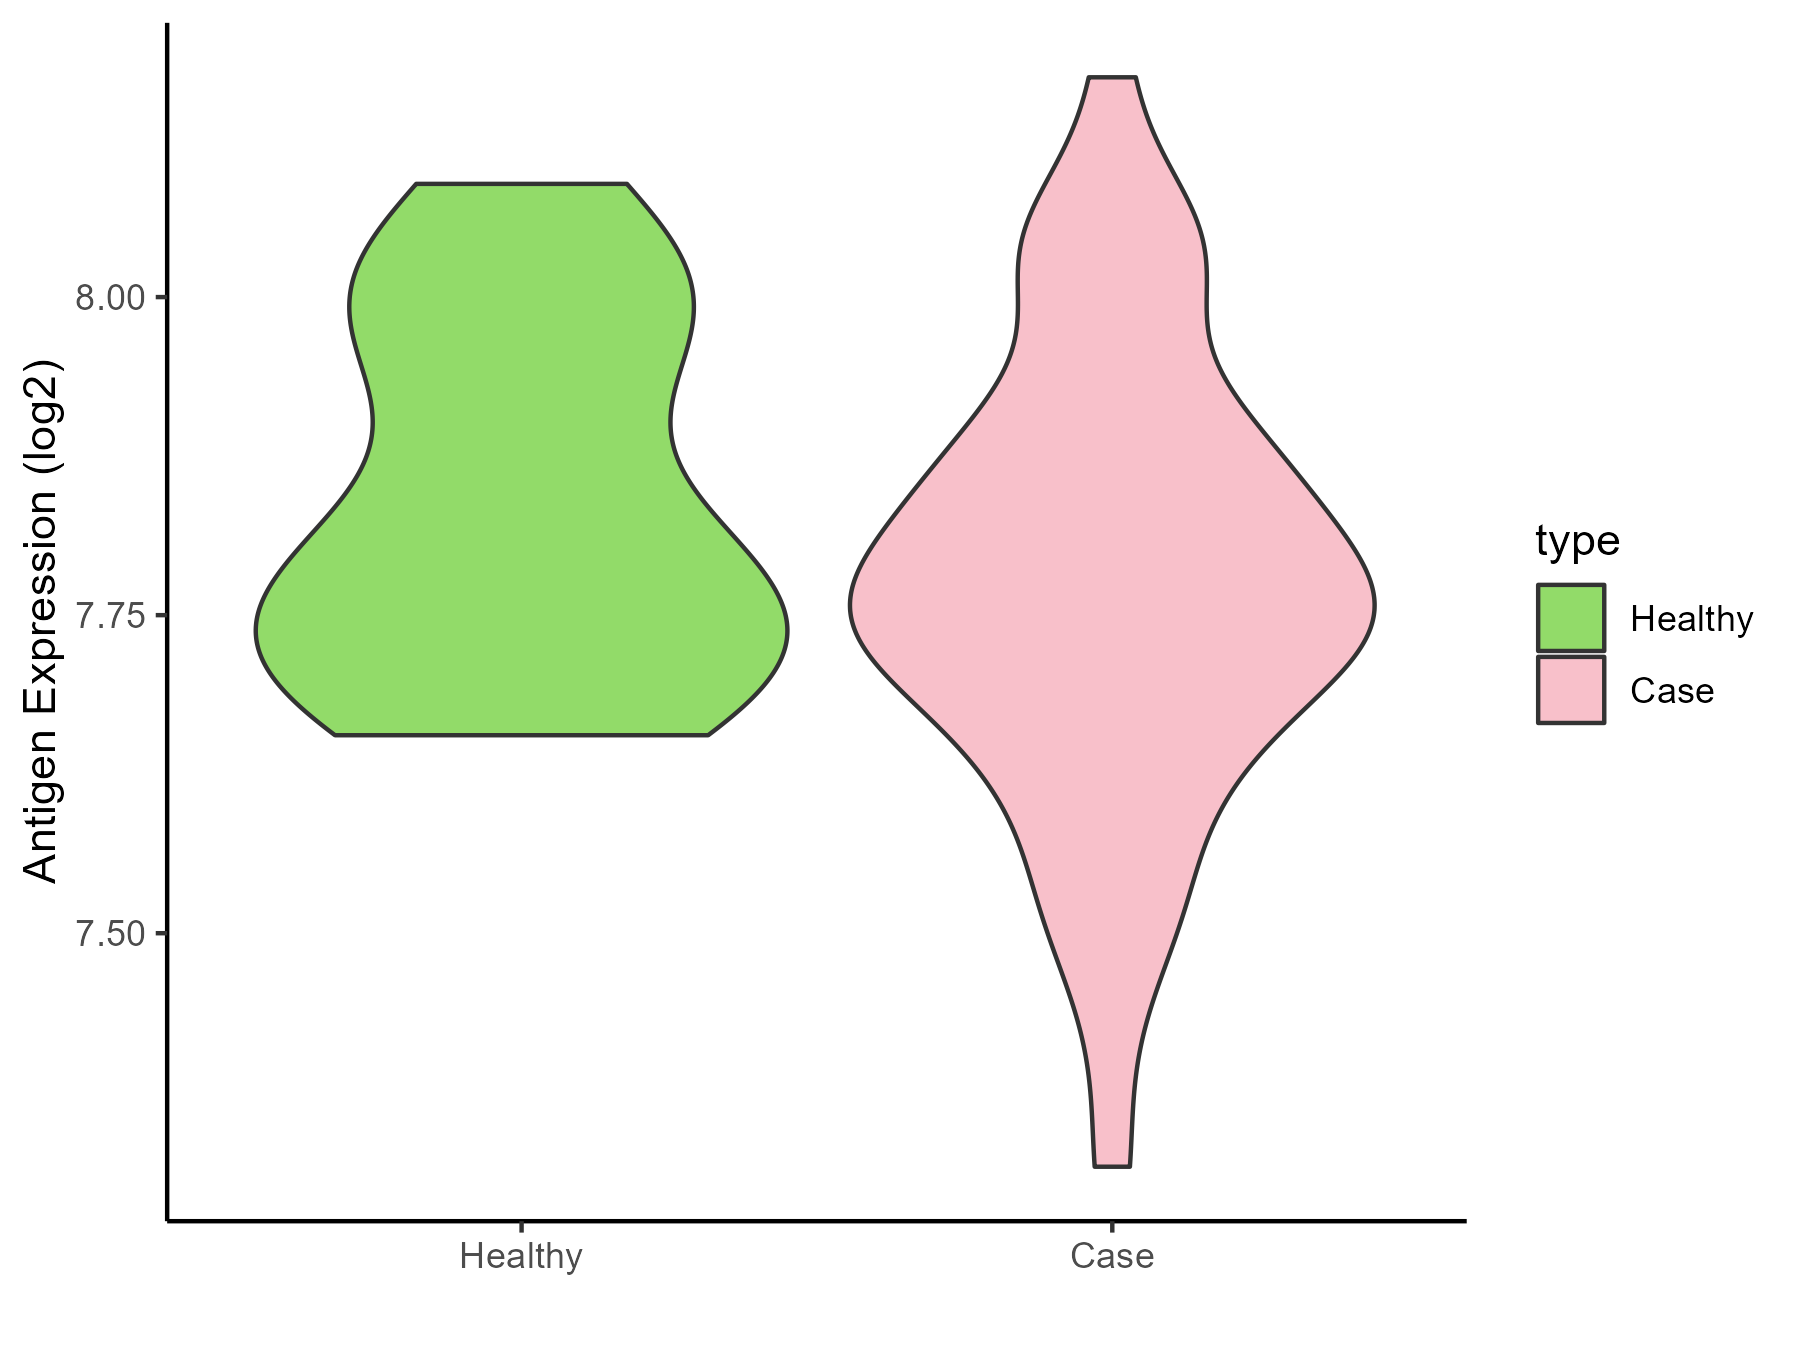
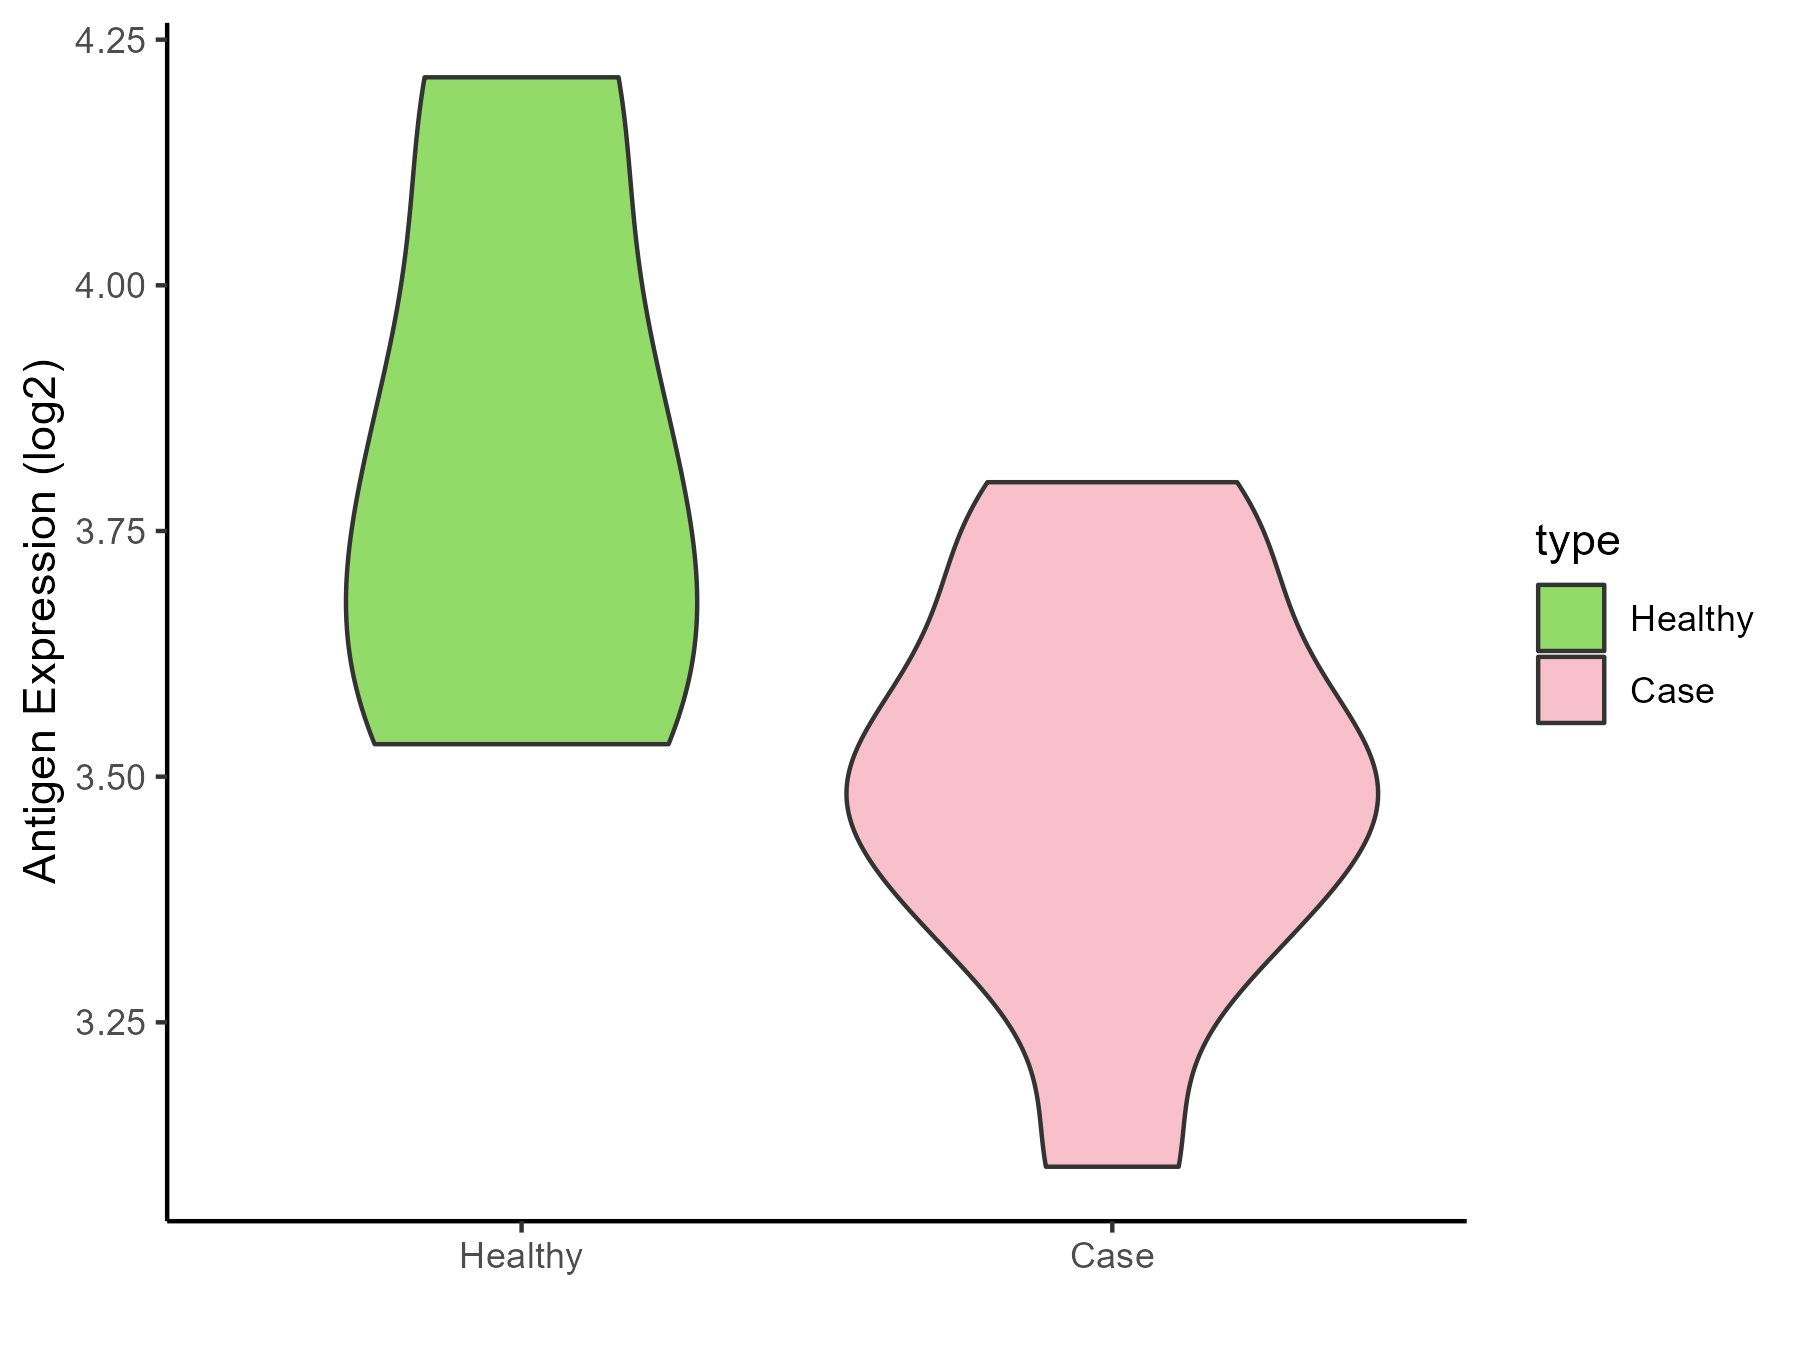
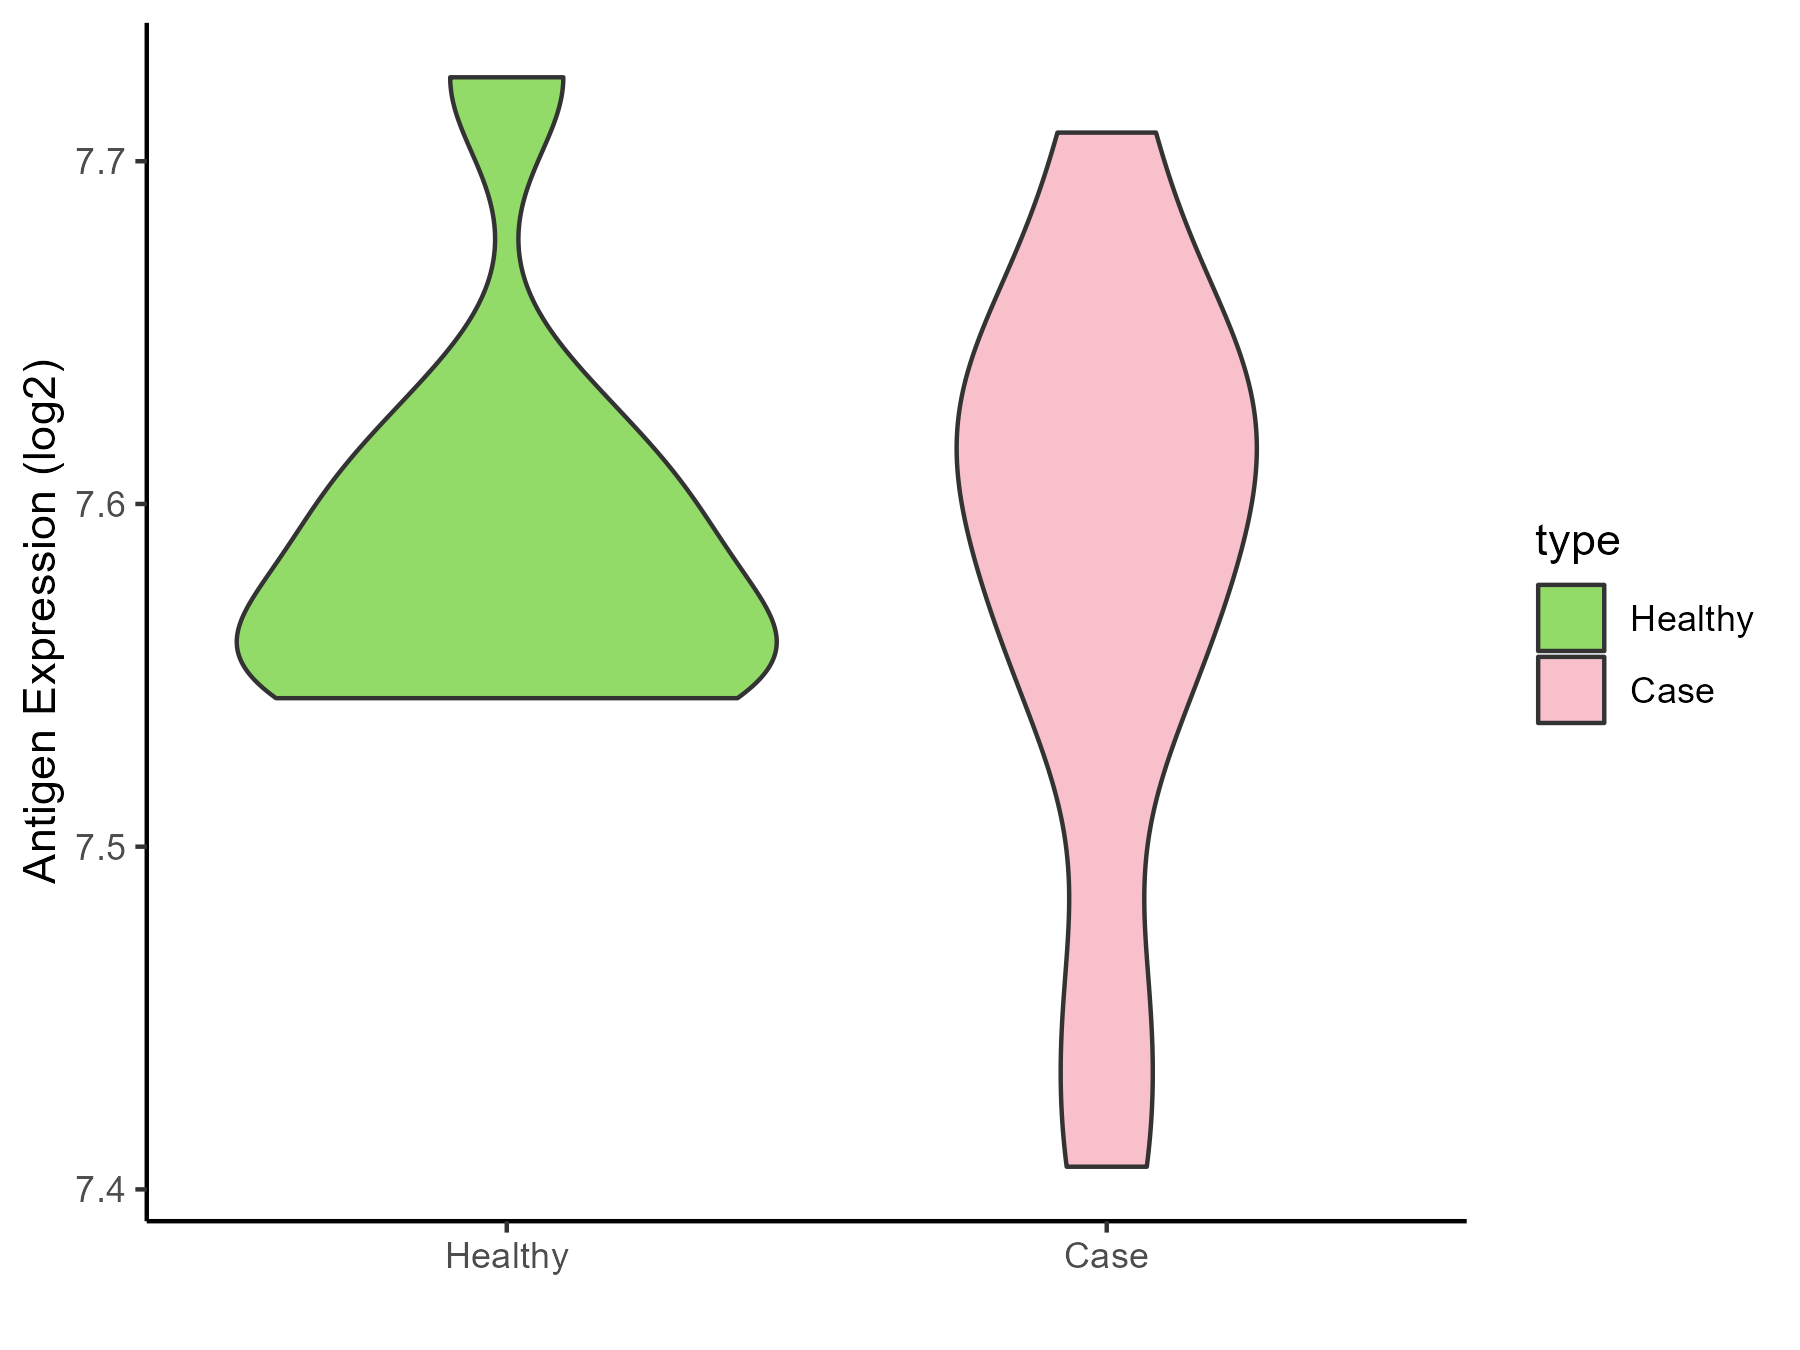
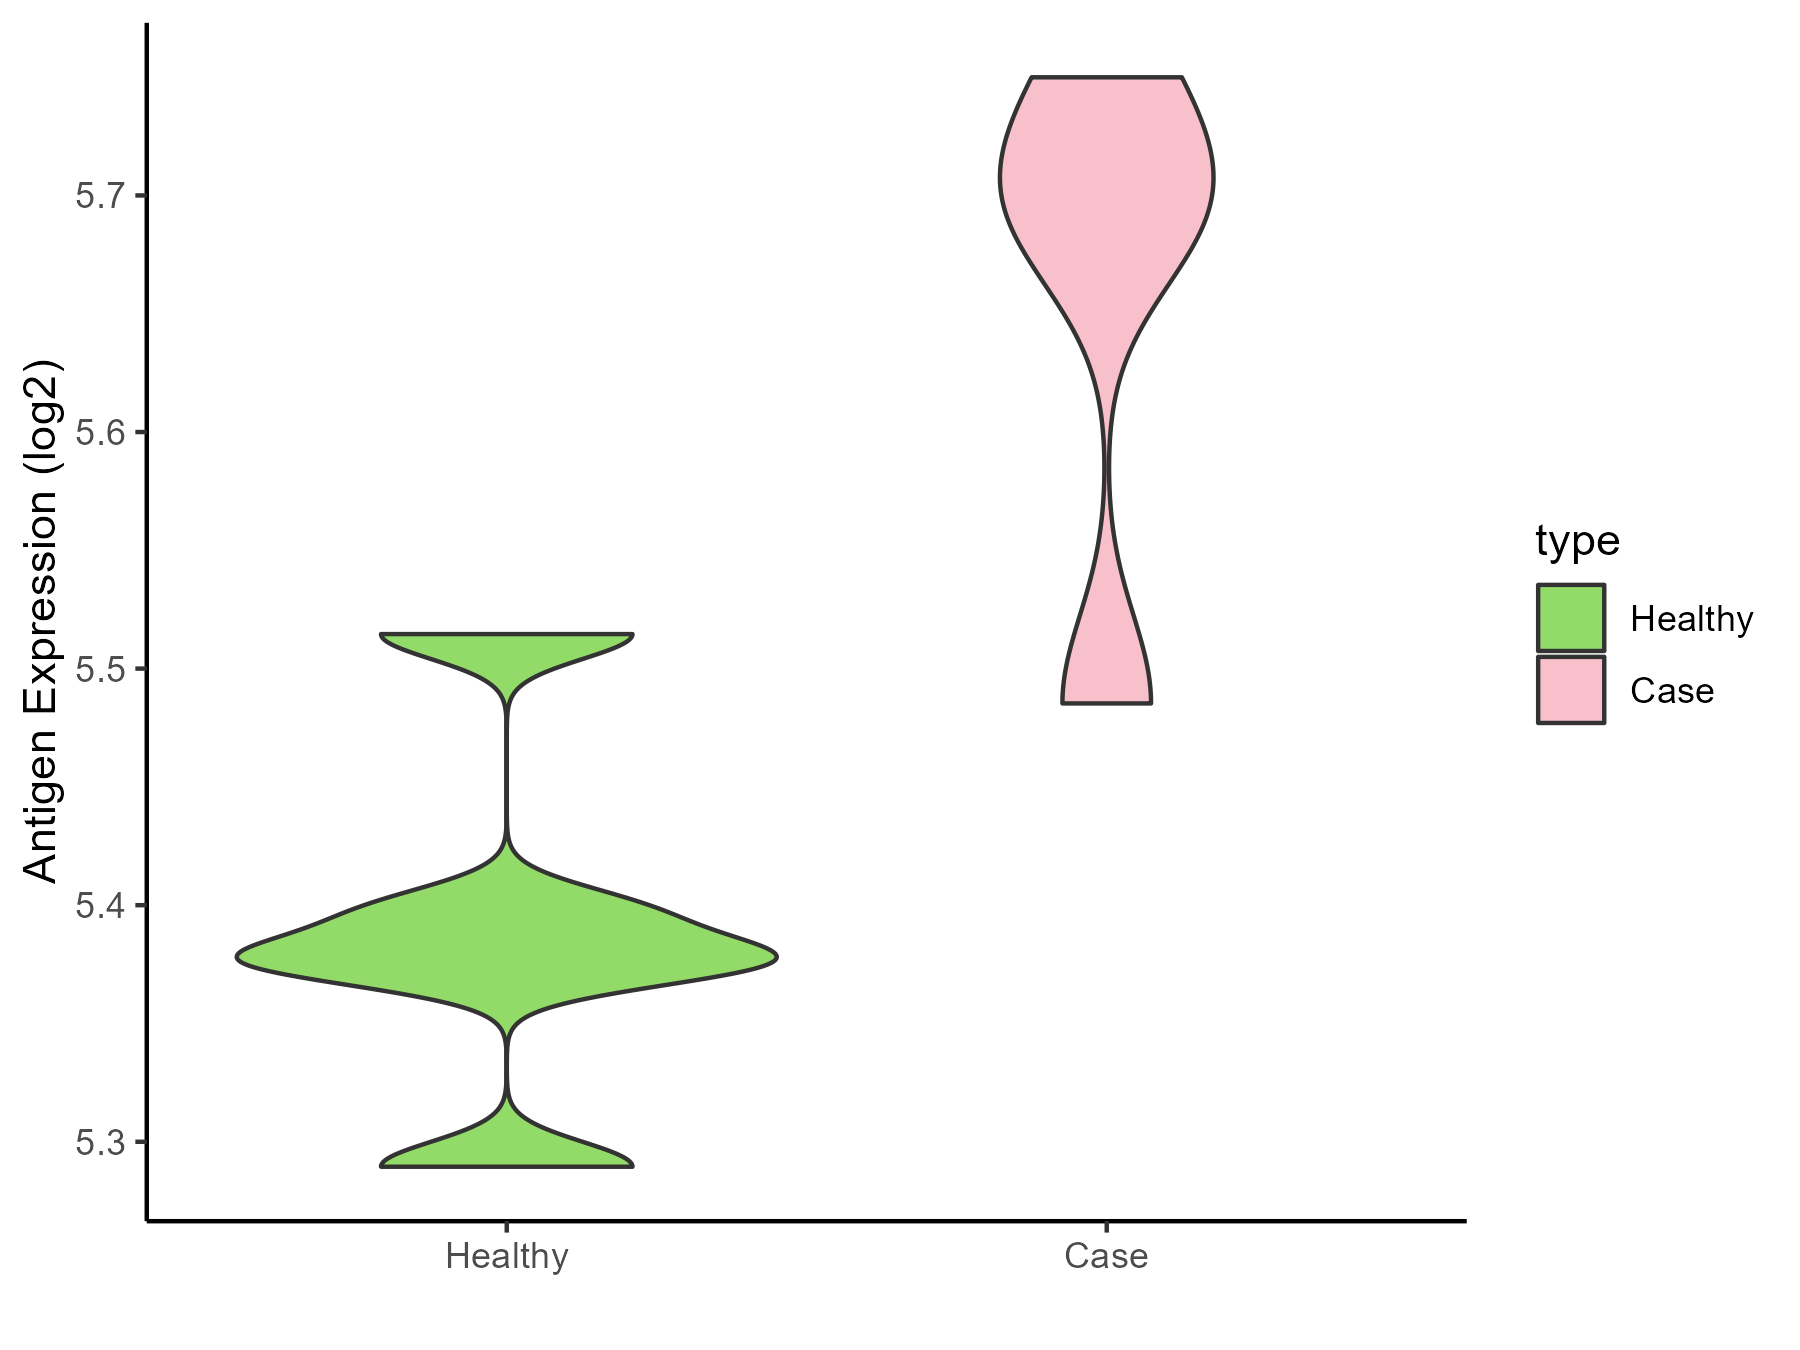
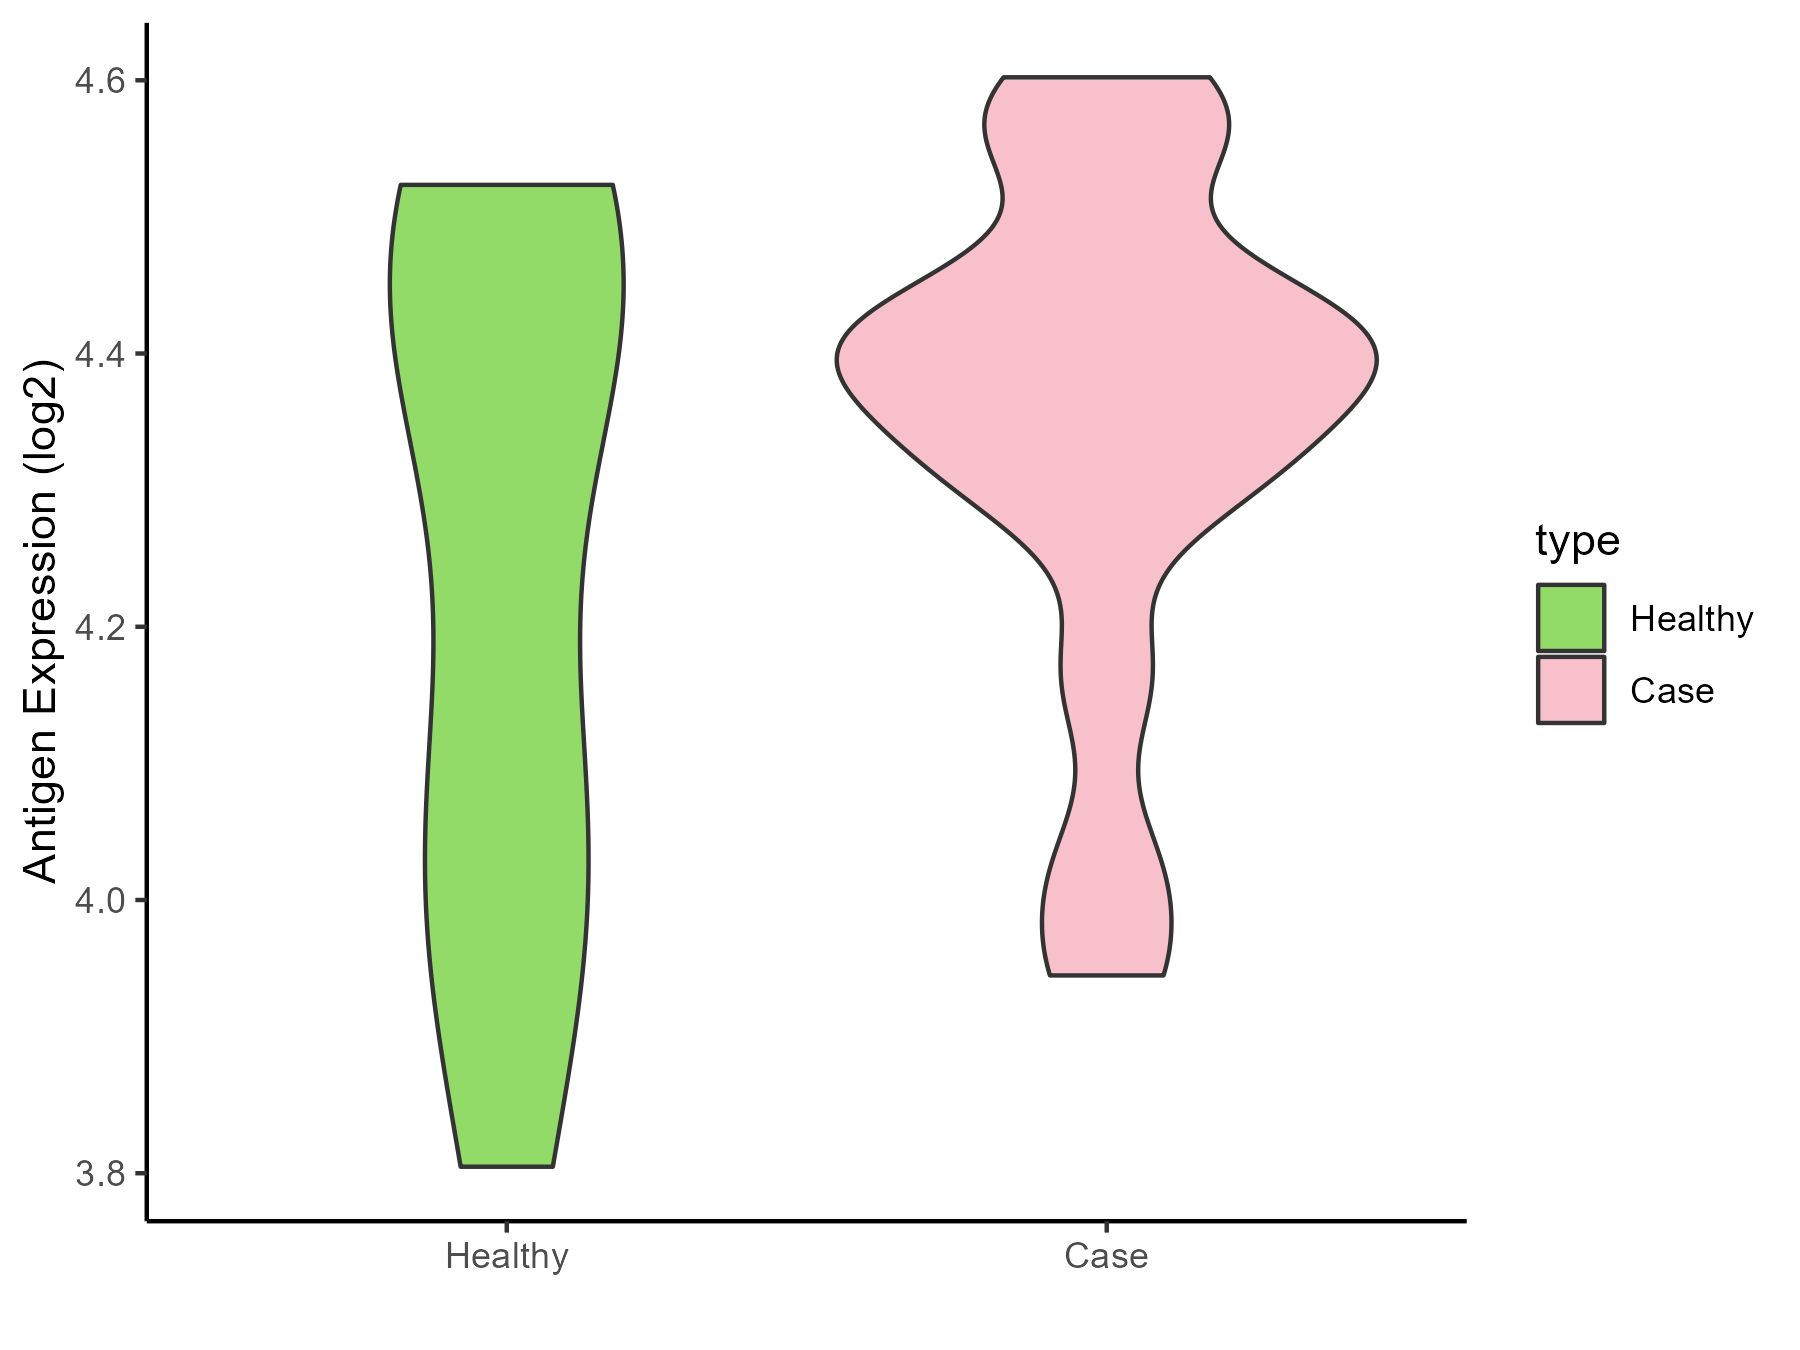
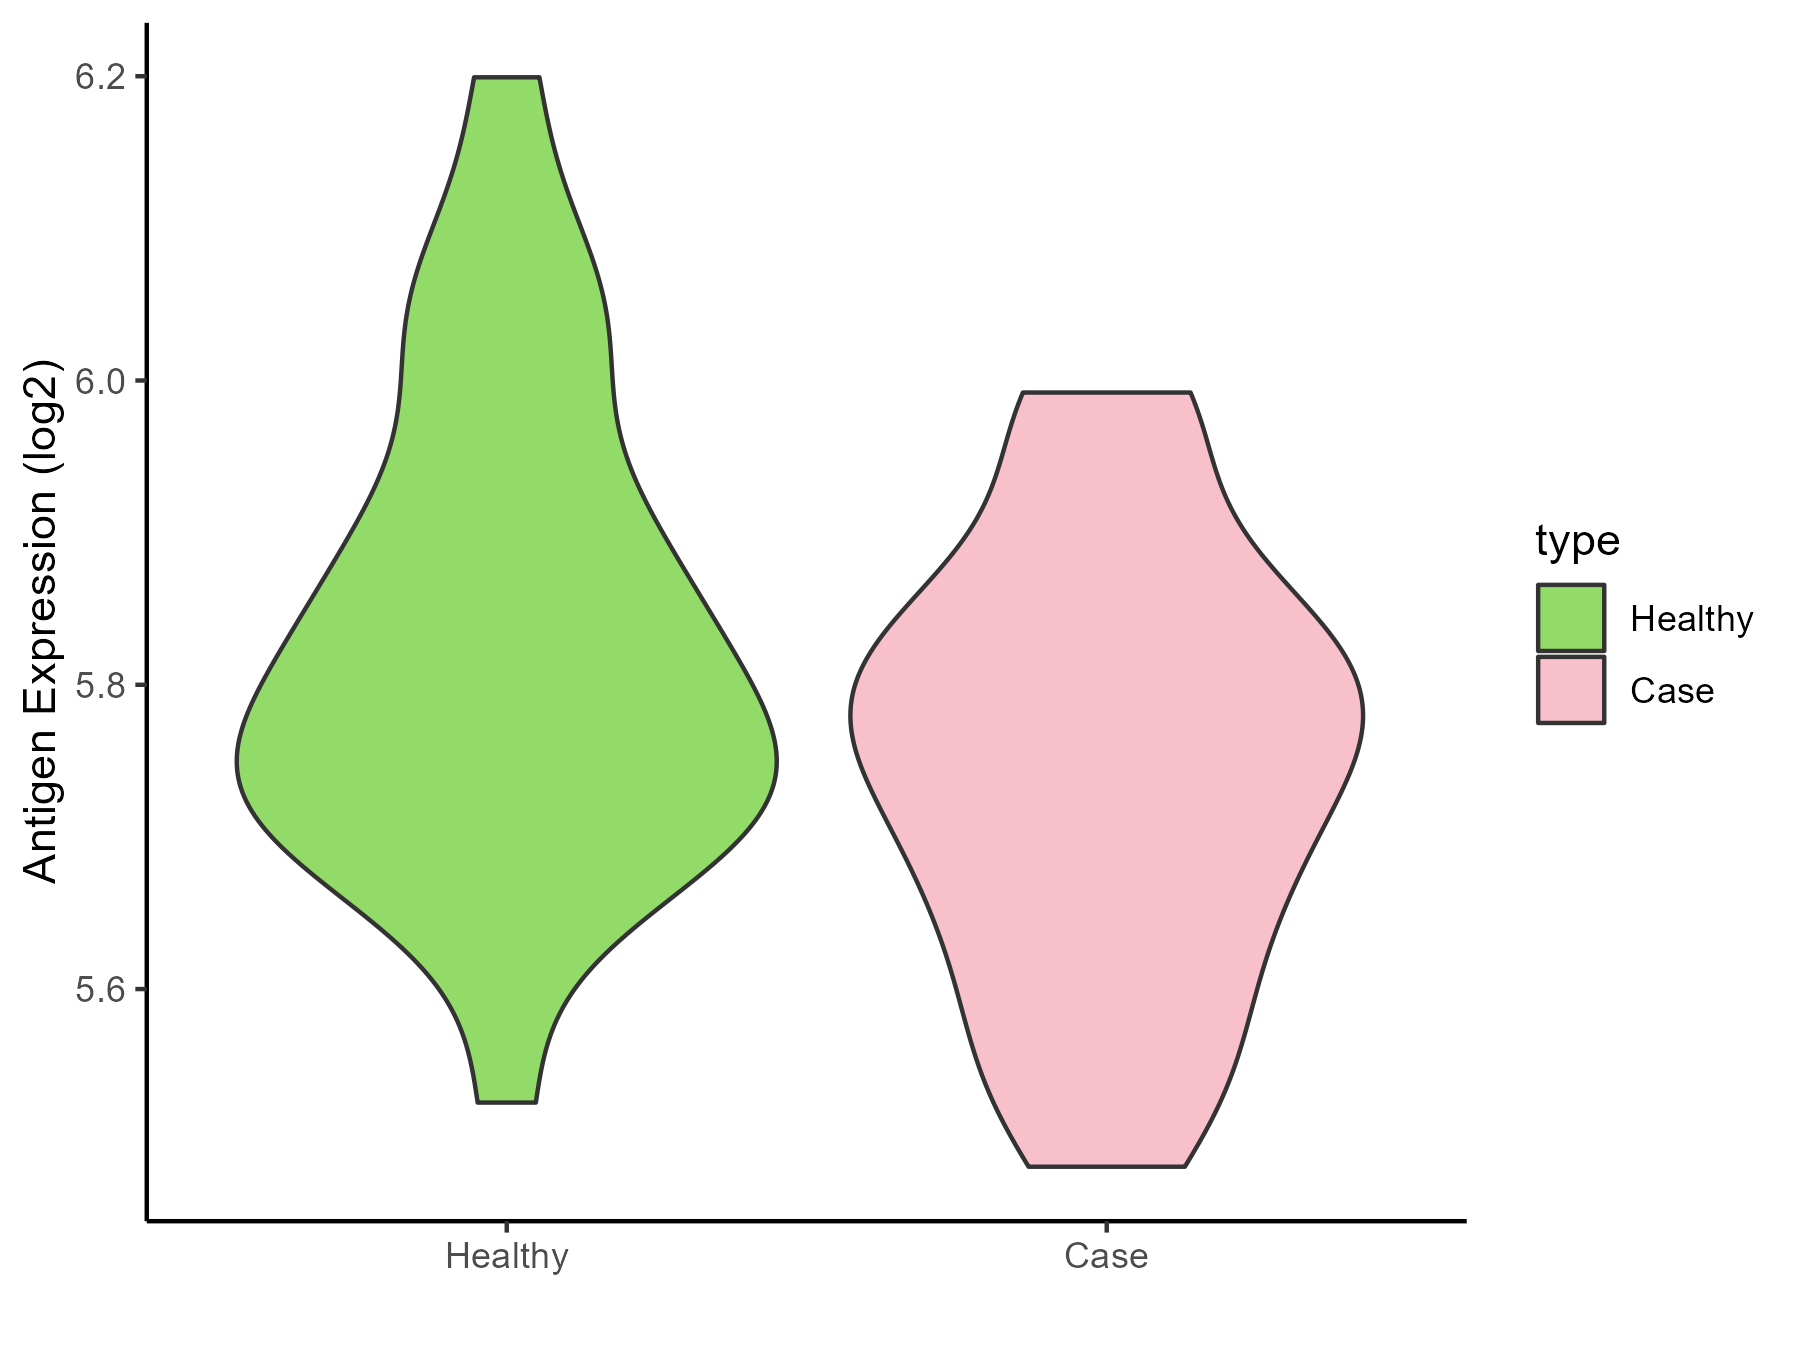
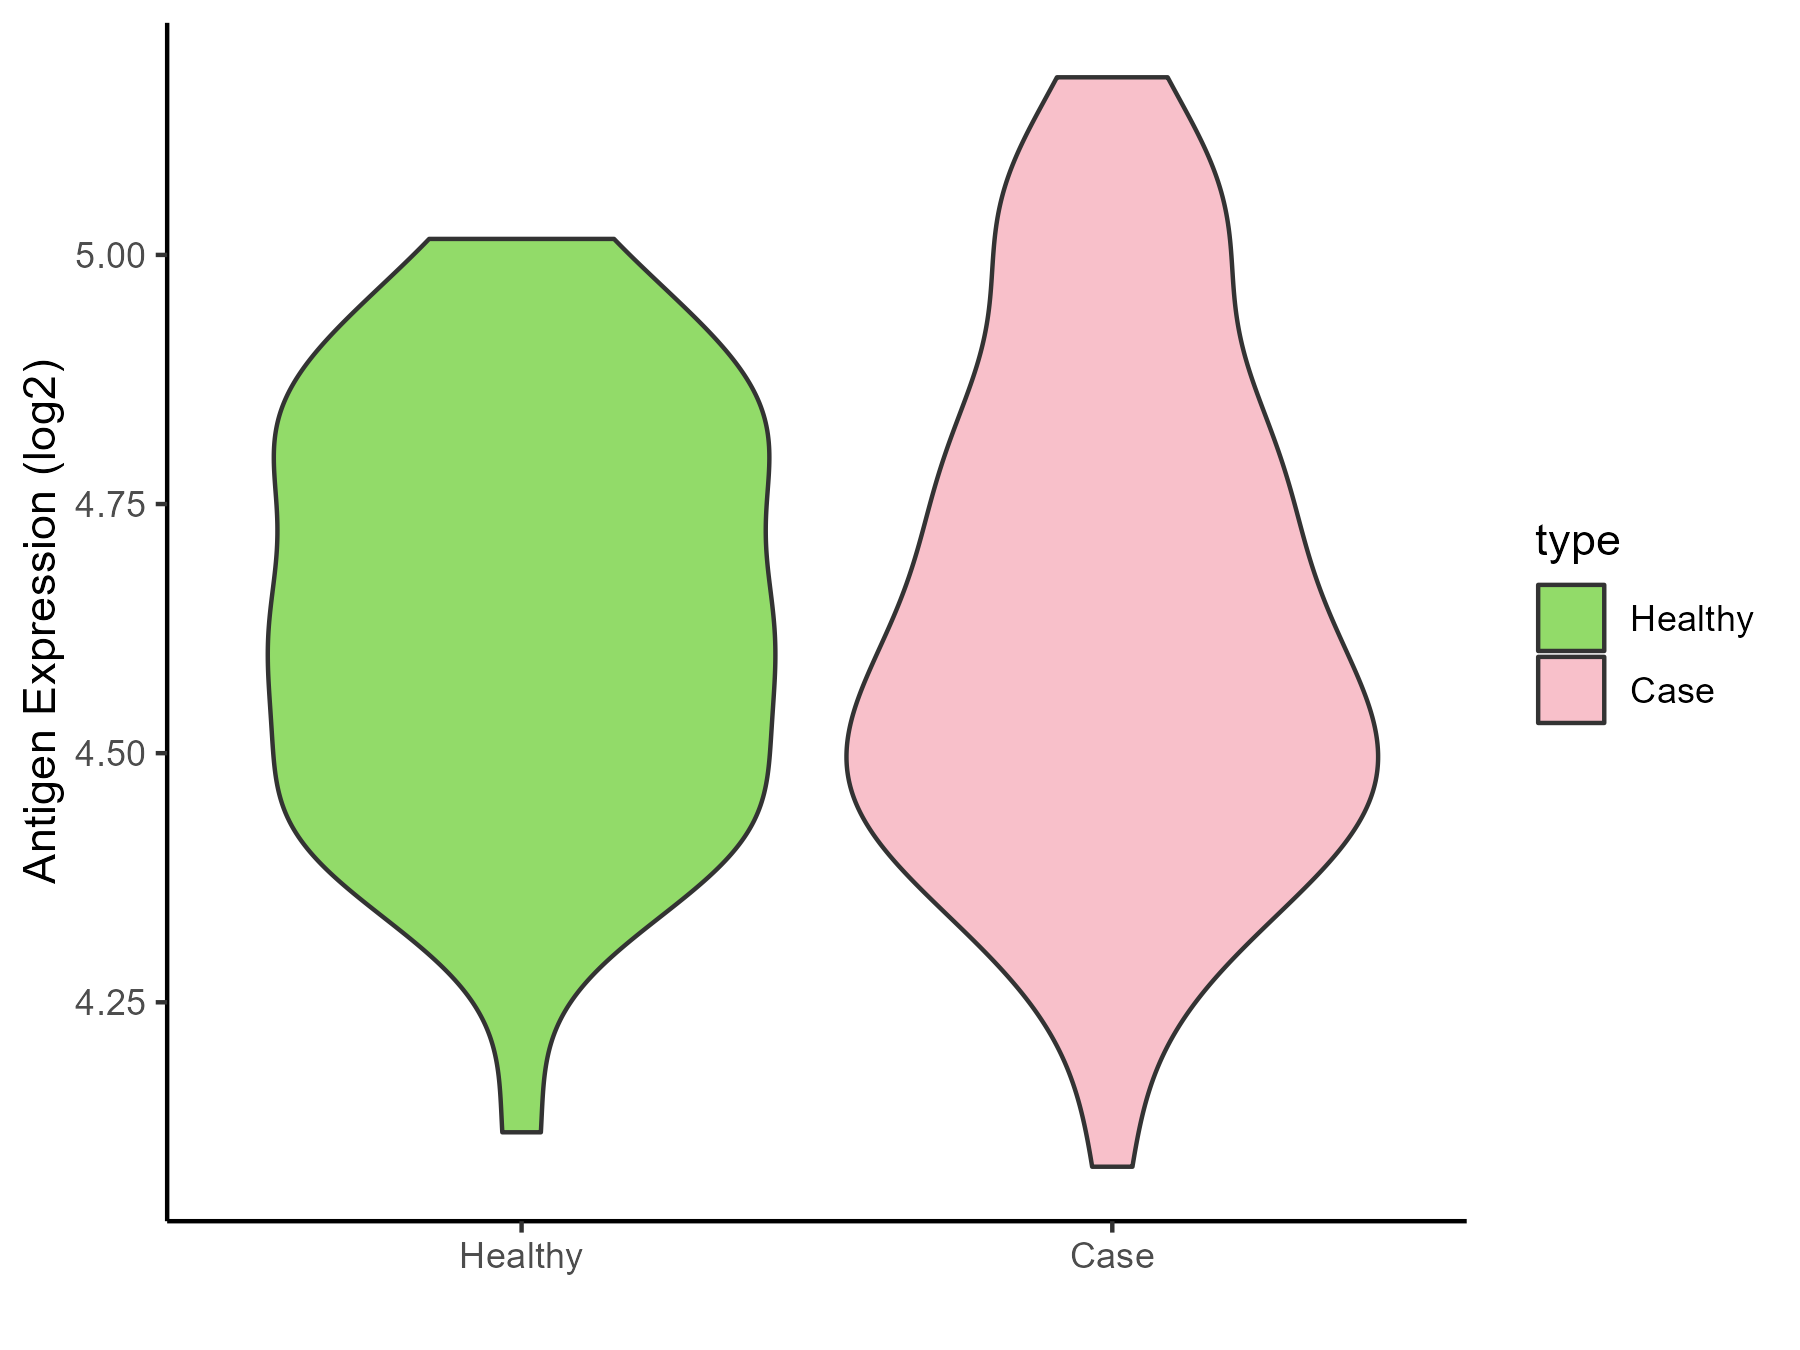
| The Studied Tissue | Brainstem | |
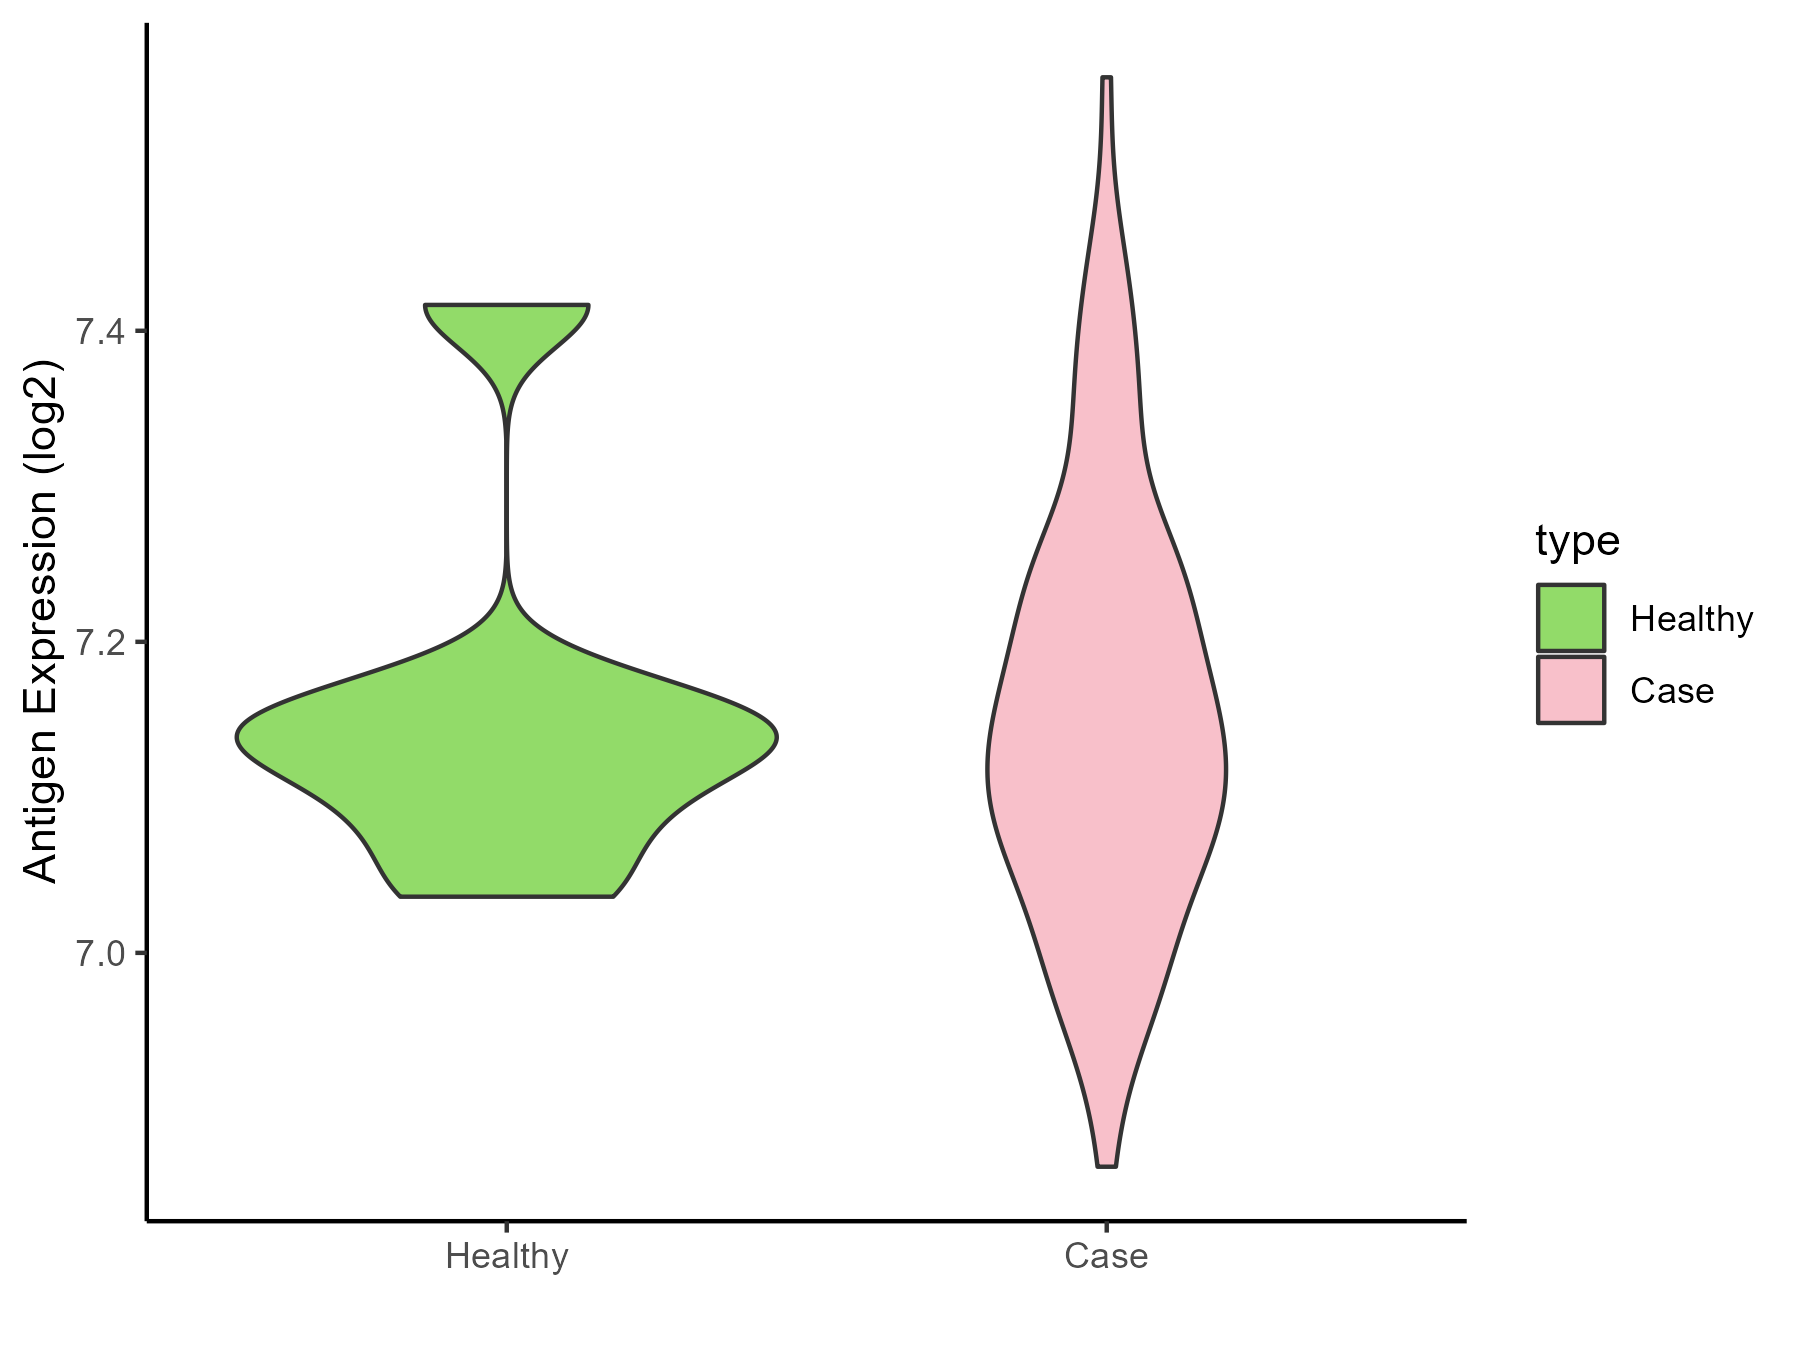
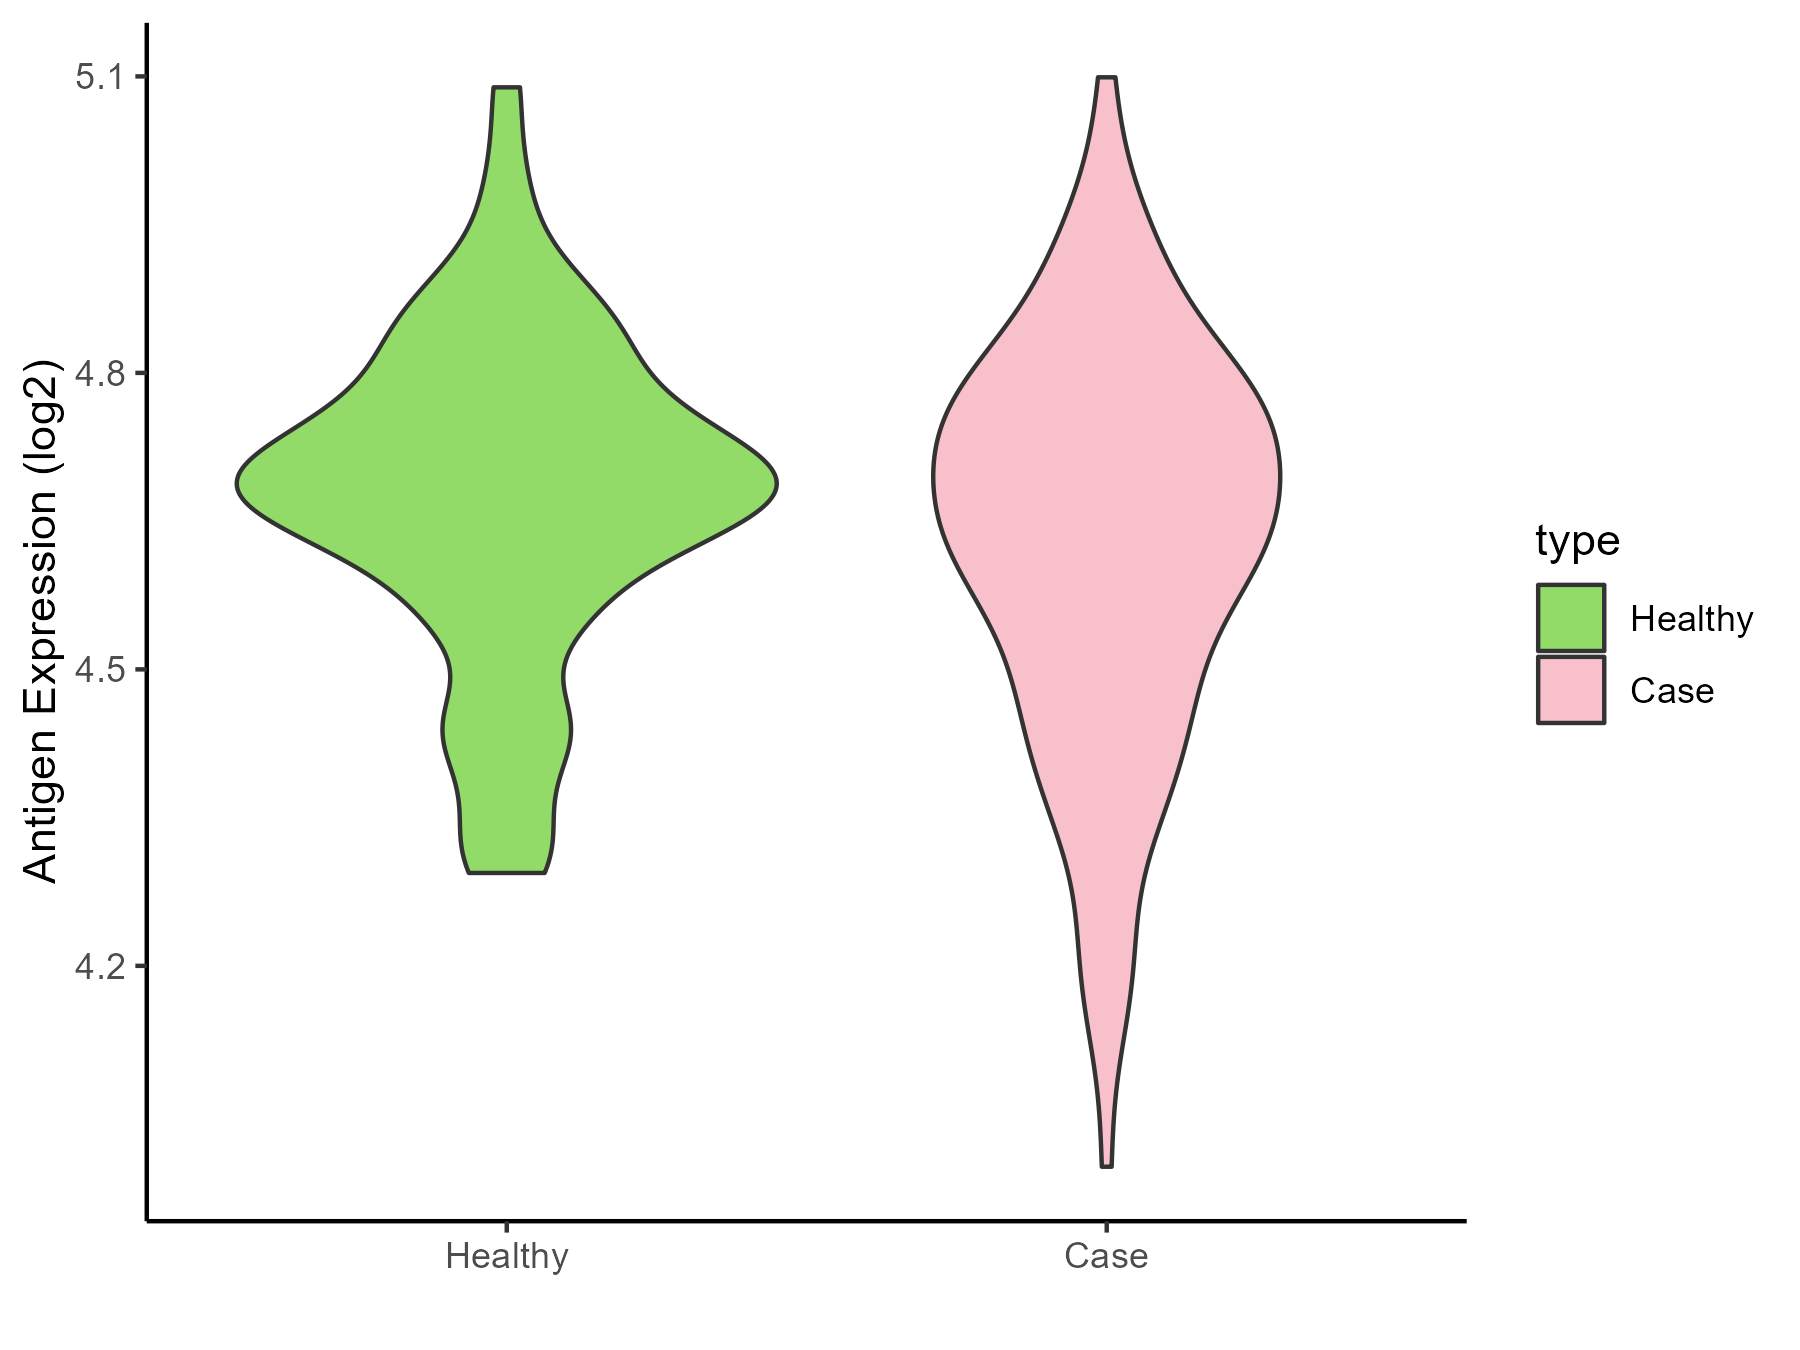
| The Specific Disease | Glioma | |
| The Expression Level of Disease Section Compare with the Healthy Individual Tissue | p-value: 0.900192081; Fold-change: 0.015264431; Z-score: 0.171641095 | |
| Disease-specific Antigen Abundances |
|
Click to View the Clearer Original Diagram |
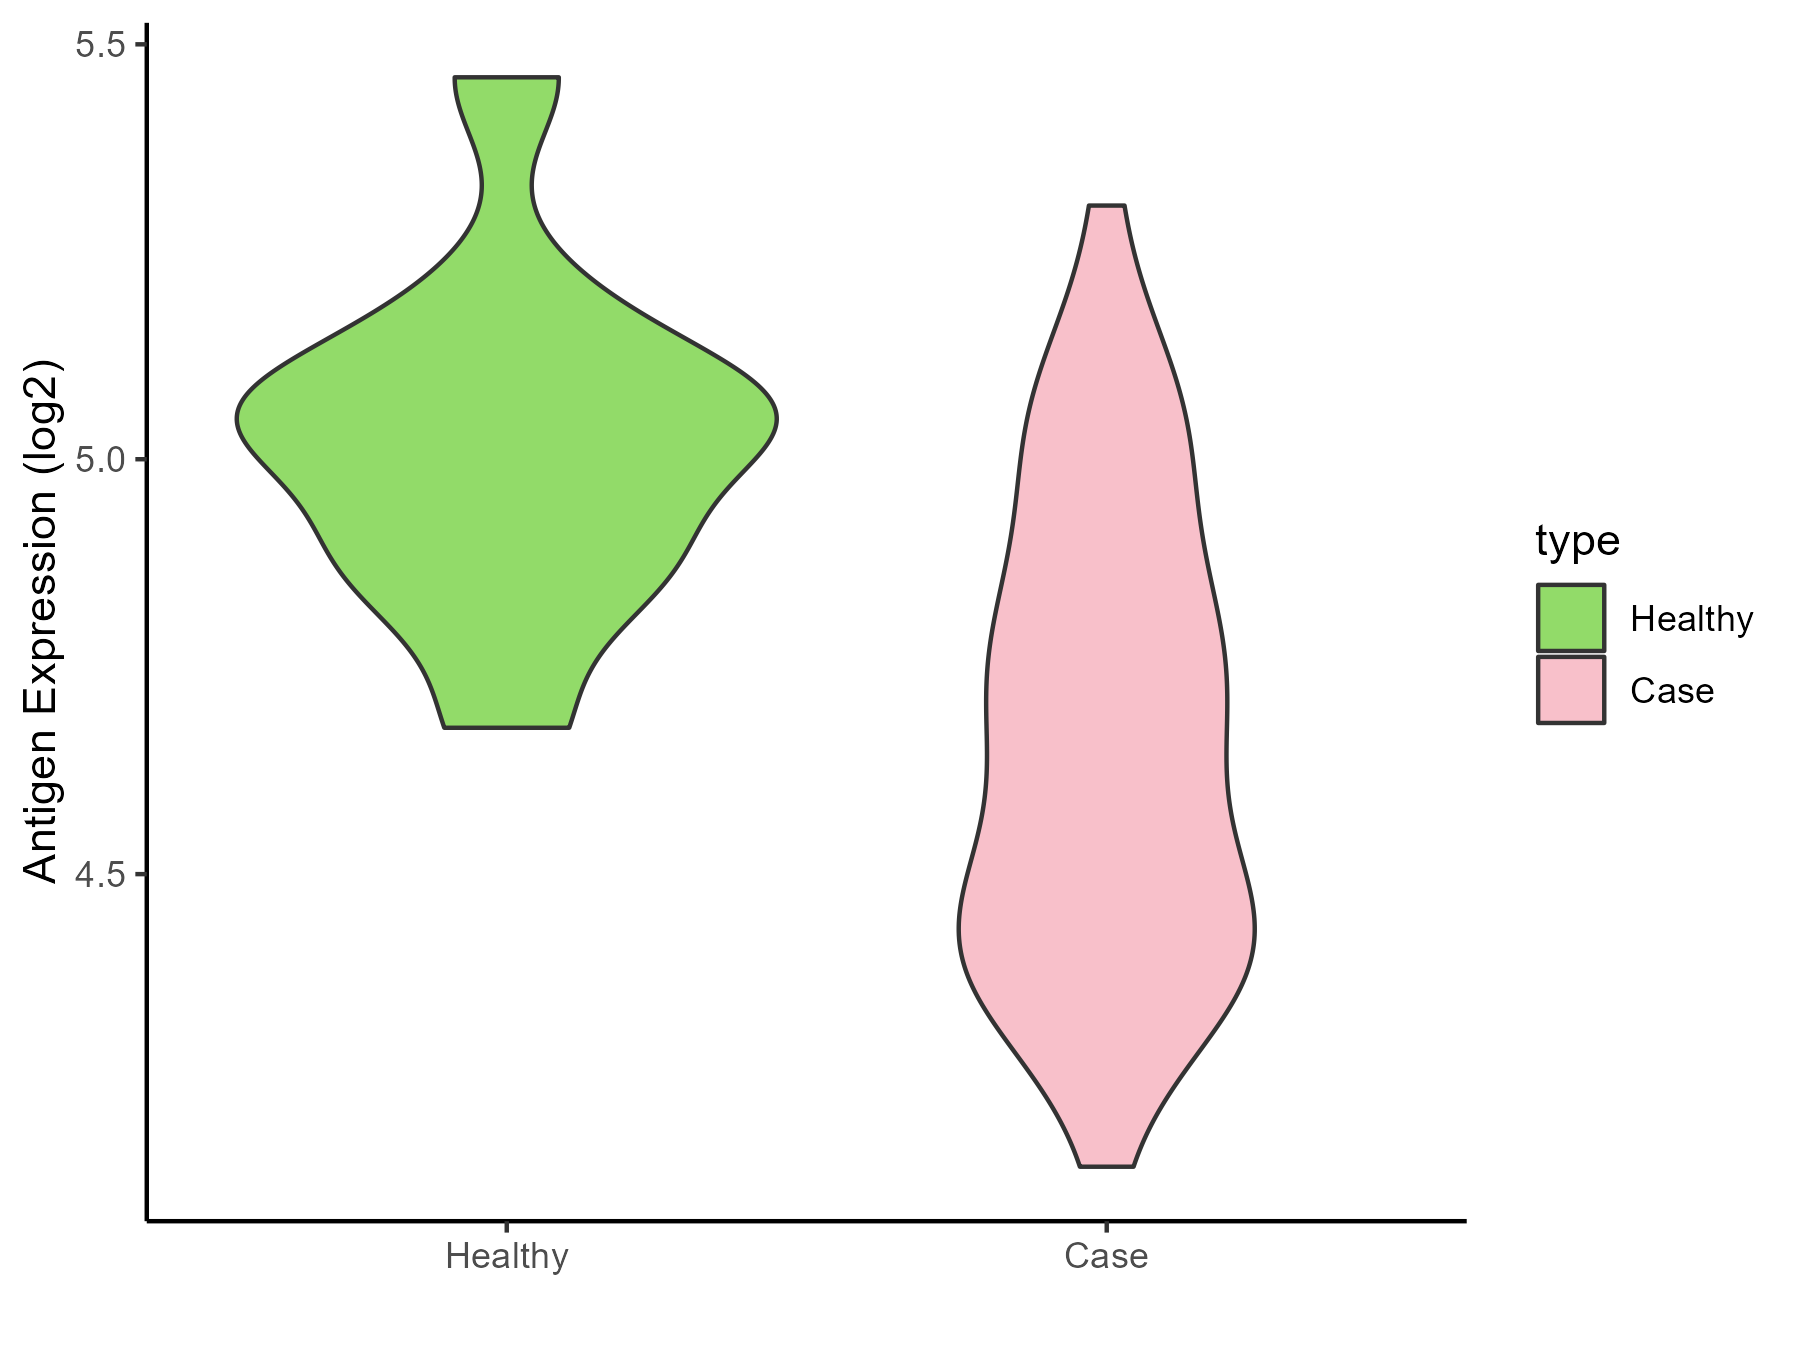
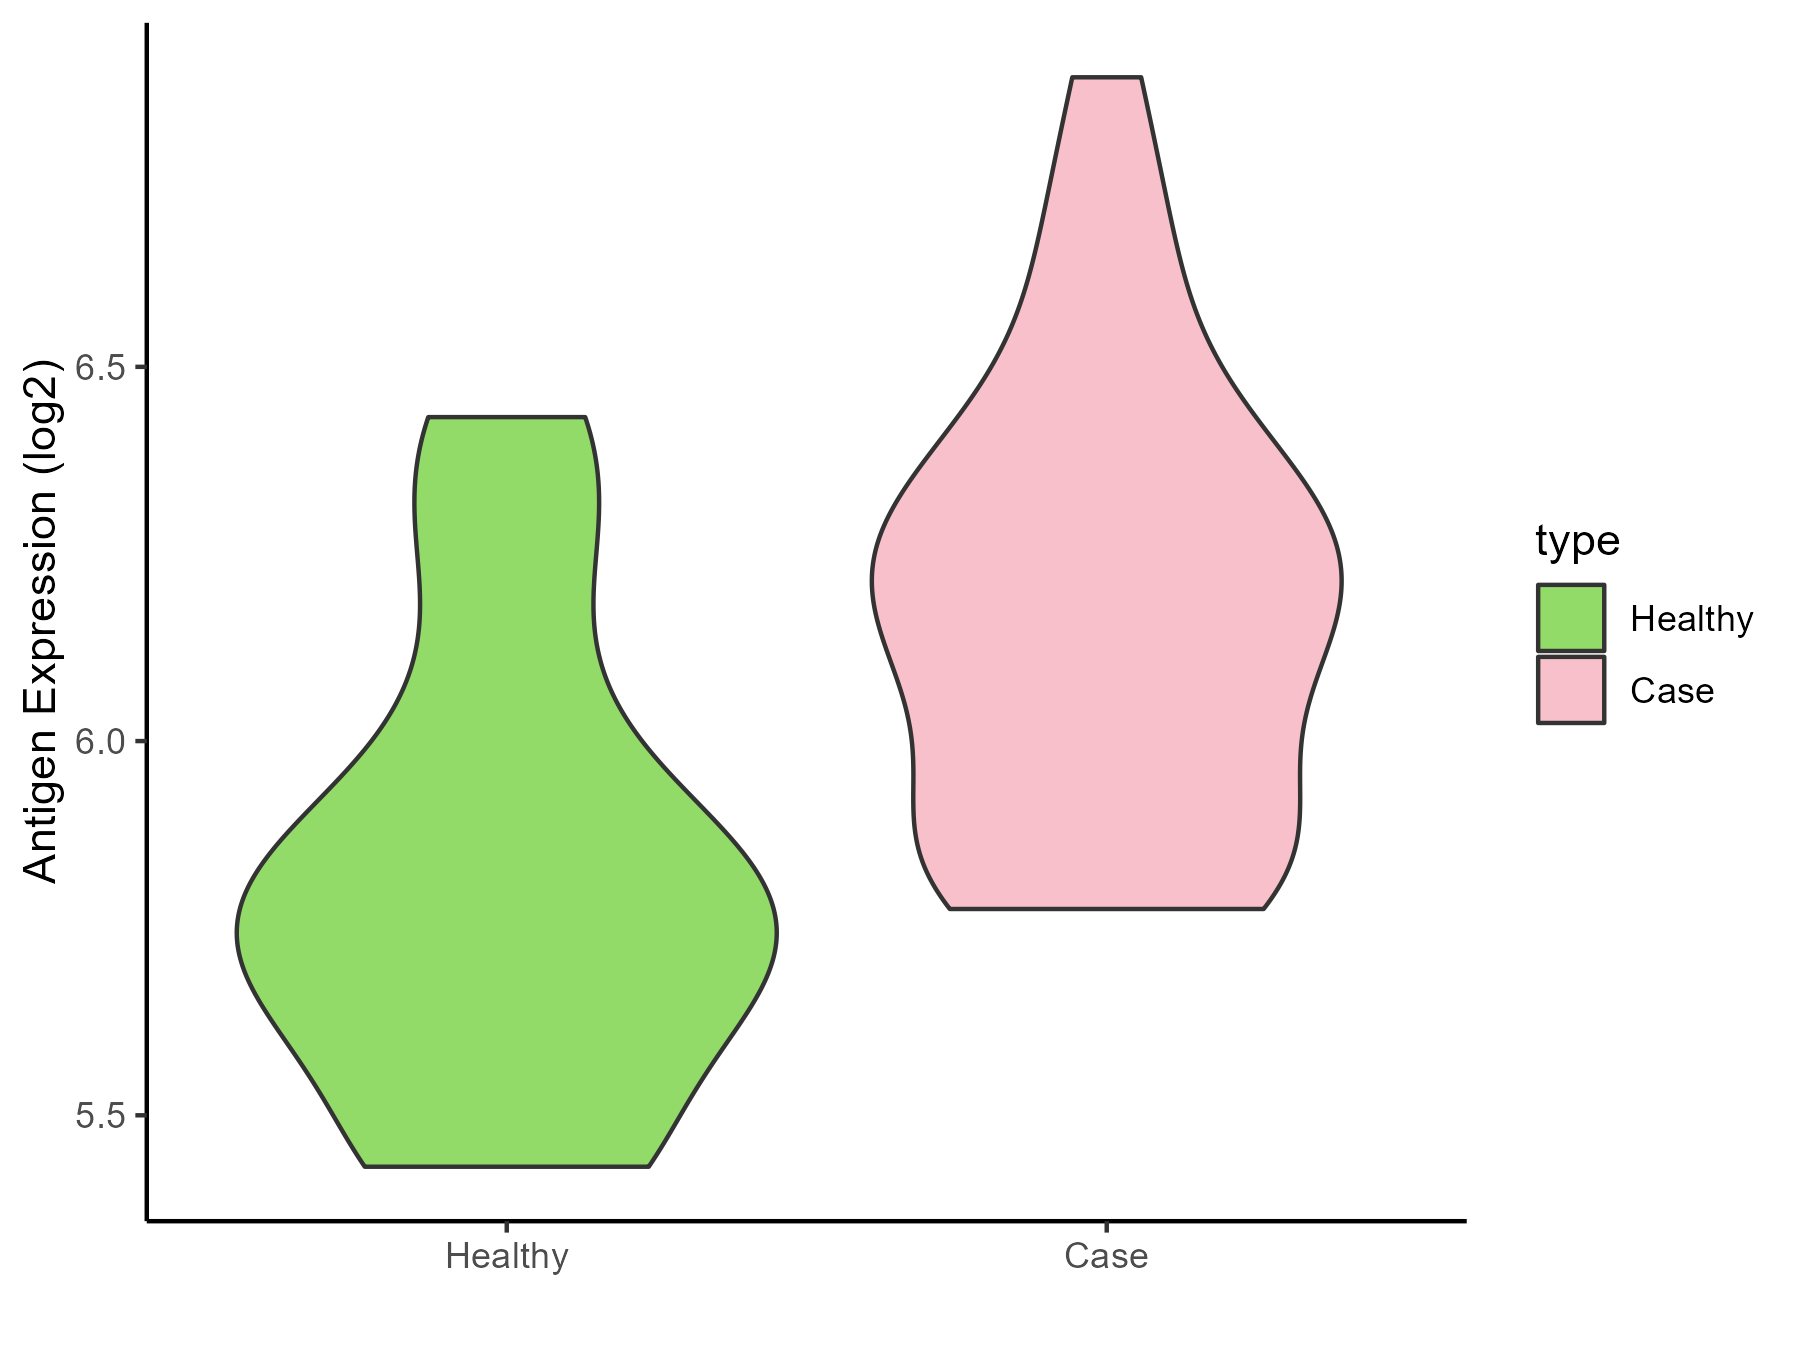
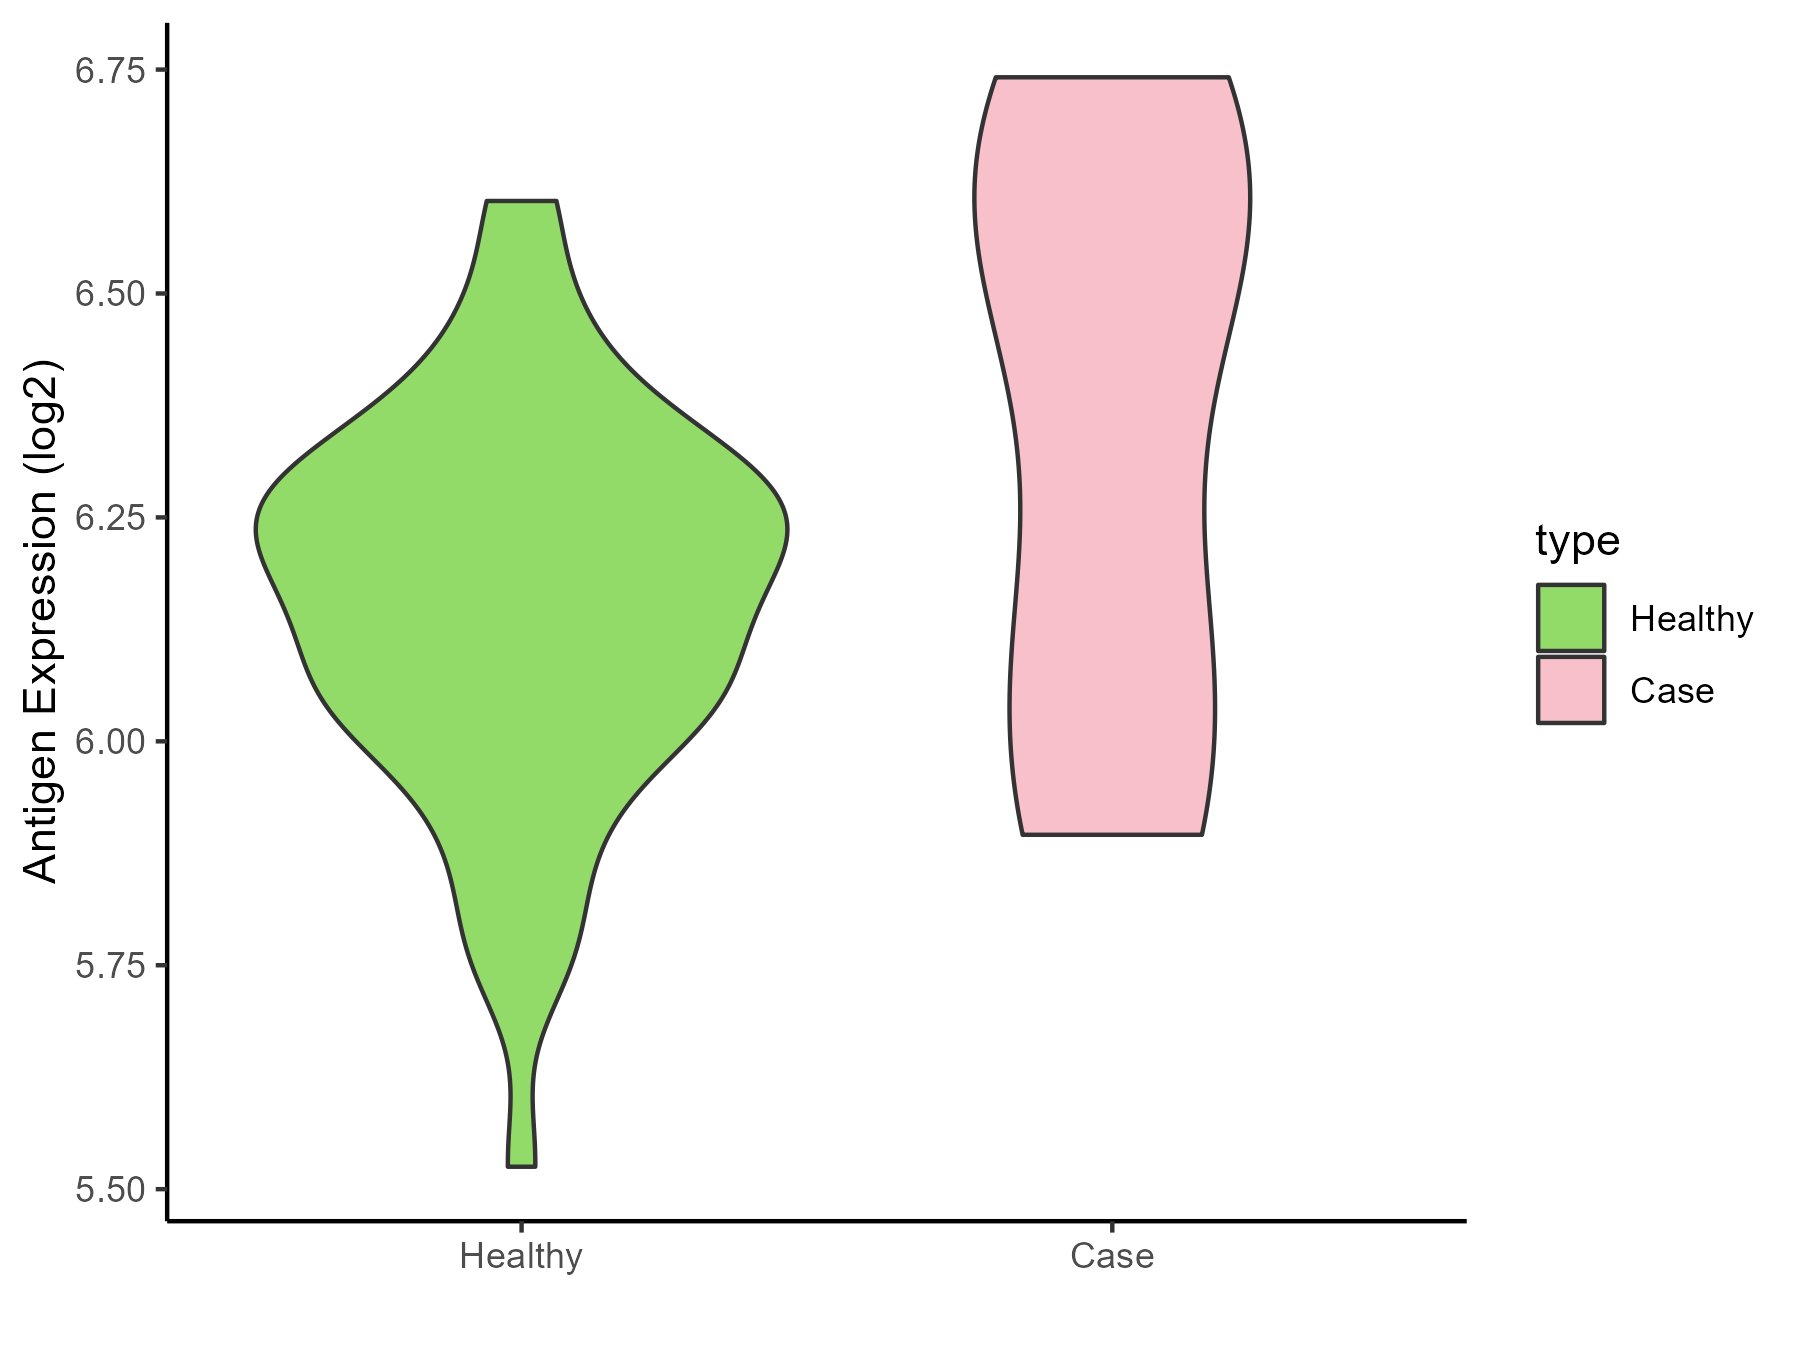
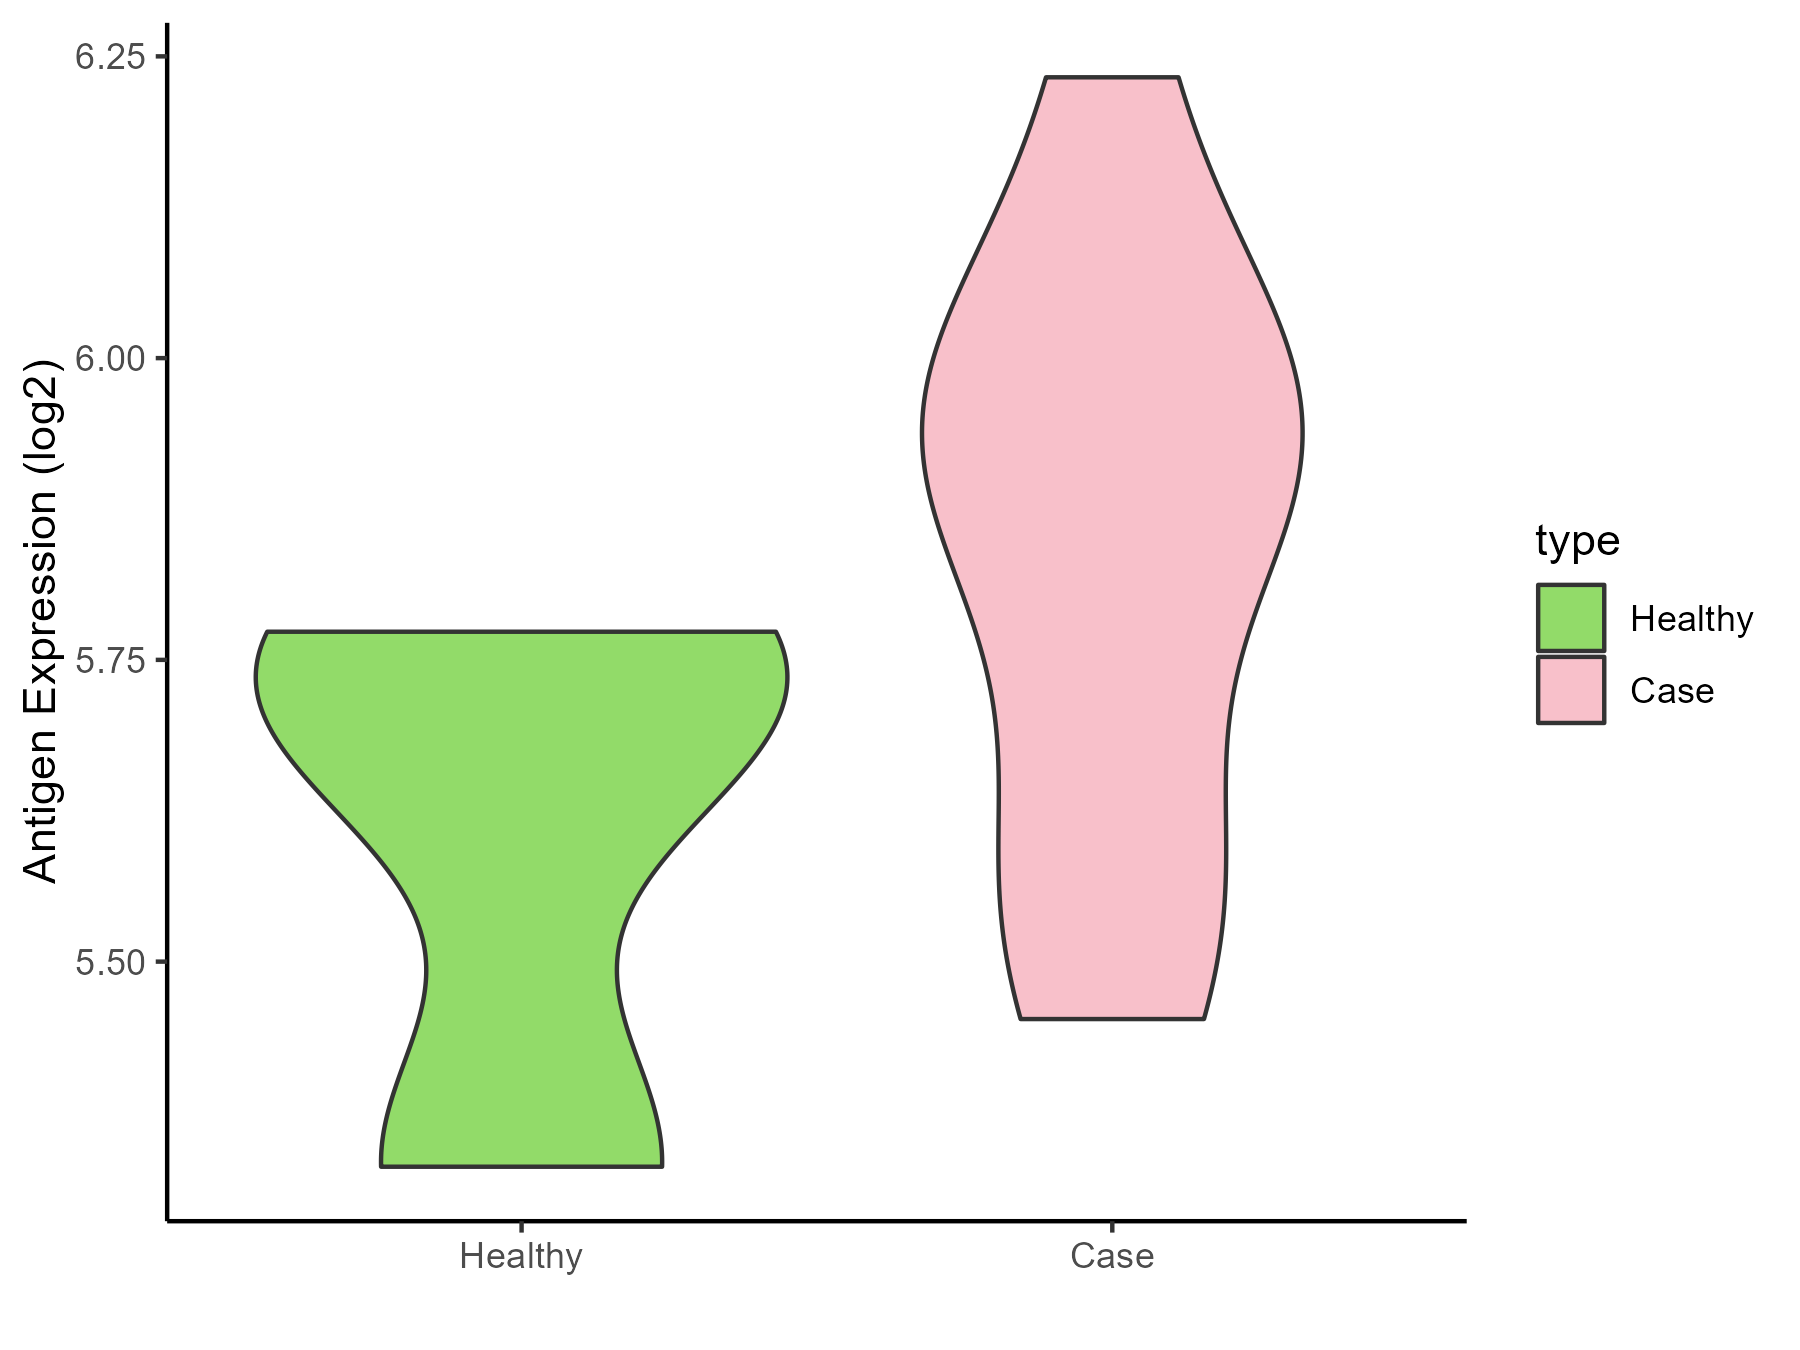
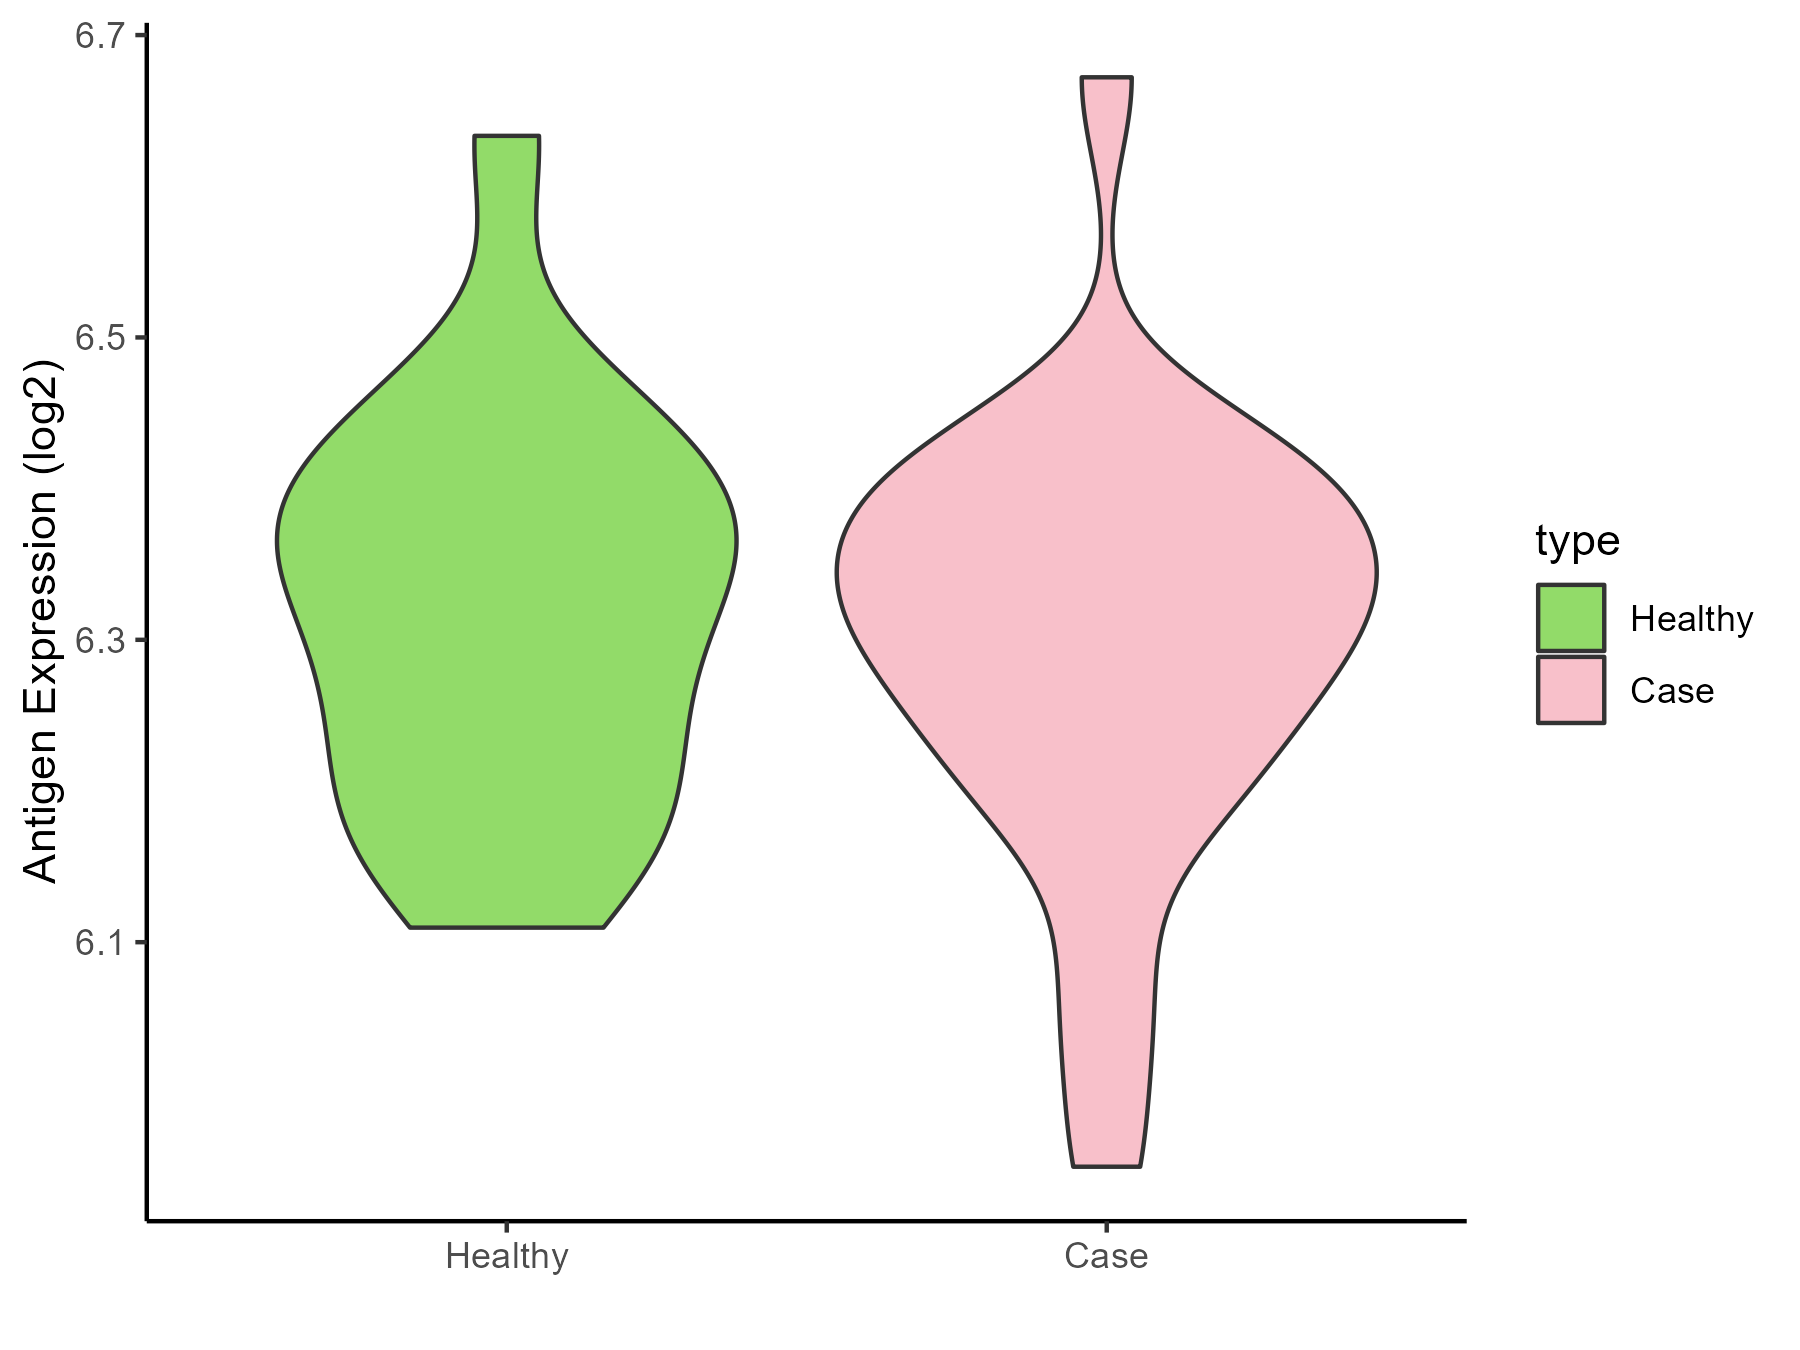
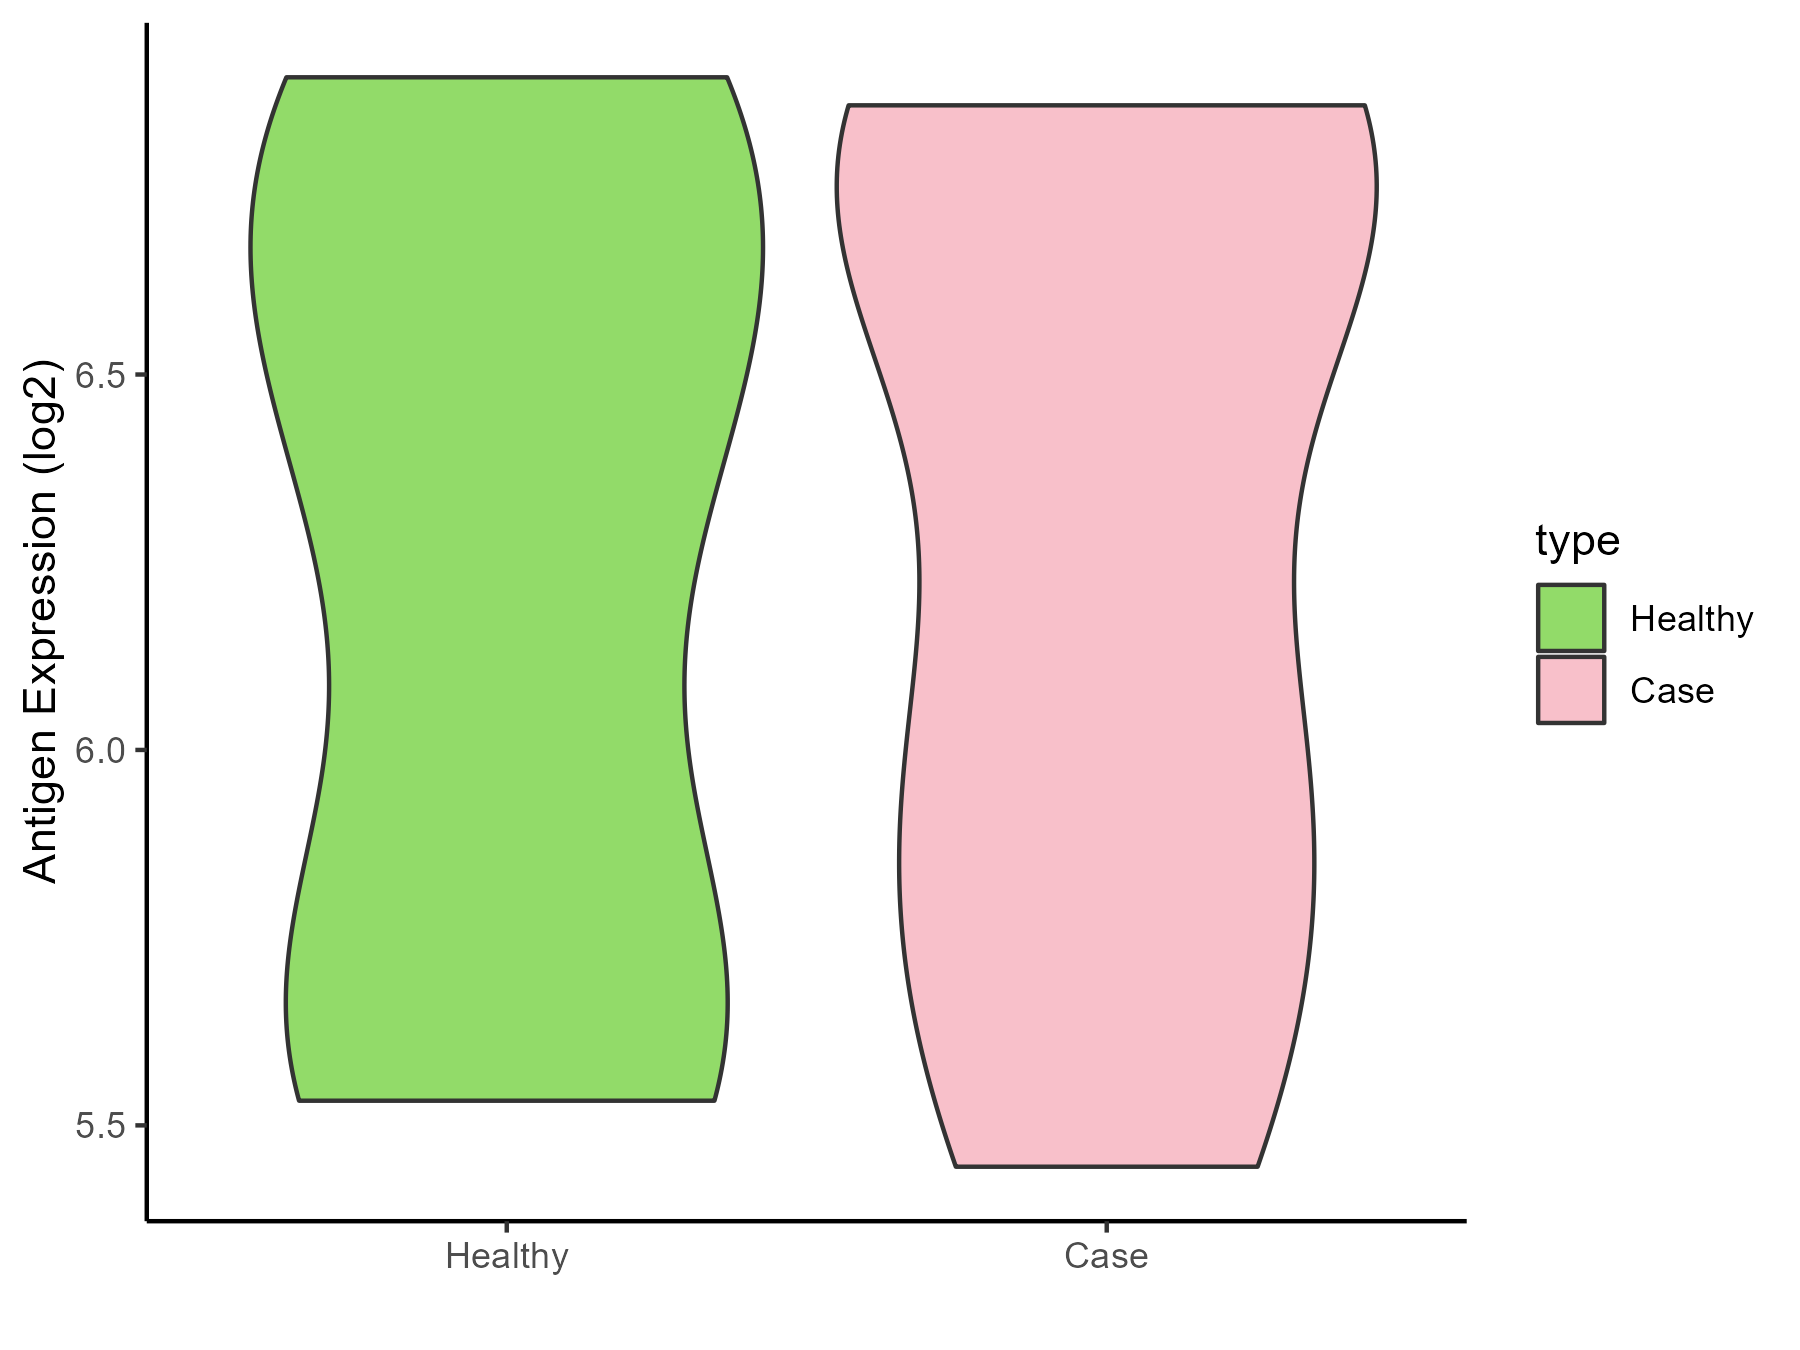
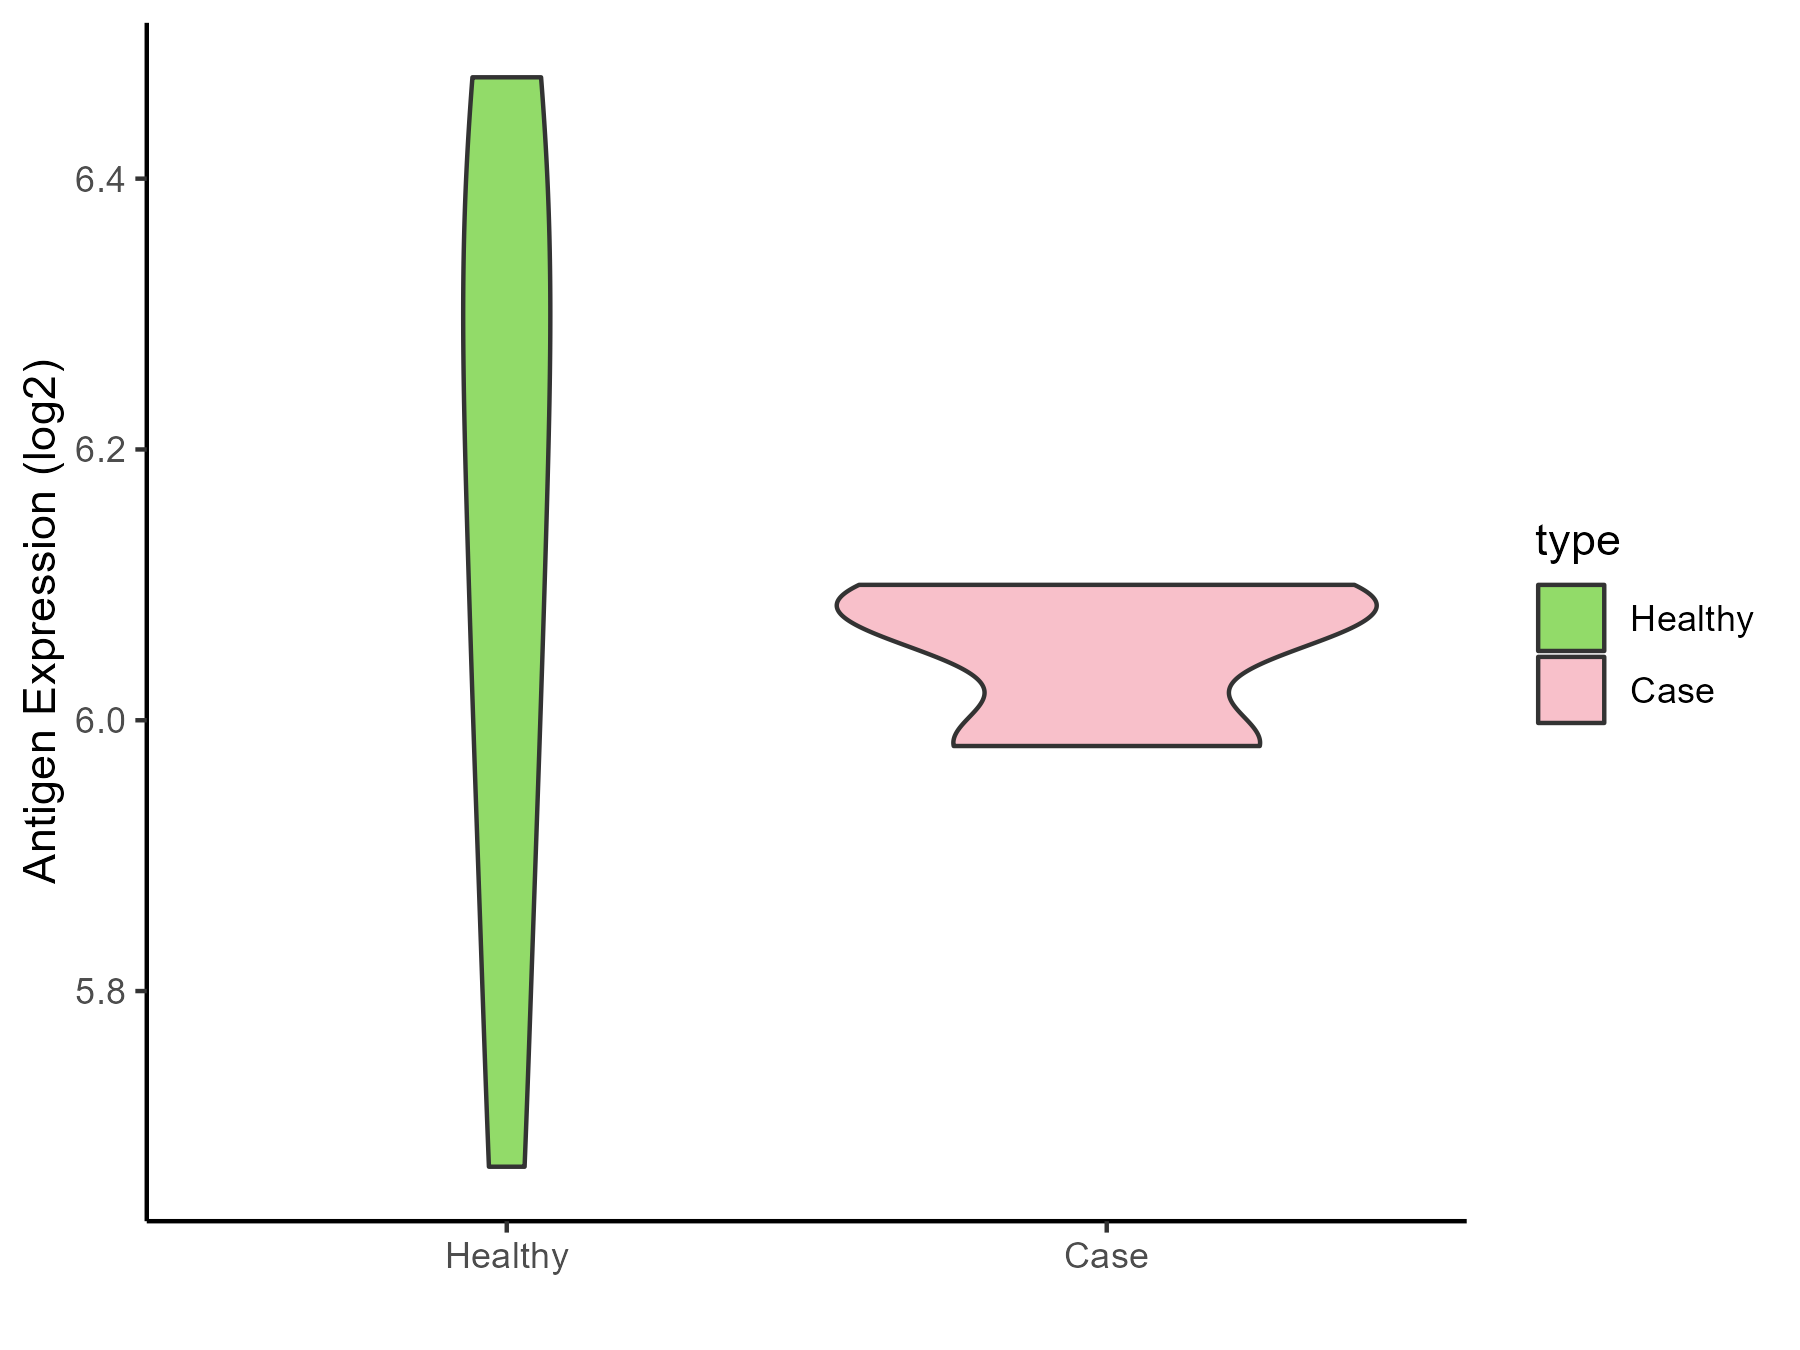
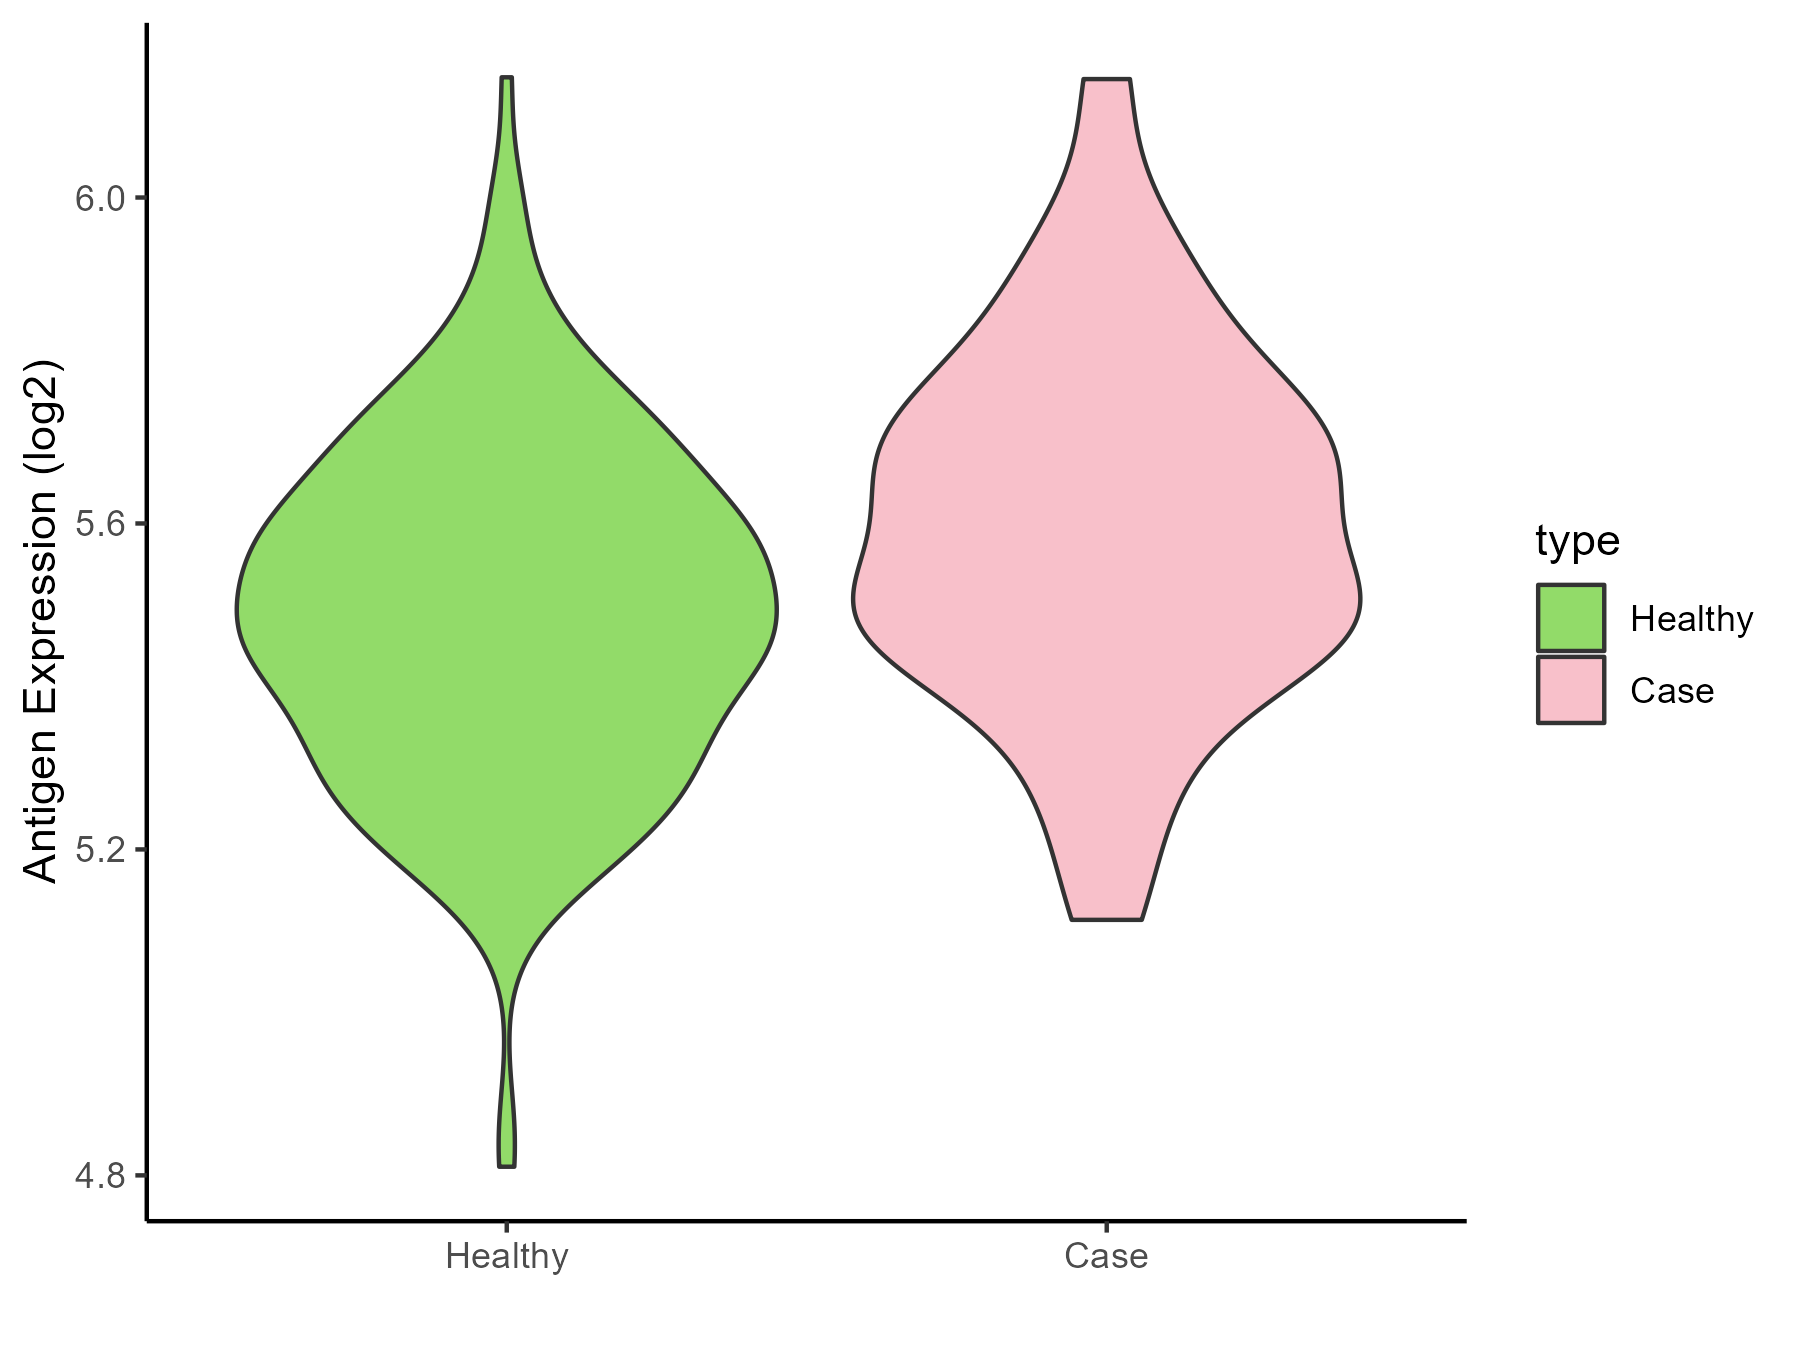
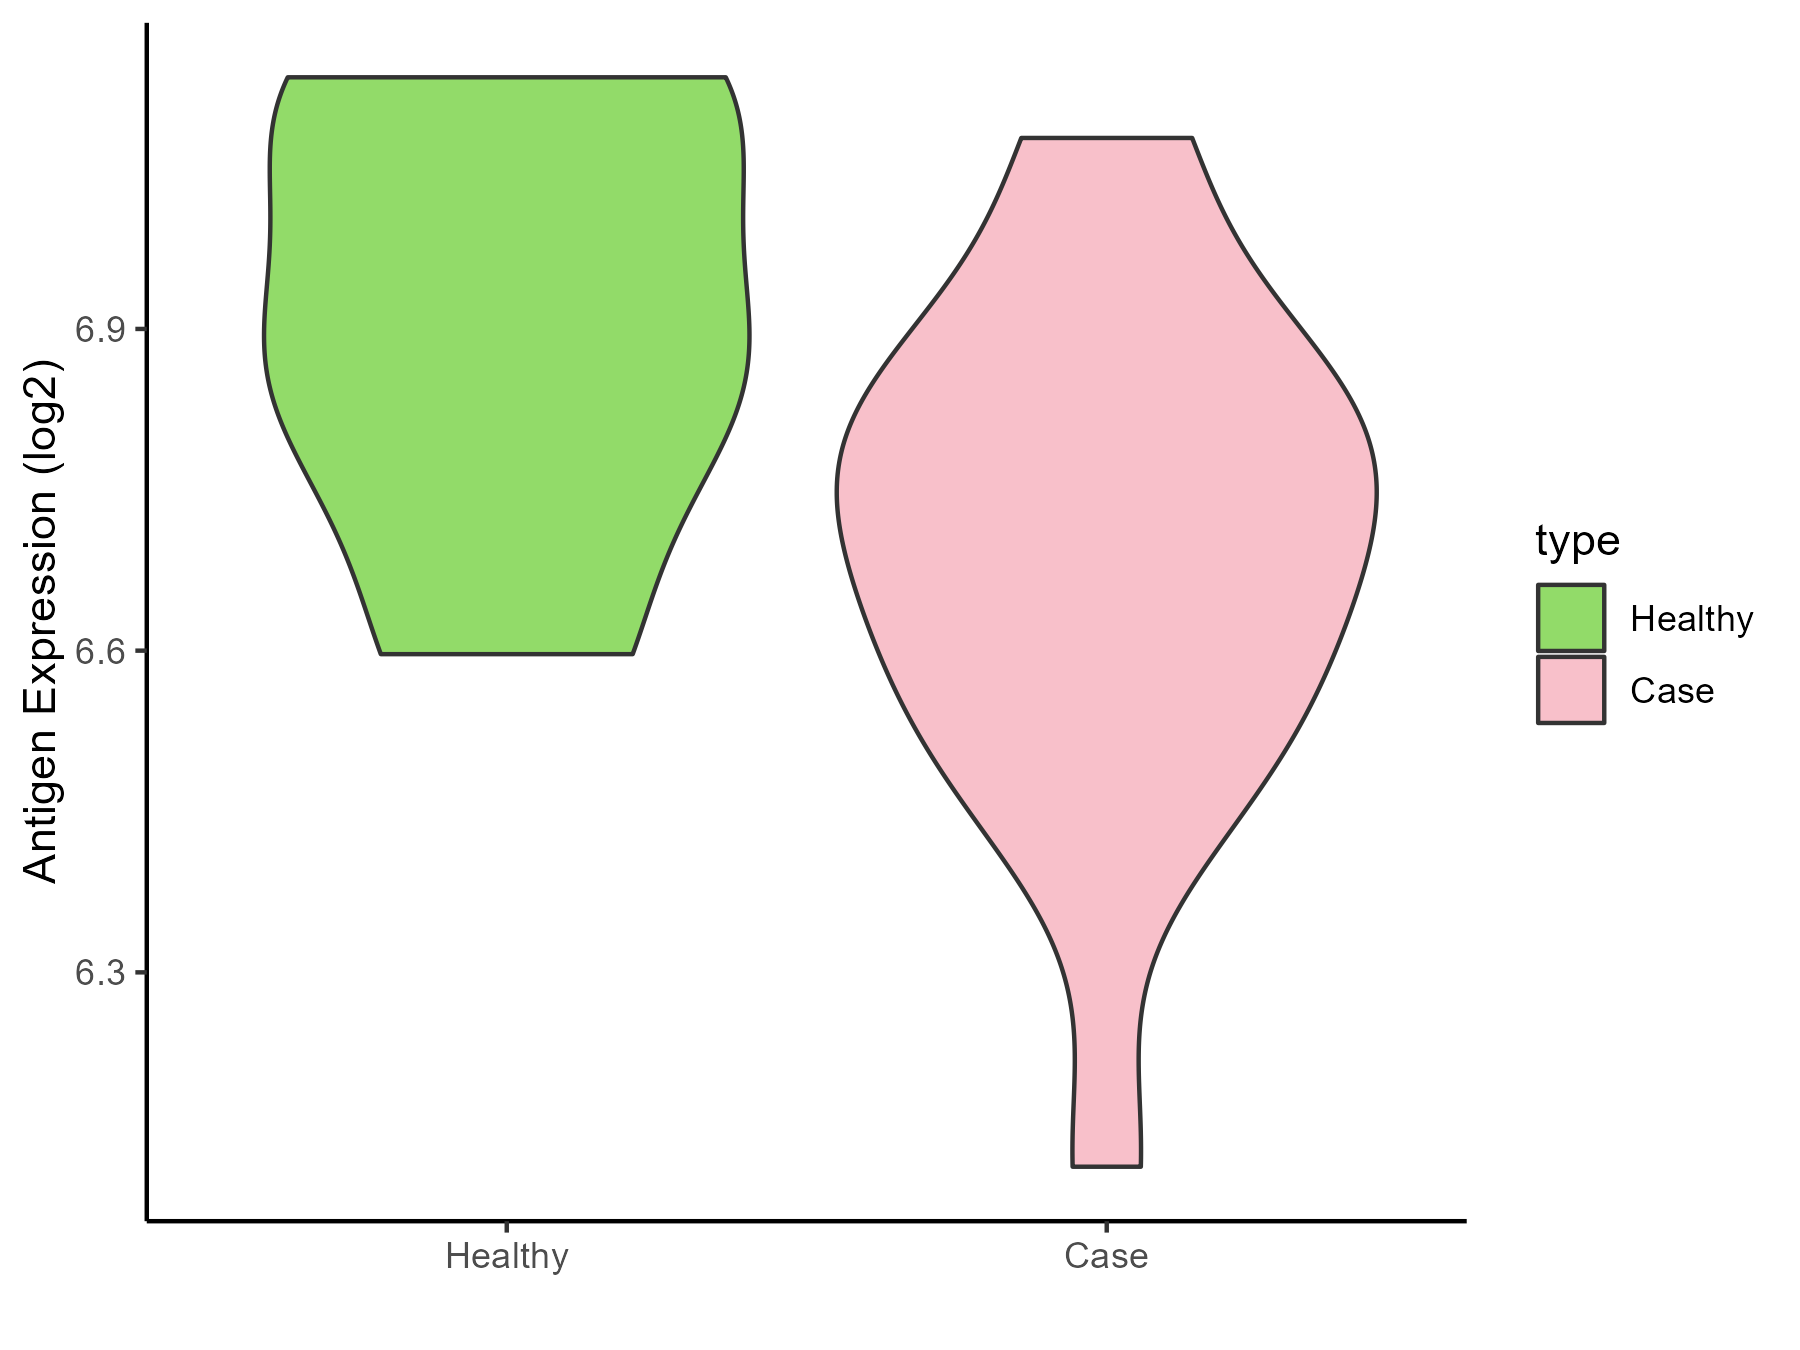
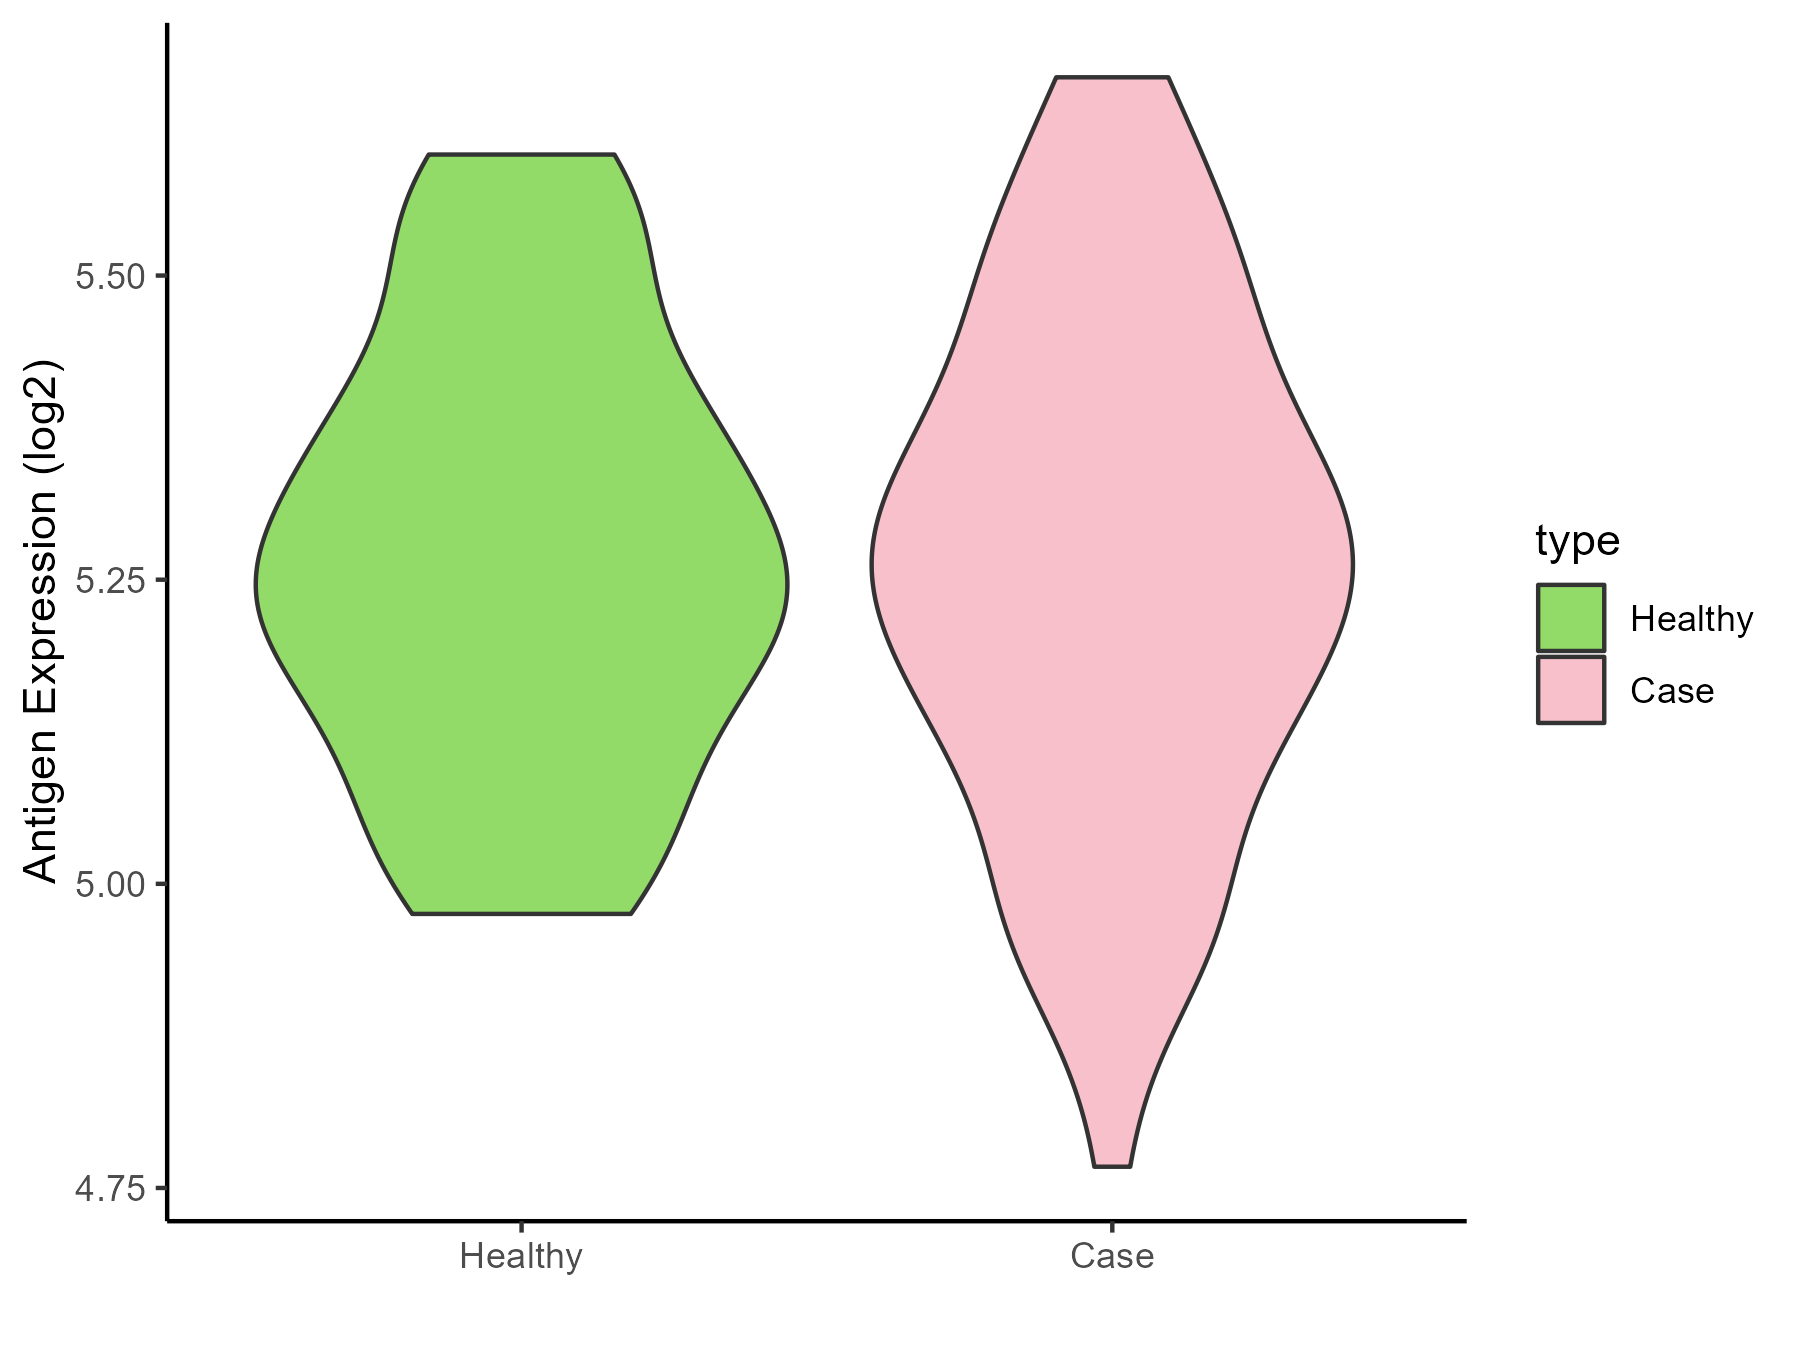
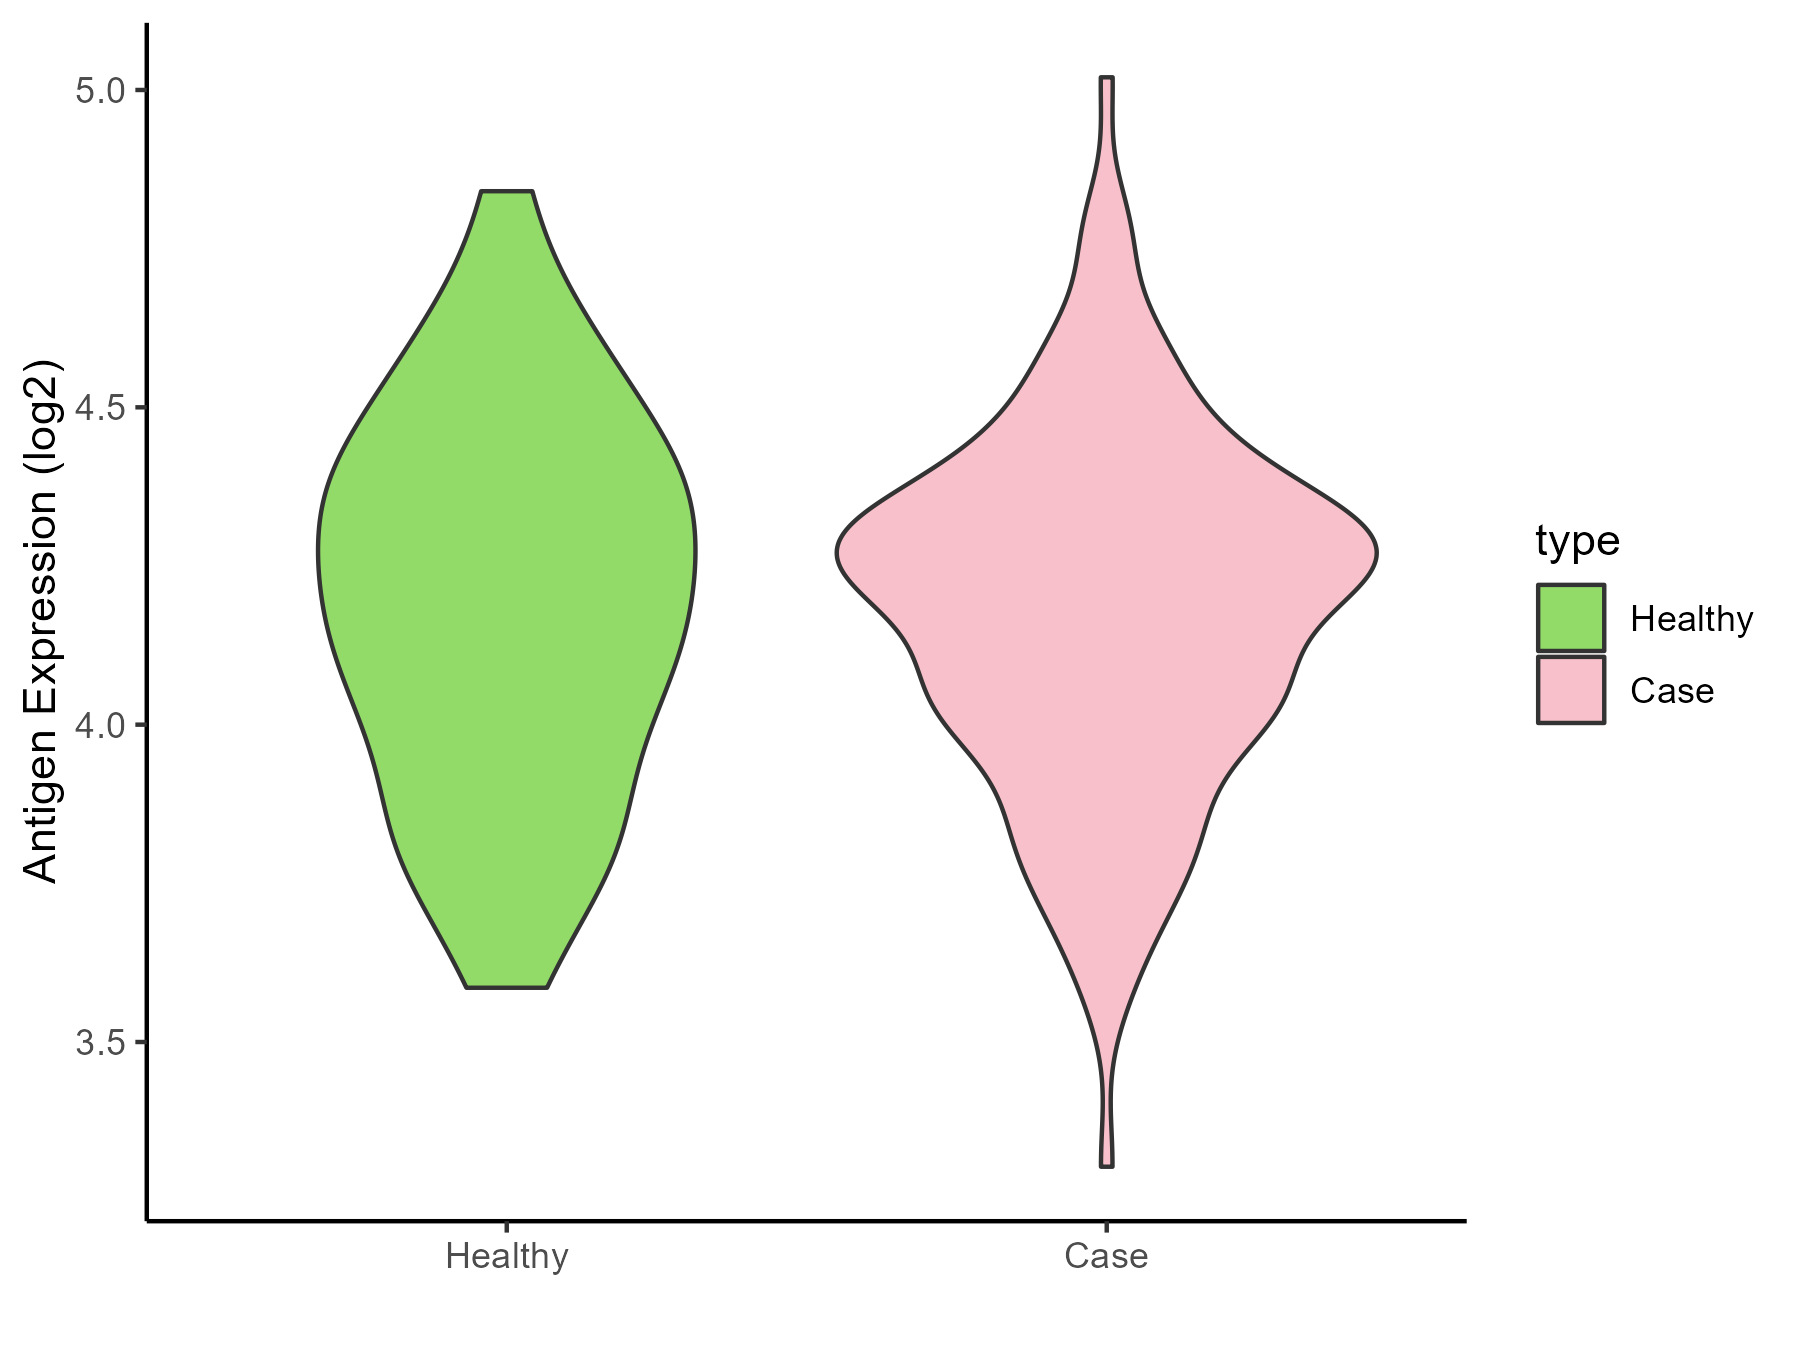
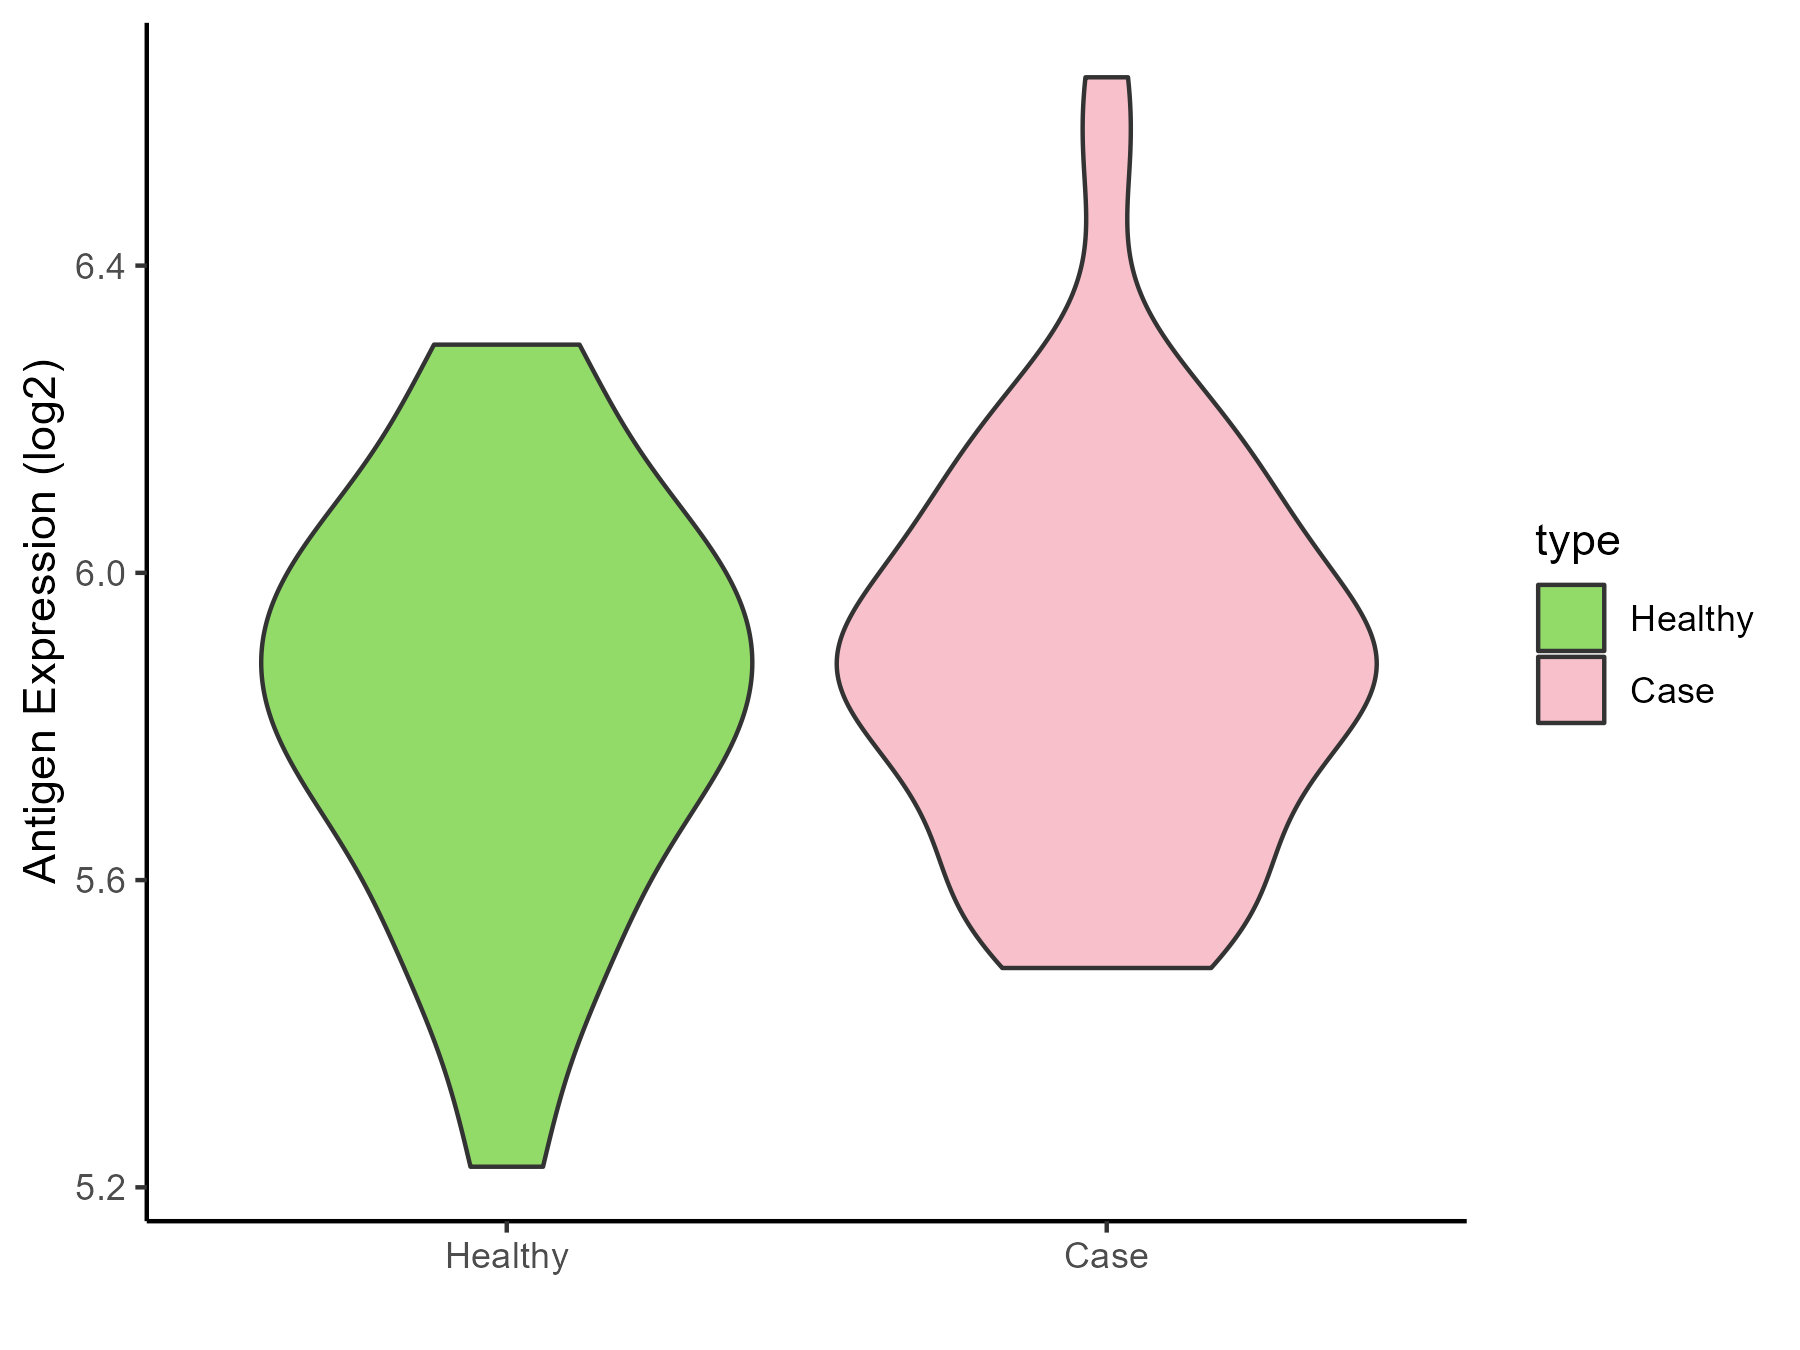
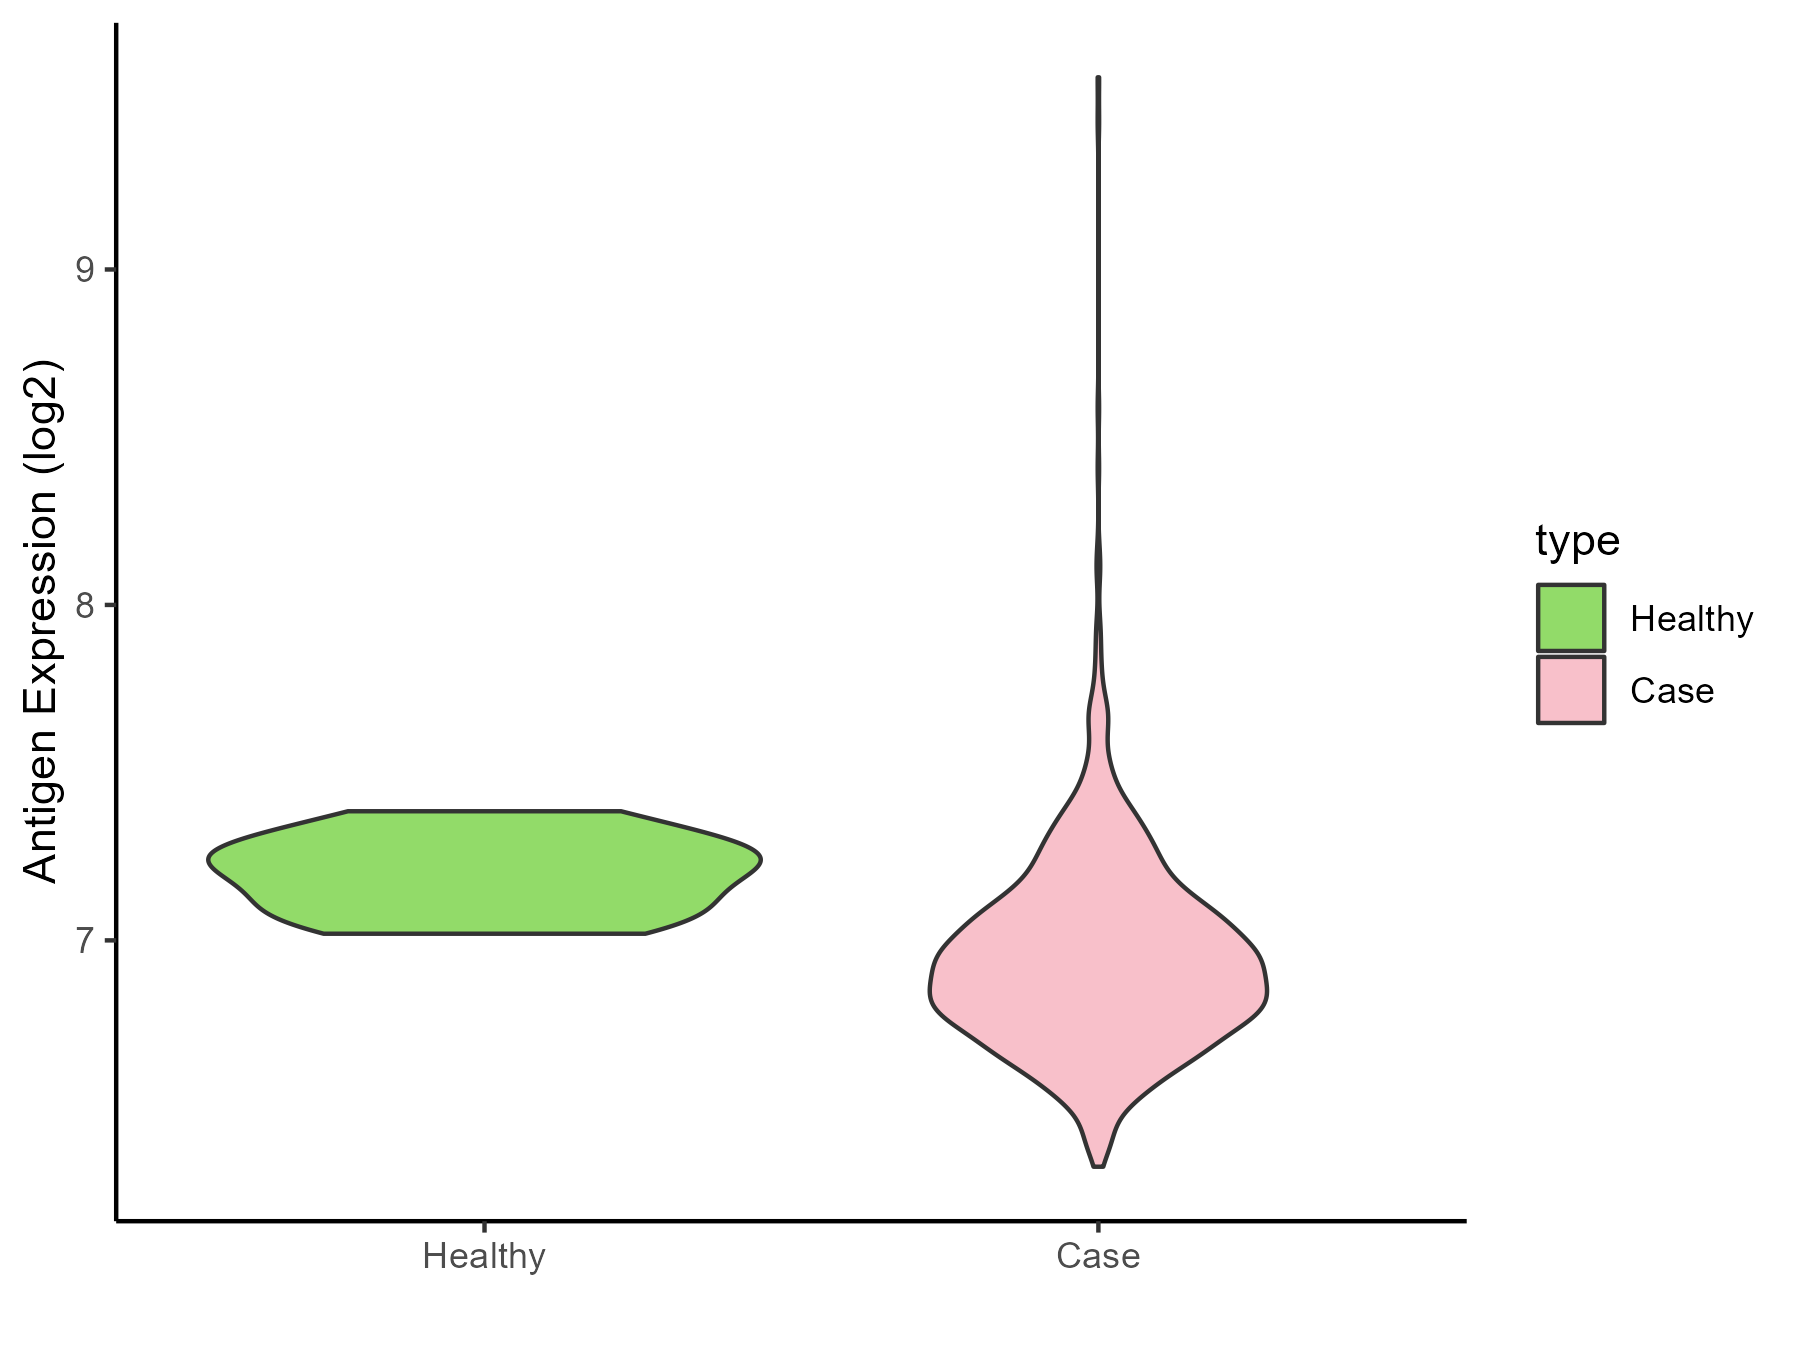
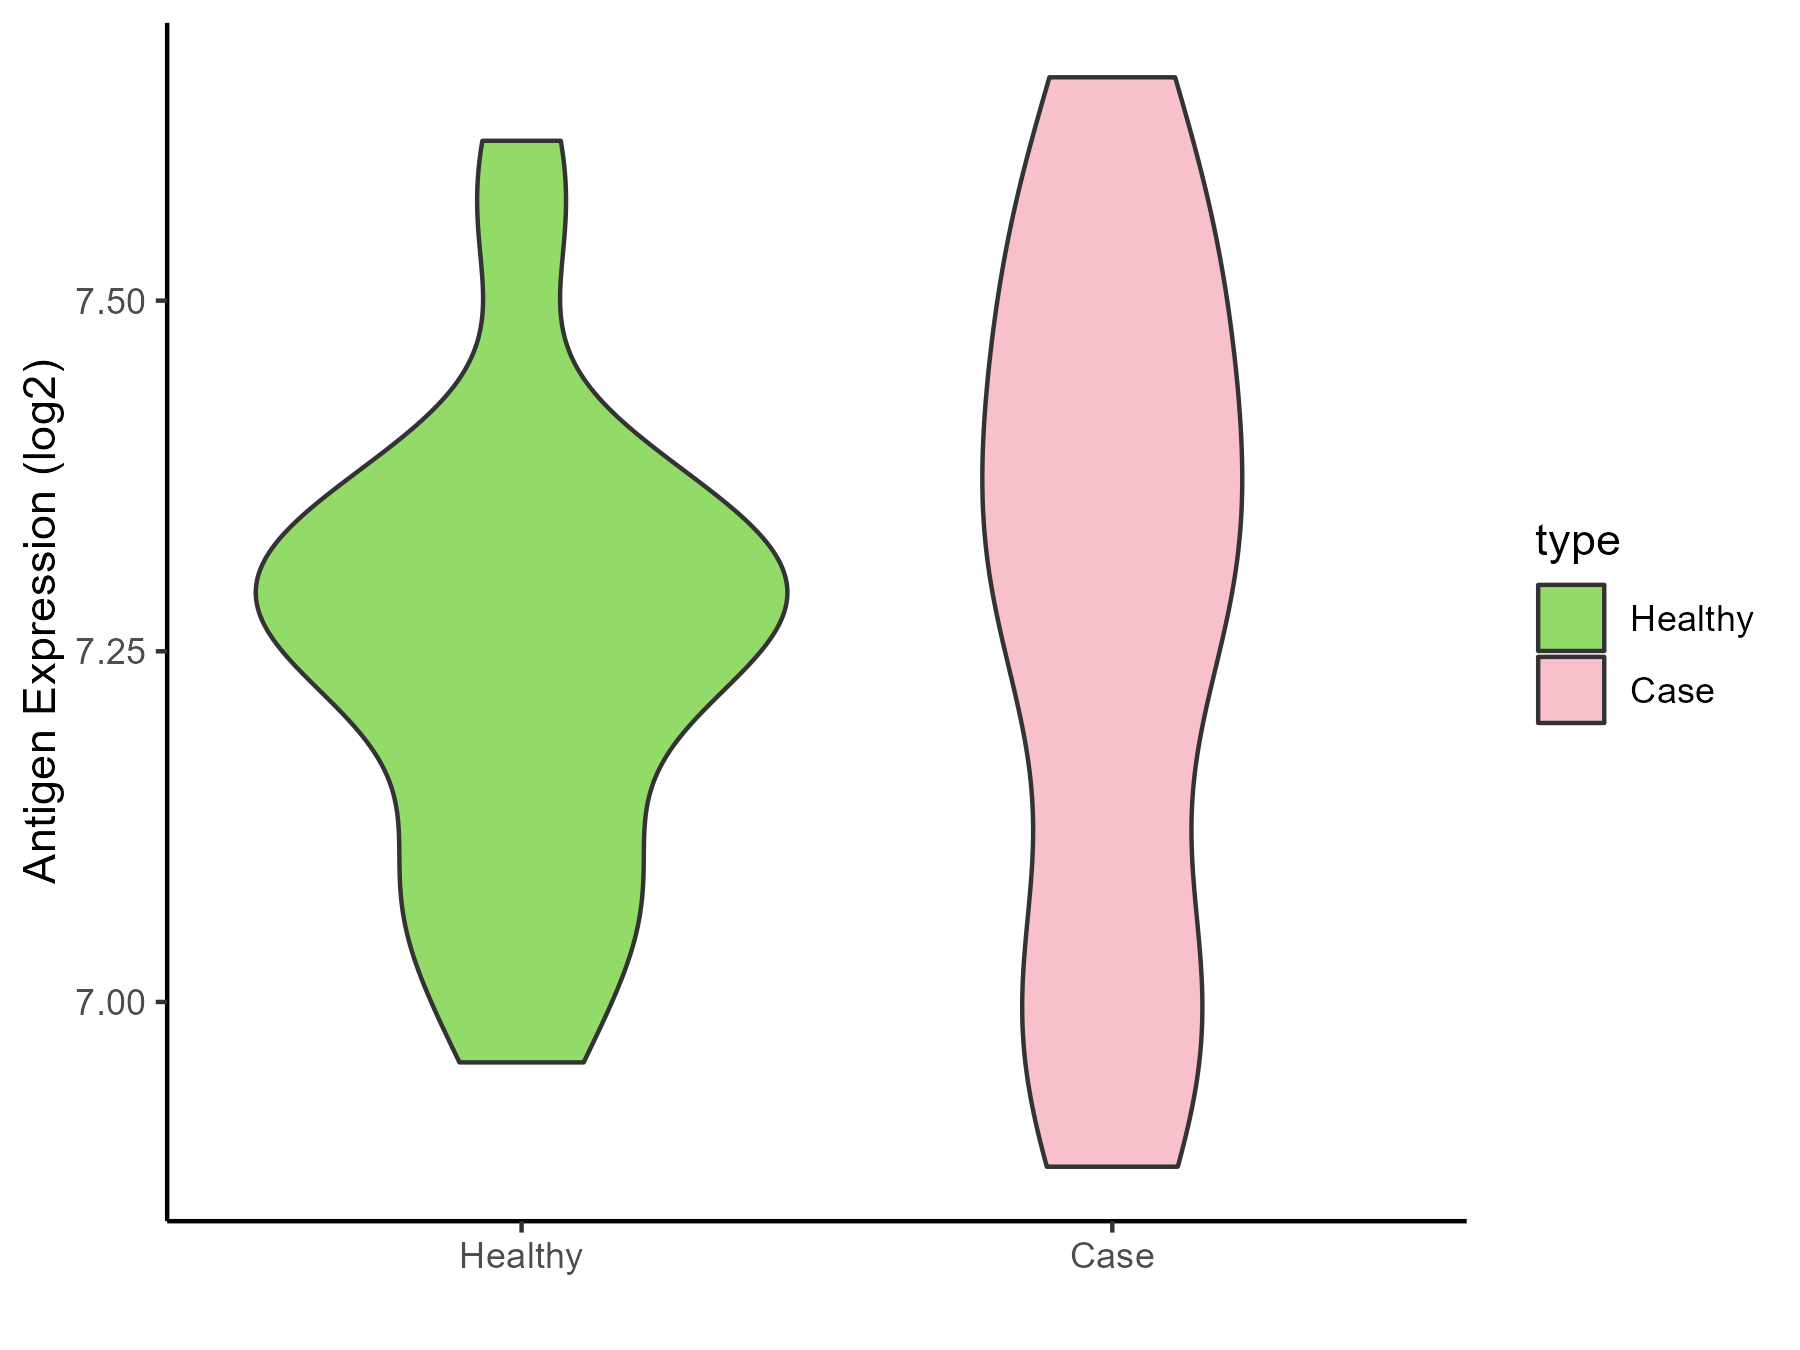
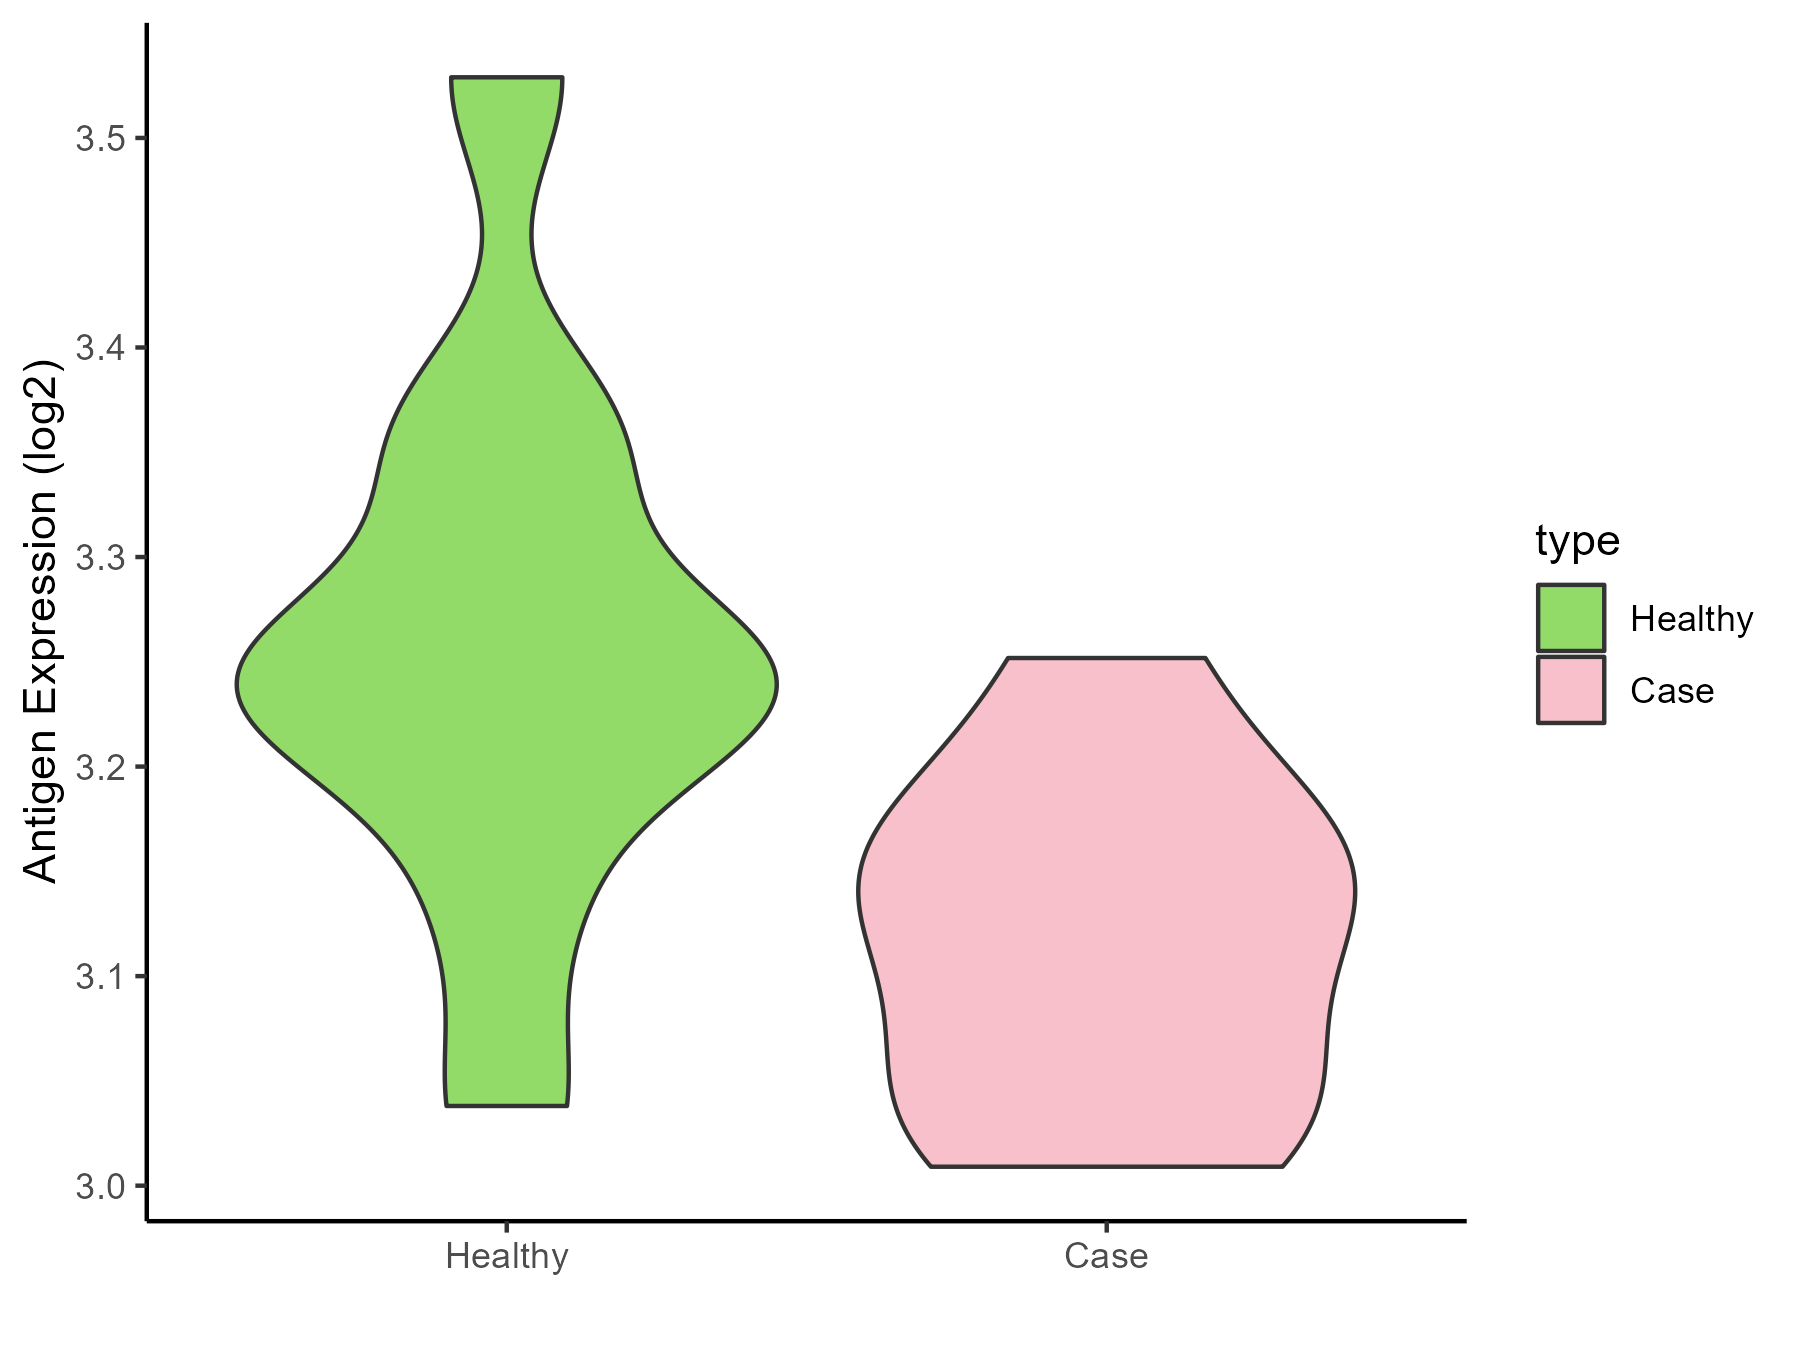
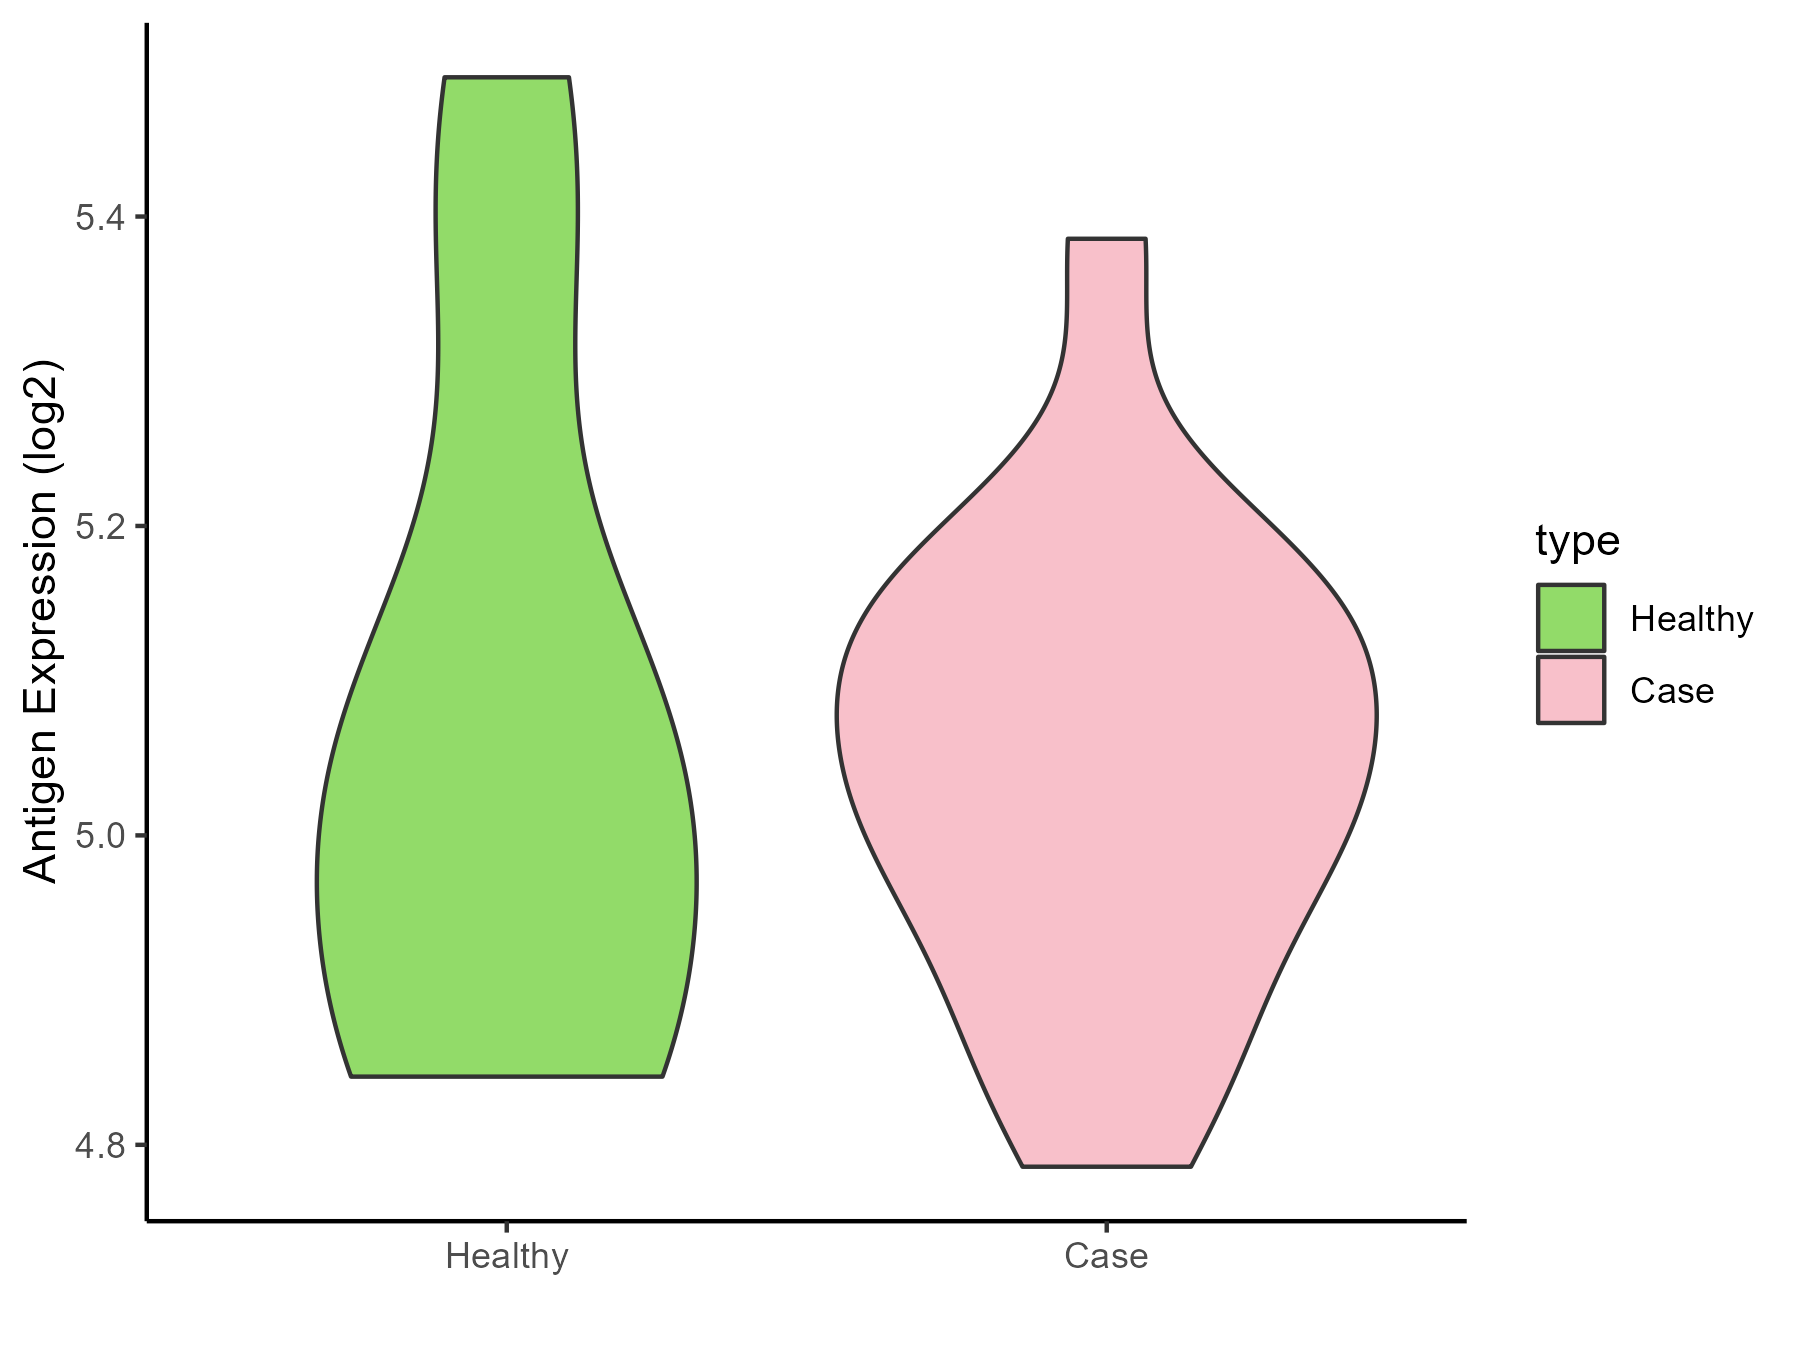
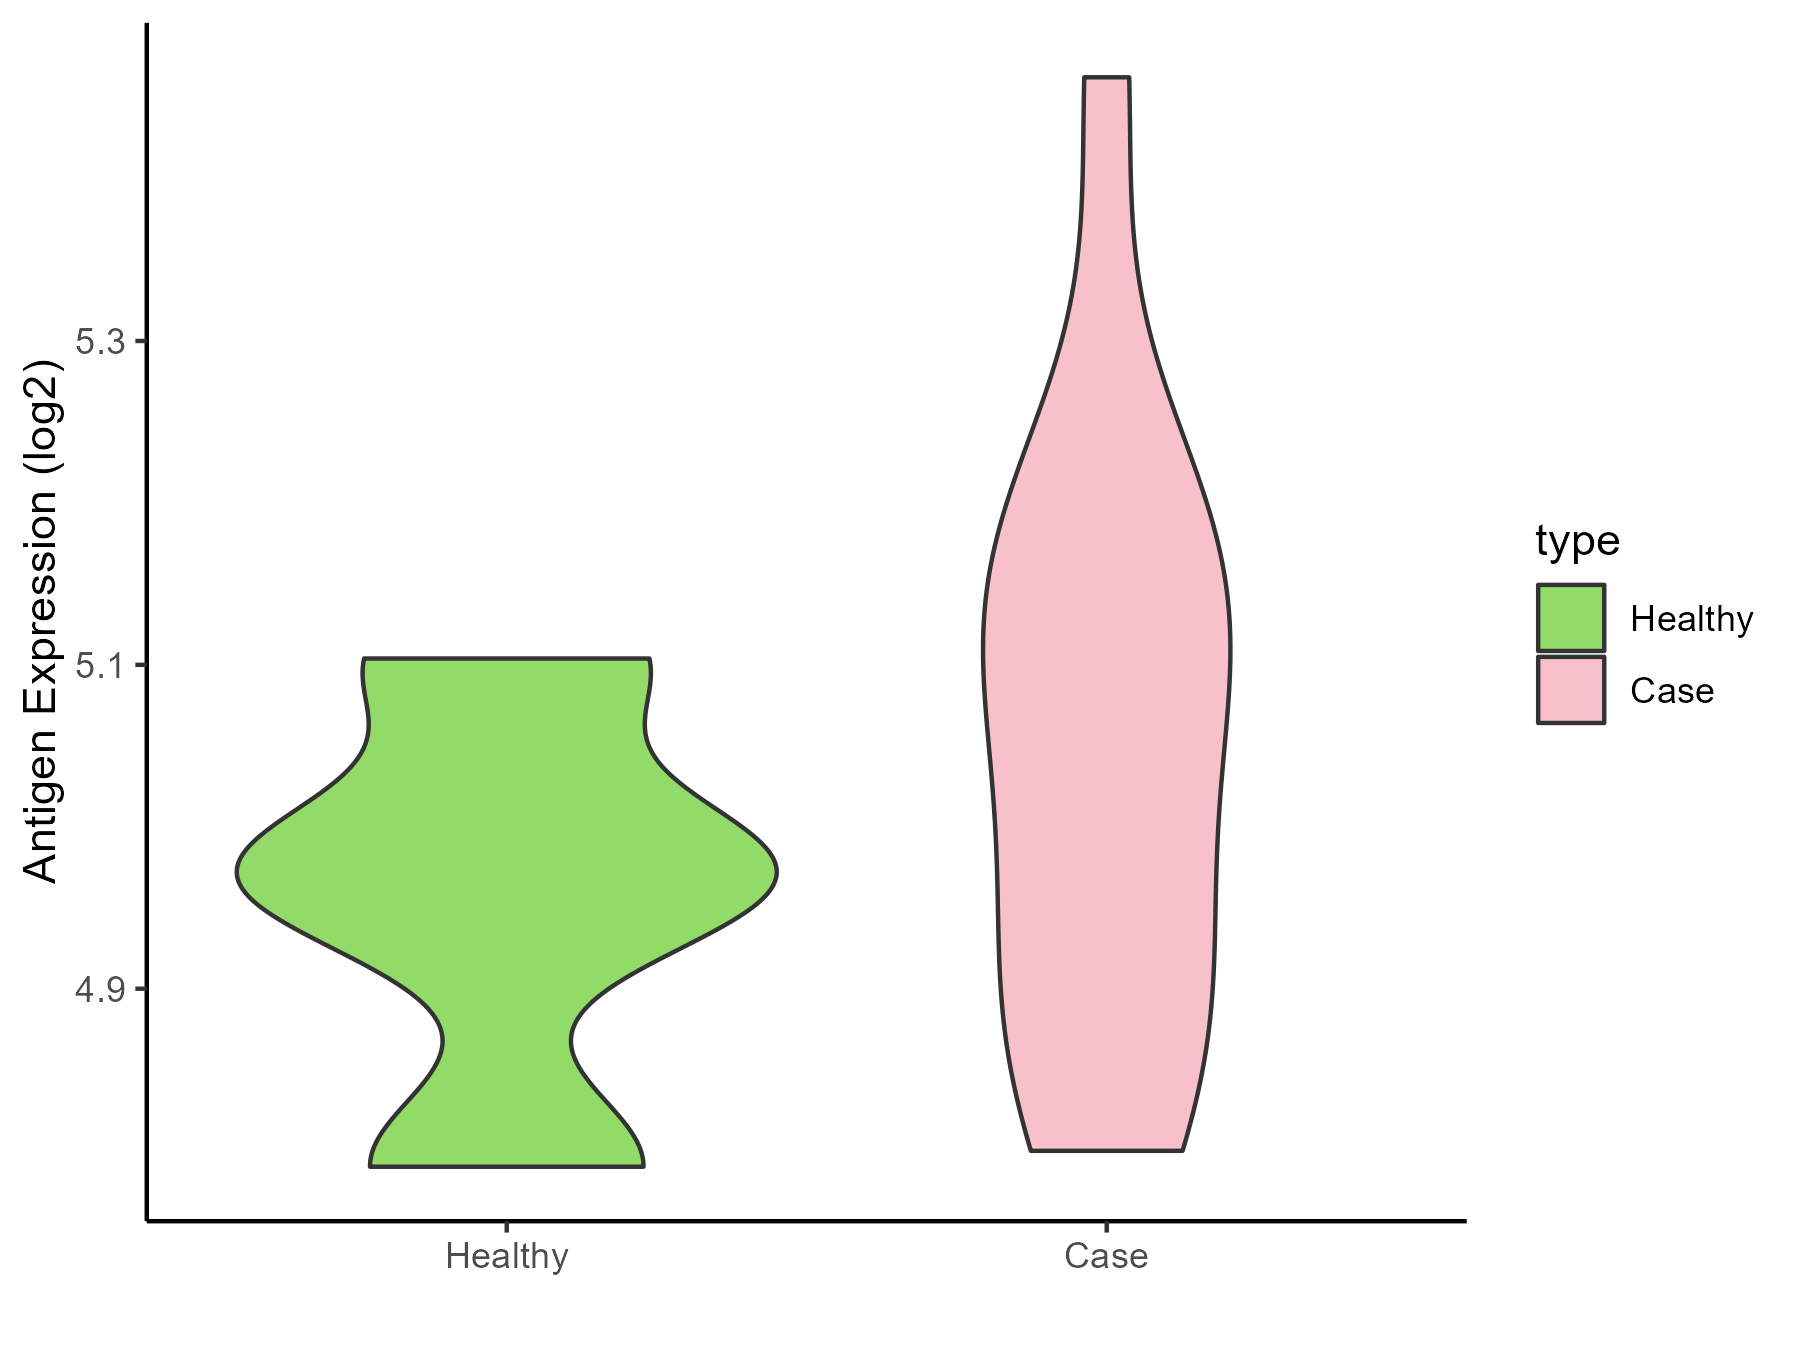
| The Studied Tissue | White matter | |
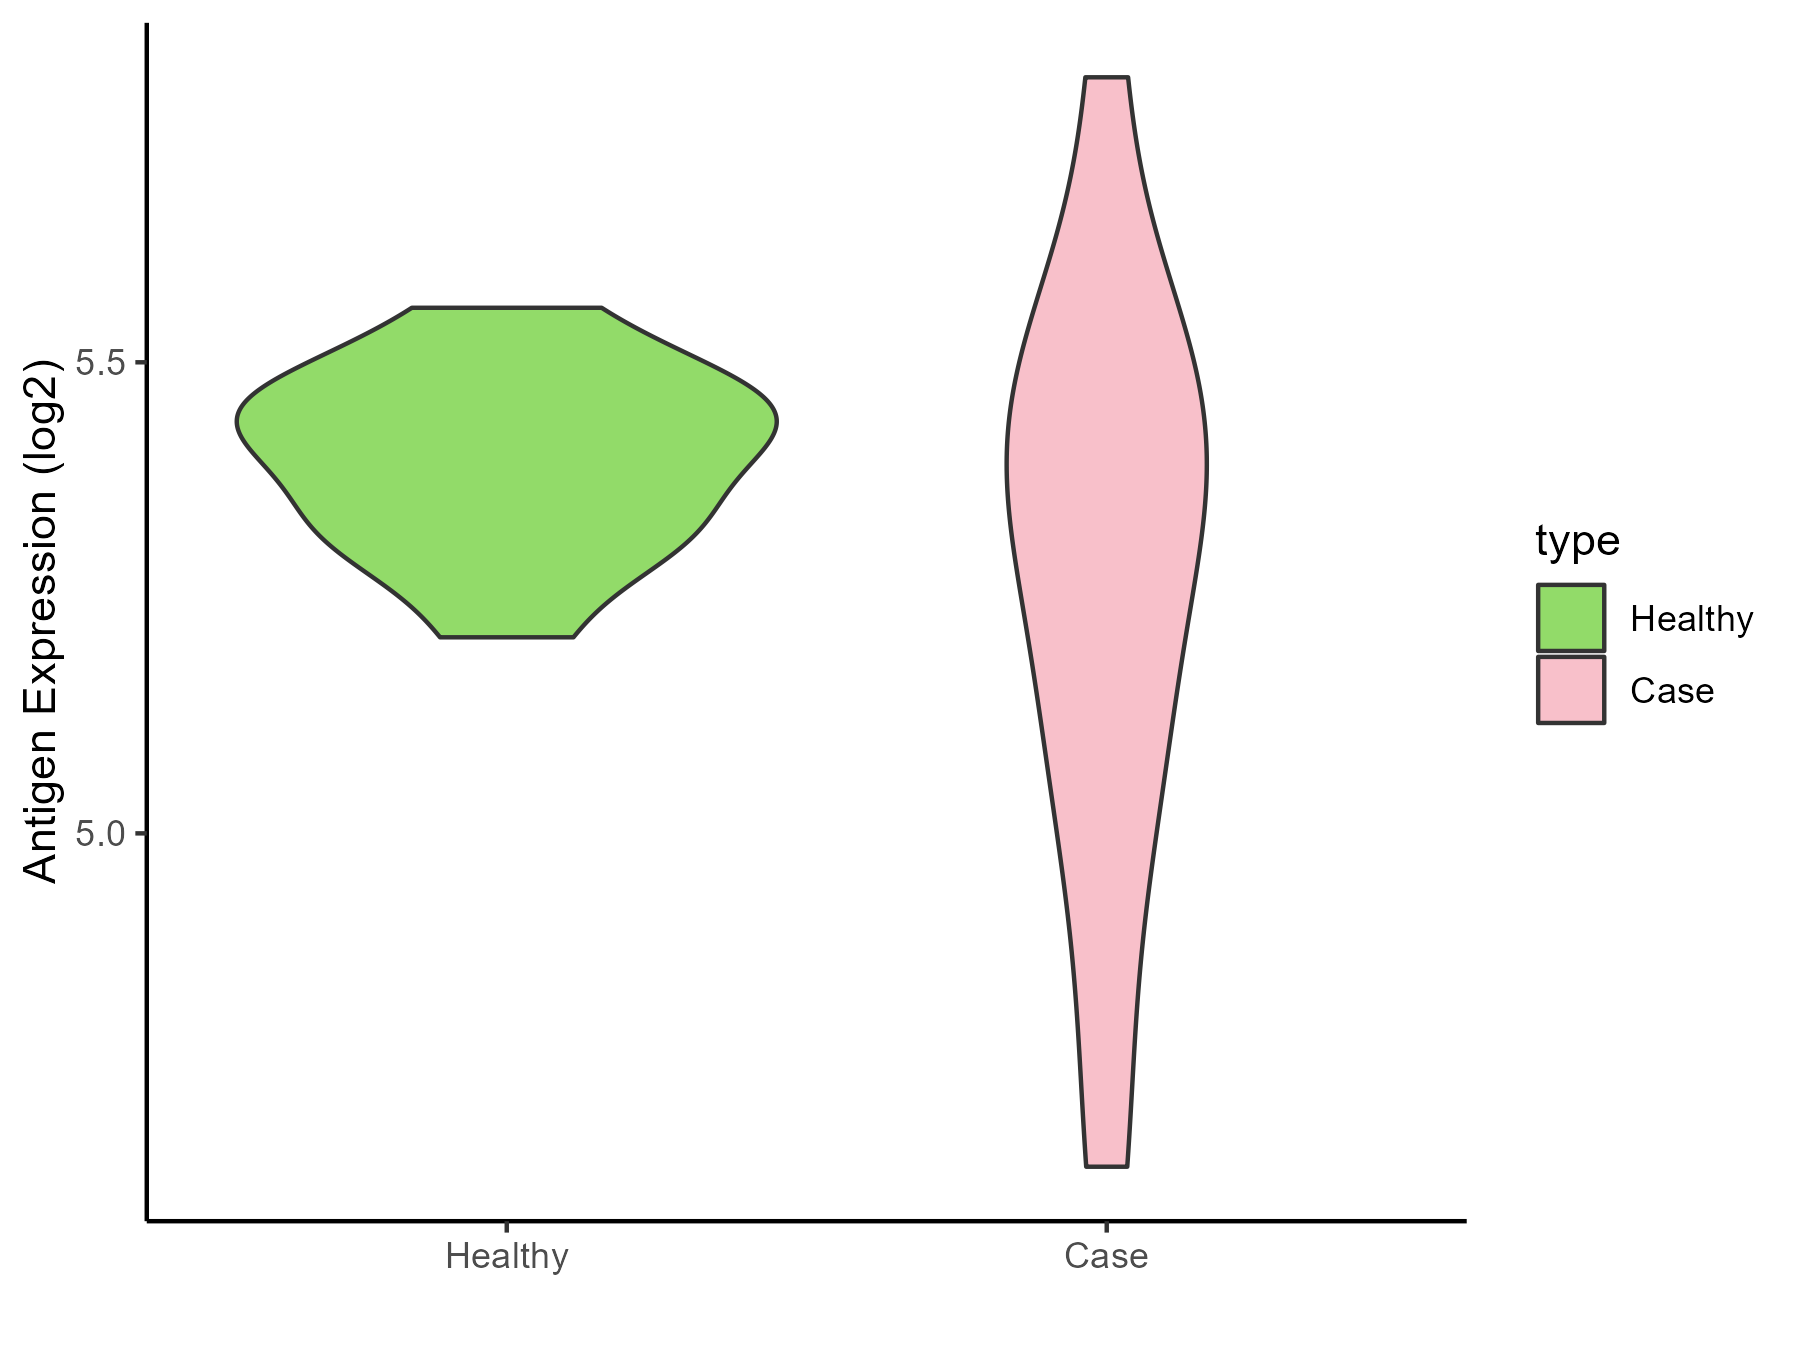
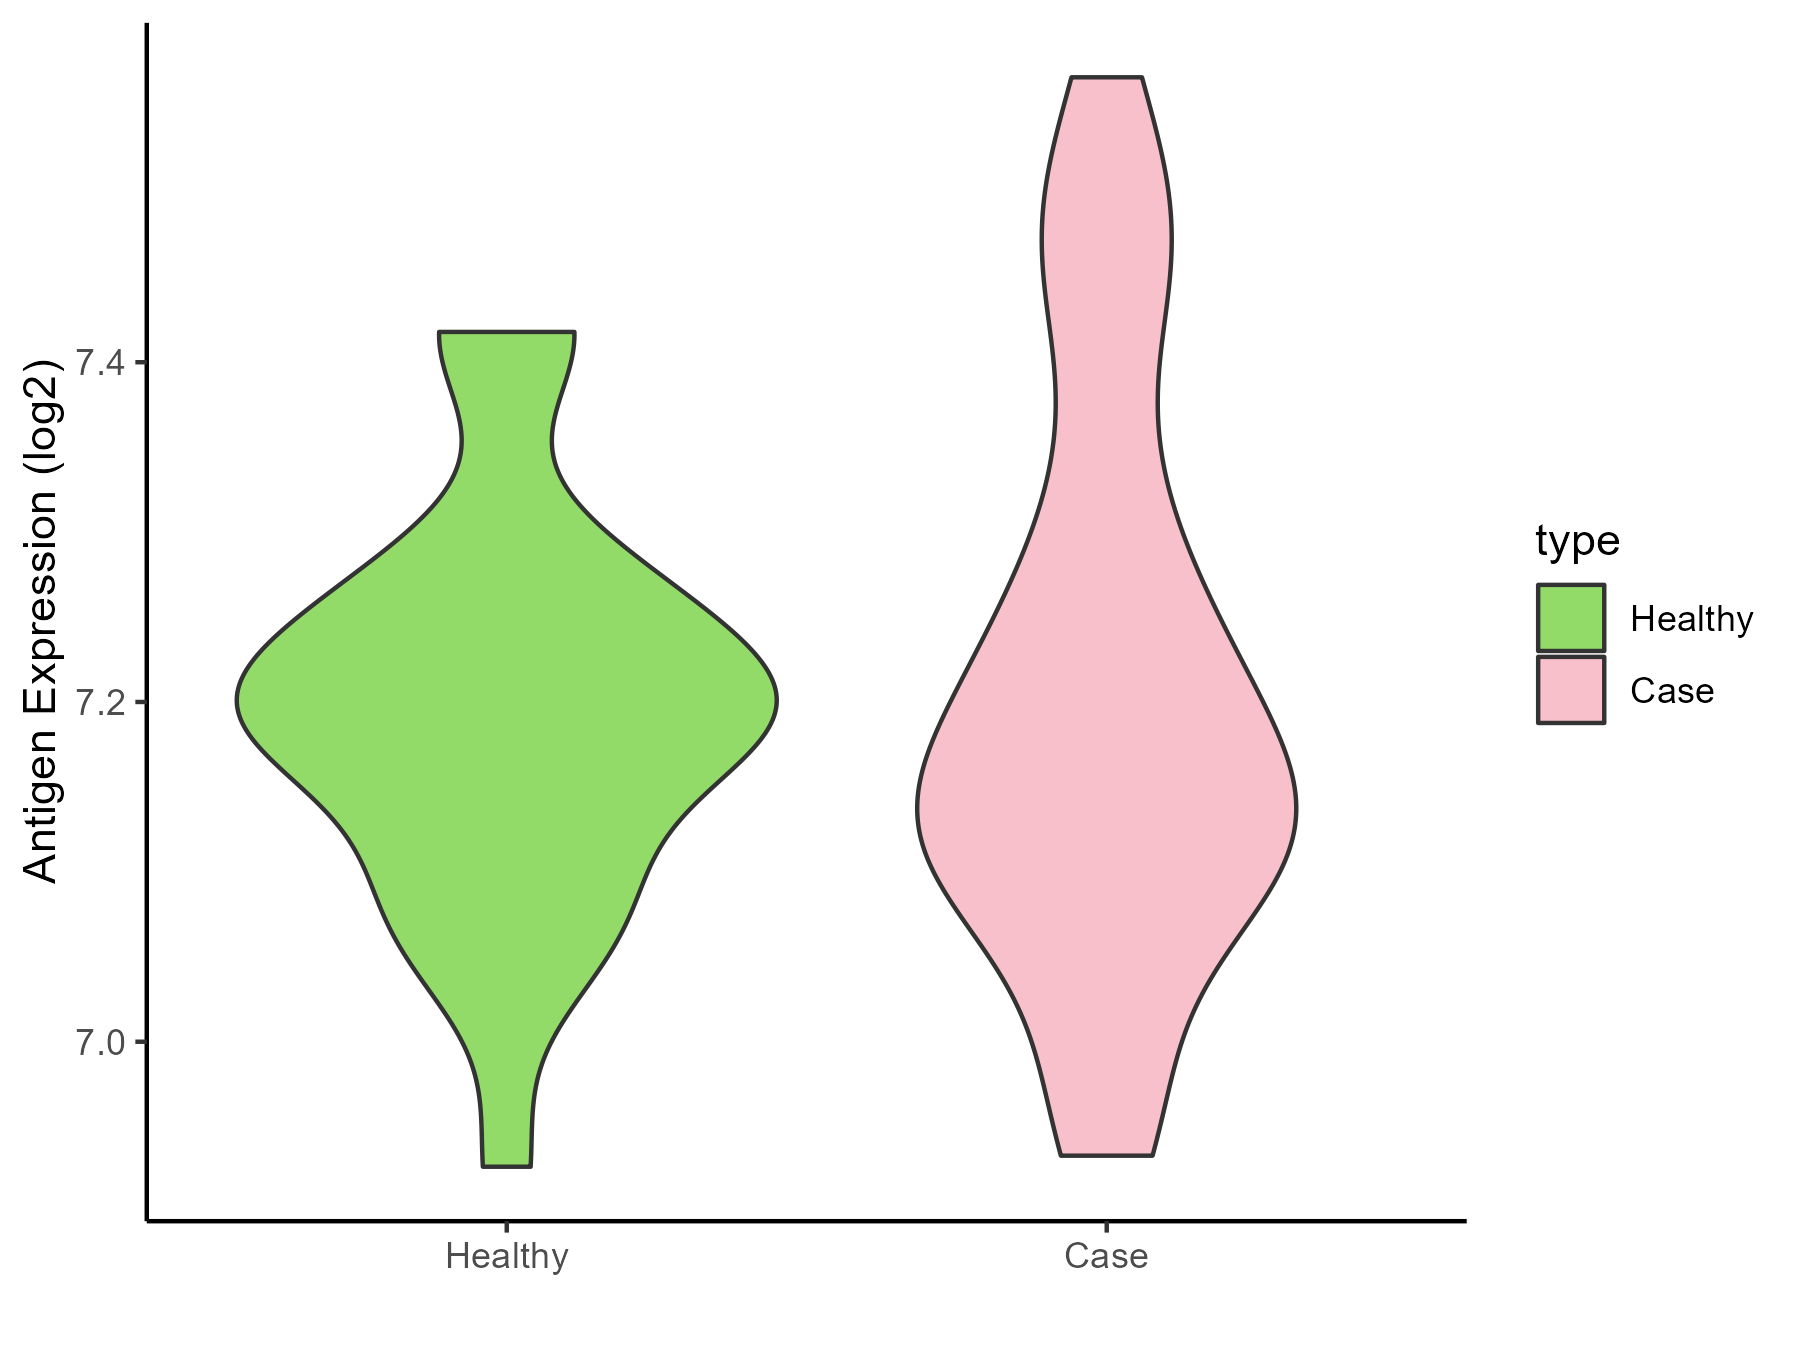
| The Specific Disease | Glioma | |
| The Expression Level of Disease Section Compare with the Healthy Individual Tissue | p-value: 0.000134098; Fold-change: -0.3728879; Z-score: -1.821142041 | |
| Disease-specific Antigen Abundances |
|
Click to View the Clearer Original Diagram |
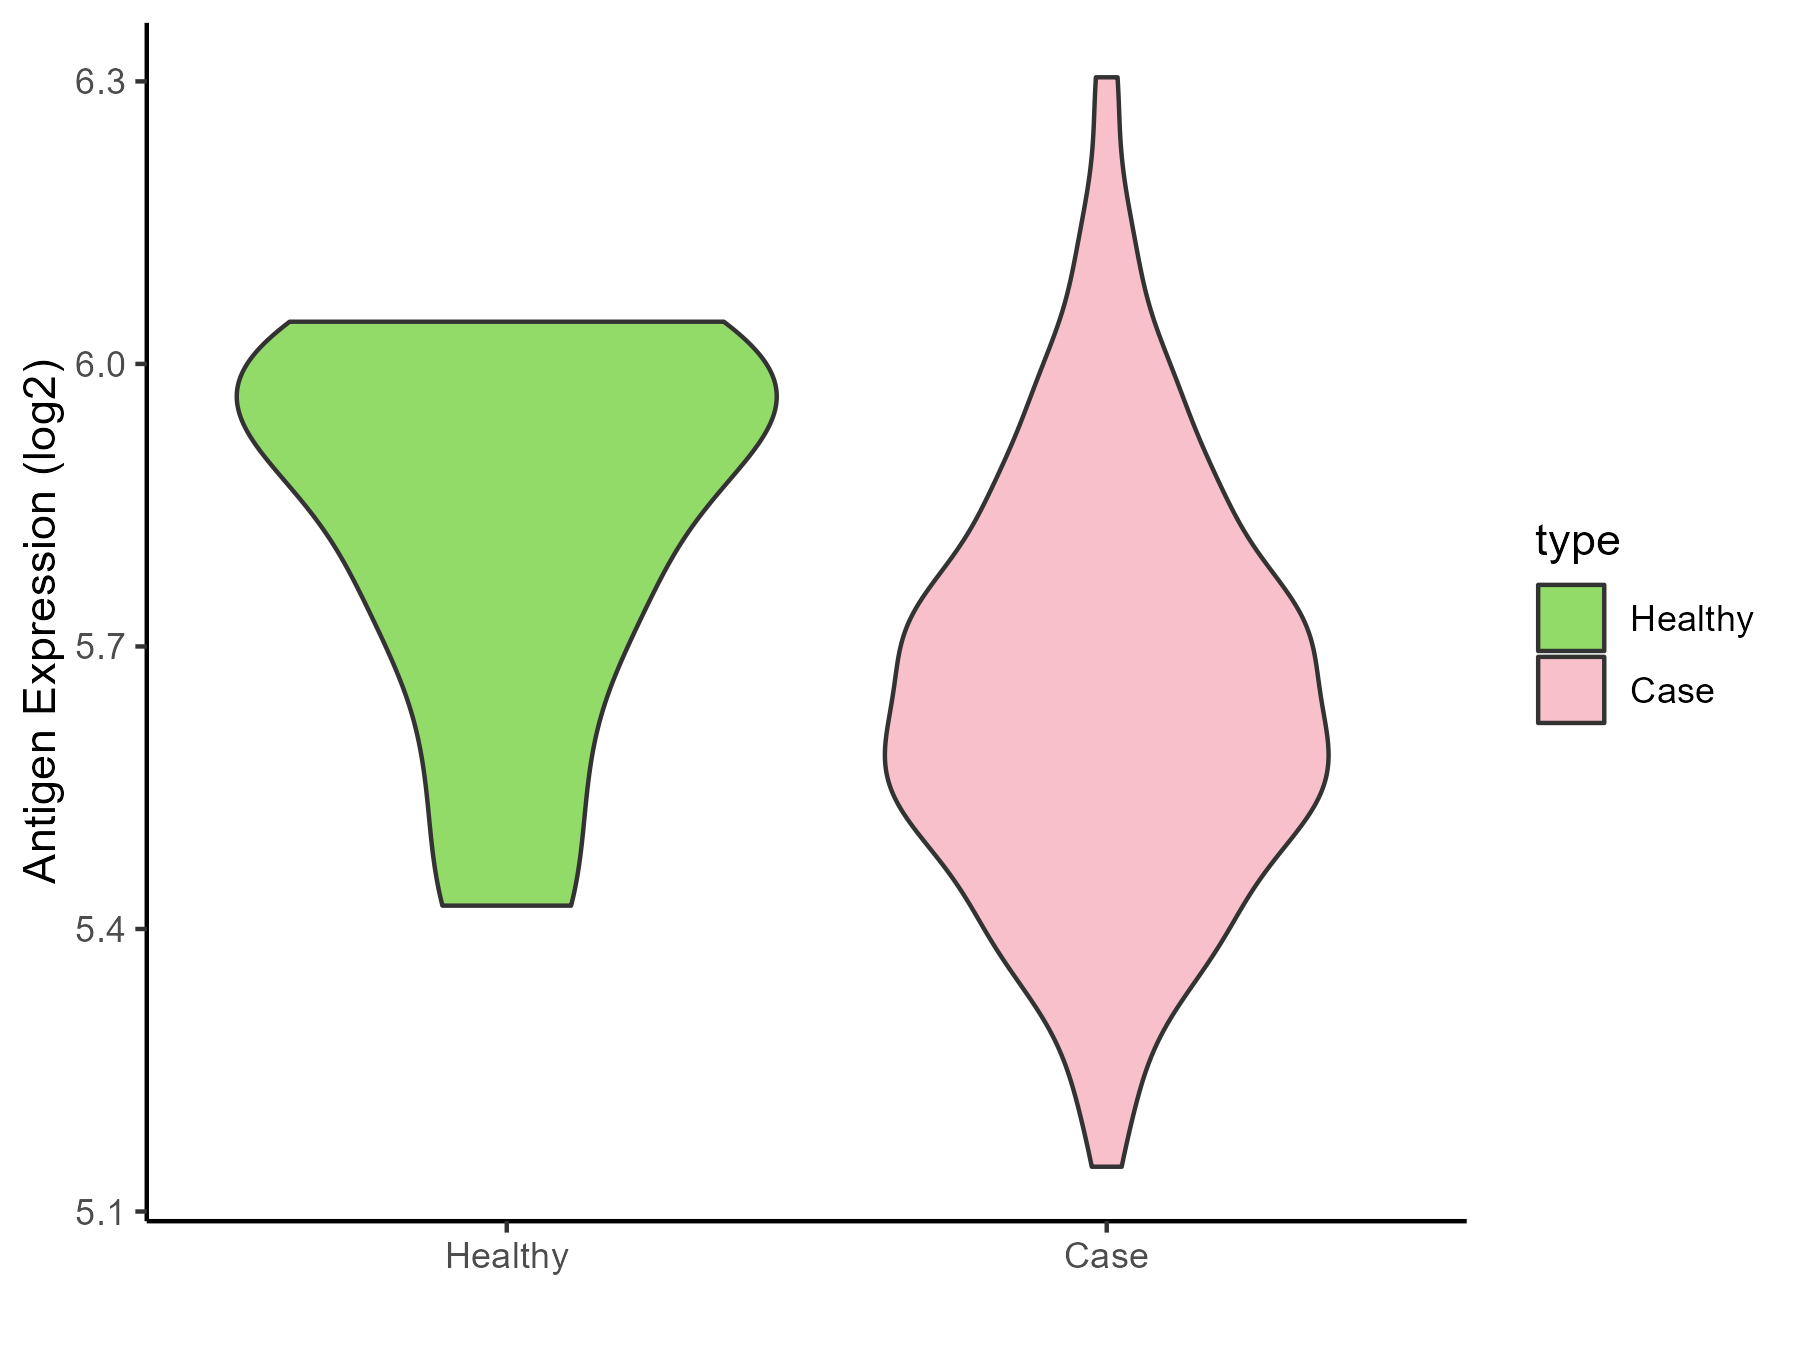
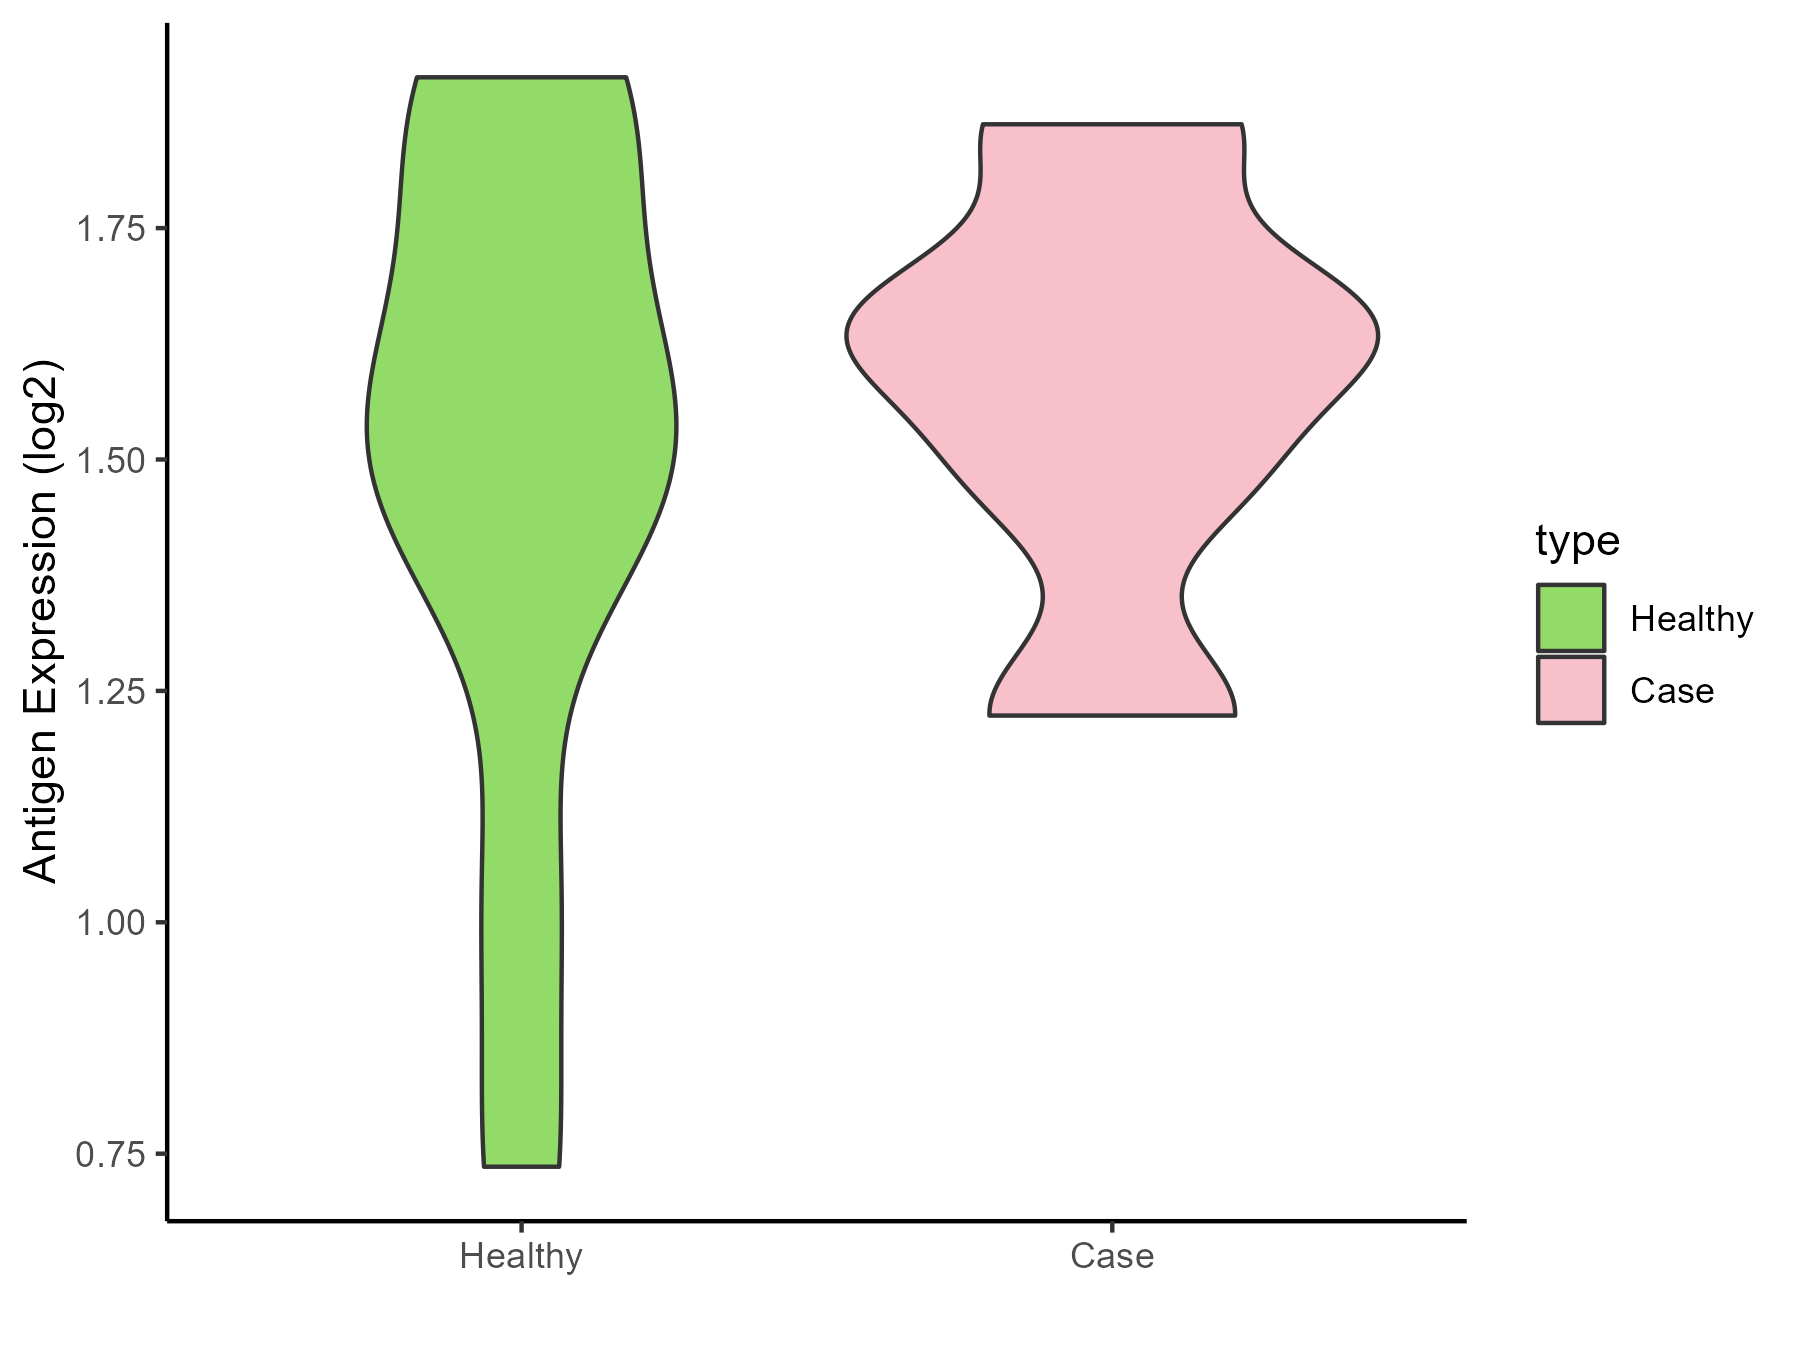
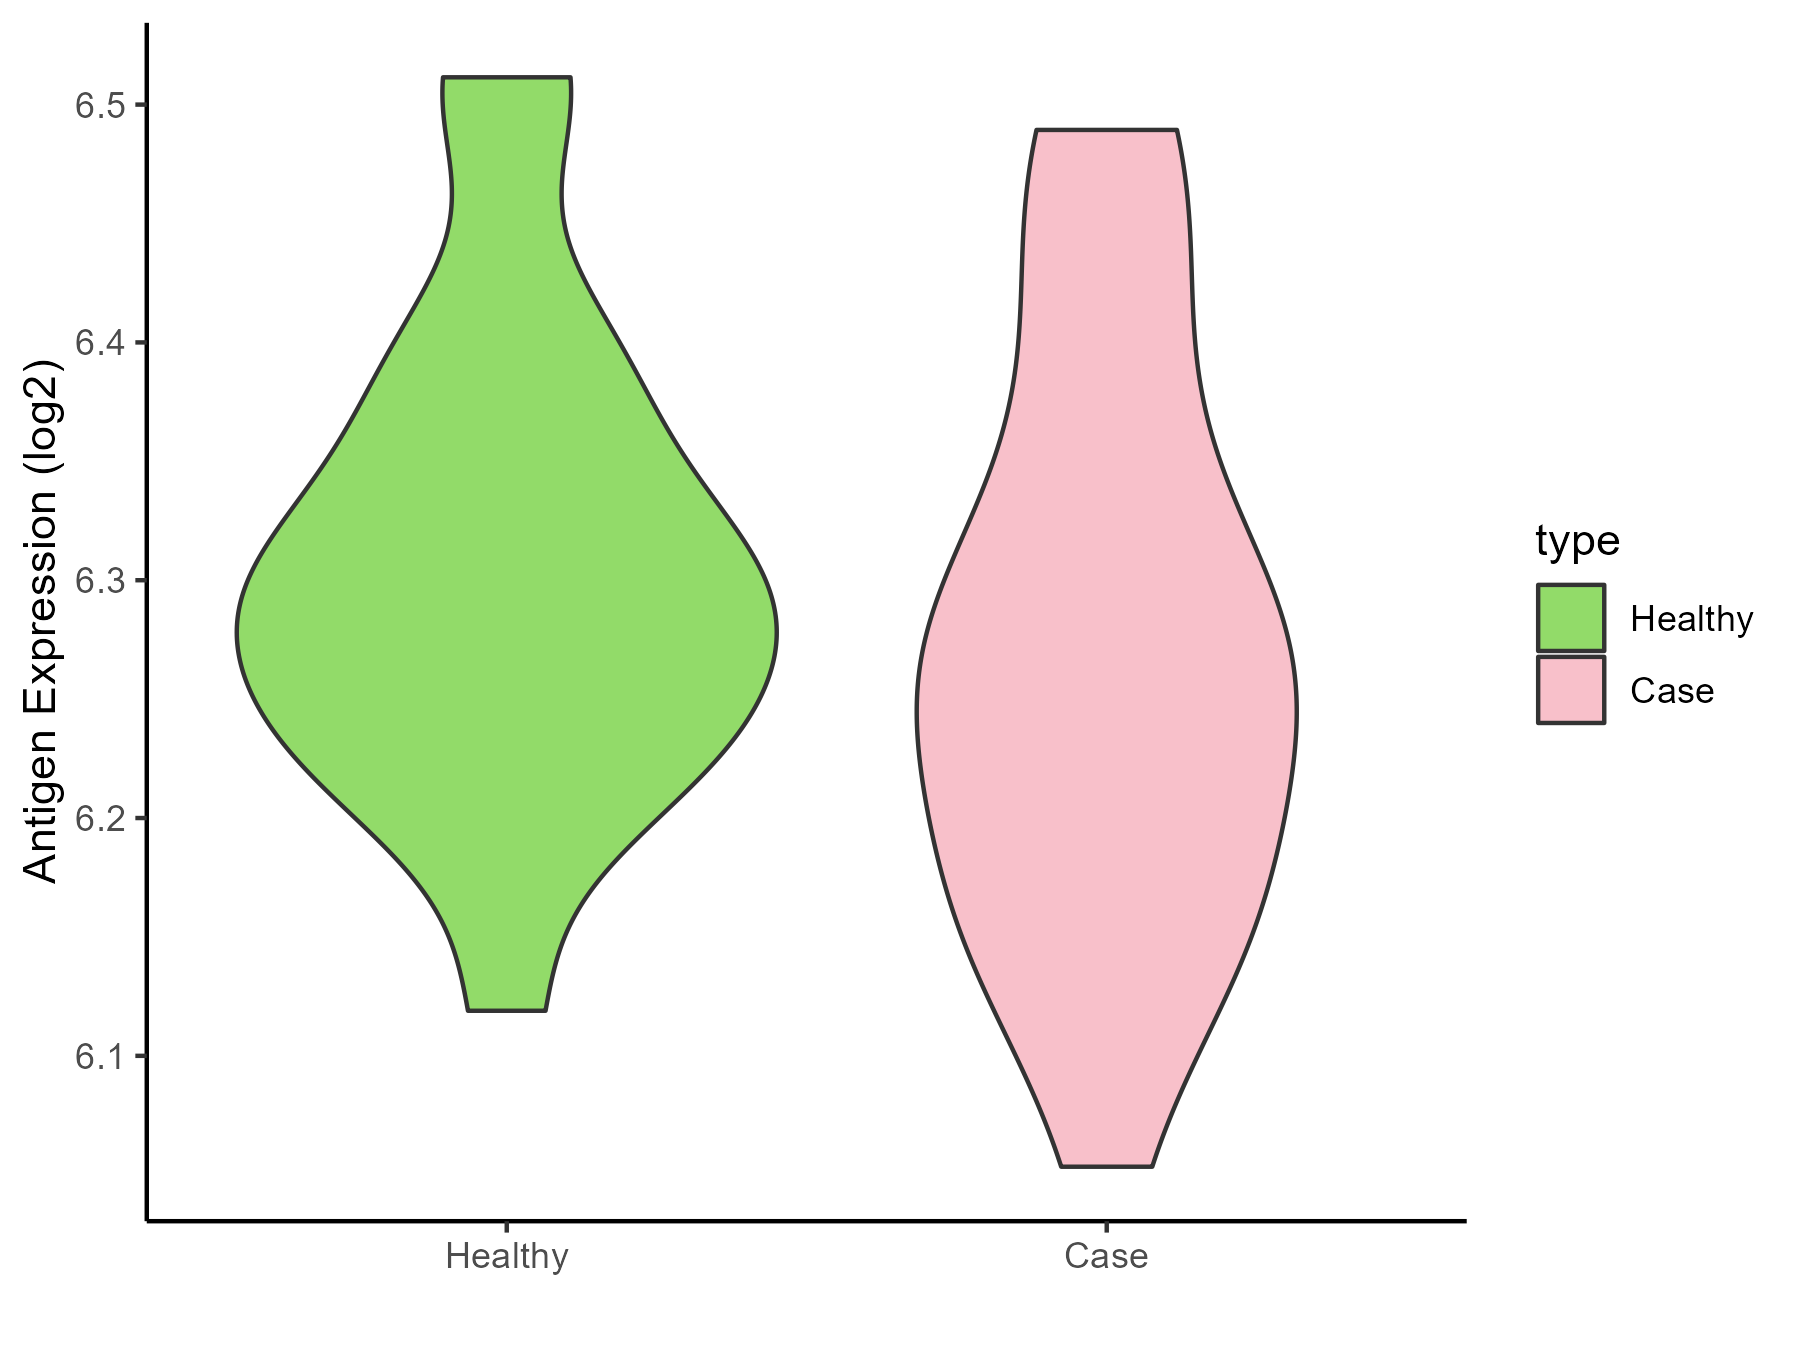
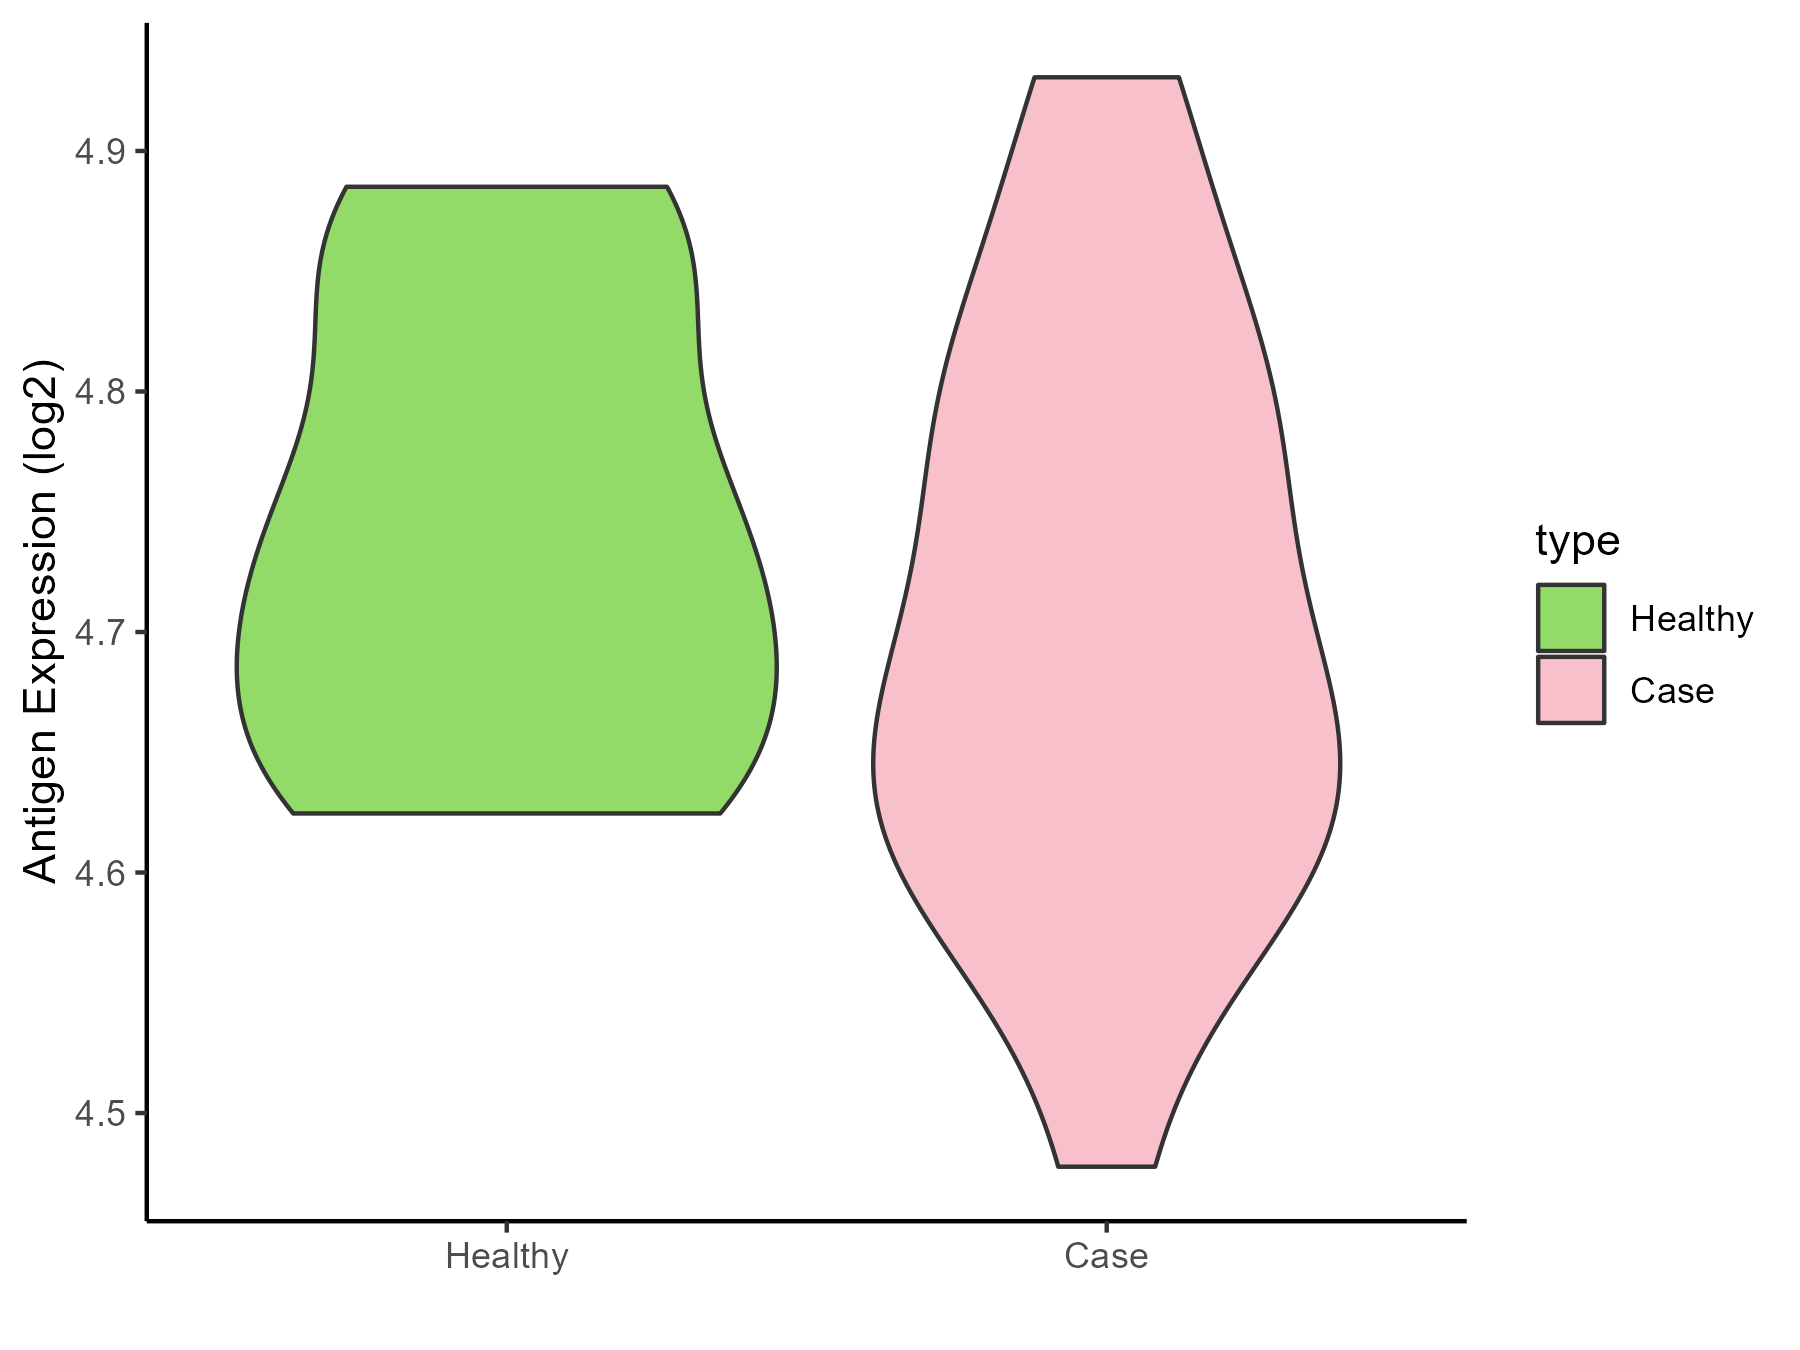
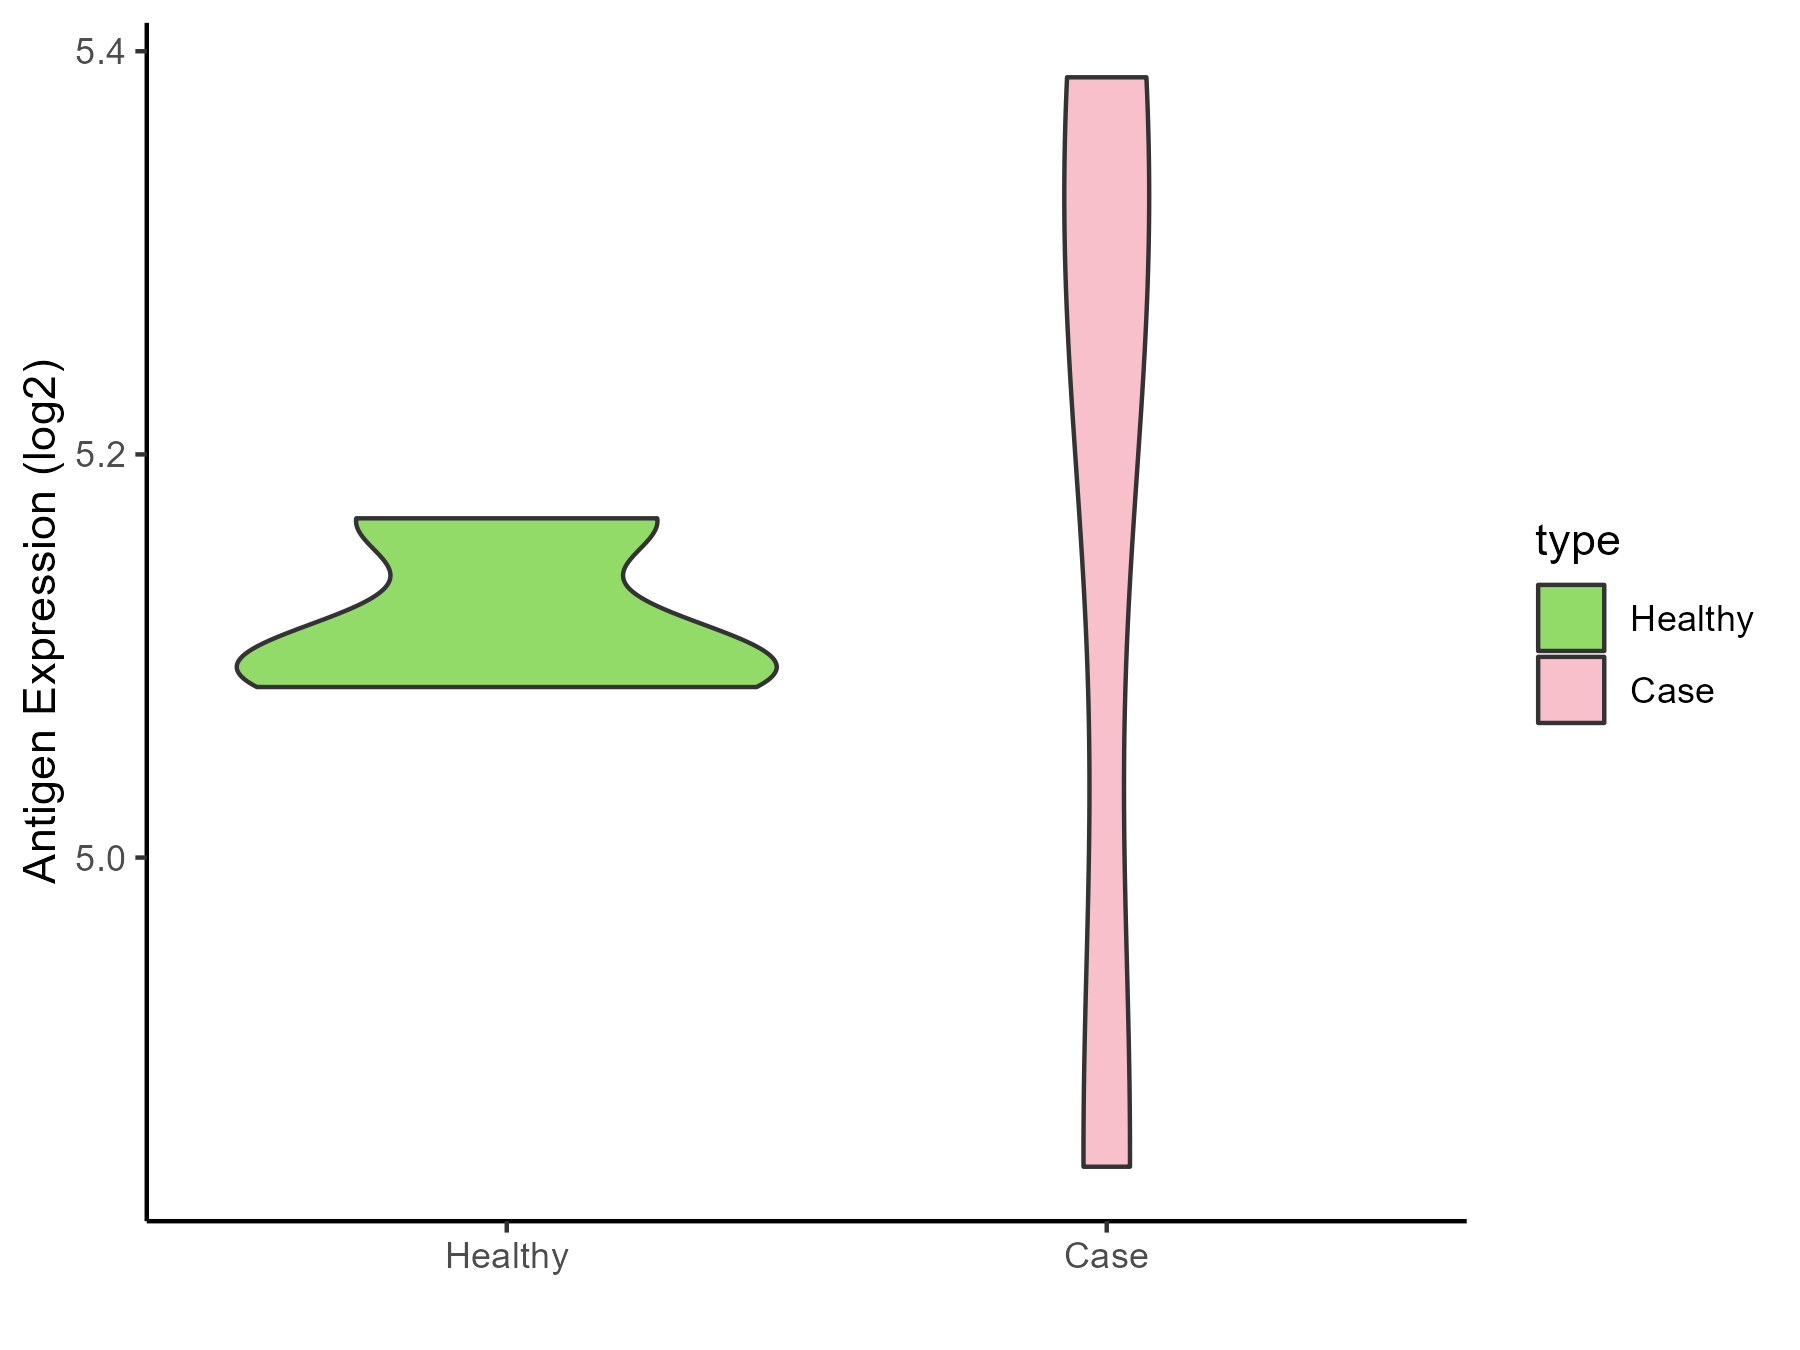
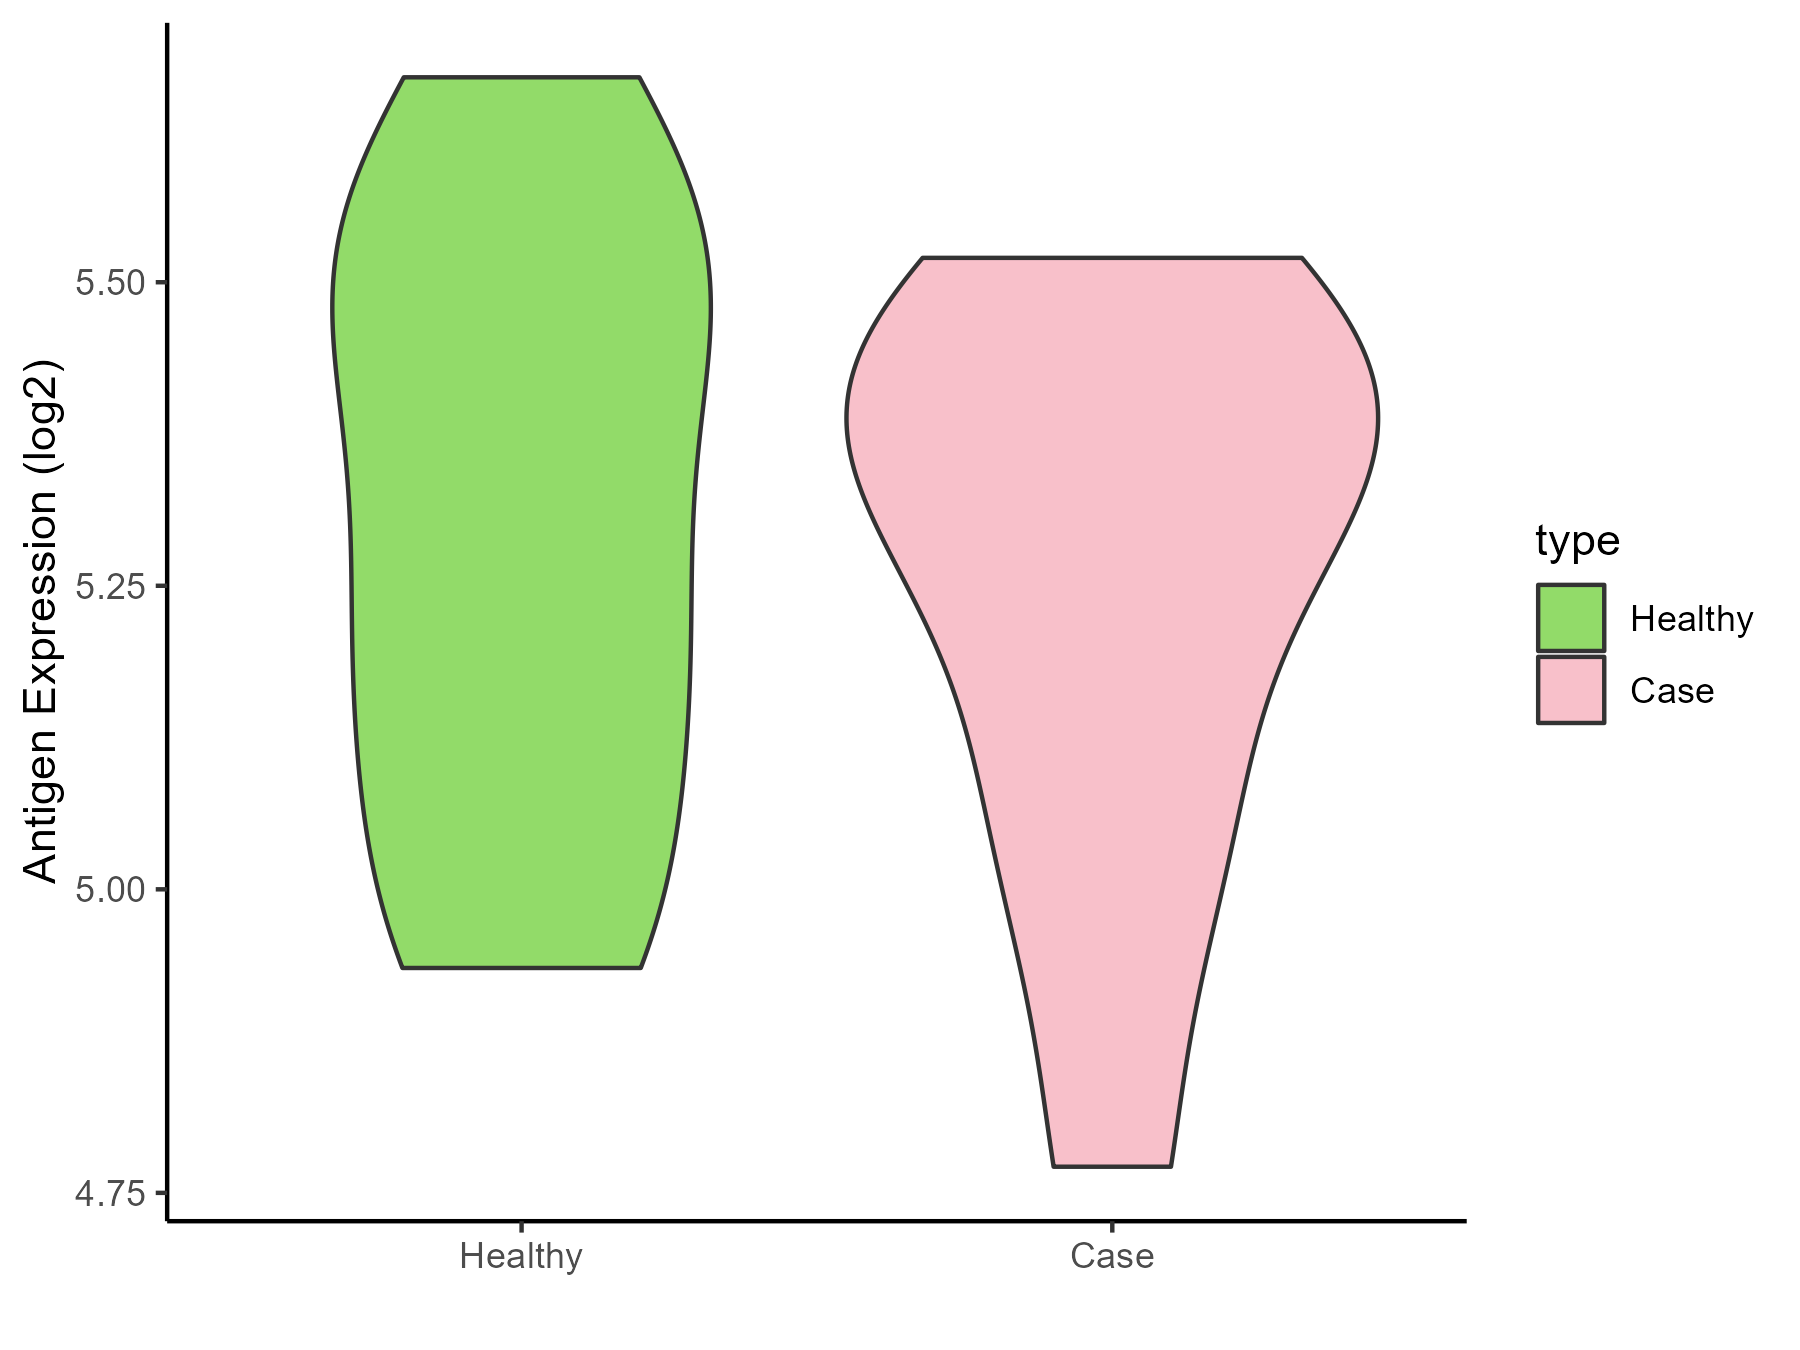
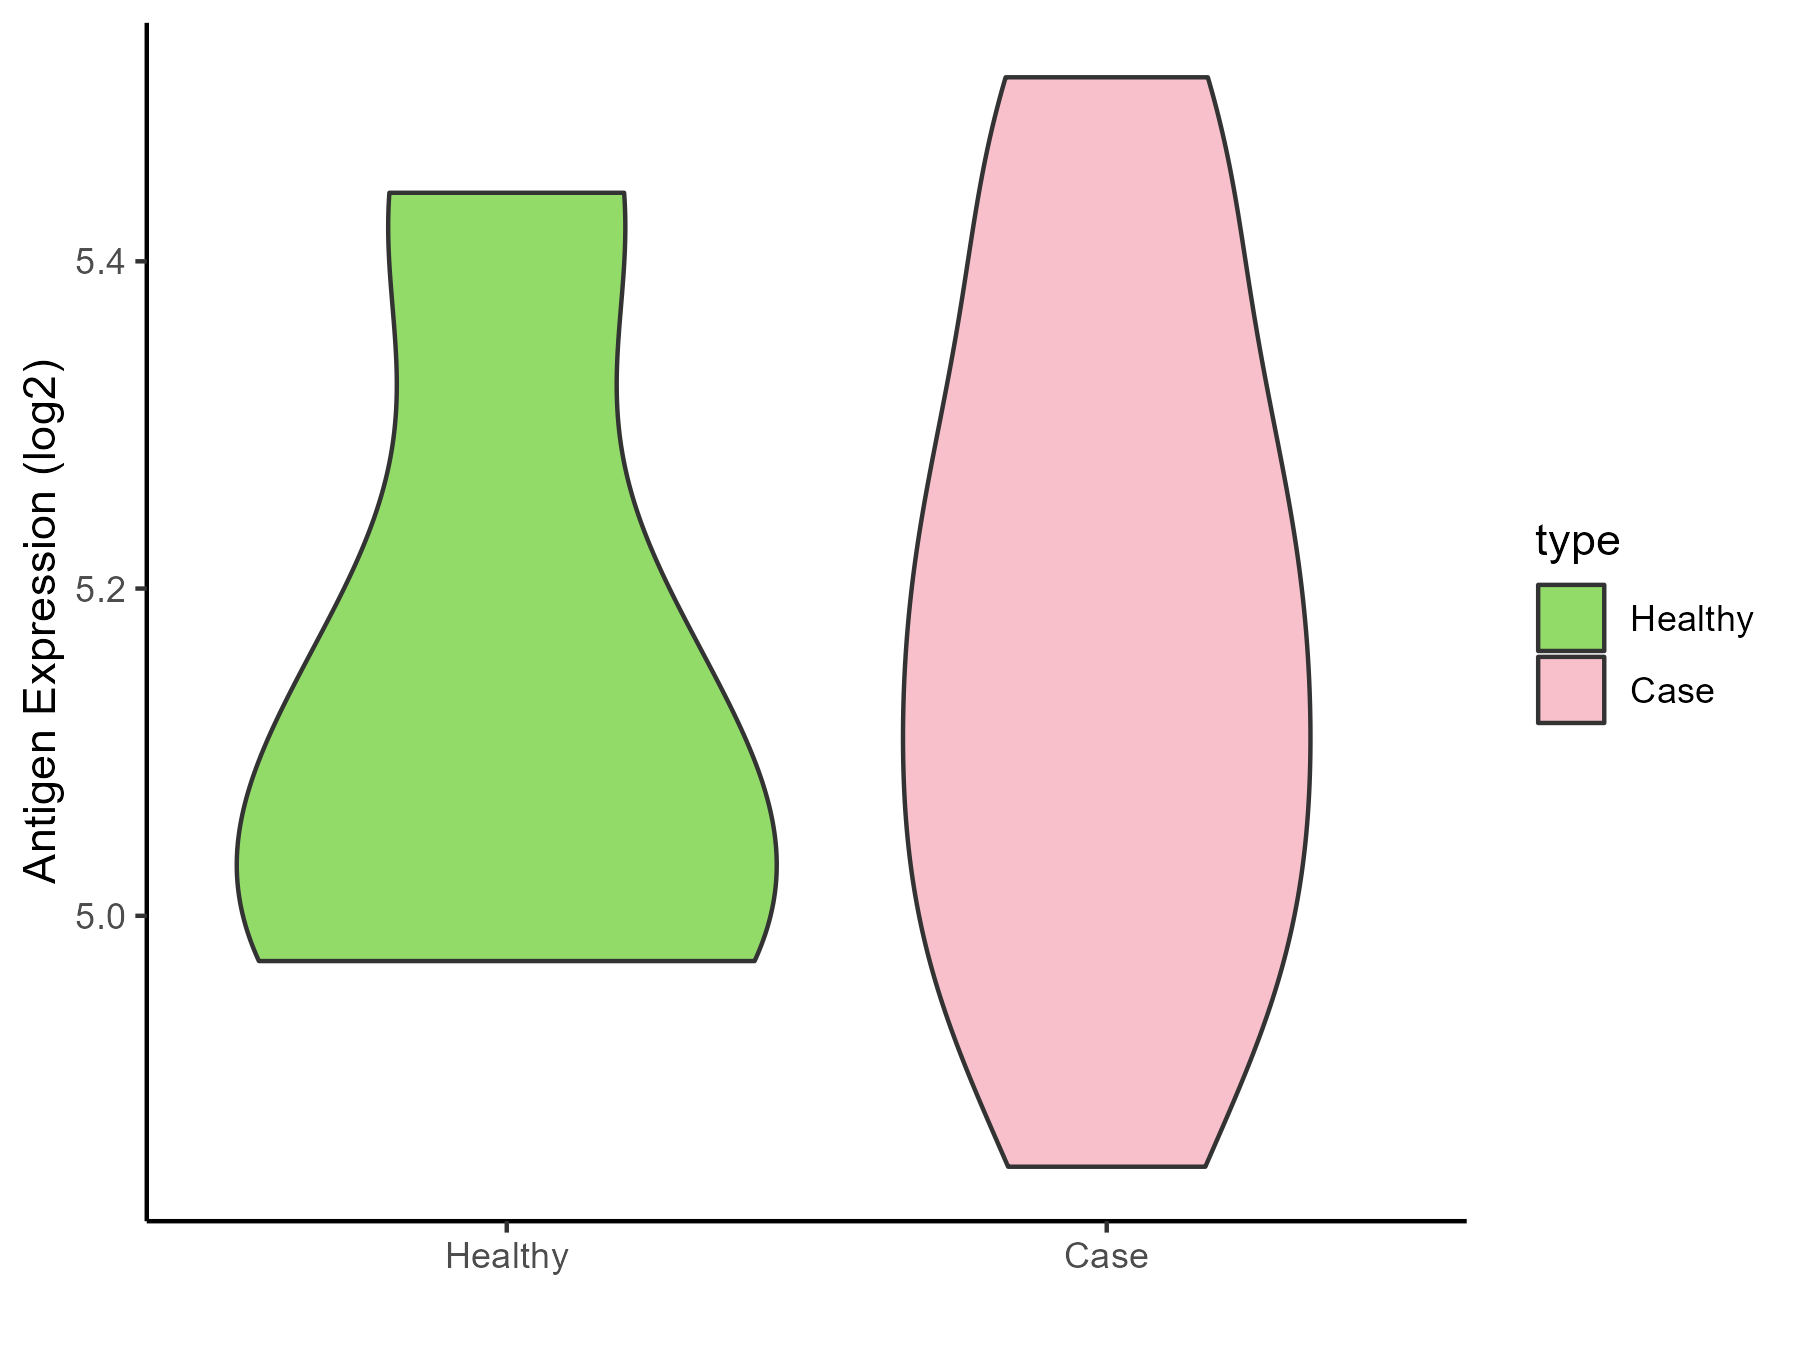
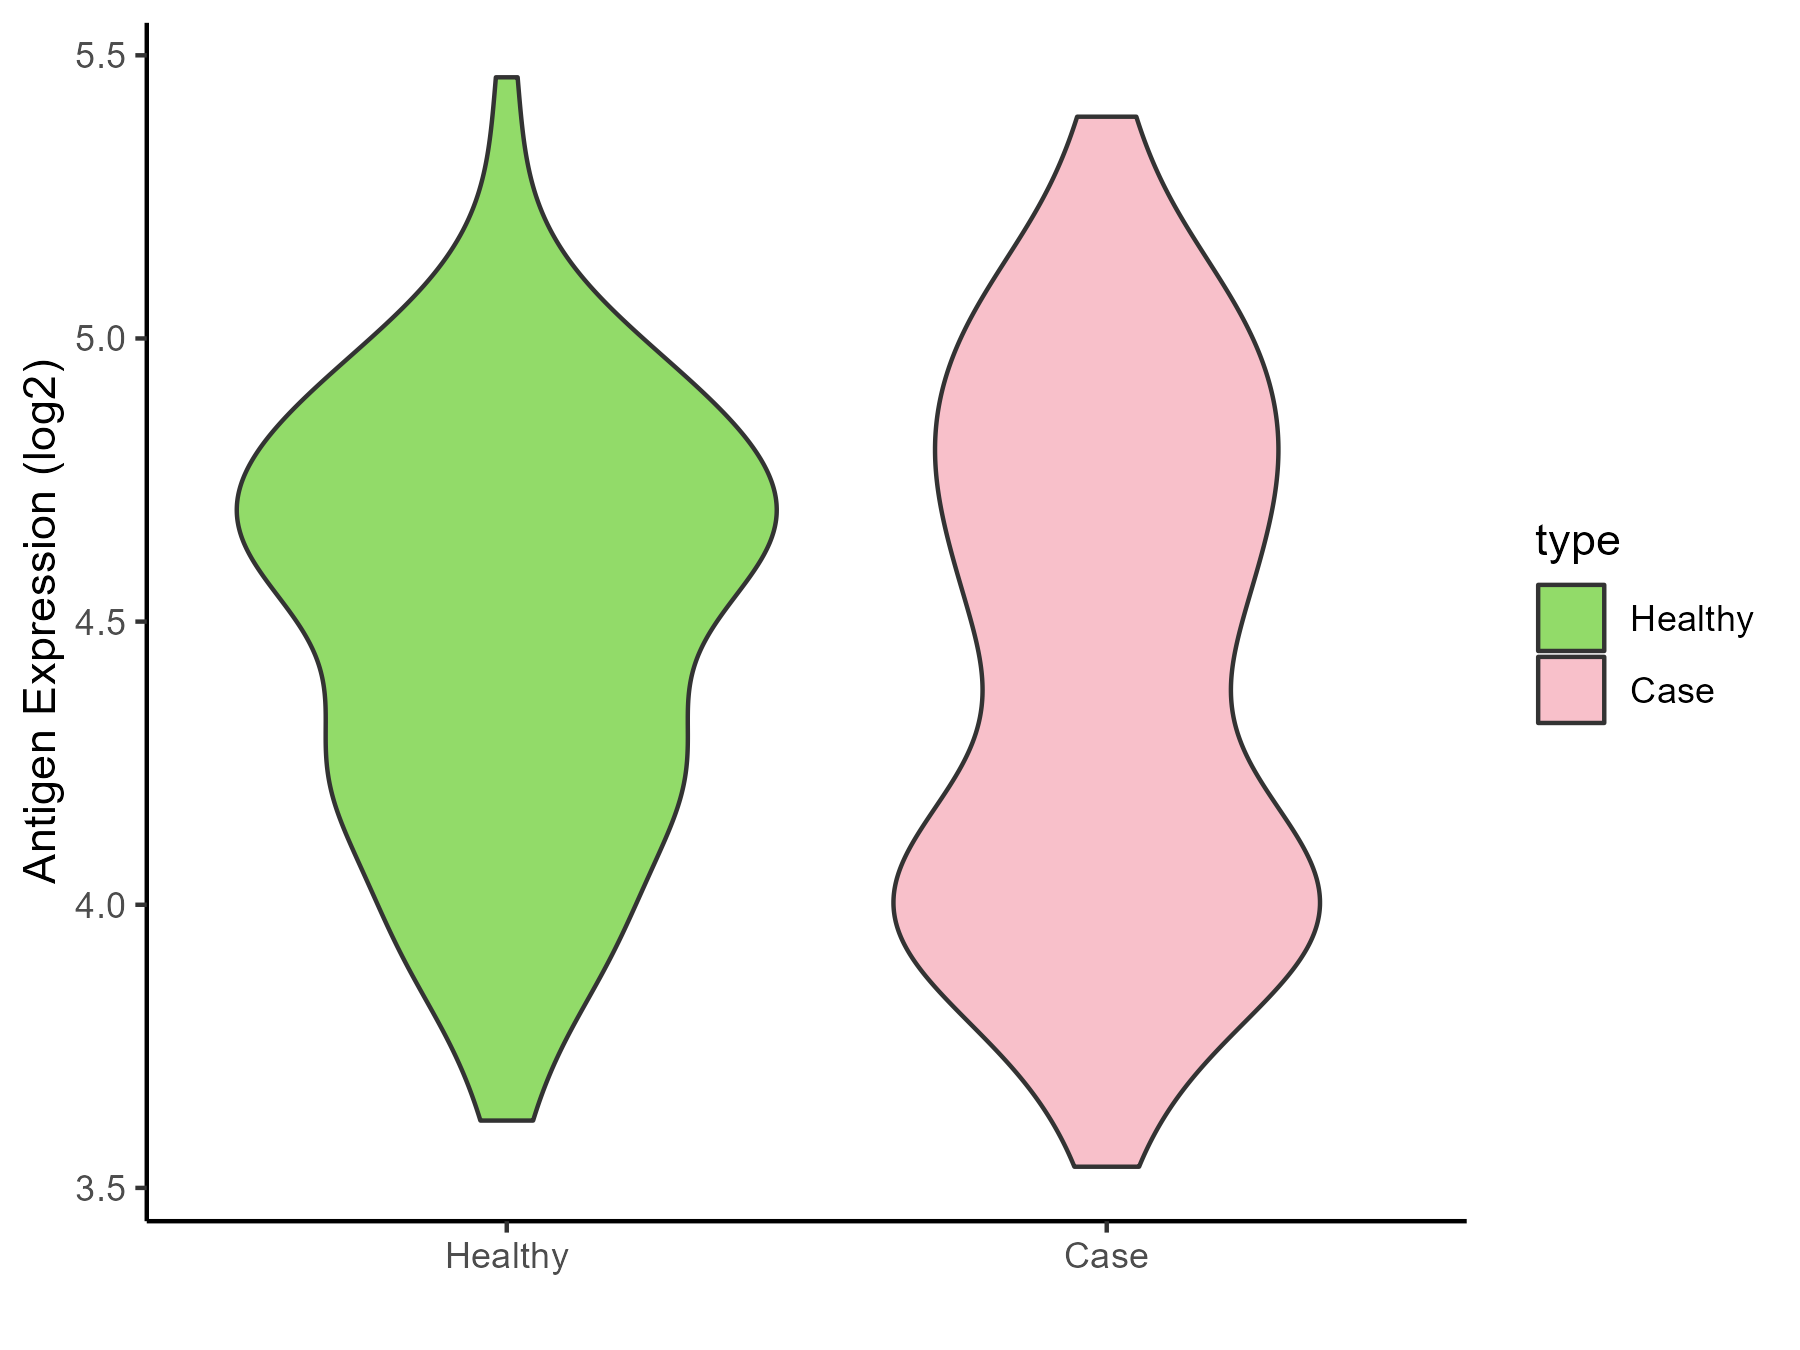
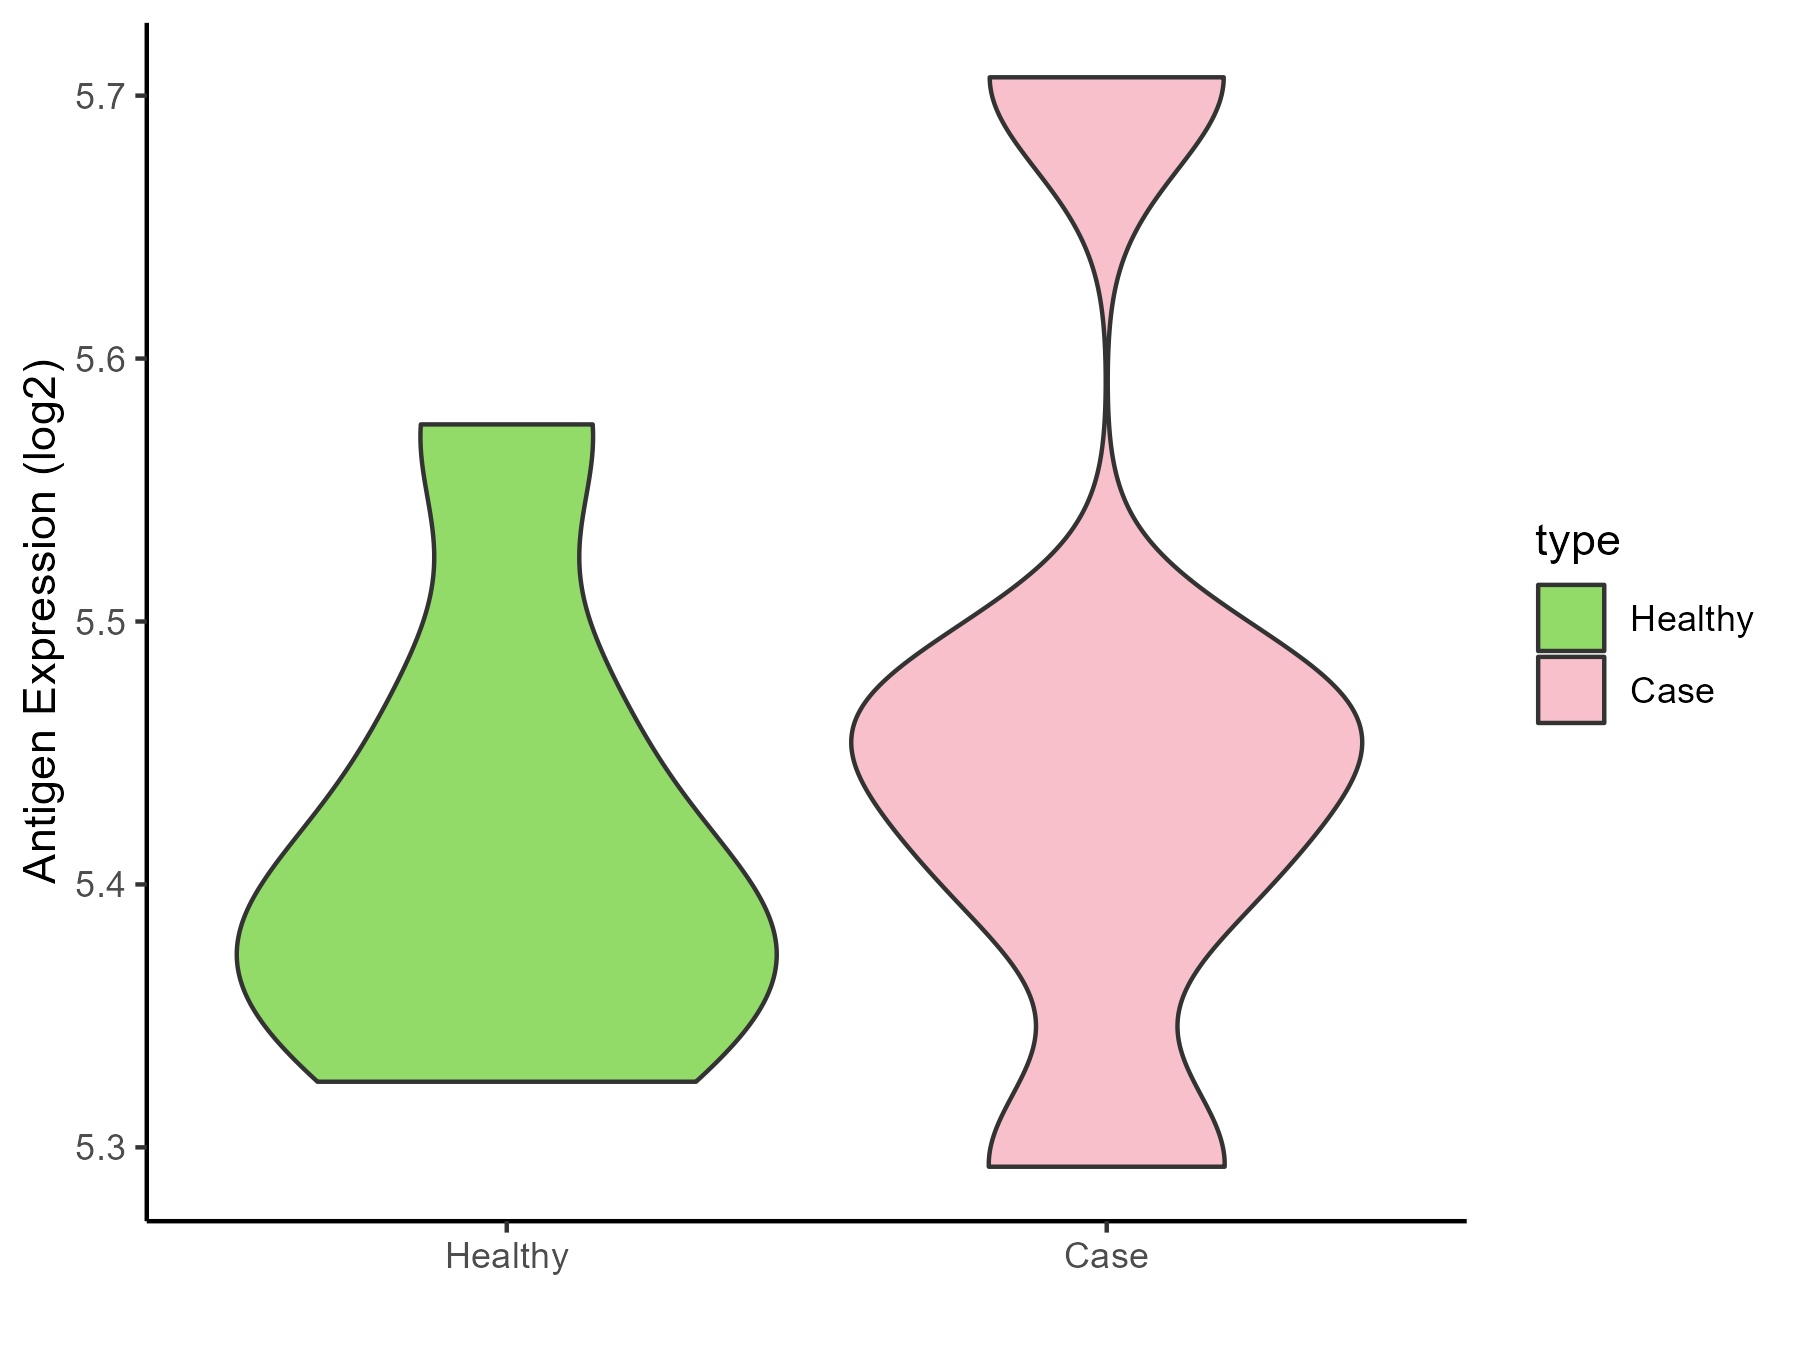
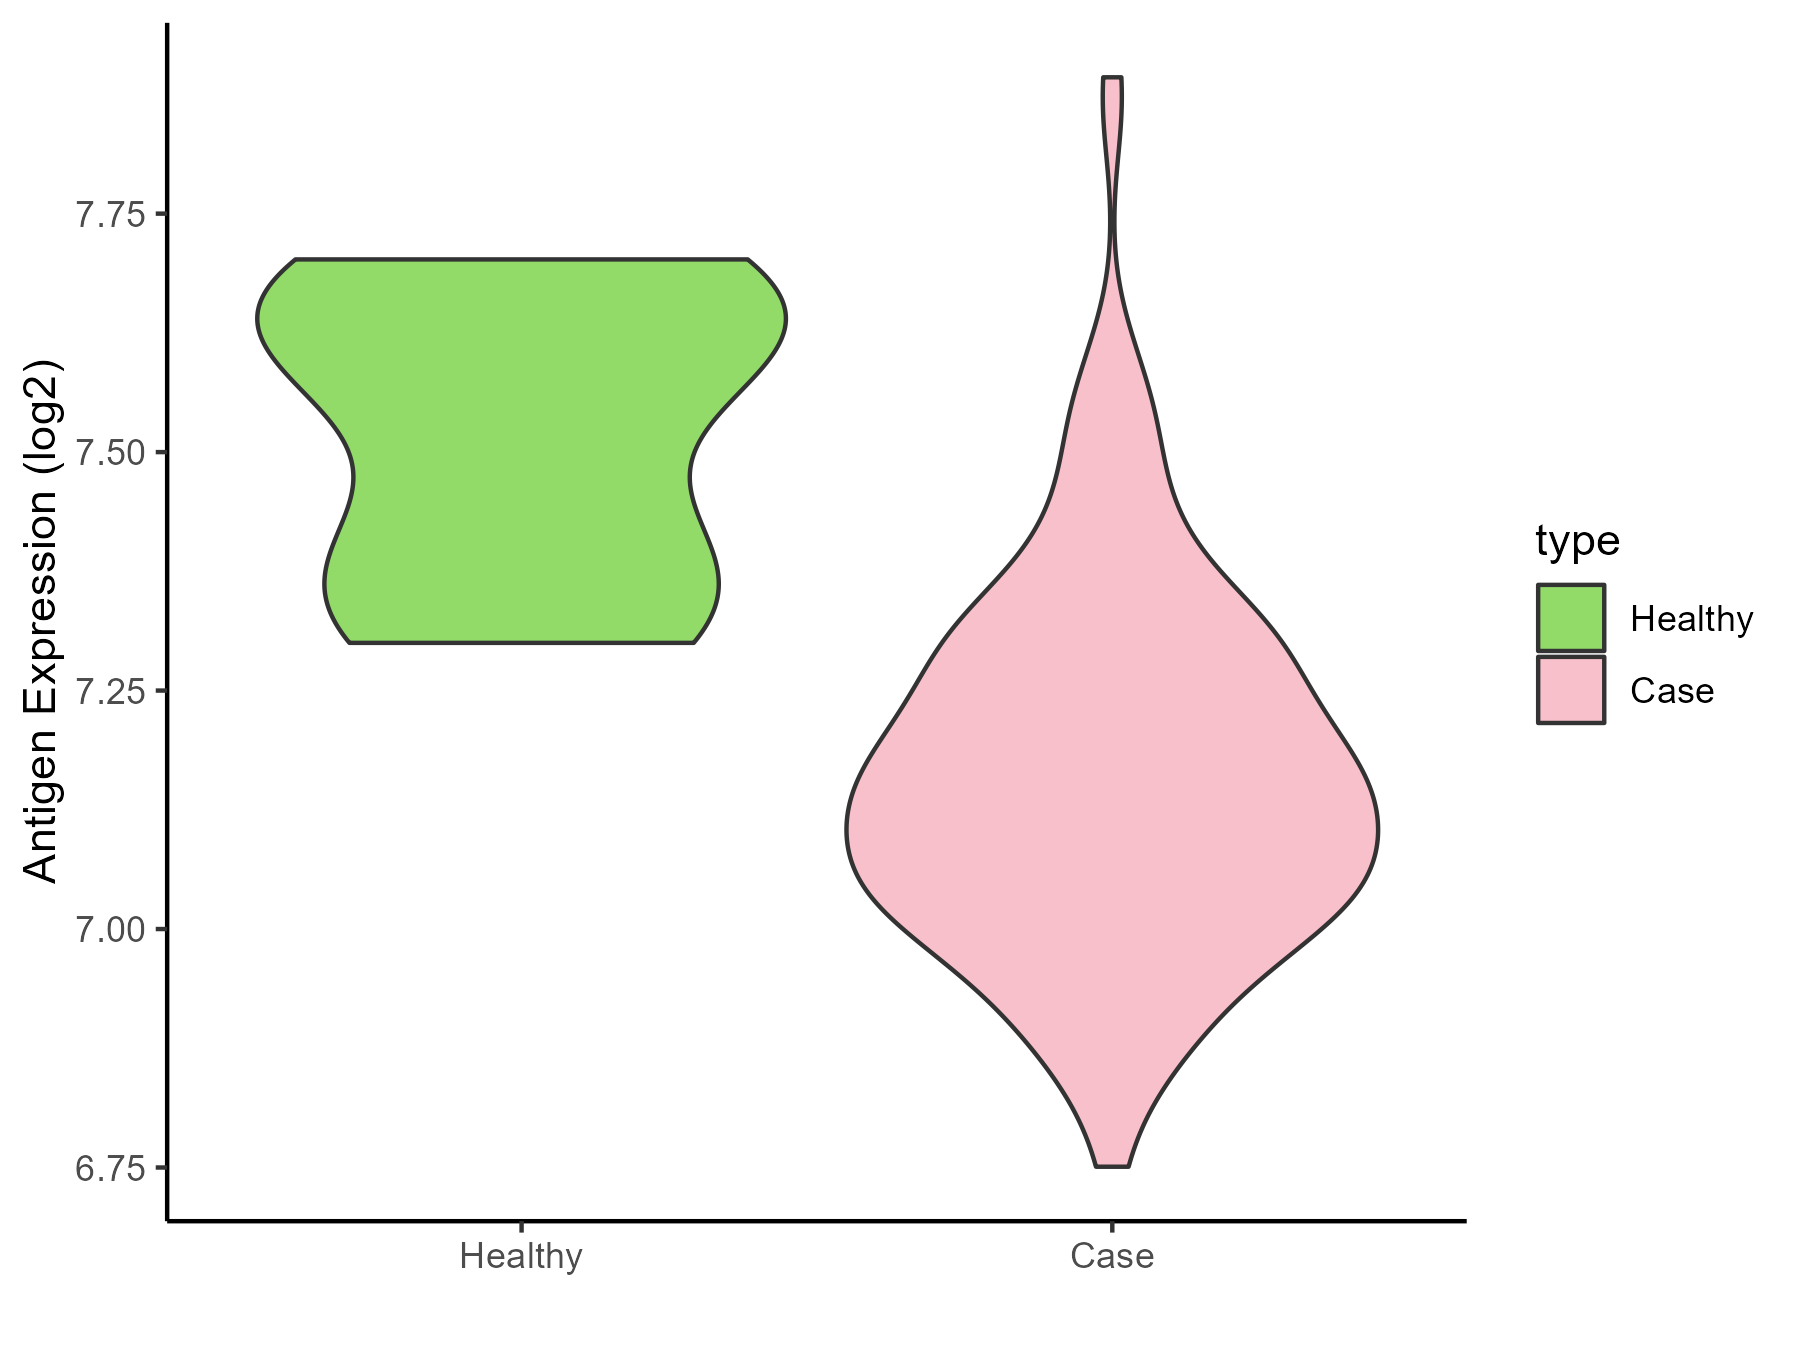
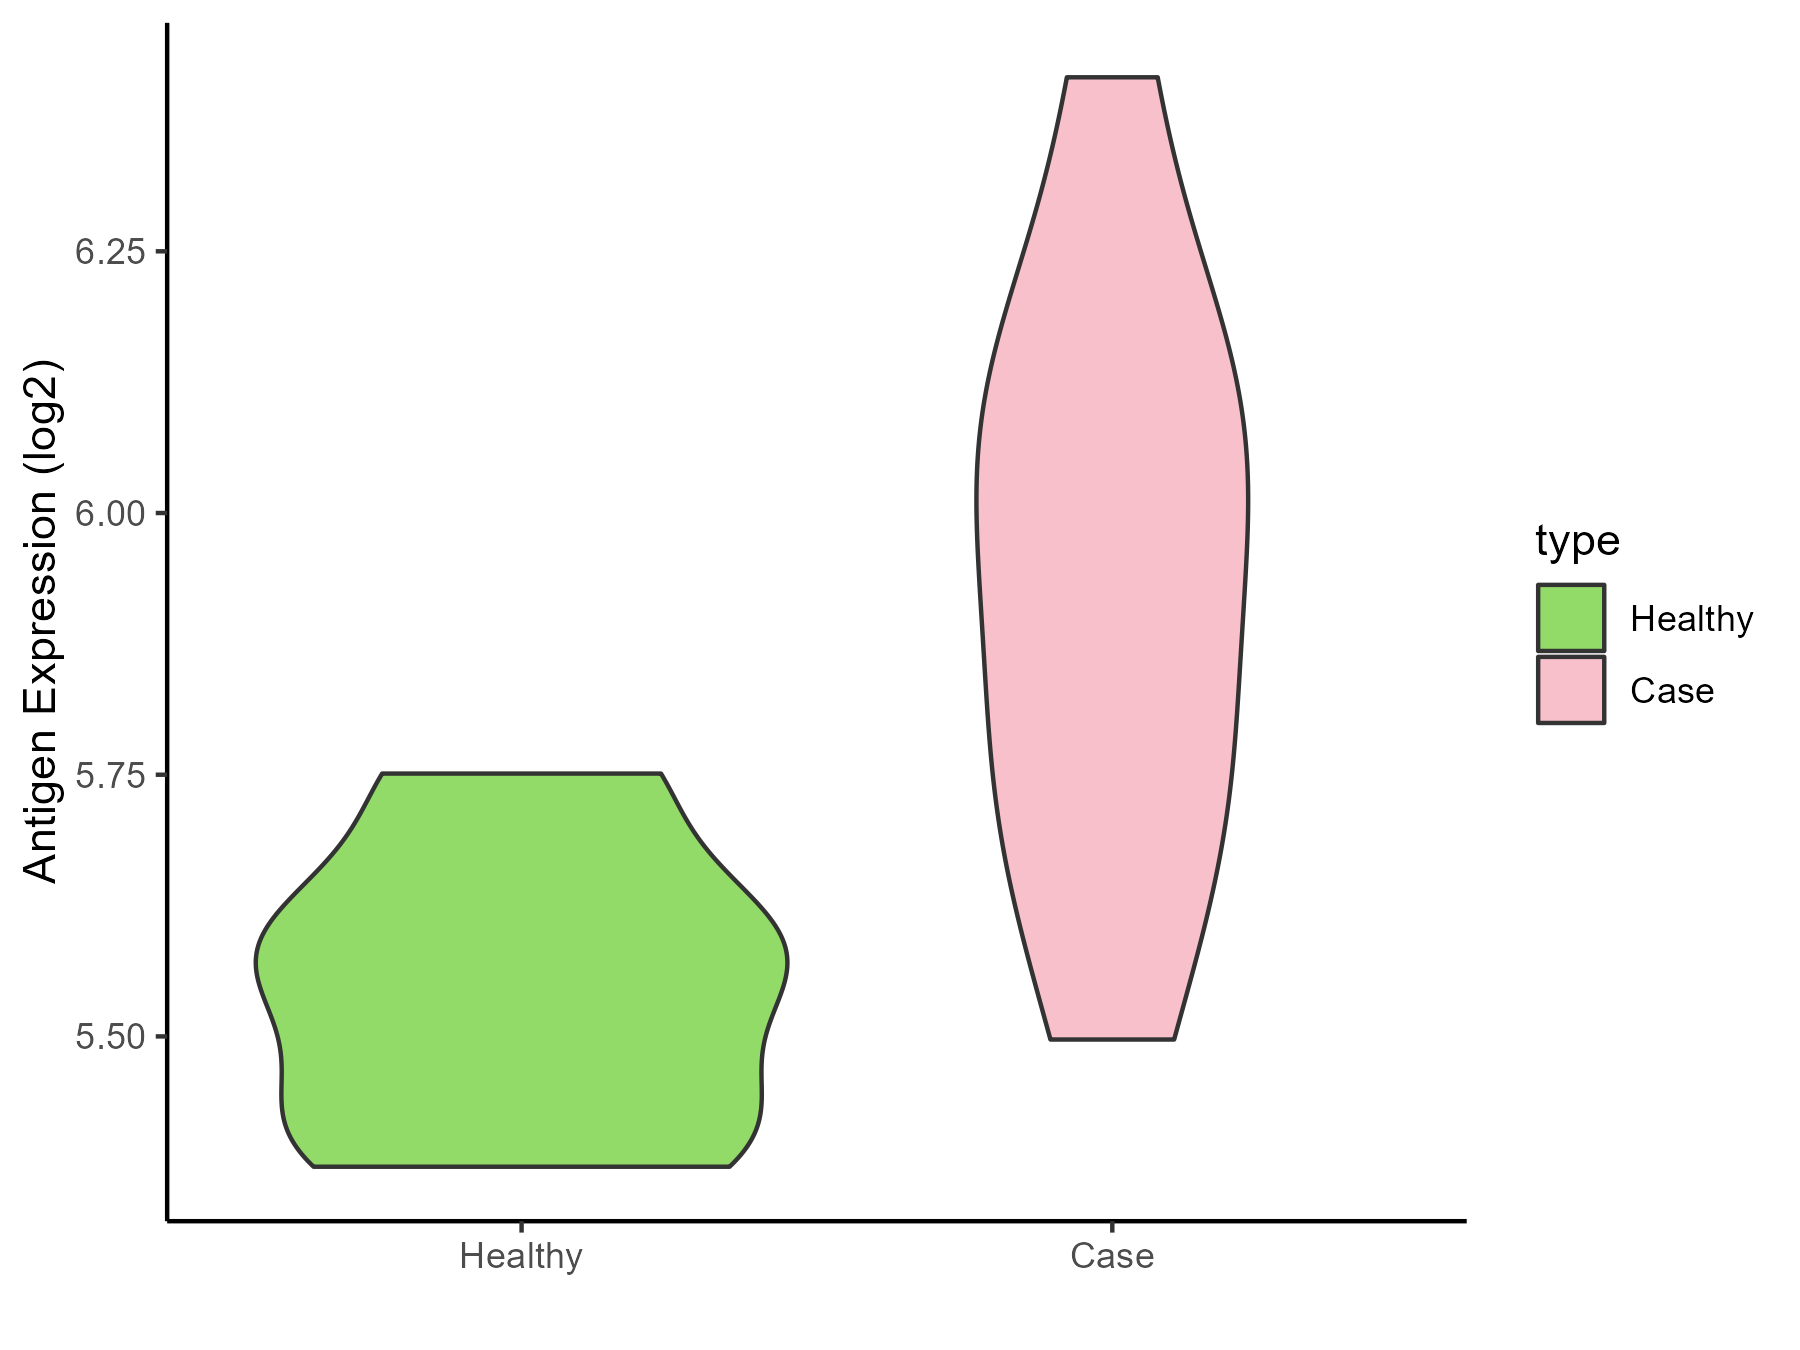
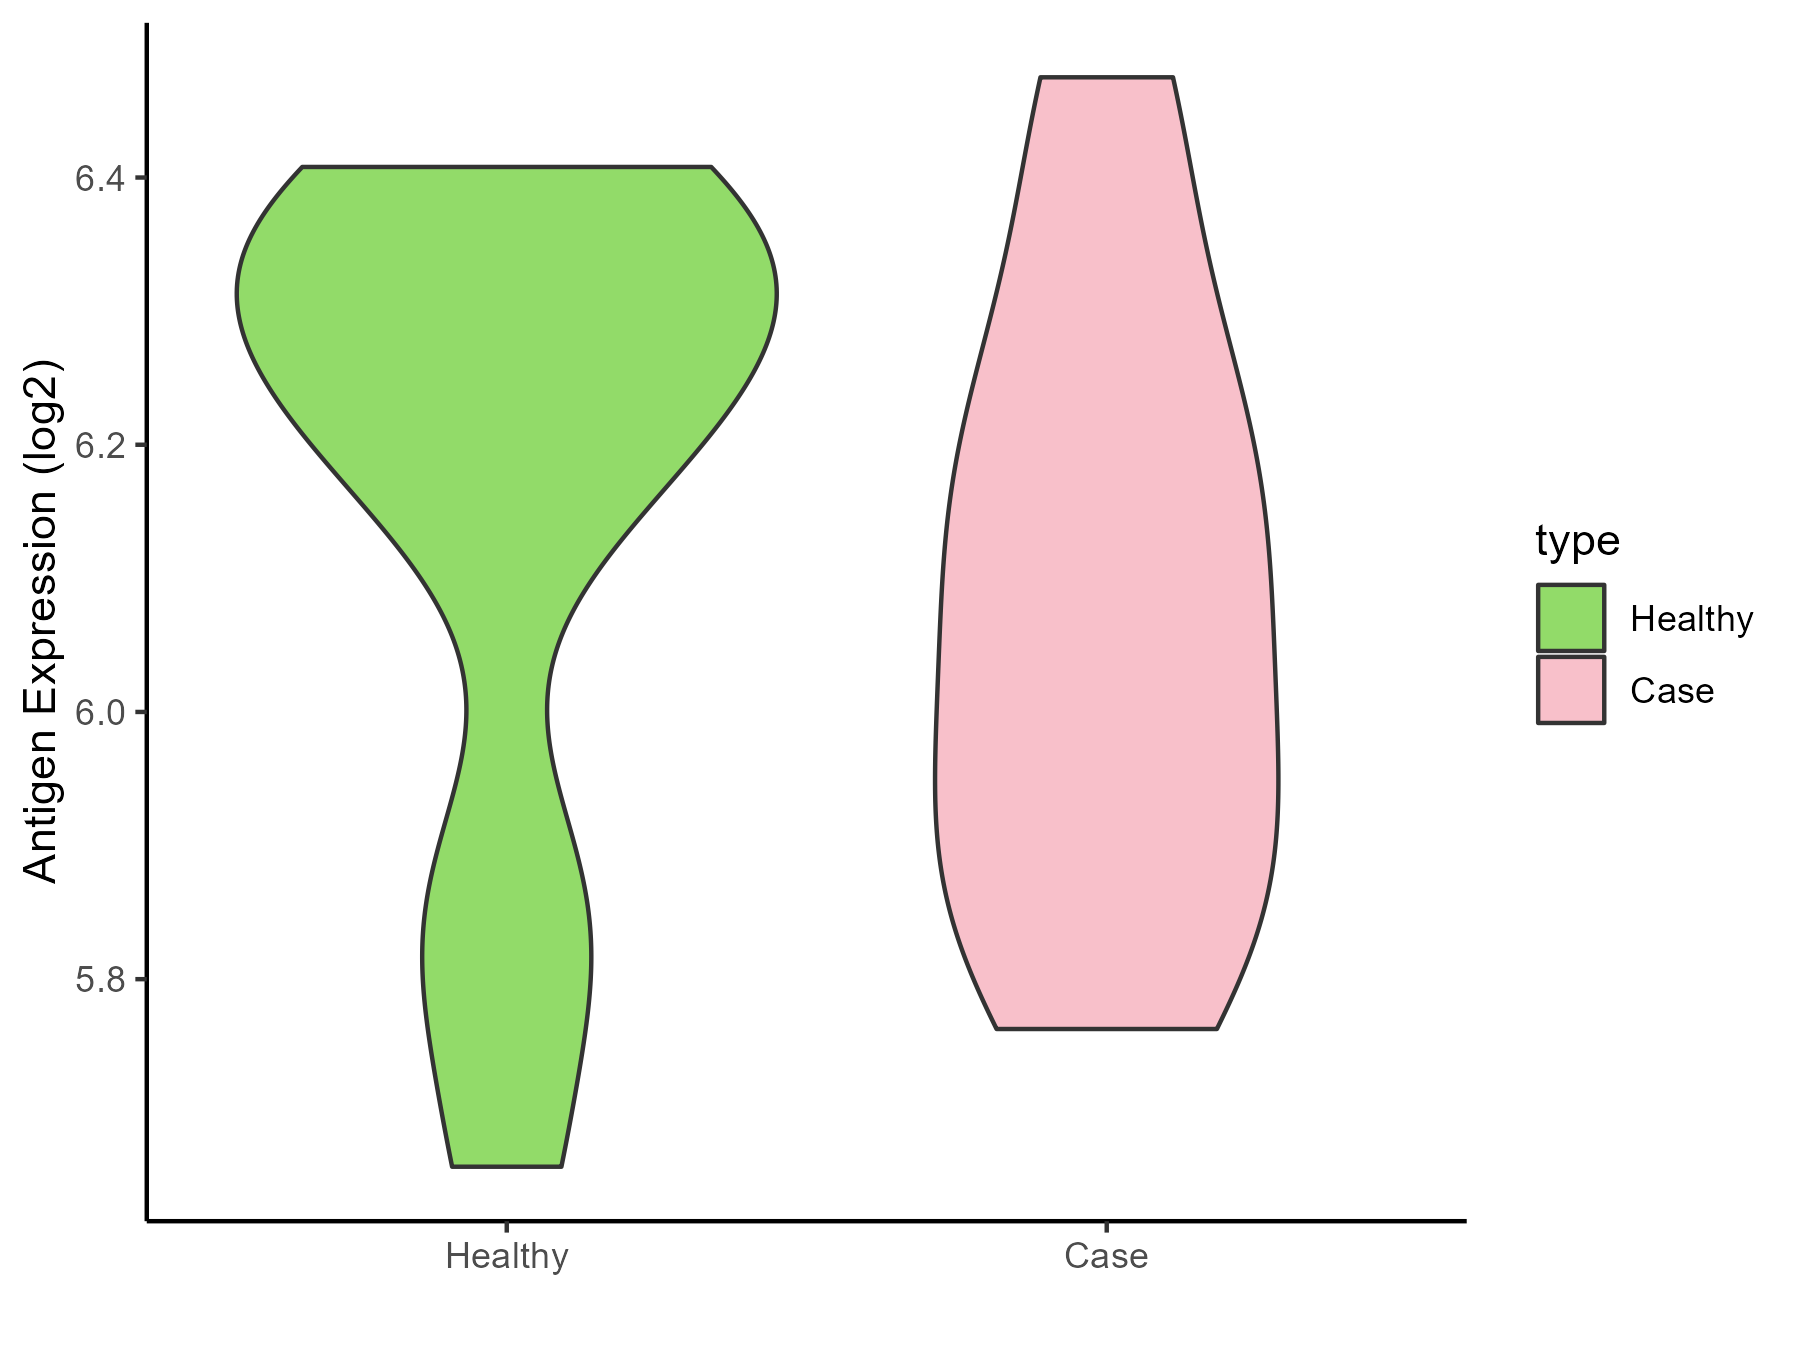
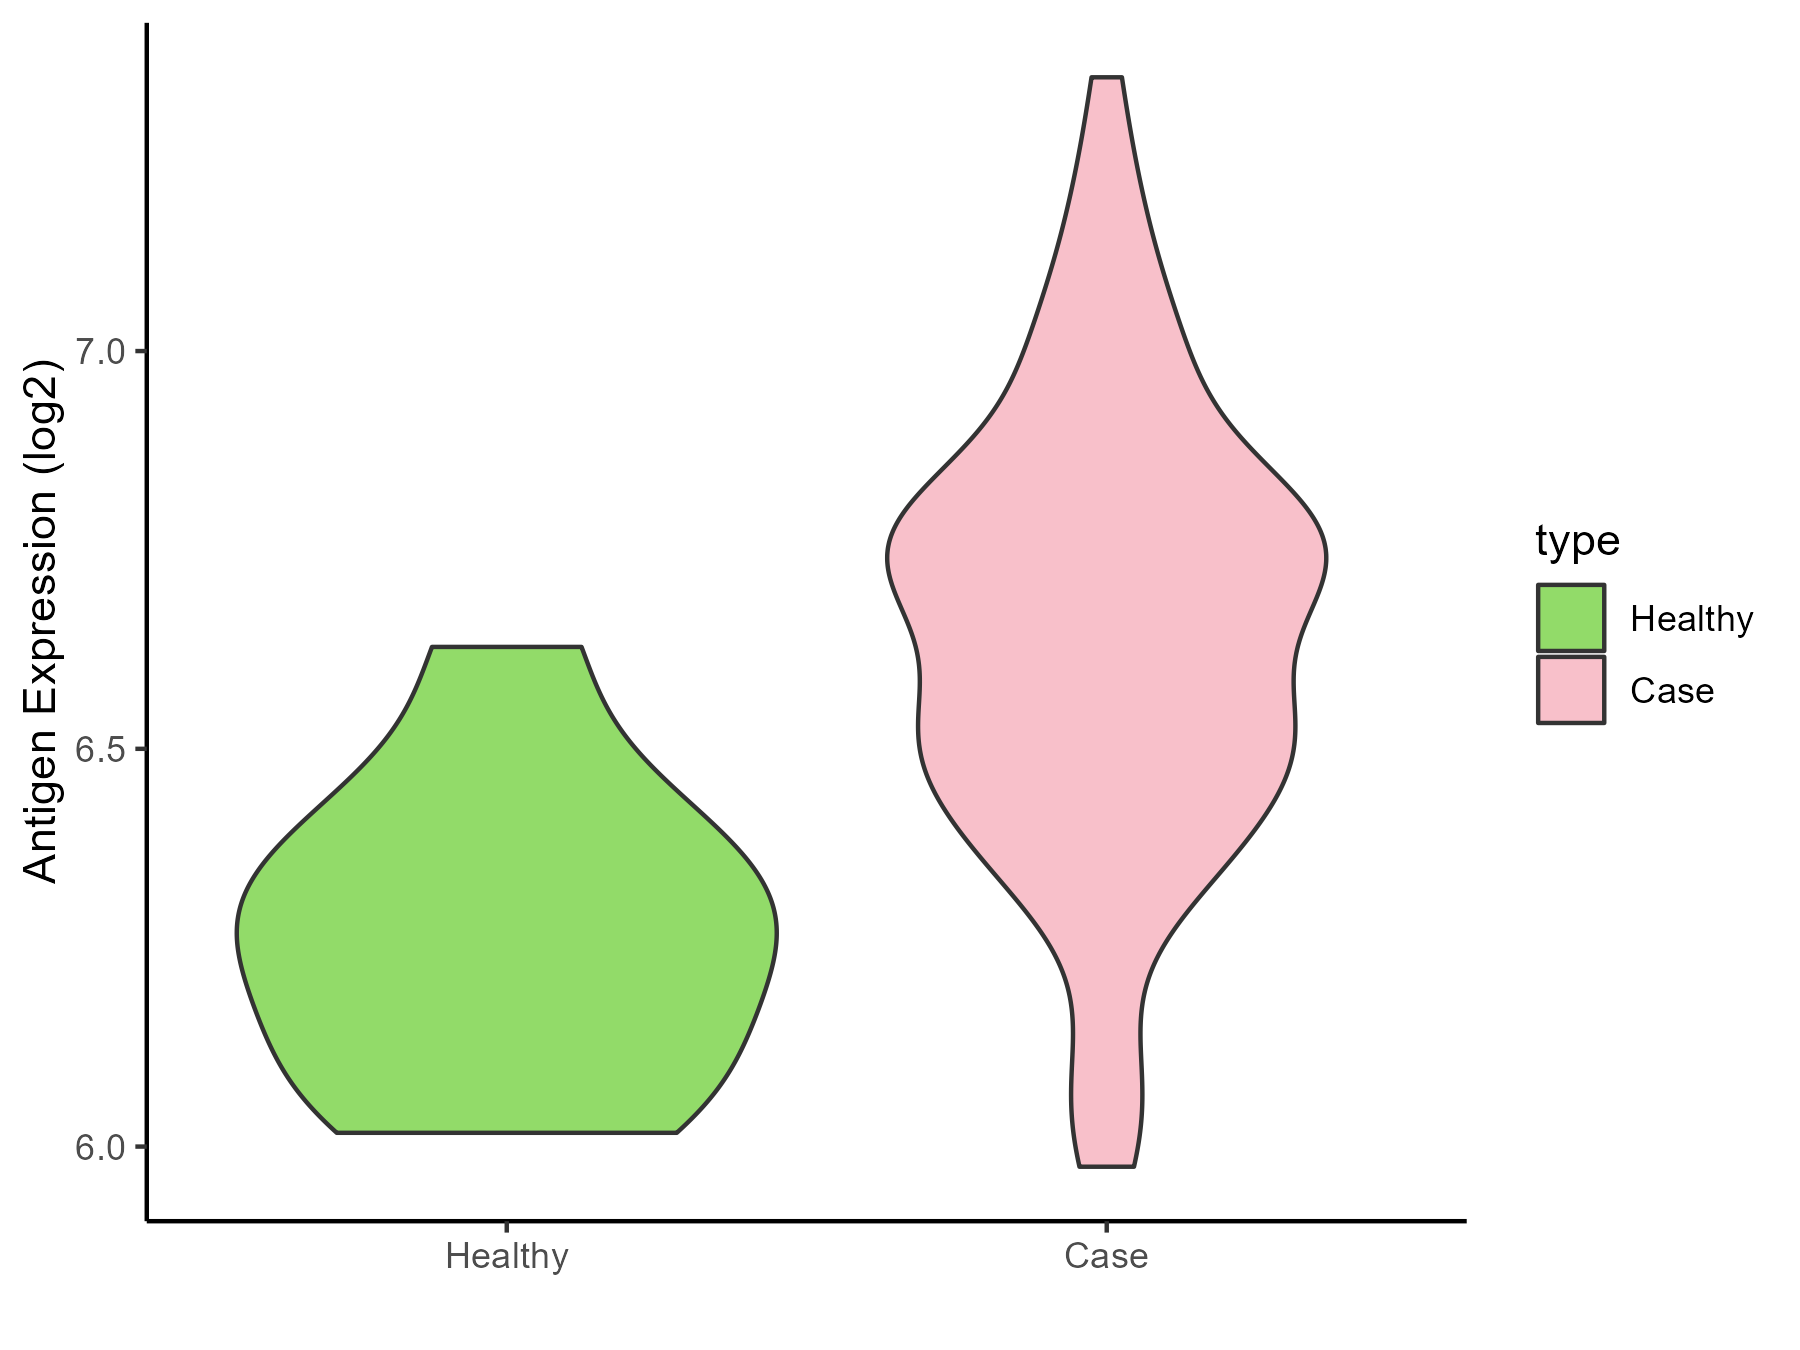
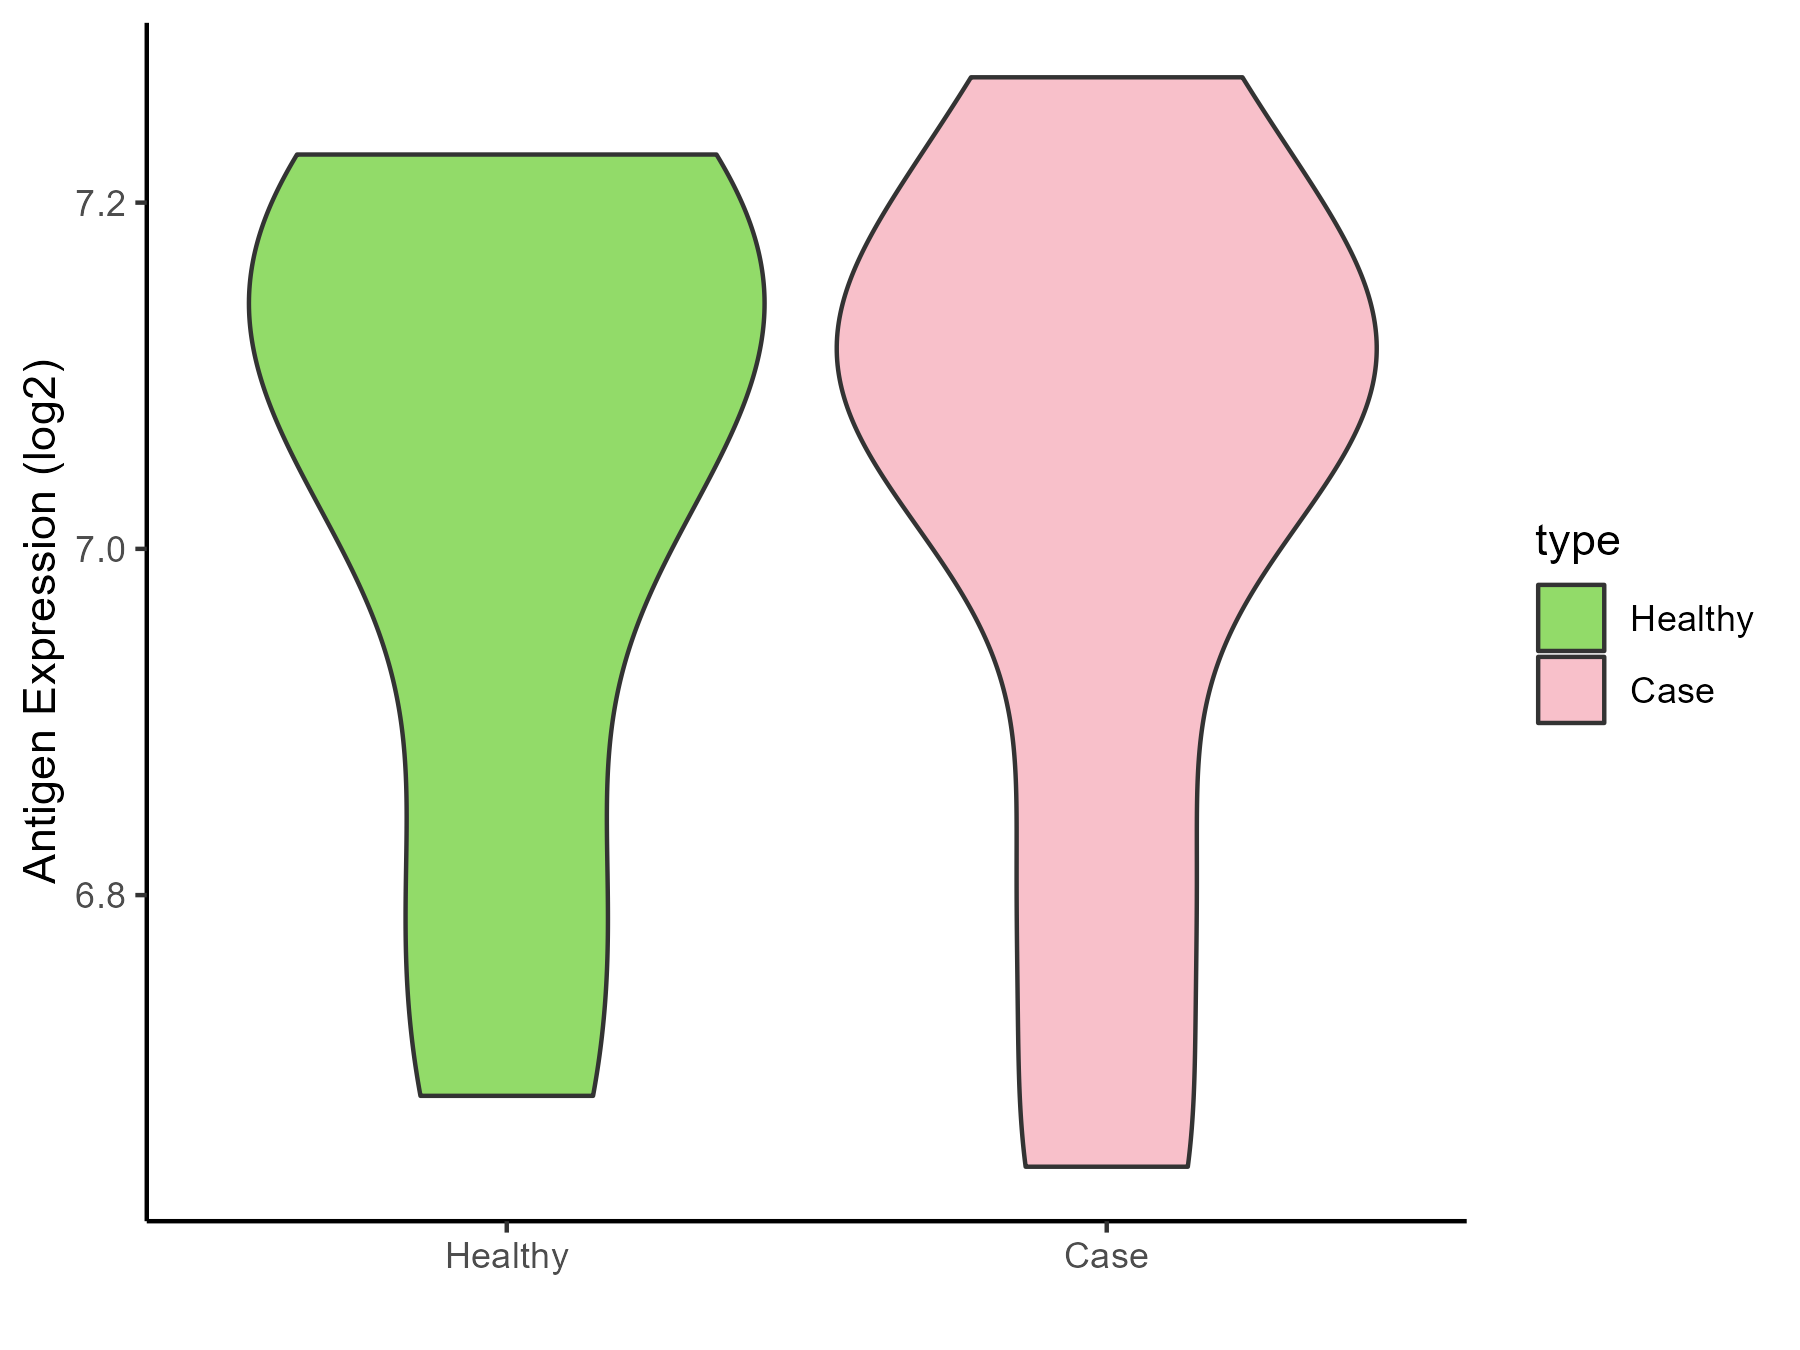
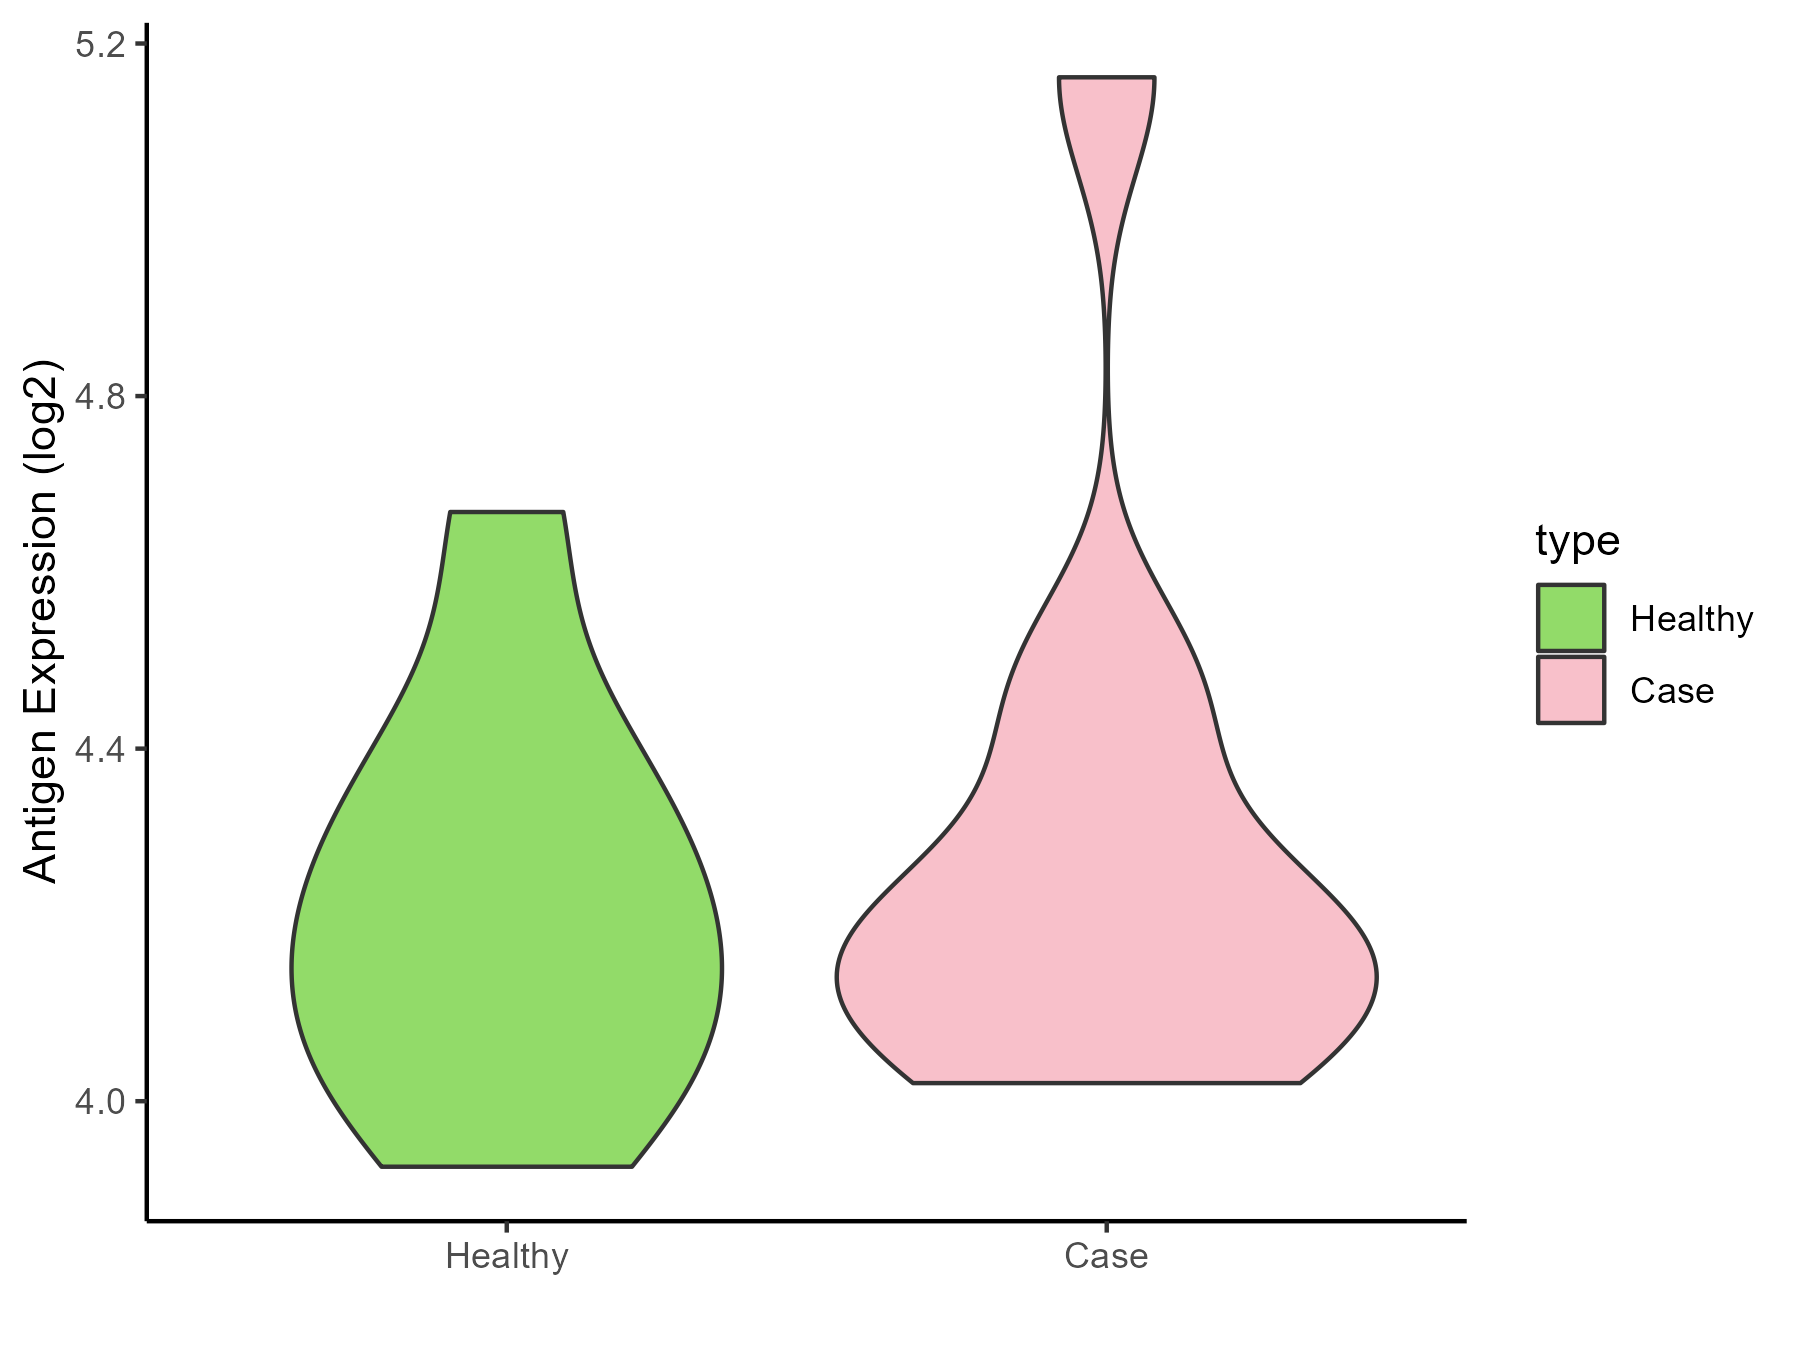
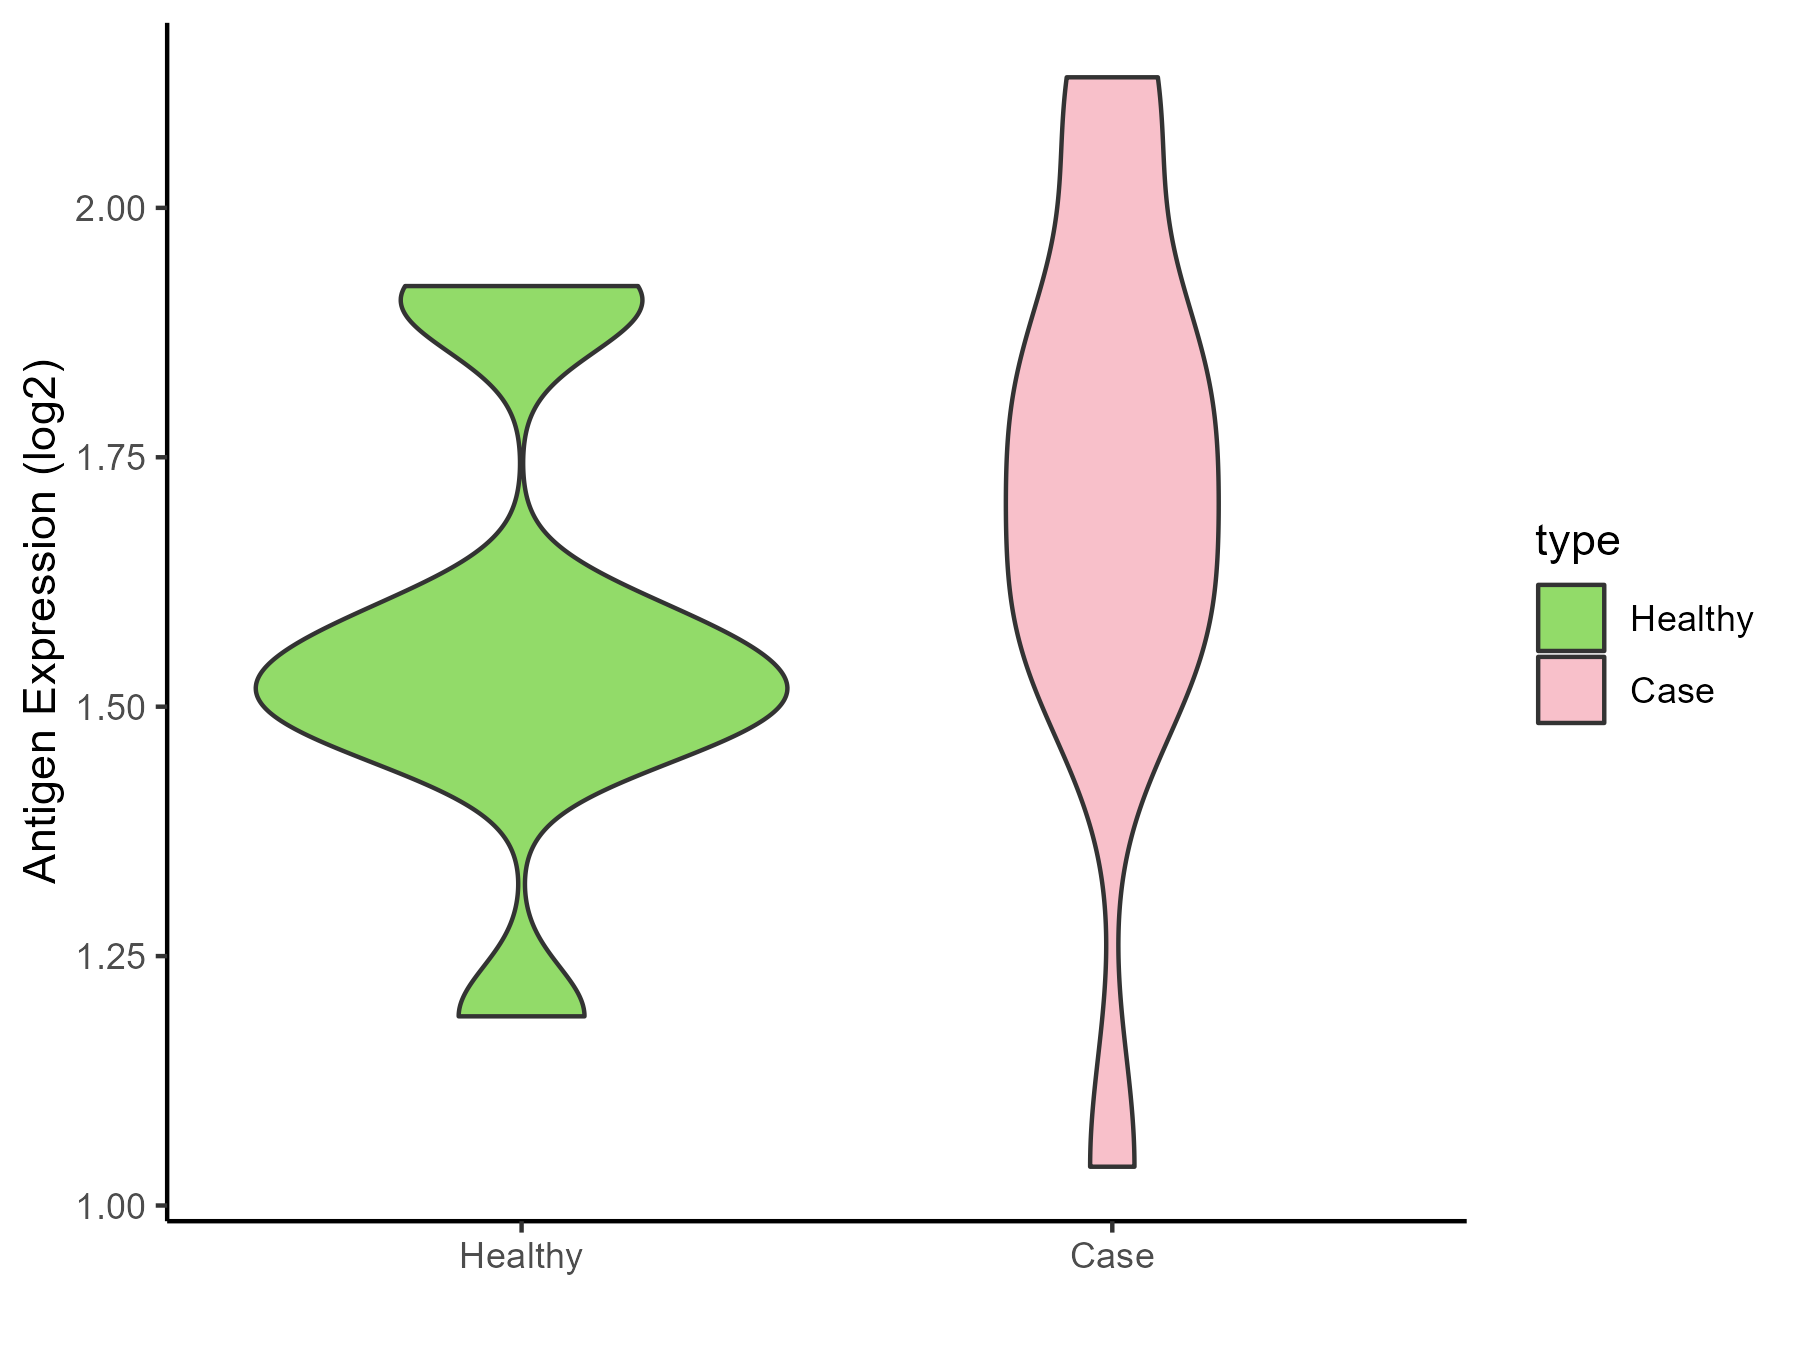
| The Studied Tissue | Brainstem | |
| The Specific Disease | Neuroectodermal tumor | |
| The Expression Level of Disease Section Compare with the Healthy Individual Tissue | p-value: 0.022899872; Fold-change: -0.288130599; Z-score: -1.401157034 | |
| Disease-specific Antigen Abundances |
|
Click to View the Clearer Original Diagram |
| The Studied Tissue | Nervous | |
| The Specific Disease | Brain cancer | |
| The Expression Level of Disease Section Compare with the Healthy Individual Tissue | p-value: 1.39E-06; Fold-change: -0.043214666; Z-score: -0.204836085 | |
| Disease-specific Antigen Abundances |
|
Click to View the Clearer Original Diagram |
| Differential expression pattern of antigen in diseases | ||
| The Studied Tissue | Whole blood | |
| The Specific Disease | Polycythemia vera | |
| The Expression Level of Disease Section Compare with the Healthy Individual Tissue | p-value: 0.061791959; Fold-change: 0.041326985; Z-score: 0.229190431 | |
| Disease-specific Antigen Abundances |
|
Click to View the Clearer Original Diagram |
| The Studied Tissue | Whole blood | |
| The Specific Disease | Myelofibrosis | |
| The Expression Level of Disease Section Compare with the Healthy Individual Tissue | p-value: 0.003134515; Fold-change: 0.072970289; Z-score: 0.43433491 | |
| Disease-specific Antigen Abundances |
|
Click to View the Clearer Original Diagram |
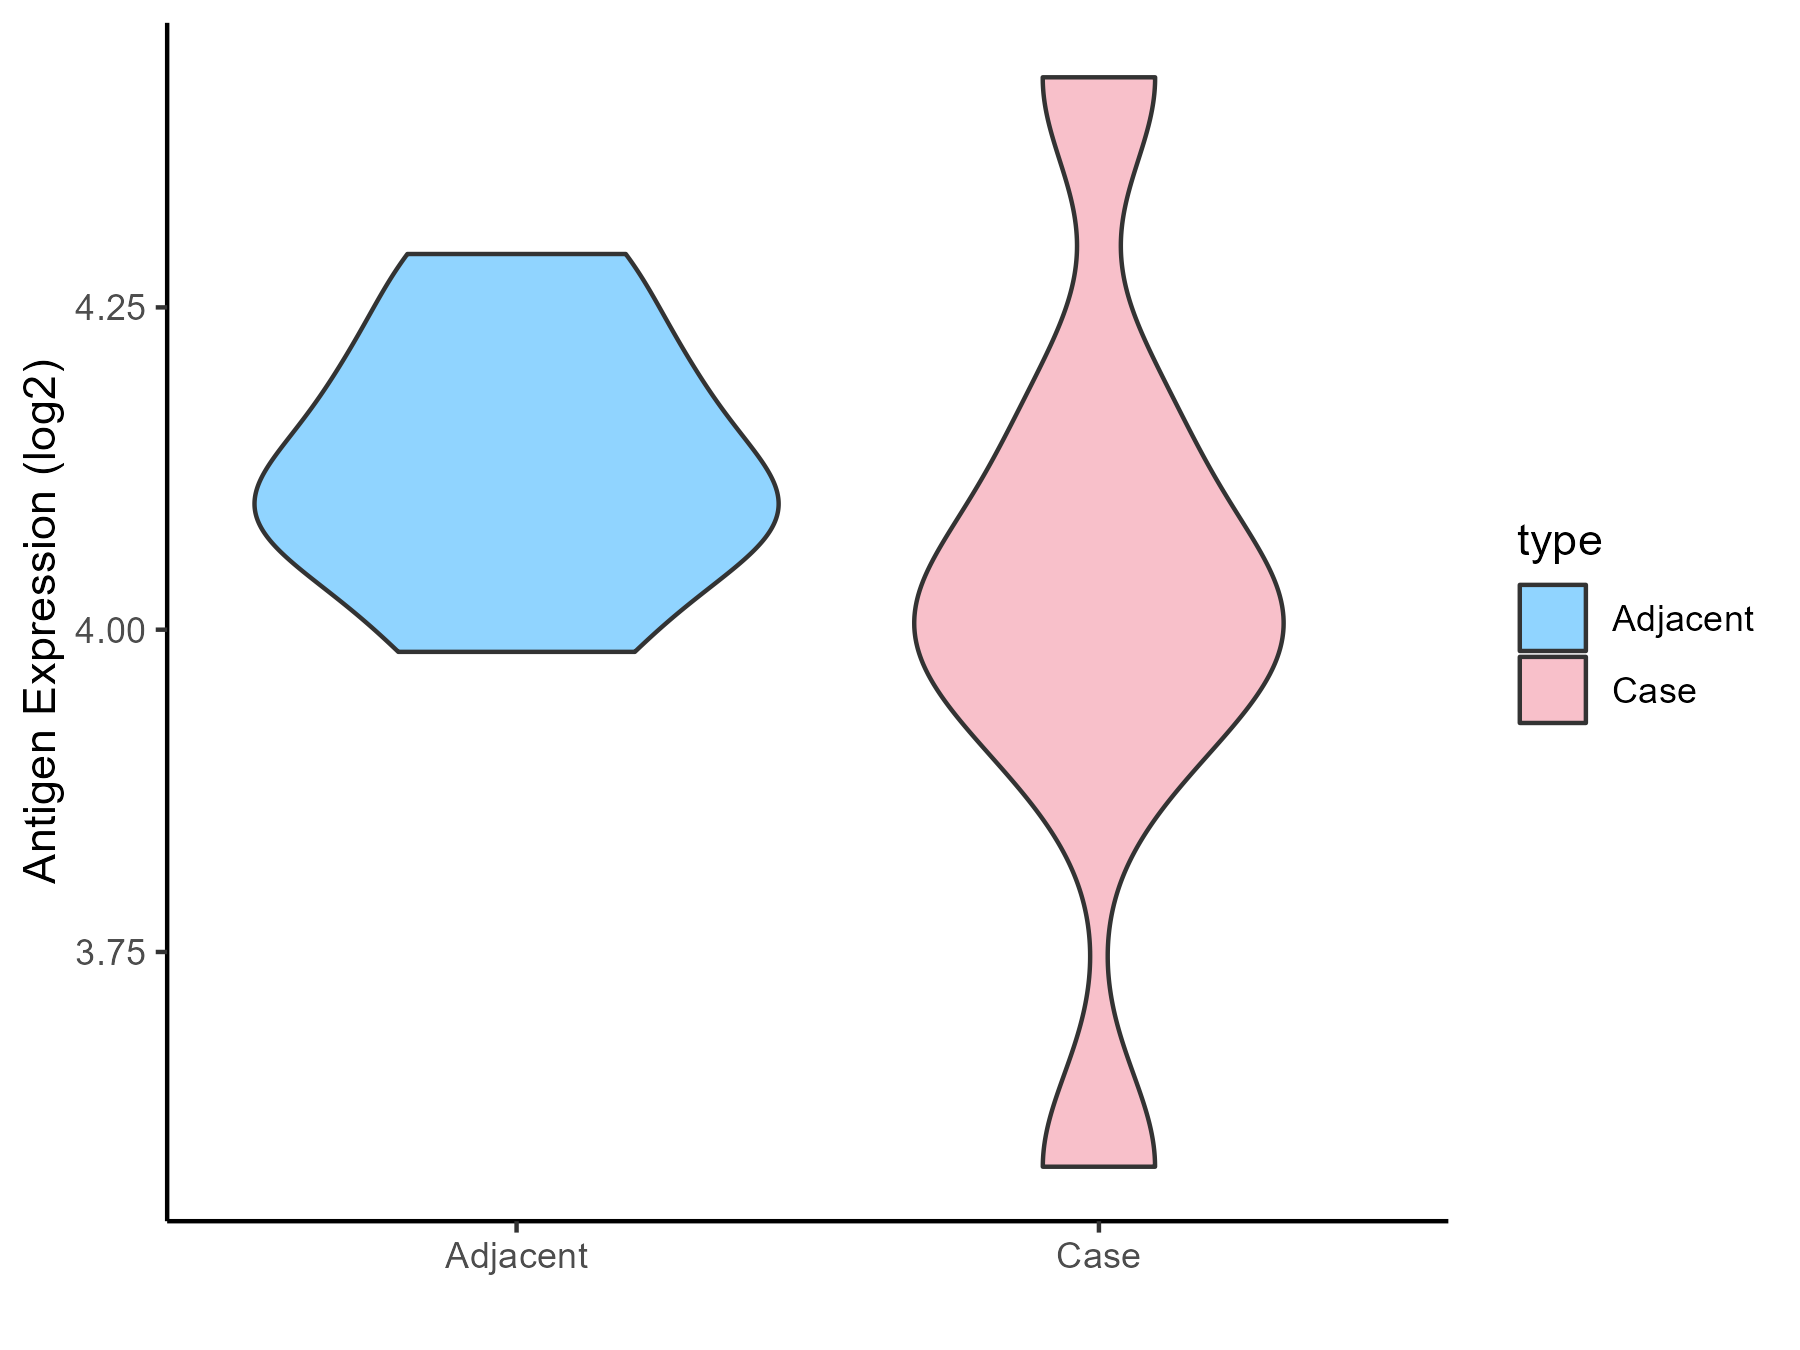
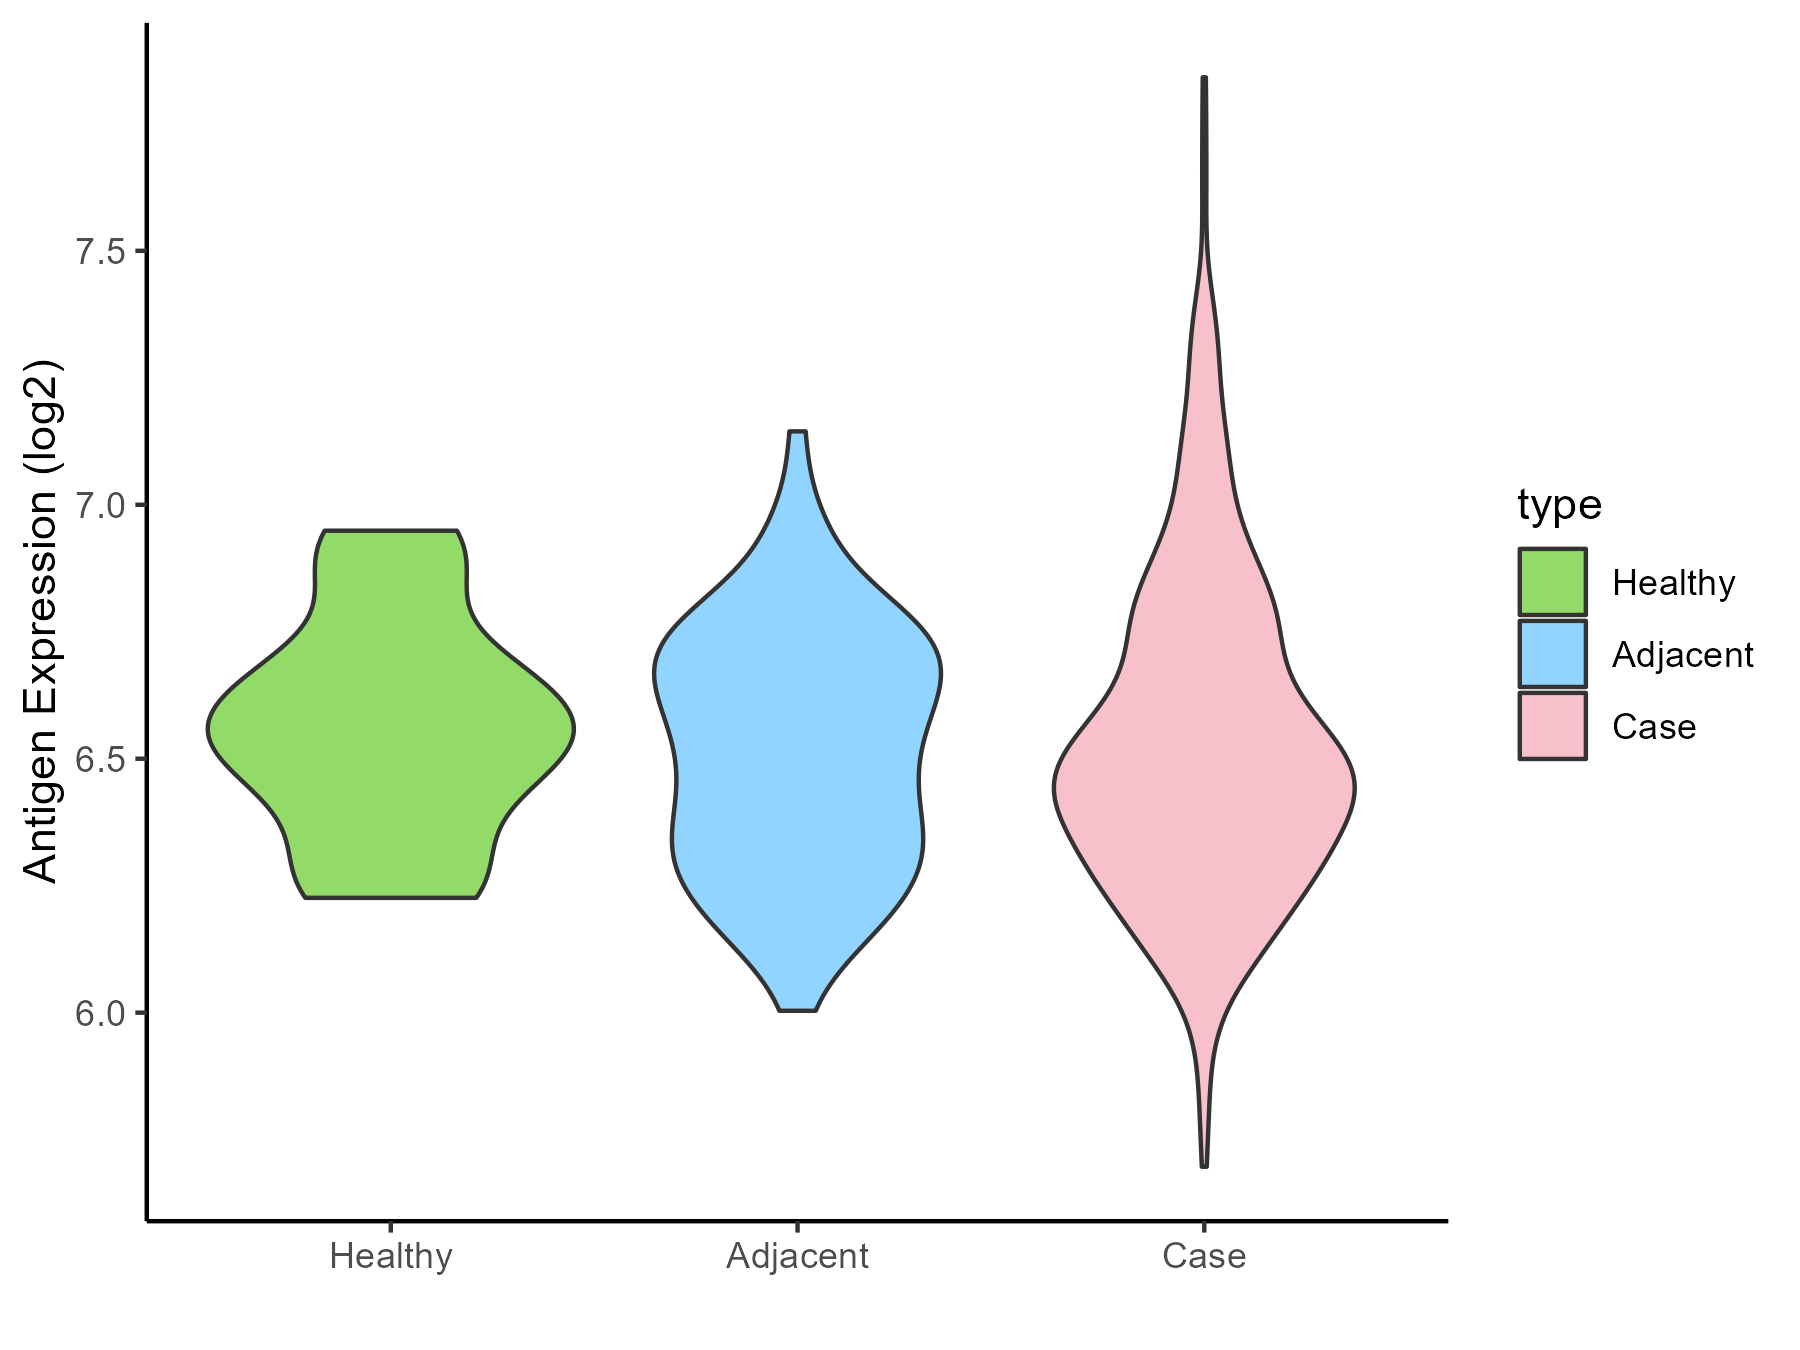
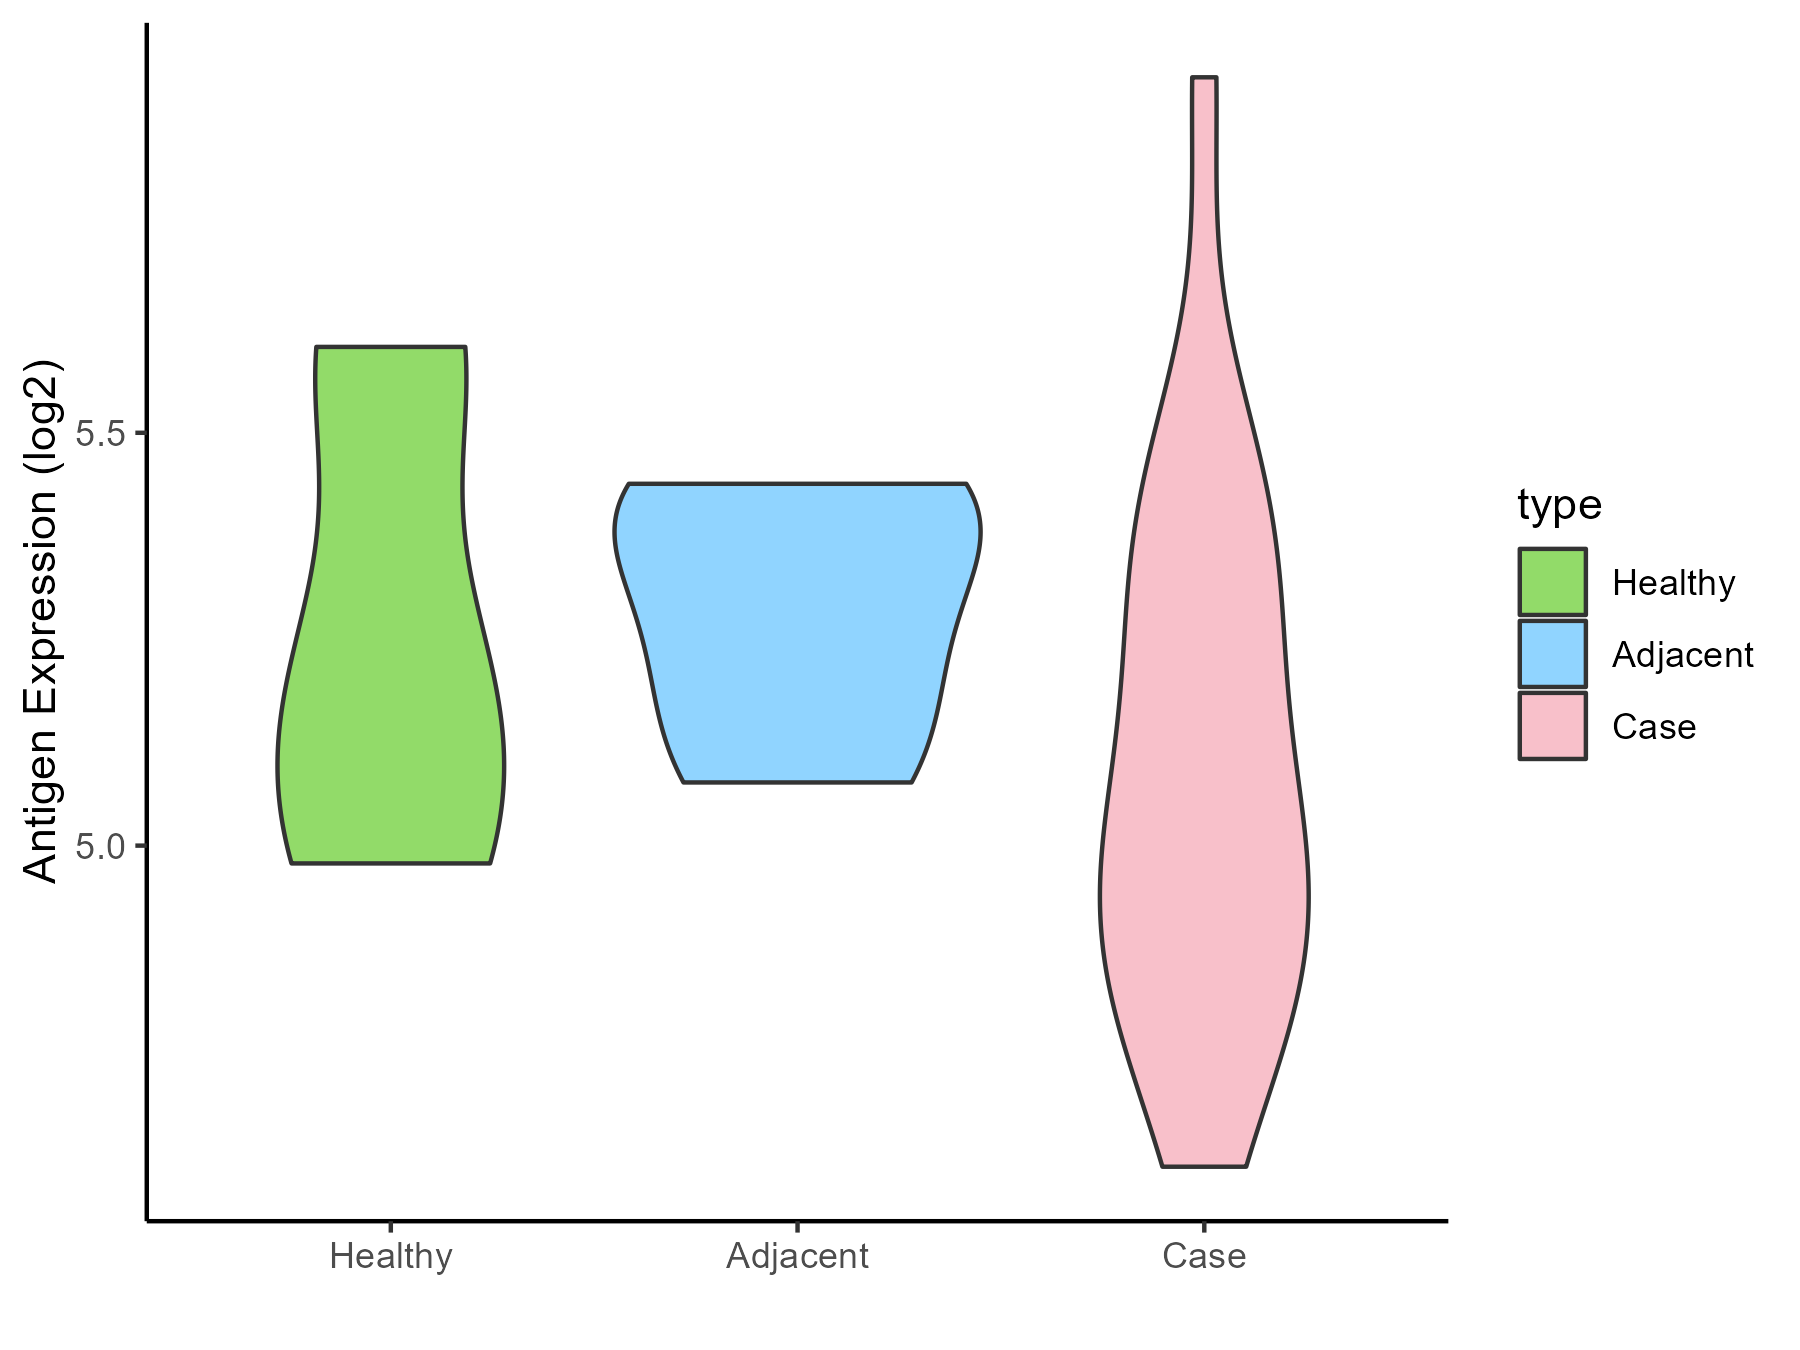
| Differential expression pattern of antigen in diseases | ||
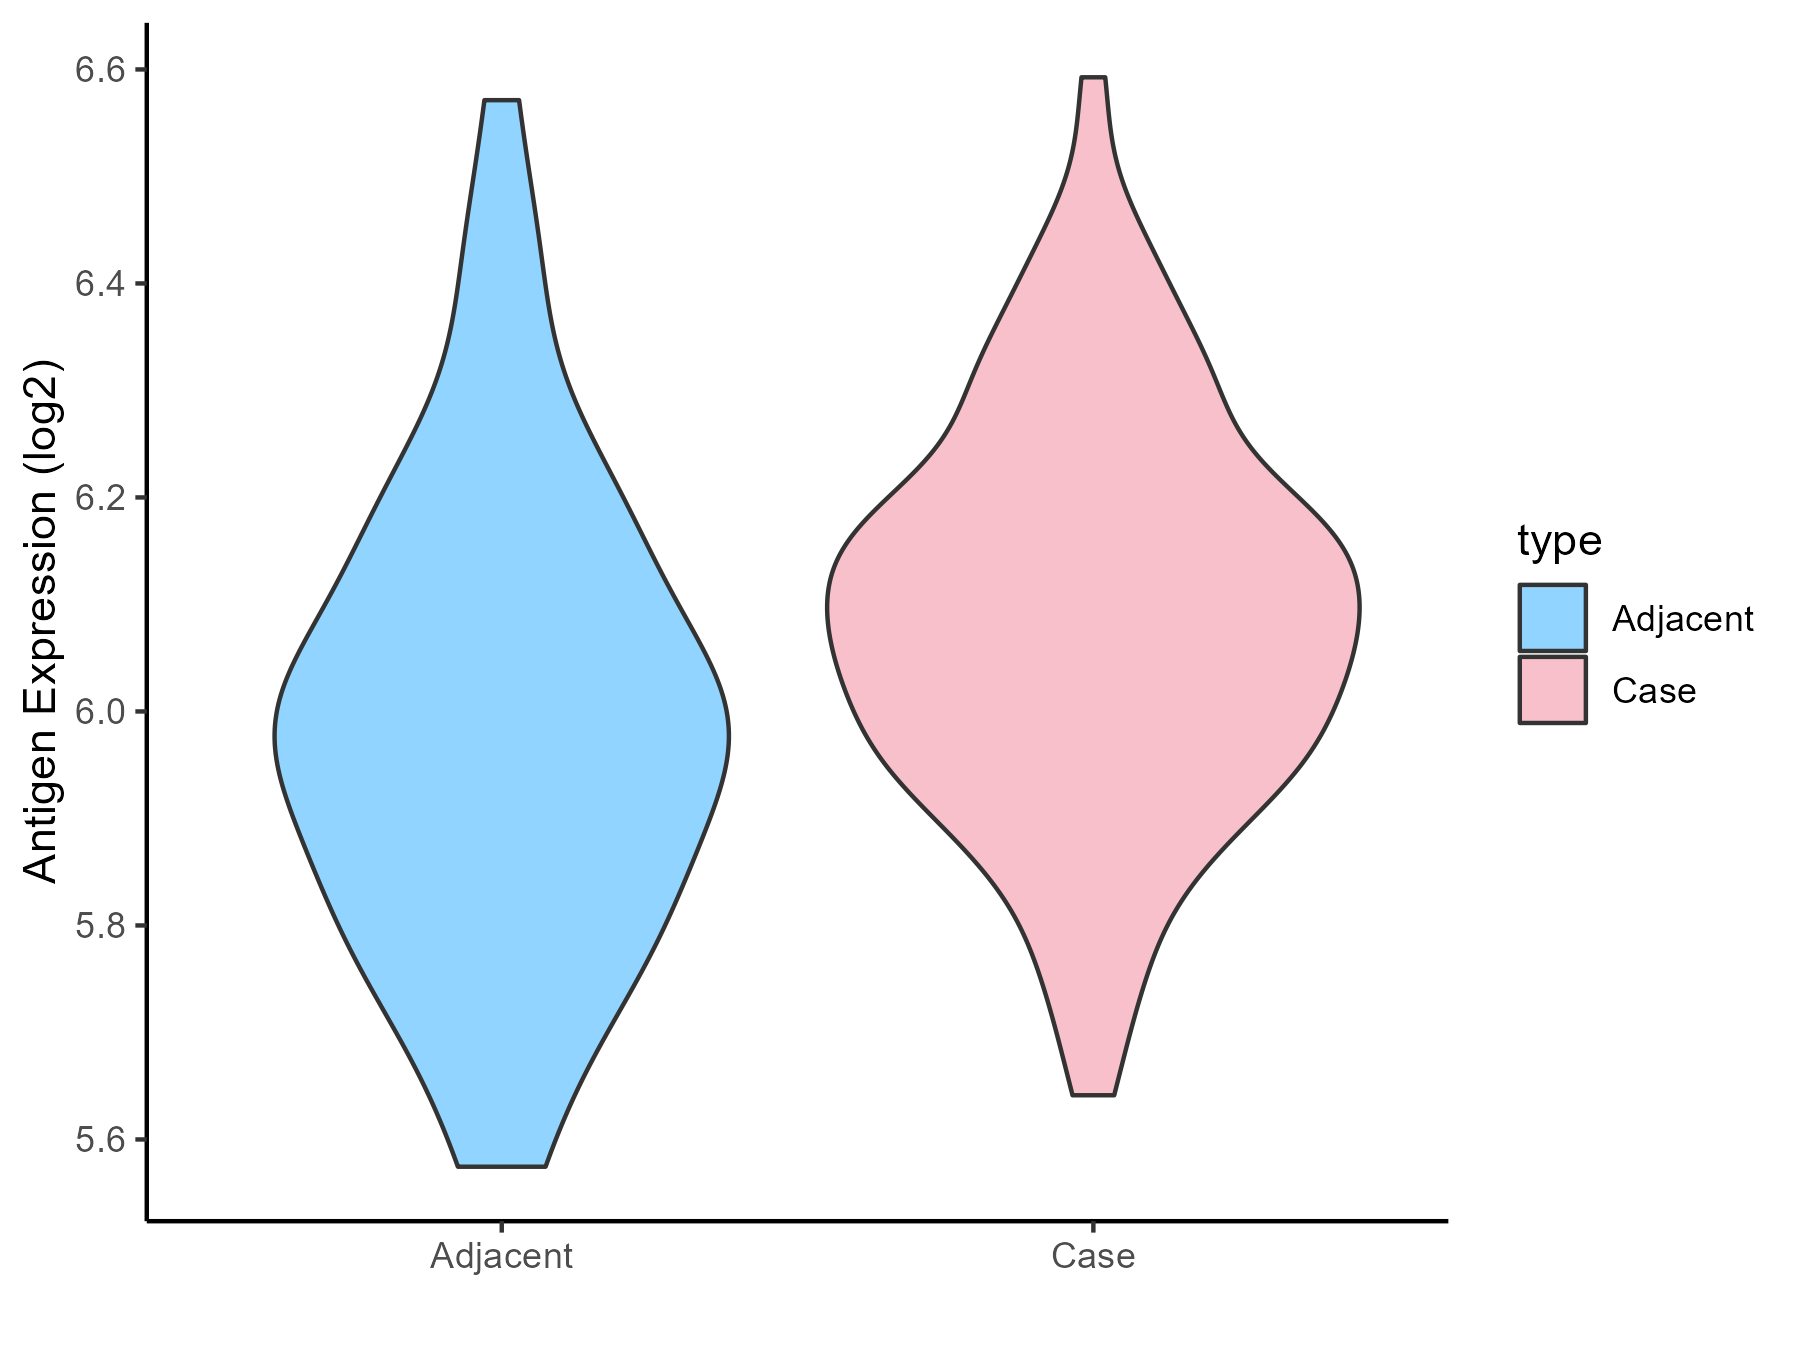
| The Studied Tissue | Bone marrow | |
| The Specific Disease | Myelodysplastic syndromes | |
| The Expression Level of Disease Section Compare with the Healthy Individual Tissue | p-value: 0.523488469; Fold-change: 0.069144642; Z-score: 0.396283681 | |
| The Expression Level of Disease Section Compare with the Adjacent Tissue | p-value: 0.089702312; Fold-change: -0.155258201; Z-score: -1.228439828 | |
| Disease-specific Antigen Abundances |
|
Click to View the Clearer Original Diagram |
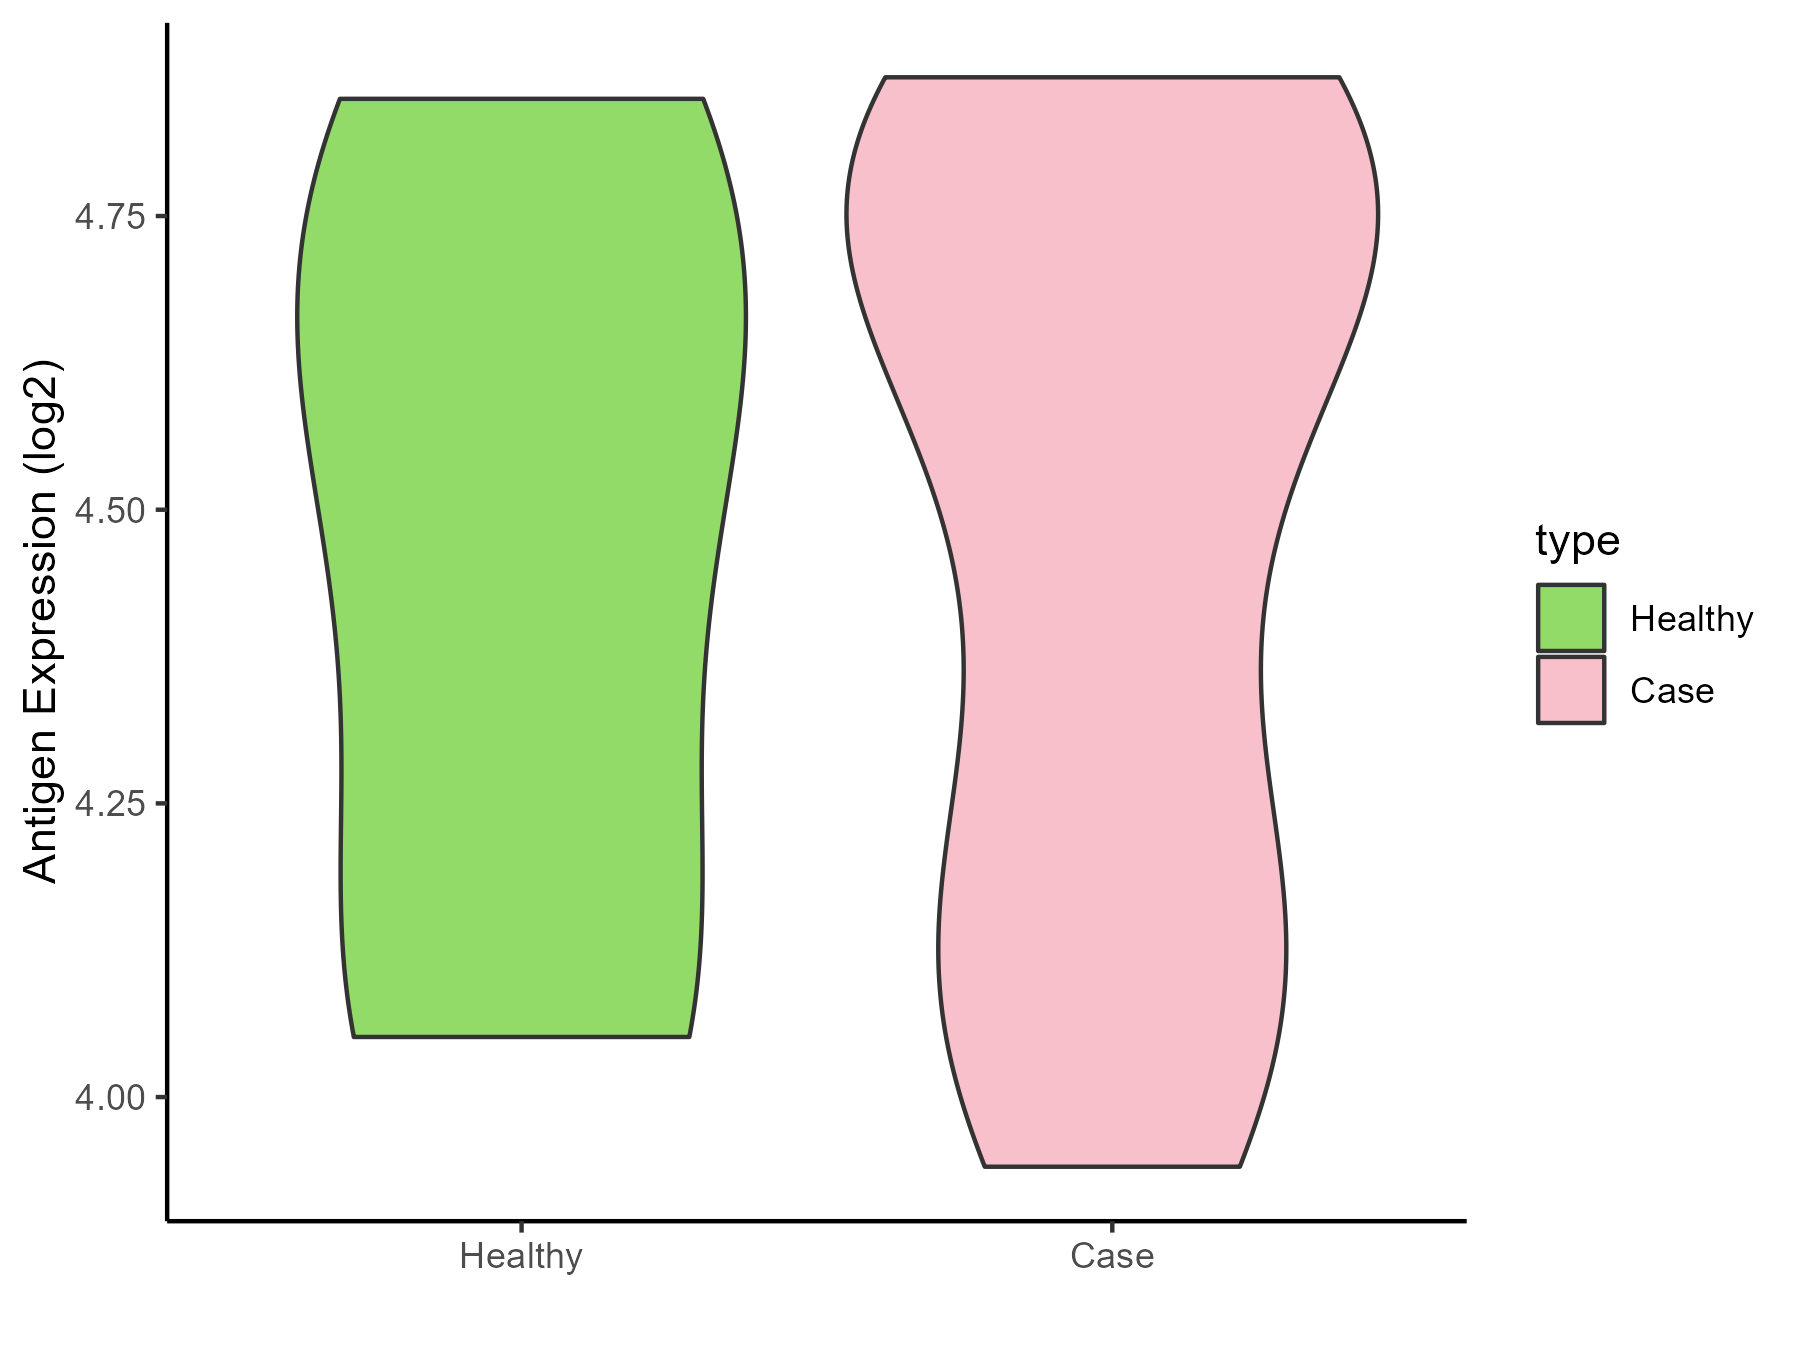
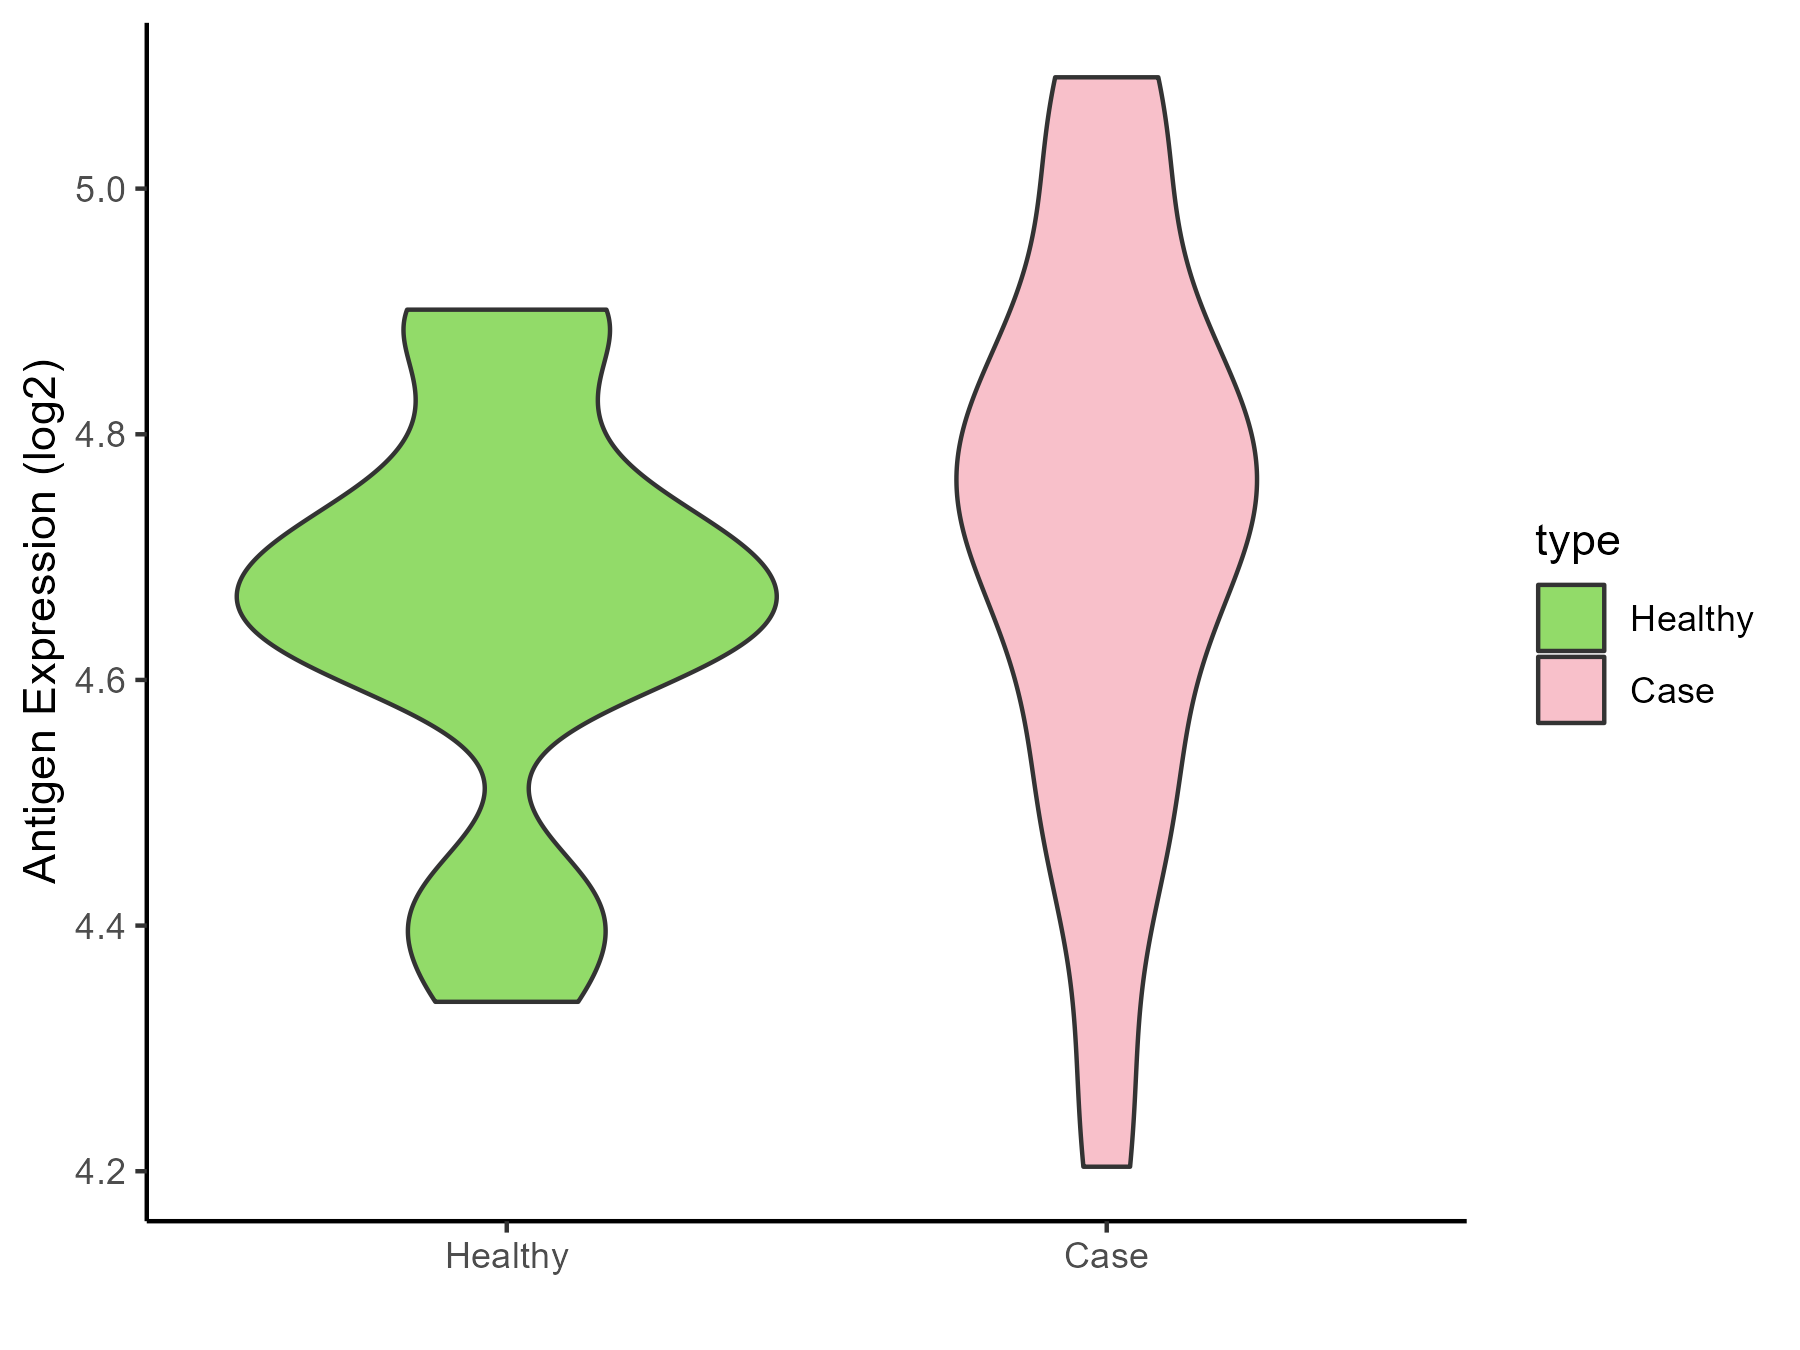
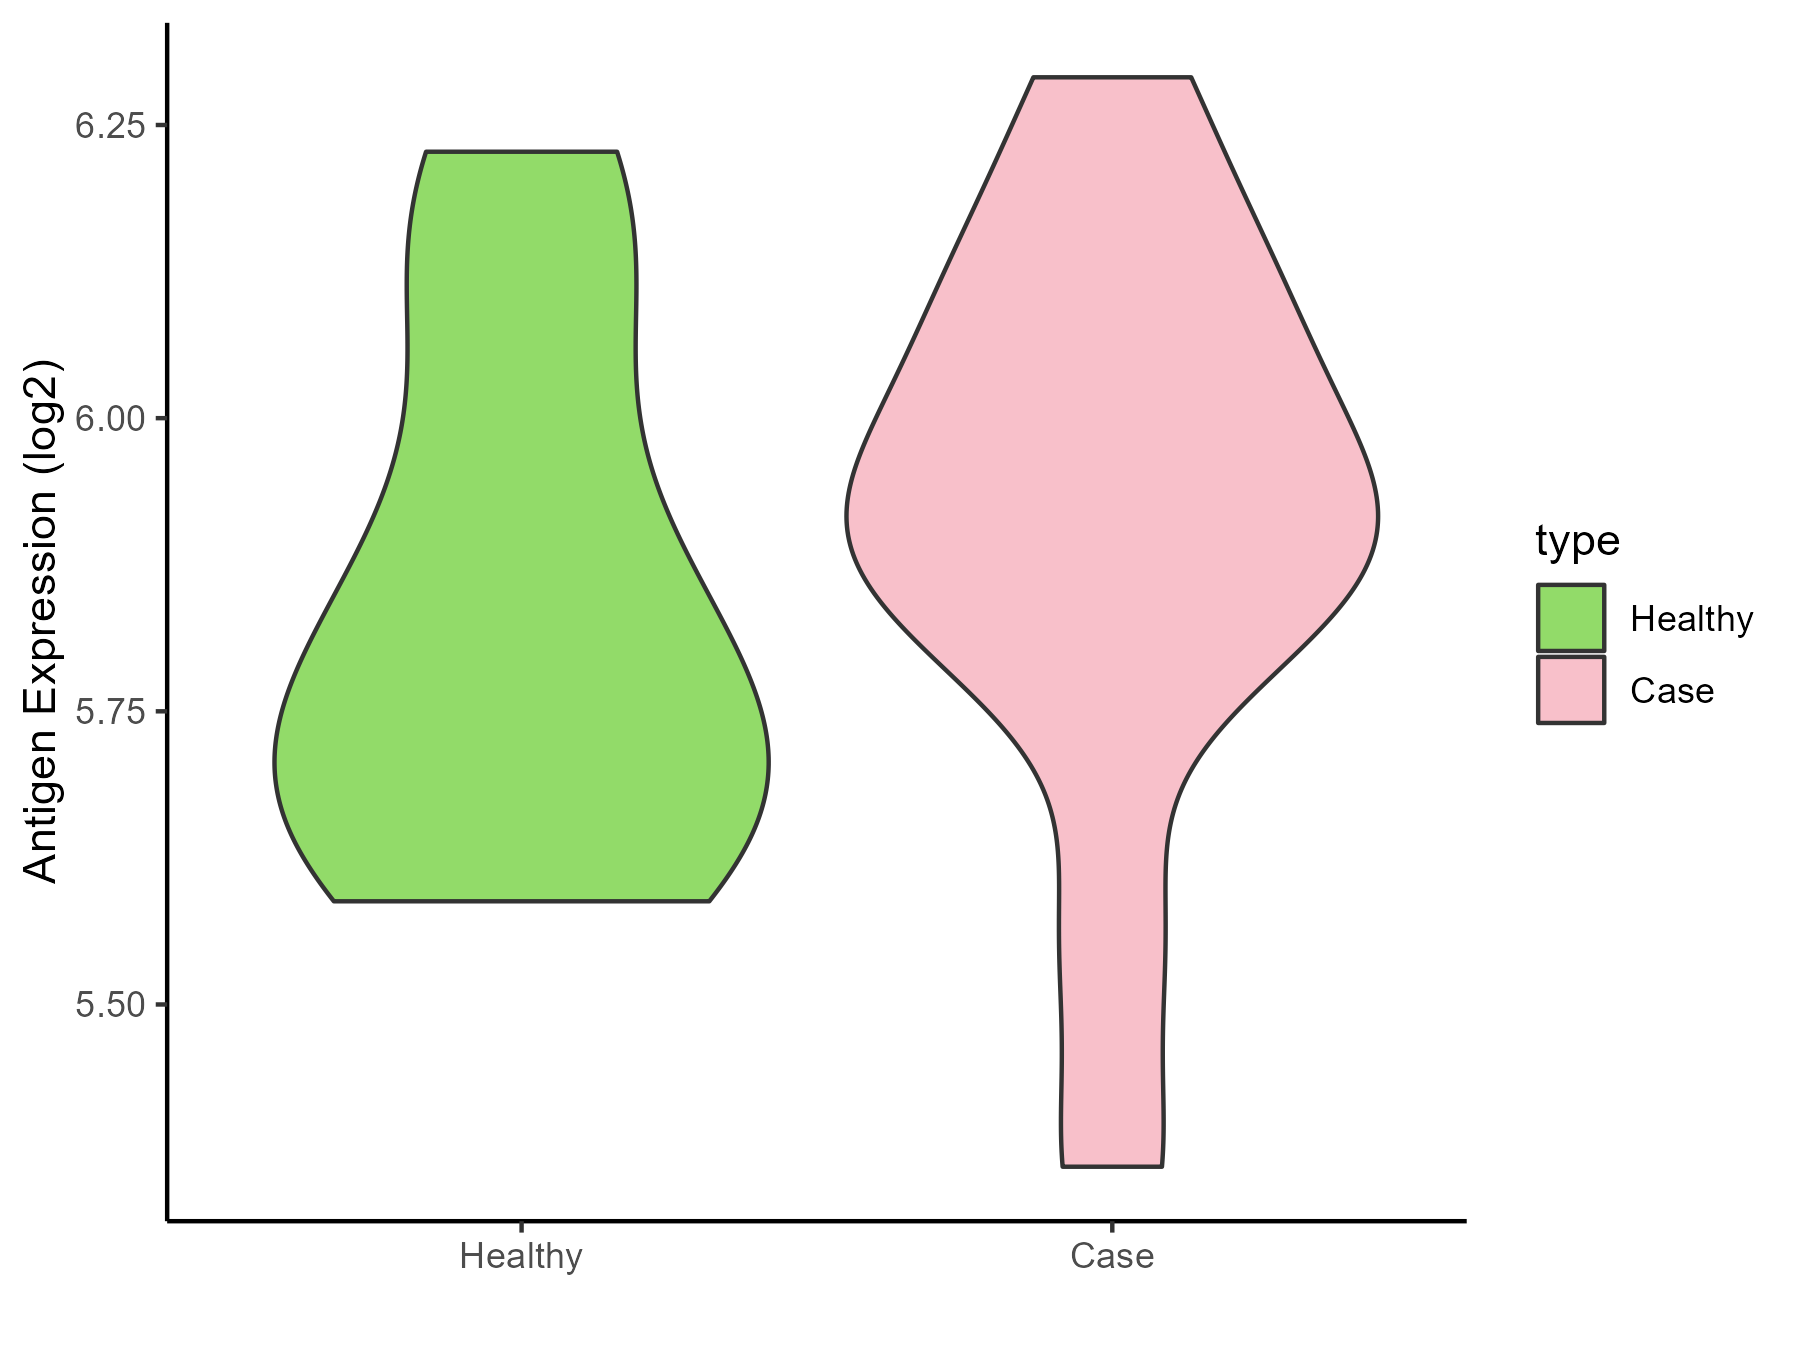
| Differential expression pattern of antigen in diseases | ||
| The Studied Tissue | Tonsil | |
| The Specific Disease | Lymphoma | |
| The Expression Level of Disease Section Compare with the Healthy Individual Tissue | p-value: 0.945861992; Fold-change: 0.026057632; Z-score: 0.124008613 | |
| Disease-specific Antigen Abundances |
|
Click to View the Clearer Original Diagram |
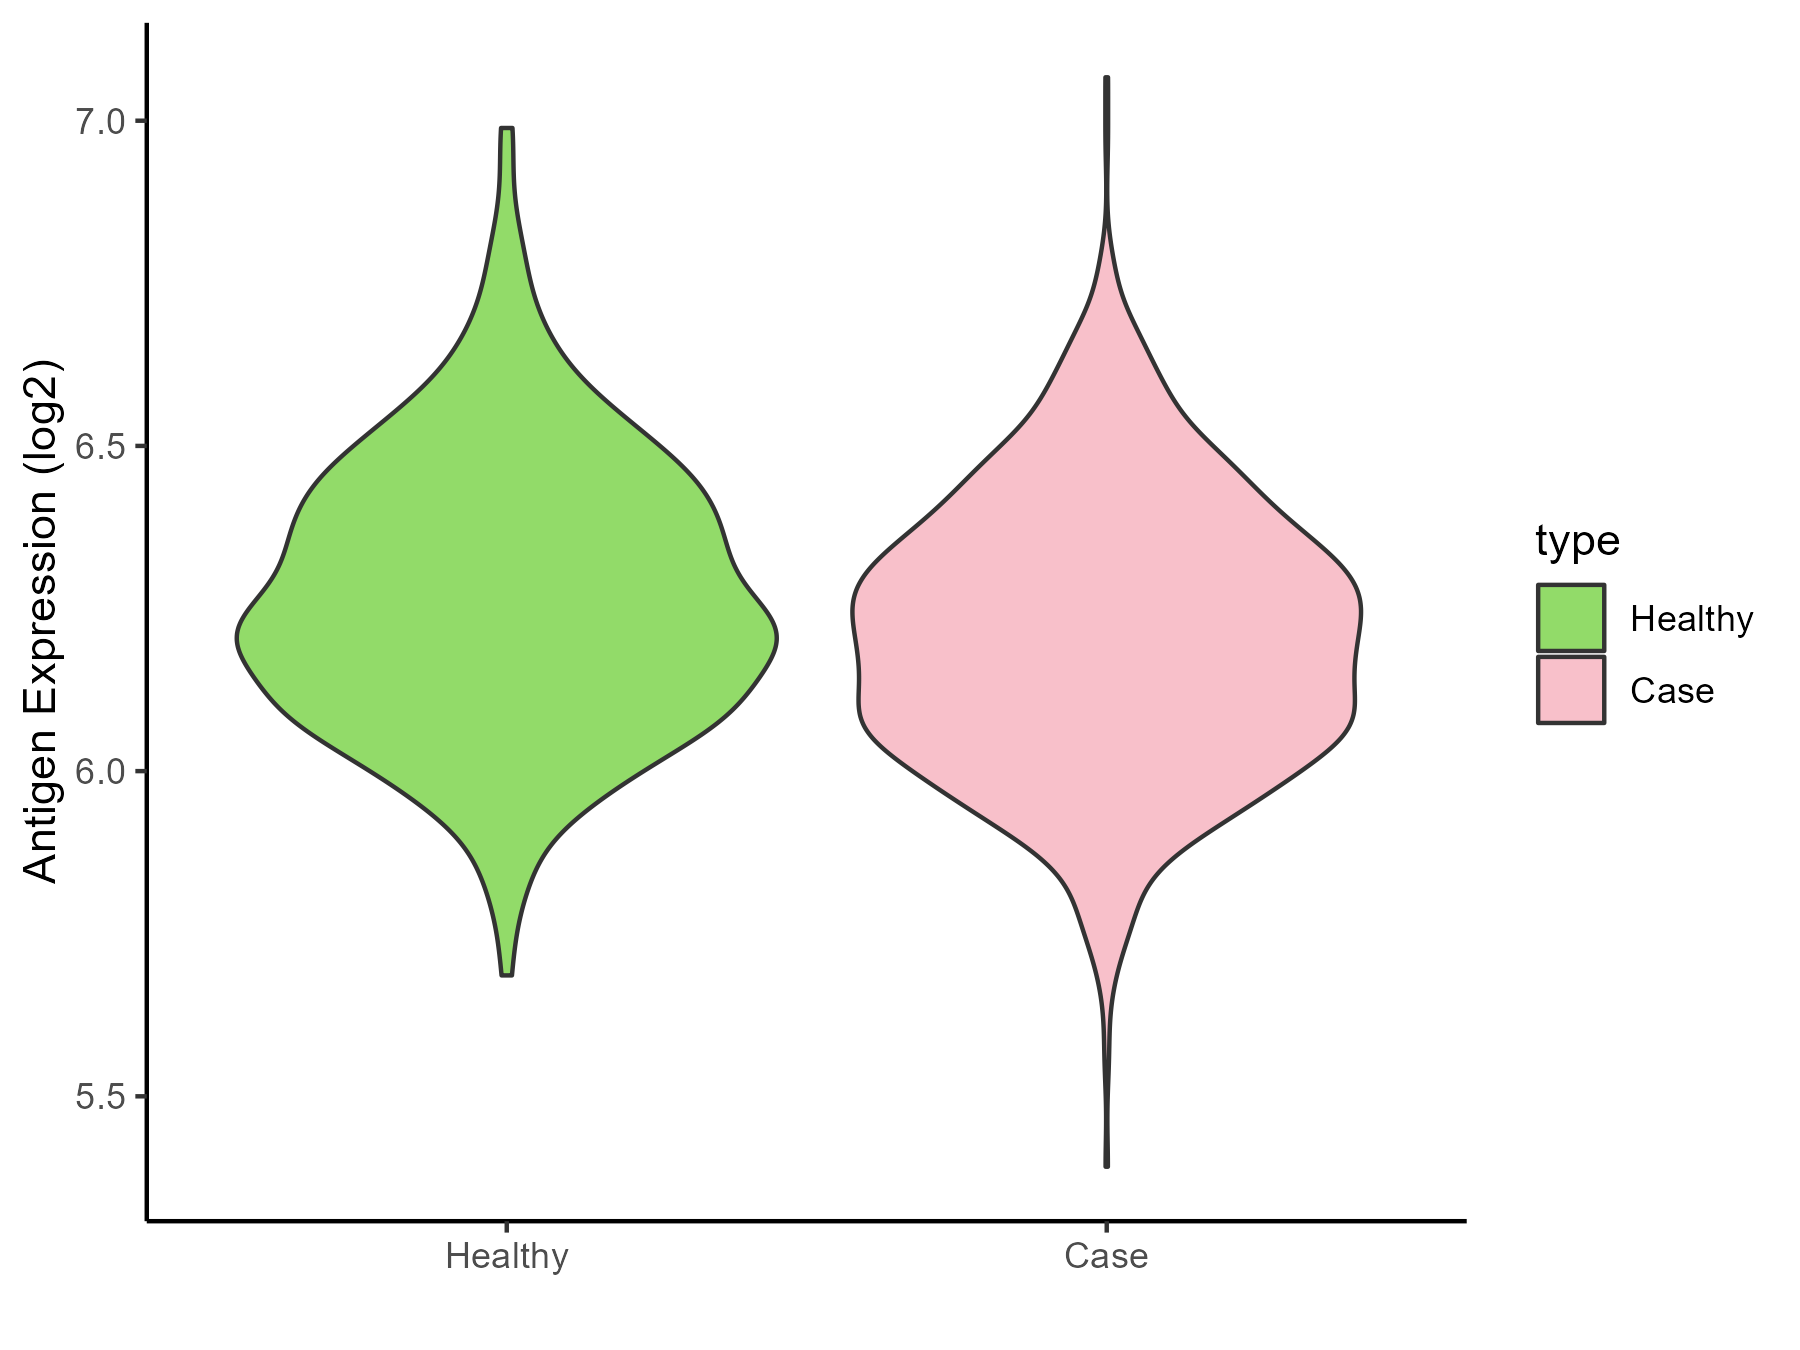
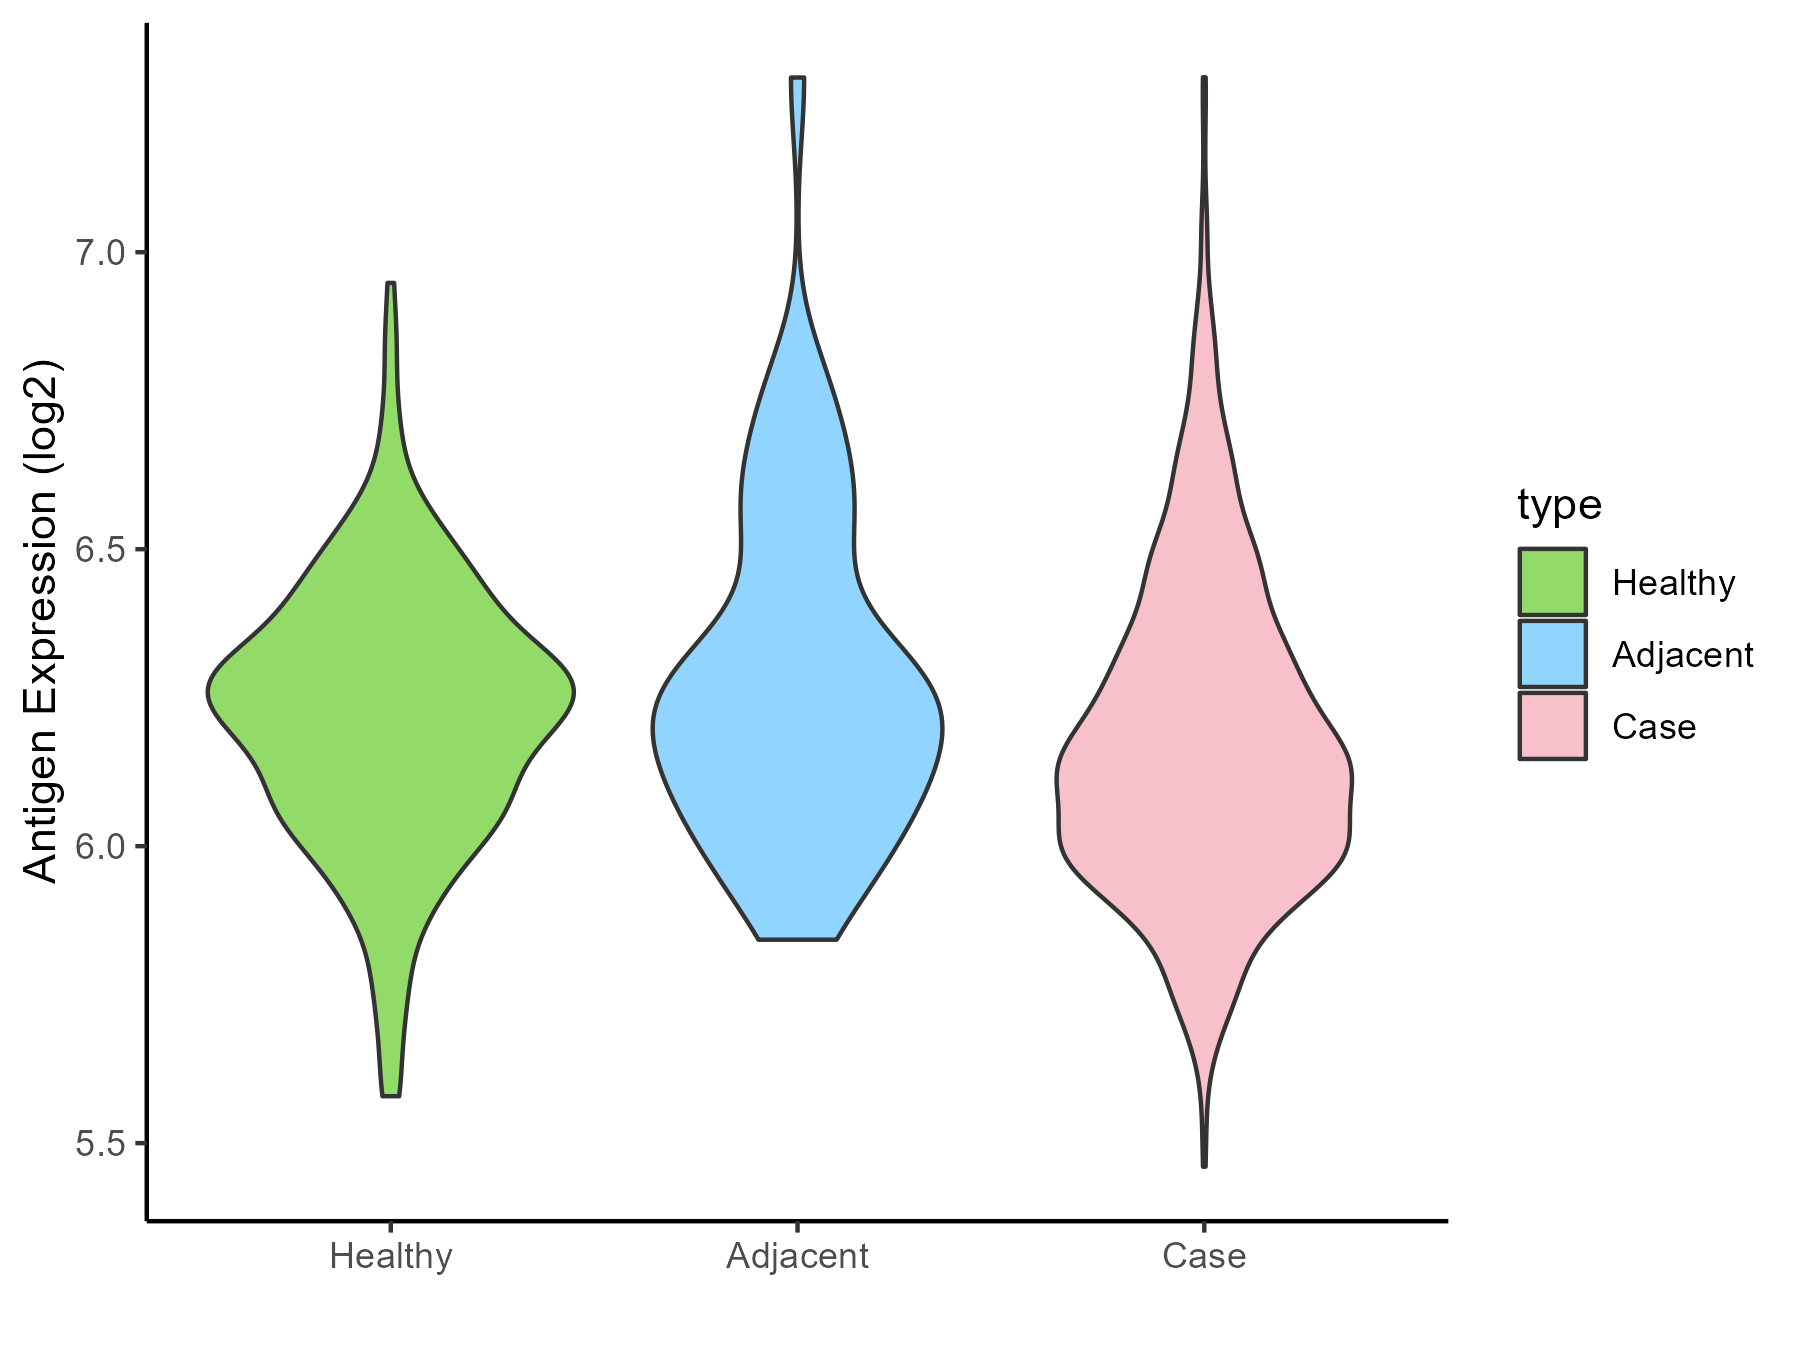
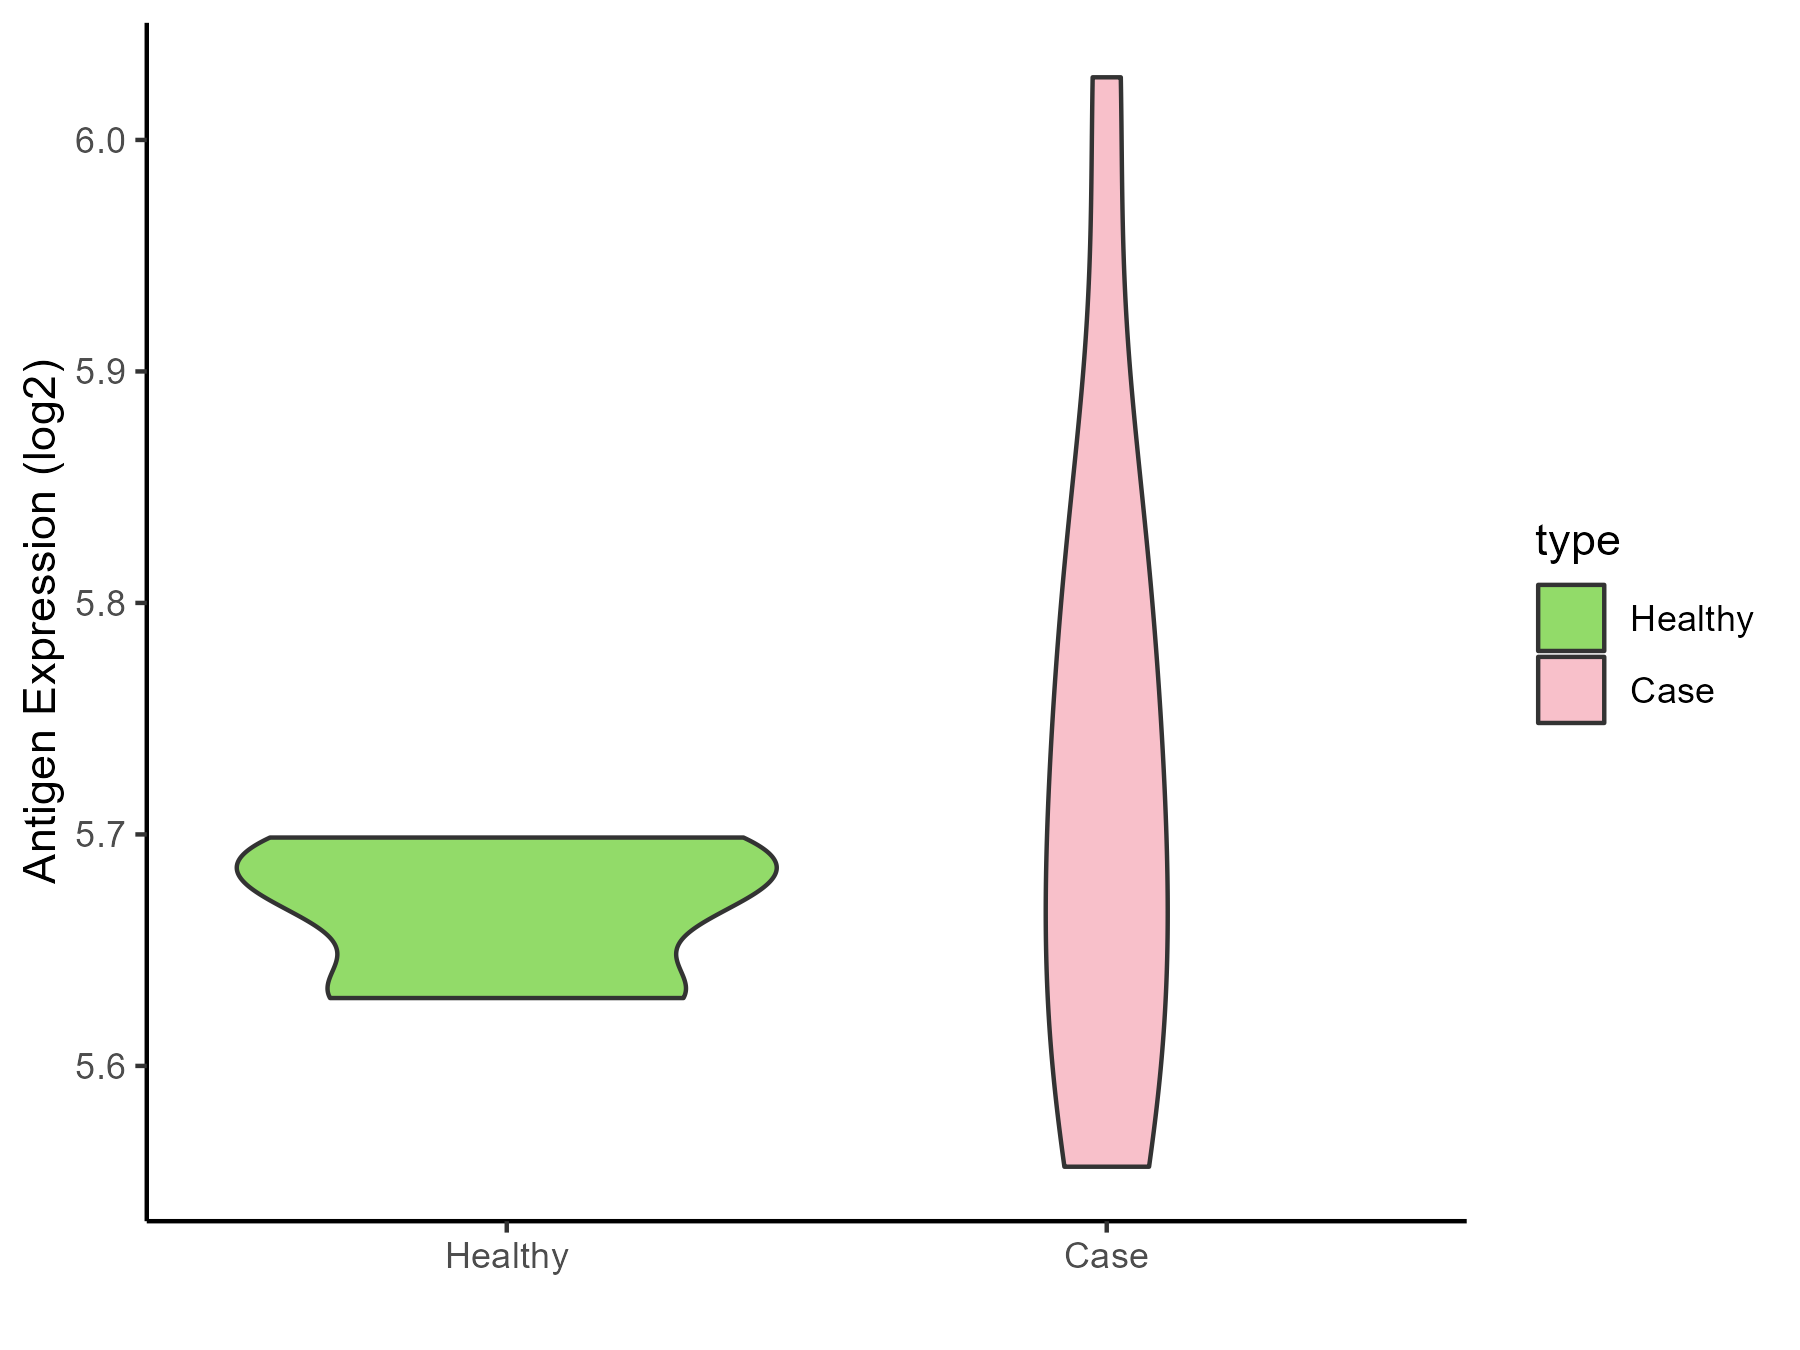
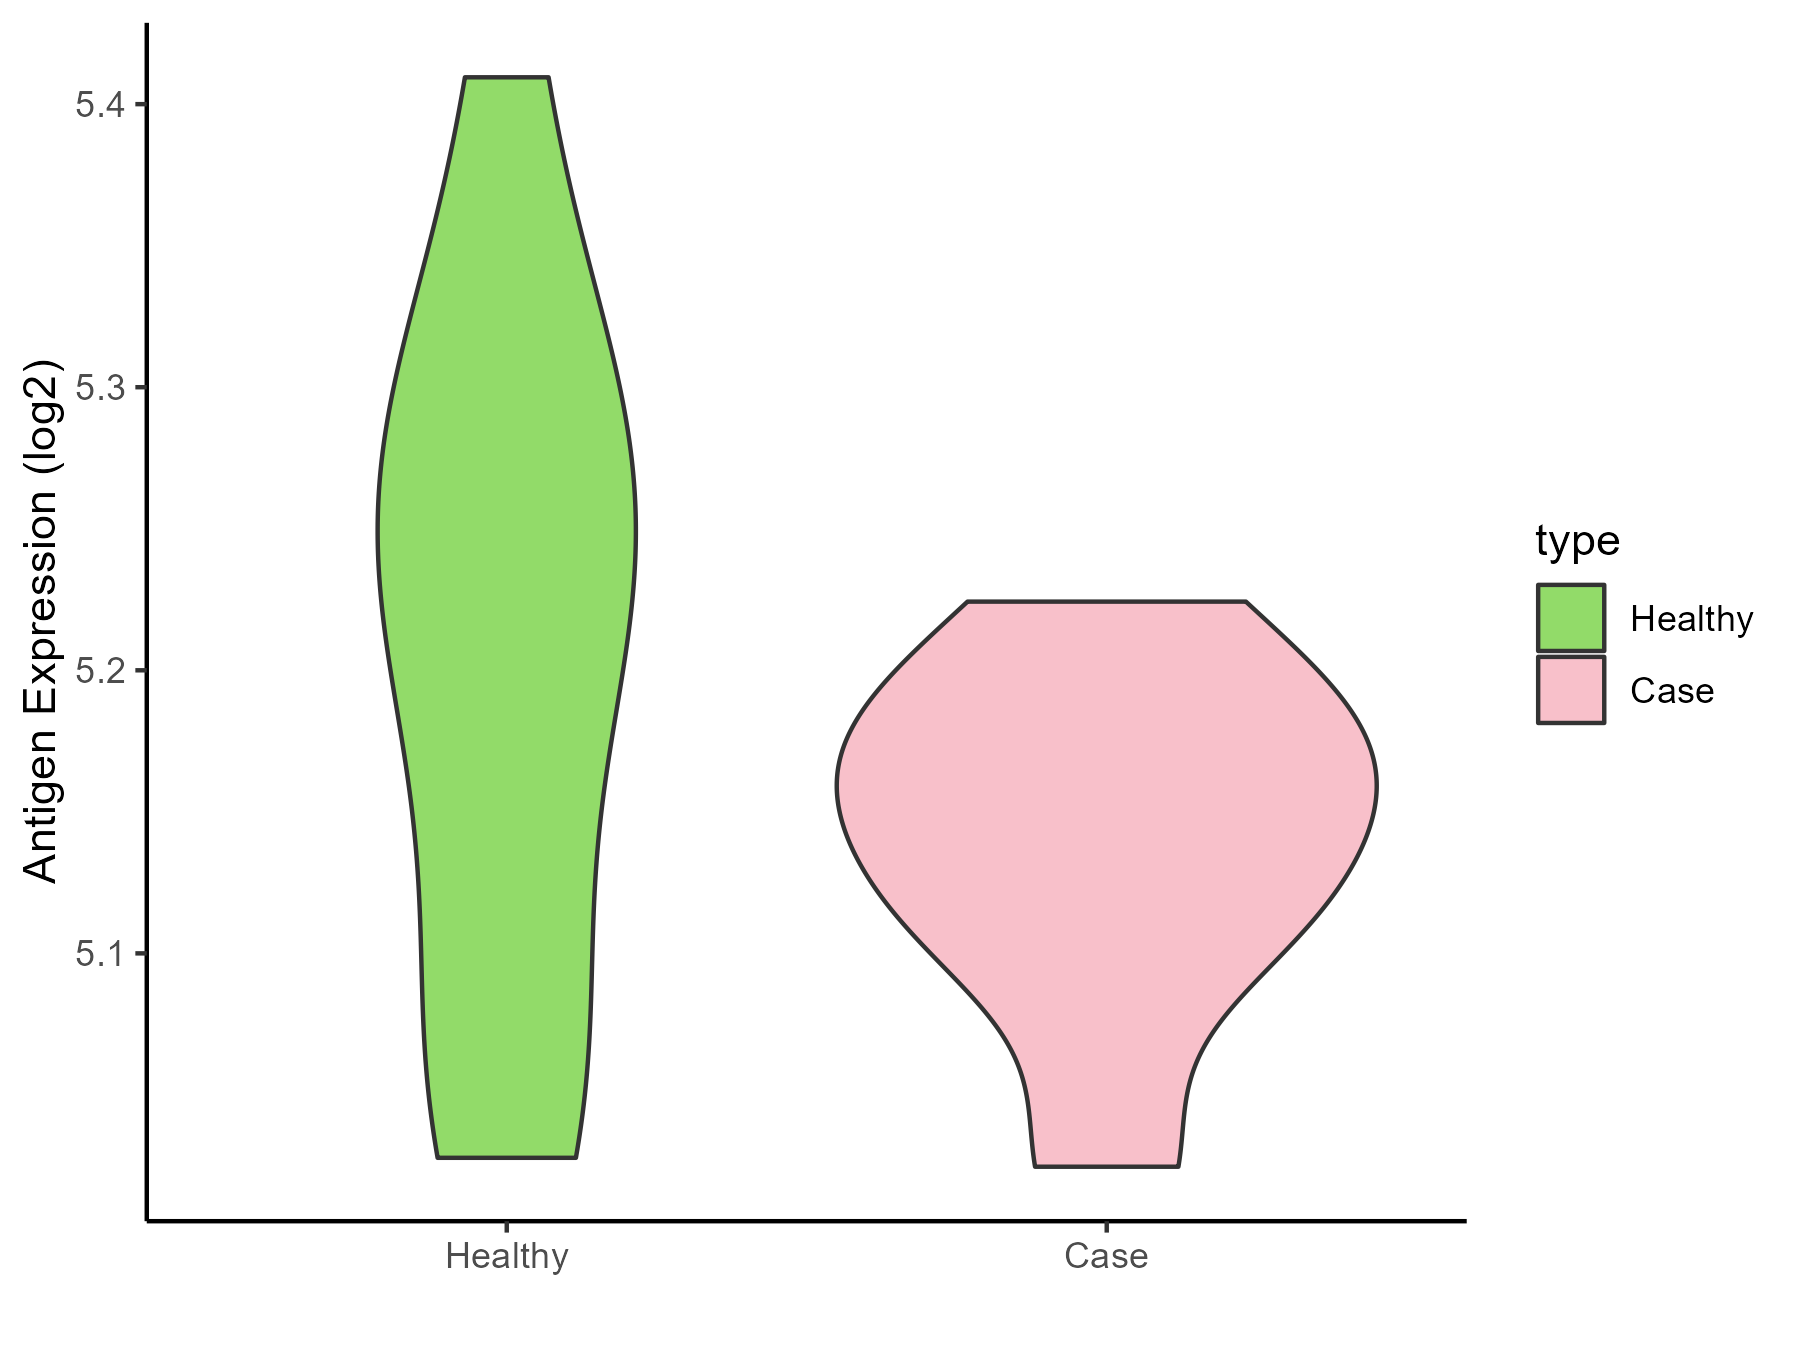
| Differential expression pattern of antigen in diseases | ||
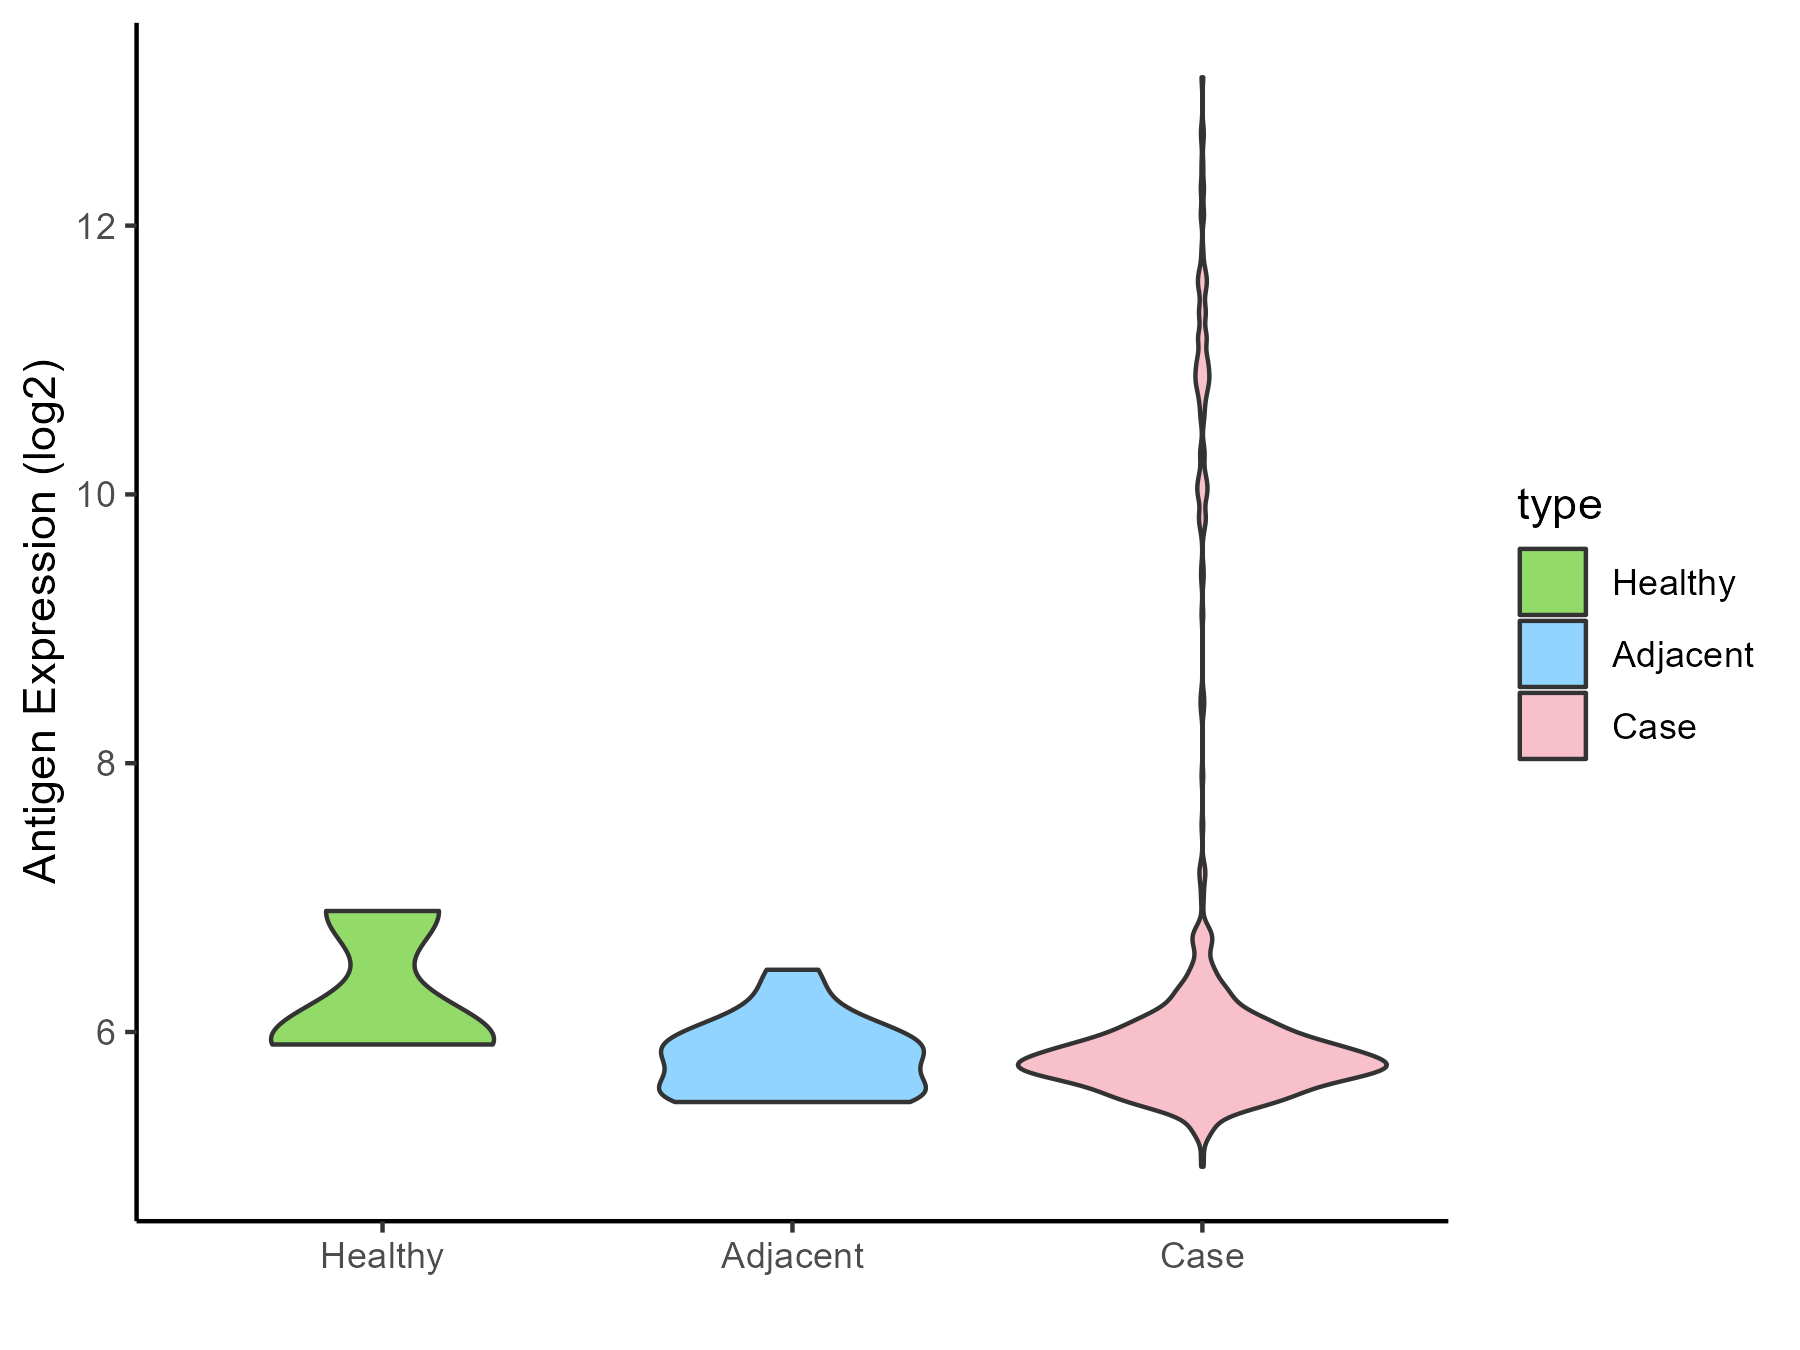
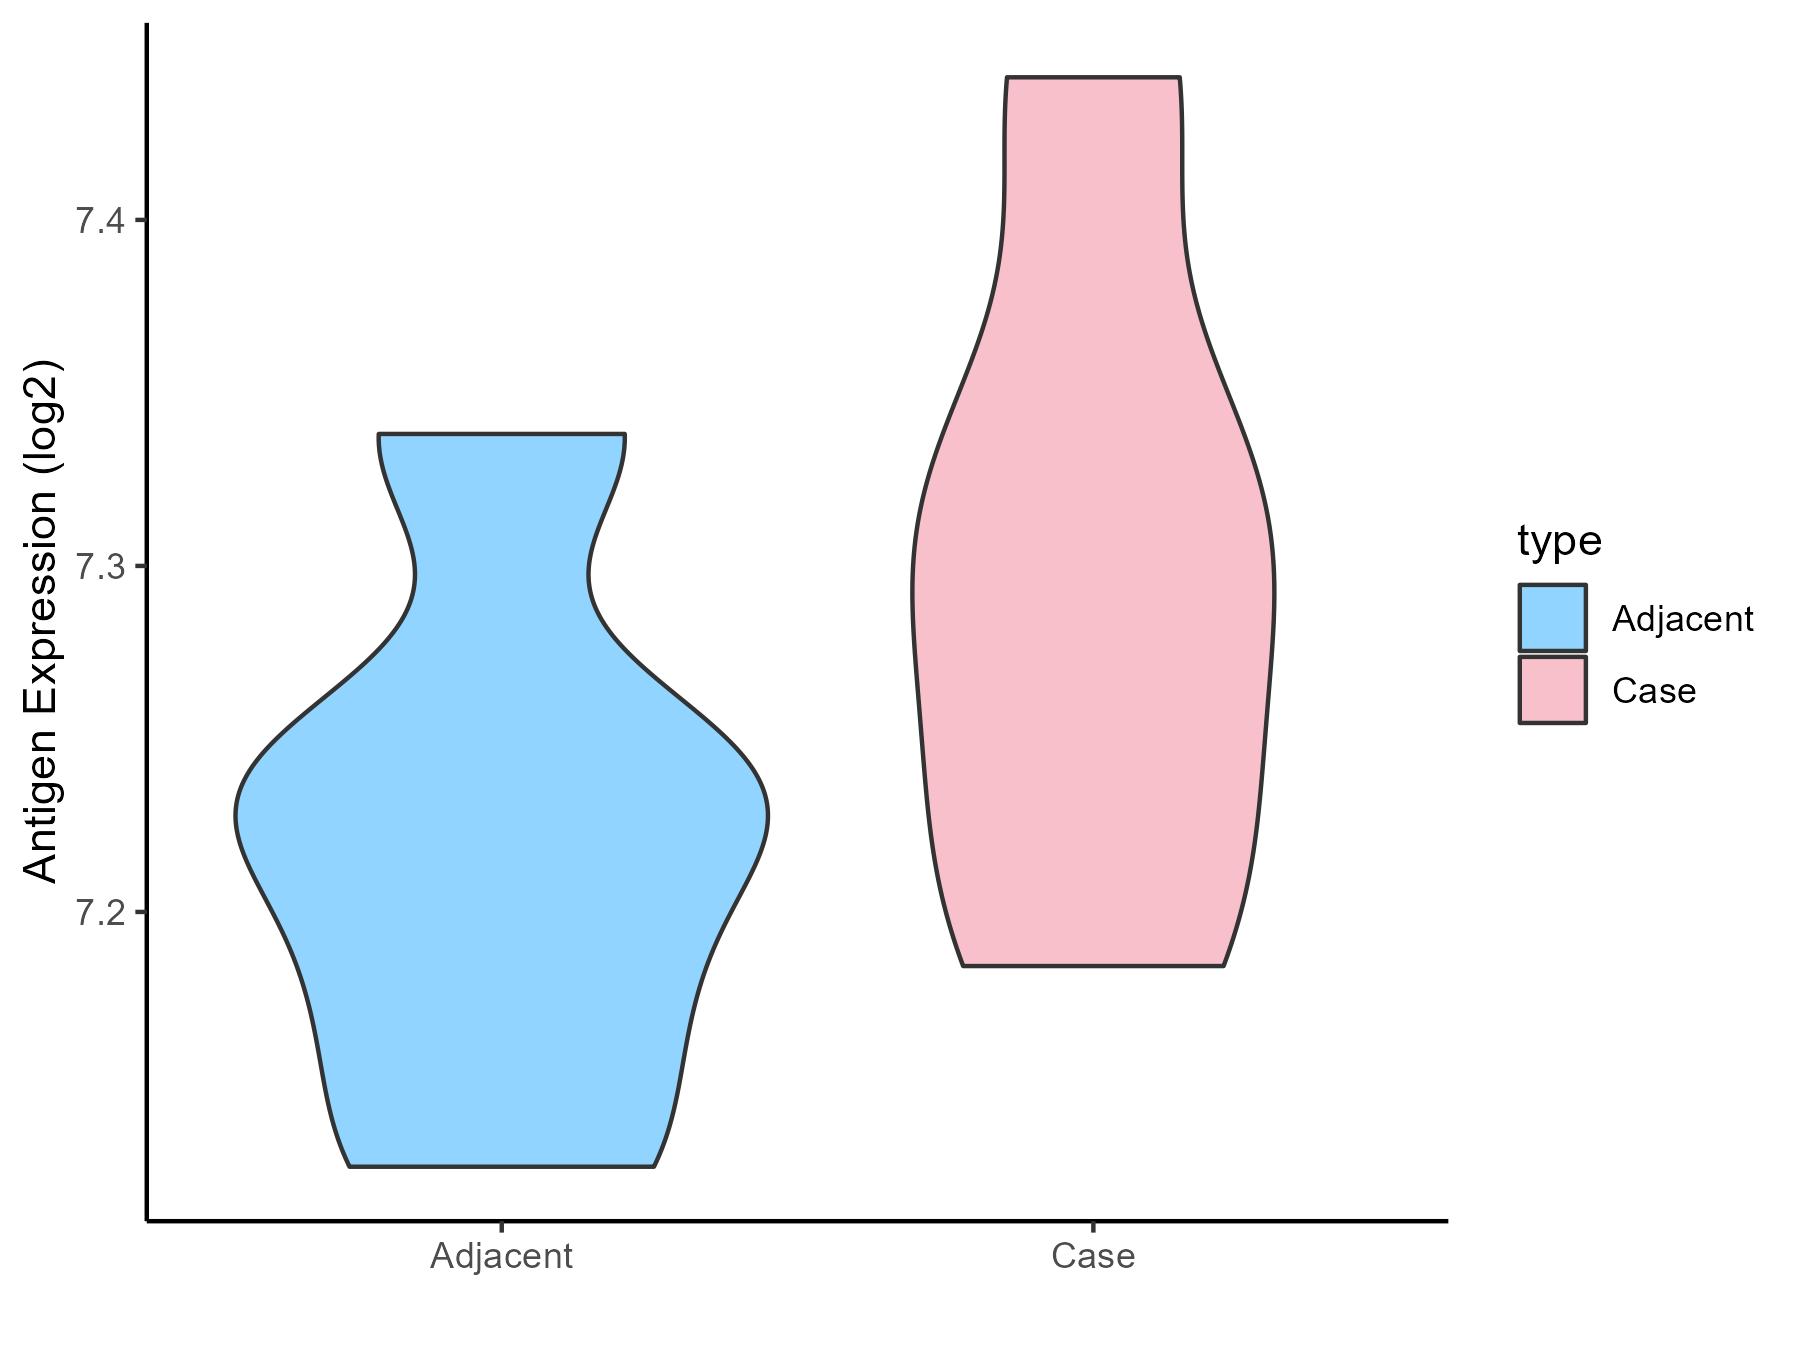
| The Studied Tissue | Gastric | |
| The Specific Disease | Gastric cancer | |
| The Expression Level of Disease Section Compare with the Healthy Individual Tissue | p-value: 0.944474296; Fold-change: -0.170512282; Z-score: -0.308367515 | |
| The Expression Level of Disease Section Compare with the Adjacent Tissue | p-value: 1.36E-05; Fold-change: -0.040222335; Z-score: -0.139477437 | |
| Disease-specific Antigen Abundances |
|
Click to View the Clearer Original Diagram |
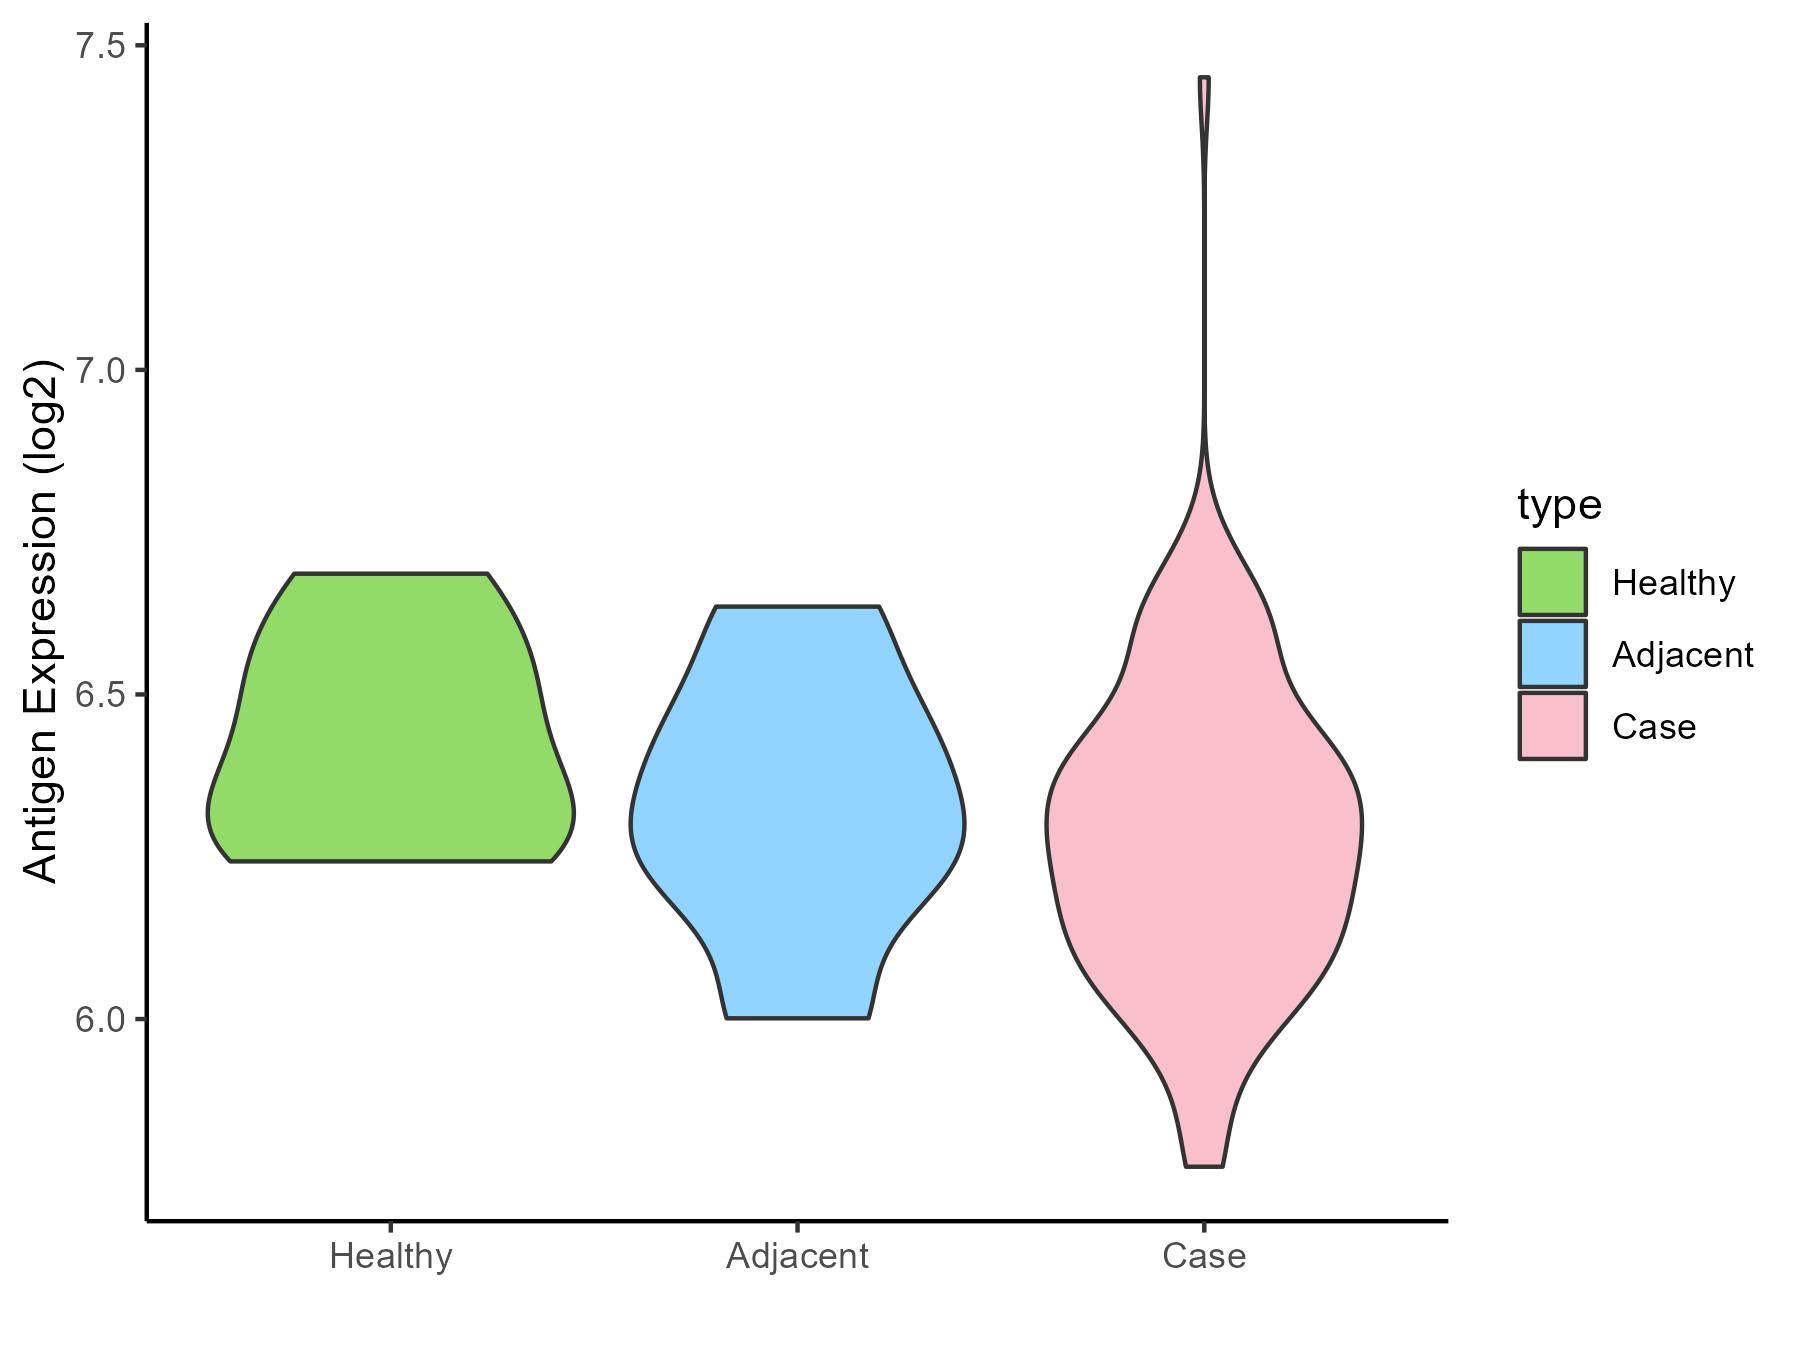
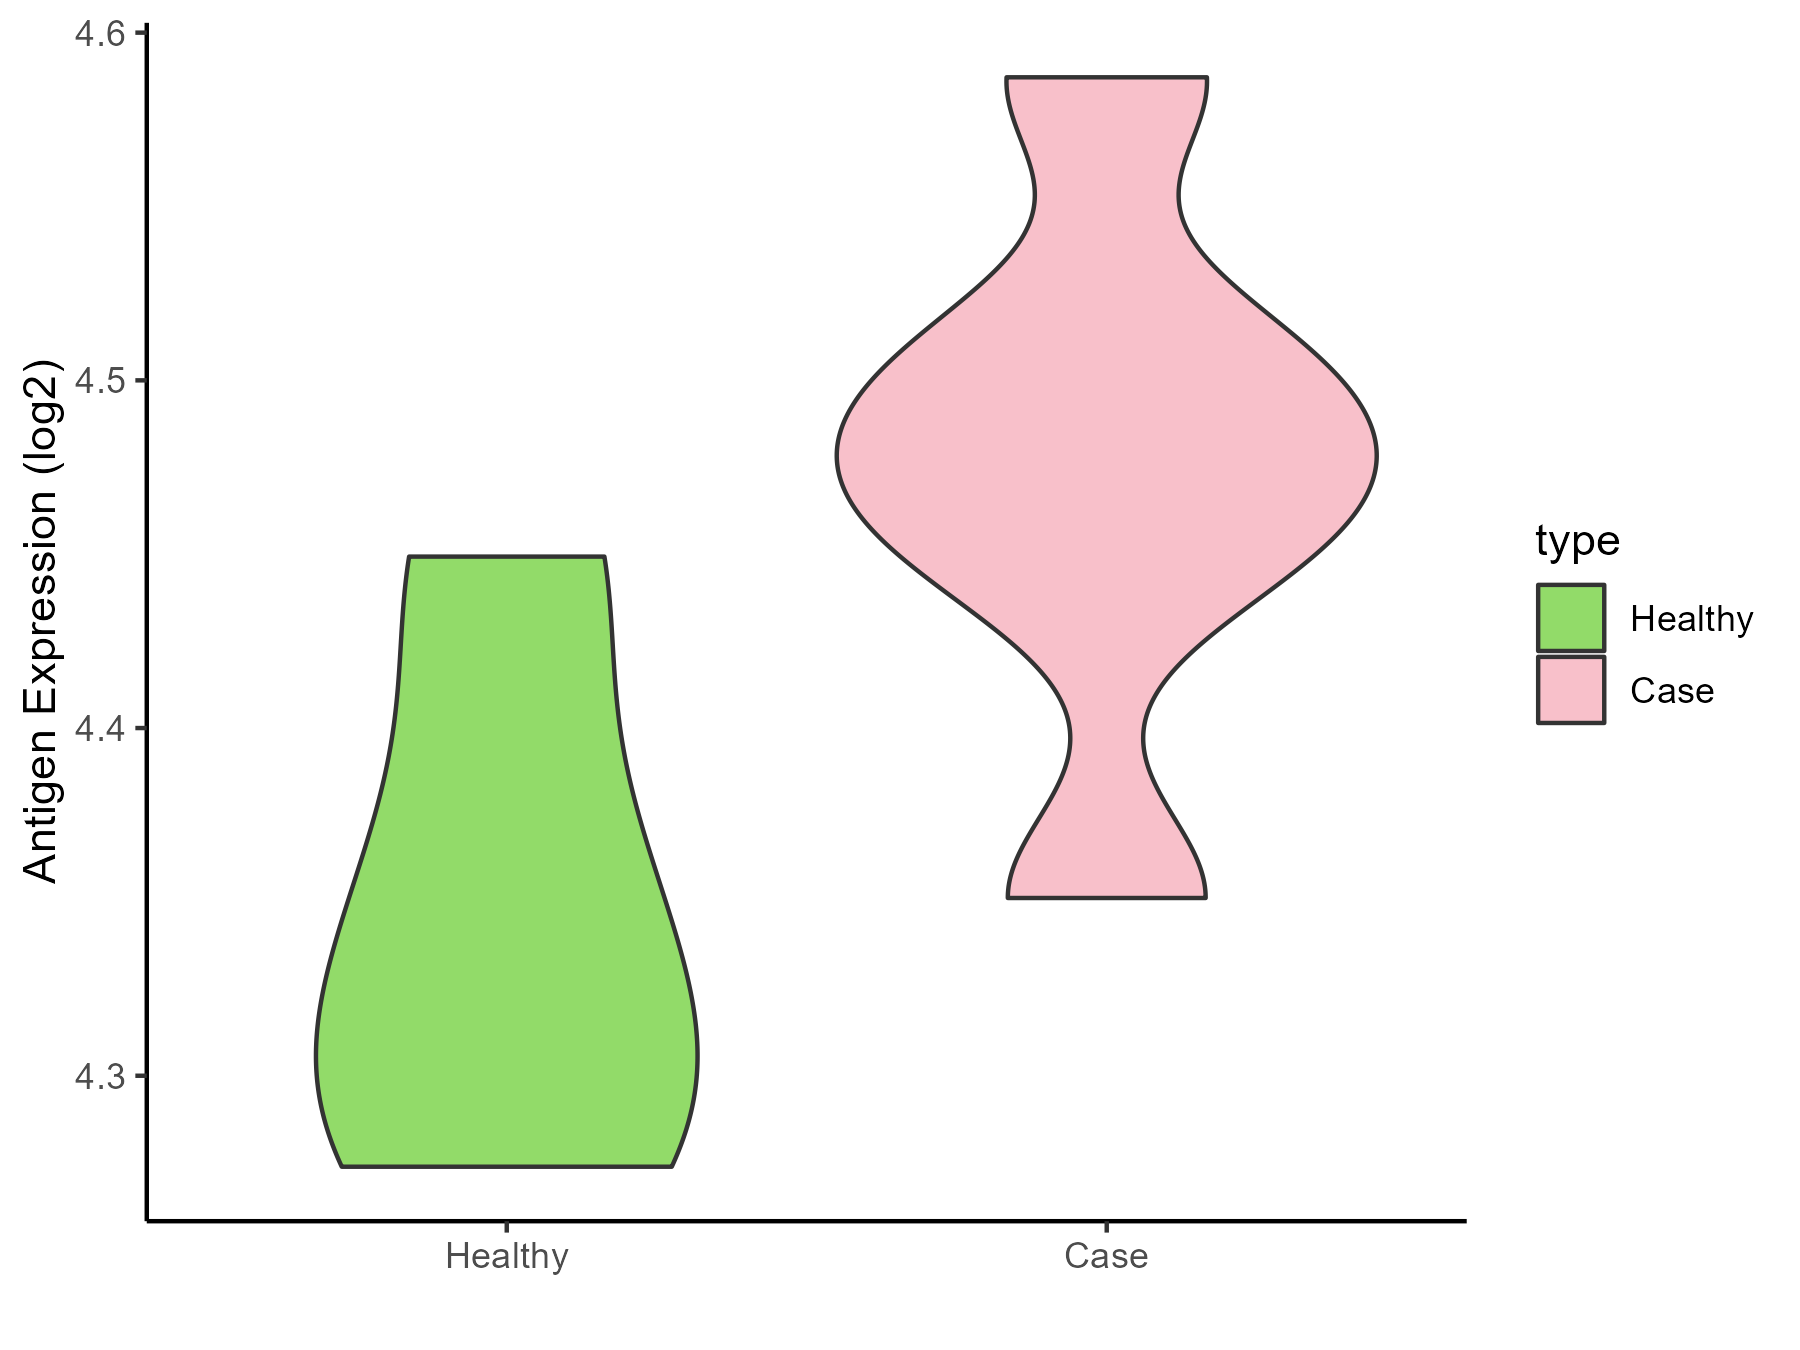
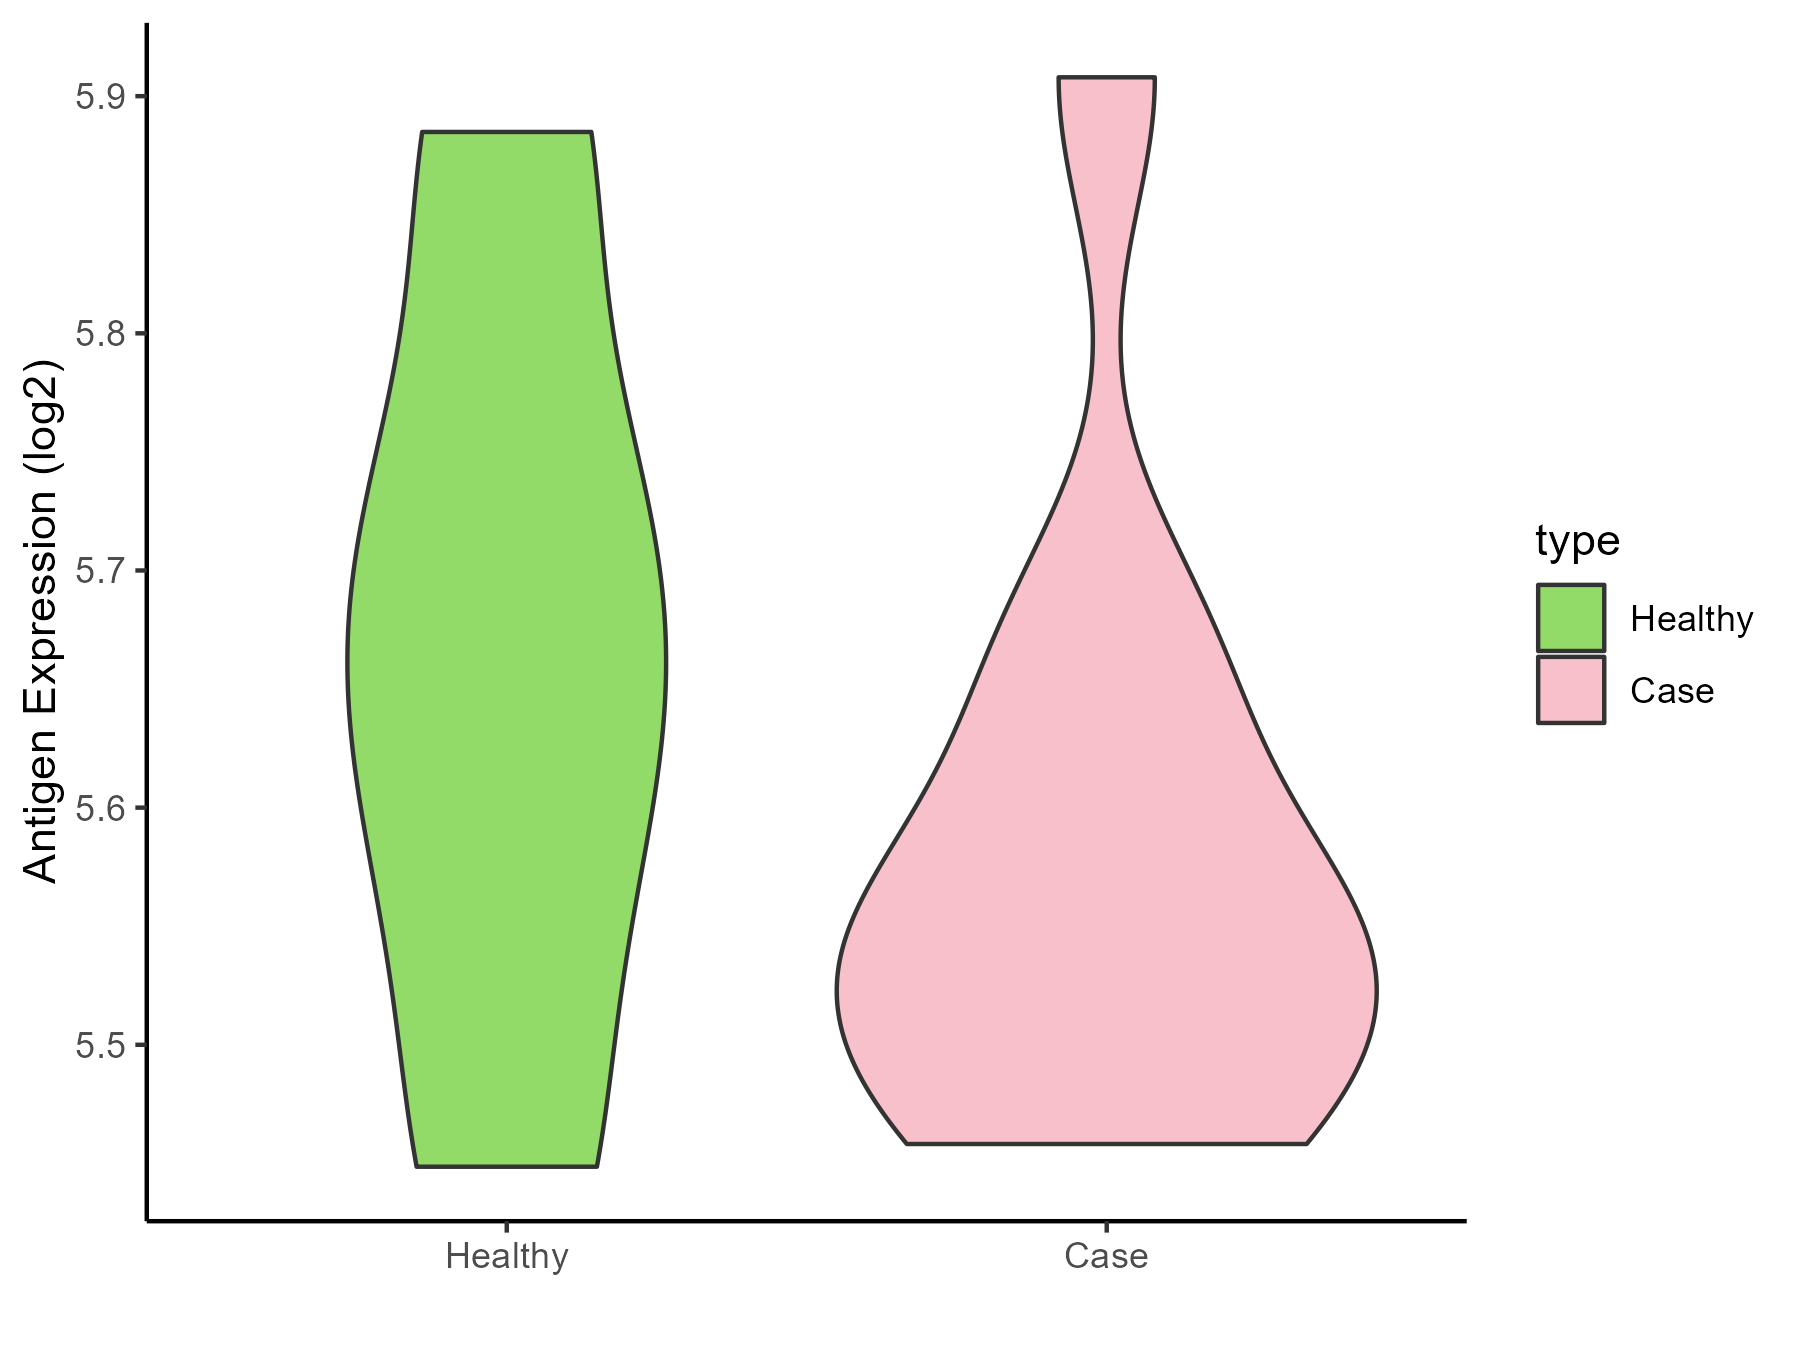
| Differential expression pattern of antigen in diseases | ||
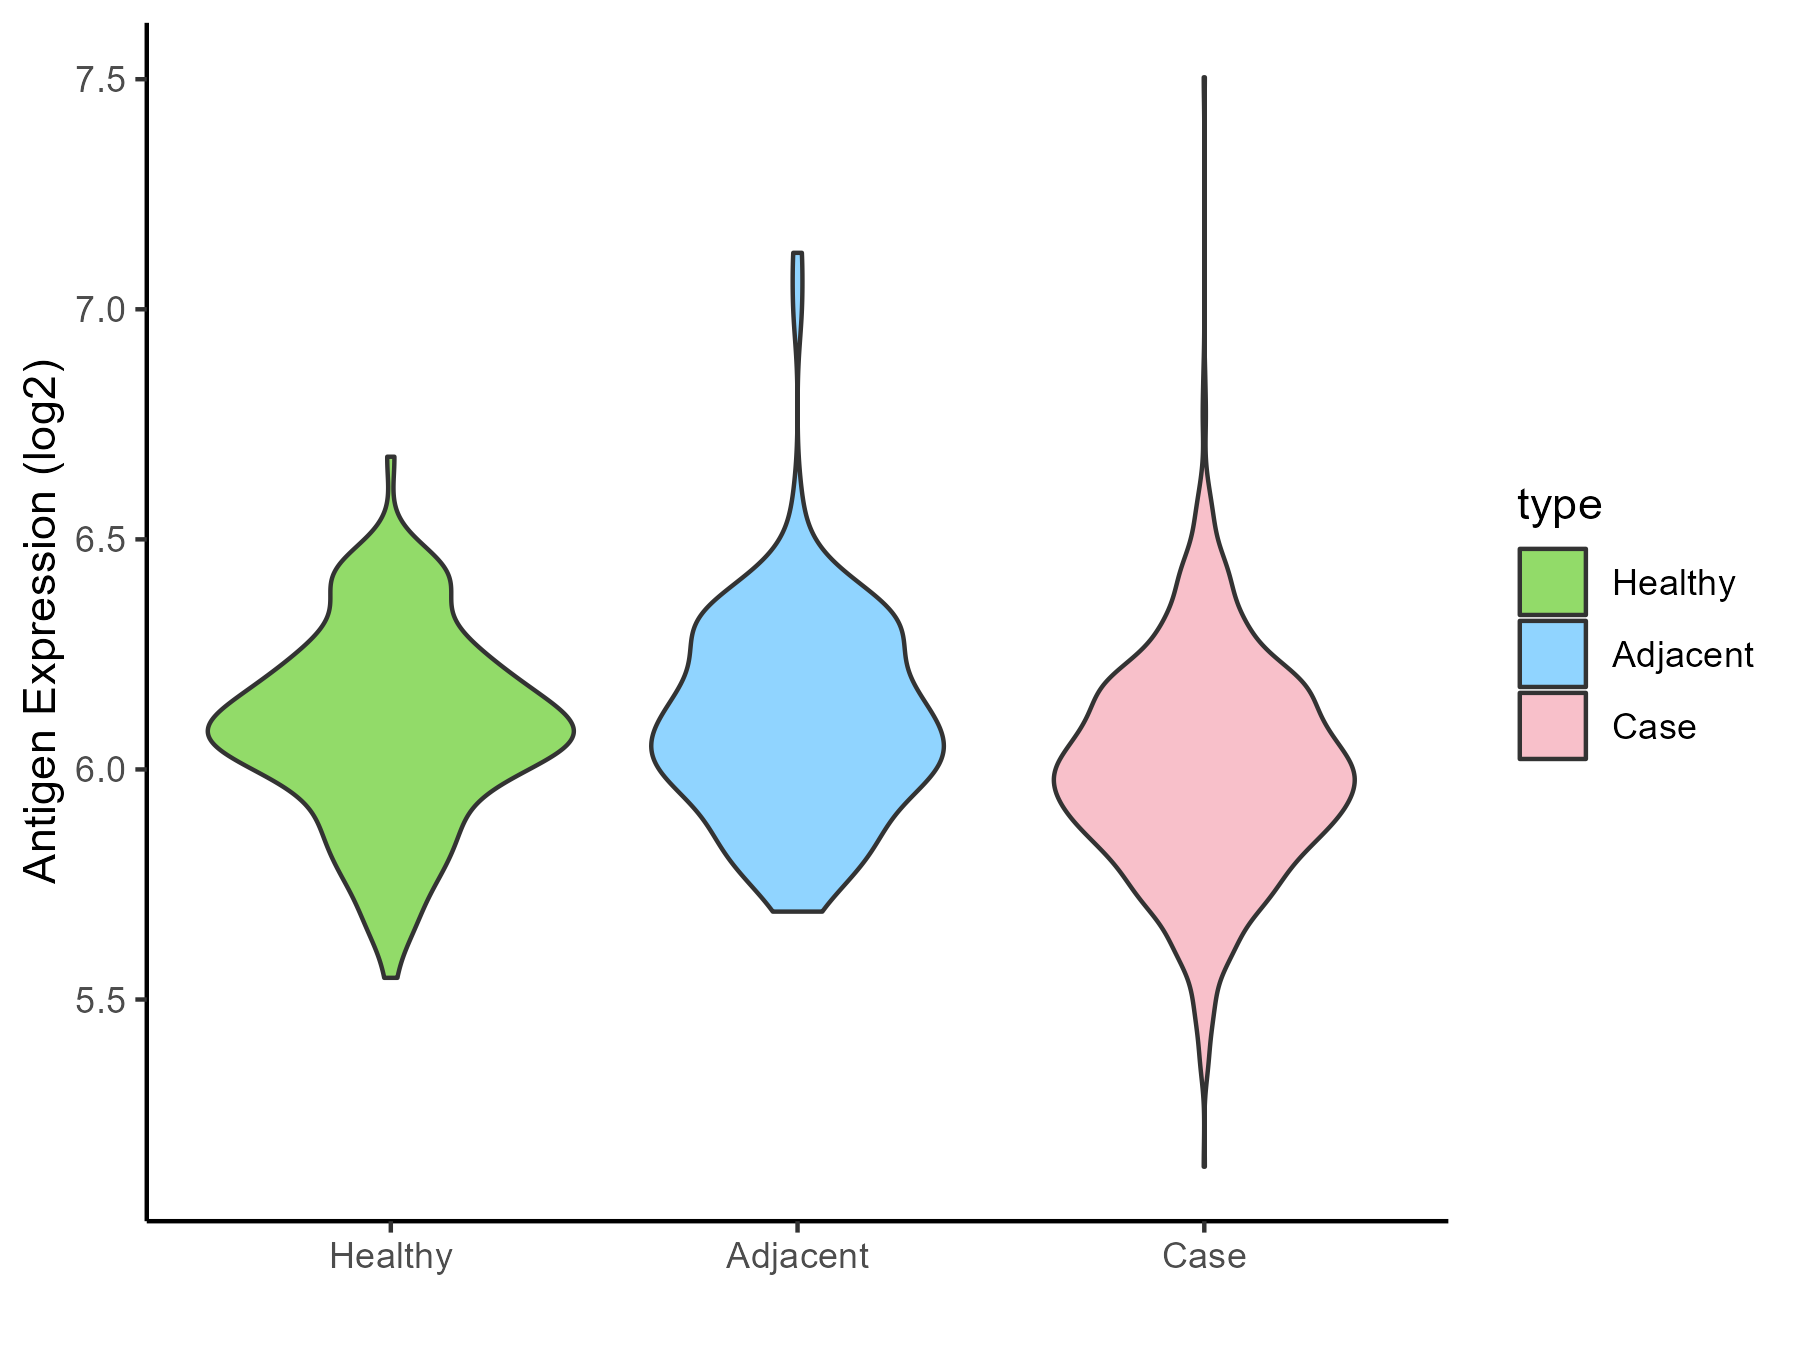
| The Studied Tissue | Colon | |
| The Specific Disease | Colon cancer | |
| The Expression Level of Disease Section Compare with the Healthy Individual Tissue | p-value: 7.71E-07; Fold-change: -0.09343683; Z-score: -0.459551135 | |
| The Expression Level of Disease Section Compare with the Adjacent Tissue | p-value: 6.14E-07; Fold-change: -0.09394043; Z-score: -0.416284548 | |
| Disease-specific Antigen Abundances |
|
Click to View the Clearer Original Diagram |
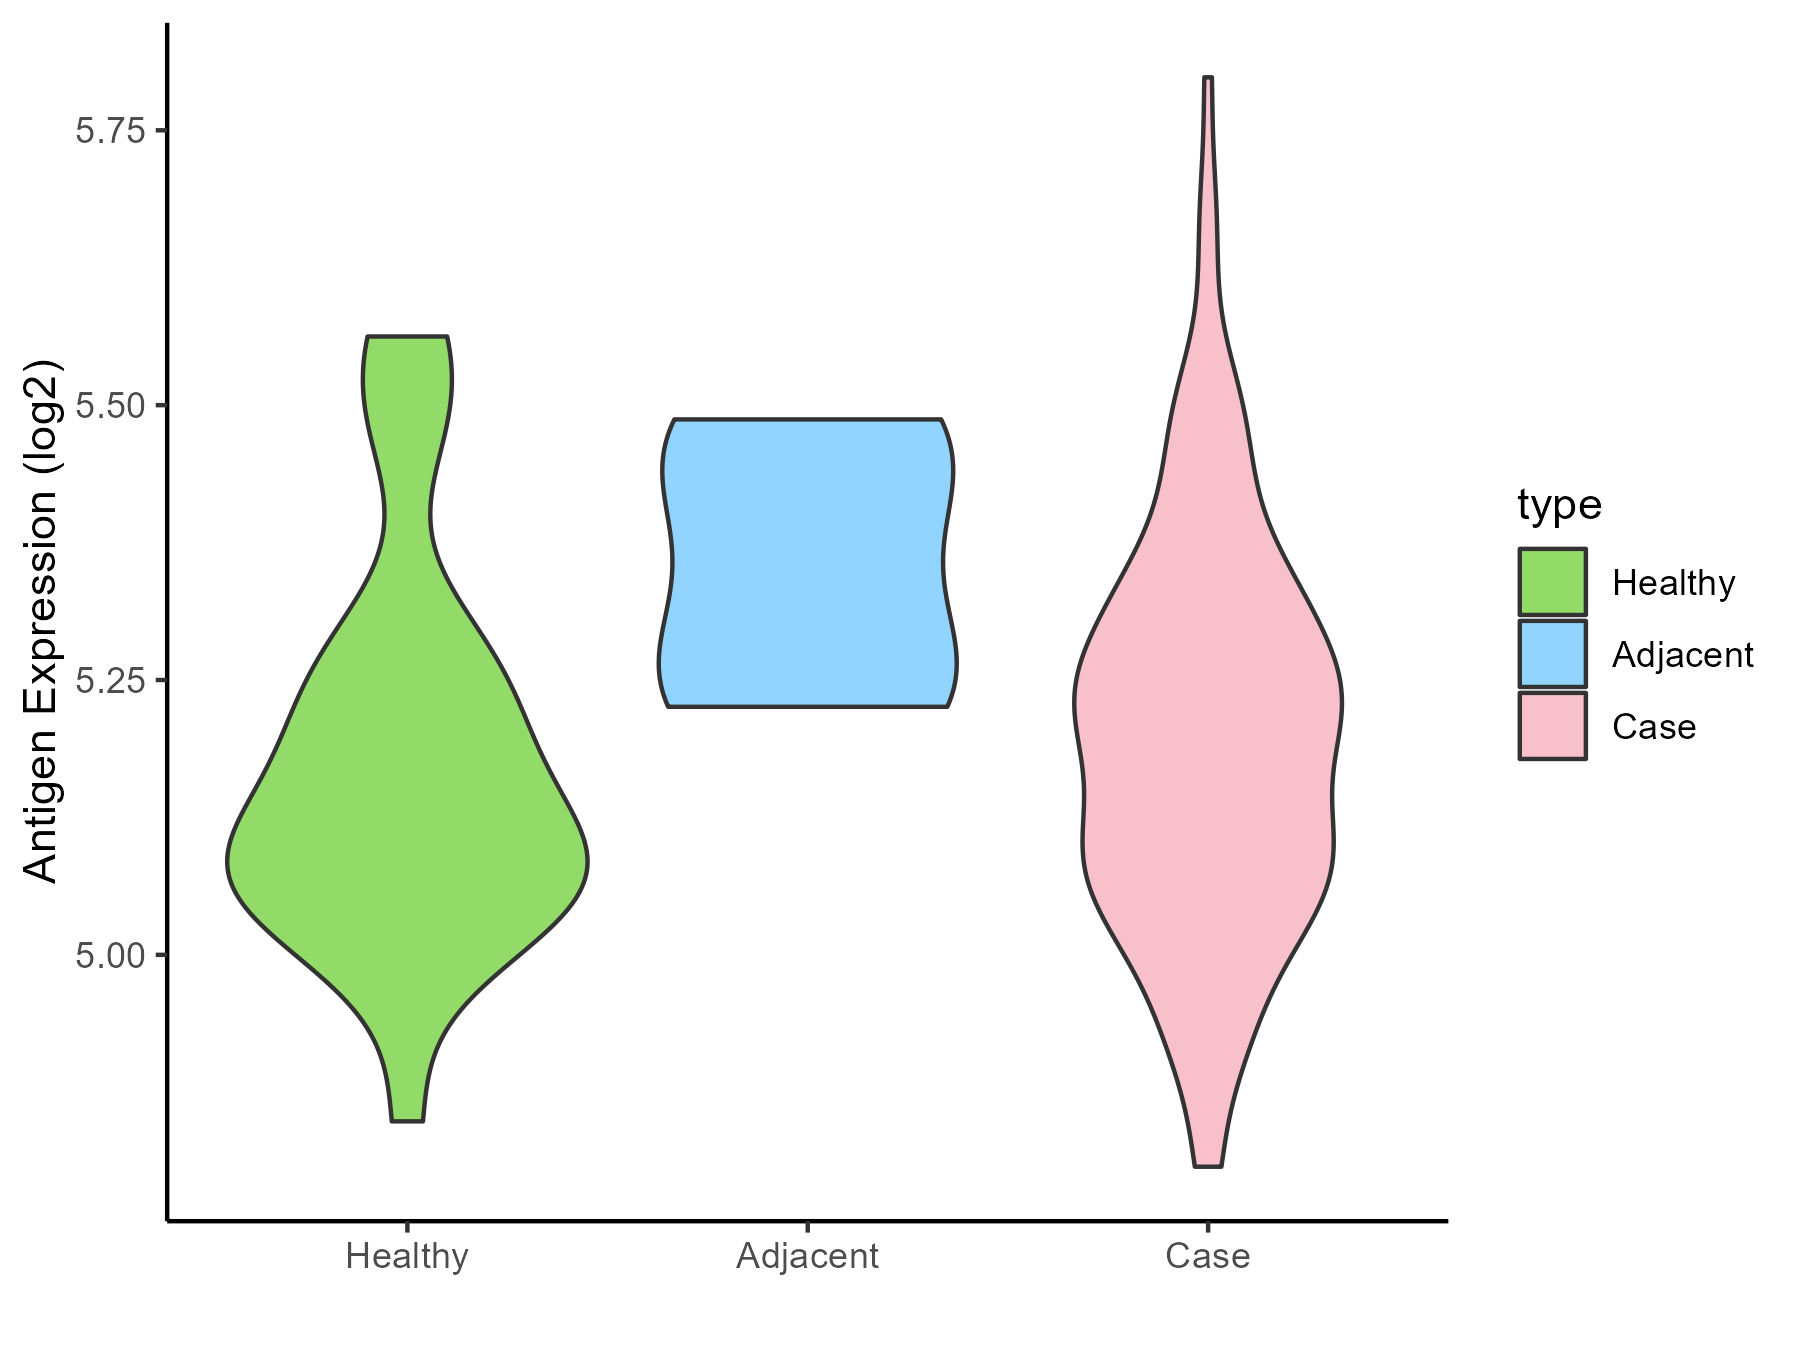
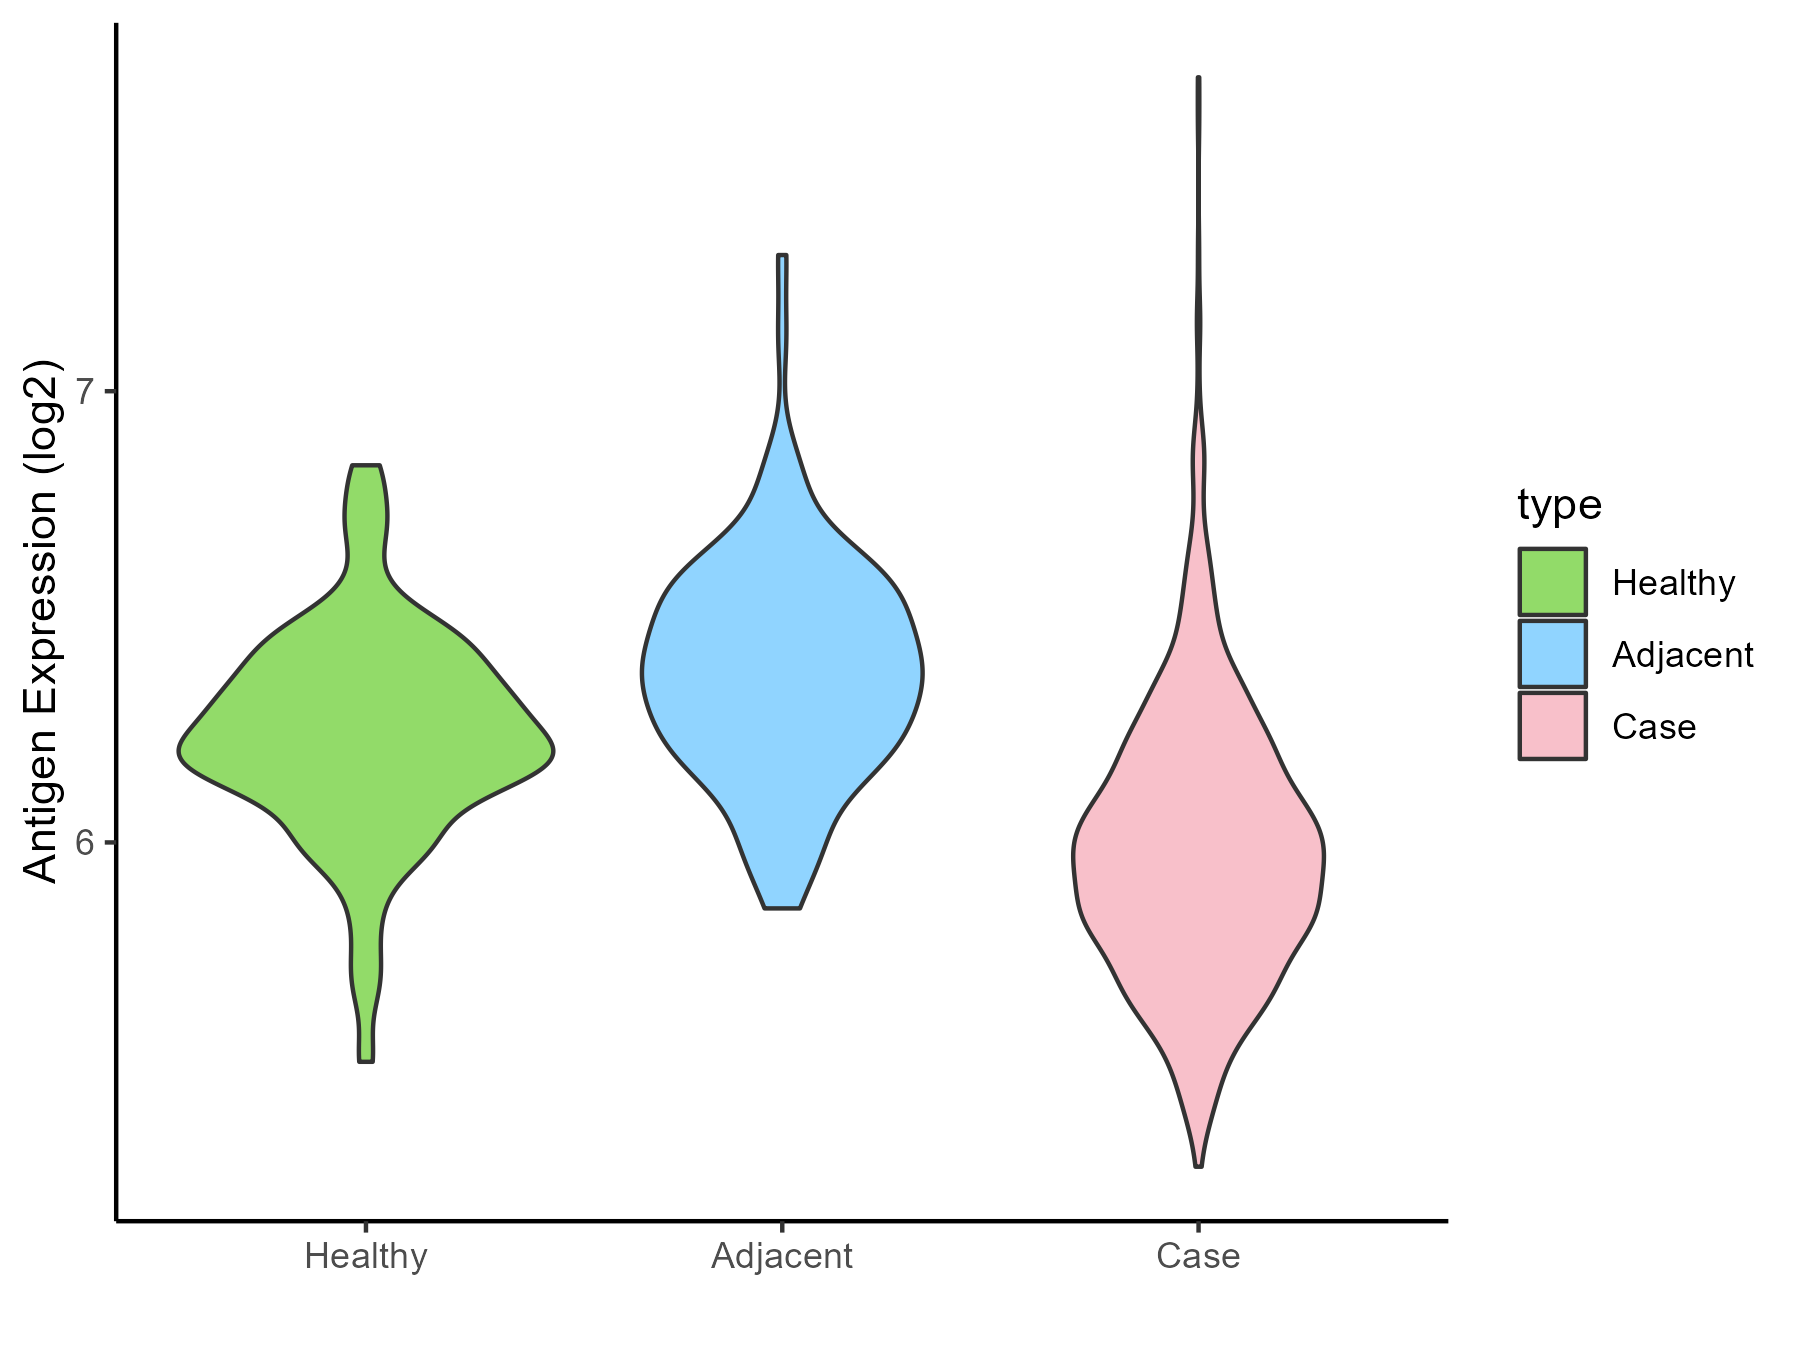
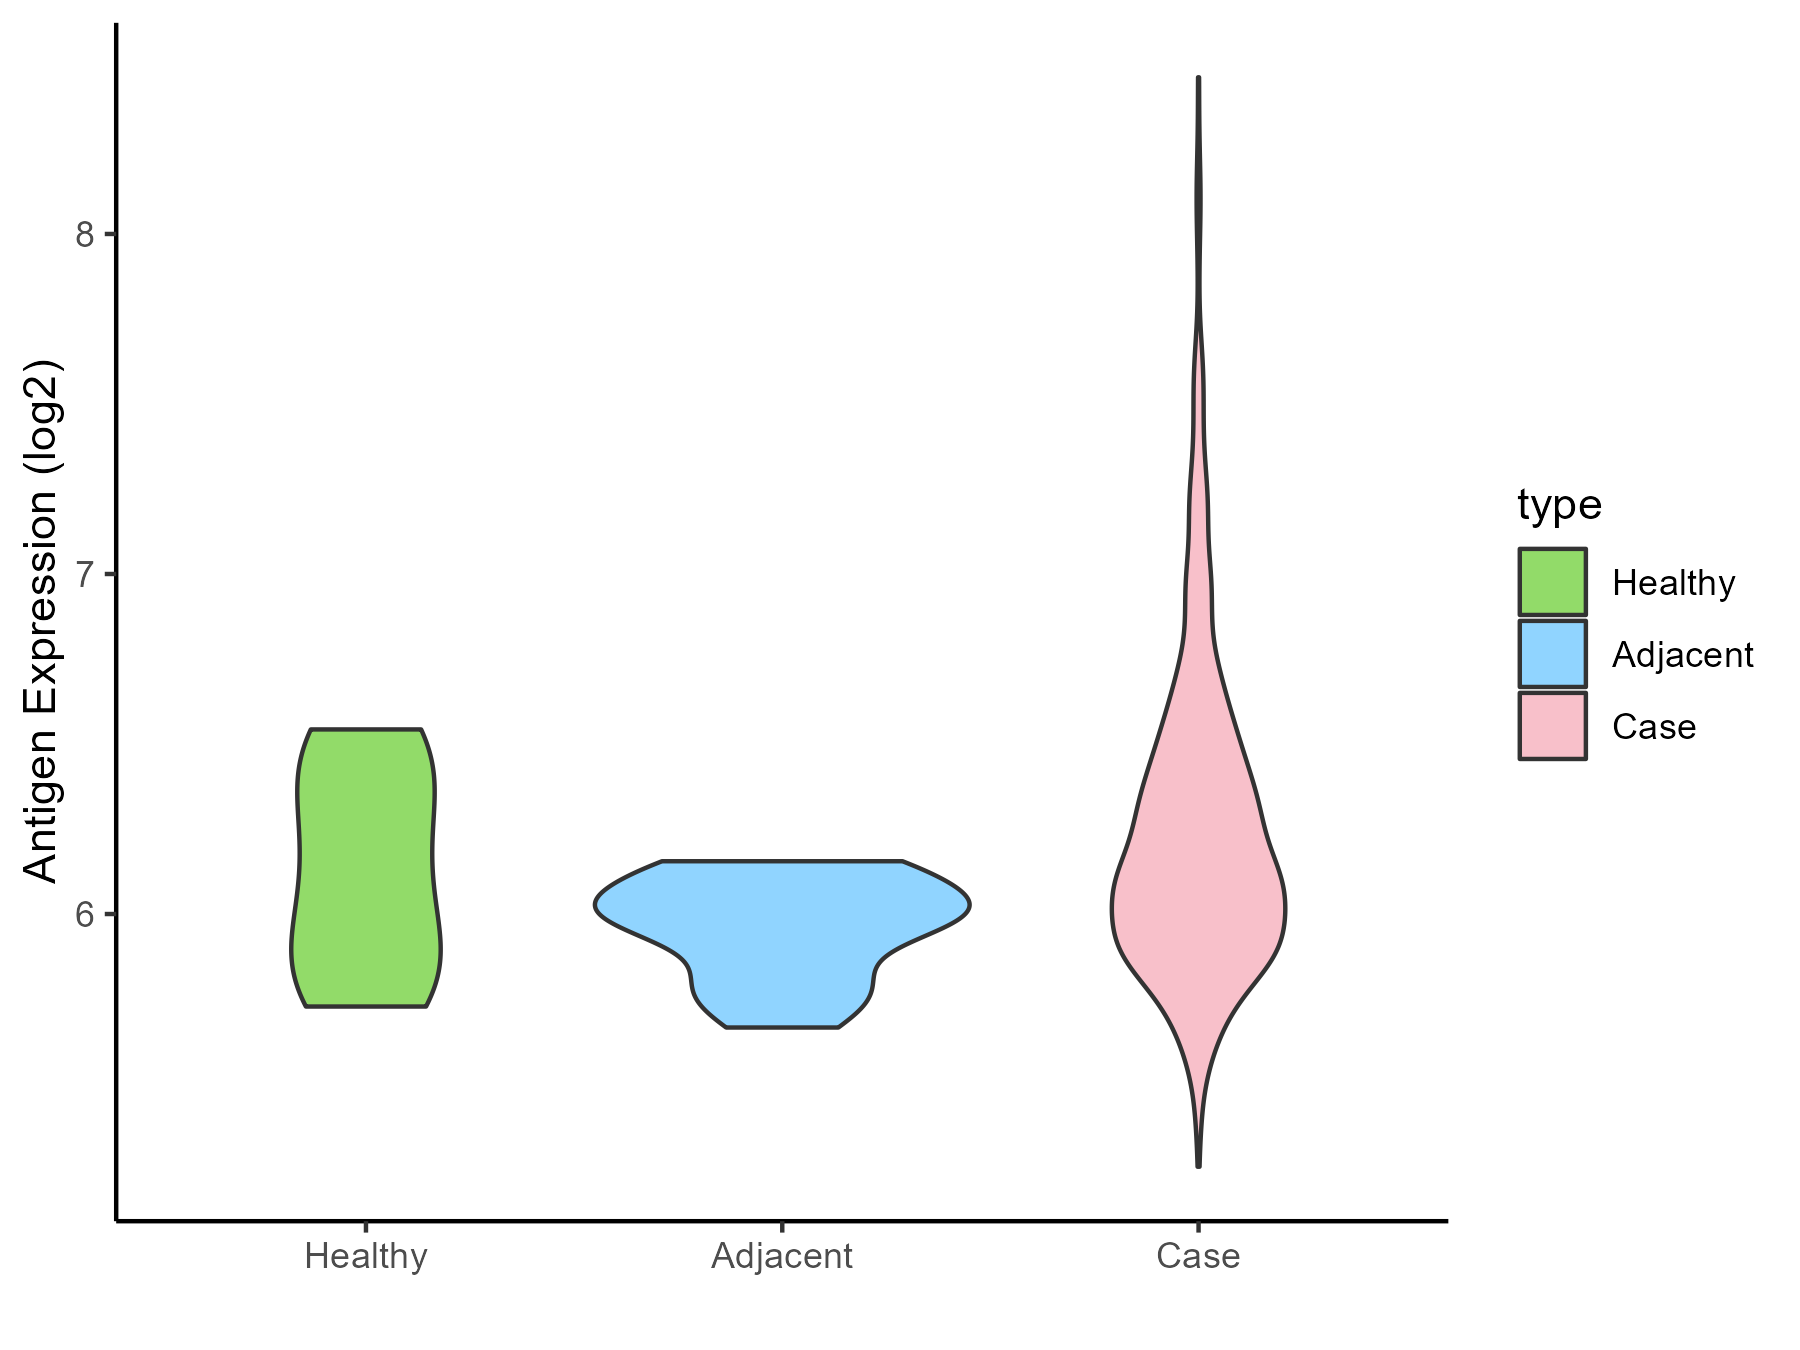
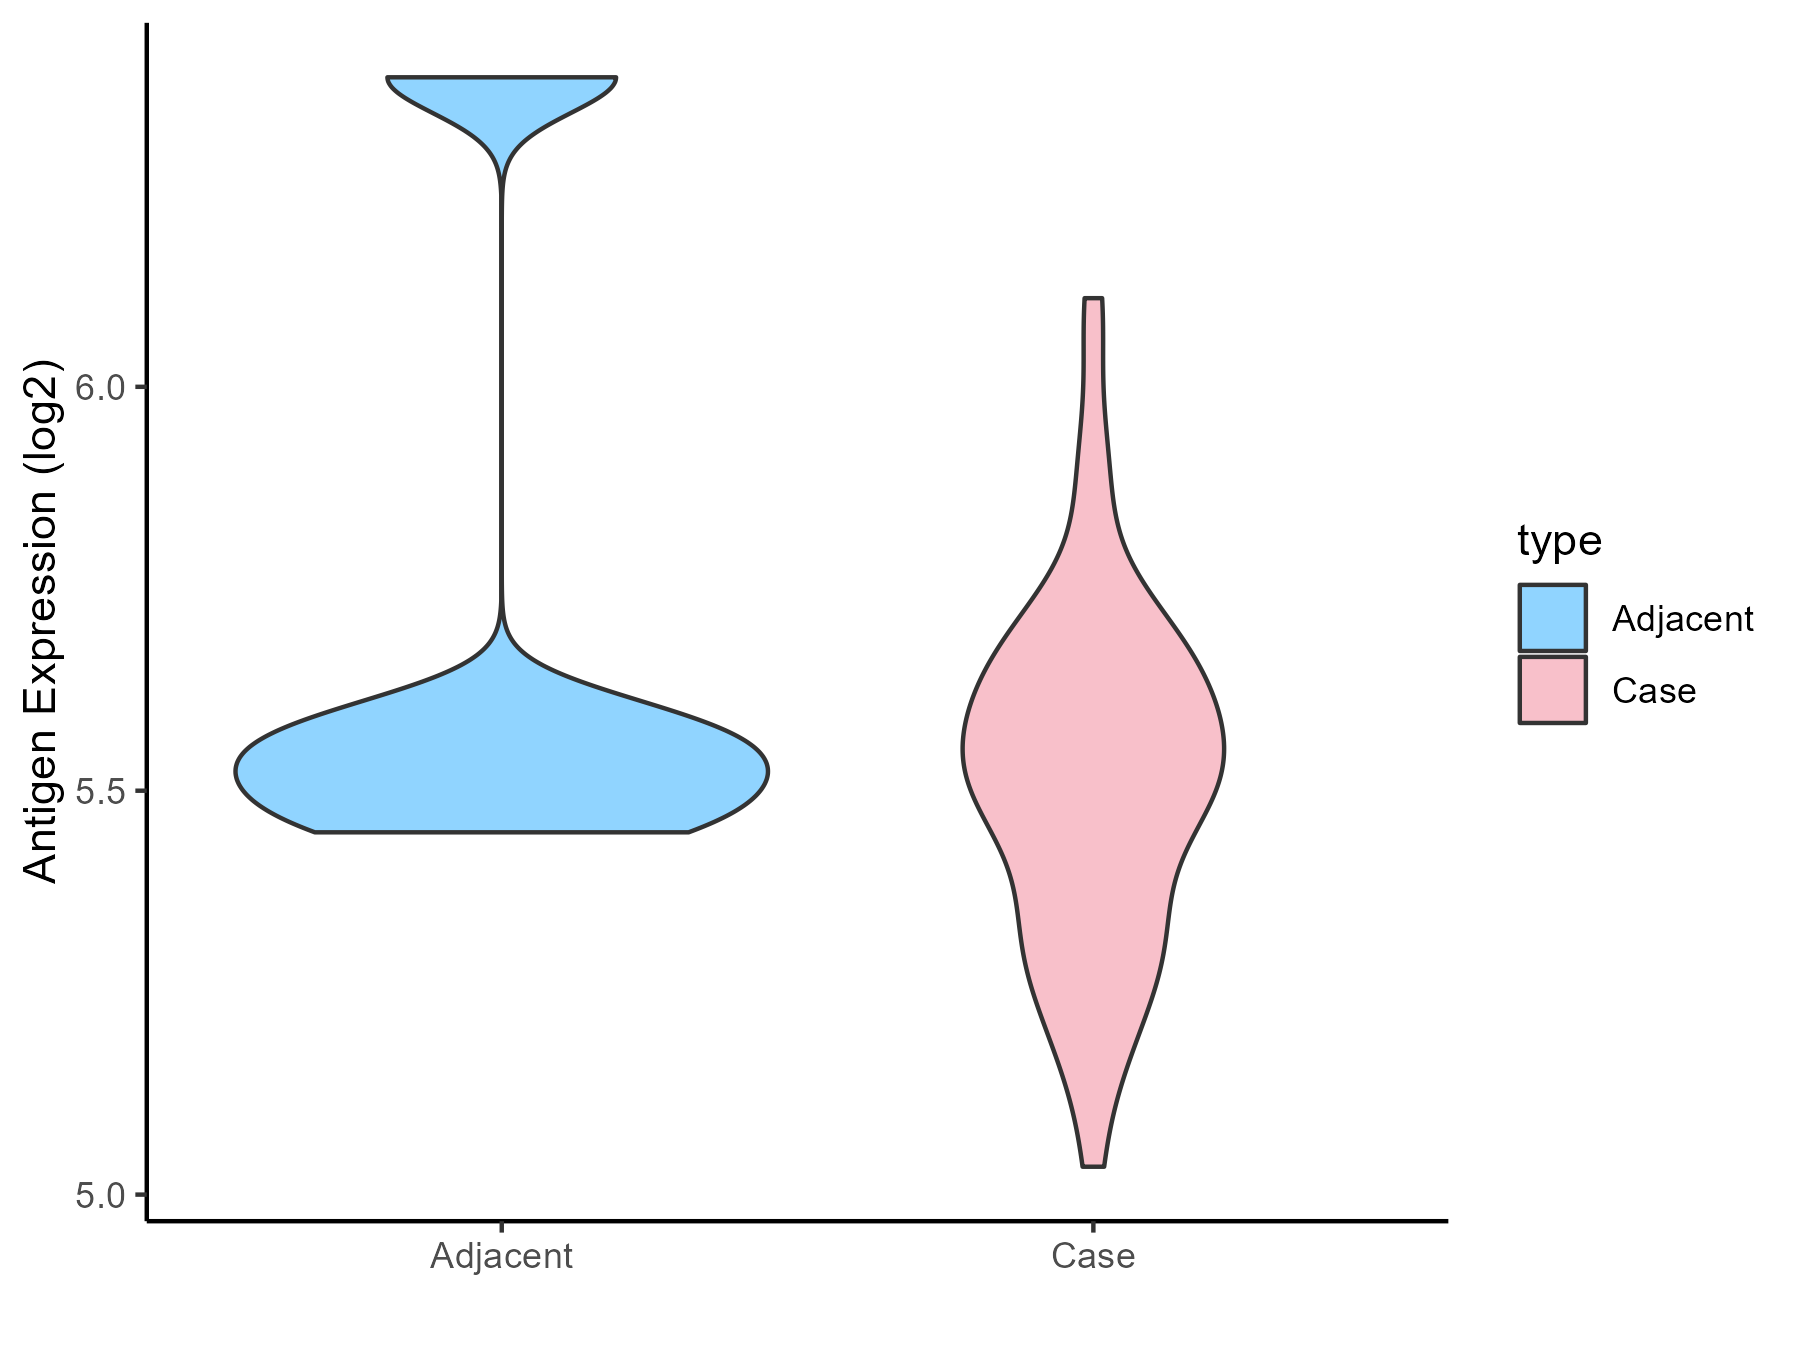
| Differential expression pattern of antigen in diseases | ||
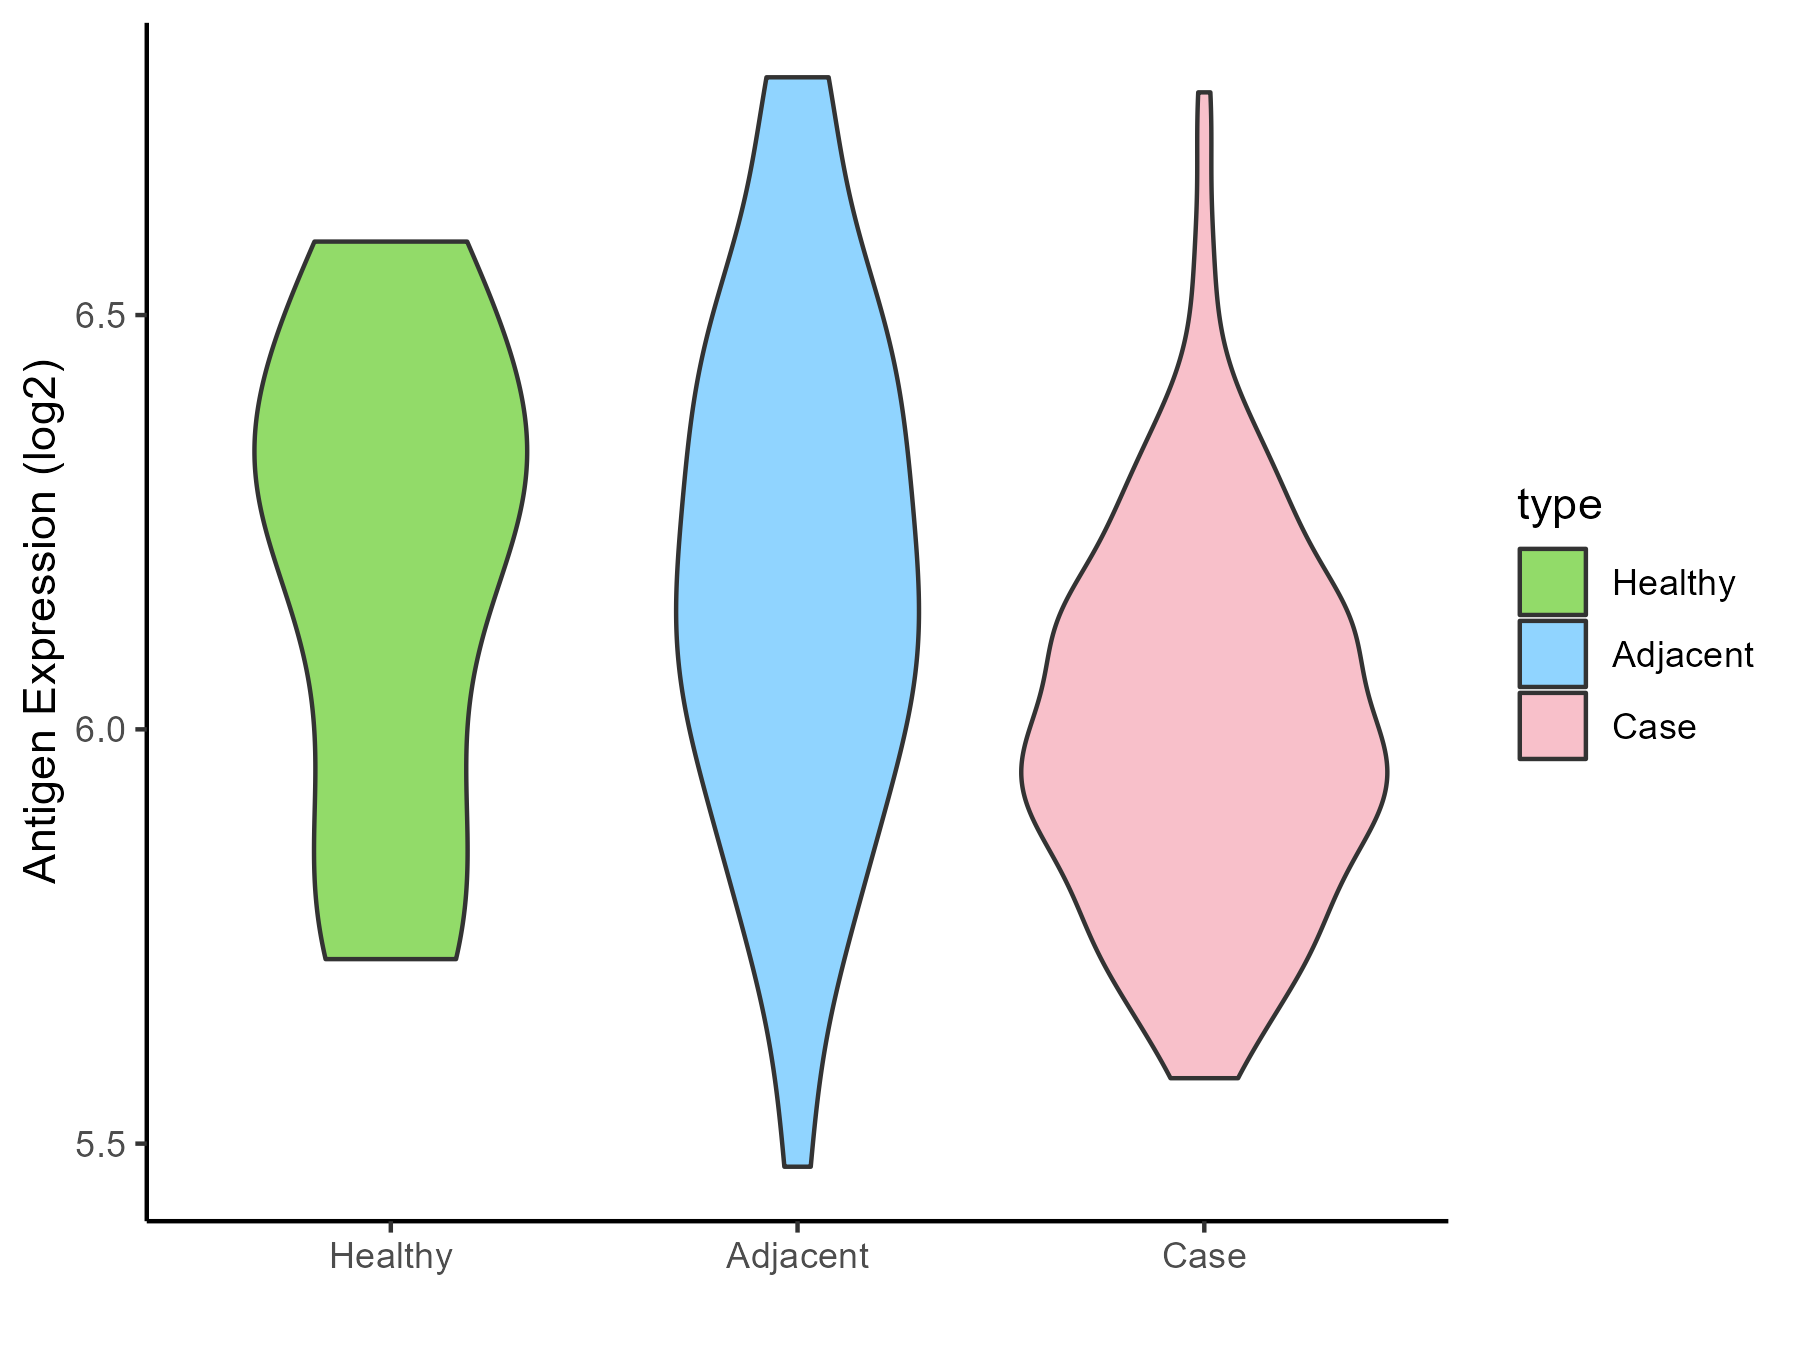
| The Studied Tissue | Pancreas | |
| The Specific Disease | Pancreatic cancer | |
| The Expression Level of Disease Section Compare with the Healthy Individual Tissue | p-value: 0.023209555; Fold-change: -0.29660424; Z-score: -1.028455153 | |
| The Expression Level of Disease Section Compare with the Adjacent Tissue | p-value: 6.01E-05; Fold-change: -0.216587167; Z-score: -0.704101021 | |
| Disease-specific Antigen Abundances |
|
Click to View the Clearer Original Diagram |
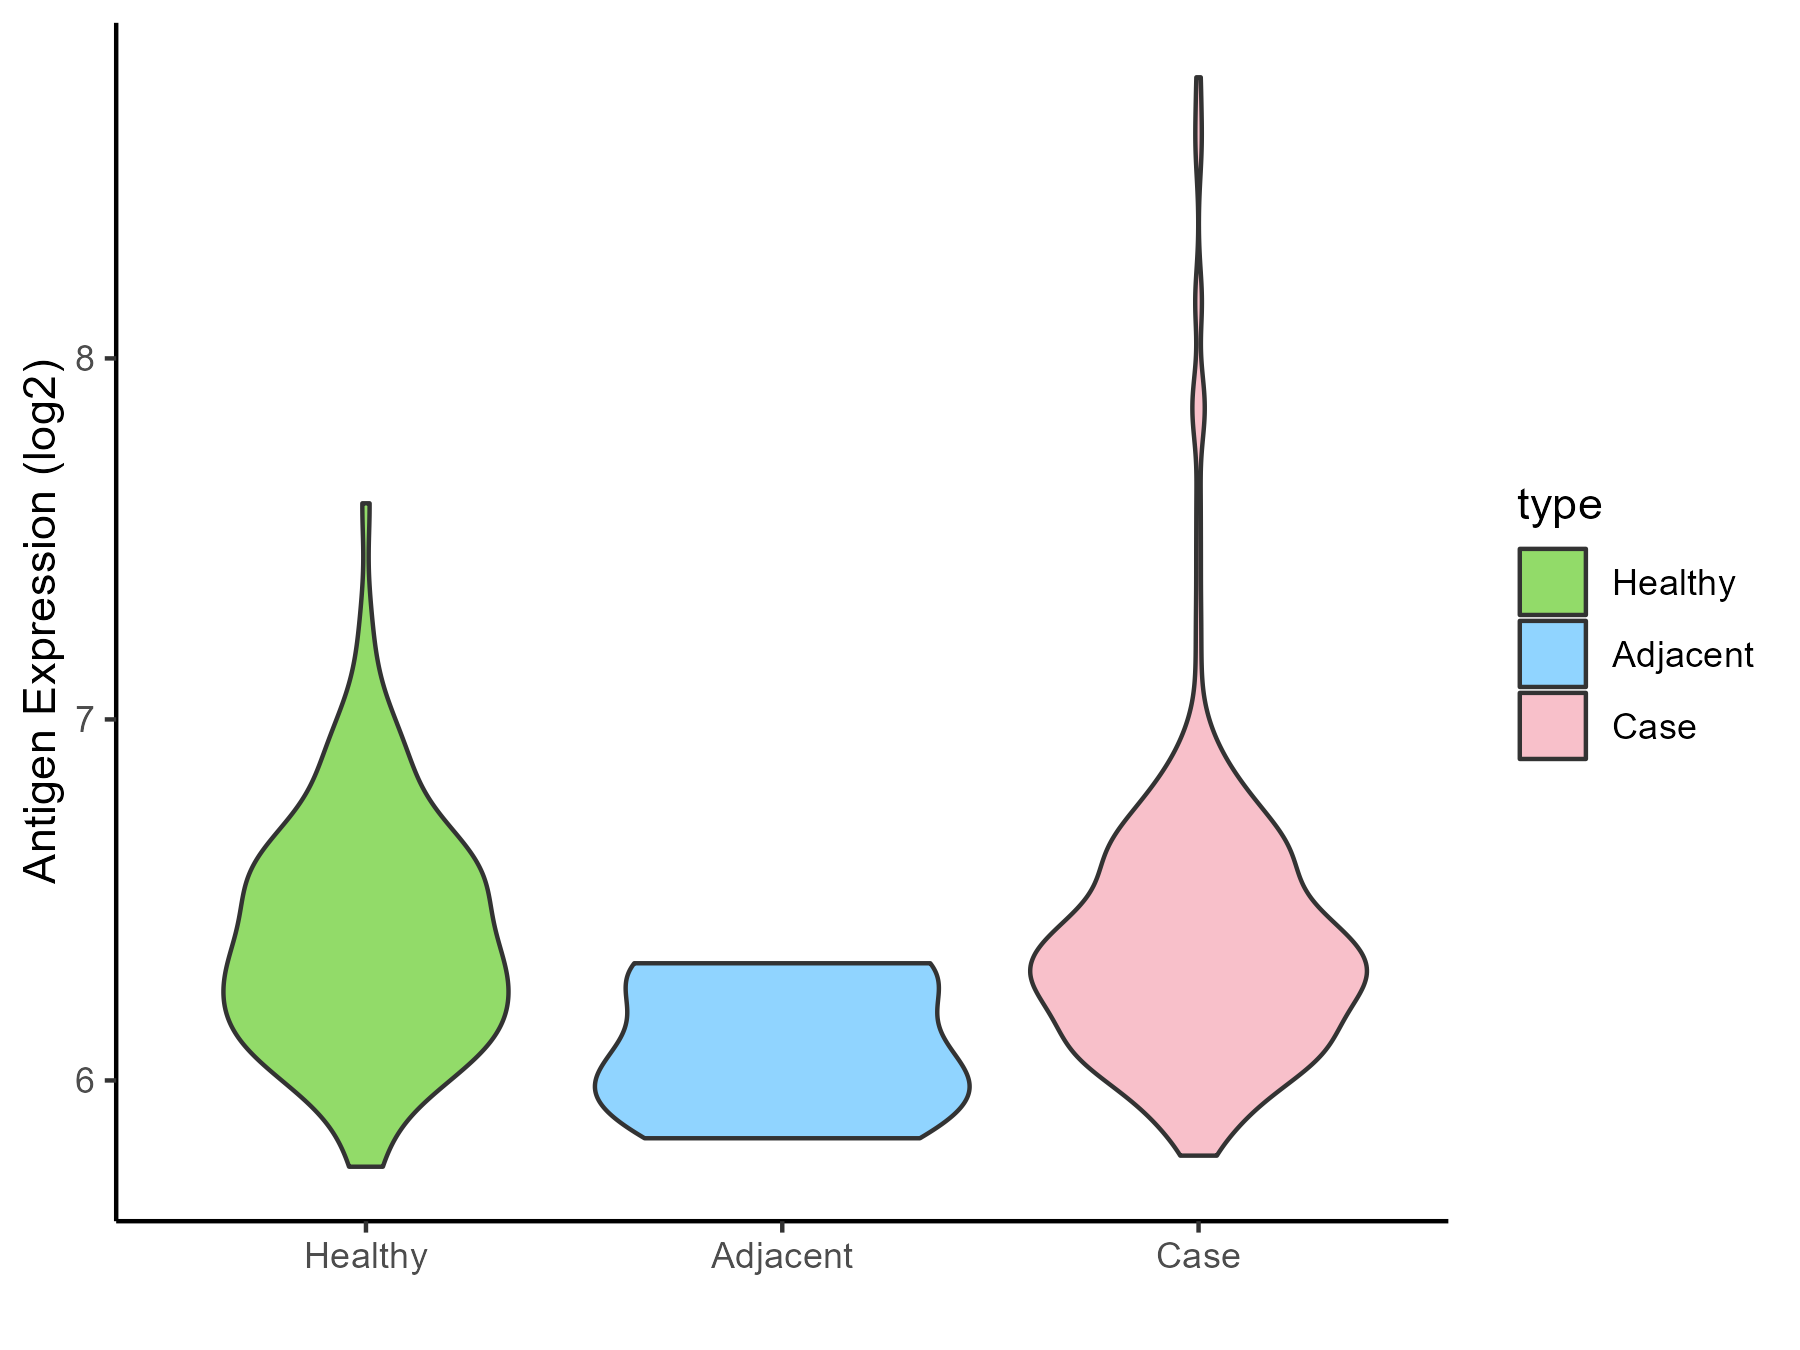
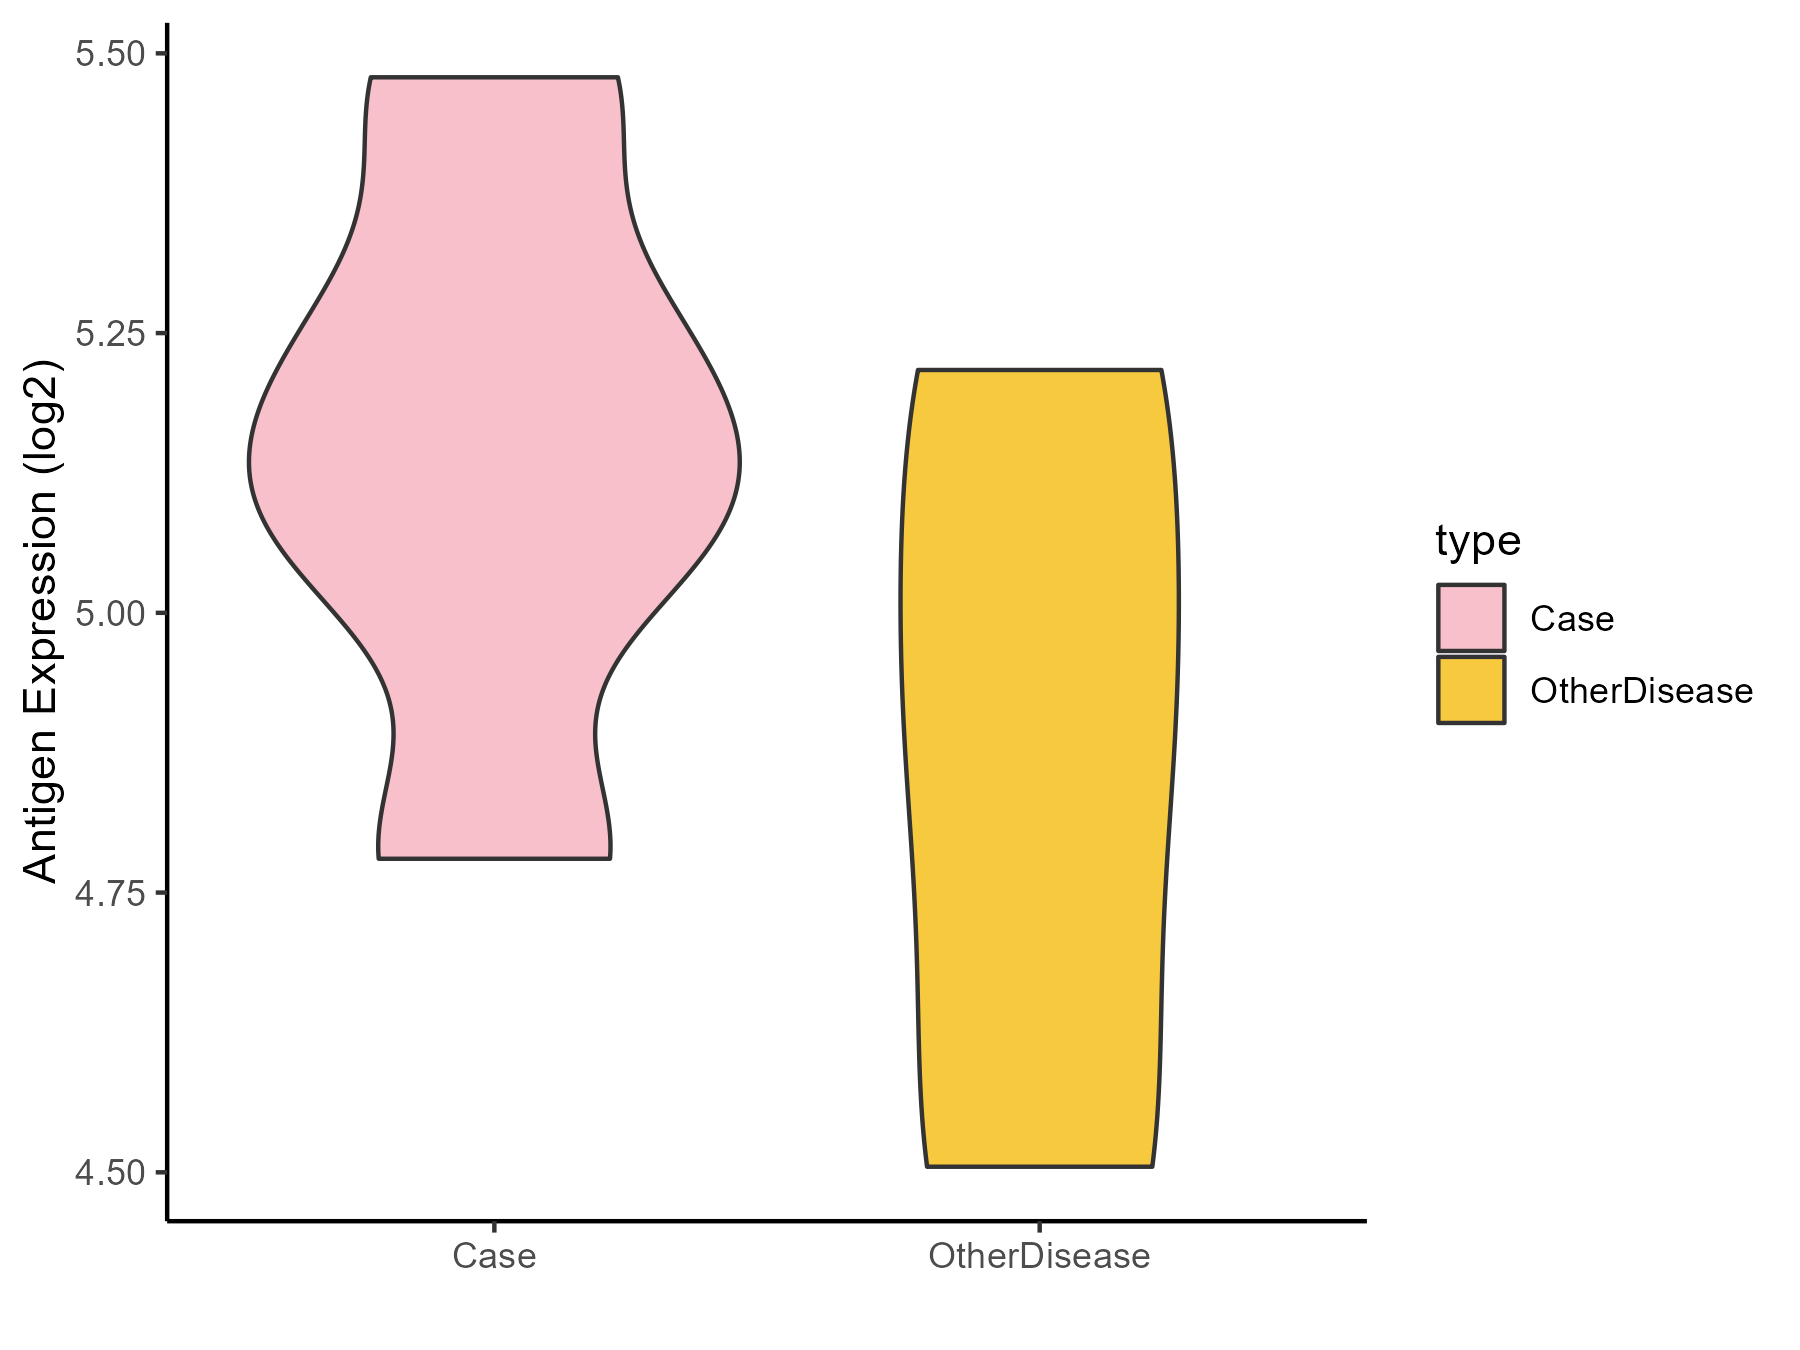
| Differential expression pattern of antigen in diseases | ||
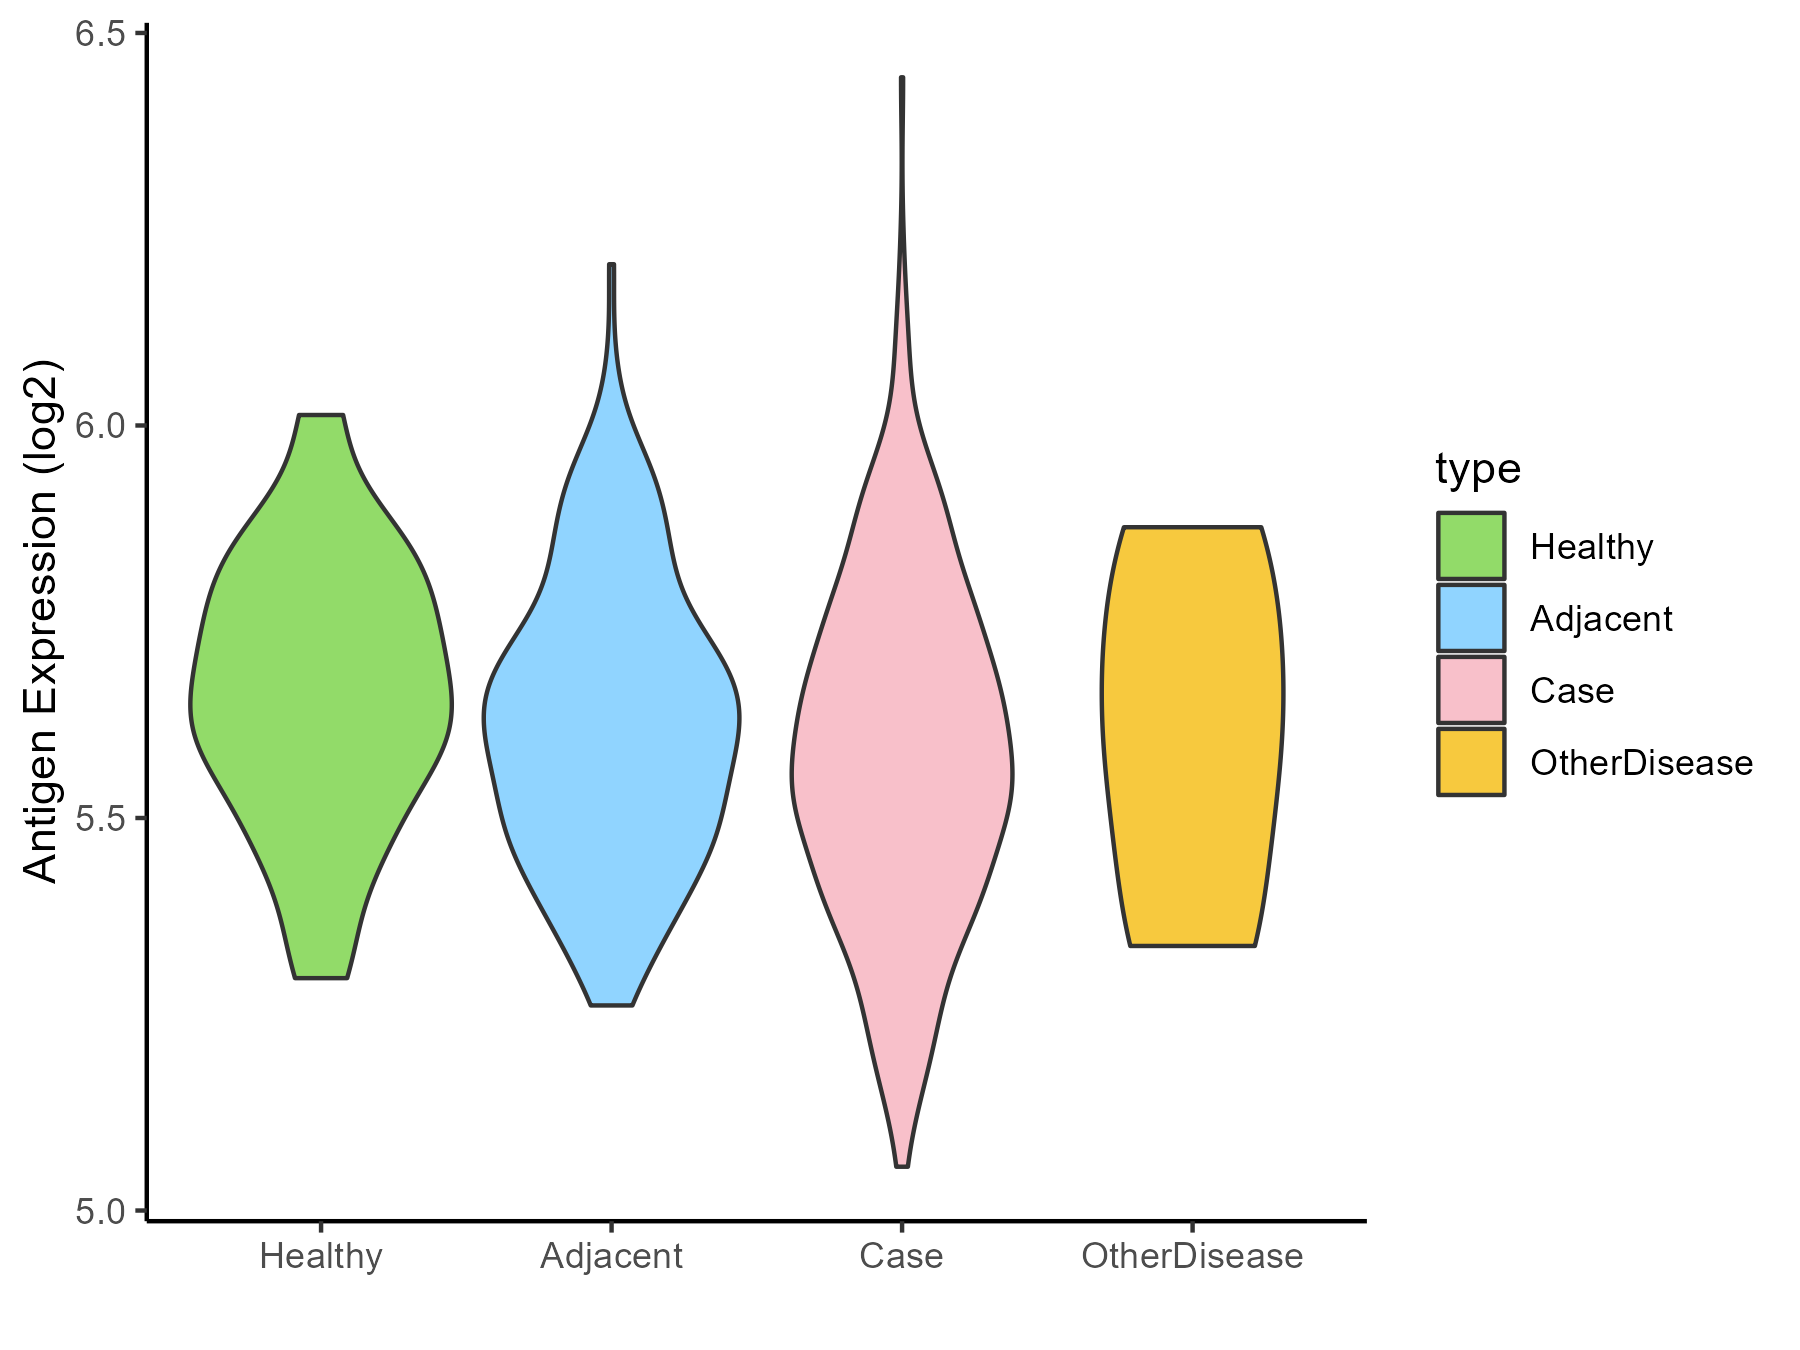
| The Studied Tissue | Liver | |
| The Specific Disease | Liver cancer | |
| The Expression Level of Disease Section Compare with the Healthy Individual Tissue | p-value: 0.00870022; Fold-change: -0.076088546; Z-score: -0.442356738 | |
| The Expression Level of Disease Section Compare with the Adjacent Tissue | p-value: 0.018919813; Fold-change: -0.038220013; Z-score: -0.210343861 | |
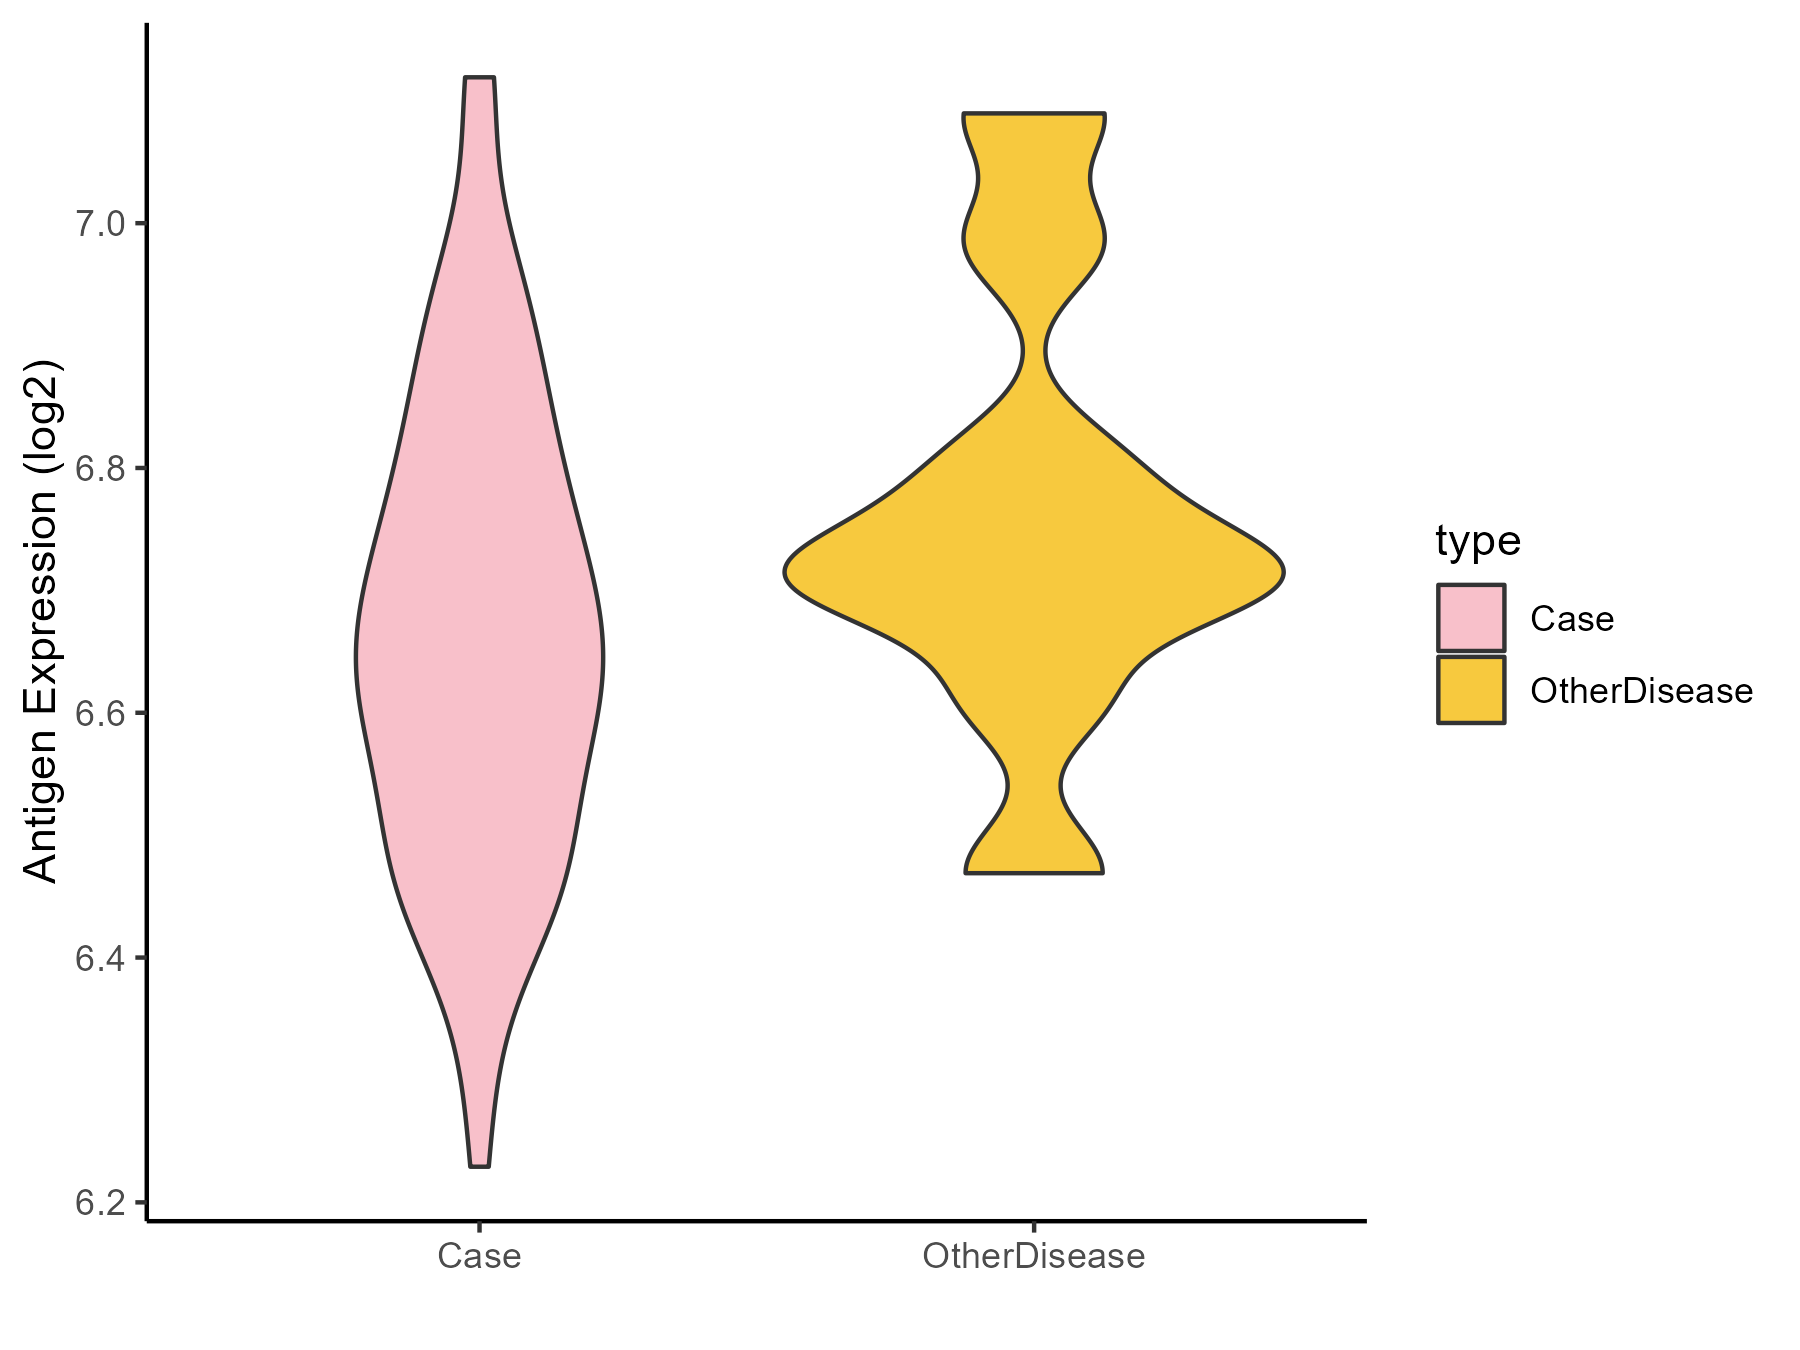
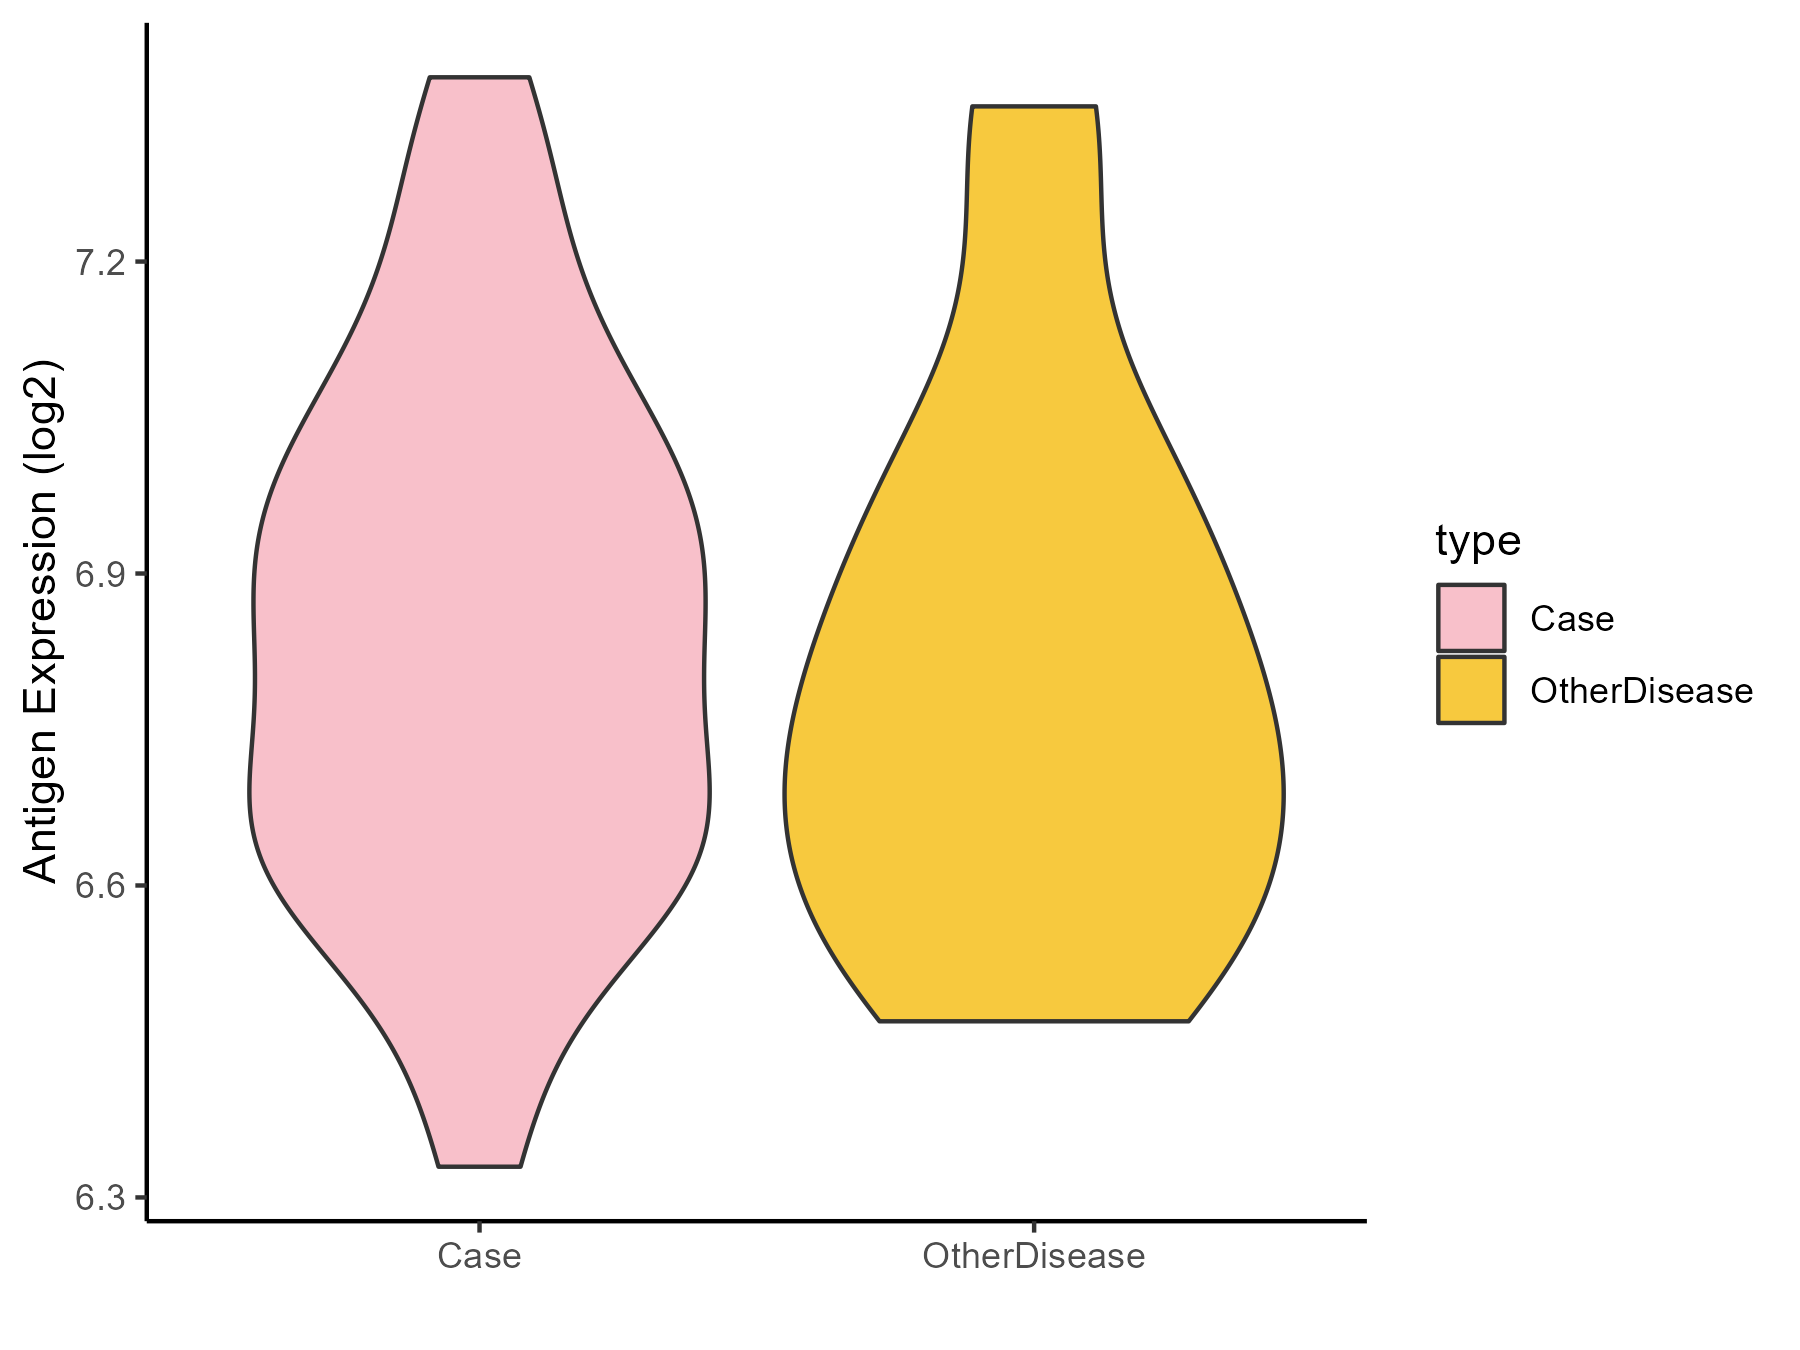
| The Expression Level of Disease Section Compare with the Other Disease Section | p-value: 0.816498404; Fold-change: -0.043741378; Z-score: -0.192468179 | |
| Disease-specific Antigen Abundances |
|
Click to View the Clearer Original Diagram |
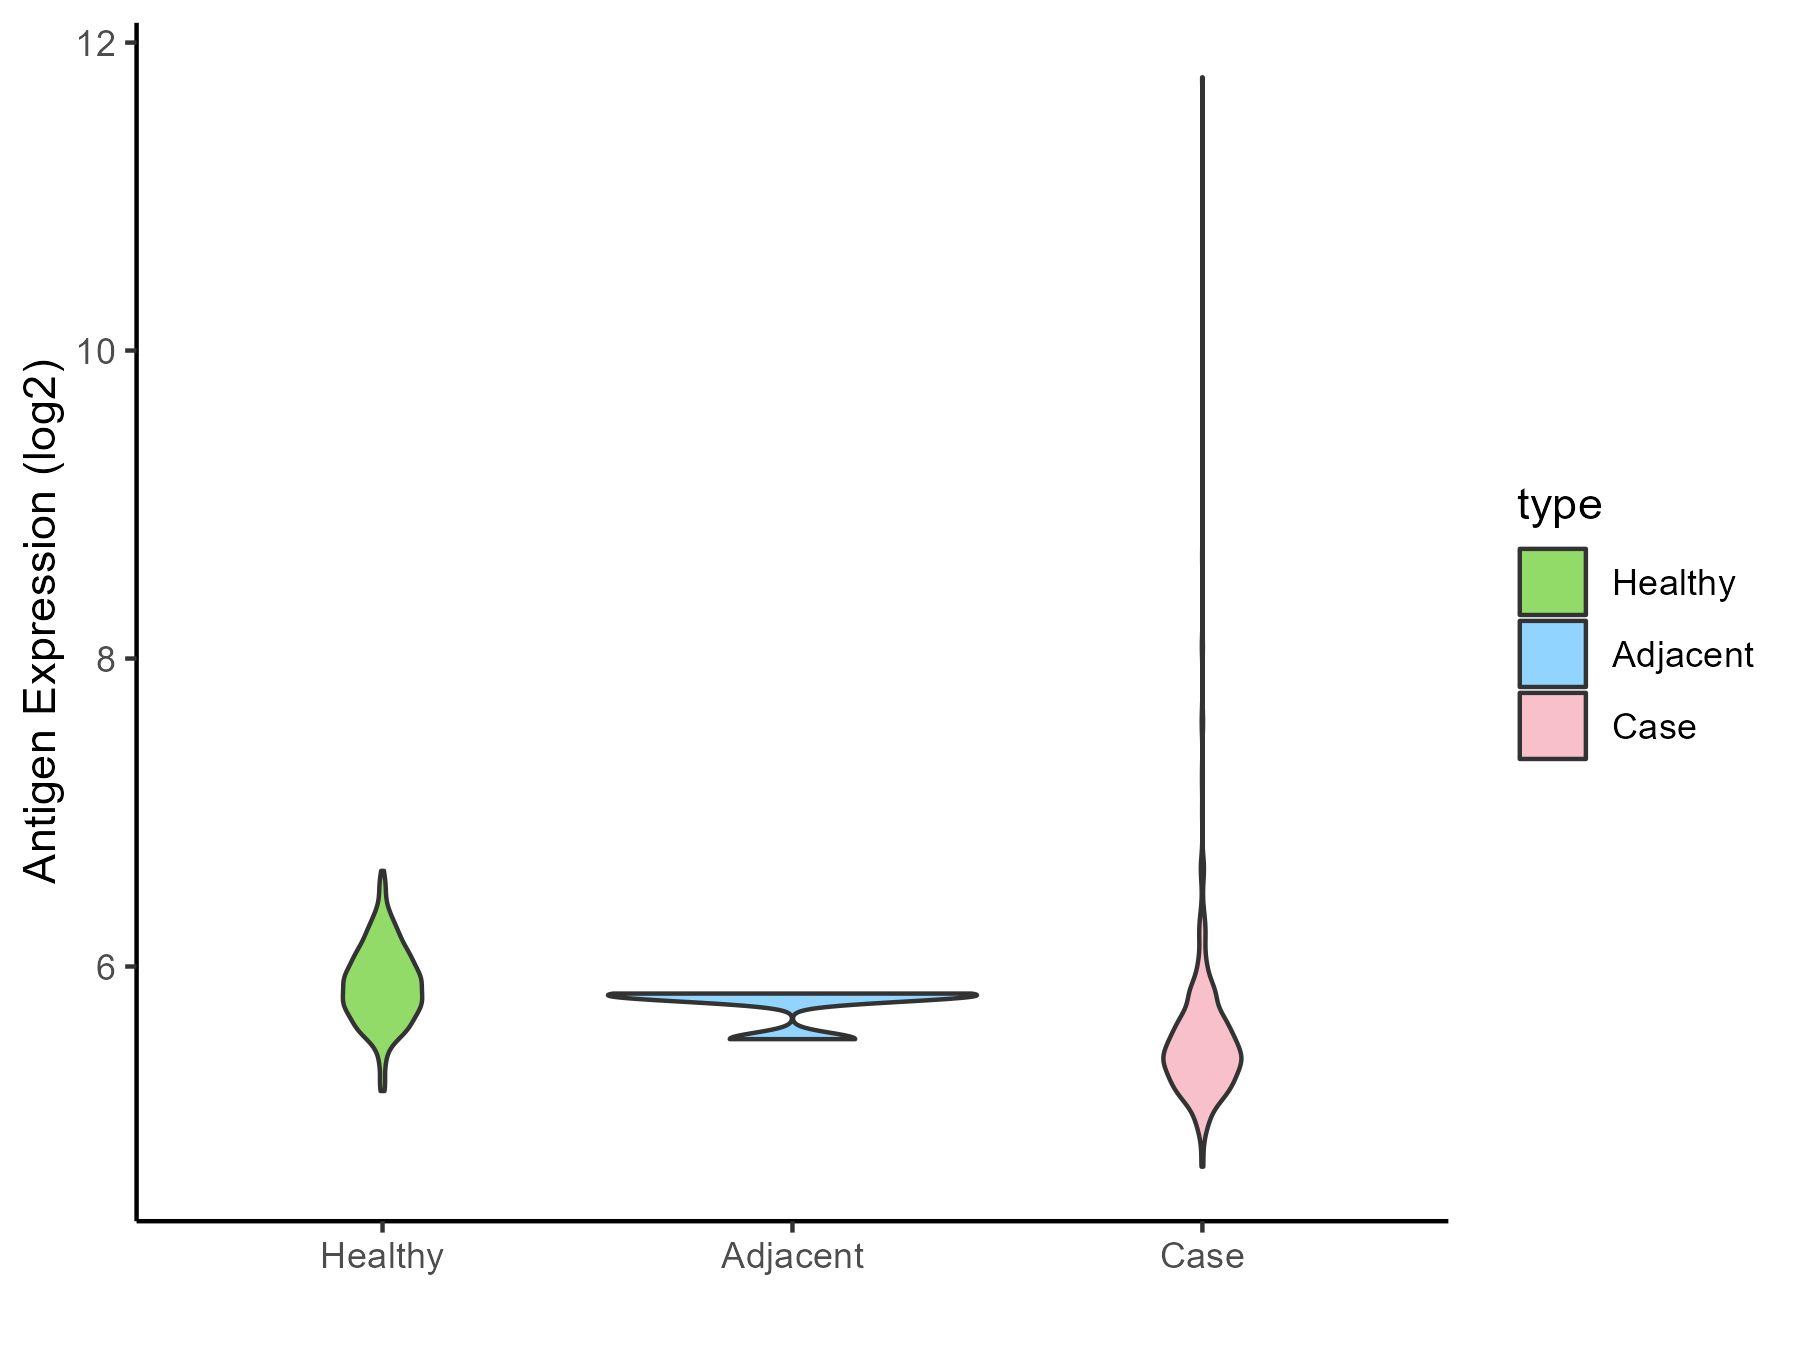
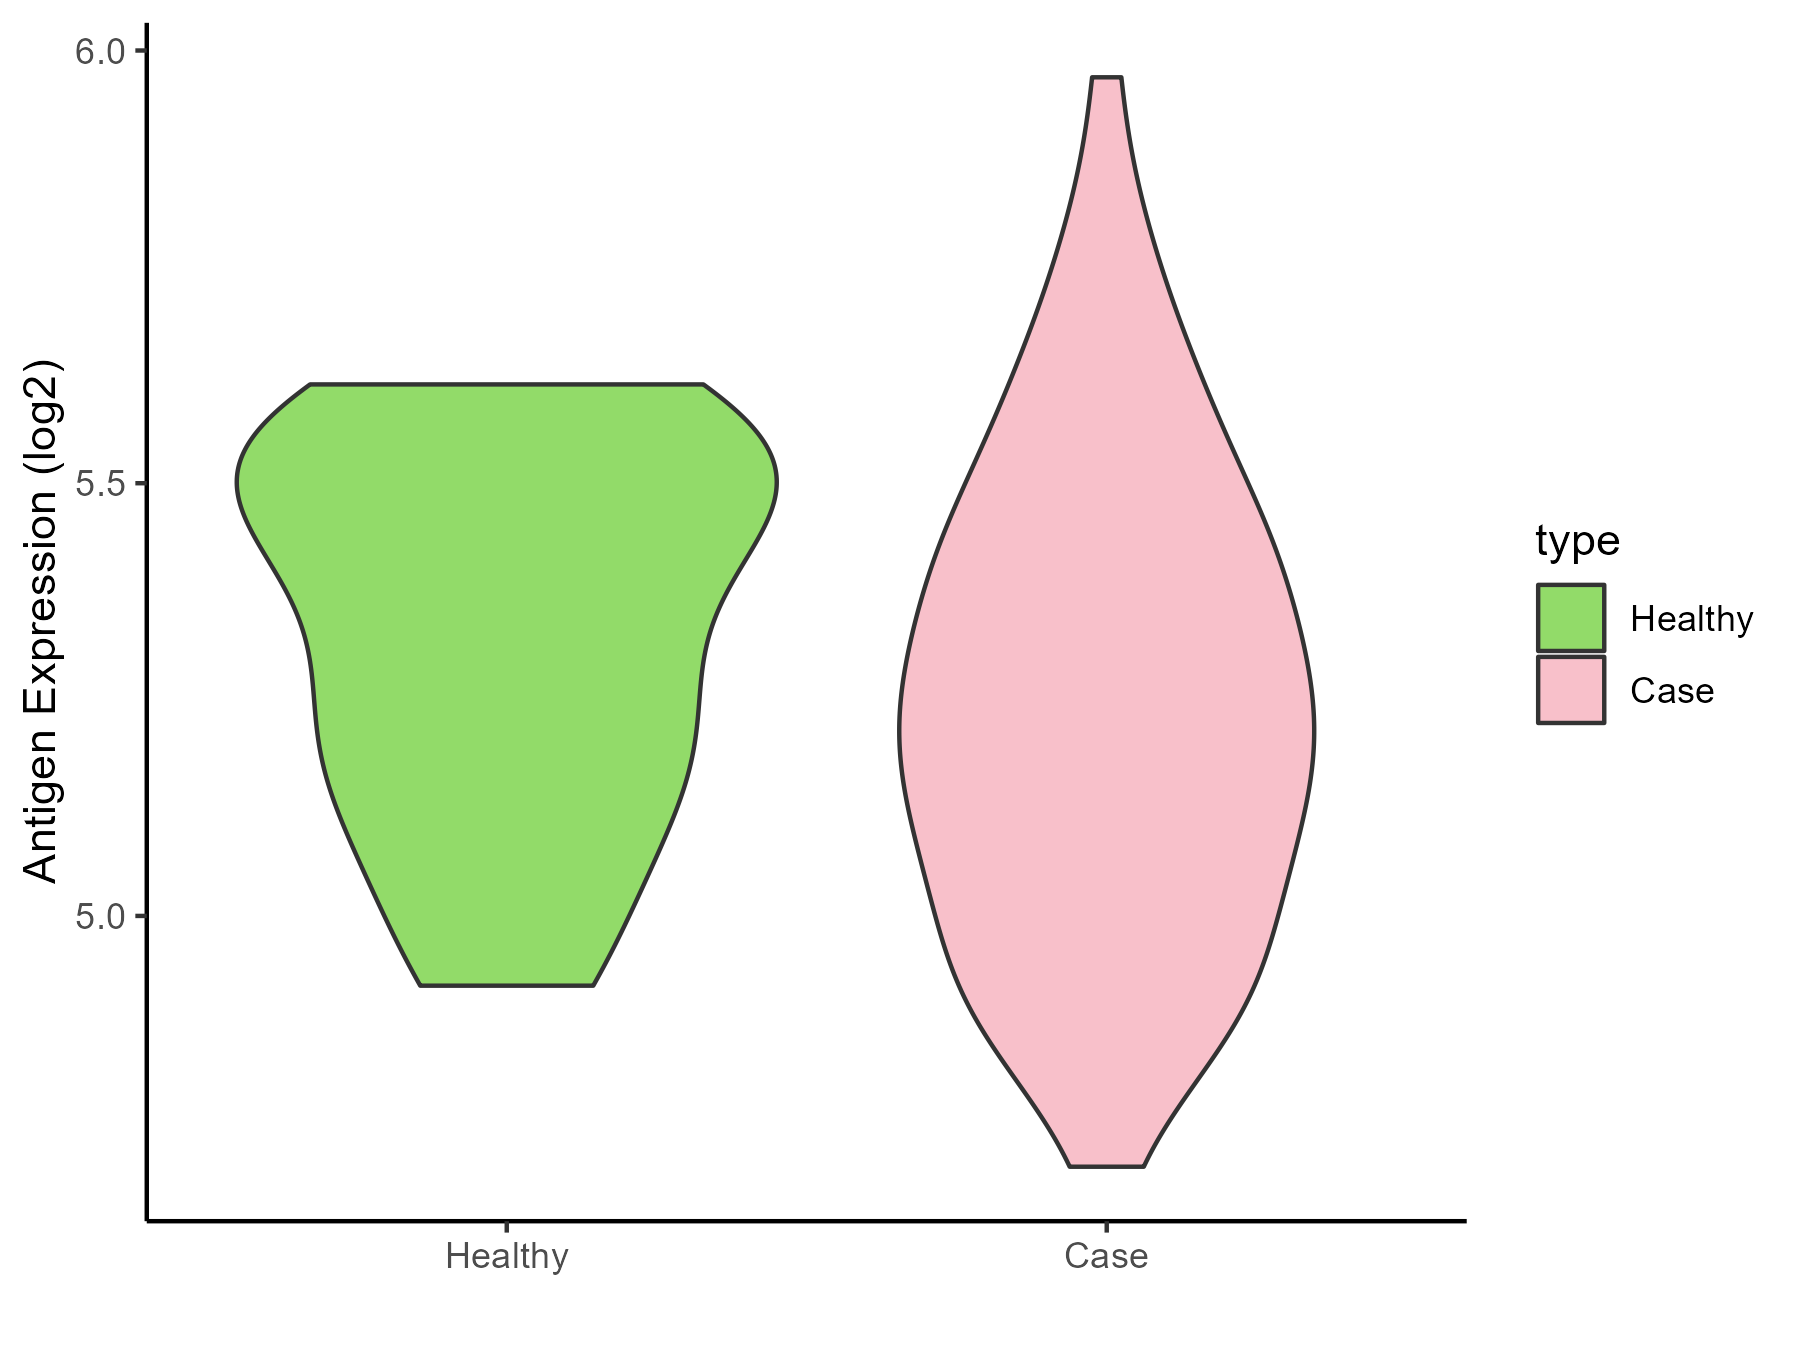
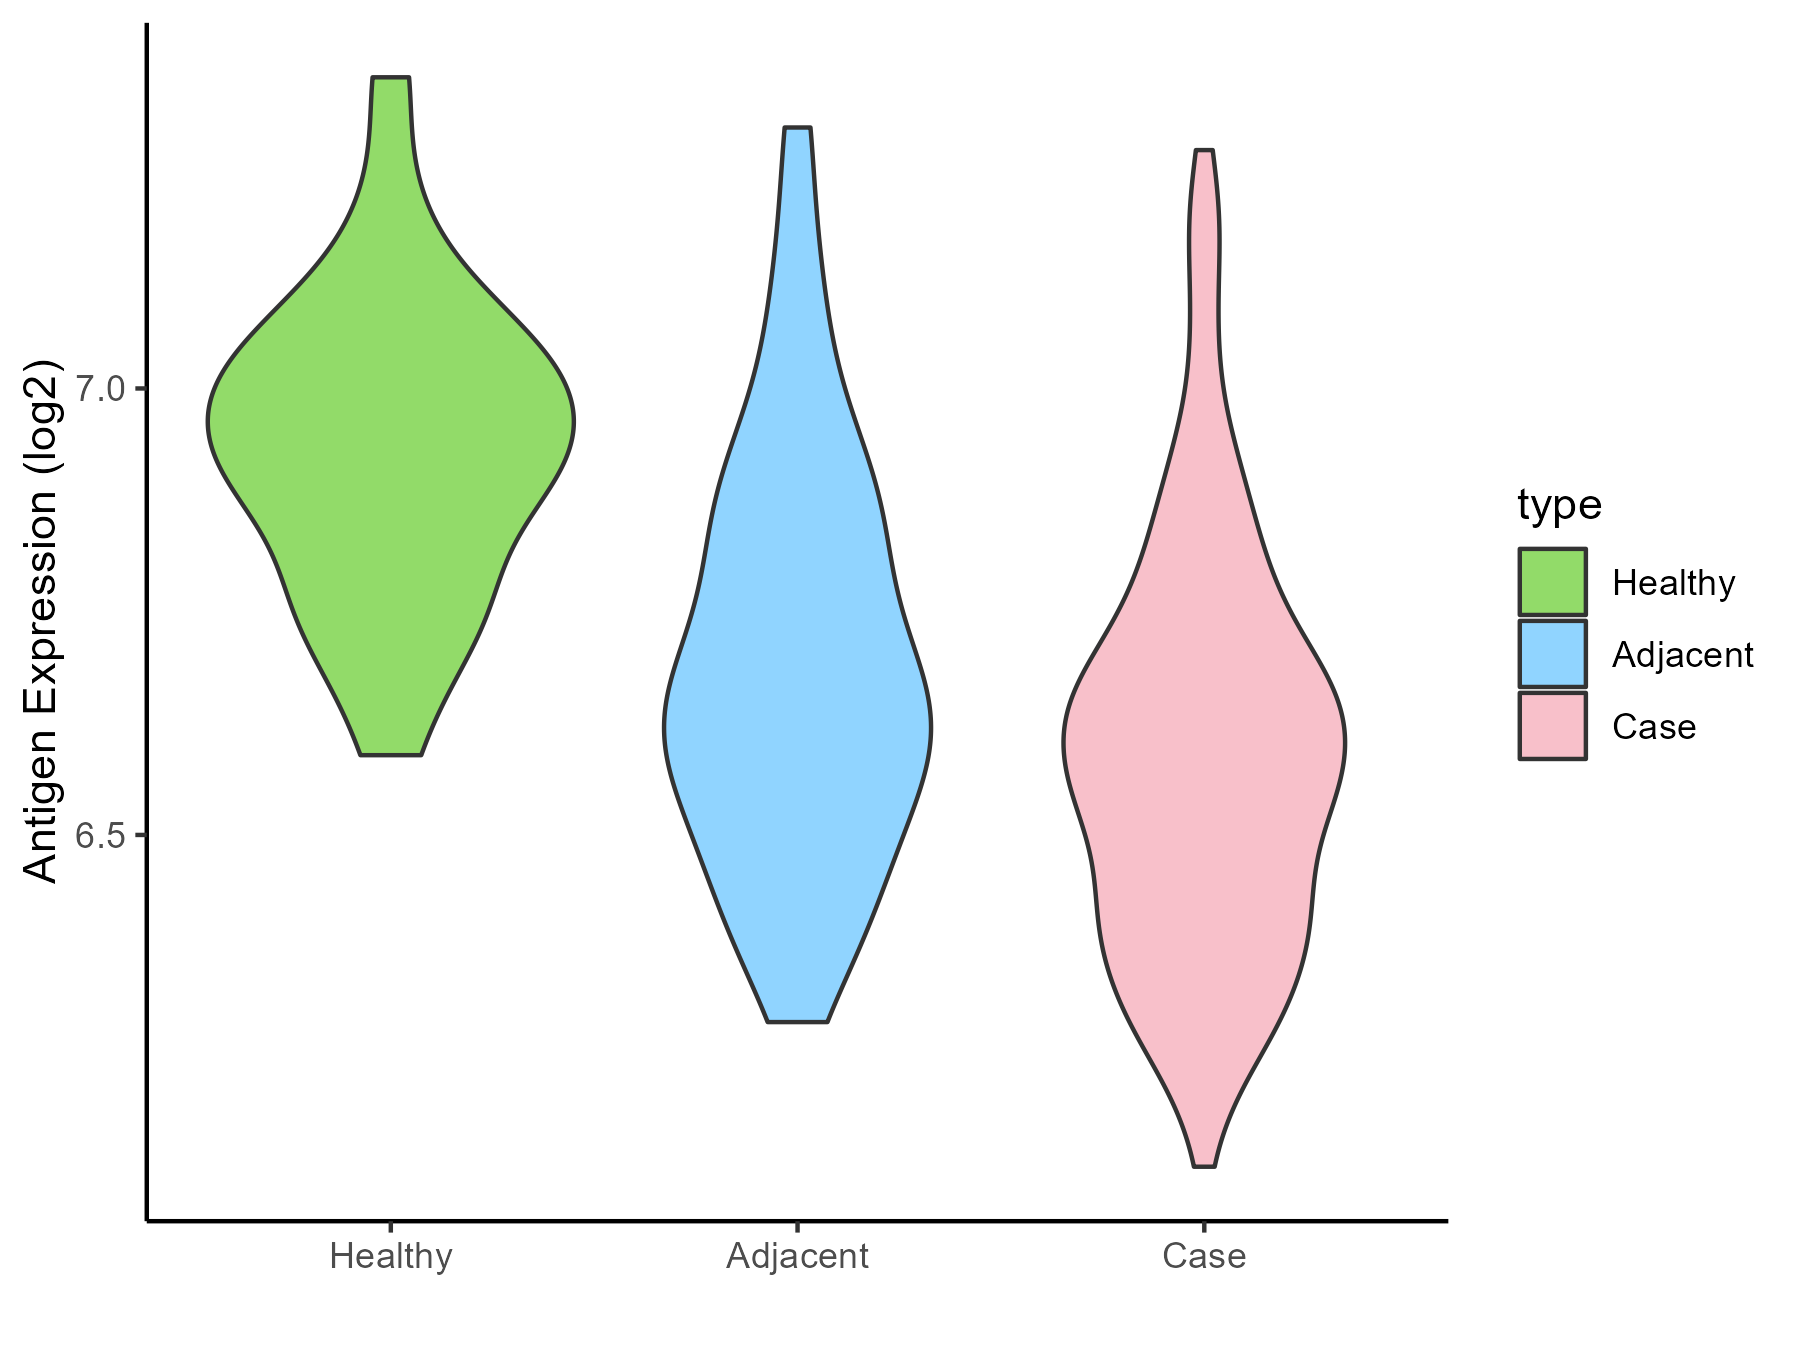
| Differential expression pattern of antigen in diseases | ||
| The Studied Tissue | Lung | |
| The Specific Disease | Lung cancer | |
| The Expression Level of Disease Section Compare with the Healthy Individual Tissue | p-value: 2.40E-31; Fold-change: -0.264312262; Z-score: -1.159945604 | |
| The Expression Level of Disease Section Compare with the Adjacent Tissue | p-value: 7.44E-35; Fold-change: -0.405669479; Z-score: -1.663592704 | |
| Disease-specific Antigen Abundances |
|
Click to View the Clearer Original Diagram |
| Differential expression pattern of antigen in diseases | ||
| The Studied Tissue | Skin | |
| The Specific Disease | Melanoma | |
| The Expression Level of Disease Section Compare with the Healthy Individual Tissue | p-value: 0.765604025; Fold-change: -0.142482376; Z-score: -0.233435708 | |
| Disease-specific Antigen Abundances |
|
Click to View the Clearer Original Diagram |
| Differential expression pattern of antigen in diseases | ||
| The Studied Tissue | Muscle | |
| The Specific Disease | Sarcoma | |
| The Expression Level of Disease Section Compare with the Healthy Individual Tissue | p-value: 1.53E-44; Fold-change: -0.432210934; Z-score: -1.714443173 | |
| The Expression Level of Disease Section Compare with the Adjacent Tissue | p-value: 0.053182707; Fold-change: -0.36818755; Z-score: -2.572204328 | |
| Disease-specific Antigen Abundances |
|
Click to View the Clearer Original Diagram |
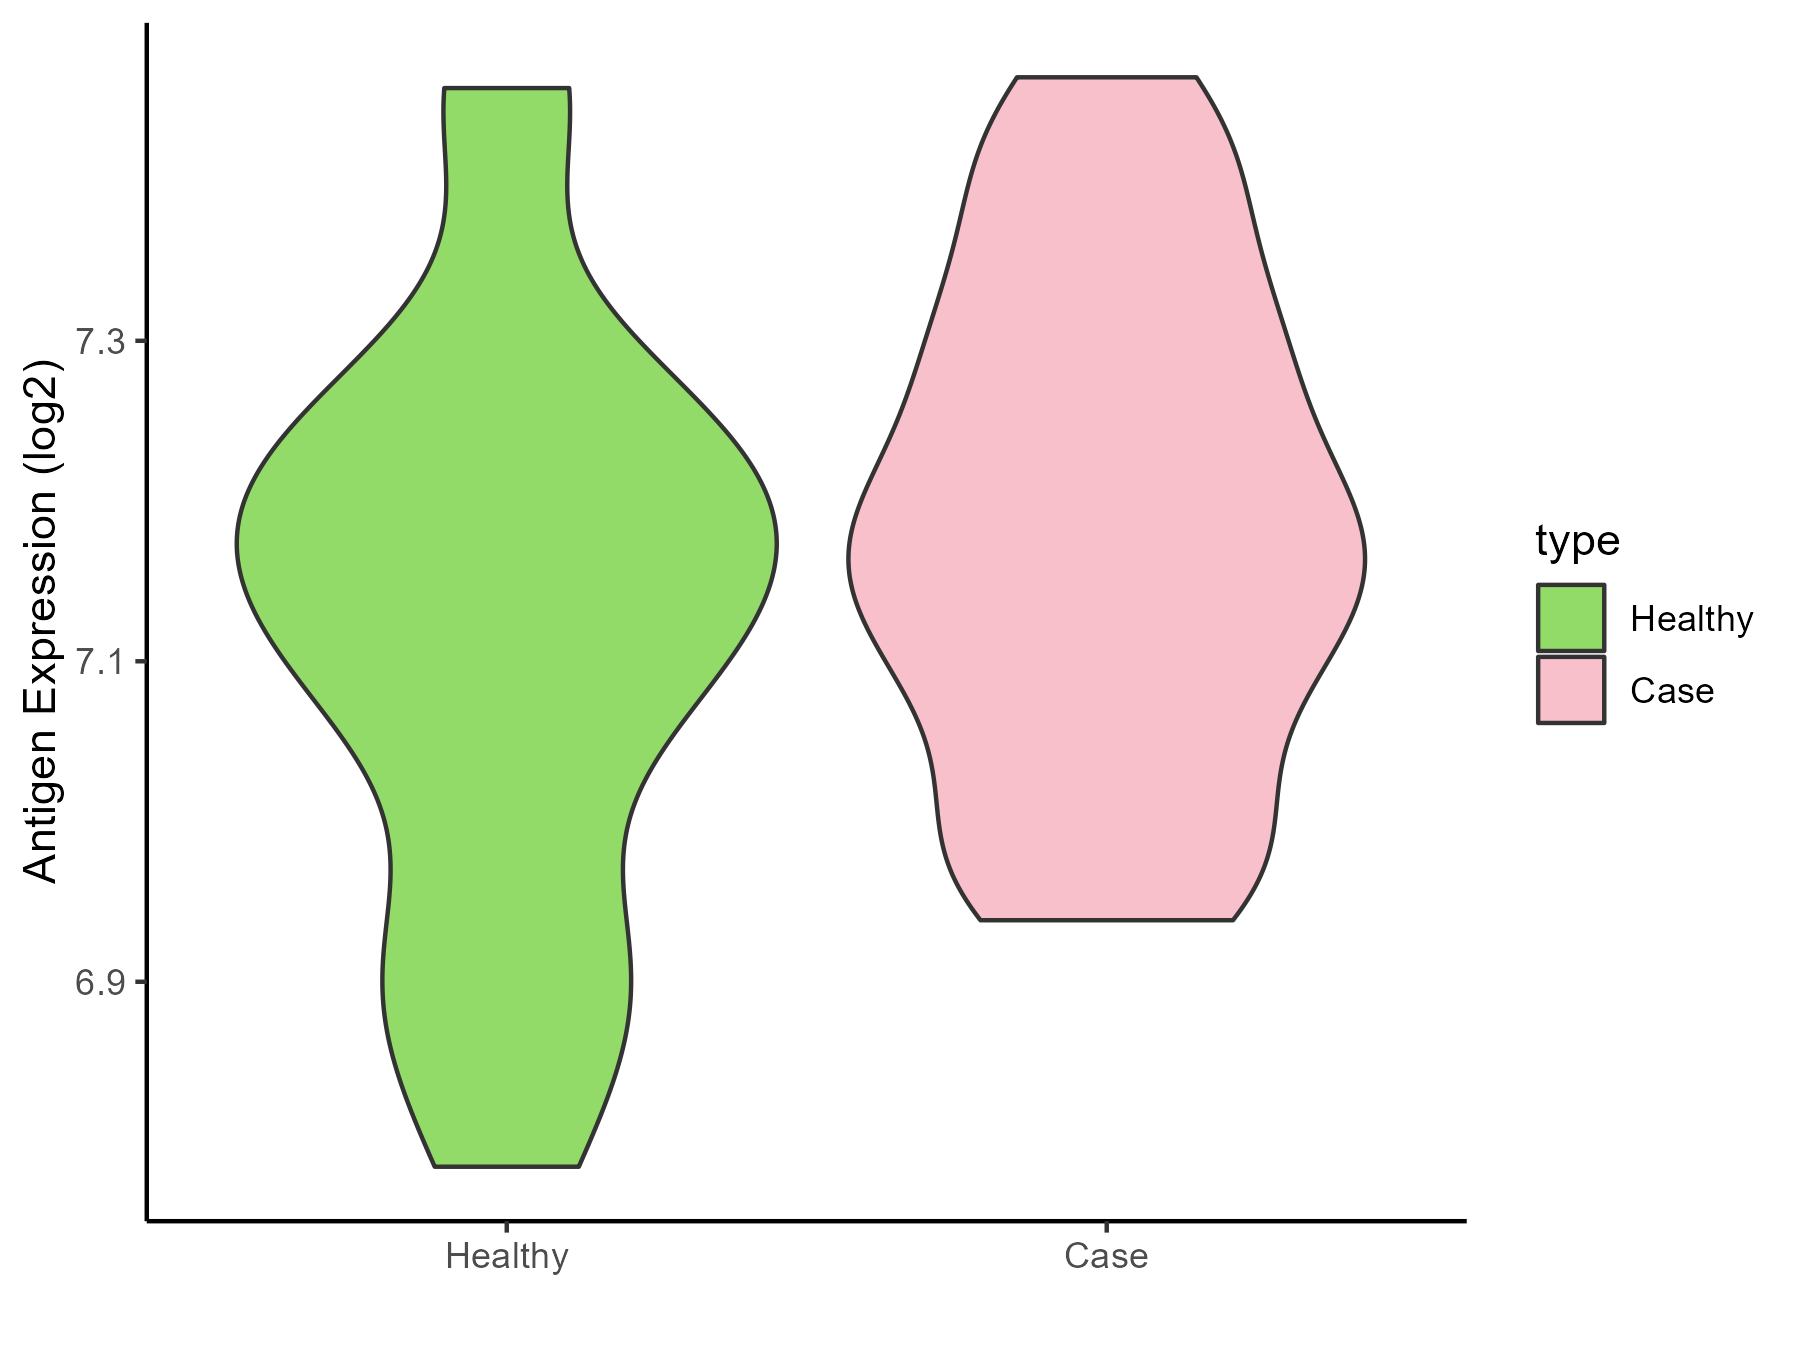
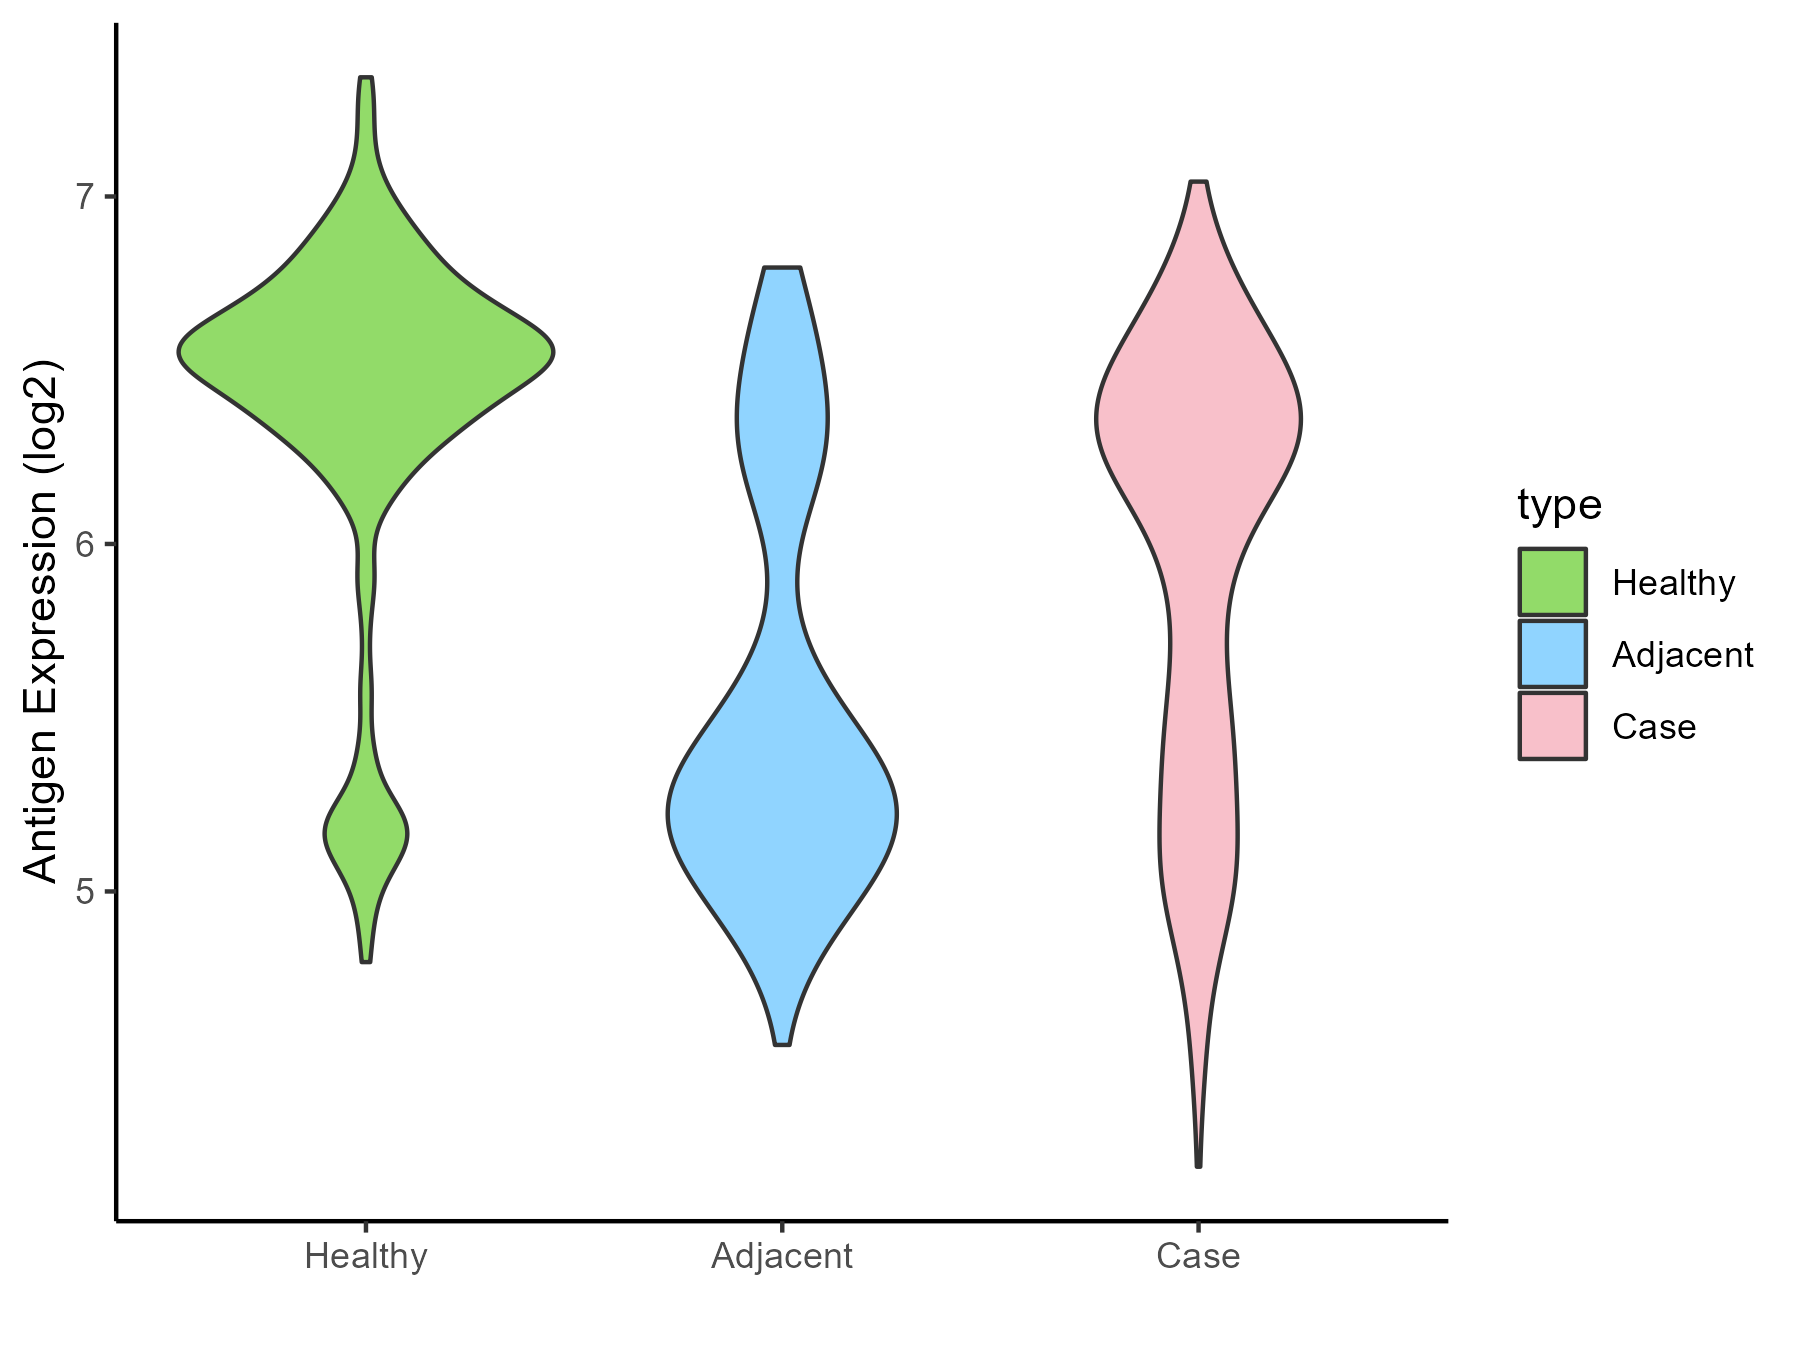
| Differential expression pattern of antigen in diseases | ||
| The Studied Tissue | Breast | |
| The Specific Disease | Breast cancer | |
| The Expression Level of Disease Section Compare with the Healthy Individual Tissue | p-value: 0.004485204; Fold-change: -0.103009235; Z-score: -0.466412892 | |
| The Expression Level of Disease Section Compare with the Adjacent Tissue | p-value: 0.012393361; Fold-change: -0.107559411; Z-score: -0.380221275 | |
| Disease-specific Antigen Abundances |
|
Click to View the Clearer Original Diagram |
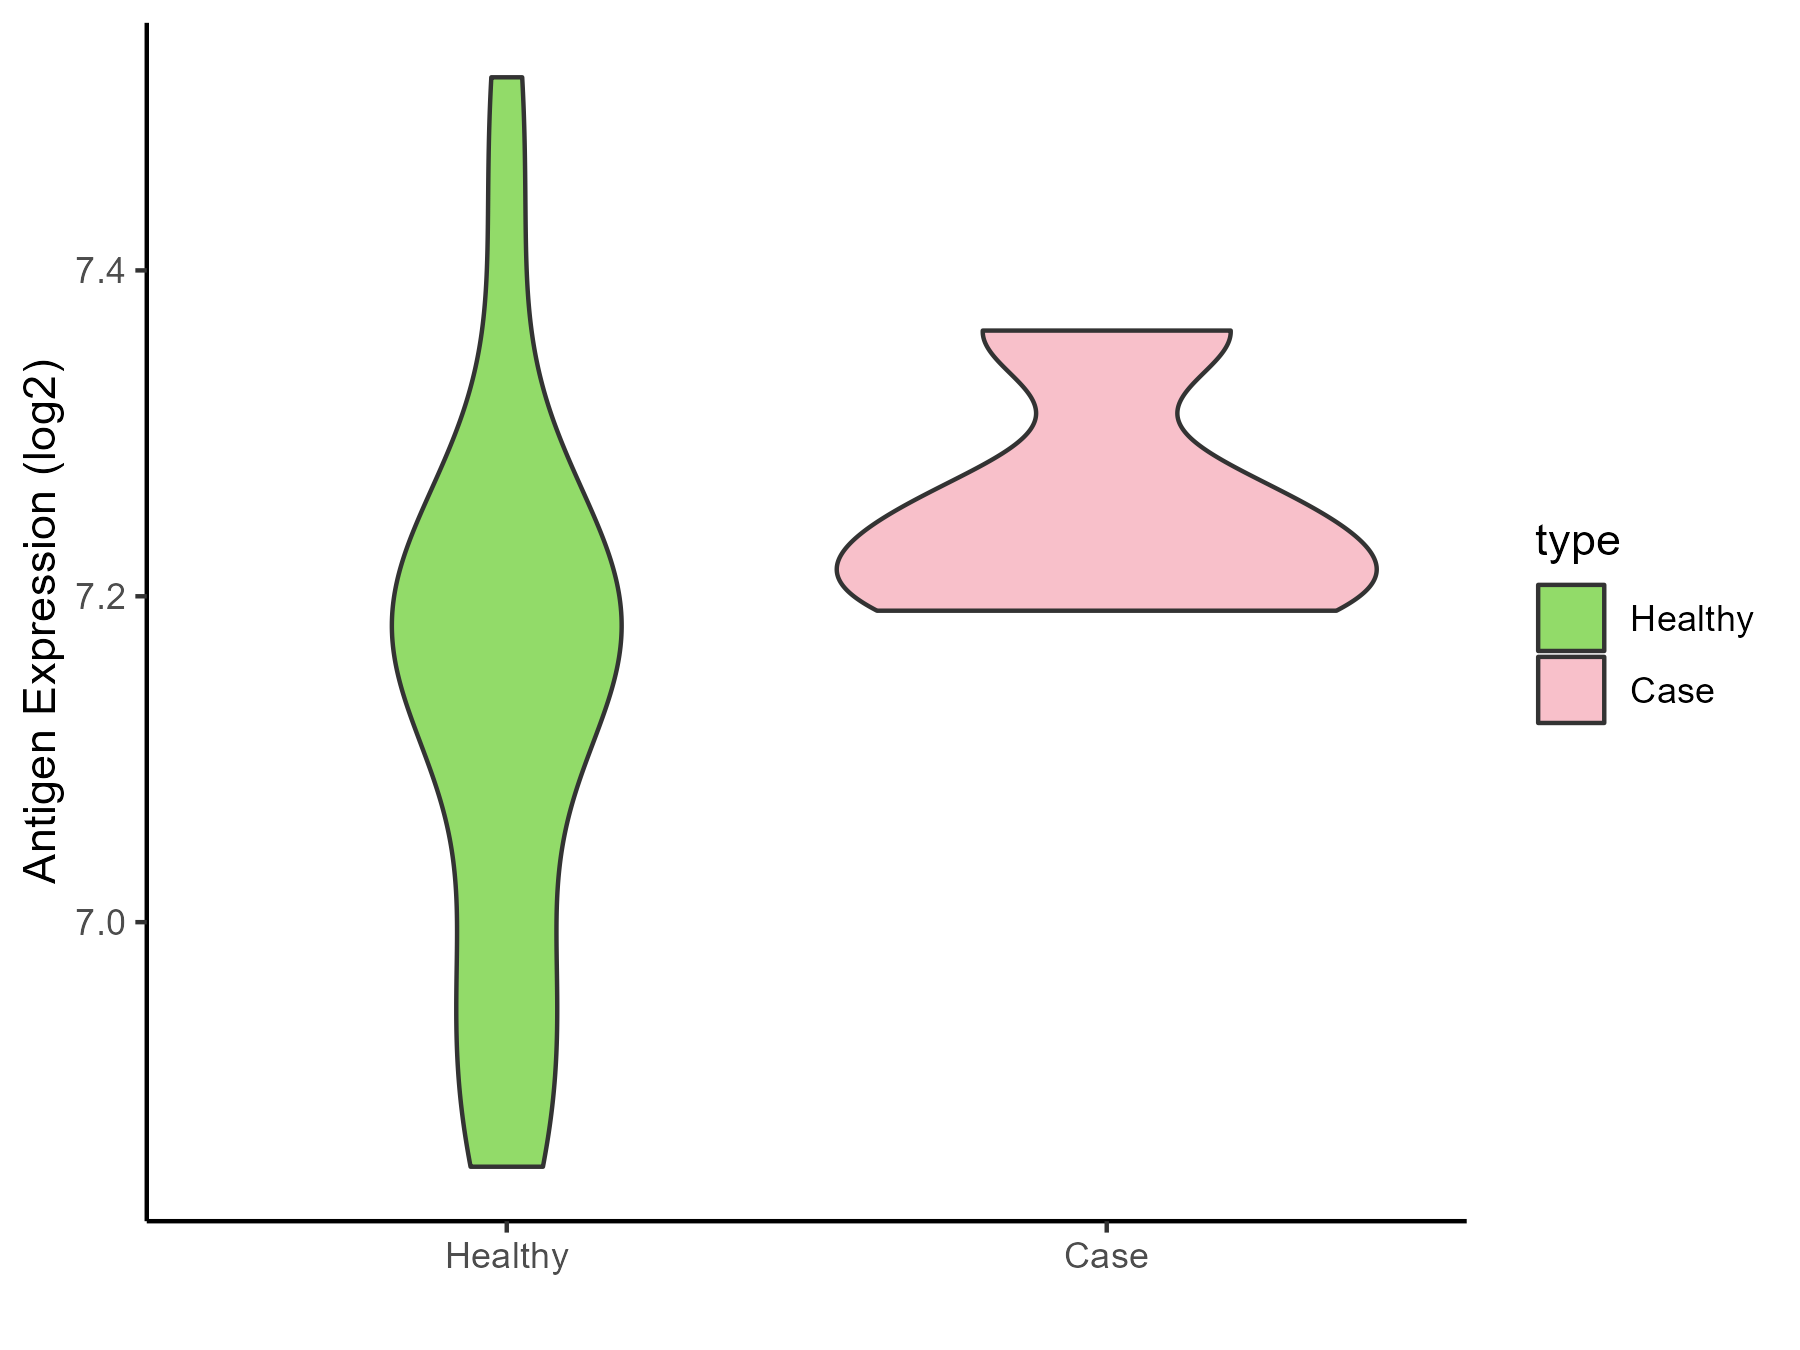
| Differential expression pattern of antigen in diseases | ||
| The Studied Tissue | Ovarian | |
| The Specific Disease | Ovarian cancer | |
| The Expression Level of Disease Section Compare with the Healthy Individual Tissue | p-value: 0.243488924; Fold-change: 0.025676141; Z-score: 0.083626934 | |
| The Expression Level of Disease Section Compare with the Adjacent Tissue | p-value: 4.57E-06; Fold-change: 0.15202569; Z-score: 0.982138026 | |
| Disease-specific Antigen Abundances |
|
Click to View the Clearer Original Diagram |
| Differential expression pattern of antigen in diseases | ||
| The Studied Tissue | Cervical | |
| The Specific Disease | Cervical cancer | |
| The Expression Level of Disease Section Compare with the Healthy Individual Tissue | p-value: 0.20362218; Fold-change: -0.027818476; Z-score: -0.158719143 | |
| Disease-specific Antigen Abundances |
|
Click to View the Clearer Original Diagram |
| Differential expression pattern of antigen in diseases | ||
| The Studied Tissue | Endometrium | |
| The Specific Disease | Uterine cancer | |
| The Expression Level of Disease Section Compare with the Healthy Individual Tissue | p-value: 0.988590338; Fold-change: -0.021200235; Z-score: -0.065601641 | |
| The Expression Level of Disease Section Compare with the Adjacent Tissue | p-value: 0.026694692; Fold-change: 0.320002515; Z-score: 1.541150673 | |
| Disease-specific Antigen Abundances |
|
Click to View the Clearer Original Diagram |
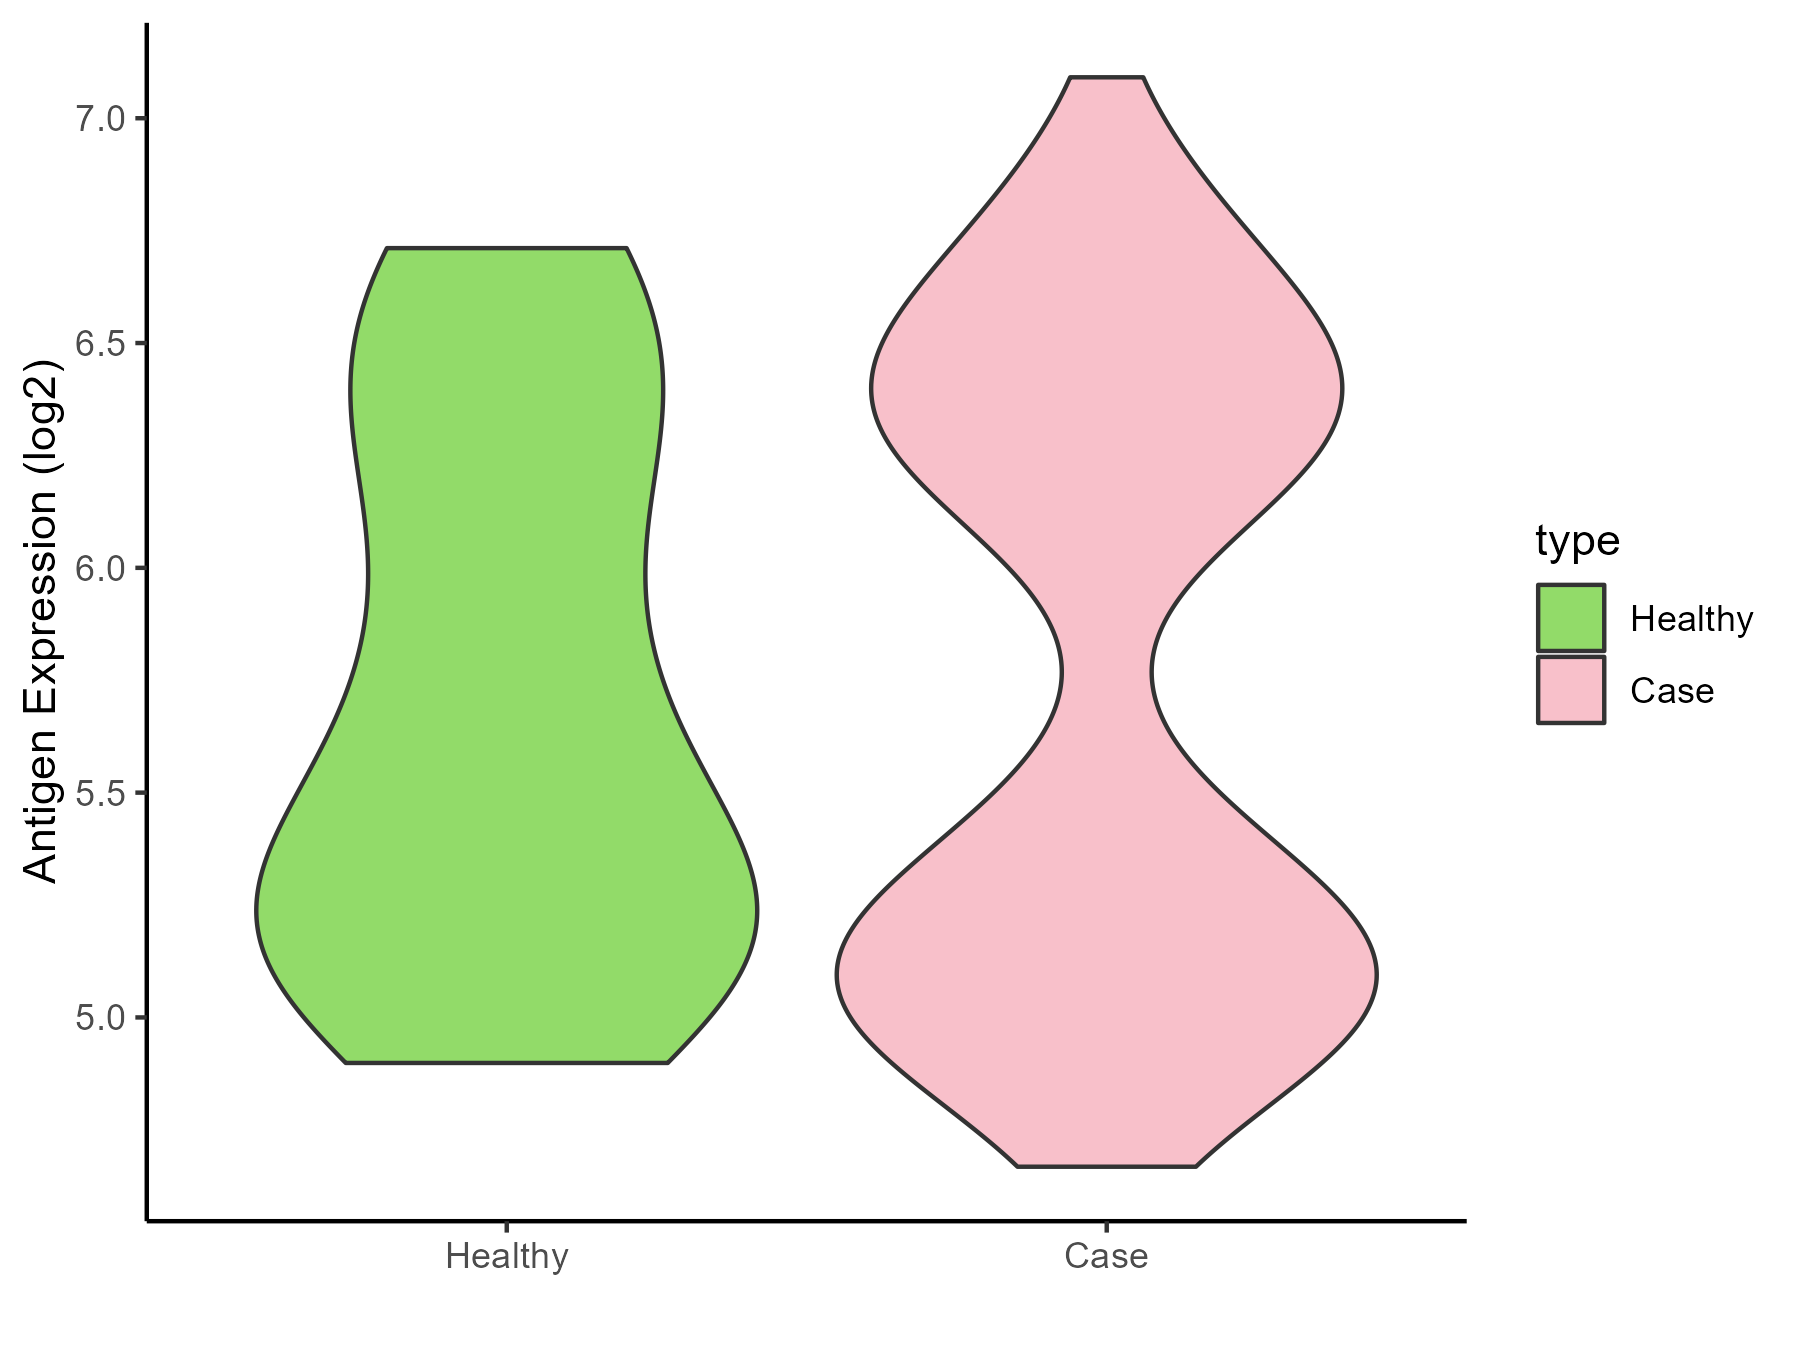
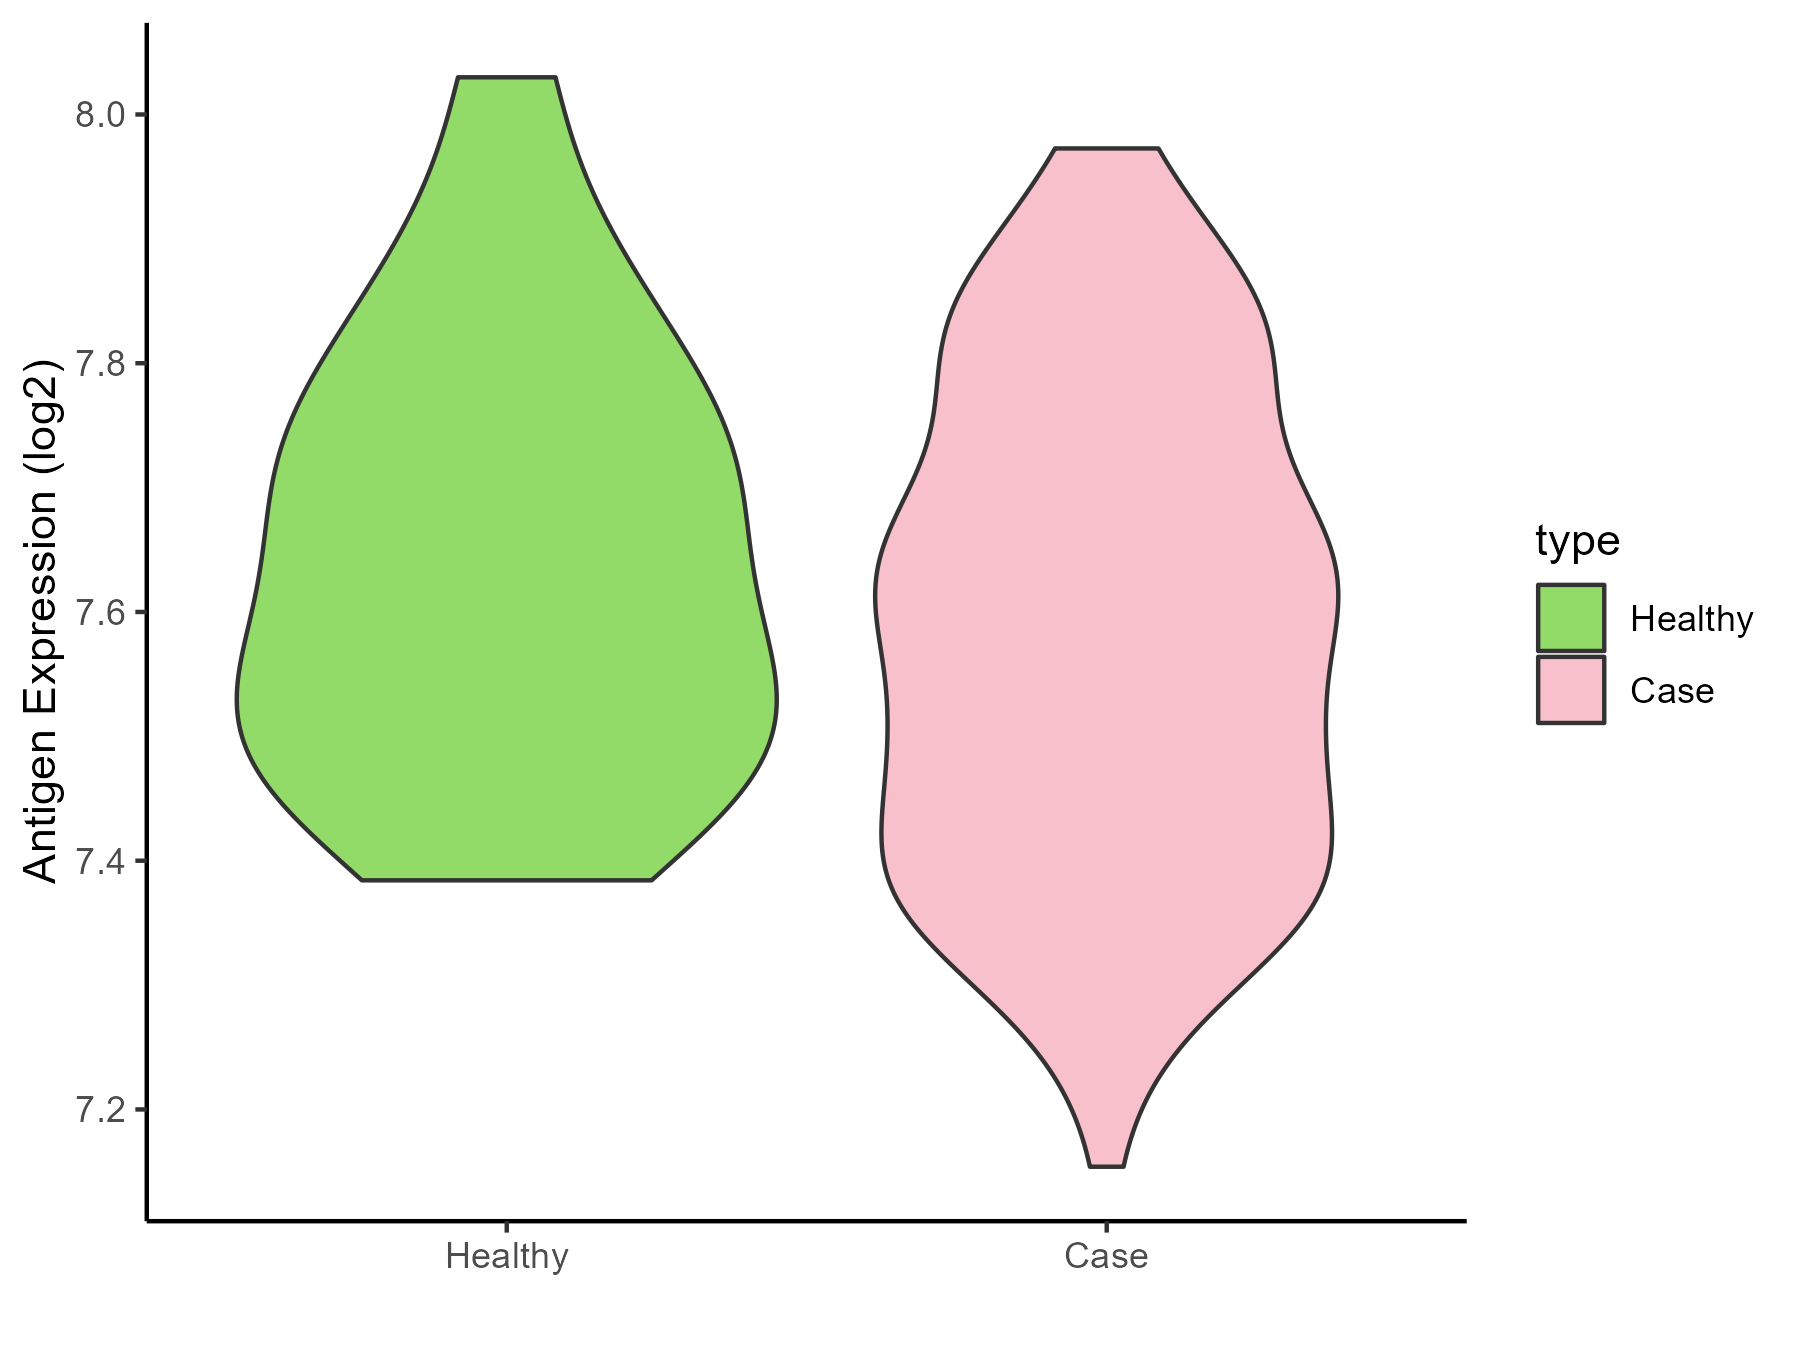
| Differential expression pattern of antigen in diseases | ||
| The Studied Tissue | Prostate | |
| The Specific Disease | Prostate cancer | |
| The Expression Level of Disease Section Compare with the Healthy Individual Tissue | p-value: 0.000472977; Fold-change: -0.961842619; Z-score: -1.407846067 | |
| Disease-specific Antigen Abundances |
|
Click to View the Clearer Original Diagram |
| Differential expression pattern of antigen in diseases | ||
| The Studied Tissue | Bladder | |
| The Specific Disease | Bladder cancer | |
| The Expression Level of Disease Section Compare with the Healthy Individual Tissue | p-value: 0.960657276; Fold-change: 0.004872738; Z-score: 0.039672126 | |
| Disease-specific Antigen Abundances |
|
Click to View the Clearer Original Diagram |
| Differential expression pattern of antigen in diseases | ||
| The Studied Tissue | Uvea | |
| The Specific Disease | Retinoblastoma tumor | |
| The Expression Level of Disease Section Compare with the Healthy Individual Tissue | p-value: 0.166533805; Fold-change: -0.070135081; Z-score: -0.71806286 | |
| Disease-specific Antigen Abundances |
|
Click to View the Clearer Original Diagram |
| Differential expression pattern of antigen in diseases | ||
| The Studied Tissue | Thyroid | |
| The Specific Disease | Thyroid cancer | |
| The Expression Level of Disease Section Compare with the Healthy Individual Tissue | p-value: 1.05E-07; Fold-change: 0.153947403; Z-score: 0.649662932 | |
| The Expression Level of Disease Section Compare with the Adjacent Tissue | p-value: 0.079534421; Fold-change: 0.047371041; Z-score: 0.24235939 | |
| Disease-specific Antigen Abundances |

|
Click to View the Clearer Original Diagram |
| Differential expression pattern of antigen in diseases | ||
| The Studied Tissue | Adrenal cortex | |
| The Specific Disease | Adrenocortical carcinoma | |
| The Expression Level of Disease Section Compare with the Other Disease Section | p-value: 0.055886956; Fold-change: -0.061349344; Z-score: -0.340149174 | |
| Disease-specific Antigen Abundances |
|
Click to View the Clearer Original Diagram |
| Differential expression pattern of antigen in diseases | ||
| The Studied Tissue | Head and neck | |
| The Specific Disease | Head and neck cancer | |
| The Expression Level of Disease Section Compare with the Healthy Individual Tissue | p-value: 6.93E-06; Fold-change: -0.169260459; Z-score: -0.806378927 | |
| Disease-specific Antigen Abundances |
|
Click to View the Clearer Original Diagram |
| Differential expression pattern of antigen in diseases | ||
| The Studied Tissue | Pituitary | |
| The Specific Disease | Pituitary gonadotrope tumor | |
| The Expression Level of Disease Section Compare with the Healthy Individual Tissue | p-value: 0.002744536; Fold-change: 0.223484586; Z-score: 1.289998031 | |
| Disease-specific Antigen Abundances |
|
Click to View the Clearer Original Diagram |
| The Studied Tissue | Pituitary | |
| The Specific Disease | Pituitary cancer | |
| The Expression Level of Disease Section Compare with the Healthy Individual Tissue | p-value: 0.005483732; Fold-change: 0.397070993; Z-score: 1.261548359 | |
| Disease-specific Antigen Abundances |
|
Click to View the Clearer Original Diagram |
ICD Disease Classification 03
| Differential expression pattern of antigen in diseases | ||
| The Studied Tissue | Whole blood | |
| The Specific Disease | Thrombocytopenia | |
| The Expression Level of Disease Section Compare with the Healthy Individual Tissue | p-value: 0.657505004; Fold-change: 0.091129276; Z-score: 0.243450511 | |
| Disease-specific Antigen Abundances |
|
Click to View the Clearer Original Diagram |
ICD Disease Classification 04
| Differential expression pattern of antigen in diseases | ||
| The Studied Tissue | Whole blood | |
| The Specific Disease | Lupus erythematosus | |
| The Expression Level of Disease Section Compare with the Healthy Individual Tissue | p-value: 0.014591638; Fold-change: -0.101041487; Z-score: -0.147105343 | |
| Disease-specific Antigen Abundances |
|
Click to View the Clearer Original Diagram |
| Differential expression pattern of antigen in diseases | ||
| The Studied Tissue | Peripheral monocyte | |
| The Specific Disease | Autoimmune uveitis | |
| The Expression Level of Disease Section Compare with the Healthy Individual Tissue | p-value: 0.071873733; Fold-change: -0.126050531; Z-score: -0.654638866 | |
| Disease-specific Antigen Abundances |
|
Click to View the Clearer Original Diagram |
ICD Disease Classification 05
| Differential expression pattern of antigen in diseases | ||
| The Studied Tissue | Whole blood | |
| The Specific Disease | Familial hypercholesterolemia | |
| The Expression Level of Disease Section Compare with the Healthy Individual Tissue | p-value: 0.132542415; Fold-change: 0.336622082; Z-score: 1.578453478 | |
| Disease-specific Antigen Abundances |
|
Click to View the Clearer Original Diagram |
ICD Disease Classification 06
| Differential expression pattern of antigen in diseases | ||
| The Studied Tissue | Superior temporal cortex | |
| The Specific Disease | Schizophrenia | |
| The Expression Level of Disease Section Compare with the Healthy Individual Tissue | p-value: 0.314290693; Fold-change: -0.031258484; Z-score: -0.314605406 | |
| Disease-specific Antigen Abundances |
|
Click to View the Clearer Original Diagram |
ICD Disease Classification 08
| Differential expression pattern of antigen in diseases | ||
| The Studied Tissue | Spinal cord | |
| The Specific Disease | Multiple sclerosis | |
| The Expression Level of Disease Section Compare with the Adjacent Tissue | p-value: 0.324670411; Fold-change: -0.100791982; Z-score: -0.982746125 | |
| Disease-specific Antigen Abundances |
|
Click to View the Clearer Original Diagram |
| The Studied Tissue | Plasmacytoid dendritic cells | |
| The Specific Disease | Multiple sclerosis | |
| The Expression Level of Disease Section Compare with the Healthy Individual Tissue | p-value: 0.846134381; Fold-change: 0.058433102; Z-score: 0.17312891 | |
| Disease-specific Antigen Abundances |
|
Click to View the Clearer Original Diagram |
| Differential expression pattern of antigen in diseases | ||
| The Studied Tissue | Peritumoral cortex | |
| The Specific Disease | Epilepsy | |
| The Expression Level of Disease Section Compare with the Other Disease Section | p-value: 0.326981319; Fold-change: 0.24795782; Z-score: 0.695845651 | |
| Disease-specific Antigen Abundances |
|
Click to View the Clearer Original Diagram |
| Differential expression pattern of antigen in diseases | ||
| The Studied Tissue | Whole blood | |
| The Specific Disease | Cardioembolic Stroke | |
| The Expression Level of Disease Section Compare with the Healthy Individual Tissue | p-value: 0.157513509; Fold-change: -0.166202839; Z-score: -0.757695196 | |
| Disease-specific Antigen Abundances |
|
Click to View the Clearer Original Diagram |
| The Studied Tissue | Peripheral blood | |
| The Specific Disease | Ischemic stroke | |
| The Expression Level of Disease Section Compare with the Healthy Individual Tissue | p-value: 0.19935012; Fold-change: -0.010105634; Z-score: -0.040224854 | |
| Disease-specific Antigen Abundances |
|
Click to View the Clearer Original Diagram |
ICD Disease Classification 1
| Differential expression pattern of antigen in diseases | ||
| The Studied Tissue | White matter | |
| The Specific Disease | HIV | |
| The Expression Level of Disease Section Compare with the Healthy Individual Tissue | p-value: 0.170419114; Fold-change: -0.023898628; Z-score: -0.166607634 | |
| Disease-specific Antigen Abundances |
|
Click to View the Clearer Original Diagram |
| Differential expression pattern of antigen in diseases | ||
| The Studied Tissue | Whole blood | |
| The Specific Disease | Influenza | |
| The Expression Level of Disease Section Compare with the Healthy Individual Tissue | p-value: 0.222729044; Fold-change: 0.189507263; Z-score: 0.797986992 | |
| Disease-specific Antigen Abundances |
|
Click to View the Clearer Original Diagram |
| Differential expression pattern of antigen in diseases | ||
| The Studied Tissue | Whole blood | |
| The Specific Disease | Chronic hepatitis C | |
| The Expression Level of Disease Section Compare with the Healthy Individual Tissue | p-value: 0.396055899; Fold-change: -0.053770153; Z-score: -0.559438884 | |
| Disease-specific Antigen Abundances |
|
Click to View the Clearer Original Diagram |
| Differential expression pattern of antigen in diseases | ||
| The Studied Tissue | Whole blood | |
| The Specific Disease | Sepsis | |
| The Expression Level of Disease Section Compare with the Healthy Individual Tissue | p-value: 0.000311036; Fold-change: -0.143905731; Z-score: -0.43569973 | |
| Disease-specific Antigen Abundances |
|
Click to View the Clearer Original Diagram |
| Differential expression pattern of antigen in diseases | ||
| The Studied Tissue | Whole blood | |
| The Specific Disease | Septic shock | |
| The Expression Level of Disease Section Compare with the Healthy Individual Tissue | p-value: 4.08E-06; Fold-change: -0.090744813; Z-score: -0.307153037 | |
| Disease-specific Antigen Abundances |
|
Click to View the Clearer Original Diagram |
| Differential expression pattern of antigen in diseases | ||
| The Studied Tissue | Peripheral blood | |
| The Specific Disease | Pediatric respiratory syncytial virus infection | |
| The Expression Level of Disease Section Compare with the Healthy Individual Tissue | p-value: 0.625957425; Fold-change: -0.023815382; Z-score: -0.179029594 | |
| Disease-specific Antigen Abundances |
|
Click to View the Clearer Original Diagram |
ICD Disease Classification 11
| Differential expression pattern of antigen in diseases | ||
| The Studied Tissue | Peripheral blood | |
| The Specific Disease | Essential hypertension | |
| The Expression Level of Disease Section Compare with the Healthy Individual Tissue | p-value: 0.792290508; Fold-change: 0.168150553; Z-score: 3.838572342 | |
| Disease-specific Antigen Abundances |
|
Click to View the Clearer Original Diagram |
| Differential expression pattern of antigen in diseases | ||
| The Studied Tissue | Peripheral blood | |
| The Specific Disease | Myocardial infarction | |
| The Expression Level of Disease Section Compare with the Healthy Individual Tissue | p-value: 0.161629579; Fold-change: 0.350705955; Z-score: 0.520558308 | |
| Disease-specific Antigen Abundances |
|
Click to View the Clearer Original Diagram |
| Differential expression pattern of antigen in diseases | ||
| The Studied Tissue | Peripheral blood | |
| The Specific Disease | Coronary artery disease | |
| The Expression Level of Disease Section Compare with the Healthy Individual Tissue | p-value: 0.103965391; Fold-change: -0.295426915; Z-score: -1.002005043 | |
| Disease-specific Antigen Abundances |
|
Click to View the Clearer Original Diagram |
| Differential expression pattern of antigen in diseases | ||
| The Studied Tissue | Calcified aortic valve | |
| The Specific Disease | Aortic stenosis | |
| The Expression Level of Disease Section Compare with the Healthy Individual Tissue | p-value: 0.859920452; Fold-change: 0.010480036; Z-score: 0.018700407 | |
| Disease-specific Antigen Abundances |
|
Click to View the Clearer Original Diagram |
| Differential expression pattern of antigen in diseases | ||
| The Studied Tissue | Peripheral blood | |
| The Specific Disease | Arteriosclerosis | |
| The Expression Level of Disease Section Compare with the Healthy Individual Tissue | p-value: 0.645527626; Fold-change: 0.043611758; Z-score: 0.175838394 | |
| Disease-specific Antigen Abundances |
|
Click to View the Clearer Original Diagram |
| Differential expression pattern of antigen in diseases | ||
| The Studied Tissue | Intracranial artery | |
| The Specific Disease | Aneurysm | |
| The Expression Level of Disease Section Compare with the Healthy Individual Tissue | p-value: 6.45E-07; Fold-change: -1.876455223; Z-score: -2.471473157 | |
| Disease-specific Antigen Abundances |
|
Click to View the Clearer Original Diagram |
ICD Disease Classification 12
| Differential expression pattern of antigen in diseases | ||
| The Studied Tissue | Peripheral blood | |
| The Specific Disease | Immunodeficiency | |
| The Expression Level of Disease Section Compare with the Healthy Individual Tissue | p-value: 0.754059421; Fold-change: 0.031640751; Z-score: 0.552879255 | |
| Disease-specific Antigen Abundances |
|
Click to View the Clearer Original Diagram |
| Differential expression pattern of antigen in diseases | ||
| The Studied Tissue | Hyperplastic tonsil | |
| The Specific Disease | Apnea | |
| The Expression Level of Disease Section Compare with the Healthy Individual Tissue | p-value: 0.441018466; Fold-change: -0.112314616; Z-score: -0.38980423 | |
| Disease-specific Antigen Abundances |
|
Click to View the Clearer Original Diagram |
| Differential expression pattern of antigen in diseases | ||
| The Studied Tissue | Peripheral blood | |
| The Specific Disease | Olive pollen allergy | |
| The Expression Level of Disease Section Compare with the Healthy Individual Tissue | p-value: 0.814803843; Fold-change: 0.090133053; Z-score: 0.423823117 | |
| Disease-specific Antigen Abundances |
|
Click to View the Clearer Original Diagram |
| Differential expression pattern of antigen in diseases | ||
| The Studied Tissue | Sinus mucosa | |
| The Specific Disease | Chronic rhinosinusitis | |
| The Expression Level of Disease Section Compare with the Healthy Individual Tissue | p-value: 0.207657791; Fold-change: -0.00470495; Z-score: -0.038489804 | |
| Disease-specific Antigen Abundances |
|
Click to View the Clearer Original Diagram |
| Differential expression pattern of antigen in diseases | ||
| The Studied Tissue | Lung | |
| The Specific Disease | Chronic obstructive pulmonary disease | |
| The Expression Level of Disease Section Compare with the Healthy Individual Tissue | p-value: 0.816590627; Fold-change: 0.020636423; Z-score: 0.100187358 | |
| Disease-specific Antigen Abundances |
|
Click to View the Clearer Original Diagram |
| The Studied Tissue | Small airway epithelium | |
| The Specific Disease | Chronic obstructive pulmonary disease | |
| The Expression Level of Disease Section Compare with the Healthy Individual Tissue | p-value: 0.008152737; Fold-change: 0.105109015; Z-score: 0.513137841 | |
| Disease-specific Antigen Abundances |
|
Click to View the Clearer Original Diagram |
| Differential expression pattern of antigen in diseases | ||
| The Studied Tissue | Nasal and bronchial airway | |
| The Specific Disease | Asthma | |
| The Expression Level of Disease Section Compare with the Healthy Individual Tissue | p-value: 0.095637289; Fold-change: -0.166875345; Z-score: -0.442201969 | |
| Disease-specific Antigen Abundances |
|
Click to View the Clearer Original Diagram |
| Differential expression pattern of antigen in diseases | ||
| The Studied Tissue | Nasal Epithelium | |
| The Specific Disease | Human rhinovirus infection | |
| The Expression Level of Disease Section Compare with the Healthy Individual Tissue | p-value: 0.604512785; Fold-change: 0.040083668; Z-score: 0.293513442 | |
| Disease-specific Antigen Abundances |
|
Click to View the Clearer Original Diagram |
| Differential expression pattern of antigen in diseases | ||
| The Studied Tissue | Lung | |
| The Specific Disease | Idiopathic pulmonary fibrosis | |
| The Expression Level of Disease Section Compare with the Healthy Individual Tissue | p-value: 0.103569287; Fold-change: -0.135115913; Z-score: -0.617824606 | |
| Disease-specific Antigen Abundances |
|
Click to View the Clearer Original Diagram |
ICD Disease Classification 13
| Differential expression pattern of antigen in diseases | ||
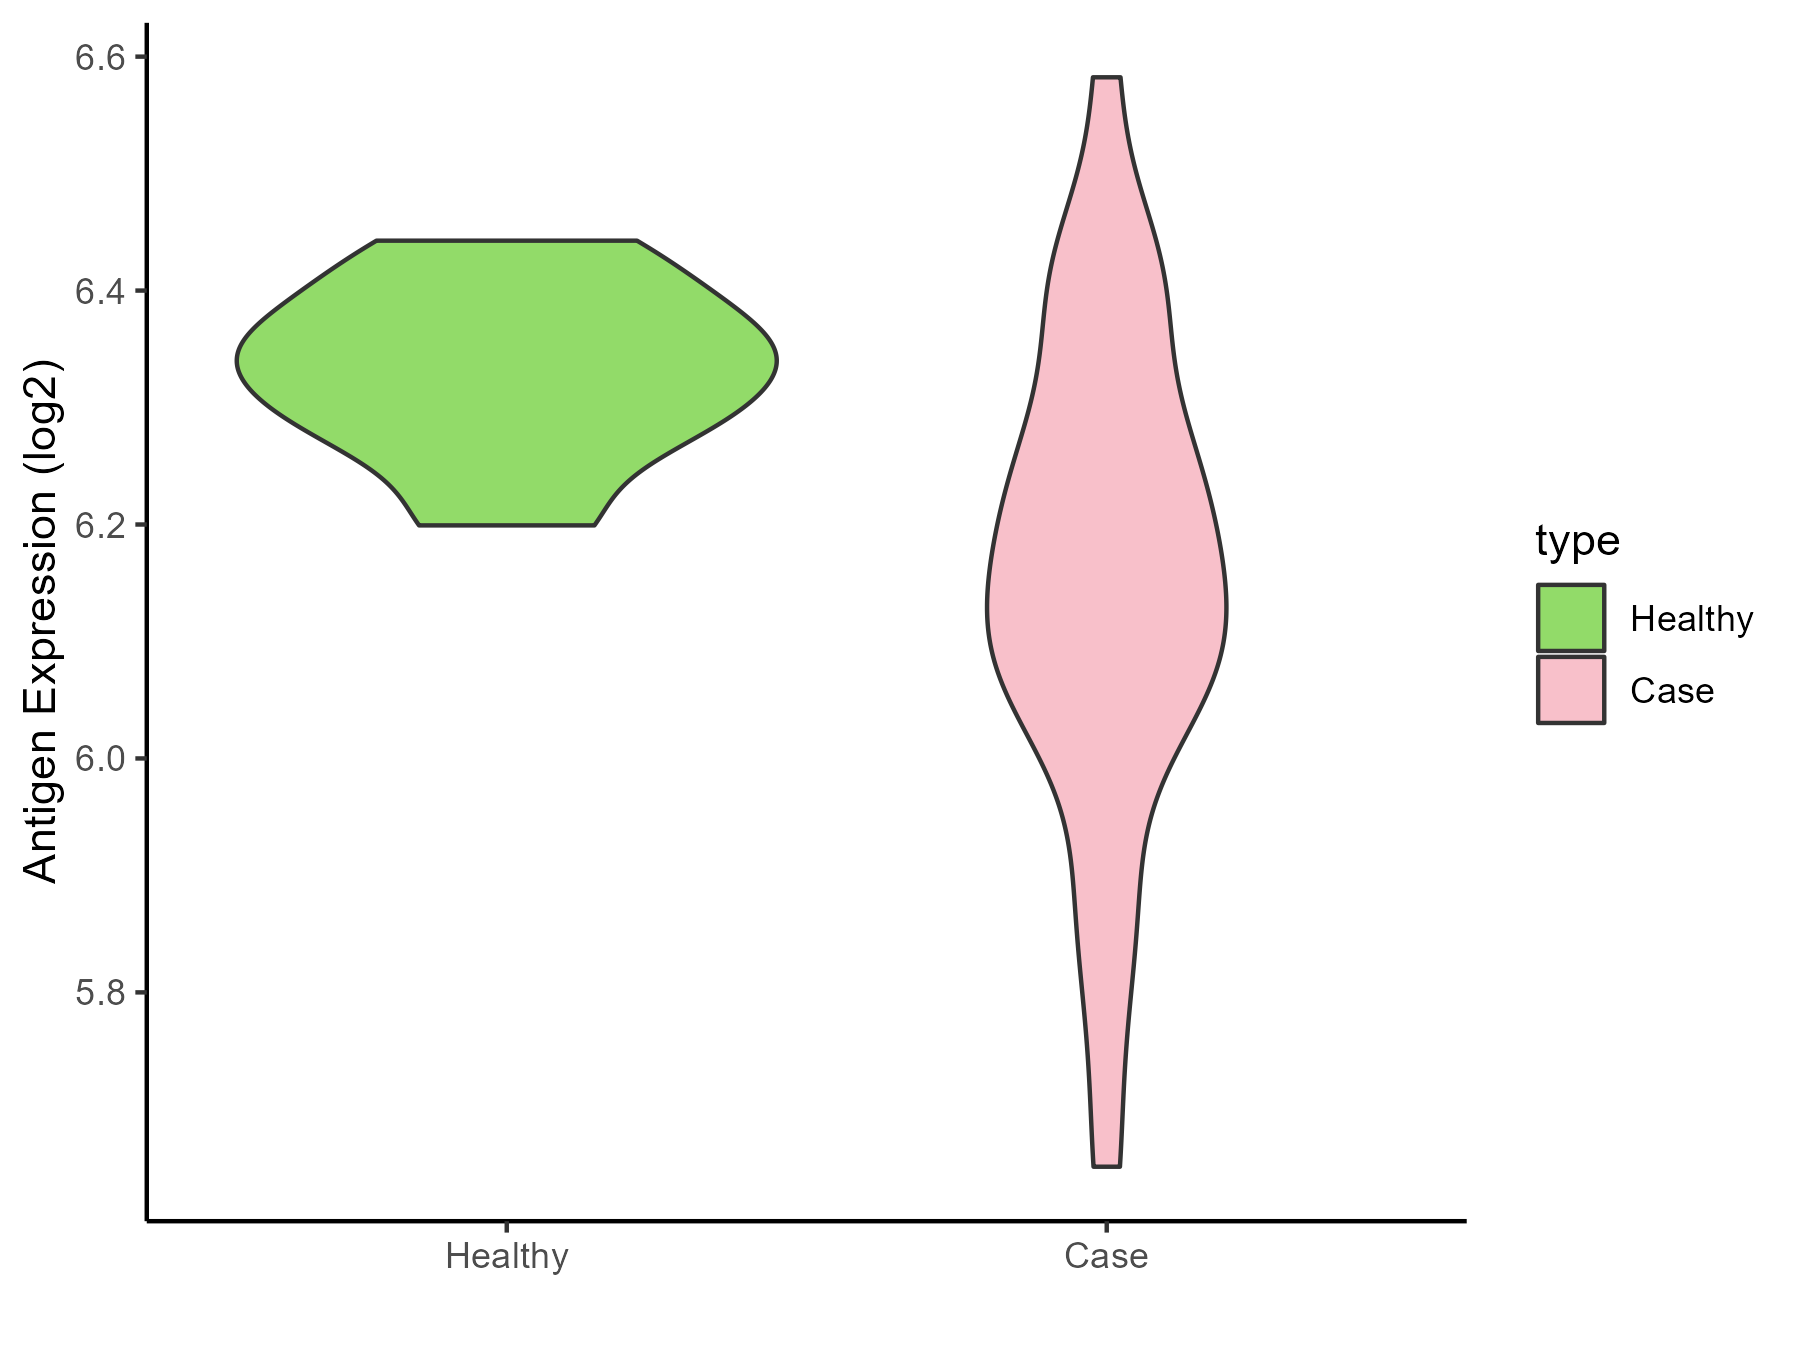
| The Studied Tissue | Gingival | |
| The Specific Disease | Periodontal disease | |
| The Expression Level of Disease Section Compare with the Adjacent Tissue | p-value: 0.002306833; Fold-change: 0.097694369; Z-score: 0.450958749 | |
| Disease-specific Antigen Abundances |
|
Click to View the Clearer Original Diagram |
| Differential expression pattern of antigen in diseases | ||
| The Studied Tissue | Gastric antrum | |
| The Specific Disease | Eosinophilic gastritis | |
| The Expression Level of Disease Section Compare with the Adjacent Tissue | p-value: 0.220099483; Fold-change: 0.069402039; Z-score: 0.878107741 | |
| Disease-specific Antigen Abundances |
|
Click to View the Clearer Original Diagram |
| Differential expression pattern of antigen in diseases | ||
| The Studied Tissue | Liver | |
| The Specific Disease | Liver failure | |
| The Expression Level of Disease Section Compare with the Healthy Individual Tissue | p-value: 0.018445564; Fold-change: -0.176464038; Z-score: -1.391756589 | |
| Disease-specific Antigen Abundances |
|
Click to View the Clearer Original Diagram |
| Differential expression pattern of antigen in diseases | ||
| The Studied Tissue | Colon mucosal | |
| The Specific Disease | Ulcerative colitis | |
| The Expression Level of Disease Section Compare with the Adjacent Tissue | p-value: 0.646223567; Fold-change: 0.079724342; Z-score: 0.306350041 | |
| Disease-specific Antigen Abundances |
|
Click to View the Clearer Original Diagram |
| Differential expression pattern of antigen in diseases | ||
| The Studied Tissue | Rectal colon | |
| The Specific Disease | Irritable bowel syndrome | |
| The Expression Level of Disease Section Compare with the Healthy Individual Tissue | p-value: 0.088168346; Fold-change: -0.045476859; Z-score: -0.27657228 | |
| Disease-specific Antigen Abundances |
|
Click to View the Clearer Original Diagram |
ICD Disease Classification 14
| Differential expression pattern of antigen in diseases | ||
| The Studied Tissue | Skin | |
| The Specific Disease | Atopic dermatitis | |
| The Expression Level of Disease Section Compare with the Healthy Individual Tissue | p-value: 0.792728511; Fold-change: -0.021853656; Z-score: -0.186760015 | |
| Disease-specific Antigen Abundances |
|
Click to View the Clearer Original Diagram |
| Differential expression pattern of antigen in diseases | ||
| The Studied Tissue | Skin | |
| The Specific Disease | Psoriasis | |
| The Expression Level of Disease Section Compare with the Healthy Individual Tissue | p-value: 1.56E-13; Fold-change: -0.201998944; Z-score: -0.526806635 | |
| The Expression Level of Disease Section Compare with the Adjacent Tissue | p-value: 3.60E-38; Fold-change: 0.973511621; Z-score: 4.71207268 | |
| Disease-specific Antigen Abundances |
|
Click to View the Clearer Original Diagram |
| Differential expression pattern of antigen in diseases | ||
| The Studied Tissue | Skin | |
| The Specific Disease | Vitiligo | |
| The Expression Level of Disease Section Compare with the Healthy Individual Tissue | p-value: 0.348749408; Fold-change: -0.033292868; Z-score: -0.368062264 | |
| Disease-specific Antigen Abundances |
|
Click to View the Clearer Original Diagram |
| Differential expression pattern of antigen in diseases | ||
| The Studied Tissue | Skin from scalp | |
| The Specific Disease | Alopecia | |
| The Expression Level of Disease Section Compare with the Healthy Individual Tissue | p-value: 0.829578408; Fold-change: 0.006270722; Z-score: 0.035208981 | |
| Disease-specific Antigen Abundances |
|
Click to View the Clearer Original Diagram |
| Differential expression pattern of antigen in diseases | ||
| The Studied Tissue | Skin | |
| The Specific Disease | Sensitive skin | |
| The Expression Level of Disease Section Compare with the Healthy Individual Tissue | p-value: 0.559658693; Fold-change: 0.061366201; Z-score: 0.678424896 | |
| Disease-specific Antigen Abundances |
|
Click to View the Clearer Original Diagram |
ICD Disease Classification 15
| Differential expression pattern of antigen in diseases | ||
| The Studied Tissue | Synovial | |
| The Specific Disease | Osteoarthritis | |
| The Expression Level of Disease Section Compare with the Healthy Individual Tissue | p-value: 0.079774216; Fold-change: -0.128765765; Z-score: -0.68077924 | |
| Disease-specific Antigen Abundances |
|
Click to View the Clearer Original Diagram |
| Differential expression pattern of antigen in diseases | ||
| The Studied Tissue | Peripheral blood | |
| The Specific Disease | Arthropathy | |
| The Expression Level of Disease Section Compare with the Healthy Individual Tissue | p-value: 0.069815733; Fold-change: -0.138719872; Z-score: -0.617186185 | |
| Disease-specific Antigen Abundances |
|
Click to View the Clearer Original Diagram |
| Differential expression pattern of antigen in diseases | ||
| The Studied Tissue | Peripheral blood | |
| The Specific Disease | Arthritis | |
| The Expression Level of Disease Section Compare with the Healthy Individual Tissue | p-value: 0.773059525; Fold-change: 0.018692337; Z-score: 0.062644129 | |
| Disease-specific Antigen Abundances |
|
Click to View the Clearer Original Diagram |
| Differential expression pattern of antigen in diseases | ||
| The Studied Tissue | Synovial | |
| The Specific Disease | Rheumatoid arthritis | |
| The Expression Level of Disease Section Compare with the Healthy Individual Tissue | p-value: 0.000932289; Fold-change: -0.46025532; Z-score: -2.821106005 | |
| Disease-specific Antigen Abundances |
|
Click to View the Clearer Original Diagram |
| Differential expression pattern of antigen in diseases | ||
| The Studied Tissue | Pheripheral blood | |
| The Specific Disease | Ankylosing spondylitis | |
| The Expression Level of Disease Section Compare with the Healthy Individual Tissue | p-value: 0.476765908; Fold-change: 0.081330651; Z-score: 0.810715982 | |
| Disease-specific Antigen Abundances |
|
Click to View the Clearer Original Diagram |
| Differential expression pattern of antigen in diseases | ||
| The Studied Tissue | Bone marrow | |
| The Specific Disease | Osteoporosis | |
| The Expression Level of Disease Section Compare with the Healthy Individual Tissue | p-value: 0.011174102; Fold-change: 0.319101286; Z-score: 3.953533997 | |
| Disease-specific Antigen Abundances |
|
Click to View the Clearer Original Diagram |
ICD Disease Classification 16
| Differential expression pattern of antigen in diseases | ||
| The Studied Tissue | Endometrium | |
| The Specific Disease | Endometriosis | |
| The Expression Level of Disease Section Compare with the Healthy Individual Tissue | p-value: 0.345027033; Fold-change: 0.023100073; Z-score: 0.087008383 | |
| Disease-specific Antigen Abundances |
|
Click to View the Clearer Original Diagram |
| Differential expression pattern of antigen in diseases | ||
| The Studied Tissue | Bladder | |
| The Specific Disease | Interstitial cystitis | |
| The Expression Level of Disease Section Compare with the Healthy Individual Tissue | p-value: 0.003486849; Fold-change: 0.381571317; Z-score: 2.600470724 | |
| Disease-specific Antigen Abundances |
|
Click to View the Clearer Original Diagram |
ICD Disease Classification 19
| Differential expression pattern of antigen in diseases | ||
| The Studied Tissue | Myometrium | |
| The Specific Disease | Preterm birth | |
| The Expression Level of Disease Section Compare with the Healthy Individual Tissue | p-value: 0.453911419; Fold-change: 0.23238461; Z-score: 0.655120063 | |
| Disease-specific Antigen Abundances |
|
Click to View the Clearer Original Diagram |
ICD Disease Classification 2
| Differential expression pattern of antigen in diseases | ||
| The Studied Tissue | Bone marrow | |
| The Specific Disease | Acute myelocytic leukemia | |
| The Expression Level of Disease Section Compare with the Healthy Individual Tissue | p-value: 0.902493816; Fold-change: 0.011006945; Z-score: 0.046641233 | |
| Disease-specific Antigen Abundances |
|
Click to View the Clearer Original Diagram |
| Differential expression pattern of antigen in diseases | ||
| The Studied Tissue | Bone marrow | |
| The Specific Disease | Myeloma | |
| The Expression Level of Disease Section Compare with the Healthy Individual Tissue | p-value: 0.000639758; Fold-change: -0.295498224; Z-score: -2.404504334 | |
| Disease-specific Antigen Abundances |
|
Click to View the Clearer Original Diagram |
| The Studied Tissue | Peripheral blood | |
| The Specific Disease | Myeloma | |
| The Expression Level of Disease Section Compare with the Healthy Individual Tissue | p-value: 0.327250658; Fold-change: -0.204533478; Z-score: -0.820410056 | |
| Disease-specific Antigen Abundances |
|
Click to View the Clearer Original Diagram |
| Differential expression pattern of antigen in diseases | ||
| The Studied Tissue | Oral | |
| The Specific Disease | Oral cancer | |
| The Expression Level of Disease Section Compare with the Healthy Individual Tissue | p-value: 7.80E-12; Fold-change: -0.356779518; Z-score: -2.118448021 | |
| The Expression Level of Disease Section Compare with the Adjacent Tissue | p-value: 0.000288694; Fold-change: -0.085798195; Z-score: -0.378111793 | |
| Disease-specific Antigen Abundances |
|
Click to View the Clearer Original Diagram |
| Differential expression pattern of antigen in diseases | ||
| The Studied Tissue | Esophagus | |
| The Specific Disease | Esophagal cancer | |
| The Expression Level of Disease Section Compare with the Adjacent Tissue | p-value: 0.366889508; Fold-change: -0.023763412; Z-score: -0.06097856 | |
| Disease-specific Antigen Abundances |
|
Click to View the Clearer Original Diagram |
| Differential expression pattern of antigen in diseases | ||
| The Studied Tissue | Rectal colon | |
| The Specific Disease | Rectal cancer | |
| The Expression Level of Disease Section Compare with the Healthy Individual Tissue | p-value: 0.101910732; Fold-change: -0.125851988; Z-score: -0.723571965 | |
| The Expression Level of Disease Section Compare with the Adjacent Tissue | p-value: 0.667702979; Fold-change: -0.038406937; Z-score: -0.175323278 | |
| Disease-specific Antigen Abundances |
|
Click to View the Clearer Original Diagram |
| Differential expression pattern of antigen in diseases | ||
| The Studied Tissue | Skin | |
| The Specific Disease | Skin cancer | |
| The Expression Level of Disease Section Compare with the Healthy Individual Tissue | p-value: 1.69E-16; Fold-change: -0.309117668; Z-score: -0.58989756 | |
| The Expression Level of Disease Section Compare with the Adjacent Tissue | p-value: 2.90E-14; Fold-change: 0.882339662; Z-score: 1.535600752 | |
| Disease-specific Antigen Abundances |
|
Click to View the Clearer Original Diagram |
| Differential expression pattern of antigen in diseases | ||
| The Studied Tissue | Kidney | |
| The Specific Disease | Renal cancer | |
| The Expression Level of Disease Section Compare with the Healthy Individual Tissue | p-value: 0.726079797; Fold-change: -0.049491537; Z-score: -0.218555735 | |
| The Expression Level of Disease Section Compare with the Adjacent Tissue | p-value: 0.587853721; Fold-change: -0.058451259; Z-score: -0.24271165 | |
| Disease-specific Antigen Abundances |
|
Click to View the Clearer Original Diagram |
| Differential expression pattern of antigen in diseases | ||
| The Studied Tissue | Urothelium | |
| The Specific Disease | Ureter cancer | |
| The Expression Level of Disease Section Compare with the Healthy Individual Tissue | p-value: 0.320676882; Fold-change: 0.058879523; Z-score: 0.353486576 | |
| Disease-specific Antigen Abundances |
|
Click to View the Clearer Original Diagram |
ICD Disease Classification 20
| Differential expression pattern of antigen in diseases | ||
| The Studied Tissue | Adipose | |
| The Specific Disease | Simpson golabi behmel syndrome | |
| The Expression Level of Disease Section Compare with the Healthy Individual Tissue | p-value: 0.274009523; Fold-change: 0.042816074; Z-score: 1.218396322 | |
| Disease-specific Antigen Abundances |
|
Click to View the Clearer Original Diagram |
| Differential expression pattern of antigen in diseases | ||
| The Studied Tissue | Perituberal | |
| The Specific Disease | Tuberous sclerosis complex | |
| The Expression Level of Disease Section Compare with the Healthy Individual Tissue | p-value: 0.038654585; Fold-change: 0.145907365; Z-score: 1.892571463 | |
| Disease-specific Antigen Abundances |
|
Click to View the Clearer Original Diagram |
ICD Disease Classification 3
| Differential expression pattern of antigen in diseases | ||
| The Studied Tissue | Bone marrow | |
| The Specific Disease | Anemia | |
| The Expression Level of Disease Section Compare with the Healthy Individual Tissue | p-value: 0.007924145; Fold-change: 0.248077119; Z-score: 1.361246453 | |
| Disease-specific Antigen Abundances |
|
Click to View the Clearer Original Diagram |
| Differential expression pattern of antigen in diseases | ||
| The Studied Tissue | Peripheral blood | |
| The Specific Disease | Sickle cell disease | |
| The Expression Level of Disease Section Compare with the Healthy Individual Tissue | p-value: 0.274942784; Fold-change: 0.028709173; Z-score: 0.110627927 | |
| Disease-specific Antigen Abundances |
|
Click to View the Clearer Original Diagram |
| Differential expression pattern of antigen in diseases | ||
| The Studied Tissue | Whole blood | |
| The Specific Disease | Thrombocythemia | |
| The Expression Level of Disease Section Compare with the Healthy Individual Tissue | p-value: 0.547503442; Fold-change: 0.037056588; Z-score: 0.232003893 | |
| Disease-specific Antigen Abundances |
|
Click to View the Clearer Original Diagram |
ICD Disease Classification 4
| Differential expression pattern of antigen in diseases | ||
| The Studied Tissue | Whole blood | |
| The Specific Disease | Scleroderma | |
| The Expression Level of Disease Section Compare with the Healthy Individual Tissue | p-value: 0.000180355; Fold-change: 0.437068382; Z-score: 2.285468841 | |
| Disease-specific Antigen Abundances |
|
Click to View the Clearer Original Diagram |
| Differential expression pattern of antigen in diseases | ||
| The Studied Tissue | Salivary gland | |
| The Specific Disease | Sjogren syndrome | |
| The Expression Level of Disease Section Compare with the Healthy Individual Tissue | p-value: 0.493496457; Fold-change: -0.185402167; Z-score: -0.585023331 | |
| The Expression Level of Disease Section Compare with the Adjacent Tissue | p-value: 0.14457079; Fold-change: -0.293306272; Z-score: -1.77128465 | |
| Disease-specific Antigen Abundances |
|
Click to View the Clearer Original Diagram |
| Differential expression pattern of antigen in diseases | ||
| The Studied Tissue | Peripheral blood | |
| The Specific Disease | Behcet disease | |
| The Expression Level of Disease Section Compare with the Healthy Individual Tissue | p-value: 0.448527439; Fold-change: 0.134598649; Z-score: 0.607118068 | |
| Disease-specific Antigen Abundances |
|
Click to View the Clearer Original Diagram |
| Differential expression pattern of antigen in diseases | ||
| The Studied Tissue | Whole blood | |
| The Specific Disease | Autosomal dominant monocytopenia | |
| The Expression Level of Disease Section Compare with the Healthy Individual Tissue | p-value: 0.143499807; Fold-change: -0.078673247; Z-score: -0.659551584 | |
| Disease-specific Antigen Abundances |
|
Click to View the Clearer Original Diagram |
ICD Disease Classification 5
| Differential expression pattern of antigen in diseases | ||
| The Studied Tissue | Liver | |
| The Specific Disease | Type 2 diabetes | |
| The Expression Level of Disease Section Compare with the Healthy Individual Tissue | p-value: 0.375331176; Fold-change: -0.117909392; Z-score: -0.718503183 | |
| Disease-specific Antigen Abundances |
|
Click to View the Clearer Original Diagram |
| Differential expression pattern of antigen in diseases | ||
| The Studied Tissue | Vastus lateralis muscle | |
| The Specific Disease | Polycystic ovary syndrome | |
| The Expression Level of Disease Section Compare with the Healthy Individual Tissue | p-value: 0.457795552; Fold-change: 0.069235482; Z-score: 0.636771325 | |
| Disease-specific Antigen Abundances |
|
Click to View the Clearer Original Diagram |
| Differential expression pattern of antigen in diseases | ||
| The Studied Tissue | Subcutaneous Adipose | |
| The Specific Disease | Obesity | |
| The Expression Level of Disease Section Compare with the Healthy Individual Tissue | p-value: 0.039898394; Fold-change: -0.038456162; Z-score: -0.245668322 | |
| Disease-specific Antigen Abundances |
|
Click to View the Clearer Original Diagram |
| Differential expression pattern of antigen in diseases | ||
| The Studied Tissue | Biceps muscle | |
| The Specific Disease | Pompe disease | |
| The Expression Level of Disease Section Compare with the Healthy Individual Tissue | p-value: 0.012364876; Fold-change: -0.121753522; Z-score: -0.917398299 | |
| Disease-specific Antigen Abundances |
|
Click to View the Clearer Original Diagram |
| Differential expression pattern of antigen in diseases | ||
| The Studied Tissue | Whole blood | |
| The Specific Disease | Batten disease | |
| The Expression Level of Disease Section Compare with the Healthy Individual Tissue | p-value: 0.924158059; Fold-change: 0.030900469; Z-score: 0.154002911 | |
| Disease-specific Antigen Abundances |
|
Click to View the Clearer Original Diagram |
ICD Disease Classification 6
| Differential expression pattern of antigen in diseases | ||
| The Studied Tissue | Whole blood | |
| The Specific Disease | Autism | |
| The Expression Level of Disease Section Compare with the Healthy Individual Tissue | p-value: 0.694282379; Fold-change: -0.005368356; Z-score: -0.022342736 | |
| Disease-specific Antigen Abundances |
|
Click to View the Clearer Original Diagram |
| Differential expression pattern of antigen in diseases | ||
| The Studied Tissue | Whole blood | |
| The Specific Disease | Anxiety disorder | |
| The Expression Level of Disease Section Compare with the Healthy Individual Tissue | p-value: 0.97336464; Fold-change: -0.048220567; Z-score: -0.23227579 | |
| Disease-specific Antigen Abundances |
|
Click to View the Clearer Original Diagram |
ICD Disease Classification 8
| Differential expression pattern of antigen in diseases | ||
| The Studied Tissue | Substantia nigra | |
| The Specific Disease | Parkinson disease | |
| The Expression Level of Disease Section Compare with the Healthy Individual Tissue | p-value: 0.816935597; Fold-change: 0.009496572; Z-score: 0.041472802 | |
| Disease-specific Antigen Abundances |
|
Click to View the Clearer Original Diagram |
| Differential expression pattern of antigen in diseases | ||
| The Studied Tissue | Whole blood | |
| The Specific Disease | Huntington disease | |
| The Expression Level of Disease Section Compare with the Healthy Individual Tissue | p-value: 0.587635266; Fold-change: -0.001953616; Z-score: -0.008529877 | |
| Disease-specific Antigen Abundances |
|
Click to View the Clearer Original Diagram |
| Differential expression pattern of antigen in diseases | ||
| The Studied Tissue | Entorhinal cortex | |
| The Specific Disease | Alzheimer disease | |
| The Expression Level of Disease Section Compare with the Healthy Individual Tissue | p-value: 0.192757028; Fold-change: -0.029836341; Z-score: -0.21969193 | |
| Disease-specific Antigen Abundances |
|
Click to View the Clearer Original Diagram |
| Differential expression pattern of antigen in diseases | ||
| The Studied Tissue | Whole blood | |
| The Specific Disease | Seizure | |
| The Expression Level of Disease Section Compare with the Healthy Individual Tissue | p-value: 0.089255288; Fold-change: -0.042803309; Z-score: -0.129169798 | |
| Disease-specific Antigen Abundances |
|
Click to View the Clearer Original Diagram |
| Differential expression pattern of antigen in diseases | ||
| The Studied Tissue | Skin | |
| The Specific Disease | Lateral sclerosis | |
| The Expression Level of Disease Section Compare with the Healthy Individual Tissue | p-value: 0.289080965; Fold-change: 0.093457811; Z-score: 0.72393853 | |
| Disease-specific Antigen Abundances |
|
Click to View the Clearer Original Diagram |
| The Studied Tissue | Cervical spinal cord | |
| The Specific Disease | Lateral sclerosis | |
| The Expression Level of Disease Section Compare with the Healthy Individual Tissue | p-value: 0.243805356; Fold-change: 0.198534466; Z-score: 0.890068671 | |
| Disease-specific Antigen Abundances |
|
Click to View the Clearer Original Diagram |
| Differential expression pattern of antigen in diseases | ||
| The Studied Tissue | Muscle | |
| The Specific Disease | Muscular atrophy | |
| The Expression Level of Disease Section Compare with the Healthy Individual Tissue | p-value: 0.001609961; Fold-change: -0.317971776; Z-score: -1.349709442 | |
| Disease-specific Antigen Abundances |
|
Click to View the Clearer Original Diagram |
| Differential expression pattern of antigen in diseases | ||
| The Studied Tissue | Muscle | |
| The Specific Disease | Myopathy | |
| The Expression Level of Disease Section Compare with the Healthy Individual Tissue | p-value: 0.000580723; Fold-change: -0.182696577; Z-score: -2.377957374 | |
| Disease-specific Antigen Abundances |
|
Click to View the Clearer Original Diagram |
References