Antigen Information
General Information of This Antigen
| Antigen ID | TAR0DEDPZ |
|||||
|---|---|---|---|---|---|---|
| Antigen Name | Tumor necrosis factor receptor superfamily member 1A (TNFRSF1A) |
|||||
| Gene Name | TNFRSF1A |
|||||
| Gene ID | ||||||
| Synonym | TNFAR; TNFR1; Tumor necrosis factor receptor 1;Tumor necrosis factor receptor type I;p55;p60;CD_antigen=CD120a |
|||||
| Sequence |
MGLSTVPDLLLPLVLLELLVGIYPSGVIGLVPHLGDREKRDSVCPQGKYIHPQNNSICCT
KCHKGTYLYNDCPGPGQDTDCRECESGSFTASENHLRHCLSCSKCRKEMGQVEISSCTVD RDTVCGCRKNQYRHYWSENLFQCFNCSLCLNGTVHLSCQEKQNTVCTCHAGFFLRENECV SCSNCKKSLECTKLCLPQIENVKGTEDSGTTVLLPLVIFFGLCLLSLLFIGLMYRYQRWK SKLYSIVCGKSTPEKEGELEGTTTKPLAPNPSFSPTPGFTPTLGFSPVPSSTFTSSSTYT PGDCPNFAAPRREVAPPYQGADPILATALASDPIPNPLQKWEDSAHKPQSLDTDDPATLY AVVENVPPLRWKEFVRRLGLSDHEIDRLELQNGRCLREAQYSMLATWRRRTPRREATLEL LGRVLRDMDLLGCLEDIEEALCGPAALPPAPSLLR Click to Show/Hide
|
|||||
| Function |
Receptor for TNFSF2/TNF-alpha and homotrimeric TNFSF1/lymphotoxin-alpha. The adapter molecule FADD recruits caspase-8 to the activated receptor. The resulting death-inducing signaling complex (DISC) performs caspase-8 proteolytic activation which initiates the subsequent cascade of caspases (aspartate-specific cysteine proteases) mediating apoptosis. Contributes to the induction of non-cytocidal TNF effects including anti-viral state and activation of the acid sphingomyelinase.
Click to Show/Hide
|
|||||
| Uniprot Entry | ||||||
| HGNC ID | ||||||
| KEGG ID | ||||||
Each Antibody-drug Conjuate AND It's Component Related to This Antigen
Full List of The ADC Related to This Antigen
Anti-TNF mAb 8c11
| ADC Info | ADC Name | Payload | Target | Linker | Ref |
|---|---|---|---|---|---|
WO2022171101A1 ADC-47 |
WO2022171101A1 ADC-47 payload |
Undisclosed |
WO2022171101A1 ADC-47 linker |
[1] | |
WO2022171101A1 ADC-49 |
WO2022171101A1 ADC-49 payload |
Undisclosed |
WO2022171101A1 ADC-49 linker |
[1] | |
WO2023025248A1 ADC-50 |
WO2023025248A1 ADC-50 payload |
Undisclosed |
WO2023025248A1 ADC-50 linker |
[2] | |
WO2023025248A1 ADC-51 |
WO2023025248A1 ADC-51 payload |
Undisclosed |
WO2023025248A1 ADC-51 linker |
[2] | |
WO2023025248A1 ADC-52 |
WO2023025248A1 ADC-52 payload |
Undisclosed |
WO2023025248A1 ADC-52 linker |
[2] | |
WO2023025248A1 ADC-53 |
WO2023025248A1 ADC-53 payload |
Undisclosed |
WO2023025248A1 ADC-53 linker |
[2] | |
WO2023025248A1 ADC-54 |
WO2023025248A1 ADC-54 payload |
Undisclosed |
WO2023025248A1 ADC-54 linker |
[2] | |
WO2023025248A1 ADC-55 |
WO2023025248A1 ADC-55 payload |
Undisclosed |
WO2023025248A1 ADC-55 linker |
[2] |
Anti-TNF mAb alpha-TNF
| ADC Info | ADC Name | Payload | Target | Linker | Ref |
|---|---|---|---|---|---|
ABBV-3373 |
GRM cpd 17 |
Glucocorticoid receptor (NR3C1) |
MP-Ala-Ala |
[3] | |
Anti-TNF ADC 104 |
GRM cpd 5 |
Glucocorticoid receptor (NR3C1) |
MP-Ala-Ala |
[4] | |
Anti-TNF ADC 105 |
GRM cpd 16 |
Glucocorticoid receptor (NR3C1) |
MP-Ala-Ala |
[4] | |
Anti-TNF ADC 106 |
GRM cpd 17 |
Glucocorticoid receptor (NR3C1) |
MP-Ala-Ala |
[4] | |
Anti-TNF ADC 107 |
GRM cpd 18 |
Glucocorticoid receptor (NR3C1) |
MP-Ala-Ala |
[4] | |
Anti-TNF ADC 108 |
GRM cpd 19 |
Glucocorticoid receptor (NR3C1) |
MP-Ala-Ala |
[4] | |
Anti-TNF ADC 109 |
GRM cpd 20 |
Glucocorticoid receptor (NR3C1) |
MP-Ala-Ala |
[4] | |
Anti-TNF ADC 110 |
GRM cpd 22 |
Glucocorticoid receptor (NR3C1) |
MP-Ala-Ala |
[4] | |
Anti-TNF ADC 111 |
GRM cpd 23 |
Glucocorticoid receptor (NR3C1) |
MP-Ala-Ala |
[4] | |
Anti-TNF ADC 112 |
GRM cpd 24 |
Glucocorticoid receptor (NR3C1) |
MP-Ala-Ala |
[4] | |
Anti-TNF ADC 113 |
GRM cpd 25 |
Glucocorticoid receptor (NR3C1) |
MP-Ala-Ala |
[4] | |
Anti-TNF ADC 114 |
GRM cpd 26 |
Glucocorticoid receptor (NR3C1) |
MP-Ala-Ala |
[4] | |
Anti-TNF ADC 115 |
GRM cpd 30 |
Glucocorticoid receptor (NR3C1) |
MP-Ala-Ala |
[4] | |
Anti-TNF ADC 116 |
GRM cpd 31 |
Glucocorticoid receptor (NR3C1) |
MP-Ala-Ala |
[4] | |
Anti-TNF ADC 117 |
GRM cpd 33 |
Glucocorticoid receptor (NR3C1) |
MP-Ala-Ala |
[4] | |
Anti-TNF ADC 118 |
GRM cpd 61 |
Glucocorticoid receptor (NR3C1) |
MP-Ala-Ala |
[4] | |
Anti-TNF ADC 119 |
GRM cpd 5 |
Glucocorticoid receptor (NR3C1) |
MP-Ala-Ala |
[4] | |
Anti-TNF ADC 120 |
GRM cpd 5 |
Glucocorticoid receptor (NR3C1) |
MP-Ala-Ala |
[4] | |
Anti-TNF ADC 121 |
GRM cpd 17 |
Glucocorticoid receptor (NR3C1) |
MP-Ala-Ala |
[4] | |
Anti-TNF ADC 123 |
GRM cpd 19 |
Glucocorticoid receptor (NR3C1) |
MP-Ala-Ala |
[4] | |
Anti-TNF ADC 124 |
GRM cpd 19 |
Glucocorticoid receptor (NR3C1) |
MP-Ala-Ala |
[4] | |
Anti-TNF ADC 125 |
GRM cpd 20 |
Glucocorticoid receptor (NR3C1) |
MP-Ala-Ala |
[4] | |
Anti-TNF ADC 126 |
GRM cpd 20 |
Glucocorticoid receptor (NR3C1) |
MP-Ala-Ala |
[4] | |
Anti-TNF ADC 127 |
GRM cpd 25 |
Glucocorticoid receptor (NR3C1) |
MP-Ala-Ala |
[4] | |
Anti-TNF ADC 128 |
GRM cpd 26 |
Glucocorticoid receptor (NR3C1) |
MP-Ala-Ala |
[4] | |
Anti-TNF ADC 129 |
GRM cpd 30 |
Glucocorticoid receptor (NR3C1) |
MP-Ala-Ala |
[4] | |
Anti-TNF ADC 130 |
GRM cpd 31 |
Glucocorticoid receptor (NR3C1) |
MP-Ala-Ala |
[4] | |
Anti-TNF ADC 131 |
GRM cpd 31 |
Glucocorticoid receptor (NR3C1) |
MP-Ala-Ala |
[4] | |
Anti-TNF ADC 132 |
GRM cpd 32 |
Glucocorticoid receptor (NR3C1) |
MP-Ala-Ala |
[4] | |
Anti-TNF ADC 133 |
GRM cpd 32 |
Glucocorticoid receptor (NR3C1) |
MP-Ala-Ala |
[4] | |
Anti-TNF ADC 134 |
GRM cpd 64 |
Glucocorticoid receptor (NR3C1) |
MP-Ala-Ala |
[4] | |
Anti-TNF ADC 135 |
GRM cpd 63 |
Glucocorticoid receptor (NR3C1) |
MP-Ala-Ala |
[4] |
Anti-TNF mAb B-II-B059
| ADC Info | ADC Name | Payload | Target | Linker | Ref |
|---|---|---|---|---|---|
WO2022171101A1 ADC-46 |
WO2022171101A1 ADC-46 payload |
Undisclosed |
WO2022171101A1 ADC-46 linker |
[1] |
BIIB059
| ADC Info | ADC Name | Payload | Target | Linker | Ref |
|---|---|---|---|---|---|
WO2022135332A1 1-12 |
WO2022135332A1_1-12 payload |
Undisclosed |
WO2022135332A1_1-12 linker |
[5] | |
WO2023025248A1 ADC-58 |
WO2023025248A1 ADC-58 payload |
Undisclosed |
WO2023025248A1 ADC-58 linker |
[2] | |
WO2023025248A1 ADC-59 |
WO2023025248A1 ADC-59 payload |
Undisclosed |
WO2023025248A1 ADC-59 linker |
[2] | |
WO2023025248A1 ADC-60 |
WO2023025248A1 ADC-60 payload |
Undisclosed |
WO2023025248A1 ADC-60 linker |
[2] |
Iscalimab
| ADC Info | ADC Name | Payload | Target | Linker | Ref |
|---|---|---|---|---|---|
WO2023025248A1 ADC-57 |
WO2023025248A1 ADC-57 payload |
Undisclosed |
WO2023025248A1 ADC-57 linker |
[2] |
Undisclosed
| ADC Info | ADC Name | Payload | Target | Linker | Ref |
|---|---|---|---|---|---|
DB-2306 |
Undisclosed |
Undisclosed |
Undisclosed |
[6] |
Tissue/Disease specific Abundances of This Antigen
Tissue specific Abundances of This Antigen
ICD Disease Classification 01
| Differential expression pattern of antigen in diseases | ||
| The Studied Tissue | Gingival | |
| The Specific Disease | Bacterial infection of gingival | |
| The Expression Level of Disease Section Compare with the Healthy Individual Tissue | p-value: 0.14811611; Fold-change: 0.047880615; Z-score: 0.151664329 | |
| Disease-specific Antigen Abundances |
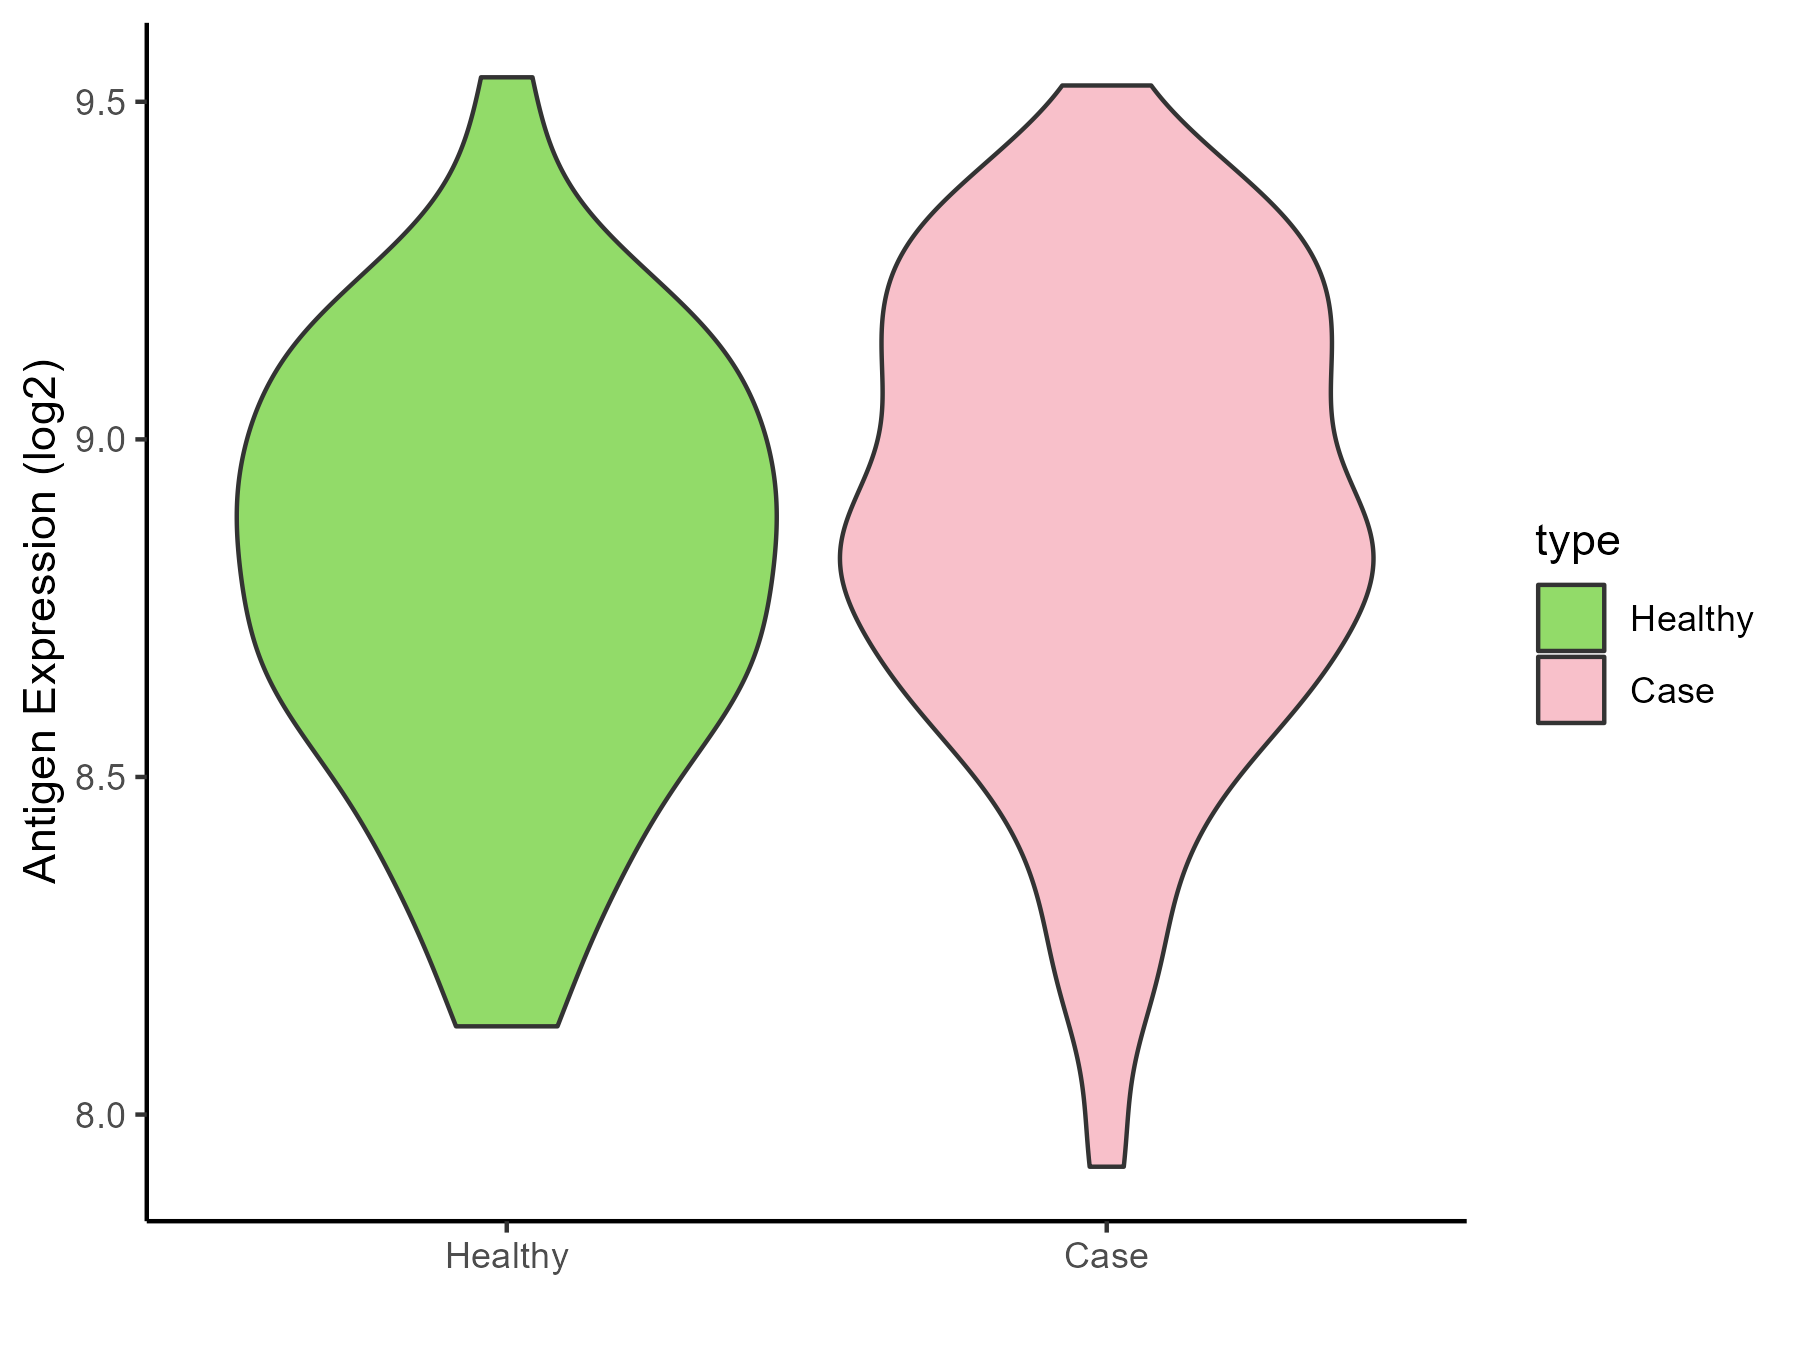
|
Click to View the Clearer Original Diagram |
ICD Disease Classification 02
| Differential expression pattern of antigen in diseases | ||
| The Studied Tissue | Brainstem | |
| The Specific Disease | Glioma | |
| The Expression Level of Disease Section Compare with the Healthy Individual Tissue | p-value: 0.042630745; Fold-change: -0.484597105; Z-score: -3.050688081 | |
| Disease-specific Antigen Abundances |
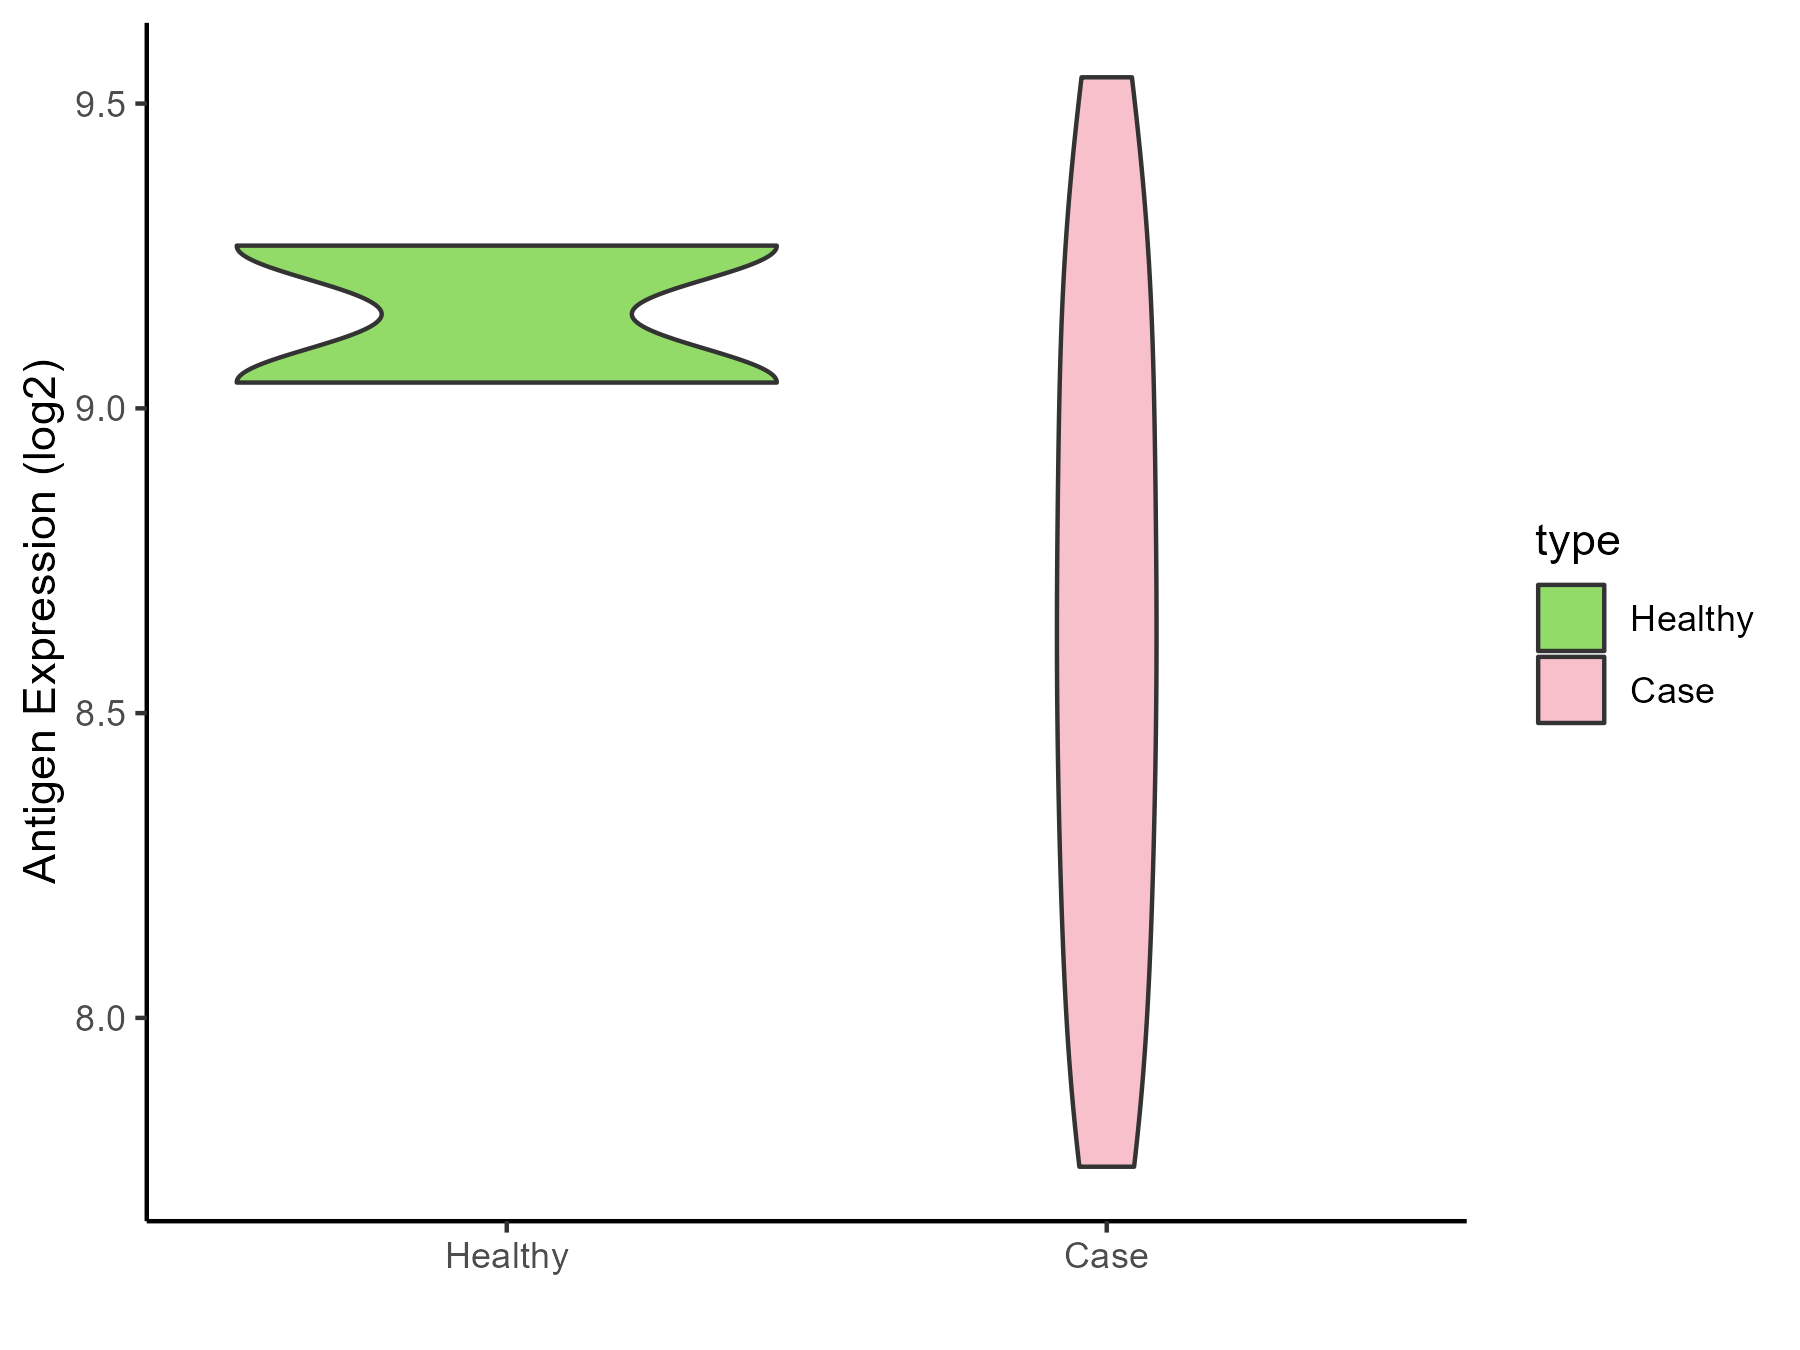
|
Click to View the Clearer Original Diagram |
| The Studied Tissue | White matter | |
| The Specific Disease | Glioma | |
| The Expression Level of Disease Section Compare with the Healthy Individual Tissue | p-value: 0.01048246; Fold-change: -0.112645548; Z-score: -0.333369085 | |
| Disease-specific Antigen Abundances |
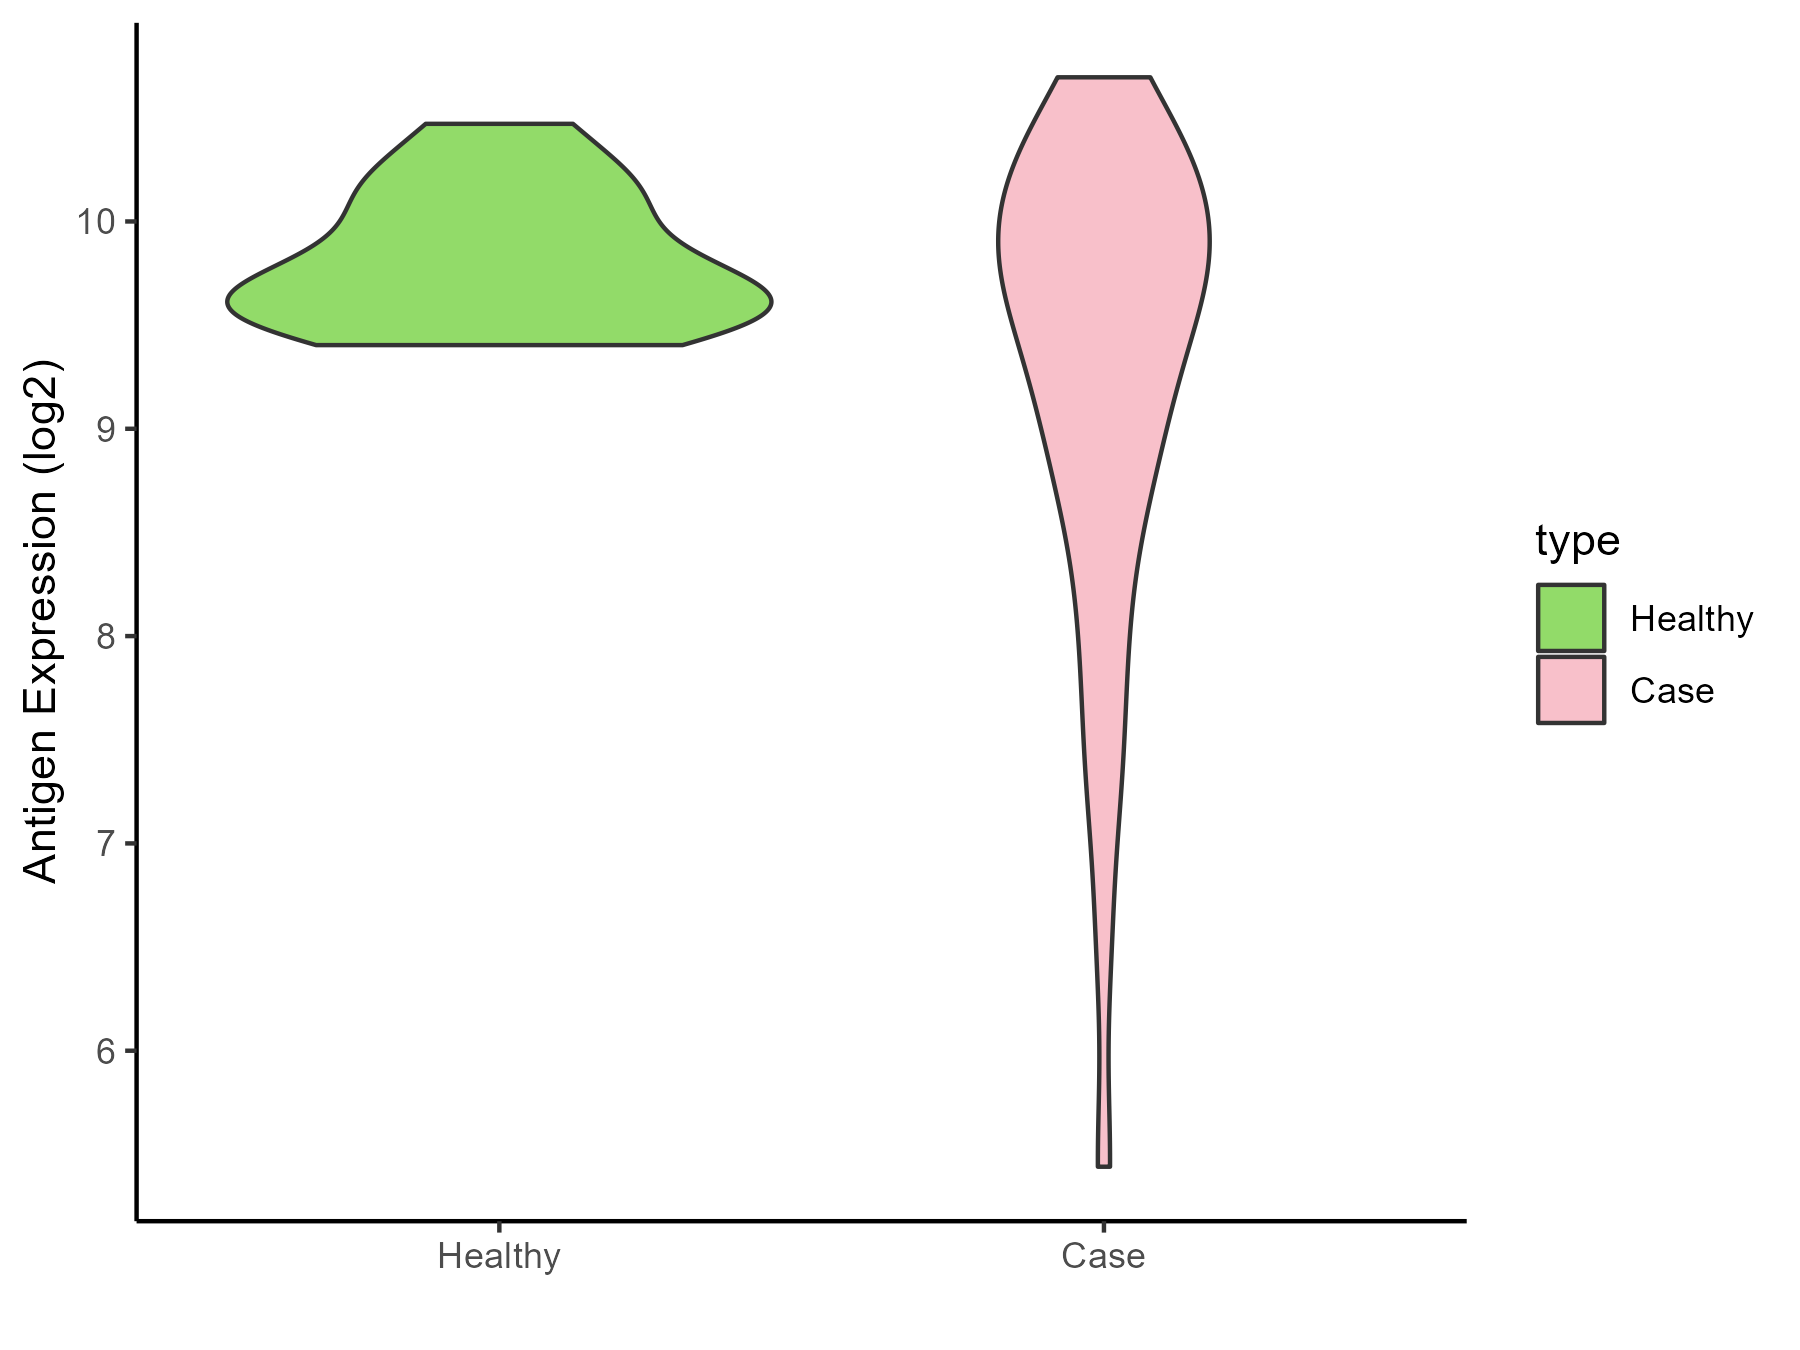
|
Click to View the Clearer Original Diagram |
| The Studied Tissue | Brainstem | |
| The Specific Disease | Neuroectodermal tumor | |
| The Expression Level of Disease Section Compare with the Healthy Individual Tissue | p-value: 0.00362344; Fold-change: -0.733975531; Z-score: -1.443145012 | |
| Disease-specific Antigen Abundances |
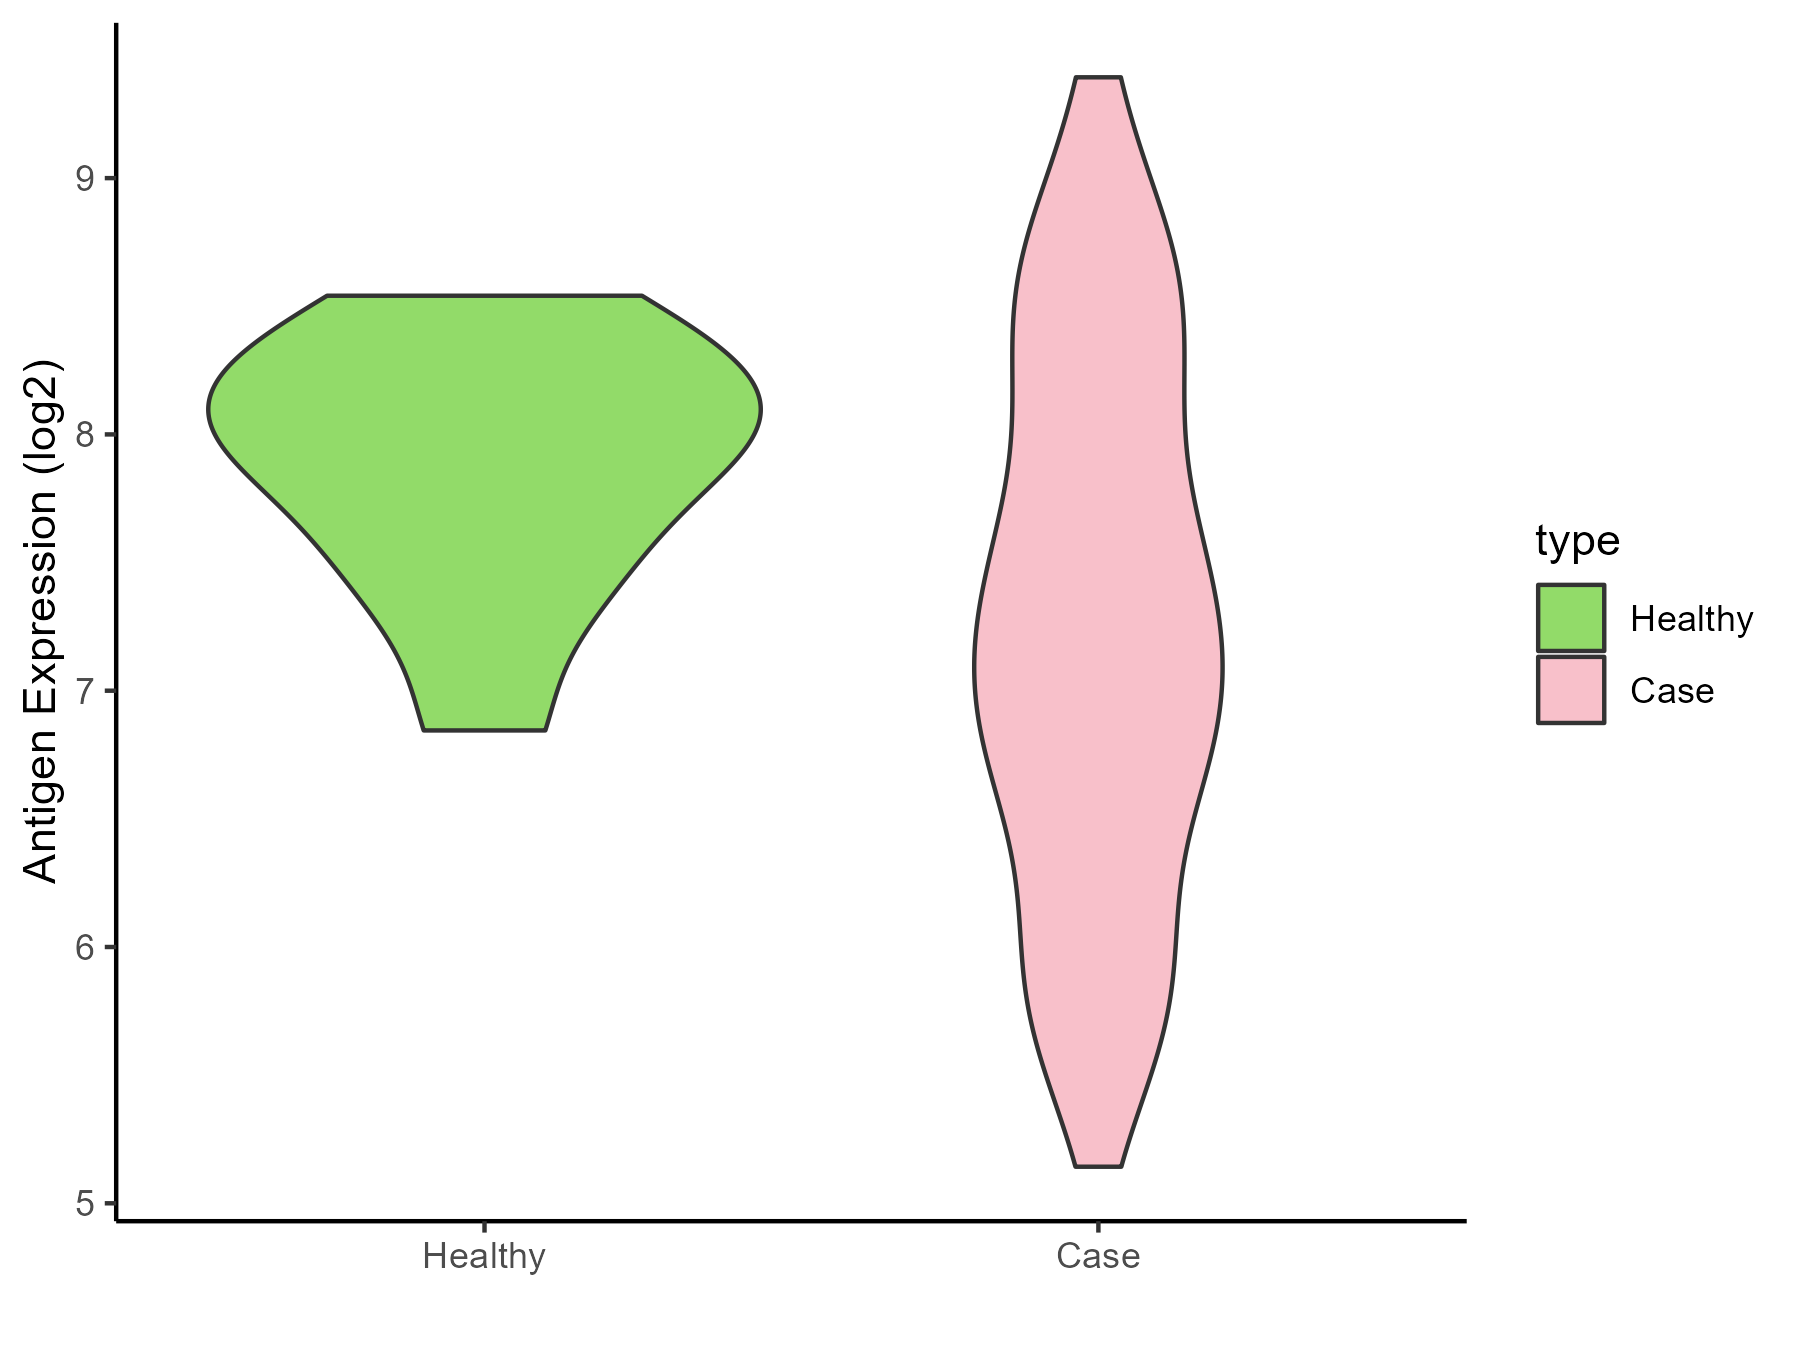
|
Click to View the Clearer Original Diagram |
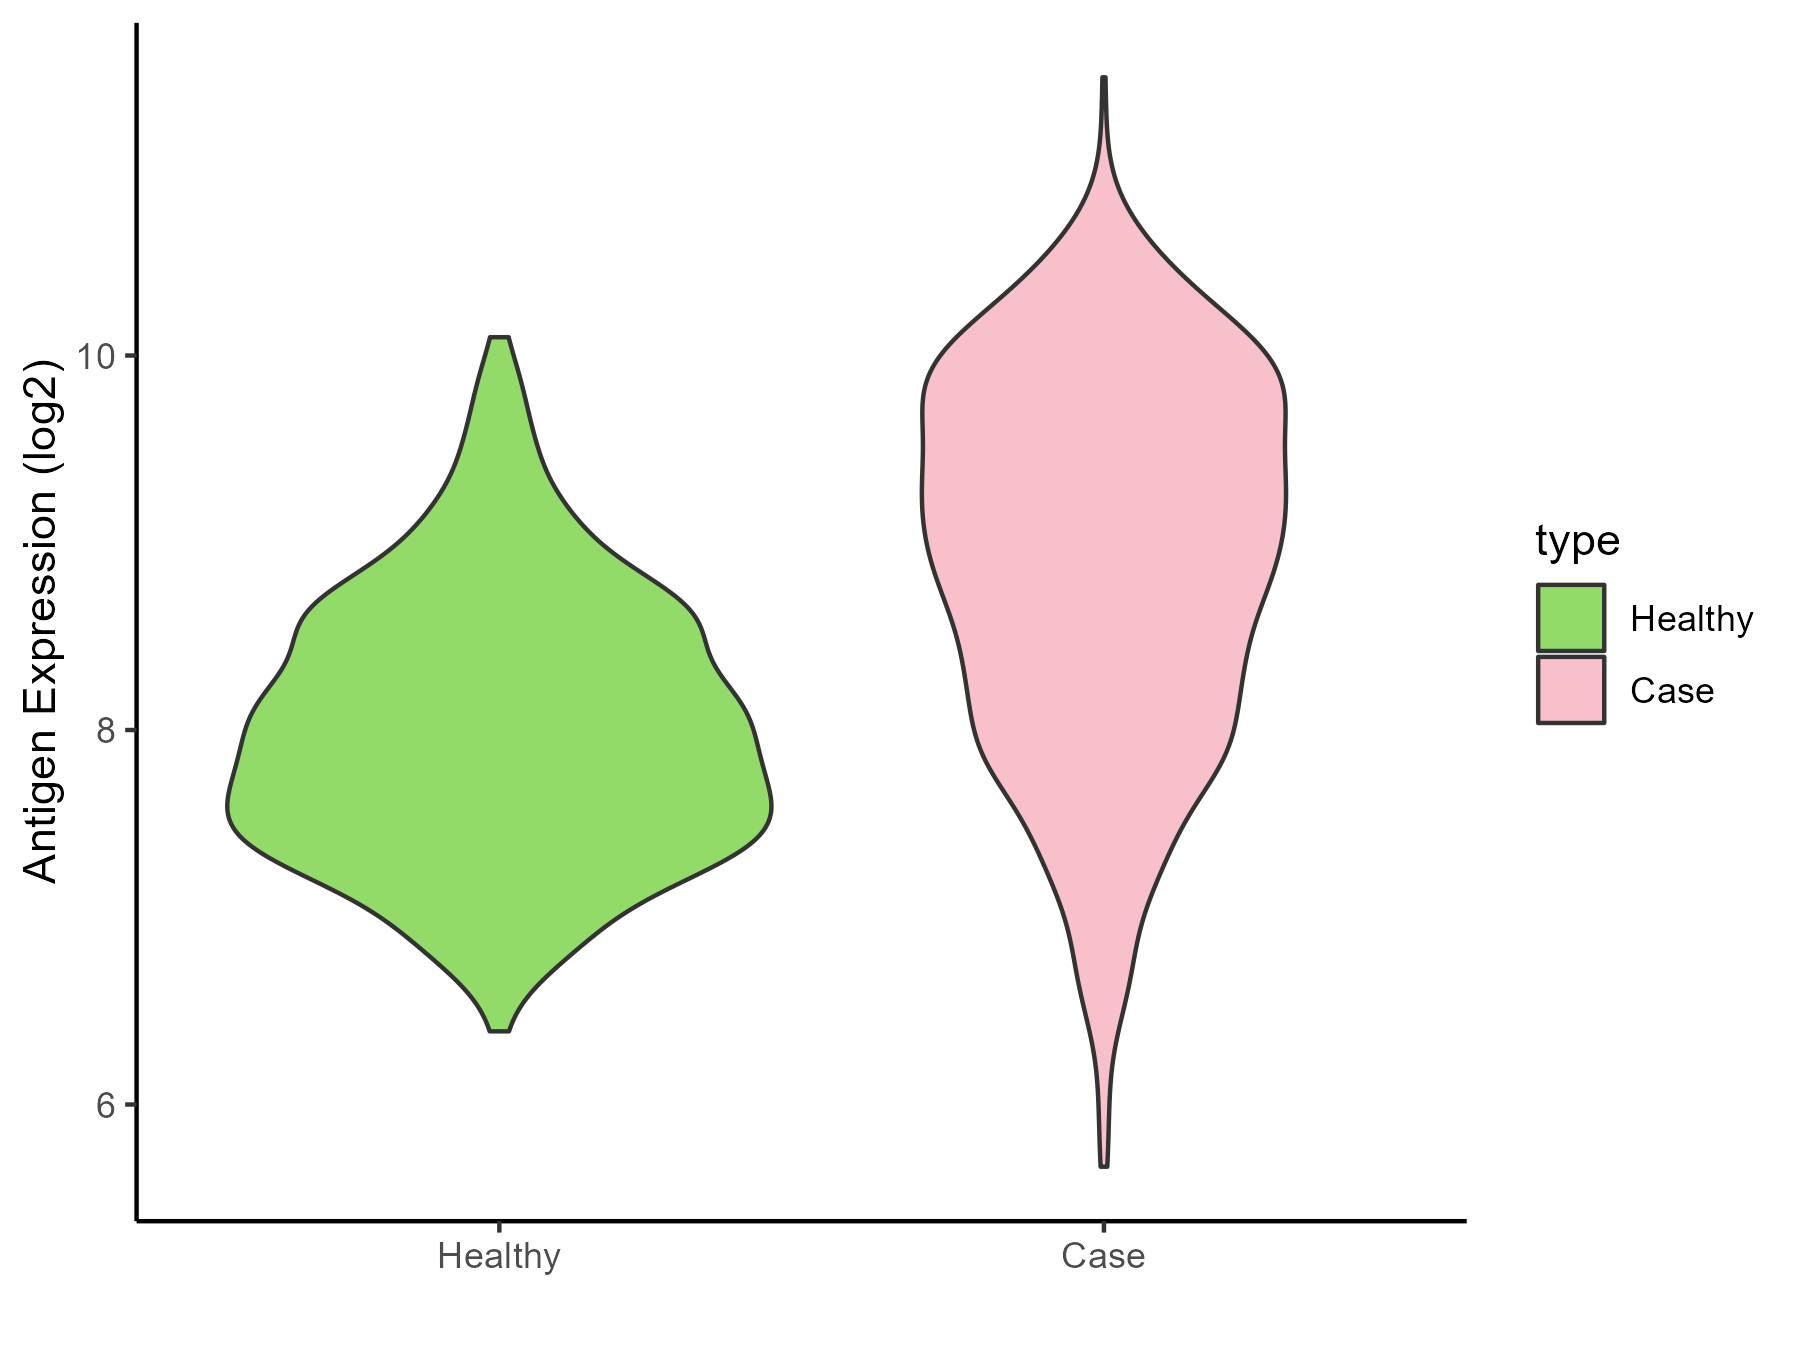
| The Studied Tissue | Nervous | |
| The Specific Disease | Brain cancer | |
| The Expression Level of Disease Section Compare with the Healthy Individual Tissue | p-value: 1.20E-67; Fold-change: 1.066715197; Z-score: 1.524245772 | |
| Disease-specific Antigen Abundances |
|
Click to View the Clearer Original Diagram |
| Differential expression pattern of antigen in diseases | ||
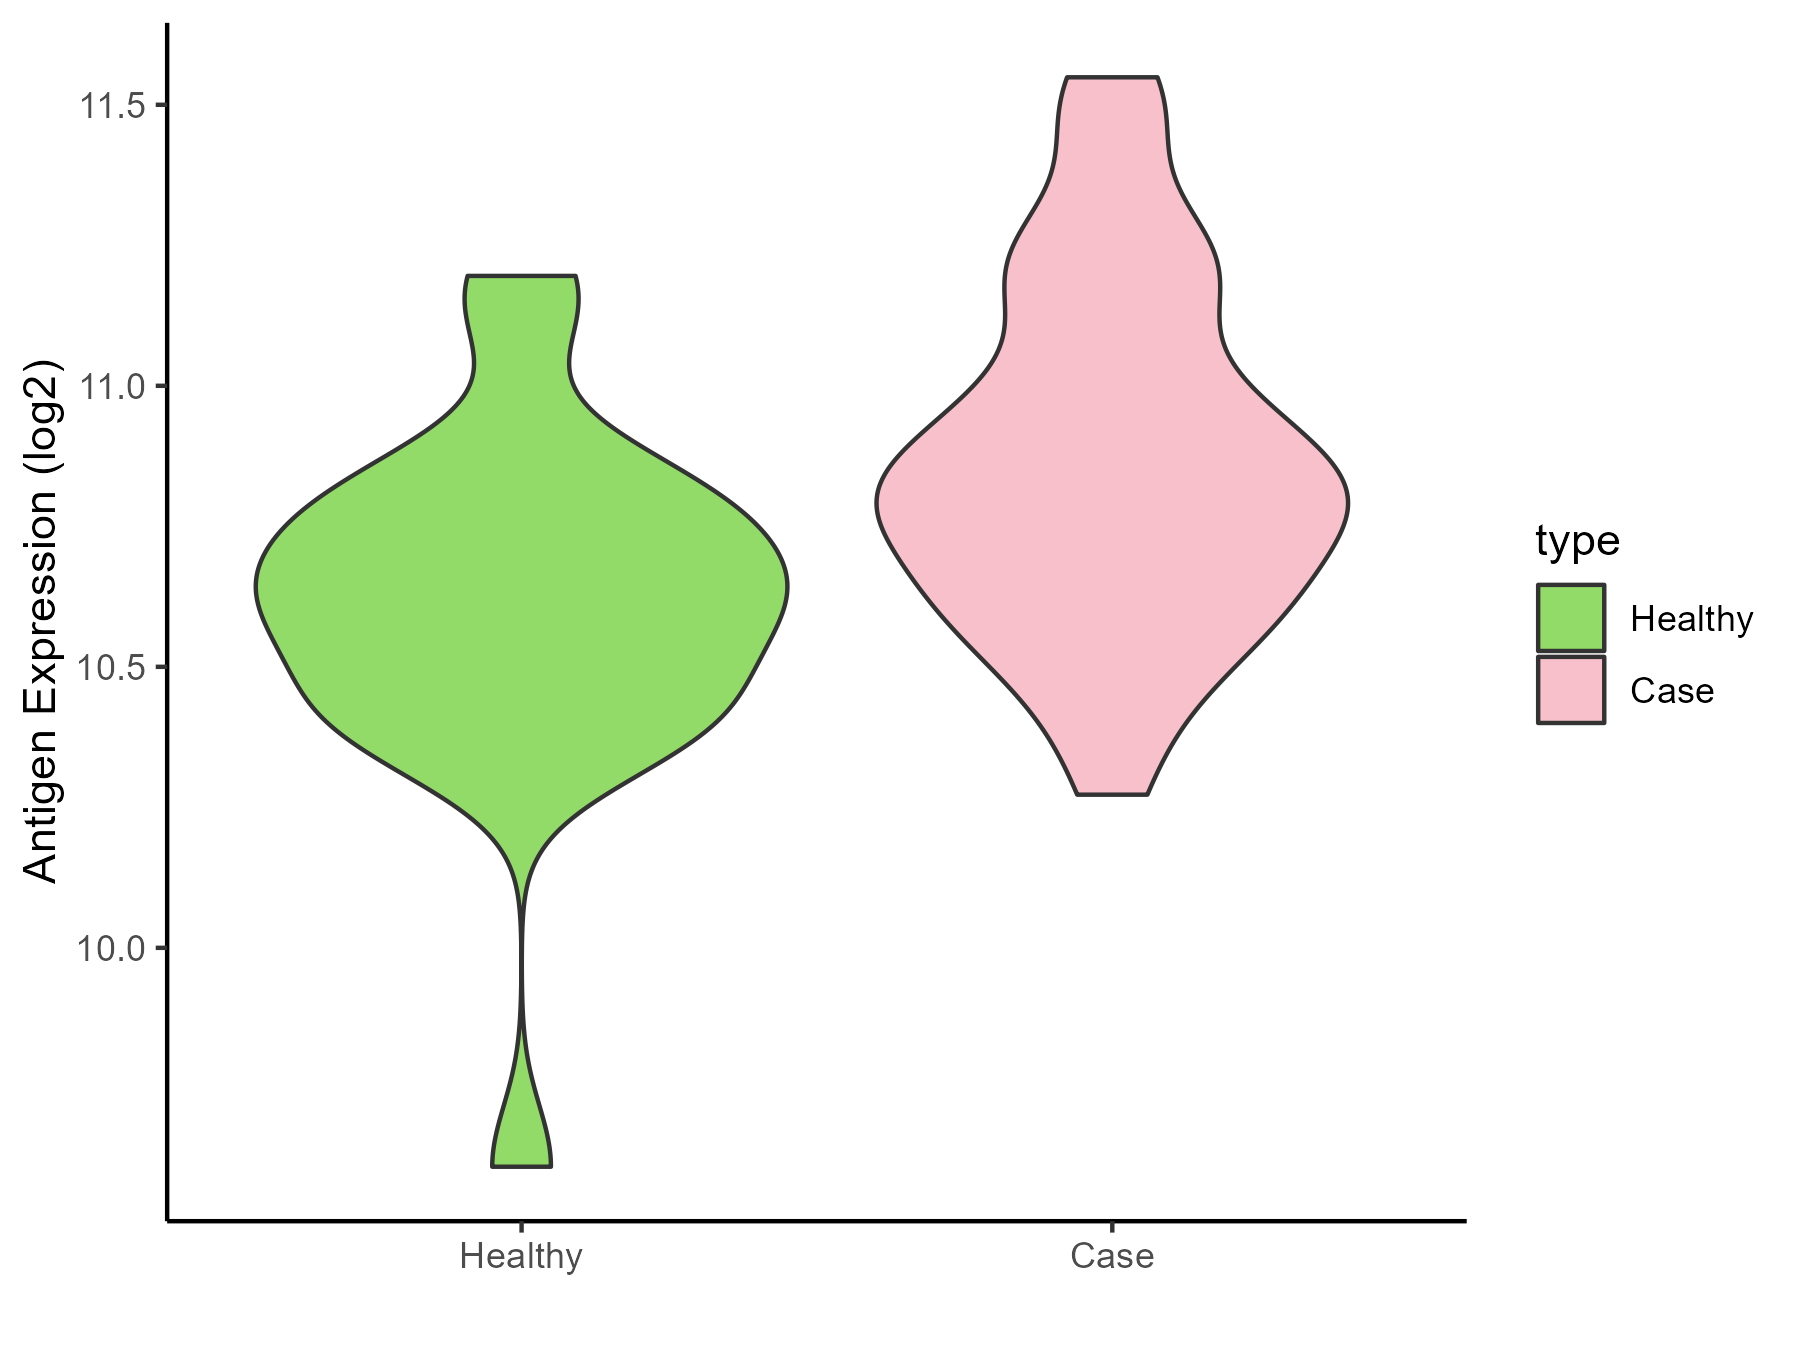
| The Studied Tissue | Whole blood | |
| The Specific Disease | Polycythemia vera | |
| The Expression Level of Disease Section Compare with the Healthy Individual Tissue | p-value: 5.32E-05; Fold-change: 0.177496209; Z-score: 0.559841743 | |
| Disease-specific Antigen Abundances |
|
Click to View the Clearer Original Diagram |
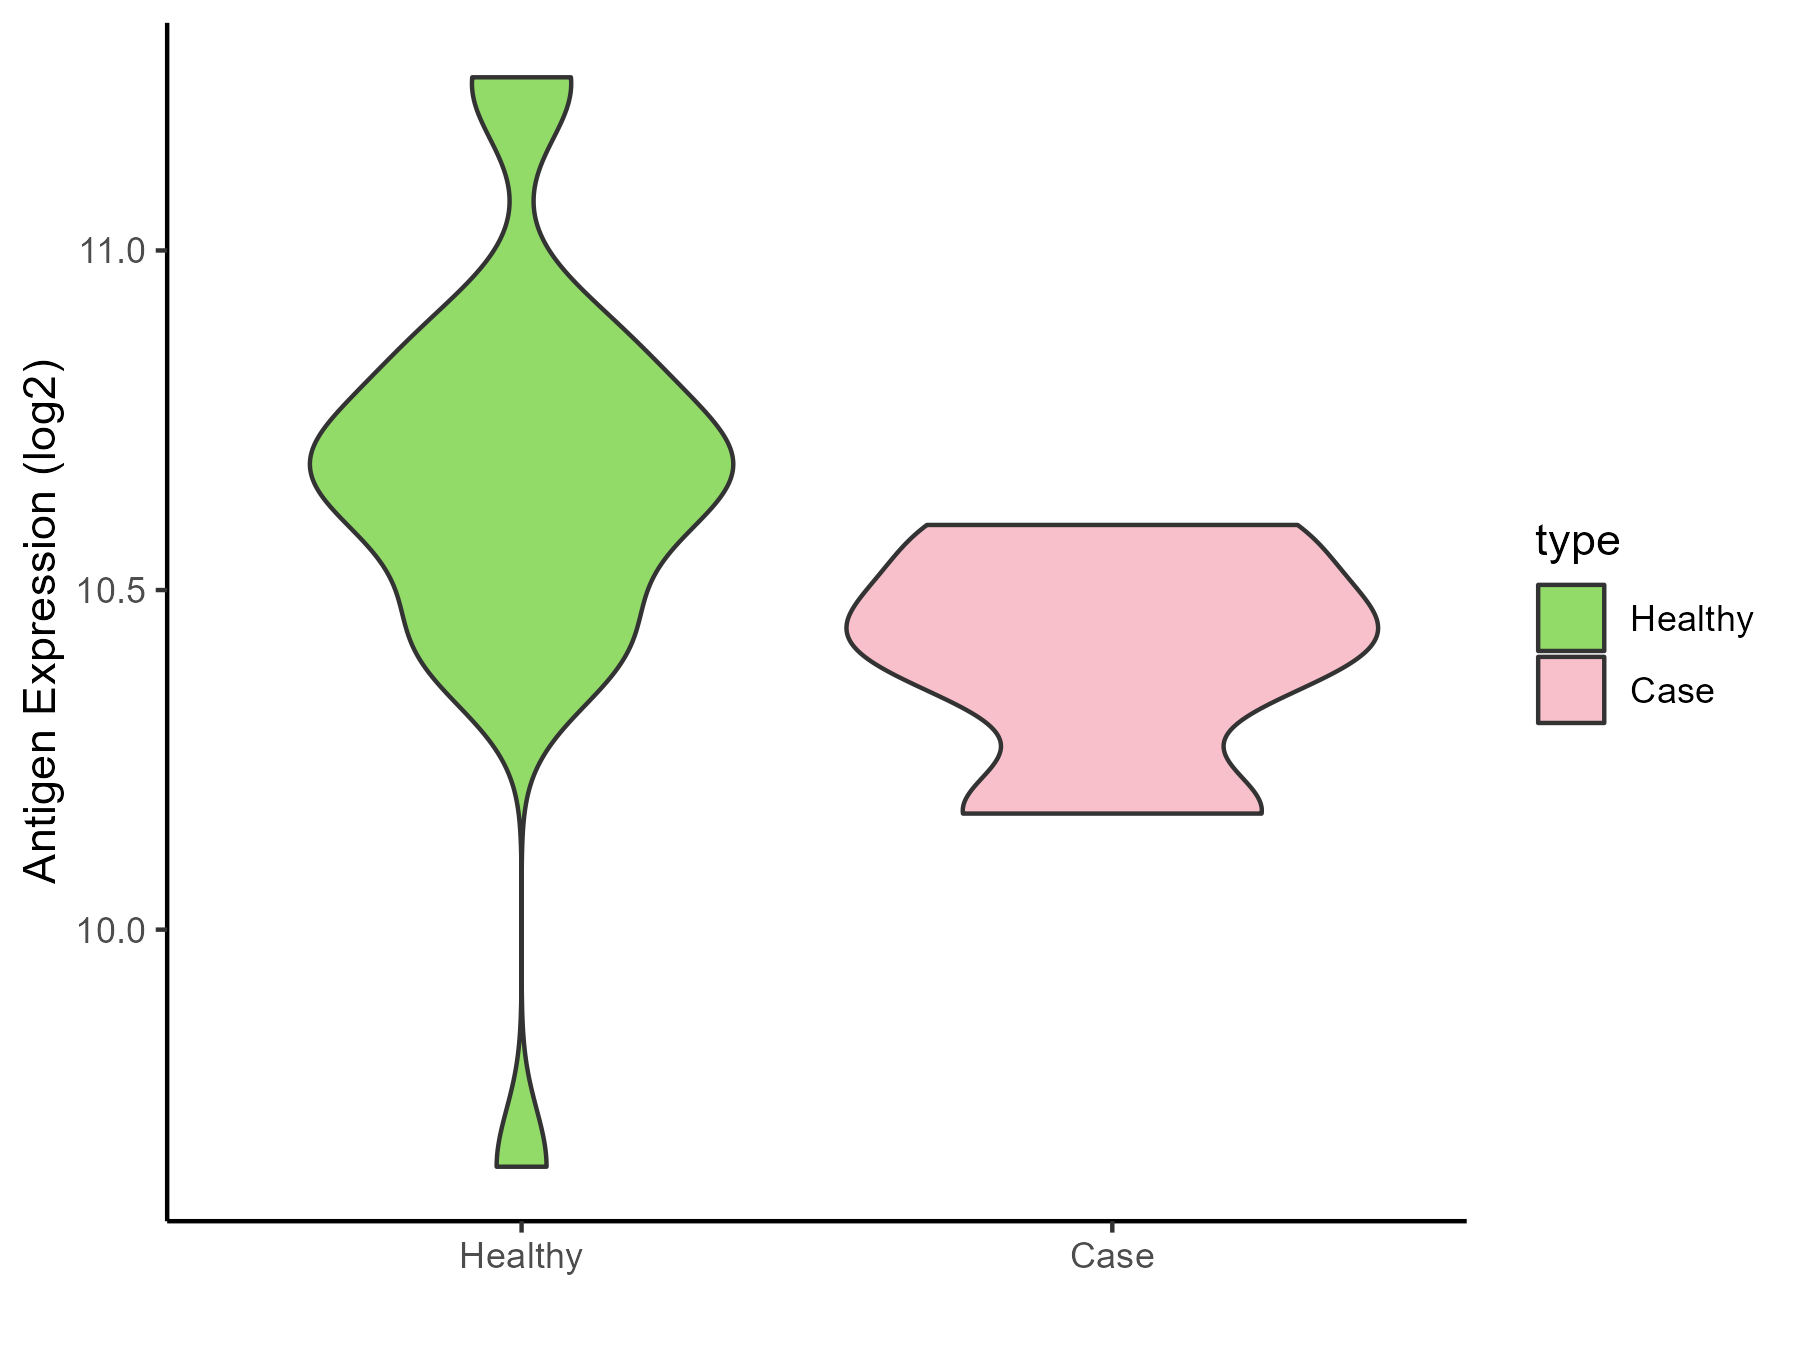
| The Studied Tissue | Whole blood | |
| The Specific Disease | Myelofibrosis | |
| The Expression Level of Disease Section Compare with the Healthy Individual Tissue | p-value: 0.00416731; Fold-change: -0.24405421; Z-score: -0.75279697 | |
| Disease-specific Antigen Abundances |
|
Click to View the Clearer Original Diagram |
| Differential expression pattern of antigen in diseases | ||
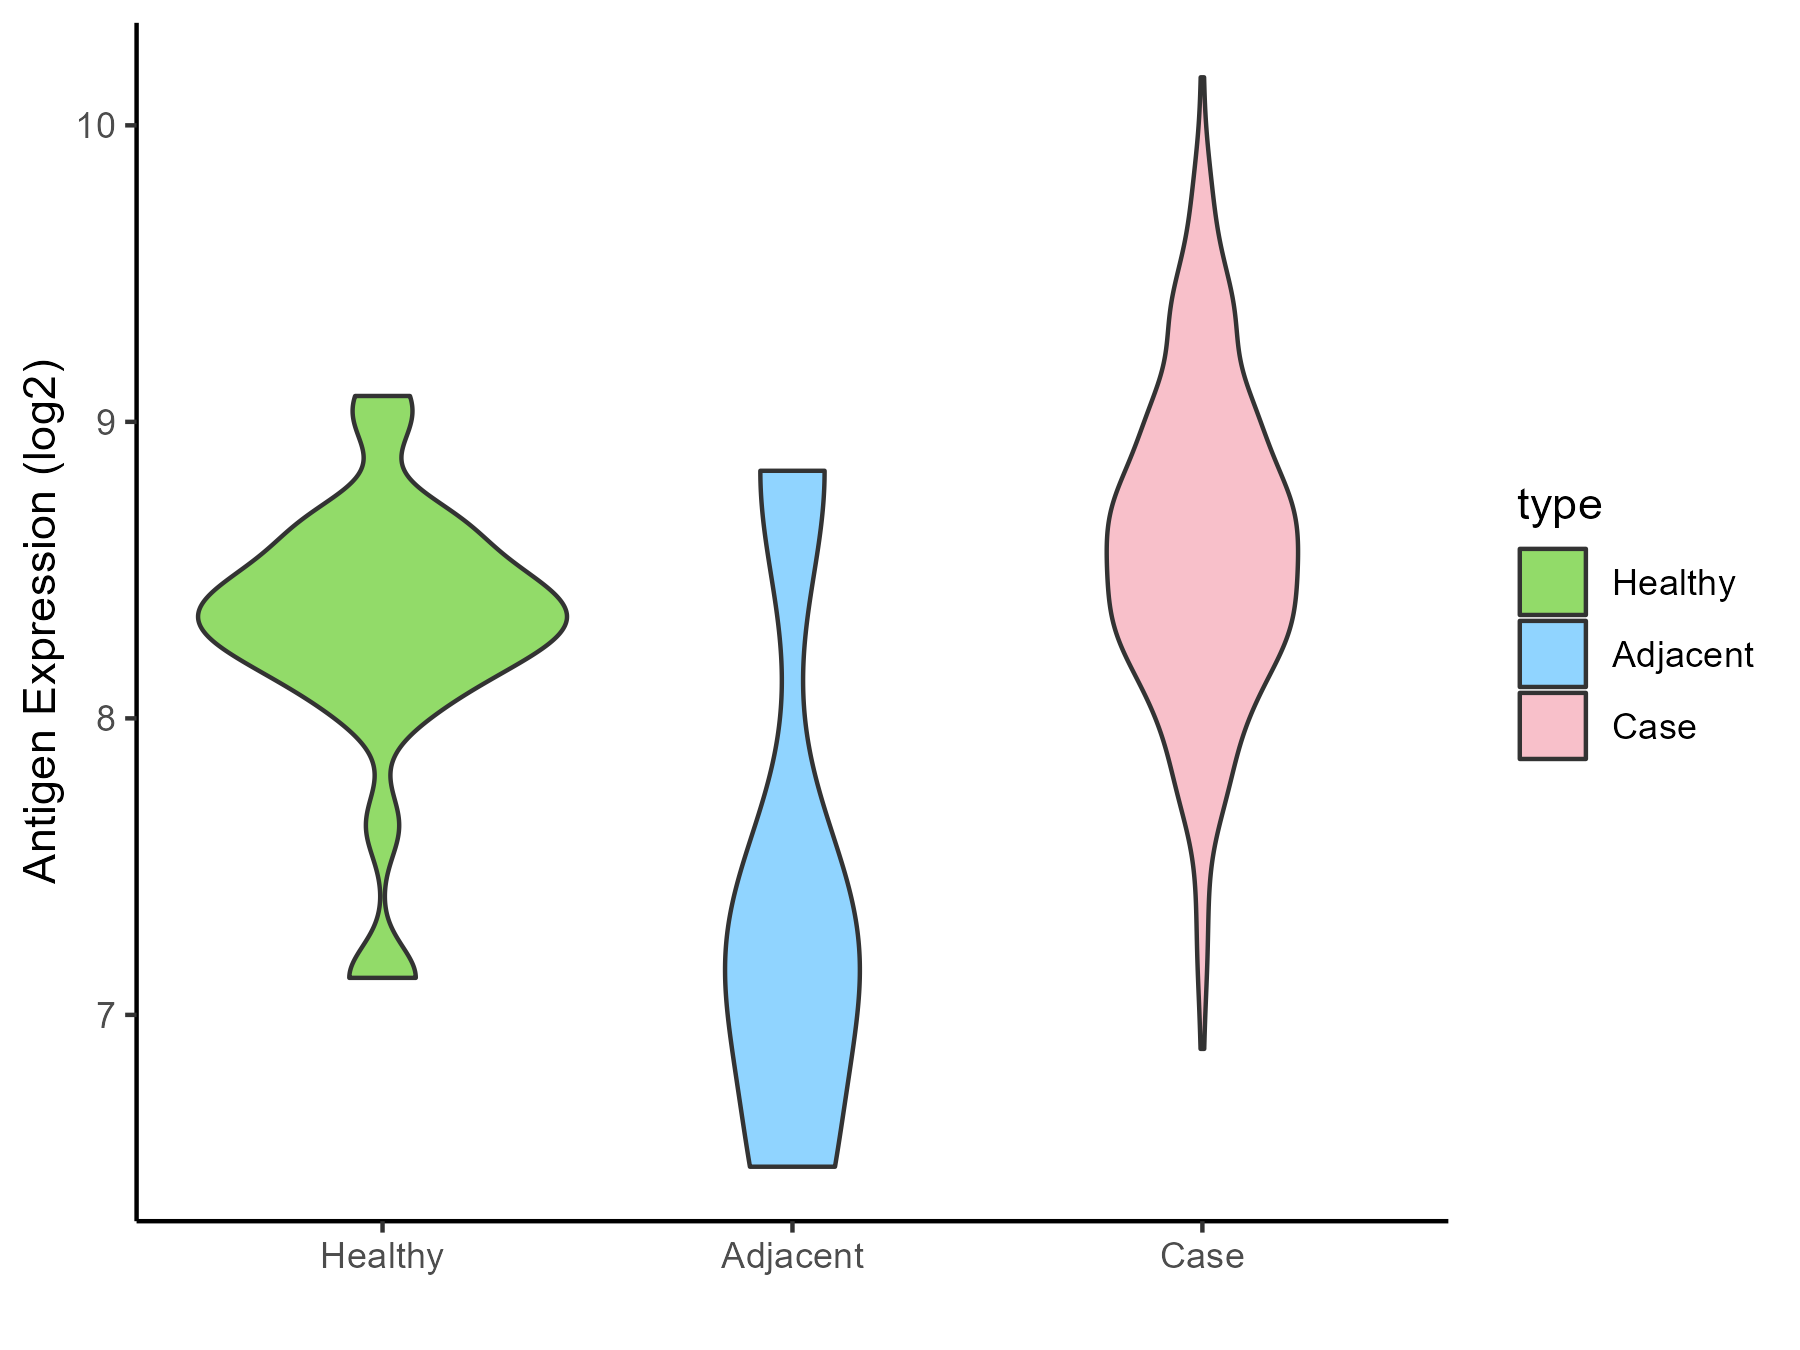
| The Studied Tissue | Bone marrow | |
| The Specific Disease | Myelodysplastic syndromes | |
| The Expression Level of Disease Section Compare with the Healthy Individual Tissue | p-value: 0.002899161; Fold-change: 0.204567919; Z-score: 0.468018048 | |
| The Expression Level of Disease Section Compare with the Adjacent Tissue | p-value: 0.106628114; Fold-change: 1.320202543; Z-score: 1.32941795 | |
| Disease-specific Antigen Abundances |
|
Click to View the Clearer Original Diagram |
| Differential expression pattern of antigen in diseases | ||
| The Studied Tissue | Tonsil | |
| The Specific Disease | Lymphoma | |
| The Expression Level of Disease Section Compare with the Healthy Individual Tissue | p-value: 0.914933233; Fold-change: -0.012299553; Z-score: -0.049773099 | |
| Disease-specific Antigen Abundances |
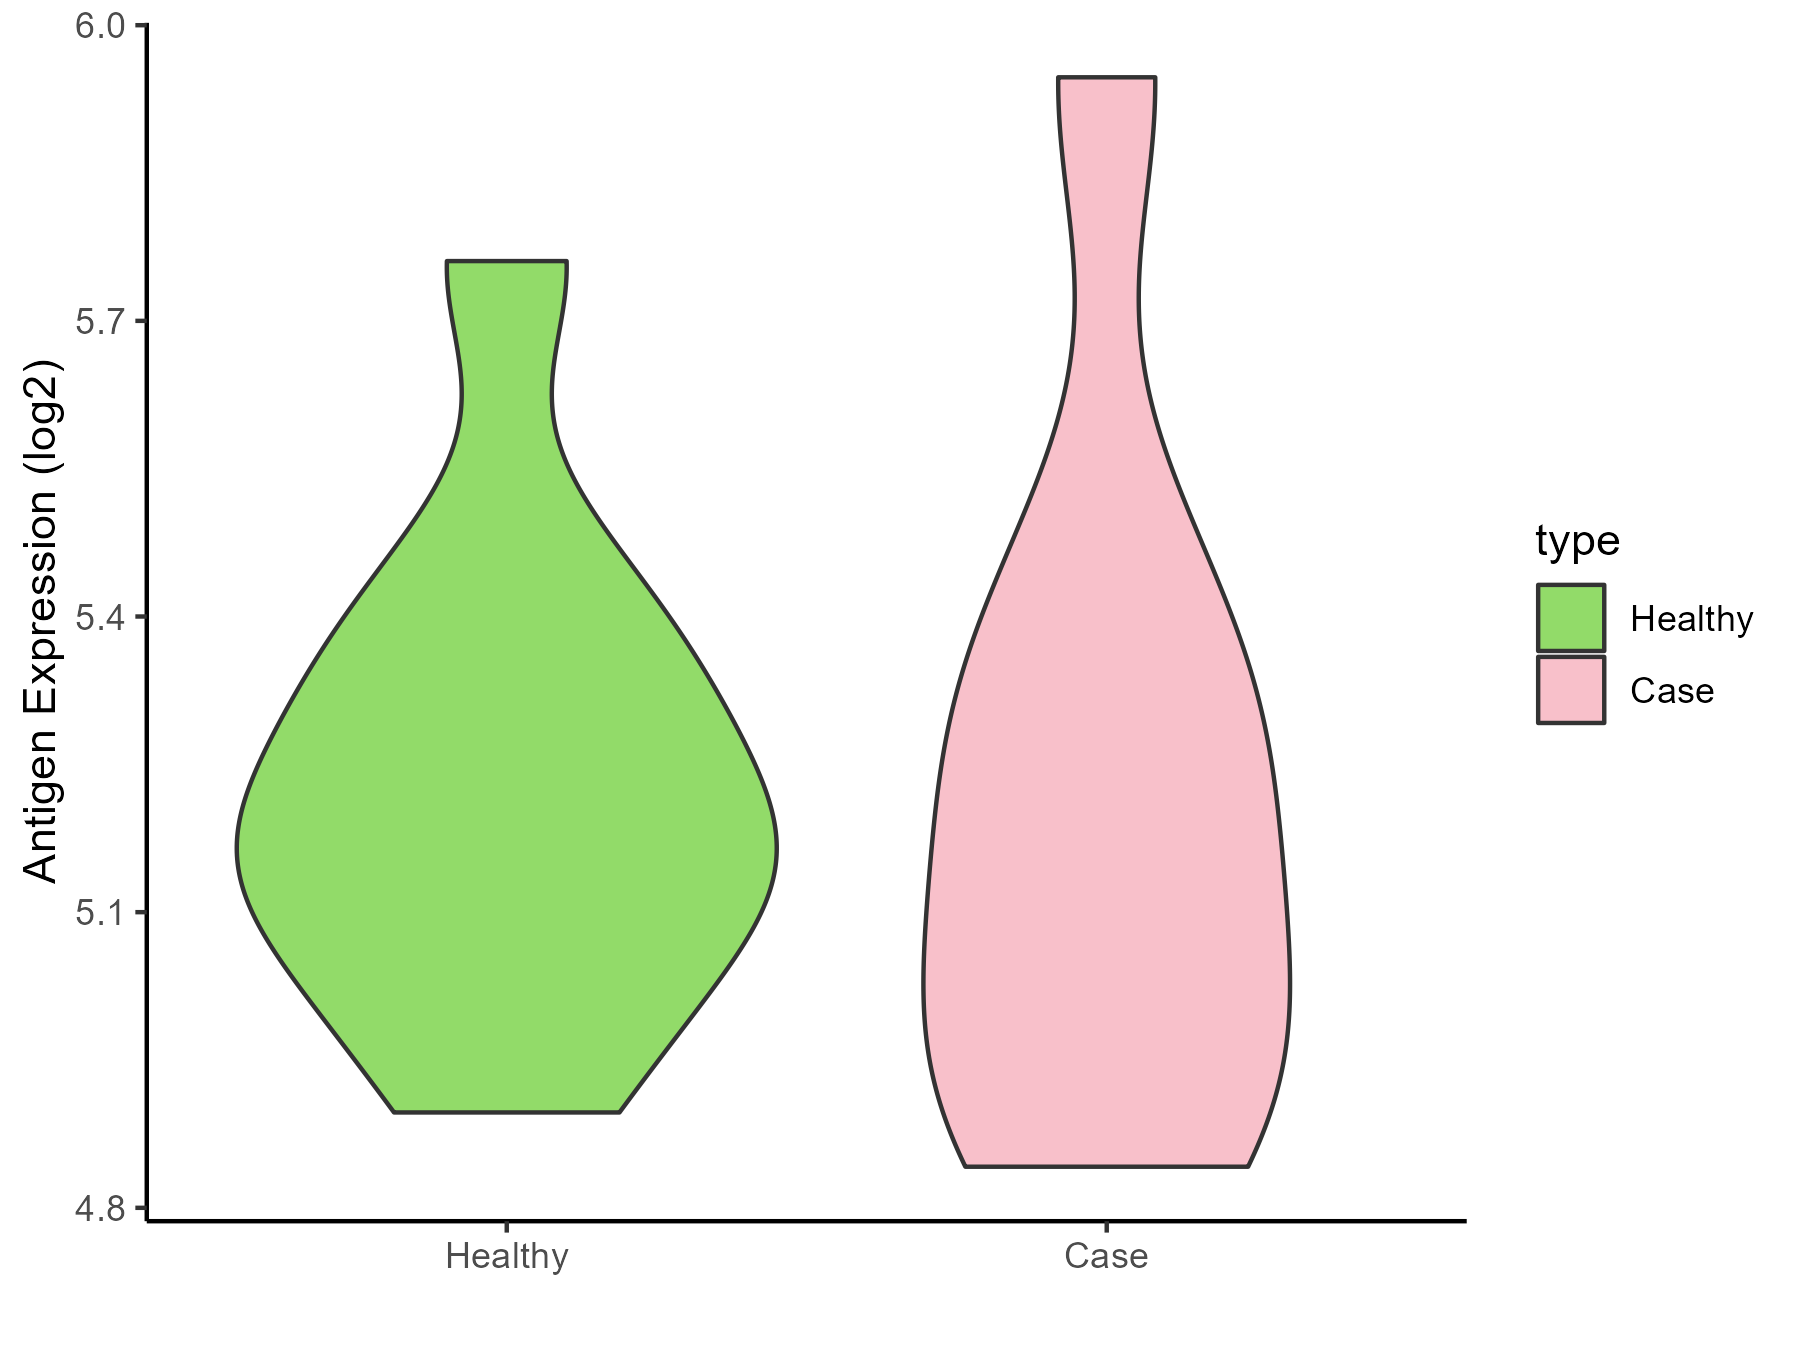
|
Click to View the Clearer Original Diagram |
| Differential expression pattern of antigen in diseases | ||
| The Studied Tissue | Gastric | |
| The Specific Disease | Gastric cancer | |
| The Expression Level of Disease Section Compare with the Healthy Individual Tissue | p-value: 0.586213624; Fold-change: 0.525449047; Z-score: 0.760179243 | |
| The Expression Level of Disease Section Compare with the Adjacent Tissue | p-value: 0.002606127; Fold-change: 0.45466692; Z-score: 1.310512942 | |
| Disease-specific Antigen Abundances |
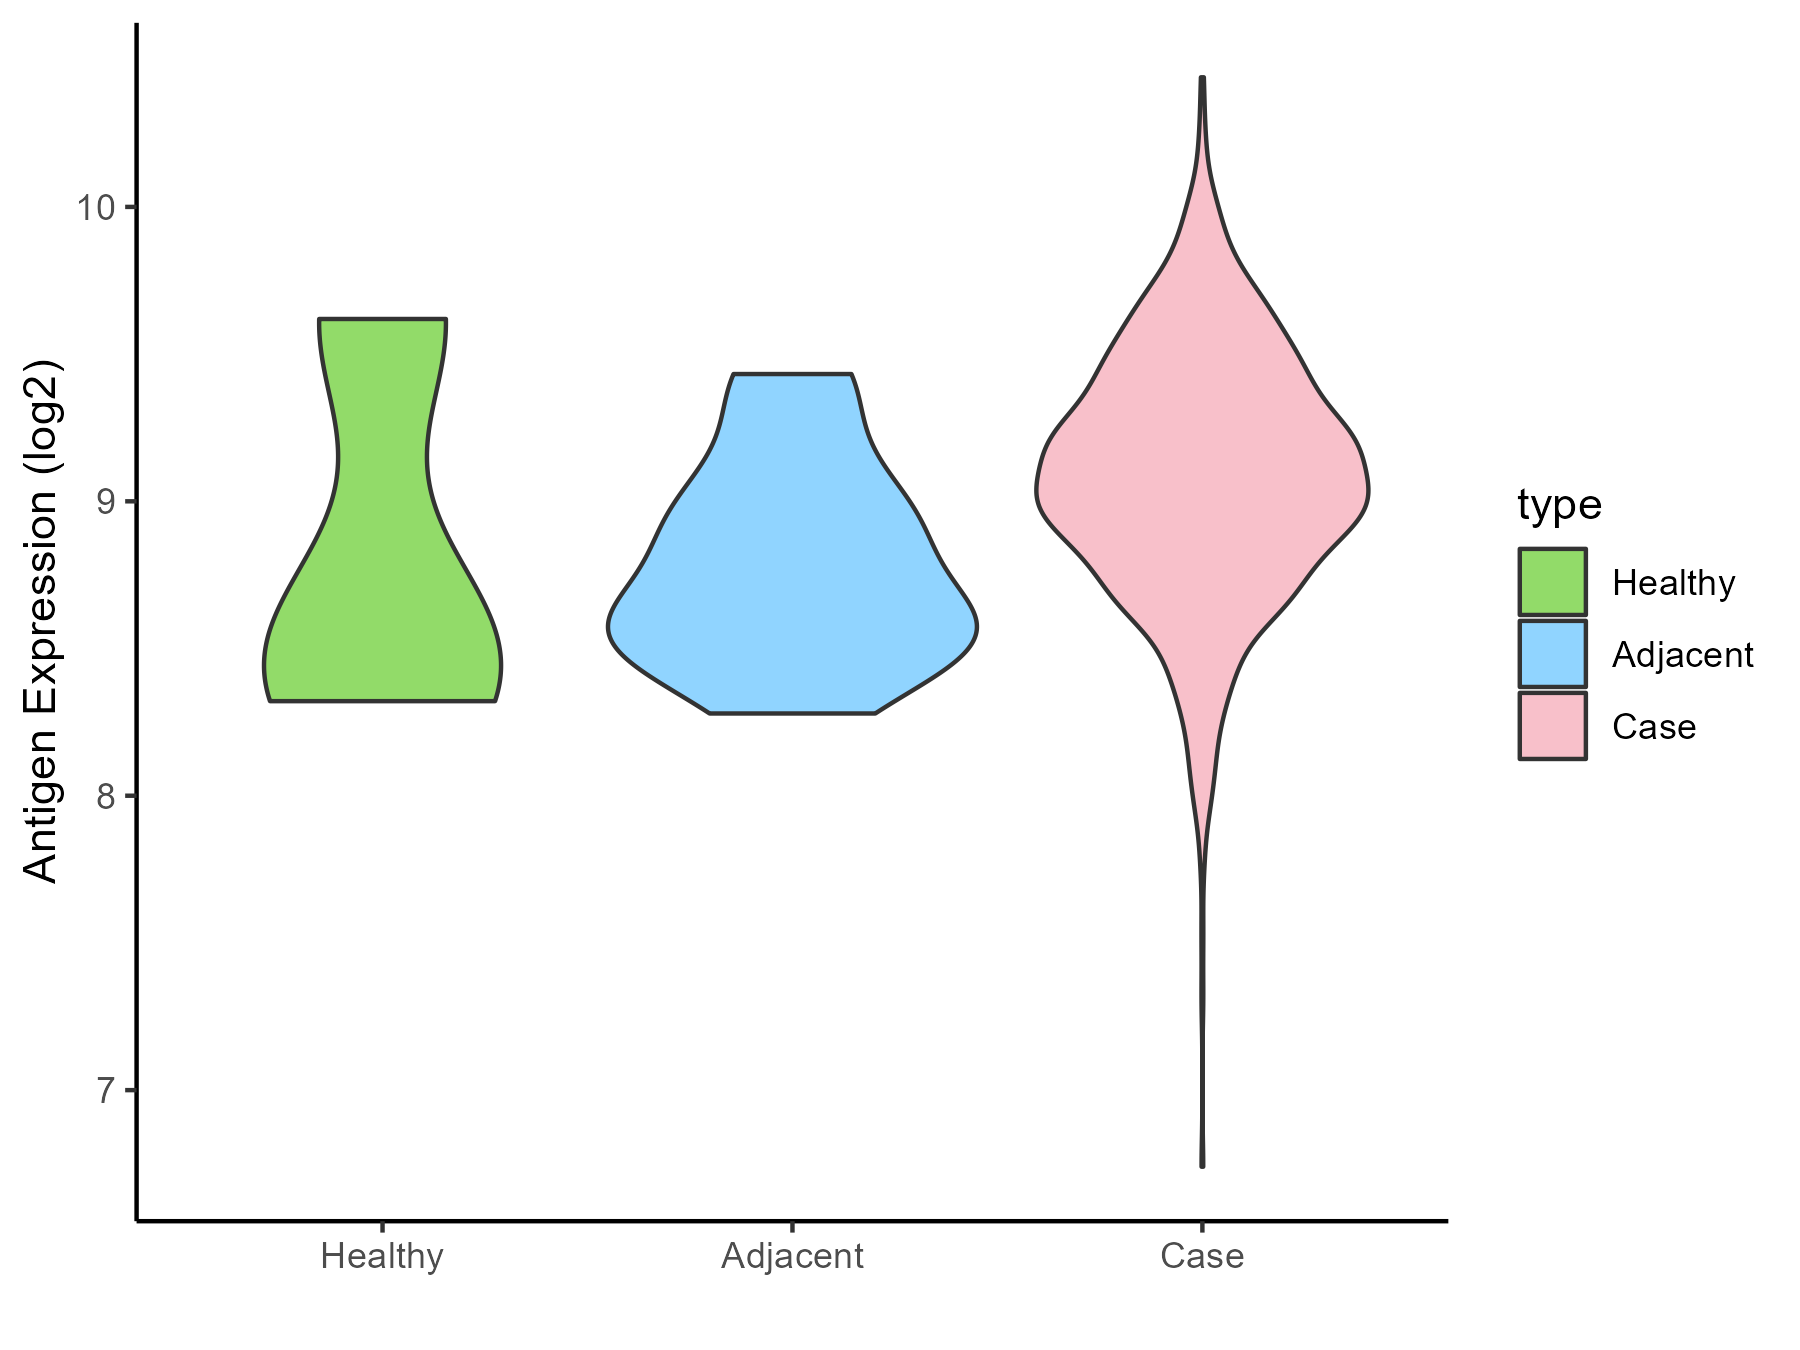
|
Click to View the Clearer Original Diagram |
| Differential expression pattern of antigen in diseases | ||
| The Studied Tissue | Colon | |
| The Specific Disease | Colon cancer | |
| The Expression Level of Disease Section Compare with the Healthy Individual Tissue | p-value: 5.82E-49; Fold-change: -0.486765321; Z-score: -1.552182406 | |
| The Expression Level of Disease Section Compare with the Adjacent Tissue | p-value: 1.47E-18; Fold-change: -0.331650086; Z-score: -0.859118072 | |
| Disease-specific Antigen Abundances |
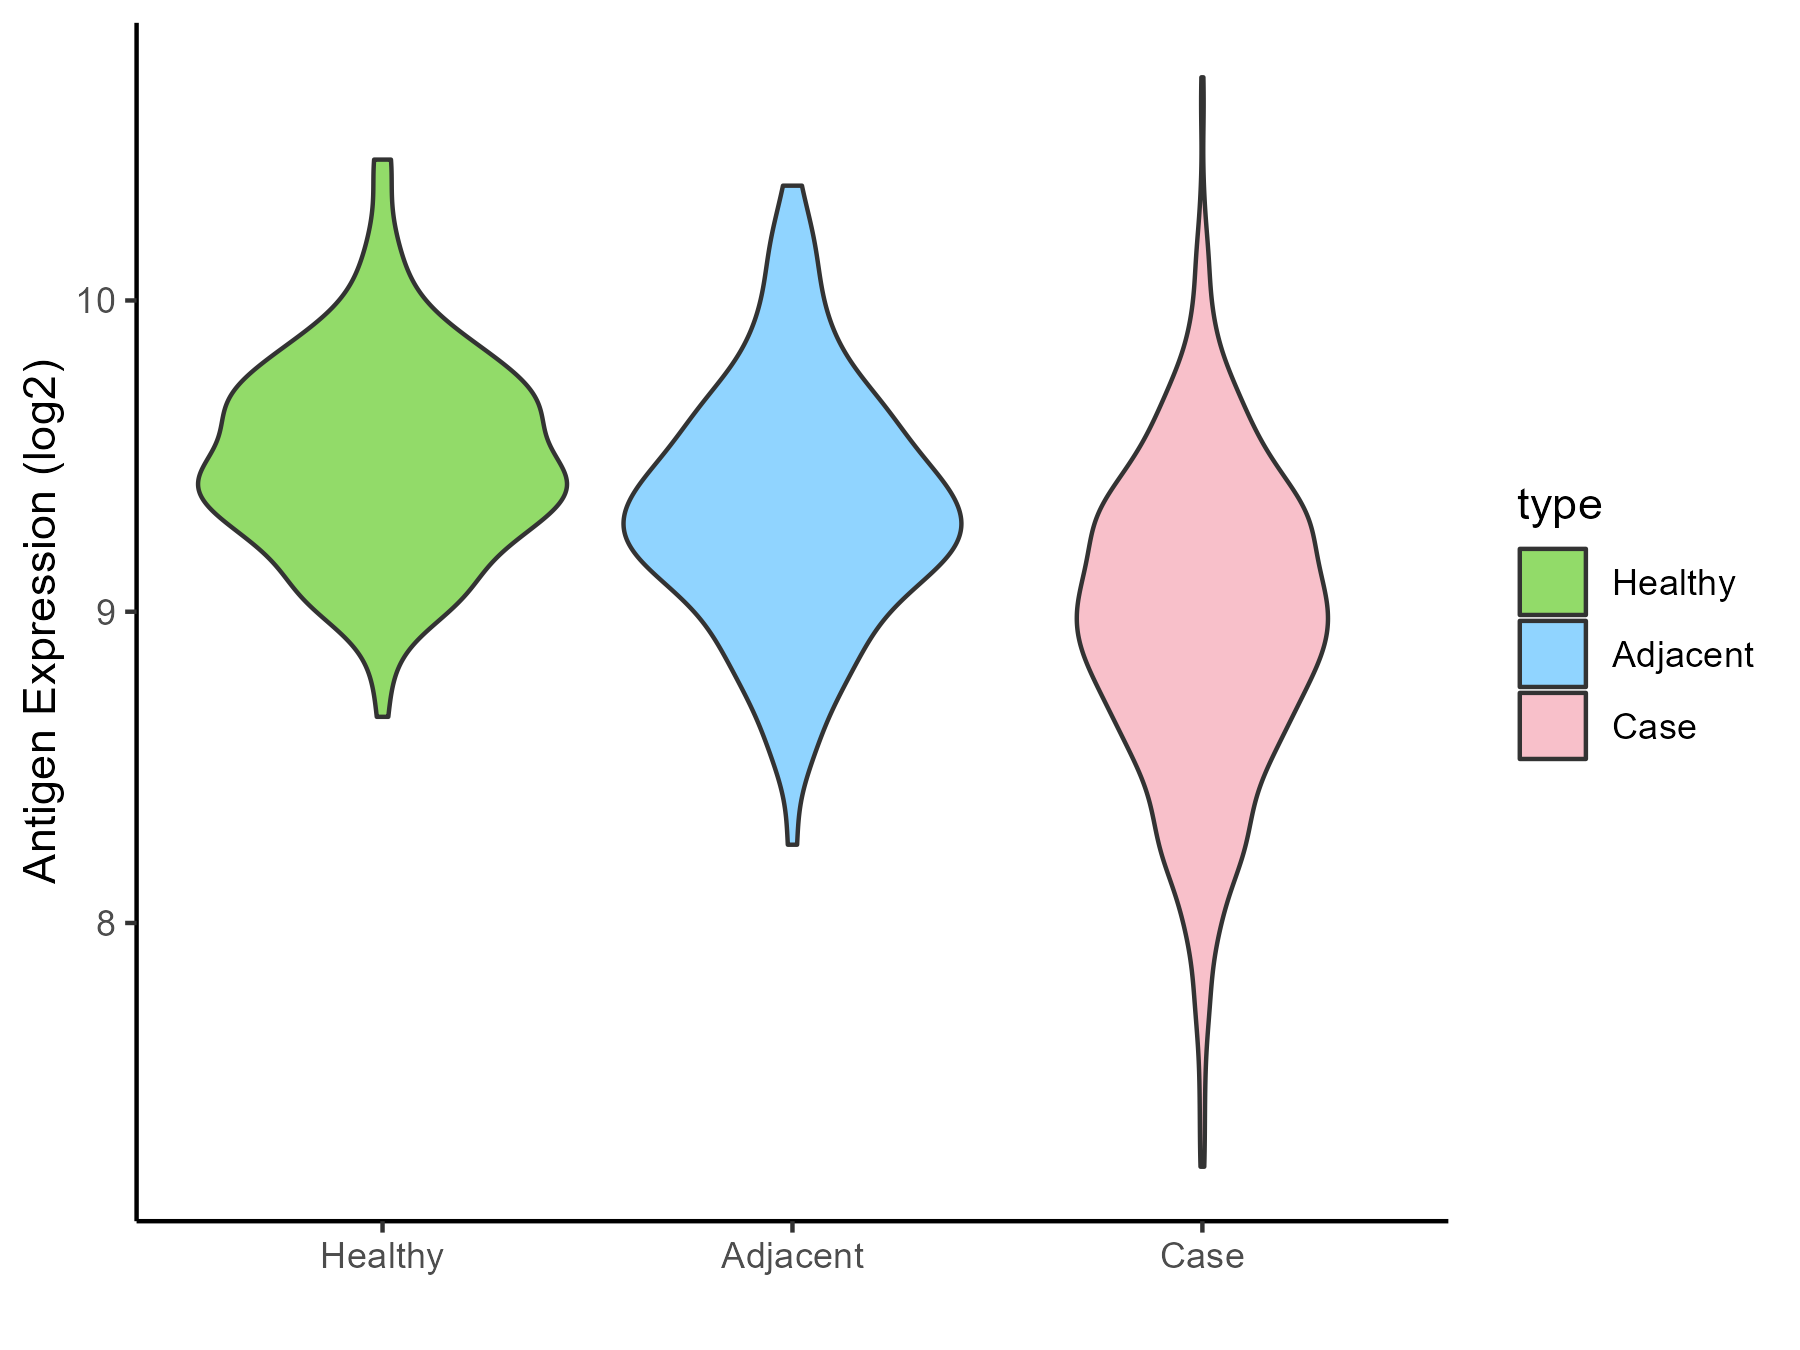
|
Click to View the Clearer Original Diagram |
| Differential expression pattern of antigen in diseases | ||
| The Studied Tissue | Pancreas | |
| The Specific Disease | Pancreatic cancer | |
| The Expression Level of Disease Section Compare with the Healthy Individual Tissue | p-value: 0.441352437; Fold-change: 0.352853393; Z-score: 0.441510248 | |
| The Expression Level of Disease Section Compare with the Adjacent Tissue | p-value: 1.02E-06; Fold-change: 0.749251934; Z-score: 0.911479533 | |
| Disease-specific Antigen Abundances |
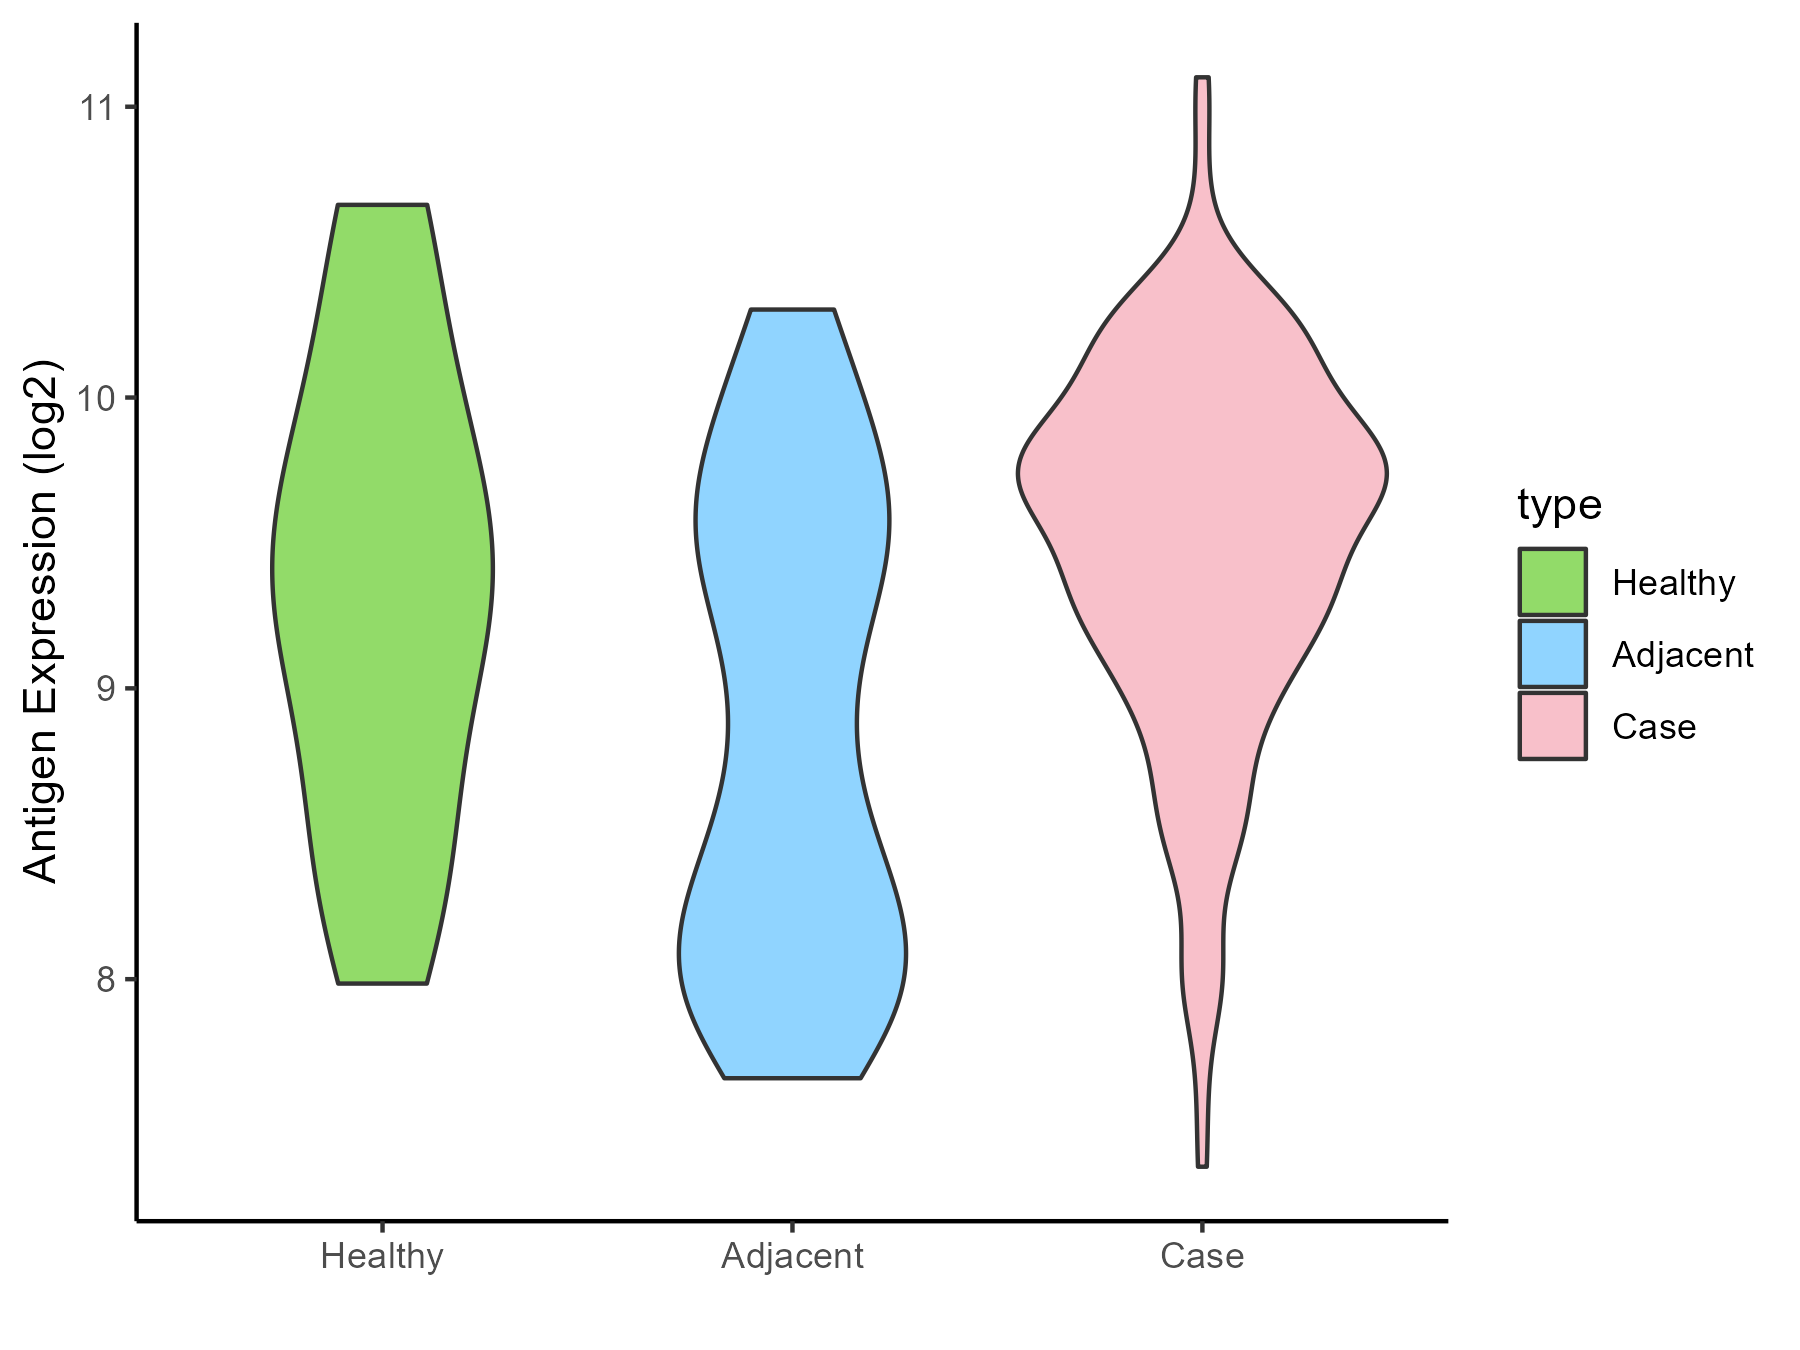
|
Click to View the Clearer Original Diagram |
| Differential expression pattern of antigen in diseases | ||
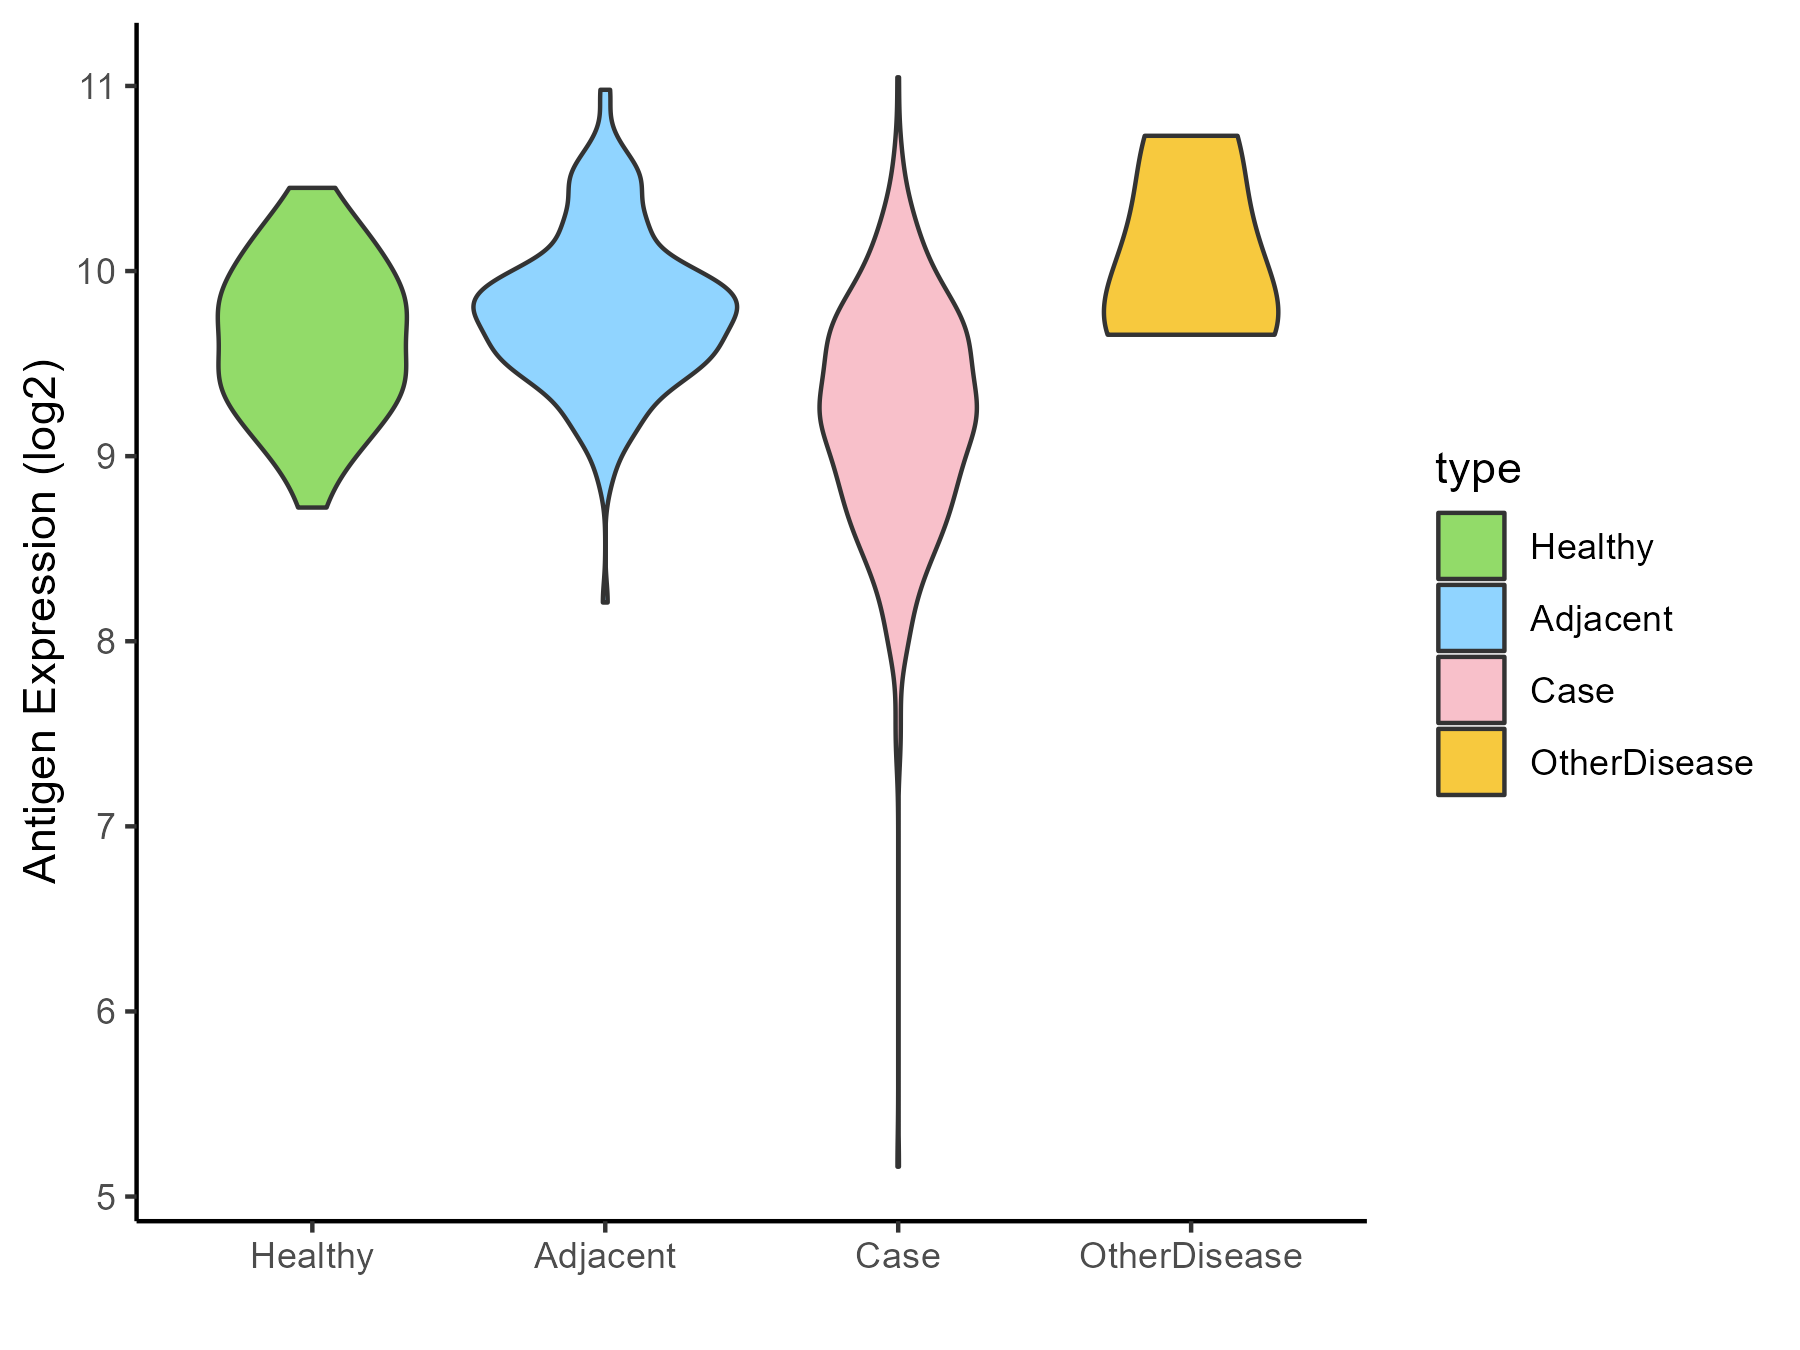
| The Studied Tissue | Liver | |
| The Specific Disease | Liver cancer | |
| The Expression Level of Disease Section Compare with the Healthy Individual Tissue | p-value: 3.45E-07; Fold-change: -0.427978811; Z-score: -1.034678765 | |
| The Expression Level of Disease Section Compare with the Adjacent Tissue | p-value: 1.10E-33; Fold-change: -0.526669484; Z-score: -1.266333069 | |
| The Expression Level of Disease Section Compare with the Other Disease Section | p-value: 0.044142156; Fold-change: -0.681588807; Z-score: -1.347481086 | |
| Disease-specific Antigen Abundances |
|
Click to View the Clearer Original Diagram |
| Differential expression pattern of antigen in diseases | ||
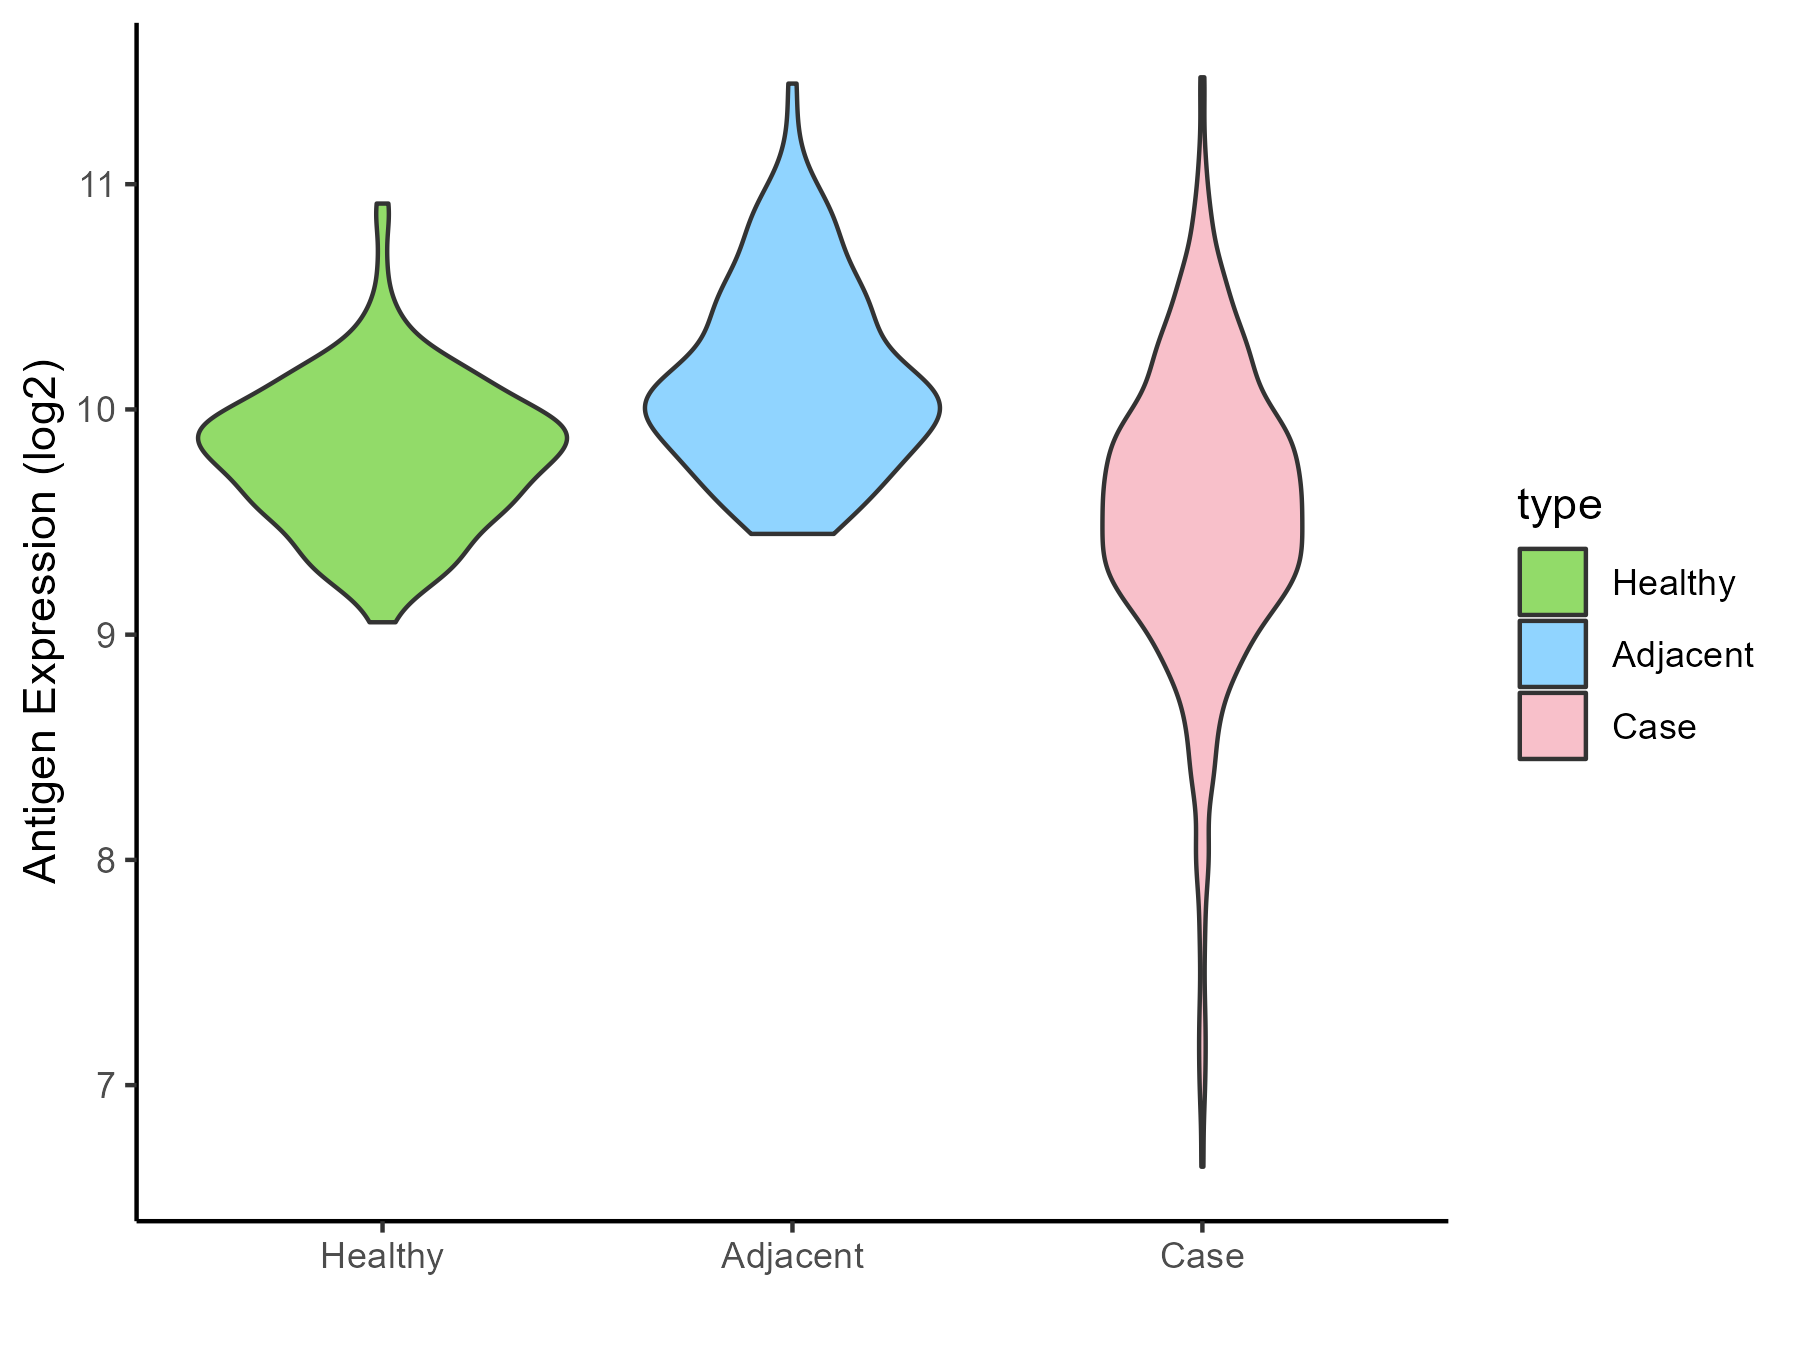
| The Studied Tissue | Lung | |
| The Specific Disease | Lung cancer | |
| The Expression Level of Disease Section Compare with the Healthy Individual Tissue | p-value: 4.68E-15; Fold-change: -0.228529432; Z-score: -0.7129685 | |
| The Expression Level of Disease Section Compare with the Adjacent Tissue | p-value: 6.85E-30; Fold-change: -0.500126255; Z-score: -1.206810823 | |
| Disease-specific Antigen Abundances |
|
Click to View the Clearer Original Diagram |
| Differential expression pattern of antigen in diseases | ||
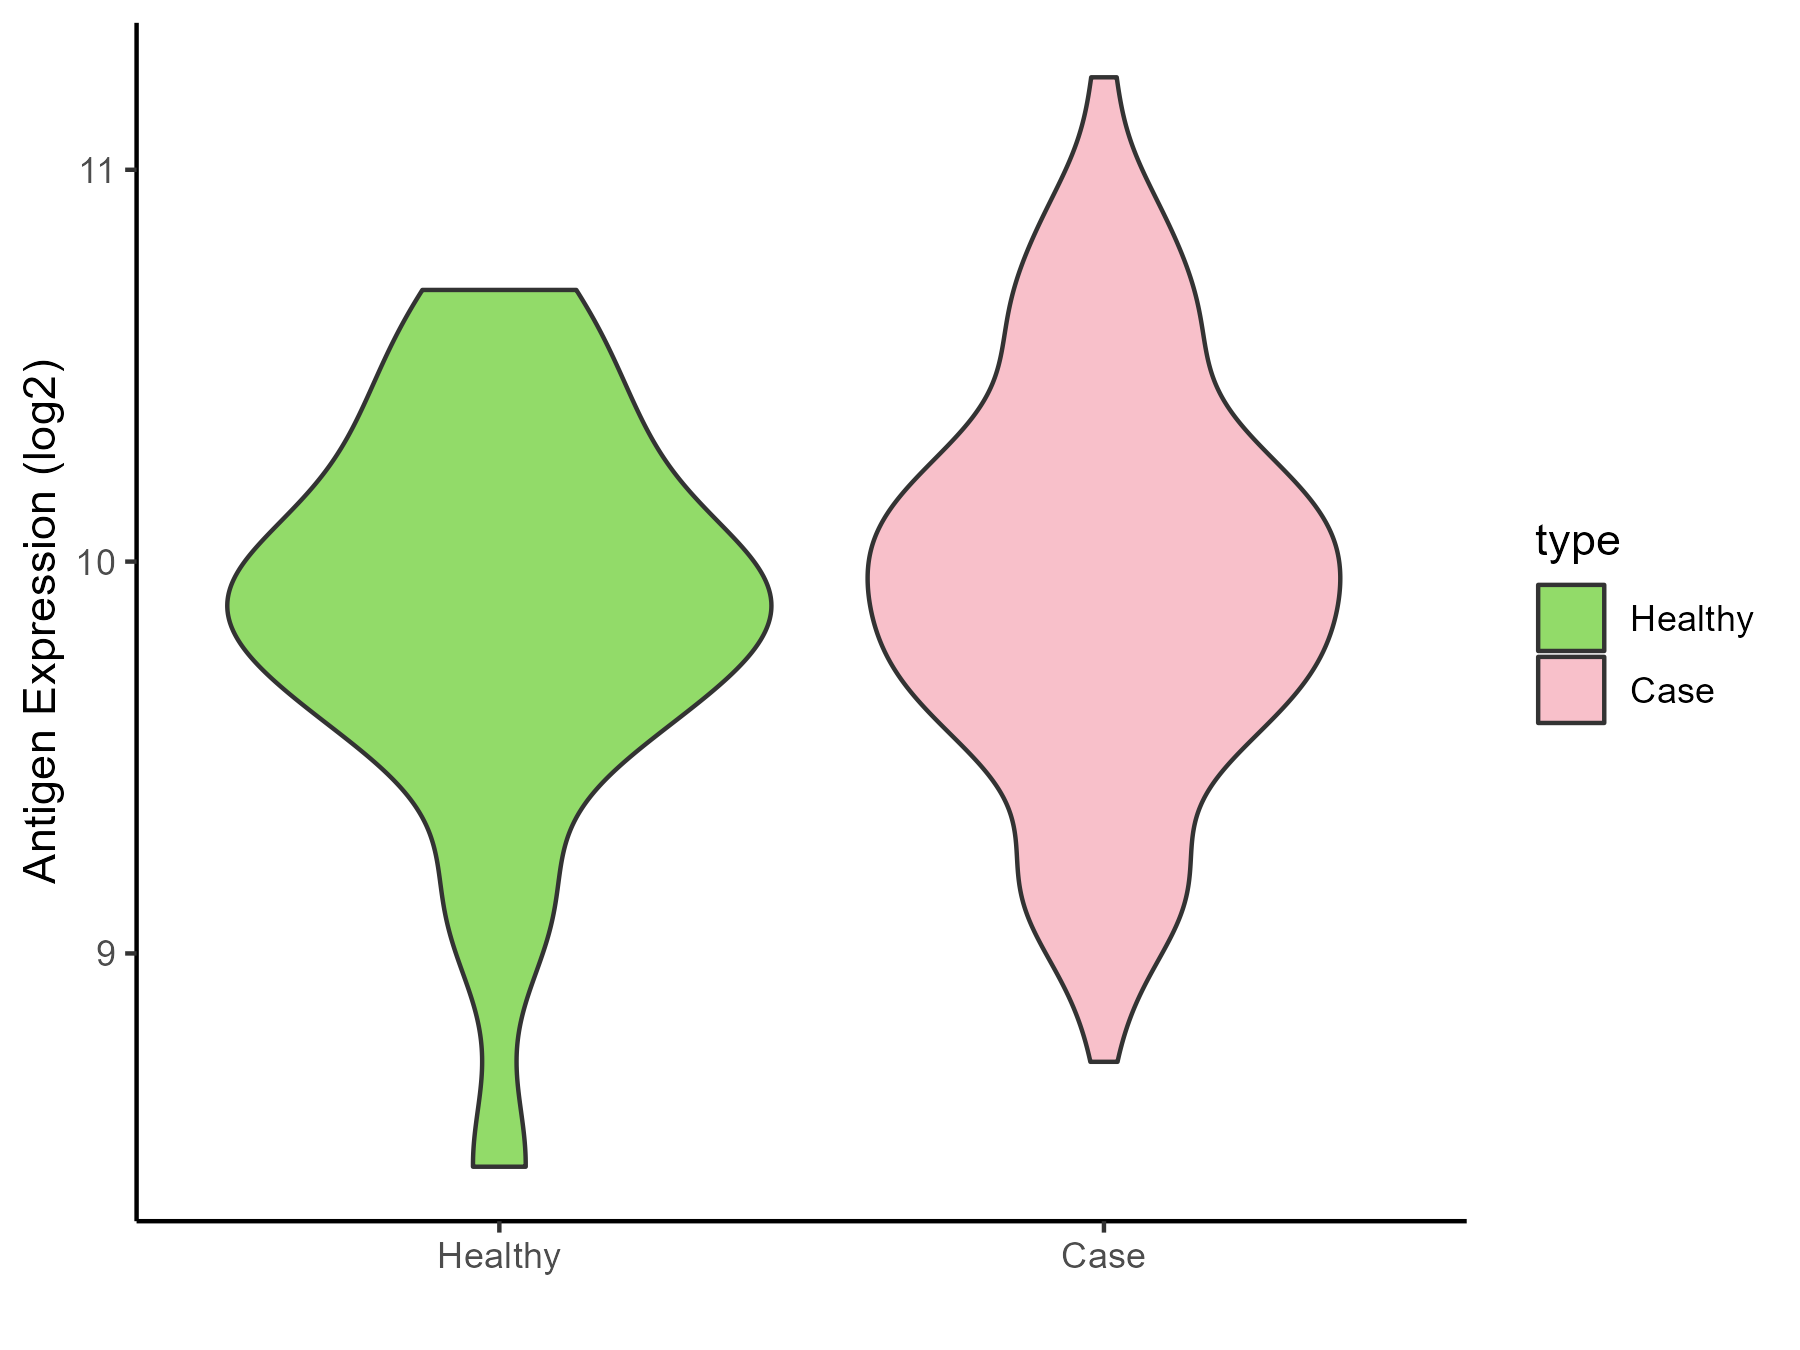
| The Studied Tissue | Skin | |
| The Specific Disease | Melanoma | |
| The Expression Level of Disease Section Compare with the Healthy Individual Tissue | p-value: 0.474791797; Fold-change: 0.033221522; Z-score: 0.064855331 | |
| Disease-specific Antigen Abundances |
|
Click to View the Clearer Original Diagram |
| Differential expression pattern of antigen in diseases | ||
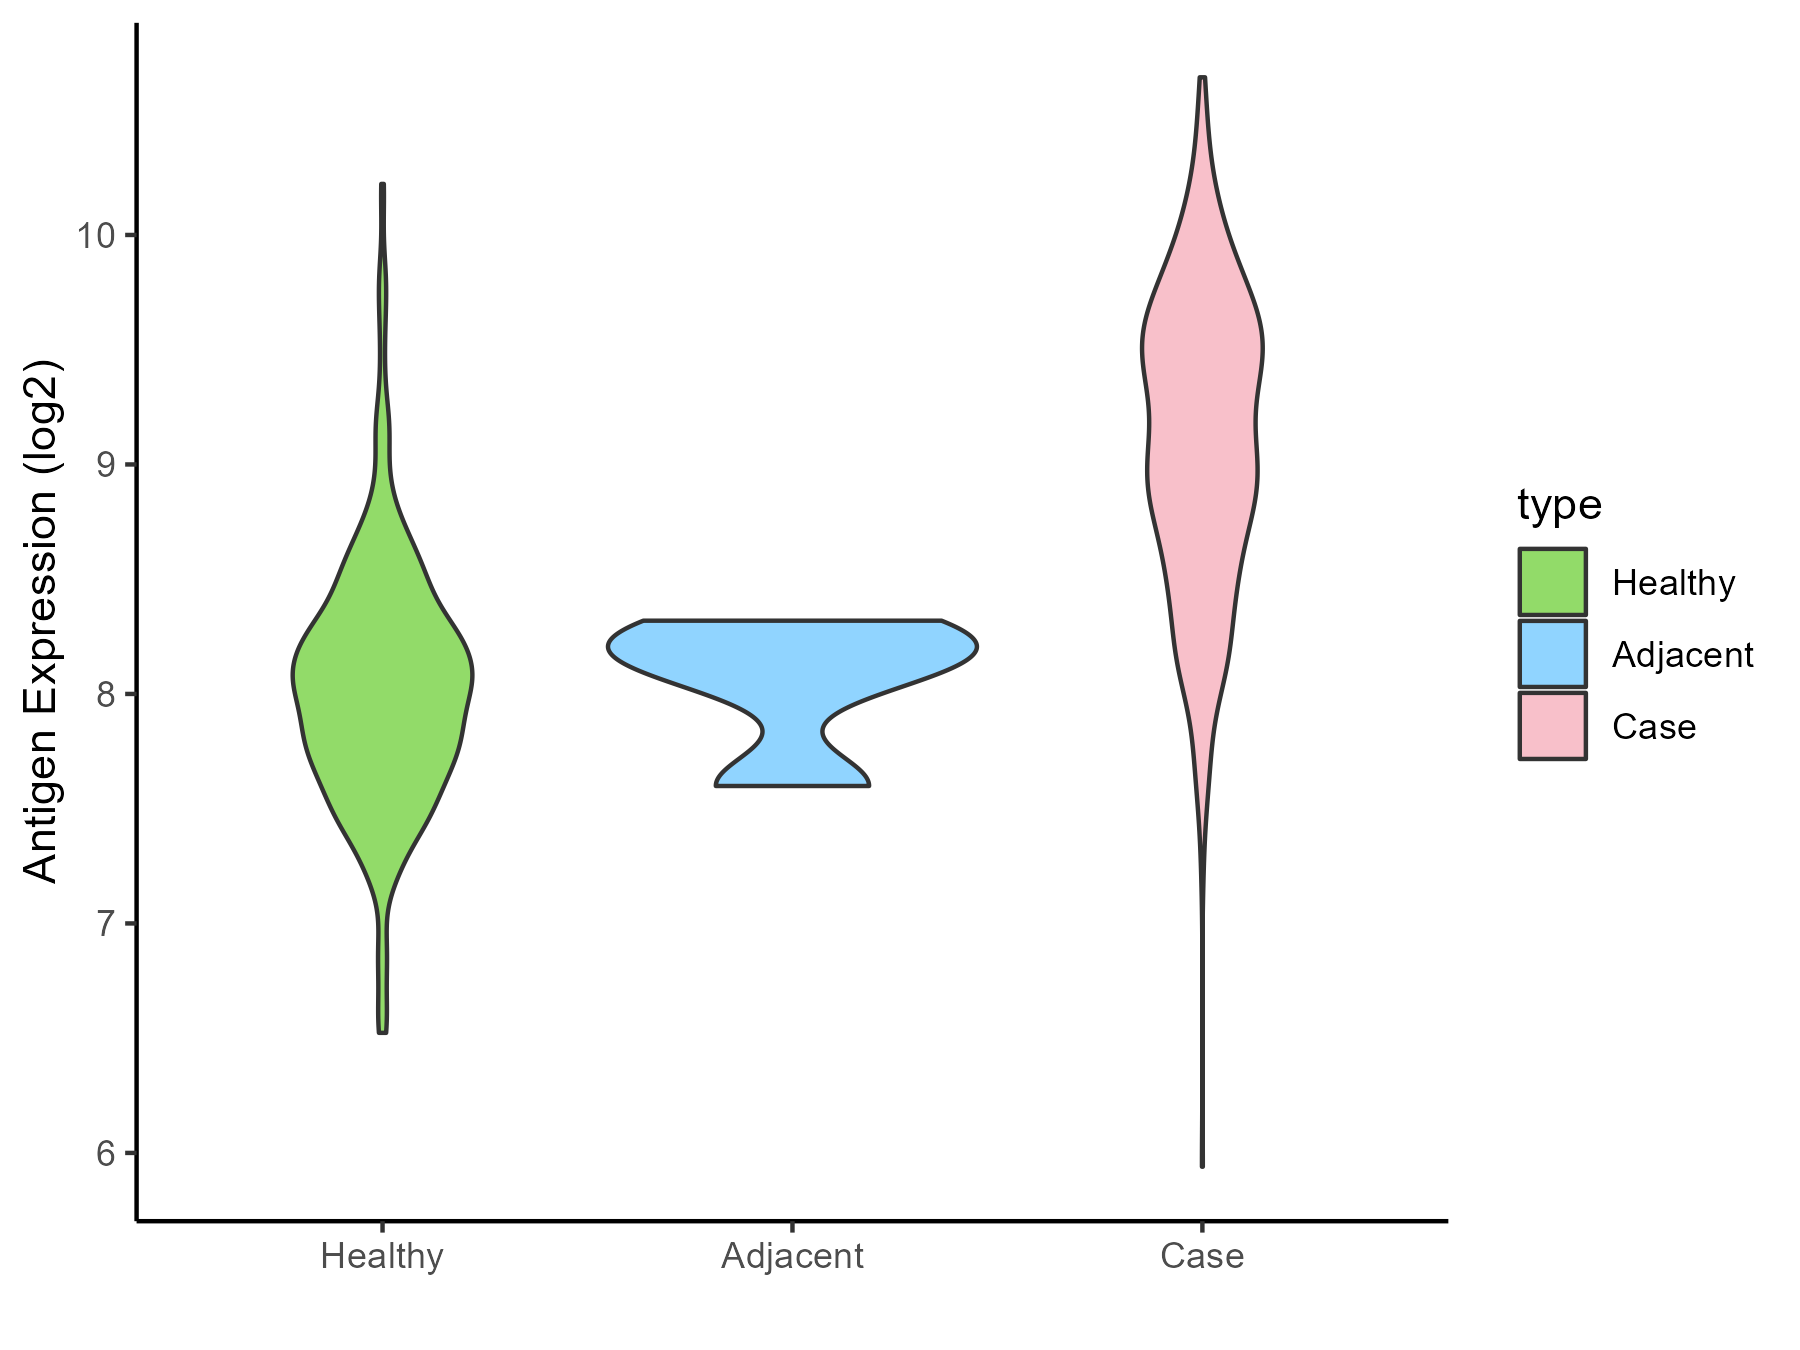
| The Studied Tissue | Muscle | |
| The Specific Disease | Sarcoma | |
| The Expression Level of Disease Section Compare with the Healthy Individual Tissue | p-value: 1.40E-136; Fold-change: 1.112024843; Z-score: 2.113295072 | |
| The Expression Level of Disease Section Compare with the Adjacent Tissue | p-value: 0.006252395; Fold-change: 0.986885457; Z-score: 3.109483034 | |
| Disease-specific Antigen Abundances |
|
Click to View the Clearer Original Diagram |
| Differential expression pattern of antigen in diseases | ||
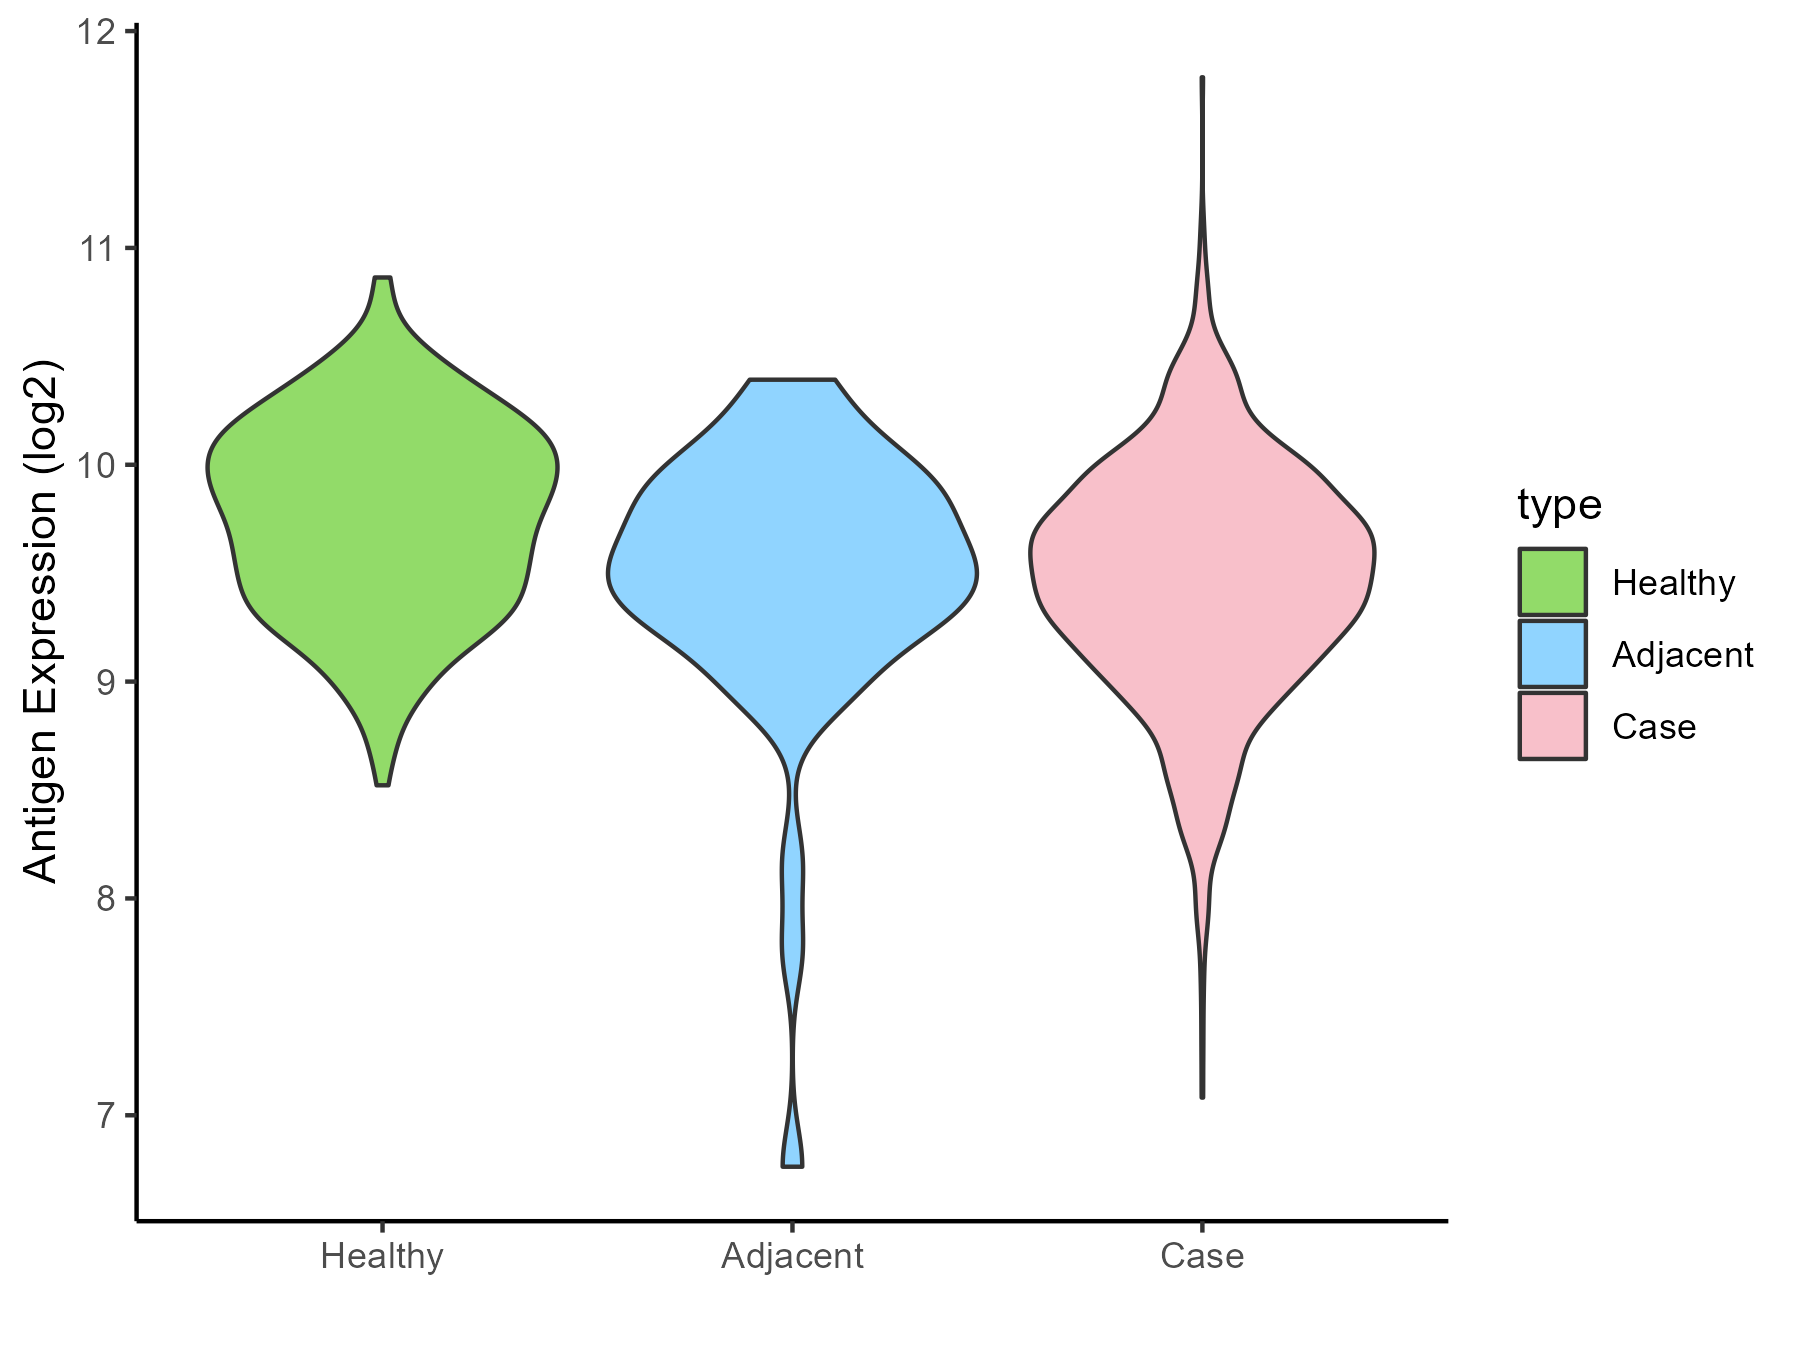
| The Studied Tissue | Breast | |
| The Specific Disease | Breast cancer | |
| The Expression Level of Disease Section Compare with the Healthy Individual Tissue | p-value: 1.27E-19; Fold-change: -0.305159689; Z-score: -0.686026556 | |
| The Expression Level of Disease Section Compare with the Adjacent Tissue | p-value: 0.814993234; Fold-change: -0.057028684; Z-score: -0.090445512 | |
| Disease-specific Antigen Abundances |
|
Click to View the Clearer Original Diagram |
| Differential expression pattern of antigen in diseases | ||
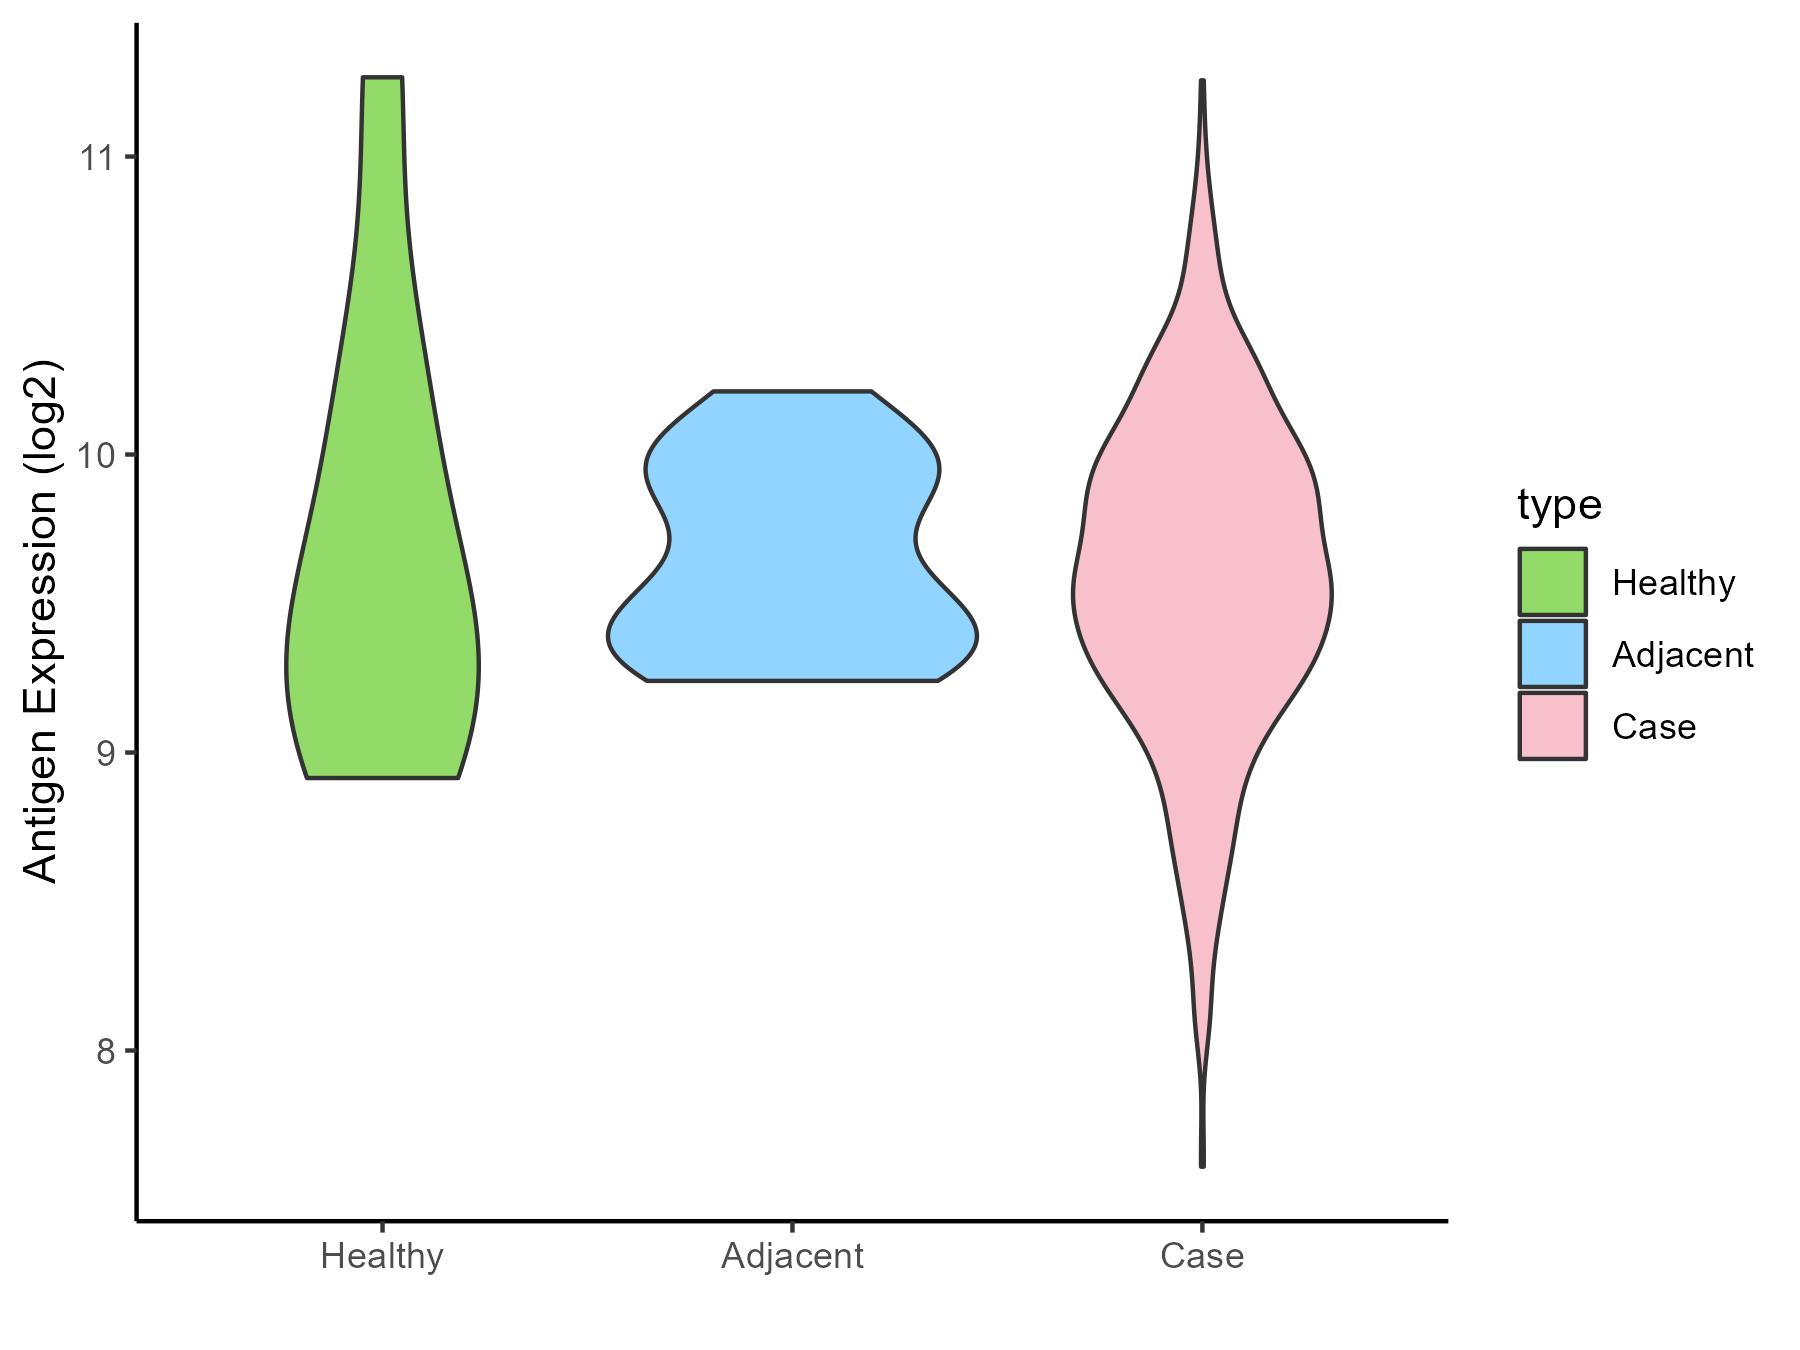
| The Studied Tissue | Ovarian | |
| The Specific Disease | Ovarian cancer | |
| The Expression Level of Disease Section Compare with the Healthy Individual Tissue | p-value: 0.716272492; Fold-change: 0.171999597; Z-score: 0.227938556 | |
| The Expression Level of Disease Section Compare with the Adjacent Tissue | p-value: 0.451923011; Fold-change: 0.011267797; Z-score: 0.034245682 | |
| Disease-specific Antigen Abundances |
|
Click to View the Clearer Original Diagram |
| Differential expression pattern of antigen in diseases | ||
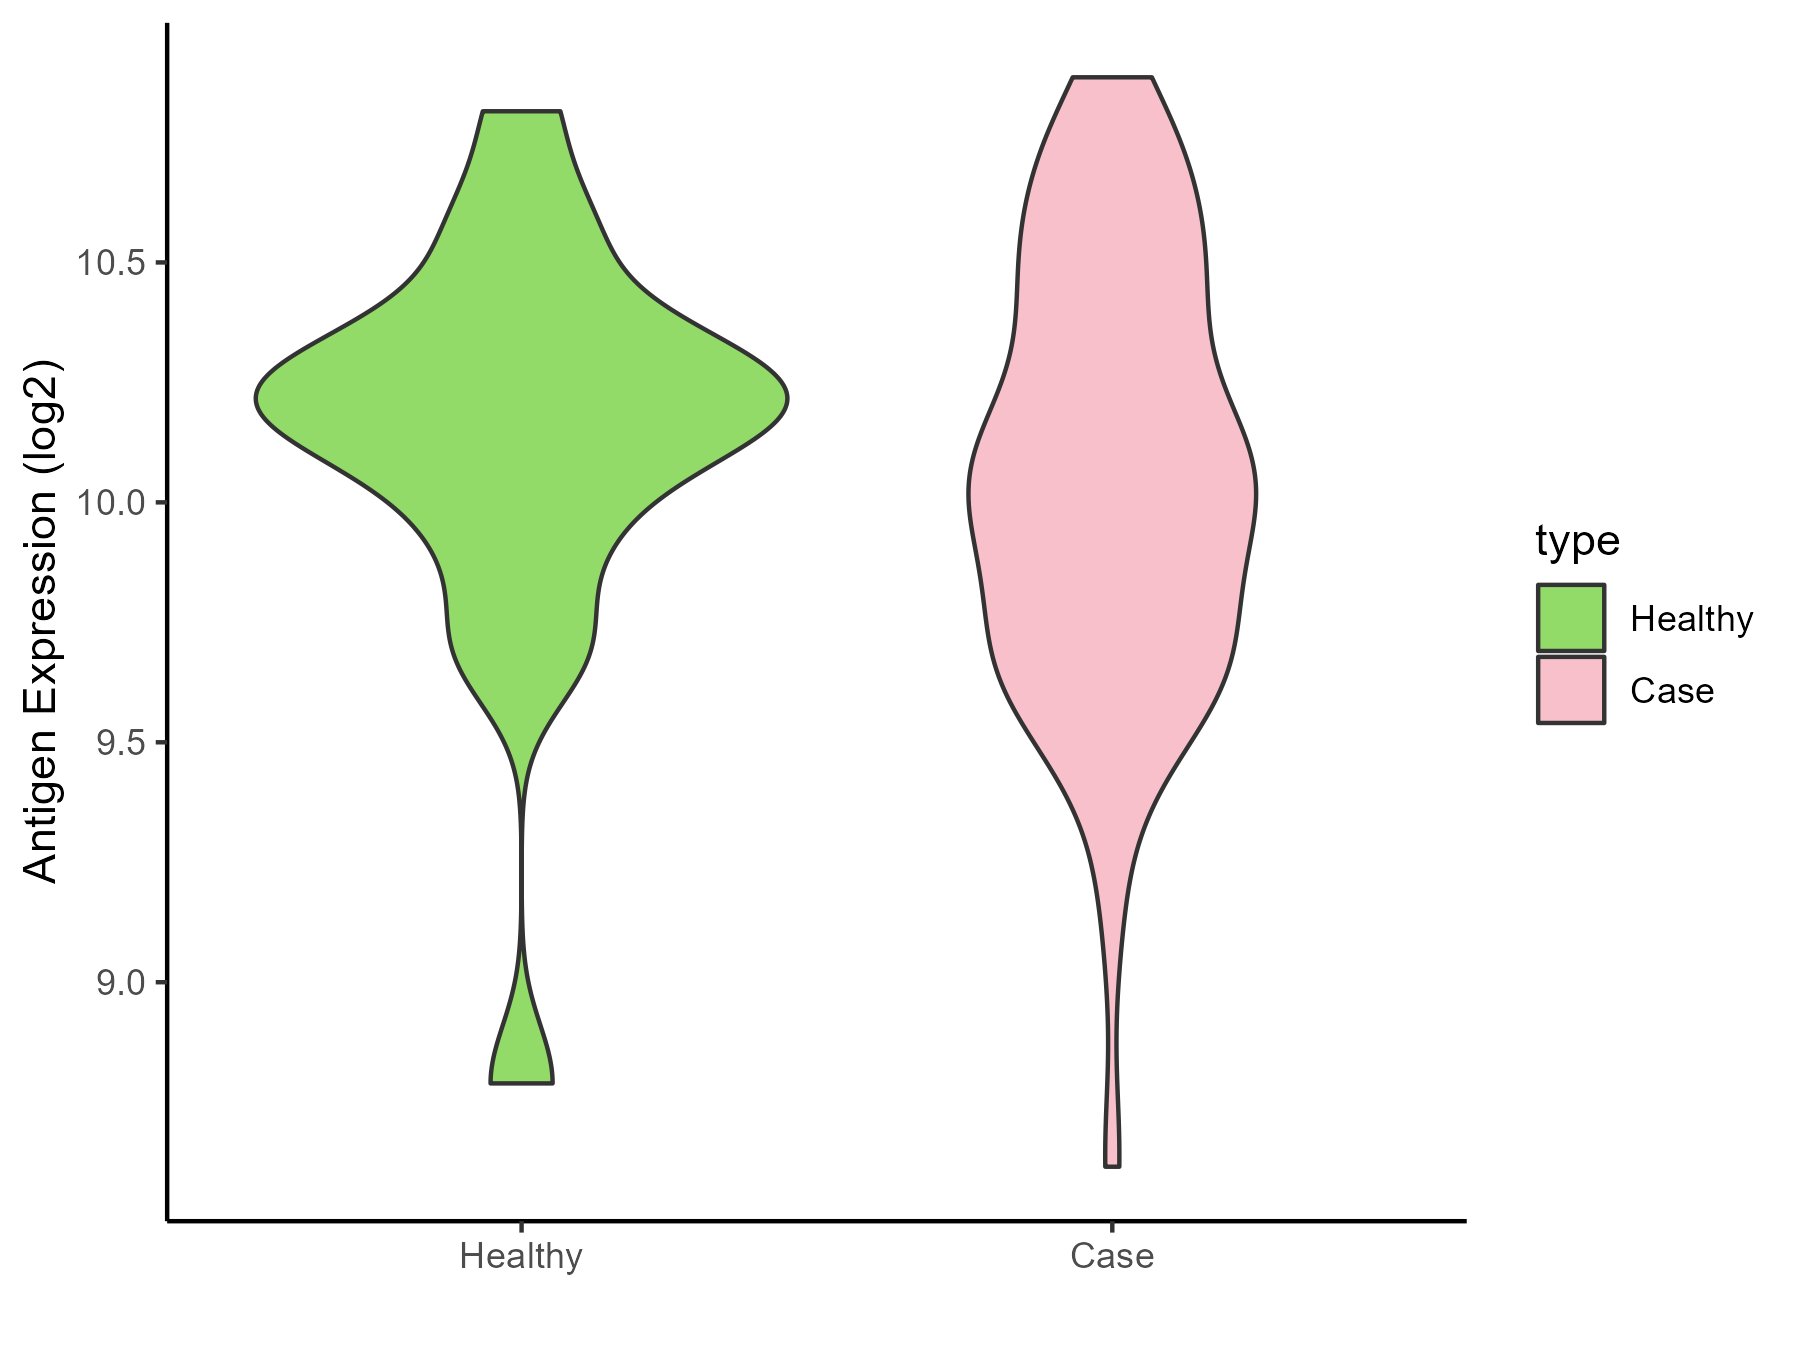
| The Studied Tissue | Cervical | |
| The Specific Disease | Cervical cancer | |
| The Expression Level of Disease Section Compare with the Healthy Individual Tissue | p-value: 0.515068935; Fold-change: -0.131908906; Z-score: -0.301694594 | |
| Disease-specific Antigen Abundances |
|
Click to View the Clearer Original Diagram |
| Differential expression pattern of antigen in diseases | ||
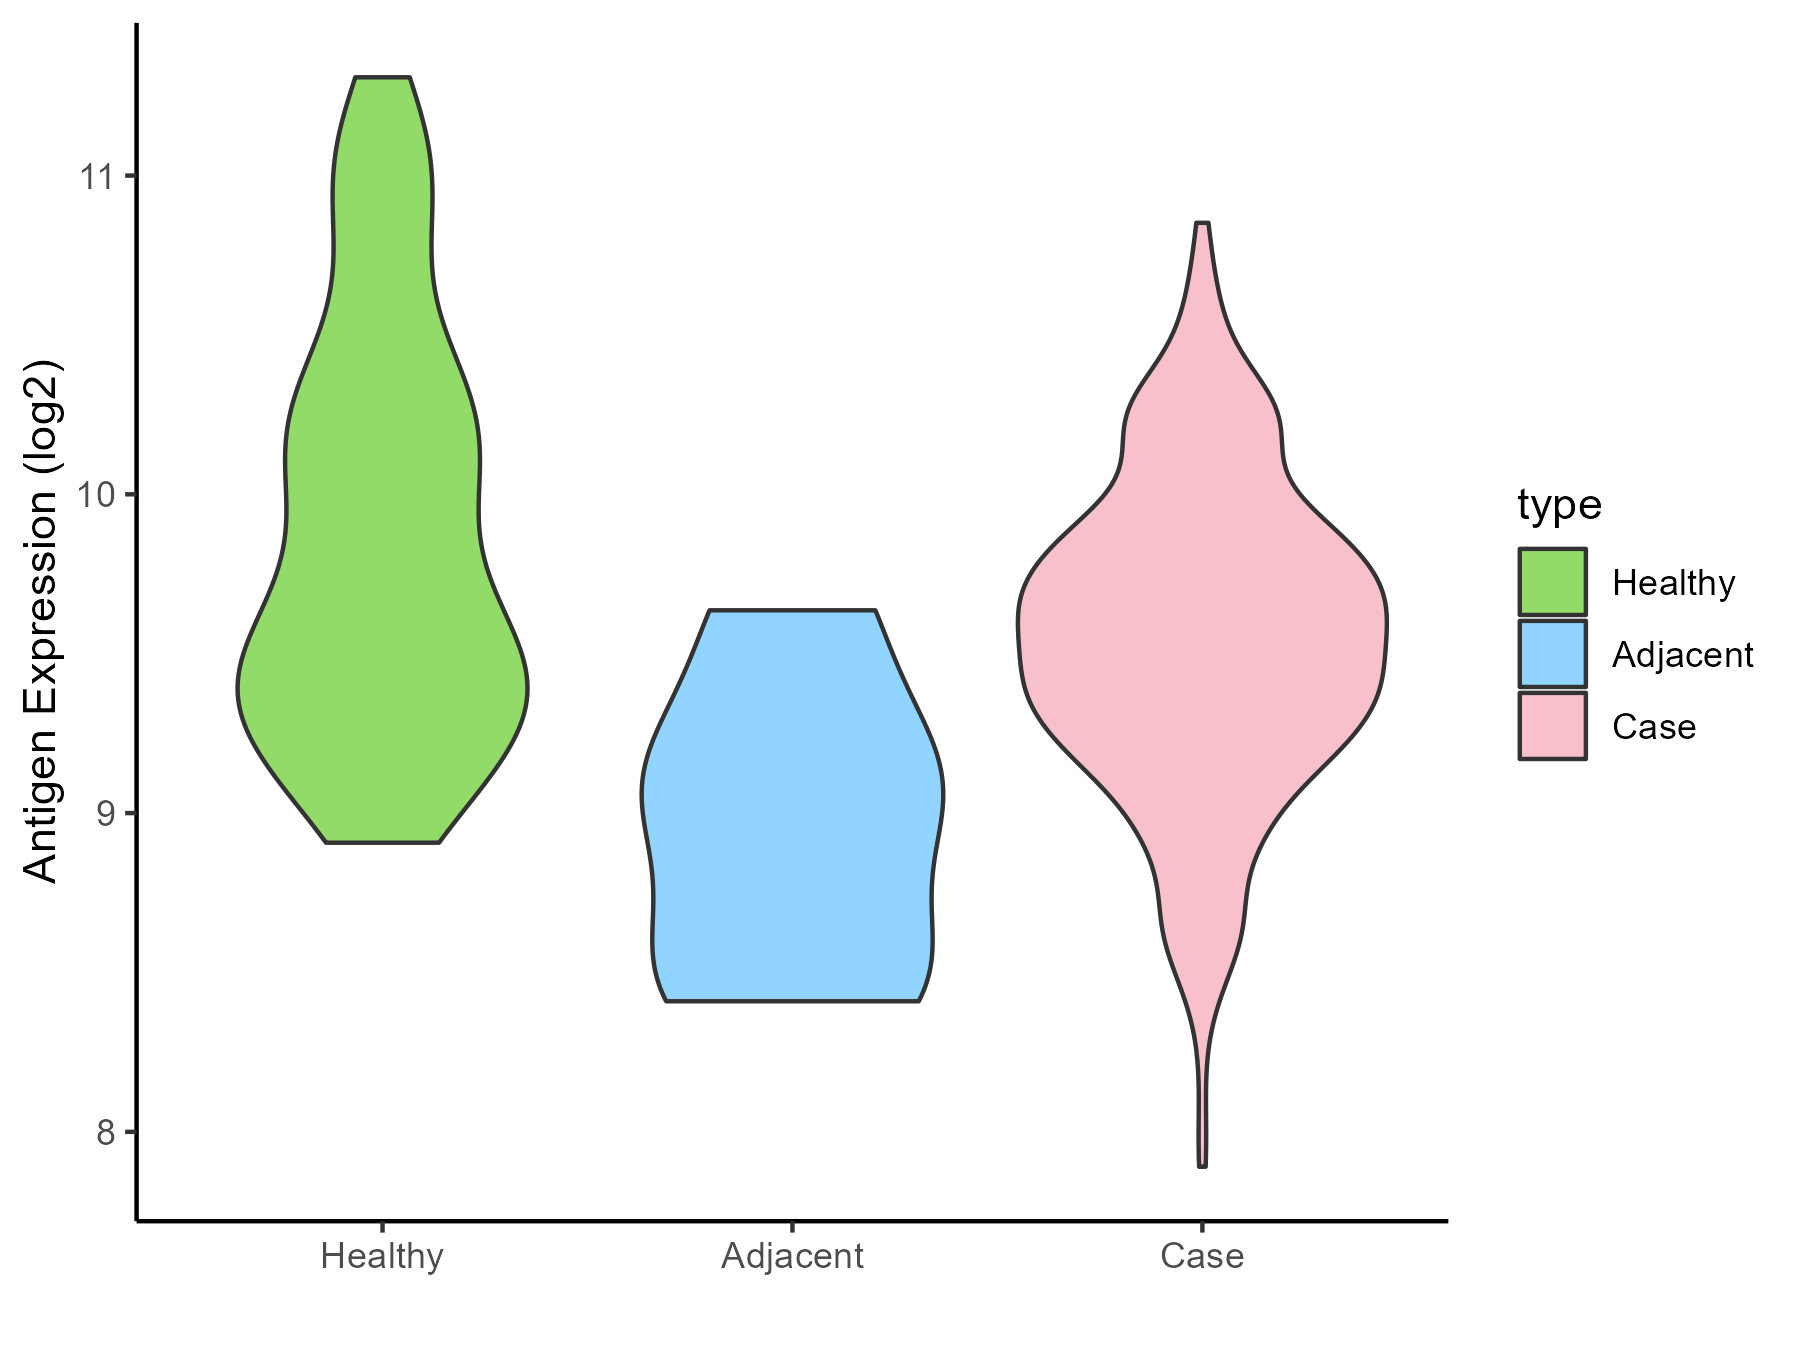
| The Studied Tissue | Endometrium | |
| The Specific Disease | Uterine cancer | |
| The Expression Level of Disease Section Compare with the Healthy Individual Tissue | p-value: 1.07E-06; Fold-change: -0.170163987; Z-score: -0.264337084 | |
| The Expression Level of Disease Section Compare with the Adjacent Tissue | p-value: 0.054666292; Fold-change: 0.494387655; Z-score: 1.010194015 | |
| Disease-specific Antigen Abundances |
|
Click to View the Clearer Original Diagram |
| Differential expression pattern of antigen in diseases | ||
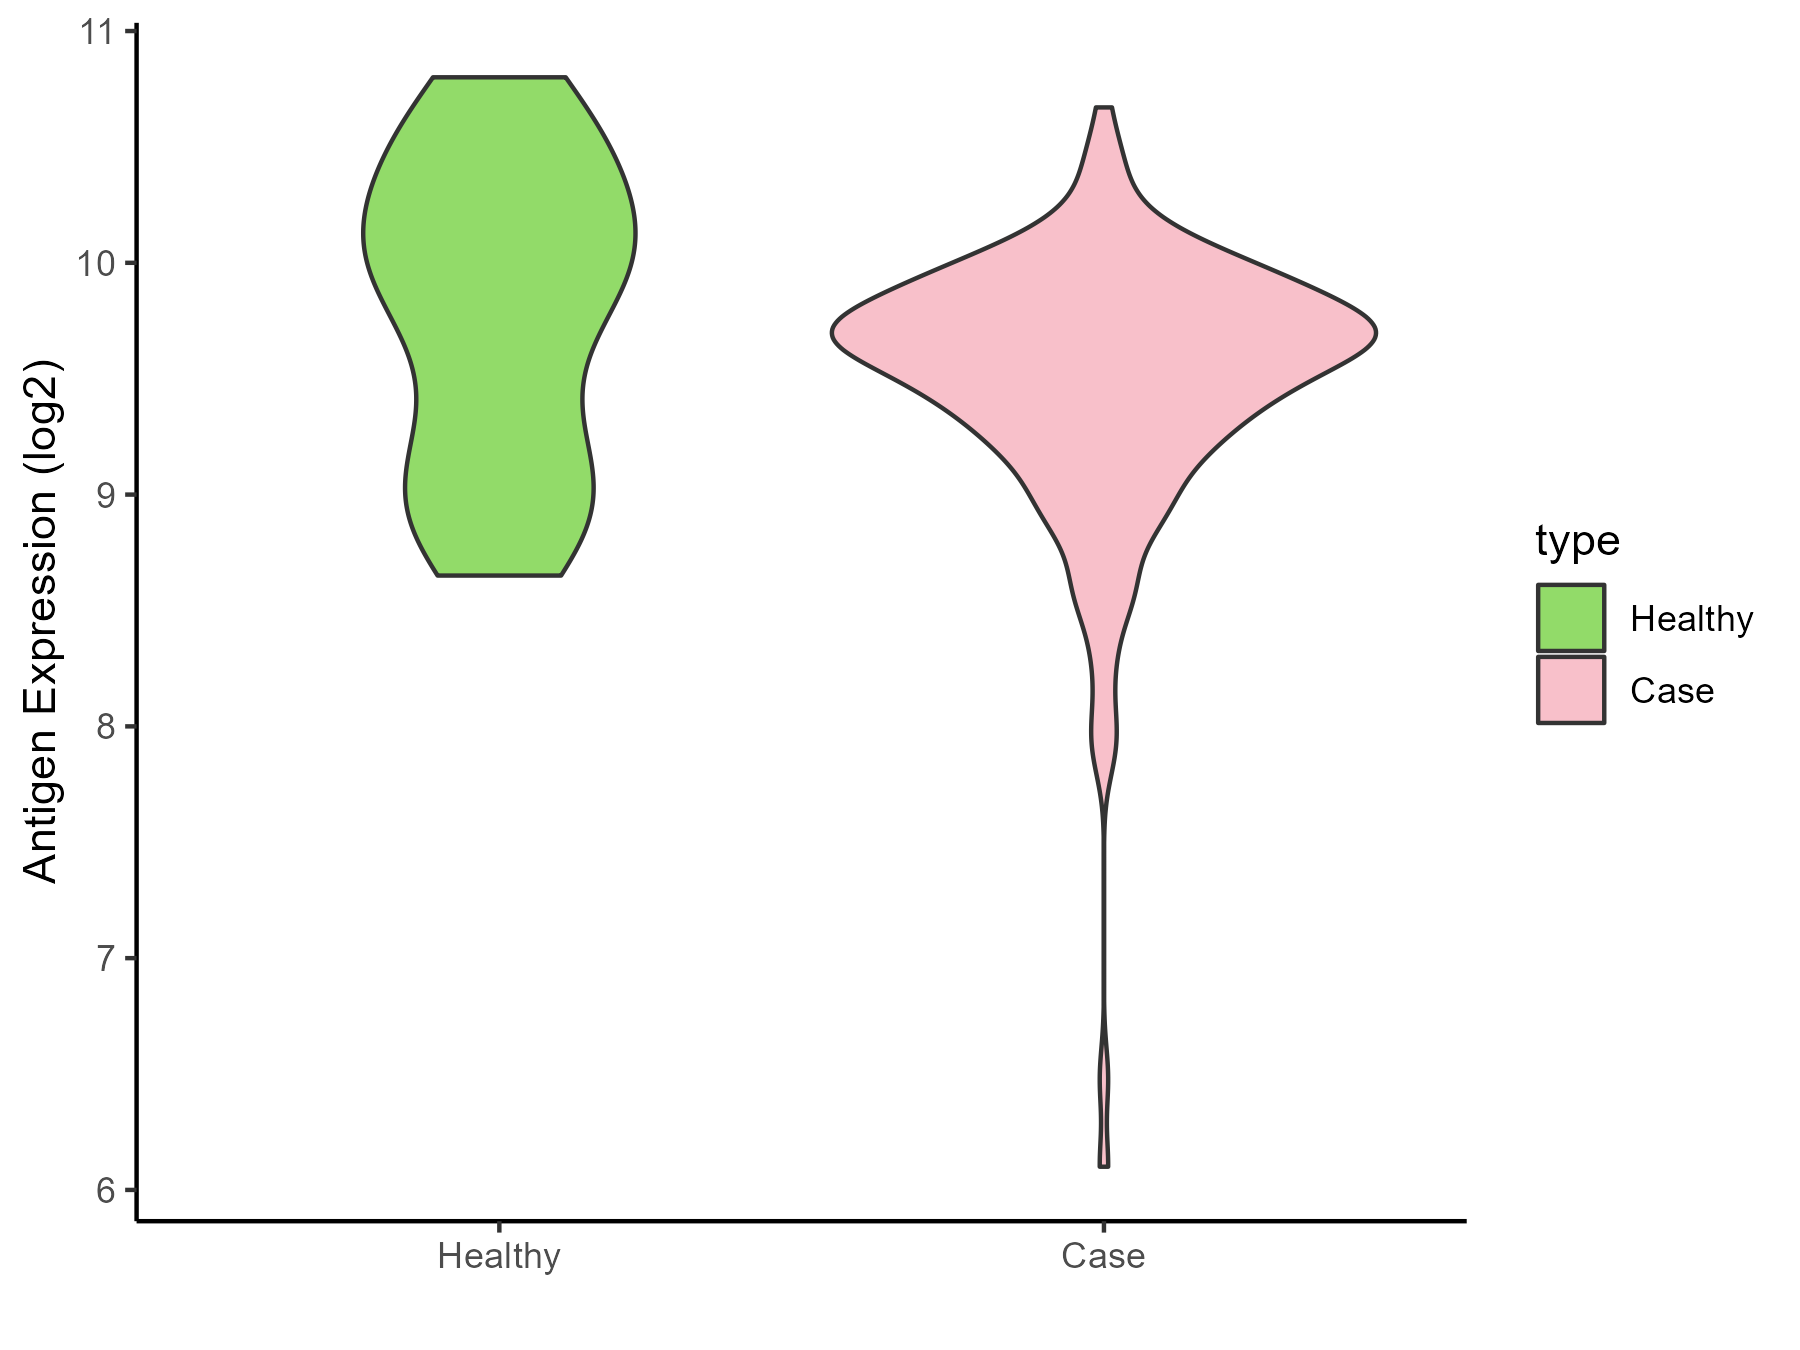
| The Studied Tissue | Prostate | |
| The Specific Disease | Prostate cancer | |
| The Expression Level of Disease Section Compare with the Healthy Individual Tissue | p-value: 0.063478614; Fold-change: -0.312512512; Z-score: -0.472150983 | |
| Disease-specific Antigen Abundances |
|
Click to View the Clearer Original Diagram |
| Differential expression pattern of antigen in diseases | ||
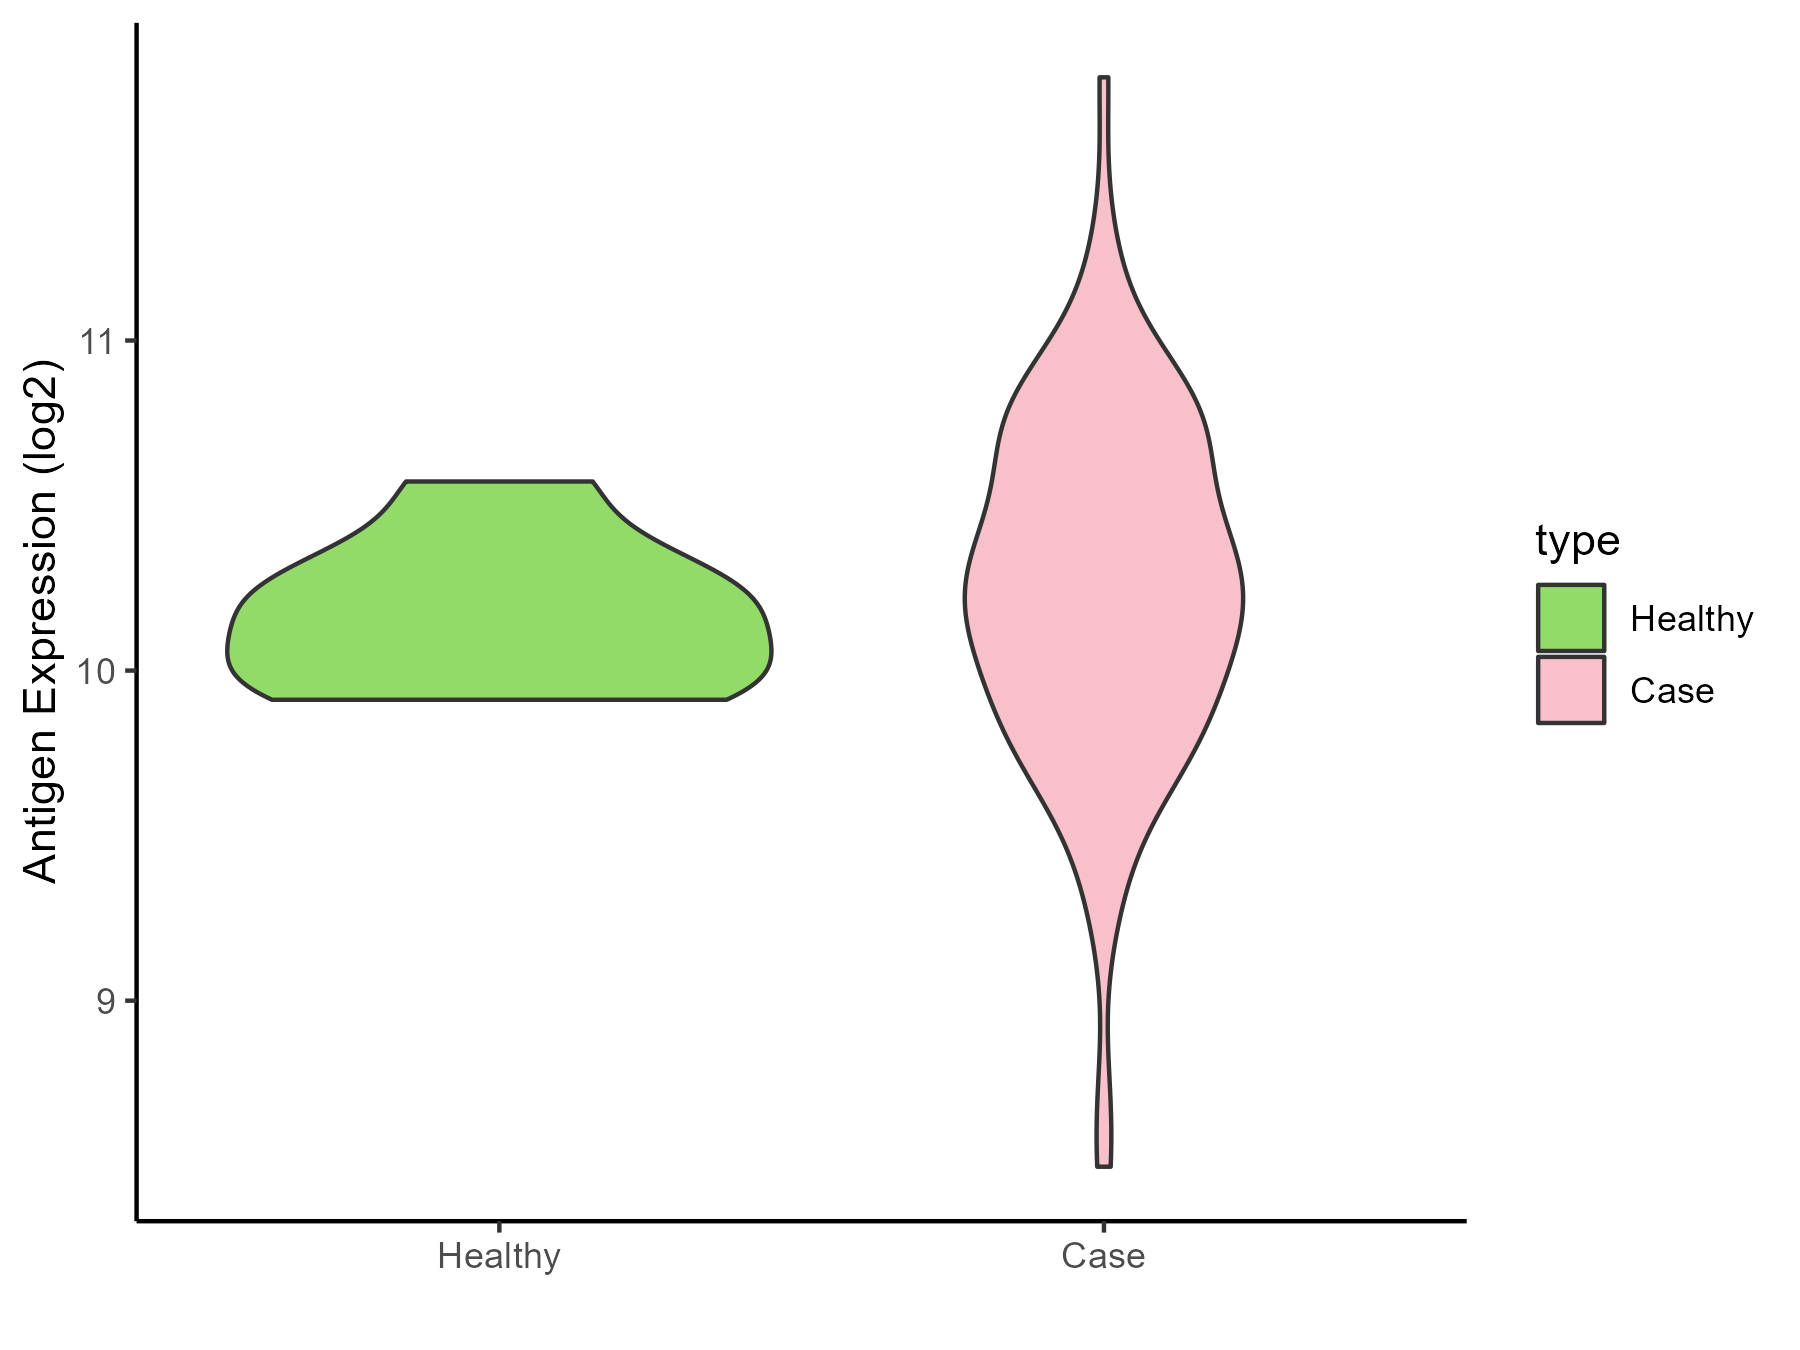
| The Studied Tissue | Bladder | |
| The Specific Disease | Bladder cancer | |
| The Expression Level of Disease Section Compare with the Healthy Individual Tissue | p-value: 0.408786444; Fold-change: 0.106476592; Z-score: 0.45379692 | |
| Disease-specific Antigen Abundances |
|
Click to View the Clearer Original Diagram |
| Differential expression pattern of antigen in diseases | ||
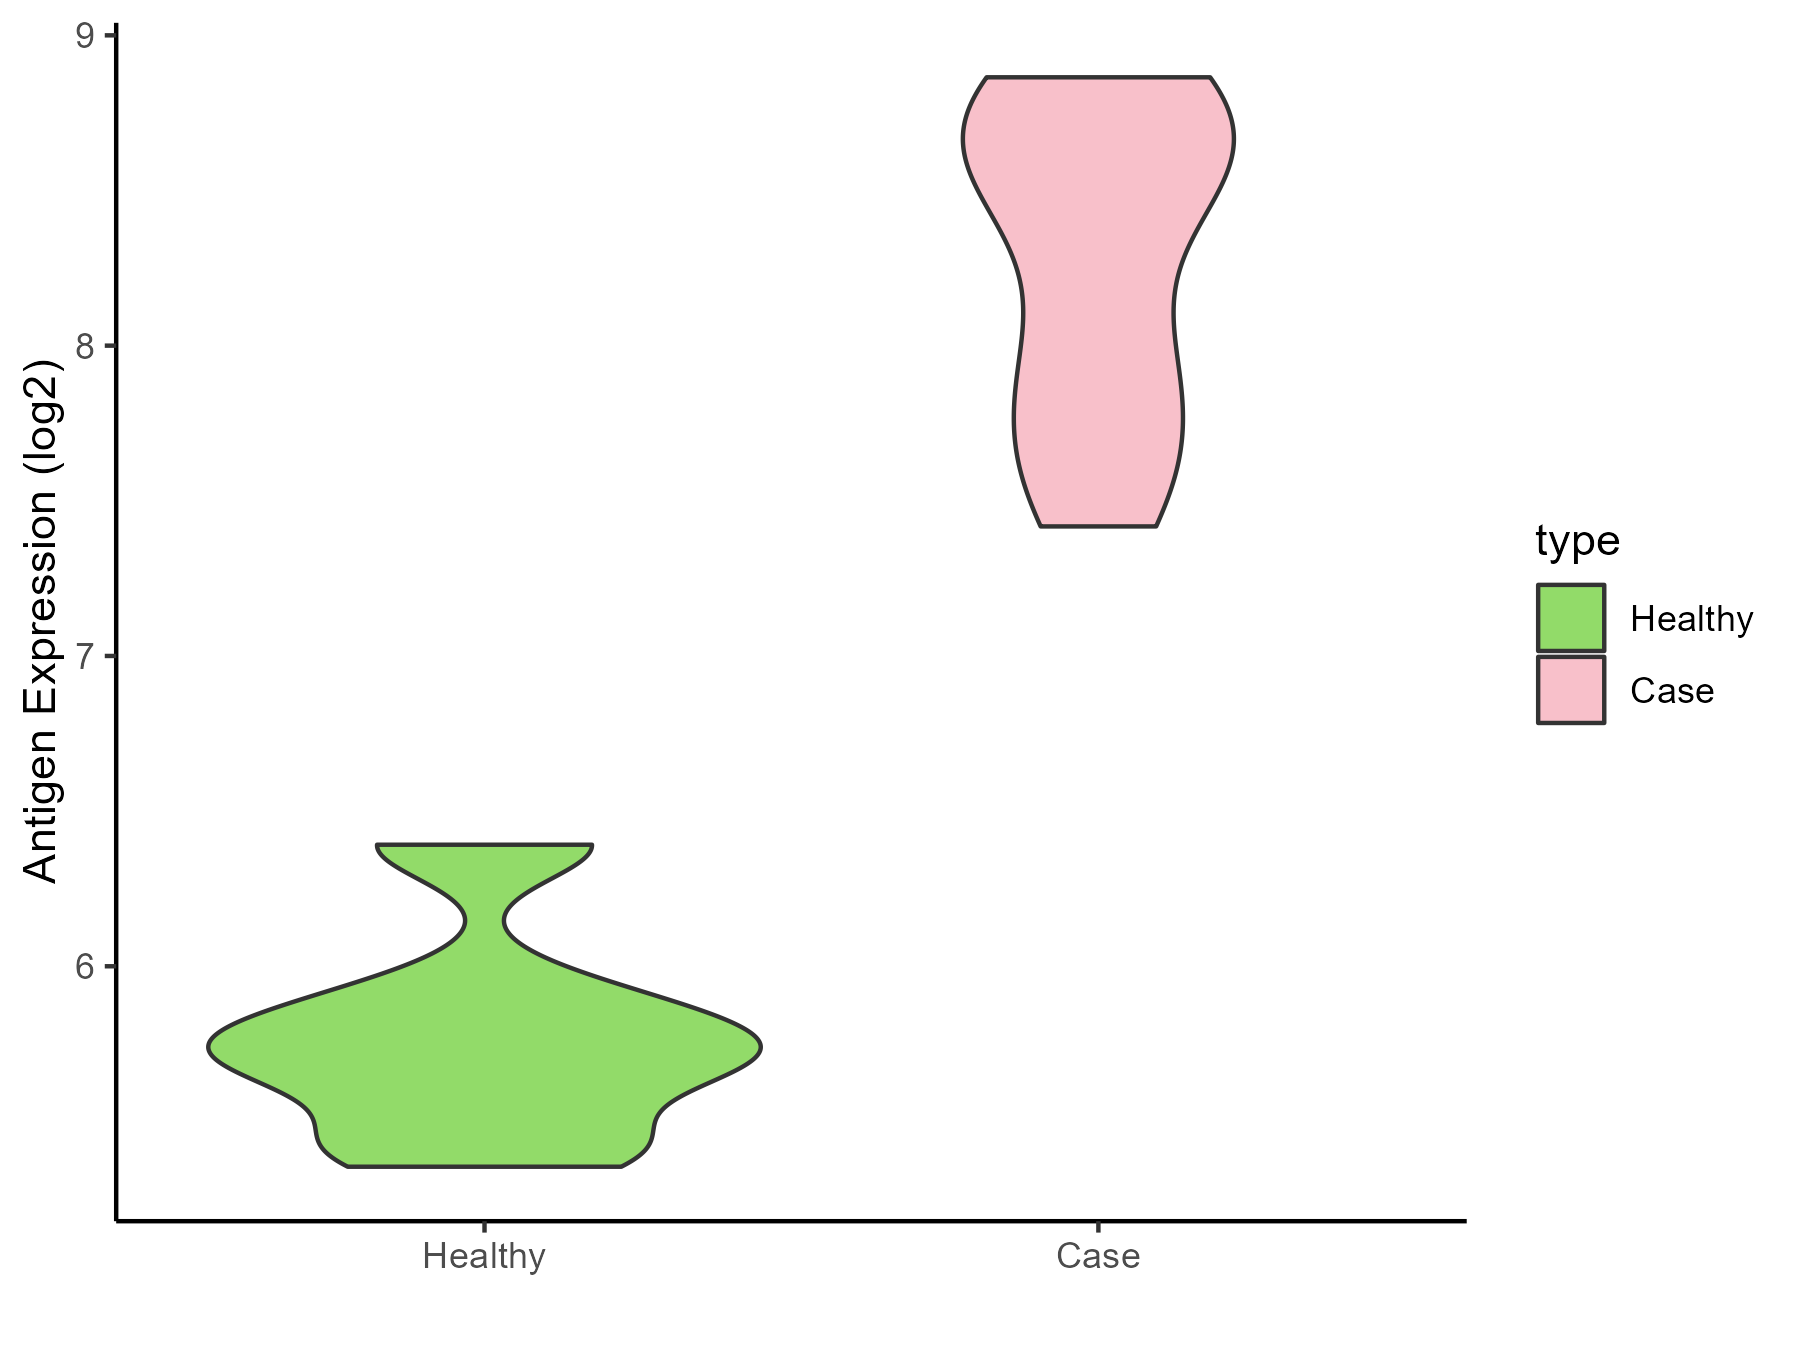
| The Studied Tissue | Uvea | |
| The Specific Disease | Retinoblastoma tumor | |
| The Expression Level of Disease Section Compare with the Healthy Individual Tissue | p-value: 3.79E-13; Fold-change: 2.786739391; Z-score: 8.335911379 | |
| Disease-specific Antigen Abundances |
|
Click to View the Clearer Original Diagram |
| Differential expression pattern of antigen in diseases | ||
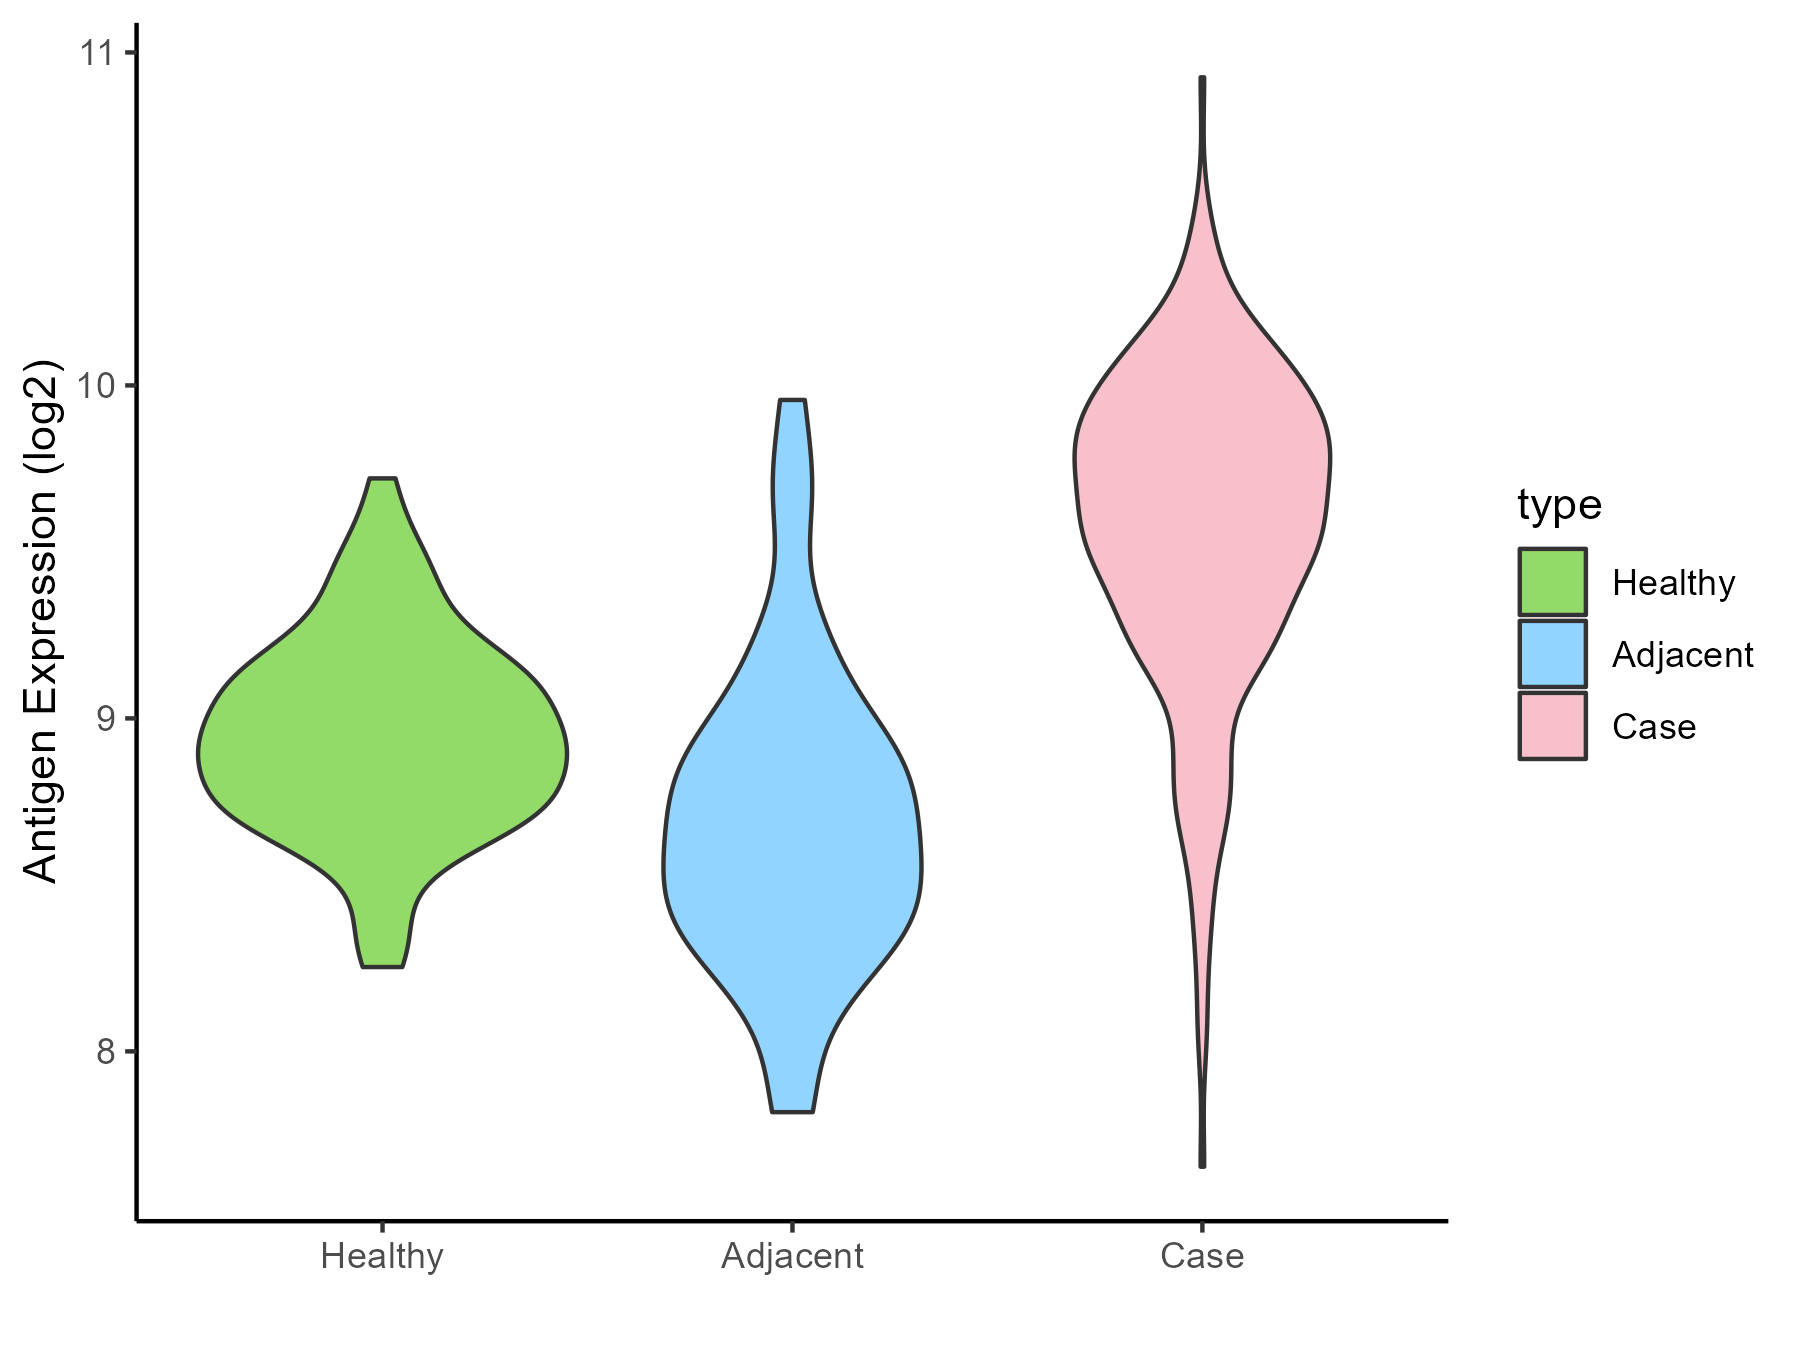
| The Studied Tissue | Thyroid | |
| The Specific Disease | Thyroid cancer | |
| The Expression Level of Disease Section Compare with the Healthy Individual Tissue | p-value: 3.36E-38; Fold-change: 0.716905234; Z-score: 2.432688964 | |
| The Expression Level of Disease Section Compare with the Adjacent Tissue | p-value: 6.88E-16; Fold-change: 0.986210945; Z-score: 2.149915133 | |
| Disease-specific Antigen Abundances |
|
Click to View the Clearer Original Diagram |
| Differential expression pattern of antigen in diseases | ||
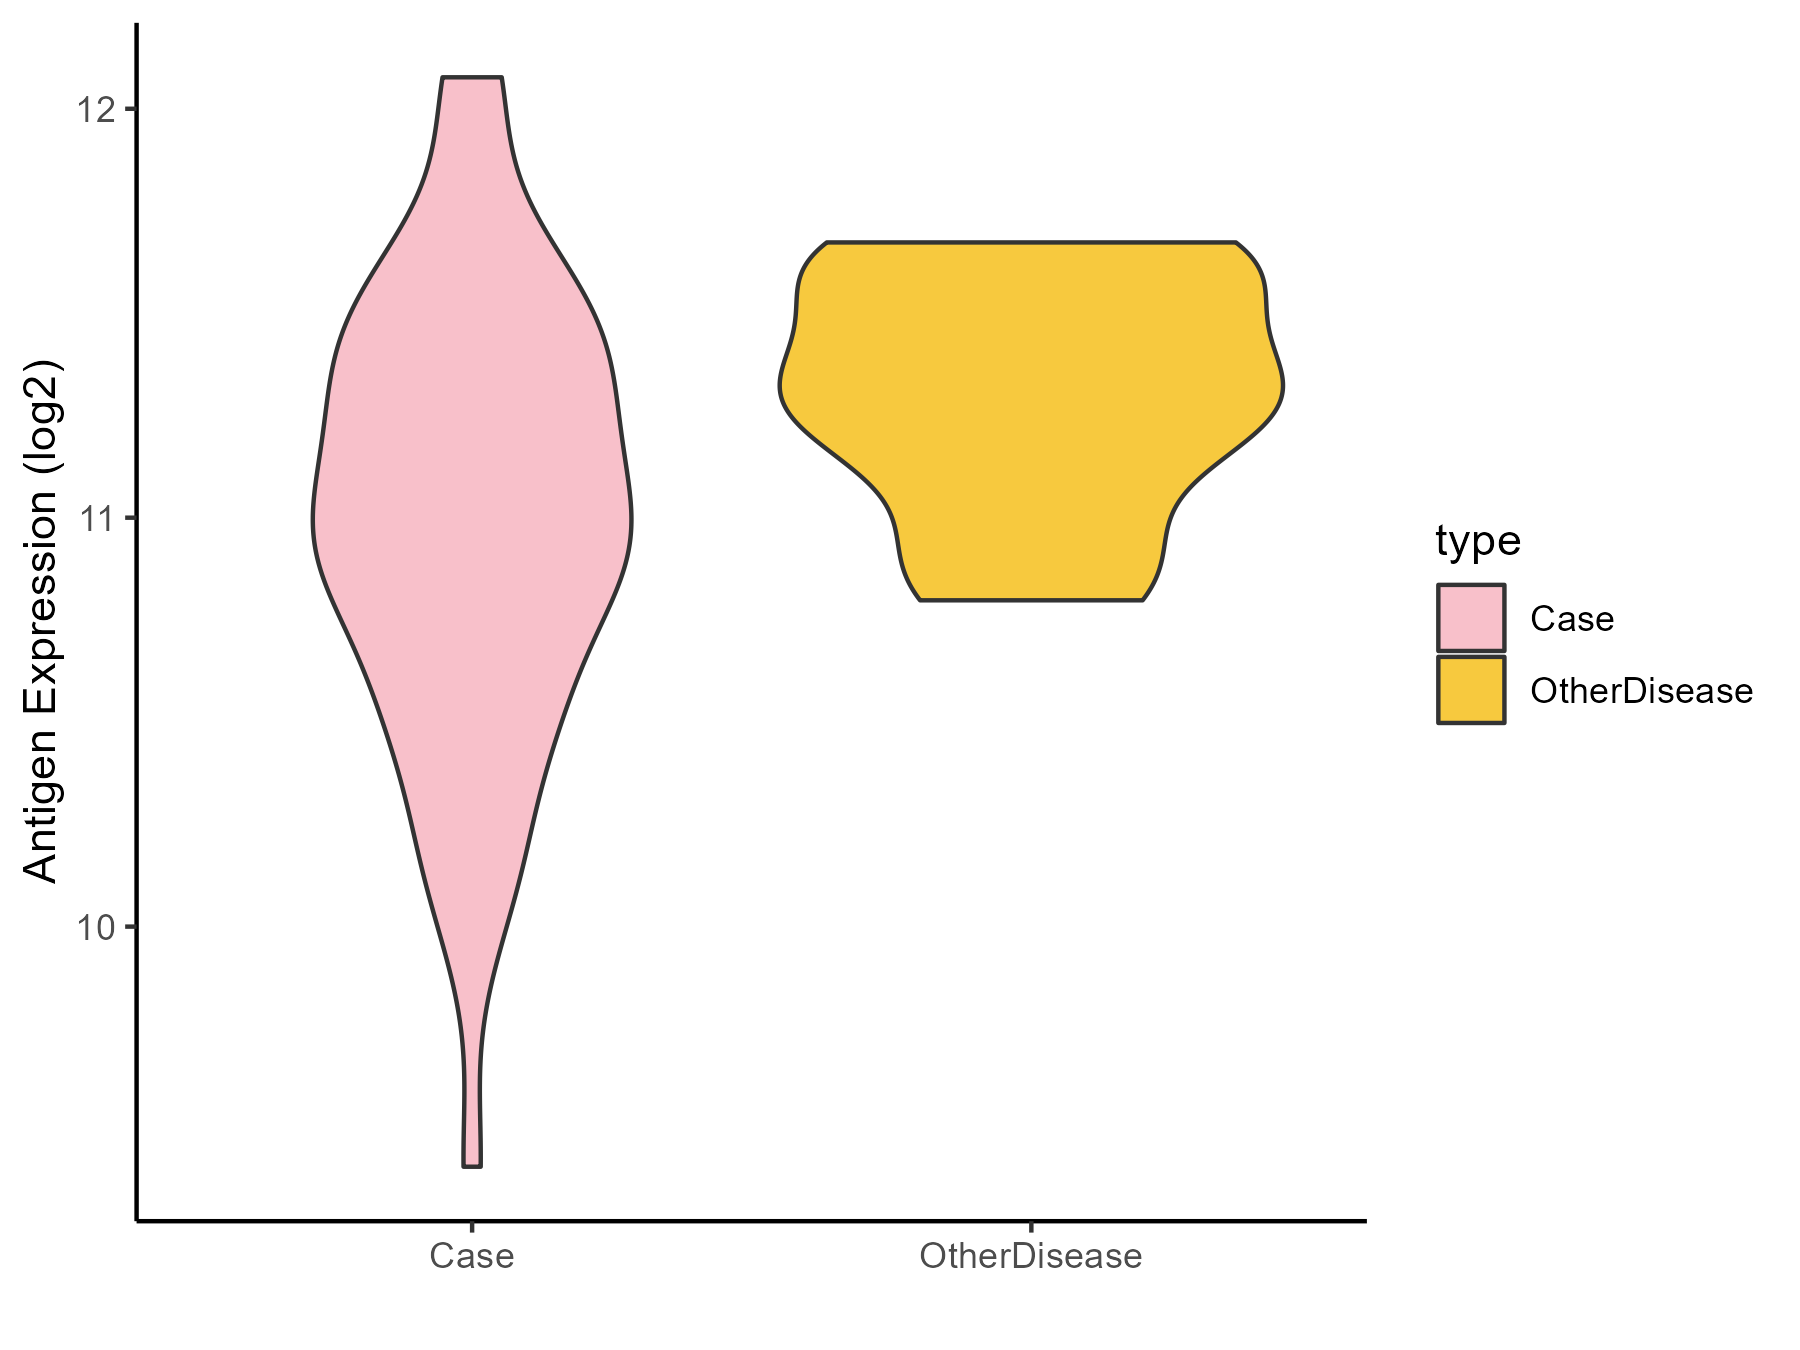
| The Studied Tissue | Adrenal cortex | |
| The Specific Disease | Adrenocortical carcinoma | |
| The Expression Level of Disease Section Compare with the Other Disease Section | p-value: 0.001130596; Fold-change: -0.334424633; Z-score: -1.124741265 | |
| Disease-specific Antigen Abundances |
|
Click to View the Clearer Original Diagram |
| Differential expression pattern of antigen in diseases | ||
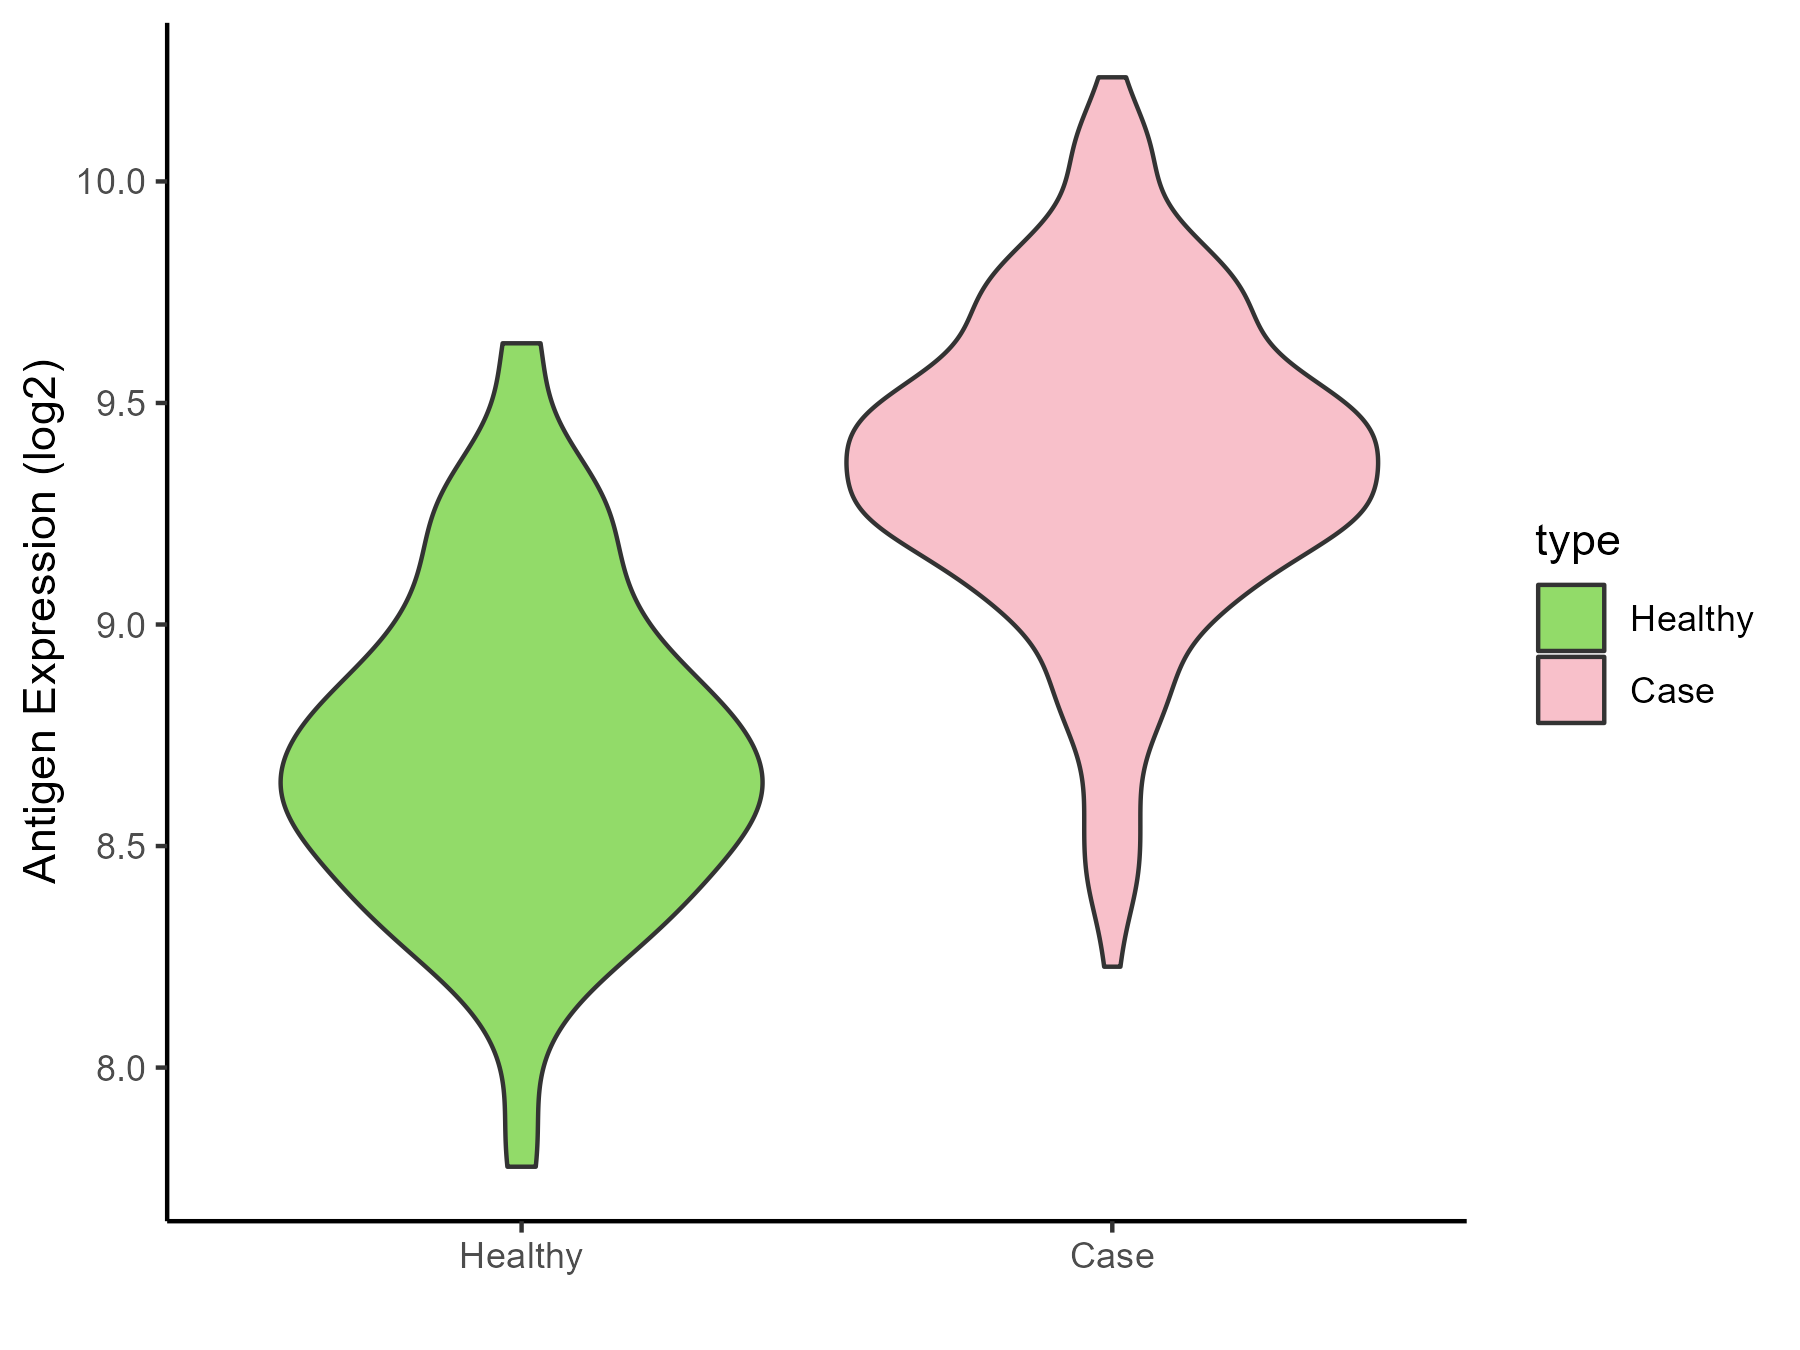
| The Studied Tissue | Head and neck | |
| The Specific Disease | Head and neck cancer | |
| The Expression Level of Disease Section Compare with the Healthy Individual Tissue | p-value: 2.15E-28; Fold-change: 0.705480495; Z-score: 1.937157873 | |
| Disease-specific Antigen Abundances |
|
Click to View the Clearer Original Diagram |
| Differential expression pattern of antigen in diseases | ||
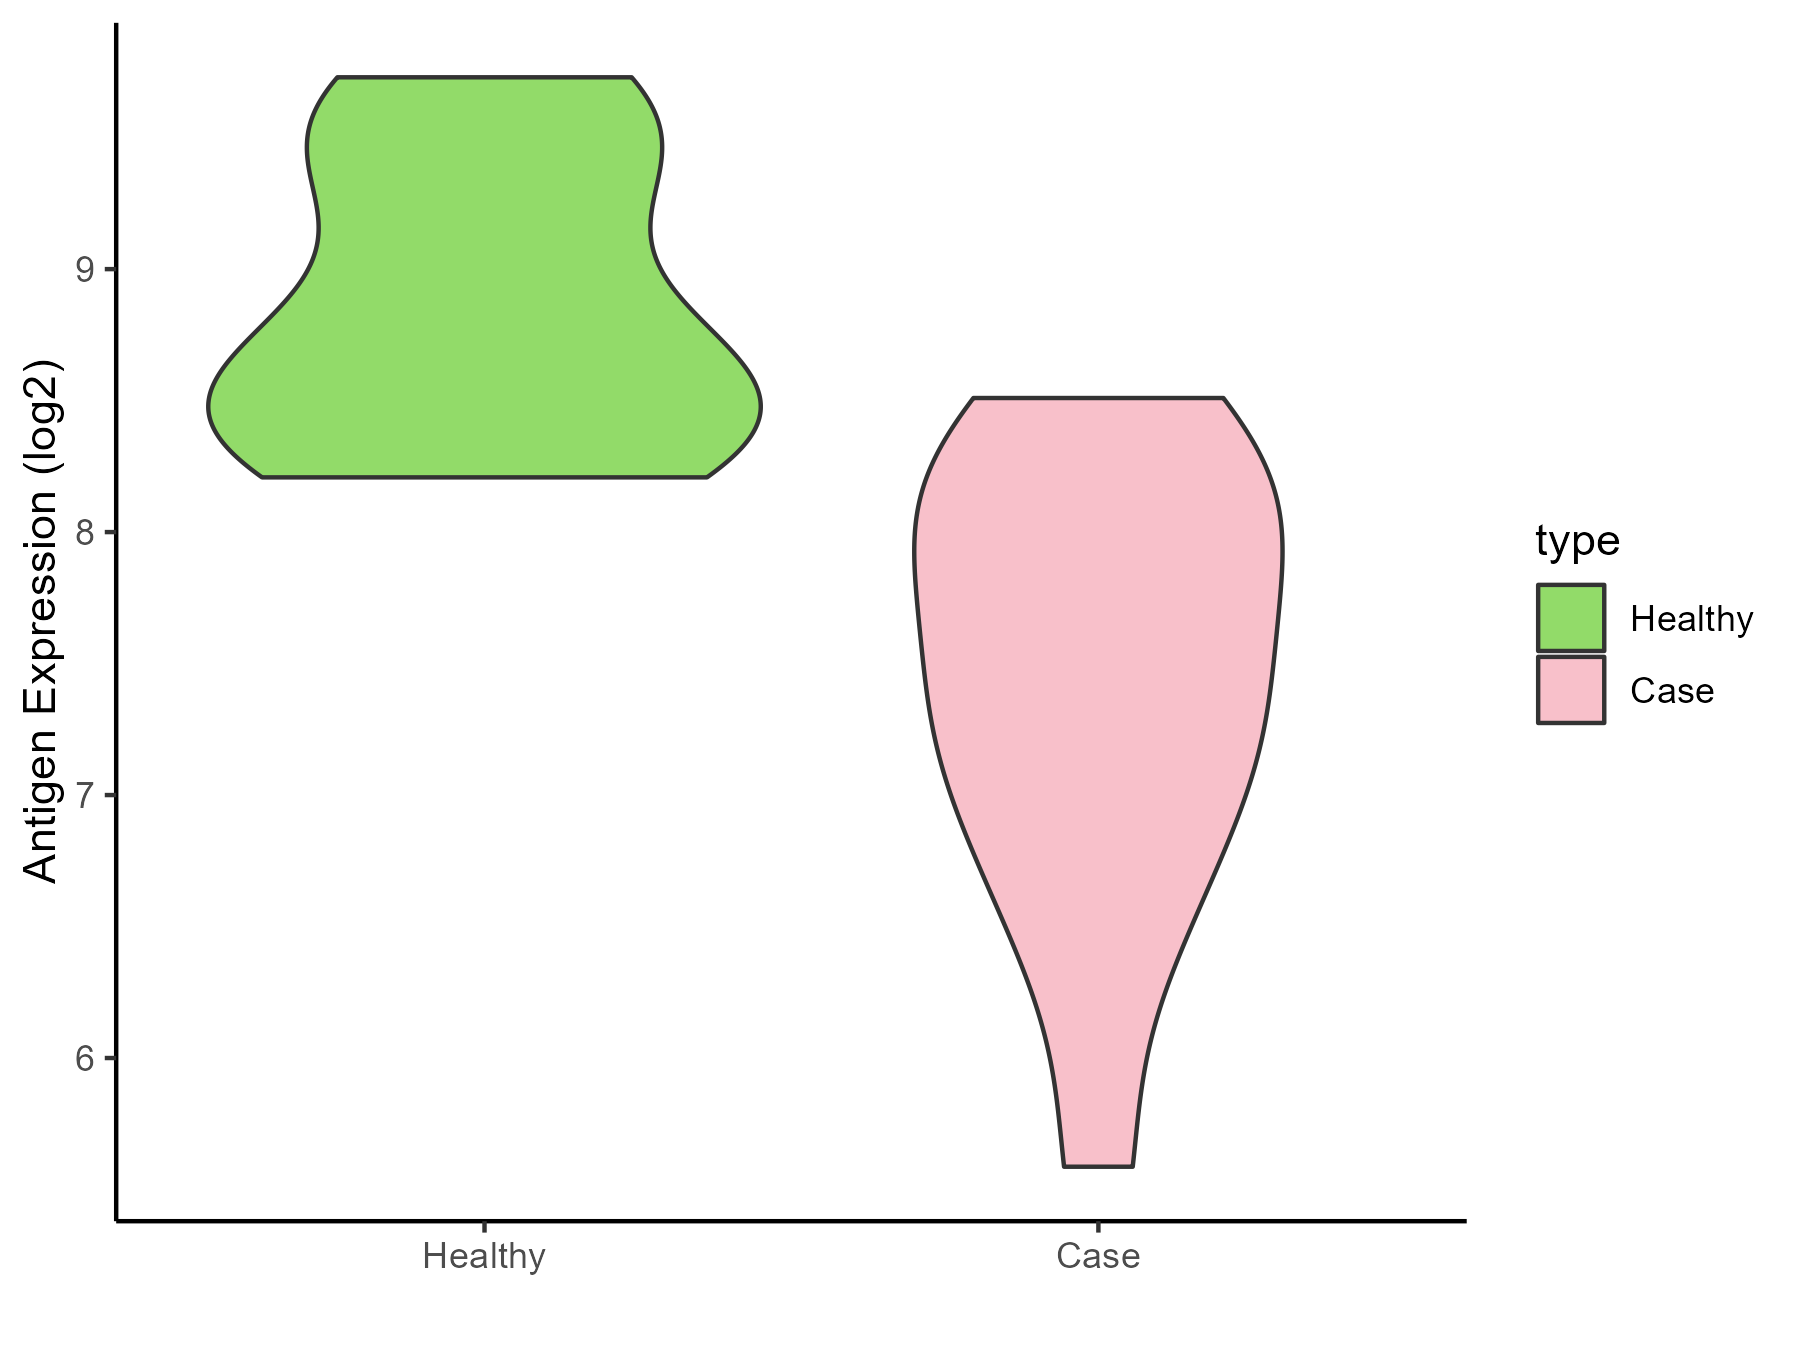
| The Studied Tissue | Pituitary | |
| The Specific Disease | Pituitary gonadotrope tumor | |
| The Expression Level of Disease Section Compare with the Healthy Individual Tissue | p-value: 8.46E-05; Fold-change: -1.061483432; Z-score: -1.852021905 | |
| Disease-specific Antigen Abundances |
|
Click to View the Clearer Original Diagram |
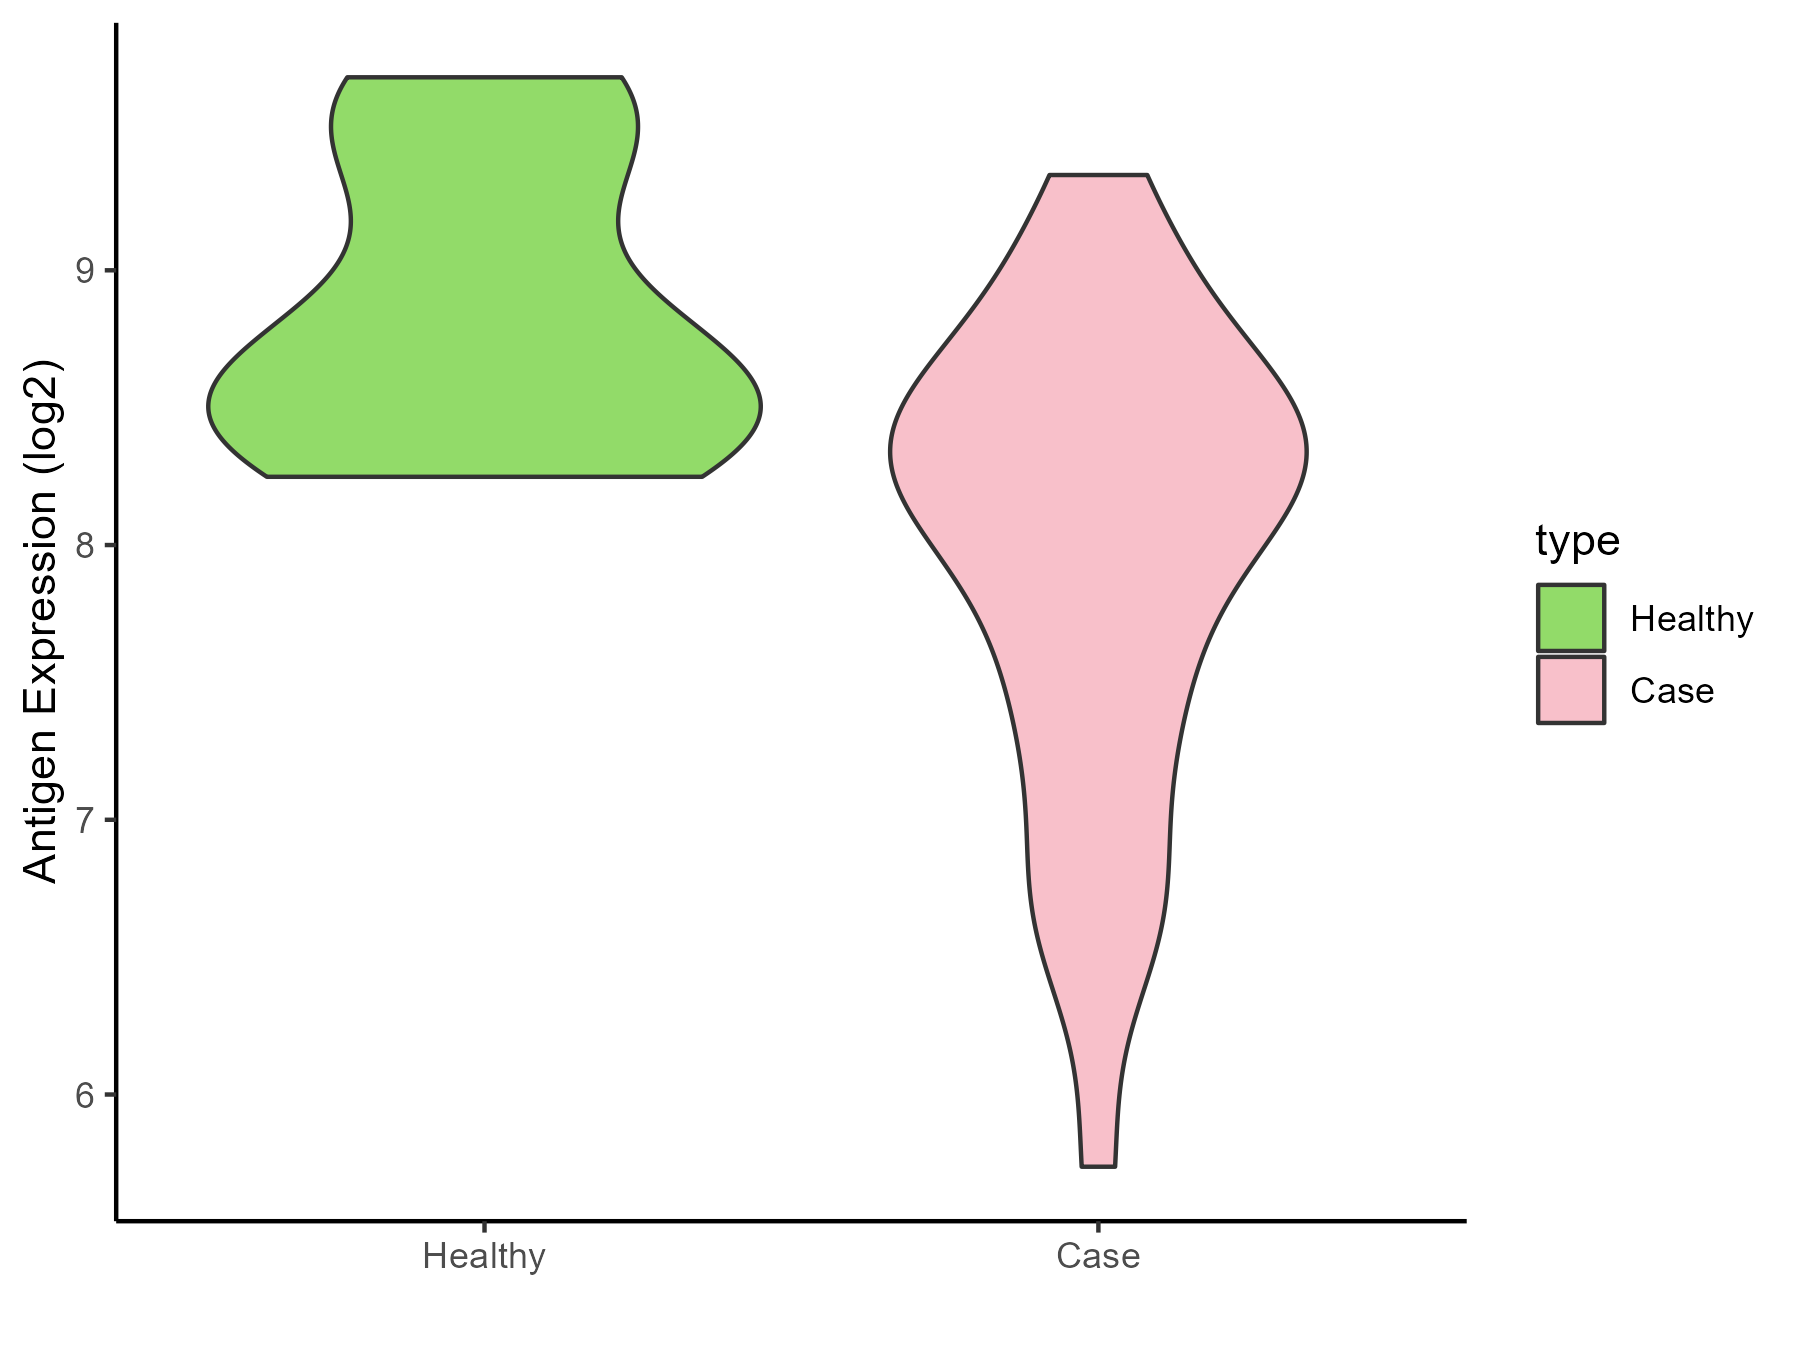
| The Studied Tissue | Pituitary | |
| The Specific Disease | Pituitary cancer | |
| The Expression Level of Disease Section Compare with the Healthy Individual Tissue | p-value: 0.000491061; Fold-change: -0.391519193; Z-score: -0.716583326 | |
| Disease-specific Antigen Abundances |
|
Click to View the Clearer Original Diagram |
ICD Disease Classification 03
| Differential expression pattern of antigen in diseases | ||
| The Studied Tissue | Whole blood | |
| The Specific Disease | Thrombocytopenia | |
| The Expression Level of Disease Section Compare with the Healthy Individual Tissue | p-value: 0.815908145; Fold-change: 0.062592346; Z-score: 0.078917283 | |
| Disease-specific Antigen Abundances |

|
Click to View the Clearer Original Diagram |
ICD Disease Classification 04
| Differential expression pattern of antigen in diseases | ||
| The Studied Tissue | Whole blood | |
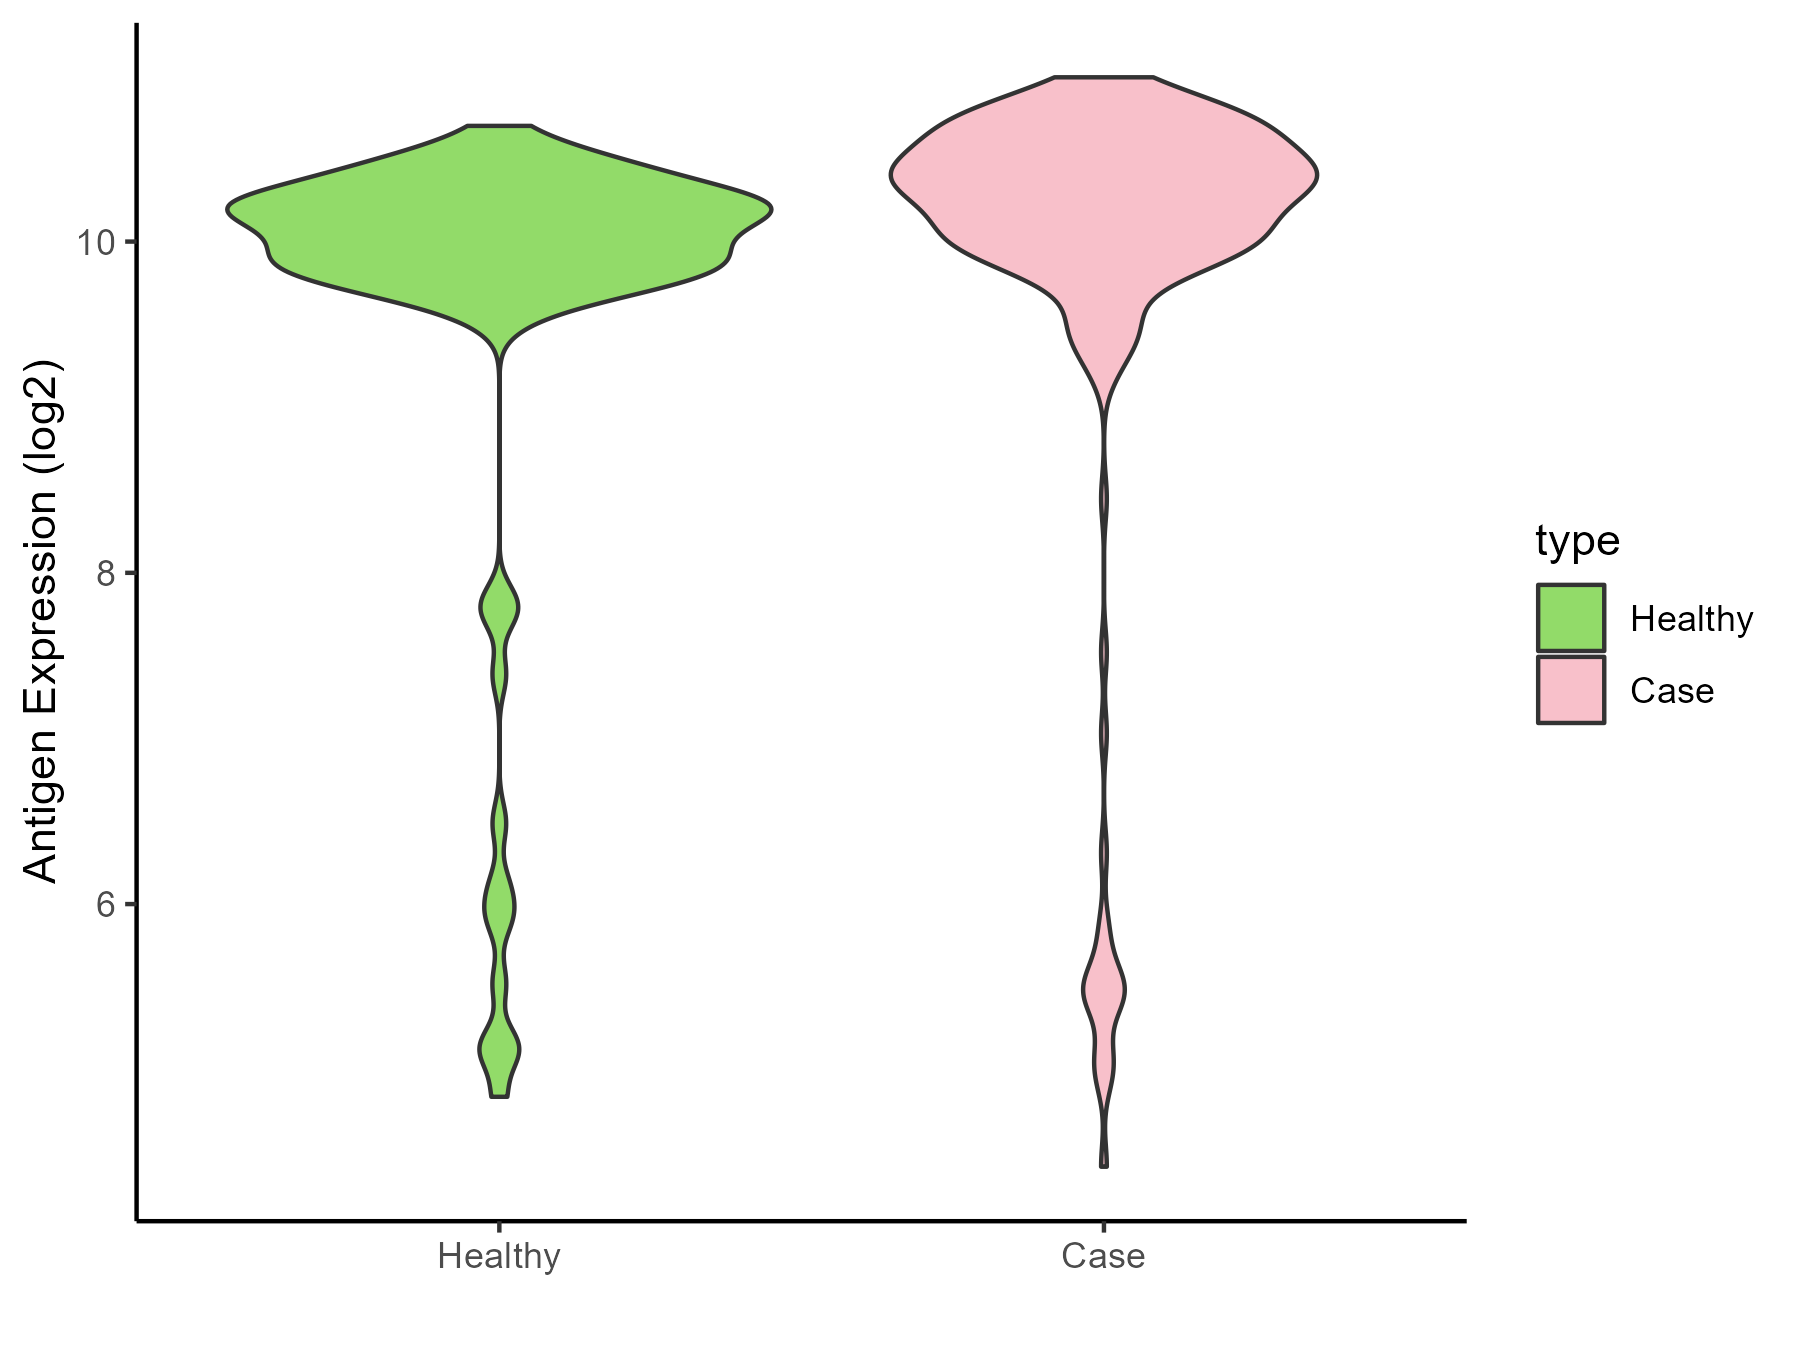
| The Specific Disease | Lupus erythematosus | |
| The Expression Level of Disease Section Compare with the Healthy Individual Tissue | p-value: 0.05556023; Fold-change: 0.229096884; Z-score: 0.178235417 | |
| Disease-specific Antigen Abundances |
|
Click to View the Clearer Original Diagram |
| Differential expression pattern of antigen in diseases | ||
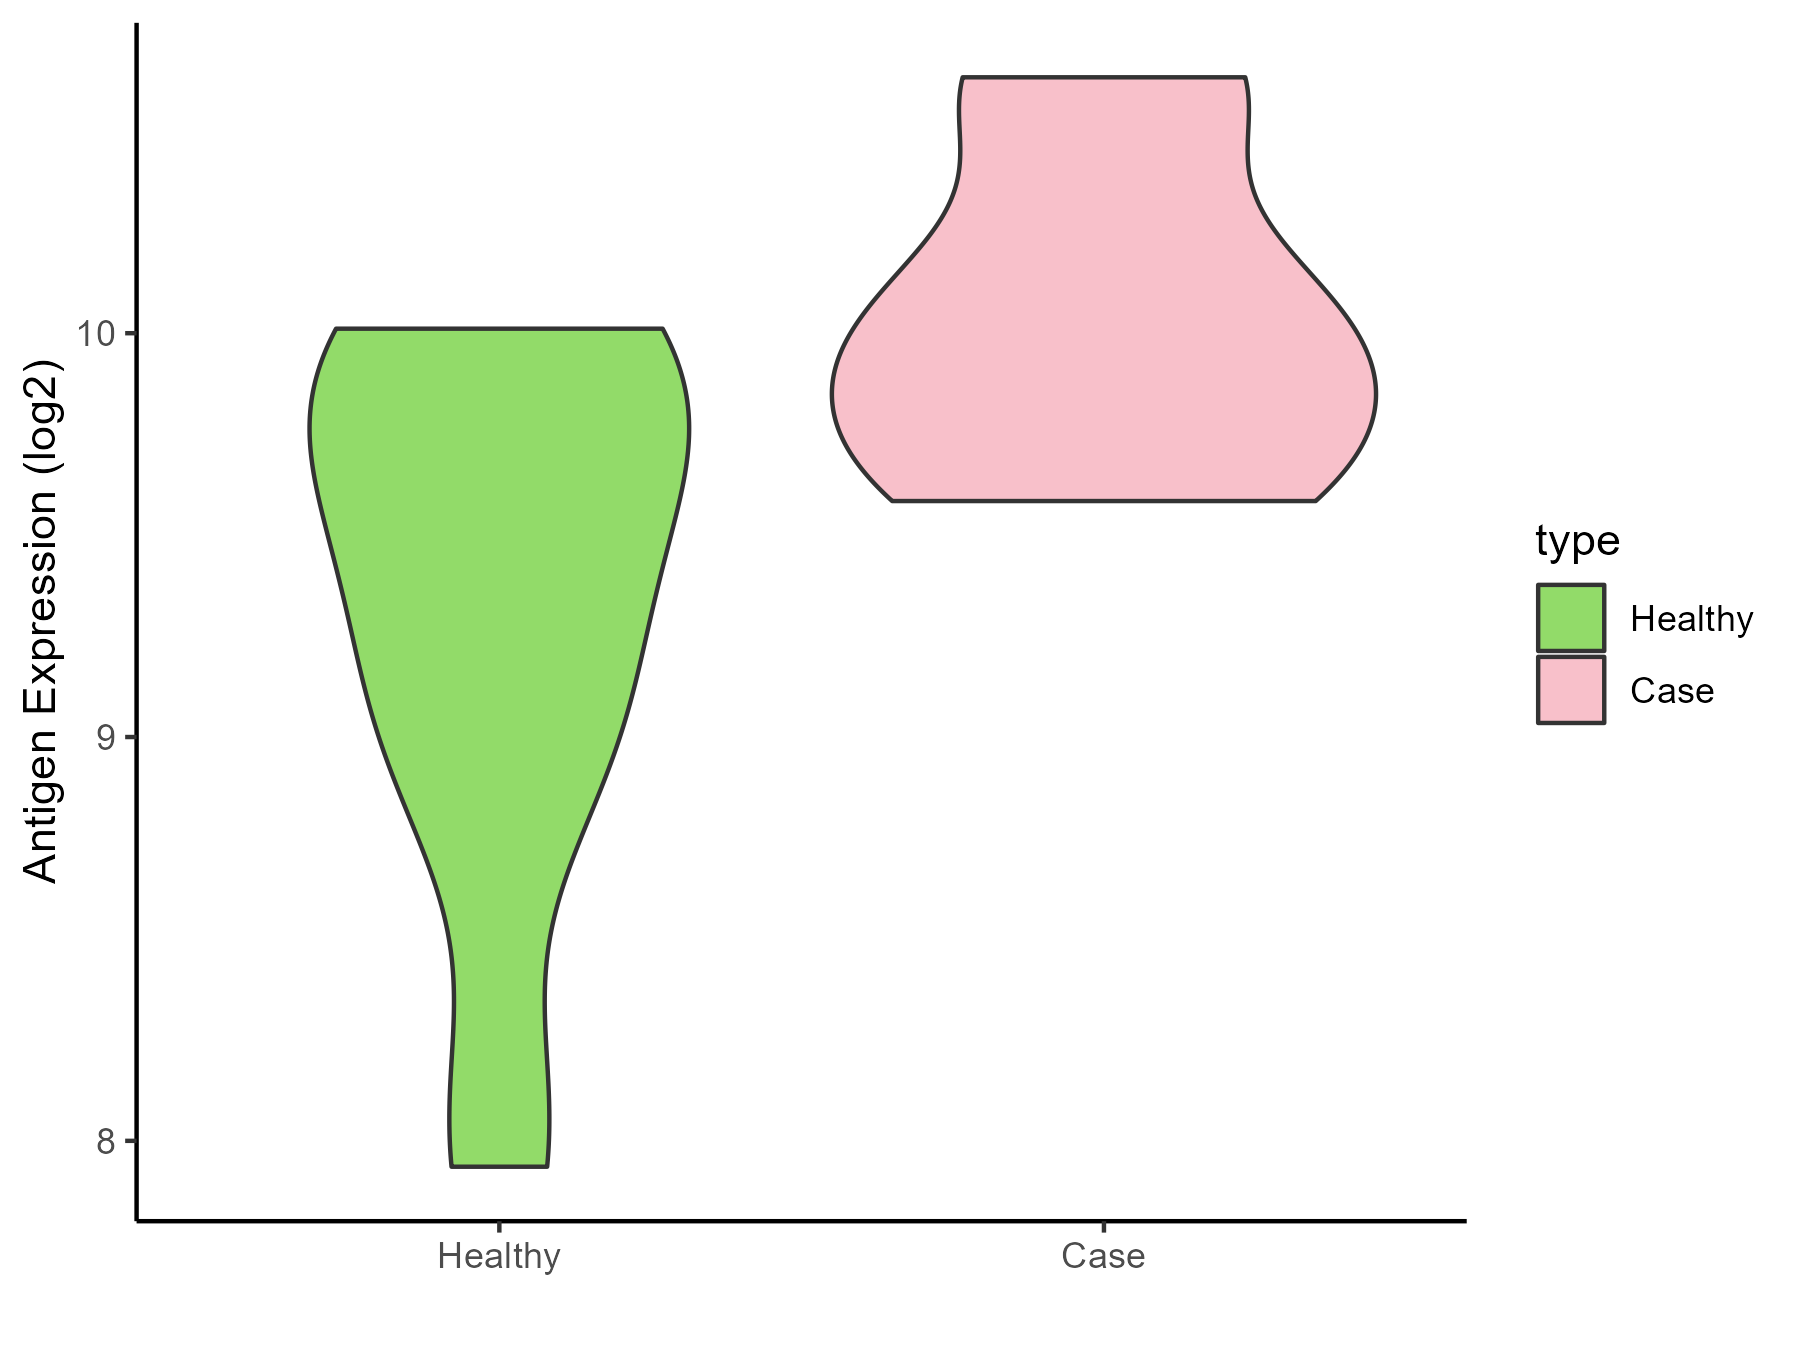
| The Studied Tissue | Peripheral monocyte | |
| The Specific Disease | Autoimmune uveitis | |
| The Expression Level of Disease Section Compare with the Healthy Individual Tissue | p-value: 0.042136337; Fold-change: 0.410125625; Z-score: 0.61262029 | |
| Disease-specific Antigen Abundances |
|
Click to View the Clearer Original Diagram |
ICD Disease Classification 05
| Differential expression pattern of antigen in diseases | ||
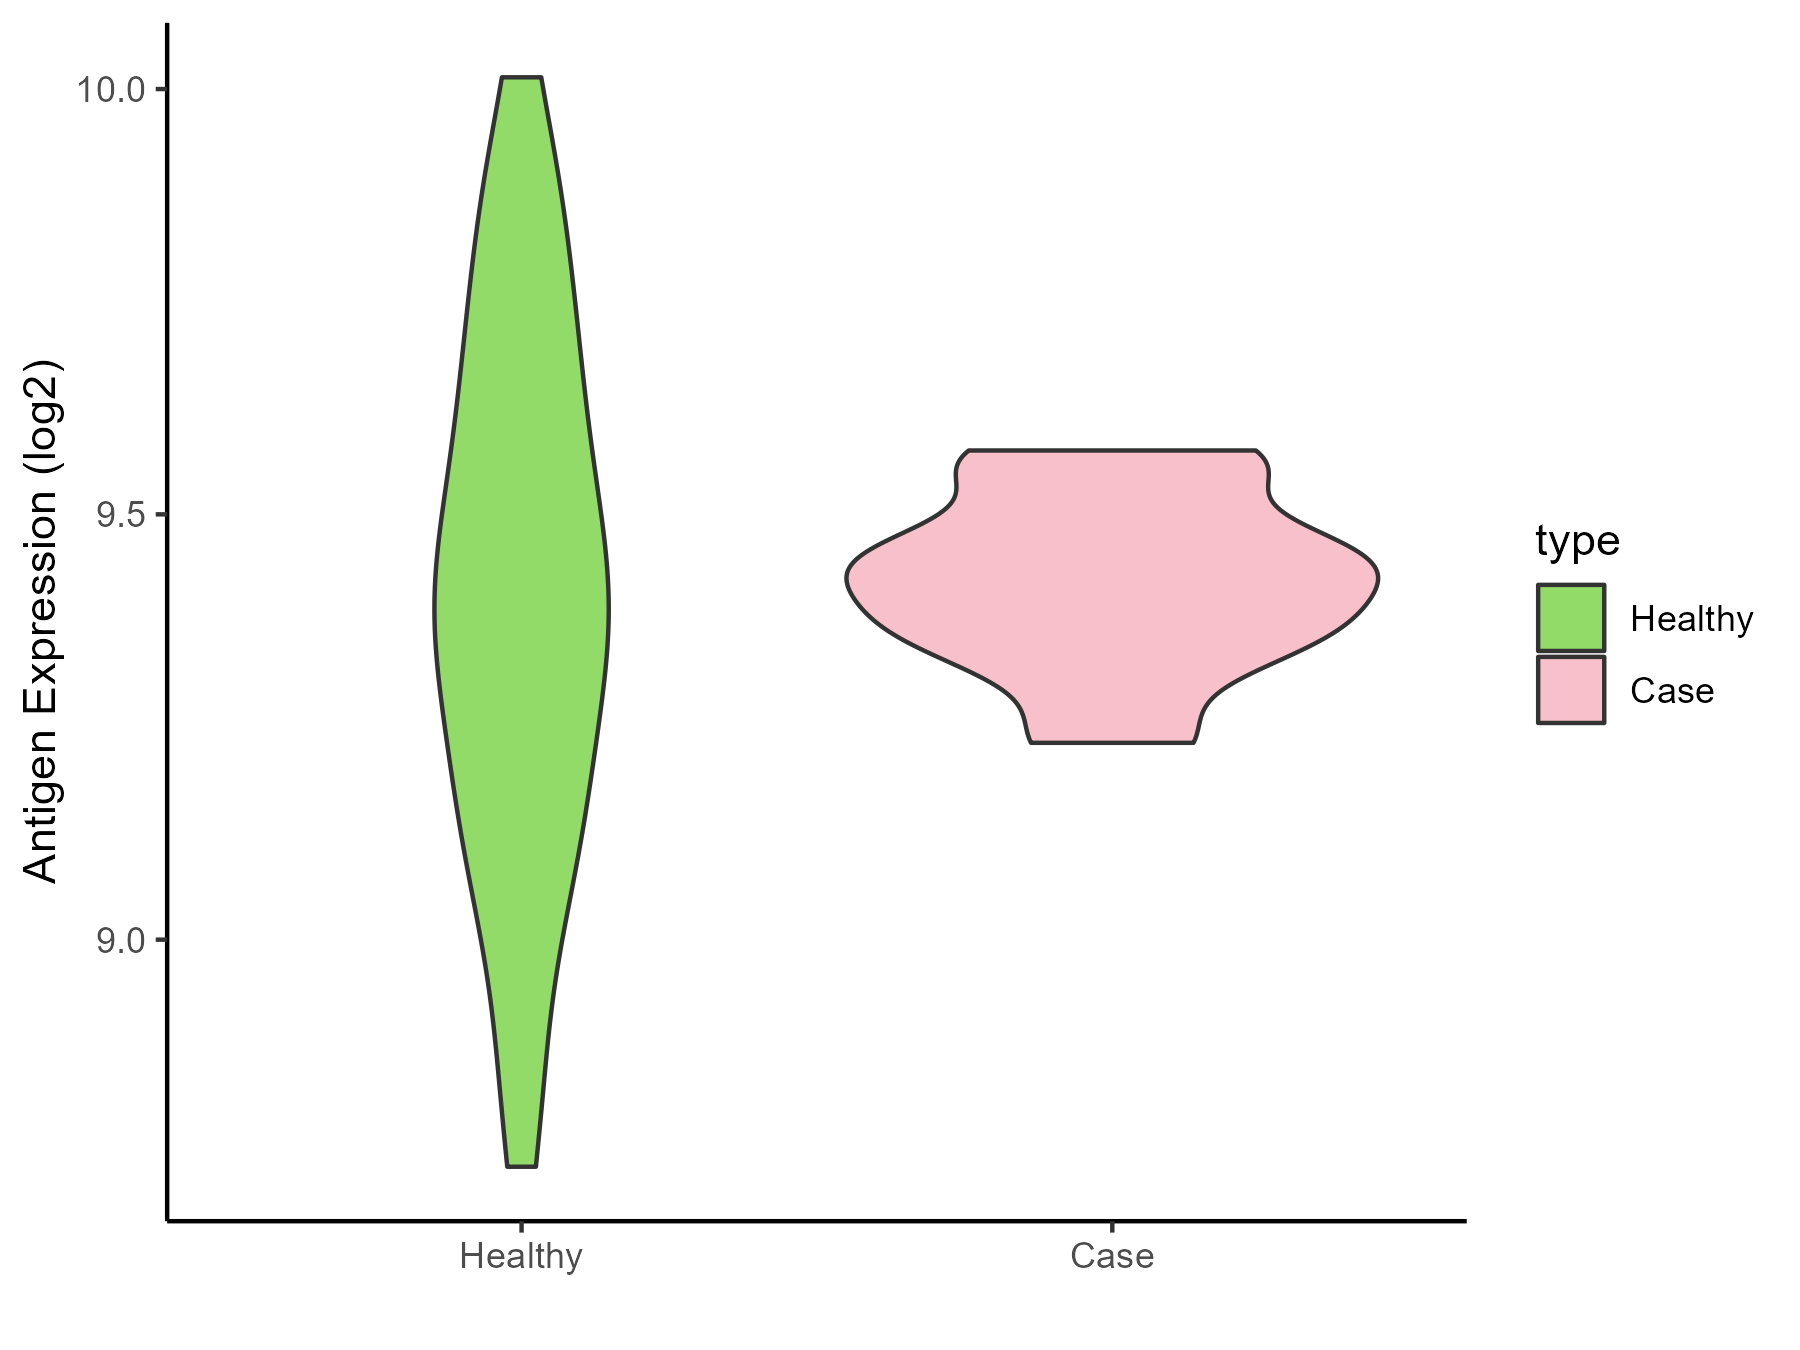
| The Studied Tissue | Whole blood | |
| The Specific Disease | Familial hypercholesterolemia | |
| The Expression Level of Disease Section Compare with the Healthy Individual Tissue | p-value: 0.778641202; Fold-change: 0.042102353; Z-score: 0.136902284 | |
| Disease-specific Antigen Abundances |
|
Click to View the Clearer Original Diagram |
ICD Disease Classification 06
| Differential expression pattern of antigen in diseases | ||
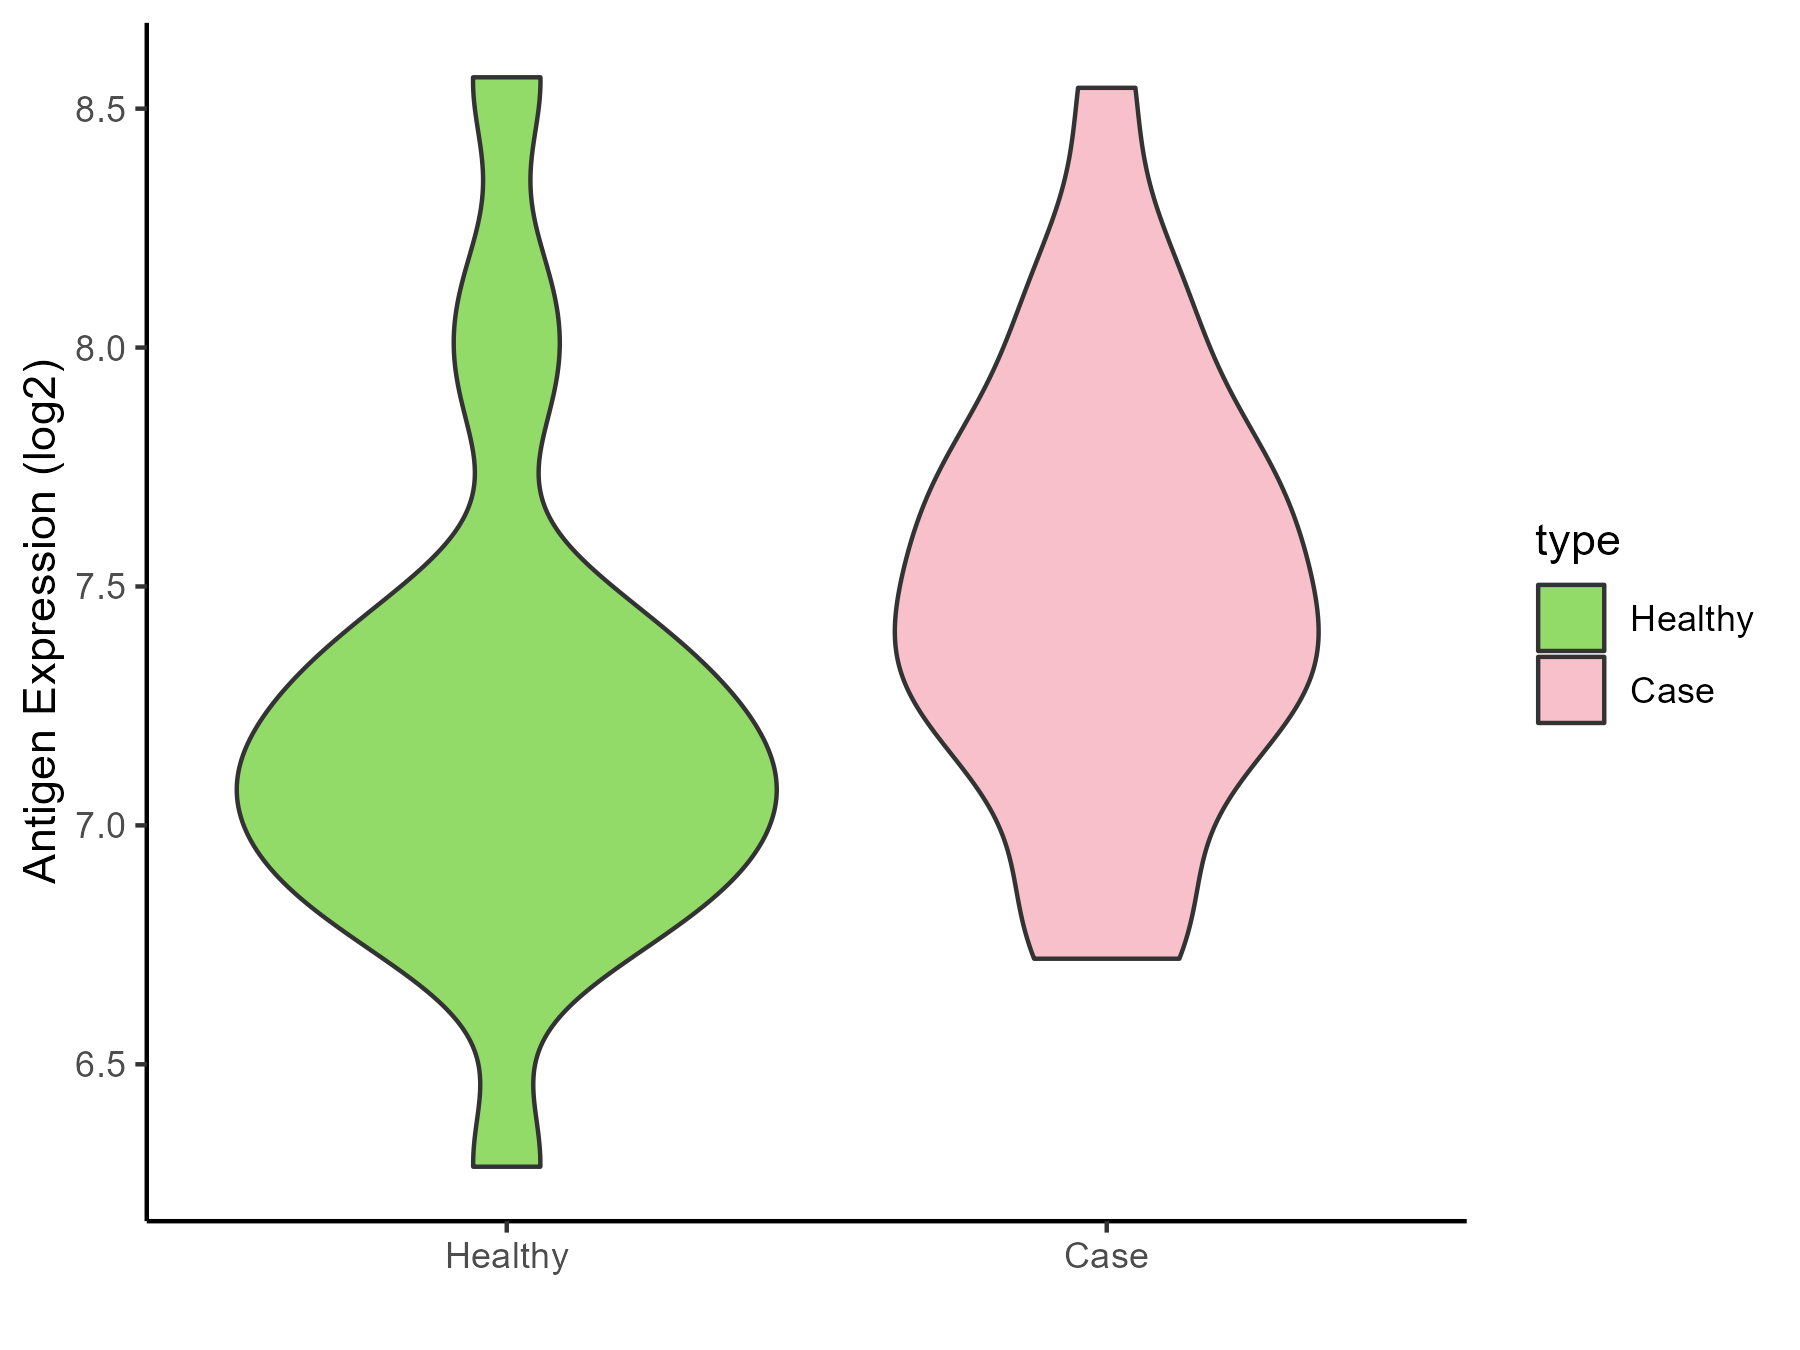
| The Studied Tissue | Superior temporal cortex | |
| The Specific Disease | Schizophrenia | |
| The Expression Level of Disease Section Compare with the Healthy Individual Tissue | p-value: 0.086403499; Fold-change: 0.344982906; Z-score: 0.665549641 | |
| Disease-specific Antigen Abundances |
|
Click to View the Clearer Original Diagram |
ICD Disease Classification 08
| Differential expression pattern of antigen in diseases | ||
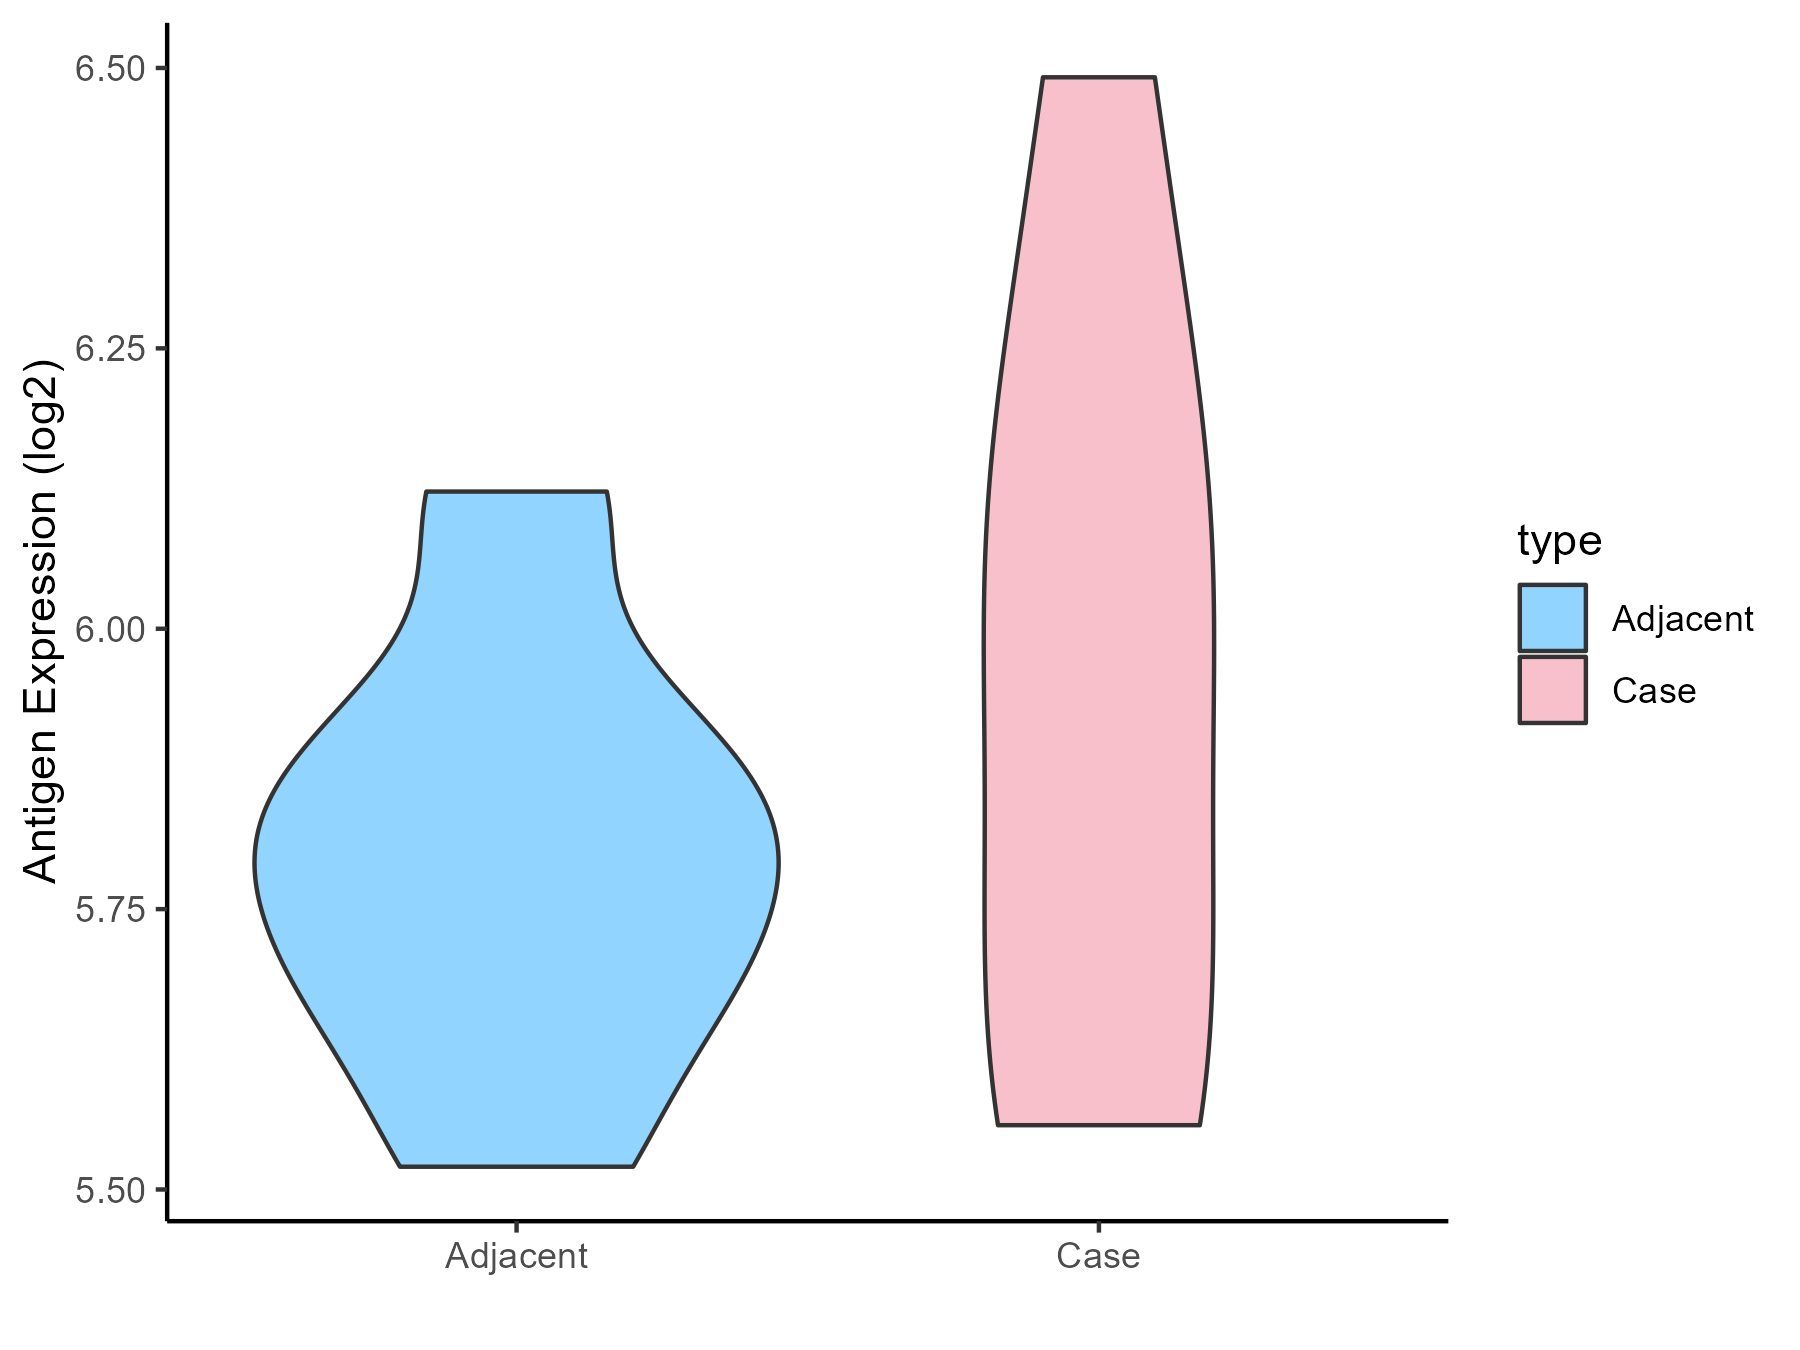
| The Studied Tissue | Spinal cord | |
| The Specific Disease | Multiple sclerosis | |
| The Expression Level of Disease Section Compare with the Adjacent Tissue | p-value: 0.353214634; Fold-change: 0.200512986; Z-score: 1.028965356 | |
| Disease-specific Antigen Abundances |
|
Click to View the Clearer Original Diagram |
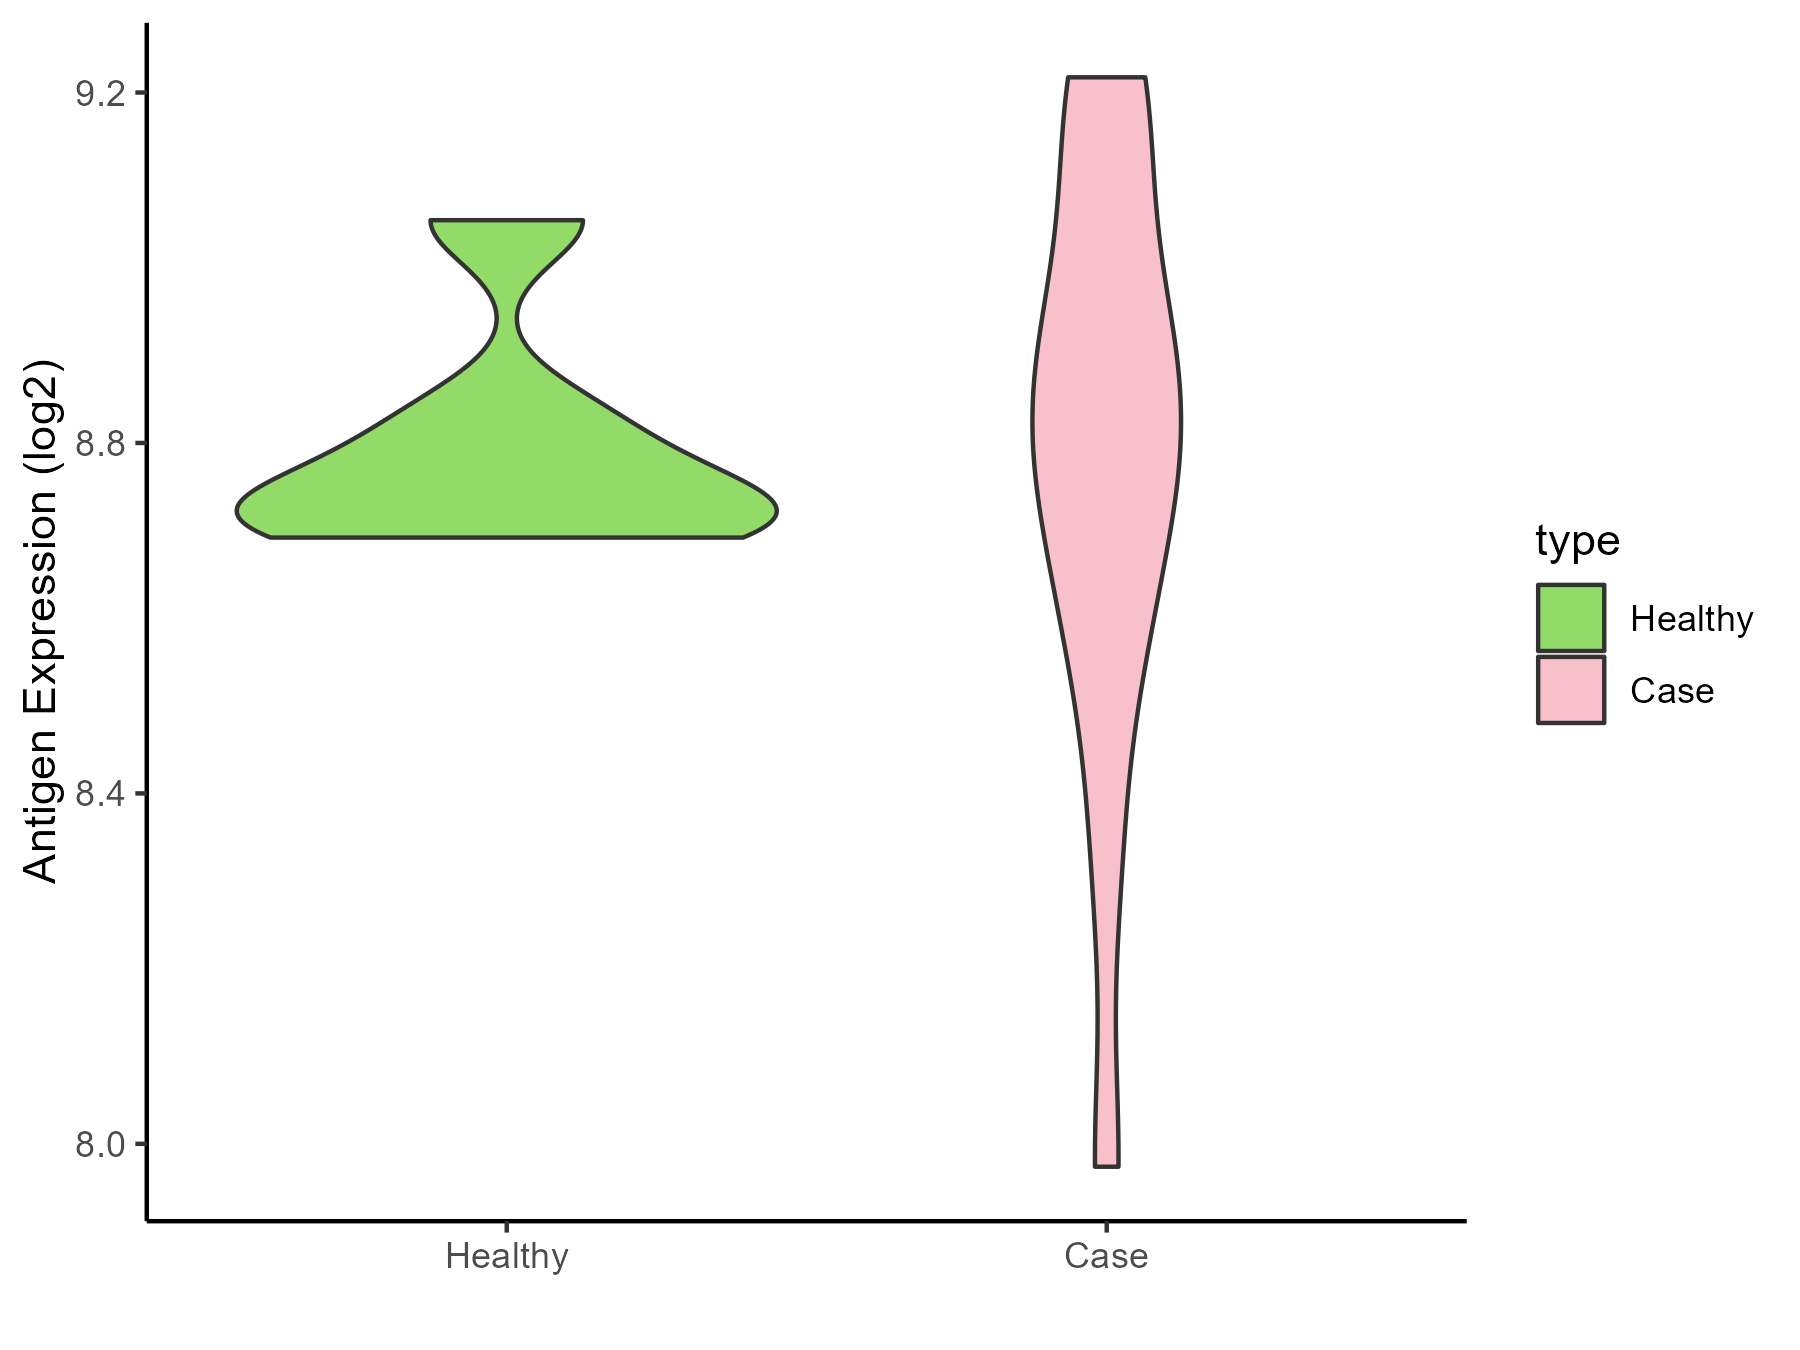
| The Studied Tissue | Plasmacytoid dendritic cells | |
| The Specific Disease | Multiple sclerosis | |
| The Expression Level of Disease Section Compare with the Healthy Individual Tissue | p-value: 0.91743123; Fold-change: 0.078650891; Z-score: 0.57683014 | |
| Disease-specific Antigen Abundances |
|
Click to View the Clearer Original Diagram |
| Differential expression pattern of antigen in diseases | ||
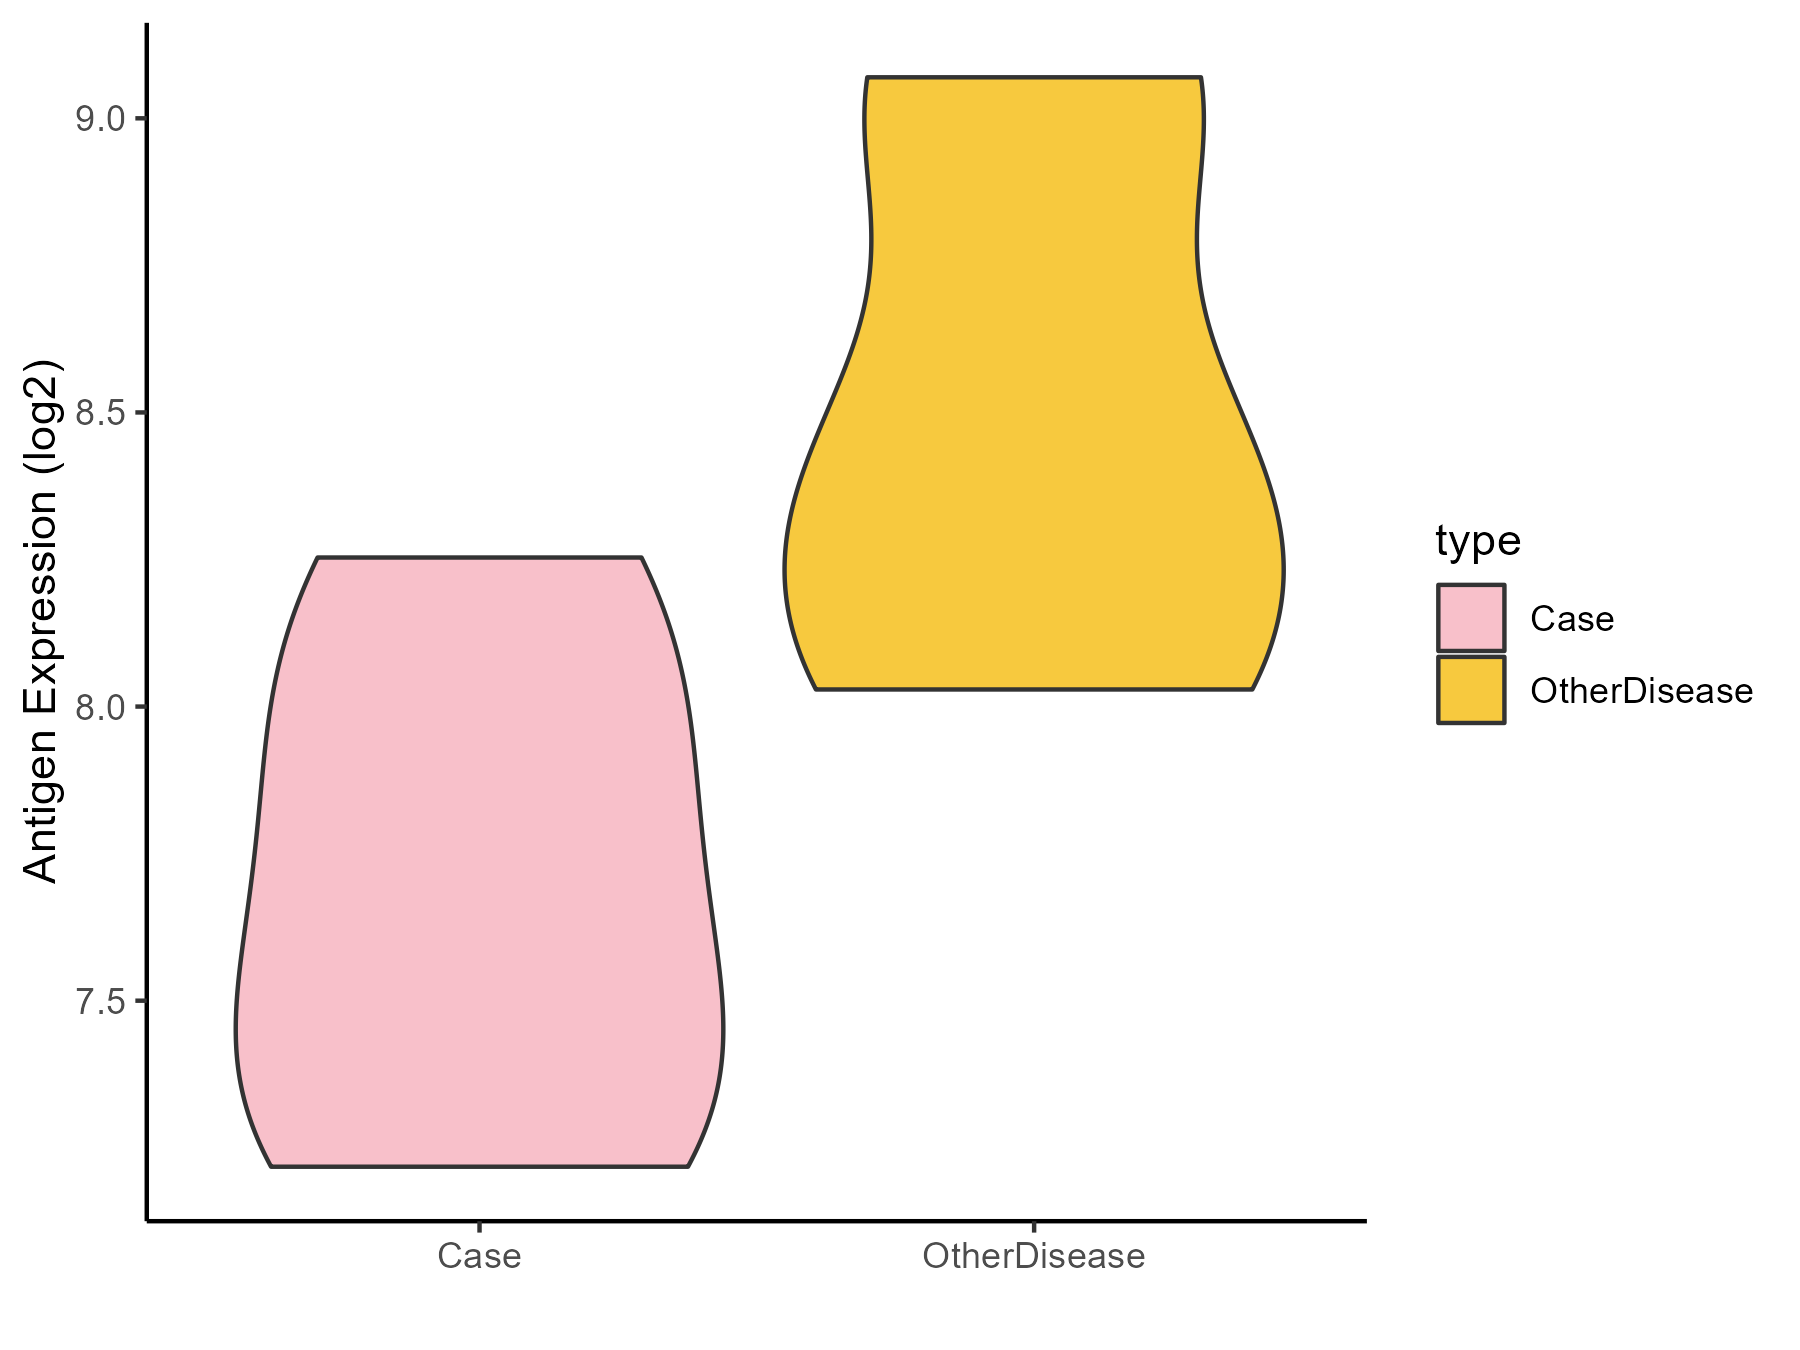
| The Studied Tissue | Peritumoral cortex | |
| The Specific Disease | Epilepsy | |
| The Expression Level of Disease Section Compare with the Other Disease Section | p-value: 0.093196395; Fold-change: -0.755284679; Z-score: -1.435163983 | |
| Disease-specific Antigen Abundances |
|
Click to View the Clearer Original Diagram |
| Differential expression pattern of antigen in diseases | ||
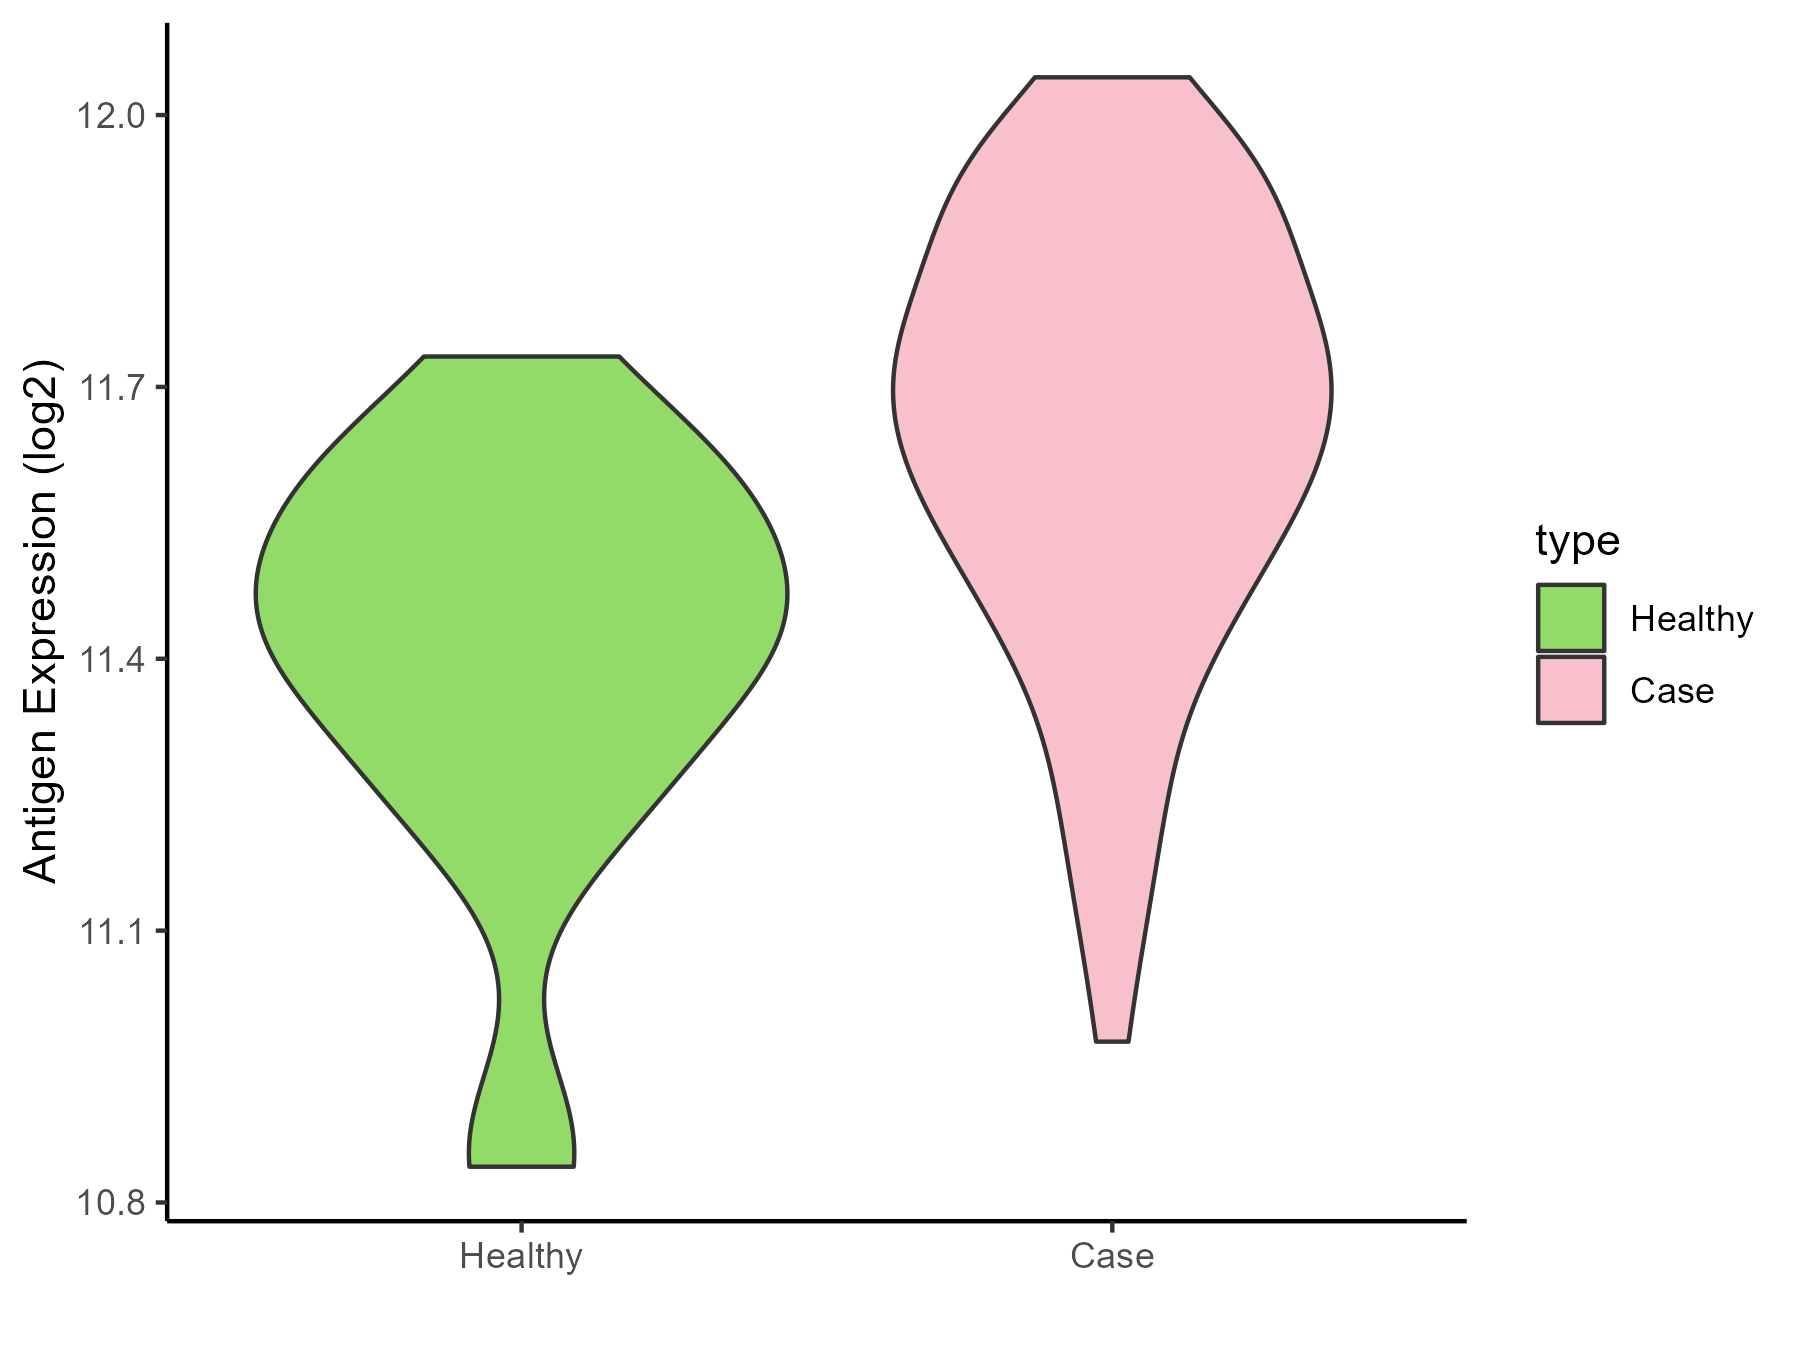
| The Studied Tissue | Whole blood | |
| The Specific Disease | Cardioembolic Stroke | |
| The Expression Level of Disease Section Compare with the Healthy Individual Tissue | p-value: 0.000196969; Fold-change: 0.22877351; Z-score: 0.984928502 | |
| Disease-specific Antigen Abundances |
|
Click to View the Clearer Original Diagram |
| The Studied Tissue | Peripheral blood | |
| The Specific Disease | Ischemic stroke | |
| The Expression Level of Disease Section Compare with the Healthy Individual Tissue | p-value: 0.204810538; Fold-change: -0.260048106; Z-score: -0.364439376 | |
| Disease-specific Antigen Abundances |
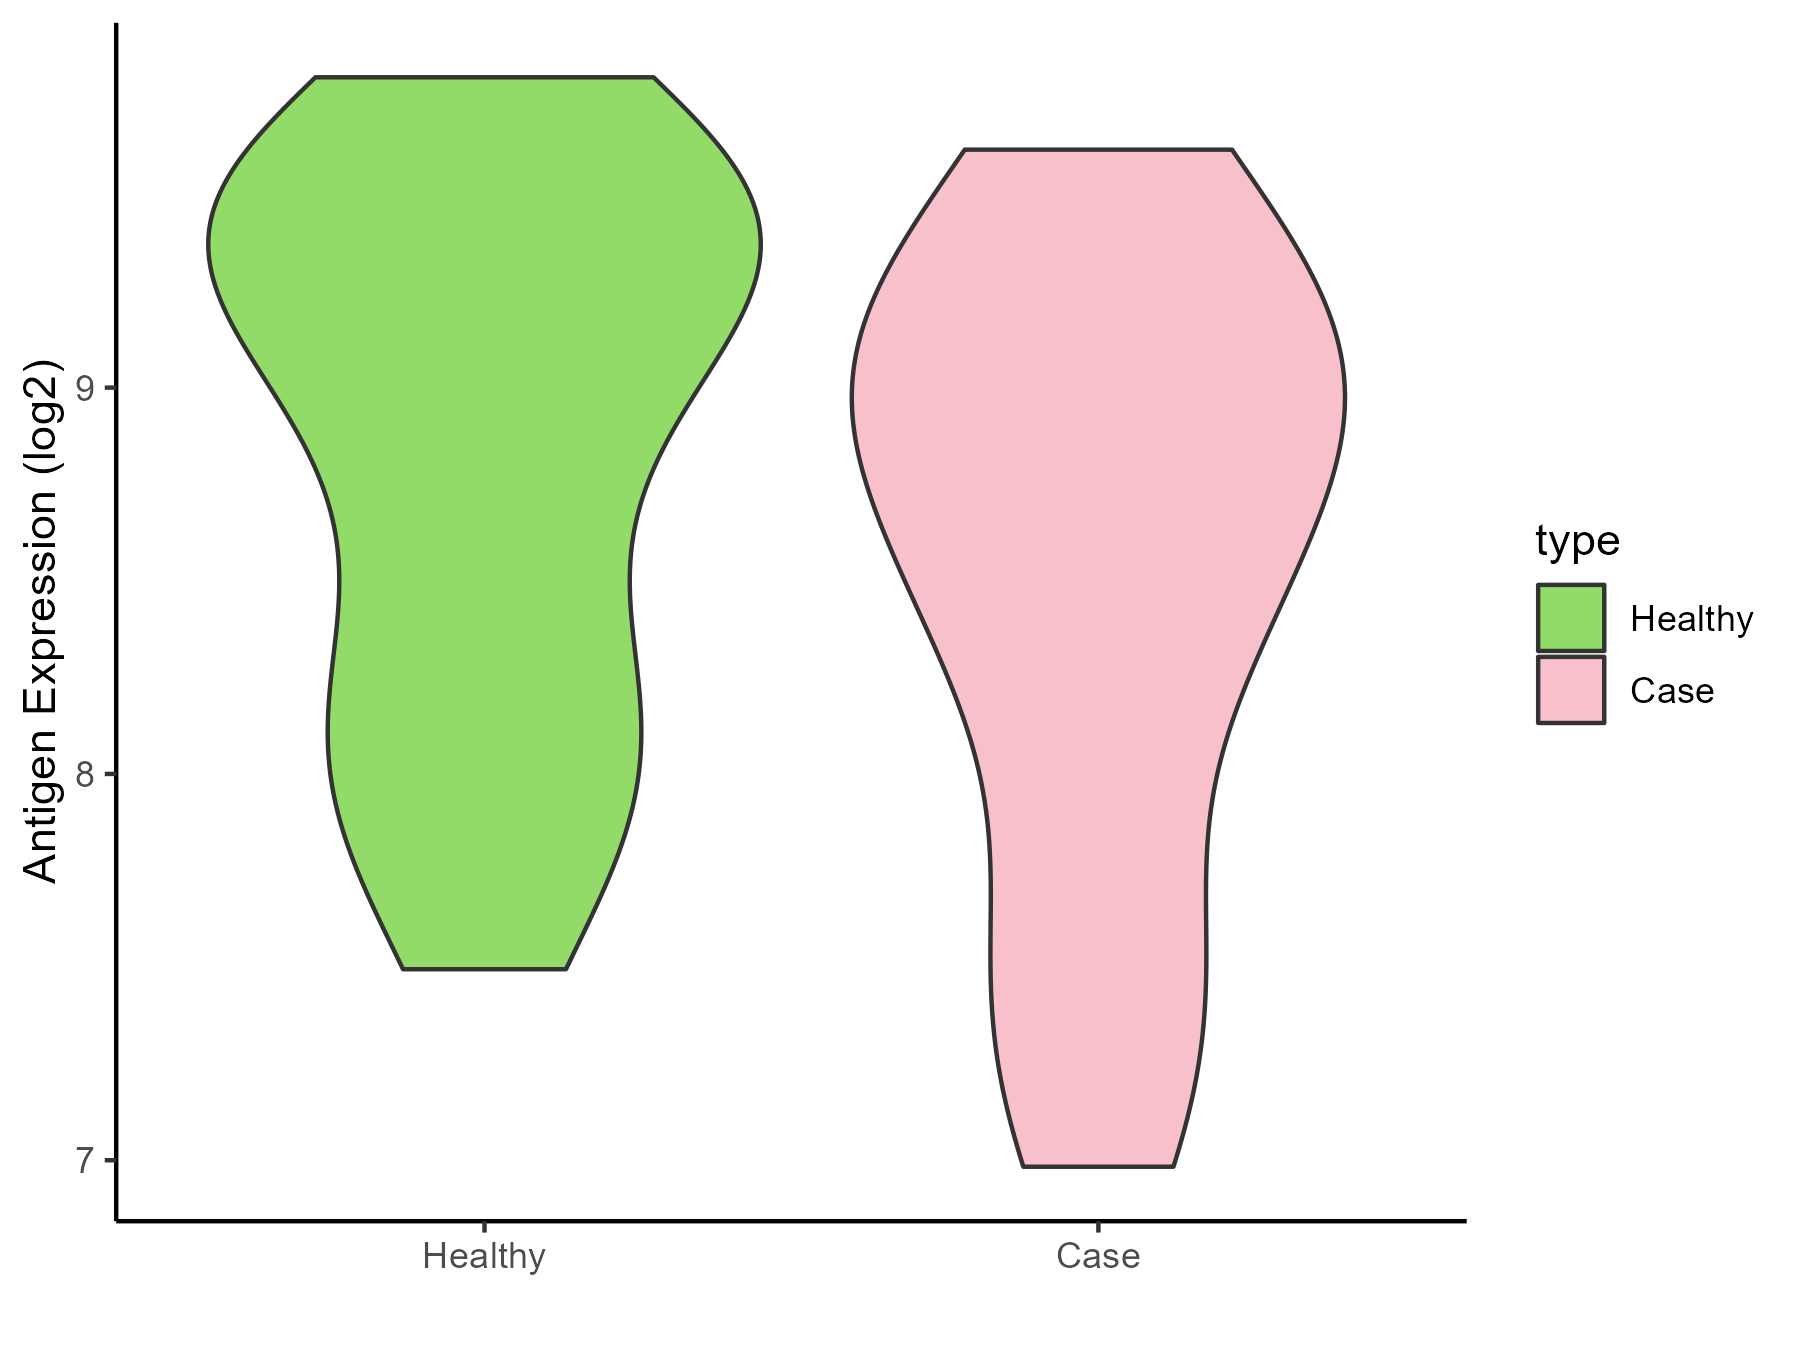
|
Click to View the Clearer Original Diagram |
ICD Disease Classification 1
| Differential expression pattern of antigen in diseases | ||
| The Studied Tissue | White matter | |
| The Specific Disease | HIV | |
| The Expression Level of Disease Section Compare with the Healthy Individual Tissue | p-value: 0.151107949; Fold-change: 0.361177204; Z-score: 0.758963249 | |
| Disease-specific Antigen Abundances |
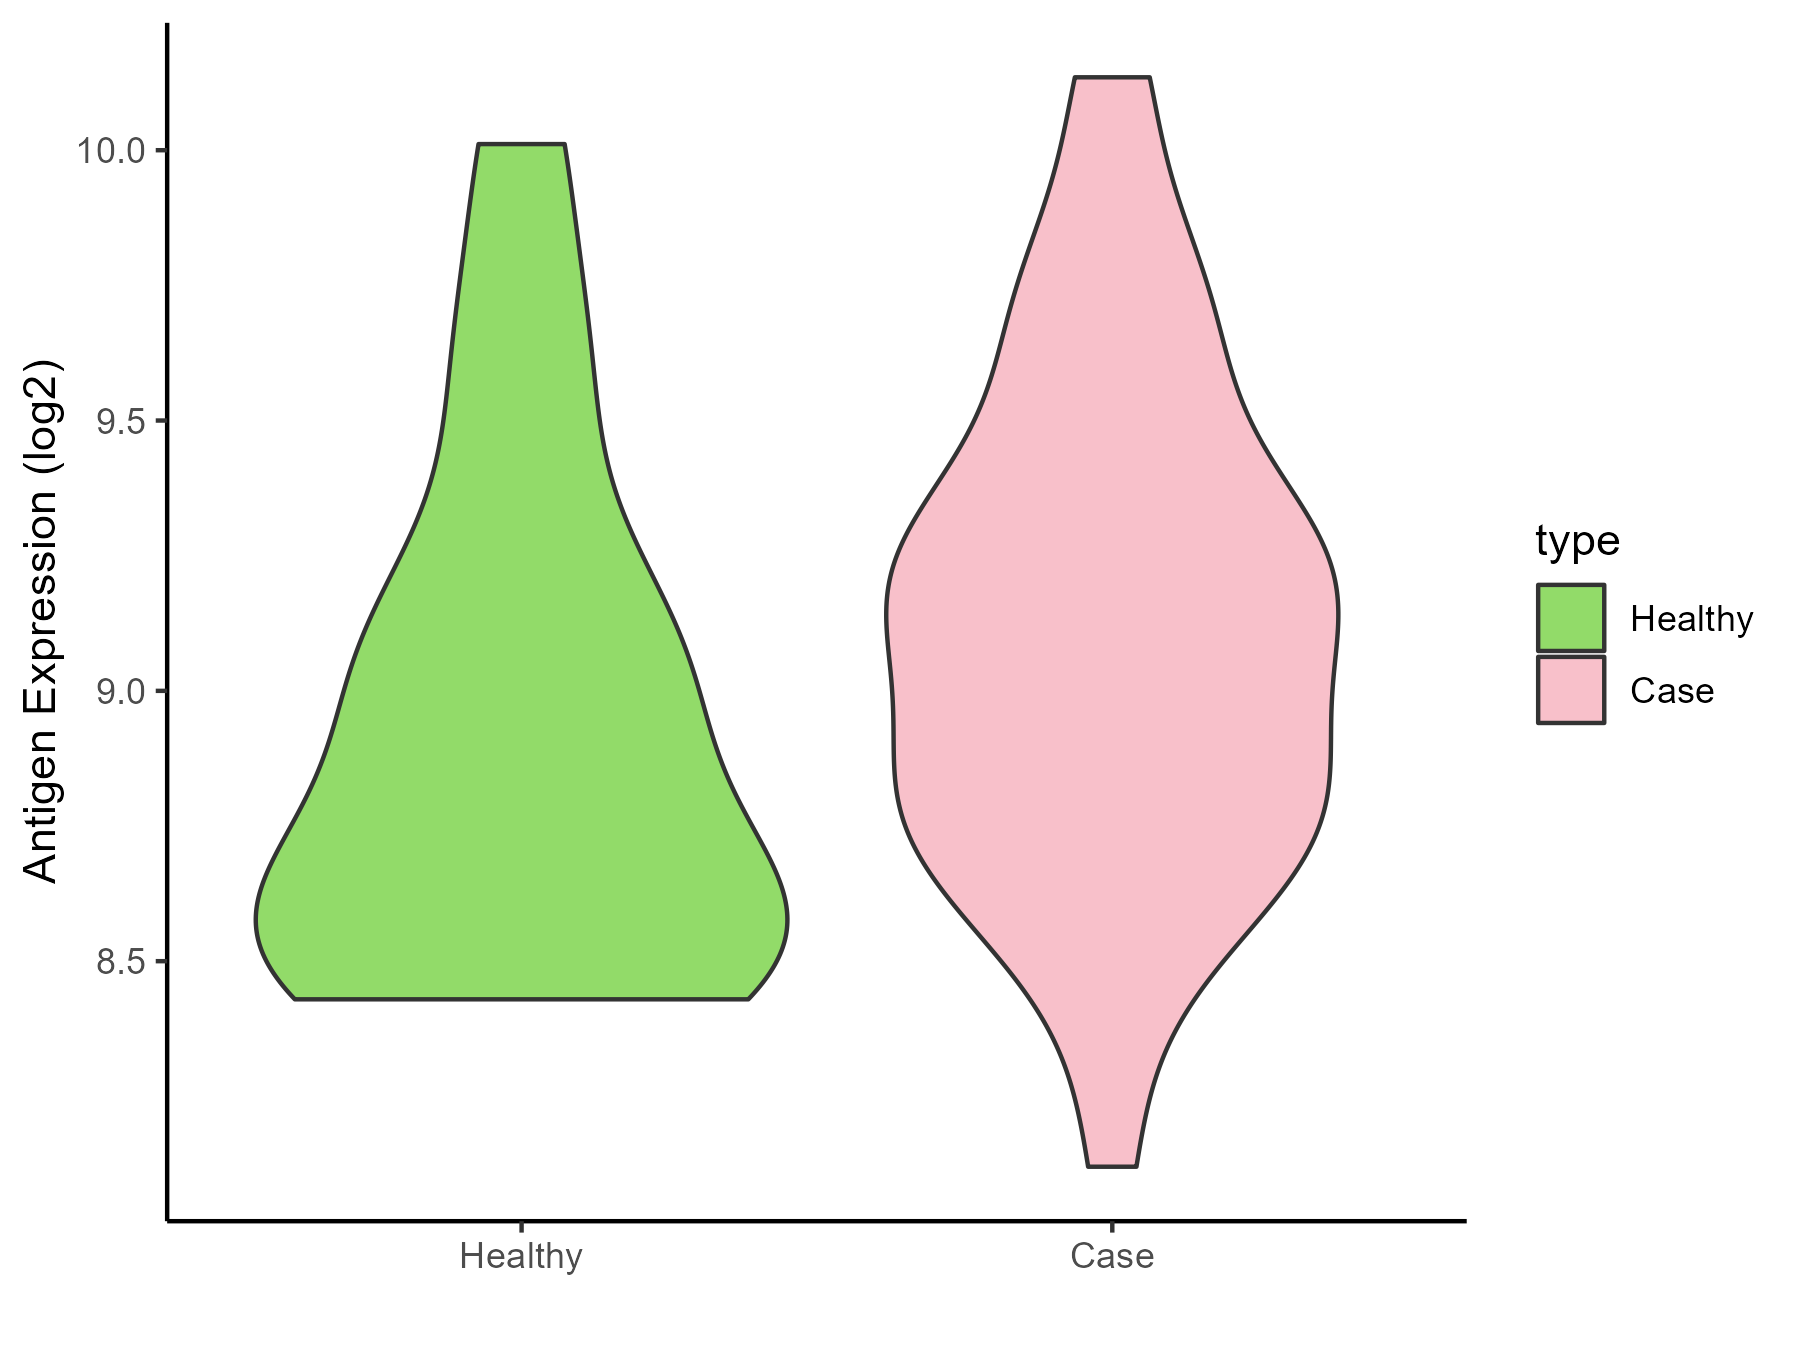
|
Click to View the Clearer Original Diagram |
| Differential expression pattern of antigen in diseases | ||
| The Studied Tissue | Whole blood | |
| The Specific Disease | Influenza | |
| The Expression Level of Disease Section Compare with the Healthy Individual Tissue | p-value: 0.003978903; Fold-change: -1.724911027; Z-score: -11.77435437 | |
| Disease-specific Antigen Abundances |
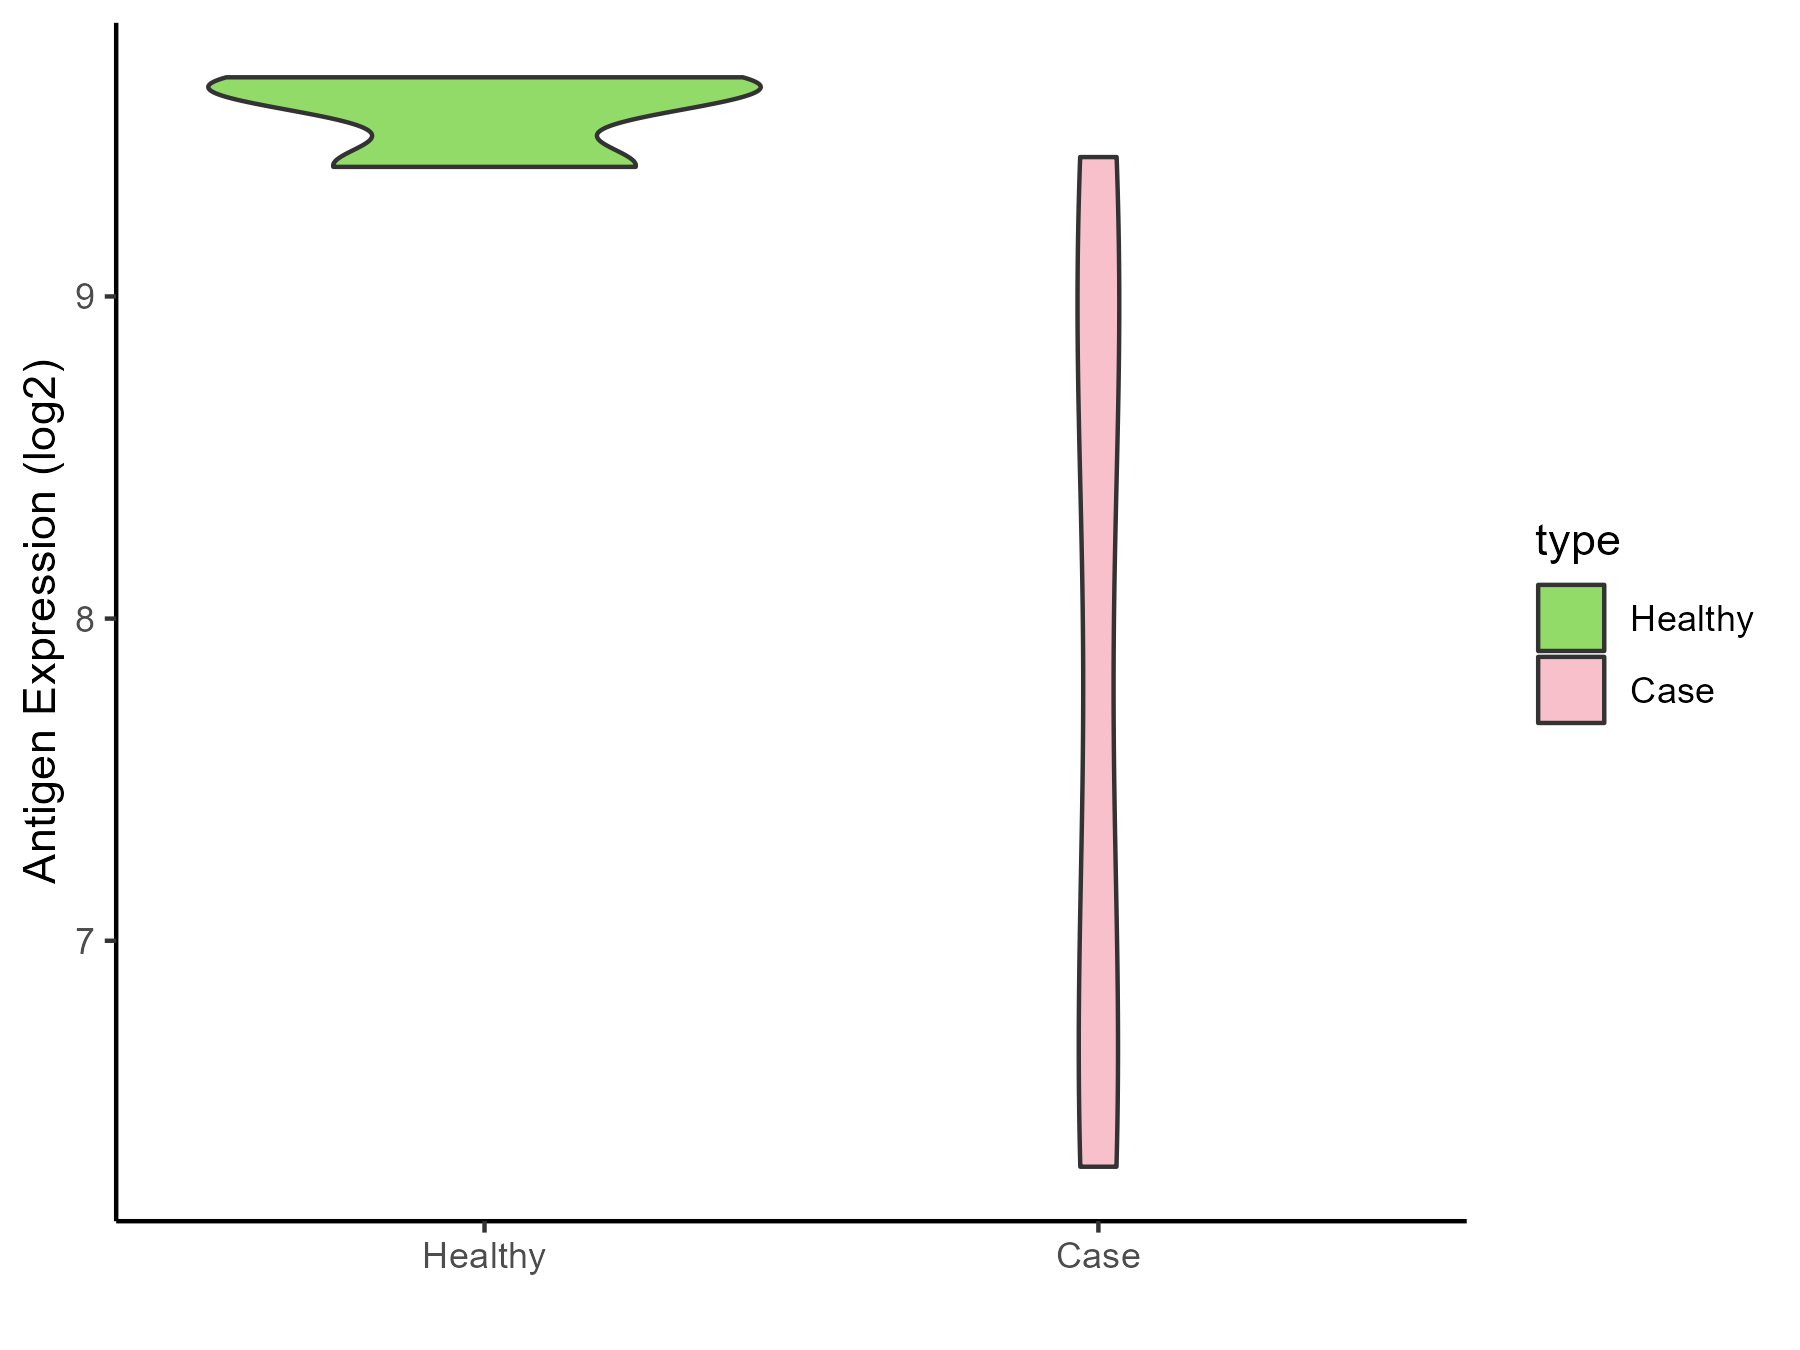
|
Click to View the Clearer Original Diagram |
| Differential expression pattern of antigen in diseases | ||
| The Studied Tissue | Whole blood | |
| The Specific Disease | Chronic hepatitis C | |
| The Expression Level of Disease Section Compare with the Healthy Individual Tissue | p-value: 0.103474706; Fold-change: -0.519573735; Z-score: -1.658842209 | |
| Disease-specific Antigen Abundances |
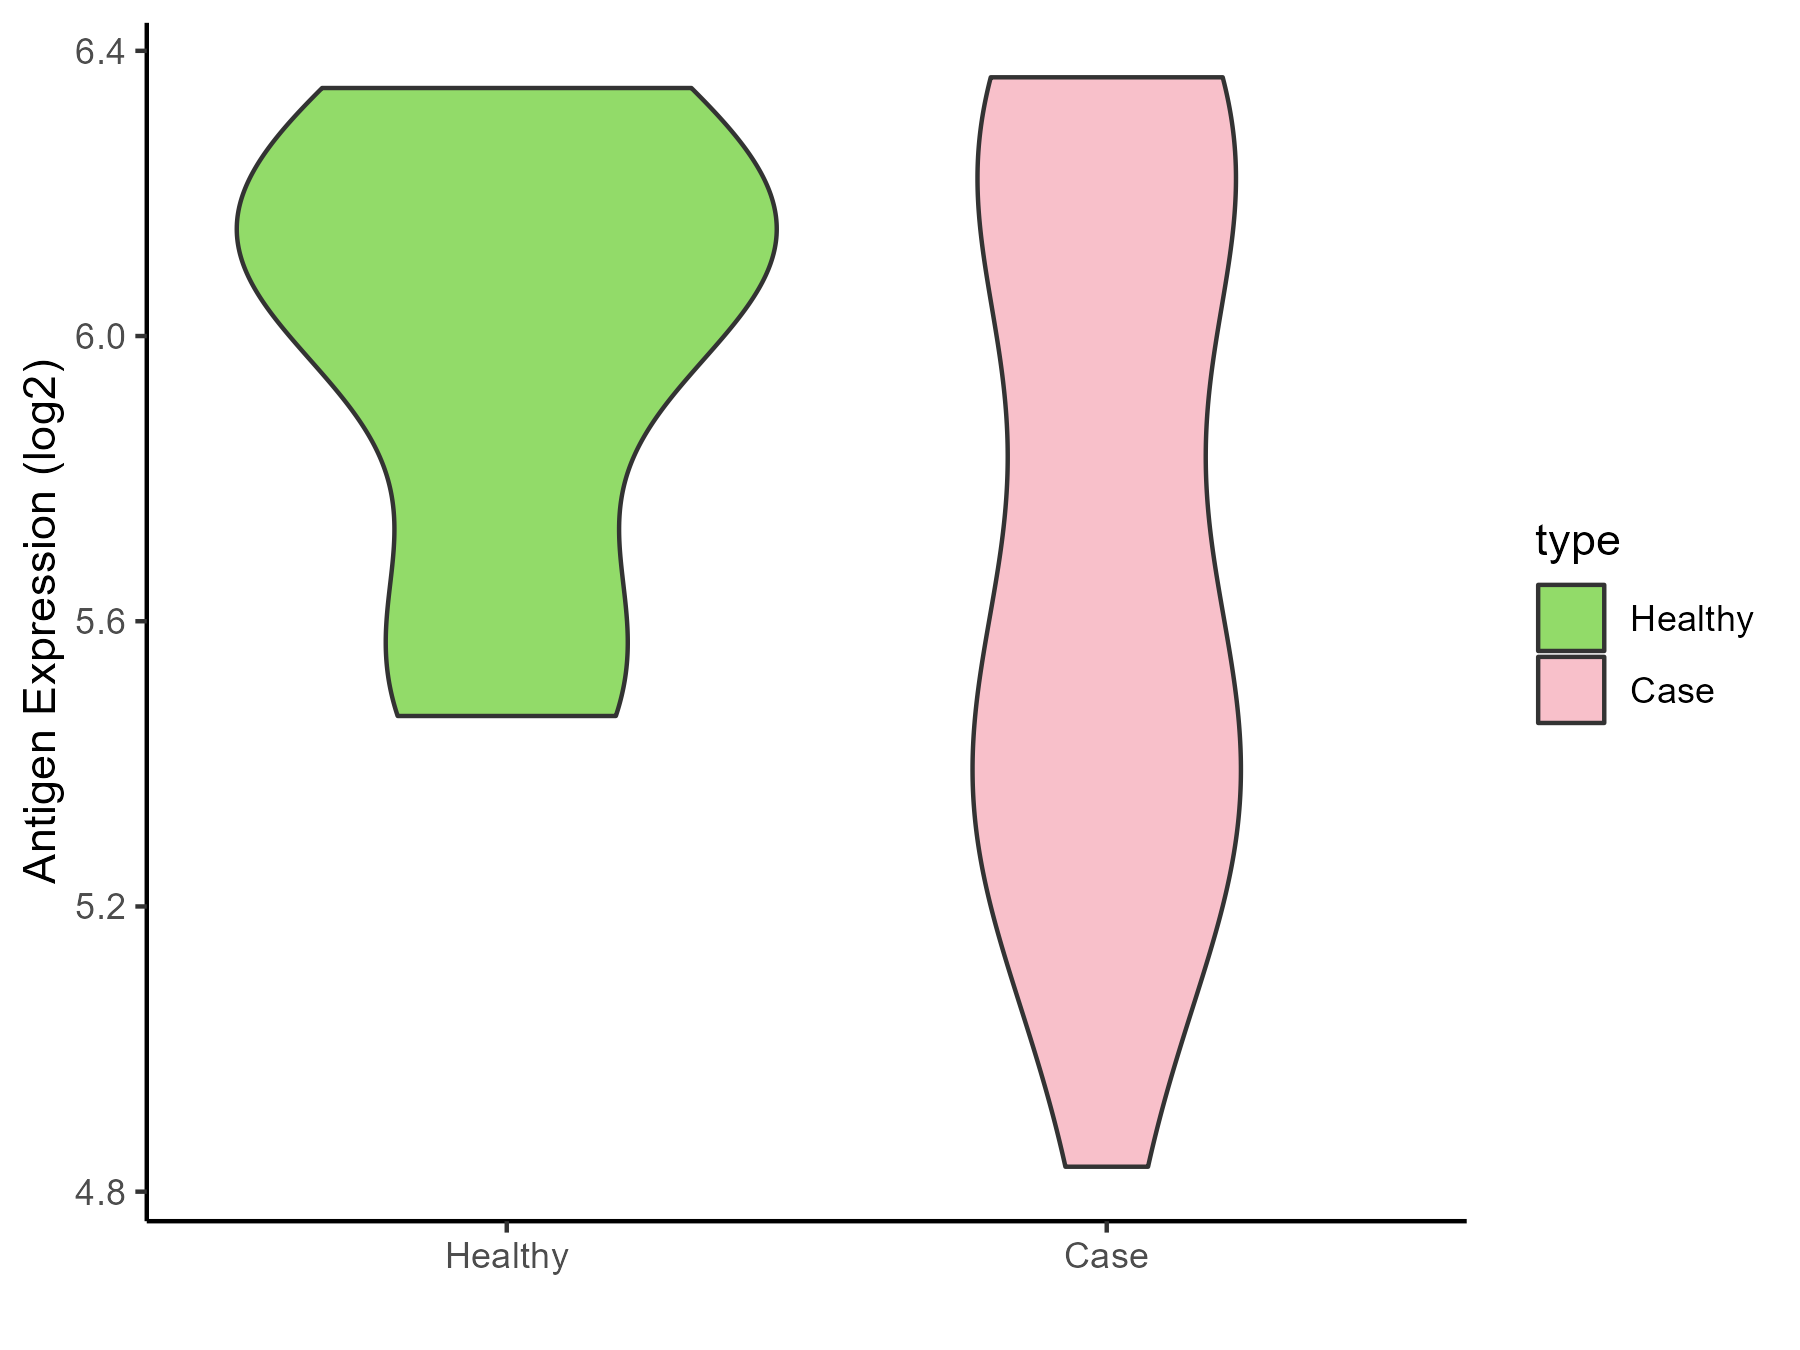
|
Click to View the Clearer Original Diagram |
| Differential expression pattern of antigen in diseases | ||
| The Studied Tissue | Whole blood | |
| The Specific Disease | Sepsis | |
| The Expression Level of Disease Section Compare with the Healthy Individual Tissue | p-value: 0.011497627; Fold-change: 0.268912522; Z-score: 0.300663381 | |
| Disease-specific Antigen Abundances |
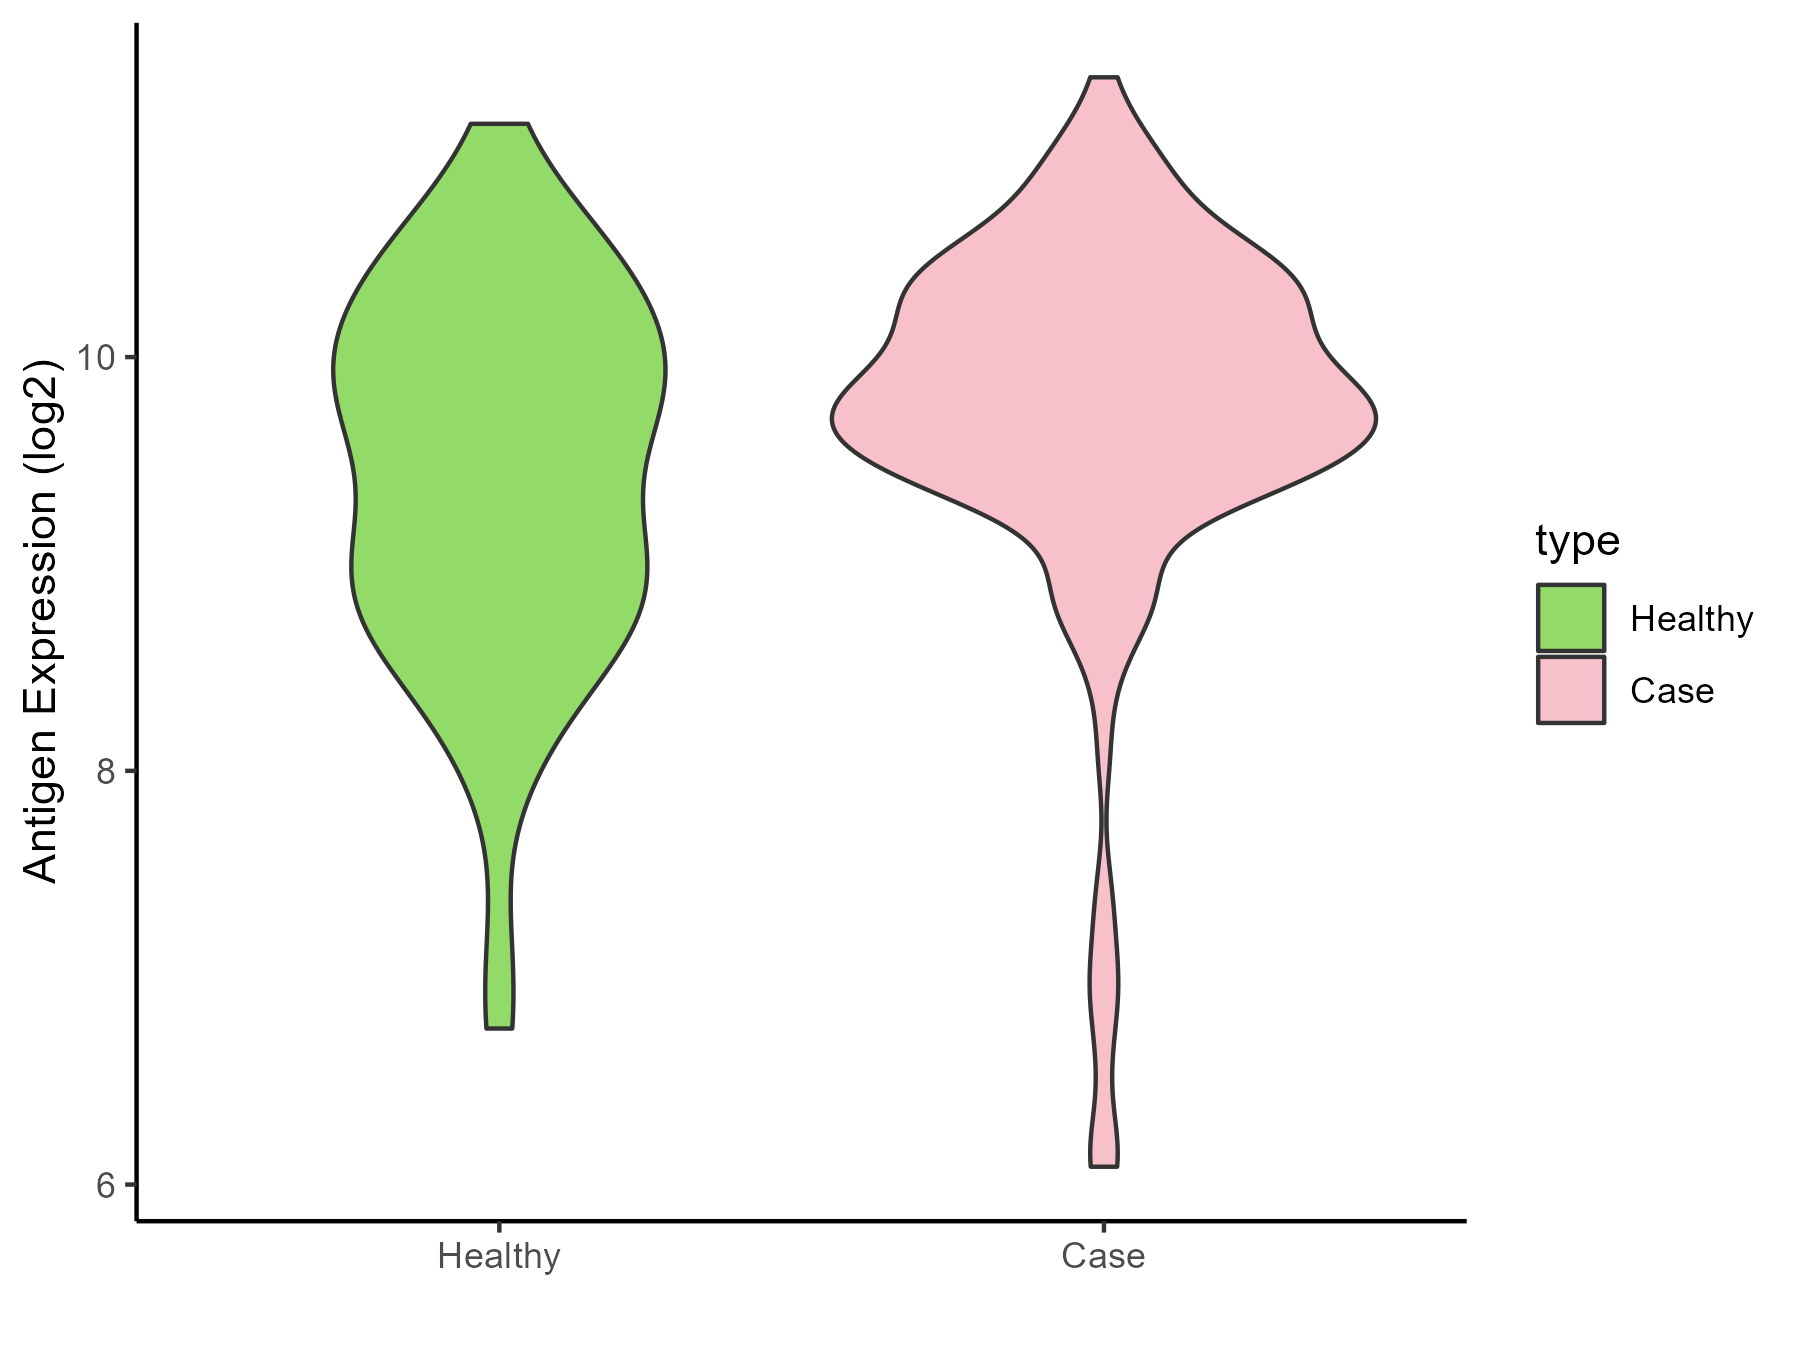
|
Click to View the Clearer Original Diagram |
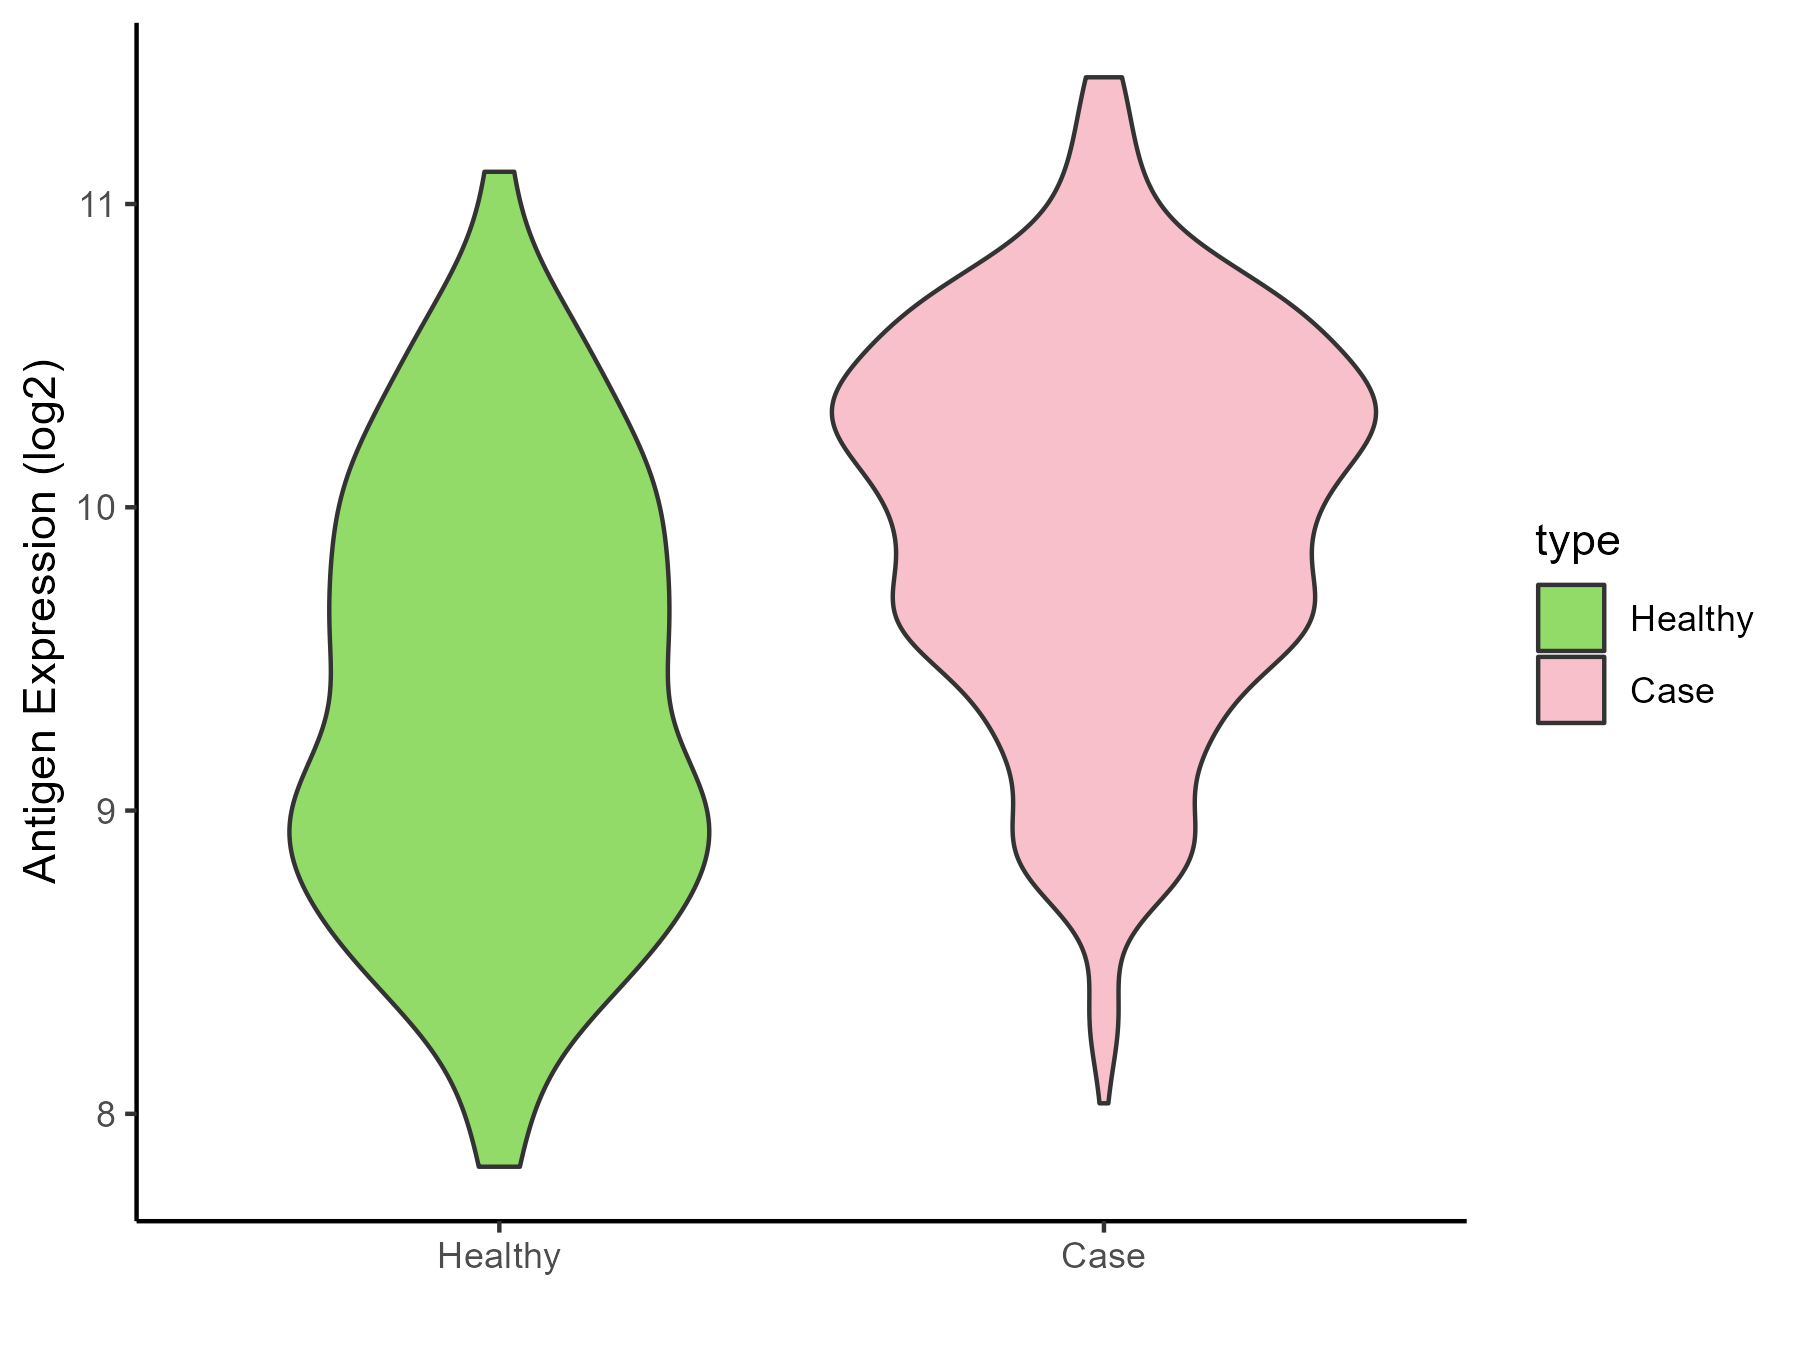
| Differential expression pattern of antigen in diseases | ||
| The Studied Tissue | Whole blood | |
| The Specific Disease | Septic shock | |
| The Expression Level of Disease Section Compare with the Healthy Individual Tissue | p-value: 6.15E-18; Fold-change: 0.693812635; Z-score: 0.965832081 | |
| Disease-specific Antigen Abundances |
|
Click to View the Clearer Original Diagram |
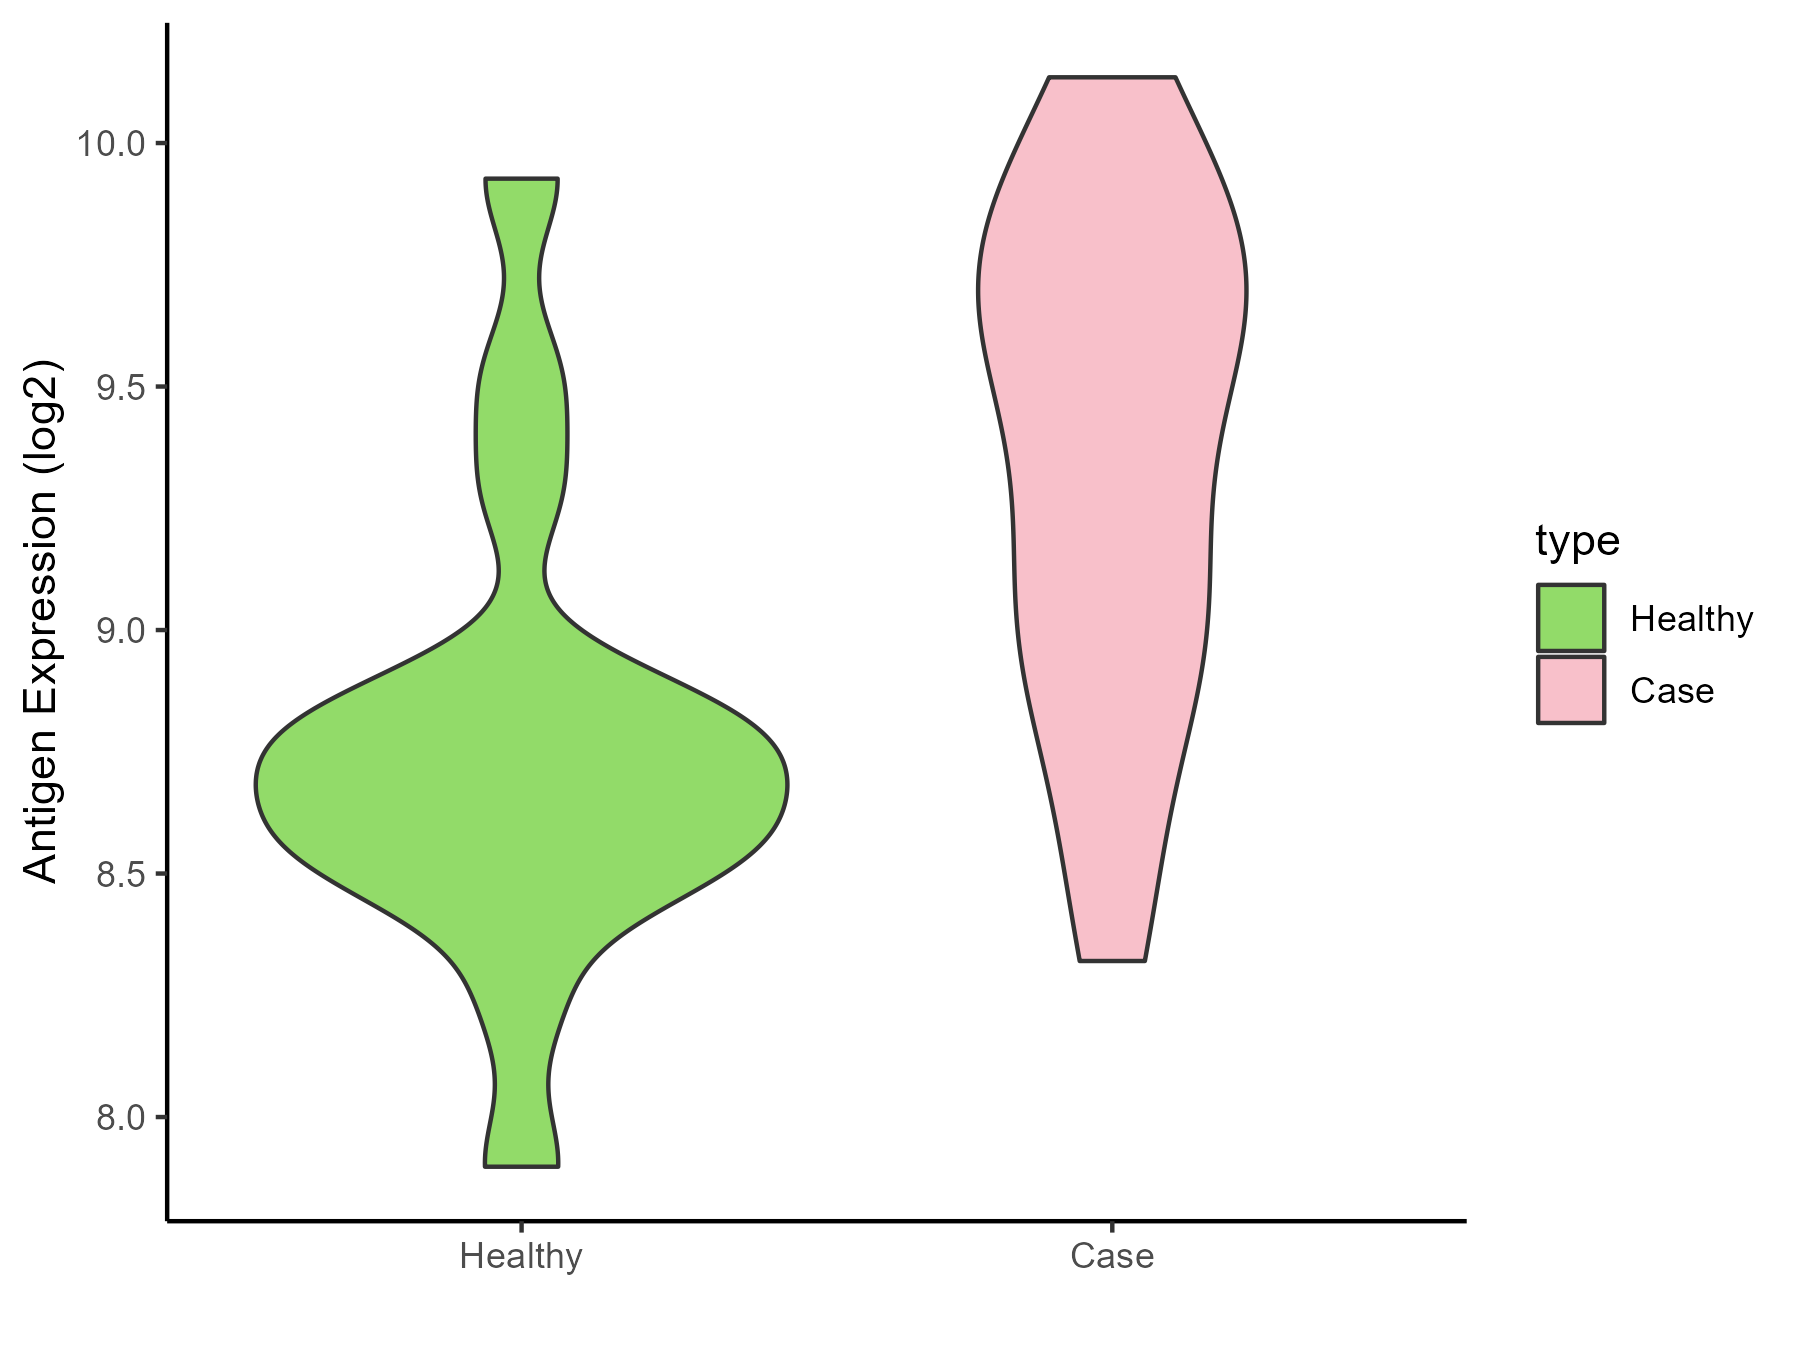
| Differential expression pattern of antigen in diseases | ||
| The Studied Tissue | Peripheral blood | |
| The Specific Disease | Pediatric respiratory syncytial virus infection | |
| The Expression Level of Disease Section Compare with the Healthy Individual Tissue | p-value: 0.000346534; Fold-change: 0.793550846; Z-score: 1.693033024 | |
| Disease-specific Antigen Abundances |
|
Click to View the Clearer Original Diagram |
ICD Disease Classification 11
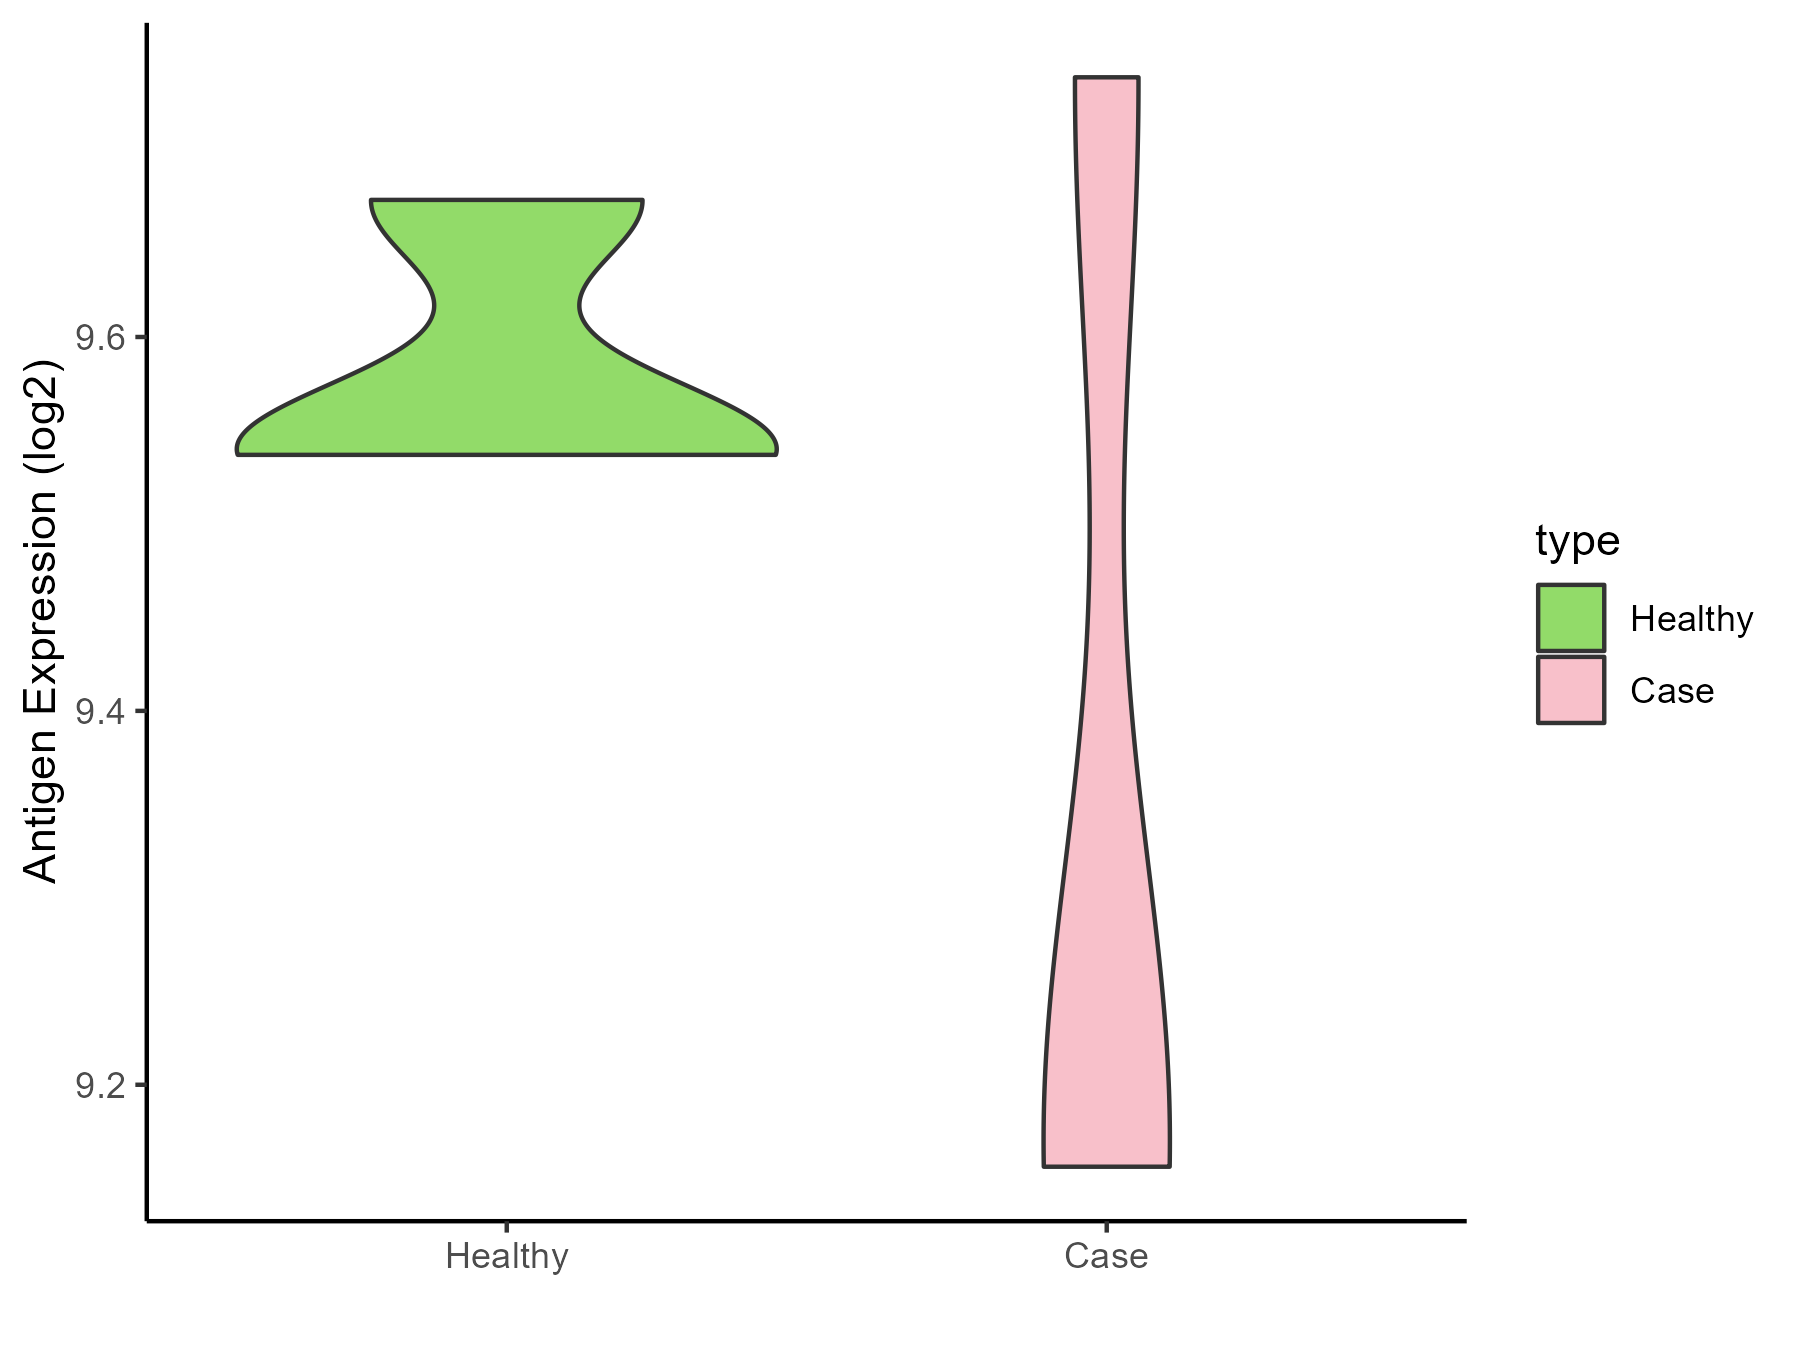
| Differential expression pattern of antigen in diseases | ||
| The Studied Tissue | Peripheral blood | |
| The Specific Disease | Essential hypertension | |
| The Expression Level of Disease Section Compare with the Healthy Individual Tissue | p-value: 0.357720645; Fold-change: -0.359950654; Z-score: -4.670924137 | |
| Disease-specific Antigen Abundances |
|
Click to View the Clearer Original Diagram |
| Differential expression pattern of antigen in diseases | ||
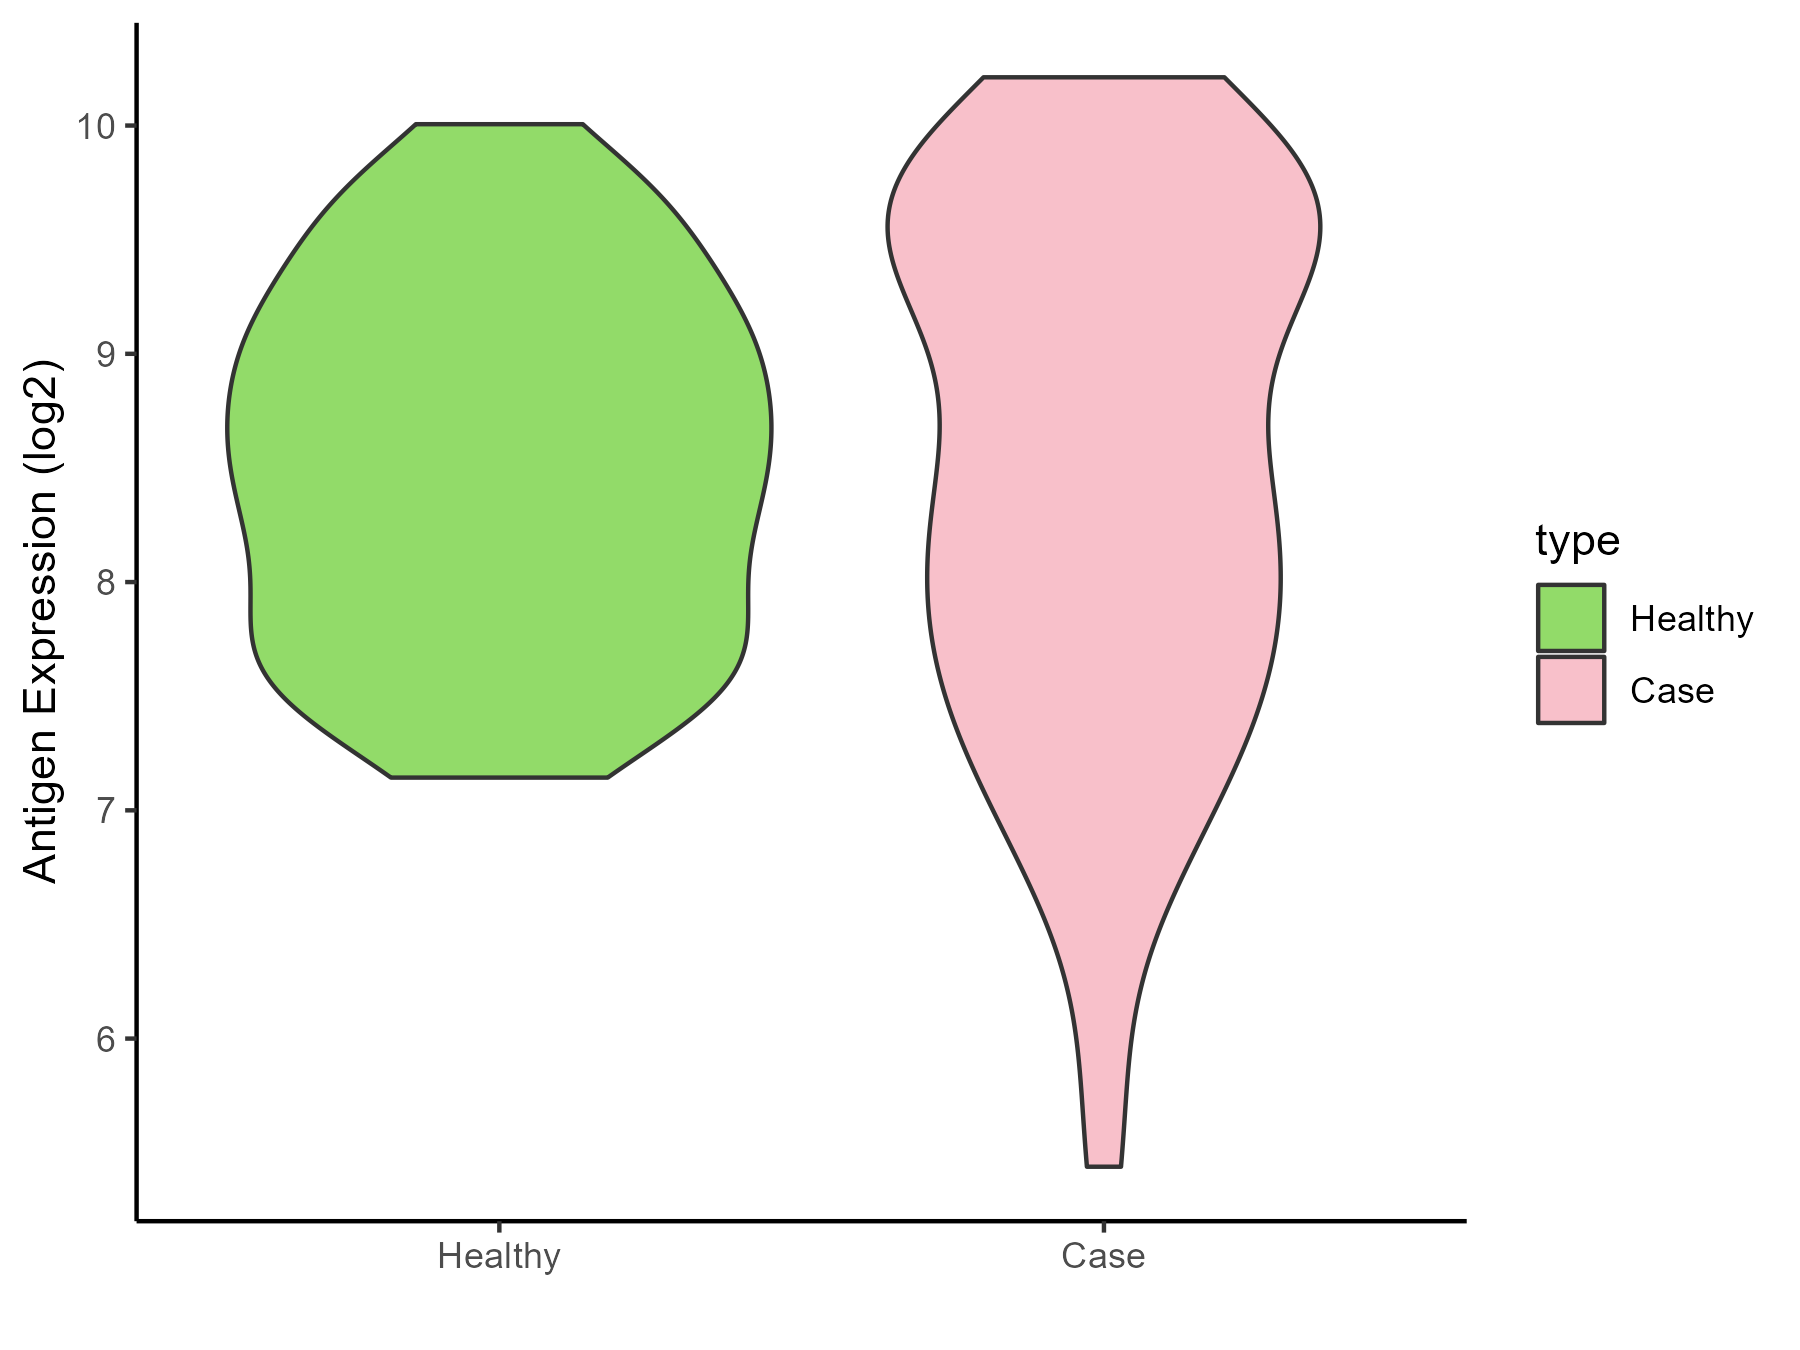
| The Studied Tissue | Peripheral blood | |
| The Specific Disease | Myocardial infarction | |
| The Expression Level of Disease Section Compare with the Healthy Individual Tissue | p-value: 0.981811397; Fold-change: -0.125897723; Z-score: -0.162497099 | |
| Disease-specific Antigen Abundances |
|
Click to View the Clearer Original Diagram |
| Differential expression pattern of antigen in diseases | ||
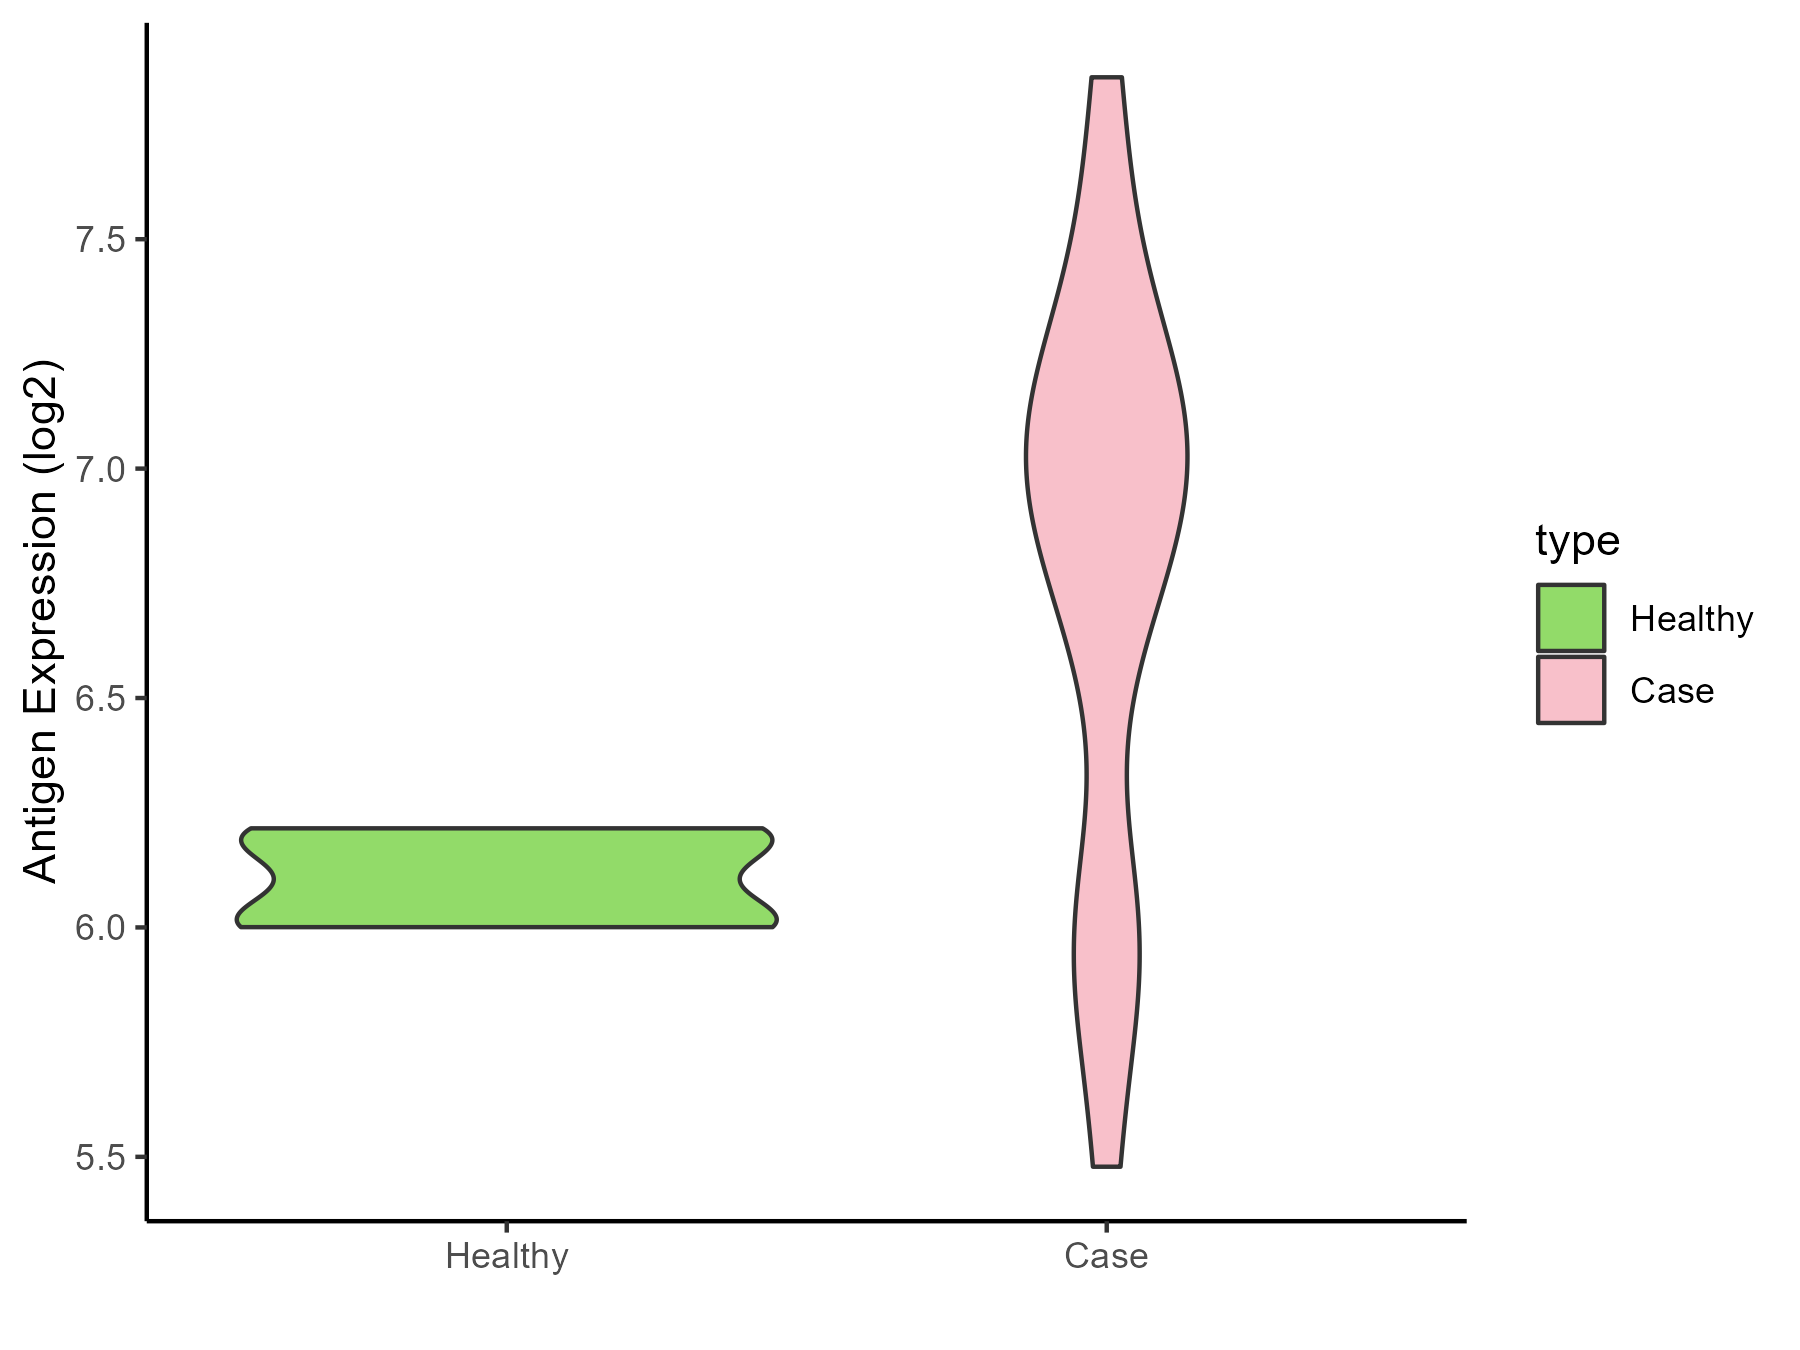
| The Studied Tissue | Peripheral blood | |
| The Specific Disease | Coronary artery disease | |
| The Expression Level of Disease Section Compare with the Healthy Individual Tissue | p-value: 0.000163969; Fold-change: 0.85902319; Z-score: 7.520569431 | |
| Disease-specific Antigen Abundances |
|
Click to View the Clearer Original Diagram |
| Differential expression pattern of antigen in diseases | ||
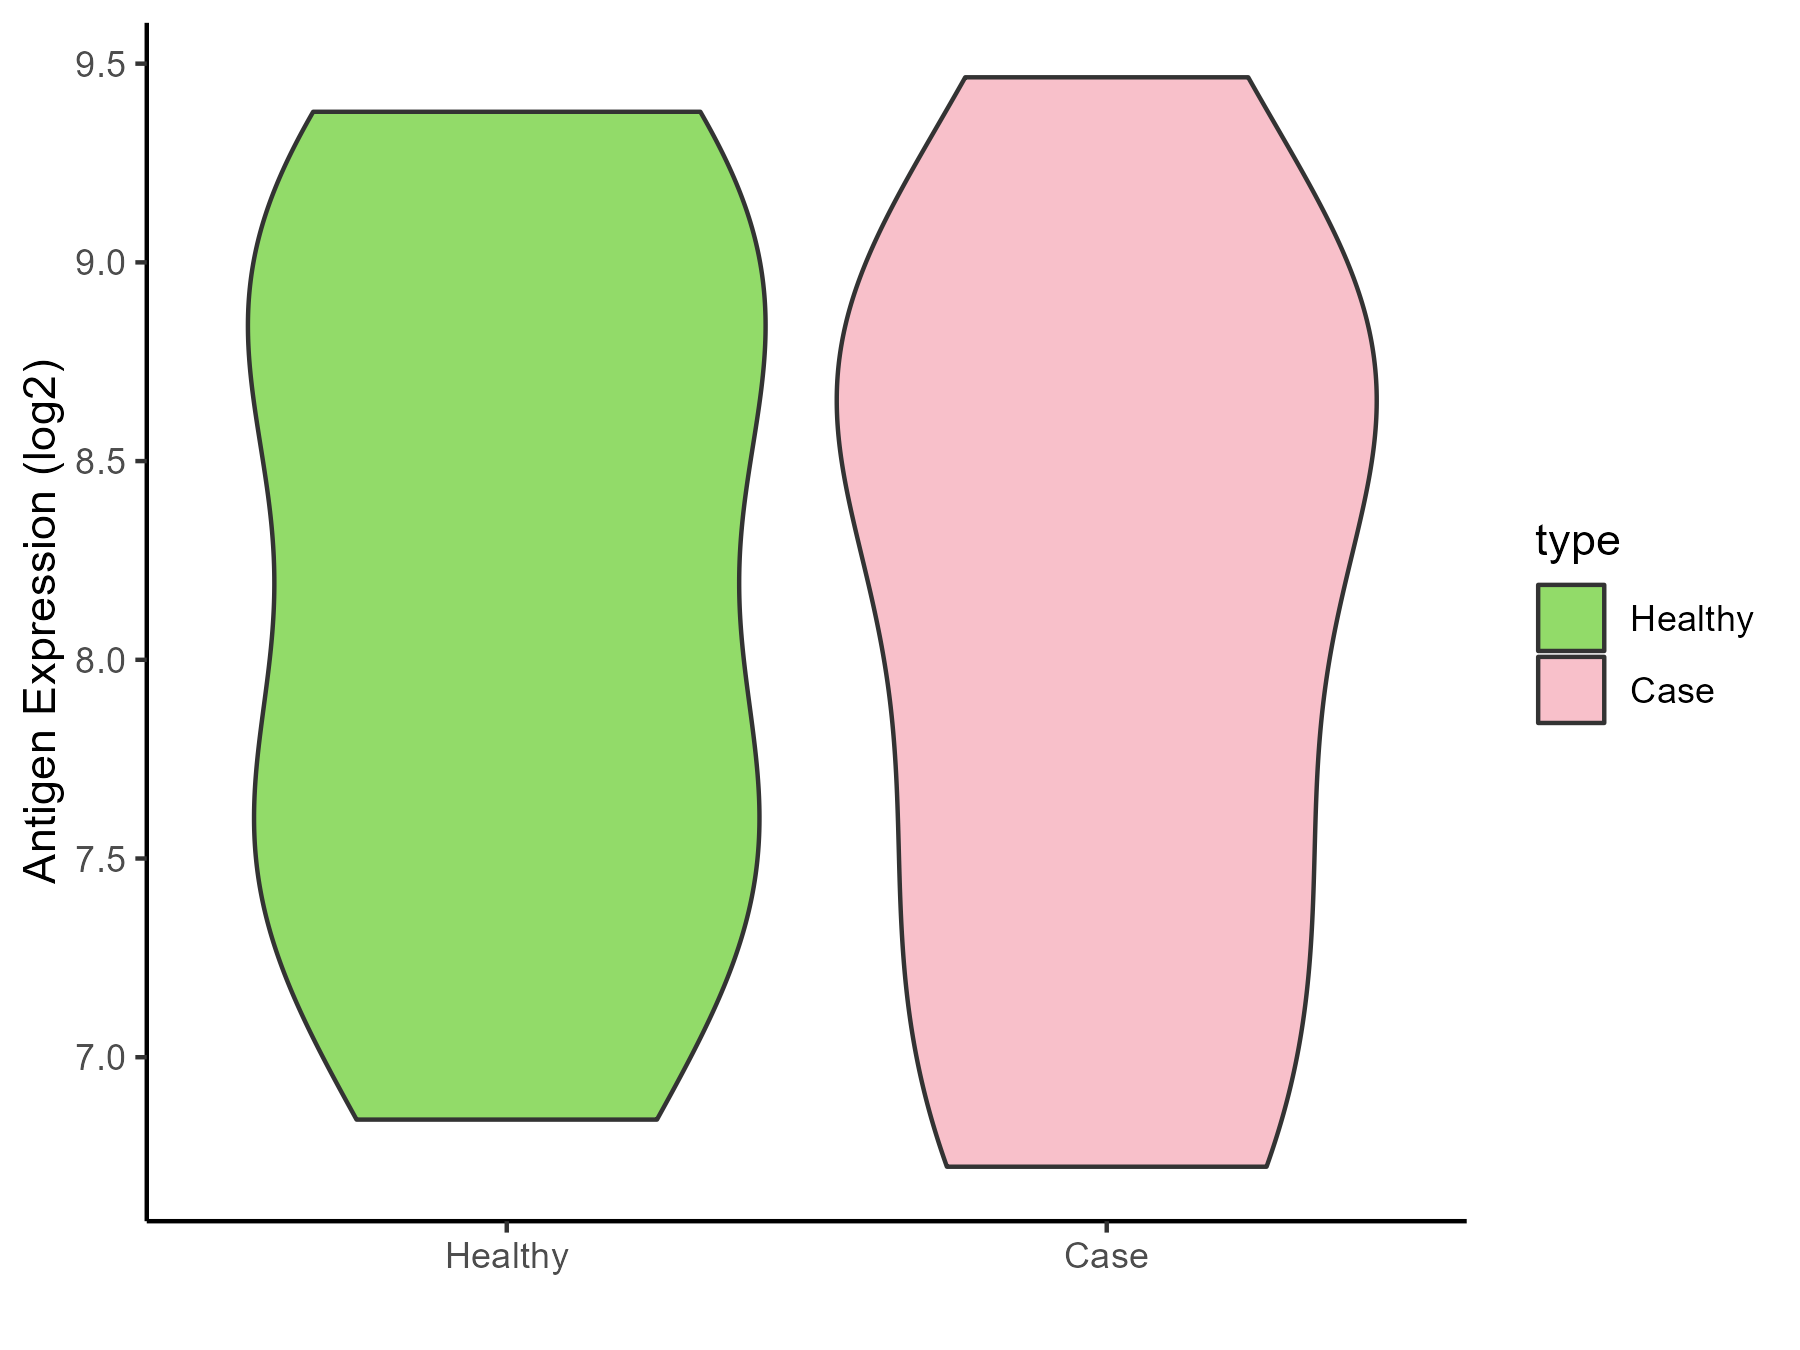
| The Studied Tissue | Calcified aortic valve | |
| The Specific Disease | Aortic stenosis | |
| The Expression Level of Disease Section Compare with the Healthy Individual Tissue | p-value: 0.782751253; Fold-change: 0.053614325; Z-score: 0.061275552 | |
| Disease-specific Antigen Abundances |
|
Click to View the Clearer Original Diagram |
| Differential expression pattern of antigen in diseases | ||
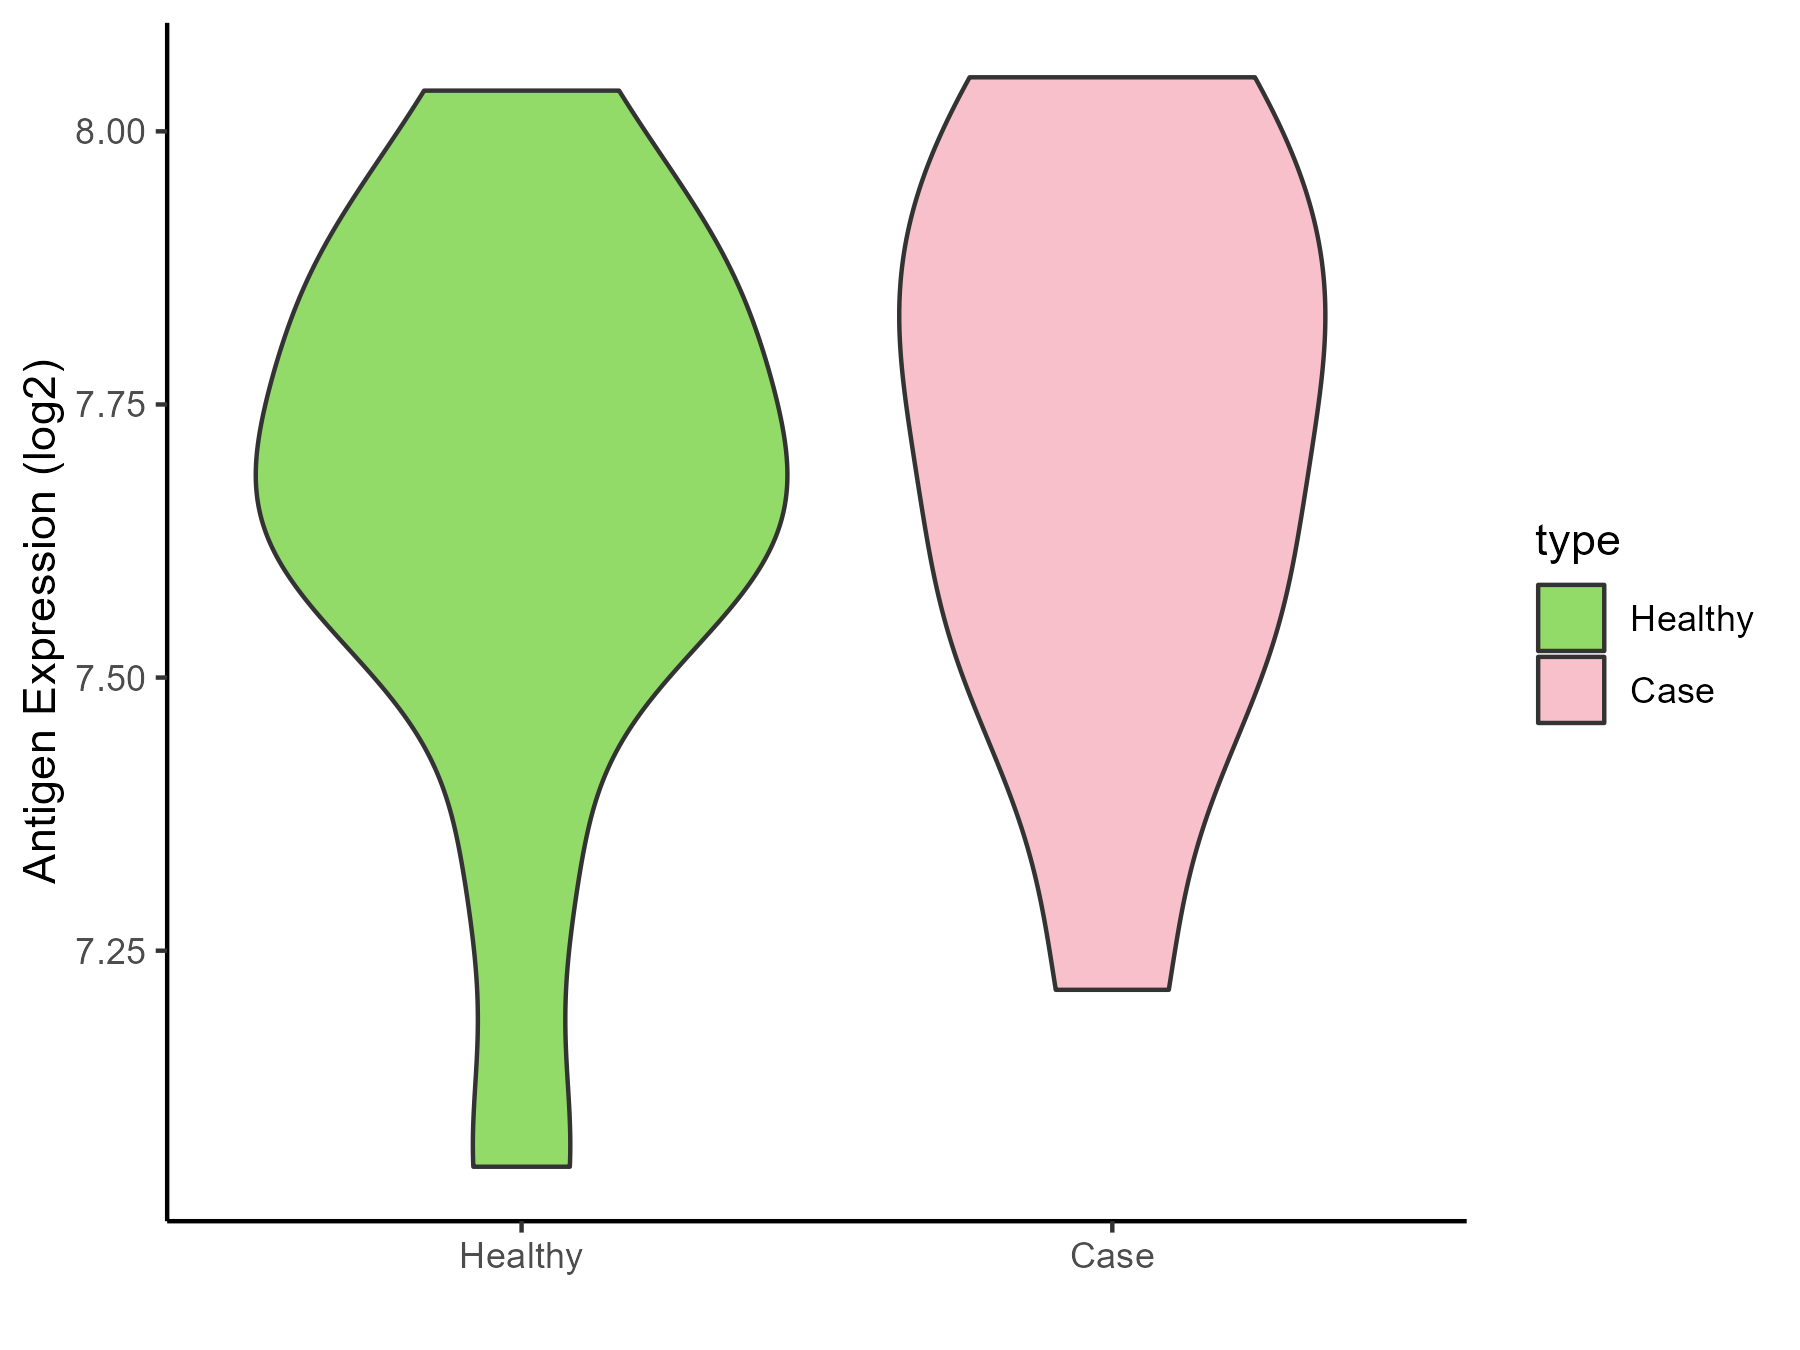
| The Studied Tissue | Peripheral blood | |
| The Specific Disease | Arteriosclerosis | |
| The Expression Level of Disease Section Compare with the Healthy Individual Tissue | p-value: 0.620481092; Fold-change: 0.084824511; Z-score: 0.318974918 | |
| Disease-specific Antigen Abundances |
|
Click to View the Clearer Original Diagram |
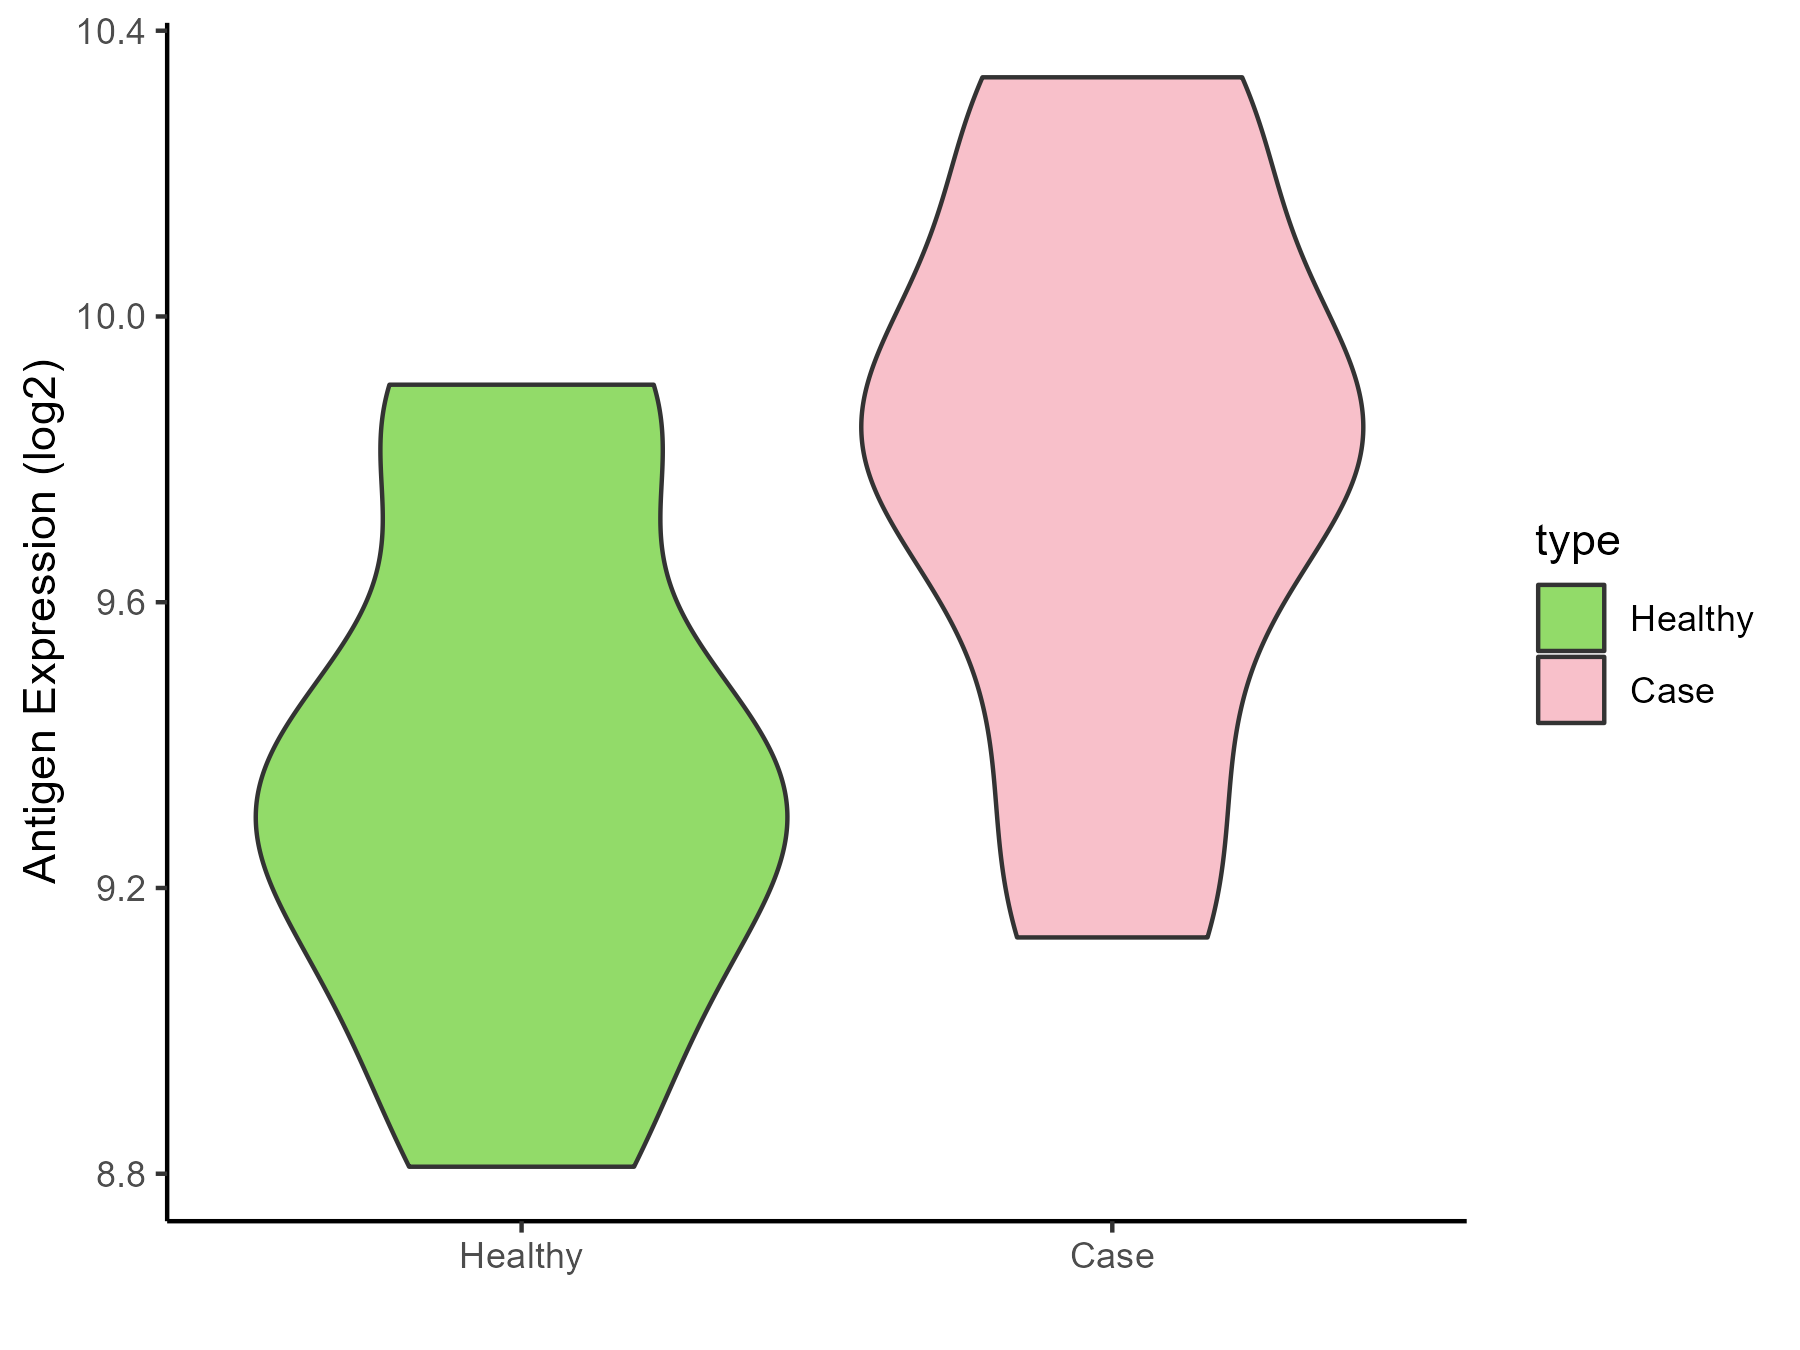
| Differential expression pattern of antigen in diseases | ||
| The Studied Tissue | Intracranial artery | |
| The Specific Disease | Aneurysm | |
| The Expression Level of Disease Section Compare with the Healthy Individual Tissue | p-value: 0.005560048; Fold-change: 0.485801419; Z-score: 1.359035102 | |
| Disease-specific Antigen Abundances |
|
Click to View the Clearer Original Diagram |
ICD Disease Classification 12
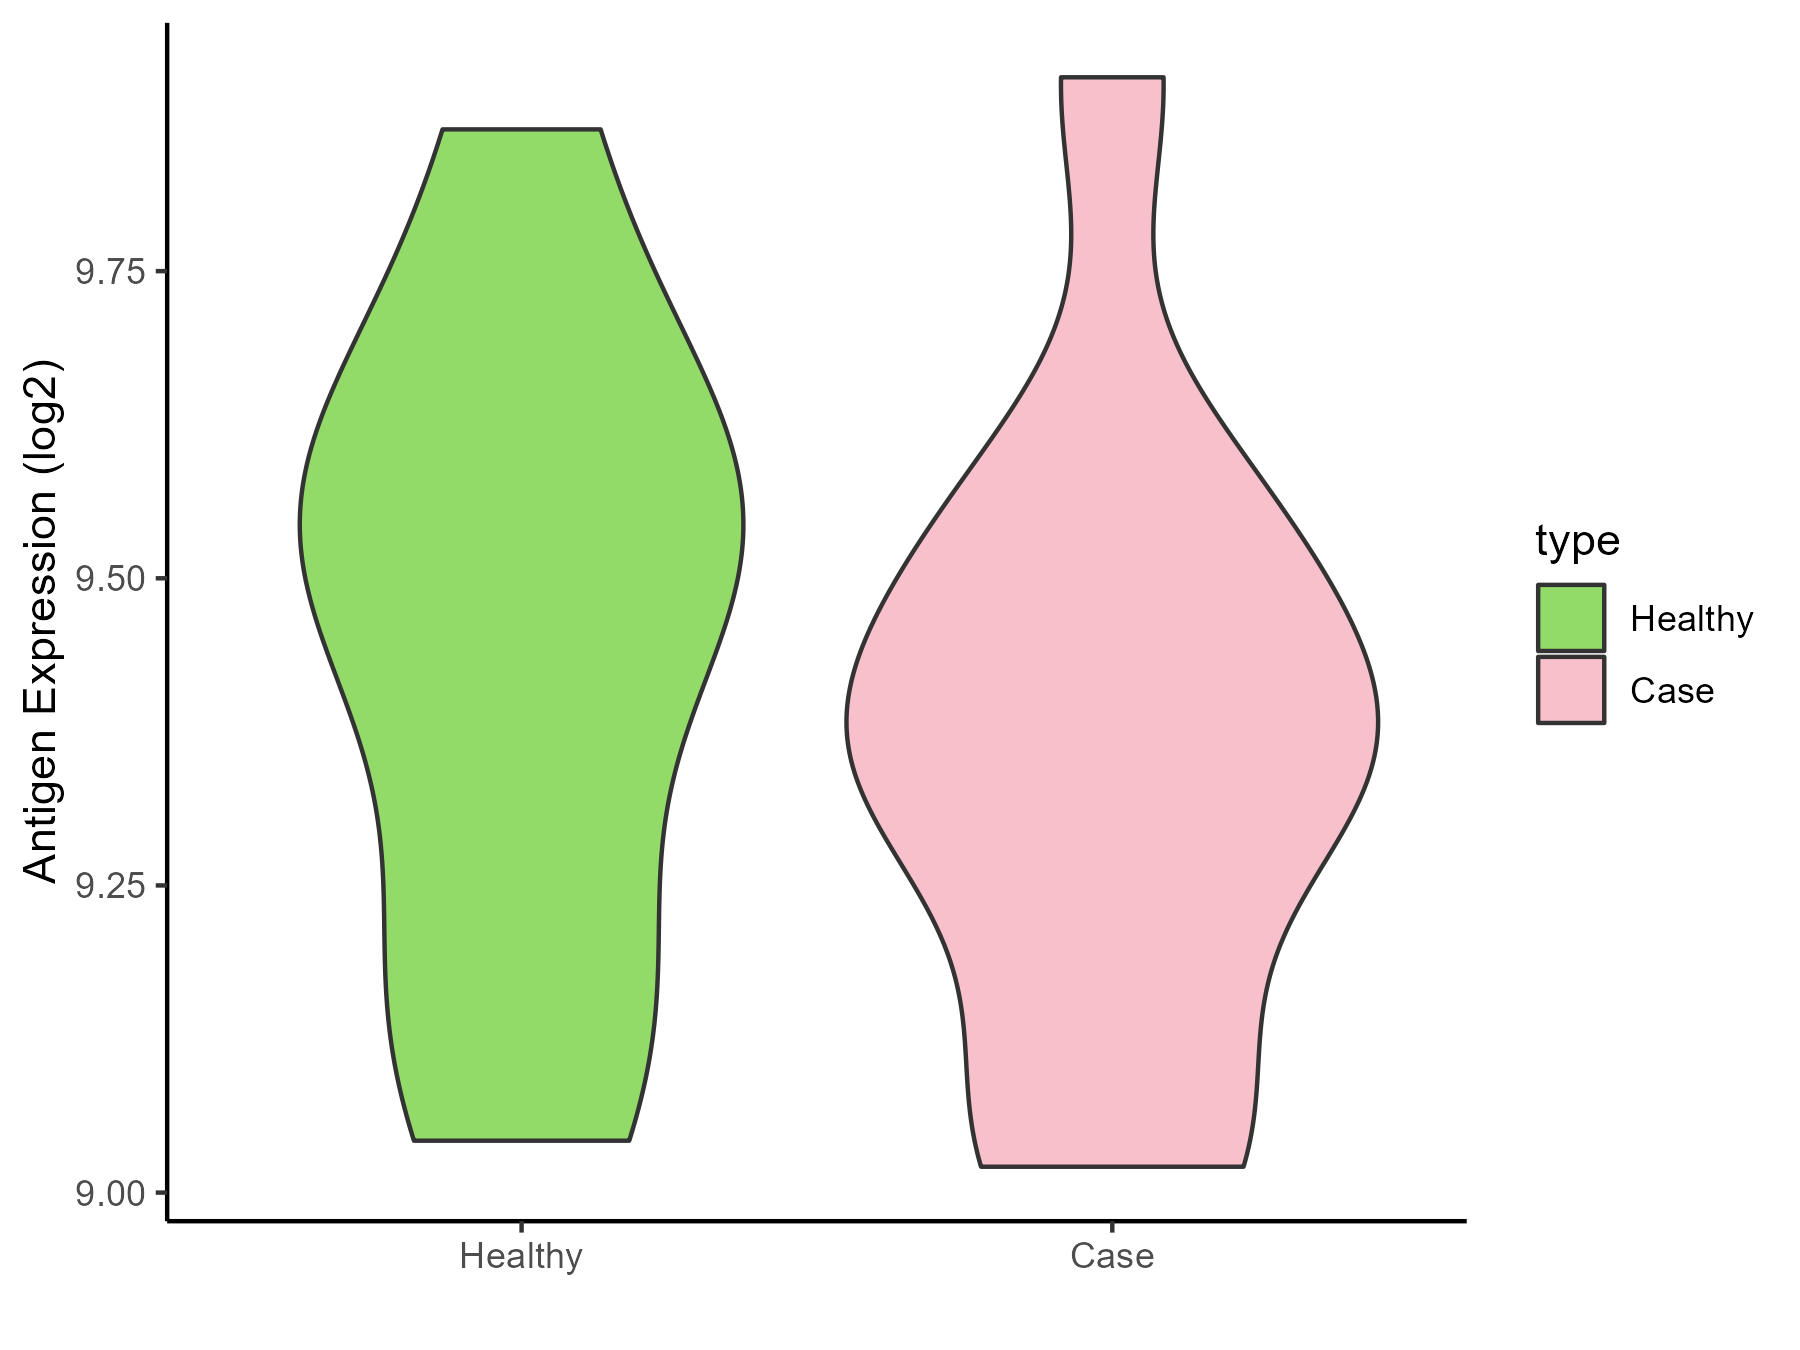
| Differential expression pattern of antigen in diseases | ||
| The Studied Tissue | Peripheral blood | |
| The Specific Disease | Immunodeficiency | |
| The Expression Level of Disease Section Compare with the Healthy Individual Tissue | p-value: 0.511109428; Fold-change: -0.136252238; Z-score: -0.517874404 | |
| Disease-specific Antigen Abundances |
|
Click to View the Clearer Original Diagram |
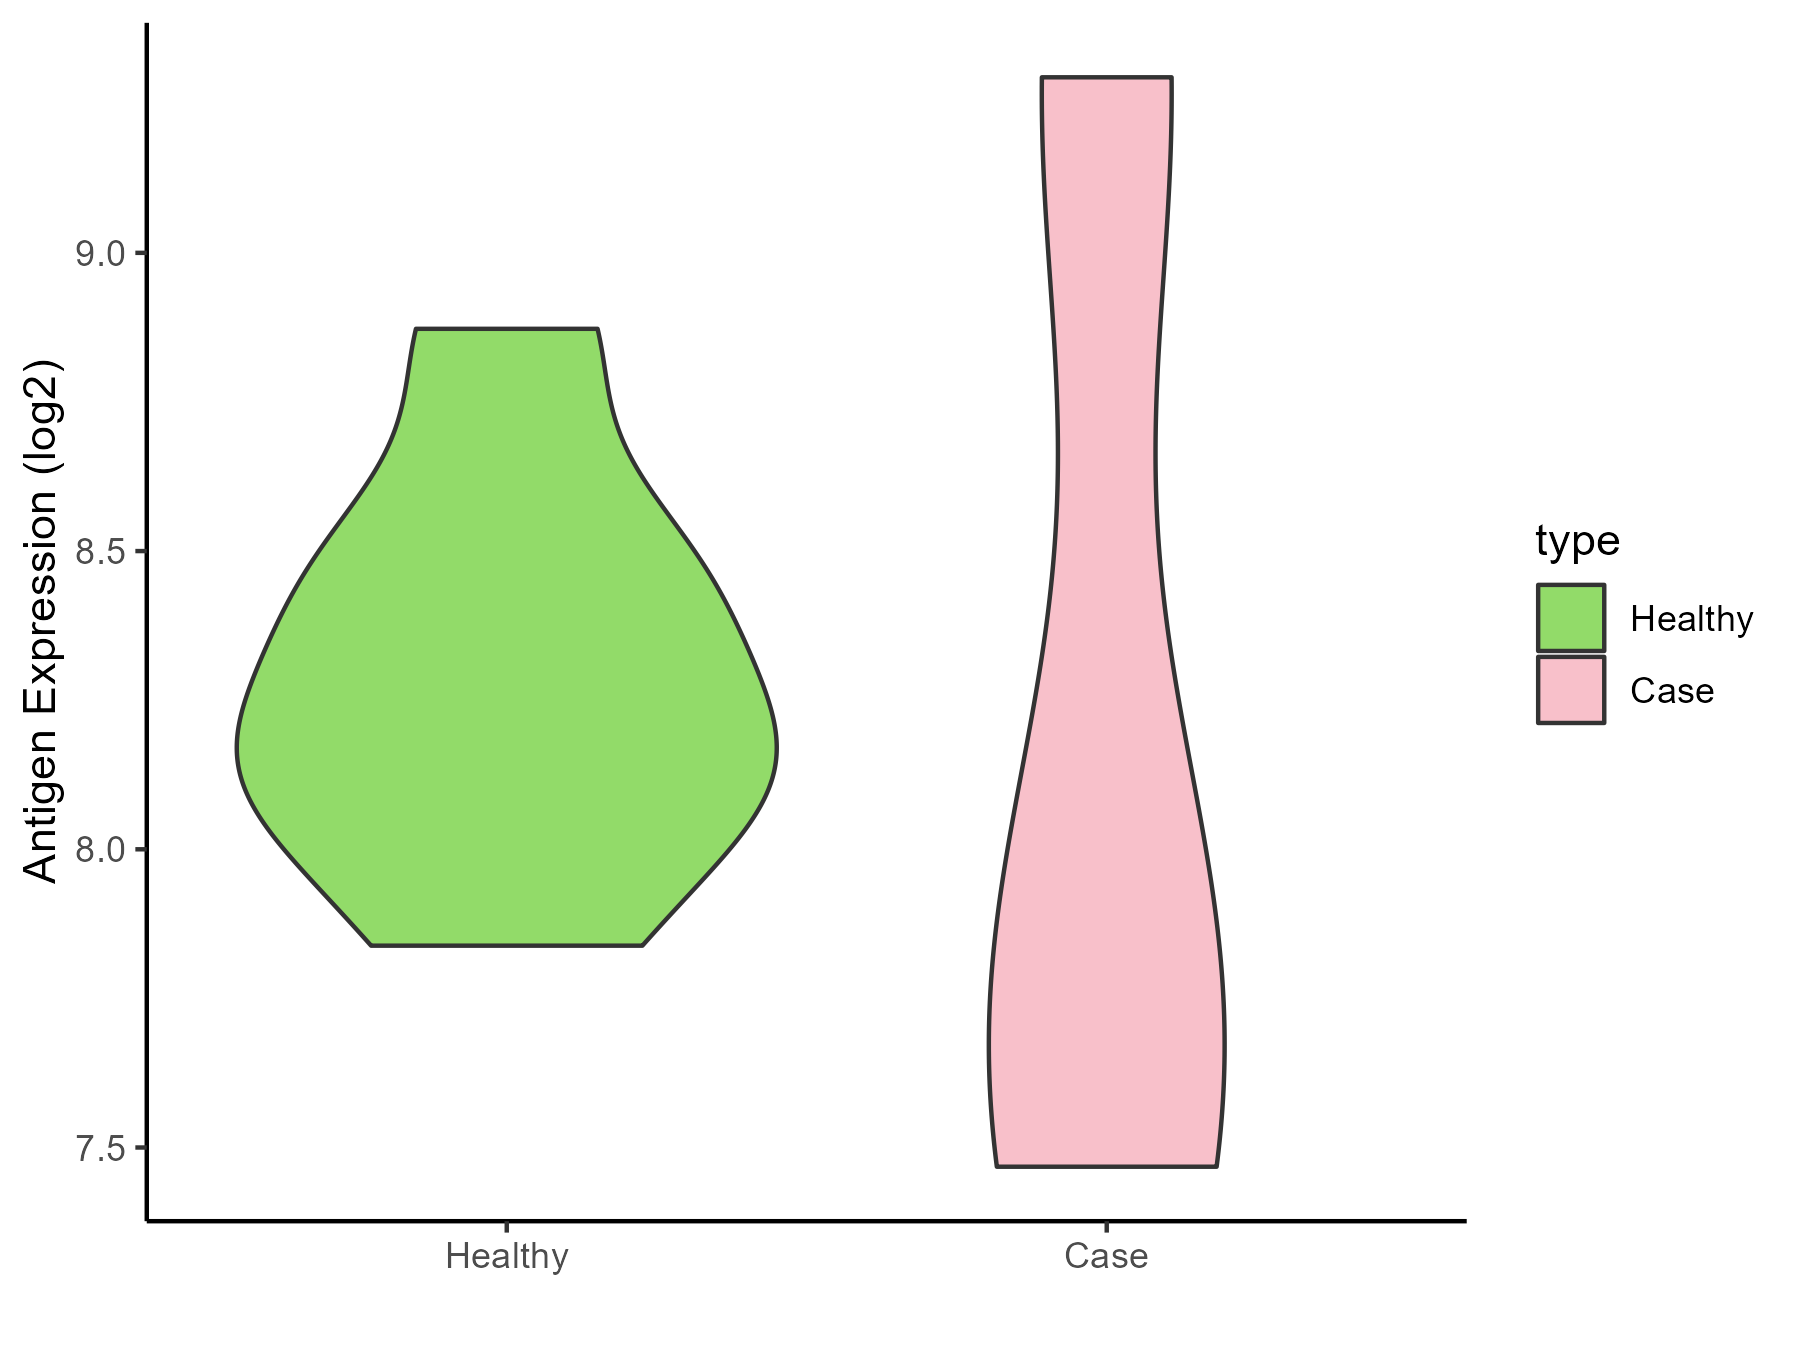
| Differential expression pattern of antigen in diseases | ||
| The Studied Tissue | Hyperplastic tonsil | |
| The Specific Disease | Apnea | |
| The Expression Level of Disease Section Compare with the Healthy Individual Tissue | p-value: 0.893679149; Fold-change: -0.356654611; Z-score: -1.051826434 | |
| Disease-specific Antigen Abundances |
|
Click to View the Clearer Original Diagram |
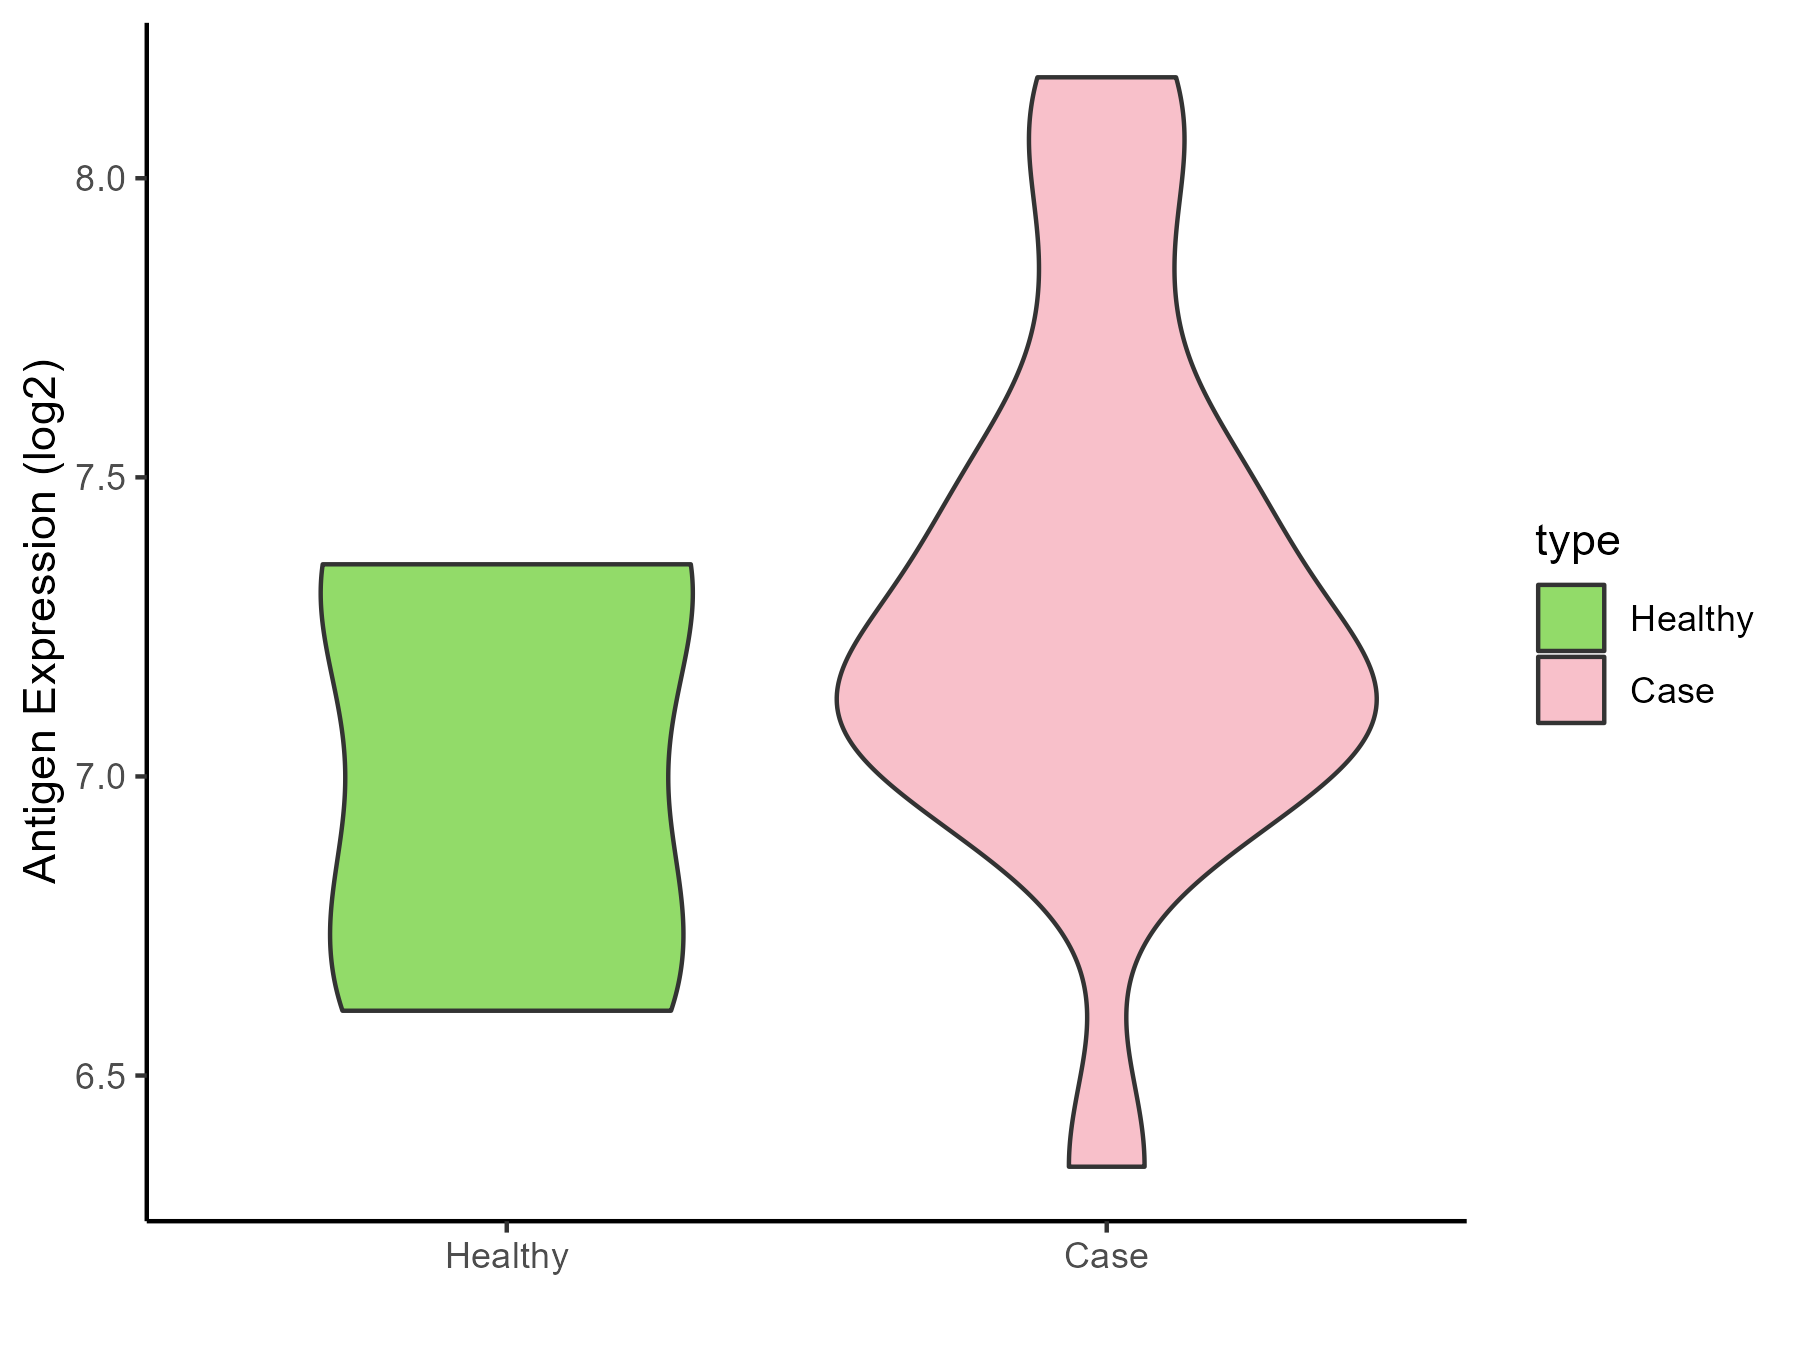
| Differential expression pattern of antigen in diseases | ||
| The Studied Tissue | Peripheral blood | |
| The Specific Disease | Olive pollen allergy | |
| The Expression Level of Disease Section Compare with the Healthy Individual Tissue | p-value: 0.260605763; Fold-change: 0.123872566; Z-score: 0.317955834 | |
| Disease-specific Antigen Abundances |
|
Click to View the Clearer Original Diagram |
| Differential expression pattern of antigen in diseases | ||
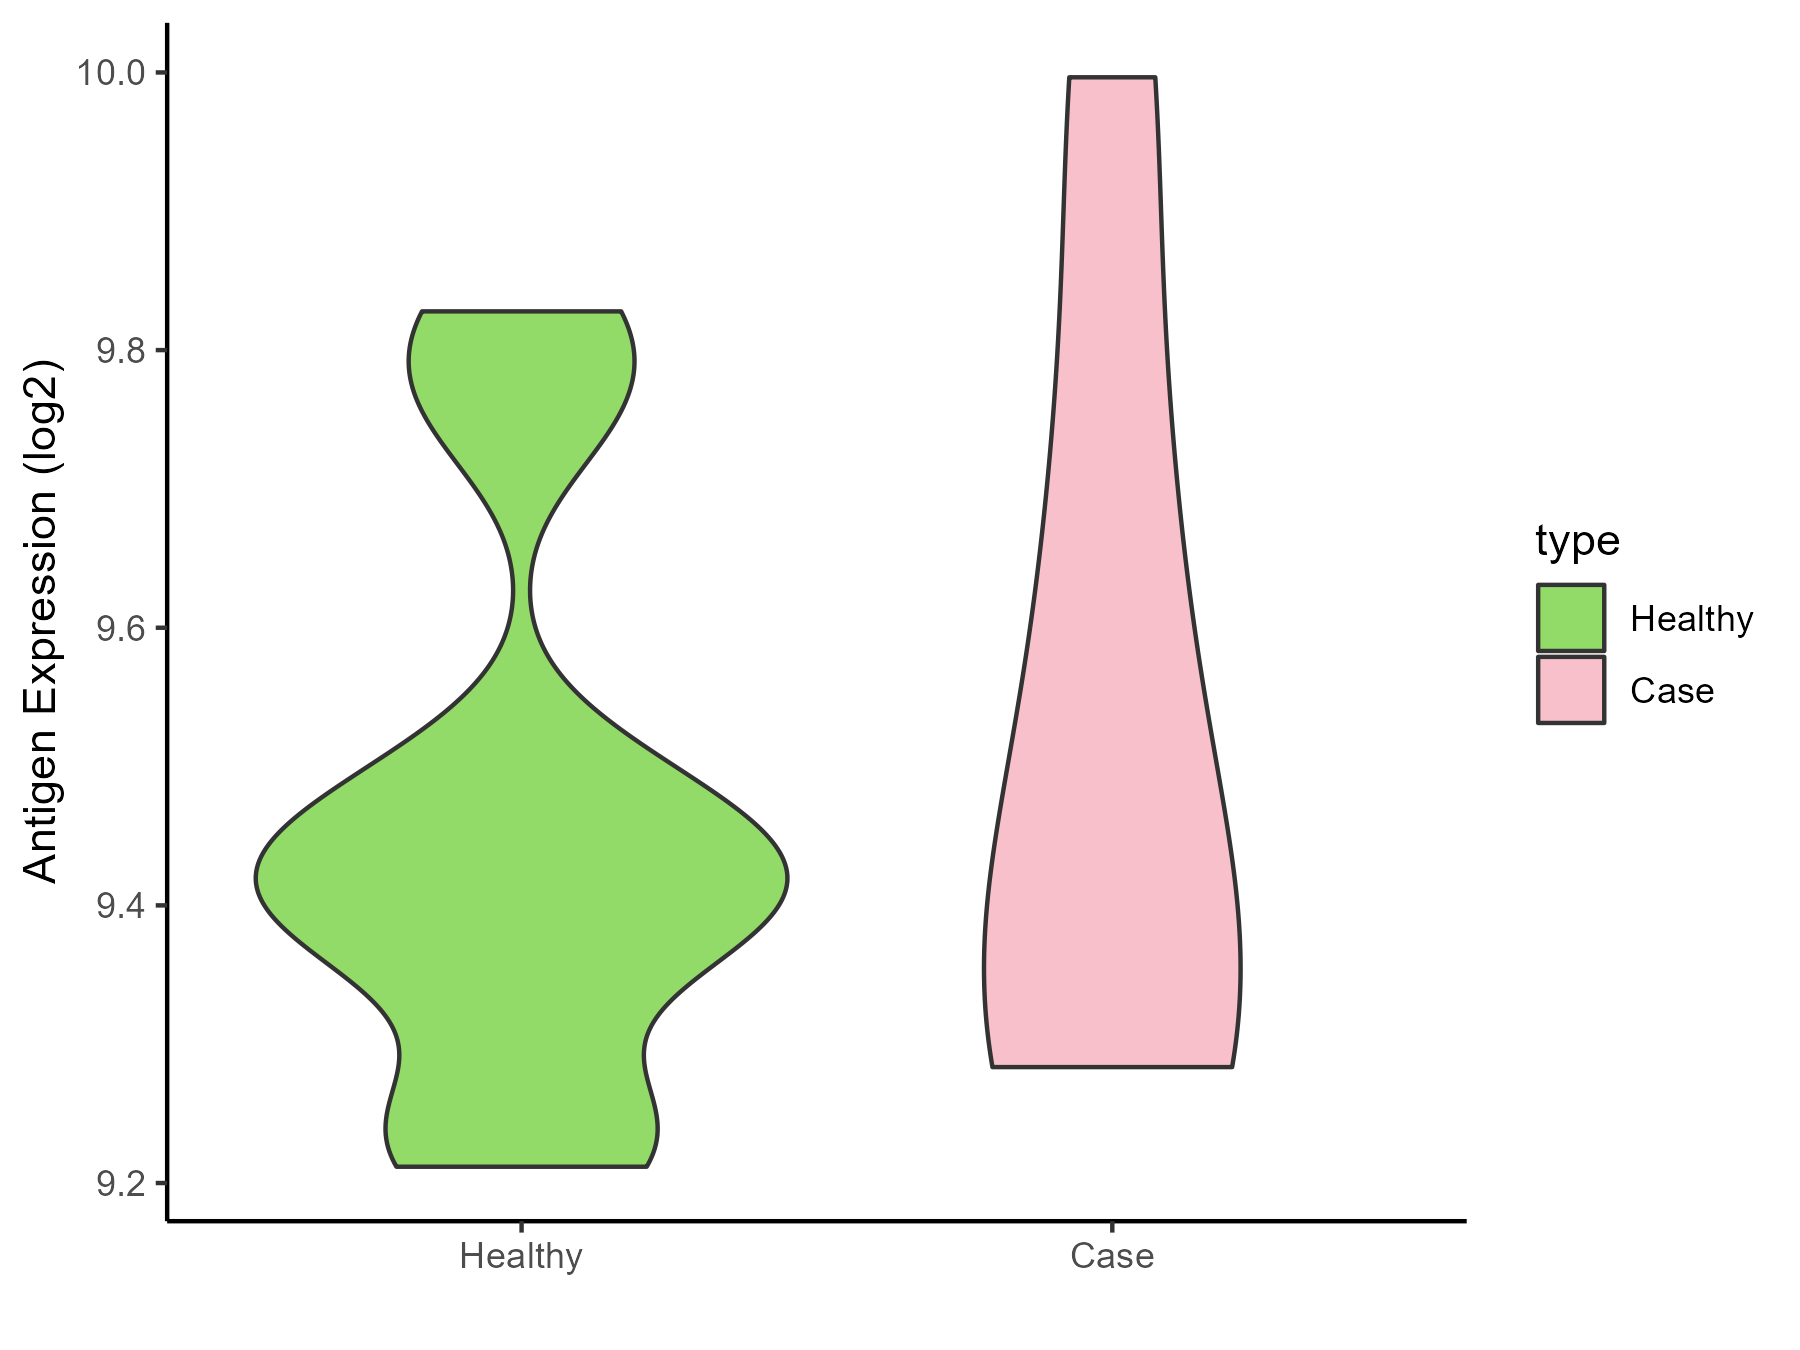
| The Studied Tissue | Sinus mucosa | |
| The Specific Disease | Chronic rhinosinusitis | |
| The Expression Level of Disease Section Compare with the Healthy Individual Tissue | p-value: 0.670425022; Fold-change: -0.014532836; Z-score: -0.070131901 | |
| Disease-specific Antigen Abundances |
|
Click to View the Clearer Original Diagram |
| Differential expression pattern of antigen in diseases | ||
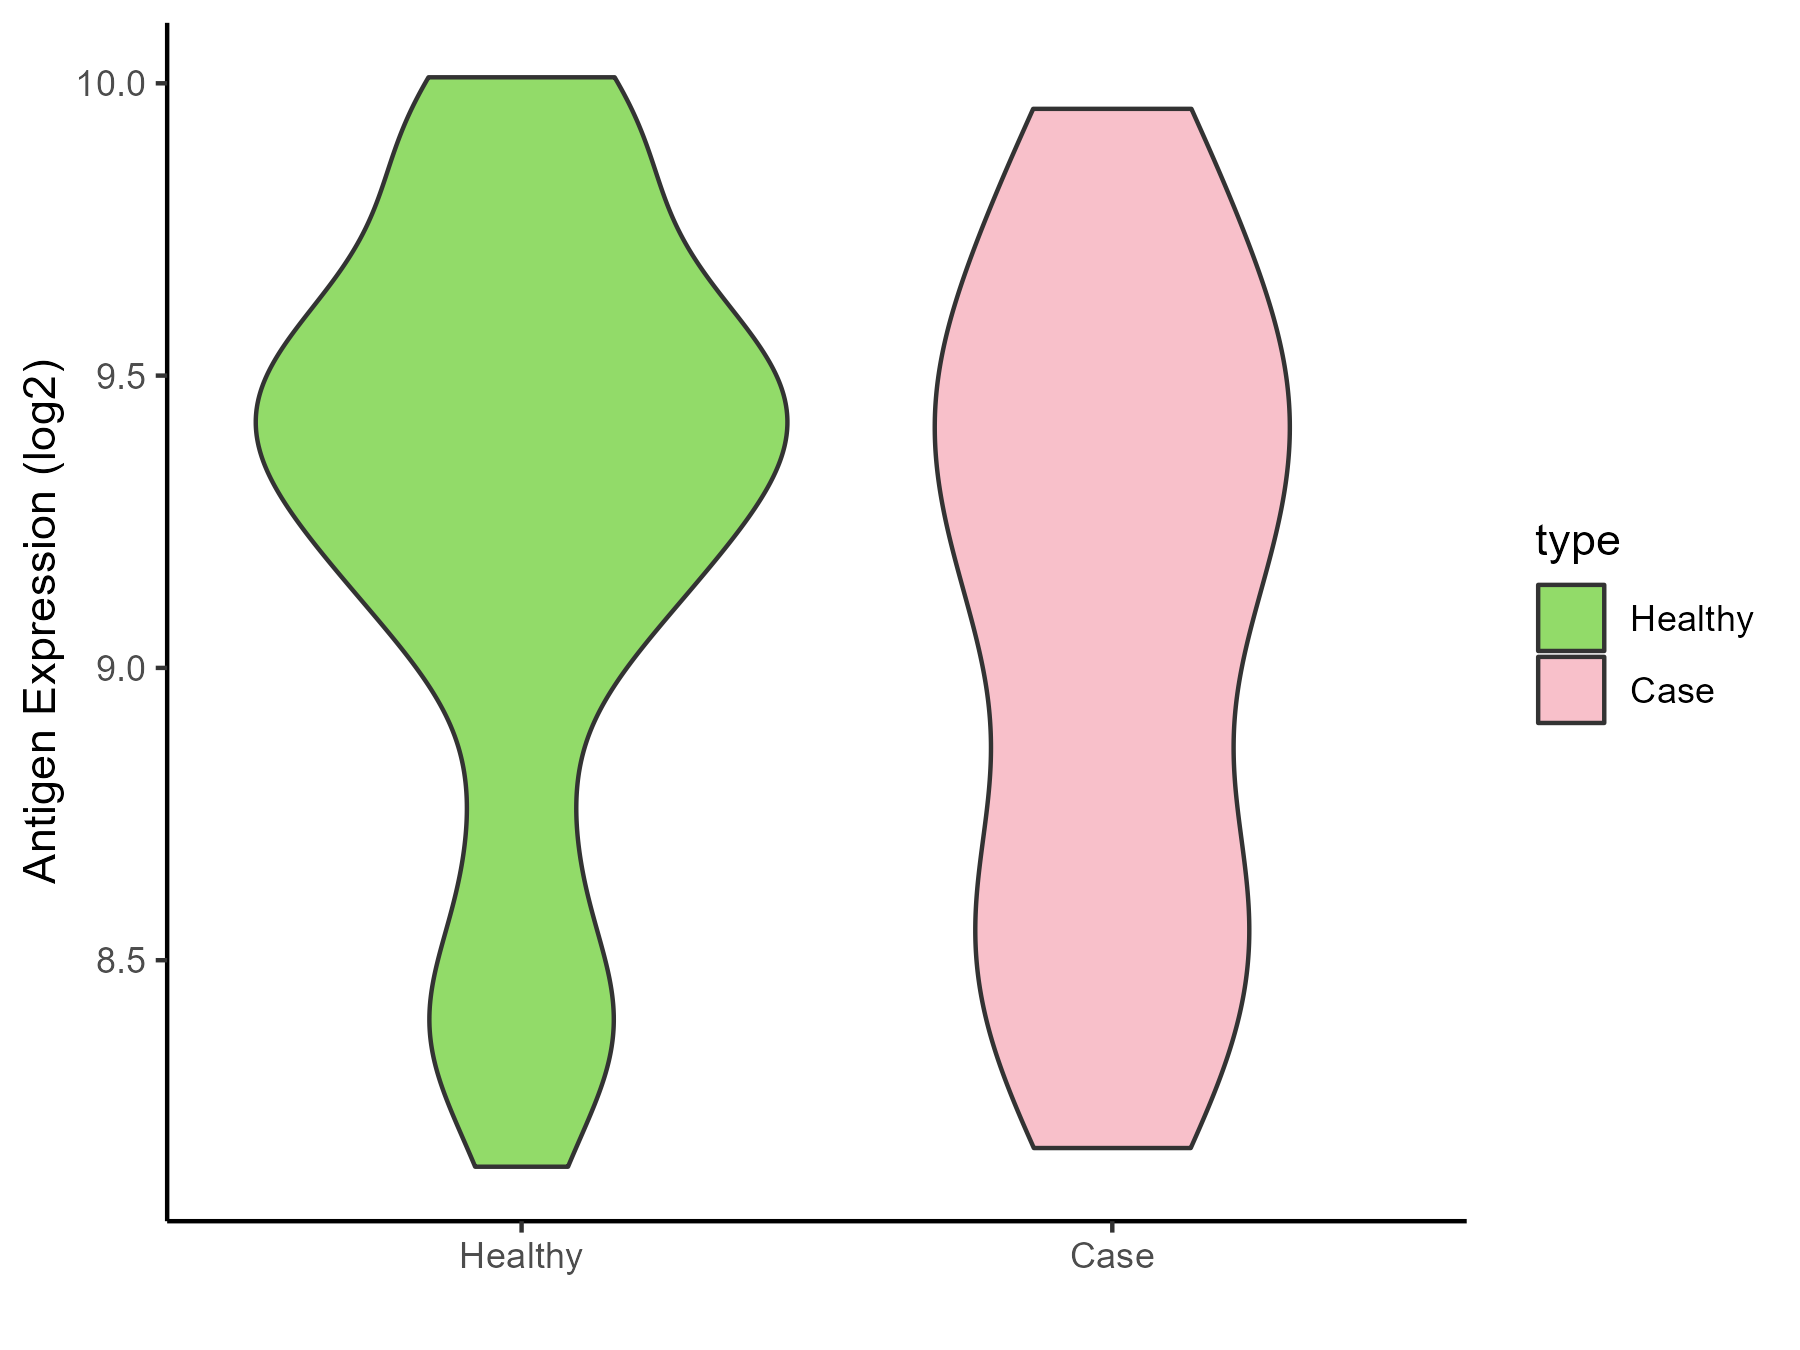
| The Studied Tissue | Lung | |
| The Specific Disease | Chronic obstructive pulmonary disease | |
| The Expression Level of Disease Section Compare with the Healthy Individual Tissue | p-value: 0.117318992; Fold-change: -0.150811952; Z-score: -0.299698211 | |
| Disease-specific Antigen Abundances |
|
Click to View the Clearer Original Diagram |
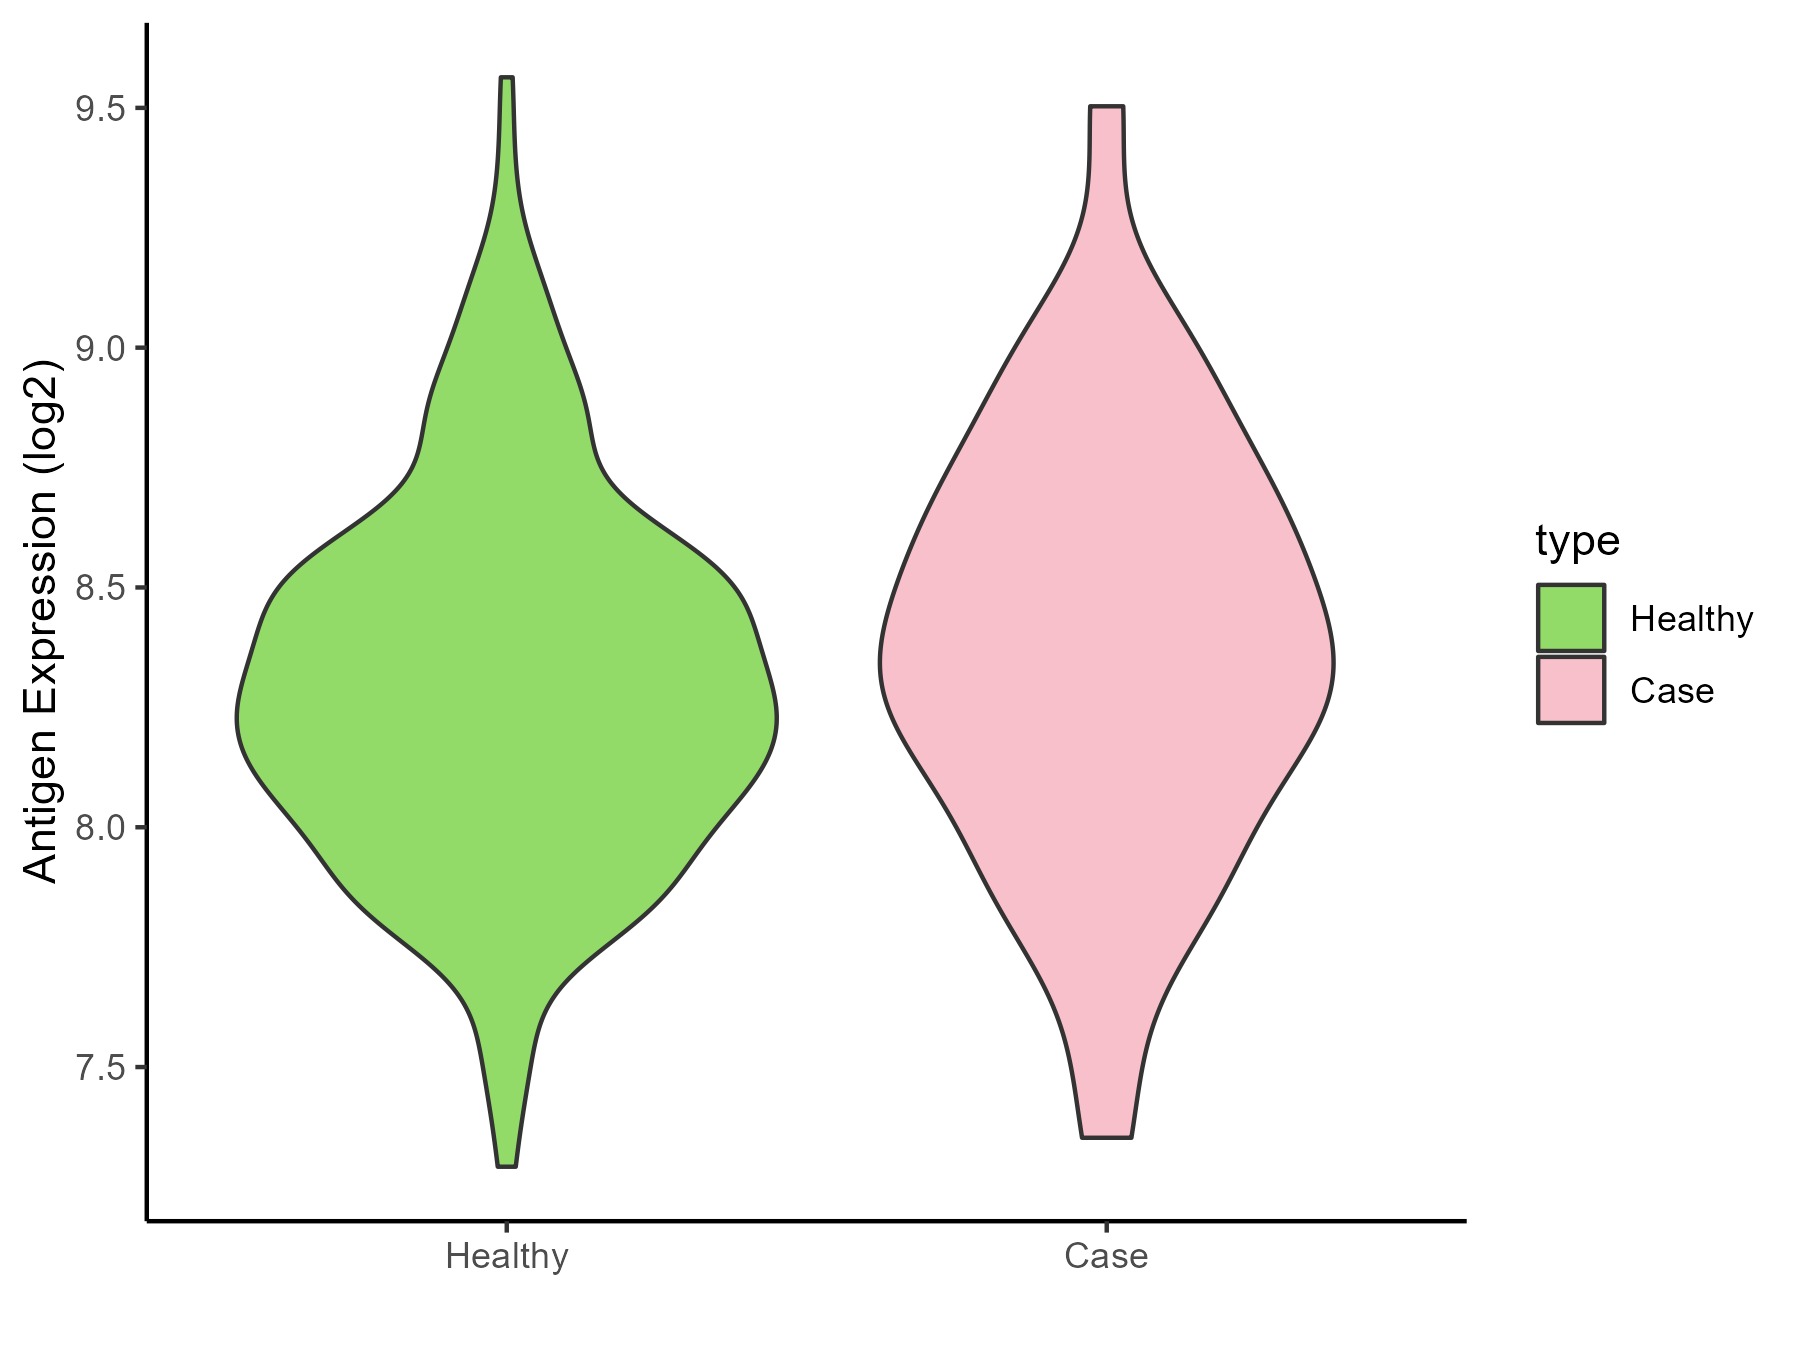
| The Studied Tissue | Small airway epithelium | |
| The Specific Disease | Chronic obstructive pulmonary disease | |
| The Expression Level of Disease Section Compare with the Healthy Individual Tissue | p-value: 0.328436415; Fold-change: 0.091971816; Z-score: 0.240920886 | |
| Disease-specific Antigen Abundances |
|
Click to View the Clearer Original Diagram |
| Differential expression pattern of antigen in diseases | ||
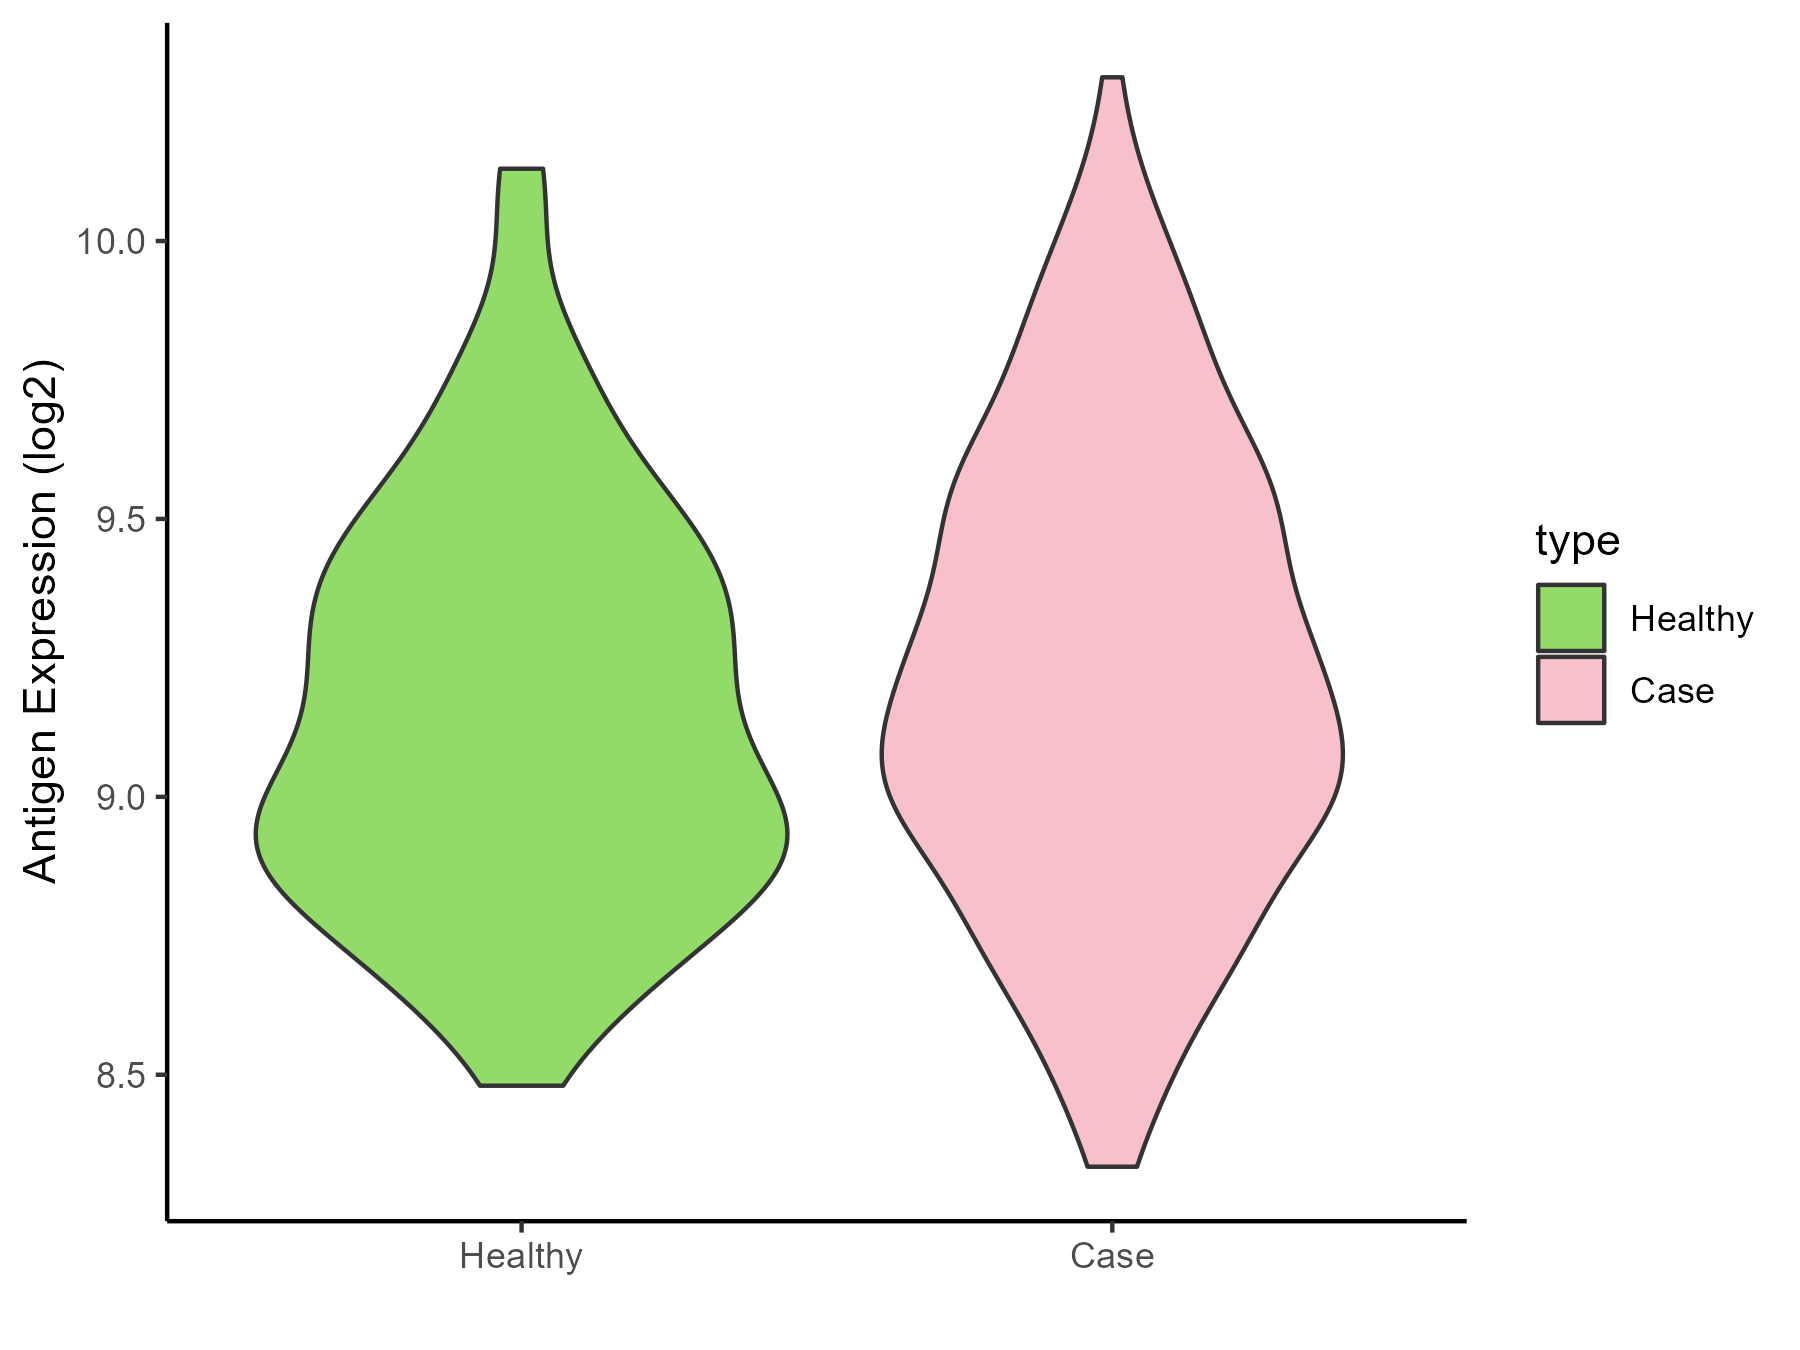
| The Studied Tissue | Nasal and bronchial airway | |
| The Specific Disease | Asthma | |
| The Expression Level of Disease Section Compare with the Healthy Individual Tissue | p-value: 0.138838415; Fold-change: 0.105637117; Z-score: 0.296091656 | |
| Disease-specific Antigen Abundances |
|
Click to View the Clearer Original Diagram |
| Differential expression pattern of antigen in diseases | ||
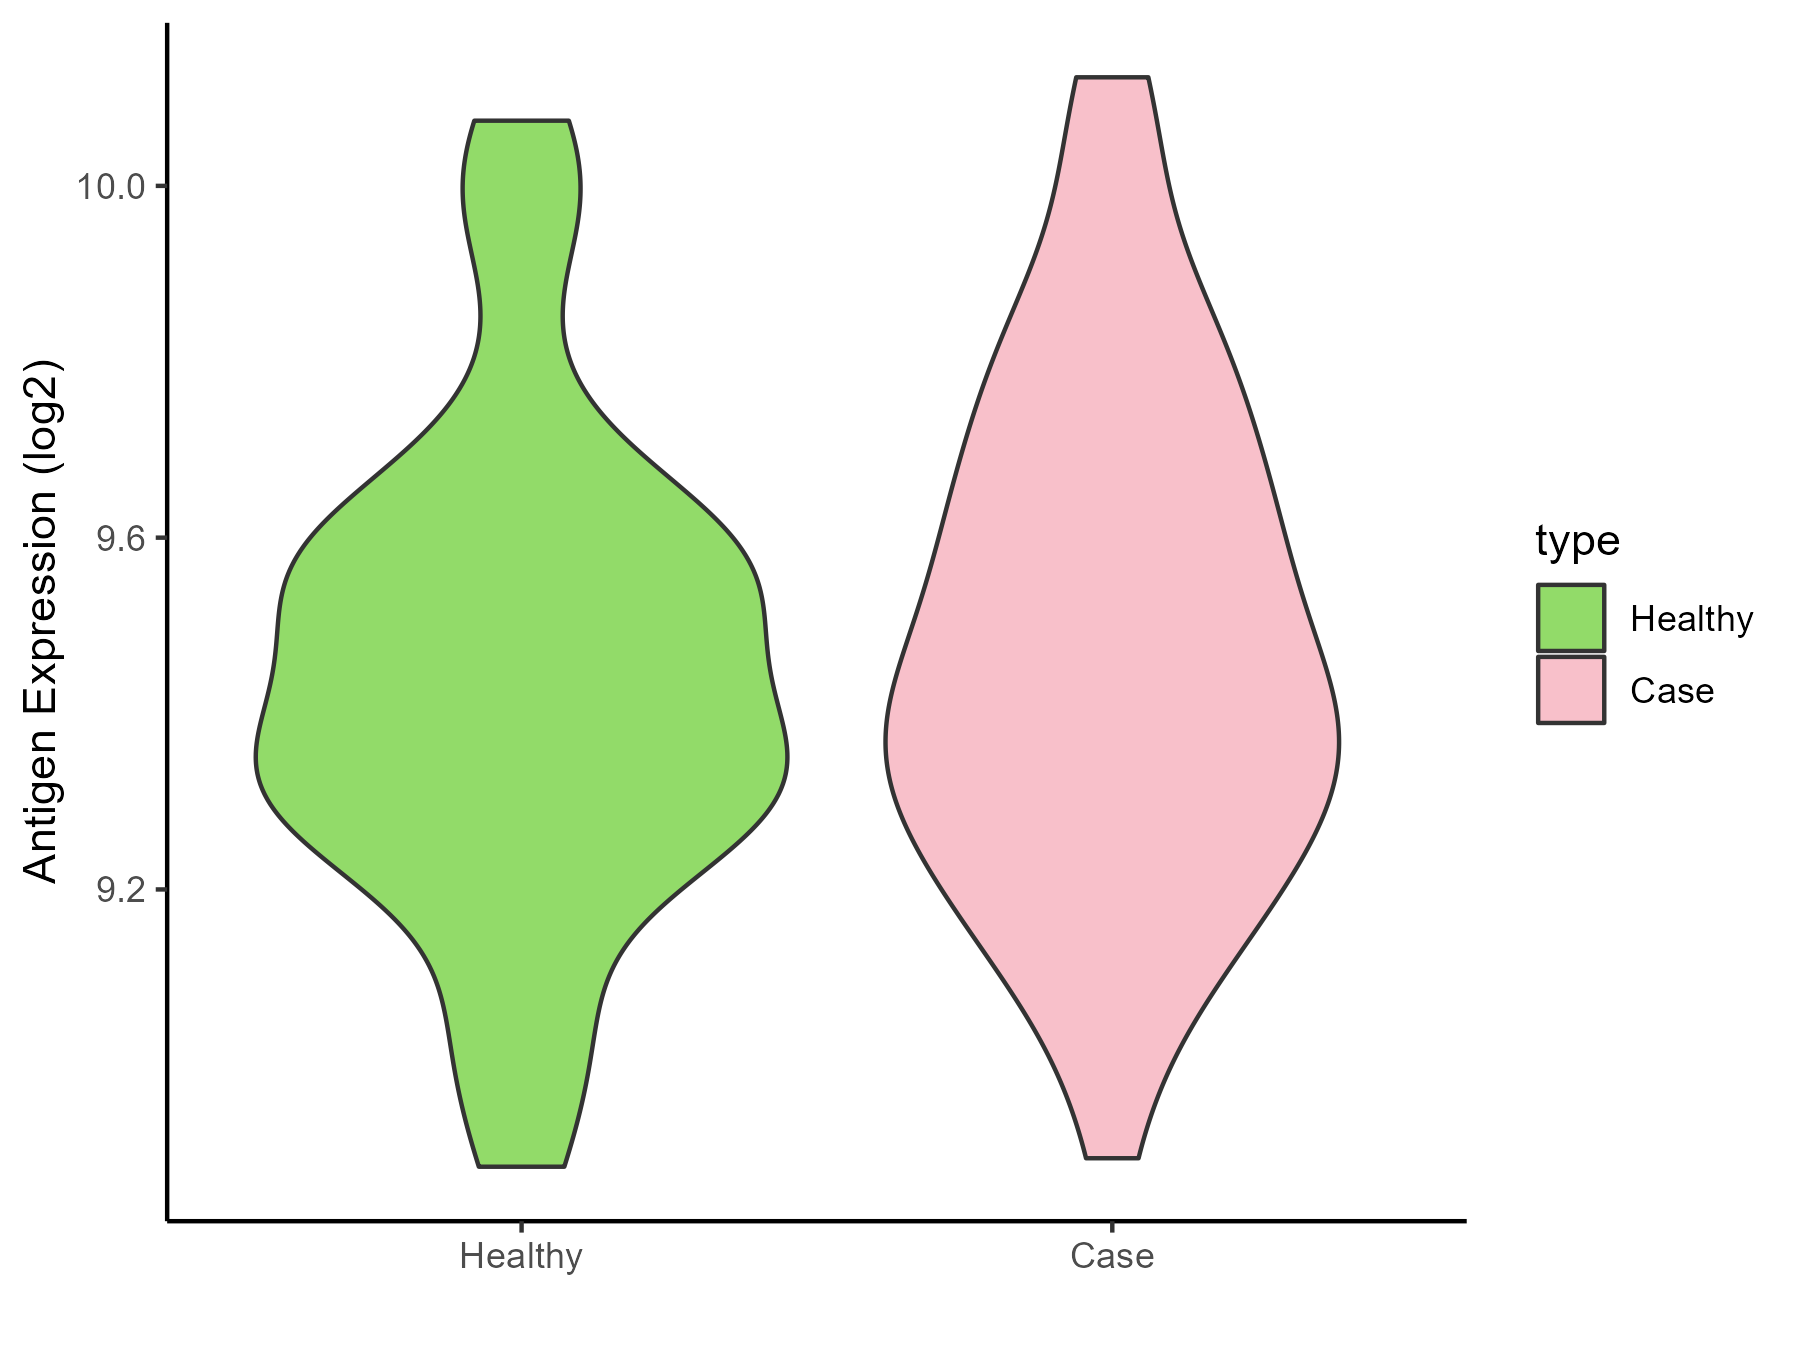
| The Studied Tissue | Nasal Epithelium | |
| The Specific Disease | Human rhinovirus infection | |
| The Expression Level of Disease Section Compare with the Healthy Individual Tissue | p-value: 0.487219875; Fold-change: 0.021456854; Z-score: 0.078777032 | |
| Disease-specific Antigen Abundances |
|
Click to View the Clearer Original Diagram |
| Differential expression pattern of antigen in diseases | ||
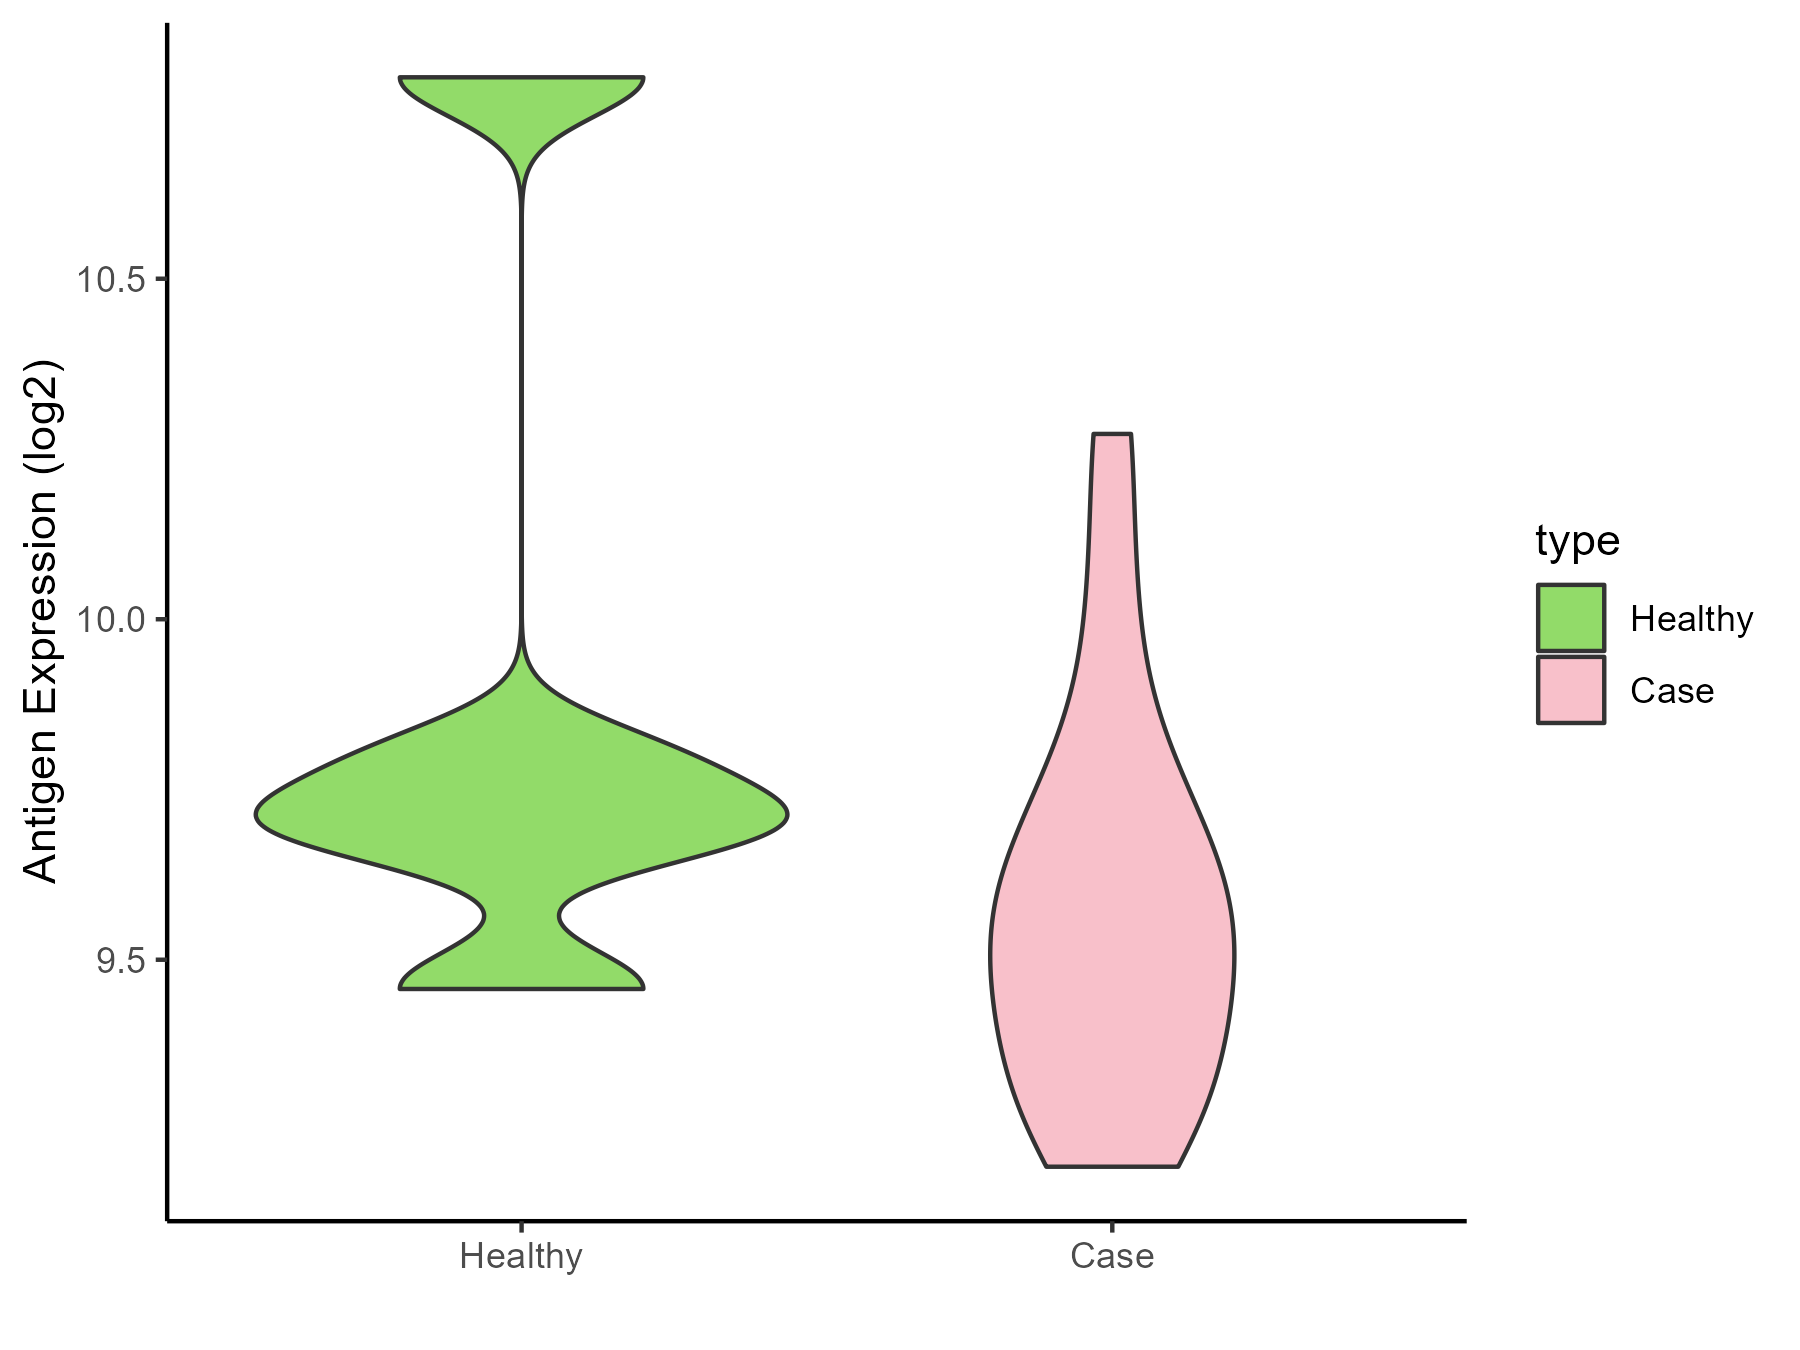
| The Studied Tissue | Lung | |
| The Specific Disease | Idiopathic pulmonary fibrosis | |
| The Expression Level of Disease Section Compare with the Healthy Individual Tissue | p-value: 0.25476147; Fold-change: -0.193934335; Z-score: -0.371523213 | |
| Disease-specific Antigen Abundances |
|
Click to View the Clearer Original Diagram |
ICD Disease Classification 13
| Differential expression pattern of antigen in diseases | ||
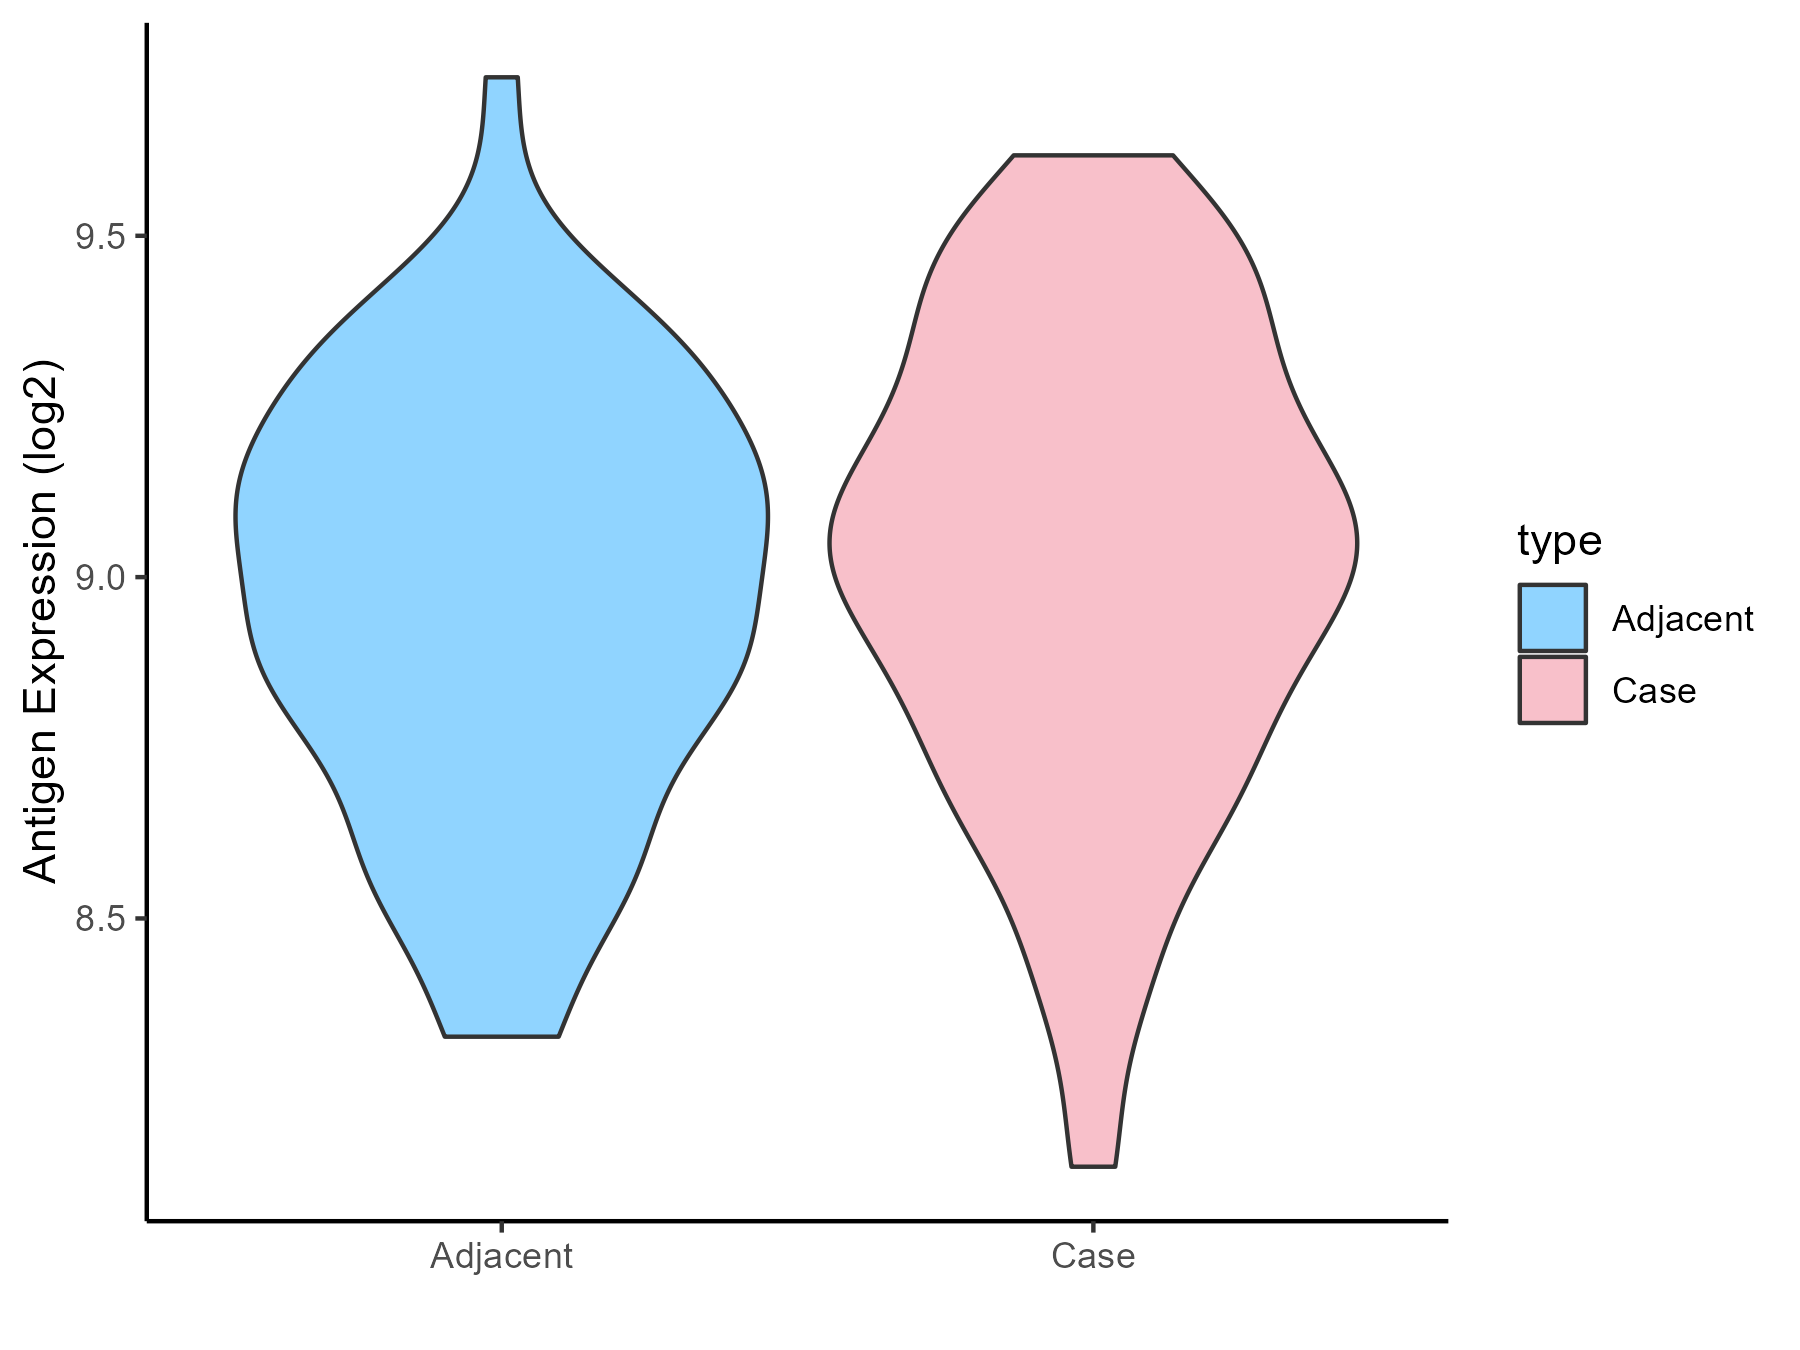
| The Studied Tissue | Gingival | |
| The Specific Disease | Periodontal disease | |
| The Expression Level of Disease Section Compare with the Adjacent Tissue | p-value: 0.288496317; Fold-change: 0.056056538; Z-score: 0.179904479 | |
| Disease-specific Antigen Abundances |
|
Click to View the Clearer Original Diagram |
| Differential expression pattern of antigen in diseases | ||
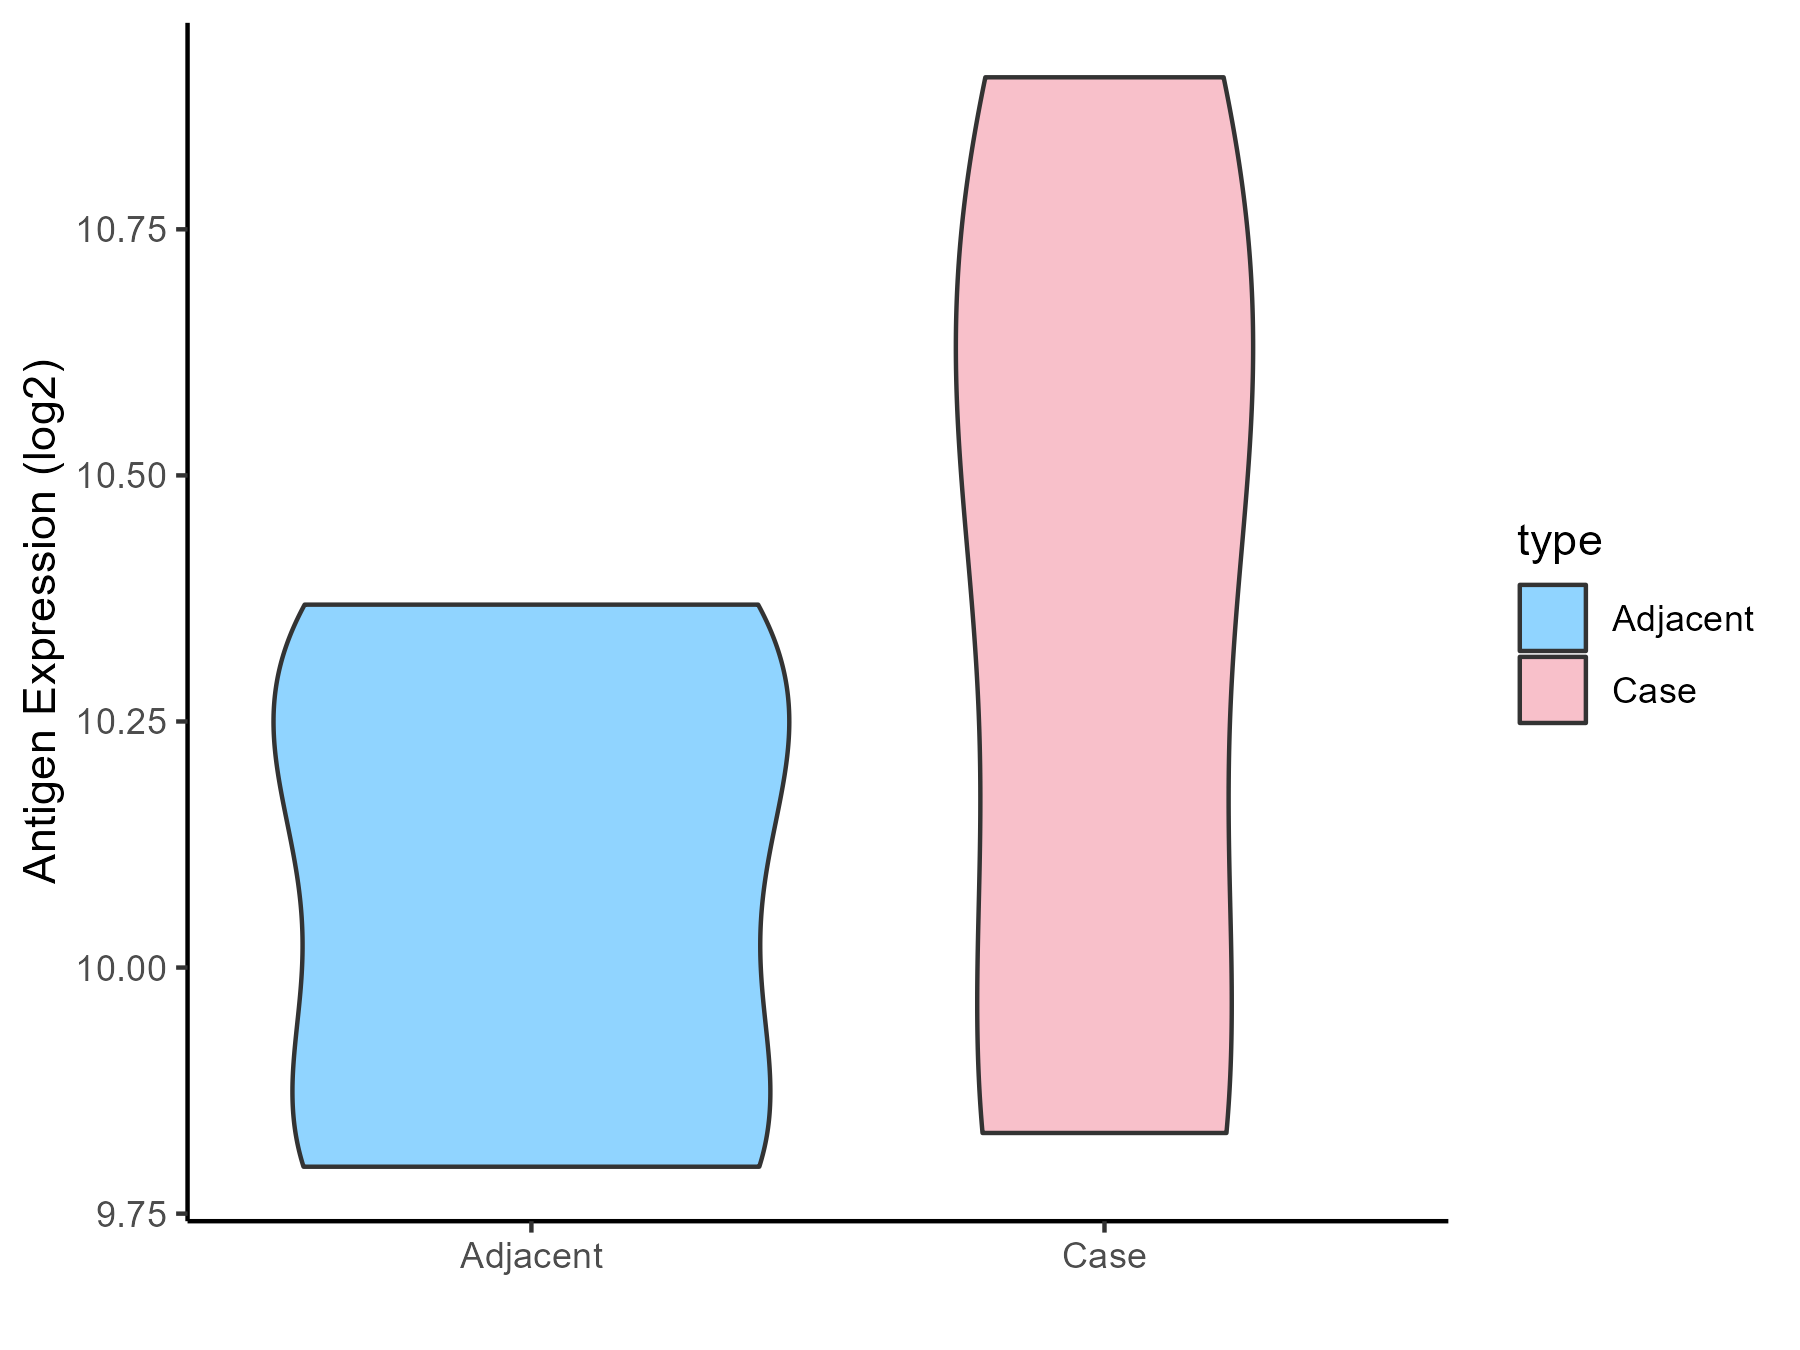
| The Studied Tissue | Gastric antrum | |
| The Specific Disease | Eosinophilic gastritis | |
| The Expression Level of Disease Section Compare with the Adjacent Tissue | p-value: 0.307063077; Fold-change: 0.358477656; Z-score: 1.356589607 | |
| Disease-specific Antigen Abundances |
|
Click to View the Clearer Original Diagram |
| Differential expression pattern of antigen in diseases | ||
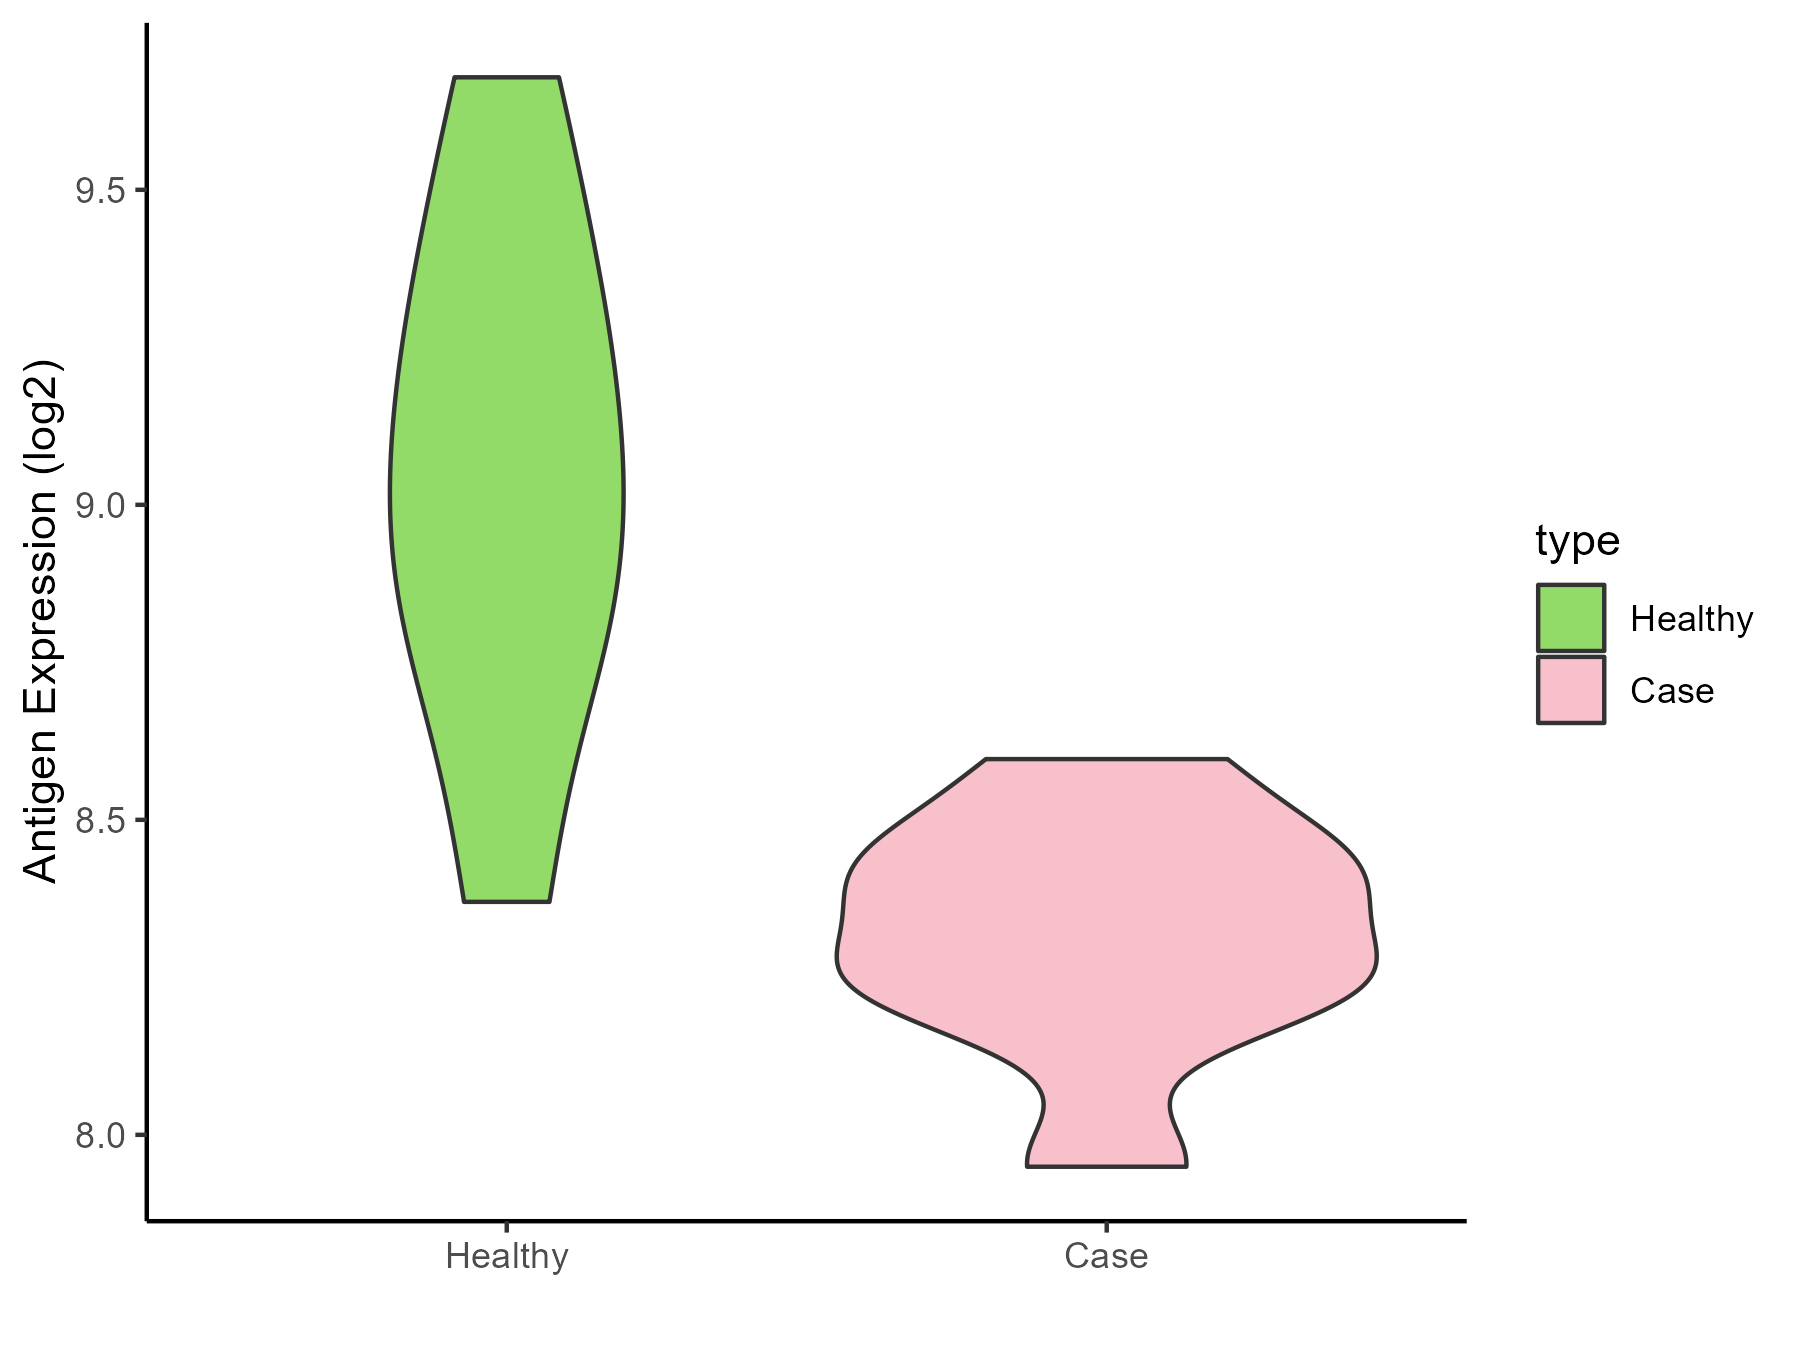
| The Studied Tissue | Liver | |
| The Specific Disease | Liver failure | |
| The Expression Level of Disease Section Compare with the Healthy Individual Tissue | p-value: 0.001106199; Fold-change: -0.709731023; Z-score: -1.721169644 | |
| Disease-specific Antigen Abundances |
|
Click to View the Clearer Original Diagram |
| Differential expression pattern of antigen in diseases | ||
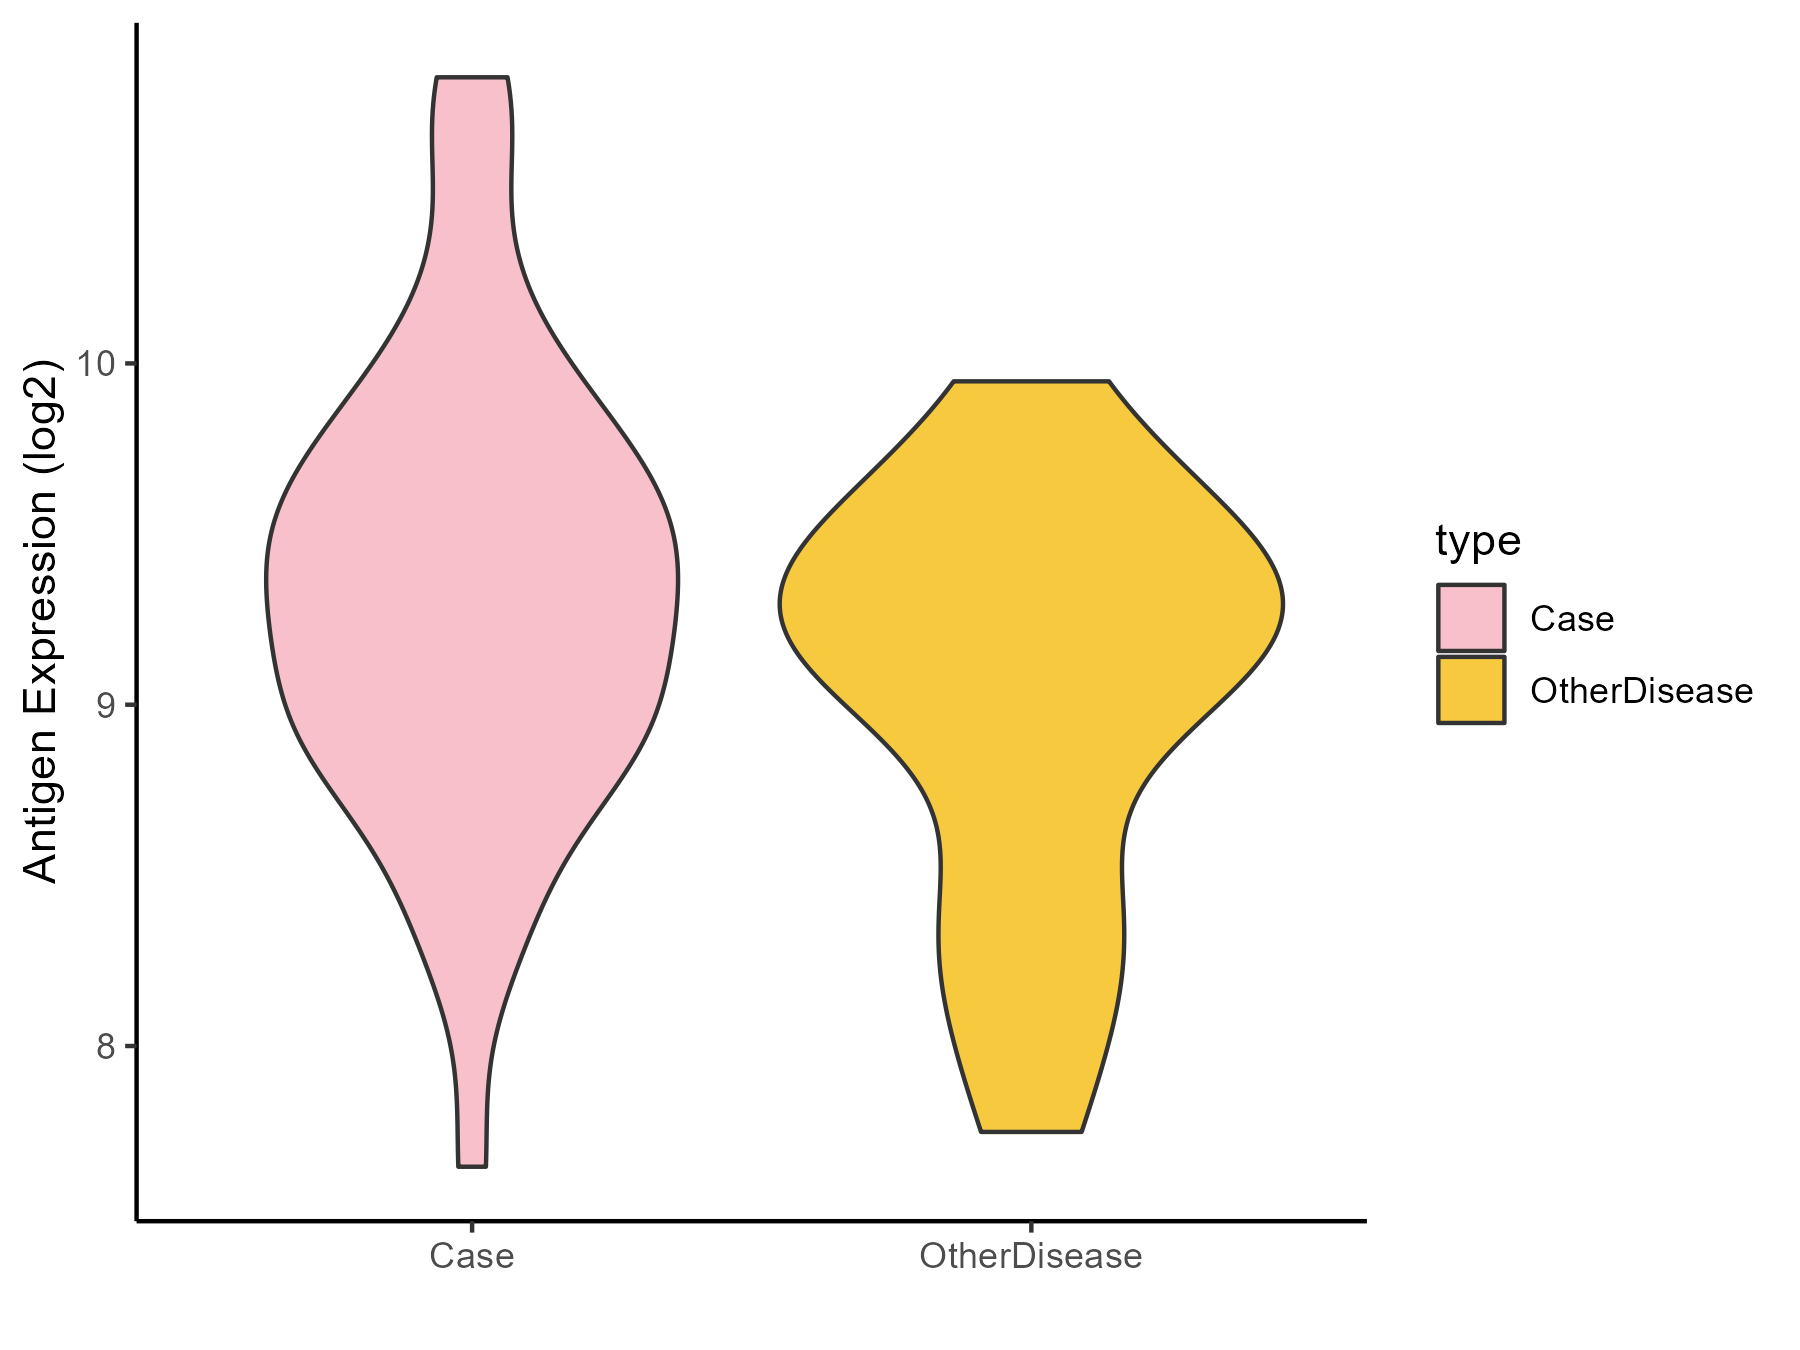
| The Studied Tissue | Colon mucosal | |
| The Specific Disease | Ulcerative colitis | |
| The Expression Level of Disease Section Compare with the Adjacent Tissue | p-value: 0.093421392; Fold-change: 0.120761728; Z-score: 0.199835897 | |
| Disease-specific Antigen Abundances |
|
Click to View the Clearer Original Diagram |
| Differential expression pattern of antigen in diseases | ||
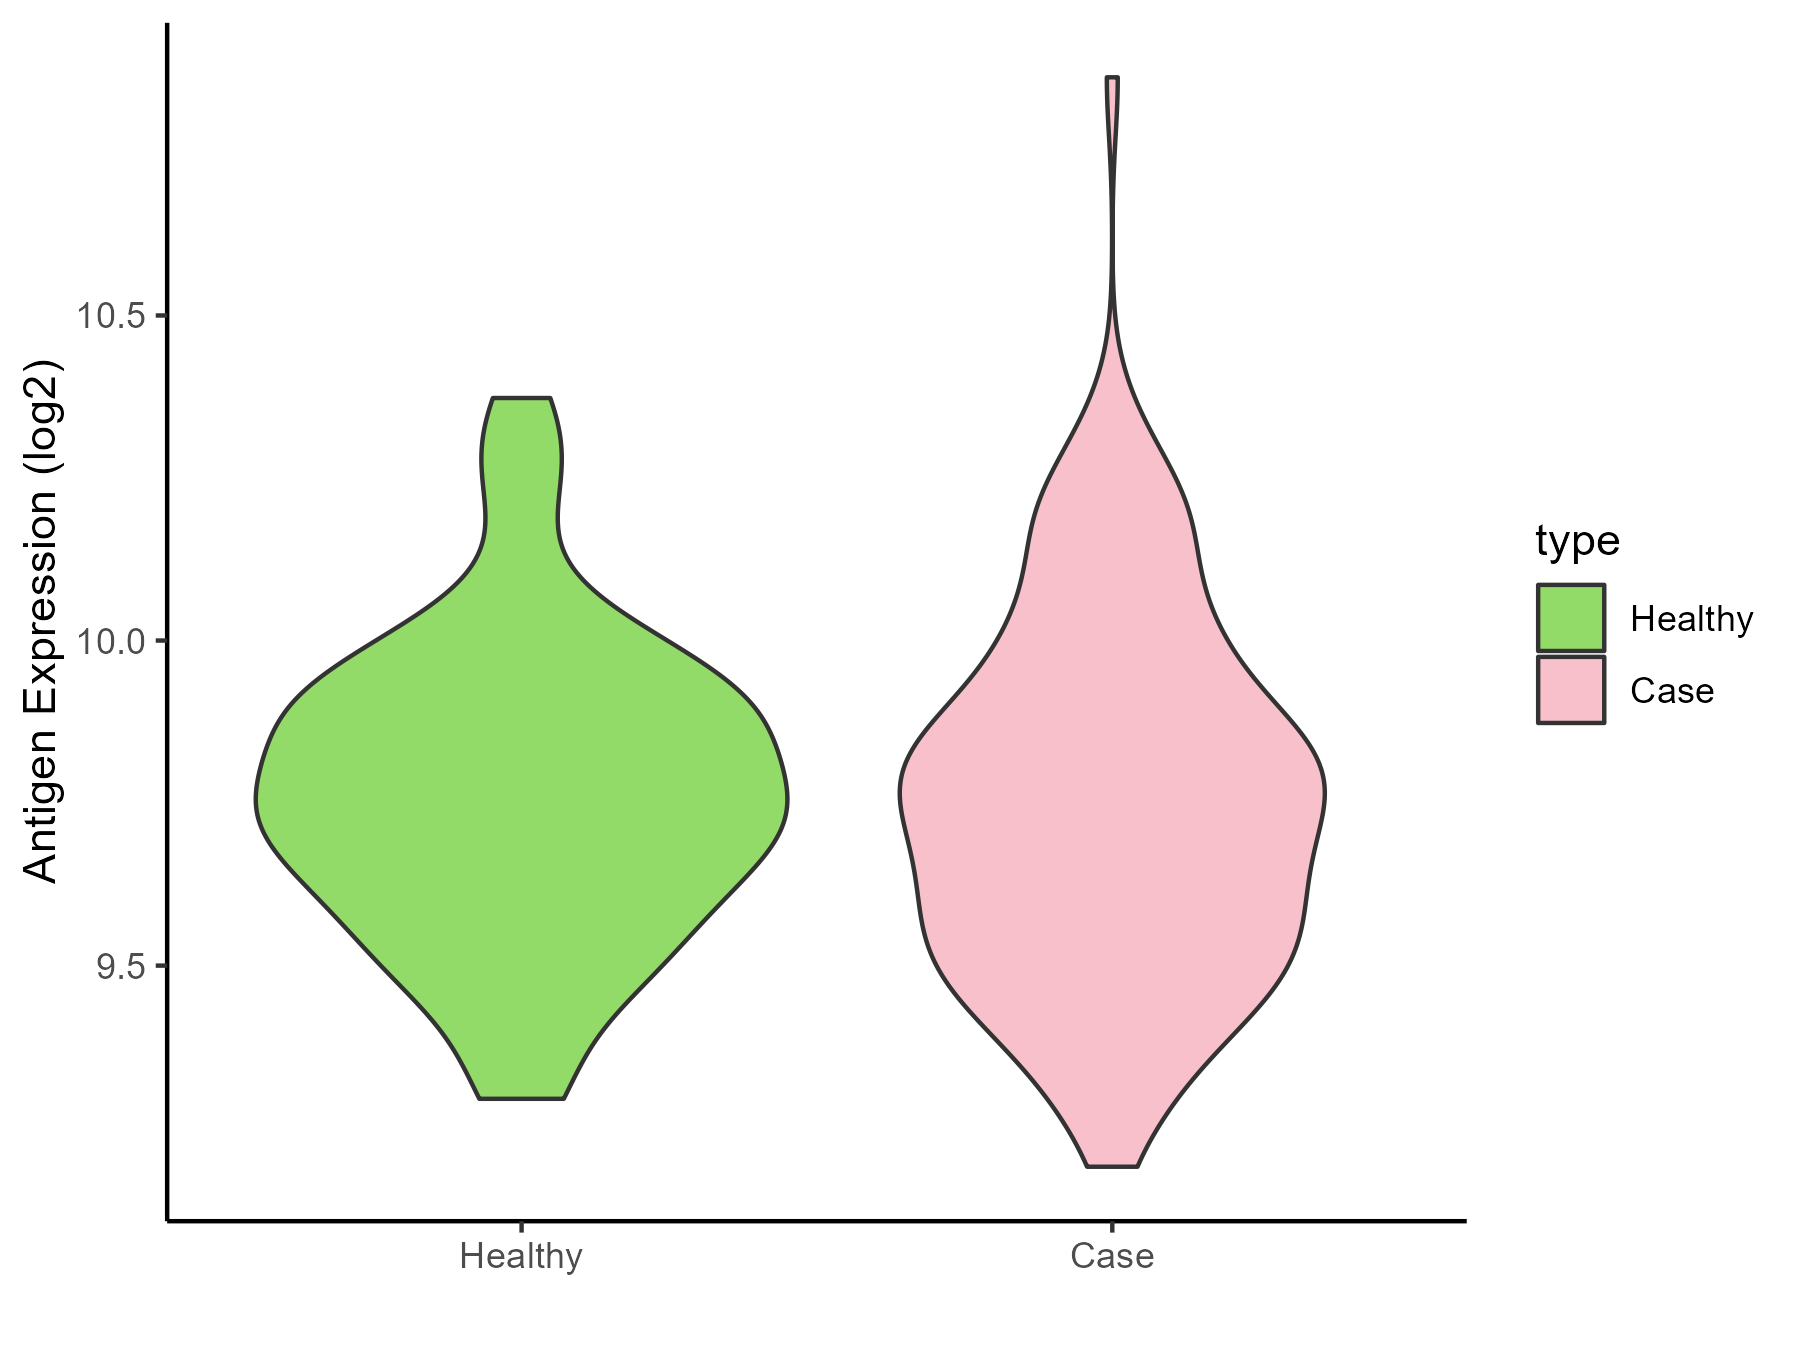
| The Studied Tissue | Rectal colon | |
| The Specific Disease | Irritable bowel syndrome | |
| The Expression Level of Disease Section Compare with the Healthy Individual Tissue | p-value: 0.710921787; Fold-change: -0.017181193; Z-score: -0.074506359 | |
| Disease-specific Antigen Abundances |
|
Click to View the Clearer Original Diagram |
ICD Disease Classification 14
| Differential expression pattern of antigen in diseases | ||
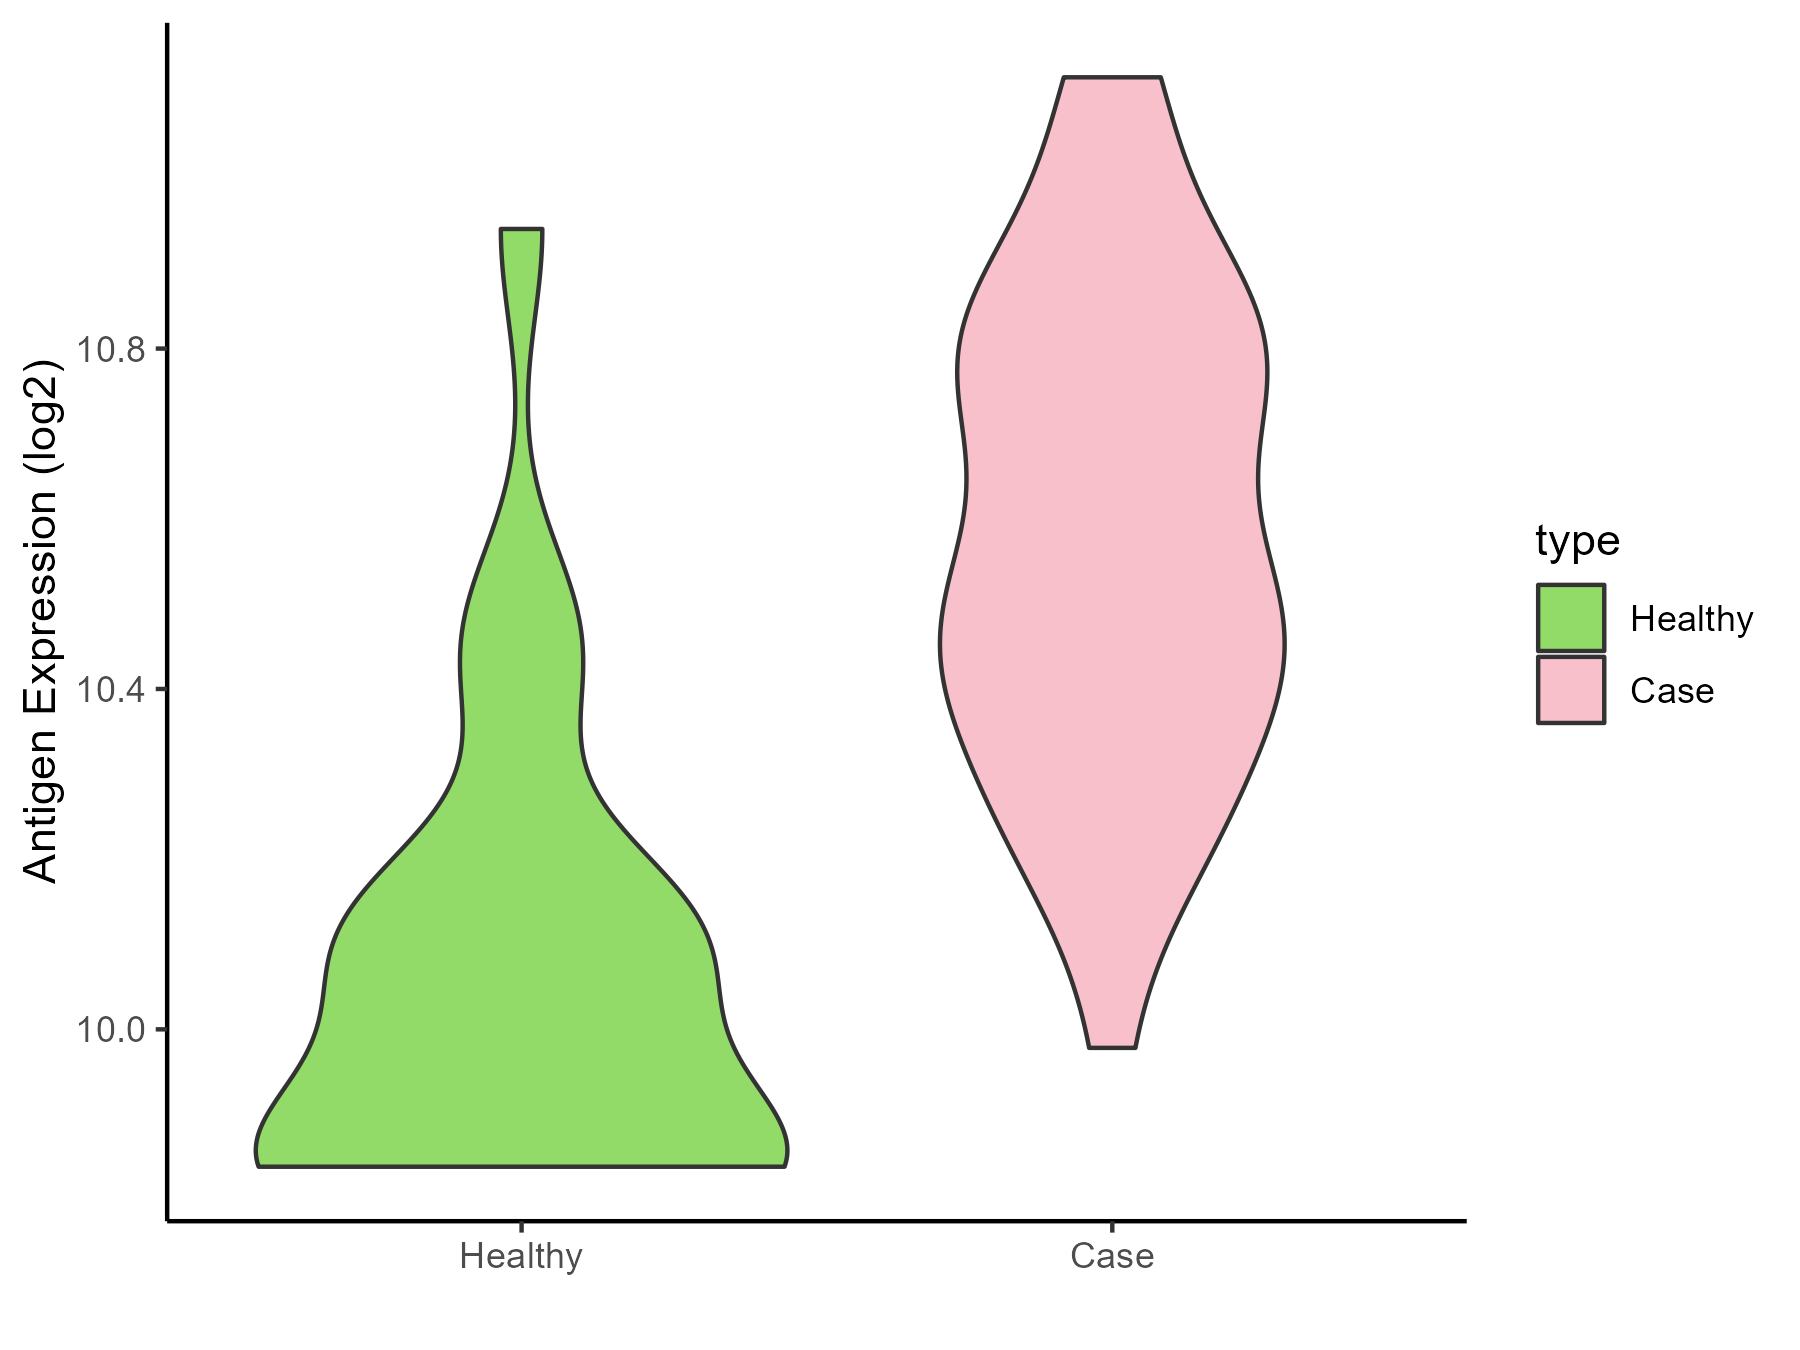
| The Studied Tissue | Skin | |
| The Specific Disease | Atopic dermatitis | |
| The Expression Level of Disease Section Compare with the Healthy Individual Tissue | p-value: 1.30E-09; Fold-change: 0.471941368; Z-score: 1.702161563 | |
| Disease-specific Antigen Abundances |
|
Click to View the Clearer Original Diagram |
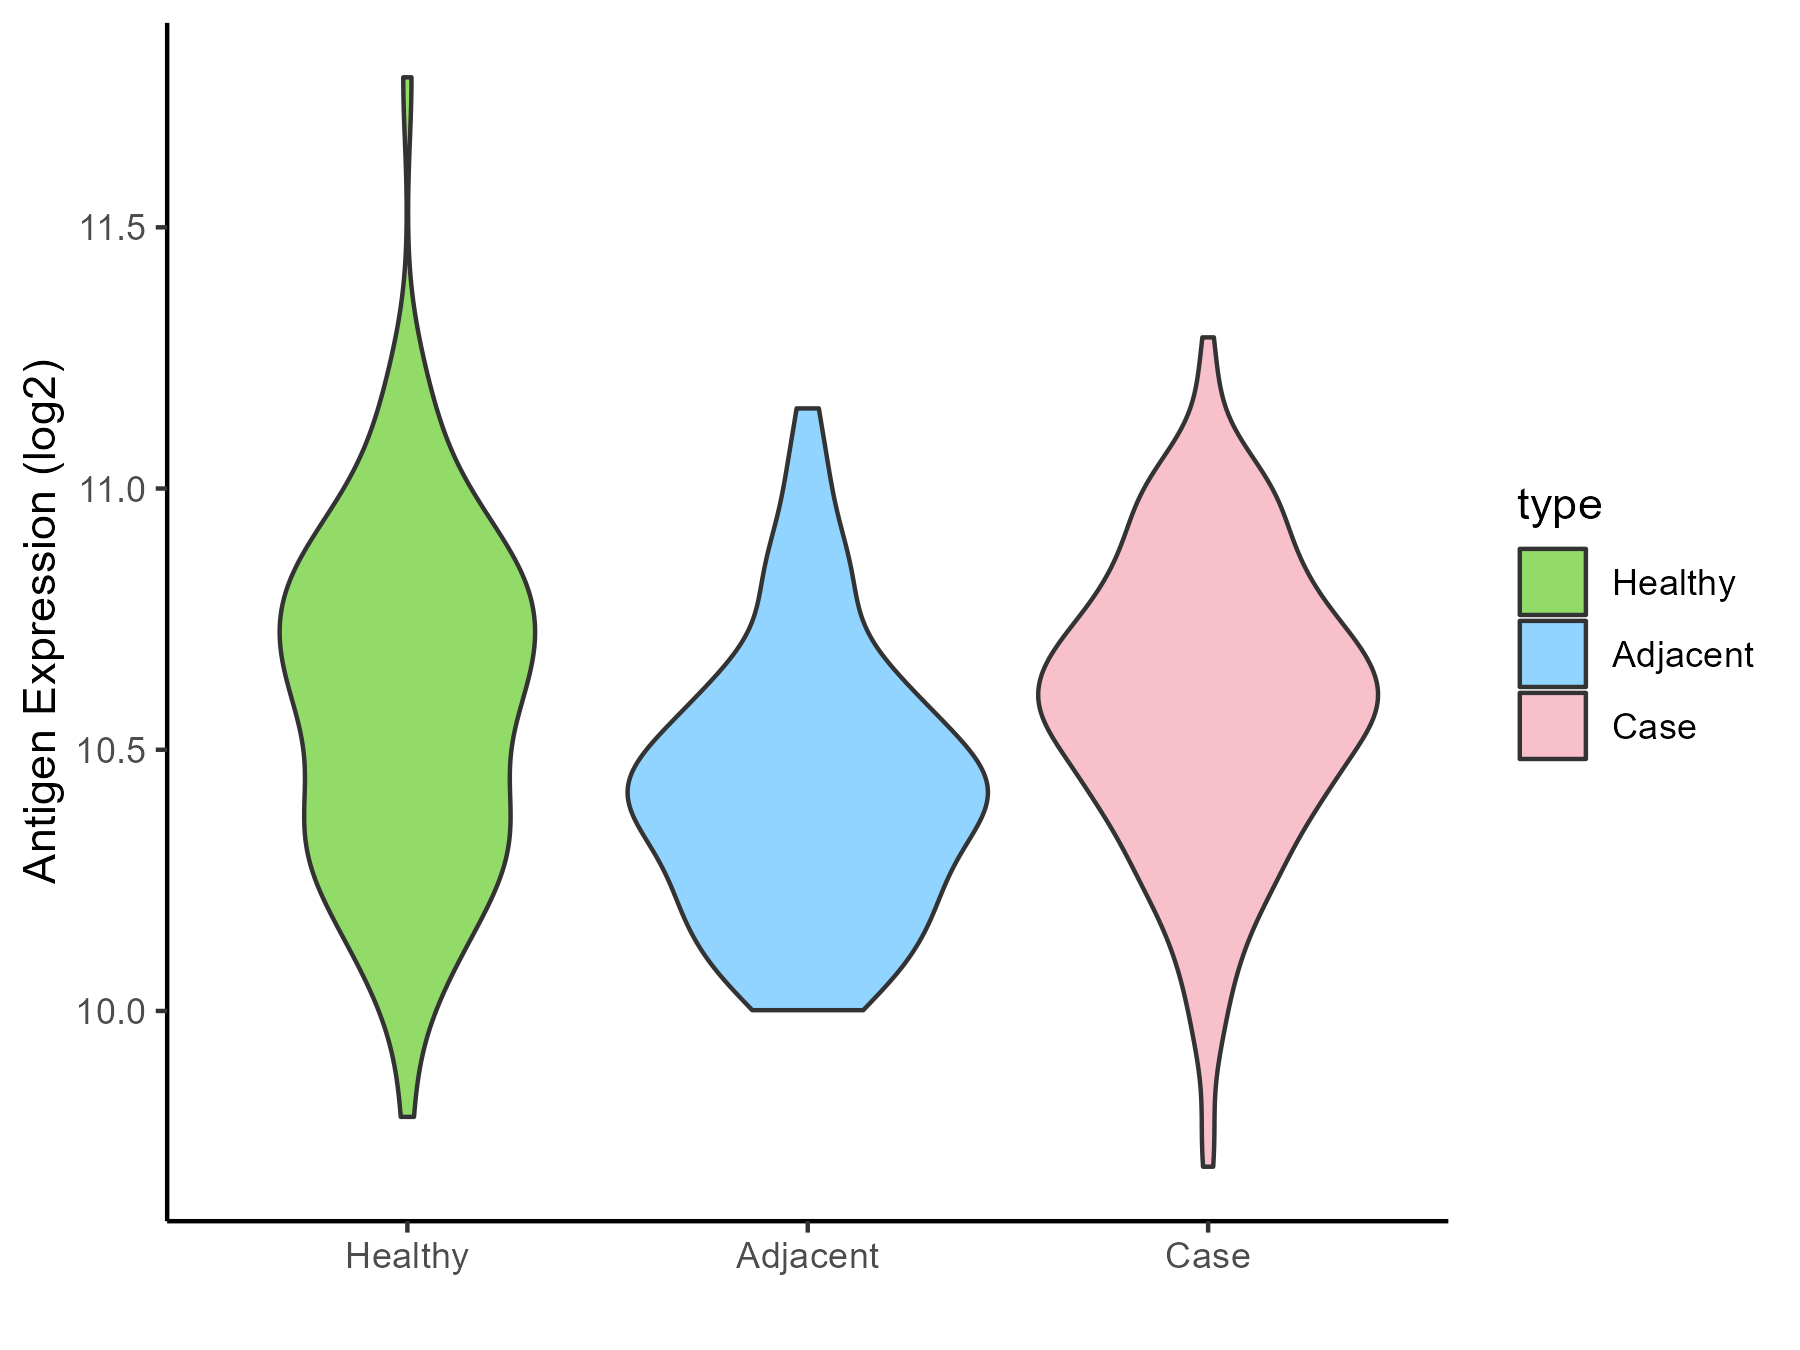
| Differential expression pattern of antigen in diseases | ||
| The Studied Tissue | Skin | |
| The Specific Disease | Psoriasis | |
| The Expression Level of Disease Section Compare with the Healthy Individual Tissue | p-value: 0.810359909; Fold-change: -0.023889936; Z-score: -0.072763597 | |
| The Expression Level of Disease Section Compare with the Adjacent Tissue | p-value: 2.37E-06; Fold-change: 0.177579144; Z-score: 0.69692906 | |
| Disease-specific Antigen Abundances |
|
Click to View the Clearer Original Diagram |
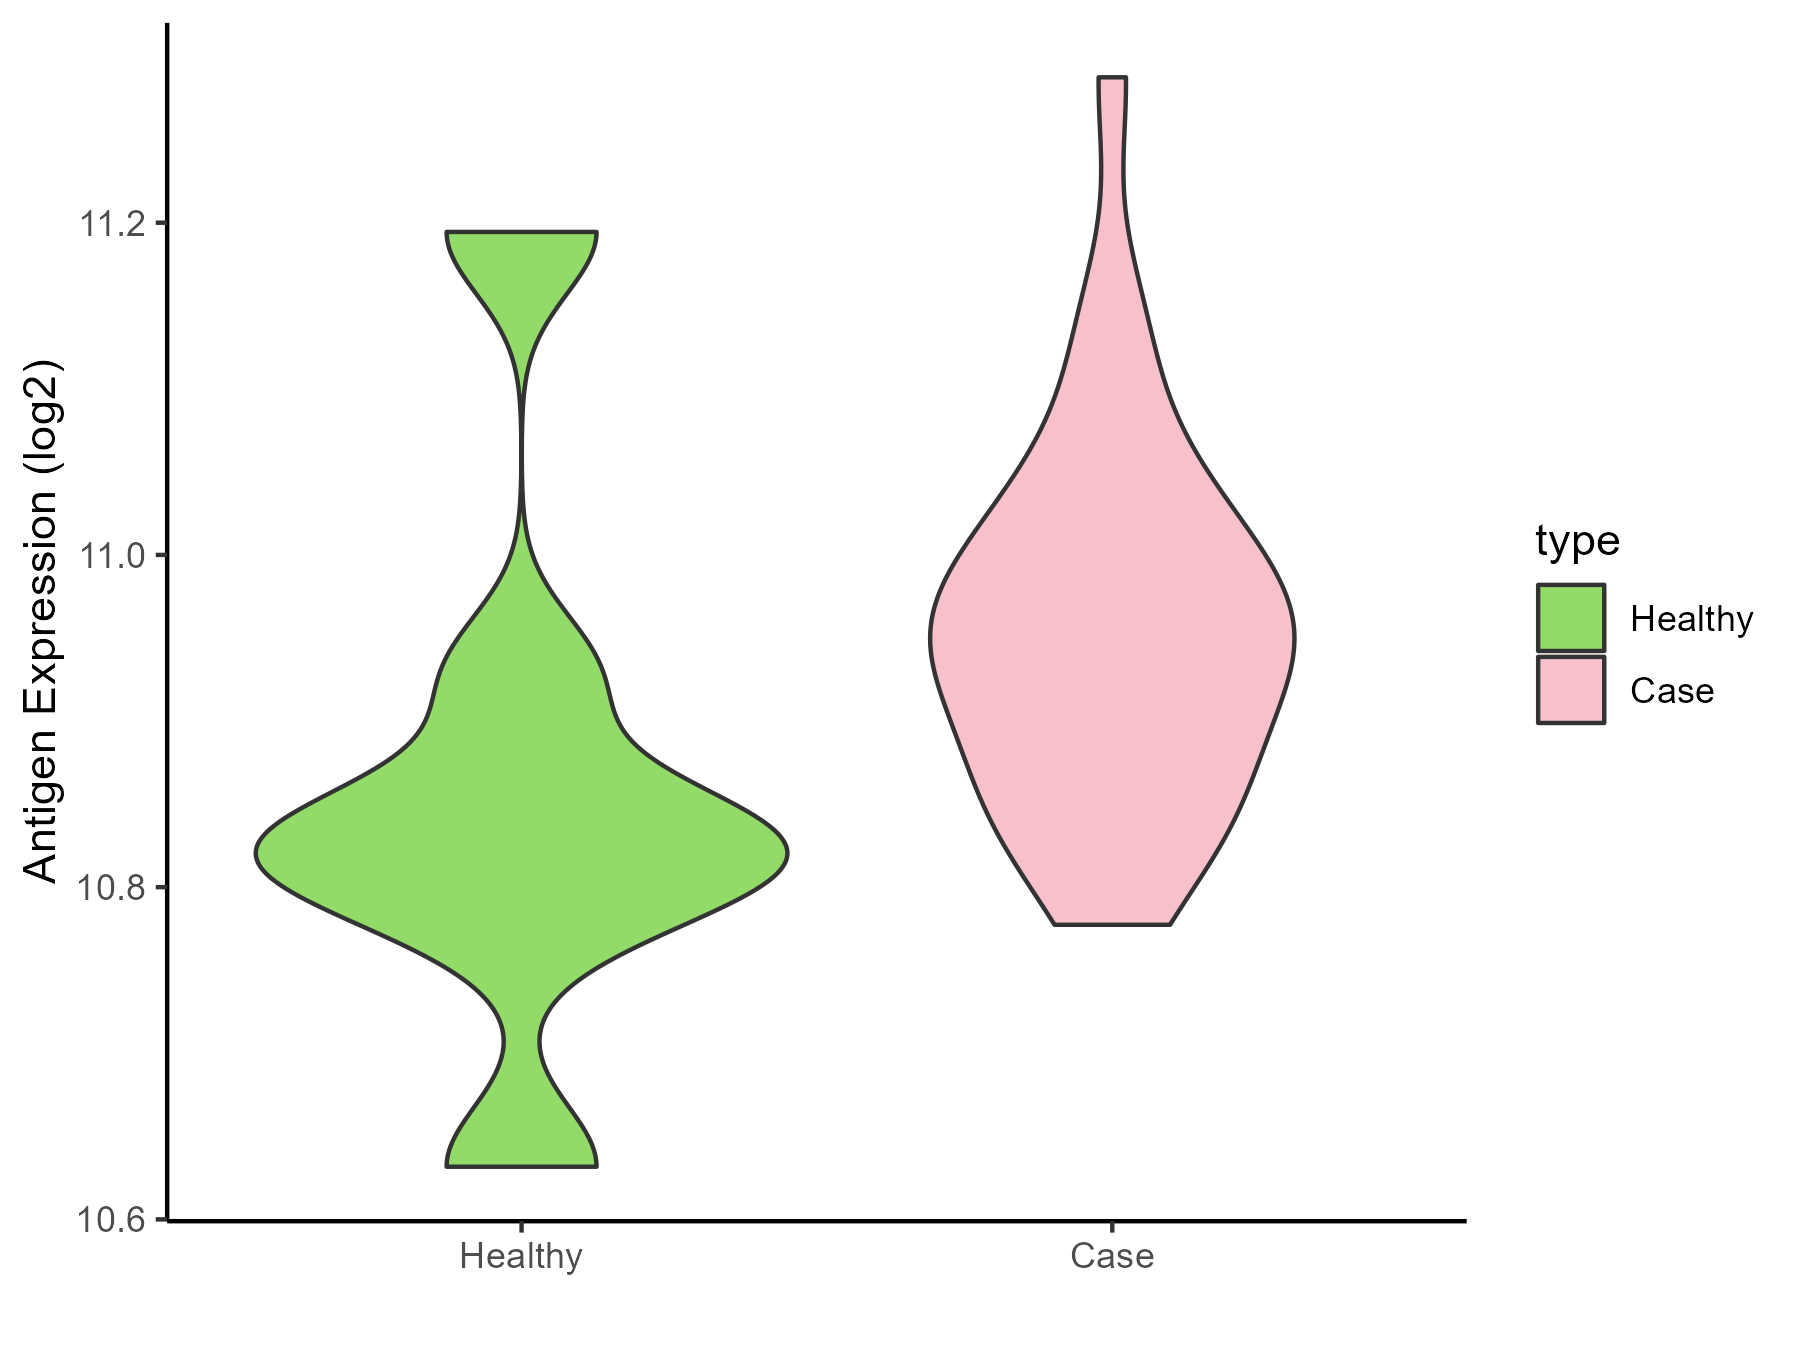
| Differential expression pattern of antigen in diseases | ||
| The Studied Tissue | Skin | |
| The Specific Disease | Vitiligo | |
| The Expression Level of Disease Section Compare with the Healthy Individual Tissue | p-value: 0.2075701; Fold-change: 0.119418424; Z-score: 0.695450374 | |
| Disease-specific Antigen Abundances |
|
Click to View the Clearer Original Diagram |
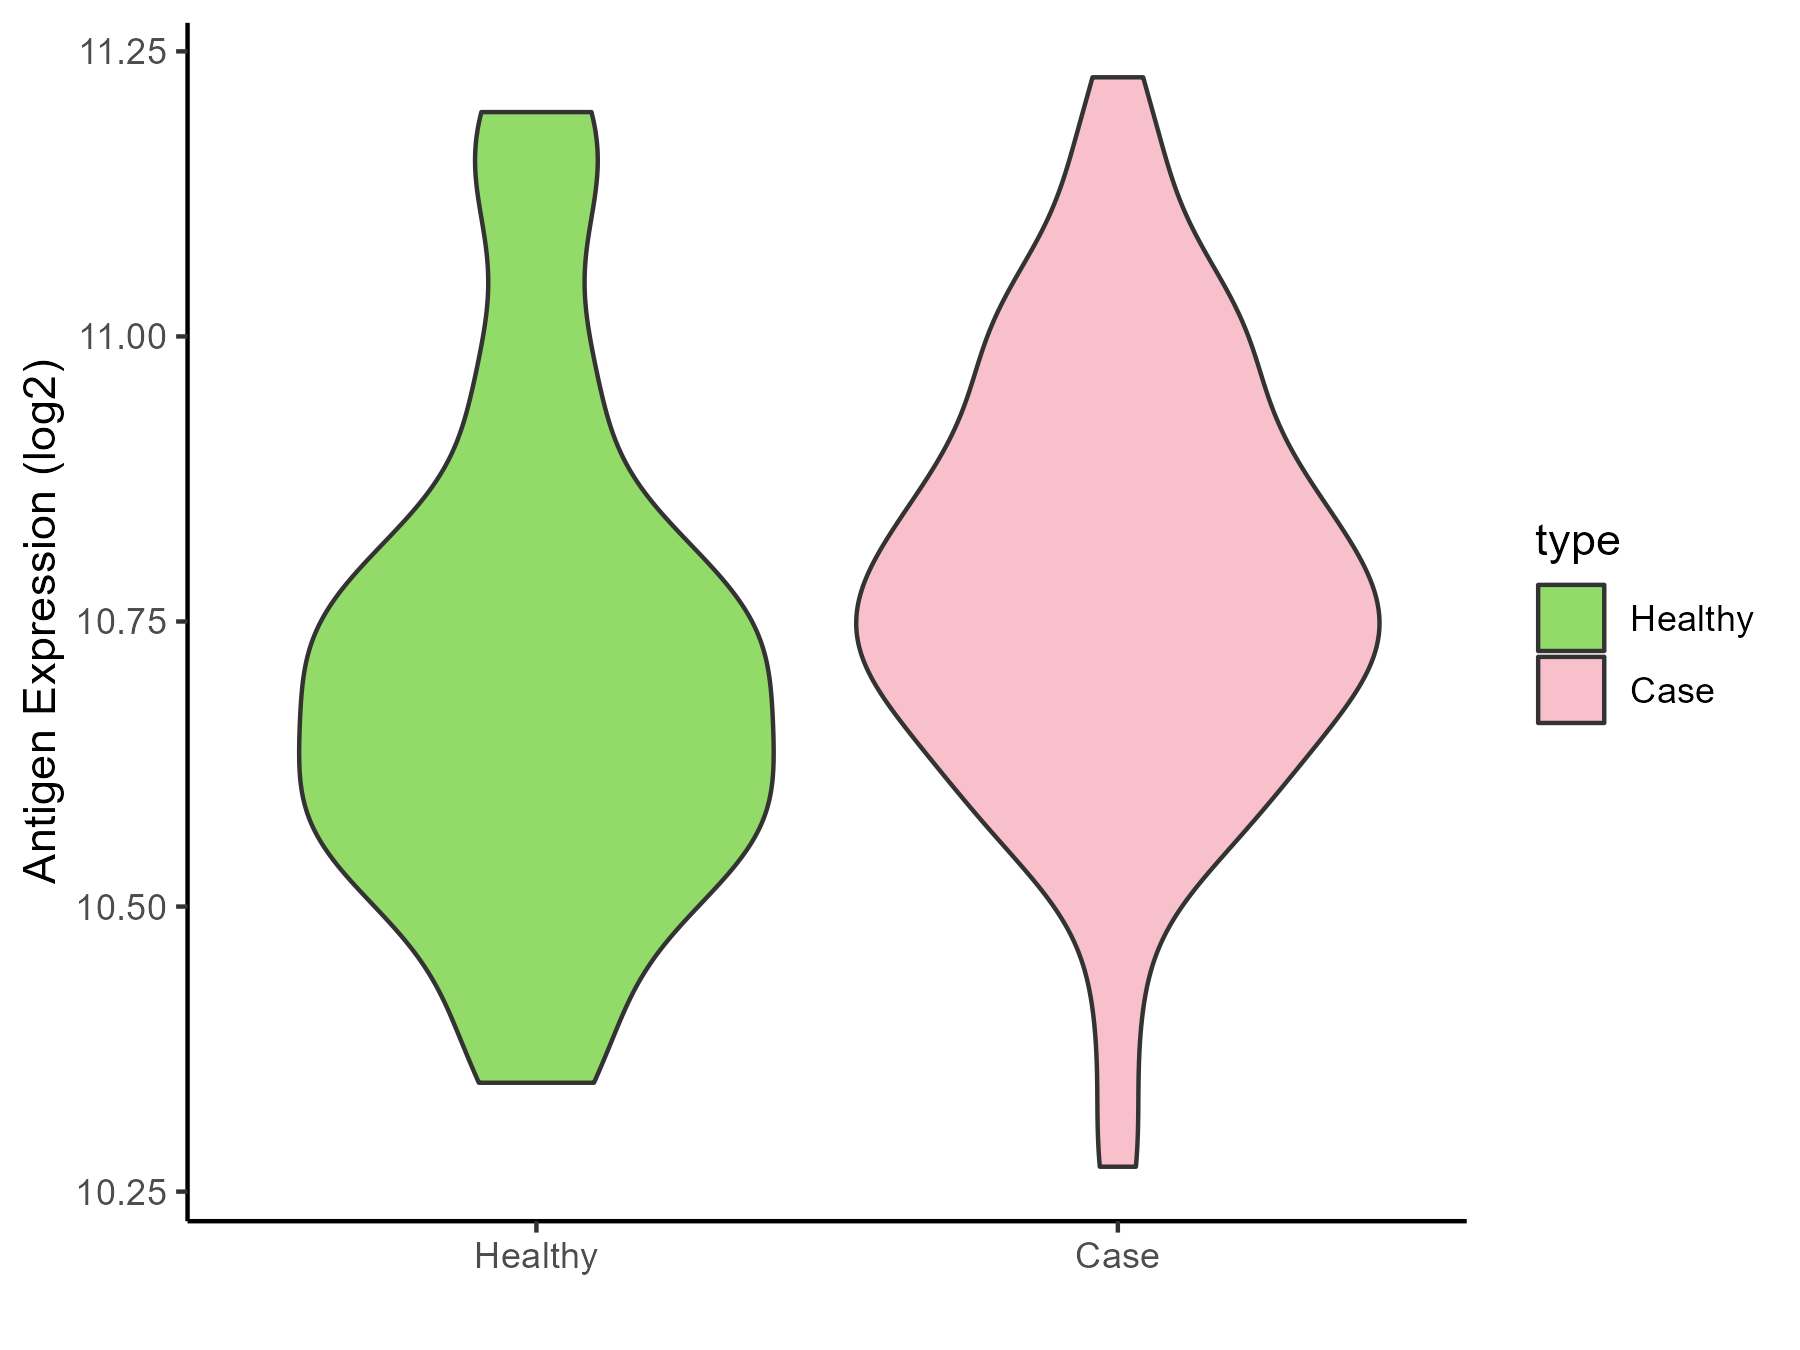
| Differential expression pattern of antigen in diseases | ||
| The Studied Tissue | Skin from scalp | |
| The Specific Disease | Alopecia | |
| The Expression Level of Disease Section Compare with the Healthy Individual Tissue | p-value: 0.067288701; Fold-change: 0.080620588; Z-score: 0.373666421 | |
| Disease-specific Antigen Abundances |
|
Click to View the Clearer Original Diagram |
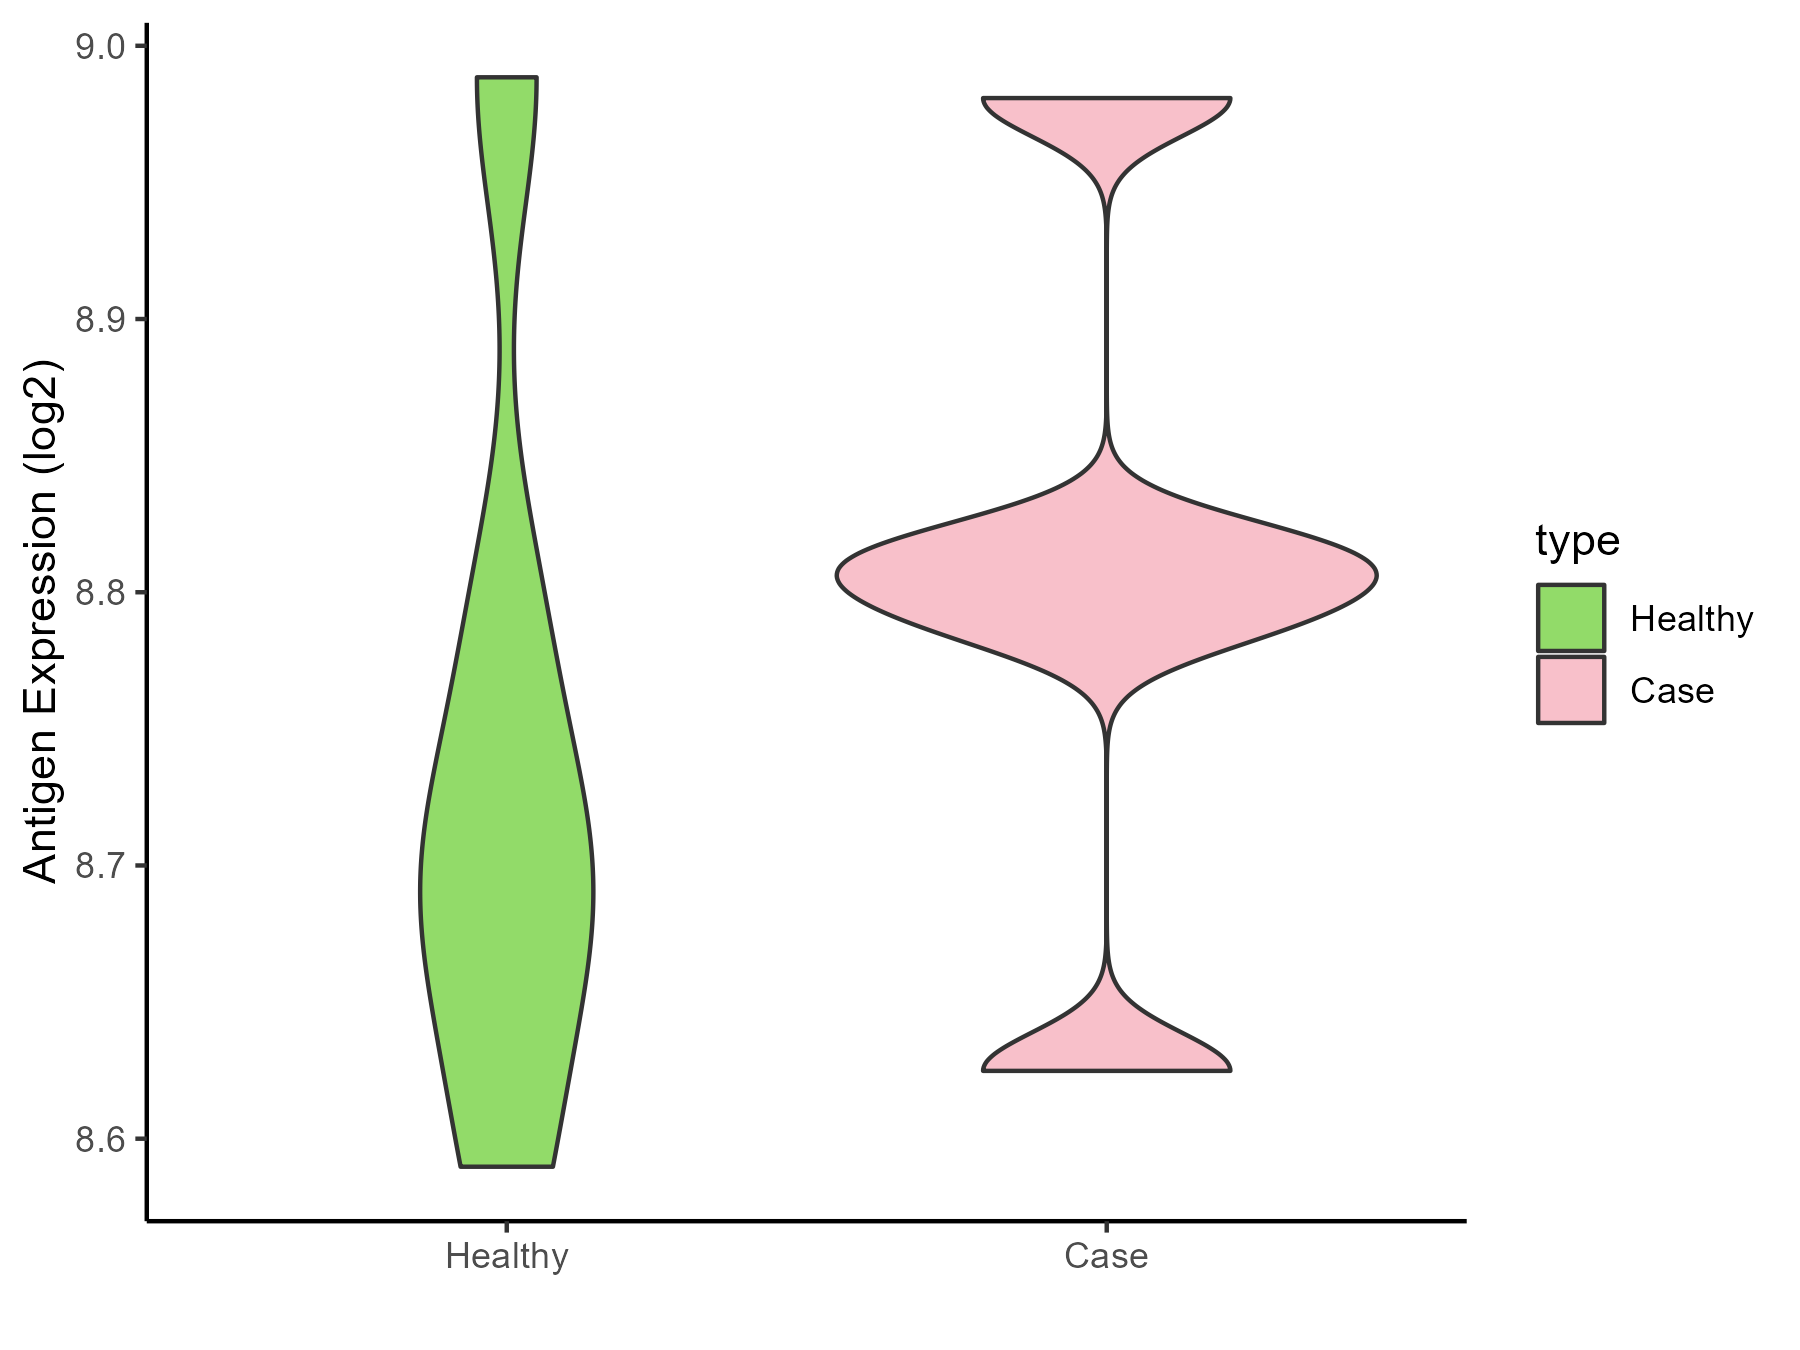
| Differential expression pattern of antigen in diseases | ||
| The Studied Tissue | Skin | |
| The Specific Disease | Sensitive skin | |
| The Expression Level of Disease Section Compare with the Healthy Individual Tissue | p-value: 0.435575017; Fold-change: 0.101654195; Z-score: 0.730841775 | |
| Disease-specific Antigen Abundances |
|
Click to View the Clearer Original Diagram |
ICD Disease Classification 15
| Differential expression pattern of antigen in diseases | ||
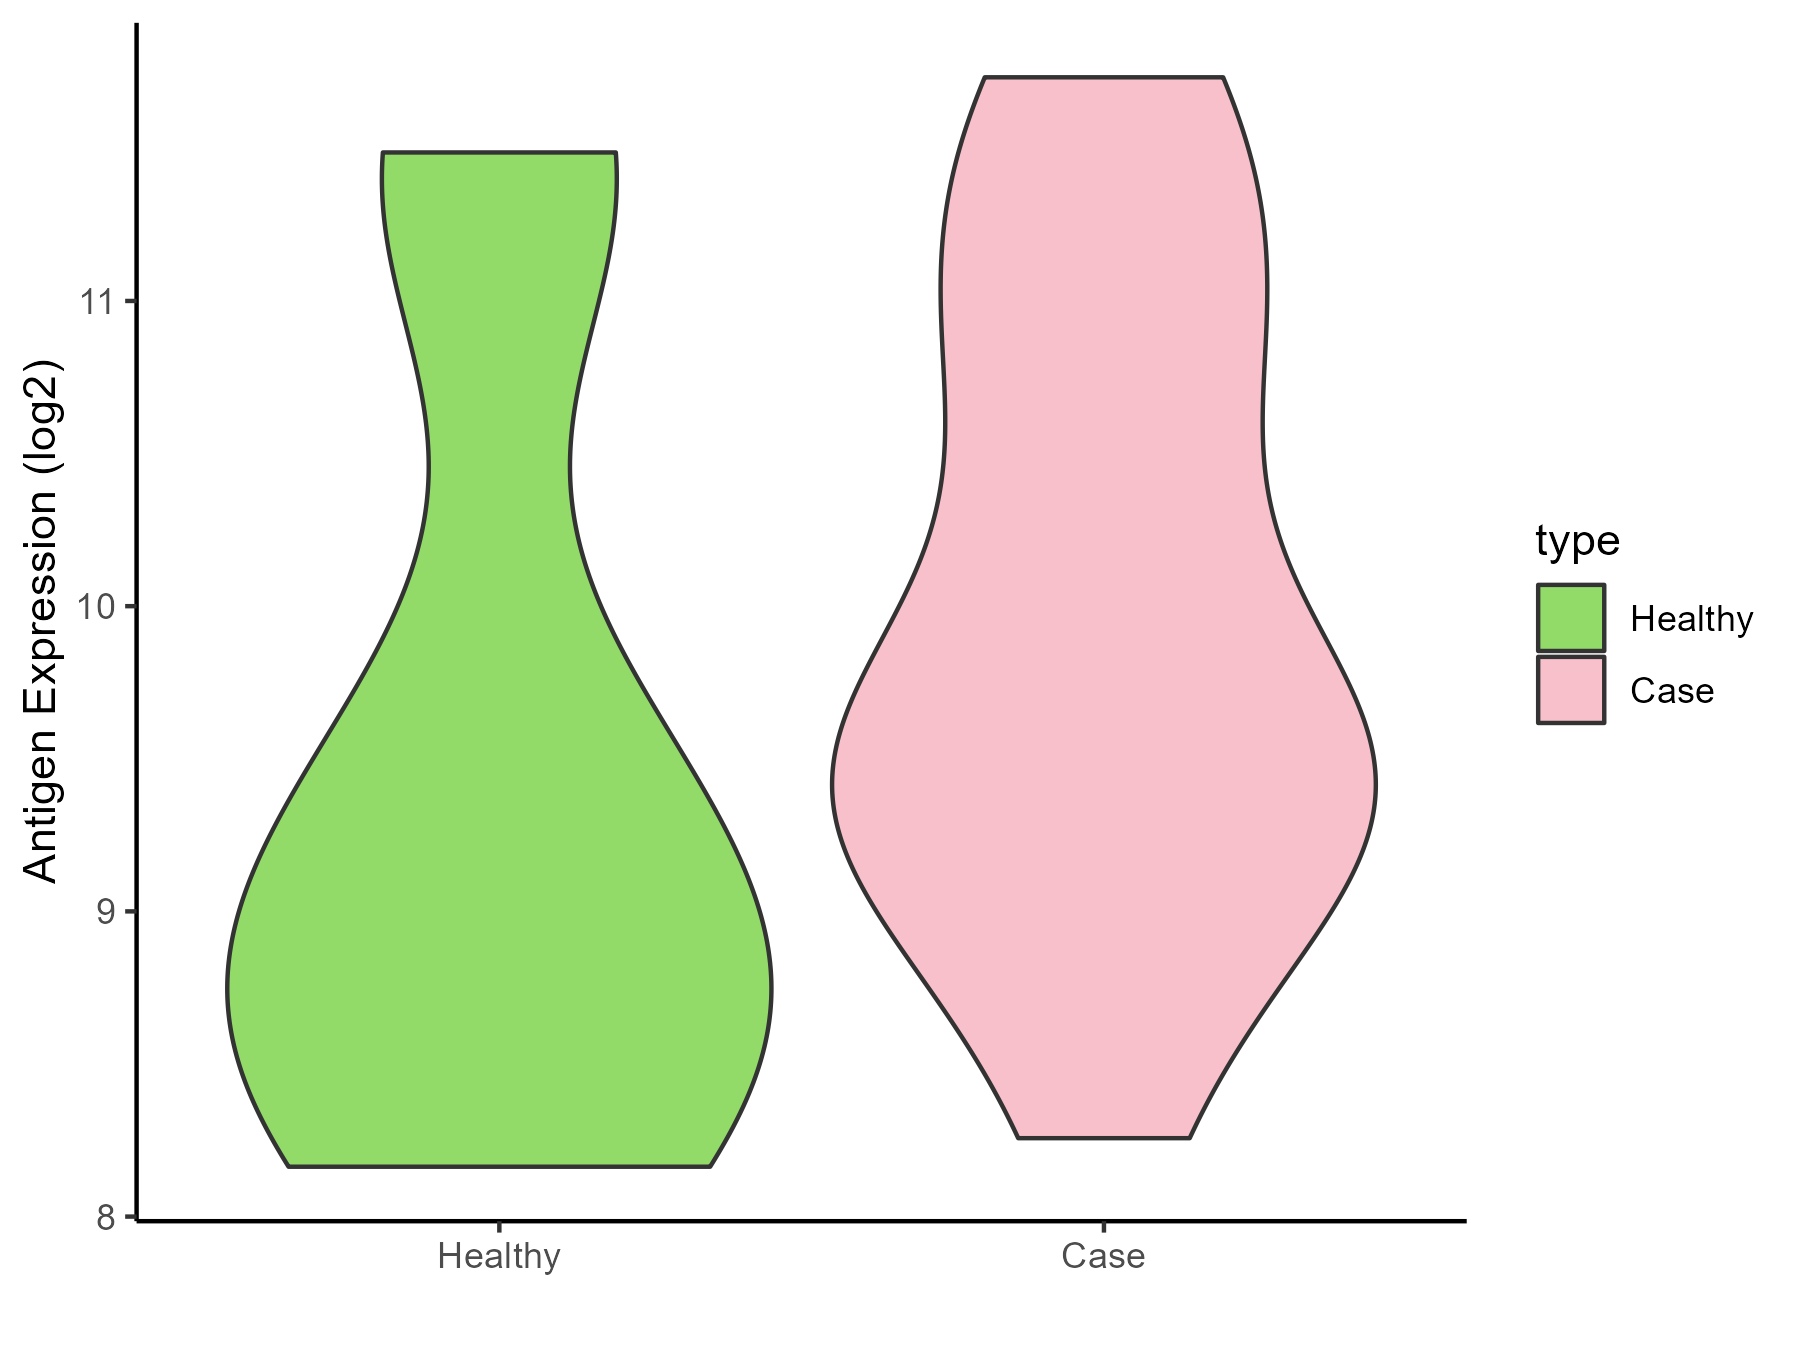
| The Studied Tissue | Synovial | |
| The Specific Disease | Osteoarthritis | |
| The Expression Level of Disease Section Compare with the Healthy Individual Tissue | p-value: 0.326161901; Fold-change: 0.598644999; Z-score: 0.462267807 | |
| Disease-specific Antigen Abundances |
|
Click to View the Clearer Original Diagram |
| Differential expression pattern of antigen in diseases | ||
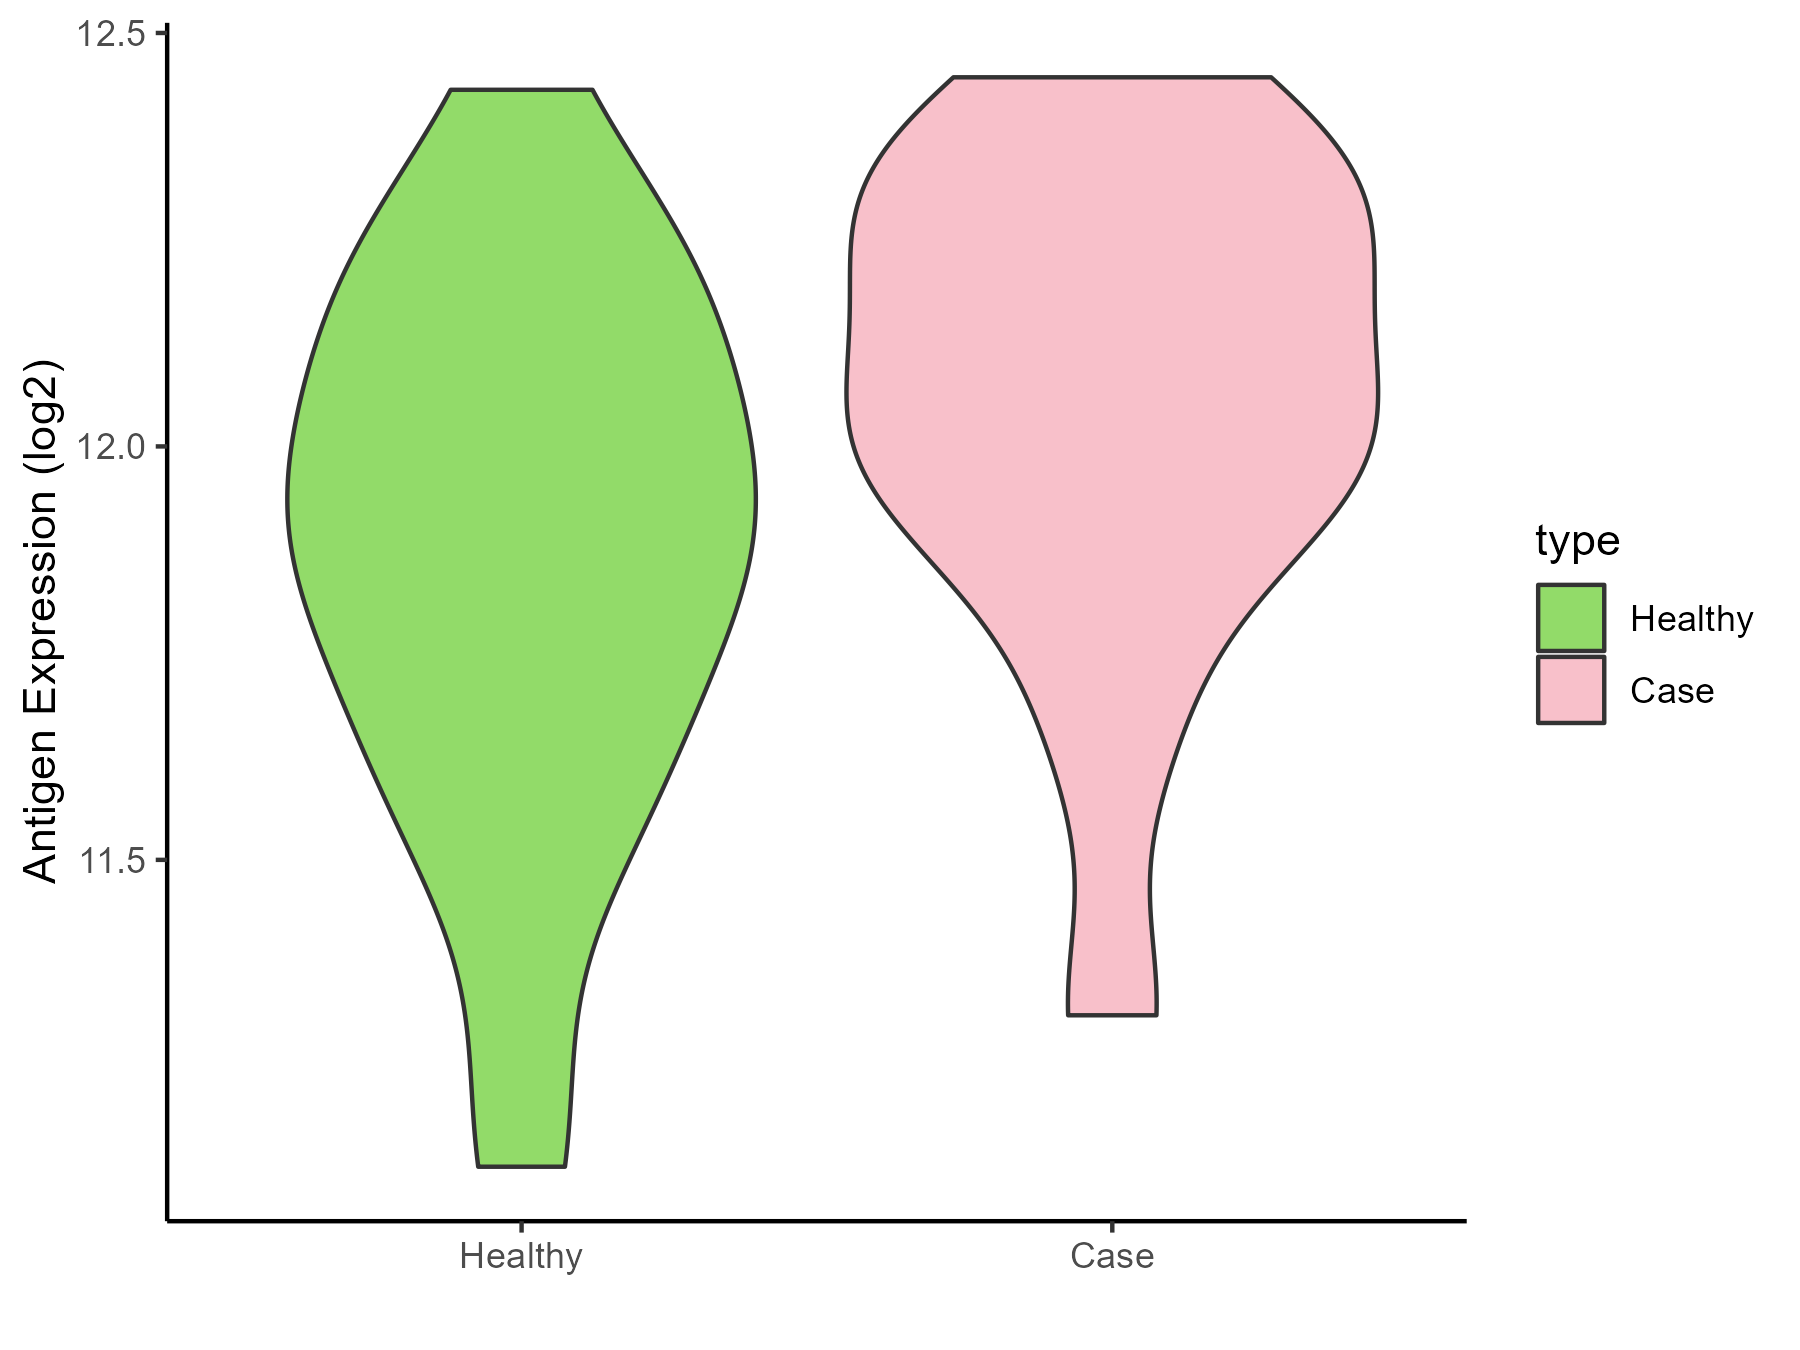
| The Studied Tissue | Peripheral blood | |
| The Specific Disease | Arthropathy | |
| The Expression Level of Disease Section Compare with the Healthy Individual Tissue | p-value: 0.086330648; Fold-change: 0.132913617; Z-score: 0.405407683 | |
| Disease-specific Antigen Abundances |
|
Click to View the Clearer Original Diagram |
| Differential expression pattern of antigen in diseases | ||
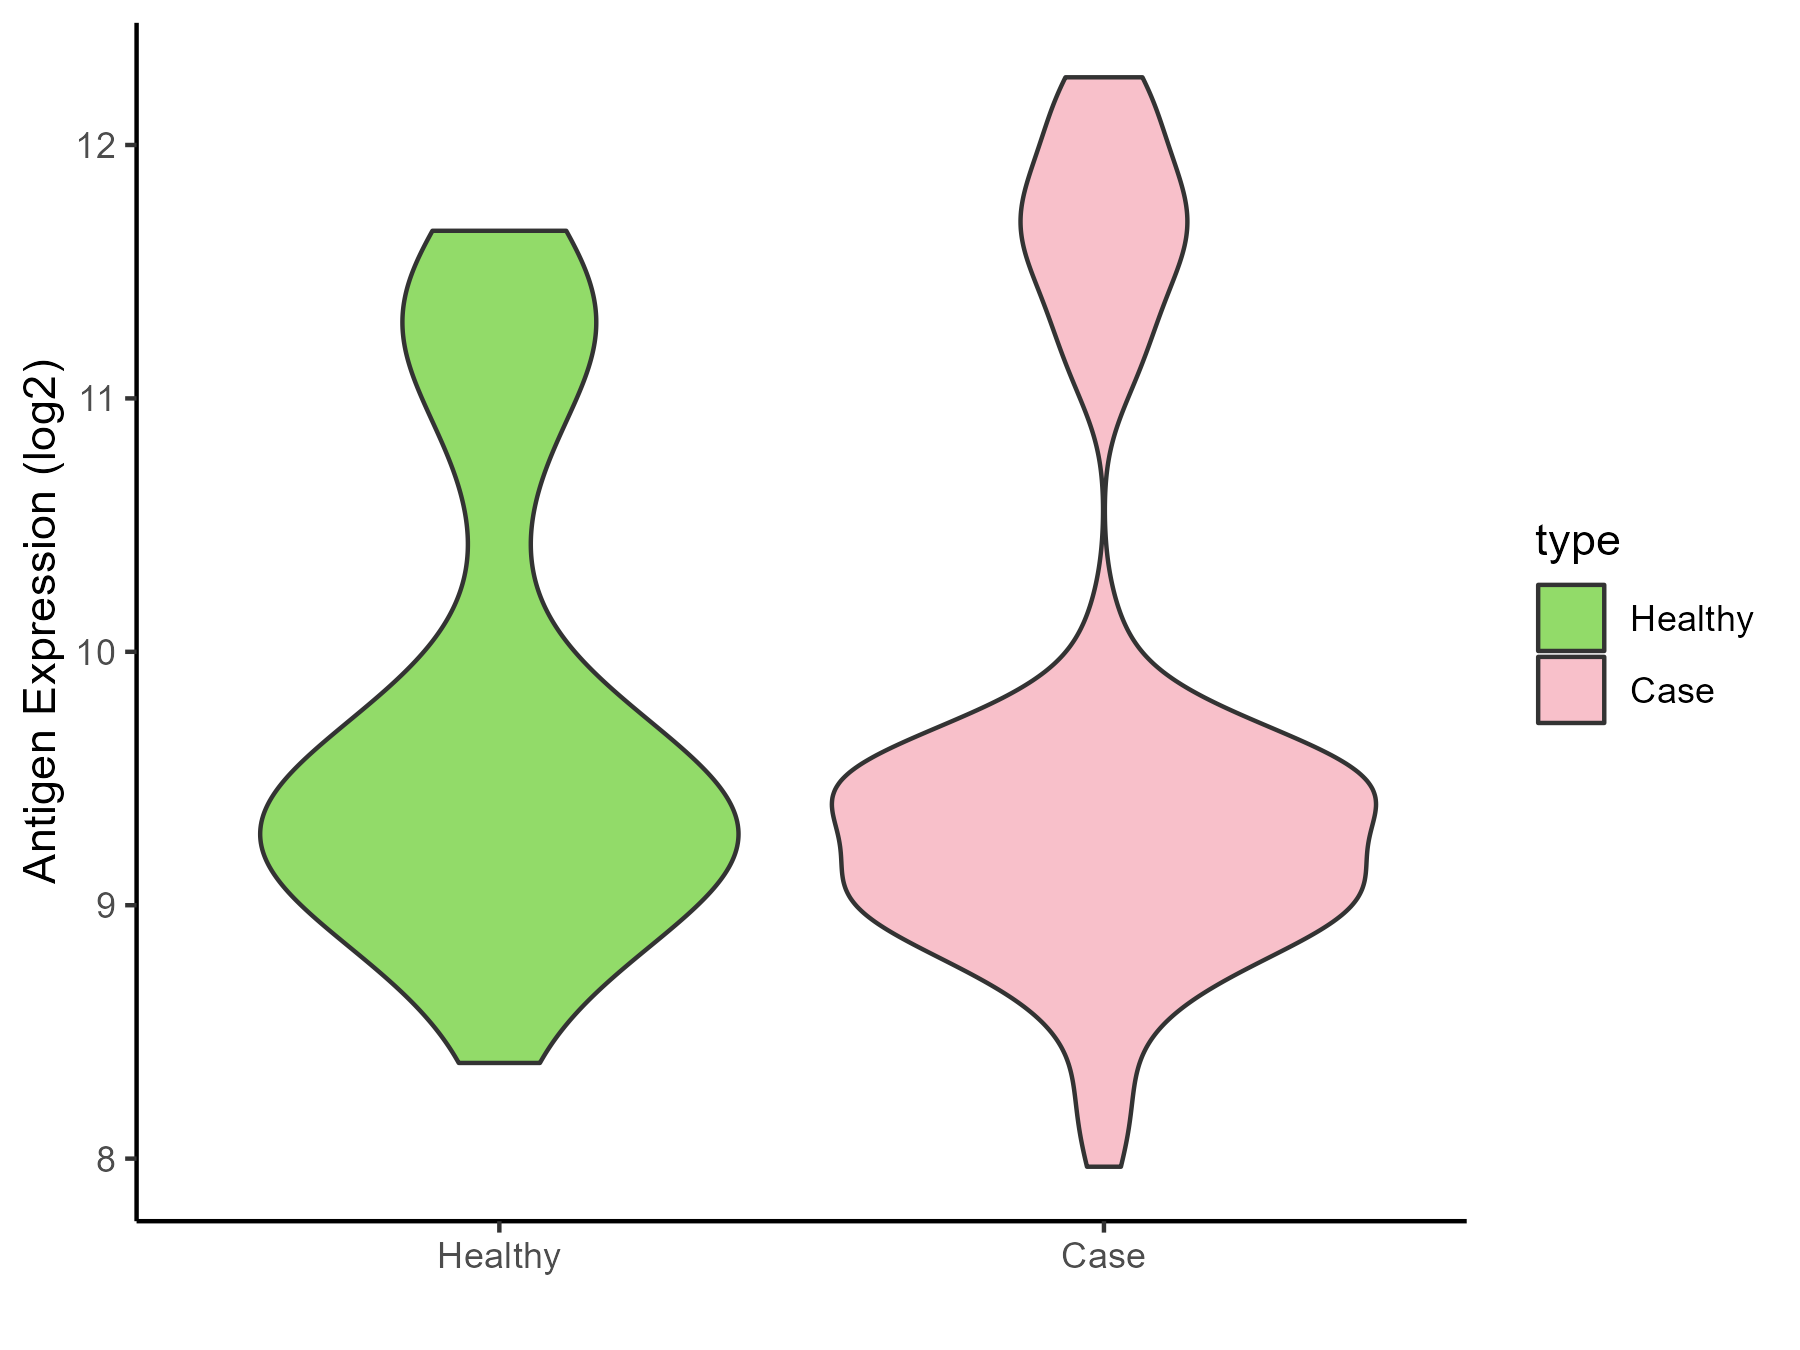
| The Studied Tissue | Peripheral blood | |
| The Specific Disease | Arthritis | |
| The Expression Level of Disease Section Compare with the Healthy Individual Tissue | p-value: 0.683794081; Fold-change: 0.038955302; Z-score: 0.041294216 | |
| Disease-specific Antigen Abundances |
|
Click to View the Clearer Original Diagram |
| Differential expression pattern of antigen in diseases | ||
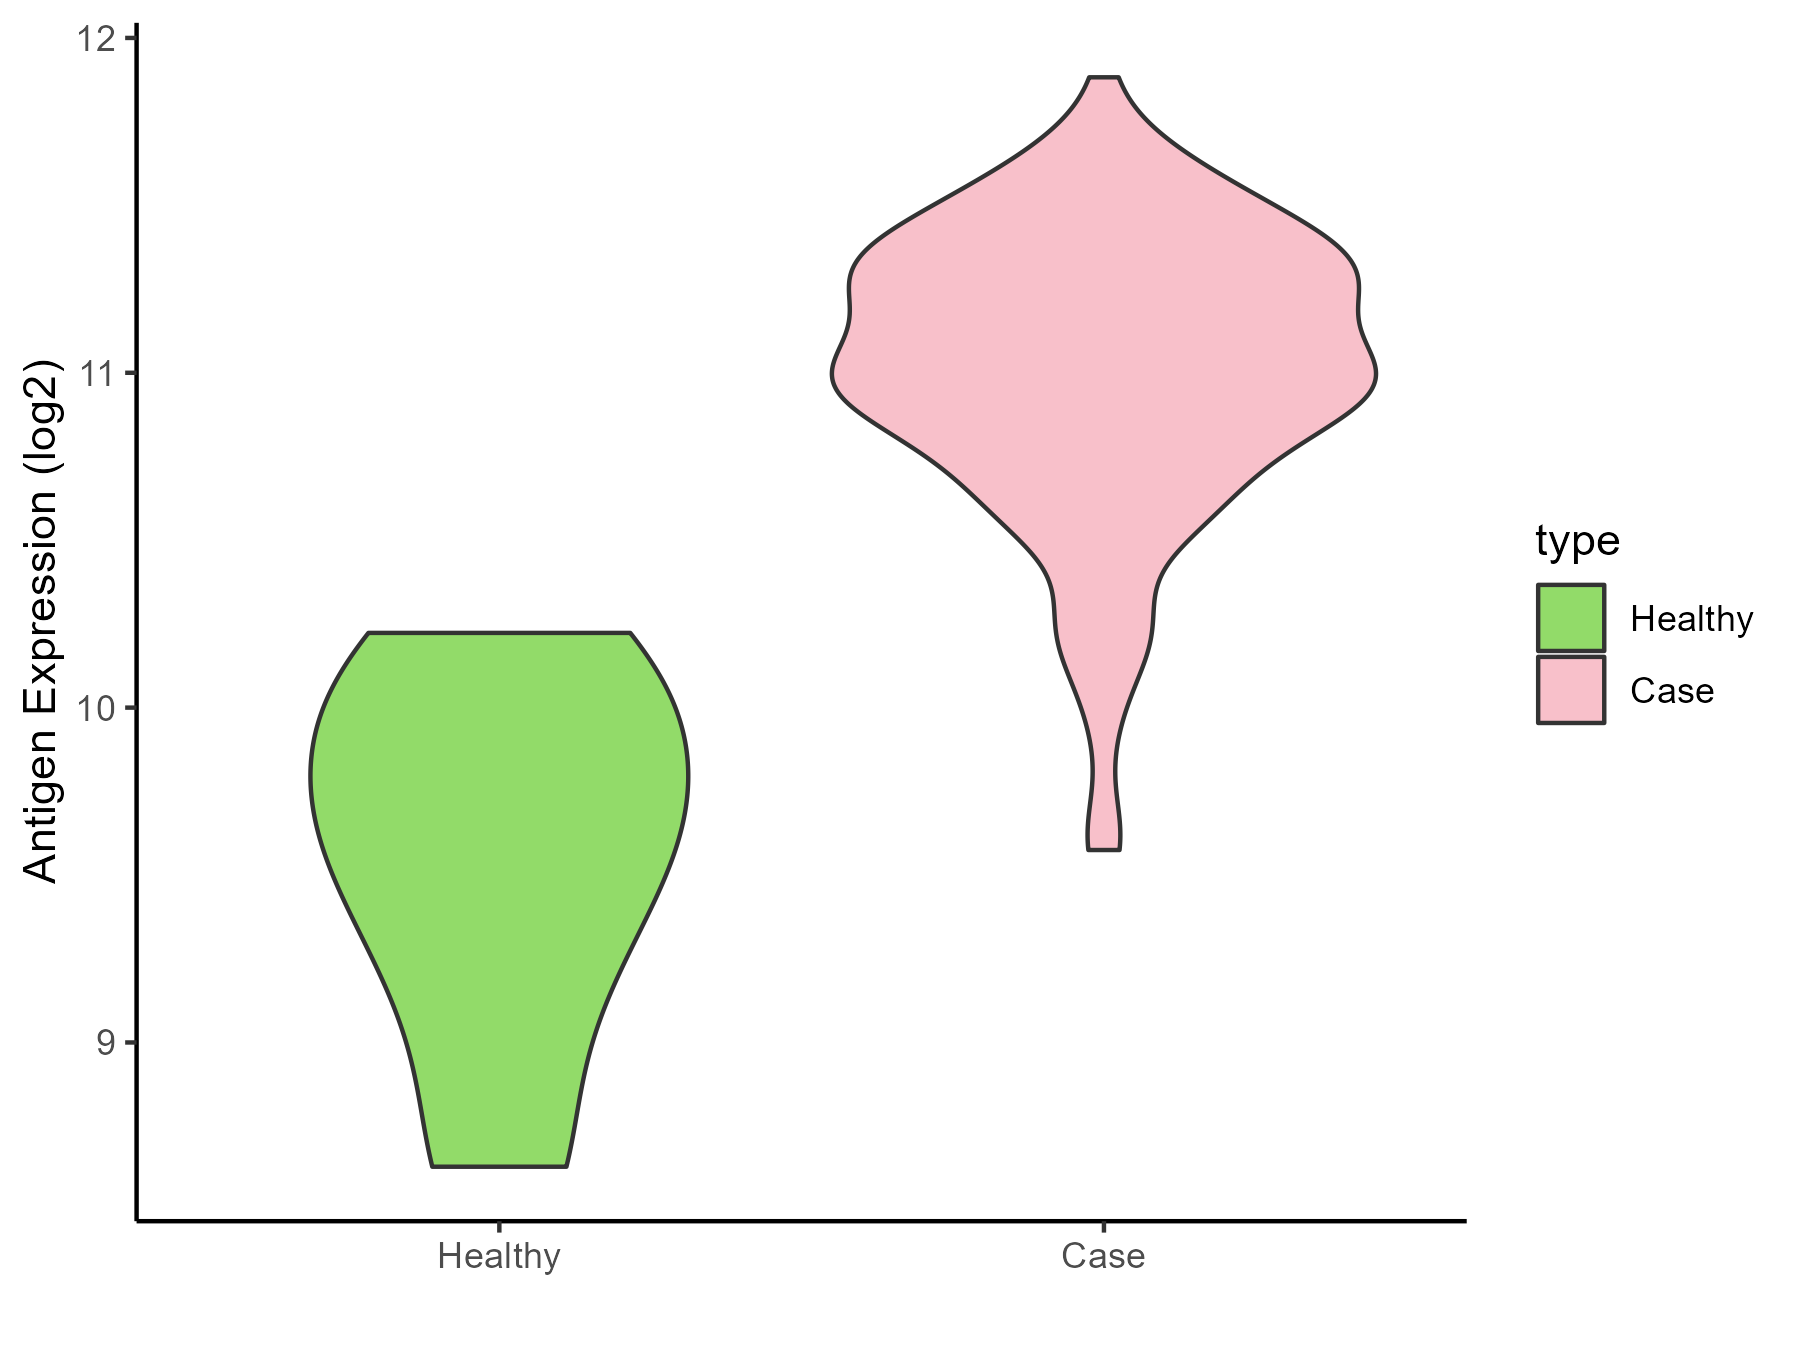
| The Studied Tissue | Synovial | |
| The Specific Disease | Rheumatoid arthritis | |
| The Expression Level of Disease Section Compare with the Healthy Individual Tissue | p-value: 0.000386959; Fold-change: 1.402249872; Z-score: 2.548657264 | |
| Disease-specific Antigen Abundances |
|
Click to View the Clearer Original Diagram |
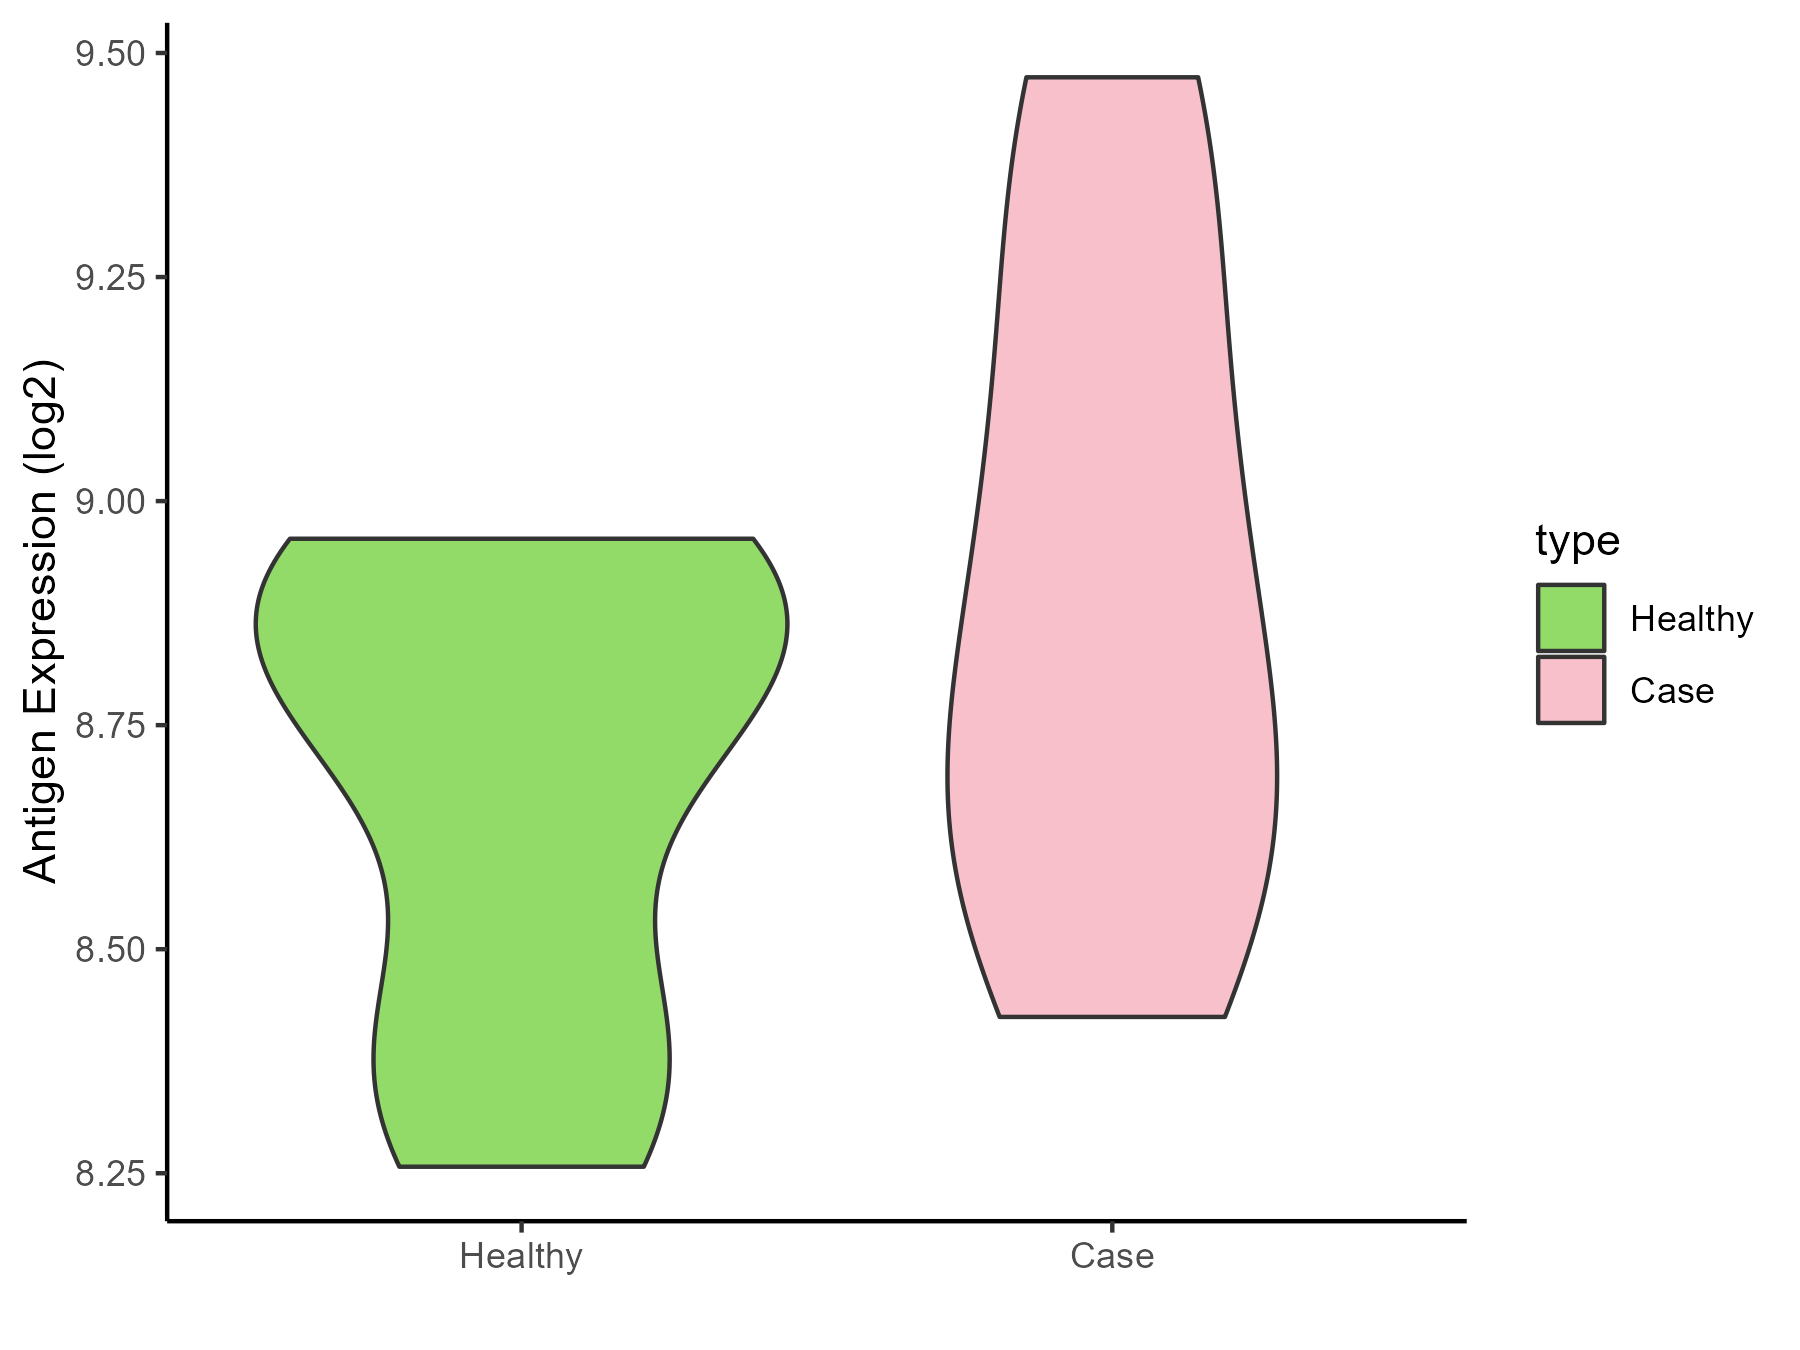
| Differential expression pattern of antigen in diseases | ||
| The Studied Tissue | Pheripheral blood | |
| The Specific Disease | Ankylosing spondylitis | |
| The Expression Level of Disease Section Compare with the Healthy Individual Tissue | p-value: 0.187668375; Fold-change: 0.060164534; Z-score: 0.224587871 | |
| Disease-specific Antigen Abundances |
|
Click to View the Clearer Original Diagram |
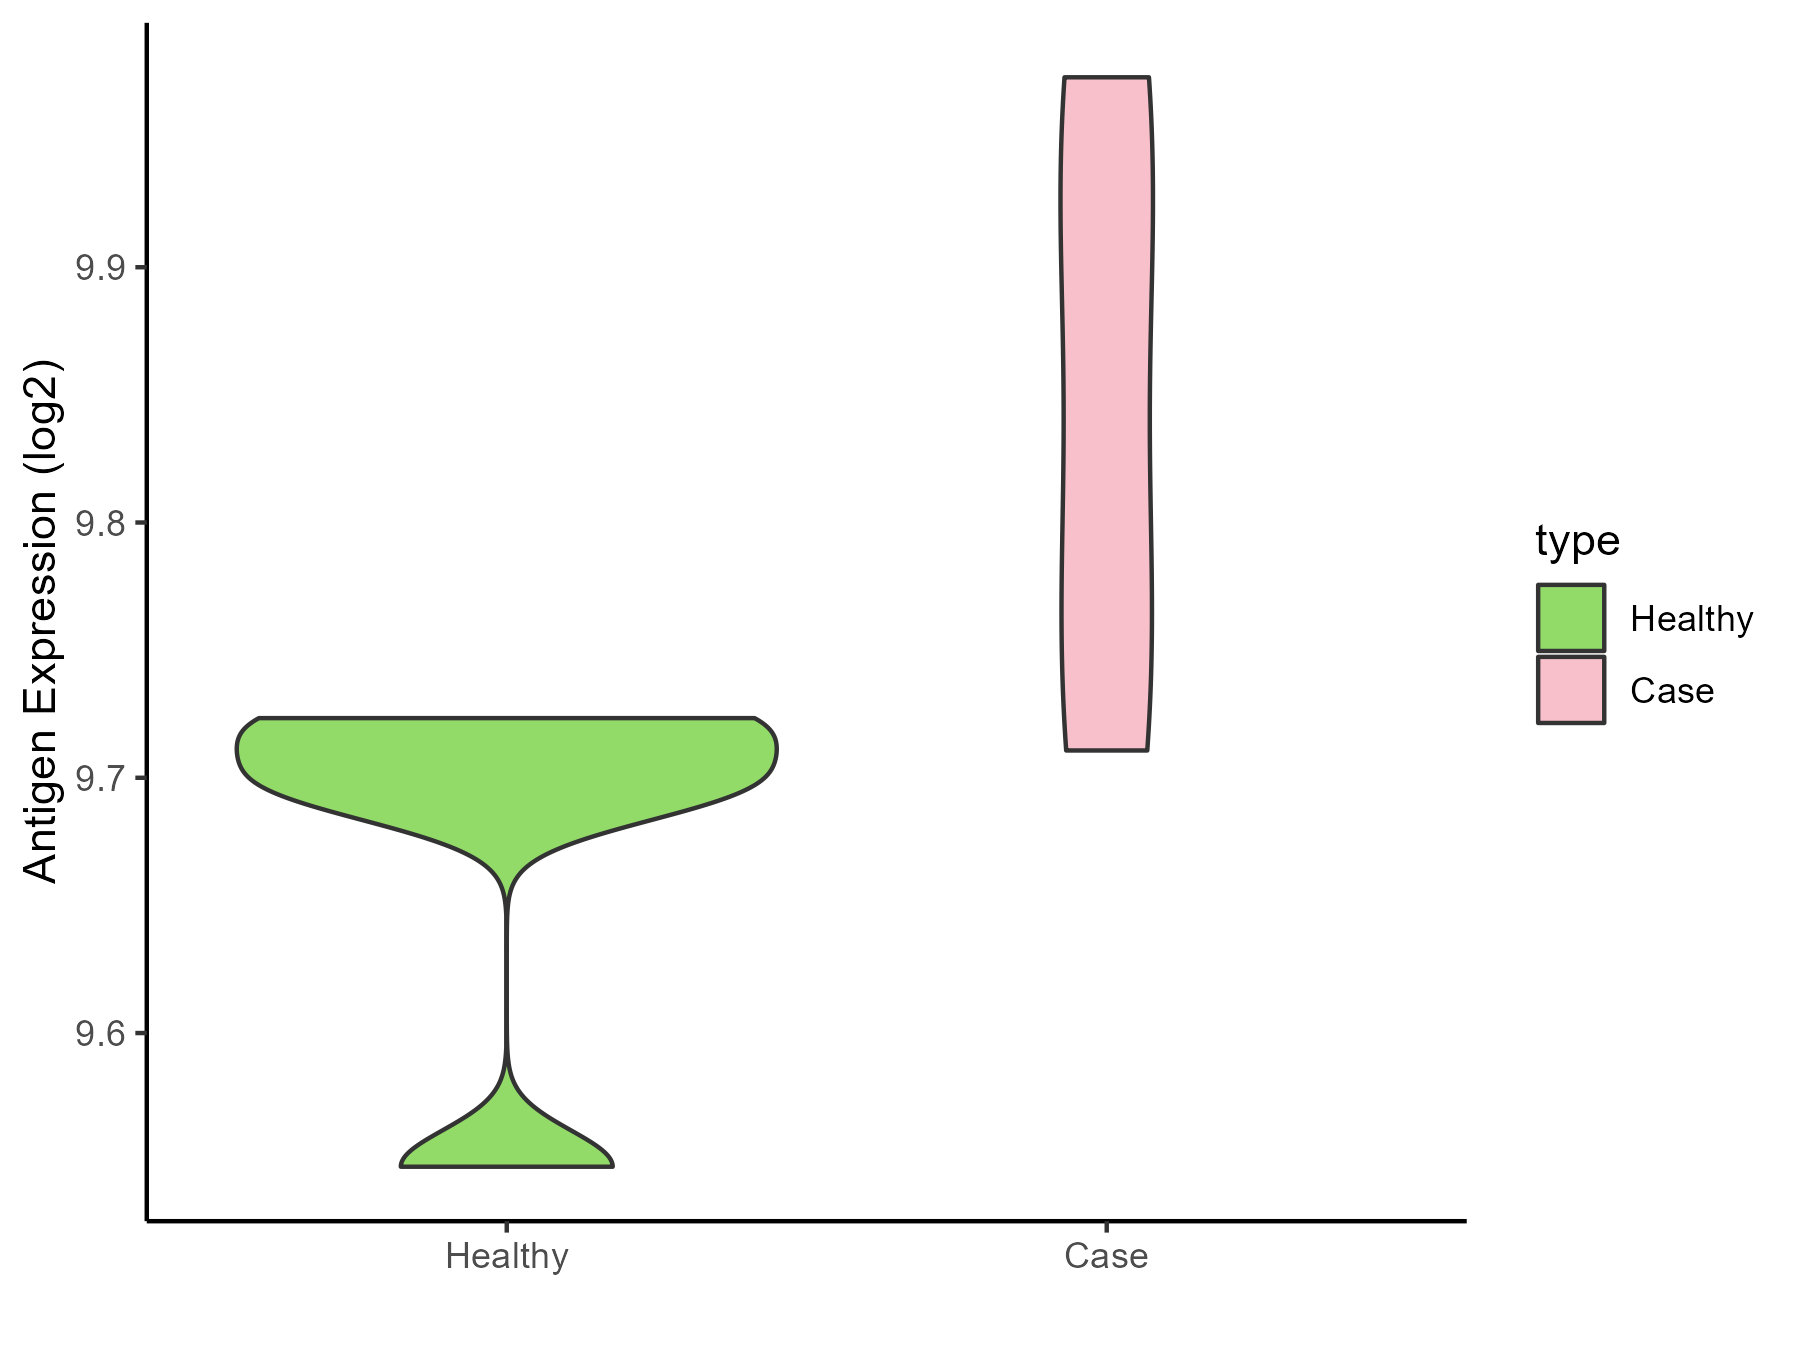
| Differential expression pattern of antigen in diseases | ||
| The Studied Tissue | Bone marrow | |
| The Specific Disease | Osteoporosis | |
| The Expression Level of Disease Section Compare with the Healthy Individual Tissue | p-value: 0.066712662; Fold-change: 0.148963479; Z-score: 2.01819718 | |
| Disease-specific Antigen Abundances |
|
Click to View the Clearer Original Diagram |
ICD Disease Classification 16
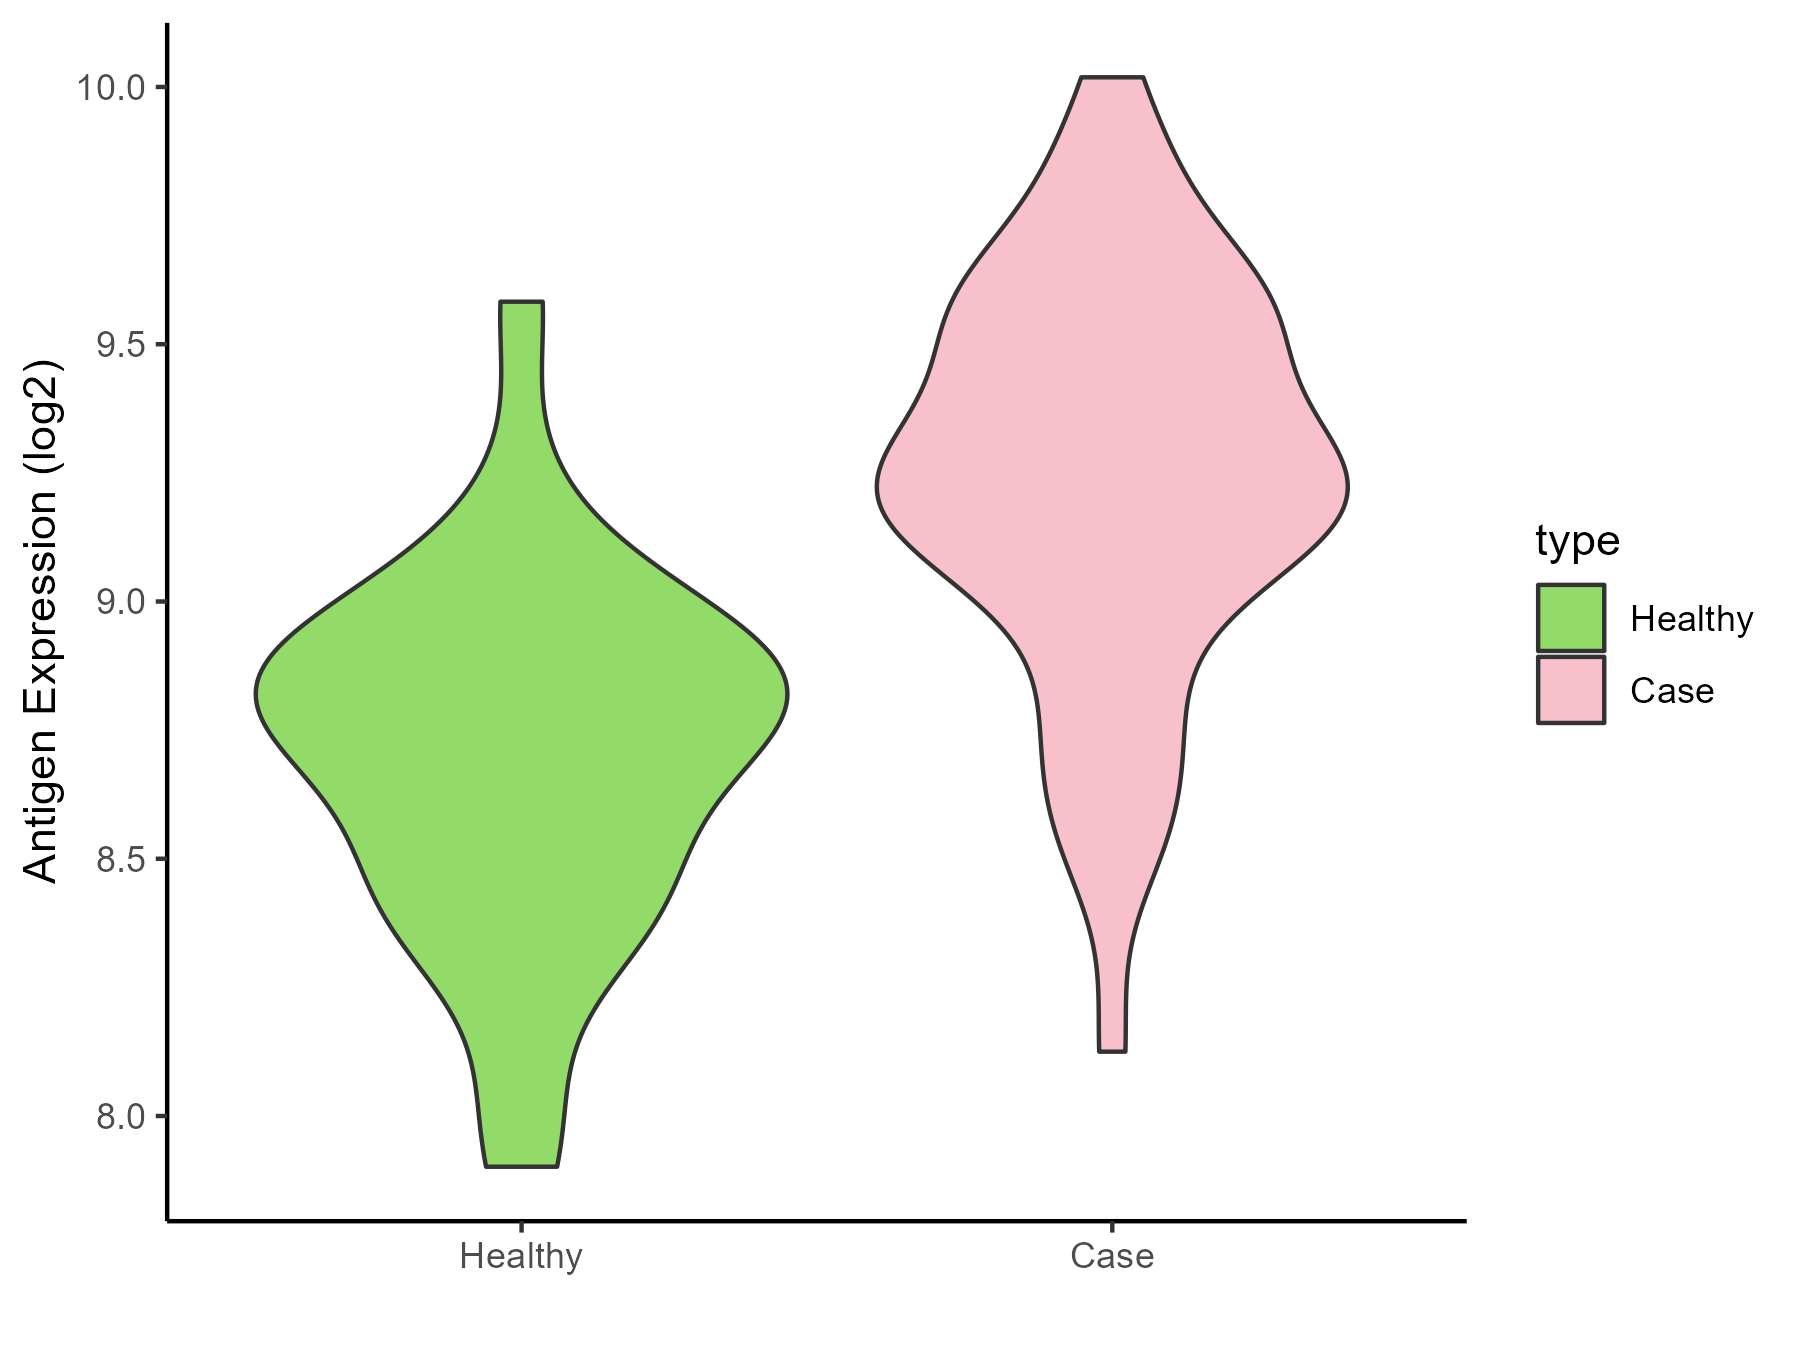
| Differential expression pattern of antigen in diseases | ||
| The Studied Tissue | Endometrium | |
| The Specific Disease | Endometriosis | |
| The Expression Level of Disease Section Compare with the Healthy Individual Tissue | p-value: 1.49E-07; Fold-change: 0.45816375; Z-score: 1.30282461 | |
| Disease-specific Antigen Abundances |
|
Click to View the Clearer Original Diagram |
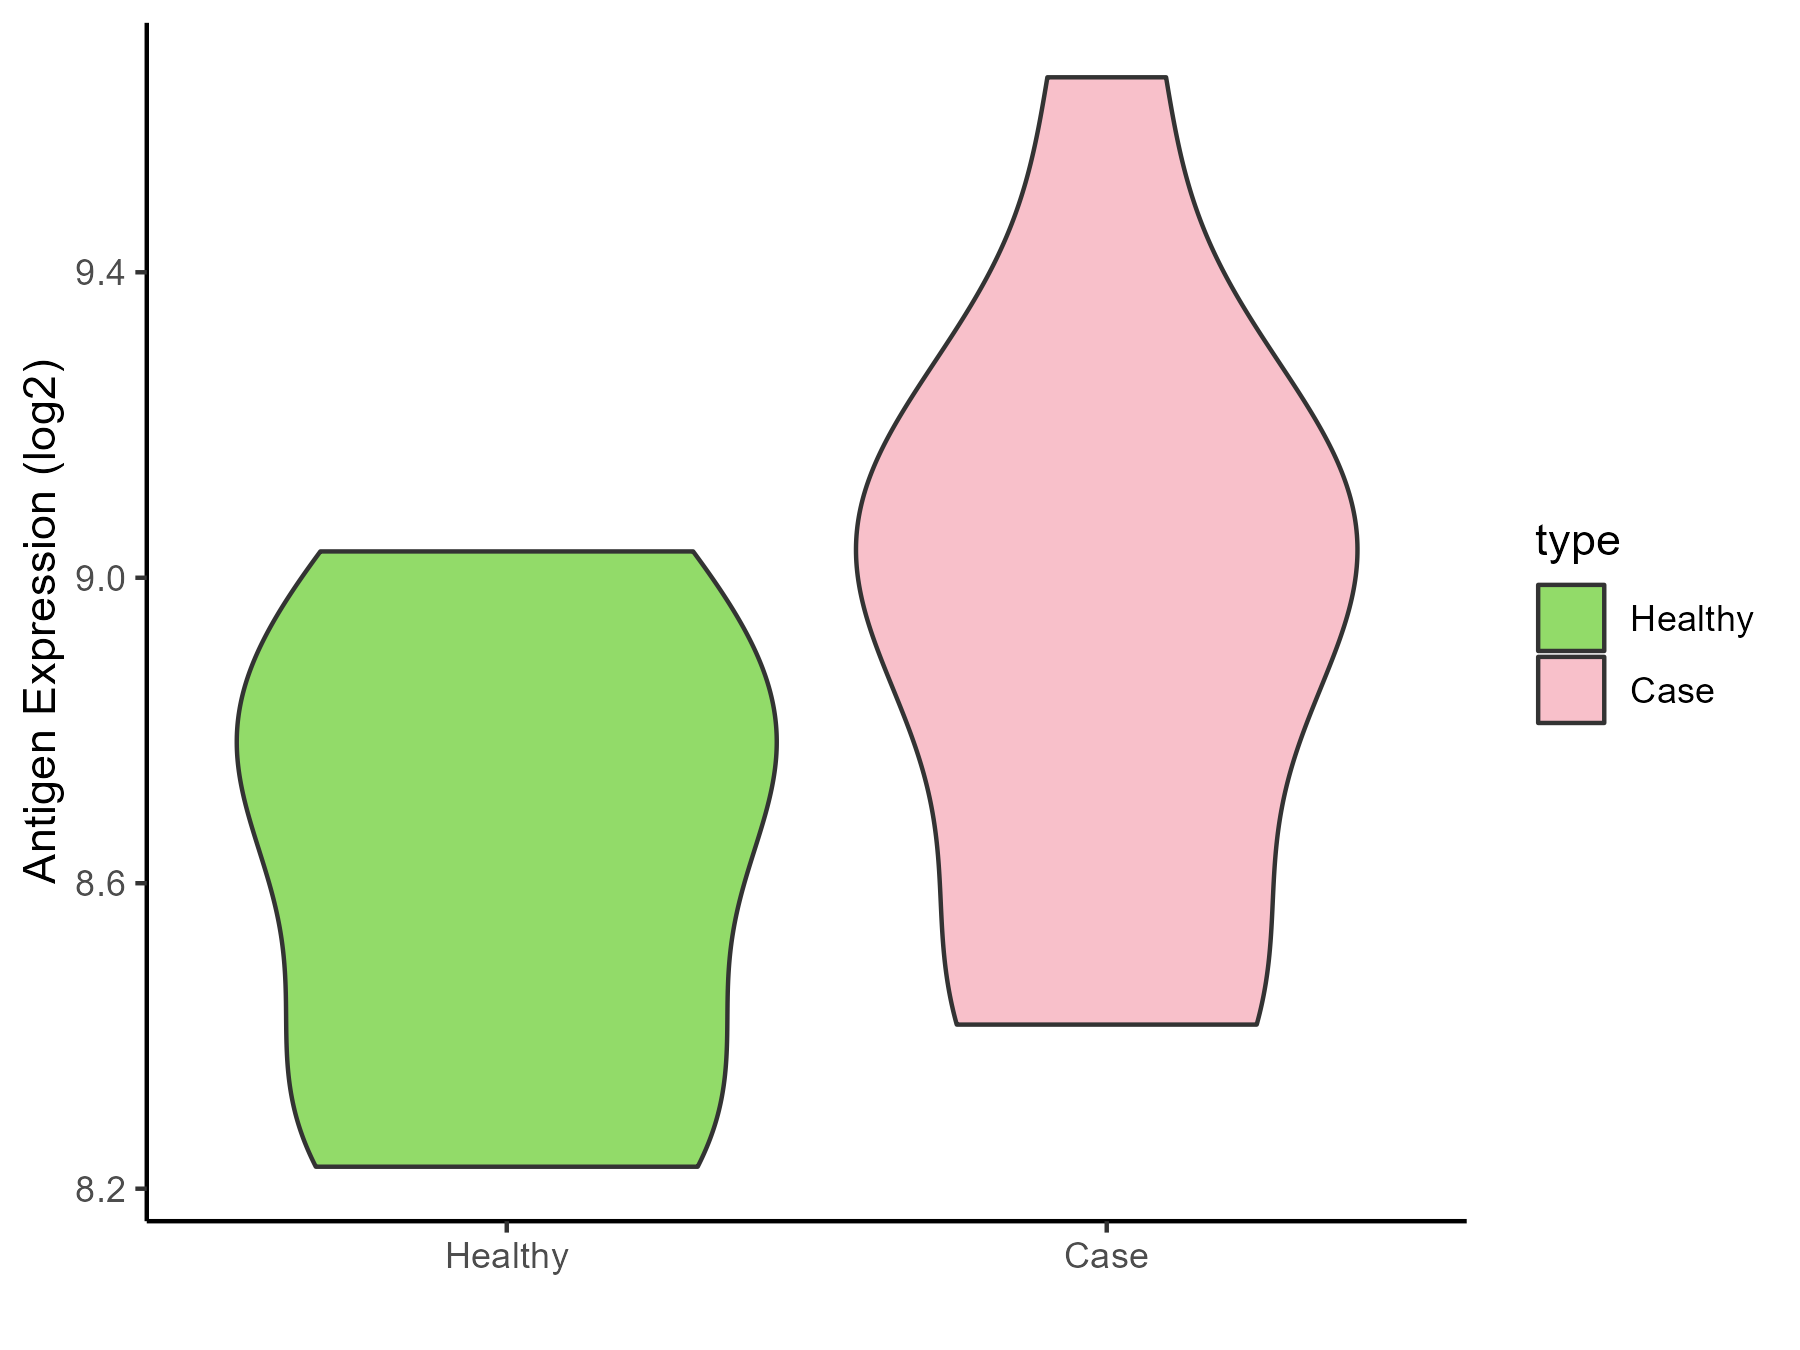
| Differential expression pattern of antigen in diseases | ||
| The Studied Tissue | Bladder | |
| The Specific Disease | Interstitial cystitis | |
| The Expression Level of Disease Section Compare with the Healthy Individual Tissue | p-value: 0.155953504; Fold-change: 0.263014466; Z-score: 0.810264786 | |
| Disease-specific Antigen Abundances |
|
Click to View the Clearer Original Diagram |
ICD Disease Classification 19
| Differential expression pattern of antigen in diseases | ||
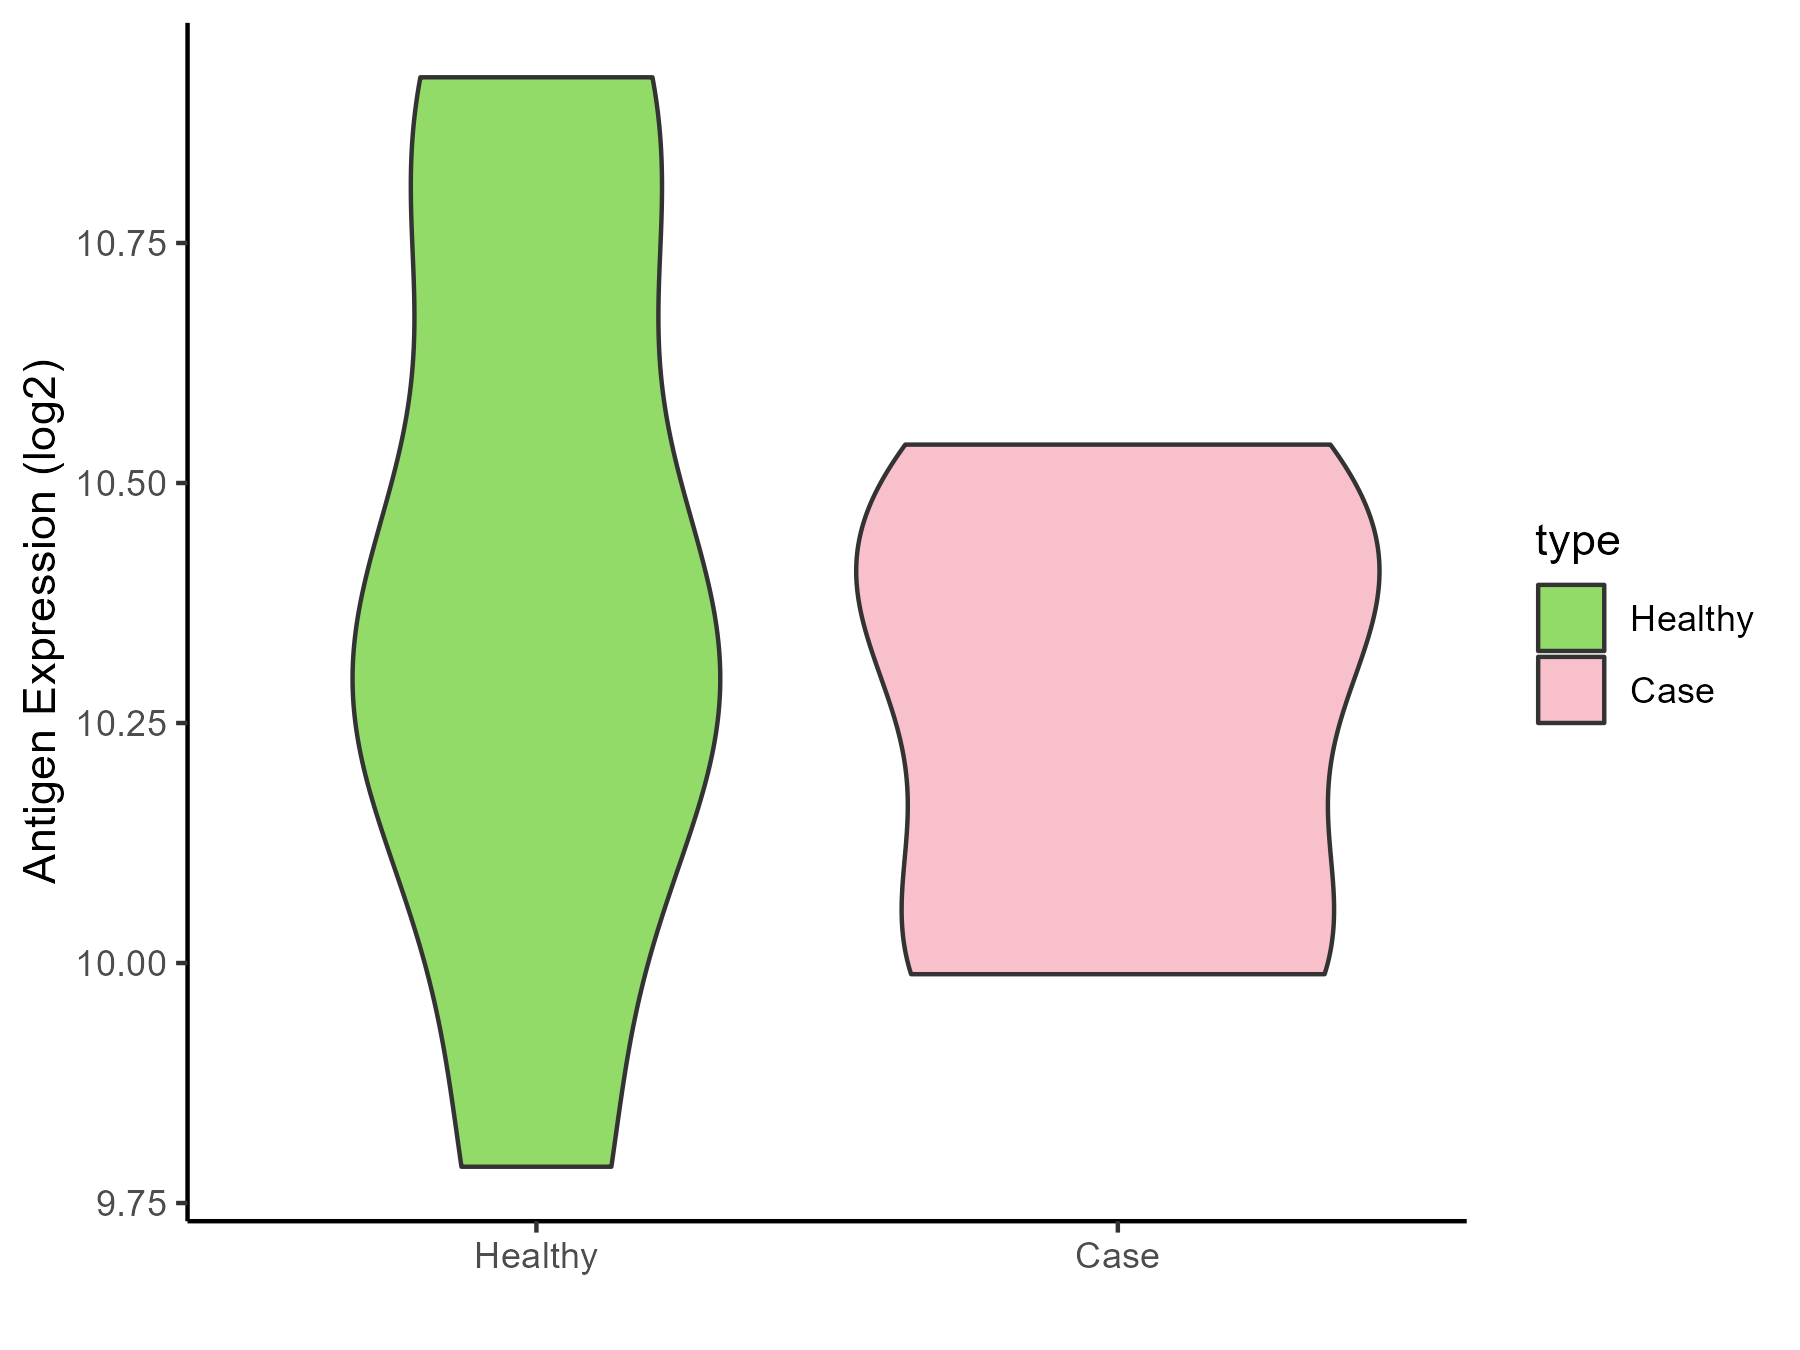
| The Studied Tissue | Myometrium | |
| The Specific Disease | Preterm birth | |
| The Expression Level of Disease Section Compare with the Healthy Individual Tissue | p-value: 0.511870556; Fold-change: -0.007347457; Z-score: -0.01776036 | |
| Disease-specific Antigen Abundances |
|
Click to View the Clearer Original Diagram |
ICD Disease Classification 2
| Differential expression pattern of antigen in diseases | ||
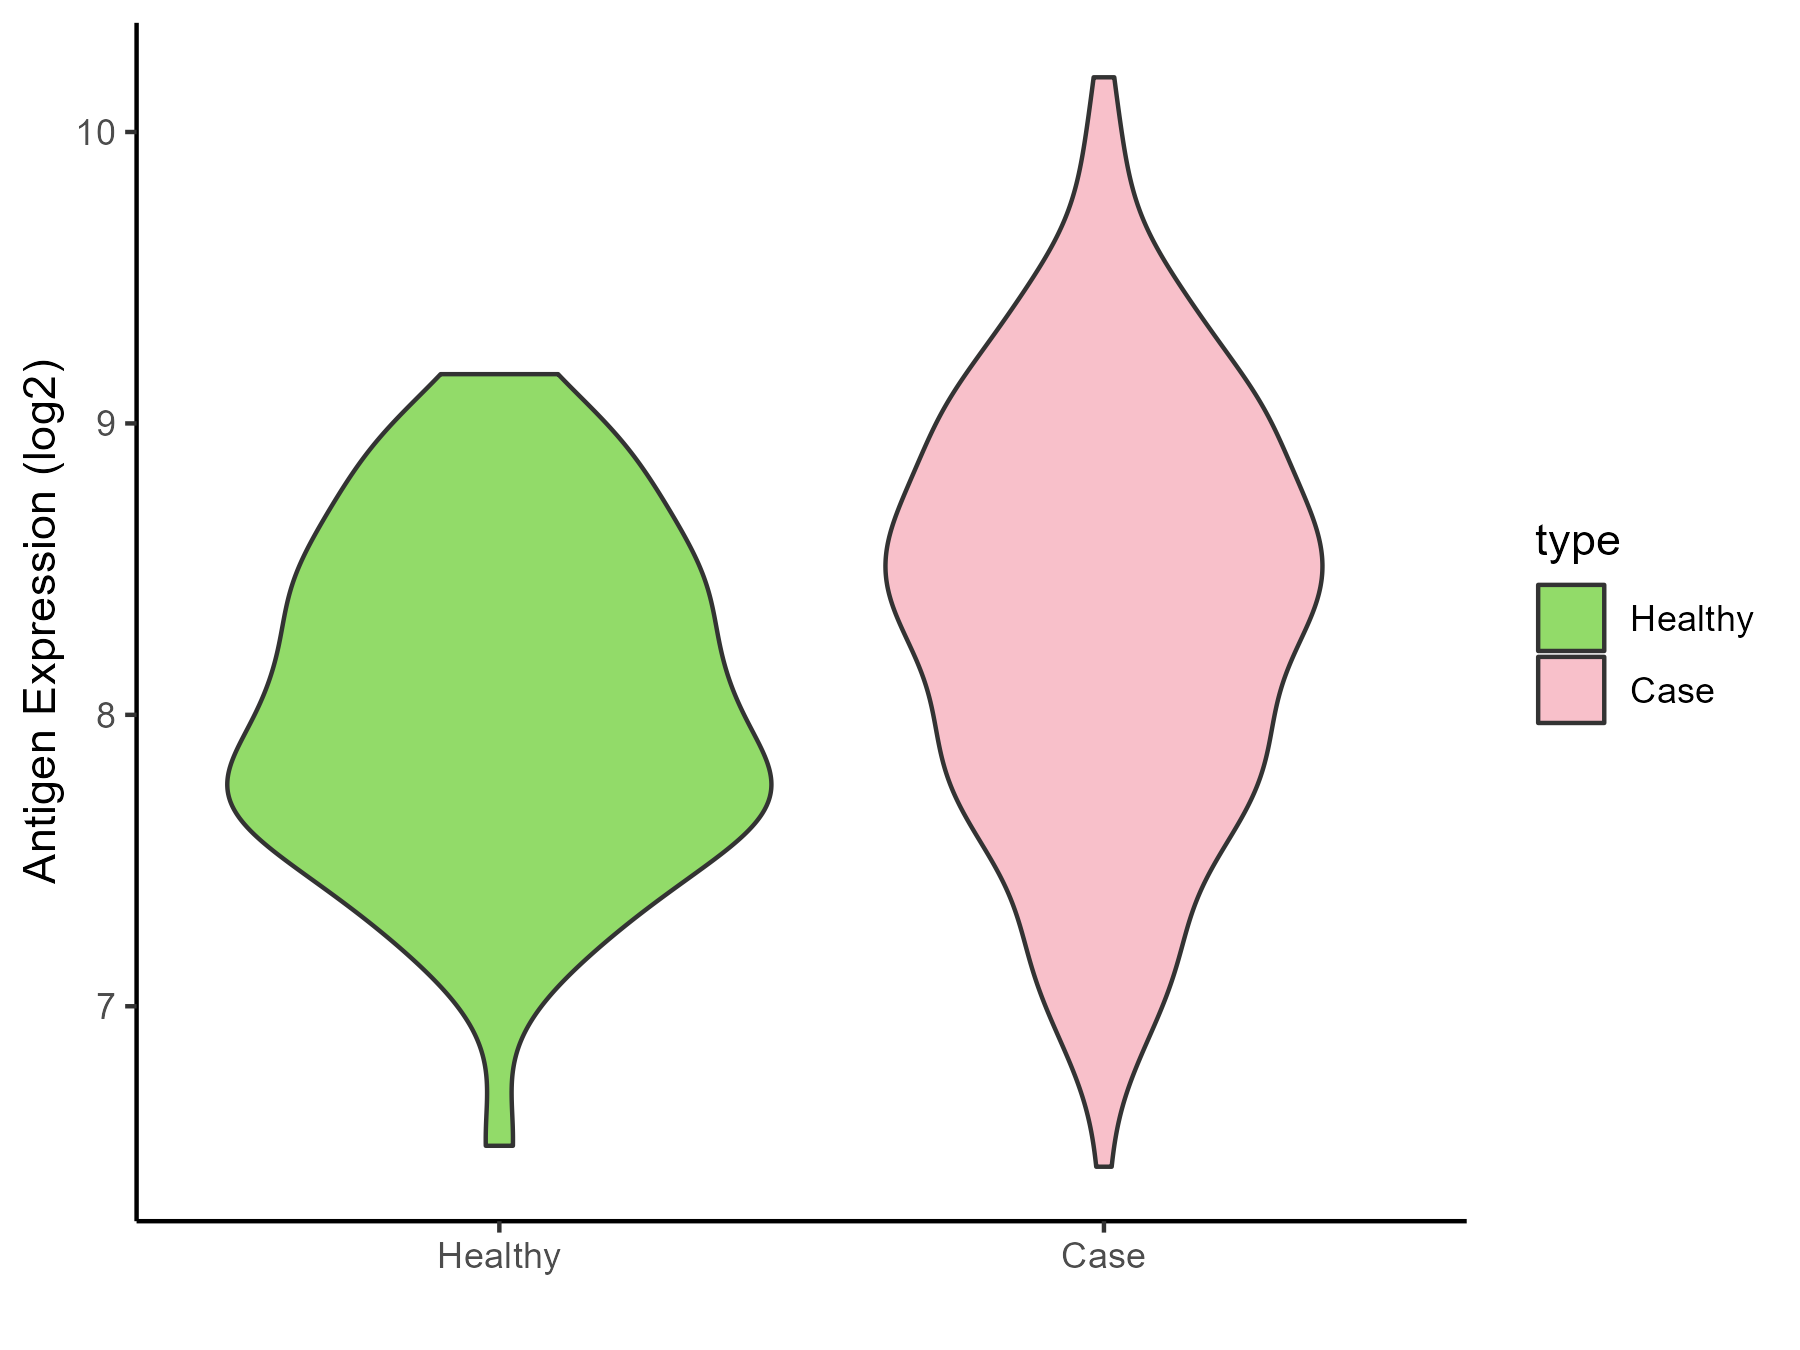
| The Studied Tissue | Bone marrow | |
| The Specific Disease | Acute myelocytic leukemia | |
| The Expression Level of Disease Section Compare with the Healthy Individual Tissue | p-value: 2.40E-06; Fold-change: 0.341778191; Z-score: 0.611779876 | |
| Disease-specific Antigen Abundances |
|
Click to View the Clearer Original Diagram |
| Differential expression pattern of antigen in diseases | ||
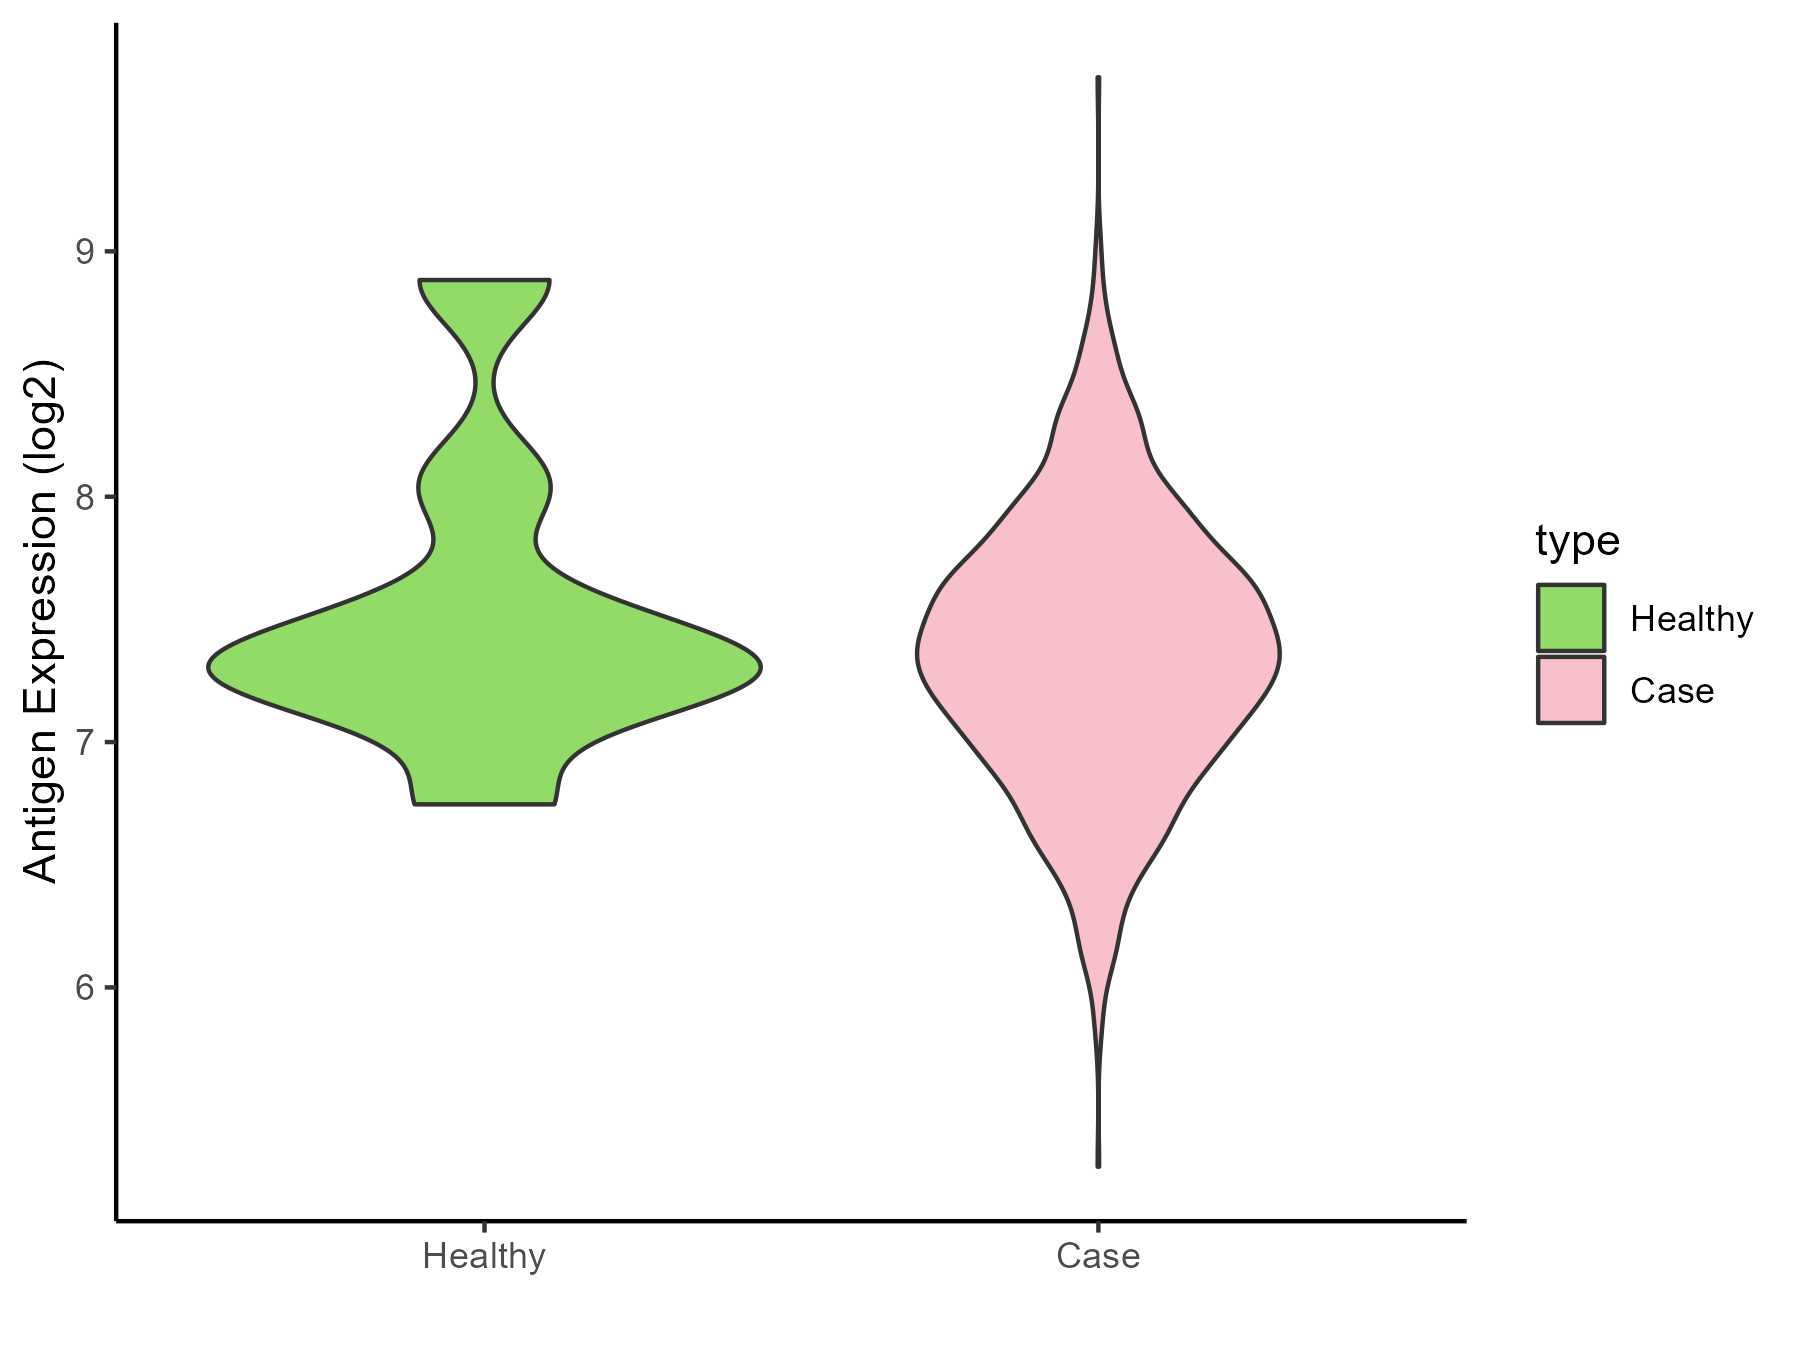
| The Studied Tissue | Bone marrow | |
| The Specific Disease | Myeloma | |
| The Expression Level of Disease Section Compare with the Healthy Individual Tissue | p-value: 0.495638961; Fold-change: 0.052191231; Z-score: 0.079943597 | |
| Disease-specific Antigen Abundances |
|
Click to View the Clearer Original Diagram |
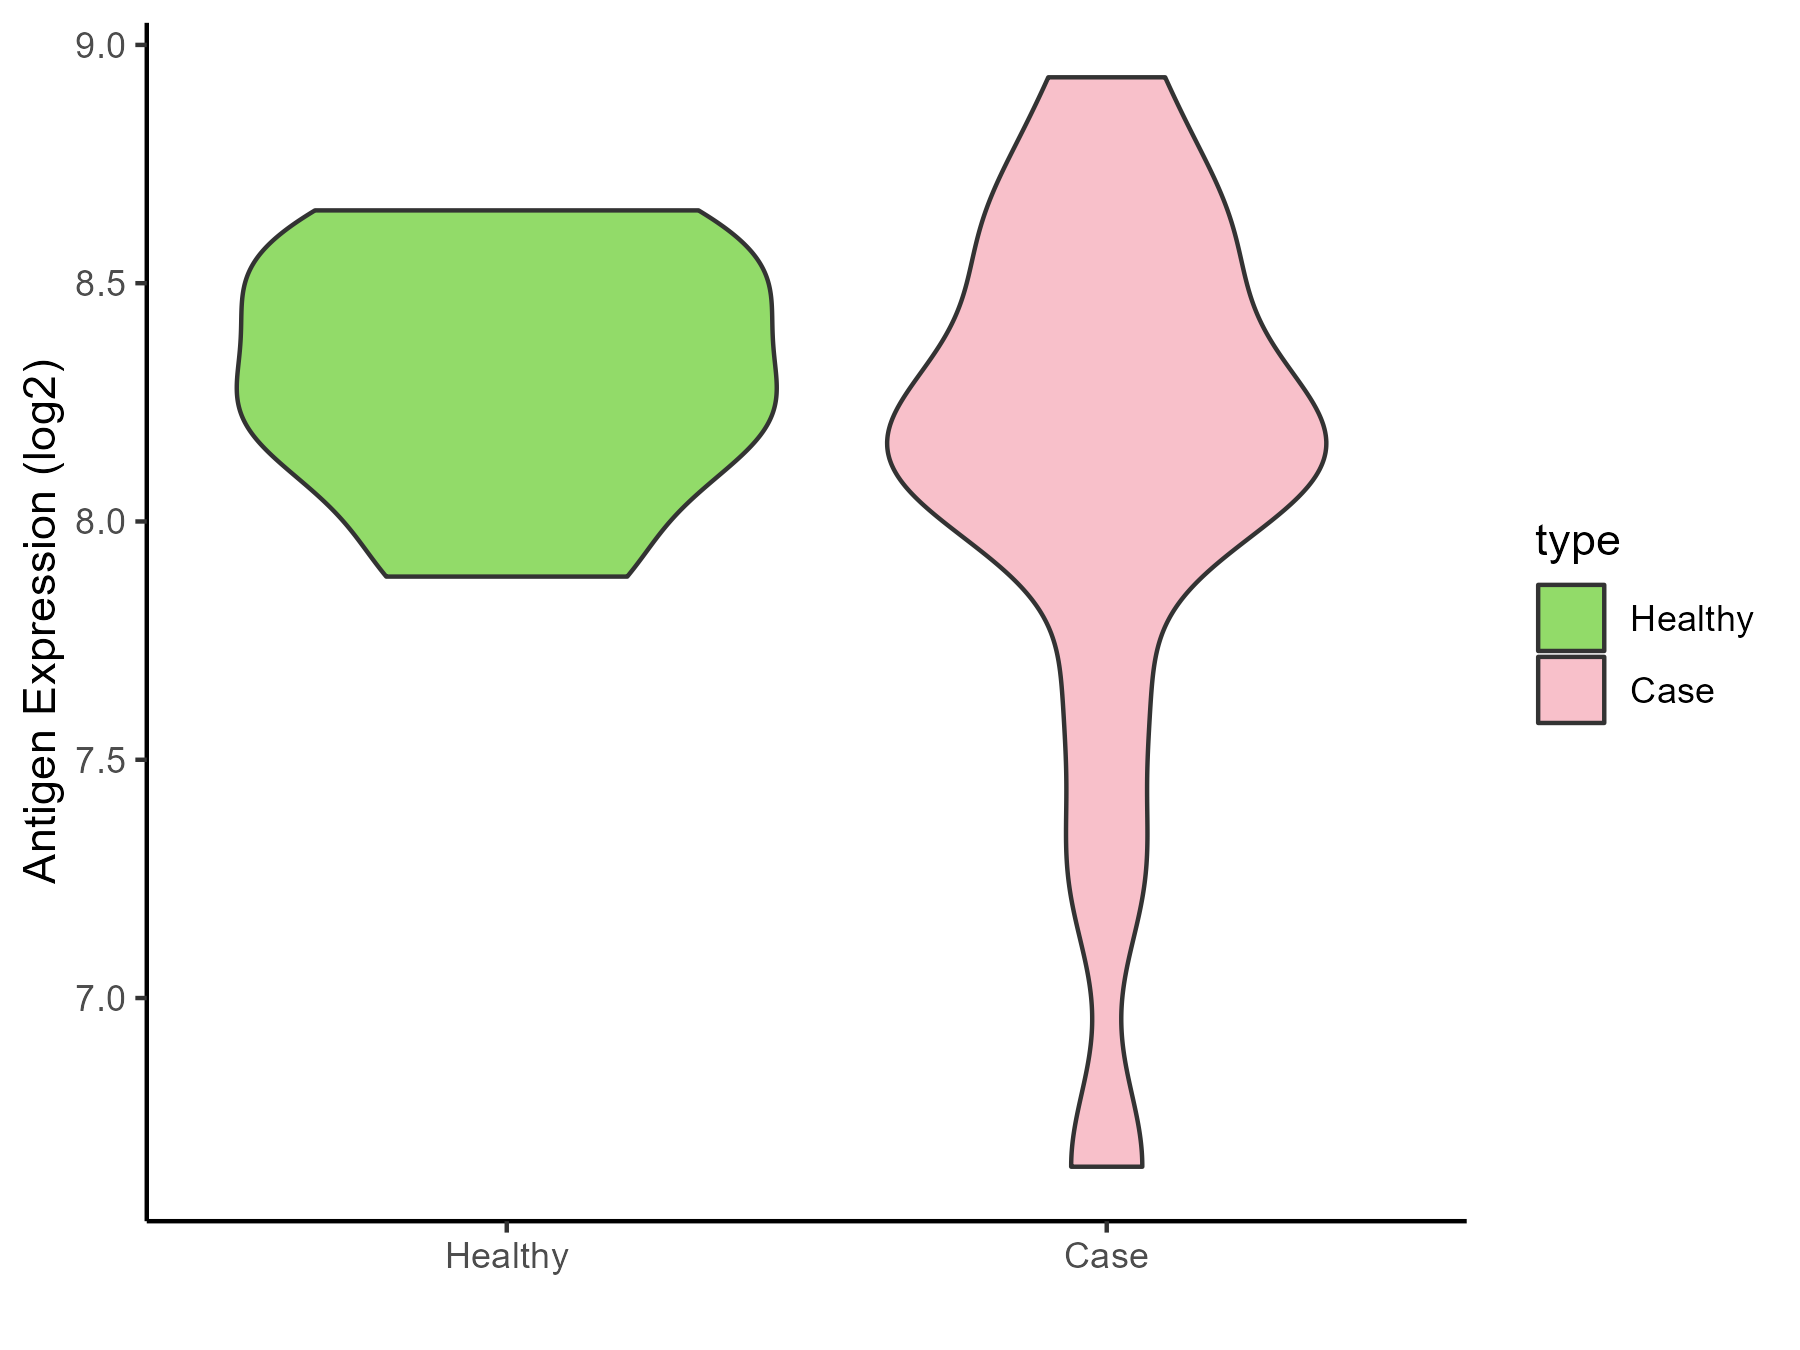
| The Studied Tissue | Peripheral blood | |
| The Specific Disease | Myeloma | |
| The Expression Level of Disease Section Compare with the Healthy Individual Tissue | p-value: 0.263292216; Fold-change: -0.166811163; Z-score: -0.654060459 | |
| Disease-specific Antigen Abundances |
|
Click to View the Clearer Original Diagram |
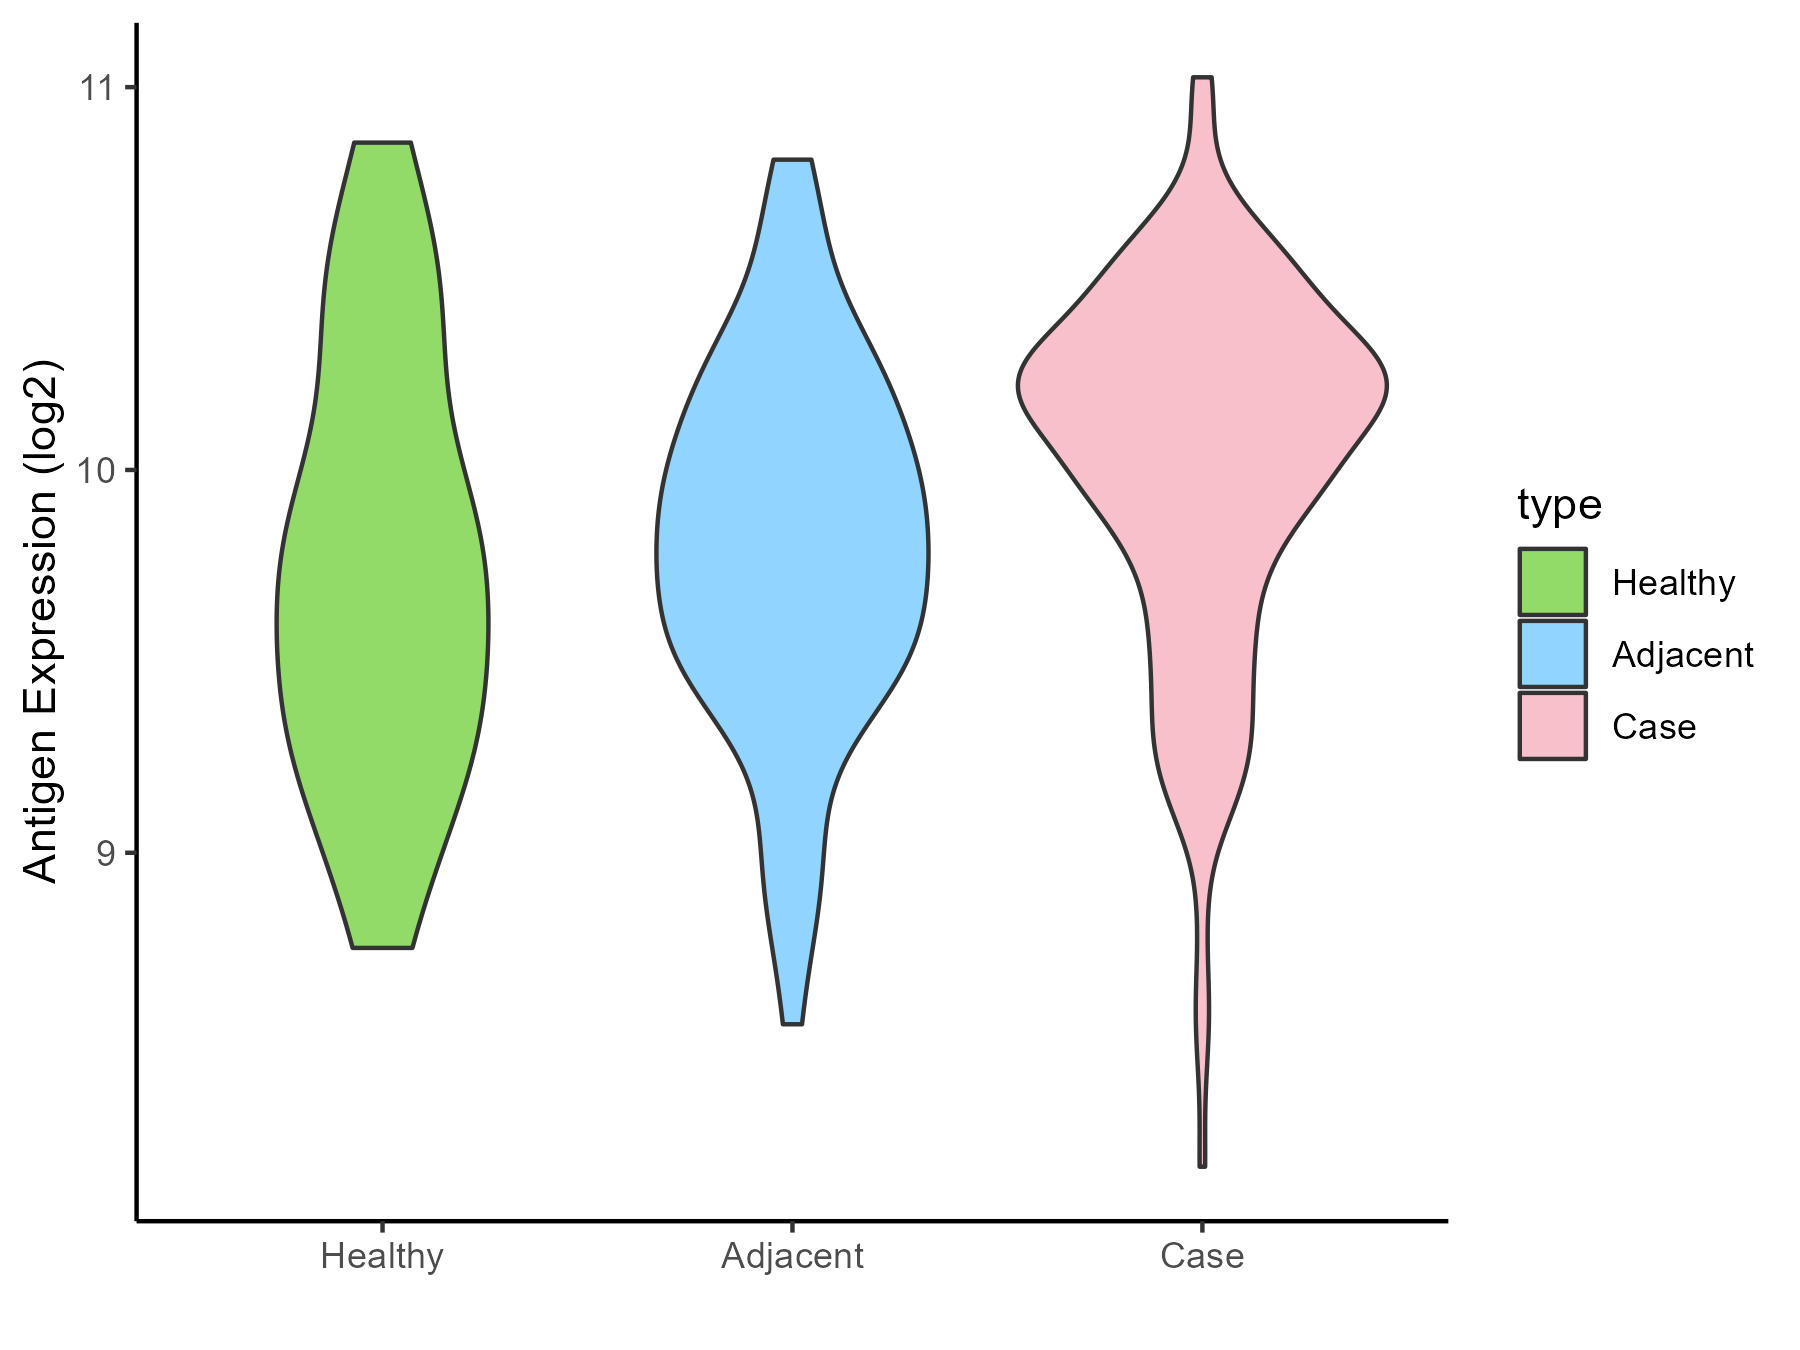
| Differential expression pattern of antigen in diseases | ||
| The Studied Tissue | Oral | |
| The Specific Disease | Oral cancer | |
| The Expression Level of Disease Section Compare with the Healthy Individual Tissue | p-value: 0.020579002; Fold-change: 0.438562885; Z-score: 0.790693767 | |
| The Expression Level of Disease Section Compare with the Adjacent Tissue | p-value: 0.000358458; Fold-change: 0.35242164; Z-score: 0.753981778 | |
| Disease-specific Antigen Abundances |
|
Click to View the Clearer Original Diagram |
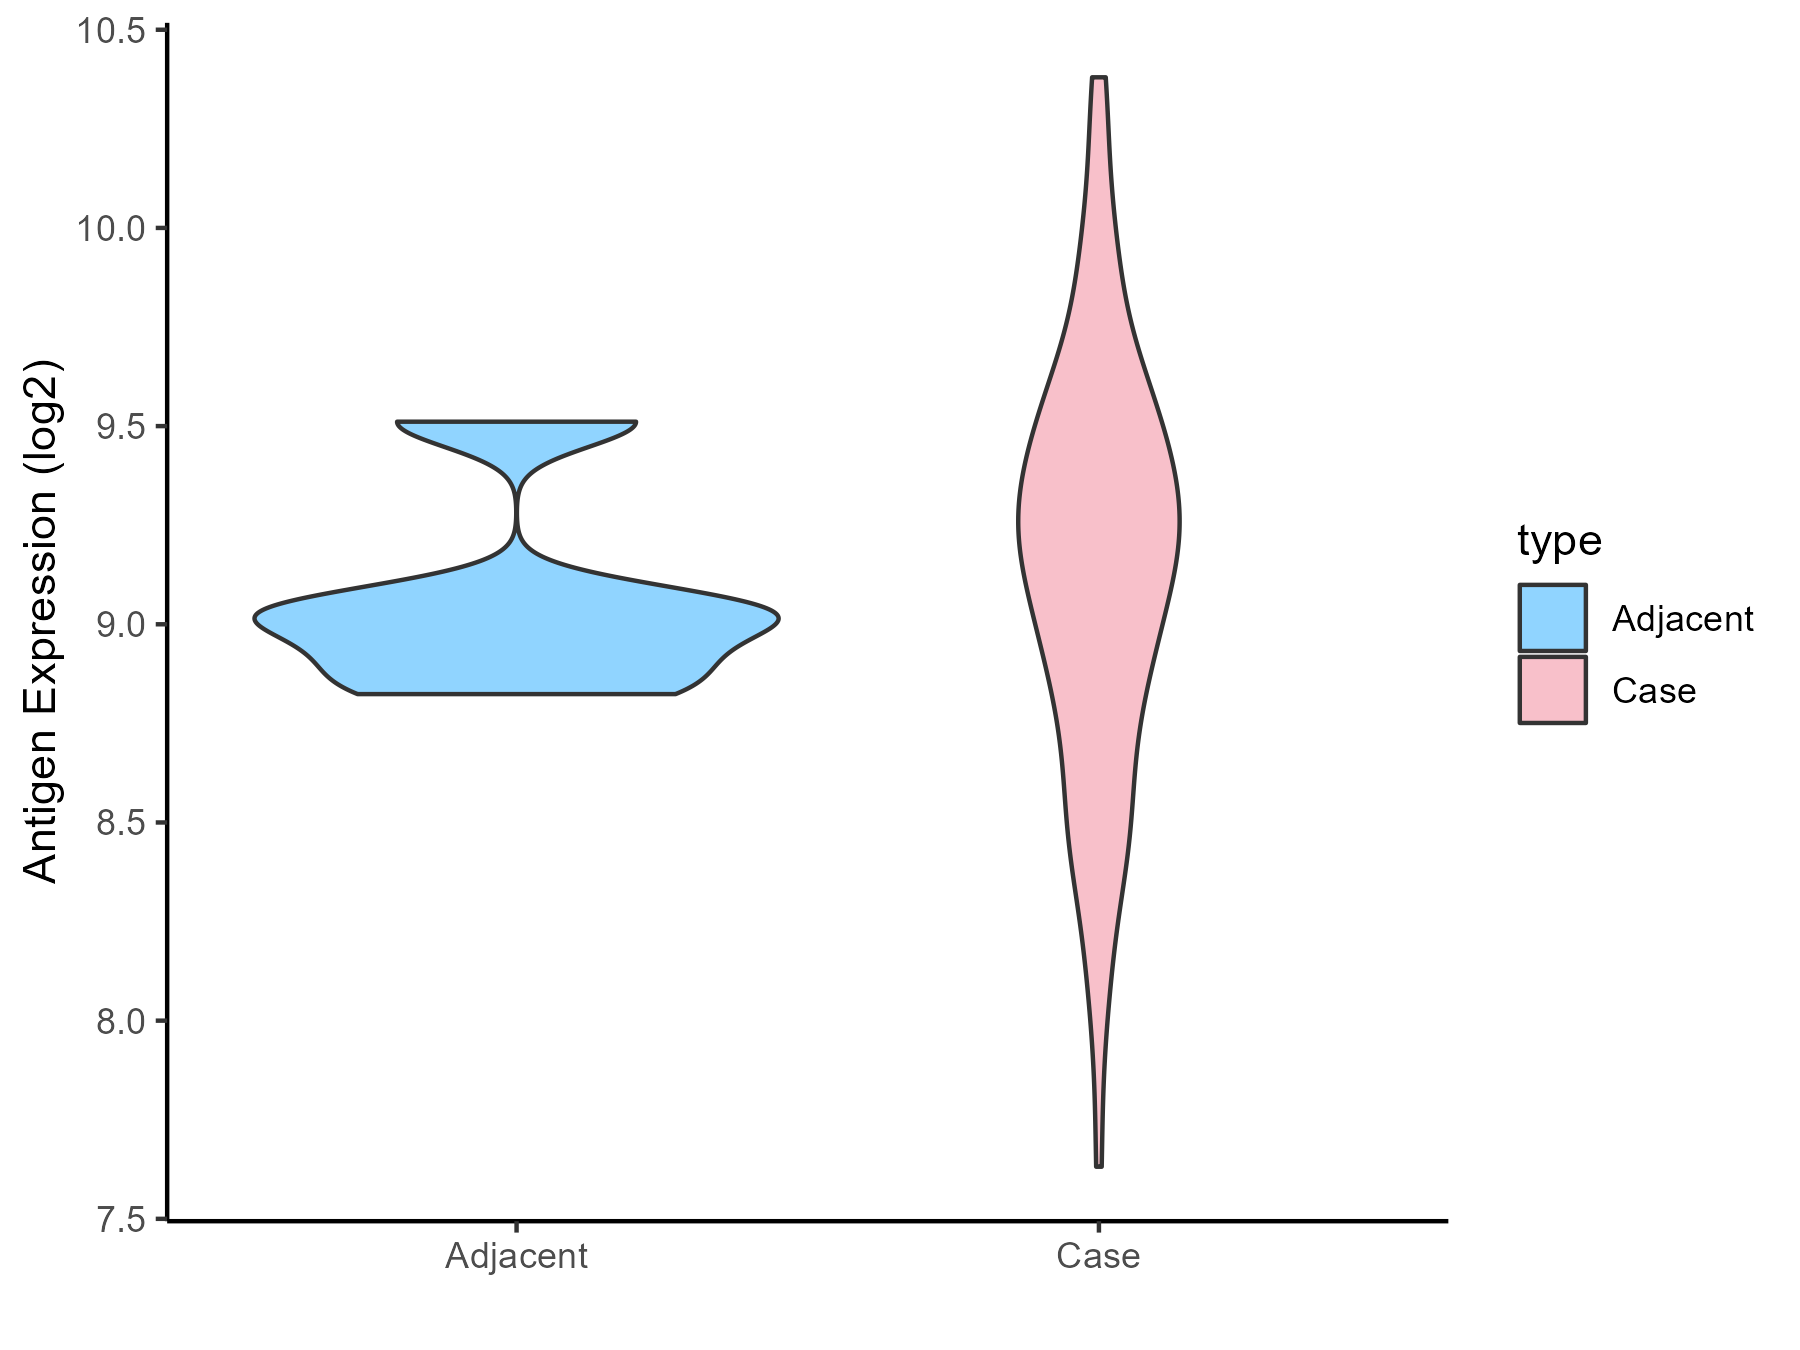
| Differential expression pattern of antigen in diseases | ||
| The Studied Tissue | Esophagus | |
| The Specific Disease | Esophagal cancer | |
| The Expression Level of Disease Section Compare with the Adjacent Tissue | p-value: 0.551584413; Fold-change: 0.183714941; Z-score: 0.693402217 | |
| Disease-specific Antigen Abundances |
|
Click to View the Clearer Original Diagram |
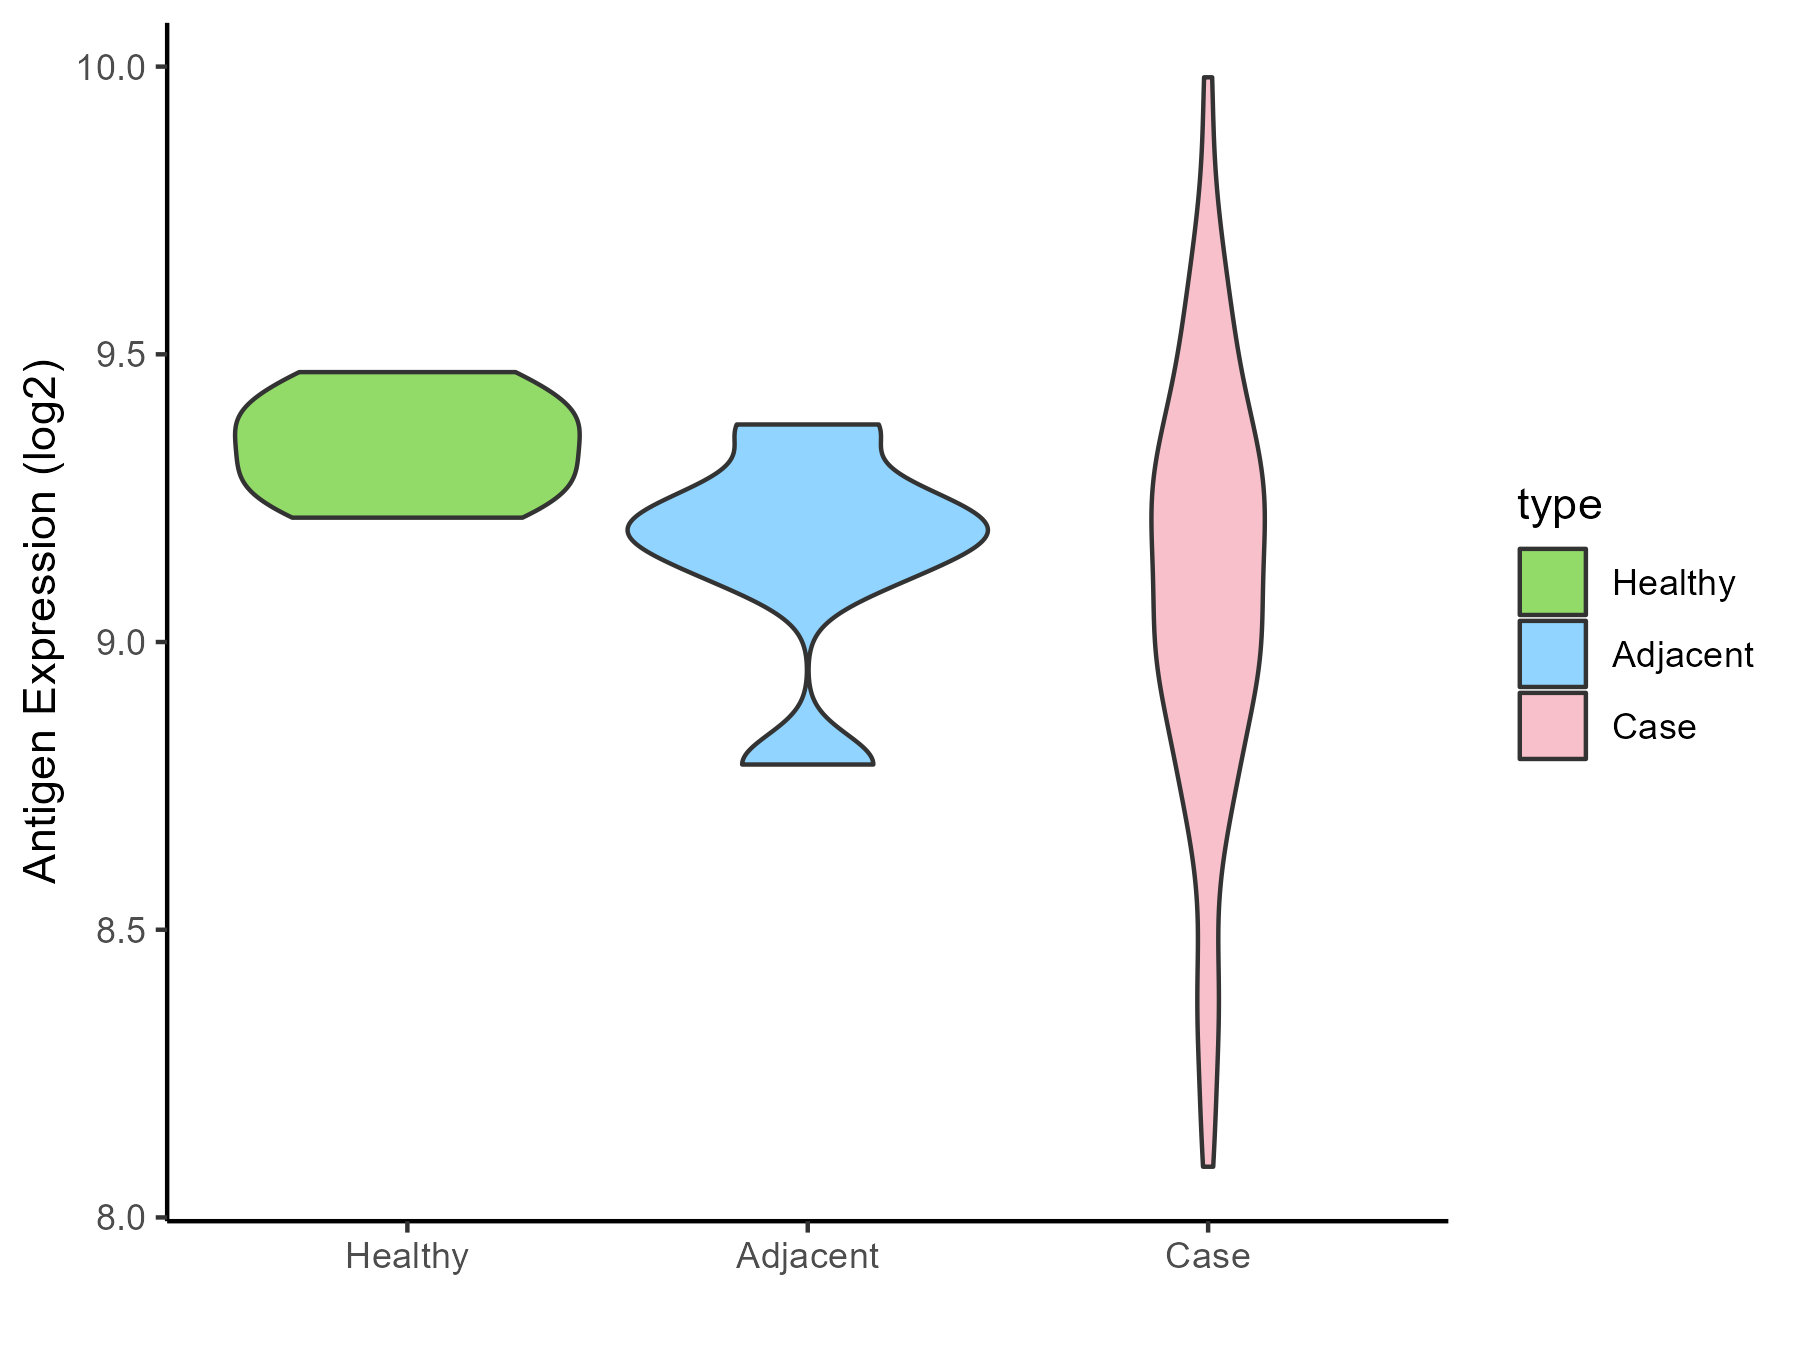
| Differential expression pattern of antigen in diseases | ||
| The Studied Tissue | Rectal colon | |
| The Specific Disease | Rectal cancer | |
| The Expression Level of Disease Section Compare with the Healthy Individual Tissue | p-value: 0.000196375; Fold-change: -0.209282095; Z-score: -2.254322985 | |
| The Expression Level of Disease Section Compare with the Adjacent Tissue | p-value: 0.530873347; Fold-change: -0.059152323; Z-score: -0.295194868 | |
| Disease-specific Antigen Abundances |
|
Click to View the Clearer Original Diagram |
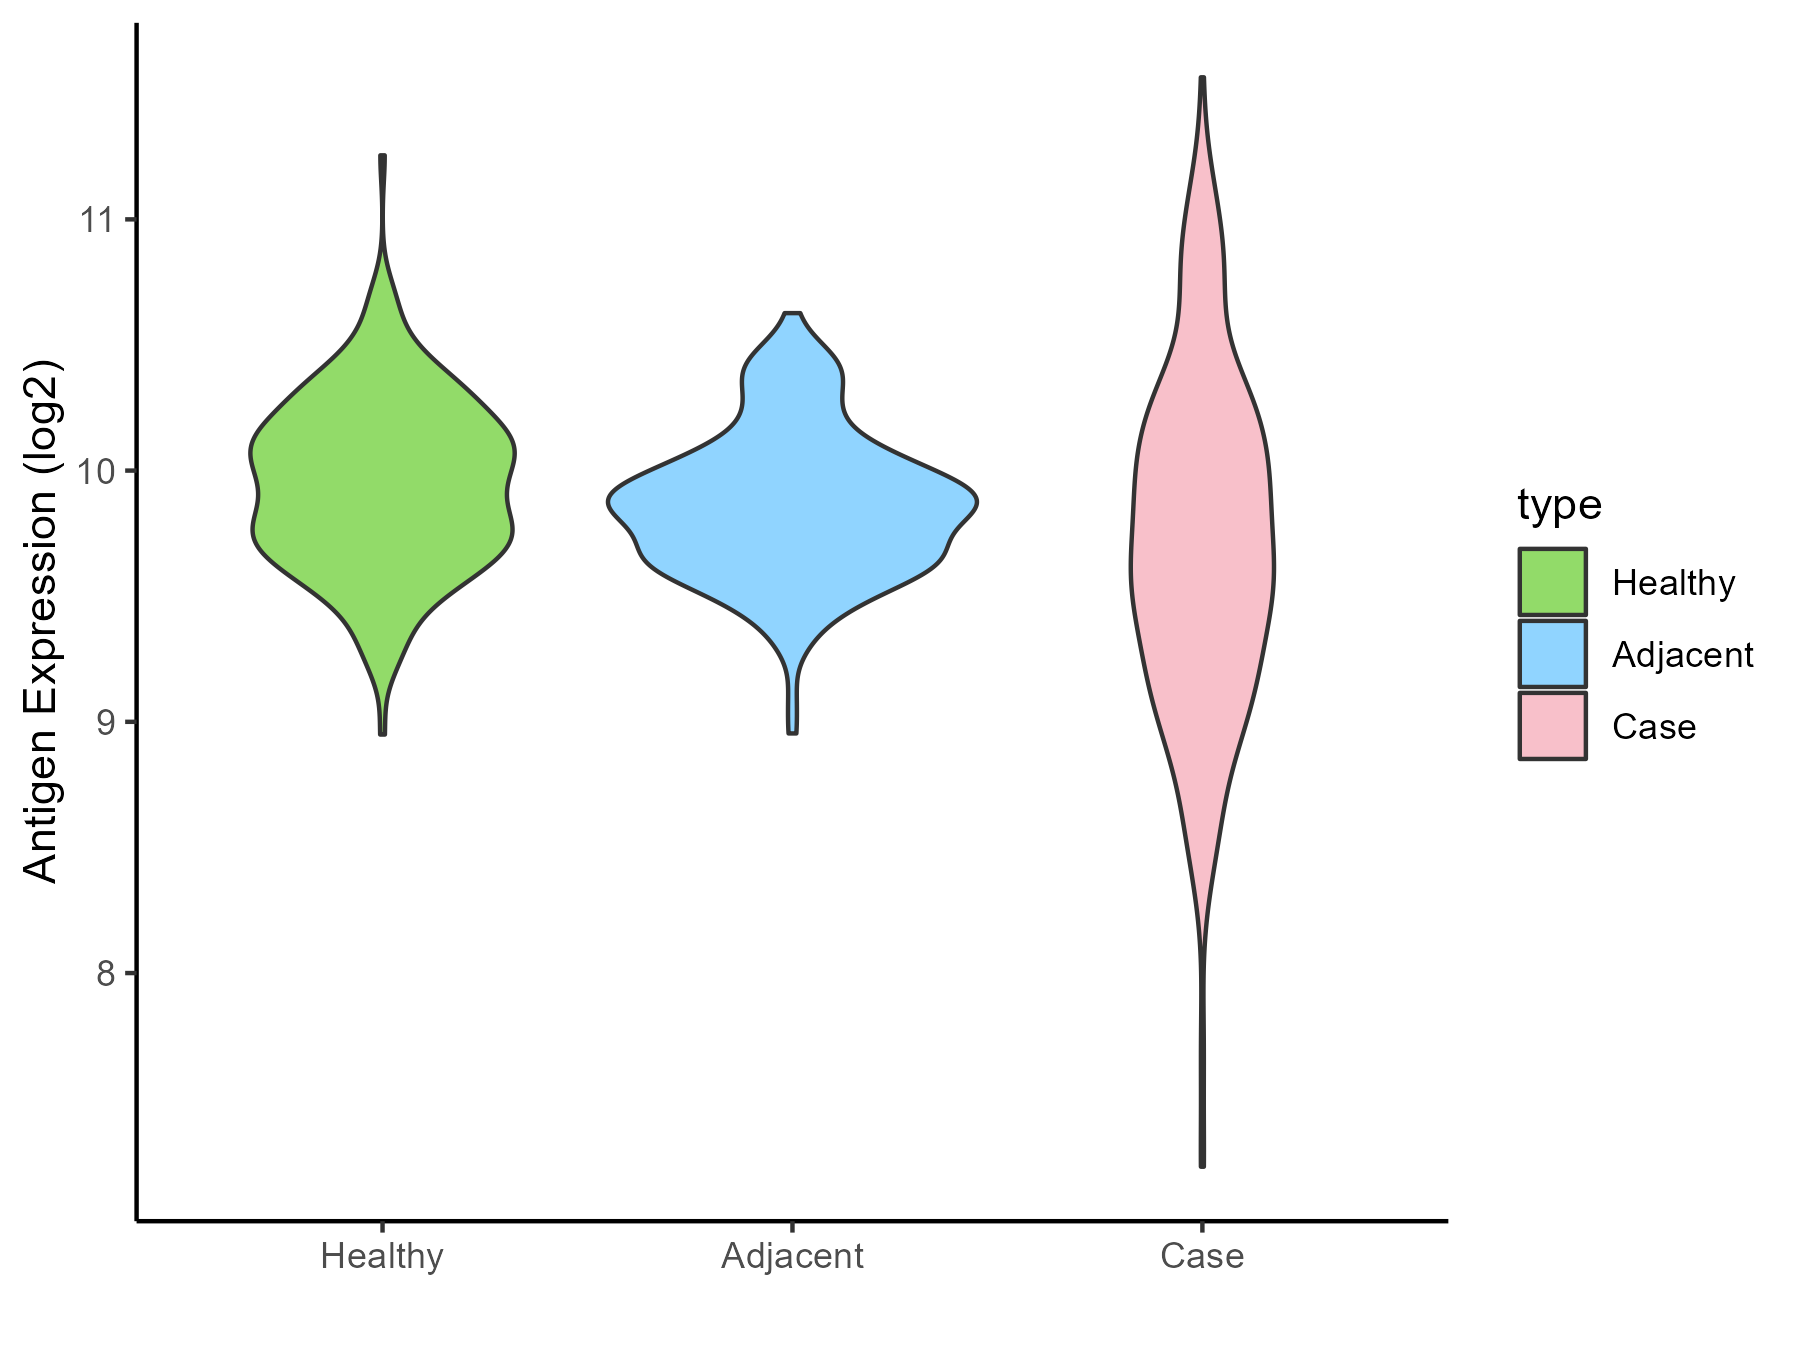
| Differential expression pattern of antigen in diseases | ||
| The Studied Tissue | Skin | |
| The Specific Disease | Skin cancer | |
| The Expression Level of Disease Section Compare with the Healthy Individual Tissue | p-value: 1.88E-08; Fold-change: -0.262431158; Z-score: -0.780846396 | |
| The Expression Level of Disease Section Compare with the Adjacent Tissue | p-value: 0.00022846; Fold-change: -0.16596218; Z-score: -0.576686848 | |
| Disease-specific Antigen Abundances |
|
Click to View the Clearer Original Diagram |
| Differential expression pattern of antigen in diseases | ||
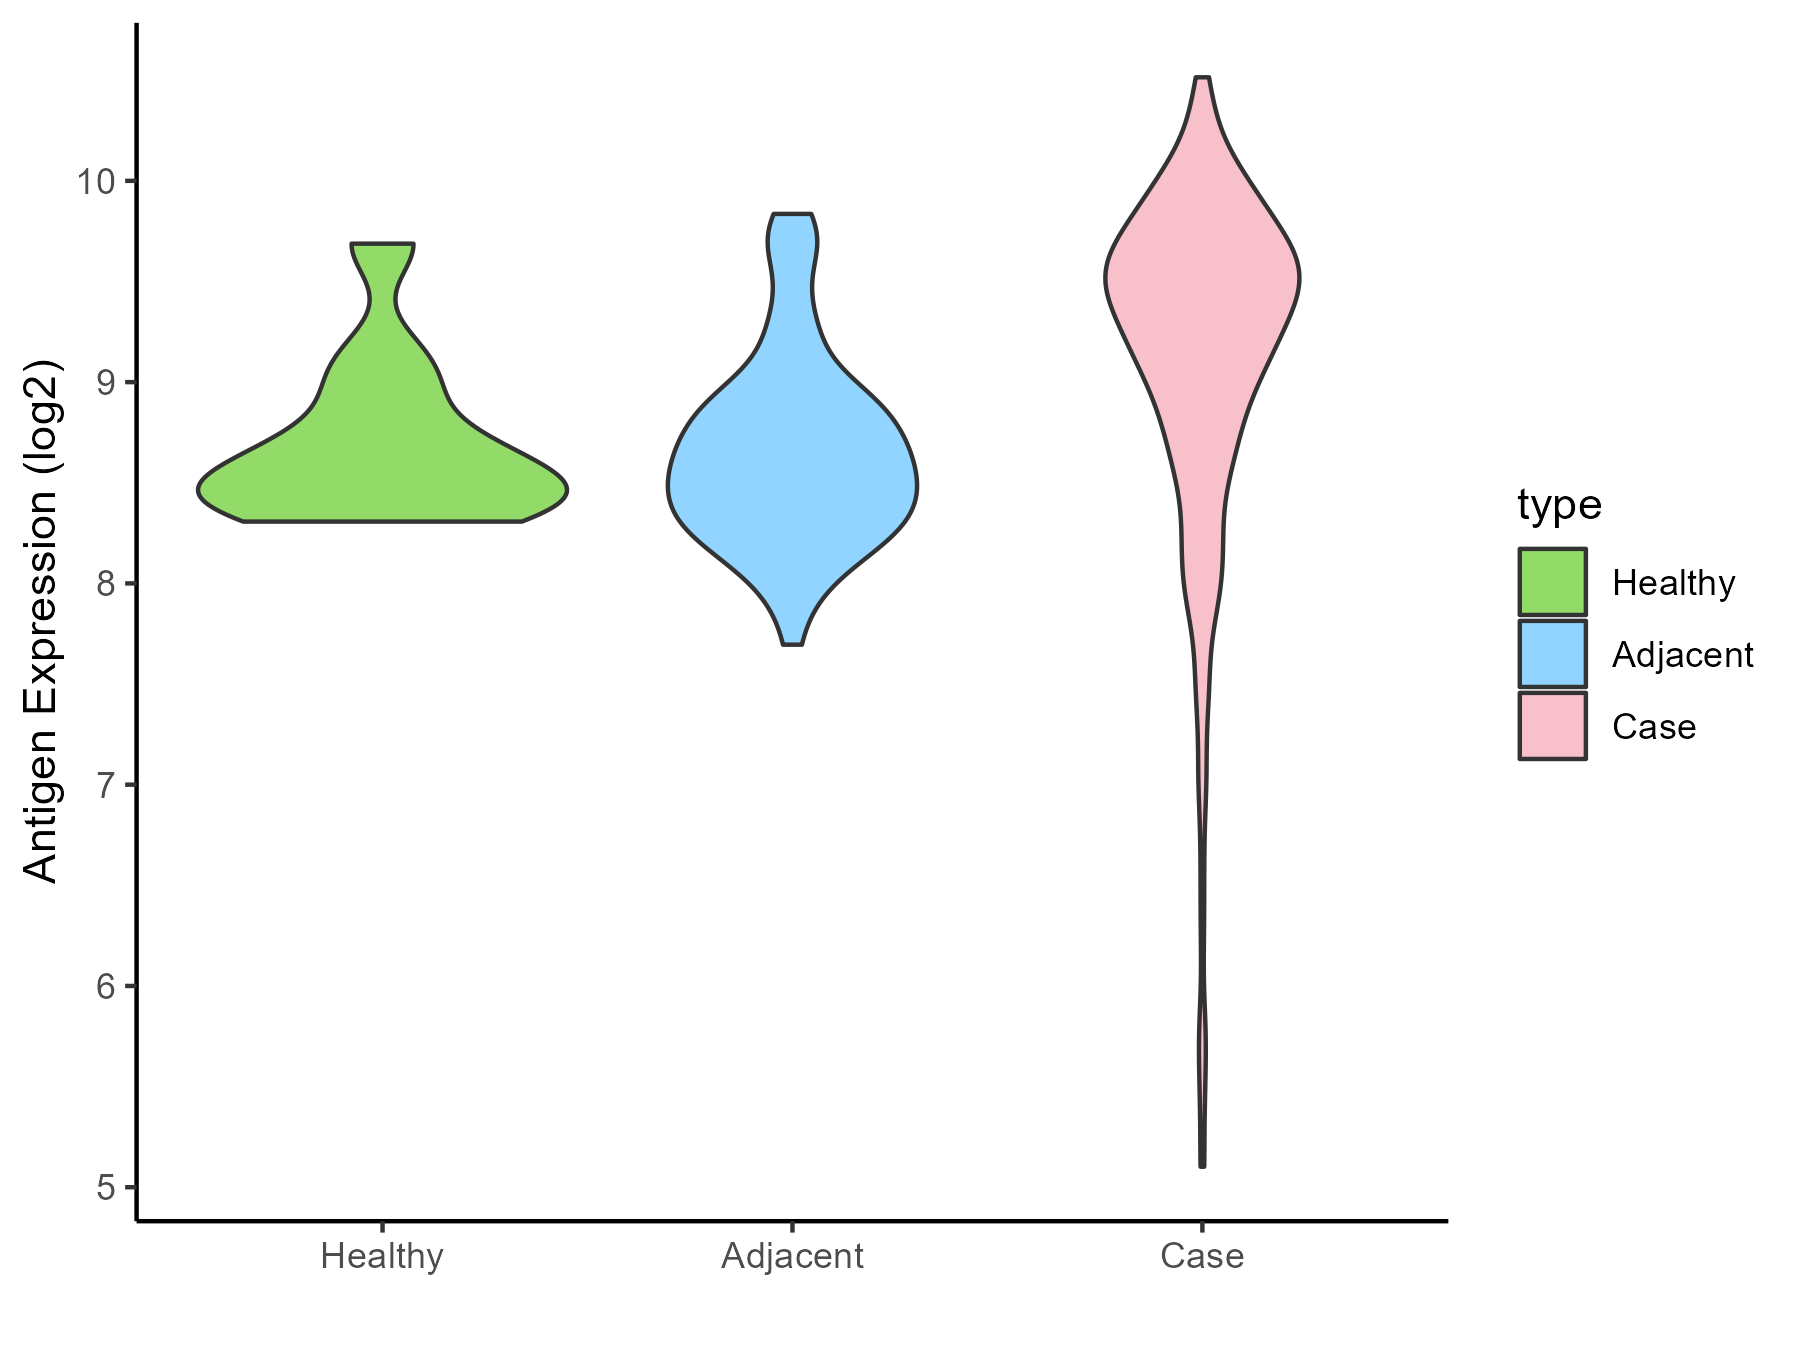
| The Studied Tissue | Kidney | |
| The Specific Disease | Renal cancer | |
| The Expression Level of Disease Section Compare with the Healthy Individual Tissue | p-value: 0.007340324; Fold-change: 0.814647993; Z-score: 1.959264983 | |
| The Expression Level of Disease Section Compare with the Adjacent Tissue | p-value: 5.53E-10; Fold-change: 0.742100341; Z-score: 1.610833071 | |
| Disease-specific Antigen Abundances |
|
Click to View the Clearer Original Diagram |
| Differential expression pattern of antigen in diseases | ||
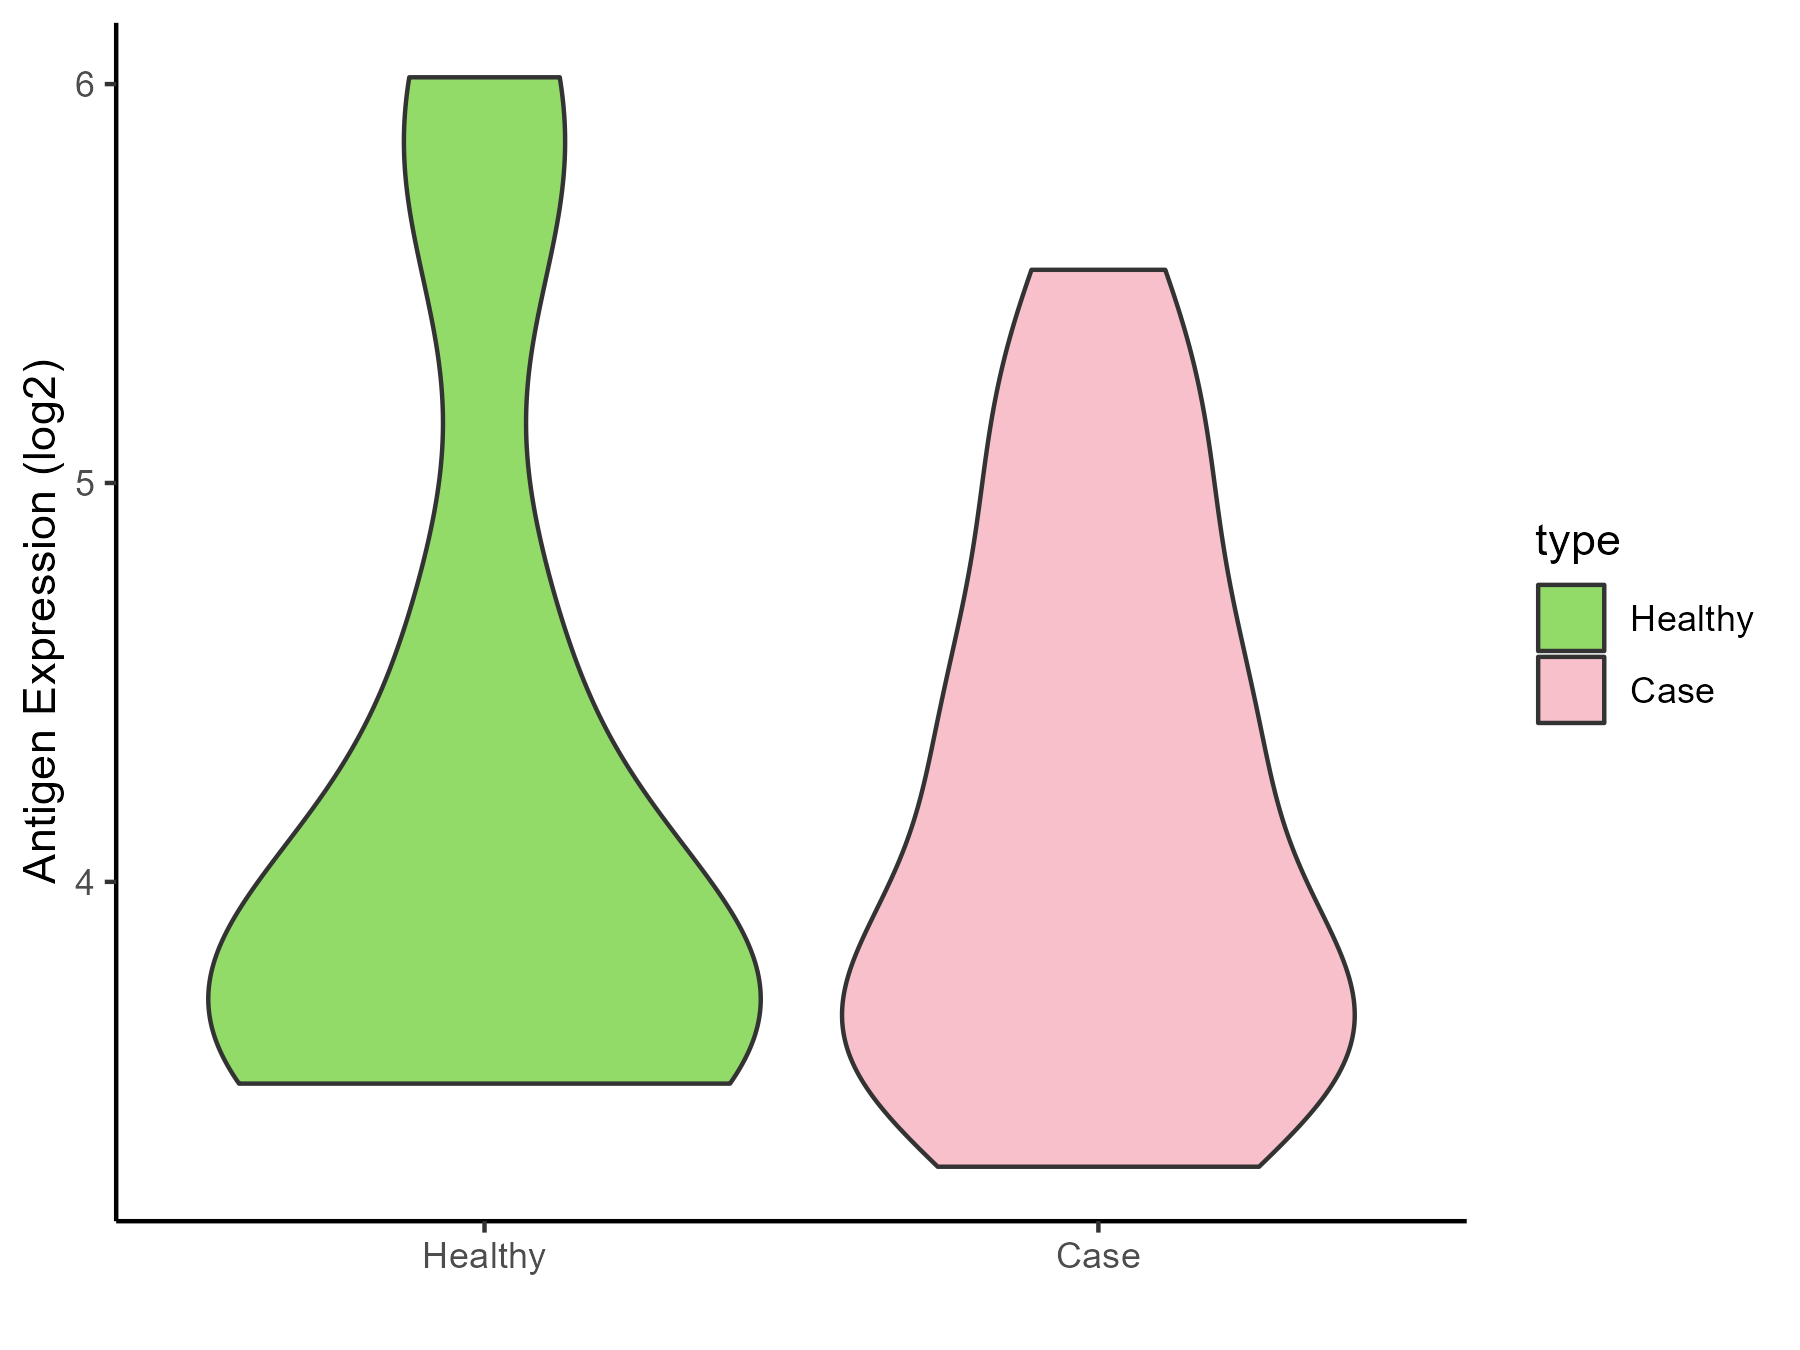
| The Studied Tissue | Urothelium | |
| The Specific Disease | Ureter cancer | |
| The Expression Level of Disease Section Compare with the Healthy Individual Tissue | p-value: 0.799653982; Fold-change: 0.127083034; Z-score: 0.141099993 | |
| Disease-specific Antigen Abundances |
|
Click to View the Clearer Original Diagram |
ICD Disease Classification 20
| Differential expression pattern of antigen in diseases | ||
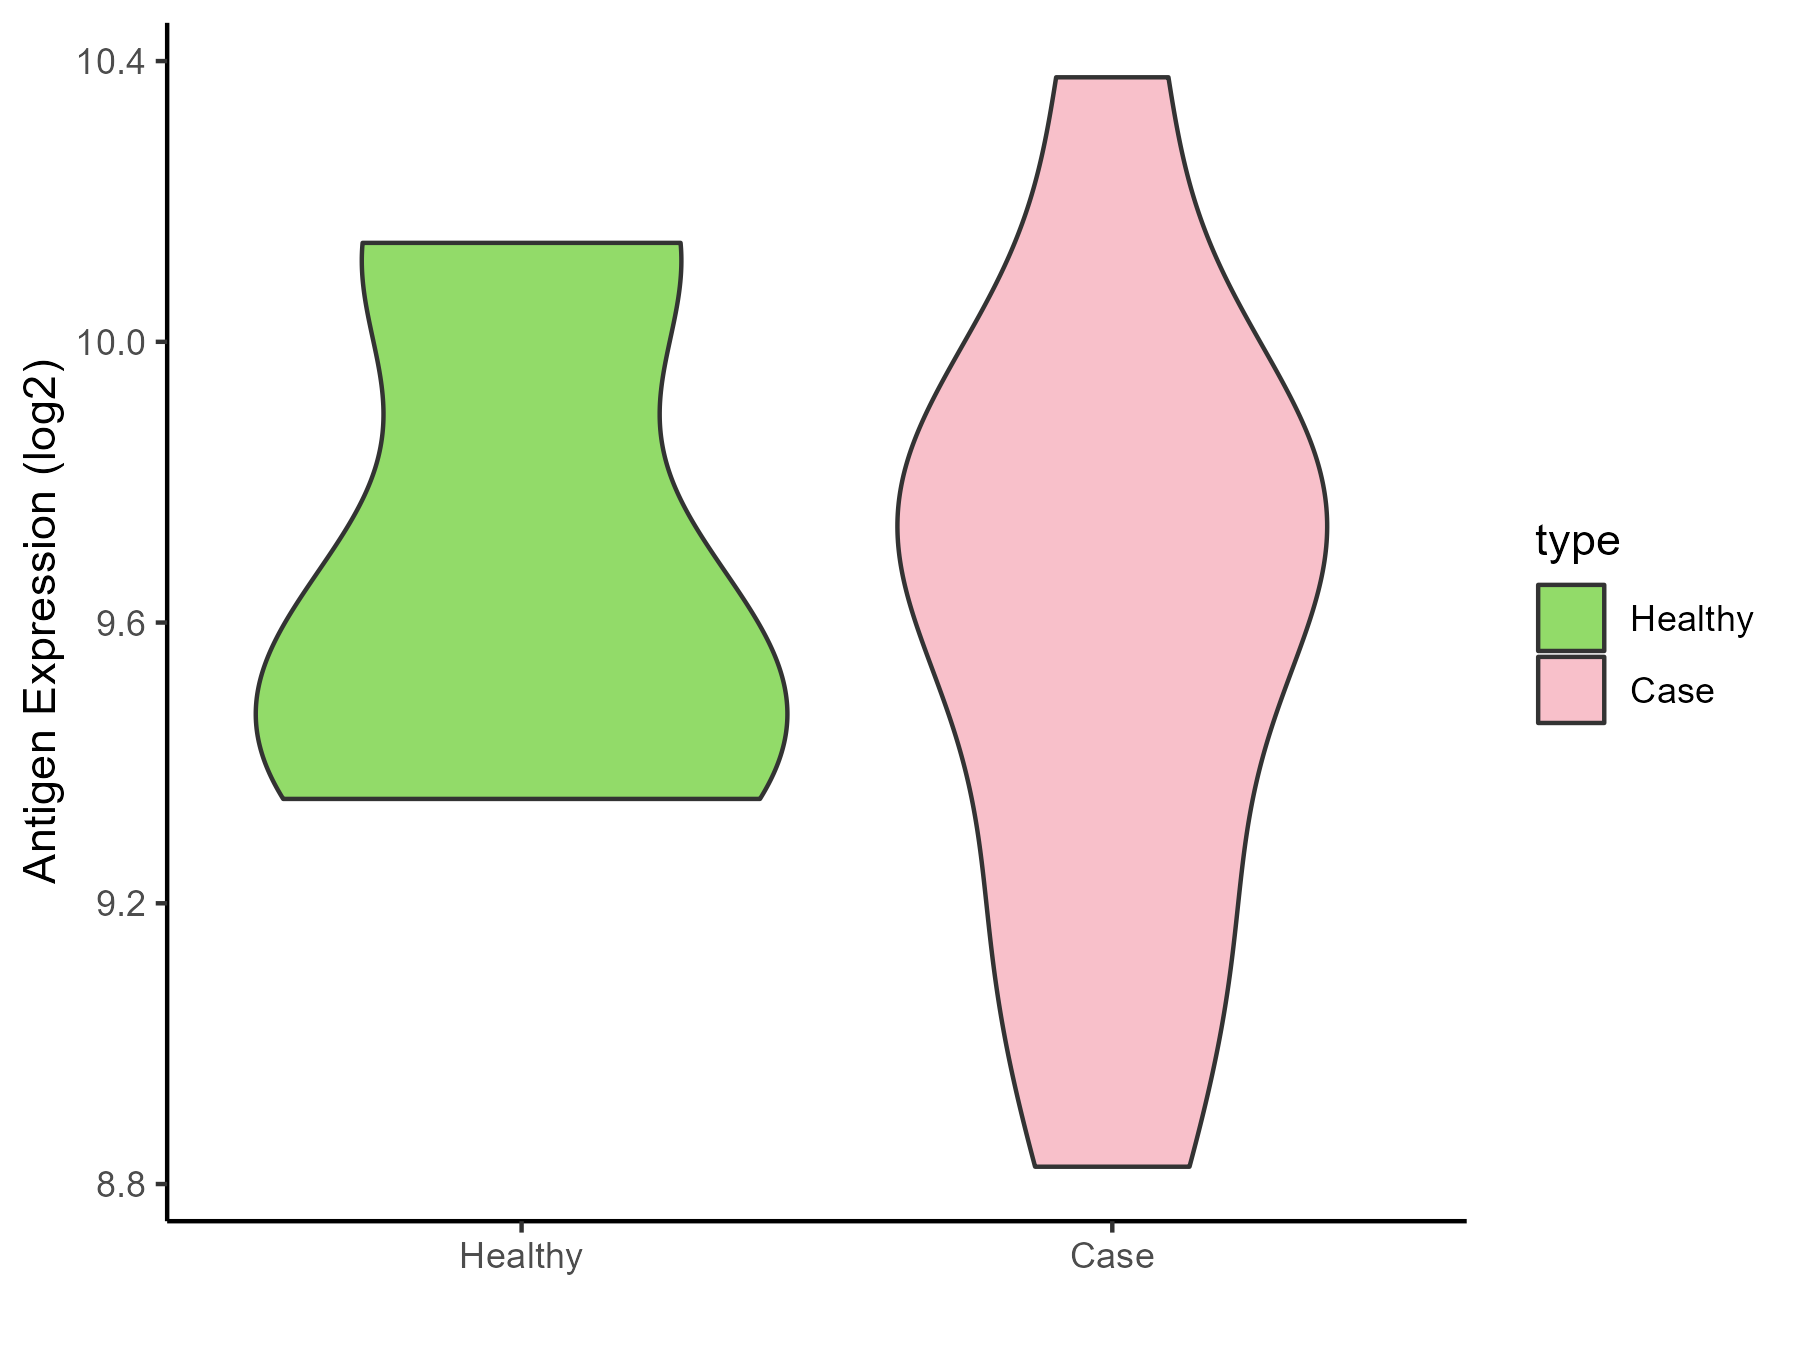
| The Studied Tissue | Adipose | |
| The Specific Disease | Simpson golabi behmel syndrome | |
| The Expression Level of Disease Section Compare with the Healthy Individual Tissue | p-value: 0.735301845; Fold-change: 0.166451706; Z-score: 0.40892545 | |
| Disease-specific Antigen Abundances |
|
Click to View the Clearer Original Diagram |
| Differential expression pattern of antigen in diseases | ||
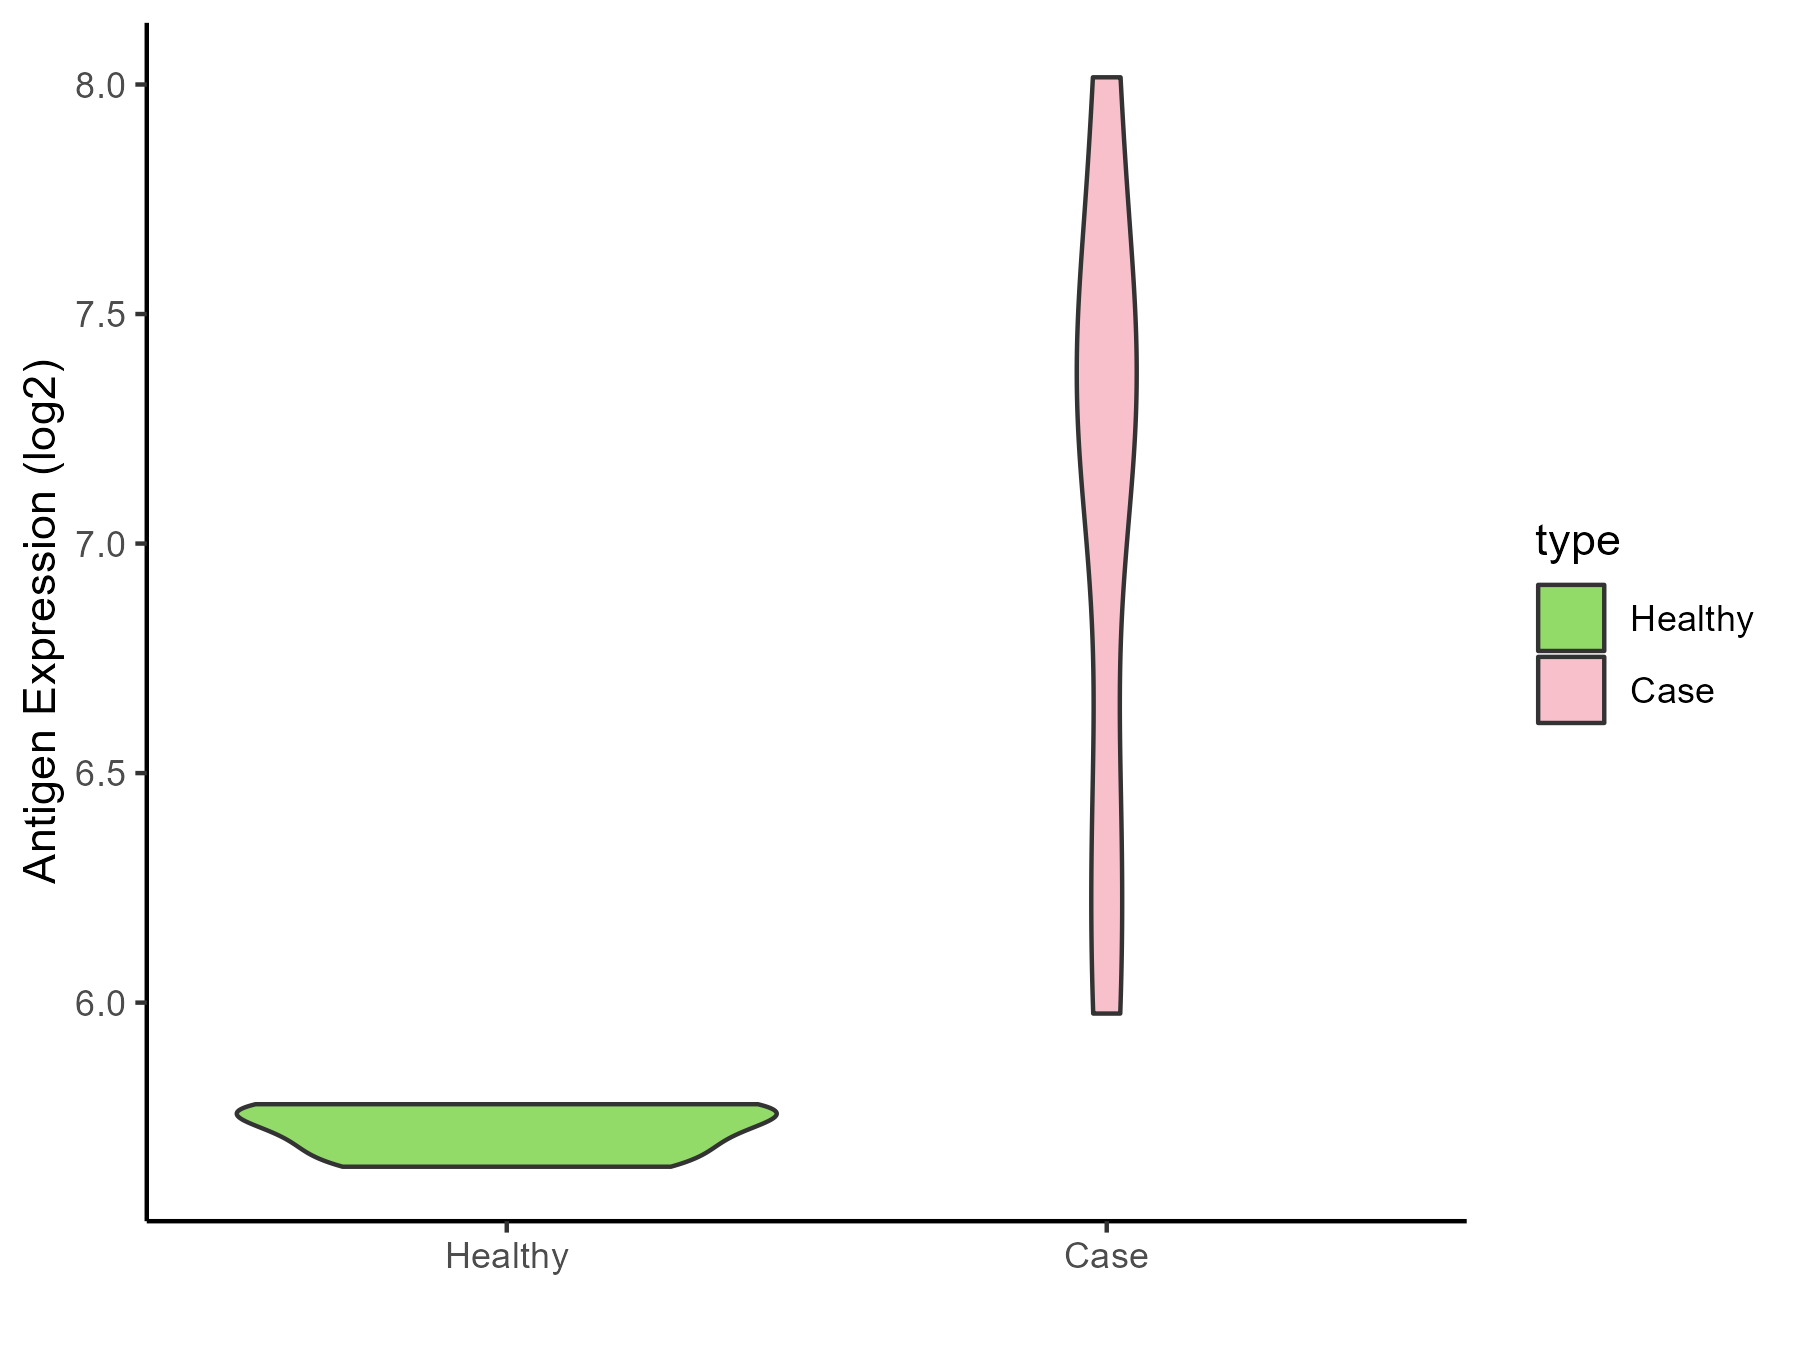
| The Studied Tissue | Perituberal | |
| The Specific Disease | Tuberous sclerosis complex | |
| The Expression Level of Disease Section Compare with the Healthy Individual Tissue | p-value: 0.006319114; Fold-change: 1.584422409; Z-score: 25.27439157 | |
| Disease-specific Antigen Abundances |
|
Click to View the Clearer Original Diagram |
ICD Disease Classification 3
| Differential expression pattern of antigen in diseases | ||
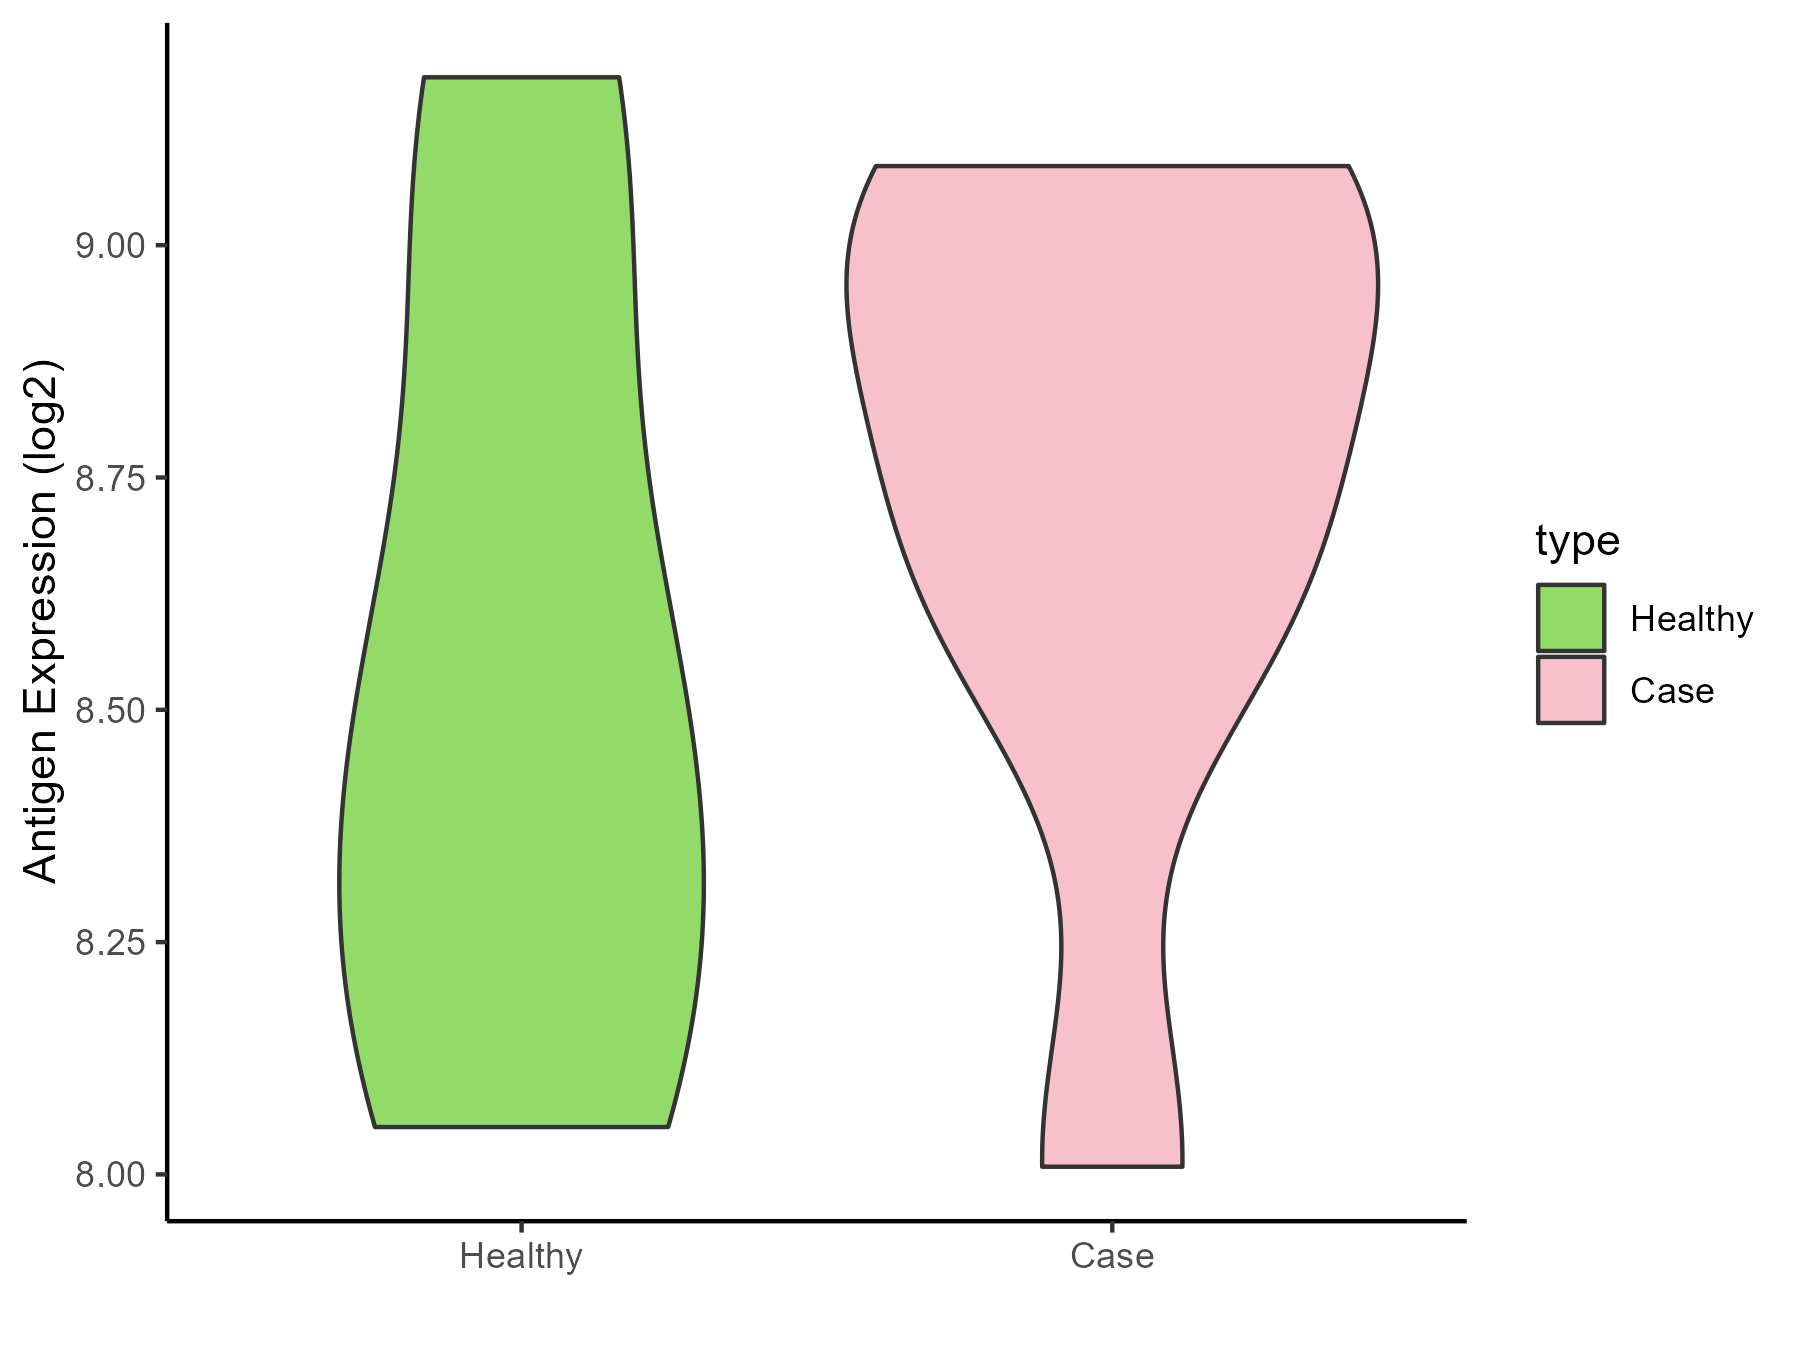
| The Studied Tissue | Bone marrow | |
| The Specific Disease | Anemia | |
| The Expression Level of Disease Section Compare with the Healthy Individual Tissue | p-value: 0.354405832; Fold-change: 0.361511228; Z-score: 0.82014903 | |
| Disease-specific Antigen Abundances |
|
Click to View the Clearer Original Diagram |
| Differential expression pattern of antigen in diseases | ||
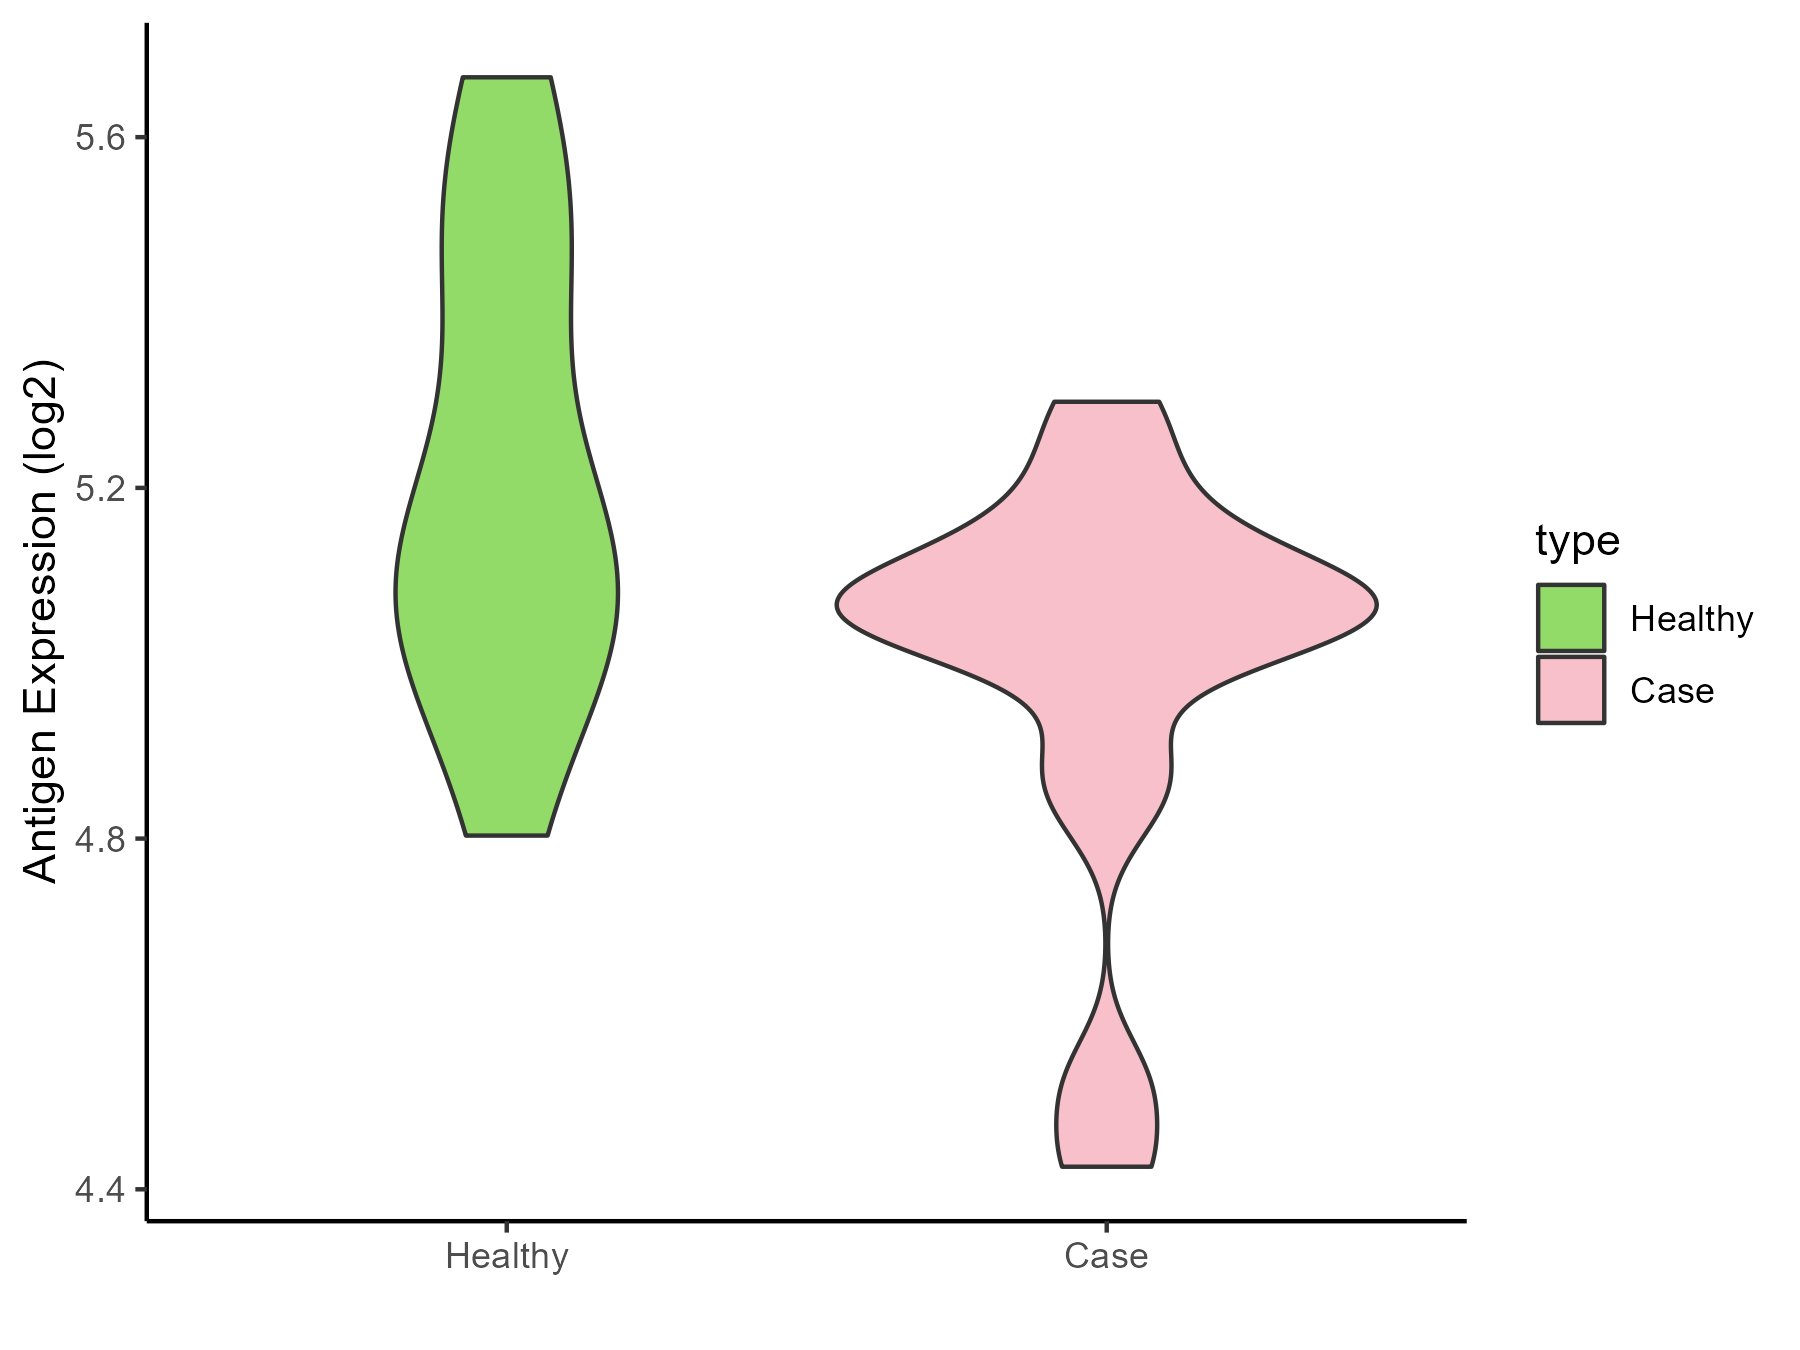
| The Studied Tissue | Peripheral blood | |
| The Specific Disease | Sickle cell disease | |
| The Expression Level of Disease Section Compare with the Healthy Individual Tissue | p-value: 0.037341761; Fold-change: -0.051031715; Z-score: -0.191787123 | |
| Disease-specific Antigen Abundances |
|
Click to View the Clearer Original Diagram |
| Differential expression pattern of antigen in diseases | ||
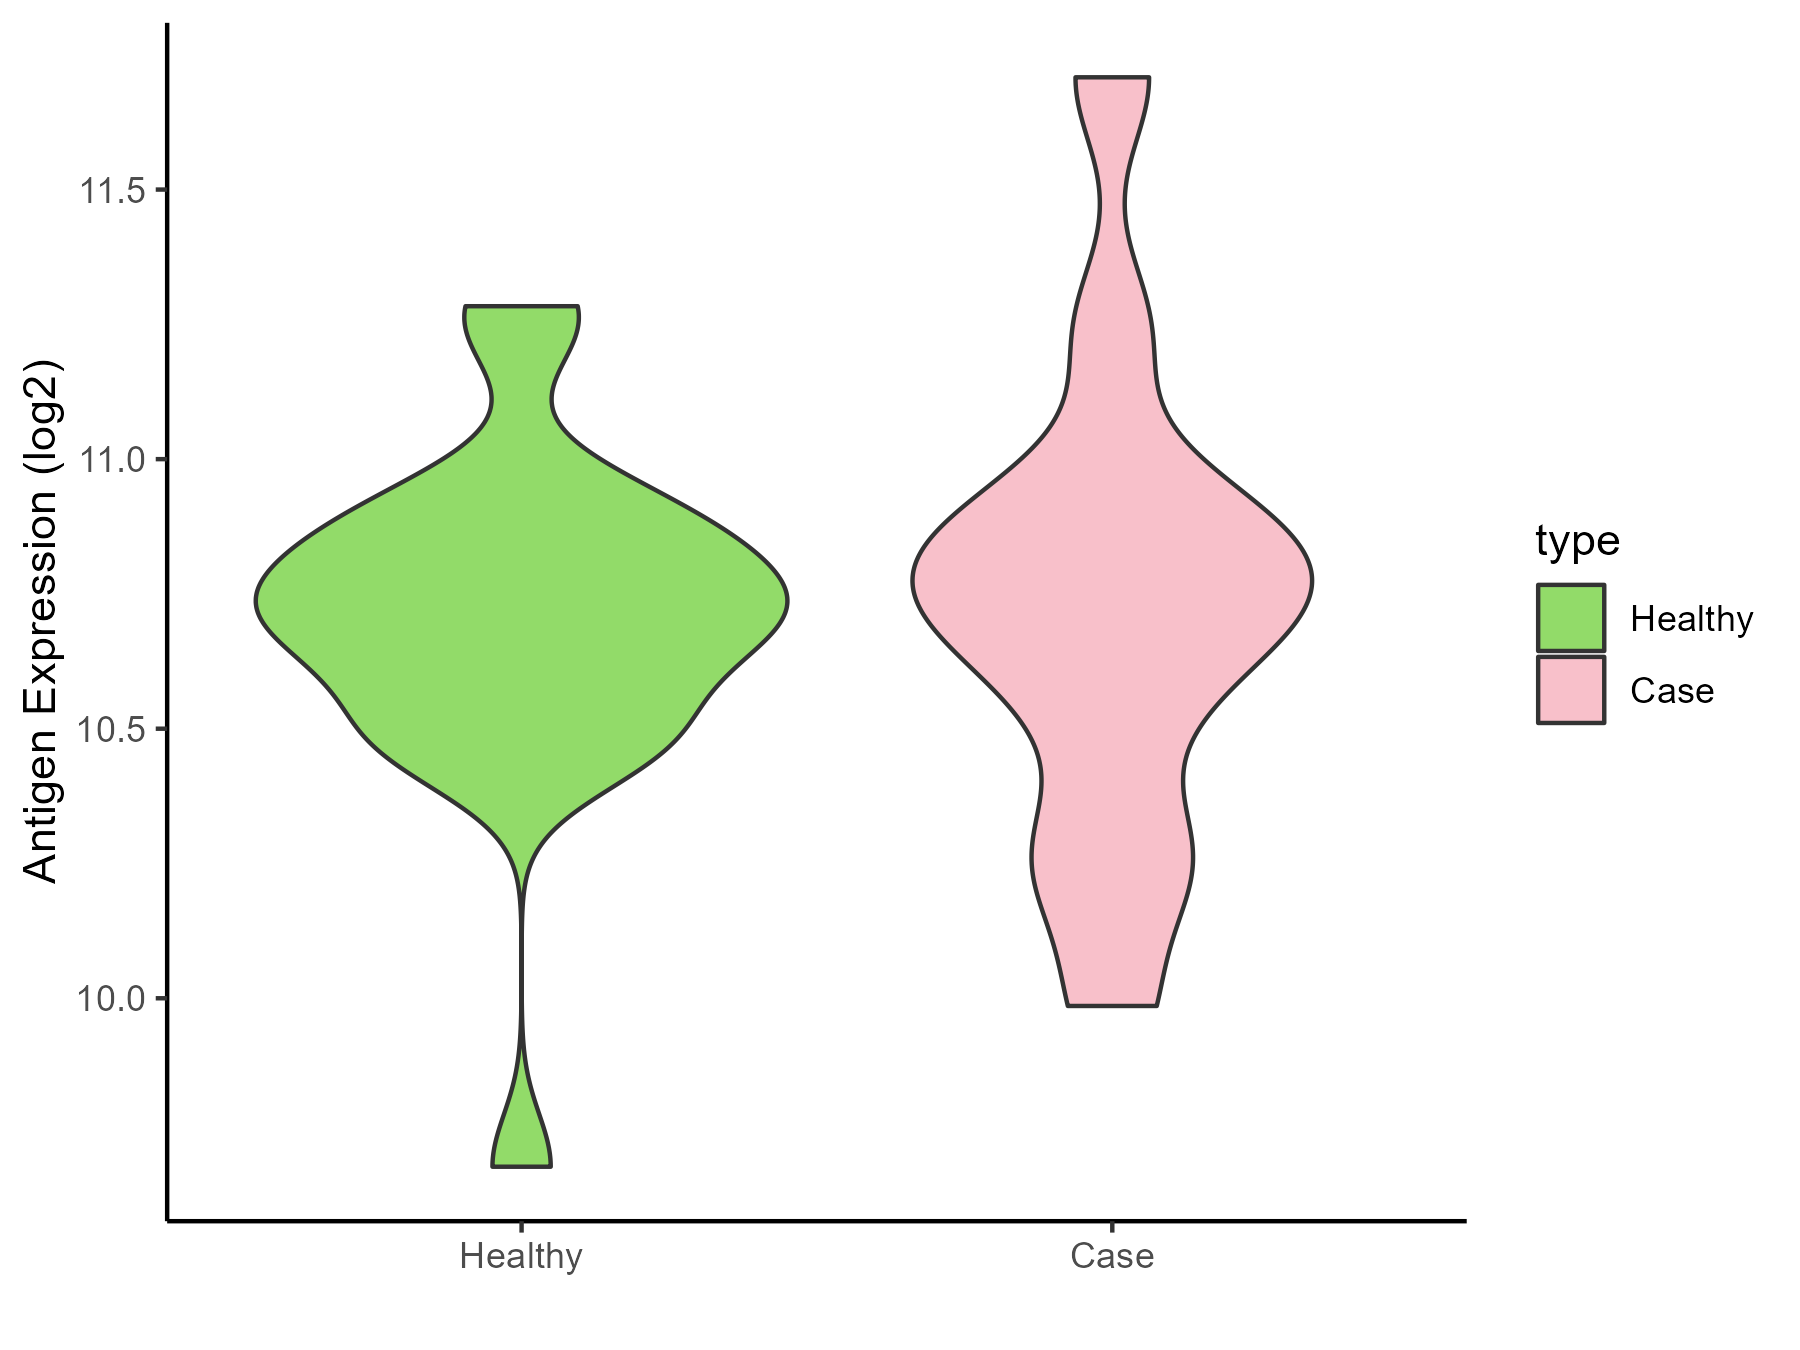
| The Studied Tissue | Whole blood | |
| The Specific Disease | Thrombocythemia | |
| The Expression Level of Disease Section Compare with the Healthy Individual Tissue | p-value: 0.792042125; Fold-change: 0.003117525; Z-score: 0.009786211 | |
| Disease-specific Antigen Abundances |
|
Click to View the Clearer Original Diagram |
ICD Disease Classification 4
| Differential expression pattern of antigen in diseases | ||
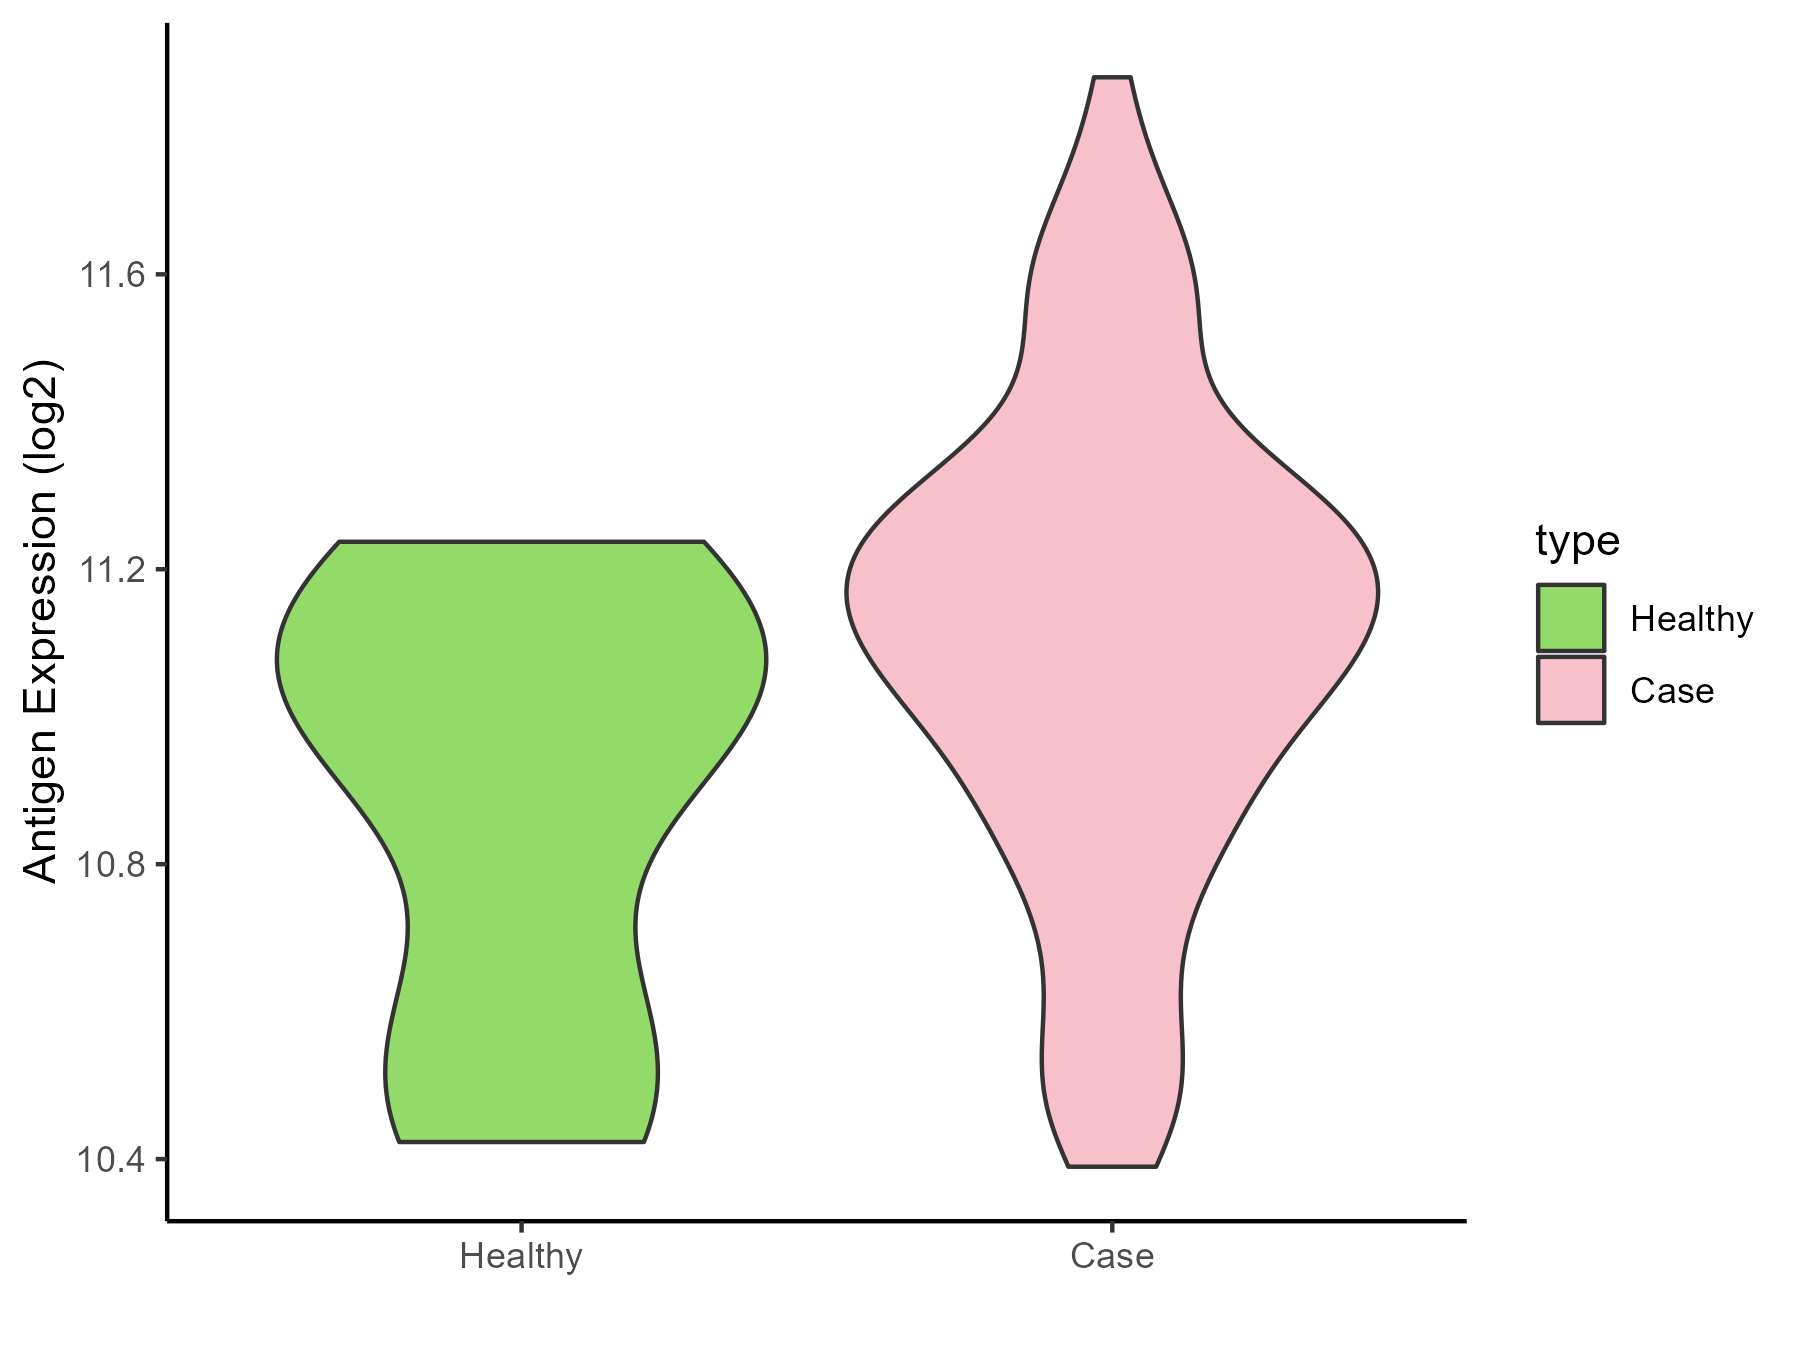
| The Studied Tissue | Whole blood | |
| The Specific Disease | Scleroderma | |
| The Expression Level of Disease Section Compare with the Healthy Individual Tissue | p-value: 0.068204689; Fold-change: 0.132645973; Z-score: 0.434299973 | |
| Disease-specific Antigen Abundances |
|
Click to View the Clearer Original Diagram |
| Differential expression pattern of antigen in diseases | ||
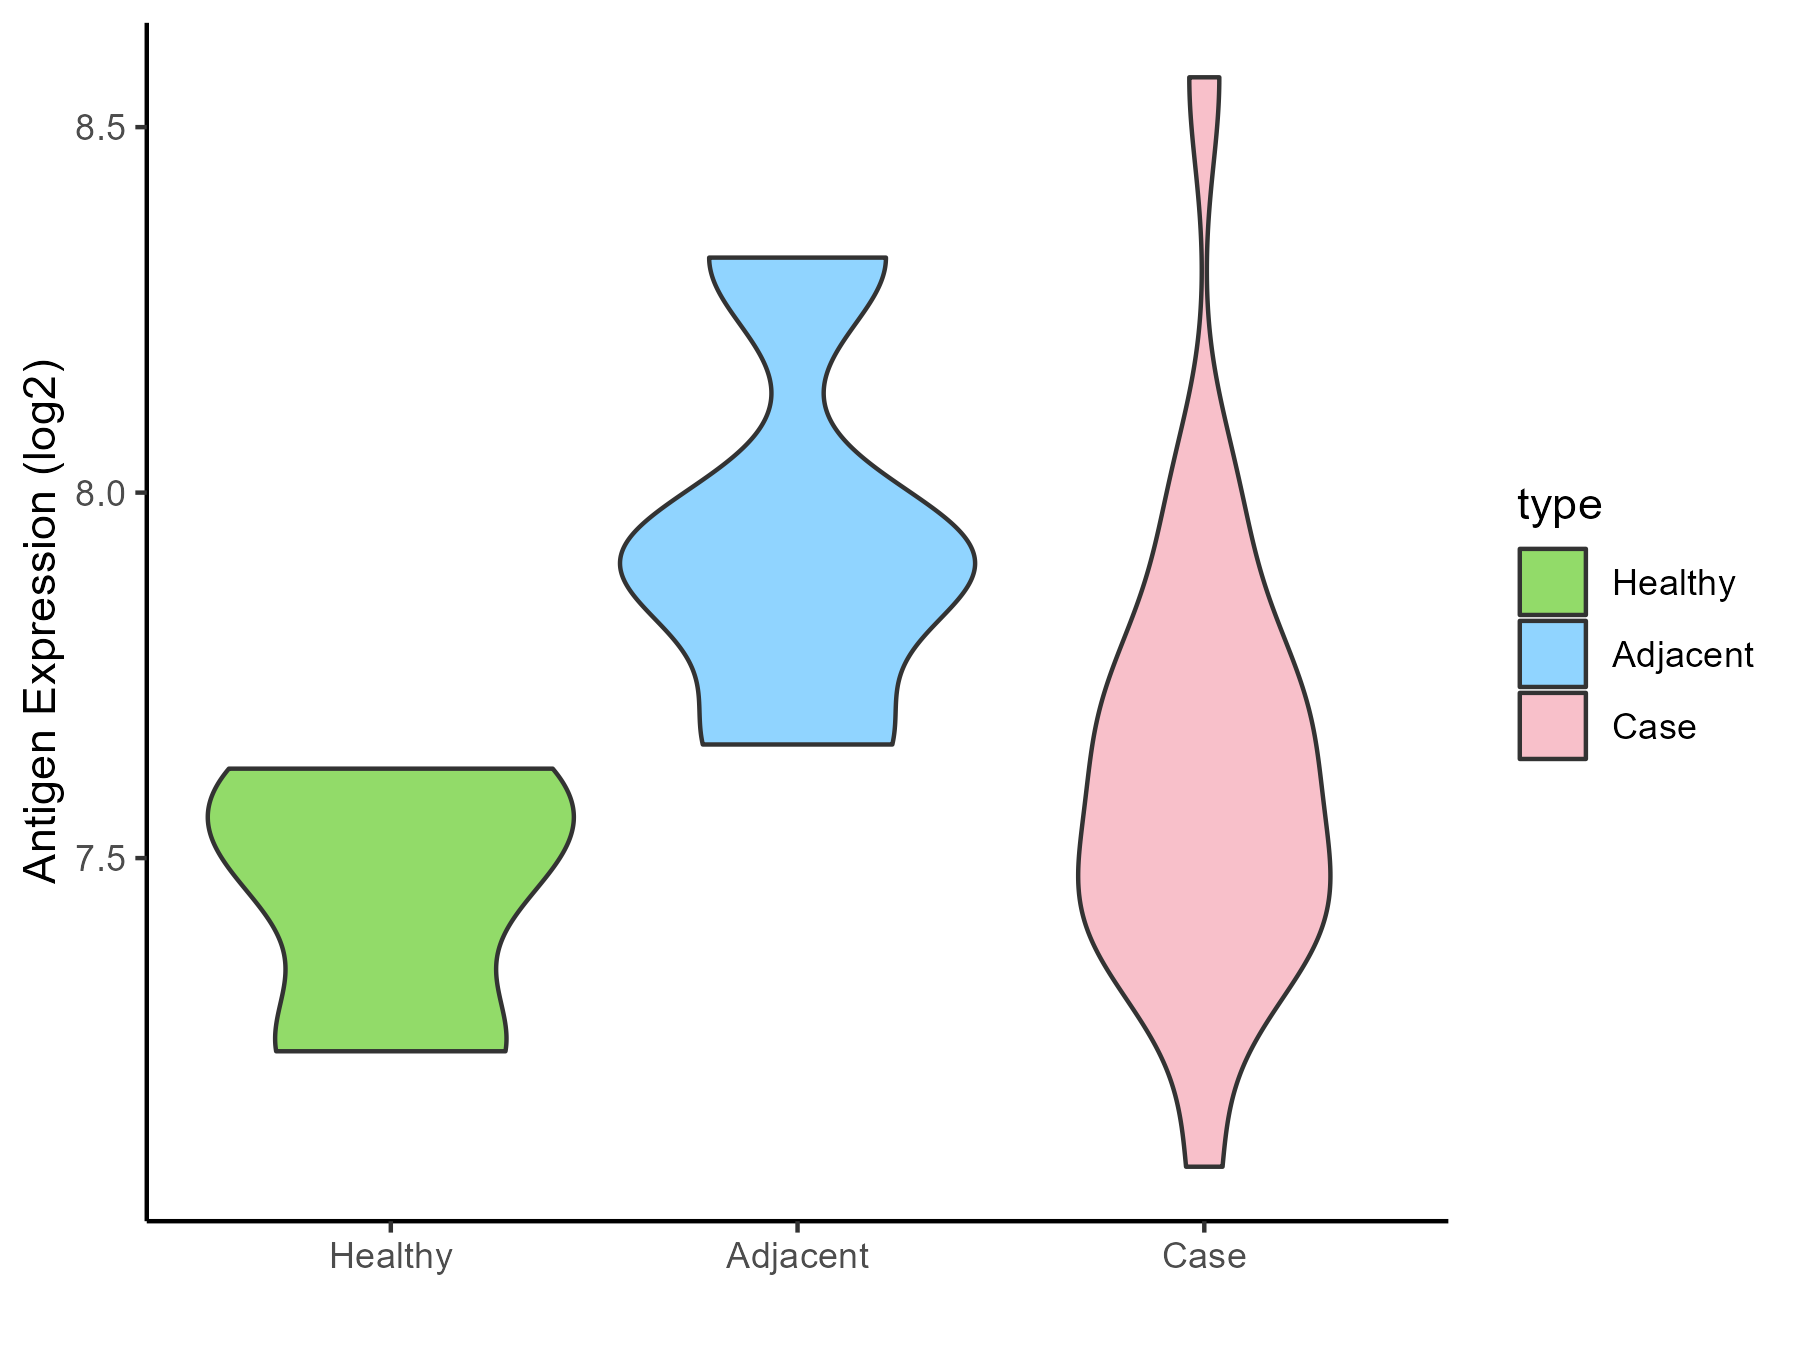
| The Studied Tissue | Salivary gland | |
| The Specific Disease | Sjogren syndrome | |
| The Expression Level of Disease Section Compare with the Healthy Individual Tissue | p-value: 0.26418191; Fold-change: 0.123951633; Z-score: 0.628998235 | |
| The Expression Level of Disease Section Compare with the Adjacent Tissue | p-value: 0.096945101; Fold-change: -0.288933832; Z-score: -1.046277655 | |
| Disease-specific Antigen Abundances |
|
Click to View the Clearer Original Diagram |
| Differential expression pattern of antigen in diseases | ||
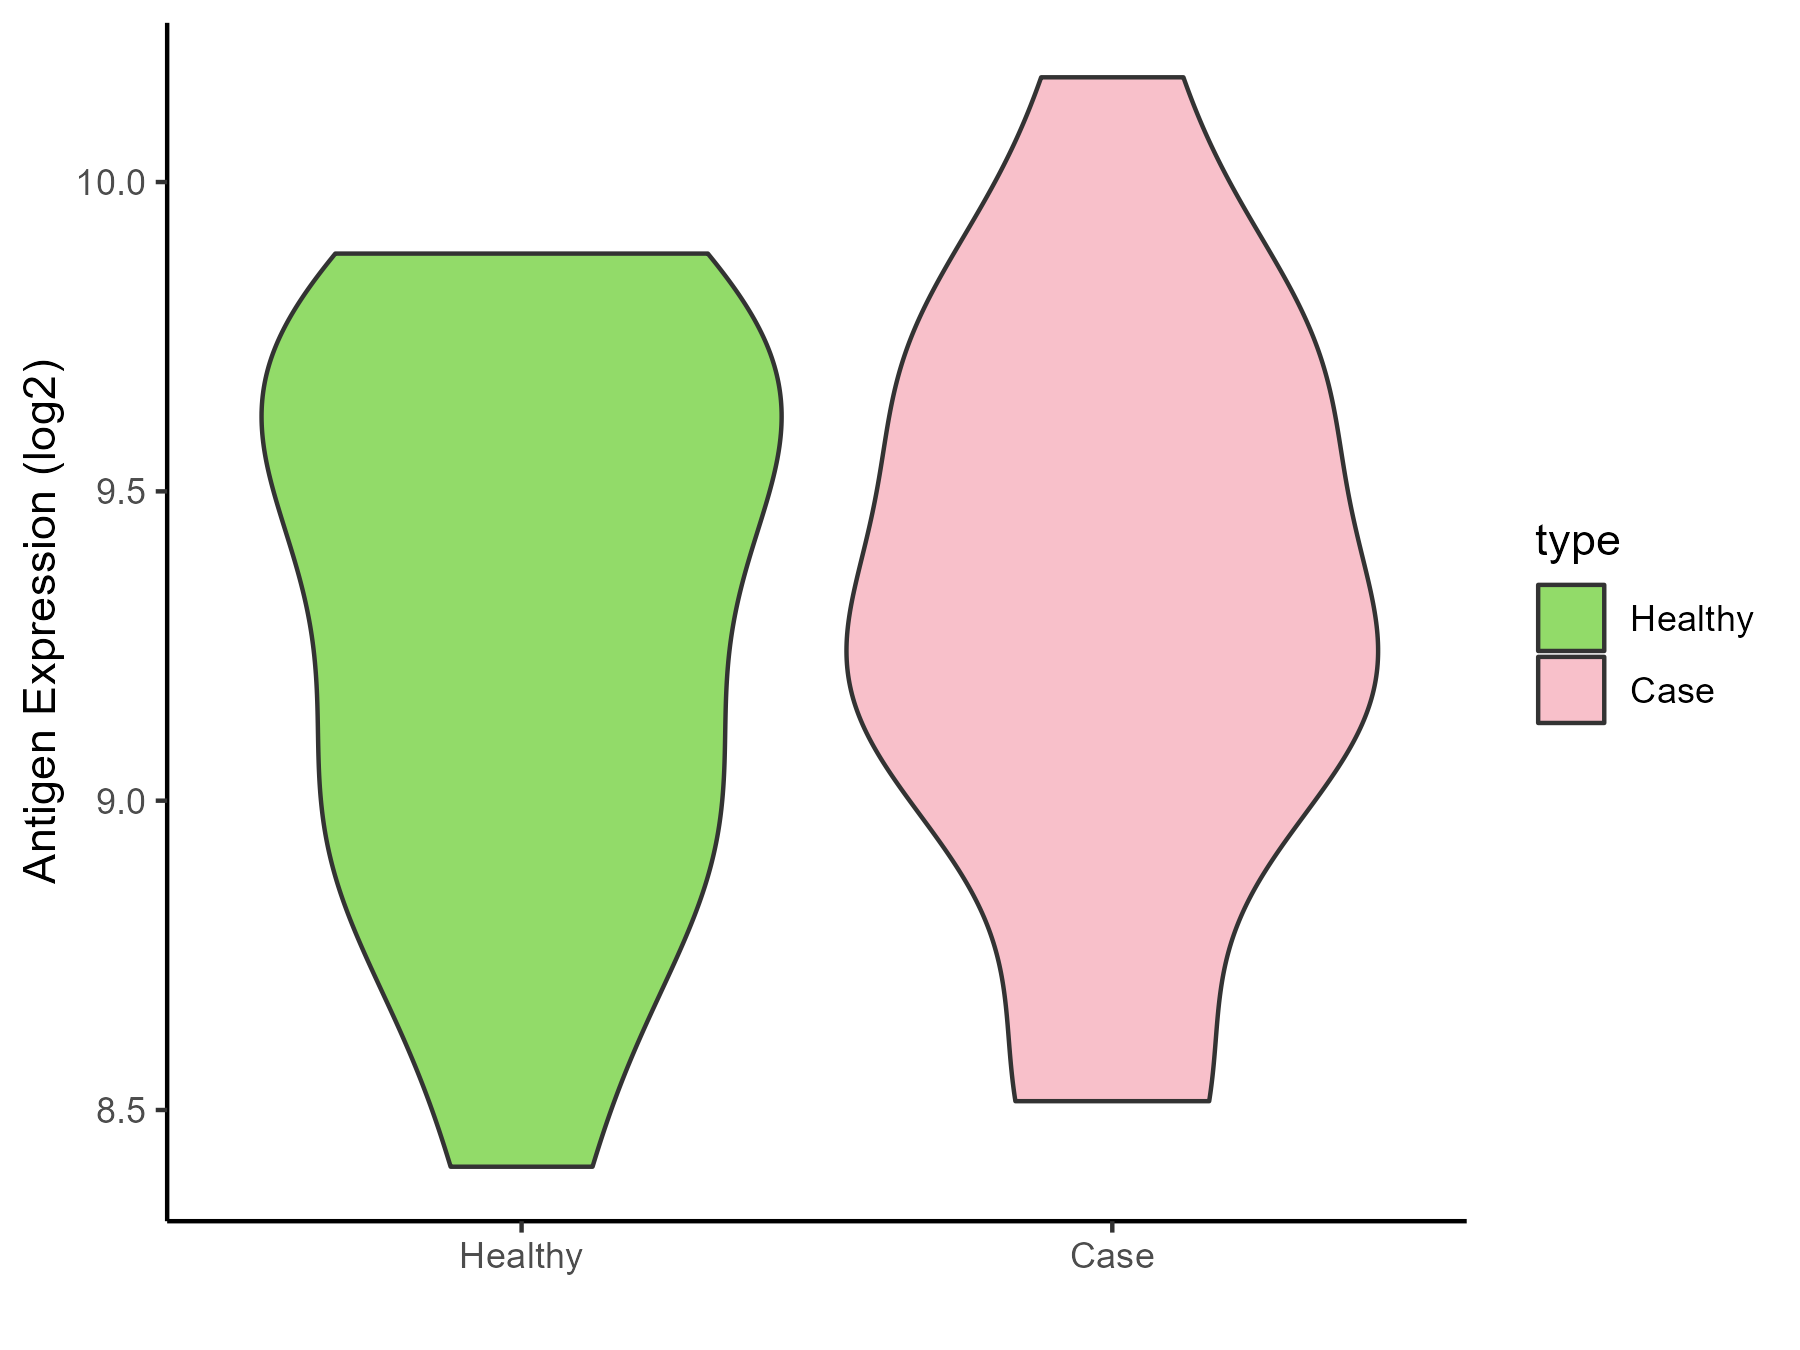
| The Studied Tissue | Peripheral blood | |
| The Specific Disease | Behcet disease | |
| The Expression Level of Disease Section Compare with the Healthy Individual Tissue | p-value: 0.885836891; Fold-change: -0.079001514; Z-score: -0.172228747 | |
| Disease-specific Antigen Abundances |
|
Click to View the Clearer Original Diagram |
| Differential expression pattern of antigen in diseases | ||
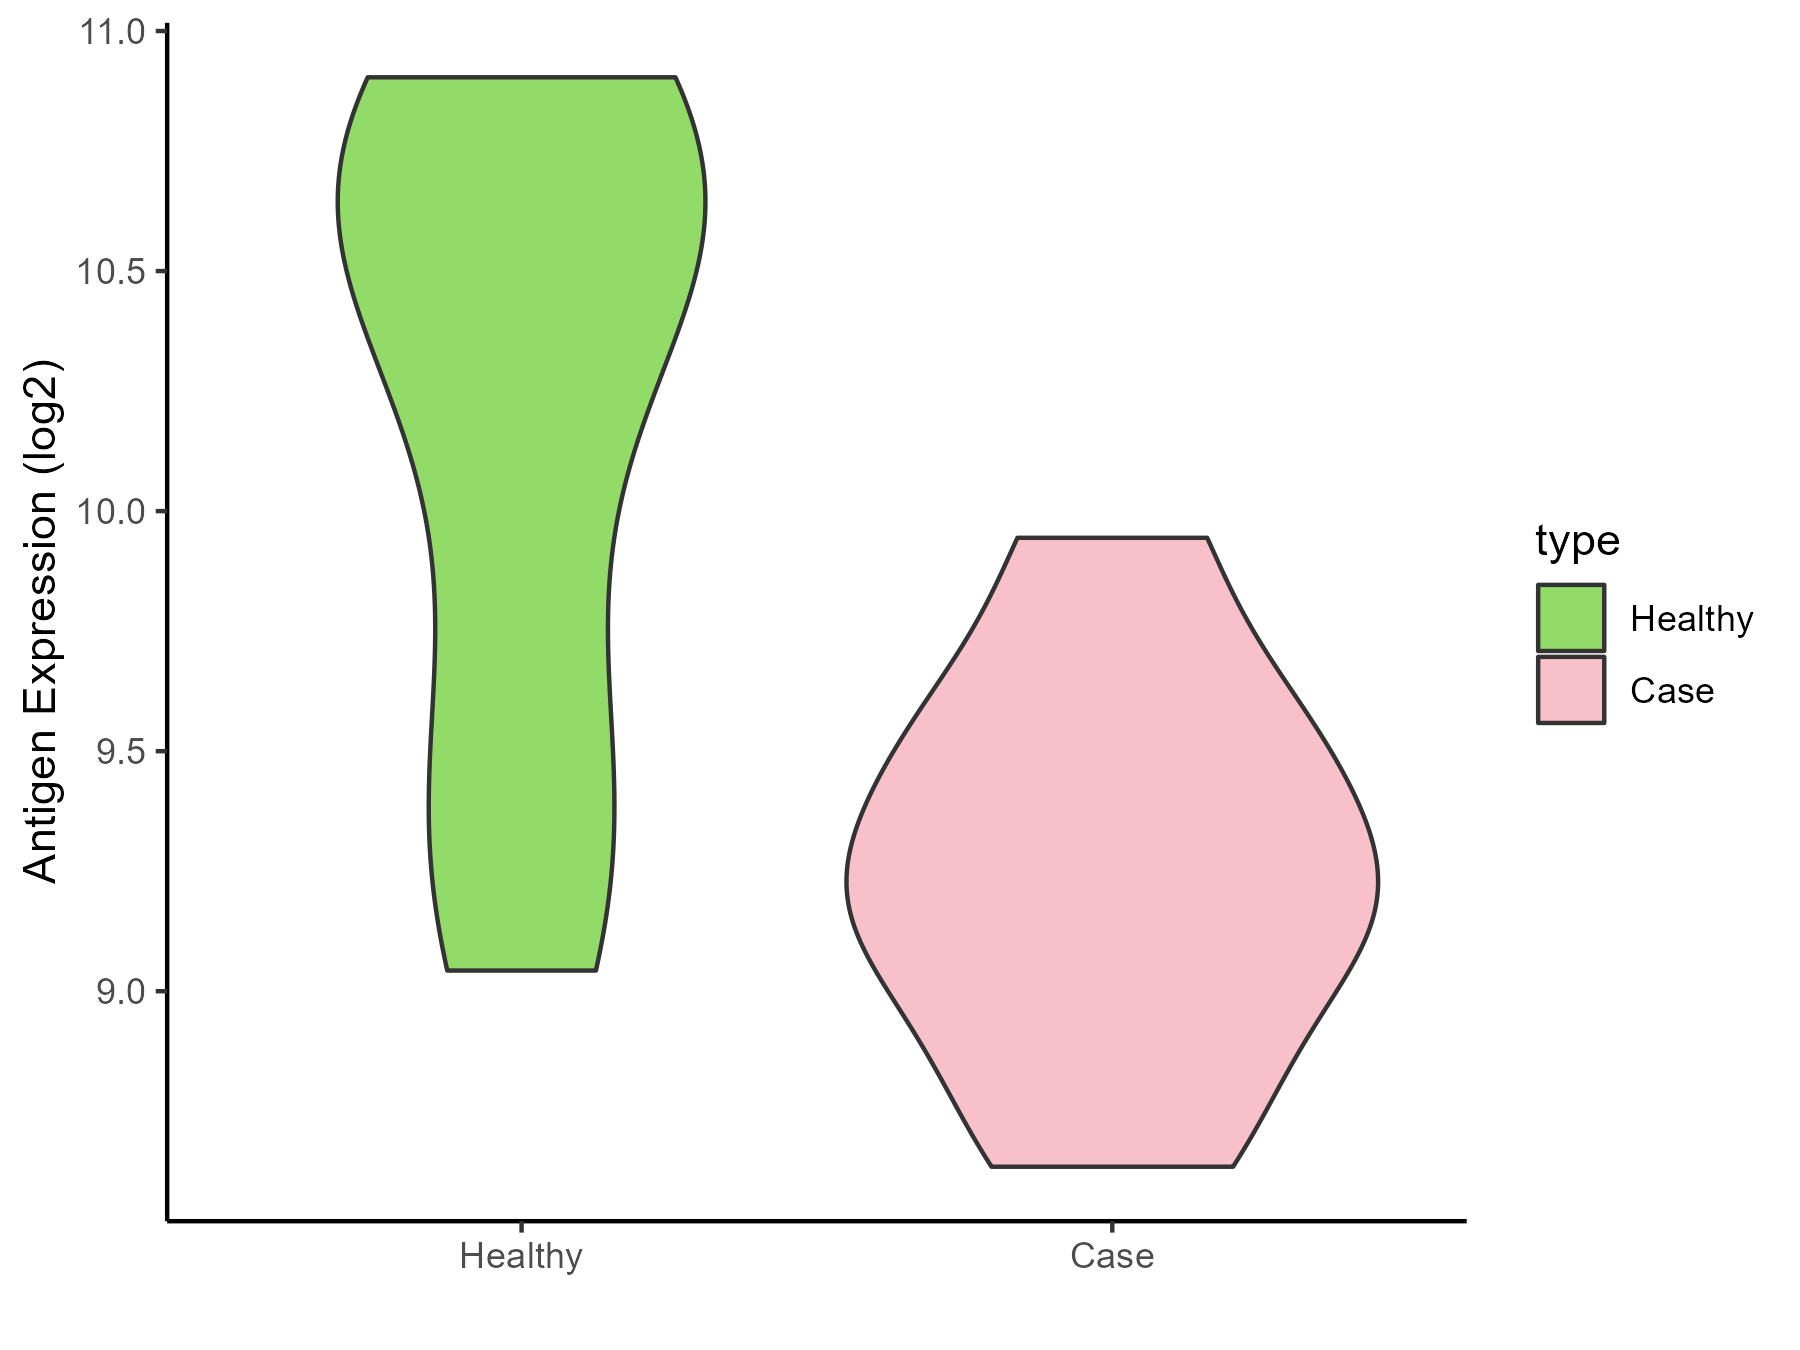
| The Studied Tissue | Whole blood | |
| The Specific Disease | Autosomal dominant monocytopenia | |
| The Expression Level of Disease Section Compare with the Healthy Individual Tissue | p-value: 0.001805864; Fold-change: -1.355582929; Z-score: -2.002174937 | |
| Disease-specific Antigen Abundances |
|
Click to View the Clearer Original Diagram |
ICD Disease Classification 5
| Differential expression pattern of antigen in diseases | ||
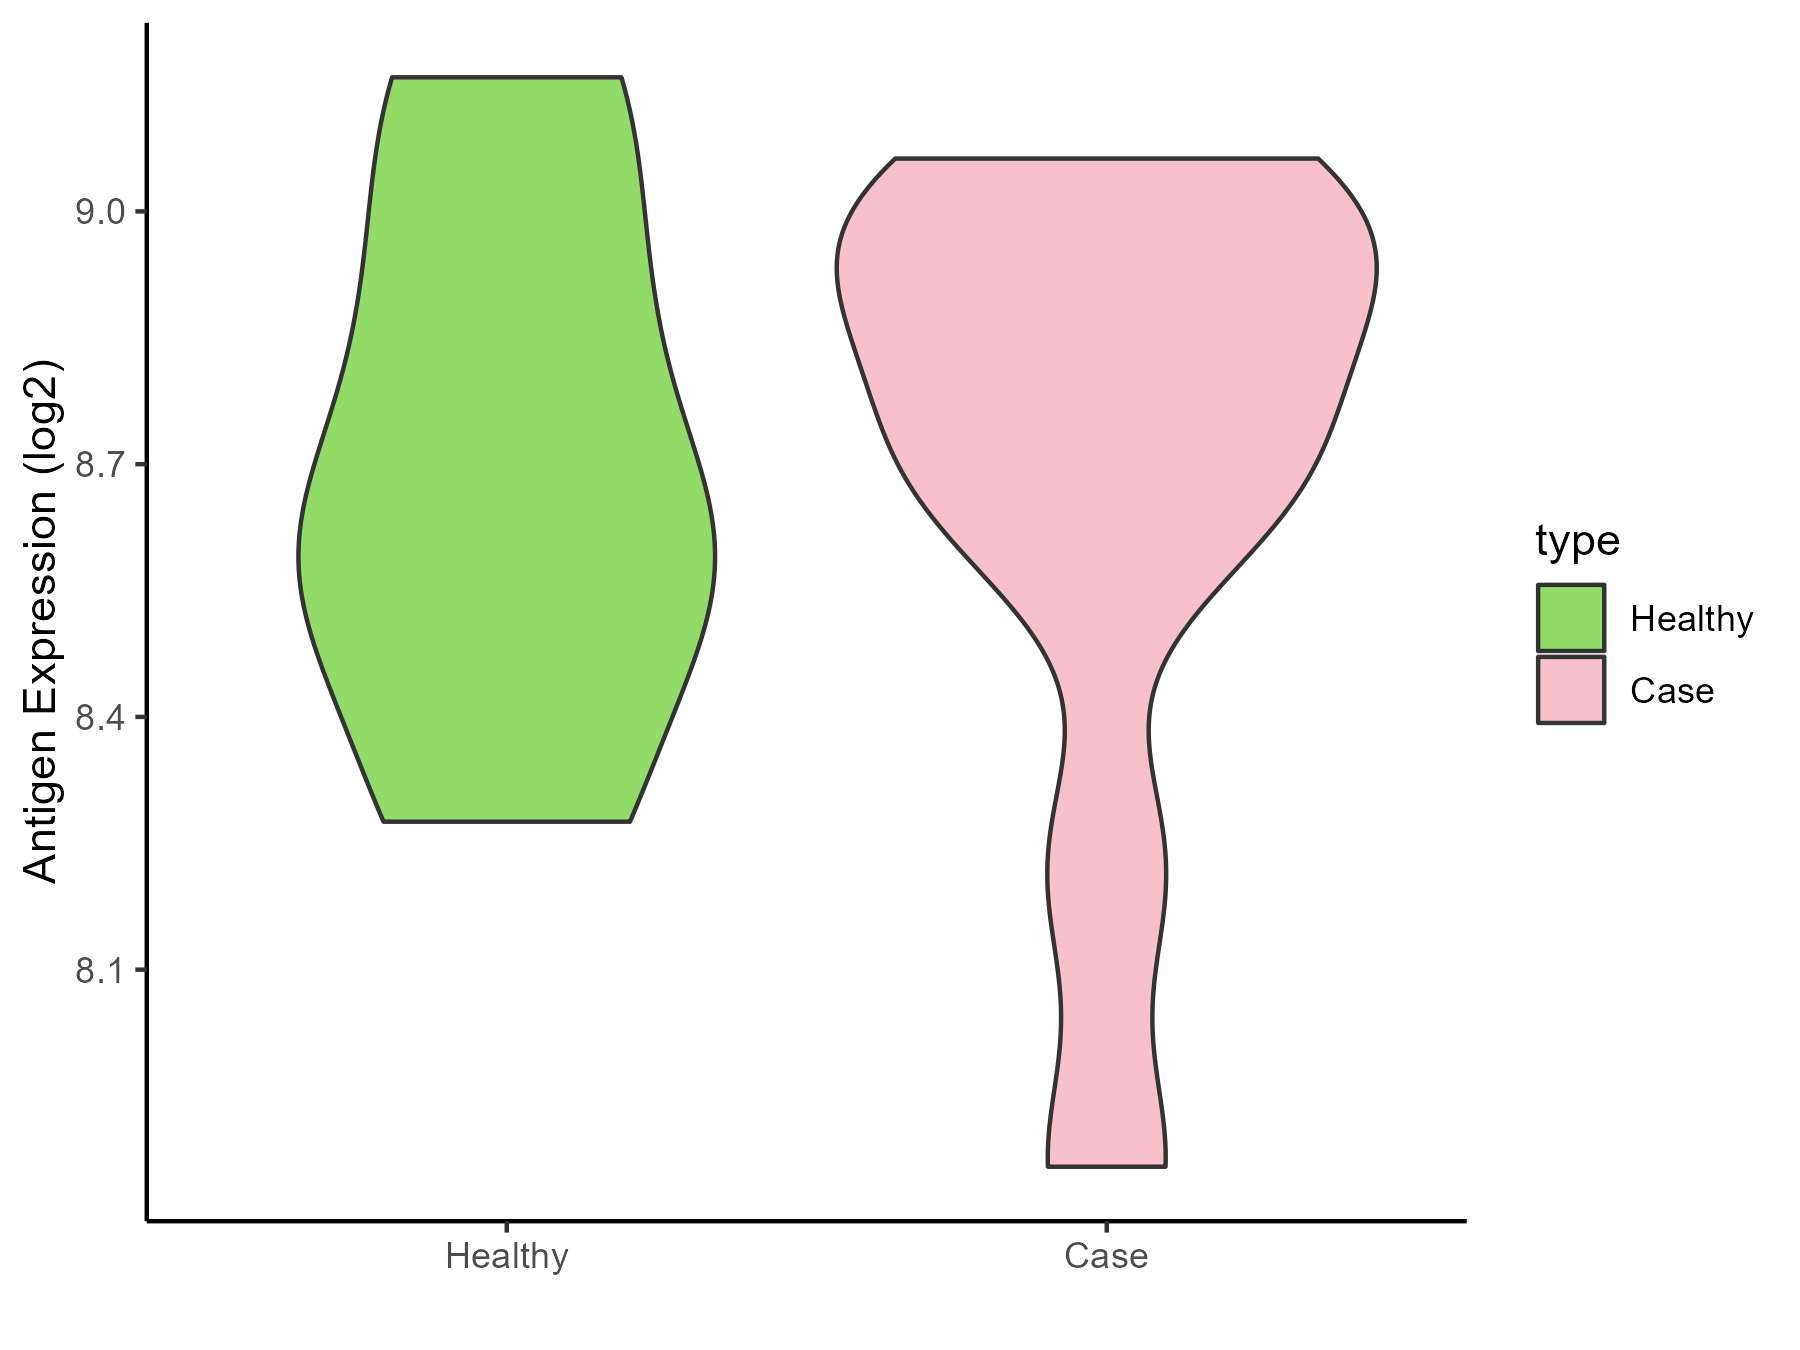
| The Studied Tissue | Liver | |
| The Specific Disease | Type 2 diabetes | |
| The Expression Level of Disease Section Compare with the Healthy Individual Tissue | p-value: 0.998258061; Fold-change: 0.171421865; Z-score: 0.507878681 | |
| Disease-specific Antigen Abundances |
|
Click to View the Clearer Original Diagram |
| Differential expression pattern of antigen in diseases | ||
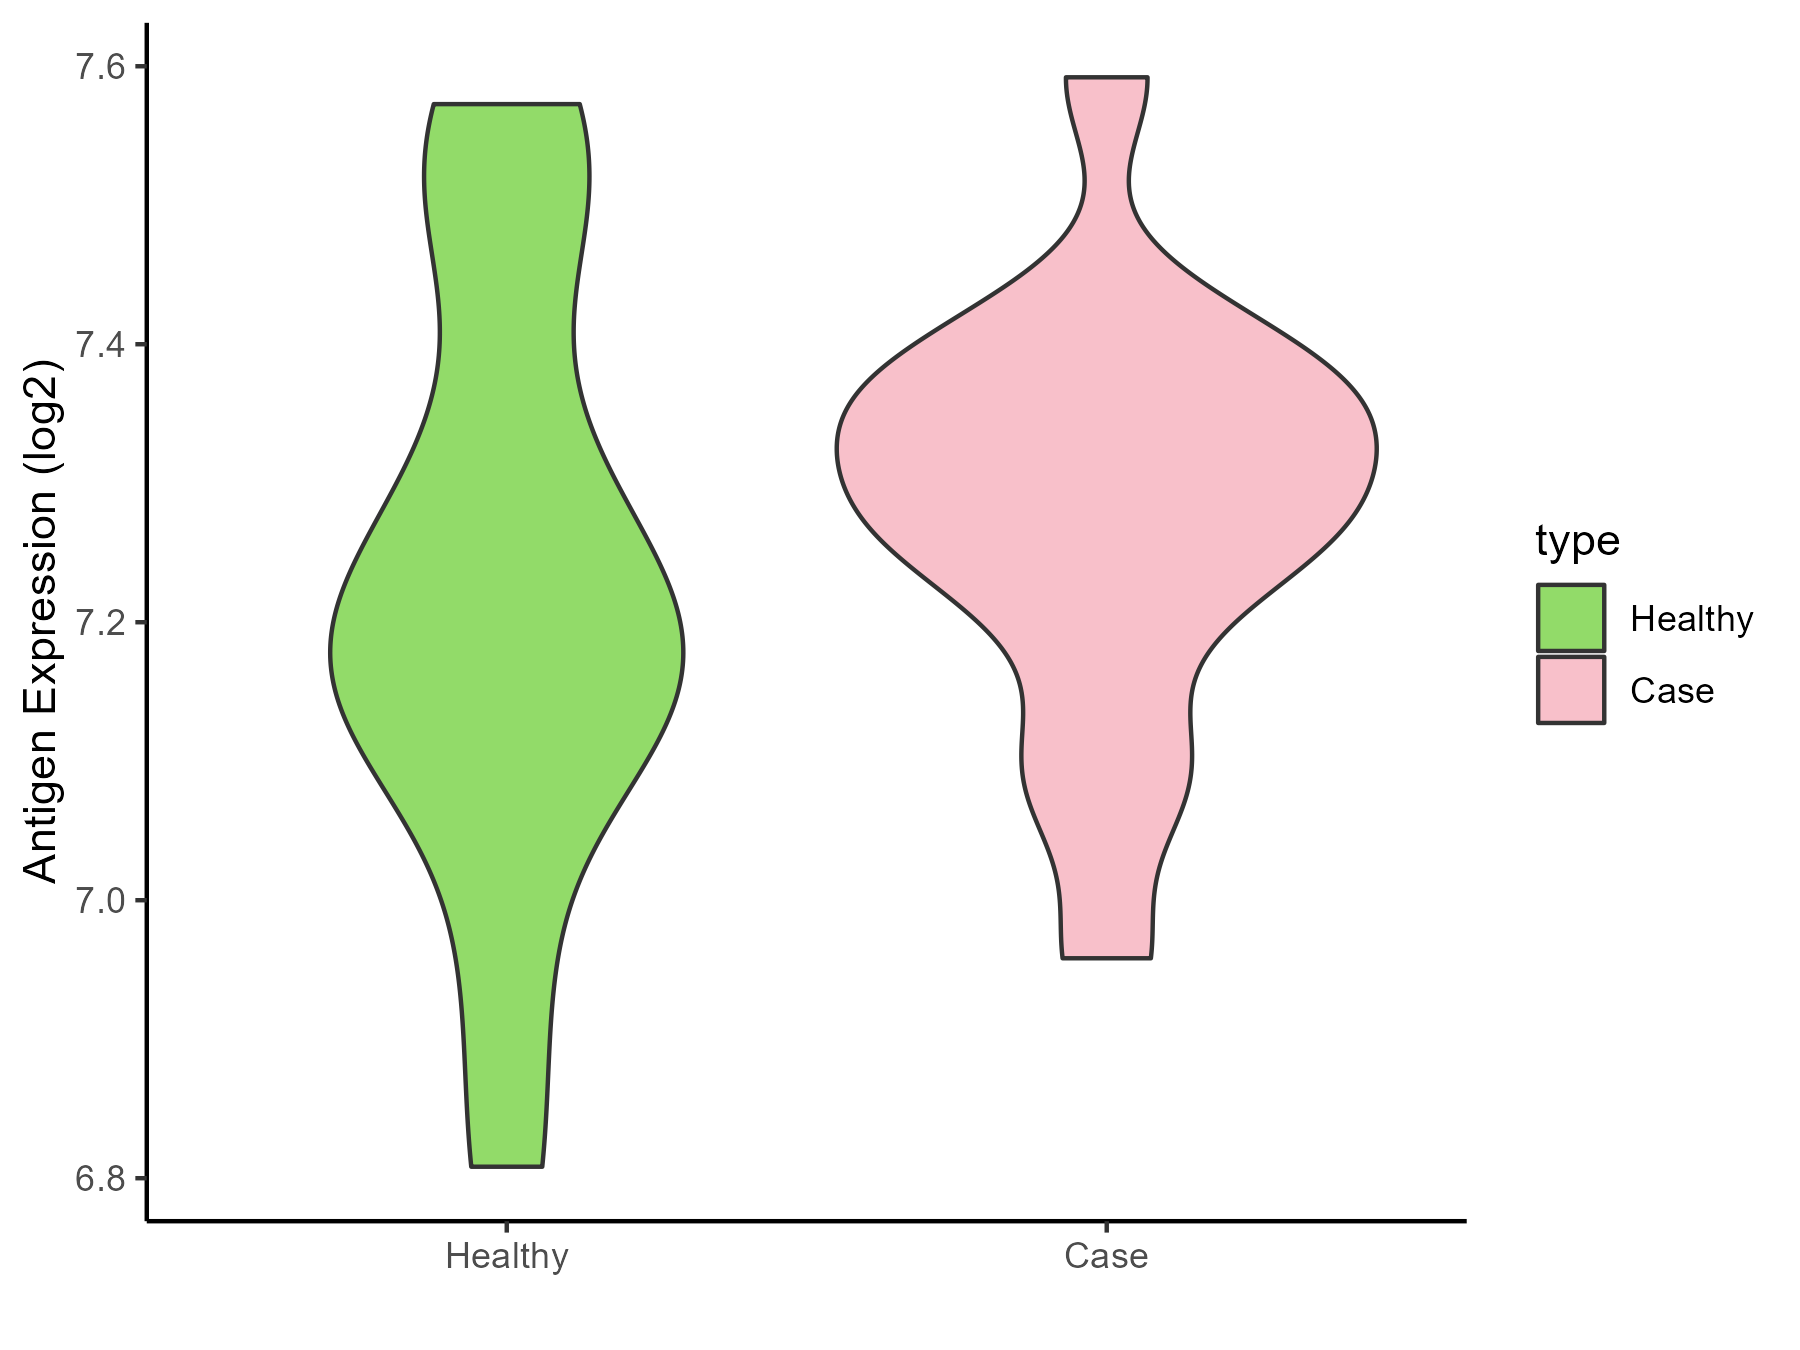
| The Studied Tissue | Vastus lateralis muscle | |
| The Specific Disease | Polycystic ovary syndrome | |
| The Expression Level of Disease Section Compare with the Healthy Individual Tissue | p-value: 0.442535066; Fold-change: 0.098376819; Z-score: 0.447692115 | |
| Disease-specific Antigen Abundances |
|
Click to View the Clearer Original Diagram |
| Differential expression pattern of antigen in diseases | ||
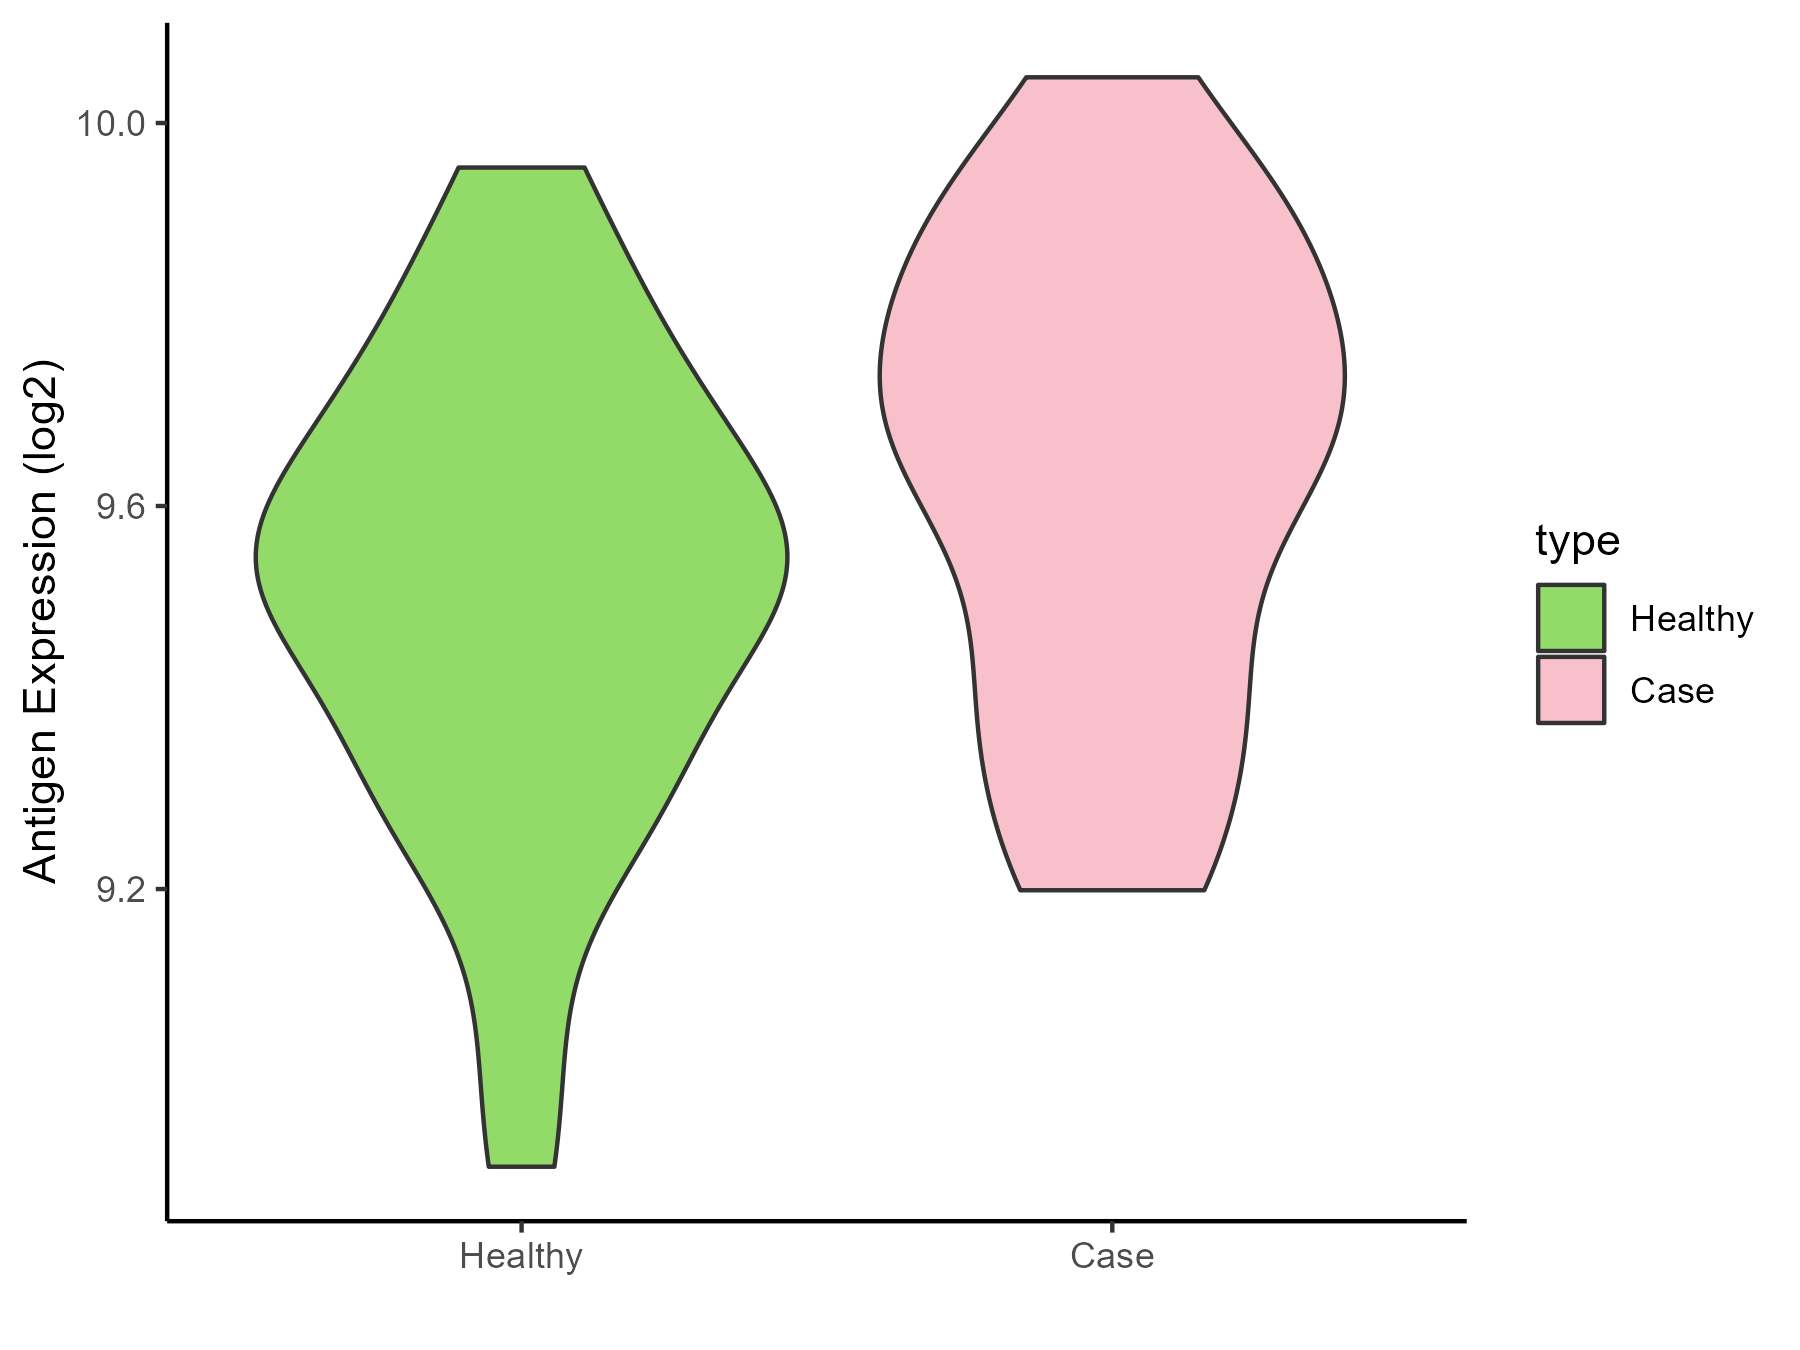
| The Studied Tissue | Subcutaneous Adipose | |
| The Specific Disease | Obesity | |
| The Expression Level of Disease Section Compare with the Healthy Individual Tissue | p-value: 0.069911437; Fold-change: 0.136719816; Z-score: 0.556866985 | |
| Disease-specific Antigen Abundances |
|
Click to View the Clearer Original Diagram |
| Differential expression pattern of antigen in diseases | ||
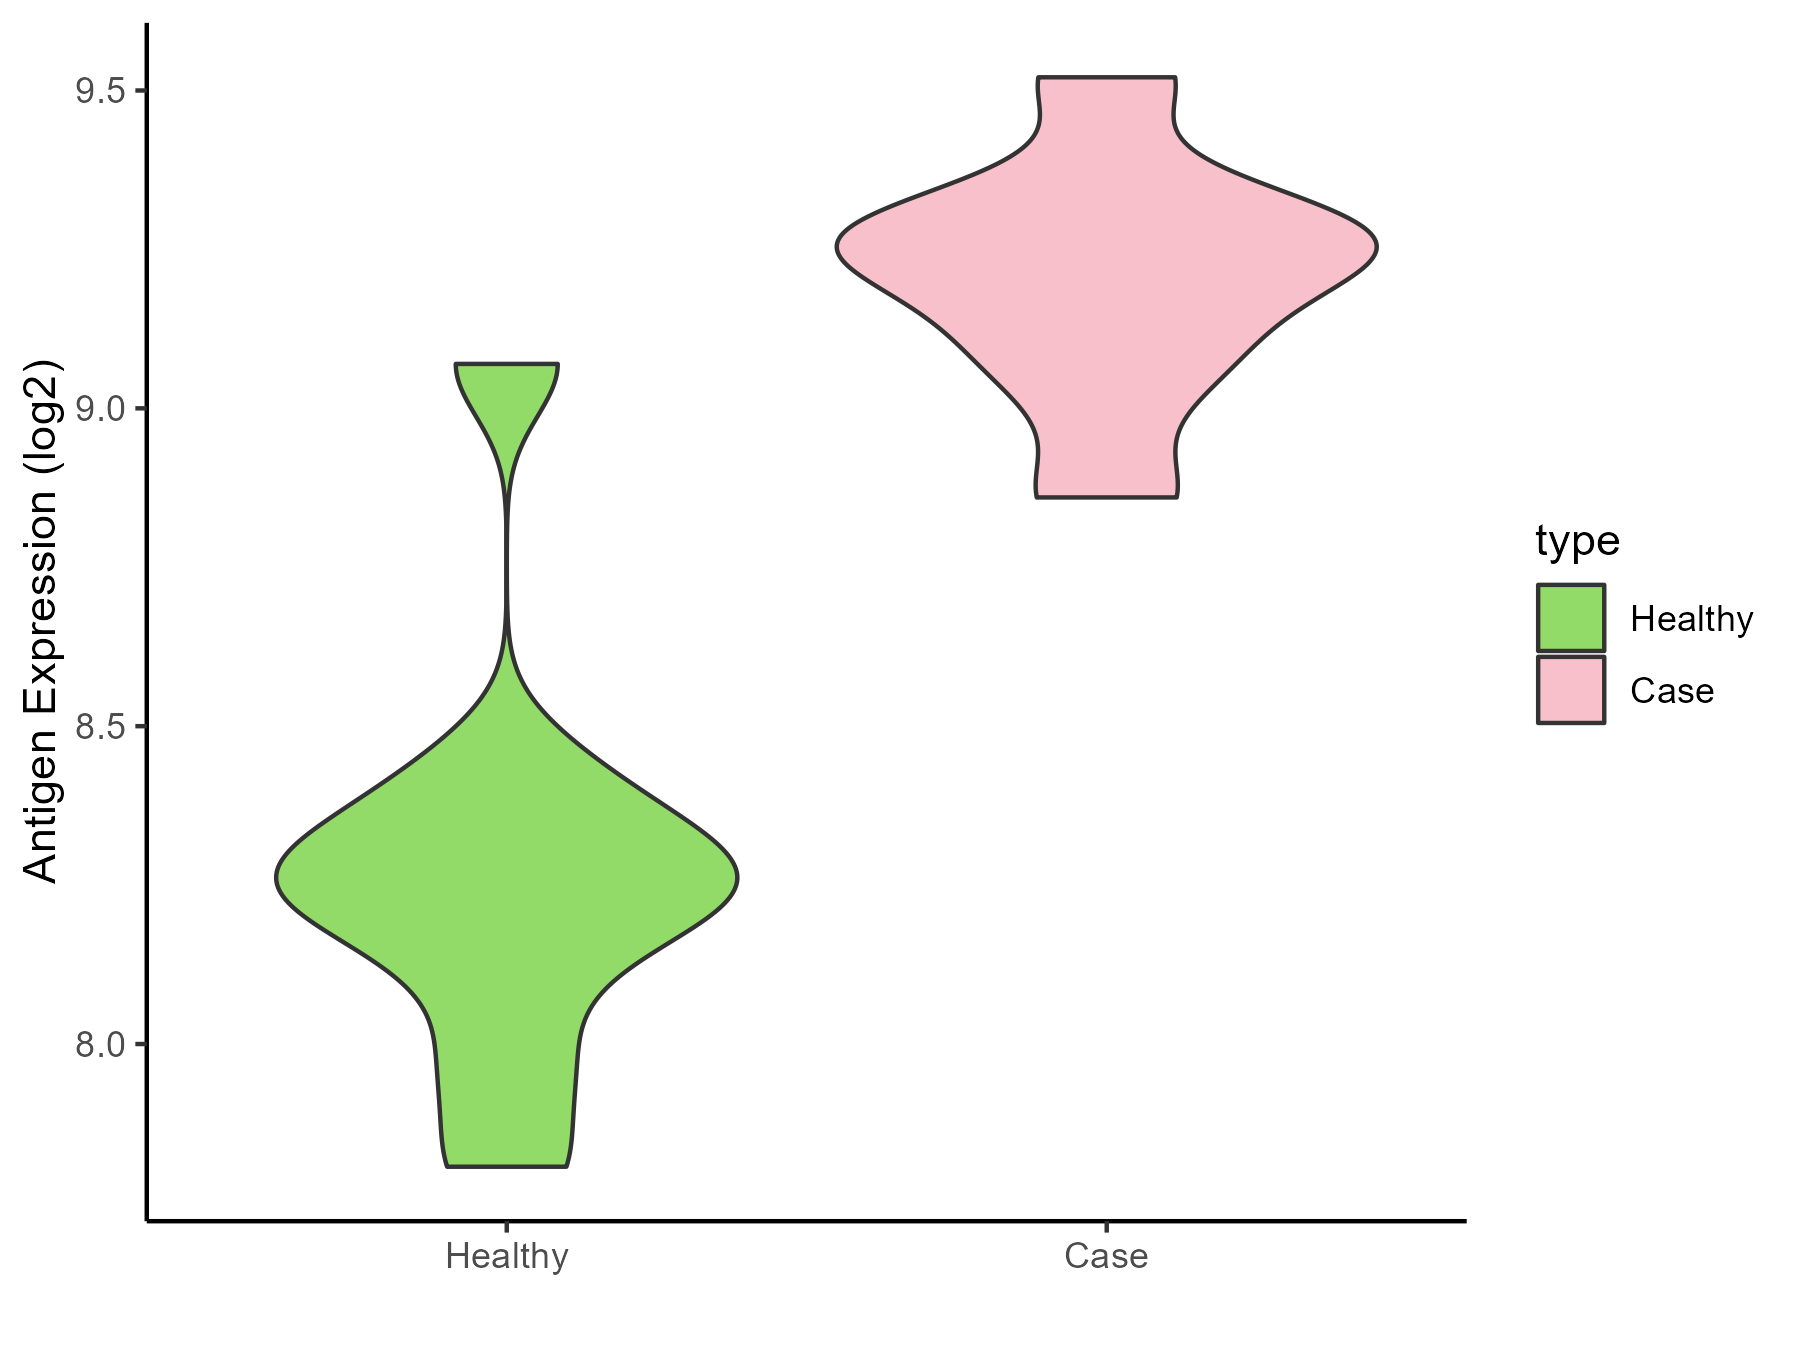
| The Studied Tissue | Biceps muscle | |
| The Specific Disease | Pompe disease | |
| The Expression Level of Disease Section Compare with the Healthy Individual Tissue | p-value: 2.61E-06; Fold-change: 1.005202455; Z-score: 2.994950012 | |
| Disease-specific Antigen Abundances |
|
Click to View the Clearer Original Diagram |
| Differential expression pattern of antigen in diseases | ||
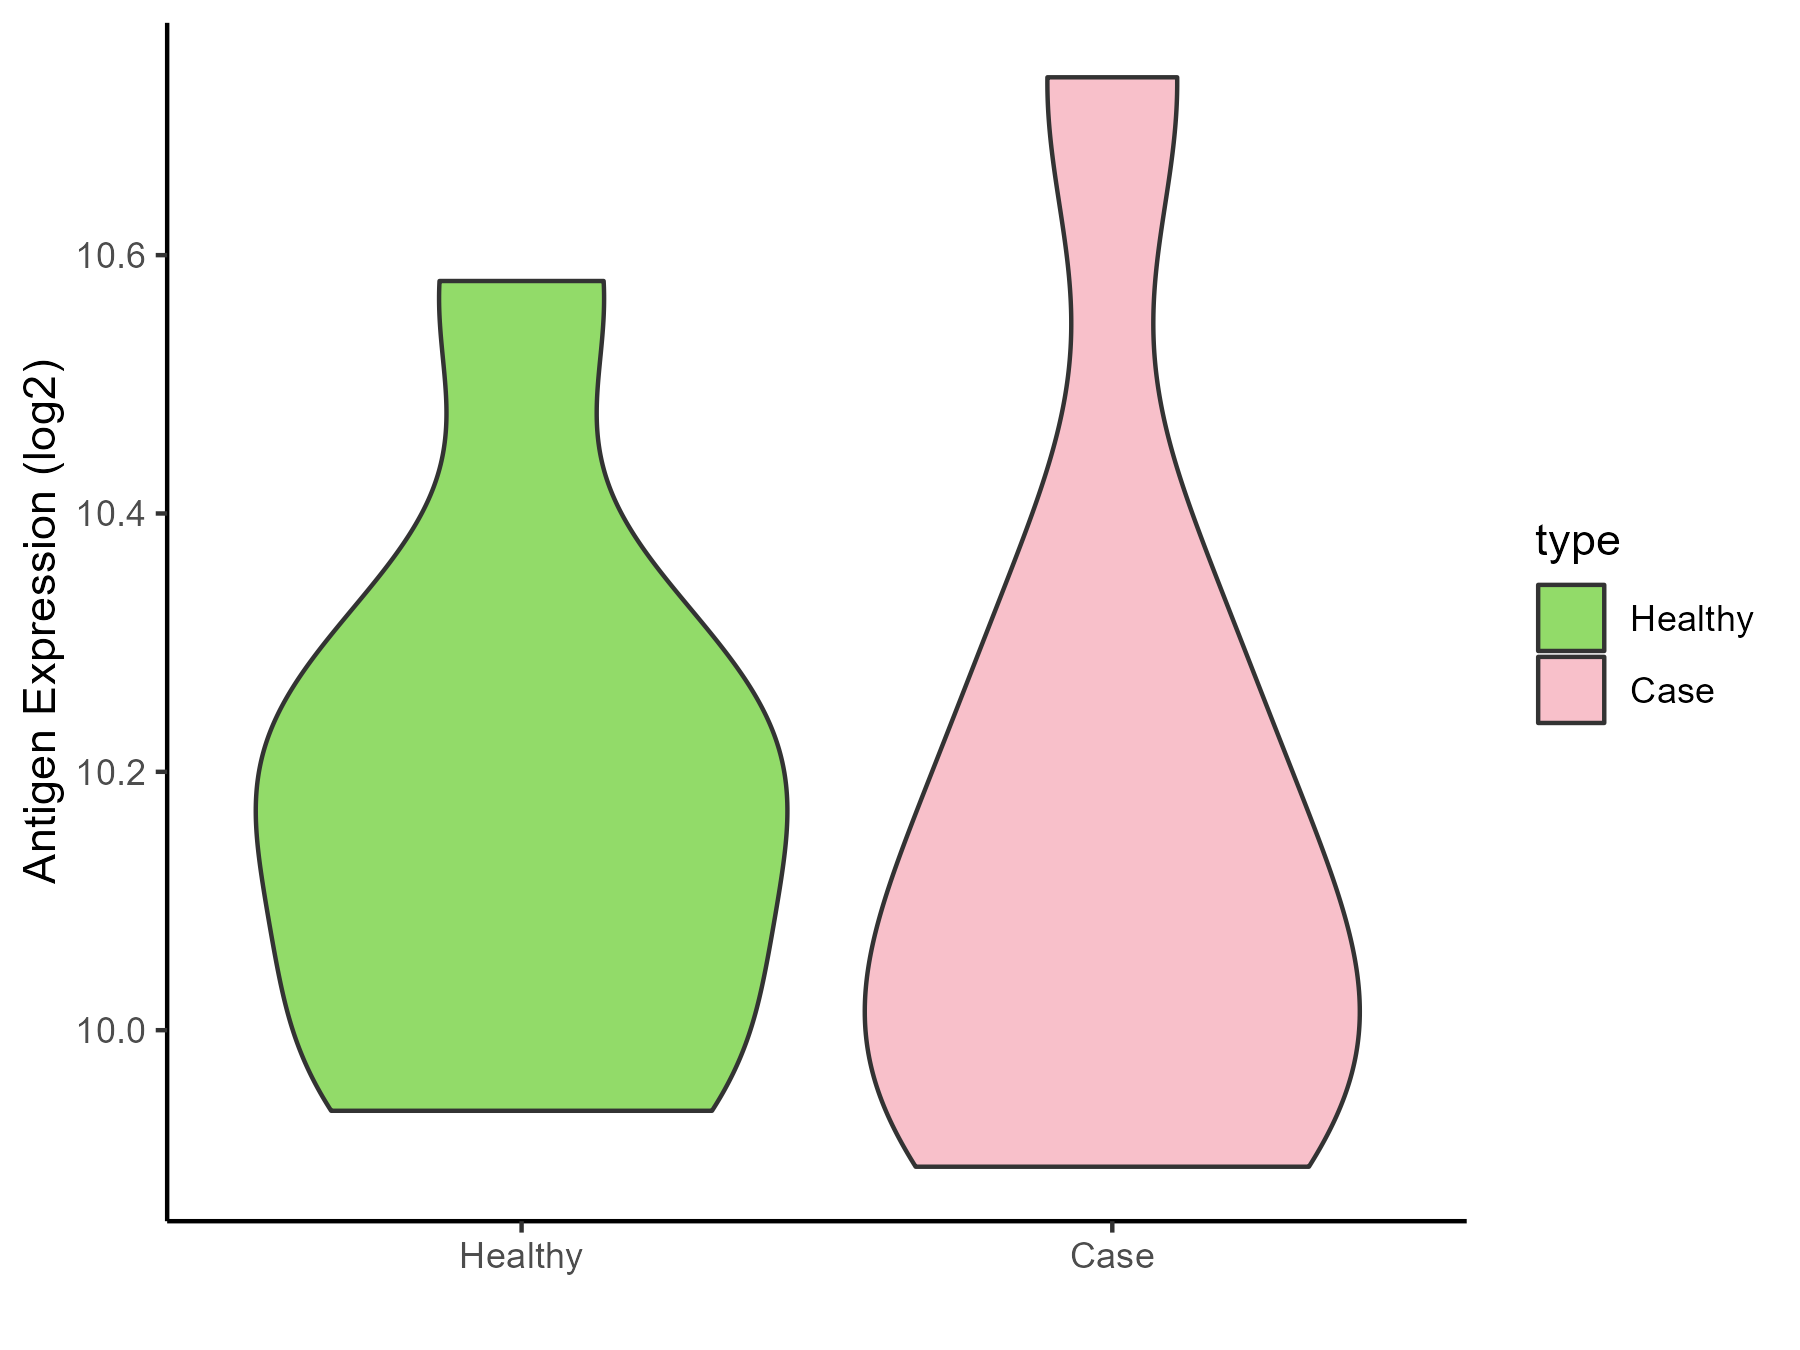
| The Studied Tissue | Whole blood | |
| The Specific Disease | Batten disease | |
| The Expression Level of Disease Section Compare with the Healthy Individual Tissue | p-value: 0.921572664; Fold-change: -0.079112271; Z-score: -0.36291543 | |
| Disease-specific Antigen Abundances |
|
Click to View the Clearer Original Diagram |
ICD Disease Classification 6
| Differential expression pattern of antigen in diseases | ||
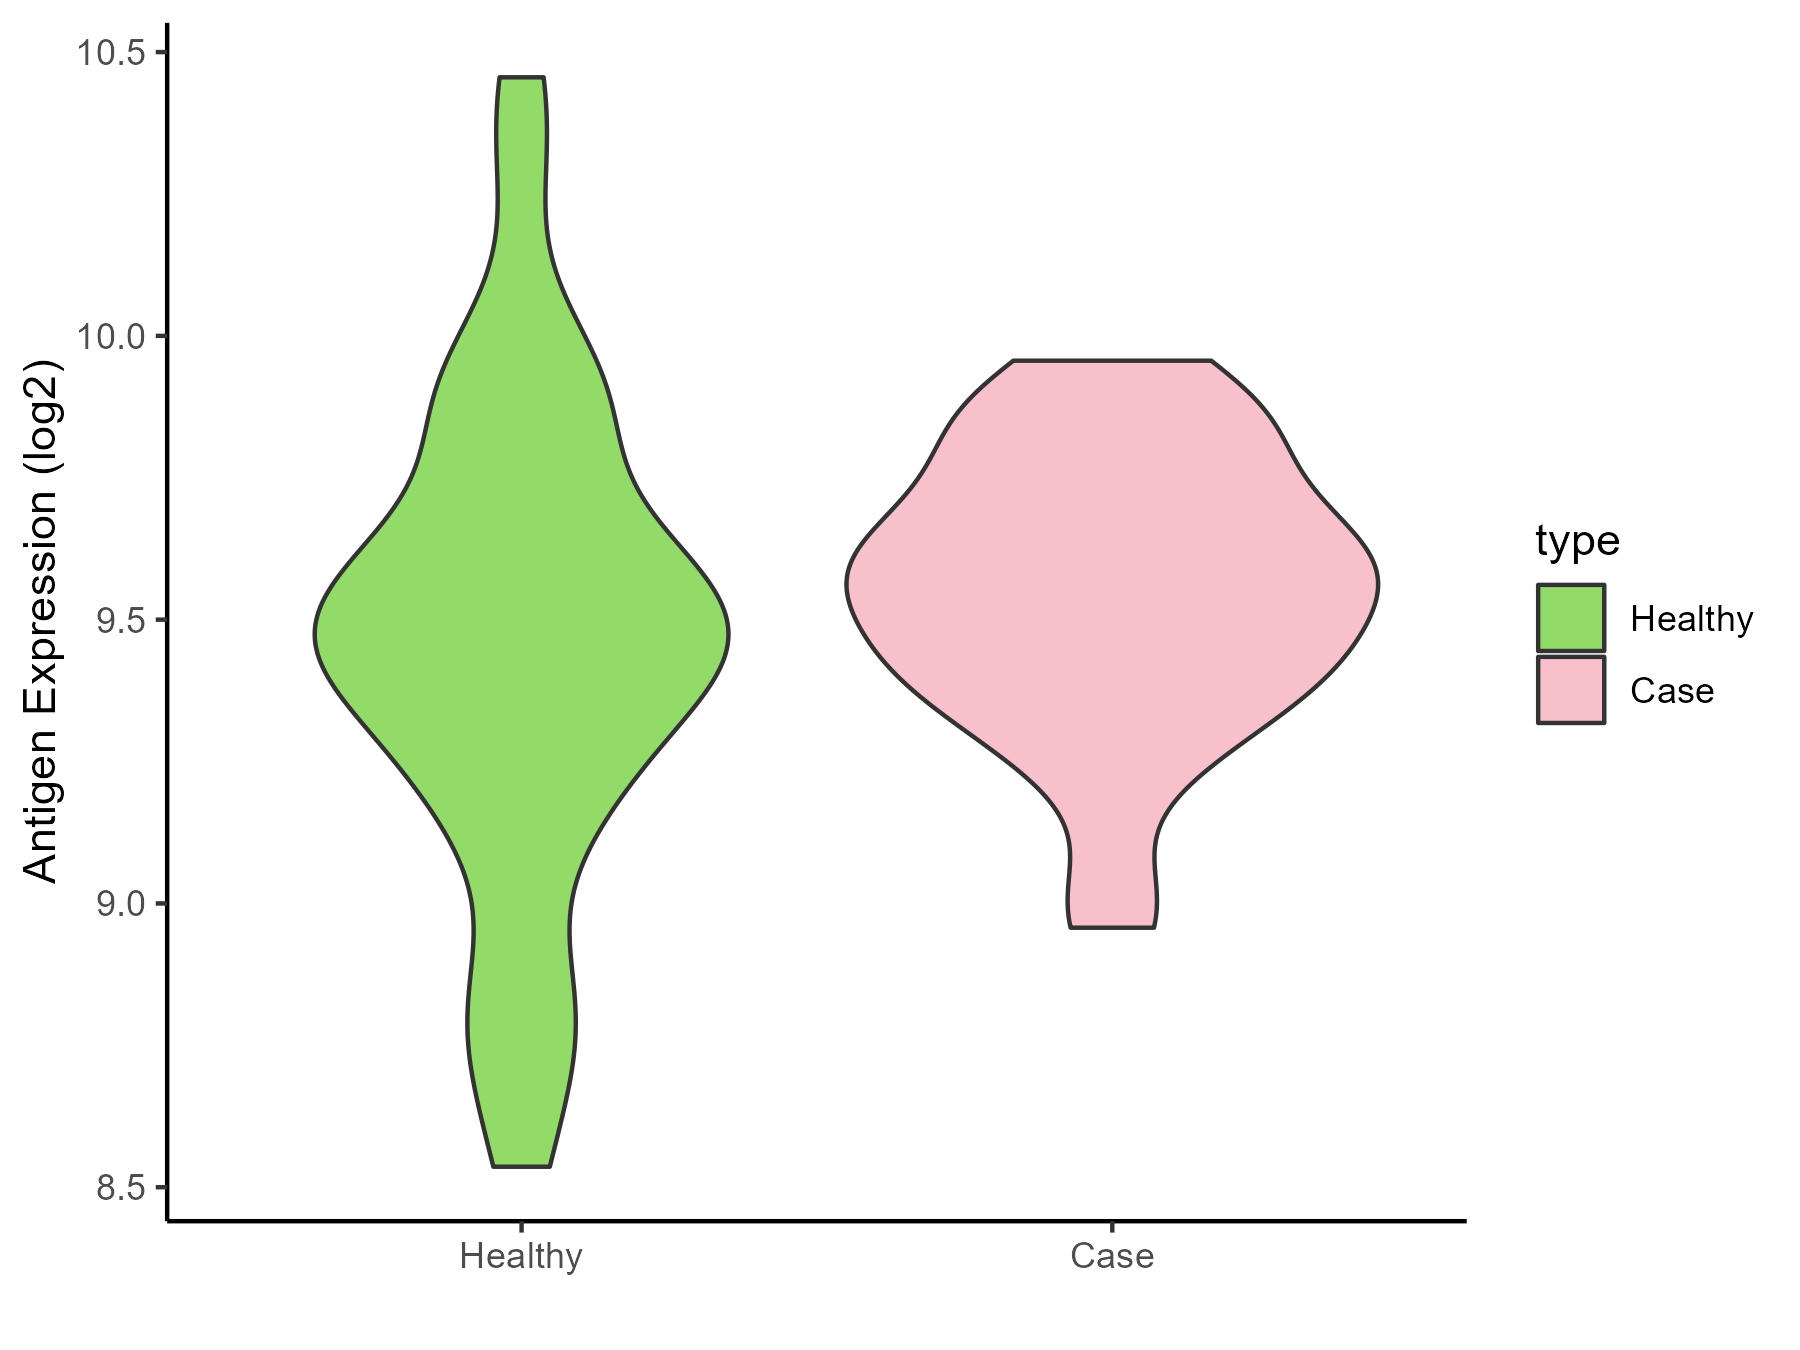
| The Studied Tissue | Whole blood | |
| The Specific Disease | Autism | |
| The Expression Level of Disease Section Compare with the Healthy Individual Tissue | p-value: 0.310726974; Fold-change: 0.085656327; Z-score: 0.201052667 | |
| Disease-specific Antigen Abundances |
|
Click to View the Clearer Original Diagram |
| Differential expression pattern of antigen in diseases | ||
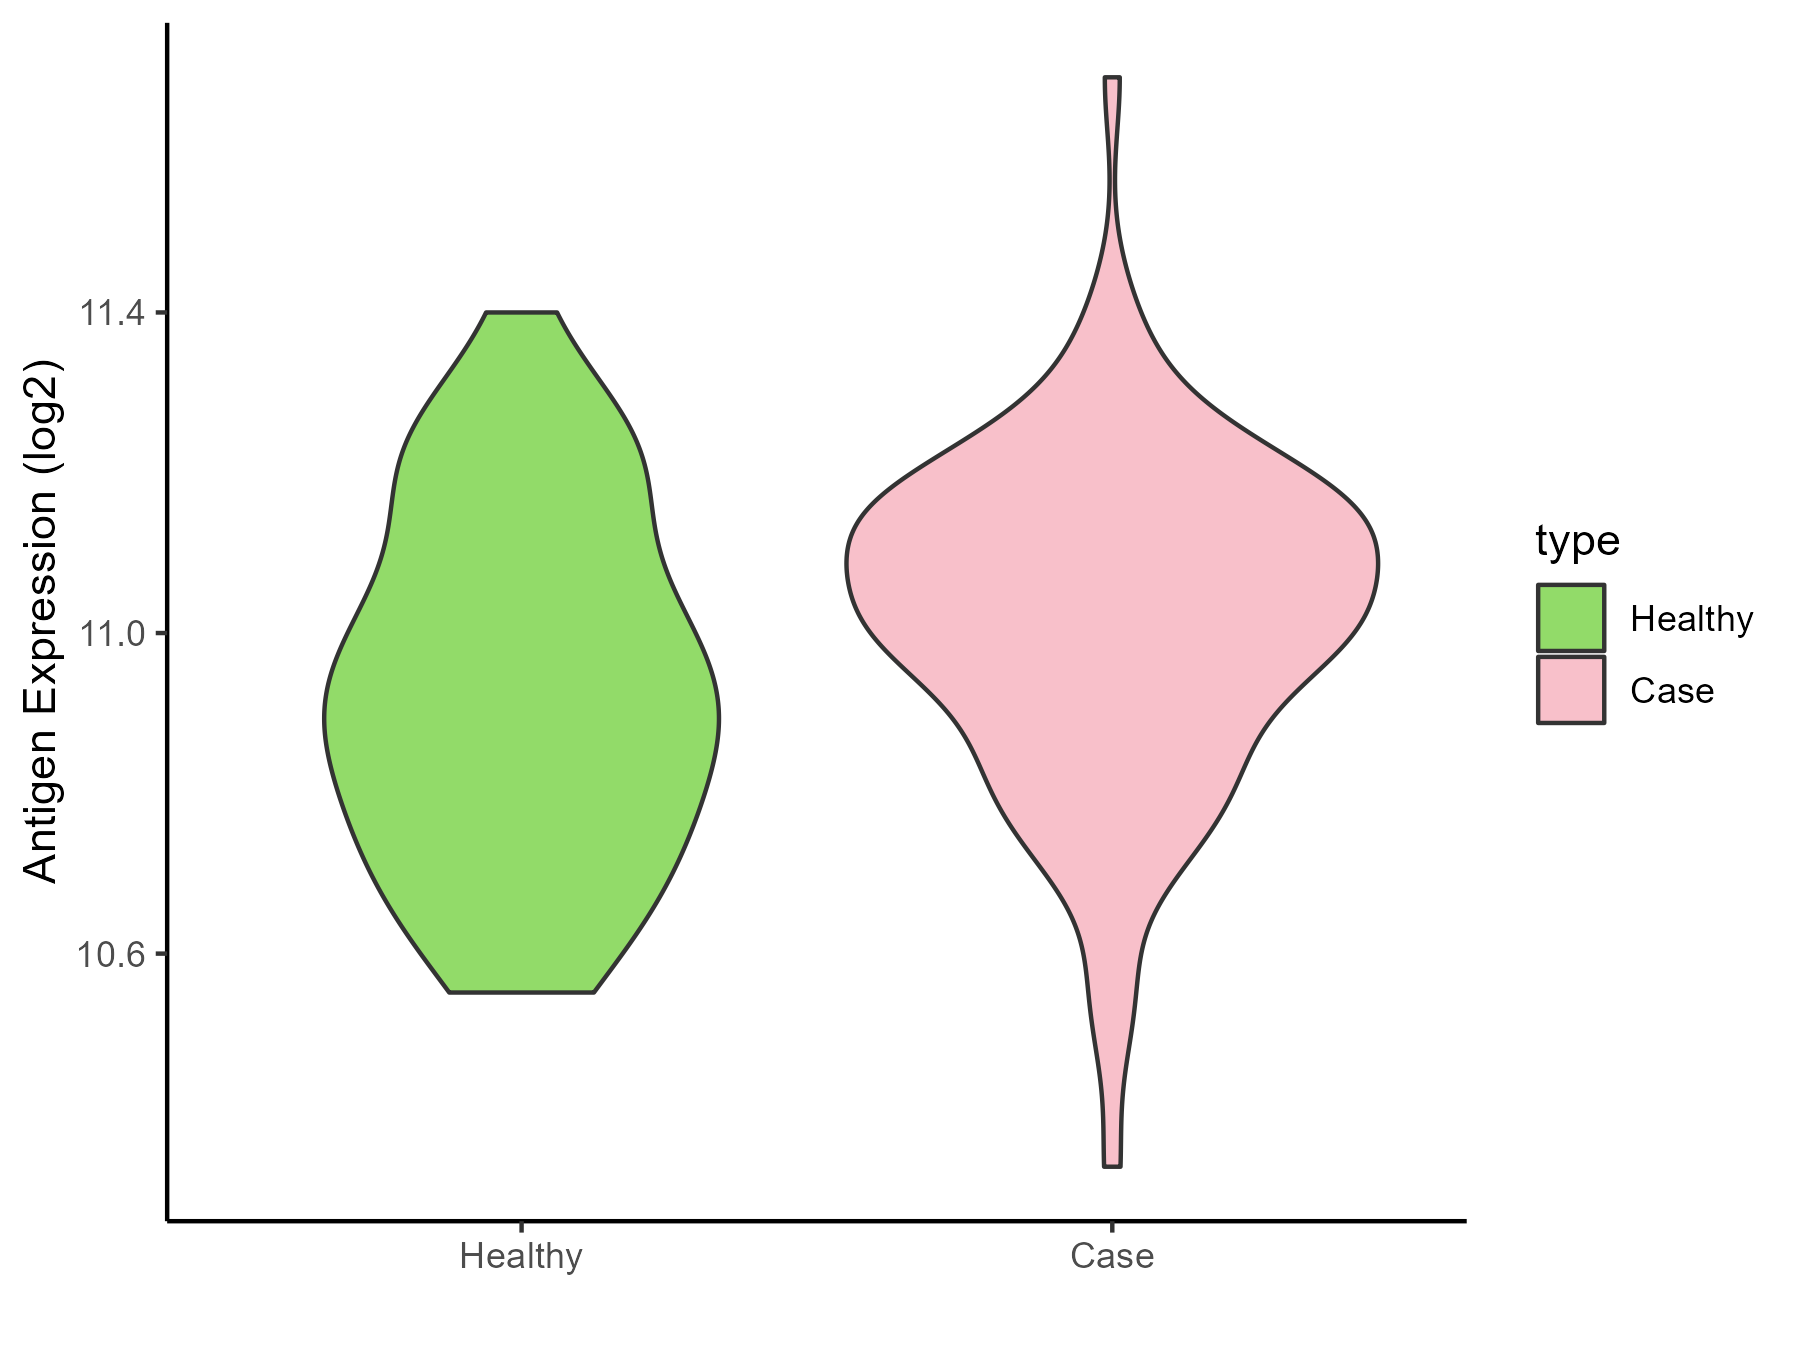
| The Studied Tissue | Whole blood | |
| The Specific Disease | Anxiety disorder | |
| The Expression Level of Disease Section Compare with the Healthy Individual Tissue | p-value: 0.033031452; Fold-change: 0.116864185; Z-score: 0.530216175 | |
| Disease-specific Antigen Abundances |
|
Click to View the Clearer Original Diagram |
ICD Disease Classification 8
| Differential expression pattern of antigen in diseases | ||
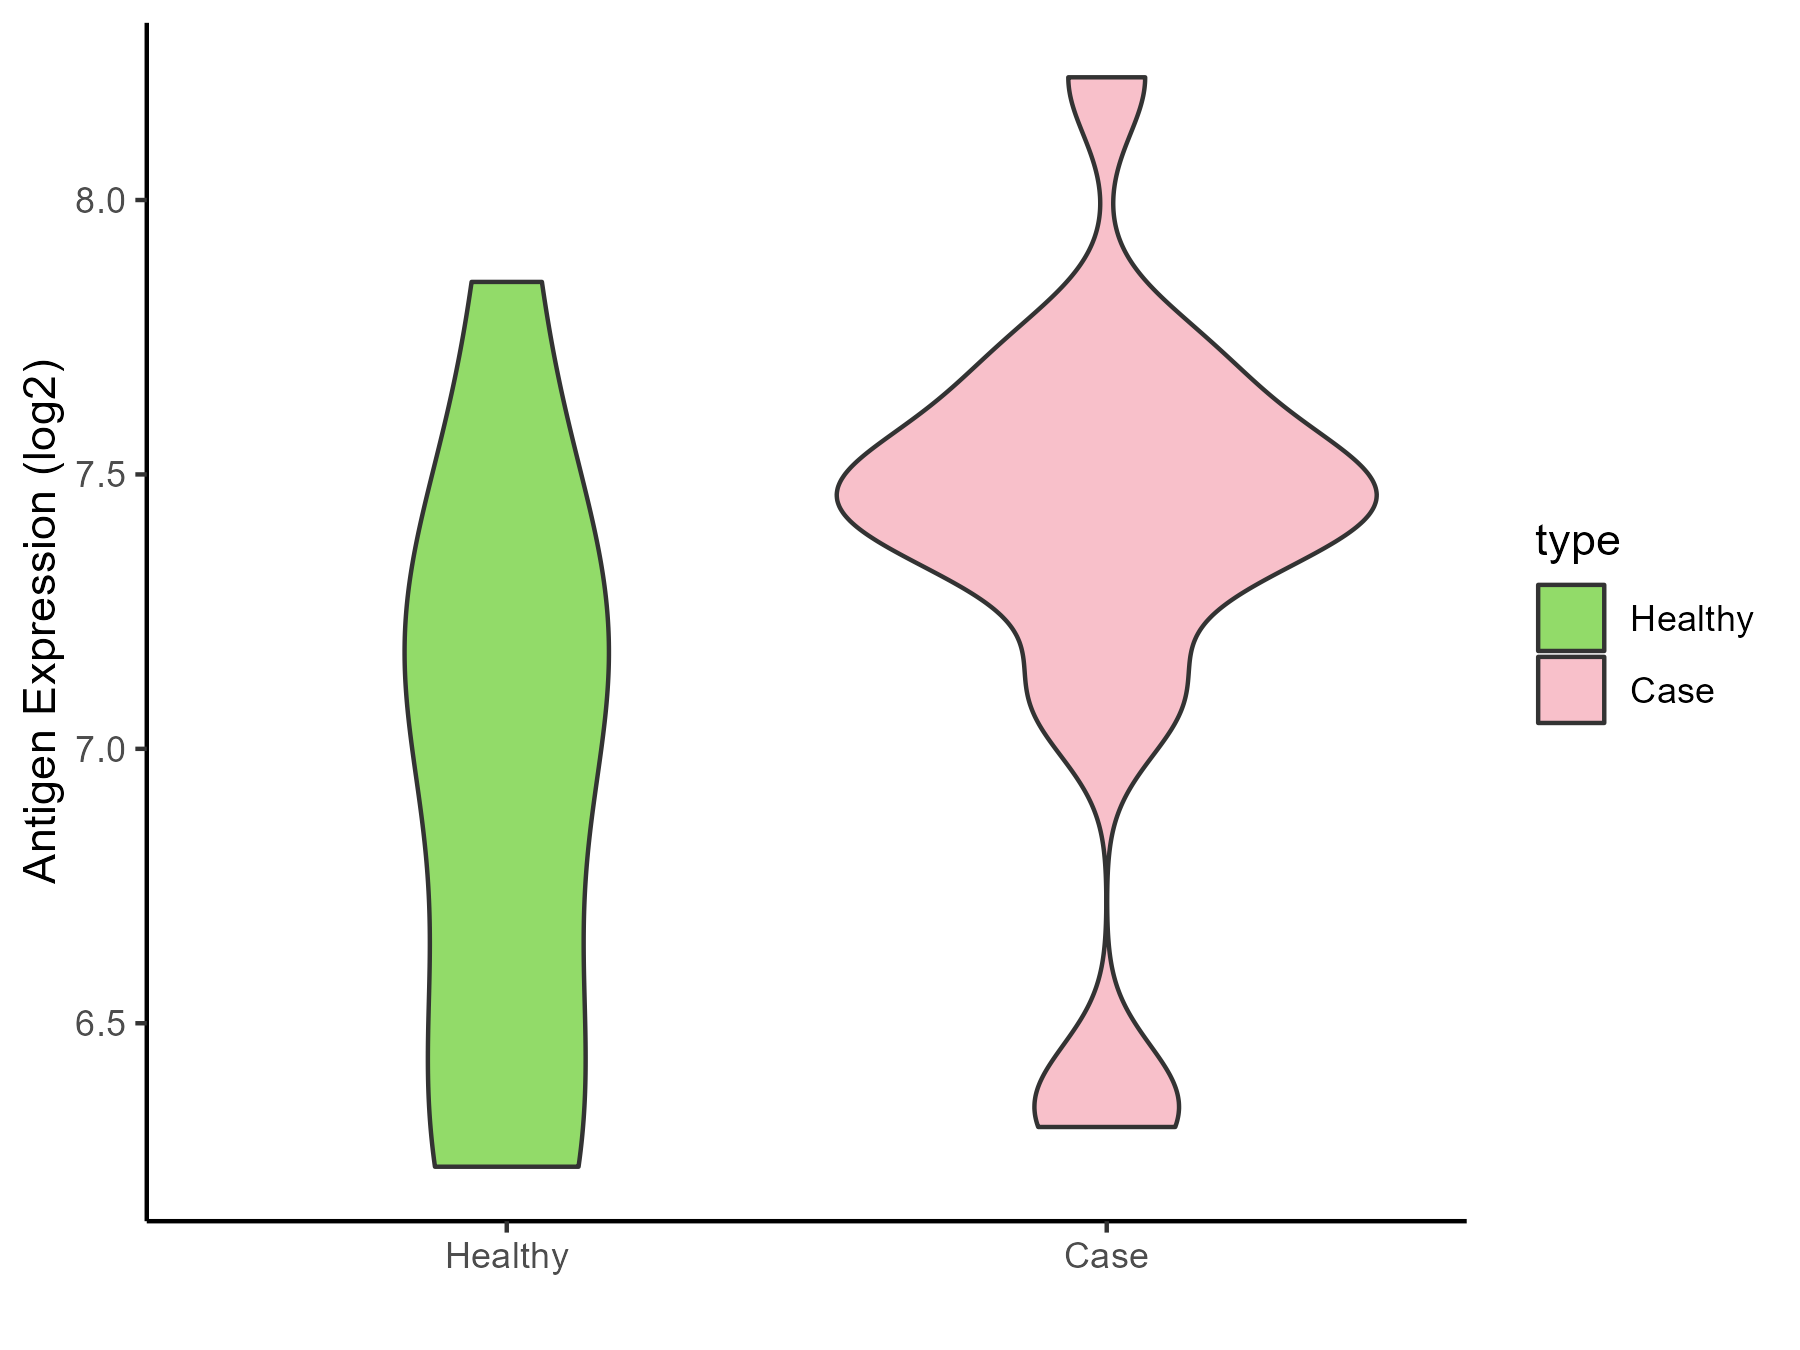
| The Studied Tissue | Substantia nigra | |
| The Specific Disease | Parkinson disease | |
| The Expression Level of Disease Section Compare with the Healthy Individual Tissue | p-value: 0.071178053; Fold-change: 0.247258966; Z-score: 0.450500913 | |
| Disease-specific Antigen Abundances |
|
Click to View the Clearer Original Diagram |
| Differential expression pattern of antigen in diseases | ||
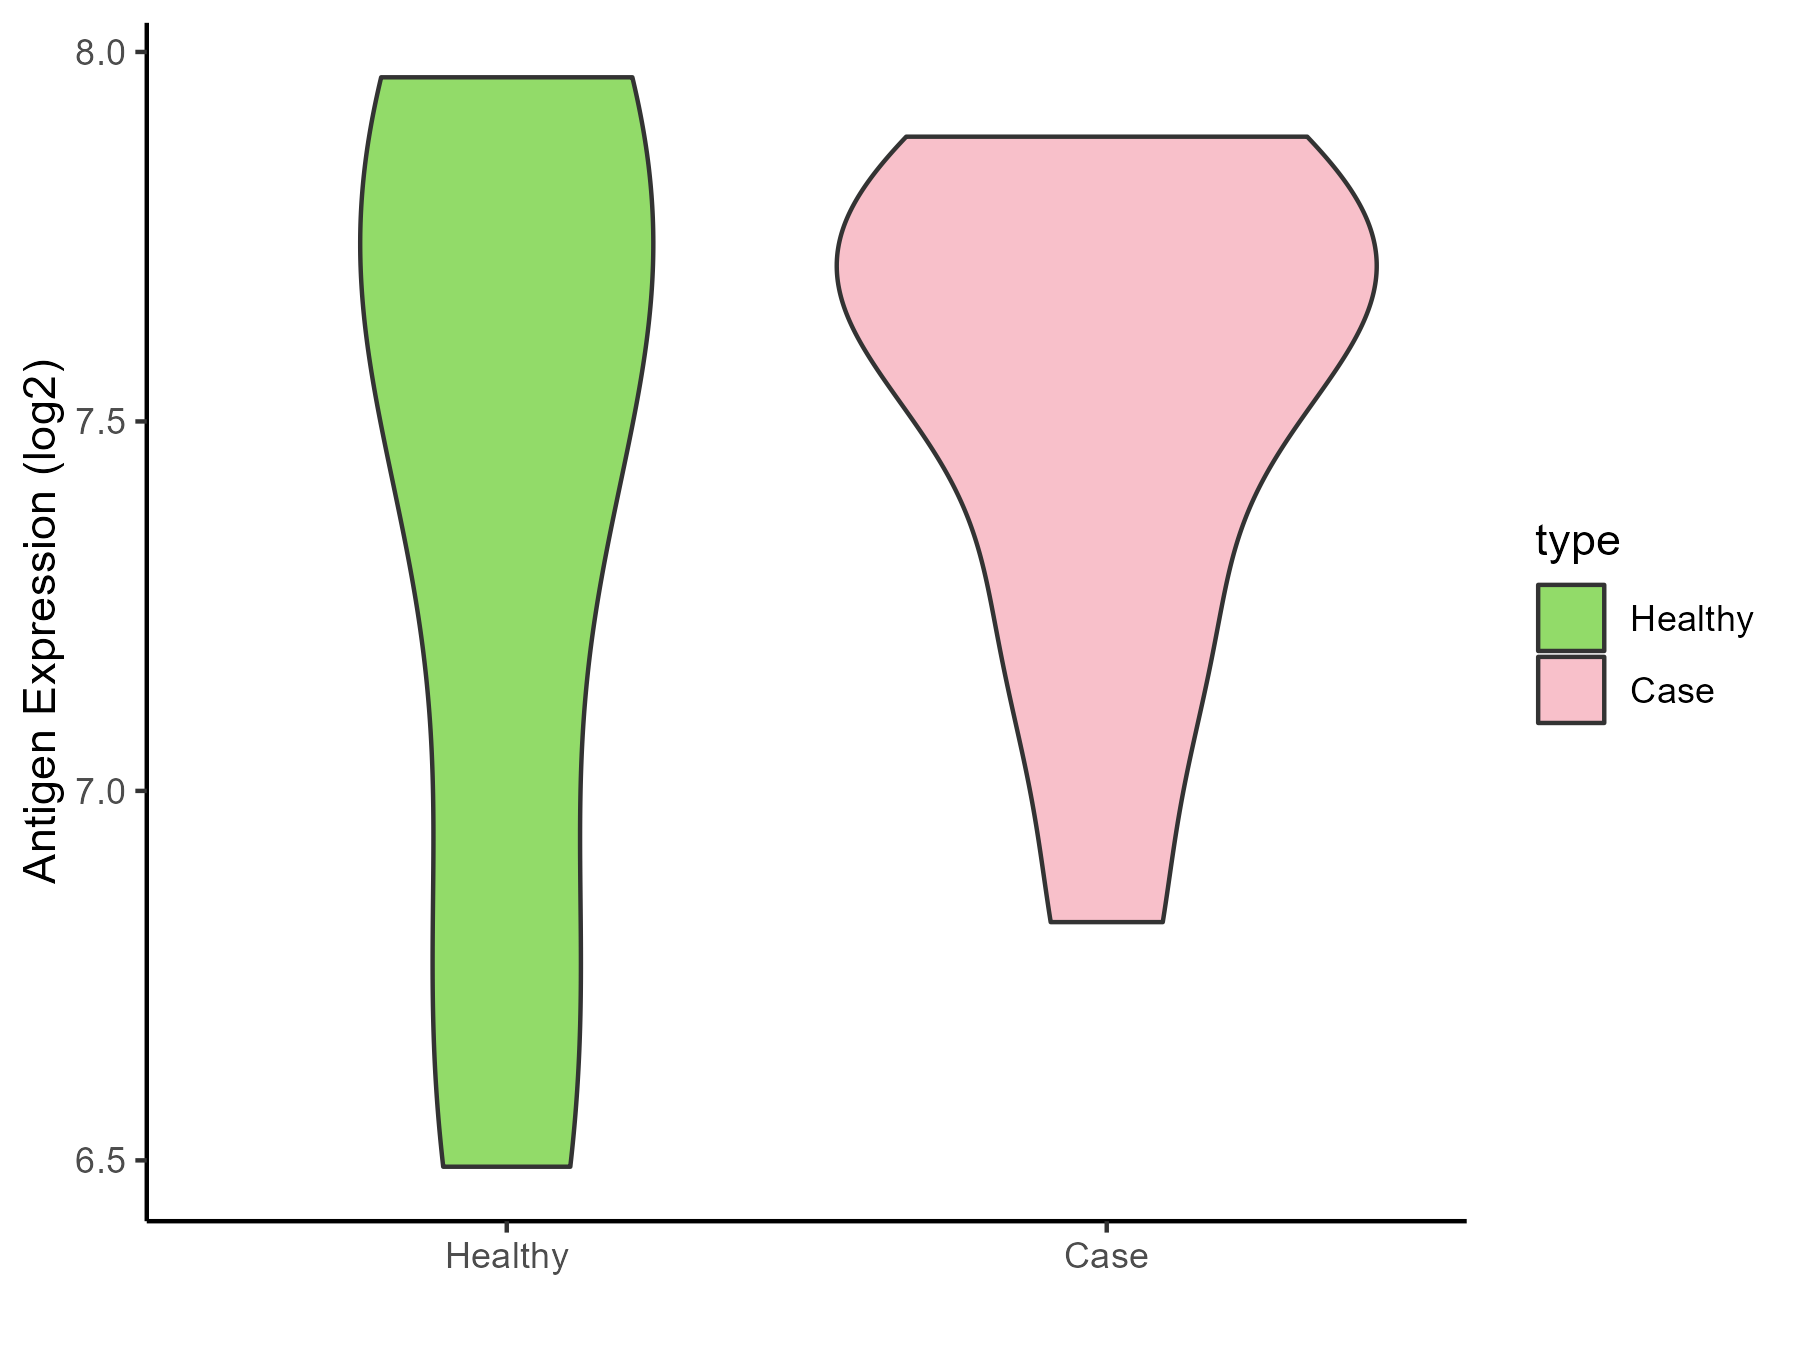
| The Studied Tissue | Whole blood | |
| The Specific Disease | Huntington disease | |
| The Expression Level of Disease Section Compare with the Healthy Individual Tissue | p-value: 0.572944413; Fold-change: 0.012613753; Z-score: 0.022477224 | |
| Disease-specific Antigen Abundances |
|
Click to View the Clearer Original Diagram |
| Differential expression pattern of antigen in diseases | ||
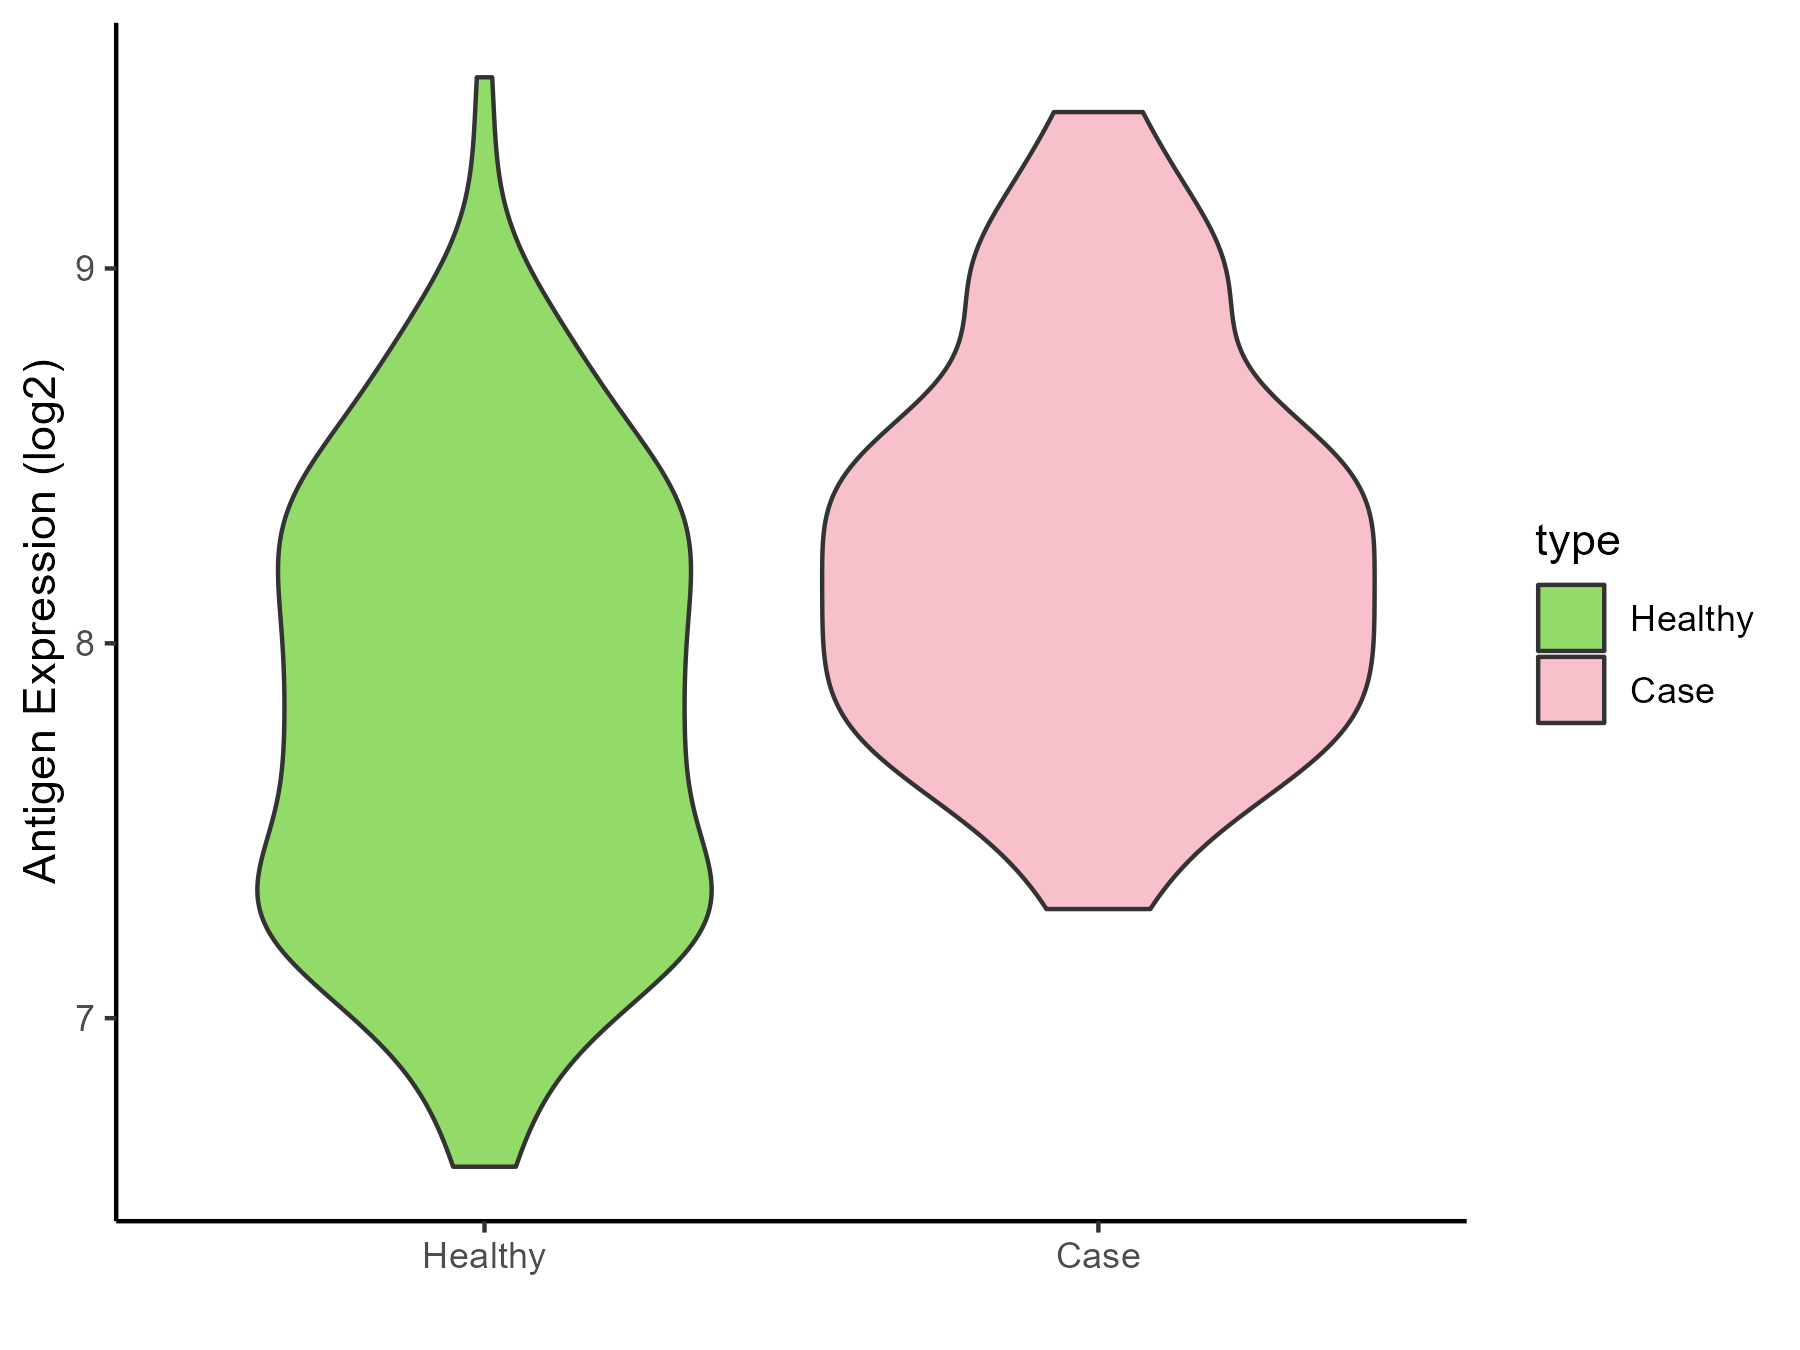
| The Studied Tissue | Entorhinal cortex | |
| The Specific Disease | Alzheimer disease | |
| The Expression Level of Disease Section Compare with the Healthy Individual Tissue | p-value: 7.17E-08; Fold-change: 0.434403012; Z-score: 0.728346623 | |
| Disease-specific Antigen Abundances |
|
Click to View the Clearer Original Diagram |
| Differential expression pattern of antigen in diseases | ||
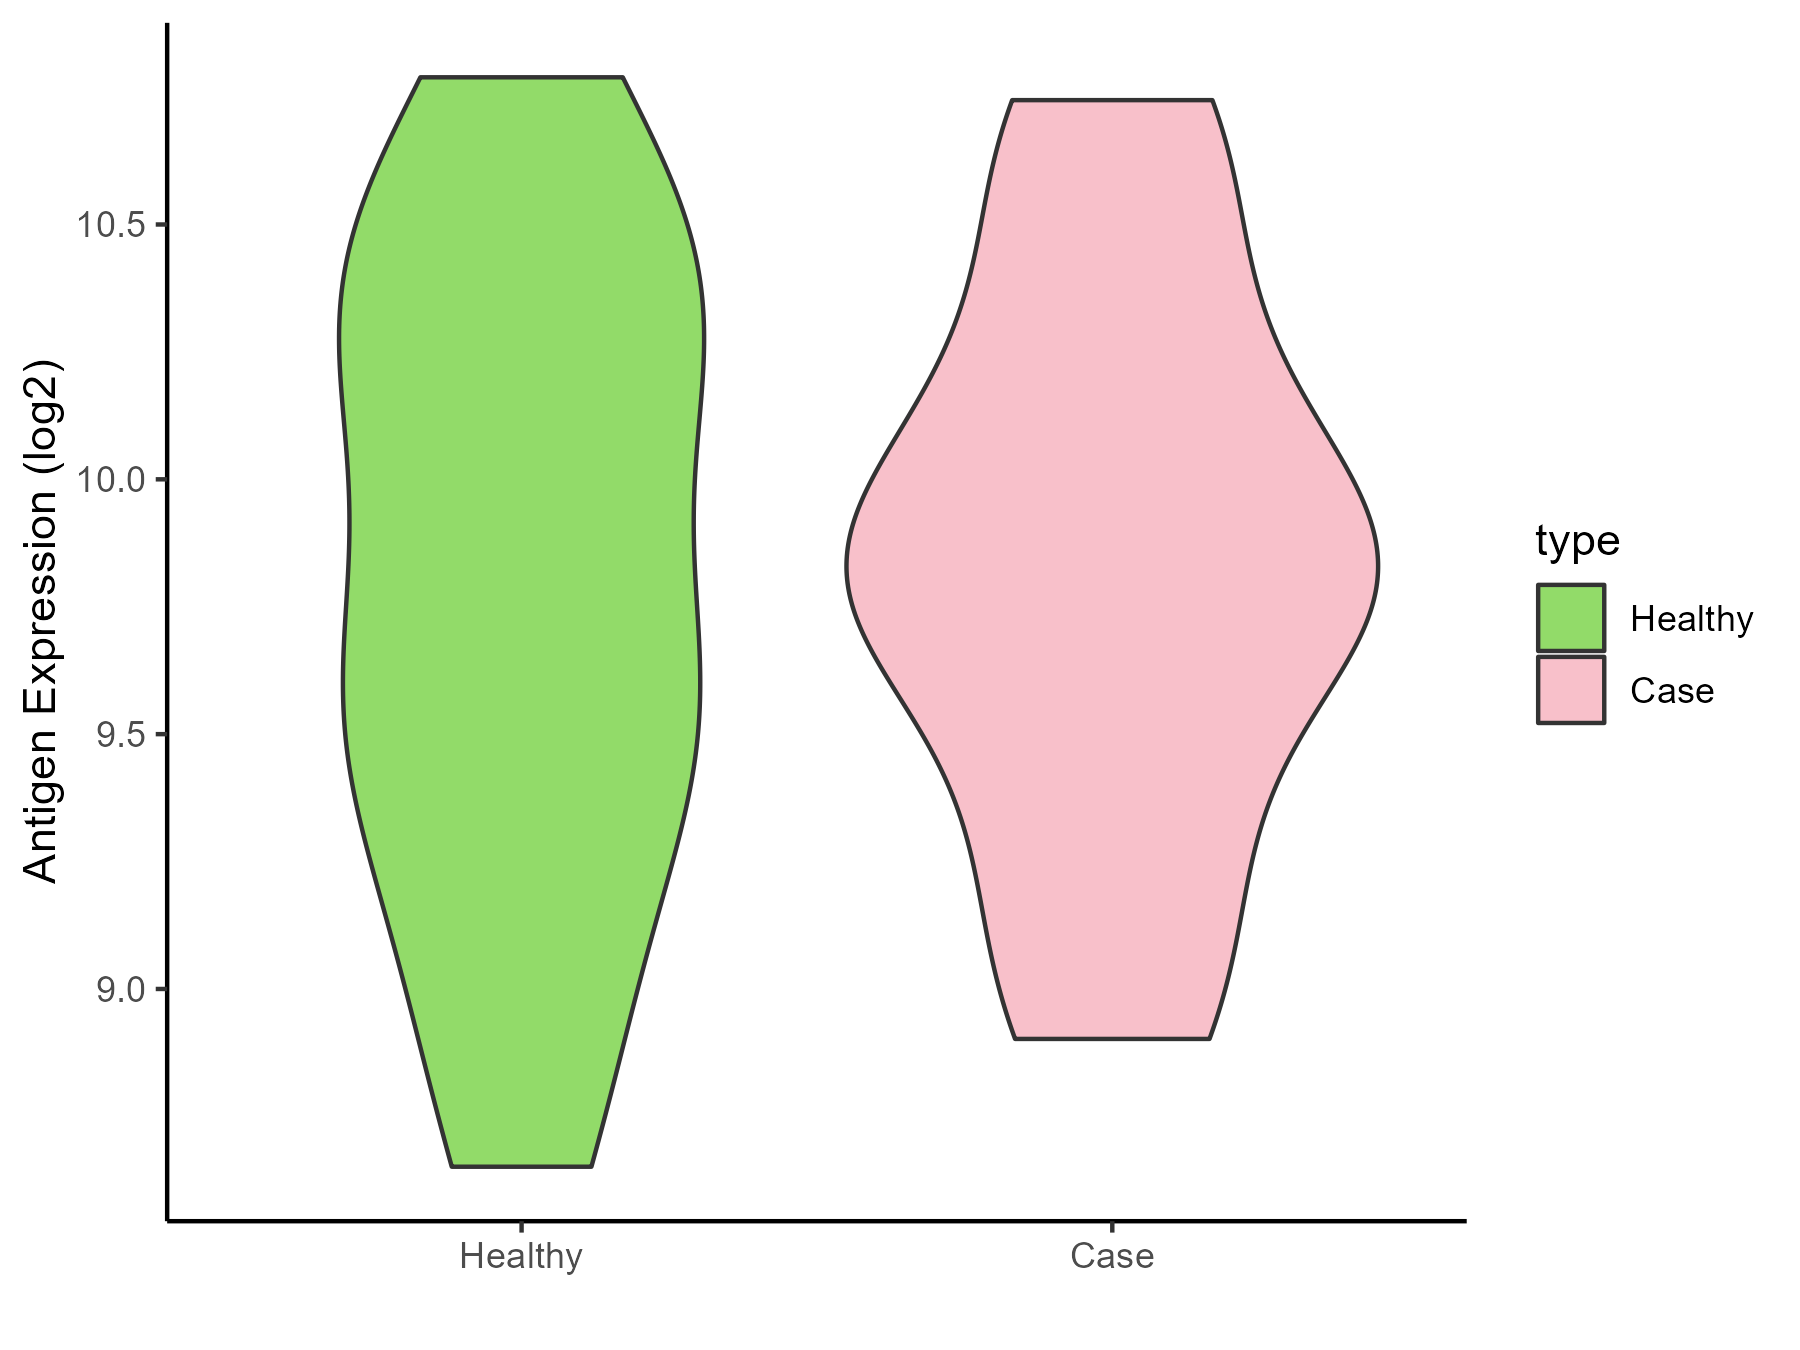
| The Studied Tissue | Whole blood | |
| The Specific Disease | Seizure | |
| The Expression Level of Disease Section Compare with the Healthy Individual Tissue | p-value: 0.899686861; Fold-change: 0.105834149; Z-score: 0.166043817 | |
| Disease-specific Antigen Abundances |
|
Click to View the Clearer Original Diagram |
| Differential expression pattern of antigen in diseases | ||
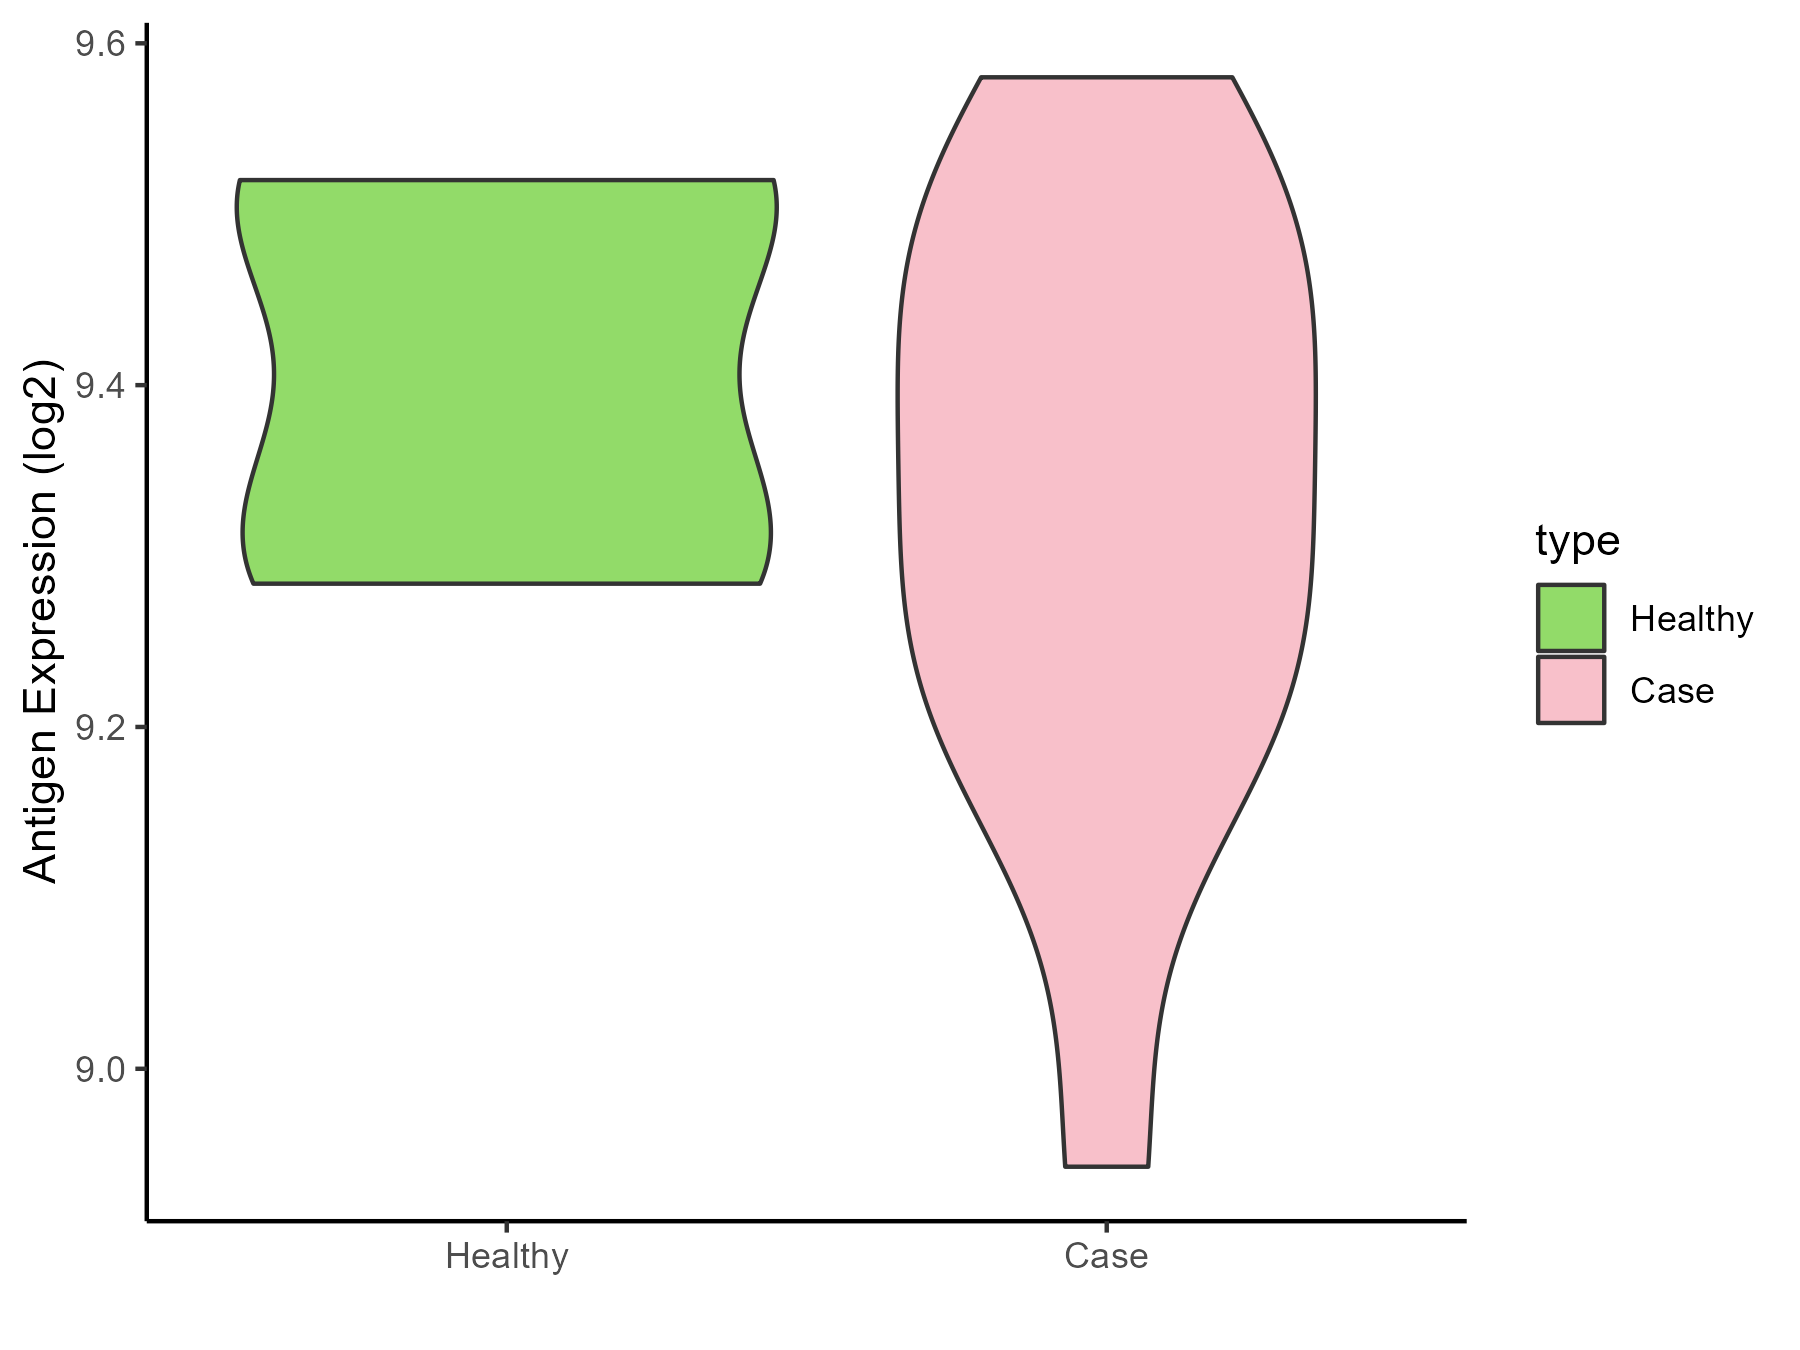
| The Studied Tissue | Skin | |
| The Specific Disease | Lateral sclerosis | |
| The Expression Level of Disease Section Compare with the Healthy Individual Tissue | p-value: 0.366546187; Fold-change: -0.06860933; Z-score: -0.544976824 | |
| Disease-specific Antigen Abundances |
|
Click to View the Clearer Original Diagram |
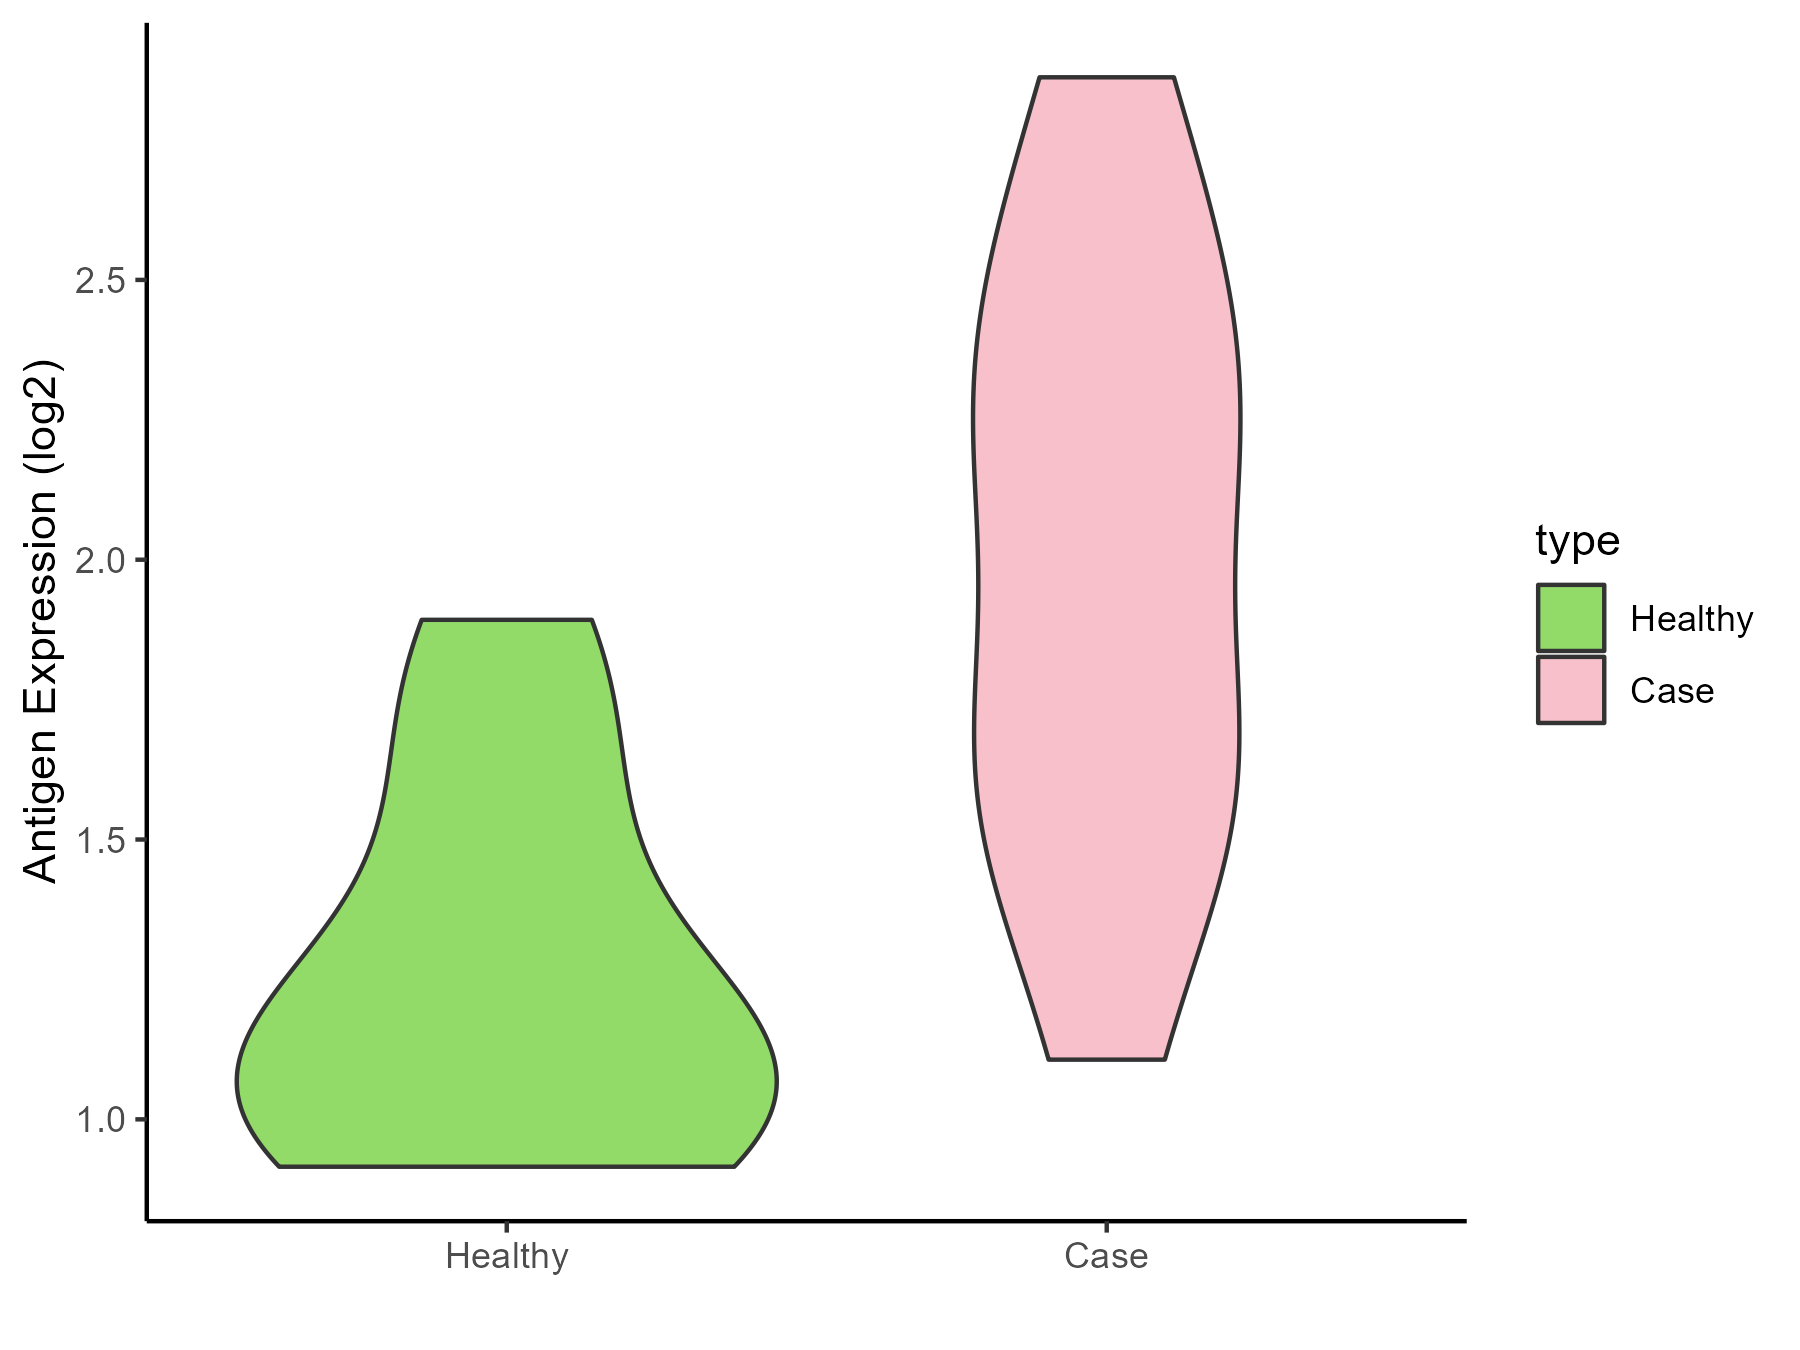
| The Studied Tissue | Cervical spinal cord | |
| The Specific Disease | Lateral sclerosis | |
| The Expression Level of Disease Section Compare with the Healthy Individual Tissue | p-value: 0.001551658; Fold-change: 0.976817945; Z-score: 2.821219396 | |
| Disease-specific Antigen Abundances |
|
Click to View the Clearer Original Diagram |
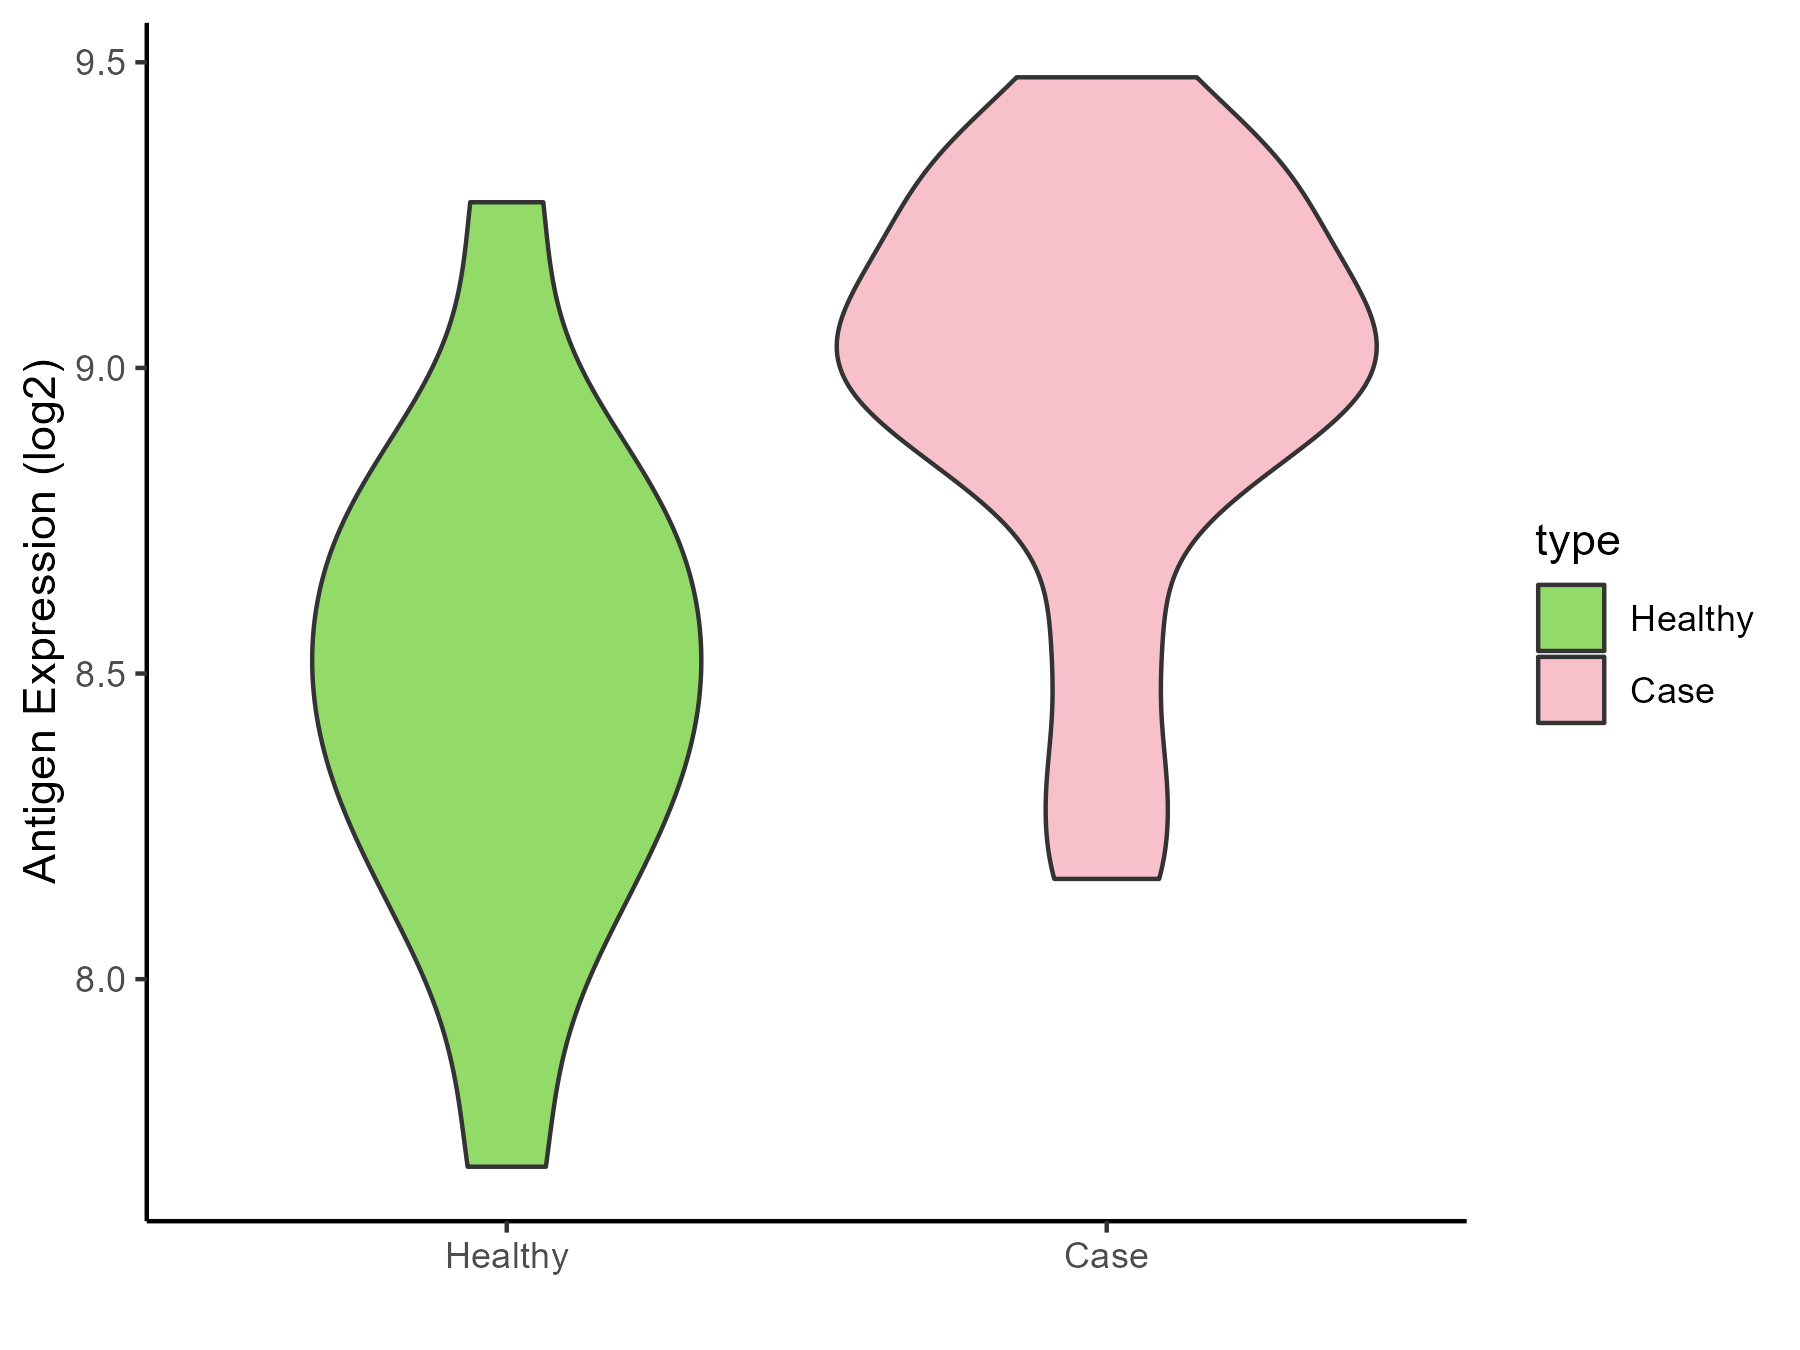
| Differential expression pattern of antigen in diseases | ||
| The Studied Tissue | Muscle | |
| The Specific Disease | Muscular atrophy | |
| The Expression Level of Disease Section Compare with the Healthy Individual Tissue | p-value: 0.001960389; Fold-change: 0.588051791; Z-score: 1.470971624 | |
| Disease-specific Antigen Abundances |
|
Click to View the Clearer Original Diagram |
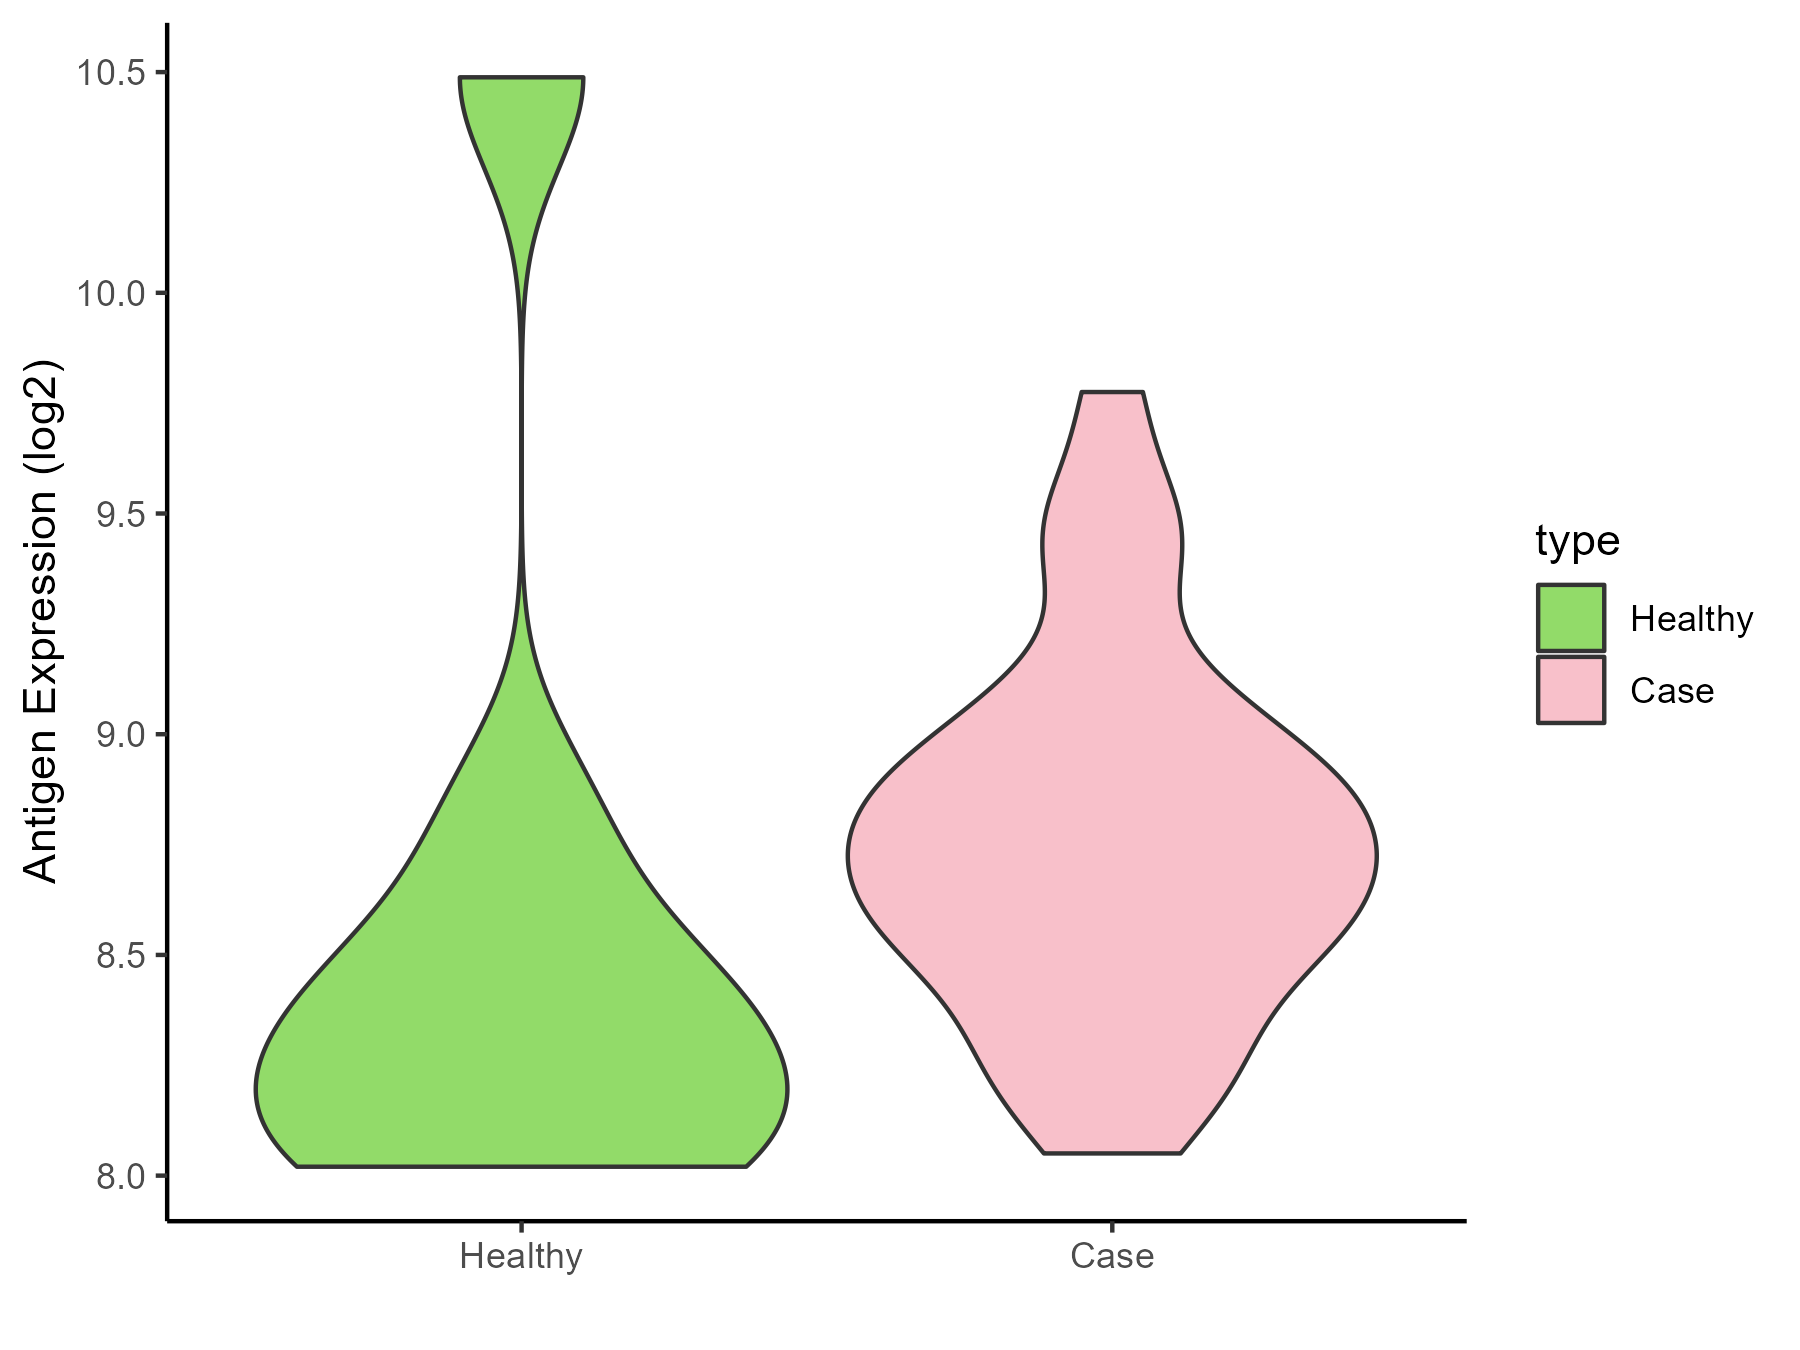
| Differential expression pattern of antigen in diseases | ||
| The Studied Tissue | Muscle | |
| The Specific Disease | Myopathy | |
| The Expression Level of Disease Section Compare with the Healthy Individual Tissue | p-value: 0.548596078; Fold-change: 0.40870303; Z-score: 0.500334194 | |
| Disease-specific Antigen Abundances |
|
Click to View the Clearer Original Diagram |
References
