
Antibody-drug Conjugate Information
General Information of This Antibody-drug Conjugate (ID: DRG0FBKIO)
| ADC Name |
ABBV-3373
|
|||||
|---|---|---|---|---|---|---|
| Synonyms |
ABBV-3373
Click to Show/Hide
|
|||||
| Organization |
AbbVie (Top20 MNC) (Originator)
|
|||||
| Drug Status |
Phase 2 (discontinued)
|
|||||
| Drug-to-Antibody Ratio |
4
|
|||||
| Structure |
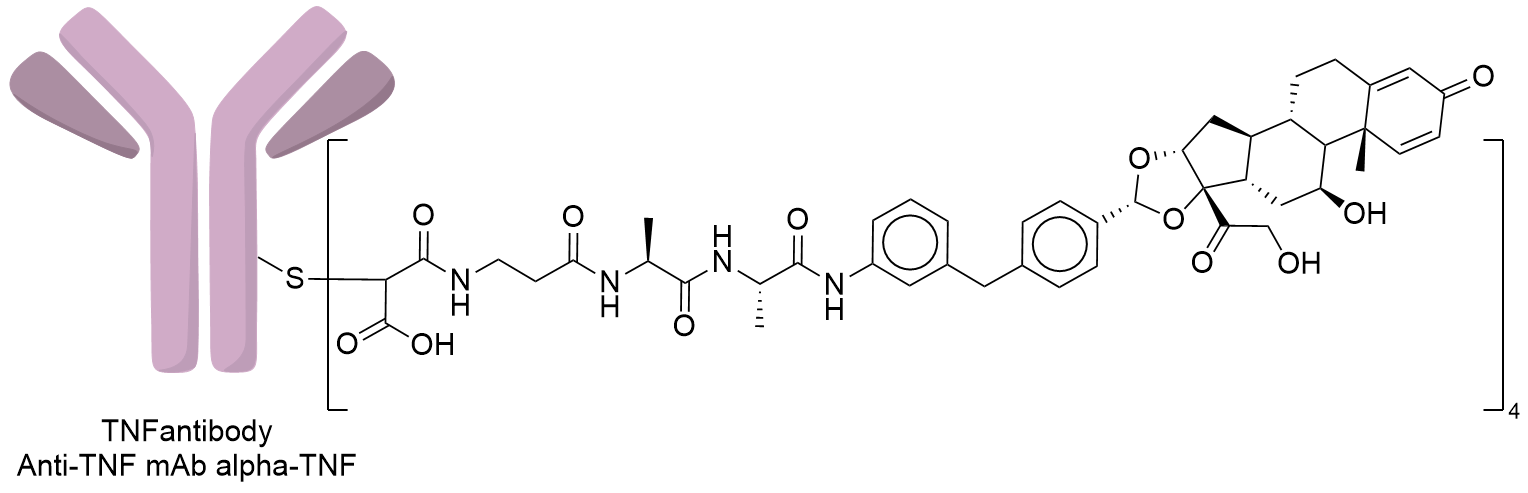
|
|||||
| Antibody Name |
Adalimumab
|
Antibody Info | ||||
| Antigen Name |
Tumor necrosis factor (TNF)
|
Antigen Info | ||||
| Payload Name |
Glucocorticoid receptor modulator
|
Payload Info | ||||
| Payload Target |
Glucocorticoid receptor (NR3C1)
|
Target Info | ||||
| Linker Name |
MP-Ala-Ala
|
Linker Info | ||||
| Conjugate Type |
Random Cysteines
|
|||||
2027 Update
The disease landscape of This ADC
2027 Update
The clinical trial pipelines of This ADC
2027 Update
General Information of The ADMET Data Related to This ADC
Absorption
| Standard Type | Value | Units | Description | Reference |
|---|---|---|---|---|
| Maximum Observed Concentration (Cmax) | 1.5 | ug/mL |
Pharmacokinetic parameters of ABBV-3373, 30 mg SC.
|
[1] |
| Time to Maximum Concentration (Tmax) | 3 | day |
Pharmacokinetic parameters of ABBV-3373, 30 mg SC.
|
[1] |
| Area Under the Concentration-Time Curve (AUC) | 390 | ug·h/mL |
Pharmacokinetic parameters of ABBV-3373, 30 mg SC, AUCtau.
|
[1] |
| Area Under the Concentration-Time Curve (AUC) | 475 | ug·h/mL |
Pharmacokinetic parameters of ABBV-3373, 30 mg SC, AUCinf.
|
[1] |
| Maximum Observed Concentration (Cmax) | 4.76 | ug/mL |
Pharmacokinetic parameters of ABBV-3373, 100 mg SC.
|
[1] |
| Time to Maximum Concentration (Tmax) | 2.5 | day |
Pharmacokinetic parameters of ABBV-3373, 100 mg SC.
|
[1] |
| Area Under the Concentration-Time Curve (AUC) | 1210 | ug·h/mL |
Pharmacokinetic parameters of ABBV-3373, 100 mg SC, AUCtau.
|
[1] |
| Area Under the Concentration-Time Curve (AUC) | 1260 | ug·h/mL |
Pharmacokinetic parameters of ABBV-3373, 100 mg SC, AUCinf.
|
[1] |
| Maximum Observed Concentration (Cmax) | 28 | ug/mL |
Pharmacokinetic parameters of ABBV-3373, 300 mg SC.
|
[1] |
| Time to Maximum Concentration (Tmax) | 3.5 | day |
Pharmacokinetic parameters of ABBV-3373, 300 mg SC.
|
[1] |
| Area Under the Concentration-Time Curve (AUC) | 10100 | ug·h/mL |
Pharmacokinetic parameters of ABBV-3373, 300 mg SC, AUCtau.
|
[1] |
| Area Under the Concentration-Time Curve (AUC) | 10200 | ug·h/mL |
Pharmacokinetic parameters of ABBV-3373, 300 mg SC, AUCinf.
|
[1] |
| Maximum Observed Concentration (Cmax) | 10.4 | ug/mL |
Pharmacokinetic parameters of ABBV-3373, 30 mg IV.
|
[1] |
| Time to Maximum Concentration (Tmax) | 2.5 | h |
Pharmacokinetic parameters of ABBV-3373, 30 mg IV.
|
[1] |
| Area Under the Concentration-Time Curve (AUC) | 1280 | ug·h/mL |
Pharmacokinetic parameters of ABBV-3373, 30 mg IV, AUCtau.
|
[1] |
| Area Under the Concentration-Time Curve (AUC) | 1310 | ug·h/mL |
Pharmacokinetic parameters of ABBV-3373, 30 mg IV, AUCinf.
|
[1] |
| Maximum Observed Concentration (Cmax) | 85.7 | ug/mL |
Pharmacokinetic parameters of ABBV-3373, 300 mg IV.
|
[1] |
| Time to Maximum Concentration (Tmax) | 1.2 | h |
Pharmacokinetic parameters of ABBV-3373, 300 mg IV.
|
[1] |
| Area Under the Concentration-Time Curve (AUC) | 18000 | ug·h/mL |
Pharmacokinetic parameters of ABBV-3373, 300 mg IV, AUCtau.
|
[1] |
| Area Under the Concentration-Time Curve (AUC) | 18100 | ug·h/mL |
Pharmacokinetic parameters of ABBV-3373, 300 mg IV, AUCinf.
|
[1] |
| Maximum Observed Concentration (Cmax) | 298 | ug/mL |
Pharmacokinetic parameters of ABBV-3373, 900 mg IV.
|
[1] |
| Time to Maximum Concentration (Tmax) | 4 | h |
Pharmacokinetic parameters of ABBV-3373, 900 mg IV.
|
[1] |
| Area Under the Concentration-Time Curve (AUC) | 55400 | ug·h/mL |
Pharmacokinetic parameters of ABBV-3373, 900 mg IV, AUCtau.
|
[1] |
| Area Under the Concentration-Time Curve (AUC) | 55600 | ug·h/mL |
Pharmacokinetic parameters of ABBV-3373, 900 mg IV, AUCinf.
|
[1] |
| Maximum Observed Concentration (Cmax) | 4.7 | ug/mL |
Concentrations of ABBV-3373 over time, week 2.
|
[2] |
| Maximum Observed Concentration (Cmax) | 6.6 | ug/mL |
Concentrations of ABBV-3373 over time, week 6.
|
[2] |
| Maximum Observed Concentration (Cmax) | 5.6 | ug/mL |
Concentrations of ABBV-3373 over time, week 10.
|
[2] |
| Maximum Observed Concentration (Cmax) | 6.4 | ug/mL |
Concentrations of ABBV-3373 over time, week 12.
|
[2] |
| Maximum Observed Concentration (Cmax) | 3 | ug/mL |
Concentrations of ABBV-3373 over time, week 14.
|
[2] |
| Maximum Observed Concentration (Cmax) | 1 | ug/mL |
Concentrations of ABBV-3373 over time, week 16.
|
[2] |
| Maximum Observed Concentration (Cmax) | 0.3 | ug/mL |
Concentrations of ABBV-3373 over time, week 20.
|
[2] |
| Maximum Observed Concentration (Cmax) | 0.1 | ug/mL |
Concentrations of ABBV-3373 over time, week 24.
|
[2] |
Distribution
| Standard Type | Value | Units | Description | Reference |
|---|---|---|---|---|
| Volume of Distribution (Vd) | 3780 | mL |
Pharmacokinetic parameters of ABBV-3373, 30 mg IV.
|
[1] |
| Volume of Distribution (Vd) | 5010 | mL |
Pharmacokinetic parameters of ABBV-3373, 300 mg IV.
|
[1] |
| Volume of Distribution (Vd) | 5010 | mL |
Pharmacokinetic parameters of ABBV-3373, 900 mg IV.
|
[1] |
Excretion
| Standard Type | Value | Units | Description | Reference |
|---|---|---|---|---|
| Elimination Half-Life (t1/2) | 4.52 | day |
Pharmacokinetic parameters of ABBV-3373, 30 mg SC.
|
[1] |
| Elimination Half-Life (t1/2) | 3.09 | day |
Pharmacokinetic parameters of ABBV-3373, 100 mg SC.
|
[1] |
| Elimination Half-Life (t1/2) | 7.37 | day |
Pharmacokinetic parameters of ABBV-3373, 300 mg SC.
|
[1] |
| Elimination Half-Life (t1/2) | 4.44 | day |
Pharmacokinetic parameters of ABBV-3373, 30 mg IV.
|
[1] |
| Clearance (CL) | 22.8 | mL/h |
Pharmacokinetic parameters of ABBV-3373, 30 mg IV.
|
[1] |
| Elimination Half-Life (t1/2) | 6.61 | day |
Pharmacokinetic parameters of ABBV-3373, 300 mg IV.
|
[1] |
| Clearance (CL) | 16.6 | mL/h |
Pharmacokinetic parameters of ABBV-3373, 300 mg IV.
|
[1] |
| Elimination Half-Life (t1/2) | 7.73 | day |
Pharmacokinetic parameters of ABBV-3373, 900 mg IV.
|
[1] |
| Clearance (CL) | 16.2 | mL/h |
Pharmacokinetic parameters of ABBV-3373, 900 mg IV.
|
[1] |
General Information of The Activity Data Related to This ADC
Identified from the Human Clinical Data
Obtained from the Model Organism Data
Revealed Based on the Cell Line Data
Full List of Activity Data of This Antibody-drug Conjugate
Identified from the Human Clinical Data
| Experiment 1 Reporting the Activity Date of This ADC | [3] | ||||
| Patients Enrolled |
Inclusion criteria require confirmed RA (1987 ACR/2010 EULAR criteria) lasting >3 months, with ≥4 swollen/tender joints (28-count), DAS28-CRP ≥3.2, and inadequate MTX response (stable dose 15-25mg/week [≥10mg/week if intolerant] for ≥4 weeks). Exclusions include prior anti-TNF use (e.g., adalimumab) or non-anti-TNF biologics/tsDMARDs (unless used <3 months without efficacy/intolerability issues).
Click to Show/Hide
|
||||
| Administration Dosage |
Participants will be administered with 100 mg ABBV-3373 by intravenous infusion and placebo to adalimumab by subcutaneous injection every other week for 12 weeks. After 12 weeks, participants will receive placebo to adalimumab every other week until Week 22.
|
||||
| Related Clinical Trial | |||||
| NCT Number | NCT03823391 | Clinical Status | PHASE2 | ||
| Clinical Description | A Randomized, Double-Blind, Double-Dummy, Active Controlled Study to Evaluate the Safety, Tolerability, Pharmacokinetics, and Efficacy of ABBV-3373 in Subjects With Moderate to Severe Rheumatoid Arthritis | ||||
| Primary Endpoint |
The primary endpoint is the change from baseline to Week 12 in Disease Activity Score 28 (DAS28-CRP), a composite index evaluating tender/swollen joint counts (28 joints), patient global assessment (VAS 0-100mm), and hsCRP (mg/L). Scores range from 0.96-10 (higher=worse activity); negative change indicates improvement.
|
||||
| Other Endpoint |
Secondary endpoints include Week 12 changes in CDAI (sum of tender/swollen joints + patient/physician global assessments [VAS 0-10cm]; score 0-76), SDAI (CDAI+CRP; score 0-86), and DAS28-ESR (similar to DAS28-CRP but using ESR). Negative changes denote improvement. Additional measures: proportion achieving DAS28-CRP ≤3.2 (low disease activity) and American College of Rheumatology 50% (ACR50) response (≥50% improvement in joint counts + ≥3 of 5 key parameters).
Click to Show/Hide
|
||||
| Experiment 2 Reporting the Activity Date of This ADC | [4] | ||||
| Related Clinical Trial | |||||
| NCT Number | NCT03823391 | Clinical Status | Phase 2 | ||
| Clinical Description | A randomized, double-blind, double-dummy, active controlled study to evaluate the safety, tolerability, pharmacokinetics, and efficacy of ABBV-3373 in subjects with moderate to severe rheumatoid arthritis. | ||||
| Experiment 3 Reporting the Activity Date of This ADC | [5] | ||||
| Patients Enrolled |
RA (based on the 1987 American College of Rheumatology [ACR] classification criteria or 2010 ACR/EULAR criteria [16, 17]), with disease duration >3 months, and active disease defined as a Disease Activity Score in 28 joints using C-reactive protein (DAS28-CRP) (18) of 3.2 and 4 of 28 swollen joints and 4 of 28 tender joints.
|
||||
| Administration Dosage |
Intravenously (IV) ABBV-3373 100 mg every other week for 12 weeks, followed by placebo for 12 weeks, or subcutaneous adalimumab 80 mg every other week for 24 weeks.
|
||||
| Related Clinical Trial | |||||
| NCT Number | NCT03823391 | Clinical Status | Phase 2 | ||
| Clinical Description | A randomized, double-blind, double-dummy, active controlled study to evaluate the safety, tolerability, pharmacokinetics, and efficacy of ABBV-3373 in subjects with moderate to severe rheumatoid arthritis. | ||||
| Primary Endpoint |
48 patients were randomized to ABBV-3373 (n=31) or adalimumab (n=17). At week 12, ABBV-3373 reduced DAS28 (CRP) versus historical adalimumab (2.65 versus 2.13; P=0.022) and combined in-trial/historical adalimumab (2.65 versus 2.29; probability=89.9%), with numerically greater improvement than in-trial adalimumab (2.51).
|
||||
| Other Endpoint |
For secondary endpoints, greater efficacy was observed with ABBV-3373 versus historical adalimumab; ABBV-3373 was predicted with 79.30-99.50% probability to be better than adalimumab based on combined in-trial/historical adalimumab data.
|
||||
Obtained from the Model Organism Data
| Experiment 1 Reporting the Activity Date of This ADC | [6] | ||||
| Efficacy Data | Paw swelling AUC | 81% | Positive TNF expression (TNF+++/++) | ||
| Method Description |
To evaluate the impact of the anti-mTNF GRM ADCs on inflammation in a chronic inflammatory setting,we progressed several ADCs into a mouse collagen-induced arthritis (mCIA) model. A single 3 mg/kg dose of the ADC was given at the first clinical signs of disease,a time point of intervention where anti-TNF treatment has a moderate impact.
|
||||
| In Vivo Model | Collagen-induced arthritis (mCIA) model | ||||
| Experiment 2 Reporting the Activity Date of This ADC | [6] | ||||
| Efficacy Data | Paw swelling AUC | 98% | Positive TNF expression (TNF+++/++) | ||
| Method Description |
To evaluate the impact of the anti-mTNF GRM ADCs on inflammation in a chronic inflammatory setting,we progressed several ADCs into a mouse collagen-induced arthritis (mCIA) model. A single 10 mg/kg dose of the ADC was given at the first clinical signs of disease,a time point of intervention where anti-TNF treatment has a moderate impact.
|
||||
| In Vivo Model | Collagen-induced arthritis (mCIA) model | ||||
| Experiment 3 Reporting the Activity Date of This ADC | [6] | ||||
| Efficacy Data | P1NP inhibition | 0% | Positive TNF expression (TNF+++/++) | ||
| Method Description |
In an acute in vivo model of contact hypersensitivity (CHS) mice were sensitized with fluorescein isothiocyanate (FITC) on the abdomen and challenged 6 days later with FITC on the ear,which resulted in an increase in ear swelling that was measured 24 h postchallenge. Anti-mTNF GRM ADCs were dosed at either 3 mg/kg once prior to FITC sensitization. Mice were challenged with adrenocorticotropic hormone (ACTH) 72 h following ADC dosing and plasma was collected 30 min later to assess P1NP level.
Click to Show/Hide
|
||||
| In Vivo Model | Acute contact hypersensitivity (CHS) model | ||||
| Experiment 4 Reporting the Activity Date of This ADC | [6] | ||||
| Efficacy Data | P1NP inhibition | 19% | Positive TNF expression (TNF+++/++) | ||
| Method Description |
In an acute in vivo model of contact hypersensitivity (CHS) mice were sensitized with fluorescein isothiocyanate (FITC) on the abdomen and challenged 6 days later with FITC on the ear,which resulted in an increase in ear swelling that was measured 24 h postchallenge. Anti-mTNF GRM ADCs were dosed at either 10 mg/kg once prior to FITC sensitization. Mice were challenged with adrenocorticotropic hormone (ACTH) 72 h following ADC dosing and plasma was collected 30 min later to assess P1NP level.
Click to Show/Hide
|
||||
| In Vivo Model | Acute contact hypersensitivity (CHS) model | ||||
| Experiment 5 Reporting the Activity Date of This ADC | [6] | ||||
| Efficacy Data | Ear swelling inhibition | 55% | Positive TNF expression (TNF+++/++) | ||
| Method Description |
In an acute in vivo model of contact hypersensitivity (CHS) mice were sensitized with fluorescein isothiocyanate (FITC) on the abdomen and challenged 6 days later with FITC on the ear,which resulted in an increase in ear swelling that was measured 24 h postchallenge. Anti-mTNF GRM ADCs were dosed at either 3 mg/kg once prior to FITC sensitization.
|
||||
| In Vivo Model | Fluorescein isothiocyanate (FITC)-induced CHS model | ||||
| Experiment 6 Reporting the Activity Date of This ADC | [6] | ||||
| Efficacy Data | Ear swelling inhibition | 88% | Positive TNF expression (TNF+++/++) | ||
| Method Description |
In an acute in vivo model of contact hypersensitivity (CHS) mice were sensitized with fluorescein isothiocyanate (FITC) on the abdomen and challenged 6 days later with FITC on the ear,which resulted in an increase in ear swelling that was measured 24 h postchallenge. Anti-mTNF GRM ADCs were dosed at either 10 mg/kg once prior to FITC sensitization.
|
||||
| In Vivo Model | Fluorescein isothiocyanate (FITC)-induced CHS model | ||||
| Experiment 7 Reporting the Activity Date of This ADC | [6] | ||||
| Efficacy Data | Corticosterone inhibition | 6% | Positive TNF expression (TNF+++/++) | ||
| Method Description |
In an acute in vivo model of contact hypersensitivity (CHS) mice were sensitized with fluorescein isothiocyanate (FITC) on the abdomen and challenged 6 days later with FITC on the ear,which resulted in an increase in ear swelling that was measured 24 h postchallenge. Anti-mTNF GRM ADCs were dosed at either 3 mg/kg once prior to FITC sensitization. Mice were challenged with adrenocorticotropic hormone (ACTH) 72 h following ADC dosing and plasma was collected 30 min later to assess corticosterone level.
Click to Show/Hide
|
||||
| In Vivo Model | Acute contact hypersensitivity (CHS) model | ||||
| Experiment 8 Reporting the Activity Date of This ADC | [6] | ||||
| Efficacy Data | Corticosterone inhibition | 15% | Positive TNF expression (TNF+++/++) | ||
| Method Description |
In an acute in vivo model of contact hypersensitivity (CHS) mice were sensitized with fluorescein isothiocyanate (FITC) on the abdomen and challenged 6 days later with FITC on the ear,which resulted in an increase in ear swelling that was measured 24 h postchallenge. Anti-mTNF GRM ADCs were dosed at either 10 mg/kg once prior to FITC sensitization. Mice were challenged with adrenocorticotropic hormone (ACTH) 72 h following ADC dosing and plasma was collected 30 min later to assess corticosterone level.
Click to Show/Hide
|
||||
| In Vivo Model | Acute contact hypersensitivity (CHS) model | ||||
Revealed Based on the Cell Line Data
| Experiment 1 Reporting the Activity Date of This ADC | [6] | ||||
| Efficacy Data | Half Maximal Effective Concentration (EC50) | 0.08 ug/mL | Positive TNF expression (TNF+++/++) | ||
| Method Description |
All the DAR purified ADCs were screened in both the TNF-expressing and wild-type K562 GRE reporter cell assay to confirm that their activity was consistent with ADCs having heterogeneous average DAR.
|
||||
| In Vitro Model | Chronic myelogenous leukemia | K-562 cells (TNF expression) | CVCL_0004 | ||
| Experiment 2 Reporting the Activity Date of This ADC | [6] | ||||
| Efficacy Data | Half Maximal Effective Concentration (EC50) | 5.8 ug/mL | Negative TNF expression (TNF-) | ||
| Method Description |
All the DAR purified ADCs were screened in both the TNF-expressing and wild-type K562 GRE reporter cell assay to confirm that their activity was consistent with ADCs having heterogeneous average DAR.
|
||||
| In Vitro Model | Chronic myelogenous leukemia | K-562 cells | CVCL_0004 | ||
References