Antigen Information
General Information of This Antigen
| Antigen ID | TAR0BKUOF |
|||||
|---|---|---|---|---|---|---|
| Antigen Name | B-lymphocyte antigen CD20 (MS4A1) |
|||||
| Gene Name | MS4A1 |
|||||
| Gene ID | ||||||
| Synonym | CD20; B-lymphocyte surface antigen B1;Bp35;Leukocyte surface antigen Leu-16;Membrane-spanning 4-domains subfamily A member 1;CD_antigen=CD20 |
|||||
| Sequence |
MTTPRNSVNGTFPAEPMKGPIAMQSGPKPLFRRMSSLVGPTQSFFMRESKTLGAVQIMNG
LFHIALGGLLMIPAGIYAPICVTVWYPLWGGIMYIISGSLLAATEKNSRKCLVKGKMIMN SLSLFAAISGMILSIMDILNIKISHFLKMESLNFIRAHTPYINIYNCEPANPSEKNSPST QYCYSIQSLFLGILSVMLIFAFFQELVIAGIVENEWKRTCSRPKSNIVLLSAEEKKEQTI EIKEEVVGLTETSSQPKNEEDIEIIPIQEEEEEETETNFPEPPQDQESSPIENDSSP Click to Show/Hide
|
|||||
| Family | MHC class II family |
|||||
| Function |
B-lymphocyte-specific membrane protein that plays a role in the regulation of cellular calcium influx necessary for the development, differentiation, and activation of B-lymphocytes. Functions as a store-operated calcium (SOC) channel component promoting calcium influx after activation by the B-cell receptor/BCR.
Click to Show/Hide
|
|||||
| Uniprot Entry | ||||||
| HGNC ID | ||||||
| KEGG ID | ||||||
Each Antibody-drug Conjuate AND It's Component Related to This Antigen
Full List of The ADC Related to This Antigen
CD20-A Anti-ody
| ADC Info | ADC Name | Payload | Target | Linker | Ref |
|---|---|---|---|---|---|
CD20-A Antibody-Compound (Ie) |
CD20-A Antibody-Compound (Ie) payload |
Undisclosed |
CD20-A Antibody-Compound (Ie) linker |
[1] | |
CD20-A Antibody-Compound (Ii) |
CD20-A Antibody-Compound (Ii) payload |
Undisclosed |
CD20-A Antibody-Compound (Ii) linker |
[1] | |
CD20-A Antibody-Compound (X) |
CD20-A Antibody-Compound (X) payload |
Undisclosed |
CD20-A Antibody-Compound (X) linker |
[1] | |
CD20-A Antibody-Compound (XI) |
CD20-A Antibody-Compound (XI) payload |
Undisclosed |
CD20-A Antibody-Compound (XI) linker |
[1] | |
CD20-A Antibody-Compound (XIV) |
CD20-A Antibody-Compound (XIV) payload |
Undisclosed |
CD20-A Antibody-Compound (XIV) linker |
[1] | |
CD20-A Antibody-Compound (XIX) |
CD20-A Antibody-Compound (XIX) payload |
Undisclosed |
CD20-A Antibody-Compound (XIX) linker |
[1] | |
CD20-A Antibody-Compound (XL) |
CD20-A Antibody-Compound (XL) payload |
Undisclosed |
CD20-A Antibody-Compound (XL) linker |
[1] | |
CD20-A Antibody-Compound (XLI) |
CD20-A Antibody-Compound (XLI) payload |
Undisclosed |
CD20-A Antibody-Compound (XLI) linker |
[1] | |
CD20-A Antibody-Compound (XLII) |
CD20-A Antibody-Compound (XLII) payload |
Undisclosed |
CD20-A Antibody-Compound (XLII) linker |
[1] | |
CD20-A Antibody-Compound (XLIII) |
CD20-A Antibody-Compound (XLIII) payload |
Undisclosed |
CD20-A Antibody-Compound (XLIII) linker |
[1] | |
CD20-A Antibody-Compound (XV) |
CD20-A Antibody-Compound (XV) payload |
Undisclosed |
CD20-A Antibody-Compound (XV) linker |
[1] | |
CD20-A Antibody-Compound (XVI) |
CD20-A Antibody-Compound (XIX) payload |
Undisclosed |
CD20-A Antibody-Compound (XIX) linker |
[1] | |
CD20-A Antibody-Compound (XVIII) |
CD20-A Antibody-Compound (XVIII) payload |
Undisclosed |
CD20-A Antibody-Compound (XVIII) linker |
[1] |
Chimeric Anti-CD20 mAb
| ADC Info | ADC Name | Payload | Target | Linker | Ref |
|---|---|---|---|---|---|
MRG-001 |
Monomethyl auristatin E |
Microtubule (MT) |
Mc-Val-Cit-PABC |
[2] |
Ibritumomab
| ADC Info | ADC Name | Payload | Target | Linker | Ref |
|---|---|---|---|---|---|
Ibritumomab-Compound 17 |
Mertansine DM4 |
Microtubule (MT) |
Ibritumomab-Compound 17 linker |
[3] | |
Ibritumomab-Compound 25 |
Monomethyl auristatin E |
Microtubule (MT) |
Ibritumomab-Compound 25 linker |
[3] | |
Ibritumomab-Compound 31 |
Auristatin 0101 |
Microtubule (MT) |
Ibritumomab-Compound 31 linker |
[3] | |
Ibritumomab-Compound 36 |
Monomethyl auristatin E |
Microtubule (MT) |
Ibritumomab-Compound 36 linker |
[3] | |
Ibritumomab-Compound 43 |
PBD dimer |
Human Deoxyribonucleic acid (hDNA) |
Ibritumomab-Compound 43 linker |
[3] | |
Ibritumomab-Compound 49 |
PBD dimer |
Human Deoxyribonucleic acid (hDNA) |
Ibritumomab-Compound 49 linker |
[3] | |
Ibritumomab-Compound 55 |
Mertansine DM1 |
Microtubule (MT) |
Ibritumomab-Compound 55 linker |
[3] | |
Ibritumomab-Compound 59 |
Mertansine DM4 |
Microtubule (MT) |
Ibritumomab-Compound 59 linker |
[3] | |
Ibritumomab-Compound 64 |
Monomethyl auristatin E |
Microtubule (MT) |
Ibritumomab-Compound 64 linker |
[3] | |
Ibritumomab-Compound 69 |
Monomethyl auristatin E |
Microtubule (MT) |
Ibritumomab-Compound 69 linker |
[3] | |
Ibritumomab-Compound 74 |
PBD dimer |
Human Deoxyribonucleic acid (hDNA) |
Ibritumomab-Compound 74 linker |
[3] | |
Ibritumomab-Compound 75 |
Monomethyl auristatin E |
Microtubule (MT) |
Ibritumomab-Compound 75 linker |
[3] | |
Ibritumomab-Compound 76 |
Monomethyl auristatin E |
Microtubule (MT) |
Ibritumomab-Compound 76 linker |
[3] | |
Ibritumomab-Compound 77 |
Mertansine DM1 |
Microtubule (MT) |
Ibritumomab-Compound 77 linker |
[3] | |
Ibritumomab-Compound 78 |
Auristatin 0101 |
Microtubule (MT) |
Ibritumomab-Compound 78 linker |
[3] | |
Ibritumomab-Compound 79 |
Auristatin 0101 |
Microtubule (MT) |
Ibritumomab-Compound 79 linker |
[3] | |
Ibritumomab-Compound 80 |
Mertansine DM4 |
Microtubule (MT) |
Ibritumomab-Compound 80 linker |
[3] | |
Ibritumomab-Compound 9 |
Mertansine DM1 |
Microtubule (MT) |
Ibritumomab-Compound 9 linker |
[3] |
Ofatumumab
| ADC Info | ADC Name | Payload | Target | Linker | Ref |
|---|---|---|---|---|---|
Ofatumumab-Compound 17 |
Mertansine DM4 |
Microtubule (MT) |
Ofatumumab-Compound 17 linker |
[3] | |
Ofatumumab-Compound 25 |
Monomethyl auristatin E |
Microtubule (MT) |
Ofatumumab-Compound 25 linker |
[3] | |
Ofatumumab-Compound 31 |
Auristatin 0101 |
Microtubule (MT) |
Ofatumumab-Compound 31 linker |
[3] | |
Ofatumumab-Compound 36 |
Monomethyl auristatin E |
Microtubule (MT) |
Ofatumumab-Compound 36 linker |
[3] | |
Ofatumumab-Compound 43 |
PBD dimer |
Human Deoxyribonucleic acid (hDNA) |
Ofatumumab-Compound 43 linker |
[3] | |
Ofatumumab-Compound 49 |
PBD dimer |
Human Deoxyribonucleic acid (hDNA) |
Ofatumumab-Compound 49 linker |
[3] | |
Ofatumumab-Compound 55 |
Mertansine DM1 |
Microtubule (MT) |
Ofatumumab-Compound 55 linker |
[3] | |
Ofatumumab-Compound 59 |
Mertansine DM4 |
Microtubule (MT) |
Ofatumumab-Compound 59 linker |
[3] | |
Ofatumumab-Compound 64 |
Monomethyl auristatin E |
Microtubule (MT) |
Ofatumumab-Compound 64 linker |
[3] | |
Ofatumumab-Compound 69 |
Monomethyl auristatin E |
Microtubule (MT) |
Ofatumumab-Compound 69 linker |
[3] | |
Ofatumumab-Compound 74 |
PBD dimer |
Human Deoxyribonucleic acid (hDNA) |
Ofatumumab-Compound 74 linker |
[3] | |
Ofatumumab-Compound 75 |
Monomethyl auristatin E |
Microtubule (MT) |
Ofatumumab-Compound 75 linker |
[3] | |
Ofatumumab-Compound 76 |
Monomethyl auristatin E |
Microtubule (MT) |
Ofatumumab-Compound 76 linker |
[3] | |
Ofatumumab-Compound 77 |
Mertansine DM1 |
Microtubule (MT) |
Ofatumumab-Compound 77 linker |
[3] | |
Ofatumumab-Compound 78 |
Auristatin 0101 |
Microtubule (MT) |
Ofatumumab-Compound 78 linker |
[3] | |
Ofatumumab-Compound 79 |
Auristatin 0101 |
Microtubule (MT) |
Ofatumumab-Compound 79 linker |
[3] | |
Ofatumumab-Compound 80 |
Mertansine DM4 |
Microtubule (MT) |
Ofatumumab-Compound 80 linker |
[3] | |
Ofatumumab-Compound 9 |
Mertansine DM1 |
Microtubule (MT) |
Ofatumumab-Compound 9 linker |
[3] |
Rituximab
| ADC Info | ADC Name | Payload | Target | Linker | Ref |
|---|---|---|---|---|---|
CON-4619 |
Undisclosed |
Unclear |
Undisclosed |
[4] | |
CN109310885B ADC-7 |
CN109310885B ADC-7 payload |
Undisclosed |
CN109310885B ADC-7 linker |
[5] | |
CN109310885B ADC-8 |
CN109310885B ADC-8 payload |
Undisclosed |
CN109310885B ADC-8 linker |
[5] | |
EDC-9 |
Undisclosed |
Undisclosed |
Undisclosed |
[6] | |
Rituximab-Compound (Ie) |
Rituximab-Compound (Ie) payload |
Undisclosed |
Rituximab-Compound (Ie) linker |
[1] | |
Rituximab-Compound (Ii) |
Rituximab-Compound (Ii) payload |
Undisclosed |
Rituximab-Compound (Ii) linker |
[1] | |
Rituximab-Compound (la) DAR 4 |
NeoDegrader P1 |
Protein cereblon (CRBN) |
Rituximab-Compound (la) linker |
[7] | |
Rituximab-Compound (la) DAR 8 |
NeoDegrader P1 |
Protein cereblon (CRBN) |
Rituximab-Compound (la) linker |
[7] | |
Rituximab-Compound (lc) |
NeoDegrader P4 |
Protein cereblon (CRBN) |
Rituximab-Compound (lc) linker |
[7] | |
Rituximab-Compound (le) |
NeoDegrader P1 |
Protein cereblon (CRBN) |
Rituximab-Compound (le) linker |
[7] | |
Rituximab-Compound (lf) |
NeoDegrader P6 |
Protein cereblon (CRBN) |
Rituximab-Compound (lf) linker |
[7] | |
Rituximab-Compound (lg) |
NeoDegrader P2 |
Protein cereblon (CRBN) |
Rituximab-Compound (lg) linker |
[7] | |
Rituximab-Compound (lh) |
NeoDegrader P13 |
Protein cereblon (CRBN) |
Rituximab-Compound (lh) linker |
[7] | |
Rituximab-Compound (li) |
NeoDegrader P1 |
Protein cereblon (CRBN) |
Rituximab-Compound (li) linker |
[7] | |
Rituximab-Compound (lj) |
NeoDegrader P1 |
Protein cereblon (CRBN) |
Rituximab-Compound (lj) linker |
[7] | |
Rituximab-Compound (lk) |
NeoDegrader P14 |
Protein cereblon (CRBN) |
Rituximab-Compound (lk) linker |
[7] | |
Rituximab-Compound (ll) |
NeoDegrader P14 |
Protein cereblon (CRBN) |
Rituximab-Compound (ll) linker |
[7] | |
Rituximab-Compound (lm) |
NeoDegrader P14 |
Protein cereblon (CRBN) |
Rituximab-Compound (lm) linker |
[7] | |
Rituximab-Compound (X) |
Rituximab-Compound (X) payload |
Undisclosed |
Rituximab-Compound (X) linker |
[1] | |
Rituximab-Compound (XI) |
Rituximab-Compound (XI) payload |
Undisclosed |
Rituximab-Compound (XI) linker |
[1] | |
Rituximab-Compound (XIV) |
Rituximab-Compound (XIV) payload |
Undisclosed |
Rituximab-Compound (XIV) linker |
[1] | |
Rituximab-Compound (XIX) |
Rituximab-Compound (XIX) payload |
Undisclosed |
Rituximab-Compound (XIX) linker |
[1] | |
Rituximab-Compound (XL) |
Rituximab-Compound (XL) payload |
Undisclosed |
Rituximab-Compound (XL) linker |
[1] | |
Rituximab-Compound (XLI) |
Rituximab-Compound (XLI) payload |
Undisclosed |
Rituximab-Compound (XLI) linker |
[1] | |
Rituximab-Compound (XLII) |
Rituximab-Compound (XLII) payload |
Undisclosed |
Rituximab-Compound (XLII) linker |
[1] | |
Rituximab-Compound (XLIII) |
Rituximab-Compound (XLIII) payload |
Undisclosed |
Rituximab-Compound (XLIII) linker |
[1] | |
Rituximab-Compound (XV) |
Rituximab-Compound (XV) payload |
Undisclosed |
Rituximab-Compound (XV) linker |
[1] | |
Rituximab-Compound (XVI) |
Rituximab-Compound (XIX) payload |
Undisclosed |
Rituximab-Compound (XIX) linker |
[1] | |
Rituximab-Compound (XVIII) |
Rituximab-Compound (XVIII) payload |
Undisclosed |
Rituximab-Compound (XVIII) linker |
[1] | |
Rituximab-Compound 17 |
Mertansine DM4 |
Microtubule (MT) |
Rituximab-Compound 17 linker |
[3] | |
Rituximab-Compound 25 |
Monomethyl auristatin E |
Microtubule (MT) |
Rituximab-Compound 25 linker |
[3] | |
Rituximab-Compound 31 |
Auristatin 0101 |
Microtubule (MT) |
Rituximab-Compound 31 linker |
[3] | |
Rituximab-Compound 36 |
Monomethyl auristatin E |
Microtubule (MT) |
Rituximab-Compound 36 linker |
[3] | |
Rituximab-Compound 43 |
PBD dimer |
Human Deoxyribonucleic acid (hDNA) |
Rituximab-Compound 43 linker |
[3] | |
Rituximab-Compound 49 |
PBD dimer |
Human Deoxyribonucleic acid (hDNA) |
Rituximab-Compound 49 linker |
[3] | |
Rituximab-Compound 55 |
Mertansine DM1 |
Microtubule (MT) |
Rituximab-Compound 55 linker |
[3] | |
Rituximab-Compound 59 |
Mertansine DM4 |
Microtubule (MT) |
Rituximab-Compound 59 linker |
[3] | |
Rituximab-Compound 64 |
Monomethyl auristatin E |
Microtubule (MT) |
Rituximab-Compound 64 linker |
[3] | |
Rituximab-Compound 69 |
Monomethyl auristatin E |
Microtubule (MT) |
Rituximab-Compound 69 linker |
[3] | |
Rituximab-Compound 74 |
PBD dimer |
Human Deoxyribonucleic acid (hDNA) |
Rituximab-Compound 74 linker |
[3] | |
Rituximab-Compound 75 |
Monomethyl auristatin E |
Microtubule (MT) |
Rituximab-Compound 75 linker |
[3] | |
Rituximab-Compound 76 |
Monomethyl auristatin E |
Microtubule (MT) |
Rituximab-Compound 76 linker |
[3] | |
Rituximab-Compound 77 |
Mertansine DM1 |
Microtubule (MT) |
Rituximab-Compound 77 linker |
[3] | |
Rituximab-Compound 78 |
Auristatin 0101 |
Microtubule (MT) |
Rituximab-Compound 78 linker |
[3] | |
Rituximab-Compound 79 |
Auristatin 0101 |
Microtubule (MT) |
Rituximab-Compound 79 linker |
[3] | |
Rituximab-Compound 80 |
Mertansine DM4 |
Microtubule (MT) |
Rituximab-Compound 80 linker |
[3] | |
Rituximab-Compound 9 |
Mertansine DM1 |
Microtubule (MT) |
Rituximab-Compound 9 linker |
[3] | |
Rituximab-DNA conjugate |
DNA mimics |
Human Deoxyribonucleic acid (hDNA) |
Undisclosed |
[8] | |
WO2017089890A1 ADC70 |
Monomethyl auristatin F |
Microtubule (MT) |
WO2017089890A1_ADC70 linker |
[9] | |
WO2017089890A1 ADC71 |
Monomethyl auristatin E |
Microtubule (MT) |
WO2017089890A1_ADC71 linker |
[9] | |
WO2017089890A1 ADC72 |
Monomethyl auristatin F |
Microtubule (MT) |
WO2017089890A1_ADC72 linker |
[9] | |
WO2017089895A1 ADC70 |
Monomethyl auristatin F |
Microtubule (MT) |
WO2017089895A1_ADC70 linker |
[10] | |
WO2017089895A1 ADC71 |
Monomethyl auristatin E |
Microtubule (MT) |
WO2017089895A1_ADC71 linker |
[10] | |
WO2017089895A1 ADC72 |
Monomethyl auristatin F |
Microtubule (MT) |
WO2017089895A1_ADC72 linker |
[10] |
Tositumomab
| ADC Info | ADC Name | Payload | Target | Linker | Ref |
|---|---|---|---|---|---|
Tositumomab-Compound 17 |
Mertansine DM4 |
Microtubule (MT) |
Tositumomab-Compound 17 linker |
[3] | |
Tositumomab-Compound 25 |
Monomethyl auristatin E |
Microtubule (MT) |
Tositumomab-Compound 25 linker |
[3] | |
Tositumomab-Compound 31 |
Auristatin 0101 |
Microtubule (MT) |
Tositumomab-Compound 31 linker |
[3] | |
Tositumomab-Compound 36 |
Monomethyl auristatin E |
Microtubule (MT) |
Tositumomab-Compound 36 linker |
[3] | |
Tositumomab-Compound 43 |
PBD dimer |
Human Deoxyribonucleic acid (hDNA) |
Tositumomab-Compound 43 linker |
[3] | |
Tositumomab-Compound 49 |
PBD dimer |
Human Deoxyribonucleic acid (hDNA) |
Tositumomab-Compound 49 linker |
[3] | |
Tositumomab-Compound 55 |
Mertansine DM1 |
Microtubule (MT) |
Tositumomab-Compound 55 linker |
[3] | |
Tositumomab-Compound 59 |
Mertansine DM4 |
Microtubule (MT) |
Tositumomab-Compound 59 linker |
[3] | |
Tositumomab-Compound 64 |
Monomethyl auristatin E |
Microtubule (MT) |
Tositumomab-Compound 64 linker |
[3] | |
Tositumomab-Compound 69 |
Monomethyl auristatin E |
Microtubule (MT) |
Tositumomab-Compound 69 linker |
[3] | |
Tositumomab-Compound 74 |
PBD dimer |
Human Deoxyribonucleic acid (hDNA) |
Tositumomab-Compound 74 linker |
[3] | |
Tositumomab-Compound 75 |
Monomethyl auristatin E |
Microtubule (MT) |
Tositumomab-Compound 75 linker |
[3] | |
Tositumomab-Compound 76 |
Monomethyl auristatin E |
Microtubule (MT) |
Tositumomab-Compound 76 linker |
[3] | |
Tositumomab-Compound 77 |
Mertansine DM1 |
Microtubule (MT) |
Tositumomab-Compound 77 linker |
[3] | |
Tositumomab-Compound 78 |
Auristatin 0101 |
Microtubule (MT) |
Tositumomab-Compound 78 linker |
[3] | |
Tositumomab-Compound 79 |
Auristatin 0101 |
Microtubule (MT) |
Tositumomab-Compound 79 linker |
[3] | |
Tositumomab-Compound 80 |
Mertansine DM4 |
Microtubule (MT) |
Tositumomab-Compound 80 linker |
[3] | |
Tositumomab-Compound 9 |
Mertansine DM1 |
Microtubule (MT) |
Tositumomab-Compound 9 linker |
[3] |
Veltuzumab
| ADC Info | ADC Name | Payload | Target | Linker | Ref |
|---|---|---|---|---|---|
Veltuzumab-CL2E-SN-38 |
Active metabolite of irinotecan SN38 |
DNA topoisomerase 1 (TOP1) |
CL2E |
[11] | |
Veltuzumab-SN-38 |
Active metabolite of irinotecan SN38 |
DNA topoisomerase 1 (TOP1) |
CL2A |
[11] |
Undisclosed
| ADC Info | ADC Name | Payload | Target | Linker | Ref |
|---|---|---|---|---|---|
TRS-005 |
Monomethyl auristatin E |
Microtubule (MT) |
Mc-Val-Cit-PABC |
[12] | |
APEC-1 |
Undisclosed |
Undisclosed |
Undisclosed |
[13] | |
B-1452 |
Monomethyl auristatin E |
Microtubule (MT) |
Mc-Val-Cit-PABC |
[14] |
Tissue/Disease specific Abundances of This Antigen
Tissue specific Abundances of This Antigen
ICD Disease Classification 01
| Differential expression pattern of antigen in diseases | ||
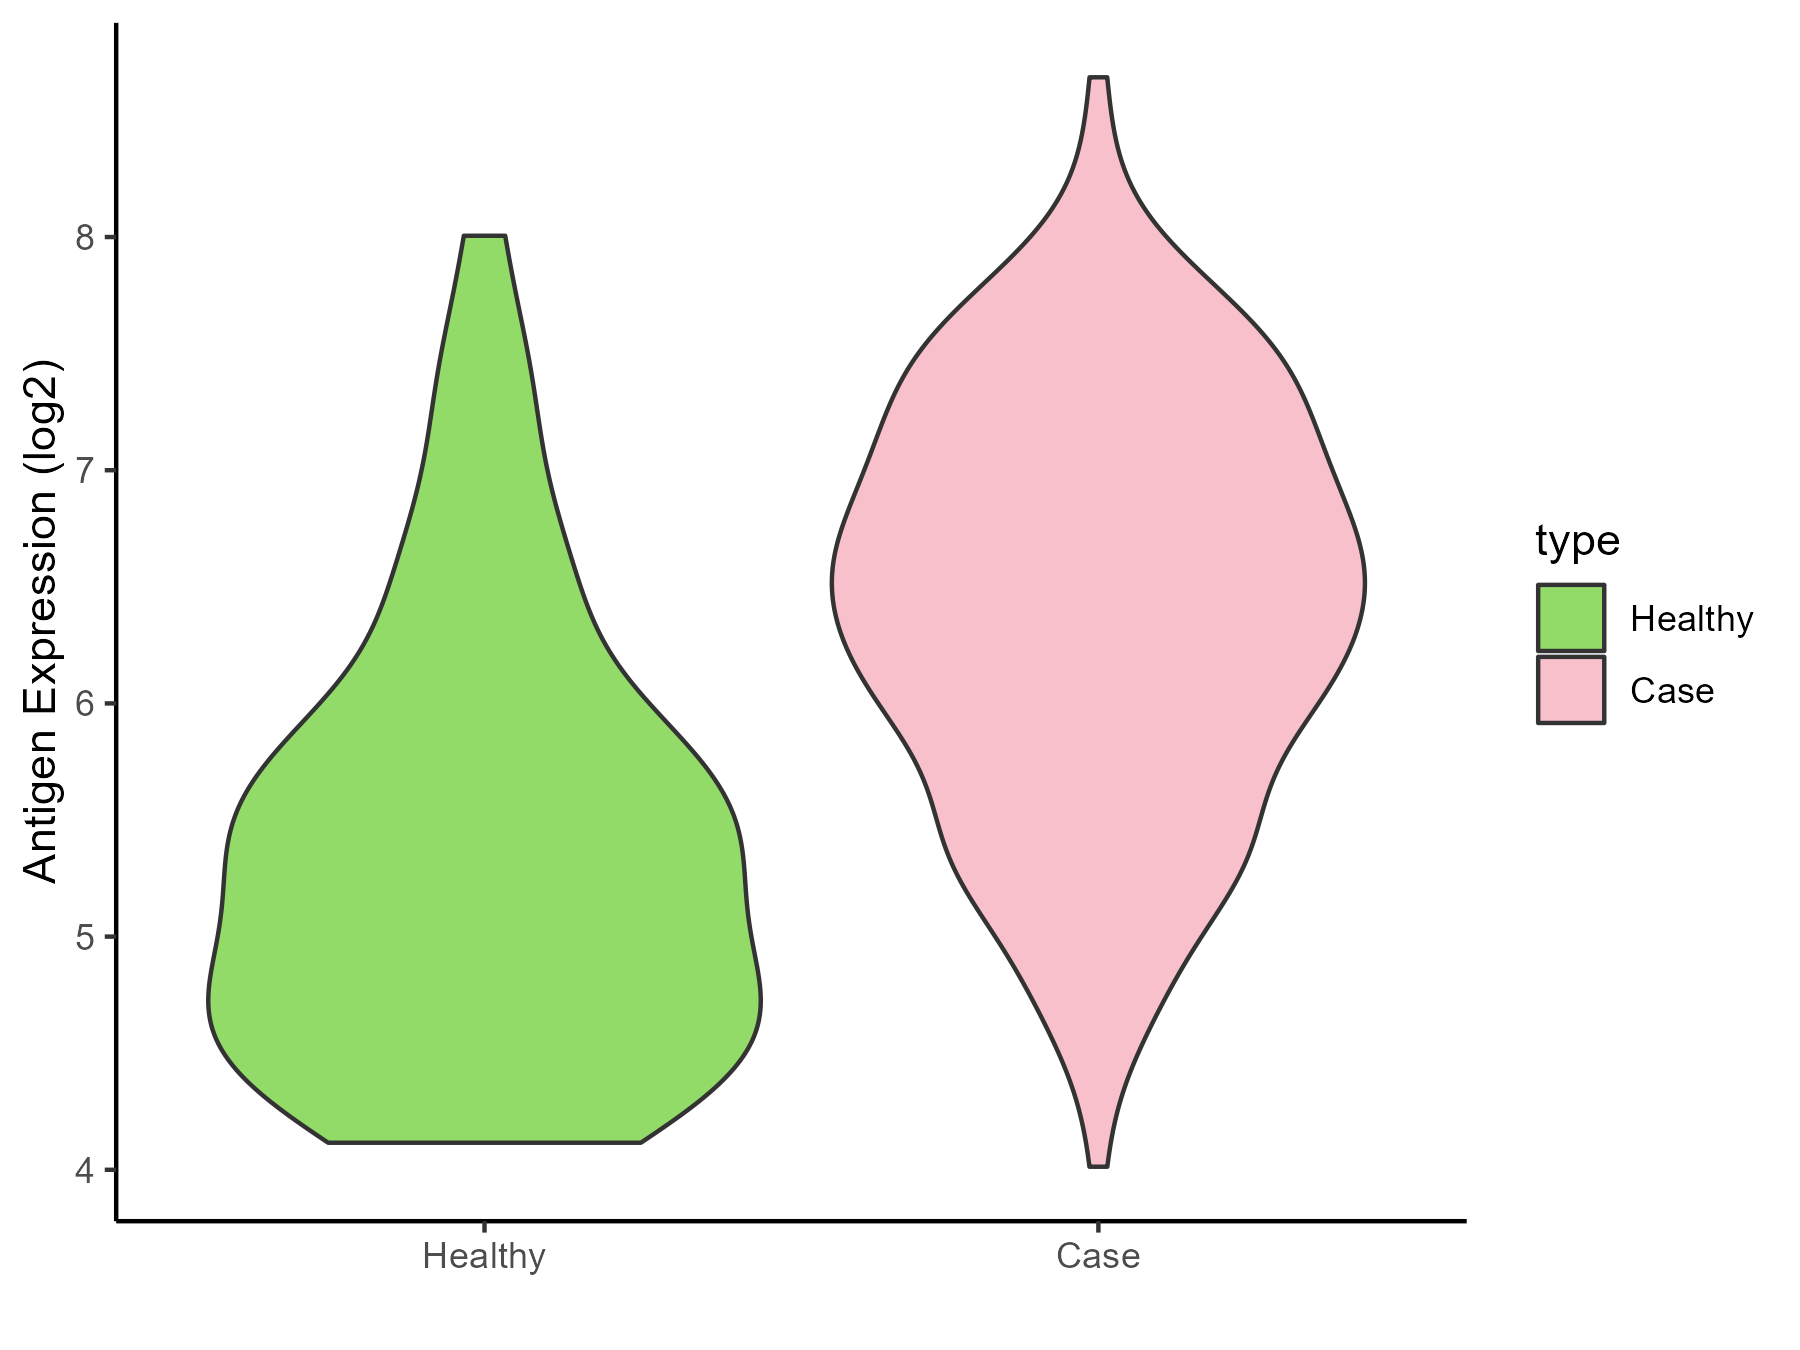
| The Studied Tissue | Gingival | |
| The Specific Disease | Bacterial infection of gingival | |
| The Expression Level of Disease Section Compare with the Healthy Individual Tissue | p-value: 6.40E-12; Fold-change: 1.216703593; Z-score: 1.315769335 | |
| Disease-specific Antigen Abundances |
|
Click to View the Clearer Original Diagram |
ICD Disease Classification 02
| Differential expression pattern of antigen in diseases | ||
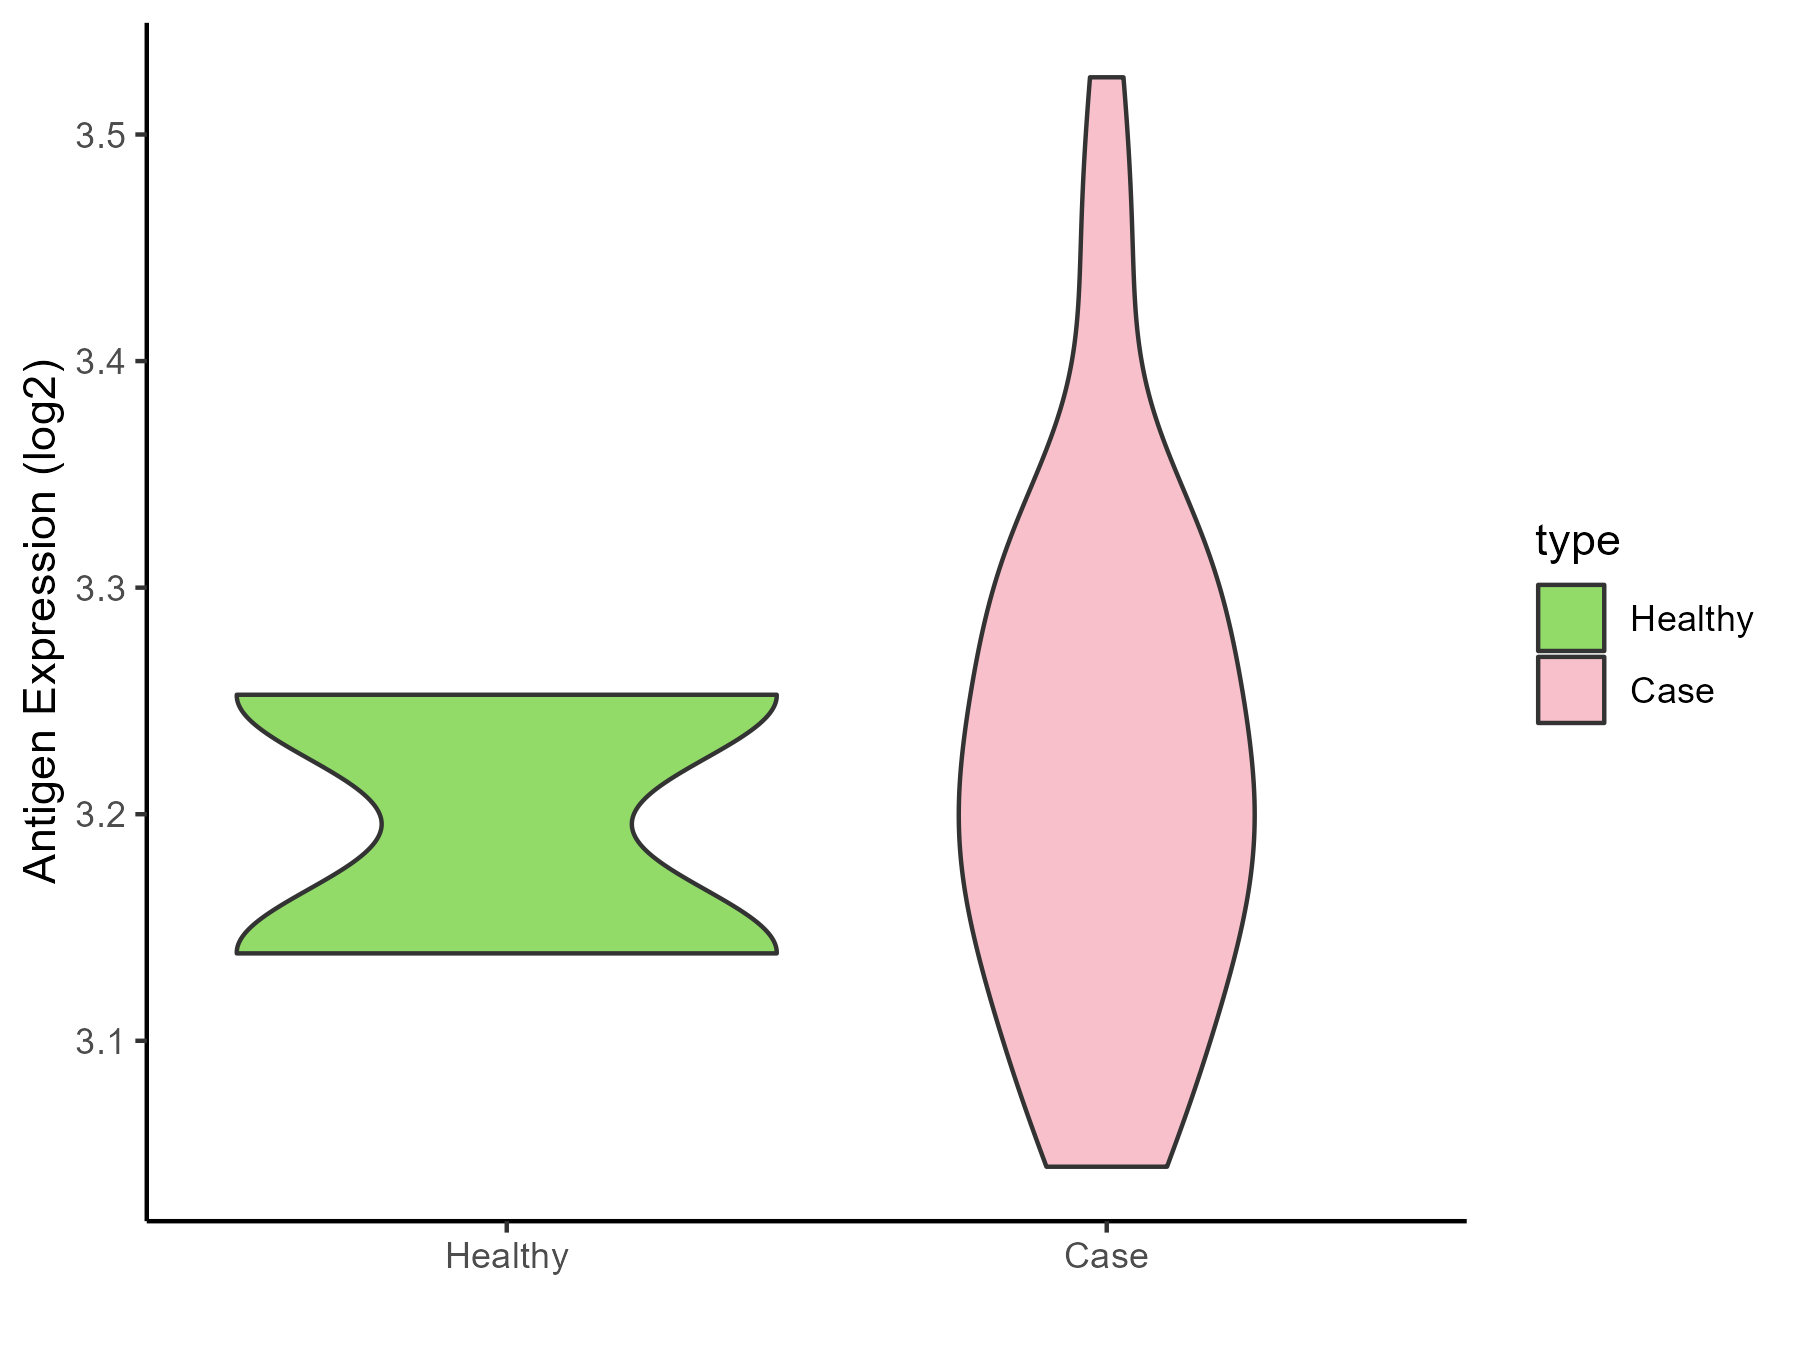
| The Studied Tissue | Brainstem | |
| The Specific Disease | Glioma | |
| The Expression Level of Disease Section Compare with the Healthy Individual Tissue | p-value: 0.712709155; Fold-change: 0.014223714; Z-score: 0.176213606 | |
| Disease-specific Antigen Abundances |
|
Click to View the Clearer Original Diagram |
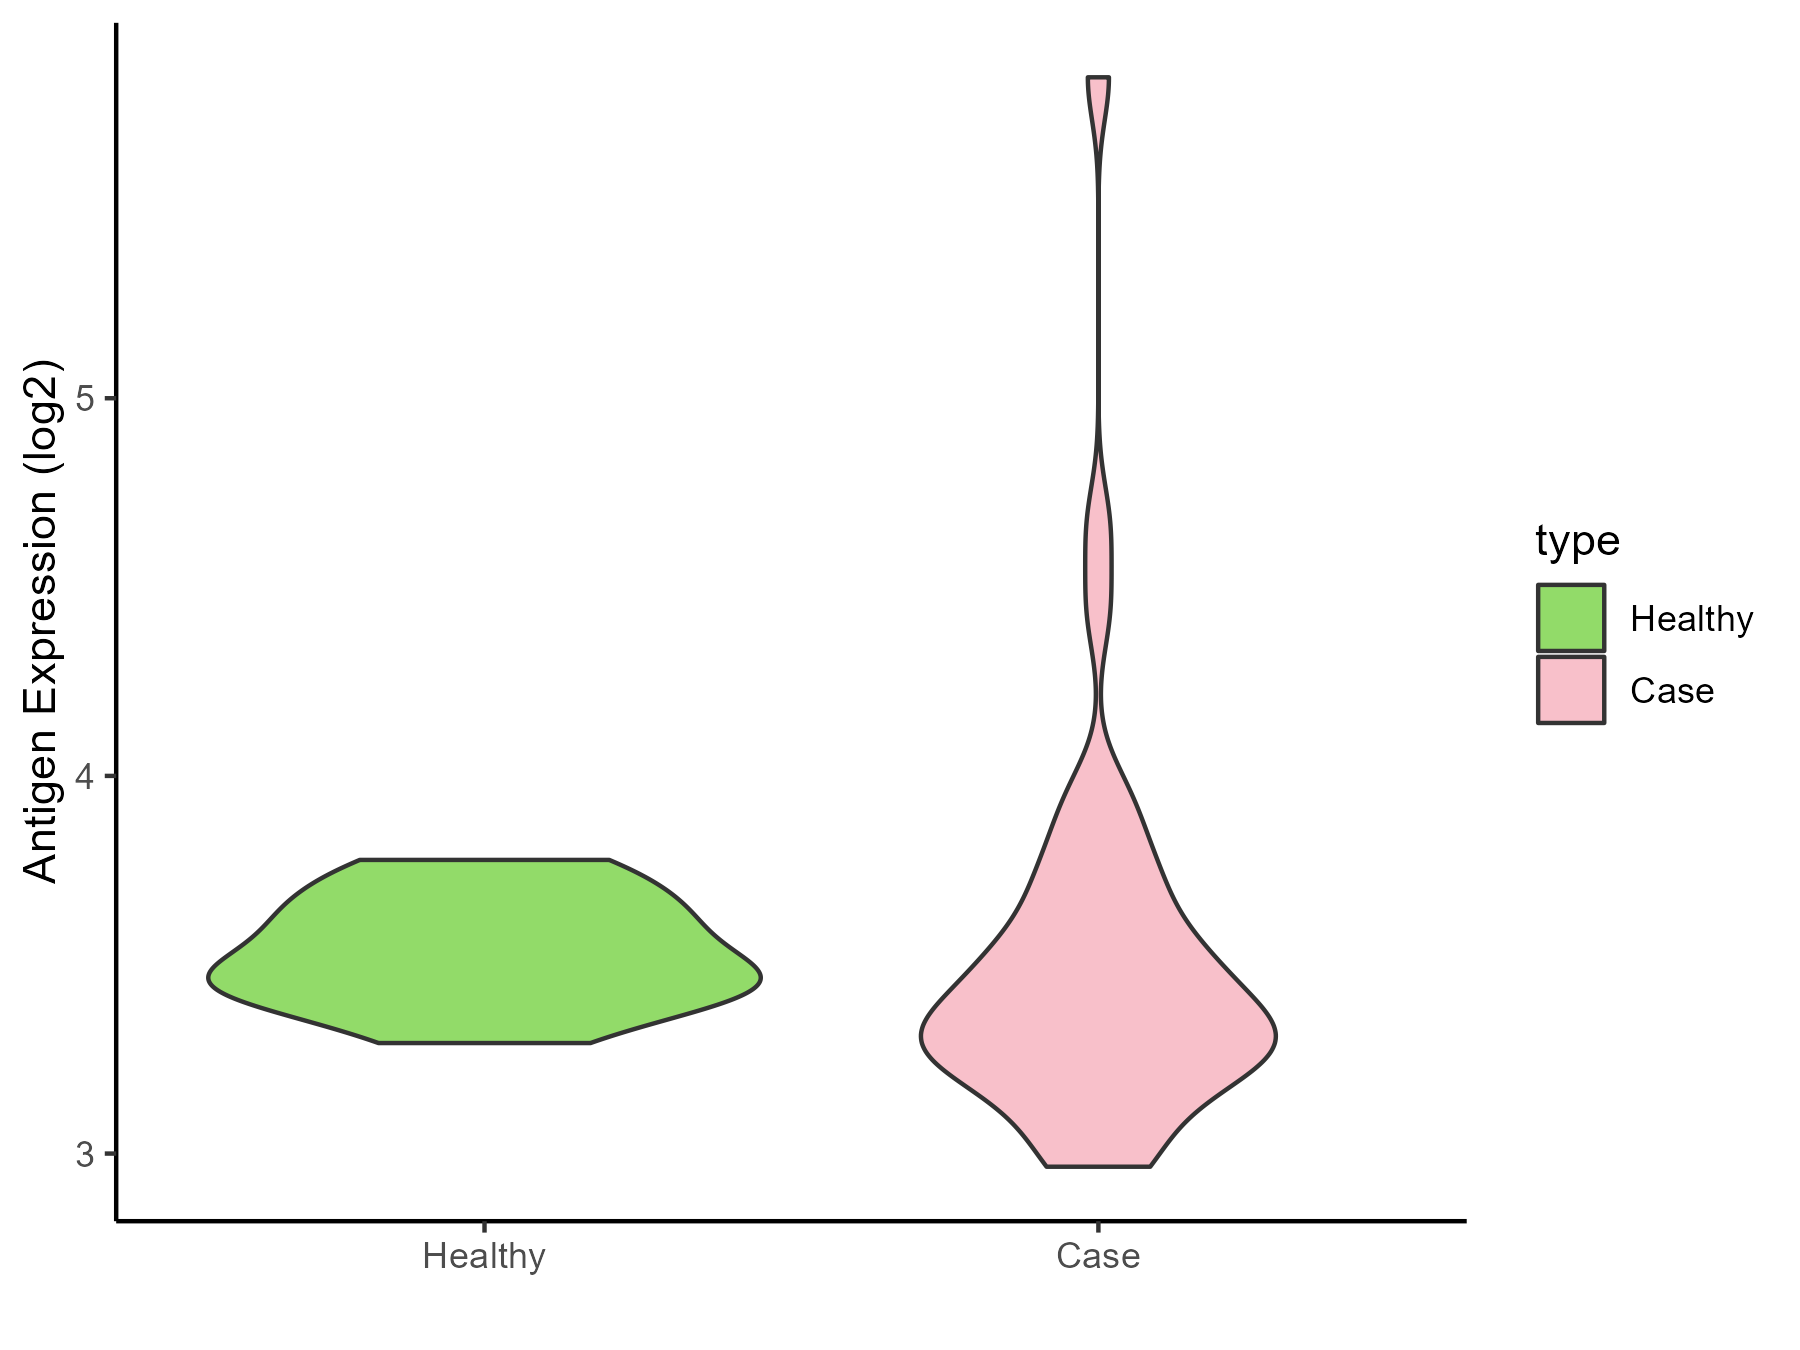
| The Studied Tissue | White matter | |
| The Specific Disease | Glioma | |
| The Expression Level of Disease Section Compare with the Healthy Individual Tissue | p-value: 0.822410822; Fold-change: -0.127909132; Z-score: -0.85850914 | |
| Disease-specific Antigen Abundances |
|
Click to View the Clearer Original Diagram |
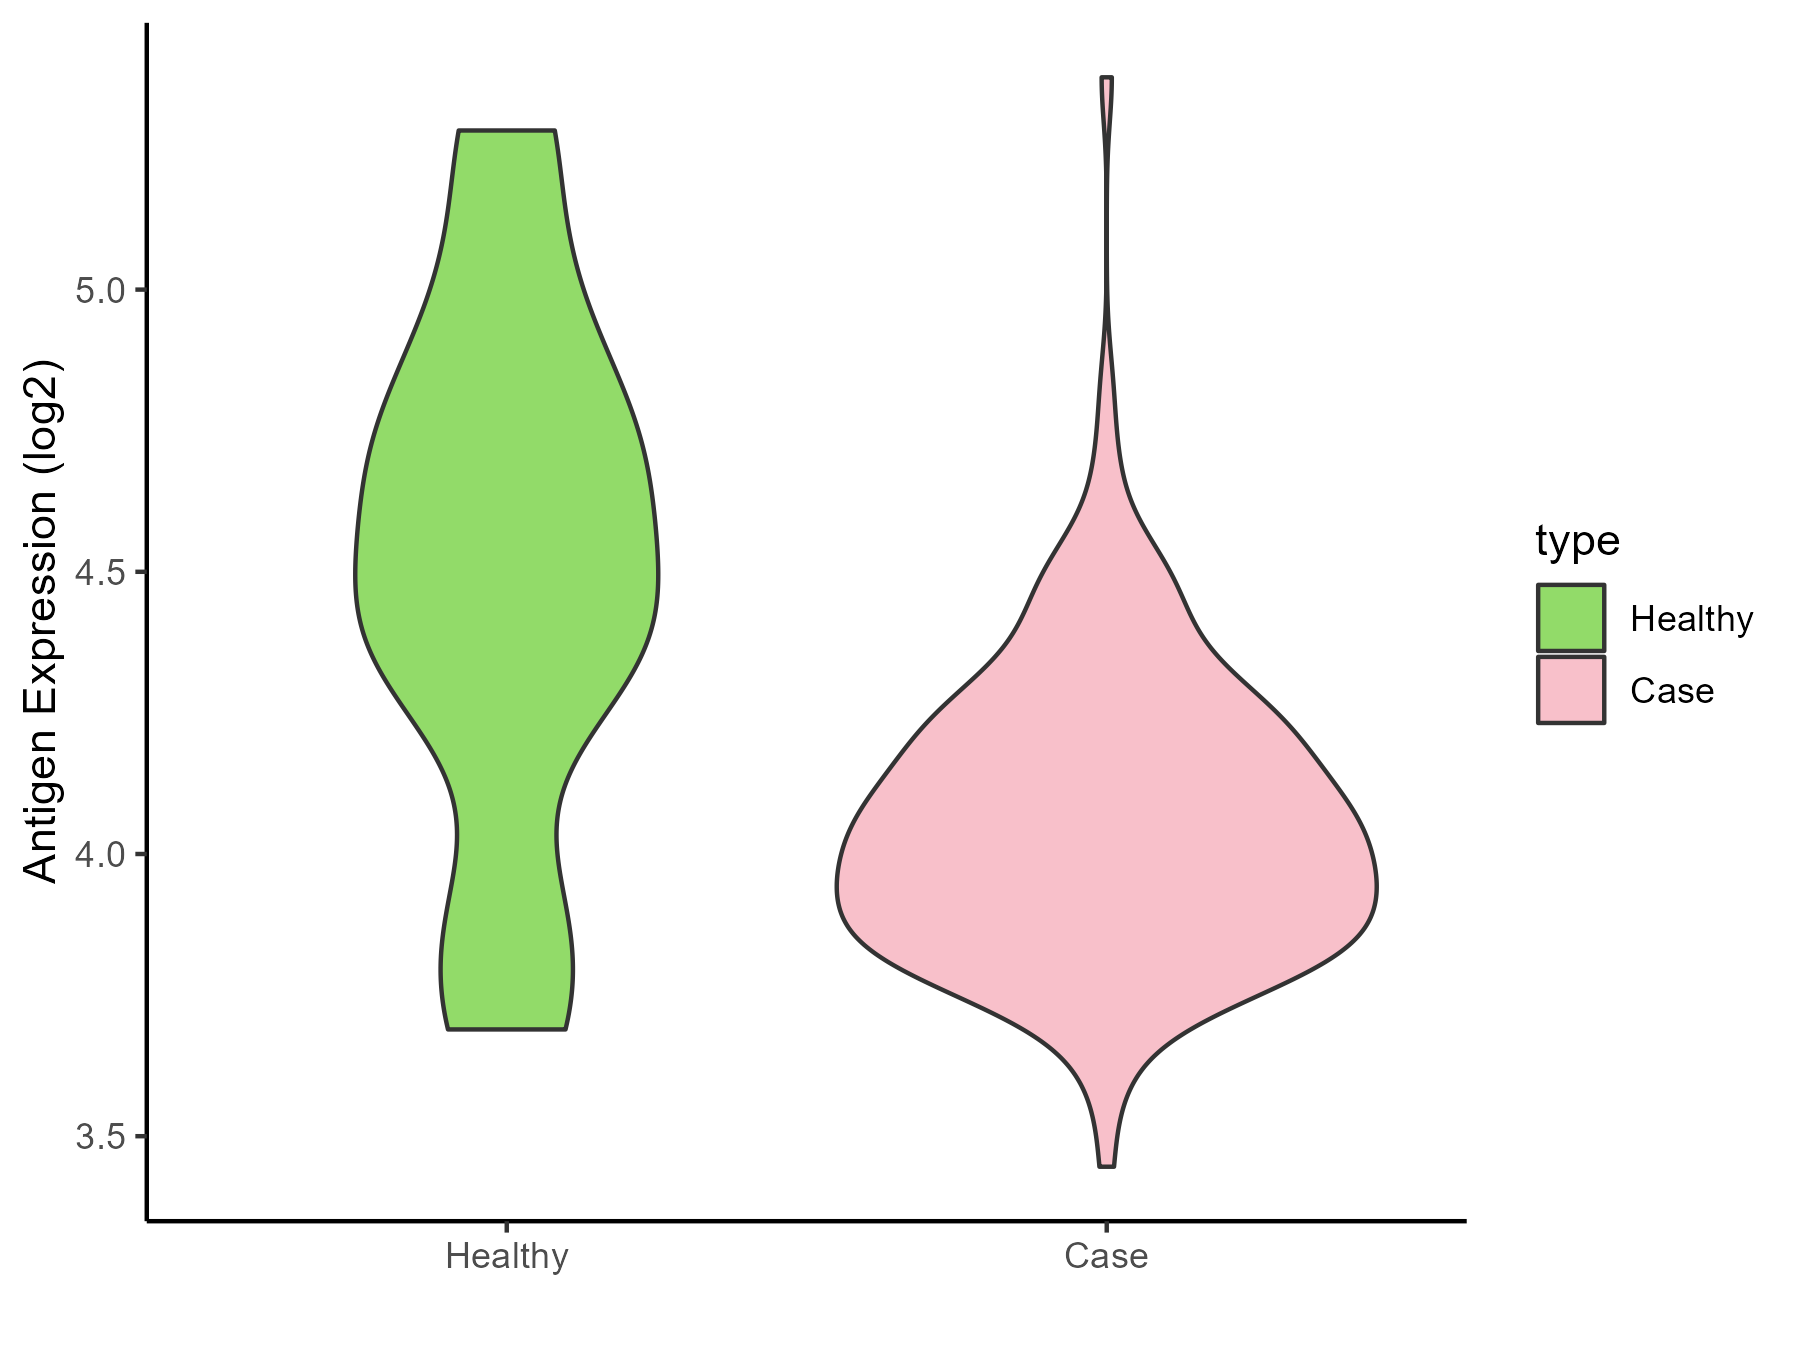
| The Studied Tissue | Brainstem | |
| The Specific Disease | Neuroectodermal tumor | |
| The Expression Level of Disease Section Compare with the Healthy Individual Tissue | p-value: 0.017084588; Fold-change: -0.47626011; Z-score: -0.997662838 | |
| Disease-specific Antigen Abundances |
|
Click to View the Clearer Original Diagram |
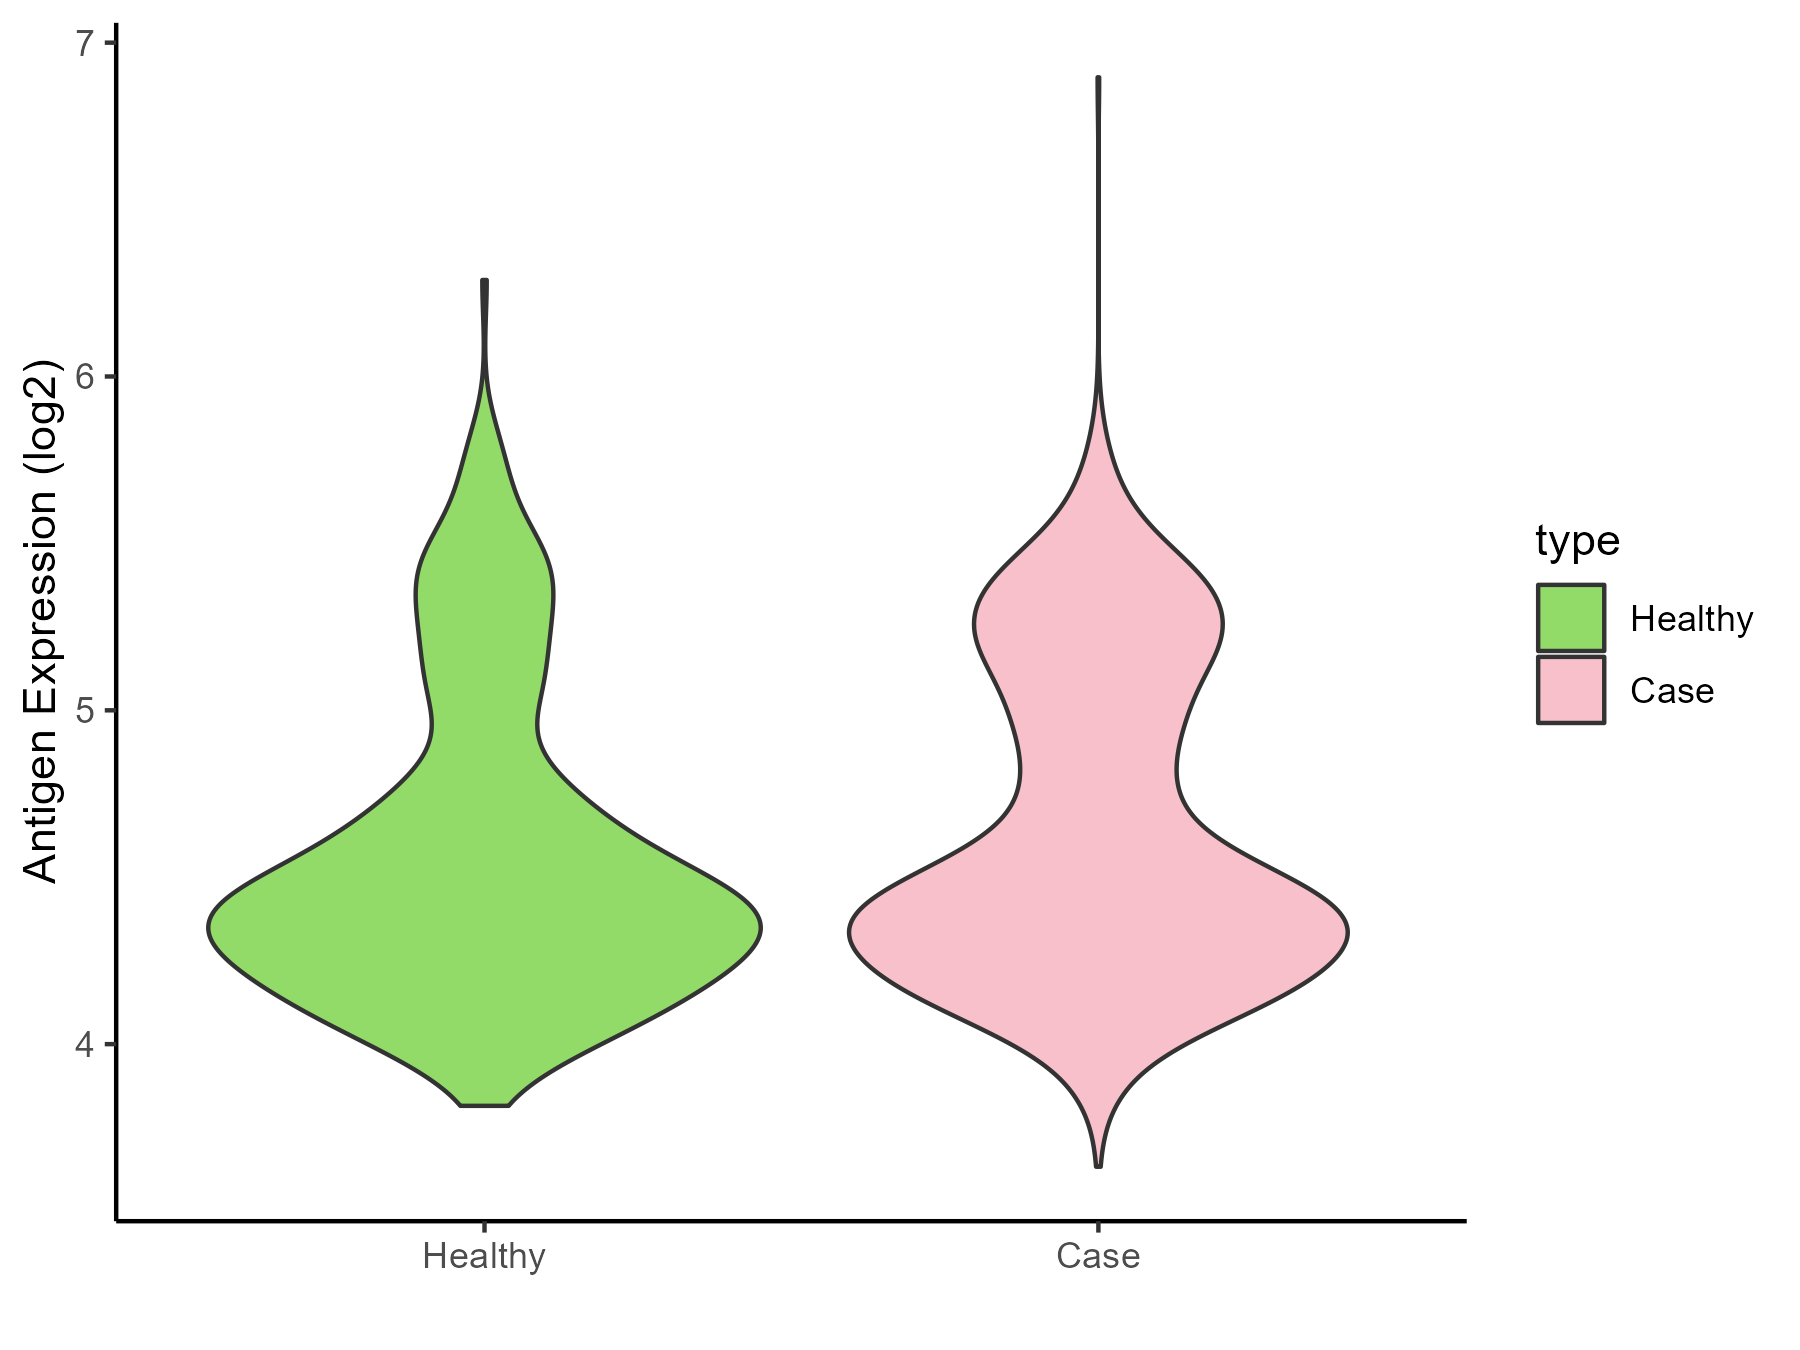
| The Studied Tissue | Nervous | |
| The Specific Disease | Brain cancer | |
| The Expression Level of Disease Section Compare with the Healthy Individual Tissue | p-value: 0.001365585; Fold-change: 0.052722889; Z-score: 0.113746929 | |
| Disease-specific Antigen Abundances |
|
Click to View the Clearer Original Diagram |
| Differential expression pattern of antigen in diseases | ||
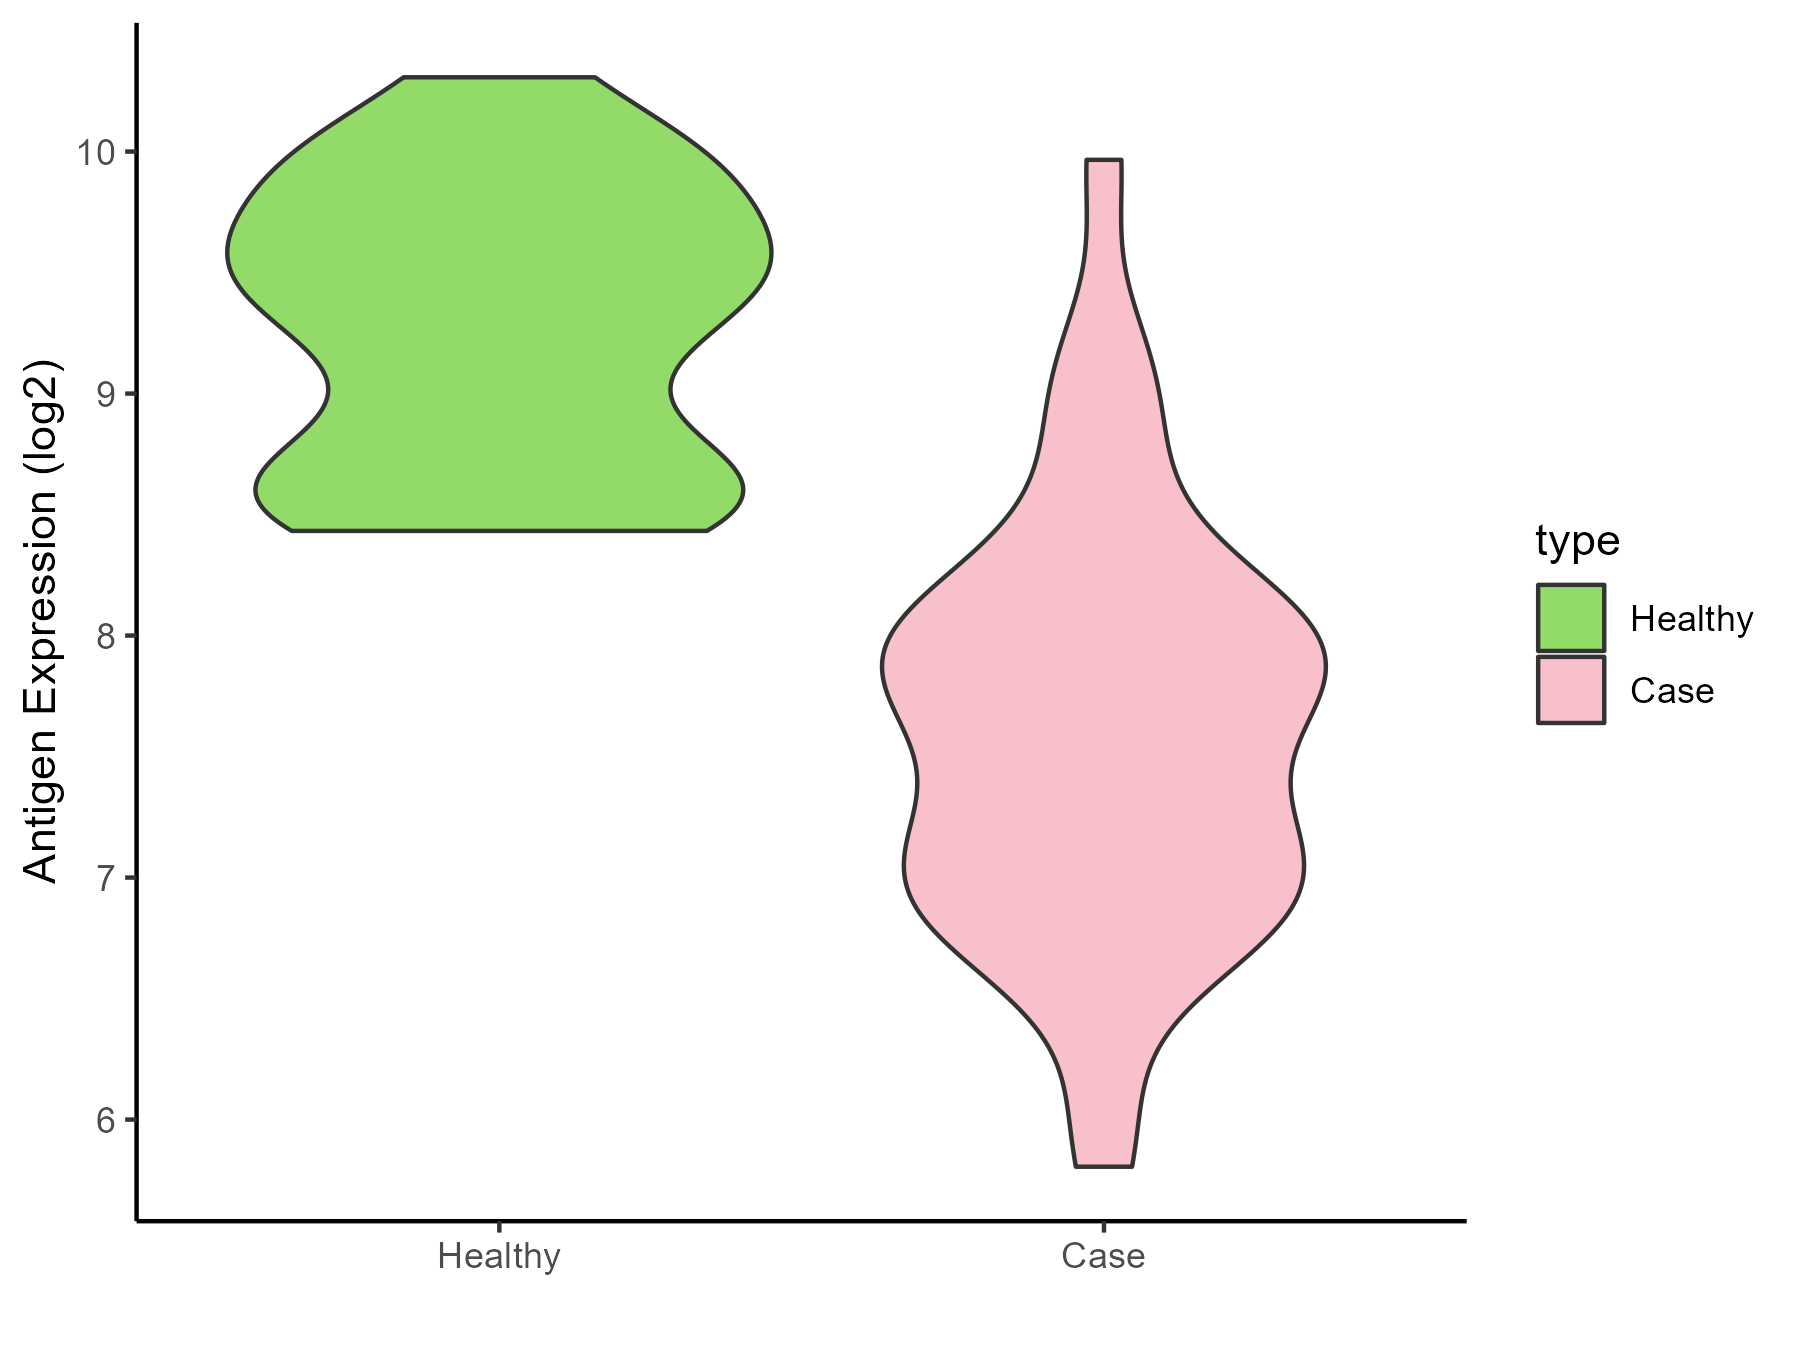
| The Studied Tissue | Whole blood | |
| The Specific Disease | Polycythemia vera | |
| The Expression Level of Disease Section Compare with the Healthy Individual Tissue | p-value: 1.91E-22; Fold-change: -1.739907356; Z-score: -2.950512191 | |
| Disease-specific Antigen Abundances |
|
Click to View the Clearer Original Diagram |
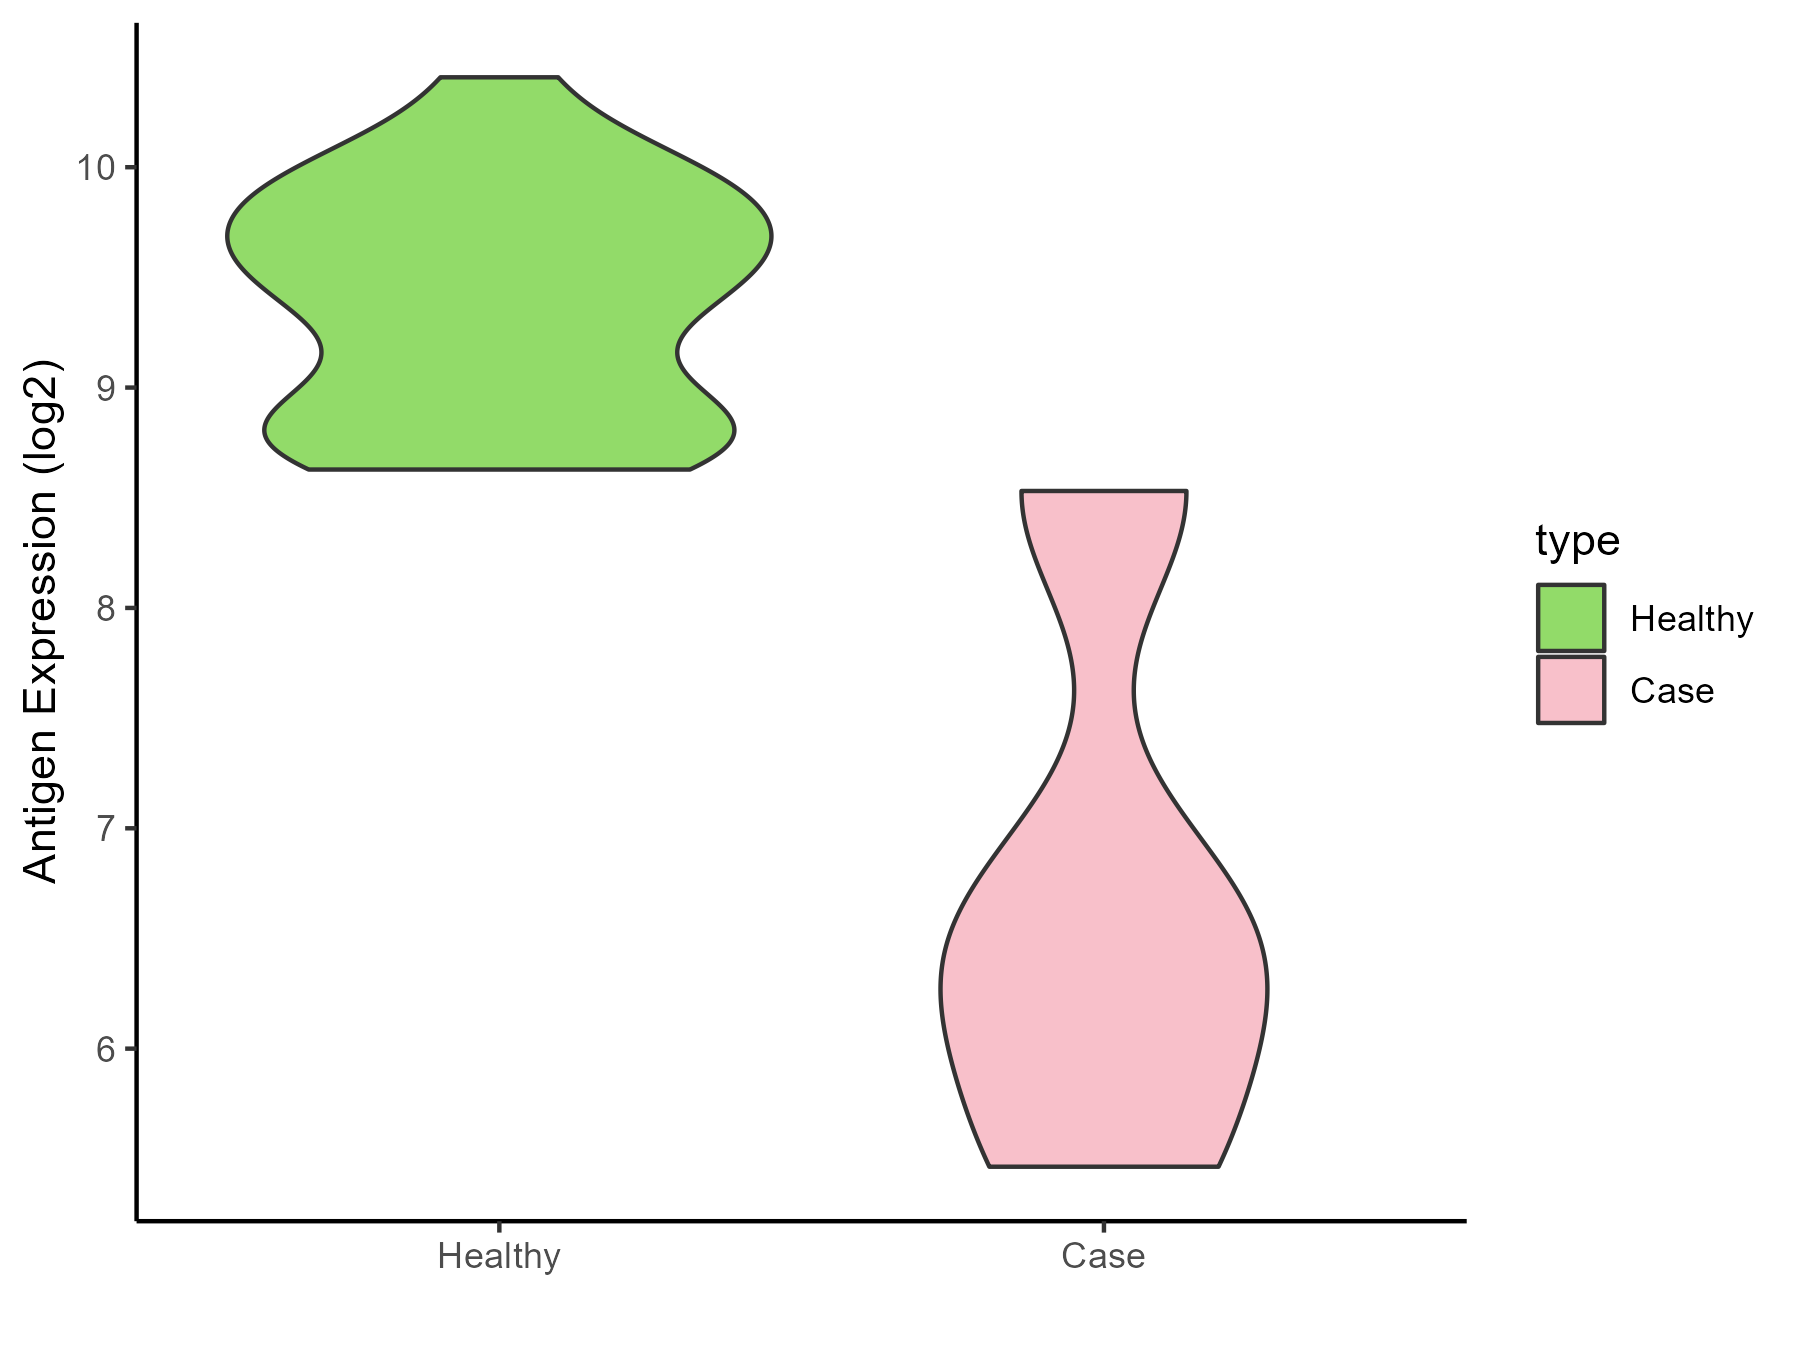
| The Studied Tissue | Whole blood | |
| The Specific Disease | Myelofibrosis | |
| The Expression Level of Disease Section Compare with the Healthy Individual Tissue | p-value: 0.000353647; Fold-change: -3.014152593; Z-score: -5.740869331 | |
| Disease-specific Antigen Abundances |
|
Click to View the Clearer Original Diagram |
| Differential expression pattern of antigen in diseases | ||
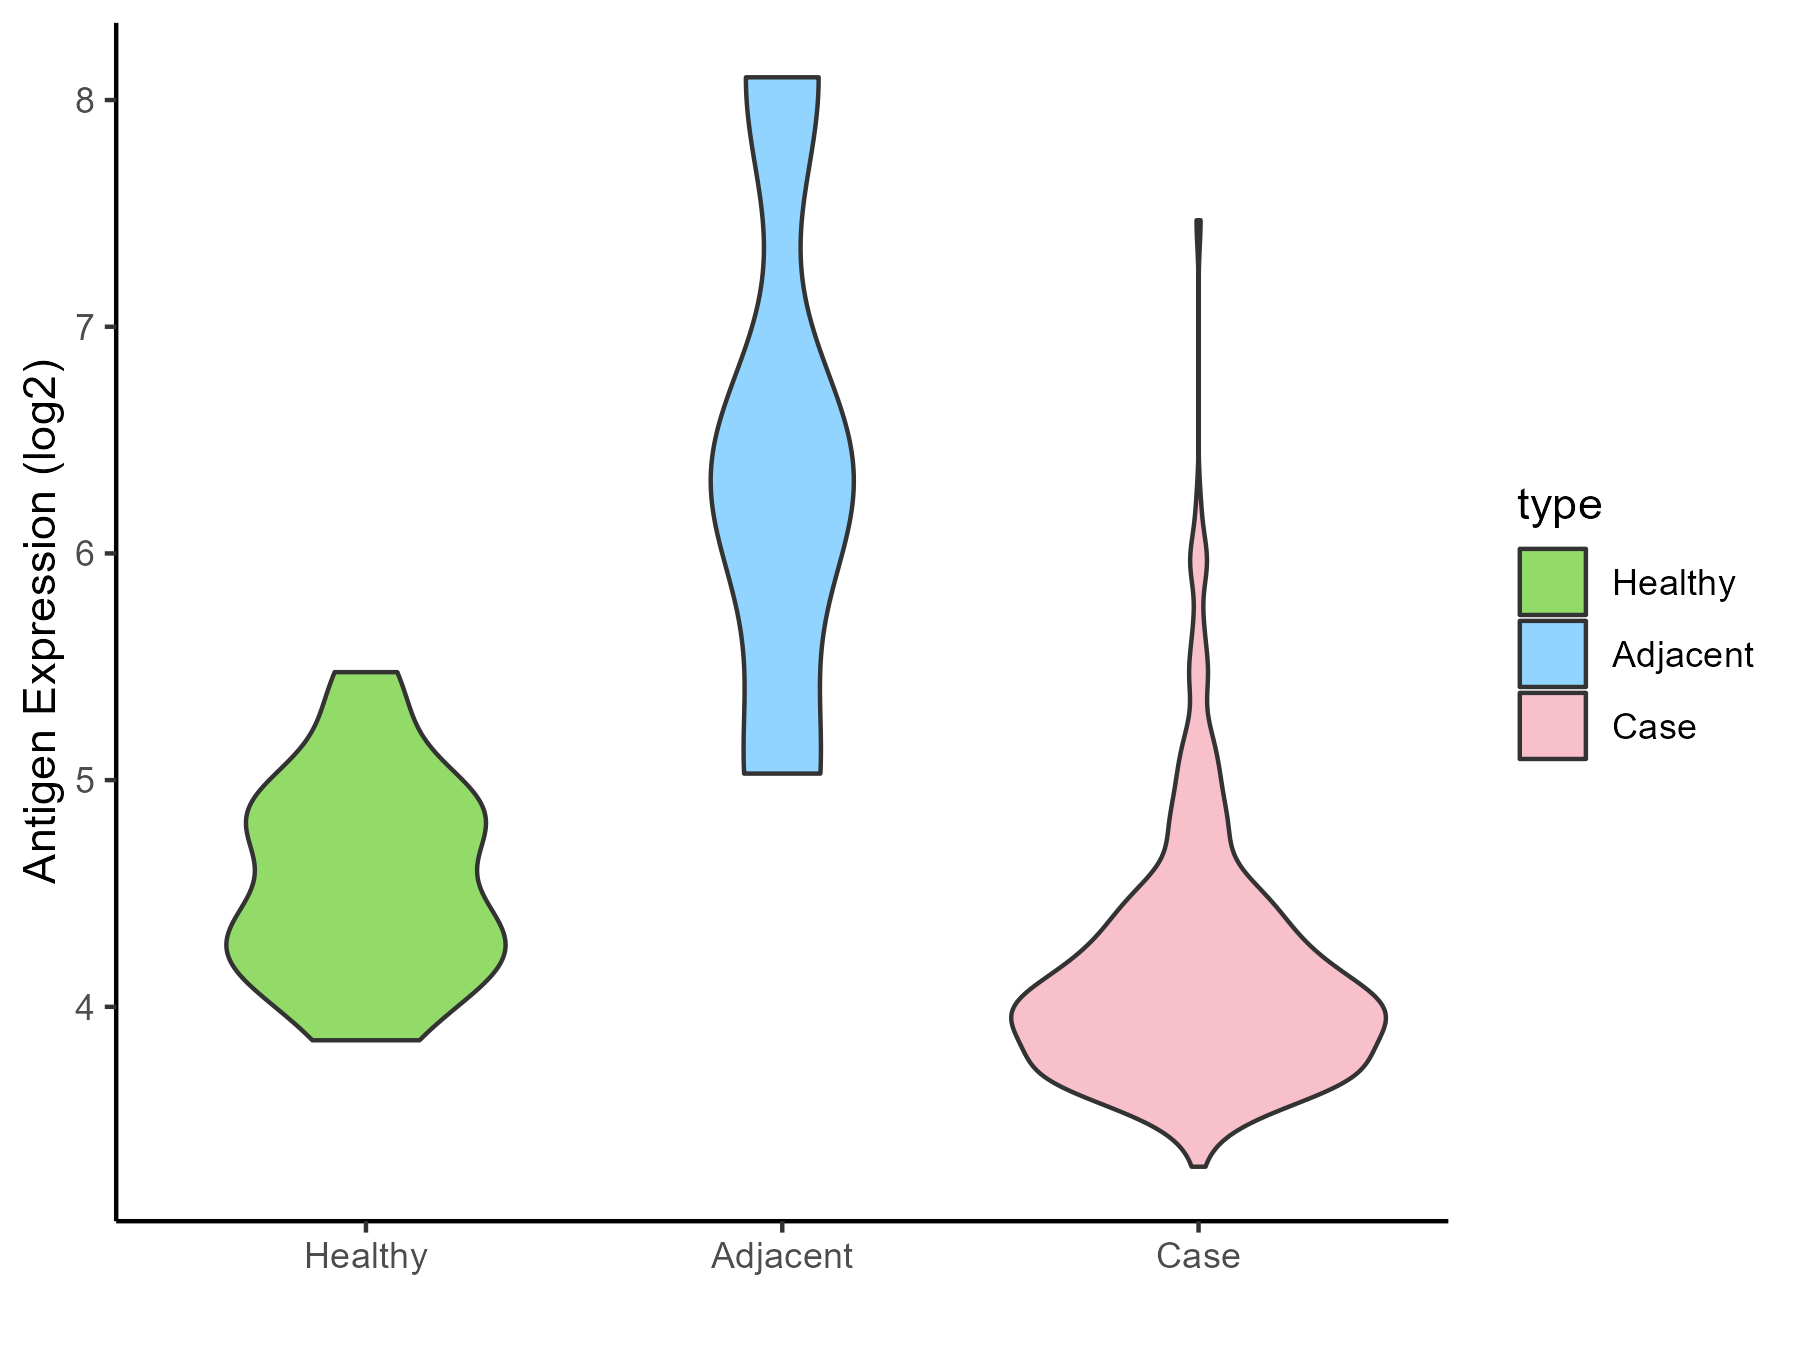
| The Studied Tissue | Bone marrow | |
| The Specific Disease | Myelodysplastic syndromes | |
| The Expression Level of Disease Section Compare with the Healthy Individual Tissue | p-value: 3.30E-05; Fold-change: -0.441996334; Z-score: -1.010247845 | |
| The Expression Level of Disease Section Compare with the Adjacent Tissue | p-value: 0.03525625; Fold-change: -2.318015384; Z-score: -1.834018106 | |
| Disease-specific Antigen Abundances |
|
Click to View the Clearer Original Diagram |
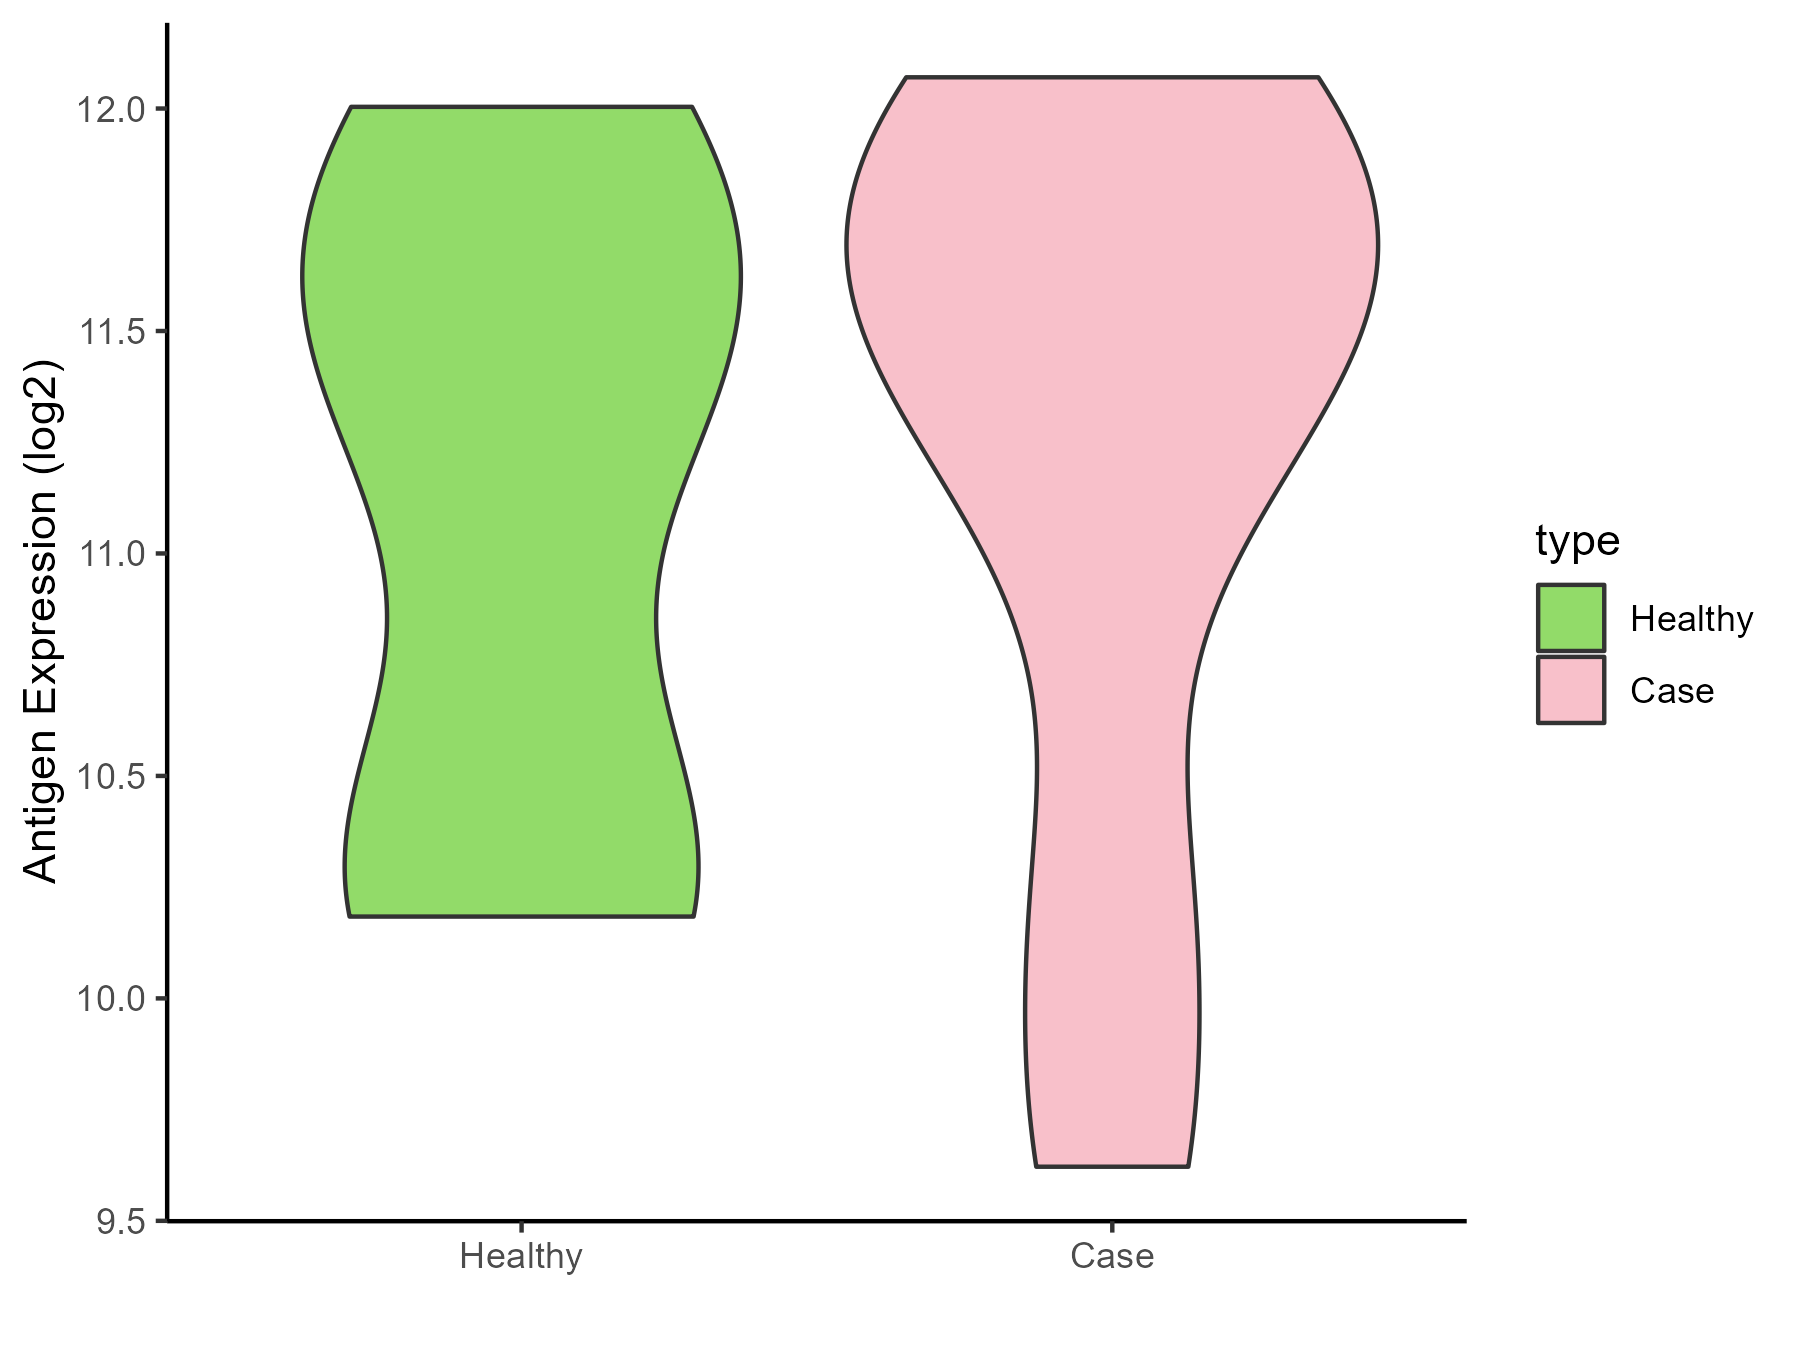
| Differential expression pattern of antigen in diseases | ||
| The Studied Tissue | Tonsil | |
| The Specific Disease | Lymphoma | |
| The Expression Level of Disease Section Compare with the Healthy Individual Tissue | p-value: 0.723884372; Fold-change: 0.218856769; Z-score: 0.293414319 | |
| Disease-specific Antigen Abundances |
|
Click to View the Clearer Original Diagram |
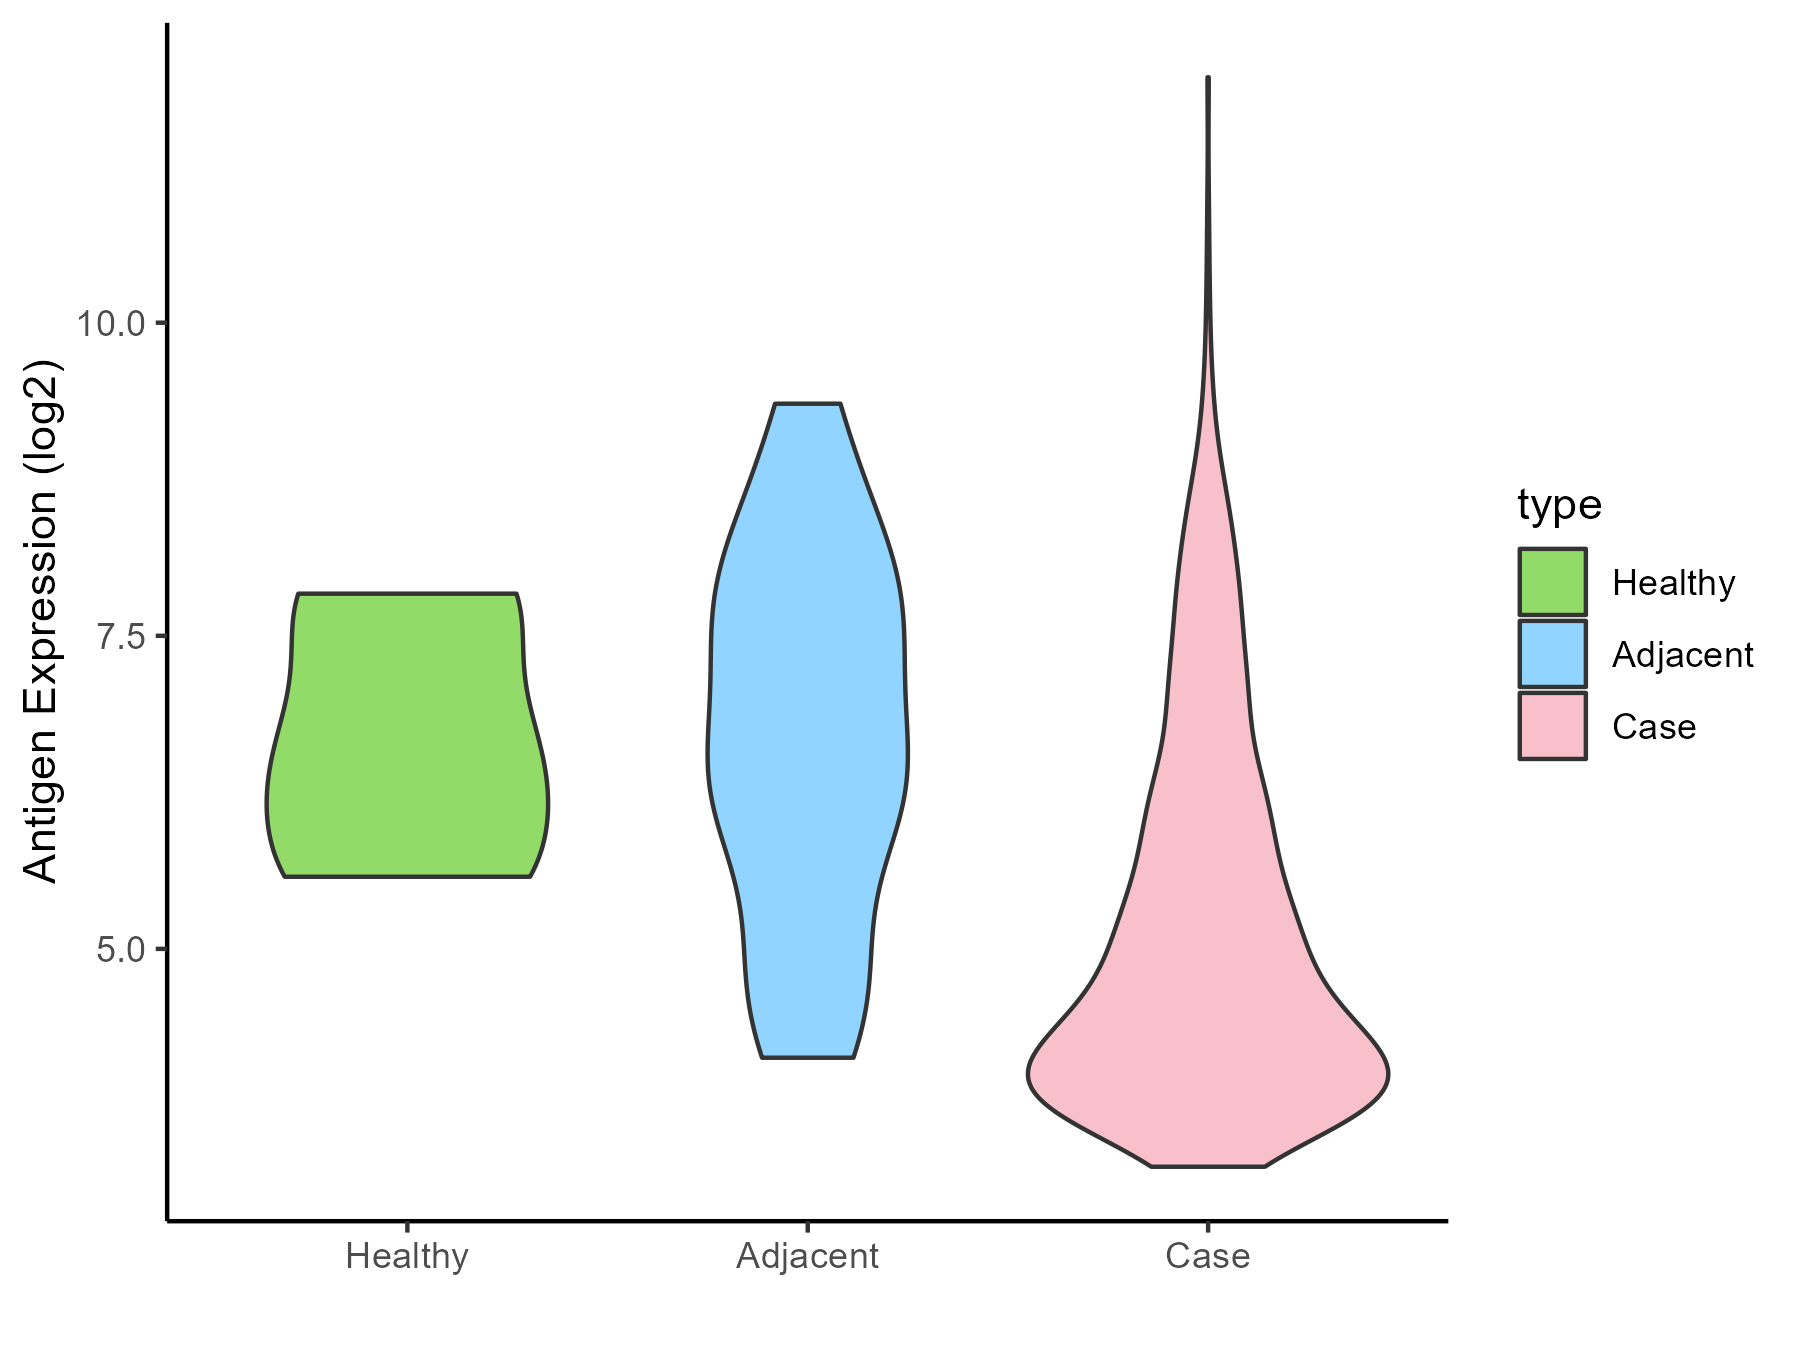
| Differential expression pattern of antigen in diseases | ||
| The Studied Tissue | Gastric | |
| The Specific Disease | Gastric cancer | |
| The Expression Level of Disease Section Compare with the Healthy Individual Tissue | p-value: 0.150148092; Fold-change: -1.883888996; Z-score: -1.663341262 | |
| The Expression Level of Disease Section Compare with the Adjacent Tissue | p-value: 0.000803619; Fold-change: -1.788783853; Z-score: -1.181988183 | |
| Disease-specific Antigen Abundances |
|
Click to View the Clearer Original Diagram |
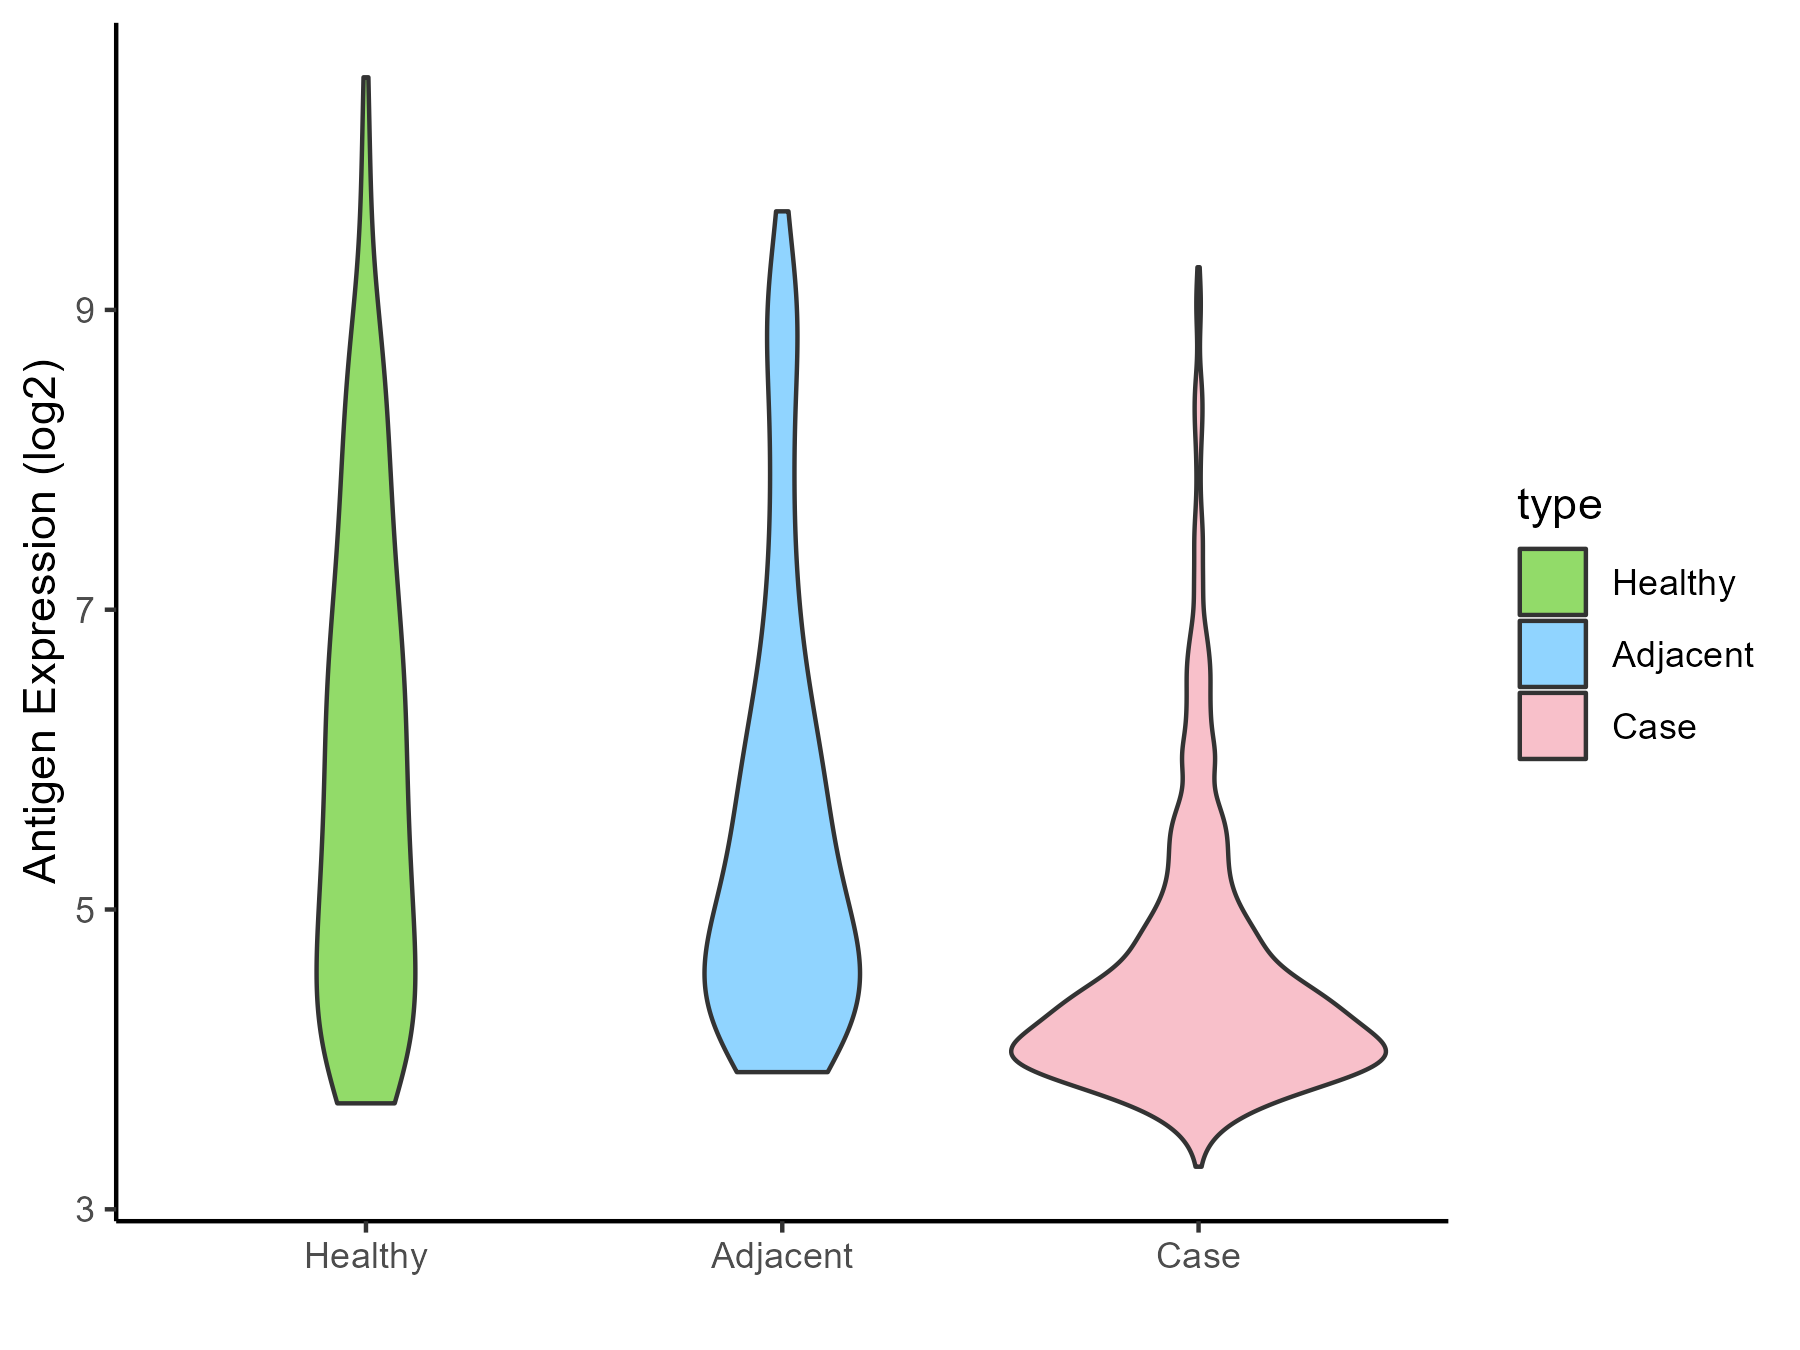
| Differential expression pattern of antigen in diseases | ||
| The Studied Tissue | Colon | |
| The Specific Disease | Colon cancer | |
| The Expression Level of Disease Section Compare with the Healthy Individual Tissue | p-value: 4.58E-20; Fold-change: -1.380161265; Z-score: -0.86077679 | |
| The Expression Level of Disease Section Compare with the Adjacent Tissue | p-value: 1.07E-11; Fold-change: -0.850297489; Z-score: -0.576412537 | |
| Disease-specific Antigen Abundances |
|
Click to View the Clearer Original Diagram |
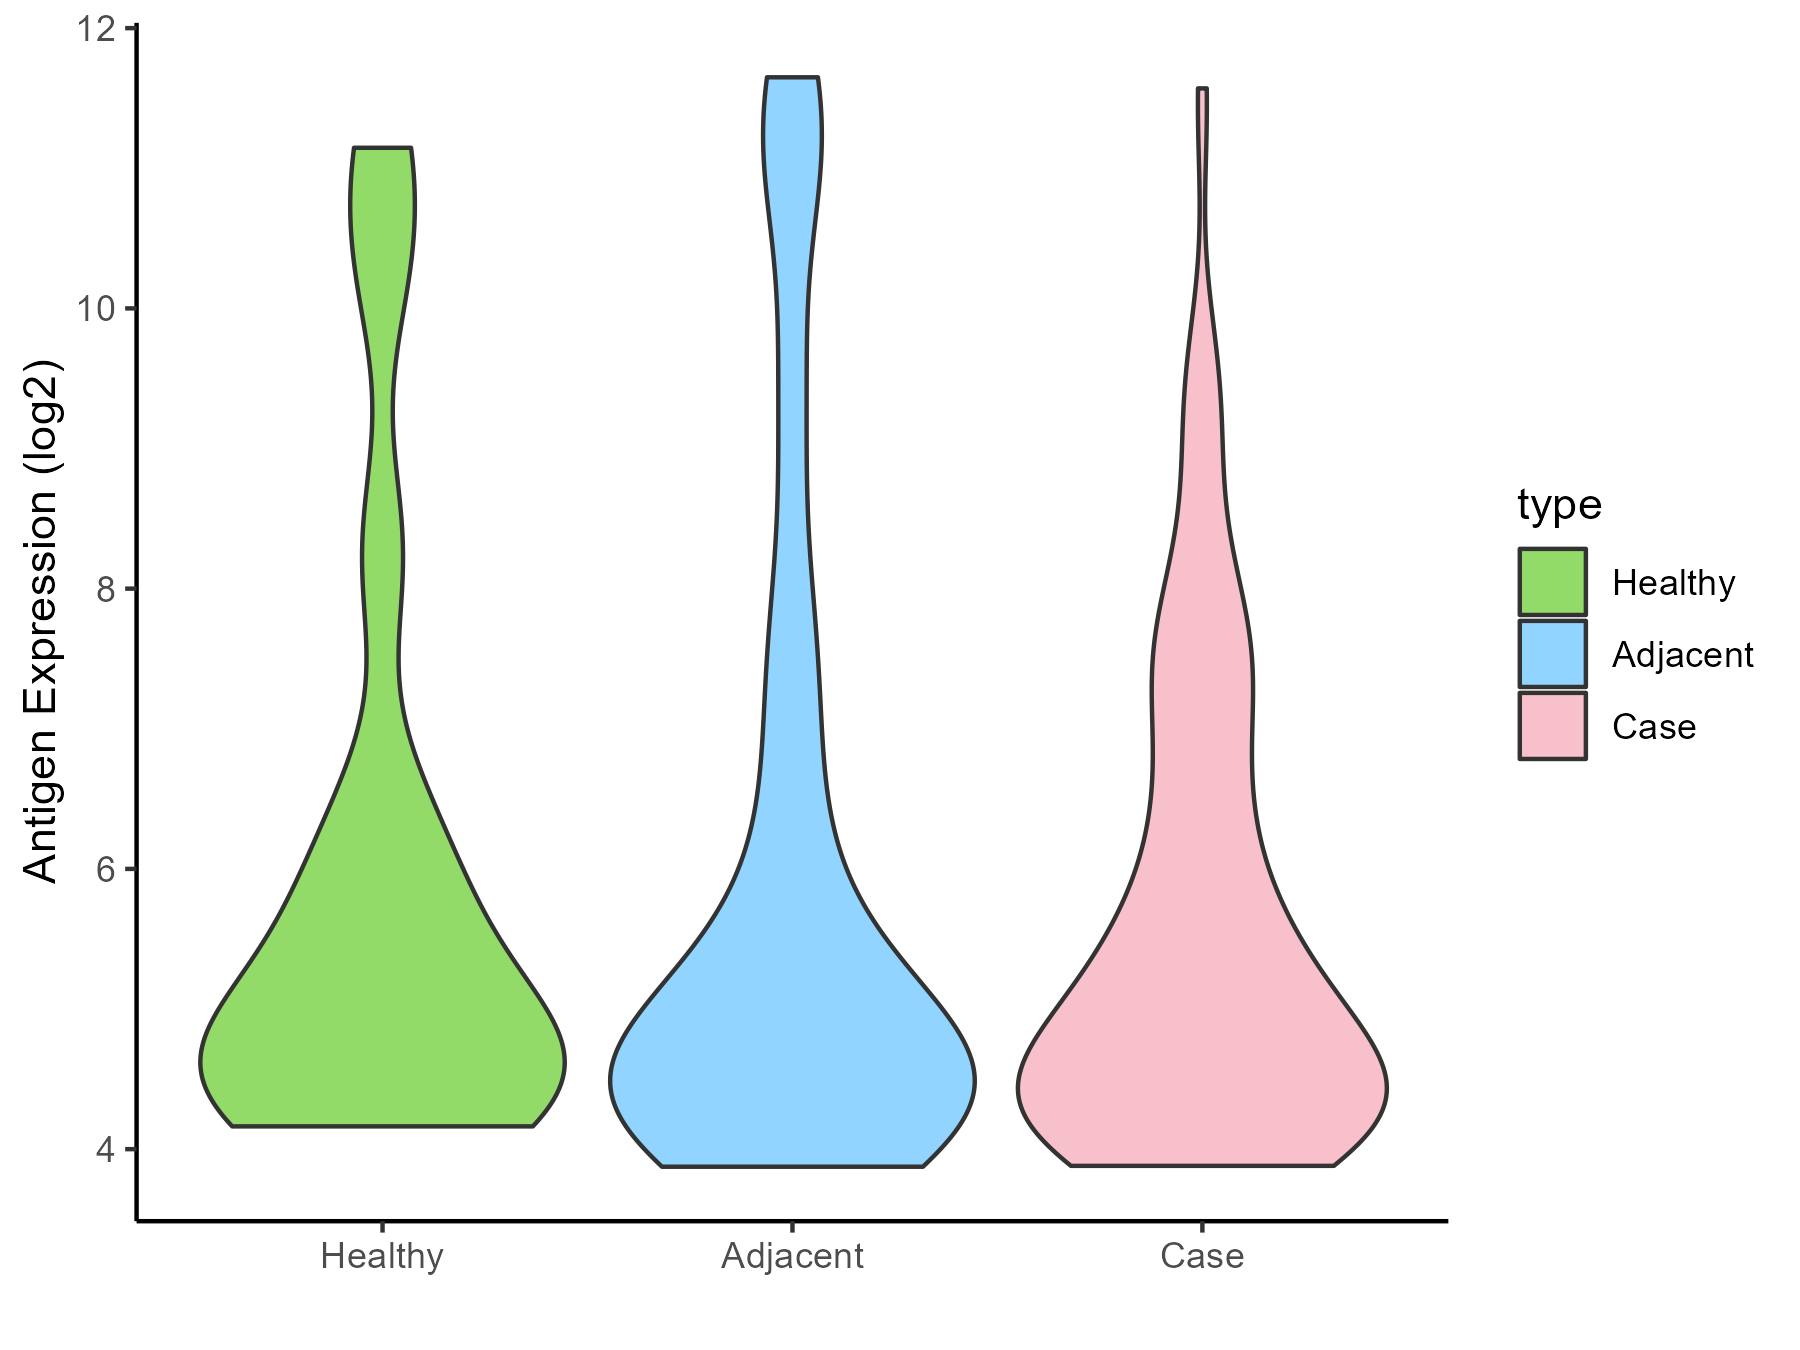
| Differential expression pattern of antigen in diseases | ||
| The Studied Tissue | Pancreas | |
| The Specific Disease | Pancreatic cancer | |
| The Expression Level of Disease Section Compare with the Healthy Individual Tissue | p-value: 0.567307243; Fold-change: 0.074793973; Z-score: 0.034427405 | |
| The Expression Level of Disease Section Compare with the Adjacent Tissue | p-value: 0.383767432; Fold-change: 0.206647516; Z-score: 0.089392326 | |
| Disease-specific Antigen Abundances |
|
Click to View the Clearer Original Diagram |
| Differential expression pattern of antigen in diseases | ||
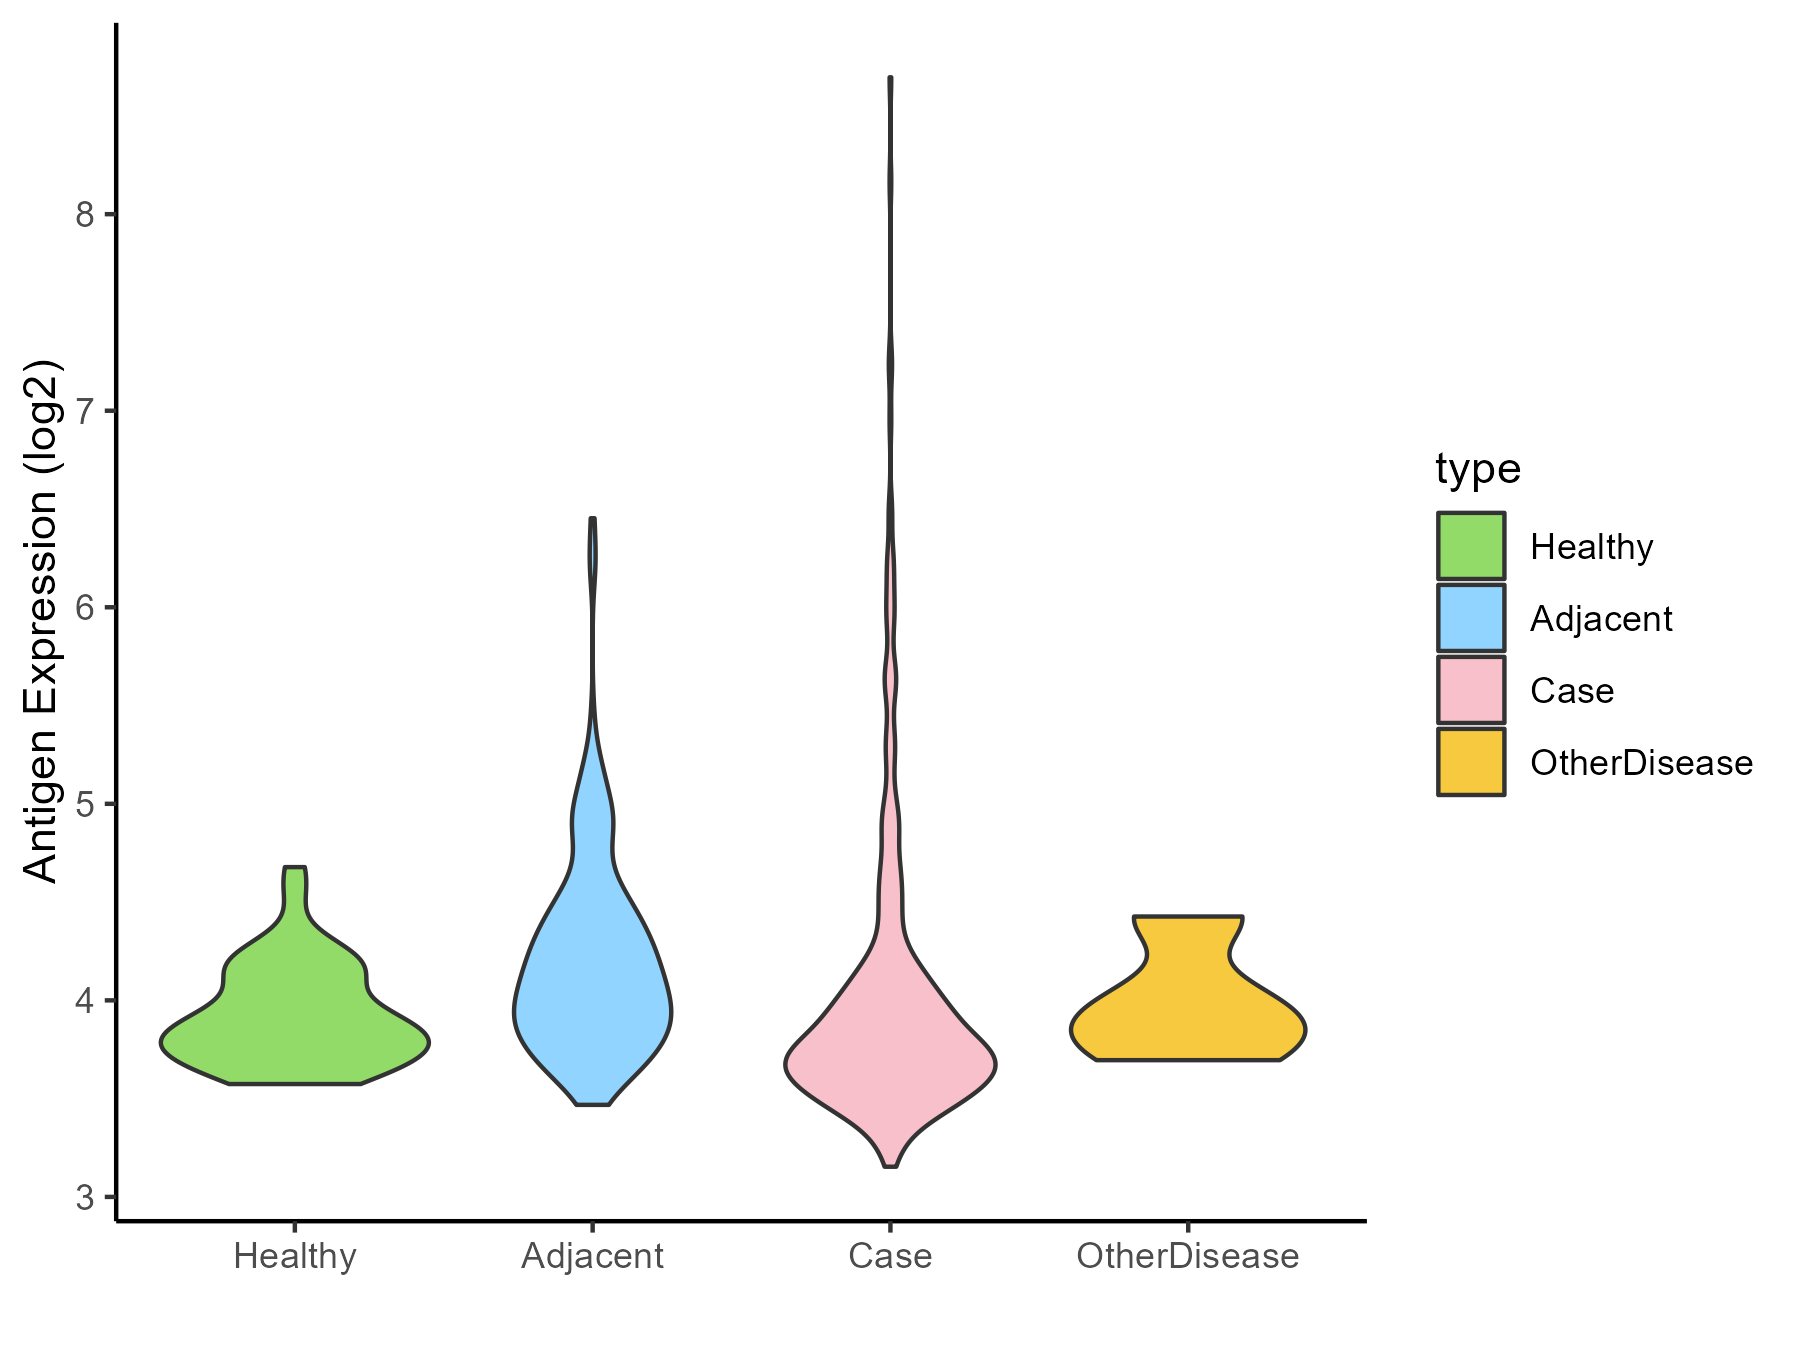
| The Studied Tissue | Liver | |
| The Specific Disease | Liver cancer | |
| The Expression Level of Disease Section Compare with the Healthy Individual Tissue | p-value: 0.100022711; Fold-change: -0.084884064; Z-score: -0.331477504 | |
| The Expression Level of Disease Section Compare with the Adjacent Tissue | p-value: 0.000185179; Fold-change: -0.31548436; Z-score: -0.639808613 | |
| The Expression Level of Disease Section Compare with the Other Disease Section | p-value: 0.923256193; Fold-change: -0.145737636; Z-score: -0.463161902 | |
| Disease-specific Antigen Abundances |
|
Click to View the Clearer Original Diagram |
| Differential expression pattern of antigen in diseases | ||
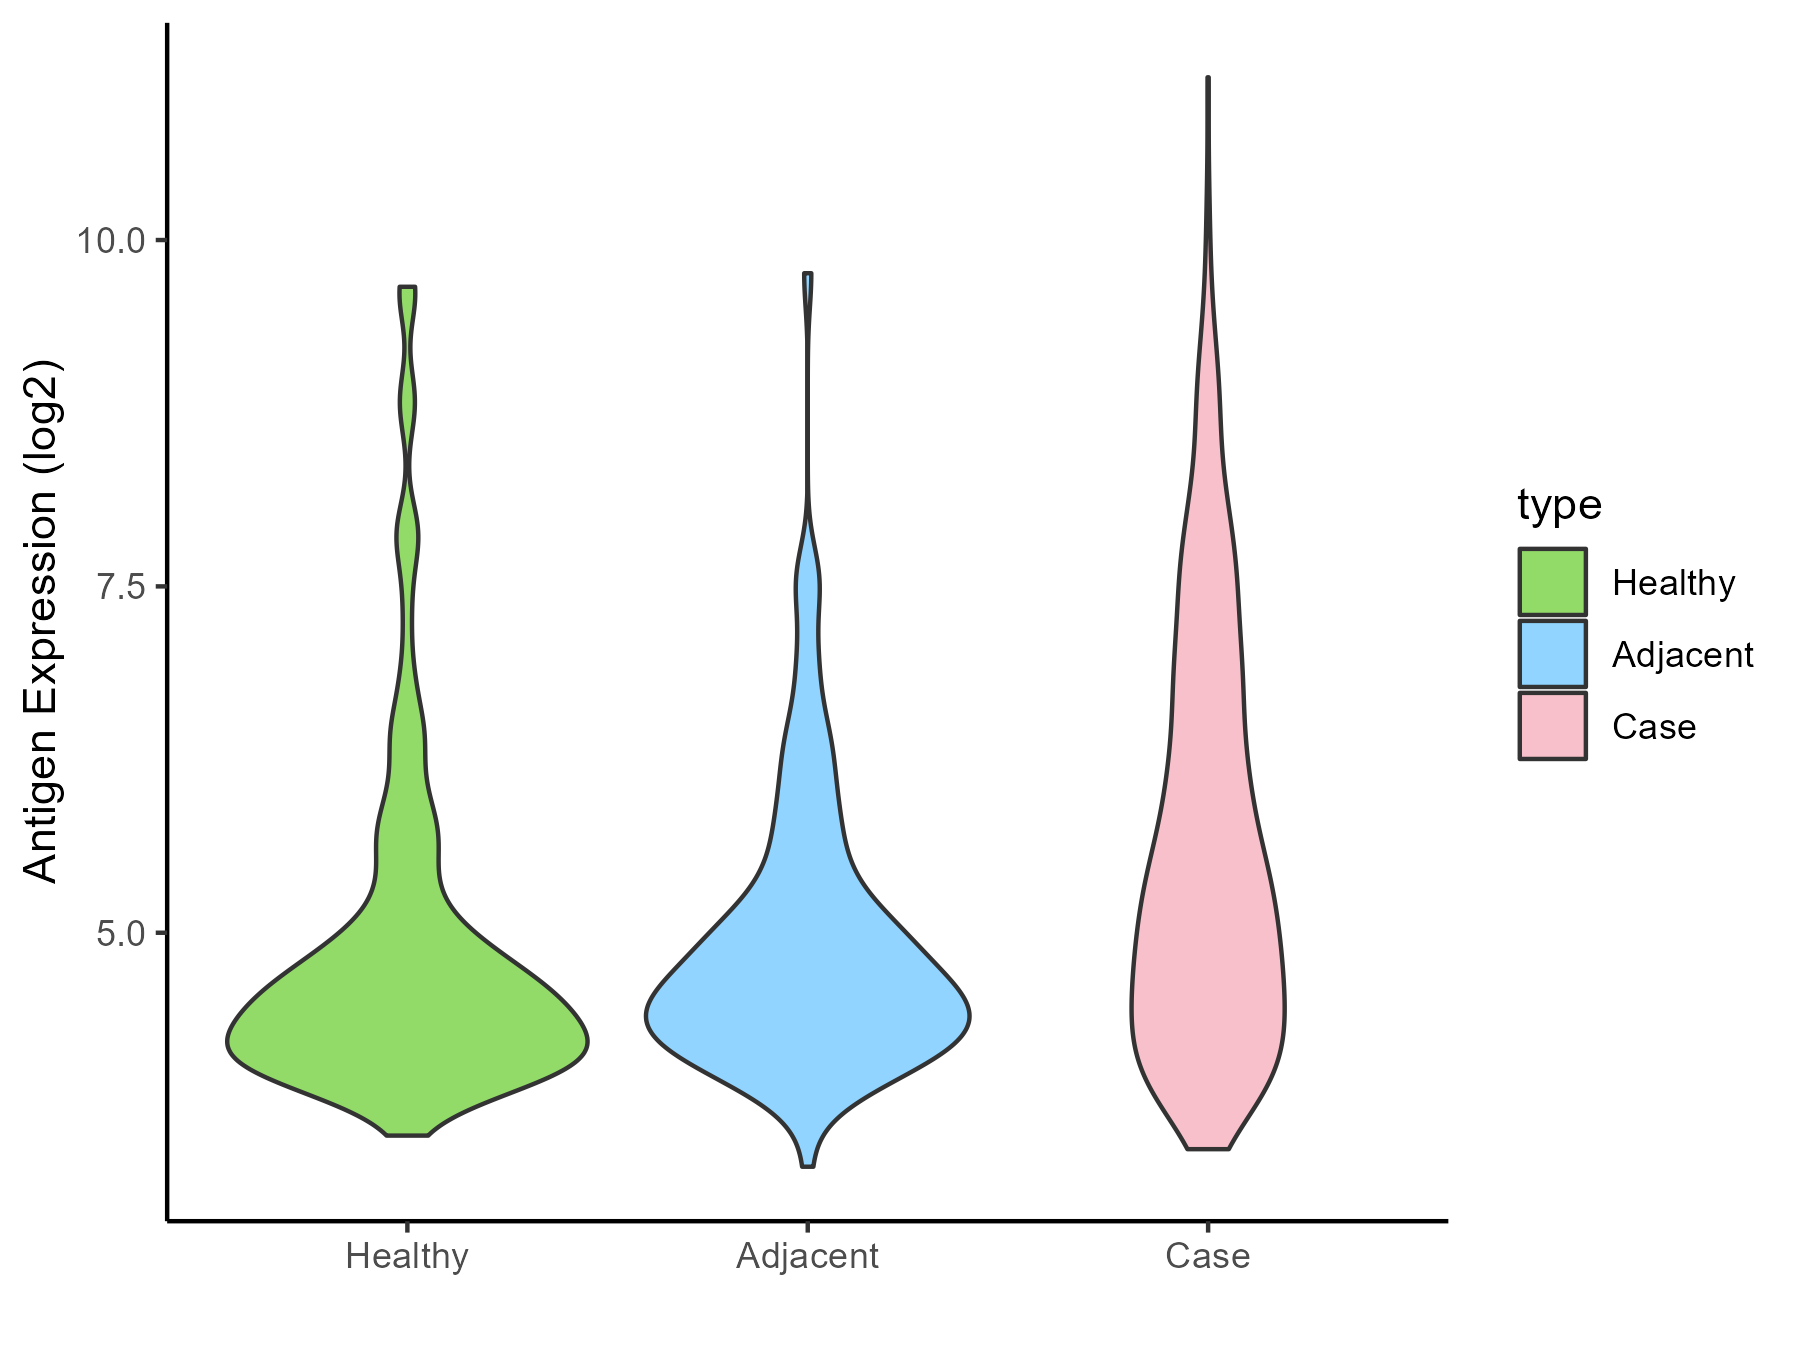
| The Studied Tissue | Lung | |
| The Specific Disease | Lung cancer | |
| The Expression Level of Disease Section Compare with the Healthy Individual Tissue | p-value: 1.04E-13; Fold-change: 0.834017441; Z-score: 0.698157434 | |
| The Expression Level of Disease Section Compare with the Adjacent Tissue | p-value: 1.02E-11; Fold-change: 0.691989723; Z-score: 0.709787757 | |
| Disease-specific Antigen Abundances |
|
Click to View the Clearer Original Diagram |
| Differential expression pattern of antigen in diseases | ||
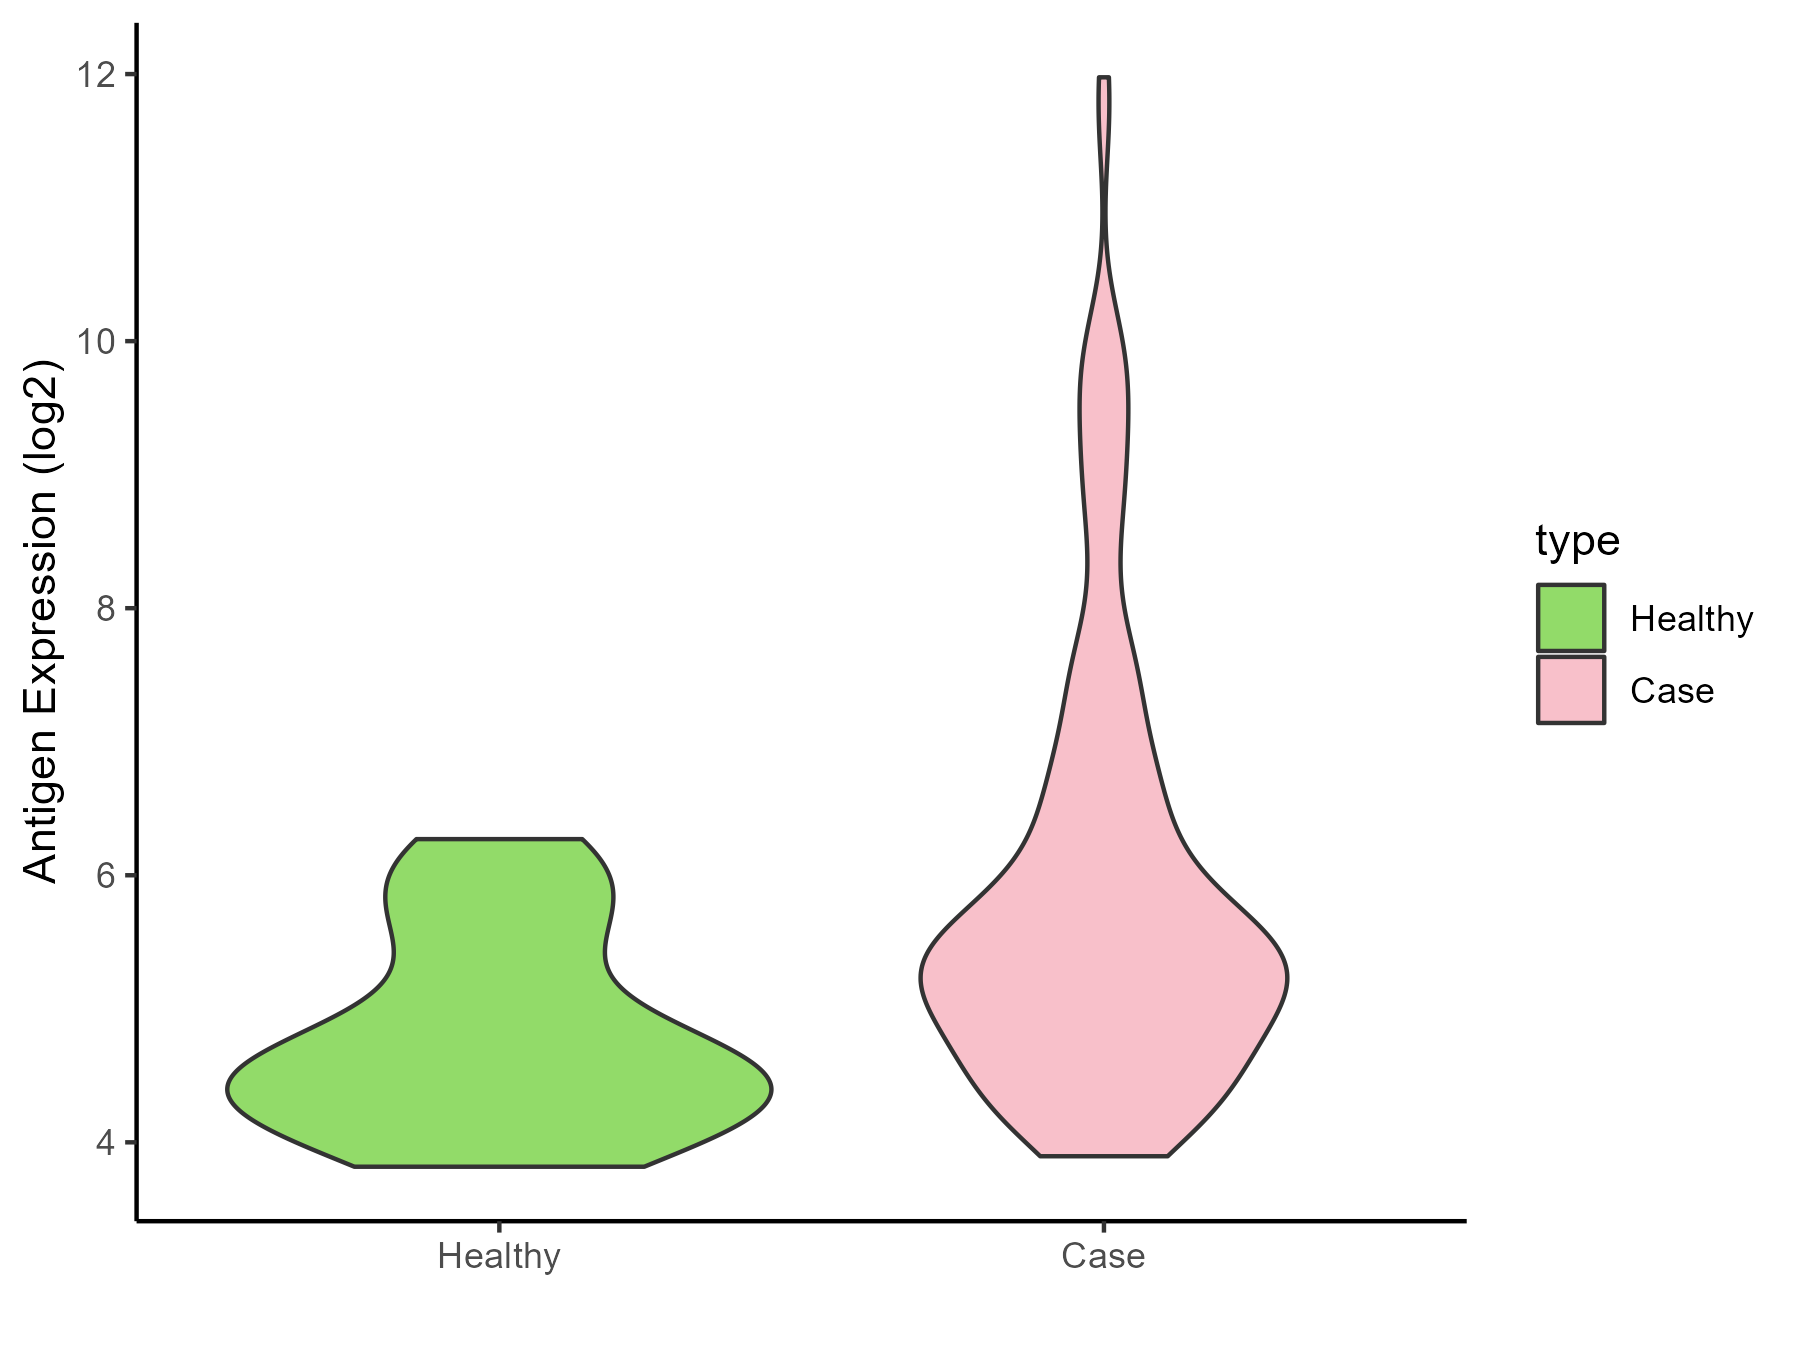
| The Studied Tissue | Skin | |
| The Specific Disease | Melanoma | |
| The Expression Level of Disease Section Compare with the Healthy Individual Tissue | p-value: 2.86E-06; Fold-change: 0.777750607; Z-score: 1.029113437 | |
| Disease-specific Antigen Abundances |
|
Click to View the Clearer Original Diagram |
| Differential expression pattern of antigen in diseases | ||
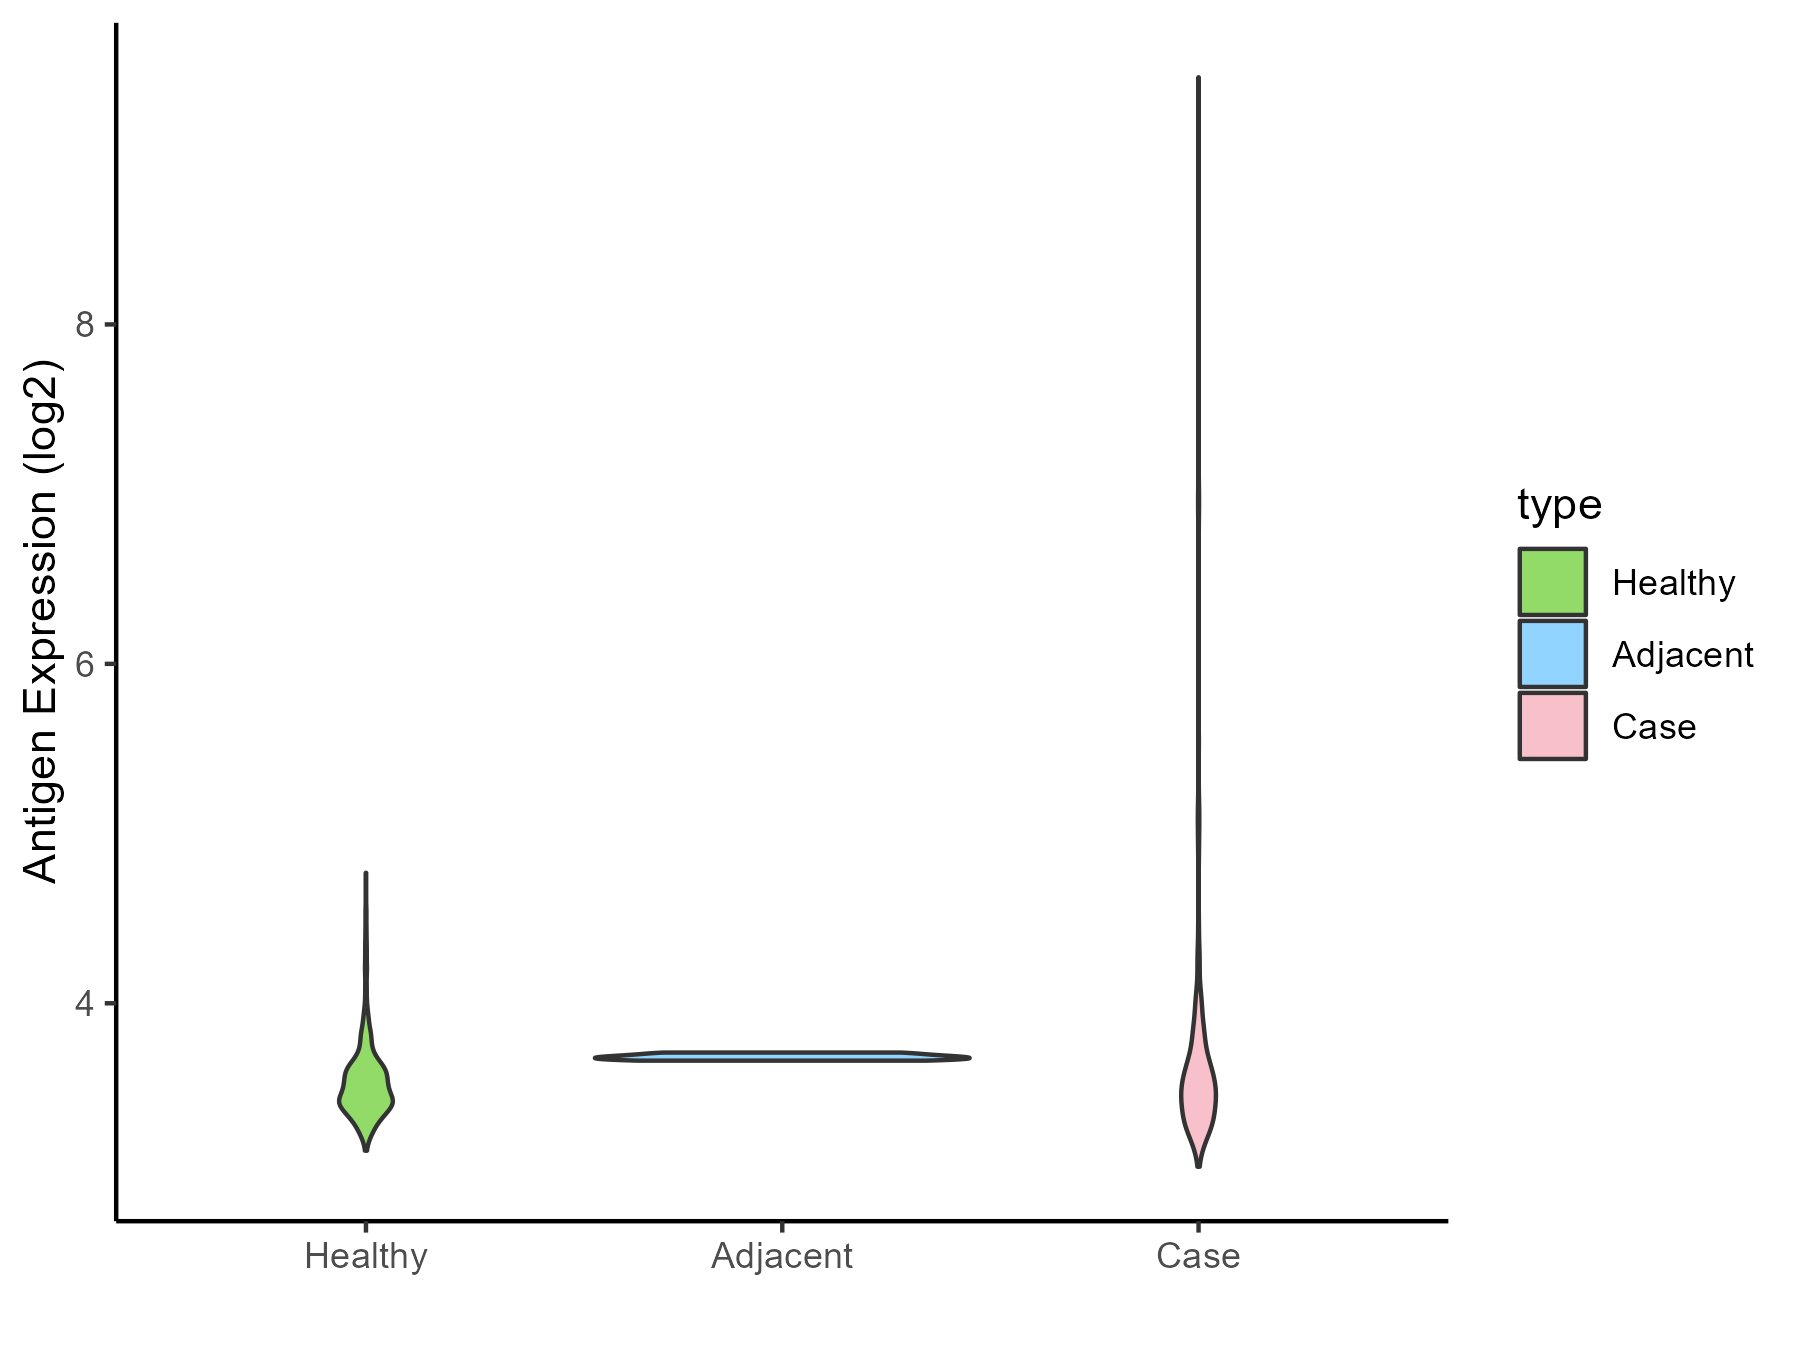
| The Studied Tissue | Muscle | |
| The Specific Disease | Sarcoma | |
| The Expression Level of Disease Section Compare with the Healthy Individual Tissue | p-value: 5.52E-07; Fold-change: 0.019590703; Z-score: 0.088036495 | |
| The Expression Level of Disease Section Compare with the Adjacent Tissue | p-value: 0.655020462; Fold-change: -0.168424499; Z-score: -8.291447933 | |
| Disease-specific Antigen Abundances |
|
Click to View the Clearer Original Diagram |
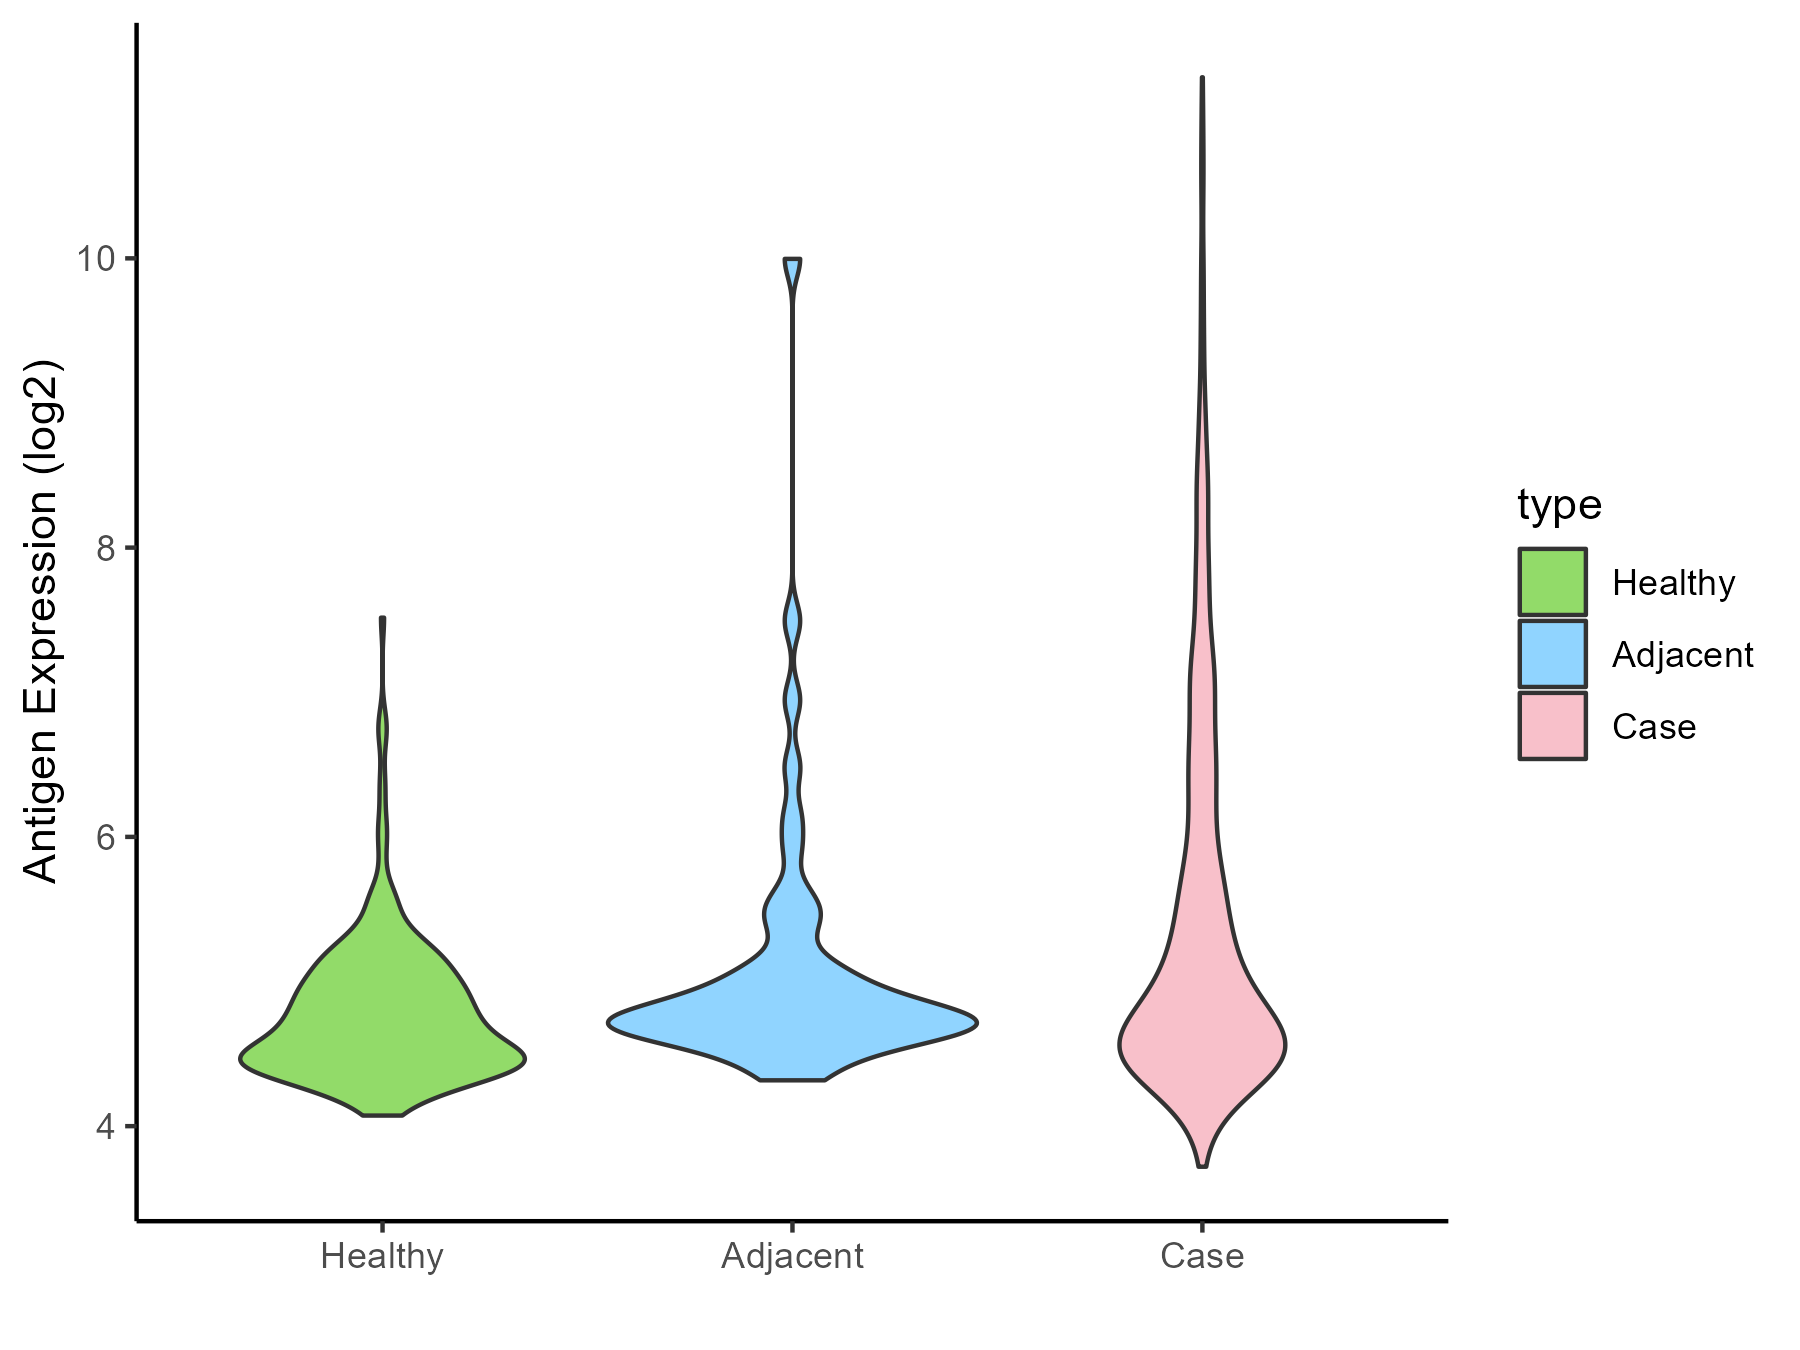
| Differential expression pattern of antigen in diseases | ||
| The Studied Tissue | Breast | |
| The Specific Disease | Breast cancer | |
| The Expression Level of Disease Section Compare with the Healthy Individual Tissue | p-value: 9.00E-41; Fold-change: 0.185942743; Z-score: 0.385775823 | |
| The Expression Level of Disease Section Compare with the Adjacent Tissue | p-value: 0.015524495; Fold-change: 0.11415017; Z-score: 0.121297024 | |
| Disease-specific Antigen Abundances |
|
Click to View the Clearer Original Diagram |
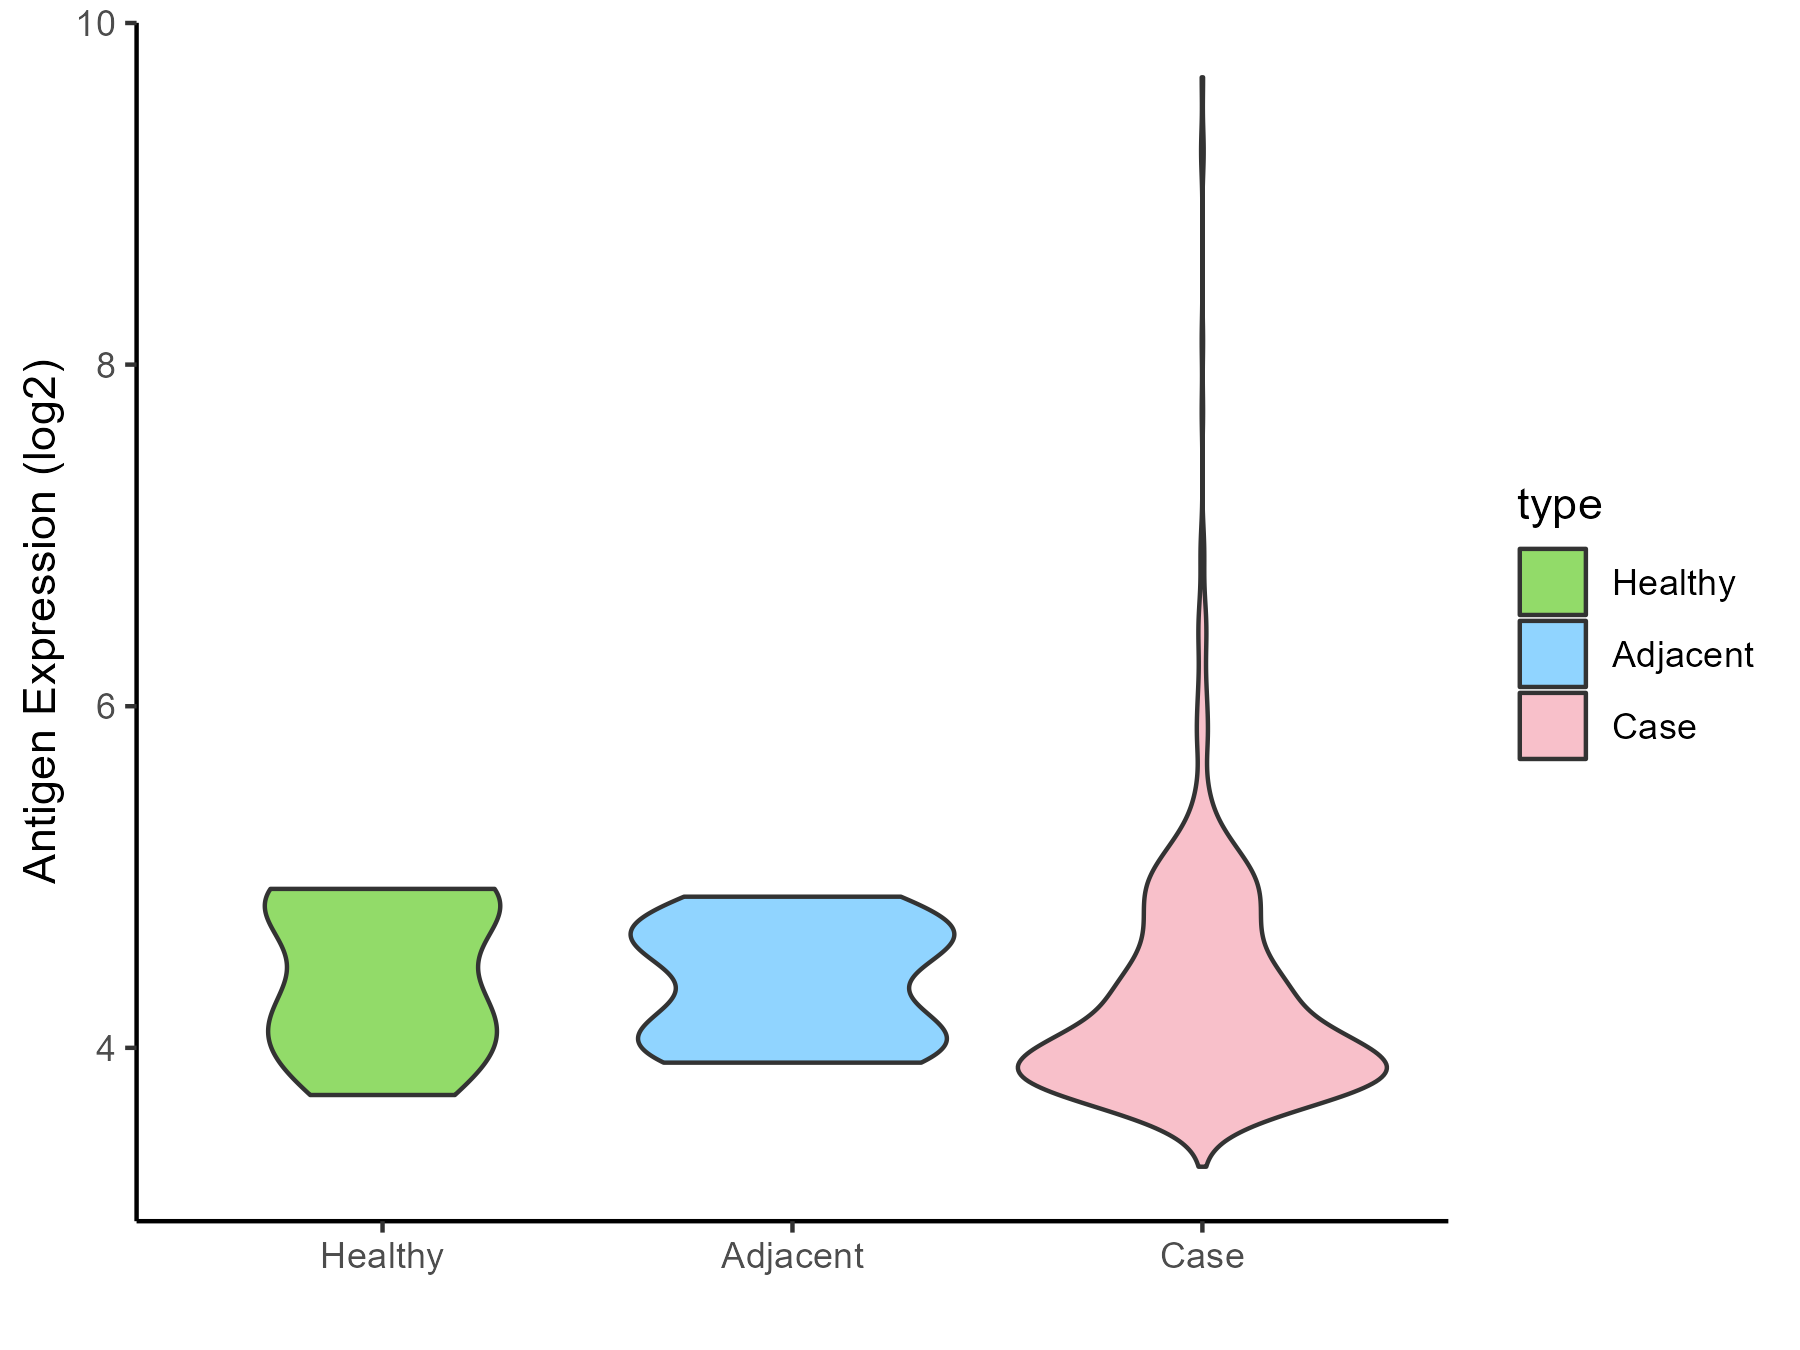
| Differential expression pattern of antigen in diseases | ||
| The Studied Tissue | Ovarian | |
| The Specific Disease | Ovarian cancer | |
| The Expression Level of Disease Section Compare with the Healthy Individual Tissue | p-value: 0.49662401; Fold-change: -0.199009328; Z-score: -0.428283765 | |
| The Expression Level of Disease Section Compare with the Adjacent Tissue | p-value: 0.402248565; Fold-change: -0.336051074; Z-score: -0.95759095 | |
| Disease-specific Antigen Abundances |
|
Click to View the Clearer Original Diagram |
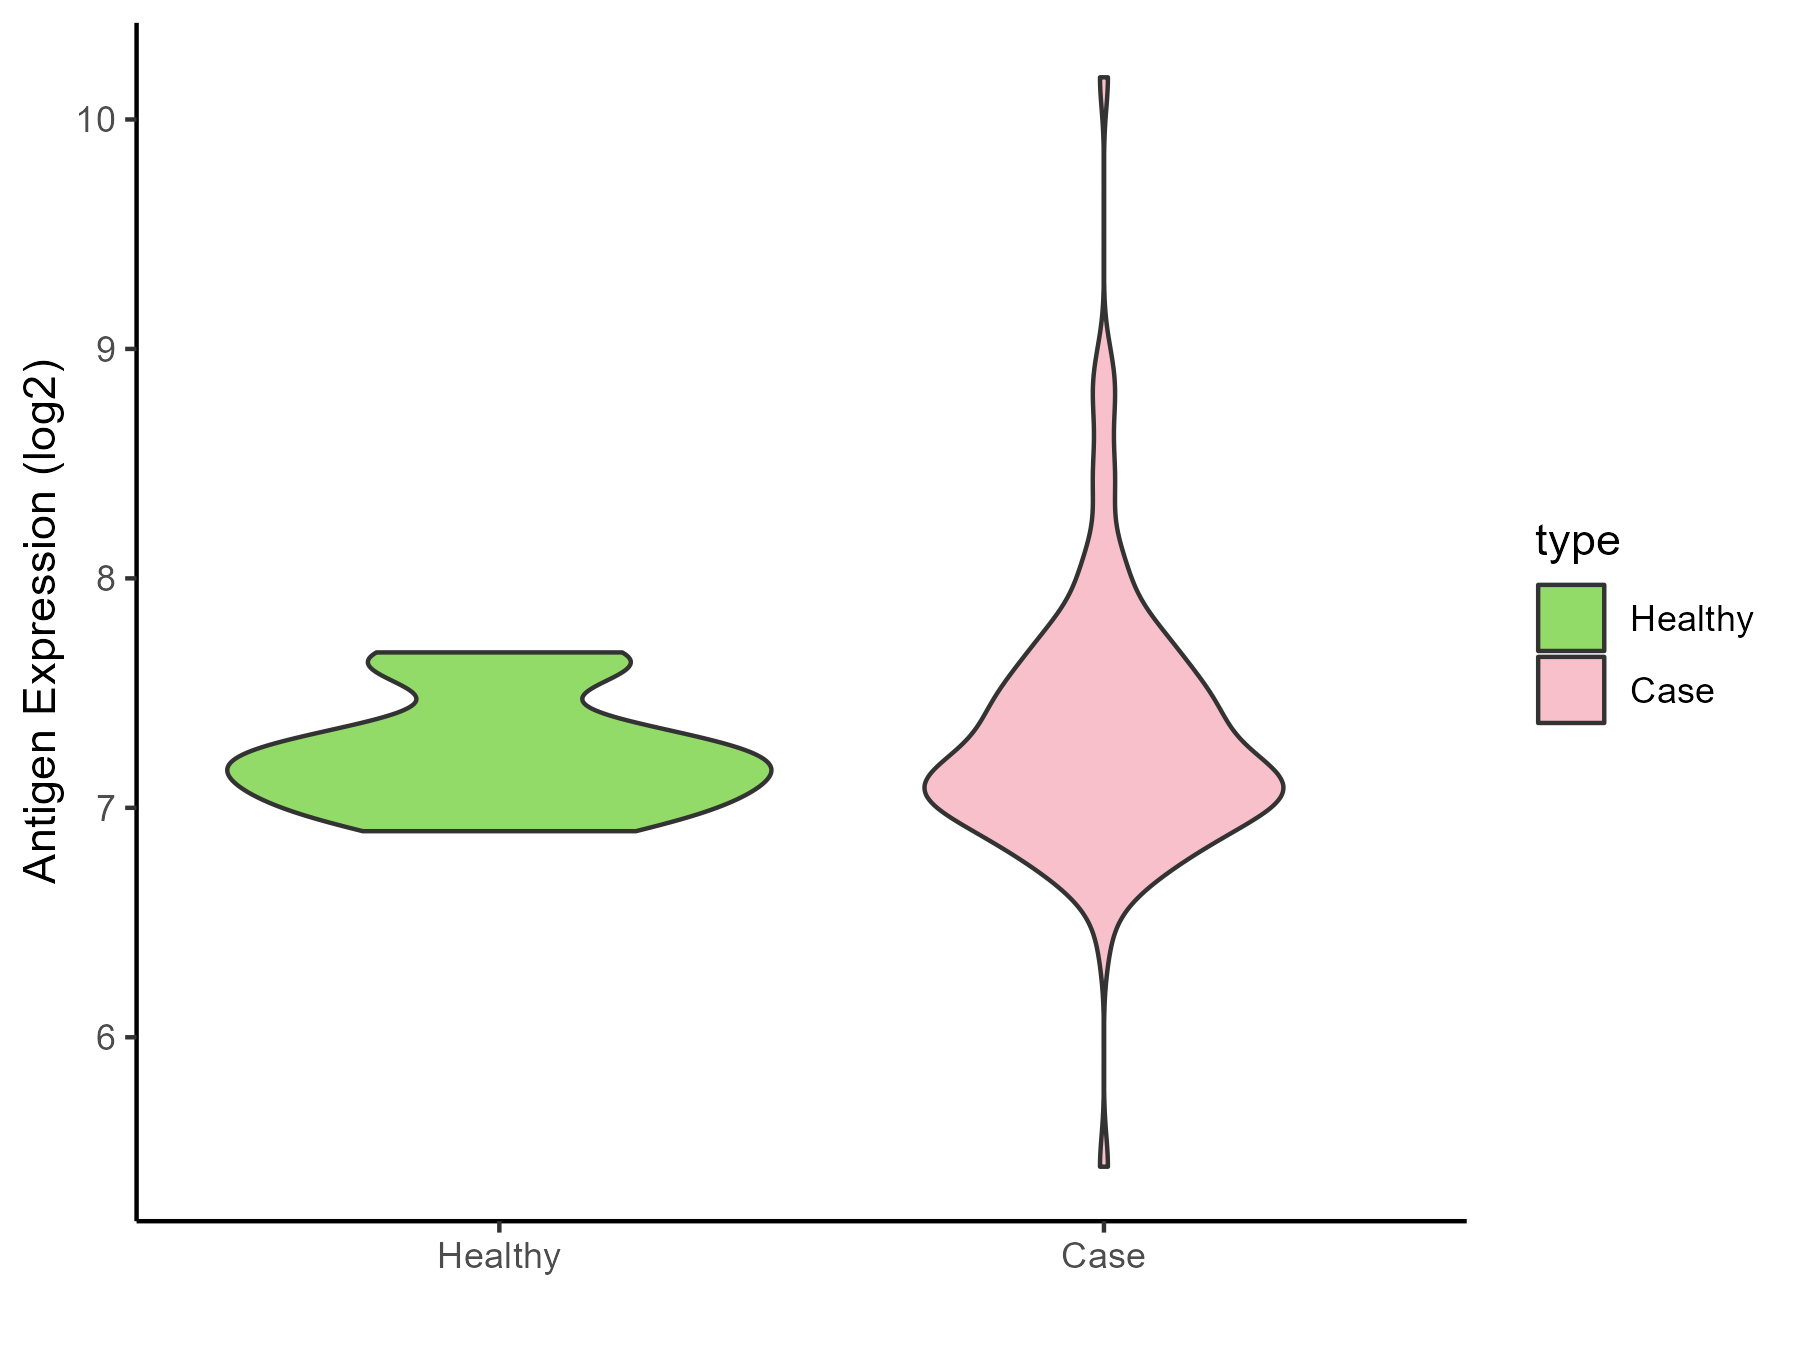
| Differential expression pattern of antigen in diseases | ||
| The Studied Tissue | Cervical | |
| The Specific Disease | Cervical cancer | |
| The Expression Level of Disease Section Compare with the Healthy Individual Tissue | p-value: 0.320974831; Fold-change: -0.013257905; Z-score: -0.052967459 | |
| Disease-specific Antigen Abundances |
|
Click to View the Clearer Original Diagram |
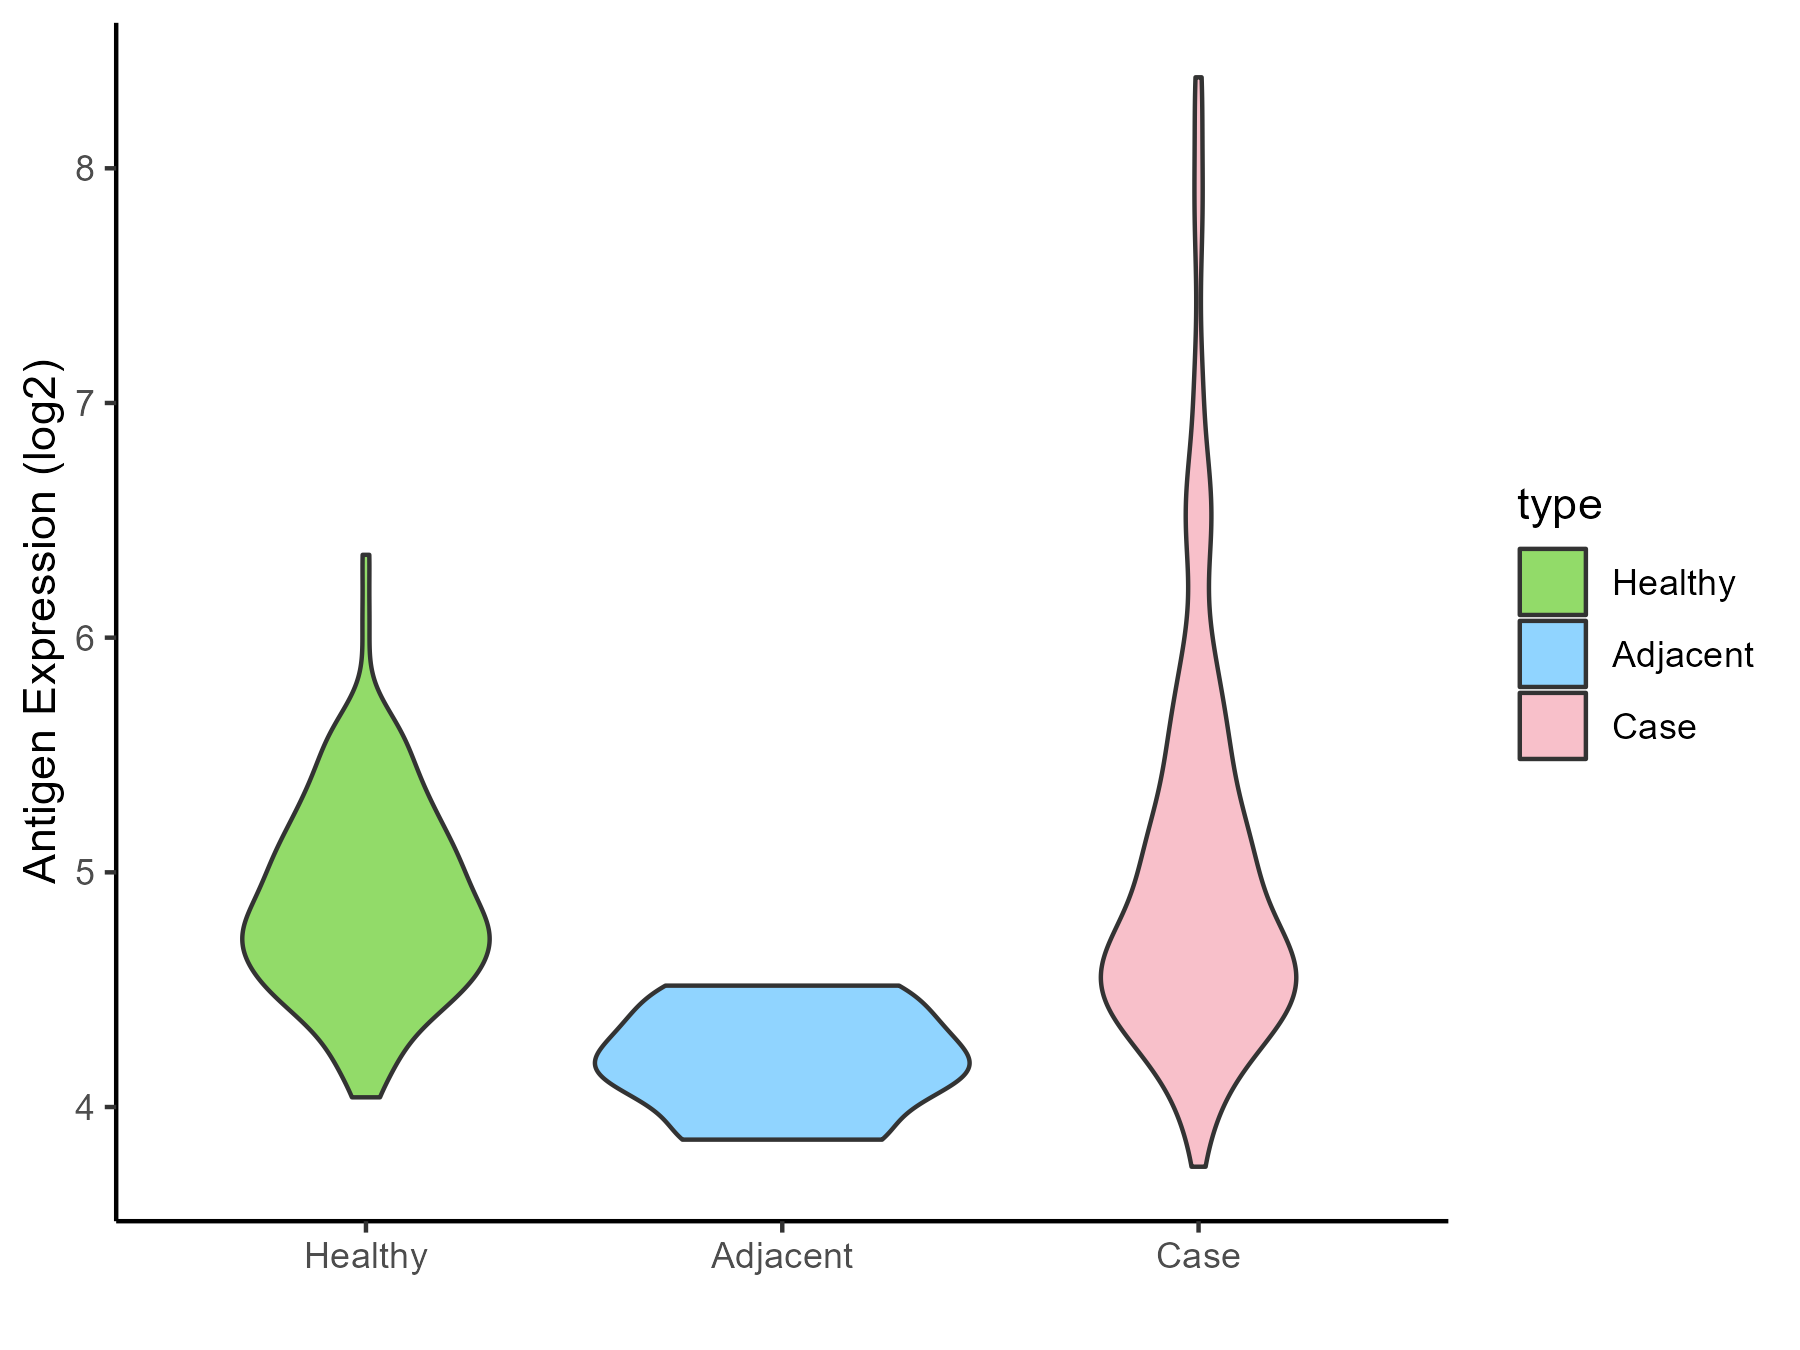
| Differential expression pattern of antigen in diseases | ||
| The Studied Tissue | Endometrium | |
| The Specific Disease | Uterine cancer | |
| The Expression Level of Disease Section Compare with the Healthy Individual Tissue | p-value: 0.007921513; Fold-change: -0.053430793; Z-score: -0.129231948 | |
| The Expression Level of Disease Section Compare with the Adjacent Tissue | p-value: 0.00056827; Fold-change: 0.57938241; Z-score: 2.328043681 | |
| Disease-specific Antigen Abundances |
|
Click to View the Clearer Original Diagram |
| Differential expression pattern of antigen in diseases | ||
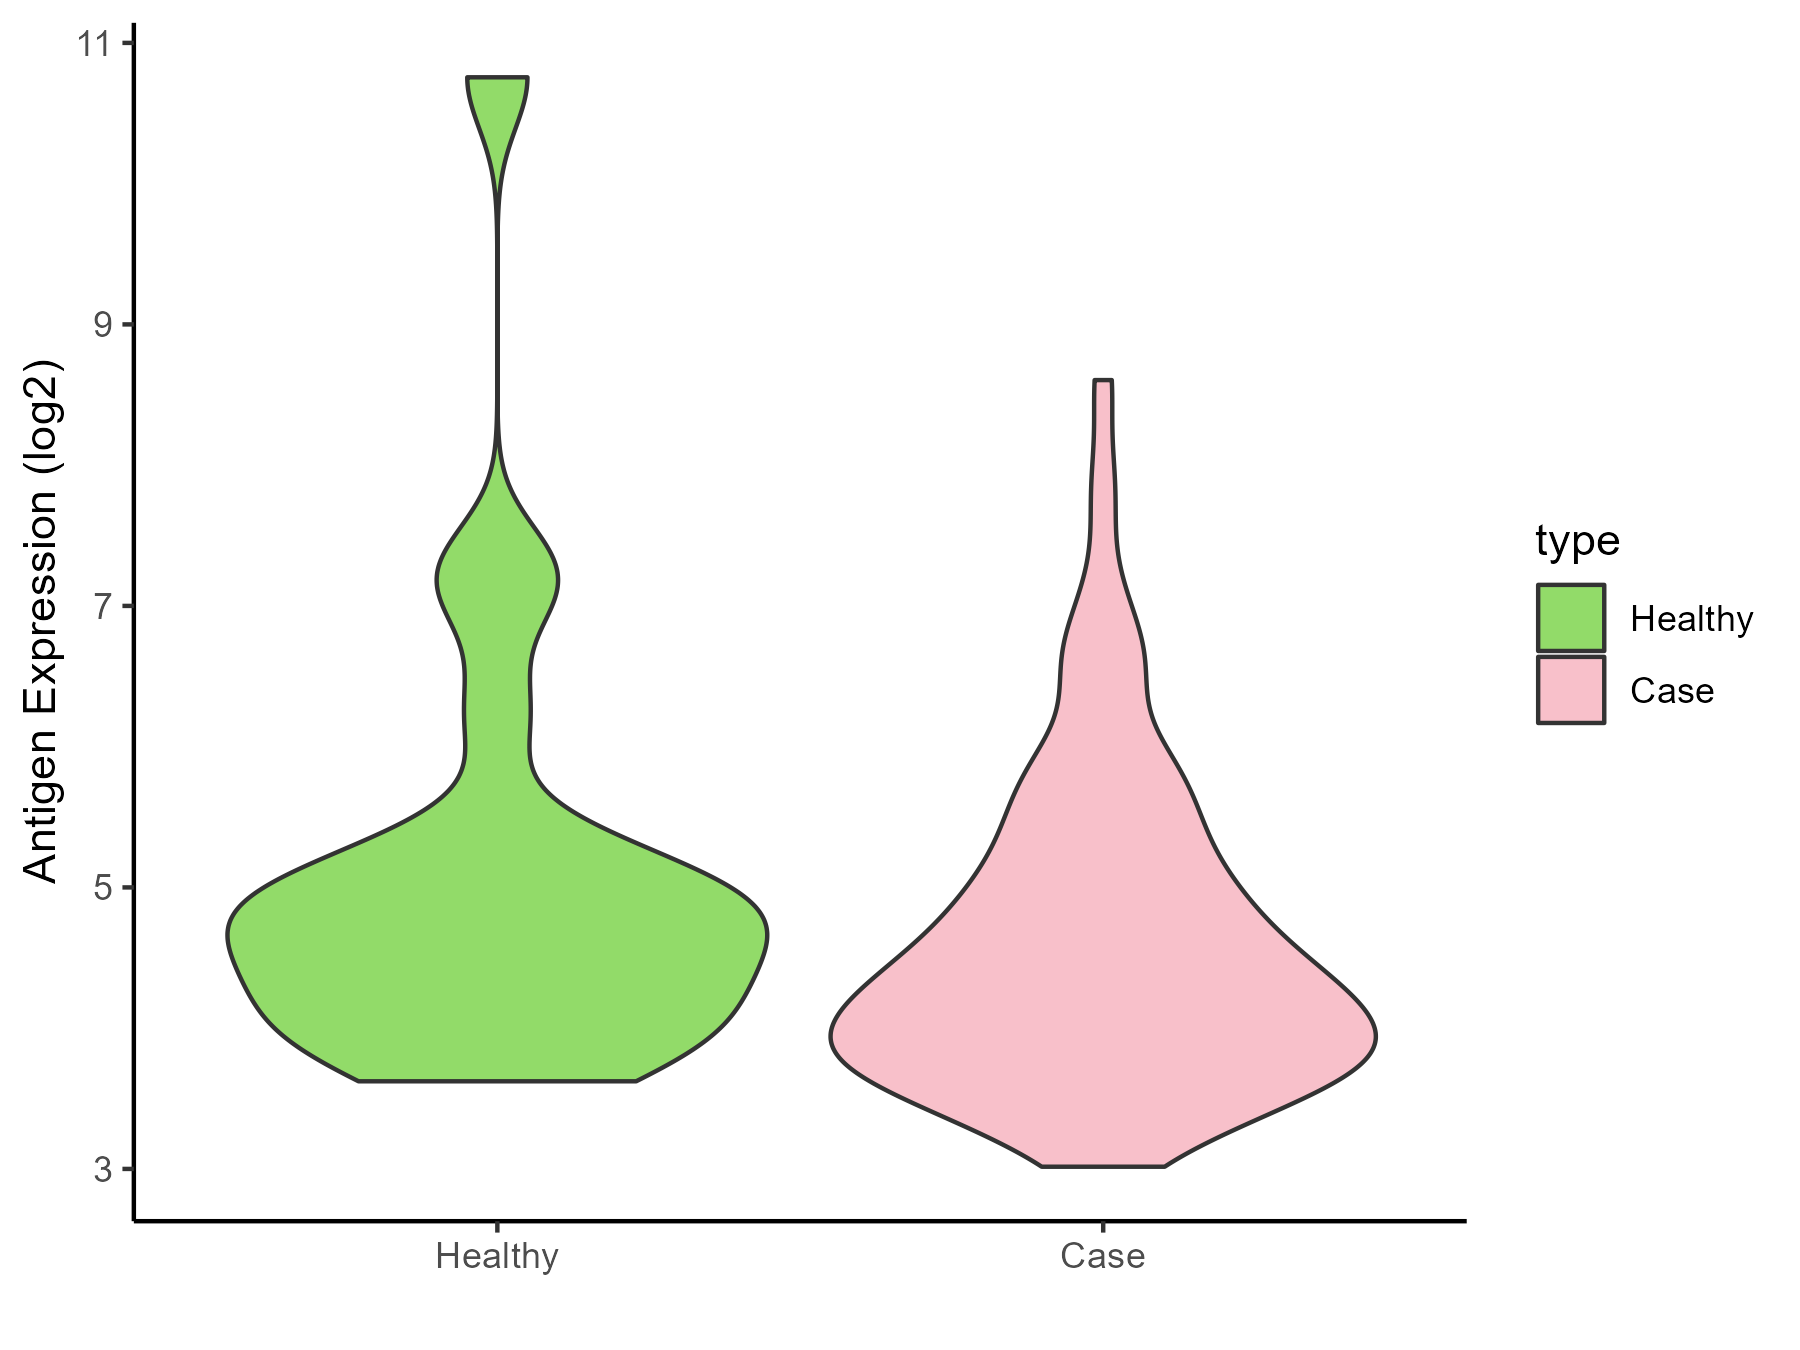
| The Studied Tissue | Prostate | |
| The Specific Disease | Prostate cancer | |
| The Expression Level of Disease Section Compare with the Healthy Individual Tissue | p-value: 0.174064176; Fold-change: -0.515081306; Z-score: -0.316445778 | |
| Disease-specific Antigen Abundances |
|
Click to View the Clearer Original Diagram |
| Differential expression pattern of antigen in diseases | ||
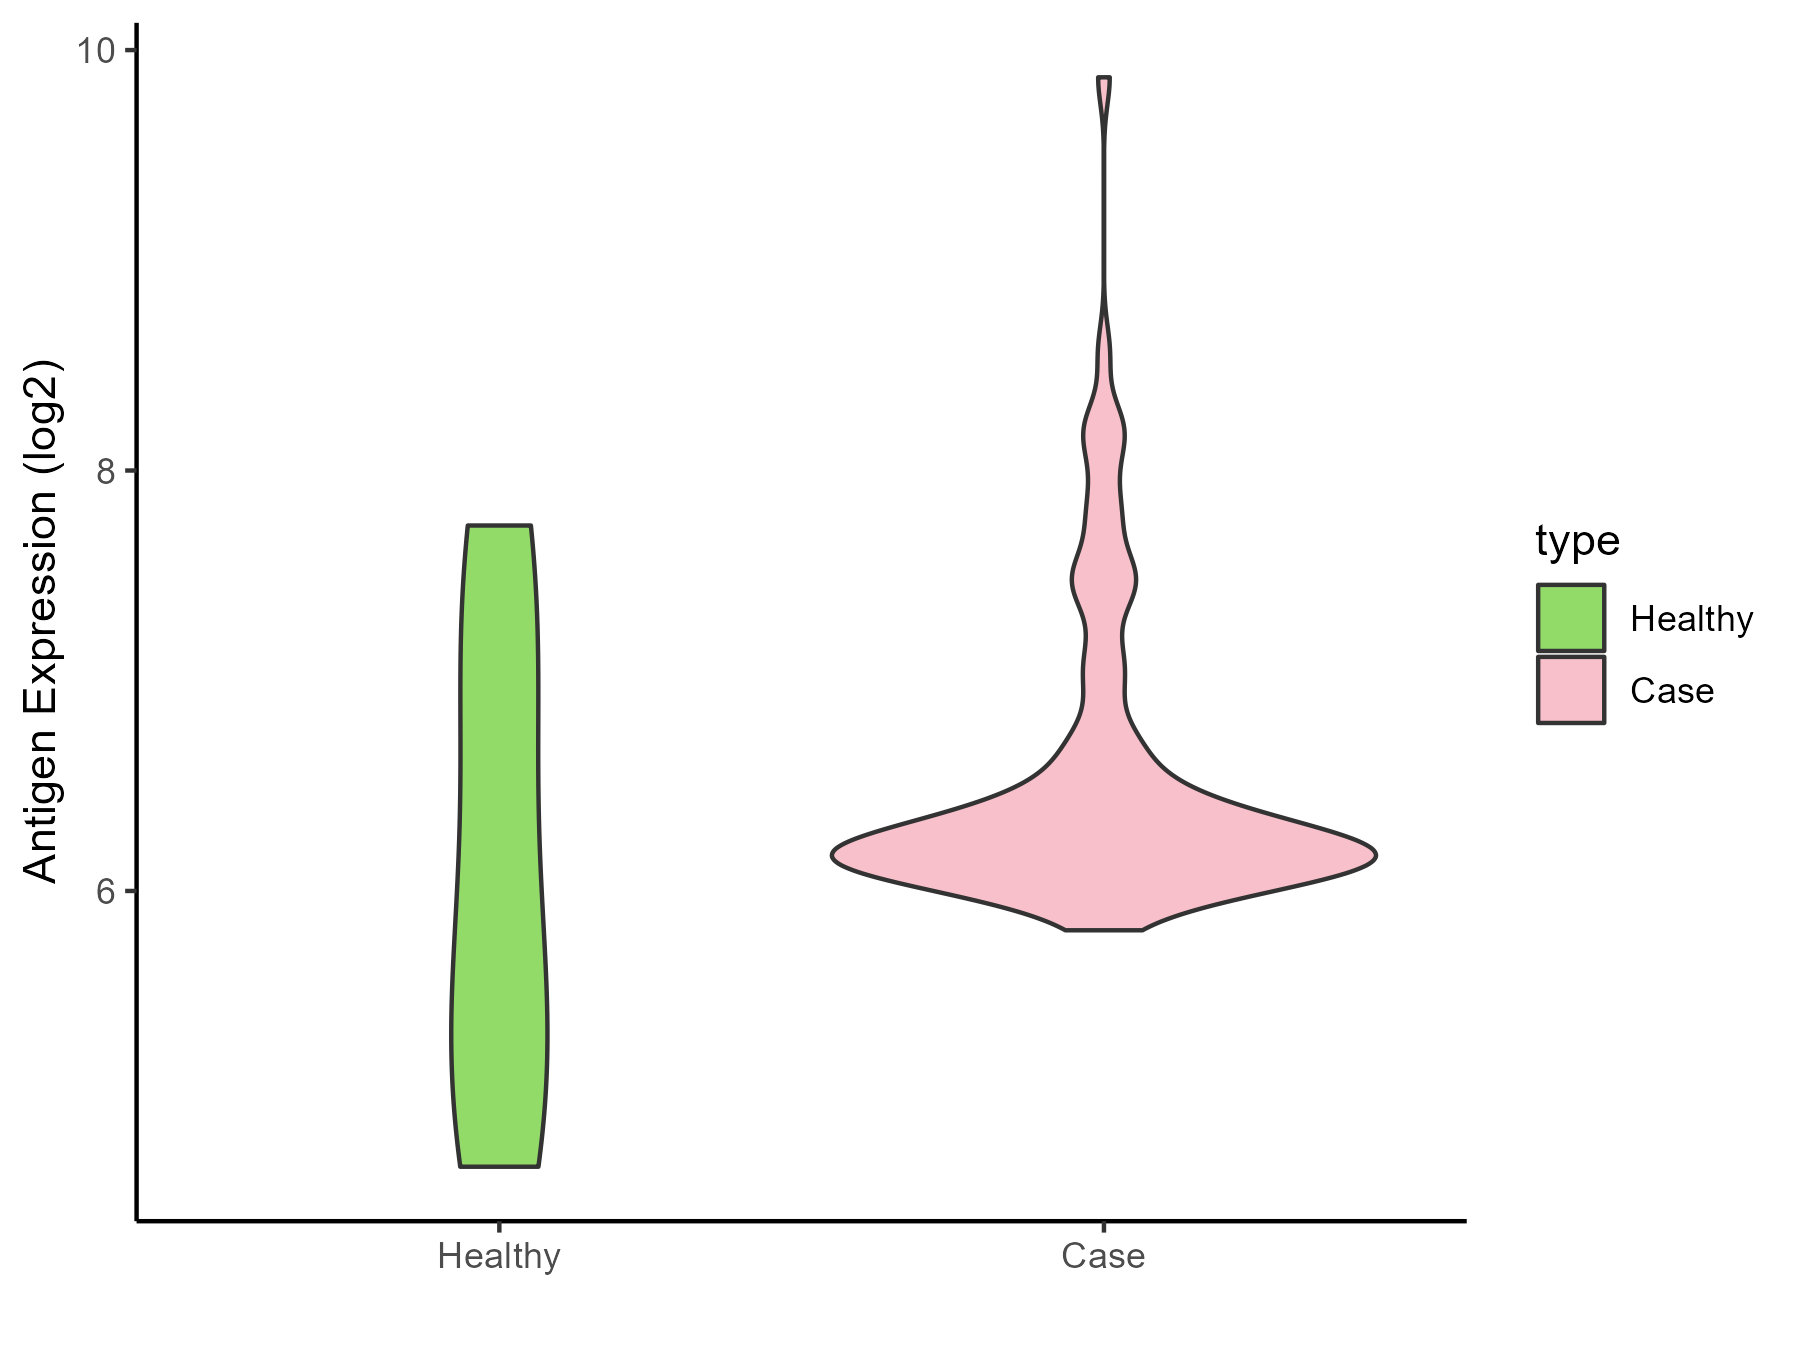
| The Studied Tissue | Bladder | |
| The Specific Disease | Bladder cancer | |
| The Expression Level of Disease Section Compare with the Healthy Individual Tissue | p-value: 0.381522523; Fold-change: 0.352947233; Z-score: 0.297186786 | |
| Disease-specific Antigen Abundances |
|
Click to View the Clearer Original Diagram |
| Differential expression pattern of antigen in diseases | ||
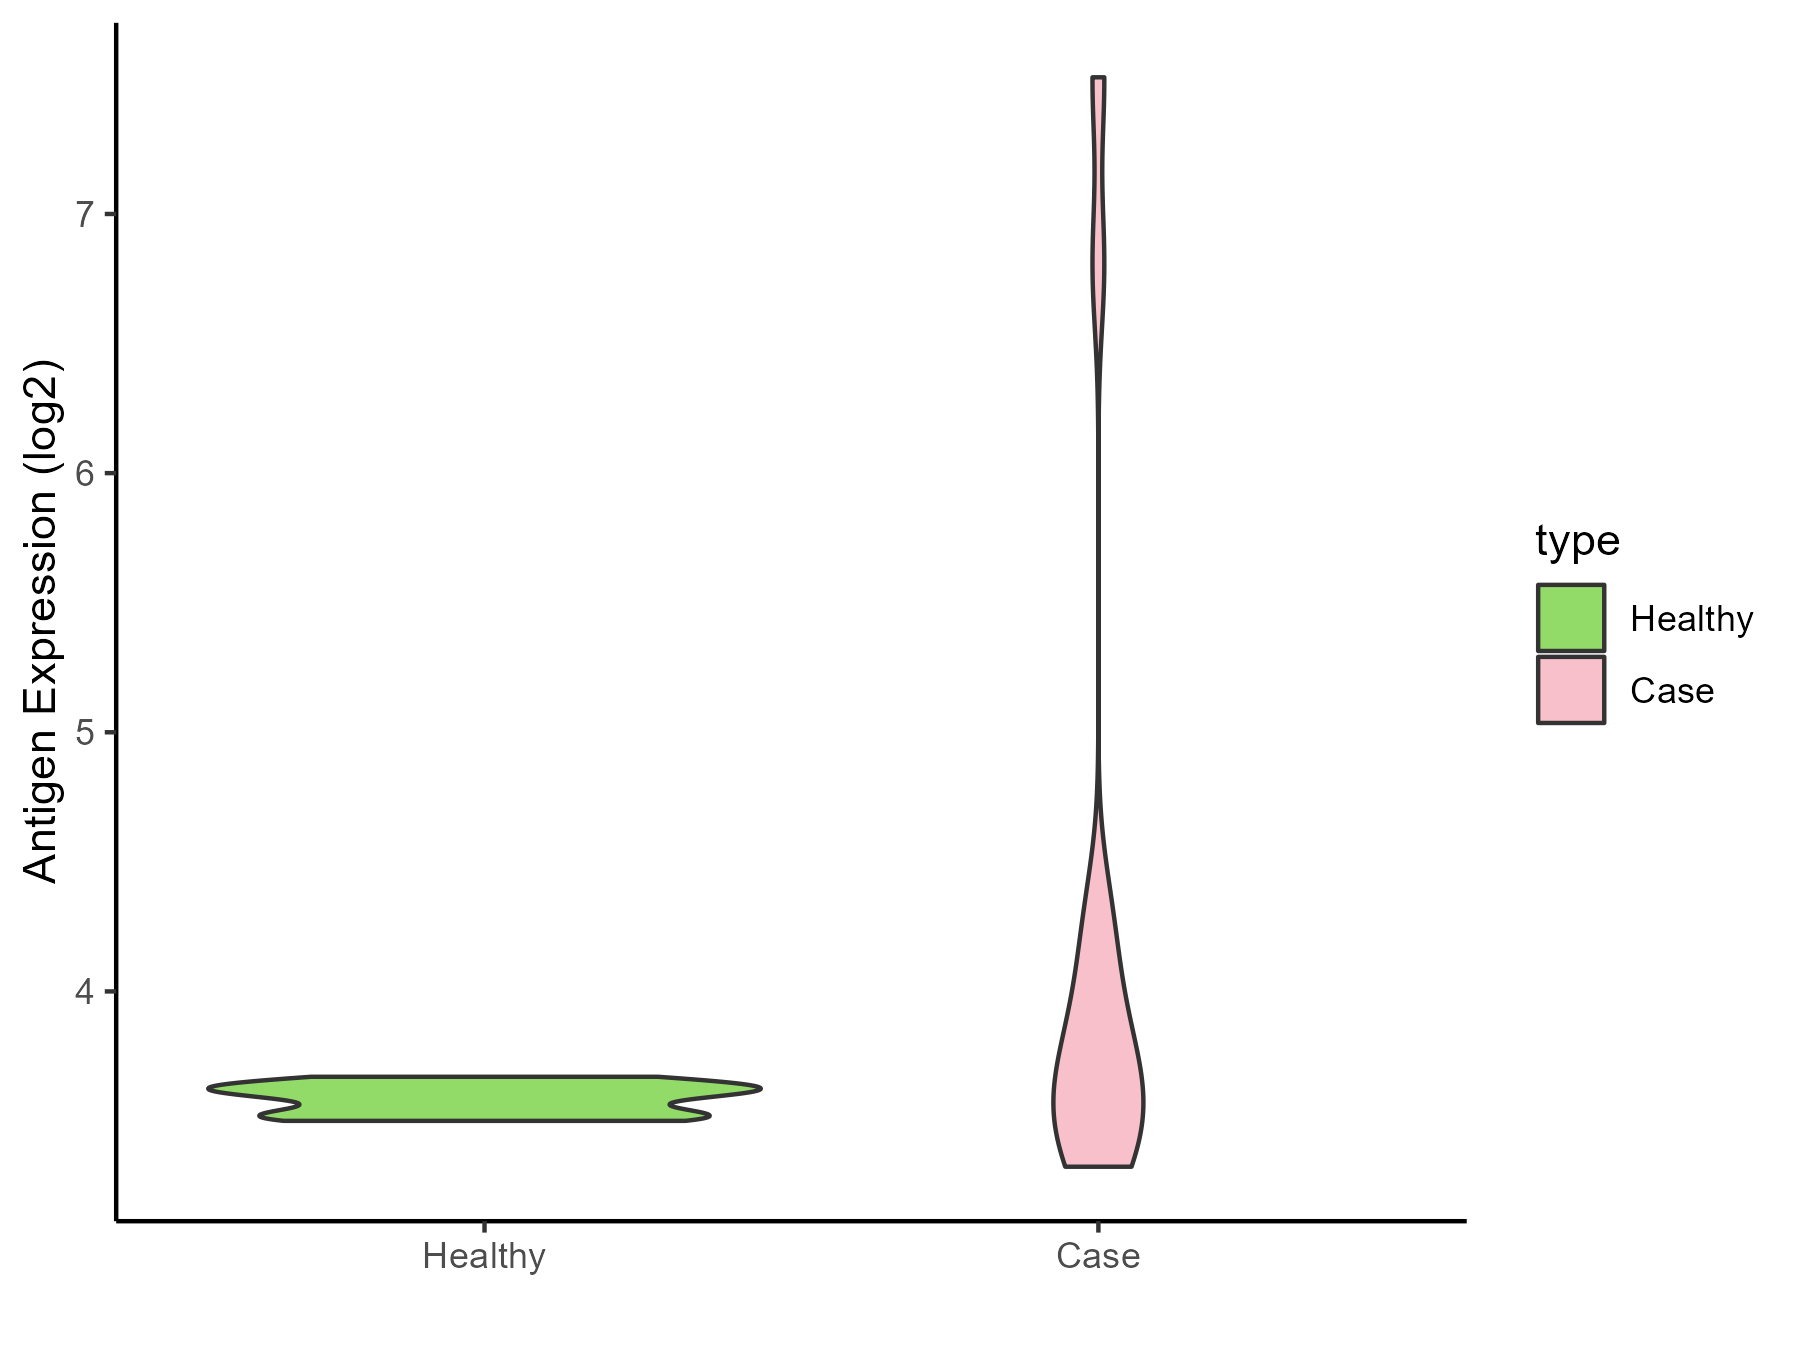
| The Studied Tissue | Uvea | |
| The Specific Disease | Retinoblastoma tumor | |
| The Expression Level of Disease Section Compare with the Healthy Individual Tissue | p-value: 0.10009362; Fold-change: 0.075716129; Z-score: 1.220239244 | |
| Disease-specific Antigen Abundances |
|
Click to View the Clearer Original Diagram |
| Differential expression pattern of antigen in diseases | ||
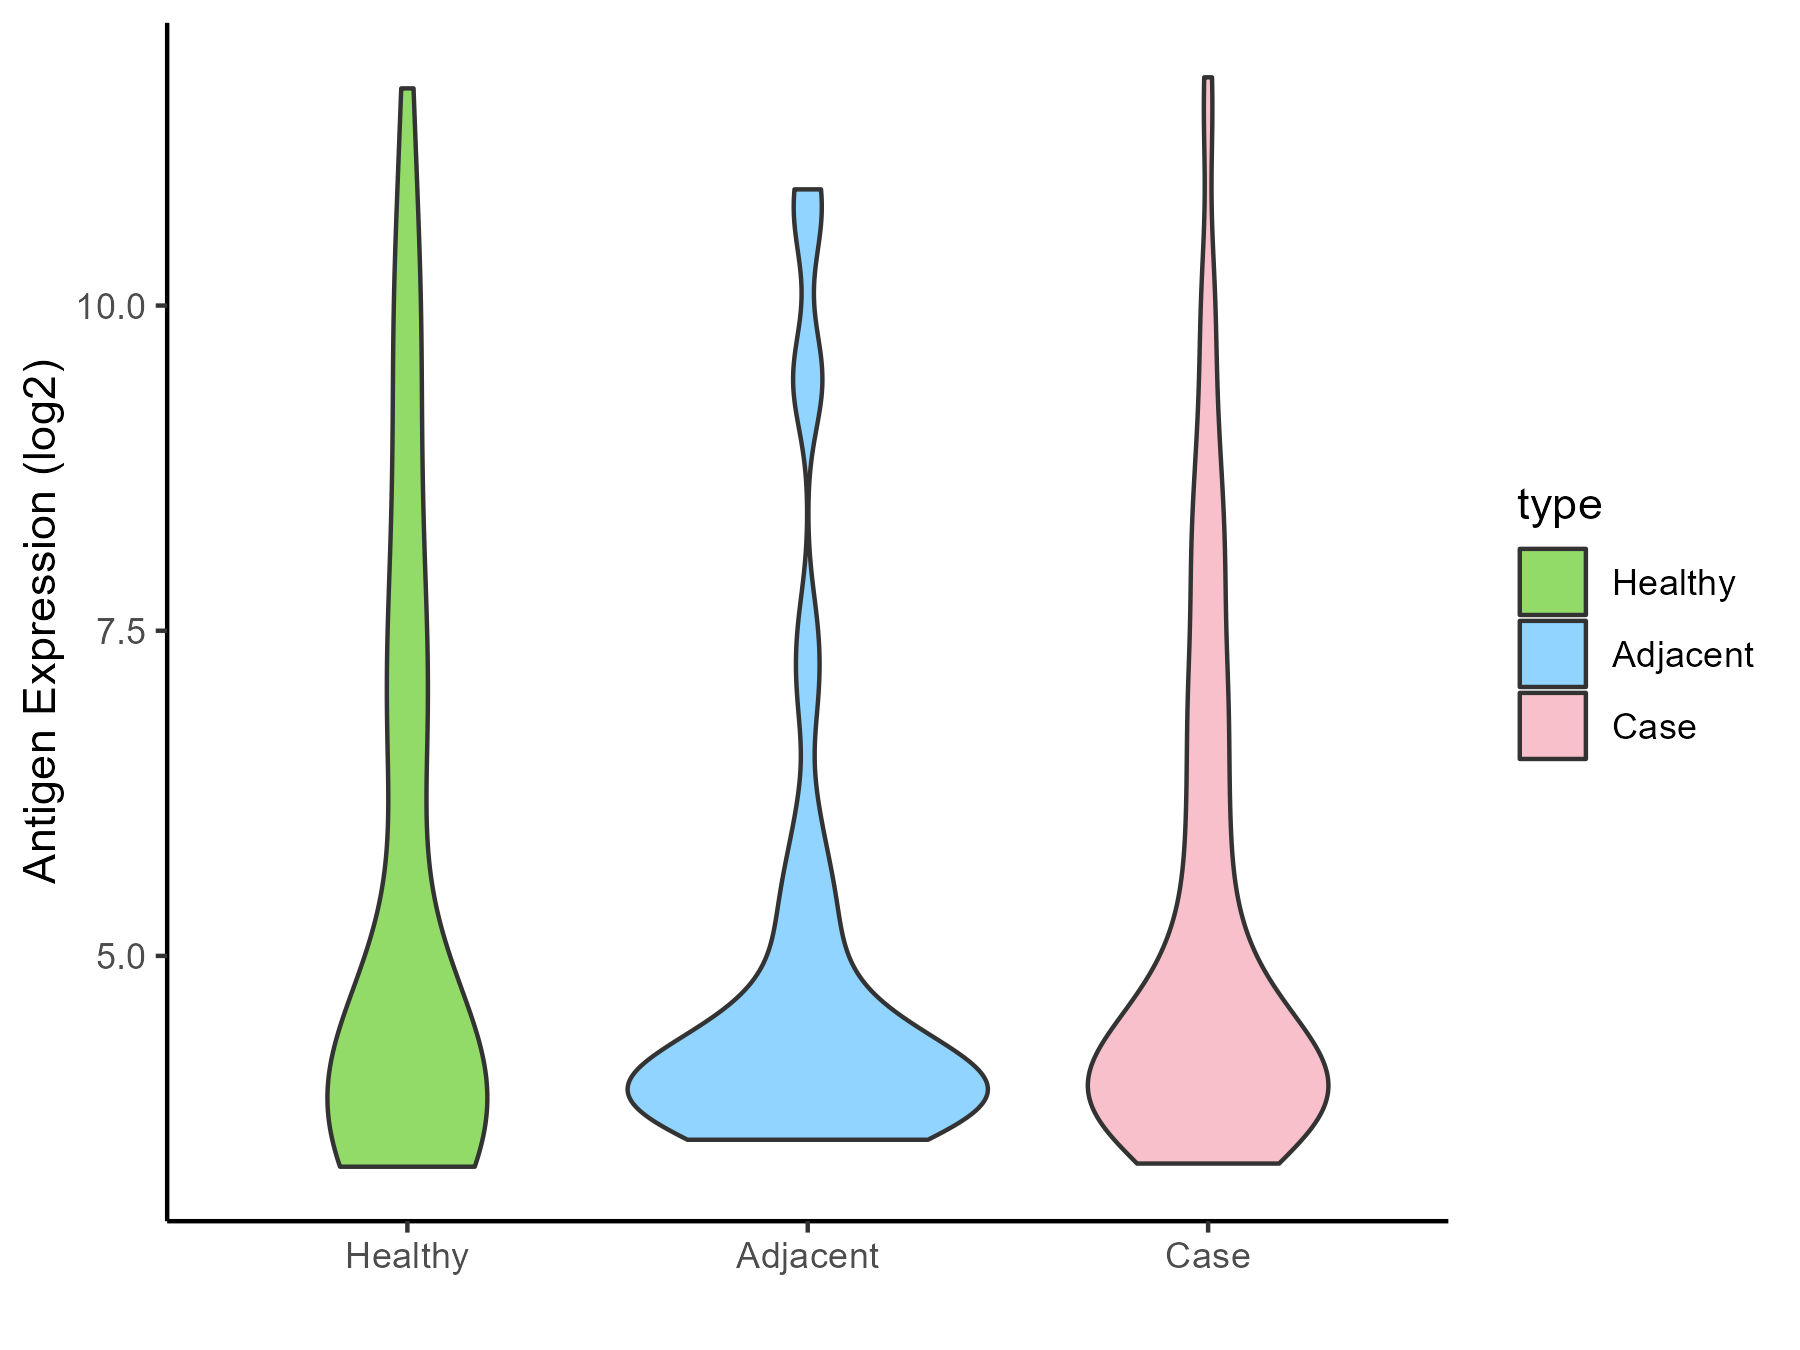
| The Studied Tissue | Thyroid | |
| The Specific Disease | Thyroid cancer | |
| The Expression Level of Disease Section Compare with the Healthy Individual Tissue | p-value: 0.327599854; Fold-change: 0.198760936; Z-score: 0.083906233 | |
| The Expression Level of Disease Section Compare with the Adjacent Tissue | p-value: 0.387521481; Fold-change: 0.229327102; Z-score: 0.119121831 | |
| Disease-specific Antigen Abundances |
|
Click to View the Clearer Original Diagram |
| Differential expression pattern of antigen in diseases | ||
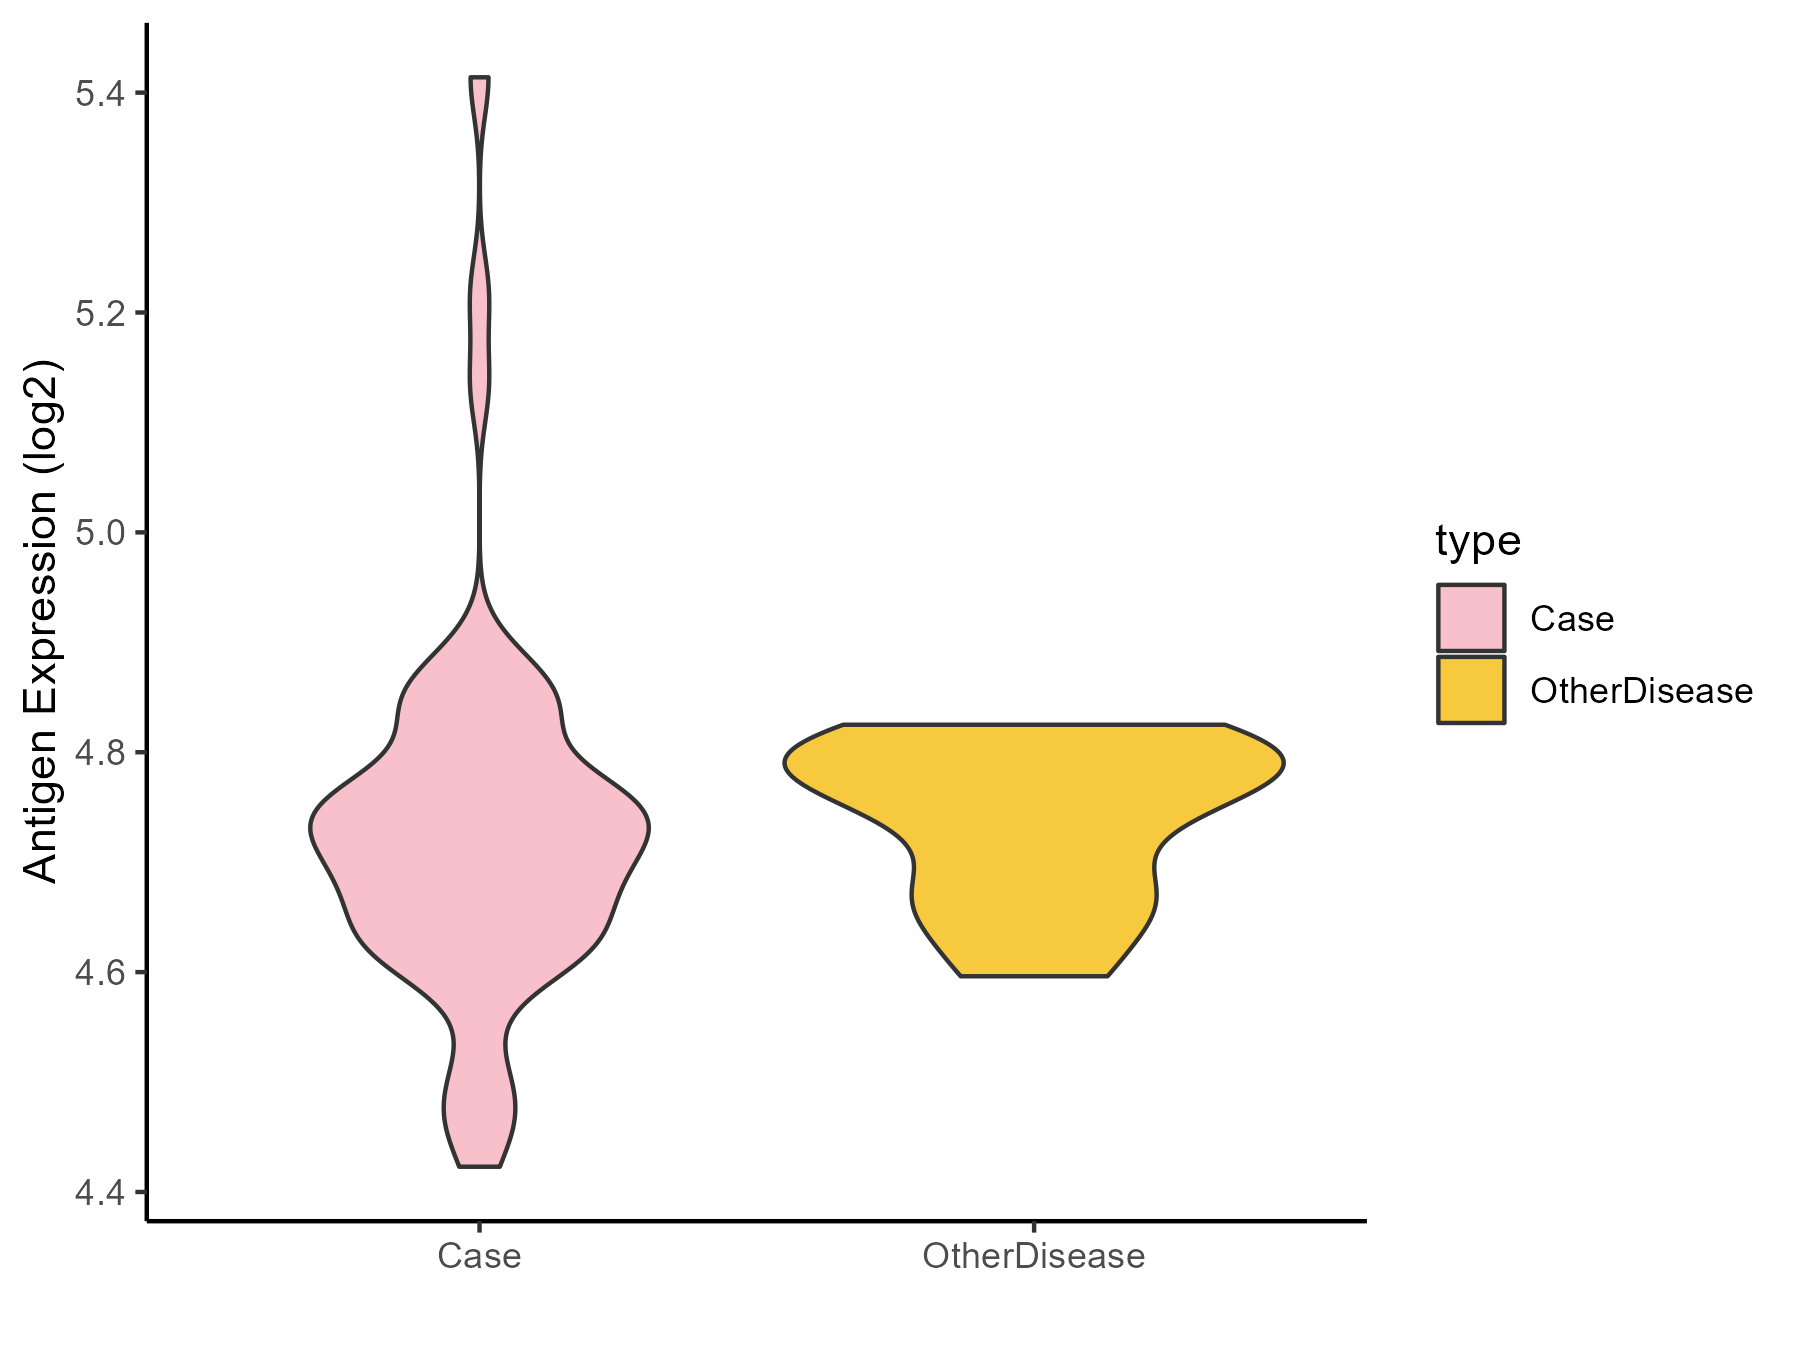
| The Studied Tissue | Adrenal cortex | |
| The Specific Disease | Adrenocortical carcinoma | |
| The Expression Level of Disease Section Compare with the Other Disease Section | p-value: 0.685543789; Fold-change: -0.050099287; Z-score: -0.653392594 | |
| Disease-specific Antigen Abundances |
|
Click to View the Clearer Original Diagram |
| Differential expression pattern of antigen in diseases | ||
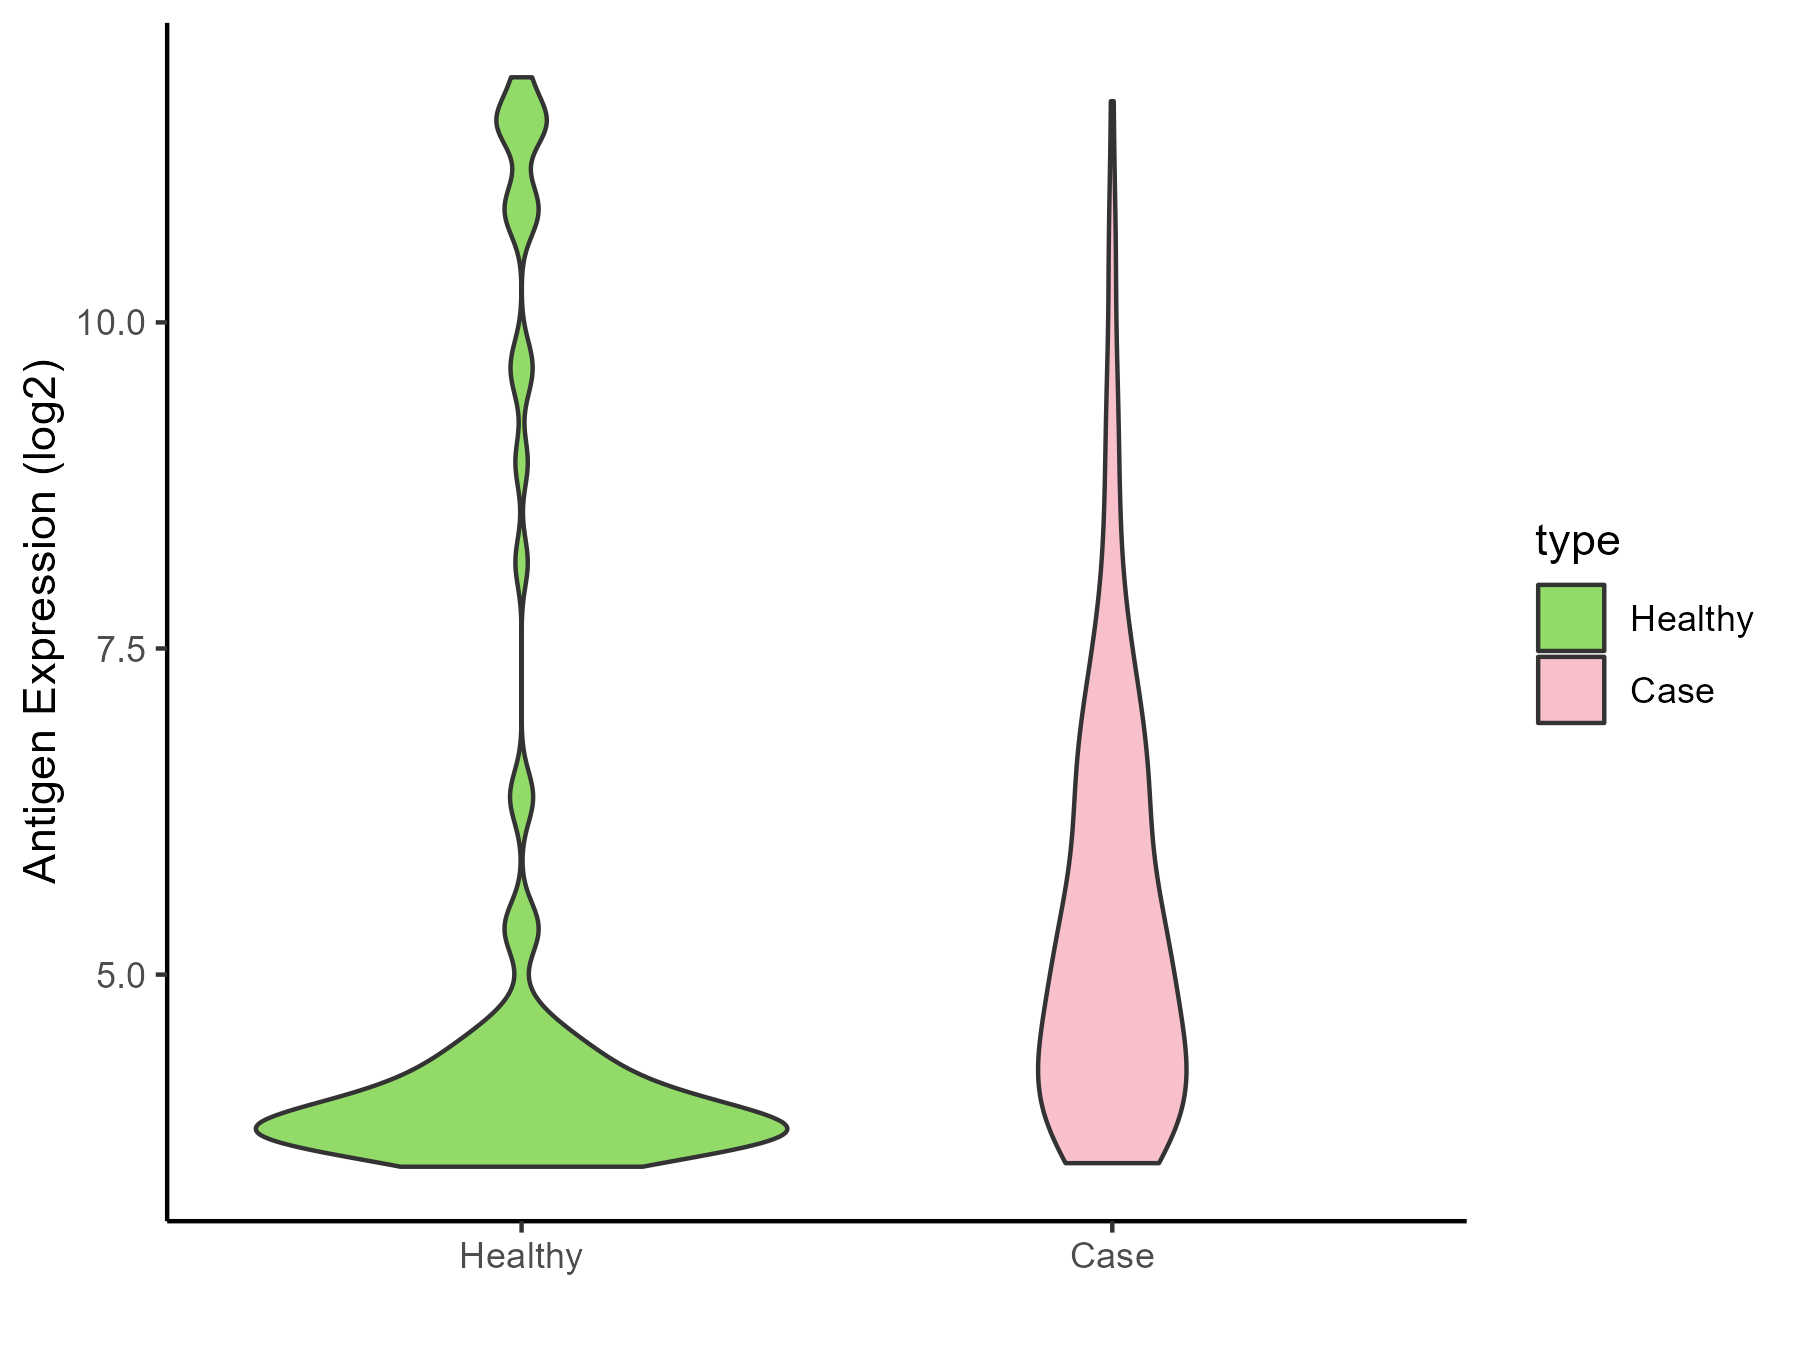
| The Studied Tissue | Head and neck | |
| The Specific Disease | Head and neck cancer | |
| The Expression Level of Disease Section Compare with the Healthy Individual Tissue | p-value: 0.086758129; Fold-change: 1.089617172; Z-score: 0.460446436 | |
| Disease-specific Antigen Abundances |
|
Click to View the Clearer Original Diagram |
| Differential expression pattern of antigen in diseases | ||
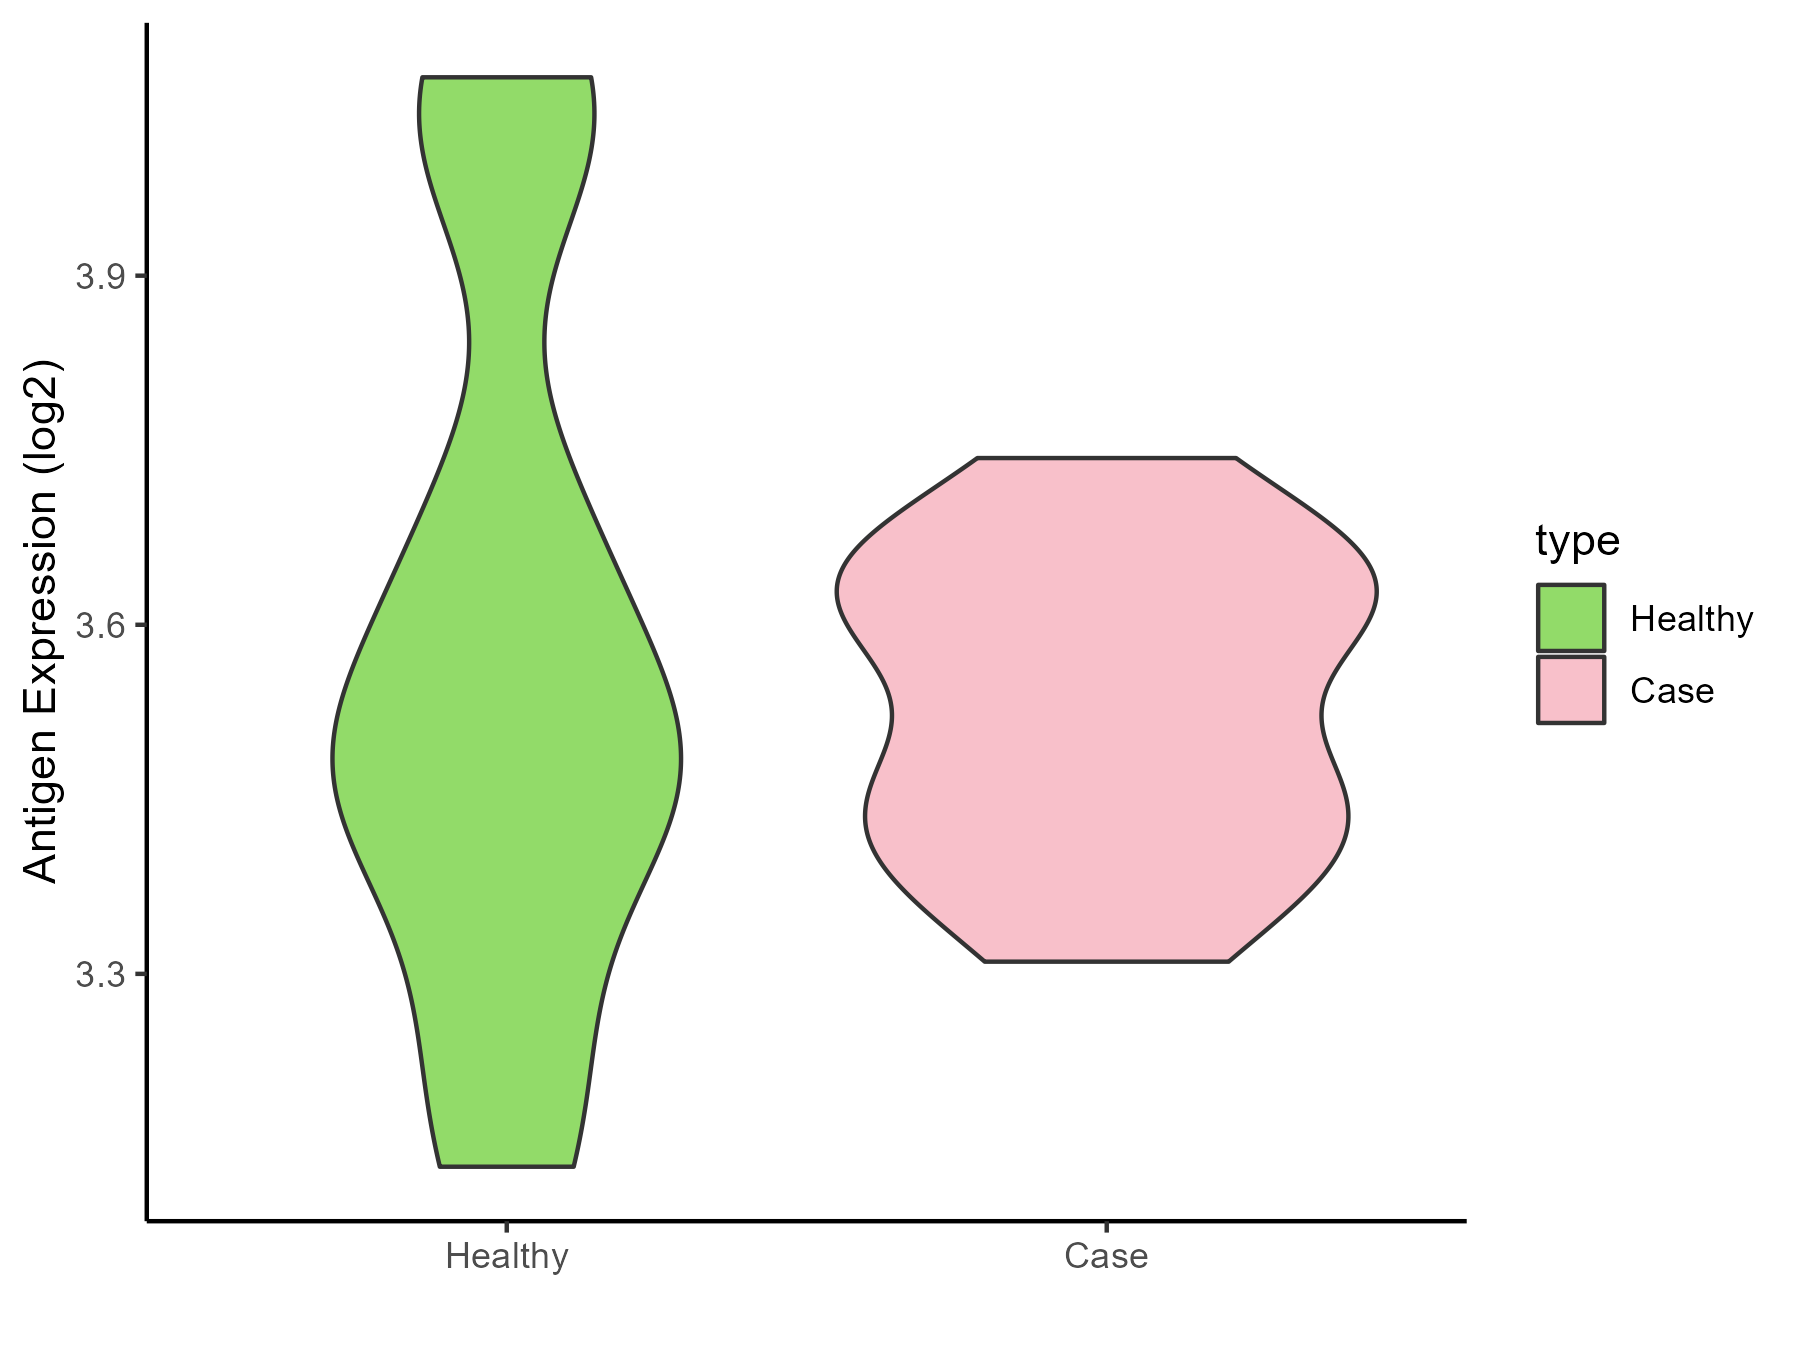
| The Studied Tissue | Pituitary | |
| The Specific Disease | Pituitary gonadotrope tumor | |
| The Expression Level of Disease Section Compare with the Healthy Individual Tissue | p-value: 0.716803812; Fold-change: 0.078806956; Z-score: 0.253300043 | |
| Disease-specific Antigen Abundances |
|
Click to View the Clearer Original Diagram |
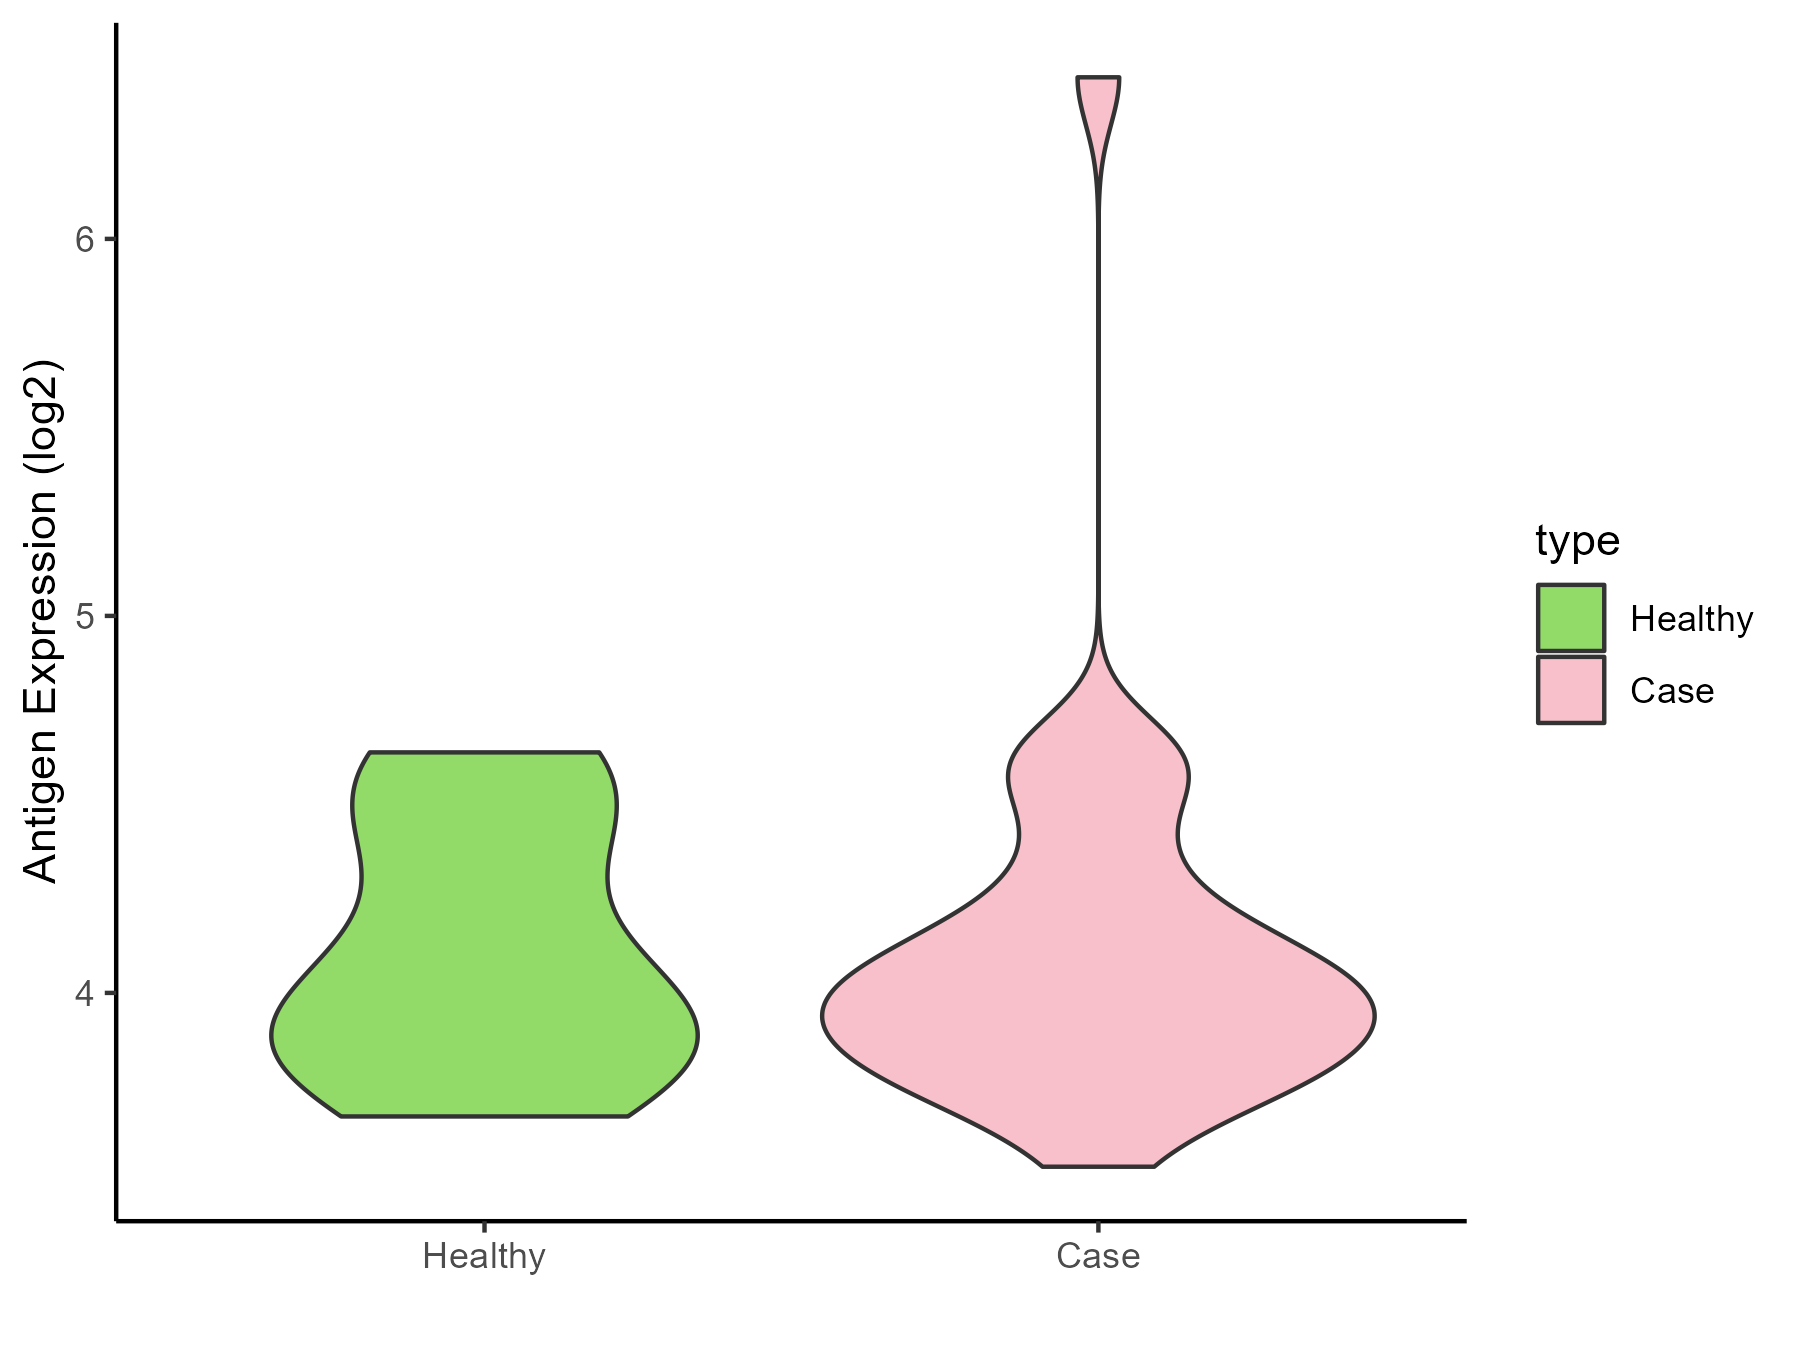
| The Studied Tissue | Pituitary | |
| The Specific Disease | Pituitary cancer | |
| The Expression Level of Disease Section Compare with the Healthy Individual Tissue | p-value: 0.945031508; Fold-change: -0.056284717; Z-score: -0.162242802 | |
| Disease-specific Antigen Abundances |
|
Click to View the Clearer Original Diagram |
ICD Disease Classification 03
| Differential expression pattern of antigen in diseases | ||
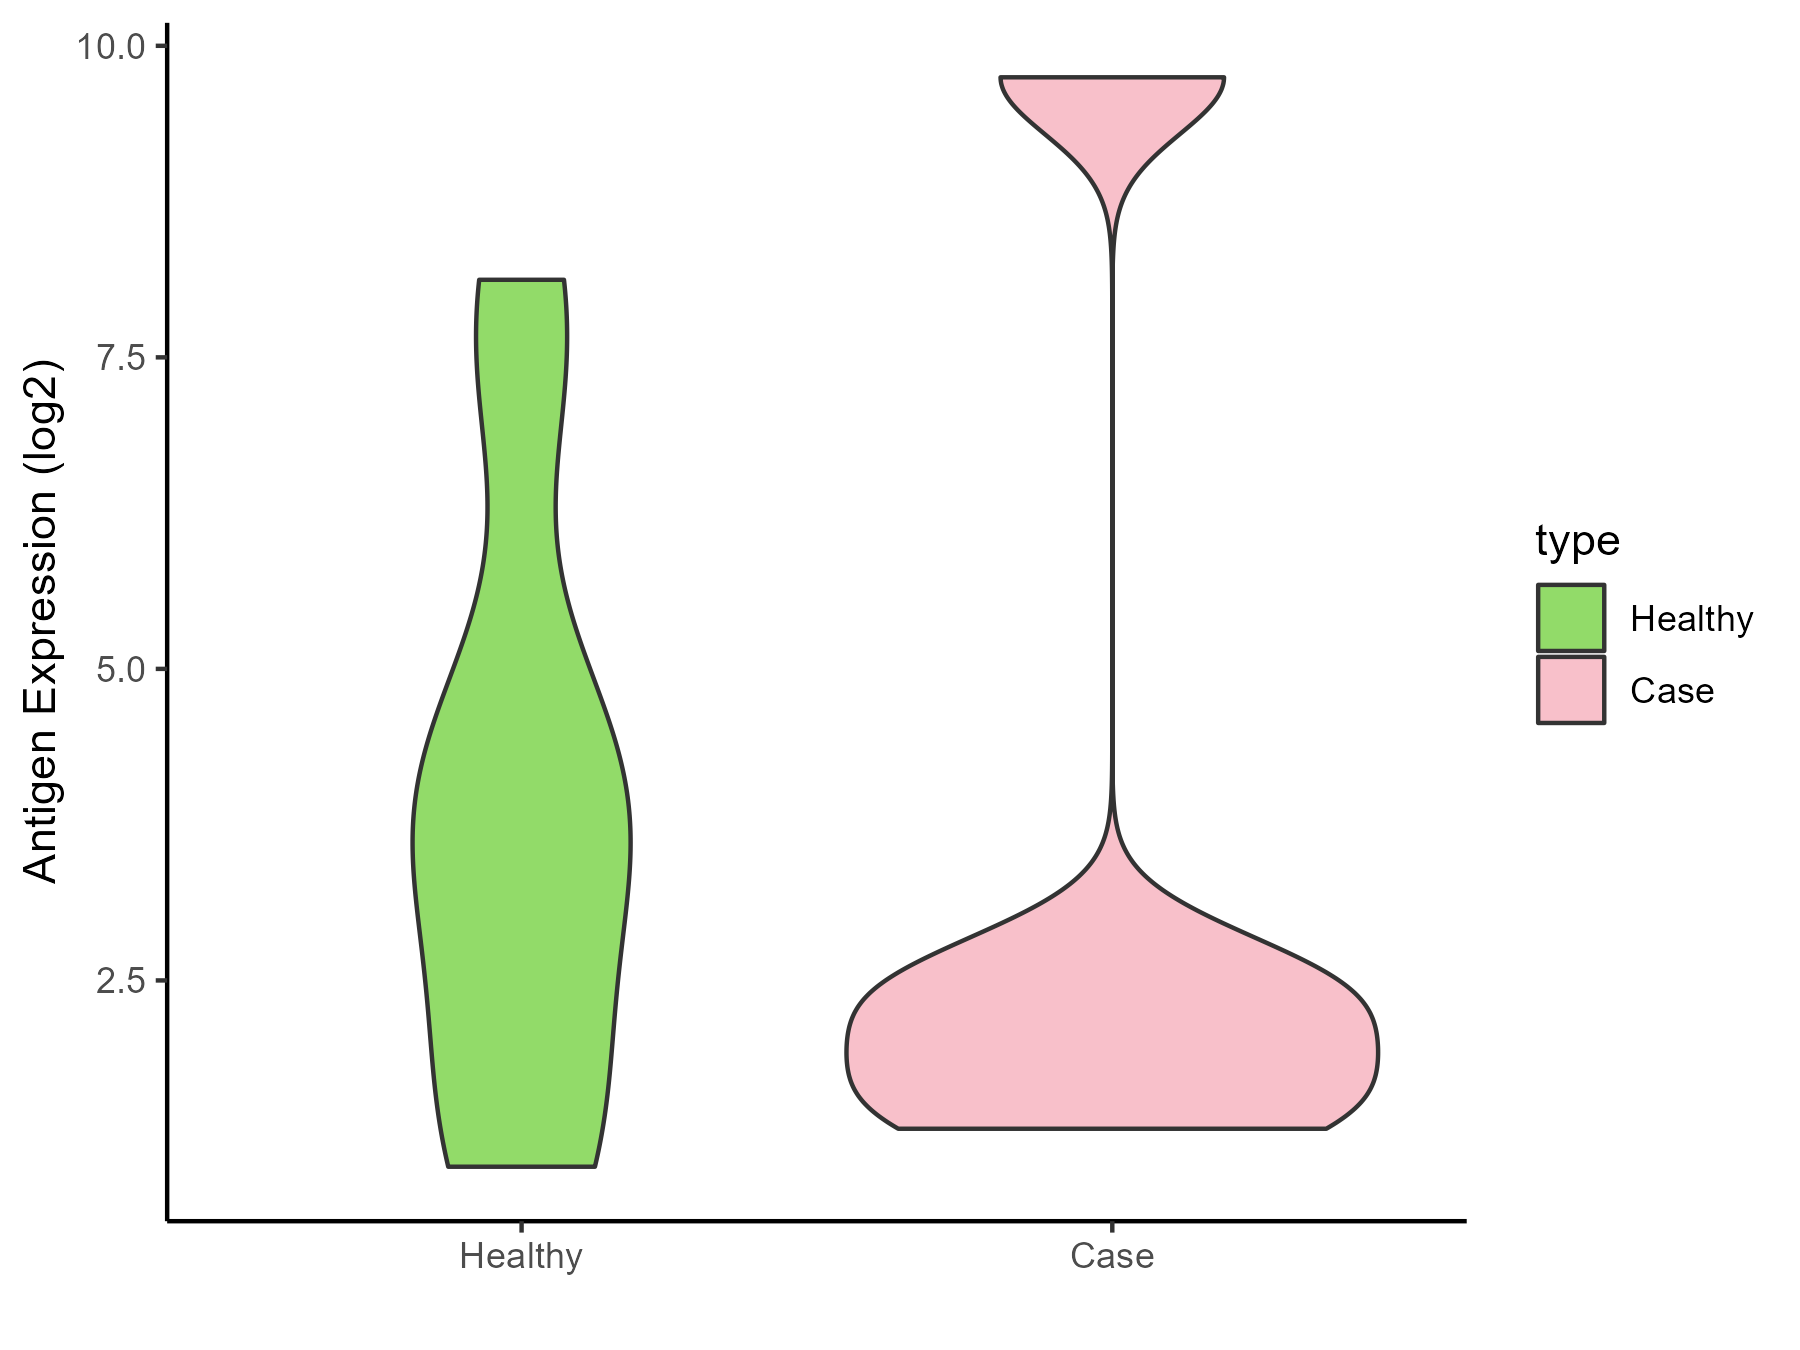
| The Studied Tissue | Whole blood | |
| The Specific Disease | Thrombocytopenia | |
| The Expression Level of Disease Section Compare with the Healthy Individual Tissue | p-value: 0.84968763; Fold-change: -1.565595288; Z-score: -0.65010836 | |
| Disease-specific Antigen Abundances |
|
Click to View the Clearer Original Diagram |
ICD Disease Classification 04
| Differential expression pattern of antigen in diseases | ||
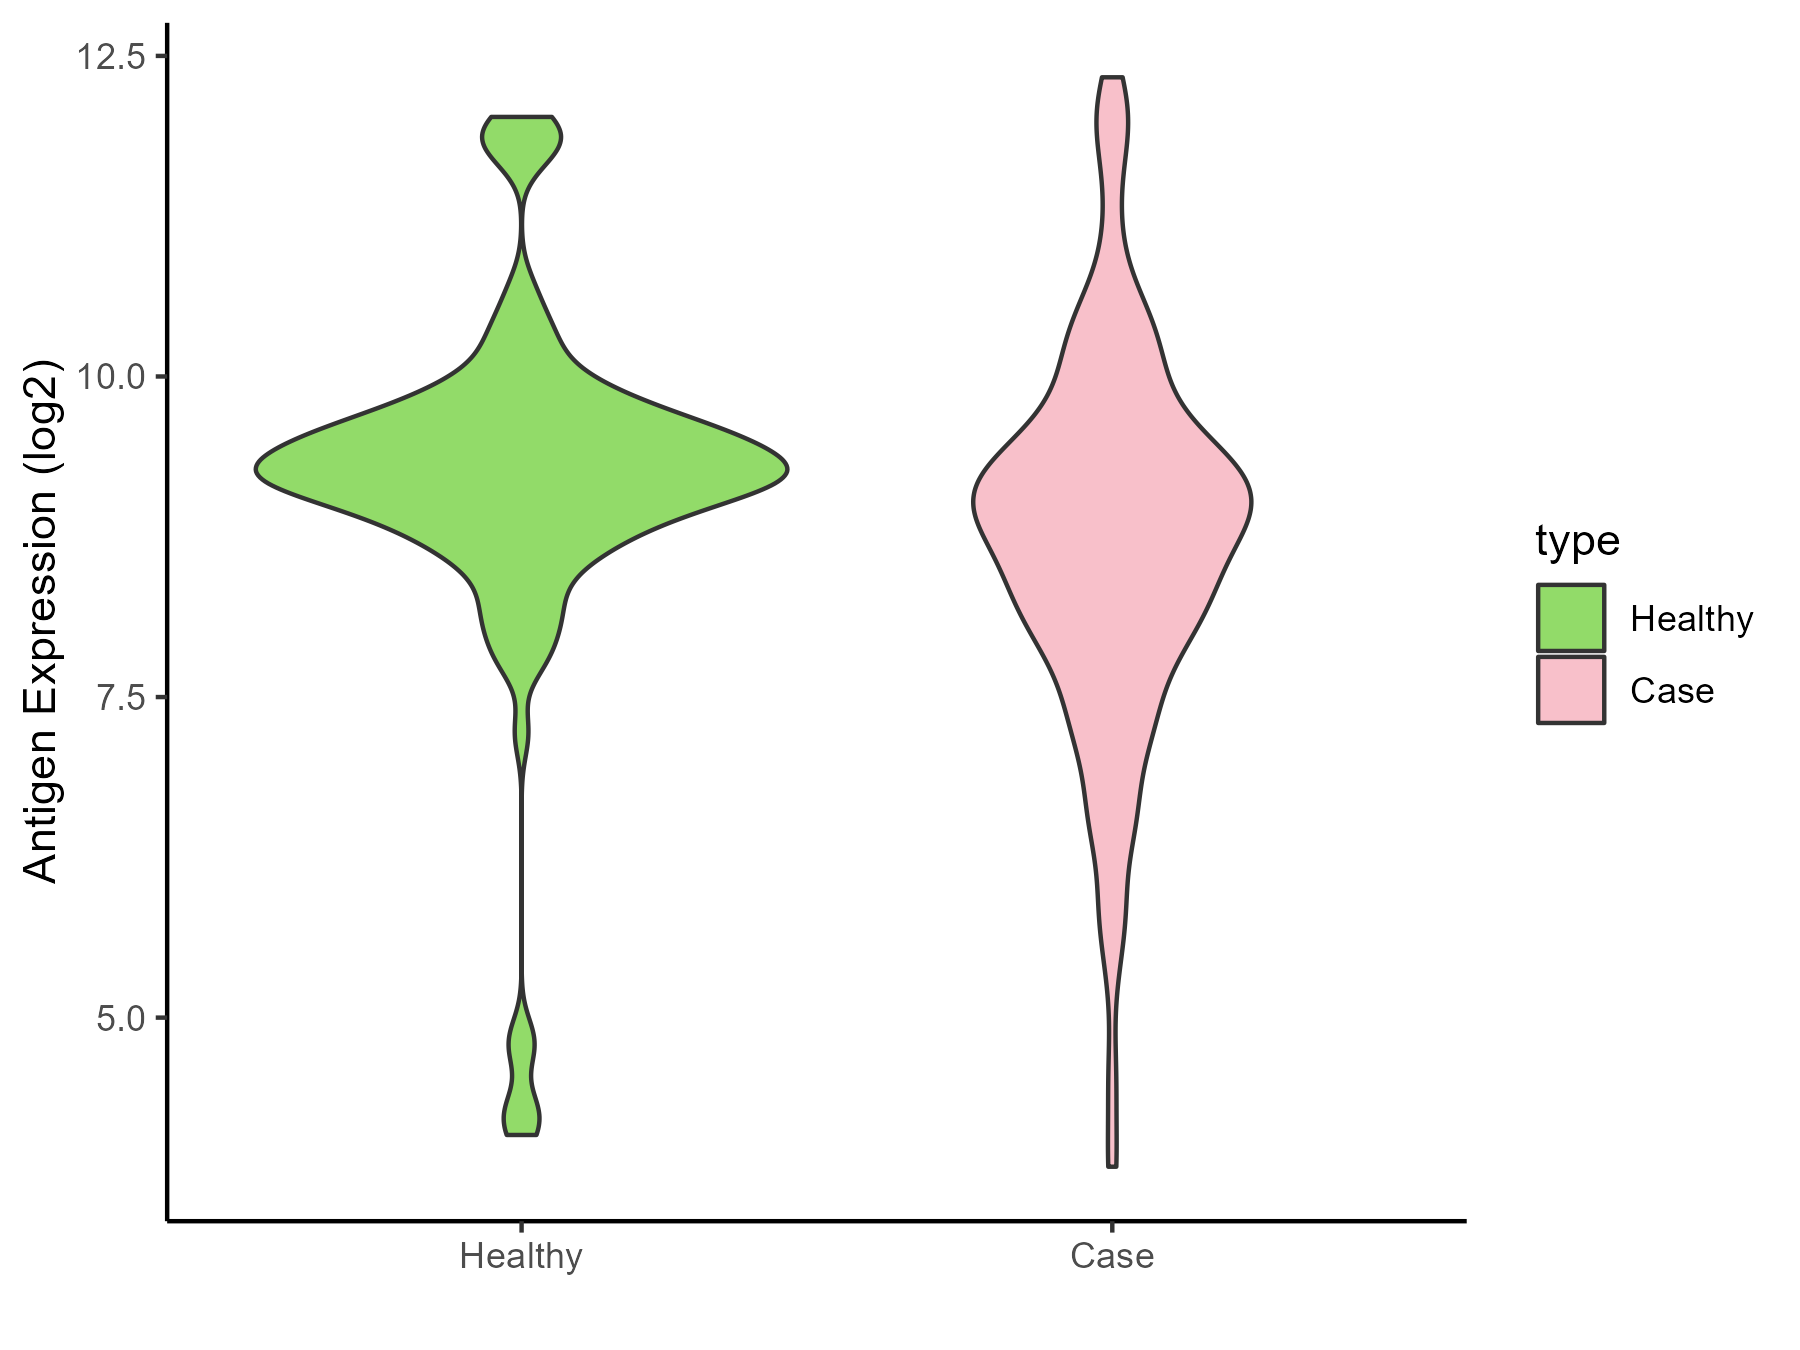
| The Studied Tissue | Whole blood | |
| The Specific Disease | Lupus erythematosus | |
| The Expression Level of Disease Section Compare with the Healthy Individual Tissue | p-value: 0.002919926; Fold-change: -0.364713632; Z-score: -0.278840746 | |
| Disease-specific Antigen Abundances |
|
Click to View the Clearer Original Diagram |
| Differential expression pattern of antigen in diseases | ||
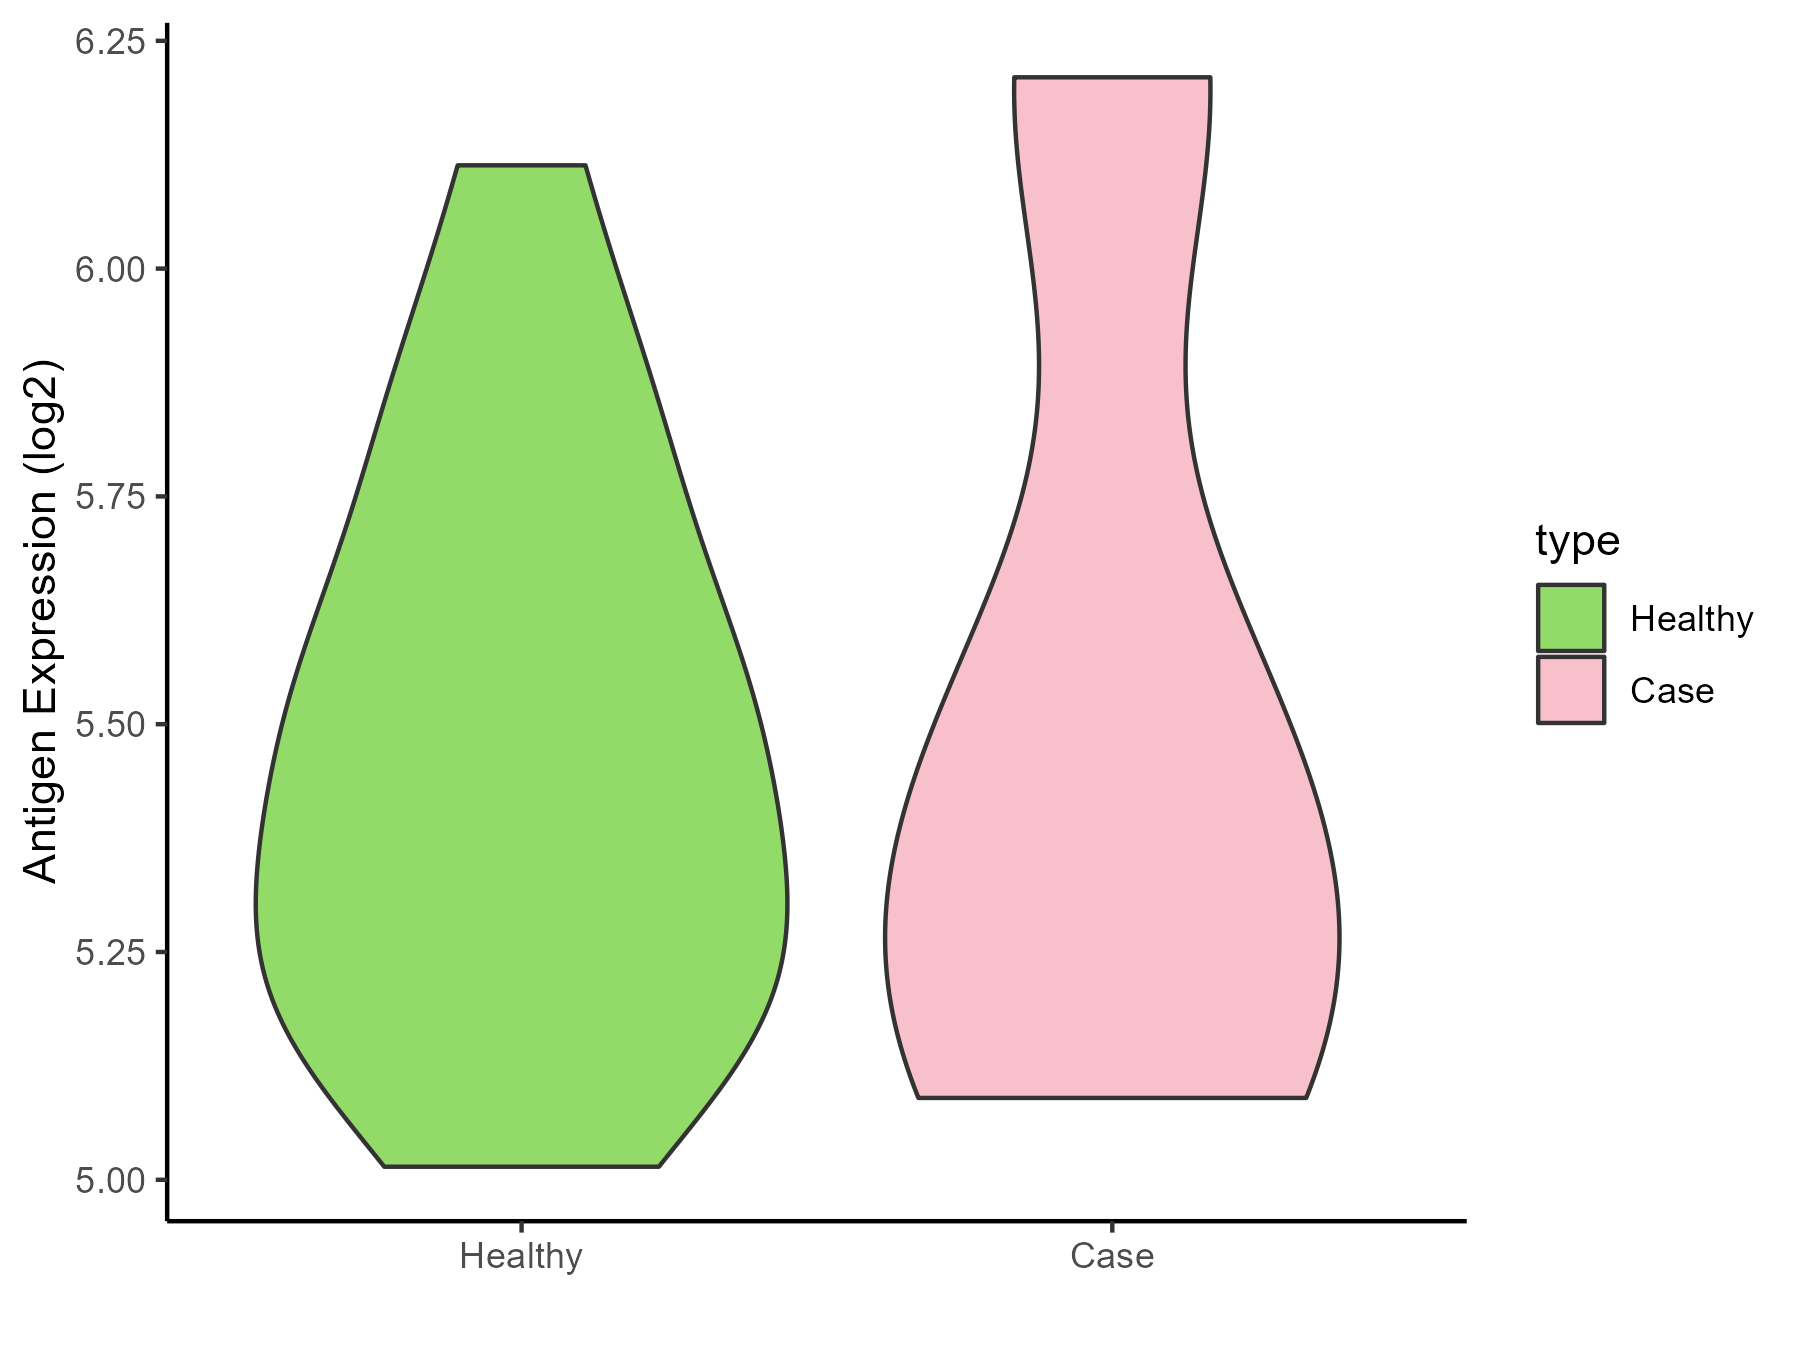
| The Studied Tissue | Peripheral monocyte | |
| The Specific Disease | Autoimmune uveitis | |
| The Expression Level of Disease Section Compare with the Healthy Individual Tissue | p-value: 0.874495557; Fold-change: -0.050686514; Z-score: -0.162454579 | |
| Disease-specific Antigen Abundances |
|
Click to View the Clearer Original Diagram |
ICD Disease Classification 05
| Differential expression pattern of antigen in diseases | ||
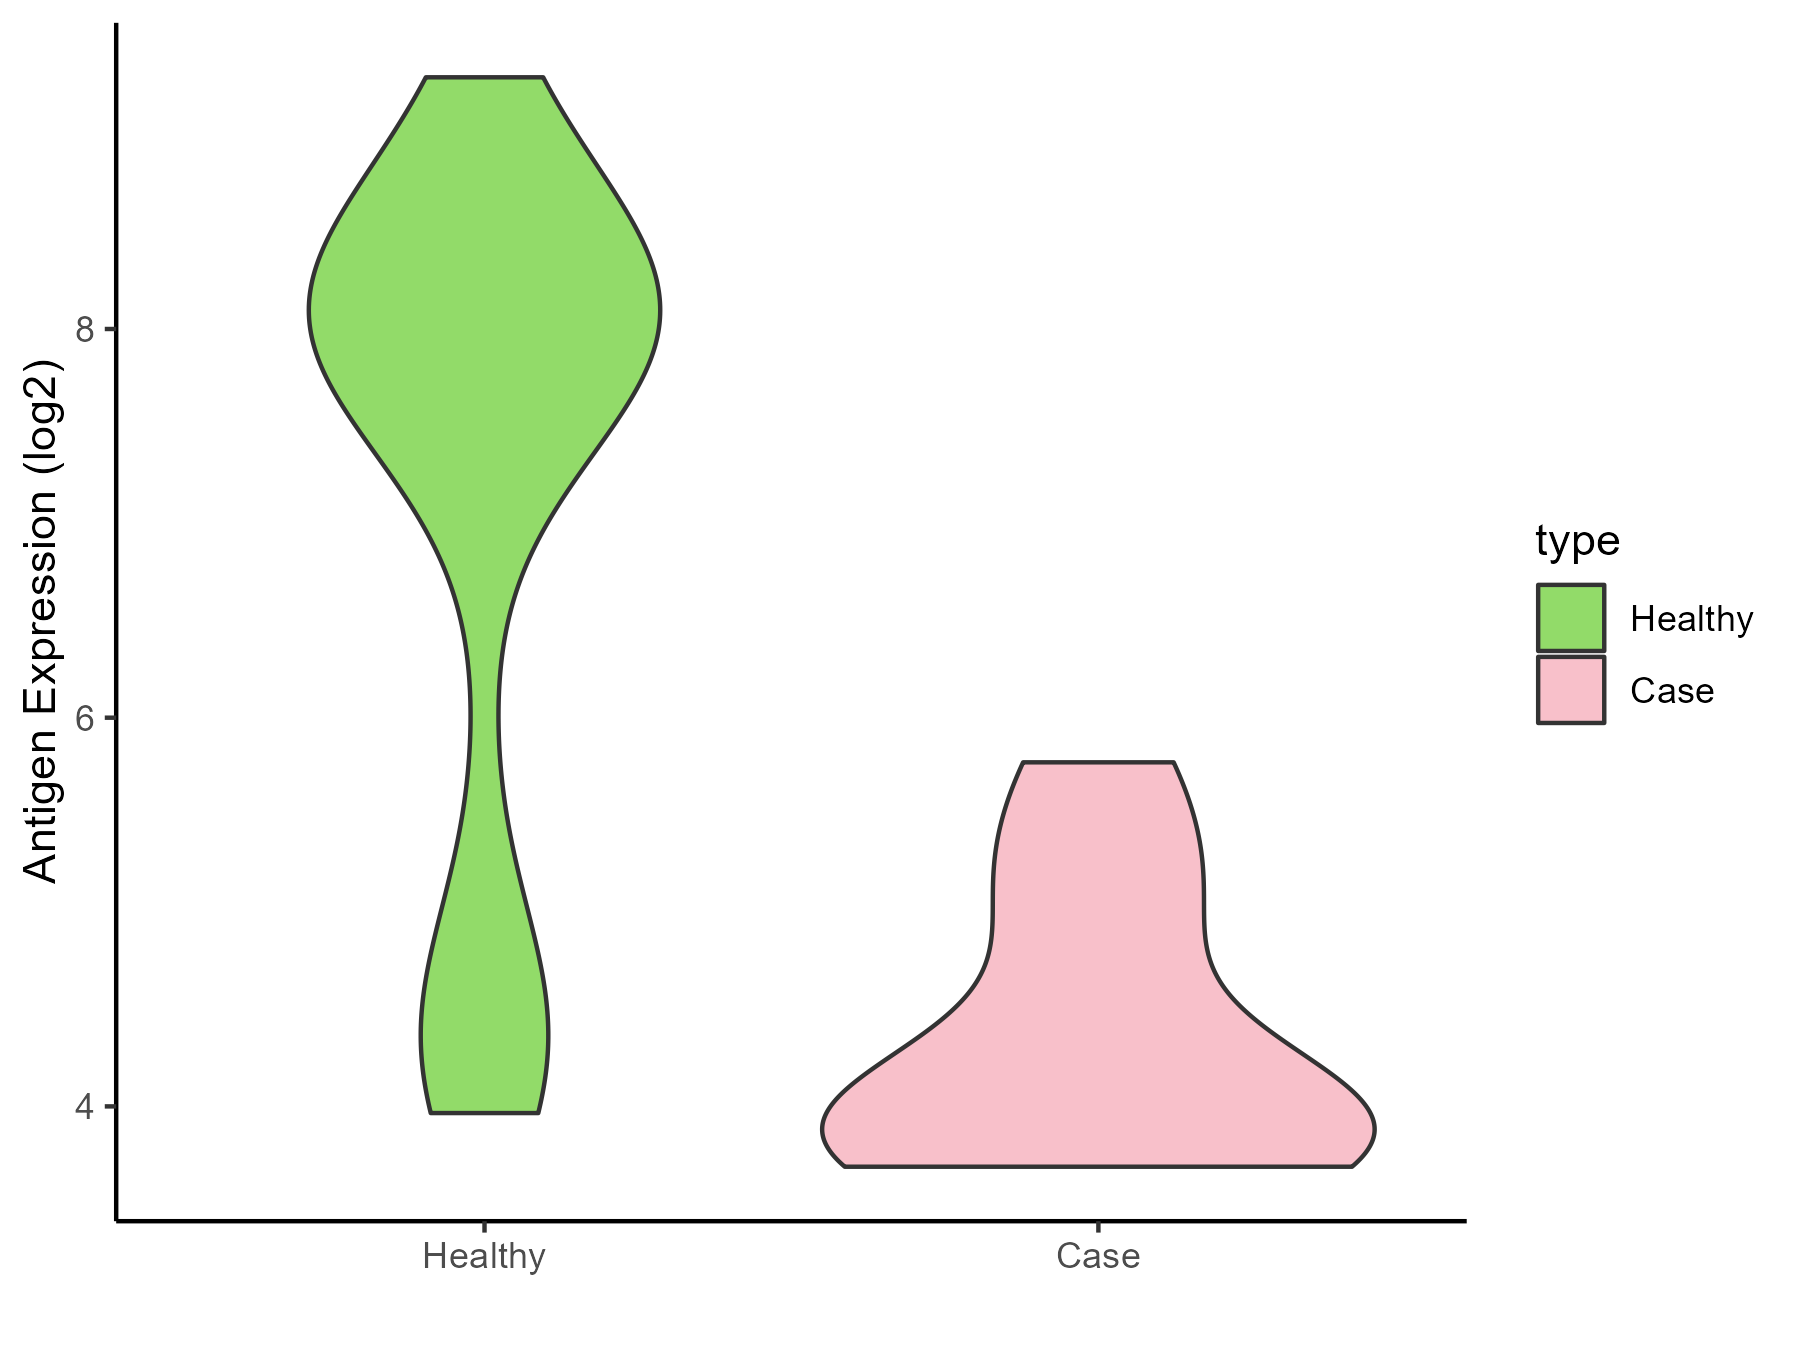
| The Studied Tissue | Whole blood | |
| The Specific Disease | Familial hypercholesterolemia | |
| The Expression Level of Disease Section Compare with the Healthy Individual Tissue | p-value: 1.17E-08; Fold-change: -3.900590421; Z-score: -2.318447457 | |
| Disease-specific Antigen Abundances |
|
Click to View the Clearer Original Diagram |
ICD Disease Classification 06
| Differential expression pattern of antigen in diseases | ||
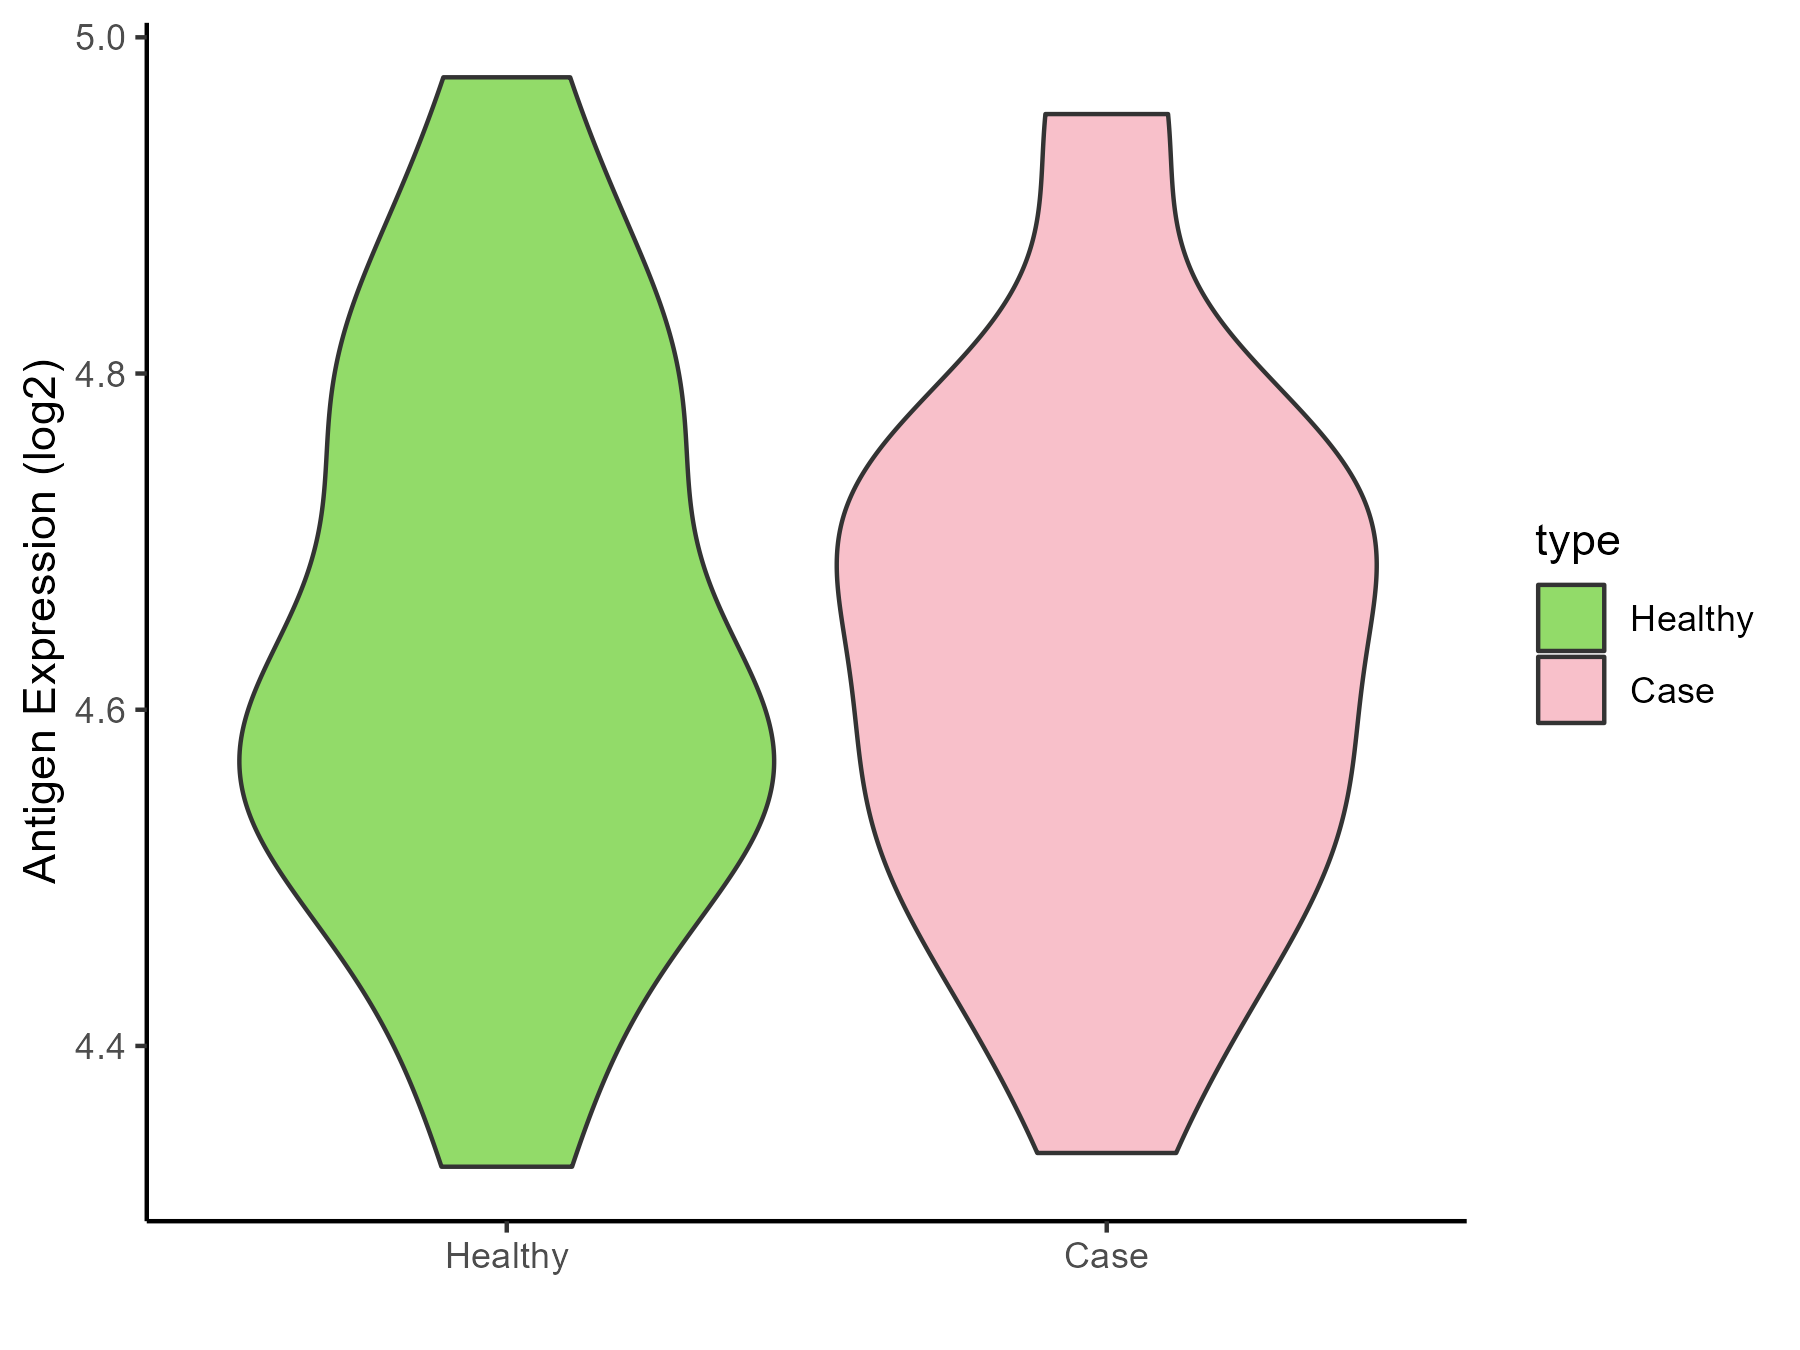
| The Studied Tissue | Superior temporal cortex | |
| The Specific Disease | Schizophrenia | |
| The Expression Level of Disease Section Compare with the Healthy Individual Tissue | p-value: 0.888022229; Fold-change: 0.041585535; Z-score: 0.243334723 | |
| Disease-specific Antigen Abundances |
|
Click to View the Clearer Original Diagram |
ICD Disease Classification 08
| Differential expression pattern of antigen in diseases | ||
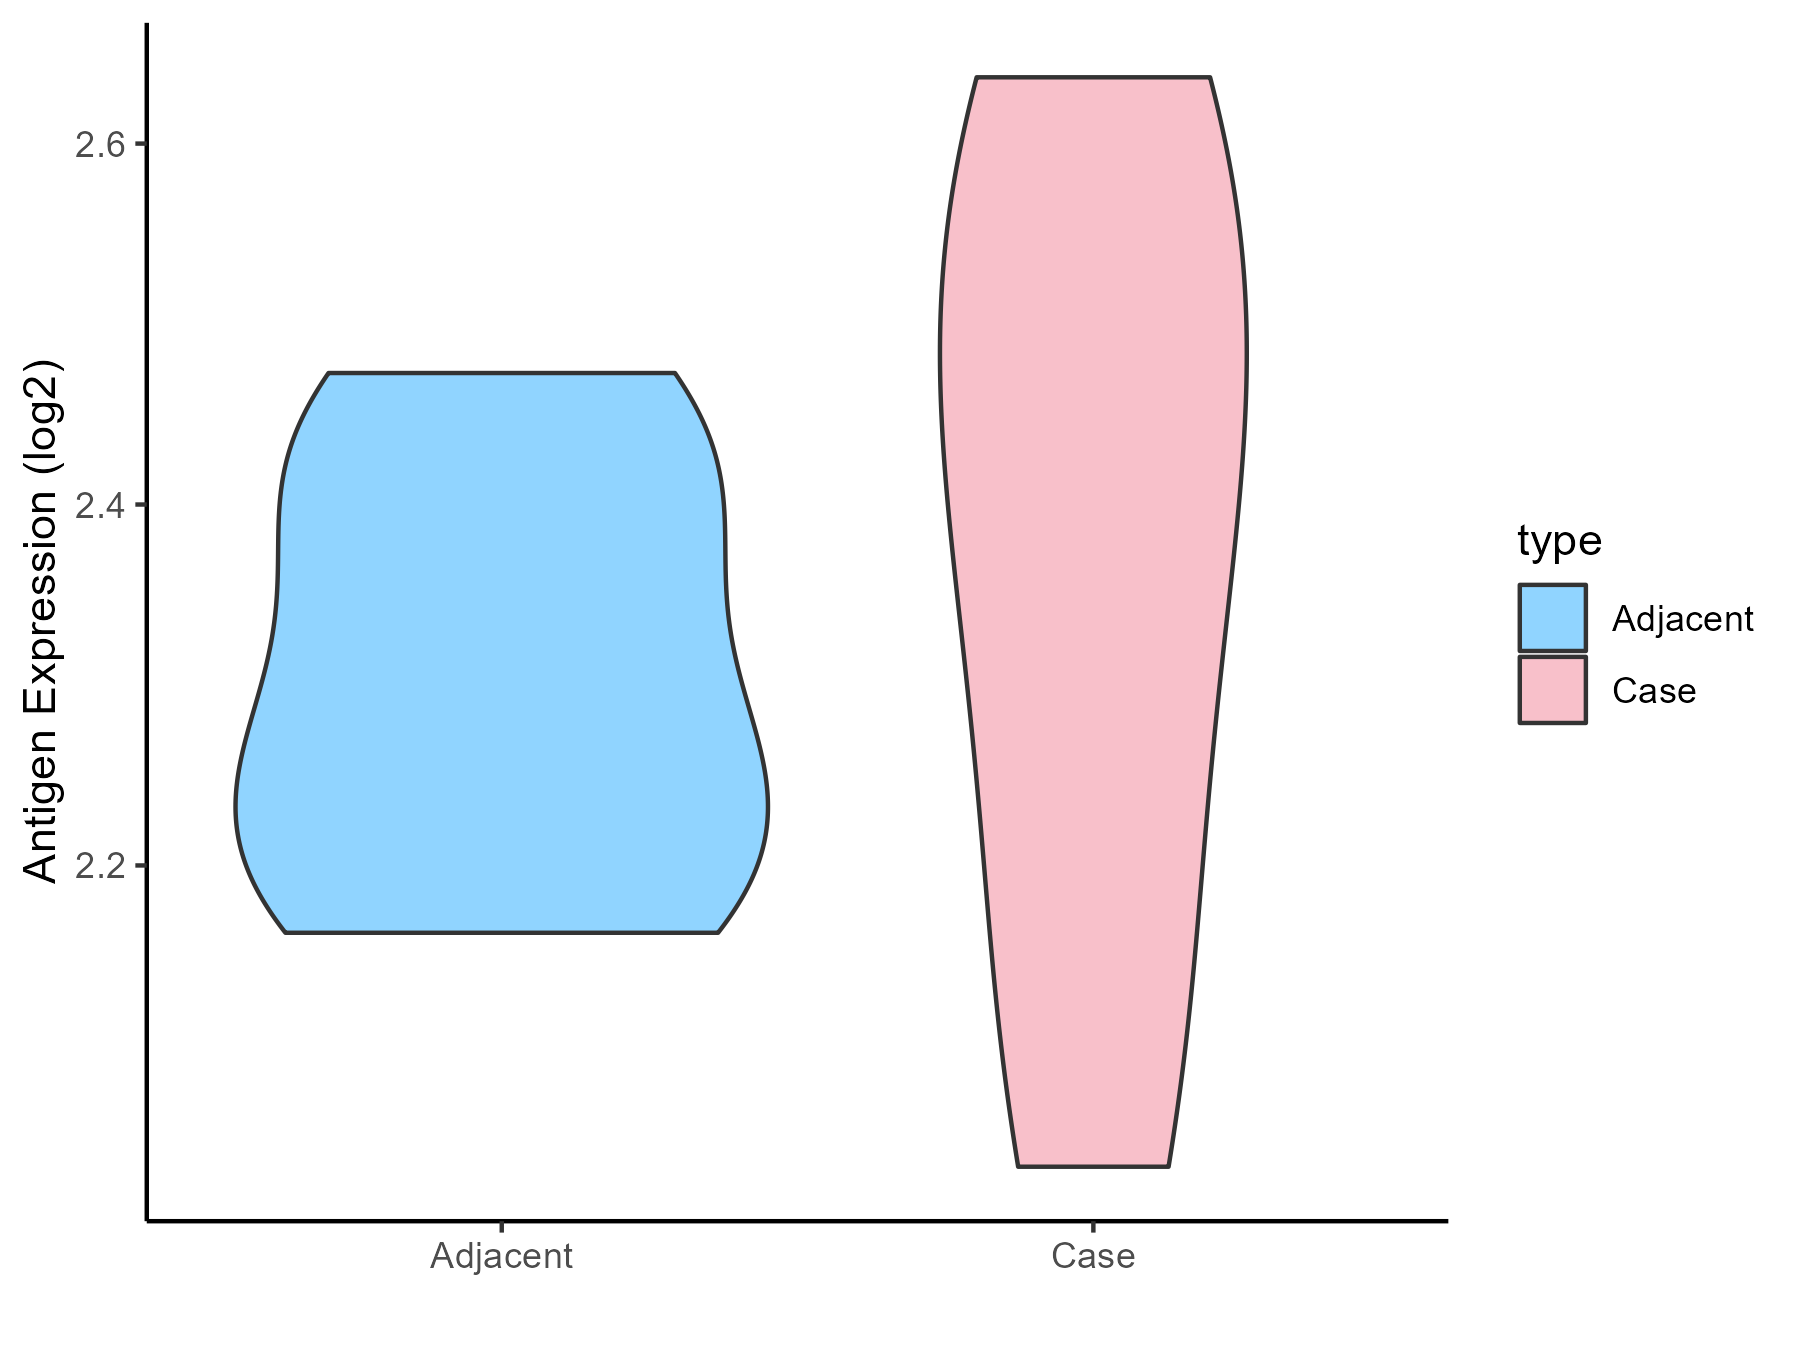
| The Studied Tissue | Spinal cord | |
| The Specific Disease | Multiple sclerosis | |
| The Expression Level of Disease Section Compare with the Adjacent Tissue | p-value: 0.483171961; Fold-change: 0.152805595; Z-score: 1.269780411 | |
| Disease-specific Antigen Abundances |
|
Click to View the Clearer Original Diagram |
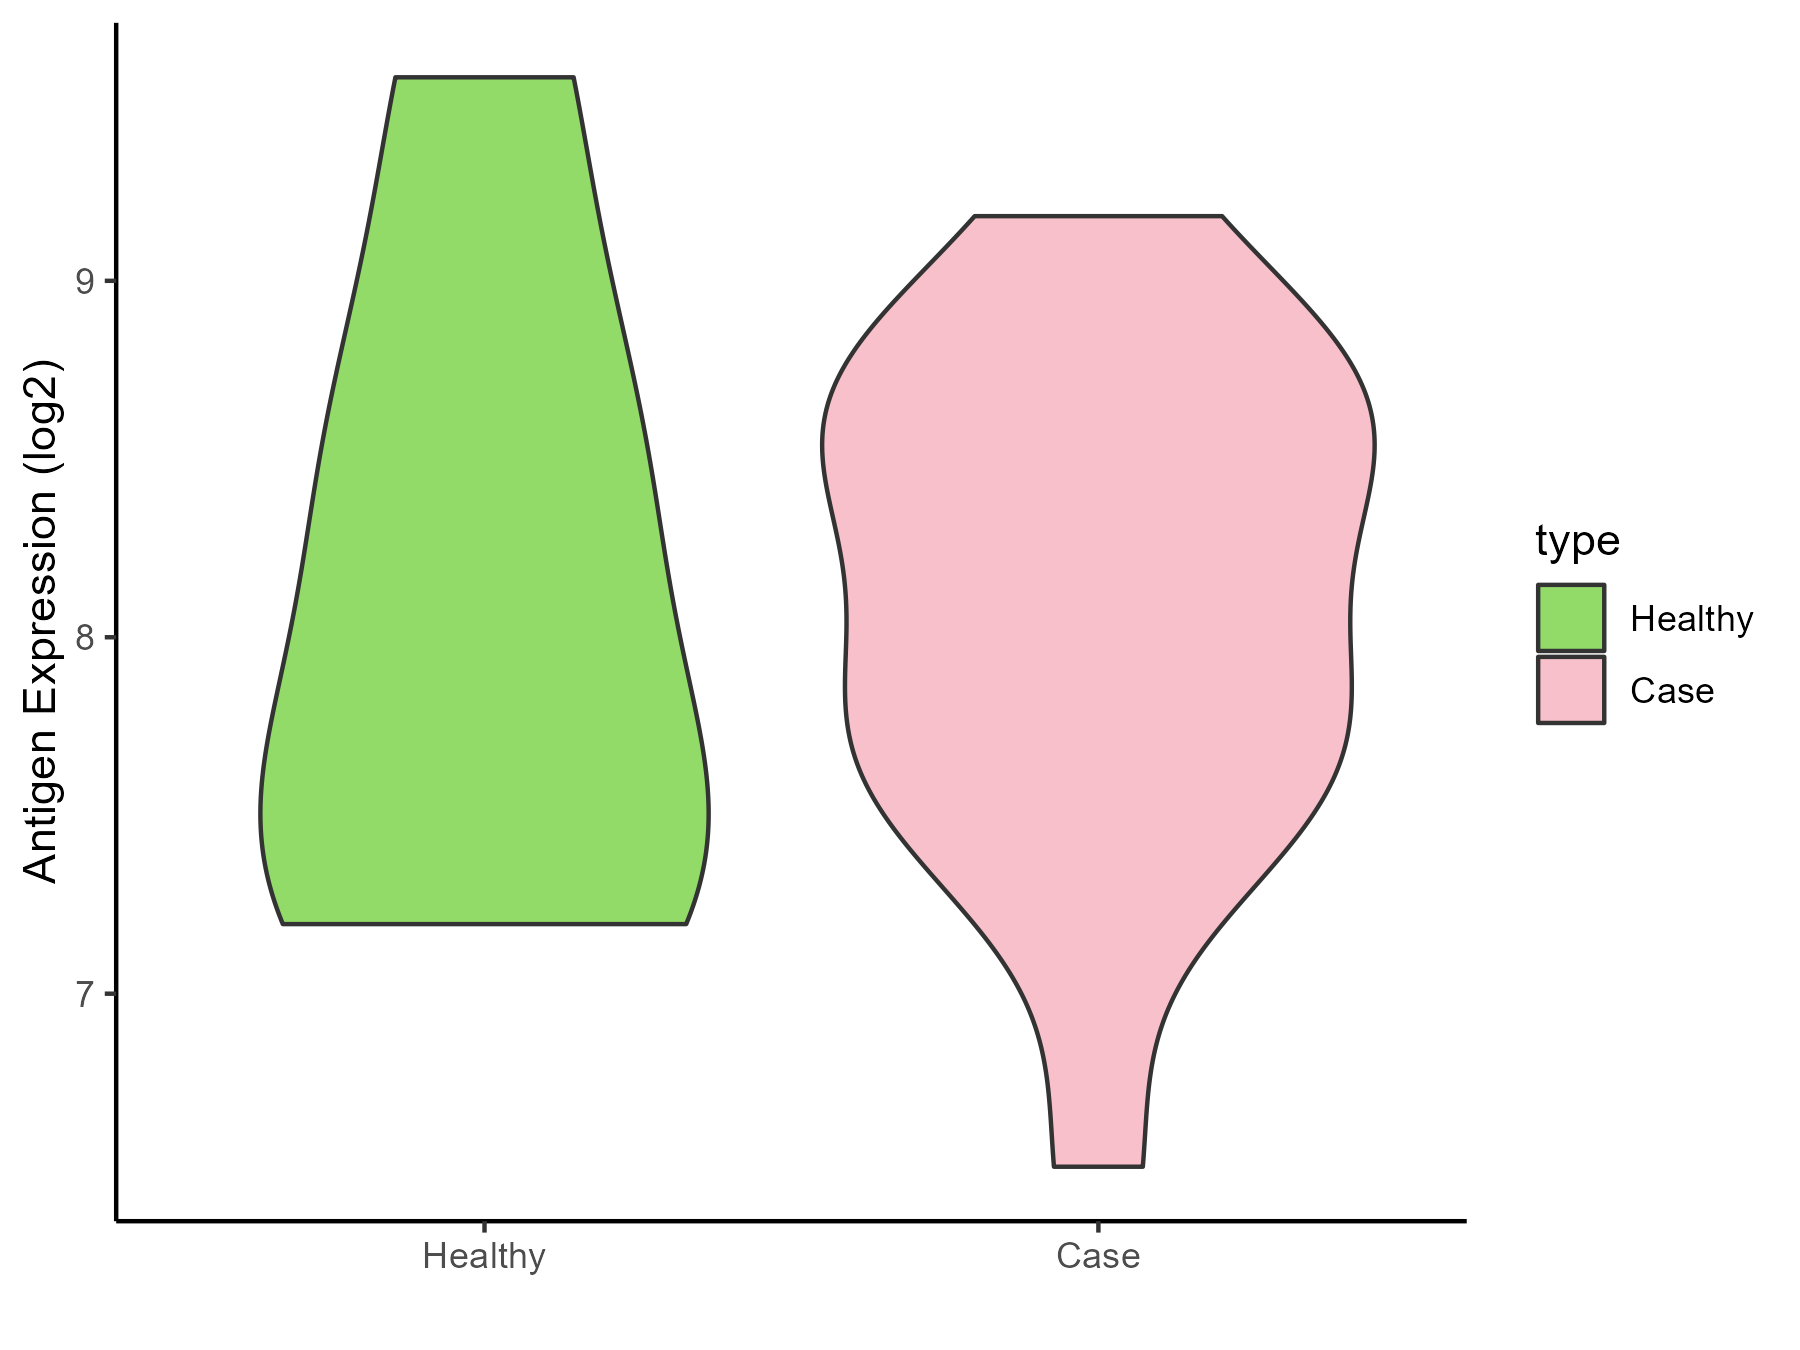
| The Studied Tissue | Plasmacytoid dendritic cells | |
| The Specific Disease | Multiple sclerosis | |
| The Expression Level of Disease Section Compare with the Healthy Individual Tissue | p-value: 0.998229558; Fold-change: 0.195171828; Z-score: 0.213417357 | |
| Disease-specific Antigen Abundances |
|
Click to View the Clearer Original Diagram |
| Differential expression pattern of antigen in diseases | ||
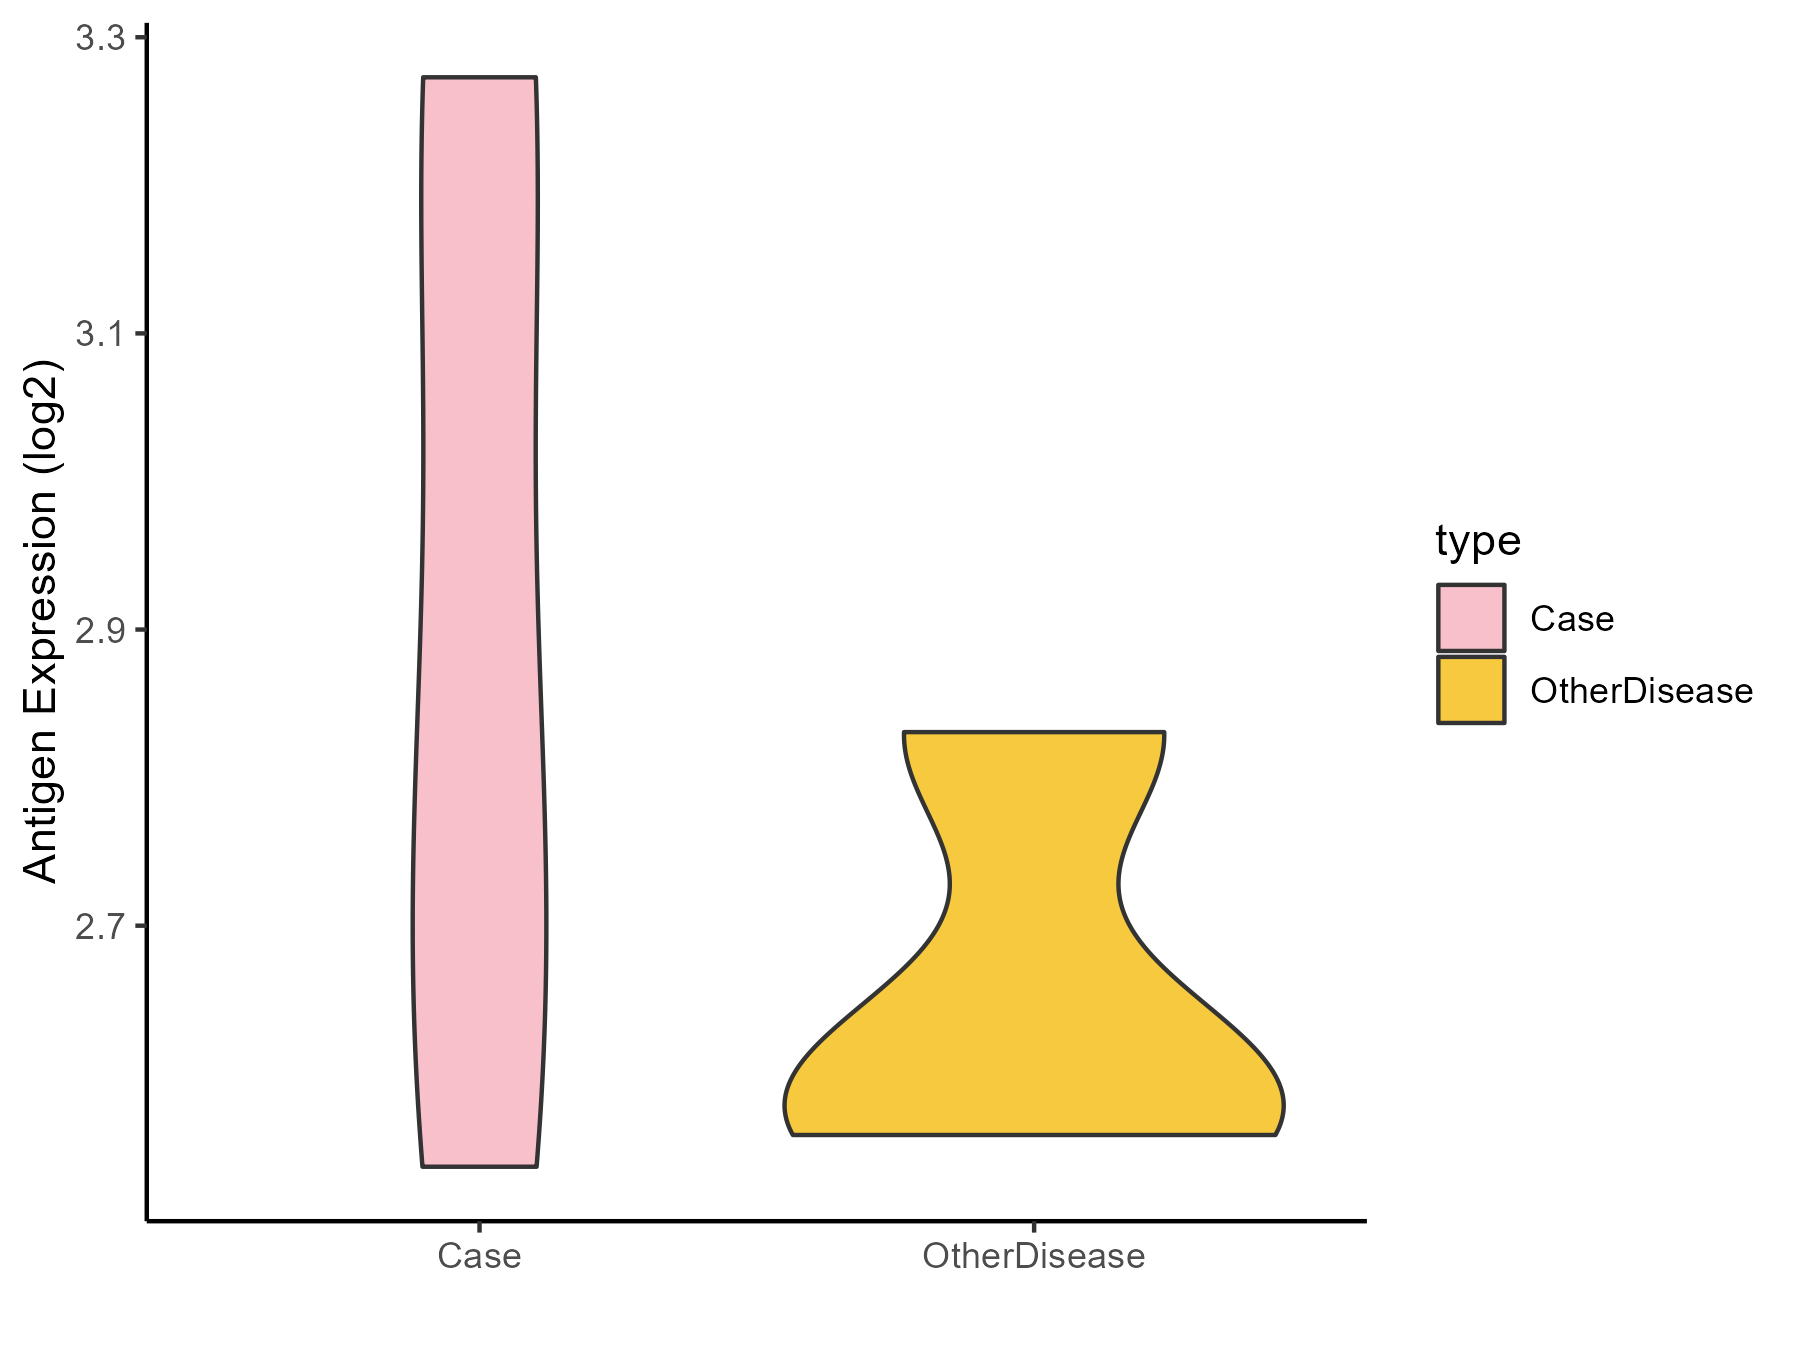
| The Studied Tissue | Peritumoral cortex | |
| The Specific Disease | Epilepsy | |
| The Expression Level of Disease Section Compare with the Other Disease Section | p-value: 0.194365942; Fold-change: 0.258016057; Z-score: 1.753972755 | |
| Disease-specific Antigen Abundances |
|
Click to View the Clearer Original Diagram |
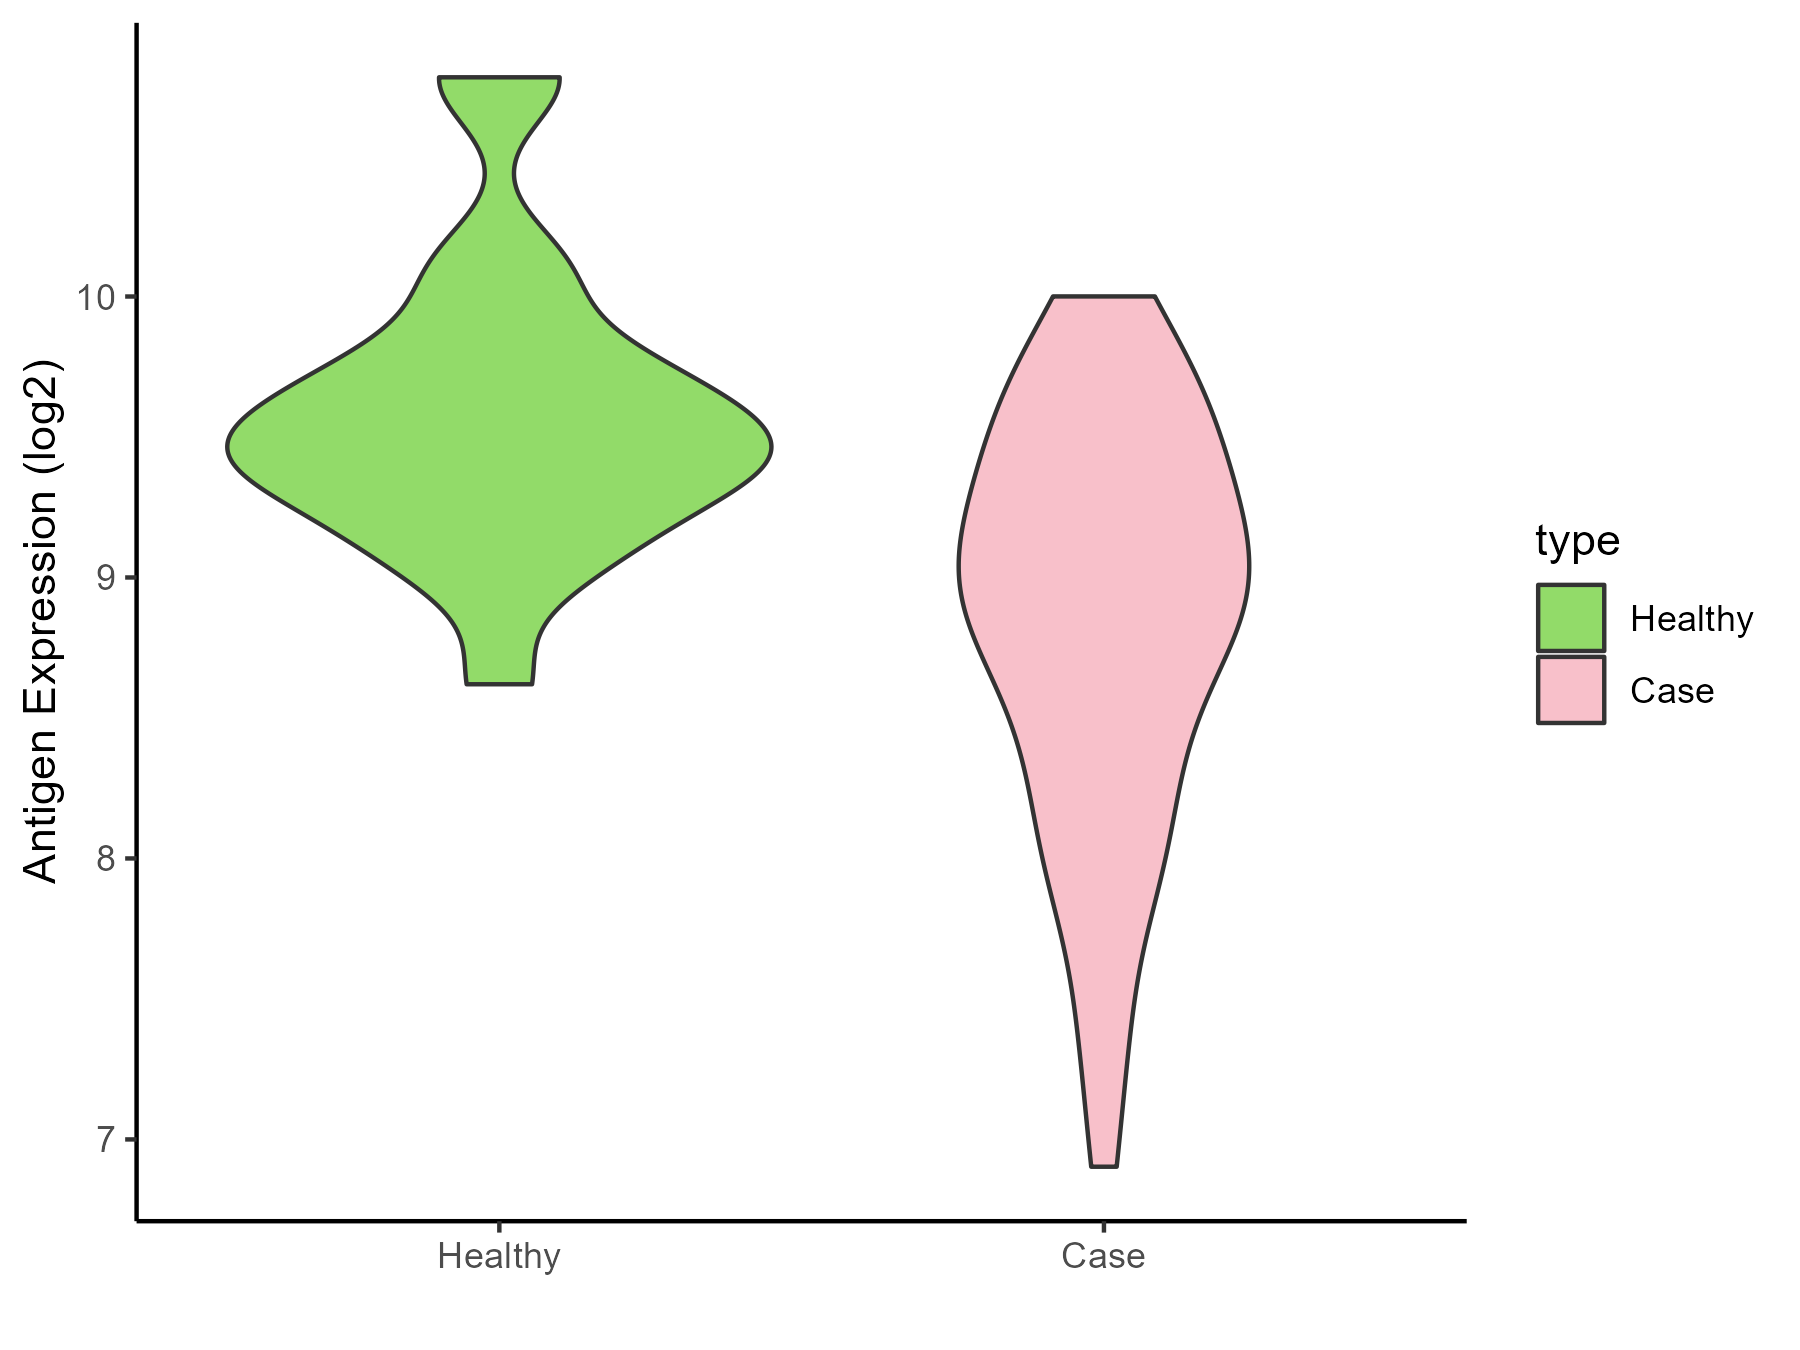
| Differential expression pattern of antigen in diseases | ||
| The Studied Tissue | Whole blood | |
| The Specific Disease | Cardioembolic Stroke | |
| The Expression Level of Disease Section Compare with the Healthy Individual Tissue | p-value: 6.13E-06; Fold-change: -0.561445736; Z-score: -1.073179795 | |
| Disease-specific Antigen Abundances |
|
Click to View the Clearer Original Diagram |
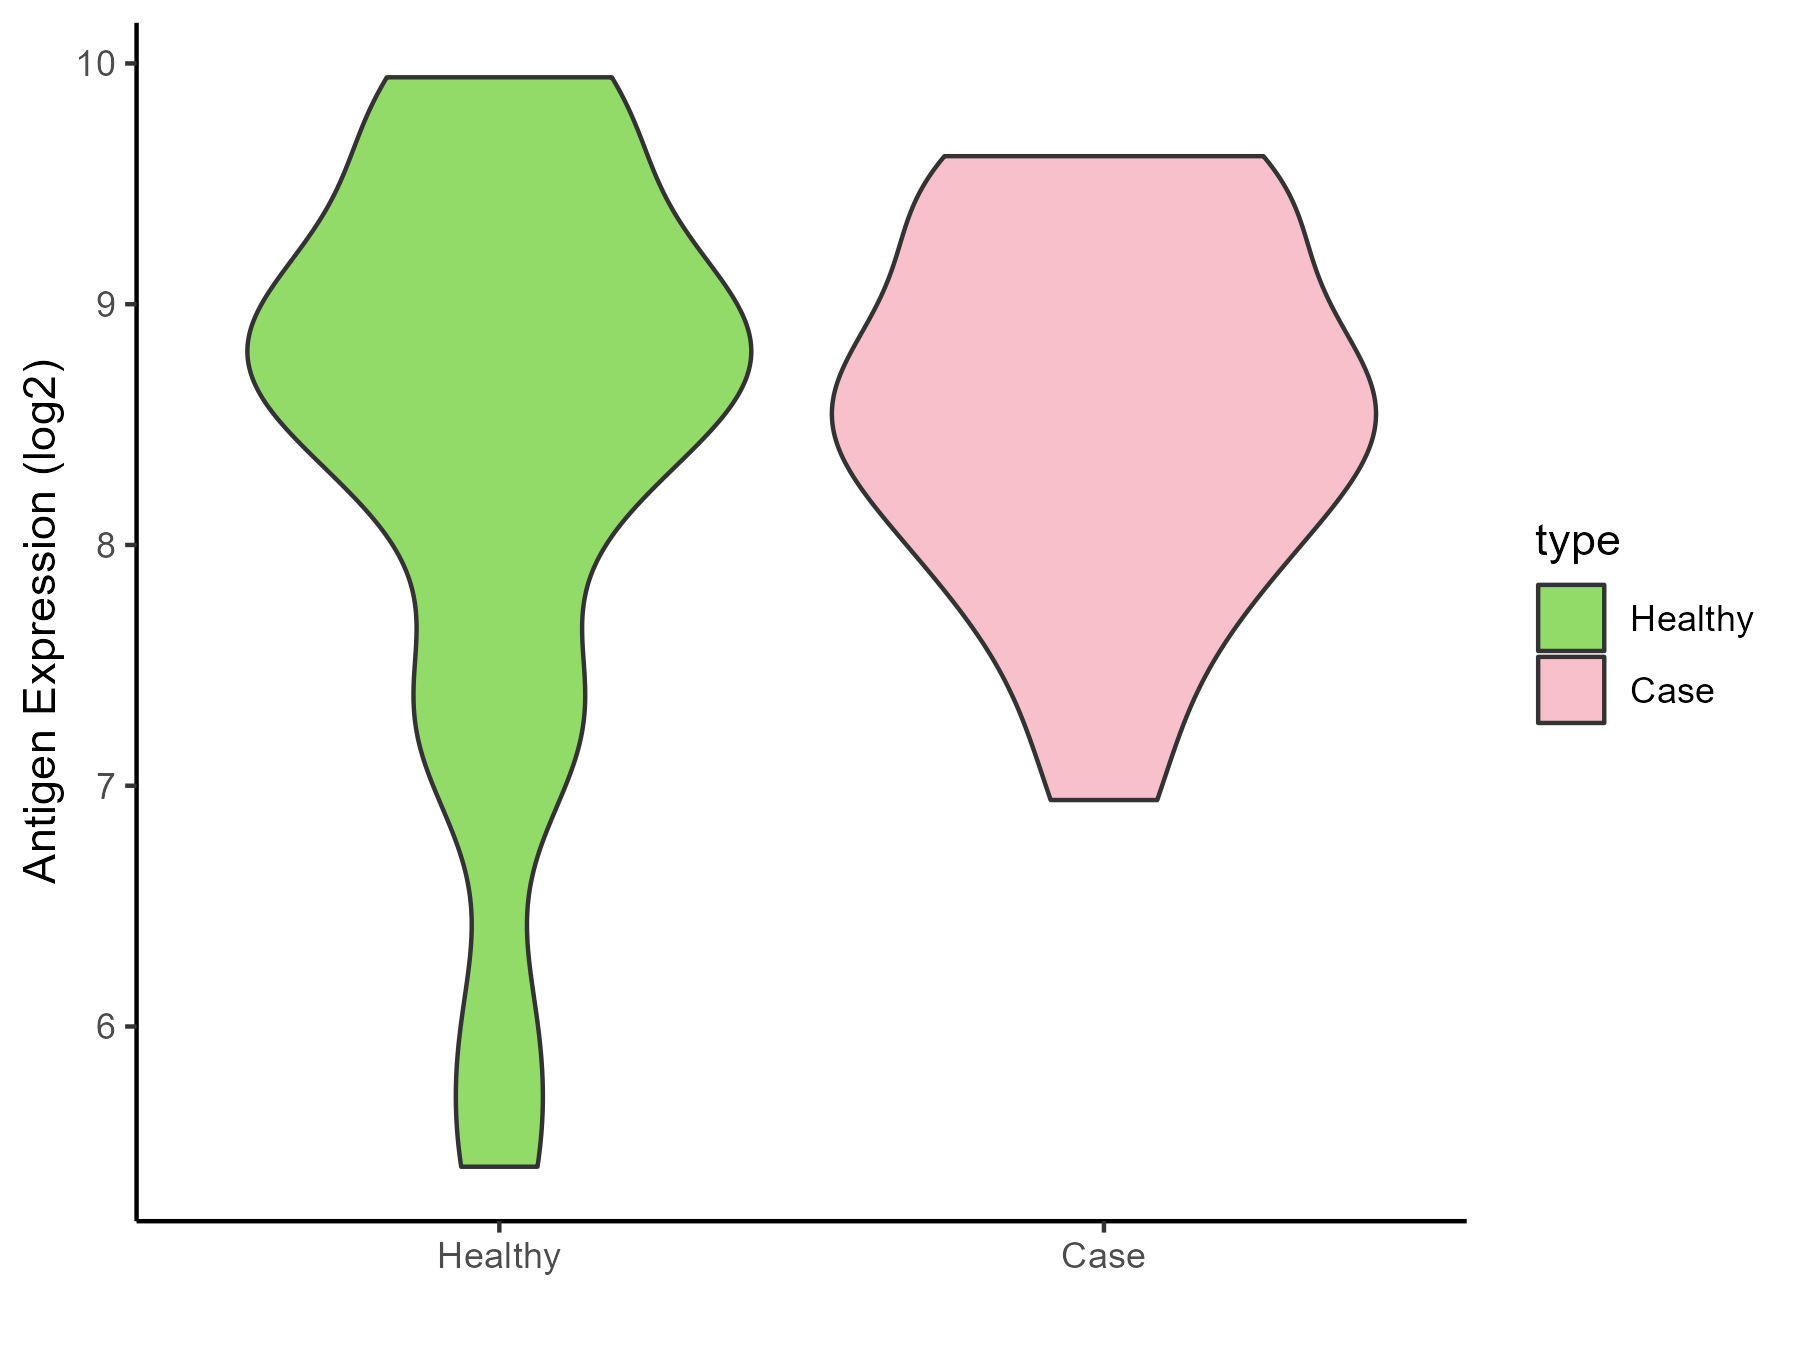
| The Studied Tissue | Peripheral blood | |
| The Specific Disease | Ischemic stroke | |
| The Expression Level of Disease Section Compare with the Healthy Individual Tissue | p-value: 0.662845608; Fold-change: -0.169886965; Z-score: -0.138758177 | |
| Disease-specific Antigen Abundances |
|
Click to View the Clearer Original Diagram |
ICD Disease Classification 1
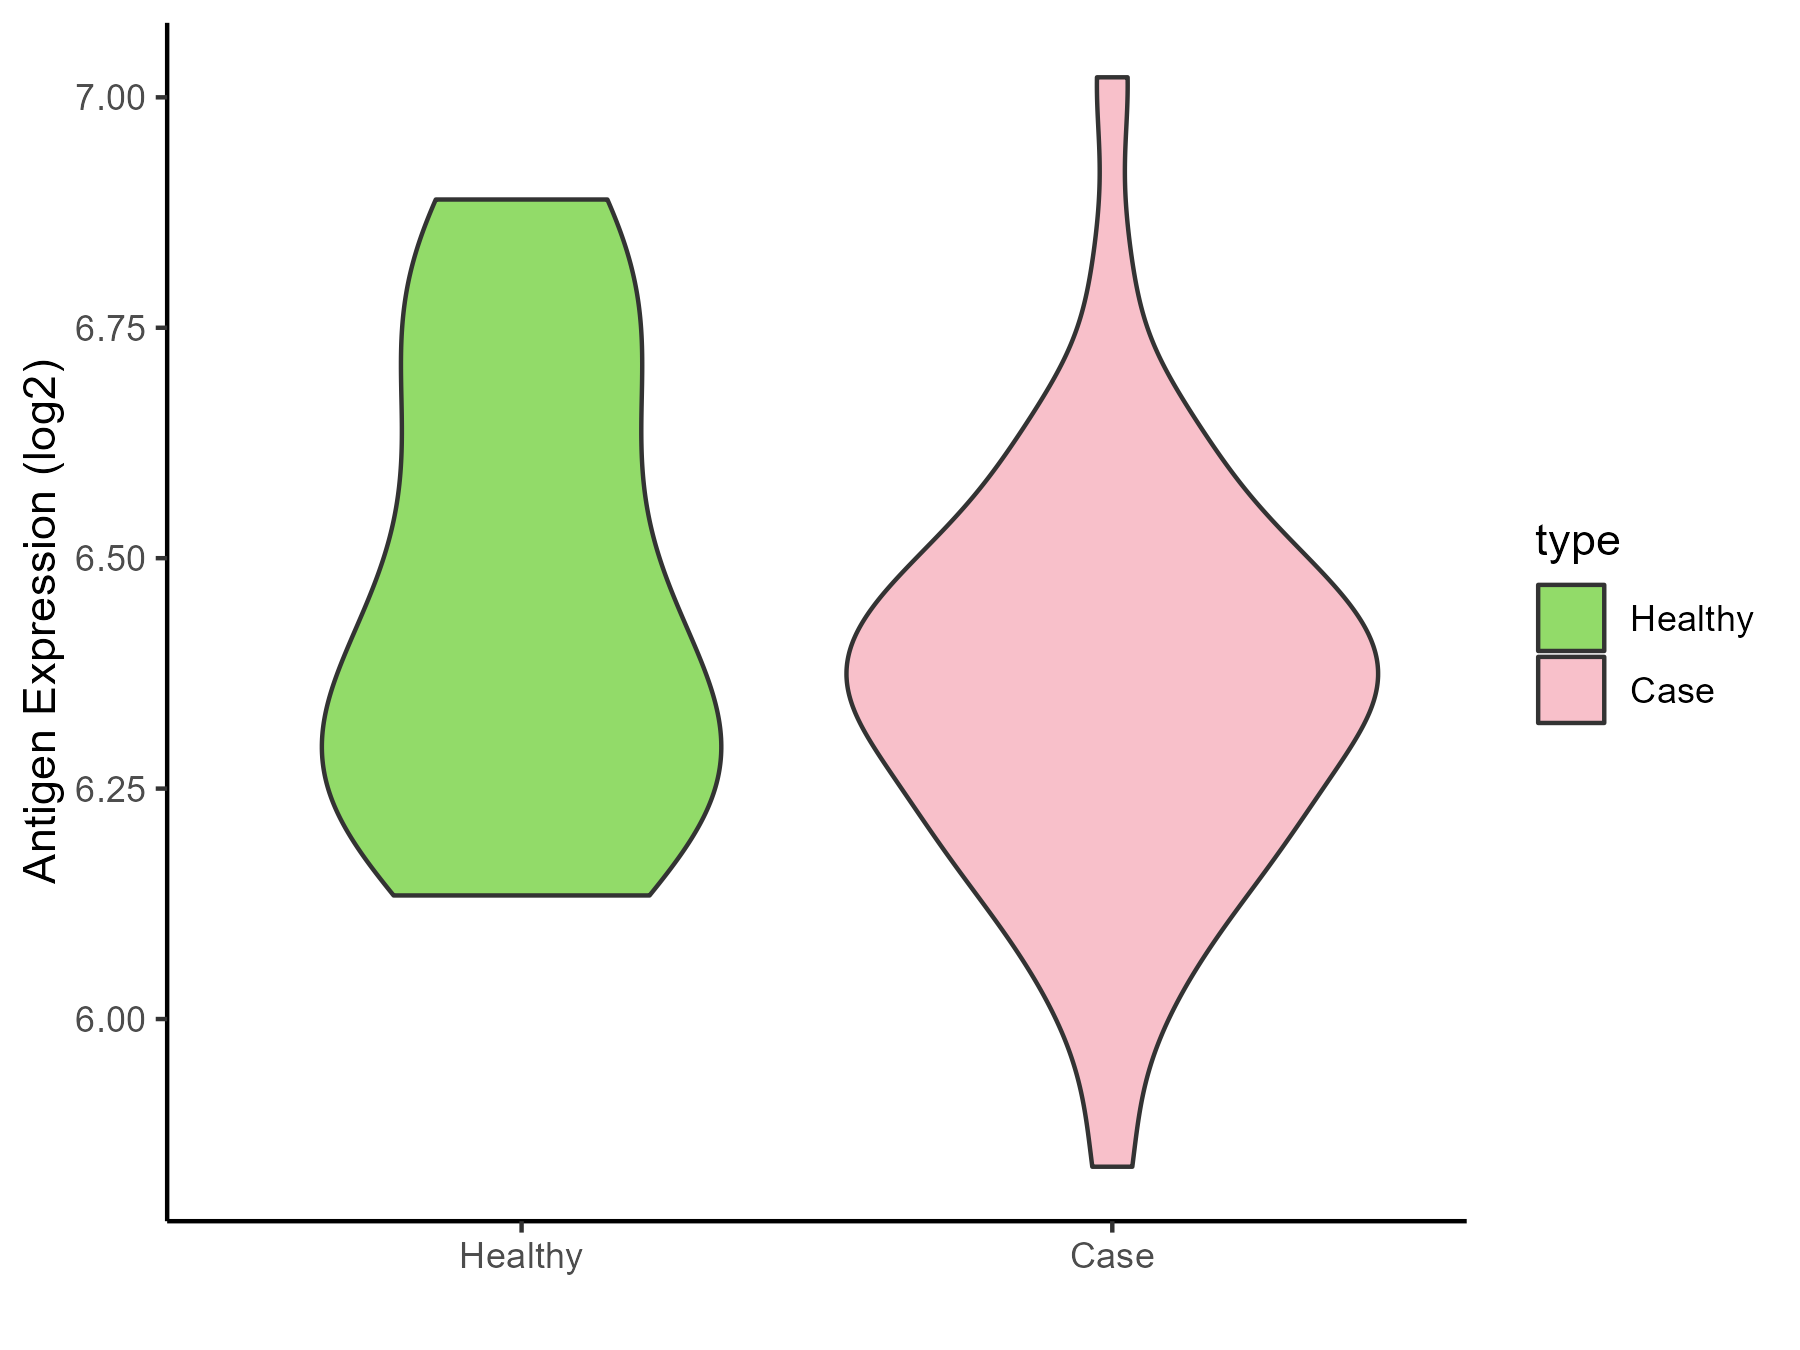
| Differential expression pattern of antigen in diseases | ||
| The Studied Tissue | White matter | |
| The Specific Disease | HIV | |
| The Expression Level of Disease Section Compare with the Healthy Individual Tissue | p-value: 0.155963909; Fold-change: -0.038867531; Z-score: -0.15657478 | |
| Disease-specific Antigen Abundances |
|
Click to View the Clearer Original Diagram |
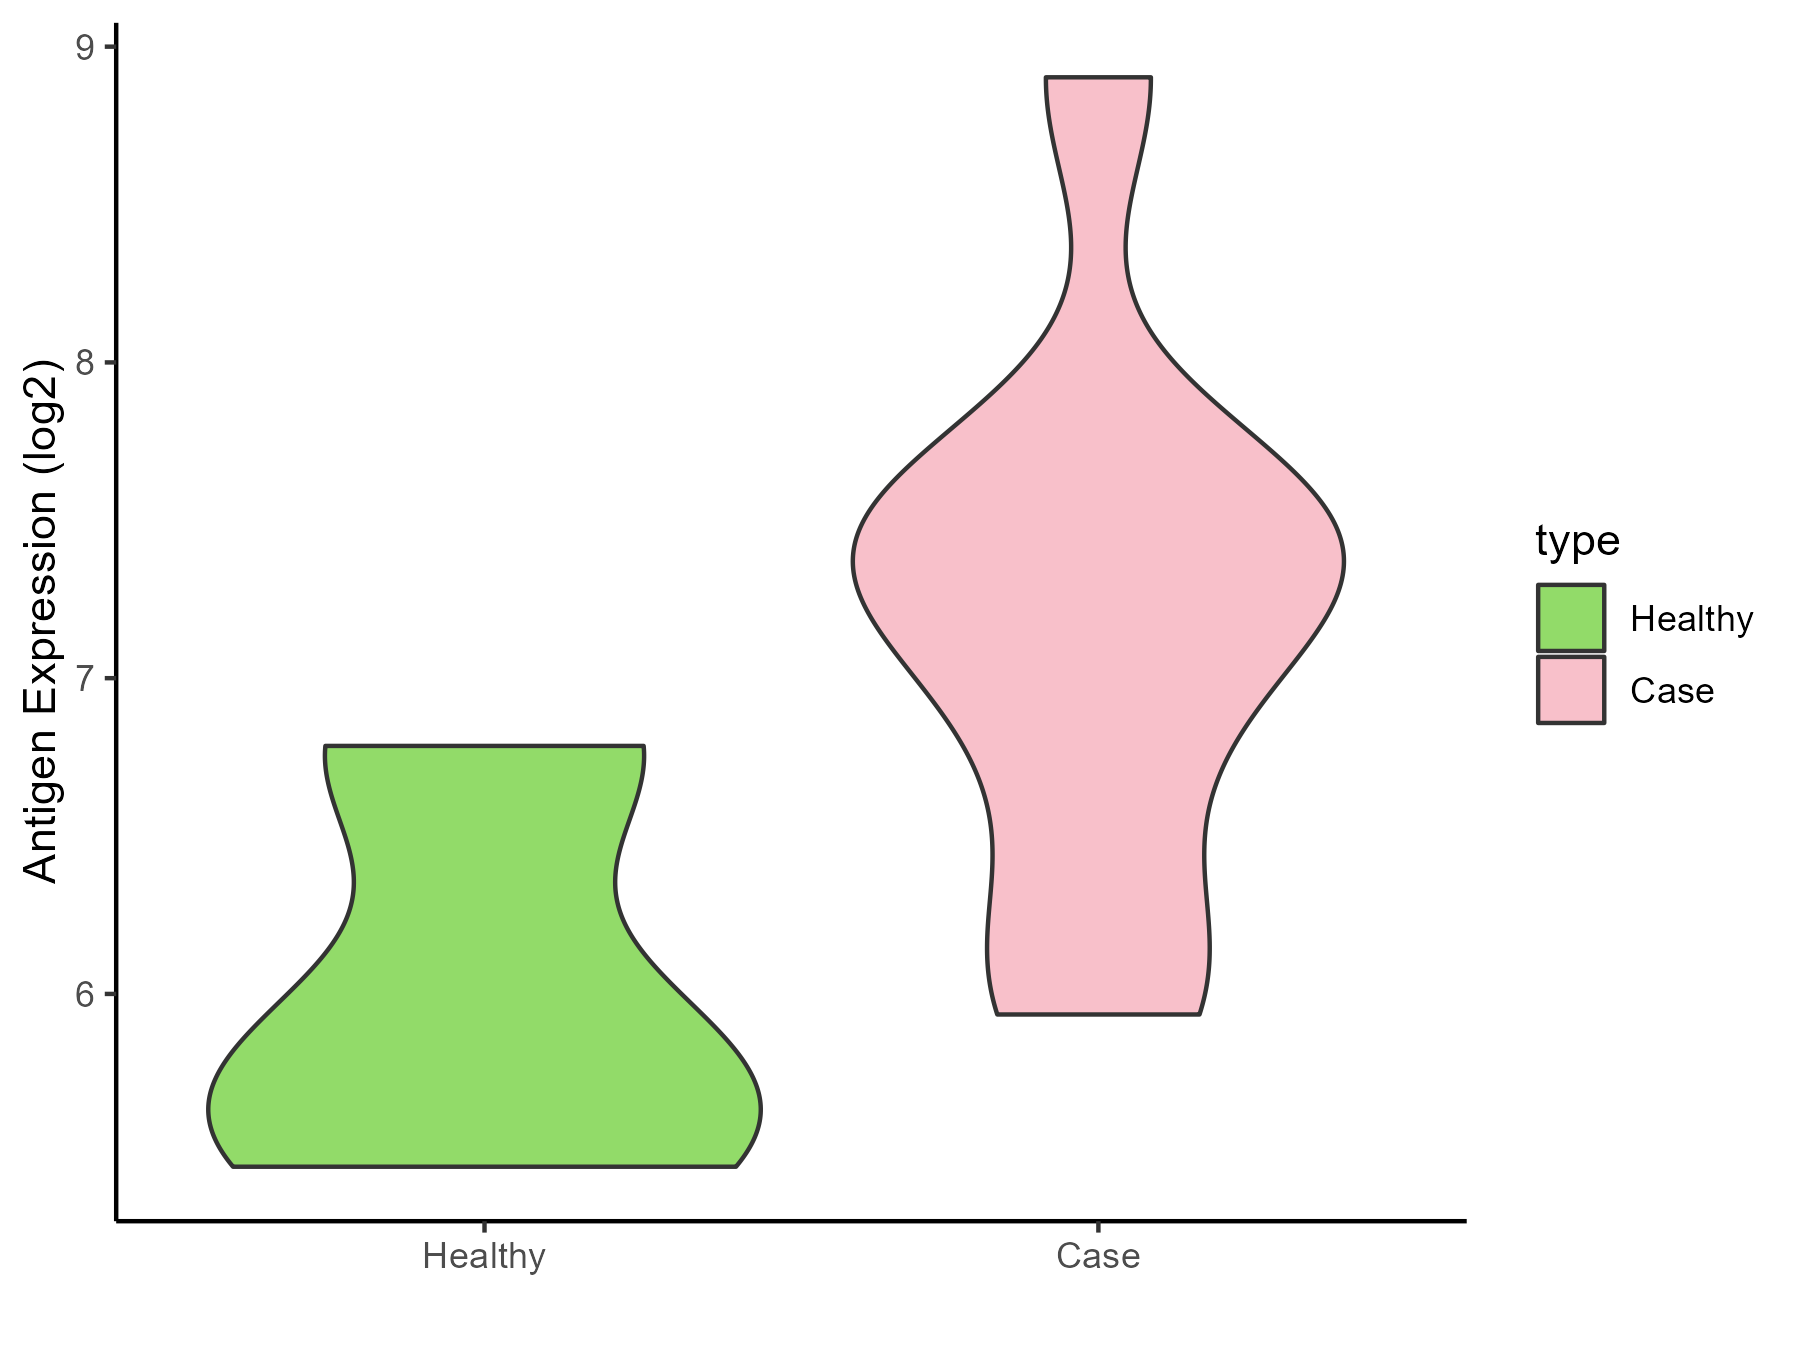
| Differential expression pattern of antigen in diseases | ||
| The Studied Tissue | Whole blood | |
| The Specific Disease | Influenza | |
| The Expression Level of Disease Section Compare with the Healthy Individual Tissue | p-value: 0.070422778; Fold-change: 1.515304039; Z-score: 2.194182361 | |
| Disease-specific Antigen Abundances |
|
Click to View the Clearer Original Diagram |
| Differential expression pattern of antigen in diseases | ||
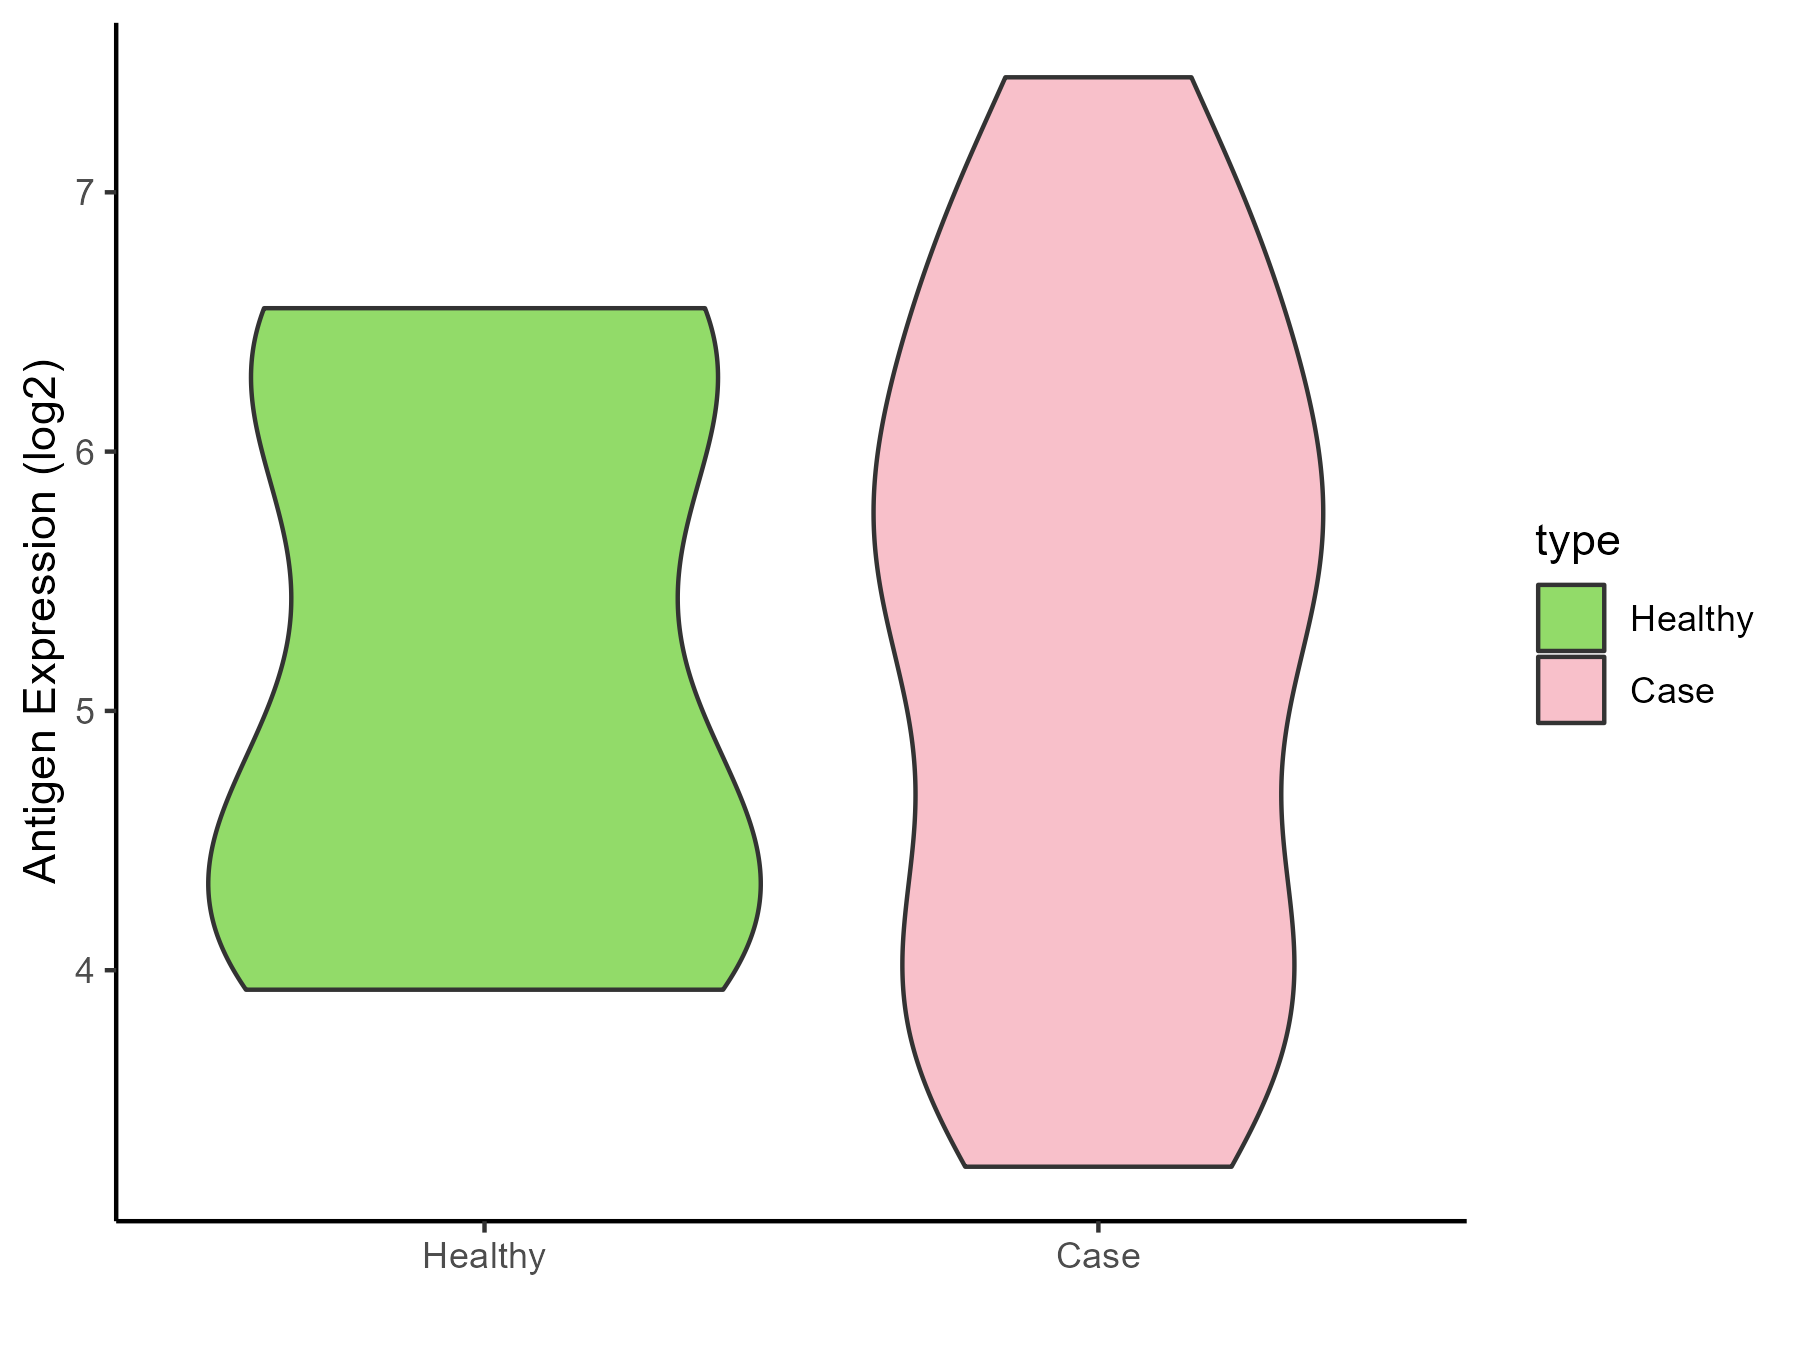
| The Studied Tissue | Whole blood | |
| The Specific Disease | Chronic hepatitis C | |
| The Expression Level of Disease Section Compare with the Healthy Individual Tissue | p-value: 0.986061067; Fold-change: 0.424587373; Z-score: 0.388819303 | |
| Disease-specific Antigen Abundances |
|
Click to View the Clearer Original Diagram |
| Differential expression pattern of antigen in diseases | ||
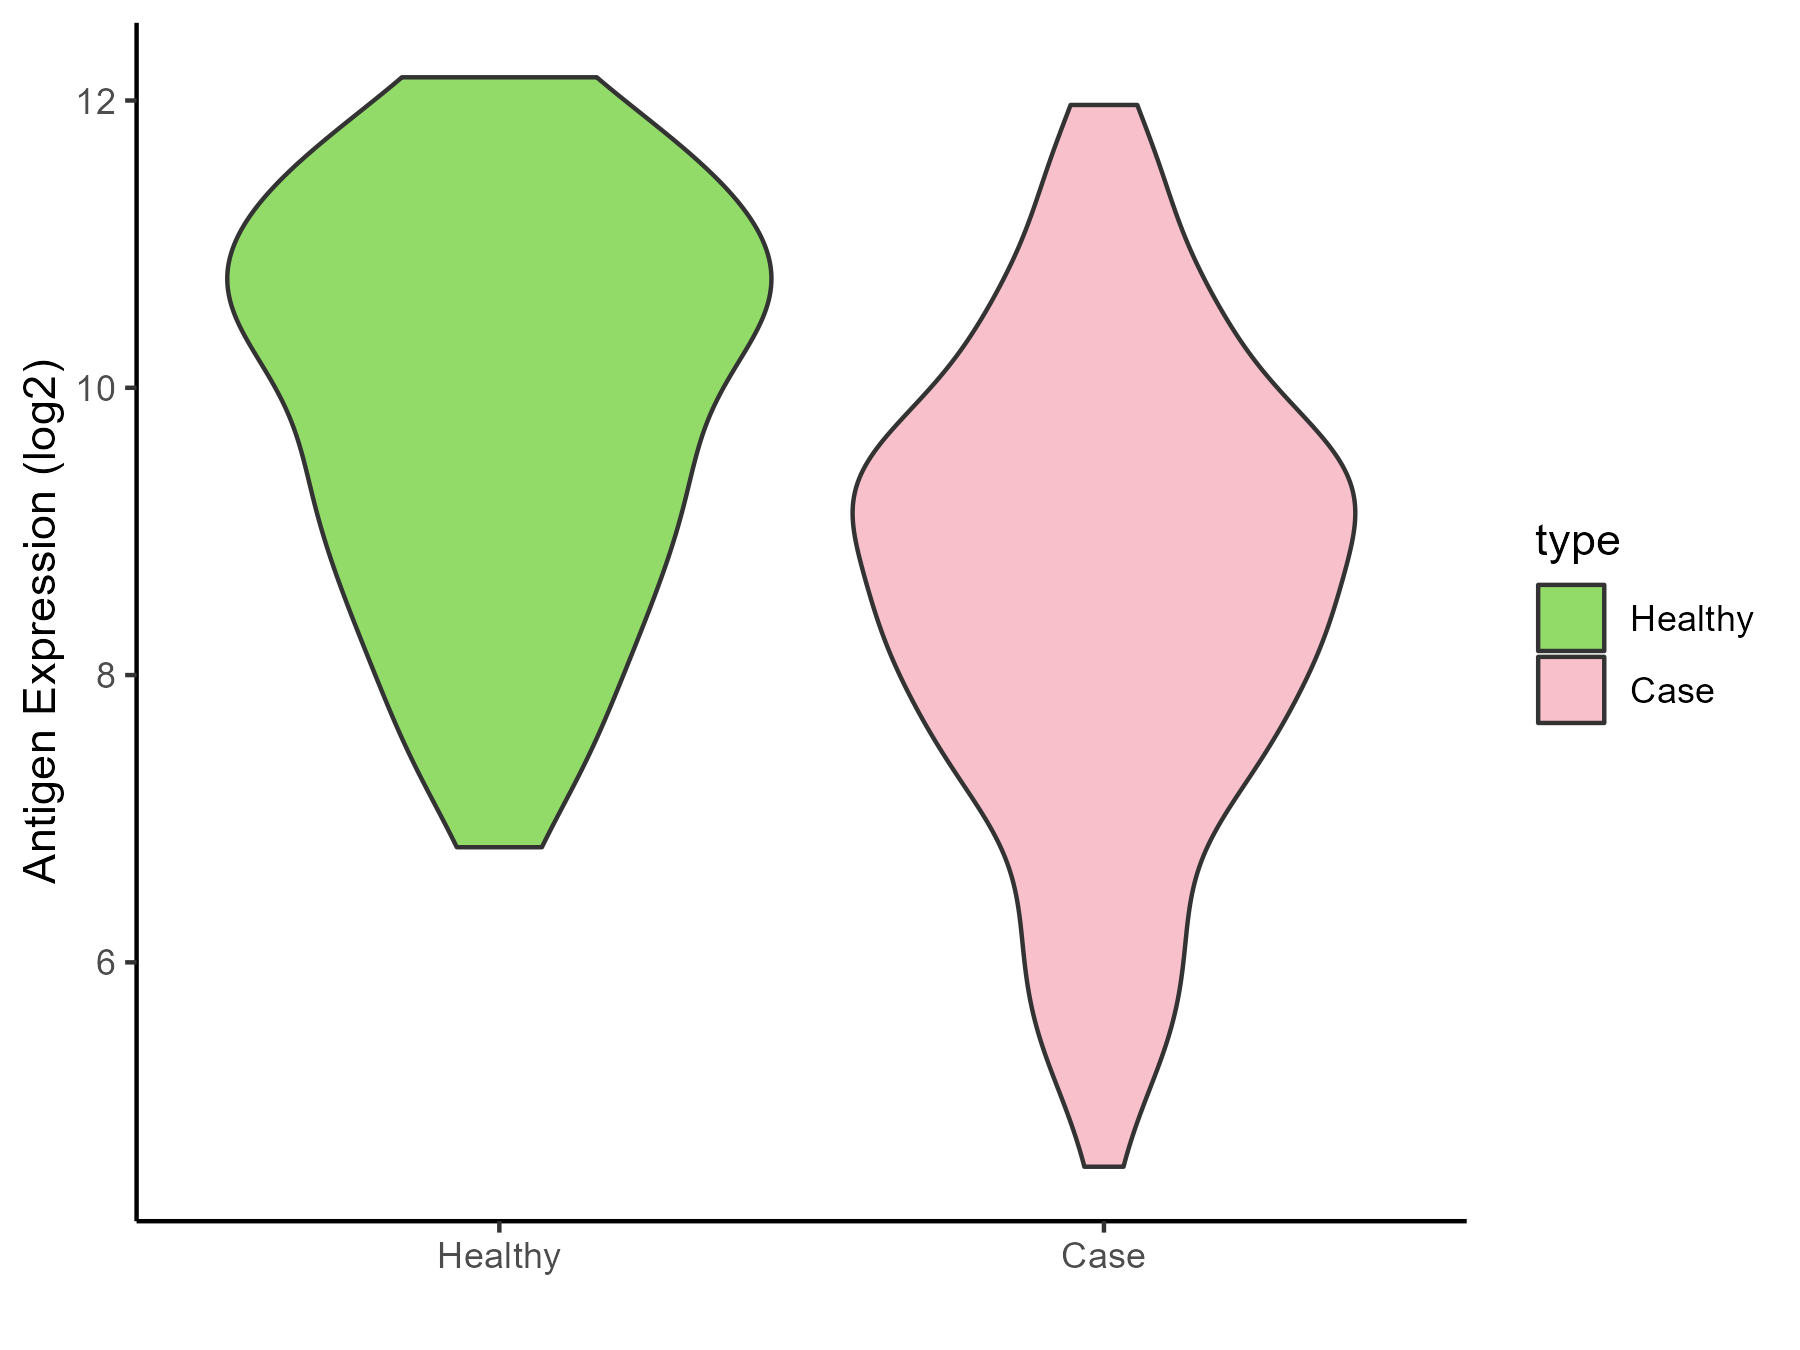
| The Studied Tissue | Whole blood | |
| The Specific Disease | Sepsis | |
| The Expression Level of Disease Section Compare with the Healthy Individual Tissue | p-value: 6.20E-11; Fold-change: -1.52660992; Z-score: -1.103806894 | |
| Disease-specific Antigen Abundances |
|
Click to View the Clearer Original Diagram |
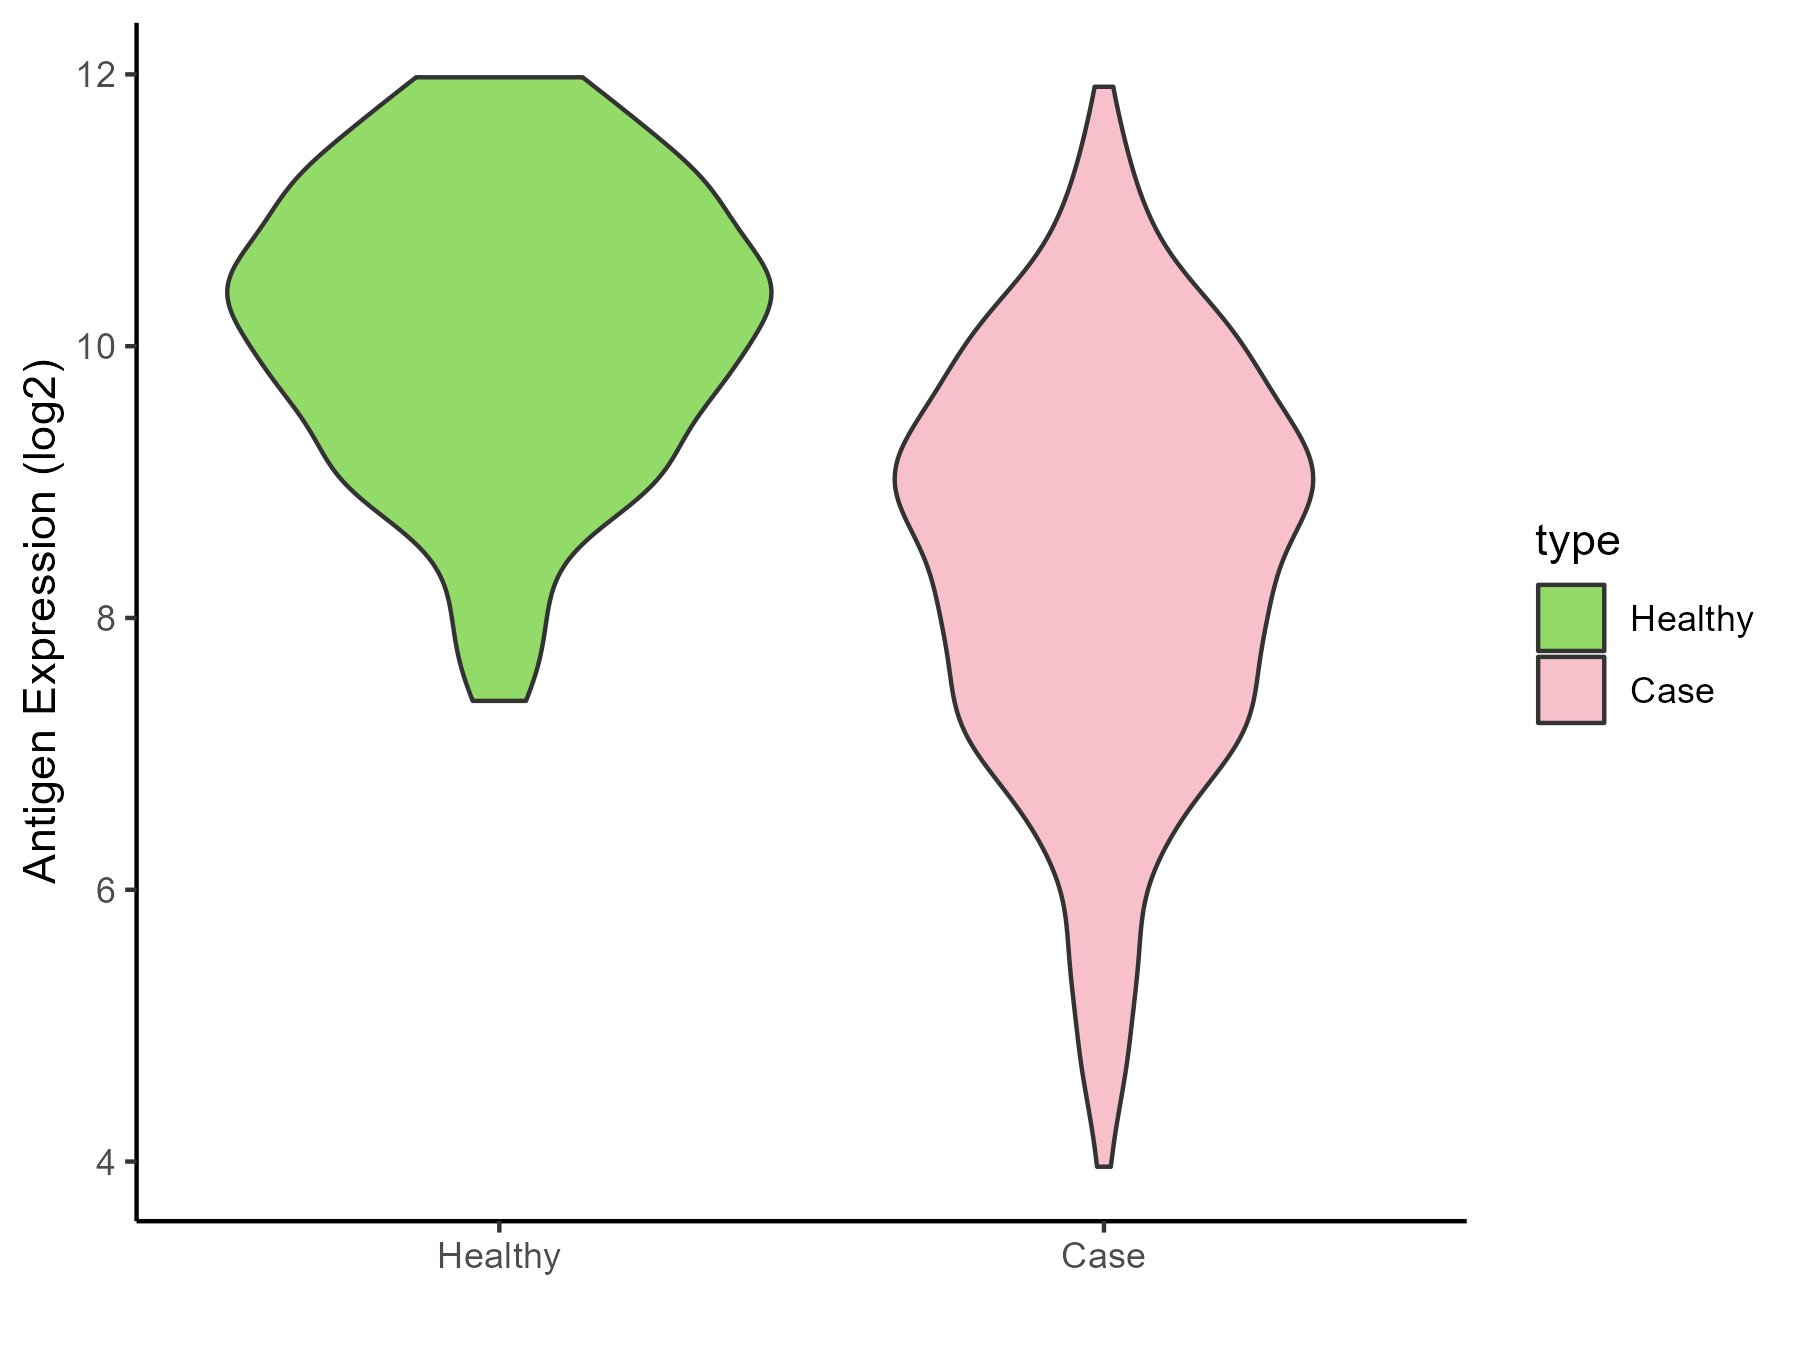
| Differential expression pattern of antigen in diseases | ||
| The Studied Tissue | Whole blood | |
| The Specific Disease | Septic shock | |
| The Expression Level of Disease Section Compare with the Healthy Individual Tissue | p-value: 2.18E-46; Fold-change: -1.652337489; Z-score: -1.559057456 | |
| Disease-specific Antigen Abundances |
|
Click to View the Clearer Original Diagram |
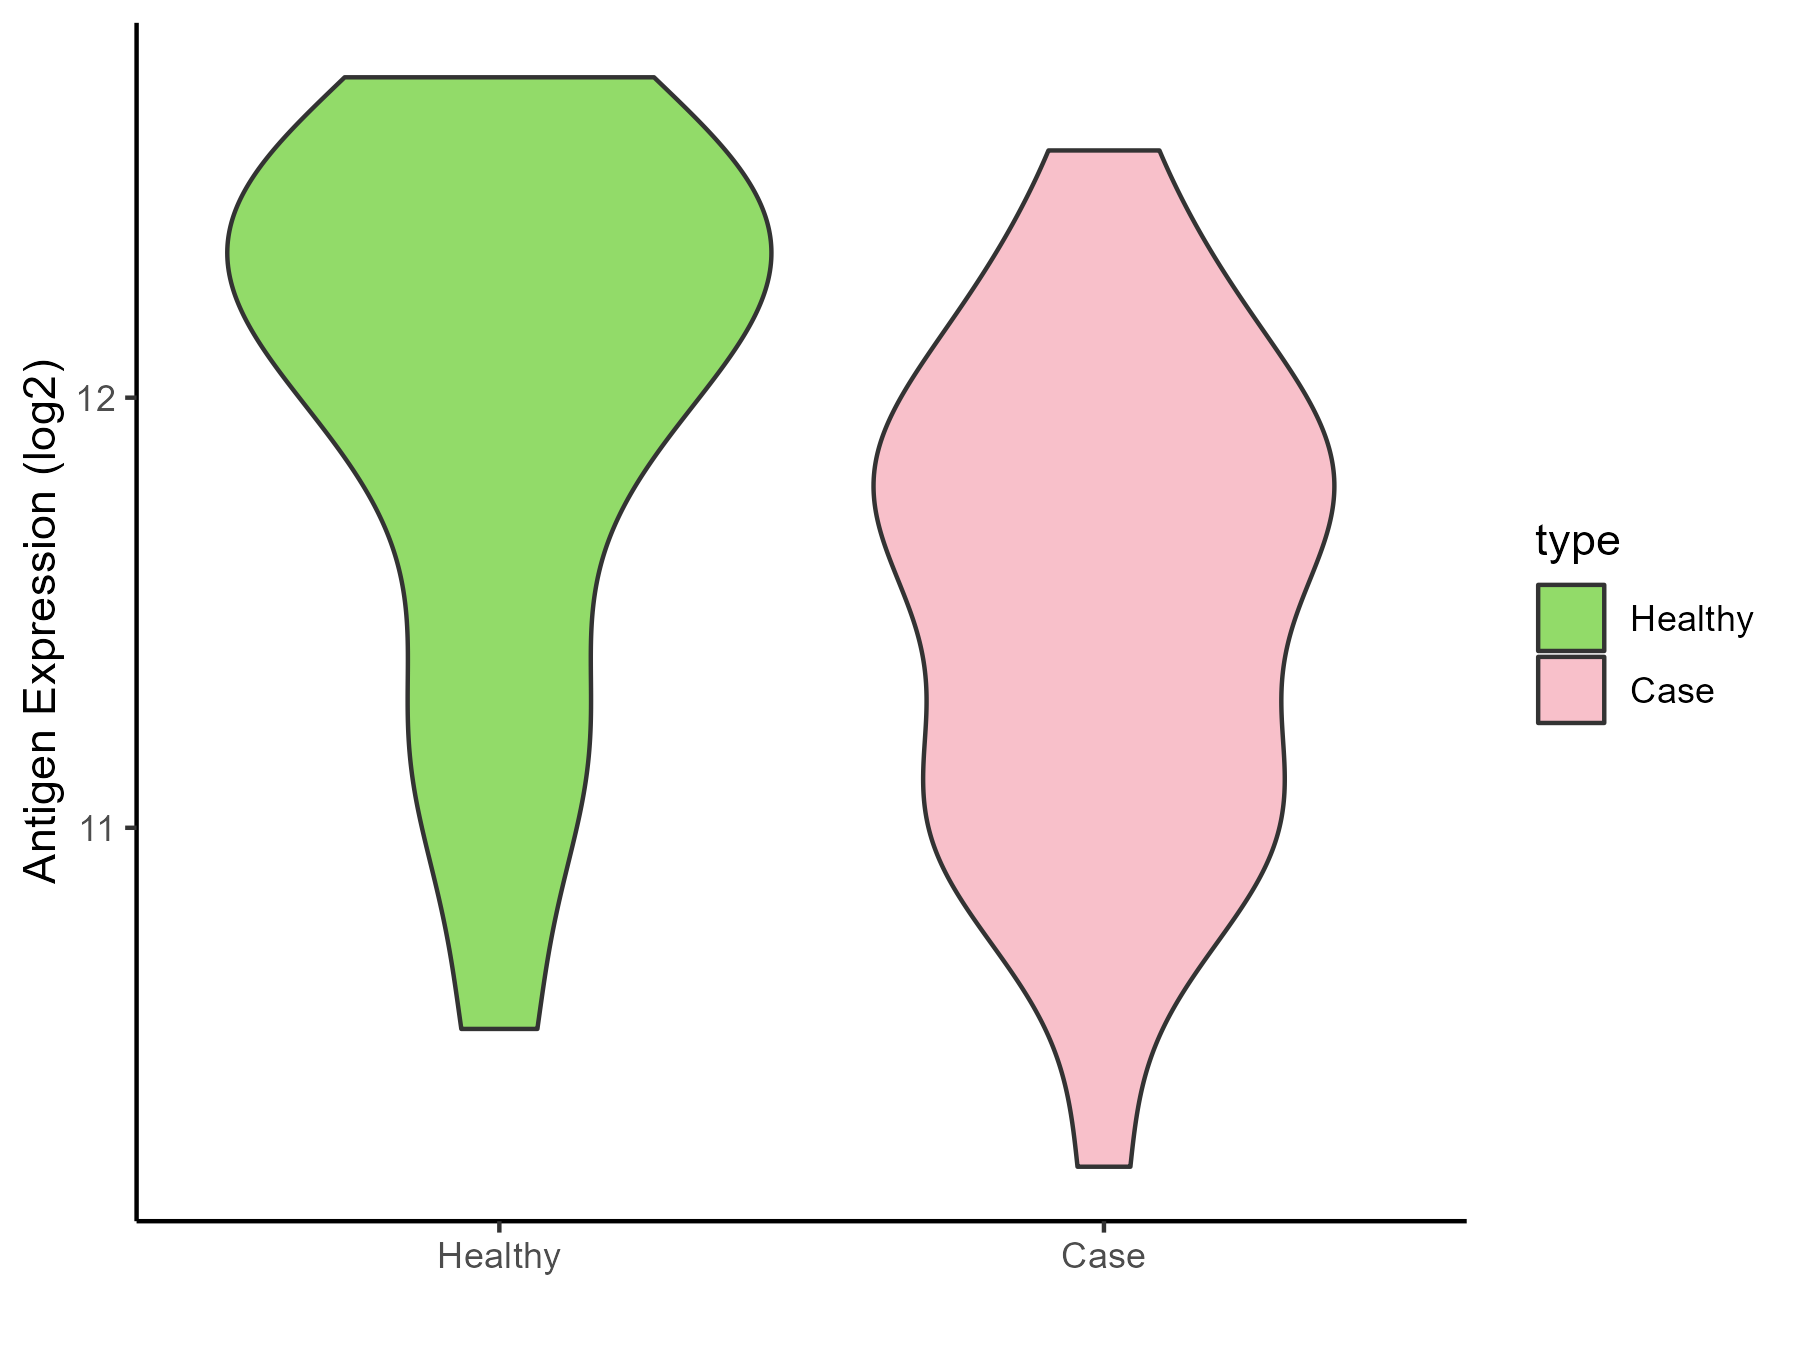
| Differential expression pattern of antigen in diseases | ||
| The Studied Tissue | Peripheral blood | |
| The Specific Disease | Pediatric respiratory syncytial virus infection | |
| The Expression Level of Disease Section Compare with the Healthy Individual Tissue | p-value: 0.018485145; Fold-change: -0.538012342; Z-score: -0.859171363 | |
| Disease-specific Antigen Abundances |
|
Click to View the Clearer Original Diagram |
ICD Disease Classification 11
| Differential expression pattern of antigen in diseases | ||
| The Studied Tissue | Peripheral blood | |
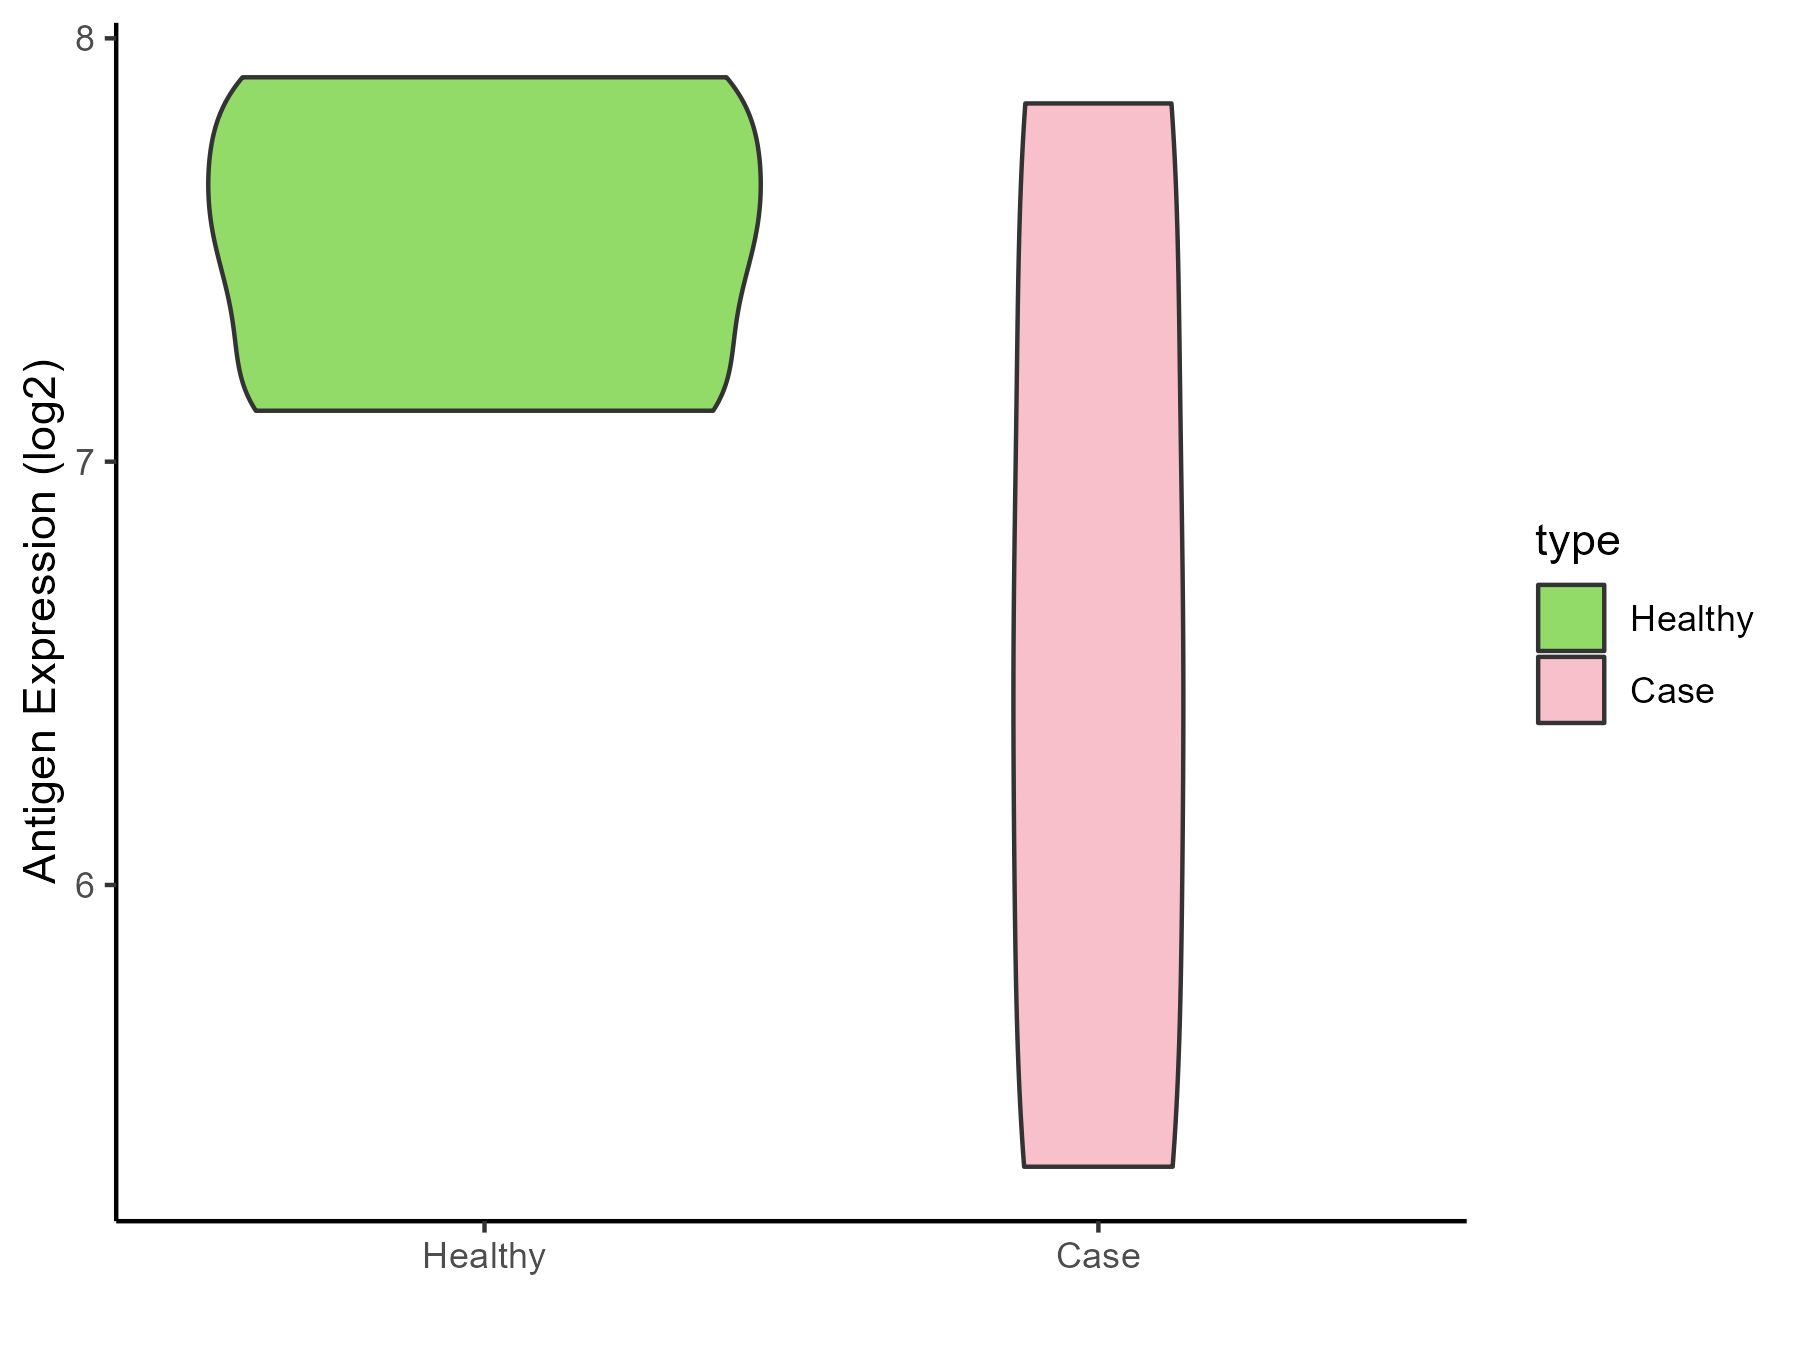
| The Specific Disease | Essential hypertension | |
| The Expression Level of Disease Section Compare with the Healthy Individual Tissue | p-value: 0.324851468; Fold-change: -0.964710772; Z-score: -2.448370949 | |
| Disease-specific Antigen Abundances |
|
Click to View the Clearer Original Diagram |
| Differential expression pattern of antigen in diseases | ||
| The Studied Tissue | Peripheral blood | |
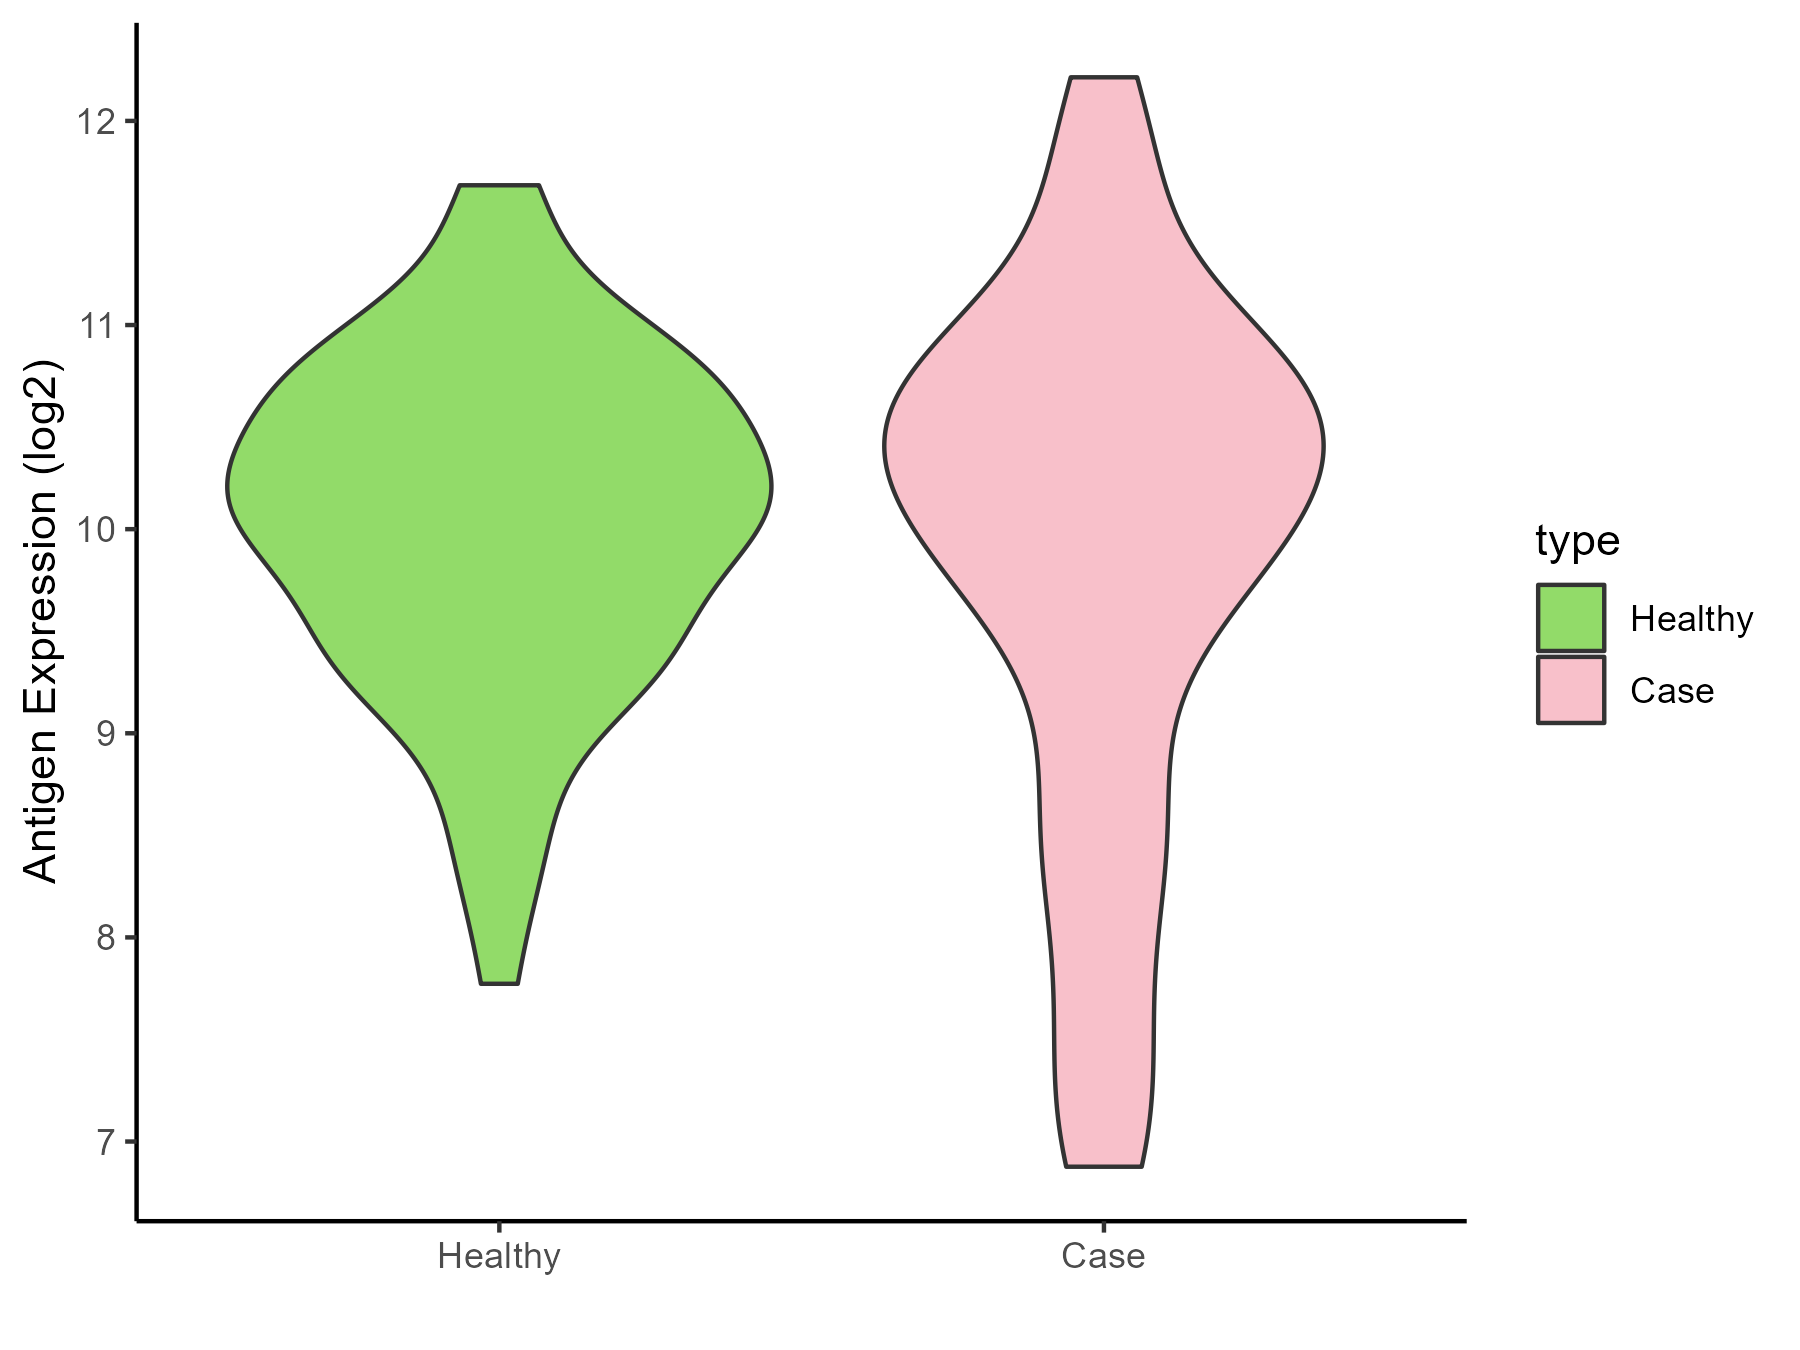
| The Specific Disease | Myocardial infarction | |
| The Expression Level of Disease Section Compare with the Healthy Individual Tissue | p-value: 0.392639083; Fold-change: 0.036453804; Z-score: 0.044623166 | |
| Disease-specific Antigen Abundances |
|
Click to View the Clearer Original Diagram |
| Differential expression pattern of antigen in diseases | ||
| The Studied Tissue | Peripheral blood | |
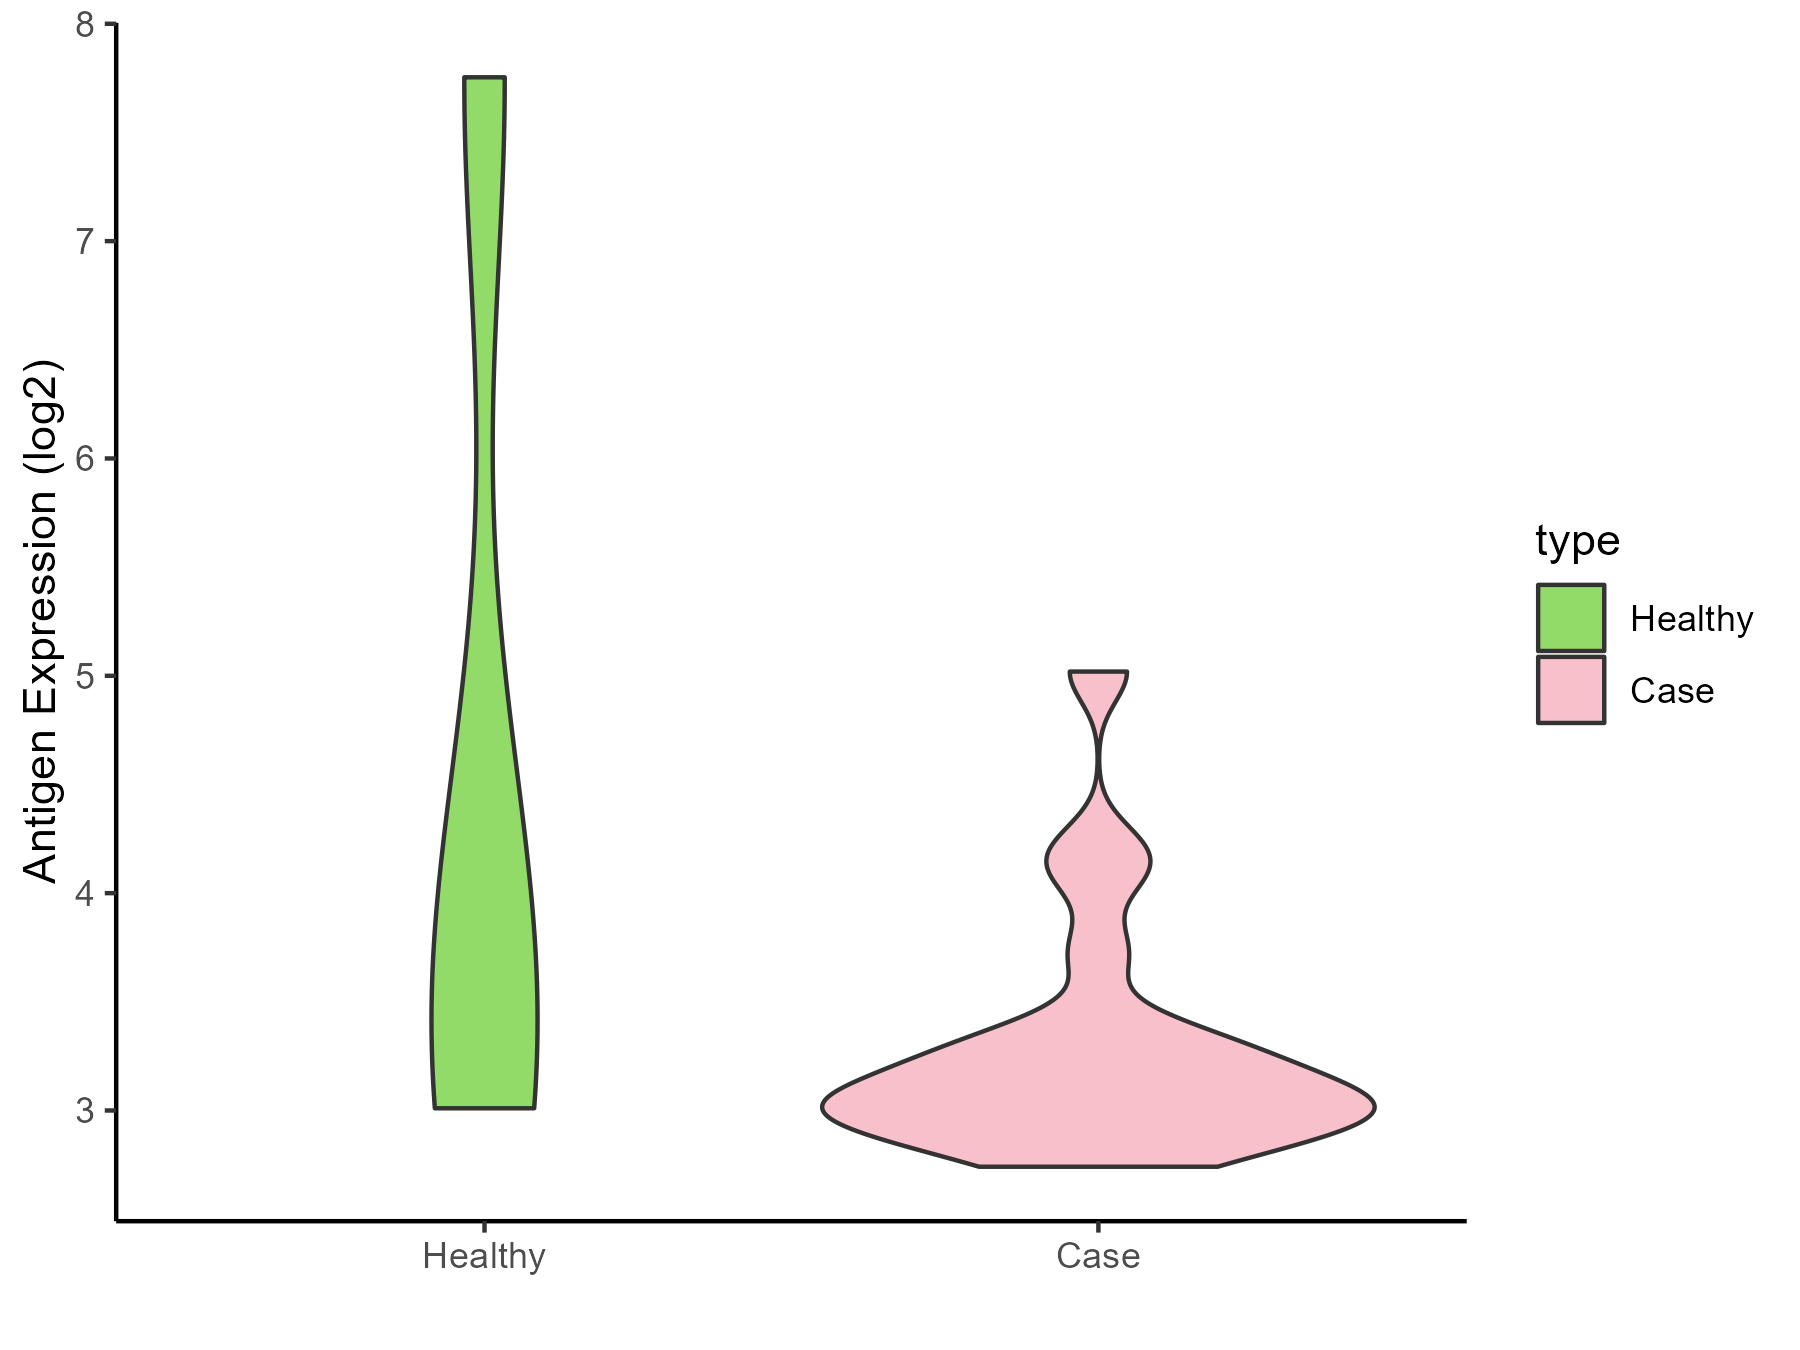
| The Specific Disease | Coronary artery disease | |
| The Expression Level of Disease Section Compare with the Healthy Individual Tissue | p-value: 0.338053662; Fold-change: -0.637083142; Z-score: -0.289391484 | |
| Disease-specific Antigen Abundances |
|
Click to View the Clearer Original Diagram |
| Differential expression pattern of antigen in diseases | ||
| The Studied Tissue | Calcified aortic valve | |
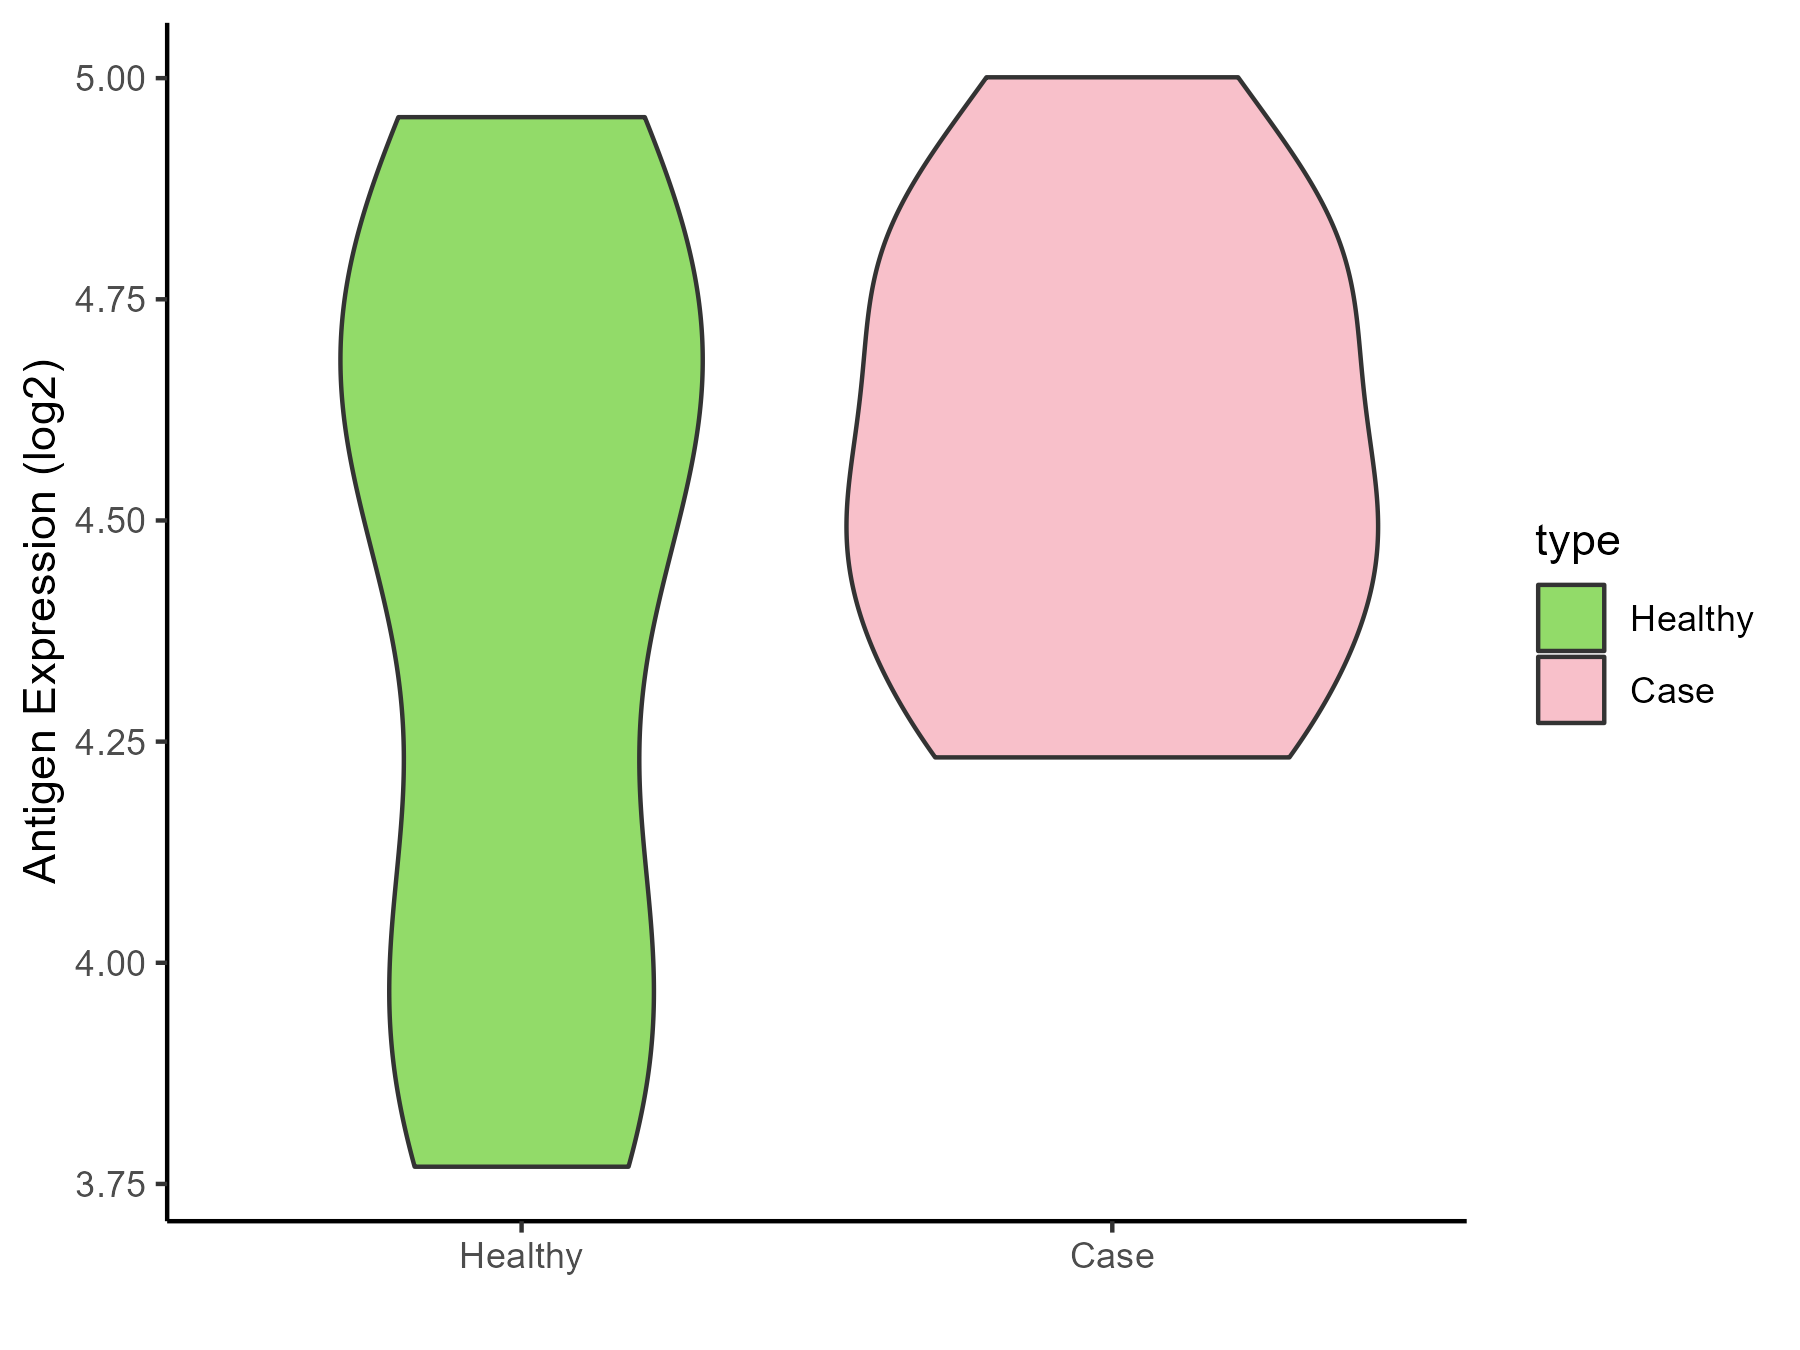
| The Specific Disease | Aortic stenosis | |
| The Expression Level of Disease Section Compare with the Healthy Individual Tissue | p-value: 0.260901571; Fold-change: 0.005583445; Z-score: 0.013131282 | |
| Disease-specific Antigen Abundances |
|
Click to View the Clearer Original Diagram |
| Differential expression pattern of antigen in diseases | ||
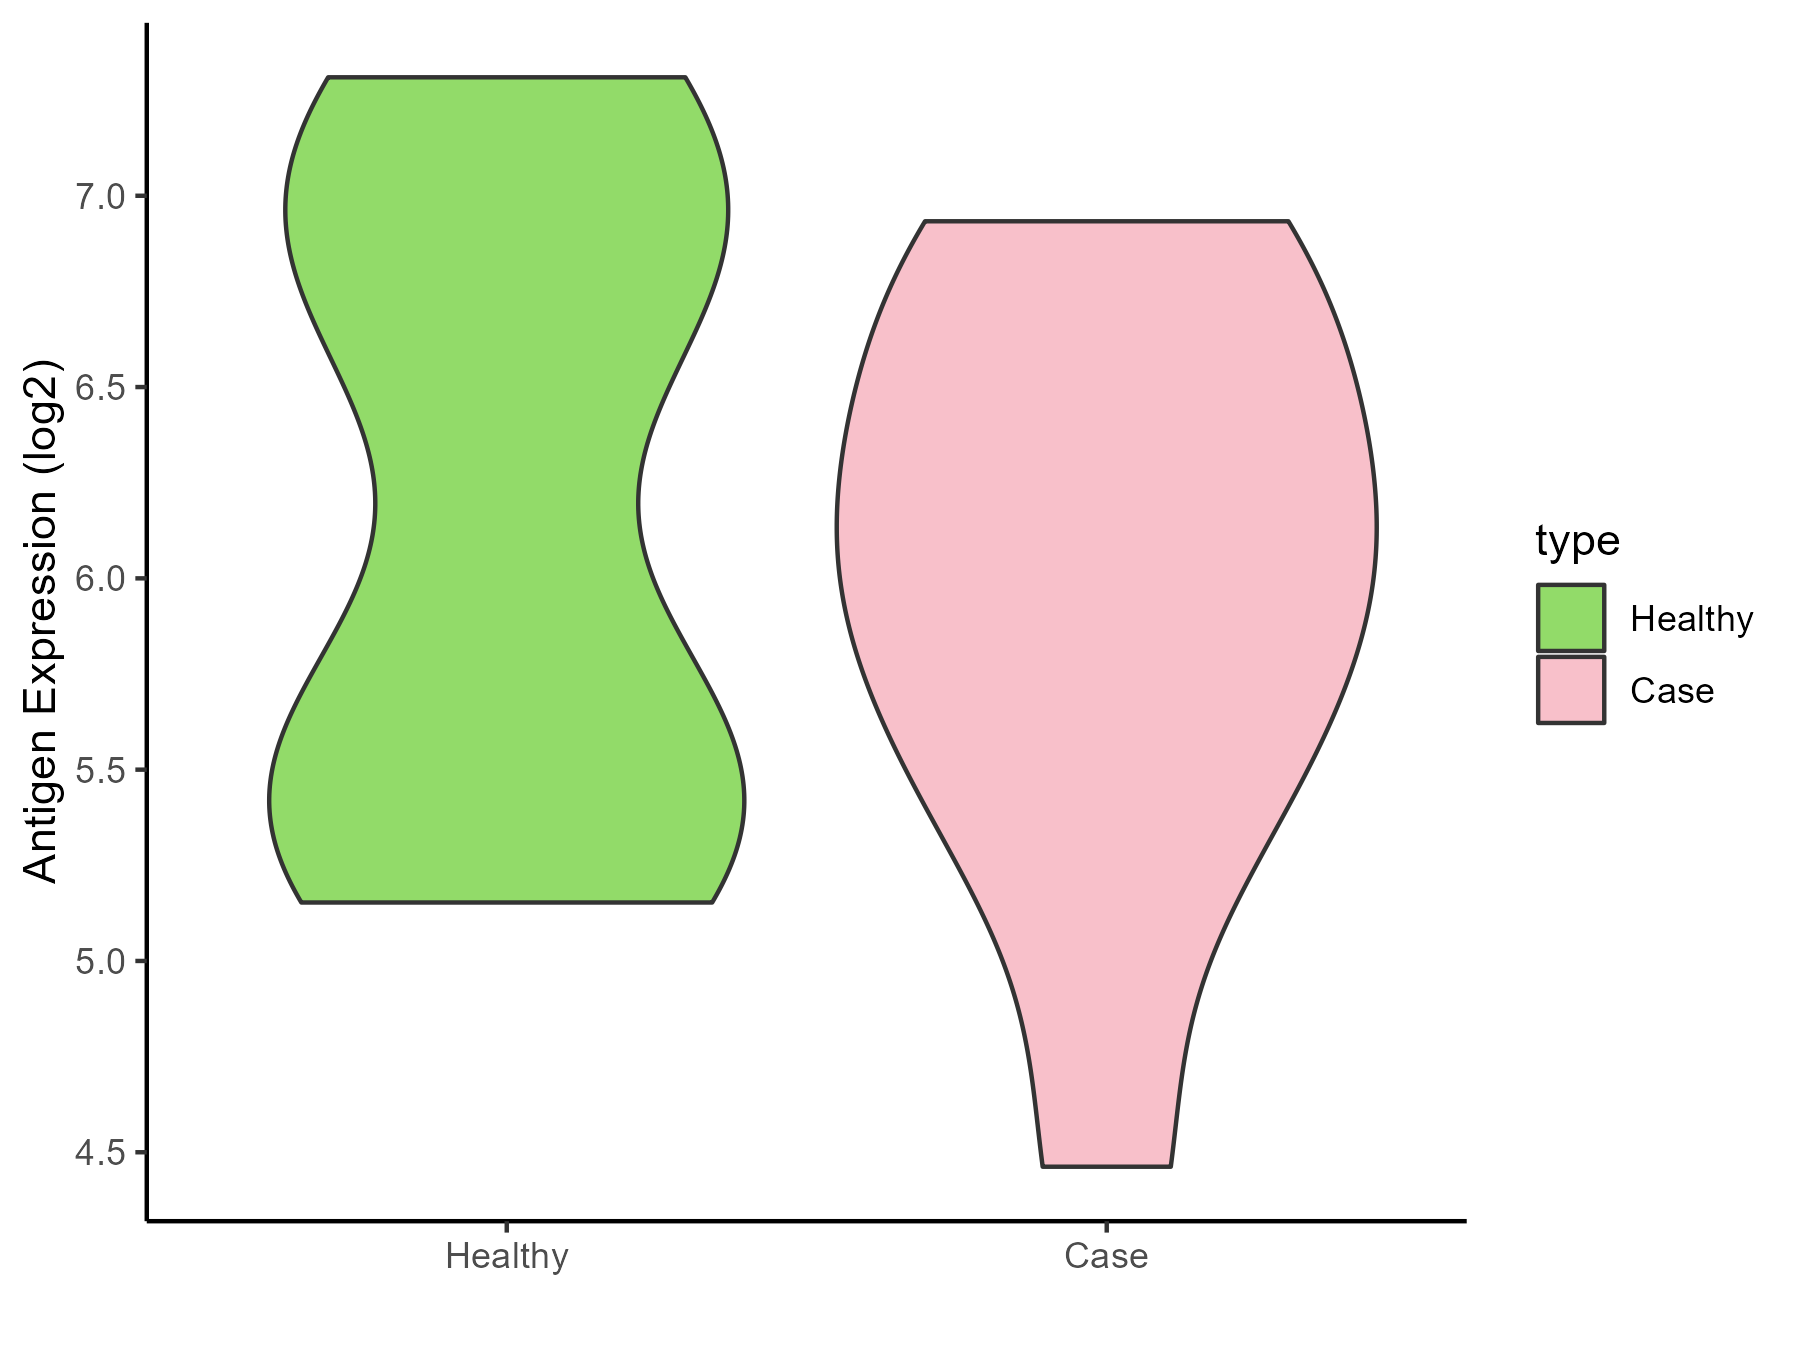
| The Studied Tissue | Peripheral blood | |
| The Specific Disease | Arteriosclerosis | |
| The Expression Level of Disease Section Compare with the Healthy Individual Tissue | p-value: 0.579529783; Fold-change: -0.071022014; Z-score: -0.084298549 | |
| Disease-specific Antigen Abundances |
|
Click to View the Clearer Original Diagram |
| Differential expression pattern of antigen in diseases | ||
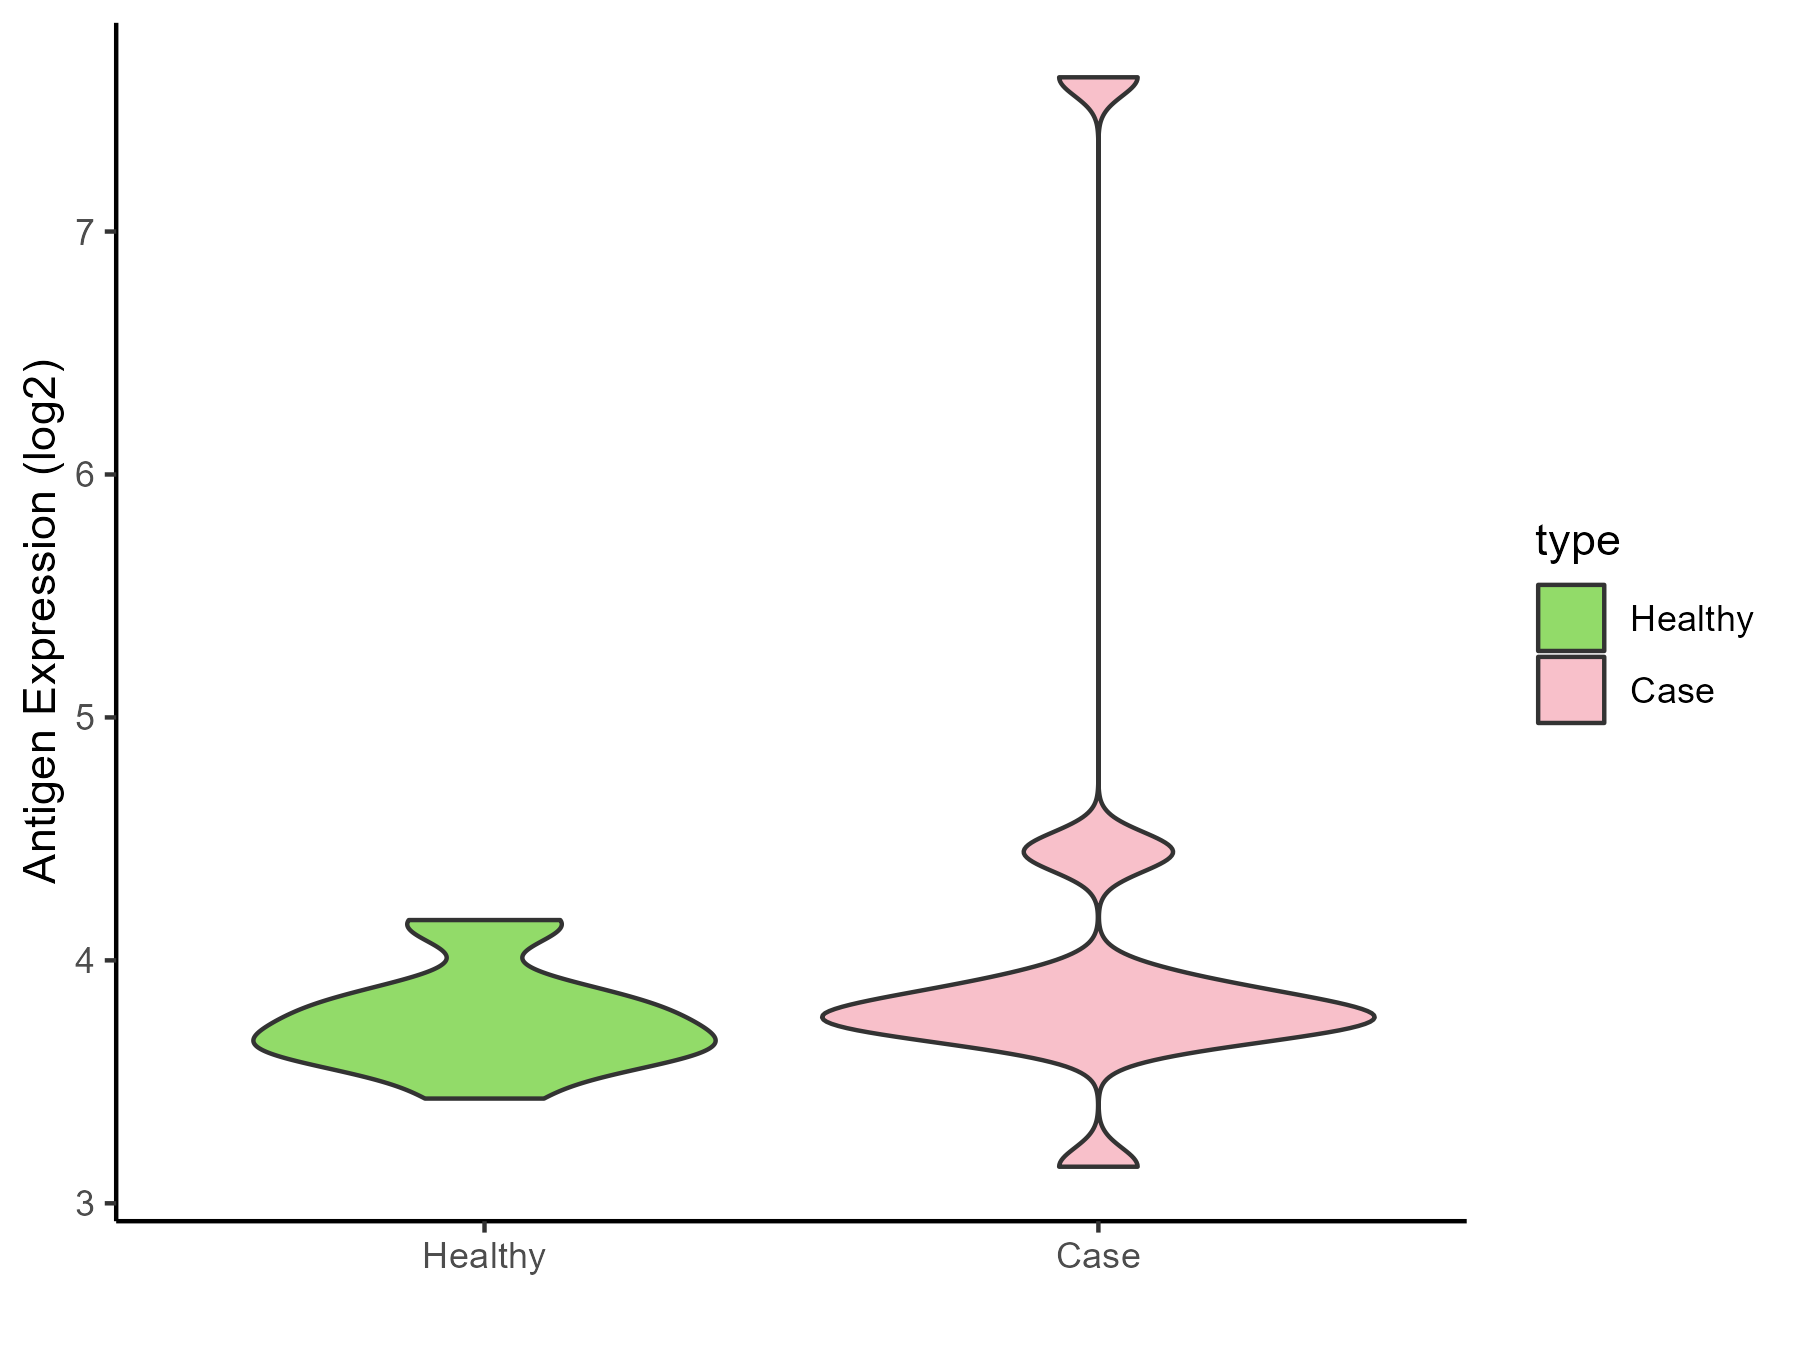
| The Studied Tissue | Intracranial artery | |
| The Specific Disease | Aneurysm | |
| The Expression Level of Disease Section Compare with the Healthy Individual Tissue | p-value: 0.246351834; Fold-change: 0.058436213; Z-score: 0.275770923 | |
| Disease-specific Antigen Abundances |
|
Click to View the Clearer Original Diagram |
ICD Disease Classification 12
| Differential expression pattern of antigen in diseases | ||
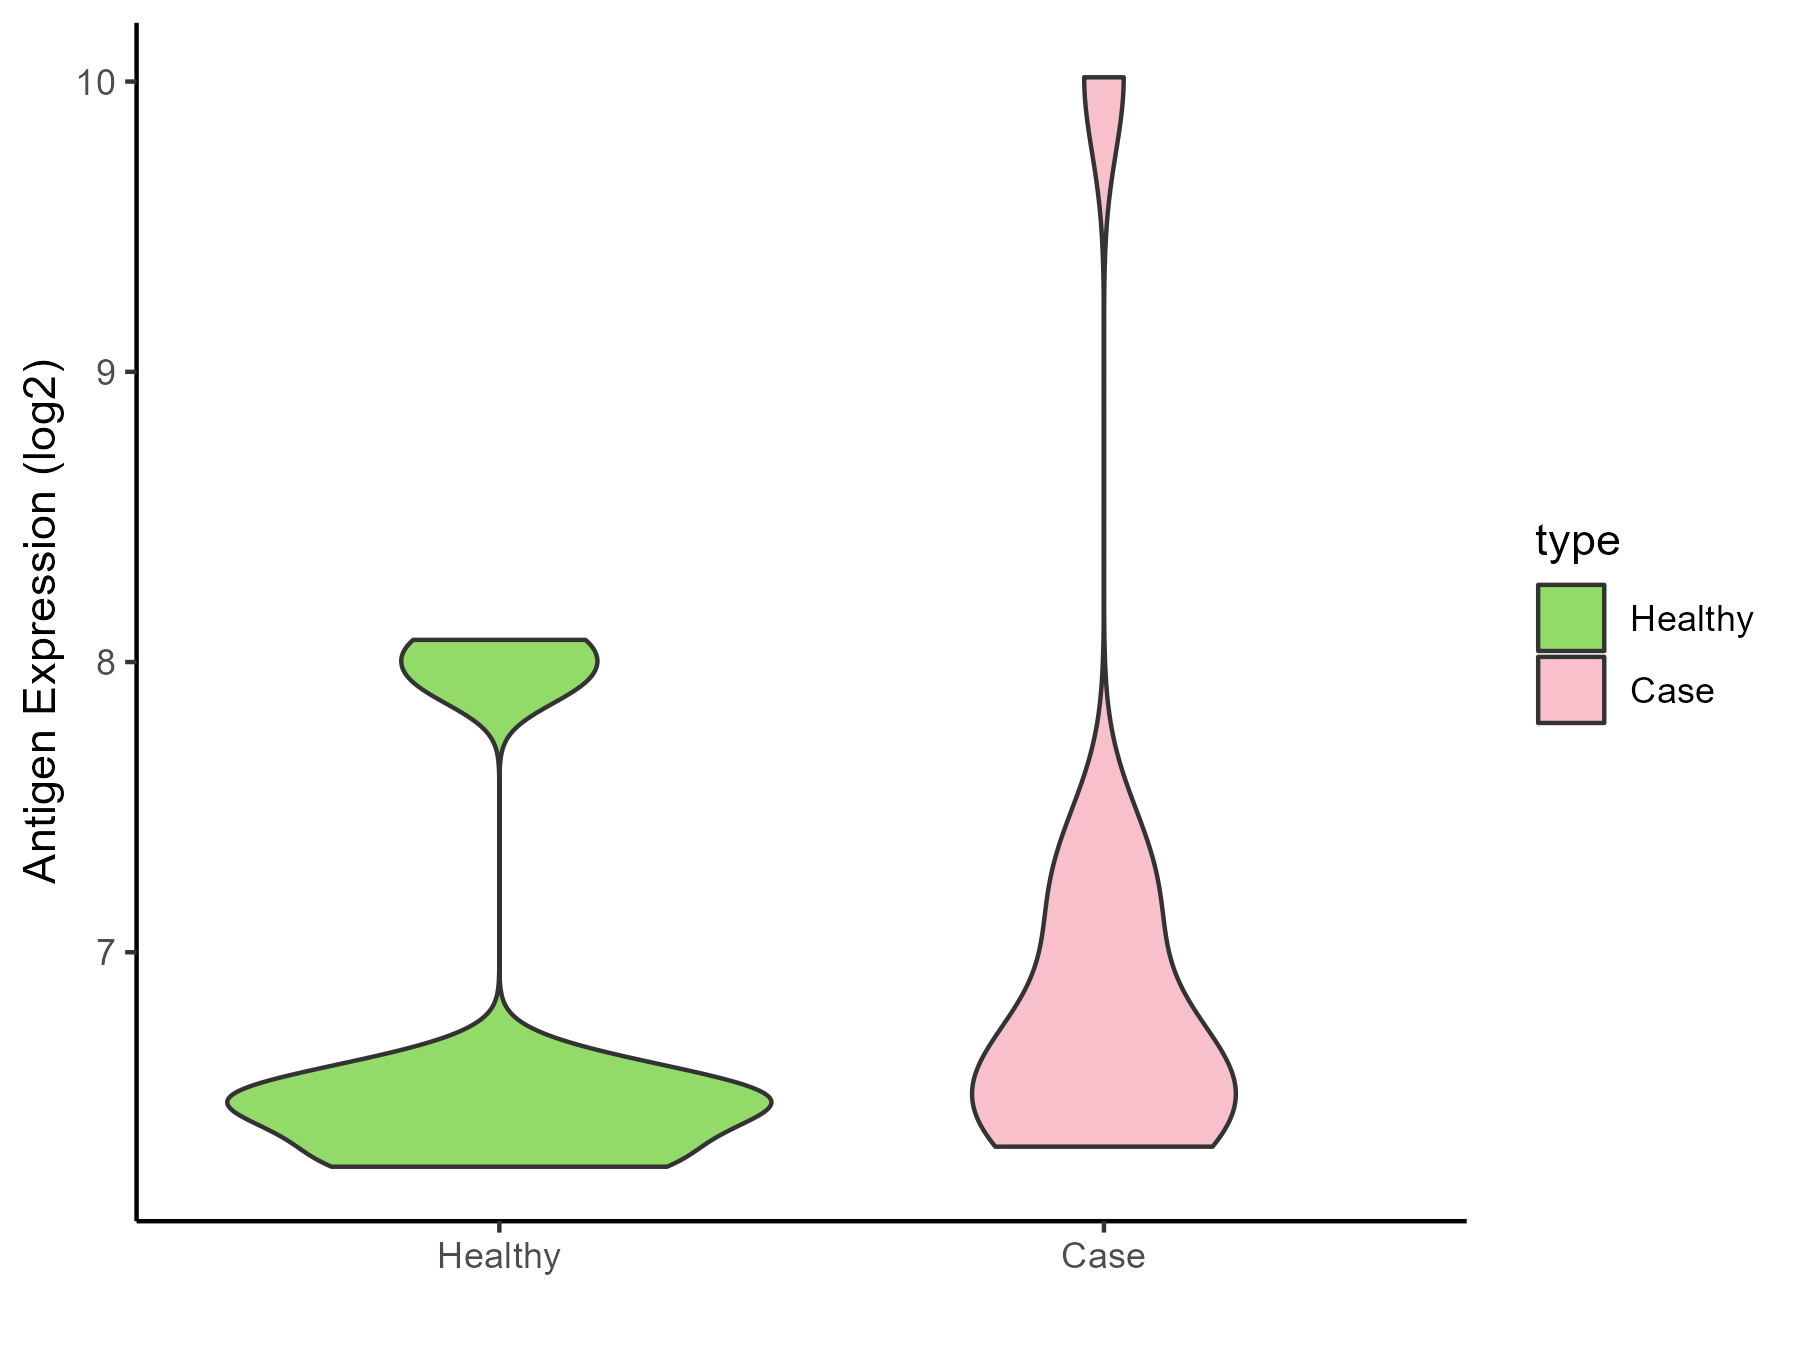
| The Studied Tissue | Peripheral blood | |
| The Specific Disease | Immunodeficiency | |
| The Expression Level of Disease Section Compare with the Healthy Individual Tissue | p-value: 0.57708459; Fold-change: 0.071540765; Z-score: 0.101704429 | |
| Disease-specific Antigen Abundances |
|
Click to View the Clearer Original Diagram |
| Differential expression pattern of antigen in diseases | ||
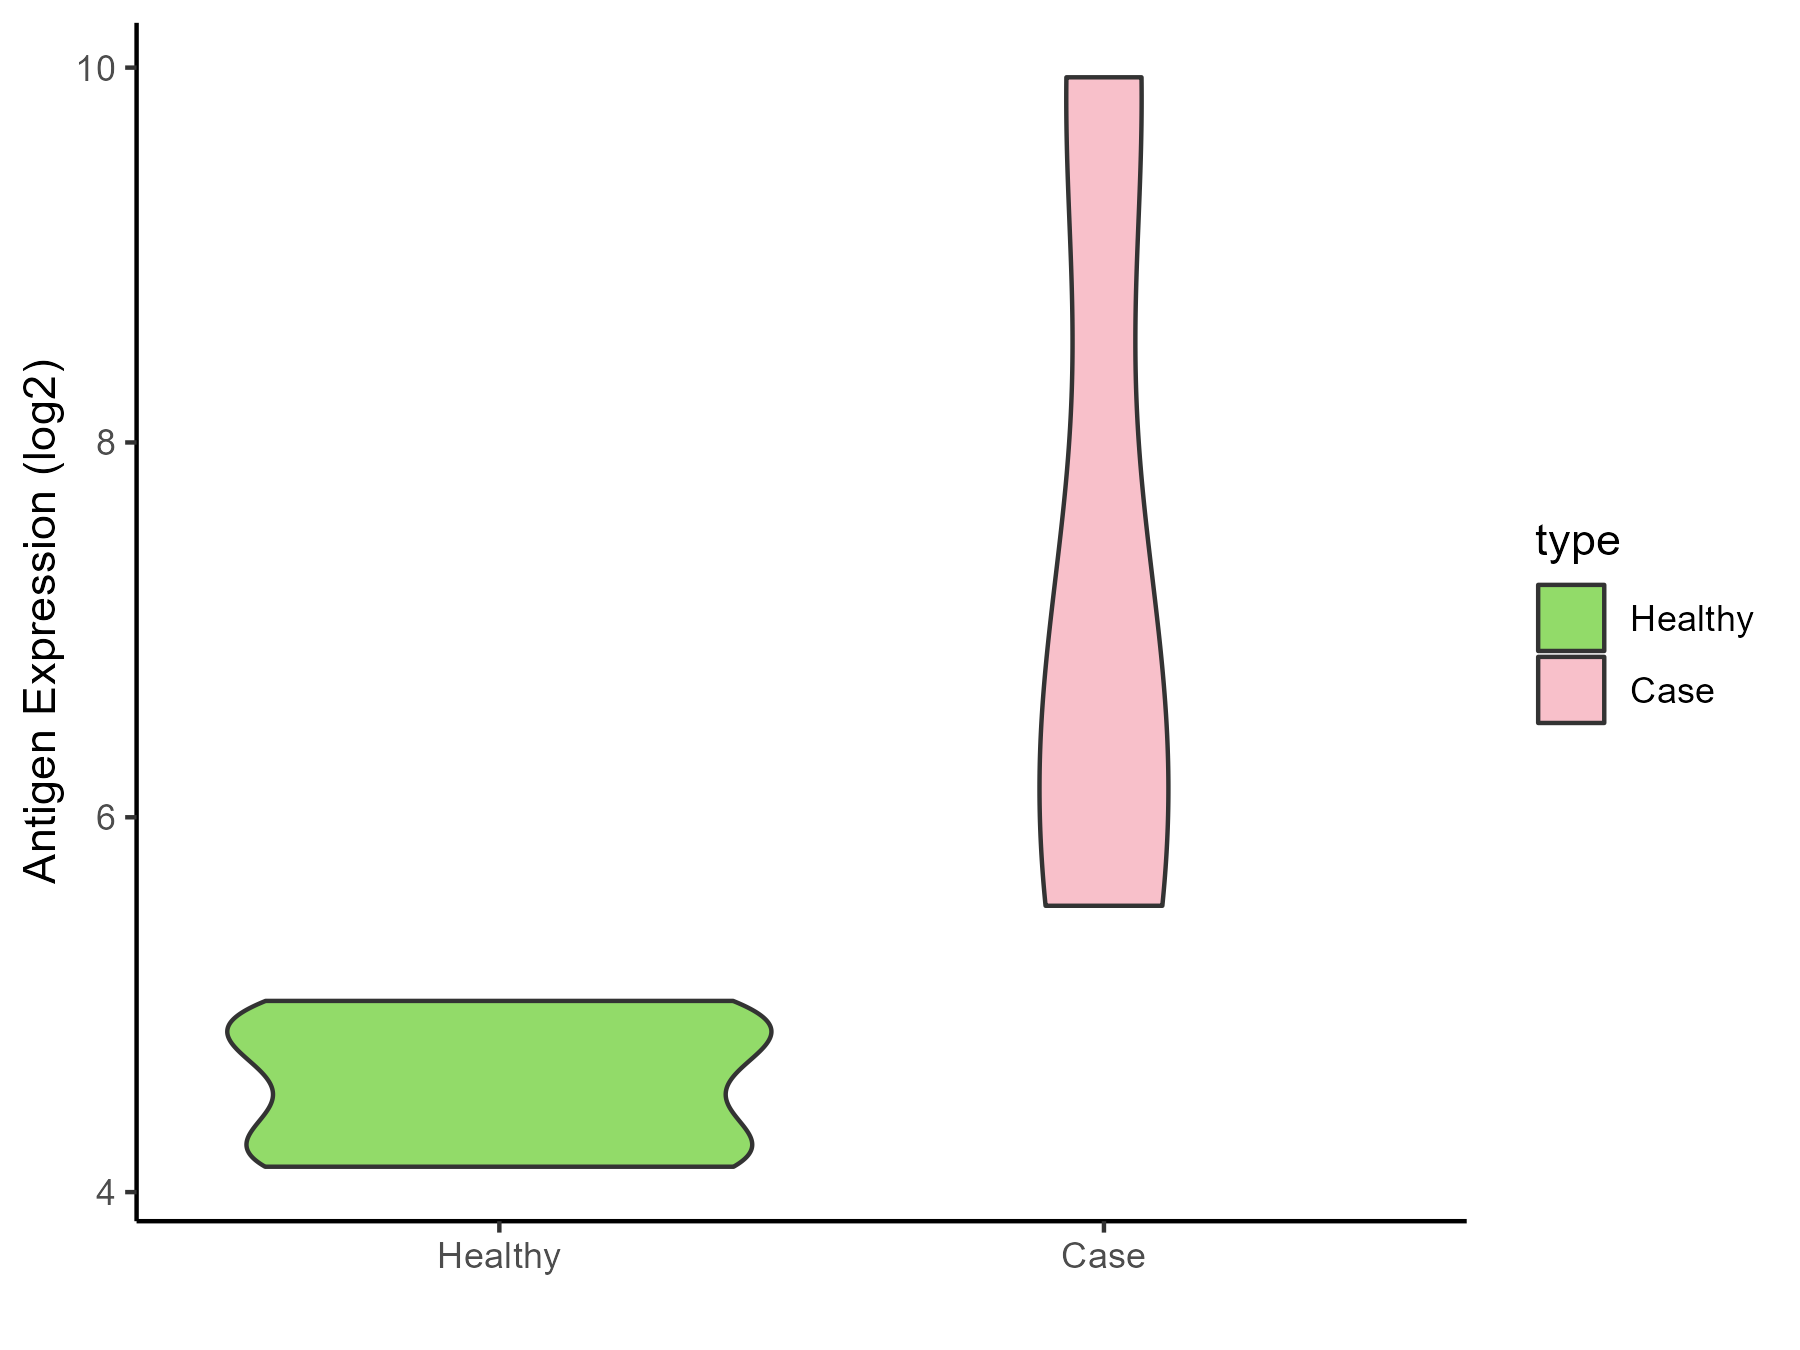
| The Studied Tissue | Hyperplastic tonsil | |
| The Specific Disease | Apnea | |
| The Expression Level of Disease Section Compare with the Healthy Individual Tissue | p-value: 0.163221069; Fold-change: 2.129959948; Z-score: 5.681434118 | |
| Disease-specific Antigen Abundances |
|
Click to View the Clearer Original Diagram |
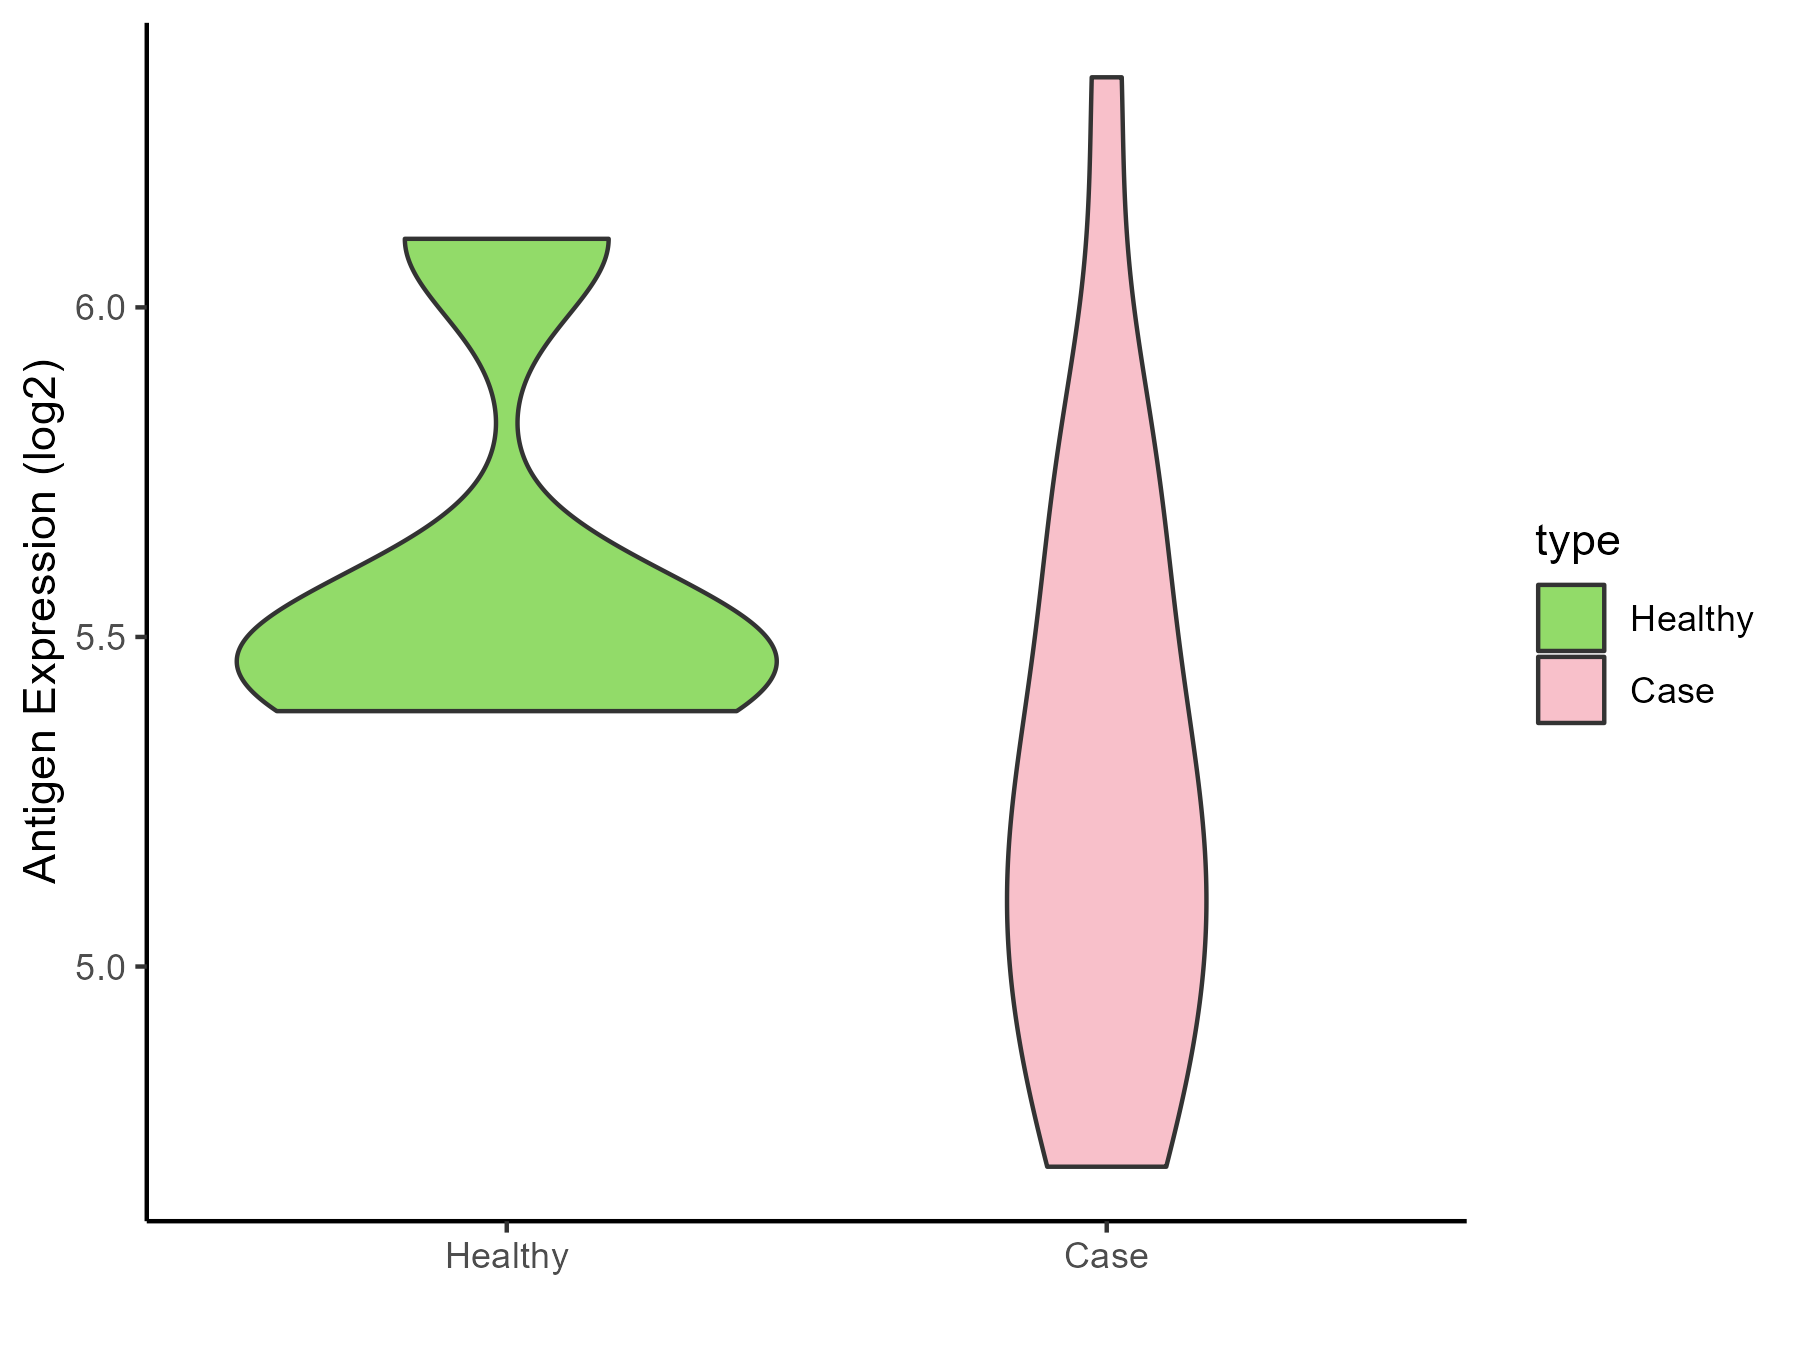
| Differential expression pattern of antigen in diseases | ||
| The Studied Tissue | Peripheral blood | |
| The Specific Disease | Olive pollen allergy | |
| The Expression Level of Disease Section Compare with the Healthy Individual Tissue | p-value: 0.138529937; Fold-change: -0.301923311; Z-score: -0.924848792 | |
| Disease-specific Antigen Abundances |
|
Click to View the Clearer Original Diagram |
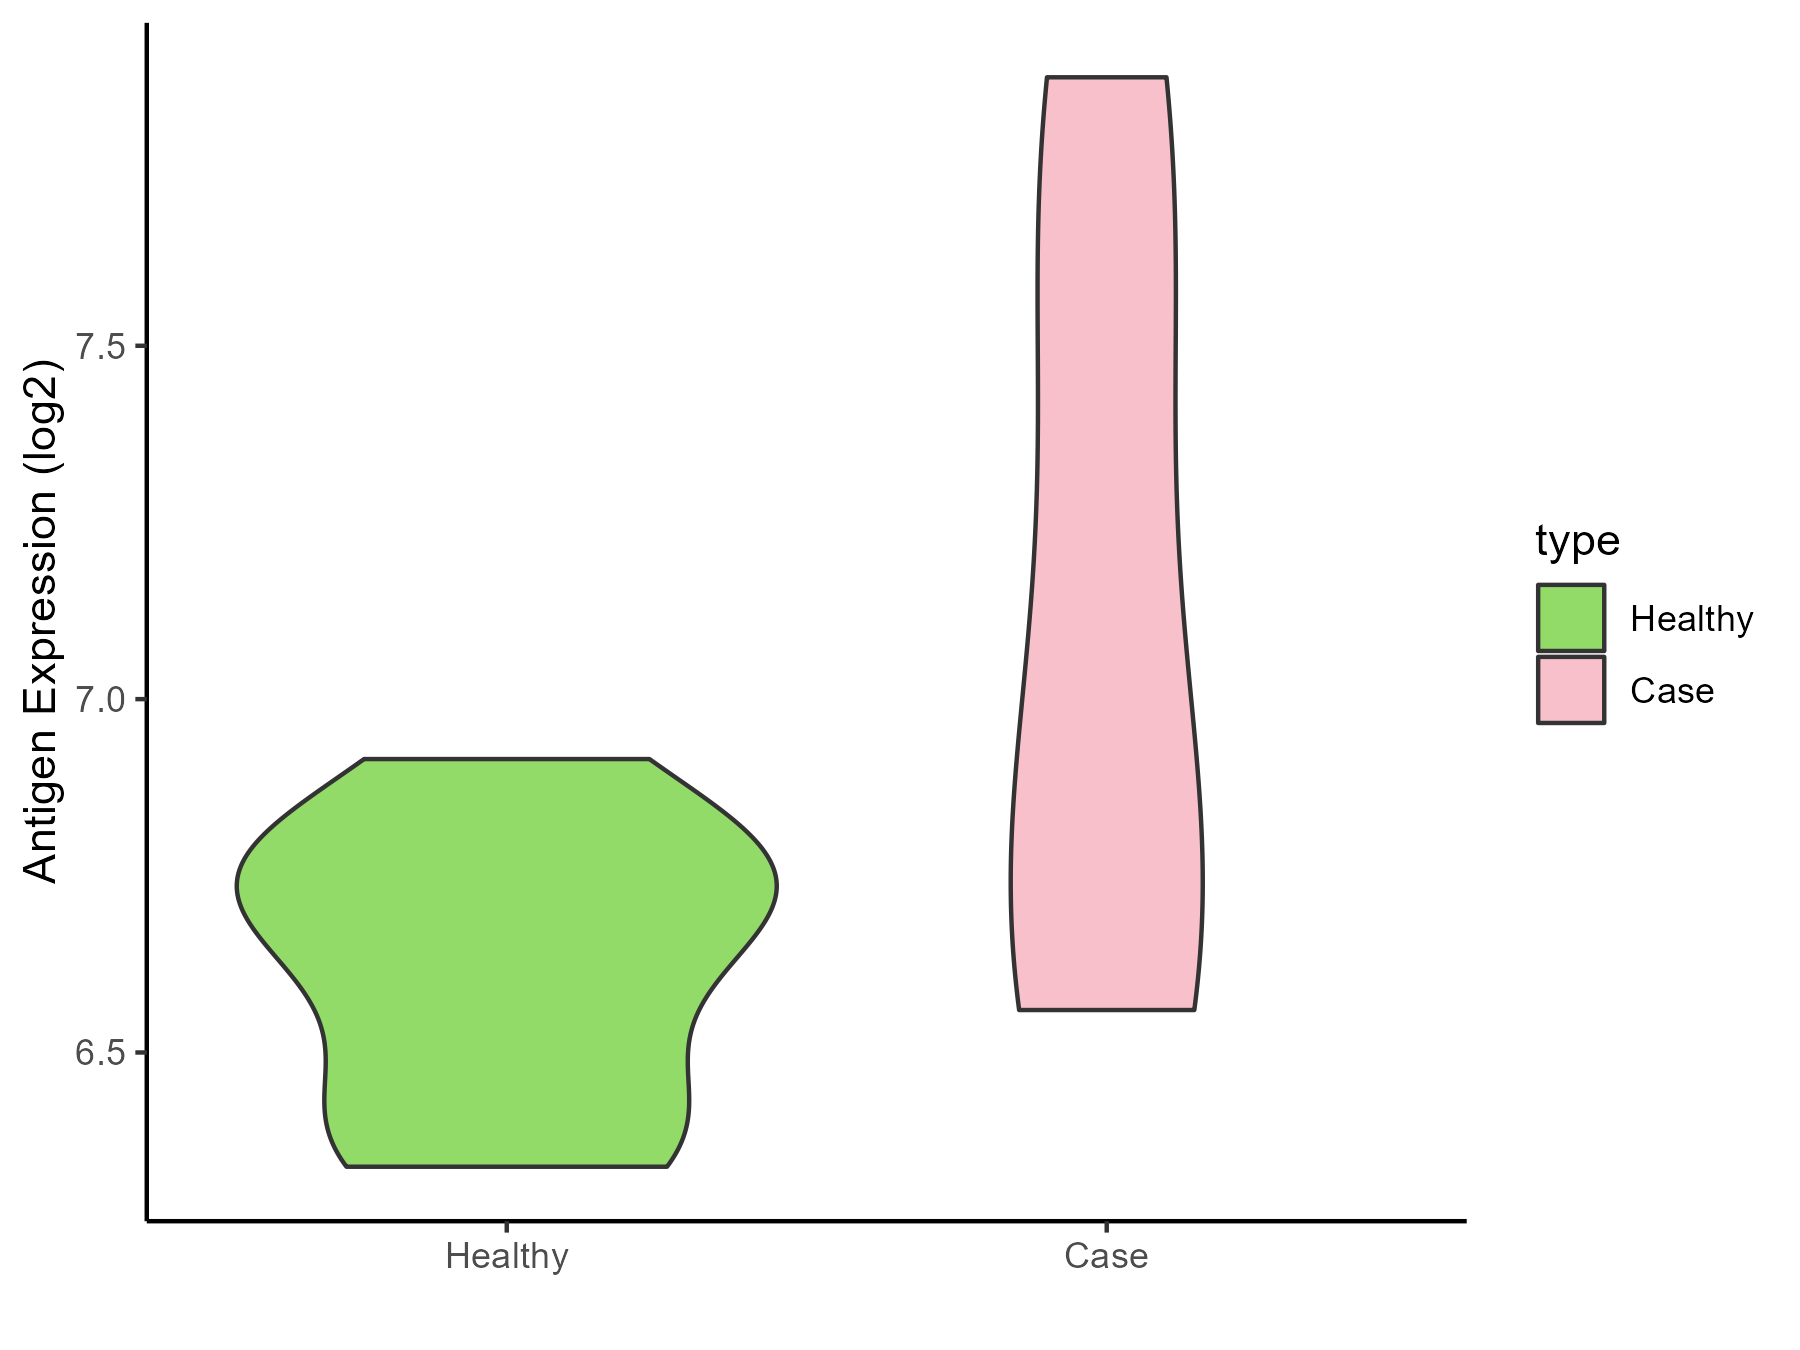
| Differential expression pattern of antigen in diseases | ||
| The Studied Tissue | Sinus mucosa | |
| The Specific Disease | Chronic rhinosinusitis | |
| The Expression Level of Disease Section Compare with the Healthy Individual Tissue | p-value: 0.078675406; Fold-change: 0.296771962; Z-score: 1.462548221 | |
| Disease-specific Antigen Abundances |
|
Click to View the Clearer Original Diagram |
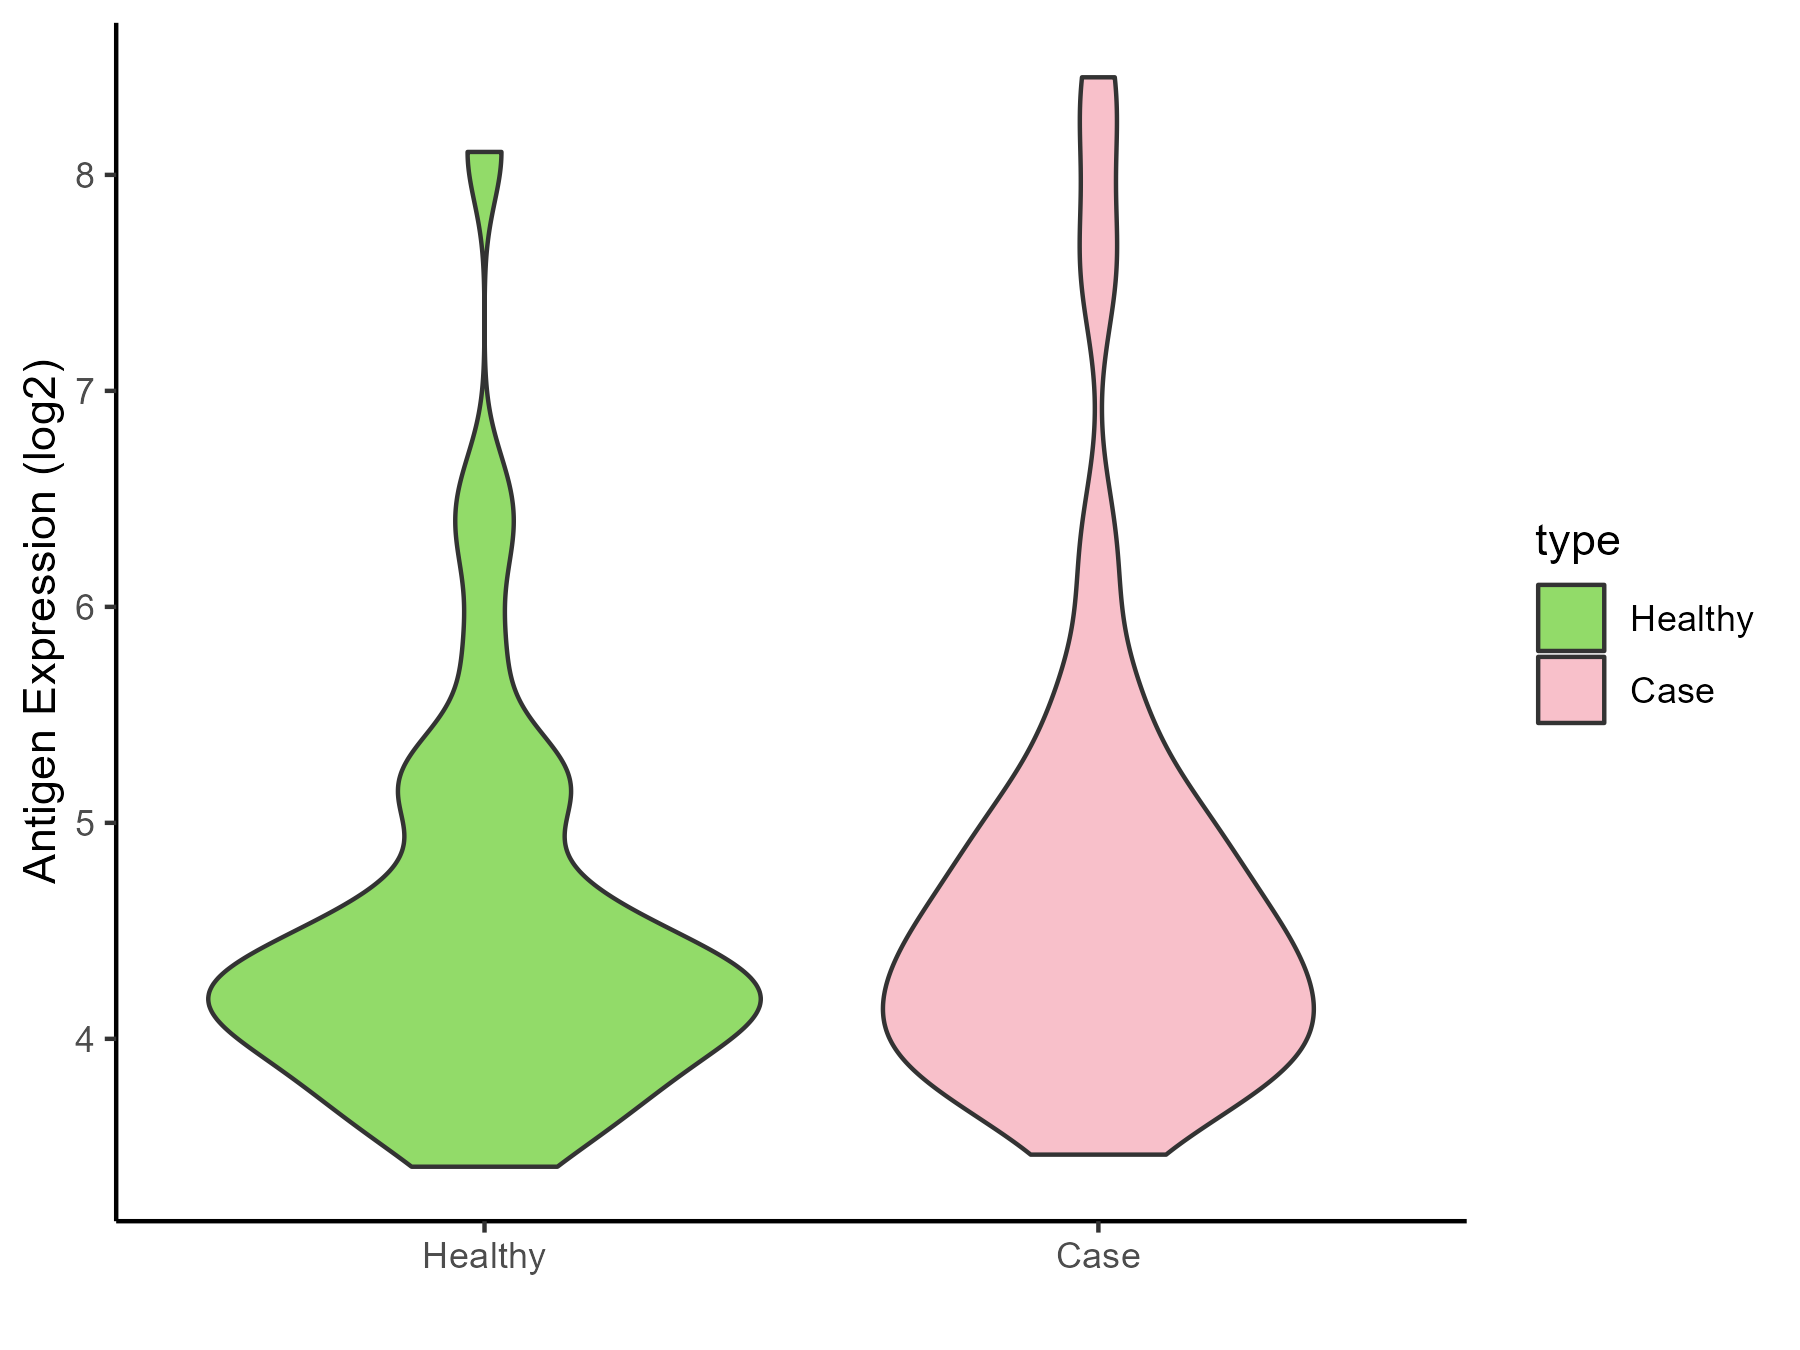
| Differential expression pattern of antigen in diseases | ||
| The Studied Tissue | Lung | |
| The Specific Disease | Chronic obstructive pulmonary disease | |
| The Expression Level of Disease Section Compare with the Healthy Individual Tissue | p-value: 0.328506396; Fold-change: 0.171395182; Z-score: 0.18421621 | |
| Disease-specific Antigen Abundances |
|
Click to View the Clearer Original Diagram |
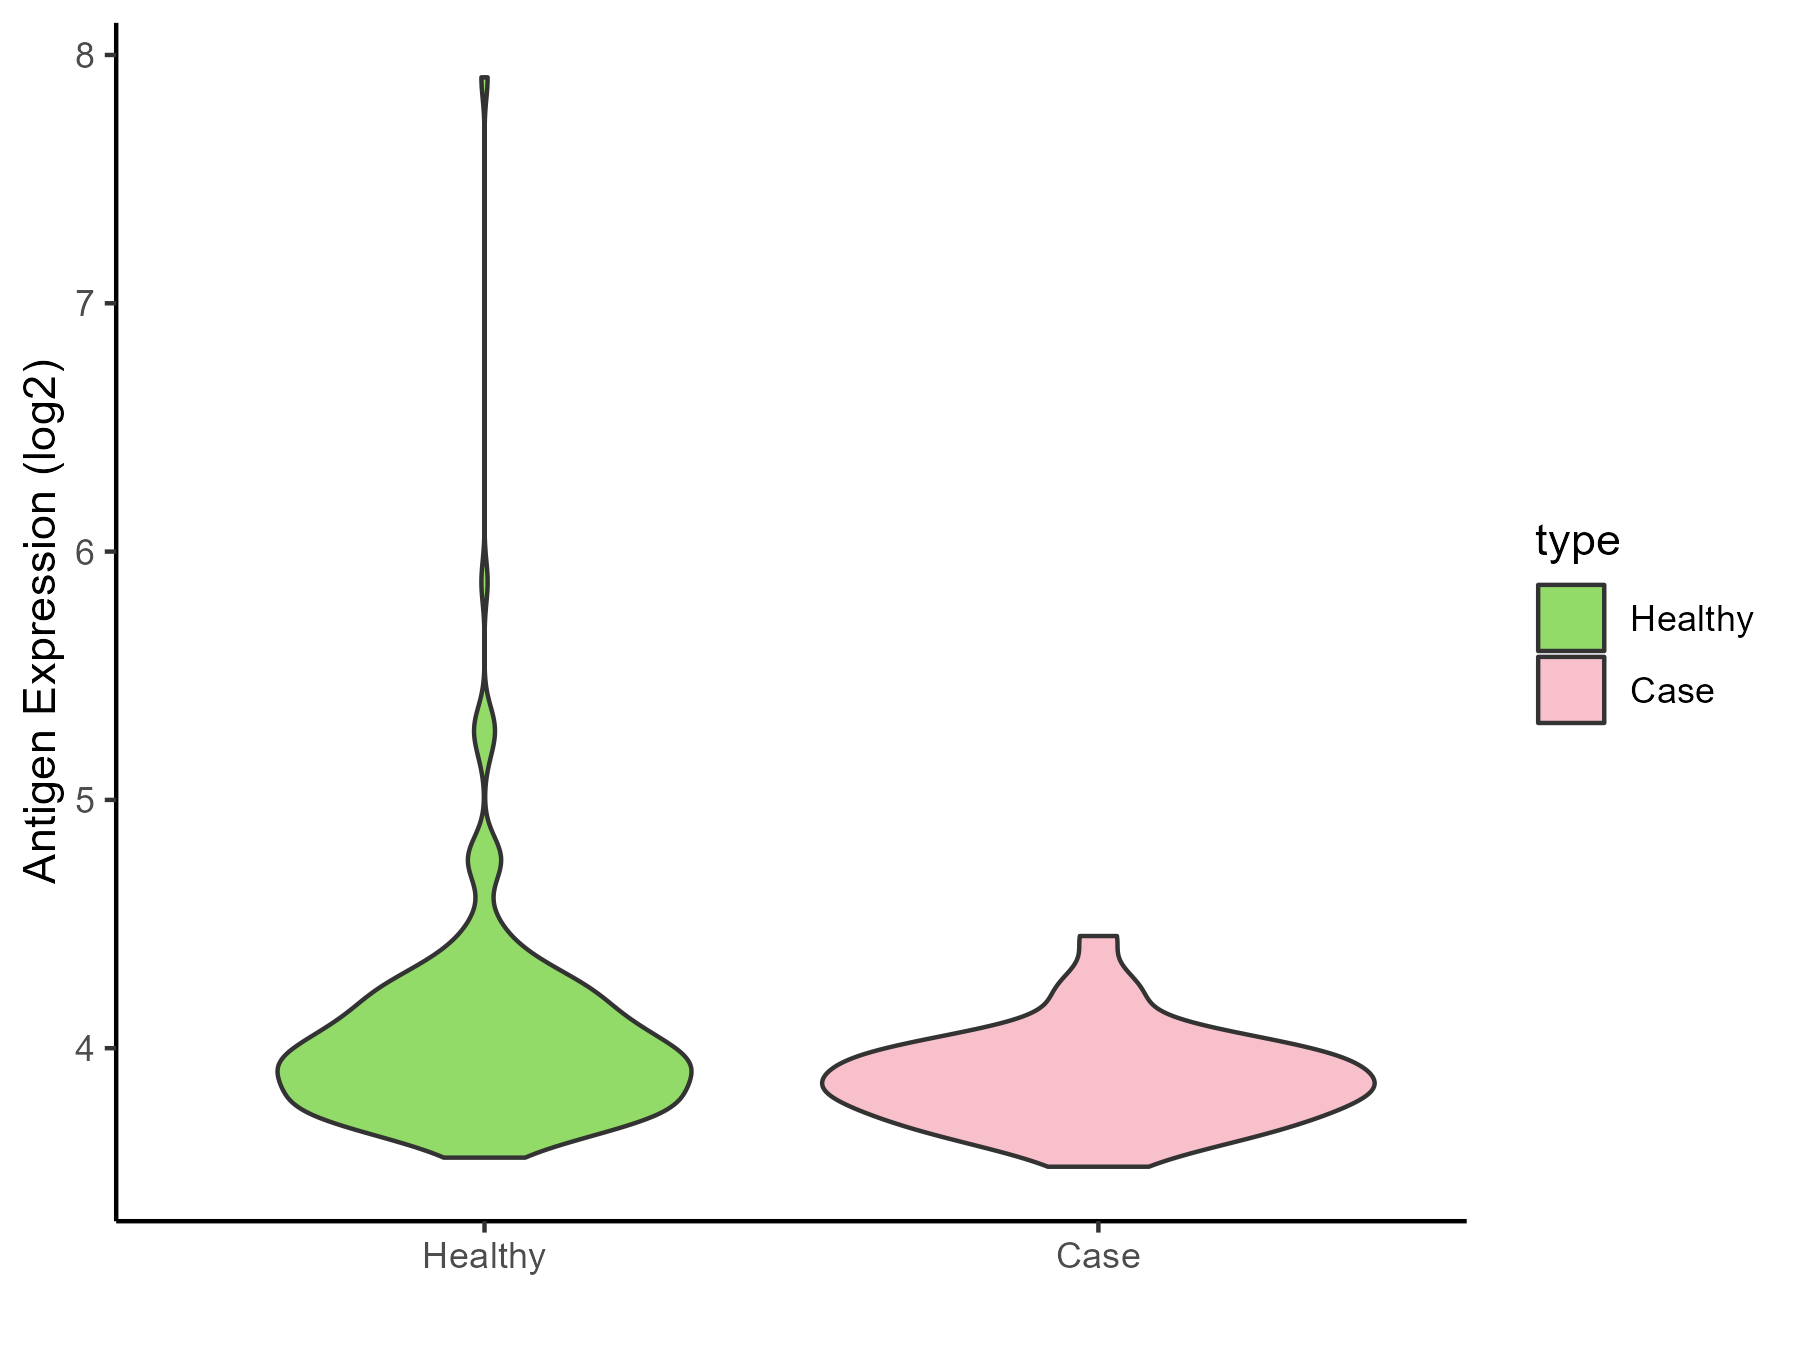
| The Studied Tissue | Small airway epithelium | |
| The Specific Disease | Chronic obstructive pulmonary disease | |
| The Expression Level of Disease Section Compare with the Healthy Individual Tissue | p-value: 0.000254771; Fold-change: -0.085037678; Z-score: -0.19905966 | |
| Disease-specific Antigen Abundances |
|
Click to View the Clearer Original Diagram |
| Differential expression pattern of antigen in diseases | ||
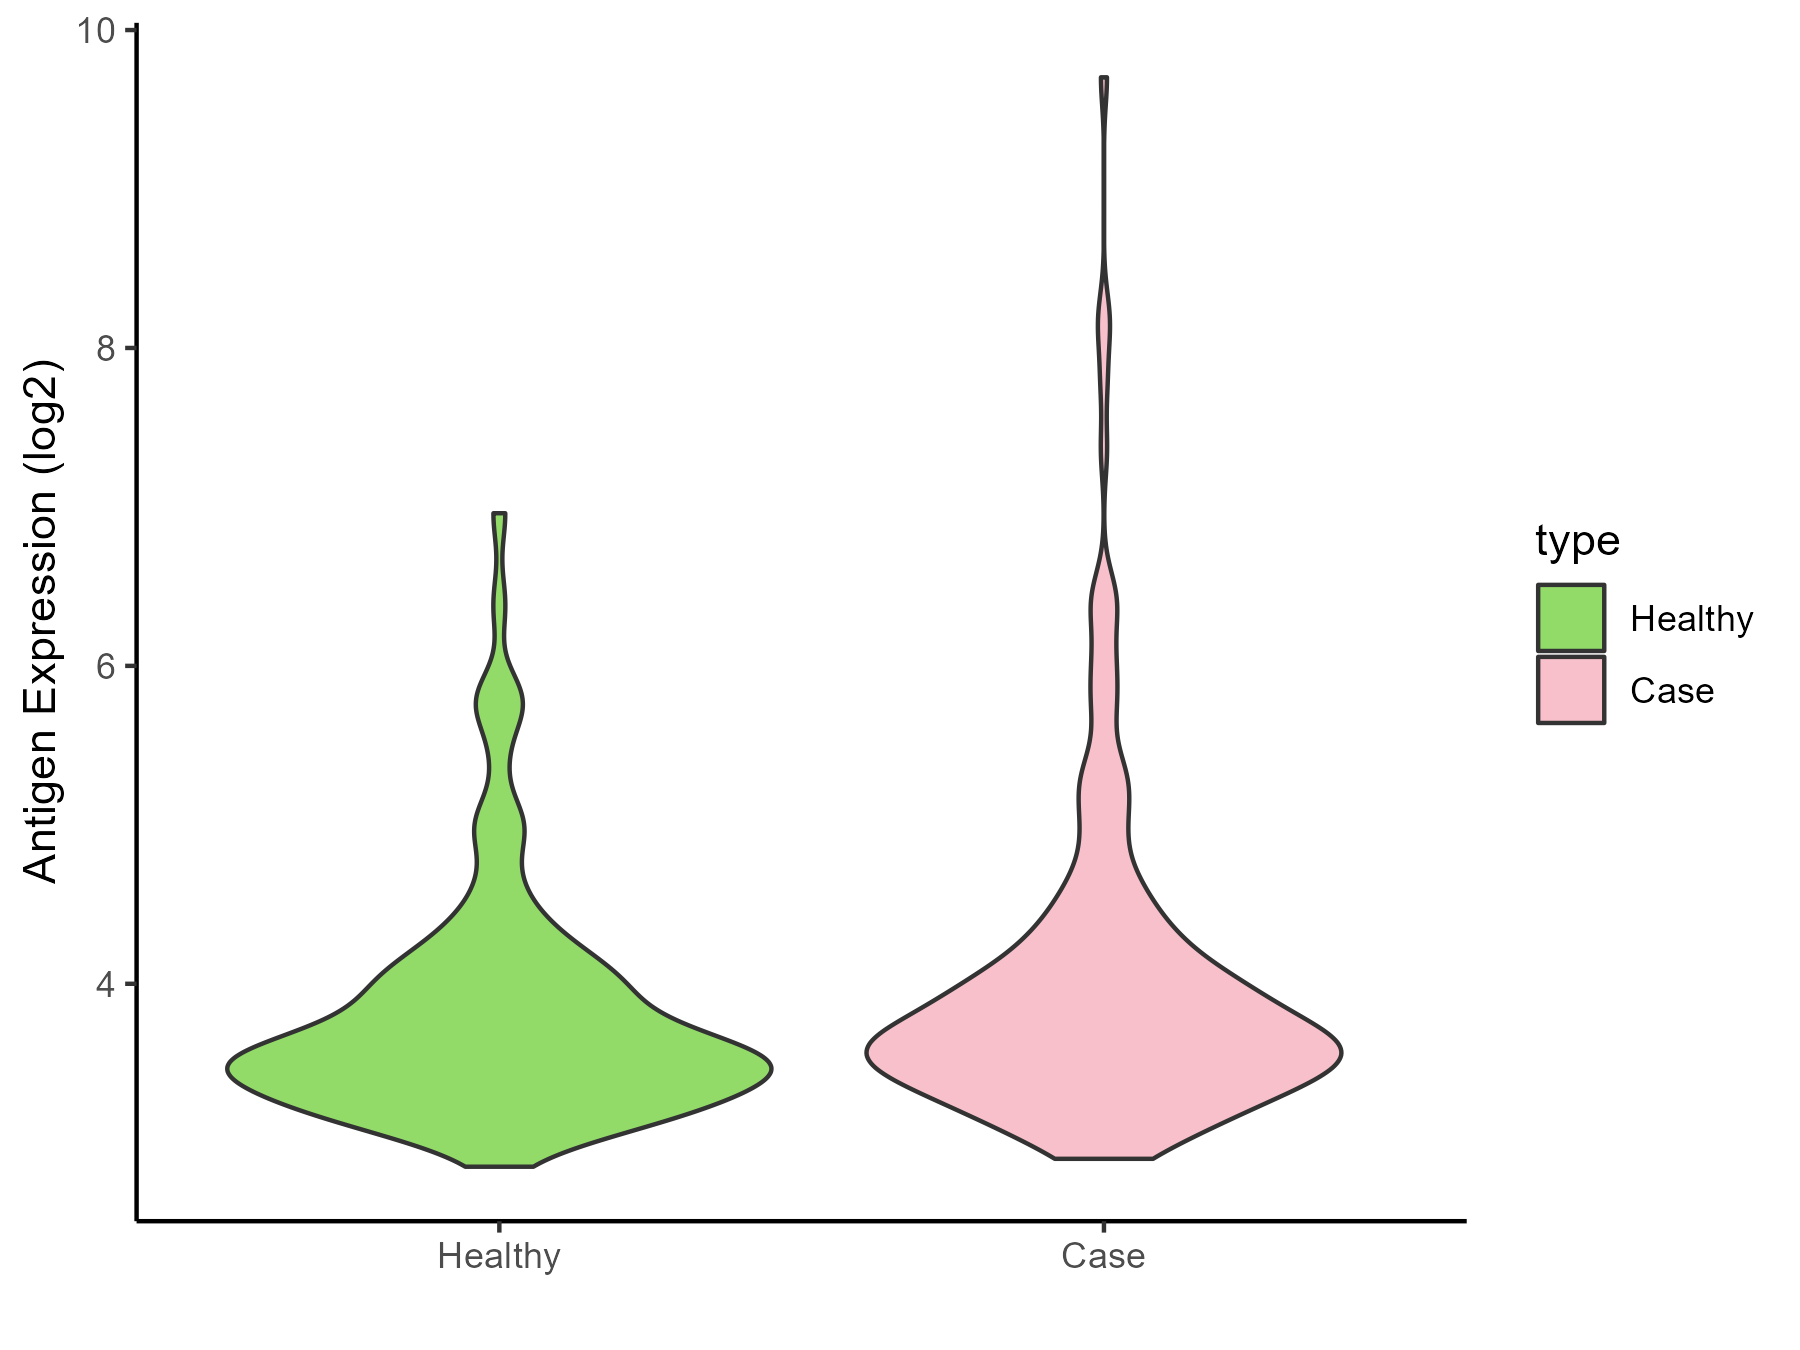
| The Studied Tissue | Nasal and bronchial airway | |
| The Specific Disease | Asthma | |
| The Expression Level of Disease Section Compare with the Healthy Individual Tissue | p-value: 0.067728183; Fold-change: 0.120697949; Z-score: 0.165505128 | |
| Disease-specific Antigen Abundances |
|
Click to View the Clearer Original Diagram |
| Differential expression pattern of antigen in diseases | ||
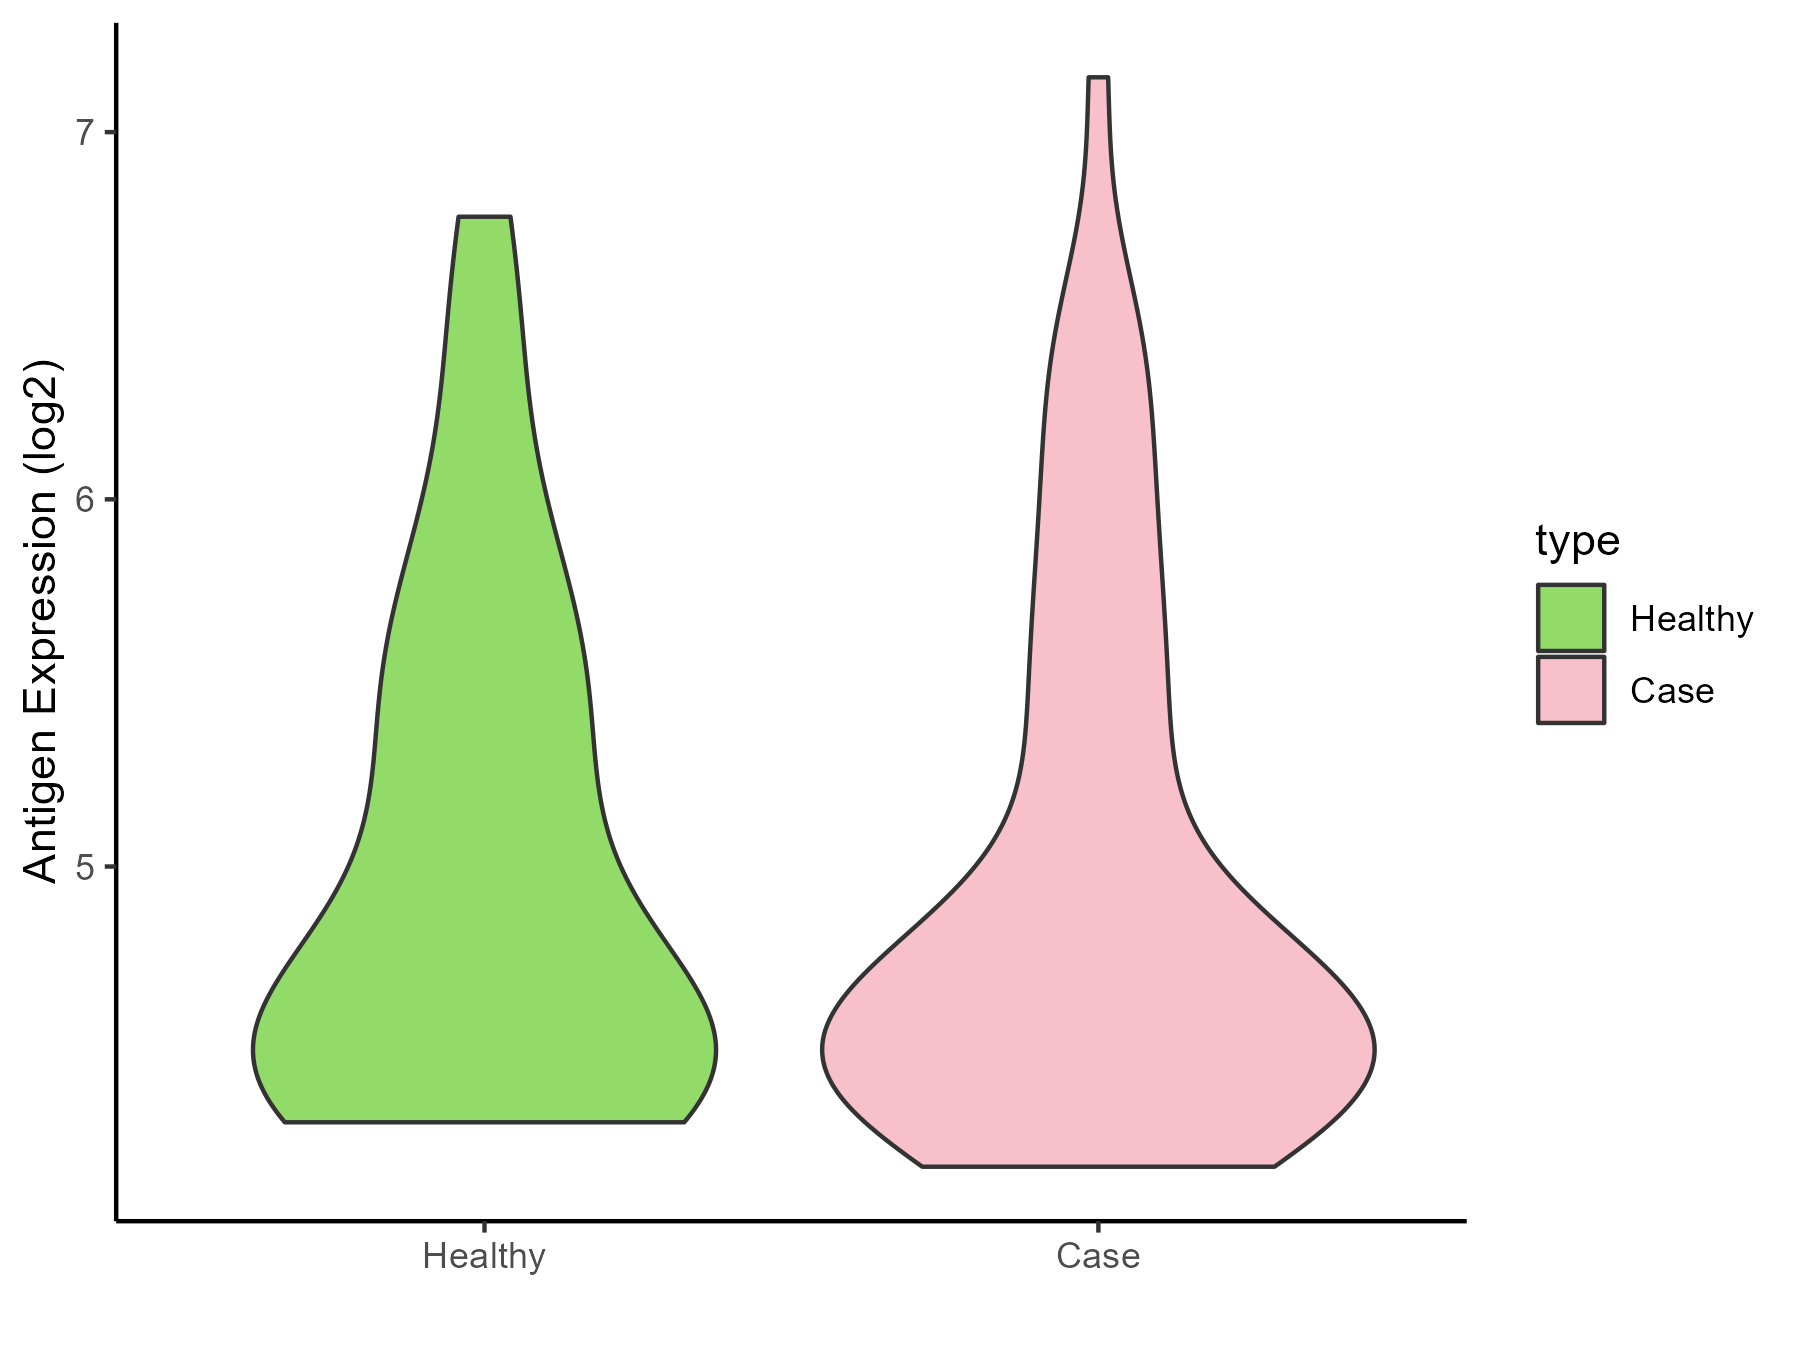
| The Studied Tissue | Nasal Epithelium | |
| The Specific Disease | Human rhinovirus infection | |
| The Expression Level of Disease Section Compare with the Healthy Individual Tissue | p-value: 0.708045884; Fold-change: -0.022514188; Z-score: -0.032269094 | |
| Disease-specific Antigen Abundances |
|
Click to View the Clearer Original Diagram |
| Differential expression pattern of antigen in diseases | ||
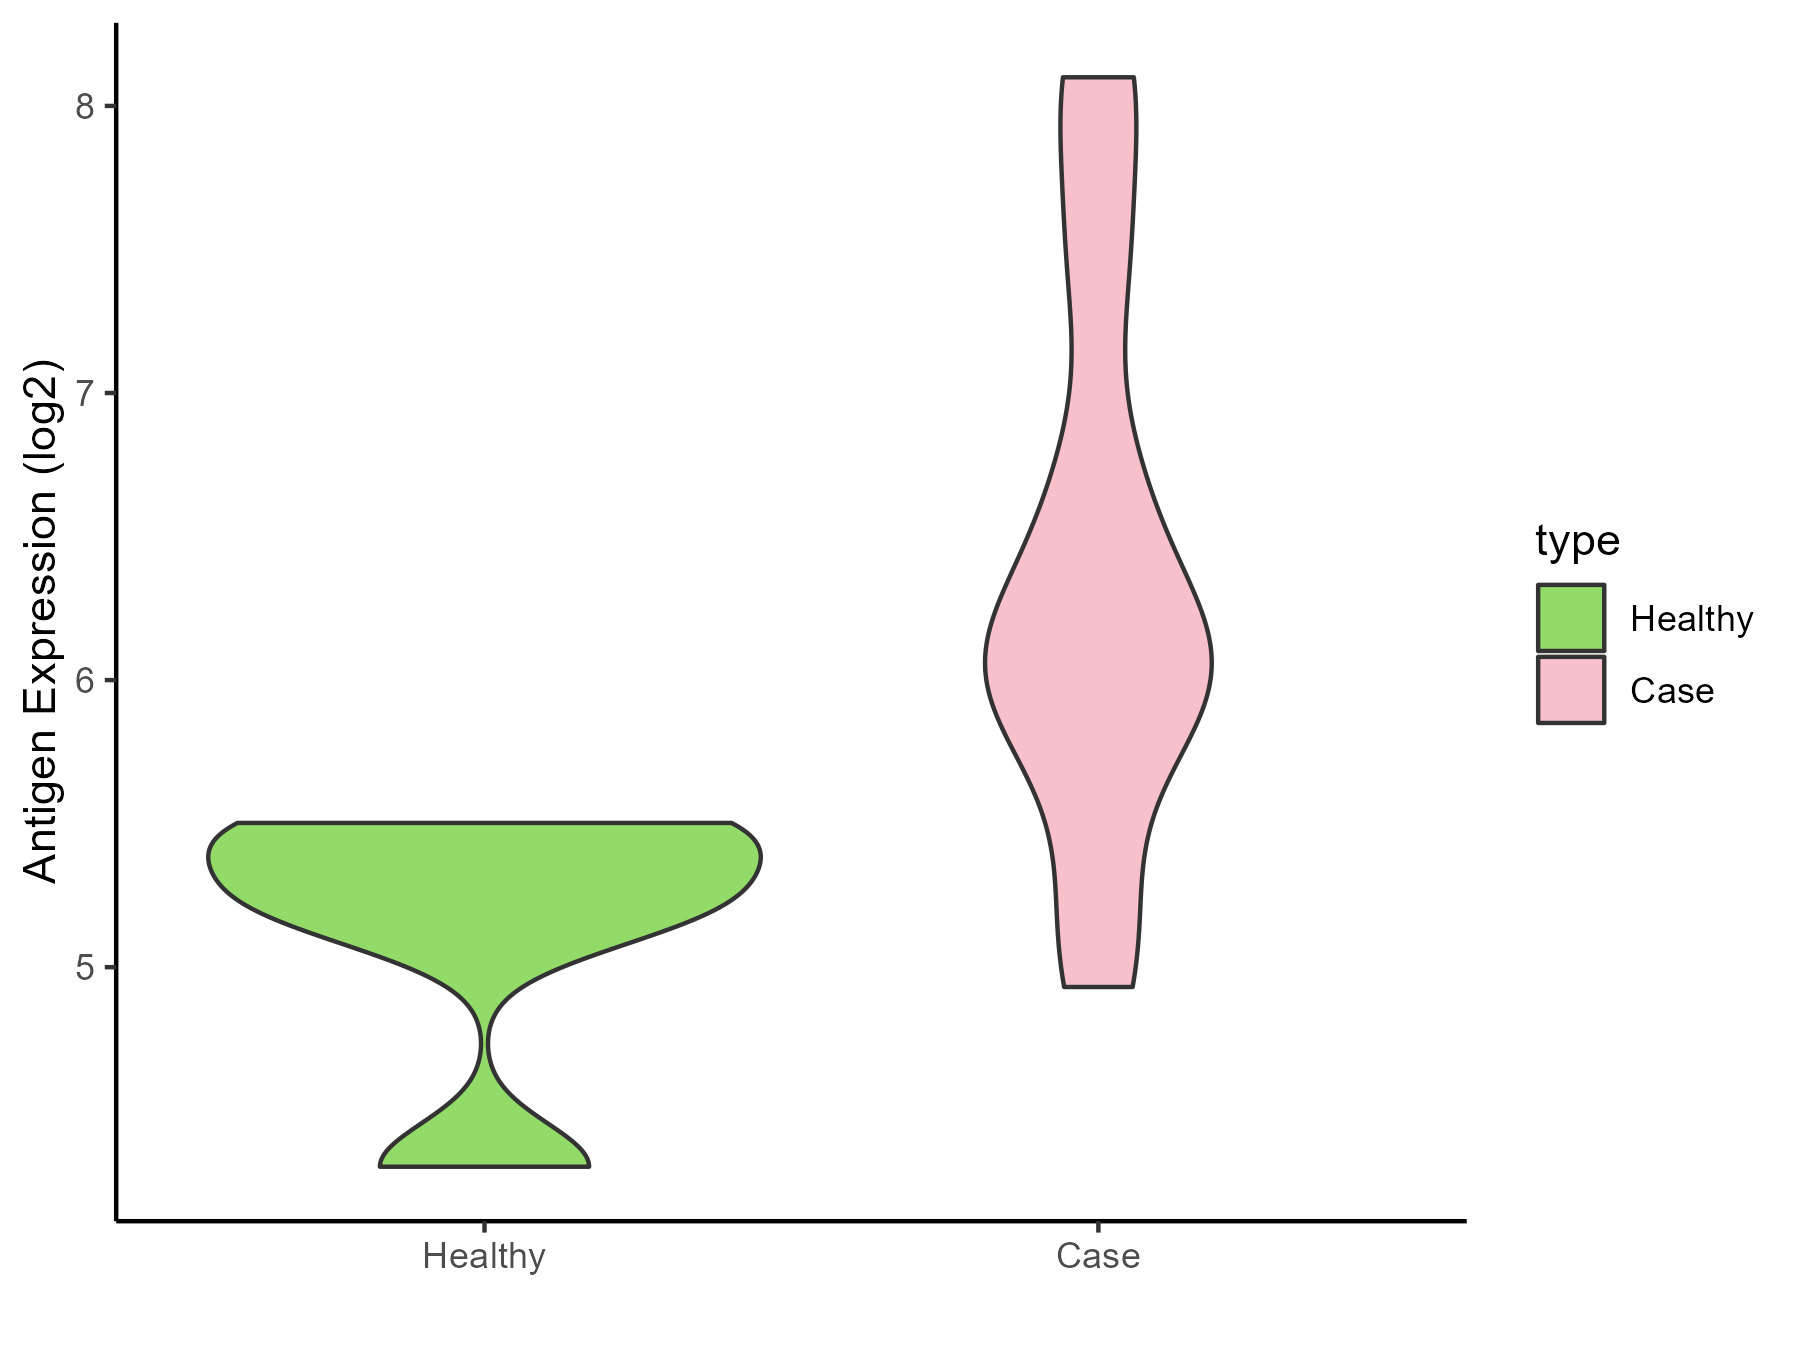
| The Studied Tissue | Lung | |
| The Specific Disease | Idiopathic pulmonary fibrosis | |
| The Expression Level of Disease Section Compare with the Healthy Individual Tissue | p-value: 0.001880484; Fold-change: 0.886657418; Z-score: 1.808683076 | |
| Disease-specific Antigen Abundances |
|
Click to View the Clearer Original Diagram |
ICD Disease Classification 13
| Differential expression pattern of antigen in diseases | ||
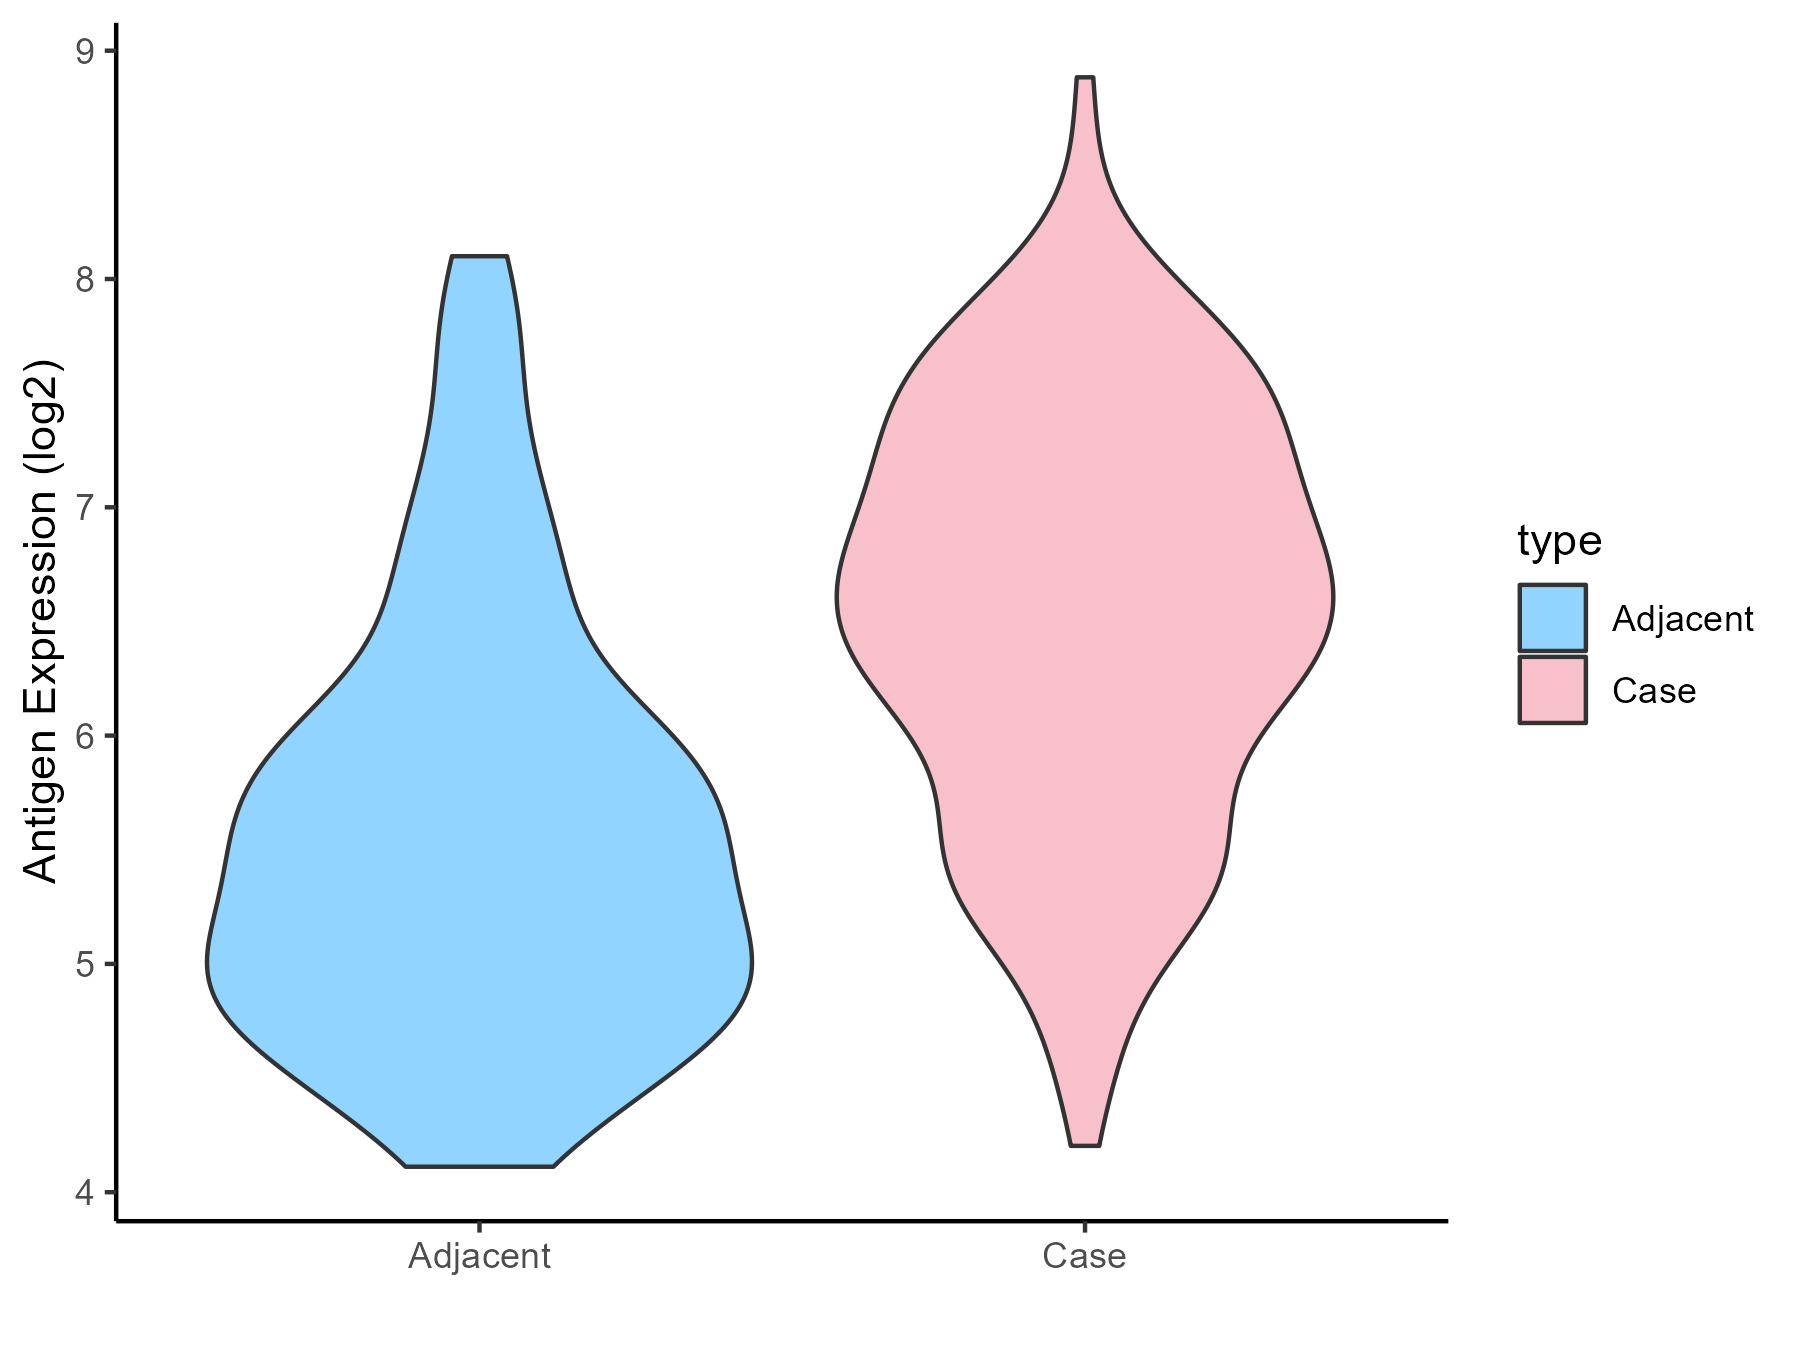
| The Studied Tissue | Gingival | |
| The Specific Disease | Periodontal disease | |
| The Expression Level of Disease Section Compare with the Adjacent Tissue | p-value: 5.65E-10; Fold-change: 1.200841496; Z-score: 1.304531564 | |
| Disease-specific Antigen Abundances |
|
Click to View the Clearer Original Diagram |
| Differential expression pattern of antigen in diseases | ||
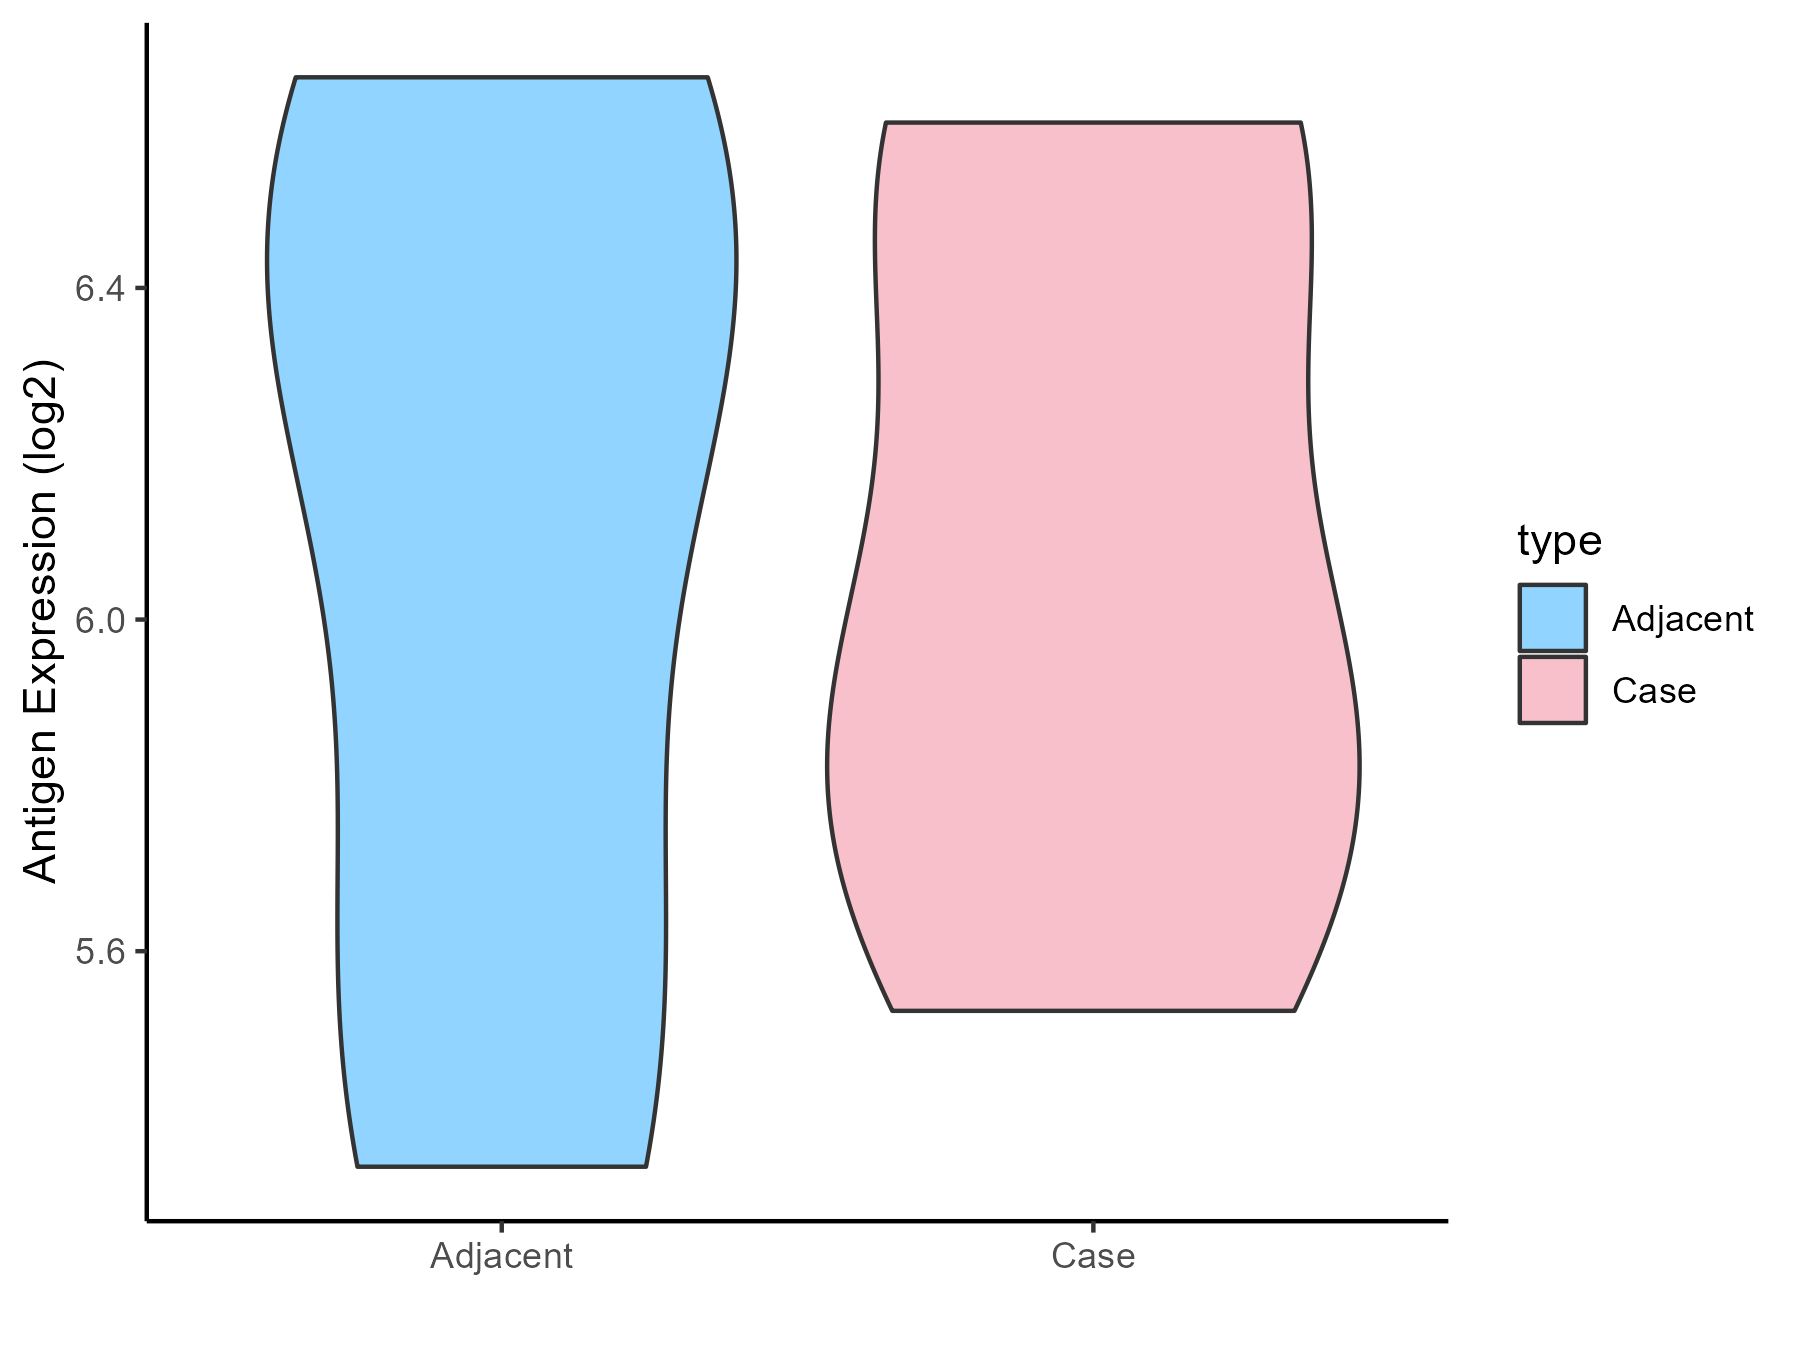
| The Studied Tissue | Gastric antrum | |
| The Specific Disease | Eosinophilic gastritis | |
| The Expression Level of Disease Section Compare with the Adjacent Tissue | p-value: 0.990850078; Fold-change: -0.401264683; Z-score: -0.712102154 | |
| Disease-specific Antigen Abundances |
|
Click to View the Clearer Original Diagram |
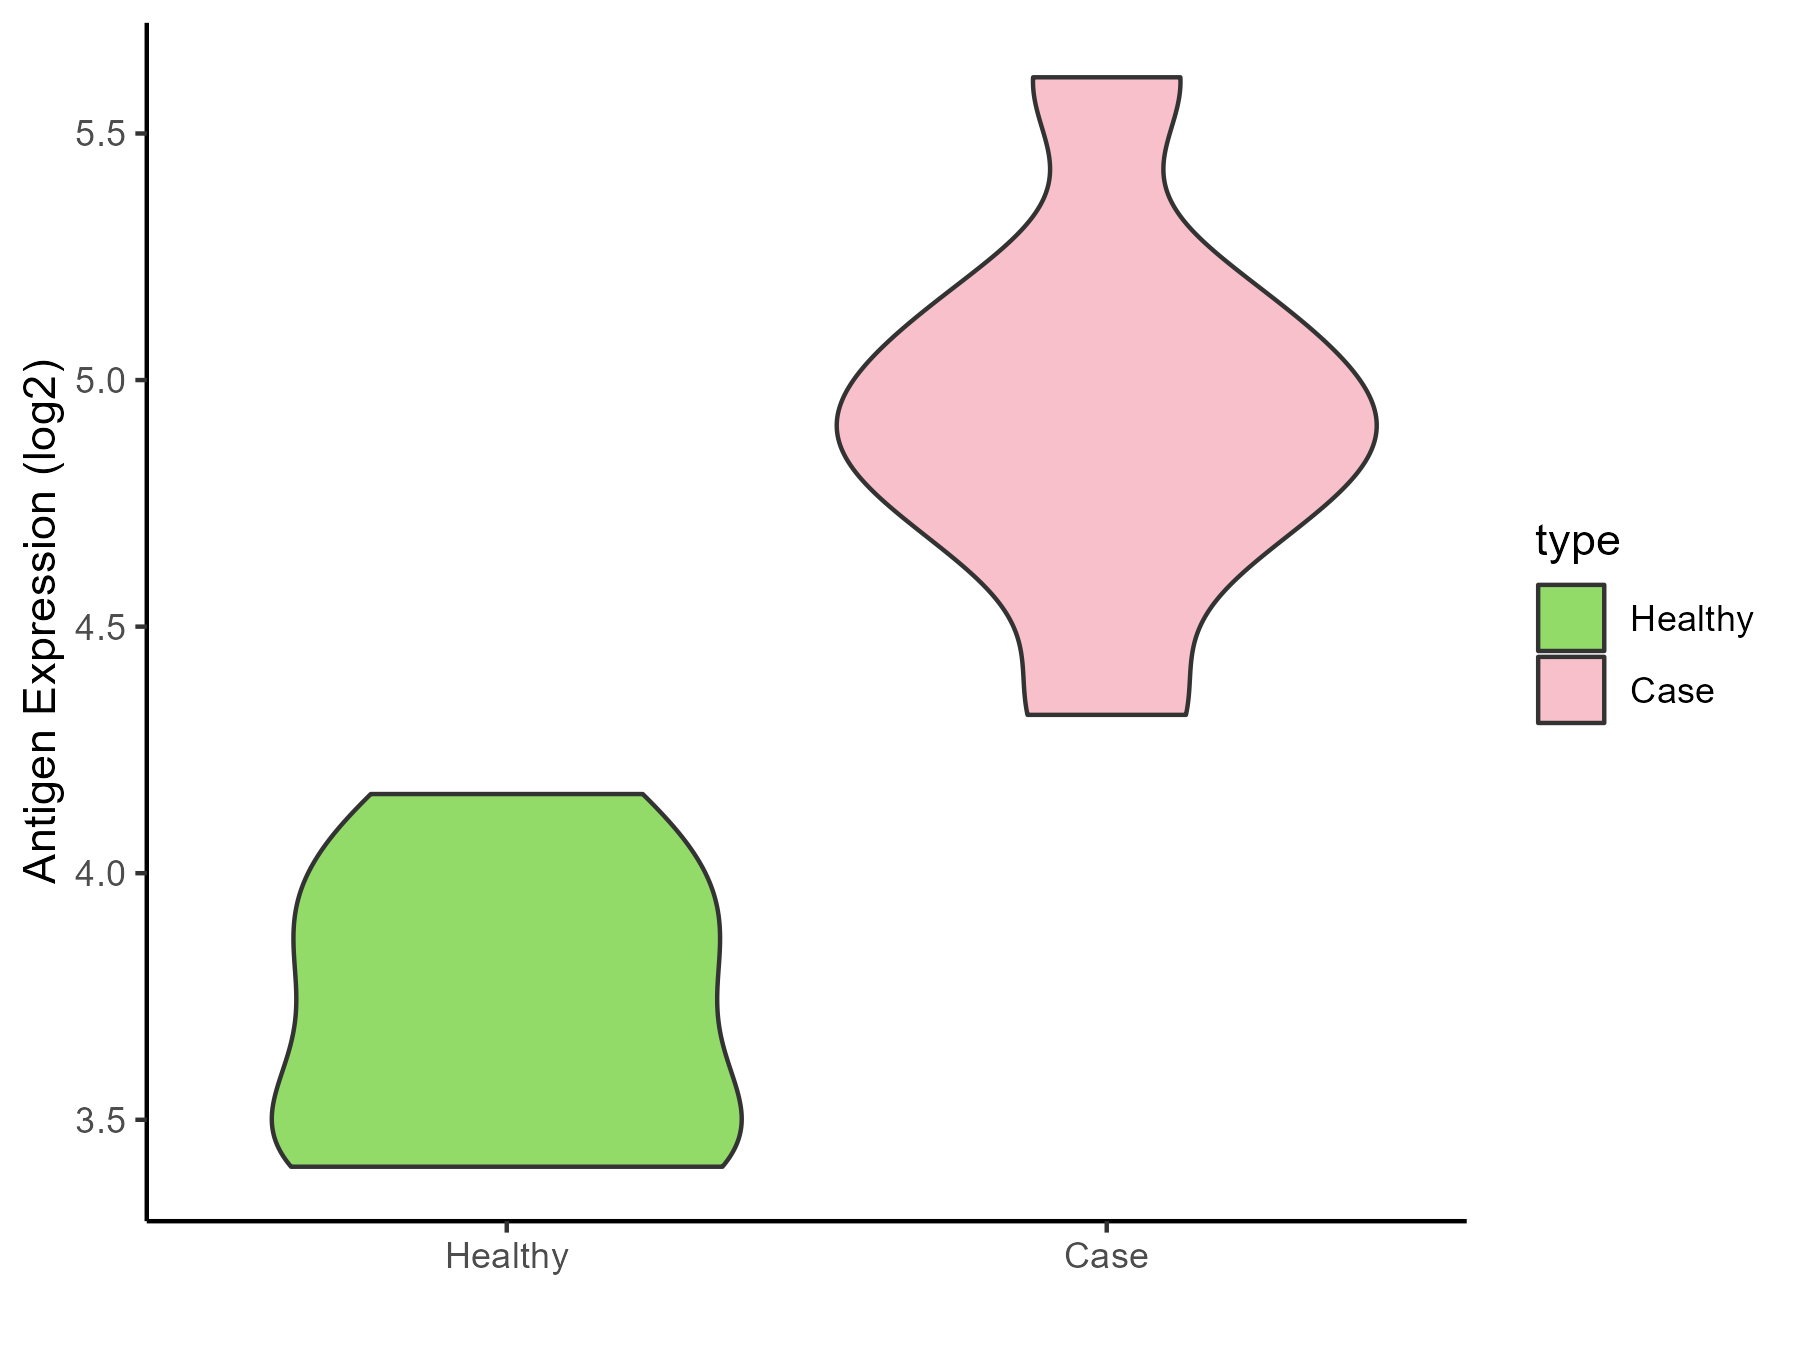
| Differential expression pattern of antigen in diseases | ||
| The Studied Tissue | Liver | |
| The Specific Disease | Liver failure | |
| The Expression Level of Disease Section Compare with the Healthy Individual Tissue | p-value: 7.70E-06; Fold-change: 1.187958151; Z-score: 4.112338896 | |
| Disease-specific Antigen Abundances |
|
Click to View the Clearer Original Diagram |
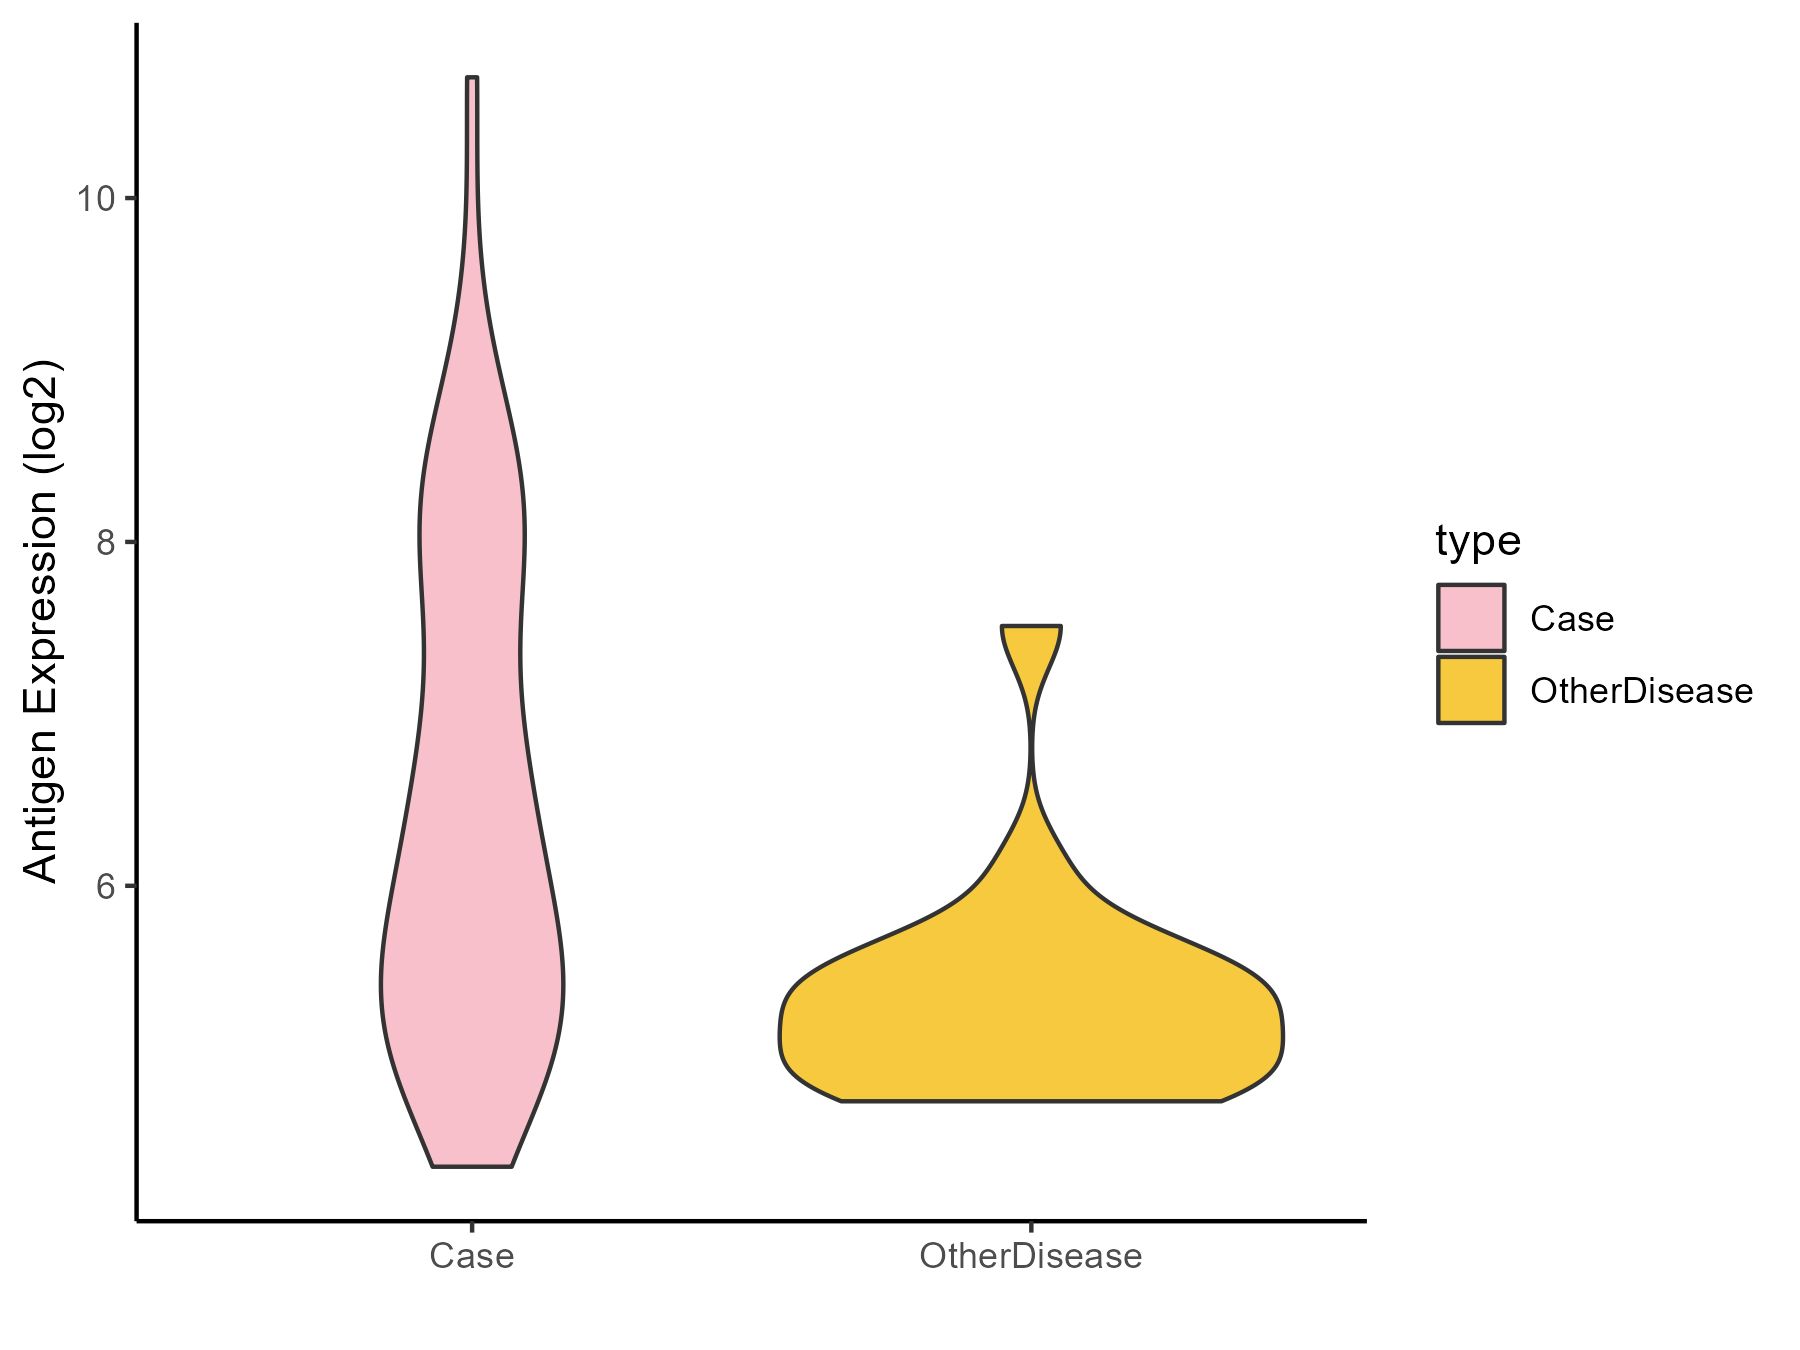
| Differential expression pattern of antigen in diseases | ||
| The Studied Tissue | Colon mucosal | |
| The Specific Disease | Ulcerative colitis | |
| The Expression Level of Disease Section Compare with the Adjacent Tissue | p-value: 6.43E-05; Fold-change: 0.984825161; Z-score: 1.510808647 | |
| Disease-specific Antigen Abundances |
|
Click to View the Clearer Original Diagram |
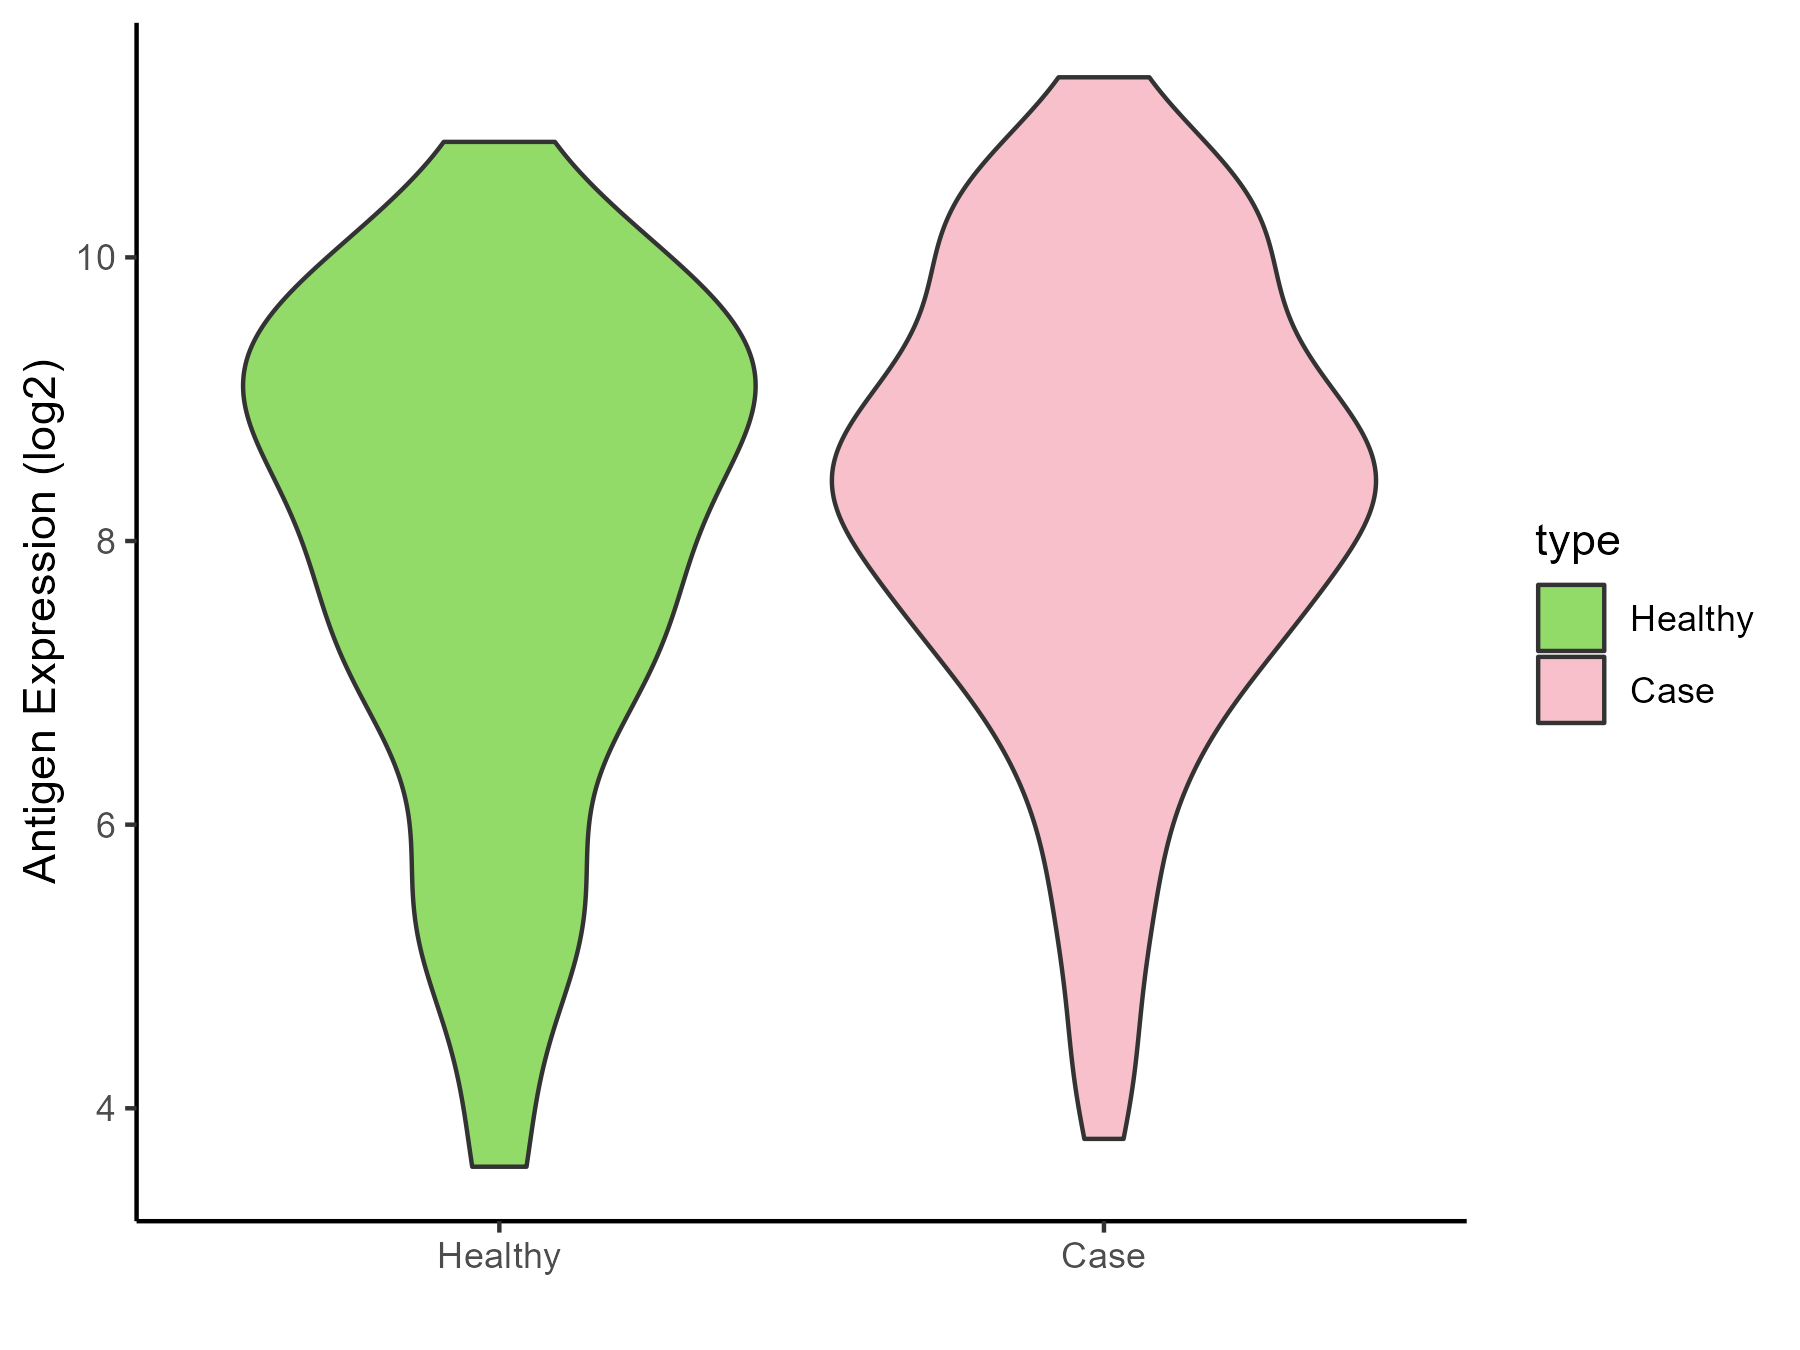
| Differential expression pattern of antigen in diseases | ||
| The Studied Tissue | Rectal colon | |
| The Specific Disease | Irritable bowel syndrome | |
| The Expression Level of Disease Section Compare with the Healthy Individual Tissue | p-value: 0.20647983; Fold-change: 0.06534649; Z-score: 0.03776449 | |
| Disease-specific Antigen Abundances |
|
Click to View the Clearer Original Diagram |
ICD Disease Classification 14
| Differential expression pattern of antigen in diseases | ||
| The Studied Tissue | Skin | |
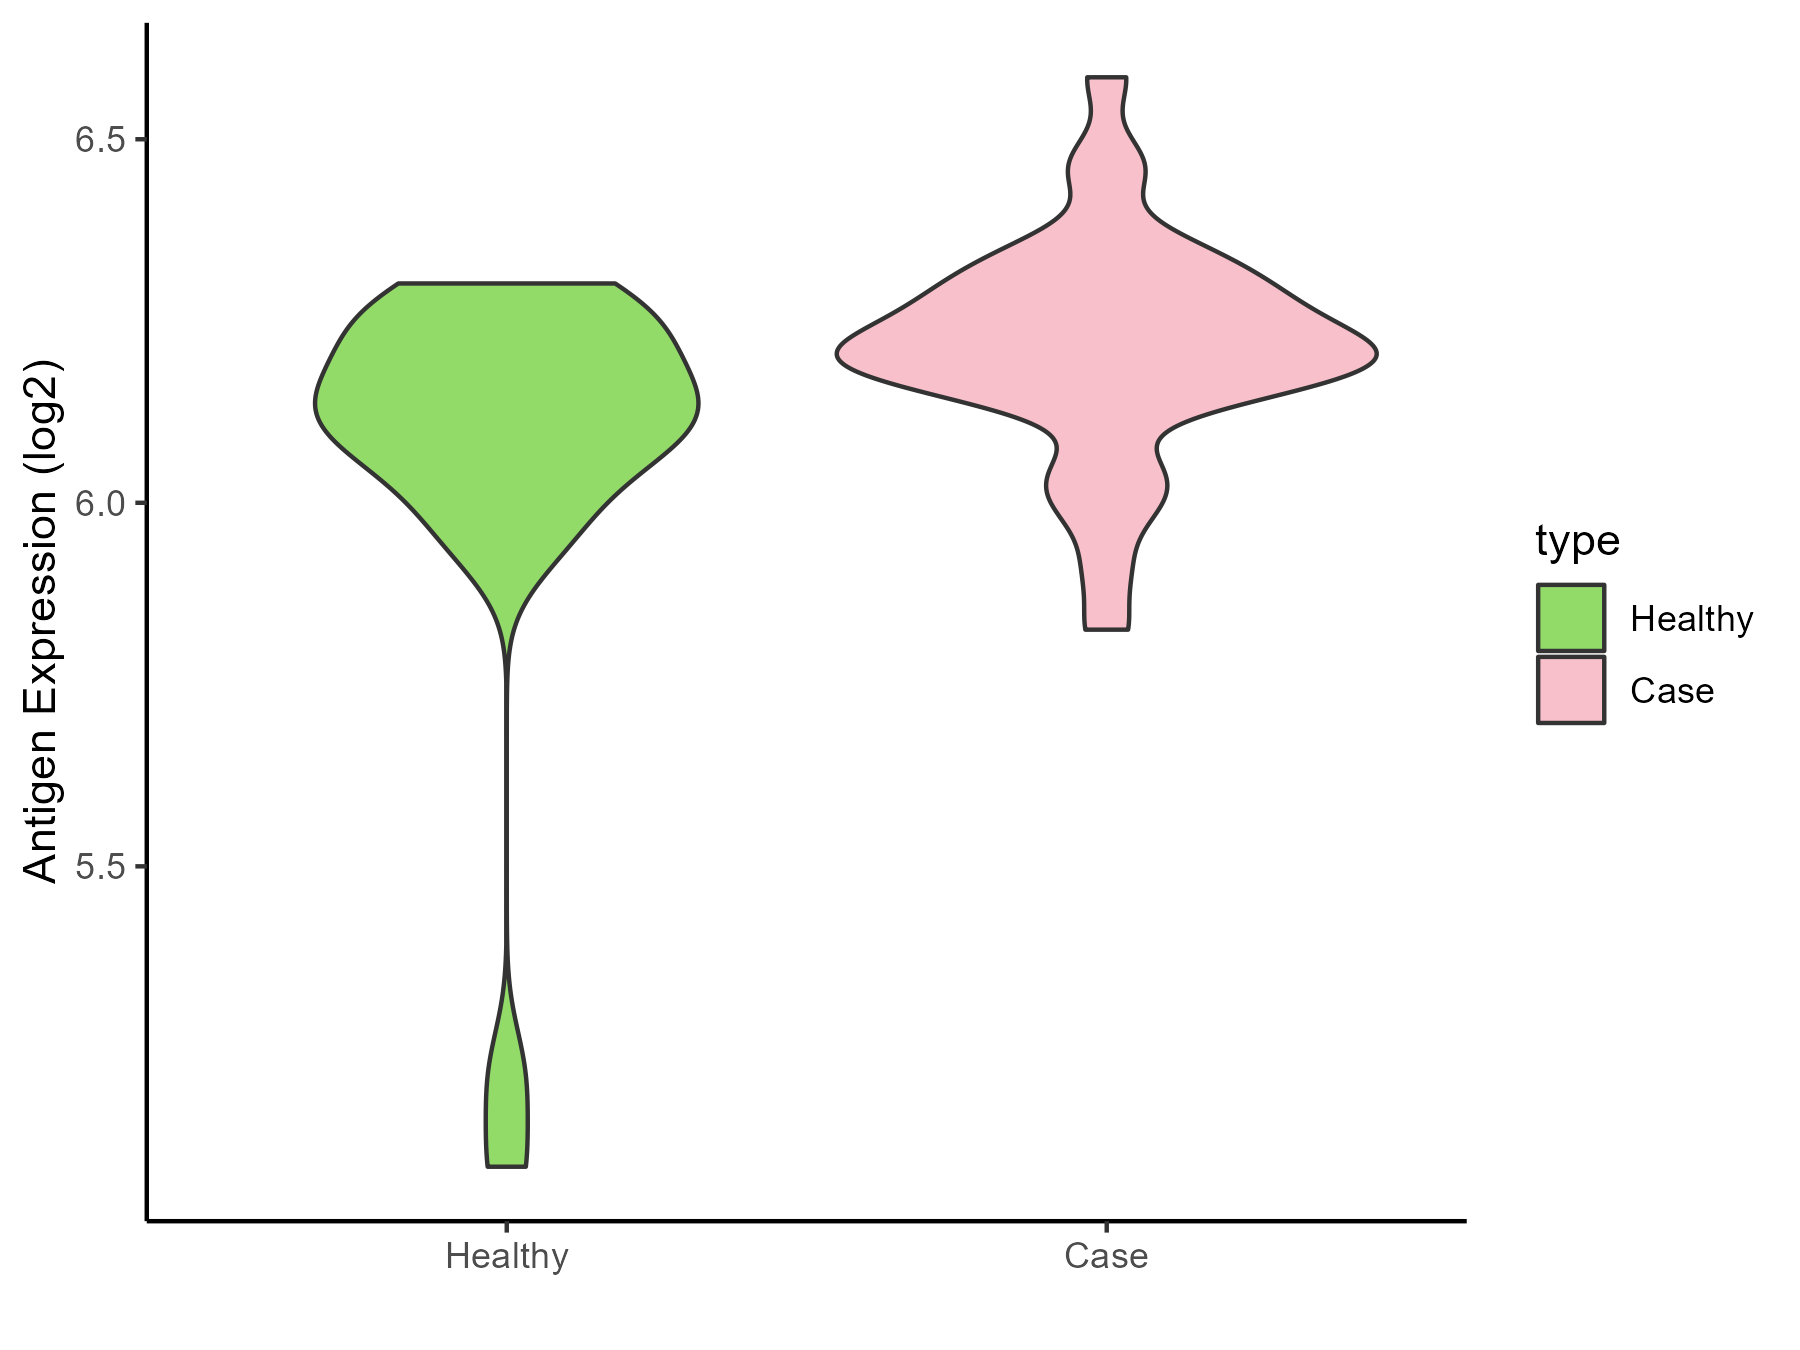
| The Specific Disease | Atopic dermatitis | |
| The Expression Level of Disease Section Compare with the Healthy Individual Tissue | p-value: 0.024017273; Fold-change: 0.071105654; Z-score: 0.242243799 | |
| Disease-specific Antigen Abundances |
|
Click to View the Clearer Original Diagram |
| Differential expression pattern of antigen in diseases | ||
| The Studied Tissue | Skin | |
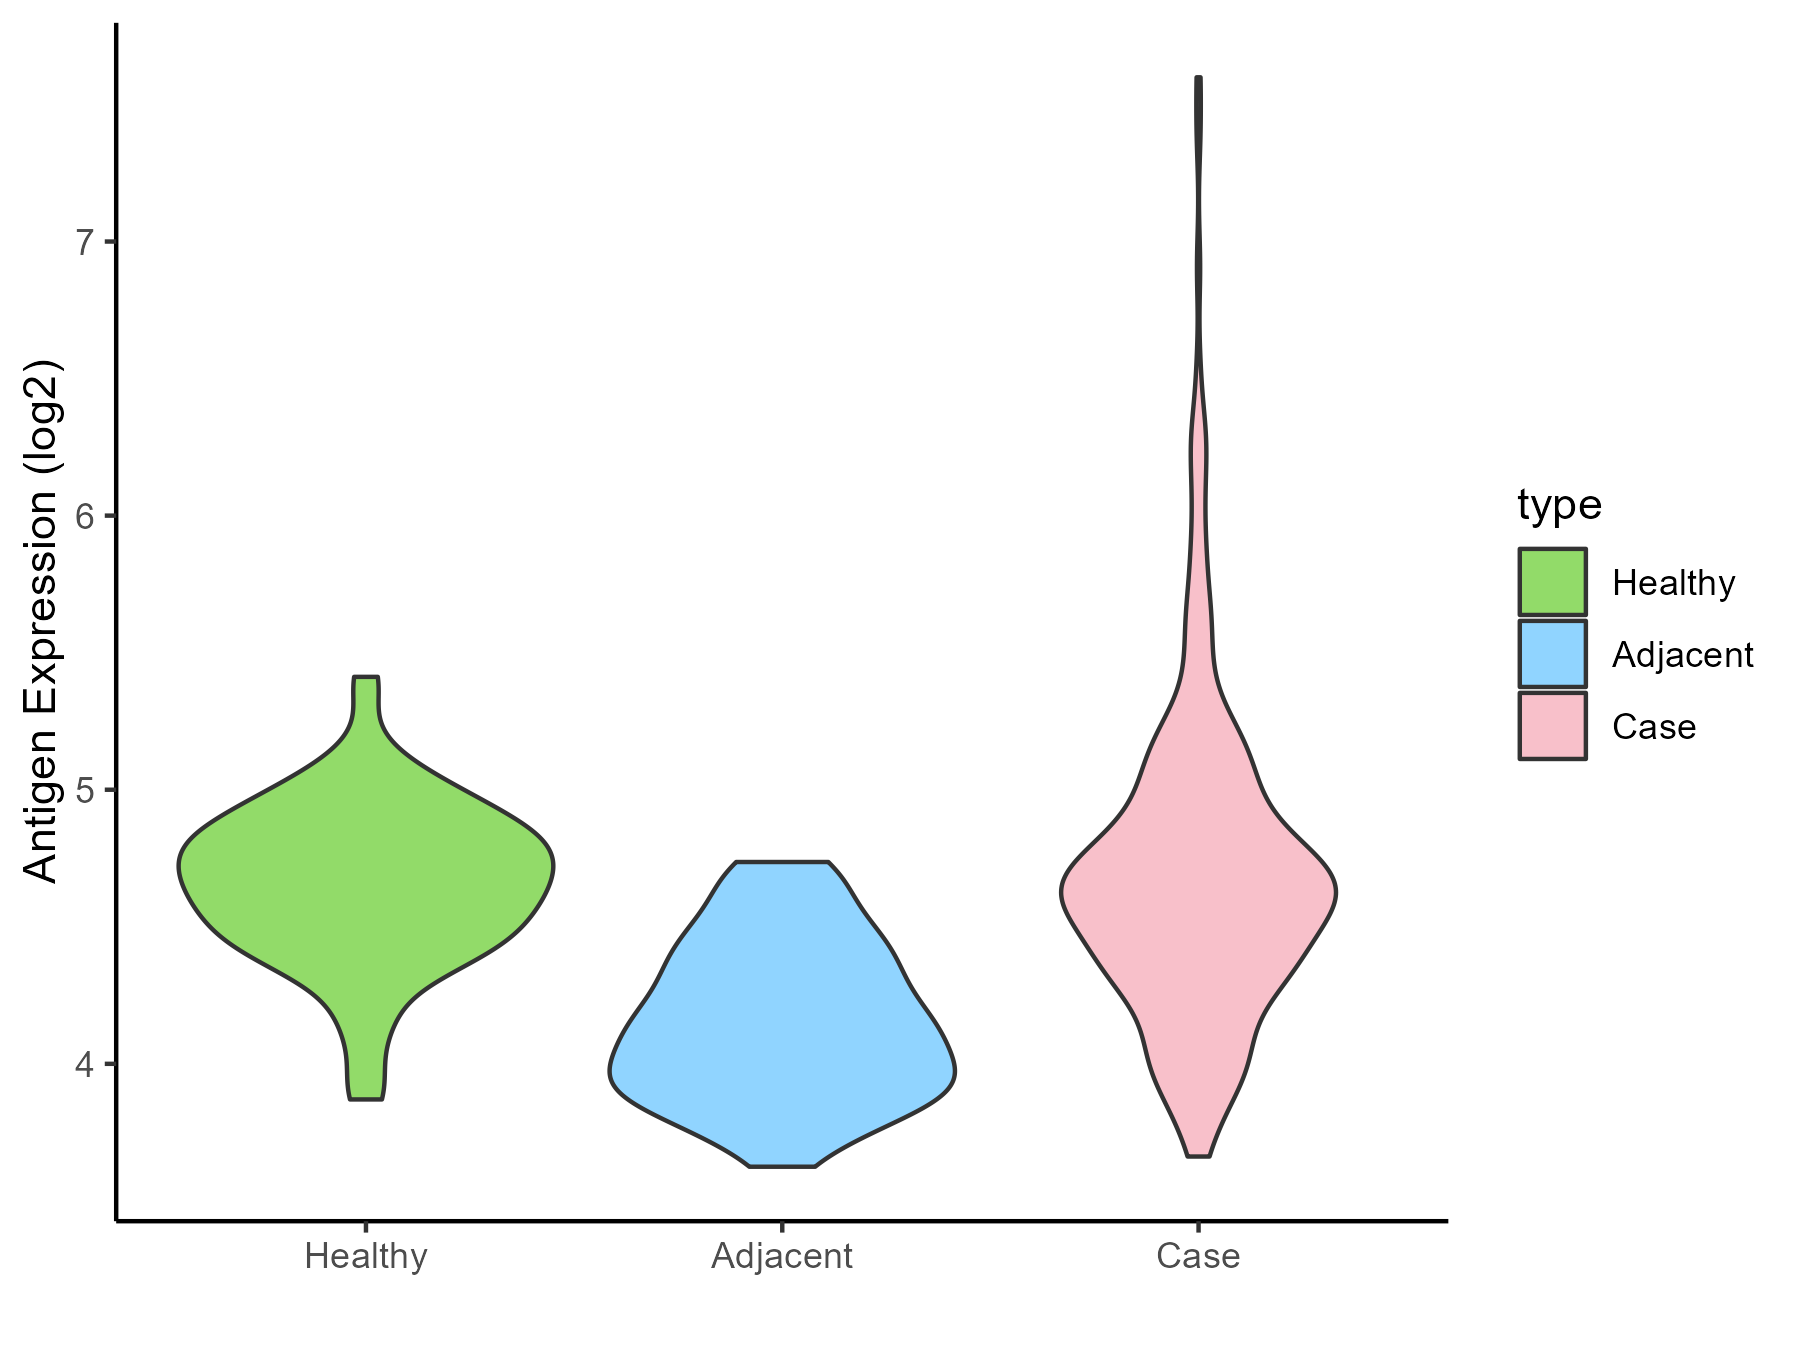
| The Specific Disease | Psoriasis | |
| The Expression Level of Disease Section Compare with the Healthy Individual Tissue | p-value: 0.509860208; Fold-change: -0.040565887; Z-score: -0.14132477 | |
| The Expression Level of Disease Section Compare with the Adjacent Tissue | p-value: 1.83E-25; Fold-change: 0.515283293; Z-score: 1.816391091 | |
| Disease-specific Antigen Abundances |
|
Click to View the Clearer Original Diagram |
| Differential expression pattern of antigen in diseases | ||
| The Studied Tissue | Skin | |
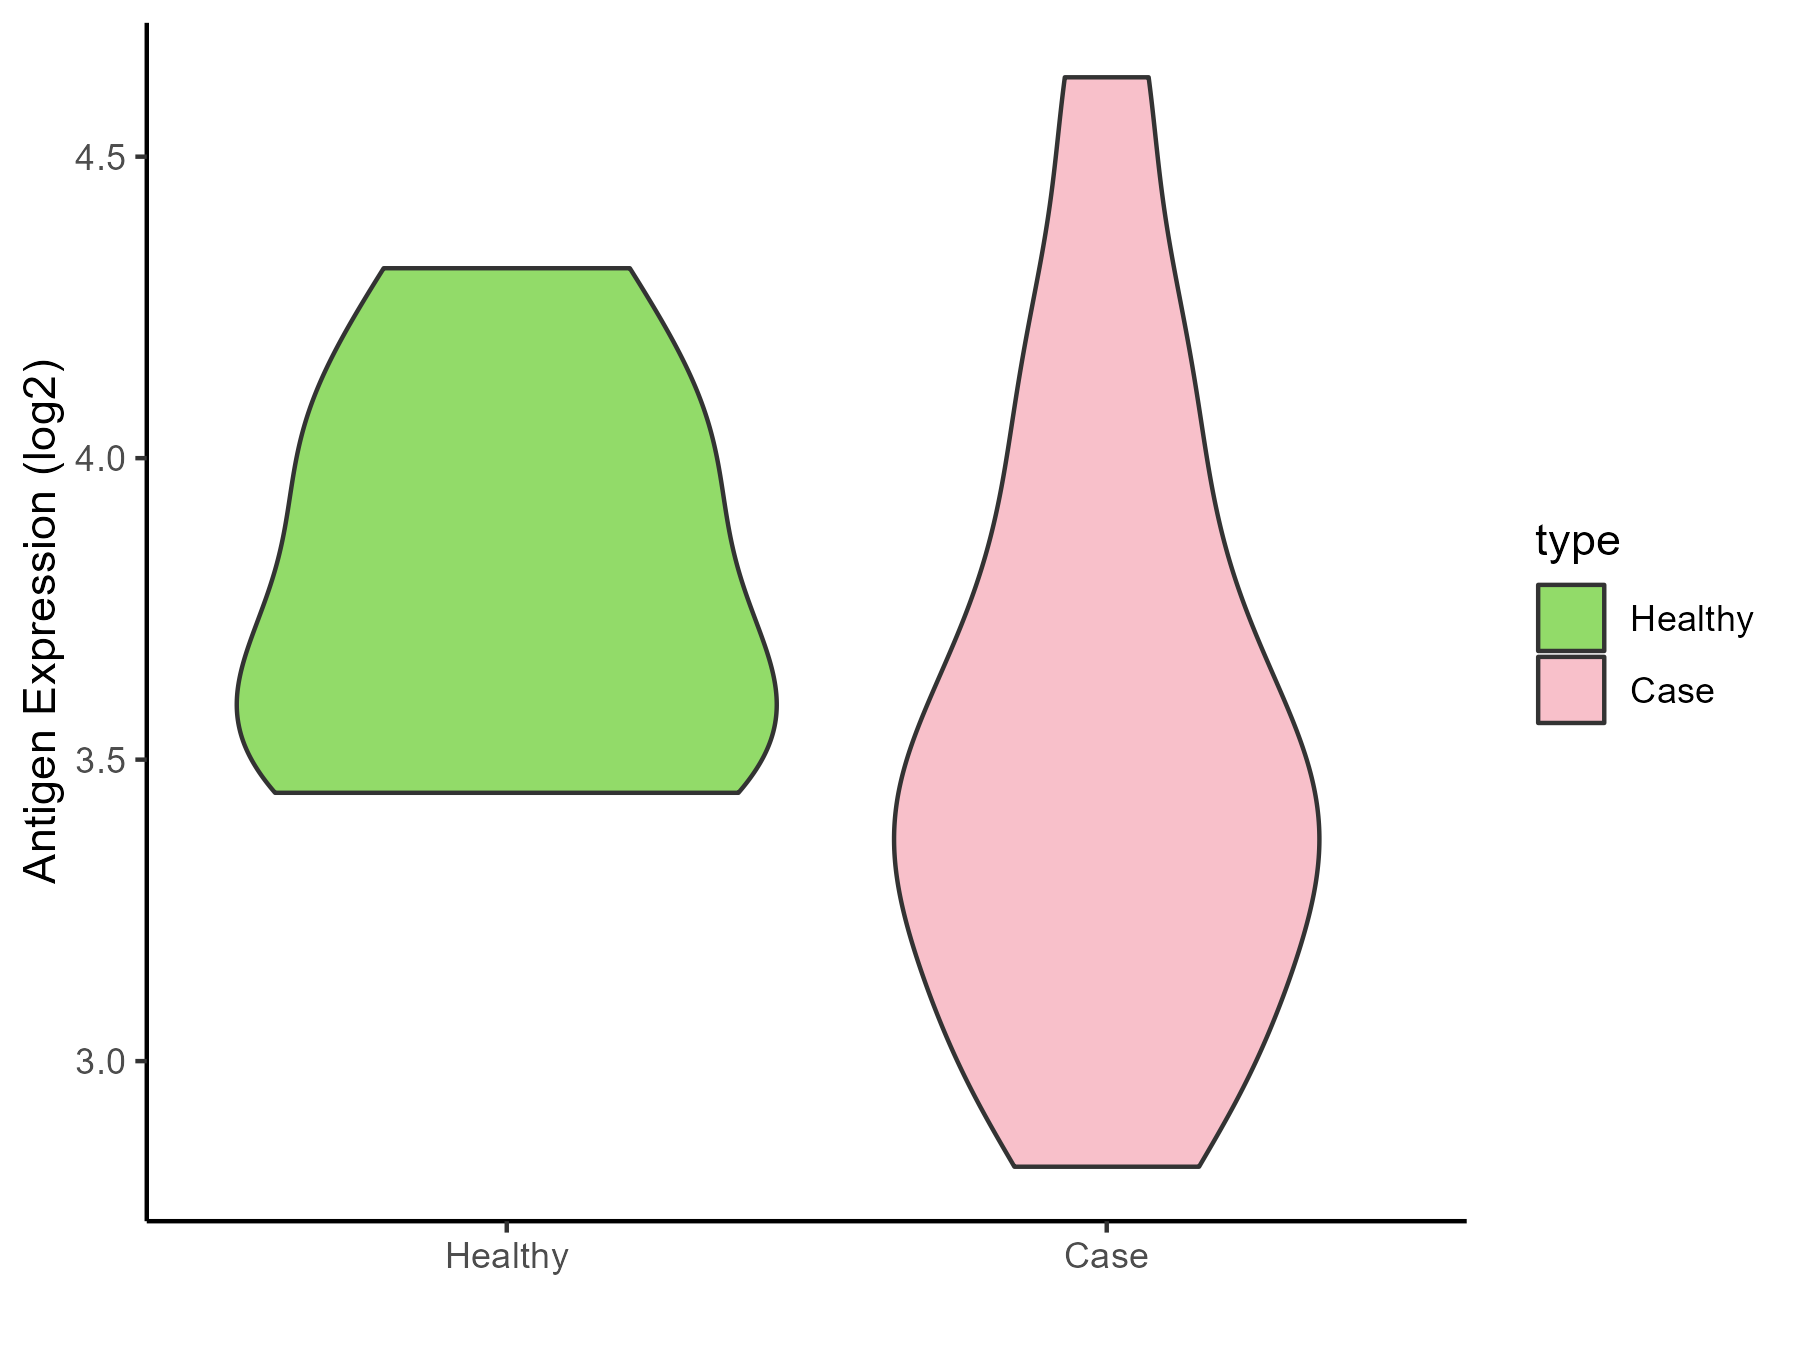
| The Specific Disease | Vitiligo | |
| The Expression Level of Disease Section Compare with the Healthy Individual Tissue | p-value: 0.126794592; Fold-change: -0.277605939; Z-score: -0.855940764 | |
| Disease-specific Antigen Abundances |
|
Click to View the Clearer Original Diagram |
| Differential expression pattern of antigen in diseases | ||
| The Studied Tissue | Skin from scalp | |
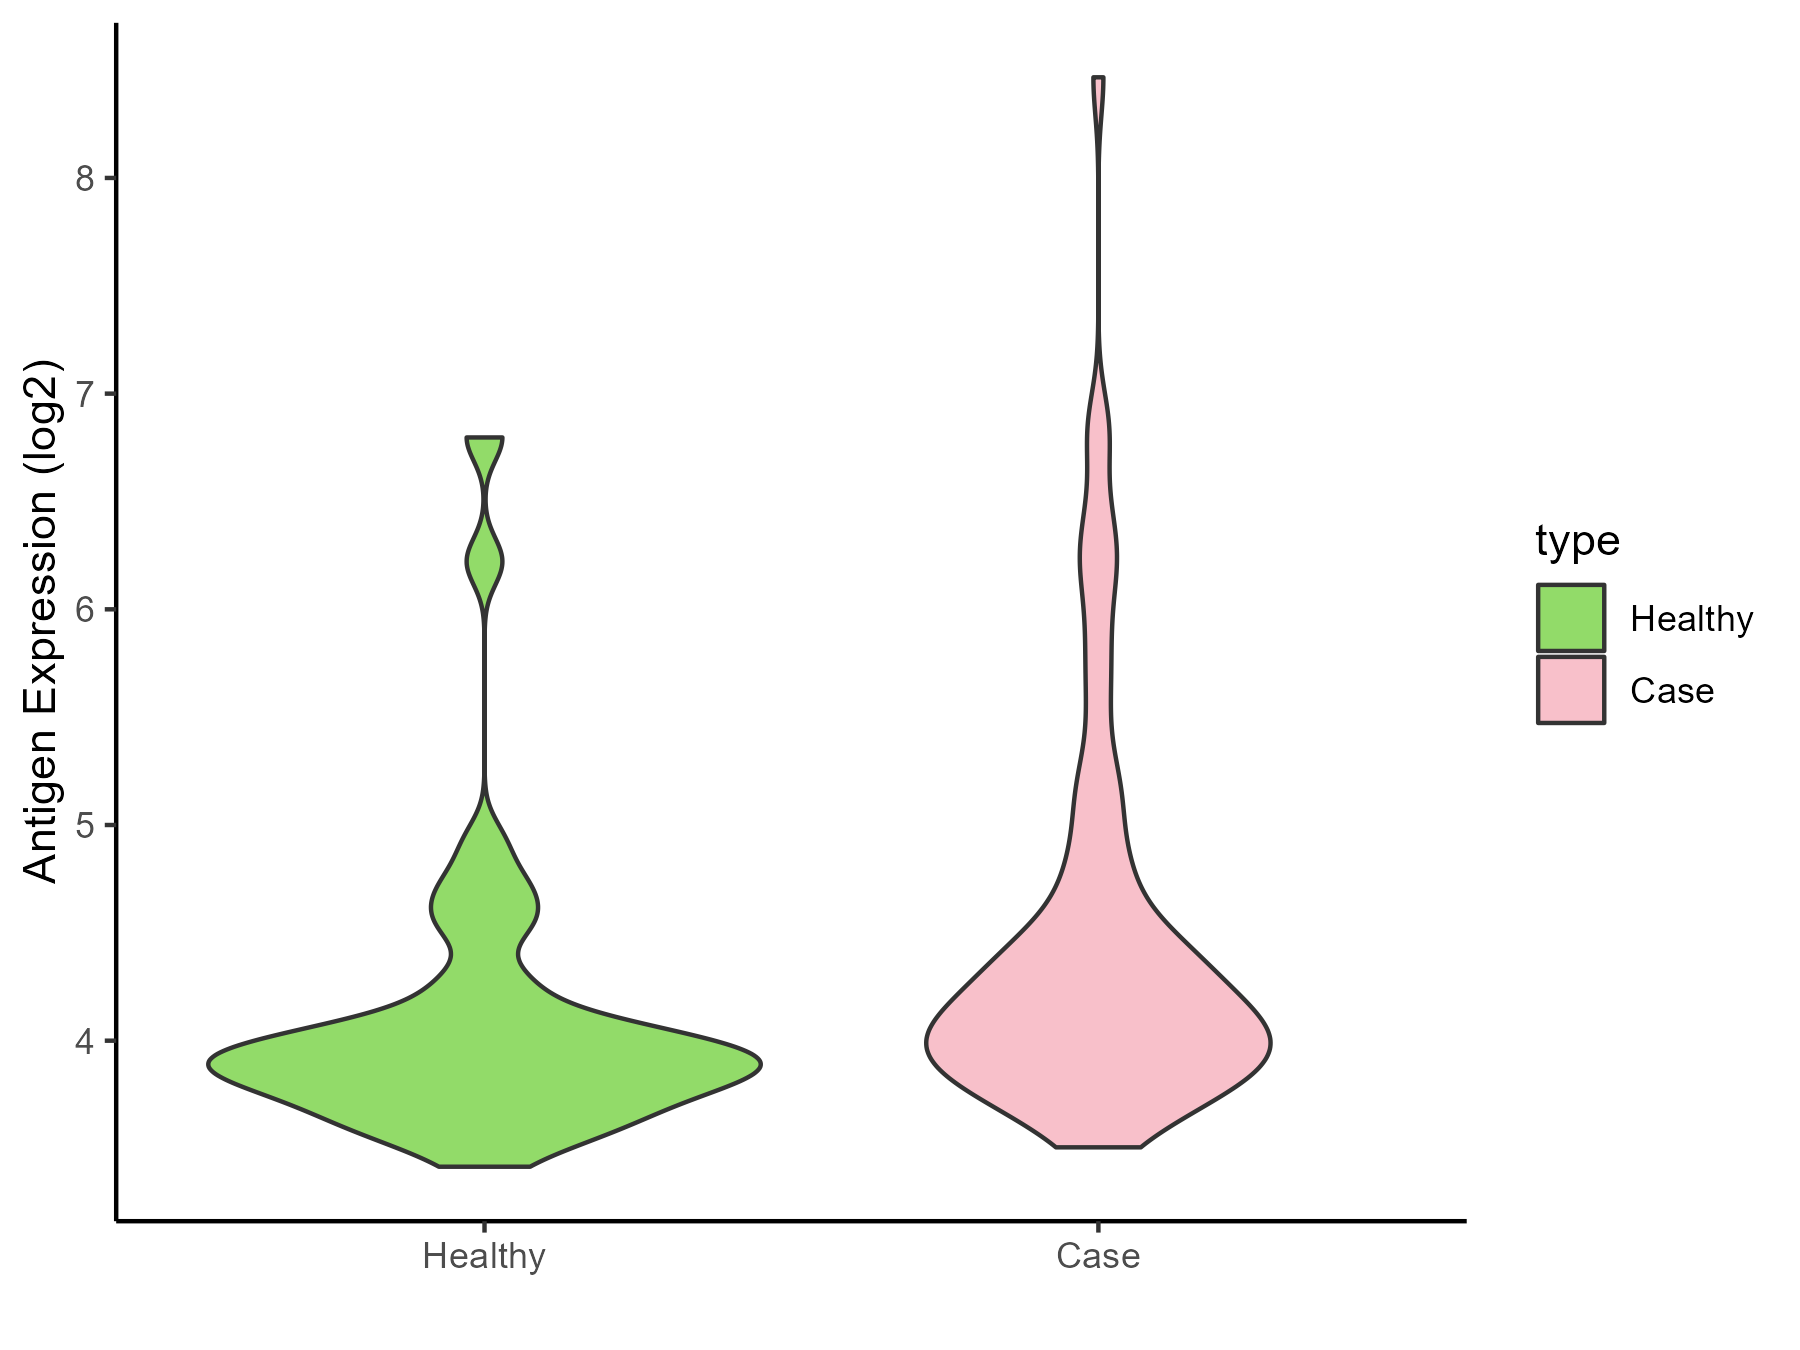
| The Specific Disease | Alopecia | |
| The Expression Level of Disease Section Compare with the Healthy Individual Tissue | p-value: 0.018010037; Fold-change: 0.209085793; Z-score: 0.311698275 | |
| Disease-specific Antigen Abundances |
|
Click to View the Clearer Original Diagram |
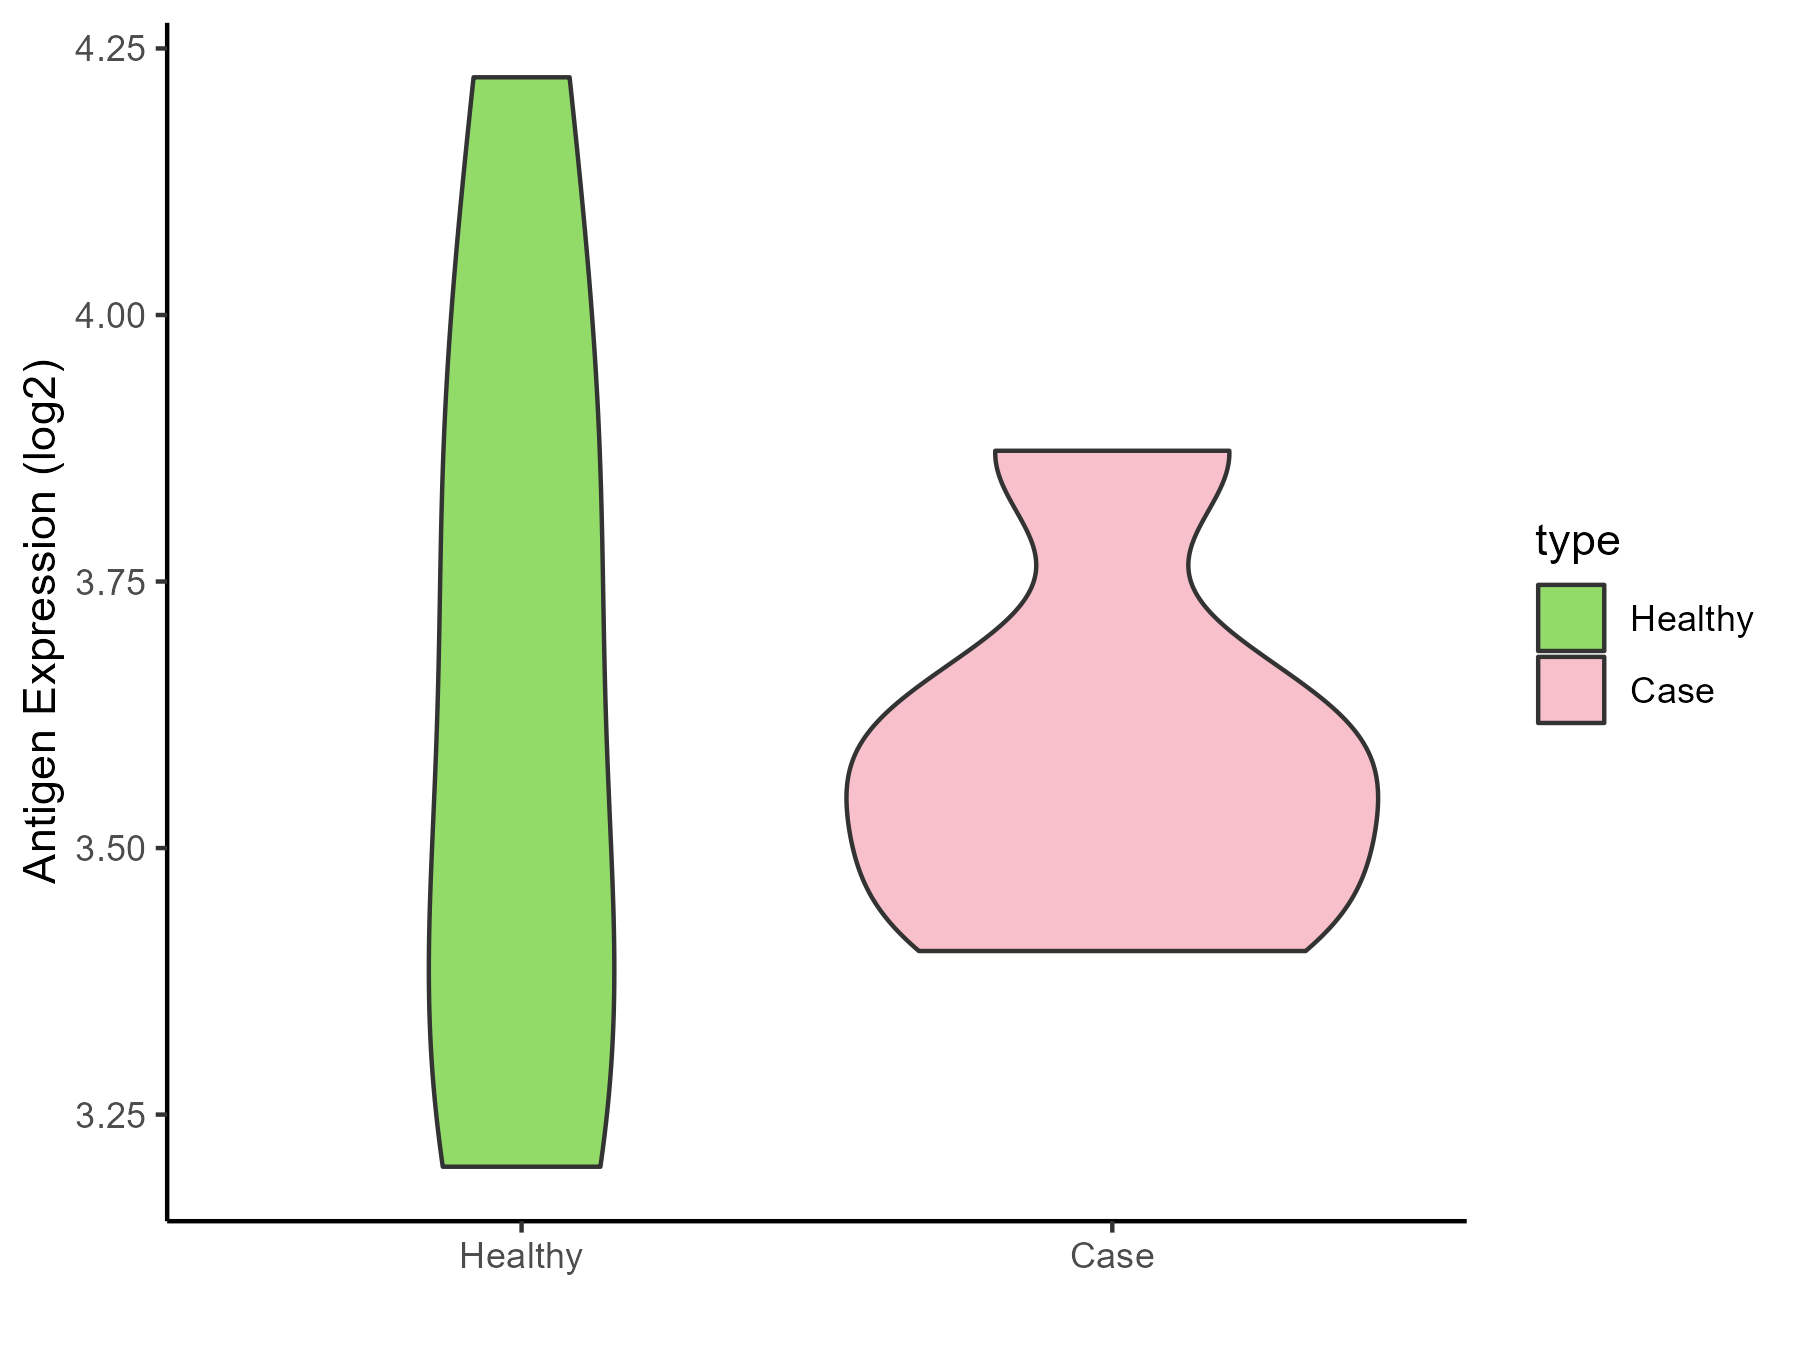
| Differential expression pattern of antigen in diseases | ||
| The Studied Tissue | Skin | |
| The Specific Disease | Sensitive skin | |
| The Expression Level of Disease Section Compare with the Healthy Individual Tissue | p-value: 0.798636167; Fold-change: -0.038415224; Z-score: -0.098363703 | |
| Disease-specific Antigen Abundances |
|
Click to View the Clearer Original Diagram |
ICD Disease Classification 15
| Differential expression pattern of antigen in diseases | ||
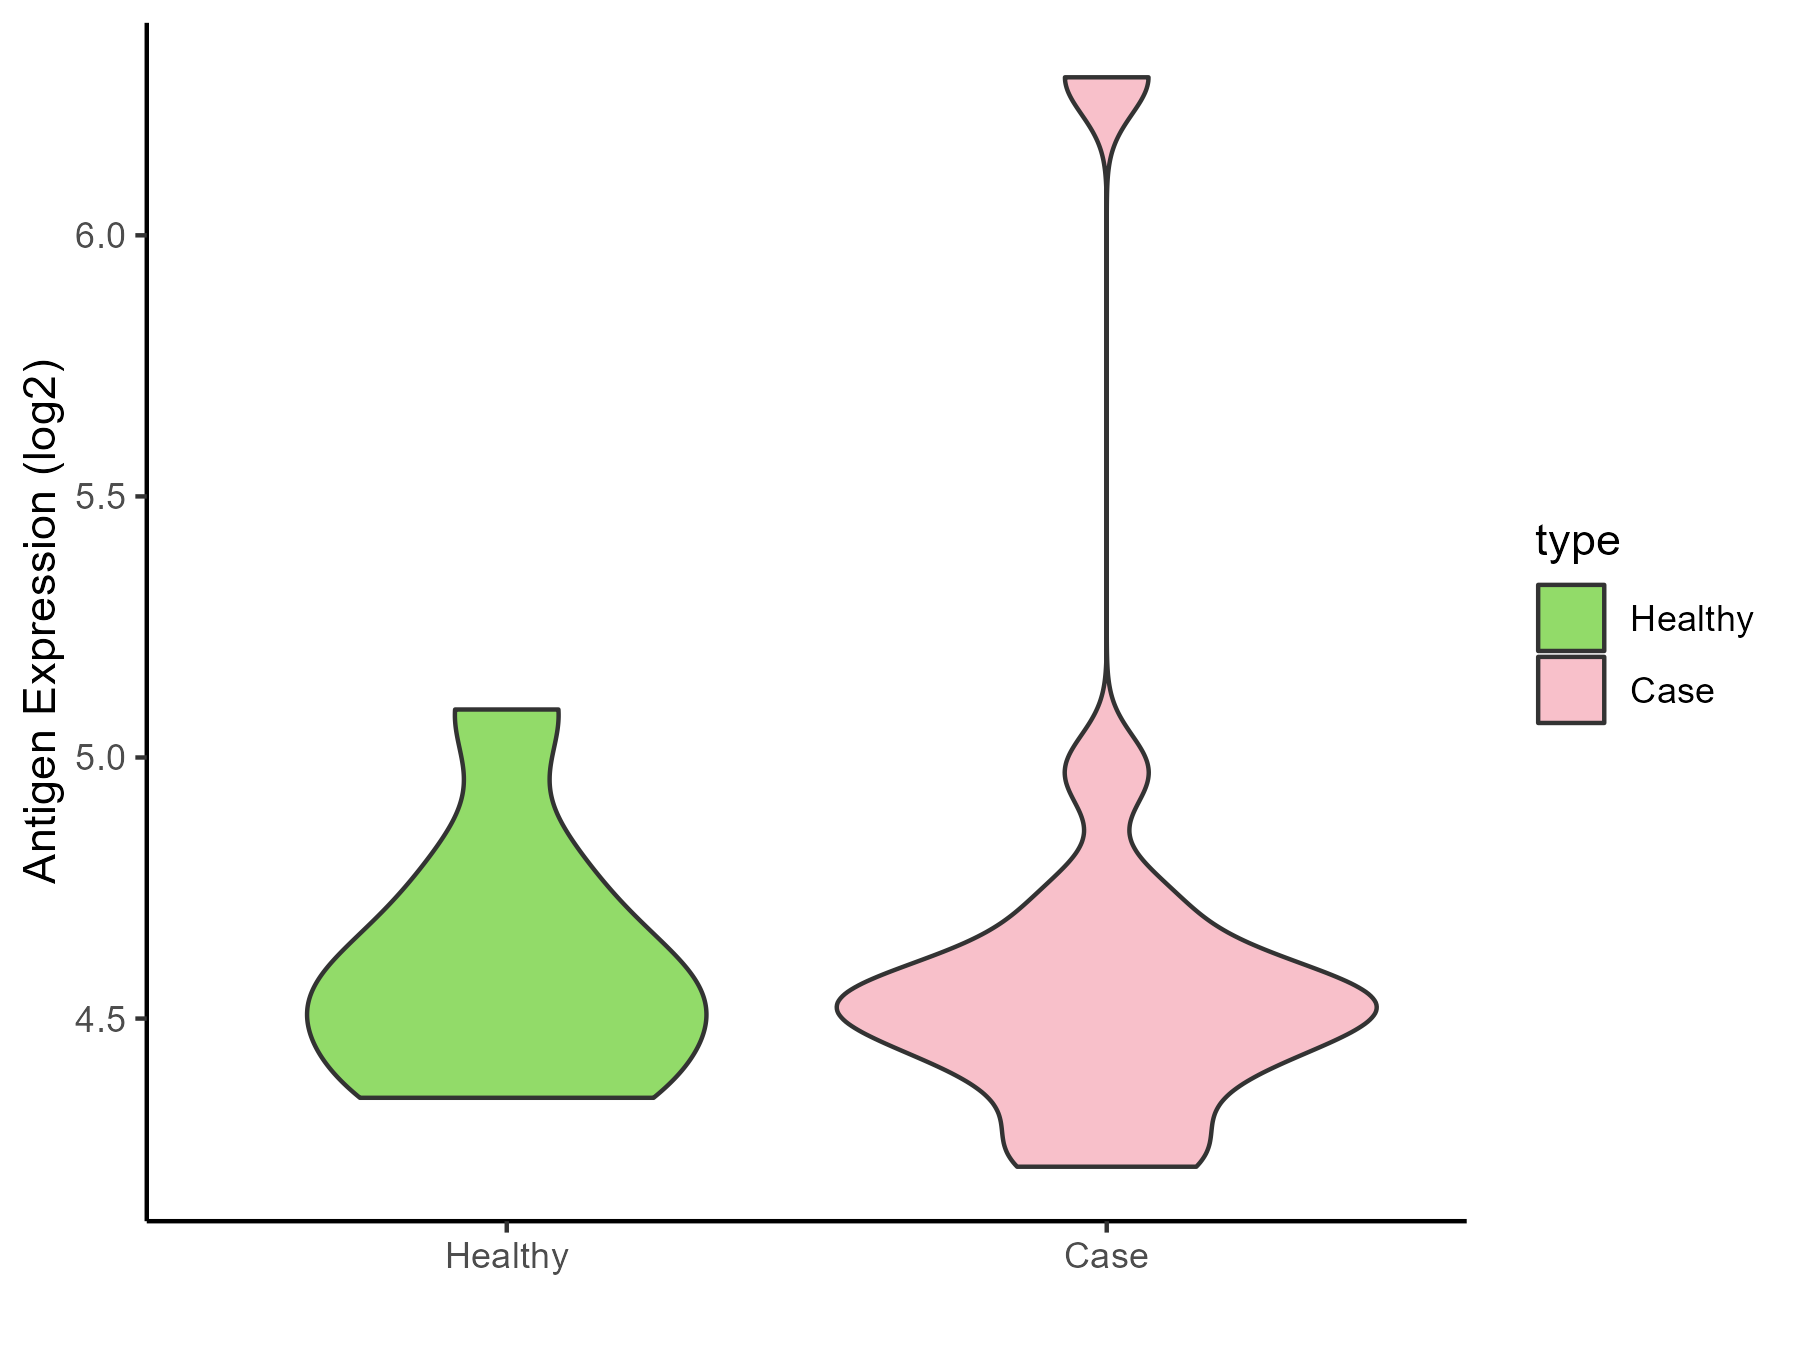
| The Studied Tissue | Synovial | |
| The Specific Disease | Osteoarthritis | |
| The Expression Level of Disease Section Compare with the Healthy Individual Tissue | p-value: 0.829929867; Fold-change: -0.013392292; Z-score: -0.054126081 | |
| Disease-specific Antigen Abundances |
|
Click to View the Clearer Original Diagram |
| Differential expression pattern of antigen in diseases | ||
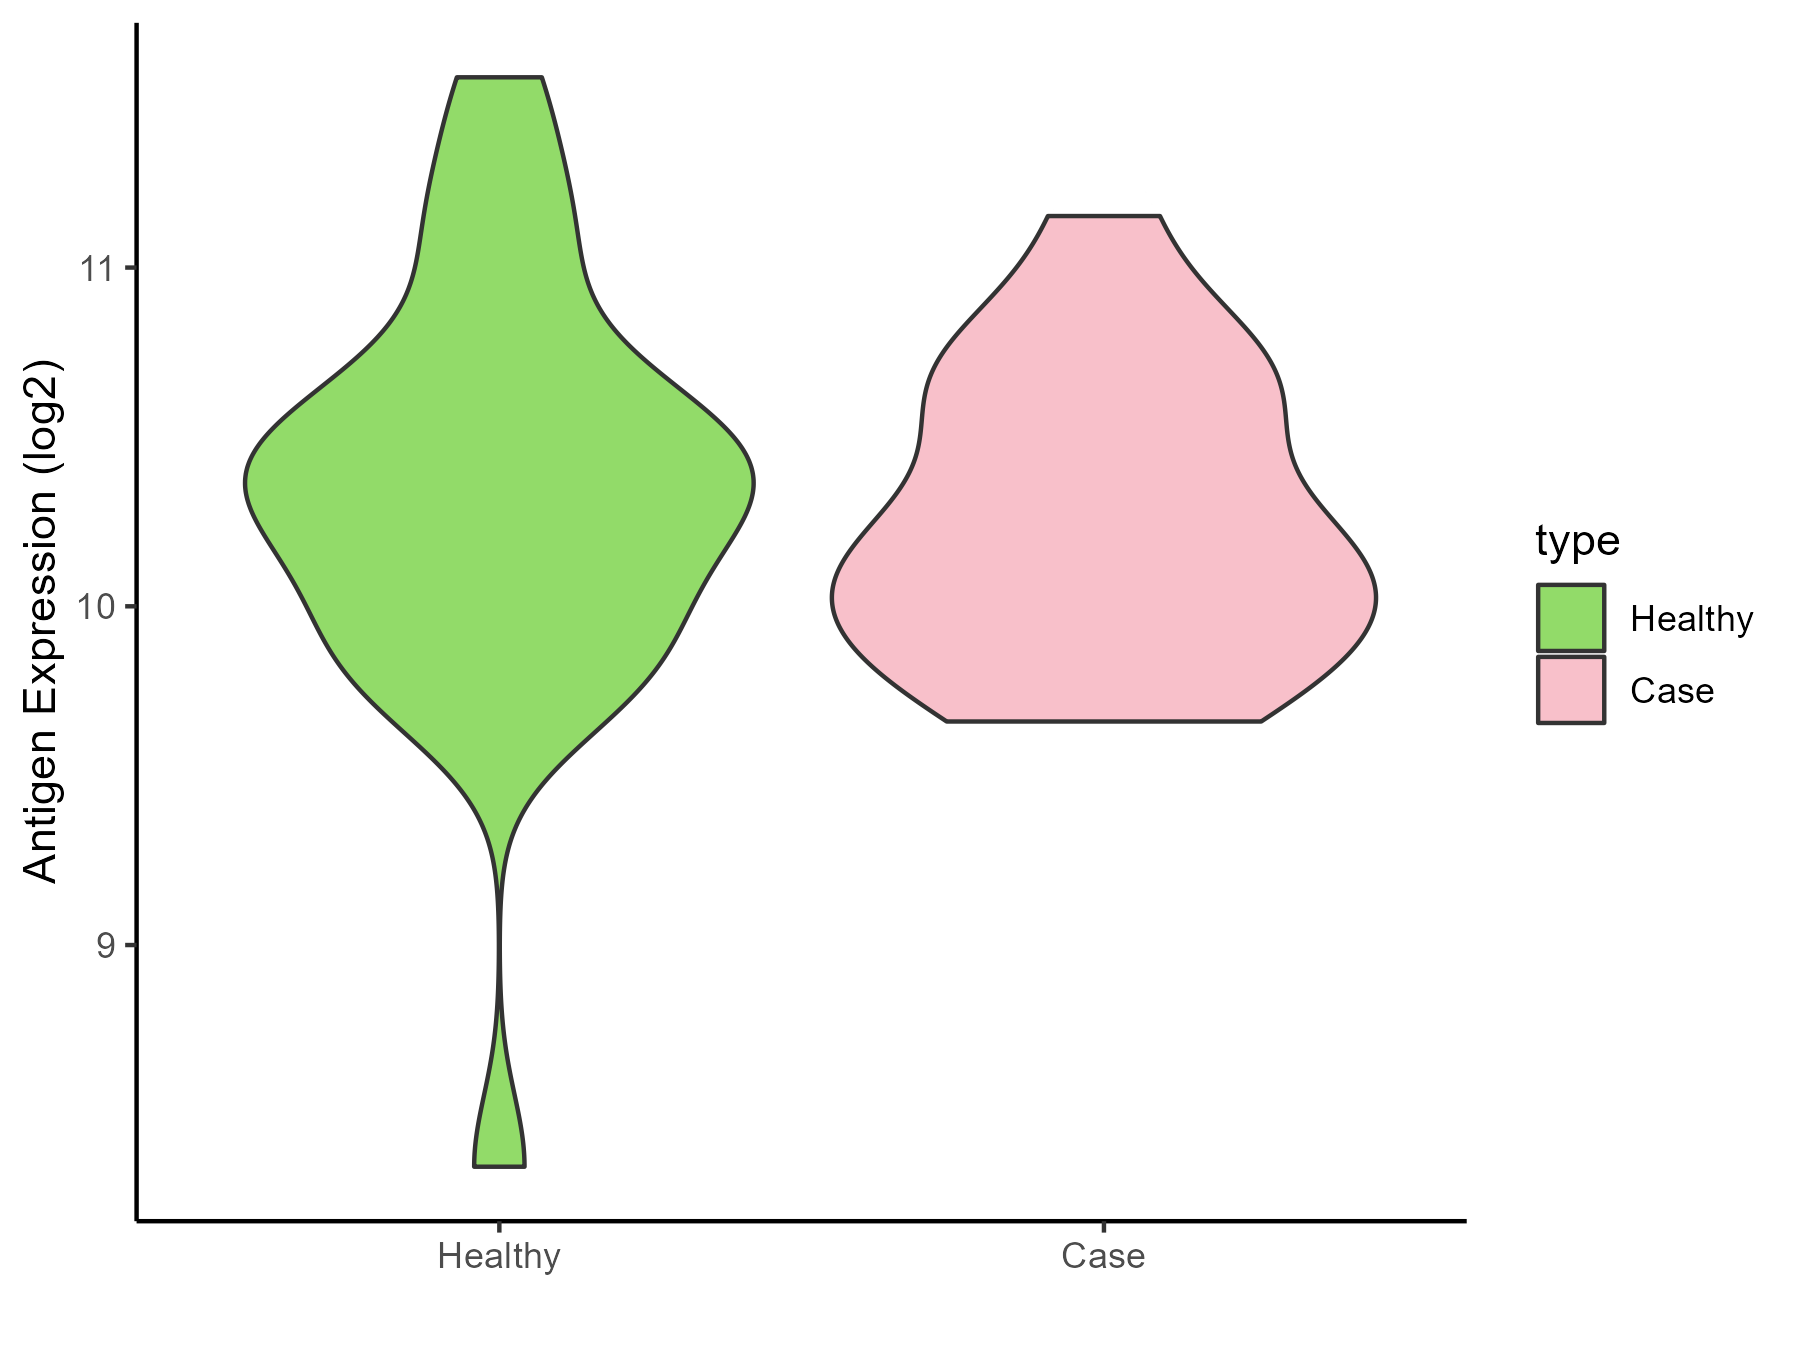
| The Studied Tissue | Peripheral blood | |
| The Specific Disease | Arthropathy | |
| The Expression Level of Disease Section Compare with the Healthy Individual Tissue | p-value: 0.698703934; Fold-change: -0.223322055; Z-score: -0.345748833 | |
| Disease-specific Antigen Abundances |
|
Click to View the Clearer Original Diagram |
| Differential expression pattern of antigen in diseases | ||
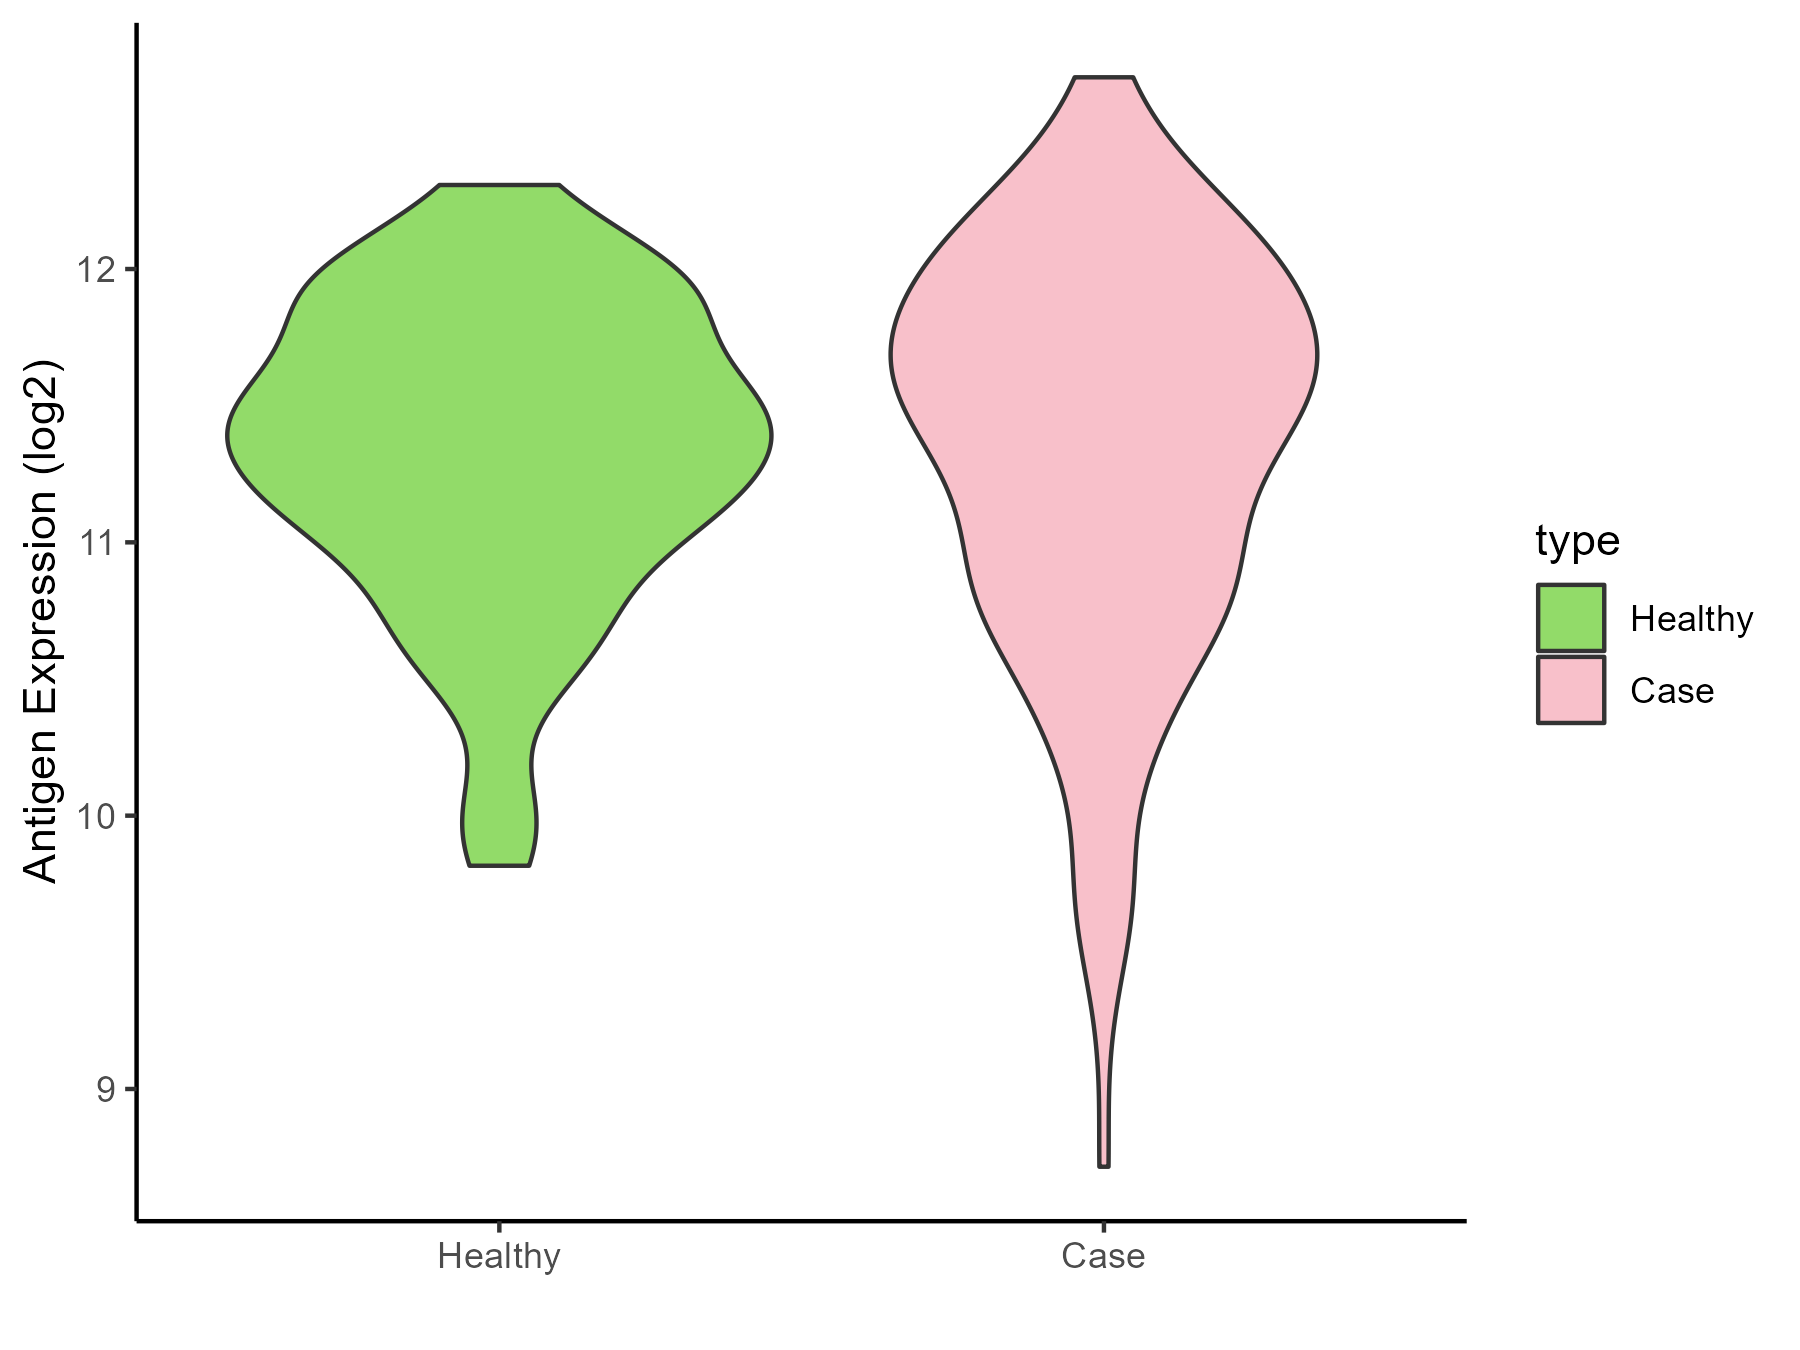
| The Studied Tissue | Peripheral blood | |
| The Specific Disease | Arthritis | |
| The Expression Level of Disease Section Compare with the Healthy Individual Tissue | p-value: 0.951197645; Fold-change: 0.07688488; Z-score: 0.138641118 | |
| Disease-specific Antigen Abundances |
|
Click to View the Clearer Original Diagram |
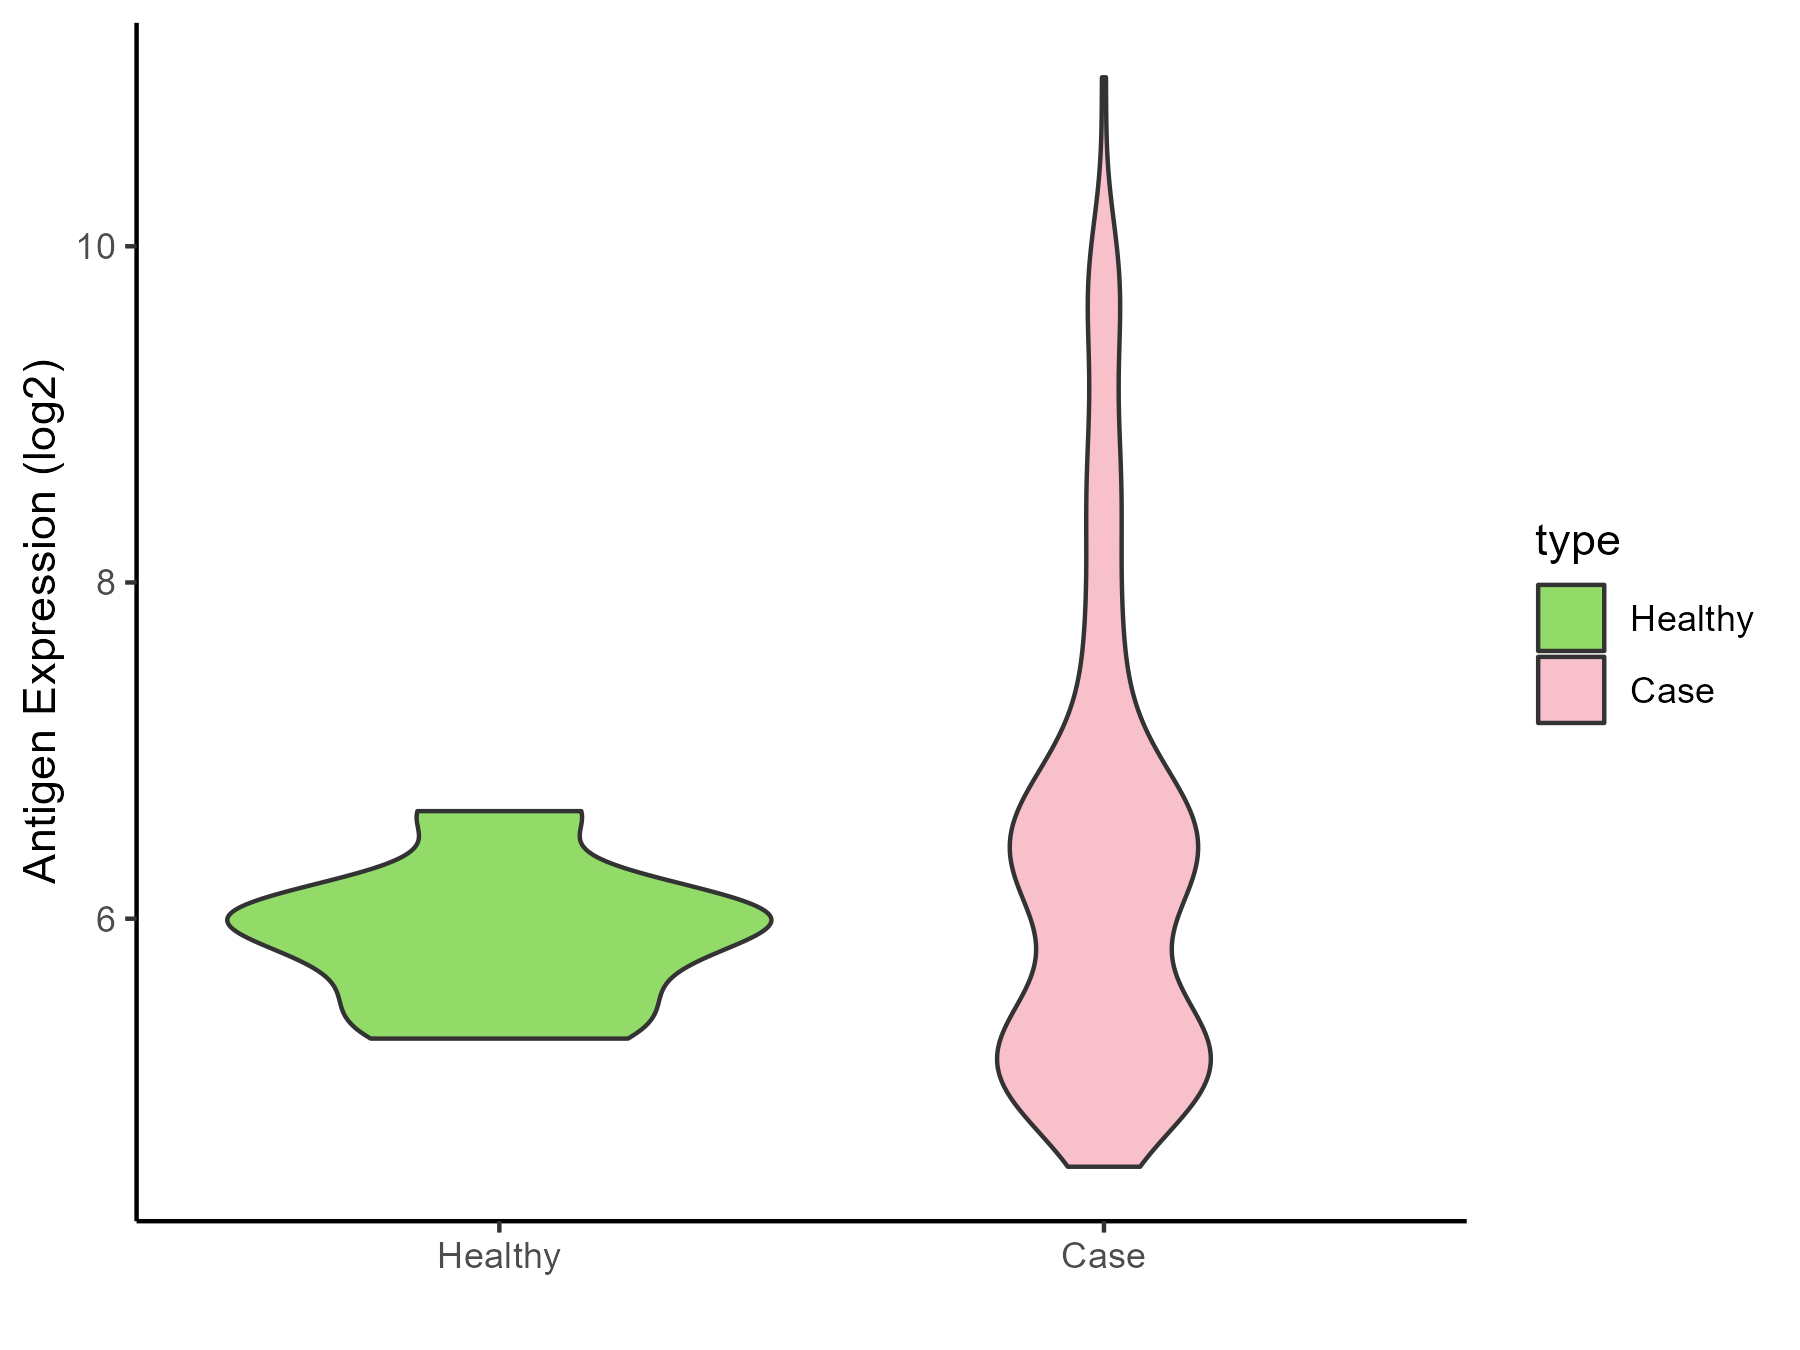
| Differential expression pattern of antigen in diseases | ||
| The Studied Tissue | Synovial | |
| The Specific Disease | Rheumatoid arthritis | |
| The Expression Level of Disease Section Compare with the Healthy Individual Tissue | p-value: 0.040029292; Fold-change: 0.248758908; Z-score: 0.563360764 | |
| Disease-specific Antigen Abundances |
|
Click to View the Clearer Original Diagram |
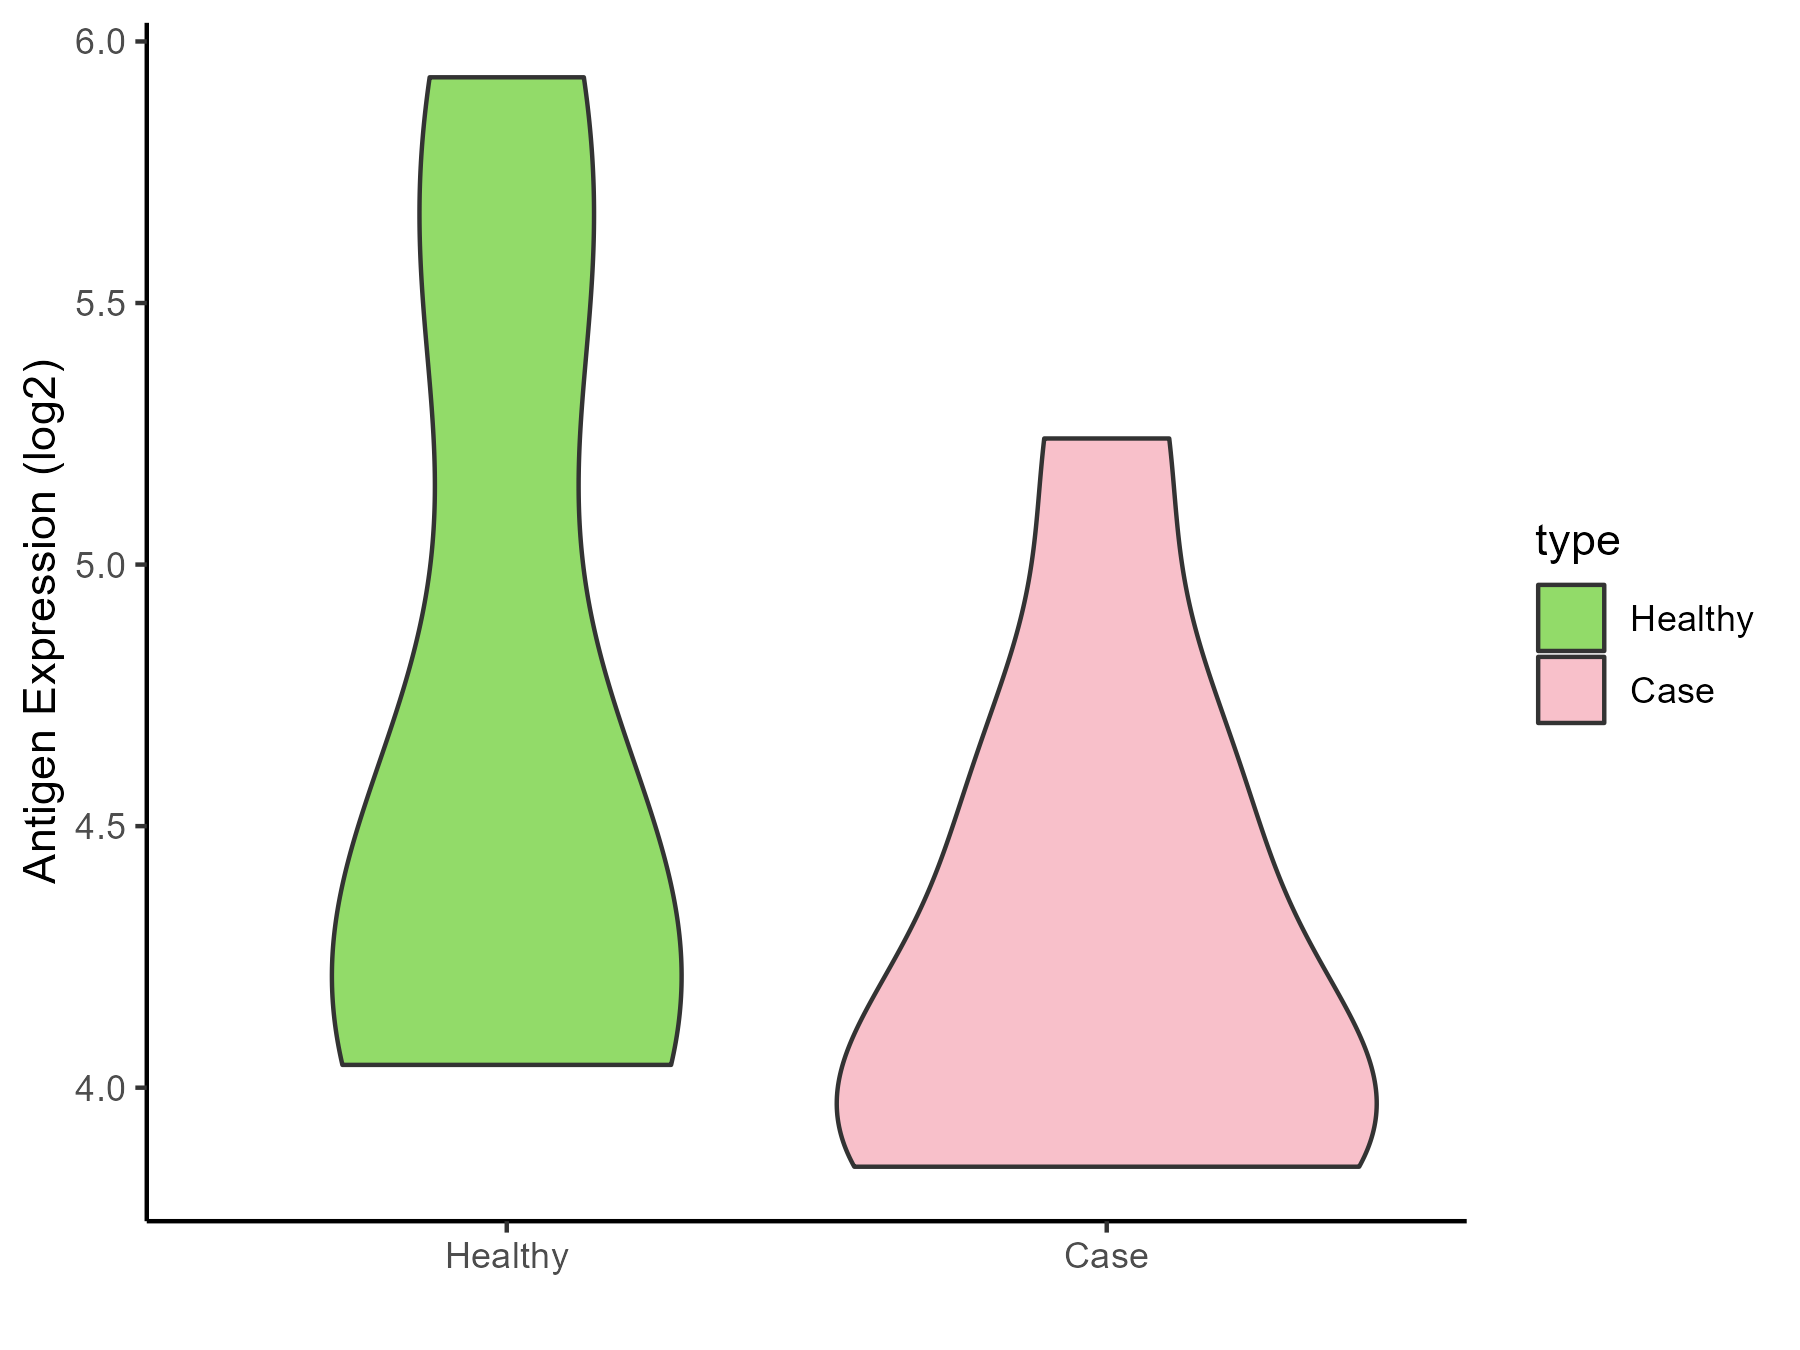
| Differential expression pattern of antigen in diseases | ||
| The Studied Tissue | Pheripheral blood | |
| The Specific Disease | Ankylosing spondylitis | |
| The Expression Level of Disease Section Compare with the Healthy Individual Tissue | p-value: 0.167020645; Fold-change: -0.240931448; Z-score: -0.31494915 | |
| Disease-specific Antigen Abundances |
|
Click to View the Clearer Original Diagram |
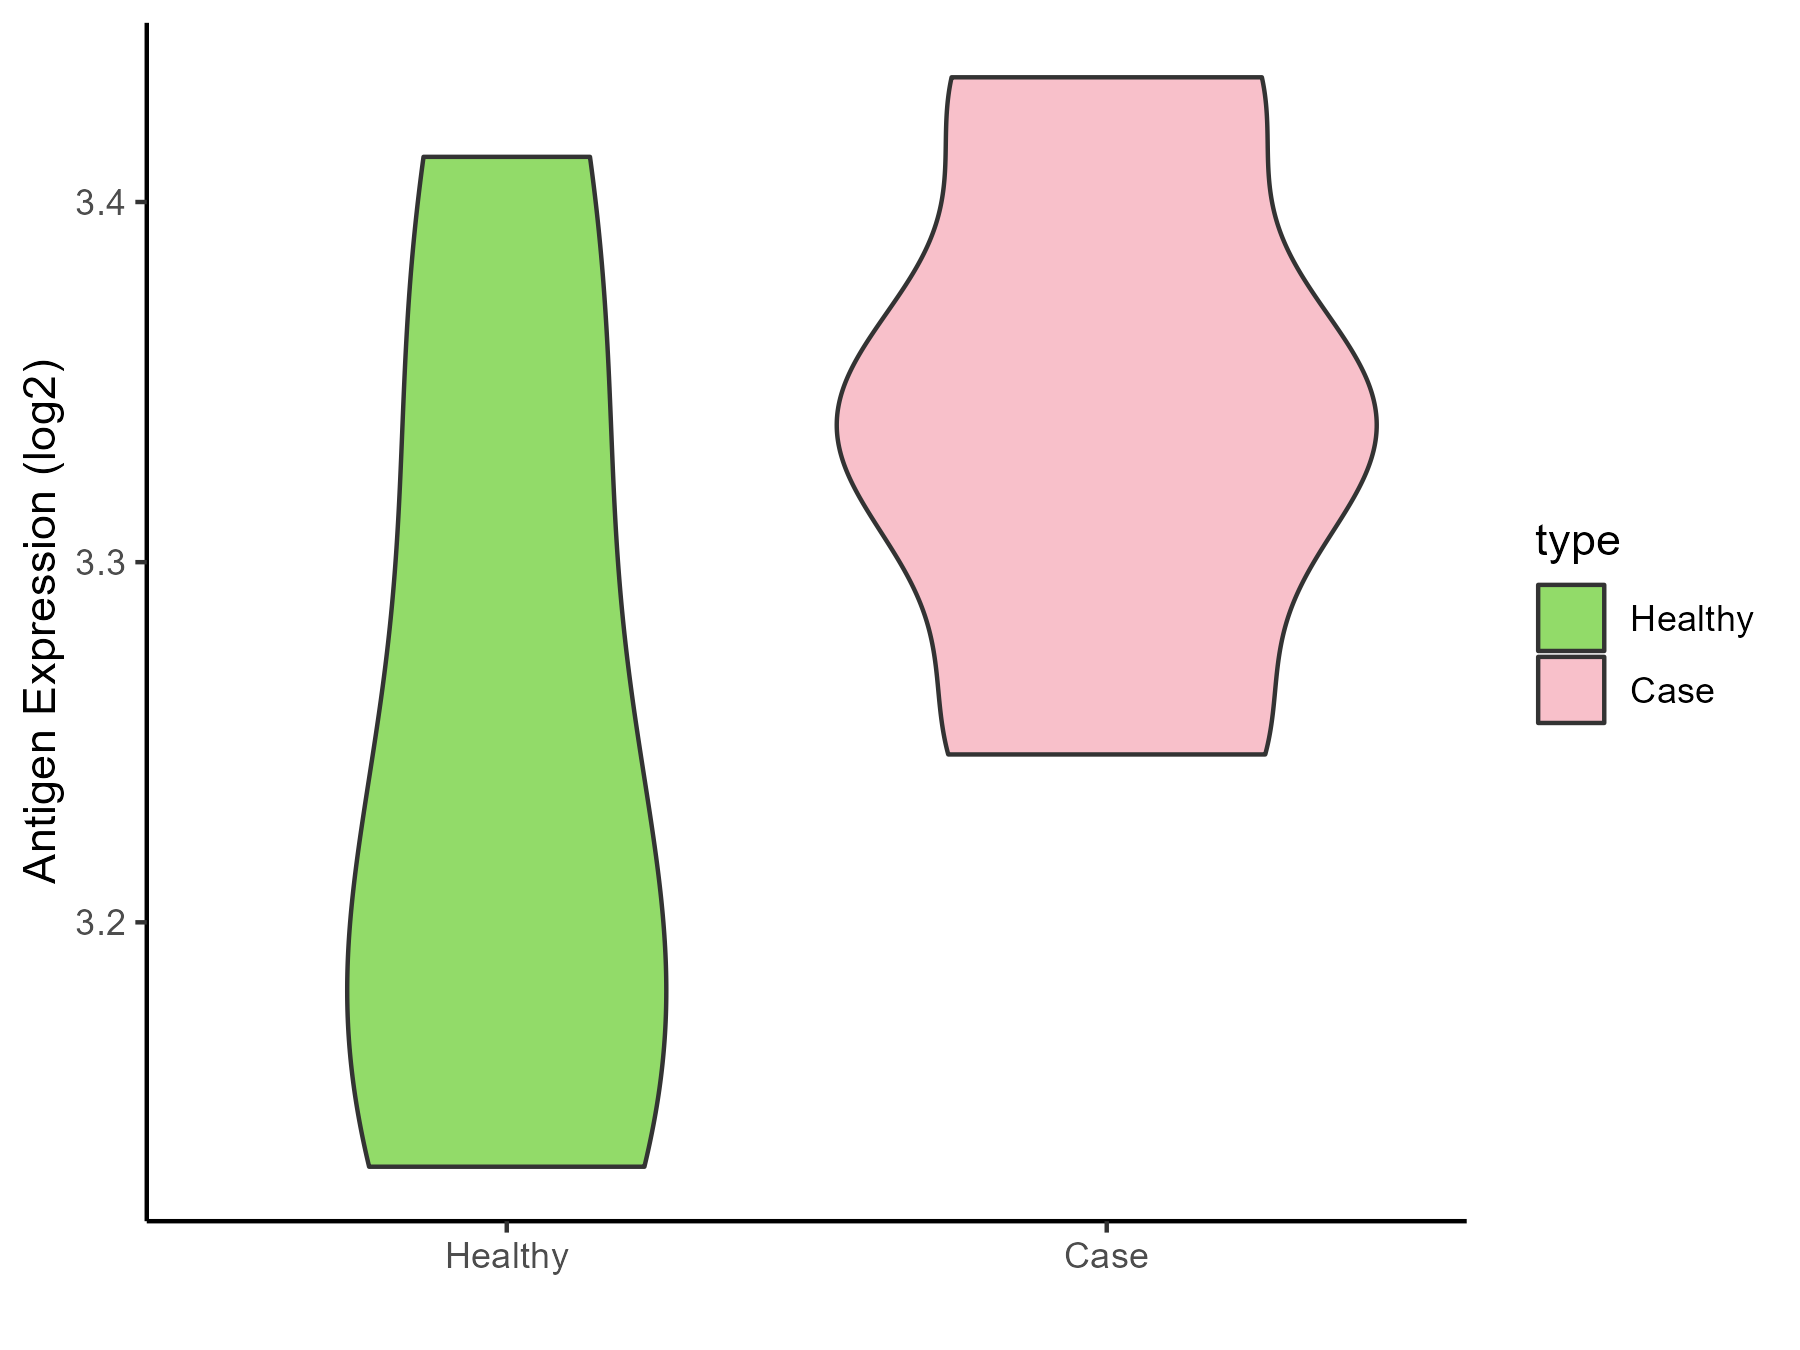
| Differential expression pattern of antigen in diseases | ||
| The Studied Tissue | Bone marrow | |
| The Specific Disease | Osteoporosis | |
| The Expression Level of Disease Section Compare with the Healthy Individual Tissue | p-value: 0.206937392; Fold-change: 0.131361242; Z-score: 1.133907868 | |
| Disease-specific Antigen Abundances |
|
Click to View the Clearer Original Diagram |
ICD Disease Classification 16
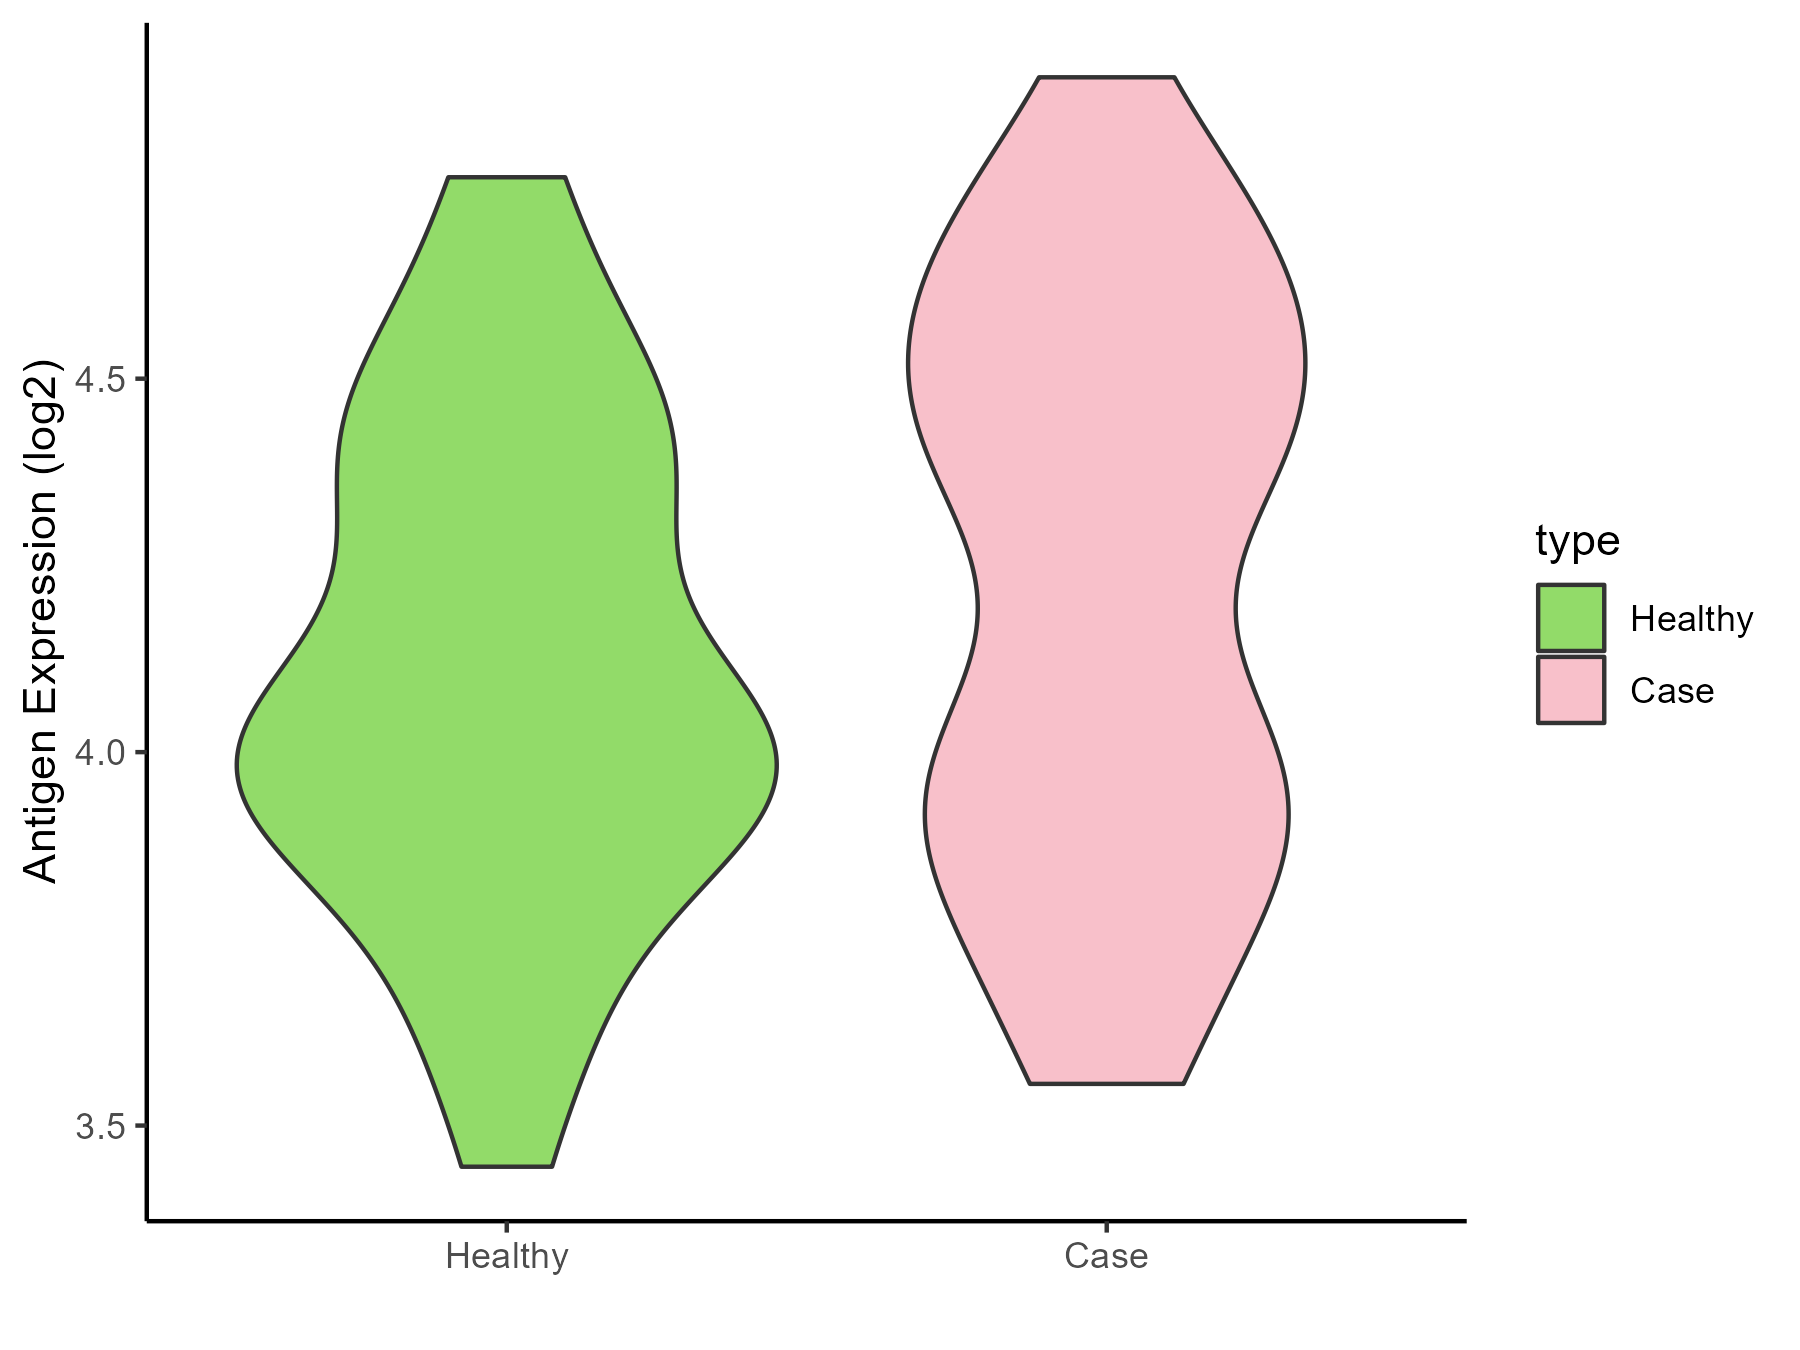
| Differential expression pattern of antigen in diseases | ||
| The Studied Tissue | Endometrium | |
| The Specific Disease | Endometriosis | |
| The Expression Level of Disease Section Compare with the Healthy Individual Tissue | p-value: 0.1869272; Fold-change: 0.323647971; Z-score: 0.977957202 | |
| Disease-specific Antigen Abundances |
|
Click to View the Clearer Original Diagram |
| Differential expression pattern of antigen in diseases | ||
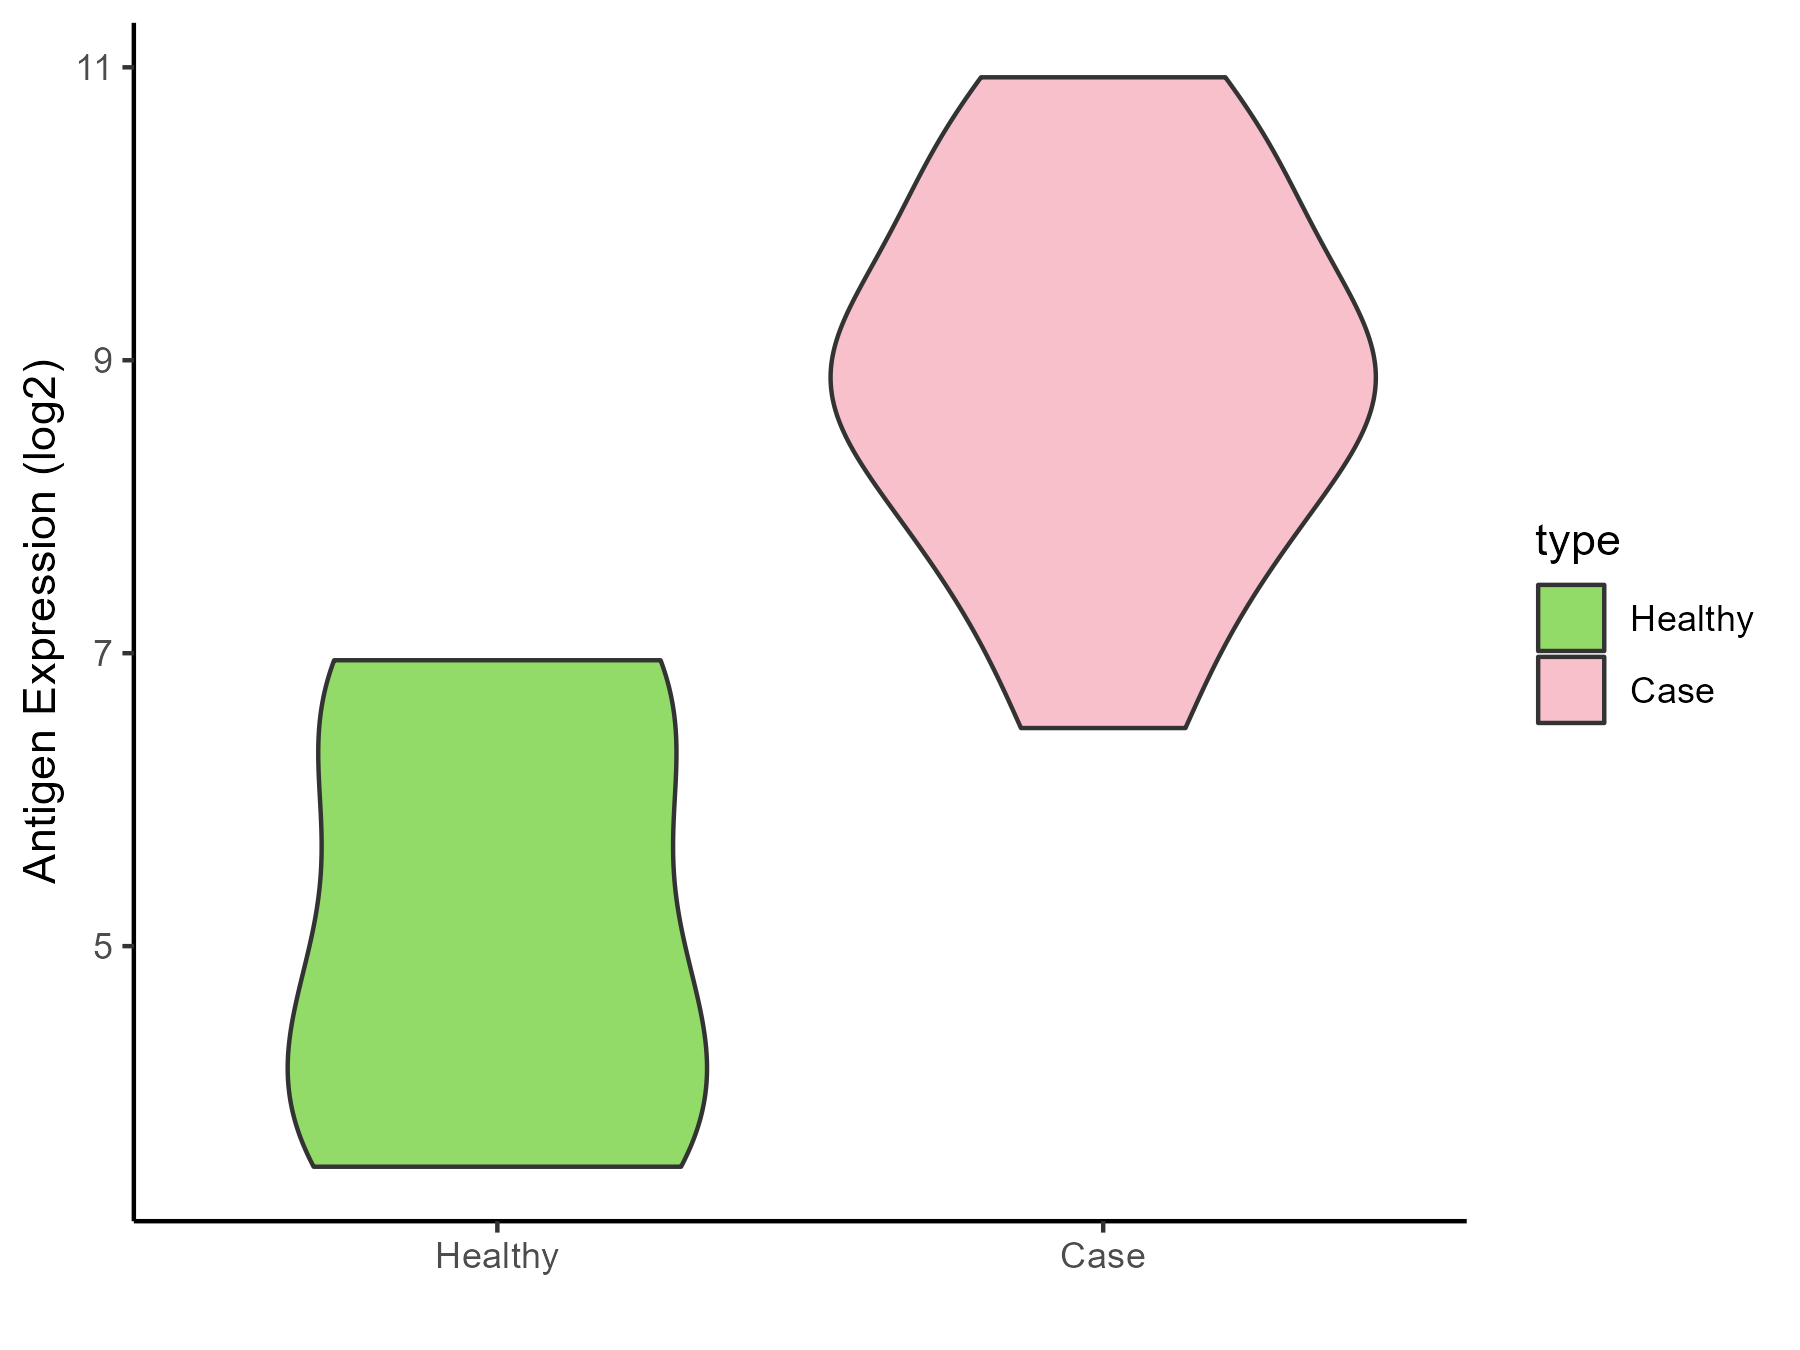
| The Studied Tissue | Bladder | |
| The Specific Disease | Interstitial cystitis | |
| The Expression Level of Disease Section Compare with the Healthy Individual Tissue | p-value: 0.002282485; Fold-change: 3.969808494; Z-score: 2.590161081 | |
| Disease-specific Antigen Abundances |
|
Click to View the Clearer Original Diagram |
ICD Disease Classification 19
| Differential expression pattern of antigen in diseases | ||
| The Studied Tissue | Myometrium | |
| The Specific Disease | Preterm birth | |
| The Expression Level of Disease Section Compare with the Healthy Individual Tissue | p-value: 0.125888508; Fold-change: -0.167777774; Z-score: -0.723463666 | |
| Disease-specific Antigen Abundances |

|
Click to View the Clearer Original Diagram |
ICD Disease Classification 2
| Differential expression pattern of antigen in diseases | ||
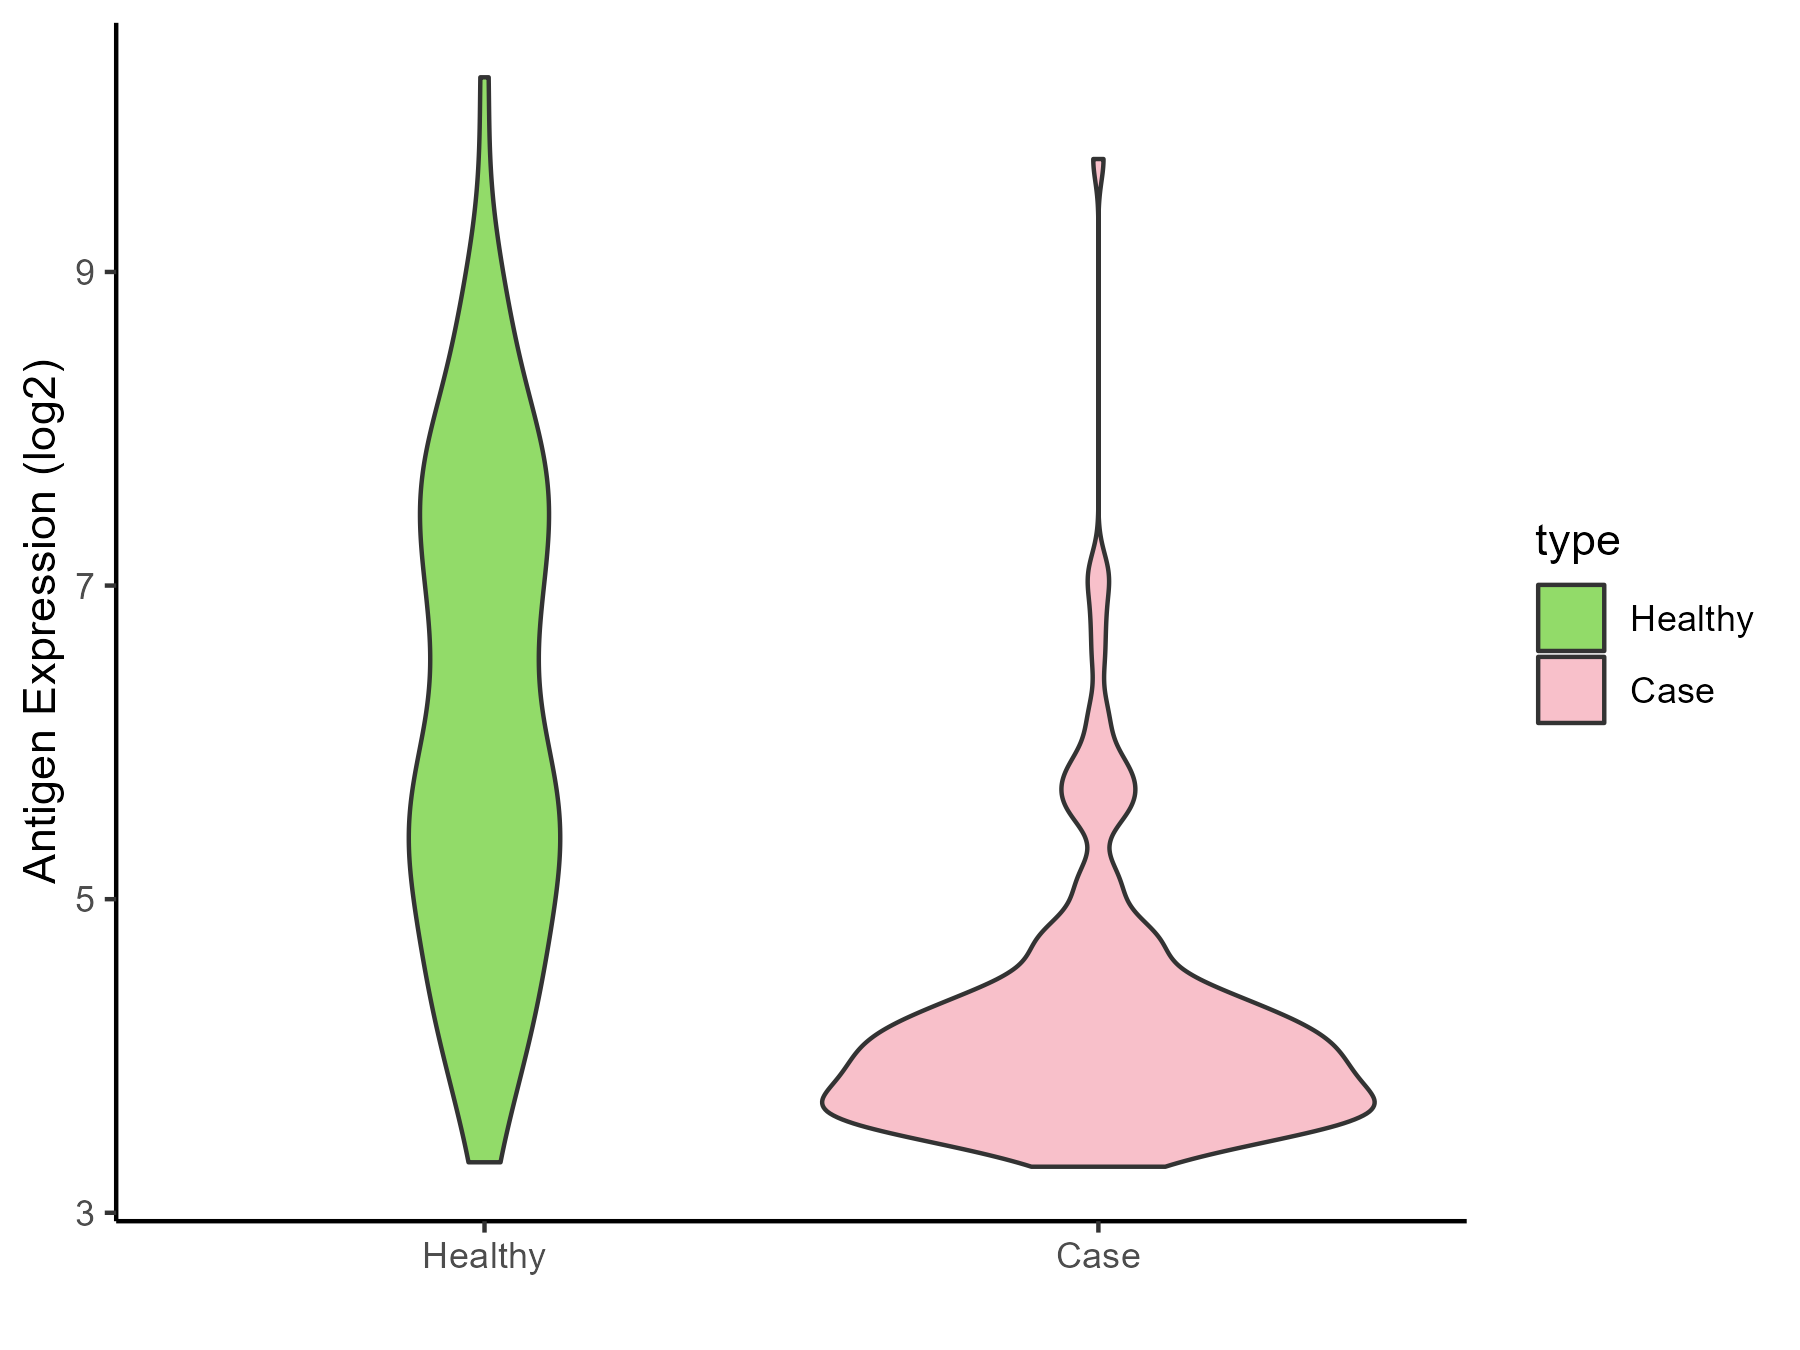
| The Studied Tissue | Bone marrow | |
| The Specific Disease | Acute myelocytic leukemia | |
| The Expression Level of Disease Section Compare with the Healthy Individual Tissue | p-value: 2.06E-30; Fold-change: -1.950320686; Z-score: -1.269513458 | |
| Disease-specific Antigen Abundances |
|
Click to View the Clearer Original Diagram |
| Differential expression pattern of antigen in diseases | ||
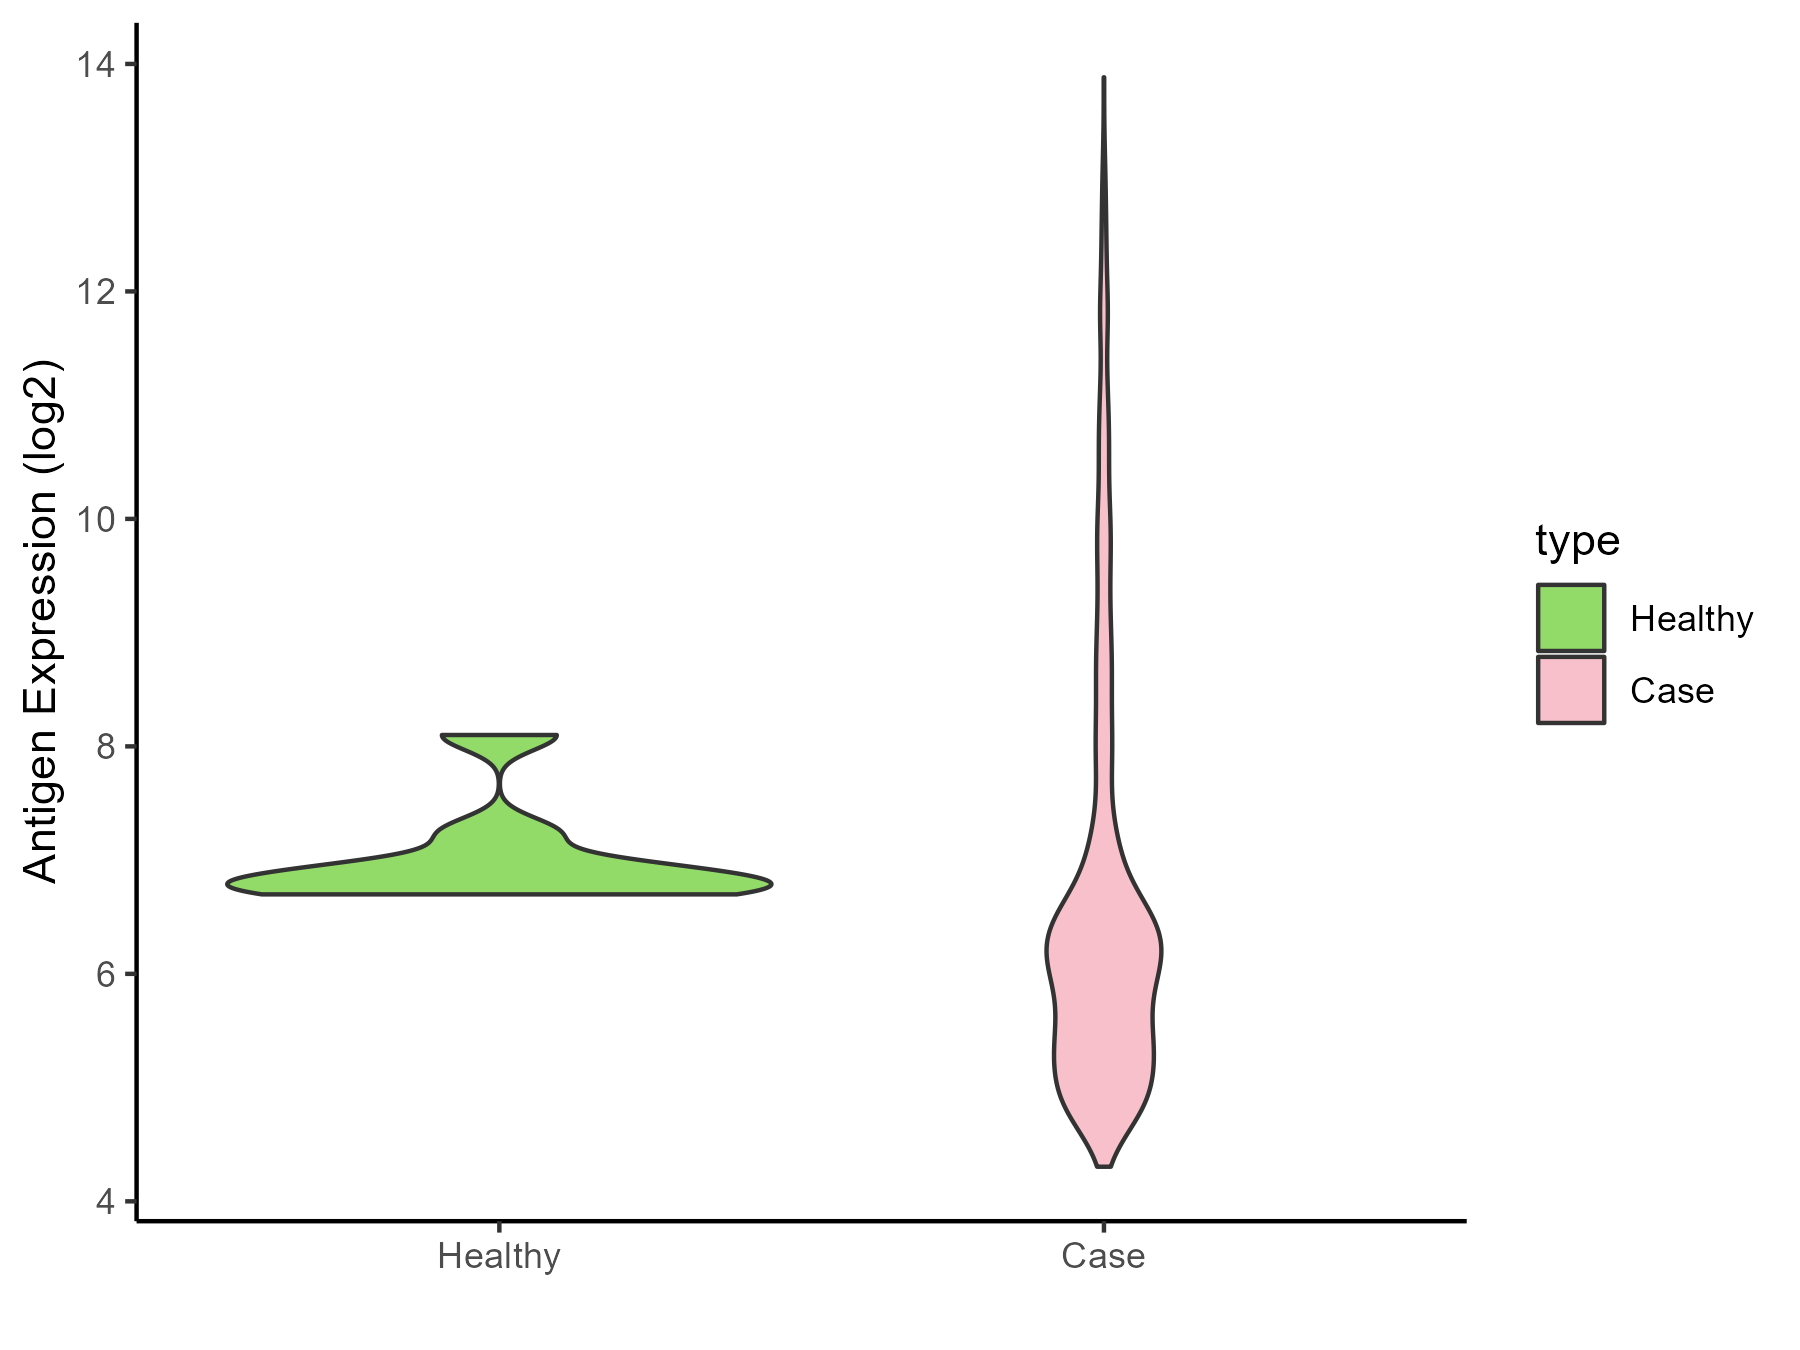
| The Studied Tissue | Bone marrow | |
| The Specific Disease | Myeloma | |
| The Expression Level of Disease Section Compare with the Healthy Individual Tissue | p-value: 0.044451567; Fold-change: -0.728719237; Z-score: -1.54010728 | |
| Disease-specific Antigen Abundances |
|
Click to View the Clearer Original Diagram |
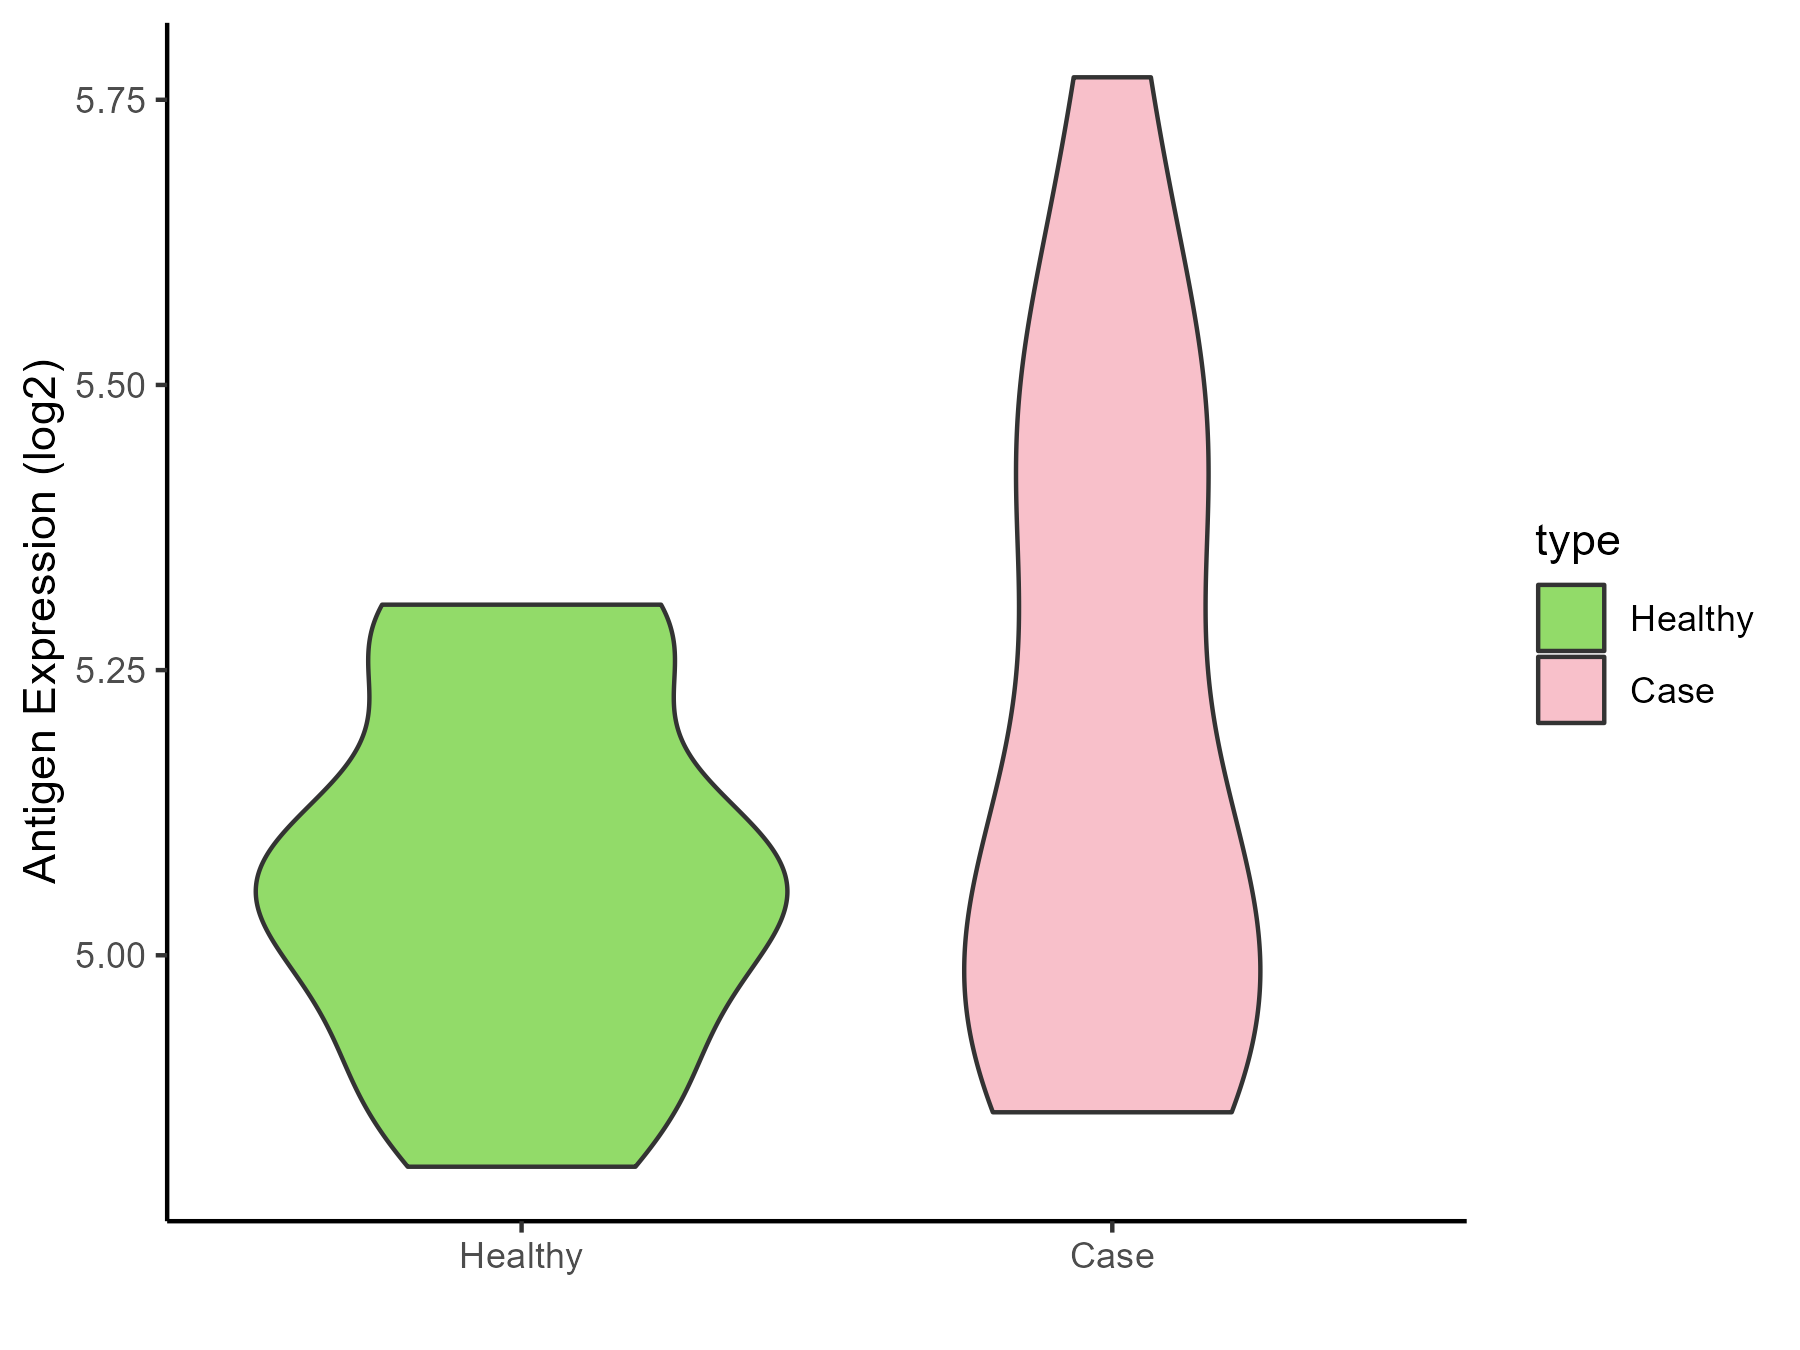
| The Studied Tissue | Peripheral blood | |
| The Specific Disease | Myeloma | |
| The Expression Level of Disease Section Compare with the Healthy Individual Tissue | p-value: 0.153986639; Fold-change: 0.032626533; Z-score: 0.204607179 | |
| Disease-specific Antigen Abundances |
|
Click to View the Clearer Original Diagram |
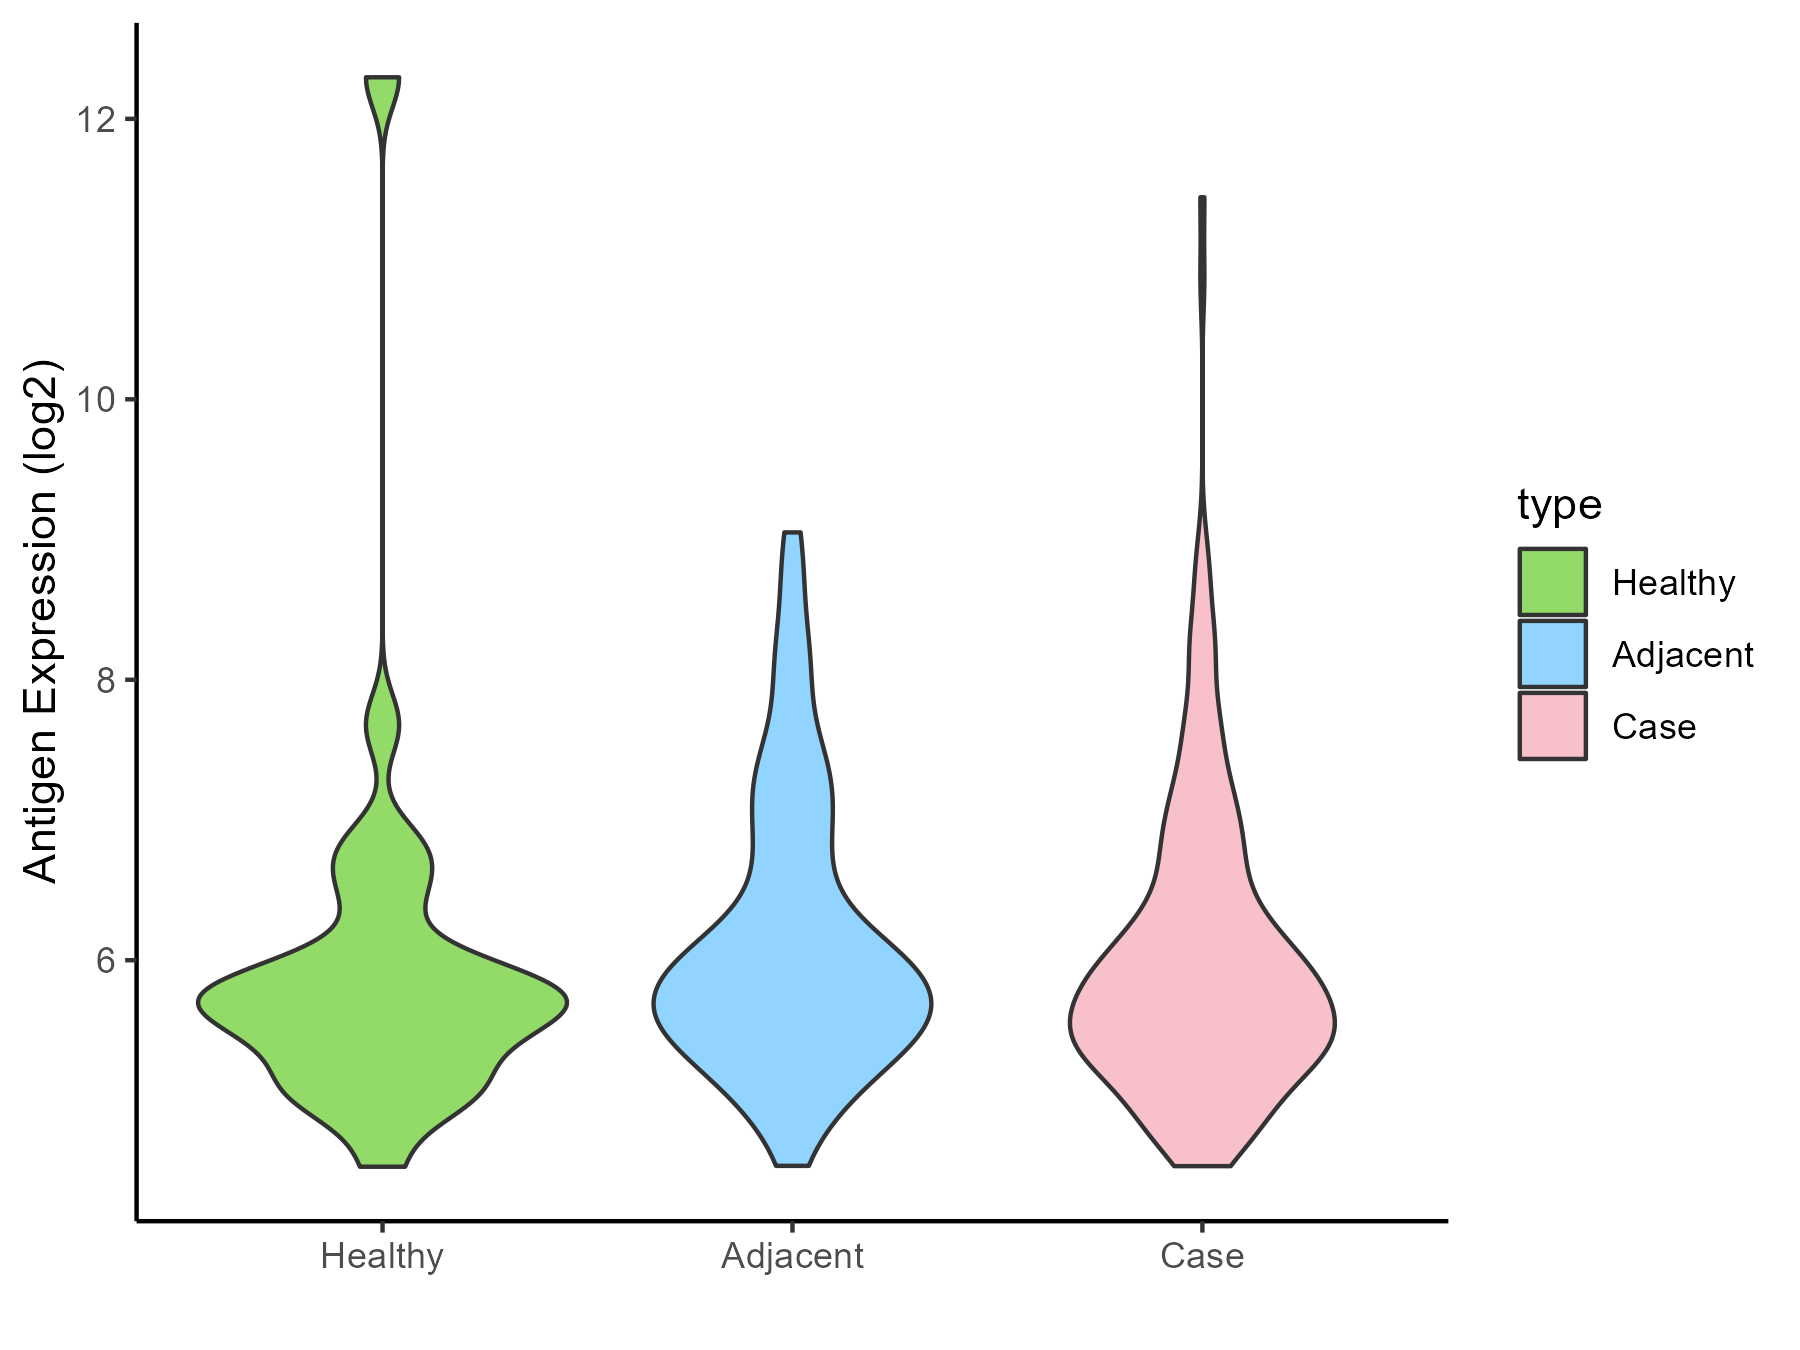
| Differential expression pattern of antigen in diseases | ||
| The Studied Tissue | Oral | |
| The Specific Disease | Oral cancer | |
| The Expression Level of Disease Section Compare with the Healthy Individual Tissue | p-value: 0.925035726; Fold-change: 0.075312087; Z-score: 0.052763329 | |
| The Expression Level of Disease Section Compare with the Adjacent Tissue | p-value: 0.320103572; Fold-change: -0.083168066; Z-score: -0.084817123 | |
| Disease-specific Antigen Abundances |
|
Click to View the Clearer Original Diagram |
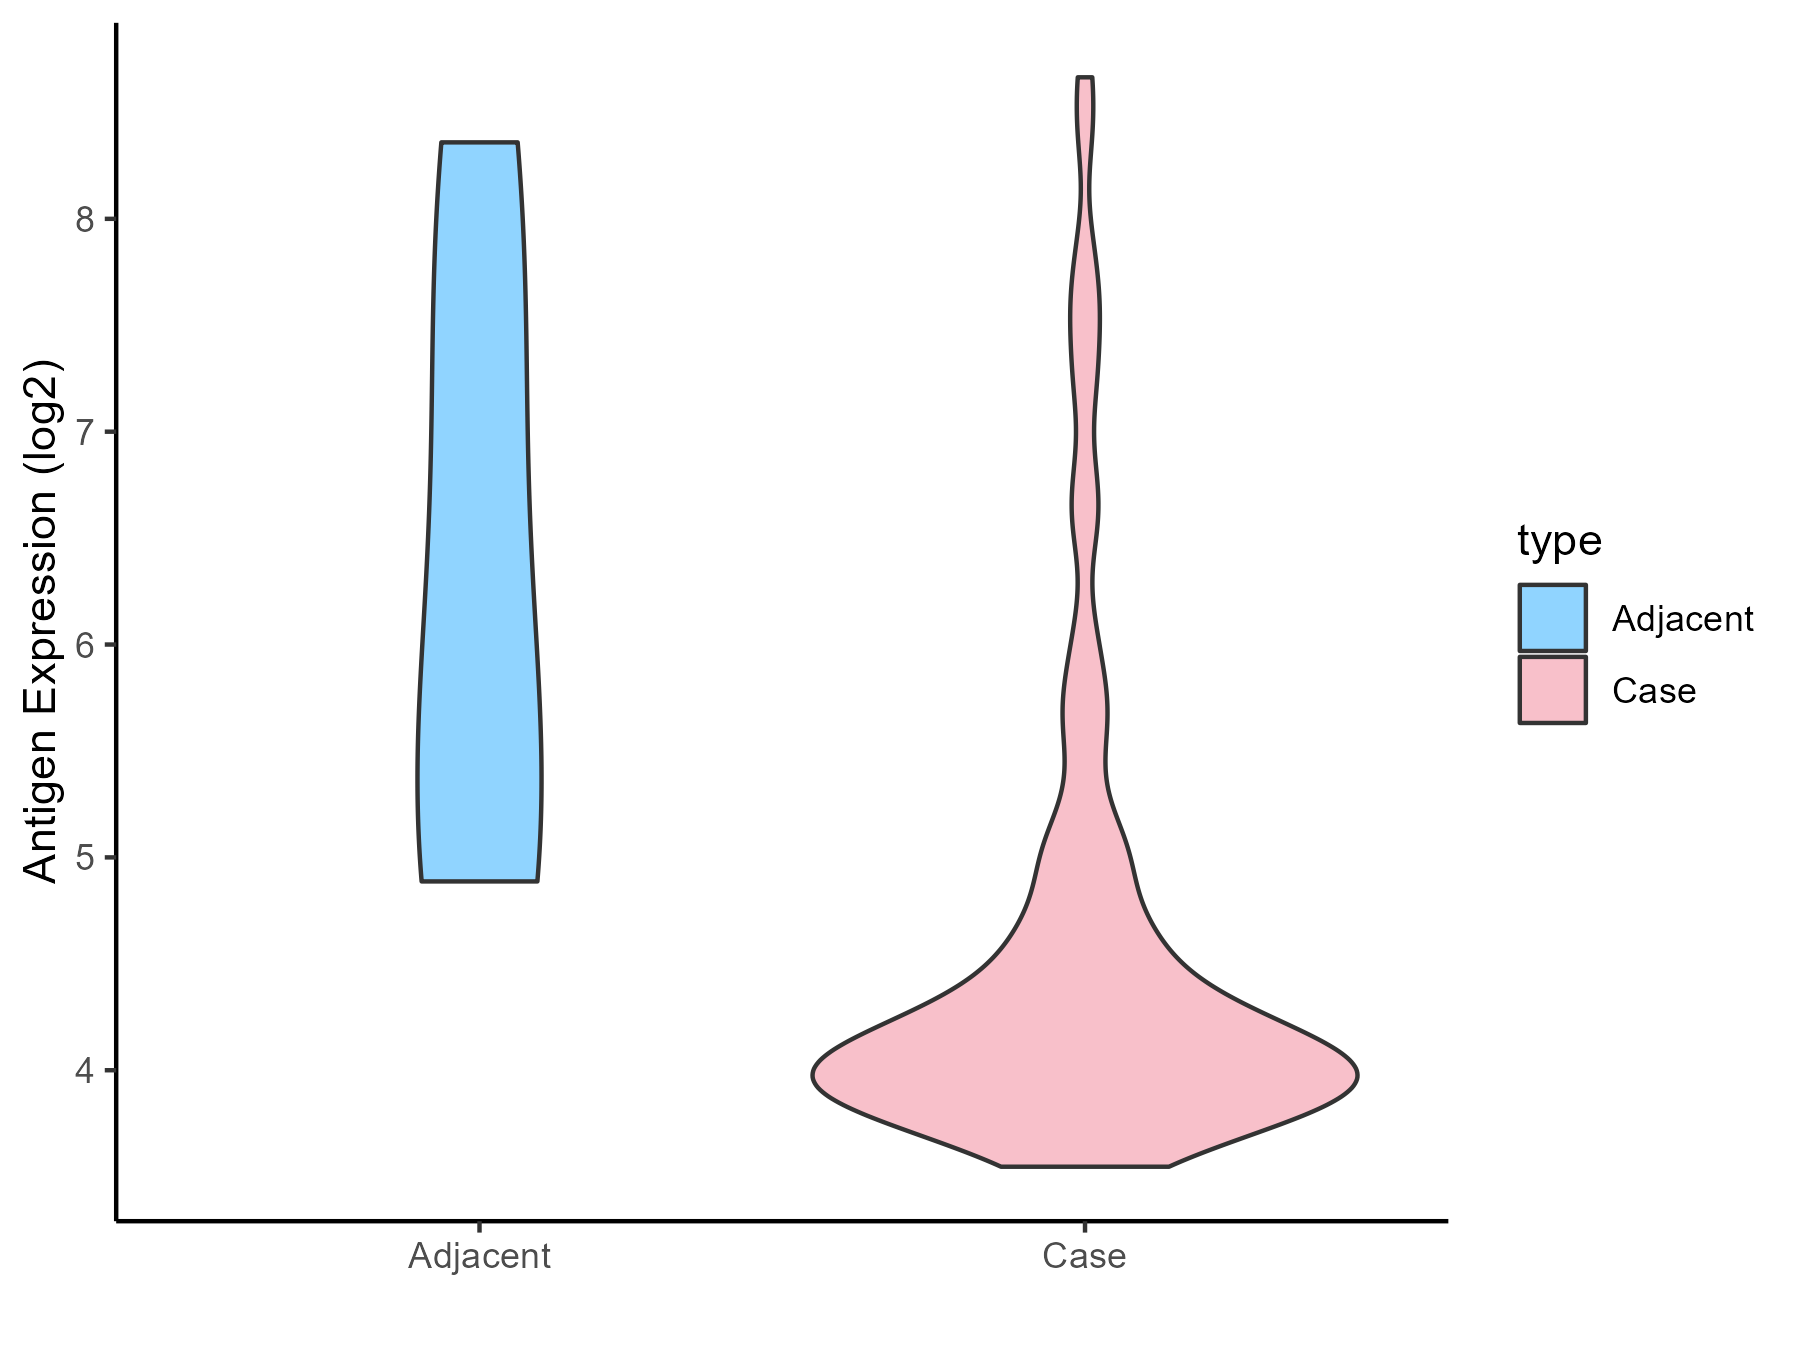
| Differential expression pattern of antigen in diseases | ||
| The Studied Tissue | Esophagus | |
| The Specific Disease | Esophagal cancer | |
| The Expression Level of Disease Section Compare with the Adjacent Tissue | p-value: 0.057676692; Fold-change: -1.888133123; Z-score: -1.234848879 | |
| Disease-specific Antigen Abundances |
|
Click to View the Clearer Original Diagram |
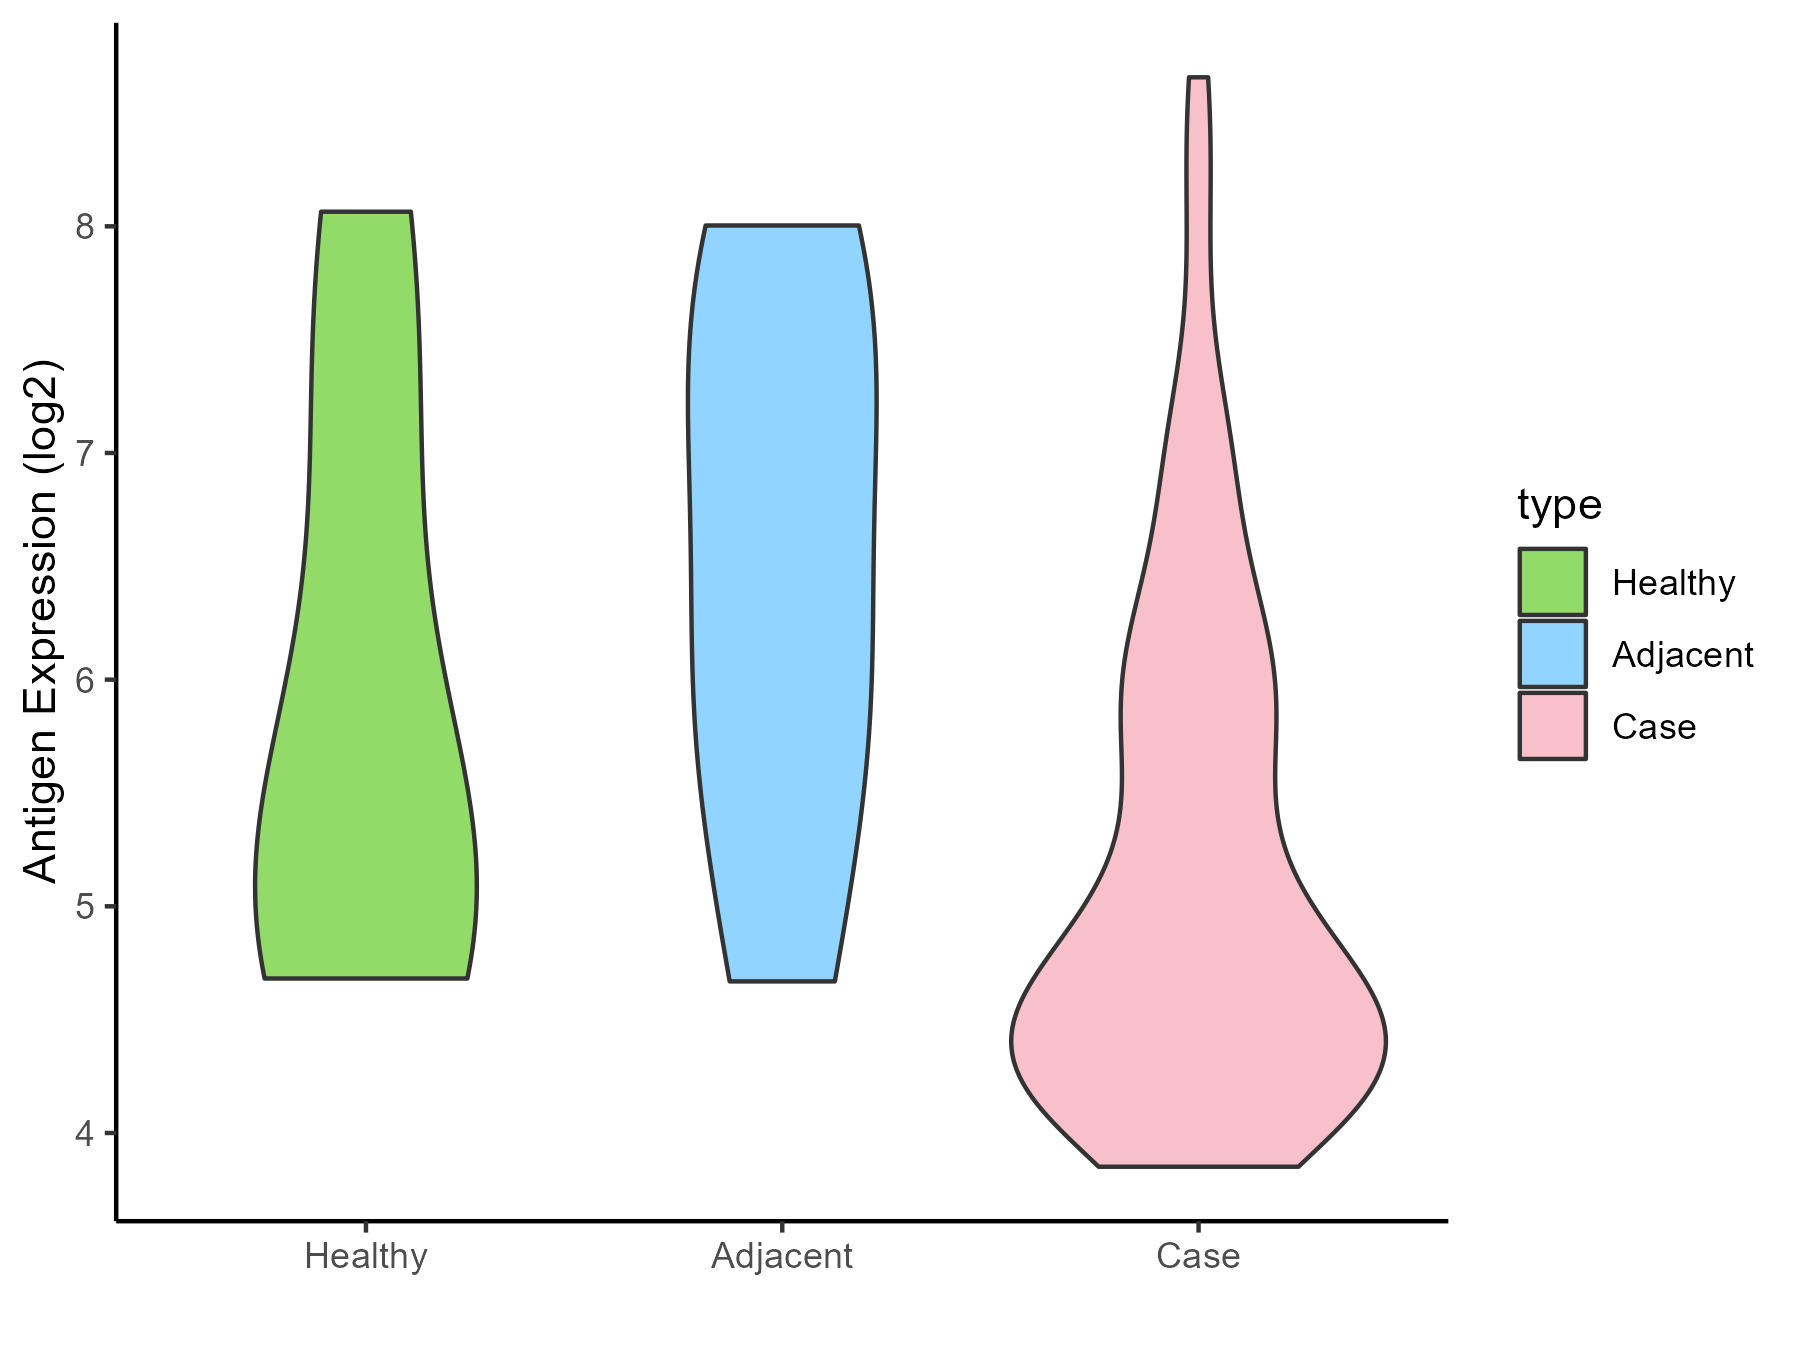
| Differential expression pattern of antigen in diseases | ||
| The Studied Tissue | Rectal colon | |
| The Specific Disease | Rectal cancer | |
| The Expression Level of Disease Section Compare with the Healthy Individual Tissue | p-value: 0.244628948; Fold-change: -0.656351587; Z-score: -0.481853717 | |
| The Expression Level of Disease Section Compare with the Adjacent Tissue | p-value: 0.047064581; Fold-change: -1.786672914; Z-score: -1.421597692 | |
| Disease-specific Antigen Abundances |
|
Click to View the Clearer Original Diagram |
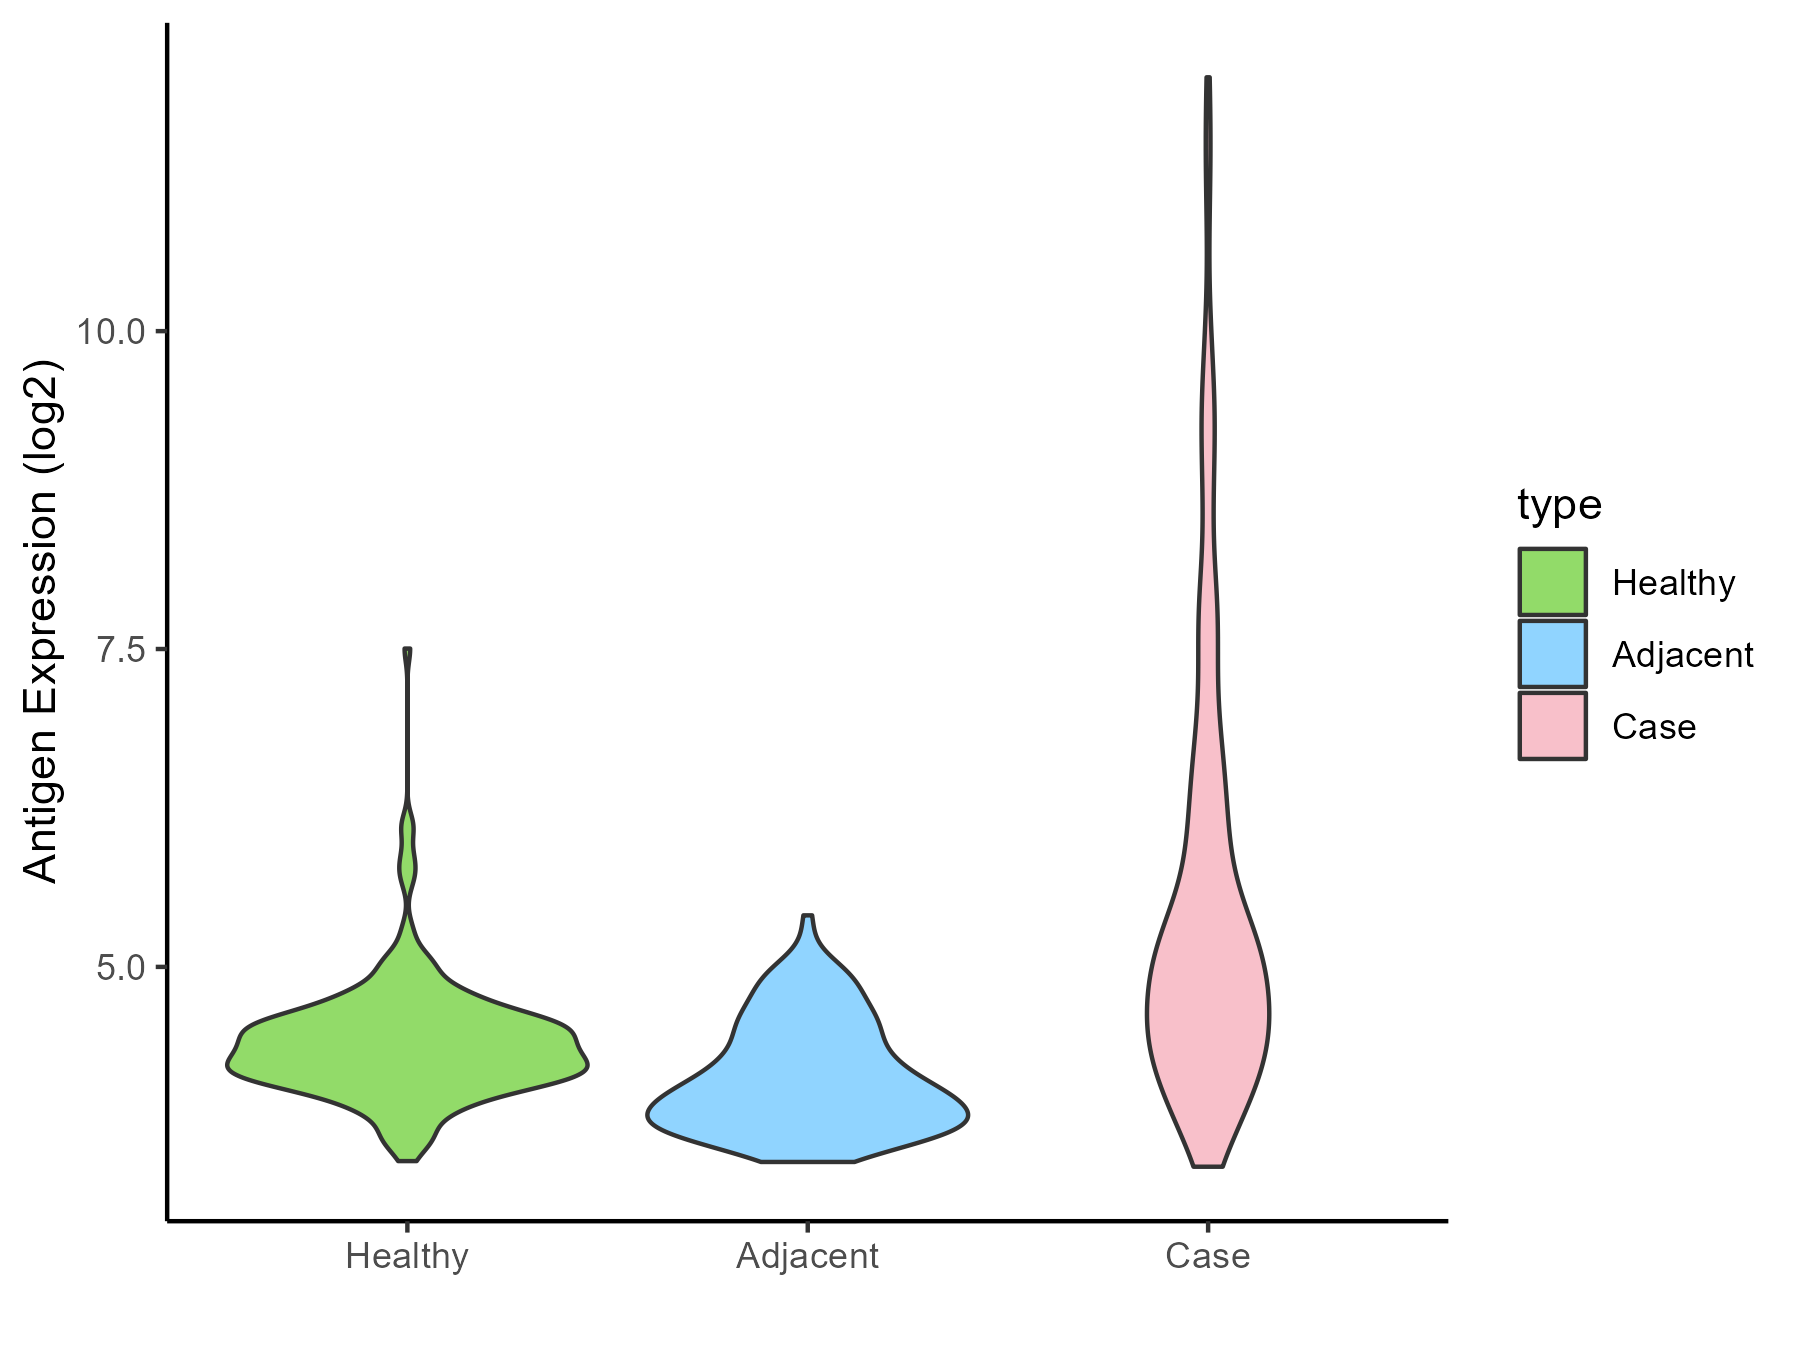
| Differential expression pattern of antigen in diseases | ||
| The Studied Tissue | Skin | |
| The Specific Disease | Skin cancer | |
| The Expression Level of Disease Section Compare with the Healthy Individual Tissue | p-value: 2.14E-29; Fold-change: 0.683114573; Z-score: 1.479986786 | |
| The Expression Level of Disease Section Compare with the Adjacent Tissue | p-value: 1.10E-41; Fold-change: 1.016961659; Z-score: 2.368773576 | |
| Disease-specific Antigen Abundances |
|
Click to View the Clearer Original Diagram |
| Differential expression pattern of antigen in diseases | ||
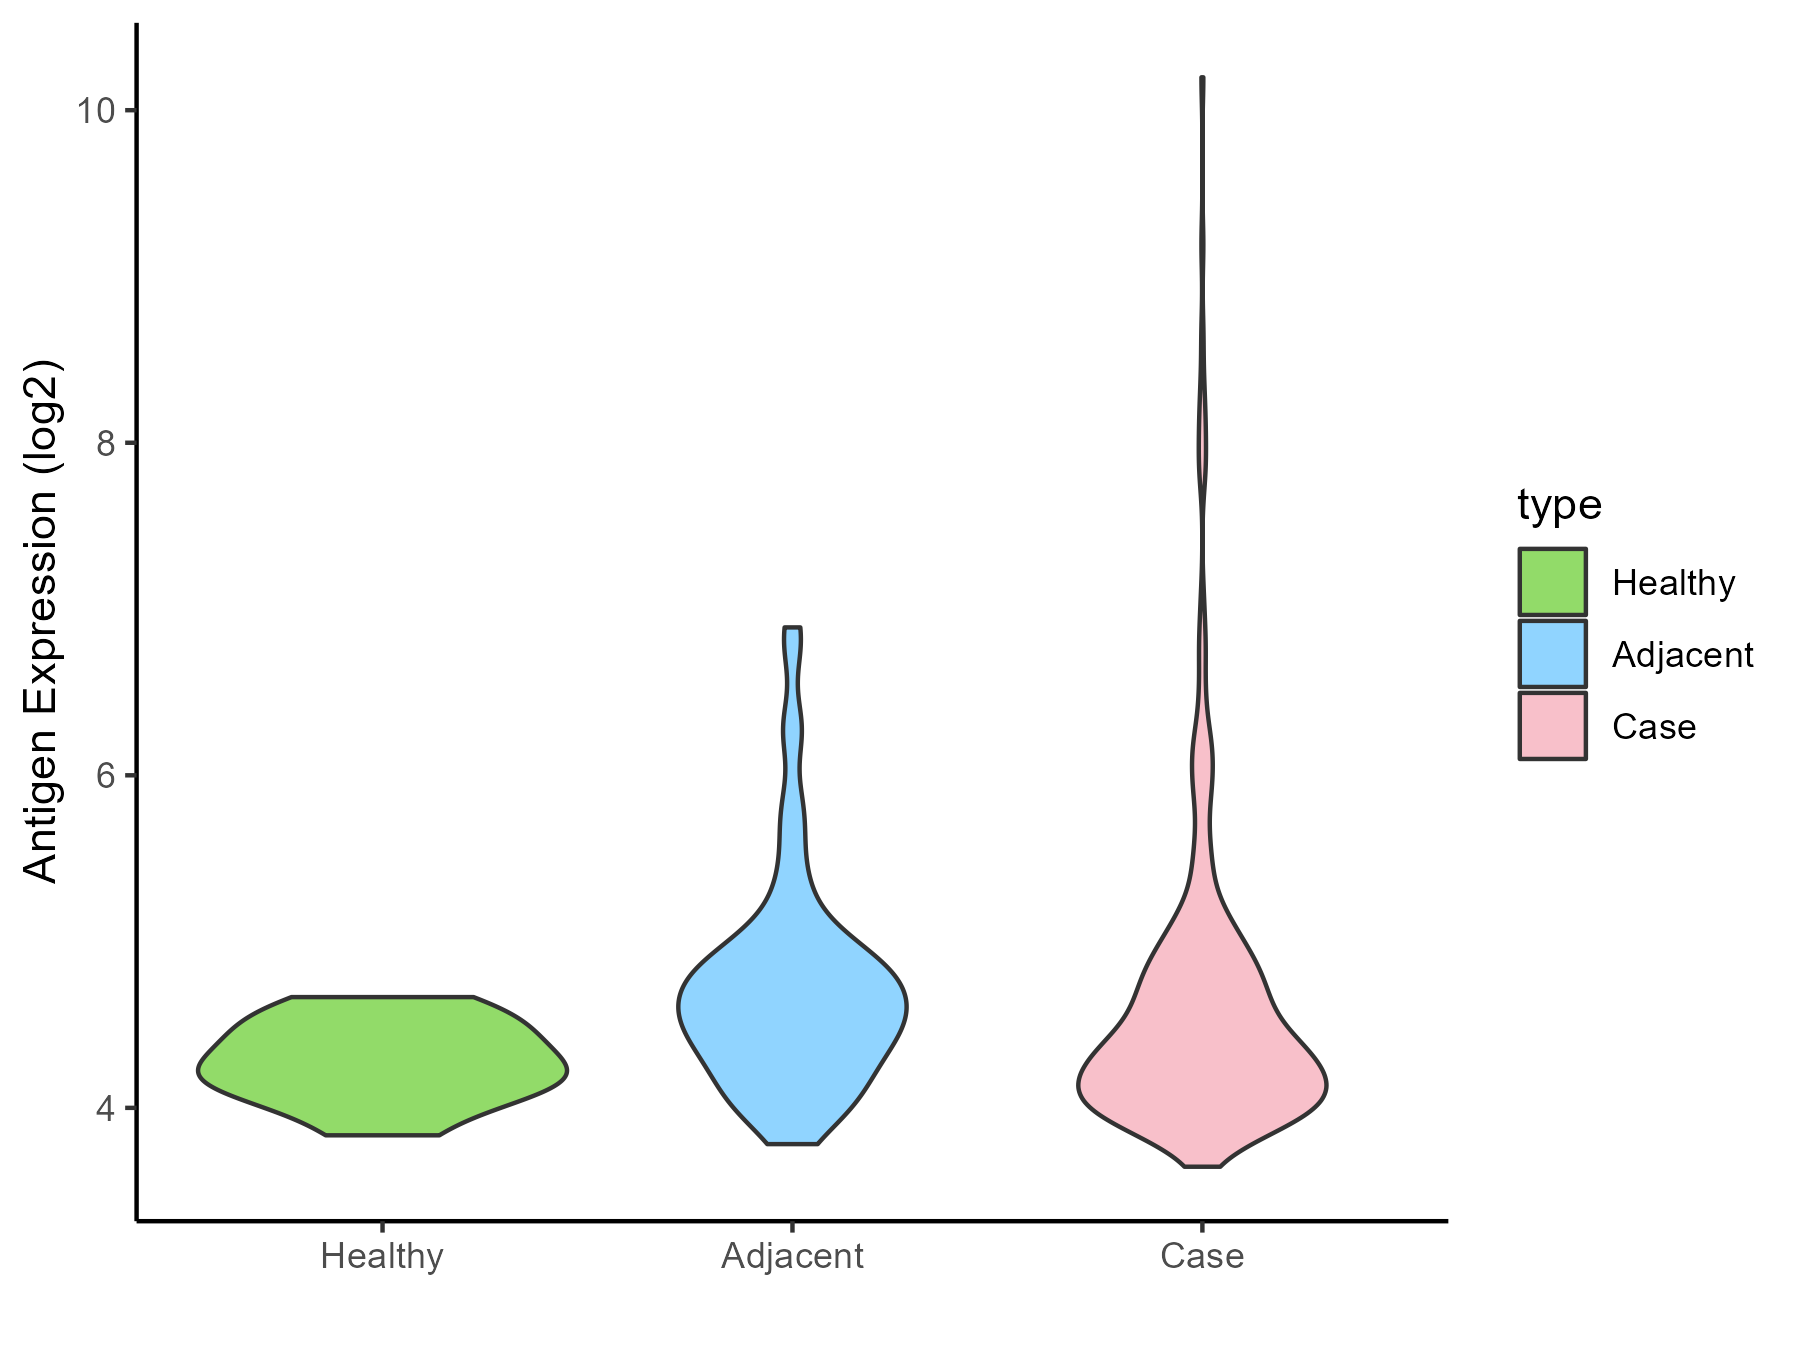
| The Studied Tissue | Kidney | |
| The Specific Disease | Renal cancer | |
| The Expression Level of Disease Section Compare with the Healthy Individual Tissue | p-value: 0.00157132; Fold-change: 0.117830818; Z-score: 0.474667145 | |
| The Expression Level of Disease Section Compare with the Adjacent Tissue | p-value: 0.249554837; Fold-change: -0.242640762; Z-score: -0.385062914 | |
| Disease-specific Antigen Abundances |
|
Click to View the Clearer Original Diagram |
| Differential expression pattern of antigen in diseases | ||
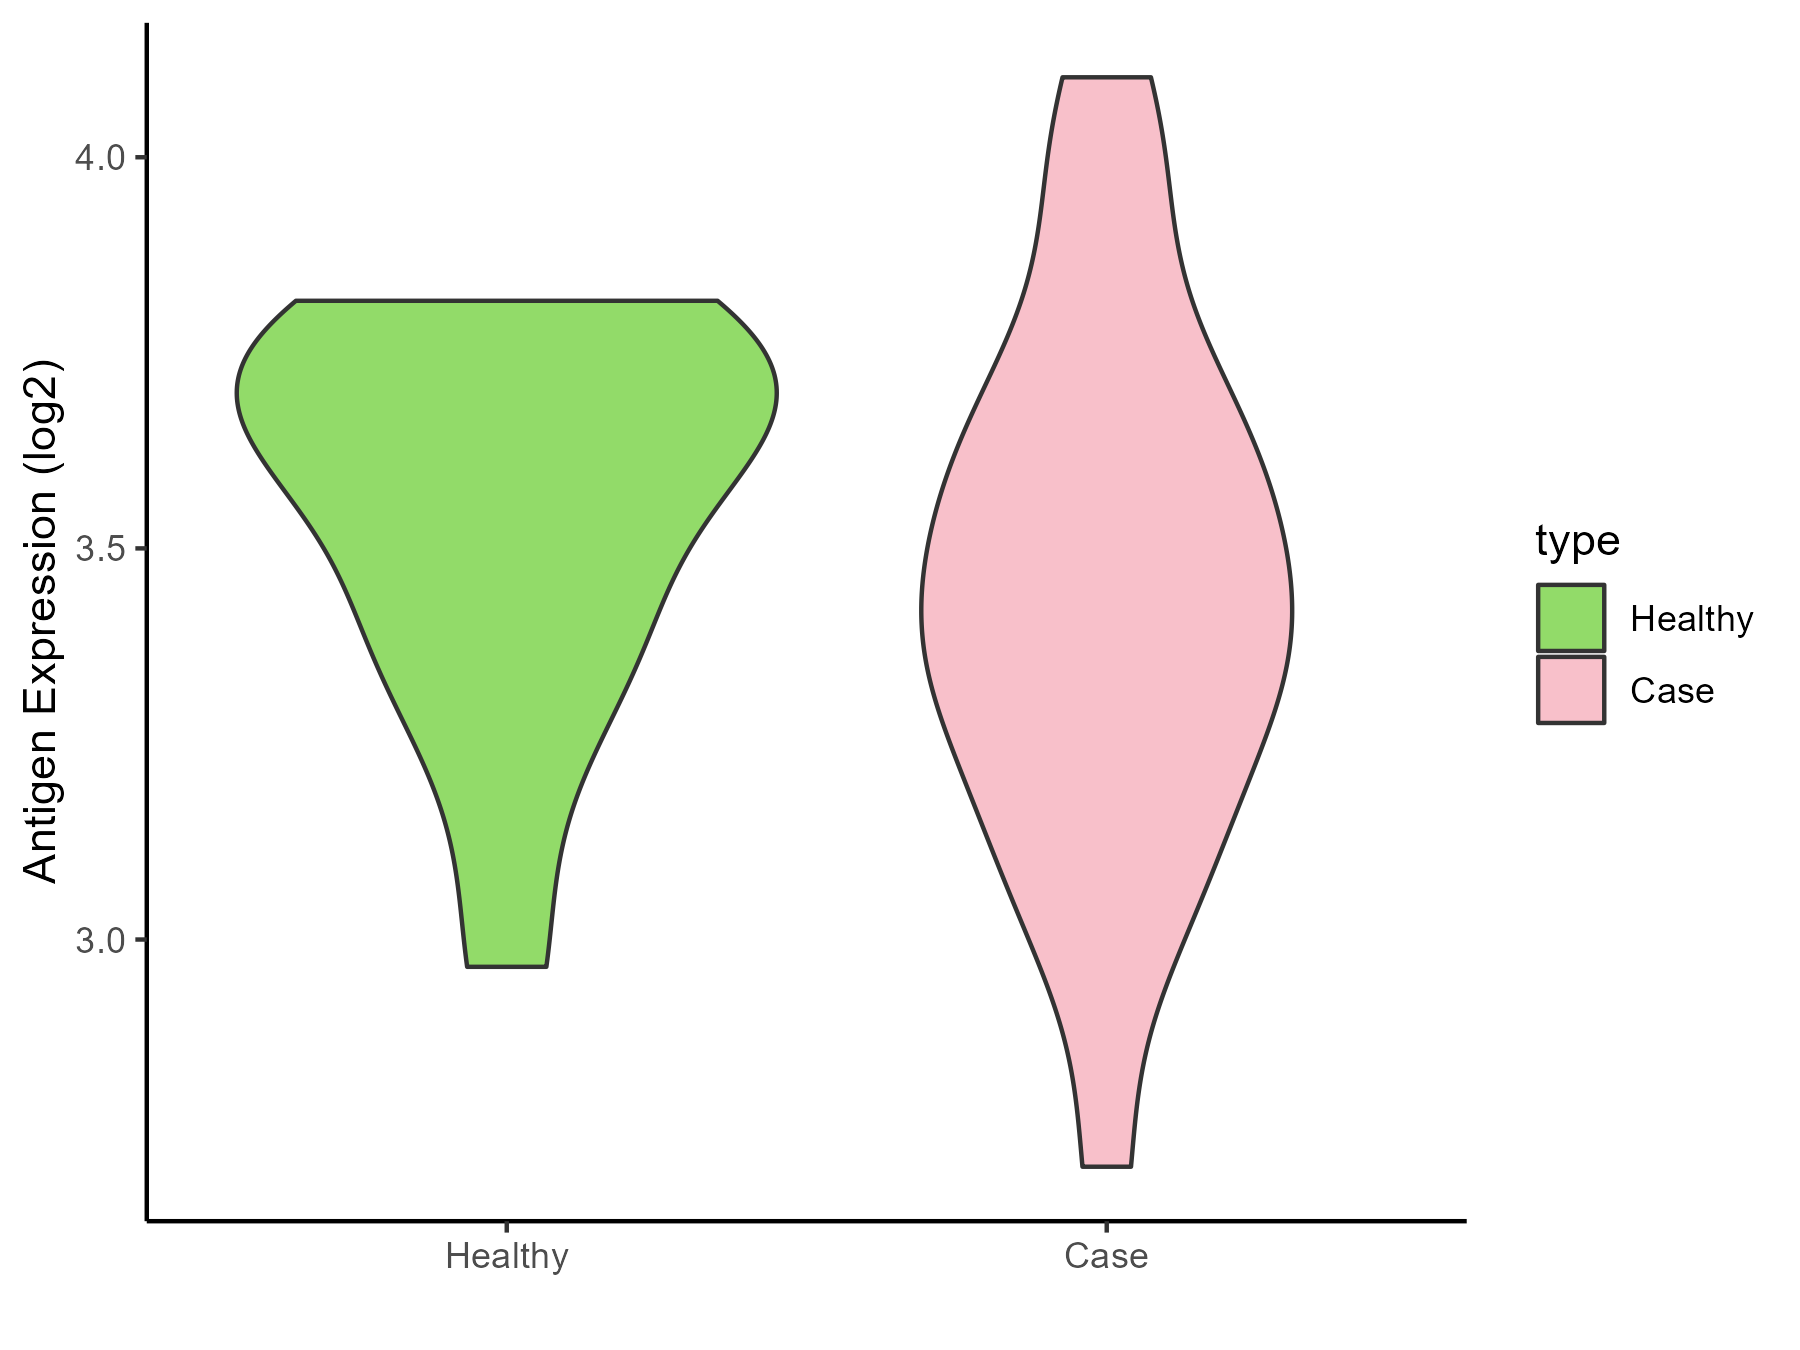
| The Studied Tissue | Urothelium | |
| The Specific Disease | Ureter cancer | |
| The Expression Level of Disease Section Compare with the Healthy Individual Tissue | p-value: 0.237401496; Fold-change: -0.202519707; Z-score: -0.818217249 | |
| Disease-specific Antigen Abundances |
|
Click to View the Clearer Original Diagram |
ICD Disease Classification 20
| Differential expression pattern of antigen in diseases | ||
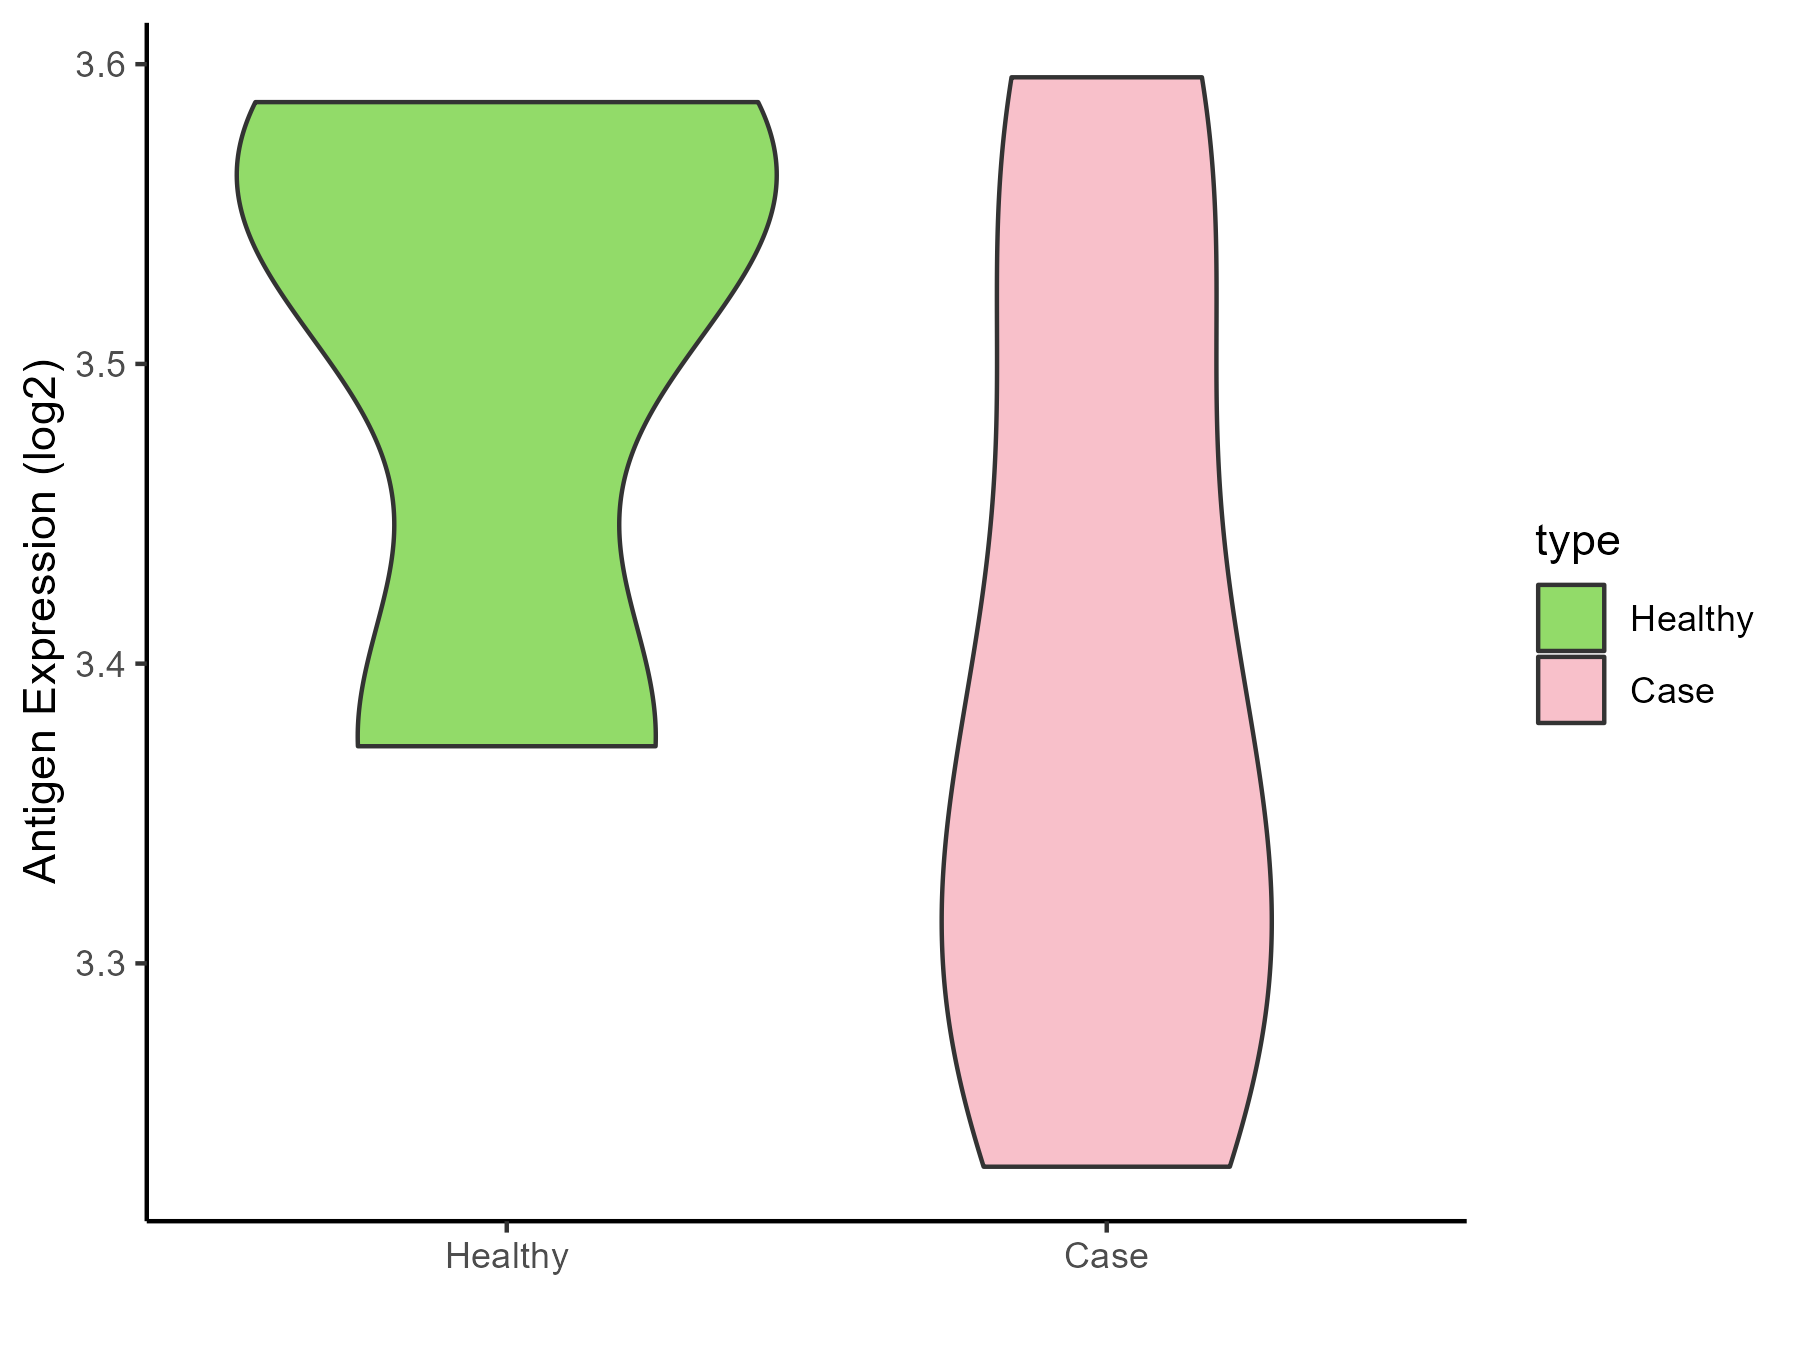
| The Studied Tissue | Adipose | |
| The Specific Disease | Simpson golabi behmel syndrome | |
| The Expression Level of Disease Section Compare with the Healthy Individual Tissue | p-value: 0.271294134; Fold-change: -0.187430744; Z-score: -1.660131291 | |
| Disease-specific Antigen Abundances |
|
Click to View the Clearer Original Diagram |
| Differential expression pattern of antigen in diseases | ||
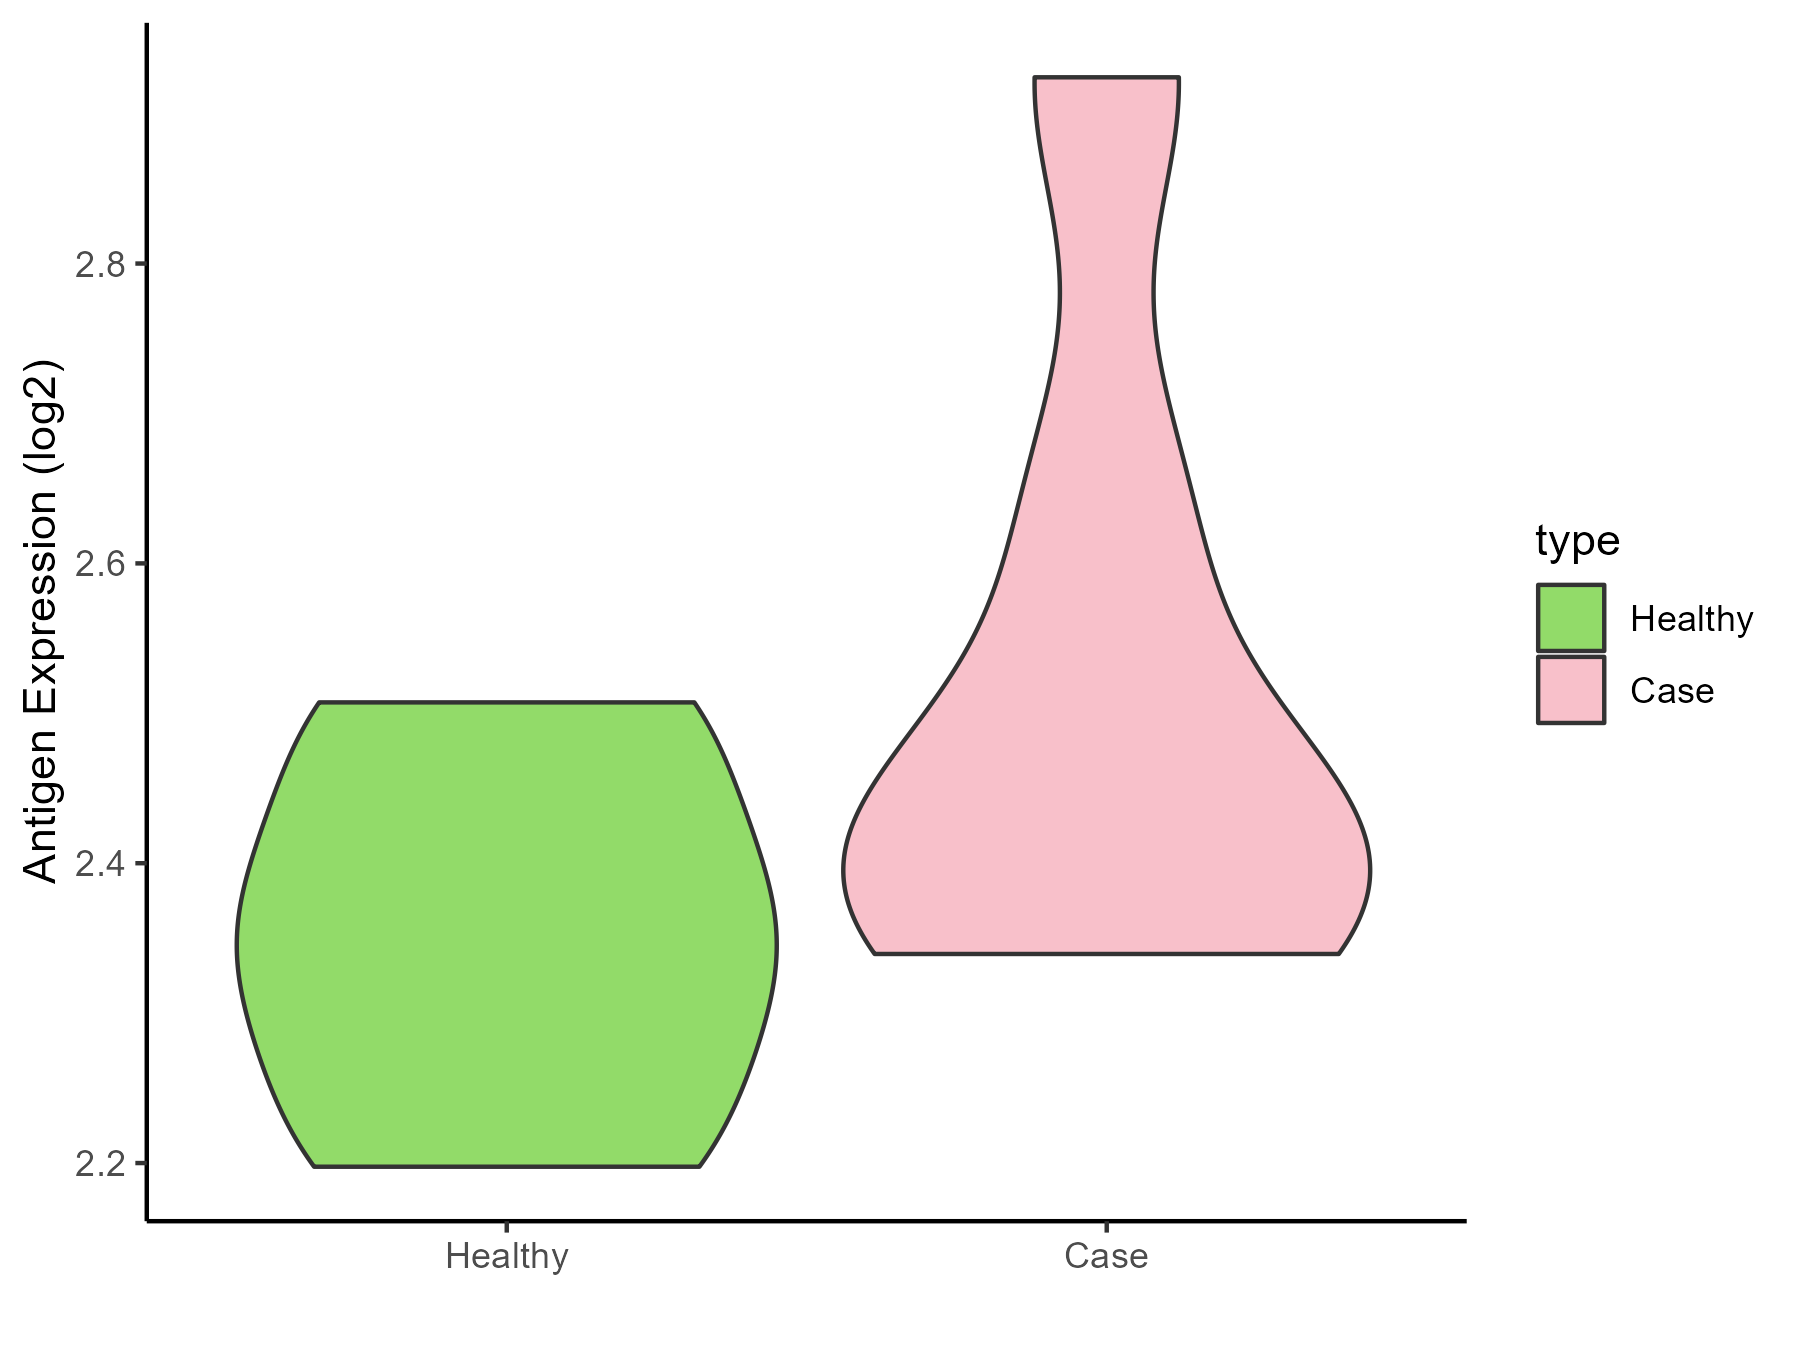
| The Studied Tissue | Perituberal | |
| The Specific Disease | Tuberous sclerosis complex | |
| The Expression Level of Disease Section Compare with the Healthy Individual Tissue | p-value: 0.170821227; Fold-change: 0.081955621; Z-score: 0.624737608 | |
| Disease-specific Antigen Abundances |
|
Click to View the Clearer Original Diagram |
ICD Disease Classification 3
| Differential expression pattern of antigen in diseases | ||
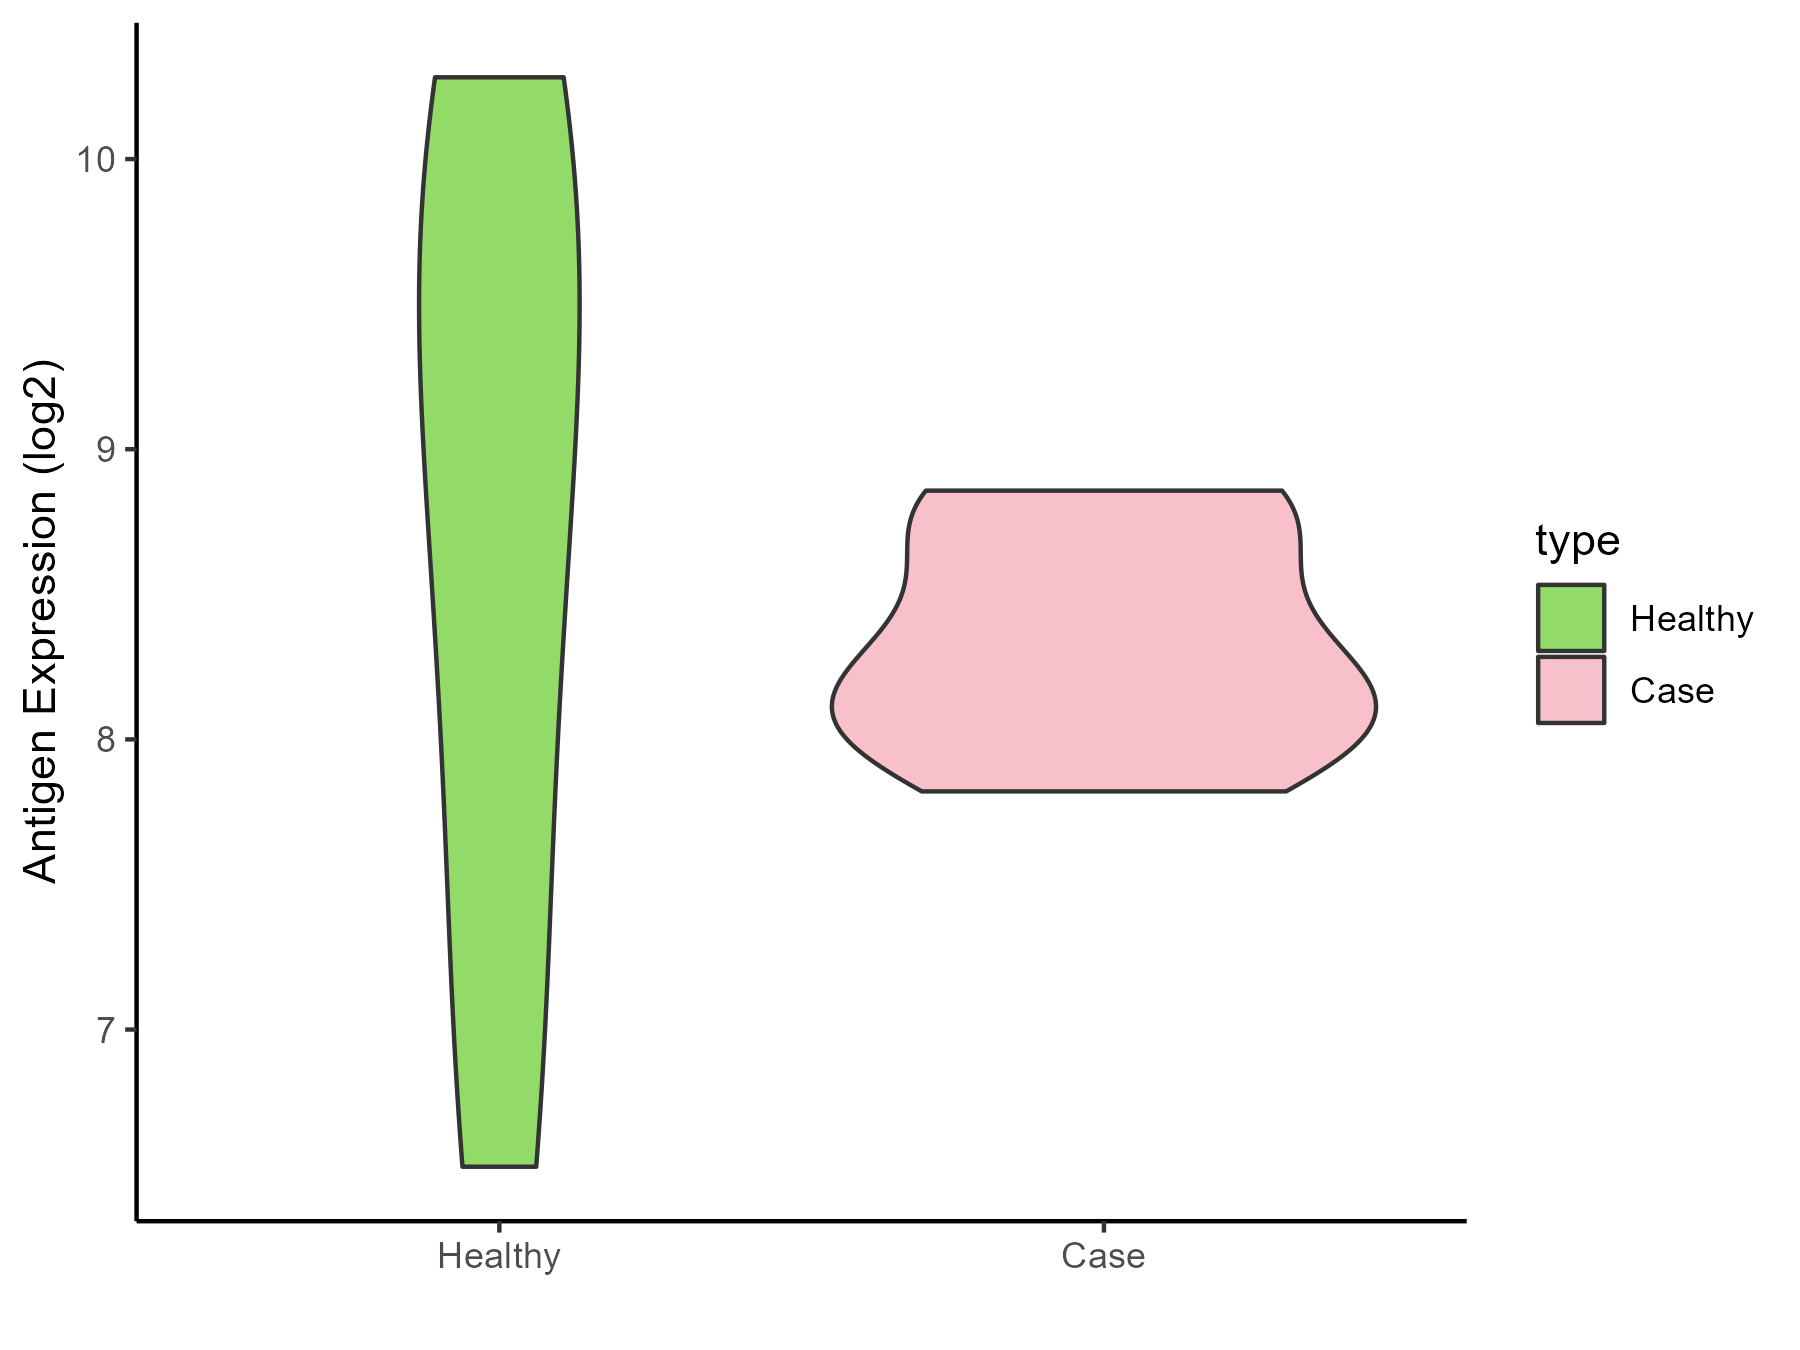
| The Studied Tissue | Bone marrow | |
| The Specific Disease | Anemia | |
| The Expression Level of Disease Section Compare with the Healthy Individual Tissue | p-value: 0.51481739; Fold-change: -0.683204939; Z-score: -0.493936034 | |
| Disease-specific Antigen Abundances |
|
Click to View the Clearer Original Diagram |
| Differential expression pattern of antigen in diseases | ||
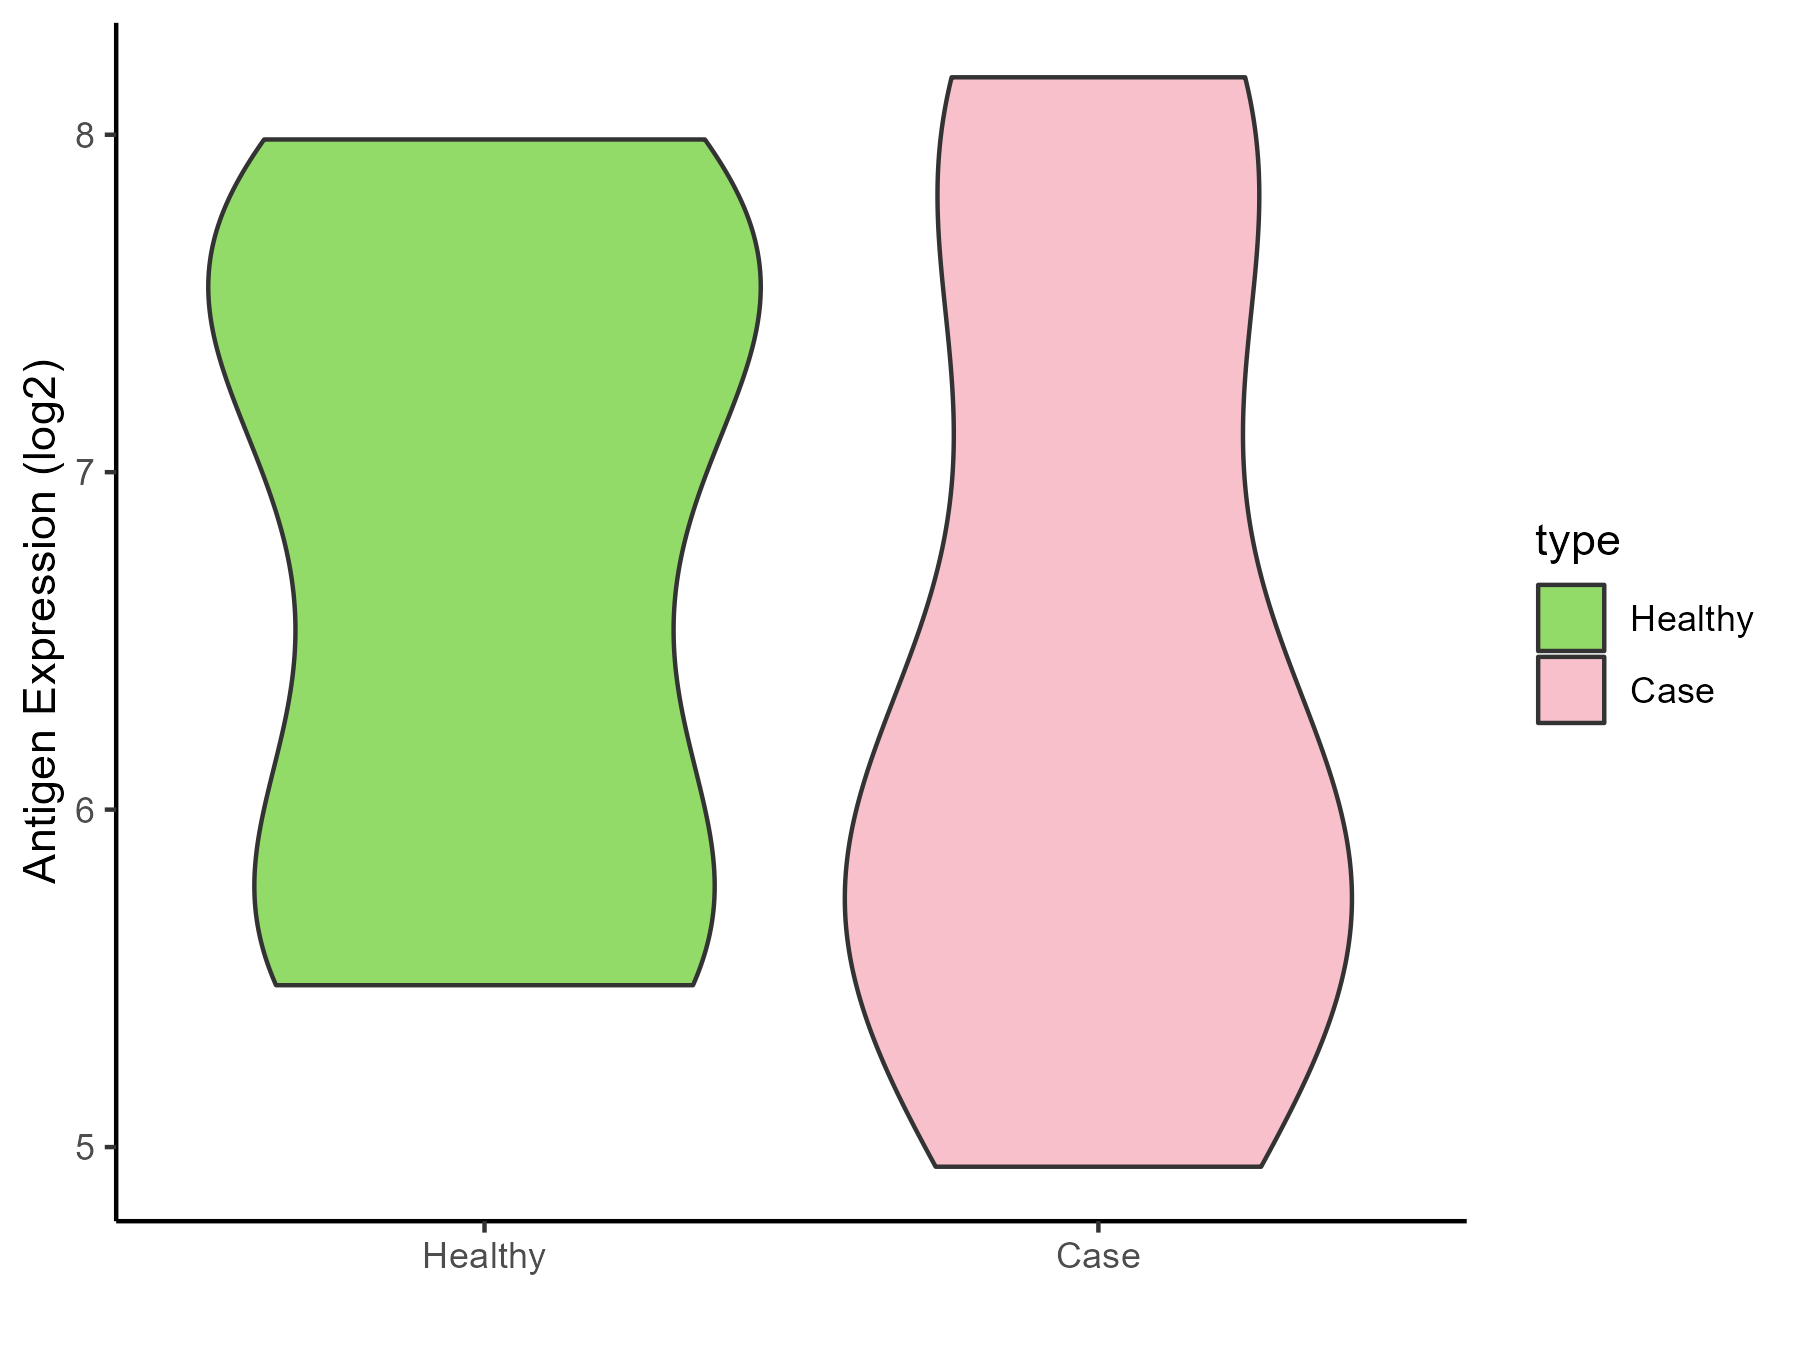
| The Studied Tissue | Peripheral blood | |
| The Specific Disease | Sickle cell disease | |
| The Expression Level of Disease Section Compare with the Healthy Individual Tissue | p-value: 0.499511545; Fold-change: -0.777629184; Z-score: -0.802899422 | |
| Disease-specific Antigen Abundances |
|
Click to View the Clearer Original Diagram |
| Differential expression pattern of antigen in diseases | ||
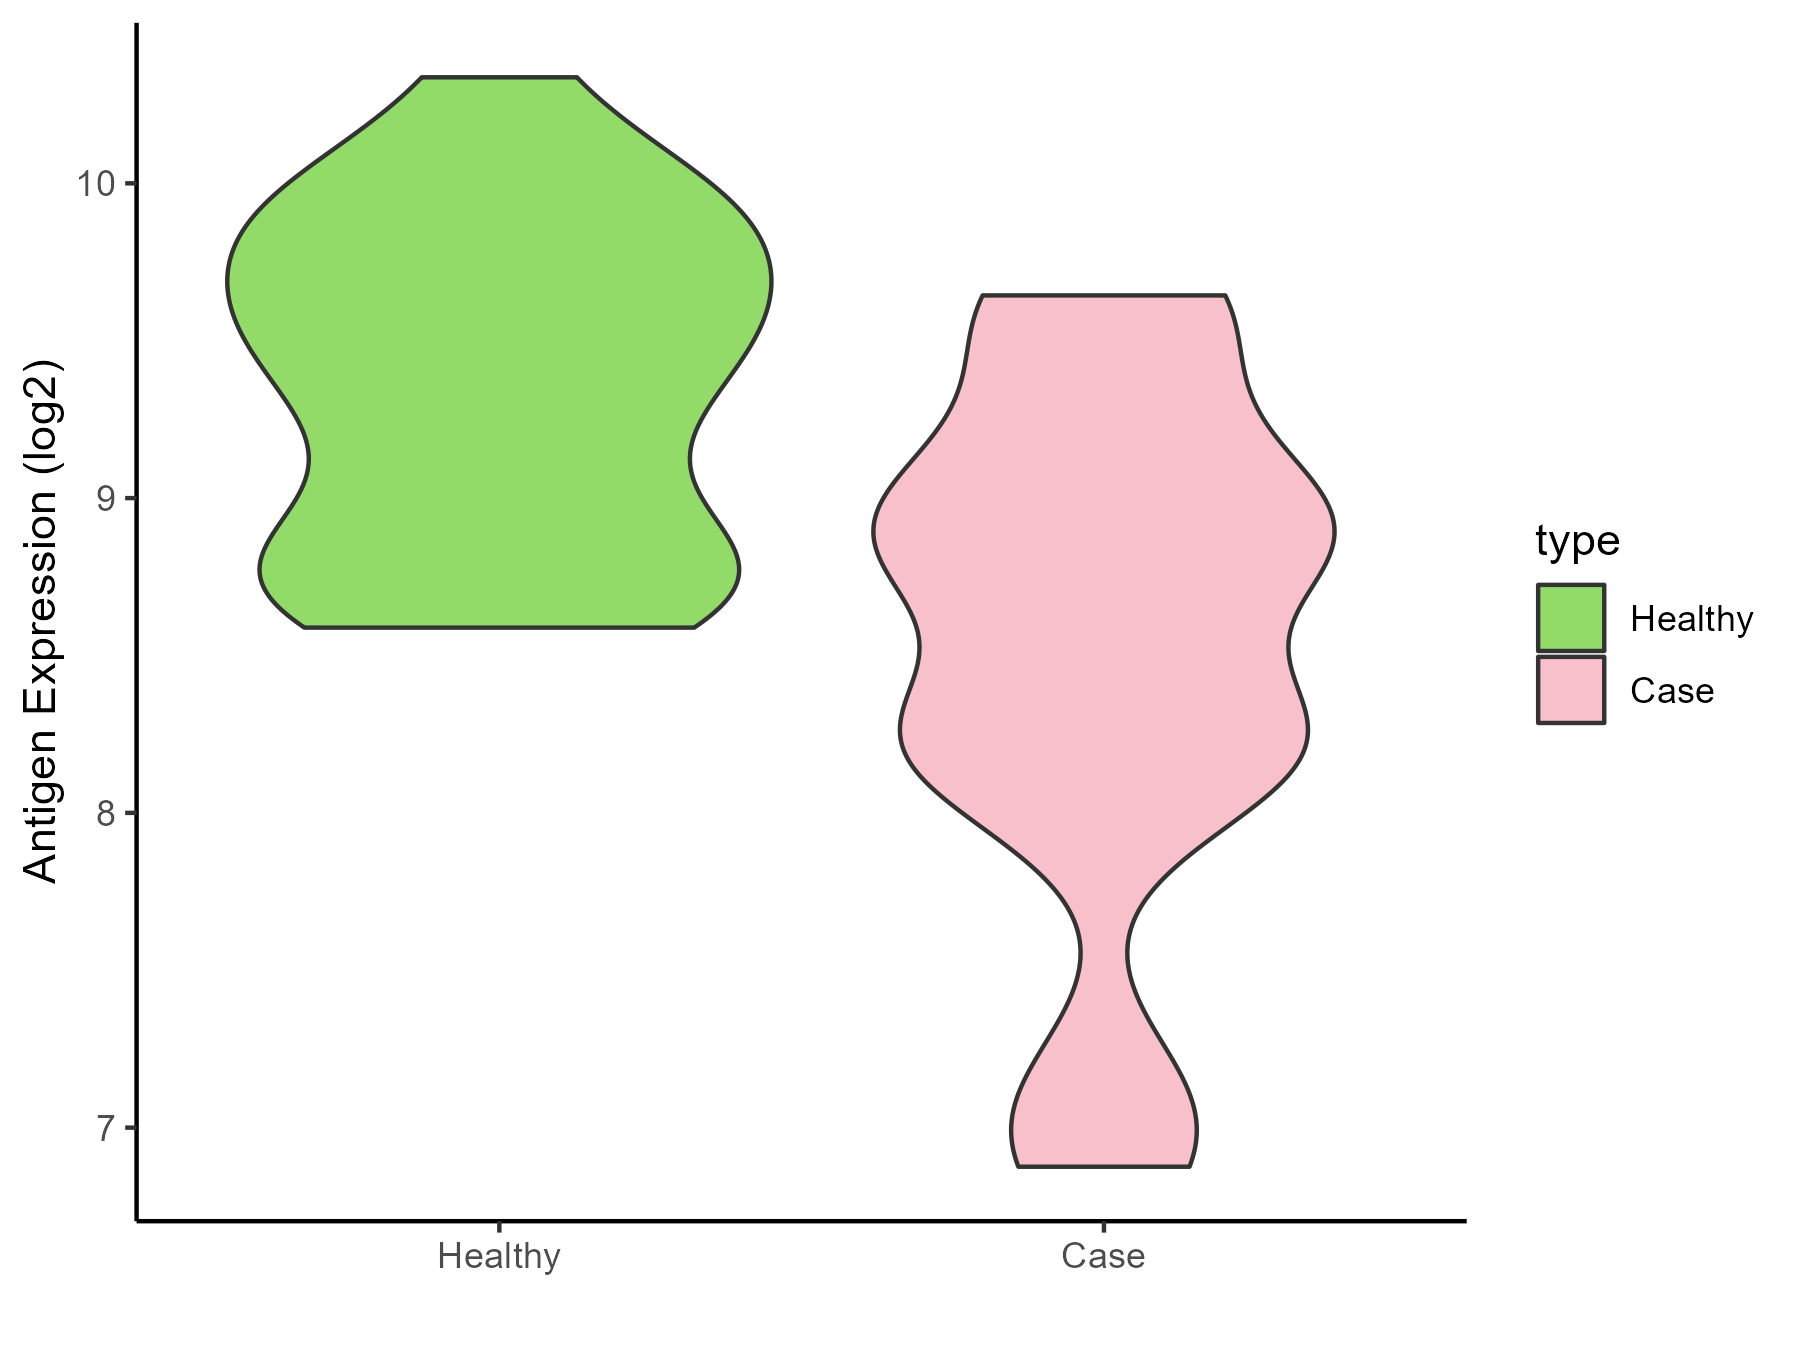
| The Studied Tissue | Whole blood | |
| The Specific Disease | Thrombocythemia | |
| The Expression Level of Disease Section Compare with the Healthy Individual Tissue | p-value: 4.56E-05; Fold-change: -0.63700321; Z-score: -1.201965685 | |
| Disease-specific Antigen Abundances |
|
Click to View the Clearer Original Diagram |
ICD Disease Classification 4
| Differential expression pattern of antigen in diseases | ||
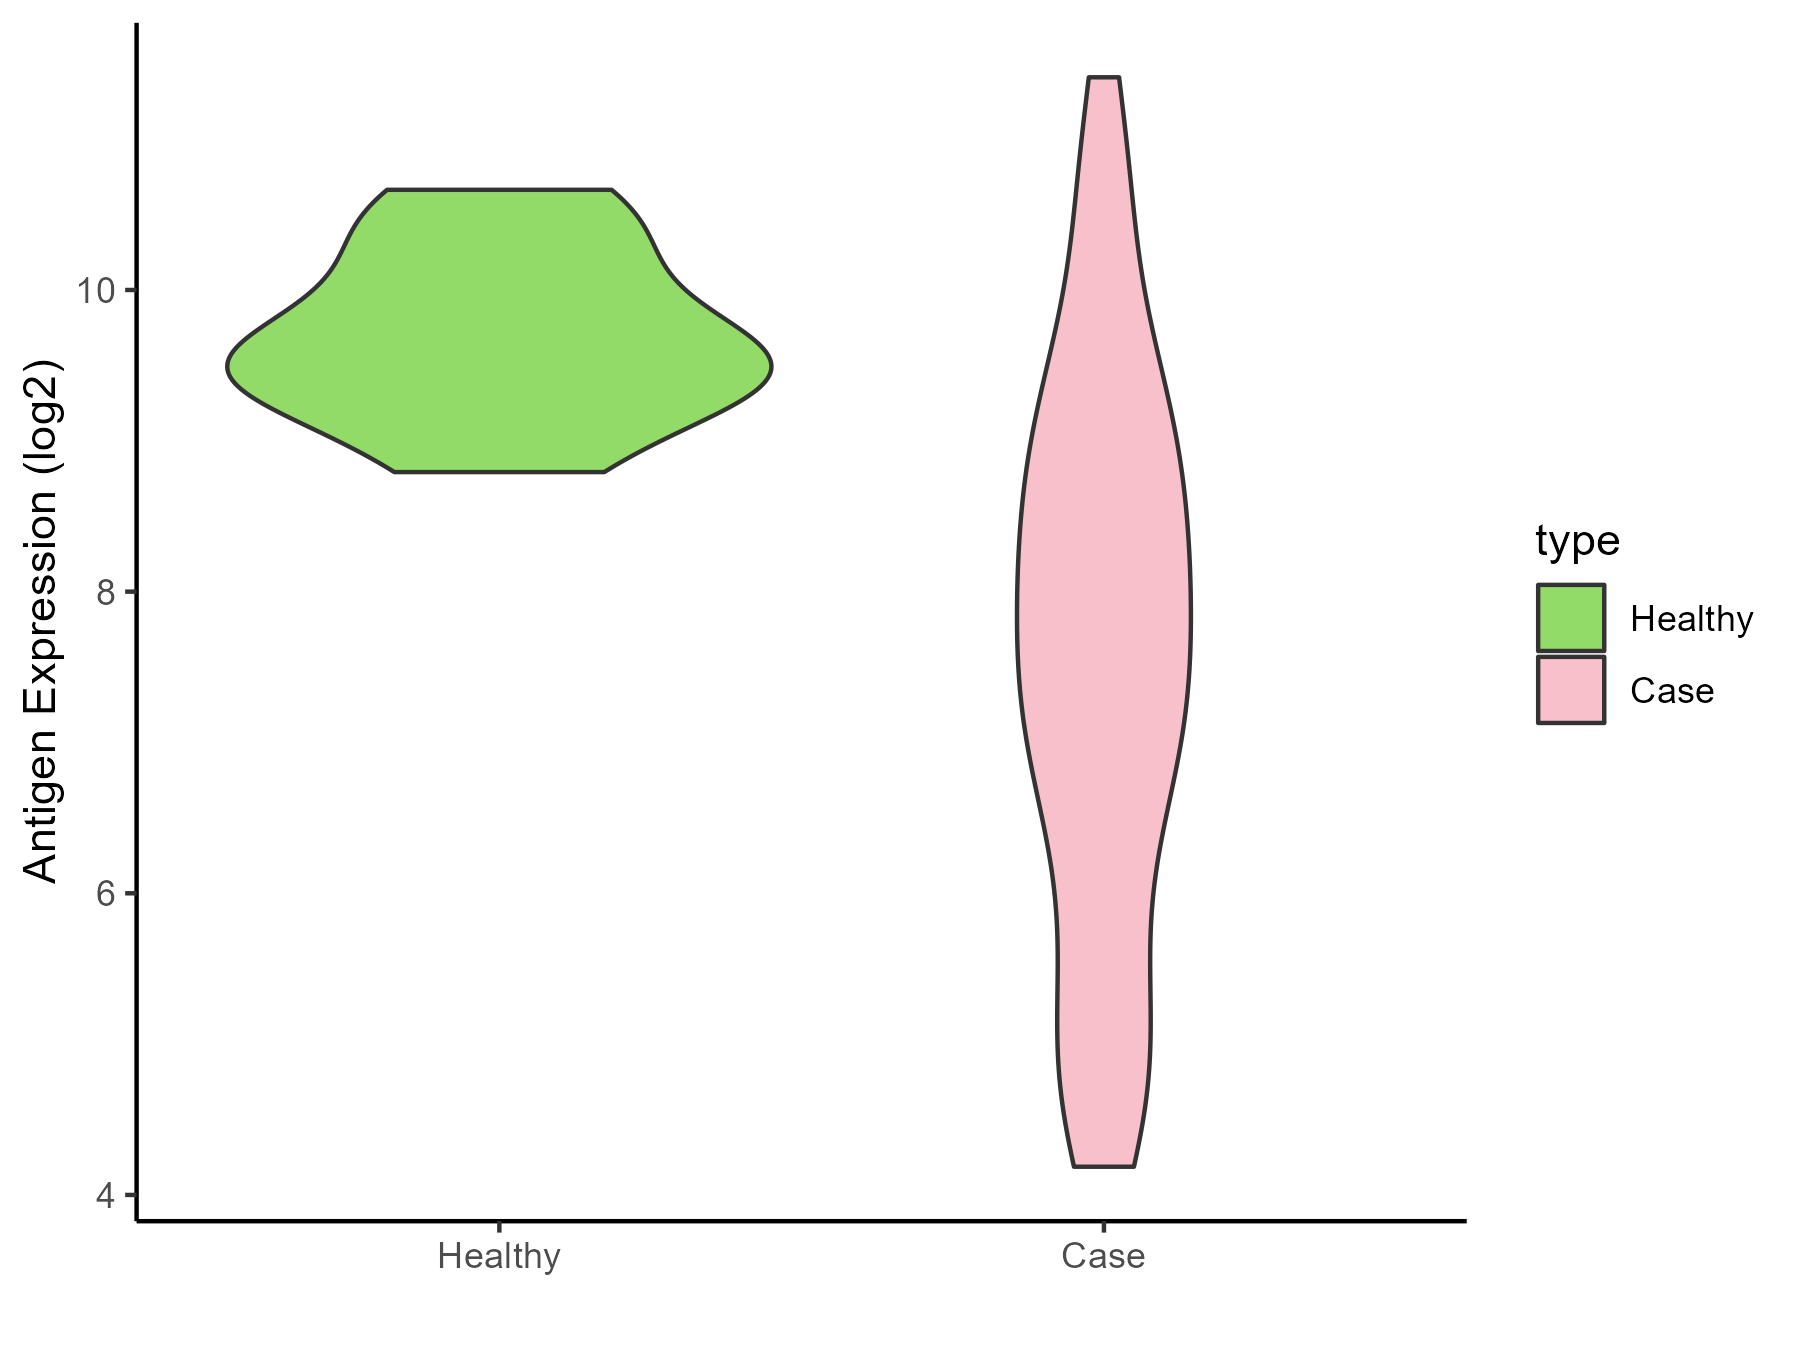
| The Studied Tissue | Whole blood | |
| The Specific Disease | Scleroderma | |
| The Expression Level of Disease Section Compare with the Healthy Individual Tissue | p-value: 2.11E-08; Fold-change: -2.090662208; Z-score: -3.547420246 | |
| Disease-specific Antigen Abundances |
|
Click to View the Clearer Original Diagram |
| Differential expression pattern of antigen in diseases | ||
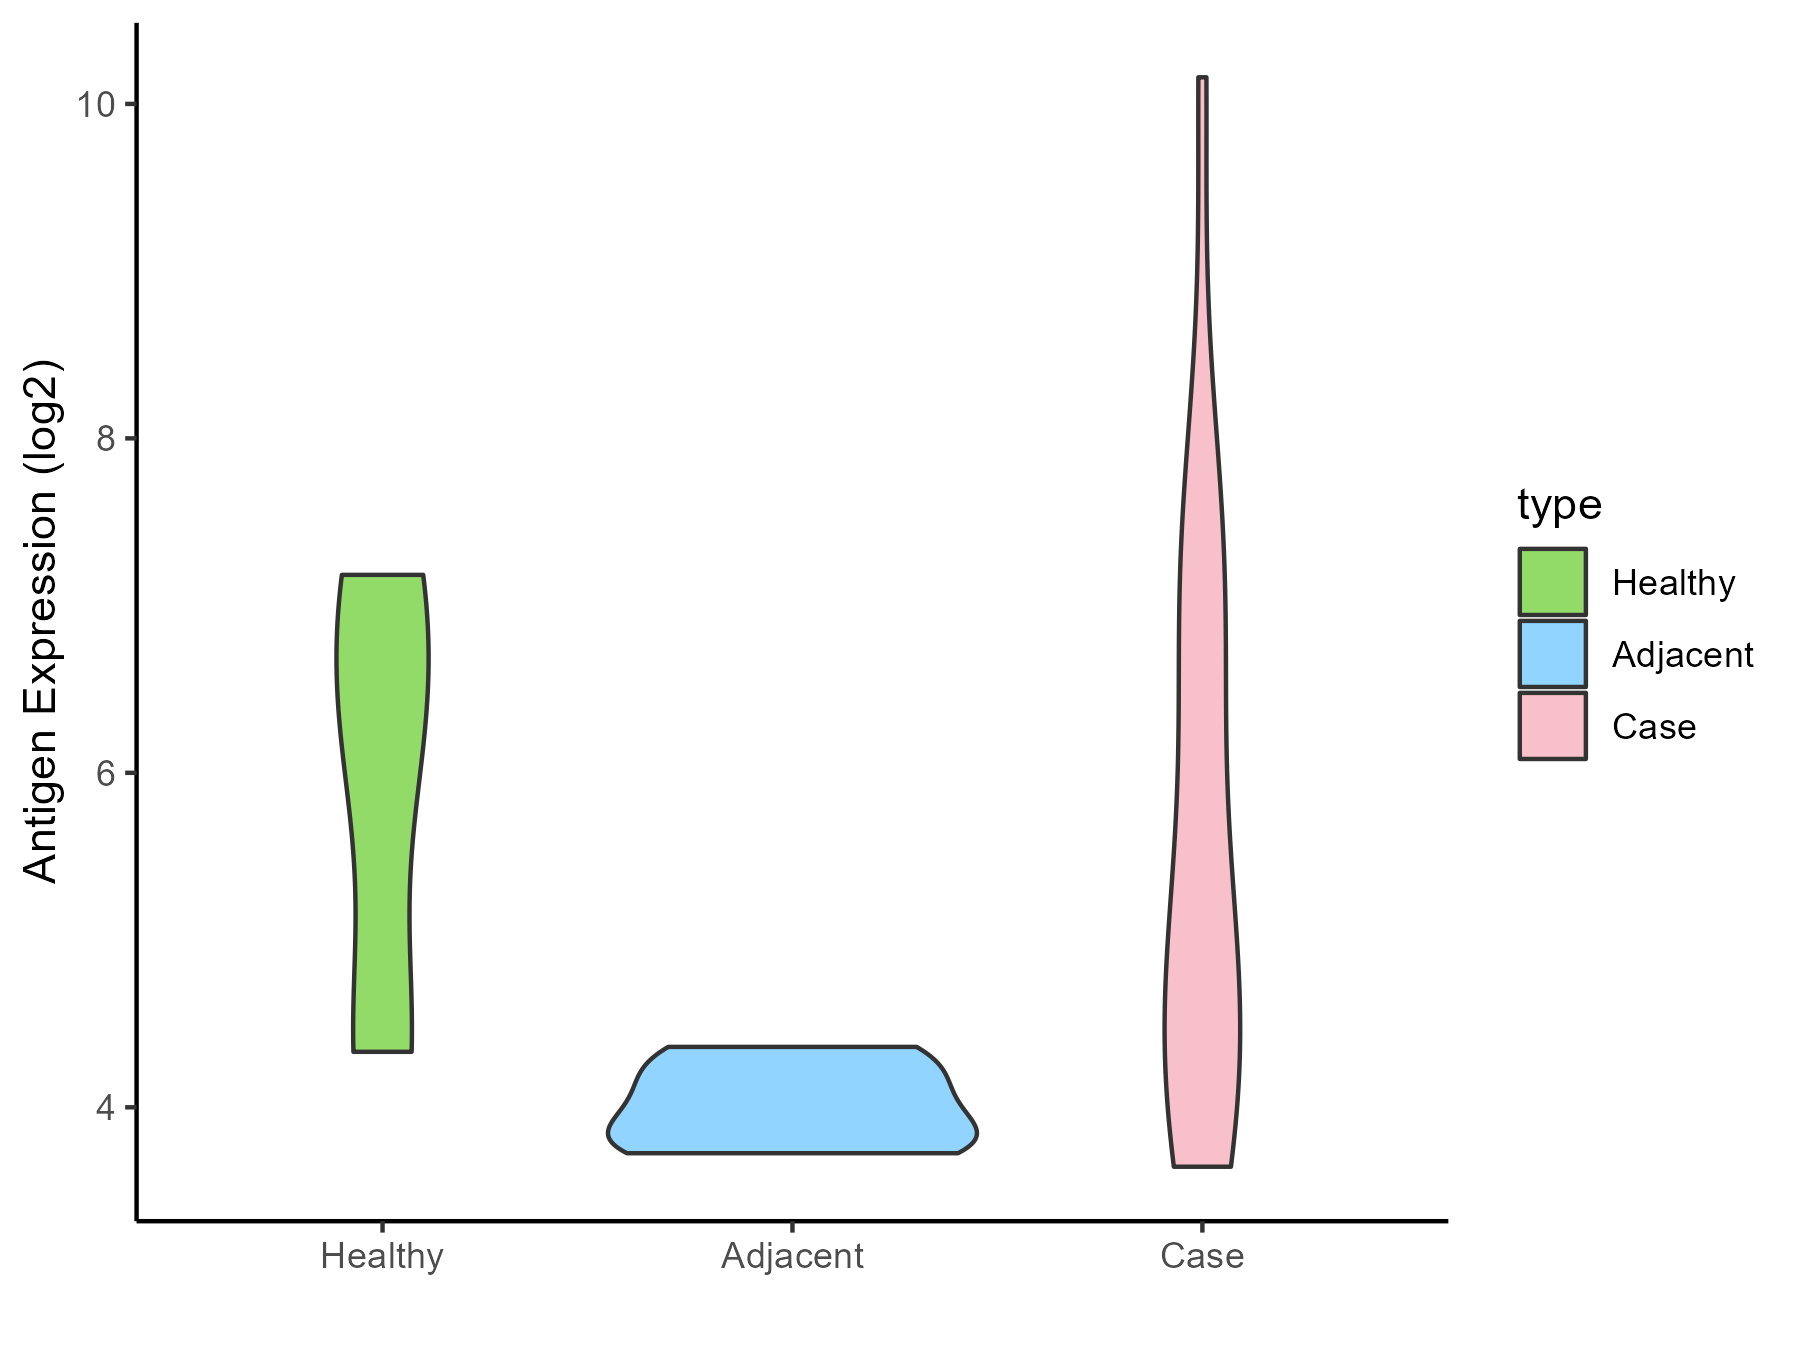
| The Studied Tissue | Salivary gland | |
| The Specific Disease | Sjogren syndrome | |
| The Expression Level of Disease Section Compare with the Healthy Individual Tissue | p-value: 0.787638636; Fold-change: -0.977282137; Z-score: -0.673081188 | |
| The Expression Level of Disease Section Compare with the Adjacent Tissue | p-value: 0.001010061; Fold-change: 1.275611118; Z-score: 4.440124437 | |
| Disease-specific Antigen Abundances |
|
Click to View the Clearer Original Diagram |
| Differential expression pattern of antigen in diseases | ||
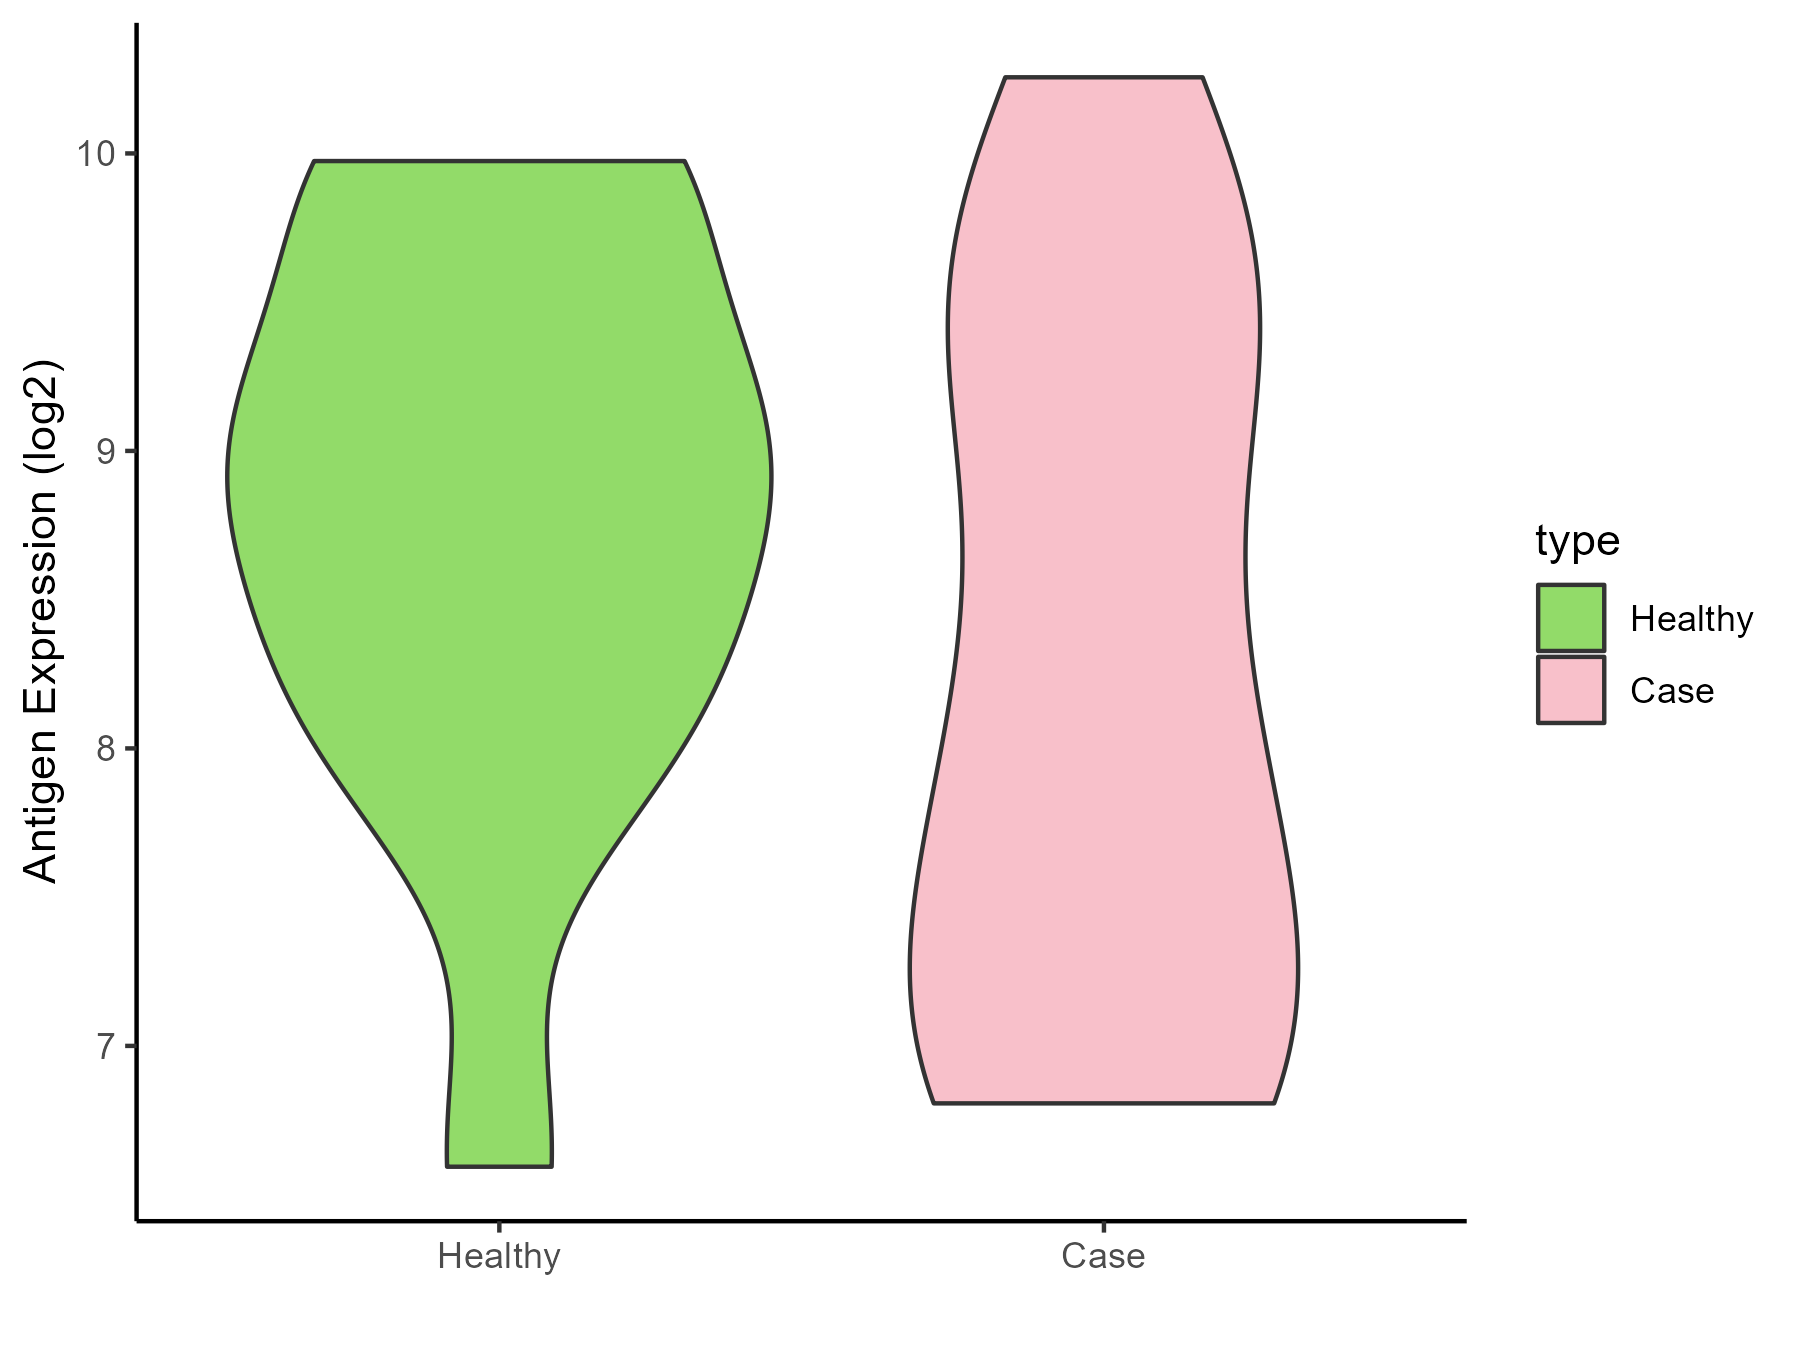
| The Studied Tissue | Peripheral blood | |
| The Specific Disease | Behcet disease | |
| The Expression Level of Disease Section Compare with the Healthy Individual Tissue | p-value: 0.241658144; Fold-change: -0.9303581; Z-score: -0.932813523 | |
| Disease-specific Antigen Abundances |
|
Click to View the Clearer Original Diagram |
| Differential expression pattern of antigen in diseases | ||
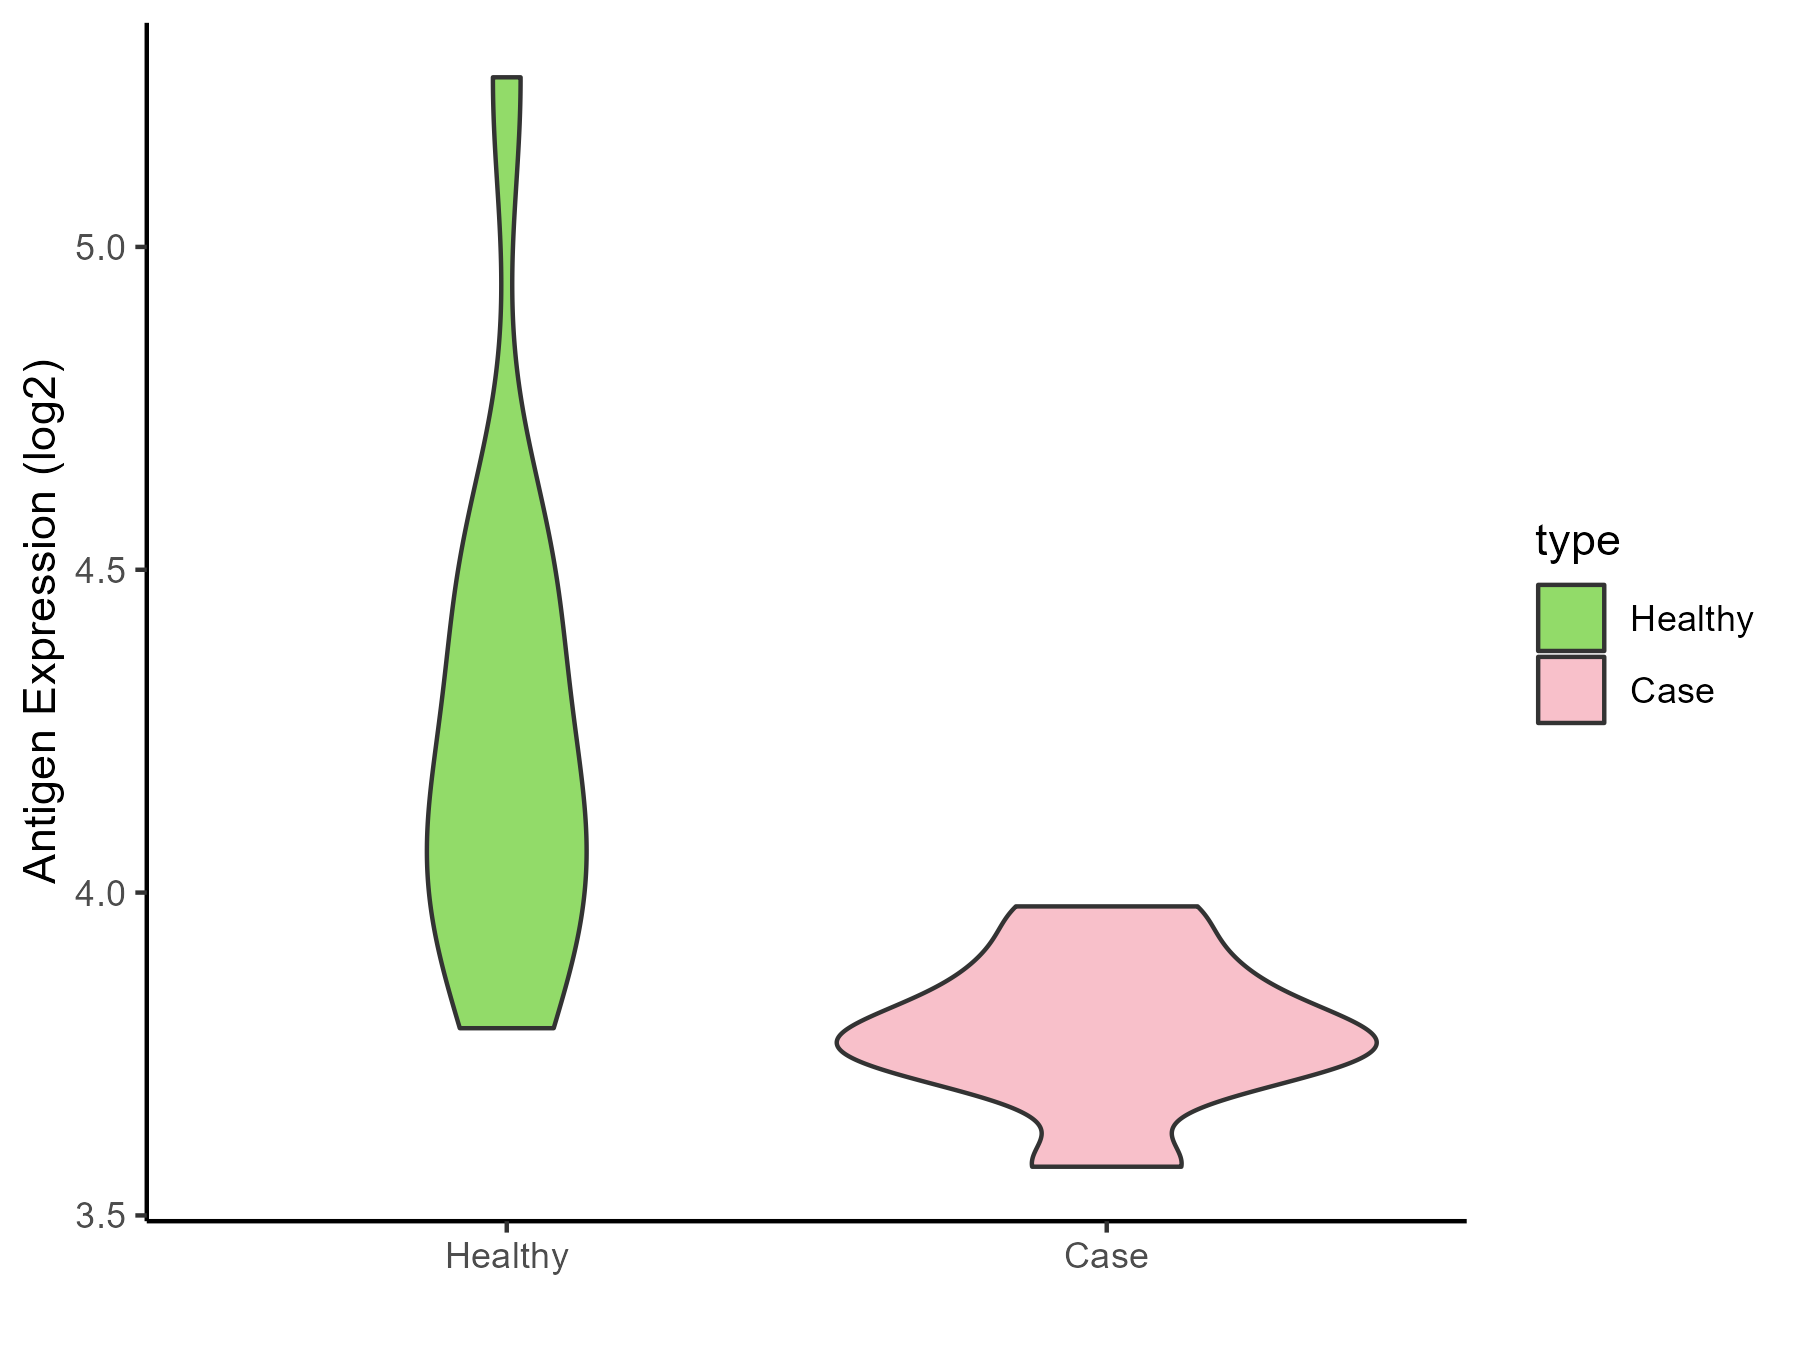
| The Studied Tissue | Whole blood | |
| The Specific Disease | Autosomal dominant monocytopenia | |
| The Expression Level of Disease Section Compare with the Healthy Individual Tissue | p-value: 0.003480785; Fold-change: -0.347656672; Z-score: -0.845483951 | |
| Disease-specific Antigen Abundances |
|
Click to View the Clearer Original Diagram |
ICD Disease Classification 5
| Differential expression pattern of antigen in diseases | ||
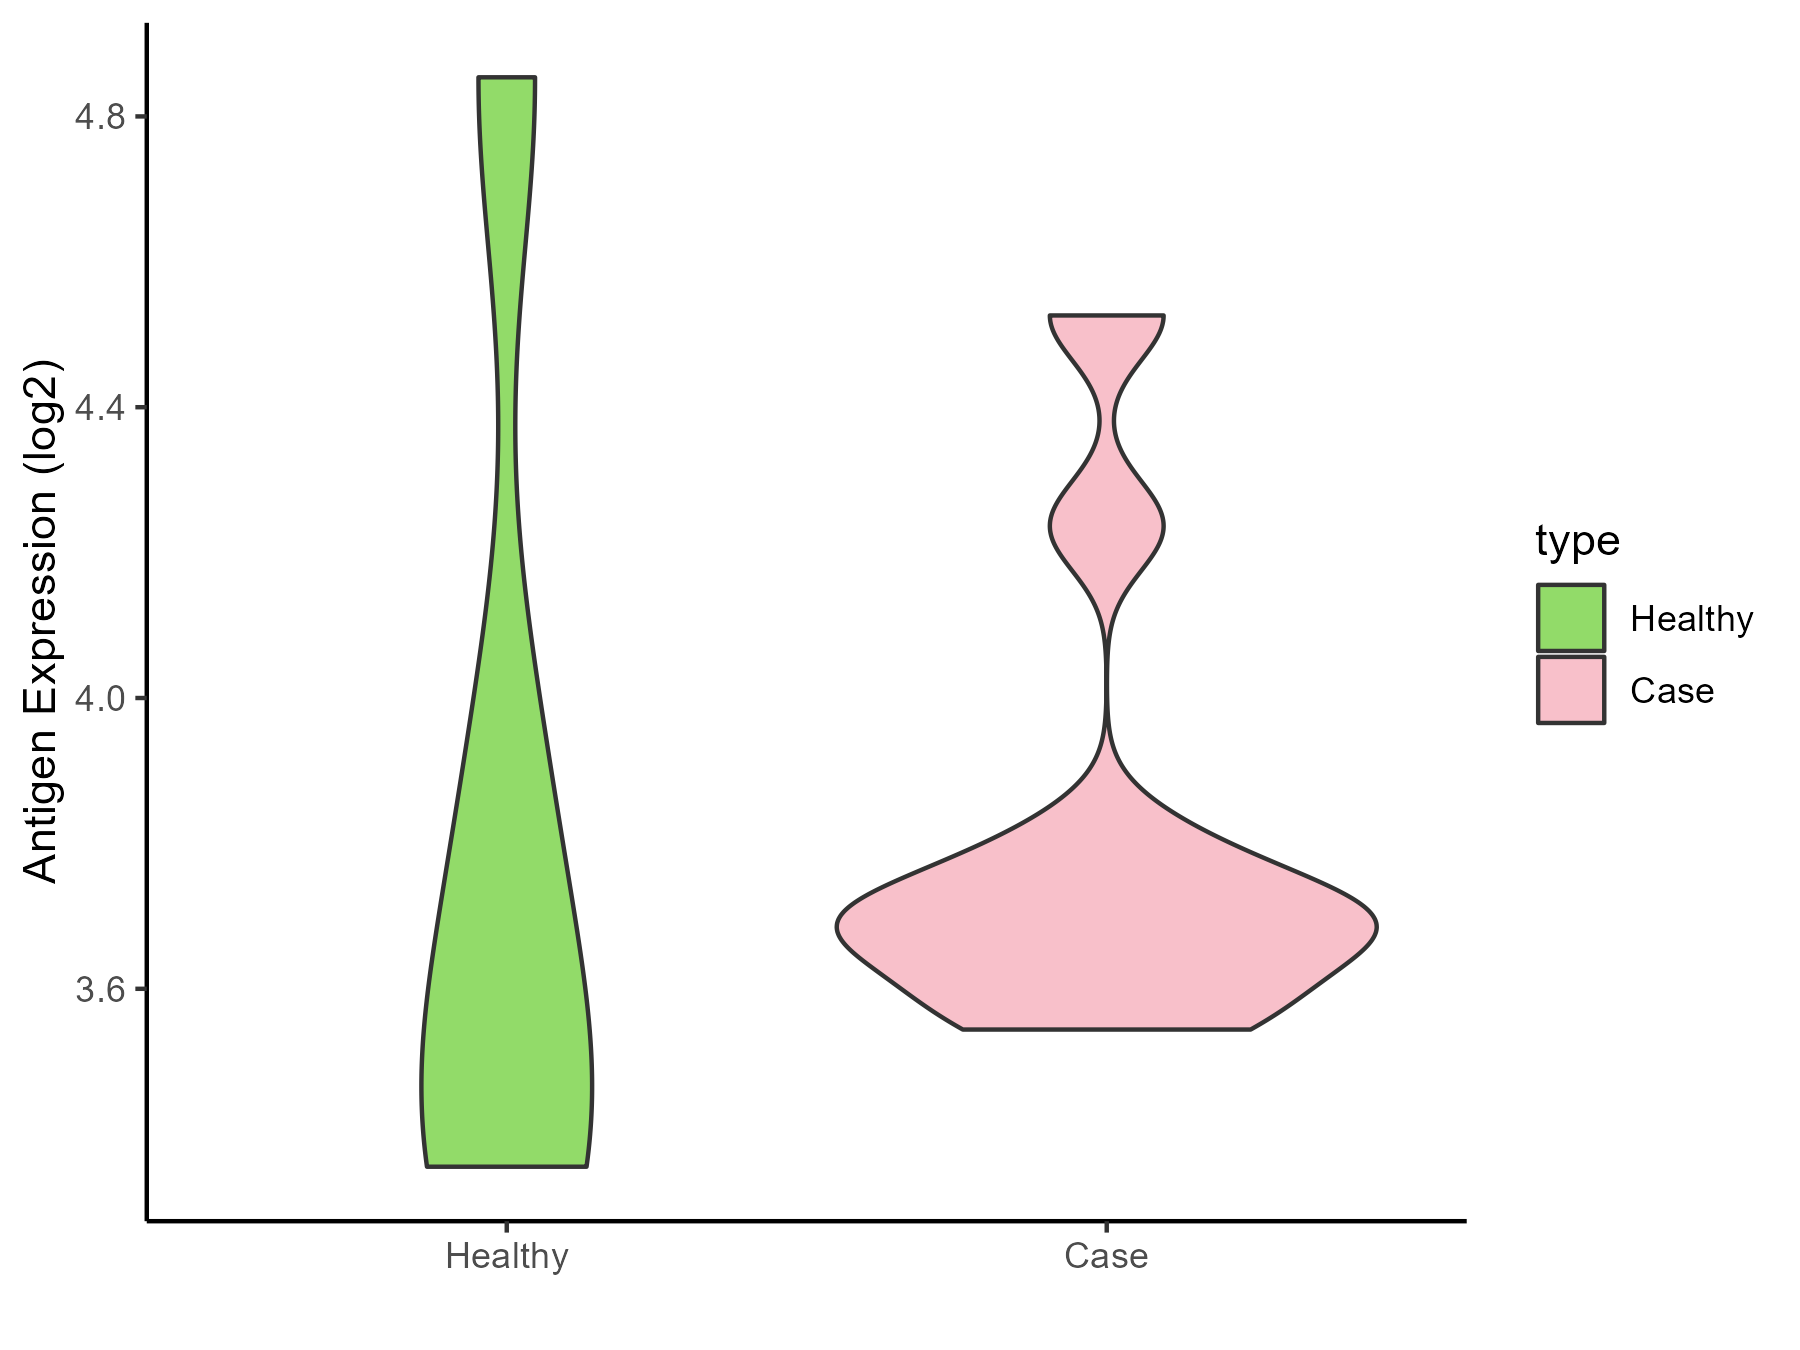
| The Studied Tissue | Liver | |
| The Specific Disease | Type 2 diabetes | |
| The Expression Level of Disease Section Compare with the Healthy Individual Tissue | p-value: 0.985177101; Fold-change: 0.136117637; Z-score: 0.218291815 | |
| Disease-specific Antigen Abundances |
|
Click to View the Clearer Original Diagram |
| Differential expression pattern of antigen in diseases | ||
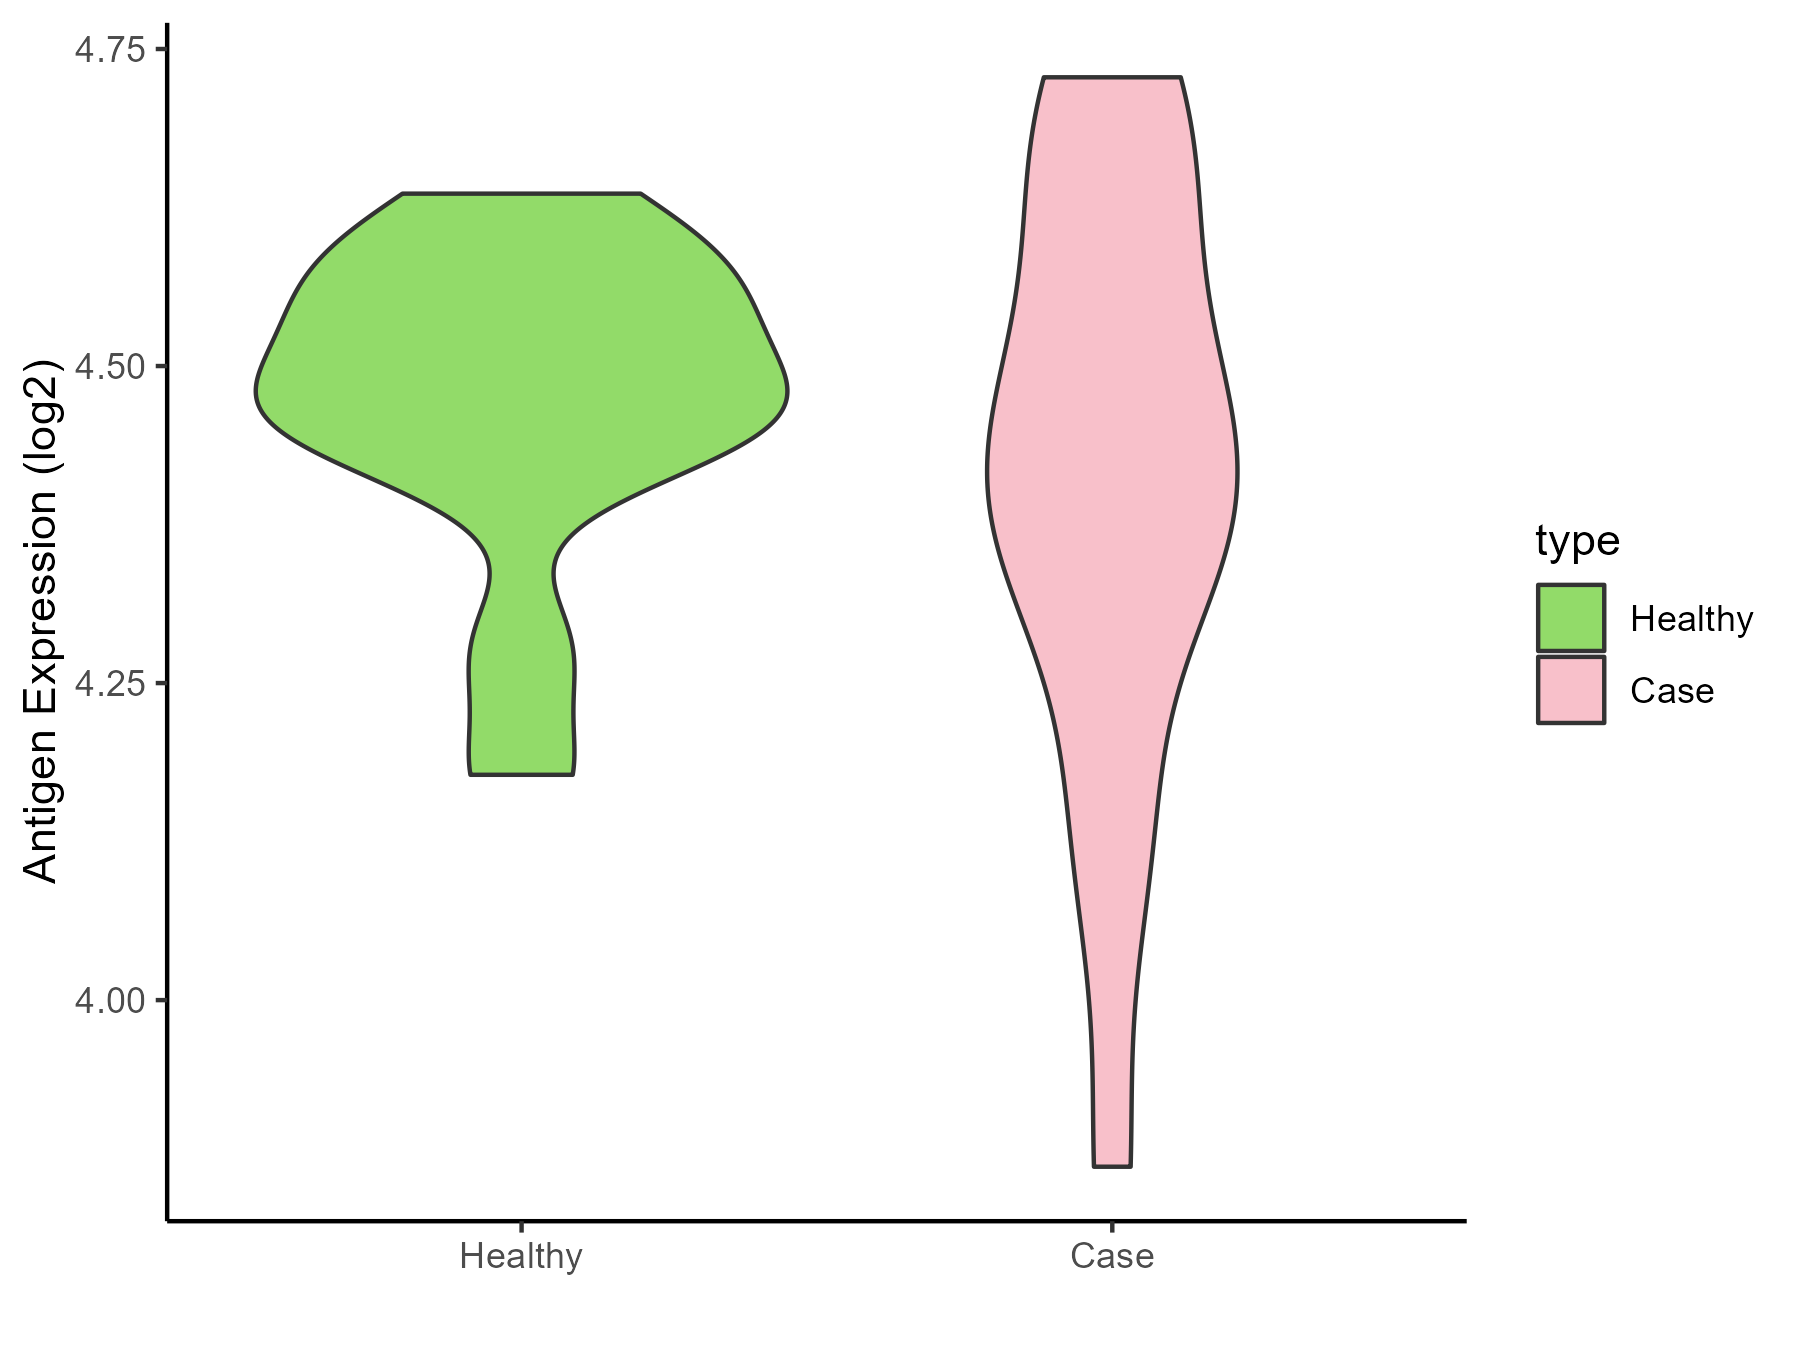
| The Studied Tissue | Vastus lateralis muscle | |
| The Specific Disease | Polycystic ovary syndrome | |
| The Expression Level of Disease Section Compare with the Healthy Individual Tissue | p-value: 0.41695012; Fold-change: -0.049126772; Z-score: -0.384608856 | |
| Disease-specific Antigen Abundances |
|
Click to View the Clearer Original Diagram |
| Differential expression pattern of antigen in diseases | ||
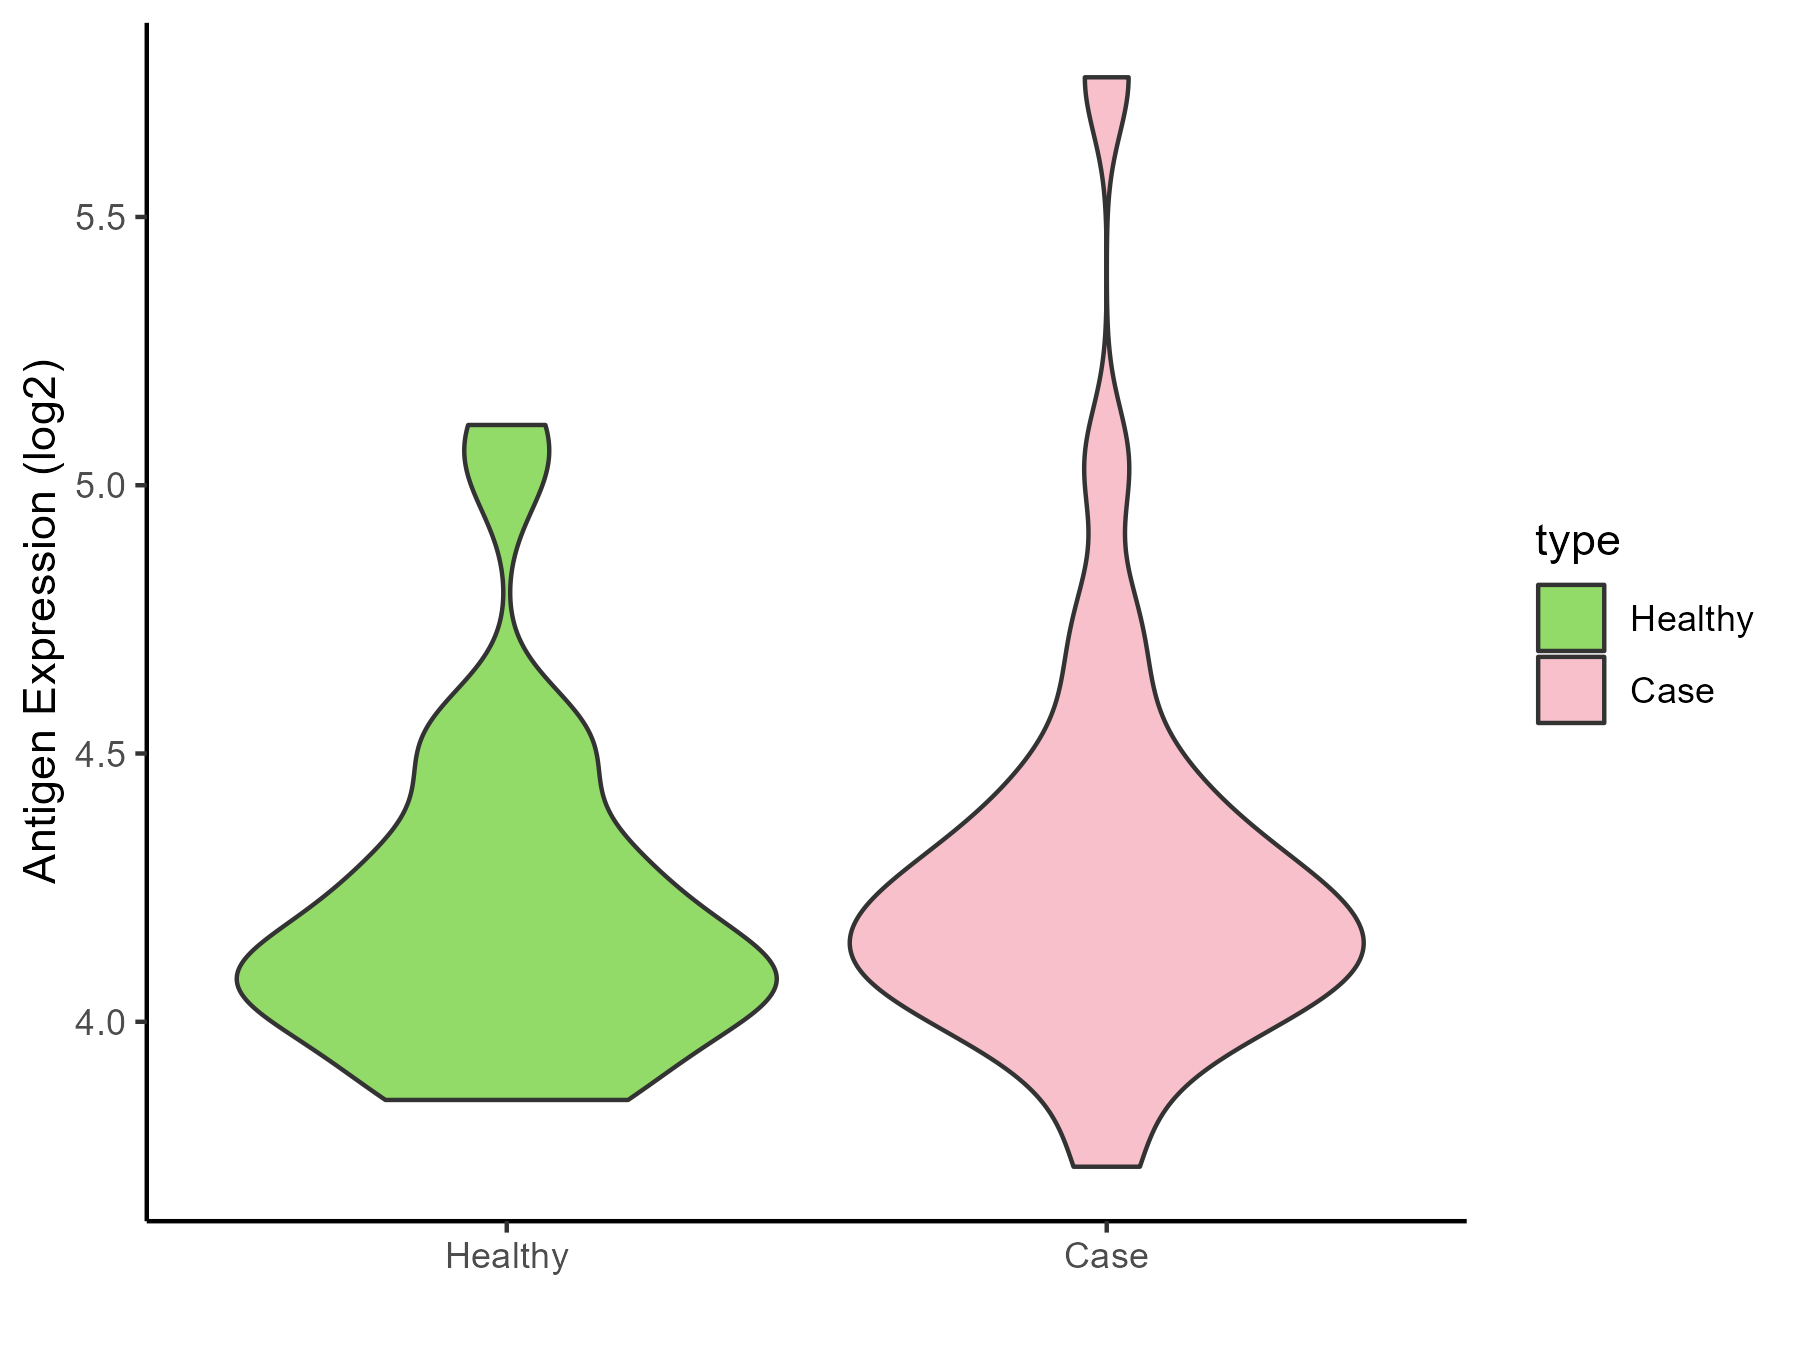
| The Studied Tissue | Subcutaneous Adipose | |
| The Specific Disease | Obesity | |
| The Expression Level of Disease Section Compare with the Healthy Individual Tissue | p-value: 0.477965615; Fold-change: 0.06439992; Z-score: 0.202819803 | |
| Disease-specific Antigen Abundances |
|
Click to View the Clearer Original Diagram |
| Differential expression pattern of antigen in diseases | ||
| The Studied Tissue | Biceps muscle | |
| The Specific Disease | Pompe disease | |
| The Expression Level of Disease Section Compare with the Healthy Individual Tissue | p-value: 0.189016426; Fold-change: -0.031245271; Z-score: -0.233709723 | |
| Disease-specific Antigen Abundances |

|
Click to View the Clearer Original Diagram |
| Differential expression pattern of antigen in diseases | ||
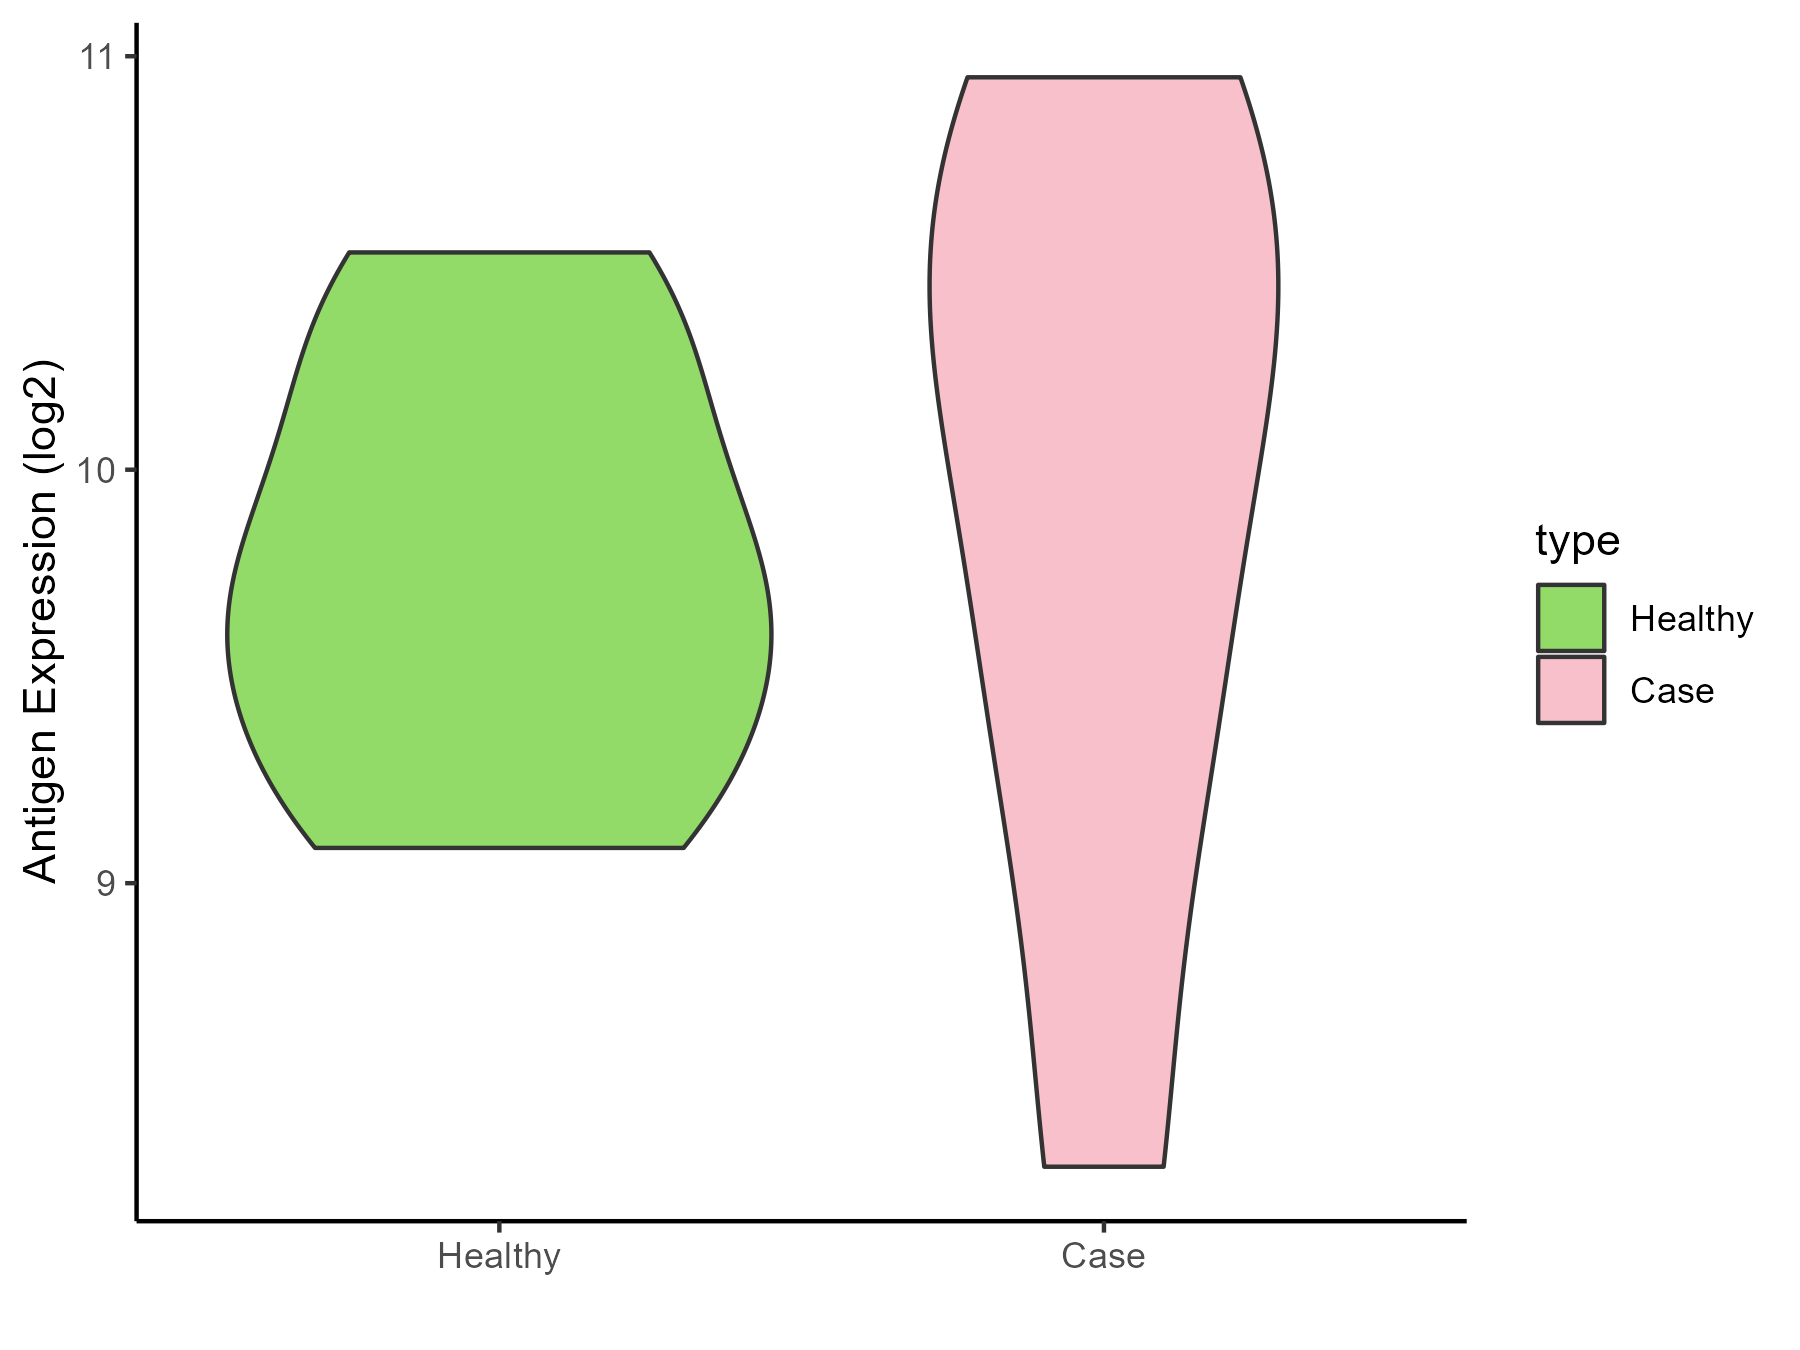
| The Studied Tissue | Whole blood | |
| The Specific Disease | Batten disease | |
| The Expression Level of Disease Section Compare with the Healthy Individual Tissue | p-value: 0.695532482; Fold-change: 0.624249052; Z-score: 1.200500399 | |
| Disease-specific Antigen Abundances |
|
Click to View the Clearer Original Diagram |
ICD Disease Classification 6
| Differential expression pattern of antigen in diseases | ||
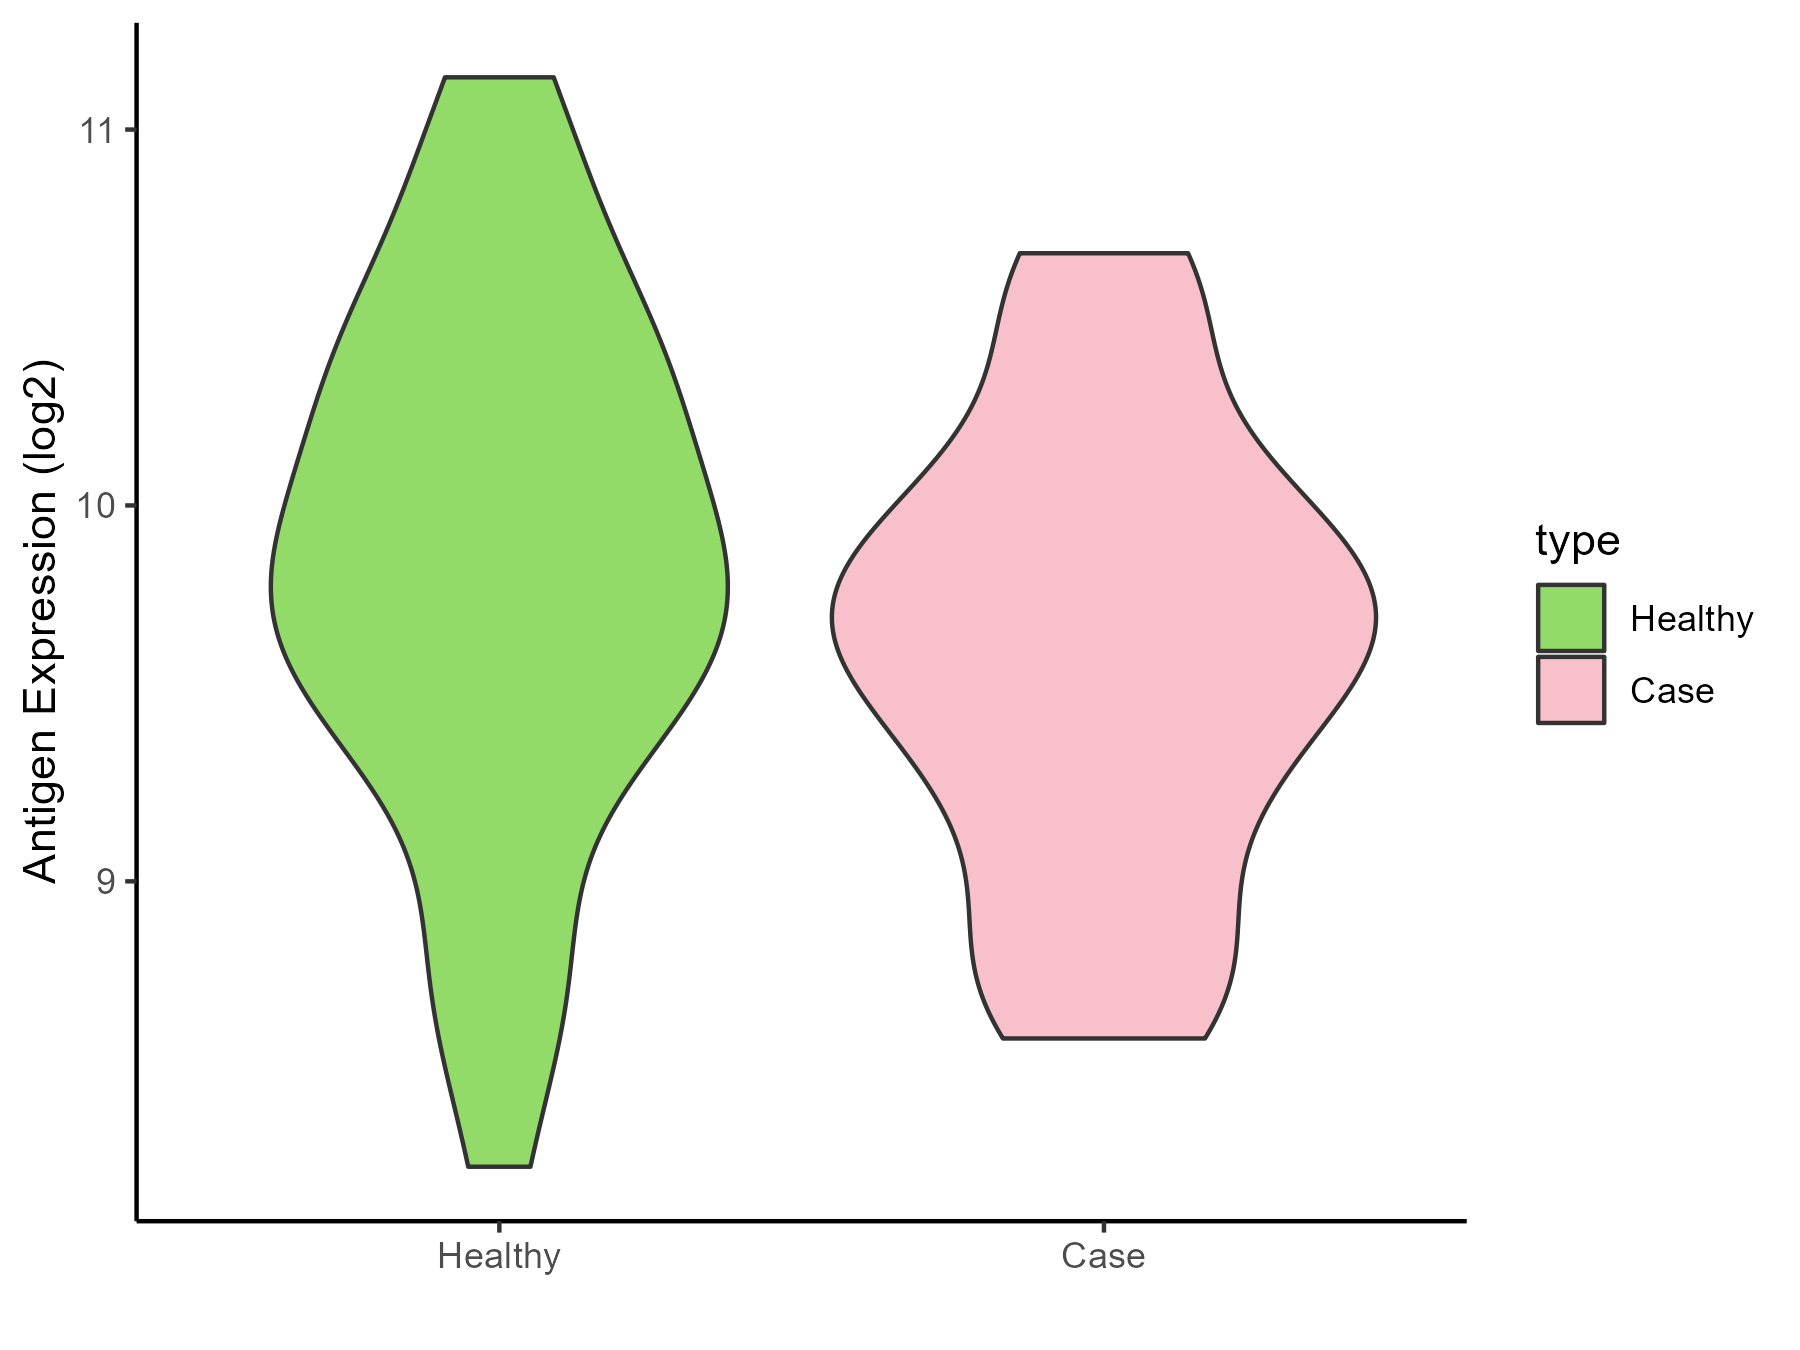
| The Studied Tissue | Whole blood | |
| The Specific Disease | Autism | |
| The Expression Level of Disease Section Compare with the Healthy Individual Tissue | p-value: 0.144859215; Fold-change: -0.120786224; Z-score: -0.175226579 | |
| Disease-specific Antigen Abundances |
|
Click to View the Clearer Original Diagram |
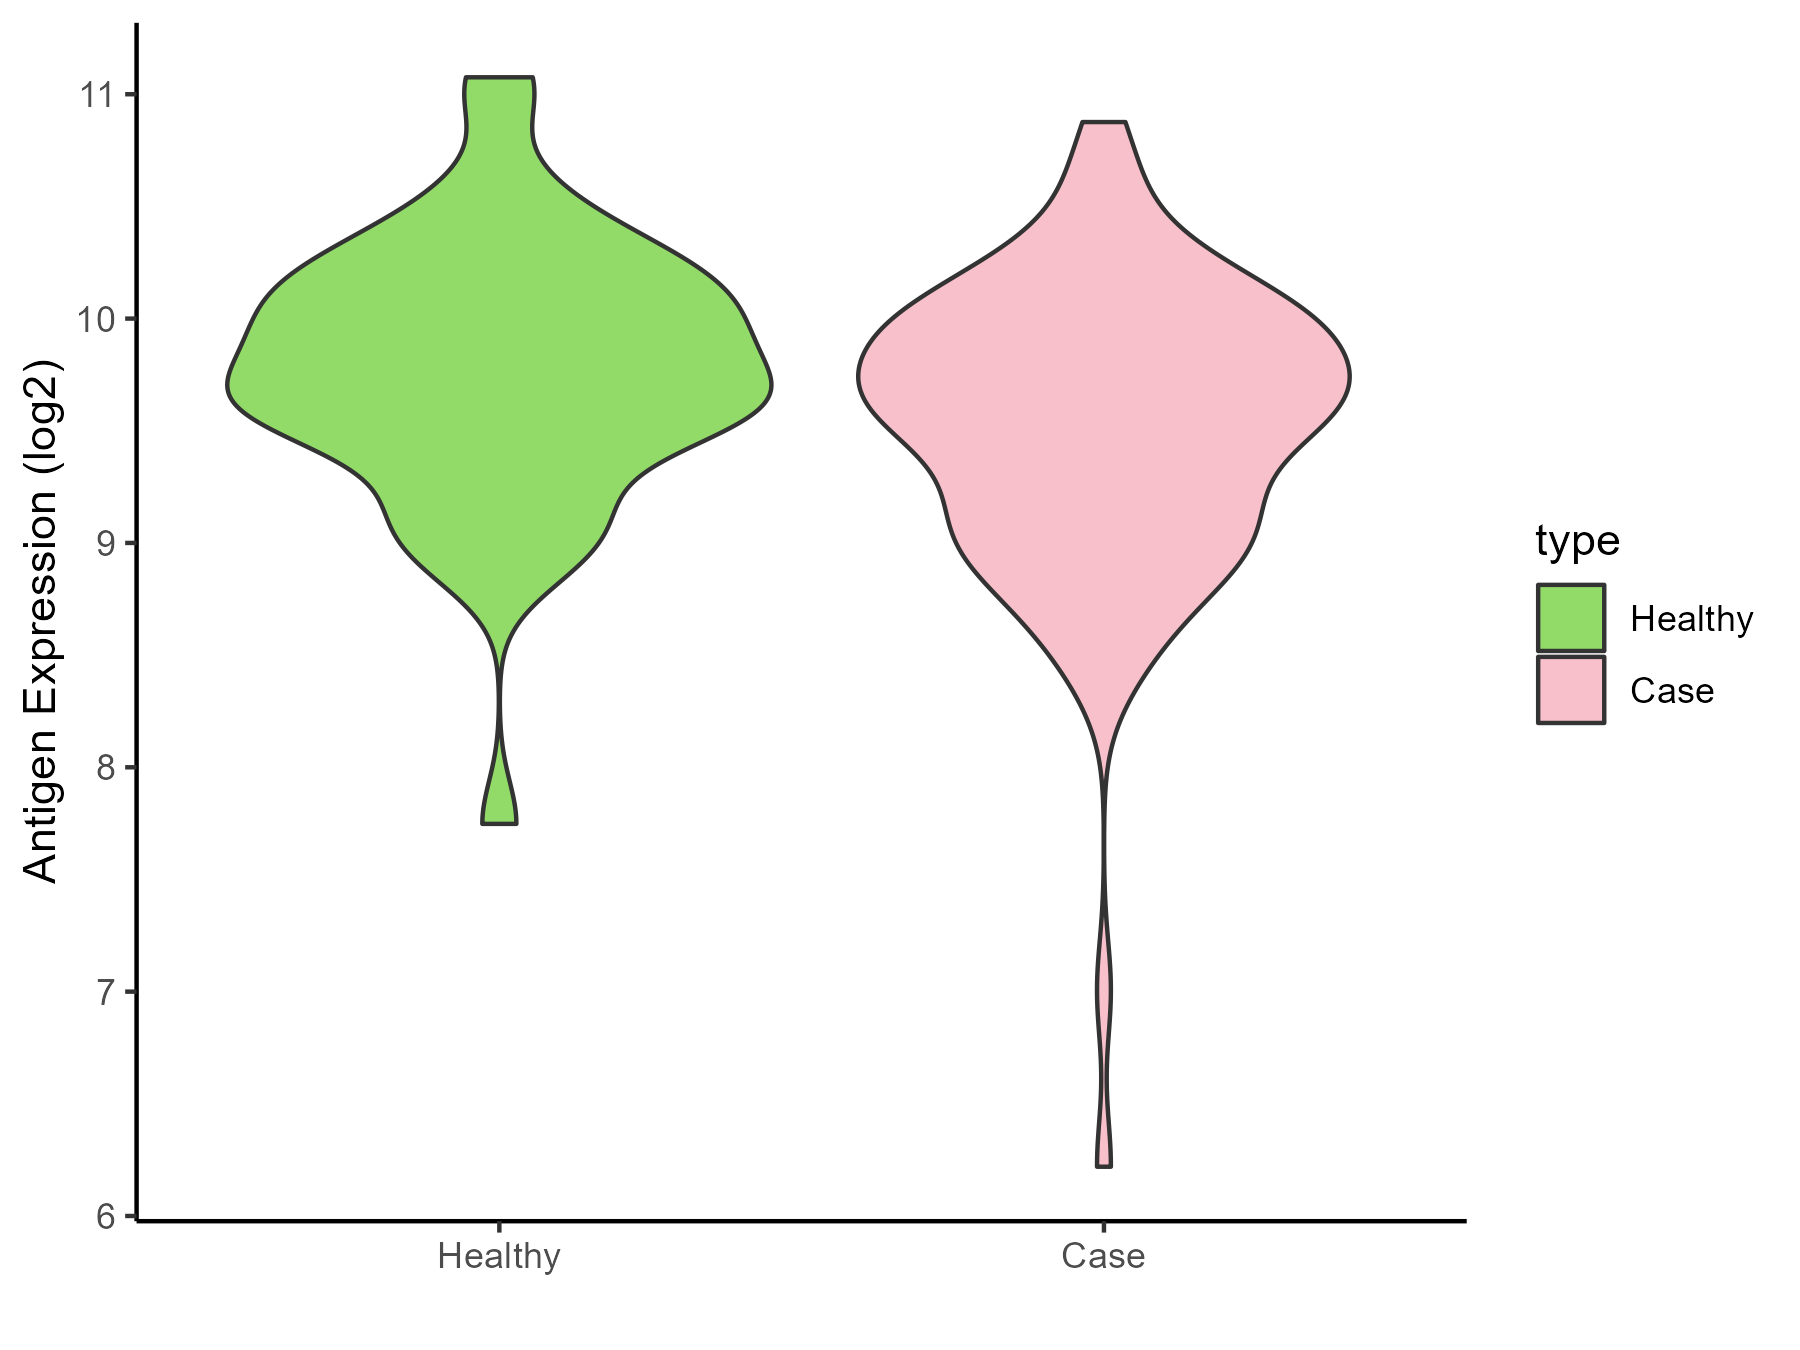
| Differential expression pattern of antigen in diseases | ||
| The Studied Tissue | Whole blood | |
| The Specific Disease | Anxiety disorder | |
| The Expression Level of Disease Section Compare with the Healthy Individual Tissue | p-value: 0.023079021; Fold-change: -0.163538991; Z-score: -0.27725982 | |
| Disease-specific Antigen Abundances |
|
Click to View the Clearer Original Diagram |
ICD Disease Classification 8
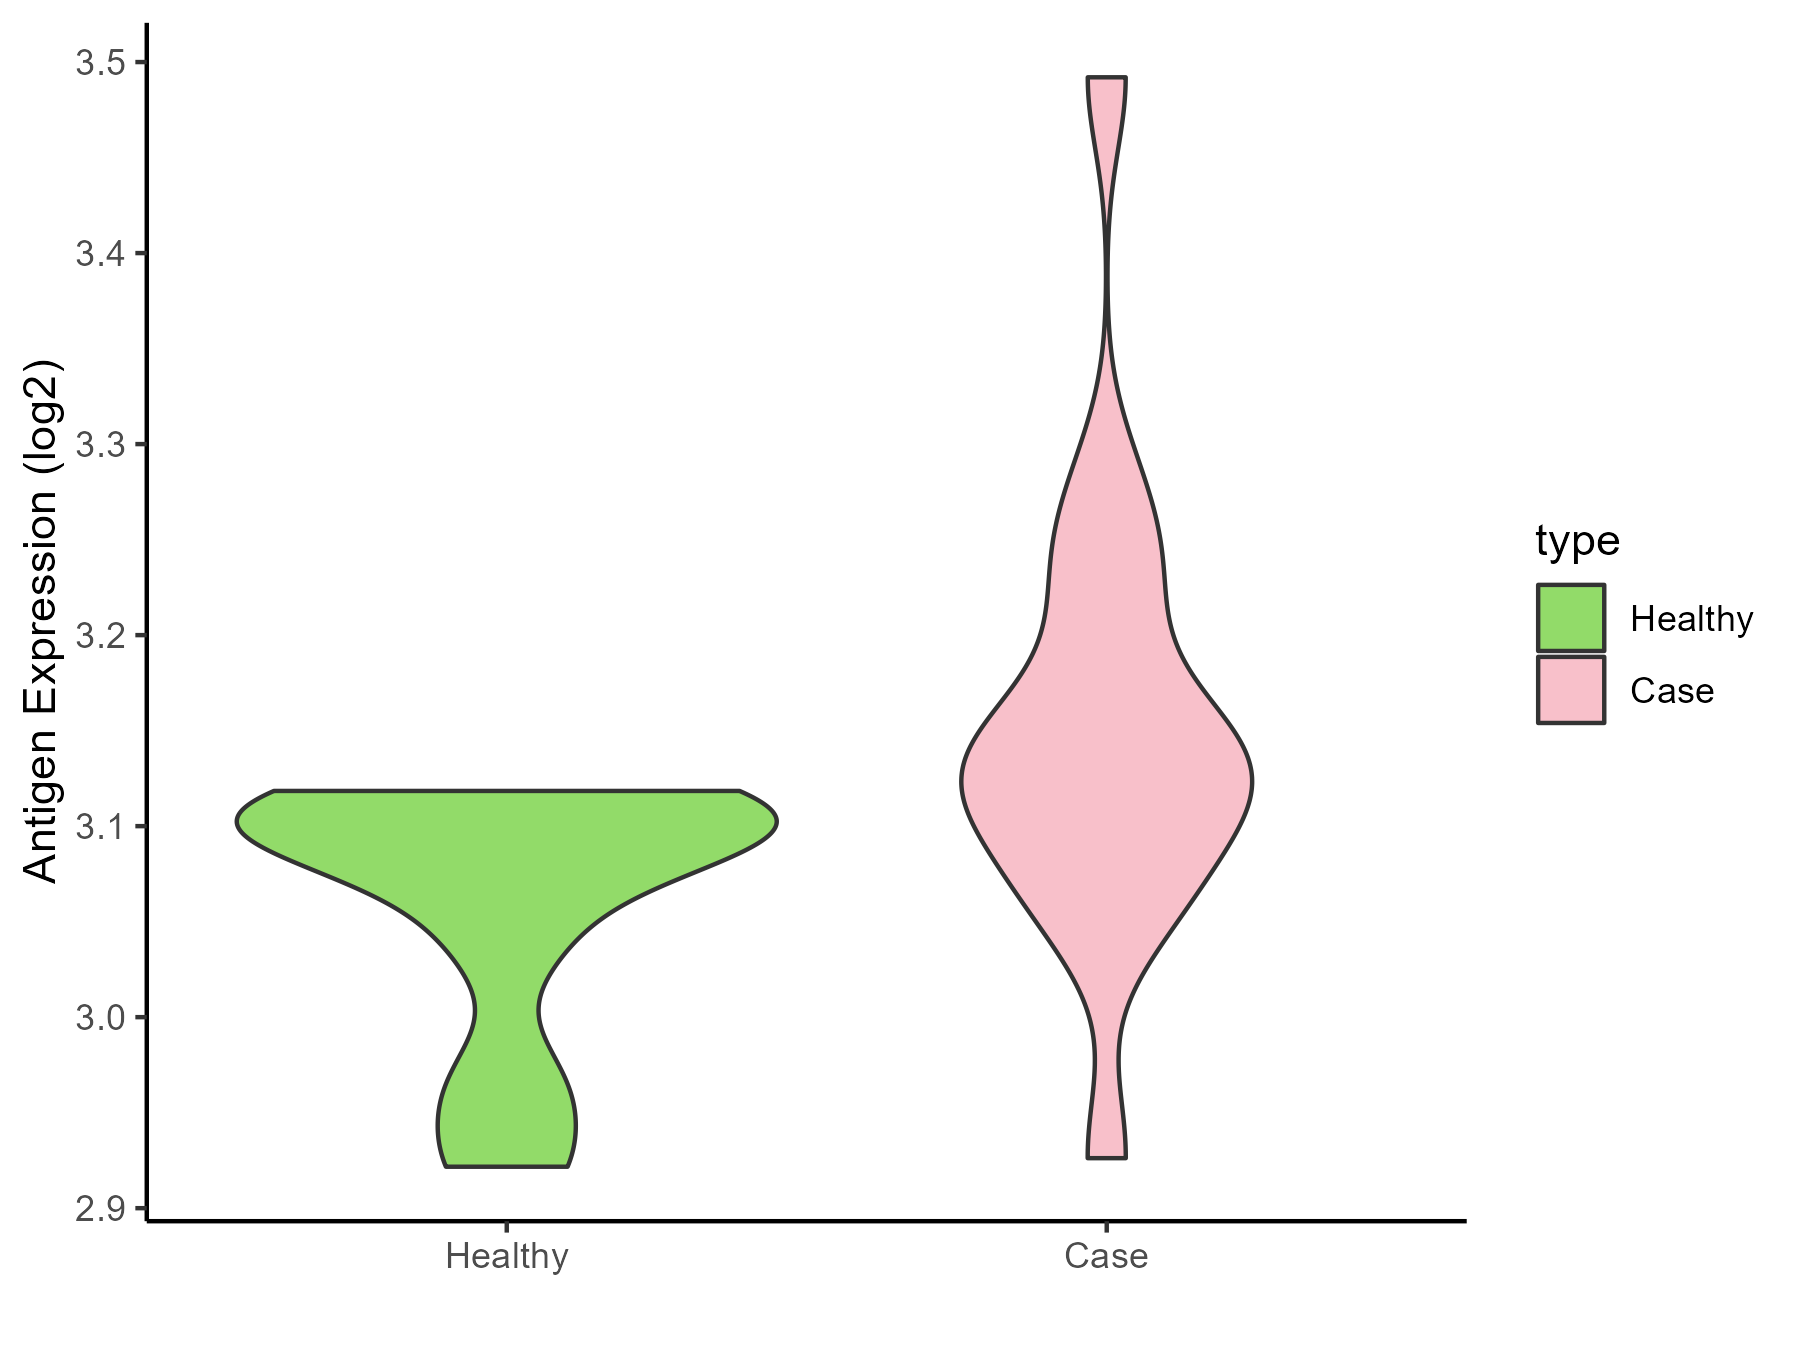
| Differential expression pattern of antigen in diseases | ||
| The Studied Tissue | Substantia nigra | |
| The Specific Disease | Parkinson disease | |
| The Expression Level of Disease Section Compare with the Healthy Individual Tissue | p-value: 0.027445971; Fold-change: 0.038450741; Z-score: 0.539669446 | |
| Disease-specific Antigen Abundances |
|
Click to View the Clearer Original Diagram |
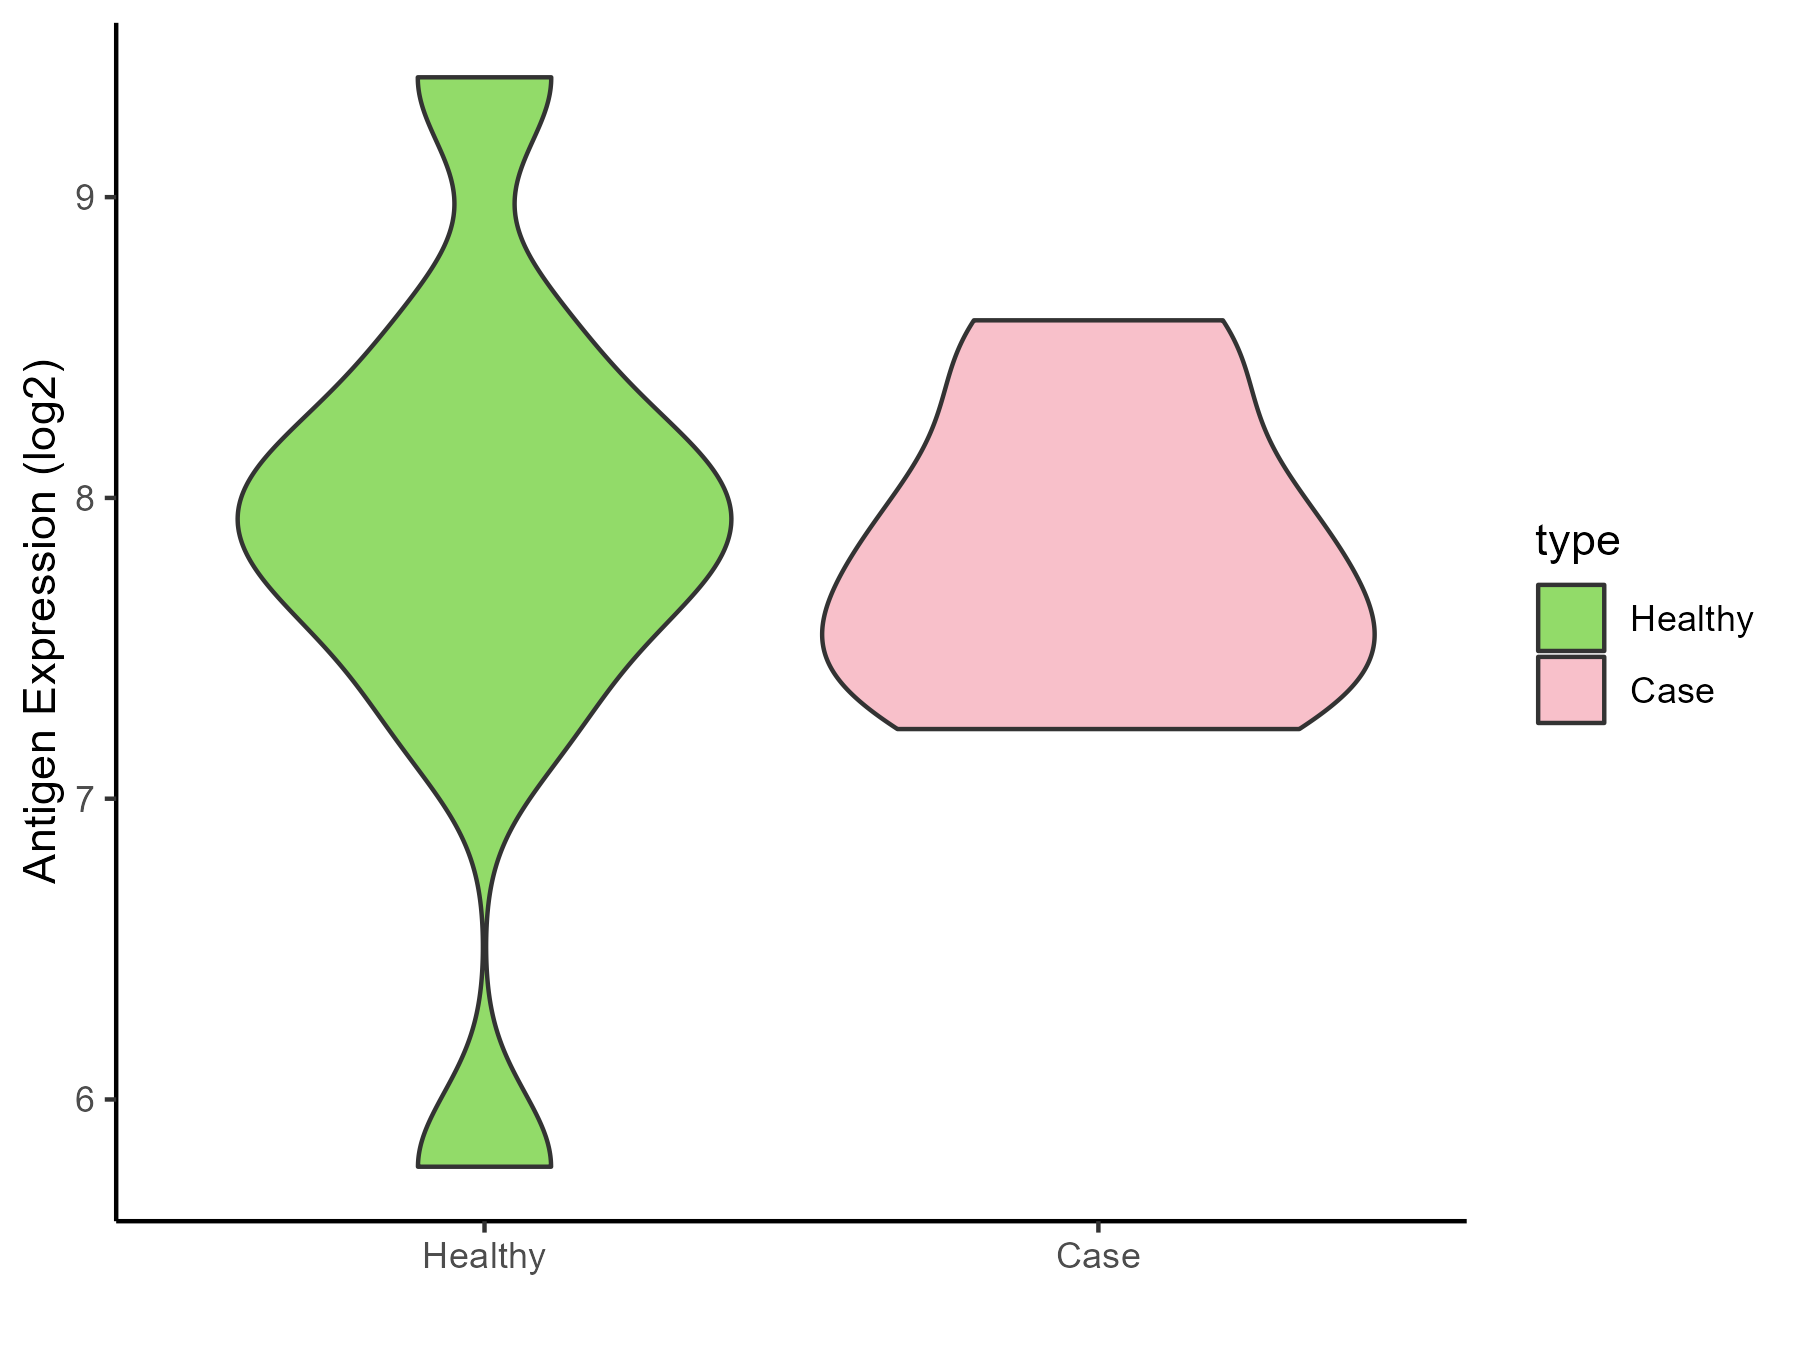
| Differential expression pattern of antigen in diseases | ||
| The Studied Tissue | Whole blood | |
| The Specific Disease | Huntington disease | |
| The Expression Level of Disease Section Compare with the Healthy Individual Tissue | p-value: 0.969477236; Fold-change: -0.126589189; Z-score: -0.128362436 | |
| Disease-specific Antigen Abundances |
|
Click to View the Clearer Original Diagram |
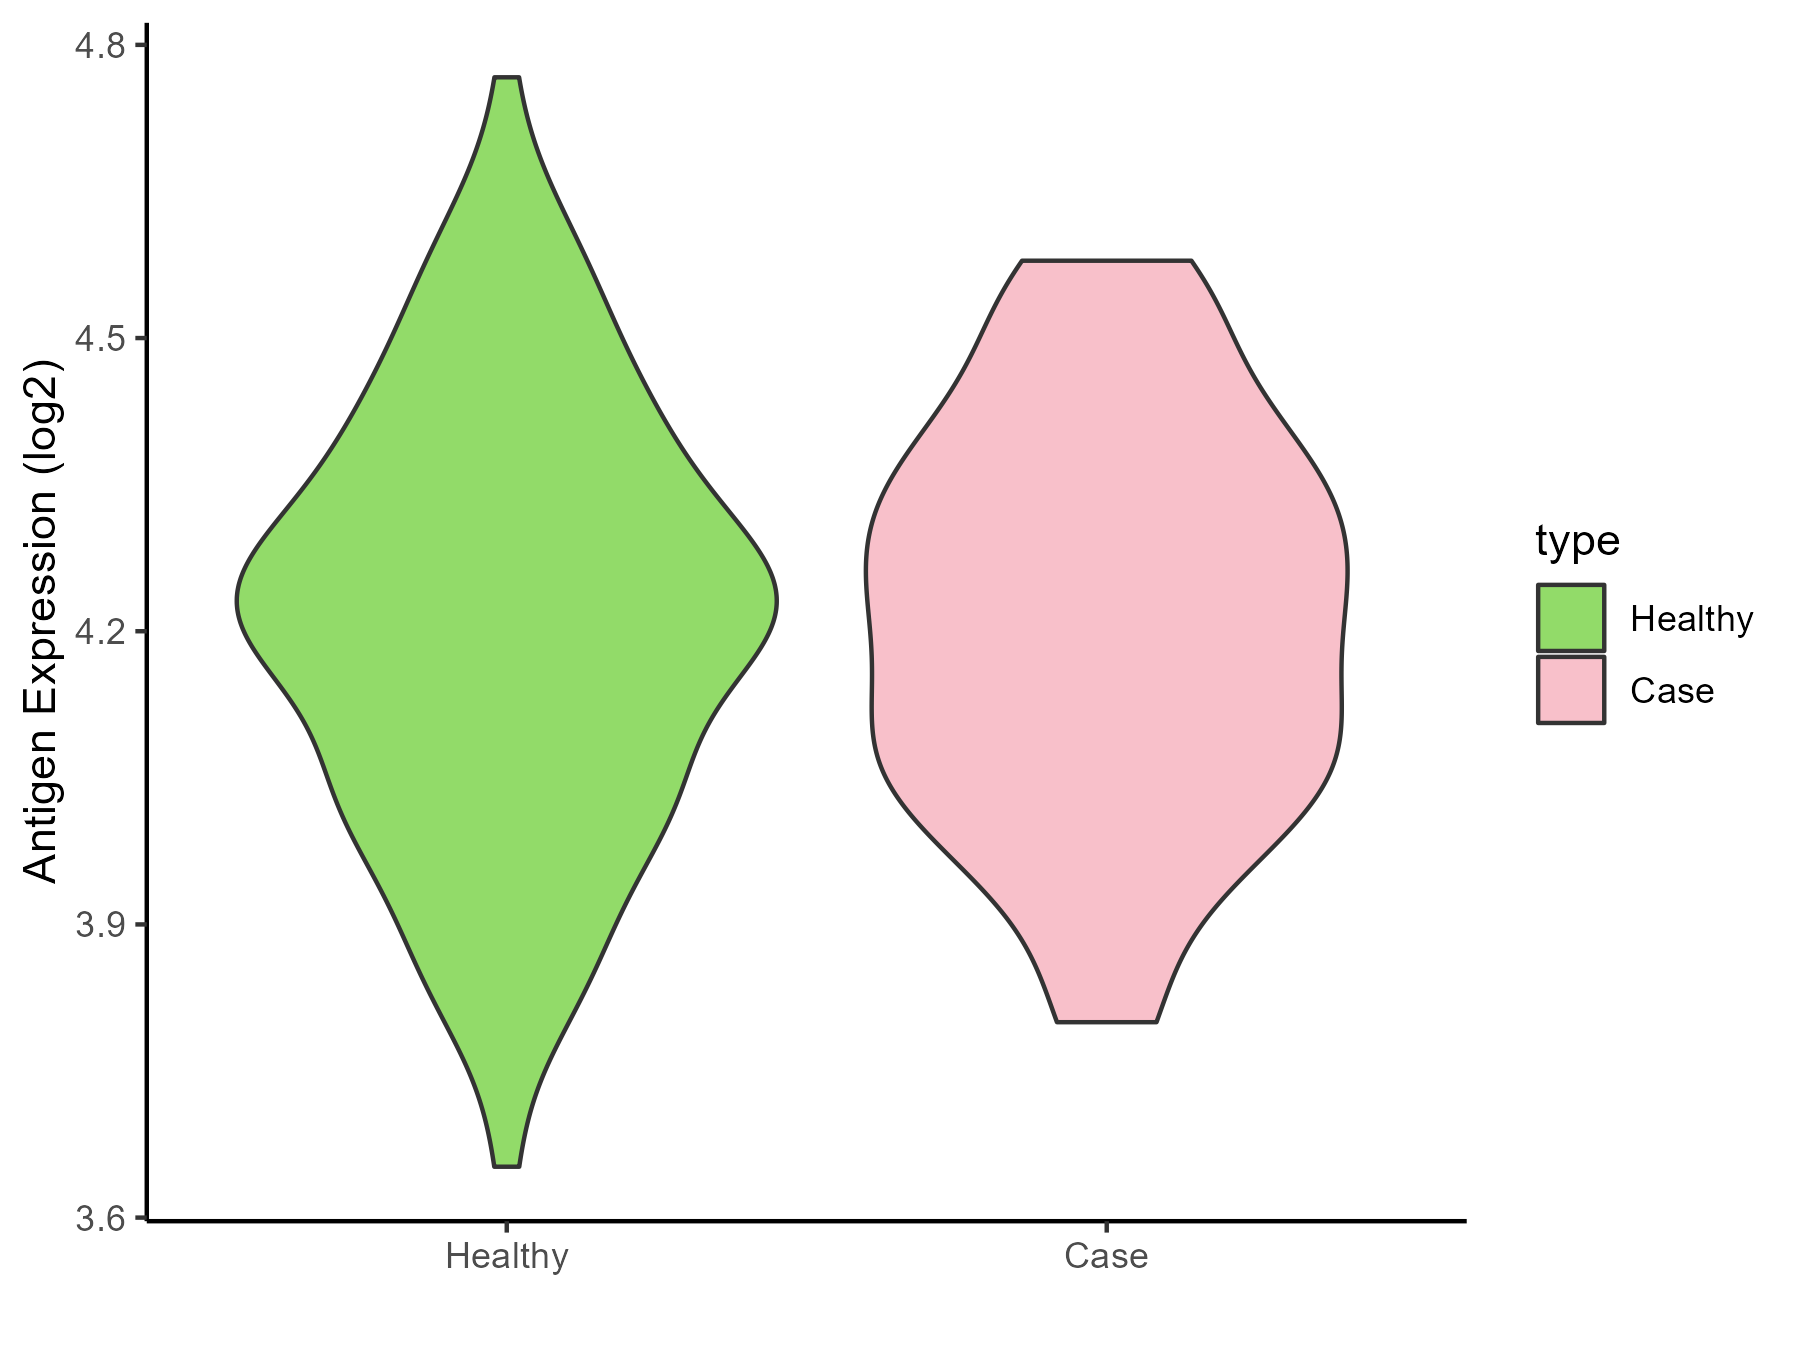
| Differential expression pattern of antigen in diseases | ||
| The Studied Tissue | Entorhinal cortex | |
| The Specific Disease | Alzheimer disease | |
| The Expression Level of Disease Section Compare with the Healthy Individual Tissue | p-value: 0.968740191; Fold-change: -0.006823825; Z-score: -0.031064468 | |
| Disease-specific Antigen Abundances |
|
Click to View the Clearer Original Diagram |
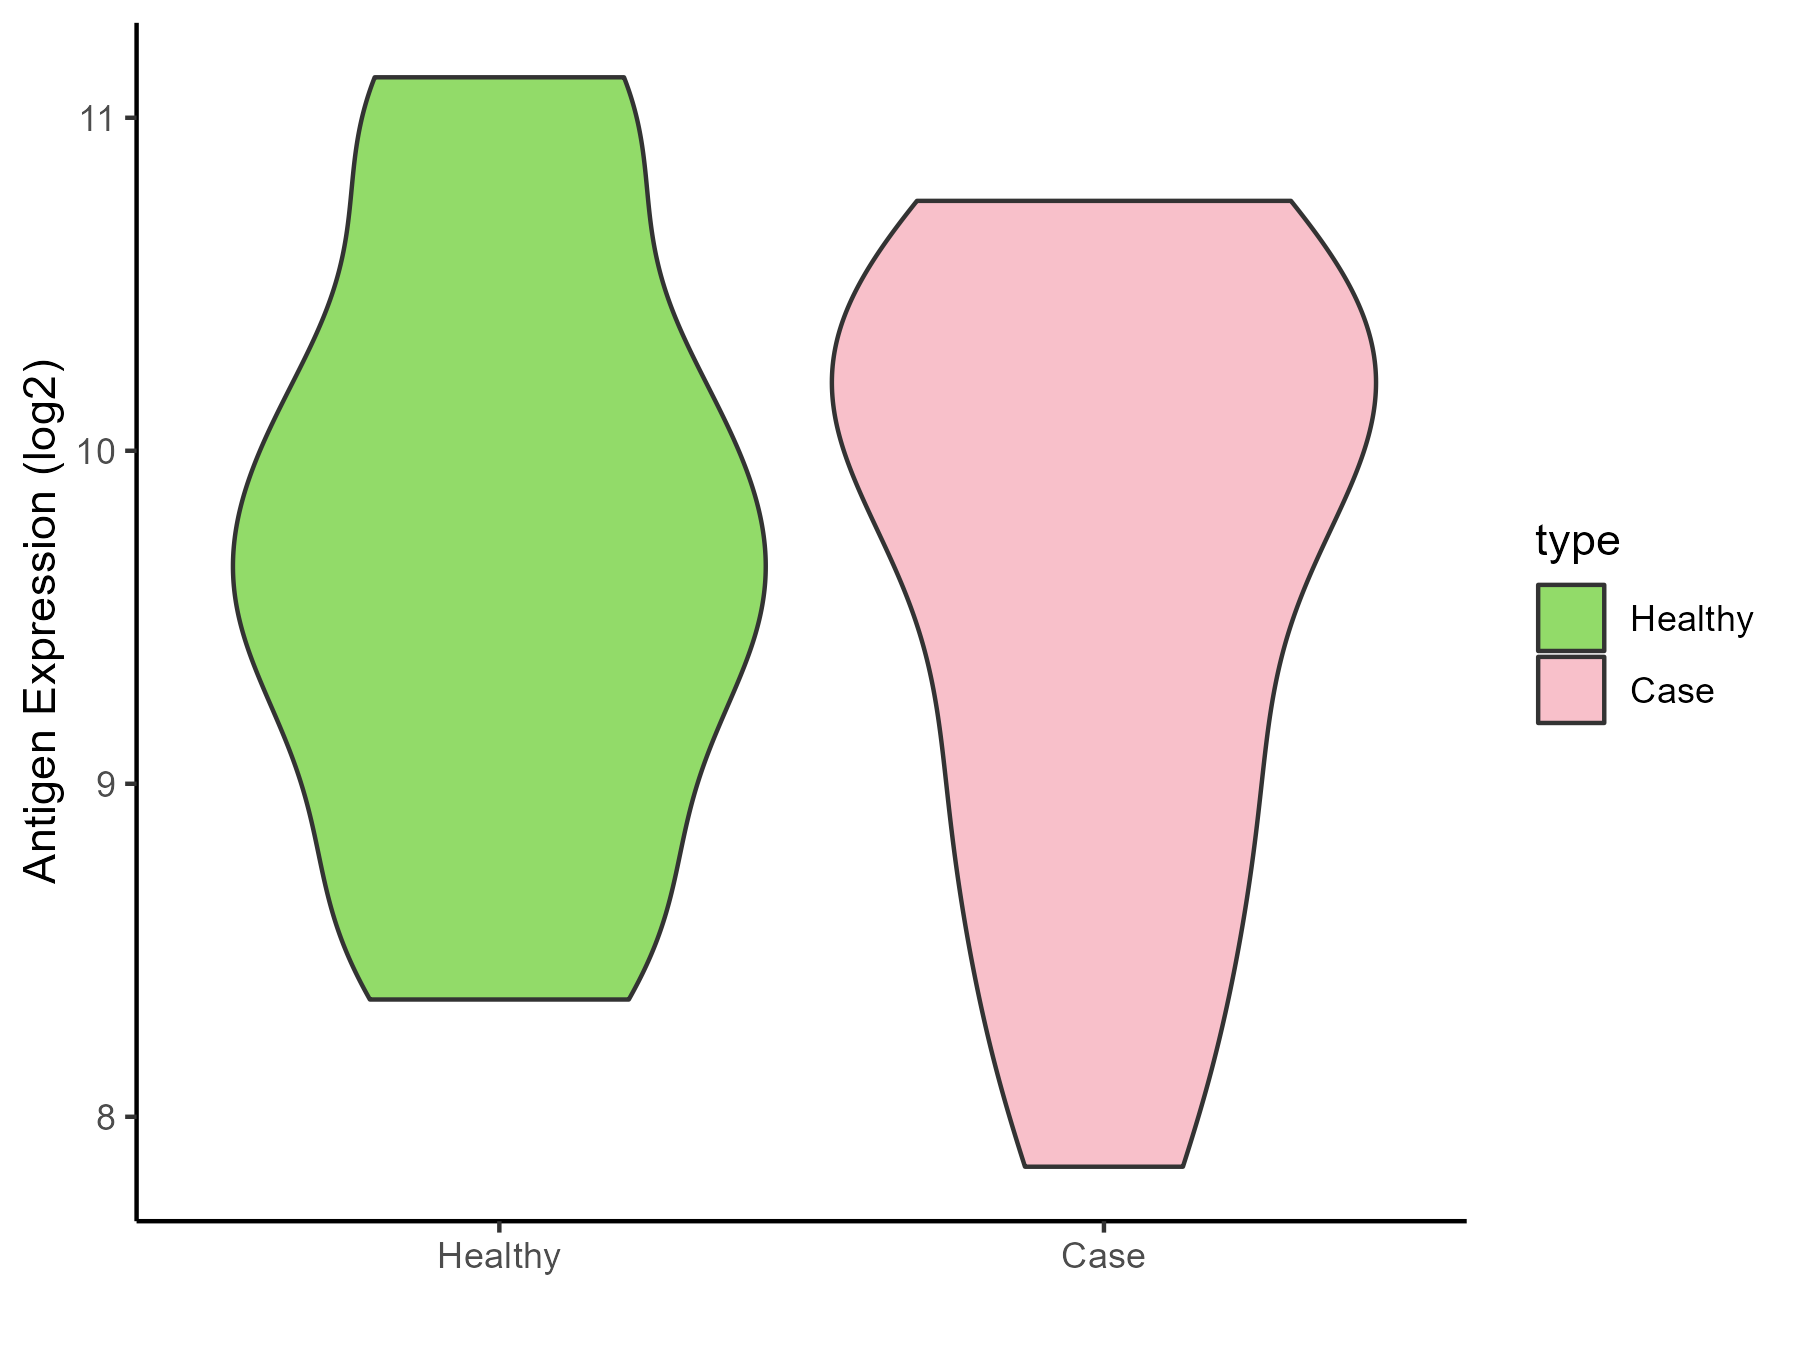
| Differential expression pattern of antigen in diseases | ||
| The Studied Tissue | Whole blood | |
| The Specific Disease | Seizure | |
| The Expression Level of Disease Section Compare with the Healthy Individual Tissue | p-value: 0.774185603; Fold-change: 0.373969869; Z-score: 0.429648344 | |
| Disease-specific Antigen Abundances |
|
Click to View the Clearer Original Diagram |
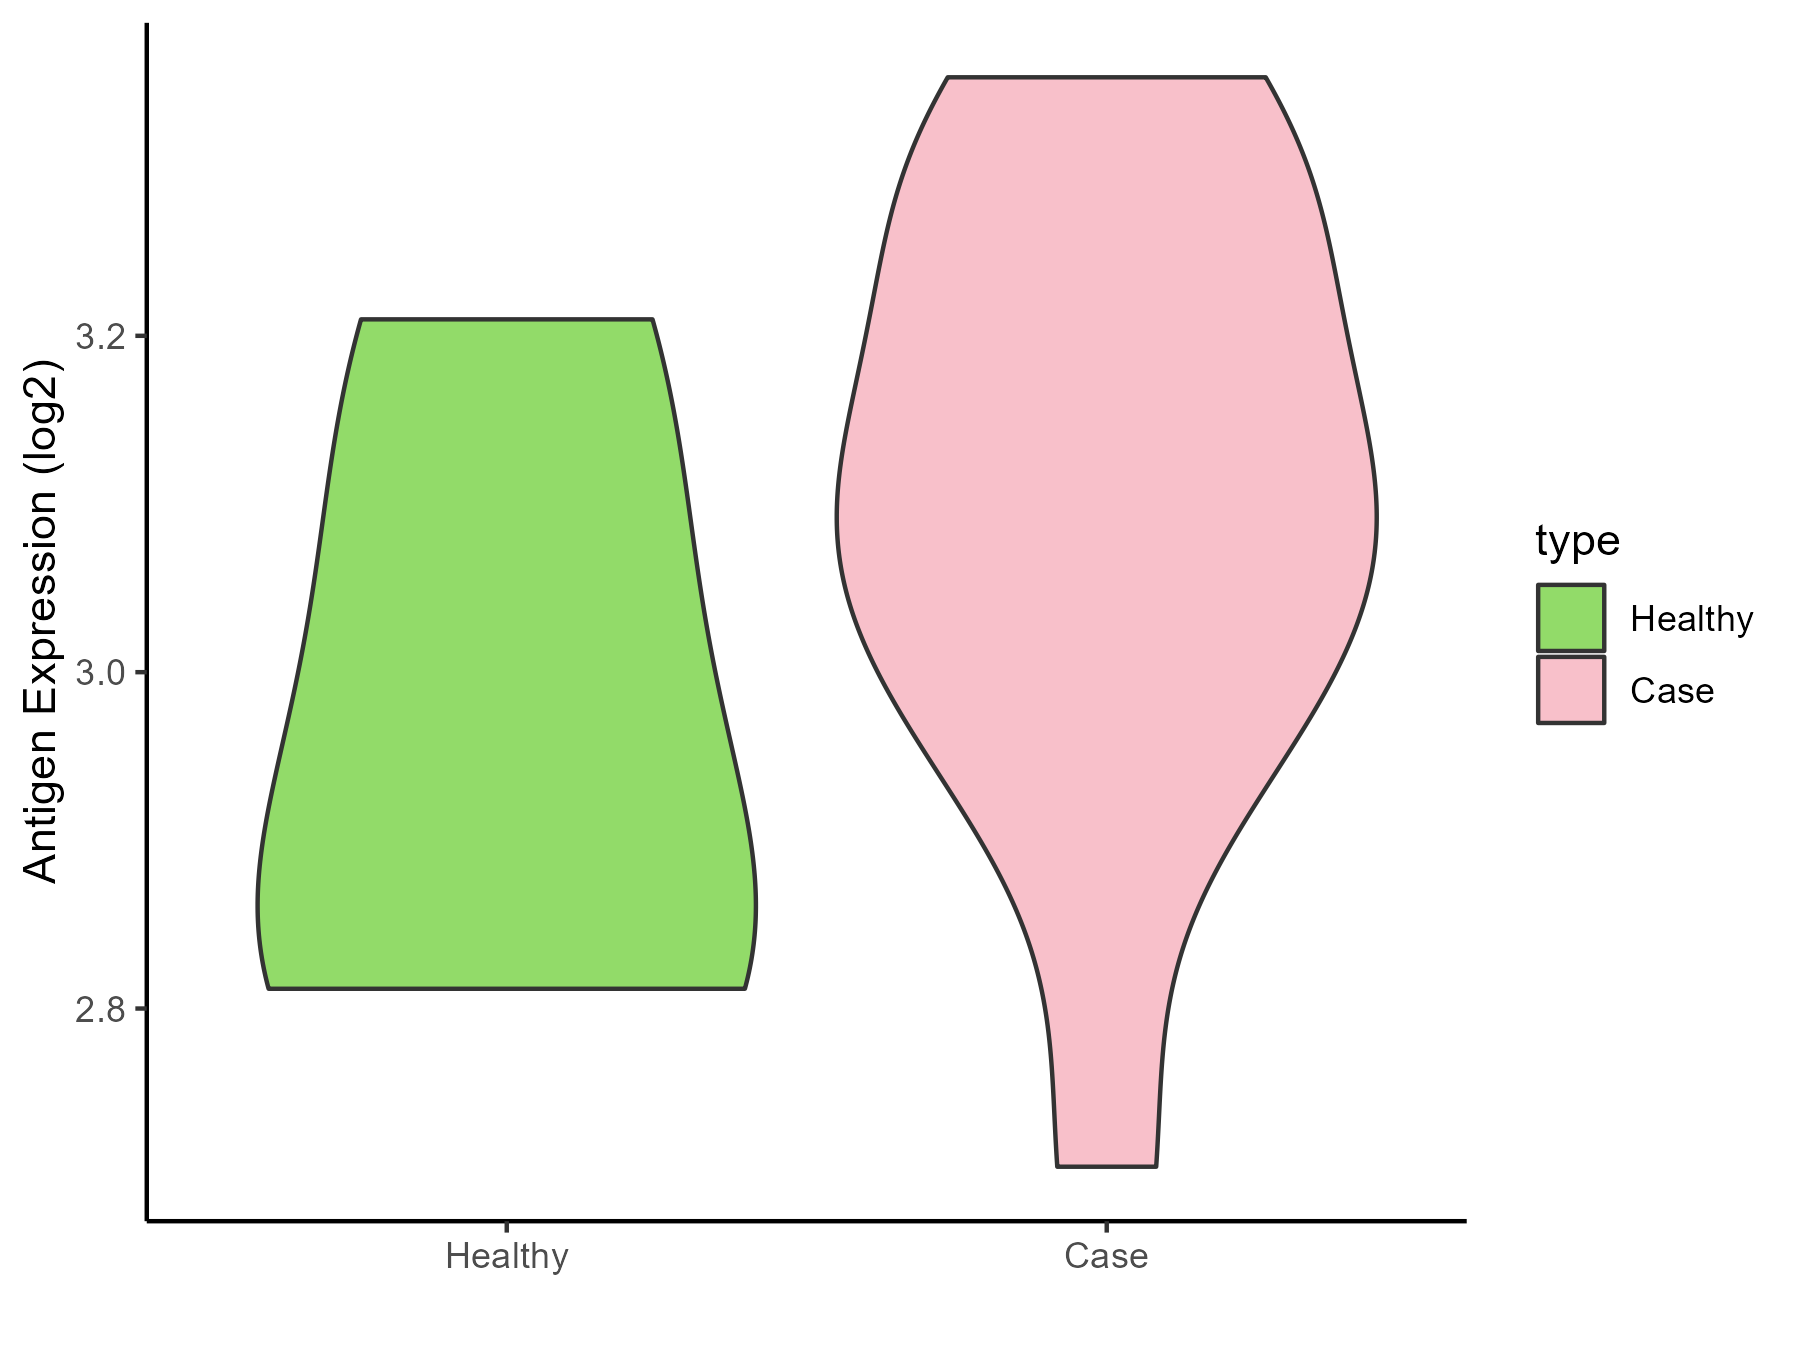
| Differential expression pattern of antigen in diseases | ||
| The Studied Tissue | Skin | |
| The Specific Disease | Lateral sclerosis | |
| The Expression Level of Disease Section Compare with the Healthy Individual Tissue | p-value: 0.25841382; Fold-change: 0.176360808; Z-score: 0.937511057 | |
| Disease-specific Antigen Abundances |
|
Click to View the Clearer Original Diagram |
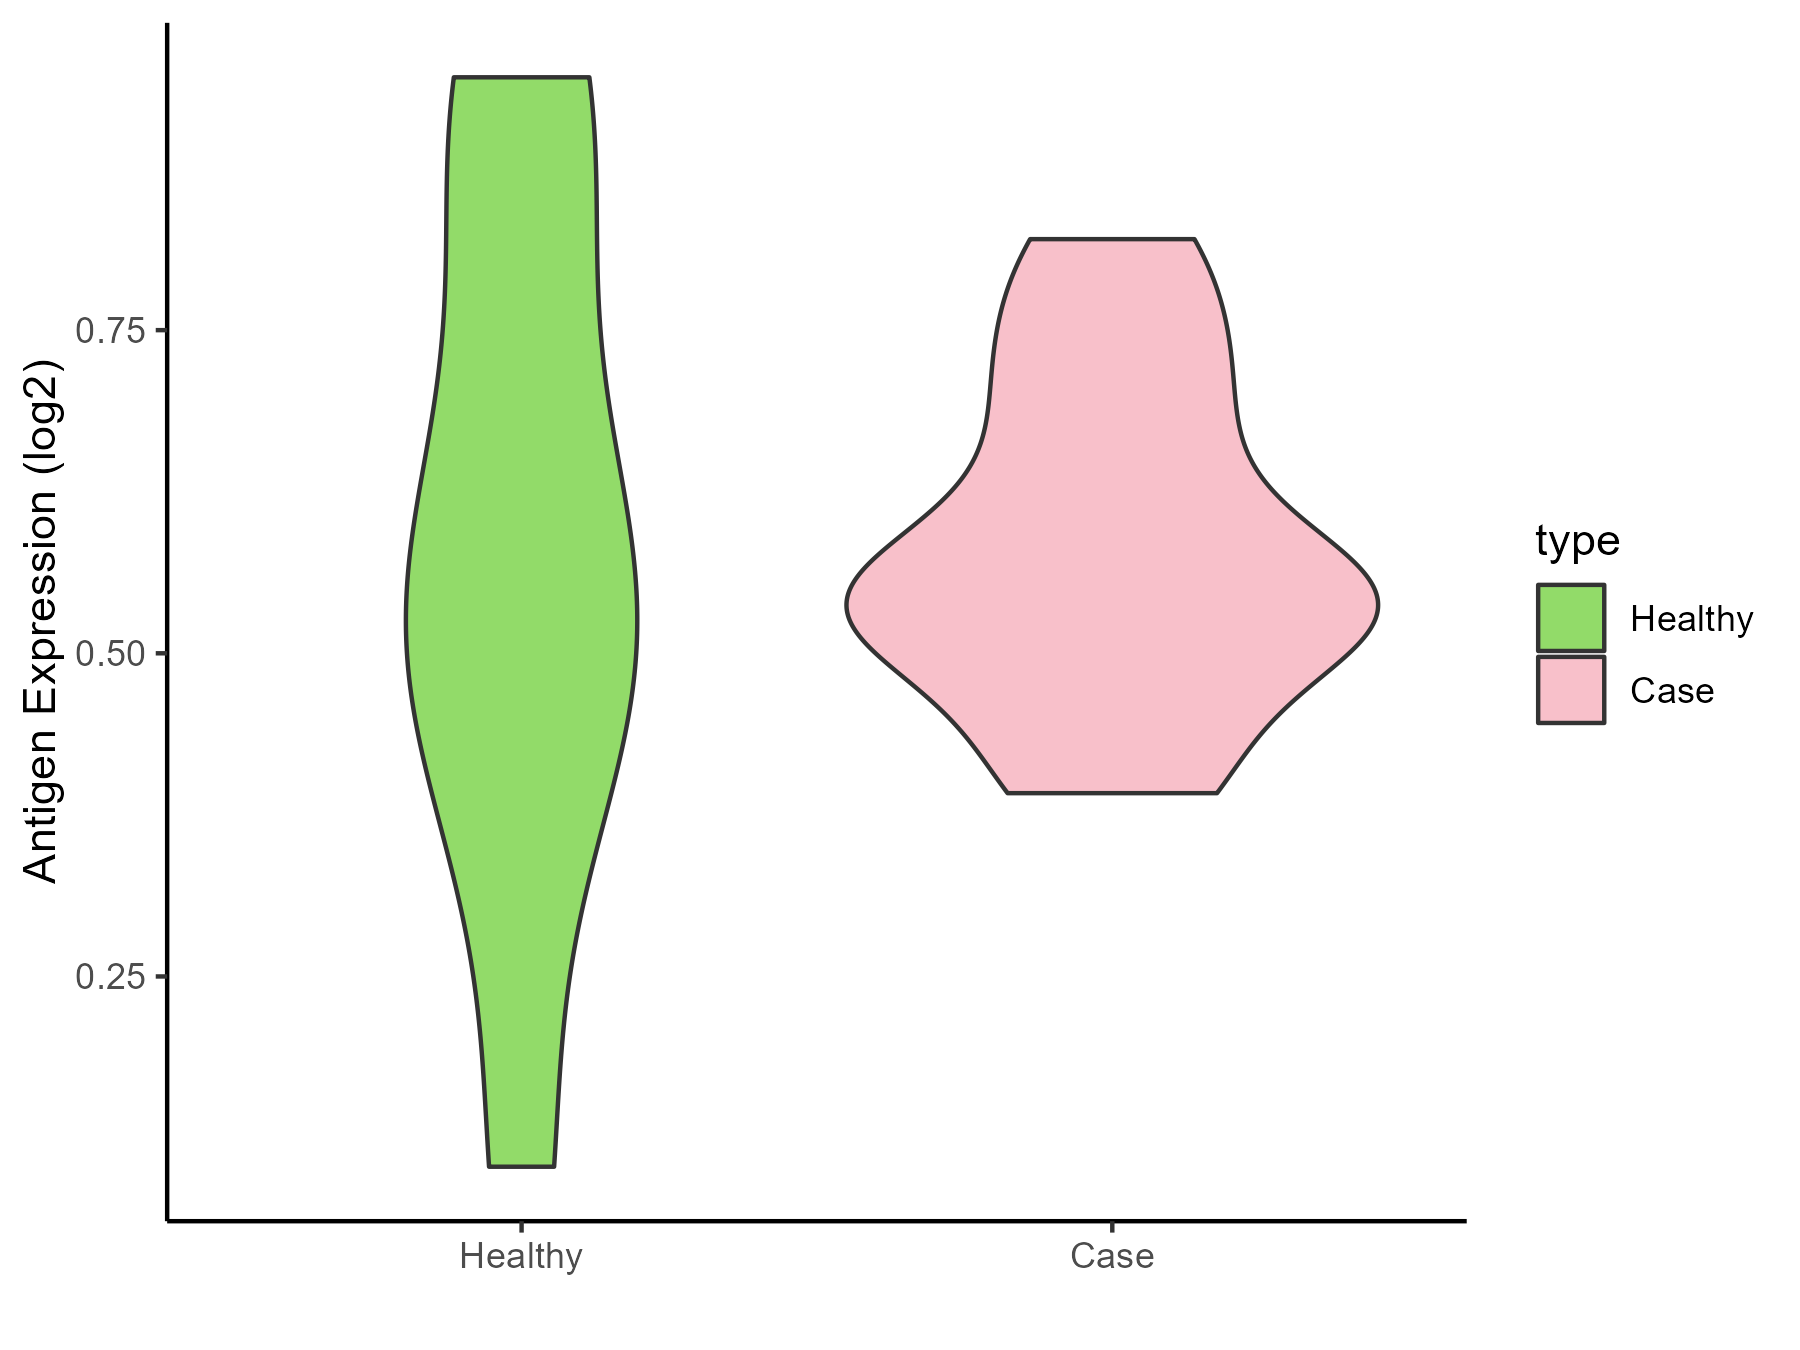
| The Studied Tissue | Cervical spinal cord | |
| The Specific Disease | Lateral sclerosis | |
| The Expression Level of Disease Section Compare with the Healthy Individual Tissue | p-value: 0.991201675; Fold-change: -0.043734917; Z-score: -0.159948453 | |
| Disease-specific Antigen Abundances |
|
Click to View the Clearer Original Diagram |
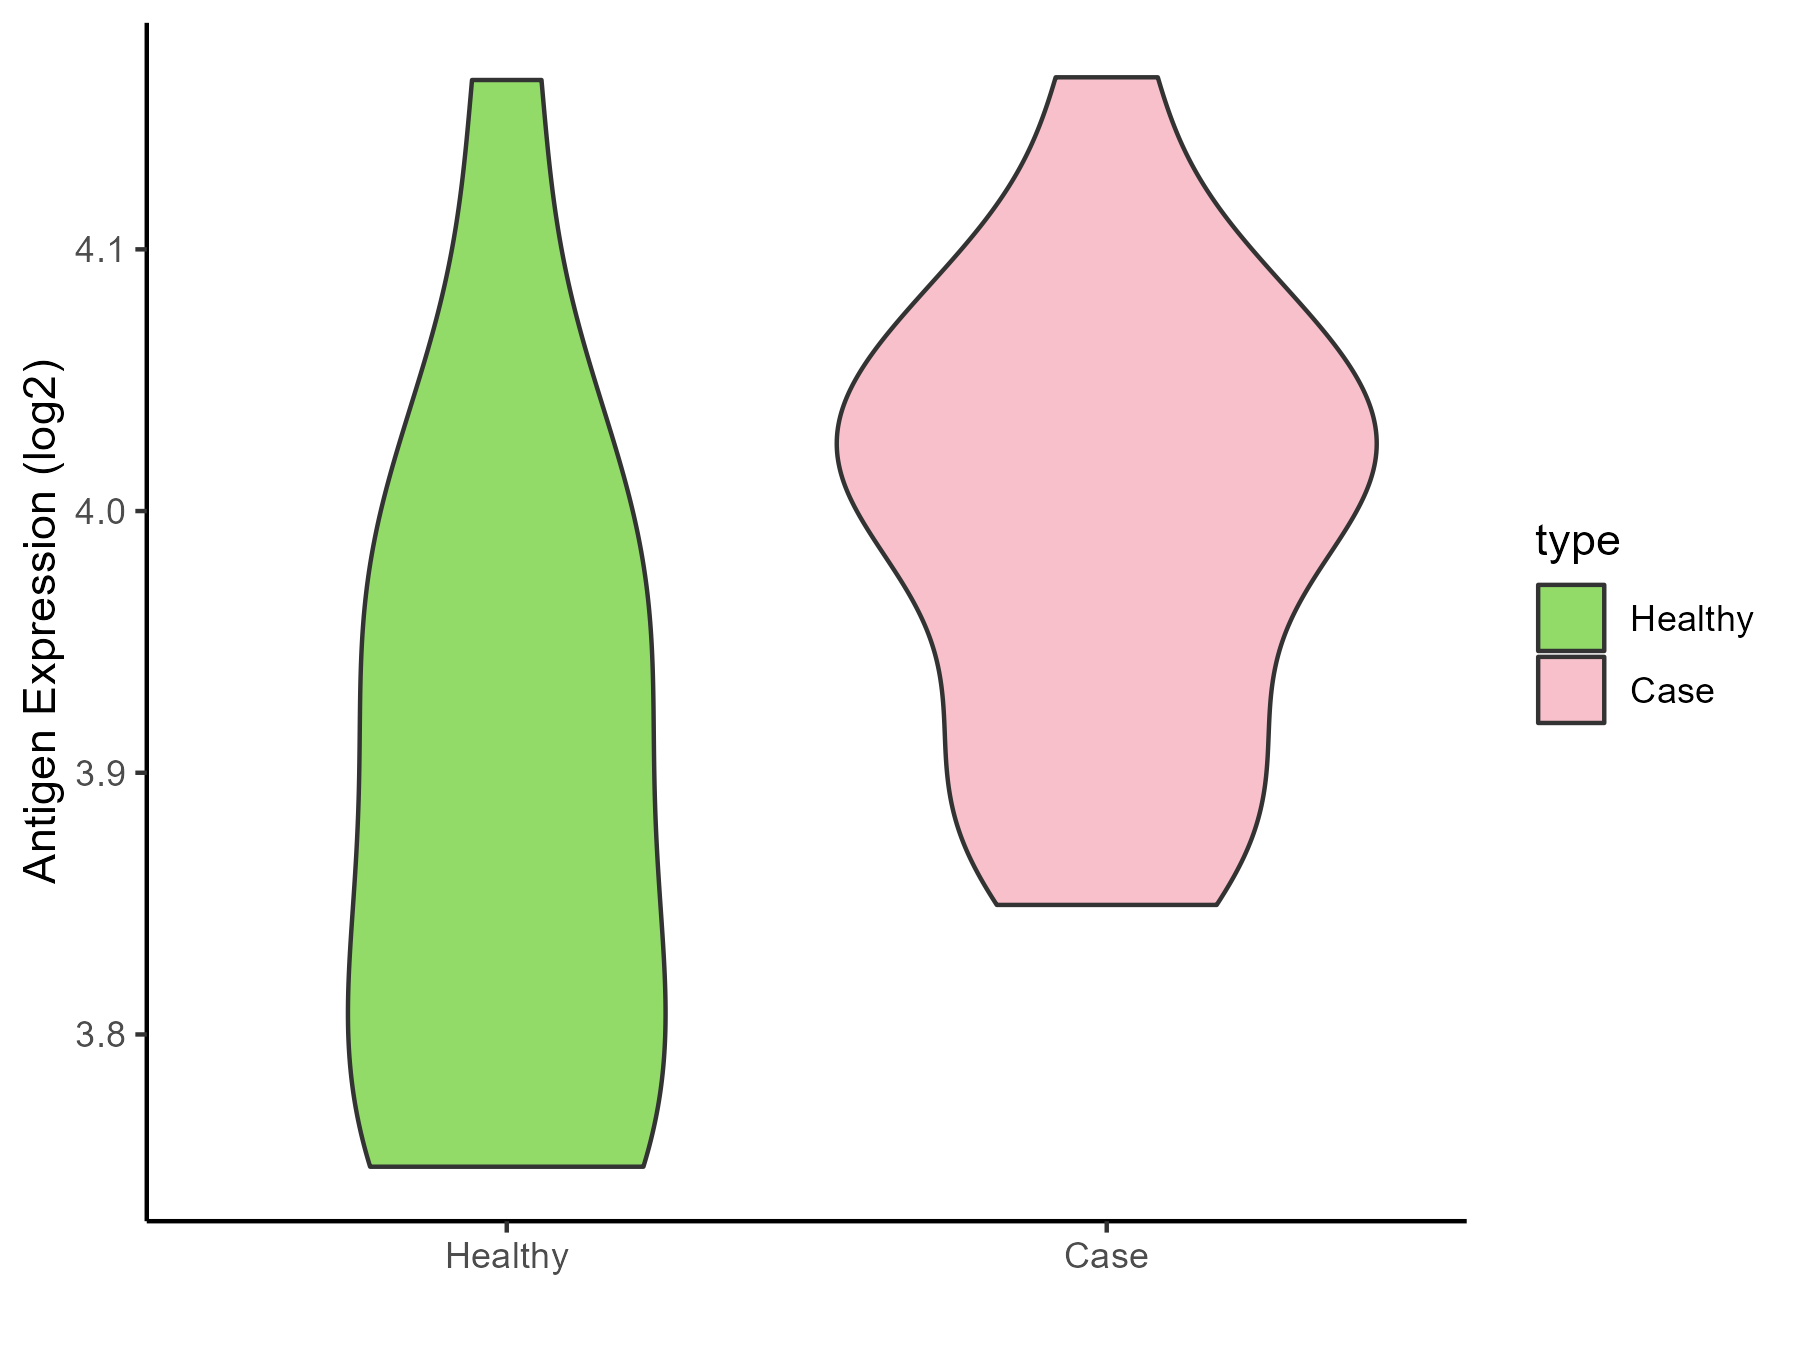
| Differential expression pattern of antigen in diseases | ||
| The Studied Tissue | Muscle | |
| The Specific Disease | Muscular atrophy | |
| The Expression Level of Disease Section Compare with the Healthy Individual Tissue | p-value: 0.025410278; Fold-change: 0.138806267; Z-score: 1.080750904 | |
| Disease-specific Antigen Abundances |
|
Click to View the Clearer Original Diagram |
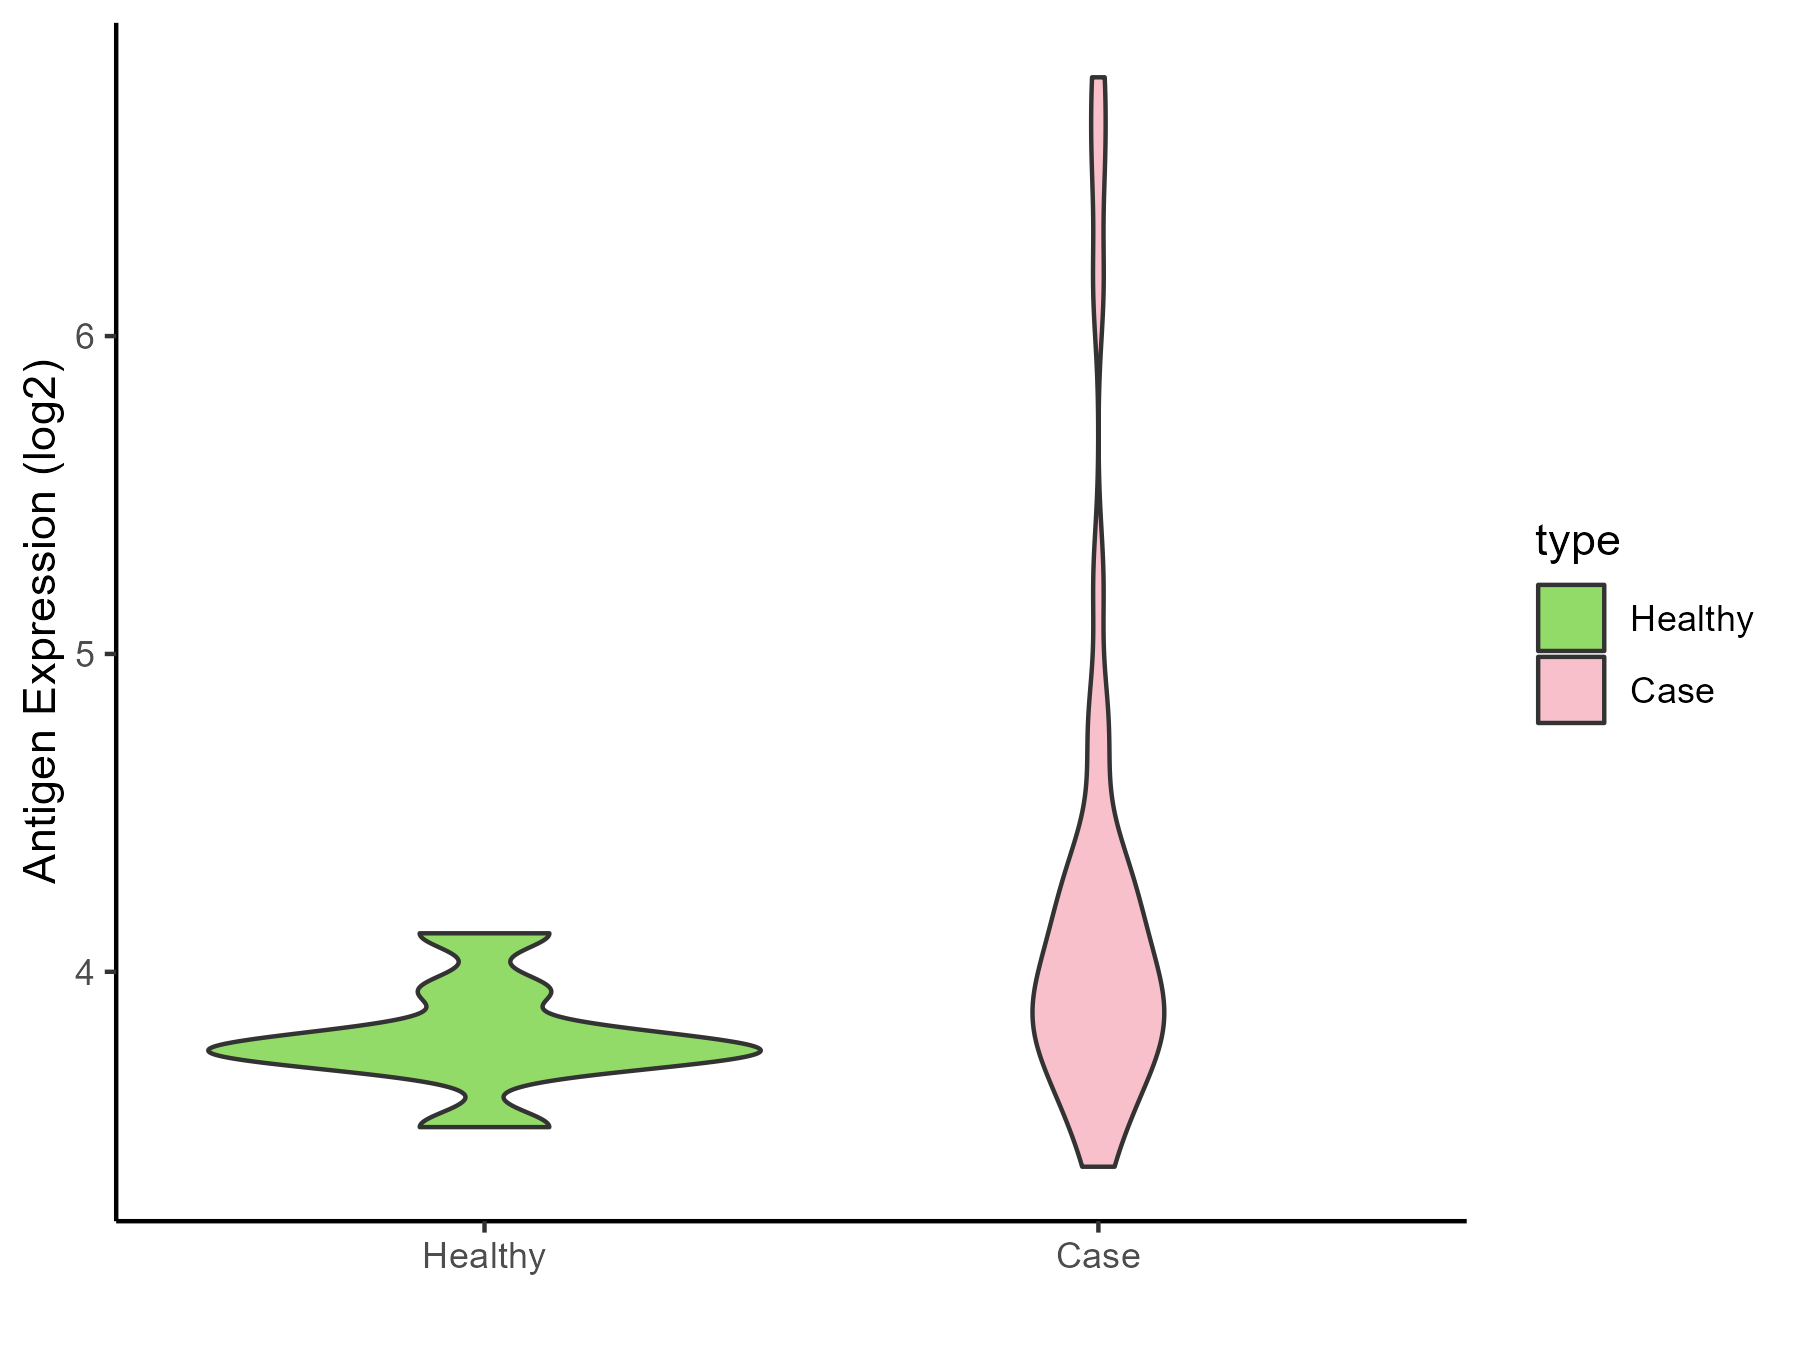
| Differential expression pattern of antigen in diseases | ||
| The Studied Tissue | Muscle | |
| The Specific Disease | Myopathy | |
| The Expression Level of Disease Section Compare with the Healthy Individual Tissue | p-value: 0.006783579; Fold-change: 0.183174411; Z-score: 1.031779028 | |
| Disease-specific Antigen Abundances |
|
Click to View the Clearer Original Diagram |
References
