Antigen Information
General Information of This Antigen
| Antigen ID | TAR0AABNG |
|||||
|---|---|---|---|---|---|---|
| Antigen Name | Sodium-dependent phosphate transport protein 2B (SLC34A2) |
|||||
| Gene Name | SLC34A2 |
|||||
| Gene ID | ||||||
| Synonym | Na(+)-dependent phosphate cotransporter 2B;NaPi3b;Sodium/phosphate cotransporter 2B;Solute carrier family 34 member 2 |
|||||
| Sequence |
MAPWPELGDAQPNPDKYLEGAAGQQPTAPDKSKETNKTDNTEAPVTKIELLPSYSTATLI
DEPTEVDDPWNLPTLQDSGIKWSERDTKGKILCFFQGIGRLILLLGFLYFFVCSLDILSS AFQLVGGKMAGQFFSNSSIMSNPLLGLVIGVLVTVLVQSSSTSTSIVVSMVSSSLLTVRA AIPIIMGANIGTSITNTIVALMQVGDRSEFRRAFAGATVHDFFNWLSVLVLLPVEVATHY LEIITQLIVESFHFKNGEDAPDLLKVITKPFTKLIVQLDKKVISQIAMNDEKAKNKSLVK IWCKTFTNKTQINVTVPSTANCTSPSLCWTDGIQNWTMKNVTYKENIAKCQHIFVNFHLP DLAVGTILLILSLLVLCGCLIMIVKILGSVLKGQVATVIKKTINTDFPFPFAWLTGYLAI LVGAGMTFIVQSSSVFTSALTPLIGIGVITIERAYPLTLGSNIGTTTTAILAALASPGNA LRSSLQIALCHFFFNISGILLWYPIPFTRLPIRMAKGLGNISAKYRWFAVFYLIIFFFLI PLTVFGLSLAGWRVLVGVGVPVVFIIILVLCLRLLQSRCPRVLPKKLQNWNFLPLWMRSL KPWDAVVSKFTGCFQMRCCCCCRVCCRACCLLCDCPKCCRCSKCCEDLEEAQEGQDVPVK APETFDNITISREAQGEVPASDSKTECTAL Click to Show/Hide
|
|||||
| Family | SEZ6 family |
|||||
| Function |
Involved in actively transporting phosphate into cells via Na(+) cotransport.
Click to Show/Hide
|
|||||
| Uniprot Entry | ||||||
| HGNC ID | ||||||
| KEGG ID | ||||||
Each Antibody-drug Conjuate AND It's Component Related to This Antigen
Full List of The ADC Related to This Antigen
10H1.11.4B
| ADC Info | ADC Name | Payload | Target | Linker | Ref |
|---|---|---|---|---|---|
CN109310885B ADC-10 |
CN109310885B ADC-10 payload |
Undisclosed |
CN109310885B ADC-10 linker |
[1] | |
CN109310885B ADC-4 |
CN109310885B ADC-4 payload |
Undisclosed |
CN109310885B ADC-4 linker |
[1] | |
CN109310885B ADC-5 |
CN109310885B ADC-5 payload |
Undisclosed |
CN109310885B ADC-5 linker |
[1] | |
CN109310885B ADC-6 |
CN109310885B ADC-6 payload |
Undisclosed |
CN109310885B ADC-6 linker |
[1] | |
CN109310885B ADC-9 |
CN109310885B ADC-9 payload |
Undisclosed |
CN109310885B ADC-9 linker |
[1] |
A humanized, Fc-silenced IgG1 antibody targeting Napi2b
| ADC Info | ADC Name | Payload | Target | Linker | Ref |
|---|---|---|---|---|---|
TUB-040 |
Exatecan |
DNA topoisomerase 1 (TOP1) |
P5 (PEG24)-Val-Cit-PABC |
[2] |
An anti-NaPi2b humanized monoclonal antibody
| ADC Info | ADC Name | Payload | Target | Linker | Ref |
|---|---|---|---|---|---|
YL-205 |
YL0010014 |
DNA topoisomerase 1 (TOP1) |
Tumor microenviroment activable tripeptide linker |
Anti-NaPi2b mAb 10H1.11.4B
| ADC Info | ADC Name | Payload | Target | Linker | Ref |
|---|---|---|---|---|---|
NaPi2b PNU ADC3-1 |
NaPi2b PNU ADC3-1 payload |
Undisclosed |
NaPi2b PNU ADC3-1 linker |
[3] | |
NaPi2b PNU ADC4-1 |
NaPi2b PNU ADC4-1 payload |
Undisclosed |
NaPi2b PNU ADC4-1 linker |
[3] | |
NaPi2b-PNU-LD1 |
NaPi2b-PNU-LD1 payload |
Undisclosed |
NaPi2b-PNU-LD1 linker |
[3] | |
NaPi2b-PNU-LD2 |
NaPi2b-PNU-LD2 payload |
Undisclosed |
NaPi2b-PNU-LD2 linker |
[3] | |
NaPi2b-PNU-LD5 |
NaPi2b-PNU-LD5 payload |
Undisclosed |
NaPi2b-PNU-LD5 linker |
[3] | |
NaPi2b-PNU-LD6 |
NaPi2b-PNU-LD6 payload |
Undisclosed |
NaPi2b-PNU-LD6 linker |
[3] | |
NaPi2b-PNU-LD7 |
NaPi2b-PNU-LD7 payload |
Undisclosed |
NaPi2b-PNU-LD7 linker |
[3] |
Anti-NaPi2b-LC-K149C
| ADC Info | ADC Name | Payload | Target | Linker | Ref |
|---|---|---|---|---|---|
Alpha-NaPi2b-LC-K149C-10 |
seco-CBI-dimer |
Human Deoxyribonucleic acid (hDNA) |
Mc-peptidomimetic based linker 10 |
[4] | |
Alpha-NaPi2b-LC-K149C-11 |
seco-CBI-dimer |
Human Deoxyribonucleic acid (hDNA) |
Mal-PEG2 |
[4] |
CN105828840B_ADC-134 antibody
| ADC Info | ADC Name | Payload | Target | Linker | Ref |
|---|---|---|---|---|---|
CN105828840B ADC-134 |
CN105828840B_ADC-134 payload |
Undisclosed |
CN105828840B_ADC-134 linker |
[5] |
CN105828840B_ADC-135 antibody
| ADC Info | ADC Name | Payload | Target | Linker | Ref |
|---|---|---|---|---|---|
CN105828840B ADC-135 |
CN105828840B_ADC-135 payload |
Undisclosed |
CN105828840B_ADC-135 linker |
[5] |
CN105828840B_ADC-136 antibody
| ADC Info | ADC Name | Payload | Target | Linker | Ref |
|---|---|---|---|---|---|
CN105828840B ADC-136 |
CN105828840B_ADC-136 payload |
Undisclosed |
CN105828840B_ADC-136 linker |
[5] |
Fully humanized Anti-SLC34A2 IgG1 mAb
| ADC Info | ADC Name | Payload | Target | Linker | Ref |
|---|---|---|---|---|---|
ZW-220 |
ZD06519 |
DNA topoisomerase 1 (TOP1) |
Mc-Gly-Gly-Phe-Gly-AM |
[6] |
Lifastuzumab
| ADC Info | ADC Name | Payload | Target | Linker | Ref |
|---|---|---|---|---|---|
Lifastuzumab vedotin |
Monomethyl auristatin E |
Microtubule (MT) |
Mc-Val-Cit-PABC |
[7] |
Thio Anti-Napi2B 10H1.11.4B LC V205C
| ADC Info | ADC Name | Payload | Target | Linker | Ref |
|---|---|---|---|---|---|
WO2017214024A1 ADC-102 |
WO2017214024A1_ADC-102 payload |
Undisclosed |
WO2017214024A1_ADC-102 linker |
[8] |
Thio hu Anti-NaPi2b 10H1.11.4B LC K149C
| ADC Info | ADC Name | Payload | Target | Linker | Ref |
|---|---|---|---|---|---|
WO2017059289A1 ADC-208 |
WO2017059289A1_ADC-208 payload |
Undisclosed |
WO2017059289A1_ADC-208 linker |
[9] |
Thio hu Anti-Napi3b 10H1.11.4B HC A118C
| ADC Info | ADC Name | Payload | Target | Linker | Ref |
|---|---|---|---|---|---|
WO2014159981A2 ADC-205 |
WO2014159981A2_ADC-205 payload |
Undisclosed |
WO2014159981A2_ADC-205 linker |
[10] | |
WO2014159981A2 ADC-SLC34A2-33 |
WO2014159981A2_ADC-SLC34A2-33 payload |
Undisclosed |
WO2014159981A2_ADC-SLC34A2-33 linker |
[10] | |
WO2014159981A2 ADC-SLC34A2-37 |
WO2014159981A2_ADC-SLC34A2-37 payload |
Undisclosed |
WO2014159981A2_ADC-SLC34A2-37 linker |
[10] |
XMT-1535
| ADC Info | ADC Name | Payload | Target | Linker | Ref |
|---|---|---|---|---|---|
Upifitamab rilsodotin |
Auristatin F hydroxypropylamide (AF-HPA) |
Microtubule (MT) |
Dolaflexin polymer |
[11] | |
CN109310885B ADC-1 |
CN109310885B ADC-1 payload |
Undisclosed |
CN109310885B ADC-1 linker |
[1] | |
CN109310885B ADC-2 |
CN109310885B ADC-2 payload |
Undisclosed |
CN109310885B ADC-2 linker |
[1] | |
CN109310885B ADC-3 |
CN109310885B ADC-3 payload |
Undisclosed |
CN109310885B ADC-3 linker |
[1] | |
WO2018098269A2 conjugate 53A |
WO2018098269A2_conjugate 53A payload |
Undisclosed |
WO2018098269A2_conjugate 53A linker |
[12] | |
WO2018098269A2 conjugate 53B |
WO2018098269A2_conjugate 53B payload |
Undisclosed |
WO2018098269A2_conjugate 53B linker |
[12] | |
WO2018098269A2 conjugate 53C |
WO2018098269A2_conjugate 53C payload |
Undisclosed |
WO2018098269A2_conjugate 53C linker |
[12] | |
WO2018098269A2 conjugate 53D |
WO2018098269A2_conjugate 53D payload |
Undisclosed |
WO2018098269A2_conjugate 53D linker |
[12] | |
WO2018098269A2 conjugate 53E |
WO2018098269A2_conjugate 53E payload |
Undisclosed |
WO2018098269A2_conjugate 53E linker |
[12] | |
WO2018098269A2 conjugate 55A |
WO2018098269A2_conjugate 55A payload |
Undisclosed |
WO2018098269A2_conjugate 55A linker |
[12] | |
WO2018098269A2 conjugate 55B |
WO2018098269A2_conjugate 55B payload |
Undisclosed |
WO2018098269A2_conjugate 55B linker |
[12] | |
WO2018098269A2 conjugate 57 |
WO2018098269A2_conjugate 57 payload |
Undisclosed |
WO2018098269A2_conjugate 57 linker |
[12] | |
WO2018098269A2 conjugate 59 |
WO2018098269A2_conjugate 59 payload |
Undisclosed |
WO2018098269A2_conjugate 59 linker |
[12] | |
WO2018098269A2 conjugate 61 |
WO2018098269A2_conjugate 61 payload |
Undisclosed |
WO2018098269A2_conjugate 61 linker |
[12] | |
WO2018098269A2 conjugate 66 |
WO2018098269A2_conjugate 66 payload |
Undisclosed |
WO2018098269A2_conjugate 66 linker |
[12] | |
WO2018098269A2 conjugate 76 |
WO2018098269A2_conjugate 76 payload |
Undisclosed |
WO2018098269A2_conjugate 76 linker |
[12] | |
WO2018098269A2 conjugate 78 |
WO2018098269A2_conjugate 78 payload |
Undisclosed |
WO2018098269A2_conjugate 78 linker |
[12] | |
WO2018098269A2 conjugate 79A |
WO2018098269A2_conjugate 79A payload |
Undisclosed |
WO2018098269A2_conjugate 79A linker |
[12] | |
WO2018098269A2 conjugate 79B |
WO2018098269A2_conjugate 79B payload |
Undisclosed |
WO2018098269A2_conjugate 79B linker |
[12] | |
WO2018098269A2 conjugate 83 |
WO2018098269A2_conjugate 83 payload |
Undisclosed |
WO2018098269A2_conjugate 83 linker |
[12] | |
WO2018098269A2 conjugate 85 |
WO2018098269A2_conjugate 85 payload |
Undisclosed |
WO2018098269A2_conjugate 85 linker |
[12] |
Undisclosed
| ADC Info | ADC Name | Payload | Target | Linker | Ref |
|---|---|---|---|---|---|
XMT-1592 |
Auristatin F hydroxypropylamide (AF-HPA) |
Microtubule (MT) |
Cys-13 ADC linker |
[13] | |
Anti-NaPi3b antibody-drug conjugate (Genentech/Roche) |
Monomethyl auristatin E |
Microtubule (MT) |
Undisclosed |
[14] | |
BSI-715 |
Undisclosed |
Undisclosed |
Undisclosed |
[15] |
Tissue/Disease specific Abundances of This Antigen
Tissue specific Abundances of This Antigen
ICD Disease Classification 01
| Differential expression pattern of antigen in diseases | ||
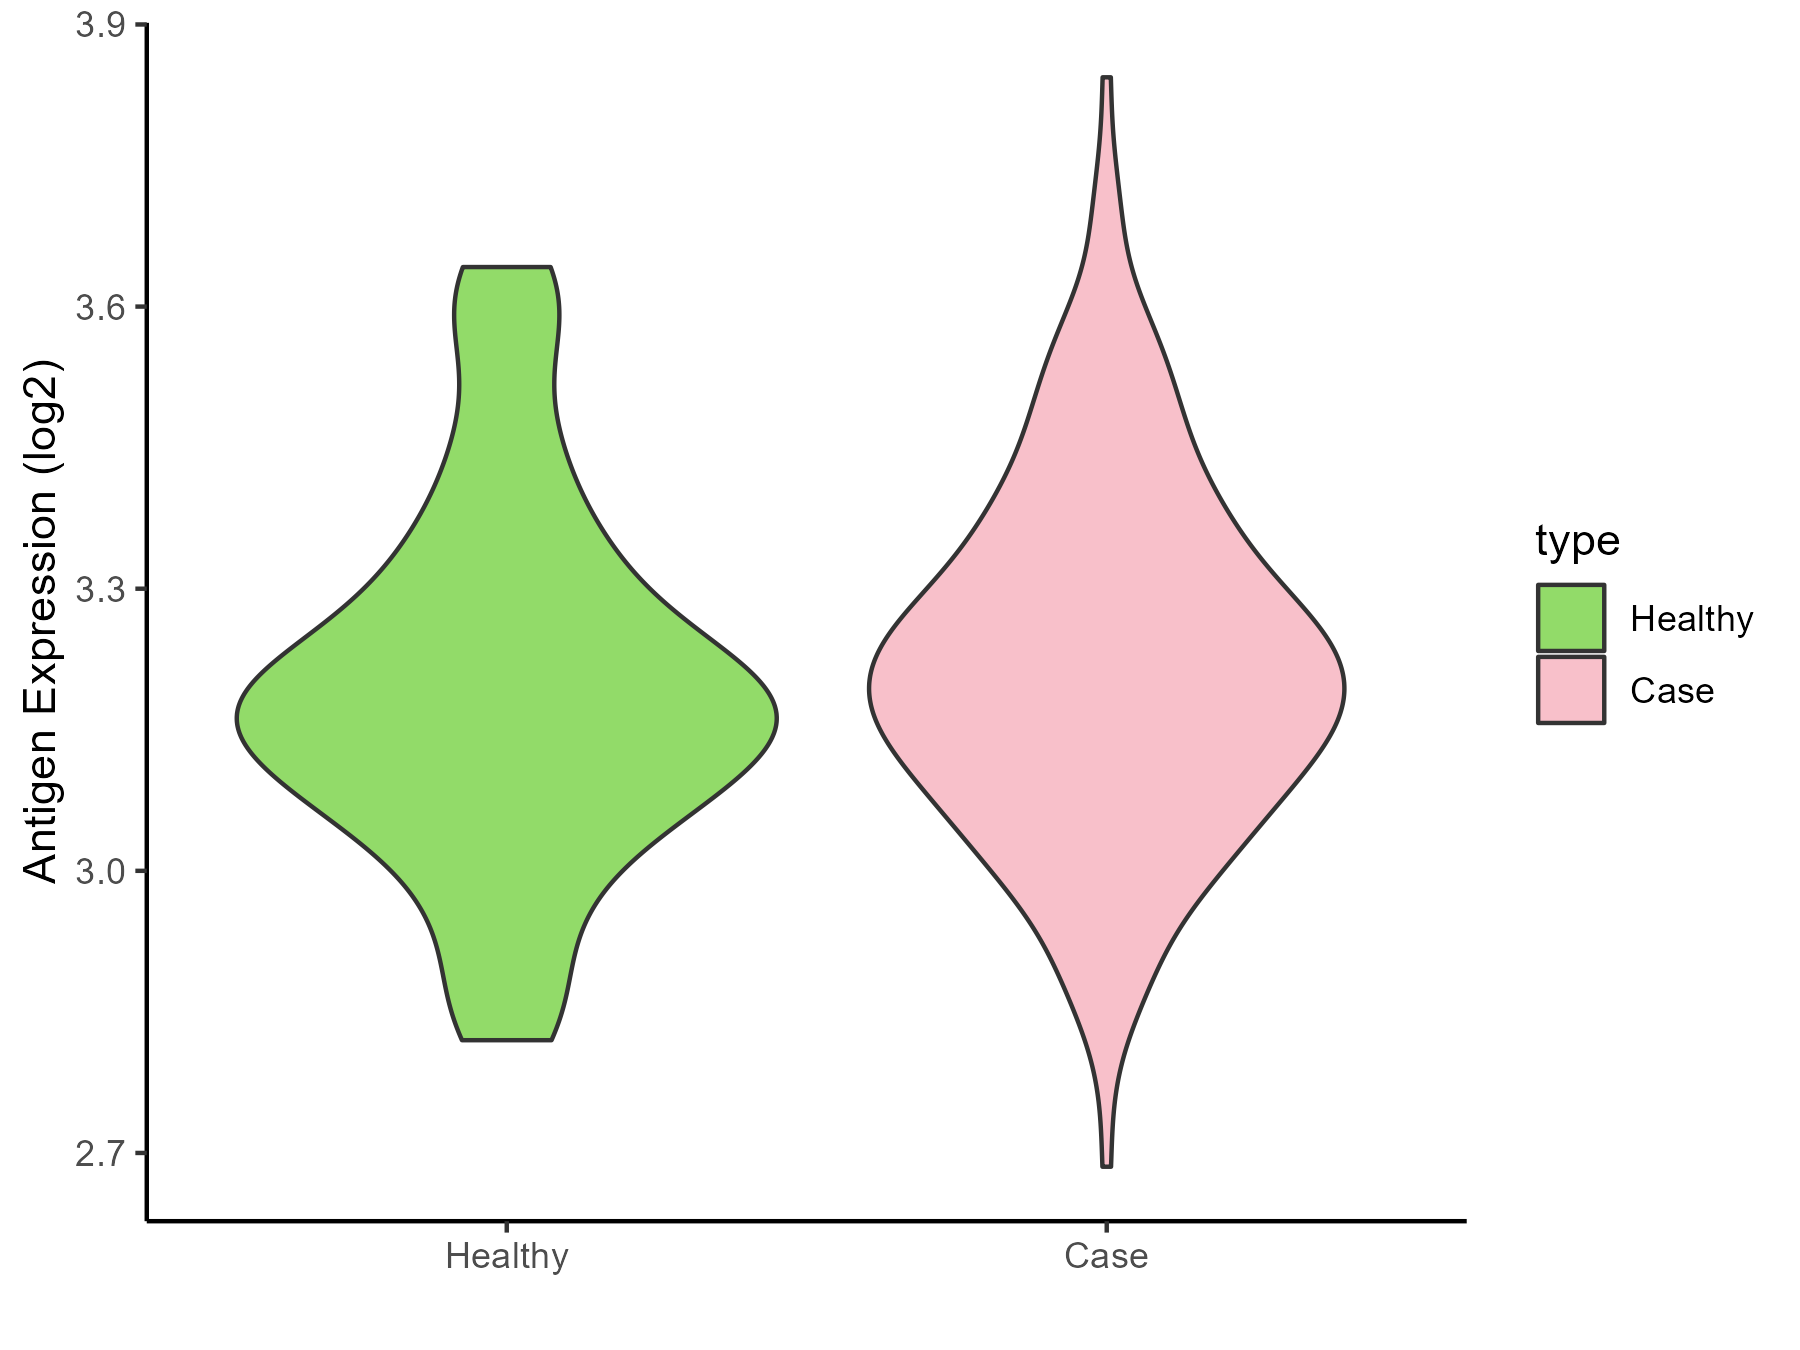
| The Studied Tissue | Gingival | |
| The Specific Disease | Bacterial infection of gingival | |
| The Expression Level of Disease Section Compare with the Healthy Individual Tissue | p-value: 0.330243367; Fold-change: 0.027363025; Z-score: 0.142733964 | |
| Disease-specific Antigen Abundances |
|
Click to View the Clearer Original Diagram |
ICD Disease Classification 02
| Differential expression pattern of antigen in diseases | ||
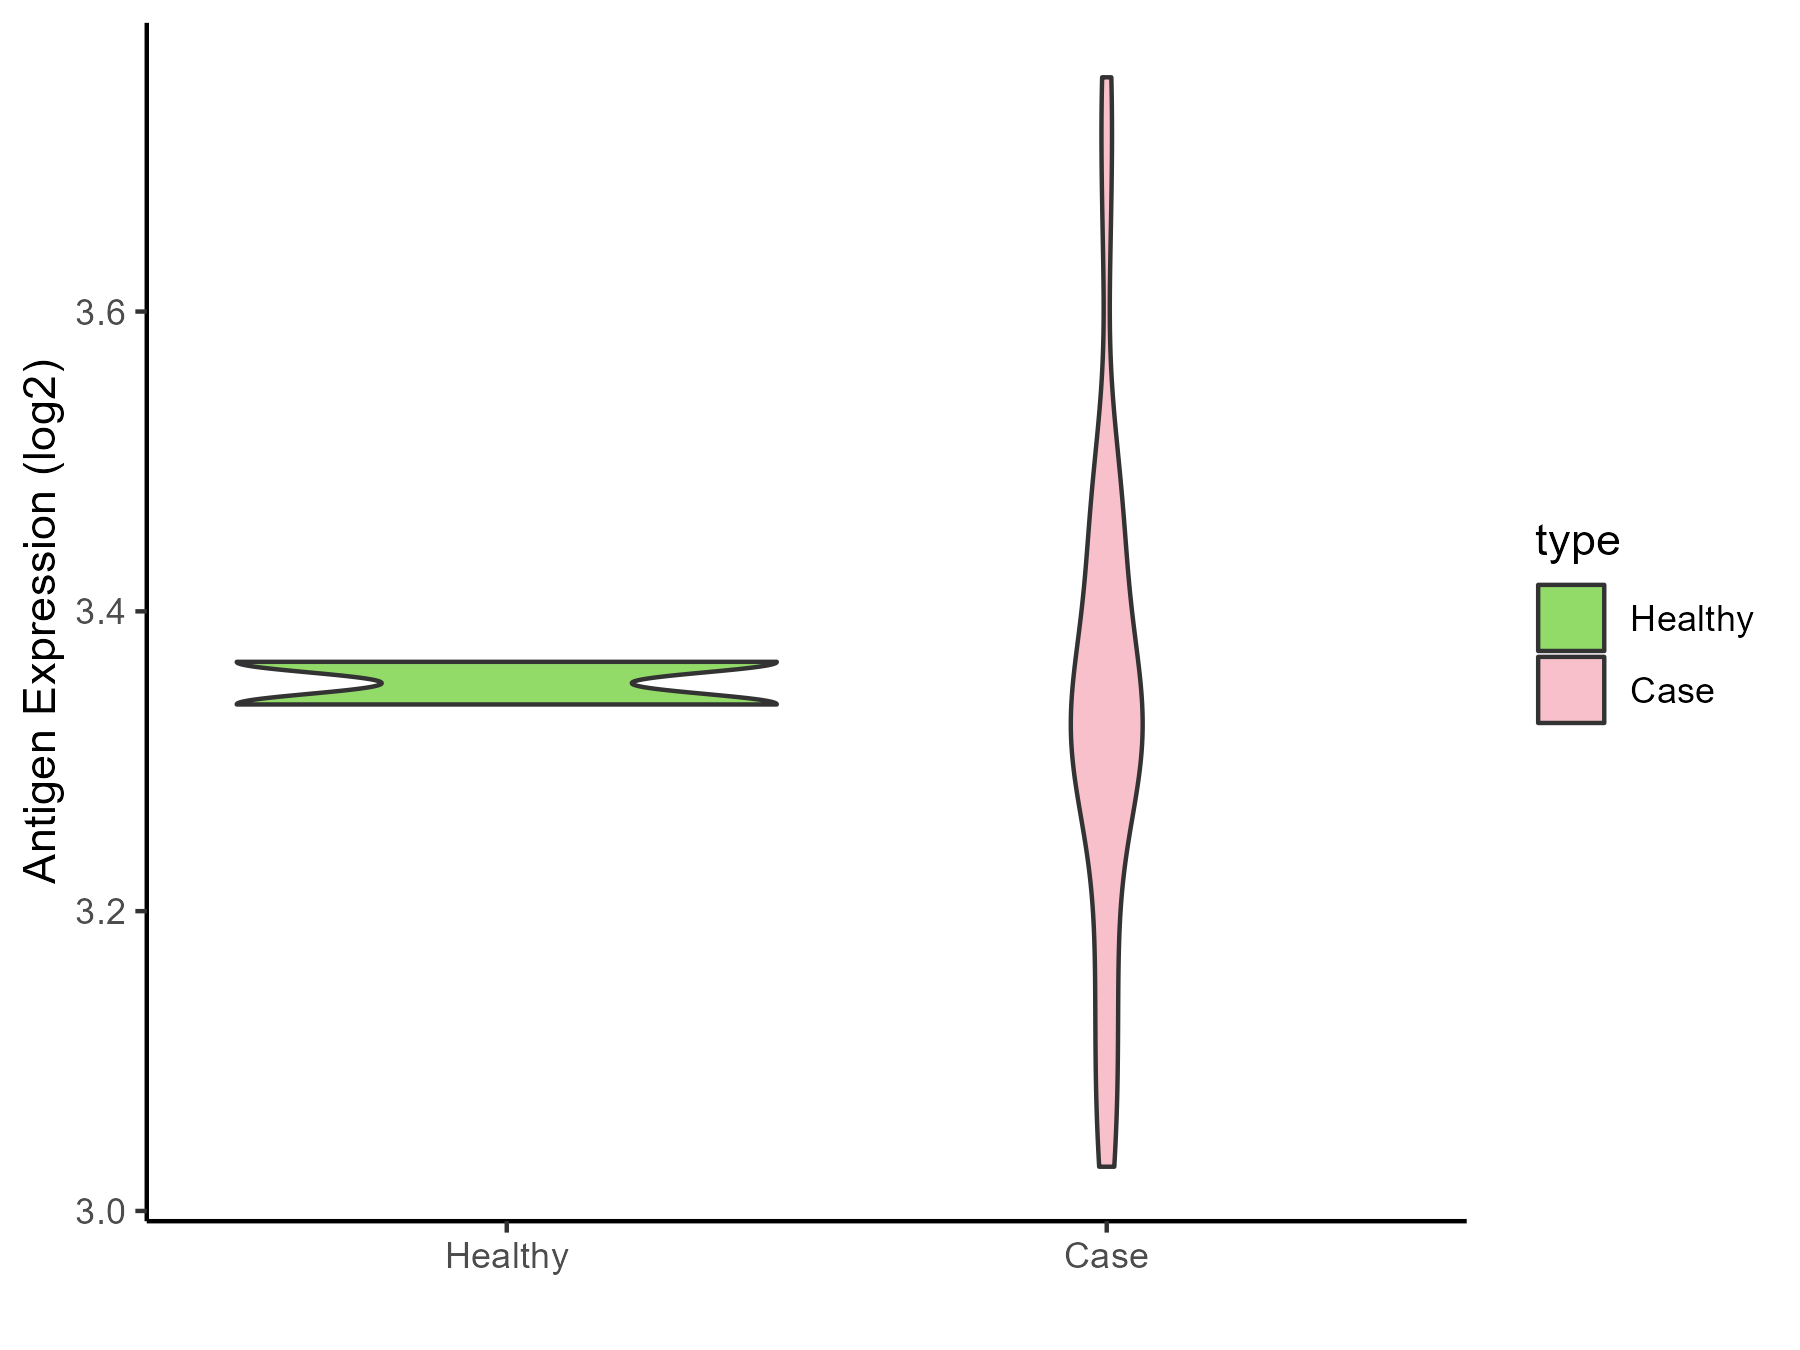
| The Studied Tissue | Brainstem | |
| The Specific Disease | Glioma | |
| The Expression Level of Disease Section Compare with the Healthy Individual Tissue | p-value: 0.63902292; Fold-change: -0.027818332; Z-score: -1.383167705 | |
| Disease-specific Antigen Abundances |
|
Click to View the Clearer Original Diagram |
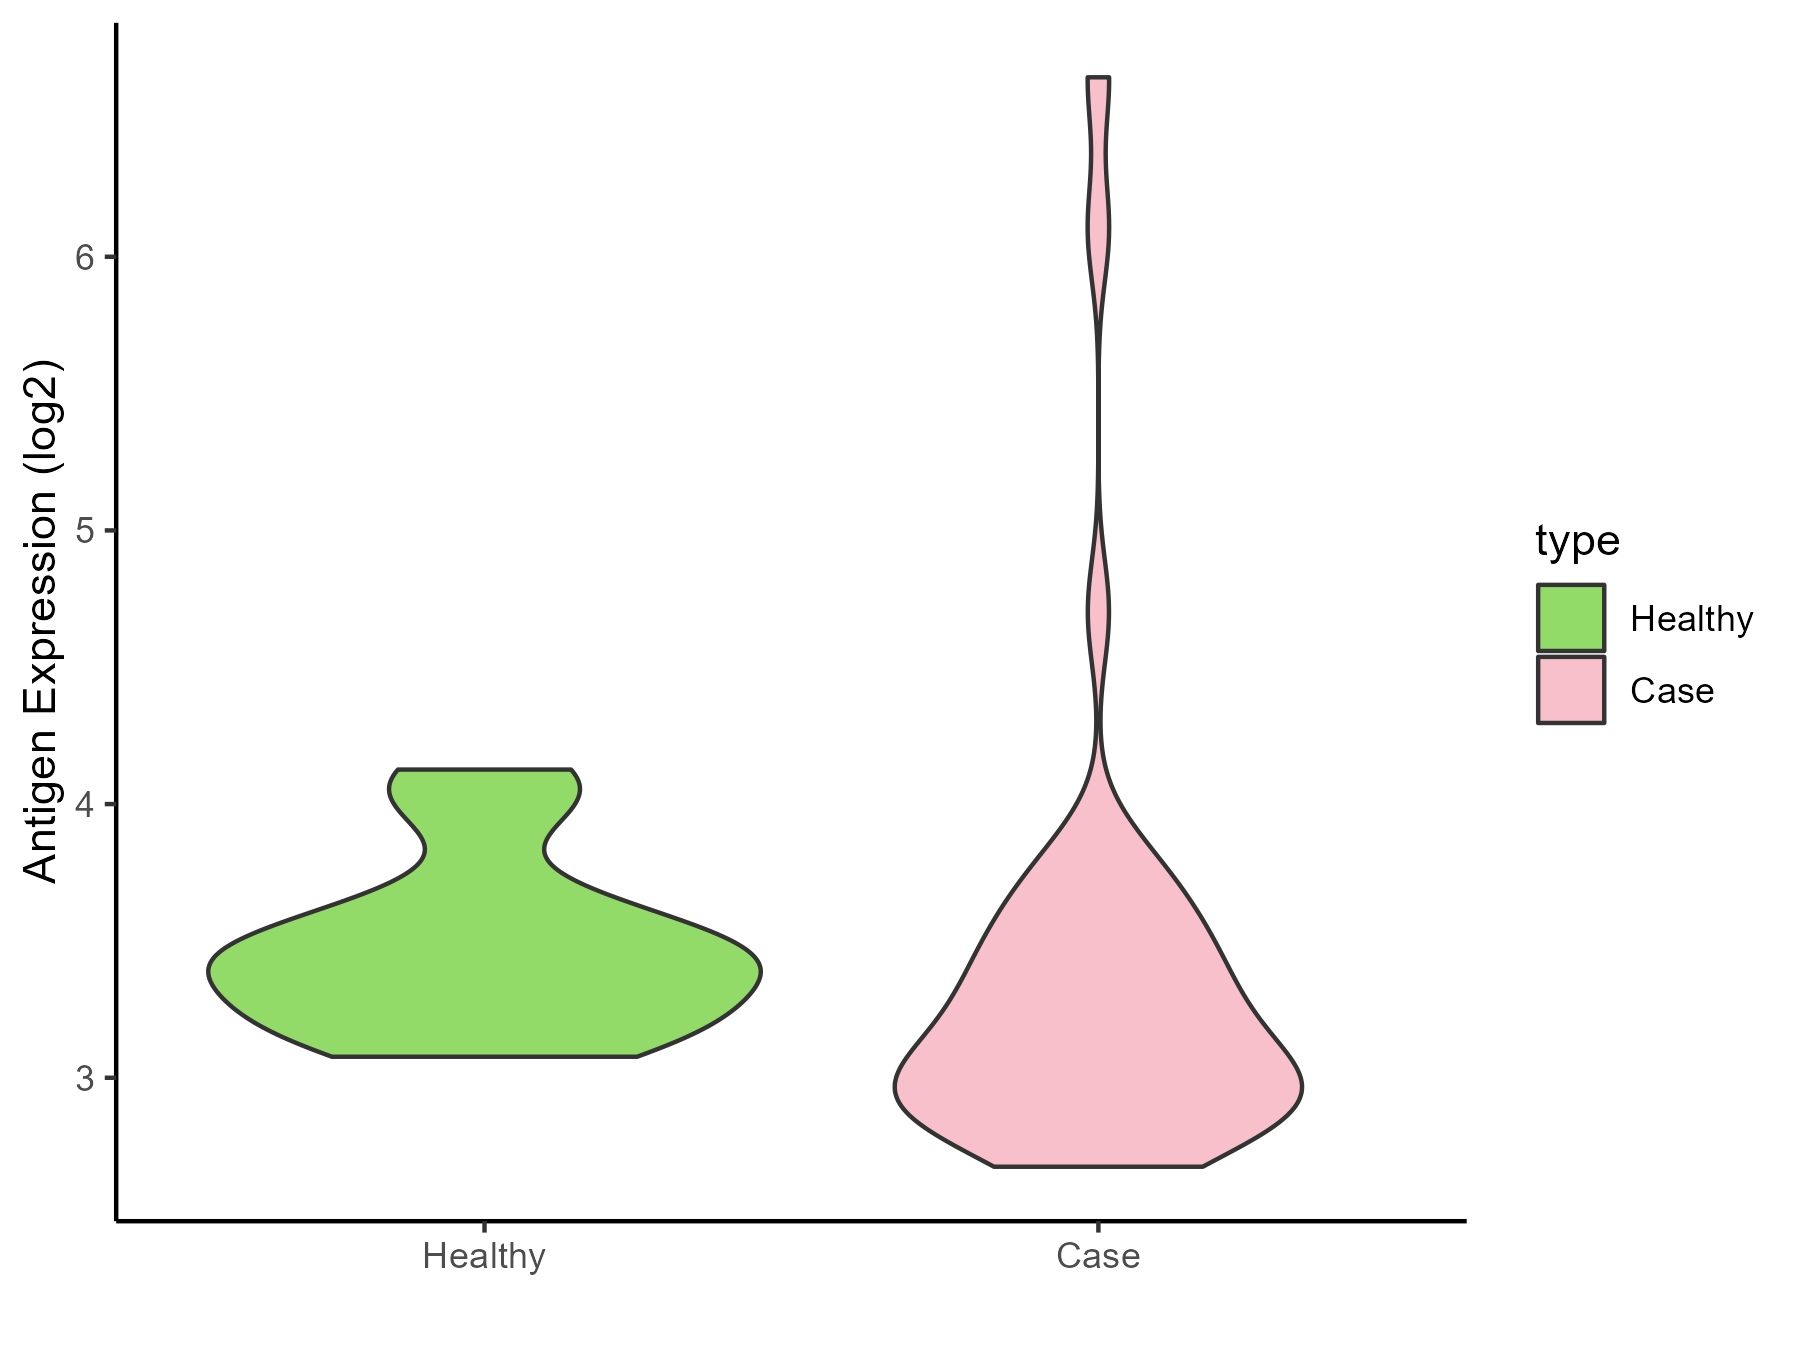
| The Studied Tissue | White matter | |
| The Specific Disease | Glioma | |
| The Expression Level of Disease Section Compare with the Healthy Individual Tissue | p-value: 0.45783172; Fold-change: -0.290701376; Z-score: -0.881628818 | |
| Disease-specific Antigen Abundances |
|
Click to View the Clearer Original Diagram |
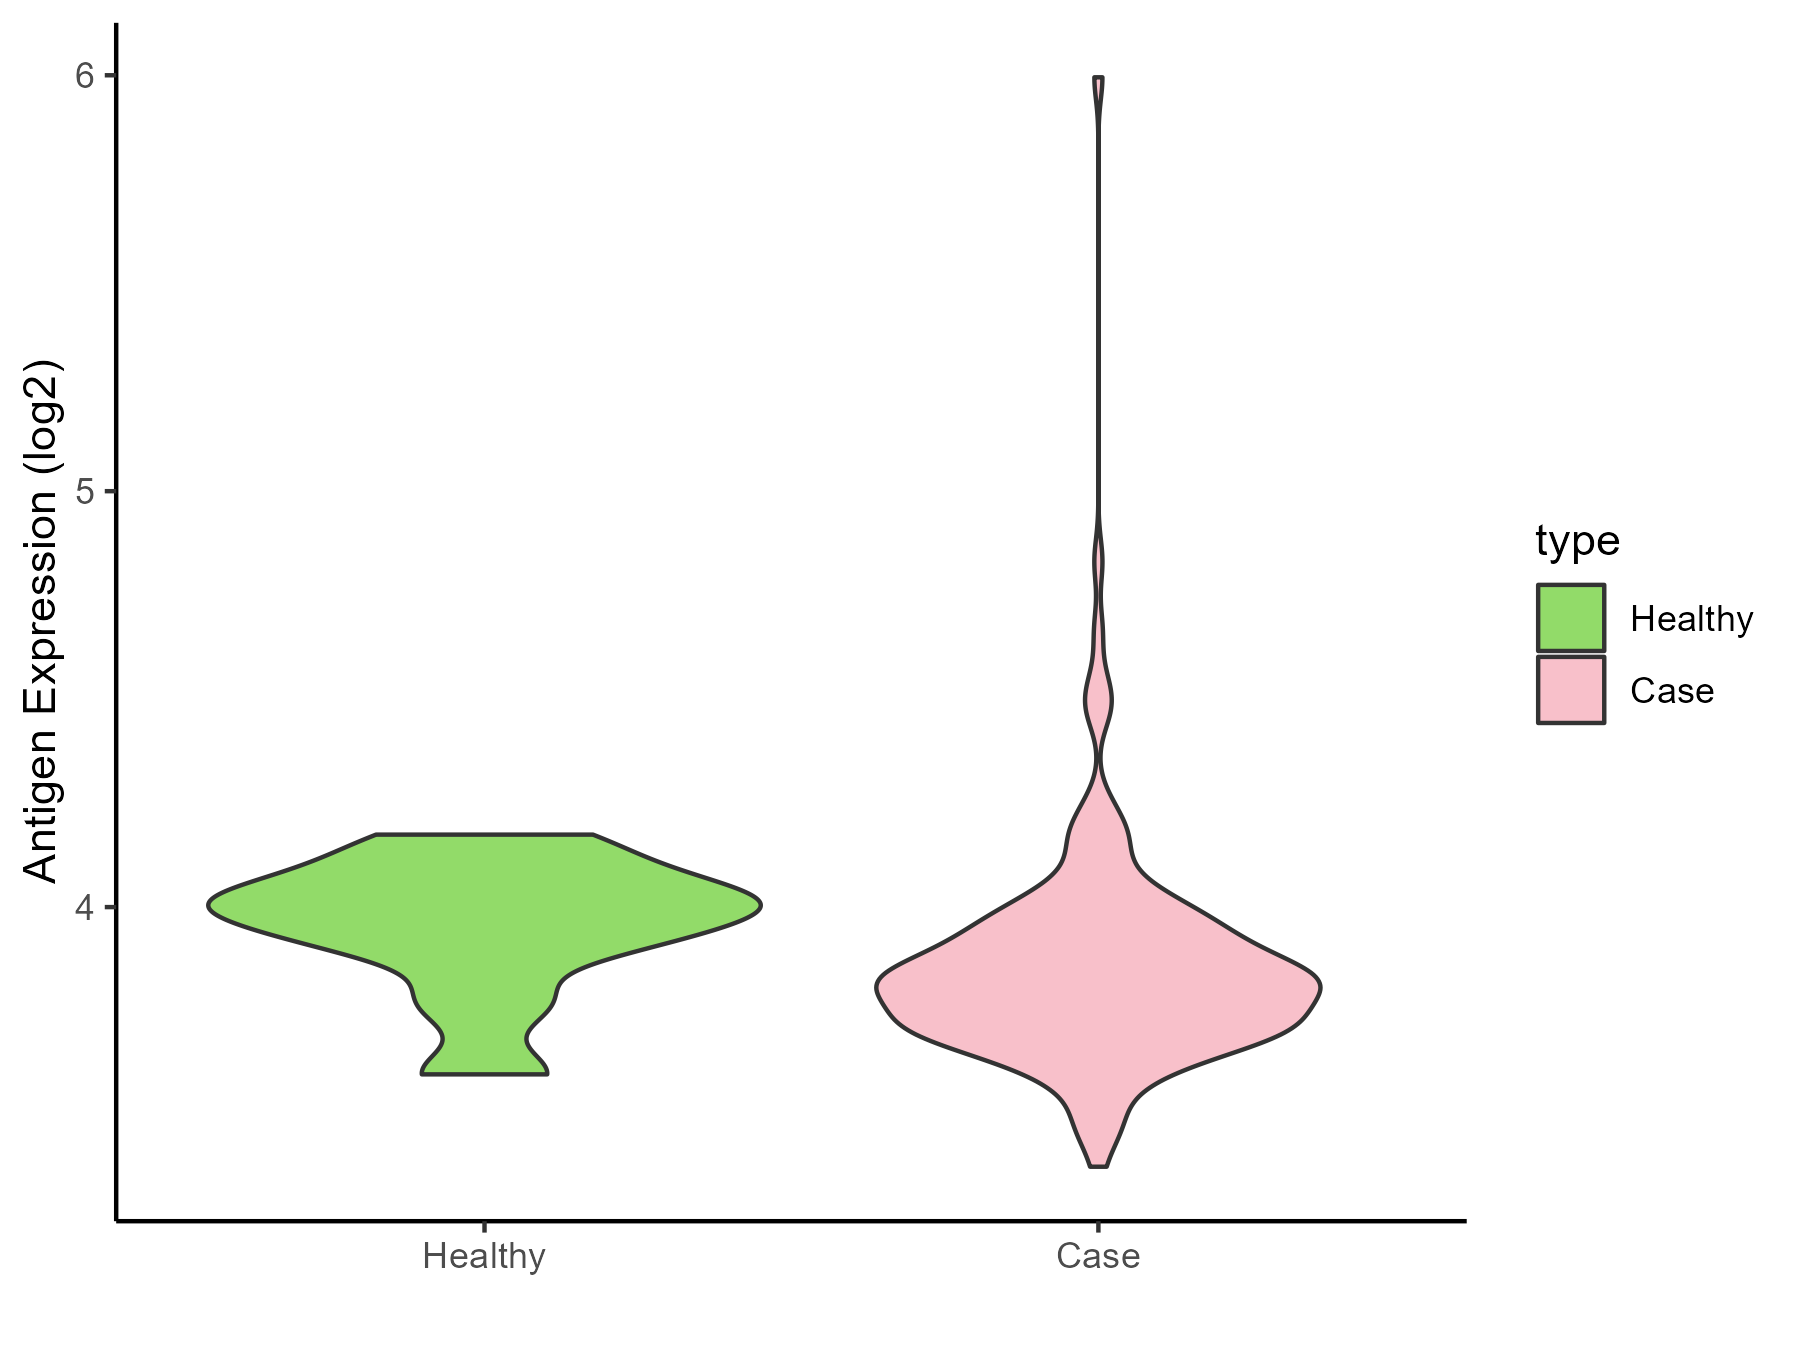
| The Studied Tissue | Brainstem | |
| The Specific Disease | Neuroectodermal tumor | |
| The Expression Level of Disease Section Compare with the Healthy Individual Tissue | p-value: 0.106223097; Fold-change: -0.176864527; Z-score: -1.047801379 | |
| Disease-specific Antigen Abundances |
|
Click to View the Clearer Original Diagram |
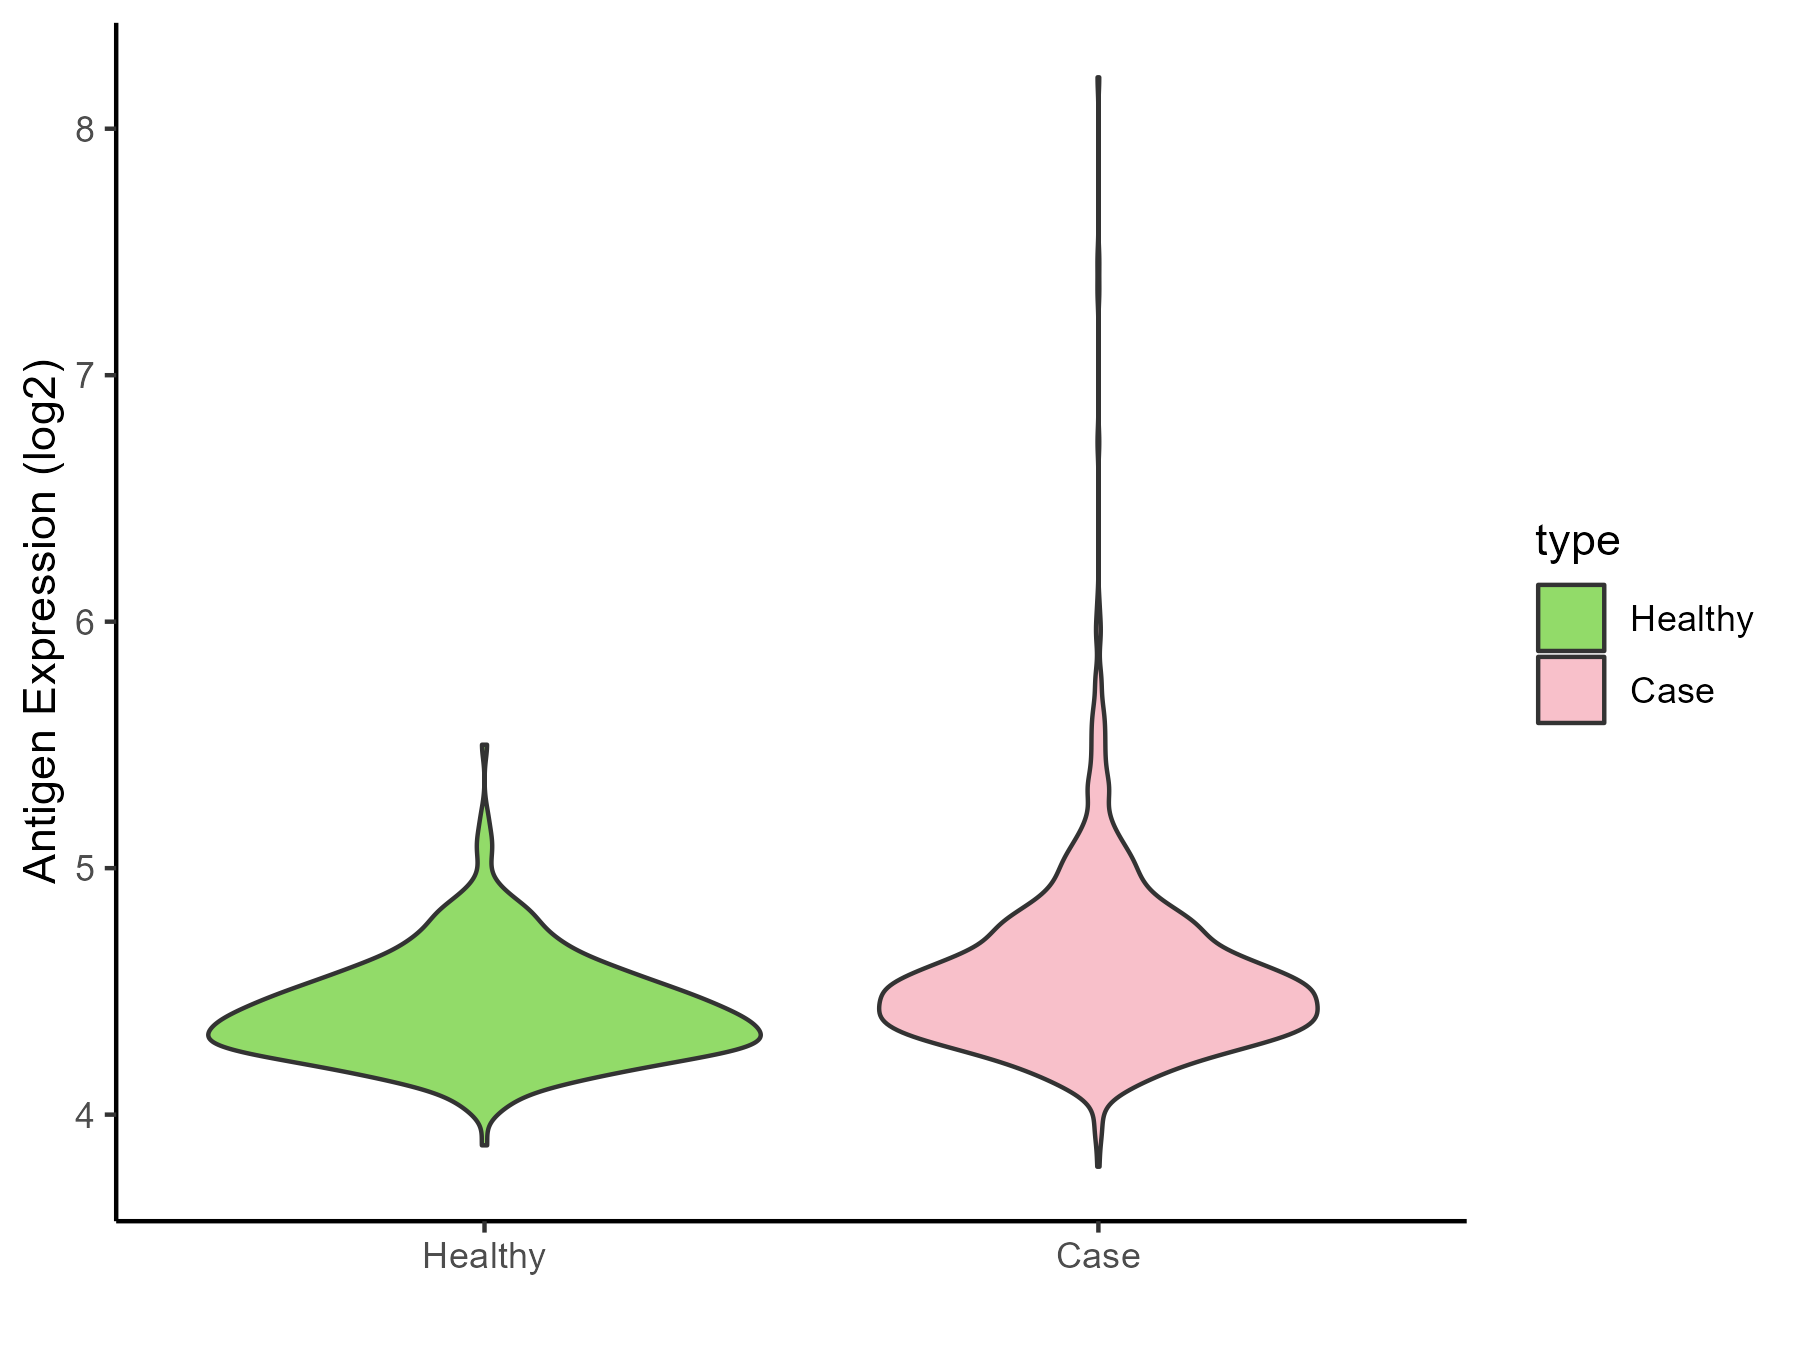
| The Studied Tissue | Nervous | |
| The Specific Disease | Brain cancer | |
| The Expression Level of Disease Section Compare with the Healthy Individual Tissue | p-value: 3.14E-21; Fold-change: 0.112726927; Z-score: 0.53830518 | |
| Disease-specific Antigen Abundances |
|
Click to View the Clearer Original Diagram |
| Differential expression pattern of antigen in diseases | ||
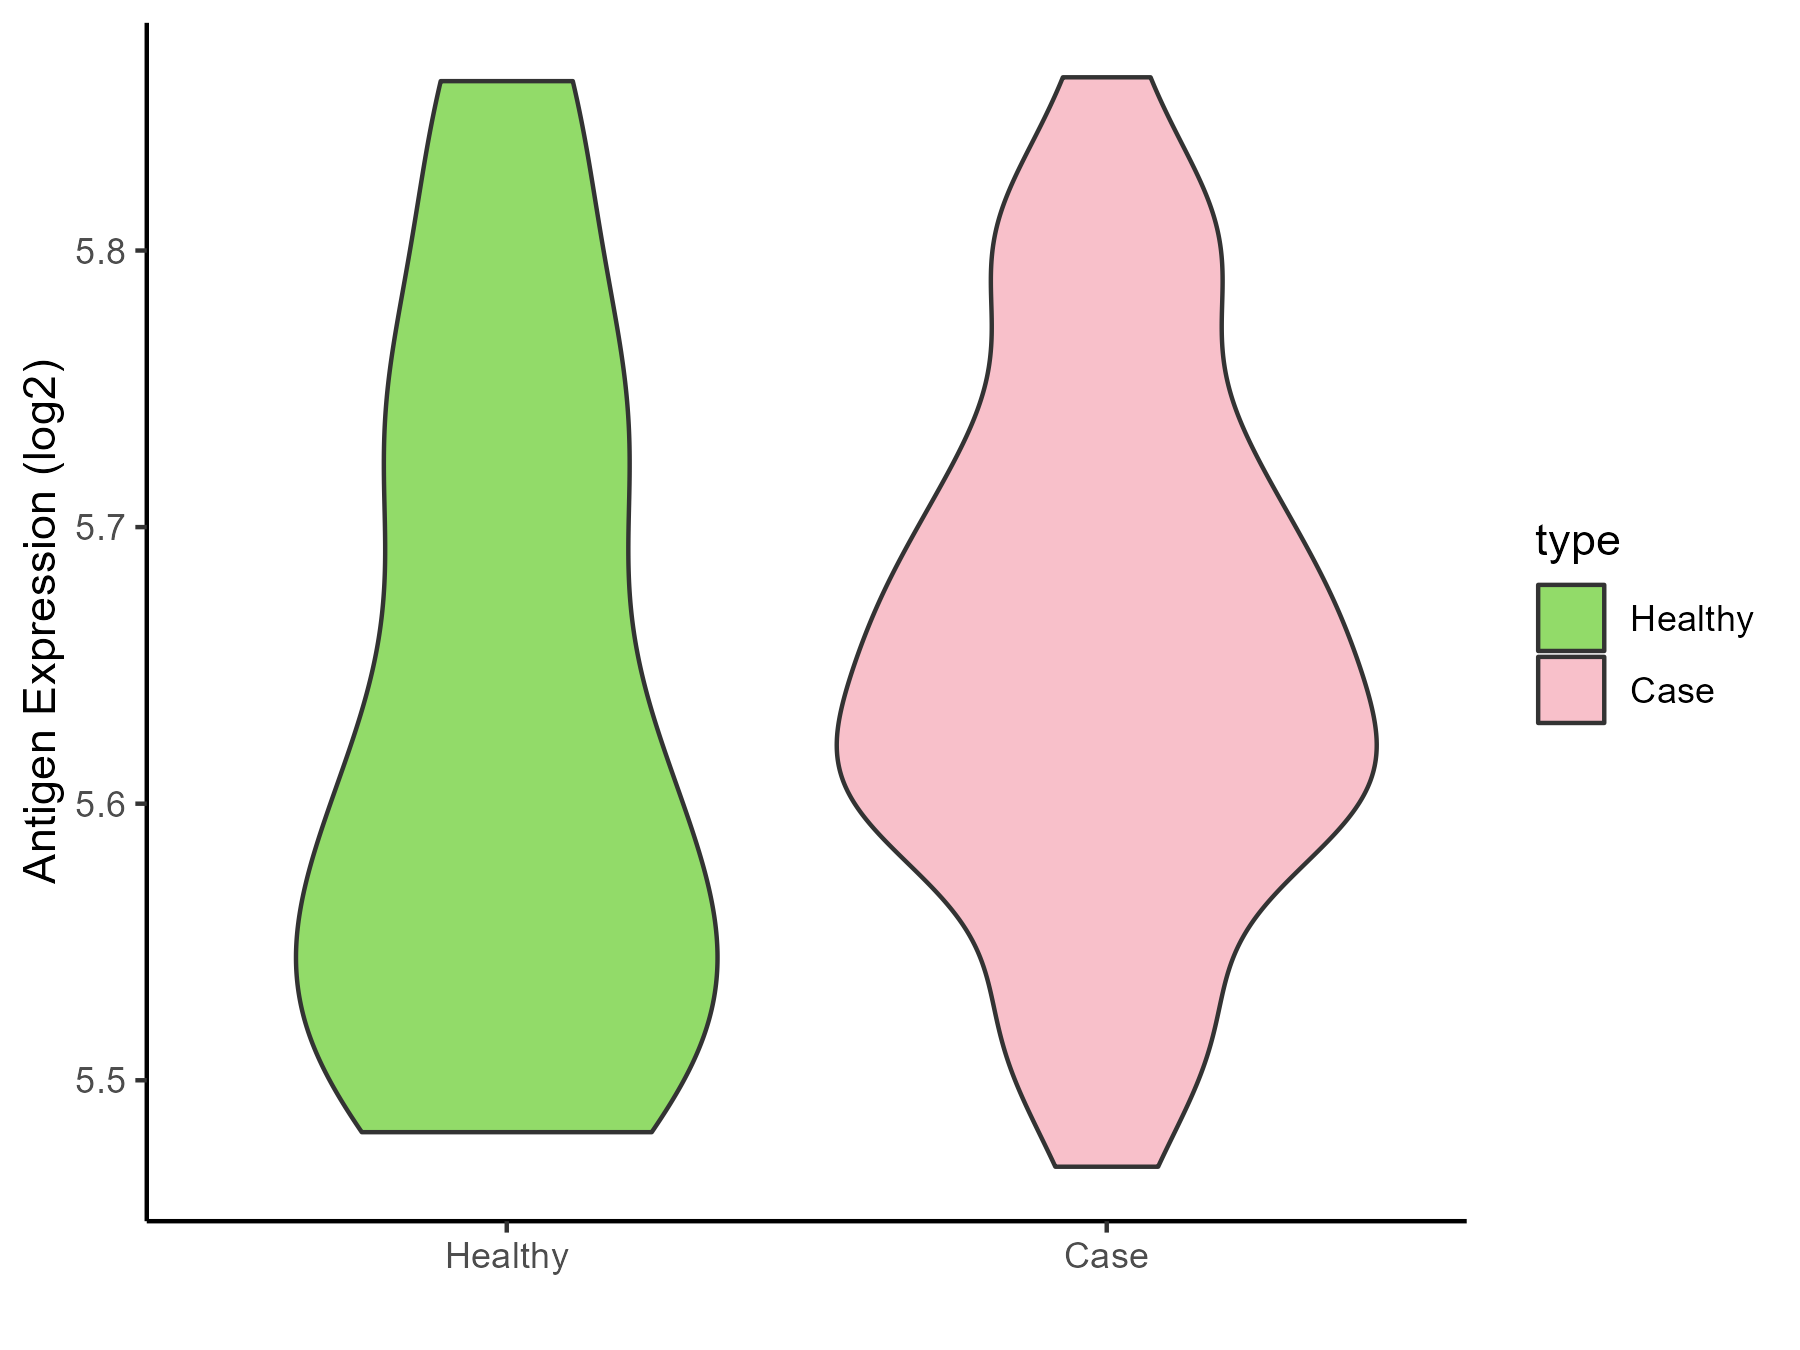
| The Studied Tissue | Whole blood | |
| The Specific Disease | Polycythemia vera | |
| The Expression Level of Disease Section Compare with the Healthy Individual Tissue | p-value: 0.32125349; Fold-change: 0.049701756; Z-score: 0.415642565 | |
| Disease-specific Antigen Abundances |
|
Click to View the Clearer Original Diagram |
| The Studied Tissue | Whole blood | |
| The Specific Disease | Myelofibrosis | |
| The Expression Level of Disease Section Compare with the Healthy Individual Tissue | p-value: 0.171630771; Fold-change: 0.098295308; Z-score: 0.836329149 | |
| Disease-specific Antigen Abundances |

|
Click to View the Clearer Original Diagram |
| Differential expression pattern of antigen in diseases | ||
| The Studied Tissue | Bone marrow | |
| The Specific Disease | Myelodysplastic syndromes | |
| The Expression Level of Disease Section Compare with the Healthy Individual Tissue | p-value: 0.003863287; Fold-change: 0.095782899; Z-score: 0.864754115 | |
| The Expression Level of Disease Section Compare with the Adjacent Tissue | p-value: 0.864365639; Fold-change: -0.020206453; Z-score: -0.178659164 | |
| Disease-specific Antigen Abundances |

|
Click to View the Clearer Original Diagram |
| Differential expression pattern of antigen in diseases | ||
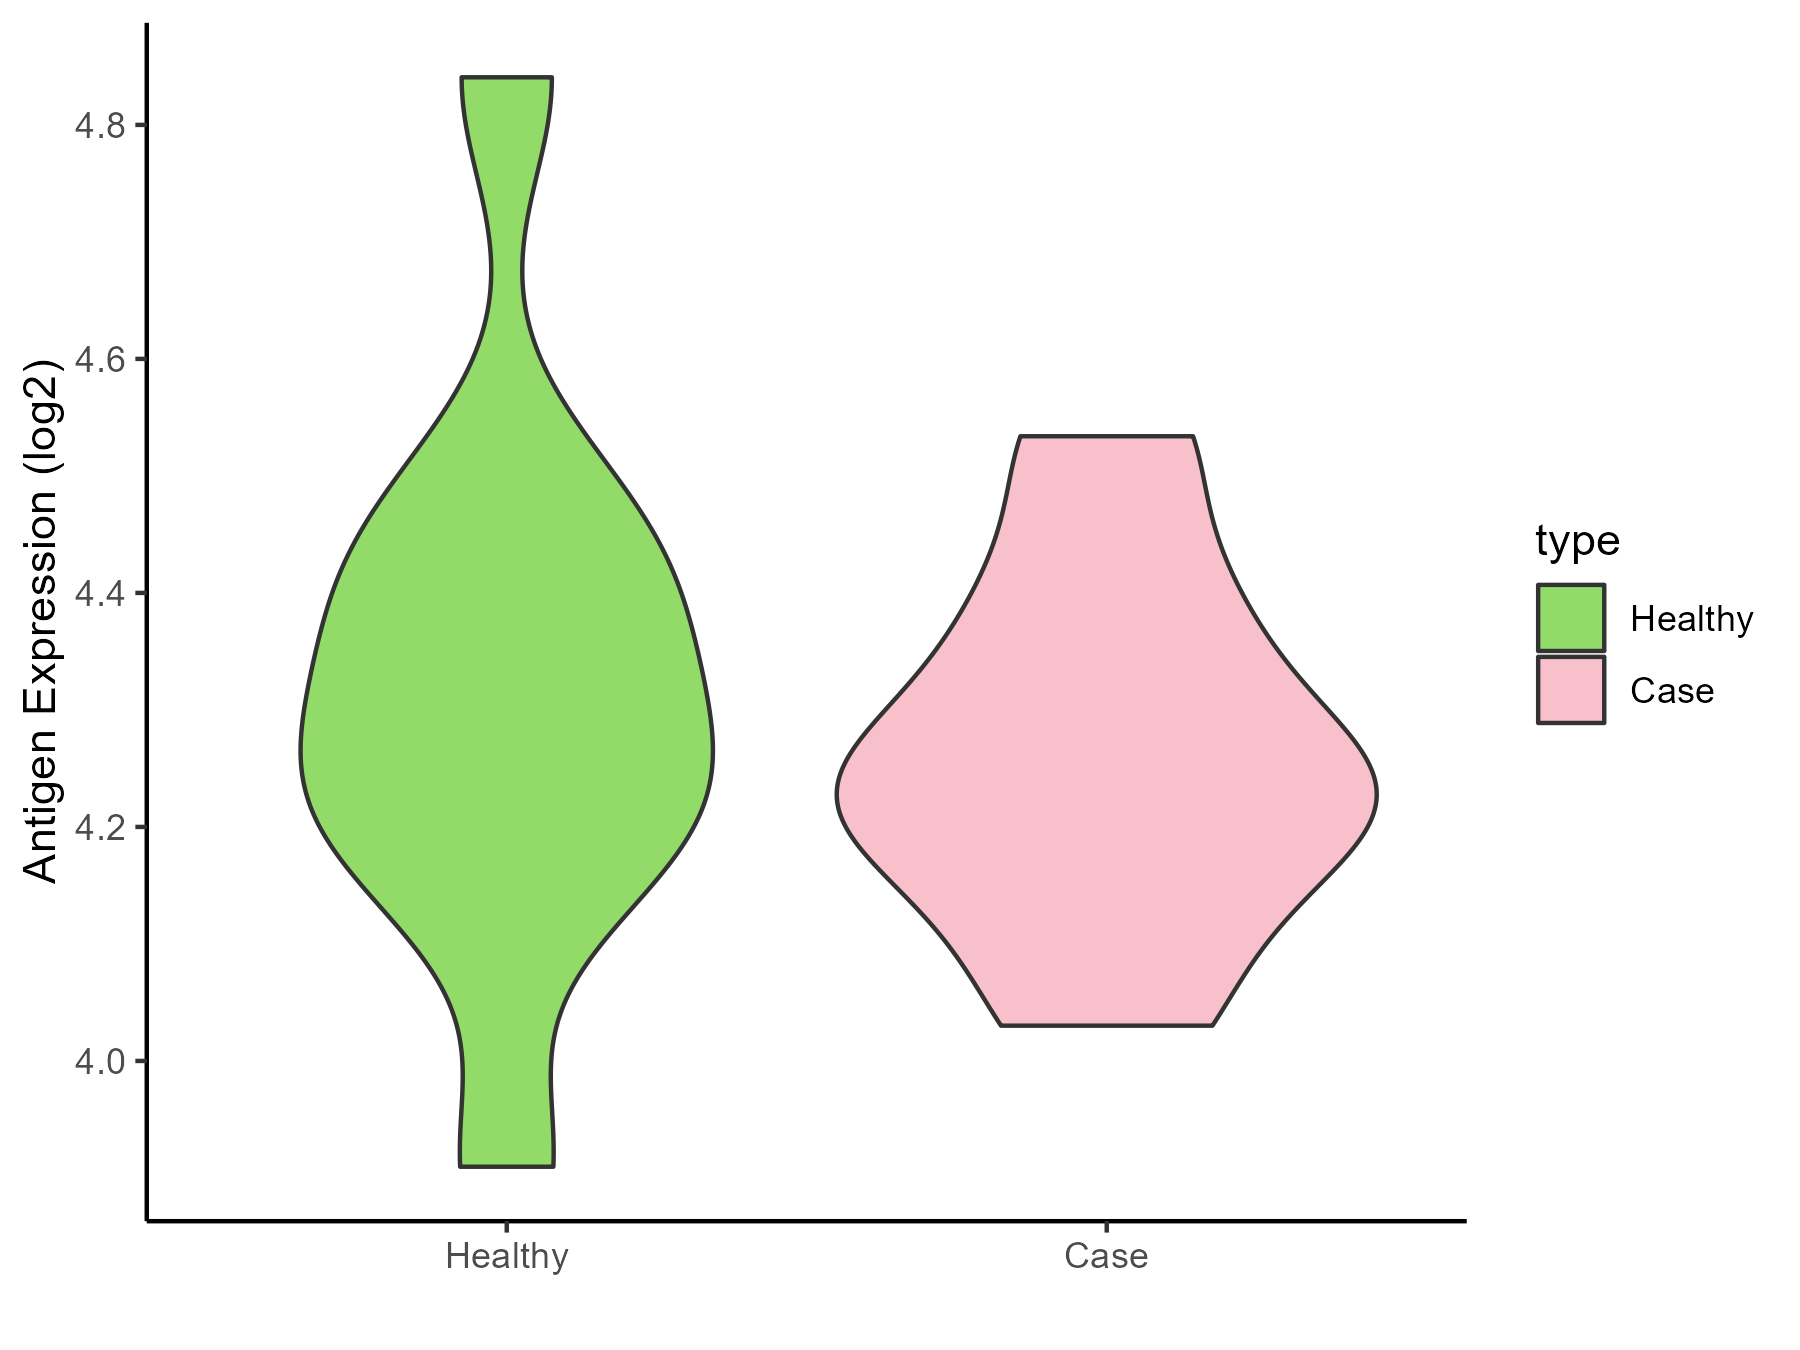
| The Studied Tissue | Tonsil | |
| The Specific Disease | Lymphoma | |
| The Expression Level of Disease Section Compare with the Healthy Individual Tissue | p-value: 0.529151048; Fold-change: -0.055596927; Z-score: -0.22719282 | |
| Disease-specific Antigen Abundances |
|
Click to View the Clearer Original Diagram |
| Differential expression pattern of antigen in diseases | ||
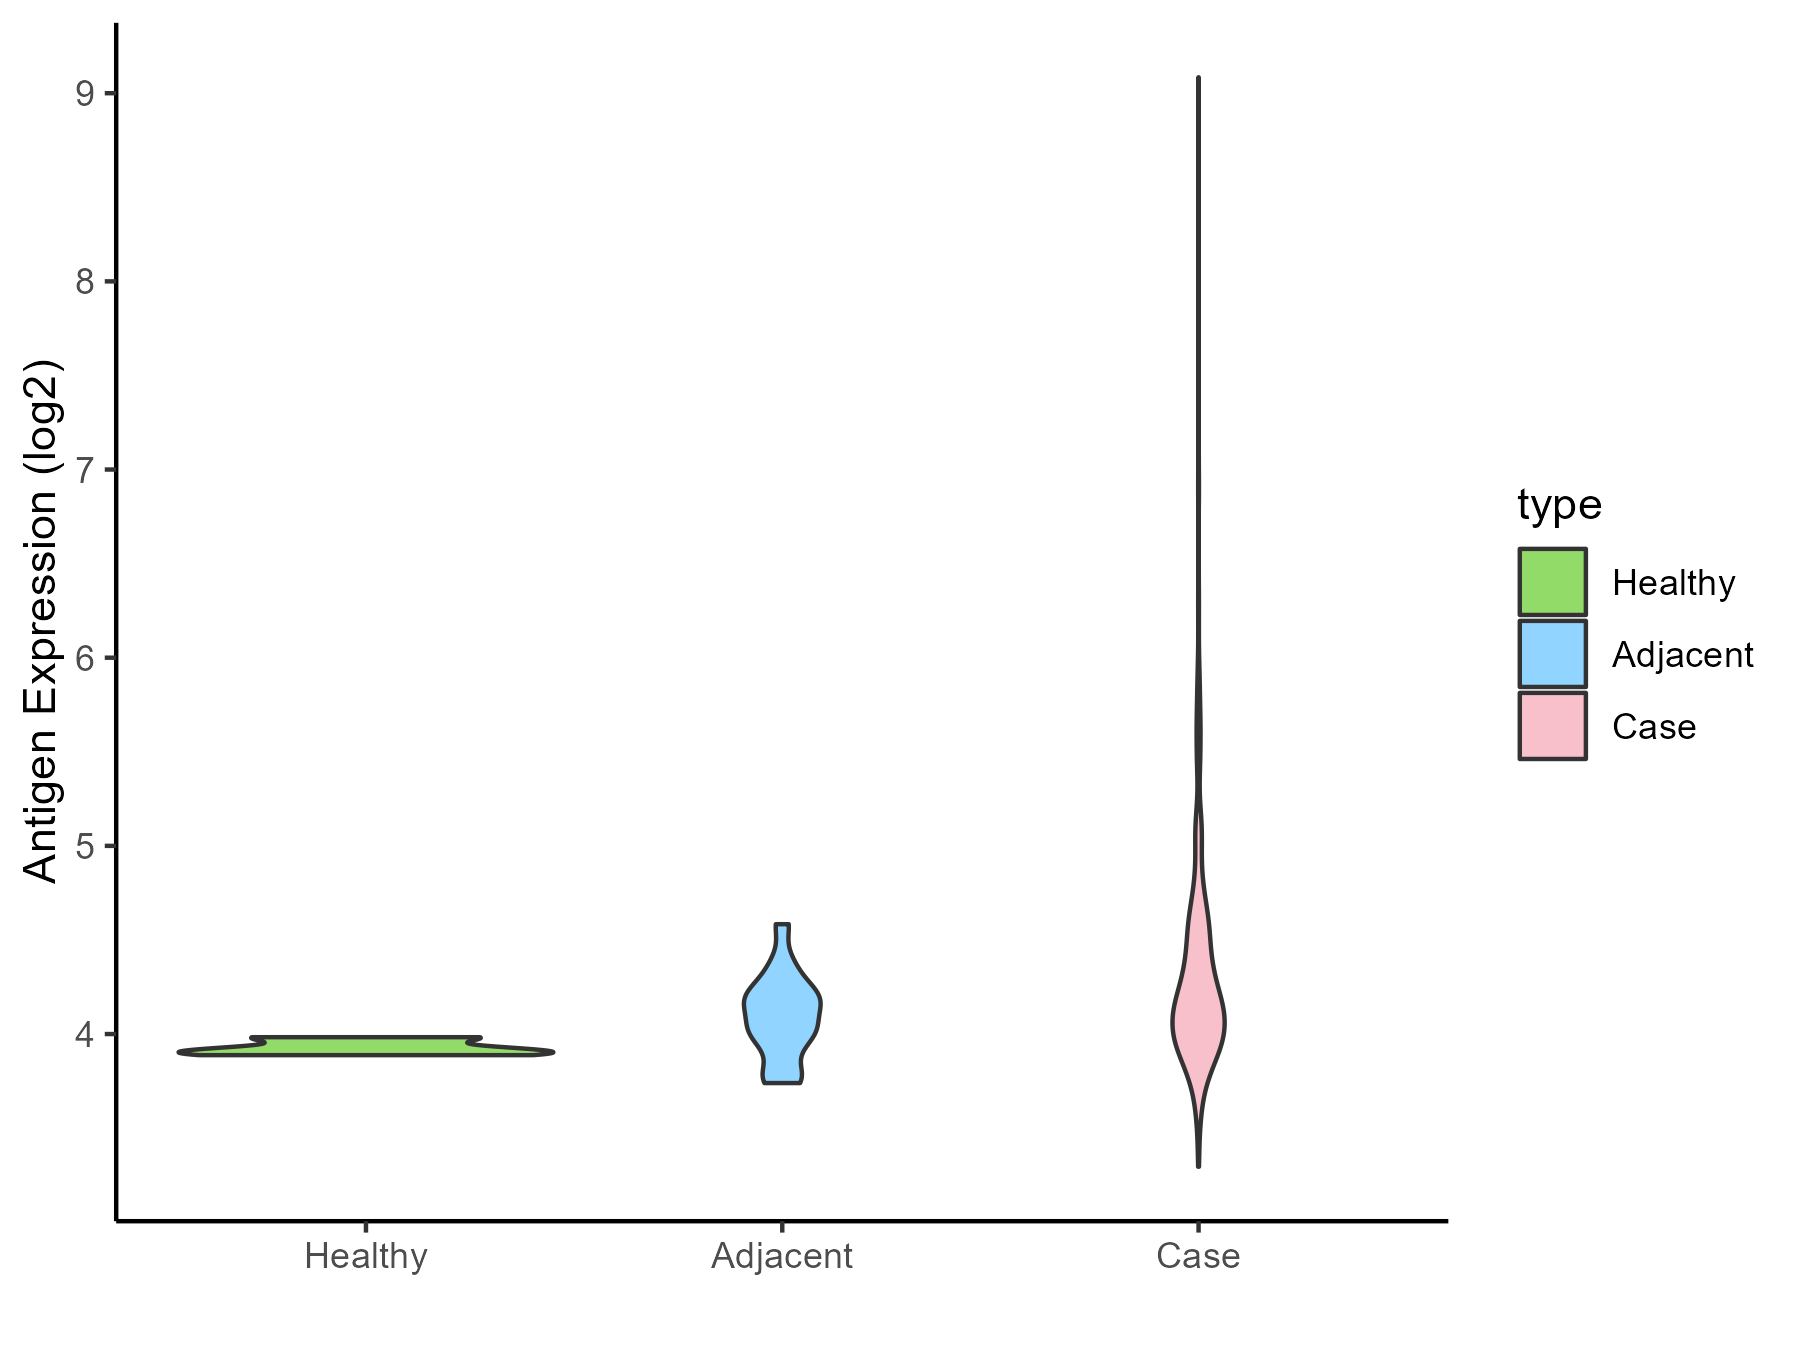
| The Studied Tissue | Gastric | |
| The Specific Disease | Gastric cancer | |
| The Expression Level of Disease Section Compare with the Healthy Individual Tissue | p-value: 0.000109413; Fold-change: 0.25736855; Z-score: 5.270474676 | |
| The Expression Level of Disease Section Compare with the Adjacent Tissue | p-value: 0.000415767; Fold-change: 0.074725411; Z-score: 0.332396516 | |
| Disease-specific Antigen Abundances |
|
Click to View the Clearer Original Diagram |
| Differential expression pattern of antigen in diseases | ||
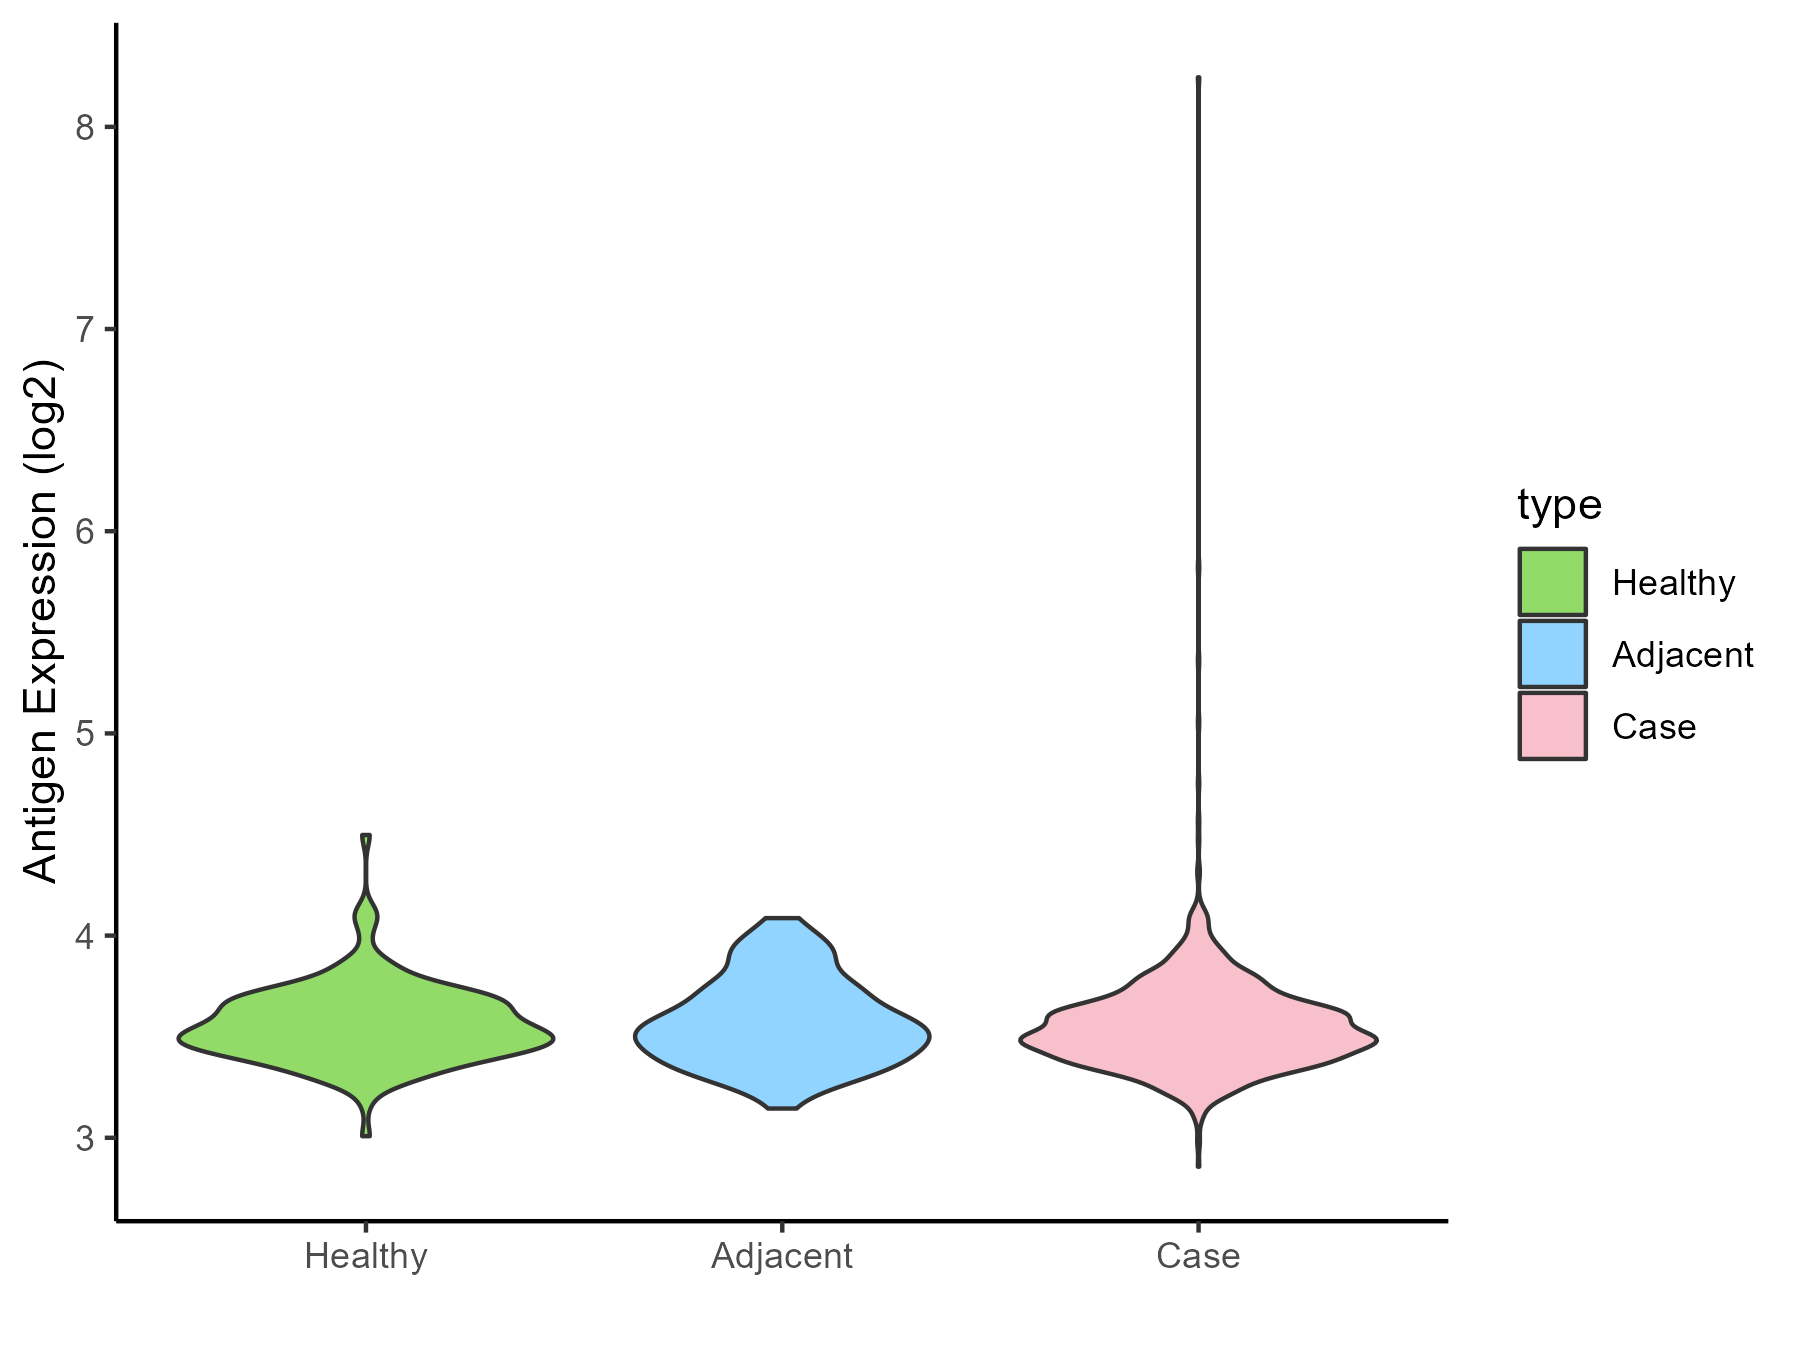
| The Studied Tissue | Colon | |
| The Specific Disease | Colon cancer | |
| The Expression Level of Disease Section Compare with the Healthy Individual Tissue | p-value: 0.725940372; Fold-change: -0.009996794; Z-score: -0.053014789 | |
| The Expression Level of Disease Section Compare with the Adjacent Tissue | p-value: 0.398221494; Fold-change: -0.023035204; Z-score: -0.108606194 | |
| Disease-specific Antigen Abundances |
|
Click to View the Clearer Original Diagram |
| Differential expression pattern of antigen in diseases | ||
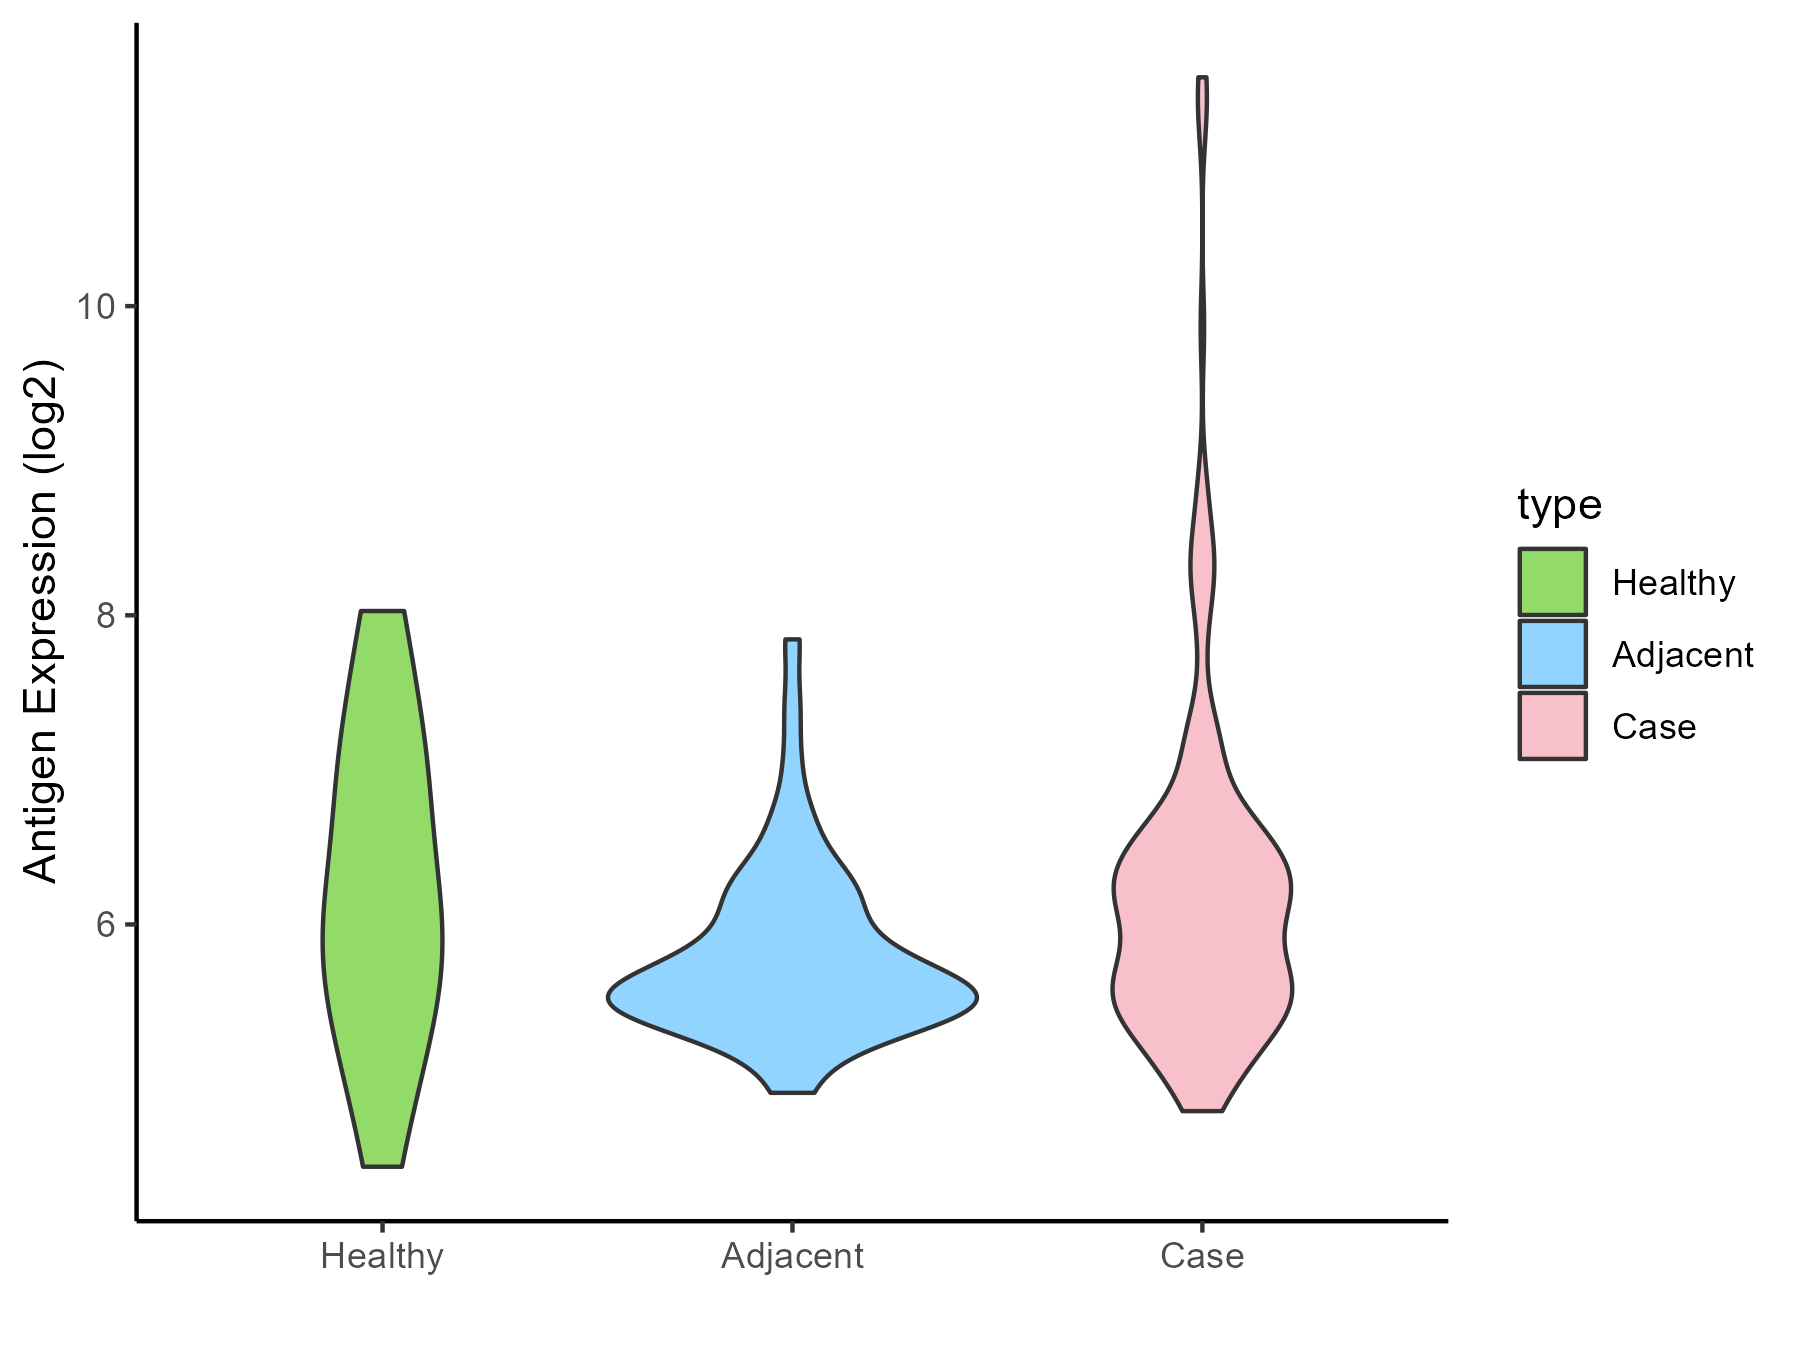
| The Studied Tissue | Pancreas | |
| The Specific Disease | Pancreatic cancer | |
| The Expression Level of Disease Section Compare with the Healthy Individual Tissue | p-value: 0.999410244; Fold-change: 0.062215107; Z-score: 0.061169598 | |
| The Expression Level of Disease Section Compare with the Adjacent Tissue | p-value: 0.000193983; Fold-change: 0.474328577; Z-score: 0.84694959 | |
| Disease-specific Antigen Abundances |
|
Click to View the Clearer Original Diagram |
| Differential expression pattern of antigen in diseases | ||
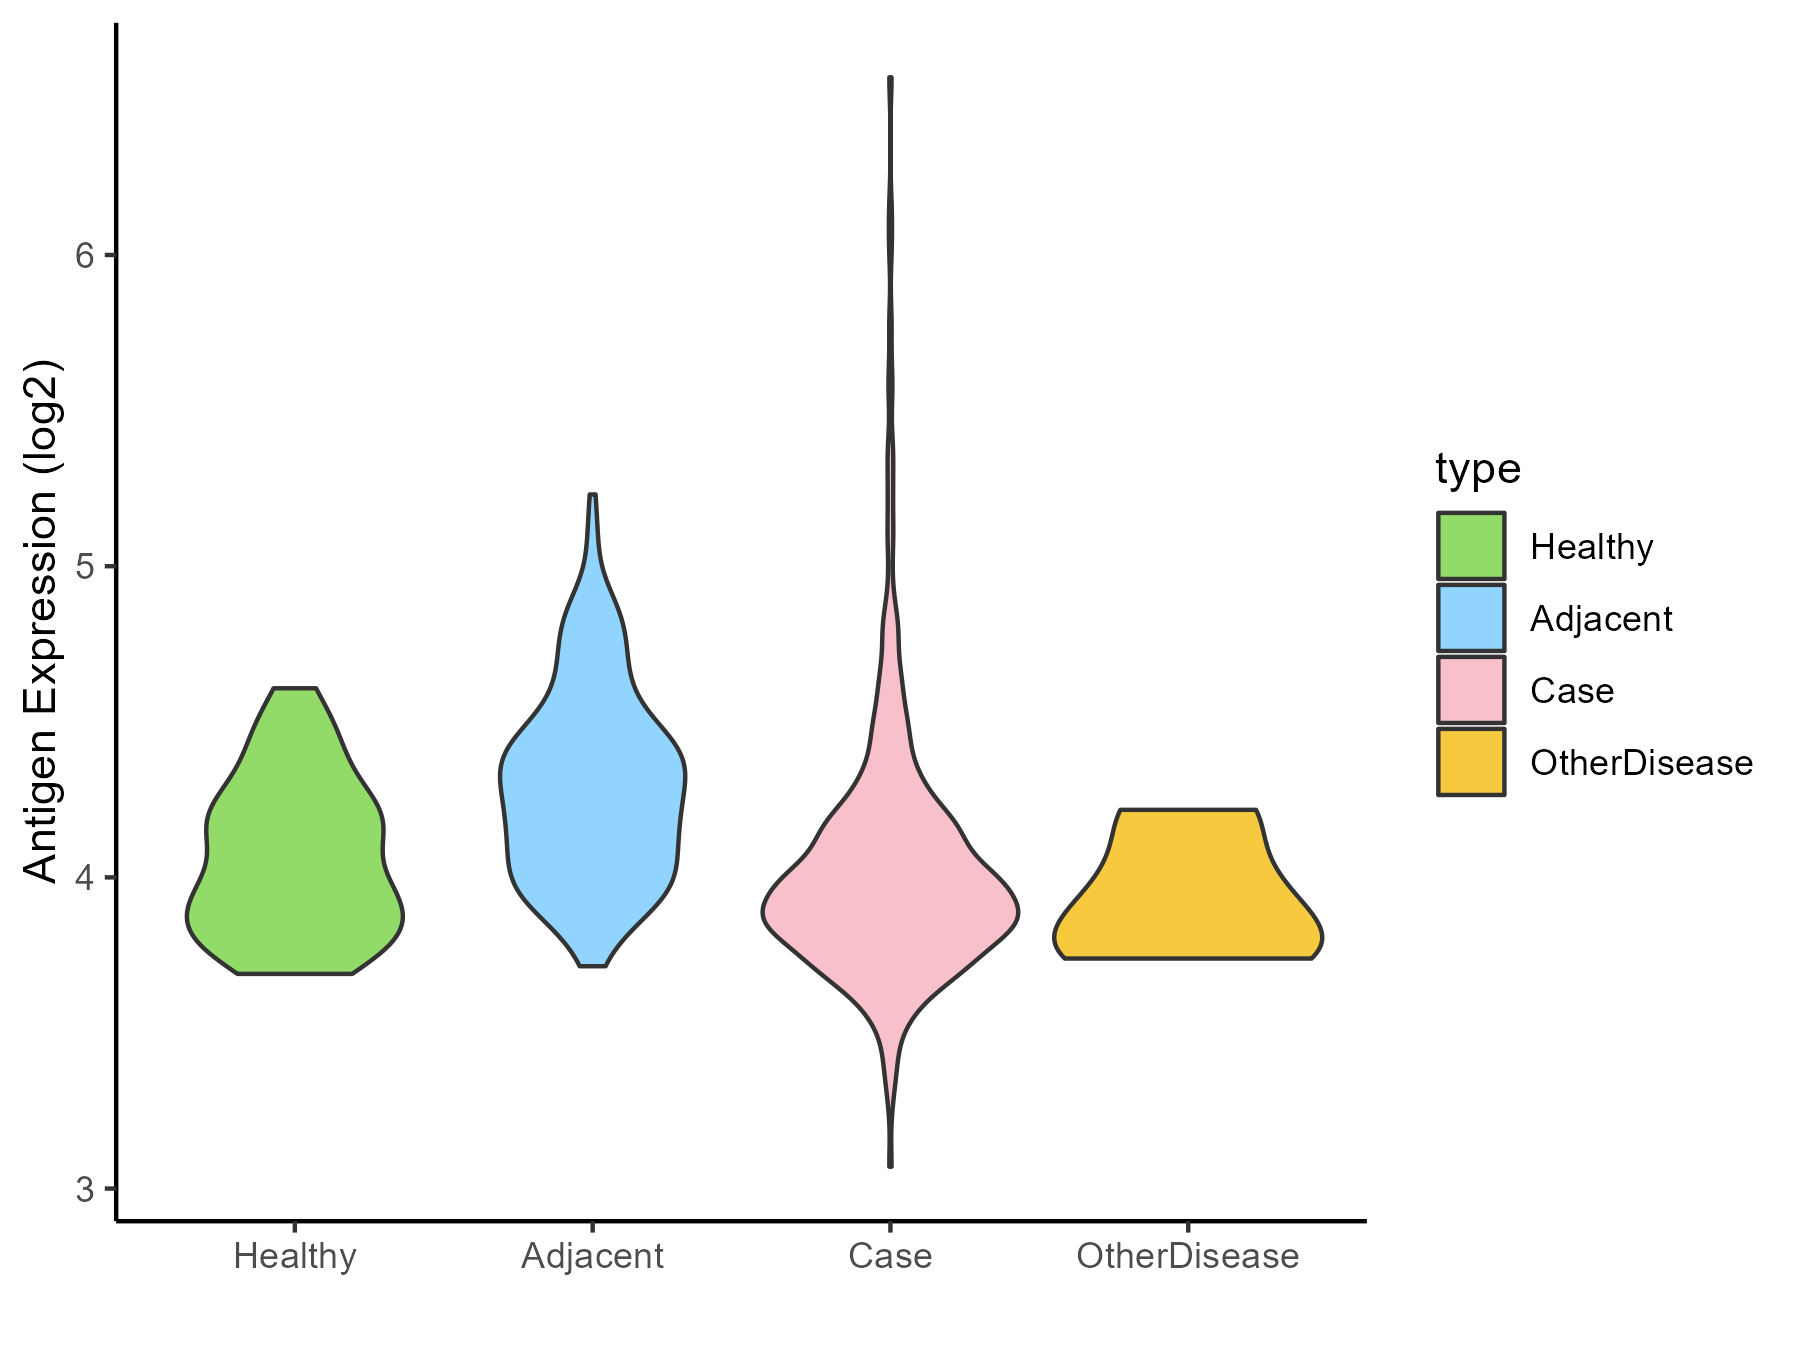
| The Studied Tissue | Liver | |
| The Specific Disease | Liver cancer | |
| The Expression Level of Disease Section Compare with the Healthy Individual Tissue | p-value: 0.453302985; Fold-change: -0.038892415; Z-score: -0.155951832 | |
| The Expression Level of Disease Section Compare with the Adjacent Tissue | p-value: 1.64E-17; Fold-change: -0.320671701; Z-score: -1.058537622 | |
| The Expression Level of Disease Section Compare with the Other Disease Section | p-value: 0.423209734; Fold-change: 0.076603615; Z-score: 0.353820853 | |
| Disease-specific Antigen Abundances |
|
Click to View the Clearer Original Diagram |
| Differential expression pattern of antigen in diseases | ||
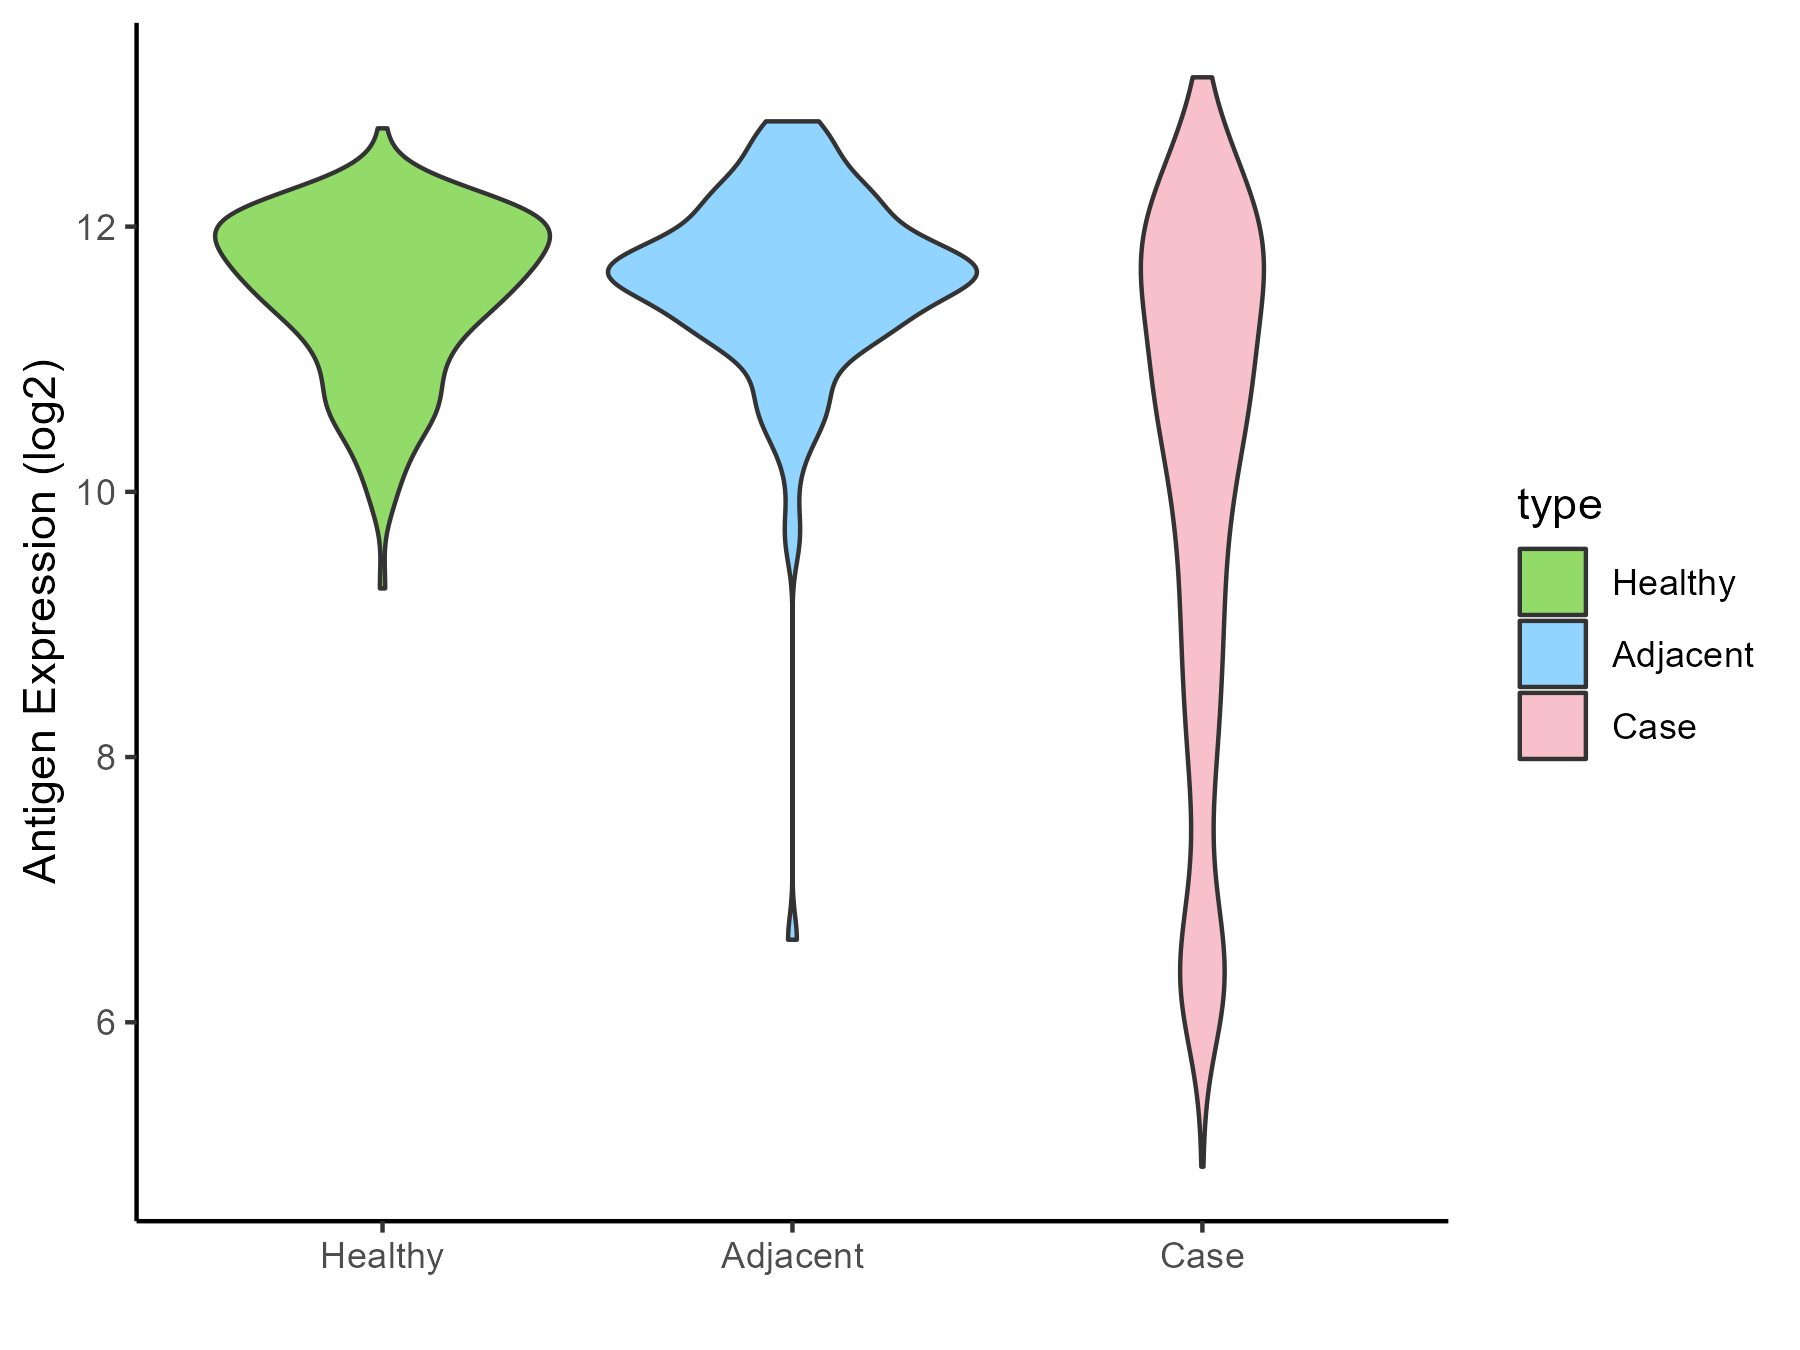
| The Studied Tissue | Lung | |
| The Specific Disease | Lung cancer | |
| The Expression Level of Disease Section Compare with the Healthy Individual Tissue | p-value: 3.17E-60; Fold-change: -0.924680721; Z-score: -1.502679789 | |
| The Expression Level of Disease Section Compare with the Adjacent Tissue | p-value: 3.56E-39; Fold-change: -0.902191718; Z-score: -1.185418337 | |
| Disease-specific Antigen Abundances |
|
Click to View the Clearer Original Diagram |
| Differential expression pattern of antigen in diseases | ||
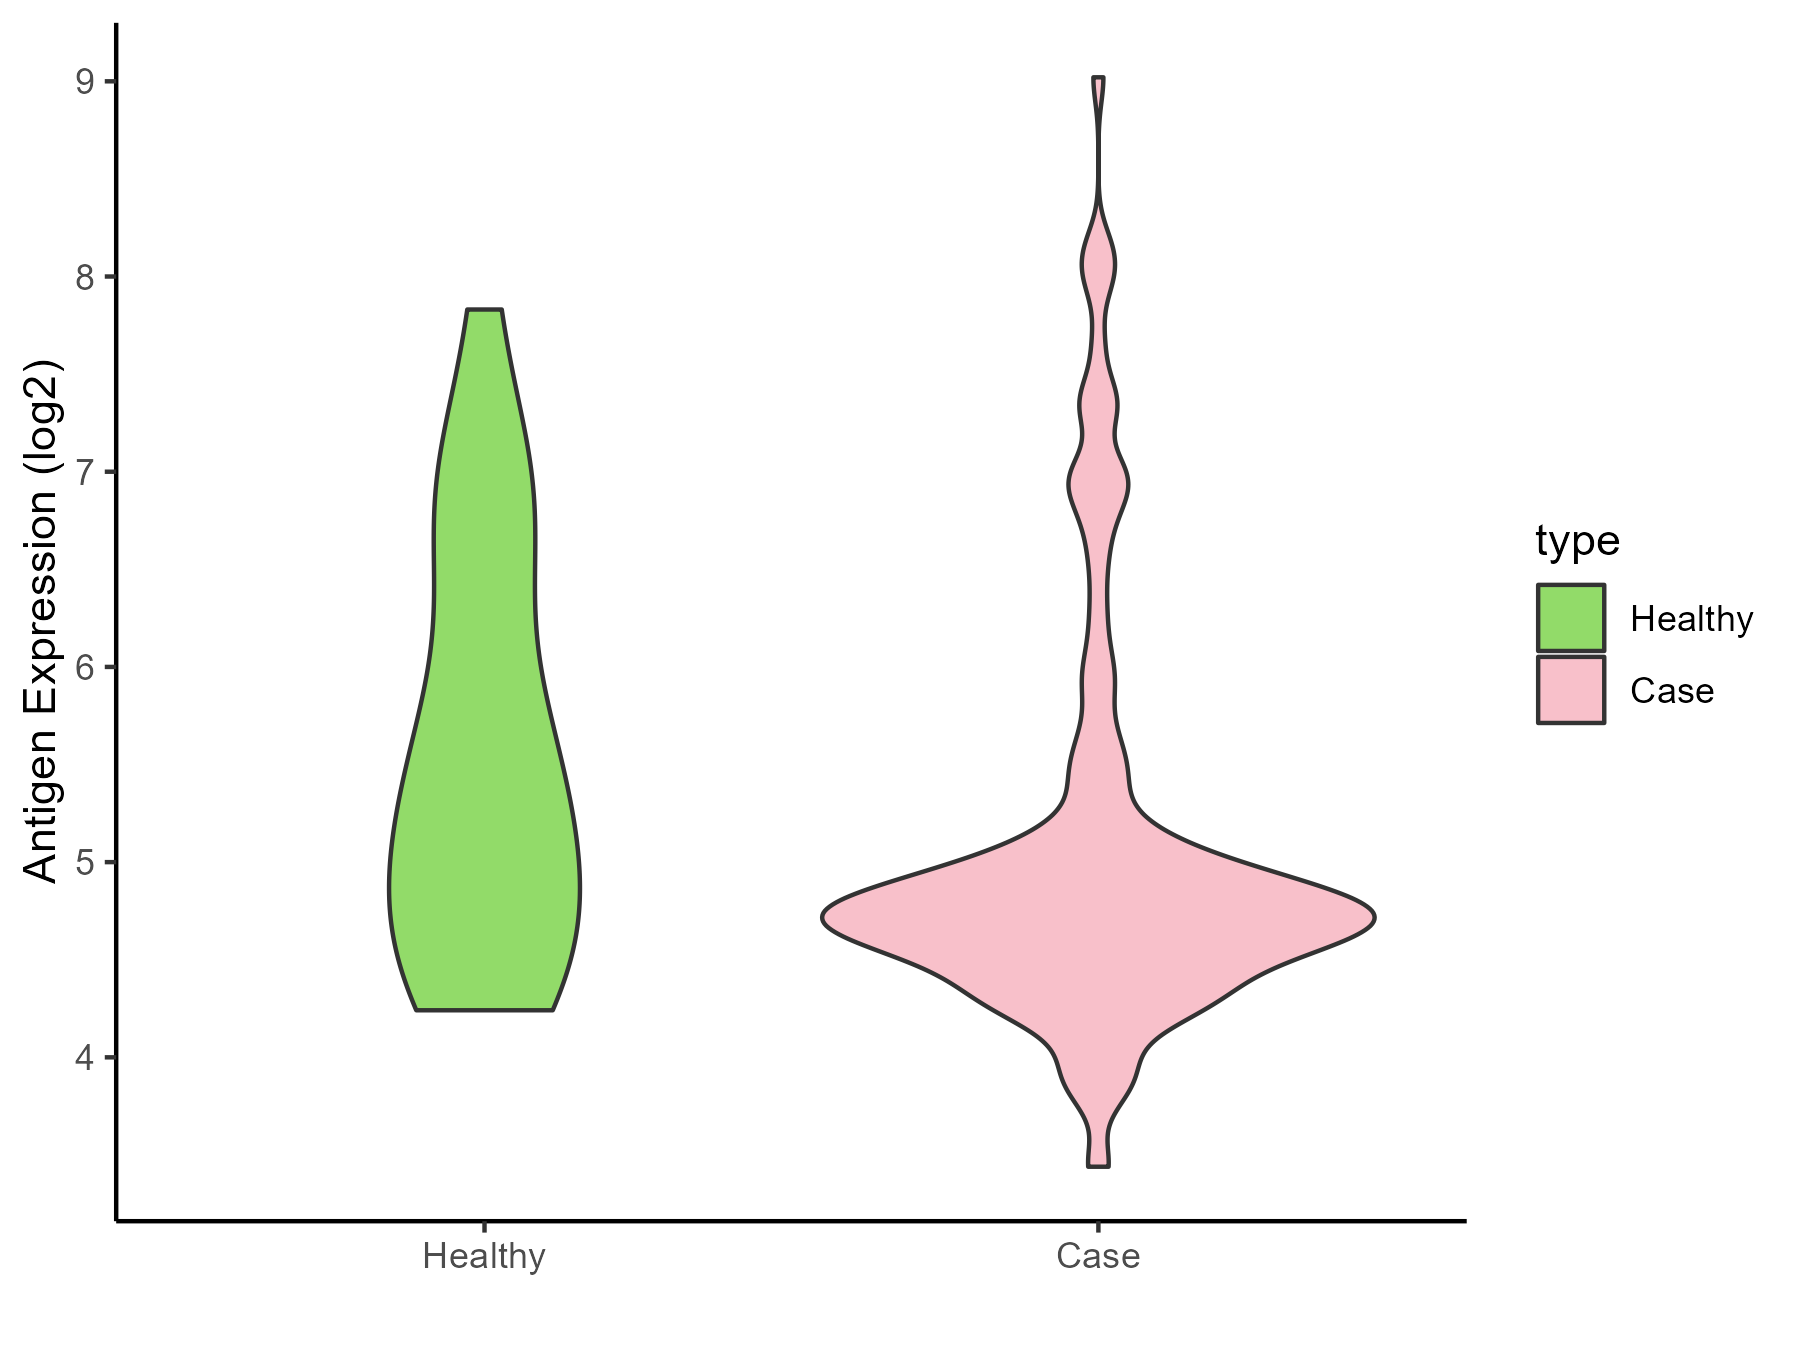
| The Studied Tissue | Skin | |
| The Specific Disease | Melanoma | |
| The Expression Level of Disease Section Compare with the Healthy Individual Tissue | p-value: 0.033324945; Fold-change: -0.561260565; Z-score: -0.533247995 | |
| Disease-specific Antigen Abundances |
|
Click to View the Clearer Original Diagram |
| Differential expression pattern of antigen in diseases | ||
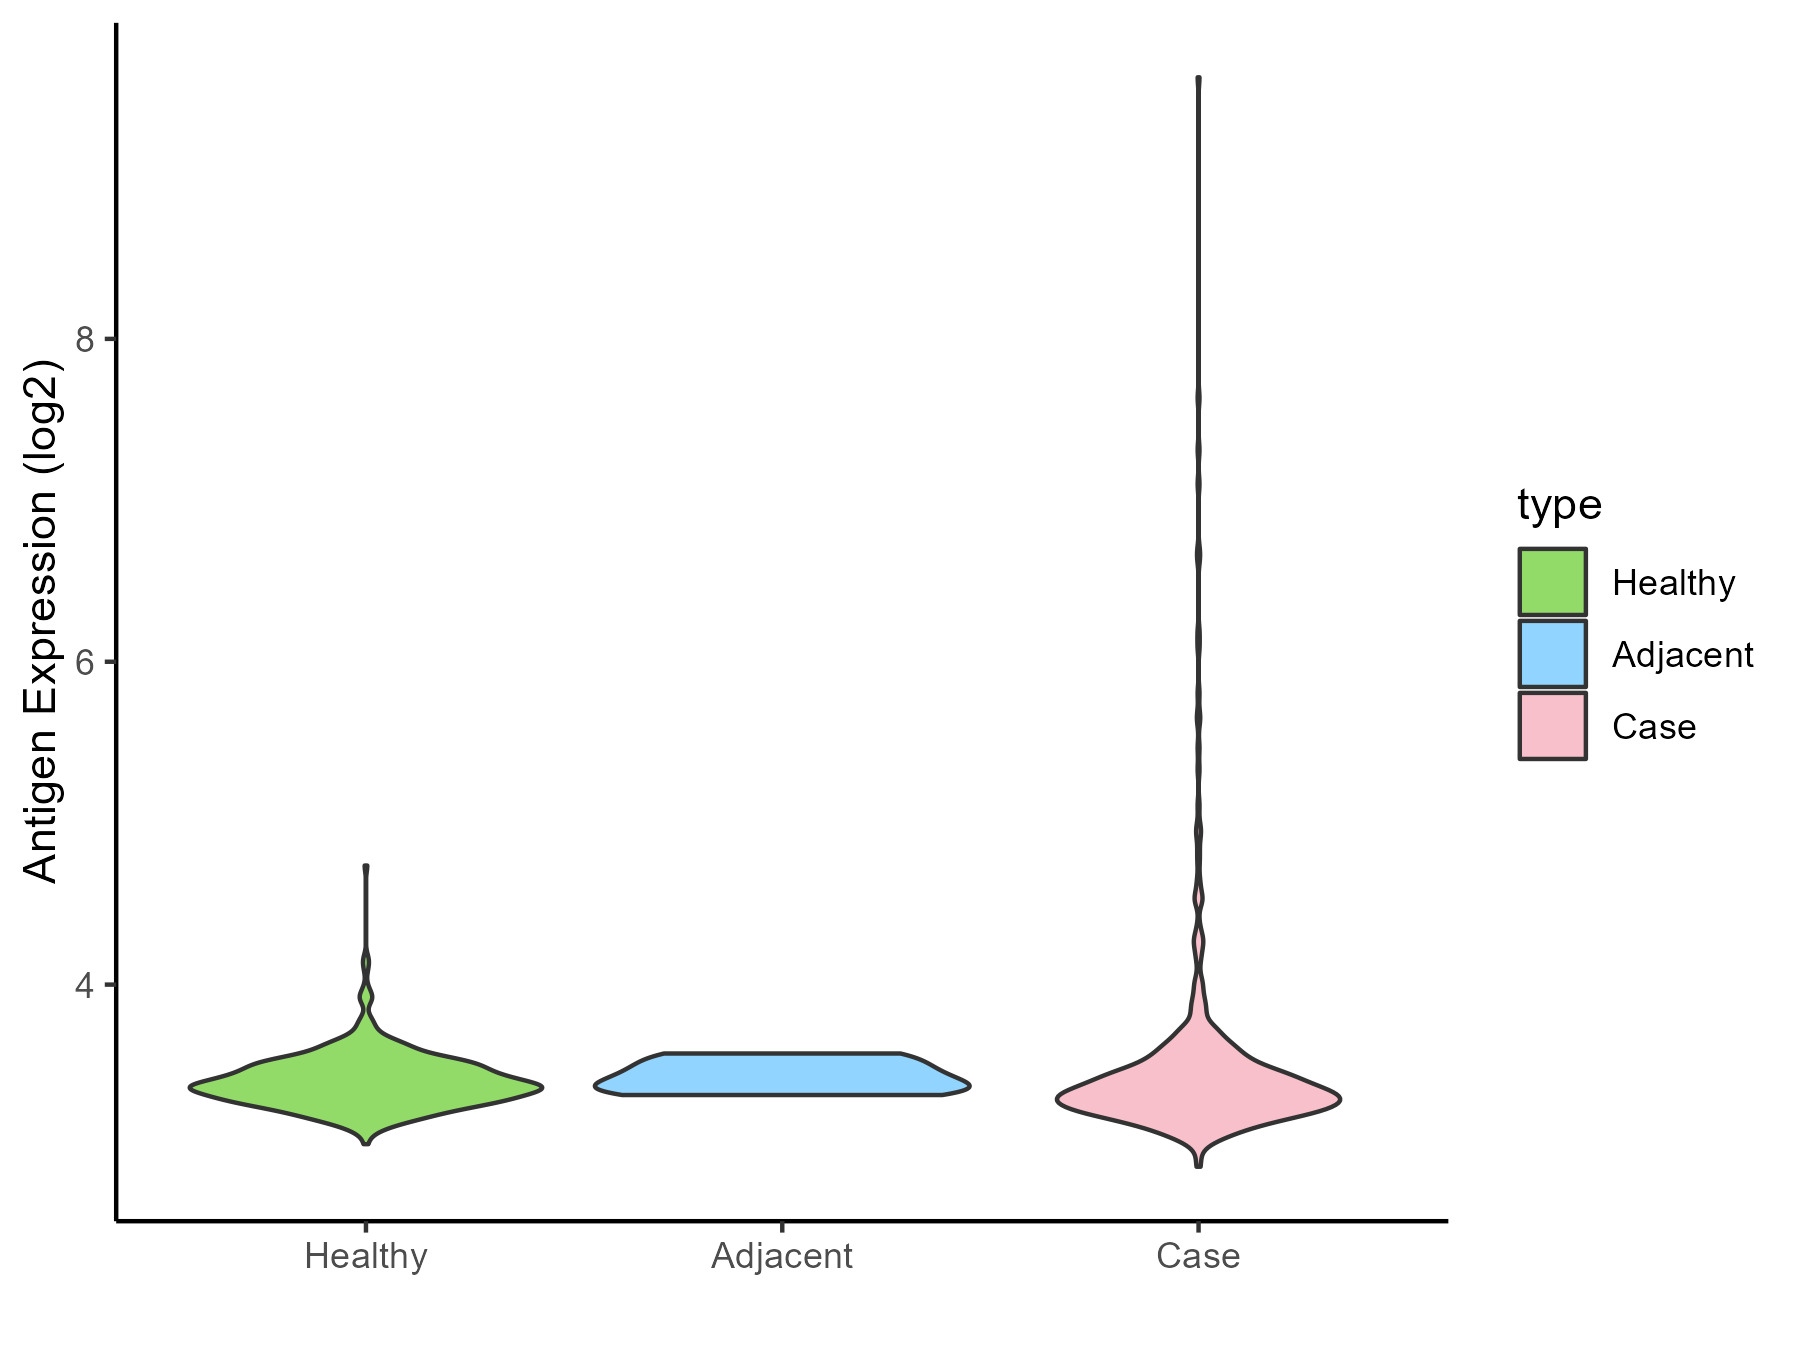
| The Studied Tissue | Muscle | |
| The Specific Disease | Sarcoma | |
| The Expression Level of Disease Section Compare with the Healthy Individual Tissue | p-value: 0.004884084; Fold-change: -0.032944816; Z-score: -0.193451934 | |
| The Expression Level of Disease Section Compare with the Adjacent Tissue | p-value: 0.539306635; Fold-change: -0.076315793; Z-score: -0.675496842 | |
| Disease-specific Antigen Abundances |
|
Click to View the Clearer Original Diagram |
| Differential expression pattern of antigen in diseases | ||
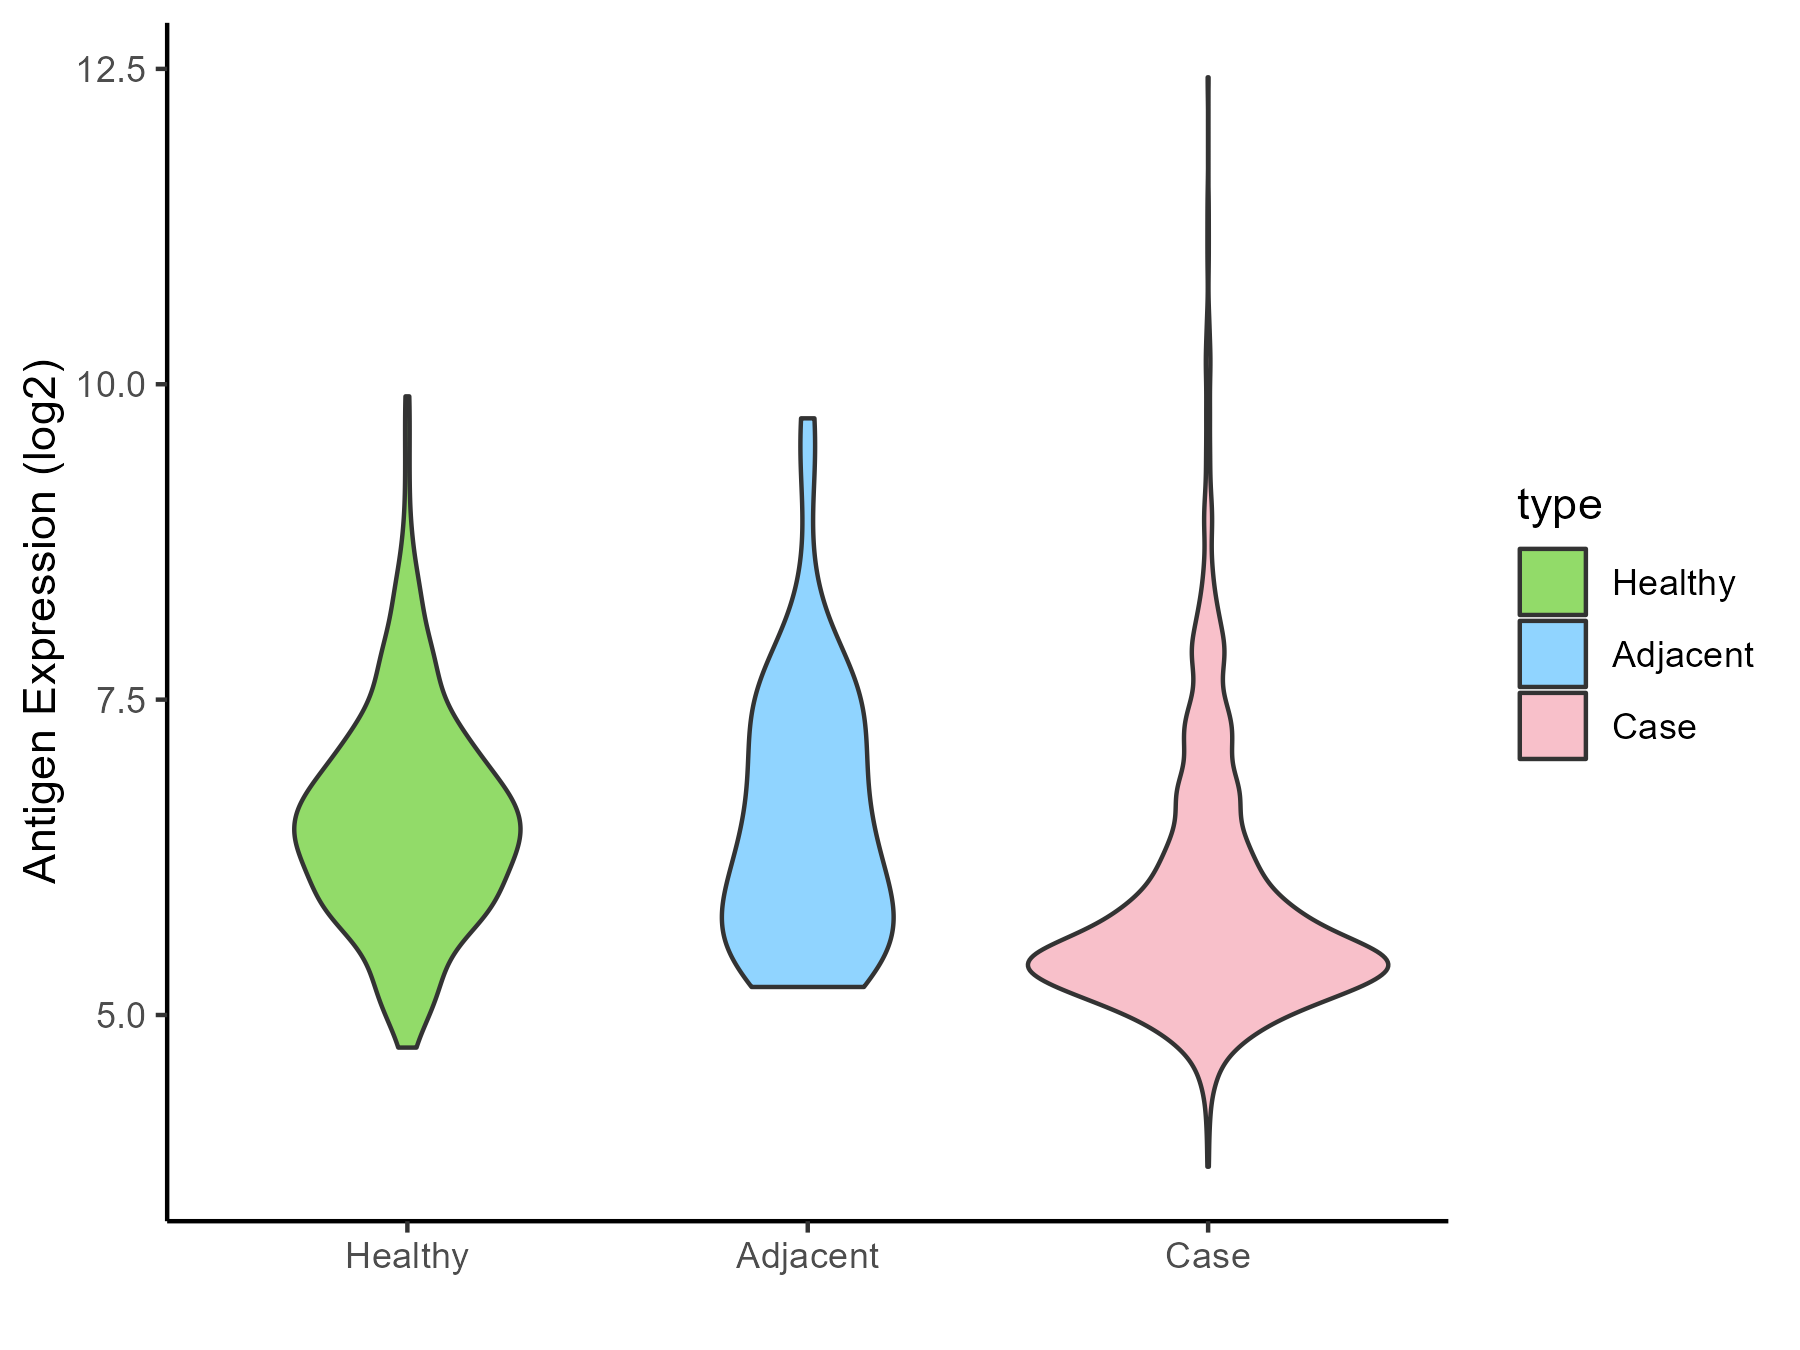
| The Studied Tissue | Breast | |
| The Specific Disease | Breast cancer | |
| The Expression Level of Disease Section Compare with the Healthy Individual Tissue | p-value: 2.73E-23; Fold-change: -0.911463459; Z-score: -1.071539413 | |
| The Expression Level of Disease Section Compare with the Adjacent Tissue | p-value: 9.16E-05; Fold-change: -0.758627639; Z-score: -0.731351566 | |
| Disease-specific Antigen Abundances |
|
Click to View the Clearer Original Diagram |
| Differential expression pattern of antigen in diseases | ||
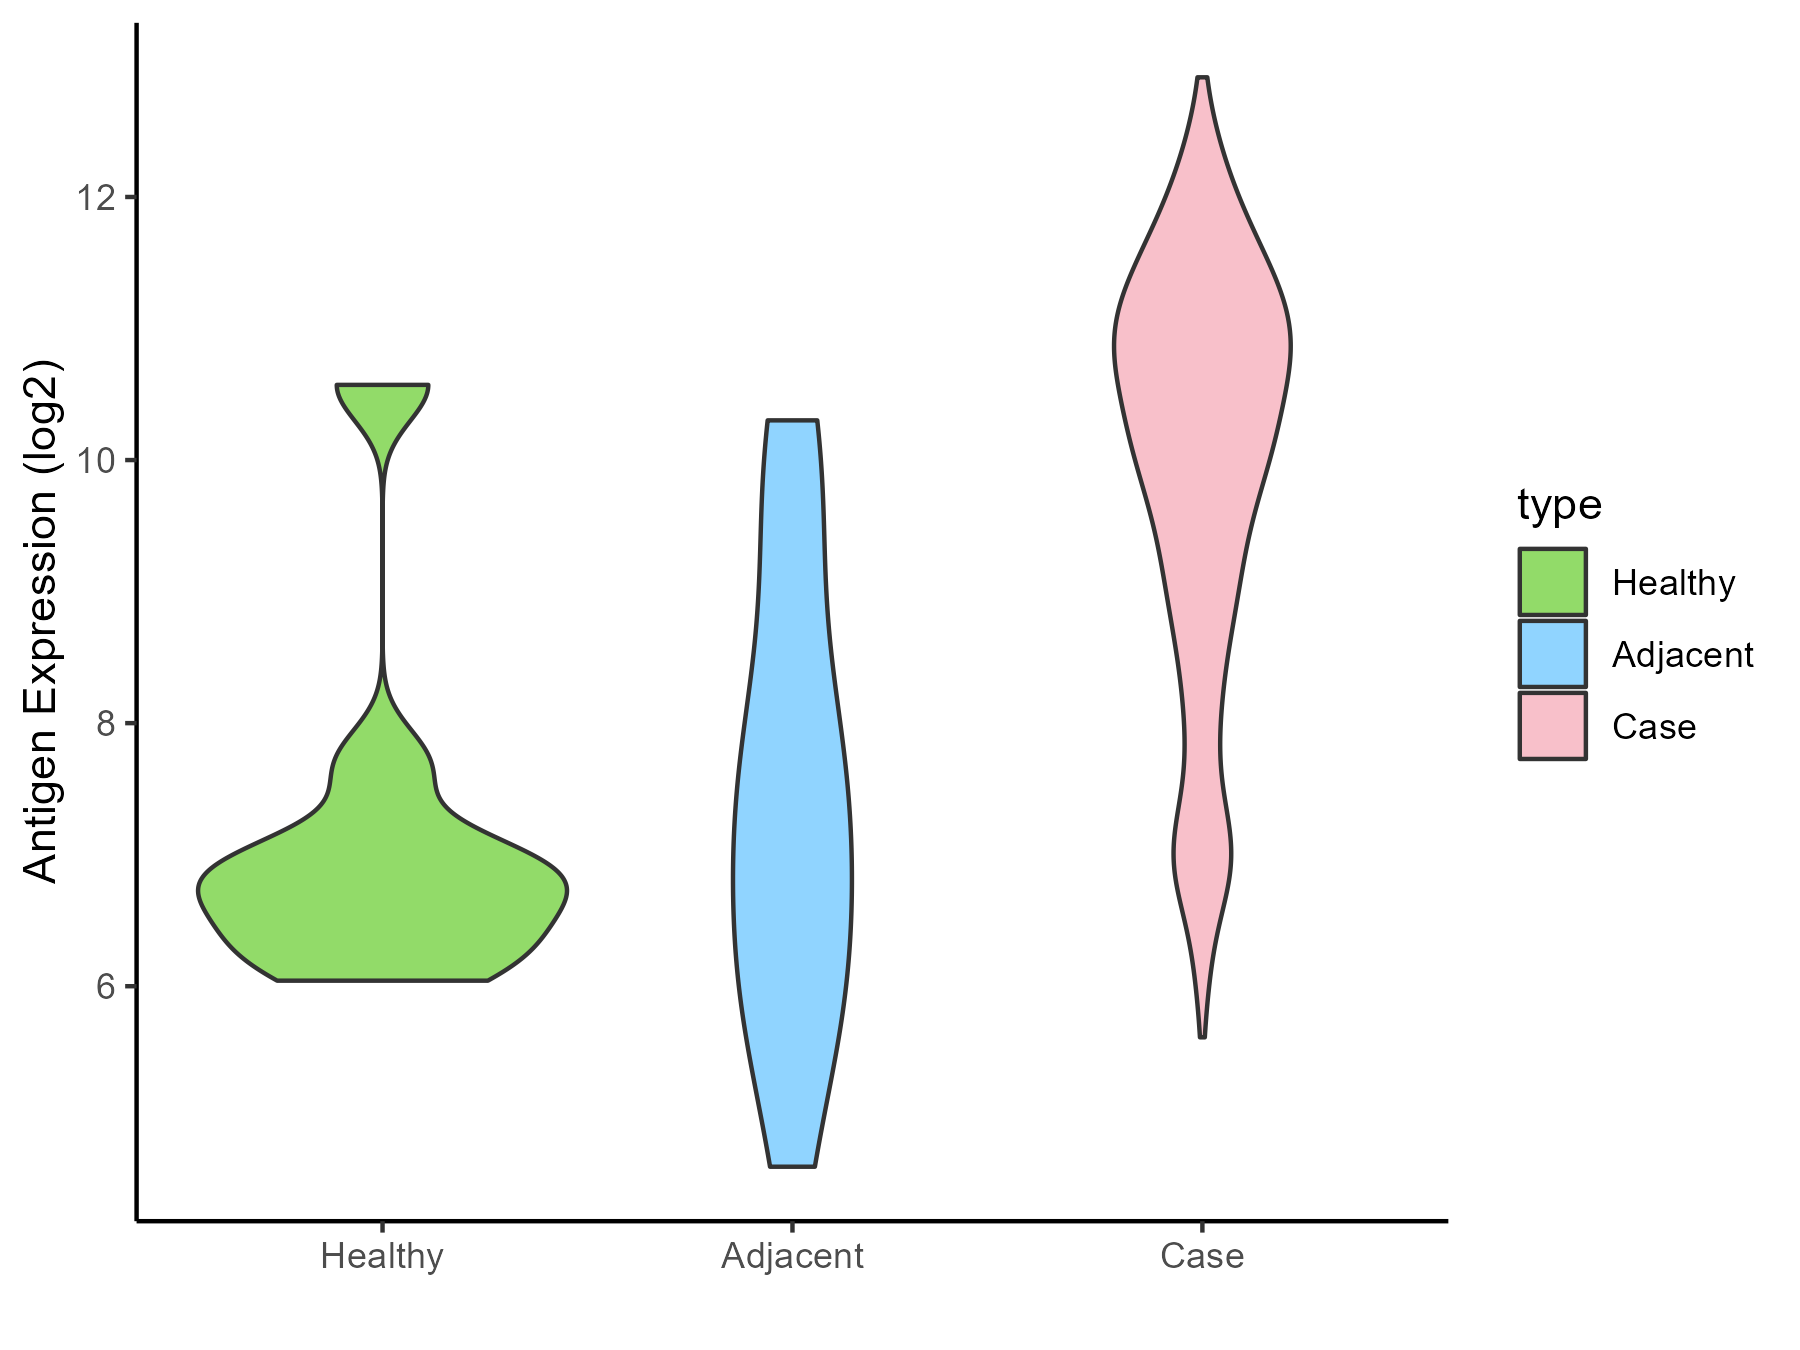
| The Studied Tissue | Ovarian | |
| The Specific Disease | Ovarian cancer | |
| The Expression Level of Disease Section Compare with the Healthy Individual Tissue | p-value: 0.000252513; Fold-change: 3.585892004; Z-score: 2.614444631 | |
| The Expression Level of Disease Section Compare with the Adjacent Tissue | p-value: 6.89E-05; Fold-change: 3.079569612; Z-score: 1.820907085 | |
| Disease-specific Antigen Abundances |
|
Click to View the Clearer Original Diagram |
| Differential expression pattern of antigen in diseases | ||
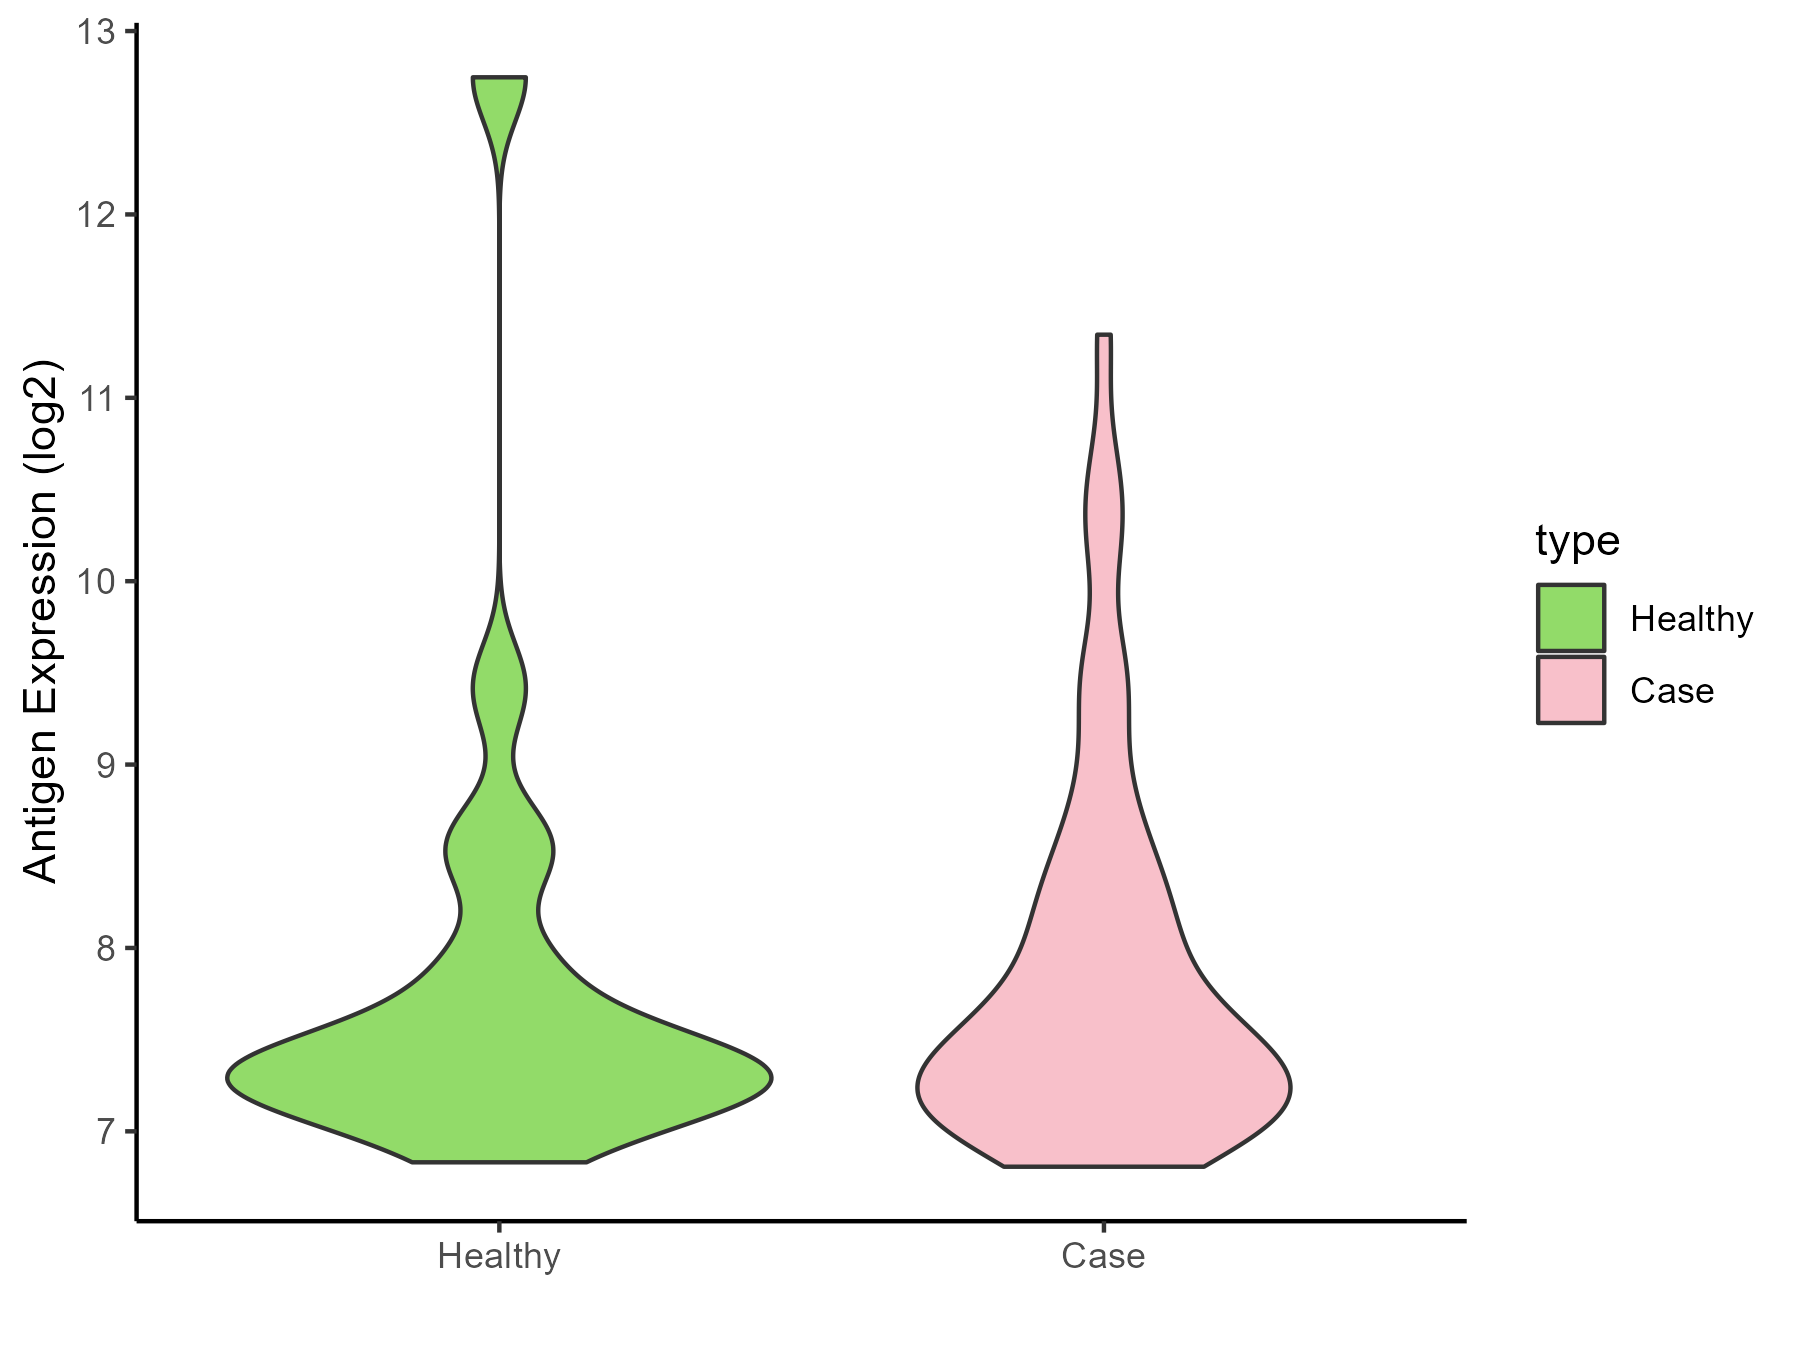
| The Studied Tissue | Cervical | |
| The Specific Disease | Cervical cancer | |
| The Expression Level of Disease Section Compare with the Healthy Individual Tissue | p-value: 0.984146868; Fold-change: 0.14386004; Z-score: 0.104713653 | |
| Disease-specific Antigen Abundances |
|
Click to View the Clearer Original Diagram |
| Differential expression pattern of antigen in diseases | ||
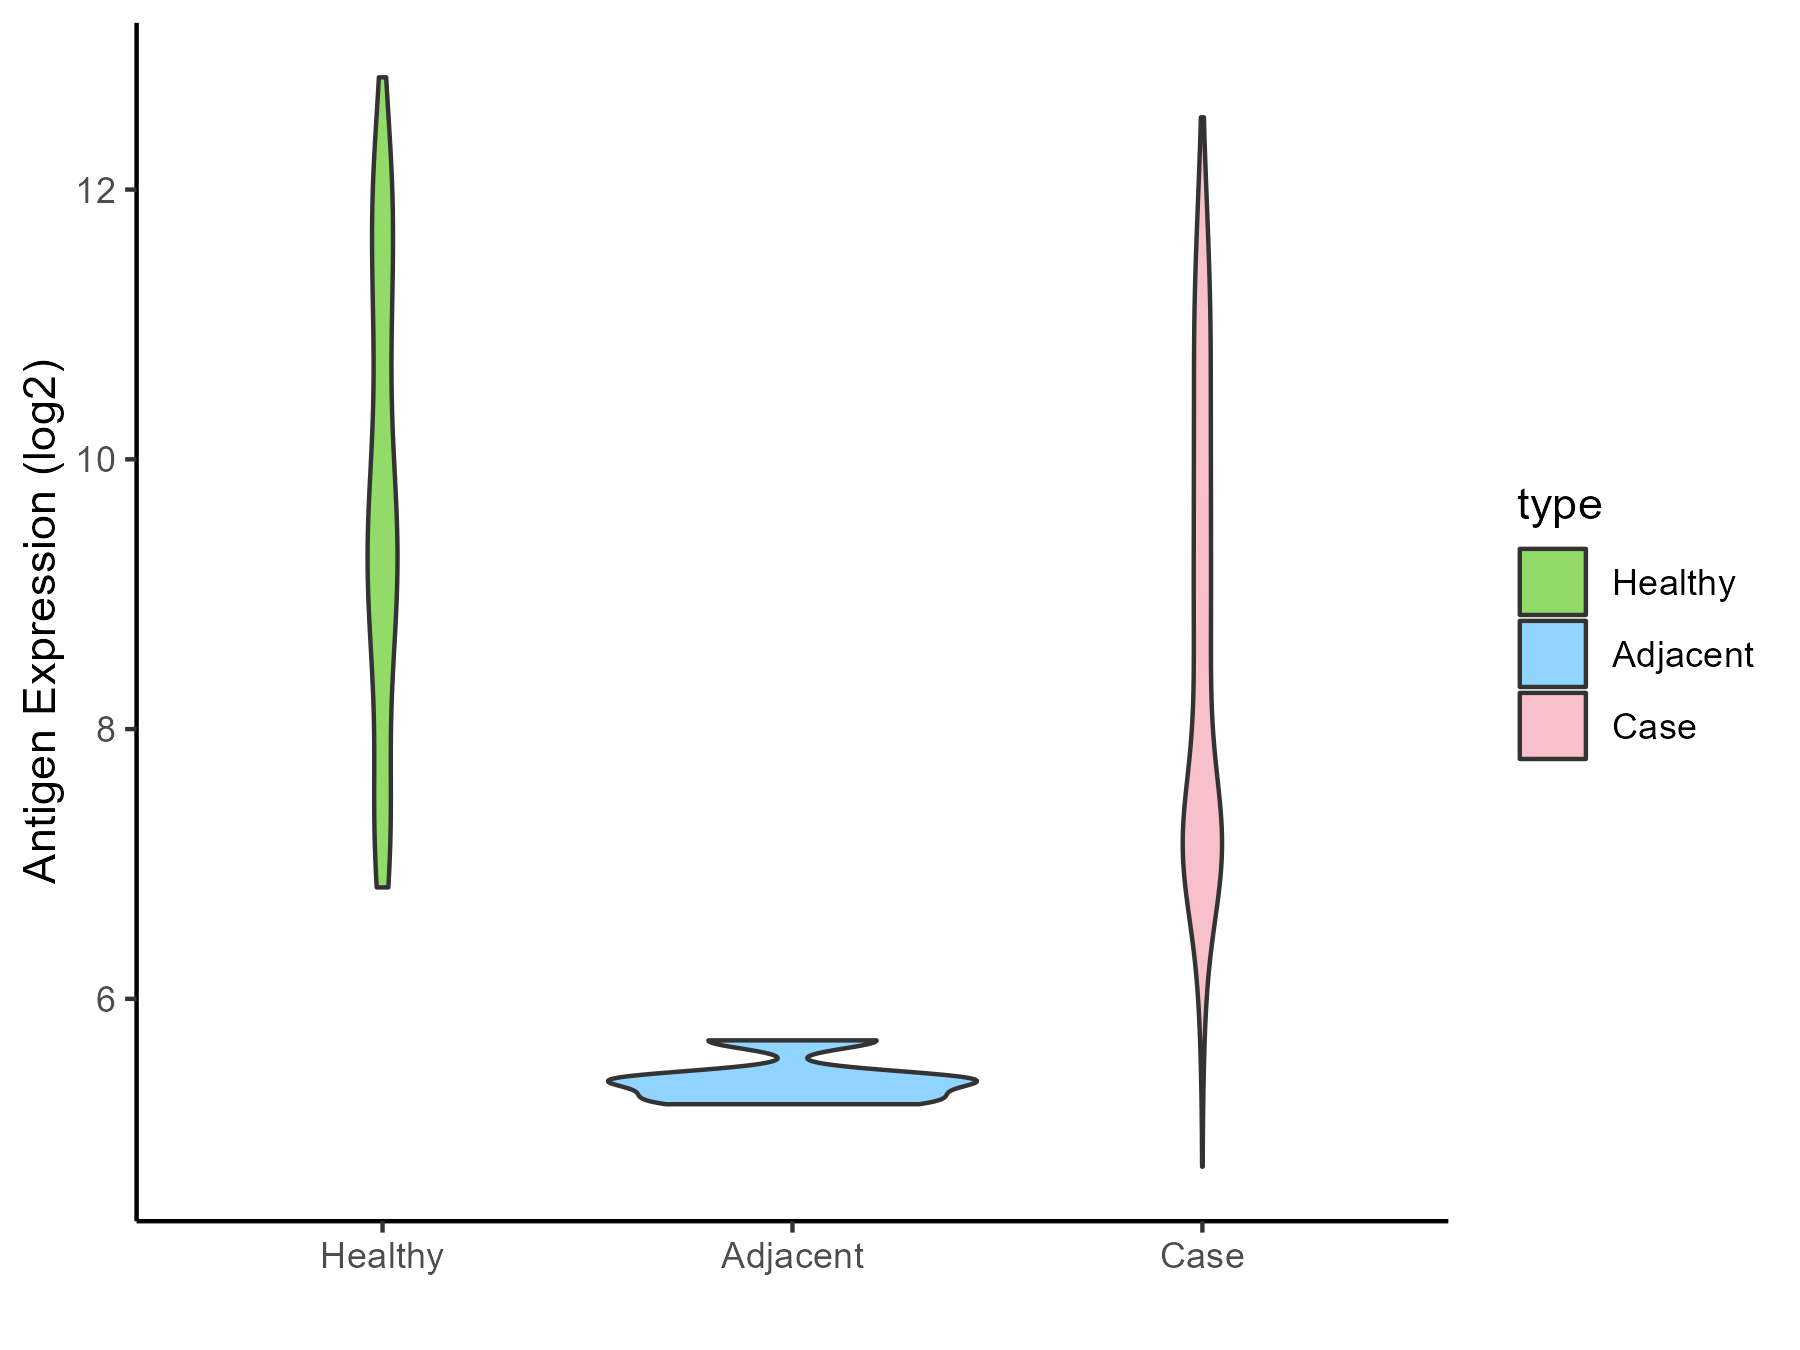
| The Studied Tissue | Endometrium | |
| The Specific Disease | Uterine cancer | |
| The Expression Level of Disease Section Compare with the Healthy Individual Tissue | p-value: 2.87E-09; Fold-change: -1.262990765; Z-score: -0.767880818 | |
| The Expression Level of Disease Section Compare with the Adjacent Tissue | p-value: 4.41E-18; Fold-change: 2.820195819; Z-score: 15.62792951 | |
| Disease-specific Antigen Abundances |
|
Click to View the Clearer Original Diagram |
| Differential expression pattern of antigen in diseases | ||
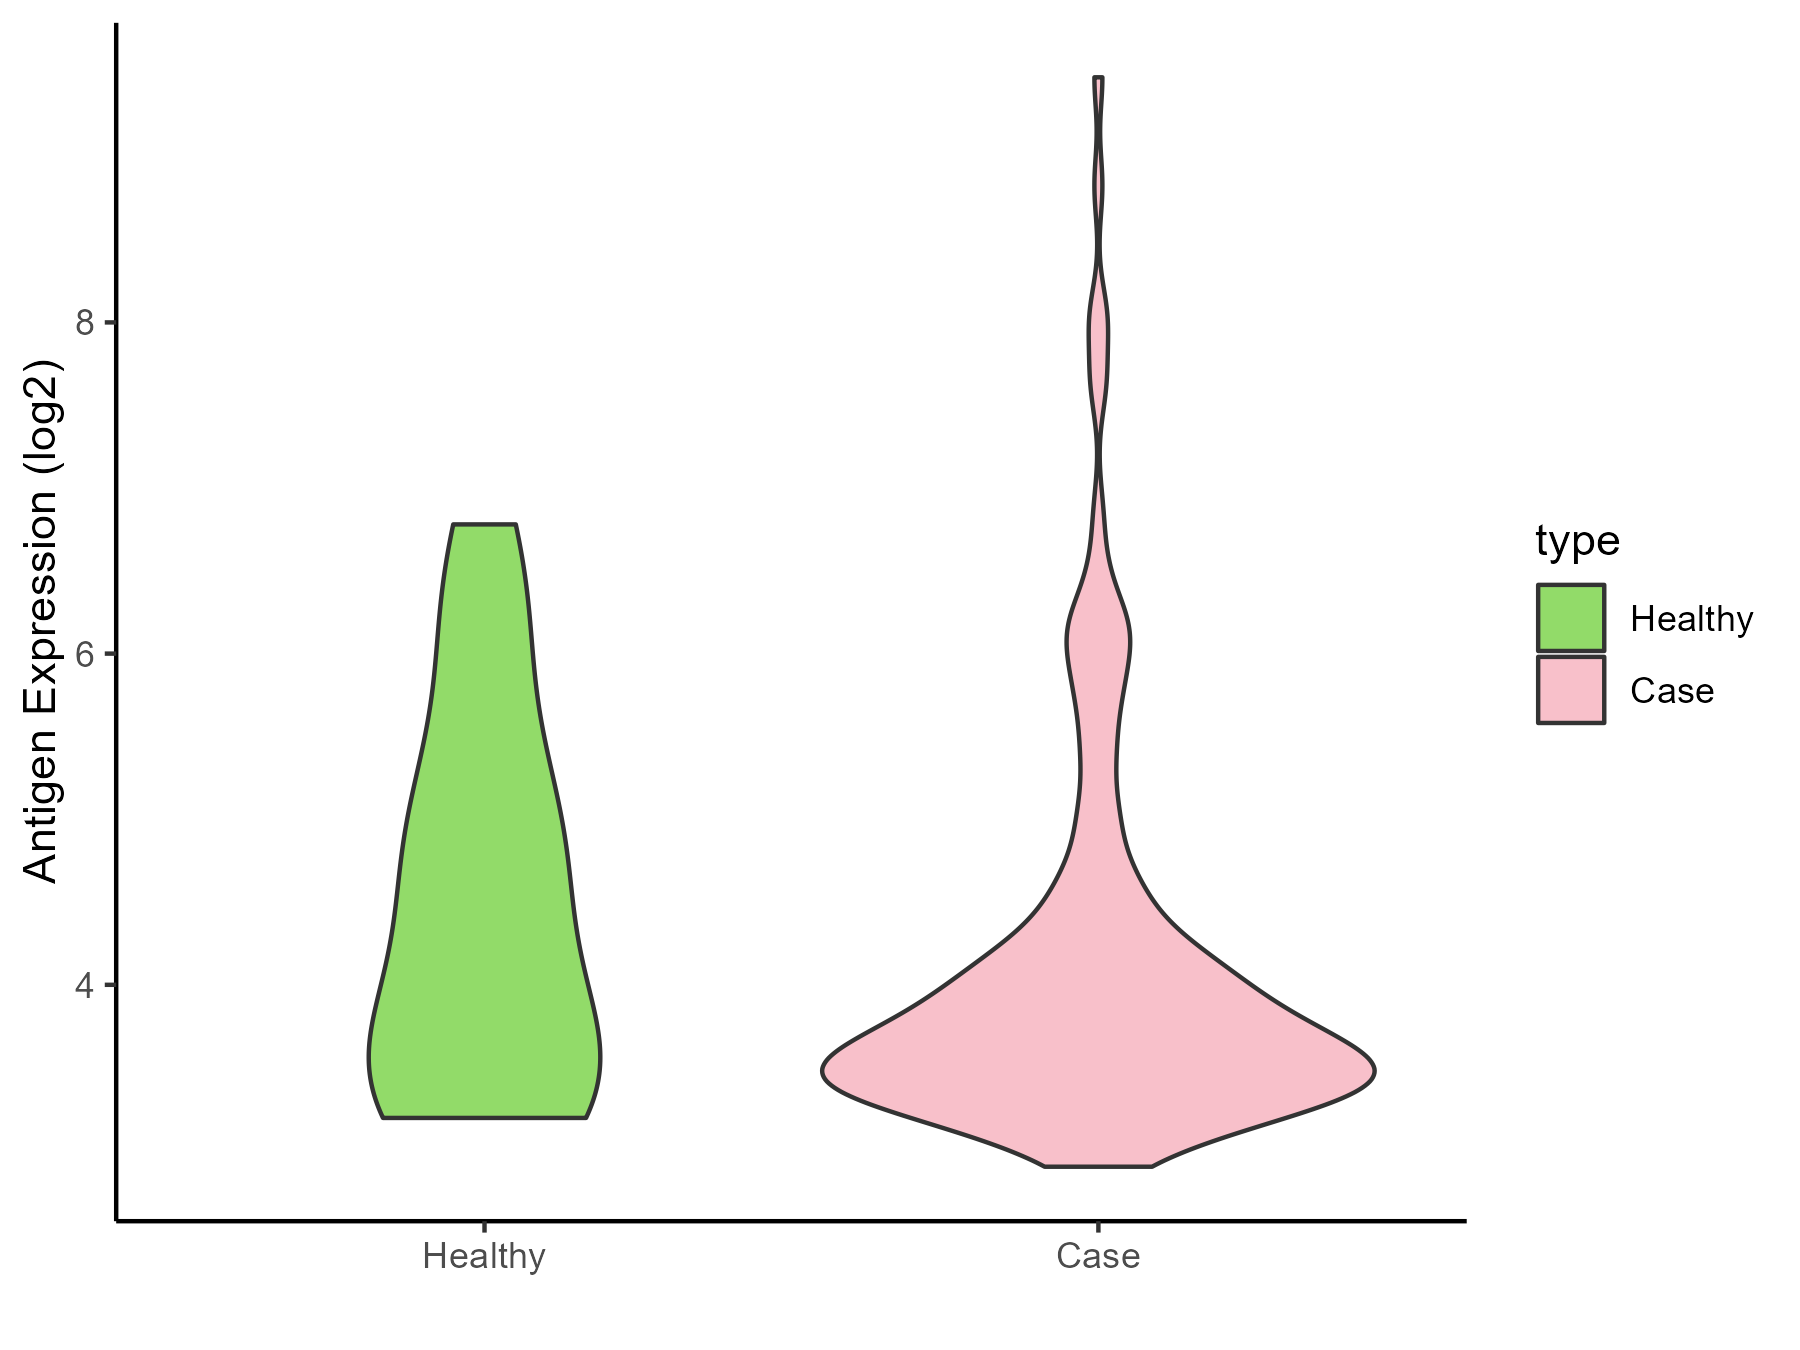
| The Studied Tissue | Prostate | |
| The Specific Disease | Prostate cancer | |
| The Expression Level of Disease Section Compare with the Healthy Individual Tissue | p-value: 0.164638748; Fold-change: -0.383940288; Z-score: -0.334867609 | |
| Disease-specific Antigen Abundances |
|
Click to View the Clearer Original Diagram |
| Differential expression pattern of antigen in diseases | ||
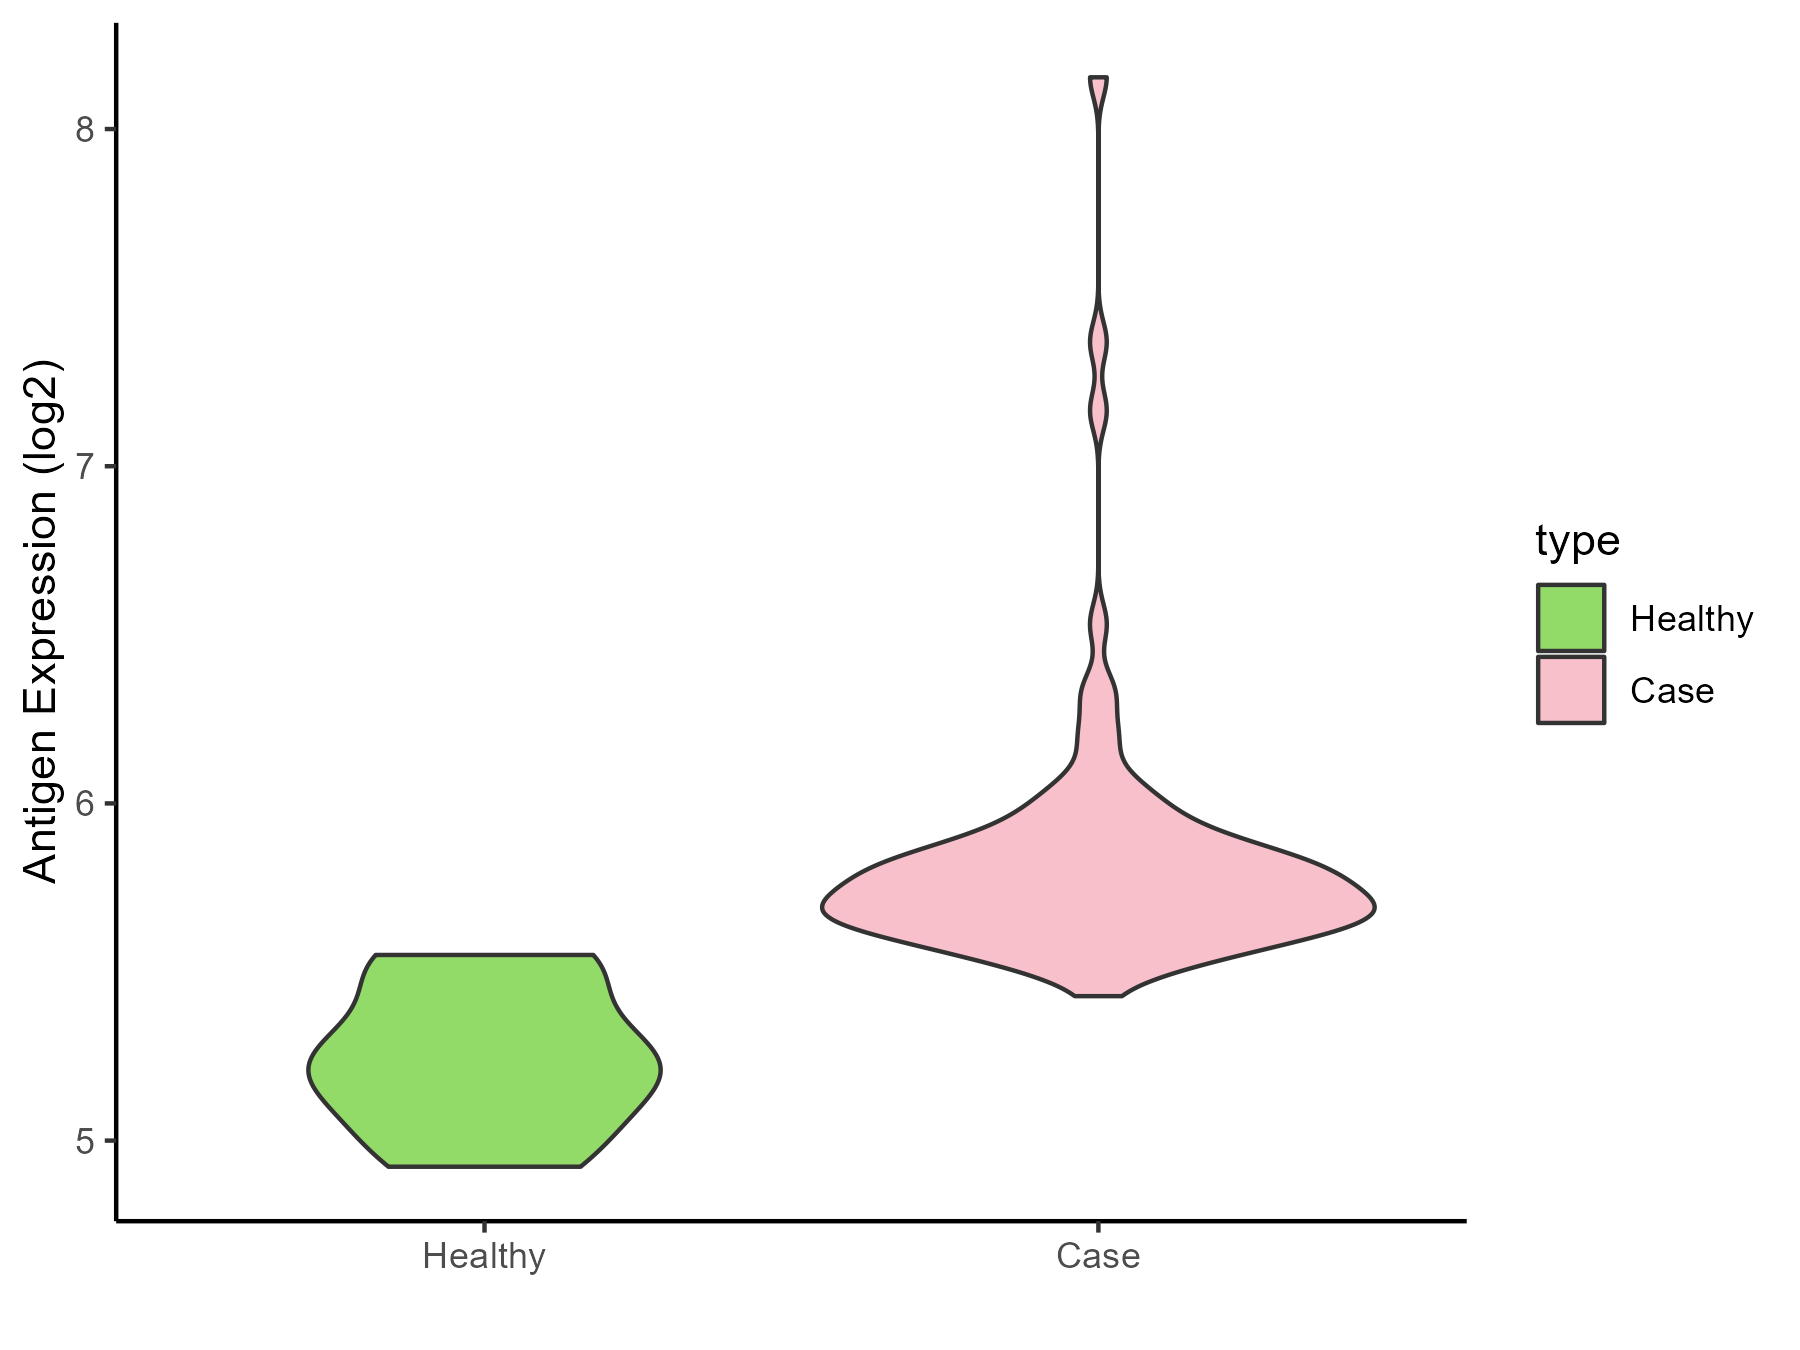
| The Studied Tissue | Bladder | |
| The Specific Disease | Bladder cancer | |
| The Expression Level of Disease Section Compare with the Healthy Individual Tissue | p-value: 0.000183668; Fold-change: 0.515590765; Z-score: 2.260742679 | |
| Disease-specific Antigen Abundances |
|
Click to View the Clearer Original Diagram |
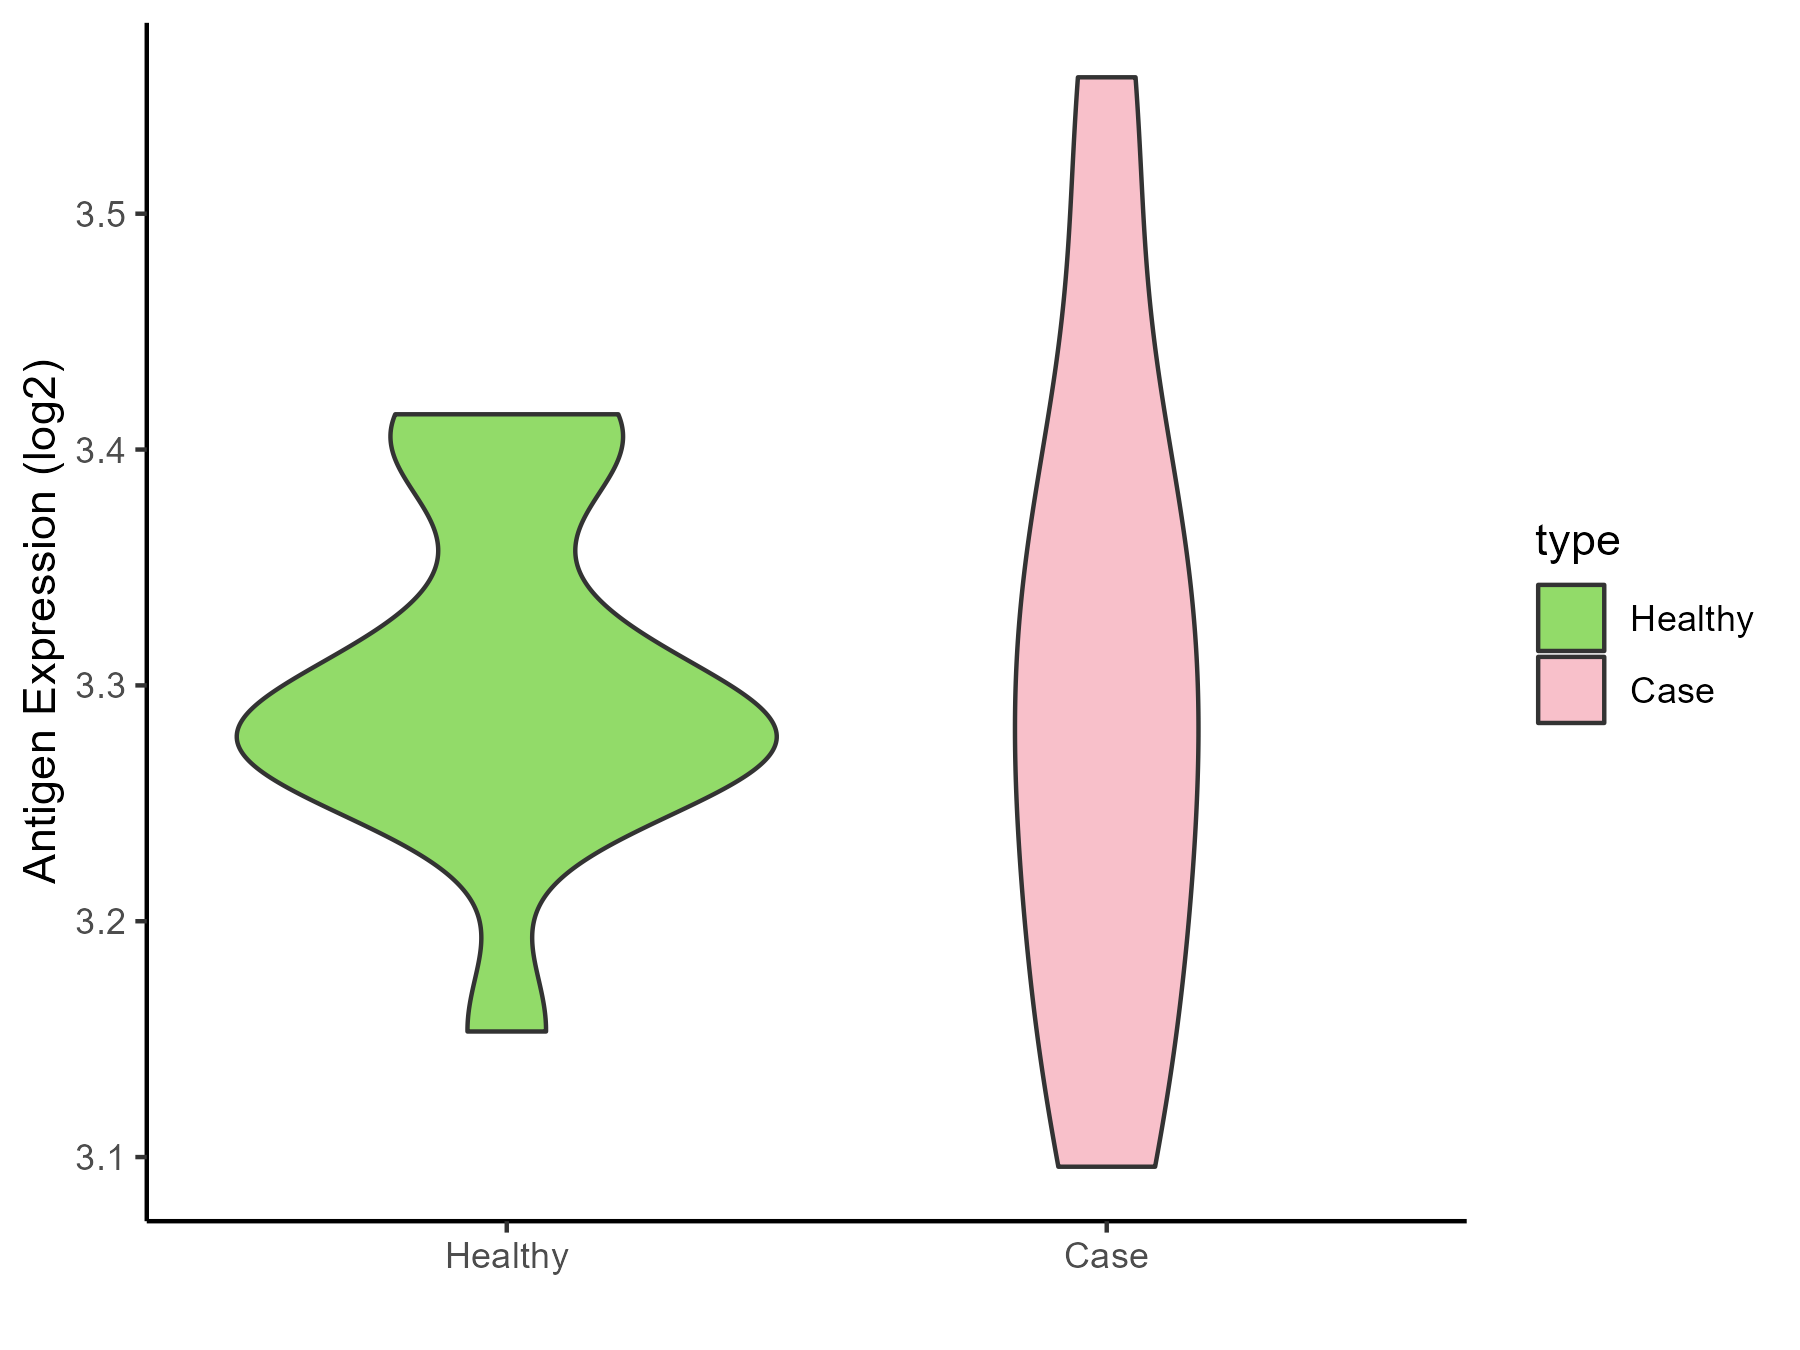
| Differential expression pattern of antigen in diseases | ||
| The Studied Tissue | Uvea | |
| The Specific Disease | Retinoblastoma tumor | |
| The Expression Level of Disease Section Compare with the Healthy Individual Tissue | p-value: 0.890950718; Fold-change: 0.003433614; Z-score: 0.046074748 | |
| Disease-specific Antigen Abundances |
|
Click to View the Clearer Original Diagram |
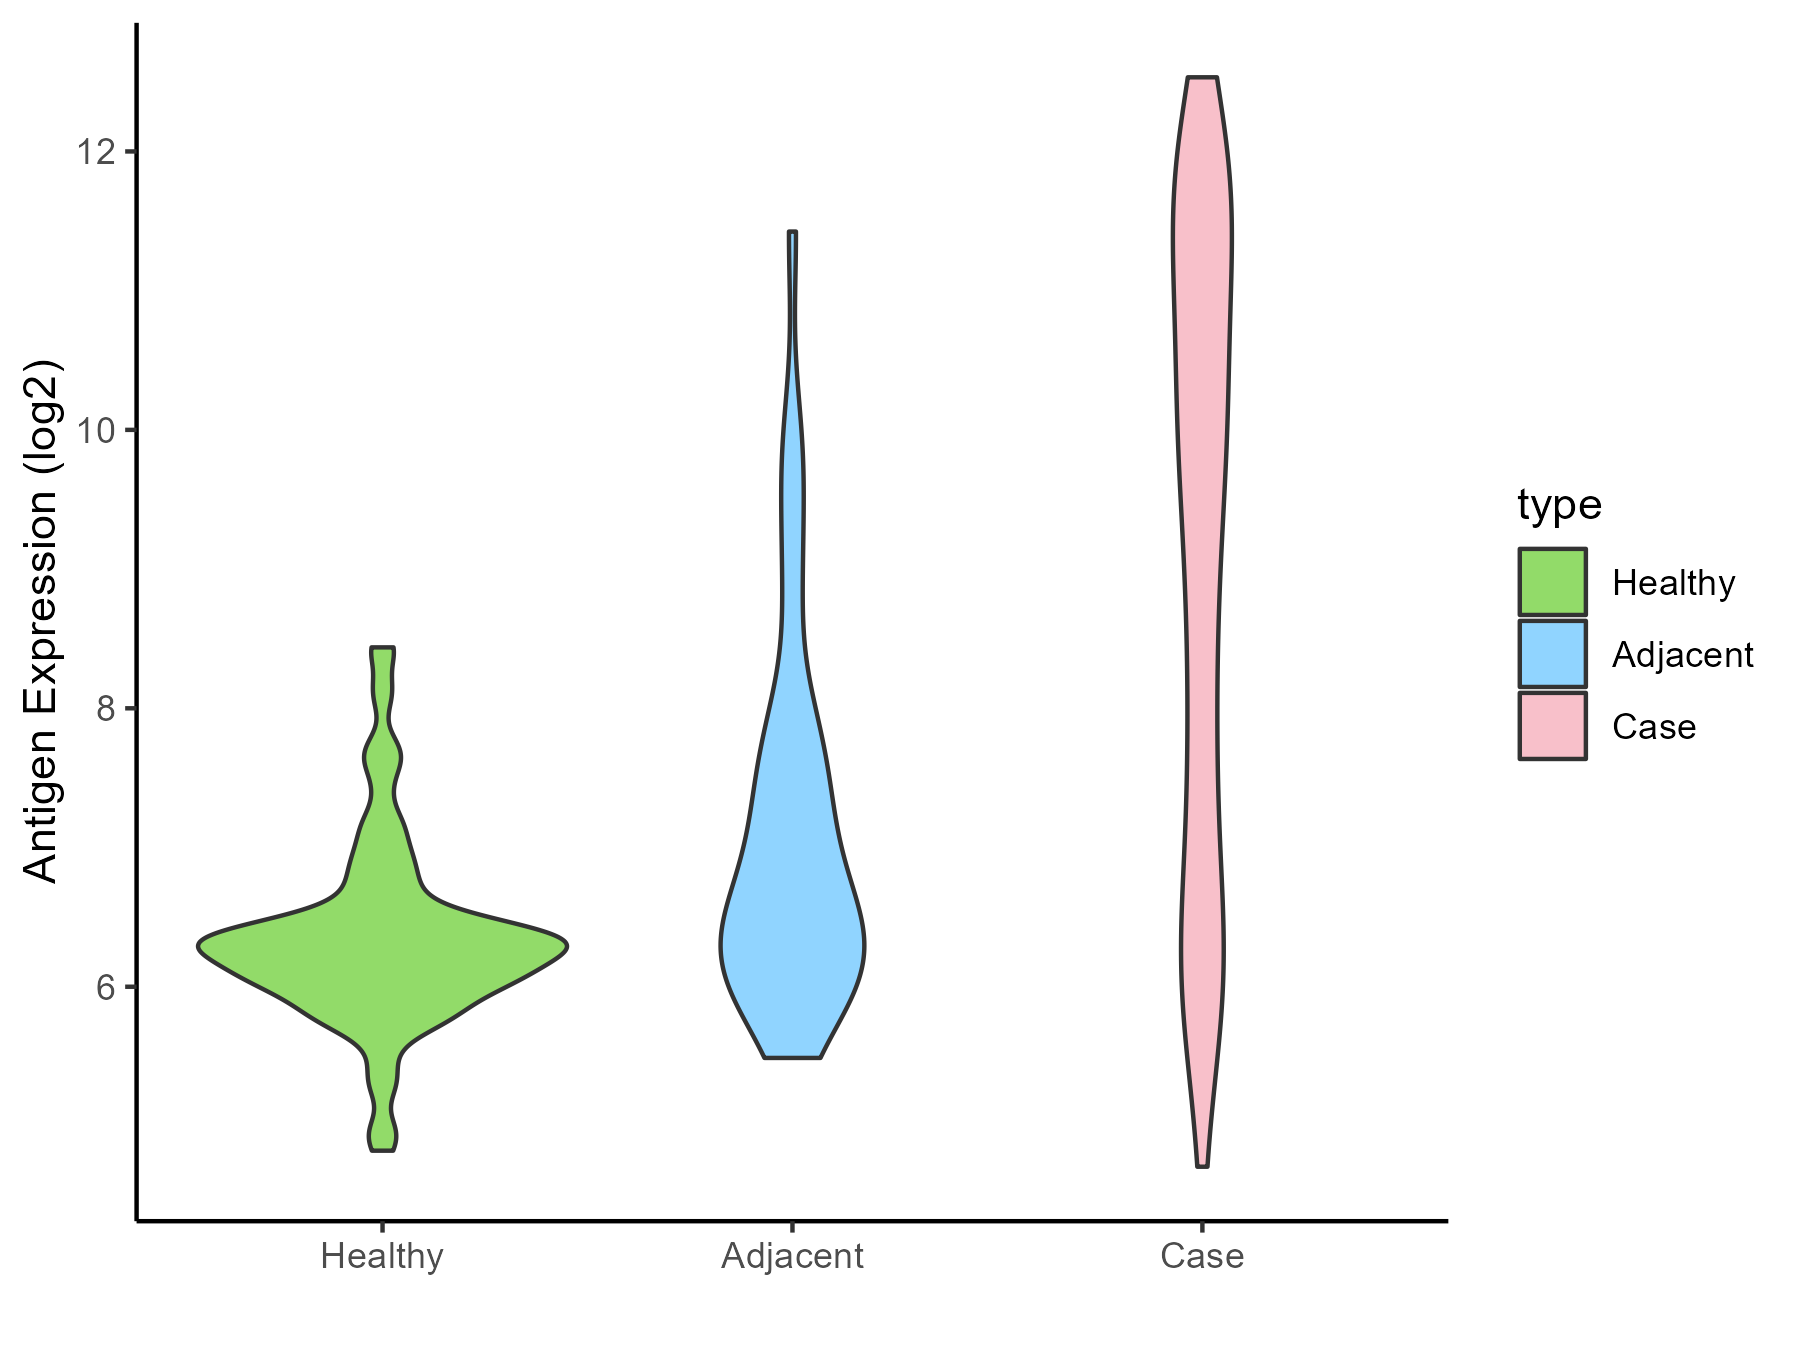
| Differential expression pattern of antigen in diseases | ||
| The Studied Tissue | Thyroid | |
| The Specific Disease | Thyroid cancer | |
| The Expression Level of Disease Section Compare with the Healthy Individual Tissue | p-value: 1.55E-53; Fold-change: 3.500705941; Z-score: 5.430210429 | |
| The Expression Level of Disease Section Compare with the Adjacent Tissue | p-value: 7.34E-13; Fold-change: 3.207566416; Z-score: 2.440300657 | |
| Disease-specific Antigen Abundances |
|
Click to View the Clearer Original Diagram |
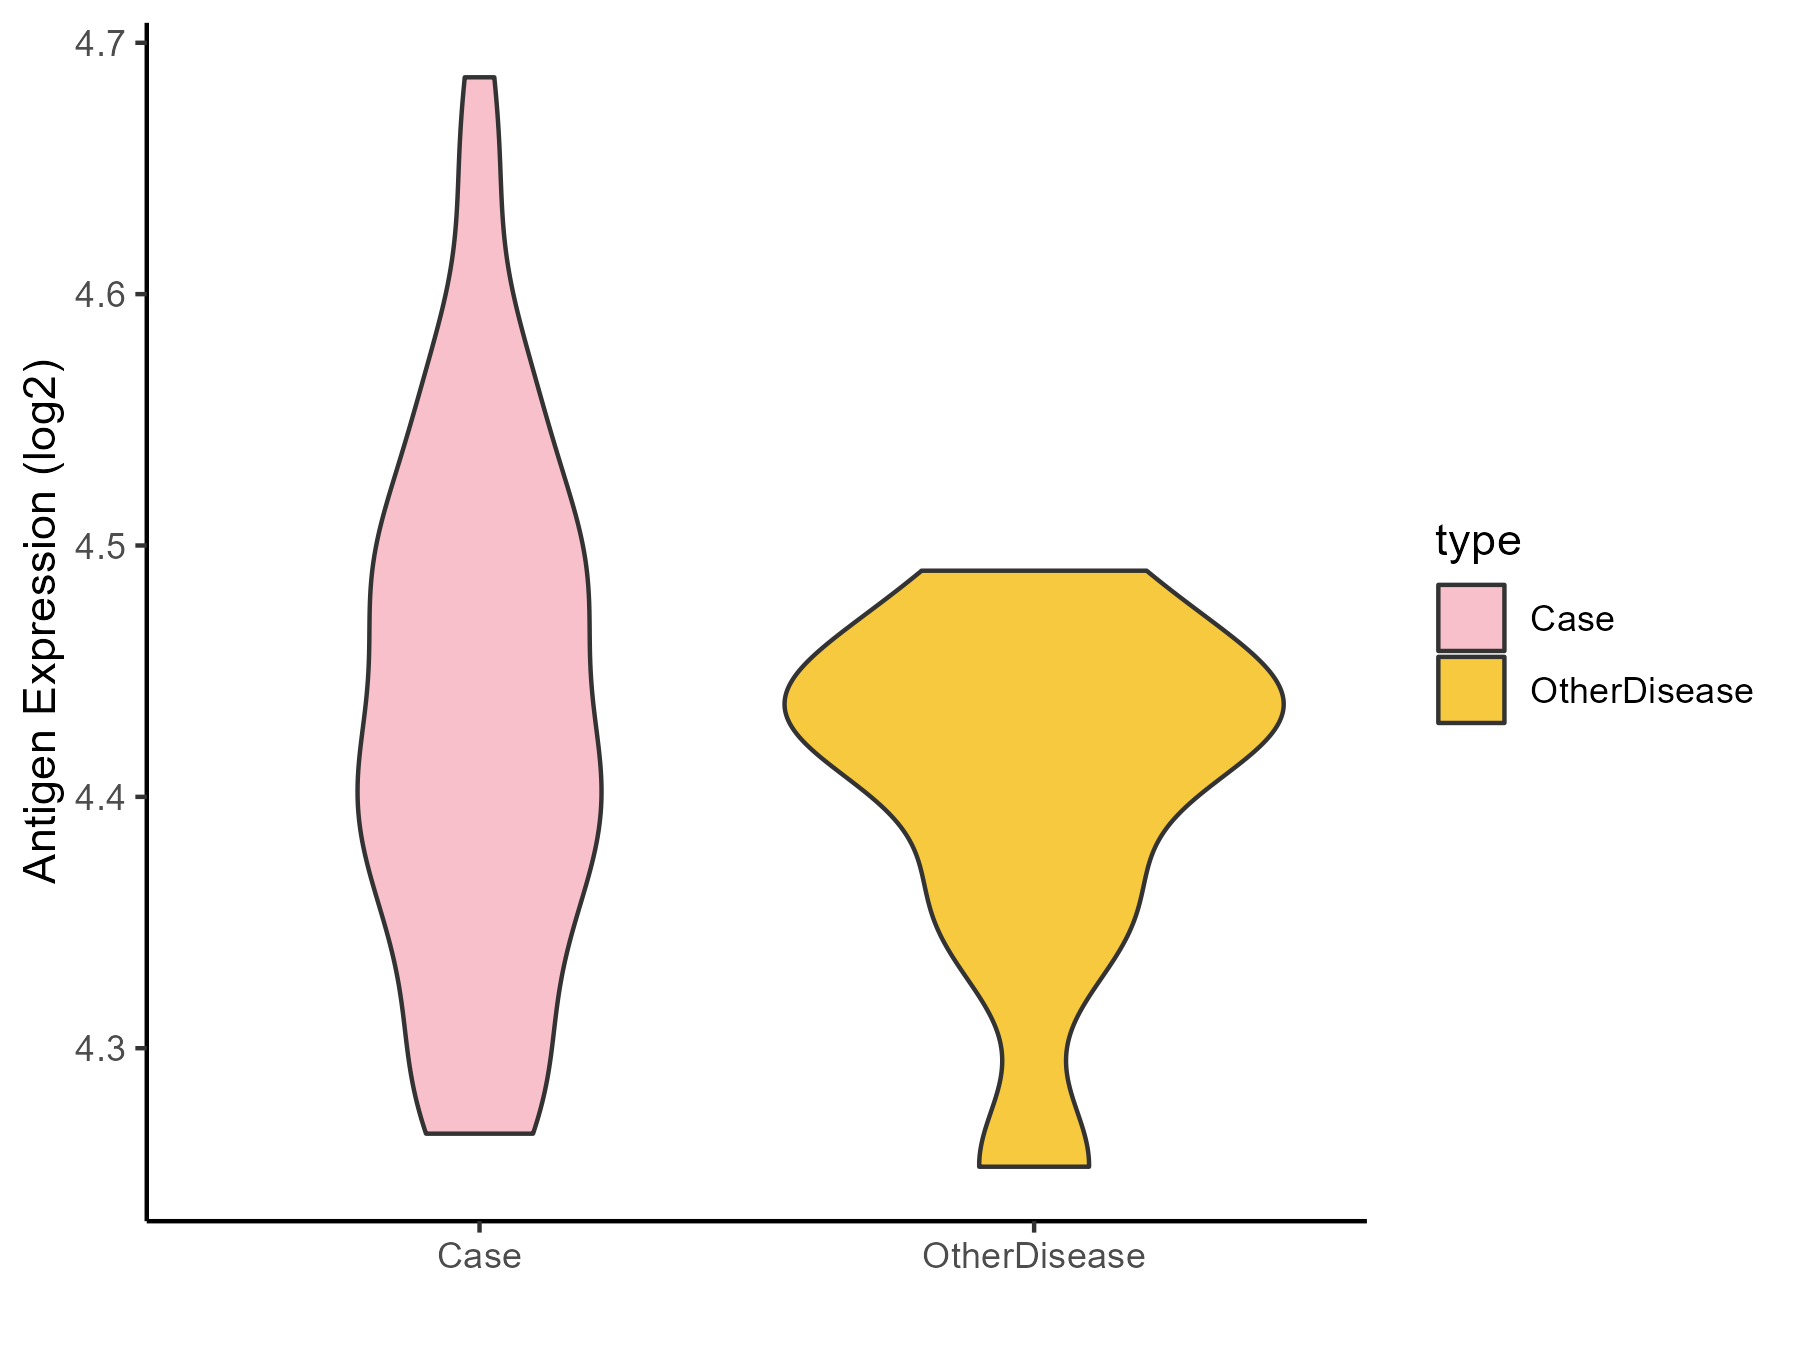
| Differential expression pattern of antigen in diseases | ||
| The Studied Tissue | Adrenal cortex | |
| The Specific Disease | Adrenocortical carcinoma | |
| The Expression Level of Disease Section Compare with the Other Disease Section | p-value: 0.129064182; Fold-change: 0.002357132; Z-score: 0.033671192 | |
| Disease-specific Antigen Abundances |
|
Click to View the Clearer Original Diagram |
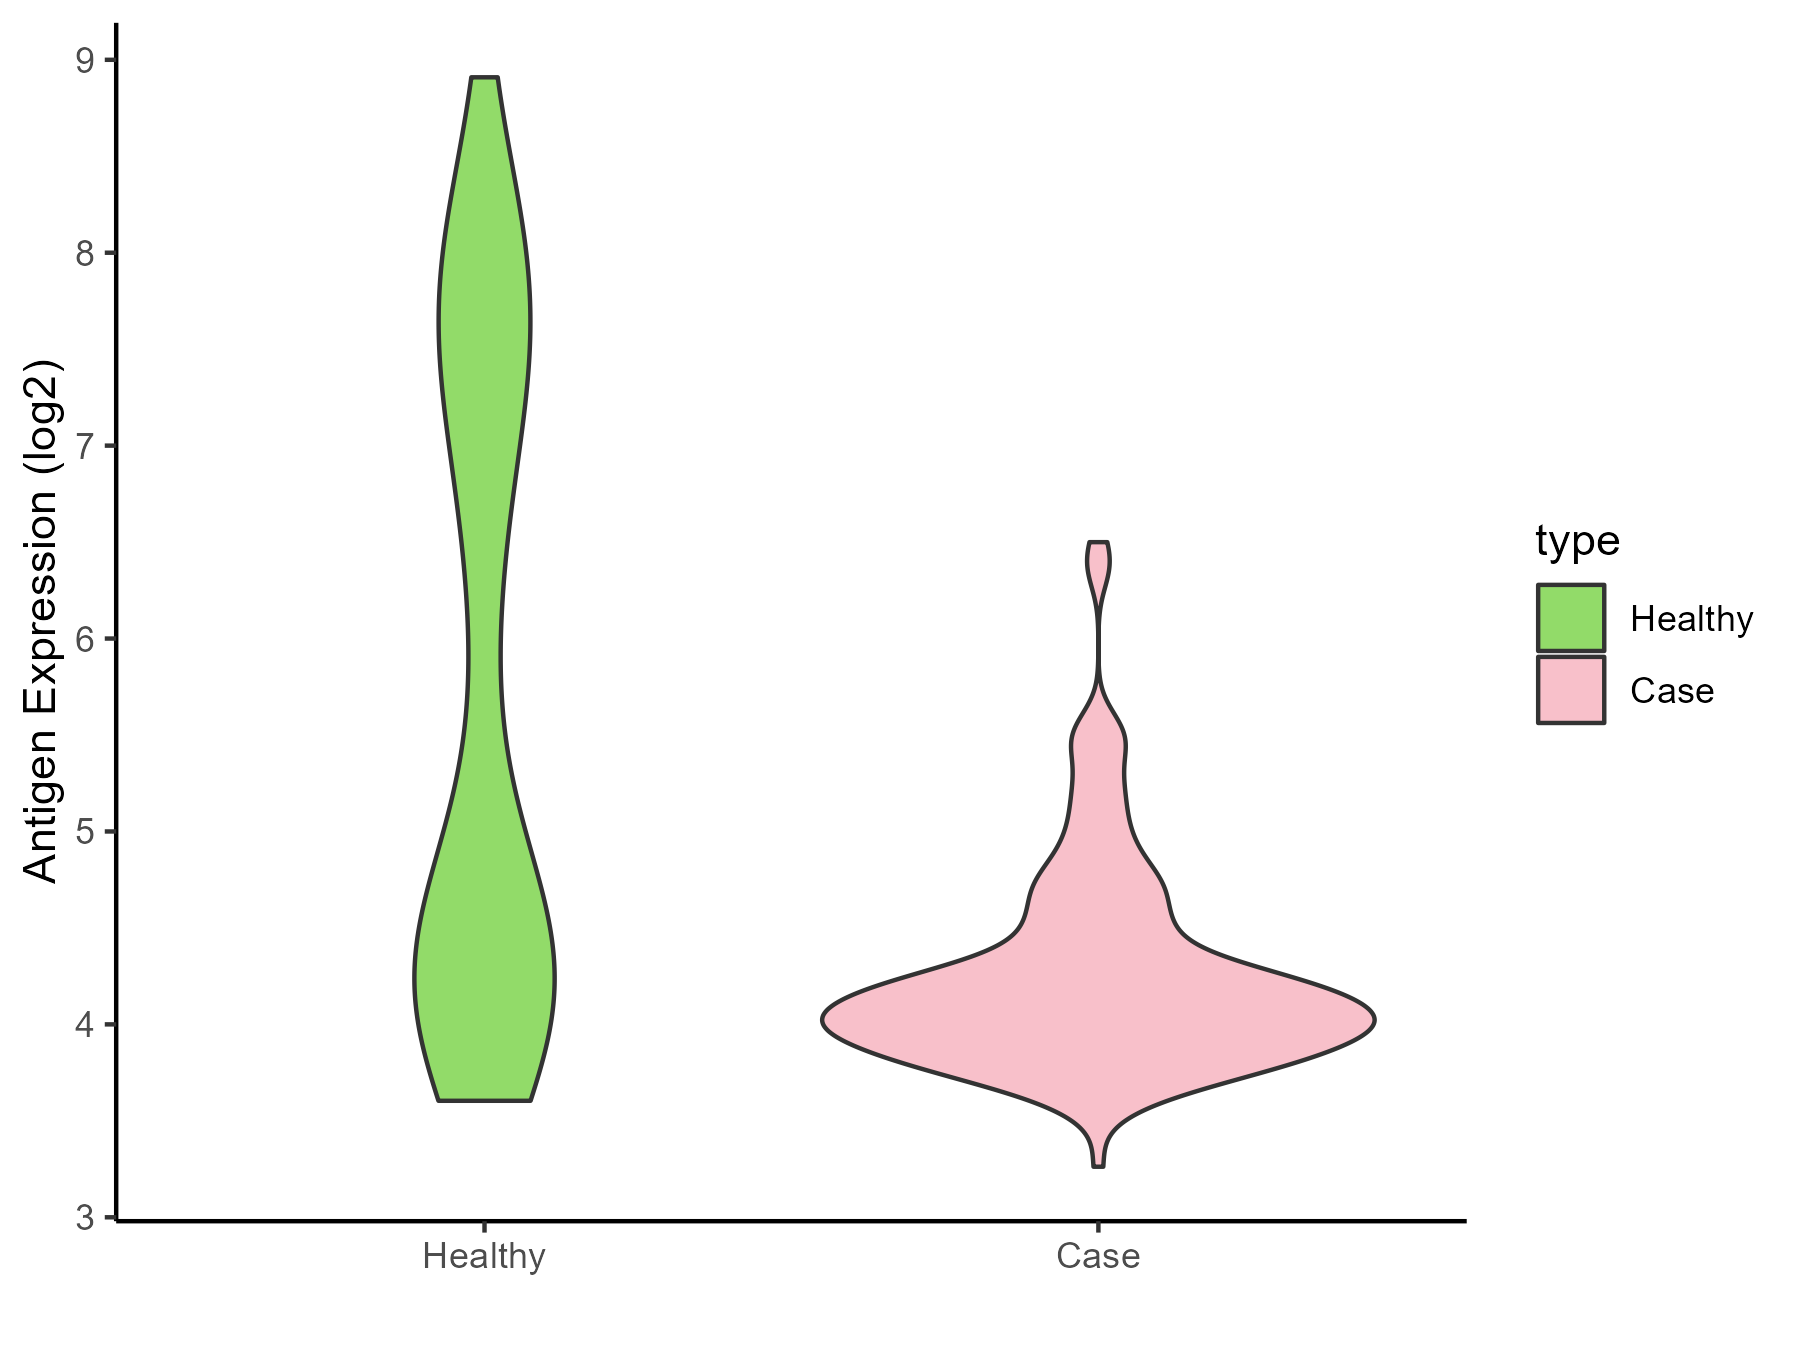
| Differential expression pattern of antigen in diseases | ||
| The Studied Tissue | Head and neck | |
| The Specific Disease | Head and neck cancer | |
| The Expression Level of Disease Section Compare with the Healthy Individual Tissue | p-value: 4.47E-12; Fold-change: -0.673135038; Z-score: -0.397962606 | |
| Disease-specific Antigen Abundances |
|
Click to View the Clearer Original Diagram |
| Differential expression pattern of antigen in diseases | ||
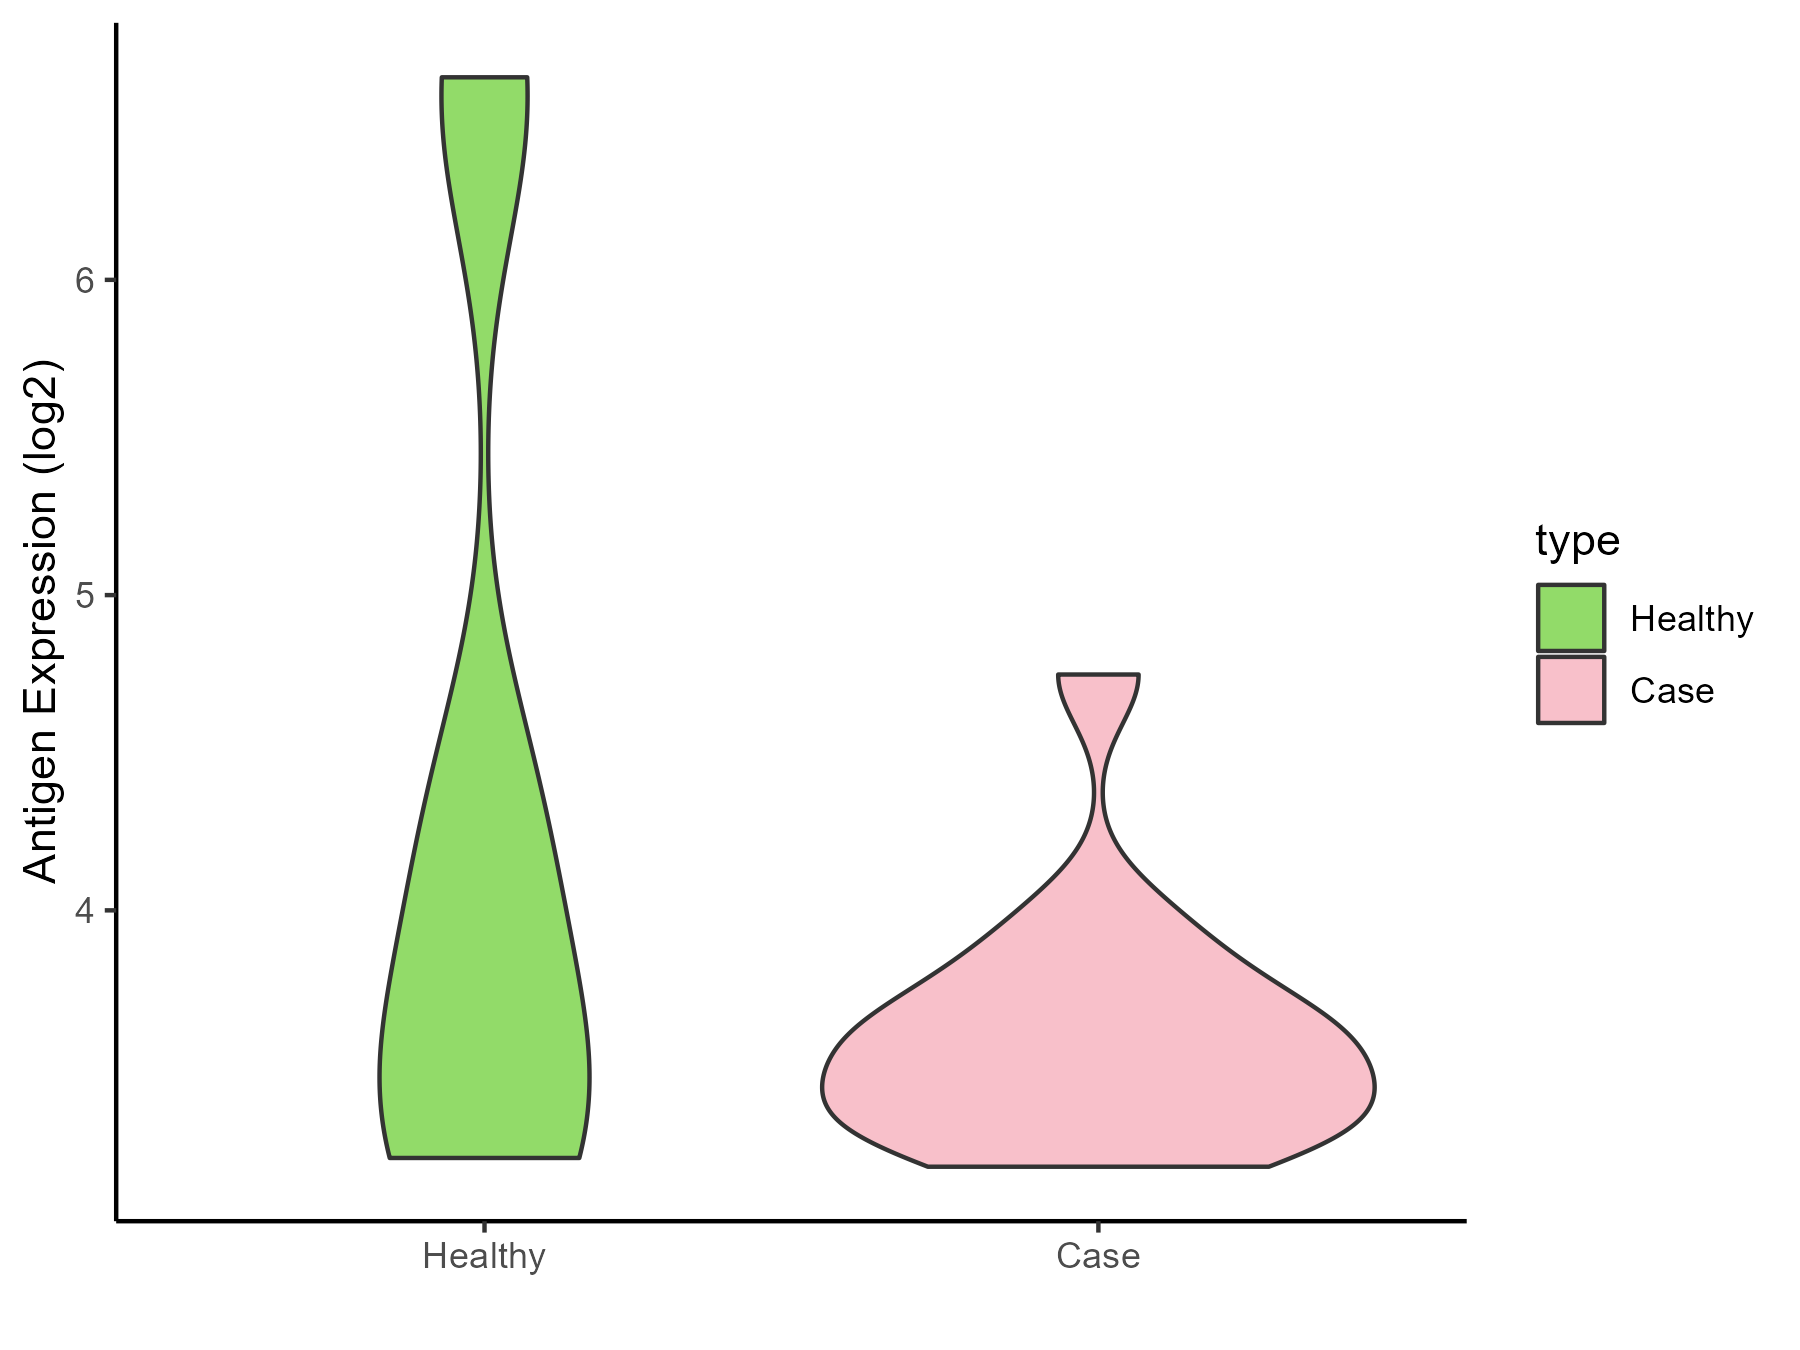
| The Studied Tissue | Pituitary | |
| The Specific Disease | Pituitary gonadotrope tumor | |
| The Expression Level of Disease Section Compare with the Healthy Individual Tissue | p-value: 0.163208845; Fold-change: -0.260100331; Z-score: -0.19260112 | |
| Disease-specific Antigen Abundances |
|
Click to View the Clearer Original Diagram |
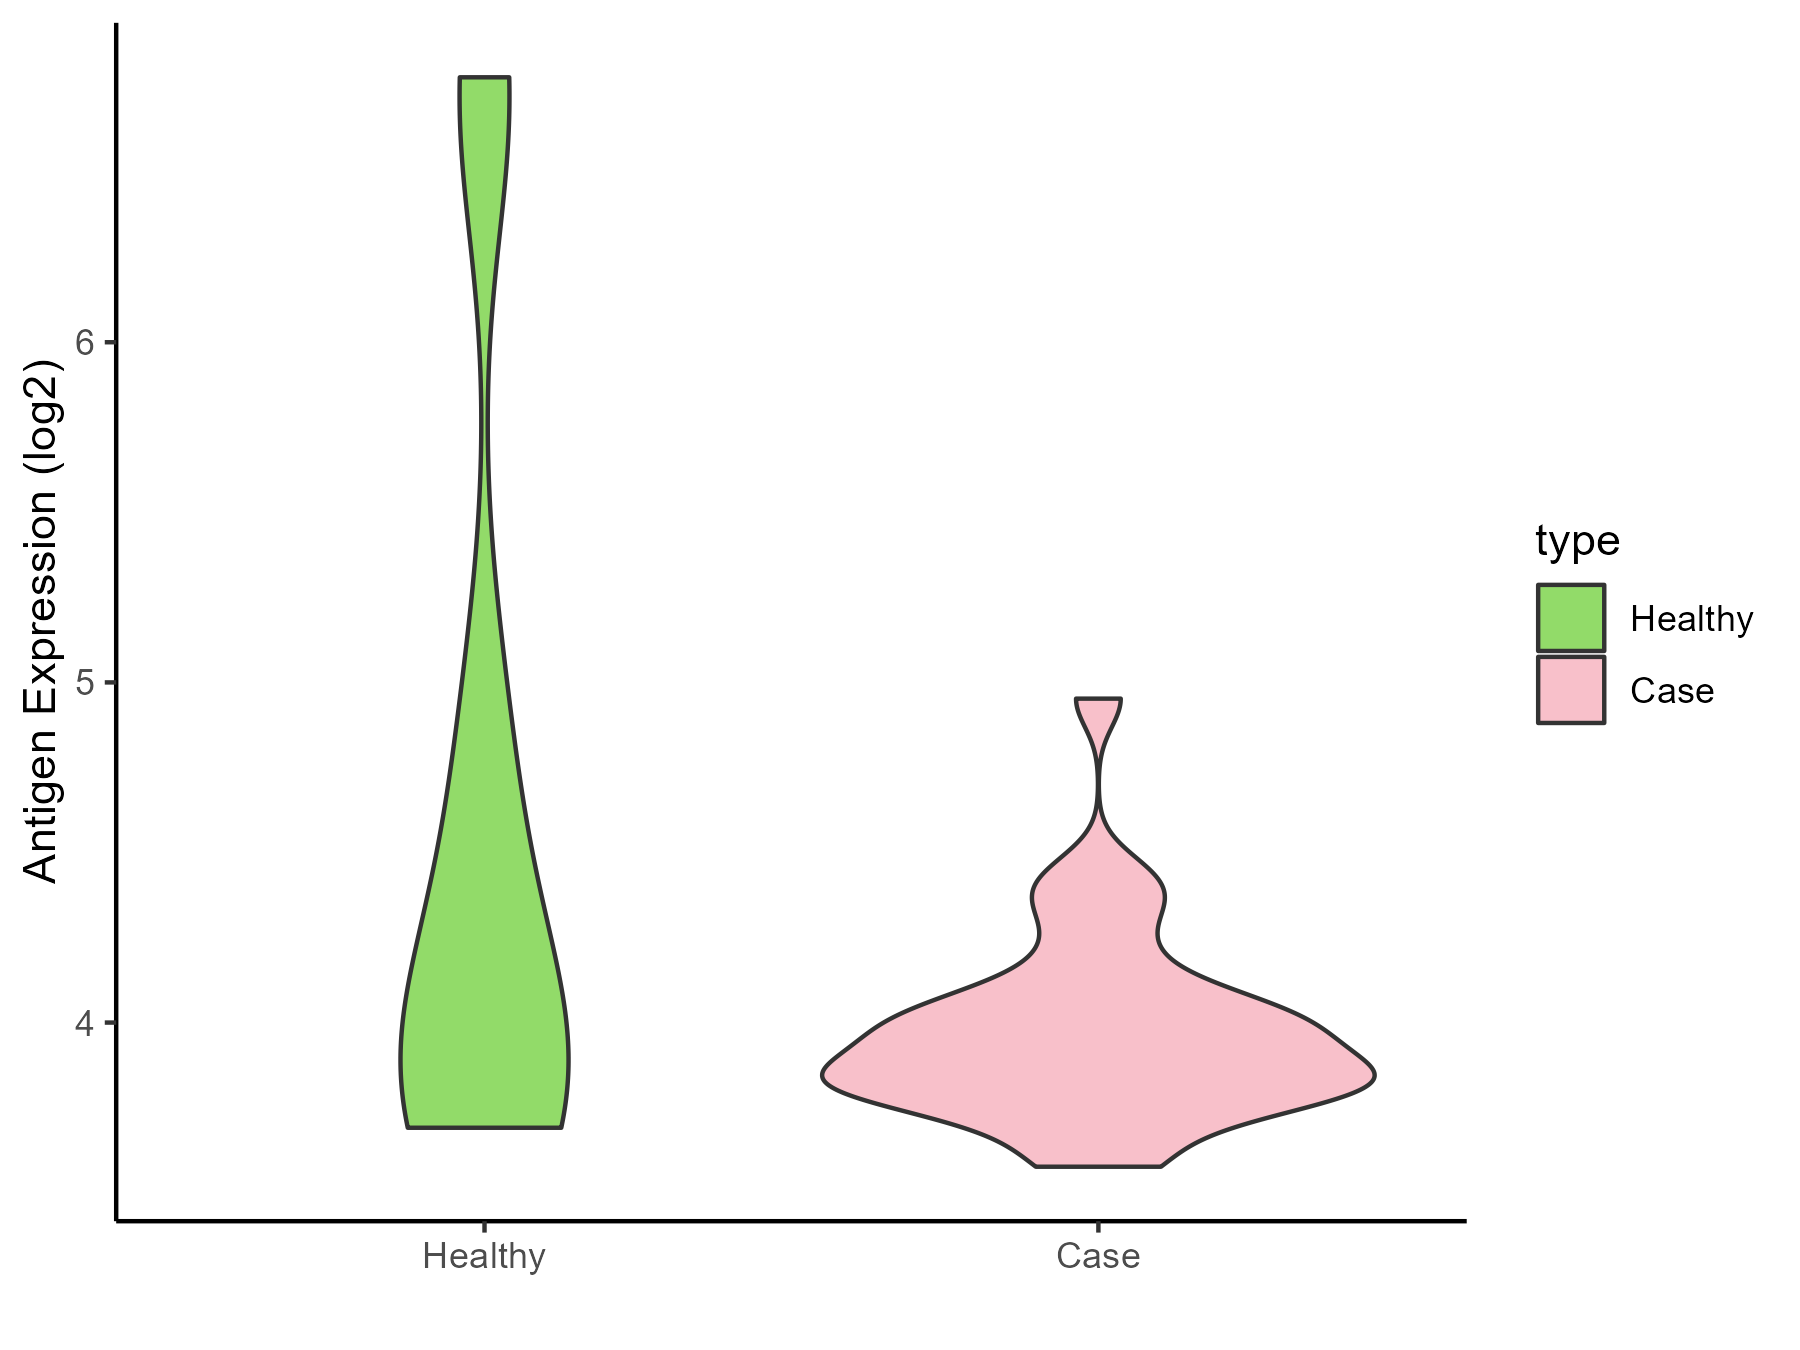
| The Studied Tissue | Pituitary | |
| The Specific Disease | Pituitary cancer | |
| The Expression Level of Disease Section Compare with the Healthy Individual Tissue | p-value: 0.129943865; Fold-change: -0.094404486; Z-score: -0.082634588 | |
| Disease-specific Antigen Abundances |
|
Click to View the Clearer Original Diagram |
ICD Disease Classification 03
| Differential expression pattern of antigen in diseases | ||
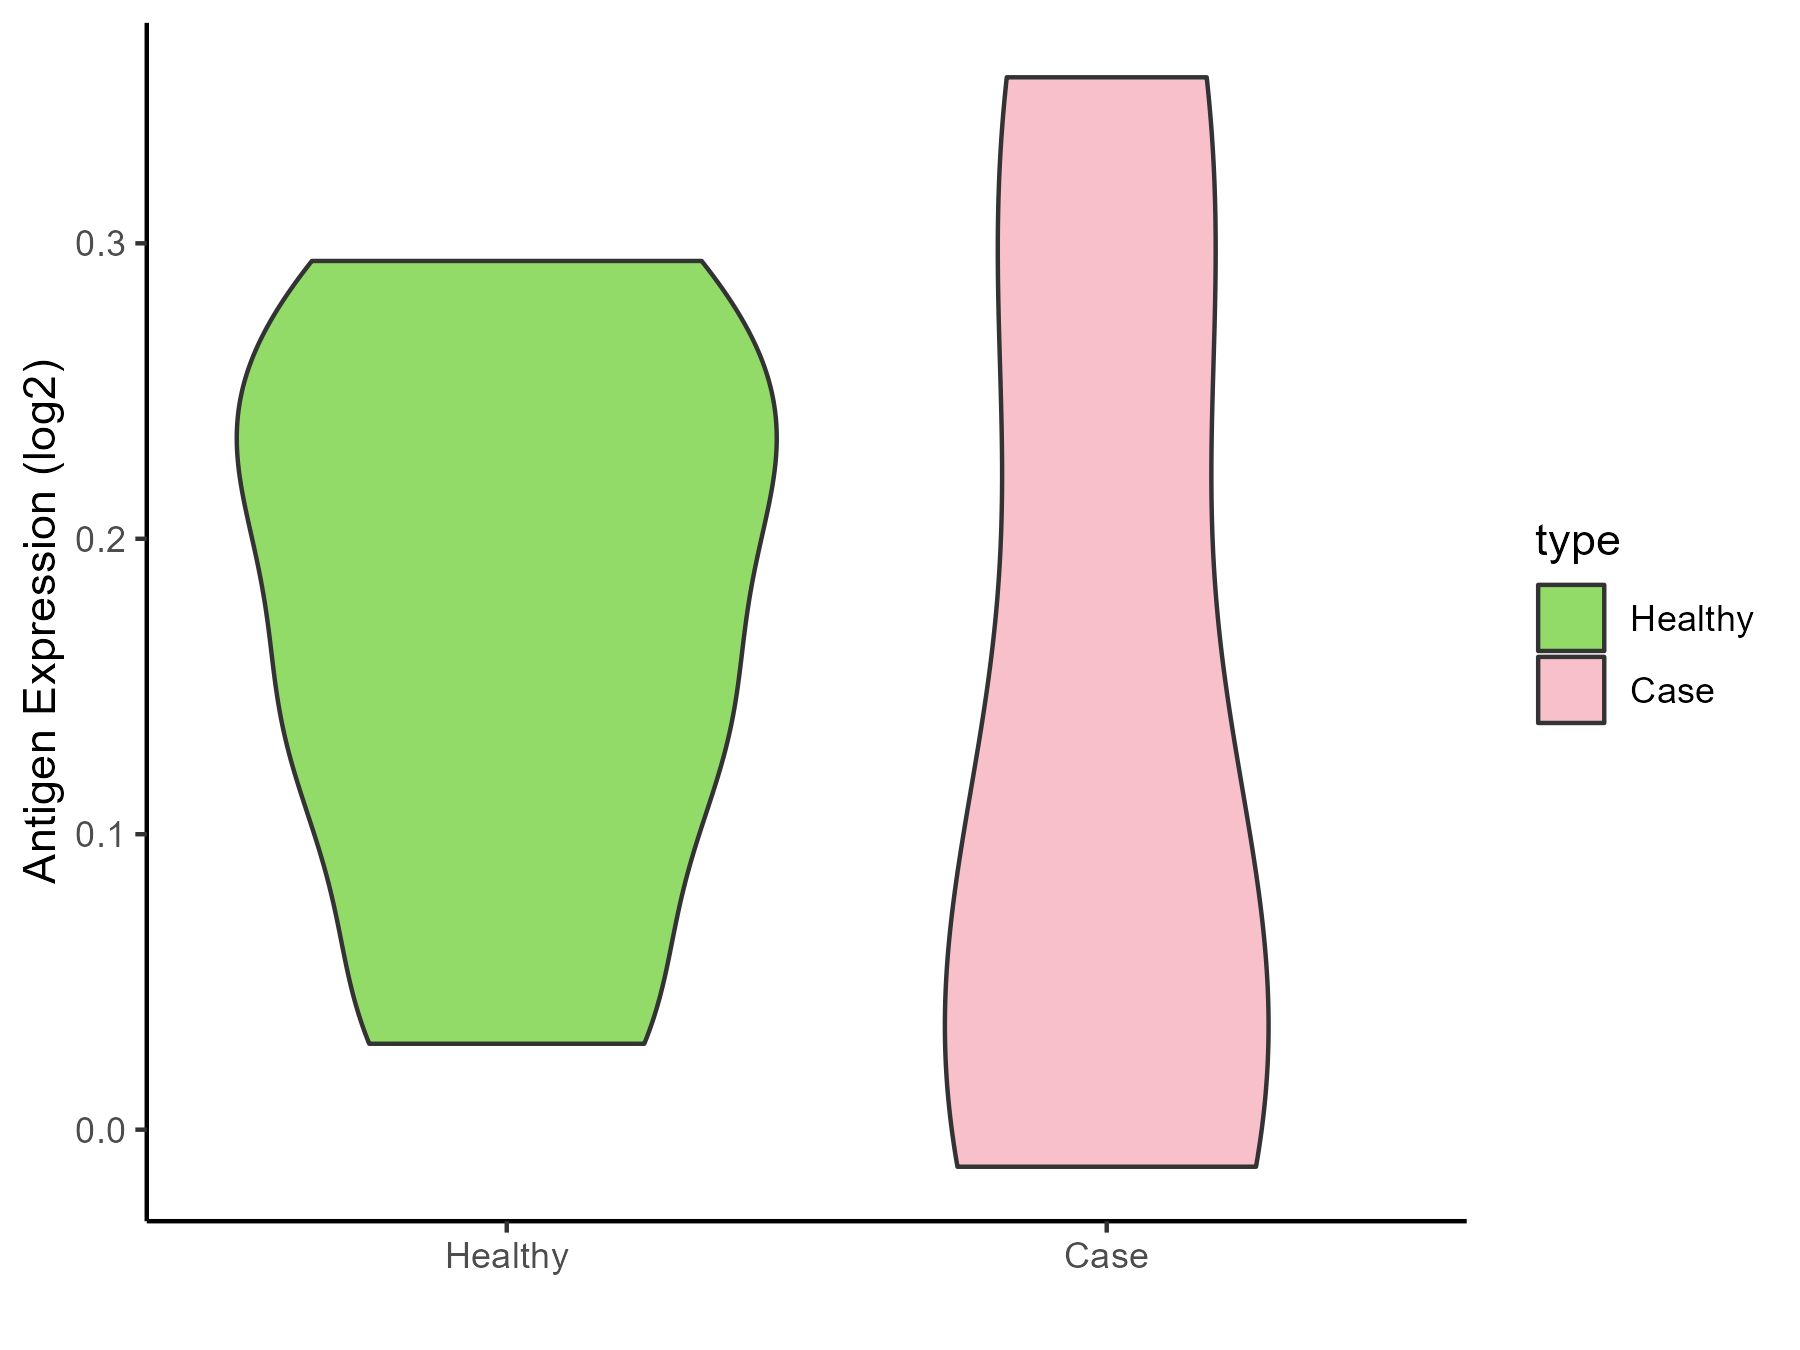
| The Studied Tissue | Whole blood | |
| The Specific Disease | Thrombocytopenia | |
| The Expression Level of Disease Section Compare with the Healthy Individual Tissue | p-value: 0.713800112; Fold-change: -0.137757287; Z-score: -1.480584459 | |
| Disease-specific Antigen Abundances |
|
Click to View the Clearer Original Diagram |
ICD Disease Classification 04
| Differential expression pattern of antigen in diseases | ||
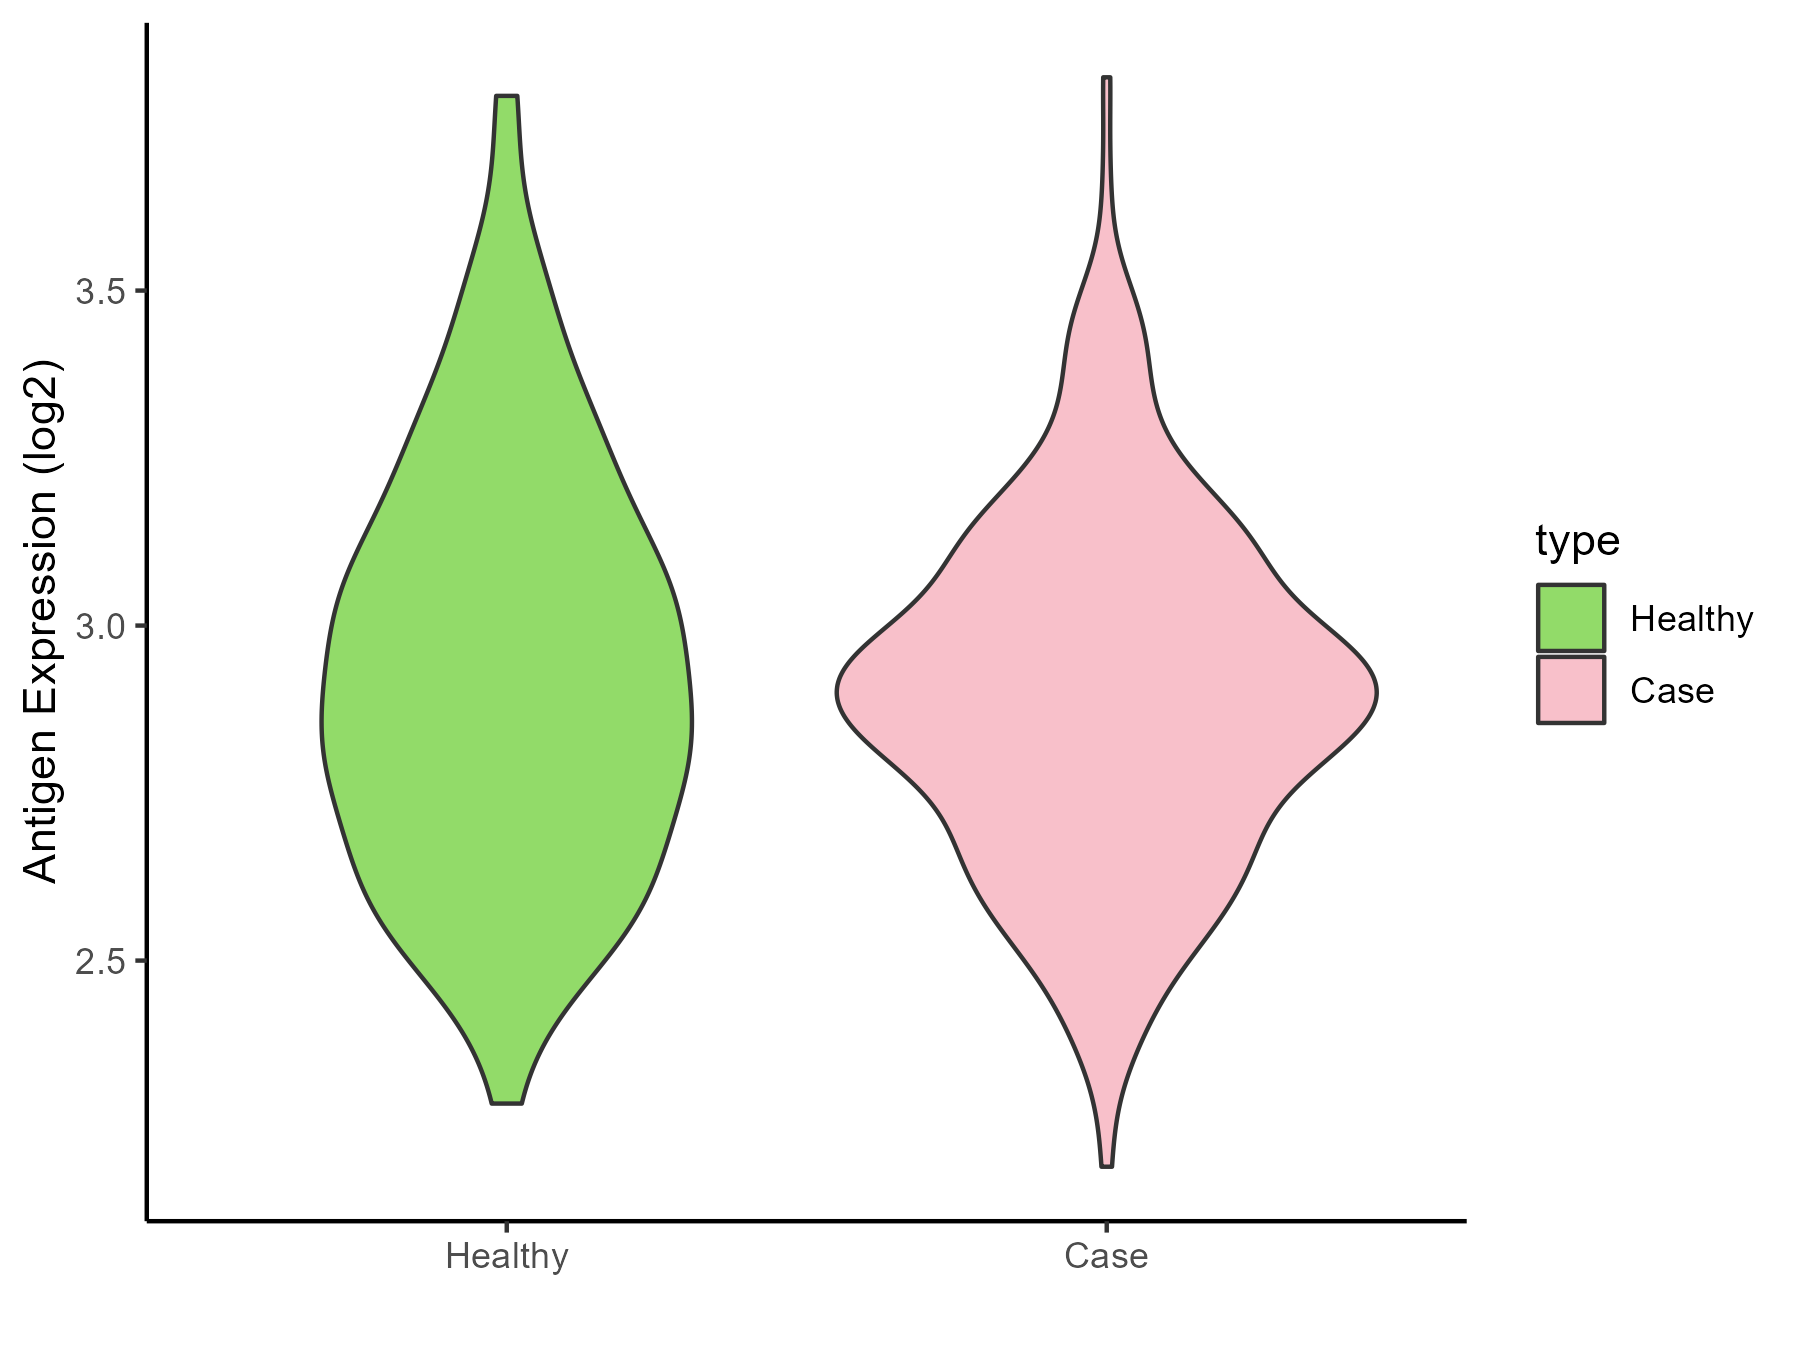
| The Studied Tissue | Whole blood | |
| The Specific Disease | Lupus erythematosus | |
| The Expression Level of Disease Section Compare with the Healthy Individual Tissue | p-value: 0.257642731; Fold-change: -0.023272831; Z-score: -0.076692965 | |
| Disease-specific Antigen Abundances |
|
Click to View the Clearer Original Diagram |
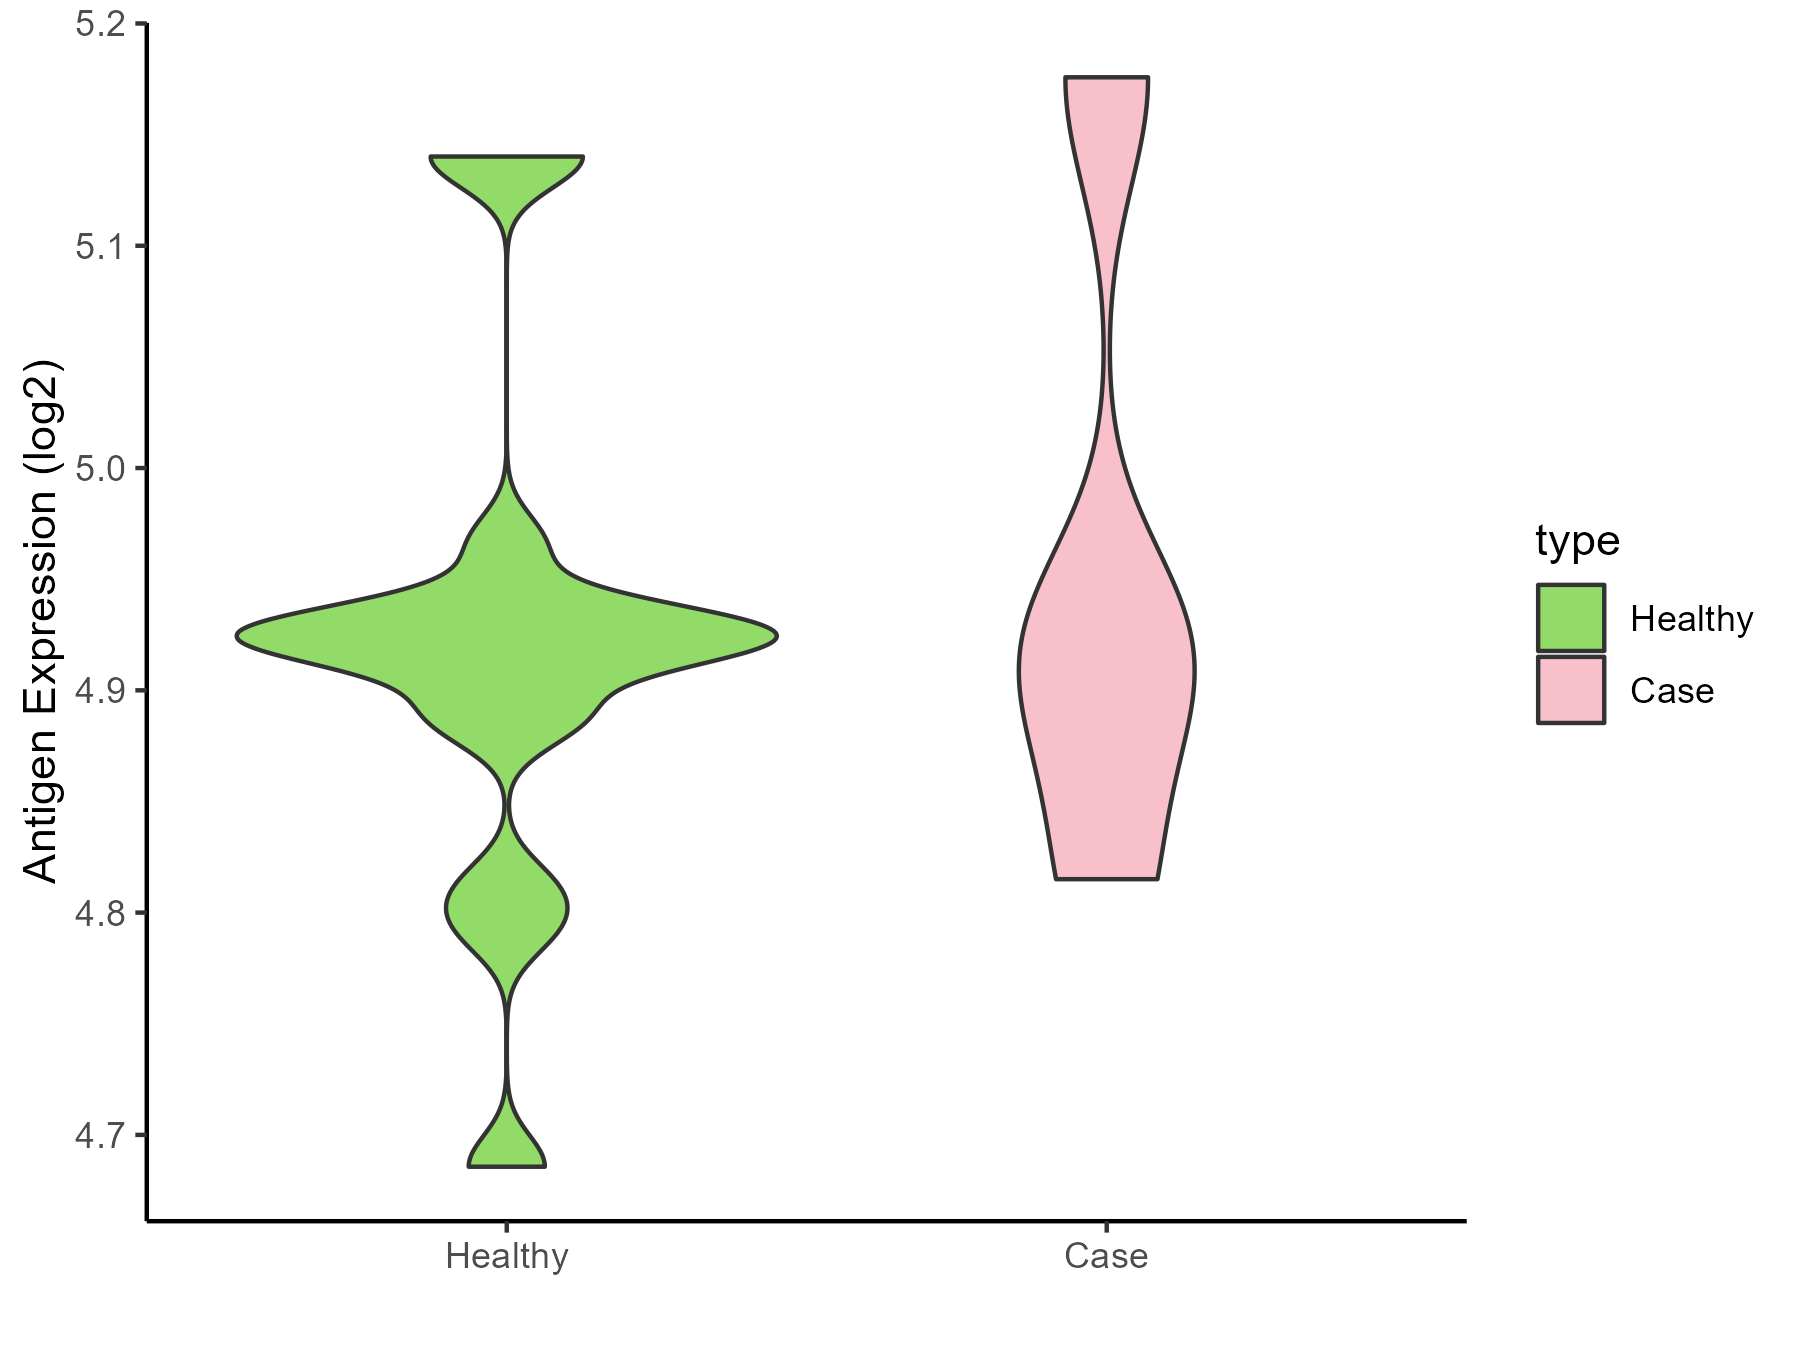
| Differential expression pattern of antigen in diseases | ||
| The Studied Tissue | Peripheral monocyte | |
| The Specific Disease | Autoimmune uveitis | |
| The Expression Level of Disease Section Compare with the Healthy Individual Tissue | p-value: 0.681003779; Fold-change: -0.008771579; Z-score: -0.076531085 | |
| Disease-specific Antigen Abundances |
|
Click to View the Clearer Original Diagram |
ICD Disease Classification 05
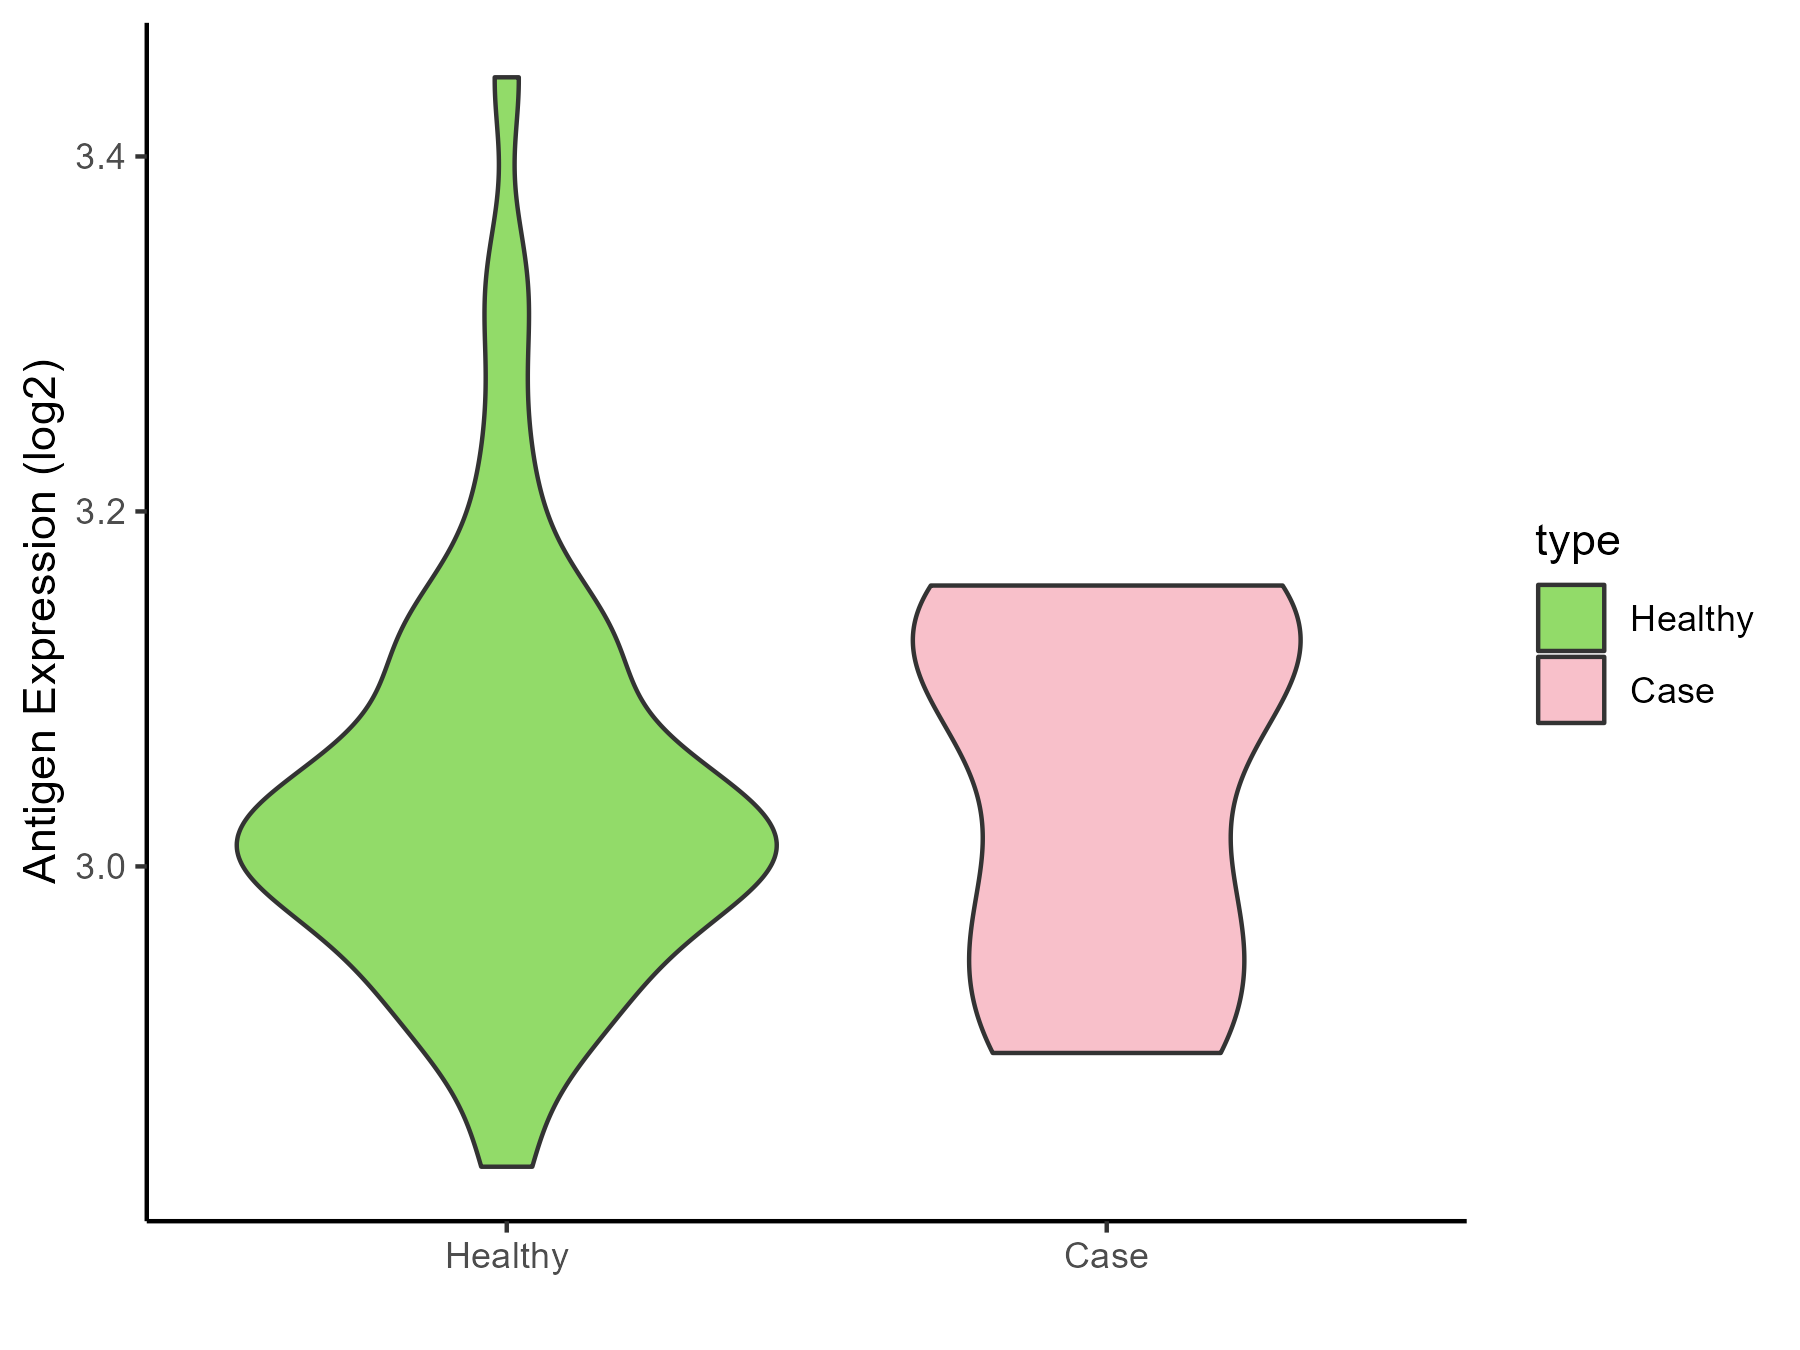
| Differential expression pattern of antigen in diseases | ||
| The Studied Tissue | Whole blood | |
| The Specific Disease | Familial hypercholesterolemia | |
| The Expression Level of Disease Section Compare with the Healthy Individual Tissue | p-value: 0.940319193; Fold-change: 0.062309563; Z-score: 0.541784796 | |
| Disease-specific Antigen Abundances |
|
Click to View the Clearer Original Diagram |
ICD Disease Classification 06
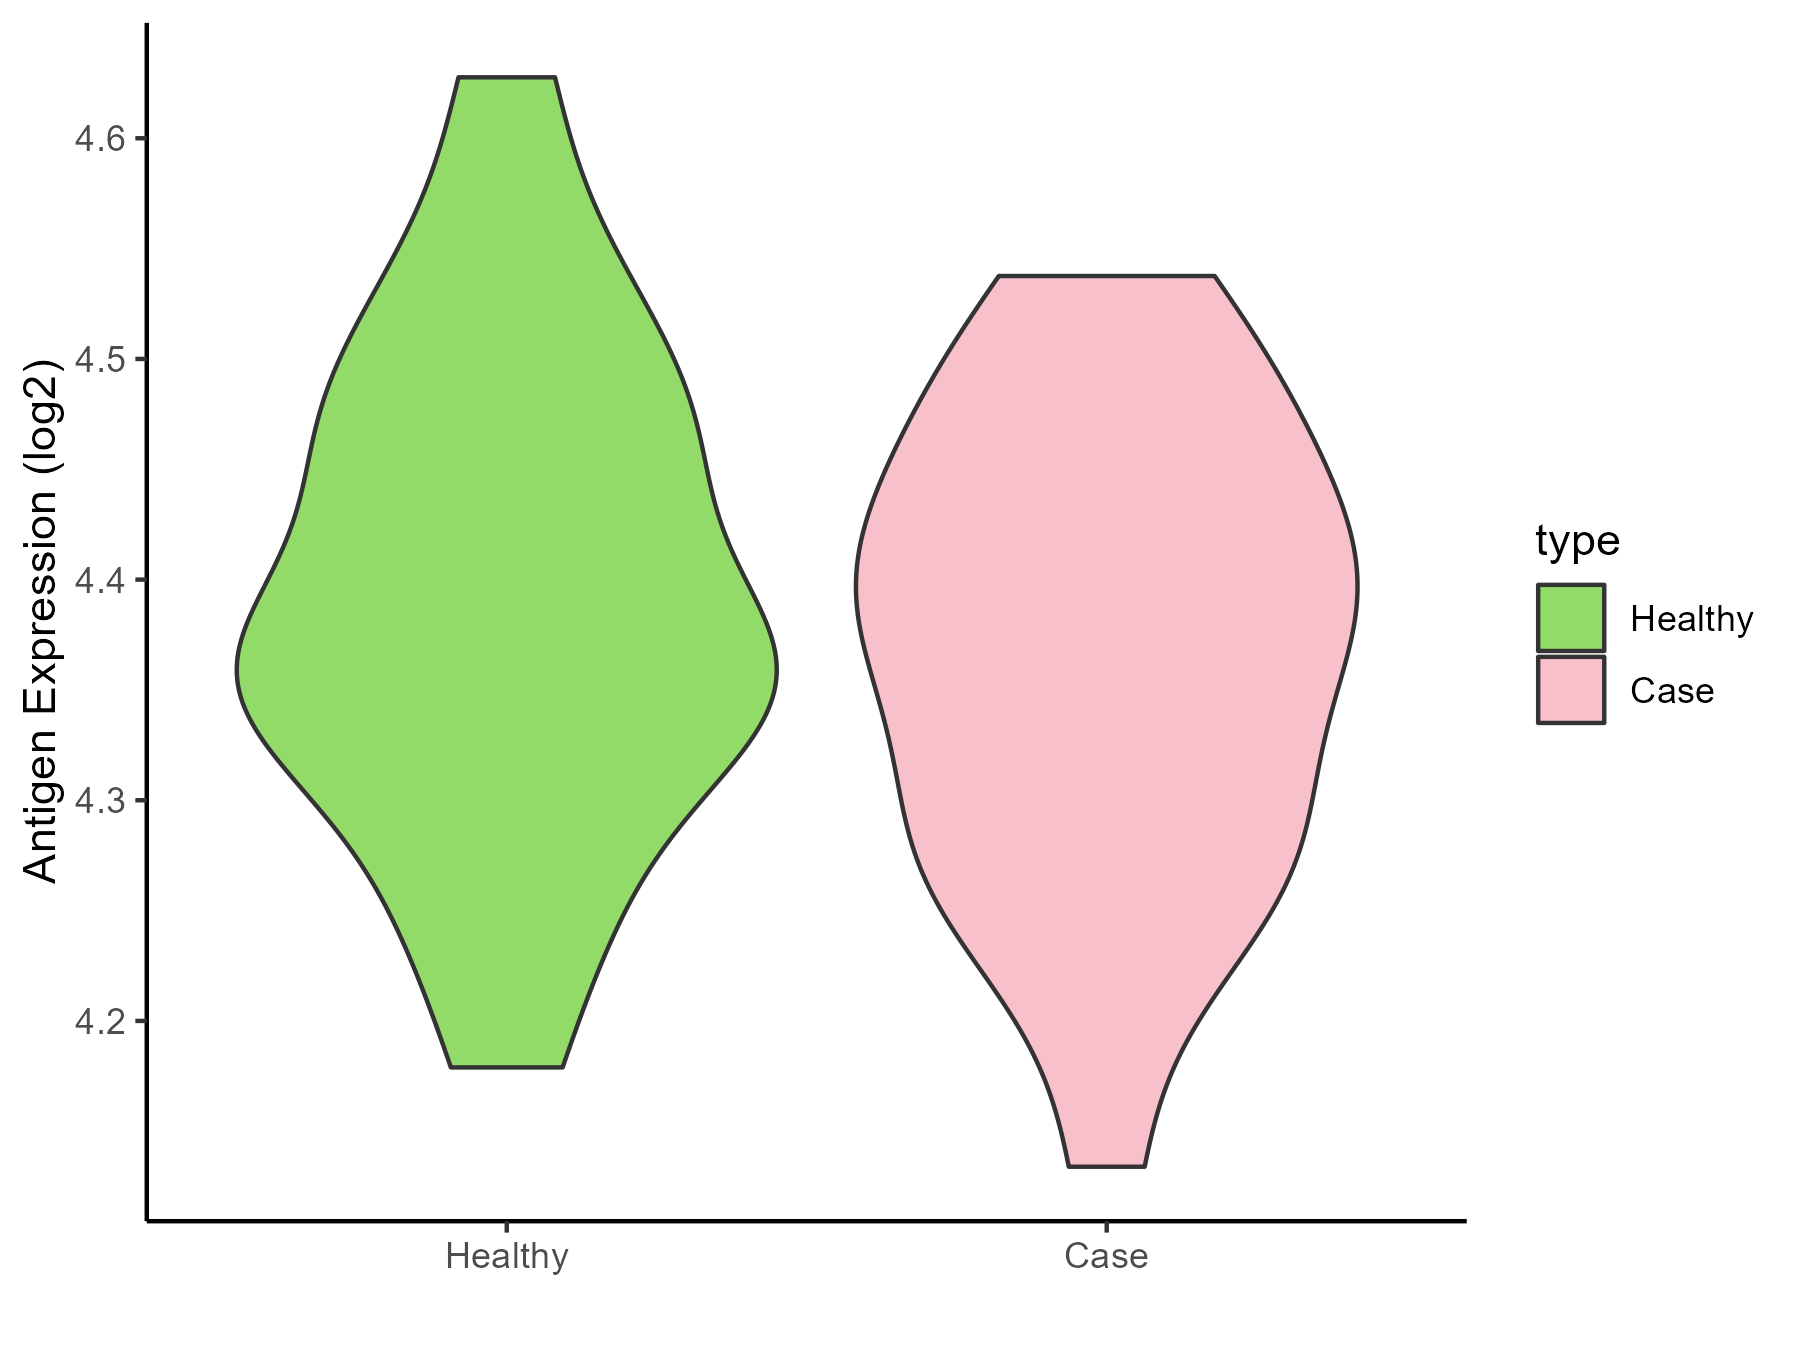
| Differential expression pattern of antigen in diseases | ||
| The Studied Tissue | Superior temporal cortex | |
| The Specific Disease | Schizophrenia | |
| The Expression Level of Disease Section Compare with the Healthy Individual Tissue | p-value: 0.43531226; Fold-change: 0.016995859; Z-score: 0.150869536 | |
| Disease-specific Antigen Abundances |
|
Click to View the Clearer Original Diagram |
ICD Disease Classification 08
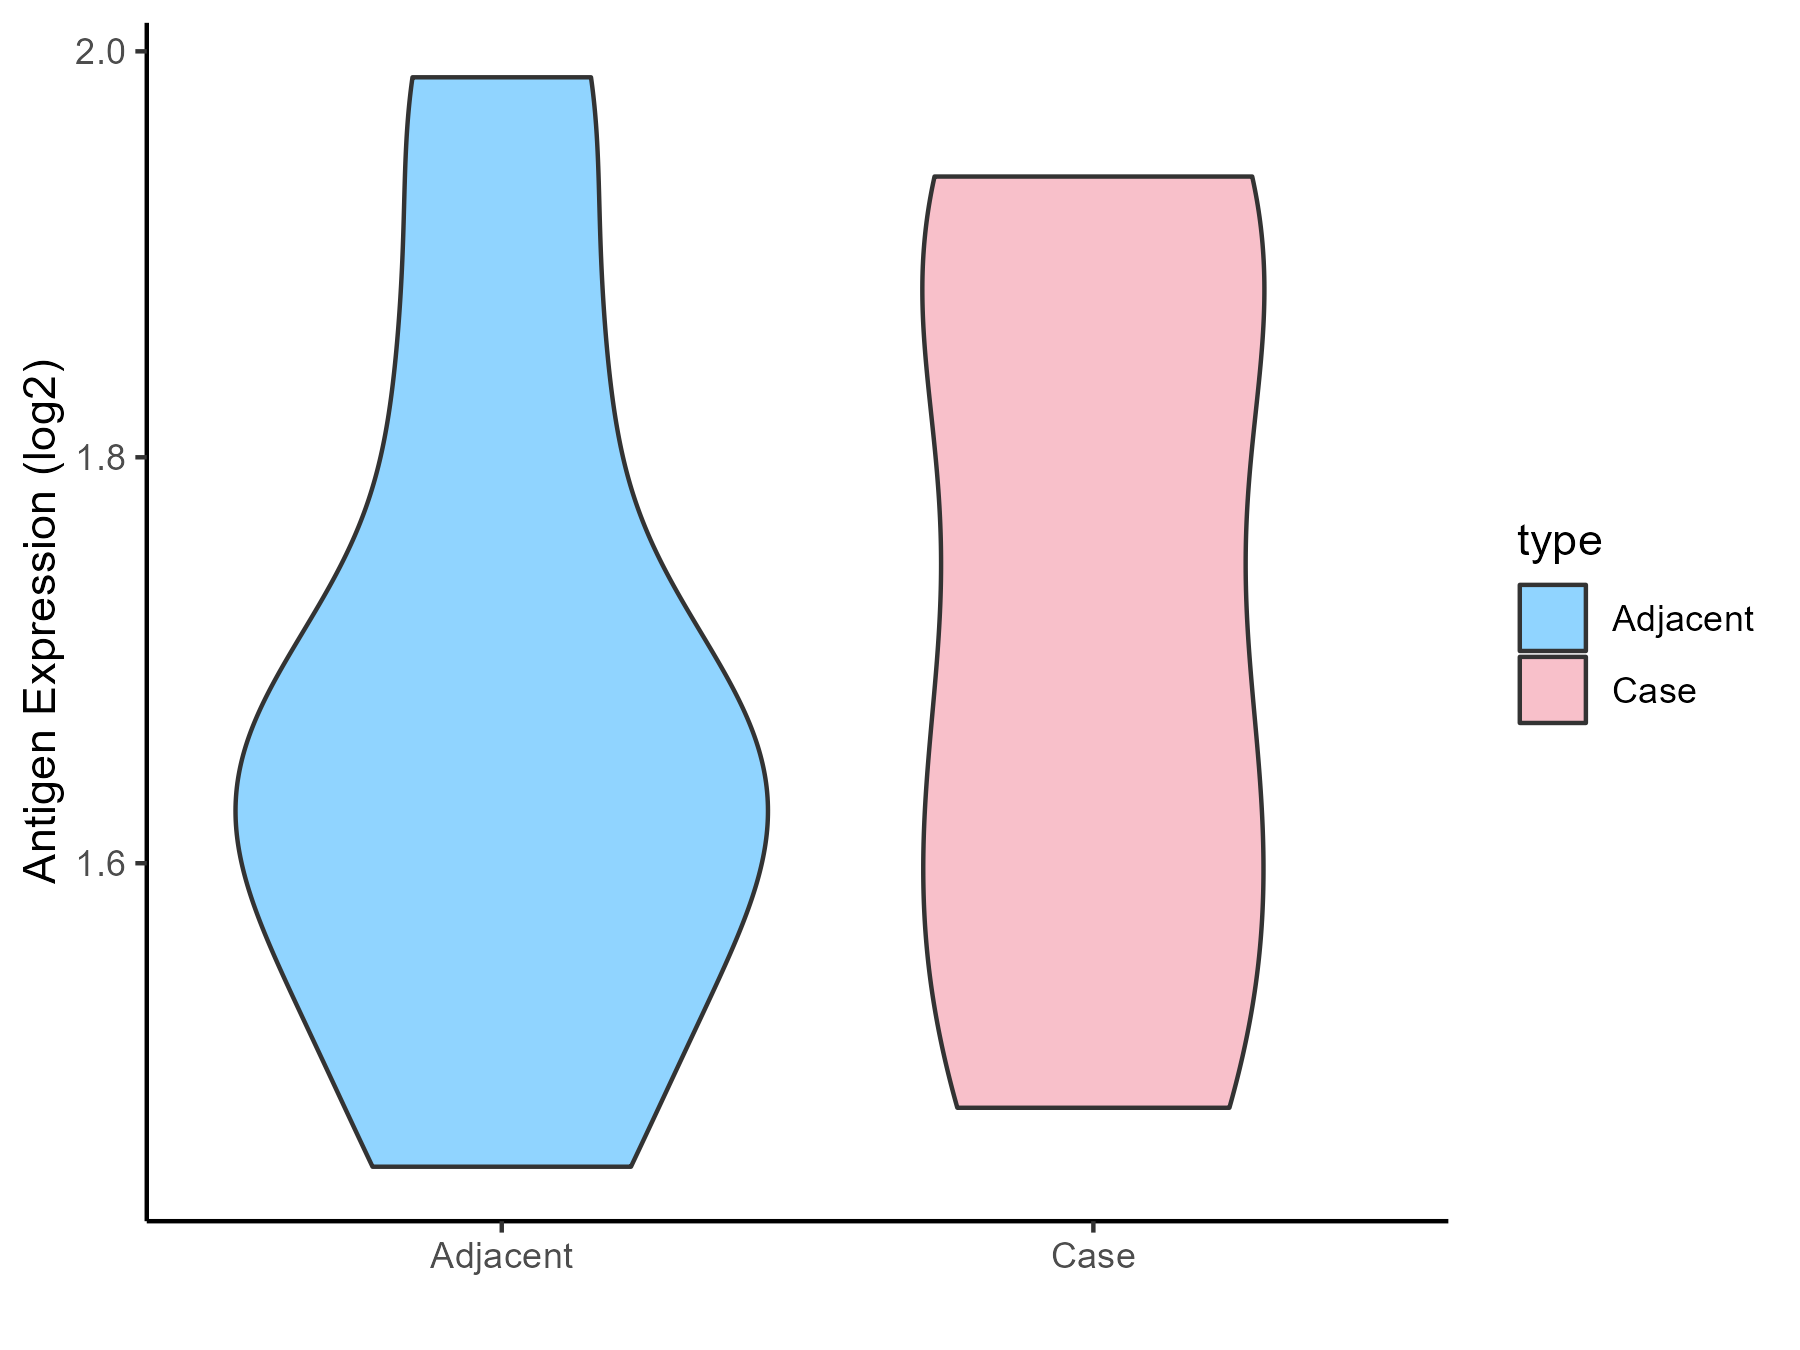
| Differential expression pattern of antigen in diseases | ||
| The Studied Tissue | Spinal cord | |
| The Specific Disease | Multiple sclerosis | |
| The Expression Level of Disease Section Compare with the Adjacent Tissue | p-value: 0.691026172; Fold-change: 0.00736888; Z-score: 0.041041837 | |
| Disease-specific Antigen Abundances |
|
Click to View the Clearer Original Diagram |
| The Studied Tissue | Plasmacytoid dendritic cells | |
| The Specific Disease | Multiple sclerosis | |
| The Expression Level of Disease Section Compare with the Healthy Individual Tissue | p-value: 0.147768034; Fold-change: 0.155538066; Z-score: 0.769519502 | |
| Disease-specific Antigen Abundances |

|
Click to View the Clearer Original Diagram |
| Differential expression pattern of antigen in diseases | ||
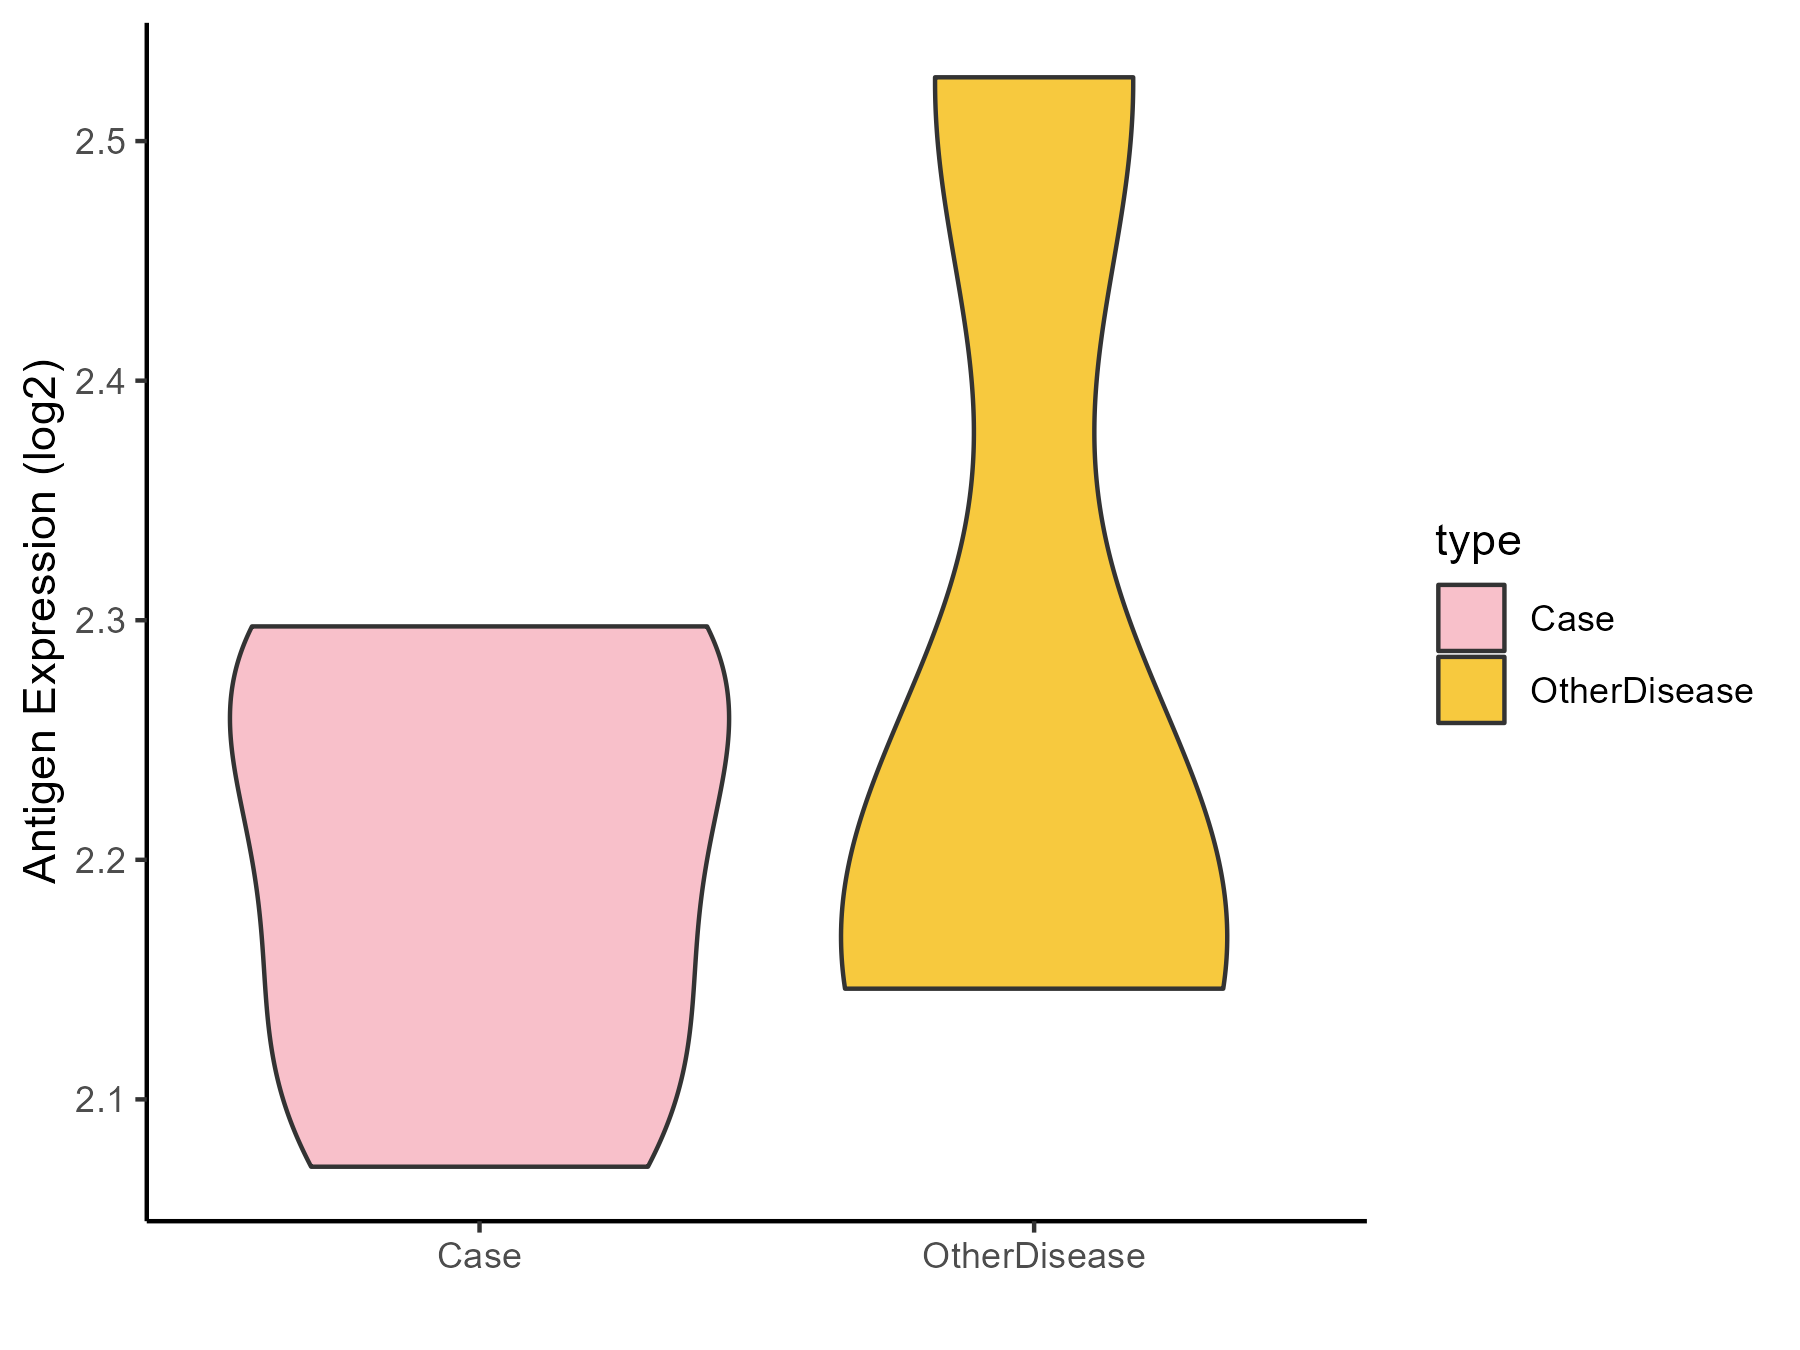
| The Studied Tissue | Peritumoral cortex | |
| The Specific Disease | Epilepsy | |
| The Expression Level of Disease Section Compare with the Other Disease Section | p-value: 0.546713009; Fold-change: 0.019557443; Z-score: 0.093811085 | |
| Disease-specific Antigen Abundances |
|
Click to View the Clearer Original Diagram |
| Differential expression pattern of antigen in diseases | ||
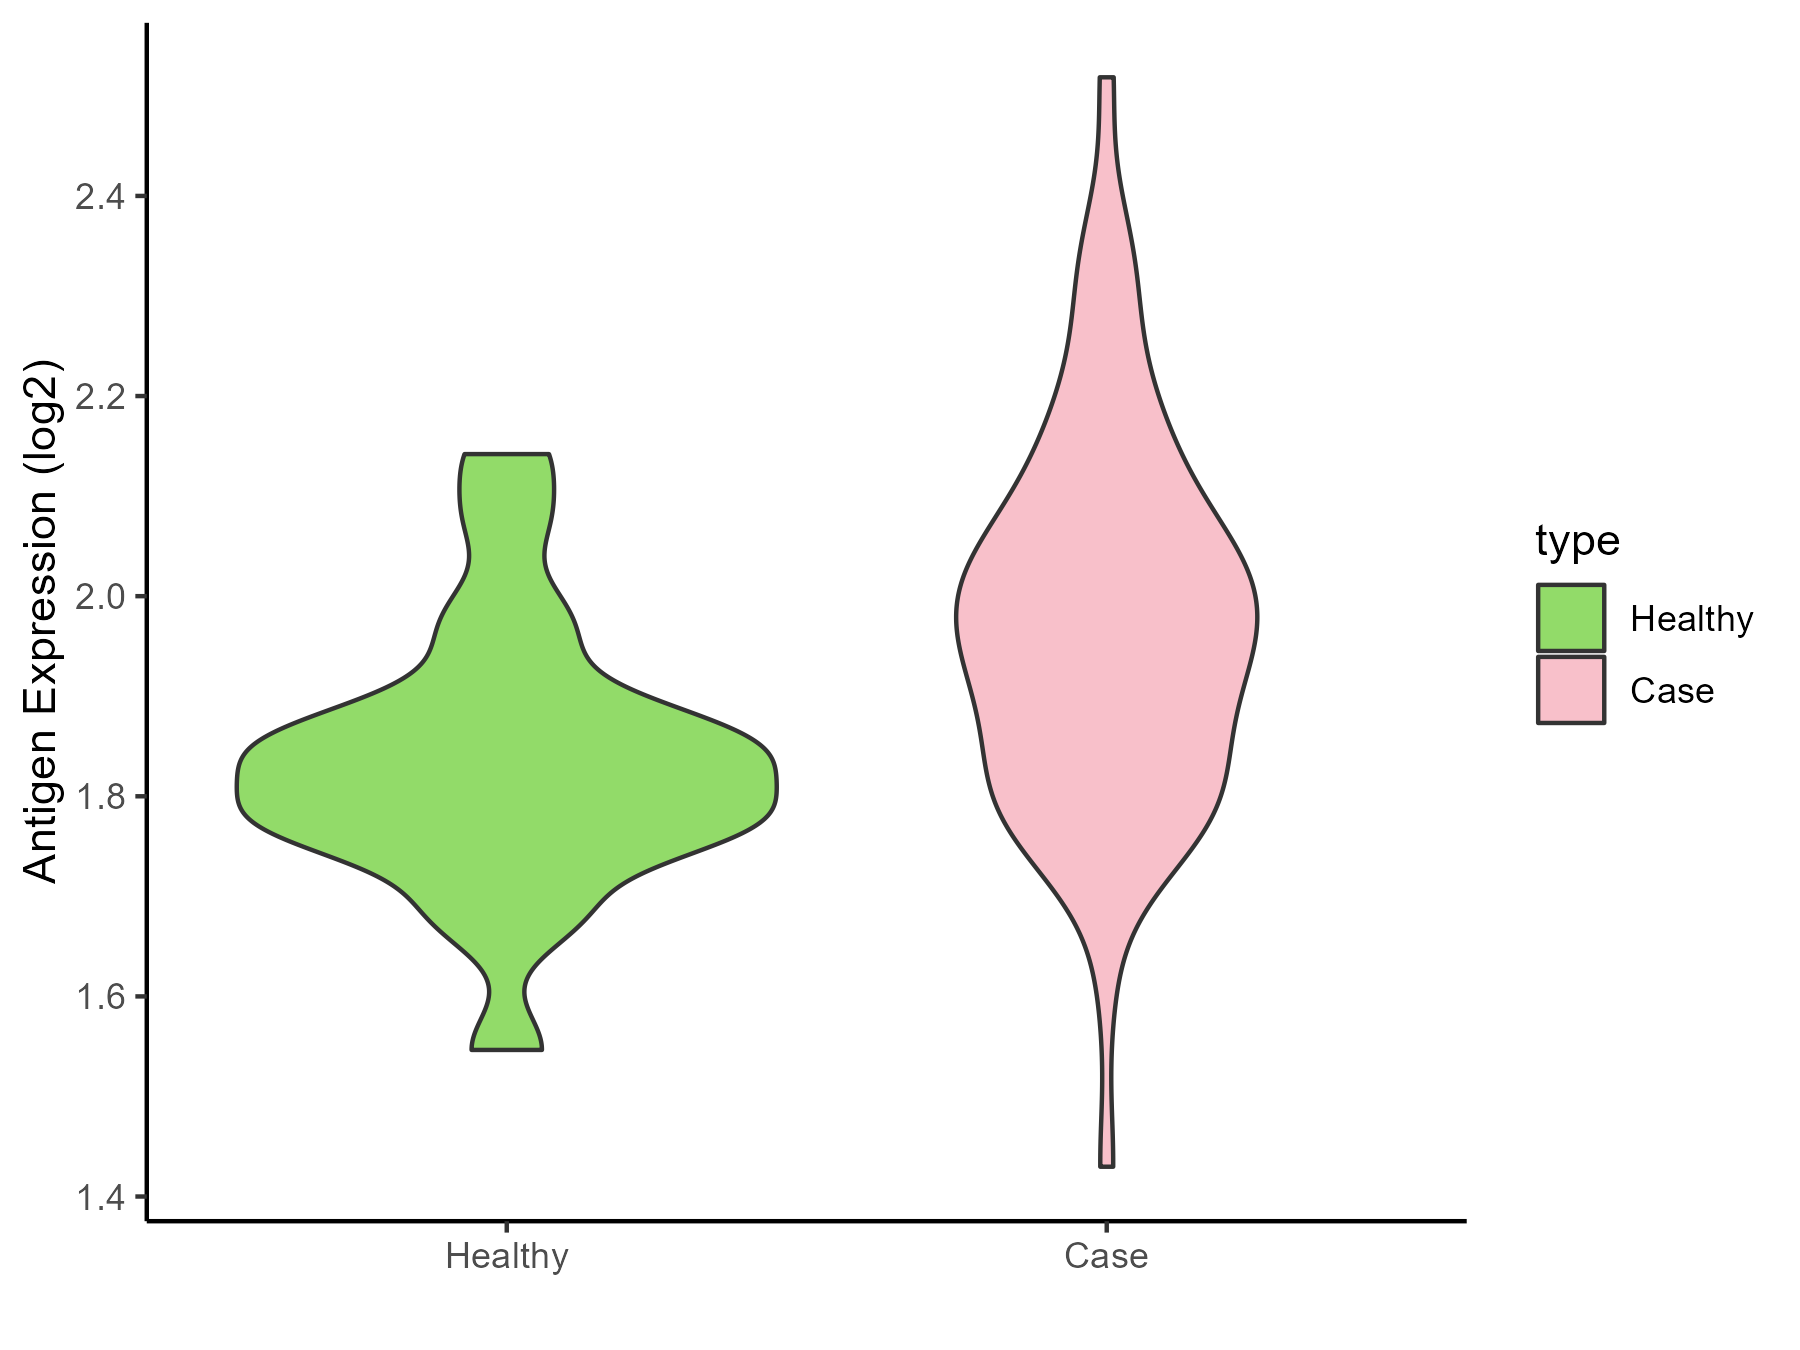
| The Studied Tissue | Whole blood | |
| The Specific Disease | Cardioembolic Stroke | |
| The Expression Level of Disease Section Compare with the Healthy Individual Tissue | p-value: 0.000543151; Fold-change: 0.136541808; Z-score: 1.027661233 | |
| Disease-specific Antigen Abundances |
|
Click to View the Clearer Original Diagram |
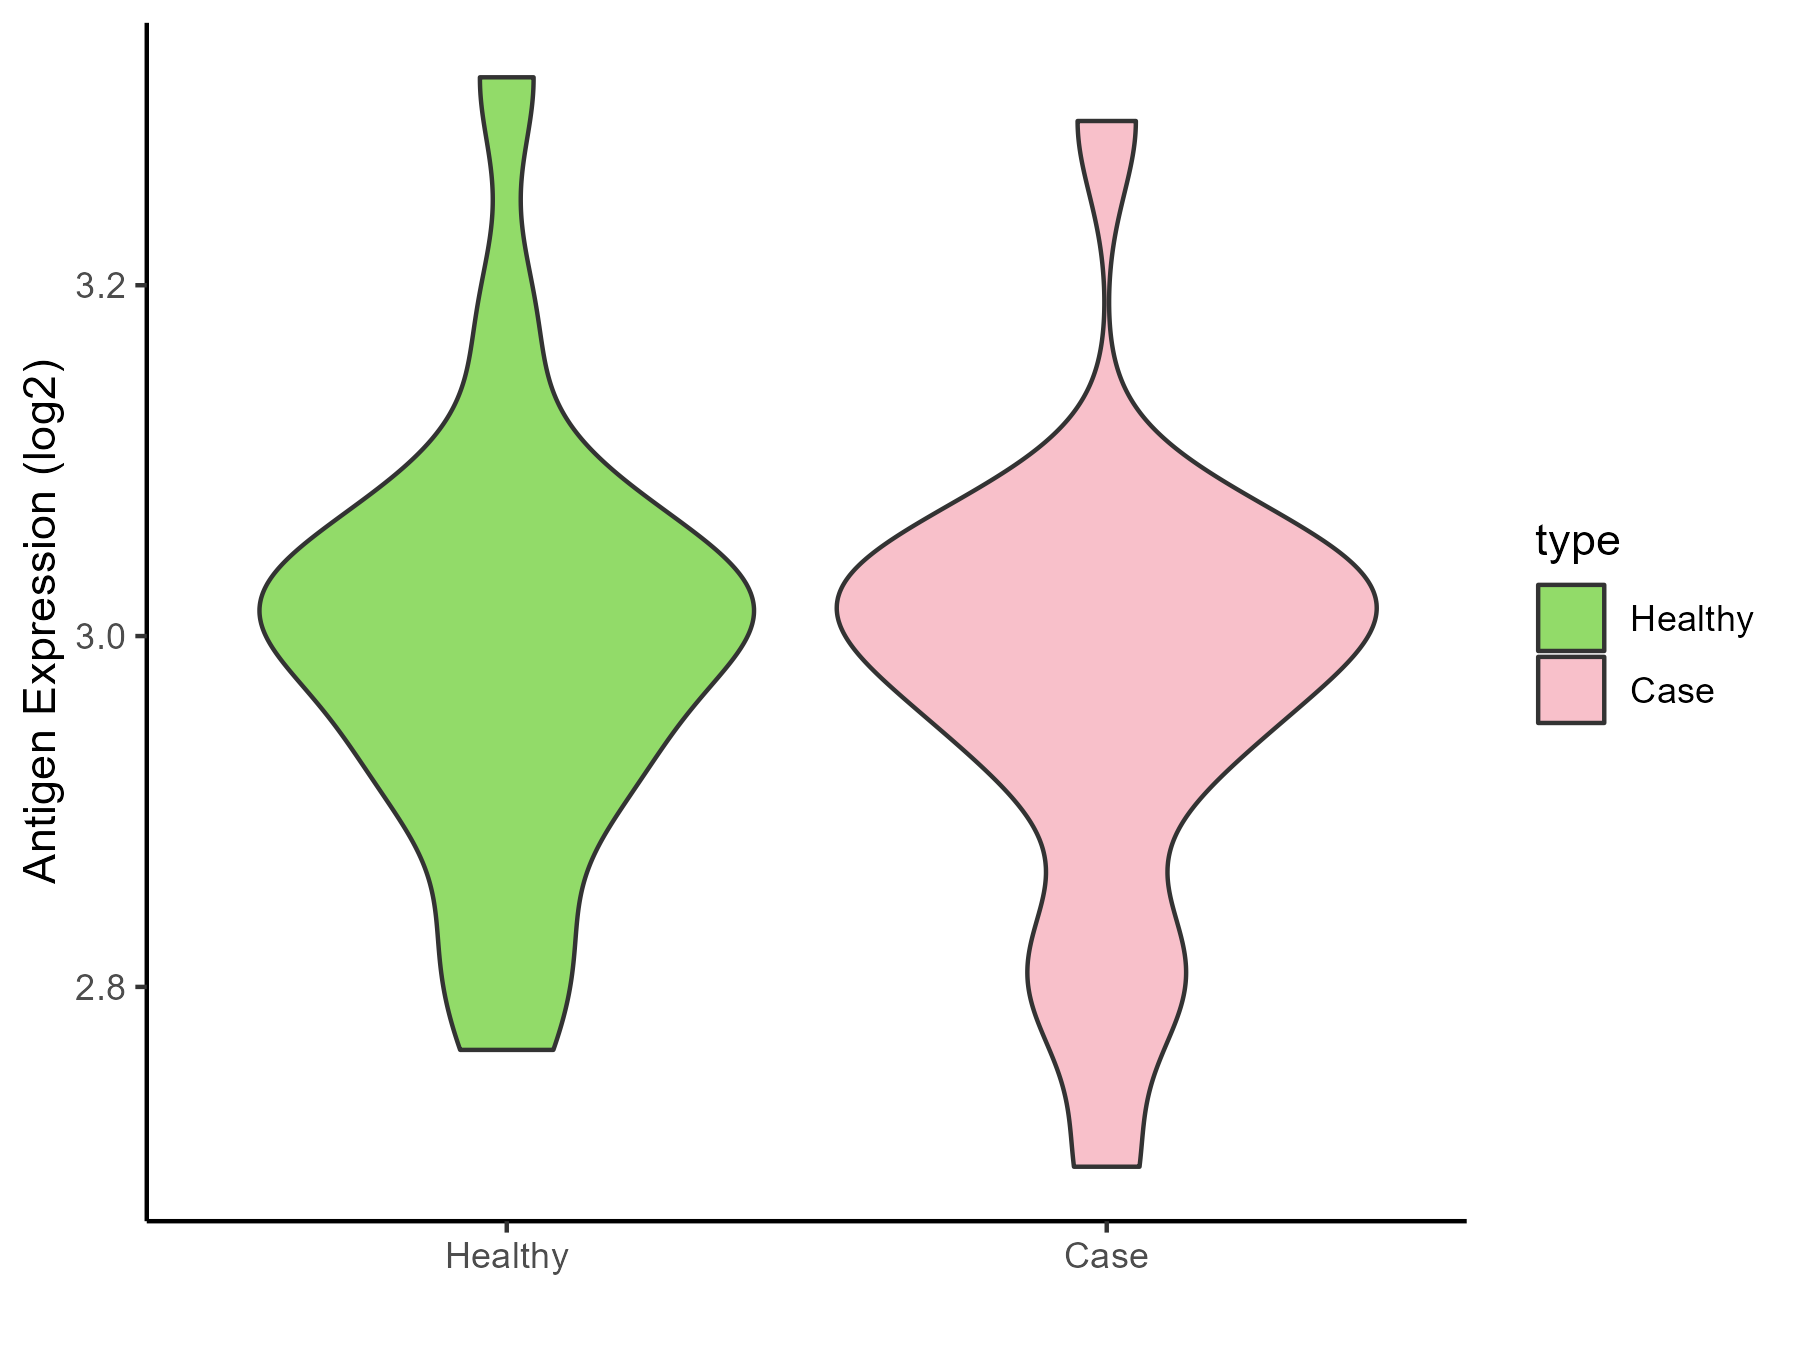
| The Studied Tissue | Peripheral blood | |
| The Specific Disease | Ischemic stroke | |
| The Expression Level of Disease Section Compare with the Healthy Individual Tissue | p-value: 0.585101023; Fold-change: -0.014066242; Z-score: -0.113468598 | |
| Disease-specific Antigen Abundances |
|
Click to View the Clearer Original Diagram |
ICD Disease Classification 1
| Differential expression pattern of antigen in diseases | ||
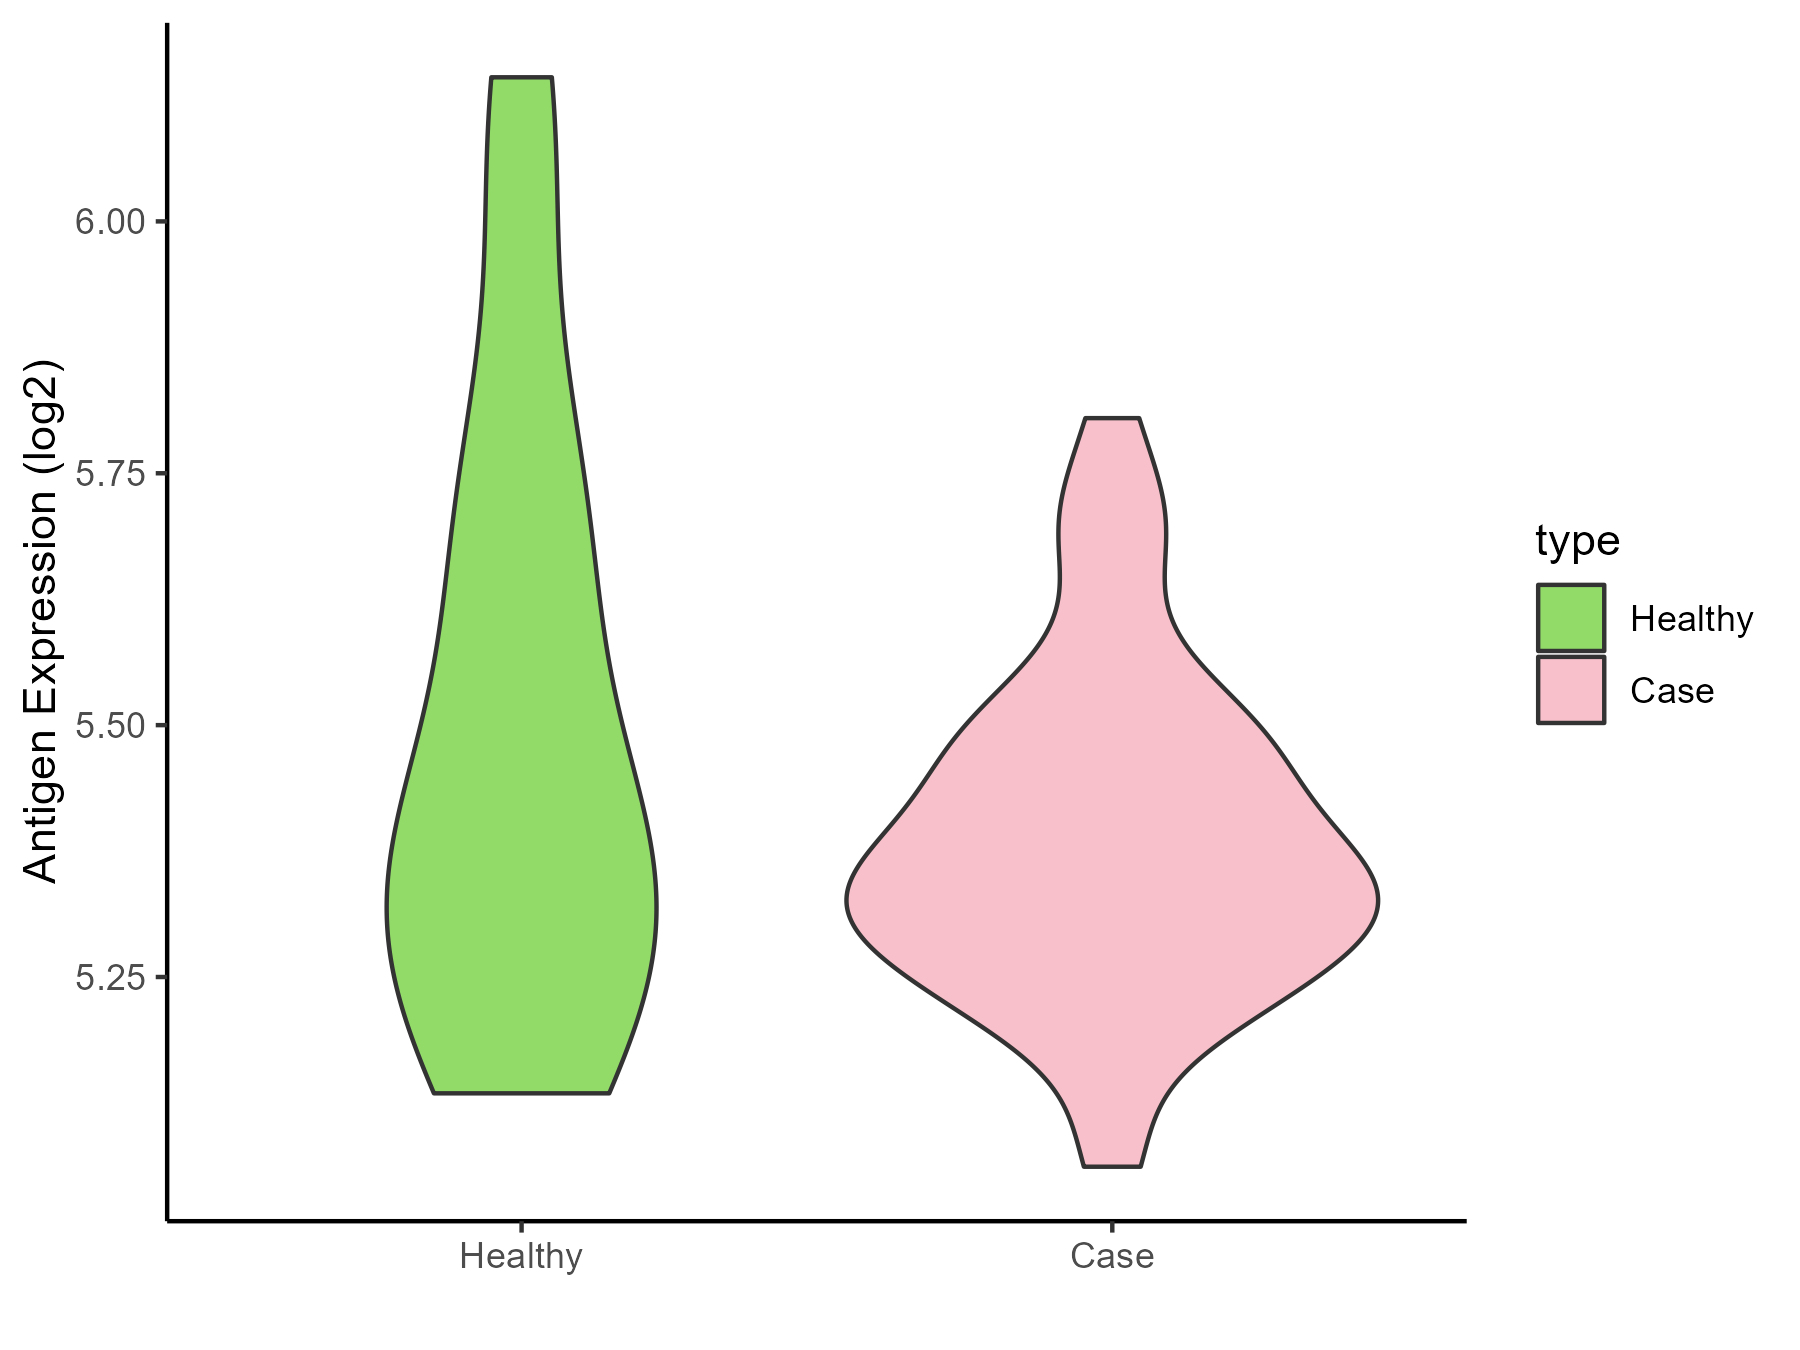
| The Studied Tissue | White matter | |
| The Specific Disease | HIV | |
| The Expression Level of Disease Section Compare with the Healthy Individual Tissue | p-value: 0.189150662; Fold-change: -0.021177265; Z-score: -0.069607541 | |
| Disease-specific Antigen Abundances |
|
Click to View the Clearer Original Diagram |
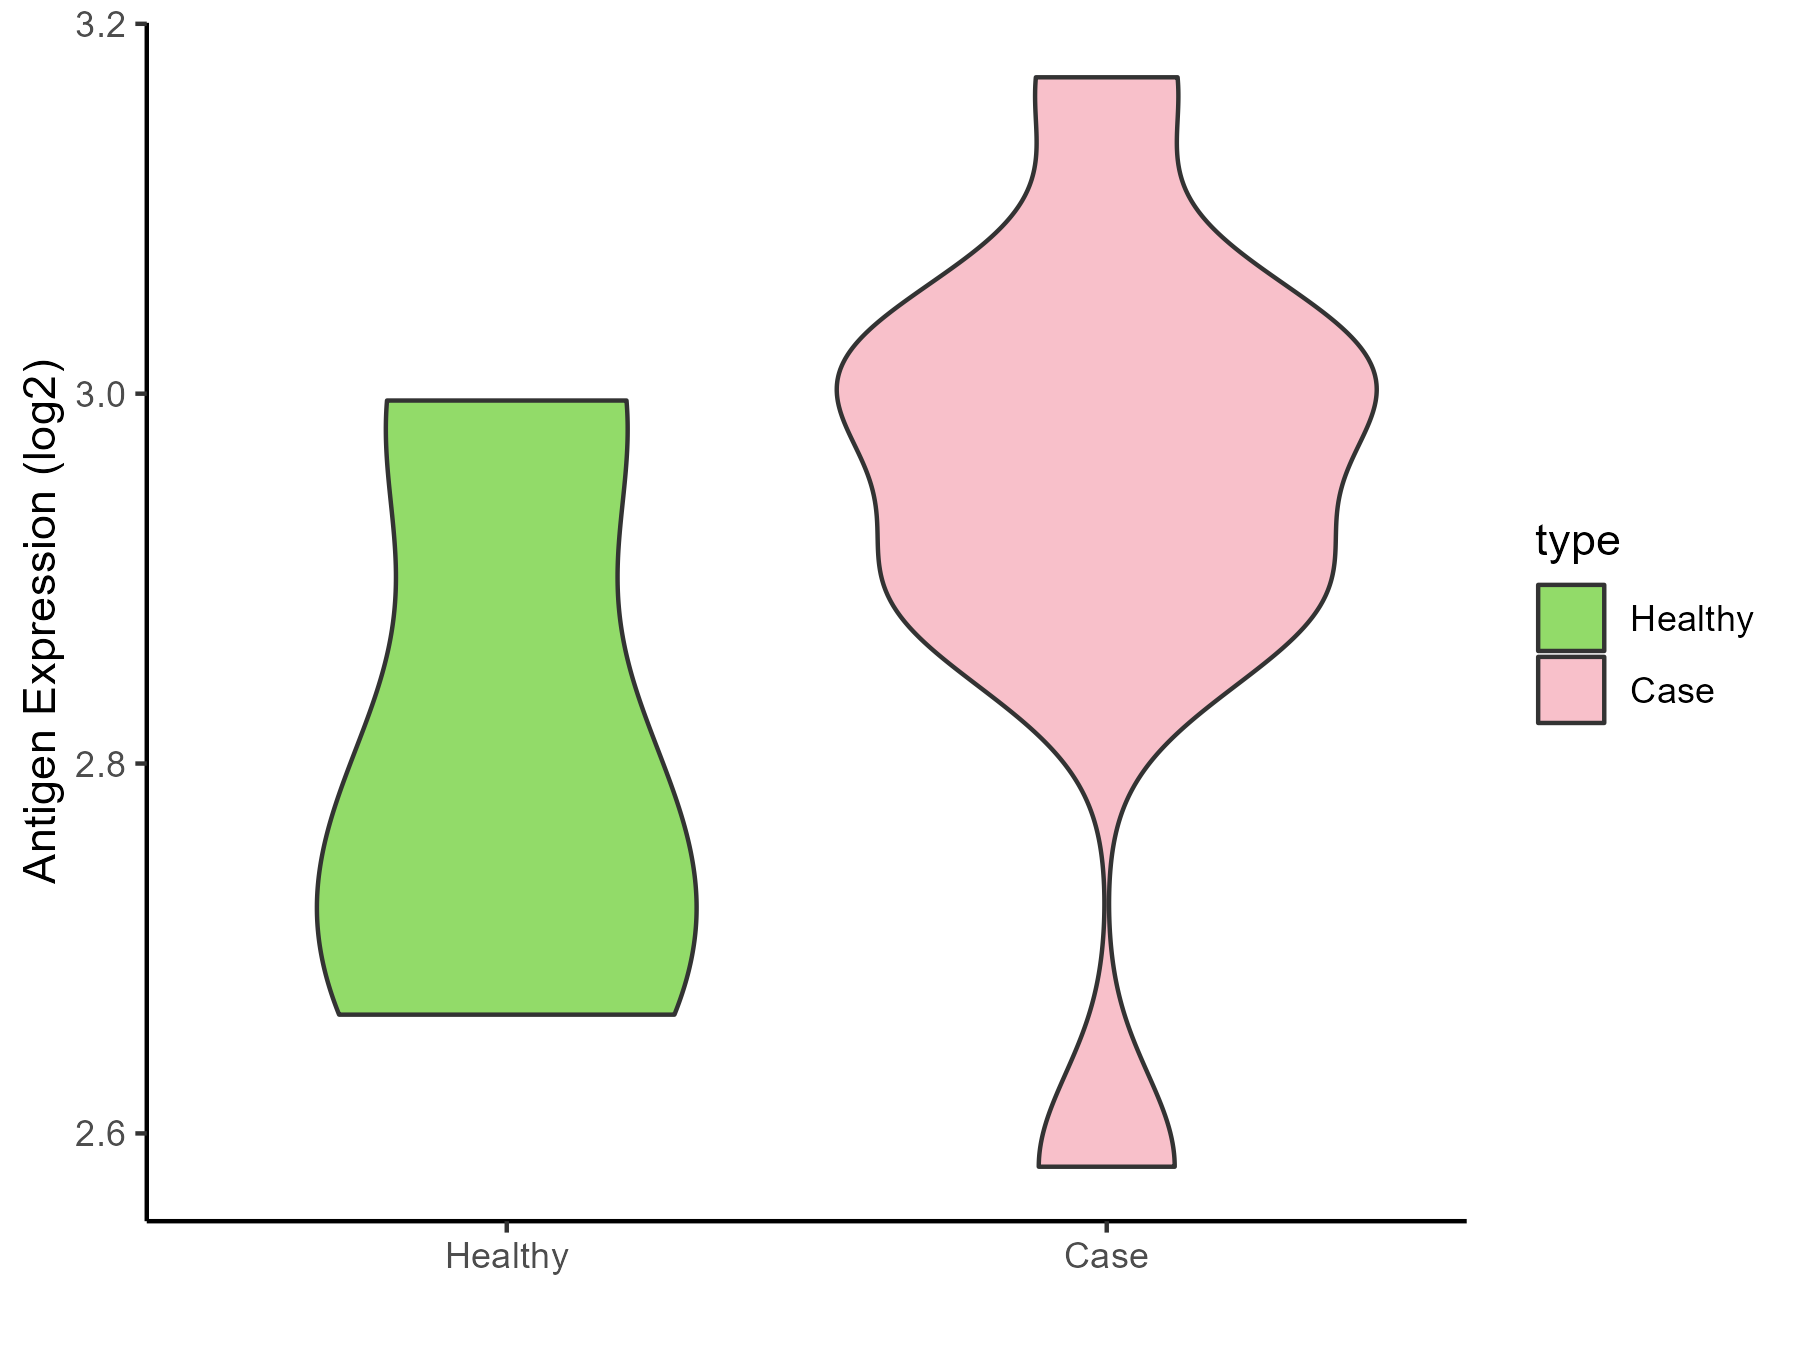
| Differential expression pattern of antigen in diseases | ||
| The Studied Tissue | Whole blood | |
| The Specific Disease | Influenza | |
| The Expression Level of Disease Section Compare with the Healthy Individual Tissue | p-value: 0.322770537; Fold-change: 0.209821606; Z-score: 1.240858436 | |
| Disease-specific Antigen Abundances |
|
Click to View the Clearer Original Diagram |
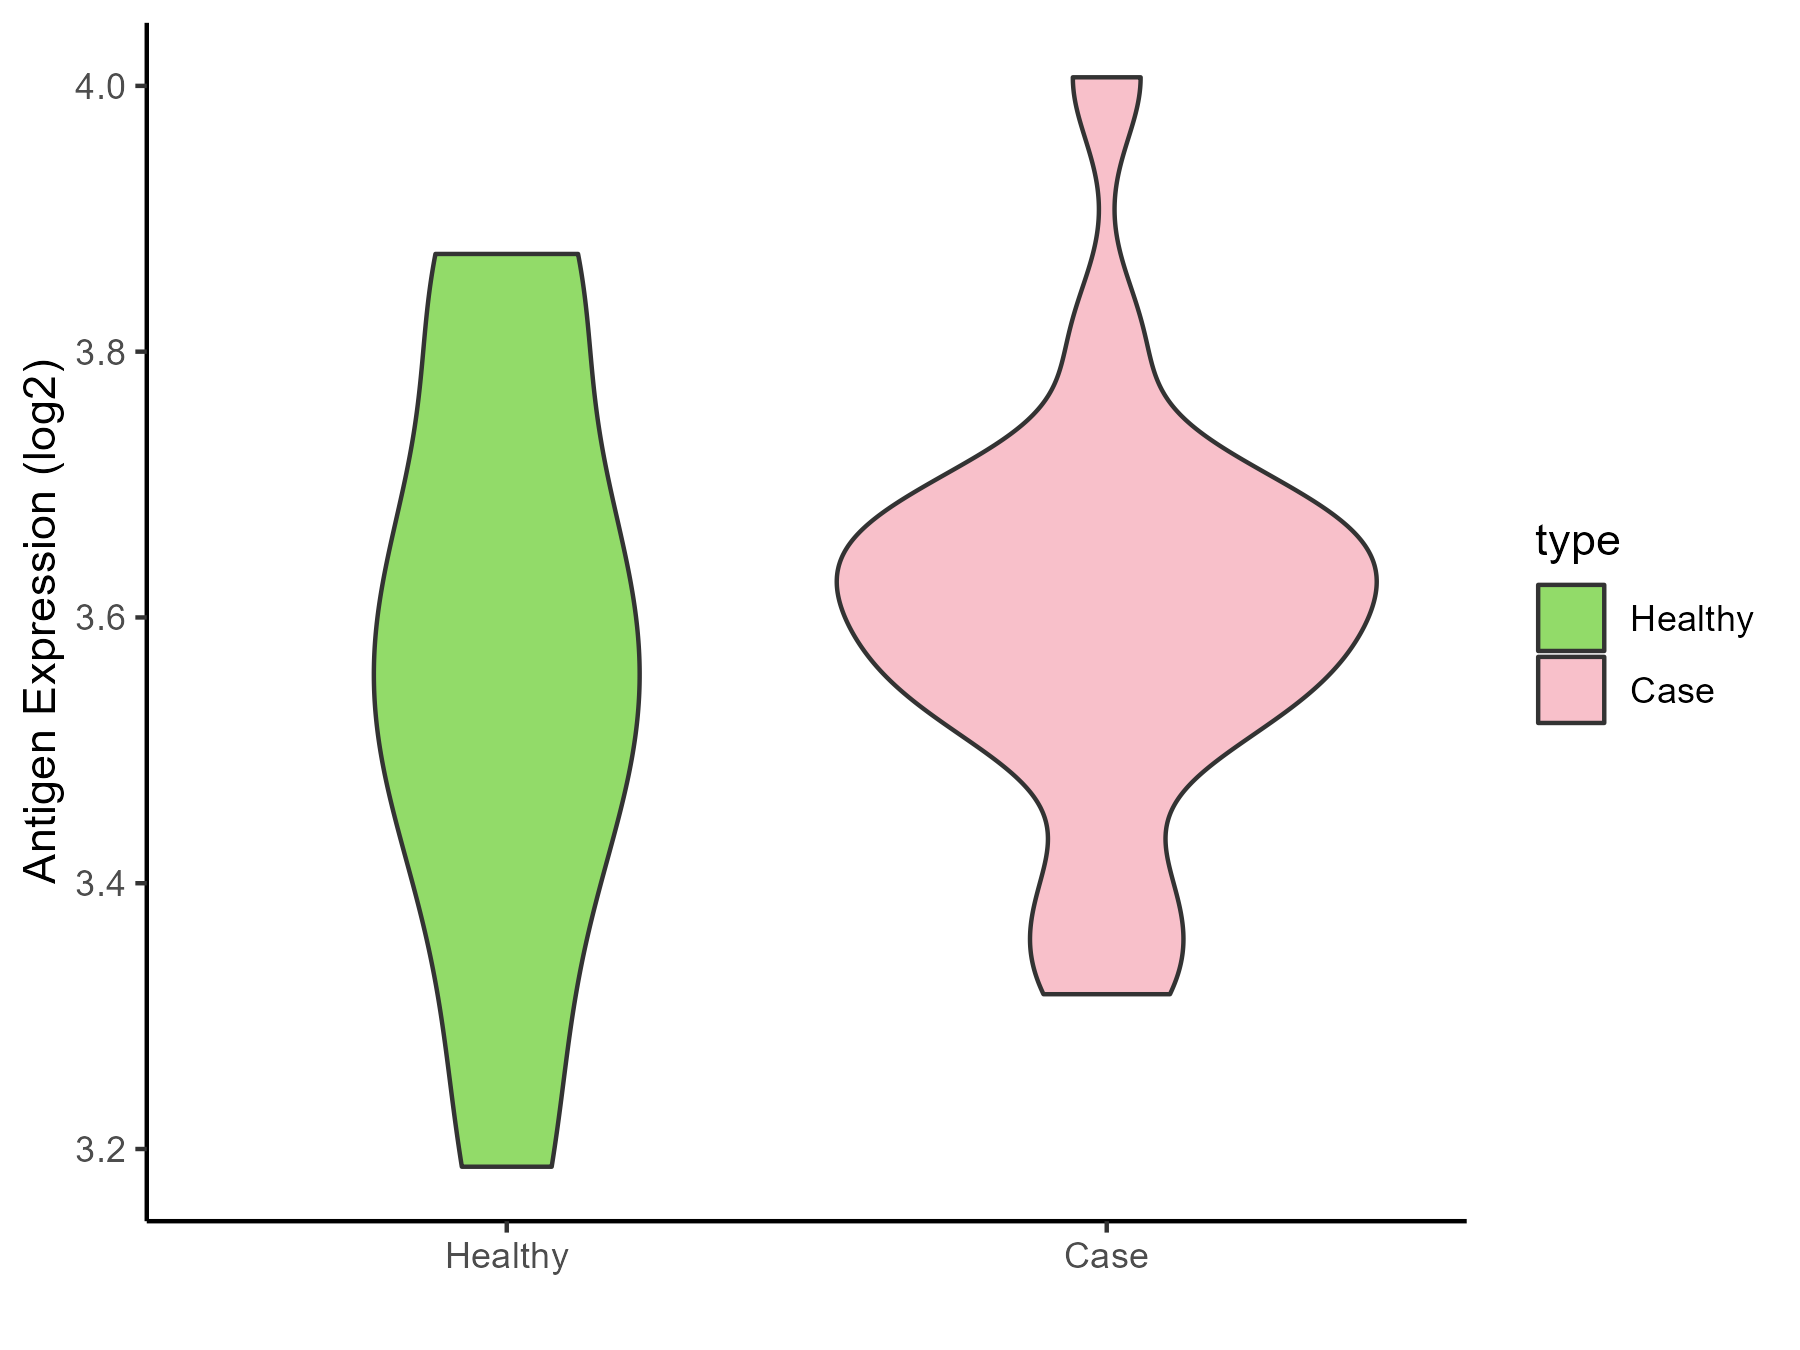
| Differential expression pattern of antigen in diseases | ||
| The Studied Tissue | Whole blood | |
| The Specific Disease | Chronic hepatitis C | |
| The Expression Level of Disease Section Compare with the Healthy Individual Tissue | p-value: 0.621975674; Fold-change: 0.034759135; Z-score: 0.159008894 | |
| Disease-specific Antigen Abundances |
|
Click to View the Clearer Original Diagram |
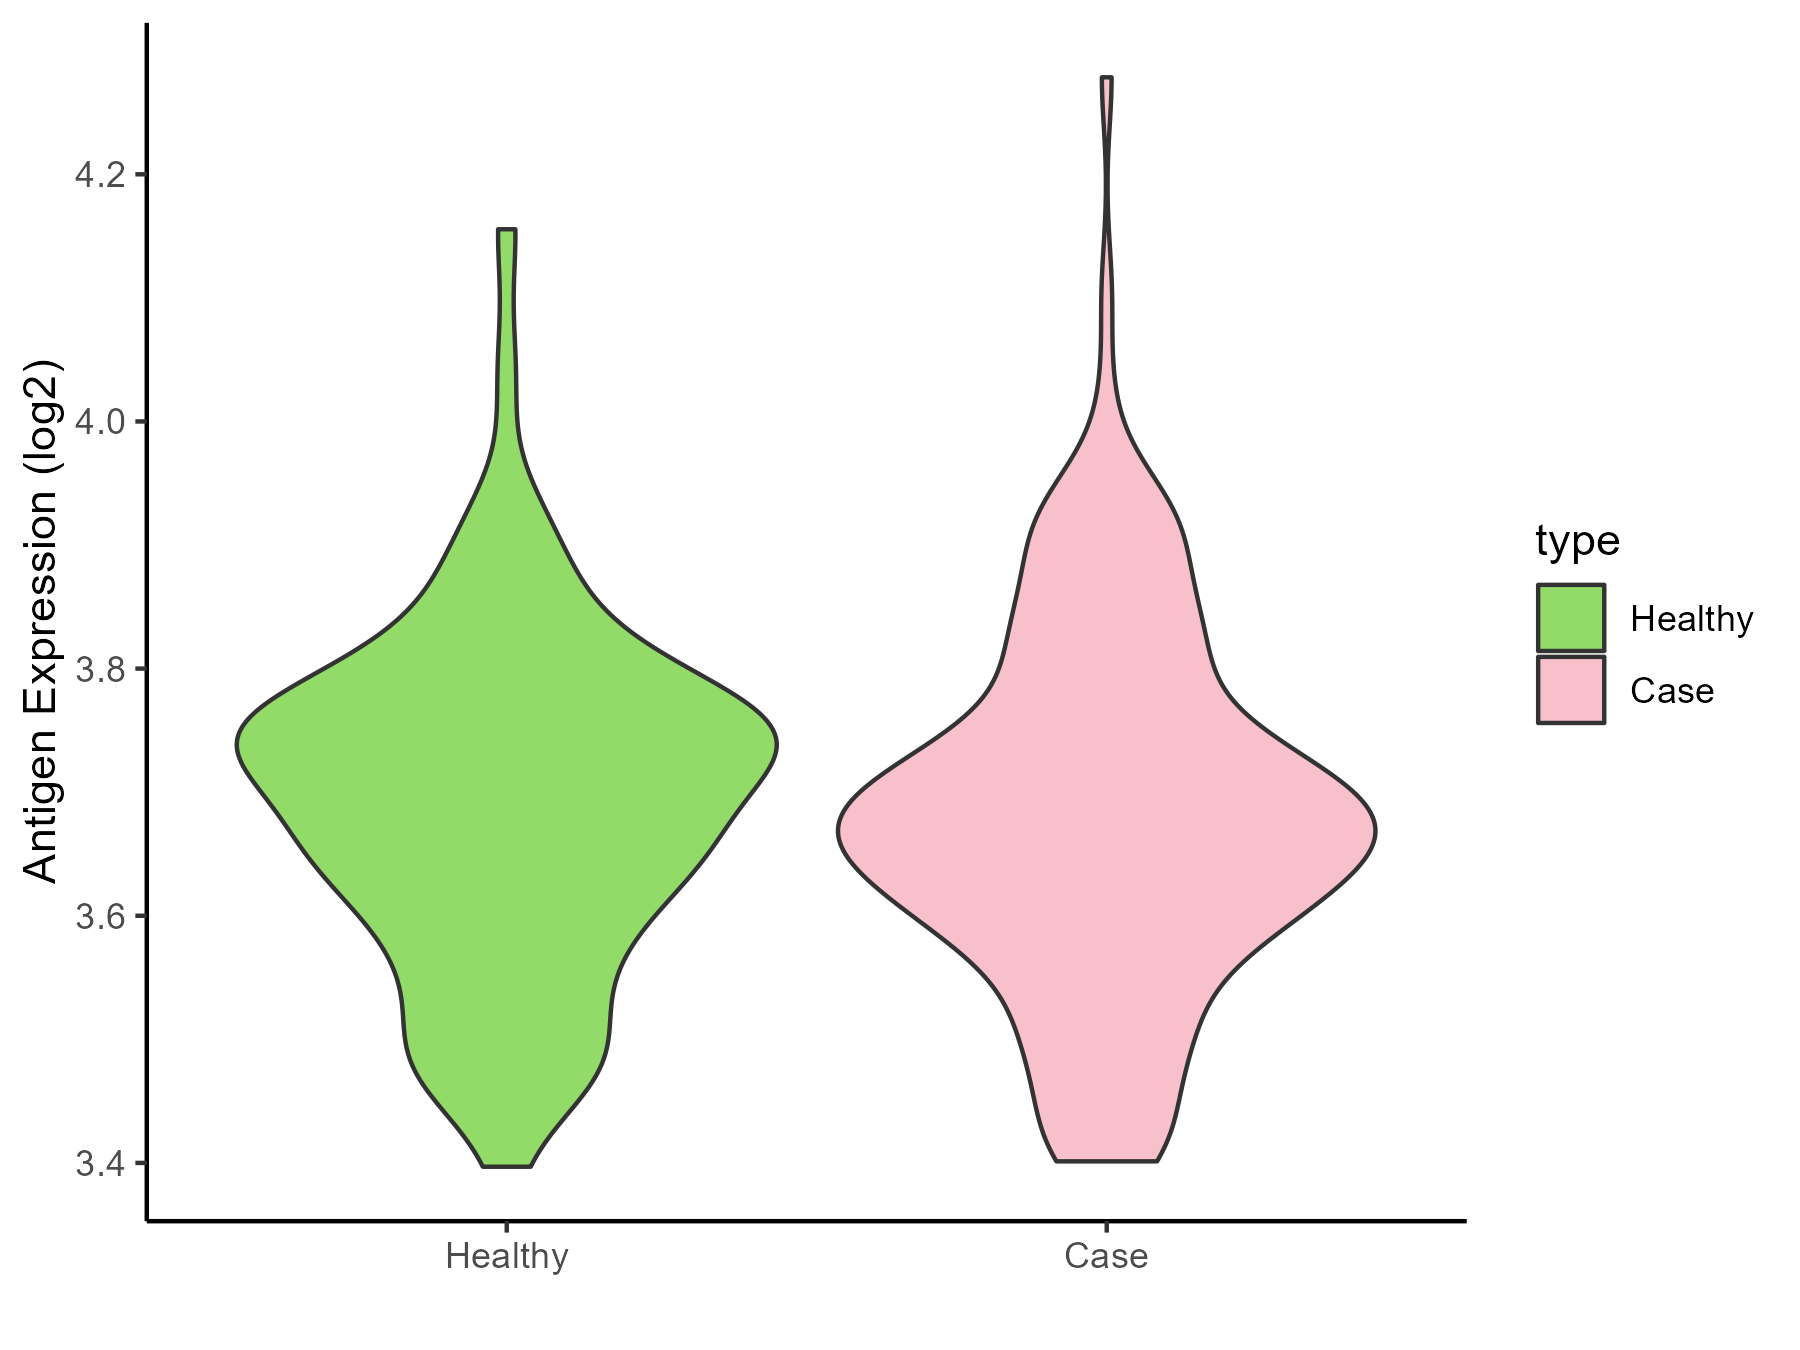
| Differential expression pattern of antigen in diseases | ||
| The Studied Tissue | Whole blood | |
| The Specific Disease | Sepsis | |
| The Expression Level of Disease Section Compare with the Healthy Individual Tissue | p-value: 0.530925172; Fold-change: -0.033461766; Z-score: -0.24936729 | |
| Disease-specific Antigen Abundances |
|
Click to View the Clearer Original Diagram |
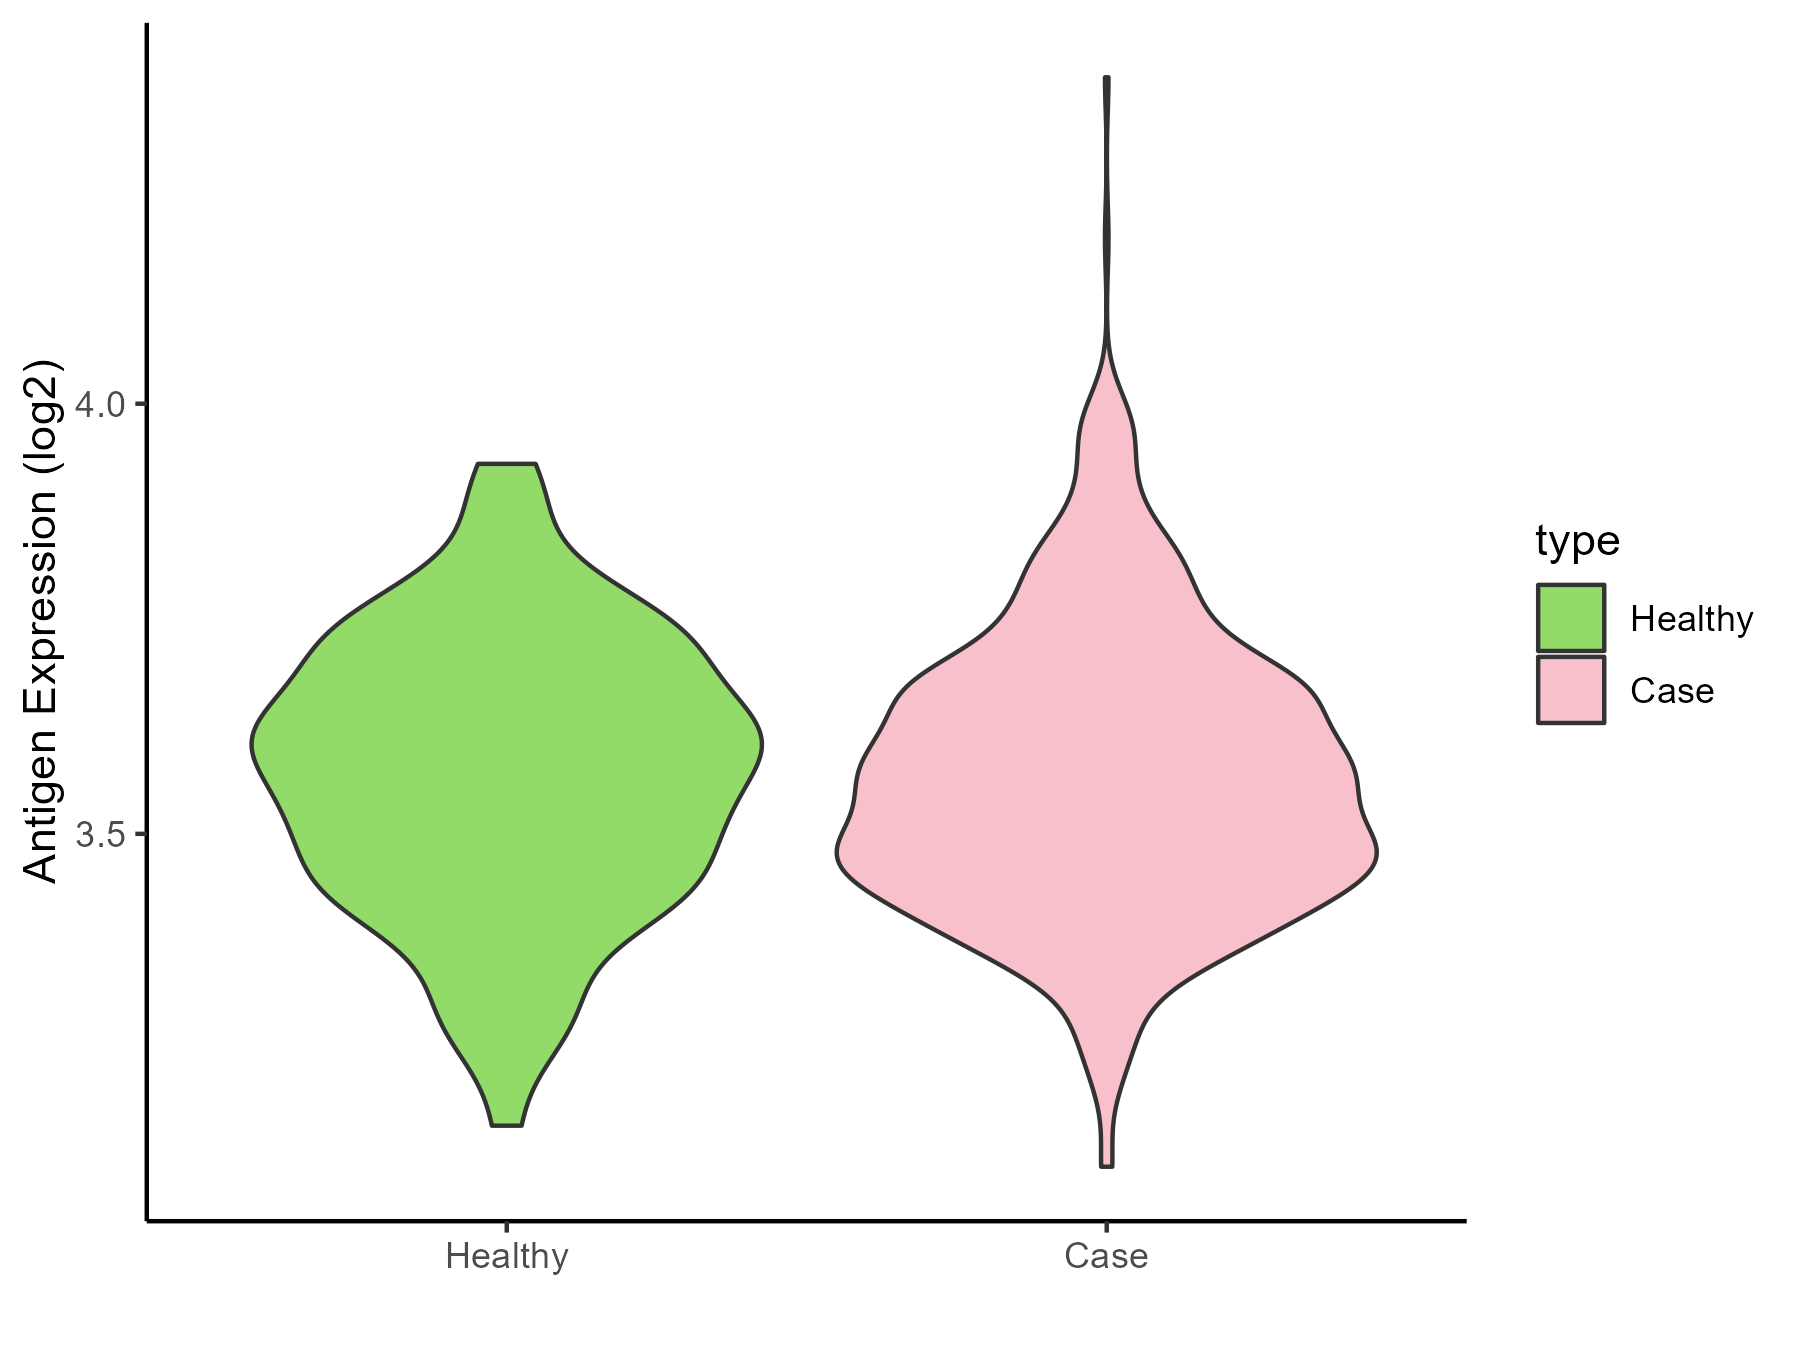
| Differential expression pattern of antigen in diseases | ||
| The Studied Tissue | Whole blood | |
| The Specific Disease | Septic shock | |
| The Expression Level of Disease Section Compare with the Healthy Individual Tissue | p-value: 0.888918556; Fold-change: -0.031287984; Z-score: -0.197265016 | |
| Disease-specific Antigen Abundances |
|
Click to View the Clearer Original Diagram |
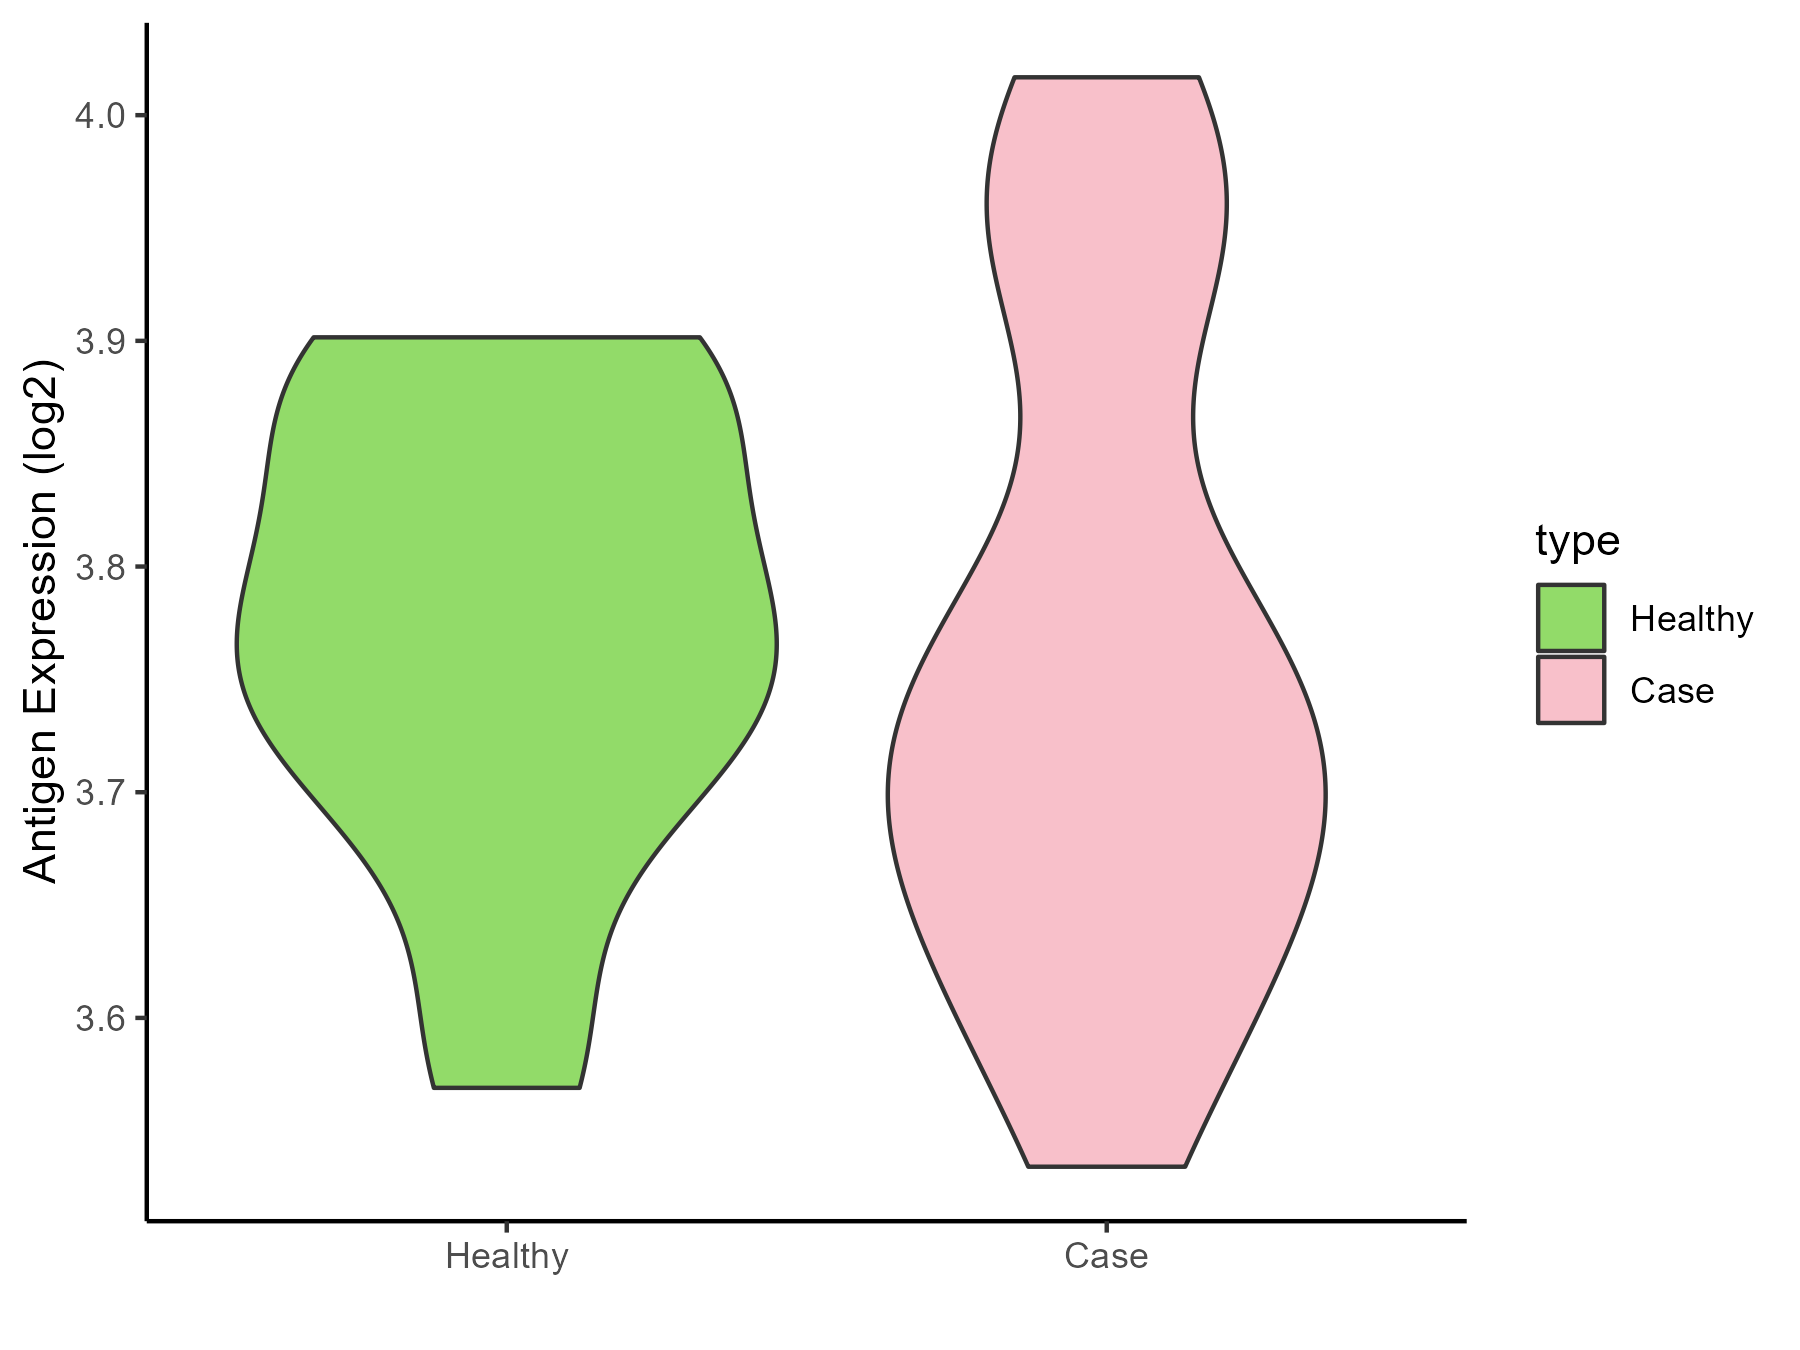
| Differential expression pattern of antigen in diseases | ||
| The Studied Tissue | Peripheral blood | |
| The Specific Disease | Pediatric respiratory syncytial virus infection | |
| The Expression Level of Disease Section Compare with the Healthy Individual Tissue | p-value: 0.746793043; Fold-change: -0.049284112; Z-score: -0.486276874 | |
| Disease-specific Antigen Abundances |
|
Click to View the Clearer Original Diagram |
ICD Disease Classification 11
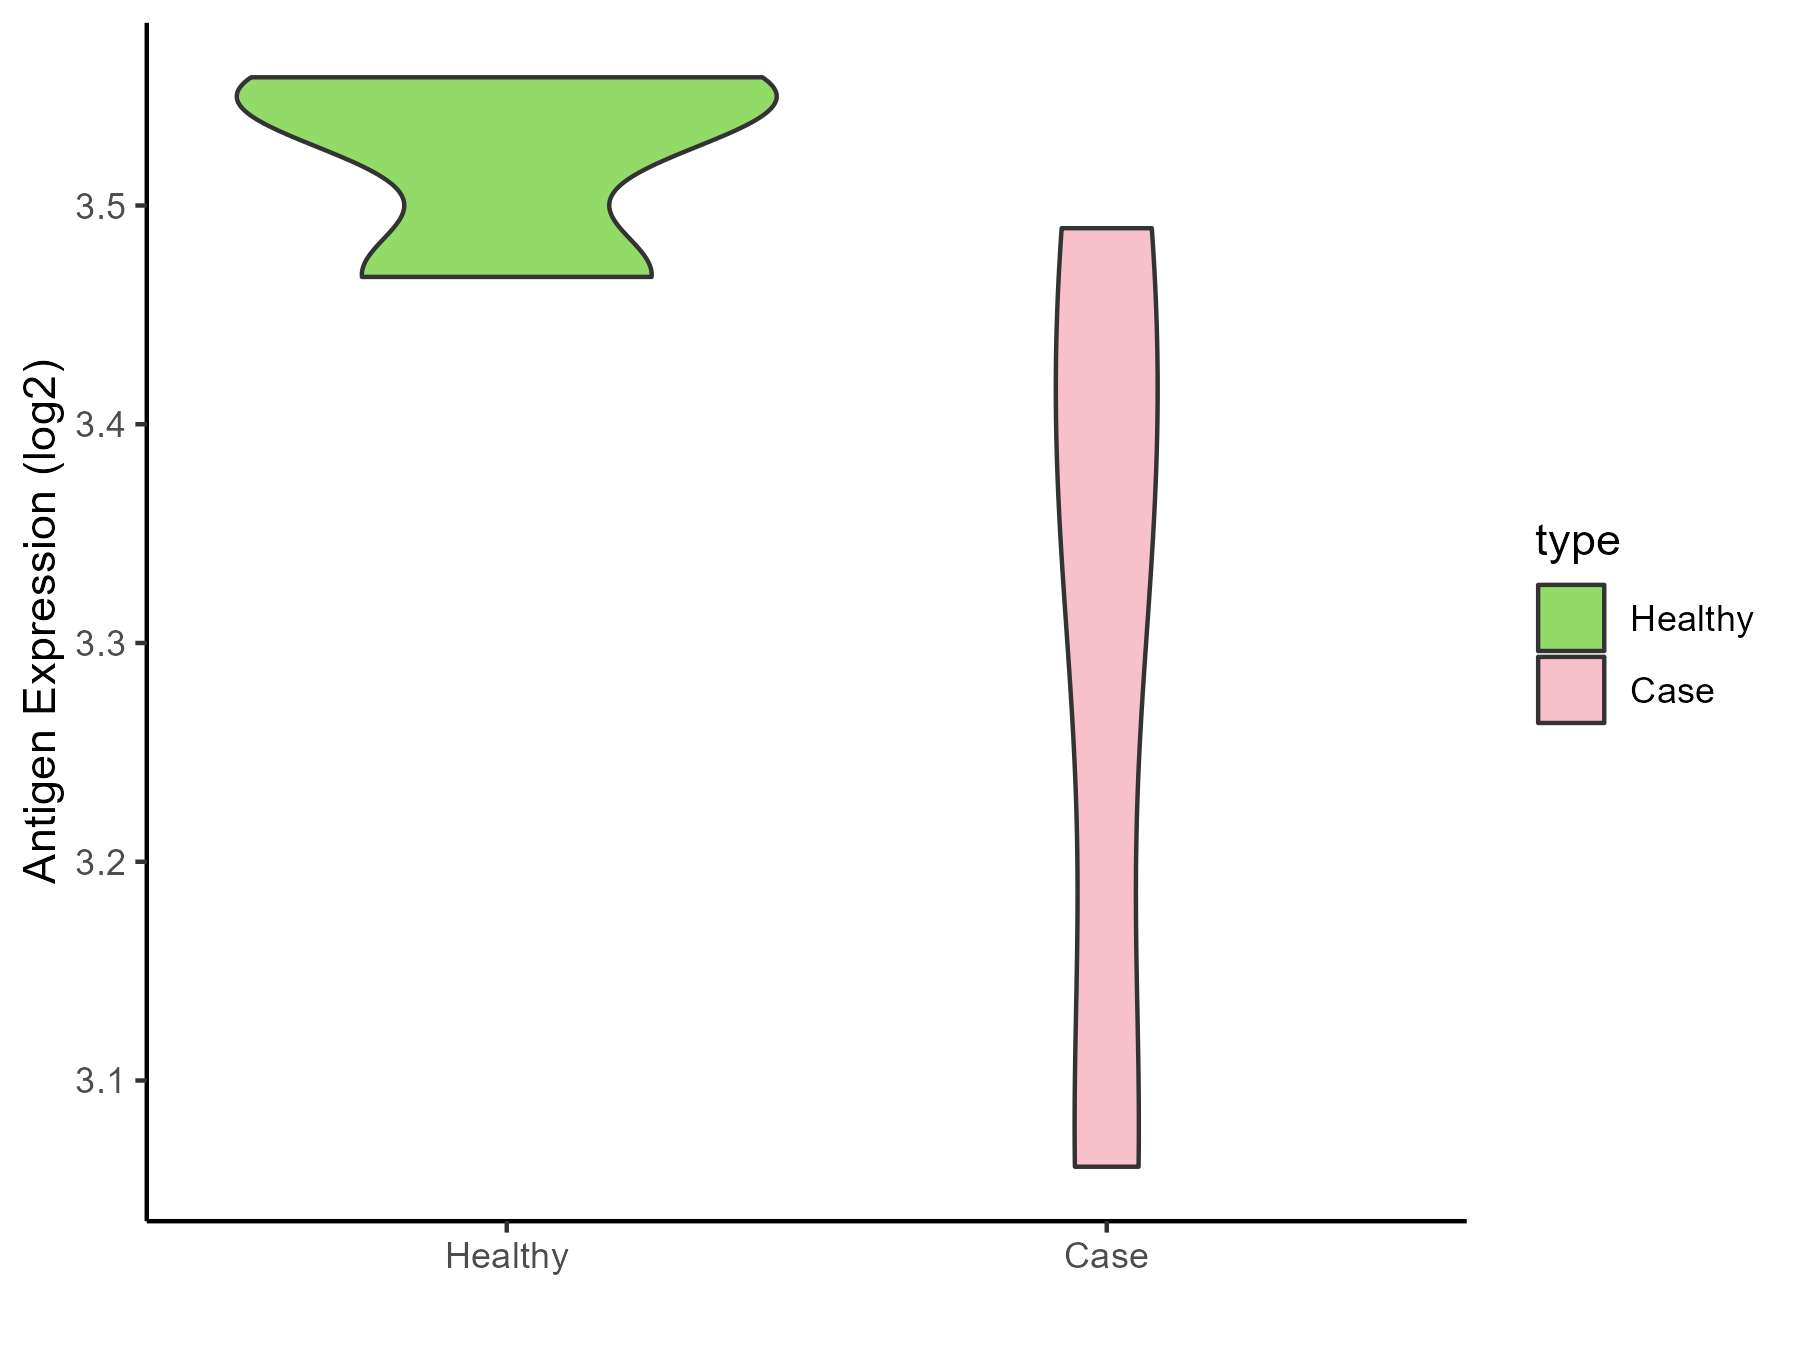
| Differential expression pattern of antigen in diseases | ||
| The Studied Tissue | Peripheral blood | |
| The Specific Disease | Essential hypertension | |
| The Expression Level of Disease Section Compare with the Healthy Individual Tissue | p-value: 0.216022927; Fold-change: -0.192291774; Z-score: -3.964162525 | |
| Disease-specific Antigen Abundances |
|
Click to View the Clearer Original Diagram |
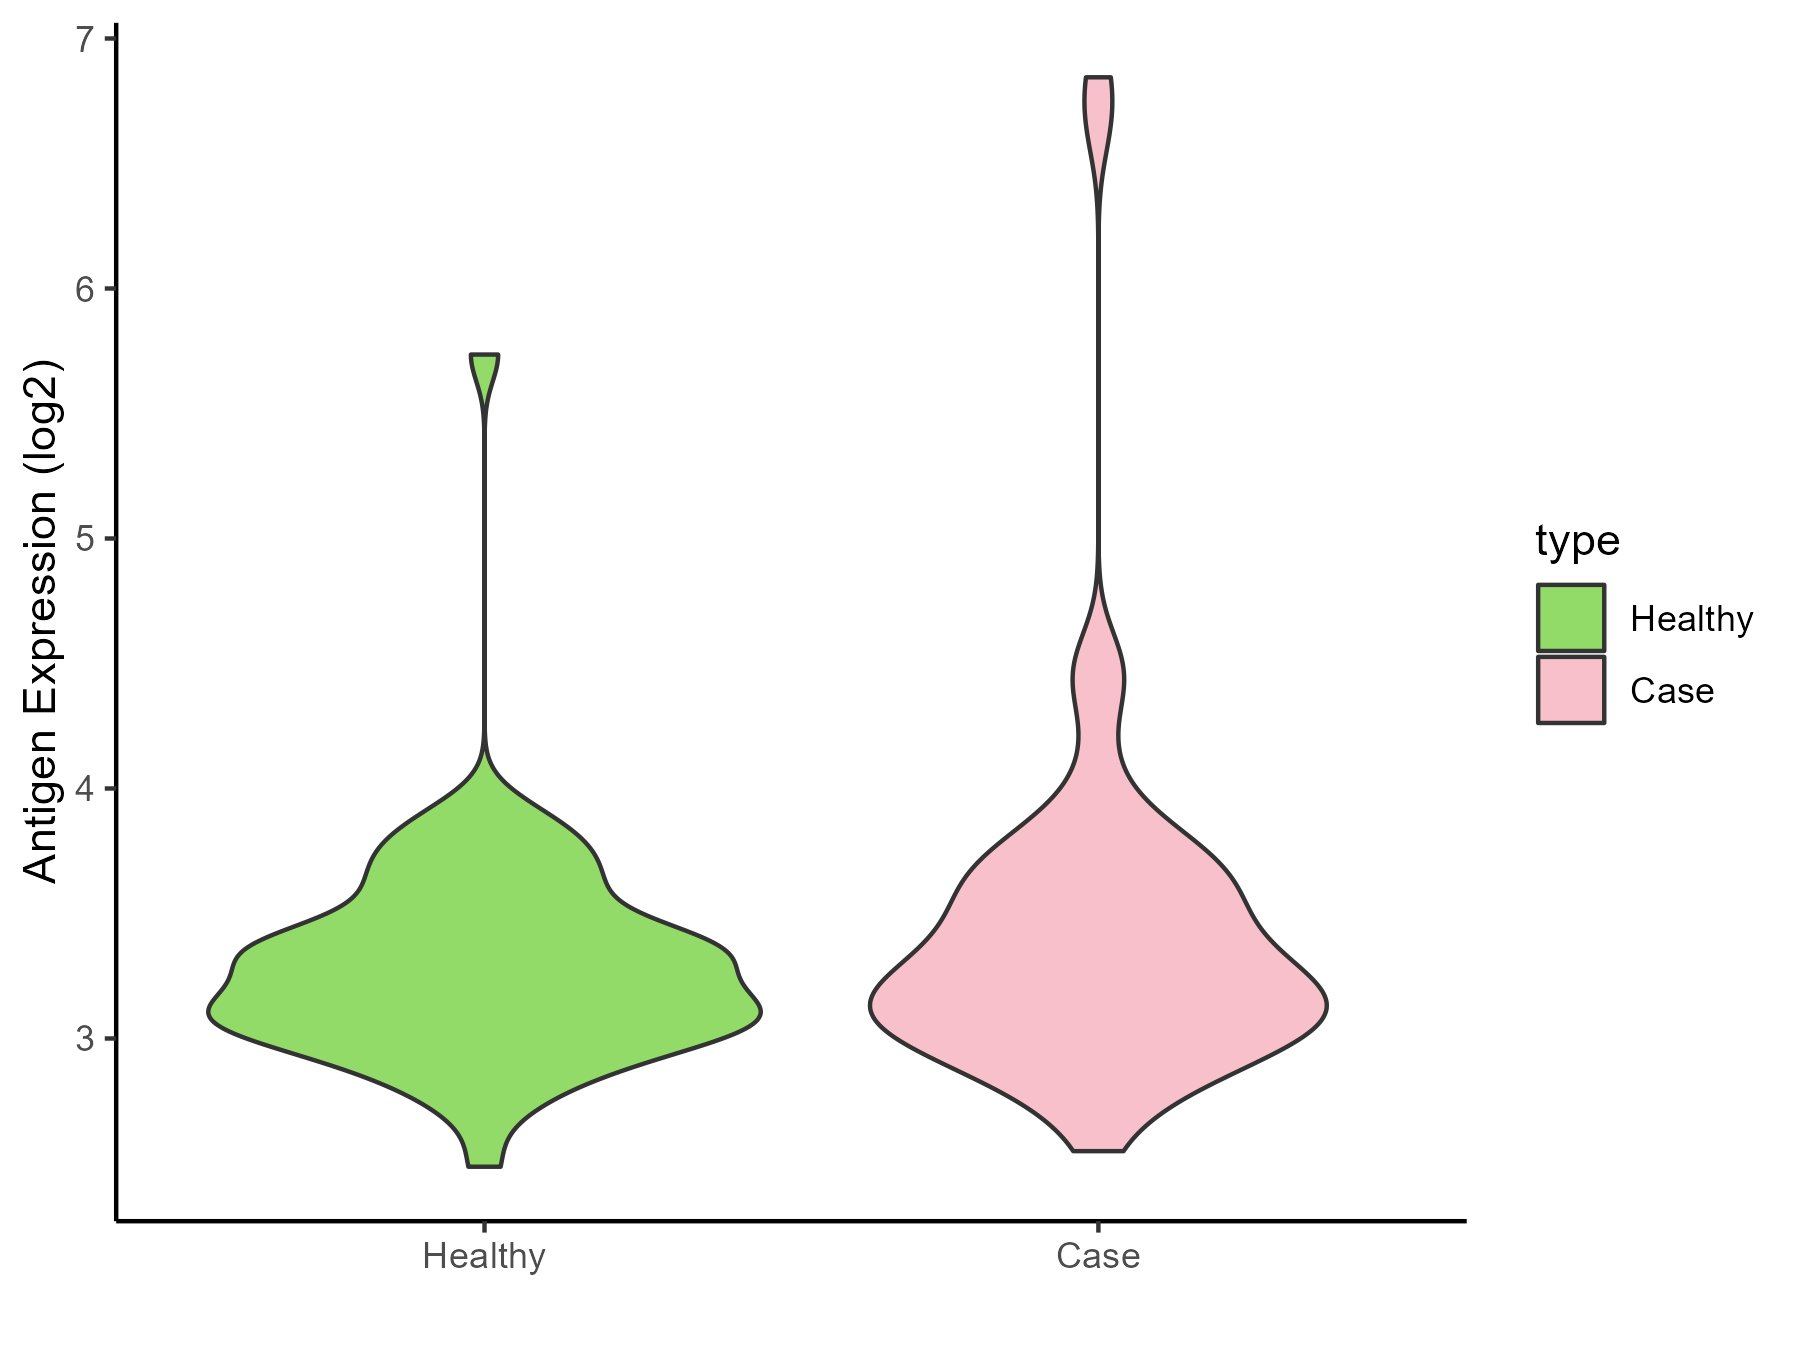
| Differential expression pattern of antigen in diseases | ||
| The Studied Tissue | Peripheral blood | |
| The Specific Disease | Myocardial infarction | |
| The Expression Level of Disease Section Compare with the Healthy Individual Tissue | p-value: 0.19569741; Fold-change: -0.007994312; Z-score: -0.018052366 | |
| Disease-specific Antigen Abundances |
|
Click to View the Clearer Original Diagram |
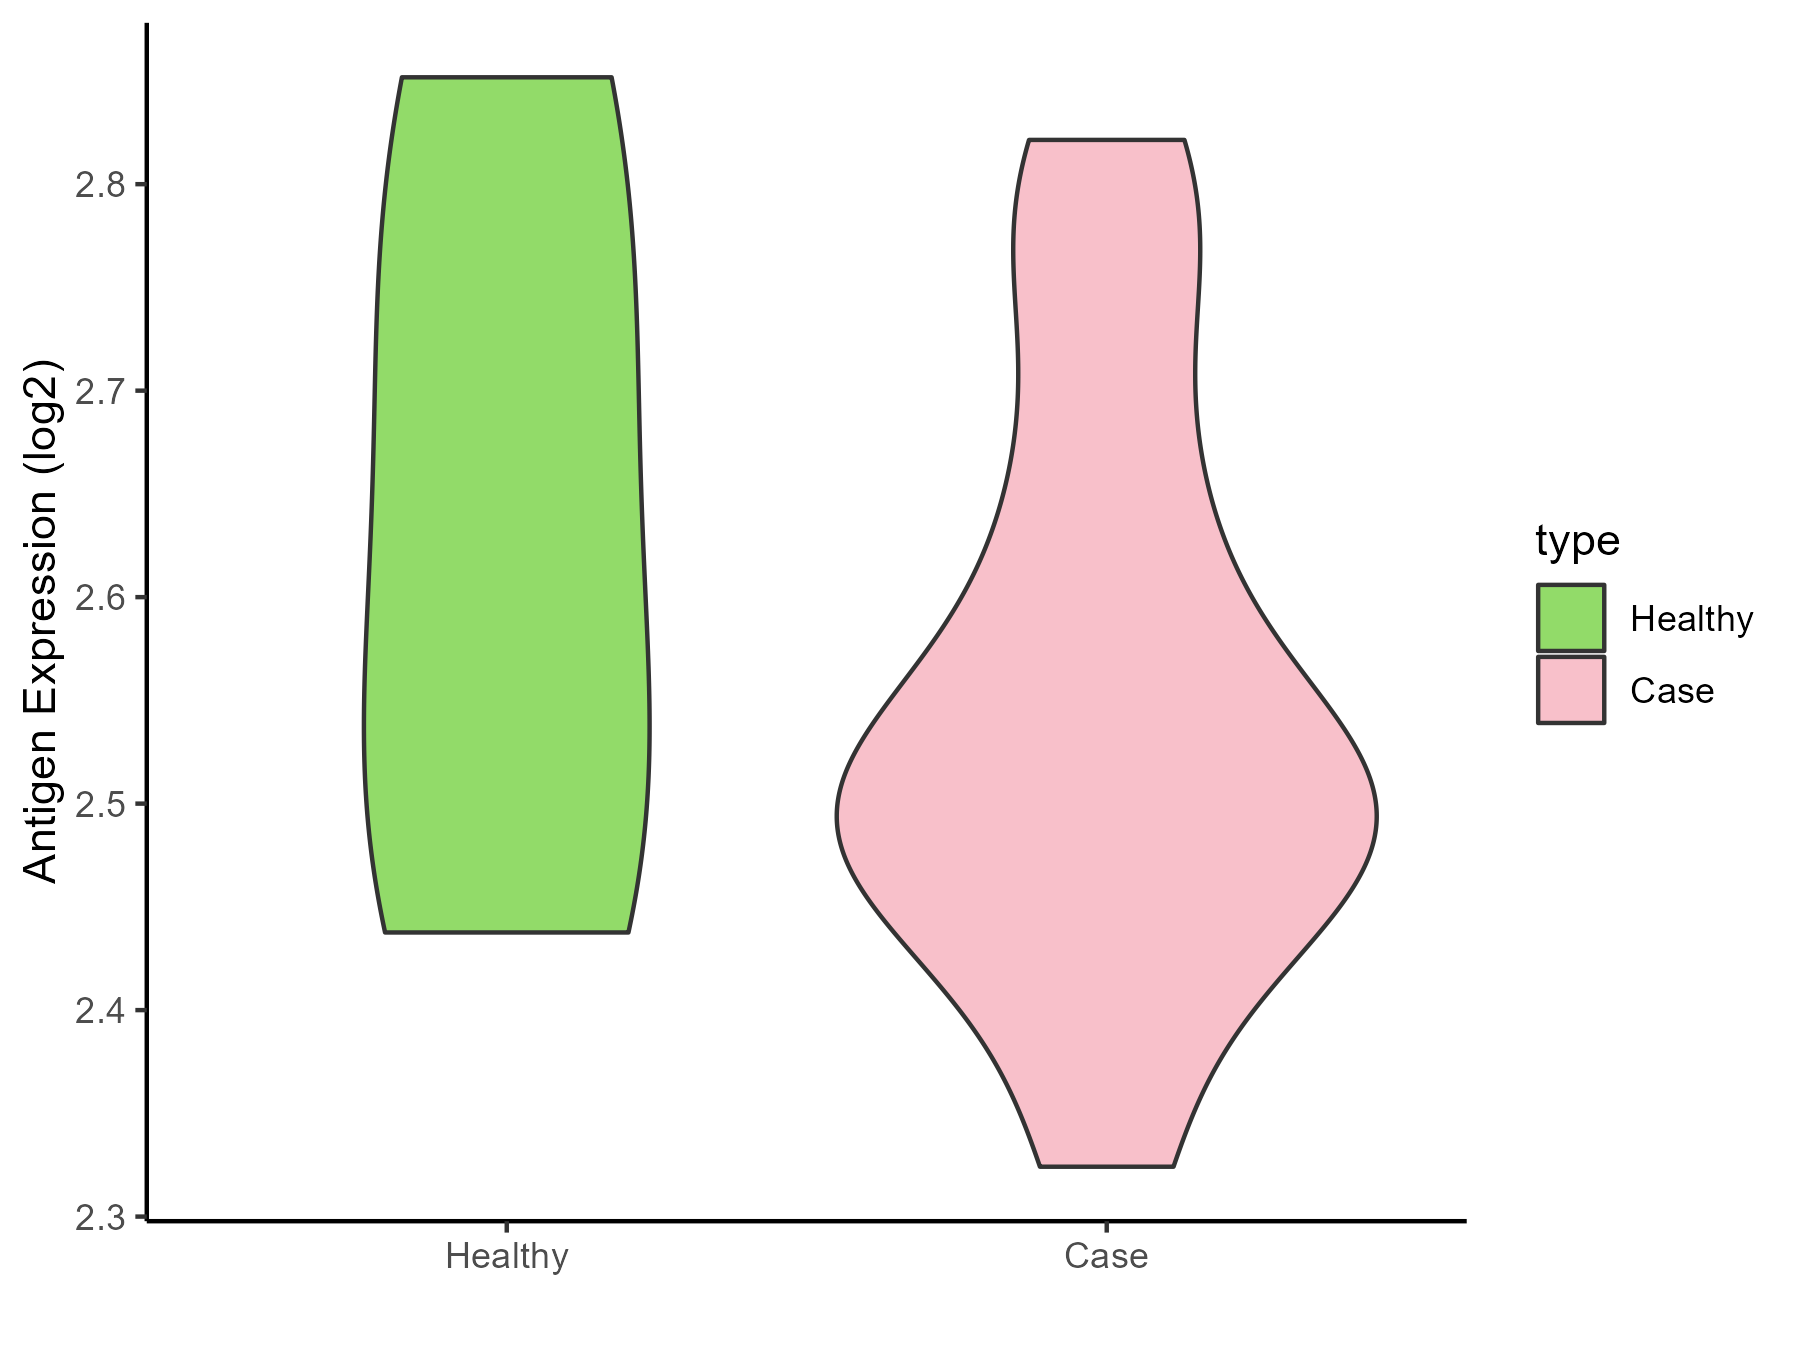
| Differential expression pattern of antigen in diseases | ||
| The Studied Tissue | Peripheral blood | |
| The Specific Disease | Coronary artery disease | |
| The Expression Level of Disease Section Compare with the Healthy Individual Tissue | p-value: 0.440053924; Fold-change: -0.116658498; Z-score: -0.636107484 | |
| Disease-specific Antigen Abundances |
|
Click to View the Clearer Original Diagram |
| Differential expression pattern of antigen in diseases | ||
| The Studied Tissue | Calcified aortic valve | |
| The Specific Disease | Aortic stenosis | |
| The Expression Level of Disease Section Compare with the Healthy Individual Tissue | p-value: 0.536997881; Fold-change: -0.010367892; Z-score: -0.064799635 | |
| Disease-specific Antigen Abundances |
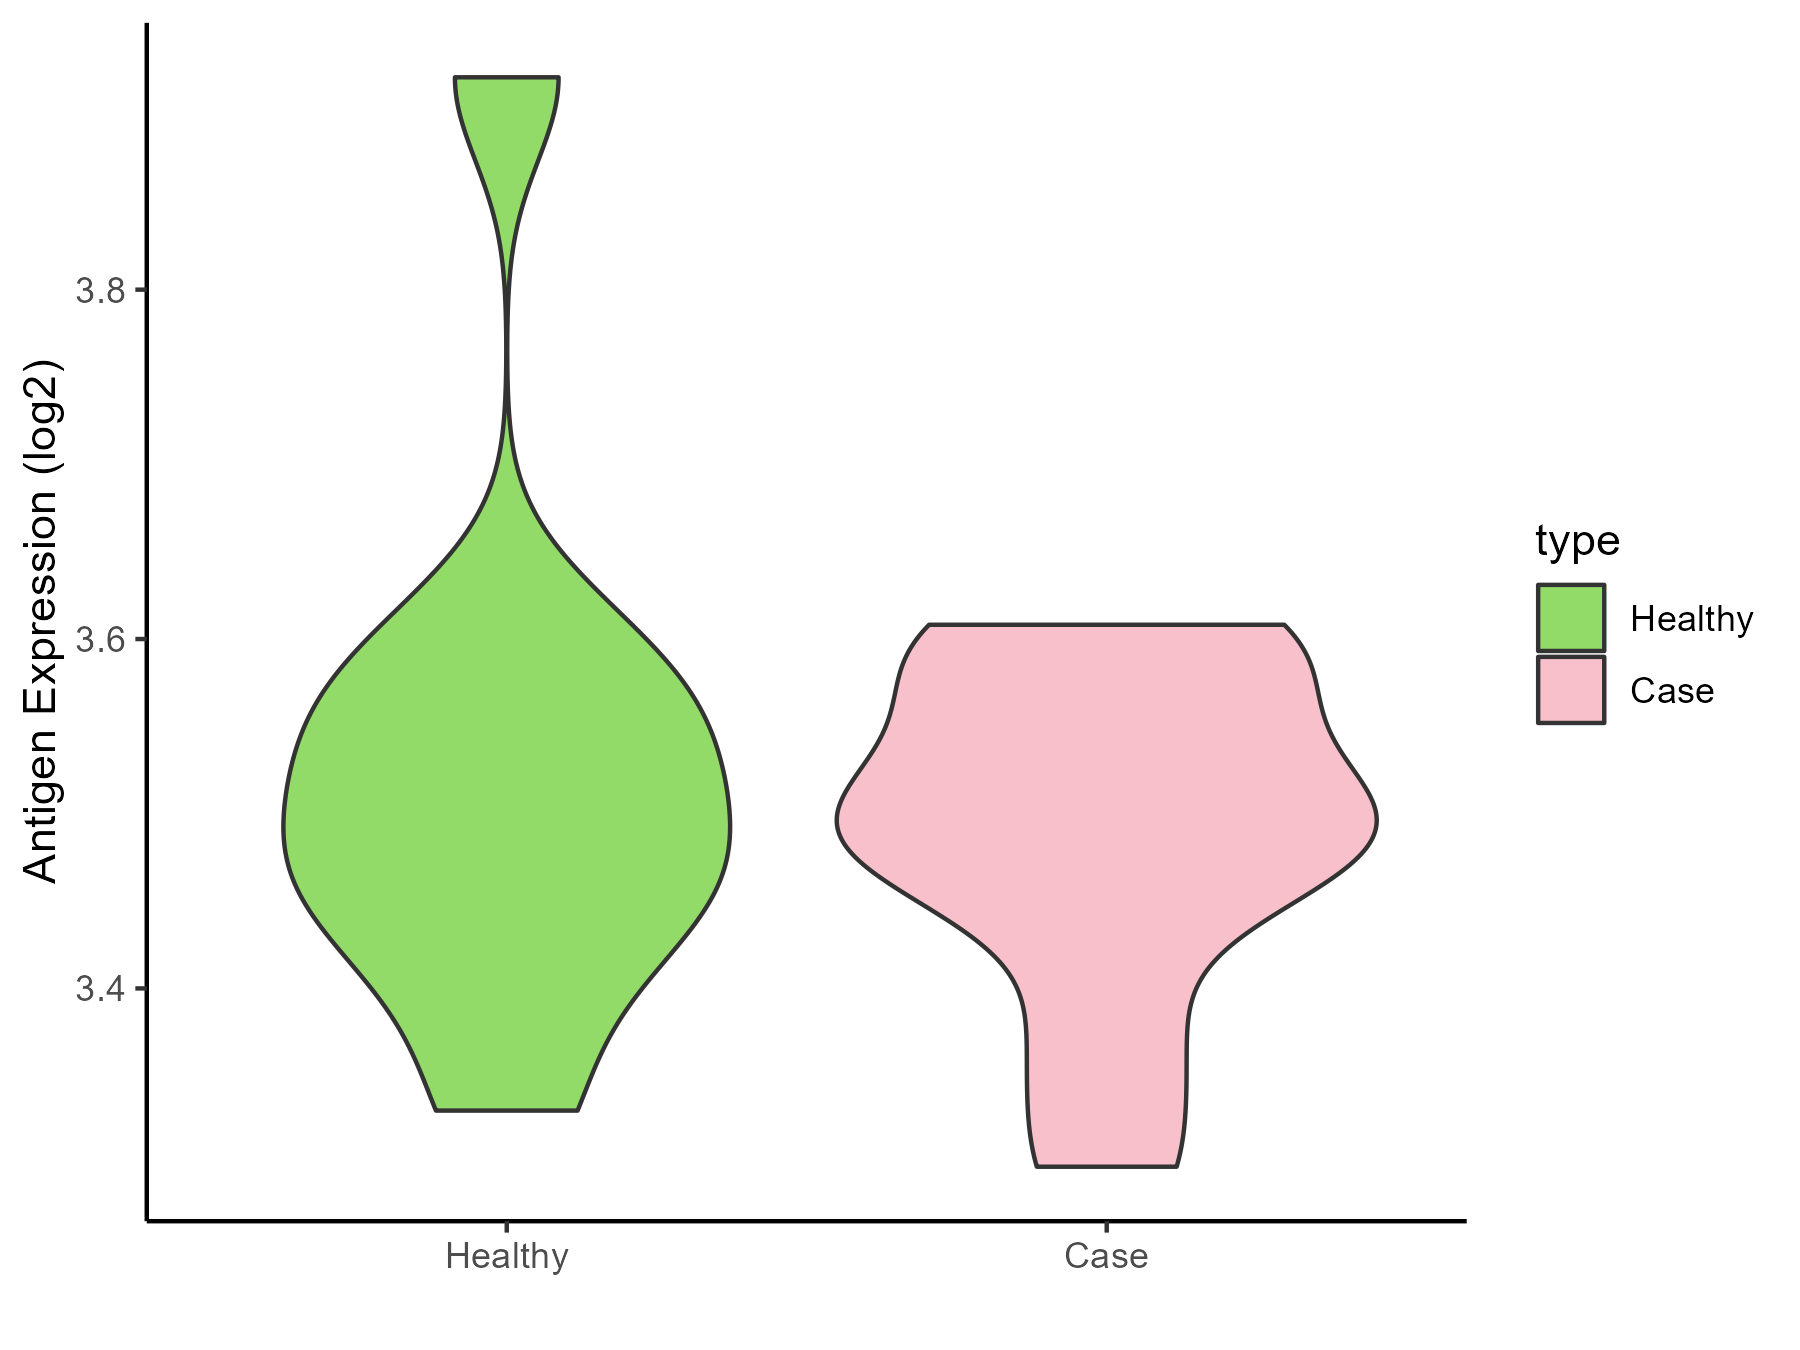
|
Click to View the Clearer Original Diagram |
| Differential expression pattern of antigen in diseases | ||
| The Studied Tissue | Peripheral blood | |
| The Specific Disease | Arteriosclerosis | |
| The Expression Level of Disease Section Compare with the Healthy Individual Tissue | p-value: 0.890715996; Fold-change: -0.000637447; Z-score: -0.006055544 | |
| Disease-specific Antigen Abundances |
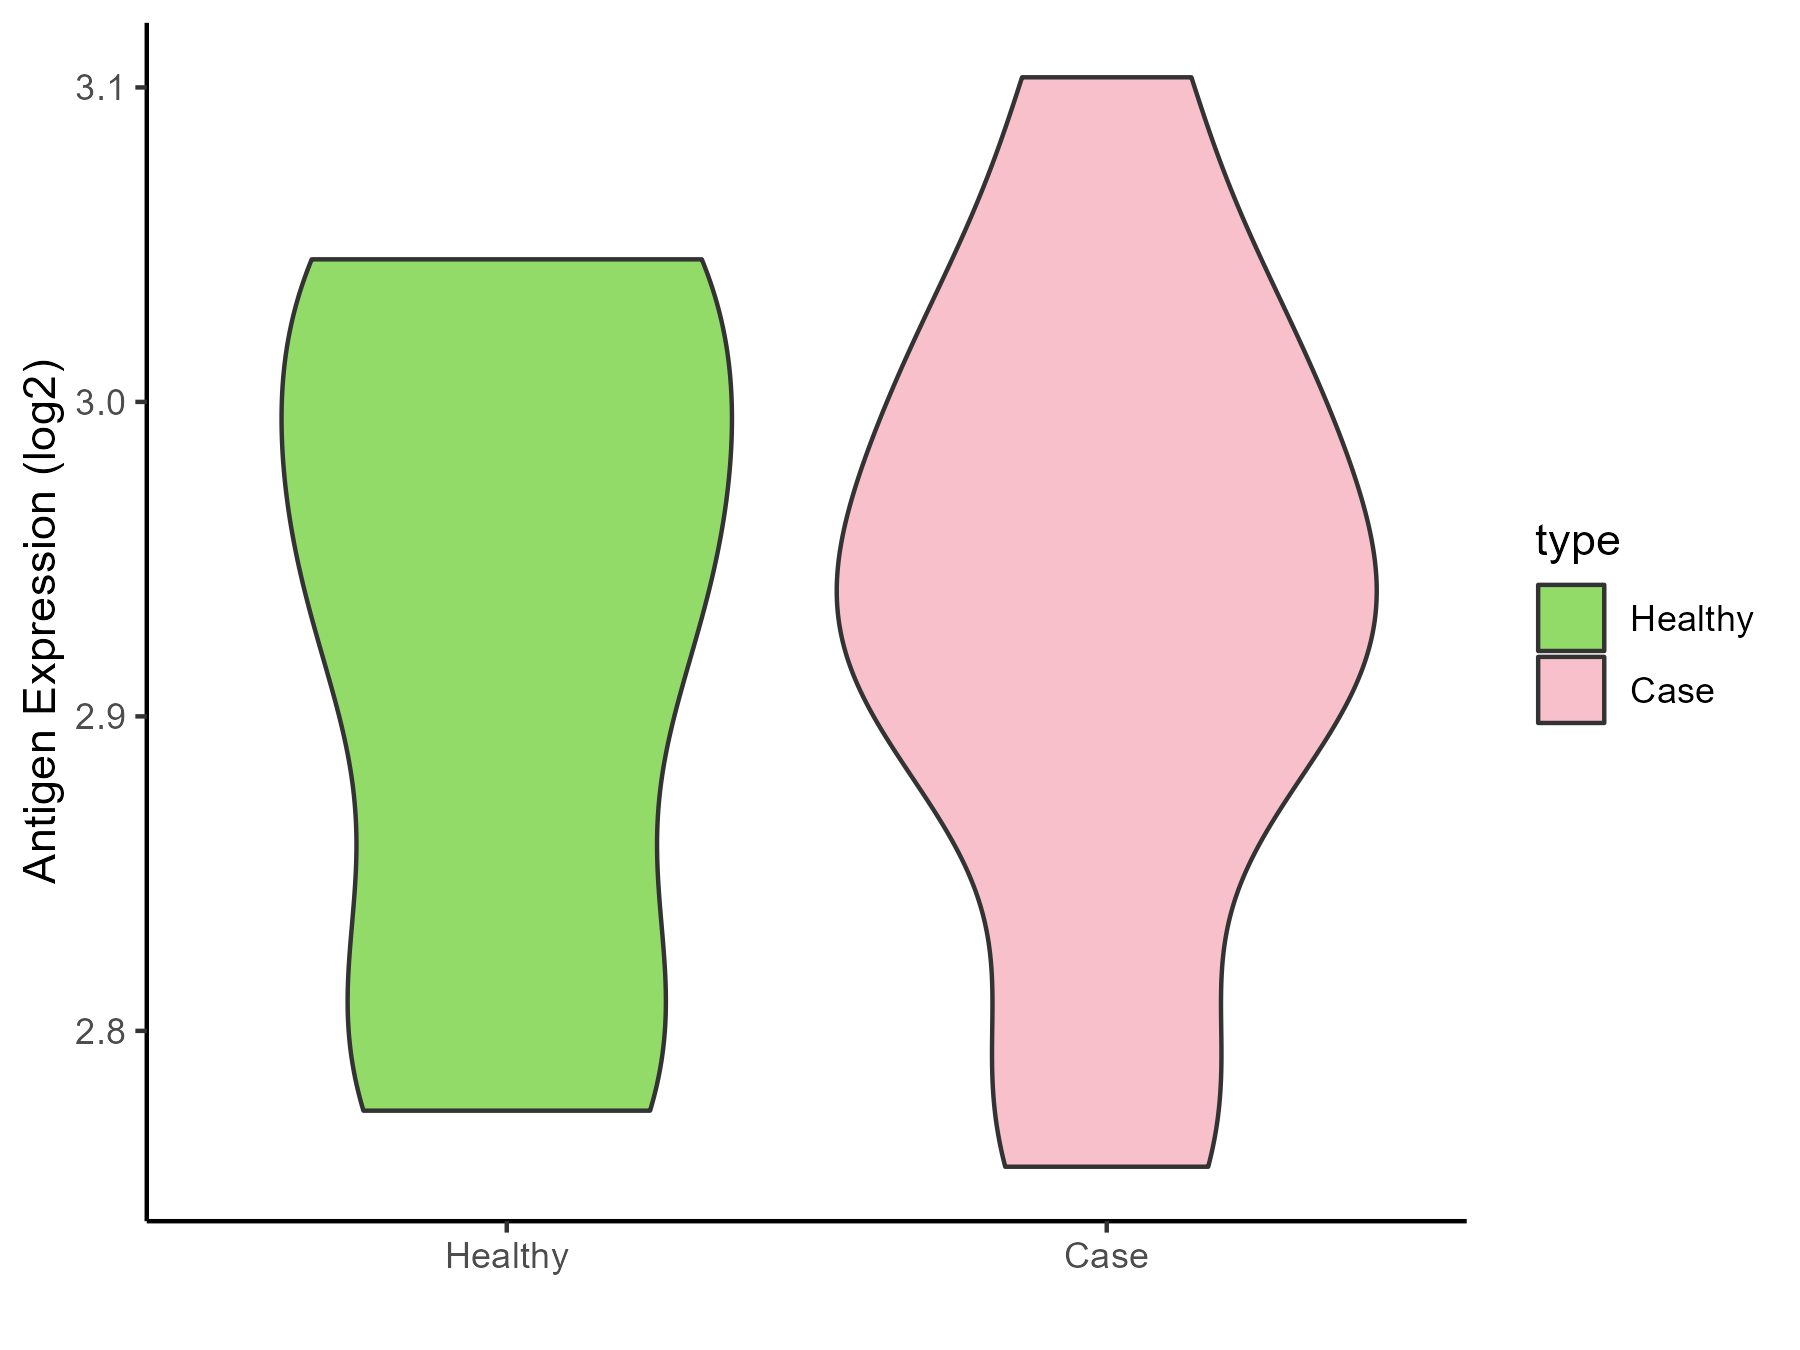
|
Click to View the Clearer Original Diagram |
| Differential expression pattern of antigen in diseases | ||
| The Studied Tissue | Intracranial artery | |
| The Specific Disease | Aneurysm | |
| The Expression Level of Disease Section Compare with the Healthy Individual Tissue | p-value: 0.309724792; Fold-change: 0.036165268; Z-score: 0.043123516 | |
| Disease-specific Antigen Abundances |
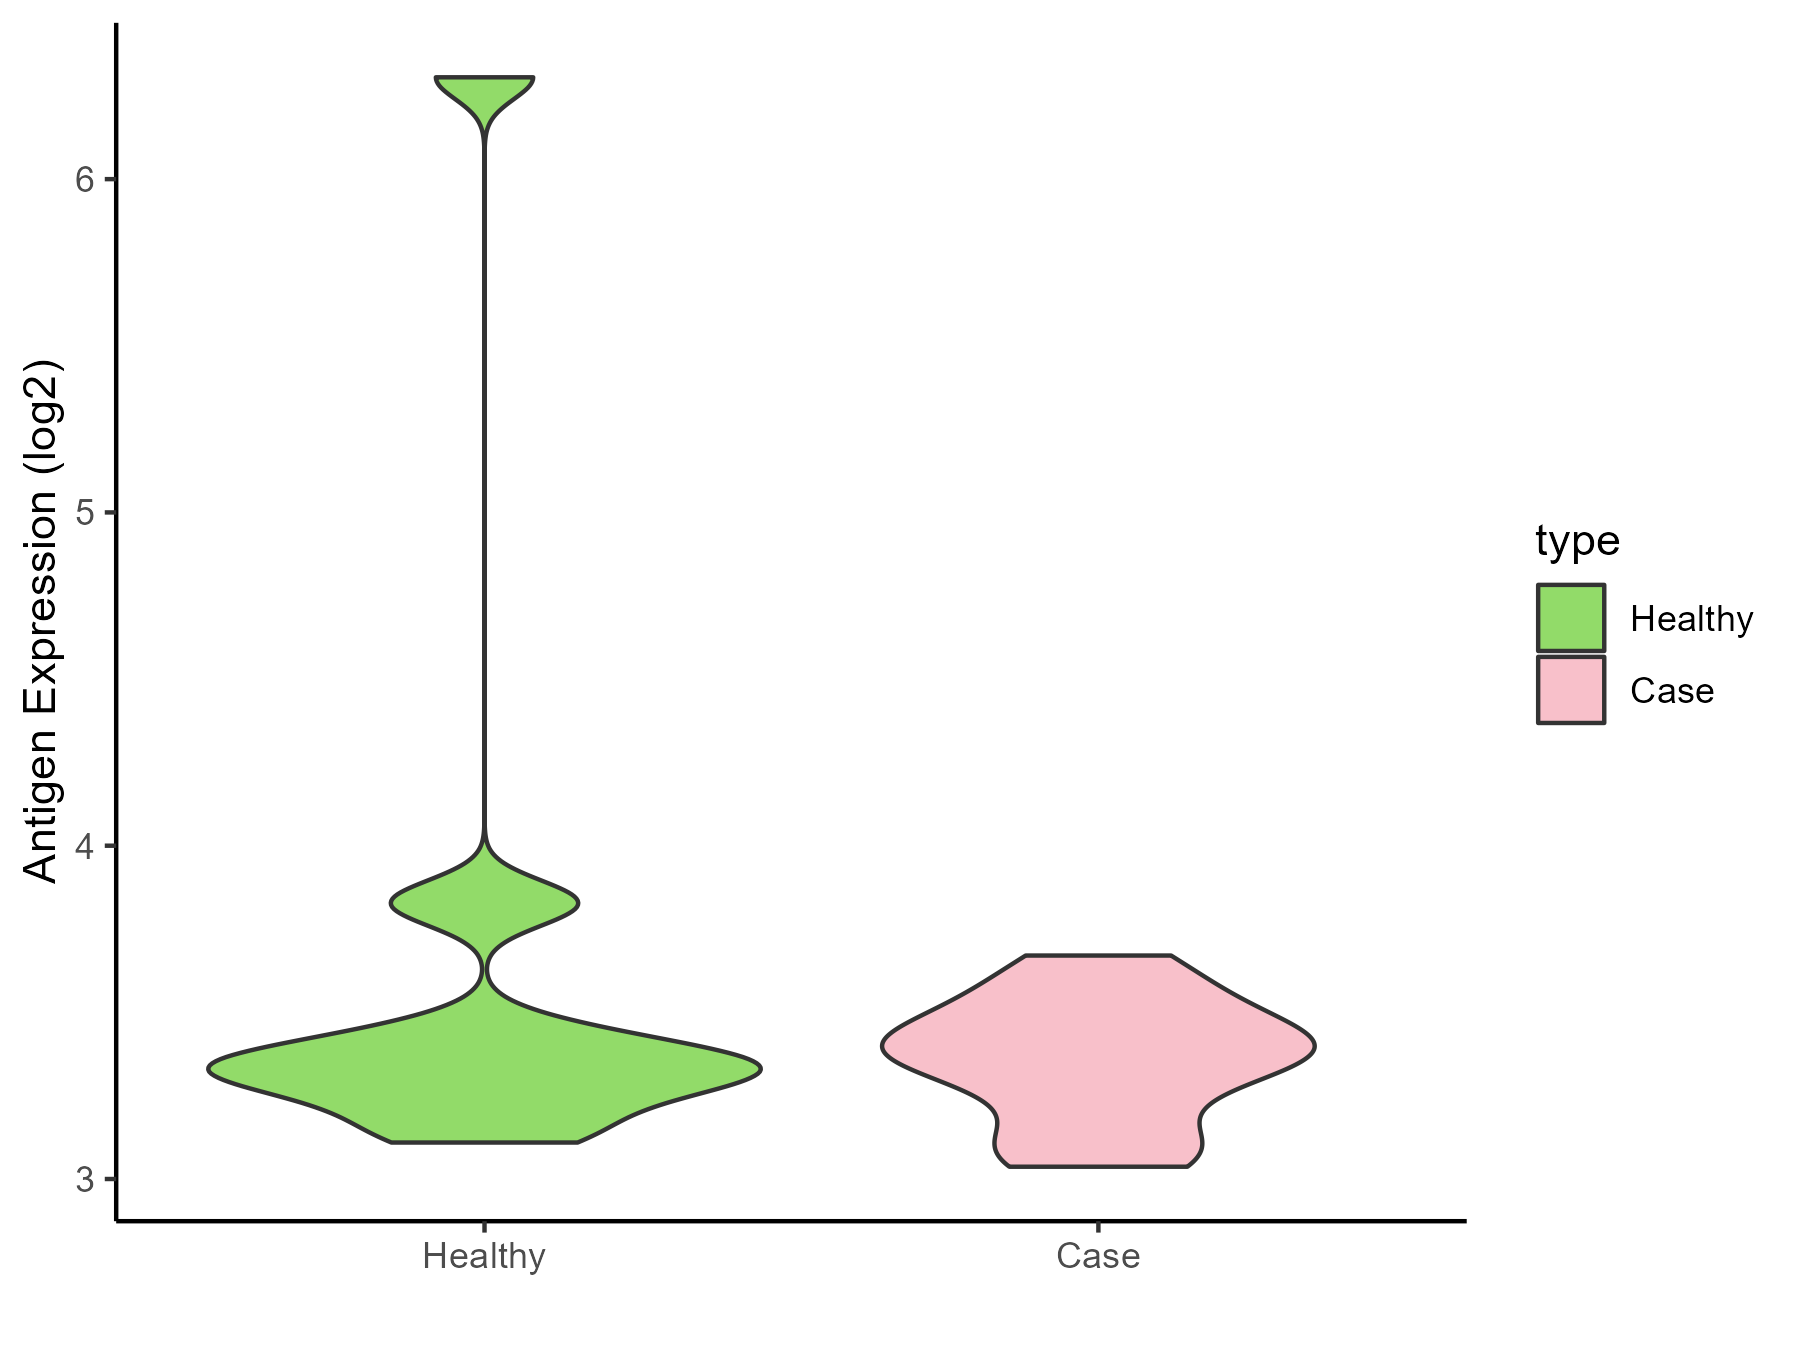
|
Click to View the Clearer Original Diagram |
ICD Disease Classification 12
| Differential expression pattern of antigen in diseases | ||
| The Studied Tissue | Peripheral blood | |
| The Specific Disease | Immunodeficiency | |
| The Expression Level of Disease Section Compare with the Healthy Individual Tissue | p-value: 0.918188955; Fold-change: -0.035321271; Z-score: -0.401037641 | |
| Disease-specific Antigen Abundances |
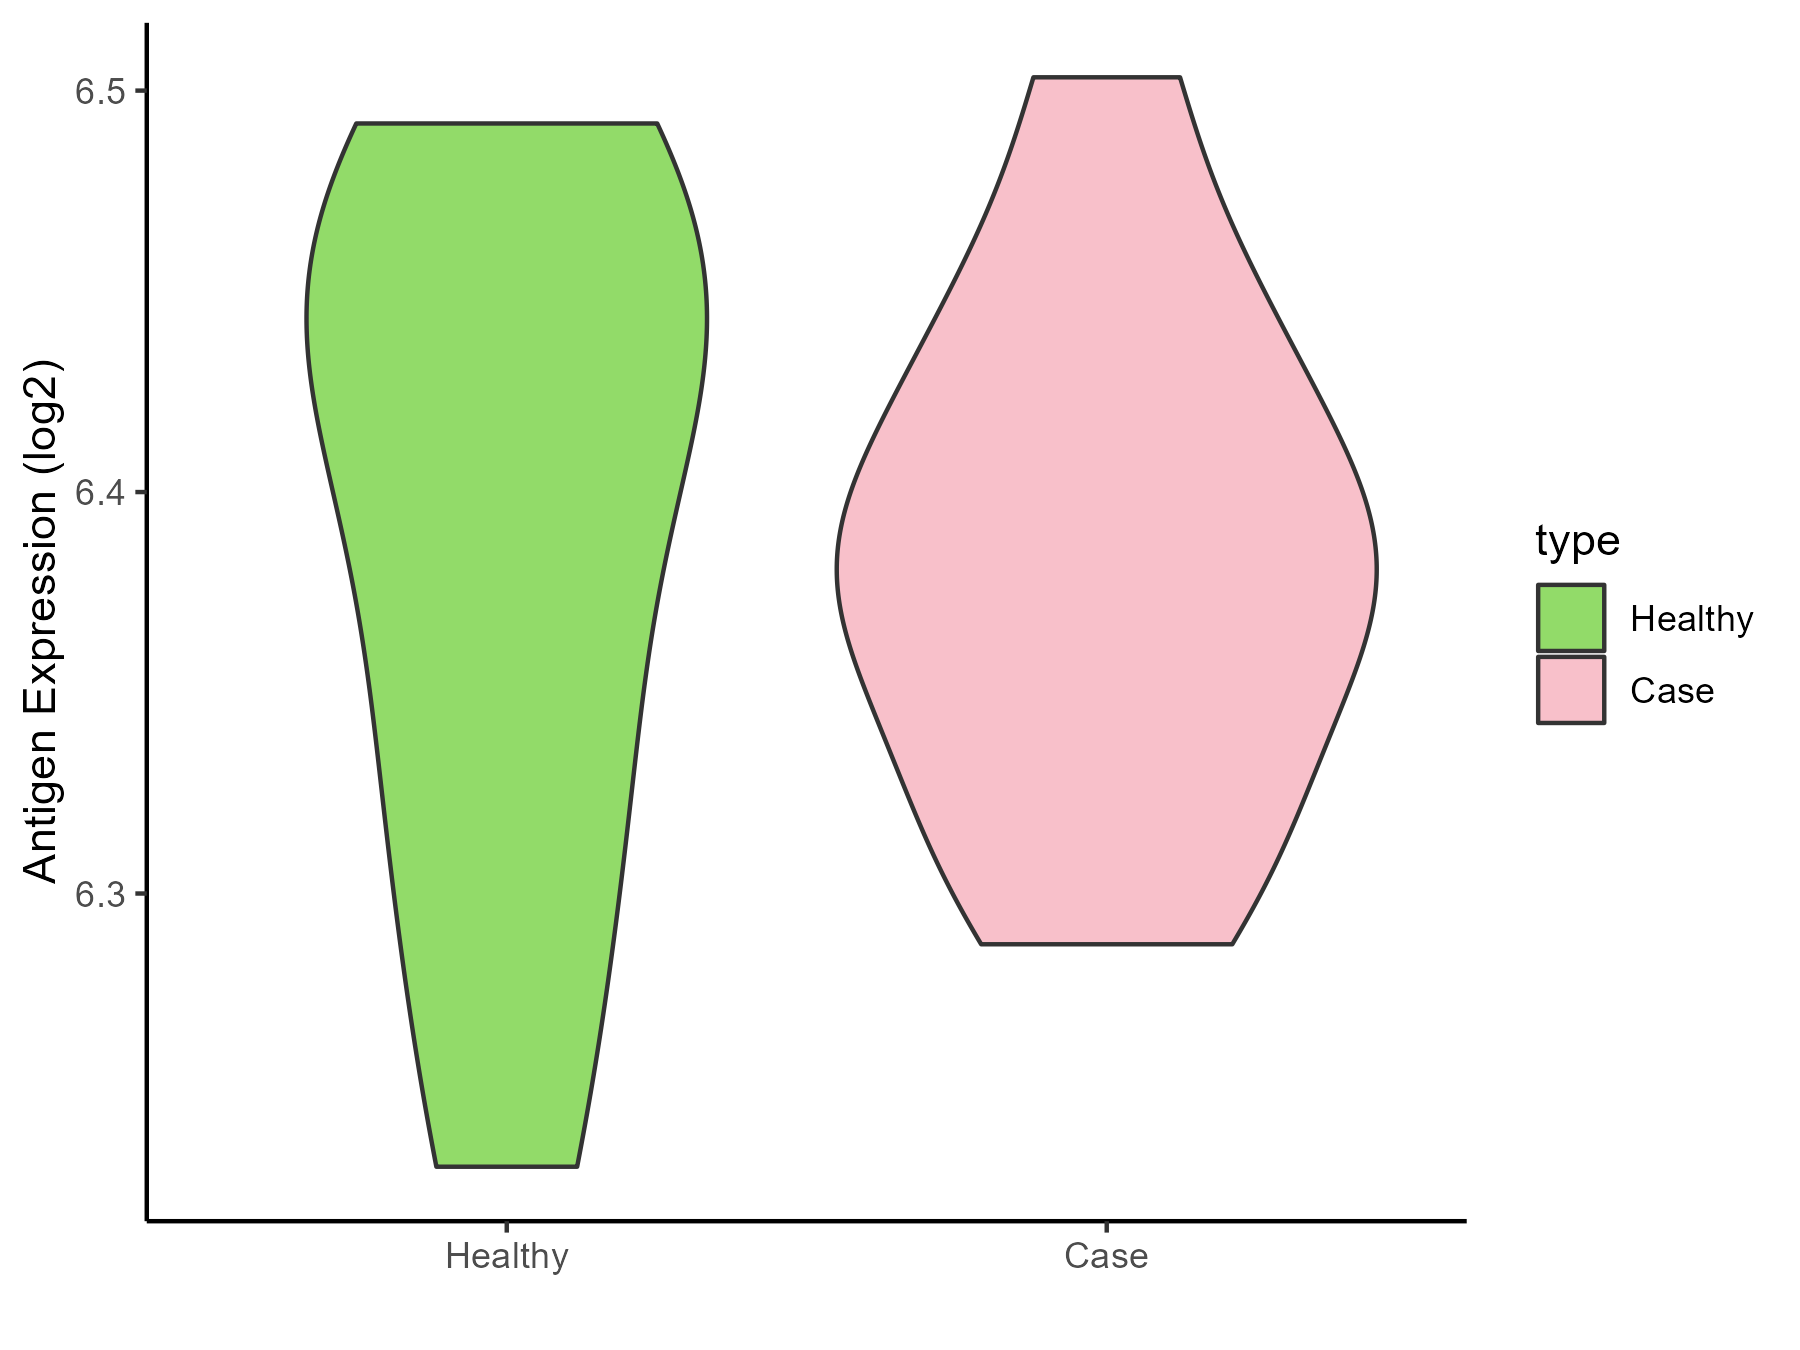
|
Click to View the Clearer Original Diagram |
| Differential expression pattern of antigen in diseases | ||
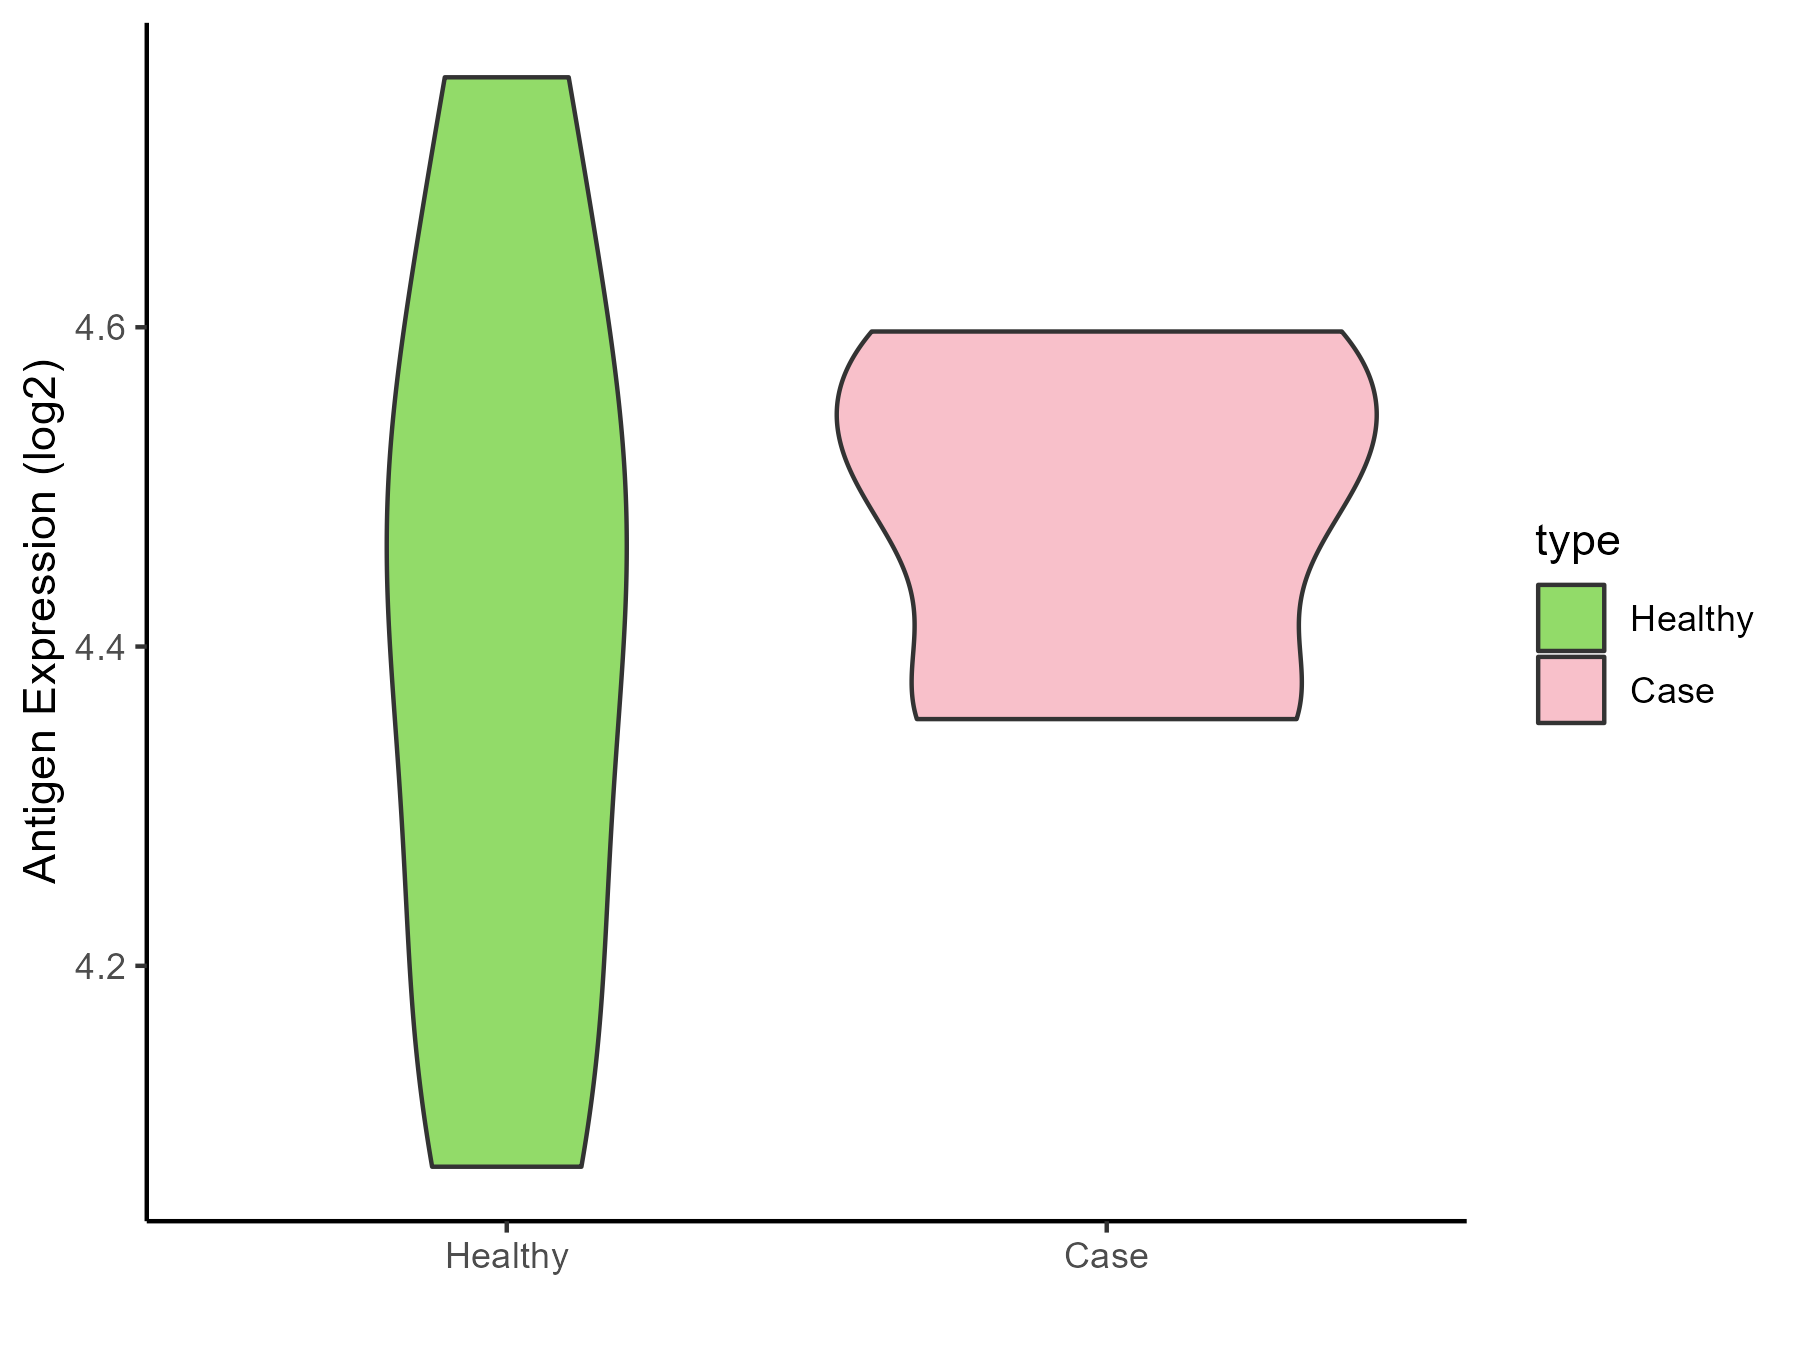
| The Studied Tissue | Hyperplastic tonsil | |
| The Specific Disease | Apnea | |
| The Expression Level of Disease Section Compare with the Healthy Individual Tissue | p-value: 0.506646838; Fold-change: 0.04406933; Z-score: 0.183928145 | |
| Disease-specific Antigen Abundances |
|
Click to View the Clearer Original Diagram |
| Differential expression pattern of antigen in diseases | ||
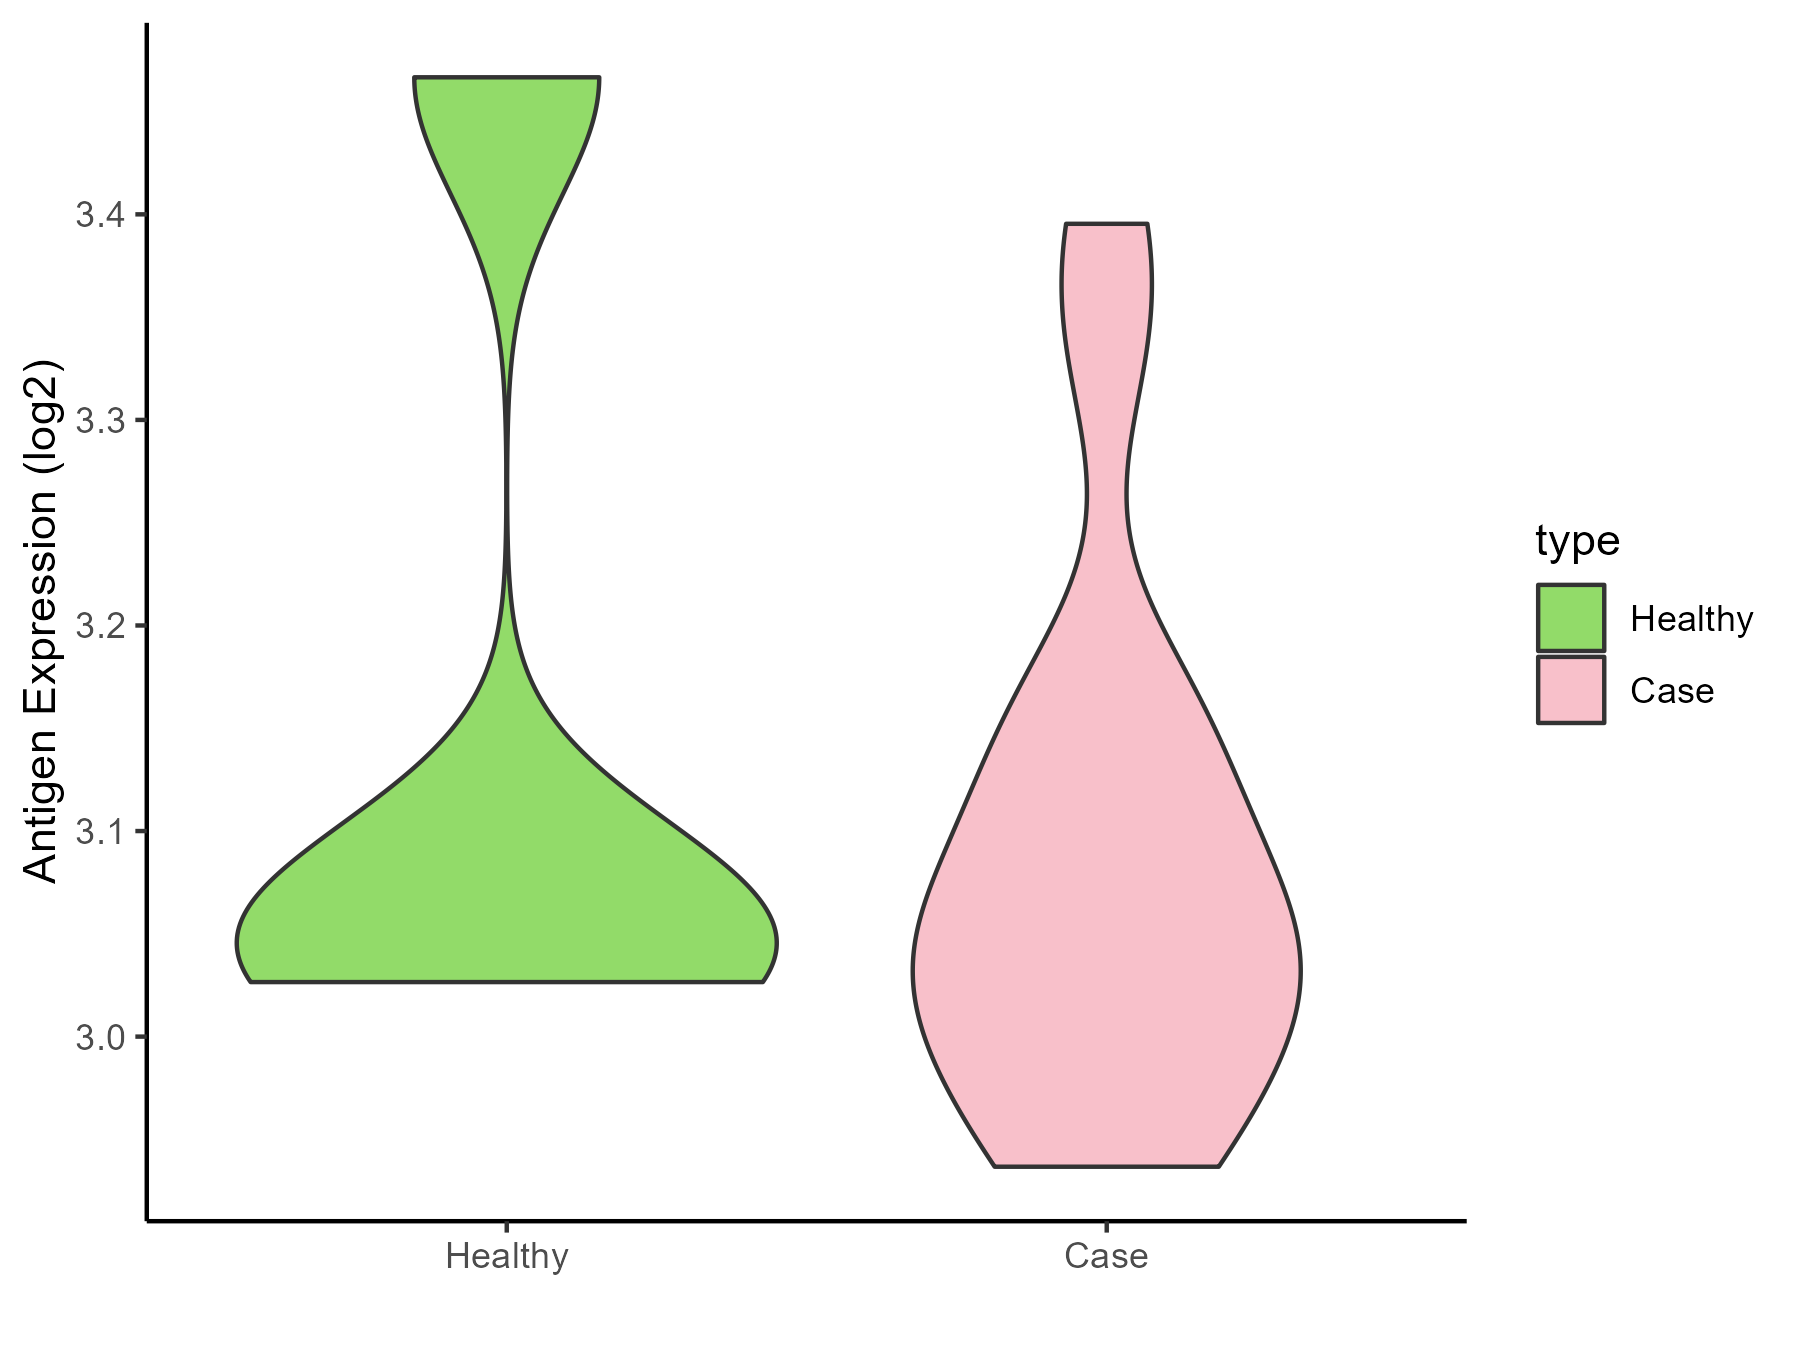
| The Studied Tissue | Peripheral blood | |
| The Specific Disease | Olive pollen allergy | |
| The Expression Level of Disease Section Compare with the Healthy Individual Tissue | p-value: 0.599273155; Fold-change: -0.001049413; Z-score: -0.004971043 | |
| Disease-specific Antigen Abundances |
|
Click to View the Clearer Original Diagram |
| Differential expression pattern of antigen in diseases | ||
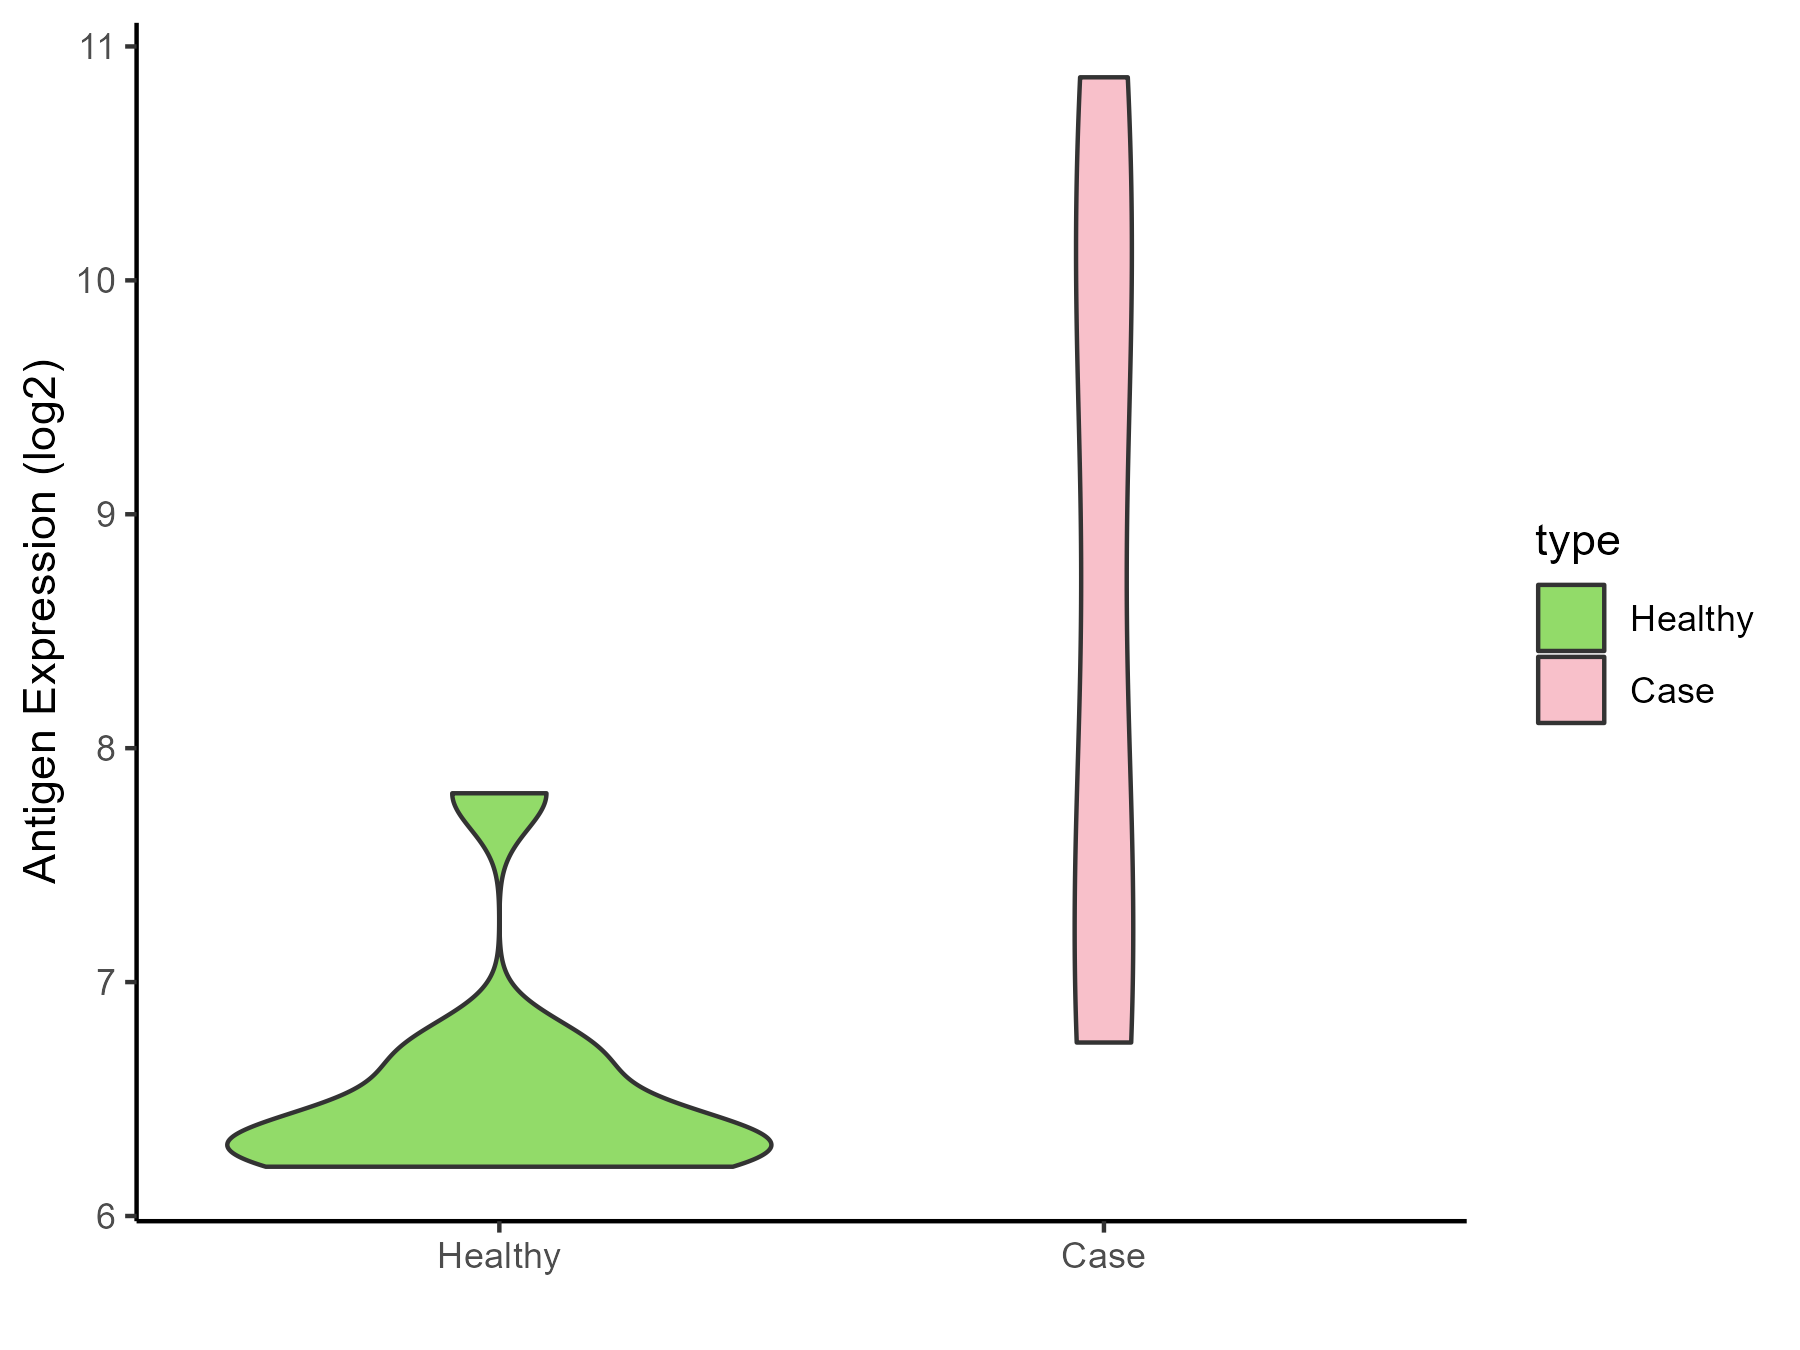
| The Studied Tissue | Sinus mucosa | |
| The Specific Disease | Chronic rhinosinusitis | |
| The Expression Level of Disease Section Compare with the Healthy Individual Tissue | p-value: 0.030677455; Fold-change: 2.303488973; Z-score: 4.581289432 | |
| Disease-specific Antigen Abundances |
|
Click to View the Clearer Original Diagram |
| Differential expression pattern of antigen in diseases | ||
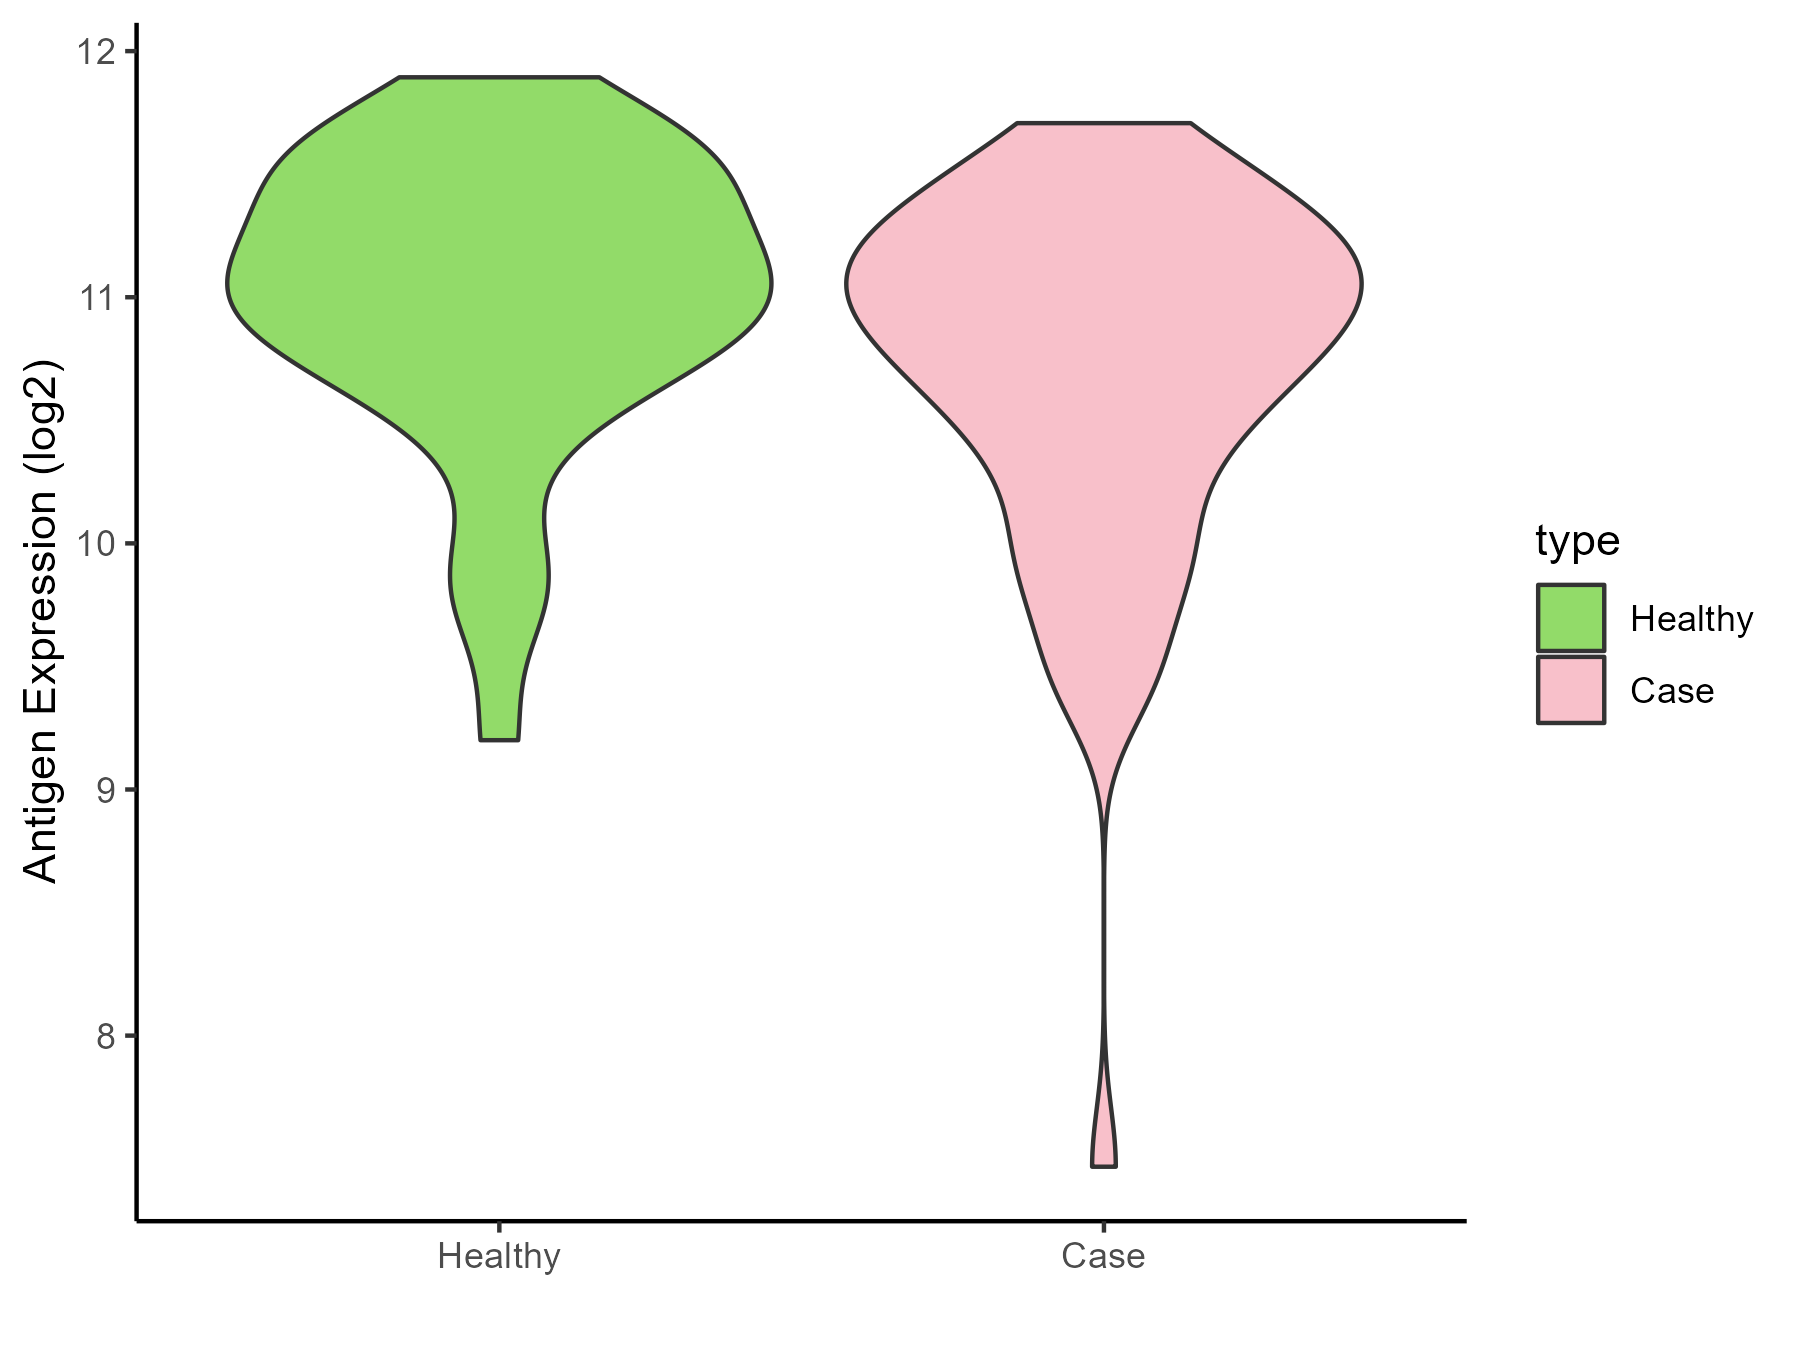
| The Studied Tissue | Lung | |
| The Specific Disease | Chronic obstructive pulmonary disease | |
| The Expression Level of Disease Section Compare with the Healthy Individual Tissue | p-value: 0.033149838; Fold-change: -0.238960929; Z-score: -0.398235148 | |
| Disease-specific Antigen Abundances |
|
Click to View the Clearer Original Diagram |
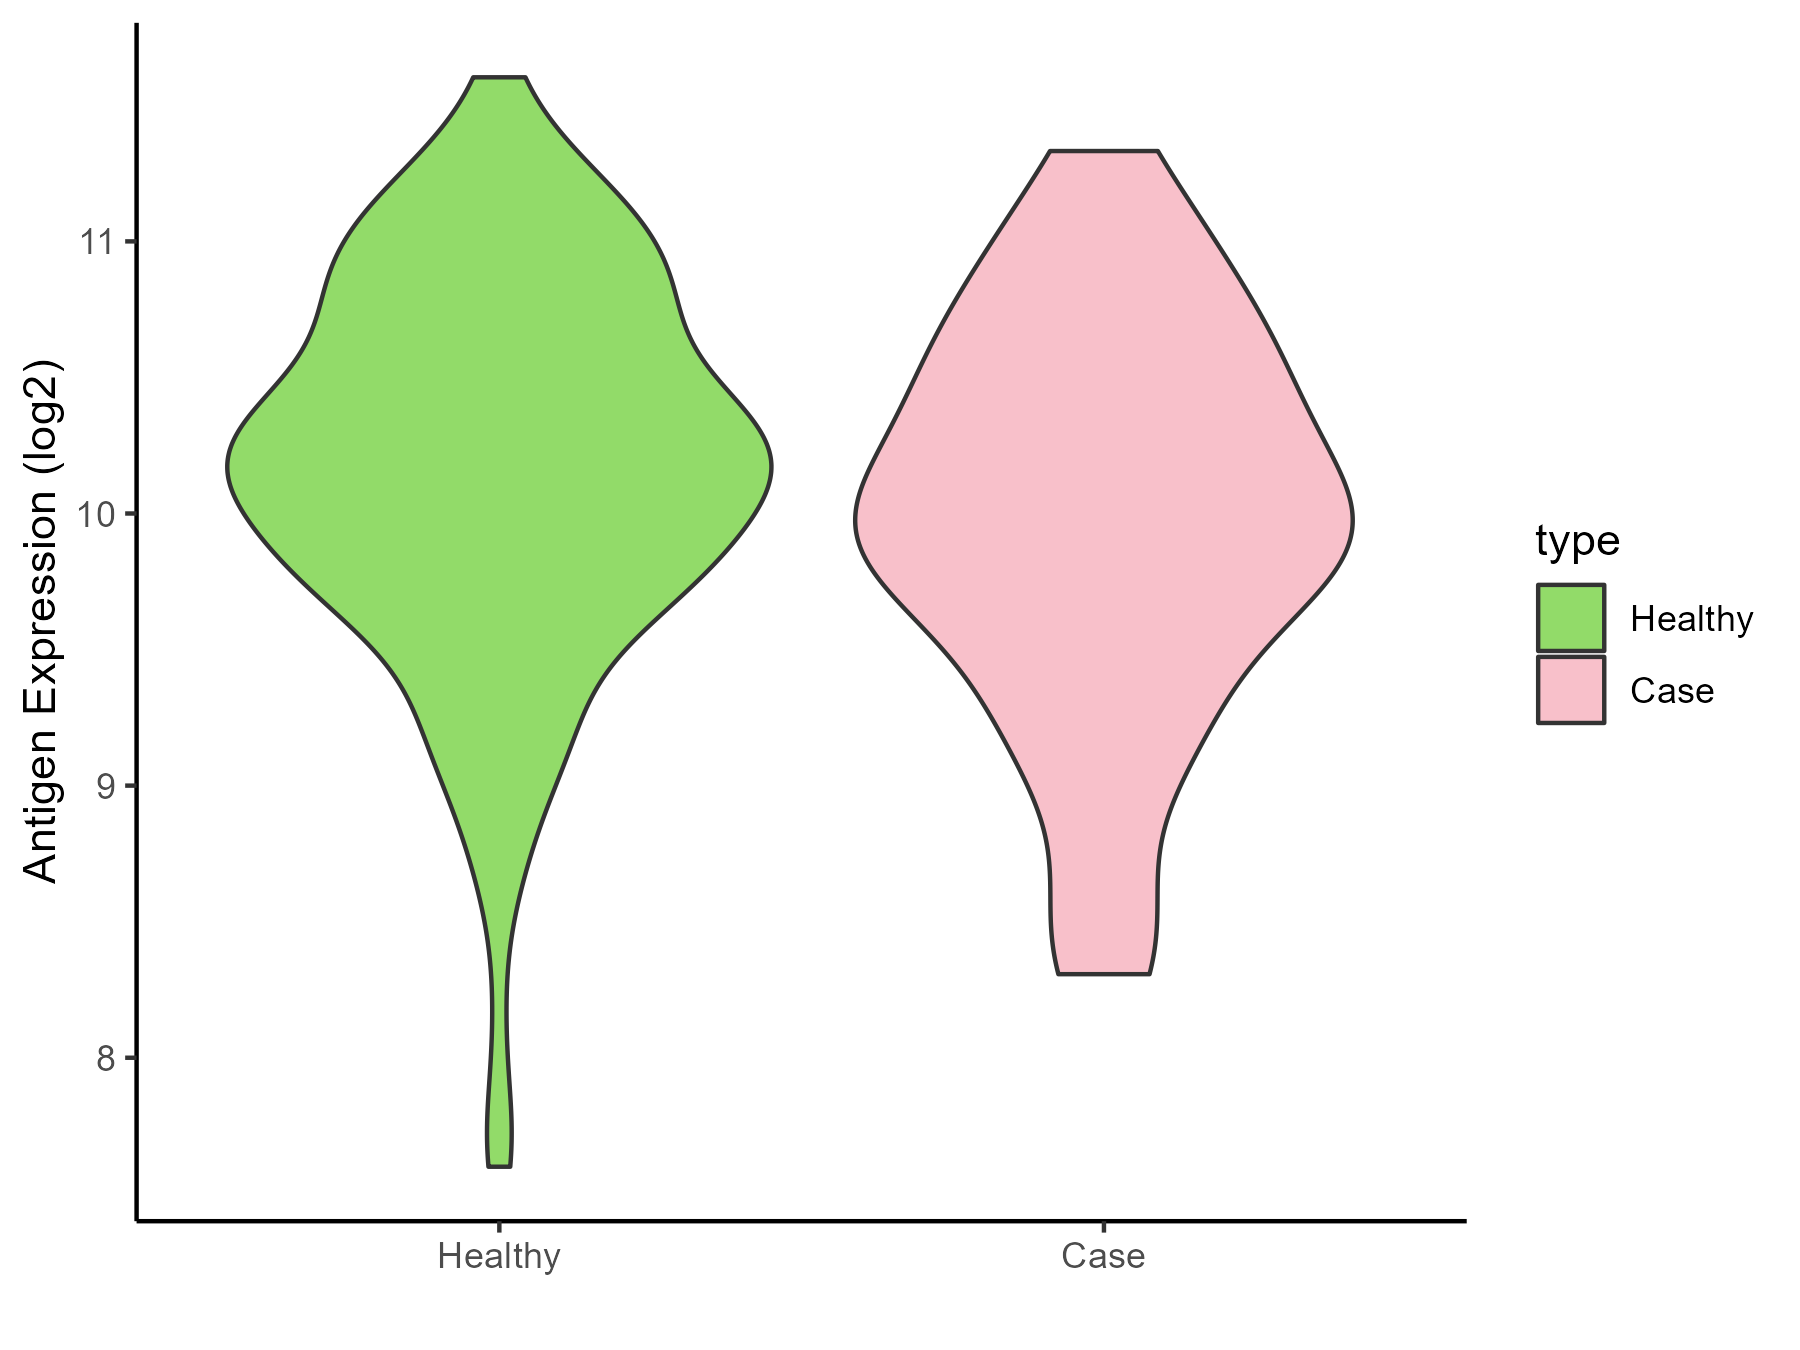
| The Studied Tissue | Small airway epithelium | |
| The Specific Disease | Chronic obstructive pulmonary disease | |
| The Expression Level of Disease Section Compare with the Healthy Individual Tissue | p-value: 0.144621822; Fold-change: -0.219427711; Z-score: -0.307452269 | |
| Disease-specific Antigen Abundances |
|
Click to View the Clearer Original Diagram |
| Differential expression pattern of antigen in diseases | ||
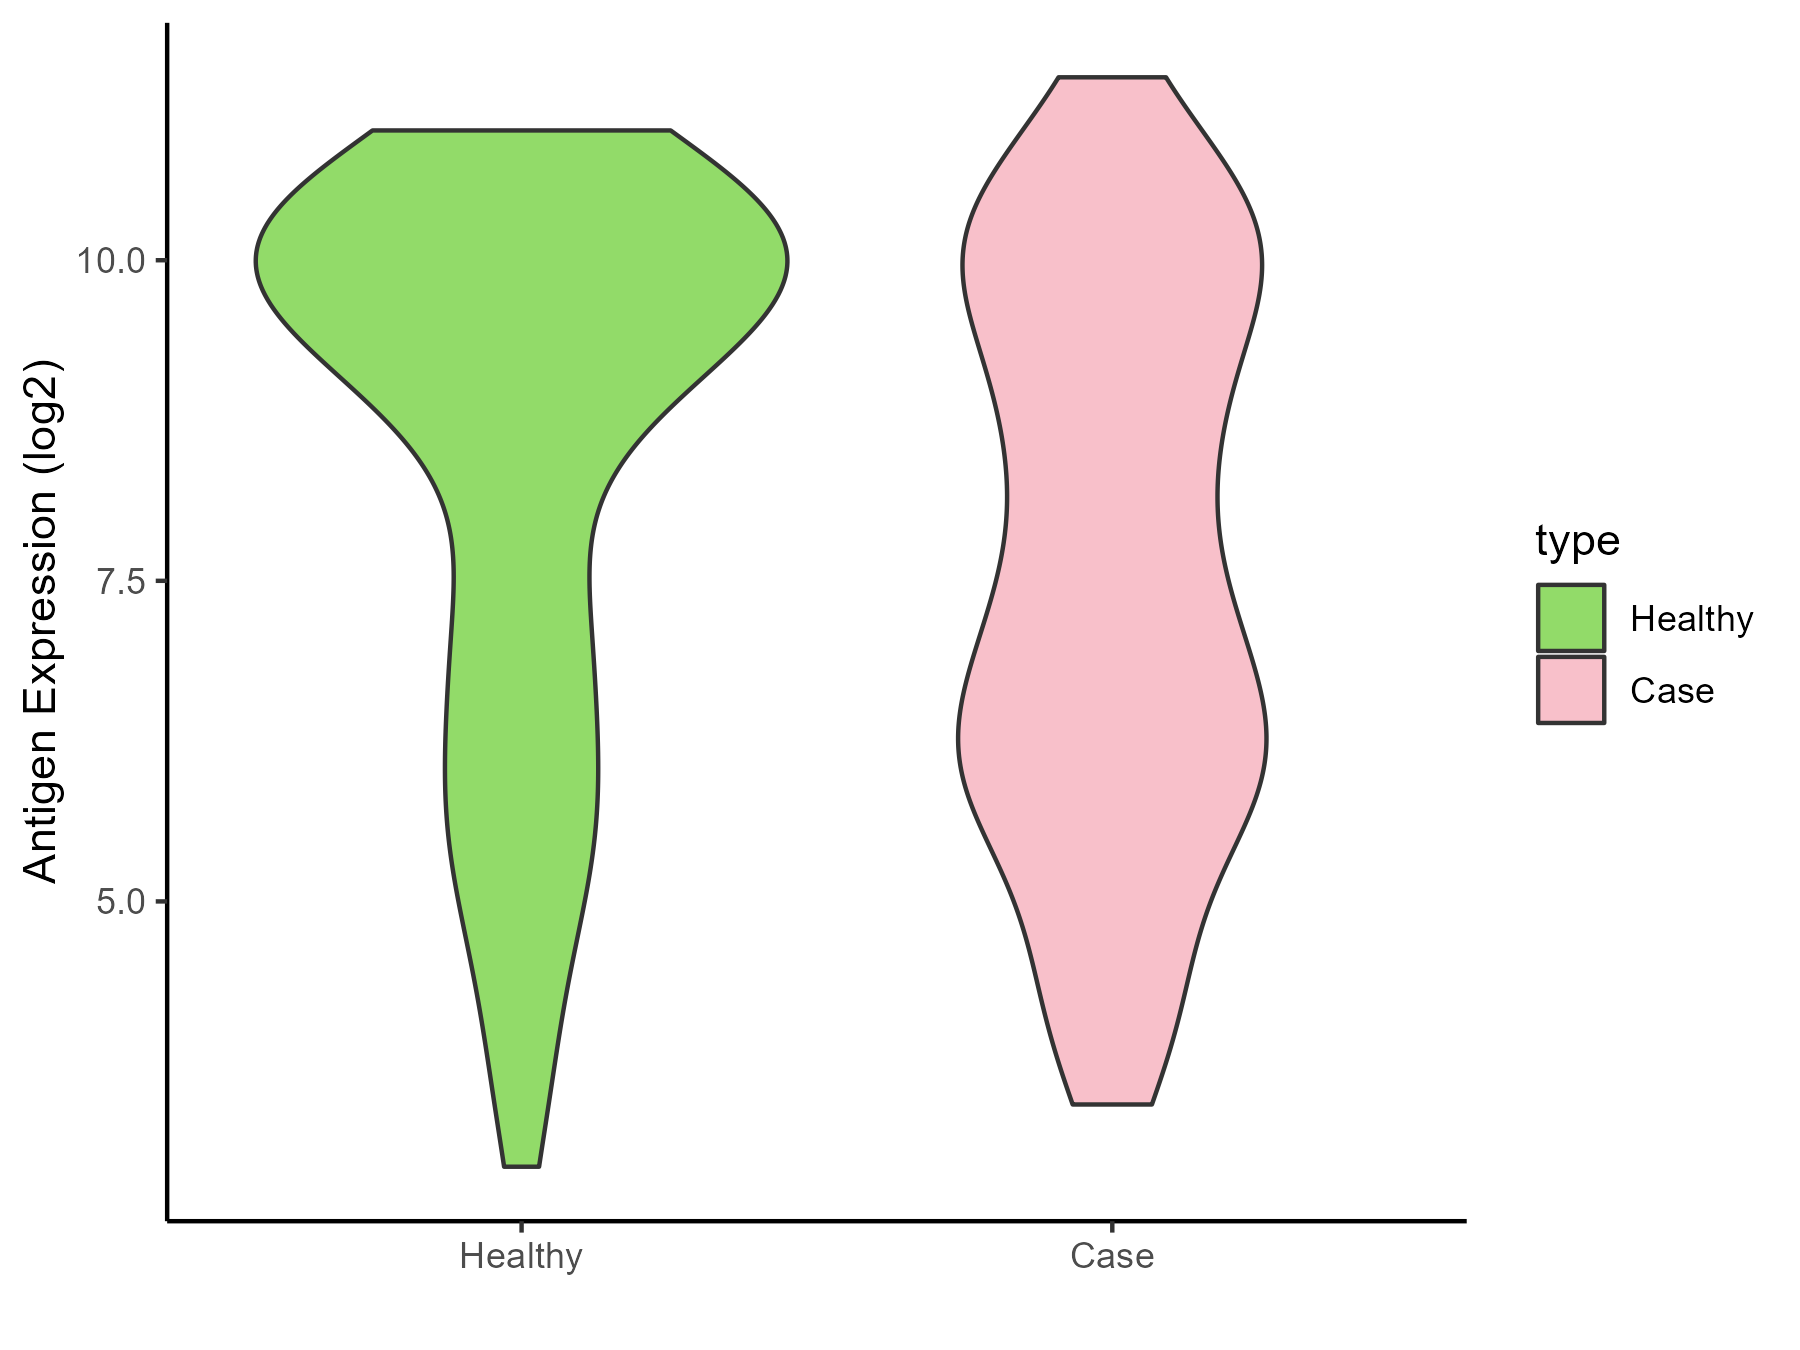
| The Studied Tissue | Nasal and bronchial airway | |
| The Specific Disease | Asthma | |
| The Expression Level of Disease Section Compare with the Healthy Individual Tissue | p-value: 0.000210833; Fold-change: -2.210117466; Z-score: -1.037802983 | |
| Disease-specific Antigen Abundances |
|
Click to View the Clearer Original Diagram |
| Differential expression pattern of antigen in diseases | ||
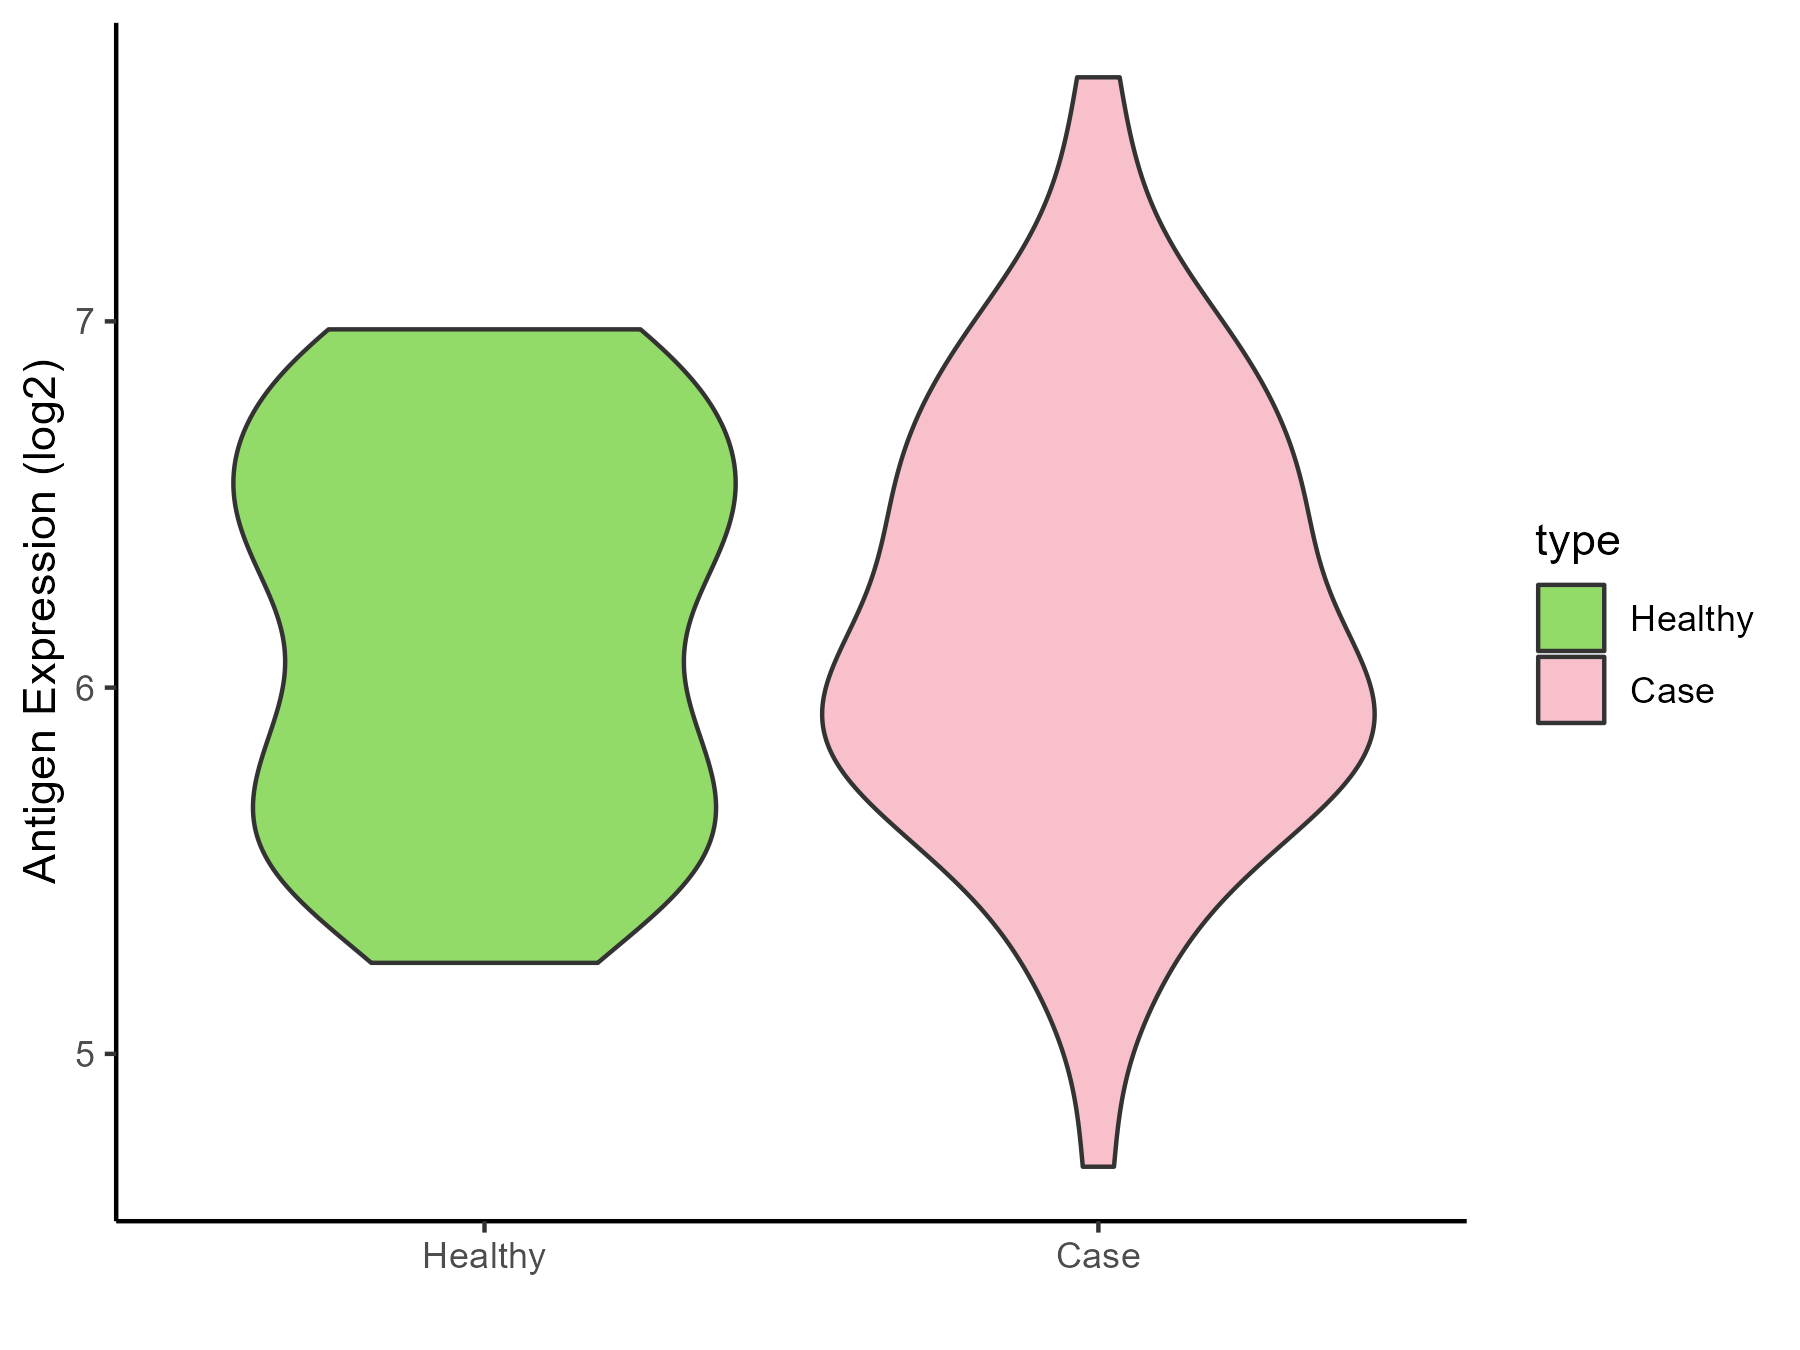
| The Studied Tissue | Nasal Epithelium | |
| The Specific Disease | Human rhinovirus infection | |
| The Expression Level of Disease Section Compare with the Healthy Individual Tissue | p-value: 0.861219023; Fold-change: -0.174022413; Z-score: -0.326437701 | |
| Disease-specific Antigen Abundances |
|
Click to View the Clearer Original Diagram |
| Differential expression pattern of antigen in diseases | ||
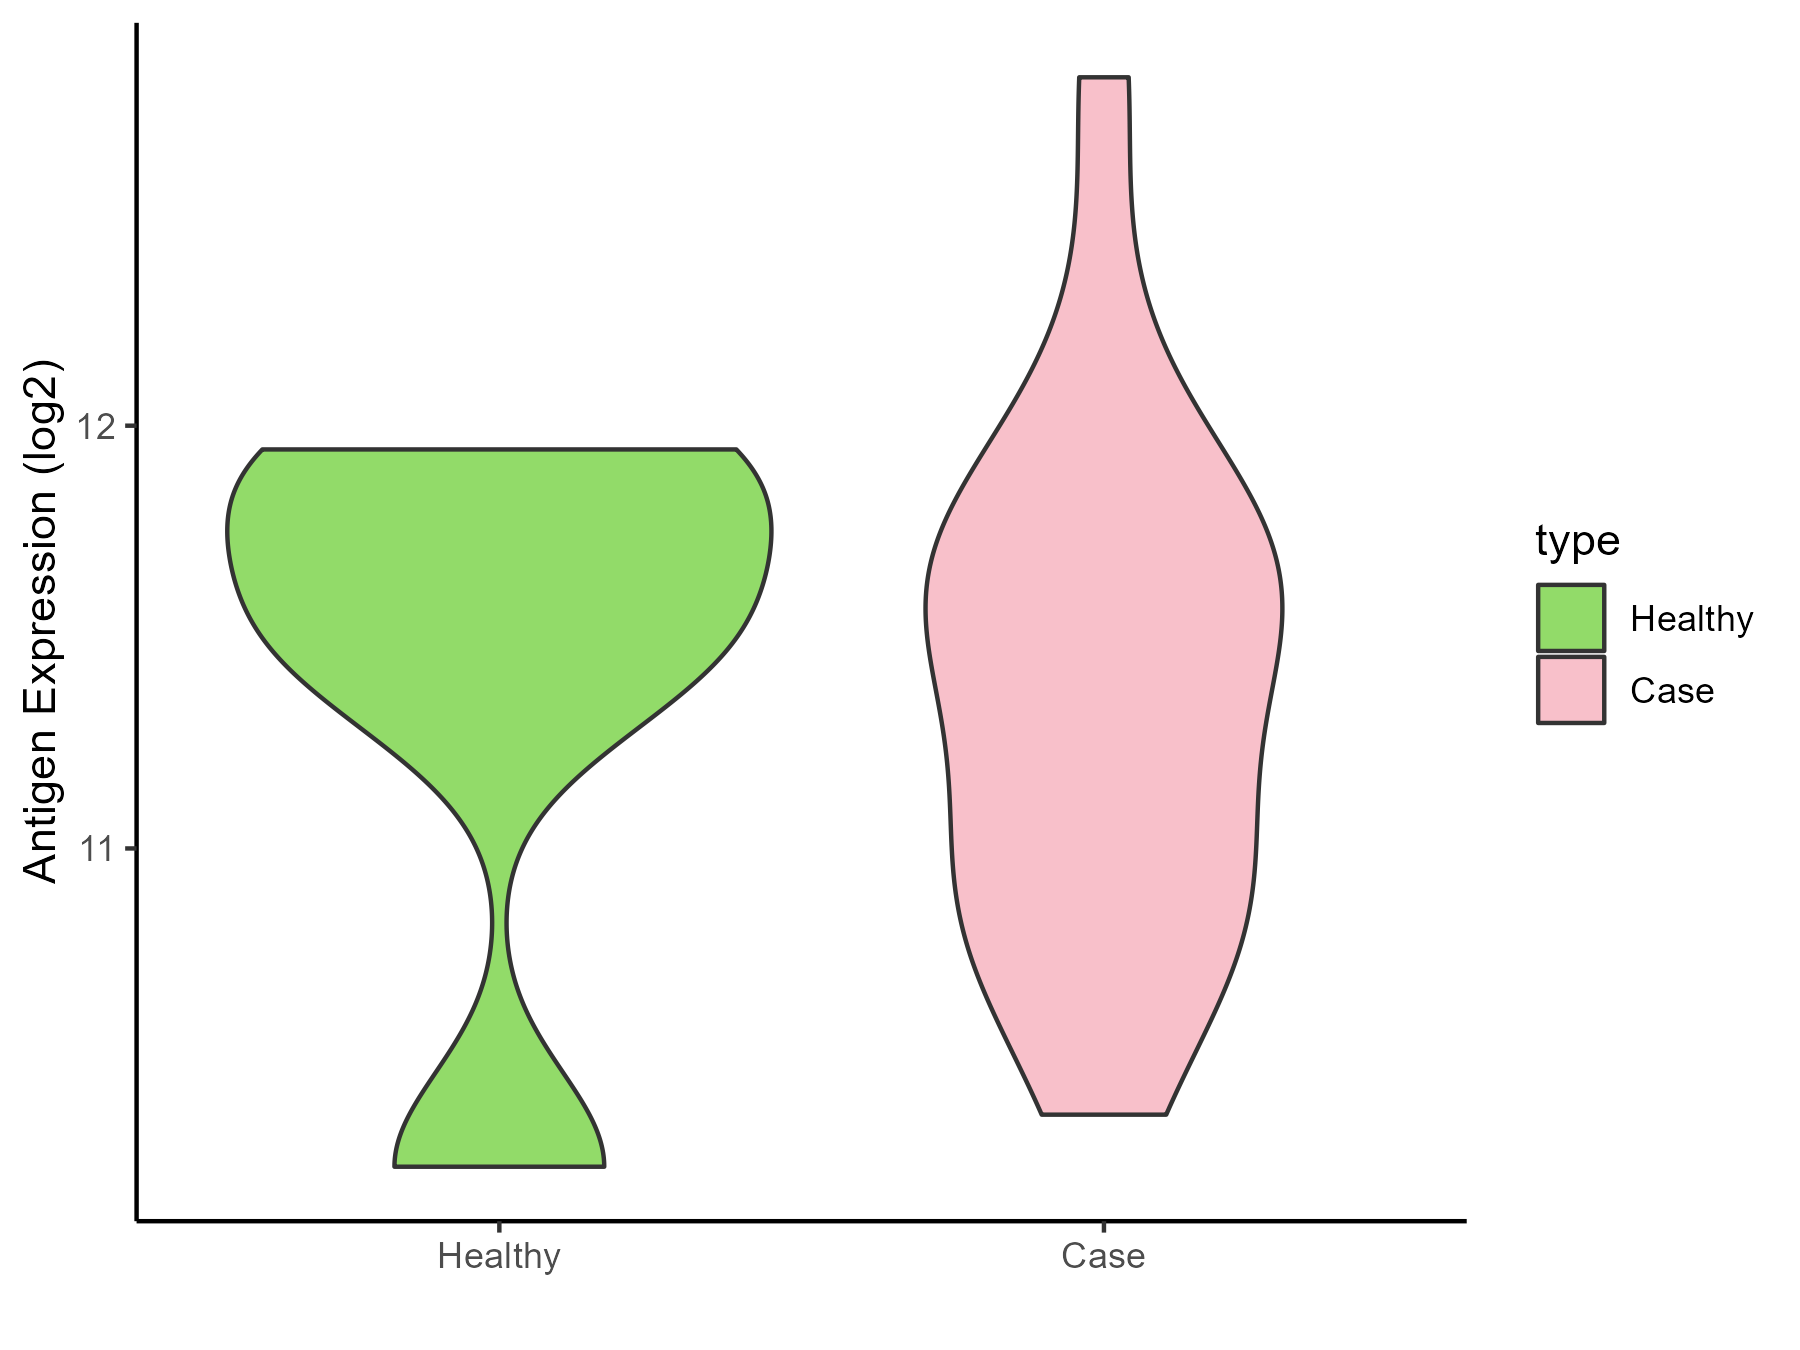
| The Studied Tissue | Lung | |
| The Specific Disease | Idiopathic pulmonary fibrosis | |
| The Expression Level of Disease Section Compare with the Healthy Individual Tissue | p-value: 0.925005444; Fold-change: -0.13509276; Z-score: -0.197170975 | |
| Disease-specific Antigen Abundances |
|
Click to View the Clearer Original Diagram |
ICD Disease Classification 13
| Differential expression pattern of antigen in diseases | ||
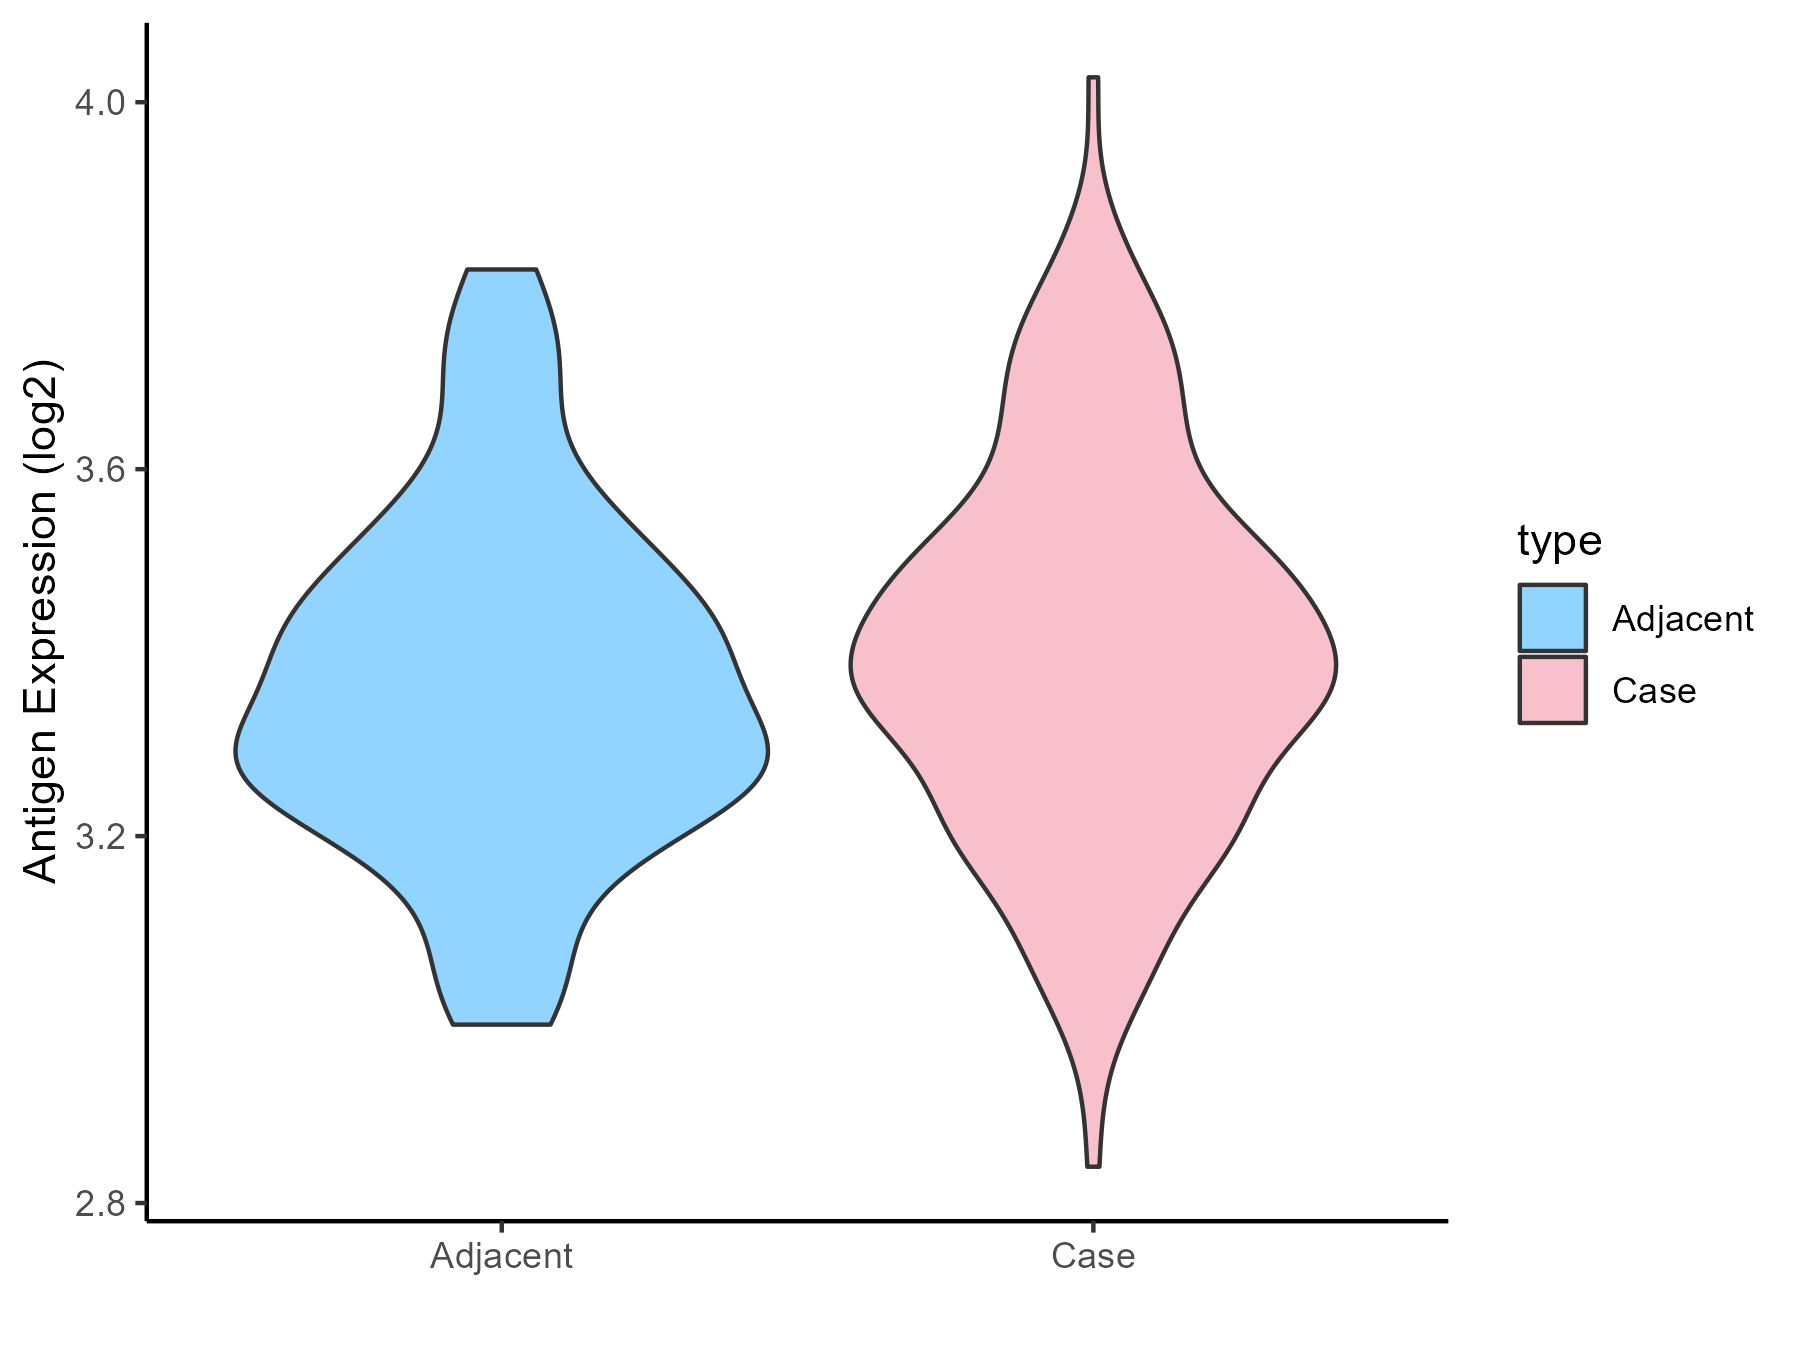
| The Studied Tissue | Gingival | |
| The Specific Disease | Periodontal disease | |
| The Expression Level of Disease Section Compare with the Adjacent Tissue | p-value: 0.20177116; Fold-change: 0.041910115; Z-score: 0.223946991 | |
| Disease-specific Antigen Abundances |
|
Click to View the Clearer Original Diagram |
| Differential expression pattern of antigen in diseases | ||
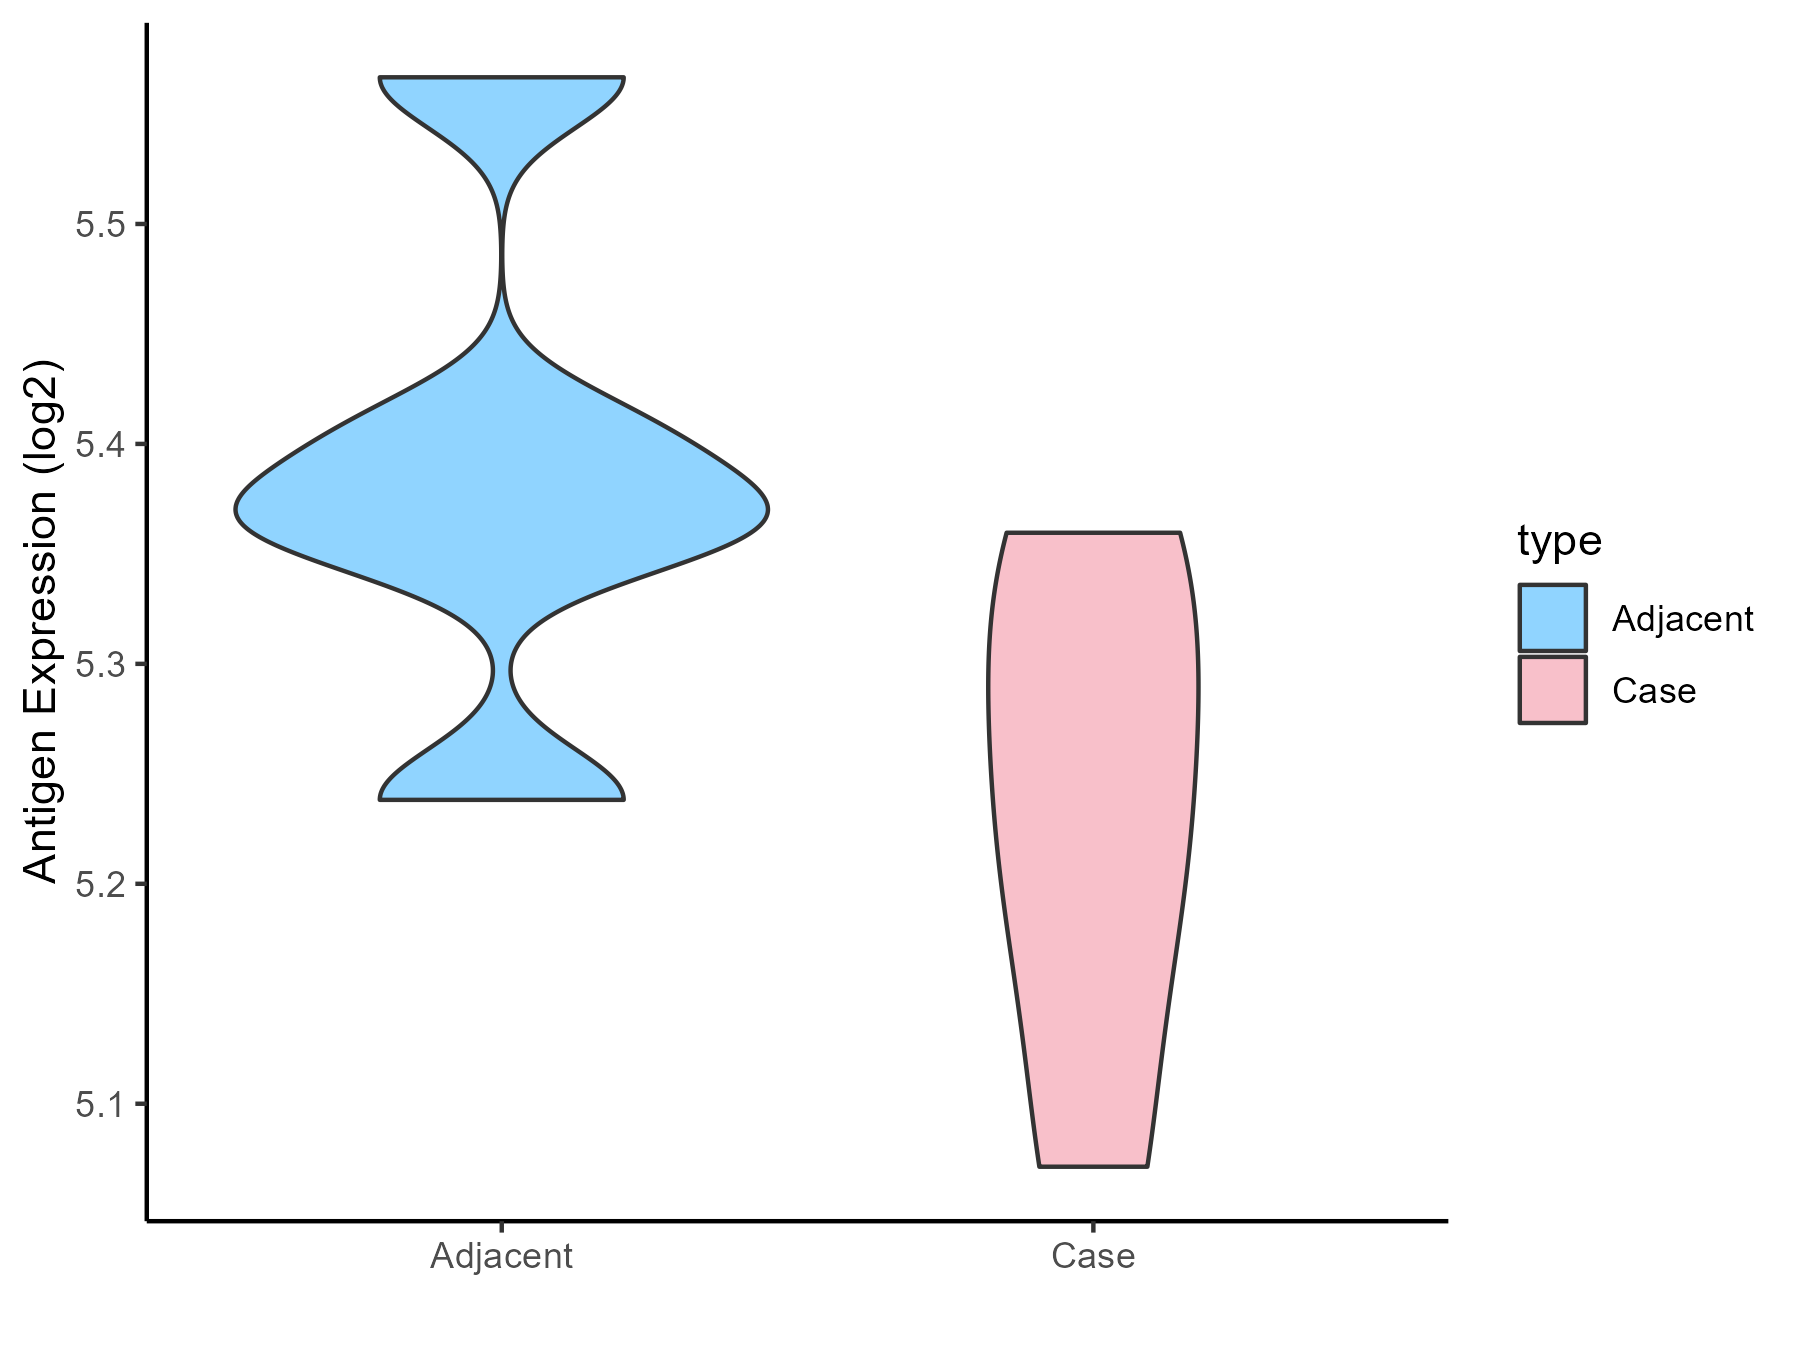
| The Studied Tissue | Gastric antrum | |
| The Specific Disease | Eosinophilic gastritis | |
| The Expression Level of Disease Section Compare with the Adjacent Tissue | p-value: 0.072050436; Fold-change: -0.129054293; Z-score: -1.091696673 | |
| Disease-specific Antigen Abundances |
|
Click to View the Clearer Original Diagram |
| Differential expression pattern of antigen in diseases | ||
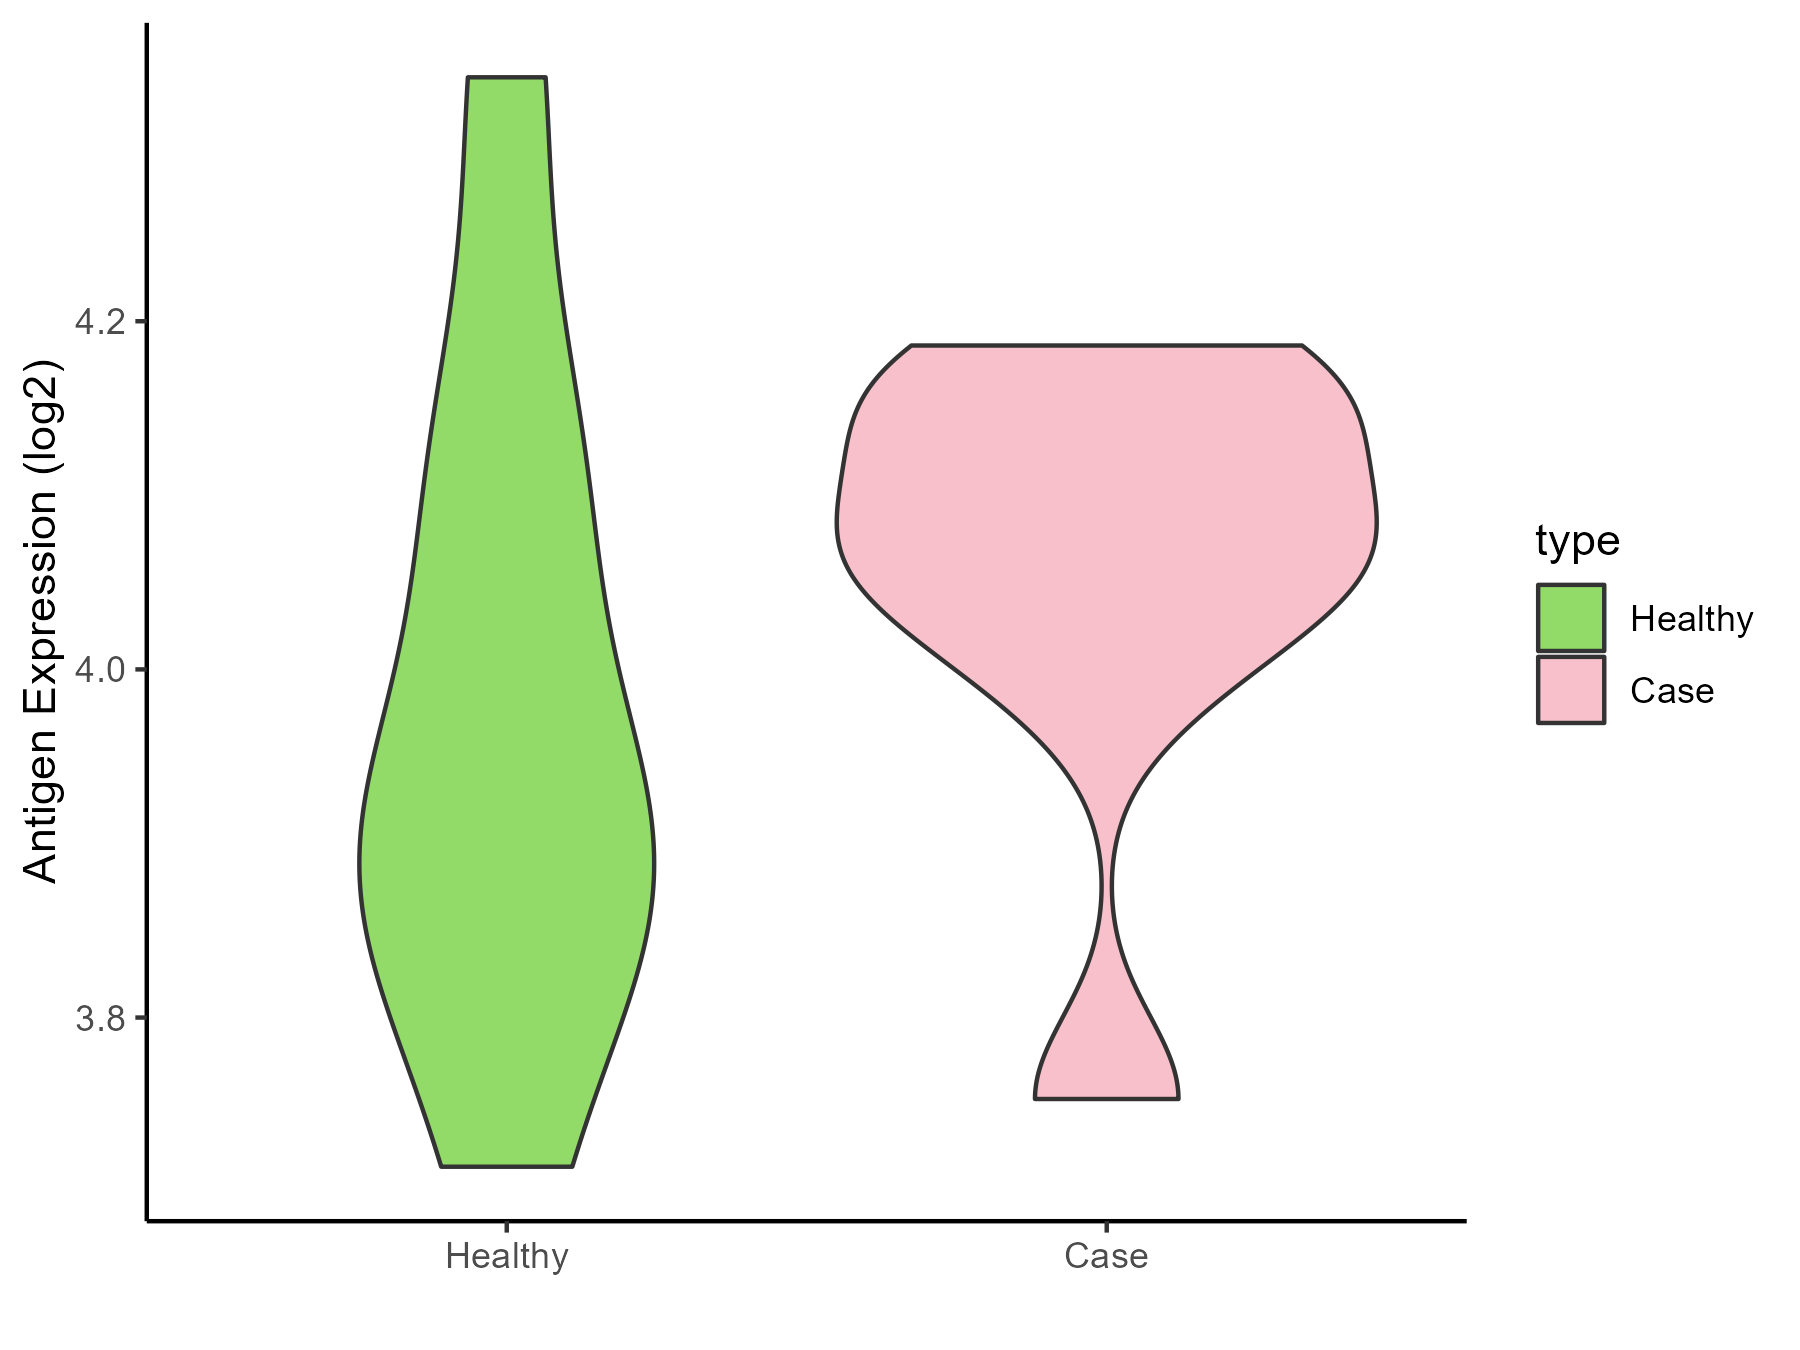
| The Studied Tissue | Liver | |
| The Specific Disease | Liver failure | |
| The Expression Level of Disease Section Compare with the Healthy Individual Tissue | p-value: 0.37143275; Fold-change: 0.168654765; Z-score: 0.86079855 | |
| Disease-specific Antigen Abundances |
|
Click to View the Clearer Original Diagram |
| Differential expression pattern of antigen in diseases | ||
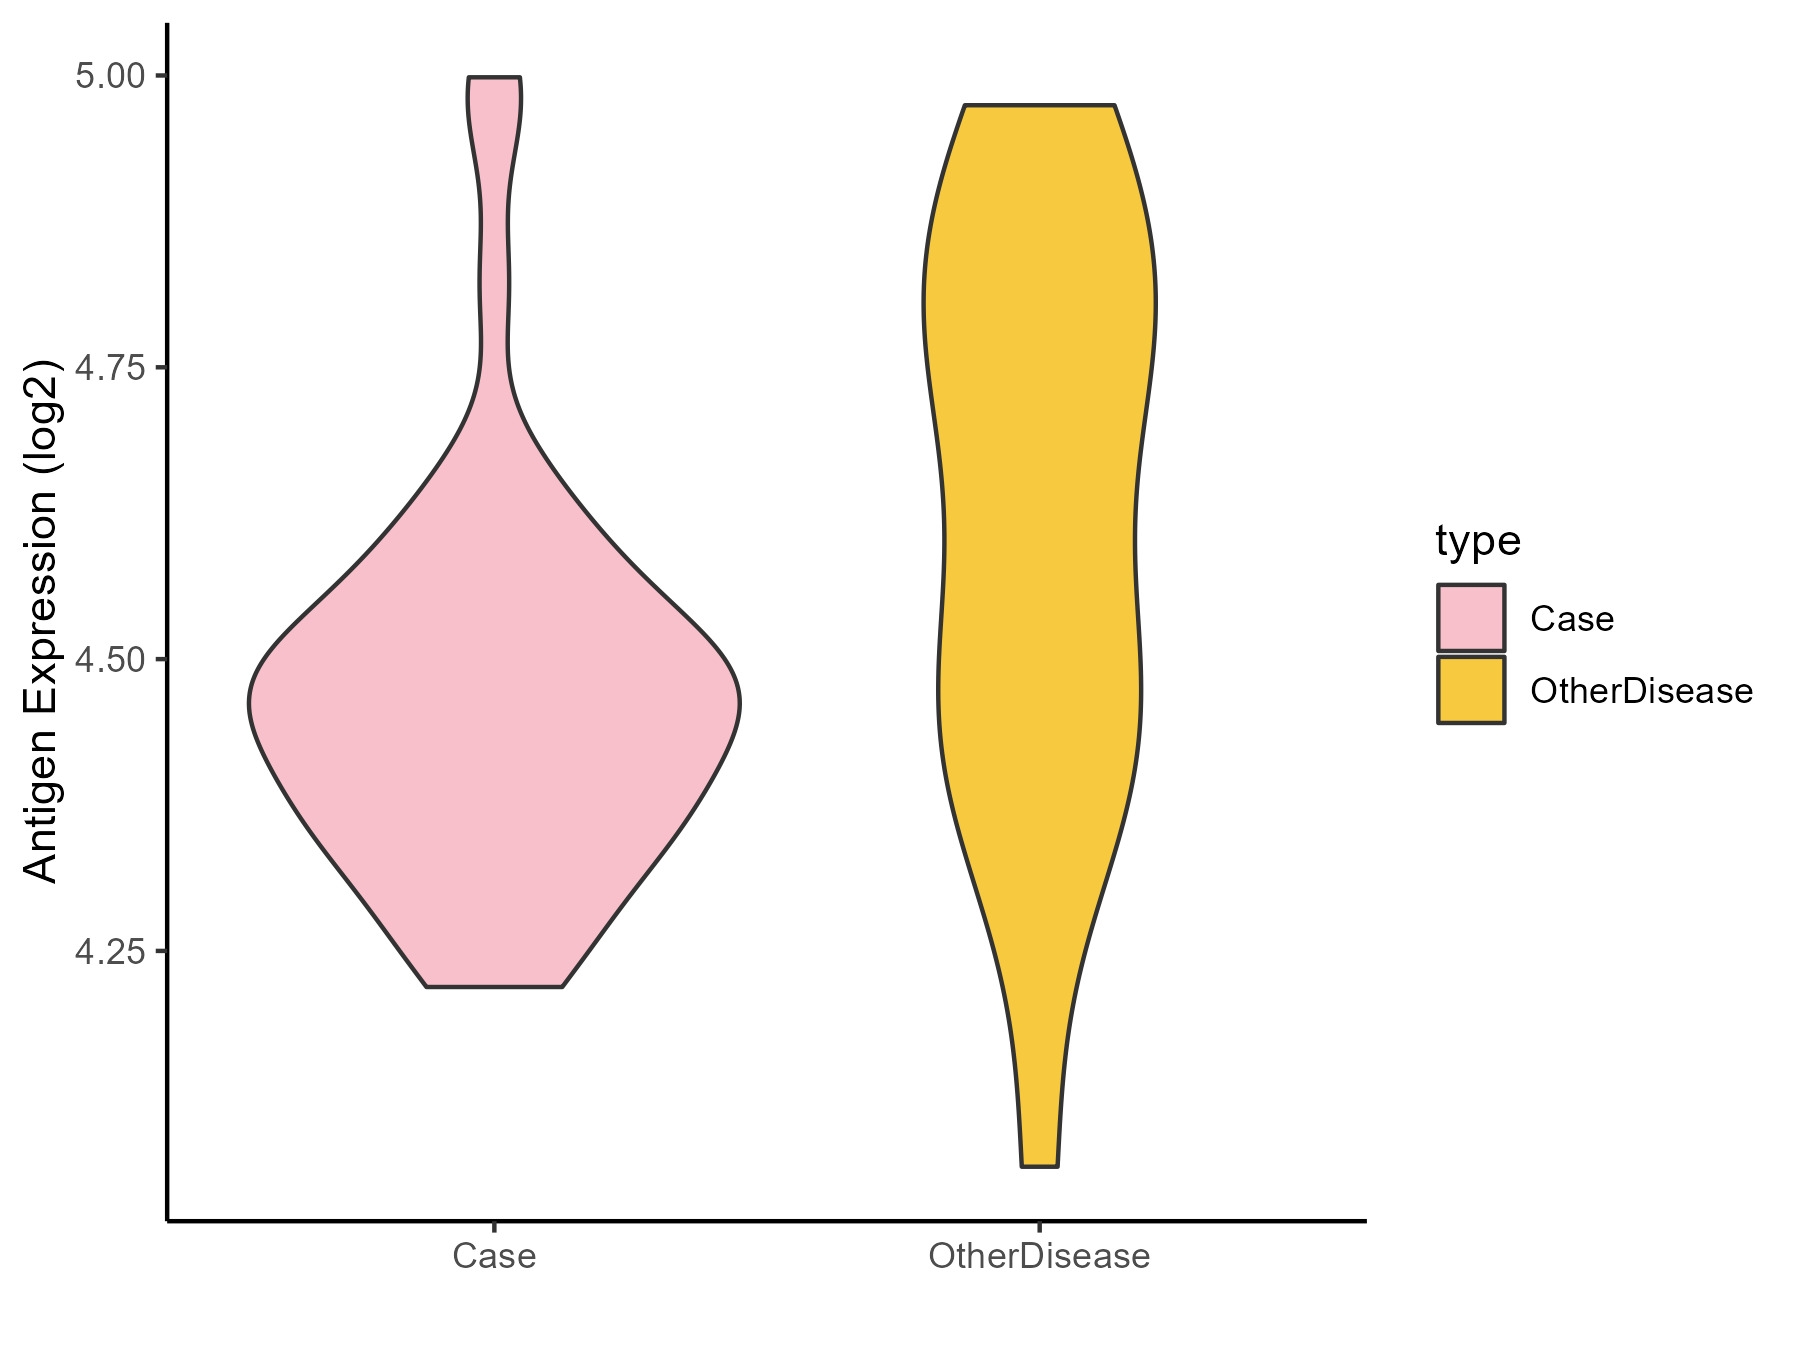
| The Studied Tissue | Colon mucosal | |
| The Specific Disease | Ulcerative colitis | |
| The Expression Level of Disease Section Compare with the Adjacent Tissue | p-value: 0.024342562; Fold-change: -0.220337439; Z-score: -0.874712498 | |
| Disease-specific Antigen Abundances |
|
Click to View the Clearer Original Diagram |
| Differential expression pattern of antigen in diseases | ||
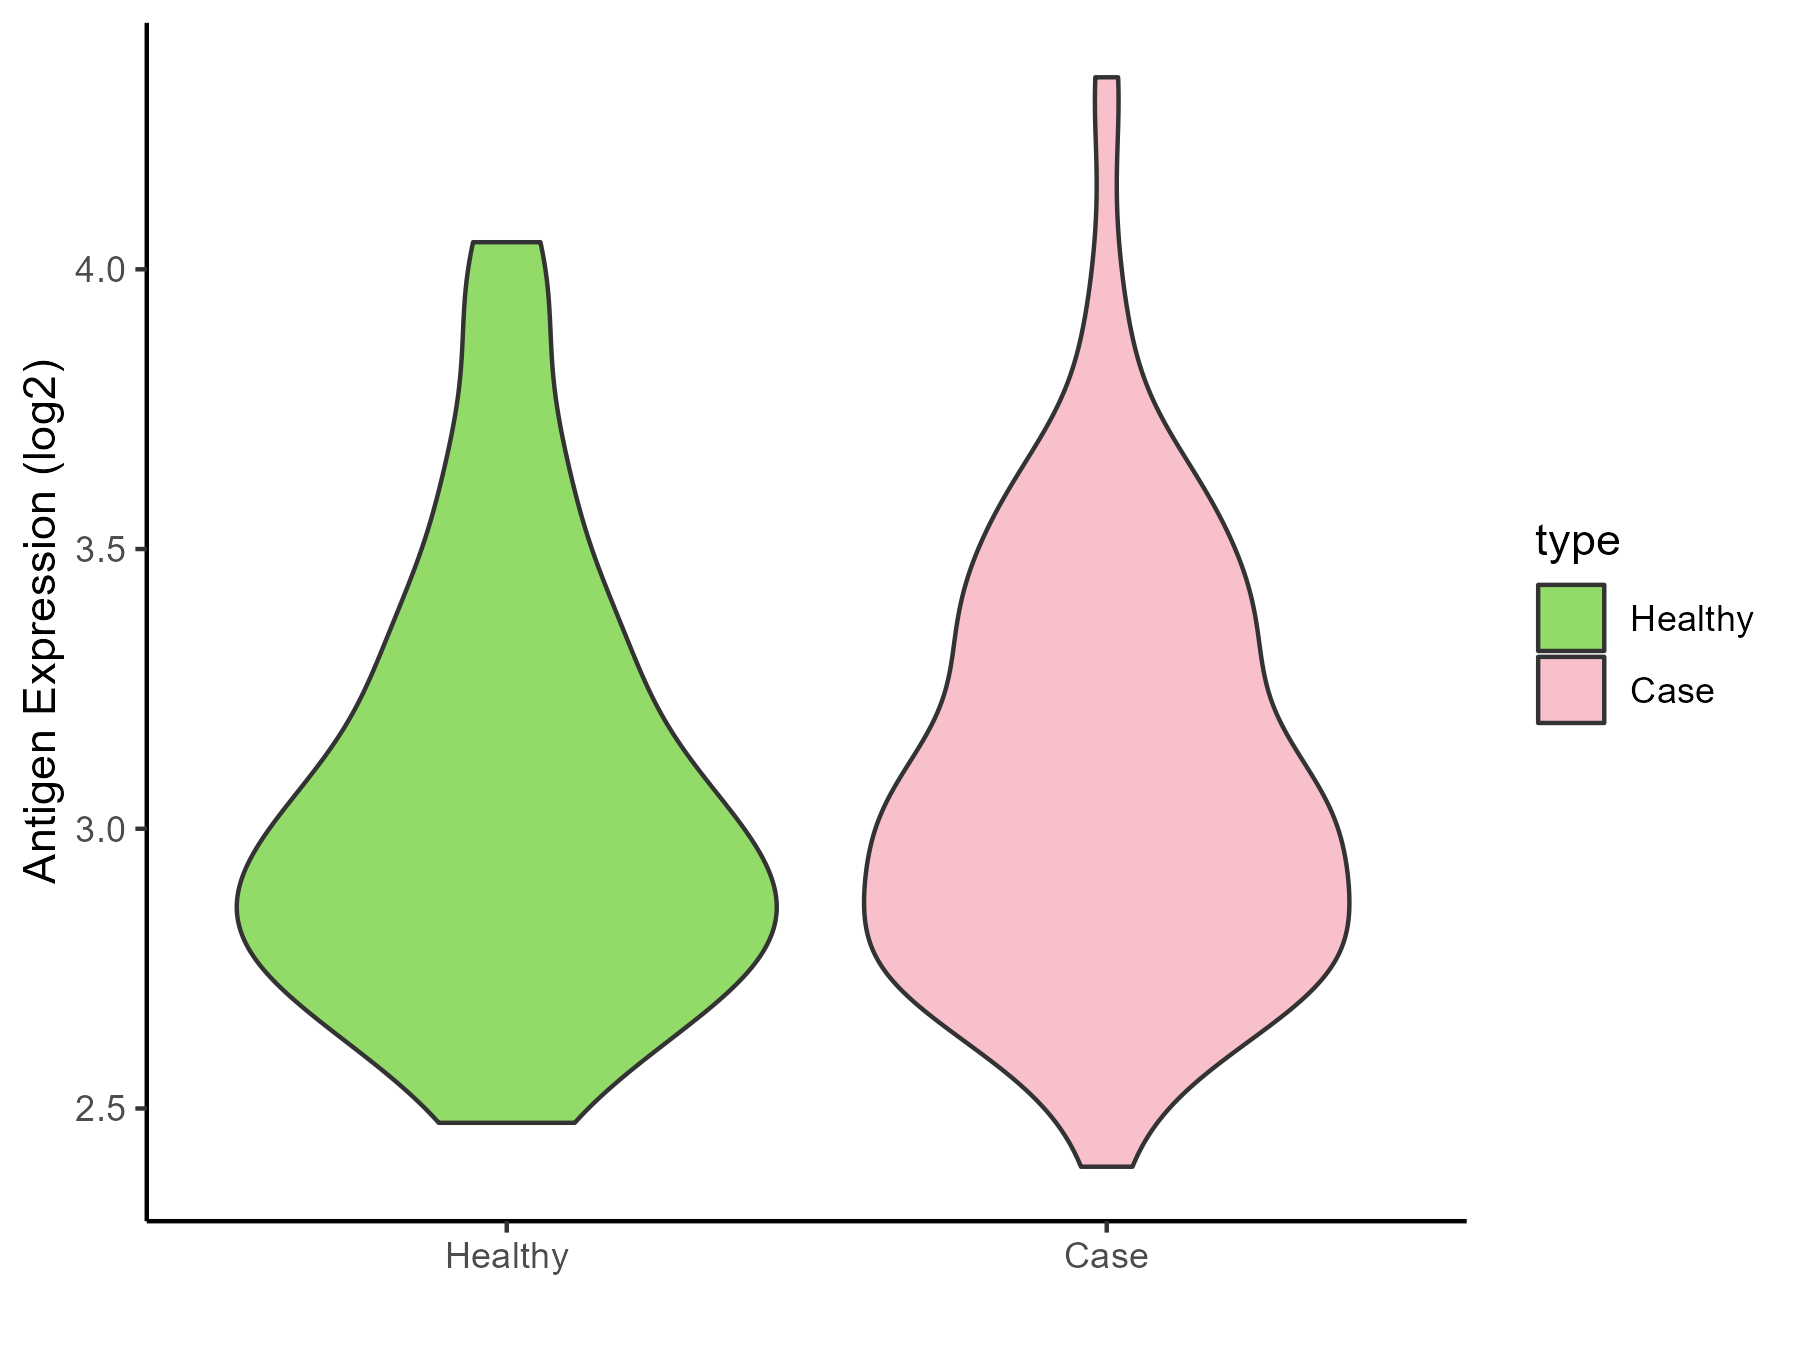
| The Studied Tissue | Rectal colon | |
| The Specific Disease | Irritable bowel syndrome | |
| The Expression Level of Disease Section Compare with the Healthy Individual Tissue | p-value: 0.558772868; Fold-change: 0.062669581; Z-score: 0.165448638 | |
| Disease-specific Antigen Abundances |
|
Click to View the Clearer Original Diagram |
ICD Disease Classification 14
| Differential expression pattern of antigen in diseases | ||
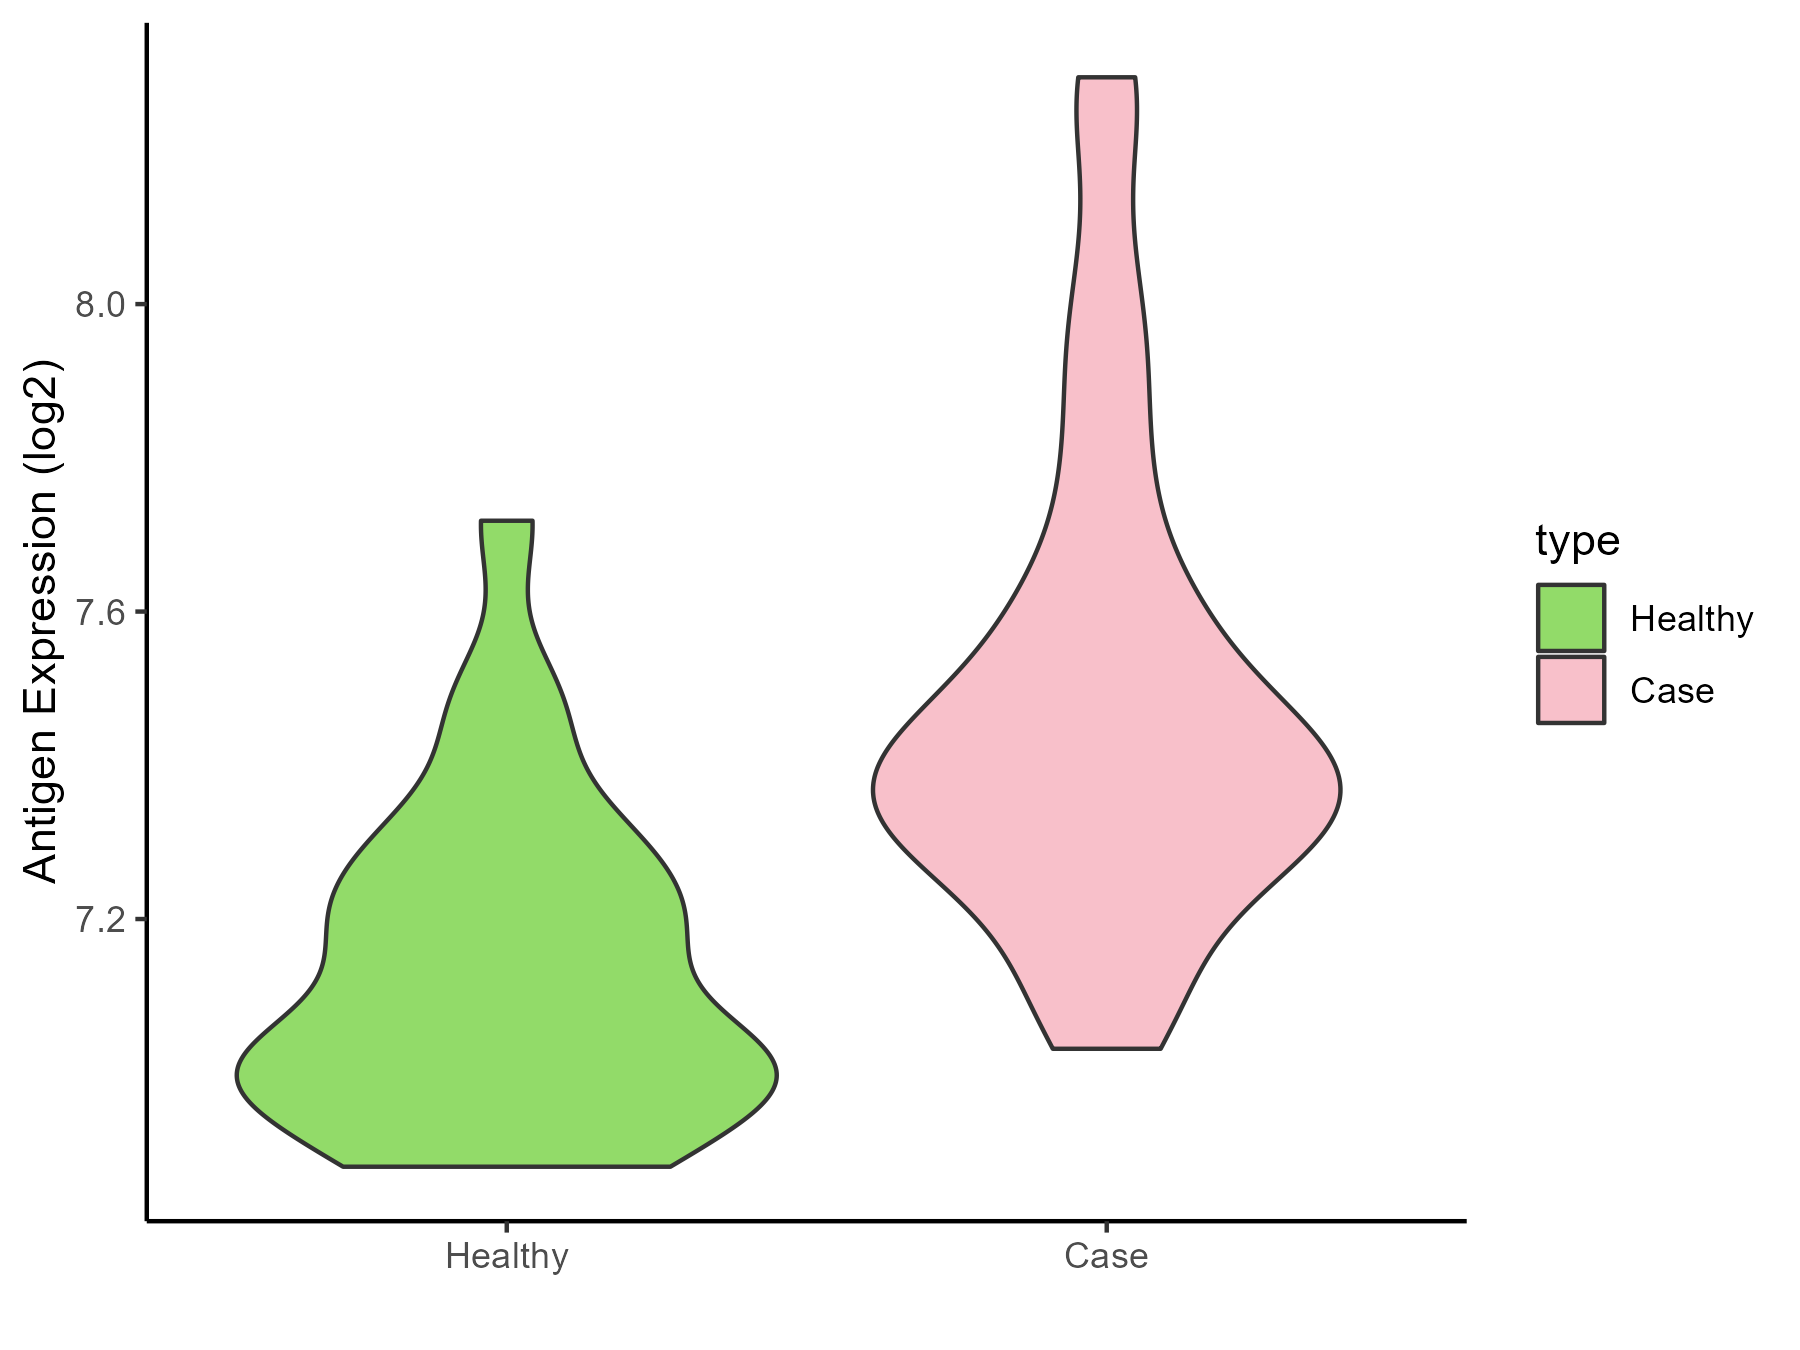
| The Studied Tissue | Skin | |
| The Specific Disease | Atopic dermatitis | |
| The Expression Level of Disease Section Compare with the Healthy Individual Tissue | p-value: 1.96E-06; Fold-change: 0.388959152; Z-score: 1.820083821 | |
| Disease-specific Antigen Abundances |
|
Click to View the Clearer Original Diagram |
| Differential expression pattern of antigen in diseases | ||
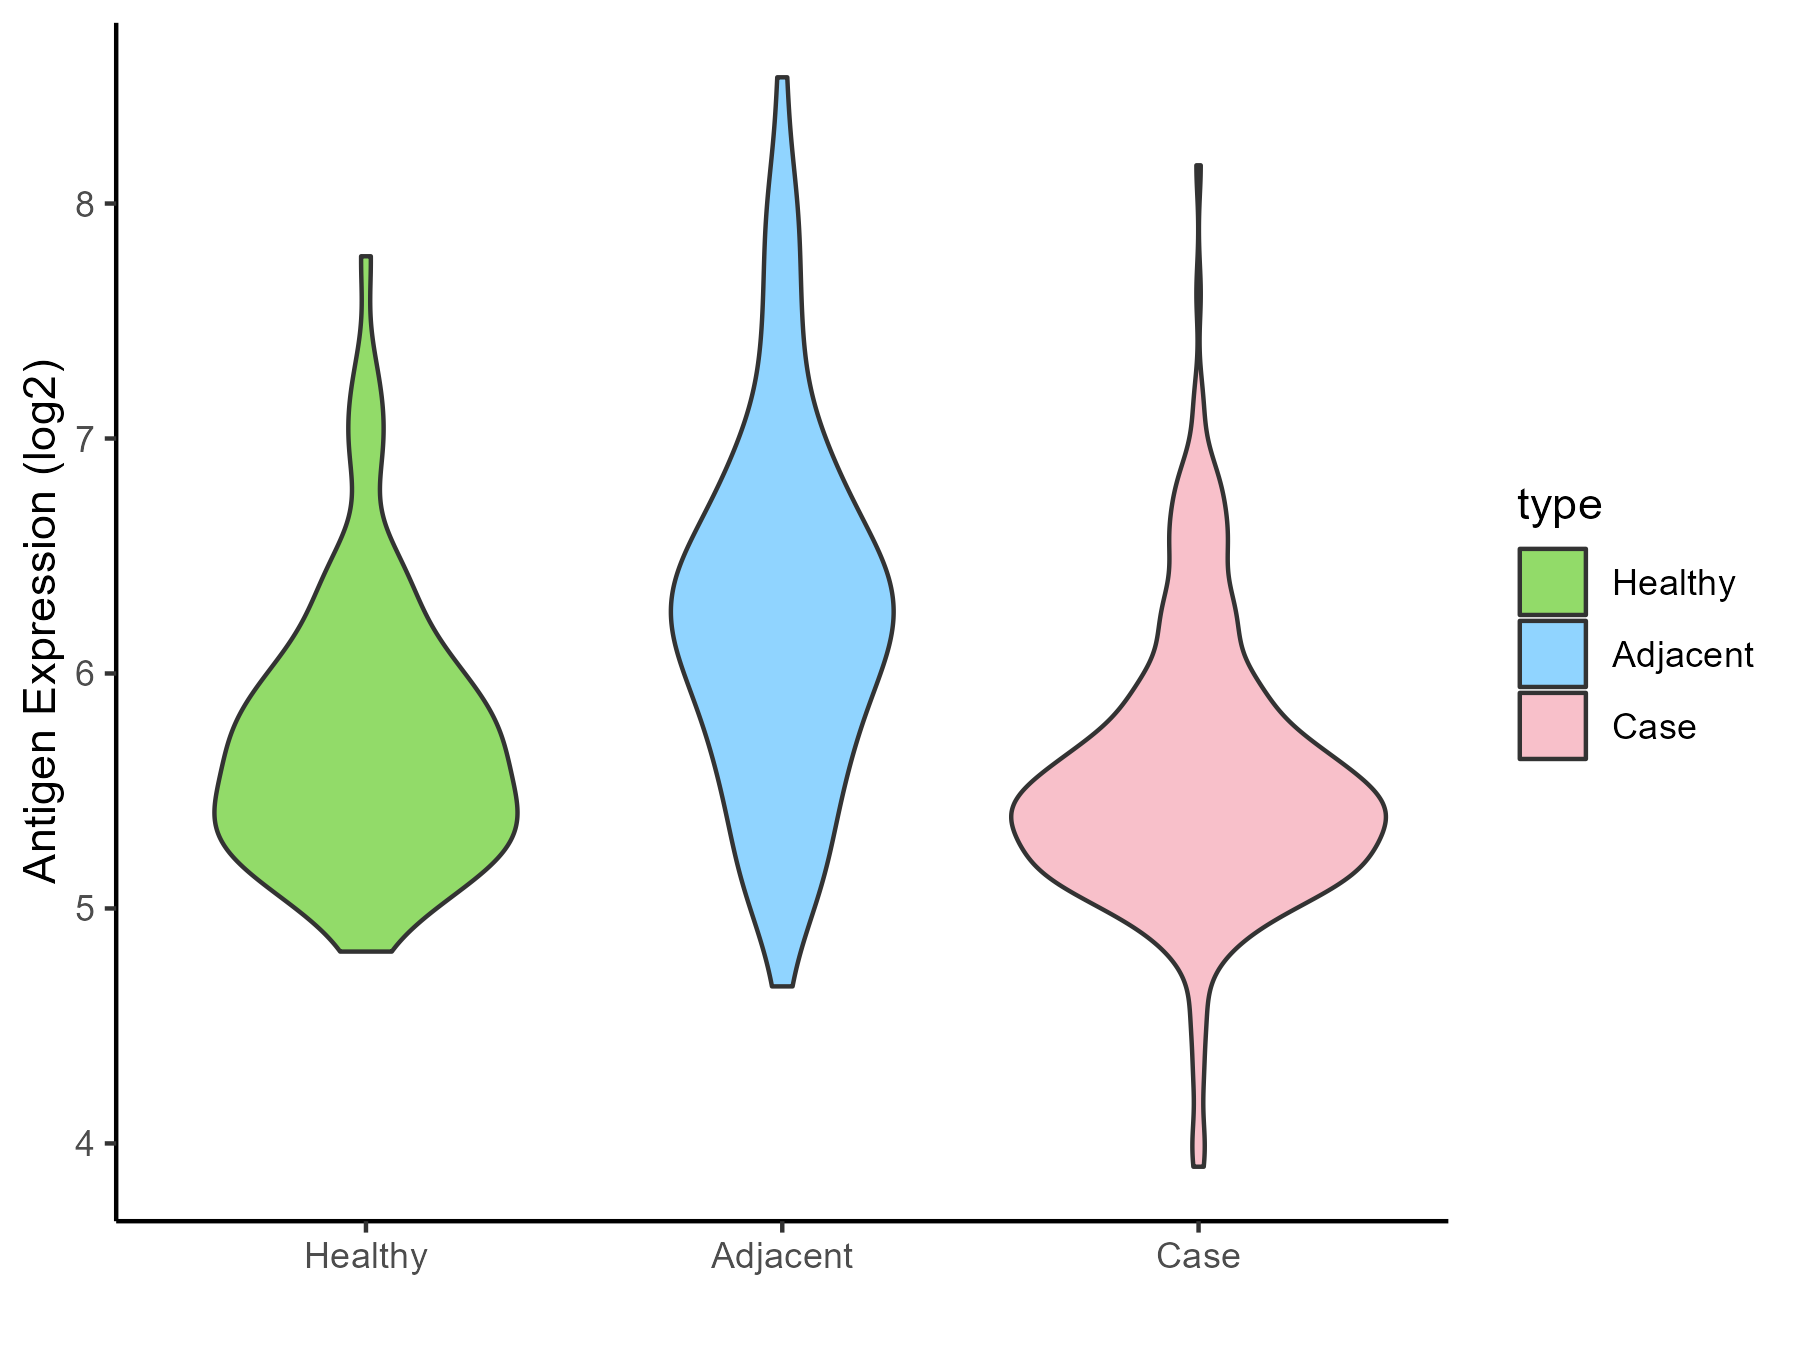
| The Studied Tissue | Skin | |
| The Specific Disease | Psoriasis | |
| The Expression Level of Disease Section Compare with the Healthy Individual Tissue | p-value: 0.011823318; Fold-change: -0.200934447; Z-score: -0.3592176 | |
| The Expression Level of Disease Section Compare with the Adjacent Tissue | p-value: 3.70E-12; Fold-change: -0.77253655; Z-score: -1.006485826 | |
| Disease-specific Antigen Abundances |
|
Click to View the Clearer Original Diagram |
| Differential expression pattern of antigen in diseases | ||
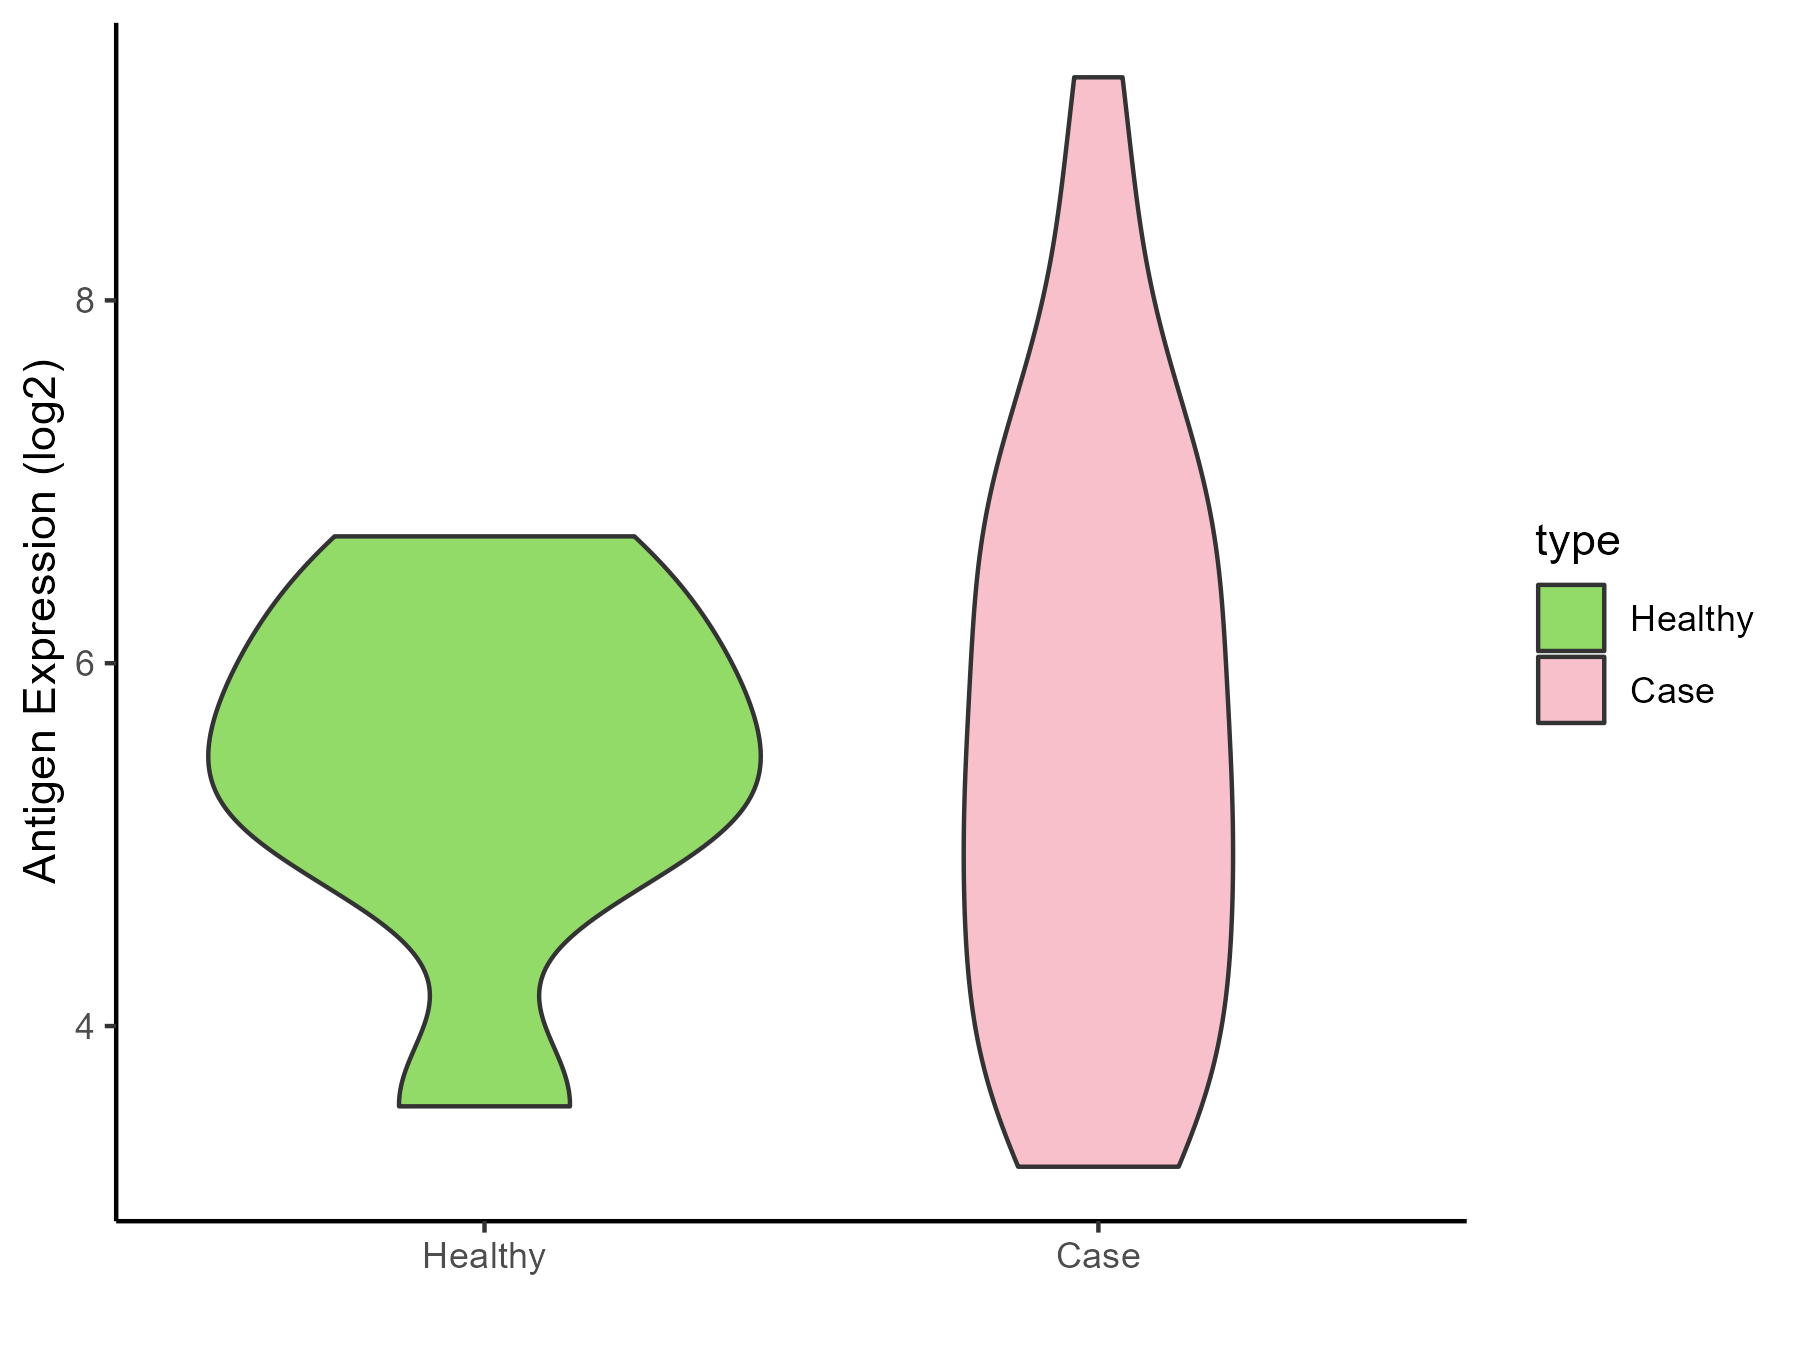
| The Studied Tissue | Skin | |
| The Specific Disease | Vitiligo | |
| The Expression Level of Disease Section Compare with the Healthy Individual Tissue | p-value: 0.738826449; Fold-change: -0.225100449; Z-score: -0.221206389 | |
| Disease-specific Antigen Abundances |
|
Click to View the Clearer Original Diagram |
| Differential expression pattern of antigen in diseases | ||
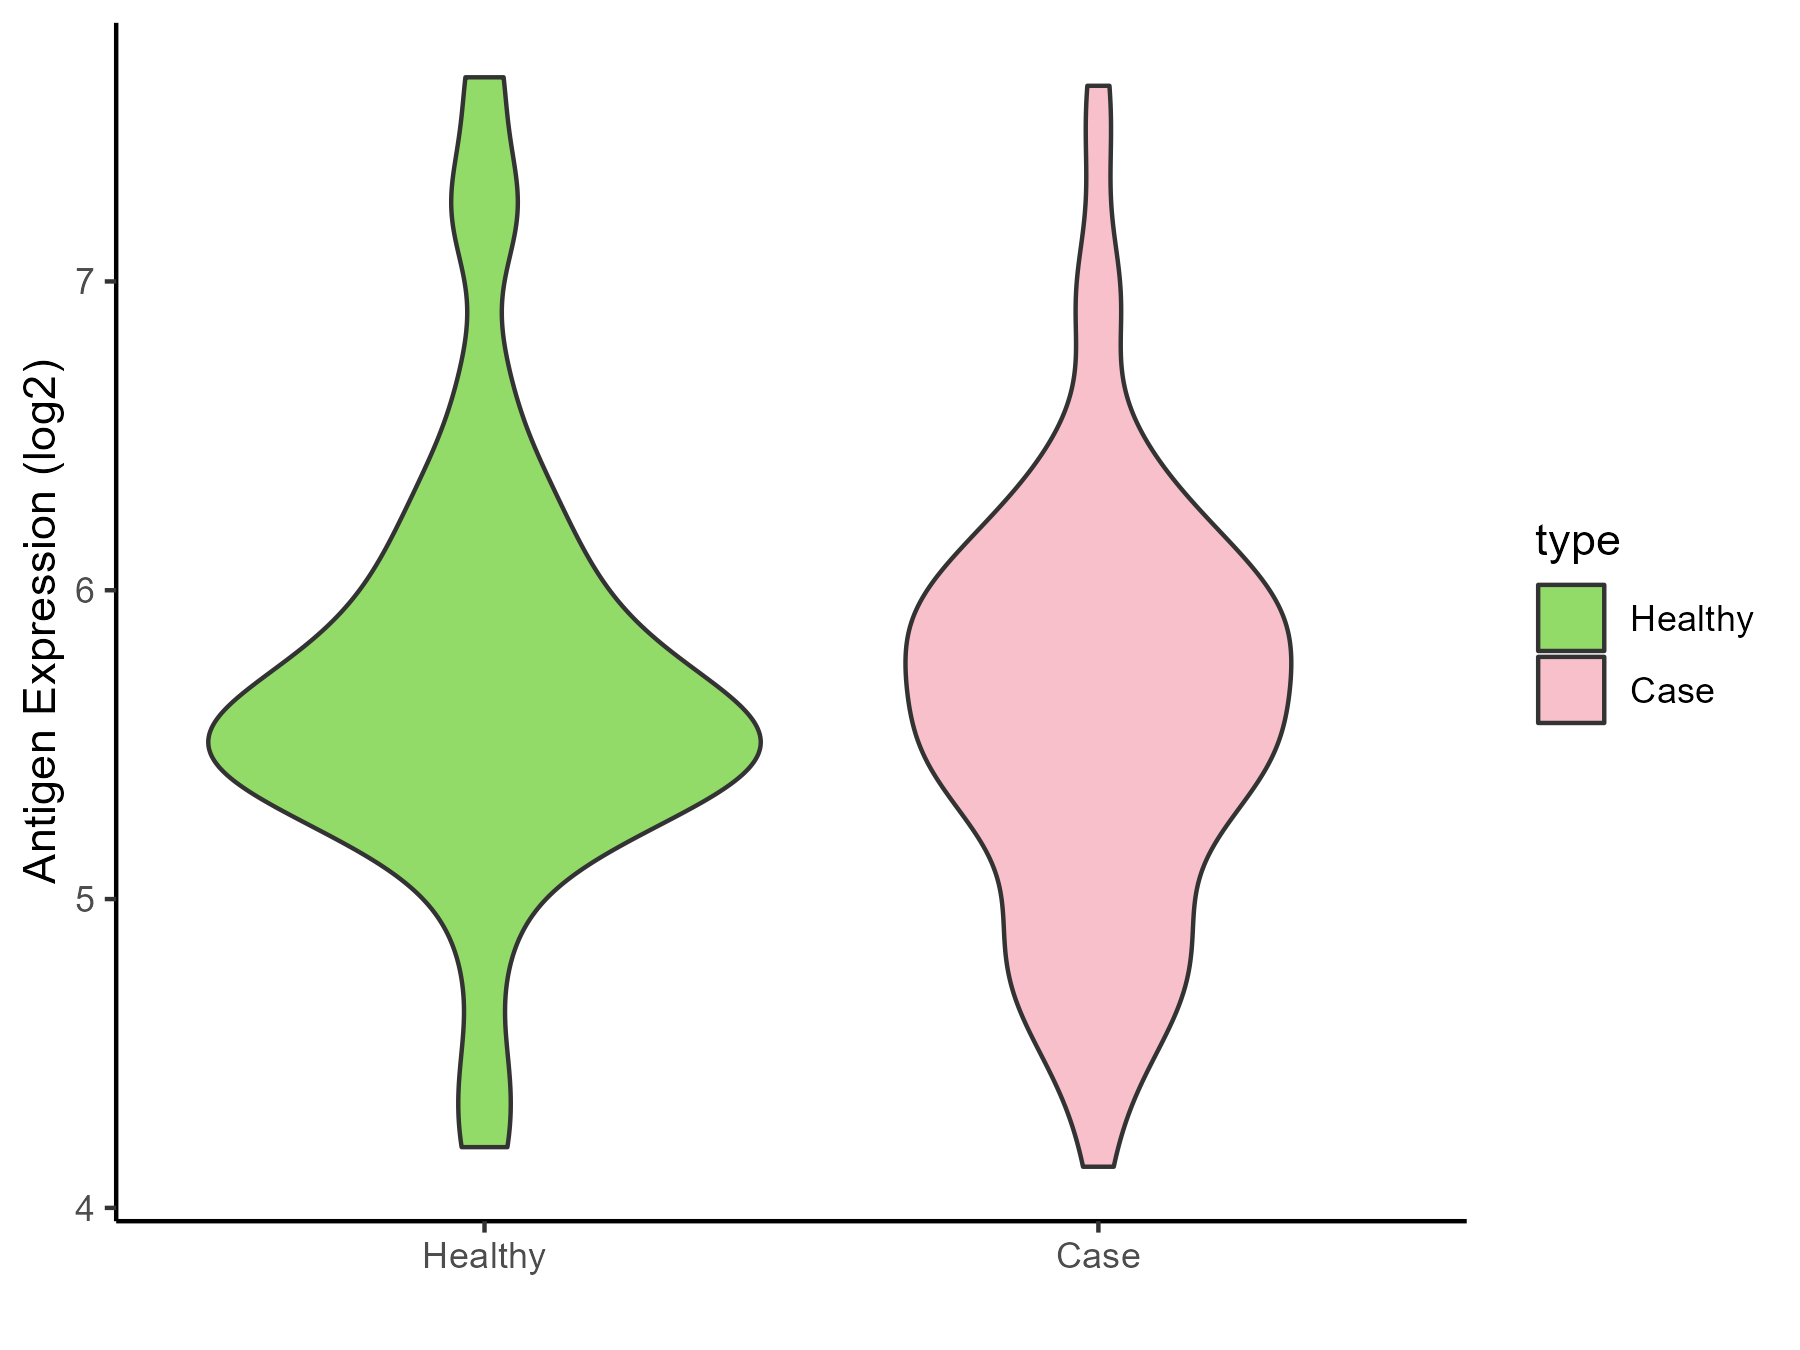
| The Studied Tissue | Skin from scalp | |
| The Specific Disease | Alopecia | |
| The Expression Level of Disease Section Compare with the Healthy Individual Tissue | p-value: 0.418258918; Fold-change: 0.033435995; Z-score: 0.048695121 | |
| Disease-specific Antigen Abundances |
|
Click to View the Clearer Original Diagram |
| Differential expression pattern of antigen in diseases | ||
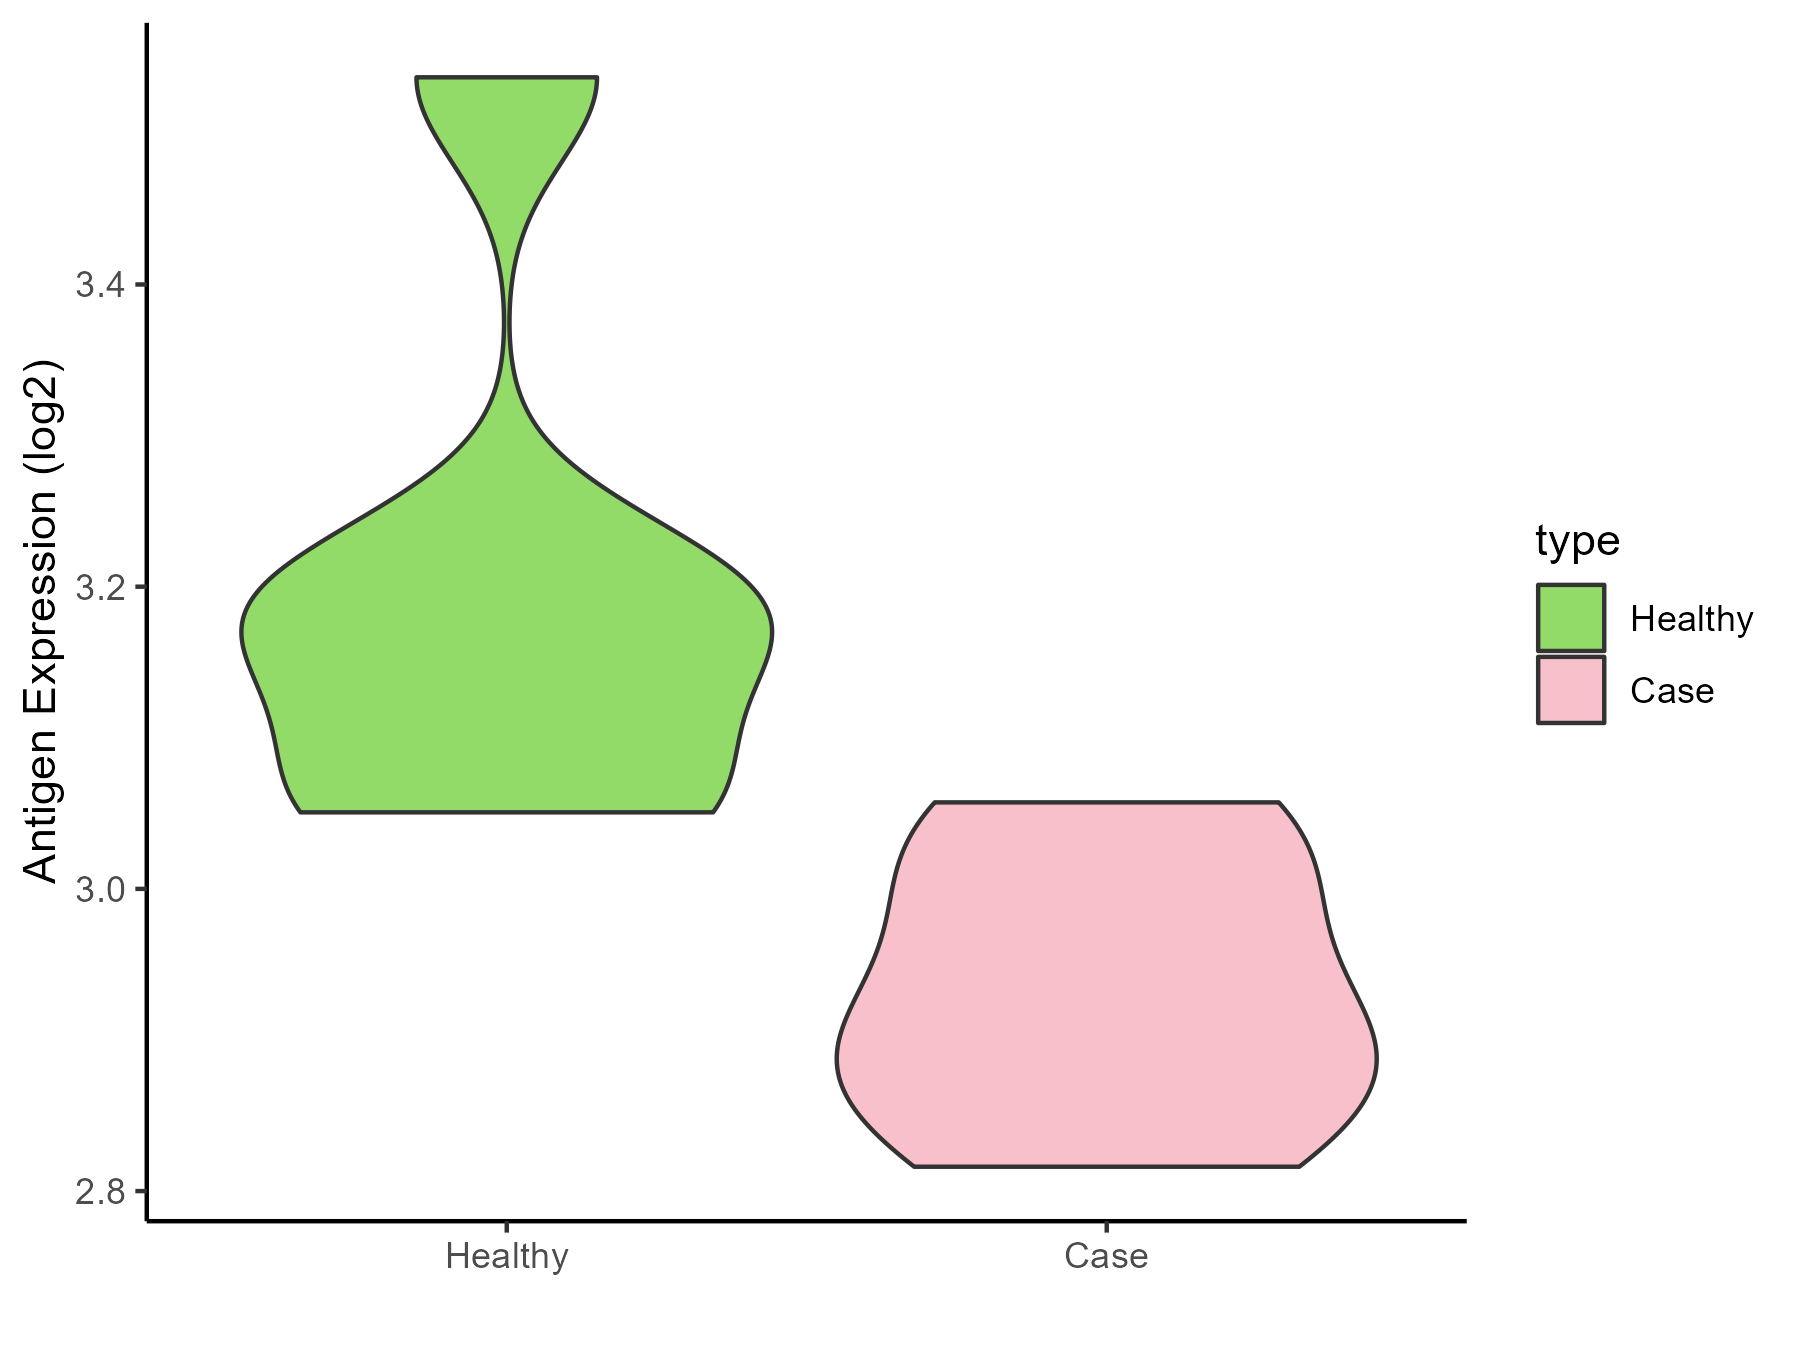
| The Studied Tissue | Skin | |
| The Specific Disease | Sensitive skin | |
| The Expression Level of Disease Section Compare with the Healthy Individual Tissue | p-value: 0.013894185; Fold-change: -0.259216776; Z-score: -1.453290277 | |
| Disease-specific Antigen Abundances |
|
Click to View the Clearer Original Diagram |
ICD Disease Classification 15
| Differential expression pattern of antigen in diseases | ||
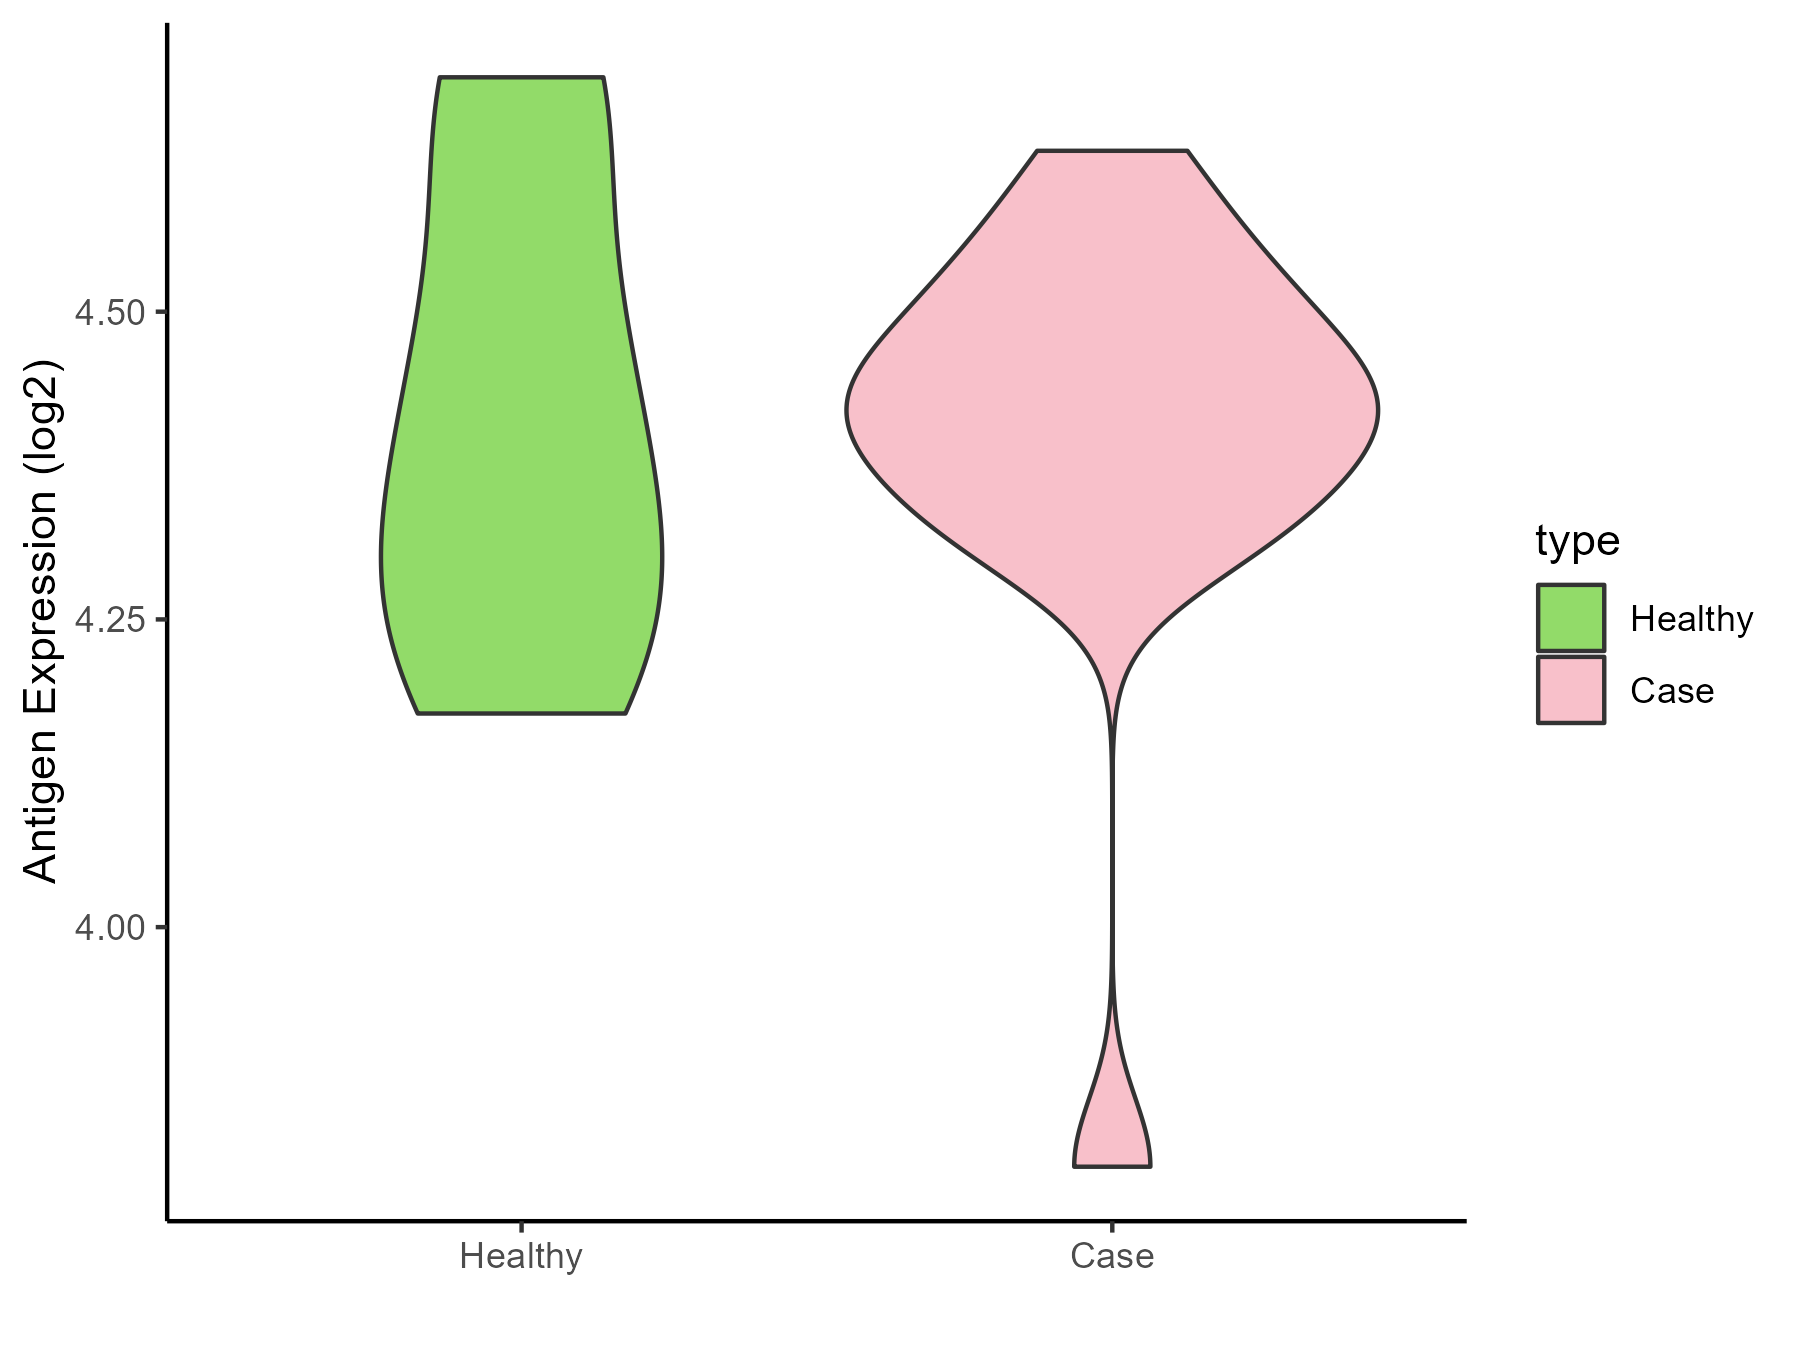
| The Studied Tissue | Synovial | |
| The Specific Disease | Osteoarthritis | |
| The Expression Level of Disease Section Compare with the Healthy Individual Tissue | p-value: 0.863098401; Fold-change: 0.037059857; Z-score: 0.188951726 | |
| Disease-specific Antigen Abundances |
|
Click to View the Clearer Original Diagram |
| Differential expression pattern of antigen in diseases | ||
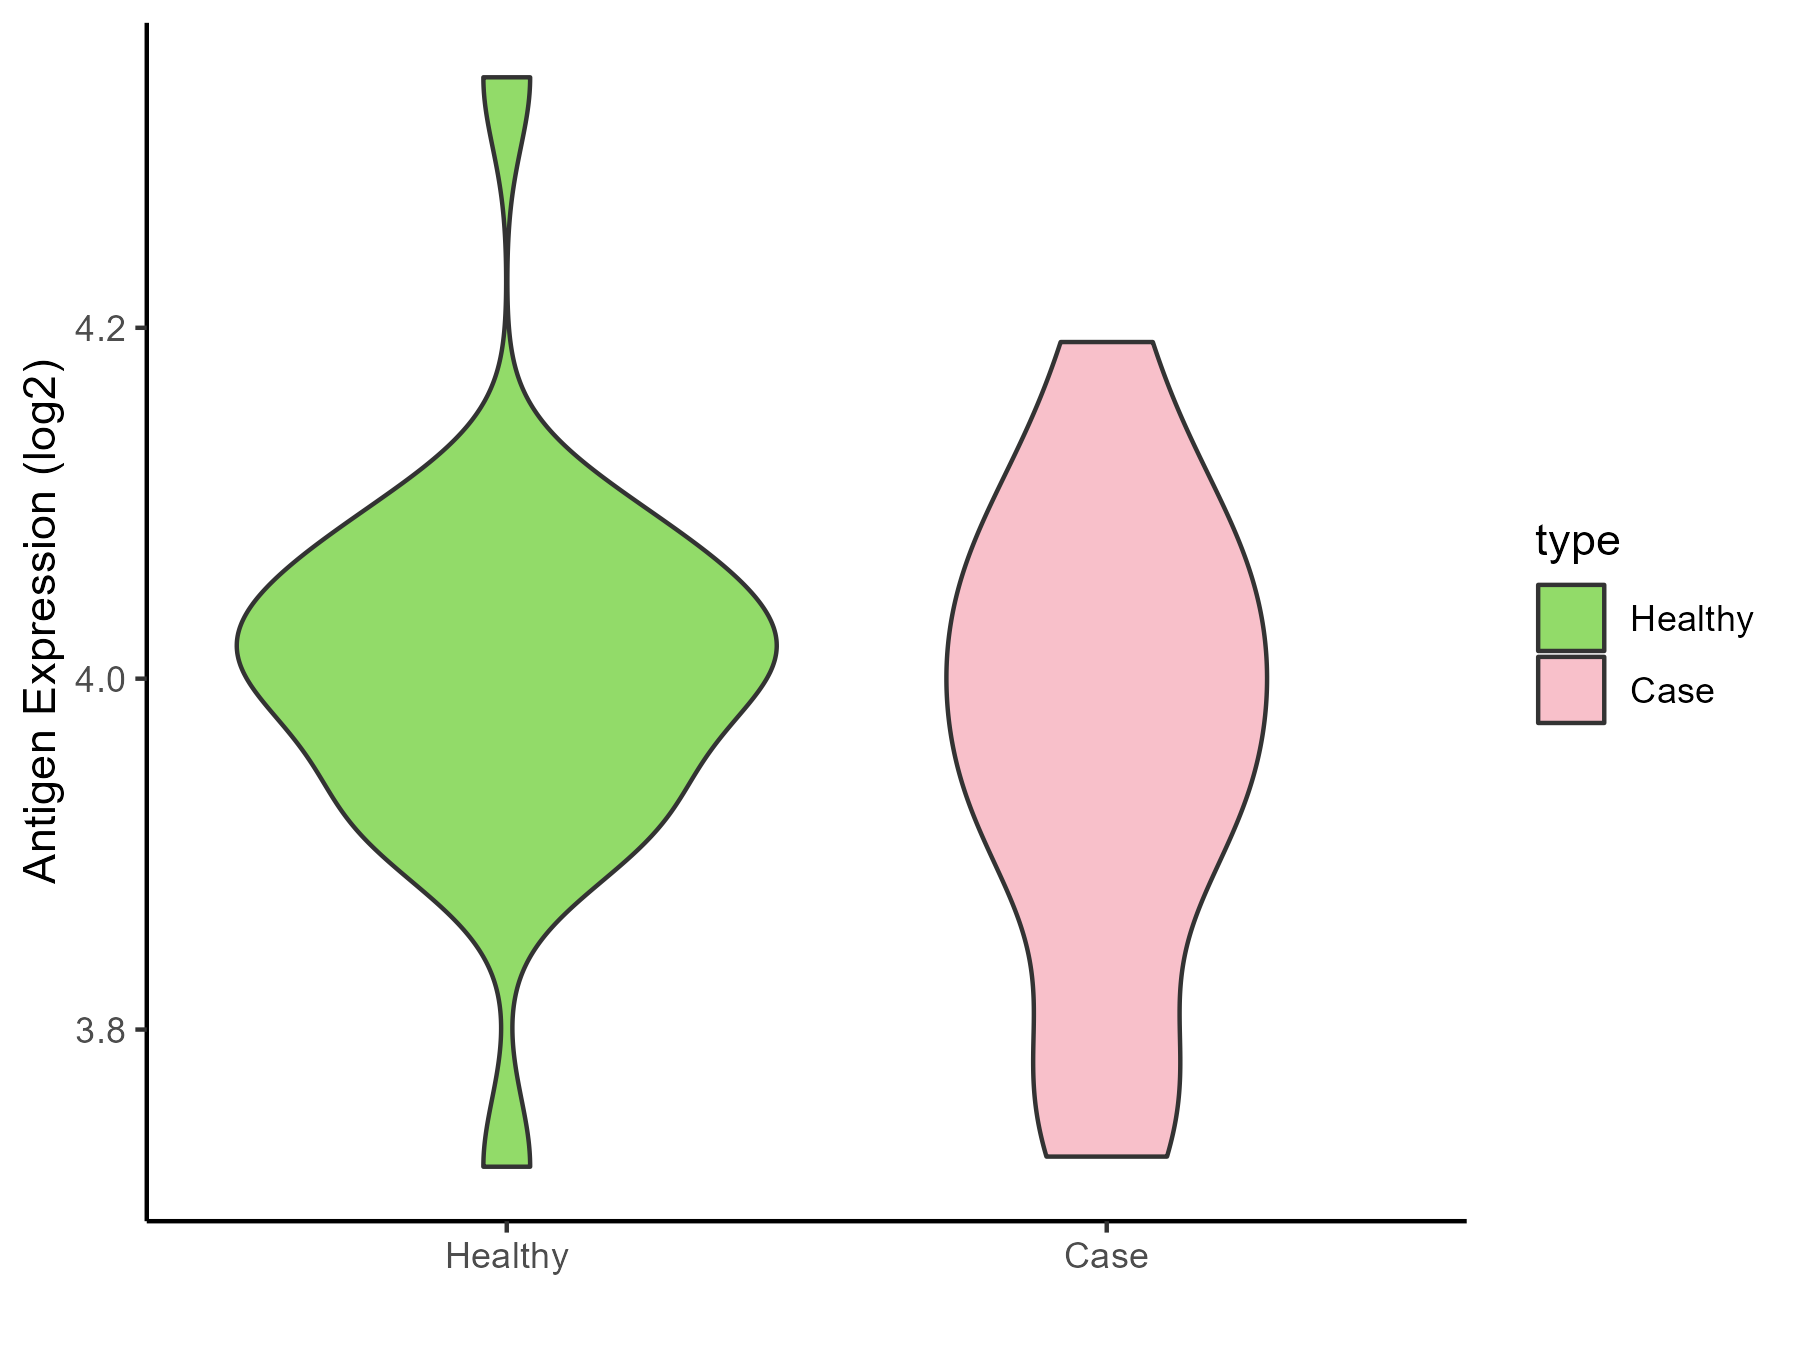
| The Studied Tissue | Peripheral blood | |
| The Specific Disease | Arthropathy | |
| The Expression Level of Disease Section Compare with the Healthy Individual Tissue | p-value: 0.339559782; Fold-change: -0.017438096; Z-score: -0.159863798 | |
| Disease-specific Antigen Abundances |
|
Click to View the Clearer Original Diagram |
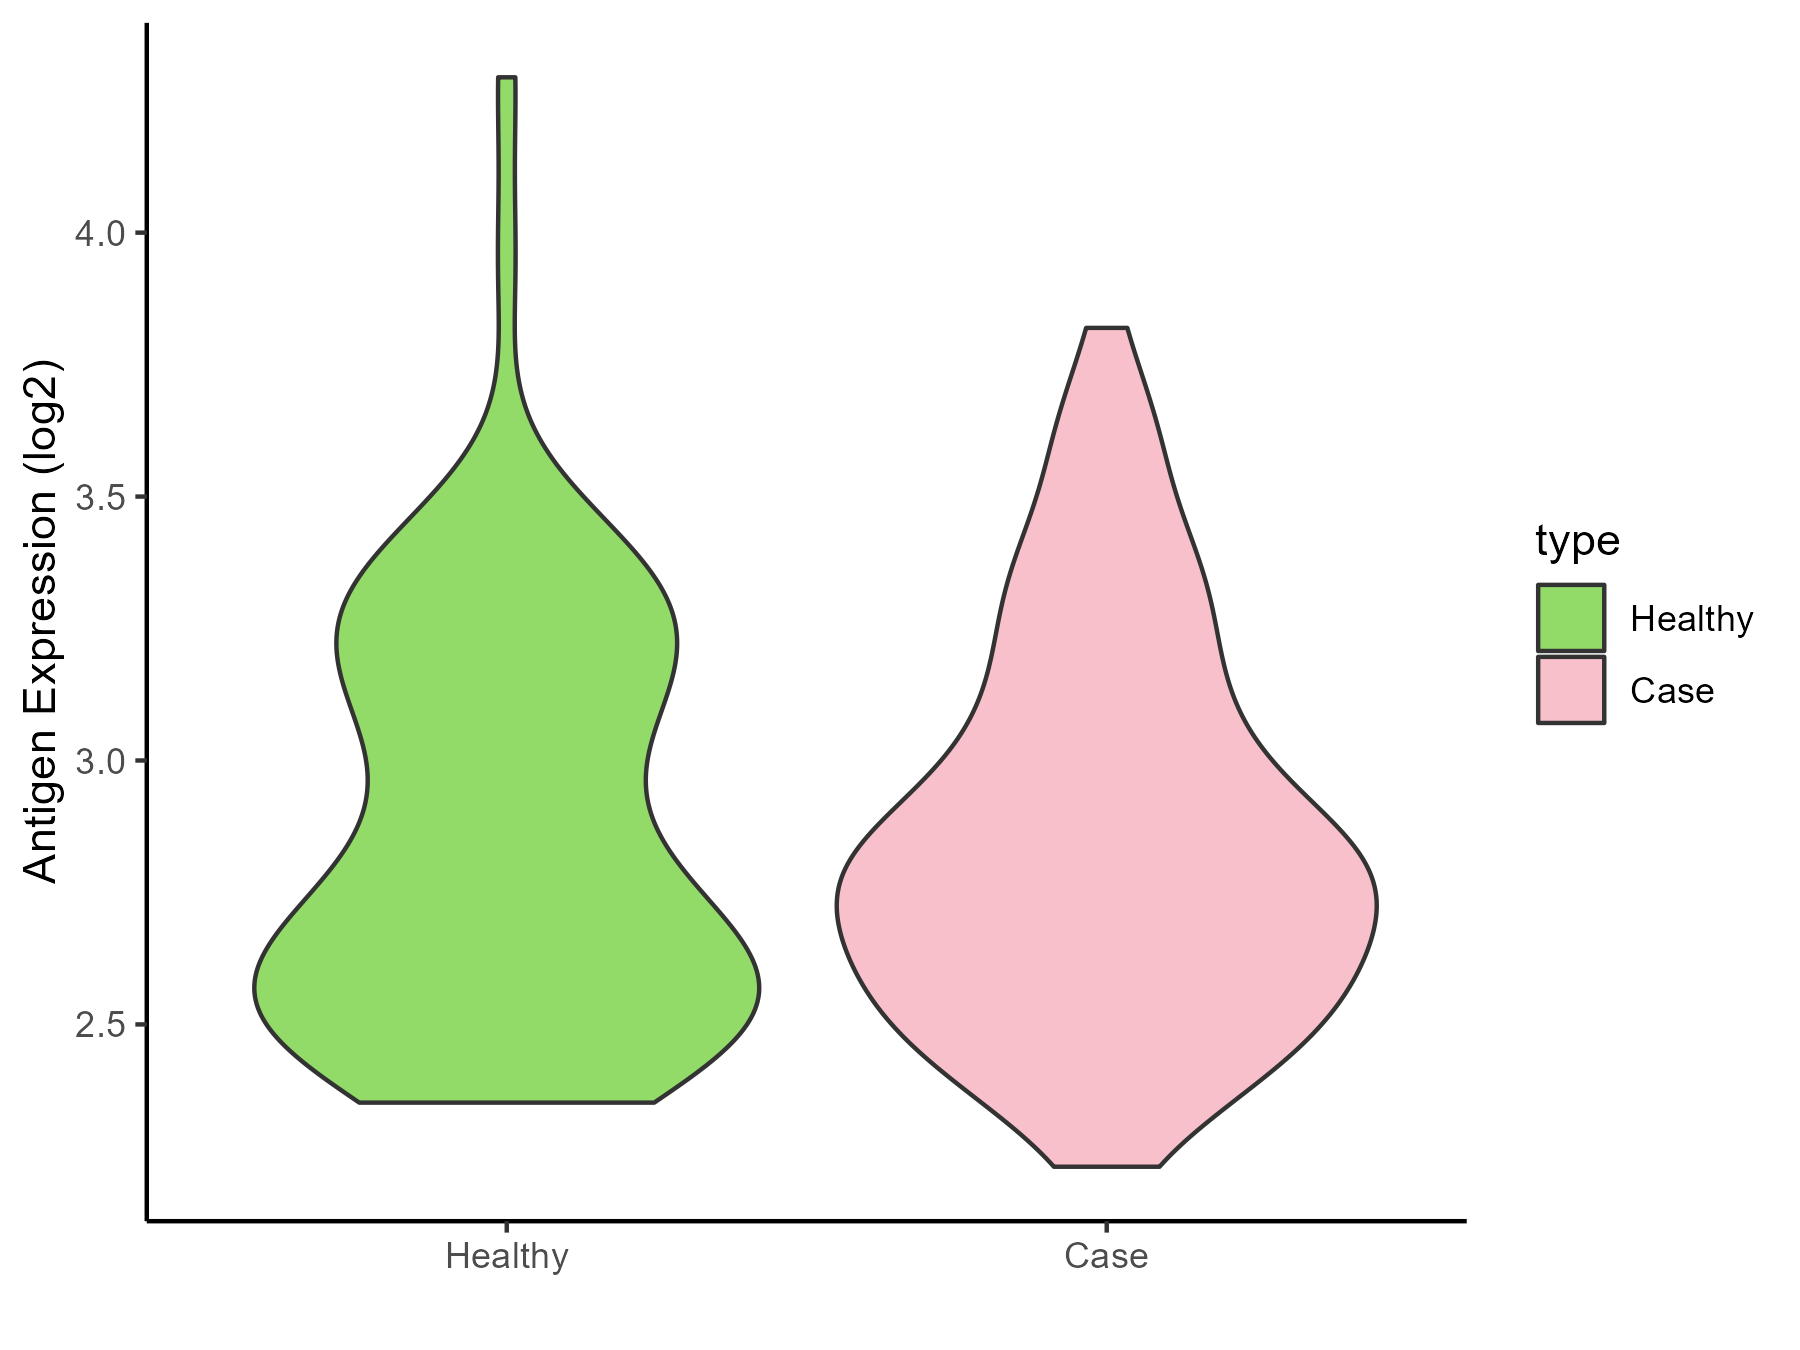
| Differential expression pattern of antigen in diseases | ||
| The Studied Tissue | Peripheral blood | |
| The Specific Disease | Arthritis | |
| The Expression Level of Disease Section Compare with the Healthy Individual Tissue | p-value: 0.708280658; Fold-change: 0.023165878; Z-score: 0.057974481 | |
| Disease-specific Antigen Abundances |
|
Click to View the Clearer Original Diagram |
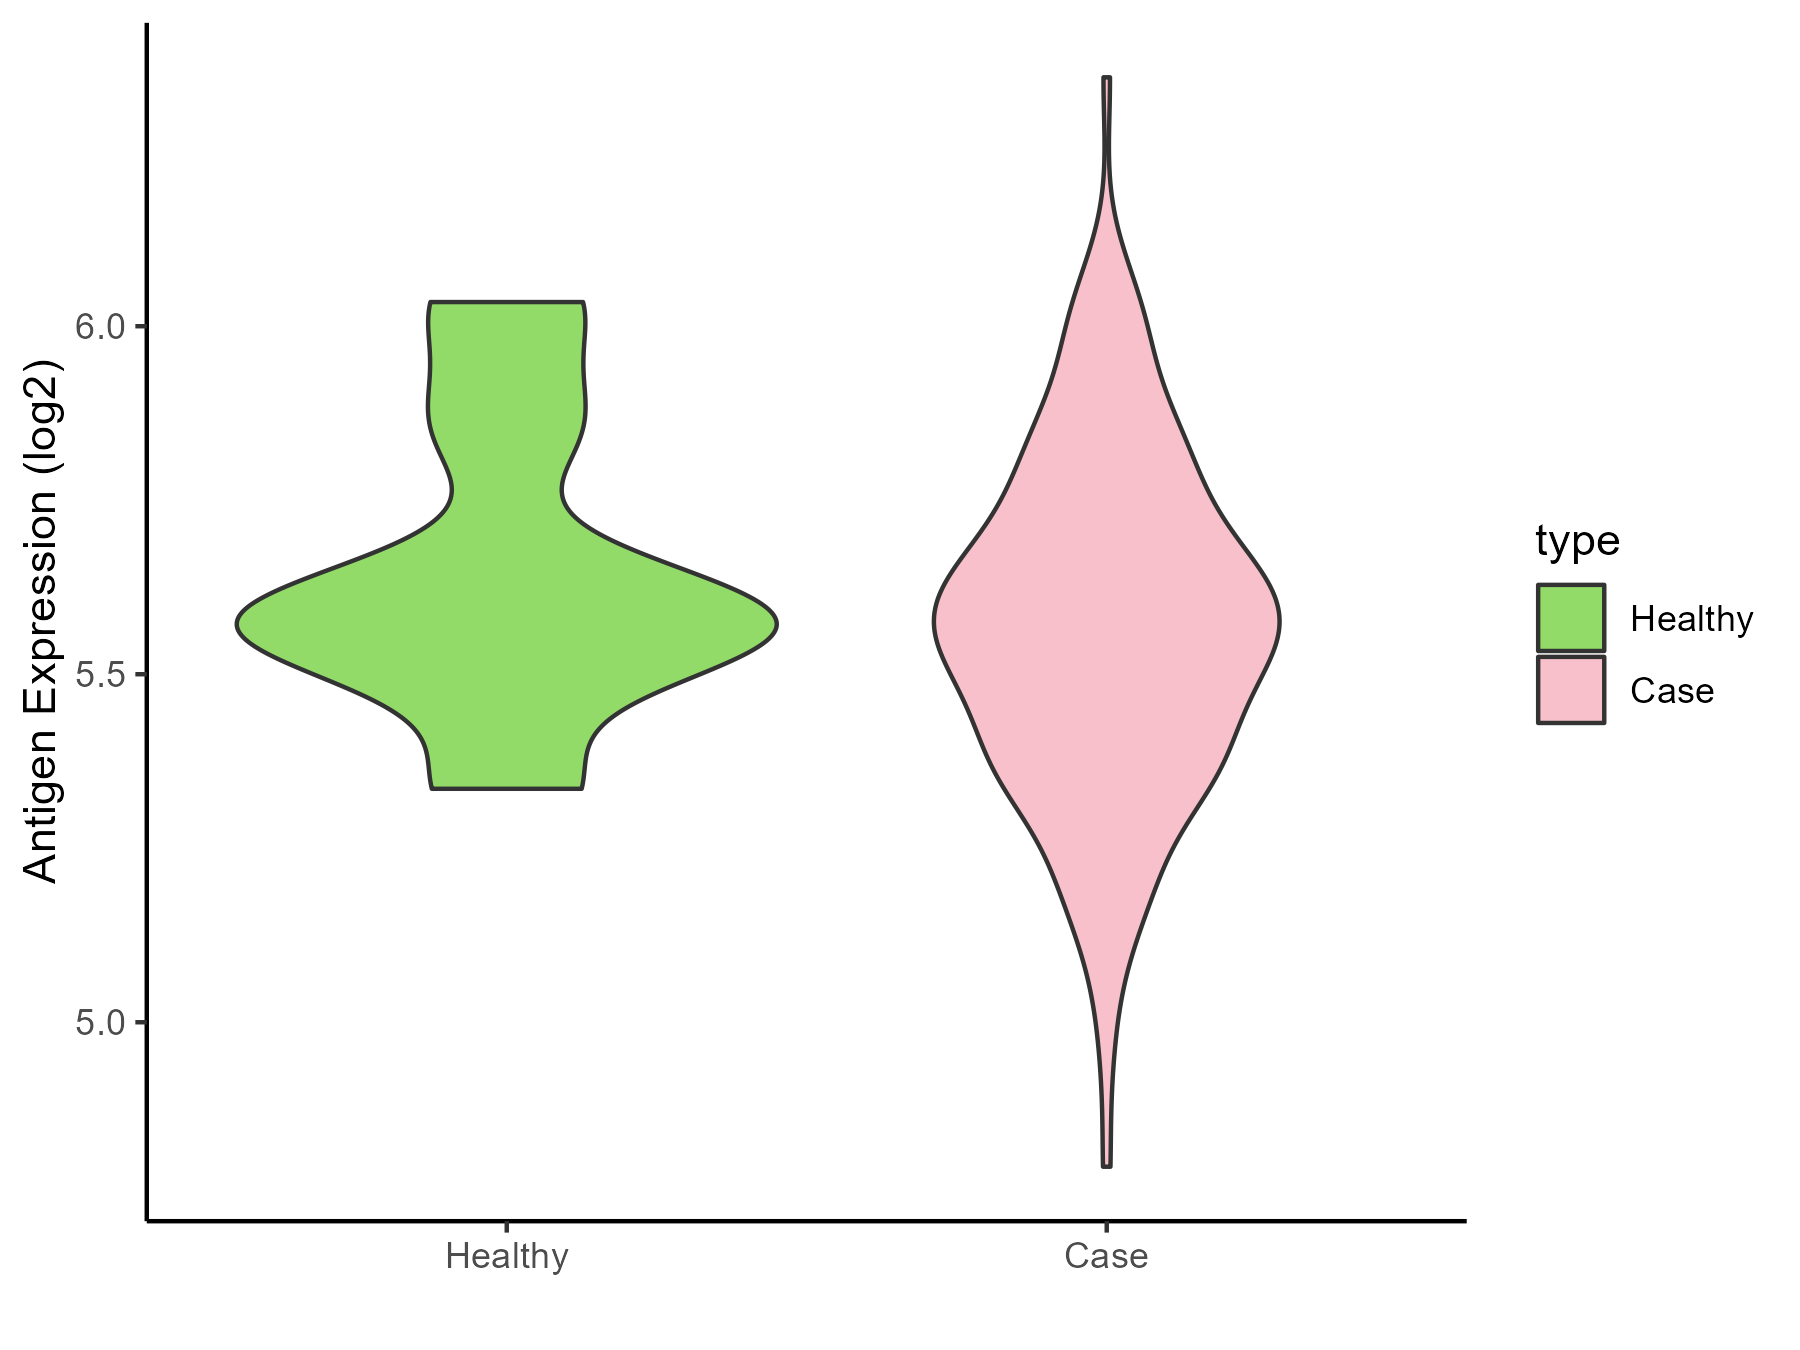
| Differential expression pattern of antigen in diseases | ||
| The Studied Tissue | Synovial | |
| The Specific Disease | Rheumatoid arthritis | |
| The Expression Level of Disease Section Compare with the Healthy Individual Tissue | p-value: 0.407597597; Fold-change: -0.023504246; Z-score: -0.102365738 | |
| Disease-specific Antigen Abundances |
|
Click to View the Clearer Original Diagram |
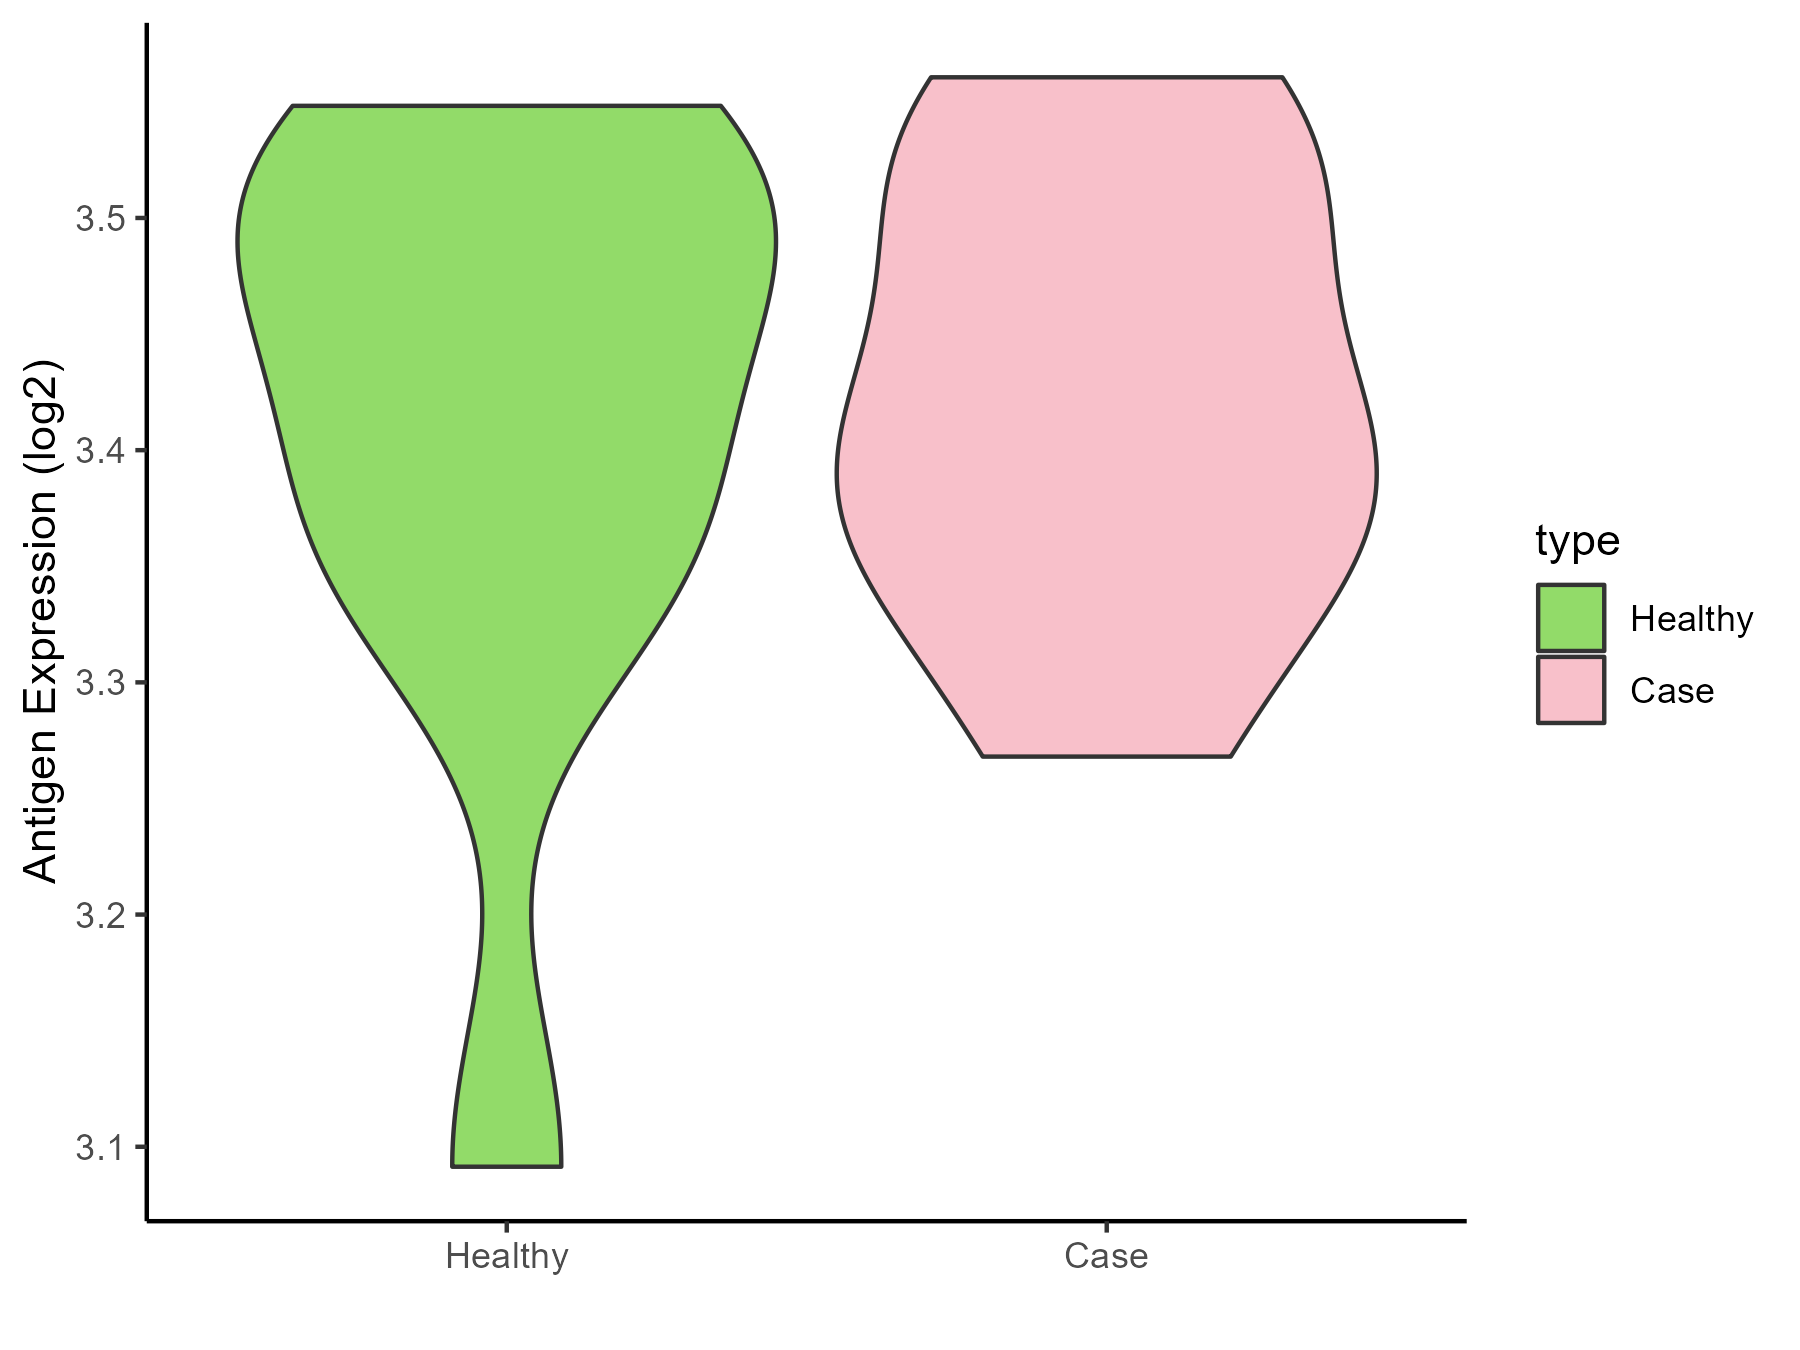
| Differential expression pattern of antigen in diseases | ||
| The Studied Tissue | Pheripheral blood | |
| The Specific Disease | Ankylosing spondylitis | |
| The Expression Level of Disease Section Compare with the Healthy Individual Tissue | p-value: 0.827812277; Fold-change: -0.046612062; Z-score: -0.330682849 | |
| Disease-specific Antigen Abundances |
|
Click to View the Clearer Original Diagram |
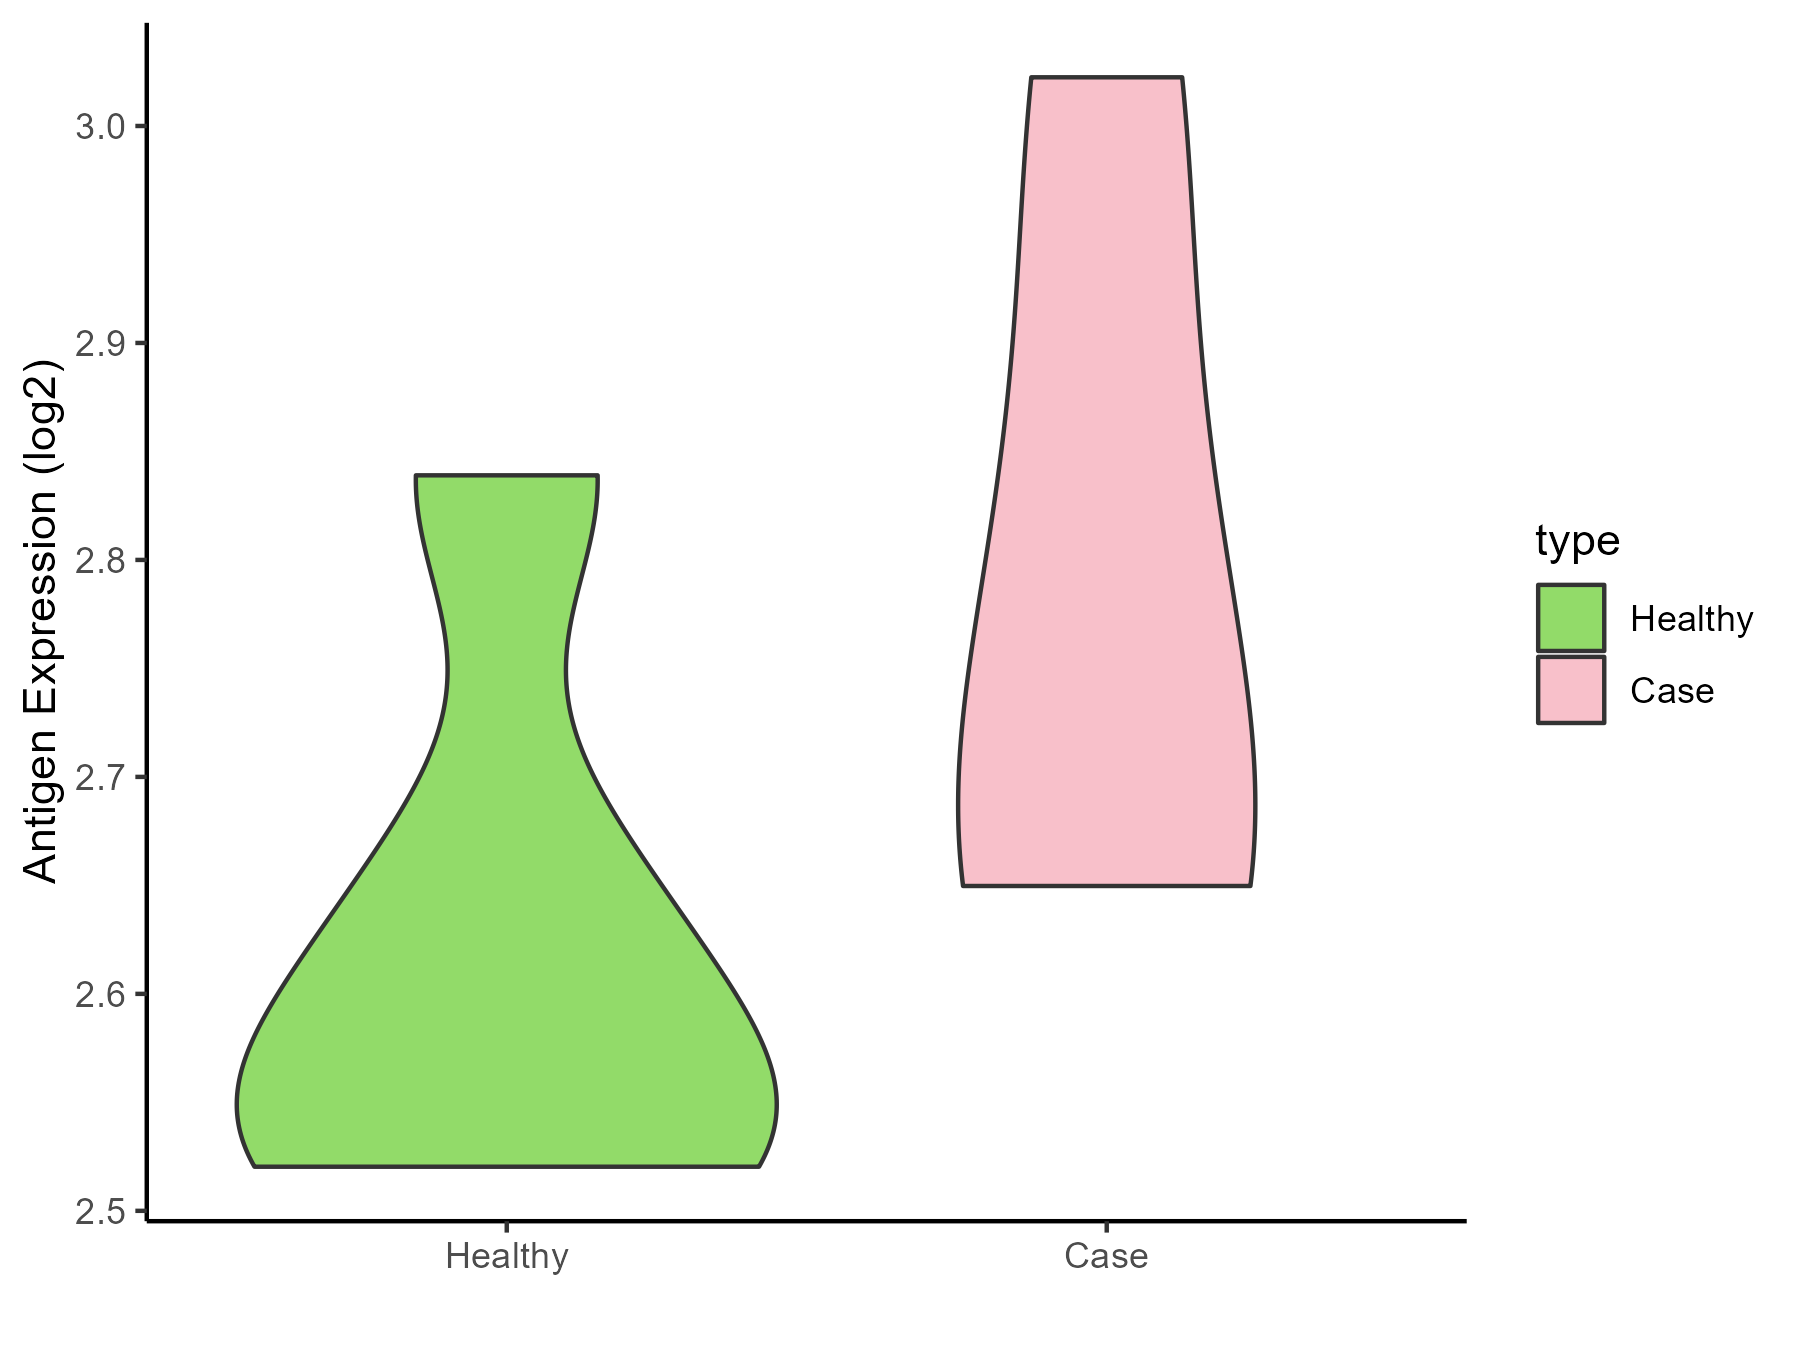
| Differential expression pattern of antigen in diseases | ||
| The Studied Tissue | Bone marrow | |
| The Specific Disease | Osteoporosis | |
| The Expression Level of Disease Section Compare with the Healthy Individual Tissue | p-value: 0.177875026; Fold-change: 0.161499276; Z-score: 1.216284144 | |
| Disease-specific Antigen Abundances |
|
Click to View the Clearer Original Diagram |
ICD Disease Classification 16
| Differential expression pattern of antigen in diseases | ||
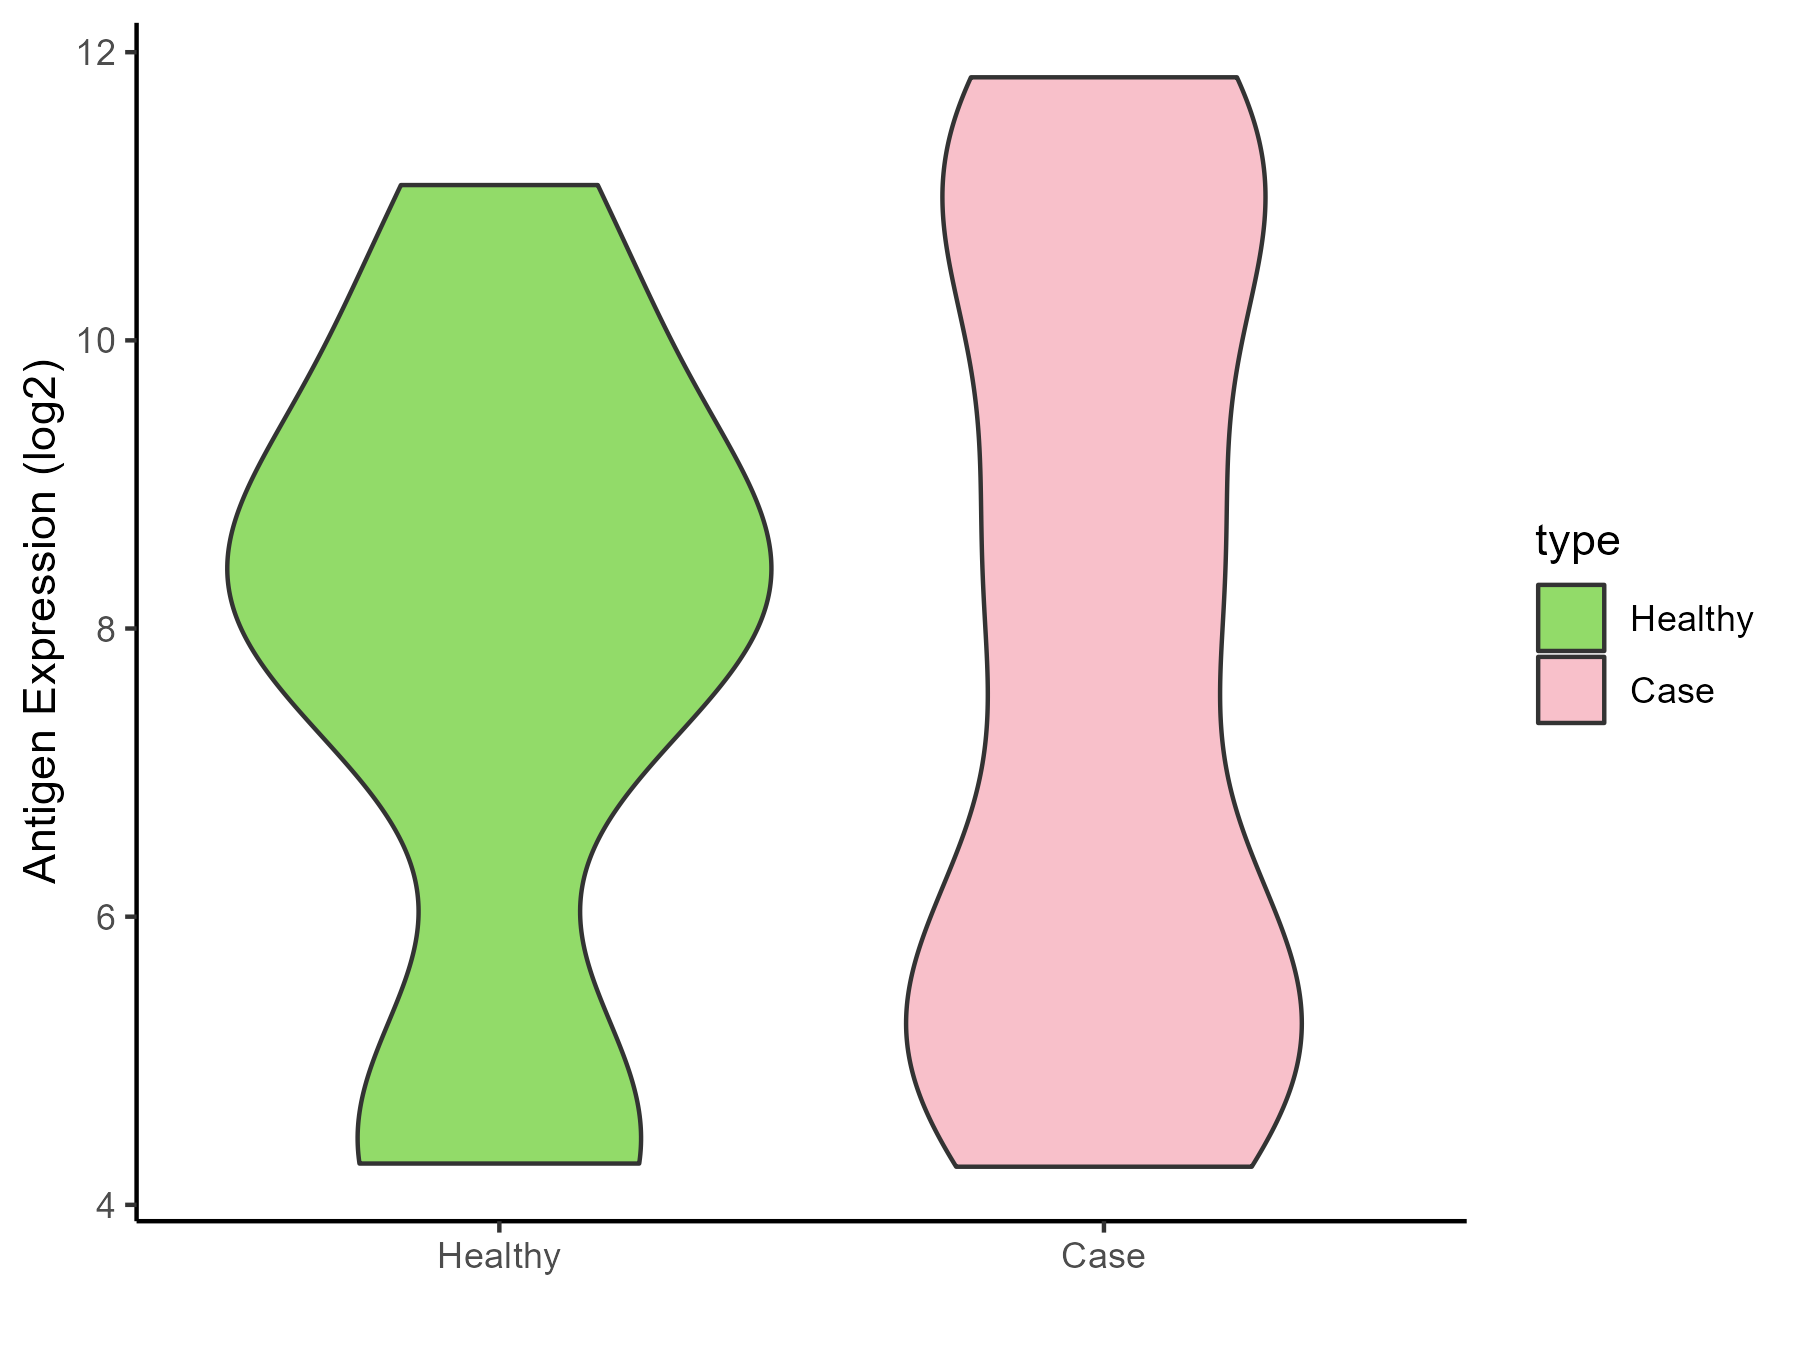
| The Studied Tissue | Endometrium | |
| The Specific Disease | Endometriosis | |
| The Expression Level of Disease Section Compare with the Healthy Individual Tissue | p-value: 0.72545033; Fold-change: -0.051017223; Z-score: -0.023001698 | |
| Disease-specific Antigen Abundances |
|
Click to View the Clearer Original Diagram |
| Differential expression pattern of antigen in diseases | ||
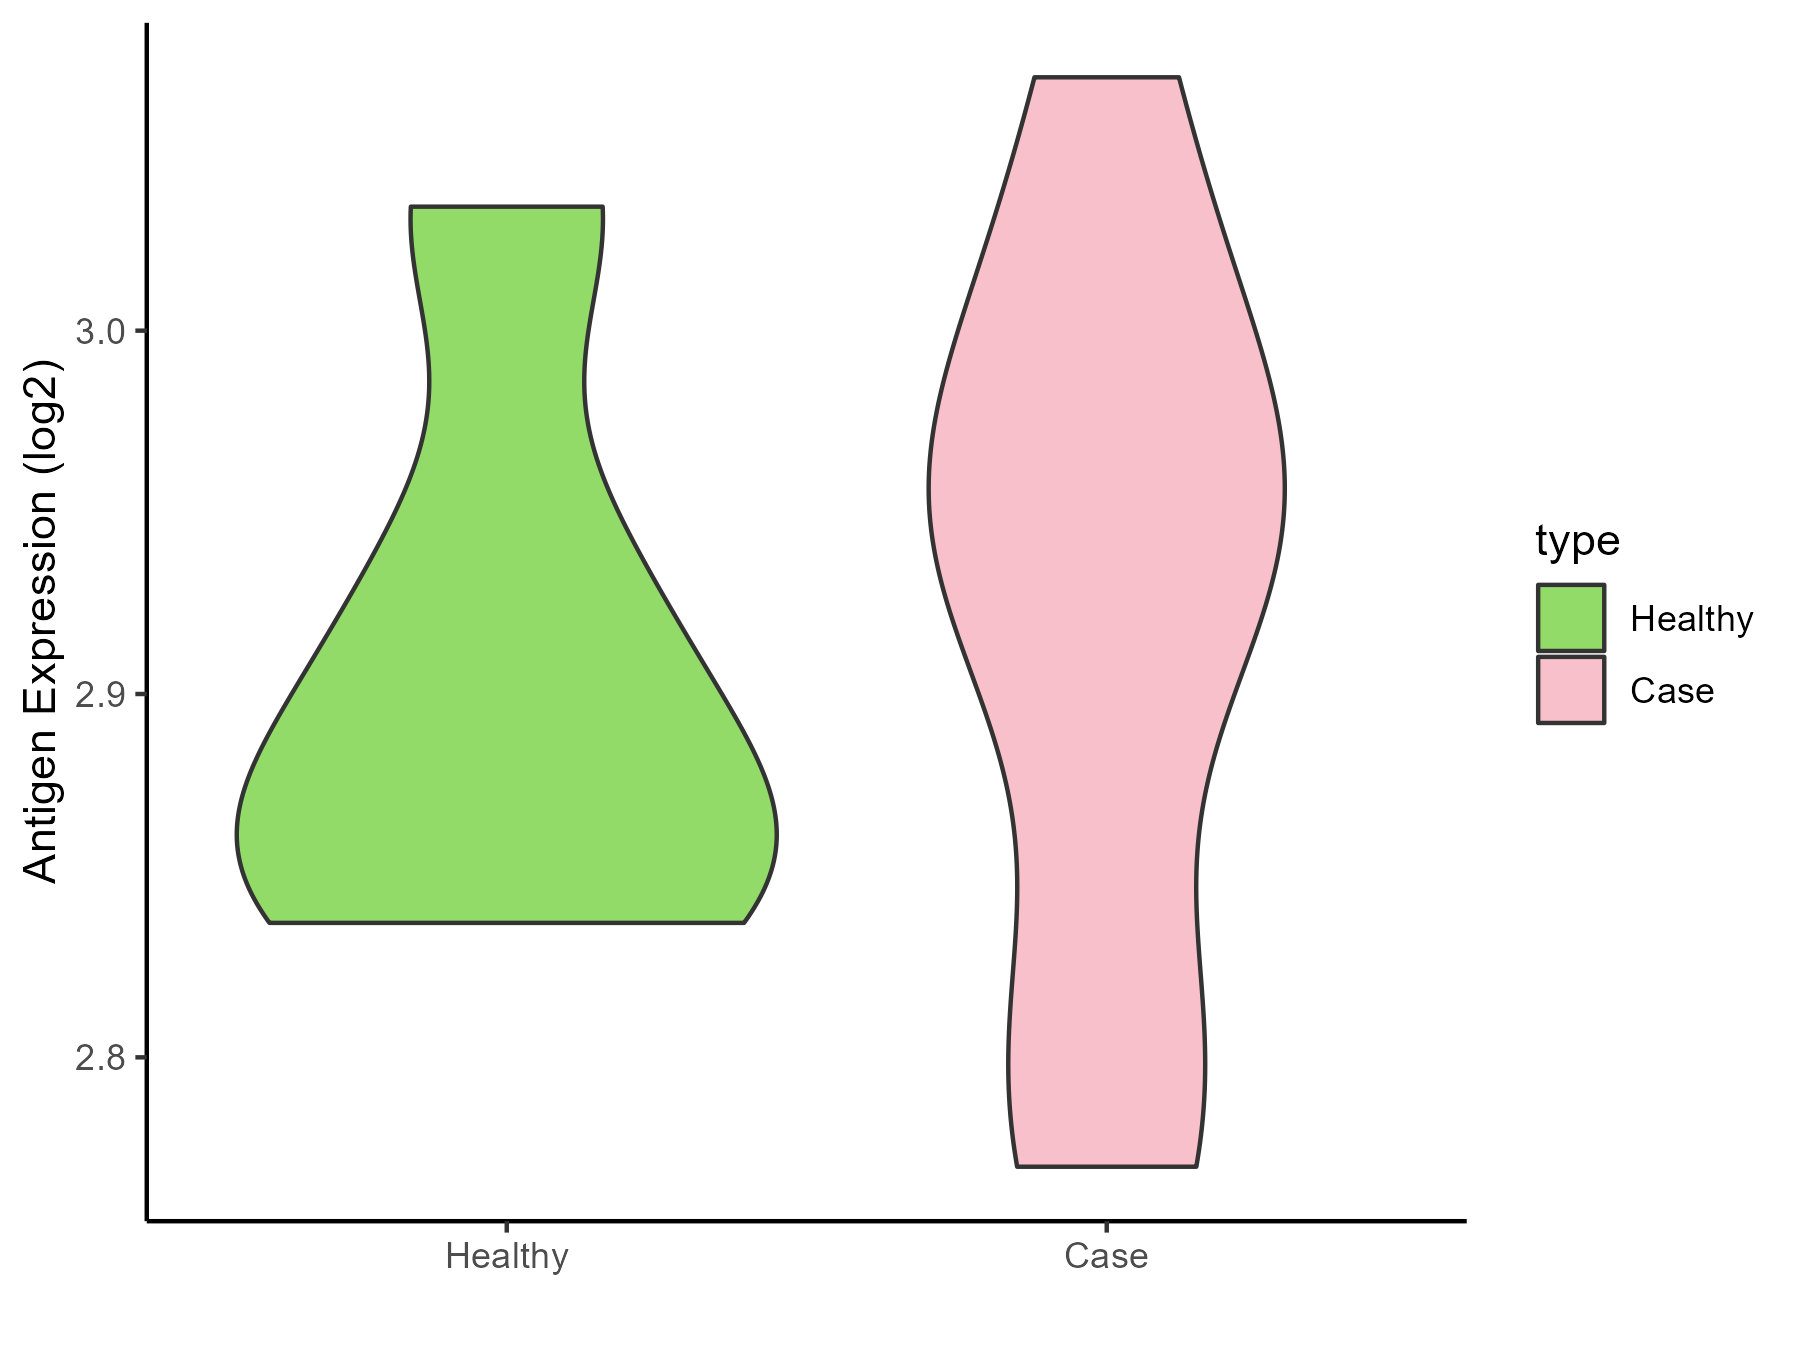
| The Studied Tissue | Bladder | |
| The Specific Disease | Interstitial cystitis | |
| The Expression Level of Disease Section Compare with the Healthy Individual Tissue | p-value: 0.764966004; Fold-change: 0.065664643; Z-score: 0.822685731 | |
| Disease-specific Antigen Abundances |
|
Click to View the Clearer Original Diagram |
ICD Disease Classification 19
| Differential expression pattern of antigen in diseases | ||
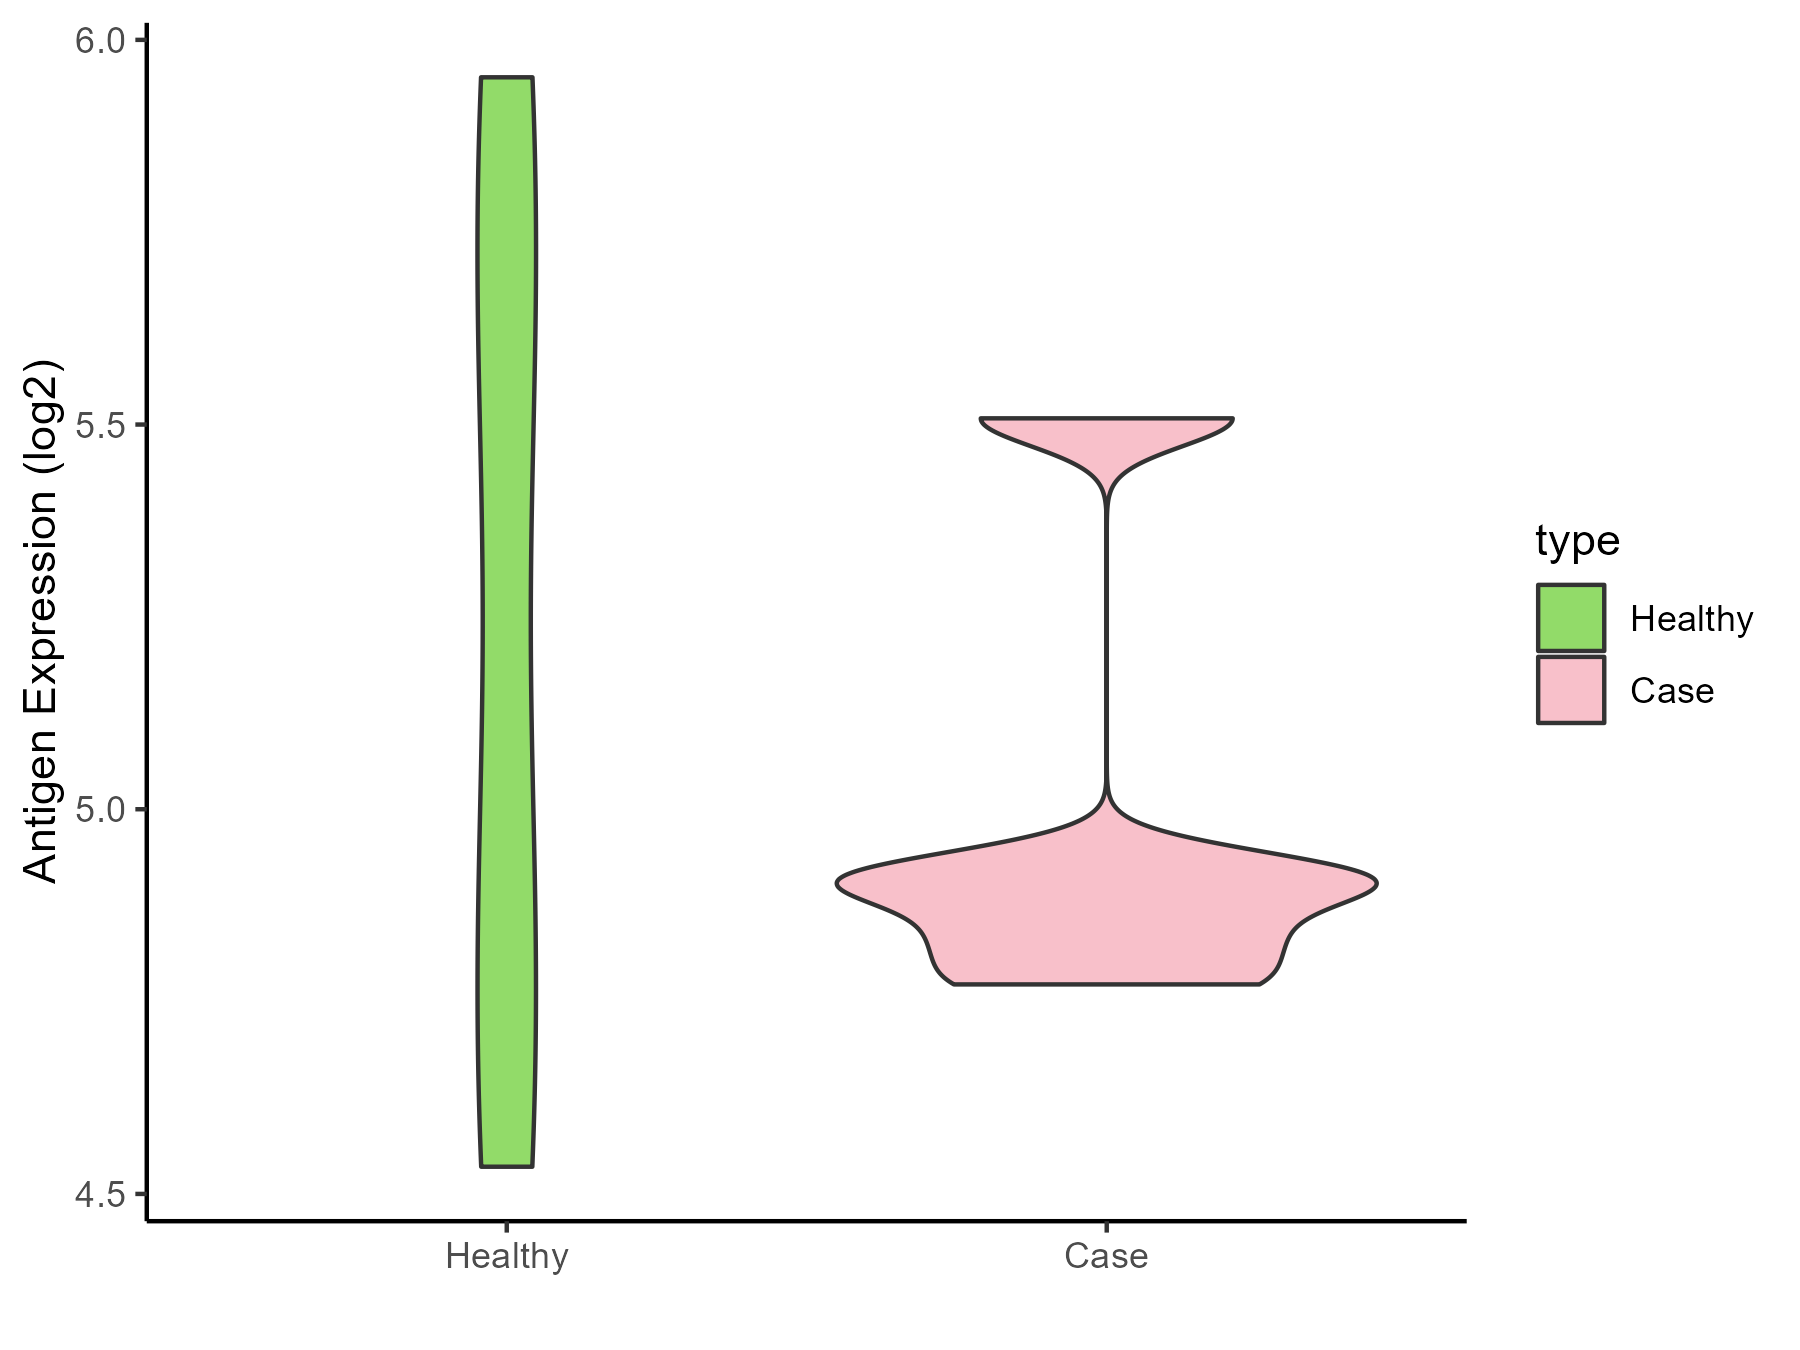
| The Studied Tissue | Myometrium | |
| The Specific Disease | Preterm birth | |
| The Expression Level of Disease Section Compare with the Healthy Individual Tissue | p-value: 0.380558148; Fold-change: -0.336398065; Z-score: -0.564831807 | |
| Disease-specific Antigen Abundances |
|
Click to View the Clearer Original Diagram |
ICD Disease Classification 2
| Differential expression pattern of antigen in diseases | ||
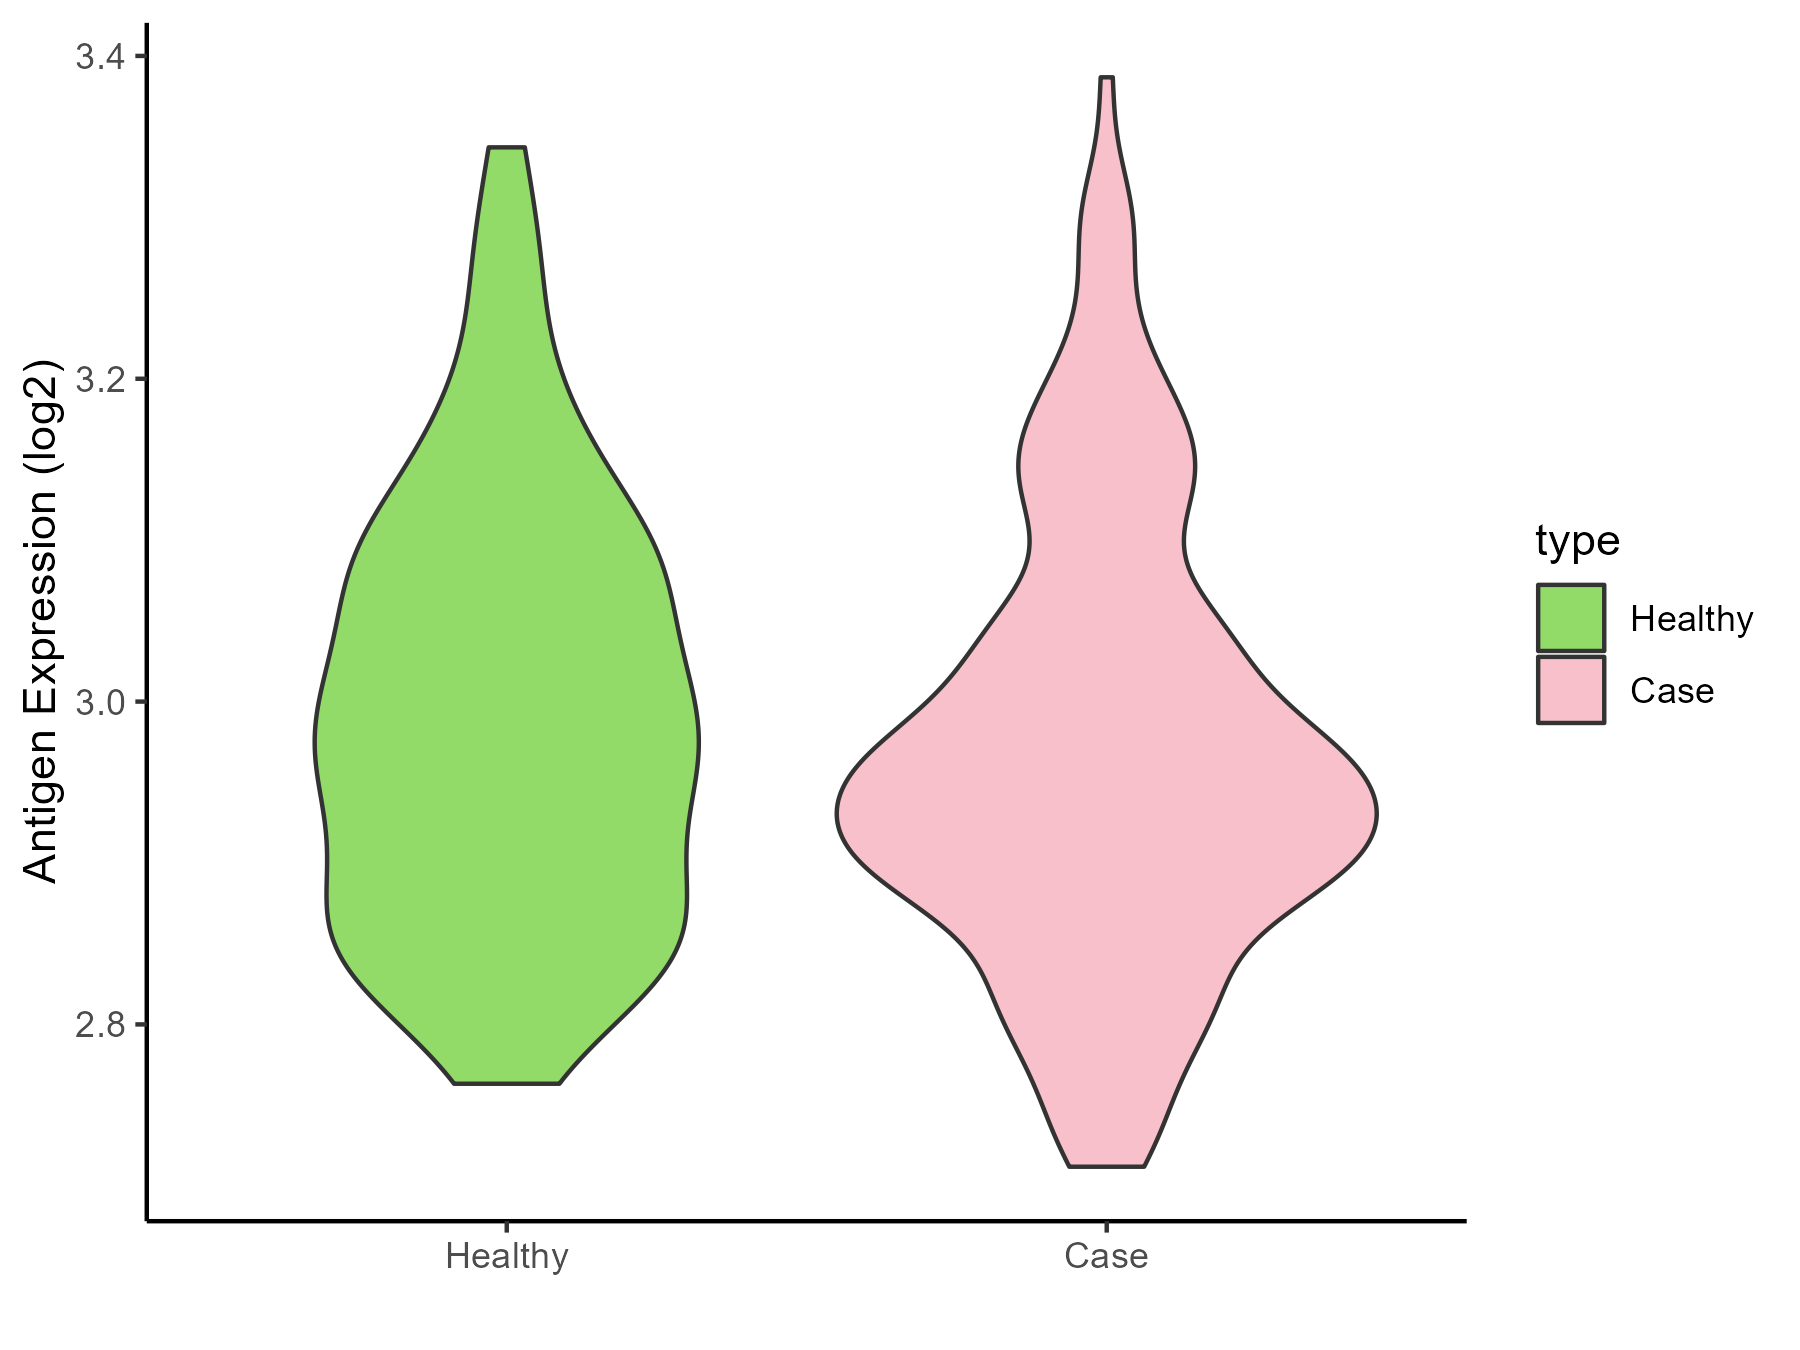
| The Studied Tissue | Bone marrow | |
| The Specific Disease | Acute myelocytic leukemia | |
| The Expression Level of Disease Section Compare with the Healthy Individual Tissue | p-value: 0.085104095; Fold-change: -0.029756015; Z-score: -0.225340817 | |
| Disease-specific Antigen Abundances |
|
Click to View the Clearer Original Diagram |
| Differential expression pattern of antigen in diseases | ||
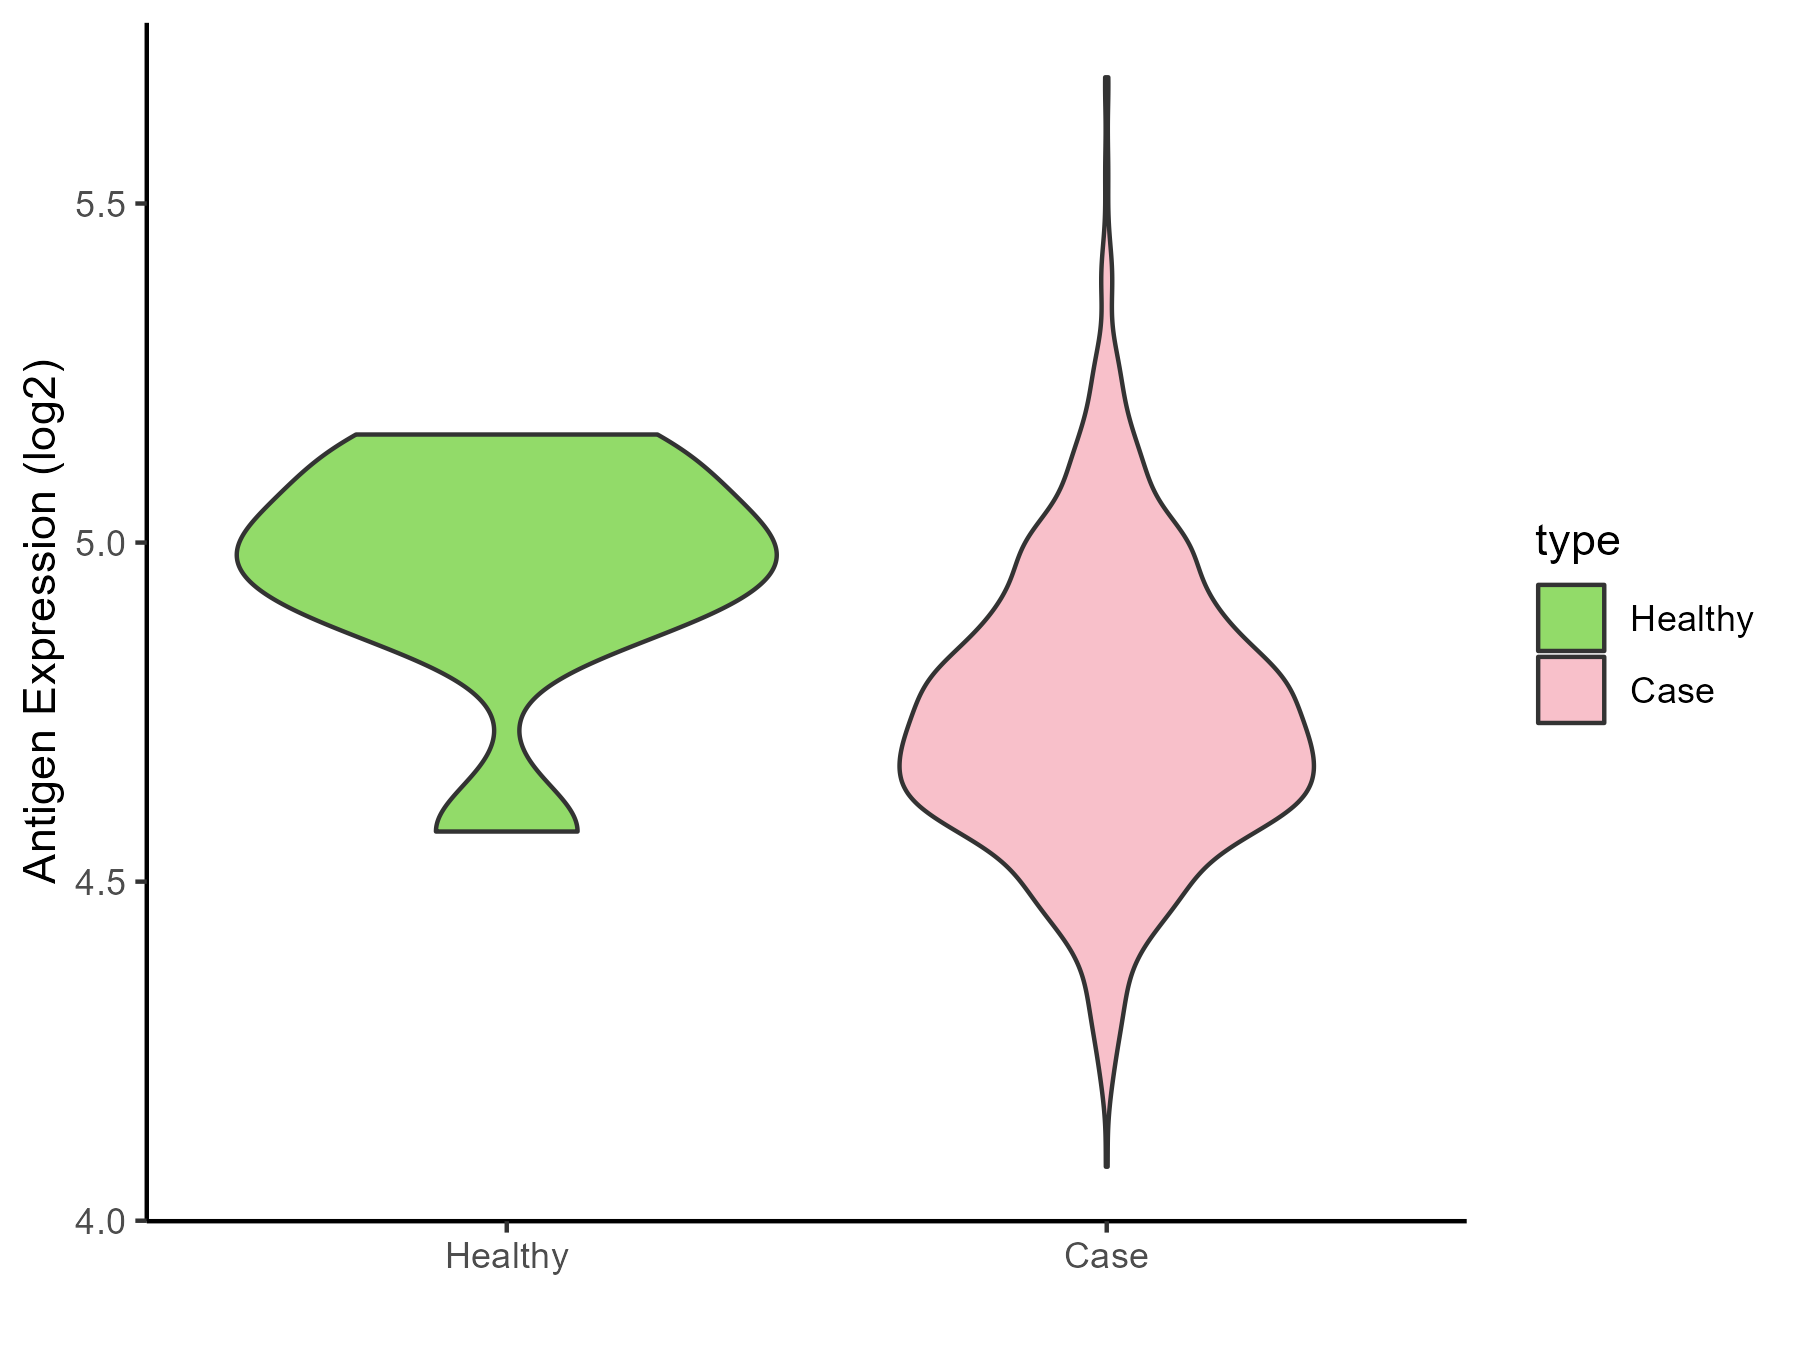
| The Studied Tissue | Bone marrow | |
| The Specific Disease | Myeloma | |
| The Expression Level of Disease Section Compare with the Healthy Individual Tissue | p-value: 0.013524309; Fold-change: -0.258665799; Z-score: -1.430998025 | |
| Disease-specific Antigen Abundances |
|
Click to View the Clearer Original Diagram |
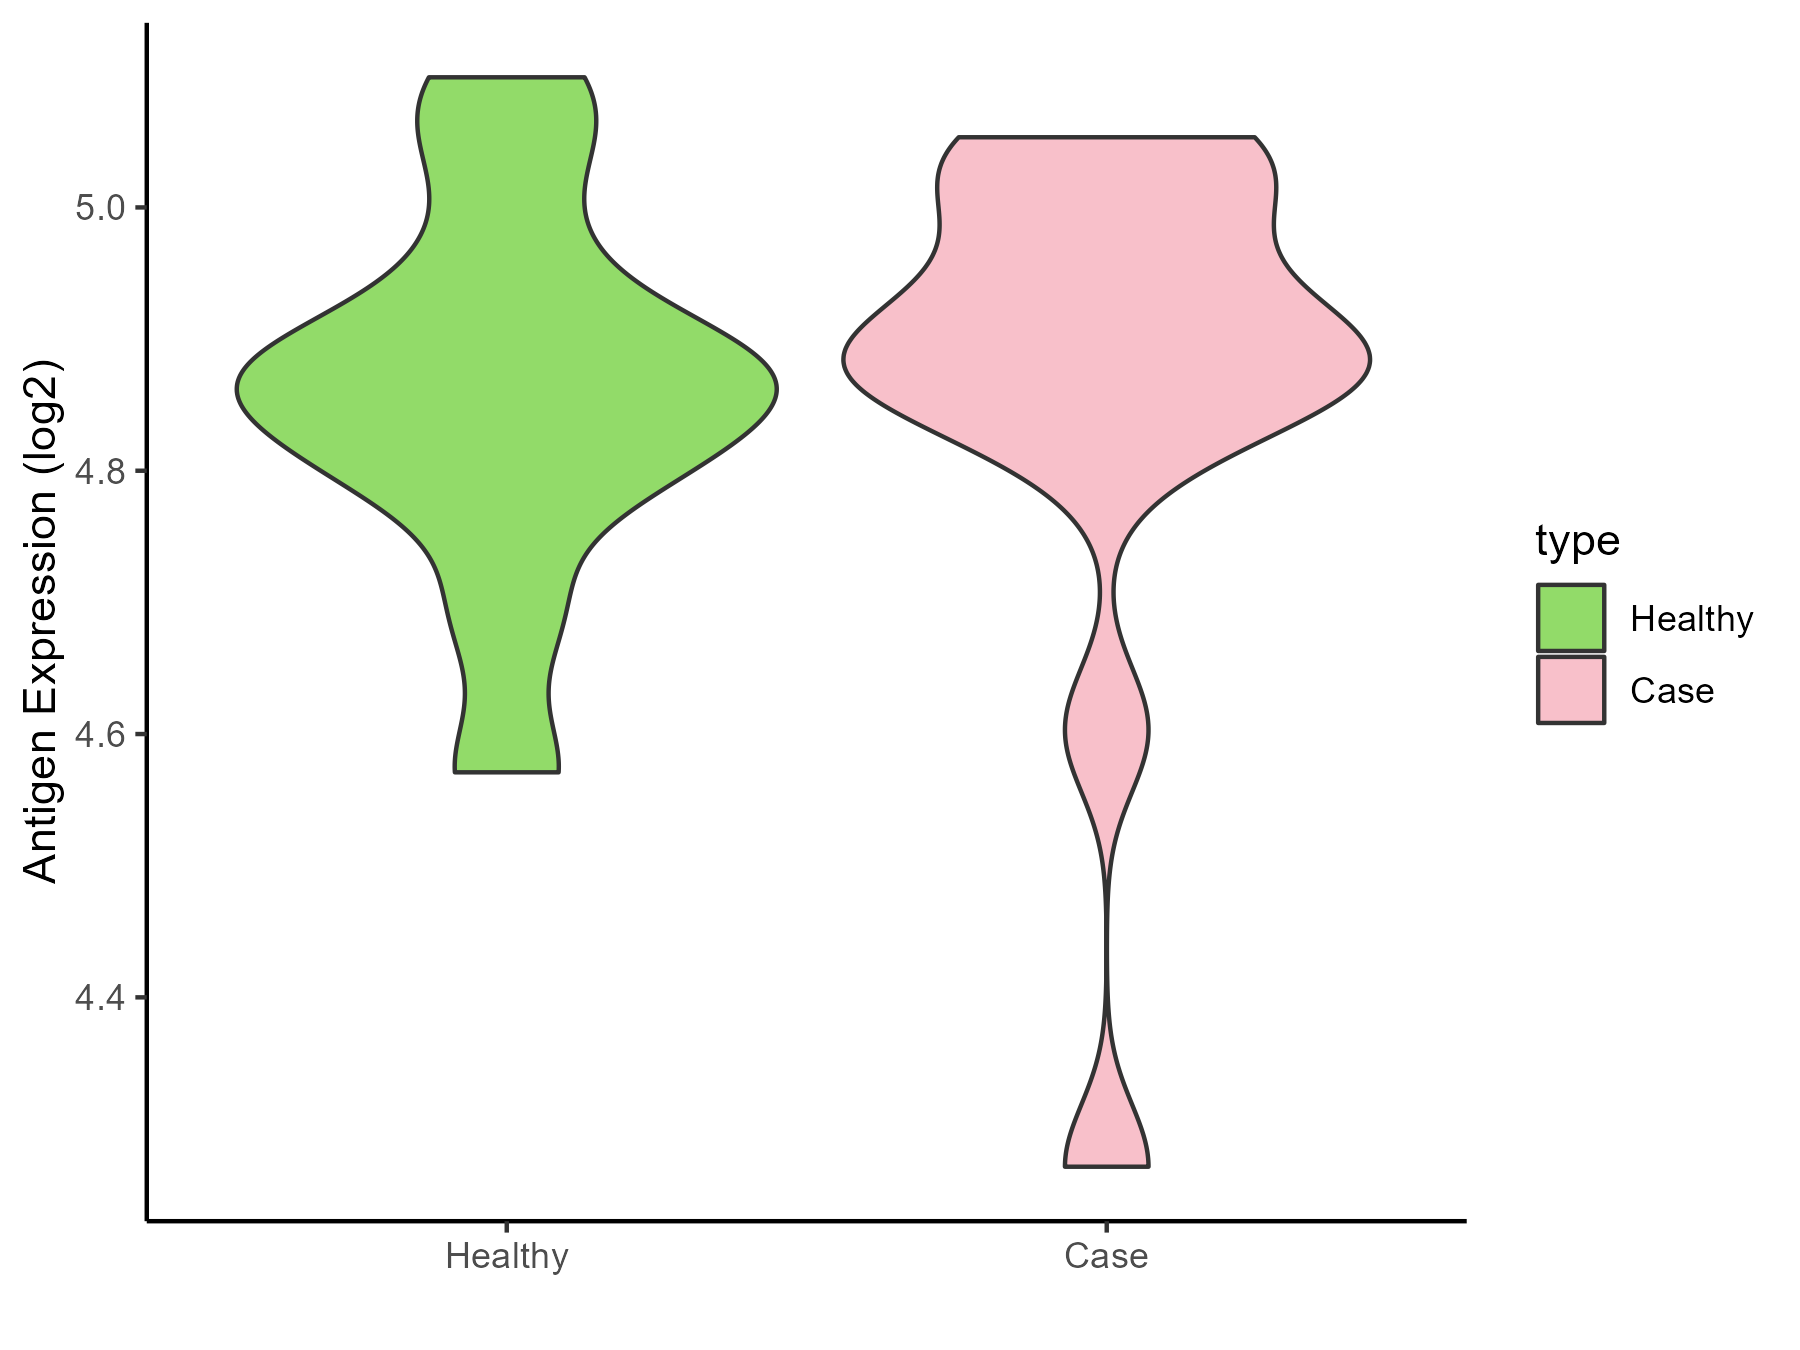
| The Studied Tissue | Peripheral blood | |
| The Specific Disease | Myeloma | |
| The Expression Level of Disease Section Compare with the Healthy Individual Tissue | p-value: 0.962660174; Fold-change: 0.024688879; Z-score: 0.172728306 | |
| Disease-specific Antigen Abundances |
|
Click to View the Clearer Original Diagram |
| Differential expression pattern of antigen in diseases | ||
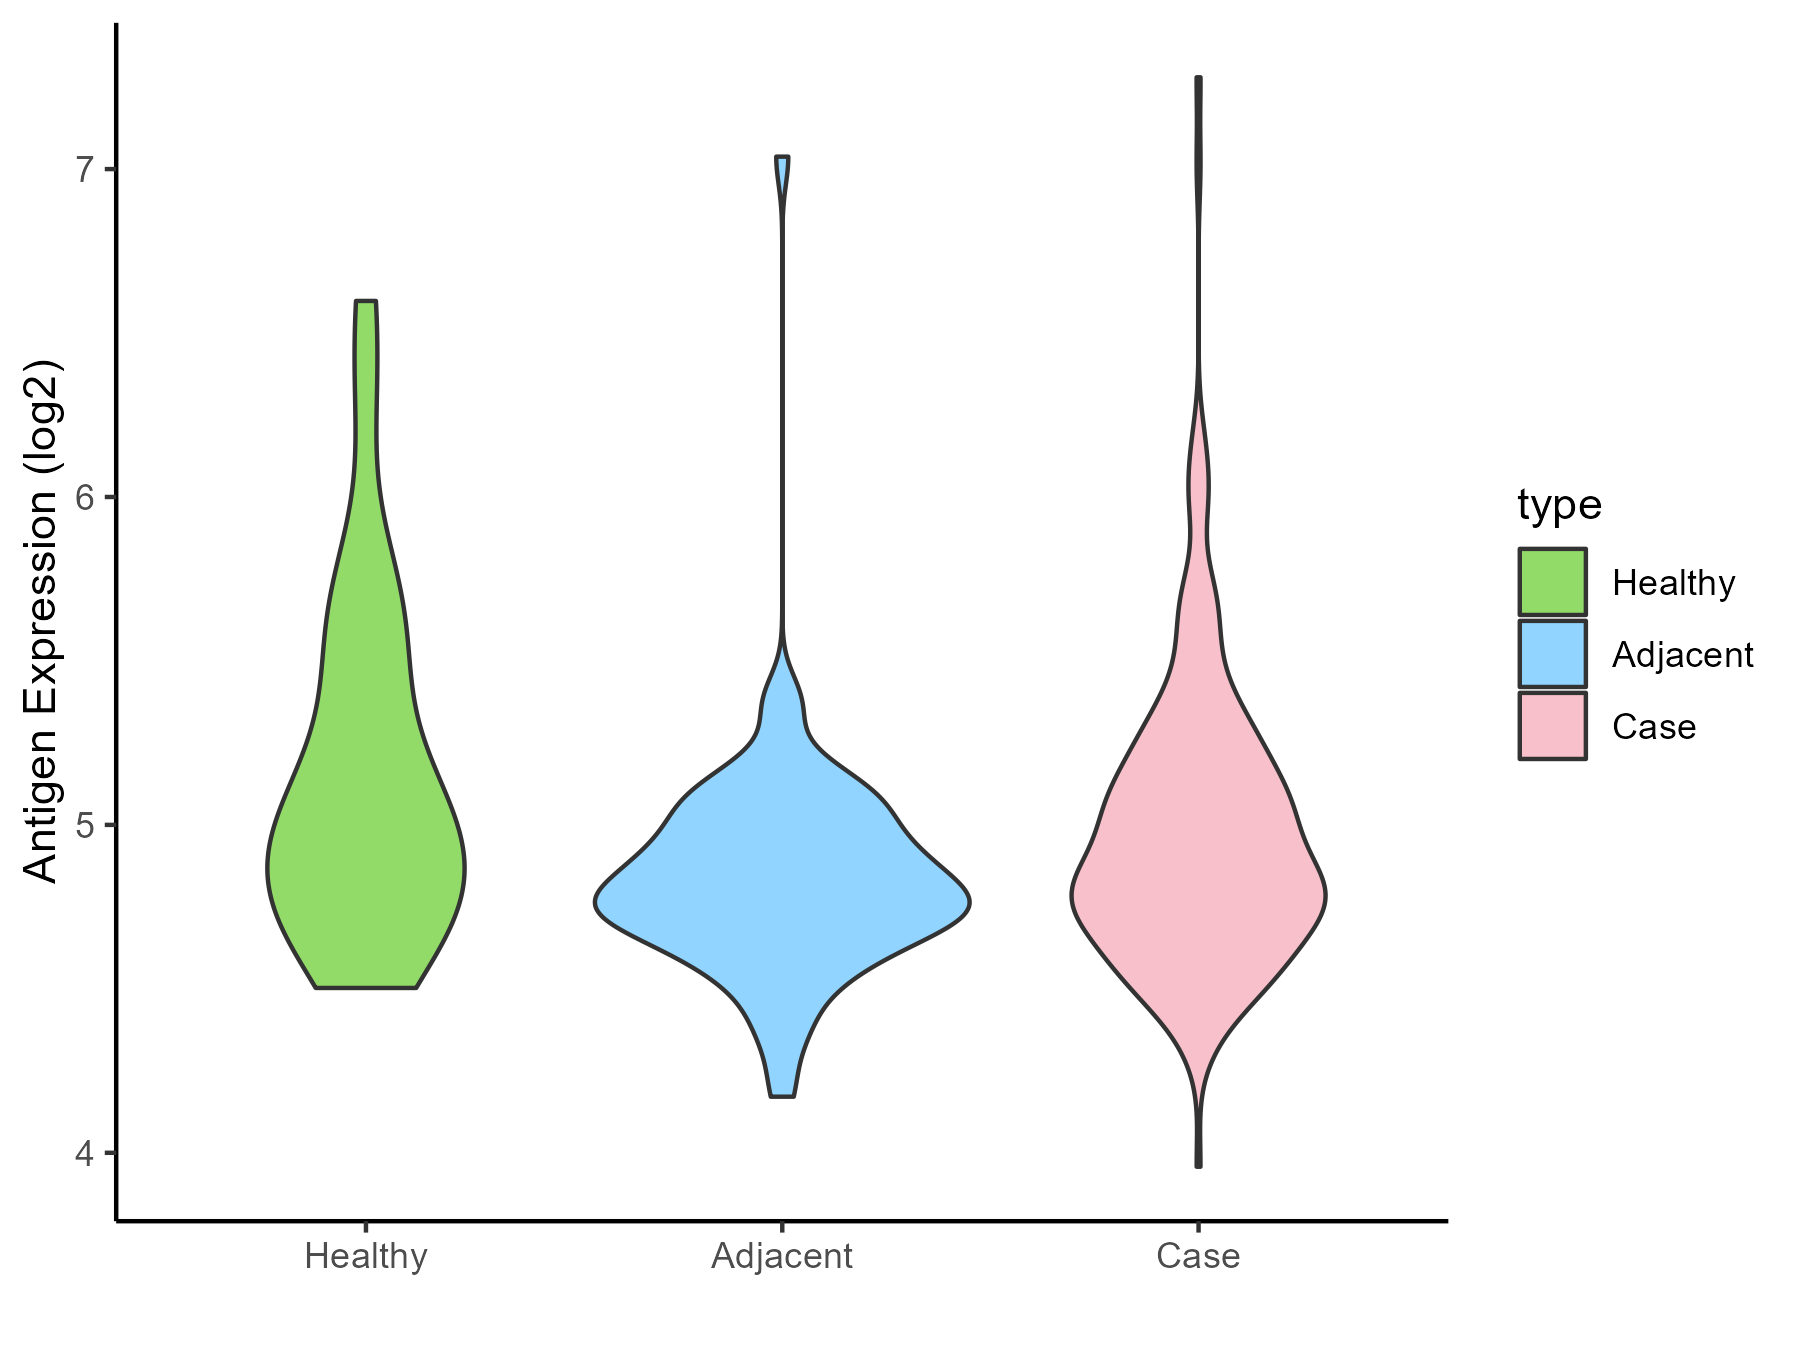
| The Studied Tissue | Oral | |
| The Specific Disease | Oral cancer | |
| The Expression Level of Disease Section Compare with the Healthy Individual Tissue | p-value: 0.113587185; Fold-change: -0.123329756; Z-score: -0.237261261 | |
| The Expression Level of Disease Section Compare with the Adjacent Tissue | p-value: 0.006810004; Fold-change: 0.093850137; Z-score: 0.275613083 | |
| Disease-specific Antigen Abundances |
|
Click to View the Clearer Original Diagram |
| Differential expression pattern of antigen in diseases | ||
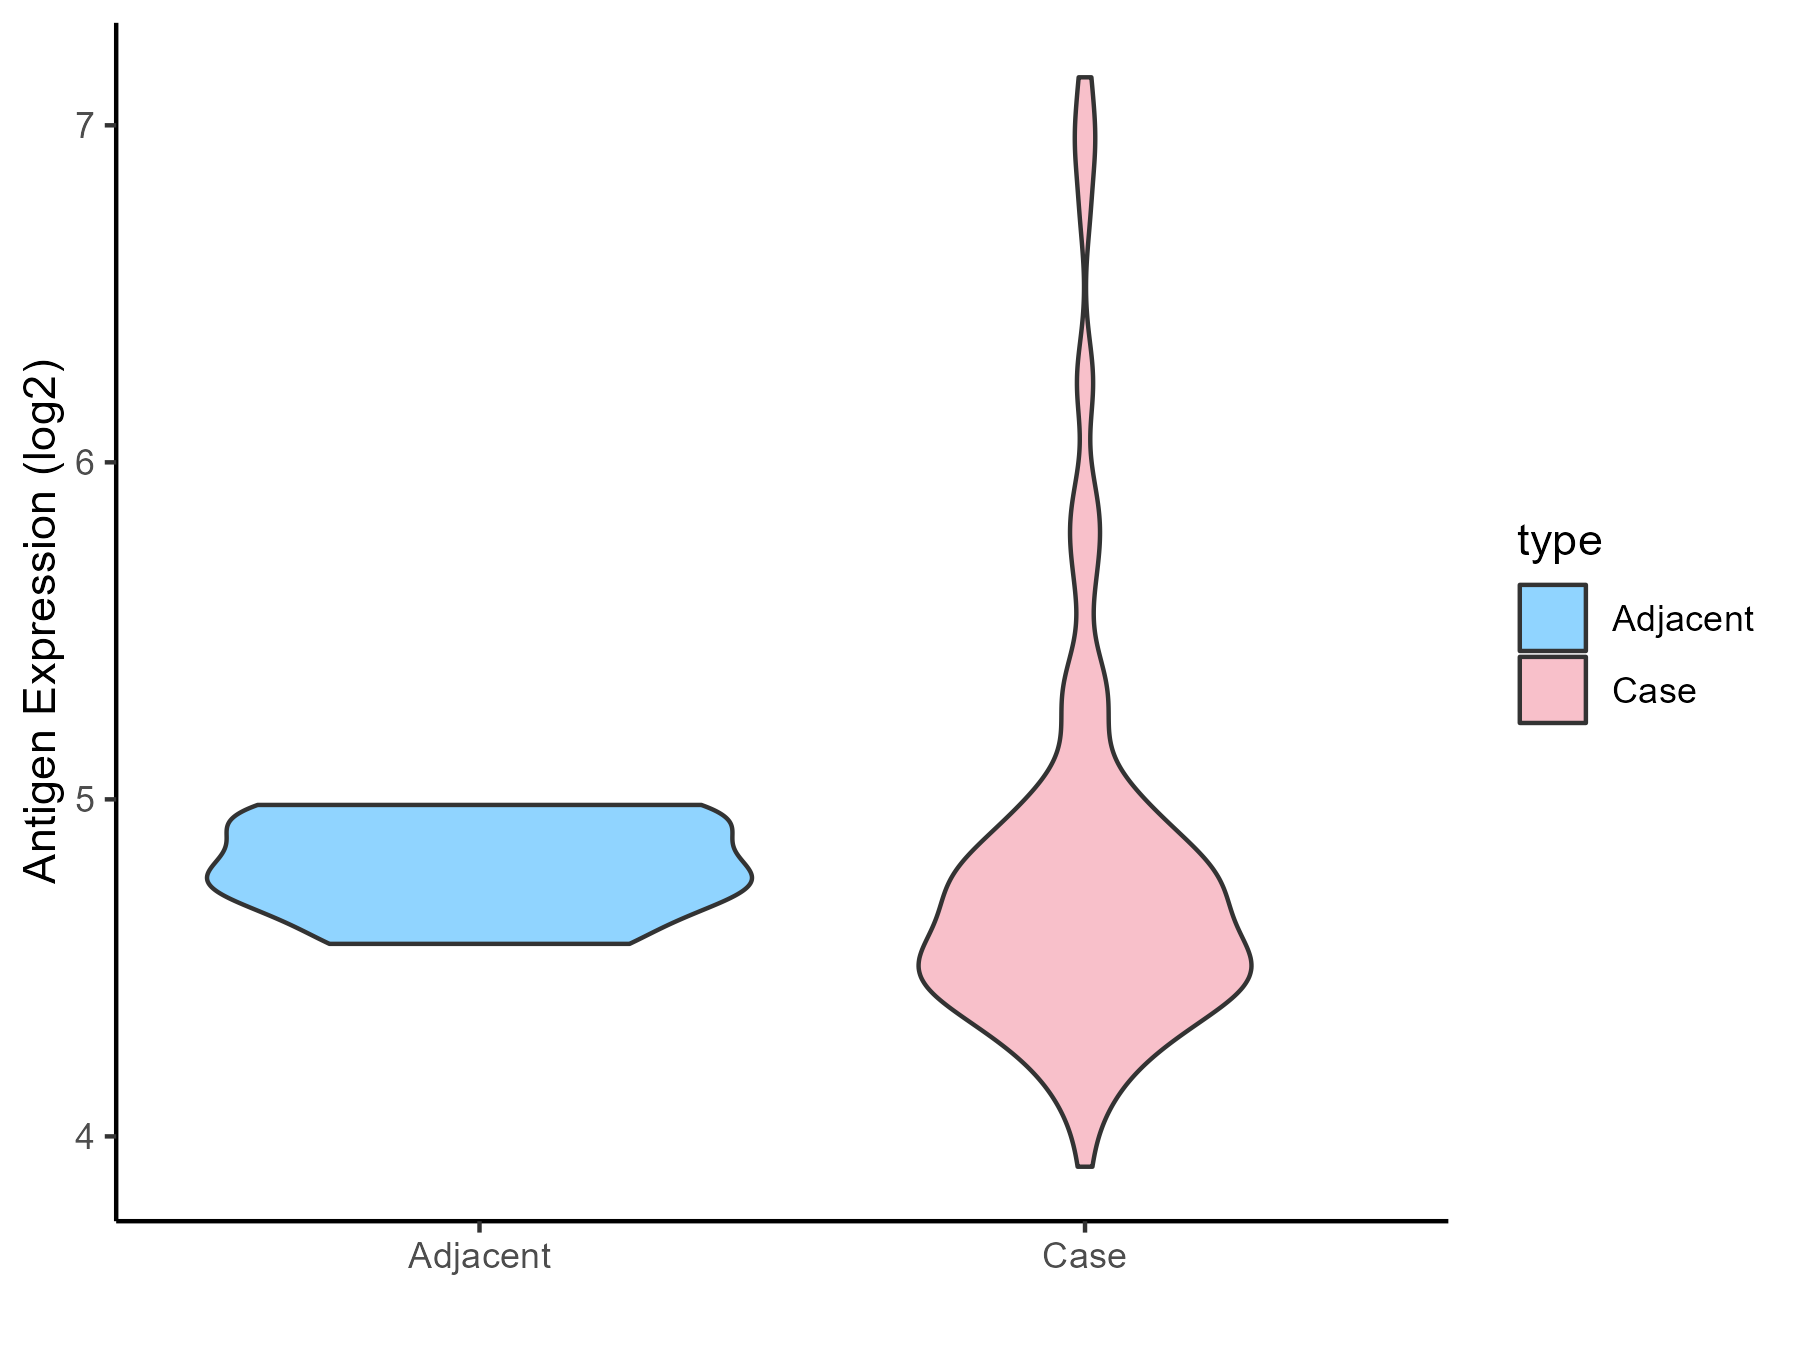
| The Studied Tissue | Esophagus | |
| The Specific Disease | Esophagal cancer | |
| The Expression Level of Disease Section Compare with the Adjacent Tissue | p-value: 0.943720474; Fold-change: -0.100884511; Z-score: -0.618432166 | |
| Disease-specific Antigen Abundances |
|
Click to View the Clearer Original Diagram |
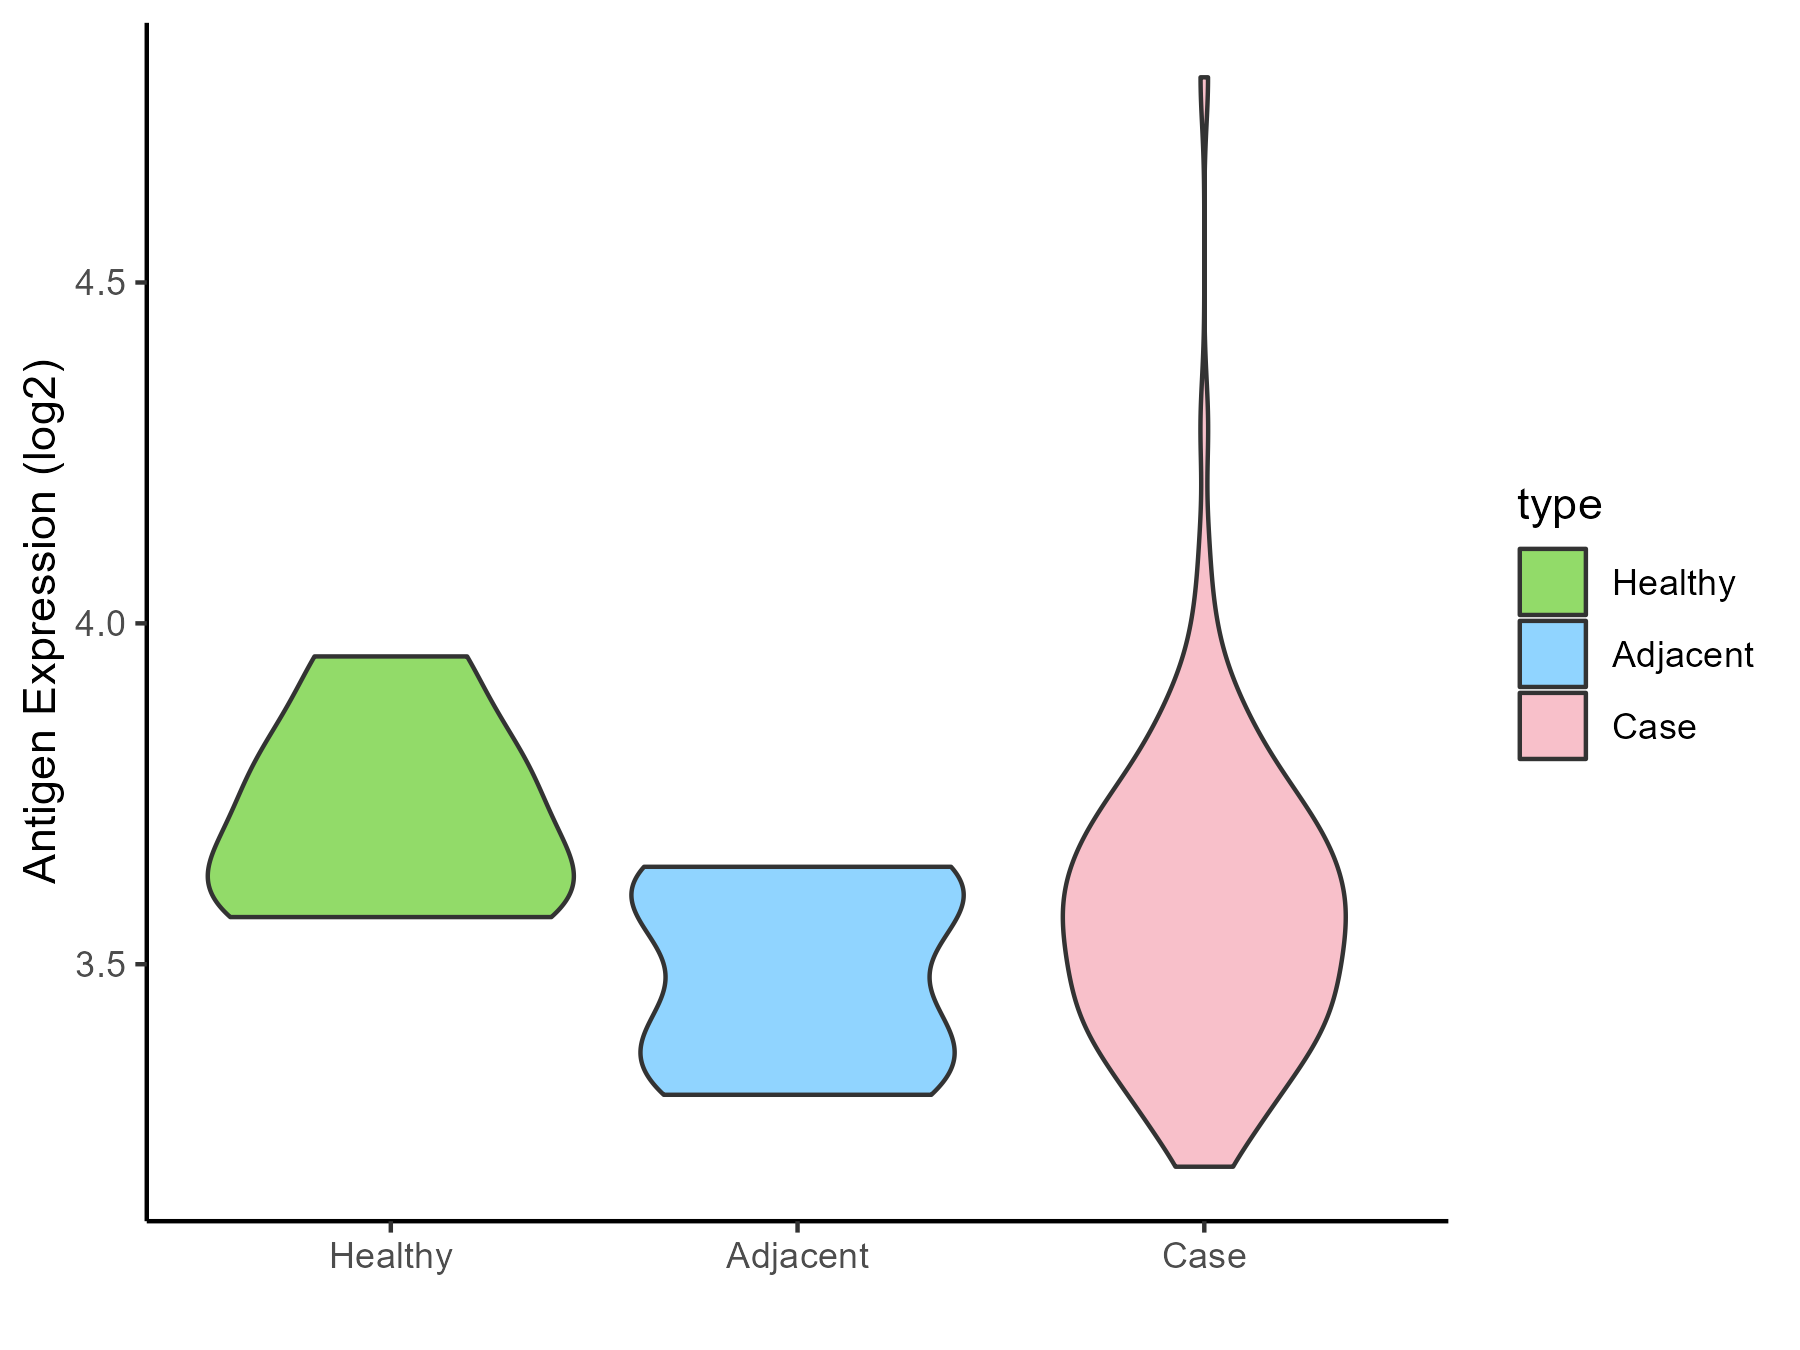
| Differential expression pattern of antigen in diseases | ||
| The Studied Tissue | Rectal colon | |
| The Specific Disease | Rectal cancer | |
| The Expression Level of Disease Section Compare with the Healthy Individual Tissue | p-value: 0.070030077; Fold-change: -0.134706609; Z-score: -0.920716279 | |
| The Expression Level of Disease Section Compare with the Adjacent Tissue | p-value: 0.168485451; Fold-change: 0.069280813; Z-score: 0.484870837 | |
| Disease-specific Antigen Abundances |
|
Click to View the Clearer Original Diagram |
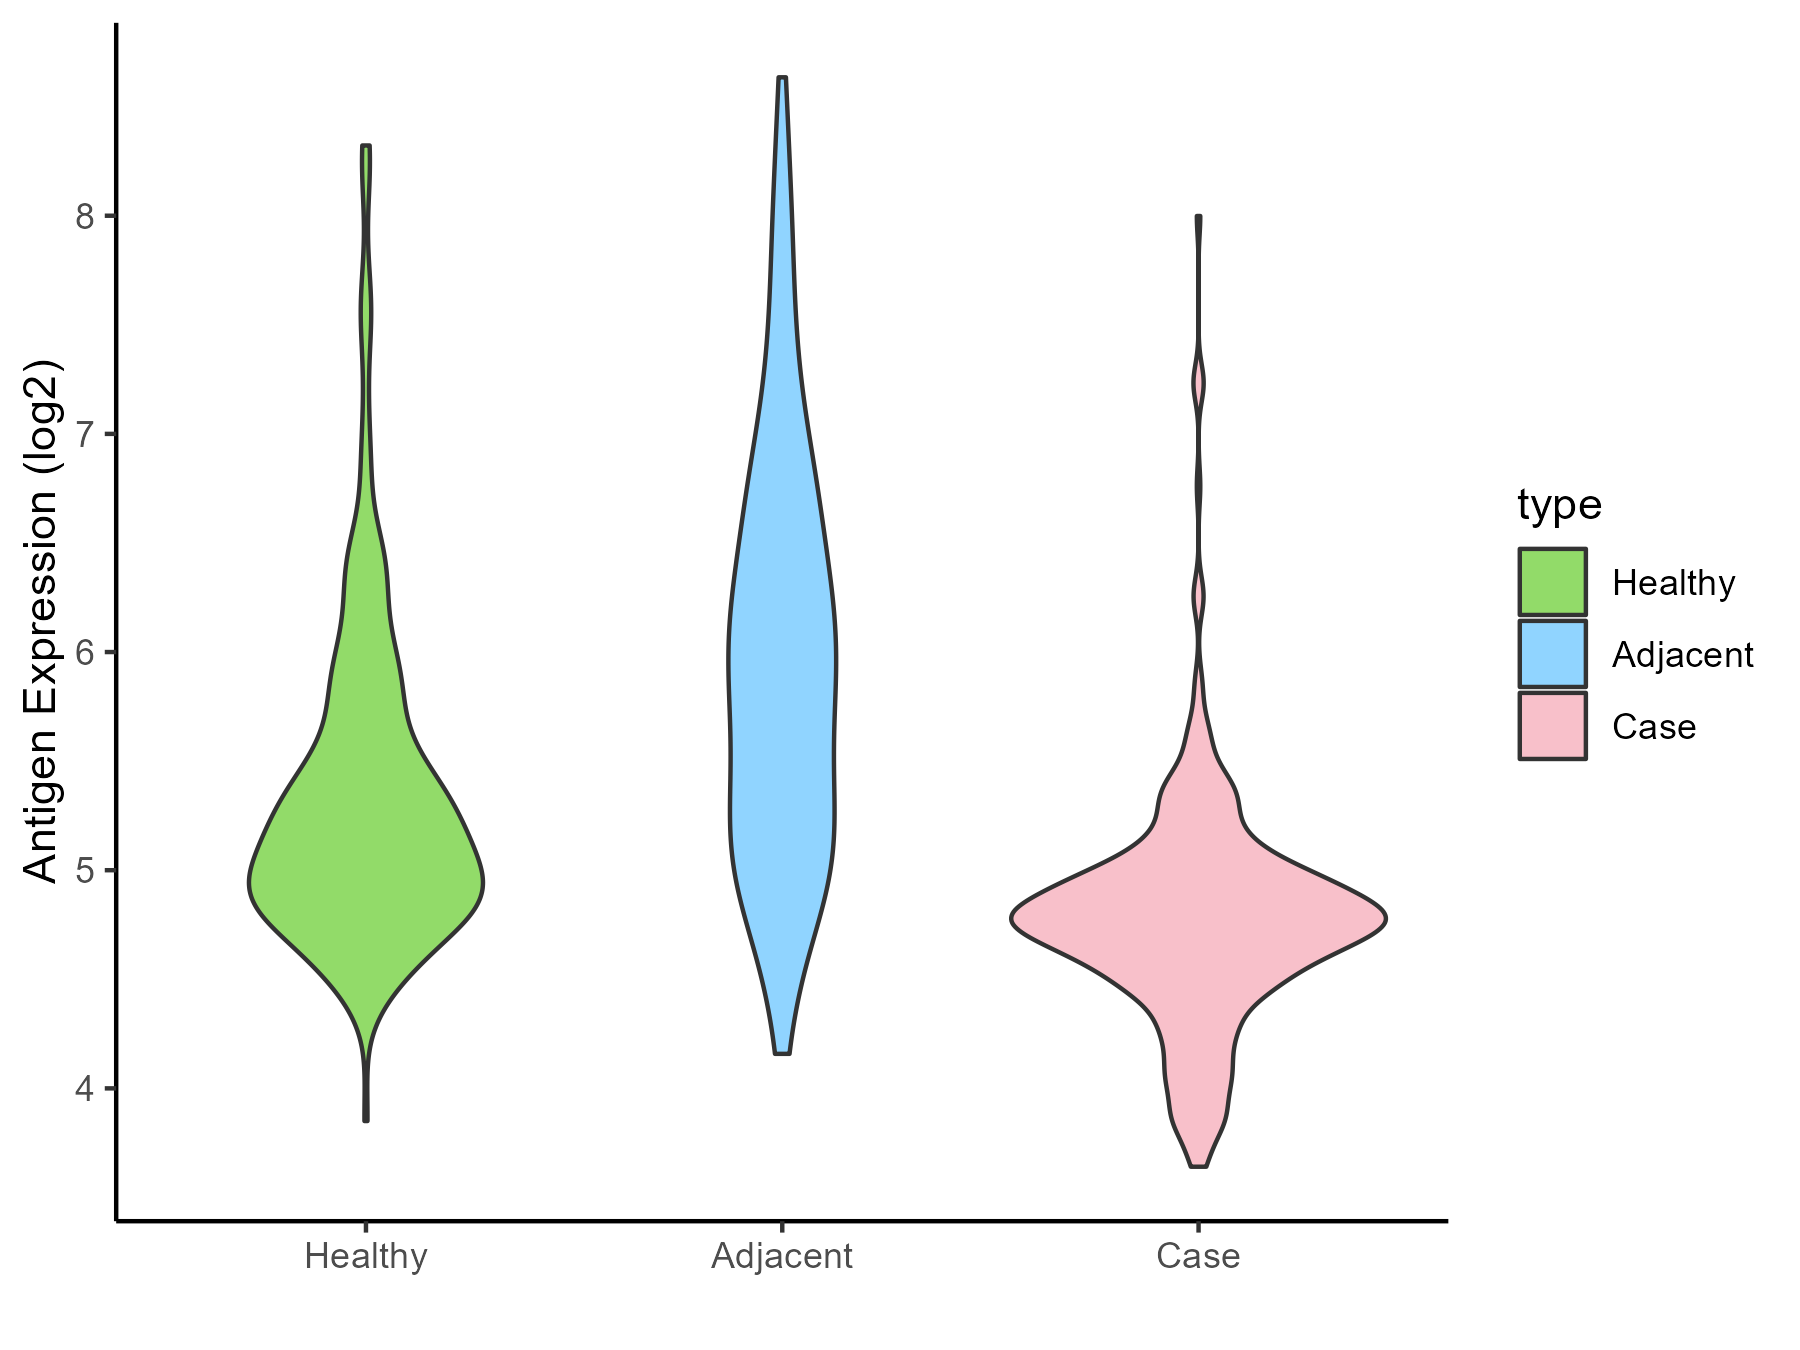
| Differential expression pattern of antigen in diseases | ||
| The Studied Tissue | Skin | |
| The Specific Disease | Skin cancer | |
| The Expression Level of Disease Section Compare with the Healthy Individual Tissue | p-value: 1.04E-21; Fold-change: -0.371667936; Z-score: -0.518473153 | |
| The Expression Level of Disease Section Compare with the Adjacent Tissue | p-value: 3.88E-40; Fold-change: -1.122091758; Z-score: -1.188455331 | |
| Disease-specific Antigen Abundances |
|
Click to View the Clearer Original Diagram |
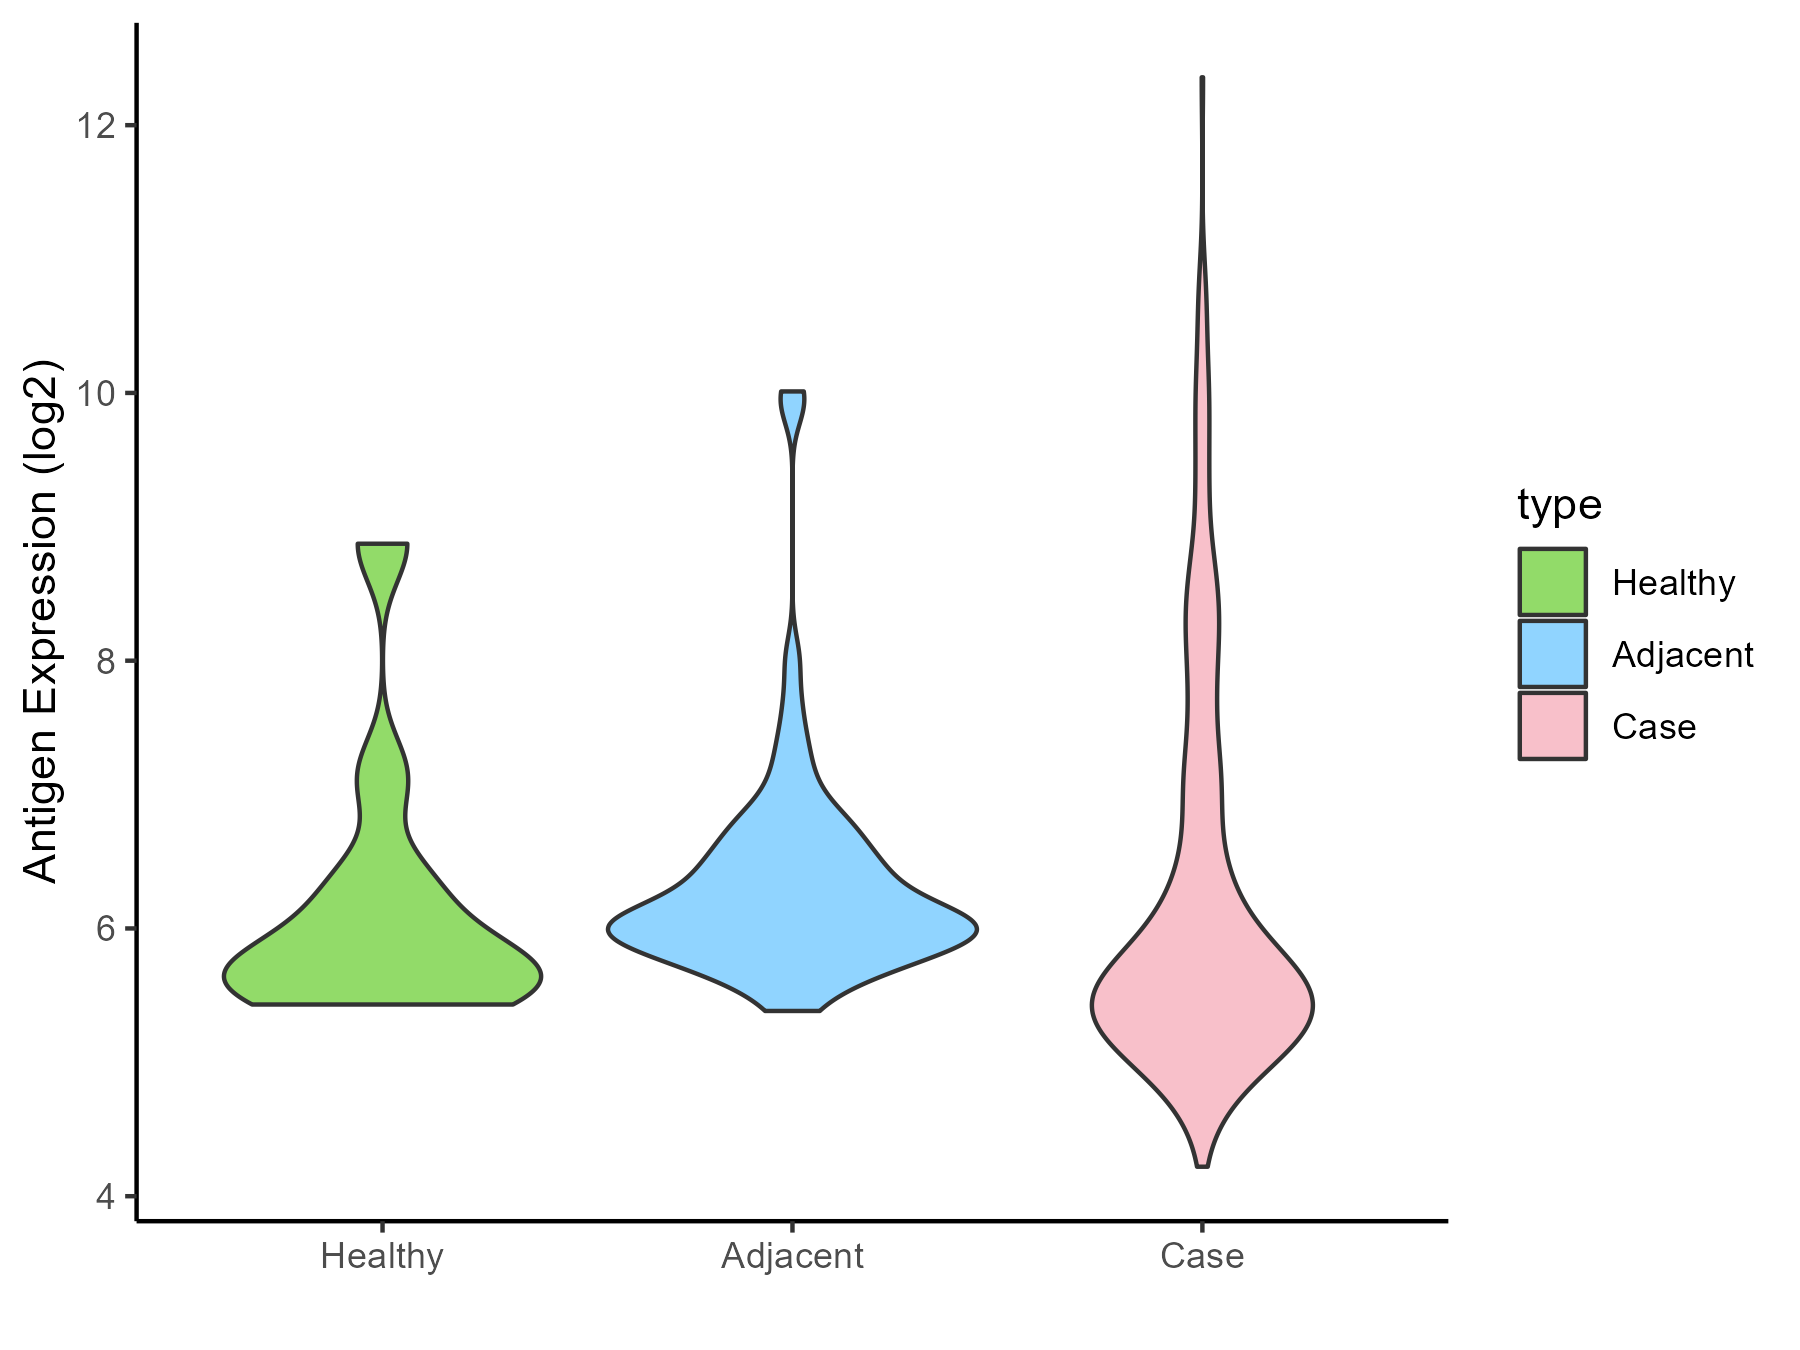
| Differential expression pattern of antigen in diseases | ||
| The Studied Tissue | Kidney | |
| The Specific Disease | Renal cancer | |
| The Expression Level of Disease Section Compare with the Healthy Individual Tissue | p-value: 0.889119713; Fold-change: -0.075827592; Z-score: -0.073894361 | |
| The Expression Level of Disease Section Compare with the Adjacent Tissue | p-value: 0.304839718; Fold-change: -0.449521768; Z-score: -0.556830297 | |
| Disease-specific Antigen Abundances |
|
Click to View the Clearer Original Diagram |
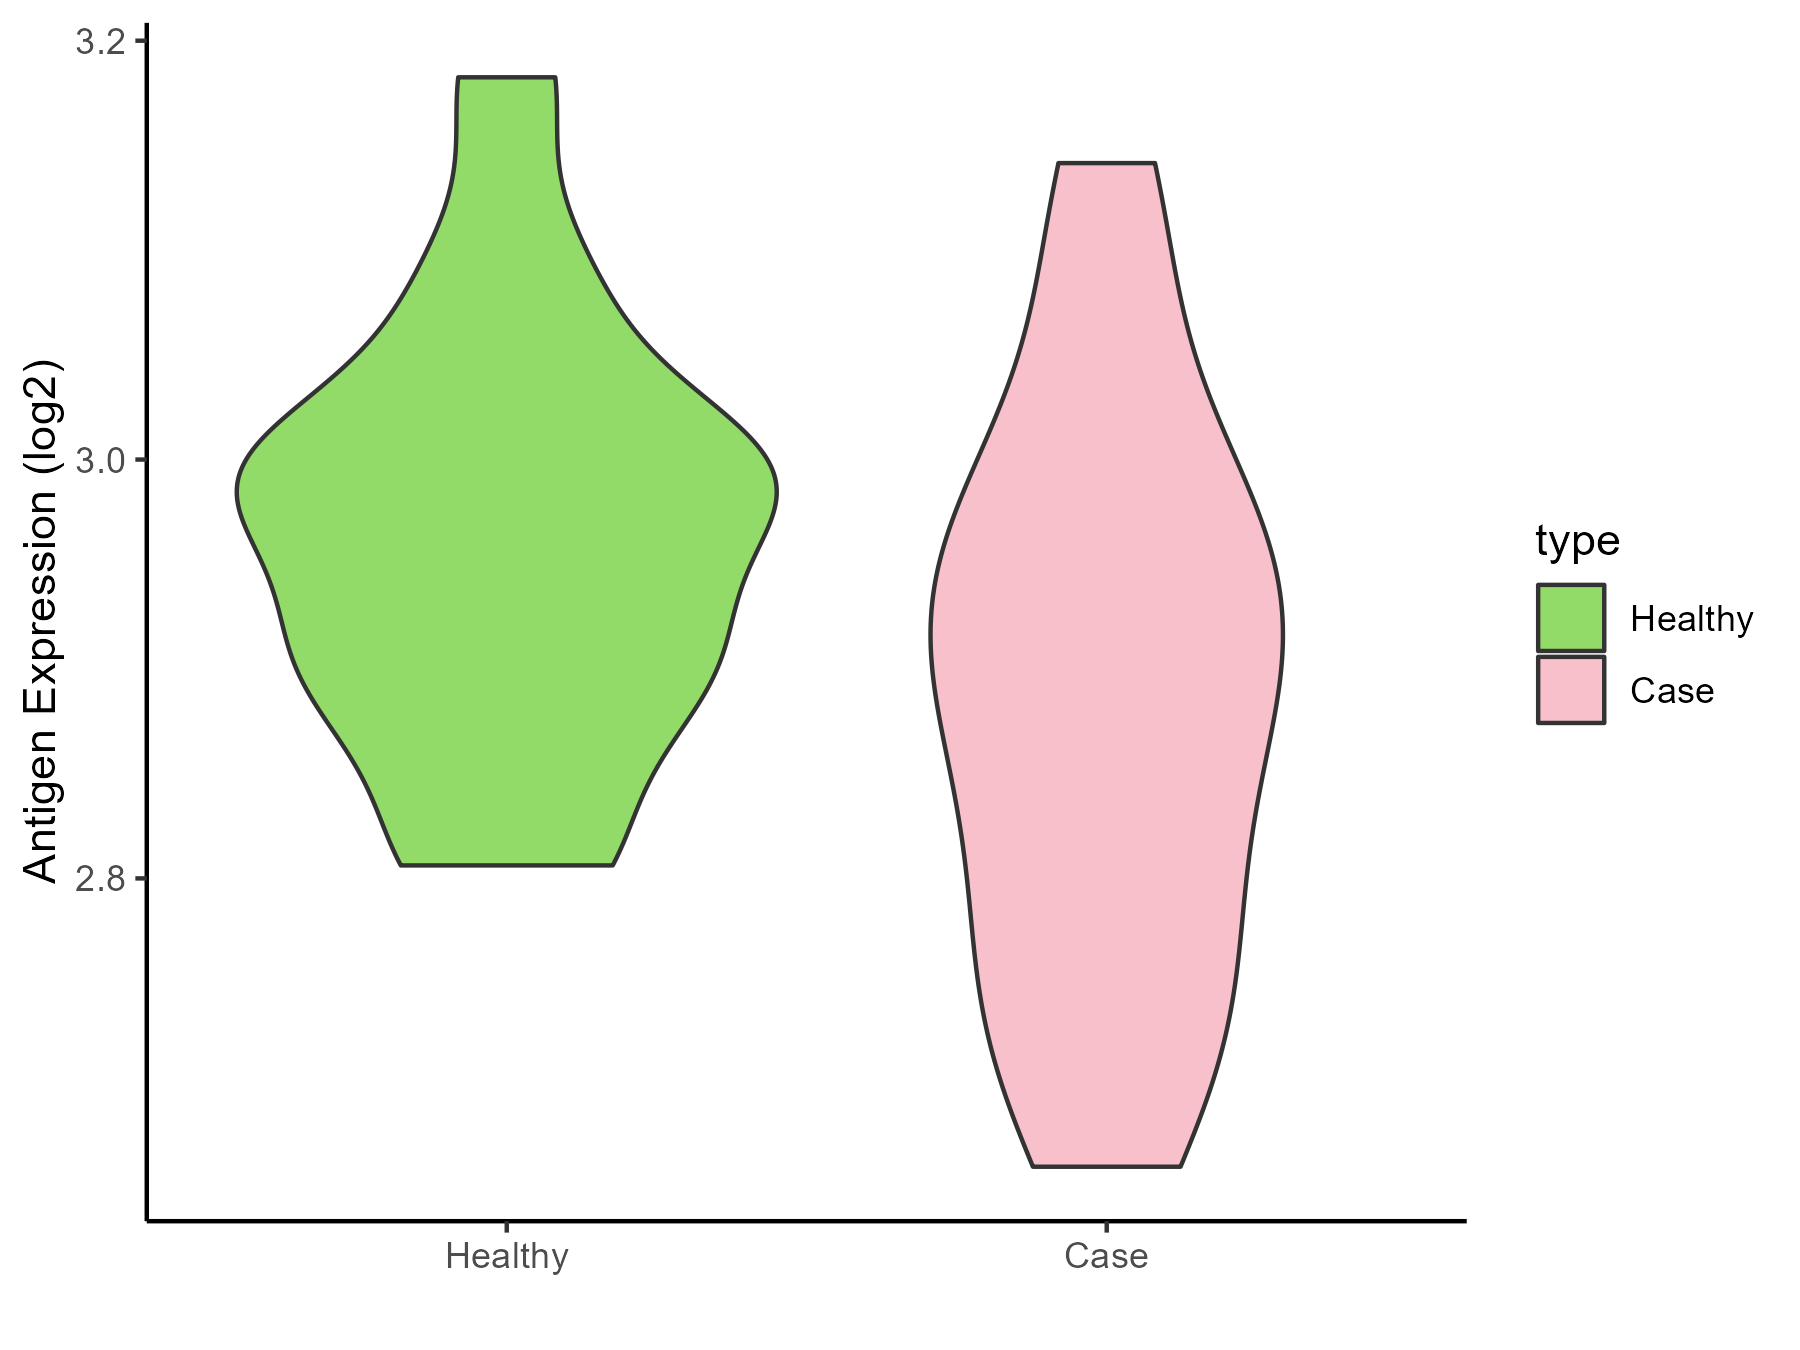
| Differential expression pattern of antigen in diseases | ||
| The Studied Tissue | Urothelium | |
| The Specific Disease | Ureter cancer | |
| The Expression Level of Disease Section Compare with the Healthy Individual Tissue | p-value: 0.046641028; Fold-change: -0.089729537; Z-score: -0.882905683 | |
| Disease-specific Antigen Abundances |
|
Click to View the Clearer Original Diagram |
ICD Disease Classification 20
| Differential expression pattern of antigen in diseases | ||
| The Studied Tissue | Adipose | |
| The Specific Disease | Simpson golabi behmel syndrome | |
| The Expression Level of Disease Section Compare with the Healthy Individual Tissue | p-value: 0.108155668; Fold-change: -0.163142988; Z-score: -2.210241813 | |
| Disease-specific Antigen Abundances |
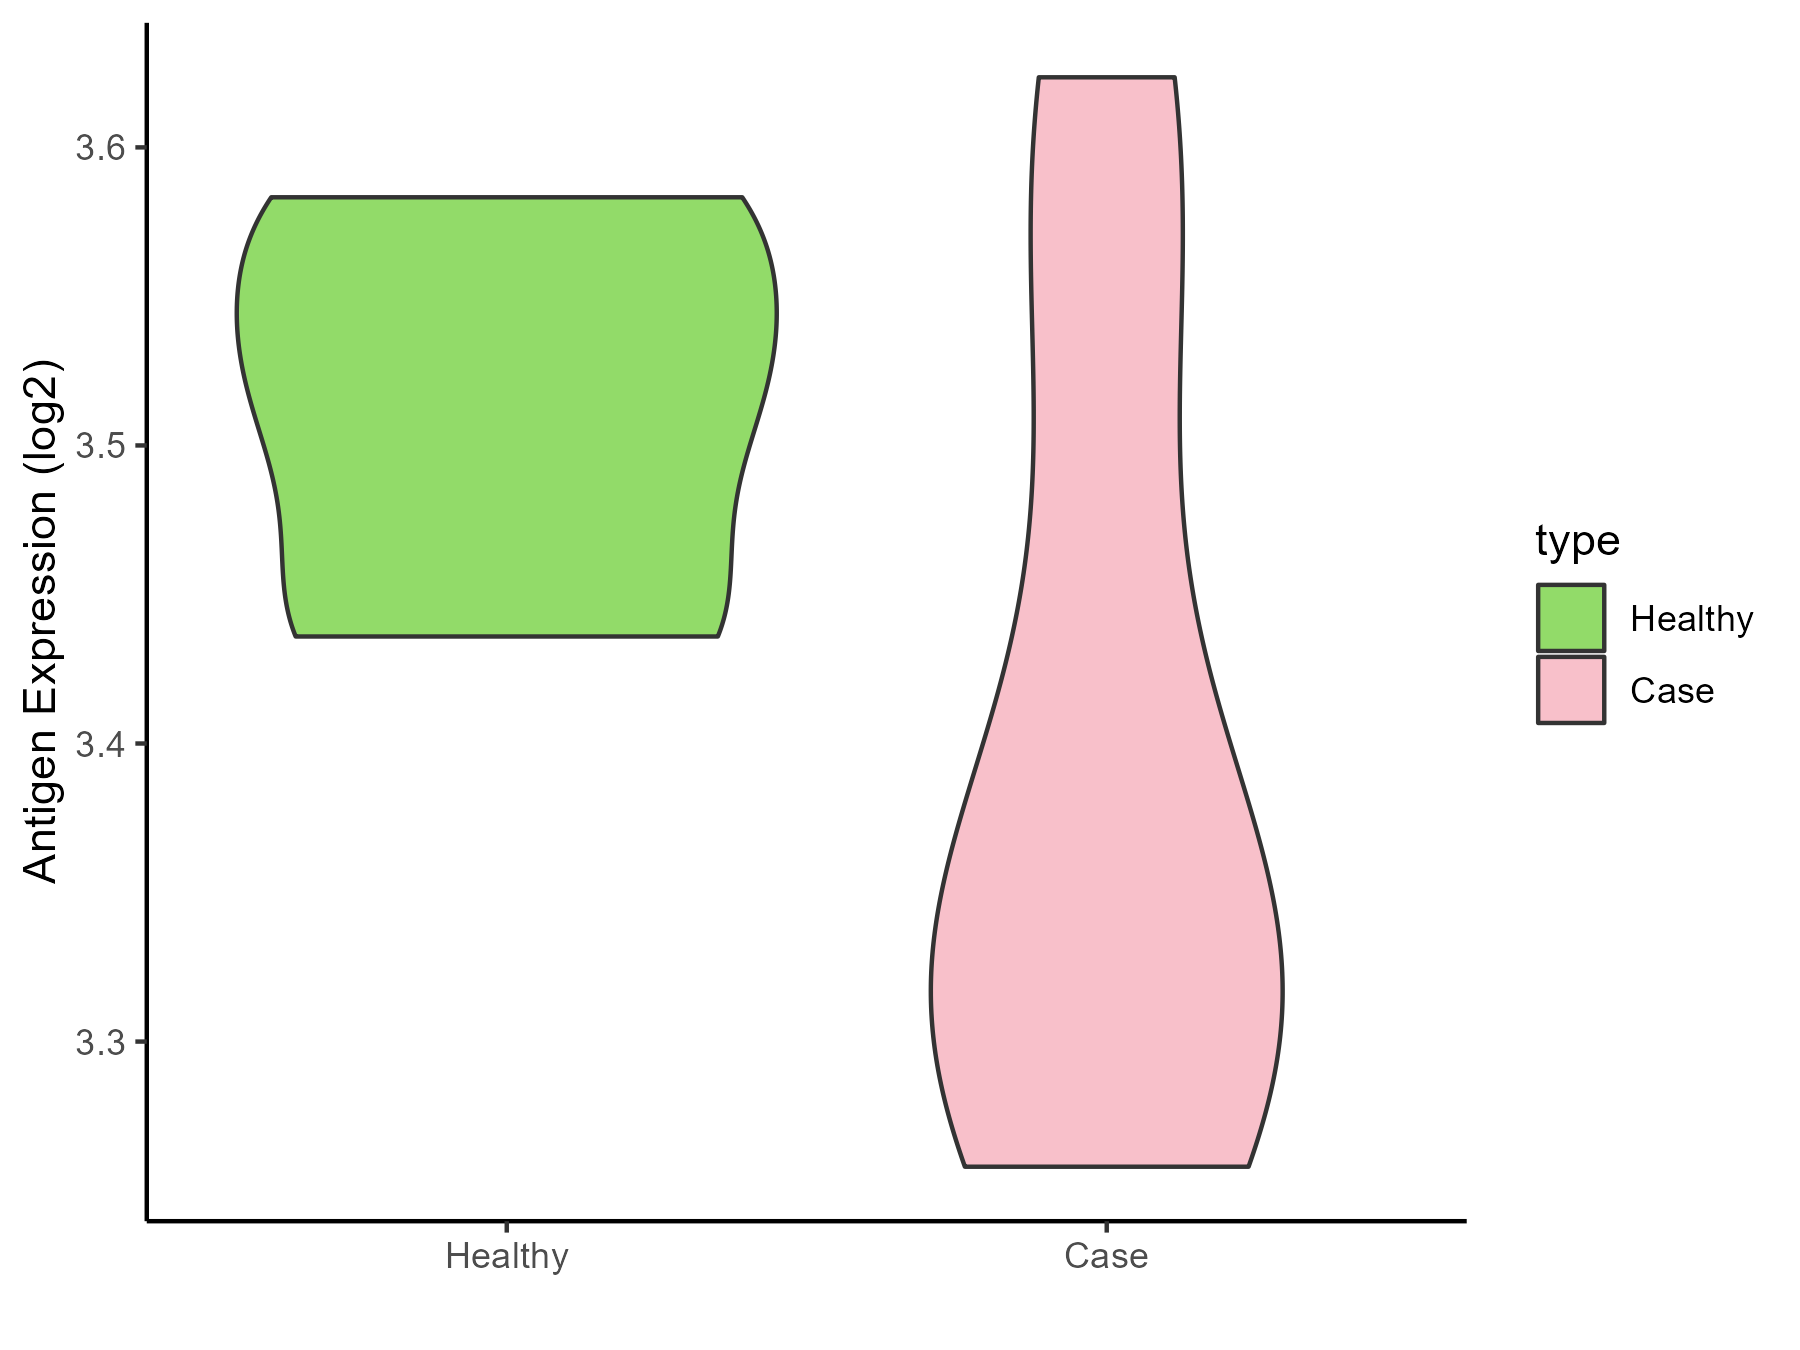
|
Click to View the Clearer Original Diagram |
| Differential expression pattern of antigen in diseases | ||
| The Studied Tissue | Perituberal | |
| The Specific Disease | Tuberous sclerosis complex | |
| The Expression Level of Disease Section Compare with the Healthy Individual Tissue | p-value: 0.008859299; Fold-change: 0.315261587; Z-score: 3.413161206 | |
| Disease-specific Antigen Abundances |
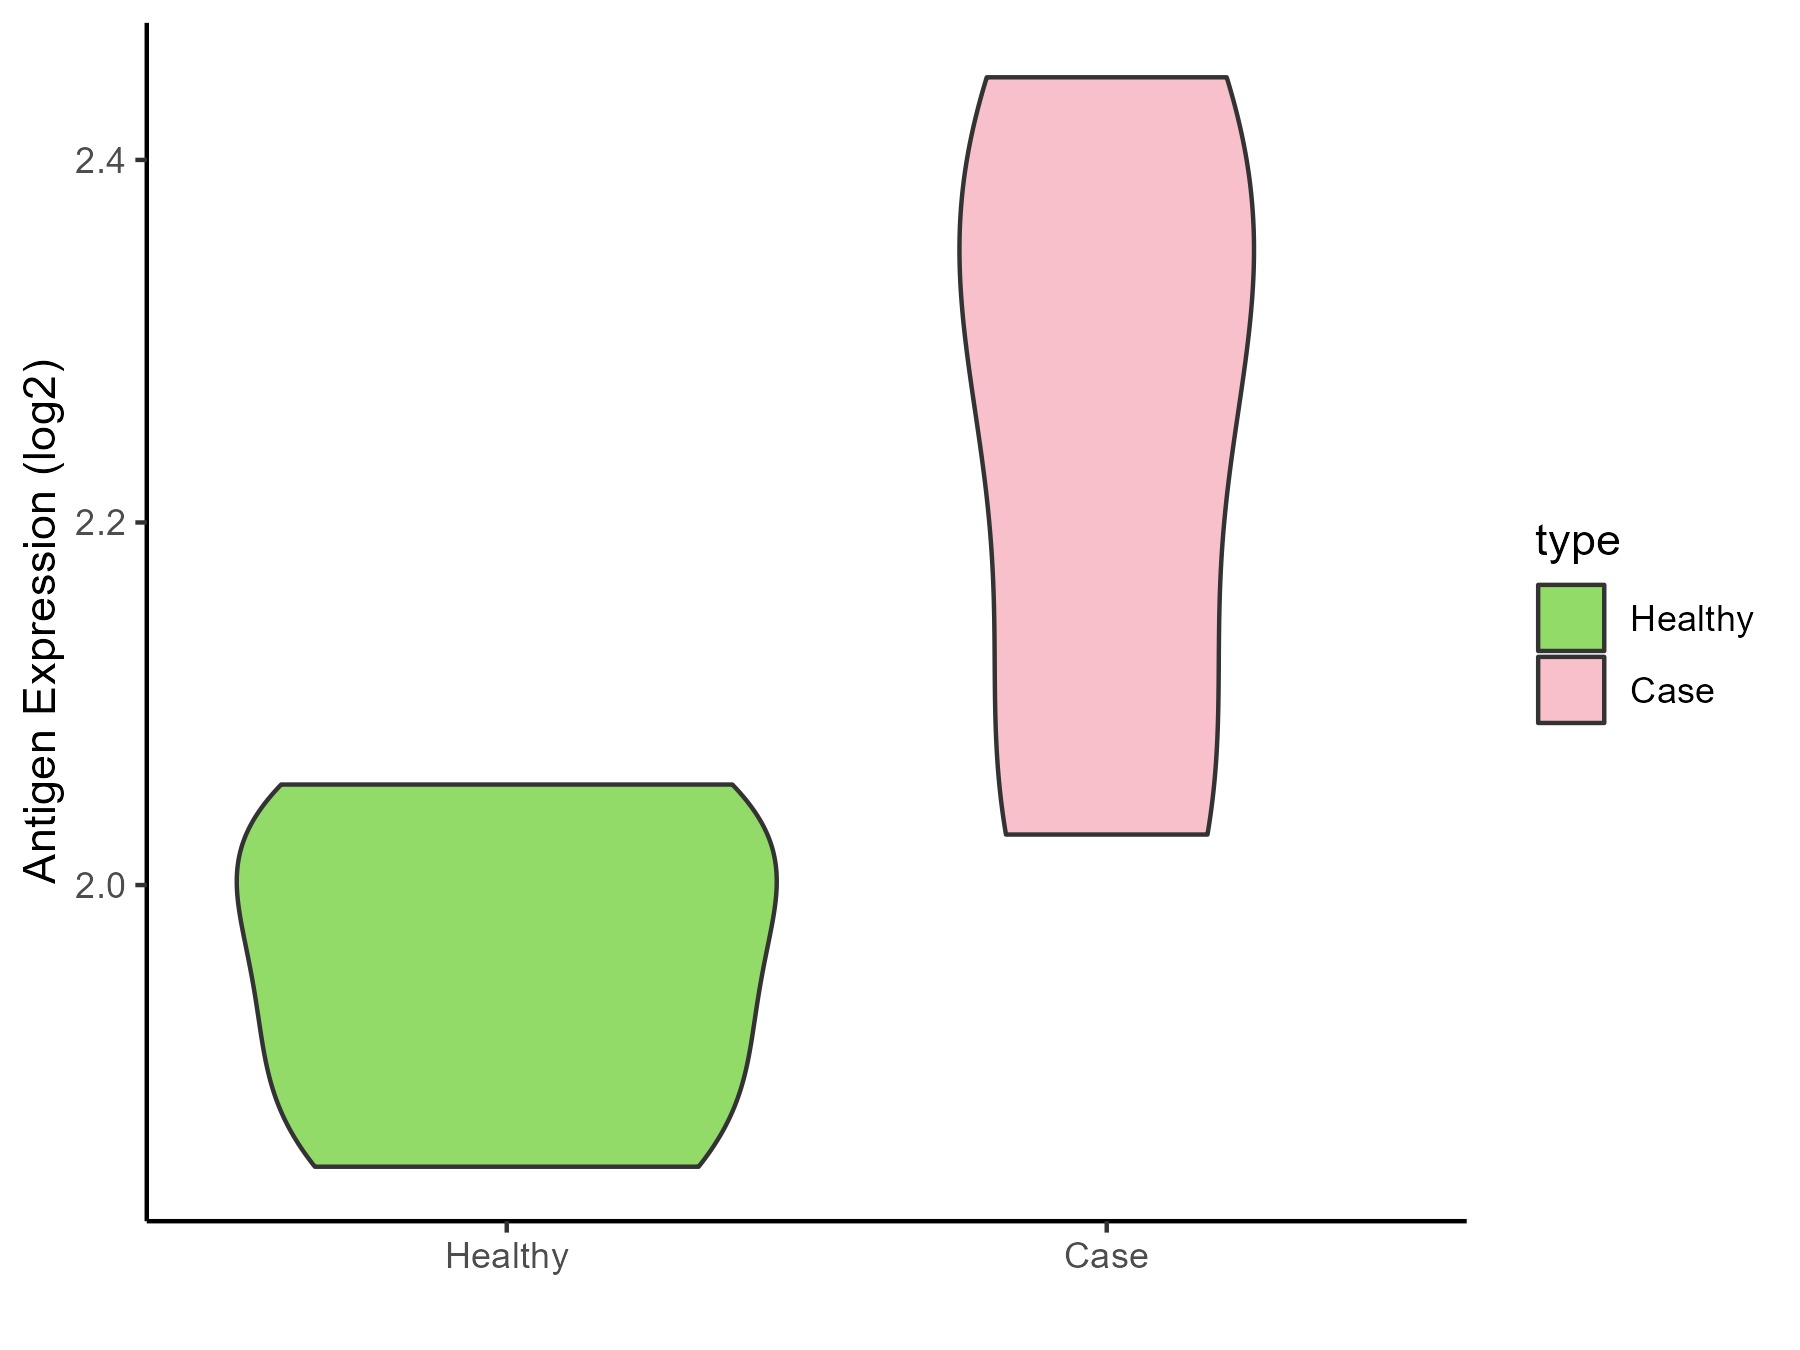
|
Click to View the Clearer Original Diagram |
ICD Disease Classification 3
| Differential expression pattern of antigen in diseases | ||
| The Studied Tissue | Bone marrow | |
| The Specific Disease | Anemia | |
| The Expression Level of Disease Section Compare with the Healthy Individual Tissue | p-value: 0.124361881; Fold-change: 0.117714973; Z-score: 0.585266007 | |
| Disease-specific Antigen Abundances |
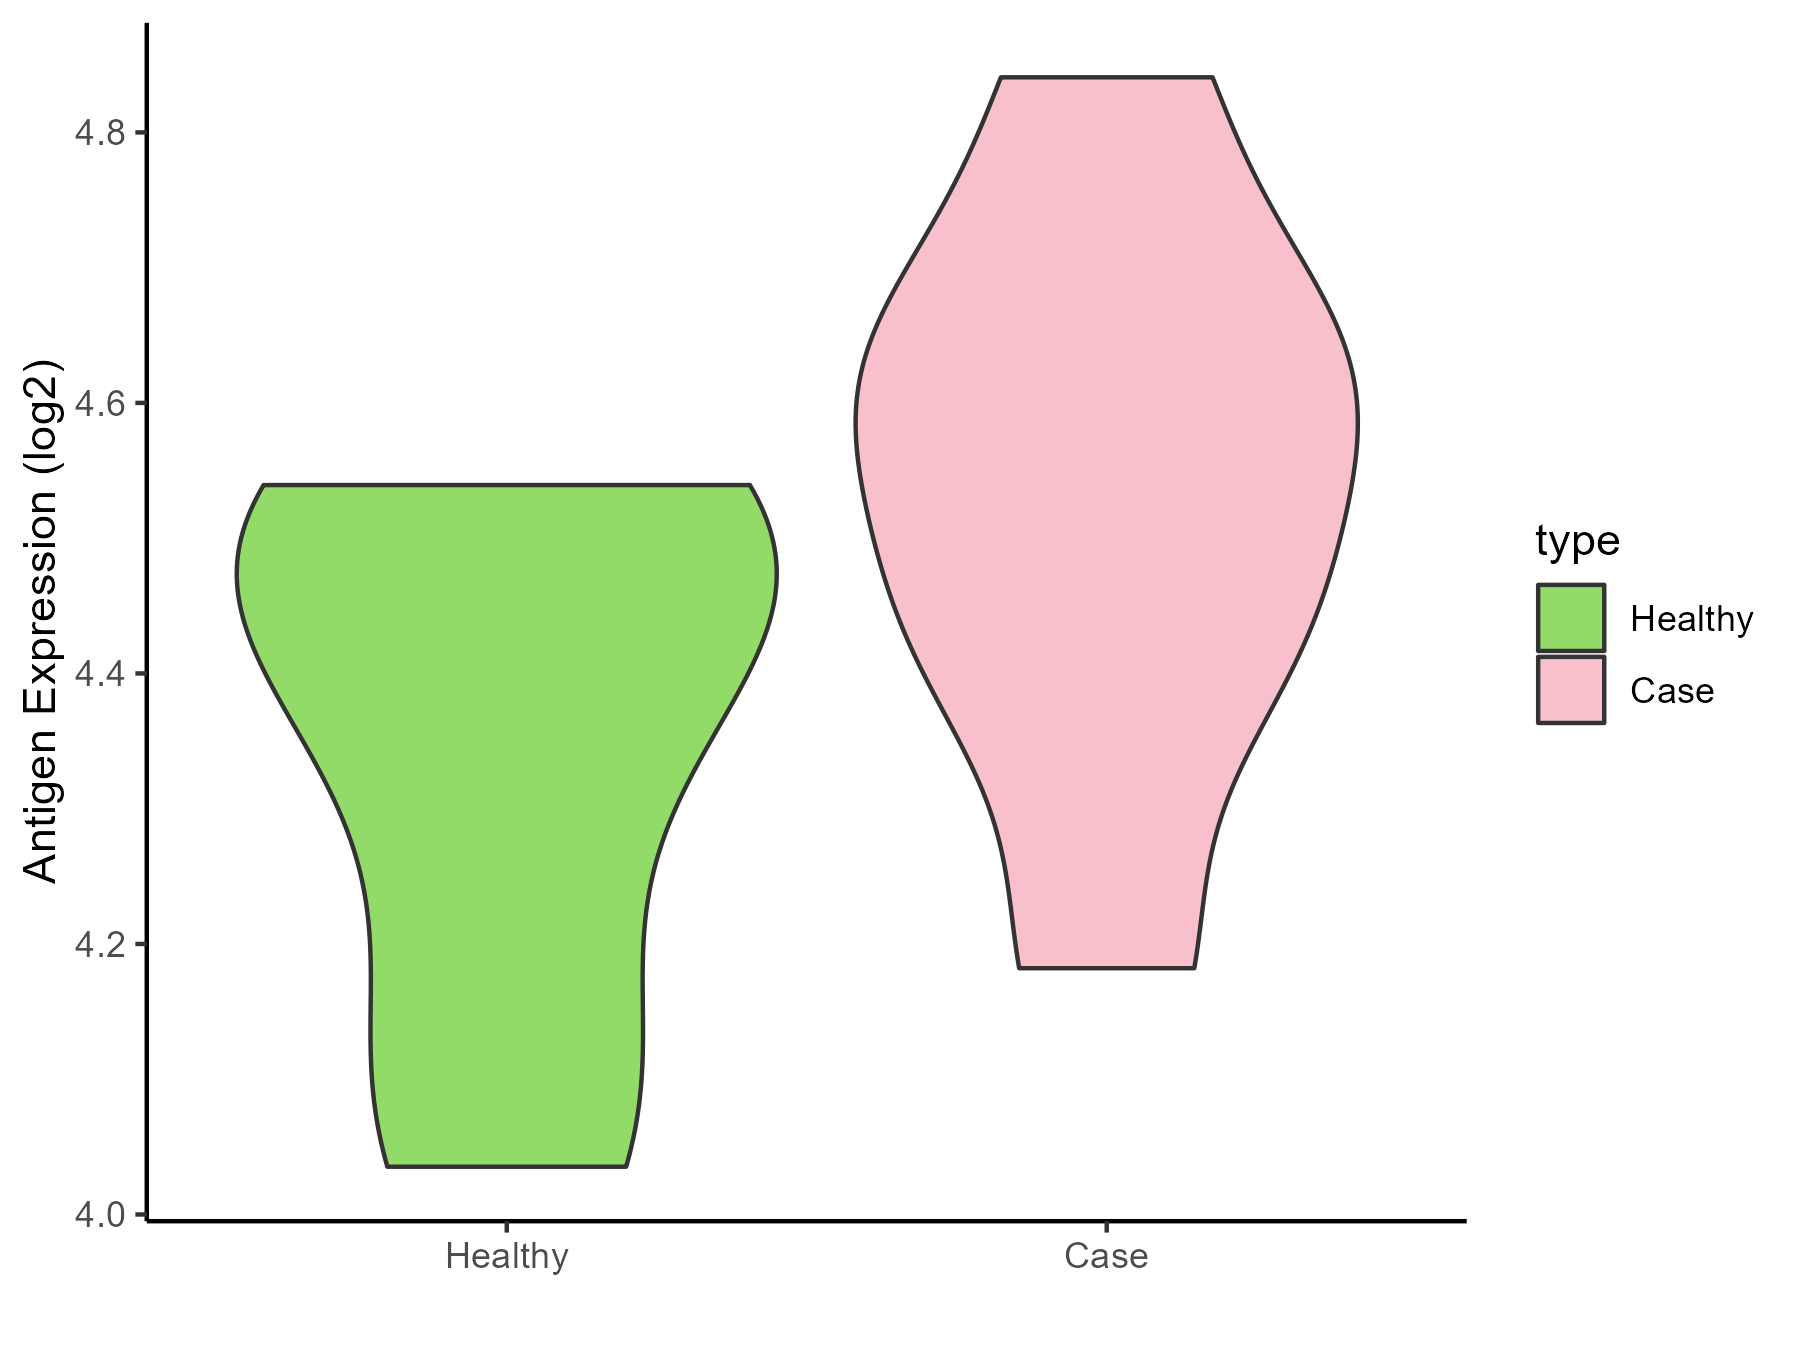
|
Click to View the Clearer Original Diagram |
| Differential expression pattern of antigen in diseases | ||
| The Studied Tissue | Peripheral blood | |
| The Specific Disease | Sickle cell disease | |
| The Expression Level of Disease Section Compare with the Healthy Individual Tissue | p-value: 0.017864122; Fold-change: 0.138803971; Z-score: 1.050797707 | |
| Disease-specific Antigen Abundances |
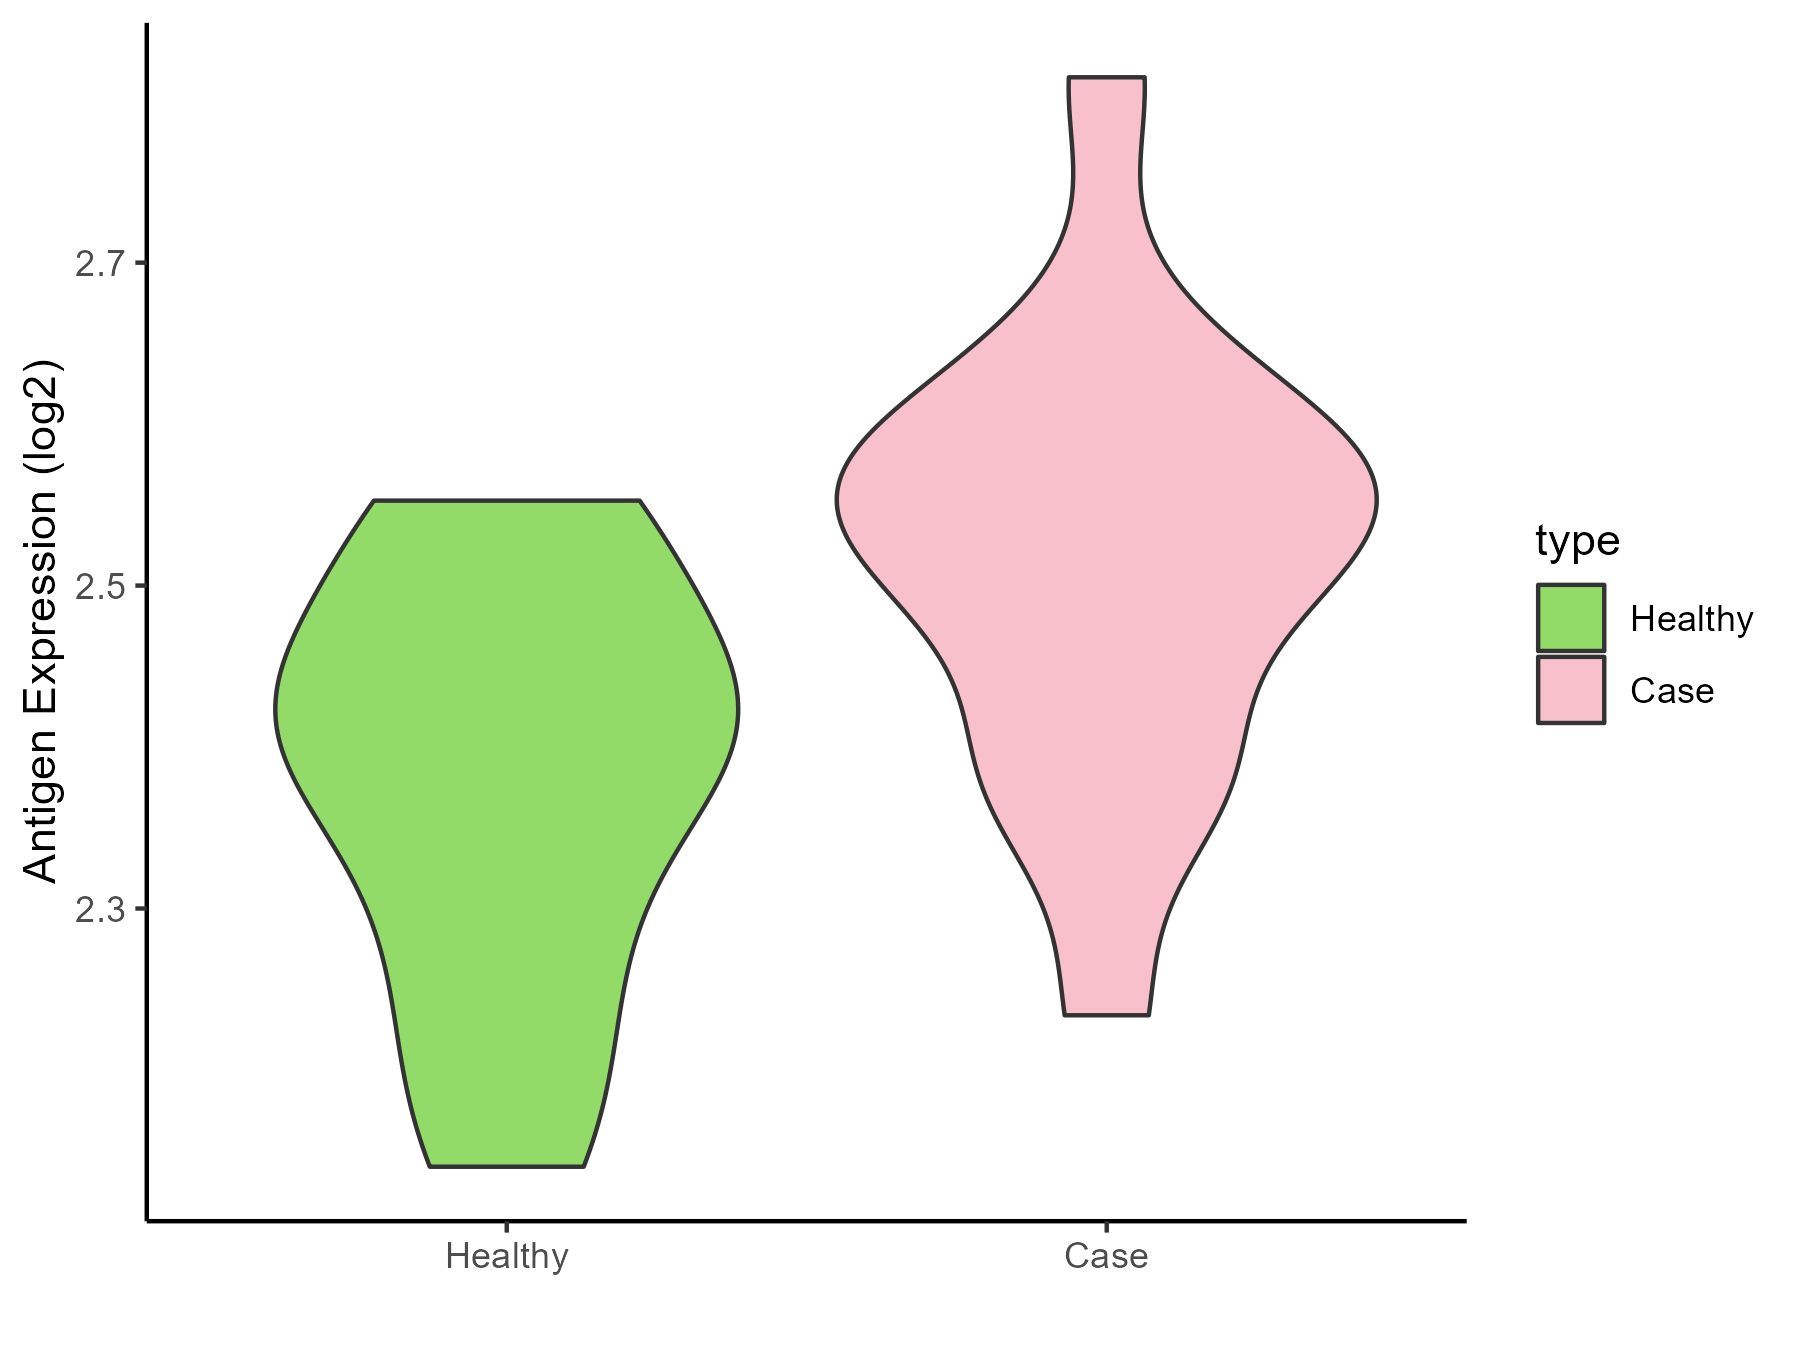
|
Click to View the Clearer Original Diagram |
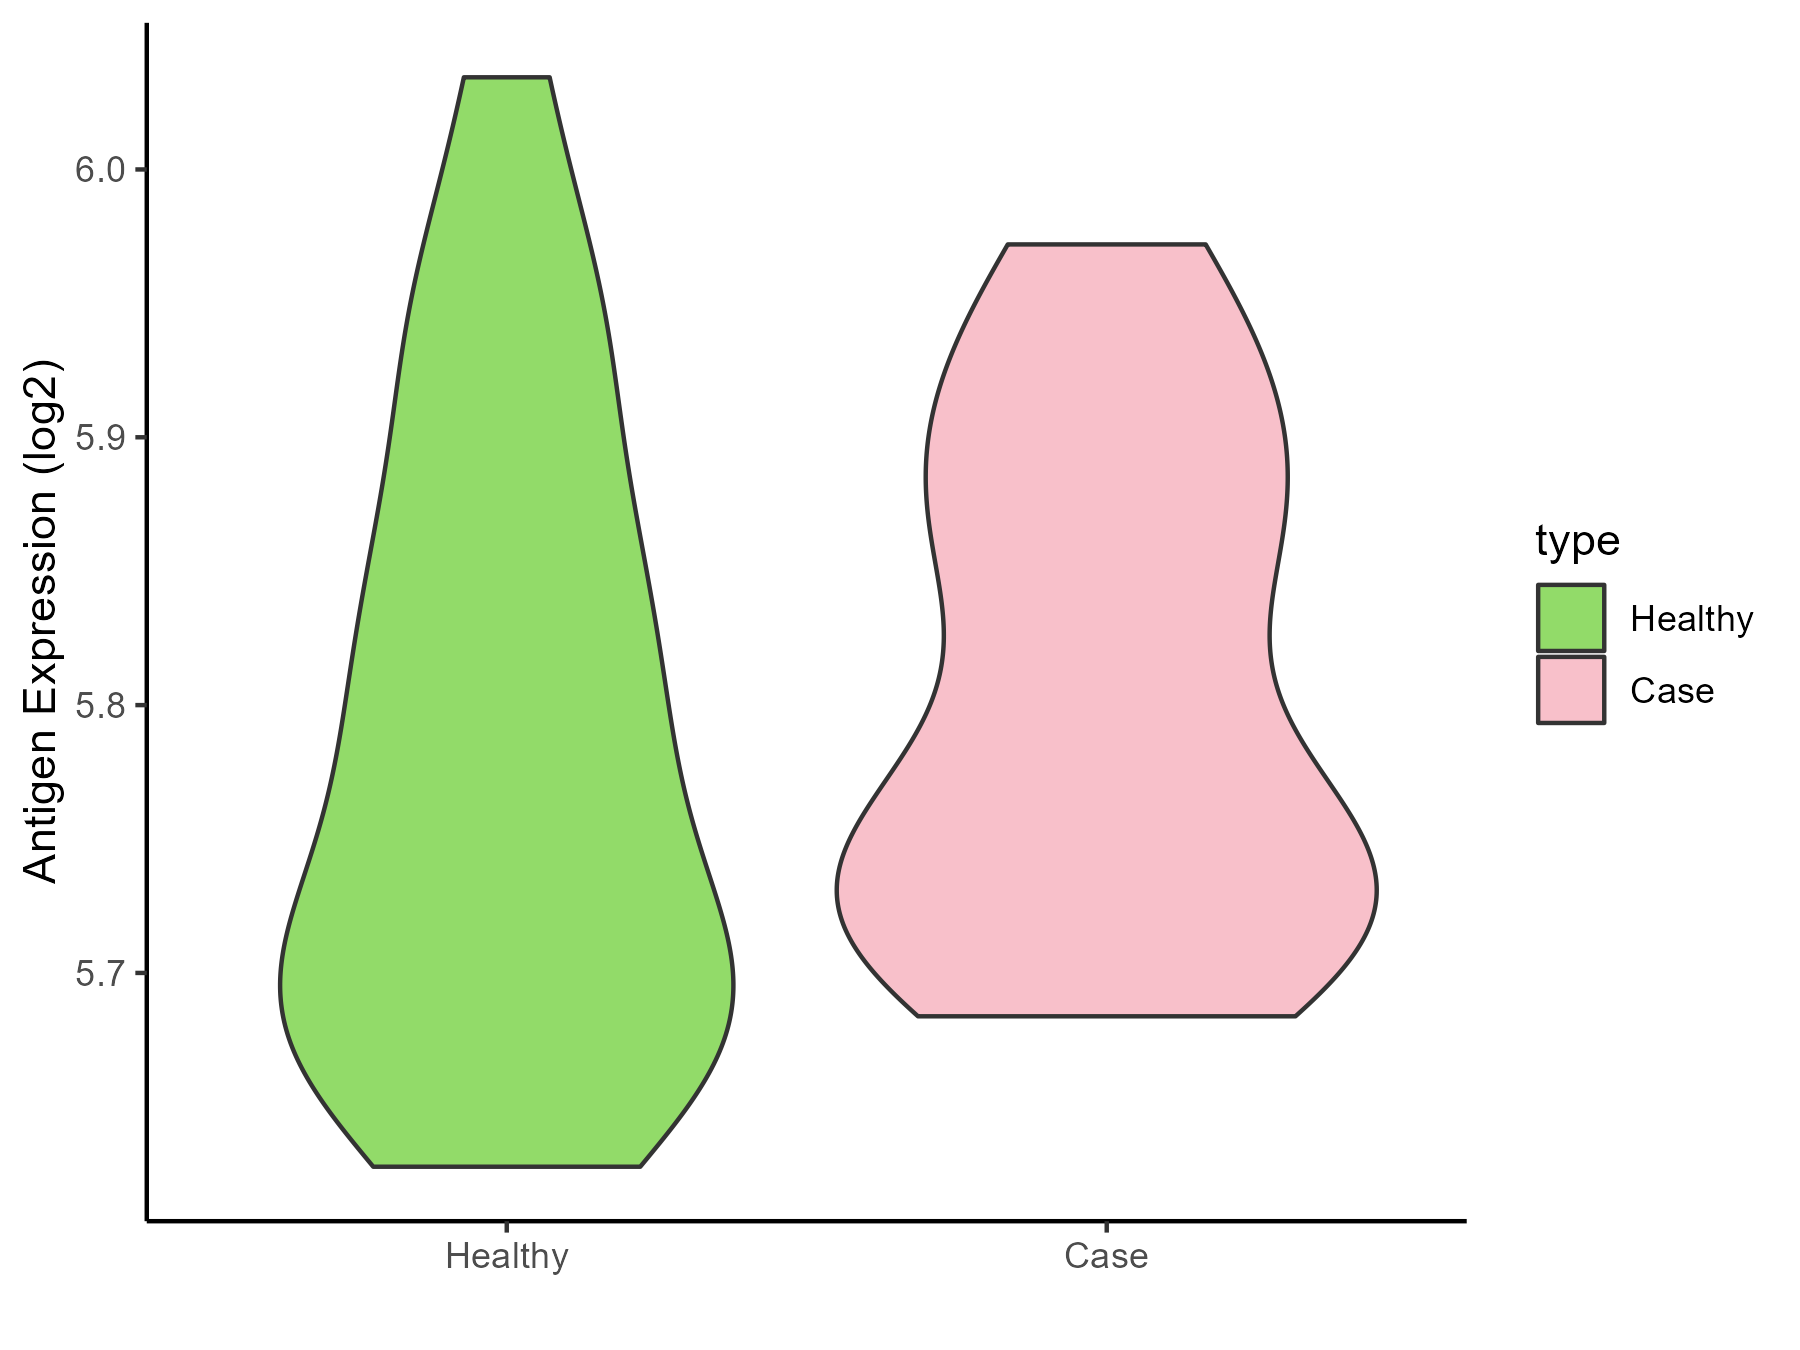
| Differential expression pattern of antigen in diseases | ||
| The Studied Tissue | Whole blood | |
| The Specific Disease | Thrombocythemia | |
| The Expression Level of Disease Section Compare with the Healthy Individual Tissue | p-value: 0.401227598; Fold-change: -0.001187209; Z-score: -0.010305973 | |
| Disease-specific Antigen Abundances |
|
Click to View the Clearer Original Diagram |
ICD Disease Classification 4
| Differential expression pattern of antigen in diseases | ||
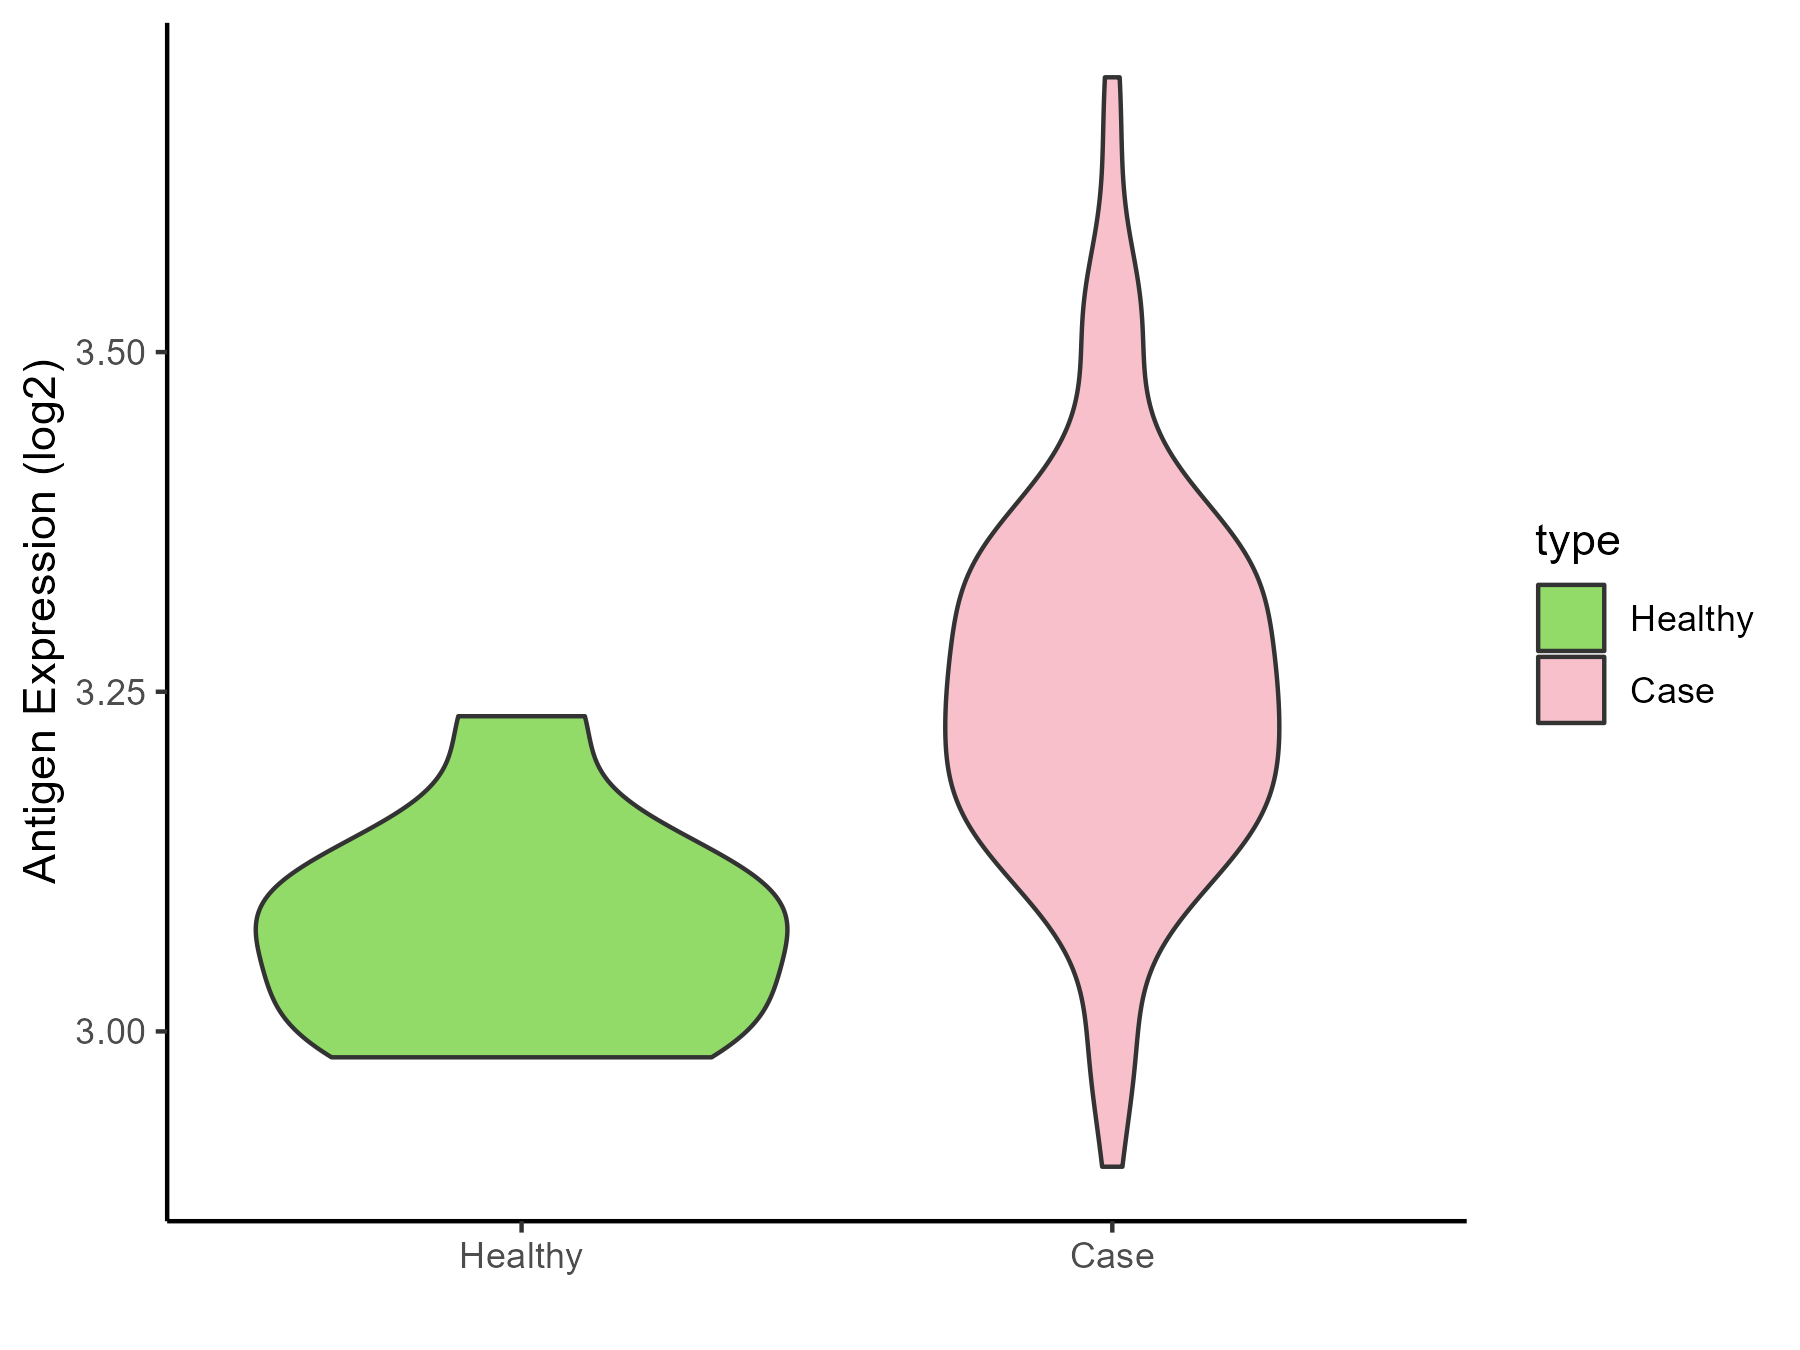
| The Studied Tissue | Whole blood | |
| The Specific Disease | Scleroderma | |
| The Expression Level of Disease Section Compare with the Healthy Individual Tissue | p-value: 2.75E-05; Fold-change: 0.172783418; Z-score: 2.202618971 | |
| Disease-specific Antigen Abundances |
|
Click to View the Clearer Original Diagram |
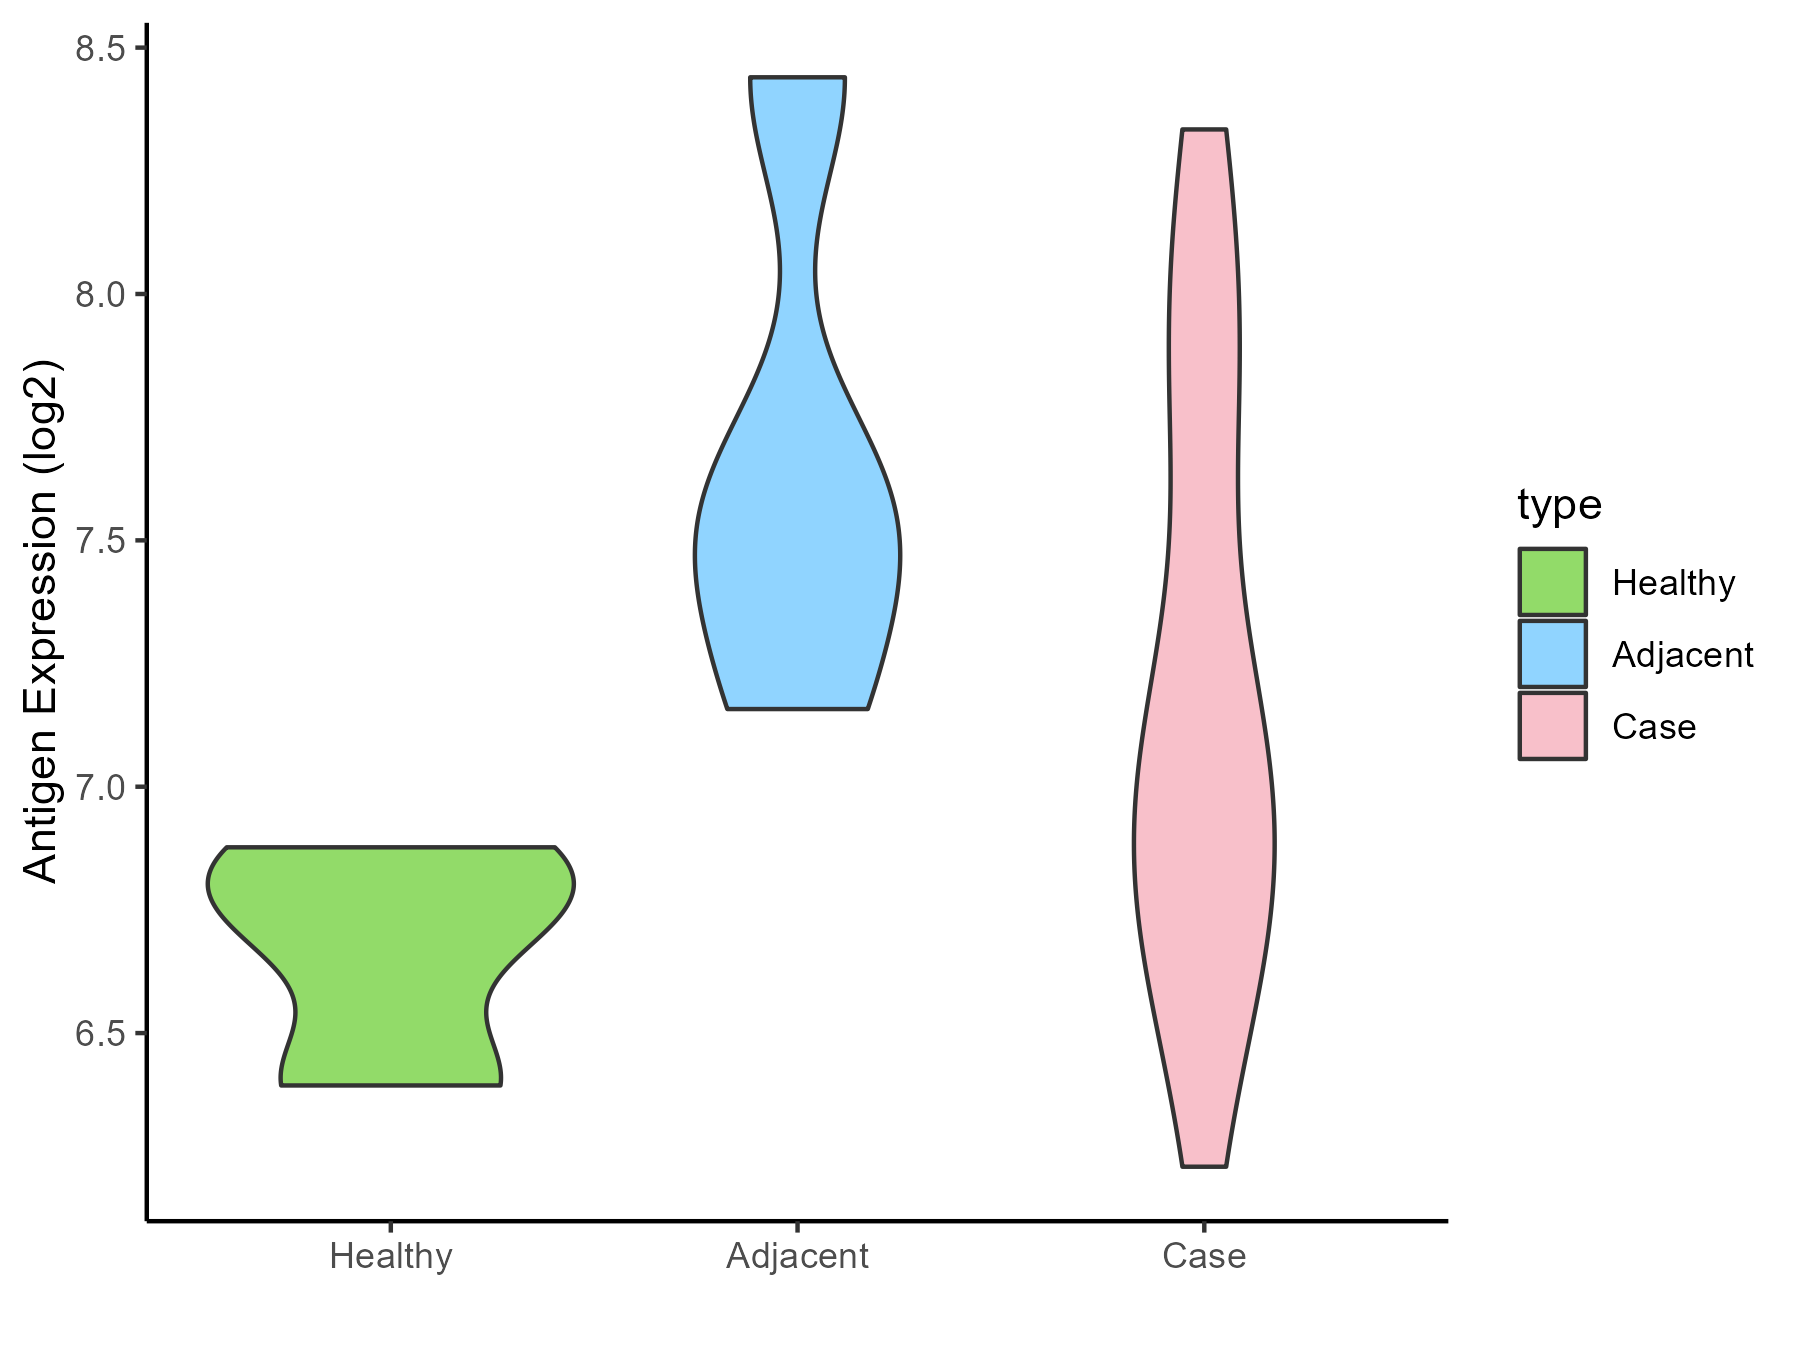
| Differential expression pattern of antigen in diseases | ||
| The Studied Tissue | Salivary gland | |
| The Specific Disease | Sjogren syndrome | |
| The Expression Level of Disease Section Compare with the Healthy Individual Tissue | p-value: 0.033217254; Fold-change: 0.264835525; Z-score: 1.066773381 | |
| The Expression Level of Disease Section Compare with the Adjacent Tissue | p-value: 0.189246231; Fold-change: -0.54139692; Z-score: -0.988681741 | |
| Disease-specific Antigen Abundances |
|
Click to View the Clearer Original Diagram |
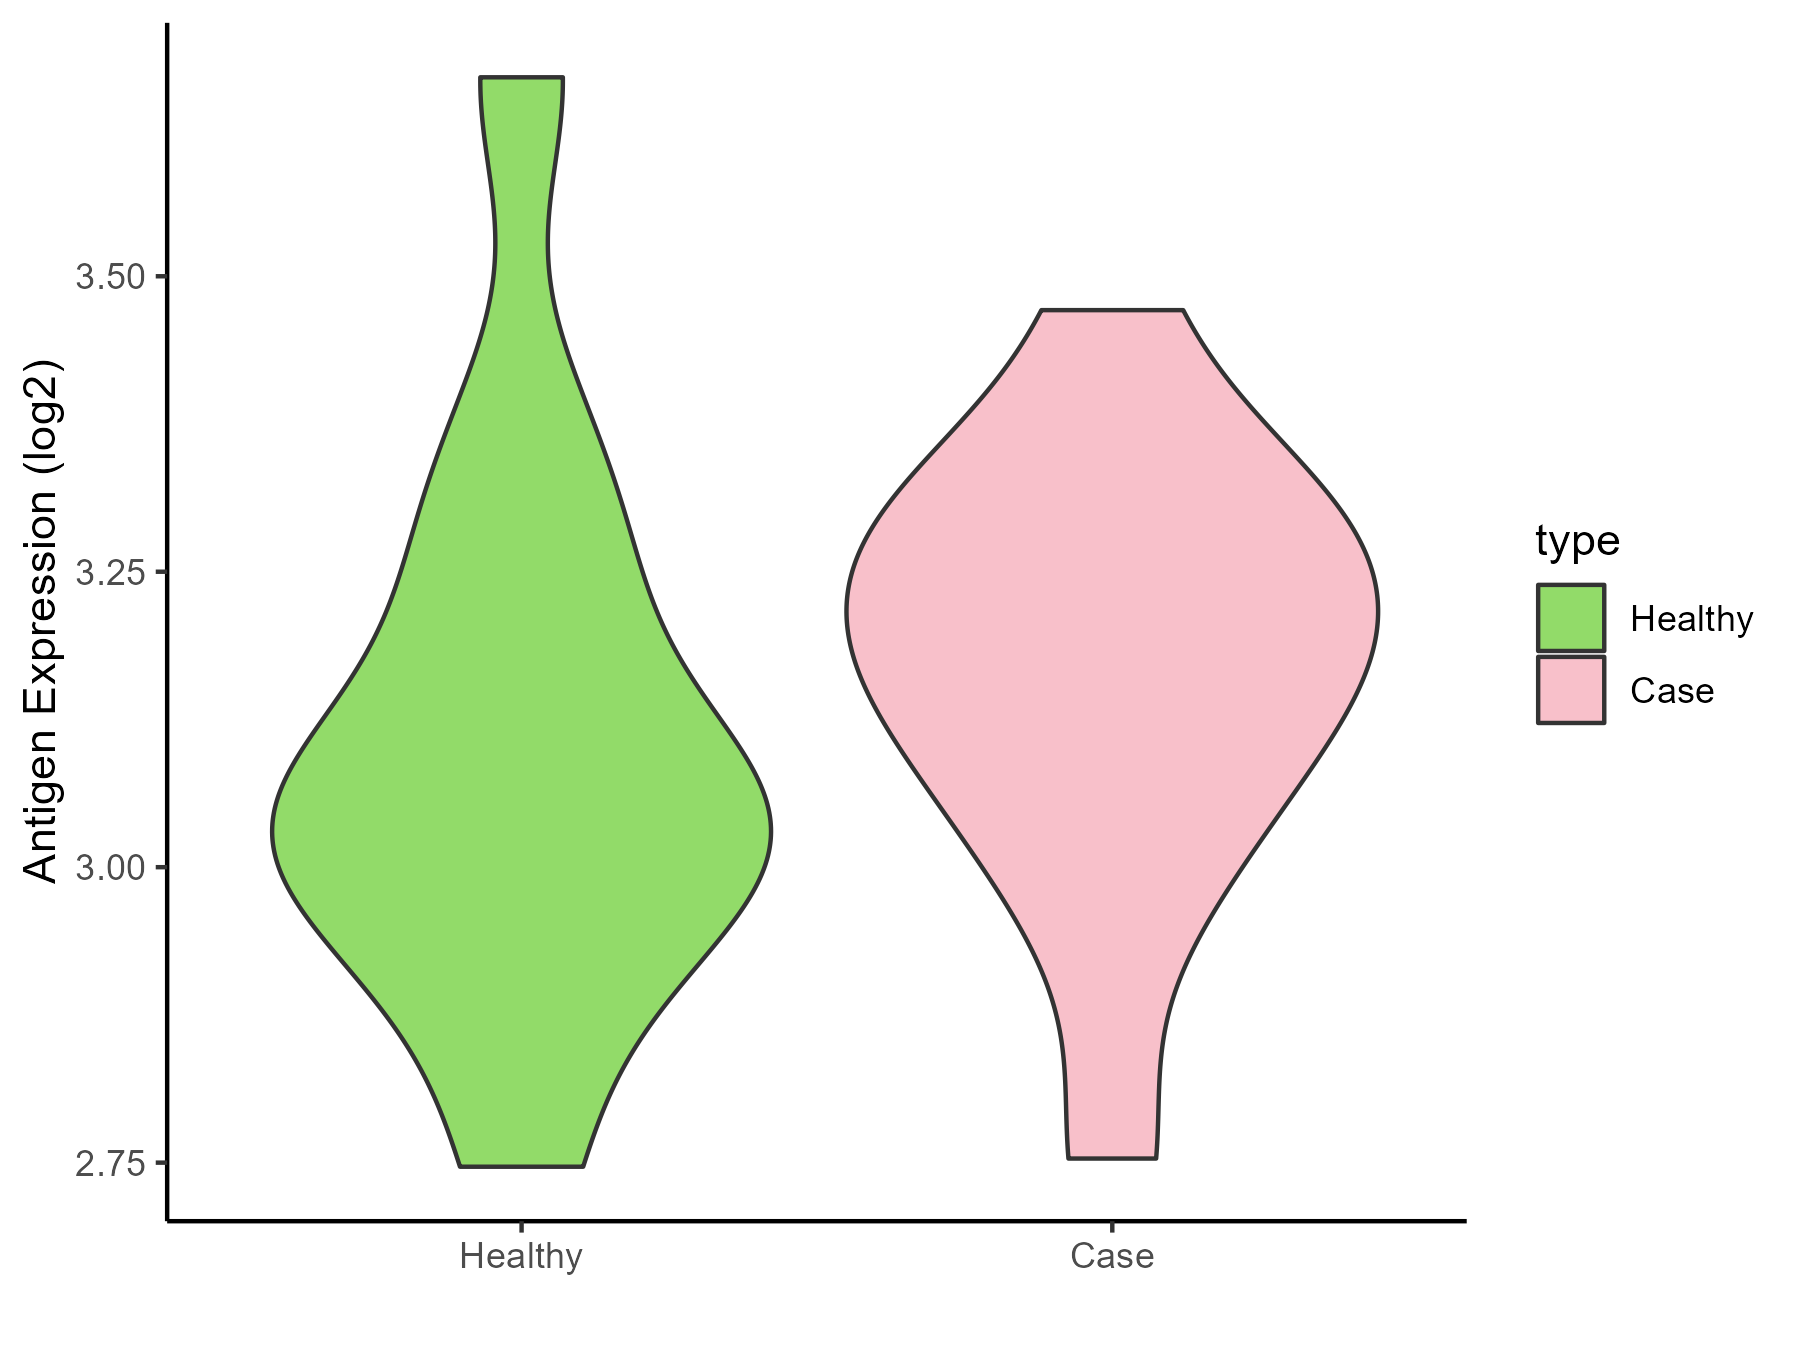
| Differential expression pattern of antigen in diseases | ||
| The Studied Tissue | Peripheral blood | |
| The Specific Disease | Behcet disease | |
| The Expression Level of Disease Section Compare with the Healthy Individual Tissue | p-value: 0.499011595; Fold-change: 0.130761057; Z-score: 0.540827522 | |
| Disease-specific Antigen Abundances |
|
Click to View the Clearer Original Diagram |
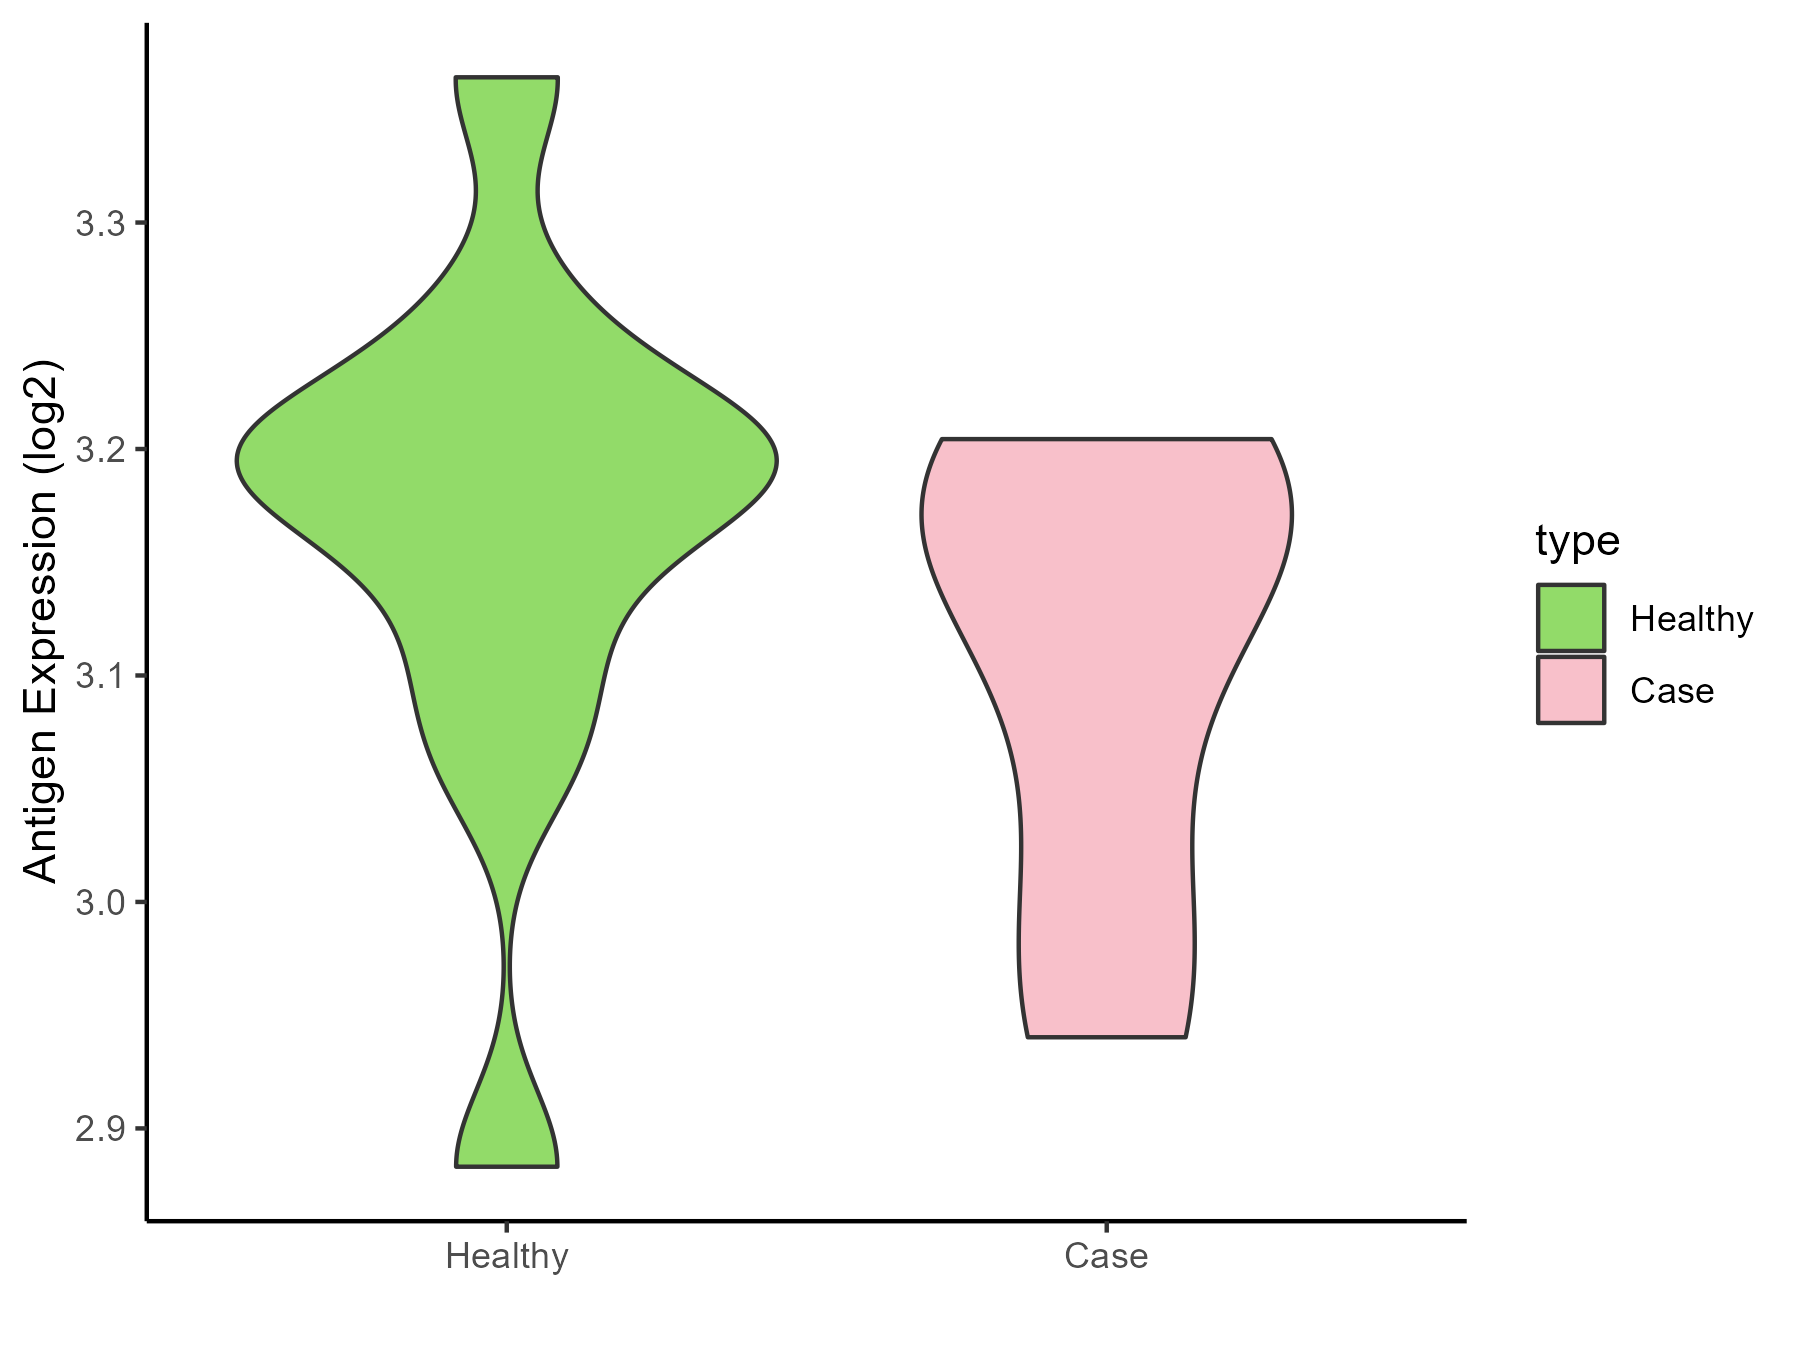
| Differential expression pattern of antigen in diseases | ||
| The Studied Tissue | Whole blood | |
| The Specific Disease | Autosomal dominant monocytopenia | |
| The Expression Level of Disease Section Compare with the Healthy Individual Tissue | p-value: 0.271044918; Fold-change: -0.034215769; Z-score: -0.280720832 | |
| Disease-specific Antigen Abundances |
|
Click to View the Clearer Original Diagram |
ICD Disease Classification 5
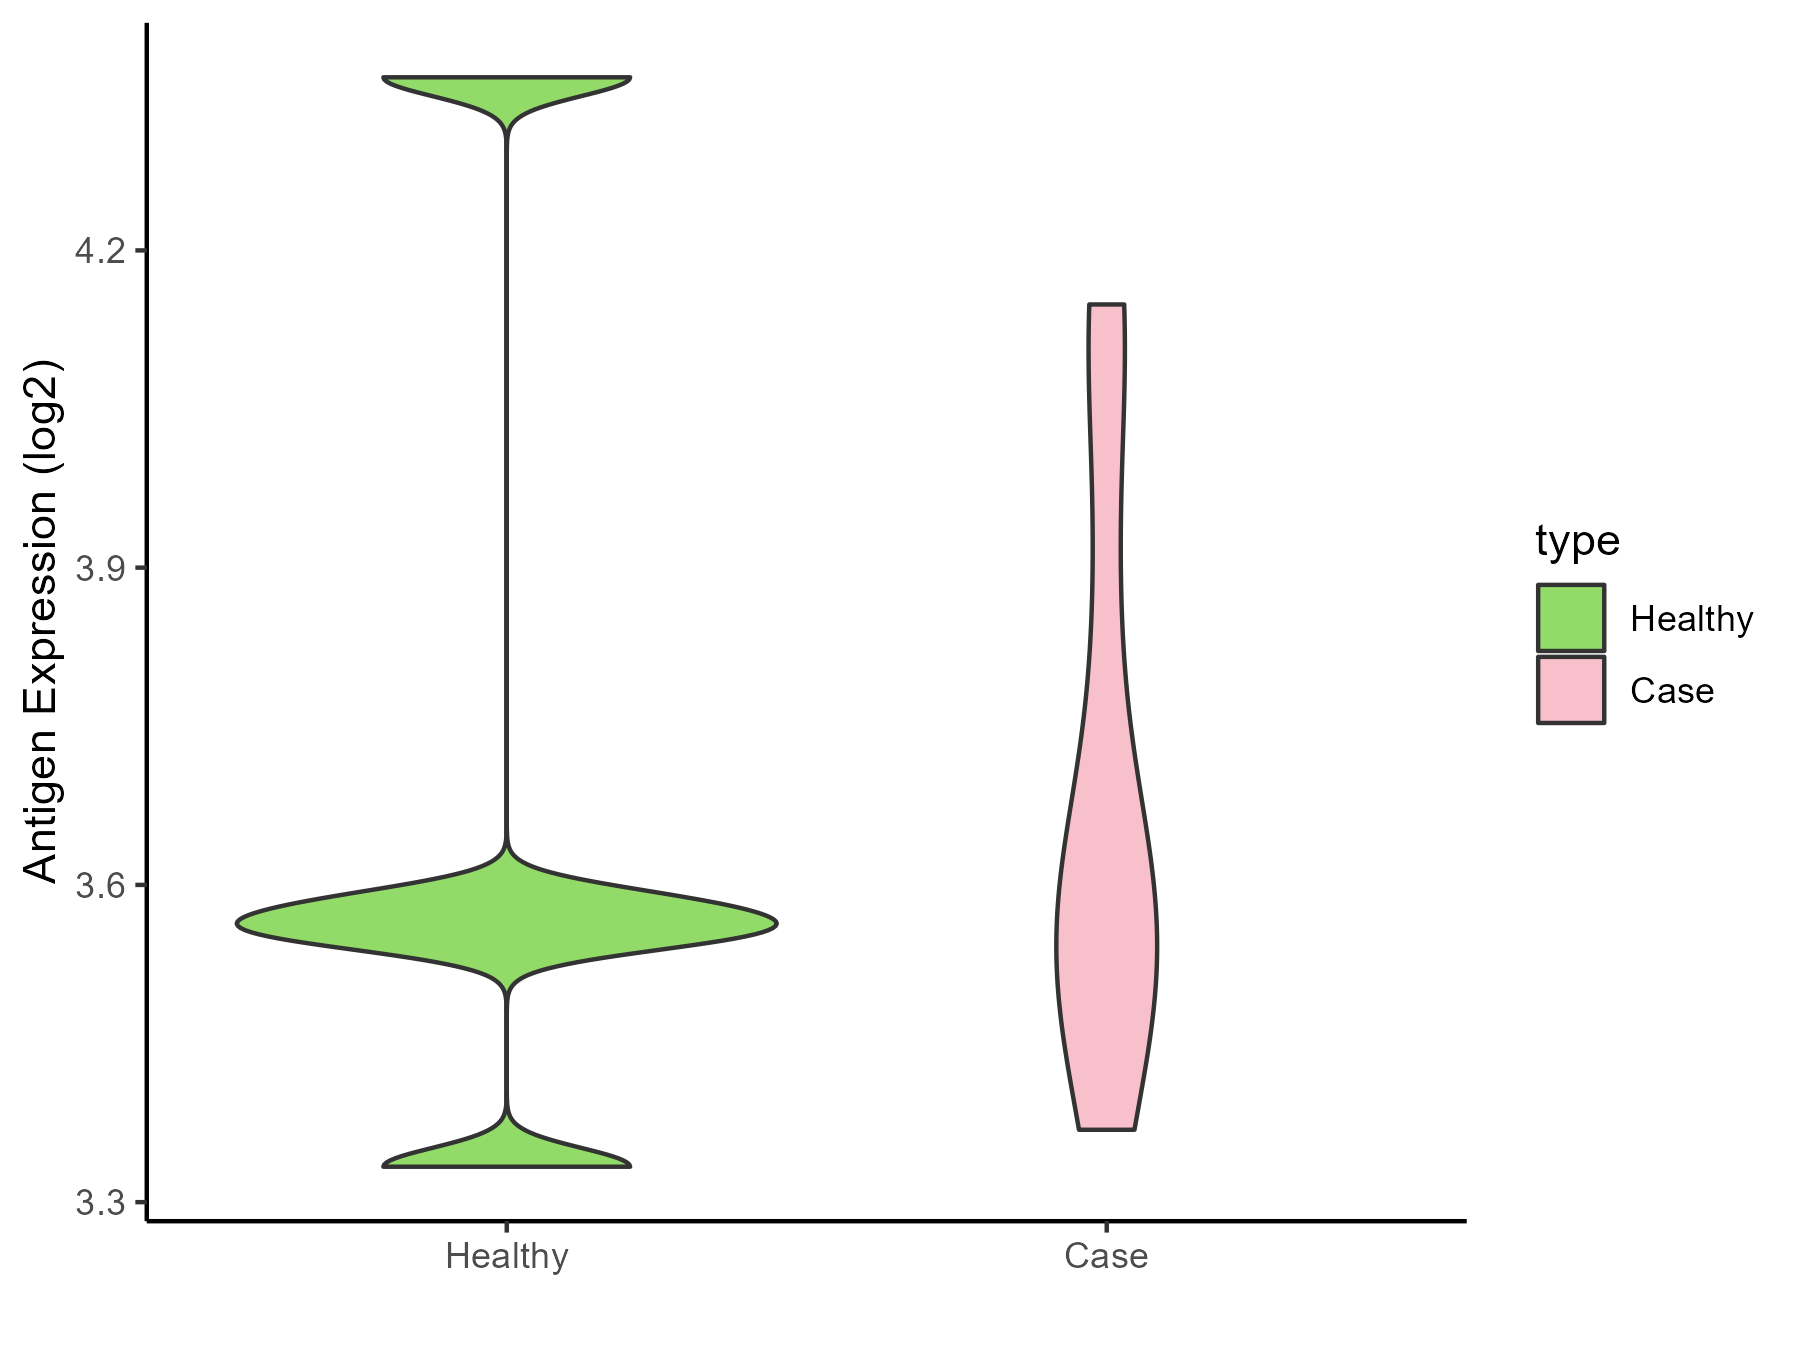
| Differential expression pattern of antigen in diseases | ||
| The Studied Tissue | Liver | |
| The Specific Disease | Type 2 diabetes | |
| The Expression Level of Disease Section Compare with the Healthy Individual Tissue | p-value: 0.985338043; Fold-change: 0.027138608; Z-score: 0.068541834 | |
| Disease-specific Antigen Abundances |
|
Click to View the Clearer Original Diagram |
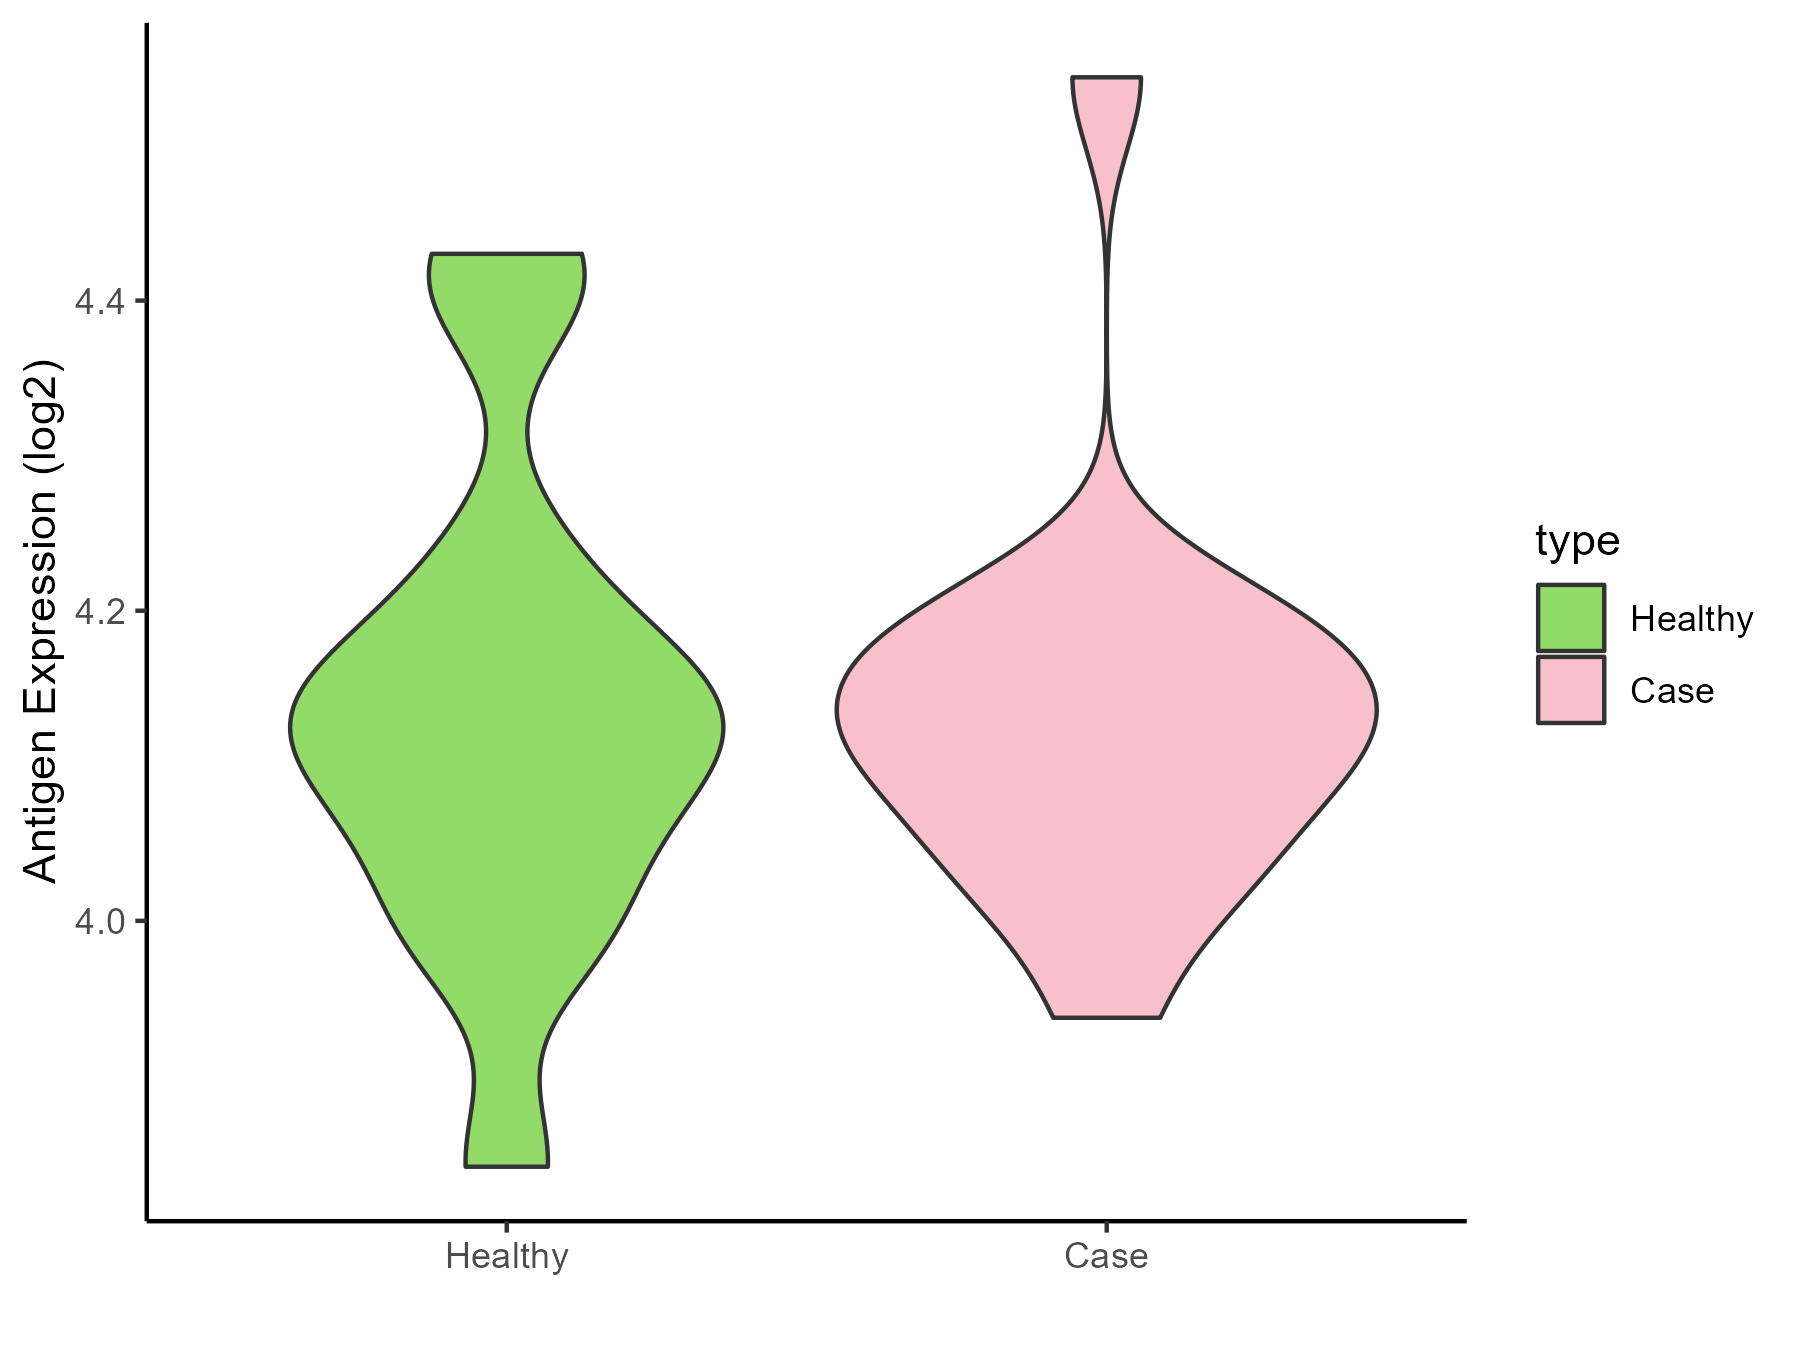
| Differential expression pattern of antigen in diseases | ||
| The Studied Tissue | Vastus lateralis muscle | |
| The Specific Disease | Polycystic ovary syndrome | |
| The Expression Level of Disease Section Compare with the Healthy Individual Tissue | p-value: 0.994727632; Fold-change: 0.003863907; Z-score: 0.024078567 | |
| Disease-specific Antigen Abundances |
|
Click to View the Clearer Original Diagram |
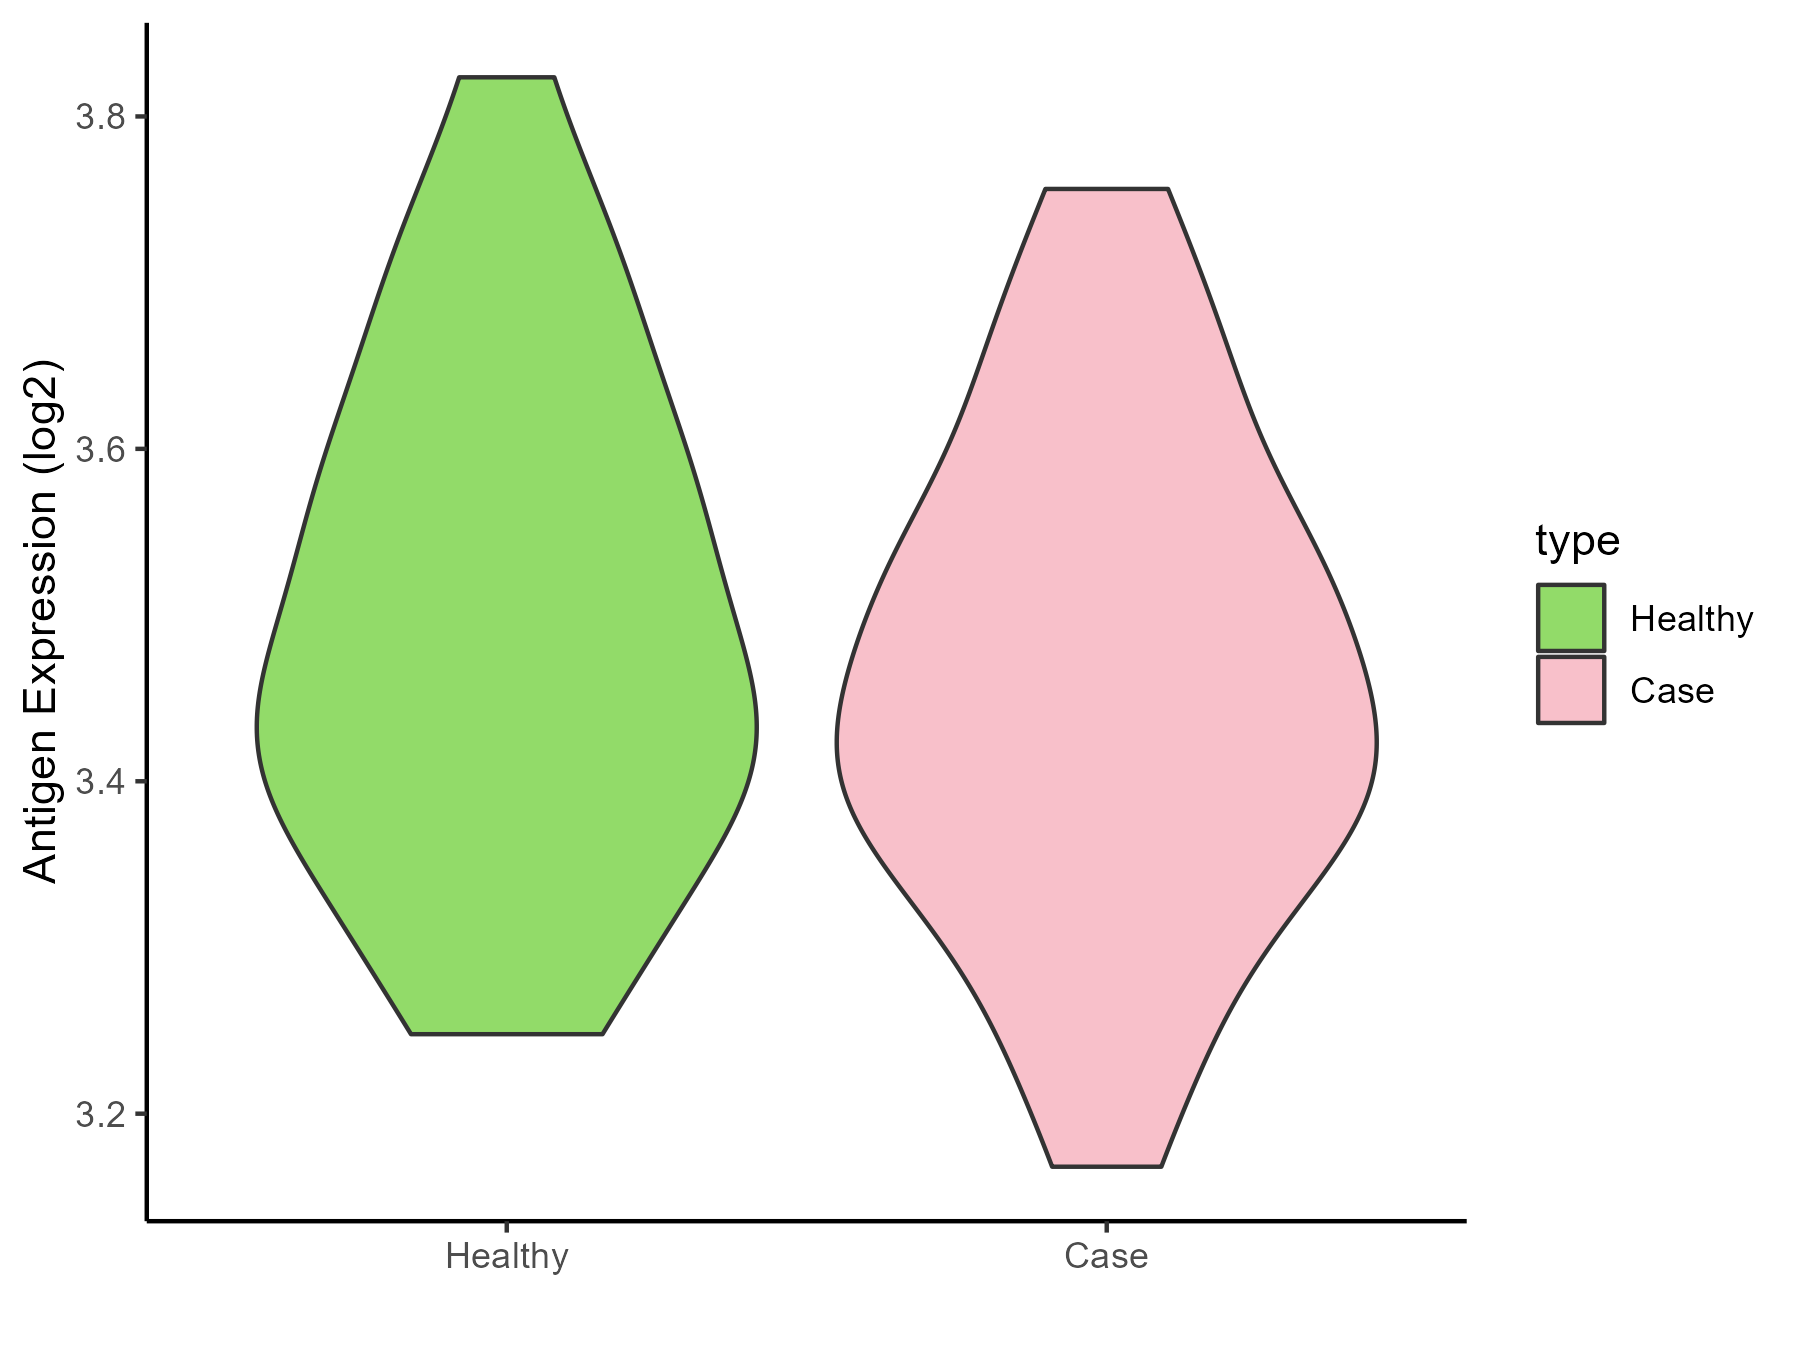
| Differential expression pattern of antigen in diseases | ||
| The Studied Tissue | Subcutaneous Adipose | |
| The Specific Disease | Obesity | |
| The Expression Level of Disease Section Compare with the Healthy Individual Tissue | p-value: 0.369986944; Fold-change: -0.021599273; Z-score: -0.142398127 | |
| Disease-specific Antigen Abundances |
|
Click to View the Clearer Original Diagram |
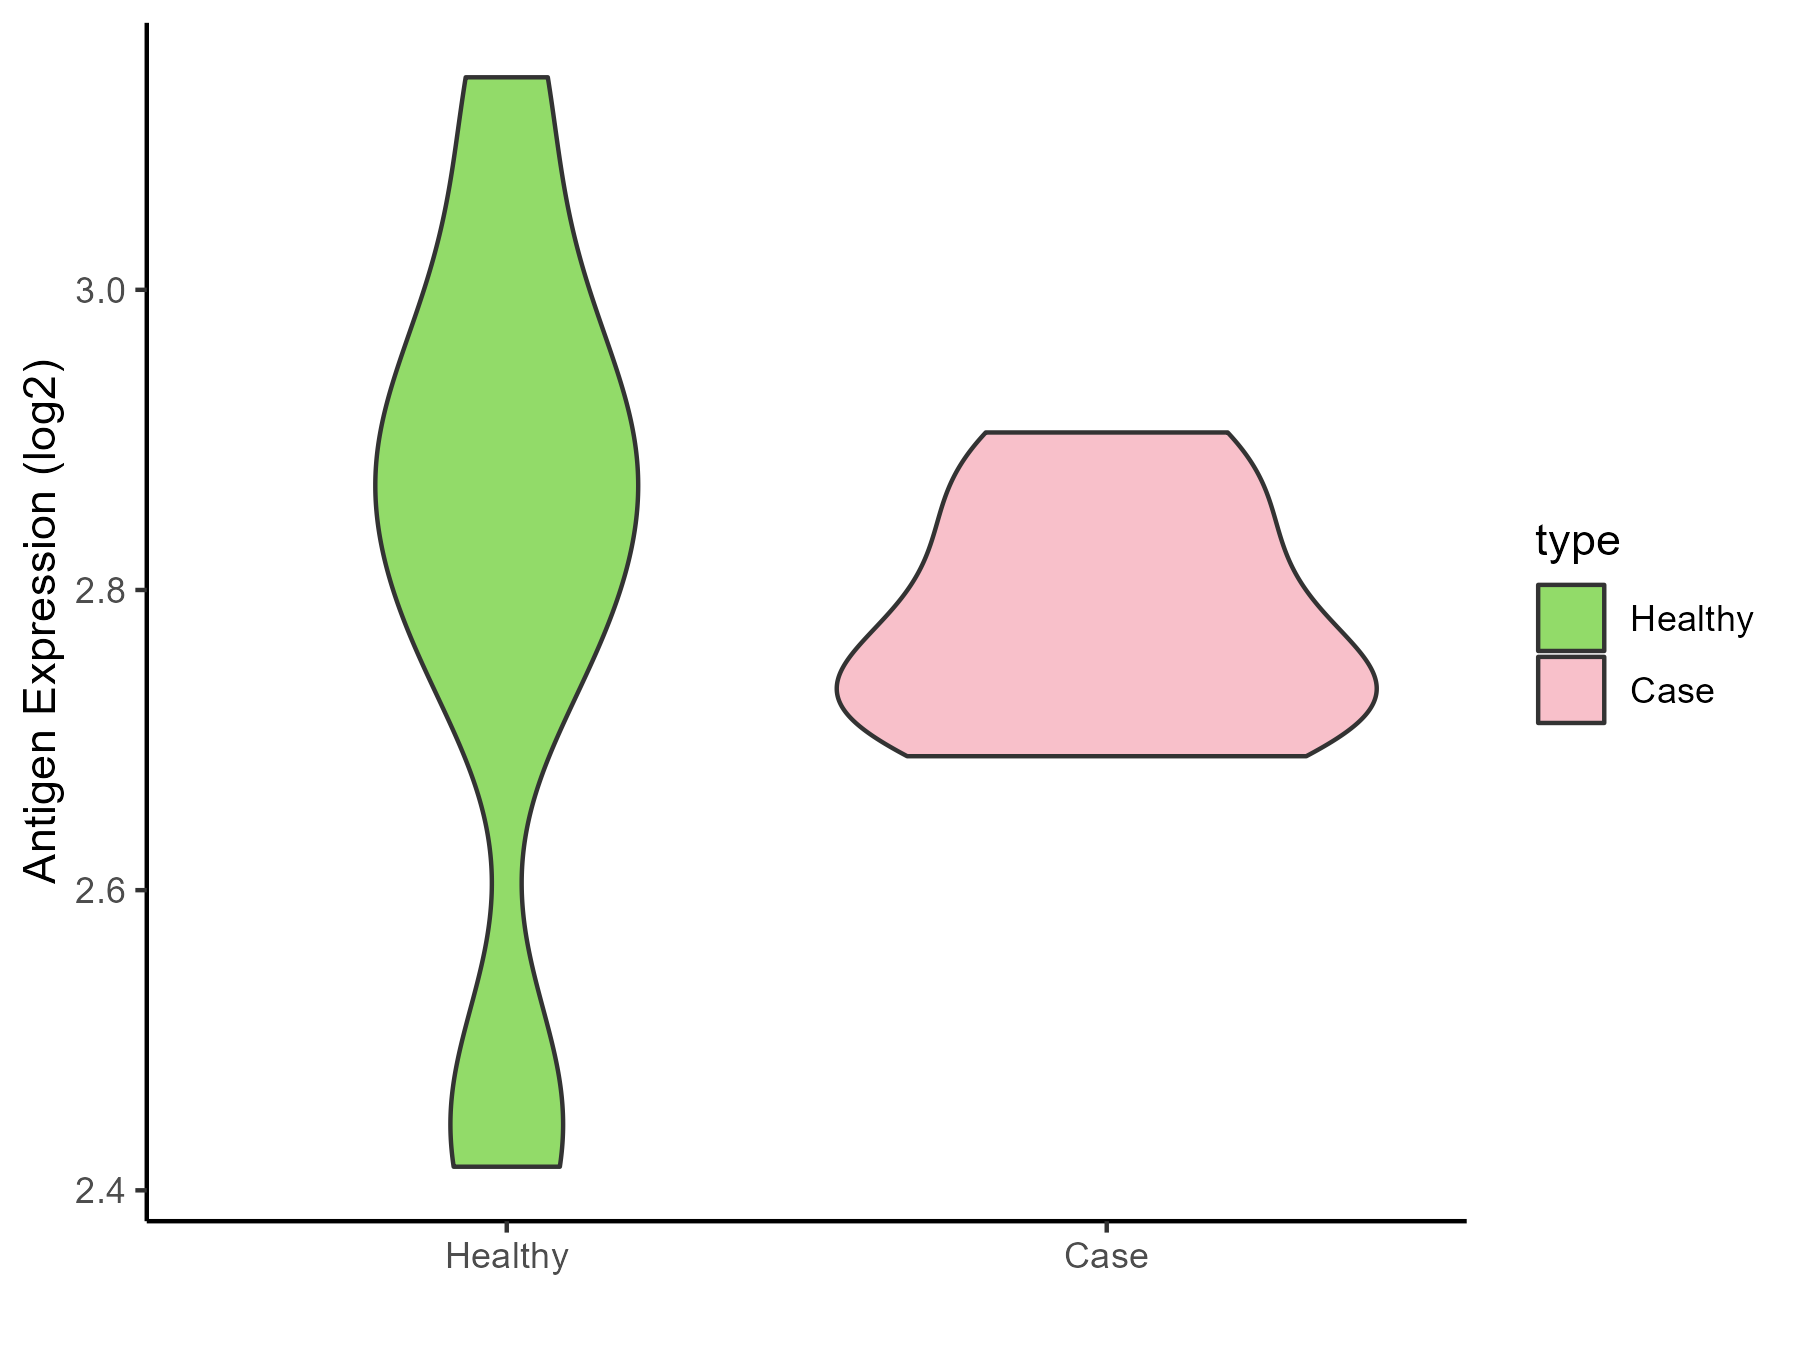
| Differential expression pattern of antigen in diseases | ||
| The Studied Tissue | Biceps muscle | |
| The Specific Disease | Pompe disease | |
| The Expression Level of Disease Section Compare with the Healthy Individual Tissue | p-value: 0.664191997; Fold-change: -0.10179519; Z-score: -0.448428519 | |
| Disease-specific Antigen Abundances |
|
Click to View the Clearer Original Diagram |
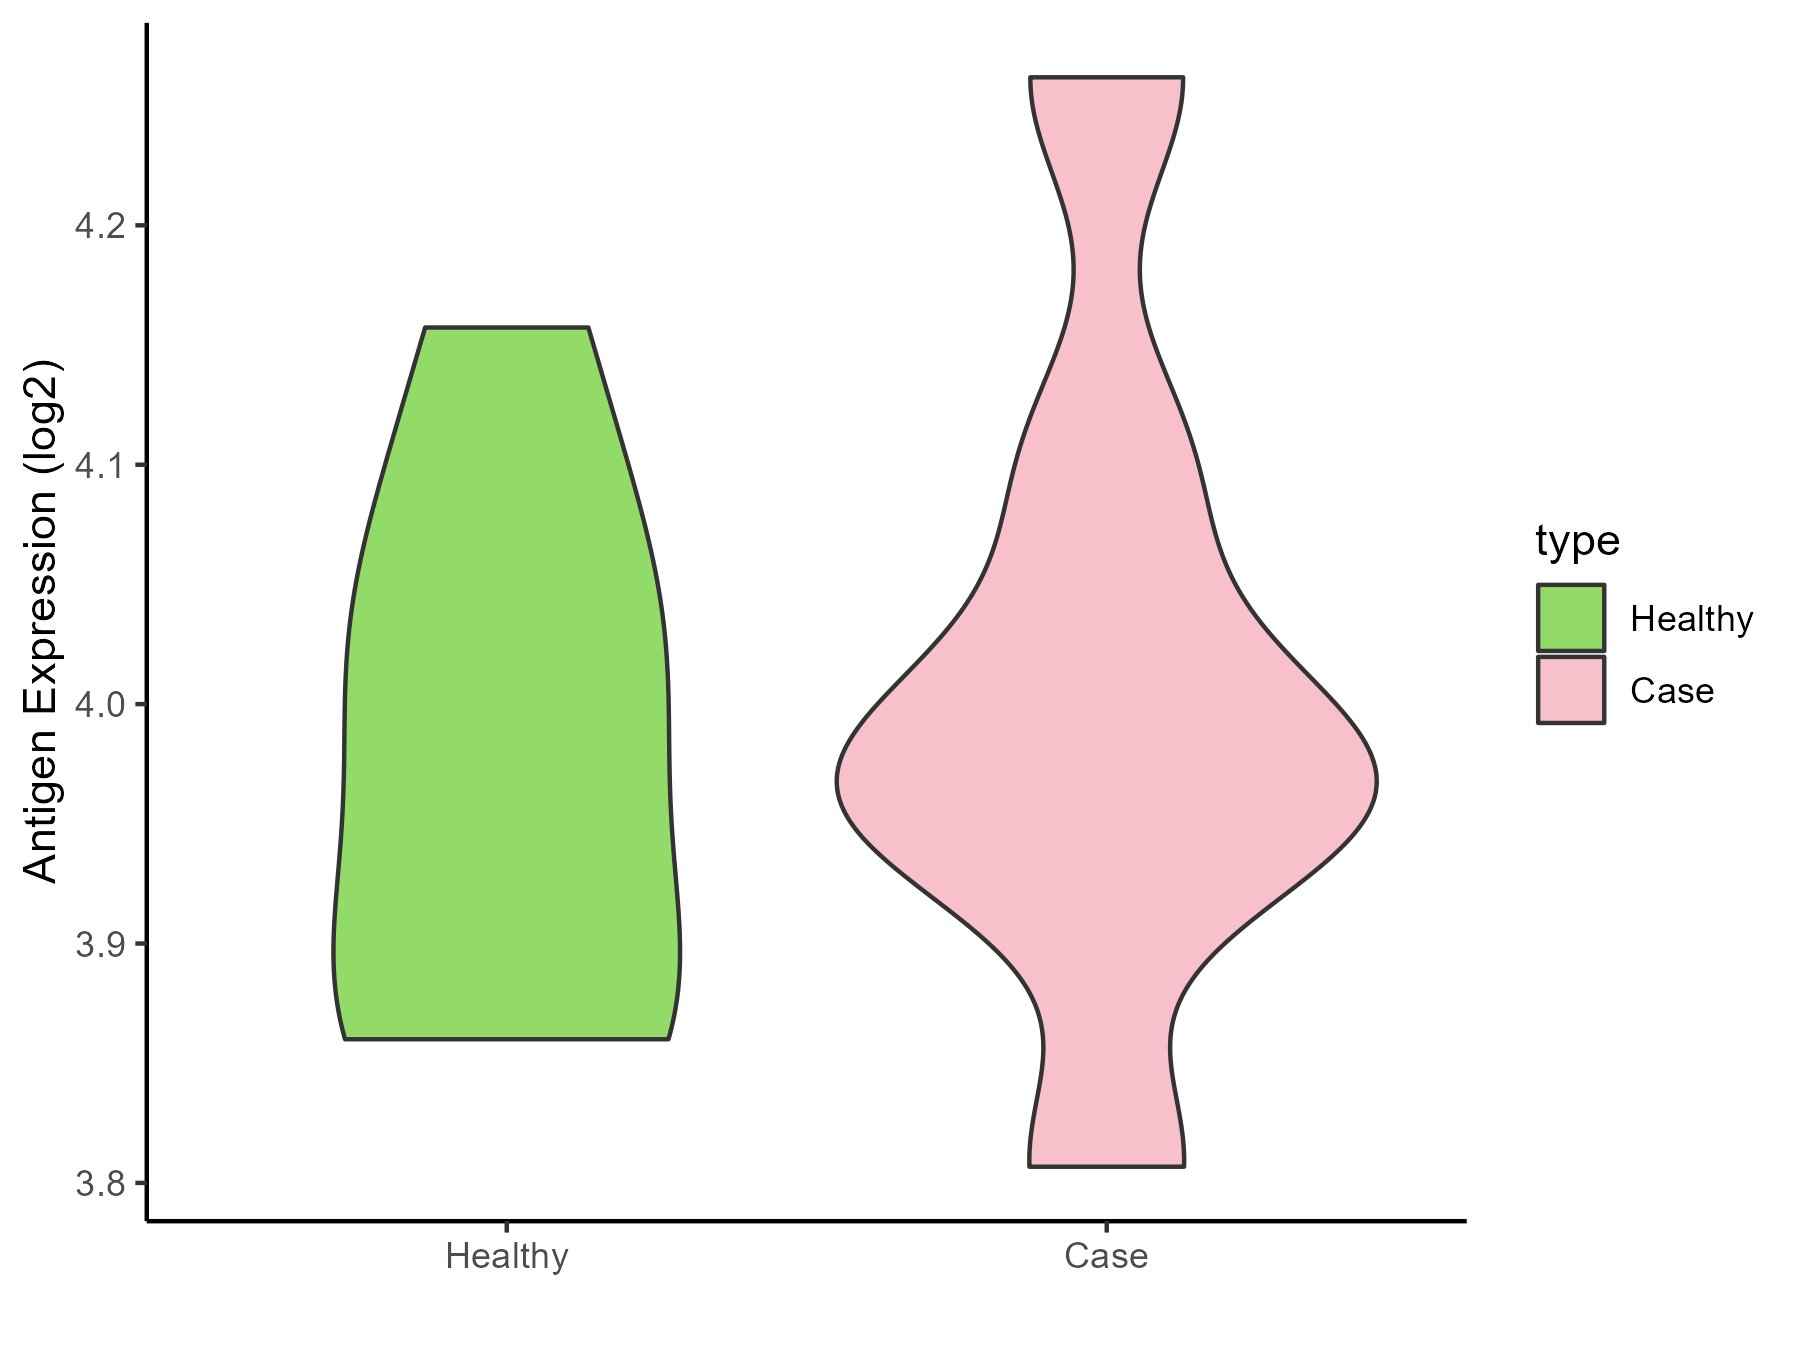
| Differential expression pattern of antigen in diseases | ||
| The Studied Tissue | Whole blood | |
| The Specific Disease | Batten disease | |
| The Expression Level of Disease Section Compare with the Healthy Individual Tissue | p-value: 0.664475252; Fold-change: -0.029882142; Z-score: -0.263606565 | |
| Disease-specific Antigen Abundances |
|
Click to View the Clearer Original Diagram |
ICD Disease Classification 6
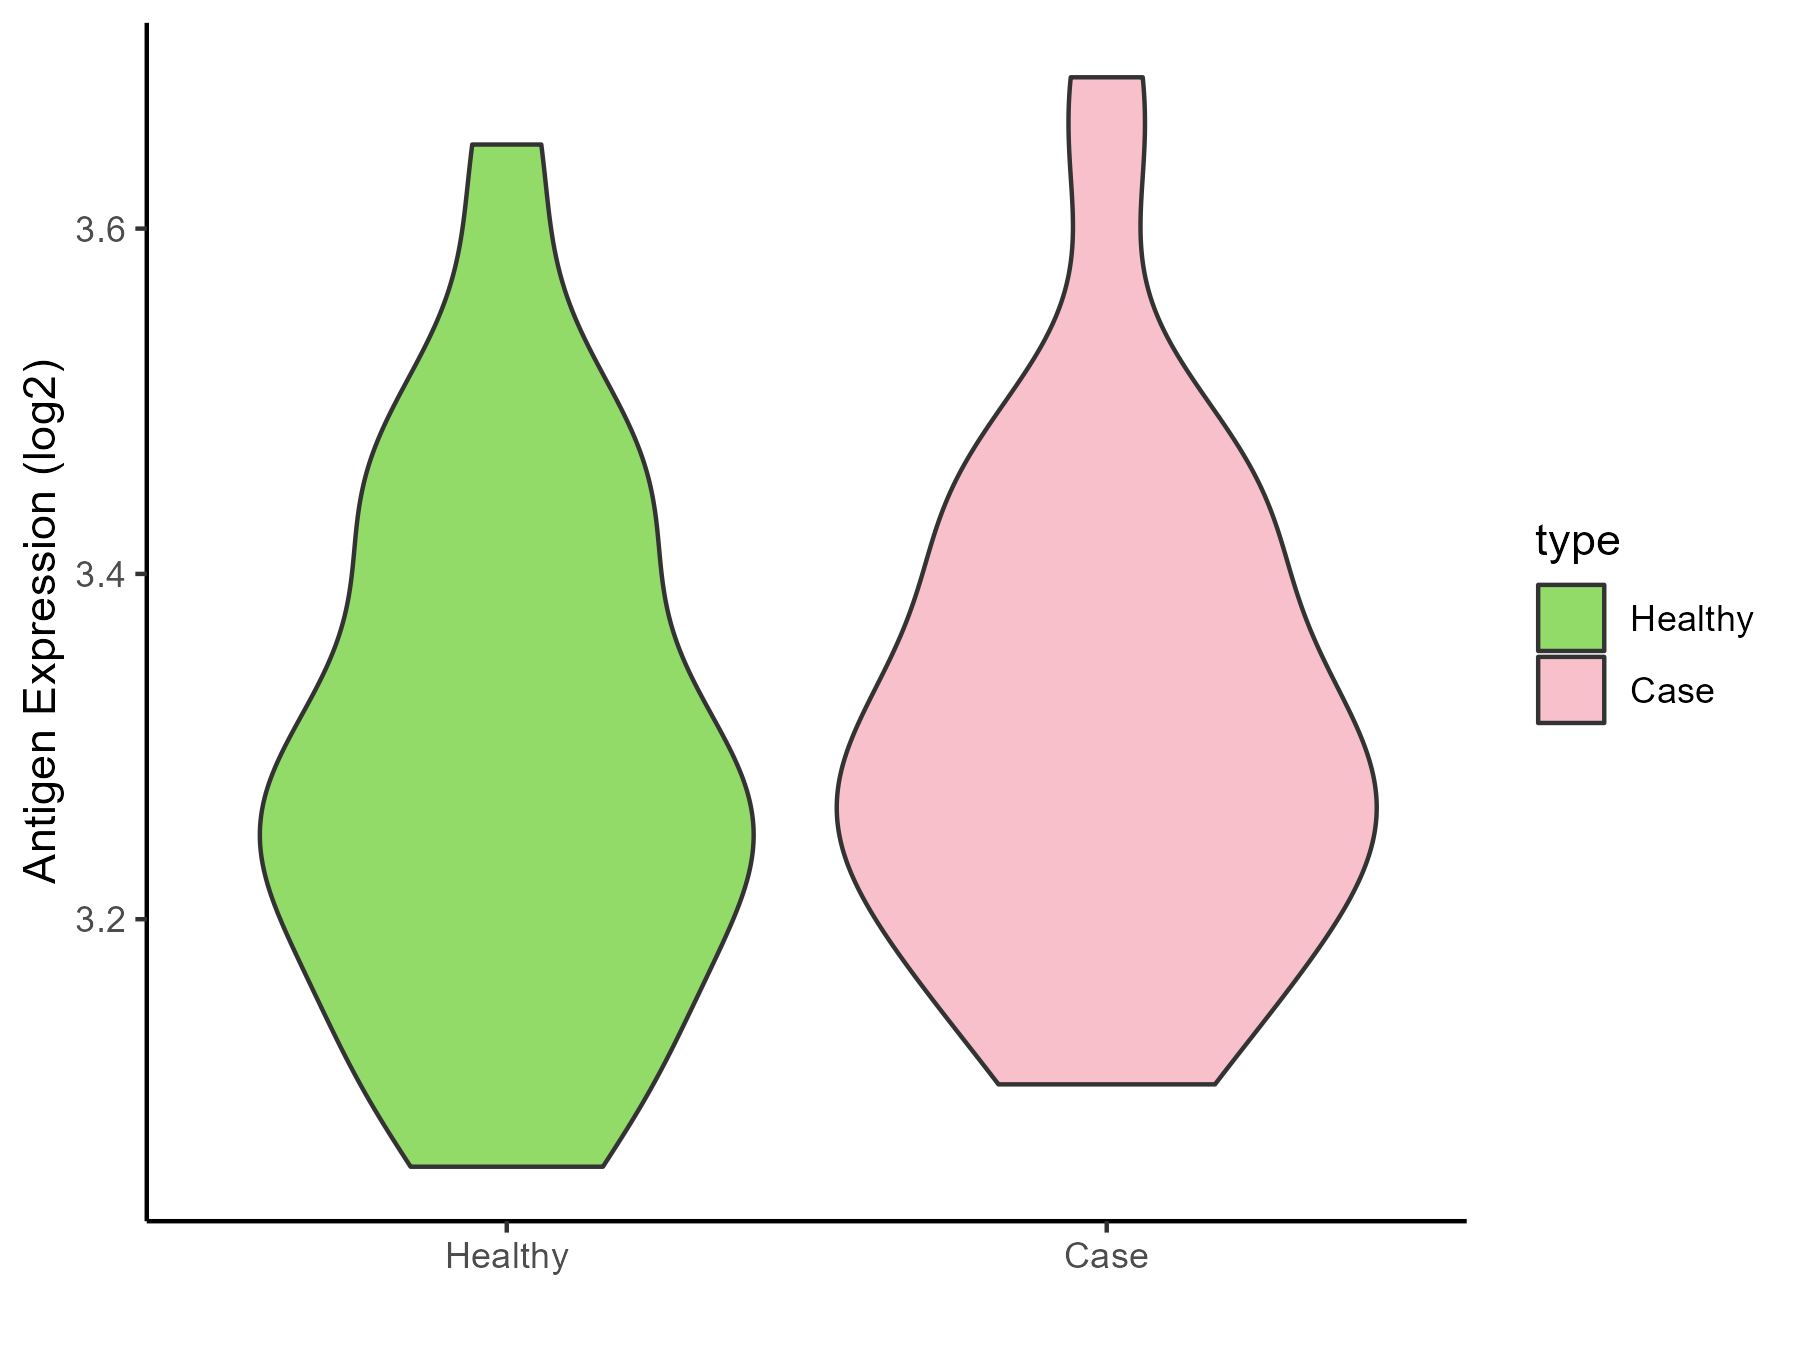
| Differential expression pattern of antigen in diseases | ||
| The Studied Tissue | Whole blood | |
| The Specific Disease | Autism | |
| The Expression Level of Disease Section Compare with the Healthy Individual Tissue | p-value: 0.54855365; Fold-change: 0.020271053; Z-score: 0.134734756 | |
| Disease-specific Antigen Abundances |
|
Click to View the Clearer Original Diagram |
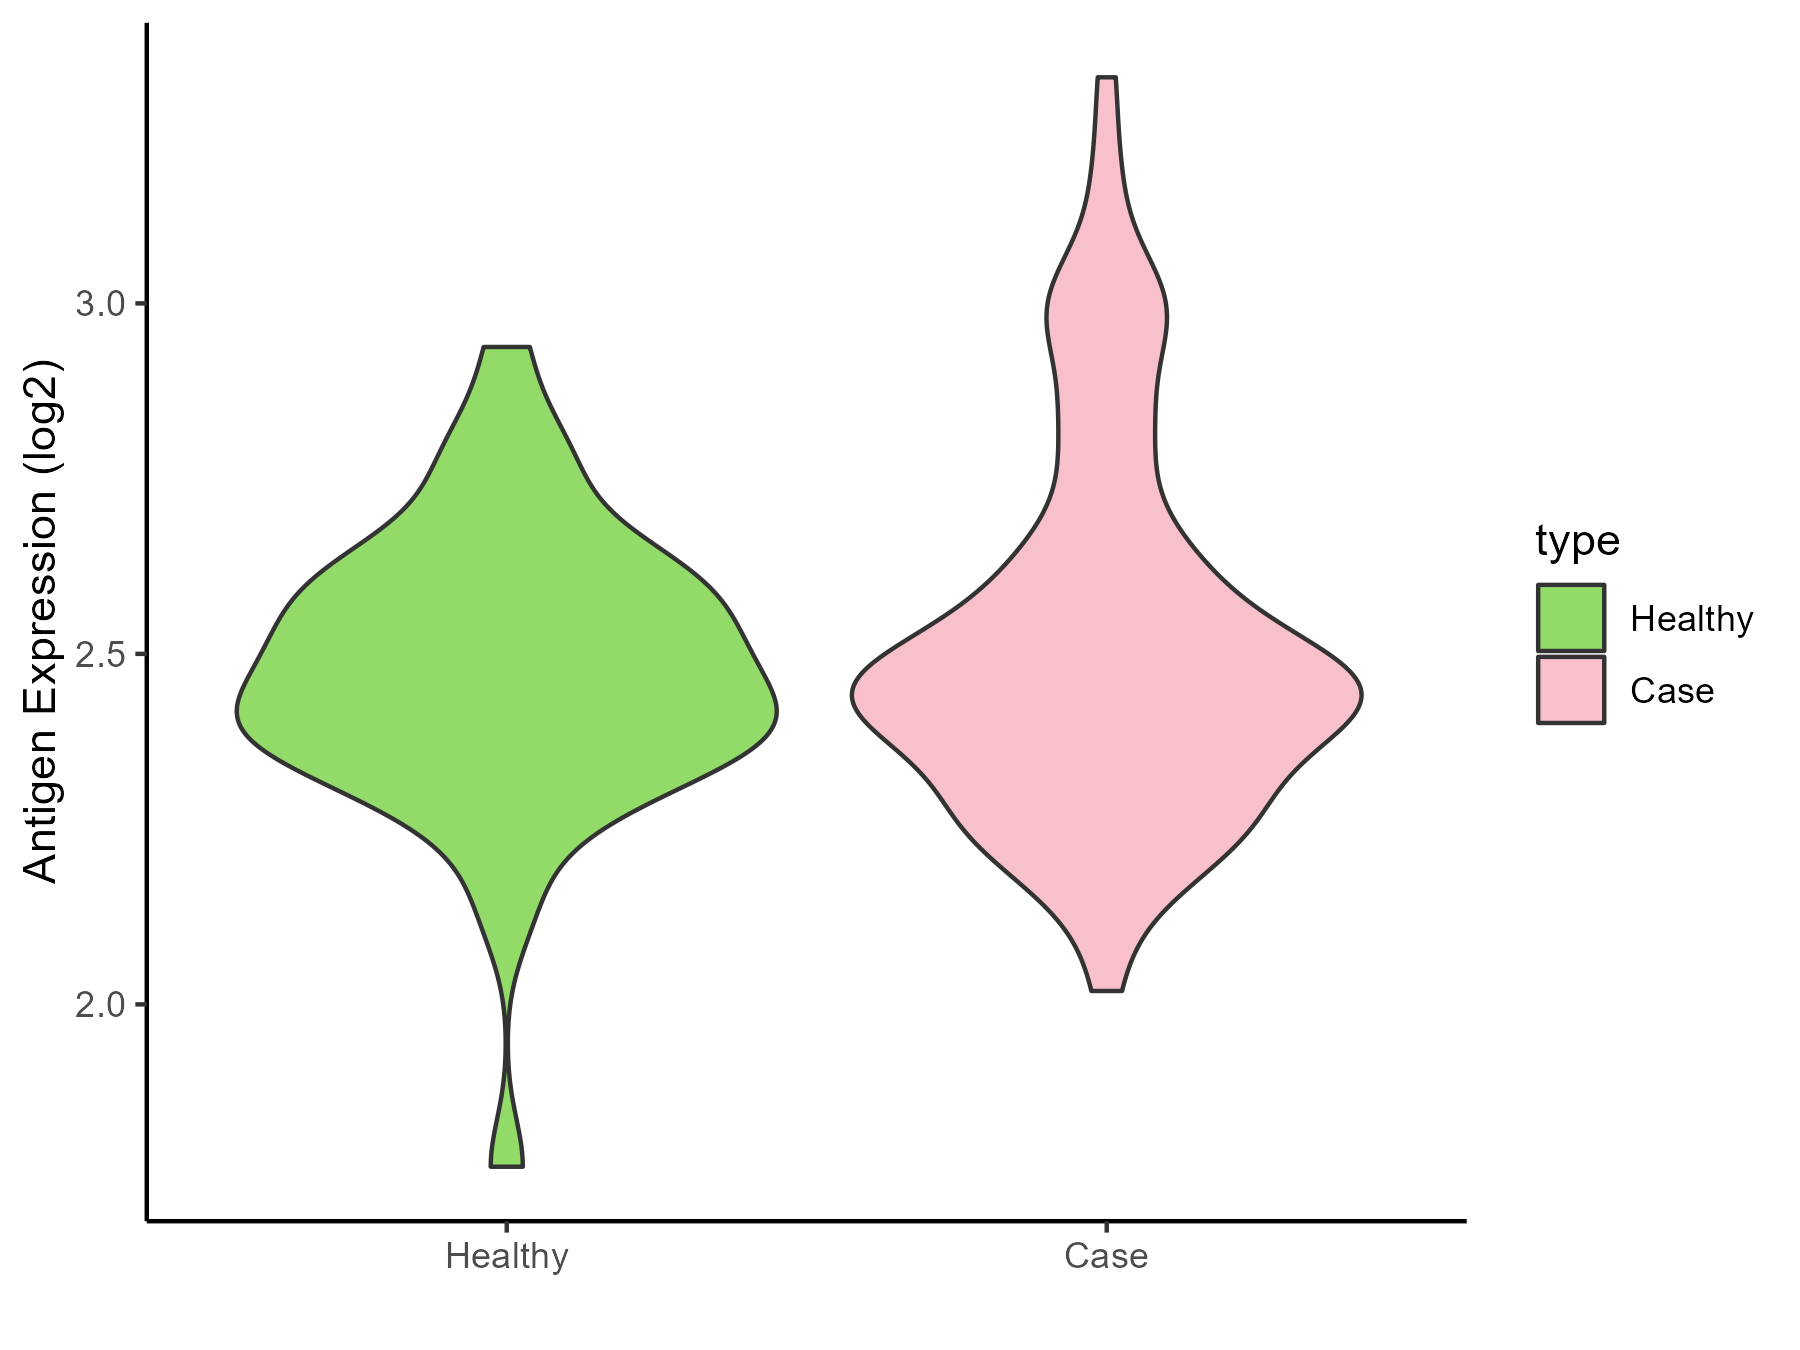
| Differential expression pattern of antigen in diseases | ||
| The Studied Tissue | Whole blood | |
| The Specific Disease | Anxiety disorder | |
| The Expression Level of Disease Section Compare with the Healthy Individual Tissue | p-value: 0.354606516; Fold-change: -0.025081918; Z-score: -0.12463661 | |
| Disease-specific Antigen Abundances |
|
Click to View the Clearer Original Diagram |
ICD Disease Classification 8
| Differential expression pattern of antigen in diseases | ||
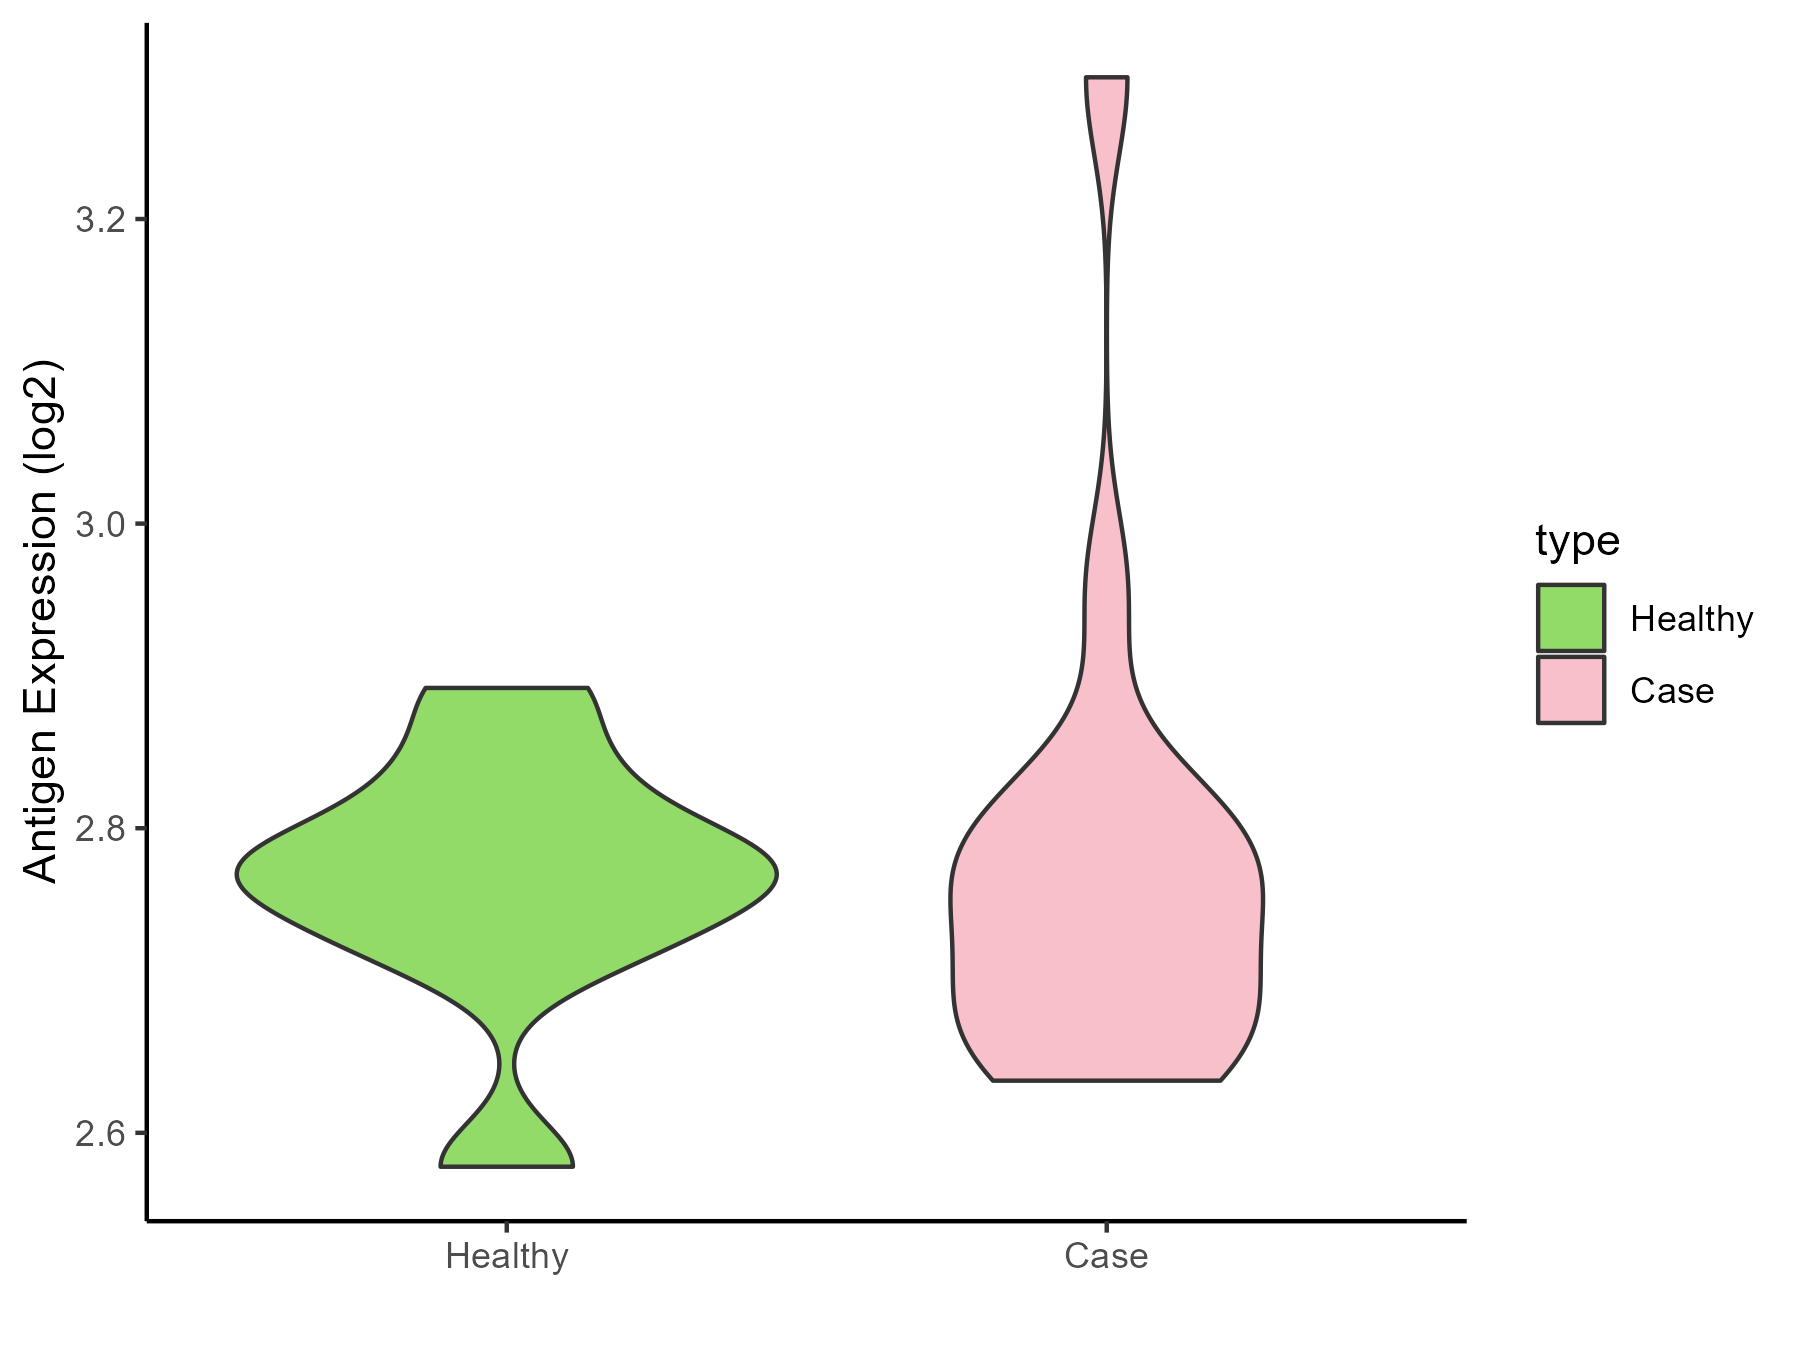
| The Studied Tissue | Substantia nigra | |
| The Specific Disease | Parkinson disease | |
| The Expression Level of Disease Section Compare with the Healthy Individual Tissue | p-value: 0.826246122; Fold-change: -0.014845302; Z-score: -0.168087436 | |
| Disease-specific Antigen Abundances |
|
Click to View the Clearer Original Diagram |
| Differential expression pattern of antigen in diseases | ||
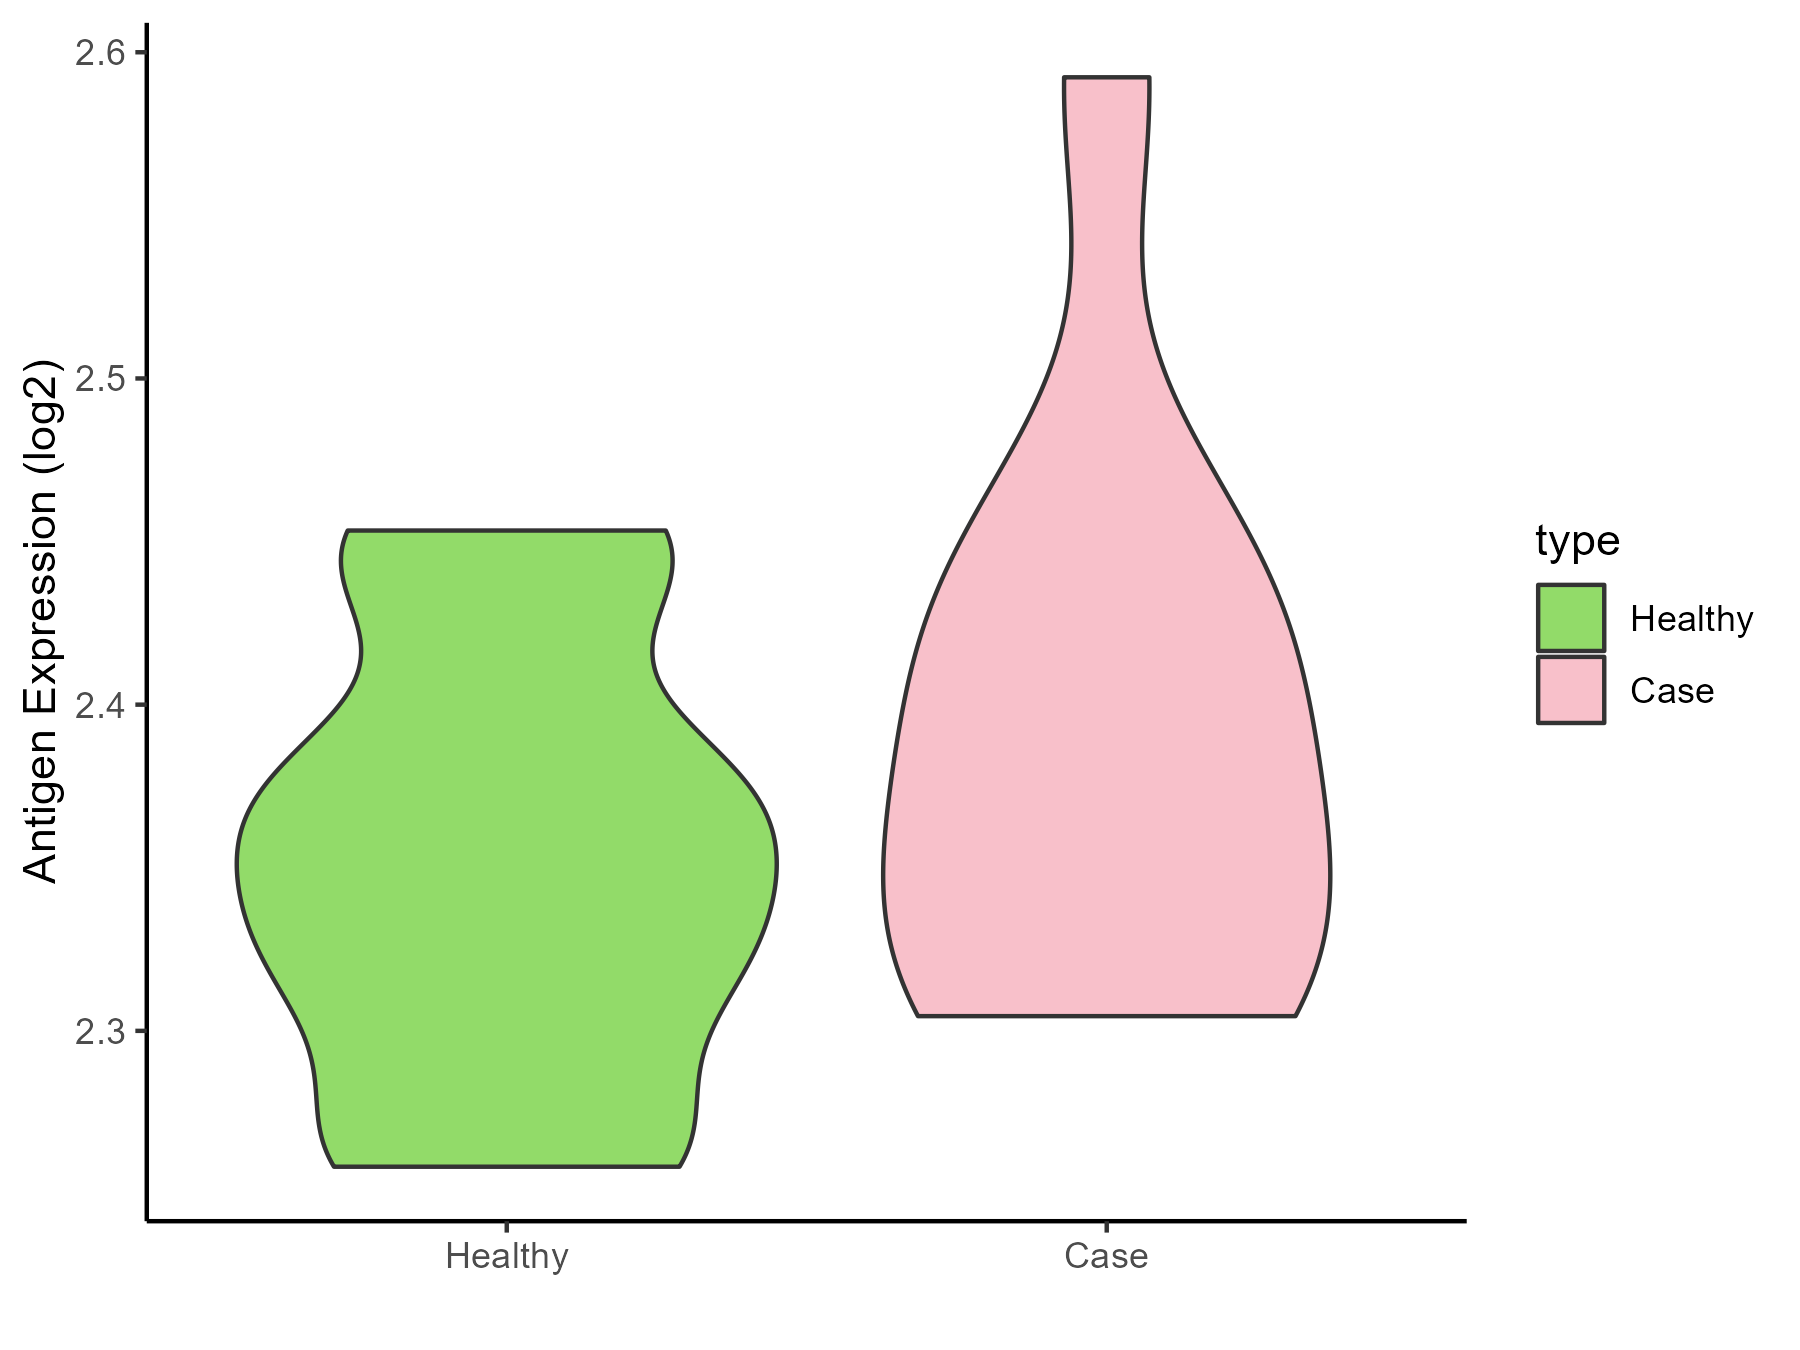
| The Studied Tissue | Whole blood | |
| The Specific Disease | Huntington disease | |
| The Expression Level of Disease Section Compare with the Healthy Individual Tissue | p-value: 0.291060792; Fold-change: 0.021272007; Z-score: 0.30931237 | |
| Disease-specific Antigen Abundances |
|
Click to View the Clearer Original Diagram |
| Differential expression pattern of antigen in diseases | ||
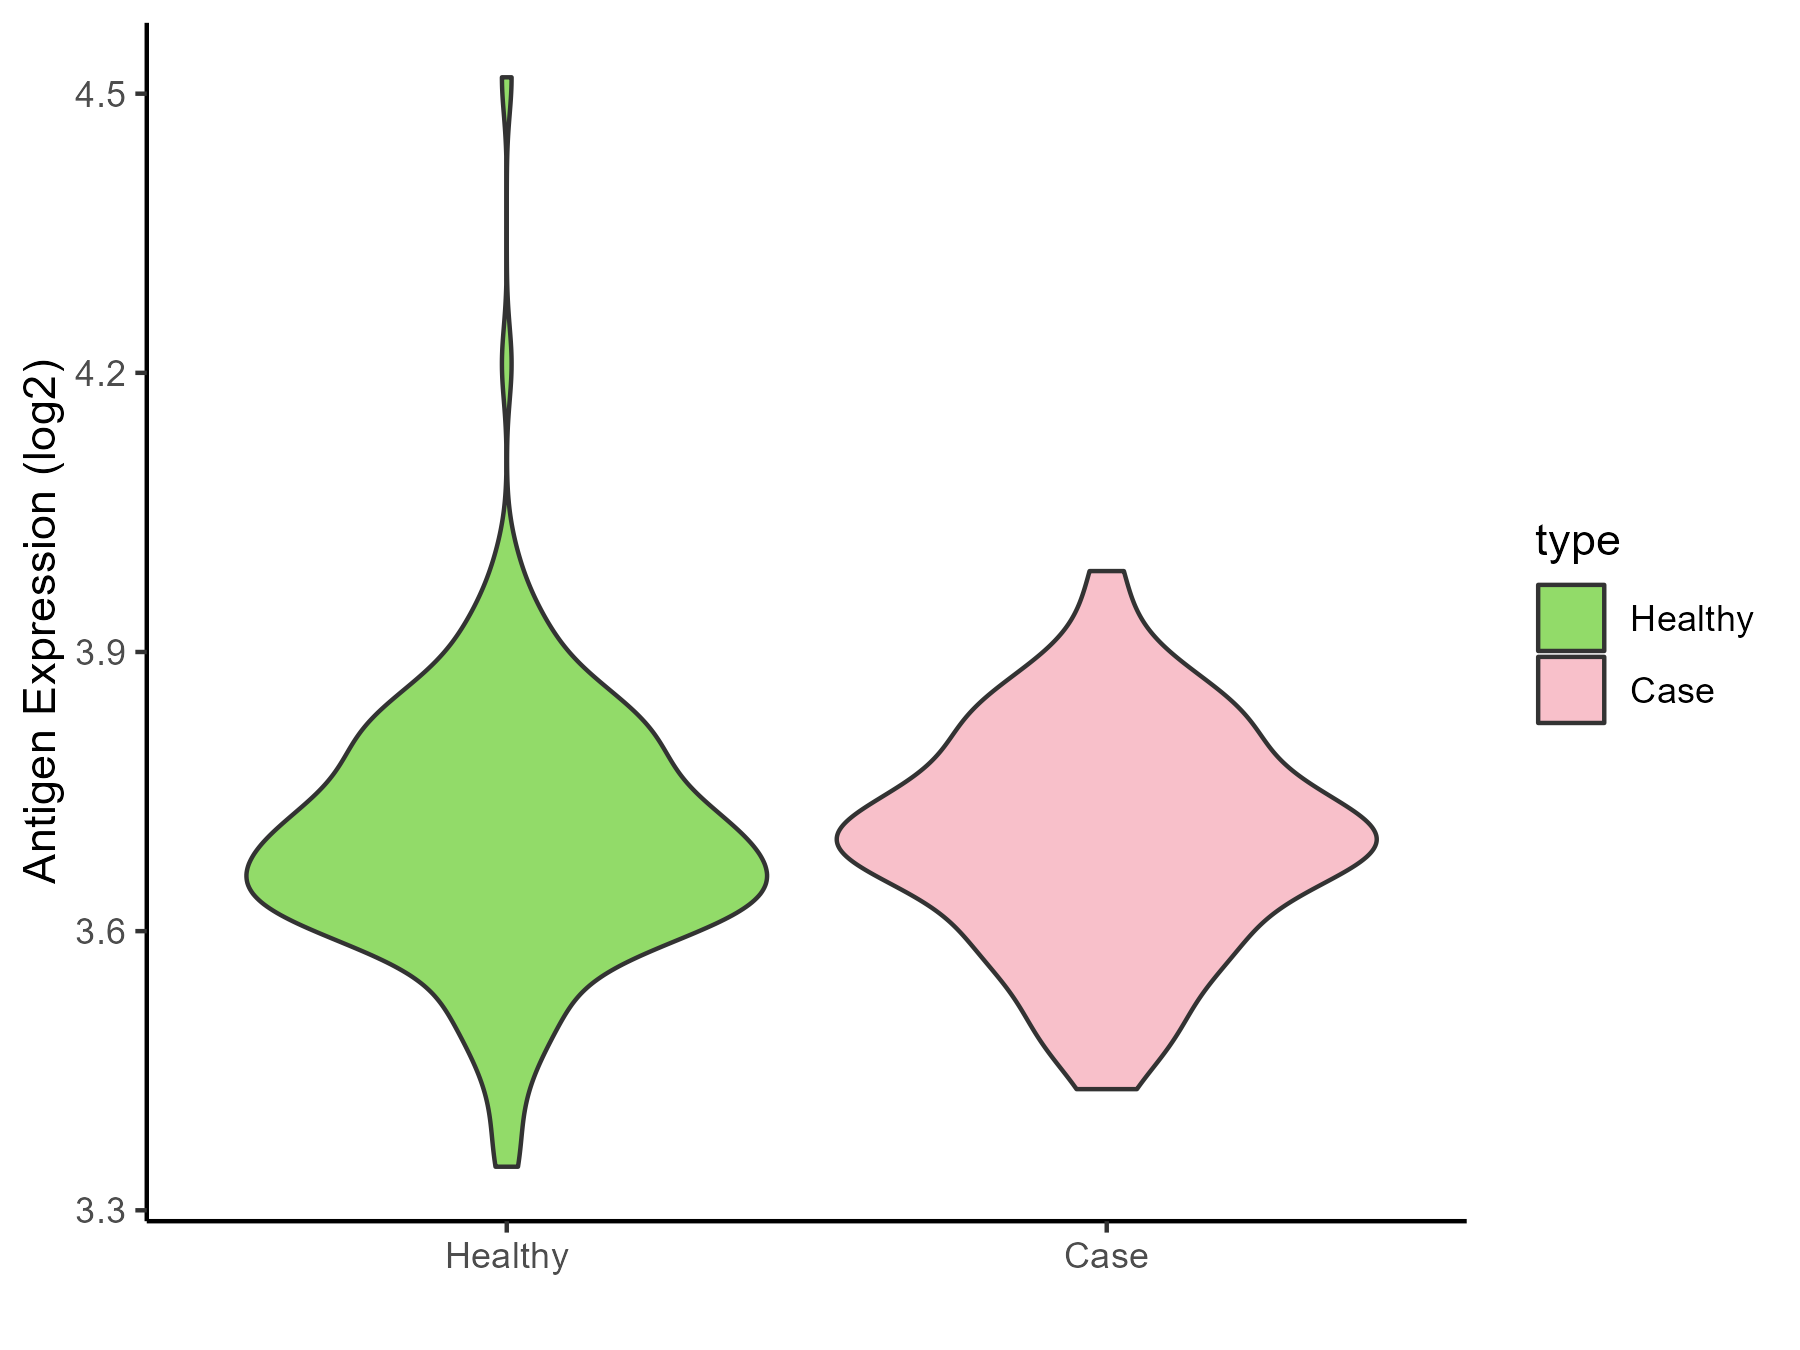
| The Studied Tissue | Entorhinal cortex | |
| The Specific Disease | Alzheimer disease | |
| The Expression Level of Disease Section Compare with the Healthy Individual Tissue | p-value: 0.77566996; Fold-change: 0.010641982; Z-score: 0.075273997 | |
| Disease-specific Antigen Abundances |
|
Click to View the Clearer Original Diagram |
| Differential expression pattern of antigen in diseases | ||
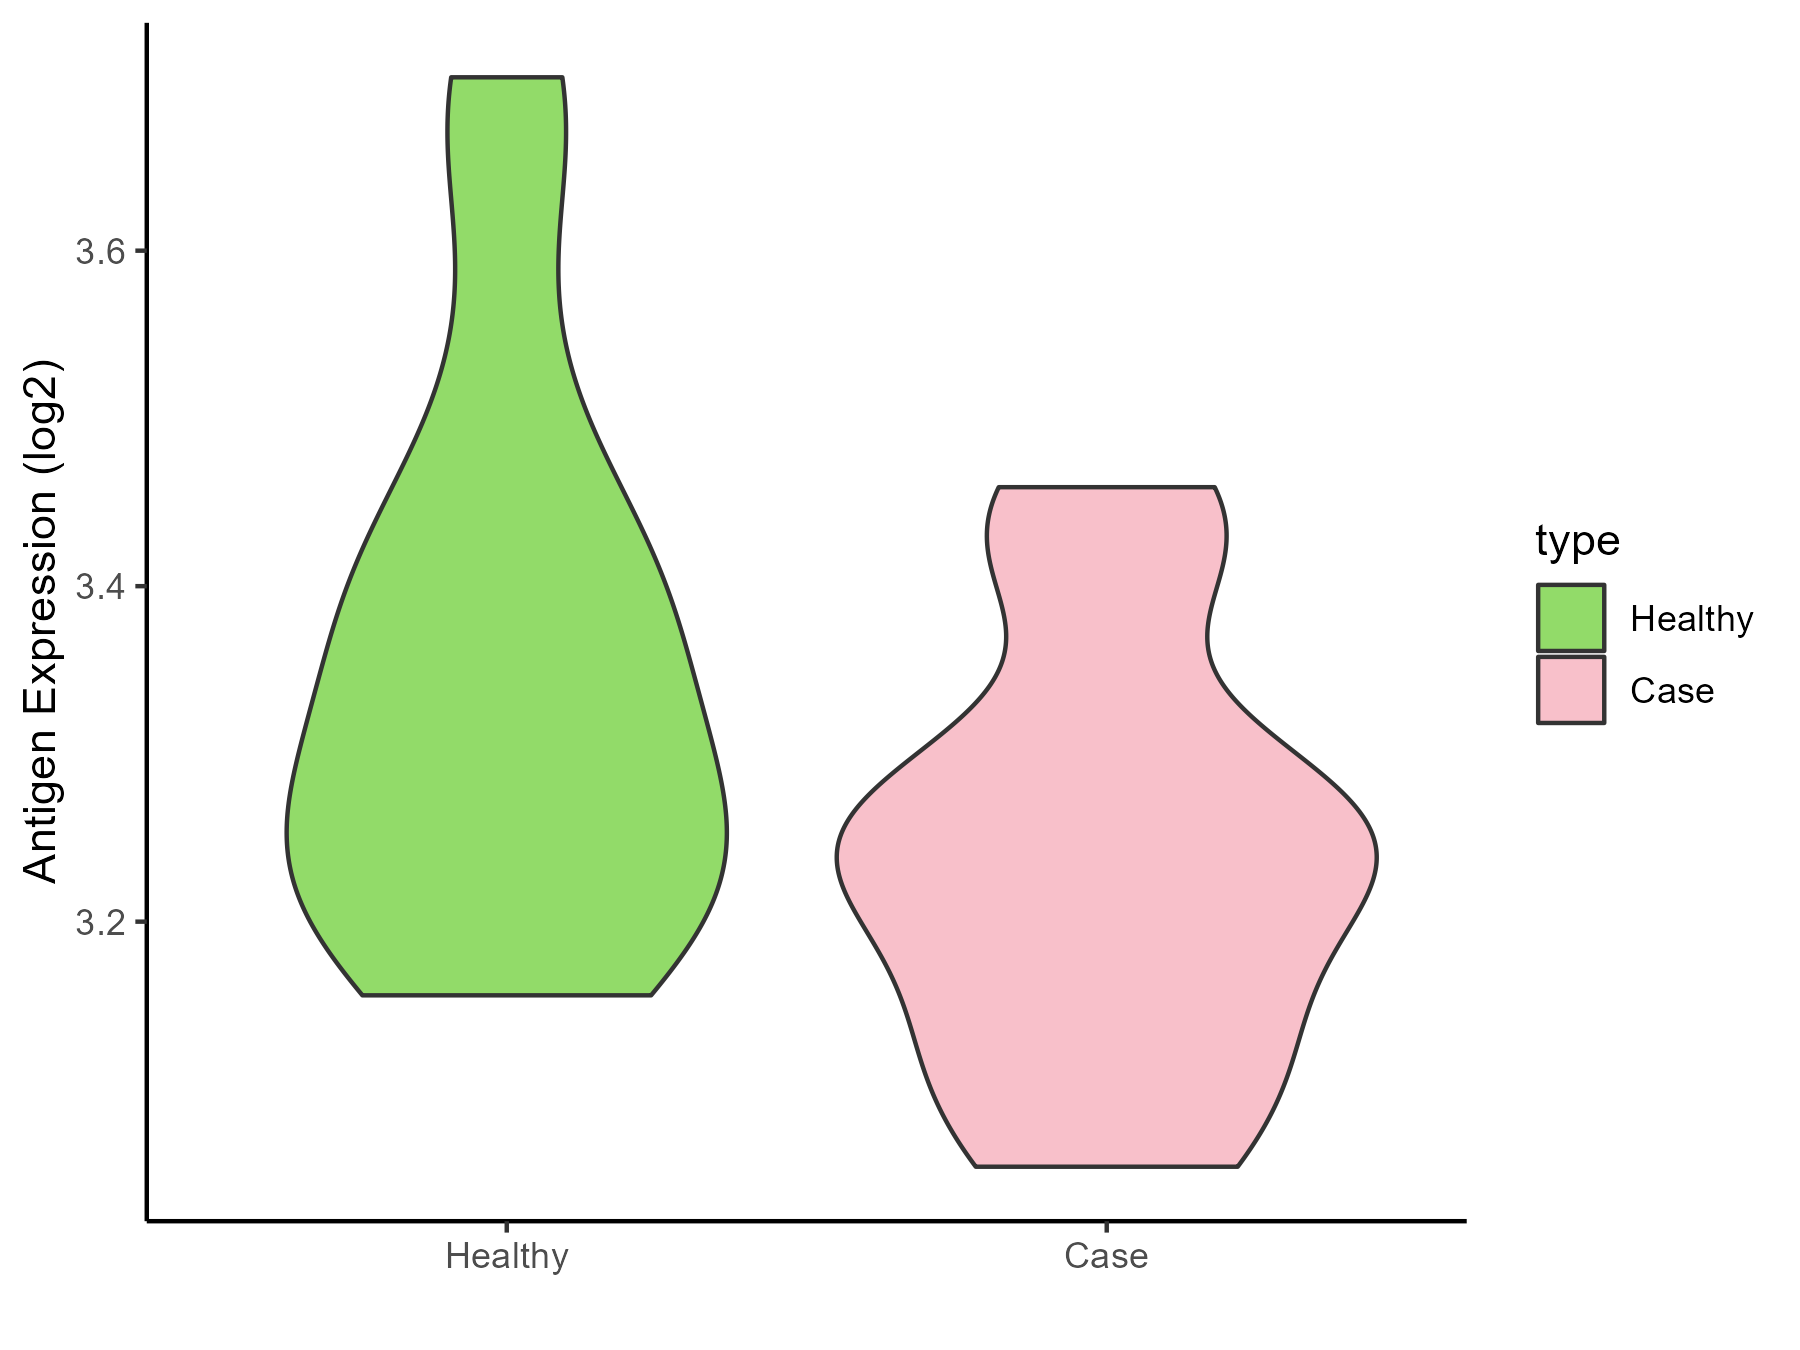
| The Studied Tissue | Whole blood | |
| The Specific Disease | Seizure | |
| The Expression Level of Disease Section Compare with the Healthy Individual Tissue | p-value: 0.036135887; Fold-change: -0.076033202; Z-score: -0.461082642 | |
| Disease-specific Antigen Abundances |
|
Click to View the Clearer Original Diagram |
| Differential expression pattern of antigen in diseases | ||
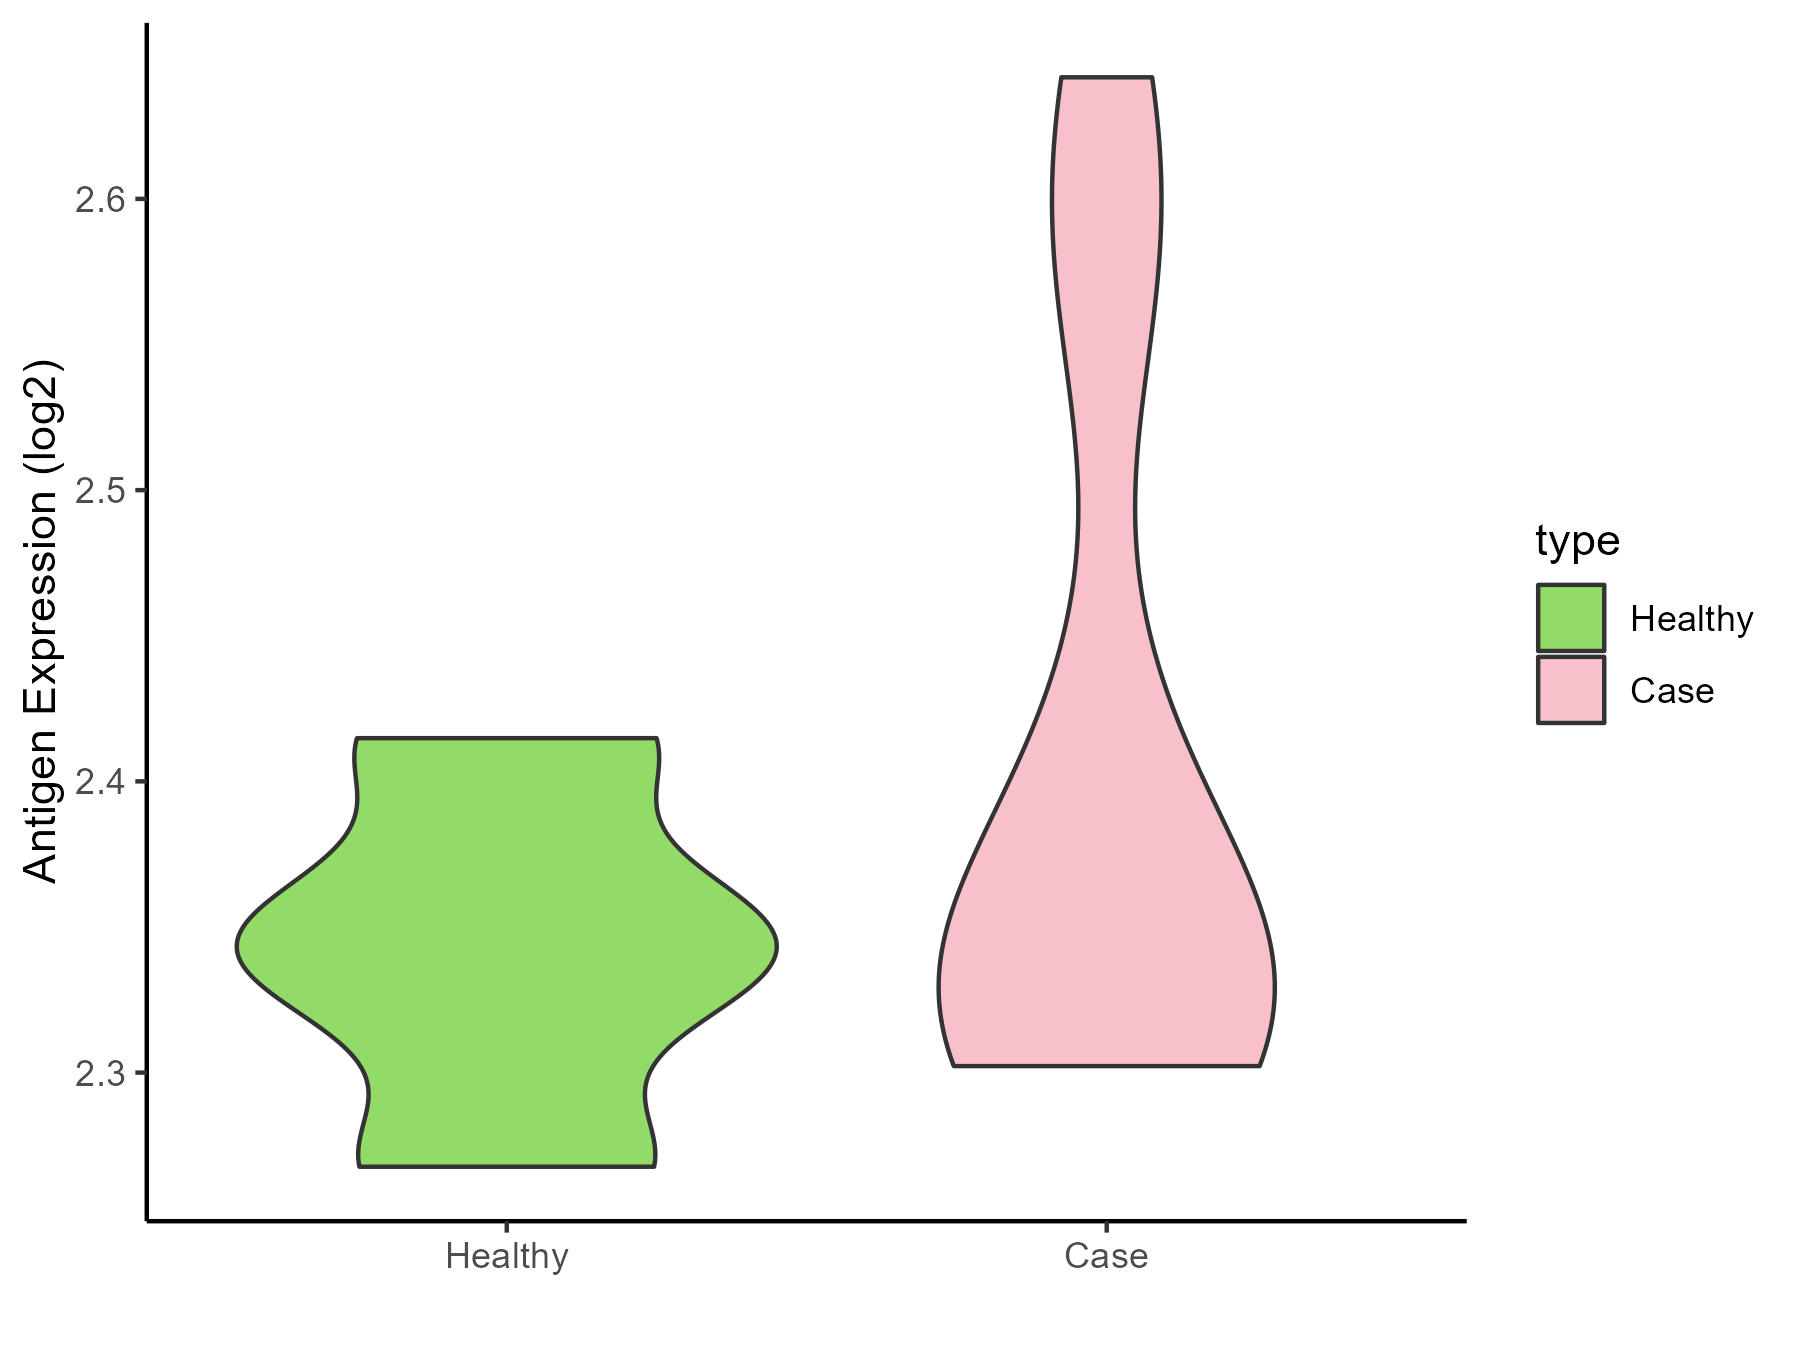
| The Studied Tissue | Skin | |
| The Specific Disease | Lateral sclerosis | |
| The Expression Level of Disease Section Compare with the Healthy Individual Tissue | p-value: 0.218924068; Fold-change: -0.004325345; Z-score: -0.071427062 | |
| Disease-specific Antigen Abundances |
|
Click to View the Clearer Original Diagram |
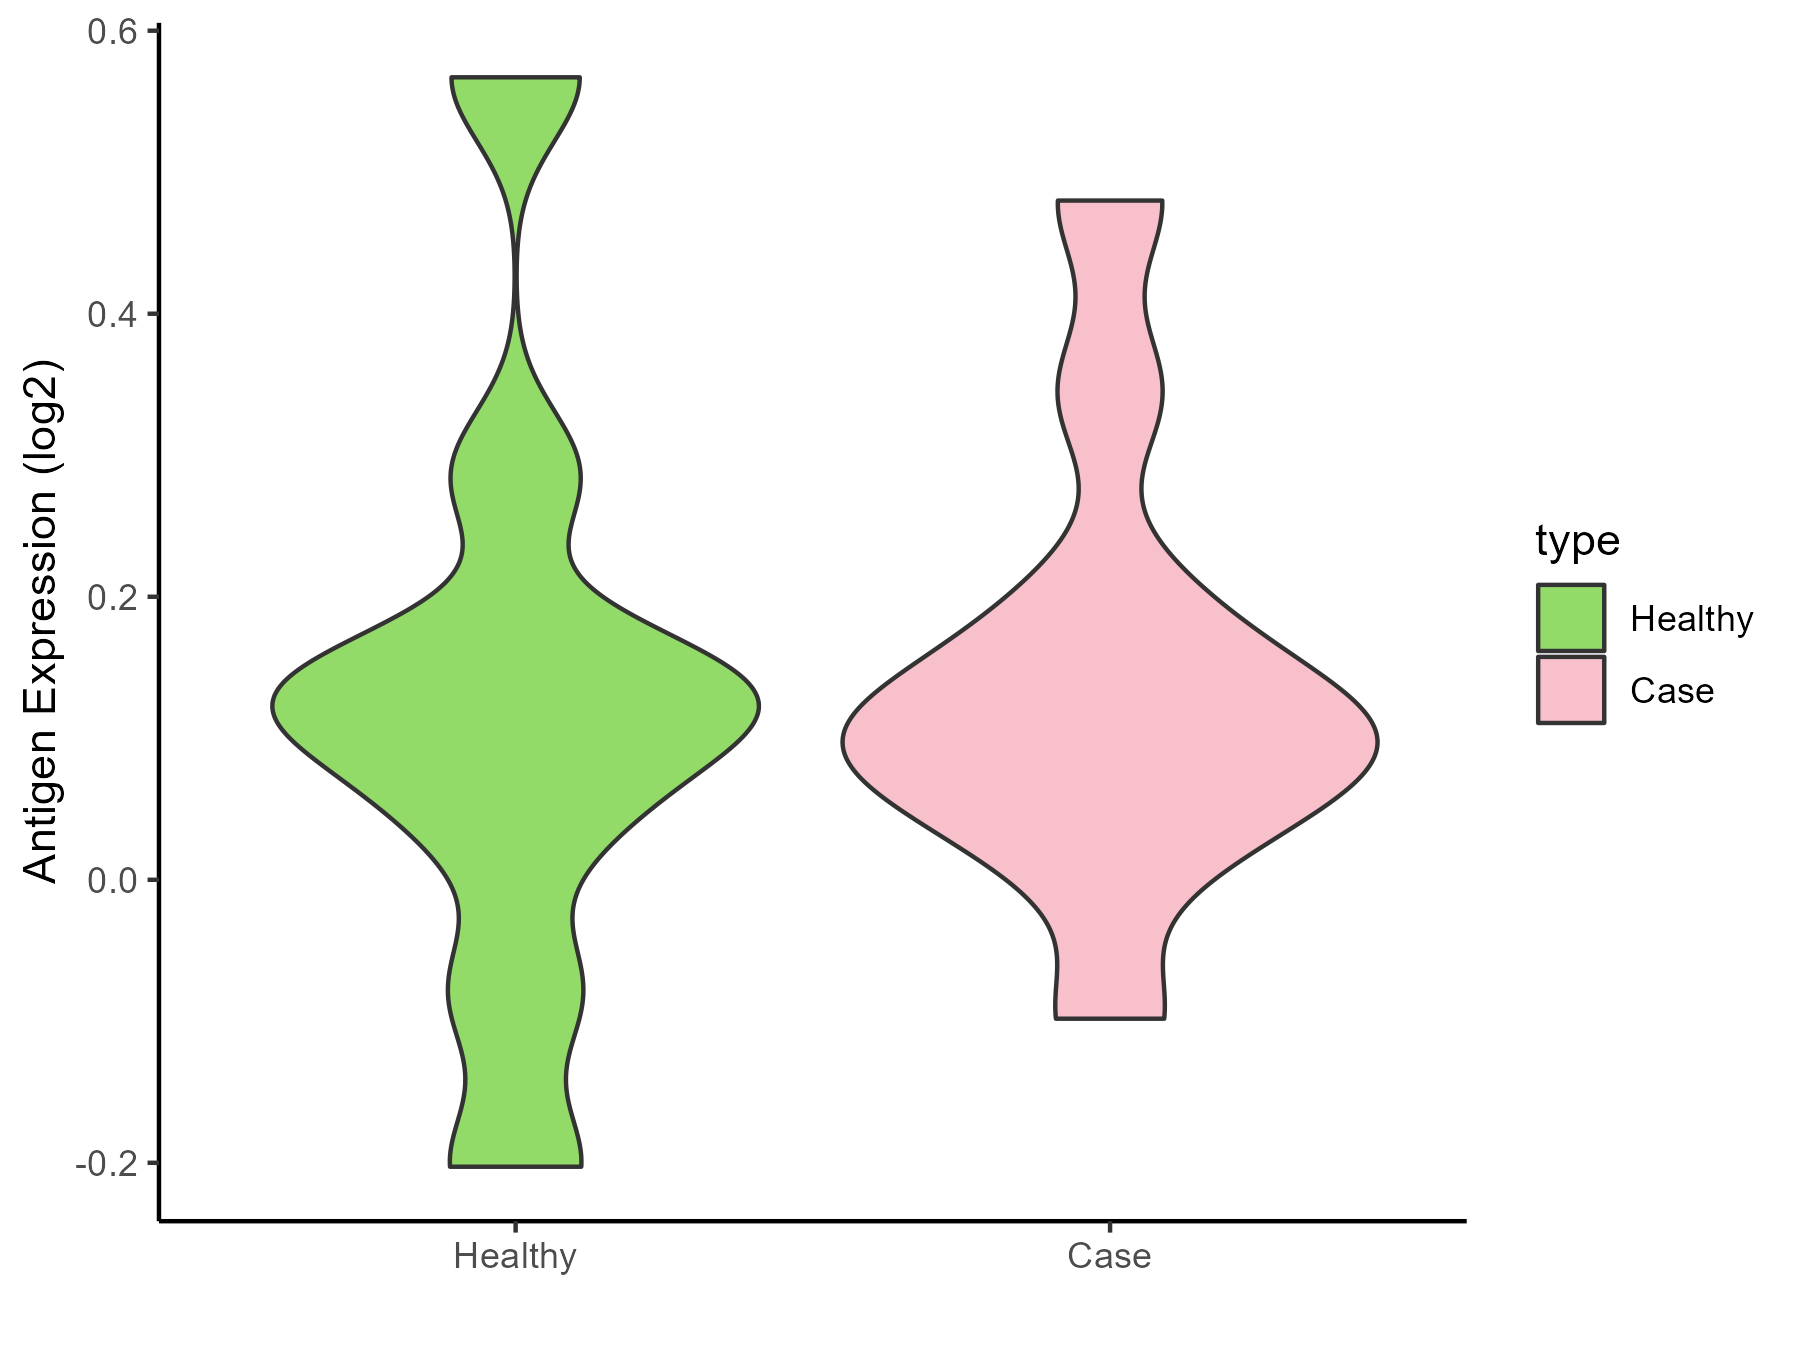
| The Studied Tissue | Cervical spinal cord | |
| The Specific Disease | Lateral sclerosis | |
| The Expression Level of Disease Section Compare with the Healthy Individual Tissue | p-value: 0.849557623; Fold-change: -0.016419999; Z-score: -0.075375484 | |
| Disease-specific Antigen Abundances |
|
Click to View the Clearer Original Diagram |
| Differential expression pattern of antigen in diseases | ||
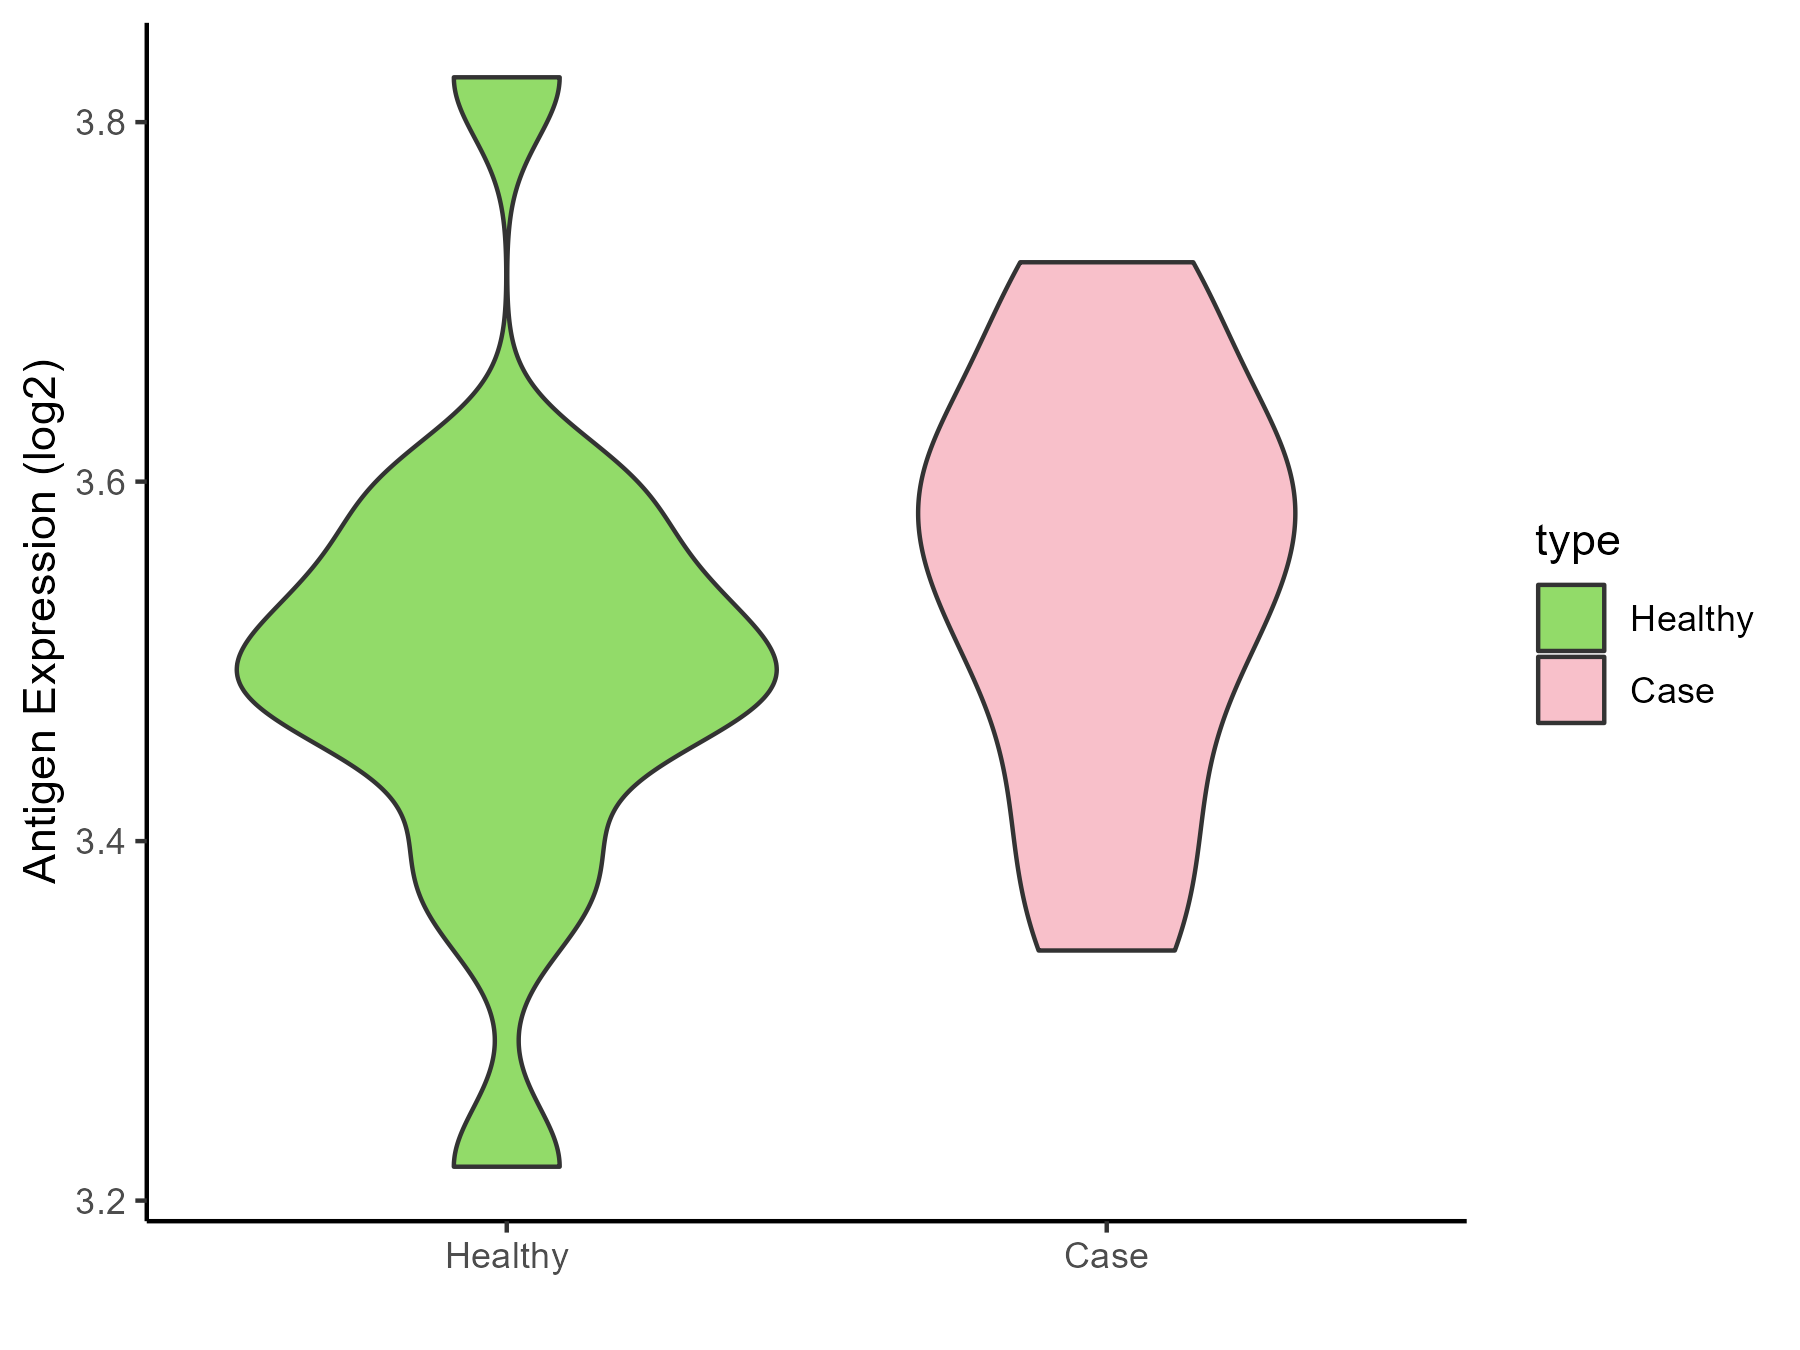
| The Studied Tissue | Muscle | |
| The Specific Disease | Muscular atrophy | |
| The Expression Level of Disease Section Compare with the Healthy Individual Tissue | p-value: 0.342463052; Fold-change: 0.060328394; Z-score: 0.4277928 | |
| Disease-specific Antigen Abundances |
|
Click to View the Clearer Original Diagram |
| Differential expression pattern of antigen in diseases | ||
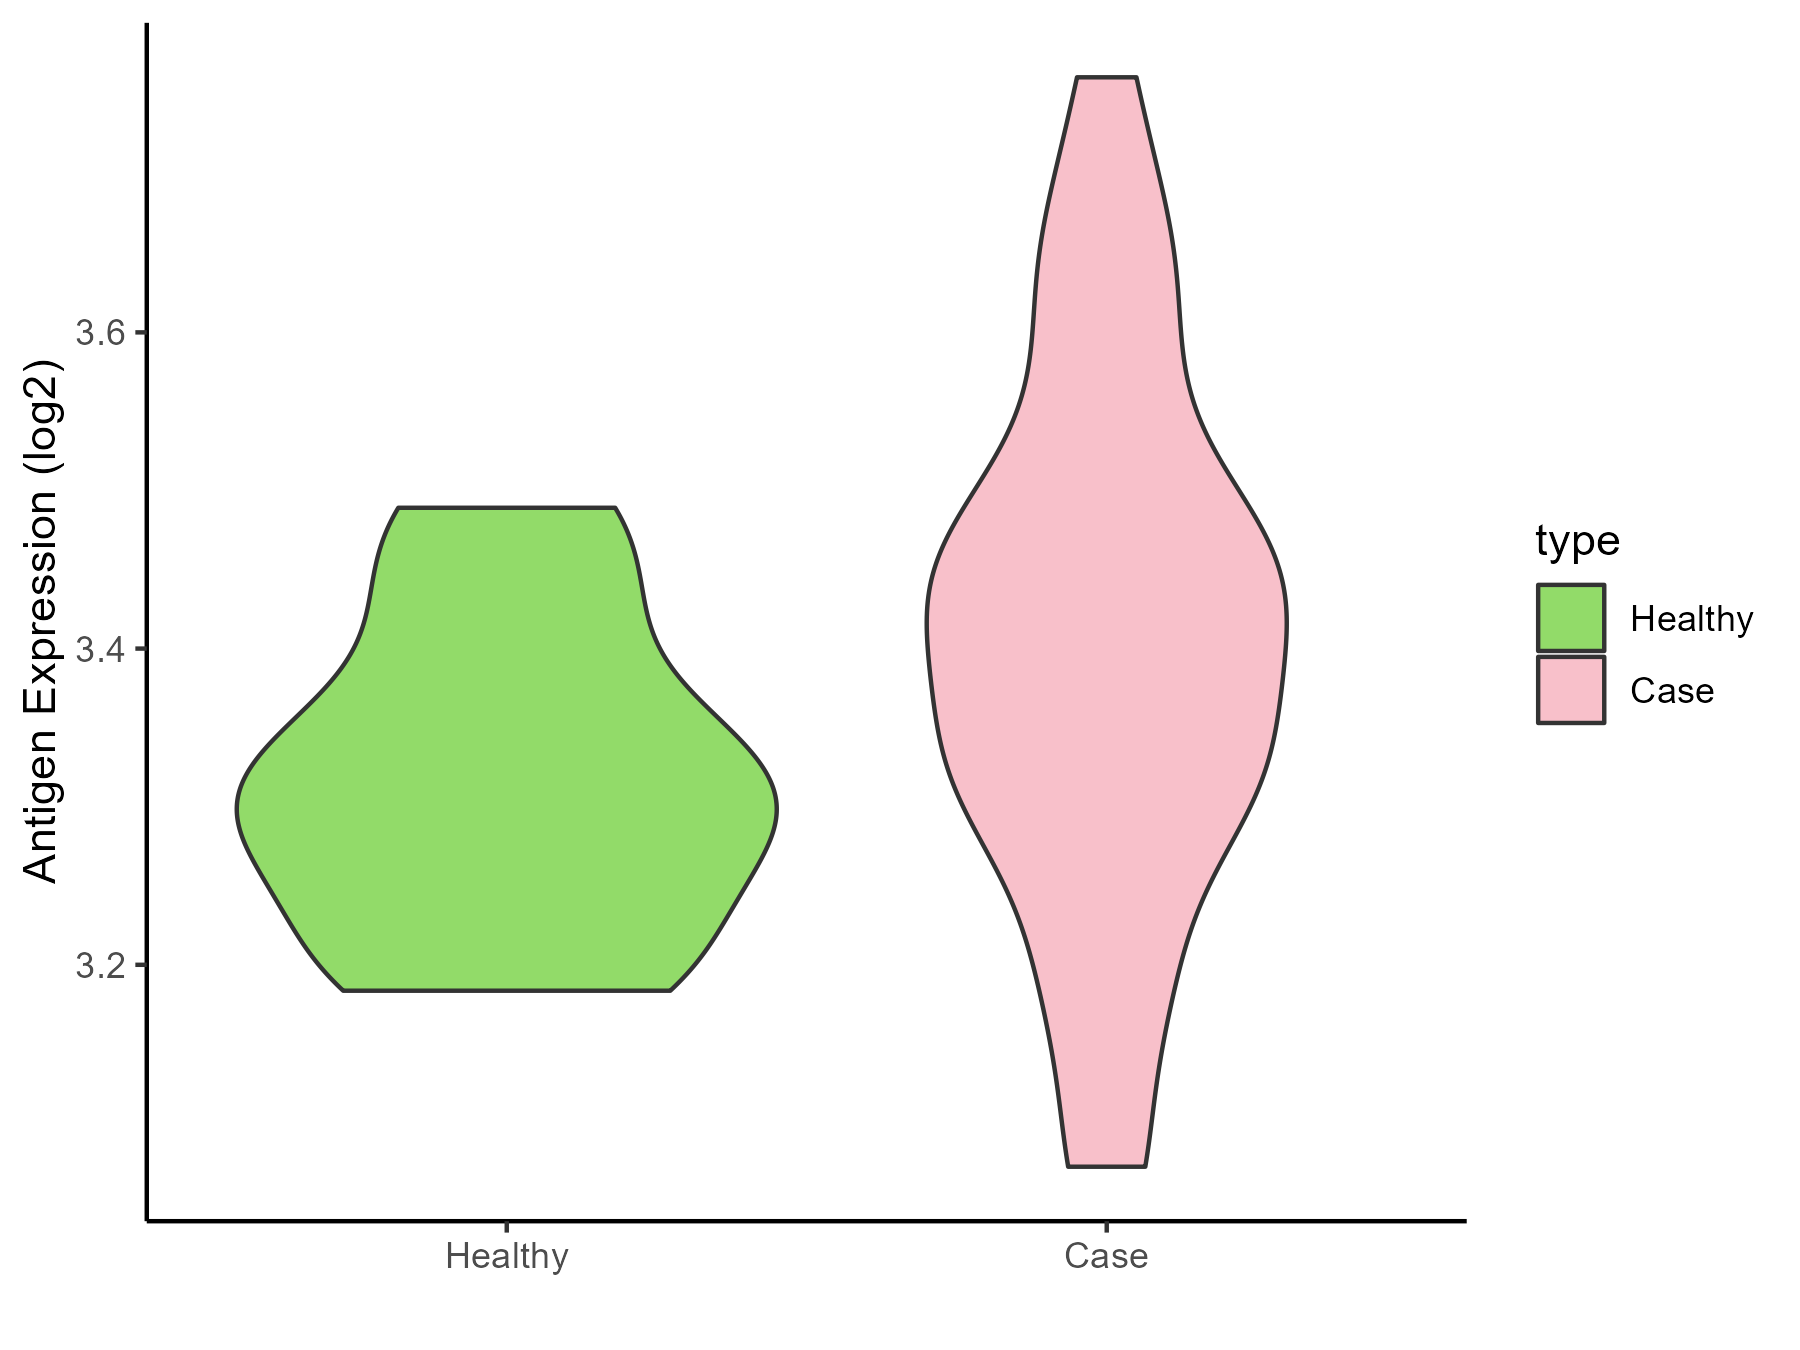
| The Studied Tissue | Muscle | |
| The Specific Disease | Myopathy | |
| The Expression Level of Disease Section Compare with the Healthy Individual Tissue | p-value: 0.085663535; Fold-change: 0.106447307; Z-score: 1.033366118 | |
| Disease-specific Antigen Abundances |
|
Click to View the Clearer Original Diagram |
References
