
Antibody-drug Conjugate Information
General Information of This Antibody-drug Conjugate (ID: DRG0OHXUL)
| ADC Name |
WO2025019776A2ADC 33-8
|
|||||
|---|---|---|---|---|---|---|
| Synonyms |
WO2025019776A2ADC 33-8
Click to Show/Hide
|
|||||
| Organization |
EXELIXIS, INC.
|
|||||
| Drug Status |
Investigative
|
|||||
| Drug-to-Antibody Ratio |
8
|
|||||
| Structure |
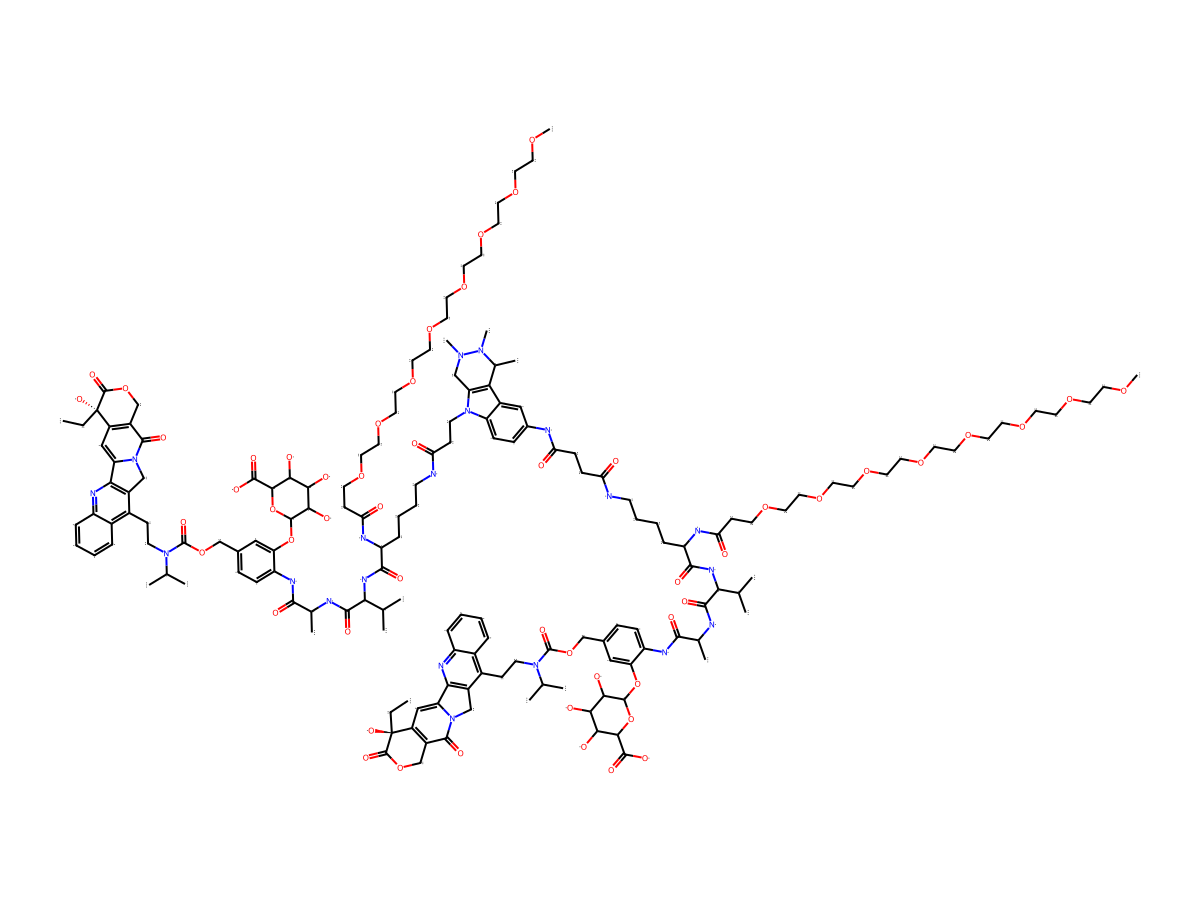
|
|||||
| Antibody Name |
A33
|
Antibody Info | ||||
| Antigen Name |
Interleukin-13 receptor subunit alpha-2 (IL13RA2)
|
Antigen Info | ||||
| Payload Name |
Belotecan
|
Payload Info | ||||
| Payload Target |
DNA topoisomerase 1 (TOP1)
|
Target Info | ||||
| Linker Name |
WO2025019776A2, ADC 22-8, Linker
|
Linker Info | ||||
| Conjugate Type |
Random conjugation through reduced inter-chain cysteines.
|
|||||
| Combination Type |
IIa
|
|||||
2027 Update
ADC-specific functional property
Bystander Killing Effect
| Bystander Killing Effect | Description | Reference |
|---|---|---|
| yes |
The potential effects of ADC 33-8 on human myeloid (CFU-GM) was assessed using colony forming cell assays. The colonies were divided into the following categories based on size and morphology: Erythroid (CFU-E and BFU-E),myeloid (CFU-GM),and multi-potential (CFU- GEMM).Photographs were taken of representative hematopoietic progenitor-derived.
Click to Show/Hide
|
[1]
|
Payload Release Efficiency
| Incubation Time | 14day | Release | 6.92ug/mL | Reference |
[1]
|
|---|---|---|---|---|---|
| Description |
Clonogenic progenitors of human myeloid and erythroid progenitors were assessed in a semi-solid methylcellulose-based media formulation containing 35%FBS,2%BSA, rhIL-3 (10 ng/mL),rhGM-CSF (10 ng/mL),rhSCF (50 ng/mL)and Epo (3 U/mL).The tested ADCs were added in at various concentrations and the tubes were vortexed to ensure equal distribution of the ADC throughout the matrix.5-FU (Sigma Aldrich)was used as a positive control for progenitor proliferation (inhibition of colony growth)and was introduced to the bone marrow cultures at 1.0,0.1,and 0.01ug/mL.The assays were initiated with bone marrow mononuclear cells (BMMNC)at 2x10⁴cells per culture.Following 14 days in culture,myeloid and erythroid colonies were assessed microscopically and scored by trained personnel.The colonies were divided into the following categories based on size and morphology:Erythroid (CFU-E and BFU-E),myeloid (CFU-GM),and multi-potential (CFU- GEMM).Photographs were taken of representative hematopoietic progenitor-derived colonies from various lineages,illustrating colonies in the presence of the solvent control as well as colonies in the presence of the test ADCs.
Click to Show/Hide
|
||||
| Incubation Time | 14day | Release | 5.36ug/mL | Reference |
[1]
|
| Description |
Clonogenic progenitors of human myeloid and erythroid progenitors were assessed in a semi-solid methylcellulose-based media formulation containing 35%FBS,2%BSA, rhIL-3 (10 ng/mL),rhGM-CSF (10 ng/mL),rhSCF (50 ng/mL)and Epo (3 U/mL).The tested ADCs were added in at various concentrations and the tubes were vortexed to ensure equal distribution of the ADC throughout the matrix.5-FU (Sigma Aldrich)was used as a positive control for progenitor proliferation (inhibition of colony growth)and was introduced to the bone marrow cultures at 1.0,0.1,and 0.01ug/mL.The assays were initiated with bone marrow mononuclear cells (BMMNC)at 2x10⁴cells per culture.Following 14 days in culture,myeloid and erythroid colonies were assessed microscopically and scored by trained personnel.The colonies were divided into the following categories based on size and morphology:Erythroid (CFU-E and BFU-E),myeloid (CFU-GM),and multi-potential (CFU- GEMM).Photographs were taken of representative hematopoietic progenitor-derived colonies from various lineages,illustrating colonies in the presence of the solvent control as well as colonies in the presence of the test ADCs.
Click to Show/Hide
|
||||
Binding Affinity
| Dissocation Constant (Kd) | Binding Target | Description | Reference |
|---|---|---|---|
| 0.1963 nM |
hIL13Ra2
|
LISA was performed to assess the binding profiles of the ADCs produced as described above and their parental antibodies to human IL13Ra2-His protein.
|
[1]
|
Circulating Stability
| Incubation Time | 11day | Release | 0.67ug/mL | Reference |
[1]
|
|---|---|---|---|---|---|
| Incubation Medium | In the neutrophil assay,CD34 cells were thawed,washed,and counted. A cell stock was prepared in the initial media formulation containing X-Vivo-15,rhIL-3 (20 ng/mL),rhIL-6 (20 ng/mL),rhSCF (100 ng/mL)and rhFlt-3L (100 ng/mL).Approximately 10,000 cells in 200 uL volume were plated per well in round-bottom 96-well plates and cultured in a humidified incubator at 37°C,5%CO2for 3 days.After this time,the cells were washed twice with X-Vivo medium and incubated in X-Vivo-15 medium supplemented with rhSCF (50 ng/mL),rhFlt-3L (100 ng/mL),rh IL3 (5 ng/mL),rhGM-CSF (5ng/mL)rhG-CSF (5 ng/mL)for 4 days.The cells were again washed (x2)and incubated in X-Vivo-15 medium supplemented with rhIL-3 (5 ng/mL)and rhG-CSF (30 ng/mL)for another 4 days.On day 11,the cells were washed twice and placed in the final media formulation containing X-Vivo- 15 supplemented with just rhG-CSF (30 ng/mL)for the final 6 days.The test articles were added at this stage and were retained in the assay for the final 6 days.The effect of ADCs on neutrophil differentiation was represented by the percentage and number (events)of CD66b within the viable cell population. The concentration of 50%inhibition (ICso)was calculated based on the sigmoid curve fit using Dose-Response,One-Site Model formula:y=A+[ (B- A)/ (1+ ((C/x)^D)),where A=the initial value (baseline response),B=maximum response,C=center (drug concentration that provokes a response halfway between A and B) and D=slope of the curve at midpoint. | ||||
| Description |
The stability of ADC linkers were assessed using a neutrophil assay. The effect of ADCs on neutrophil differentiation was represented by the percentage and number (events)of CD66b within the viable cell population.
Click to Show/Hide
|
||||
2027 Update
General Information of The ADMET Data Related to This ADC
Absorption
| Standard Type | Value | Units | Description | Reference |
|---|---|---|---|---|
| Area Under the Concentration-Time Curve (AUC) | ≈7000000 | hr·ng/mL |
Male JVC/FVC cannulated Sprague-Dawley rats (5 per group)were dosed intravenously with a single dose of 5mg/kg of the tested ADC on Day 1 after 16 hours of fasting.100uL K2EDTA plasma was collected at 30 min,4h,24h (on Day 2),168h (on Day 8),240h (on Day 11),336h (on Day 15),and 504h (on Day 22)post-dose,saved in bullet tubes and stored at -23°C until end of the study.
Click to Show/Hide
|
[1] |
Excretion
| Standard Type | Value | Units | Description | Reference |
|---|---|---|---|---|
| Clearance (CL) | ≈0.55 | mL/hr/kg |
Male JVC/FVC cannulated Sprague-Dawley rats (5 per group)were dosed intravenously with a single dose of 5mg/kg of the tested ADC on Day 1 after 16 hours of fasting.100uL K2EDTA plasma was collected at 30 min,4h,24h (on Day 2),168h (on Day 8),240h (on Day 11),336h (on Day 15),and 504h (on Day 22)post-dose,saved in bullet tubes and stored at -25°C until end of the study.
Click to Show/Hide
|
[1] |
| Elimination Half-Life (t1/2) | ≈240 | hr |
Male JVC/FVC cannulated Sprague-Dawley rats (5 per group)were dosed intravenously with a single dose of 5mg/kg of the tested ADC on Day 1 after 16 hours of fasting.100uL K2EDTA plasma was collected at 30 min,4h,24h (on Day 2),168h (on Day 8),240h (on Day 11),336h (on Day 15),and 504h (on Day 22)post-dose,saved in bullet tubes and stored at -25°C until end of the study.
Click to Show/Hide
|
[1] |
General Information of The Activity Data Related to This ADC
Discovered Using Cell Line-derived Xenograft Model
Discovered Using Patient-derived Xenograft Model
| Standard Type | Value | Units | Animal Model (No. of PDX) |
|---|---|---|---|
| Tumor Growth lnhibition value (TGl) |
86
|
%
|
Patient-Derived Xenograft (PDX)Models- NSCLC
|
Revealed Based on the Cell Line Data
Full List of Activity Data of This Antibody-drug Conjugate
Discovered Using Cell Line-derived Xenograft Model
| Experiment 1 Reporting the Activity Date of This ADC | [1] | ||||
| Efficacy Data | Tumor Growth lnhibition value (TGl) | 12.40% | Positive IL13Ra2 expression (IL13Ra2+++/++) | ||
| Method Description |
Each female BALB/c Nude mouse was inoculated subcutaneously in the right upper flank region with 0.5x10 6of SK-MES-1 tumor cells (a non-small cell lung cancer (NSCLC)cell line having an IL13Ra2 copy number of about 4x10⁴)in 0.1 mL of PBS for tumor development.When the mean tumor size reached about 80-150 mm 3,mice were randomized into respective treatment groups (8 mice per group)and received intravenous injections of PBS vehicle or a single dose of the tested ADC 33-8 at 1 mg/kg on Day 1. The end of the study was day 44.
Click to Show/Hide
|
||||
| In Vivo Model | CDX Model-SK-MES-1 | ||||
| Experiment 2 Reporting the Activity Date of This ADC | [1] | ||||
| Efficacy Data | Tumor Growth lnhibition value (TGl) | 51.40% | Positive IL13Ra2 expression (IL13Ra2+++/++) | ||
| Method Description |
Each female BALB/c Nude mouse was inoculated subcutaneously in the right upper flank region with 0.5x10 6of SK-MES-1 tumor cells (a non-small cell lung cancer (NSCLC)cell line having an IL13Ra2 copy number of about 4x10⁴)in 0.1 mL of PBS for tumor development.When the mean tumor size reached about 80-150 mm 3,mice were randomized into respective treatment groups (8 mice per group)and received intravenous injections of PBS vehicle or a single dose of the tested ADC 33-8 at 3 mg/kg on Day 1. The end of the study was day 44.
Click to Show/Hide
|
||||
| In Vivo Model | CDX Model-SK-MES-1 | ||||
| Experiment 3 Reporting the Activity Date of This ADC | [1] | ||||
| Efficacy Data | Tumor Growth lnhibition value (TGl) | 61.10% | Positive IL13Ra2 expression (IL13Ra2+++/++) | ||
| Method Description |
Each female BALB/c Nude mouse was inoculated subcutaneously in the right upper flank region with 0.5x10 6of SK-MES-1 tumor cells (a non-small cell lung cancer (NSCLC)cell line having an IL13Ra2 copy number of about 4x10⁴)in 0.1 mL of PBS for tumor development.When the mean tumor size reached about 80-150 mm 3,mice were randomized into respective treatment groups (8 mice per group)and received intravenous injections of PBS vehicle or a single dose of the tested ADC 33-8 at 6 mg/kg on Day 1. The end of the study was day 44.
Click to Show/Hide
|
||||
| In Vivo Model | CDX Model-SK-MES-1 | ||||
| Experiment 4 Reporting the Activity Date of This ADC | [1] | ||||
| Efficacy Data | Tumor Growth lnhibition value (TGl) | 62% | Positive IL13Ra2 expression (IL13Ra2+++/++) | ||
| Method Description |
Each female BALB/c Nude mouse was inoculated subcutaneously in the right upper flank region with 0.5x10 6of SK-MES-1 tumor cells (a non-small cell lung cancer (NSCLC)cell line having an IL13Ra2 copy number of about 4x10⁴)in 0.1 mL of PBS for tumor development.When the mean tumor size reached about 80-150 mm 3,mice were randomized into respective treatment groups (8 mice per group)and received intravenous injections of PBS vehicle or a single dose of the tested ADC 33-8 at 10 mg/kg on Day 1. The end of the study was day 44.
Click to Show/Hide
|
||||
| In Vivo Model | CDX Model-SK-MES-1 | ||||
| Experiment 5 Reporting the Activity Date of This ADC | [1] | ||||
| Efficacy Data | Tumor Growth lnhibition value (TGl) | 80.50% | Positive IL13Ra2 expression (IL13Ra2+++/++) | ||
| Method Description |
Each female BALB/c Nude mouse was inoculated subcutaneously in the right upper/lower flank region with 1x10 7of H2228 tumor cells (an NSCLC cell line having an IL13Ra2 copy number of about 2,000)in 0.1 mL of PBS mixed with MATRIGELR (1:1)for tumor development.When the mean tumor size reached about 80-150 mm 3,mice were randomized into respective treatment groups (10 mice per group)and received intravenous injections of vehicle or a single dose of the tested ADCs at 10 mg/kg on Day 1. Body weights and tumor volumes were measured twice per week until the end of the study (Day 48).
Click to Show/Hide
|
||||
| In Vivo Model | CDX Model-H2228 | ||||
| Experiment 6 Reporting the Activity Date of This ADC | [1] | ||||
| Efficacy Data | Tumor Growth lnhibition value (TGl) | 88.90% | Positive IL13Ra2 expression (IL13Ra2+++/++) | ||
| Method Description |
Each female BALB/c Nude mouse was inoculated subcutaneously in the right upper flank region with 0.5x10 6of SK-MES-1 tumor cells (a non-small cell lung cancer (NSCLC)cell line having an IL13Ra2 copy number of about 4x10⁴)in 0.1 mL of PBS for tumor development.When the mean tumor size reached about 80-150 mm 3,mice were randomized into respective treatment groups (10 mice per group)and received intravenous injections of PBS vehicle or a single dose of the tested ADCs at 10 mg/kg on Day 1. The end of the study was day 49.
Click to Show/Hide
|
||||
| In Vivo Model | CDX Model-SK-MES-1 | ||||
| Experiment 7 Reporting the Activity Date of This ADC | [1] | ||||
| Efficacy Data | Tumor Growth lnhibition value (TGl) | 105.50% | Positive IL13Ra2 expression (IL13Ra2+++/++) | ||
| Method Description |
Each female NOD.Cg-Prkdcscid II2rgmIVst/Vst (NPG)mouse was inoculated subcutaneously in the right upper flank region with 1x10 7of H1792 tumor cells (an NSCLC cell line having an IL13Ra2 copy number of about 47000)in 0.1 mL of PBS mixed with MATRIGELR (1:1)for tumor development.When the mean tumor size reached about 80-150 mm 3,mice were randomized into respective treatment groups (10 mice per group)and received intravenous injections of vehicle or a single dose of the tested ADCs at 10 mg/kg on Day 1. Body weights and tumor volumes were measured twice per week until the end of the study (Day 57).
Click to Show/Hide
|
||||
| In Vivo Model | CDX Model-H1792 | ||||
| Experiment 8 Reporting the Activity Date of This ADC | [1] | ||||
| Efficacy Data | Tumor Growth lnhibition value (TGl) | 125% | High IL13Ra2 expression (IL13Ra2 +++) | ||
| Method Description |
0.5x10⁶of A375 tumor cells (a melanoma cancer cell line having an IL13Ra2 copy number of 3.5x10⁵measured as described in Example 11)mixed in 1:10 dilution of MATRIGELR (Corning Life Sciences)with serum free media was implanted subcutaneously at the hind right flank in female BALB/c Nude mice on Day-10.When the average tumor volume reached about 140 mm3,mice were randomized into respective treatment groups (10 mice per group)and received intravenous injections of PBS vehicle or the tested ADC 33-8 just on Day 1 with a dose of 3 mg/kg. Body weights and tumor volumes were measured twice per week until the end of the study. Days post-dosing 18, the TGI (vs isotype ADC) was calculated.
Click to Show/Hide
|
||||
| In Vivo Model | A375 BALB/c Nude mice model | ||||
Discovered Using Patient-derived Xenograft Model
| Experiment 1 Reporting the Activity Date of This ADC | [1] | ||||
| Efficacy Data | Tumor Growth lnhibition value (TGl) | 86% | Positive IL13Ra2 expression (IL13Ra2+++/++) | ||
| Method Description |
Female athymic nude-Foxnlnu mice were implanted (left flank)with patient tumor cells. H score: 225. Tumor cells from one NSCLC patient were tested. When sufficient stock animals reached 1000-1500 mm 3,tumors were harvested for re-implantation into pre-study animals.Pre-study animals were implanted unilaterally on the left flank with tumor fragments harvested from stock animals.When the average tumor volume reached 150-300 mm 3on Day 0,mice were randomized into respective treatment groups and received intravenous injections of vehicle or the tested ADC 33-8 (5mg/kg).Body weights and tumor volumes were measured twice per week until the end of the study.Any animal exhibiting>20%net weight loss for a period lasting 7 days or mice displaying>30% net weight loss when compared to Day O was considered moribund and euthanized. Beginning on Day 0,tumor dimensions were measured twice weekly by digital caliper,and data including individual and mean estimated tumor volumes (Mean TV± SEM)was recorded for each group;tumor volume was calculated using the formula (1): TV=width2xlengthx0.52.
Click to Show/Hide
|
||||
| In Vivo Model | Patient-Derived Xenograft (PDX)Models- NSCLC | ||||
Revealed Based on the Cell Line Data
| Experiment 1 Reporting the Activity Date of This ADC | [1] | ||||
| Efficacy Data | the MFI (geometric mean) signal | ≈ 40000-50000 . | Positive hIL13Ra2 expression (hIL13Ra2+++/++) | ||
| Method Description |
FACS was used to evaluate the binding profiles of A375 cells expressing IL13Ra2. The samples were then read by flow cytometry and the MFI (geometric mean) signal was calculated.
|
||||
| In Vitro Model | Amelanotic melanoma | A375 cells | CVCL_0132 | ||
| Experiment 2 Reporting the Activity Date of This ADC | [1] | ||||
| Efficacy Data | the MFI (geometric mean) signal | ≈ 40000-50000 . | Positive hIL13Ra2 expression (hIL13Ra2+++/++) | ||
| Method Description |
FACS was used to evaluate the binding profiles of HEK293 cells engineered to express IL13Ra2 (HEK293-IL13Ra2) cells expressing IL13Ra2. The samples were then read by flow cytometry and the MFI (geometric mean) signal was calculated.
|
||||
| In Vitro Model | Normal | HEK293 cells | CVCL_0045 | ||
| Experiment 3 Reporting the Activity Date of This ADC | [1] | ||||
| Efficacy Data | Half Maximal inhibitory Concentration (lC50) | 2 nM | High hIL13Ra2 expression (hIL13Ra2 +++) | ||
| Method Description |
The cytotoxic activity of ADC 33-8 was determined against cancer cell lines A375.FITC and anti-Hen egg-white lysozyme isotype control antibody (HEWL)conjugated to the same linker payloads.
|
||||
| In Vitro Model | Amelanotic melanoma | A375 cells | CVCL_0132 | ||
| Experiment 4 Reporting the Activity Date of This ADC | [1] | ||||
| Efficacy Data | Half Maximal inhibitory Concentration (lC50) | > 100 nM | Positive hIL13Ra2 expression (hIL13Ra2+++/++) | ||
| Method Description |
The cytotoxic activity of ADC 33-8 was determined against cancer cell lines H1792.FITC and anti-Hen egg-white lysozyme isotype control antibody (HEWL)conjugated to the same linker payloads.
|
||||
| In Vitro Model | Lung adenocarcinoma | H1792 cells | CVCL_1495 | ||
| Experiment 5 Reporting the Activity Date of This ADC | [1] | ||||
| Efficacy Data | Half Maximal inhibitory Concentration (lC50) | > 100 nM | Positive hIL13Ra2 expression (hIL13Ra2+++/++) | ||
| Method Description |
The cytotoxic activity of ADC 33-8 was determined against cancer cell lines H2228.FITC and anti-Hen egg-white lysozyme isotype control antibody (HEWL)conjugated to the same linker payloads.
|
||||
| In Vitro Model | Lung adenocarcinoma | H2228 cells | CVCL_1543 | ||
| Experiment 6 Reporting the Activity Date of This ADC | [1] | ||||
| Efficacy Data | Half Maximal inhibitory Concentration (lC50) | > 100 nM | Positive hIL13Ra2 expression (hIL13Ra2+++/++) | ||
| Method Description |
The cytotoxic activity of ADC 33-8 was determined against cancer cell lines SK-MES-1.FITC and anti-Hen egg-white lysozyme isotype control antibody (HEWL)conjugated to the same linker payloads.
|
||||
| In Vitro Model | Lung squamous cell carcinoma | SK-MES-1 cells | CVCL_0630 | ||