
Antibody-drug Conjugate Information
General Information of This Antibody-drug Conjugate (ID: DRG0DEGEG)
| ADC Name |
Vobramitamab duocarmazine
|
|||||
|---|---|---|---|---|---|---|
| Synonyms |
vobramitamab duocarmazine; MGC018
Click to Show/Hide
|
|||||
| Organization |
MacroGenics (Originator);Byondis
|
|||||
| Drug Status |
Phase 2 (discontinued)
|
|||||
| Drug-to-Antibody Ratio |
2.7
|
|||||
| Structure |
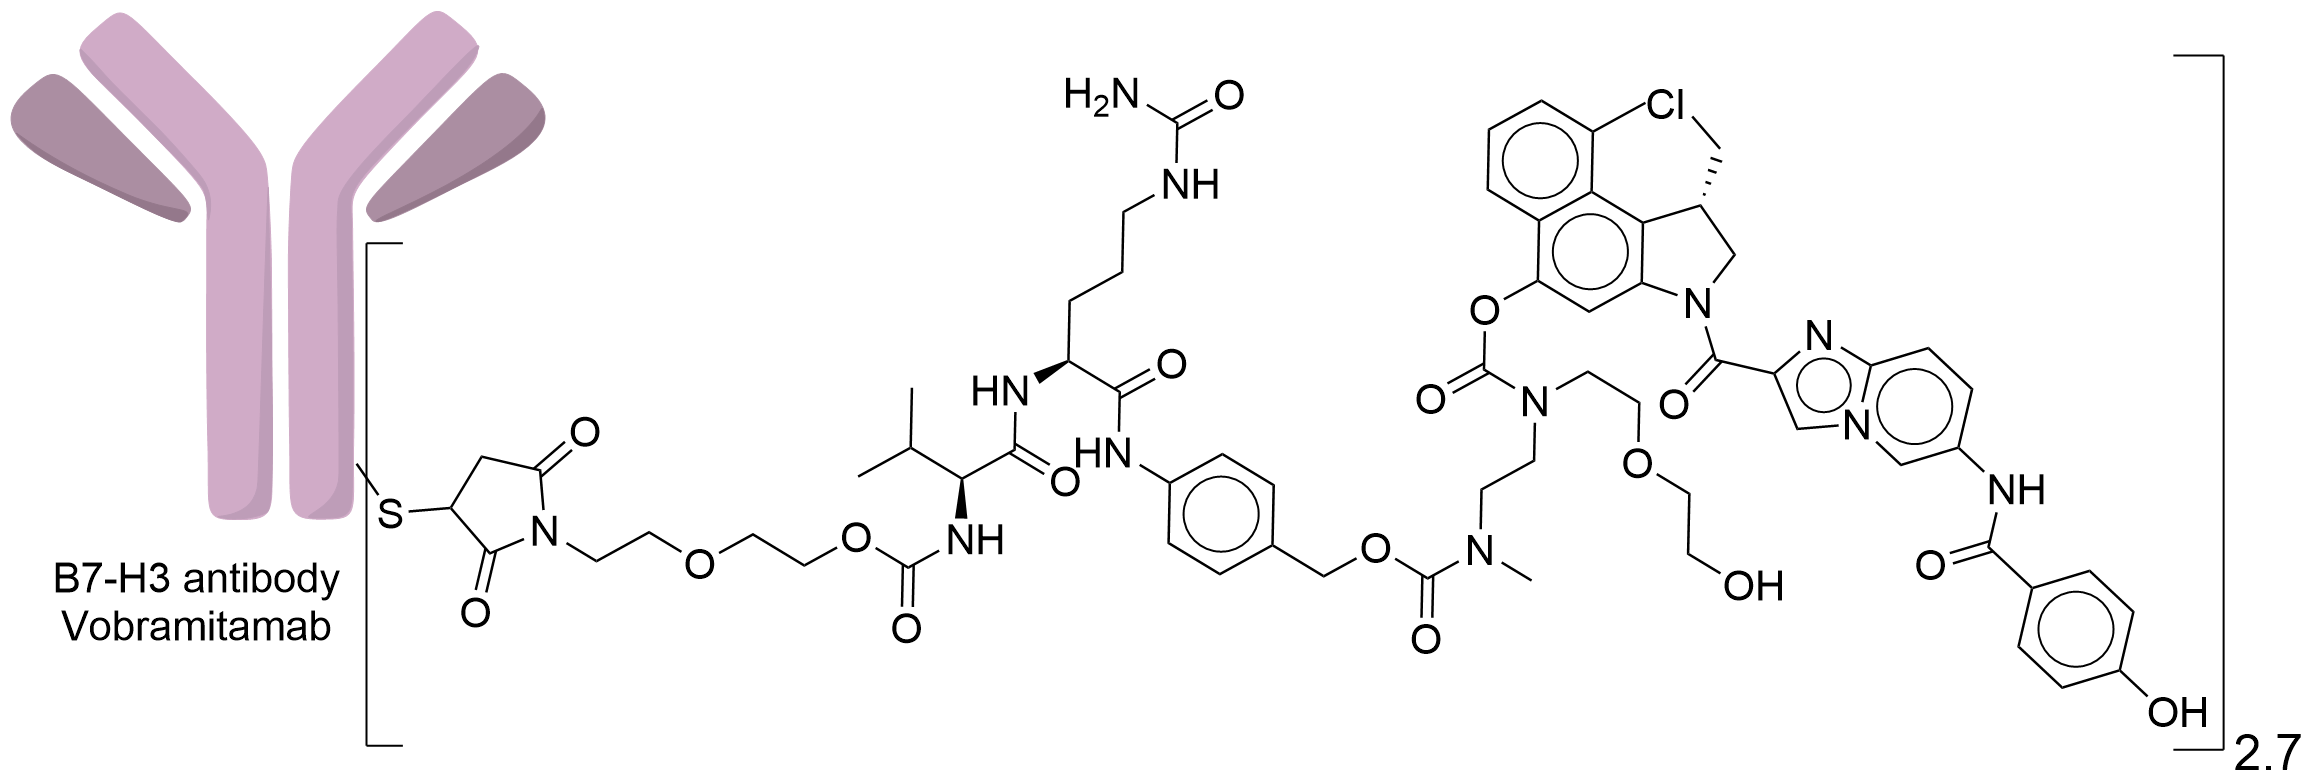
|
|||||
| Antibody Name |
Vobramitamab
|
Antibody Info | ||||
| Antigen Name |
CD276 antigen (CD276)
|
Antigen Info | ||||
| Payload Name |
Seco-DUBA
|
Payload Info | ||||
| Payload Target |
Human deoxyribonucleic acid (hDNA)
|
Target Info | ||||
| Linker Name |
Mal-PEG2-Val-Cit-PABA-Cyclization Spacer
|
Linker Info | ||||
| Conjugate Type |
Random Cysteines
|
|||||
| Combination Type |
duocarmazine
|
|||||
2027 Update
The disease landscape of This ADC
2027 Update
The clinical trial pipelines of This ADC
| Disease Name | Phase 1 | Phase 2 | Phase 3 | Approved |
|---|---|---|---|---|
| Lung cancer | ||||
| Melanoma | ||||
| Breast cancer | ||||
| Prostate cancer | ||||
| Head and neck cancer | ||||
| Unspecific solid tumor |
2027 Update
ADC-specific functional property
Bystander Killing Effect
| Bystander Killing Effect | Description | Reference |
|---|---|---|
| yes |
To assess the potential for bystander killing, an in vitro coculture experiment was conducted in which Hs700T/B7-H3 KO cells, engineered to express stabilized red fluorescent protein (Hs700T/B7-H3 KO/RFP), were cultured alone, or in the presence of progressively larger amounts of unlabeled parental Hs700T cells. The cultures were incubated with MGC018 and the number of viable RFP-labeled cells (only Hs700T/B7-H3 KO/RFP cells were visible) were monitored by time-lapse fluorescent microscopy over a period of 5 days. As shown in Fig. 1B, treatment with MGC018 had no effect on the viability of Hs700T/B7-H3 KO/RFP cells when cultured alone (gray bar vs. white bar). Conversely, MGC018 treatment led to killing of greater than 90% of parental Hs700T cells. However, in the coculture setting, bystander killing of Hs700T/B7-H3 KO/RFP cells was observed, with the magnitude of bystander killing increasing as the number of parental Hs700T cells increased (orange bars).
Click to Show/Hide
|
[1]
|
| yes |
To assess the potential for bystander killing, an in vitro coculture experiment was conducted in which Hs700T/B7-H3 KO cells, engineered to express stabilized red fluorescent protein (Hs700T/B7-H3 KO/RFP), were cultured alone, or in the presence of progressively larger amounts of unlabeled parental Hs700T cells. The cultures were incubated with MGC018 and the number of viable RFP-labeled cells (only Hs700T/B7-H3 KO/RFP cells were visible) were monitored by time-lapse fluorescent microscopy over a period of 5 days. As shown in Fig. 1B, treatment with MGC018 had no effect on the viability of Hs700T/B7-H3 KO/RFP cells when cultured alone (gray bar vs. white bar). Conversely, MGC018 treatment led to killing of greater than 90% of parental Hs700T cells. However, in the coculture setting, bystander killing of Hs700T/B7-H3 KO/RFP cells was observed, with the magnitude of bystander killing increasing as the number of parental Hs700T cells increased (orange bars).
Click to Show/Hide
|
[1]
|
| yes |
To assess the potential for bystander killing, an in vitro coculture experiment was conducted in which Hs700T/B7-H3 KO cells, engineered to express stabilized red fluorescent protein (Hs700T/B7-H3 KO/RFP), were cultured alone, or in the presence of progressively larger amounts of unlabeled parental Hs700T cells. The cultures were incubated with MGC018 and the number of viable RFP-labeled cells (only Hs700T/B7-H3 KO/RFP cells were visible) were monitored by time-lapse fluorescent microscopy over a period of 5 days. As shown in Fig. 1B, treatment with MGC018 had no effect on the viability of Hs700T/B7-H3 KO/RFP cells when cultured alone (gray bar vs. white bar). Conversely, MGC018 treatment led to killing of greater than 90% of parental Hs700T cells. However, in the coculture setting, bystander killing of Hs700T/B7-H3 KO/RFP cells was observed, with the magnitude of bystander killing increasing as the number of parental Hs700T cells increased (orange bars).
Click to Show/Hide
|
[1]
|
2027 Update
General Information of The ADMET Data Related to This ADC
Absorption
| Standard Type | Value | Units | Description | Reference |
|---|---|---|---|---|
| Area Under the Concentration-Time Curve (AUC) | 47201.1 | ug·h/mL |
Summary of total and conjugated antibody pharmacokinetic parameters from noncompartmental analysis following incubation in the Human sera.
|
[1] |
| Area Under the Concentration-Time Curve (AUC) | 35015.27 | ug·h/mL |
Summary of total and conjugated antibody pharmacokinetic parameters from noncompartmental analysis following incubation in the Cynomolgus Monkey sera.
|
[1] |
| Area Under the Concentration-Time Curve (AUC) | 614.72 | ug·h/mL |
Summary of total and conjugated antibody pharmacokinetic parameters from noncompartmental analysis following incubation in the CD-1 Nude Mouse sera.
|
[1] |
| Area Under the Concentration-Time Curve (AUC) | 11371.21 | ug·h/mL |
Summary of total and conjugated antibody pharmacokinetic parameters from noncompartmental analysis following incubation in the CES1 KO Mouse sera.
|
[1] |
| Time to Maximum Concentration (Tmax) | 1.2 | h |
Summary of conjugated antibody pharmacokinetic parameters from noncompartmental analysis of first MGC018 dose data in cynomolgus monkeys, 1mg/kg.
|
[1] |
| Maximum Observed Concentration (Cmax) | 26.4 | ug/mL |
Summary of conjugated antibody pharmacokinetic parameters from noncompartmental analysis of first MGC018 dose data in cynomolgus monkeys, 1mg/kg.
|
[1] |
| Area Under the Concentration-Time Curve (AUC) | 659 | ug·h/mL |
Summary of conjugated antibody pharmacokinetic parameters from noncompartmental analysis of first MGC018 dose data in cynomolgus monkeys, 1mg/kg, AUClast.
|
[1] |
| Area Under the Concentration-Time Curve (AUC) | 663 | ug·h/mL |
Summary of conjugated antibody pharmacokinetic parameters from noncompartmental analysis of first MGC018 dose data in cynomolgus monkeys, 1mg/kg, AUCinf.
|
[1] |
| Time to Maximum Concentration (Tmax) | 1.8 | h |
Summary of conjugated antibody pharmacokinetic parameters from noncompartmental analysis of first MGC018 dose data in cynomolgus monkeys, 3 mg/kg.
|
[1] |
| Maximum Observed Concentration (Cmax) | 92 | ug/mL |
Summary of conjugated antibody pharmacokinetic parameters from noncompartmental analysis of first MGC018 dose data in cynomolgus monkeys, 3 mg/kg.
|
[1] |
| Area Under the Concentration-Time Curve (AUC) | 3179 | ug·h/mL |
Summary of conjugated antibody pharmacokinetic parameters from noncompartmental analysis of first MGC018 dose data in cynomolgus monkeys, 3 mg/kg, AUClast.
|
[1] |
| Area Under the Concentration-Time Curve (AUC) | 3210 | ug·h/mL |
Summary of conjugated antibody pharmacokinetic parameters from noncompartmental analysis of first MGC018 dose data in cynomolgus monkeys, 3 mg/kg, AUCinf.
|
[1] |
| Time to Maximum Concentration (Tmax) | 1.9 | h |
Summary of conjugated antibody pharmacokinetic parameters from noncompartmental analysis of first MGC018 dose data in cynomolgus monkeys, 6 mg/kg.
|
[1] |
| Maximum Observed Concentration (Cmax) | 181.5 | ug/mL |
Summary of conjugated antibody pharmacokinetic parameters from noncompartmental analysis of first MGC018 dose data in cynomolgus monkeys, 6 mg/kg.
|
[1] |
| Area Under the Concentration-Time Curve (AUC) | 8950 | ug·h/mL |
Summary of conjugated antibody pharmacokinetic parameters from noncompartmental analysis of first MGC018 dose data in cynomolgus monkeys, 6 mg/kg, AUClast.
|
[1] |
| Area Under the Concentration-Time Curve (AUC) | 9032 | ug·h/mL |
Summary of conjugated antibody pharmacokinetic parameters from noncompartmental analysis of first MGC018 dose data in cynomolgus monkeys, 6 mg/kg, AUCinf.
|
[1] |
| Time to Maximum Concentration (Tmax) | 1.2 | h |
Summary of conjugated antibody pharmacokinetic parameters from noncompartmental analysis of first MGC018 dose data in cynomolgus monkeys, 10 mg/kg.
|
[1] |
| Maximum Observed Concentration (Cmax) | 310.9 | ug/mL |
Summary of conjugated antibody pharmacokinetic parameters from noncompartmental analysis of first MGC018 dose data in cynomolgus monkeys, 10 mg/kg.
|
[1] |
| Area Under the Concentration-Time Curve (AUC) | 14894 | ug·h/mL |
Summary of conjugated antibody pharmacokinetic parameters from noncompartmental analysis of first MGC018 dose data in cynomolgus monkeys, 10 mg/kg, AUClast.
|
[1] |
| Area Under the Concentration-Time Curve (AUC) | 15075 | ug·h/mL |
Summary of conjugated antibody pharmacokinetic parameters from noncompartmental analysis of first MGC018 dose data in cynomolgus monkeys, 10 mg/kg, AUCinf.
|
[1] |
| Time to Maximum Concentration (Tmax) | 0.5 | h |
Summary of ADC pharmacokinetic parameters from noncompartmental analysis of first MGC018 dose data in CD1 nude mice, 5 mg/kg.
|
[1] |
| Maximum Observed Concentration (Cmax) | 47.2 | ug/mL |
Summary of ADC pharmacokinetic parameters from noncompartmental analysis of first MGC018 dose data in CD1 nude mice, 5 mg/kg.
|
[1] |
| Area Under the Concentration-Time Curve (AUC) | 2908.9 | ug·h/mL |
Summary of ADC pharmacokinetic parameters from noncompartmental analysis of first MGC018 dose data in CD1 nude mice, 5 mg/kg AUClast.
|
[1] |
| Area Under the Concentration-Time Curve (AUC) | 8848 | ug·h/mL |
Summary of ADC pharmacokinetic parameters from noncompartmental analysis of first MGC018 dose data in CD1 nude mice, 5 mg/kg AUCinf.
|
[1] |
| Time to Maximum Concentration (Tmax) | 0.5 | h |
Summary of ADC pharmacokinetic parameters from noncompartmental analysis of first MGC018 dose data in SCID/CES1c knock out mice, 5 mg/kg.
|
[1] |
| Maximum Observed Concentration (Cmax) | 31.4 | ug/mL |
Summary of ADC pharmacokinetic parameters from noncompartmental analysis of first MGC018 dose data in SCID/CES1c knock out mice, 5 mg/kg.
|
[1] |
| Area Under the Concentration-Time Curve (AUC) | 3689.2 | ug·h/mL |
Summary of ADC pharmacokinetic parameters from noncompartmental analysis of first MGC018 dose data in SCID/CES1c knock out mice, 5 mg/kg AUClast.
|
[1] |
| Area Under the Concentration-Time Curve (AUC) | 6660.2 | ug·h/mL |
Summary of ADC pharmacokinetic parameters from noncompartmental analysis of first MGC018 dose data in SCID/CES1c knock out mice, 5 mg/kg AUCinf.
|
[1] |
Distribution
| Standard Type | Value | Units | Description | Reference |
|---|---|---|---|---|
| Volume of Distribution (Vd) | 81.4 | mL/kg |
Summary of conjugated antibody pharmacokinetic parameters from noncompartmental analysis of first MGC018 dose data in cynomolgus monkeys, 1mg/kg.
|
[1] |
| Volume of Distribution (Vd) | 66.3 | mL/kg |
Summary of conjugated antibody pharmacokinetic parameters from noncompartmental analysis of first MGC018 dose data in cynomolgus monkeys, 3 mg/kg.
|
[1] |
| Volume of Distribution (Vd) | 56.8 | mL/kg |
Summary of conjugated antibody pharmacokinetic parameters from noncompartmental analysis of first MGC018 dose data in cynomolgus monkeys, 6 mg/kg.
|
[1] |
| Volume of Distribution (Vd) | 64.6 | mL/kg |
Summary of conjugated antibody pharmacokinetic parameters from noncompartmental analysis of first MGC018 dose data in cynomolgus monkeys, 10 mg/kg.
|
[1] |
Excretion
| Standard Type | Value | Units | Description | Reference |
|---|---|---|---|---|
| Elimination Half-Life (t1/2) | 78.1 | h |
Summary of conjugated antibody pharmacokinetic parameters from noncompartmental analysis of first MGC018 dose data in cynomolgus monkeys, 1mg/kg.
|
[1] |
| Clearance (CL) | 1.53 | mL/h/kg |
Summary of conjugated antibody pharmacokinetic parameters from noncompartmental analysis of first MGC018 dose data in cynomolgus monkeys, 1mg/kg.
|
[1] |
| Elimination Half-Life (t1/2) | 84.5 | h |
Summary of conjugated antibody pharmacokinetic parameters from noncompartmental analysis of first MGC018 dose data in cynomolgus monkeys, 3 mg/kg.
|
[1] |
| Clearance (CL) | 0.95 | mL/h/kg |
Summary of conjugated antibody pharmacokinetic parameters from noncompartmental analysis of first MGC018 dose data in cynomolgus monkeys, 3 mg/kg.
|
[1] |
| Elimination Half-Life (t1/2) | 67.9 | h |
Summary of conjugated antibody pharmacokinetic parameters from noncompartmental analysis of first MGC018 dose data in cynomolgus monkeys, 6 mg/kg.
|
[1] |
| Clearance (CL) | 0.68 | mL/h/kg |
Summary of conjugated antibody pharmacokinetic parameters from noncompartmental analysis of first MGC018 dose data in cynomolgus monkeys, 6 mg/kg.
|
[1] |
| Elimination Half-Life (t1/2) | 74.1 | h |
Summary of conjugated antibody pharmacokinetic parameters from noncompartmental analysis of first MGC018 dose data in cynomolgus monkeys, 10 mg/kg.
|
[1] |
| Clearance (CL) | 0.67 | mL/h/kg |
Summary of conjugated antibody pharmacokinetic parameters from noncompartmental analysis of first MGC018 dose data in cynomolgus monkeys, 10 mg/kg.
|
[1] |
| Elimination Half-Life (t1/2) | 424.5 | h |
Summary of ADC pharmacokinetic parameters from noncompartmental analysis of first MGC018 dose data in CD1 nude mice, 5 mg/kg.
|
[1] |
| Clearance (CL) | 0.57 | mL/h/kg |
Summary of ADC pharmacokinetic parameters from noncompartmental analysis of first MGC018 dose data in CD1 nude mice, 5 mg/kg.
|
[1] |
| Elimination Half-Life (t1/2) | 205.1 | h |
Summary of ADC pharmacokinetic parameters from noncompartmental analysis of first MGC018 dose data in SCID/CES1c knock out mice, 5 mg/kg.
|
[1] |
| Clearance (CL) | 0.75 | mL/h/kg |
Summary of ADC pharmacokinetic parameters from noncompartmental analysis of first MGC018 dose data in SCID/CES1c knock out mice, 5 mg/kg.
|
[1] |
General Information of The Activity Data Related to This ADC
Identified from the Human Clinical Data
Discovered Using Patient-derived Xenograft Model
Discovered Using Cell Line-derived Xenograft Model
Revealed Based on the Cell Line Data
Full List of Activity Data of This Antibody-drug Conjugate
Identified from the Human Clinical Data
| Experiment 1 Reporting the Activity Date of This ADC | [2] | ||||
| Patients Enrolled |
Eligible participants include those with prostate adenocarcinoma (Part 1; prior ARAT therapy permitted) or select squamous/small cell carcinomas (Part 2; 1-2 prior therapies). Key exclusions involve excessive prior treatments, active CNS metastases, B7-H3 therapy history, or contraindications to corticosteroids. Archival tissue and measurable disease are required. Contraception and baseline organ function criteria apply.
Click to Show/Hide
|
||||
| Administration Dosage |
MGC018 2.0, 2.7 mg/kg every 4 weeks
|
||||
| Related Clinical Trial | |||||
| NCT Number | NCT05551117 | Clinical Status | PHASE2 | ||
| Clinical Description | A Phase 2, Open-label, Study of Vobramitamab Duocarmazine in Participants With Metastatic Castration-resistant Prostate Cancer and Other Solid Tumors | ||||
| Primary Endpoint |
In Part 1, radiographic progression-free survival (rPFS) will be assessed every 8-12 weeks for up to 2 years using PCWG3 criteria, with a landmark 6-month rPFS analysis. In Part 2, objective response rate (ORR) will be measured by RECIST 1.1 based on confirmed complete (CR) or partial responses (PR).
|
||||
| Other Endpoint |
Secondary endpoints include prostate-specific outcomes (PSA response, time to PSA progression, symptomatic skeletal events), tumor response metrics (ORR, duration of response, tumor size change), and safety (AEs, SAEs, immunogenicity). Assessments will be performed every 4-12 weeks per protocol-defined intervals.
|
||||
| Experiment 2 Reporting the Activity Date of This ADC | [3] | ||||
| Patients Enrolled |
Eligible patients must be ≥18 with platinum-refractory SCLC (including EGFR-mutant NSCLC-transformed SCLC), measurable disease (RECIST v1.1), ECOG 0-2, and adequate organ function. Key exclusions: untreated/symptomatic brain metastases, leptomeningeal disease, concurrent malignancies, or significant effusions. Women/men must adhere to strict contraception requirements. Archived/fresh tumor tissue is mandatory unless biopsy is medically unfeasible. Concurrent investigational agents or major surgery within 4 weeks pre-treatment are prohibited.
Click to Show/Hide
|
||||
| Administration Dosage |
Intravenous (IV) Infusion, 2.7 mg/kg on Day 1 of each 28 day cycle
|
||||
| Related Clinical Trial | |||||
| NCT Number | NCT06227546 | Clinical Status | PHASE2 | ||
| Clinical Description | A Phase II Study of MGC018 in Patients With Relapsed or Refractory Extensive-Stage Small-Cell Lung Cancer (ES-SCLC) | ||||
| Primary Endpoint |
The primary efficacy endpoint is investigator-assessed Objective Response Rate (ORR) per RECIST v1.1, with tumor evaluations every 2 cycles (each 28 days) over 1 year.
|
||||
| Other Endpoint |
Safety assessments include treatment-emergent adverse events (per CTCAE v5.0) from treatment start until 60 days post-last dose (~1 year). Secondary efficacy measures include Duration of Response (DOR), median PFS, 6-month PFS (both assessed via Kaplan-Meier over 1 year), and Overall Survival (OS) monitored for 3 years.
|
||||
| Experiment 3 Reporting the Activity Date of This ADC | [4] | ||||
| Related Clinical Trial | |||||
| NCT Number | NCT05551117 | Clinical Status | Phase 2 | ||
| Clinical Description | A phase 2, randomized, open-label, study of two dose levels of obramitamab duocarmazine in participants with metastatic castration-resistant prostate cancer. | ||||
| Experiment 4 Reporting the Activity Date of This ADC | [5] | ||||
| Patients Enrolled |
Patients of multiple tumor types, which included 3 melanoma patients refractory to 2 prior lines of checkpoint therapy.
|
||||
| Administration Dosage |
6 dose cohorts (0.50-4.00 mg/kg) every 3 weeks.
|
||||
| Related Clinical Trial | |||||
| NCT Number | NCT03729596 | Clinical Status | Phase 1/2 | ||
| Clinical Description | A phase 1/2, first-in-human, open-label, dose-escalation study of MGC018 (anti-B7-H3 antibody drug conjugate) alone and in combination with MGA012 (anti-PD-1 antibody) in patients with advanced solid tumors. | ||||
| Experiment 5 Reporting the Activity Date of This ADC | [6] | ||||
| Related Clinical Trial | |||||
| NCT Number | NCT05293496 | Clinical Status | Phase 1 | ||
| Clinical Description | A phase 1/1b dose escalation and cohort expansion study of MGC018 in combination with checkpoint inhibitor in participants with advanced solid tumors. | ||||
Discovered Using Patient-derived Xenograft Model
| Experiment 1 Reporting the Activity Date of This ADC | [7] | ||||
| Efficacy Data | Tumor Growth Inhibition value (TGI) | ≈ 96.10% | High MET expression (MET+++; IHC H-score=265) | ||
| Method Description |
Female Athymic Nude-Foxn1nu from Envigo (head and neck,triple-negative breast cancer models),68 weeks of age,were used for the PDX studies. Low passage tumor fragments were implanted into stock animals. When tumors reached 1.01.5 cm3,they were reimplanted into prestudy animals unilaterally on the left flank. When tumors reached an average tumor volume of 150-300 mm3,animals were matched by tumor volume into treatment or vehicle control groups. Three animals were assigned to each group and dosed intravenously by tail vein injection (10 mL/kg). Tumor volumes were measured twice weekly by calipers. Prostate cancer subcutaneous PDX model treated with MGC018 or control ADC at 3 mg/kg (QW3).
Click to Show/Hide
|
||||
| In Vivo Model | Pancreatic cancer PDX model (PDX: PDX-PAX-13565) | ||||
| Experiment 2 Reporting the Activity Date of This ADC | [7] | ||||
| Efficacy Data | Tumor Growth Inhibition value (TGI) | ≈ 97.60% | Moderate MET expression (MET++; IHC H-score=130) | ||
| Method Description |
Male NOG mice from Taconic (prostate cancer model),68 weeks of age,were used for the PDX studies. Low passage tumor fragments were implanted into stock animals. When tumors reached 1.01.5 cm3,they were reimplanted into prestudy animals unilaterally on the left flank. When tumors reached an average tumor volume of 150-300 mm3,animals were matched by tumor volume into treatment or vehicle control groups. Three animals were assigned to each group and dosed intravenously by tail vein injection (10 mL/kg). Tumor volumes were measured twice weekly by calipers. Head and neck cancer subcutaneous PDX model treated with MGC018 or control ADC at 3 mg/kg (Q2W 2).
Click to Show/Hide
|
||||
| In Vivo Model | Head and neck cancer PDX model | ||||
| Experiment 3 Reporting the Activity Date of This ADC | [7] | ||||
| Efficacy Data | Tumor Growth Inhibition value (TGI) | ≈ 98.20% | High MET expression (MET+++; IHC H-score=240) | ||
| Method Description |
Female Athymic Nude-Foxn1nu from Envigo (head and neck,triple-negative breast cancer models),68 weeks of age,were used for the PDX studies. Low passage tumor fragments were implanted into stock animals. When tumors reached 1.01.5 cm3,they were reimplanted into prestudy animals unilaterally on the left flank. When tumors reached an average tumor volume of 150-300 mm3,animals were matched by tumor volume into treatment or vehicle control groups. Three animals were assigned to each group and dosed intravenously by tail vein injection (10 mL/kg). Tumor volumes were measured twice weekly by calipers. Triple-negative breast cancer subcutaneous PDX model treated with MGC018 or control ADC at 3 mg/kg (QW2).
Click to Show/Hide
|
||||
| In Vivo Model | Triple-negative breast cancer PDX model | ||||
Discovered Using Cell Line-derived Xenograft Model
| Experiment 1 Reporting the Activity Date of This ADC | [7] | ||||
| Efficacy Data | Tumor Growth Inhibition value (TGI) | ≈ 22.40% | High MET expression (MET+++; IHC H-score=287) | ||
| Method Description |
Human tumor cells (5x10⁶) were resuspended in 1:1 medium (DMEM/F-12) and Matrigel basement membrane matrix (Corning) and implanted subcutaneously into the flank (A375.S2,Calu-6,PA-1) or mammary fat pad (MDA-MB-468) of mice. Mice were randomized into groups of 5-7 individuals per group. ADCs or vehicle control (PBS) were administered intravenously by tail vein injection (10 mL/kg) following growth of established tumors (100-150 mm3). Calu-6 lung cancer subcutaneous xenografts were treated with MGC018 or control ADC at 0.3 mg/kg QWx4.
Click to Show/Hide
|
||||
| In Vivo Model | Lung cancer CDX model | ||||
| In Vitro Model | Lung adenocarcinoma | Calu-6 cells | CVCL_0236 | ||
| Experiment 2 Reporting the Activity Date of This ADC | [7] | ||||
| Efficacy Data | Tumor Growth Inhibition value (TGI) | ≈ 30.10% | Moderate MET expression (MET++; IHC H-score=150) | ||
| Method Description |
Human tumor cells (5x10⁶) were resuspended in 1:1 medium (DMEM/F-12) and Matrigel basement membrane matrix (Corning) and implanted subcutaneously into the flank (A375.S2,Calu-6,PA-1) or mammary fat pad (MDA-MB-468) of mice. Mice were randomized into groups of 5-7 individuals per group. ADCs or vehicle control (PBS) were administered intravenously by tail vein injection (10 mL/kg) following growth of established tumors (100-150 mm3). PA-1 ovarian cancer subcutaneous xenografts were treated with MGC018 or control ADC at 3 mg/kg as a single dose,QW1.
Click to Show/Hide
|
||||
| In Vivo Model | Ovarian cancer CDX model | ||||
| In Vitro Model | Ovarian mixed germ cell tumor | PA-1 cells | CVCL_0479 | ||
| Experiment 3 Reporting the Activity Date of This ADC | [7] | ||||
| Efficacy Data | Tumor Growth Inhibition value (TGI) | ≈ 42.90% | High MET expression (MET+++; IHC H-score=287) | ||
| Method Description |
Human tumor cells (5x10⁶) were resuspended in 1:1 medium (DMEM/F-12) and Matrigel basement membrane matrix (Corning) and implanted subcutaneously into the flank (A375.S2,Calu-6,PA-1) or mammary fat pad (MDA-MB-468) of mice. Mice were randomized into groups of 5-7 individuals per group. ADCs or vehicle control (PBS) were administered intravenously by tail vein injection (10 mL/kg) following growth of established tumors (100-150 mm3). A-1 ovarian cancer subcutaneous xenografts were treated with MGC018 or control ADC at 3 mg/kg.
Click to Show/Hide
|
||||
| In Vivo Model | Ovarian cancer CDX model | ||||
| In Vitro Model | Ovarian mixed germ cell tumor | PA-1 cells | CVCL_0479 | ||
| Experiment 4 Reporting the Activity Date of This ADC | [7] | ||||
| Efficacy Data | Tumor Growth Inhibition value (TGI) | ≈ 43.90% | NegativeCD276 expression (CD276-) | ||
| Method Description |
Human tumor cells (5x10⁶) were resuspended in 1:1 medium (DMEM/F-12) and Matrigel basement membrane matrix (Corning) and implanted subcutaneously into the flank (A375.S2,Calu-6,PA-1) or mammary fat pad (MDA-MB-468) of mice. Mice were randomized into groups of 5-7 individuals per group. ADCs or vehicle control (PBS) were administered intravenously by tail vein injection (10 mL/kg) following growth of established tumors (100-150 mm3). MDA-MB-468 triple-negative breast cancer orthotopic xenografts were treated with MGC018 or control ADC at 3 mg/kg.
Click to Show/Hide
|
||||
| In Vivo Model | Triple-negative breast cancer CDX model | ||||
| In Vitro Model | Breast adenocarcinoma | MDA-MB-468 Luc cells | CVCL_0419 | ||
| Experiment 5 Reporting the Activity Date of This ADC | [7] | ||||
| Efficacy Data | Tumor Growth Inhibition value (TGI) | ≈ 59.30% | High MET expression (MET+++; IHC H-score=255) | ||
| Method Description |
Human tumor cells (5x10⁶) were resuspended in 1:1 medium (DMEM/F-12) and Matrigel basement membrane matrix (Corning) and implanted subcutaneously into the flank (A375.S2,Calu-6,PA-1) or mammary fat pad (MDA-MB-468) of mice. Mice were randomized into groups of 5-7 individuals per group. ADCs or vehicle control (PBS) were administered intravenously by tail vein injection (10 mL/kg) following growth of established tumors (100-150 mm3). Calu-6 lung cancer subcutaneous xenografts were treated with MGC018 or control ADC at 3 mg/kg.
Click to Show/Hide
|
||||
| In Vivo Model | Lung cancer CDX model | ||||
| In Vitro Model | Lung adenocarcinoma | Calu-6 cells | CVCL_0236 | ||
| Experiment 6 Reporting the Activity Date of This ADC | [7] | ||||
| Efficacy Data | Tumor Growth Inhibition value (TGI) | ≈ 62.70% | Moderate MET expression (MET++; IHC H-score=150) | ||
| Method Description |
Human tumor cells (5x10⁶) were resuspended in 1:1 medium (DMEM/F-12) and Matrigel basement membrane matrix (Corning) and implanted subcutaneously into the flank (A375.S2,Calu-6,PA-1) or mammary fat pad (MDA-MB-468) of mice. Mice were randomized into groups of 5-7 individuals per group. ADCs or vehicle control (PBS) were administered intravenously by tail vein injection (10 mL/kg) following growth of established tumors (100-150 mm3).MDA-MB-468 triple-negative breast cancer orthotopic xenografts were treated with MGC018 or control ADC at 0.3 mg/kg QW4.
Click to Show/Hide
|
||||
| In Vivo Model | Triple-negative breast cancer CDX model | ||||
| In Vitro Model | Breast adenocarcinoma | MDA-MB-468 Luc cells | CVCL_0419 | ||
| Experiment 7 Reporting the Activity Date of This ADC | [7] | ||||
| Efficacy Data | Tumor Growth Inhibition value (TGI) | ≈ 62.80% | High MET expression (MET+++; IHC H-score=287) | ||
| Method Description |
Human tumor cells (5x10⁶) were resuspended in 1:1 medium (DMEM/F-12) and Matrigel basement membrane matrix (Corning) and implanted subcutaneously into the flank (A375.S2,Calu-6,PA-1) or mammary fat pad (MDA-MB-468) of mice. Mice were randomized into groups of 5-7 individuals per group. ADCs or vehicle control (PBS) were administered intravenously by tail vein injection (10 mL/kg) following growth of established tumors (100-150 mm3). PA-1 ovarian cancer subcutaneous xenografts were treated with MGC018 or control ADC at 0.3 mg/kg QW4.
Click to Show/Hide
|
||||
| In Vivo Model | Ovarian cancer CDX model | ||||
| In Vitro Model | Ovarian mixed germ cell tumor | PA-1 cells | CVCL_0479 | ||
| Experiment 8 Reporting the Activity Date of This ADC | [7] | ||||
| Efficacy Data | Tumor Growth Inhibition value (TGI) | ≈ 66.50% | High MET expression (MET+++; IHC H-score=255) | ||
| Method Description |
Human tumor cells (5x10⁶) were resuspended in 1:1 medium (DMEM/F-12) and Matrigel basement membrane matrix (Corning) and implanted subcutaneously into the flank (A375.S2,Calu-6,PA-1) or mammary fat pad (MDA-MB-468) of mice. Mice were randomized into groups of 5-7 individuals per group. ADCs or vehicle control (PBS) were administered intravenously by tail vein injection (10 mL/kg) following growth of established tumors (100-150 mm3). Calu-6 lung cancer subcutaneous xenografts were treated with MGC018 or control ADC at 3 mg/kg.
Click to Show/Hide
|
||||
| In Vivo Model | Lung cancer CDX model | ||||
| In Vitro Model | Lung adenocarcinoma | Calu-6 cells | CVCL_0236 | ||
| Experiment 9 Reporting the Activity Date of This ADC | [7] | ||||
| Efficacy Data | Tumor Growth Inhibition value (TGI) | ≈ 71.90% | High MET expression (MET+++; IHC H-score=255) | ||
| Method Description |
Human tumor cells (5x10⁶) were resuspended in 1:1 medium (DMEM/F-12) and Matrigel basement membrane matrix (Corning) and implanted subcutaneously into the flank (A375.S2,Calu-6,PA-1) or mammary fat pad (MDA-MB-468) of mice. Mice were randomized into groups of 5-7 individuals per group. ADCs or vehicle control (PBS) were administered intravenously by tail vein injection (10 mL/kg) following growth of established tumors (100-150 mm3). Calu-6 lung cancer subcutaneous xenografts were treated with MGC018 or control ADC at 1 mg/kg QWx4.
Click to Show/Hide
|
||||
| In Vivo Model | Lung cancer CDX model | ||||
| In Vitro Model | Lung adenocarcinoma | Calu-6 cells | CVCL_0236 | ||
| Experiment 10 Reporting the Activity Date of This ADC | [7] | ||||
| Efficacy Data | Tumor Growth Inhibition value (TGI) | ≈ 76.30% | High MET expression (MET+++; IHC H-score=255) | ||
| Method Description |
Human tumor cells (5x10⁶) were resuspended in 1:1 medium (DMEM/F-12) and Matrigel basement membrane matrix (Corning) and implanted subcutaneously into the flank (A375.S2,Calu-6,PA-1) or mammary fat pad (MDA-MB-468) of mice. Mice were randomized into groups of 5-7 individuals per group. ADCs or vehicle control (PBS) were administered intravenously by tail vein injection (10 mL/kg) following growth of established tumors (100-150 mm3). Calu-6 lung cancer subcutaneous xenografts were treated with MGC018 or control ADC at 6 mg/kg.
Click to Show/Hide
|
||||
| In Vivo Model | Lung cancer CDX model | ||||
| In Vitro Model | Lung adenocarcinoma | Calu-6 cells | CVCL_0236 | ||
| Experiment 11 Reporting the Activity Date of This ADC | [7] | ||||
| Efficacy Data | Tumor Growth Inhibition value (TGI) | ≈ 76.60% | High MET expression (MET+++; IHC H-score=255) | ||
| Method Description |
Human tumor cells (5x10⁶) were resuspended in 1:1 medium (DMEM/F-12) and Matrigel basement membrane matrix (Corning) and implanted subcutaneously into the flank (A375.S2,Calu-6,PA-1) or mammary fat pad (MDA-MB-468) of mice. Mice were randomized into groups of 5-7 individuals per group. ADCs or vehicle control (PBS) were administered intravenously by tail vein injection (10 mL/kg) following growth of established tumors (100-150 mm3). A375.S2 melanoma subcutaneous xenografts were treated with MGC018 or control ADC at 0.3 mg/kg QW4.
Click to Show/Hide
|
||||
| In Vivo Model | Melanoma CDX model | ||||
| In Vitro Model | Amelanotic melanoma | A375.S2 cells | CVCL_0136 | ||
| Experiment 12 Reporting the Activity Date of This ADC | [7] | ||||
| Efficacy Data | Tumor Growth Inhibition value (TGI) | ≈ 82.80% | High MET expression (MET+++; IHC H-score=255) | ||
| Method Description |
Human tumor cells (5x10⁶) were resuspended in 1:1 medium (DMEM/F-12) and Matrigel basement membrane matrix (Corning) and implanted subcutaneously into the flank (A375.S2,Calu-6,PA-1) or mammary fat pad (MDA-MB-468) of mice. Mice were randomized into groups of 5-7 individuals per group. ADCs or vehicle control (PBS) were administered intravenously by tail vein injection (10 mL/kg) following growth of established tumors (100-150 mm3). Calu-6 lung cancer subcutaneous xenografts were treated with MGC018 or control ADC at 3 mg/kg QWx4.
Click to Show/Hide
|
||||
| In Vivo Model | Lung cancer CDX model | ||||
| In Vitro Model | Lung adenocarcinoma | Calu-6 cells | CVCL_0236 | ||
| Experiment 13 Reporting the Activity Date of This ADC | [7] | ||||
| Efficacy Data | Tumor Growth Inhibition value (TGI) | ≈ 83.90% | High MET expression (MET+++; IHC H-score=265) | ||
| Method Description |
Human tumor cells (5x10⁶) were resuspended in 1:1 medium (DMEM/F-12) and Matrigel basement membrane matrix (Corning) and implanted subcutaneously into the flank (A375.S2,Calu-6,PA-1) or mammary fat pad (MDA-MB-468) of mice. Mice were randomized into groups of 5-7 individuals per group. ADCs or vehicle control (PBS) were administered intravenously by tail vein injection (10 mL/kg) following growth of established tumors (100-150 mm3). A375.S2 melanoma subcutaneous xenografts were treated with MGC018 or control ADC at 1 mg/kg.
Click to Show/Hide
|
||||
| In Vivo Model | Melanoma CDX model | ||||
| In Vitro Model | Amelanotic melanoma | A375.S2 cells | CVCL_0136 | ||
| Experiment 14 Reporting the Activity Date of This ADC | [7] | ||||
| Efficacy Data | Tumor Growth Inhibition value (TGI) | ≈ 87.50% | High MET expression (MET+++; IHC H-score=255) | ||
| Method Description |
Human tumor cells (5x10⁶) were resuspended in 1:1 medium (DMEM/F-12) and Matrigel basement membrane matrix (Corning) and implanted subcutaneously into the flank (A375.S2,Calu-6,PA-1) or mammary fat pad (MDA-MB-468) of mice. Mice were randomized into groups of 5-7 individuals per group. ADCs or vehicle control (PBS) were administered intravenously by tail vein injection (10 mL/kg) following growth of established tumors (100-150 mm3). Calu-6 lung cancer subcutaneous xenografts were treated with MGC018 or control ADC at 10 mg/kg.
Click to Show/Hide
|
||||
| In Vivo Model | Lung cancer CDX model | ||||
| In Vitro Model | Lung adenocarcinoma | Calu-6 cells | CVCL_0236 | ||
| Experiment 15 Reporting the Activity Date of This ADC | [7] | ||||
| Efficacy Data | Tumor Growth Inhibition value (TGI) | ≈ 88.80% | High MET expression (MET+++; IHC H-score=287) | ||
| Method Description |
Human tumor cells (5x10⁶) were resuspended in 1:1 medium (DMEM/F-12) and Matrigel basement membrane matrix (Corning) and implanted subcutaneously into the flank (A375.S2,Calu-6,PA-1) or mammary fat pad (MDA-MB-468) of mice. Mice were randomized into groups of 5-7 individuals per group. ADCs or vehicle control (PBS) were administered intravenously by tail vein injection (10 mL/kg) following growth of established tumors (100-150 mm3). A-1 ovarian cancer subcutaneous xenografts were treated with MGC018 or control ADC at 6 mg/kg.
Click to Show/Hide
|
||||
| In Vivo Model | Ovarian cancer CDX model | ||||
| In Vitro Model | Ovarian mixed germ cell tumor | PA-1 cells | CVCL_0479 | ||
| Experiment 16 Reporting the Activity Date of This ADC | [7] | ||||
| Efficacy Data | Tumor Growth Inhibition value (TGI) | ≈ 90.50% | High MET expression (MET+++; IHC H-score=287) | ||
| Method Description |
Human tumor cells (5x10⁶) were resuspended in 1:1 medium (DMEM/F-12) and Matrigel basement membrane matrix (Corning) and implanted subcutaneously into the flank (A375.S2,Calu-6,PA-1) or mammary fat pad (MDA-MB-468) of mice. Mice were randomized into groups of 5-7 individuals per group. ADCs or vehicle control (PBS) were administered intravenously by tail vein injection (10 mL/kg) following growth of established tumors (100-150 mm3). A-1 ovarian cancer subcutaneous xenografts were treated with MGC018 or control ADC at 10 mg/kg.
Click to Show/Hide
|
||||
| In Vivo Model | Ovarian cancer CDX model | ||||
| In Vitro Model | Ovarian mixed germ cell tumor | PA-1 cells | CVCL_0479 | ||
| Experiment 17 Reporting the Activity Date of This ADC | [7] | ||||
| Efficacy Data | Tumor Growth Inhibition value (TGI) | ≈ 91.40% | High MET expression (MET+++; IHC H-score=287) | ||
| Method Description |
Human tumor cells (5x10⁶) were resuspended in 1:1 medium (DMEM/F-12) and Matrigel basement membrane matrix (Corning) and implanted subcutaneously into the flank (A375.S2,Calu-6,PA-1) or mammary fat pad (MDA-MB-468) of mice. Mice were randomized into groups of 5-7 individuals per group. ADCs or vehicle control (PBS) were administered intravenously by tail vein injection (10 mL/kg) following growth of established tumors (100-150 mm3). PA-1 ovarian cancer subcutaneous xenografts were treated with MGC018 or control ADC at 3 mg/kg as a single dose,QW4.
Click to Show/Hide
|
||||
| In Vivo Model | Ovarian cancer CDX model | ||||
| In Vitro Model | Ovarian mixed germ cell tumor | PA-1 cells | CVCL_0479 | ||
| Experiment 18 Reporting the Activity Date of This ADC | [7] | ||||
| Efficacy Data | Tumor Growth Inhibition value (TGI) | ≈ 94.60% | High MET expression (MET+++; IHC H-score=287) | ||
| Method Description |
Human tumor cells (5x10⁶) were resuspended in 1:1 medium (DMEM/F-12) and Matrigel basement membrane matrix (Corning) and implanted subcutaneously into the flank (A375.S2,Calu-6,PA-1) or mammary fat pad (MDA-MB-468) of mice. Mice were randomized into groups of 5-7 individuals per group. ADCs or vehicle control (PBS) were administered intravenously by tail vein injection (10 mL/kg) following growth of established tumors (100-150 mm3). PA-1 ovarian cancer subcutaneous xenografts were treated with MGC018 or control ADC at 1 mg/kg QW4.
Click to Show/Hide
|
||||
| In Vivo Model | Ovarian cancer CDX model | ||||
| In Vitro Model | Ovarian mixed germ cell tumor | PA-1 cells | CVCL_0479 | ||
| Experiment 19 Reporting the Activity Date of This ADC | [7] | ||||
| Efficacy Data | Tumor Growth Inhibition value (TGI) | ≈ 96.70% | High MET expression (MET+++; IHC H-score=255) | ||
| Method Description |
Human tumor cells (5x10⁶) were resuspended in 1:1 medium (DMEM/F-12) and Matrigel basement membrane matrix (Corning) and implanted subcutaneously into the flank (A375.S2,Calu-6,PA-1) or mammary fat pad (MDA-MB-468) of mice. Mice were randomized into groups of 5-7 individuals per group. ADCs or vehicle control (PBS) were administered intravenously by tail vein injection (10 mL/kg) following growth of established tumors (100-150 mm3). Calu-6 lung cancer subcutaneous xenografts were treated with MGC018 or control ADC at 6 mg/kg.
Click to Show/Hide
|
||||
| In Vivo Model | Lung cancer CDX model | ||||
| In Vitro Model | Lung adenocarcinoma | Calu-6 cells | CVCL_0236 | ||
| Experiment 20 Reporting the Activity Date of This ADC | [7] | ||||
| Efficacy Data | Tumor Growth Inhibition value (TGI) | ≈ 97% | Moderate MET expression (MET++; IHC H-score=150) | ||
| Method Description |
Human tumor cells (5x10⁶) were resuspended in 1:1 medium (DMEM/F-12) and Matrigel basement membrane matrix (Corning) and implanted subcutaneously into the flank (A375.S2,Calu-6,PA-1) or mammary fat pad (MDA-MB-468) of mice. Mice were randomized into groups of 5-7 individuals per group. ADCs or vehicle control (PBS) were administered intravenously by tail vein injection (10 mL/kg) following growth of established tumors (100-150 mm3).MDA-MB-468 triple-negative breast cancer orthotopic xenografts were treated with MGC018 or control ADC at 1 mg/kg QW4.
Click to Show/Hide
|
||||
| In Vivo Model | Triple-negative breast cancer CDX model | ||||
| In Vitro Model | Breast adenocarcinoma | MDA-MB-468 Luc cells | CVCL_0419 | ||
| Experiment 21 Reporting the Activity Date of This ADC | [7] | ||||
| Efficacy Data | Tumor Growth Inhibition value (TGI) | ≈ 97.60% | High MET expression (MET+++; IHC H-score=287) | ||
| Method Description |
Human tumor cells (5x10⁶) were resuspended in 1:1 medium (DMEM/F-12) and Matrigel basement membrane matrix (Corning) and implanted subcutaneously into the flank (A375.S2,Calu-6,PA-1) or mammary fat pad (MDA-MB-468) of mice. Mice were randomized into groups of 5-7 individuals per group. ADCs or vehicle control (PBS) were administered intravenously by tail vein injection (10 mL/kg) following growth of established tumors (100-150 mm3). PA-1 ovarian cancer subcutaneous xenografts were treated with MGC018 or control ADC at 3 mg/kg as a single dose,Q2W4.
Click to Show/Hide
|
||||
| In Vivo Model | Ovarian cancer CDX model | ||||
| In Vitro Model | Ovarian mixed germ cell tumor | PA-1 cells | CVCL_0479 | ||
| Experiment 22 Reporting the Activity Date of This ADC | [7] | ||||
| Efficacy Data | Tumor Growth Inhibition value (TGI) | ≈ 97.90% | Moderate MET expression (MET++; IHC H-score=150) | ||
| Method Description |
Human tumor cells (5x10⁶) were resuspended in 1:1 medium (DMEM/F-12) and Matrigel basement membrane matrix (Corning) and implanted subcutaneously into the flank (A375.S2,Calu-6,PA-1) or mammary fat pad (MDA-MB-468) of mice. Mice were randomized into groups of 5-7 individuals per group. ADCs or vehicle control (PBS) were administered intravenously by tail vein injection (10 mL/kg) following growth of established tumors (100-150 mm3). MDA-MB-468 triple-negative breast cancer orthotopic xenografts were treated with MGC018 or control ADC at 6 mg/kg.
Click to Show/Hide
|
||||
| In Vivo Model | Triple-negative breast cancer CDX model | ||||
| In Vitro Model | Breast adenocarcinoma | MDA-MB-468 Luc cells | CVCL_0419 | ||
| Experiment 23 Reporting the Activity Date of This ADC | [7] | ||||
| Efficacy Data | Tumor Growth Inhibition value (TGI) | ≈ 98.10% | High MET expression (MET+++; IHC H-score=265) | ||
| Method Description |
Human tumor cells (5x10⁶) were resuspended in 1:1 medium (DMEM/F-12) and Matrigel basement membrane matrix (Corning) and implanted subcutaneously into the flank (A375.S2,Calu-6,PA-1) or mammary fat pad (MDA-MB-468) of mice. Mice were randomized into groups of 5-7 individuals per group. ADCs or vehicle control (PBS) were administered intravenously by tail vein injection (10 mL/kg) following growth of established tumors (100-150 mm3). A375.S2 melanoma subcutaneous xenografts were treated with MGC018 or control ADC at 3 mg/kg.
Click to Show/Hide
|
||||
| In Vivo Model | Melanoma CDX model | ||||
| In Vitro Model | Amelanotic melanoma | A375.S2 cells | CVCL_0136 | ||
| Experiment 24 Reporting the Activity Date of This ADC | [7] | ||||
| Efficacy Data | Tumor Growth Inhibition value (TGI) | ≈ 98.60% | High MET expression (MET+++; IHC H-score=255) | ||
| Method Description |
Human tumor cells (5x10⁶) were resuspended in 1:1 medium (DMEM/F-12) and Matrigel basement membrane matrix (Corning) and implanted subcutaneously into the flank (A375.S2,Calu-6,PA-1) or mammary fat pad (MDA-MB-468) of mice. Mice were randomized into groups of 5-7 individuals per group. ADCs or vehicle control (PBS) were administered intravenously by tail vein injection (10 mL/kg) following growth of established tumors (100-150 mm3). Calu-6 lung cancer subcutaneous xenografts were treated with MGC018 or control ADC at 10 mg/kg.
Click to Show/Hide
|
||||
| In Vivo Model | Lung cancer CDX model | ||||
| In Vitro Model | Lung adenocarcinoma | Calu-6 cells | CVCL_0236 | ||
| Experiment 25 Reporting the Activity Date of This ADC | [7] | ||||
| Efficacy Data | Tumor Growth Inhibition value (TGI) | ≈ 99.70% | High MET expression (MET+++; IHC H-score=265) | ||
| Method Description |
Human tumor cells (5x10⁶) were resuspended in 1:1 medium (DMEM/F-12) and Matrigel basement membrane matrix (Corning) and implanted subcutaneously into the flank (A375.S2,Calu-6,PA-1) or mammary fat pad (MDA-MB-468) of mice. Mice were randomized into groups of 5-7 individuals per group. ADCs or vehicle control (PBS) were administered intravenously by tail vein injection (10 mL/kg) following growth of established tumors (100-150 mm3). A375.S2 melanoma subcutaneous xenografts were treated with MGC018 or control ADC at 1 mg/kg QW4.
Click to Show/Hide
|
||||
| In Vivo Model | Melanoma CDX model | ||||
| In Vitro Model | Amelanotic melanoma | A375.S2 cells | CVCL_0136 | ||
Revealed Based on the Cell Line Data
| Experiment 1 Reporting the Activity Date of This ADC | [7] | ||||
| Efficacy Data | Half Maximal Inhibitory Concentration (IC50) | 181 pM | High CD276 expression (CD276+++; 138,000 CD276 molecules/cell) | ||
| Method Description |
MGC018-mediated in vitro cytotoxicity was evaluated across a set of tumor cell lines representing multiple cancer types expressing varying levels of B7-H3. MDA-MB-468,A375.S2,PA-1,Calu-6,Hs700T,SW48,and LN-229 tumor cell lines were obtained from ATCC and cultured in DMEM/F-12 media containing 10% FBS. NCI-H1703 and Raji tumor cell lines were obtained from ATCC and cultured in RPMI1640 media containing 10% FBS.
Click to Show/Hide
|
||||
| In Vitro Model | Amelanotic melanoma | A375.S2 cells | CVCL_0136 | ||
| Experiment 2 Reporting the Activity Date of This ADC | [7] | ||||
| Efficacy Data | Half Maximal Inhibitory Concentration (IC50) | 260 pM | High CD276 expression (CD276+++; 139,000 CD276 molecules/cell) | ||
| Method Description |
MGC018-mediated in vitro cytotoxicity was evaluated across a set of tumor cell lines representing multiple cancer types expressing varying levels of B7-H3. MDA-MB-468,A375.S2,PA-1,Calu-6,Hs700T,SW48,and LN-229 tumor cell lines were obtained from ATCC and cultured in DMEM/F-12 media containing 10% FBS. NCI-H1703 and Raji tumor cell lines were obtained from ATCC and cultured in RPMI1640 media containing 10% FBS.
Click to Show/Hide
|
||||
| In Vitro Model | Lung adenocarcinoma | Calu-6 cells | CVCL_0236 | ||
| Experiment 3 Reporting the Activity Date of This ADC | [7] | ||||
| Efficacy Data | Half Maximal Inhibitory Concentration (IC50) | 275 pM | High CD276 expression (CD276+++; 310,000 CD276 molecules/cell) | ||
| Method Description |
MGC018-mediated in vitro cytotoxicity was evaluated across a set of tumor cell lines representing multiple cancer types expressing varying levels of B7-H3. MDA-MB-468,A375.S2,PA-1,Calu-6,Hs700T,SW48,and LN-229 tumor cell lines were obtained from ATCC and cultured in DMEM/F-12 media containing 10% FBS. NCI-H1703 and Raji tumor cell lines were obtained from ATCC and cultured in RPMI1640 media containing 10% FBS.
Click to Show/Hide
|
||||
| In Vitro Model | Ovarian mixed germ cell tumor | PA-1 cells | CVCL_0479 | ||
| Experiment 4 Reporting the Activity Date of This ADC | [7] | ||||
| Efficacy Data | Half Maximal Inhibitory Concentration (IC50) | 319 pM | High CD276 expression (CD276+++; 122,000 CD276 molecules/cell) | ||
| Method Description |
MGC018-mediated in vitro cytotoxicity was evaluated across a set of tumor cell lines representing multiple cancer types expressing varying levels of B7-H3. MDA-MB-468,A375.S2,PA-1,Calu-6,Hs700T,SW48,and LN-229 tumor cell lines were obtained from ATCC and cultured in DMEM/F-12 media containing 10% FBS. NCI-H1703 and Raji tumor cell lines were obtained from ATCC and cultured in RPMI1640 media containing 10% FBS.
Click to Show/Hide
|
||||
| In Vitro Model | Neoplasm | Hs 700T cells | CVCL_0858 | ||
| Experiment 5 Reporting the Activity Date of This ADC | [7] | ||||
| Efficacy Data | Half Maximal Inhibitory Concentration (IC50) | 585 pM | Moderate MET expression (MET++; IHC H-score=180) | ||
| Method Description |
MGC018-mediated in vitro cytotoxicity was evaluated across a set of tumor cell lines representing multiple cancer types expressing varying levels of B7-H3. MDA-MB-468,A375.S2,PA-1,Calu-6,Hs700T,SW48,and LN-229 tumor cell lines were obtained from ATCC and cultured in DMEM/F-12 media containing 10% FBS. NCI-H1703 and Raji tumor cell lines were obtained from ATCC and cultured in RPMI1640 media containing 10% FBS.
Click to Show/Hide
|
||||
| In Vitro Model | Lung squamous cell carcinoma | NCI-H1703 cells | CVCL_1490 | ||
| Experiment 6 Reporting the Activity Date of This ADC | [7] | ||||
| Efficacy Data | Half Maximal Inhibitory Concentration (IC50) | 767 pM | Moderate CD276 expression (CD276++; 57,000 CD276 molecules/cell) | ||
| Method Description |
MGC018-mediated in vitro cytotoxicity was evaluated across a set of tumor cell lines representing multiple cancer types expressing varying levels of B7-H3. MDA-MB-468,A375.S2,PA-1,Calu-6,Hs700T,SW48,and LN-229 tumor cell lines were obtained from ATCC and cultured in DMEM/F-12 media containing 10% FBS. NCI-H1703 and Raji tumor cell lines were obtained from ATCC and cultured in RPMI1640 media containing 10% FBS.
Click to Show/Hide
|
||||
| In Vitro Model | Breast adenocarcinoma | MDA-MB-468 cells | CVCL_0419 | ||
| Experiment 7 Reporting the Activity Date of This ADC | [7] | ||||
| Efficacy Data | Half Maximal Inhibitory Concentration (IC50) | 910 pM | Moderate CD276 expression (CD276++; 73,700 CD276 molecules/cell) | ||
| Method Description |
MGC018-mediated in vitro cytotoxicity was evaluated across a set of tumor cell lines representing multiple cancer types expressing varying levels of B7-H3. MDA-MB-468,A375.S2,PA-1,Calu-6,Hs700T,SW48,and LN-229 tumor cell lines were obtained from ATCC and cultured in DMEM/F-12 media containing 10% FBS. NCI-H1703 and Raji tumor cell lines were obtained from ATCC and cultured in RPMI1640 media containing 10% FBS.
Click to Show/Hide
|
||||
| In Vitro Model | Glioblastoma | LN-229 cells | CVCL_0393 | ||
| Experiment 8 Reporting the Activity Date of This ADC | [7] | ||||
| Efficacy Data | Half Maximal Inhibitory Concentration (IC50) | 1447 pM | High CD276 expression (CD276+++; 153,000 CD276 molecules/cell) | ||
| Method Description |
MGC018-mediated in vitro cytotoxicity was evaluated across a set of tumor cell lines representing multiple cancer types expressing varying levels of B7-H3. MDA-MB-468,A375.S2,PA-1,Calu-6,Hs700T,SW48,and LN-229 tumor cell lines were obtained from ATCC and cultured in DMEM/F-12 media containing 10% FBS. NCI-H1703 and Raji tumor cell lines were obtained from ATCC and cultured in RPMI1640 media containing 10% FBS.
Click to Show/Hide
|
||||
| In Vitro Model | Colon adenocarcinoma | SW48 cells | CVCL_1724 | ||
| Experiment 9 Reporting the Activity Date of This ADC | [7] | ||||
| Efficacy Data | Half Maximal Inhibitory Concentration (IC50) | > 10 nM | Moderate CD276 expression (CD276++; 59,800 CD276 molecules/cell) | ||
| Method Description |
MGC018-mediated in vitro cytotoxicity was evaluated across a set of tumor cell lines representing multiple cancer types expressing varying levels of B7-H3. MDA-MB-468,A375.S2,PA-1,Calu-6,Hs700T,SW48,and LN-229 tumor cell lines were obtained from ATCC and cultured in DMEM/F-12 media containing 10% FBS. NCI-H1703 and Raji tumor cell lines were obtained from ATCC and cultured in RPMI1640 media containing 10% FBS.
Click to Show/Hide
|
||||
| In Vitro Model | EBV-related Burkitt lymphoma | Raji cells | CVCL_0511 | ||
References