
Antibody-drug Conjugate Information
General Information of This Antibody-drug Conjugate (ID: DRG0ABIGI)
| ADC Name |
WO2025019776A2ADC 52-8
|
|||||
|---|---|---|---|---|---|---|
| Synonyms |
WO2025019776A2ADC 52-8
Click to Show/Hide
|
|||||
| Organization |
EXELIXIS, INC.
|
|||||
| Drug Status |
Investigative
|
|||||
| Drug-to-Antibody Ratio |
8
|
|||||
| Structure |
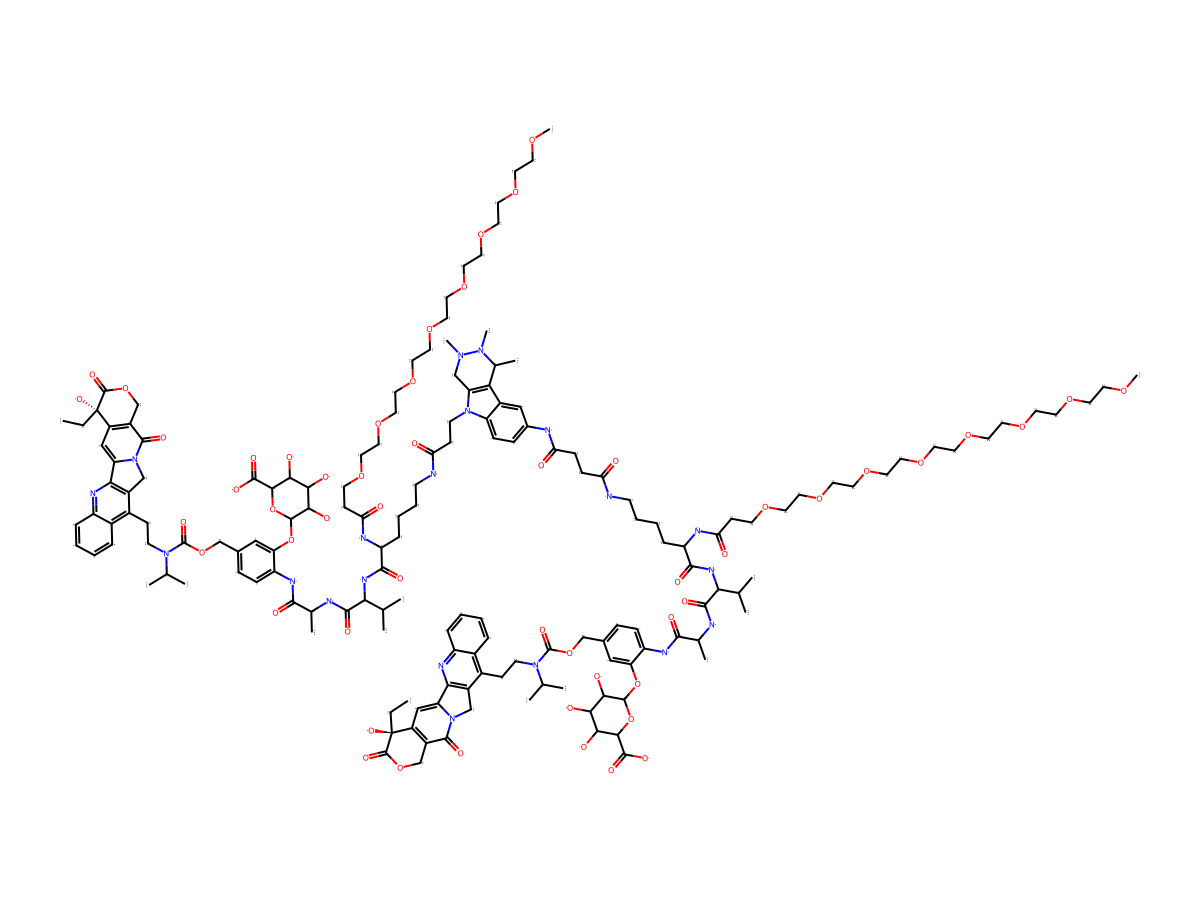
|
|||||
| Antibody Name |
A52
|
Antibody Info | ||||
| Antigen Name |
Interleukin-13 receptor subunit alpha-2 (IL13RA2)
|
Antigen Info | ||||
| Payload Name |
Belotecan
|
Payload Info | ||||
| Payload Target |
DNA topoisomerase 1 (TOP1)
|
Target Info | ||||
| Linker Name |
WO2025019776A2, ADC 22-8, Linker
|
Linker Info | ||||
| Conjugate Type |
site formylglycine residue random conjugation
|
|||||
| Combination Type |
IIa
|
|||||
2027 Update
ADC-specific functional property
Bystander Killing Effect
| Bystander Killing Effect | Description | Reference |
|---|---|---|
| yes |
The potential effects of ADC 52-8 on human myeloid (CFU-GM) was assessed using colony forming cell assays. The colonies were divided into the following categories based on size and morphology: Erythroid (CFU-E and BFU-E),myeloid (CFU-GM),and multi-potential (CFU- GEMM).Photographs were taken of representative hematopoietic progenitor-derived.
Click to Show/Hide
|
[1]
|
Payload Release Efficiency
| Incubation Time | 14day | Release | 21.85ug/mL | Reference |
[1]
|
|---|---|---|---|---|---|
| Description |
Clonogenic progenitors of human myeloid and erythroid progenitors were assessed in a semi-solid methylcellulose-based media formulation containing 35%FBS,2%BSA, rhIL-3 (10 ng/mL),rhGM-CSF (10 ng/mL),rhSCF (50 ng/mL)and Epo (3 U/mL).The tested ADCs were added in at various concentrations and the tubes were vortexed to ensure equal distribution of the ADC throughout the matrix.5-FU (Sigma Aldrich)was used as a positive control for progenitor proliferation (inhibition of colony growth)and was introduced to the bone marrow cultures at 1.0,0.1,and 0.01ug/mL.The assays were initiated with bone marrow mononuclear cells (BMMNC)at 2x10⁴cells per culture.Following 14 days in culture,myeloid and erythroid colonies were assessed microscopically and scored by trained personnel.The colonies were divided into the following categories based on size and morphology:Erythroid (CFU-E and BFU-E),myeloid (CFU-GM),and multi-potential (CFU- GEMM).Photographs were taken of representative hematopoietic progenitor-derived colonies from various lineages,illustrating colonies in the presence of the solvent control as well as colonies in the presence of the test ADCs.
Click to Show/Hide
|
||||
| Incubation Time | 14day | Release | 5.88ug/mL | Reference |
[1]
|
| Description |
Clonogenic progenitors of human myeloid and erythroid progenitors were assessed in a semi-solid methylcellulose-based media formulation containing 35%FBS,2%BSA, rhIL-3 (10 ng/mL),rhGM-CSF (10 ng/mL),rhSCF (50 ng/mL)and Epo (3 U/mL).The tested ADCs were added in at various concentrations and the tubes were vortexed to ensure equal distribution of the ADC throughout the matrix.5-FU (Sigma Aldrich)was used as a positive control for progenitor proliferation (inhibition of colony growth)and was introduced to the bone marrow cultures at 1.0,0.1,and 0.01ug/mL.The assays were initiated with bone marrow mononuclear cells (BMMNC)at 2x10⁴cells per culture.Following 14 days in culture,myeloid and erythroid colonies were assessed microscopically and scored by trained personnel.The colonies were divided into the following categories based on size and morphology:Erythroid (CFU-E and BFU-E),myeloid (CFU-GM),and multi-potential (CFU- GEMM).Photographs were taken of representative hematopoietic progenitor-derived colonies from various lineages,illustrating colonies in the presence of the solvent control as well as colonies in the presence of the test ADCs.
Click to Show/Hide
|
||||
Binding Affinity
| Dissocation Constant (Kd) | Binding Target | Description | Reference |
|---|---|---|---|
| 0.2891 nM |
hIL13Ra2
|
LISA was performed to assess the binding profiles of the ADCs produced as described above and their parental antibodies to human IL13Ra2-His protein.
|
[1]
|
Circulating Stability
| Incubation Time | 11day | Release | 0.54ug/mL | Reference |
[1]
|
|---|---|---|---|---|---|
| Incubation Medium | In the neutrophil assay,CD34 cells were thawed,washed,and counted. A cell stock was prepared in the initial media formulation containing X-Vivo-15,rhIL-3 (20 ng/mL),rhIL-6 (20 ng/mL),rhSCF (100 ng/mL)and rhFlt-3L (100 ng/mL).Approximately 10,000 cells in 200 uL volume were plated per well in round-bottom 96-well plates and cultured in a humidified incubator at 37°C,5%CO2for 3 days.After this time,the cells were washed twice with X-Vivo medium and incubated in X-Vivo-15 medium supplemented with rhSCF (50 ng/mL),rhFlt-3L (100 ng/mL),rh IL3 (5 ng/mL),rhGM-CSF (5ng/mL)rhG-CSF (5 ng/mL)for 4 days.The cells were again washed (x2)and incubated in X-Vivo-15 medium supplemented with rhIL-3 (5 ng/mL)and rhG-CSF (30 ng/mL)for another 4 days.On day 11,the cells were washed twice and placed in the final media formulation containing X-Vivo- 15 supplemented with just rhG-CSF (30 ng/mL)for the final 6 days.The test articles were added at this stage and were retained in the assay for the final 6 days.The effect of ADCs on neutrophil differentiation was represented by the percentage and number (events)of CD66b within the viable cell population. The concentration of 50%inhibition (ICso)was calculated based on the sigmoid curve fit using Dose-Response,One-Site Model formula:y=A+[ (B- A)/ (1+ ((C/x)^D)),where A=the initial value (baseline response),B=maximum response,C=center (drug concentration that provokes a response halfway between A and B) and D=slope of the curve at midpoint. | ||||
| Description |
The stability of ADC linkers were assessed using a neutrophil assay. The effect of ADCs on neutrophil differentiation was represented by the percentage and number (events)of CD66b within the viable cell population.
Click to Show/Hide
|
||||
2027 Update
General Information of The ADMET Data Related to This ADC
Absorption
| Standard Type | Value | Units | Description | Reference |
|---|---|---|---|---|
| Area Under the Concentration-Time Curve (AUC) | ≈6000000 | hr·ng/mL |
Male JVC/FVC cannulated Sprague-Dawley rats (5 per group)were dosed intravenously with a single dose of 5mg/kg of the tested ADC on Day 1 after 16 hours of fasting.100uL K2EDTA plasma was collected at 30 min,4h,24h (on Day 2),168h (on Day 8),240h (on Day 11),336h (on Day 15),and 504h (on Day 22)post-dose,saved in bullet tubes and stored at -25°C until end of the study.
Click to Show/Hide
|
[1] |
Excretion
| Standard Type | Value | Units | Description | Reference |
|---|---|---|---|---|
| Clearance (CL) | ≈0.7 | mL/hr/kg |
Male JVC/FVC cannulated Sprague-Dawley rats (5 per group)were dosed intravenously with a single dose of 5mg/kg of the tested ADC on Day 1 after 16 hours of fasting.100uL K2EDTA plasma was collected at 30 min,4h,24h (on Day 2),168h (on Day 8),240h (on Day 11),336h (on Day 15),and 504h (on Day 22)post-dose,saved in bullet tubes and stored at -25°C until end of the study.
Click to Show/Hide
|
[1] |
| Elimination Half-Life (t1/2) | ≈210 | hr |
Male JVC/FVC cannulated Sprague-Dawley rats (5 per group)were dosed intravenously with a single dose of 5mg/kg of the tested ADC on Day 1 after 16 hours of fasting.100uL K2EDTA plasma was collected at 30 min,4h,24h (on Day 2),168h (on Day 8),240h (on Day 11),336h (on Day 15),and 504h (on Day 22)post-dose,saved in bullet tubes and stored at -25°C until end of the study.
Click to Show/Hide
|
[1] |
General Information of The Activity Data Related to This ADC
Discovered Using Cell Line-derived Xenograft Model
| Standard Type | Value | Units | Cell Line | Disease Model |
|---|---|---|---|---|
| Tumor Growth lnhibition value (TGl) |
66.6
|
%
|
Undisclosed | Undisclosed |
| Tumor Growth lnhibition value (TGl) |
83.4
|
%
|
Undisclosed | Undisclosed |
Revealed Based on the Cell Line Data
Full List of Activity Data of This Antibody-drug Conjugate
Discovered Using Cell Line-derived Xenograft Model
| Experiment 1 Reporting the Activity Date of This ADC | [1] | ||||
| Efficacy Data | Tumor Growth lnhibition value (TGl) | 66.60% | Positive IL13Ra2 expression (IL13Ra2+++/++) | ||
| Method Description |
Each female BALB/c Nude mouse was inoculated subcutaneously in the right upper/lower flank region with 1x10 7of H2228 tumor cells (an NSCLC cell line having an IL13Ra2 copy number of about 2,000)in 0.1 mL of PBS mixed with MATRIGELR (1:1)for tumor development.When the mean tumor size reached about 80-150 mm 3,mice were randomized into respective treatment groups (10 mice per group)and received intravenous injections of vehicle or a single dose of the tested ADCs at 10 mg/kg on Day 1. Body weights and tumor volumes were measured twice per week until the end of the study (Day 48).
Click to Show/Hide
|
||||
| In Vivo Model | CDX Model-H2228 | ||||
| Experiment 2 Reporting the Activity Date of This ADC | [1] | ||||
| Efficacy Data | Tumor Growth lnhibition value (TGl) | 83.40% | Positive IL13Ra2 expression (IL13Ra2+++/++) | ||
| Method Description |
Each female BALB/c Nude mouse was inoculated subcutaneously in the right upper flank region with 0.5x10 6of SK-MES-1 tumor cells (a non-small cell lung cancer (NSCLC)cell line having an IL13Ra2 copy number of about 4x10⁴)in 0.1 mL of PBS for tumor development.When the mean tumor size reached about 80-150 mm 3,mice were randomized into respective treatment groups (10 mice per group)and received intravenous injections of PBS vehicle or a single dose of the tested ADCs at 10 mg/kg on Day 1. The end of the study was day 49.
Click to Show/Hide
|
||||
| In Vivo Model | CDX Model-SK-MES-1 | ||||
Revealed Based on the Cell Line Data
| Experiment 1 Reporting the Activity Date of This ADC | [1] | ||||
| Efficacy Data | the MFI (geometric mean) signal | ≈ 30000-40000 . | Positive hIL13Ra2 expression (hIL13Ra2+++/++) | ||
| Method Description |
FACS was used to evaluate the binding profiles of HEK293 cells engineered to express IL13Ra2 (HEK293-IL13Ra2) cells expressing IL13Ra2. The samples were then read by flow cytometry and the MFI (geometric mean) signal was calculated.
|
||||
| In Vitro Model | Normal | HEK293 cells | CVCL_0045 | ||
| Experiment 2 Reporting the Activity Date of This ADC | [1] | ||||
| Efficacy Data | the MFI (geometric mean) signal | ≈ 40000-50000 . | Positive hIL13Ra2 expression (hIL13Ra2+++/++) | ||
| Method Description |
FACS was used to evaluate the binding profiles of A375 cells expressing IL13Ra2. The samples were then read by flow cytometry and the MFI (geometric mean) signal was calculated.
|
||||
| In Vitro Model | Amelanotic melanoma | A375 cells | CVCL_0132 | ||
| Experiment 3 Reporting the Activity Date of This ADC | [1] | ||||
| Efficacy Data | Half Maximal inhibitory Concentration (lC50) | 2 nM | High hIL13Ra2 expression (hIL13Ra2 +++) | ||
| Method Description |
The cytotoxic activity of ADC 52-8 was determined against cancer cell lines A375.FITC and anti-Hen egg-white lysozyme isotype control antibody (HEWL)conjugated to the same linker payloads.
|
||||
| In Vitro Model | Amelanotic melanoma | A375 cells | CVCL_0132 | ||
| Experiment 4 Reporting the Activity Date of This ADC | [1] | ||||
| Efficacy Data | Half Maximal inhibitory Concentration (lC50) | > 100 nM | Positive hIL13Ra2 expression (hIL13Ra2+++/++) | ||
| Method Description |
The cytotoxic activity of ADC 52-8 was determined against cancer cell lines H1792.FITC and anti-Hen egg-white lysozyme isotype control antibody (HEWL)conjugated to the same linker payloads.
|
||||
| In Vitro Model | Lung adenocarcinoma | H1792 cells | CVCL_1495 | ||
| Experiment 5 Reporting the Activity Date of This ADC | [1] | ||||
| Efficacy Data | Half Maximal inhibitory Concentration (lC50) | > 100 nM | Positive hIL13Ra2 expression (hIL13Ra2+++/++) | ||
| Method Description |
The cytotoxic activity of ADC 52-8 was determined against cancer cell lines H2228.FITC and anti-Hen egg-white lysozyme isotype control antibody (HEWL)conjugated to the same linker payloads.
|
||||
| In Vitro Model | Lung adenocarcinoma | H2228 cells | CVCL_1543 | ||
| Experiment 6 Reporting the Activity Date of This ADC | [1] | ||||
| Efficacy Data | Half Maximal inhibitory Concentration (lC50) | > 100 nM | Positive hIL13Ra2 expression (hIL13Ra2+++/++) | ||
| Method Description |
The cytotoxic activity of ADC 52-8 was determined against cancer cell lines SK-MES-1.FITC and anti-Hen egg-white lysozyme isotype control antibody (HEWL)conjugated to the same linker payloads.
|
||||
| In Vitro Model | Lung squamous cell carcinoma | SK-MES-1 cells | CVCL_0630 | ||