Antigen Information
General Information of This Antigen
| Antigen ID | TAR0ODKQM |
|||||
|---|---|---|---|---|---|---|
| Antigen Name | Fibroblast growth factor receptor 2 (FGFR2); Fibroblast growth factor receptor 4 (FGFR4) |
|||||
| Gene Name | FGFR2; FGFR4 |
|||||
| Gene ID | ||||||
| Synonym1 | BEK, KGFR, KSAM |
|||||
| Synonym2 | JTK2, TKF |
|||||
| Sequence1 |
MVSWGRFICLVVVTMATLSLARPSFSLVEDTTLEPEEPPTKYQISQPEVYVAAPGESLEV
RCLLKDAAVISWTKDGVHLGPNNRTVLIGEYLQIKGATPRDSGLYACTASRTVDSETWYF MVNVTDAISSGDDEDDTDGAEDFVSENSNNKRAPYWTNTEKMEKRLHAVPAANTVKFRCP AGGNPMPTMRWLKNGKEFKQEHRIGGYKVRNQHWSLIMESVVPSDKGNYTCVVENEYGSI NHTYHLDVVERSPHRPILQAGLPANASTVVGGDVEFVCKVYSDAQPHIQWIKHVEKNGSK YGPDGLPYLKVLKAAGVNTTDKEIEVLYIRNVTFEDAGEYTCLAGNSIGISFHSAWLTVL PAPGREKEITASPDYLEIAIYCIGVFLIACMVVTVILCRMKNTTKKPDFSSQPAVHKLTK RIPLRRQVTVSAESSSSMNSNTPLVRITTRLSSTADTPMLAGVSEYELPEDPKWEFPRDK LTLGKPLGEGCFGQVVMAEAVGIDKDKPKEAVTVAVKMLKDDATEKDLSDLVSEMEMMKM IGKHKNIINLLGACTQDGPLYVIVEYASKGNLREYLRARRPPGMEYSYDINRVPEEQMTF KDLVSCTYQLARGMEYLASQKCIHRDLAARNVLVTENNVMKIADFGLARDINNIDYYKKT TNGRLPVKWMAPEALFDRVYTHQSDVWSFGVLMWEIFTLGGSPYPGIPVEELFKLLKEGH RMDKPANCTNELYMMMRDCWHAVPSQRPTFKQLVEDLDRILTLTTNEEYLDLSQPLEQYS PSYPDTRSSCSSGDDSVFSPDPMPYEPCLPQYPHINGSVKT Click to Show/Hide
|
|||||
| Sequence2 |
MRLLLALLGVLLSVPGPPVLSLEASEEVELEPCLAPSLEQQEQELTVALGQPVRLCCGRA
ERGGHWYKEGSRLAPAGRVRGWRGRLEIASFLPEDAGRYLCLARGSMIVLQNLTLITGDS LTSSNDDEDPKSHRDPSNRHSYPQQAPYWTHPQRMEKKLHAVPAGNTVKFRCPAAGNPTP TIRWLKDGQAFHGENRIGGIRLRHQHWSLVMESVVPSDRGTYTCLVENAVGSIRYNYLLD VLERSPHRPILQAGLPANTTAVVGSDVELLCKVYSDAQPHIQWLKHIVINGSSFGADGFP YVQVLKTADINSSEVEVLYLRNVSAEDAGEYTCLAGNSIGLSYQSAWLTVLPEEDPTWTA AAPEARYTDIILYASGSLALAVLLLLAGLYRGQALHGRHPRPPATVQKLSRFPLARQFSL ESGSSGKSSSSLVRGVRLSSSGPALLAGLVSLDLPLDPLWEFPRDRLVLGKPLGEGCFGQ VVRAEAFGMDPARPDQASTVAVKMLKDNASDKDLADLVSEMEVMKLIGRHKNIINLLGVC TQEGPLYVIVECAAKGNLREFLRARRPPGPDLSPDGPRSSEGPLSFPVLVSCAYQVARGM QYLESRKCIHRDLAARNVLVTEDNVMKIADFGLARGVHHIDYYKKTSNGRLPVKWMAPEA LFDRVYTHQSDVWSFGILLWEIFTLGGSPYPGIPVEELFSLLREGHRMDRPPHCPPELYG LMRECWHAAPSQRPTFKQLVEALDKVLLAVSEEYLDLRLTFGPYSPSGGDASSTCSSSDS VFSHDPLPLGSSSFPFGSGVQT Click to Show/Hide
|
|||||
| Family1 | Tyr protein family |
|||||
| Family2 | Tyr protein kinase family |
|||||
| Function1 |
Tyrosine-protein kinase that acts as cell-surface receptor for fibroblast growth factors and plays an essential role in the regulation of cell proliferation, differentiation, migration and apoptosis, and in the regulation of embryonic development. Required for normal embryonic patterning, trophoblast function, limb bud development, lung morphogenesis, osteogenesis and skin development. Plays an essential role in the regulation of osteoblast differentiation, proliferation and apoptosis, and is required for normal skeleton development. Promotes cell proliferation in keratinocytes and immature osteoblasts, but promotes apoptosis in differentiated osteoblasts. Phosphorylates PLCG1, FRS2 and PAK4. Ligand binding leads to the activation of several signaling cascades. Activation of PLCG1 leads to the production of the cellular signaling molecules diacylglycerol and inositol 1,4,5-trisphosphate. Phosphorylation of FRS2 triggers recruitment of GRB2, GAB1, PIK3R1 and SOS1, and mediates activation of RAS, MAPK1/ERK2, MAPK3/ERK1 and the MAP kinase signaling pathway, as well as of the AKT1 signaling pathway. FGFR2 signaling is down-regulated by ubiquitination, internalization and degradation. Mutations that lead to constitutive kinase activation or impair normal FGFR2 maturation, internalization and degradation lead to aberrant signaling. Over-expressed FGFR2 promotes activation of STAT1.
Click to Show/Hide
|
|||||
| Function2 |
Tyrosine-protein kinase that acts as cell-surface receptor for fibroblast growth factors and plays a role in the regulation of cell proliferation, differentiation and migration, and in regulation of lipid metabolism, bile acid biosynthesis, glucose uptake, vitamin D metabolism and phosphate homeostasis. Required for normal down- regulation of the expression of CYP7A1, the rate-limiting enzyme in bile acid synthesis, in response to FGF19. Phosphorylates PLCG1 and FRS2. Ligand binding leads to the activation of several signaling cascades. Activation of PLCG1 leads to the production of the cellular signaling molecules diacylglycerol and inositol 1,4,5-trisphosphate. Phosphorylation of FRS2 triggers recruitment of GRB2, GAB1, PIK3R1 and SOS1, and mediates activation of RAS, MAPK1/ERK2, MAPK3/ERK1 and the MAP kinase signaling pathway, as well as of the AKT1 signaling pathway. Promotes SRC-dependent phosphorylation of the matrix protease MMP14 and its lysosomal degradation. FGFR4 signaling is down-regulated by receptor internalization and degradation; MMP14 promotes internalization and degradation of FGFR4. Mutations that lead to constitutive kinase activation or impair normal FGFR4 inactivation lead to aberrant signaling.
Click to Show/Hide
|
|||||
| Uniprot Entry | ||||||
| HGNC ID | ||||||
| KEGG ID | ||||||
Each Antibody-drug Conjuate AND It's Component Related to This Antigen
Full List of The ADC Related to This Antigen
Anti-FGFR2/4 mAb 10553
| ADC Info | ADC Name | Payload | Target | Linker | Ref |
|---|---|---|---|---|---|
Anti-FGFR2/4 mAb-10553 CX1-1-DM1 |
Mertansine DM1 |
Microtubule (MT) |
2,5-Dioxopyrrolidin-1-yl 17-(2,5-dioxo-2,5-dihydro-1H-pyrrol-1-yl)-5,8,11,14-tetraazaheptadecan-1-oate (CX1-1) |
[1] | |
Anti-FGFR2/4 mAb-10553 SMCC-DM1 |
Mertansine DM1 |
Microtubule (MT) |
Succinimidyl-4-(N-maleimidomethyl)cyclohexane-1-carboxylate (SMCC) |
[1] | |
Anti-FGFR2/4 mAb-10553 SPDB-DM4 |
Mertansine DM4 |
Microtubule (MT) |
N-succinimidyl 4-(2-pyridyldithio) butanoate (SPDB) |
[1] | |
Anti-FGFR2/4 mAb-10553 SPDP-DM1 |
Mertansine DM1 |
Microtubule (MT) |
N-succinimidyl 3-(2-pyridyldithio) propionate (SPDP) |
[1] | |
Anti-FGFR2/4 mAb-10553 SPP-DM1 |
Mertansine DM1 |
Microtubule (MT) |
N-succinimidyl 4-(2-pyridyldithio) pentanoate (SPP) |
[1] | |
Anti-FGFR2/4 mAb-10553 SSNPP-DM3 |
Maytansinoid DM3 |
Microtubule (MT) |
Sulfosuccinimidyl-N-succinimidyl-4-(5-nitro-2-pyridyldithio) pentanoate (SSNPP) |
[1] | |
Anti-FGFR2/4 mAb-10553 Sulfo-SPDB-DM4 |
Mertansine DM4 |
Microtubule (MT) |
Sulfo-SPDB |
[1] |
Anti-FGFR2/4 mAb 10554
| ADC Info | ADC Name | Payload | Target | Linker | Ref |
|---|---|---|---|---|---|
Anti-FGFR2/4 mAb-10554 CX1-1-DM1 |
Mertansine DM1 |
Microtubule (MT) |
2,5-Dioxopyrrolidin-1-yl 17-(2,5-dioxo-2,5-dihydro-1H-pyrrol-1-yl)-5,8,11,14-tetraazaheptadecan-1-oate (CX1-1) |
[1] | |
Anti-FGFR2/4 mAb-10554 SMCC-DM1 |
Mertansine DM1 |
Microtubule (MT) |
Succinimidyl-4-(N-maleimidomethyl)cyclohexane-1-carboxylate (SMCC) |
[1] | |
Anti-FGFR2/4 mAb-10554 SPDB-DM4 |
Mertansine DM4 |
Microtubule (MT) |
N-succinimidyl 4-(2-pyridyldithio) butanoate (SPDB) |
[1] | |
Anti-FGFR2/4 mAb-10554 SPDP-DM1 |
Mertansine DM1 |
Microtubule (MT) |
N-succinimidyl 3-(2-pyridyldithio) propionate (SPDP) |
[1] | |
Anti-FGFR2/4 mAb-10554 SPP-DM1 |
Mertansine DM1 |
Microtubule (MT) |
N-succinimidyl 4-(2-pyridyldithio) pentanoate (SPP) |
[1] | |
Anti-FGFR2/4 mAb-10554 SSNPP-DM3 |
Maytansinoid DM3 |
Microtubule (MT) |
Sulfosuccinimidyl-N-succinimidyl-4-(5-nitro-2-pyridyldithio) pentanoate (SSNPP) |
[1] | |
Anti-FGFR2/4 mAb-10554 Sulfo-SPDB-DM4 |
Mertansine DM4 |
Microtubule (MT) |
Sulfo-SPDB |
[1] |
Anti-FGFR2/4 mAb 10729
| ADC Info | ADC Name | Payload | Target | Linker | Ref |
|---|---|---|---|---|---|
Anti-FGFR2/4 mAb-10729 CX1-1-DM1 |
Mertansine DM1 |
Microtubule (MT) |
2,5-Dioxopyrrolidin-1-yl 17-(2,5-dioxo-2,5-dihydro-1H-pyrrol-1-yl)-5,8,11,14-tetraazaheptadecan-1-oate (CX1-1) |
[1] | |
Anti-FGFR2/4 mAb-10729 SMCC-DM1 |
Mertansine DM1 |
Microtubule (MT) |
Succinimidyl-4-(N-maleimidomethyl)cyclohexane-1-carboxylate (SMCC) |
[1] | |
Anti-FGFR2/4 mAb-10729 SPDB-DM4 |
Mertansine DM4 |
Microtubule (MT) |
N-succinimidyl 4-(2-pyridyldithio) butanoate (SPDB) |
[1] | |
Anti-FGFR2/4 mAb-10729 SPDP-DM1 |
Mertansine DM1 |
Microtubule (MT) |
N-succinimidyl 3-(2-pyridyldithio) propionate (SPDP) |
[1] | |
Anti-FGFR2/4 mAb-10729 SPP-DM1 |
Mertansine DM1 |
Microtubule (MT) |
N-succinimidyl 4-(2-pyridyldithio) pentanoate (SPP) |
[1] | |
Anti-FGFR2/4 mAb-10729 SSNPP-DM3 |
Maytansinoid DM3 |
Microtubule (MT) |
Sulfosuccinimidyl-N-succinimidyl-4-(5-nitro-2-pyridyldithio) pentanoate (SSNPP) |
[1] | |
Anti-FGFR2/4 mAb-10729 Sulfo-SPDB-DM4 |
Mertansine DM4 |
Microtubule (MT) |
Sulfo-SPDB |
[1] |
Anti-FGFR2/4 mAb 10918
| ADC Info | ADC Name | Payload | Target | Linker | Ref |
|---|---|---|---|---|---|
Anti-FGFR2/4 mAb-10918 CX1-1-DM1 |
Mertansine DM1 |
Microtubule (MT) |
2,5-Dioxopyrrolidin-1-yl 17-(2,5-dioxo-2,5-dihydro-1H-pyrrol-1-yl)-5,8,11,14-tetraazaheptadecan-1-oate (CX1-1) |
[1] | |
Anti-FGFR2/4 mAb-10918 SMCC-DM1 |
Mertansine DM1 |
Microtubule (MT) |
Succinimidyl-4-(N-maleimidomethyl)cyclohexane-1-carboxylate (SMCC) |
[1] | |
Anti-FGFR2/4 mAb-10918 SPDB-DM4 |
Mertansine DM4 |
Microtubule (MT) |
N-succinimidyl 4-(2-pyridyldithio) butanoate (SPDB) |
[1] | |
Anti-FGFR2/4 mAb-10918 SPDP-DM1 |
Mertansine DM1 |
Microtubule (MT) |
N-succinimidyl 3-(2-pyridyldithio) propionate (SPDP) |
[1] | |
Anti-FGFR2/4 mAb-10918 SPP-DM1 |
Mertansine DM1 |
Microtubule (MT) |
N-succinimidyl 4-(2-pyridyldithio) pentanoate (SPP) |
[1] | |
Anti-FGFR2/4 mAb-10918 SSNPP-DM3 |
Maytansinoid DM3 |
Microtubule (MT) |
Sulfosuccinimidyl-N-succinimidyl-4-(5-nitro-2-pyridyldithio) pentanoate (SSNPP) |
[1] | |
Anti-FGFR2/4 mAb-10918 Sulfo-SPDB-DM4 |
Mertansine DM4 |
Microtubule (MT) |
Sulfo-SPDB |
[1] |
Anti-FGFR2/4 mAb 10923
| ADC Info | ADC Name | Payload | Target | Linker | Ref |
|---|---|---|---|---|---|
Anti-FGFR2/4 mAb-10923 CX1-1-DM1 |
Mertansine DM1 |
Microtubule (MT) |
2,5-Dioxopyrrolidin-1-yl 17-(2,5-dioxo-2,5-dihydro-1H-pyrrol-1-yl)-5,8,11,14-tetraazaheptadecan-1-oate (CX1-1) |
[1] | |
Anti-FGFR2/4 mAb-10923 SMCC-DM1 |
Mertansine DM1 |
Microtubule (MT) |
Succinimidyl-4-(N-maleimidomethyl)cyclohexane-1-carboxylate (SMCC) |
[1] | |
Anti-FGFR2/4 mAb-10923 SPDB-DM4 |
Mertansine DM4 |
Microtubule (MT) |
N-succinimidyl 4-(2-pyridyldithio) butanoate (SPDB) |
[1] | |
Anti-FGFR2/4 mAb-10923 SPDP-DM1 |
Mertansine DM1 |
Microtubule (MT) |
N-succinimidyl 3-(2-pyridyldithio) propionate (SPDP) |
[1] | |
Anti-FGFR2/4 mAb-10923 SPP-DM1 |
Mertansine DM1 |
Microtubule (MT) |
N-succinimidyl 4-(2-pyridyldithio) pentanoate (SPP) |
[1] | |
Anti-FGFR2/4 mAb-10923 SSNPP-DM3 |
Maytansinoid DM3 |
Microtubule (MT) |
Sulfosuccinimidyl-N-succinimidyl-4-(5-nitro-2-pyridyldithio) pentanoate (SSNPP) |
[1] | |
Anti-FGFR2/4 mAb-10923 Sulfo-SPDB-DM4 |
Mertansine DM4 |
Microtubule (MT) |
Sulfo-SPDB |
[1] |
Anti-FGFR2/4 mAb 10925
| ADC Info | ADC Name | Payload | Target | Linker | Ref |
|---|---|---|---|---|---|
Anti-FGFR2/4 mAb-10925 CX1-1-DM1 |
Mertansine DM1 |
Microtubule (MT) |
2,5-Dioxopyrrolidin-1-yl 17-(2,5-dioxo-2,5-dihydro-1H-pyrrol-1-yl)-5,8,11,14-tetraazaheptadecan-1-oate (CX1-1) |
[1] | |
Anti-FGFR2/4 mAb-10925 SMCC-DM1 |
Mertansine DM1 |
Microtubule (MT) |
Succinimidyl-4-(N-maleimidomethyl)cyclohexane-1-carboxylate (SMCC) |
[1] | |
Anti-FGFR2/4 mAb-10925 SPDB-DM4 |
Mertansine DM4 |
Microtubule (MT) |
N-succinimidyl 4-(2-pyridyldithio) butanoate (SPDB) |
[1] | |
Anti-FGFR2/4 mAb-10925 SPDP-DM1 |
Mertansine DM1 |
Microtubule (MT) |
N-succinimidyl 3-(2-pyridyldithio) propionate (SPDP) |
[1] | |
Anti-FGFR2/4 mAb-10925 SPP-DM1 |
Mertansine DM1 |
Microtubule (MT) |
N-succinimidyl 4-(2-pyridyldithio) pentanoate (SPP) |
[1] | |
Anti-FGFR2/4 mAb-10925 SSNPP-DM3 |
Maytansinoid DM3 |
Microtubule (MT) |
Sulfosuccinimidyl-N-succinimidyl-4-(5-nitro-2-pyridyldithio) pentanoate (SSNPP) |
[1] | |
Anti-FGFR2/4 mAb-10925 Sulfo-SPDB-DM4 |
Mertansine DM4 |
Microtubule (MT) |
Sulfo-SPDB |
[1] |
Anti-FGFR2/4 mAb 11722
| ADC Info | ADC Name | Payload | Target | Linker | Ref |
|---|---|---|---|---|---|
Anti-FGFR2/4 mAb-11722 CX1-1-DM1 |
Mertansine DM1 |
Microtubule (MT) |
2,5-Dioxopyrrolidin-1-yl 17-(2,5-dioxo-2,5-dihydro-1H-pyrrol-1-yl)-5,8,11,14-tetraazaheptadecan-1-oate (CX1-1) |
[1] | |
Anti-FGFR2/4 mAb-11722 SMCC-DM1 |
Mertansine DM1 |
Microtubule (MT) |
Succinimidyl-4-(N-maleimidomethyl)cyclohexane-1-carboxylate (SMCC) |
[1] | |
Anti-FGFR2/4 mAb-11722 SPDB-DM4 |
Mertansine DM4 |
Microtubule (MT) |
N-succinimidyl 4-(2-pyridyldithio) butanoate (SPDB) |
[1] | |
Anti-FGFR2/4 mAb-11722 SPDP-DM1 |
Mertansine DM1 |
Microtubule (MT) |
N-succinimidyl 3-(2-pyridyldithio) propionate (SPDP) |
[1] | |
Anti-FGFR2/4 mAb-11722 SPP-DM1 |
Mertansine DM1 |
Microtubule (MT) |
N-succinimidyl 4-(2-pyridyldithio) pentanoate (SPP) |
[1] | |
Anti-FGFR2/4 mAb-11722 SSNPP-DM3 |
Maytansinoid DM3 |
Microtubule (MT) |
Sulfosuccinimidyl-N-succinimidyl-4-(5-nitro-2-pyridyldithio) pentanoate (SSNPP) |
[1] | |
Anti-FGFR2/4 mAb-11722 Sulfo-SPDB-DM4 |
Mertansine DM4 |
Microtubule (MT) |
Sulfo-SPDB |
[1] |
Anti-FGFR2/4 mAb 12422
| ADC Info | ADC Name | Payload | Target | Linker | Ref |
|---|---|---|---|---|---|
Anti-FGFR2/4 mAb-12422 CX1-1-DM1 |
Mertansine DM1 |
Microtubule (MT) |
2,5-Dioxopyrrolidin-1-yl 17-(2,5-dioxo-2,5-dihydro-1H-pyrrol-1-yl)-5,8,11,14-tetraazaheptadecan-1-oate (CX1-1) |
[1] | |
Anti-FGFR2/4 mAb-12422 SMCC-DM1 |
Mertansine DM1 |
Microtubule (MT) |
Succinimidyl-4-(N-maleimidomethyl)cyclohexane-1-carboxylate (SMCC) |
[1] | |
Anti-FGFR2/4 mAb-12422 SPDB-DM4 |
Mertansine DM4 |
Microtubule (MT) |
N-succinimidyl 4-(2-pyridyldithio) butanoate (SPDB) |
[1] | |
Anti-FGFR2/4 mAb-12422 SPDP-DM1 |
Mertansine DM1 |
Microtubule (MT) |
N-succinimidyl 3-(2-pyridyldithio) propionate (SPDP) |
[1] | |
Anti-FGFR2/4 mAb-12422 SPP-DM1 |
Mertansine DM1 |
Microtubule (MT) |
N-succinimidyl 4-(2-pyridyldithio) pentanoate (SPP) |
[1] | |
Anti-FGFR2/4 mAb-12422 SSNPP-DM3 |
Maytansinoid DM3 |
Microtubule (MT) |
Sulfosuccinimidyl-N-succinimidyl-4-(5-nitro-2-pyridyldithio) pentanoate (SSNPP) |
[1] | |
Anti-FGFR2/4 mAb-12422 Sulfo-SPDB-DM4 |
Mertansine DM4 |
Microtubule (MT) |
Sulfo-SPDB |
[1] |
Anti-FGFR2/4 mAb 12425
| ADC Info | ADC Name | Payload | Target | Linker | Ref |
|---|---|---|---|---|---|
Anti-FGFR2/4 mAb-12425 CX1-1-DM1 |
Mertansine DM1 |
Microtubule (MT) |
2,5-Dioxopyrrolidin-1-yl 17-(2,5-dioxo-2,5-dihydro-1H-pyrrol-1-yl)-5,8,11,14-tetraazaheptadecan-1-oate (CX1-1) |
[1] | |
Anti-FGFR2/4 mAb-12425 SMCC-DM1 |
Mertansine DM1 |
Microtubule (MT) |
Succinimidyl-4-(N-maleimidomethyl)cyclohexane-1-carboxylate (SMCC) |
[1] | |
Anti-FGFR2/4 mAb-12425 SPDB-DM4 |
Mertansine DM4 |
Microtubule (MT) |
N-succinimidyl 4-(2-pyridyldithio) butanoate (SPDB) |
[1] | |
Anti-FGFR2/4 mAb-12425 SPDP-DM1 |
Mertansine DM1 |
Microtubule (MT) |
N-succinimidyl 3-(2-pyridyldithio) propionate (SPDP) |
[1] | |
Anti-FGFR2/4 mAb-12425 SPP-DM1 |
Mertansine DM1 |
Microtubule (MT) |
N-succinimidyl 4-(2-pyridyldithio) pentanoate (SPP) |
[1] | |
Anti-FGFR2/4 mAb-12425 SSNPP-DM3 |
Maytansinoid DM3 |
Microtubule (MT) |
Sulfosuccinimidyl-N-succinimidyl-4-(5-nitro-2-pyridyldithio) pentanoate (SSNPP) |
[1] | |
Anti-FGFR2/4 mAb-12425 Sulfo-SPDB-DM4 |
Mertansine DM4 |
Microtubule (MT) |
Sulfo-SPDB |
[1] |
Anti-FGFR2/4 mAb 12435
| ADC Info | ADC Name | Payload | Target | Linker | Ref |
|---|---|---|---|---|---|
Anti-FGFR2/4 mAb-12435 CX1-1-DM1 |
Mertansine DM1 |
Microtubule (MT) |
2,5-Dioxopyrrolidin-1-yl 17-(2,5-dioxo-2,5-dihydro-1H-pyrrol-1-yl)-5,8,11,14-tetraazaheptadecan-1-oate (CX1-1) |
[1] | |
Anti-FGFR2/4 mAb-12435 SMCC-DM1 |
Mertansine DM1 |
Microtubule (MT) |
Succinimidyl-4-(N-maleimidomethyl)cyclohexane-1-carboxylate (SMCC) |
[1] | |
Anti-FGFR2/4 mAb-12435 SPDB-DM4 |
Mertansine DM4 |
Microtubule (MT) |
N-succinimidyl 4-(2-pyridyldithio) butanoate (SPDB) |
[1] | |
Anti-FGFR2/4 mAb-12435 SPDP-DM1 |
Mertansine DM1 |
Microtubule (MT) |
N-succinimidyl 3-(2-pyridyldithio) propionate (SPDP) |
[1] | |
Anti-FGFR2/4 mAb-12435 SPP-DM1 |
Mertansine DM1 |
Microtubule (MT) |
N-succinimidyl 4-(2-pyridyldithio) pentanoate (SPP) |
[1] | |
Anti-FGFR2/4 mAb-12435 SSNPP-DM3 |
Maytansinoid DM3 |
Microtubule (MT) |
Sulfosuccinimidyl-N-succinimidyl-4-(5-nitro-2-pyridyldithio) pentanoate (SSNPP) |
[1] | |
Anti-FGFR2/4 mAb-12435 Sulfo-SPDB-DM4 |
Mertansine DM4 |
Microtubule (MT) |
Sulfo-SPDB |
[1] |
Anti-FGFR2/4 mAb 12438
| ADC Info | ADC Name | Payload | Target | Linker | Ref |
|---|---|---|---|---|---|
Anti-FGFR2/4 mAb-12438 CX1-1-DM1 |
Mertansine DM1 |
Microtubule (MT) |
2,5-Dioxopyrrolidin-1-yl 17-(2,5-dioxo-2,5-dihydro-1H-pyrrol-1-yl)-5,8,11,14-tetraazaheptadecan-1-oate (CX1-1) |
[1] | |
Anti-FGFR2/4 mAb-12438 SMCC-DM1 |
Mertansine DM1 |
Microtubule (MT) |
Succinimidyl-4-(N-maleimidomethyl)cyclohexane-1-carboxylate (SMCC) |
[1] | |
Anti-FGFR2/4 mAb-12438 SPDB-DM4 |
Mertansine DM4 |
Microtubule (MT) |
N-succinimidyl 4-(2-pyridyldithio) butanoate (SPDB) |
[1] | |
Anti-FGFR2/4 mAb-12438 SPDP-DM1 |
Mertansine DM1 |
Microtubule (MT) |
N-succinimidyl 3-(2-pyridyldithio) propionate (SPDP) |
[1] | |
Anti-FGFR2/4 mAb-12438 SPP-DM1 |
Mertansine DM1 |
Microtubule (MT) |
N-succinimidyl 4-(2-pyridyldithio) pentanoate (SPP) |
[1] | |
Anti-FGFR2/4 mAb-12438 SSNPP-DM3 |
Maytansinoid DM3 |
Microtubule (MT) |
Sulfosuccinimidyl-N-succinimidyl-4-(5-nitro-2-pyridyldithio) pentanoate (SSNPP) |
[1] | |
Anti-FGFR2/4 mAb-12438 Sulfo-SPDB-DM4 |
Mertansine DM4 |
Microtubule (MT) |
Sulfo-SPDB |
[1] |
Anti-FGFR2/4 mAb 12439
| ADC Info | ADC Name | Payload | Target | Linker | Ref |
|---|---|---|---|---|---|
Anti-FGFR2/4 mAb-12439 CX1-1-DM1 |
Mertansine DM1 |
Microtubule (MT) |
2,5-Dioxopyrrolidin-1-yl 17-(2,5-dioxo-2,5-dihydro-1H-pyrrol-1-yl)-5,8,11,14-tetraazaheptadecan-1-oate (CX1-1) |
[1] | |
Anti-FGFR2/4 mAb-12439 SMCC-DM1 |
Mertansine DM1 |
Microtubule (MT) |
Succinimidyl-4-(N-maleimidomethyl)cyclohexane-1-carboxylate (SMCC) |
[1] | |
Anti-FGFR2/4 mAb-12439 SPDB-DM4 |
Mertansine DM4 |
Microtubule (MT) |
N-succinimidyl 4-(2-pyridyldithio) butanoate (SPDB) |
[1] | |
Anti-FGFR2/4 mAb-12439 SPDP-DM1 |
Mertansine DM1 |
Microtubule (MT) |
N-succinimidyl 3-(2-pyridyldithio) propionate (SPDP) |
[1] | |
Anti-FGFR2/4 mAb-12439 SPP-DM1 |
Mertansine DM1 |
Microtubule (MT) |
N-succinimidyl 4-(2-pyridyldithio) pentanoate (SPP) |
[1] | |
Anti-FGFR2/4 mAb-12439 SSNPP-DM3 |
Maytansinoid DM3 |
Microtubule (MT) |
Sulfosuccinimidyl-N-succinimidyl-4-(5-nitro-2-pyridyldithio) pentanoate (SSNPP) |
[1] | |
Anti-FGFR2/4 mAb-12439 Sulfo-SPDB-DM4 |
Mertansine DM4 |
Microtubule (MT) |
Sulfo-SPDB |
[1] |
Anti-FGFR2/4 mAb 14629
| ADC Info | ADC Name | Payload | Target | Linker | Ref |
|---|---|---|---|---|---|
Anti-FGFR2/4 mAb-14629 CX1-1-DM1 |
Mertansine DM1 |
Microtubule (MT) |
2,5-Dioxopyrrolidin-1-yl 17-(2,5-dioxo-2,5-dihydro-1H-pyrrol-1-yl)-5,8,11,14-tetraazaheptadecan-1-oate (CX1-1) |
[1] | |
Anti-FGFR2/4 mAb-14629 SMCC-DM1 |
Mertansine DM1 |
Microtubule (MT) |
Succinimidyl-4-(N-maleimidomethyl)cyclohexane-1-carboxylate (SMCC) |
[1] | |
Anti-FGFR2/4 mAb-14629 SPDB-DM4 |
Mertansine DM4 |
Microtubule (MT) |
N-succinimidyl 4-(2-pyridyldithio) butanoate (SPDB) |
[1] | |
Anti-FGFR2/4 mAb-14629 SPDP-DM1 |
Mertansine DM1 |
Microtubule (MT) |
N-succinimidyl 3-(2-pyridyldithio) propionate (SPDP) |
[1] | |
Anti-FGFR2/4 mAb-14629 SPP-DM1 |
Mertansine DM1 |
Microtubule (MT) |
N-succinimidyl 4-(2-pyridyldithio) pentanoate (SPP) |
[1] | |
Anti-FGFR2/4 mAb-14629 SSNPP-DM3 |
Maytansinoid DM3 |
Microtubule (MT) |
Sulfosuccinimidyl-N-succinimidyl-4-(5-nitro-2-pyridyldithio) pentanoate (SSNPP) |
[1] | |
Anti-FGFR2/4 mAb-14629 Sulfo-SPDB-DM4 |
Mertansine DM4 |
Microtubule (MT) |
Sulfo-SPDB |
[1] |
Anti-FGFR2/4 mAb 20562
| ADC Info | ADC Name | Payload | Target | Linker | Ref |
|---|---|---|---|---|---|
Anti-FGFR2/4 mAb-20562 CX1-1-DM1 |
Mertansine DM1 |
Microtubule (MT) |
2,5-Dioxopyrrolidin-1-yl 17-(2,5-dioxo-2,5-dihydro-1H-pyrrol-1-yl)-5,8,11,14-tetraazaheptadecan-1-oate (CX1-1) |
[1] | |
Anti-FGFR2/4 mAb-20562 SMCC-DM1 |
Mertansine DM1 |
Microtubule (MT) |
Succinimidyl-4-(N-maleimidomethyl)cyclohexane-1-carboxylate (SMCC) |
[1] | |
Anti-FGFR2/4 mAb-20562 SPDB-DM4 |
Mertansine DM4 |
Microtubule (MT) |
N-succinimidyl 4-(2-pyridyldithio) butanoate (SPDB) |
[1] | |
Anti-FGFR2/4 mAb-20562 SPDP-DM1 |
Mertansine DM1 |
Microtubule (MT) |
N-succinimidyl 3-(2-pyridyldithio) propionate (SPDP) |
[1] | |
Anti-FGFR2/4 mAb-20562 SPP-DM1 |
Mertansine DM1 |
Microtubule (MT) |
N-succinimidyl 4-(2-pyridyldithio) pentanoate (SPP) |
[1] | |
Anti-FGFR2/4 mAb-20562 SSNPP-DM3 |
Maytansinoid DM3 |
Microtubule (MT) |
Sulfosuccinimidyl-N-succinimidyl-4-(5-nitro-2-pyridyldithio) pentanoate (SSNPP) |
[1] | |
Anti-FGFR2/4 mAb-20562 Sulfo-SPDB-DM4 |
Mertansine DM4 |
Microtubule (MT) |
Sulfo-SPDB |
[1] |
Anti-FGFR2/4 mAb 20811
| ADC Info | ADC Name | Payload | Target | Linker | Ref |
|---|---|---|---|---|---|
Anti-FGFR2/4 mAb-20811 CX1-1-DM1 |
Mertansine DM1 |
Microtubule (MT) |
2,5-Dioxopyrrolidin-1-yl 17-(2,5-dioxo-2,5-dihydro-1H-pyrrol-1-yl)-5,8,11,14-tetraazaheptadecan-1-oate (CX1-1) |
[1] | |
Anti-FGFR2/4 mAb-20811 SMCC-DM1 |
Mertansine DM1 |
Microtubule (MT) |
Succinimidyl-4-(N-maleimidomethyl)cyclohexane-1-carboxylate (SMCC) |
[1] | |
Anti-FGFR2/4 mAb-20811 SPDB-DM4 |
Mertansine DM4 |
Microtubule (MT) |
N-succinimidyl 4-(2-pyridyldithio) butanoate (SPDB) |
[1] | |
Anti-FGFR2/4 mAb-20811 SPDP-DM1 |
Mertansine DM1 |
Microtubule (MT) |
N-succinimidyl 3-(2-pyridyldithio) propionate (SPDP) |
[1] | |
Anti-FGFR2/4 mAb-20811 SPP-DM1 |
Mertansine DM1 |
Microtubule (MT) |
N-succinimidyl 4-(2-pyridyldithio) pentanoate (SPP) |
[1] | |
Anti-FGFR2/4 mAb-20811 SSNPP-DM3 |
Maytansinoid DM3 |
Microtubule (MT) |
Sulfosuccinimidyl-N-succinimidyl-4-(5-nitro-2-pyridyldithio) pentanoate (SSNPP) |
[1] | |
Anti-FGFR2/4 mAb-20811 Sulfo-SPDB-DM4 |
Mertansine DM4 |
Microtubule (MT) |
Sulfo-SPDB |
[1] |
Undisclosed
| ADC Info | ADC Name | Payload | Target | Linker | Ref |
|---|---|---|---|---|---|
FGFR2/FGFR4 dual targeting antibody-drug conjugate |
Mertansine DM1 |
Microtubule (MT) |
Succinimidyl-4-(N-maleimidomethyl)cyclohexane-1-carboxylate (SMCC) |
[2] |
Tissue/Disease specific Abundances of This Antigen
Tissue specific Abundances of This Antigen
ICD Disease Classification 01
| Differential expression pattern of antigen in diseases | ||
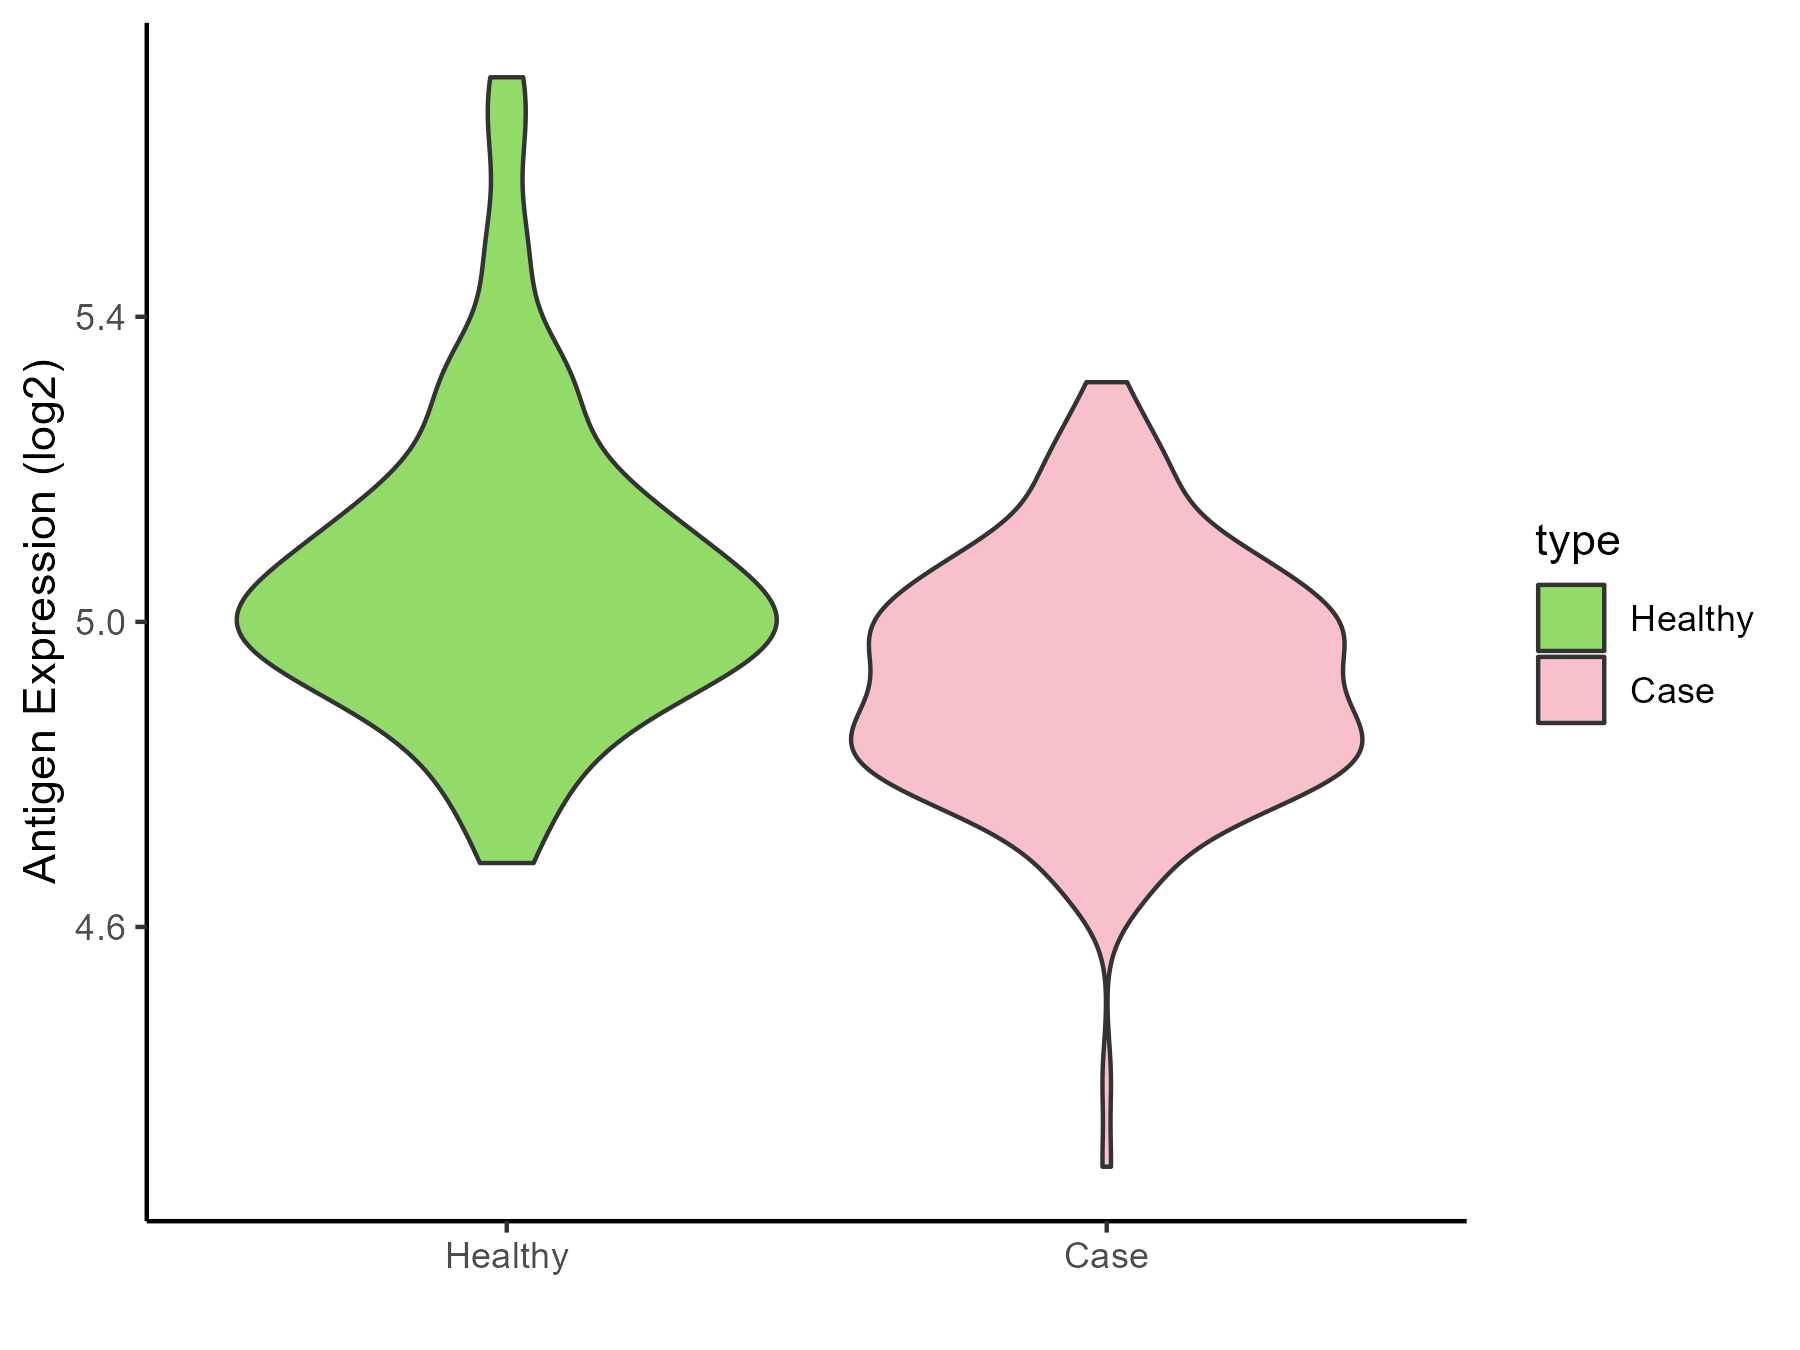
| The Studied Tissue | Gingival | |
| The Specific Disease | Bacterial infection of gingival | |
| The Expression Level of Disease Section Compare with the Healthy Individual Tissue | p-value: 3.92E-06; Fold-change: -0.114979921; Z-score: -0.571501227 | |
| Disease-specific Antigen Abundances |
|
Click to View the Clearer Original Diagram |
ICD Disease Classification 02
| Differential expression pattern of antigen in diseases | ||
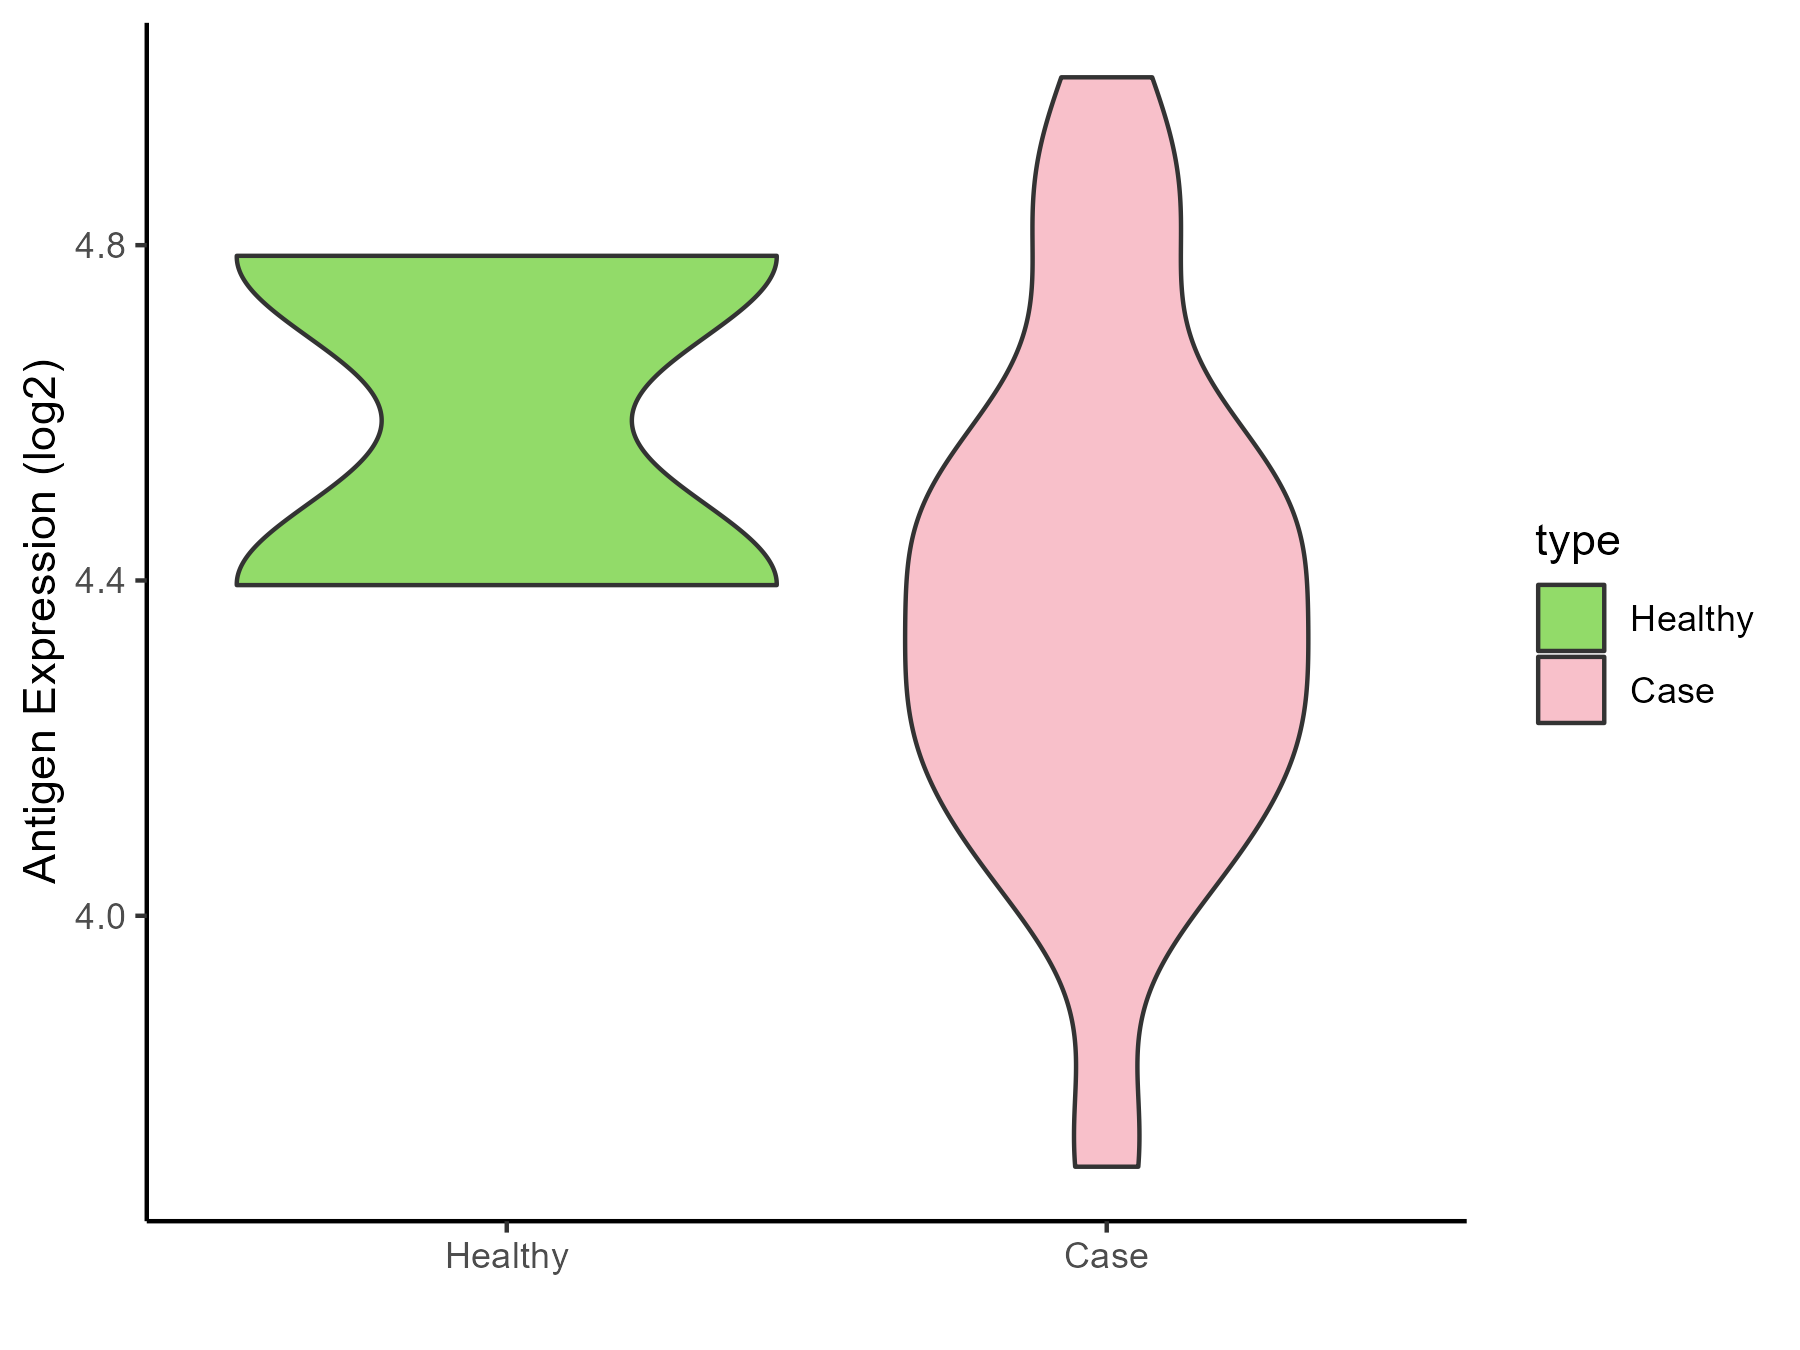
| The Studied Tissue | Brainstem | |
| The Specific Disease | Glioma | |
| The Expression Level of Disease Section Compare with the Healthy Individual Tissue | p-value: 0.459808373; Fold-change: -0.223923174; Z-score: -0.806190322 | |
| Disease-specific Antigen Abundances |
|
Click to View the Clearer Original Diagram |
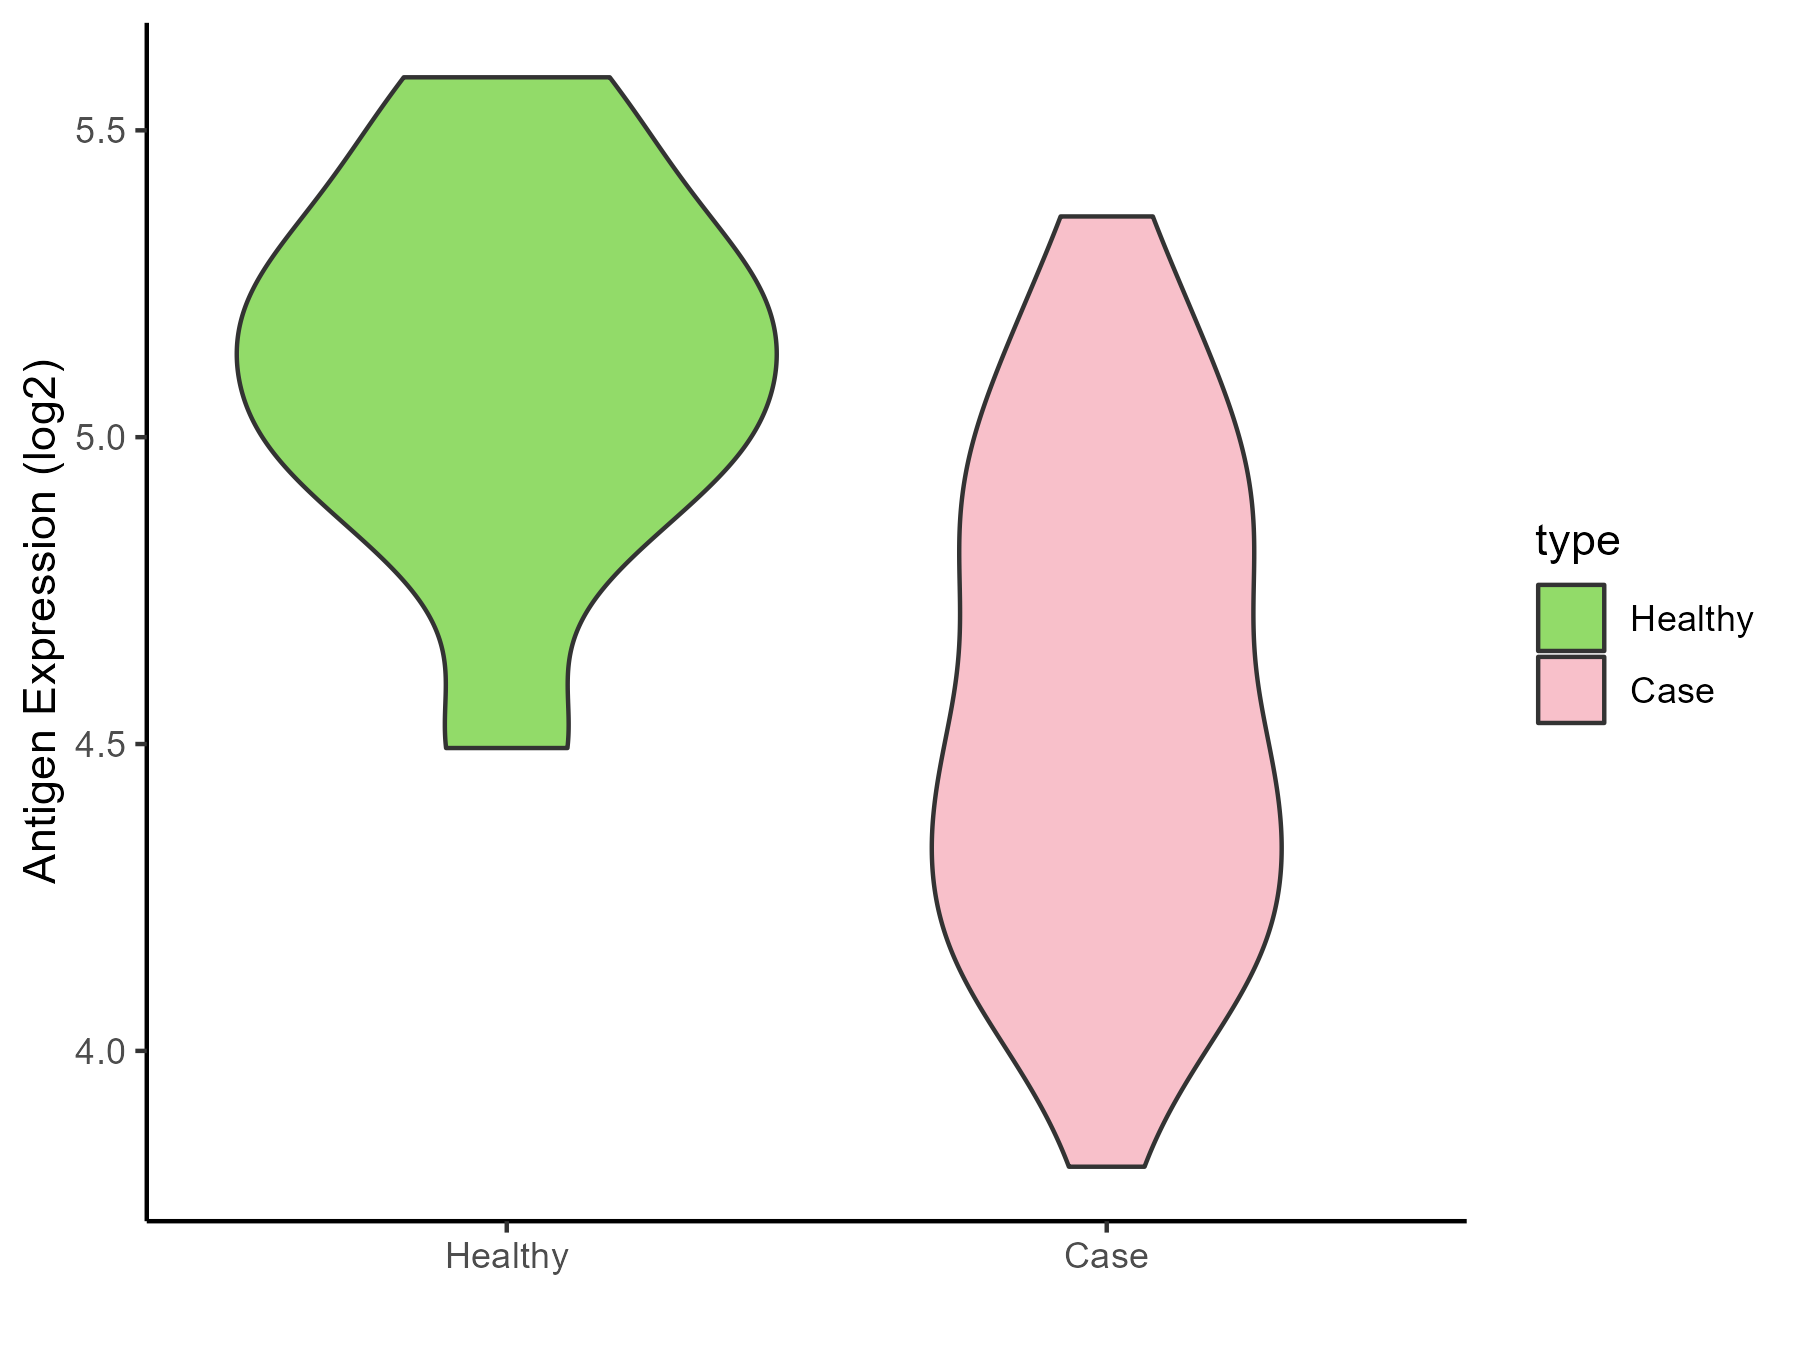
| The Studied Tissue | White matter | |
| The Specific Disease | Glioma | |
| The Expression Level of Disease Section Compare with the Healthy Individual Tissue | p-value: 0.000101013; Fold-change: -0.660105692; Z-score: -2.157183477 | |
| Disease-specific Antigen Abundances |
|
Click to View the Clearer Original Diagram |
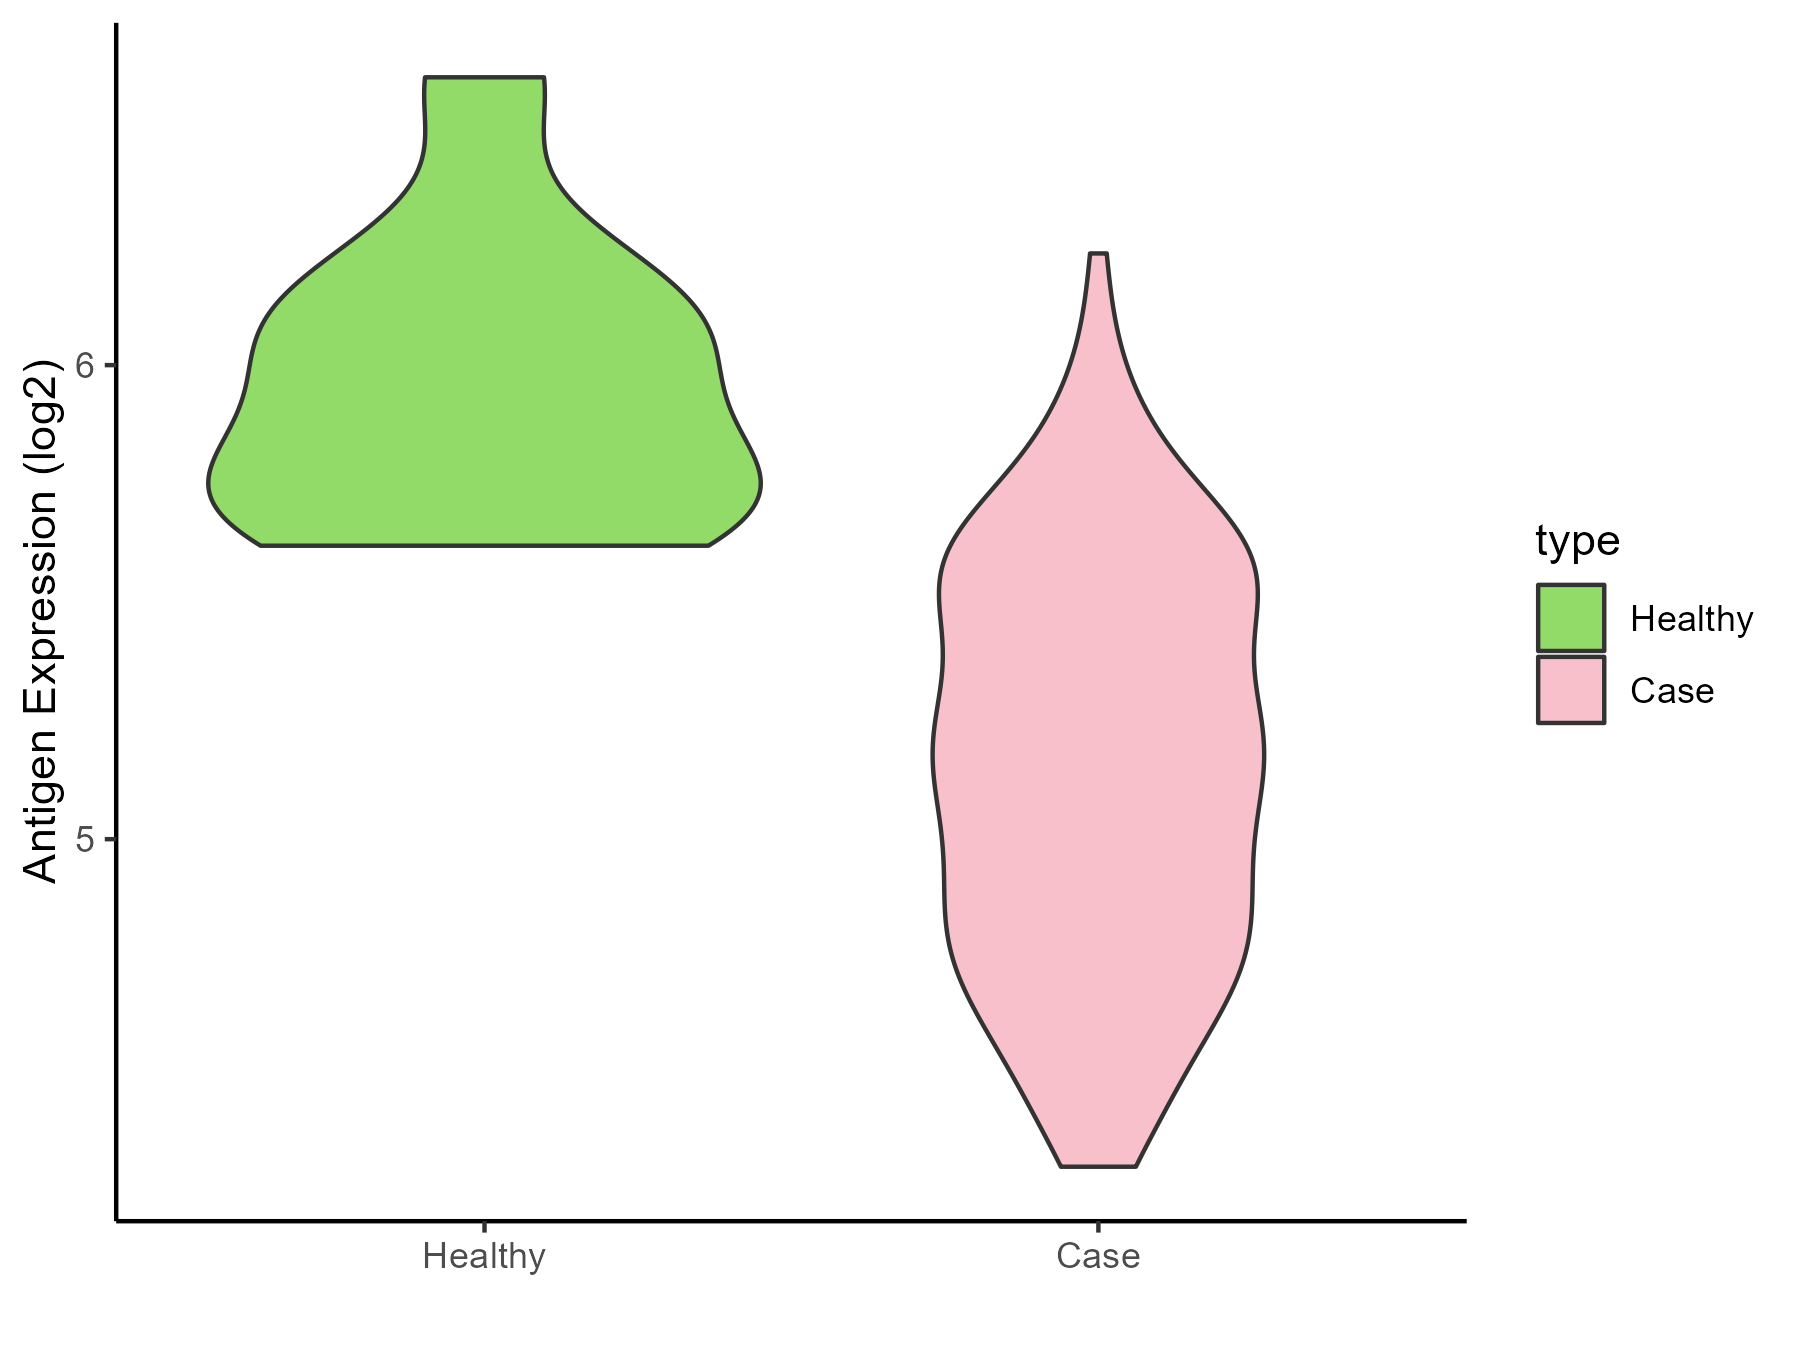
| The Studied Tissue | Brainstem | |
| The Specific Disease | Neuroectodermal tumor | |
| The Expression Level of Disease Section Compare with the Healthy Individual Tissue | p-value: 7.65E-06; Fold-change: -0.743772666; Z-score: -2.418510976 | |
| Disease-specific Antigen Abundances |
|
Click to View the Clearer Original Diagram |
| The Studied Tissue | Nervous | |
| The Specific Disease | Brain cancer | |
| The Expression Level of Disease Section Compare with the Healthy Individual Tissue | p-value: 1.28E-88; Fold-change: -0.417185596; Z-score: -1.345067831 | |
| Disease-specific Antigen Abundances |

|
Click to View the Clearer Original Diagram |
| Differential expression pattern of antigen in diseases | ||
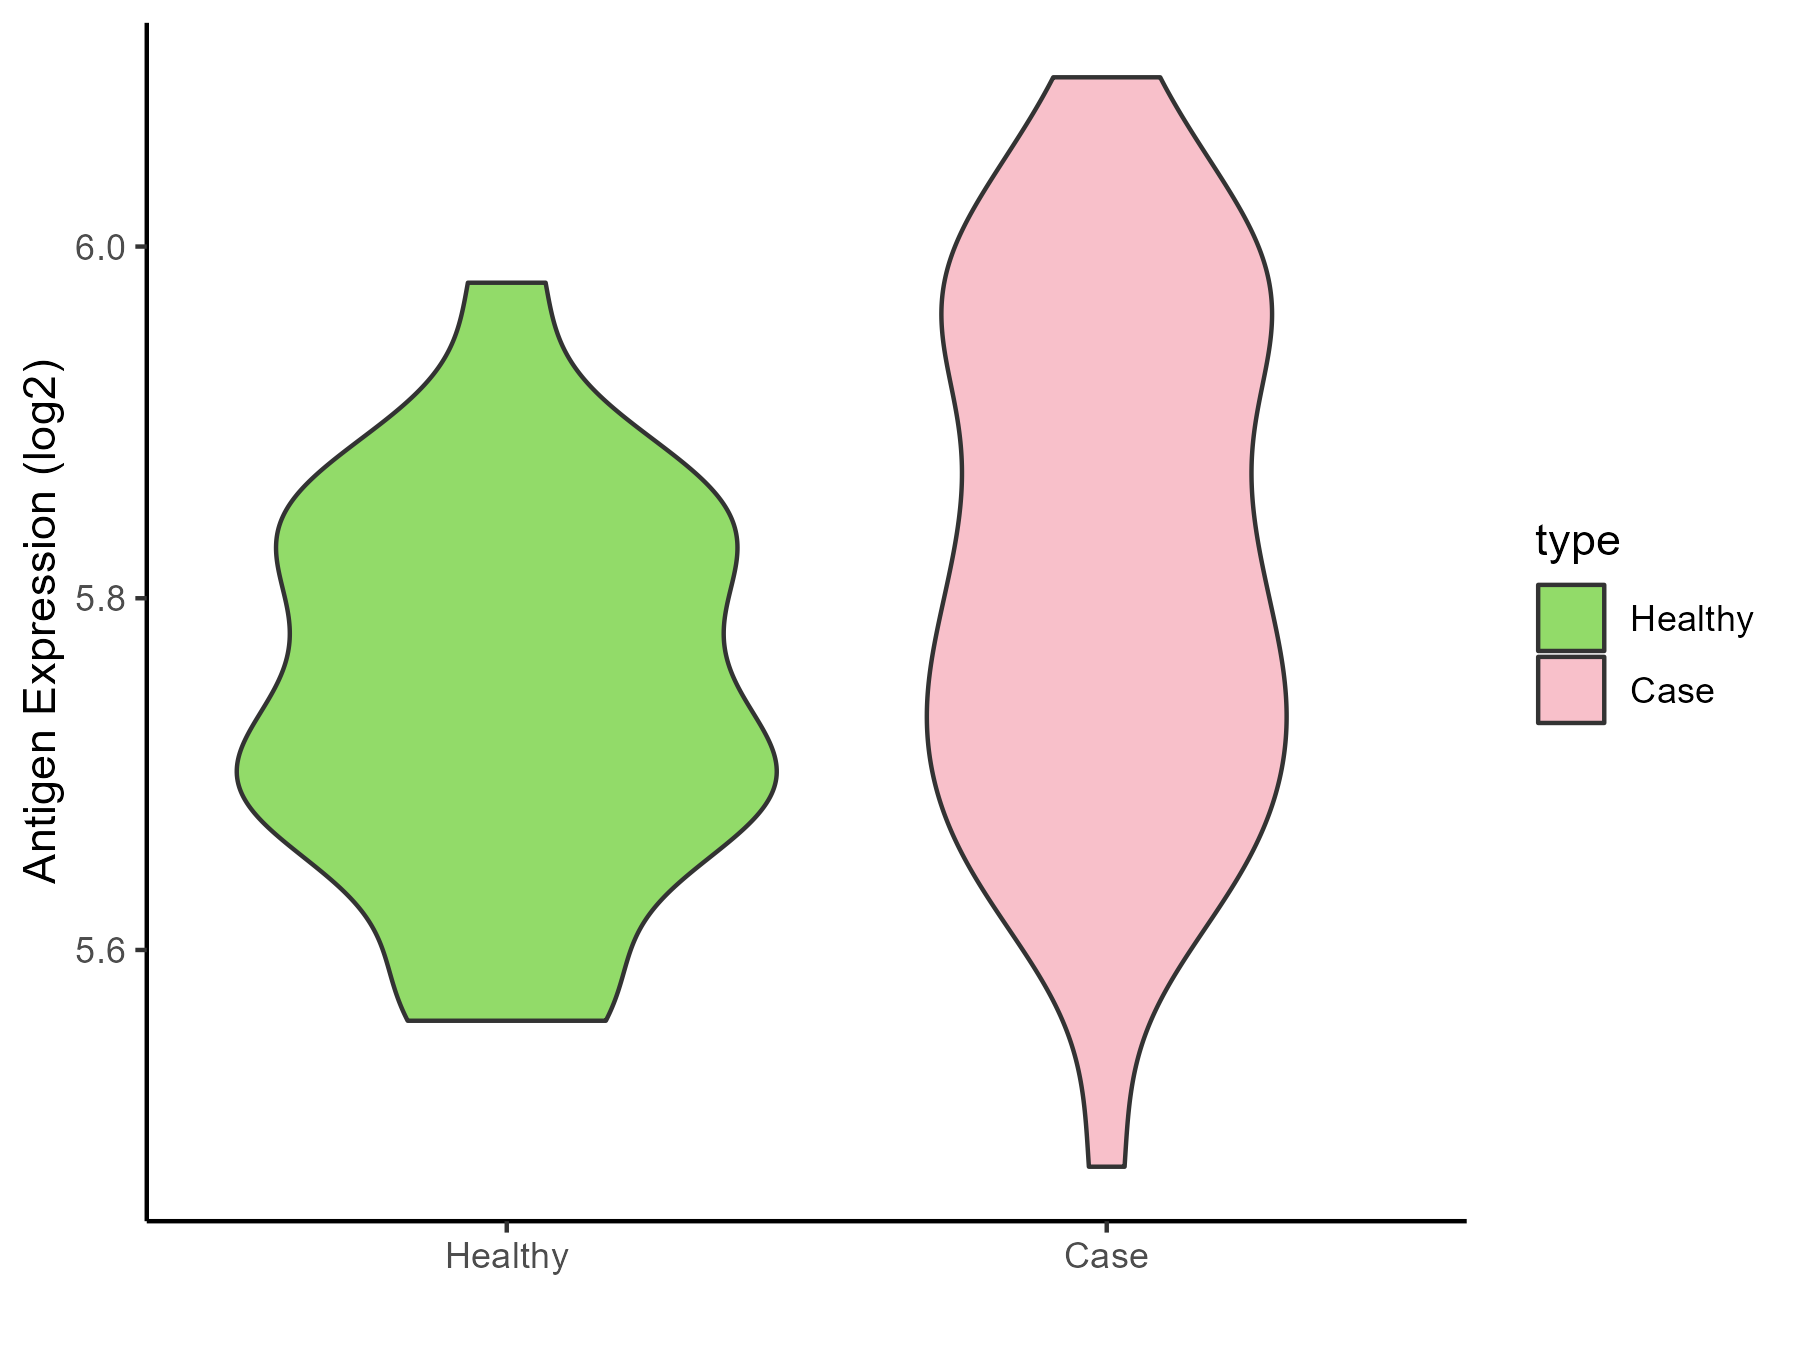
| The Studied Tissue | Whole blood | |
| The Specific Disease | Polycythemia vera | |
| The Expression Level of Disease Section Compare with the Healthy Individual Tissue | p-value: 0.00196648; Fold-change: 0.068327072; Z-score: 0.631235973 | |
| Disease-specific Antigen Abundances |
|
Click to View the Clearer Original Diagram |
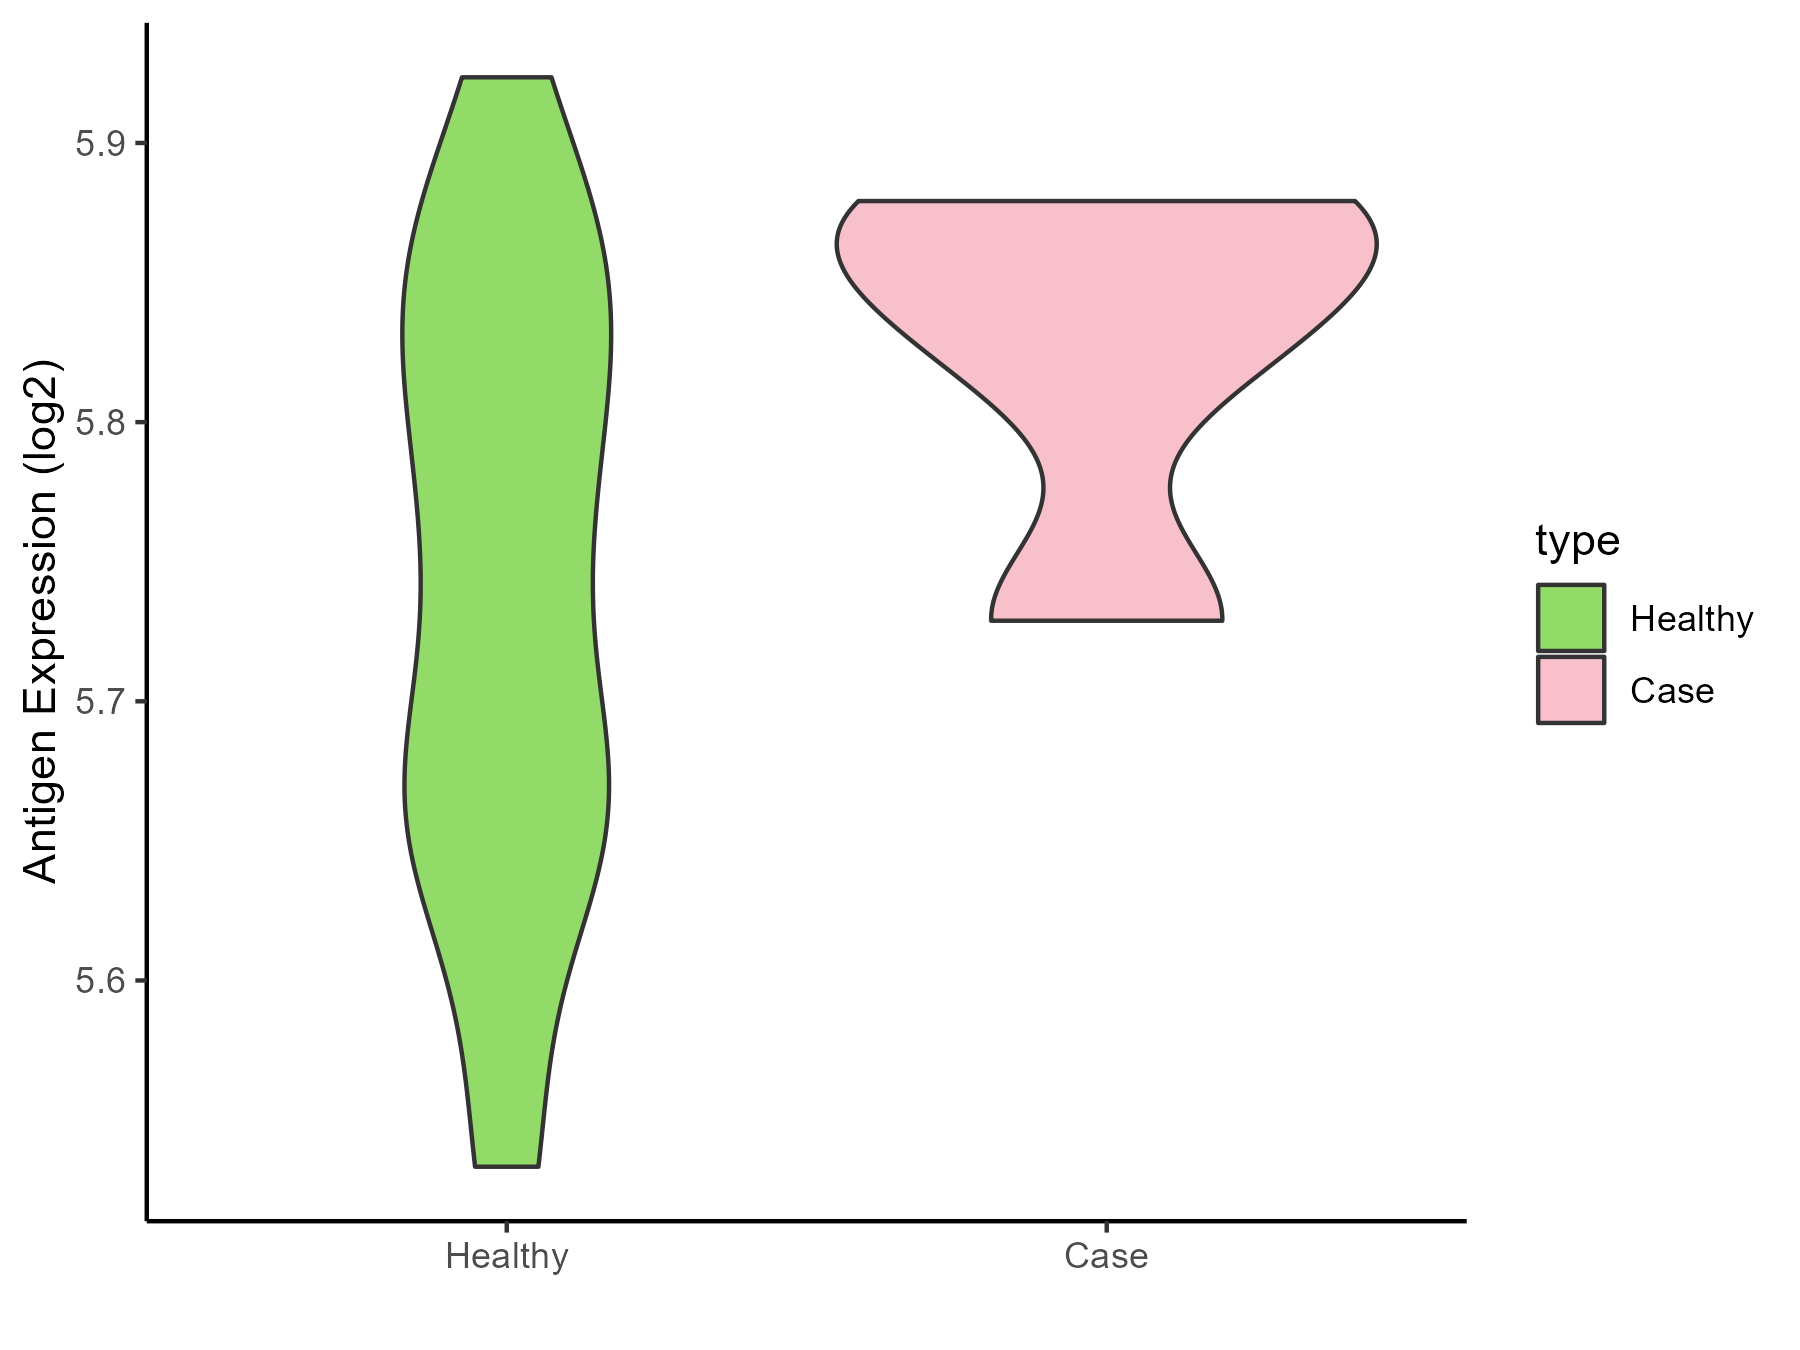
| The Studied Tissue | Whole blood | |
| The Specific Disease | Myelofibrosis | |
| The Expression Level of Disease Section Compare with the Healthy Individual Tissue | p-value: 0.008273771; Fold-change: 0.099237515; Z-score: 0.904817396 | |
| Disease-specific Antigen Abundances |
|
Click to View the Clearer Original Diagram |
| Differential expression pattern of antigen in diseases | ||
| The Studied Tissue | Bone marrow | |
| The Specific Disease | Myelodysplastic syndromes | |
| The Expression Level of Disease Section Compare with the Healthy Individual Tissue | p-value: 0.440665339; Fold-change: 0.06351574; Z-score: 0.393133443 | |
| The Expression Level of Disease Section Compare with the Adjacent Tissue | p-value: 0.166771036; Fold-change: -0.104103621; Z-score: -0.910767738 | |
| Disease-specific Antigen Abundances |

|
Click to View the Clearer Original Diagram |
| Differential expression pattern of antigen in diseases | ||
| The Studied Tissue | Tonsil | |
| The Specific Disease | Lymphoma | |
| The Expression Level of Disease Section Compare with the Healthy Individual Tissue | p-value: 0.962701438; Fold-change: -0.00264363; Z-score: -0.023375136 | |
| Disease-specific Antigen Abundances |

|
Click to View the Clearer Original Diagram |
| Differential expression pattern of antigen in diseases | ||
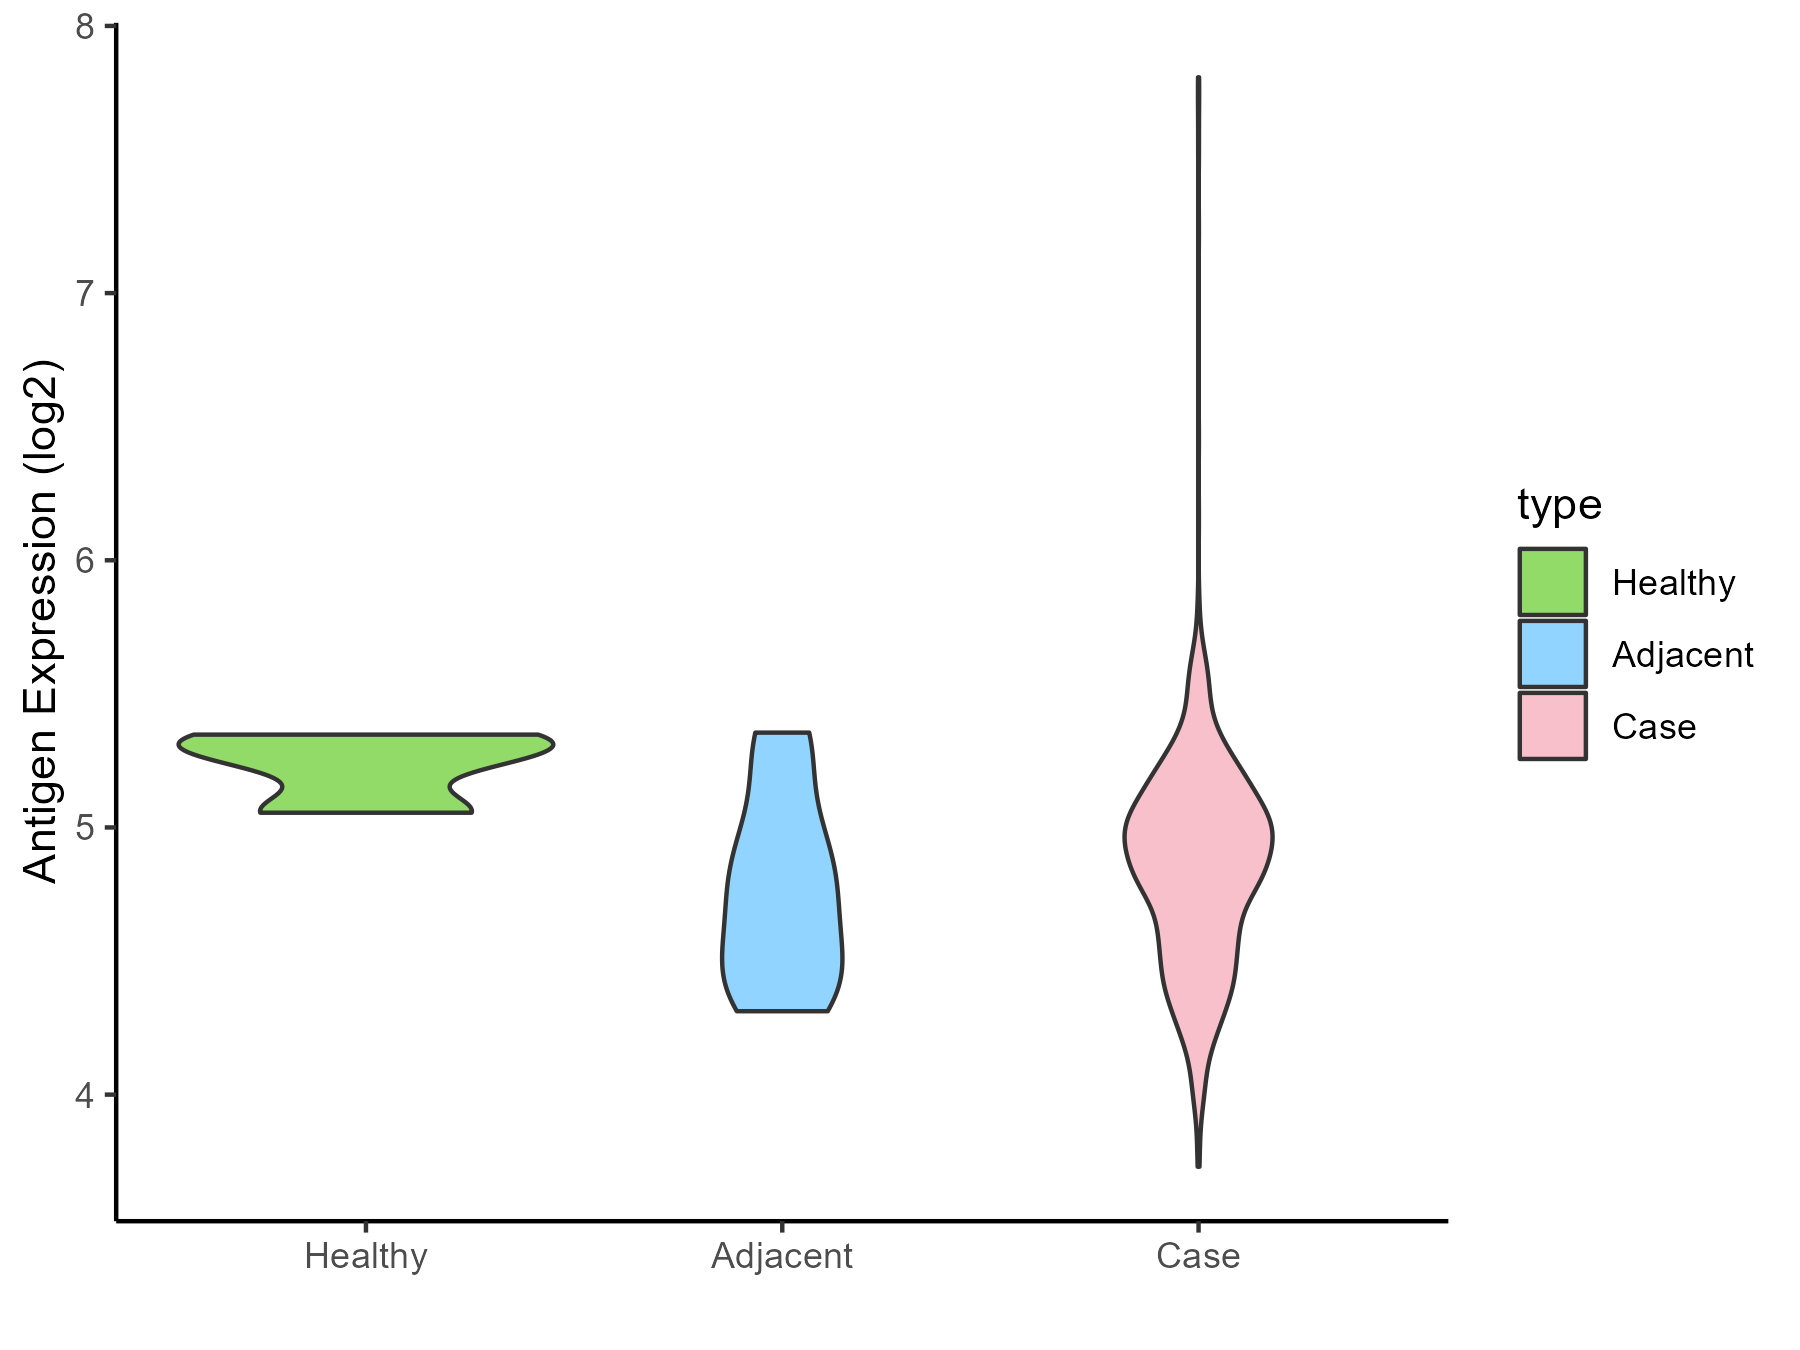
| The Studied Tissue | Gastric | |
| The Specific Disease | Gastric cancer | |
| The Expression Level of Disease Section Compare with the Healthy Individual Tissue | p-value: 0.050513204; Fold-change: -0.393216055; Z-score: -2.580602363 | |
| The Expression Level of Disease Section Compare with the Adjacent Tissue | p-value: 0.258066068; Fold-change: 0.151202462; Z-score: 0.434437722 | |
| Disease-specific Antigen Abundances |
|
Click to View the Clearer Original Diagram |
| Differential expression pattern of antigen in diseases | ||
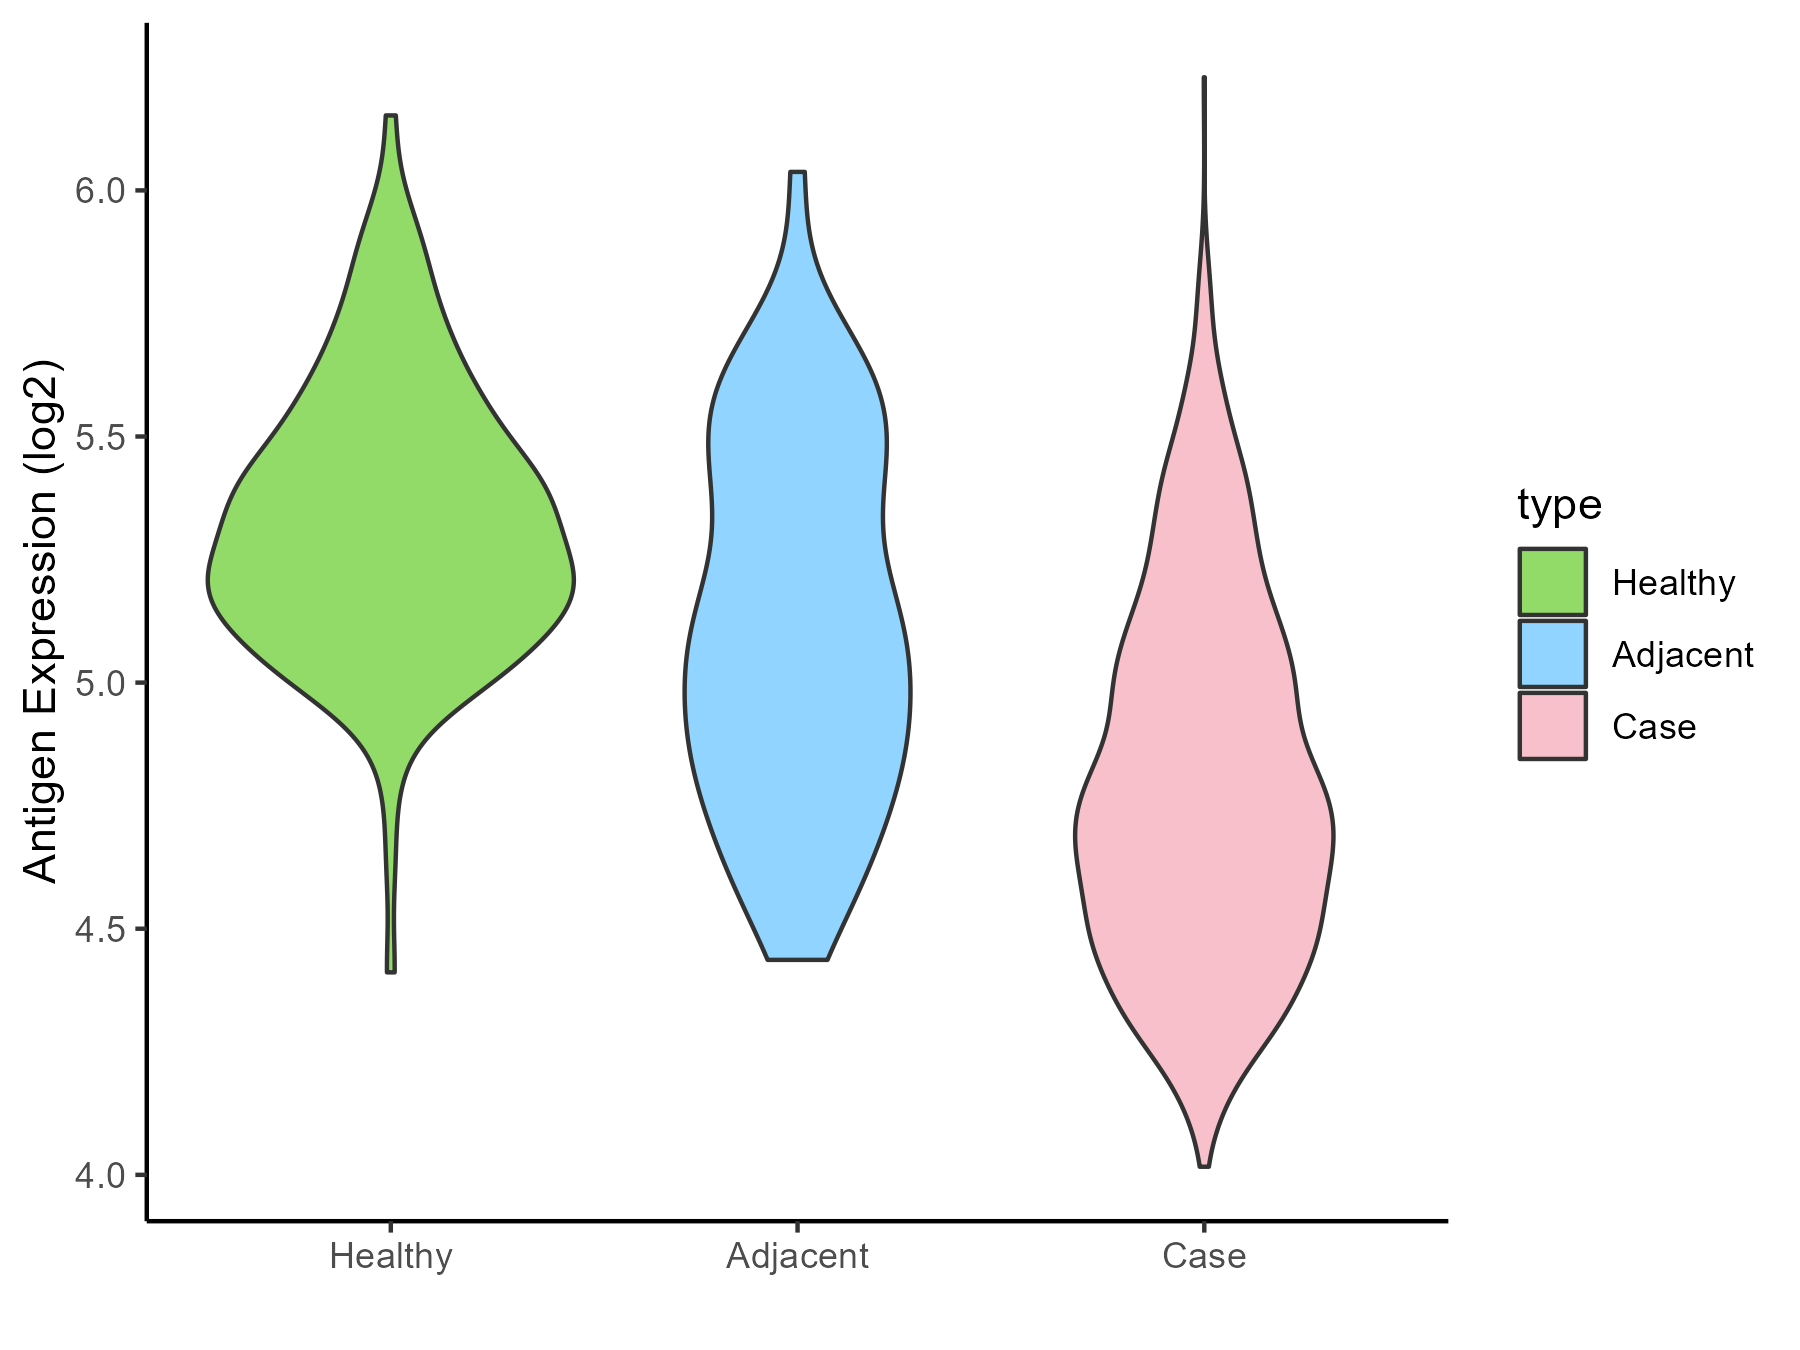
| The Studied Tissue | Colon | |
| The Specific Disease | Colon cancer | |
| The Expression Level of Disease Section Compare with the Healthy Individual Tissue | p-value: 4.31E-56; Fold-change: -0.545053016; Z-score: -1.982831797 | |
| The Expression Level of Disease Section Compare with the Adjacent Tissue | p-value: 2.58E-16; Fold-change: -0.337280663; Z-score: -0.910863885 | |
| Disease-specific Antigen Abundances |
|
Click to View the Clearer Original Diagram |
| Differential expression pattern of antigen in diseases | ||
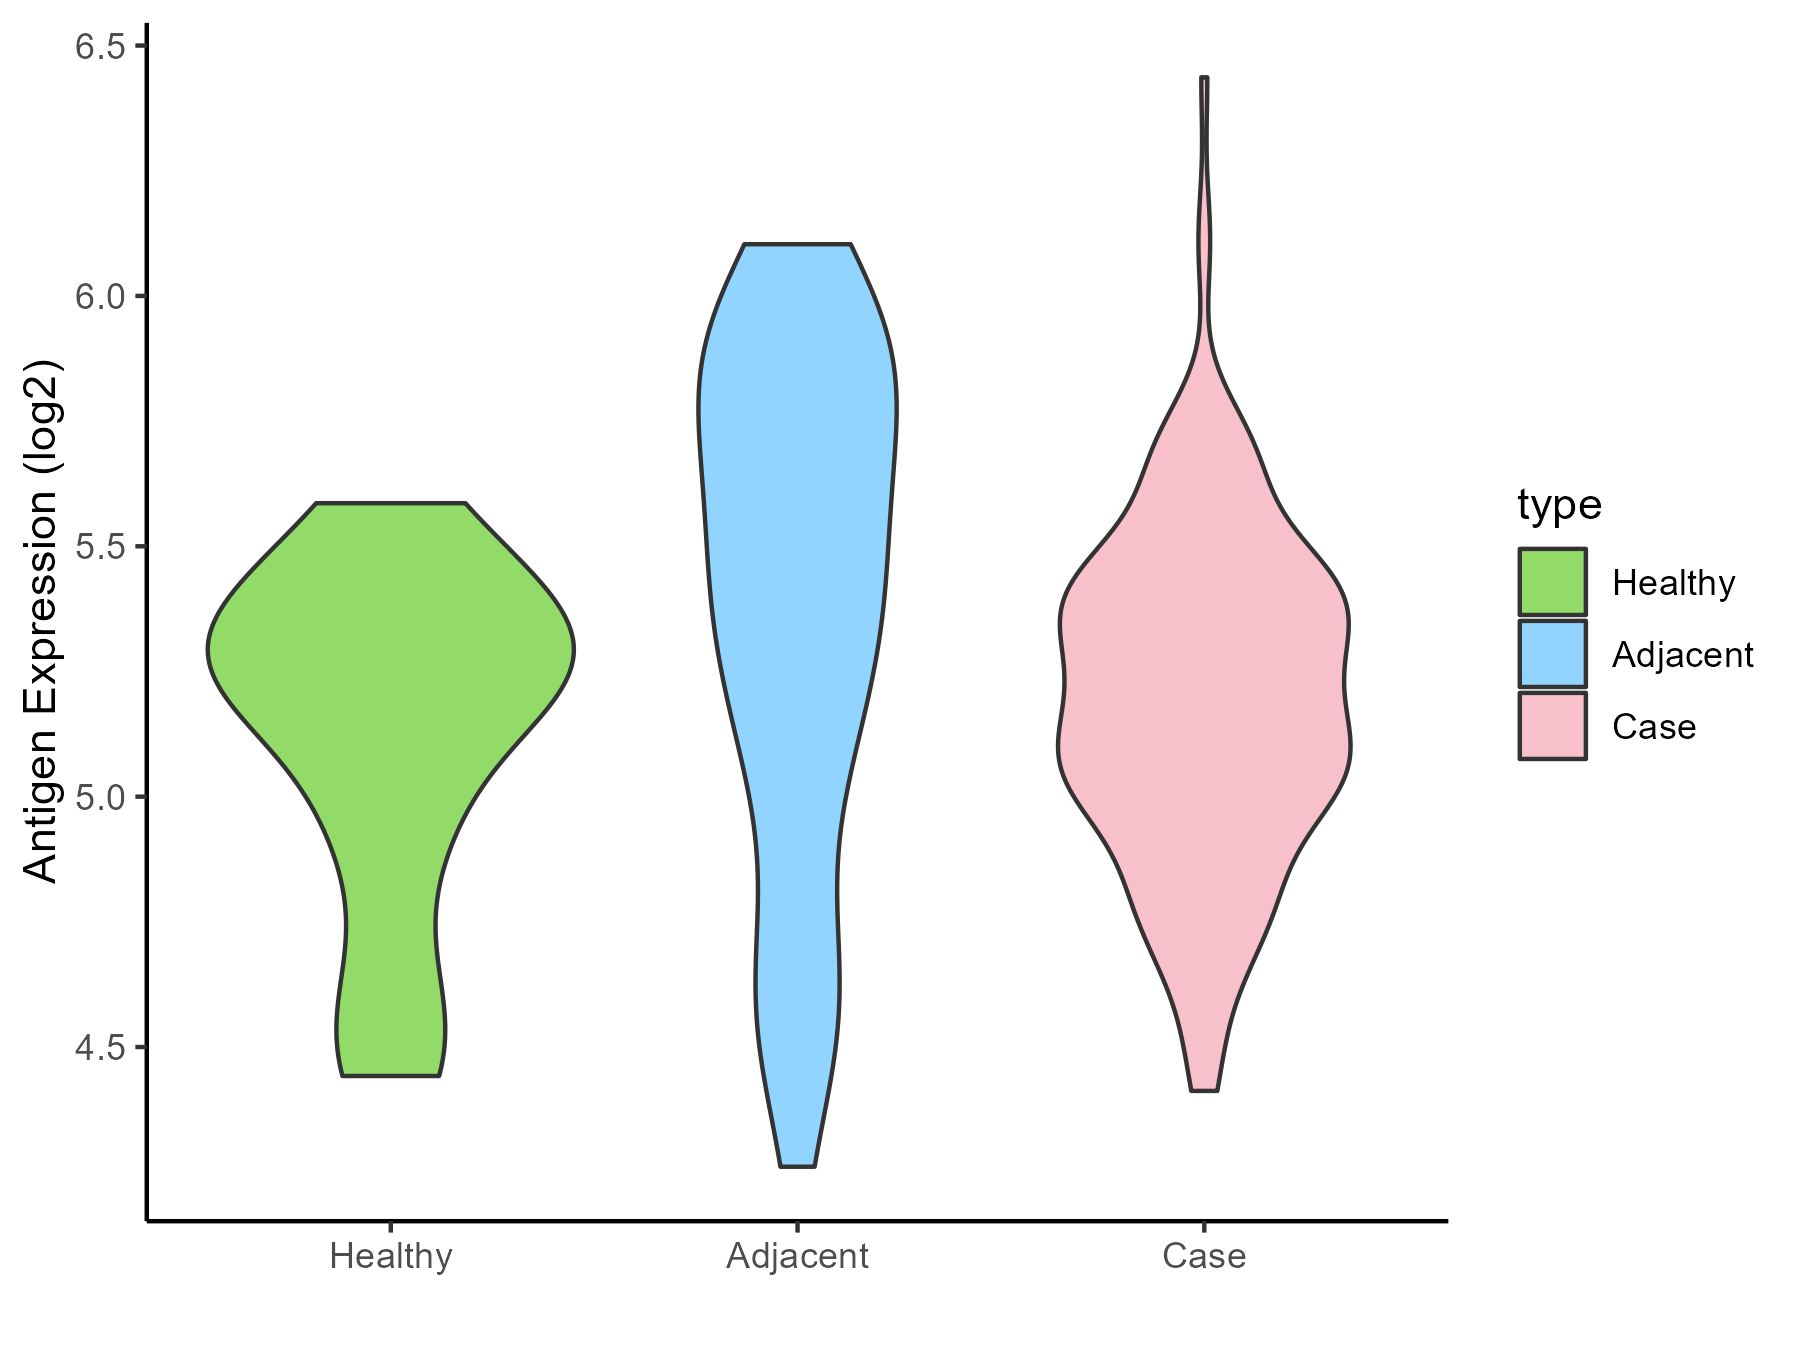
| The Studied Tissue | Pancreas | |
| The Specific Disease | Pancreatic cancer | |
| The Expression Level of Disease Section Compare with the Healthy Individual Tissue | p-value: 0.498536012; Fold-change: -0.038849414; Z-score: -0.113693222 | |
| The Expression Level of Disease Section Compare with the Adjacent Tissue | p-value: 0.006351348; Fold-change: -0.285847237; Z-score: -0.576085618 | |
| Disease-specific Antigen Abundances |
|
Click to View the Clearer Original Diagram |
| Differential expression pattern of antigen in diseases | ||
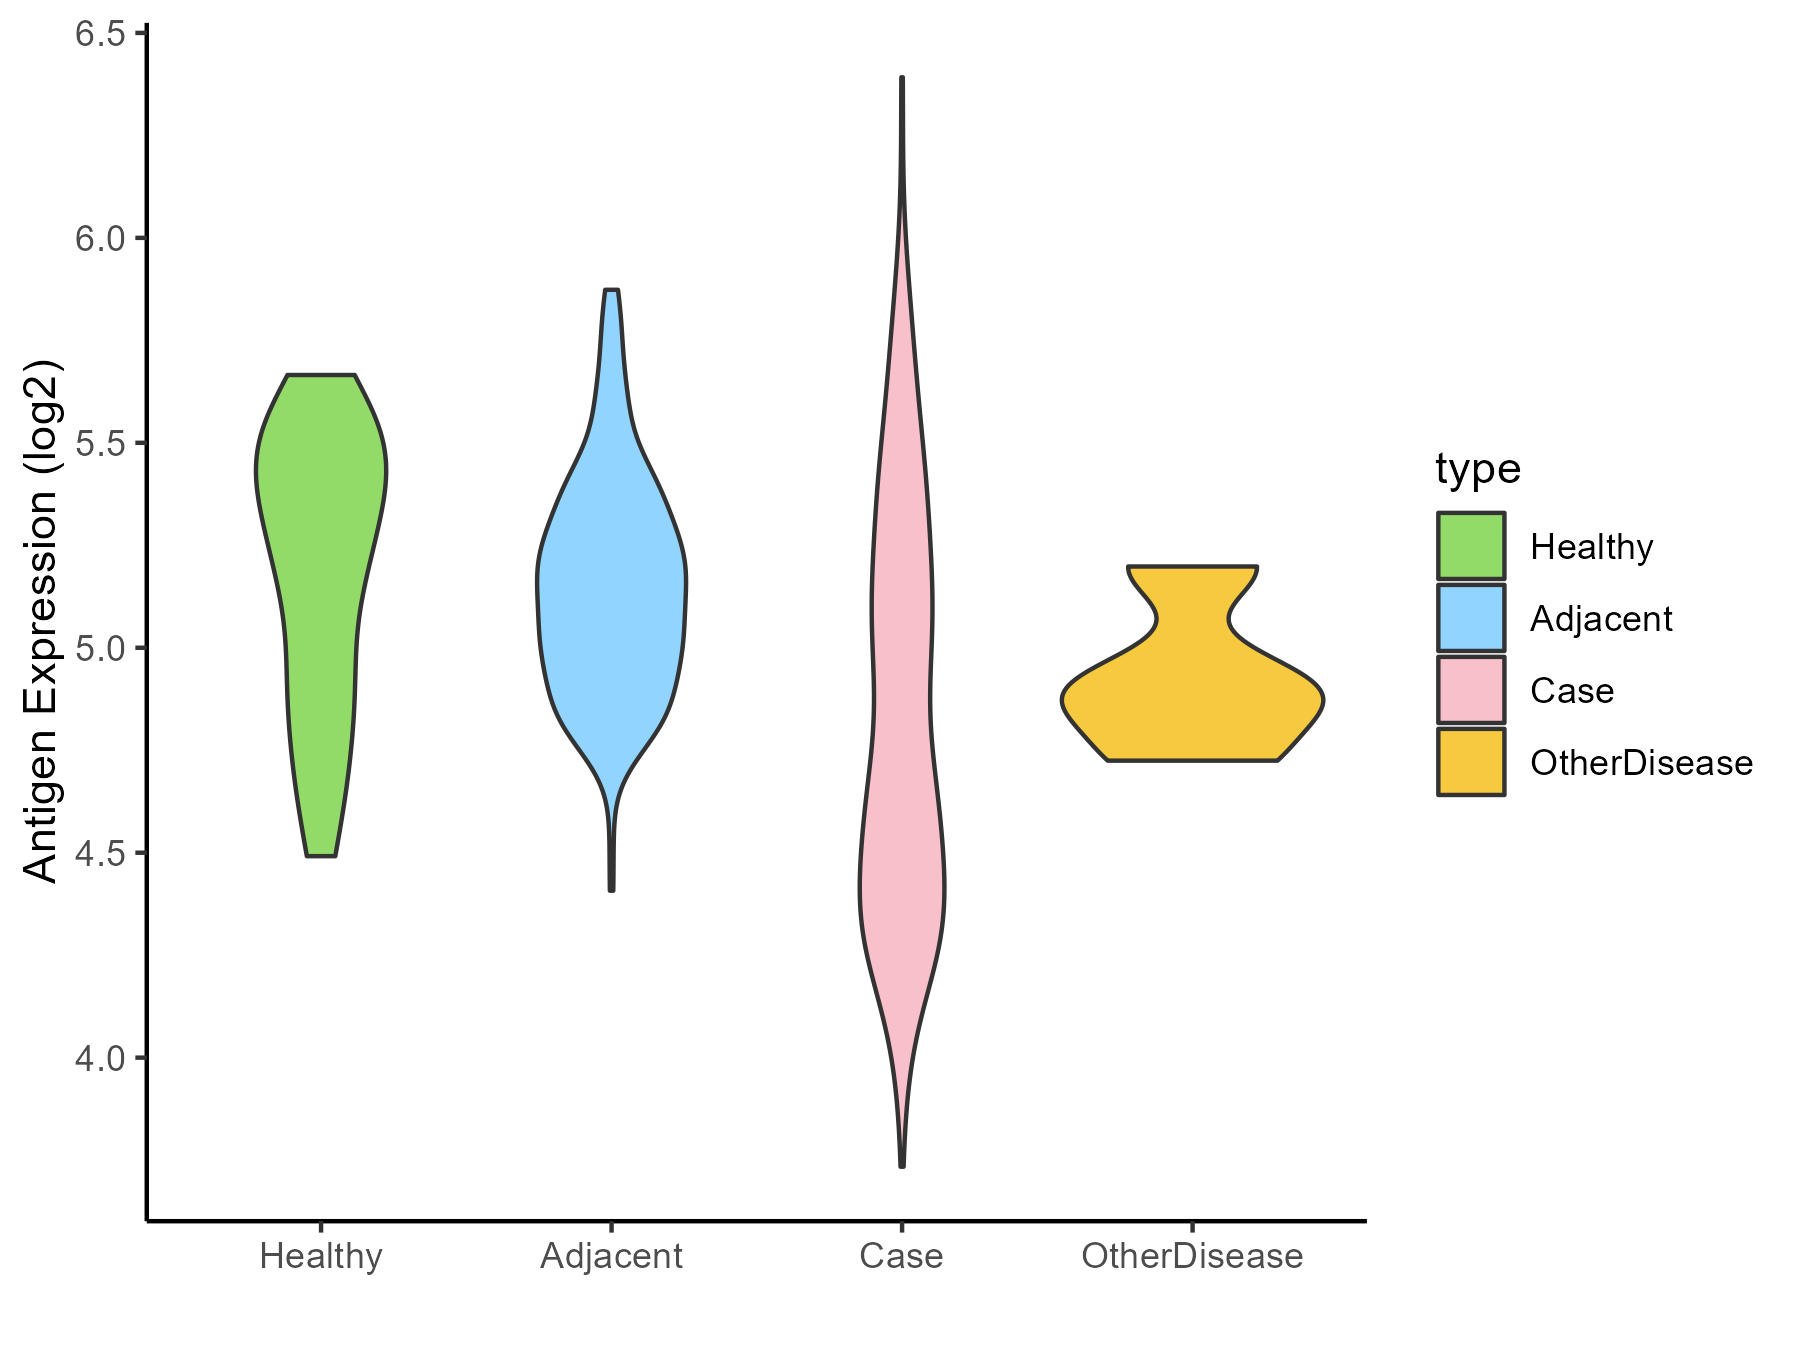
| The Studied Tissue | Liver | |
| The Specific Disease | Liver cancer | |
| The Expression Level of Disease Section Compare with the Healthy Individual Tissue | p-value: 3.43E-08; Fold-change: -0.515211479; Z-score: -1.544691411 | |
| The Expression Level of Disease Section Compare with the Adjacent Tissue | p-value: 1.65E-21; Fold-change: -0.390465401; Z-score: -1.47036154 | |
| The Expression Level of Disease Section Compare with the Other Disease Section | p-value: 0.423486814; Fold-change: -0.146114392; Z-score: -0.733971651 | |
| Disease-specific Antigen Abundances |
|
Click to View the Clearer Original Diagram |
| Differential expression pattern of antigen in diseases | ||
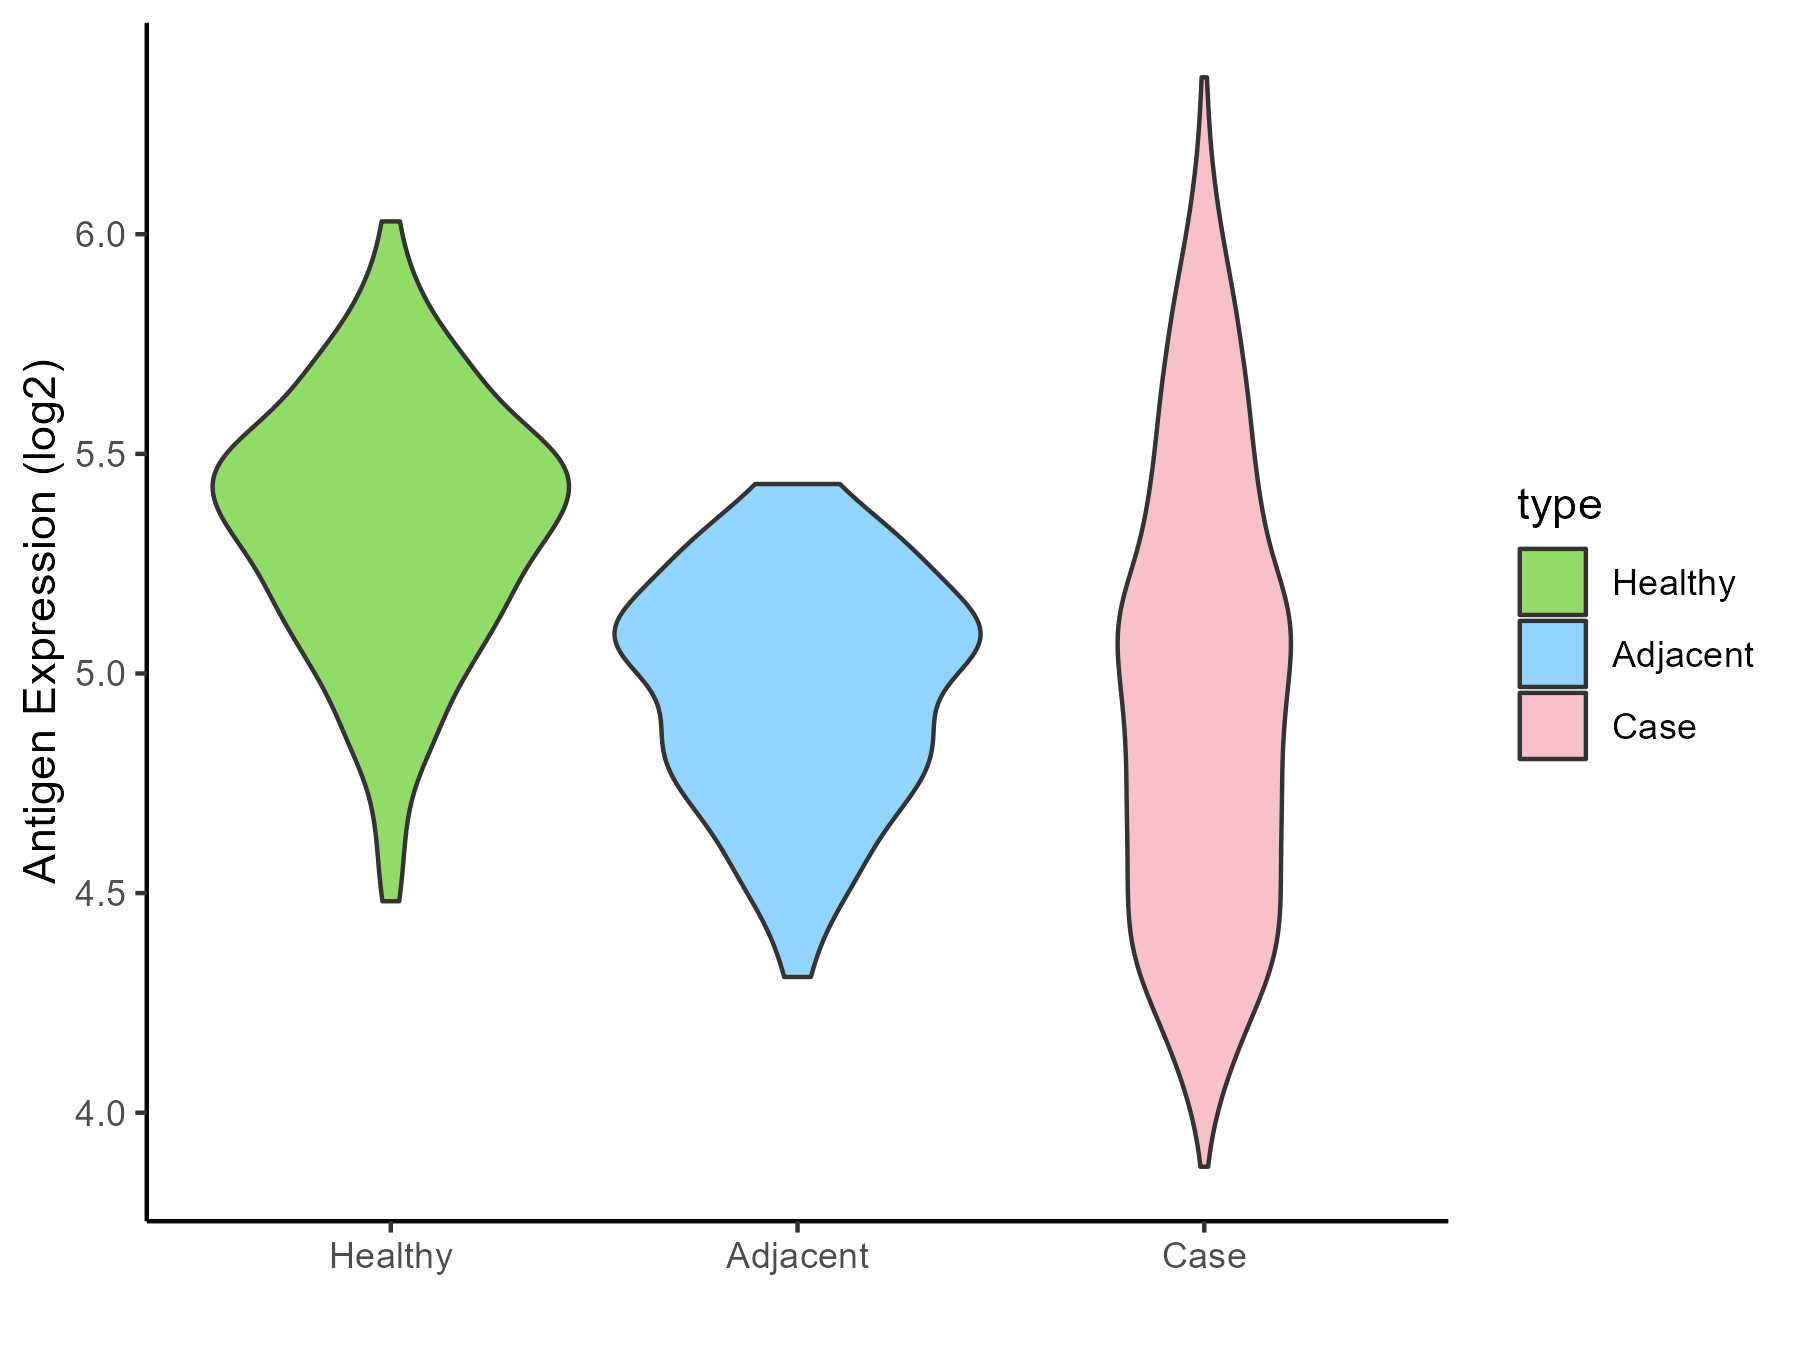
| The Studied Tissue | Lung | |
| The Specific Disease | Lung cancer | |
| The Expression Level of Disease Section Compare with the Healthy Individual Tissue | p-value: 5.05E-35; Fold-change: -0.424238735; Z-score: -1.451649639 | |
| The Expression Level of Disease Section Compare with the Adjacent Tissue | p-value: 0.969642635; Fold-change: -0.089466371; Z-score: -0.347810701 | |
| Disease-specific Antigen Abundances |
|
Click to View the Clearer Original Diagram |
| Differential expression pattern of antigen in diseases | ||
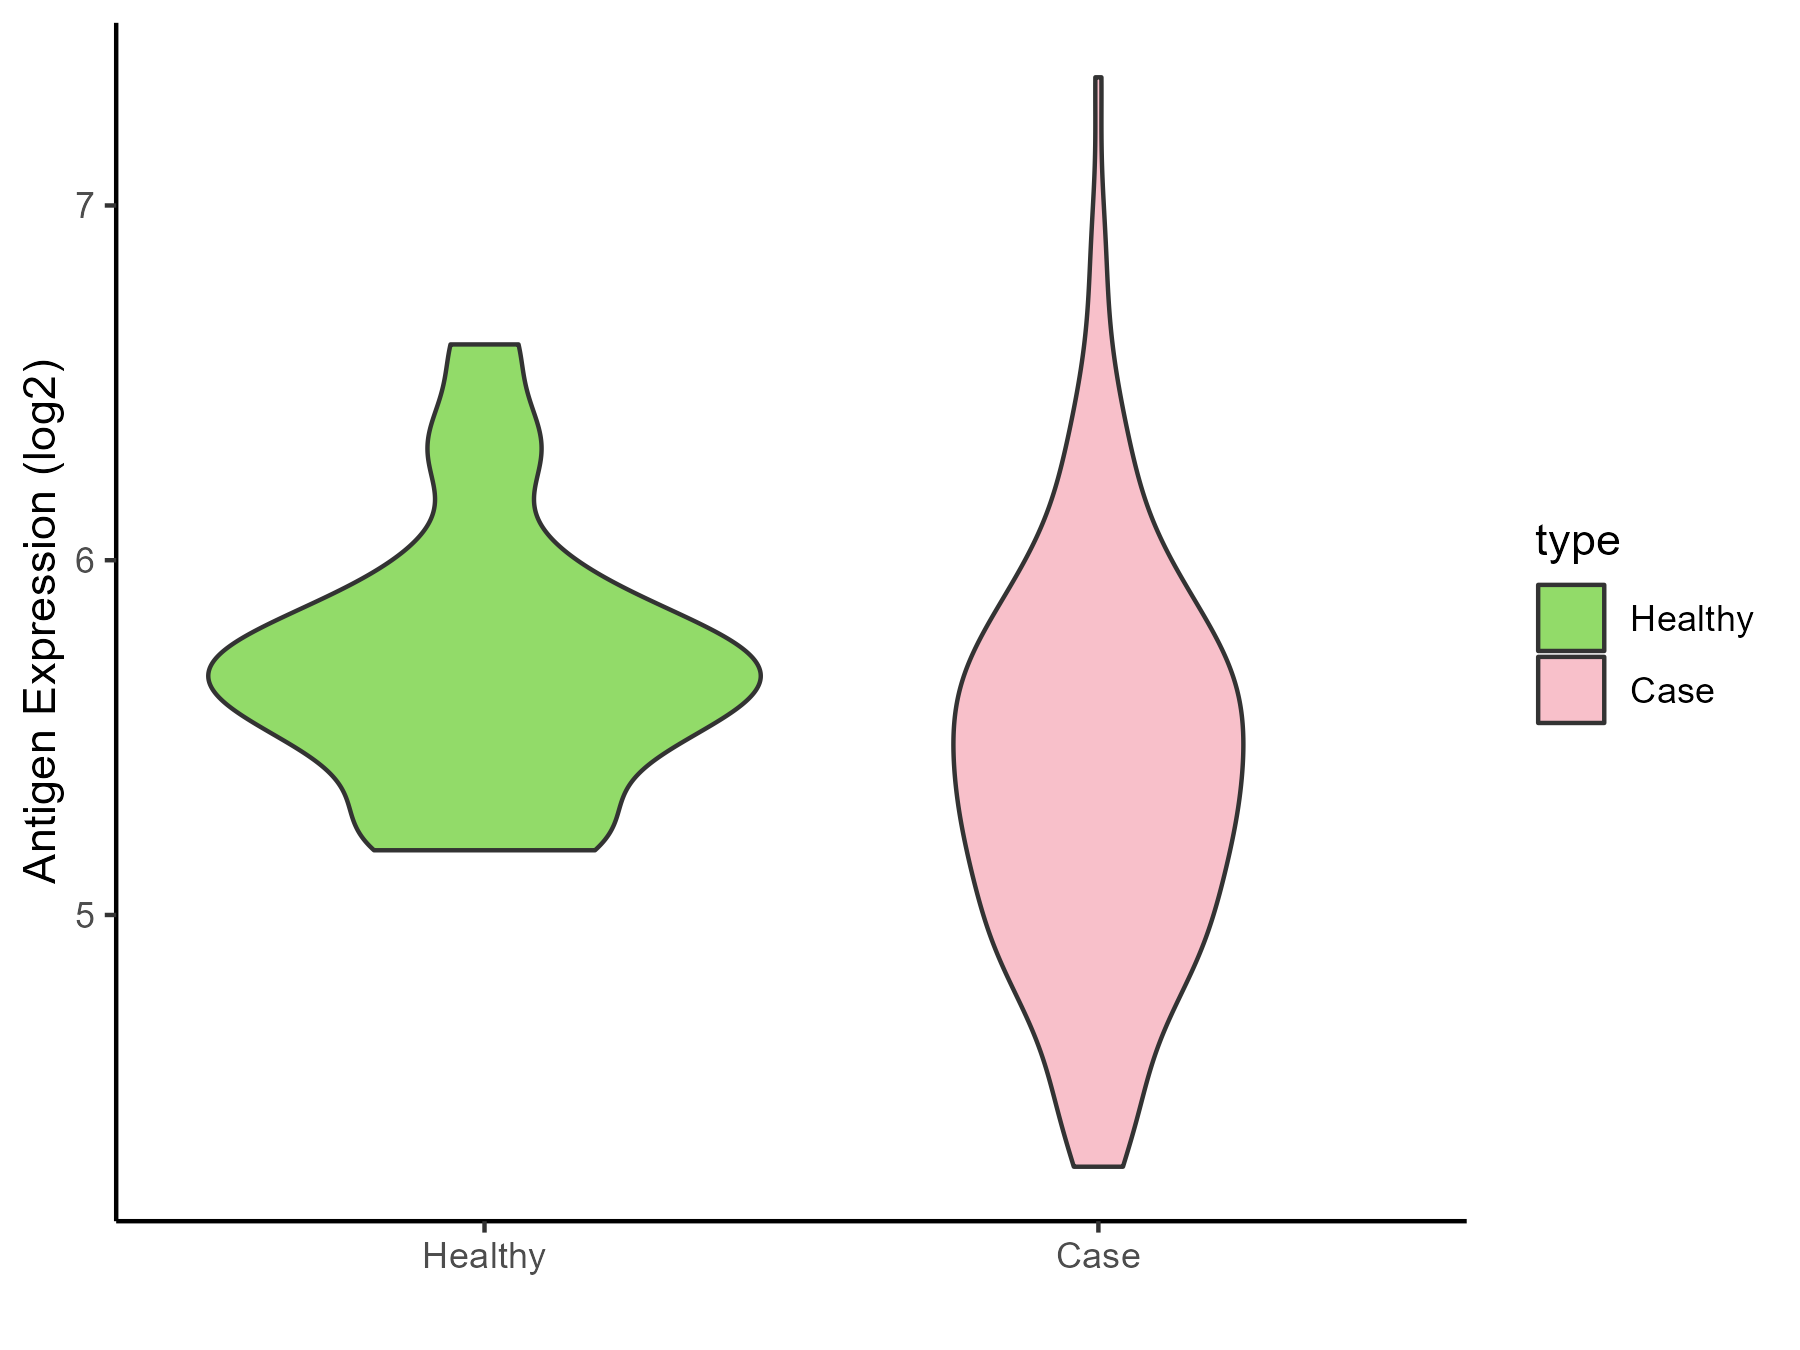
| The Studied Tissue | Skin | |
| The Specific Disease | Melanoma | |
| The Expression Level of Disease Section Compare with the Healthy Individual Tissue | p-value: 0.001440269; Fold-change: -0.258941085; Z-score: -0.711654471 | |
| Disease-specific Antigen Abundances |
|
Click to View the Clearer Original Diagram |
| Differential expression pattern of antigen in diseases | ||
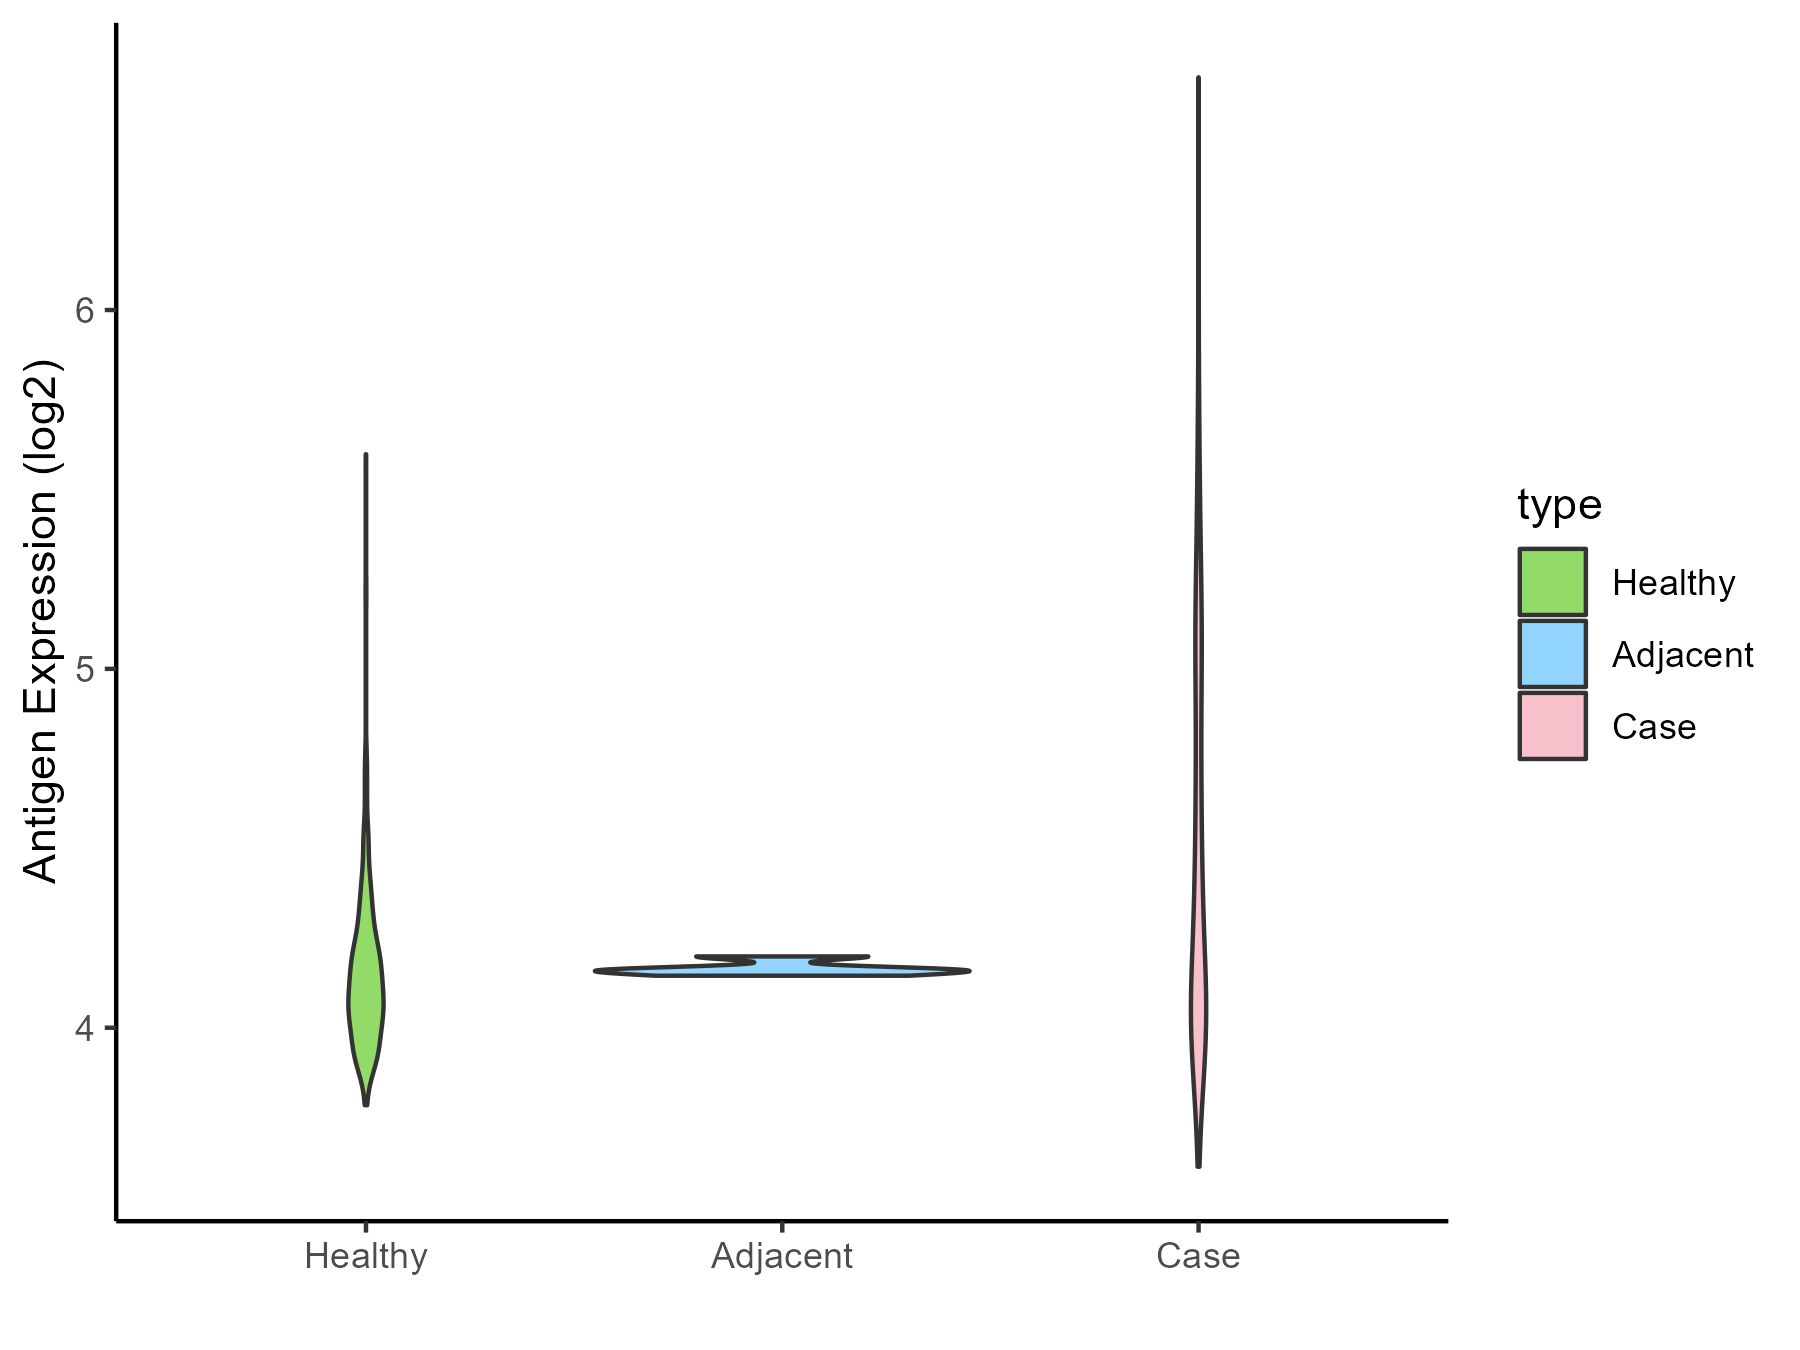
| The Studied Tissue | Muscle | |
| The Specific Disease | Sarcoma | |
| The Expression Level of Disease Section Compare with the Healthy Individual Tissue | p-value: 3.07E-36; Fold-change: 0.207227269; Z-score: 0.962384876 | |
| The Expression Level of Disease Section Compare with the Adjacent Tissue | p-value: 2.52E-19; Fold-change: 0.159065174; Z-score: 6.924975881 | |
| Disease-specific Antigen Abundances |
|
Click to View the Clearer Original Diagram |
| Differential expression pattern of antigen in diseases | ||
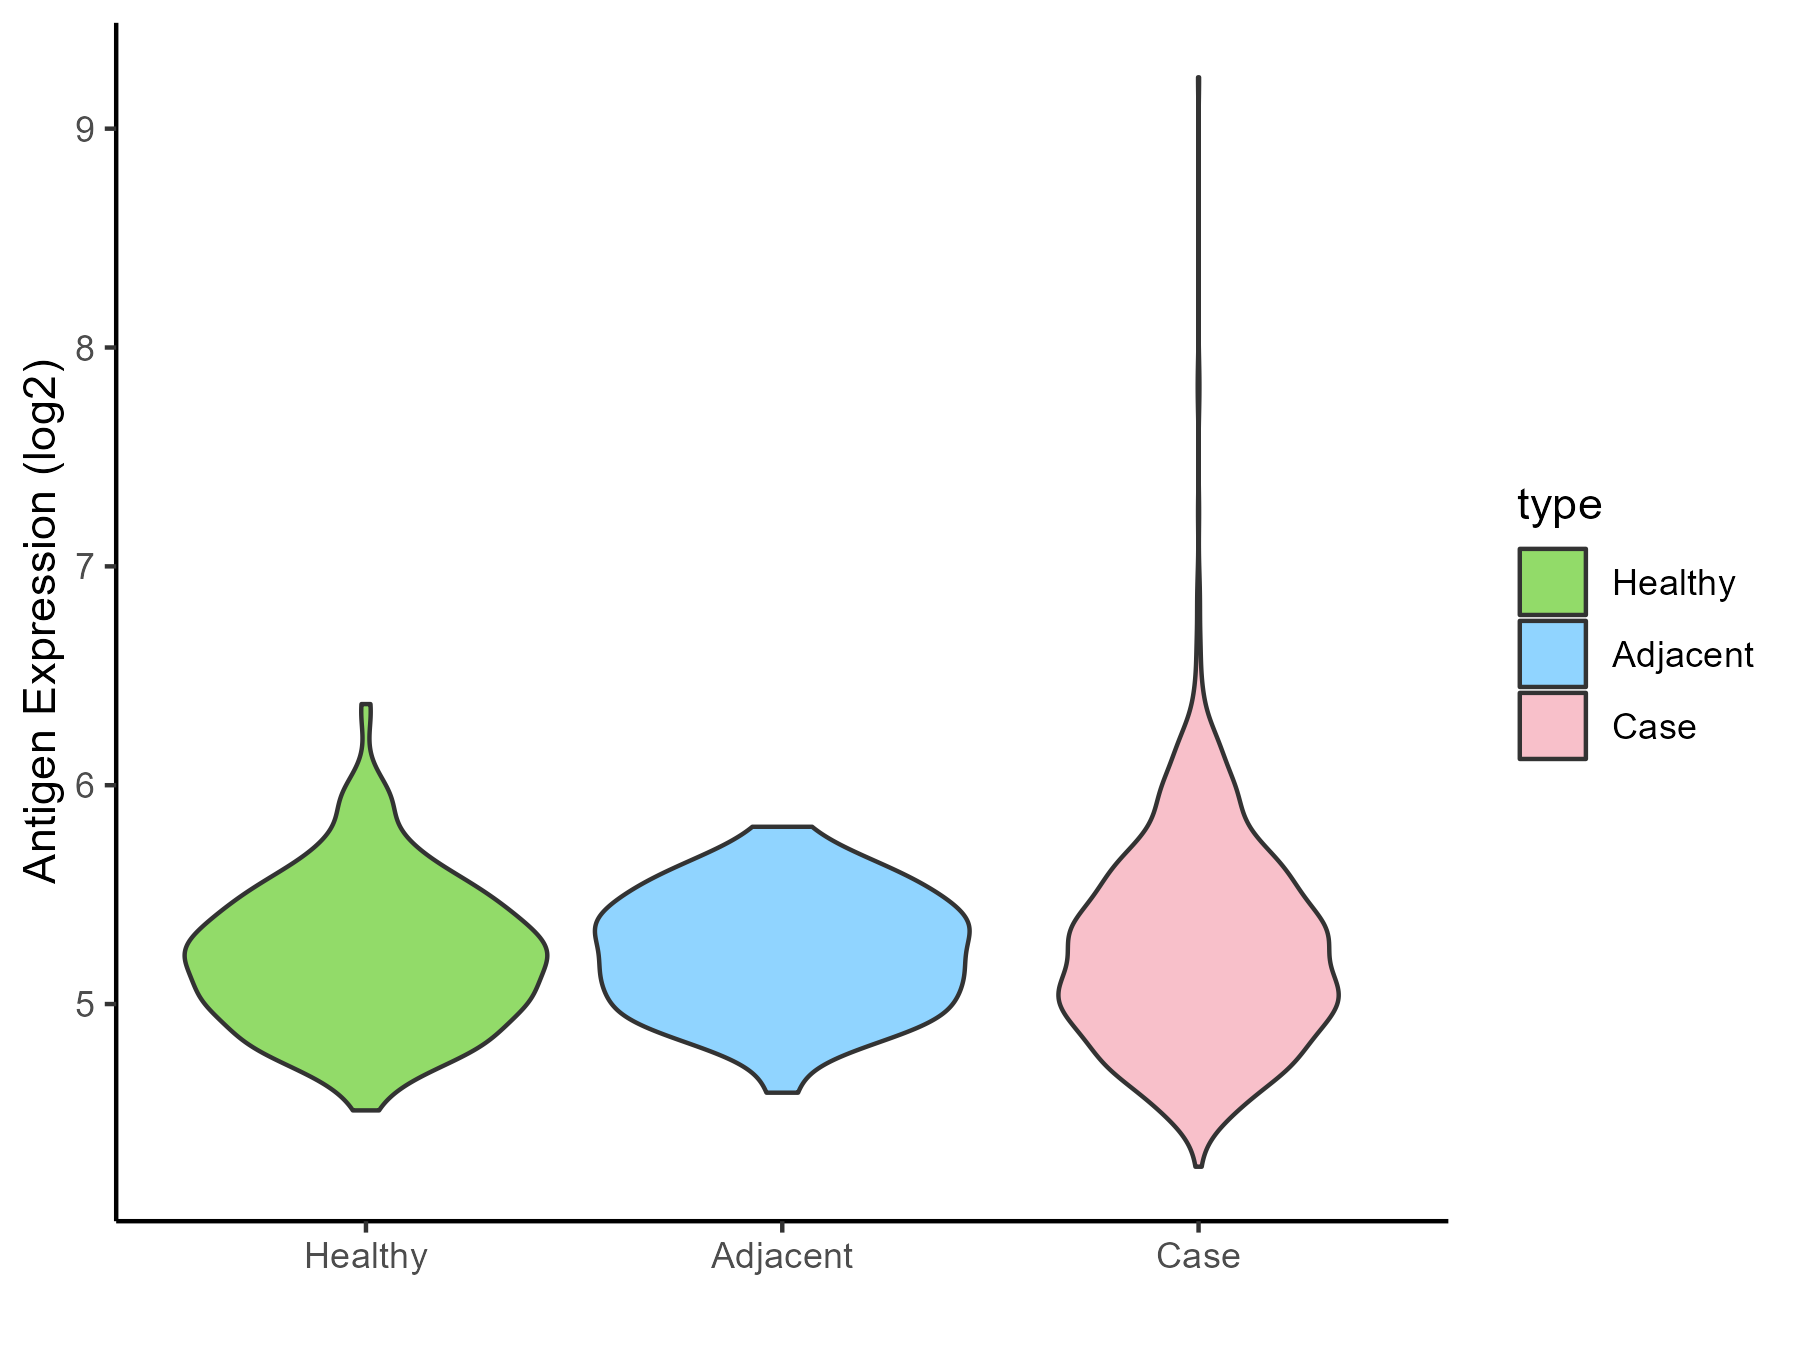
| The Studied Tissue | Breast | |
| The Specific Disease | Breast cancer | |
| The Expression Level of Disease Section Compare with the Healthy Individual Tissue | p-value: 0.195931207; Fold-change: -0.000731556; Z-score: -0.002227255 | |
| The Expression Level of Disease Section Compare with the Adjacent Tissue | p-value: 0.732192055; Fold-change: -0.042879454; Z-score: -0.158768001 | |
| Disease-specific Antigen Abundances |
|
Click to View the Clearer Original Diagram |
| Differential expression pattern of antigen in diseases | ||
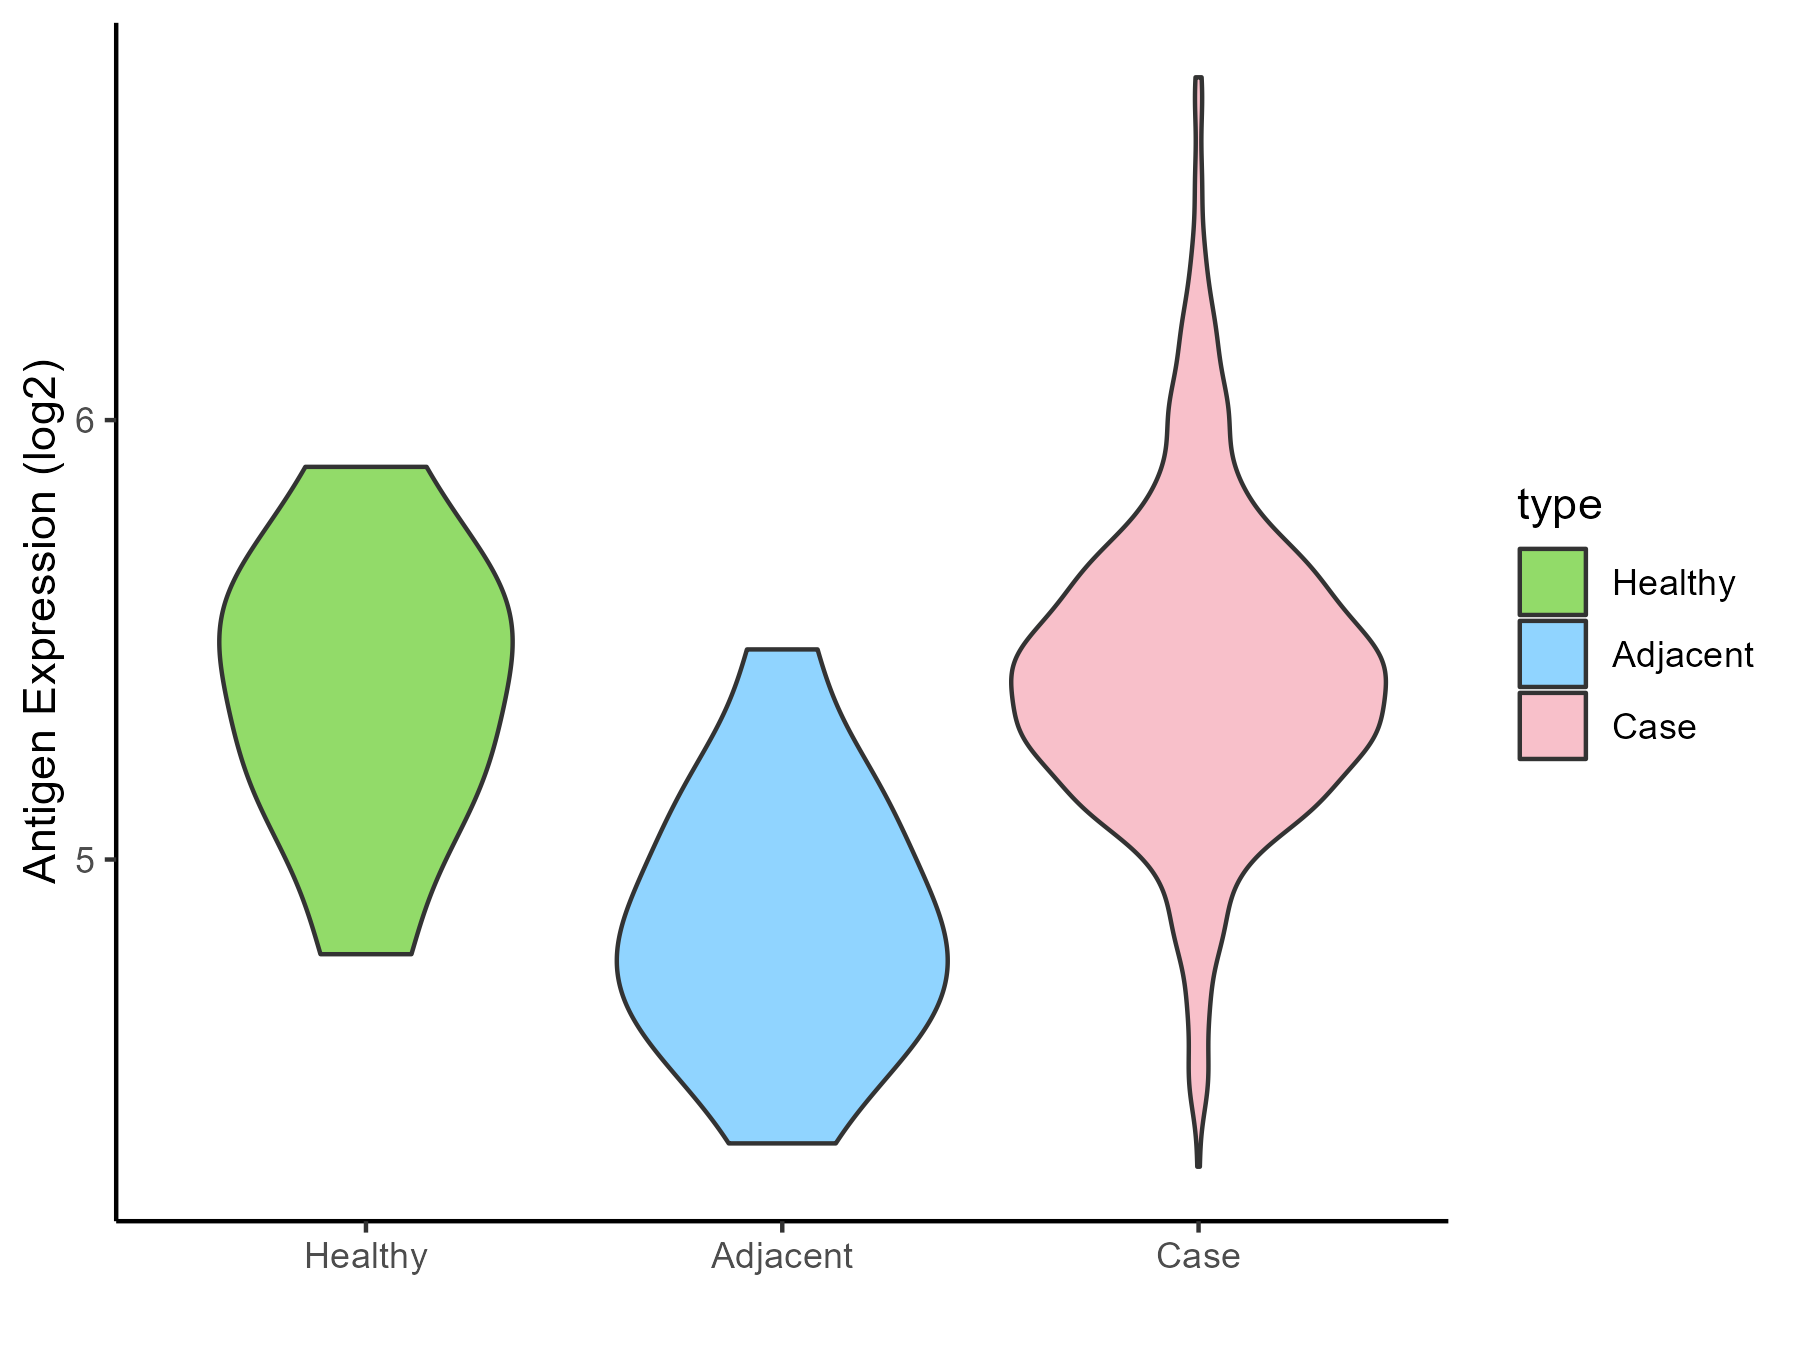
| The Studied Tissue | Ovarian | |
| The Specific Disease | Ovarian cancer | |
| The Expression Level of Disease Section Compare with the Healthy Individual Tissue | p-value: 0.699053377; Fold-change: -0.00993422; Z-score: -0.029808809 | |
| The Expression Level of Disease Section Compare with the Adjacent Tissue | p-value: 7.98E-06; Fold-change: 0.583973335; Z-score: 1.942246205 | |
| Disease-specific Antigen Abundances |
|
Click to View the Clearer Original Diagram |
| Differential expression pattern of antigen in diseases | ||
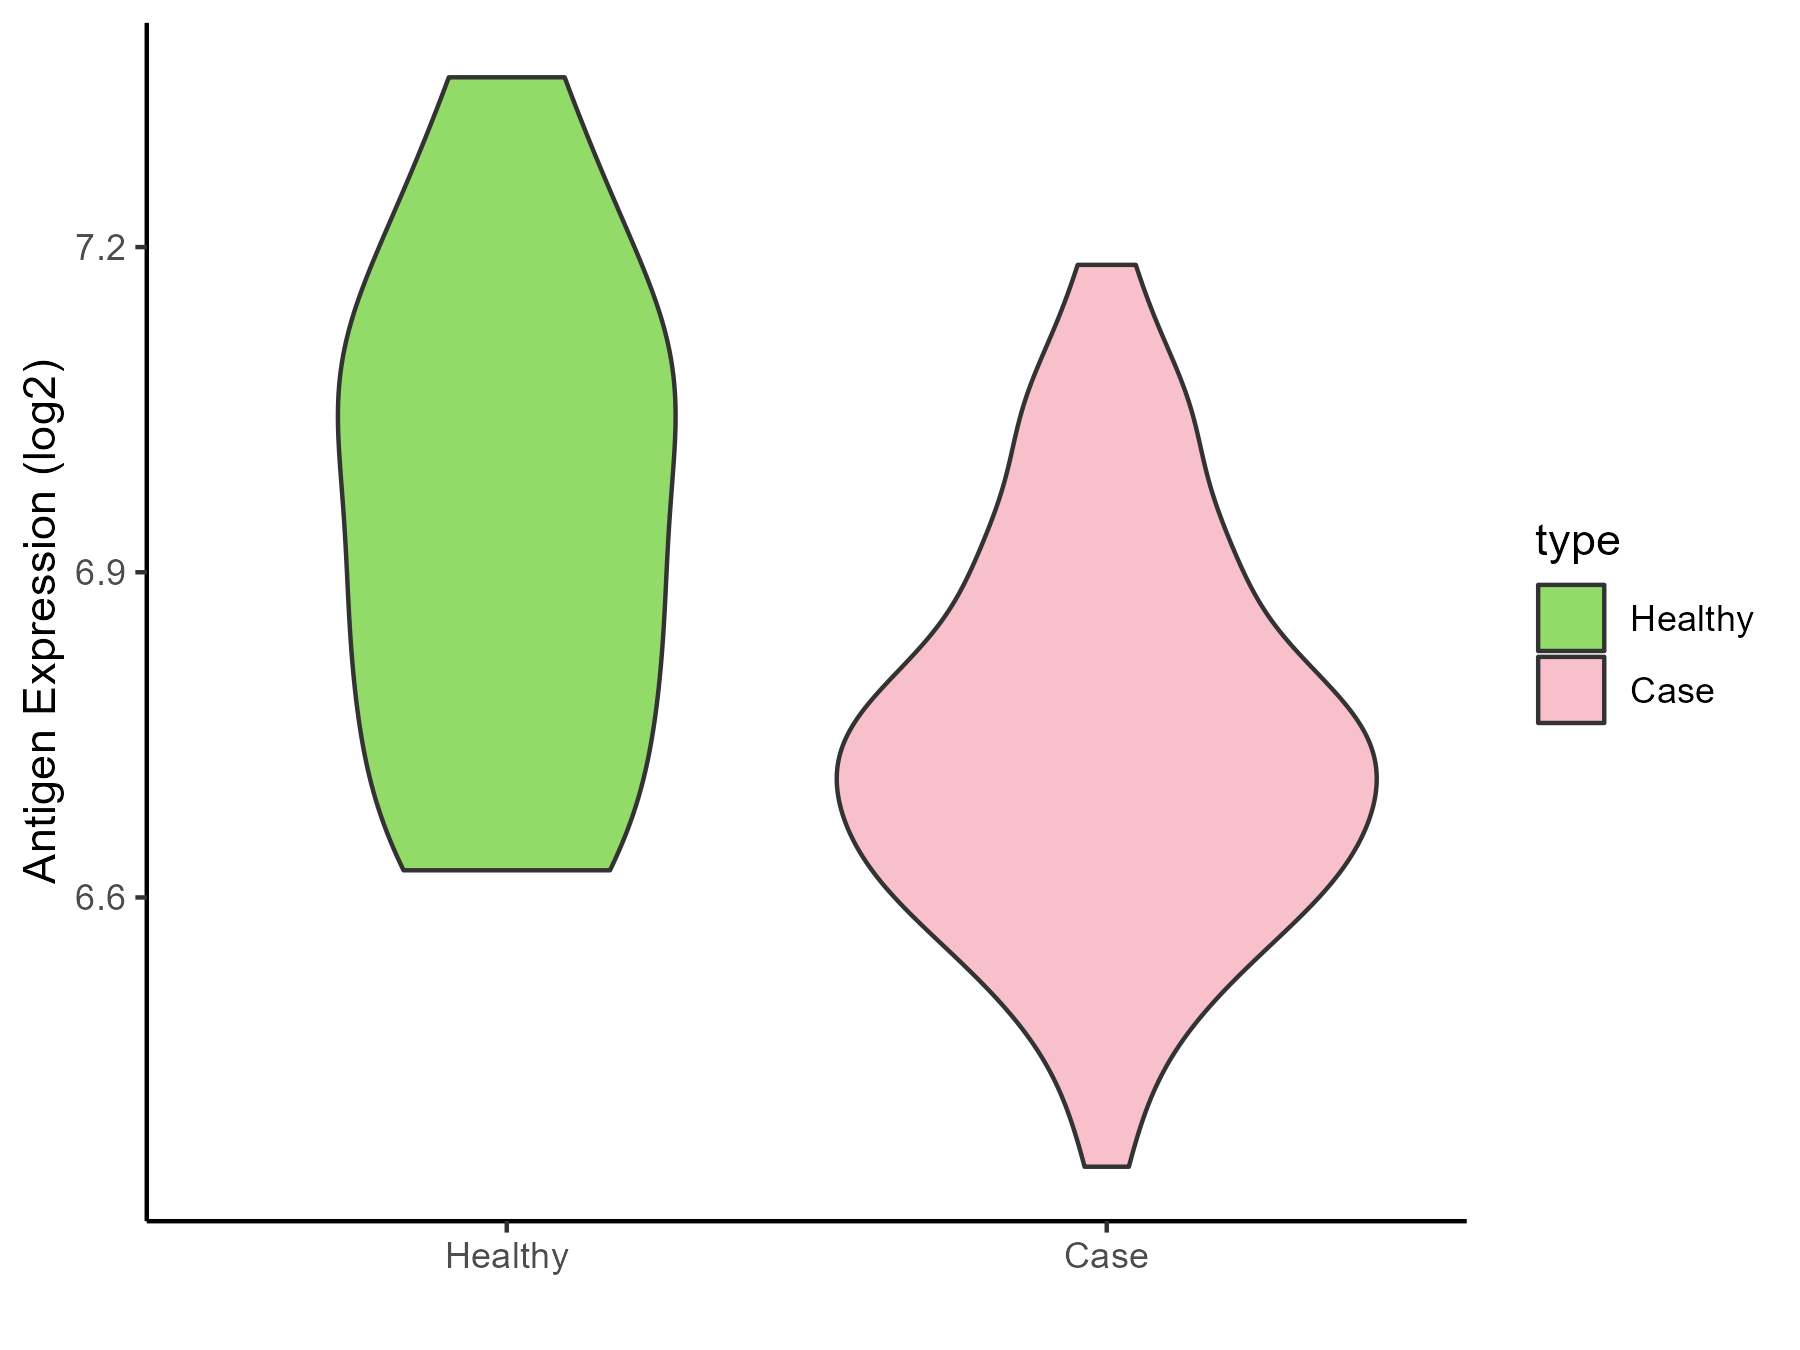
| The Studied Tissue | Cervical | |
| The Specific Disease | Cervical cancer | |
| The Expression Level of Disease Section Compare with the Healthy Individual Tissue | p-value: 0.001209979; Fold-change: -0.219233829; Z-score: -0.996821226 | |
| Disease-specific Antigen Abundances |
|
Click to View the Clearer Original Diagram |
| Differential expression pattern of antigen in diseases | ||
| The Studied Tissue | Endometrium | |
| The Specific Disease | Uterine cancer | |
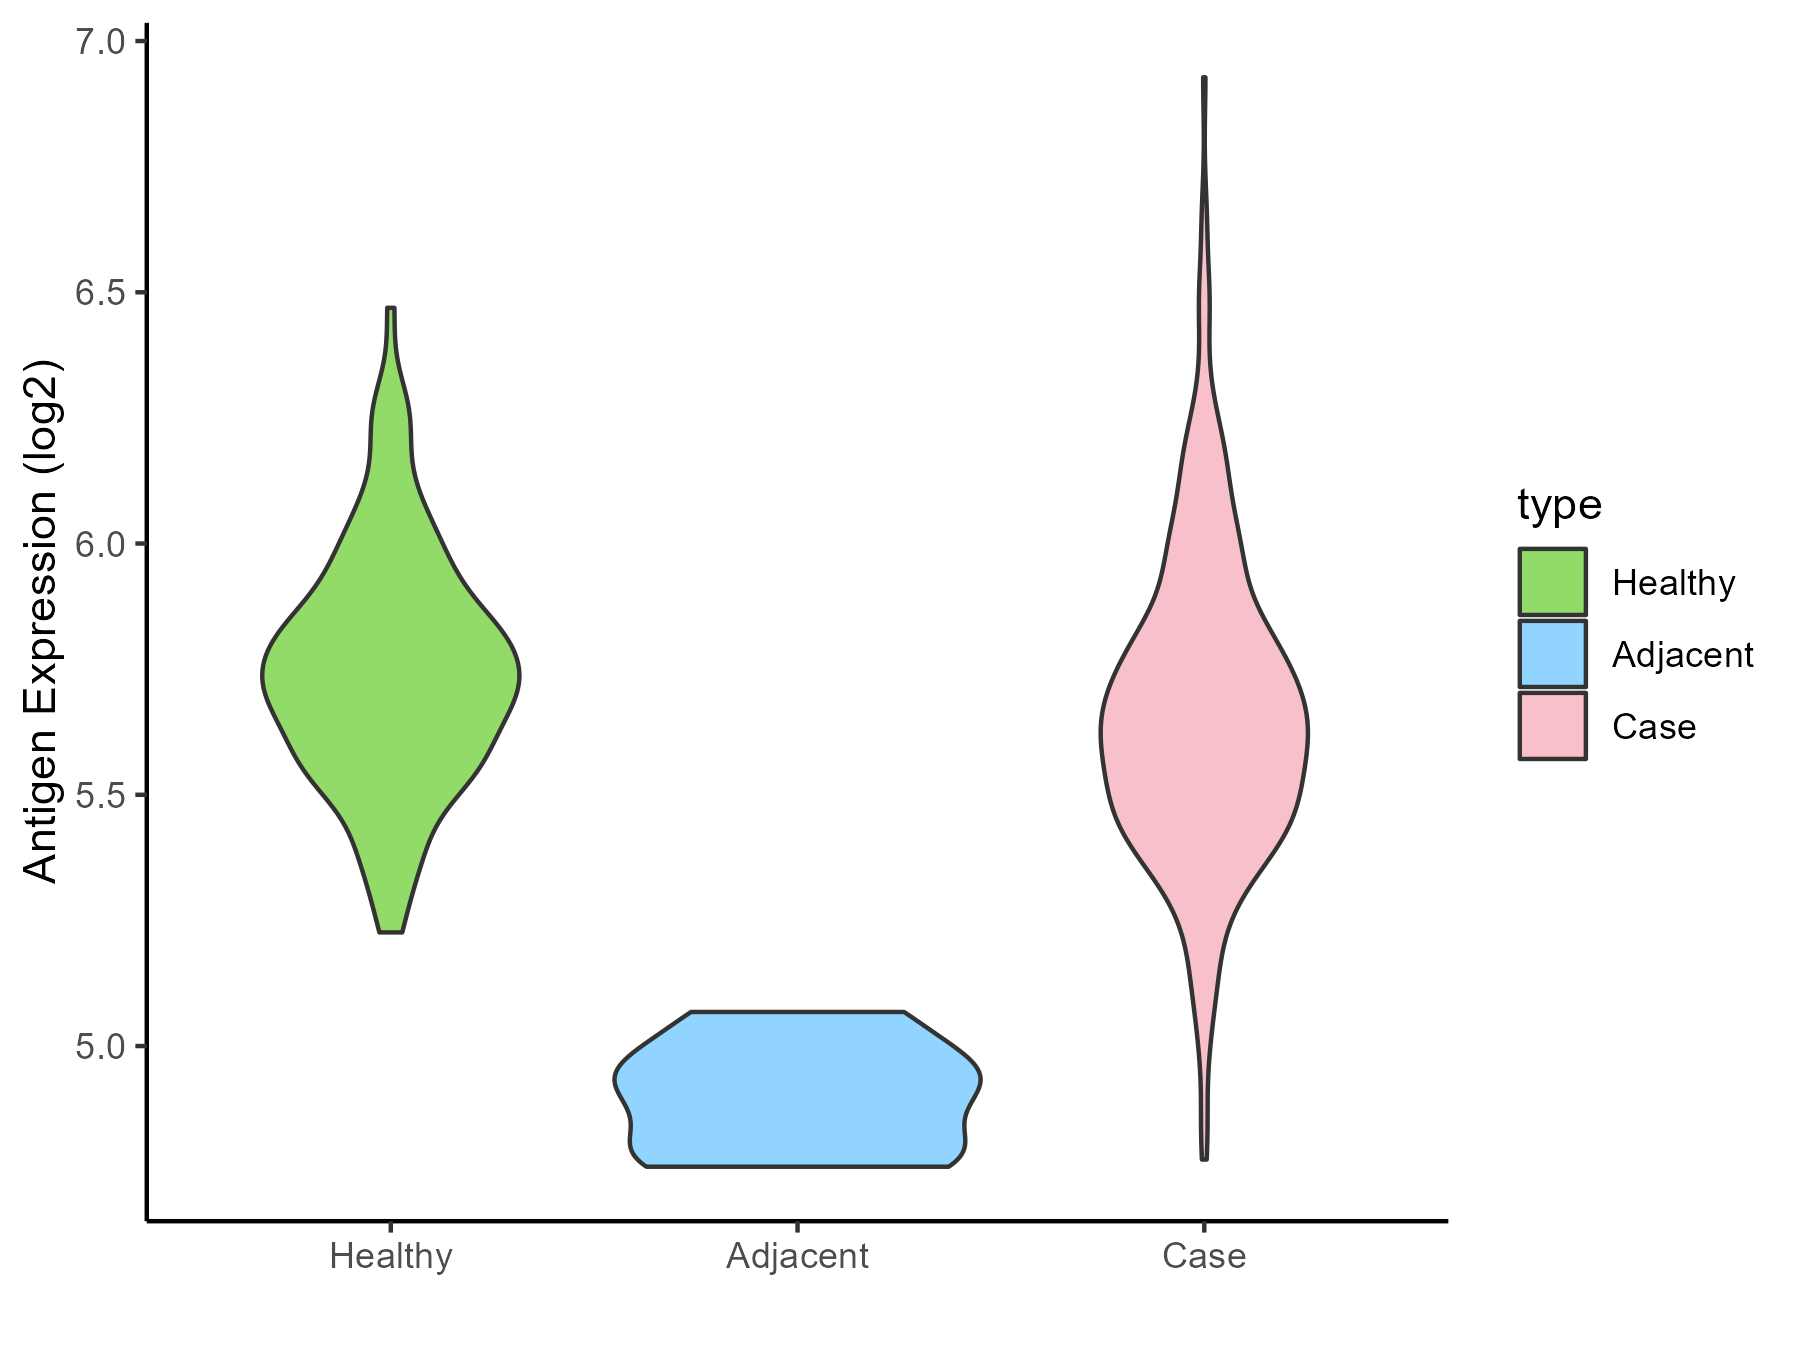
| The Expression Level of Disease Section Compare with the Healthy Individual Tissue | p-value: 0.001975237; Fold-change: -0.089186321; Z-score: -0.383195256 | |
| The Expression Level of Disease Section Compare with the Adjacent Tissue | p-value: 6.19E-05; Fold-change: 0.705884196; Z-score: 5.708723415 | |
| Disease-specific Antigen Abundances |
|
Click to View the Clearer Original Diagram |
| Differential expression pattern of antigen in diseases | ||
| The Studied Tissue | Prostate | |
| The Specific Disease | Prostate cancer | |
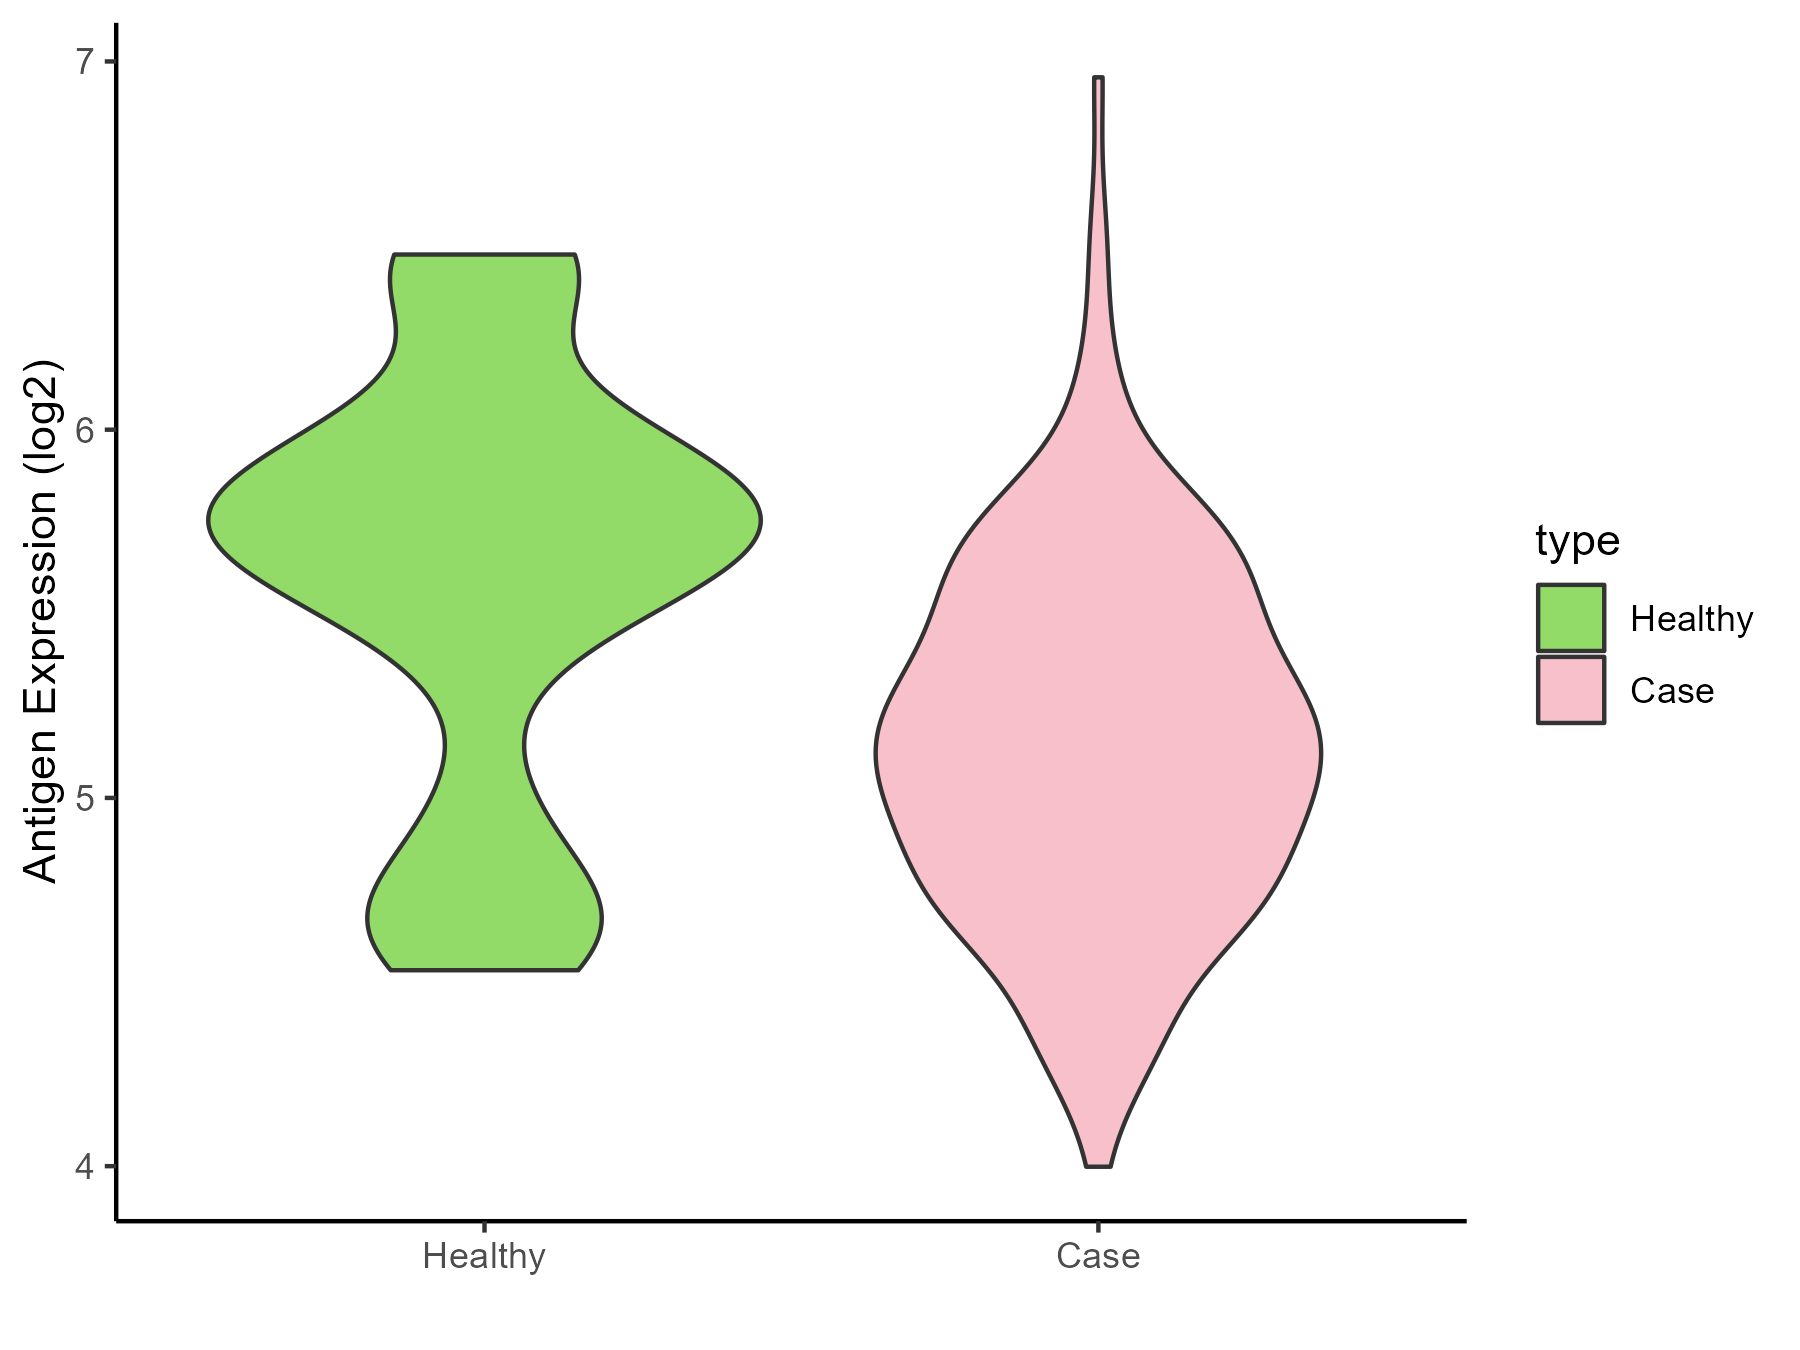
| The Expression Level of Disease Section Compare with the Healthy Individual Tissue | p-value: 0.002736557; Fold-change: -0.528968328; Z-score: -0.902885543 | |
| Disease-specific Antigen Abundances |
|
Click to View the Clearer Original Diagram |
| Differential expression pattern of antigen in diseases | ||
| The Studied Tissue | Bladder | |
| The Specific Disease | Bladder cancer | |
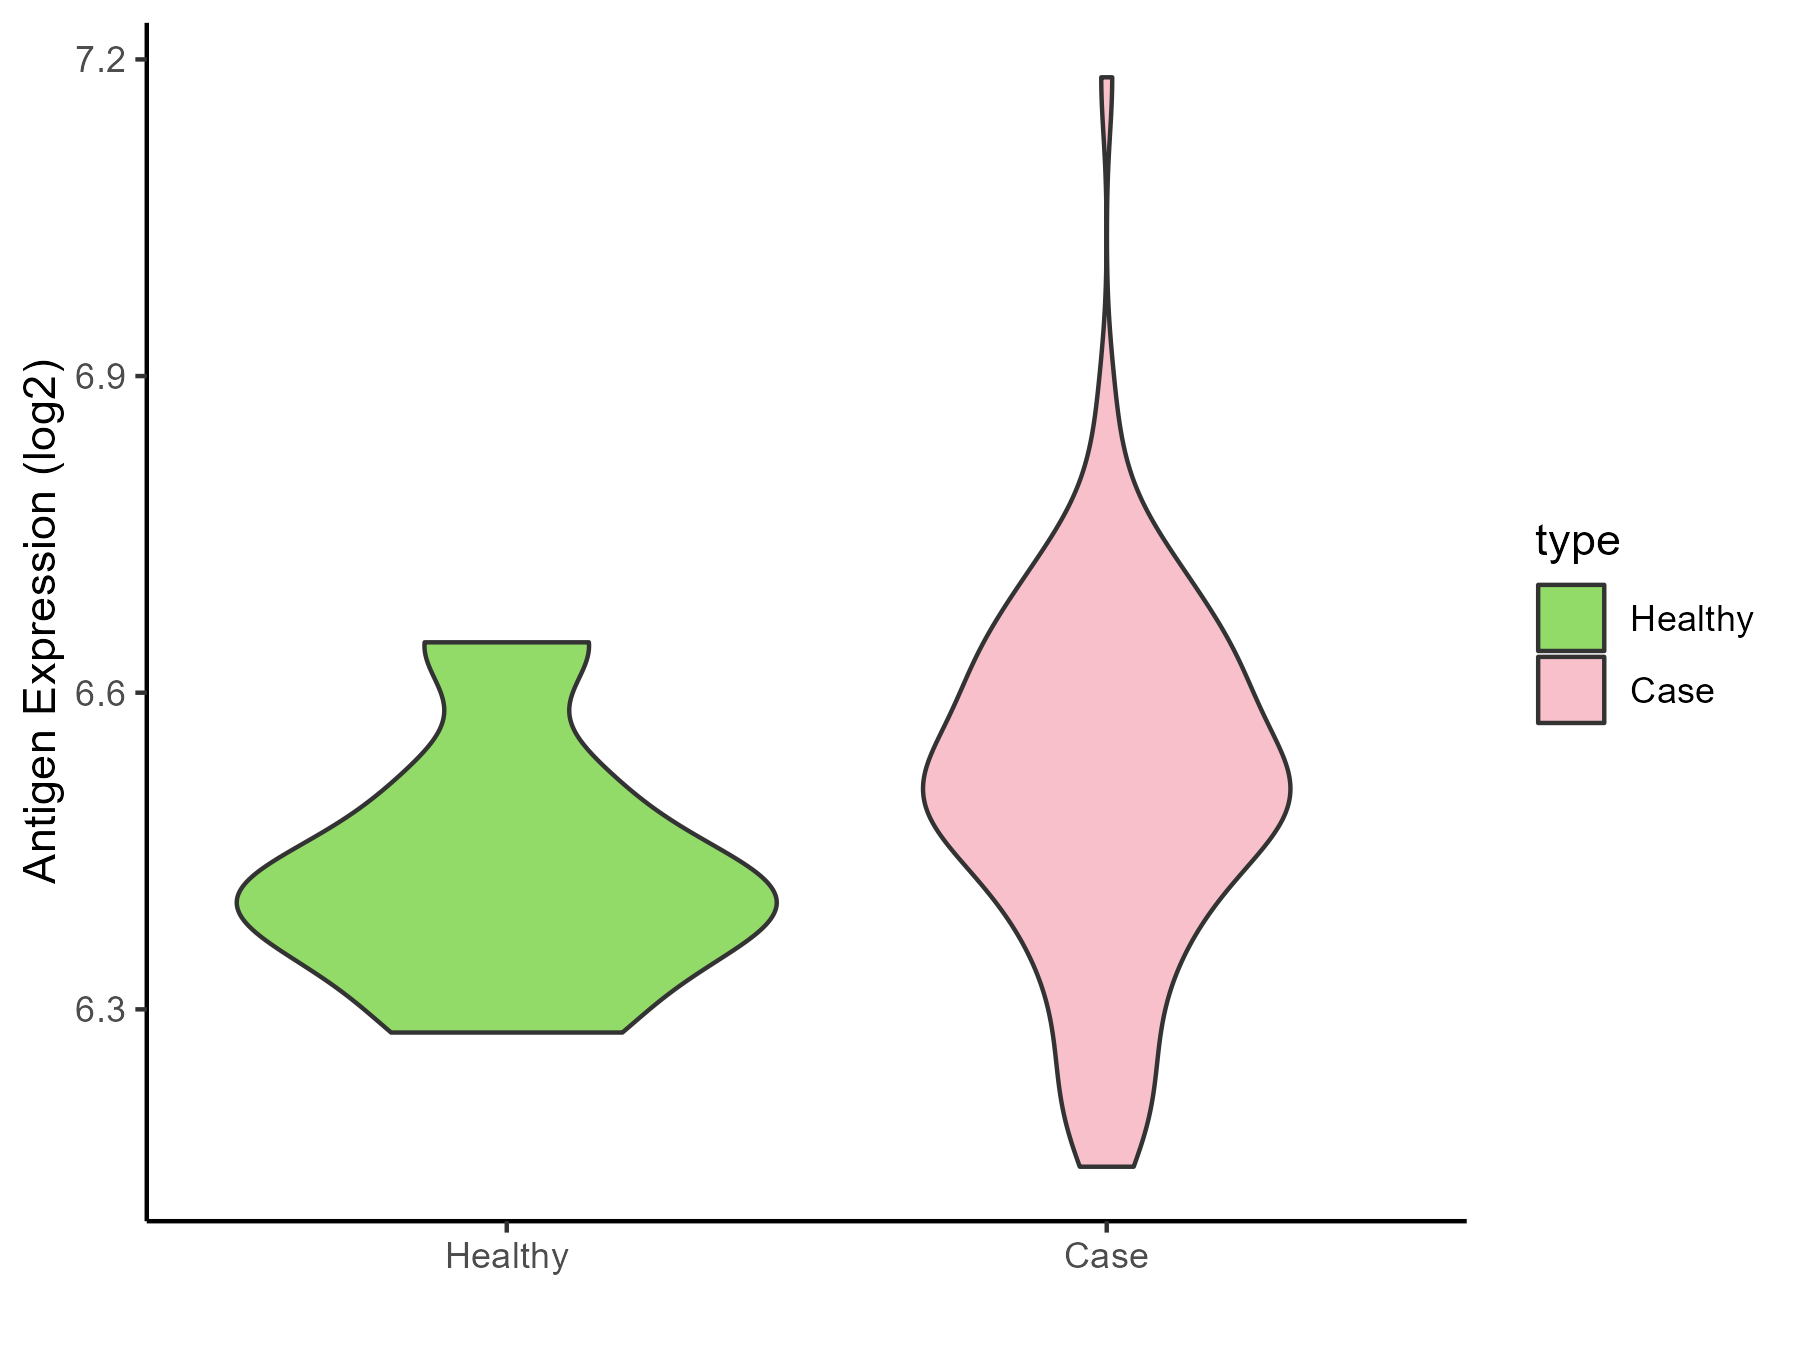
| The Expression Level of Disease Section Compare with the Healthy Individual Tissue | p-value: 0.131969739; Fold-change: 0.092870785; Z-score: 0.775460382 | |
| Disease-specific Antigen Abundances |
|
Click to View the Clearer Original Diagram |
| Differential expression pattern of antigen in diseases | ||
| The Studied Tissue | Uvea | |
| The Specific Disease | Retinoblastoma tumor | |
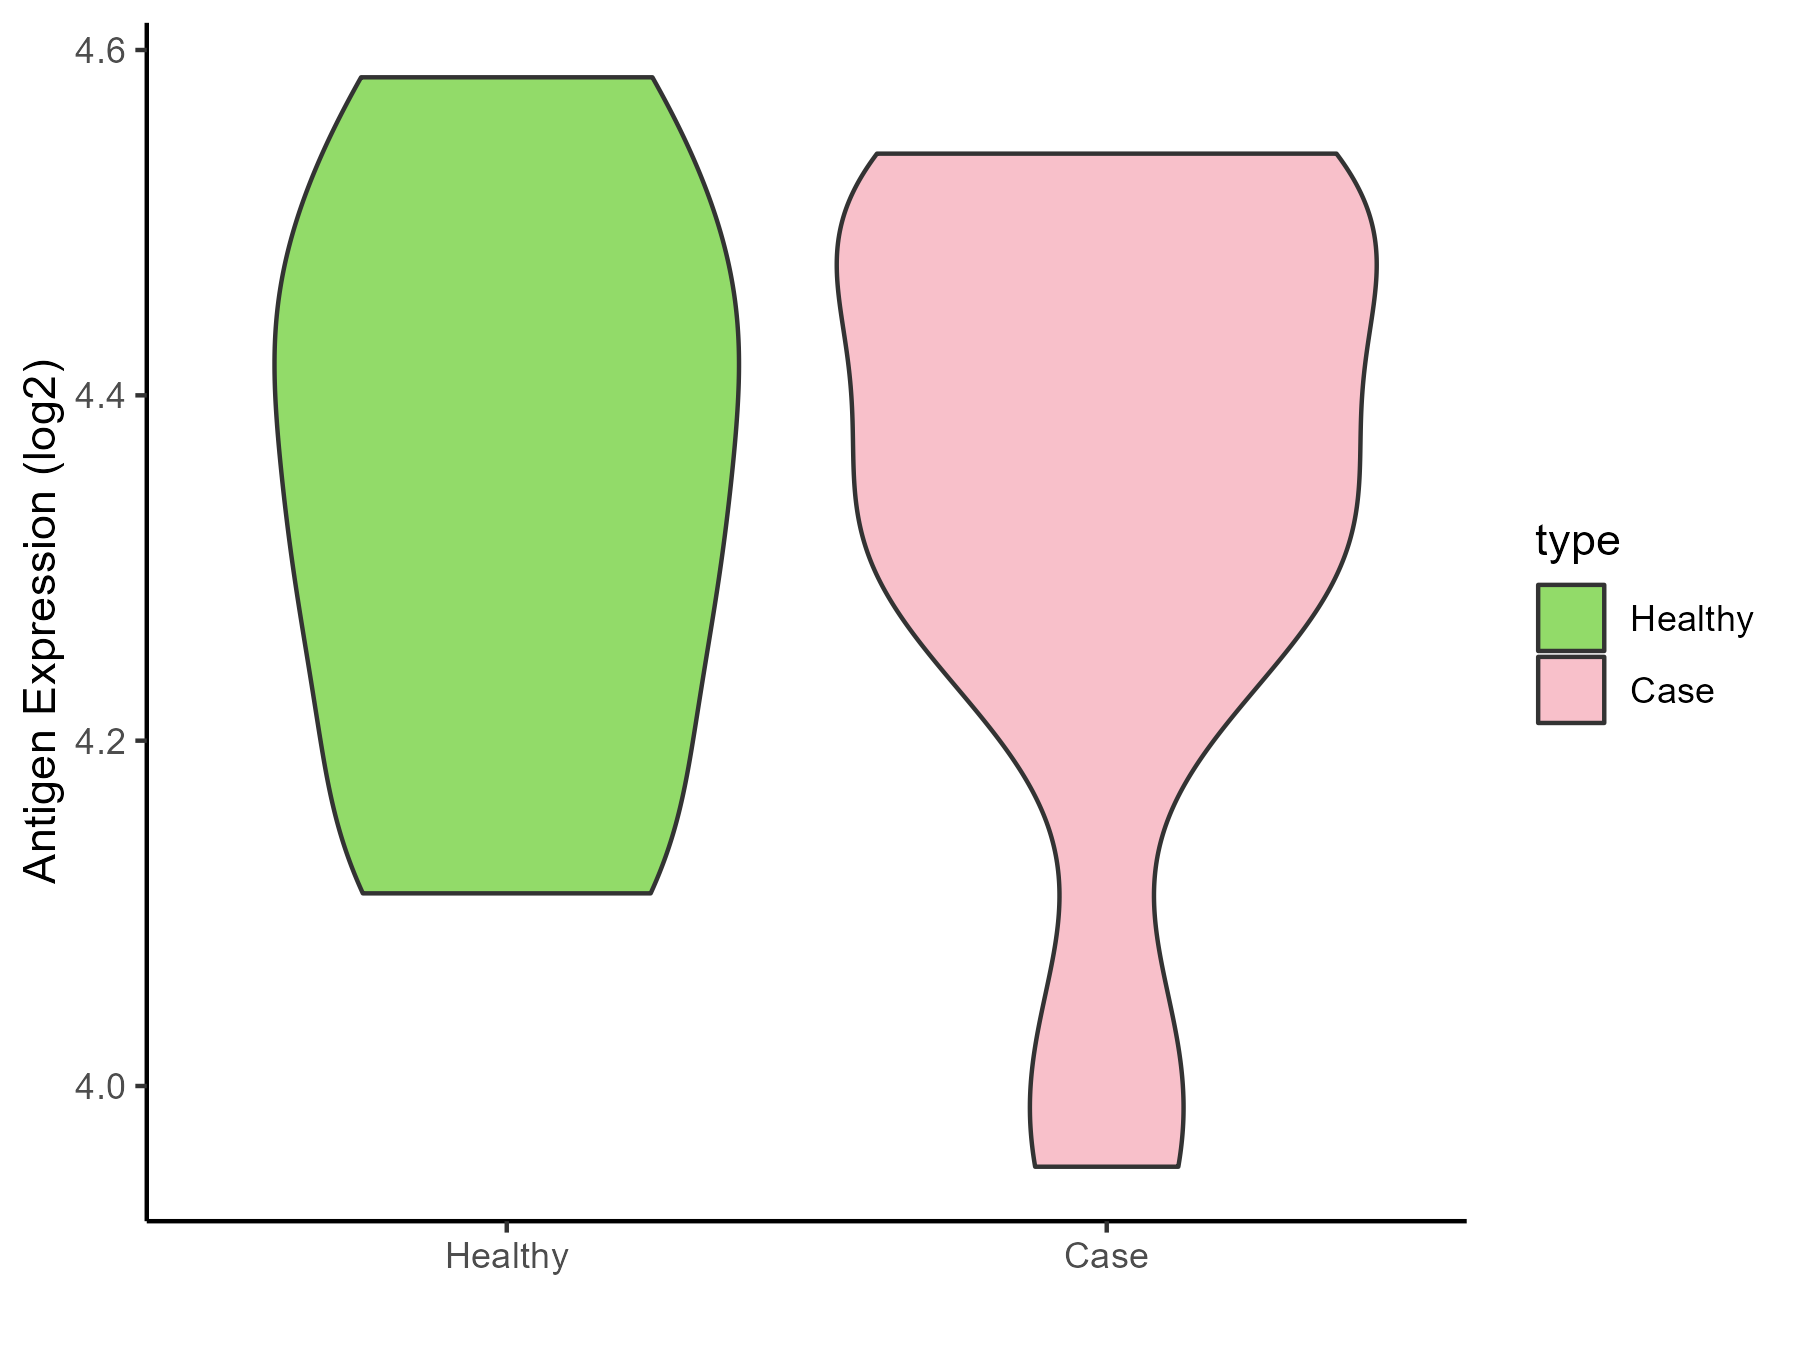
| The Expression Level of Disease Section Compare with the Healthy Individual Tissue | p-value: 0.974416323; Fold-change: 0.001076983; Z-score: 0.006611129 | |
| Disease-specific Antigen Abundances |
|
Click to View the Clearer Original Diagram |
| Differential expression pattern of antigen in diseases | ||
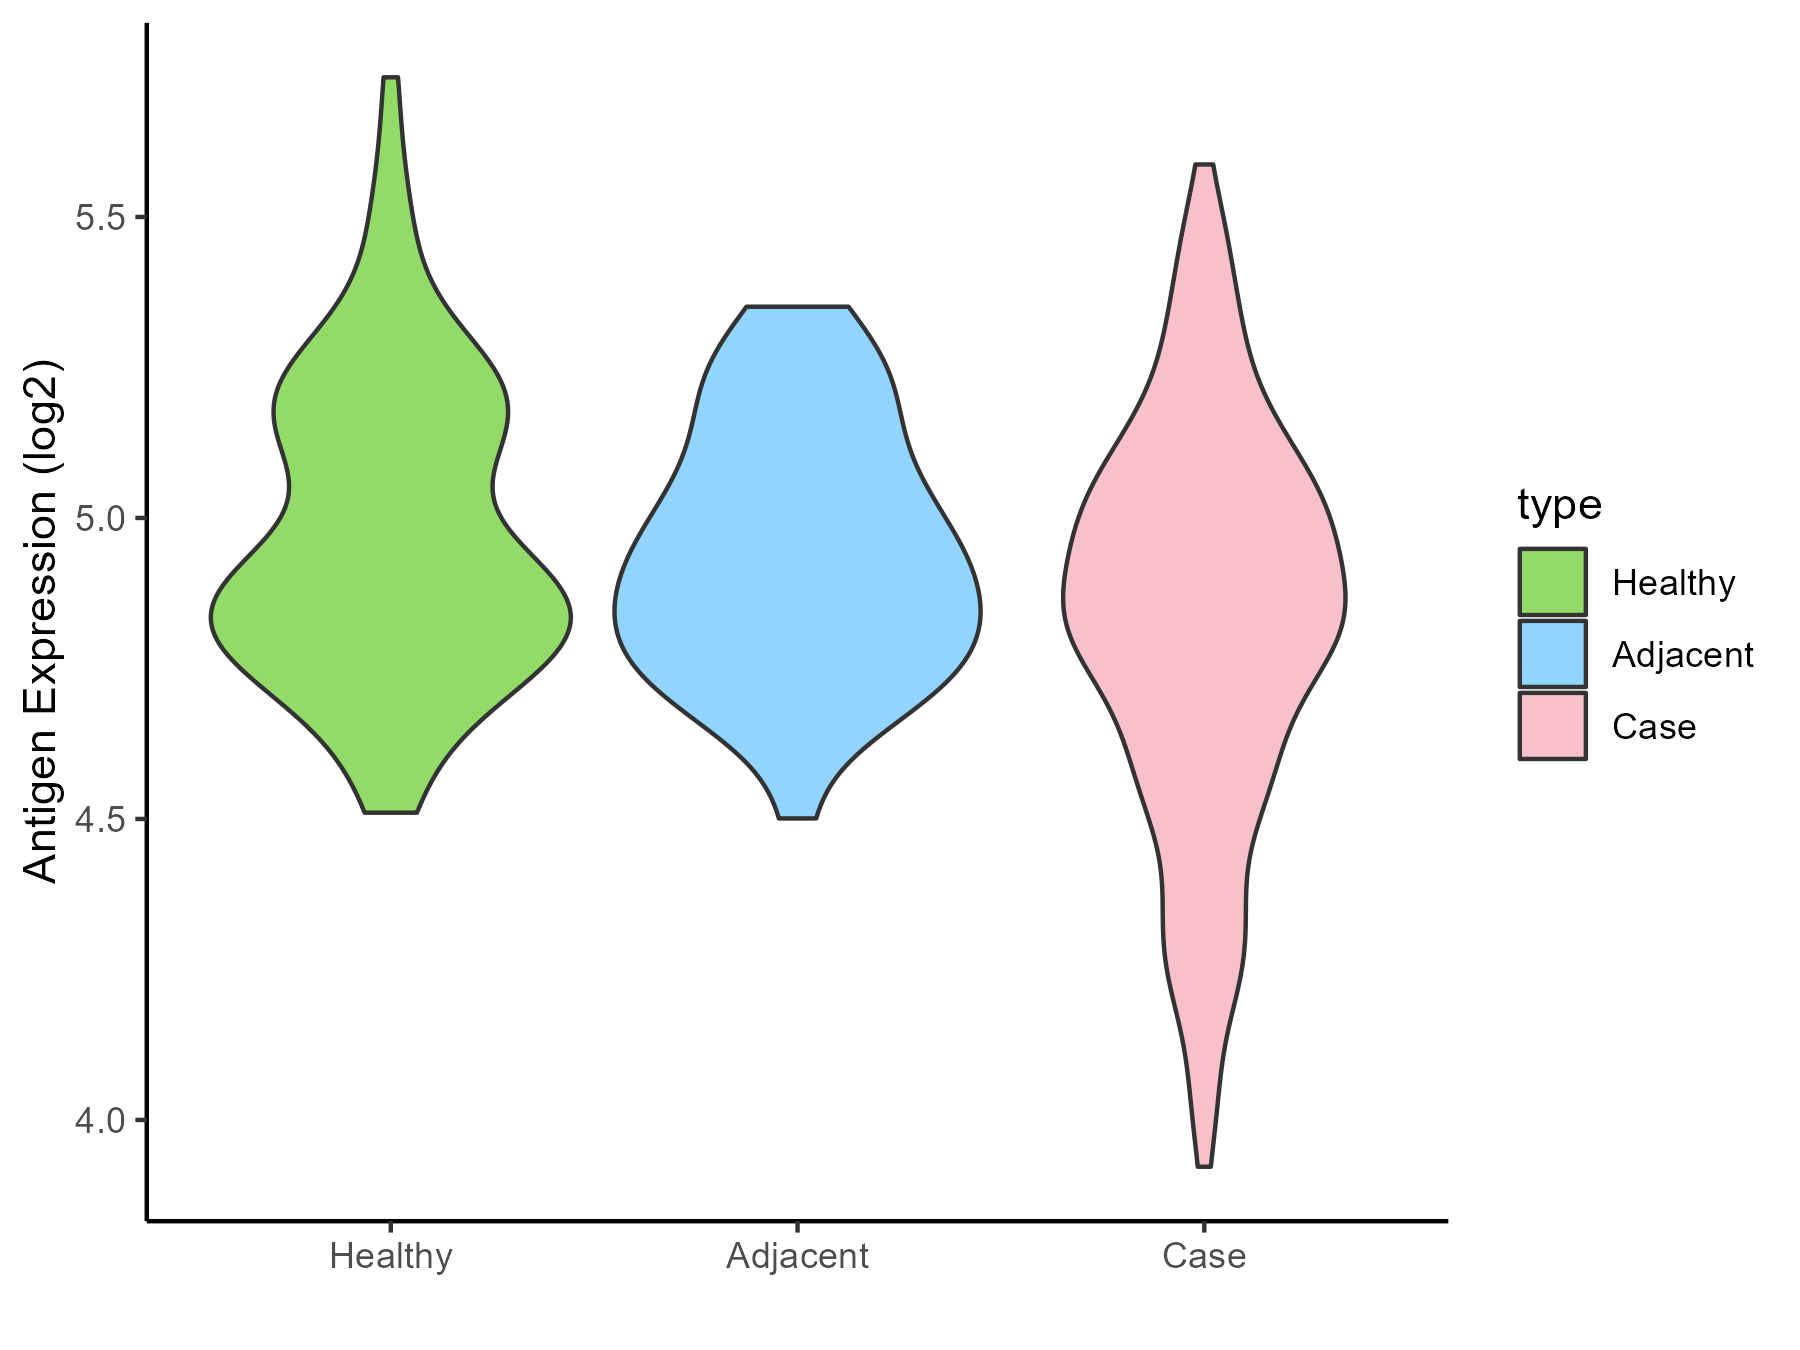
| The Studied Tissue | Thyroid | |
| The Specific Disease | Thyroid cancer | |
| The Expression Level of Disease Section Compare with the Healthy Individual Tissue | p-value: 2.53E-06; Fold-change: -0.069342385; Z-score: -0.276331373 | |
| The Expression Level of Disease Section Compare with the Adjacent Tissue | p-value: 0.003194736; Fold-change: -0.077719667; Z-score: -0.376172281 | |
| Disease-specific Antigen Abundances |
|
Click to View the Clearer Original Diagram |
| Differential expression pattern of antigen in diseases | ||
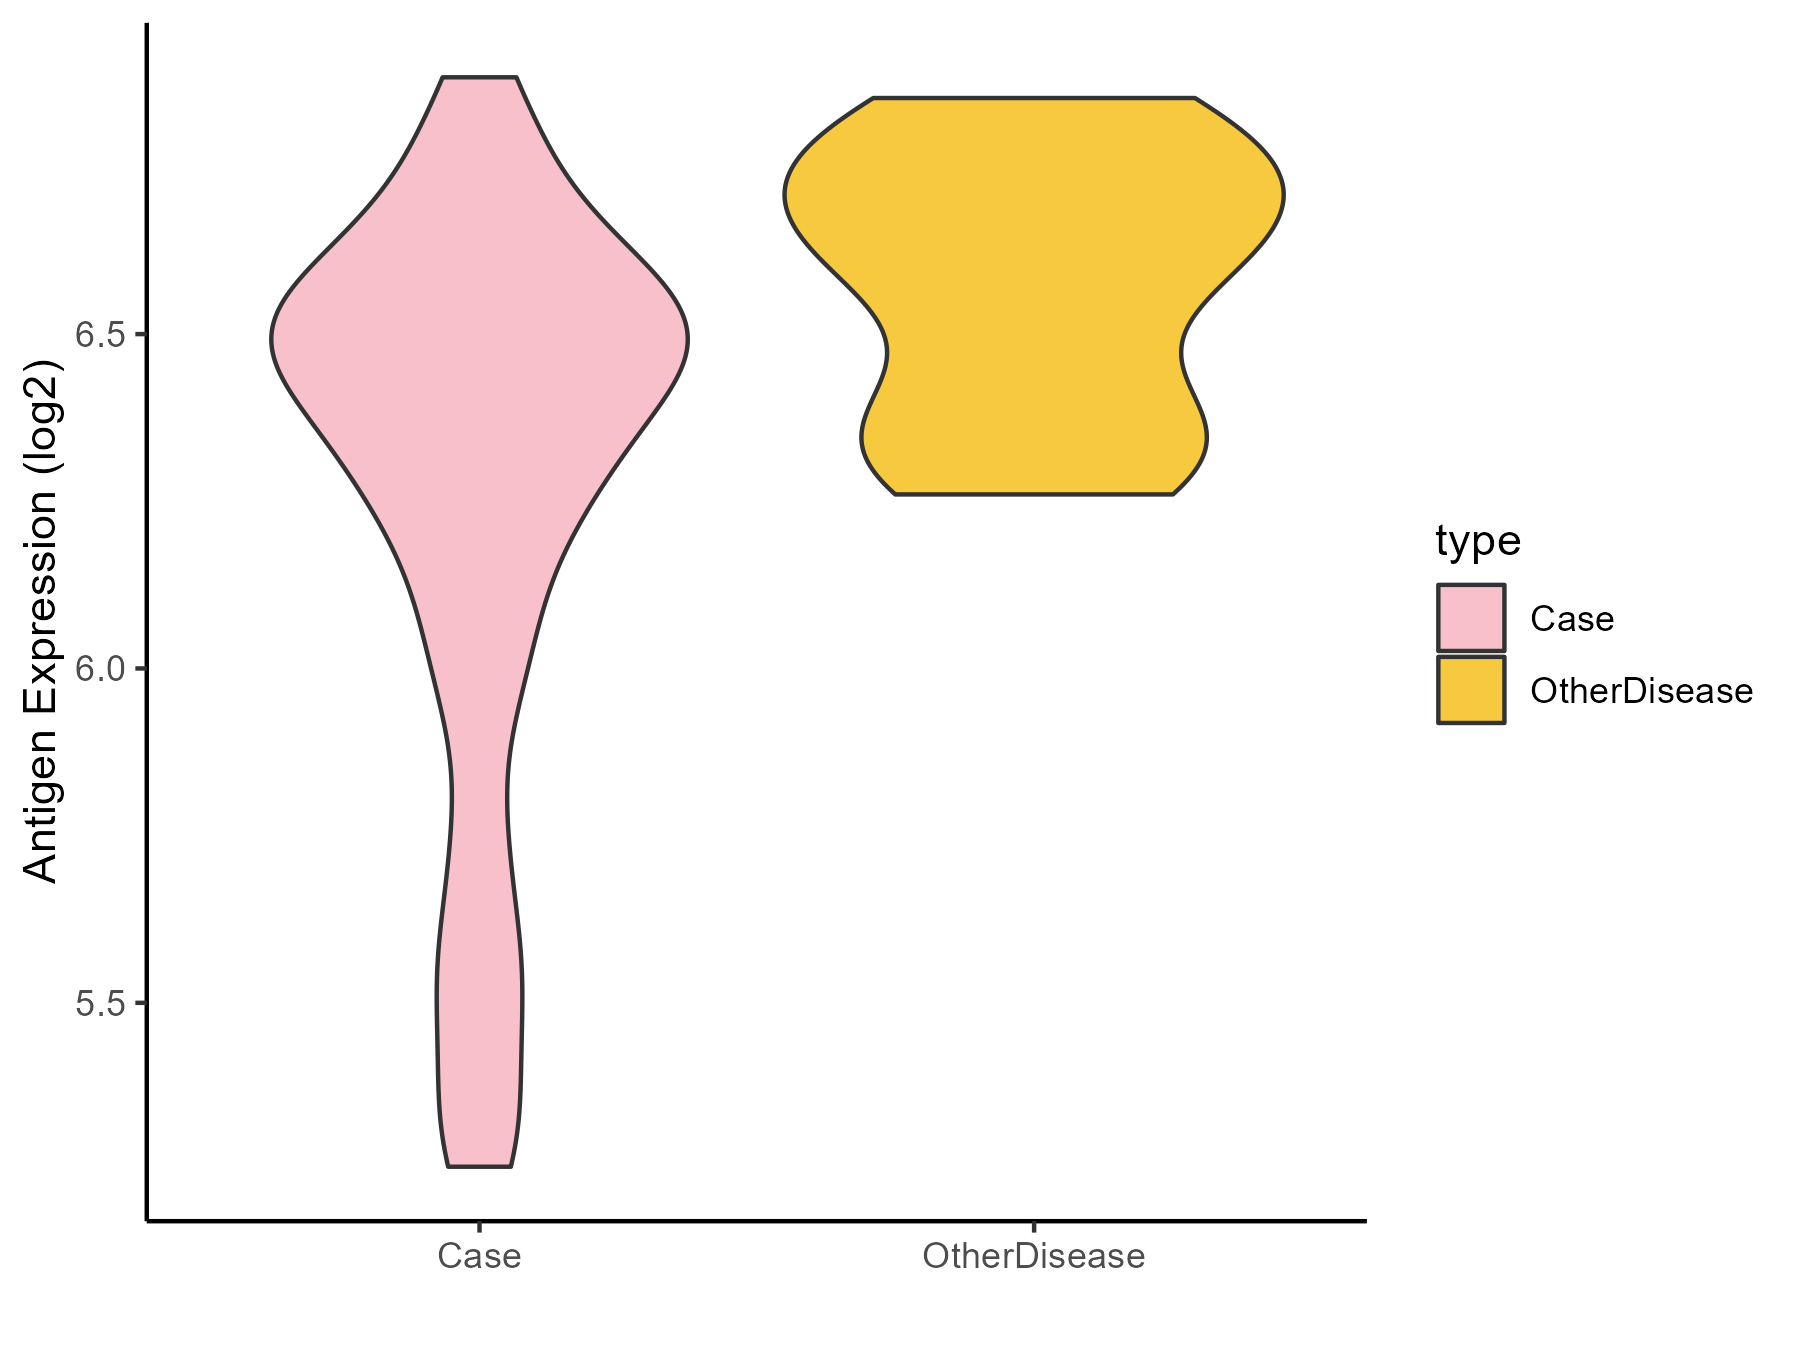
| The Studied Tissue | Adrenal cortex | |
| The Specific Disease | Adrenocortical carcinoma | |
| The Expression Level of Disease Section Compare with the Other Disease Section | p-value: 1.18E-05; Fold-change: -0.201410598; Z-score: -0.987850299 | |
| Disease-specific Antigen Abundances |
|
Click to View the Clearer Original Diagram |
| Differential expression pattern of antigen in diseases | ||
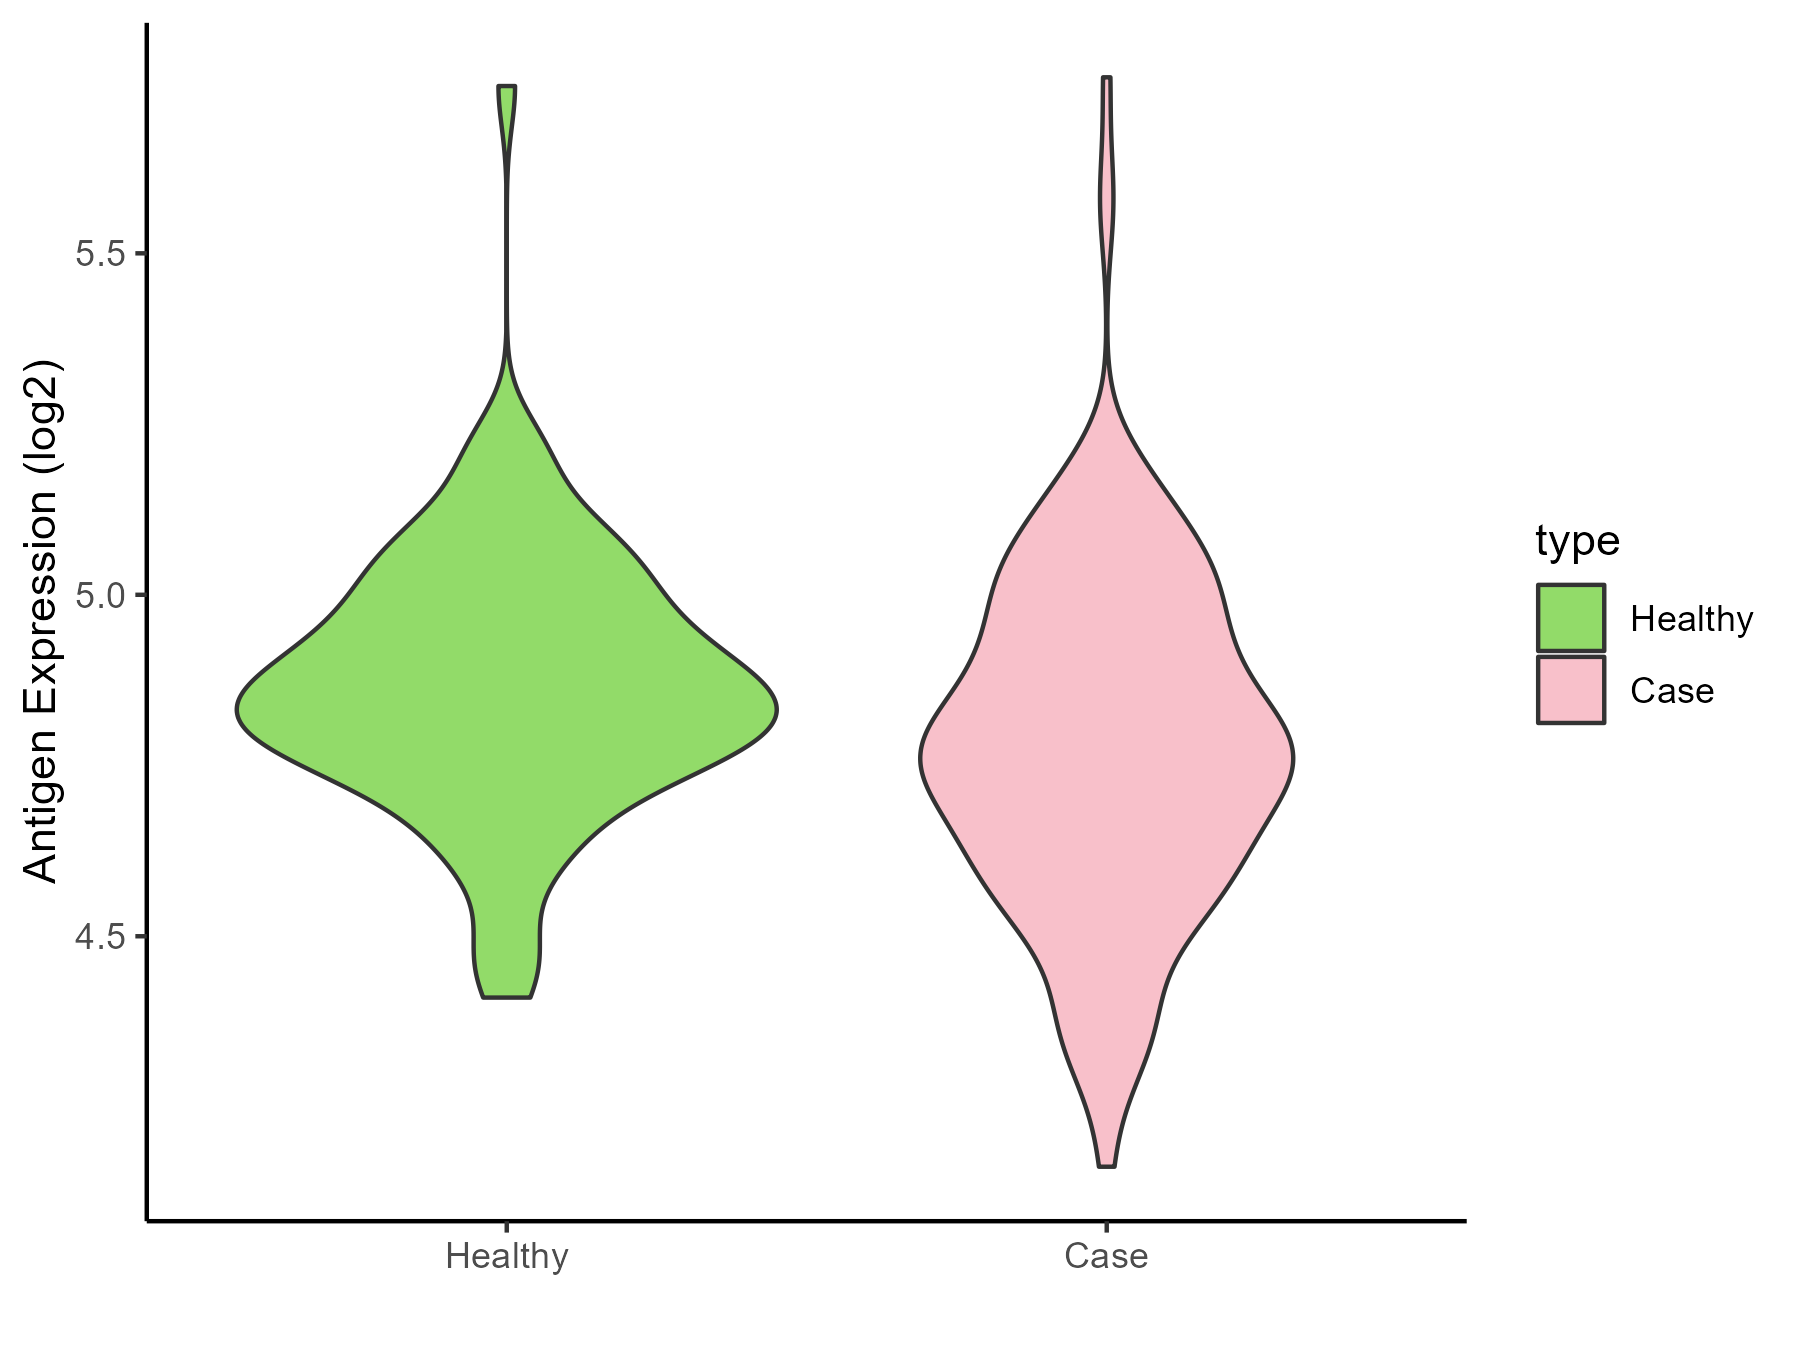
| The Studied Tissue | Head and neck | |
| The Specific Disease | Head and neck cancer | |
| The Expression Level of Disease Section Compare with the Healthy Individual Tissue | p-value: 0.001184174; Fold-change: -0.093993602; Z-score: -0.48193288 | |
| Disease-specific Antigen Abundances |
|
Click to View the Clearer Original Diagram |
| Differential expression pattern of antigen in diseases | ||
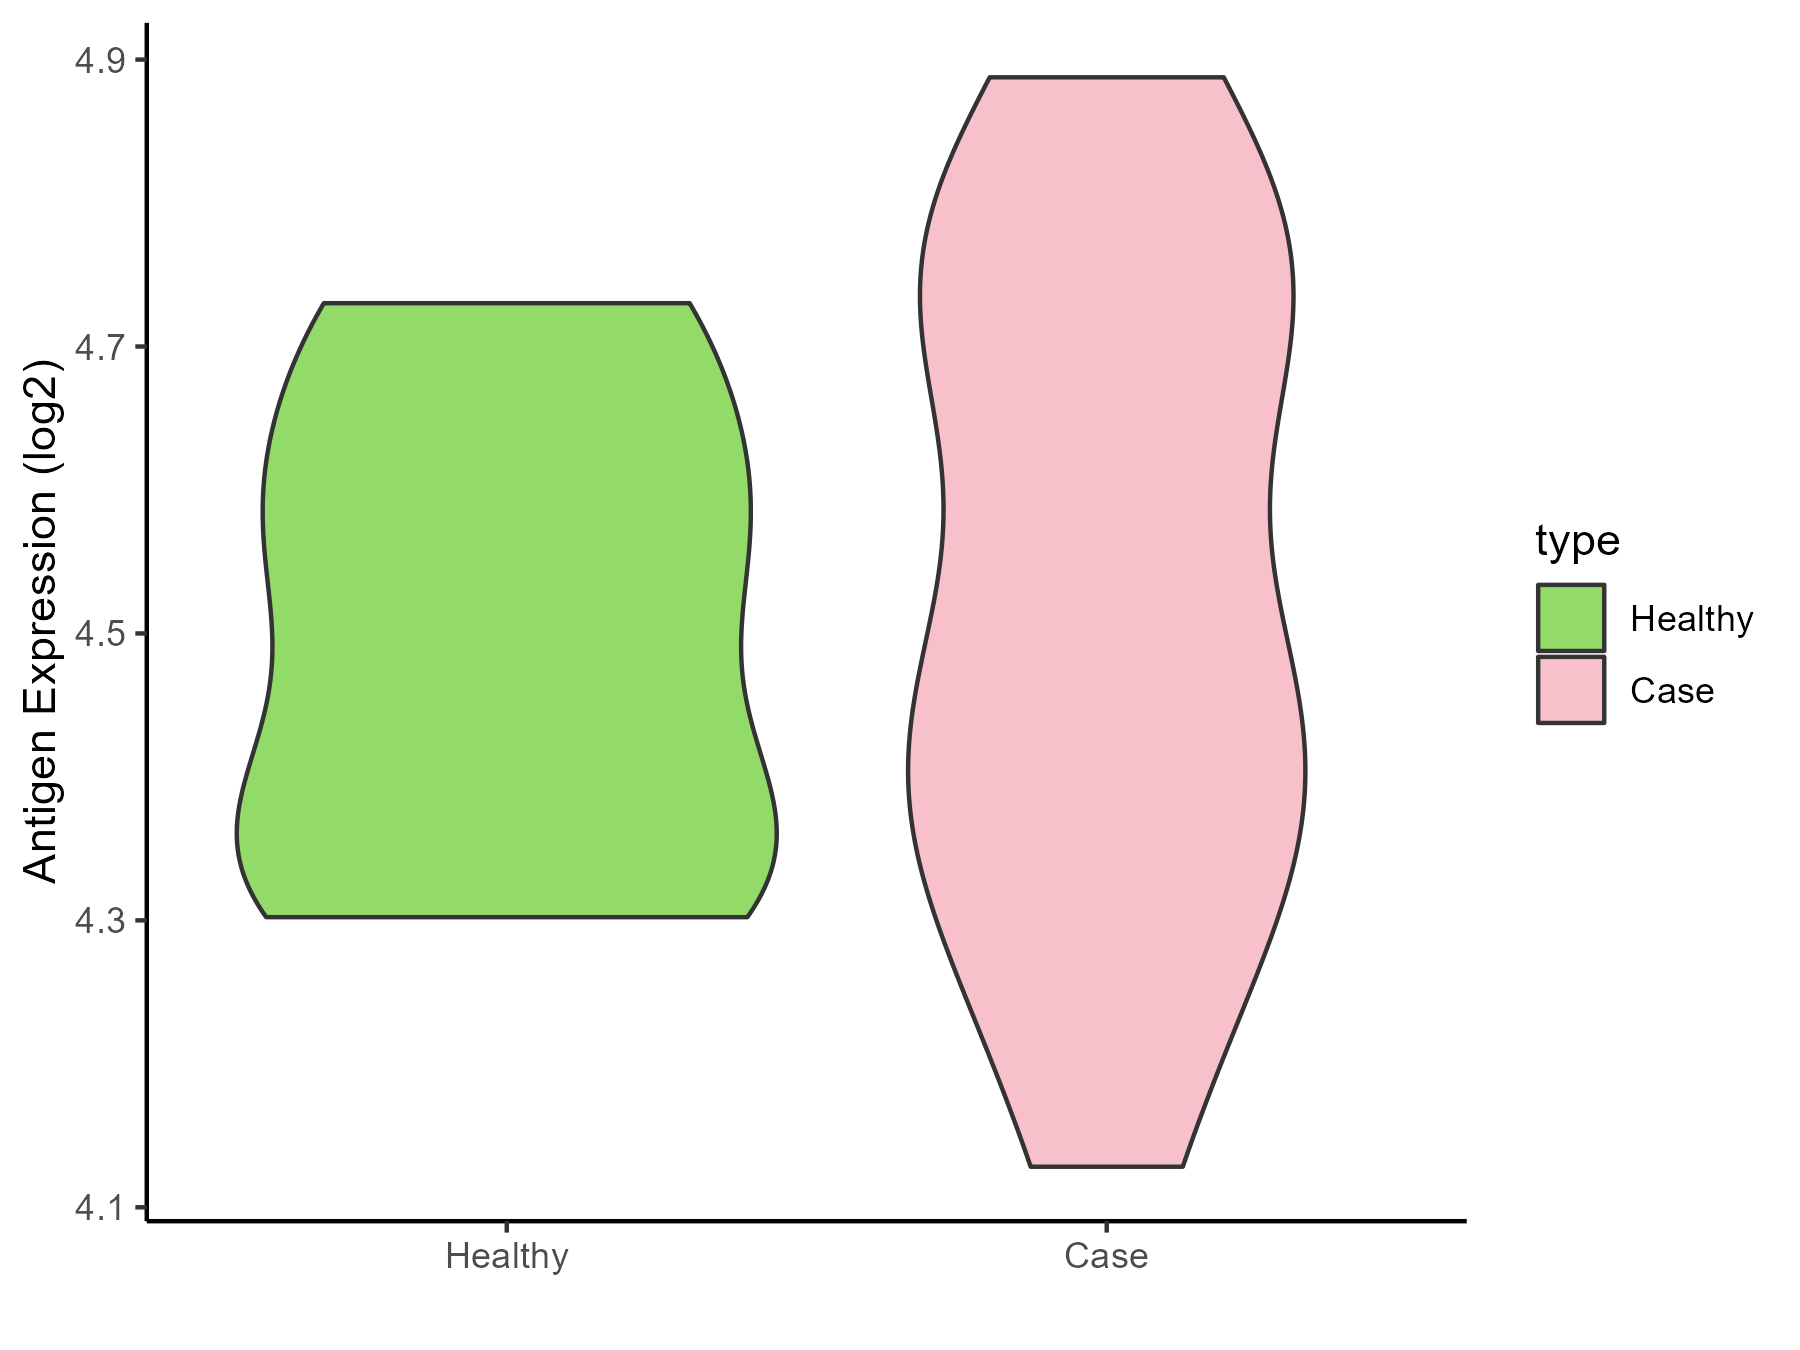
| The Studied Tissue | Pituitary | |
| The Specific Disease | Pituitary gonadotrope tumor | |
| The Expression Level of Disease Section Compare with the Healthy Individual Tissue | p-value: 0.72374308; Fold-change: -0.05878199; Z-score: -0.349835913 | |
| Disease-specific Antigen Abundances |
|
Click to View the Clearer Original Diagram |
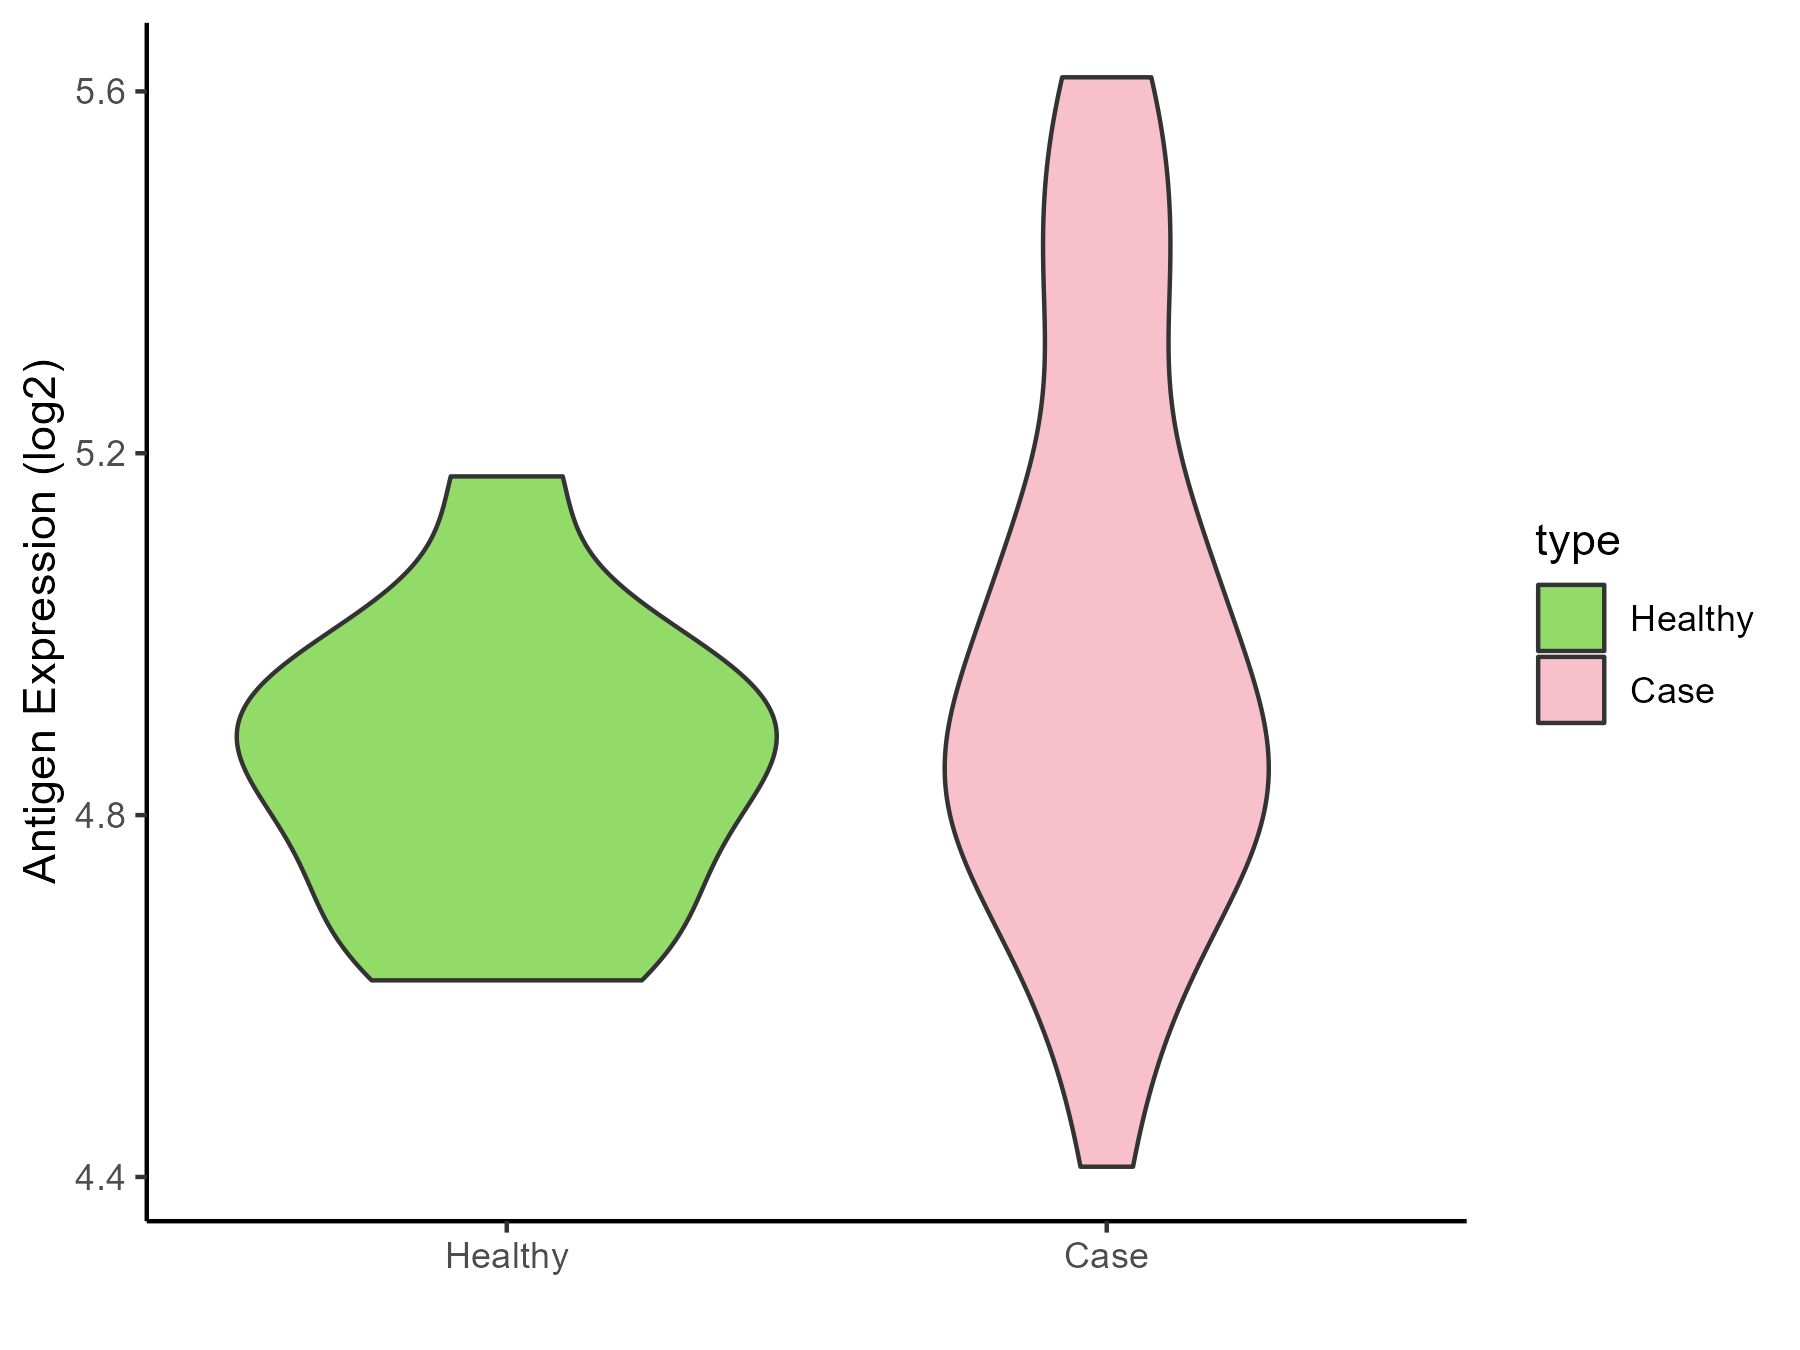
| The Studied Tissue | Pituitary | |
| The Specific Disease | Pituitary cancer | |
| The Expression Level of Disease Section Compare with the Healthy Individual Tissue | p-value: 0.071458539; Fold-change: 0.076726474; Z-score: 0.477460136 | |
| Disease-specific Antigen Abundances |
|
Click to View the Clearer Original Diagram |
ICD Disease Classification 03
| Differential expression pattern of antigen in diseases | ||
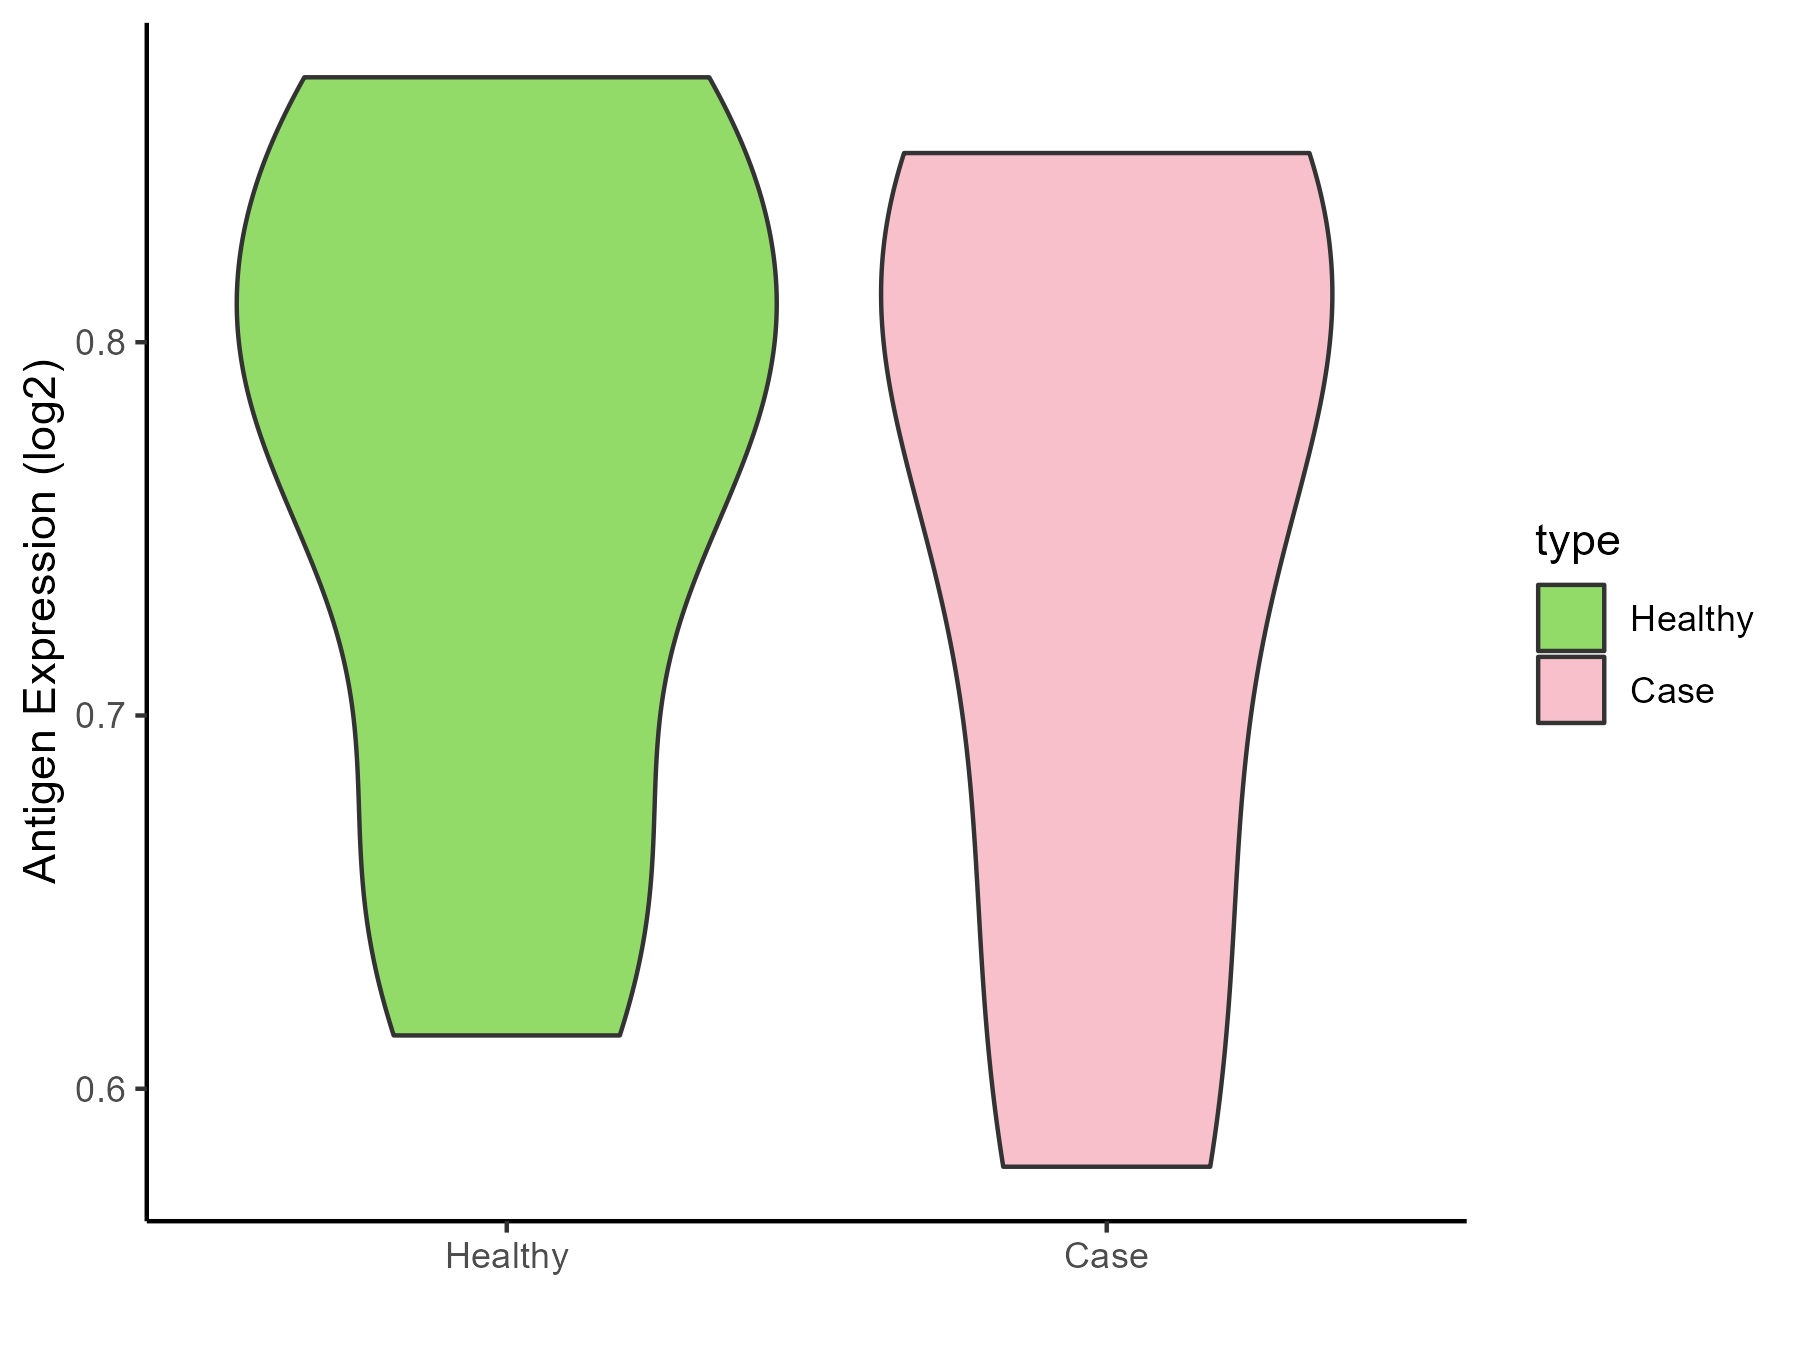
| The Studied Tissue | Whole blood | |
| The Specific Disease | Thrombocytopenia | |
| The Expression Level of Disease Section Compare with the Healthy Individual Tissue | p-value: 0.714365025; Fold-change: 0.009825228; Z-score: 0.109240679 | |
| Disease-specific Antigen Abundances |
|
Click to View the Clearer Original Diagram |
ICD Disease Classification 04
| Differential expression pattern of antigen in diseases | ||
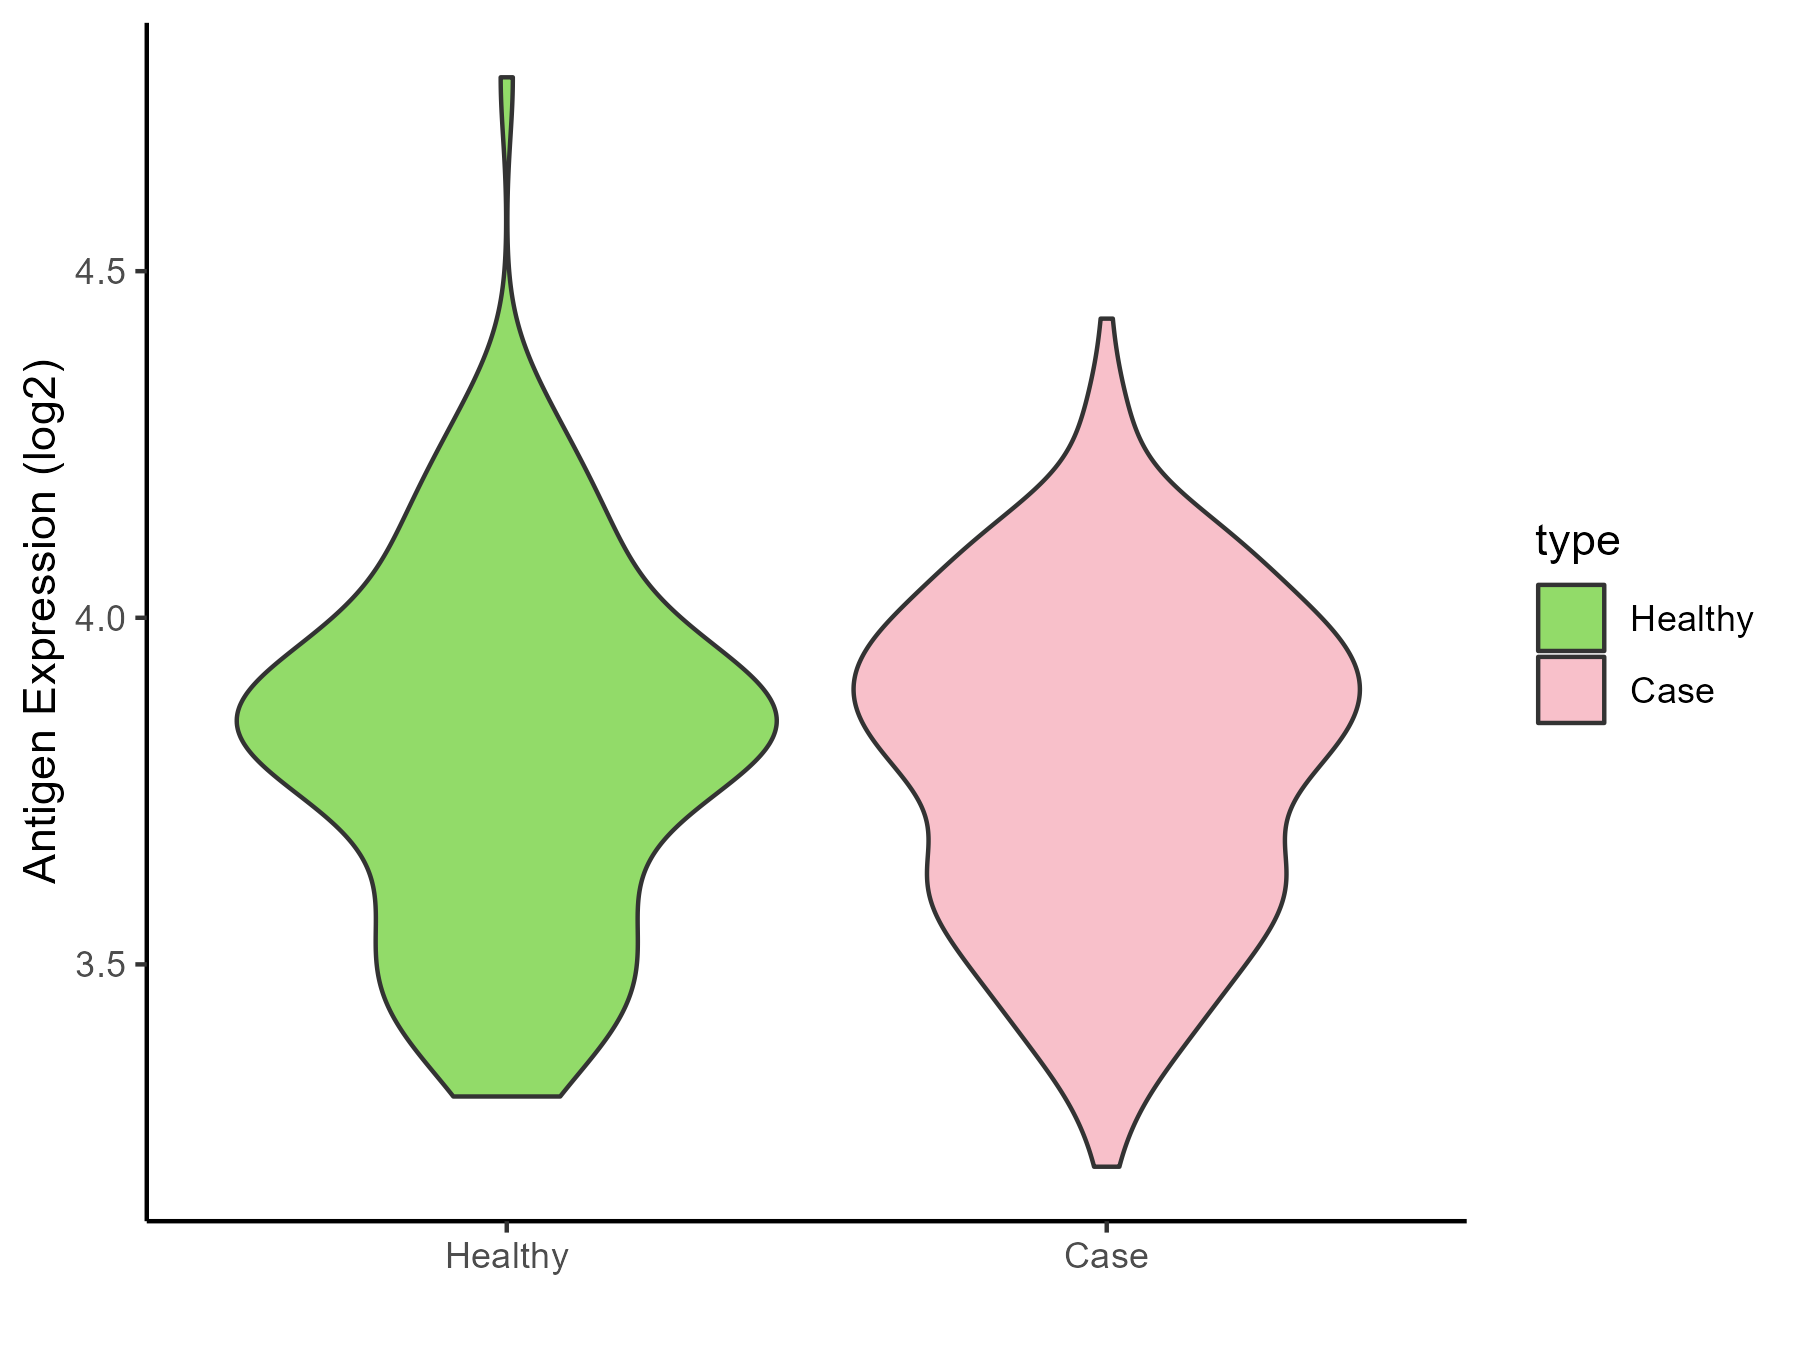
| The Studied Tissue | Whole blood | |
| The Specific Disease | Lupus erythematosus | |
| The Expression Level of Disease Section Compare with the Healthy Individual Tissue | p-value: 0.55603468; Fold-change: -0.012266804; Z-score: -0.047103522 | |
| Disease-specific Antigen Abundances |
|
Click to View the Clearer Original Diagram |
| Differential expression pattern of antigen in diseases | ||
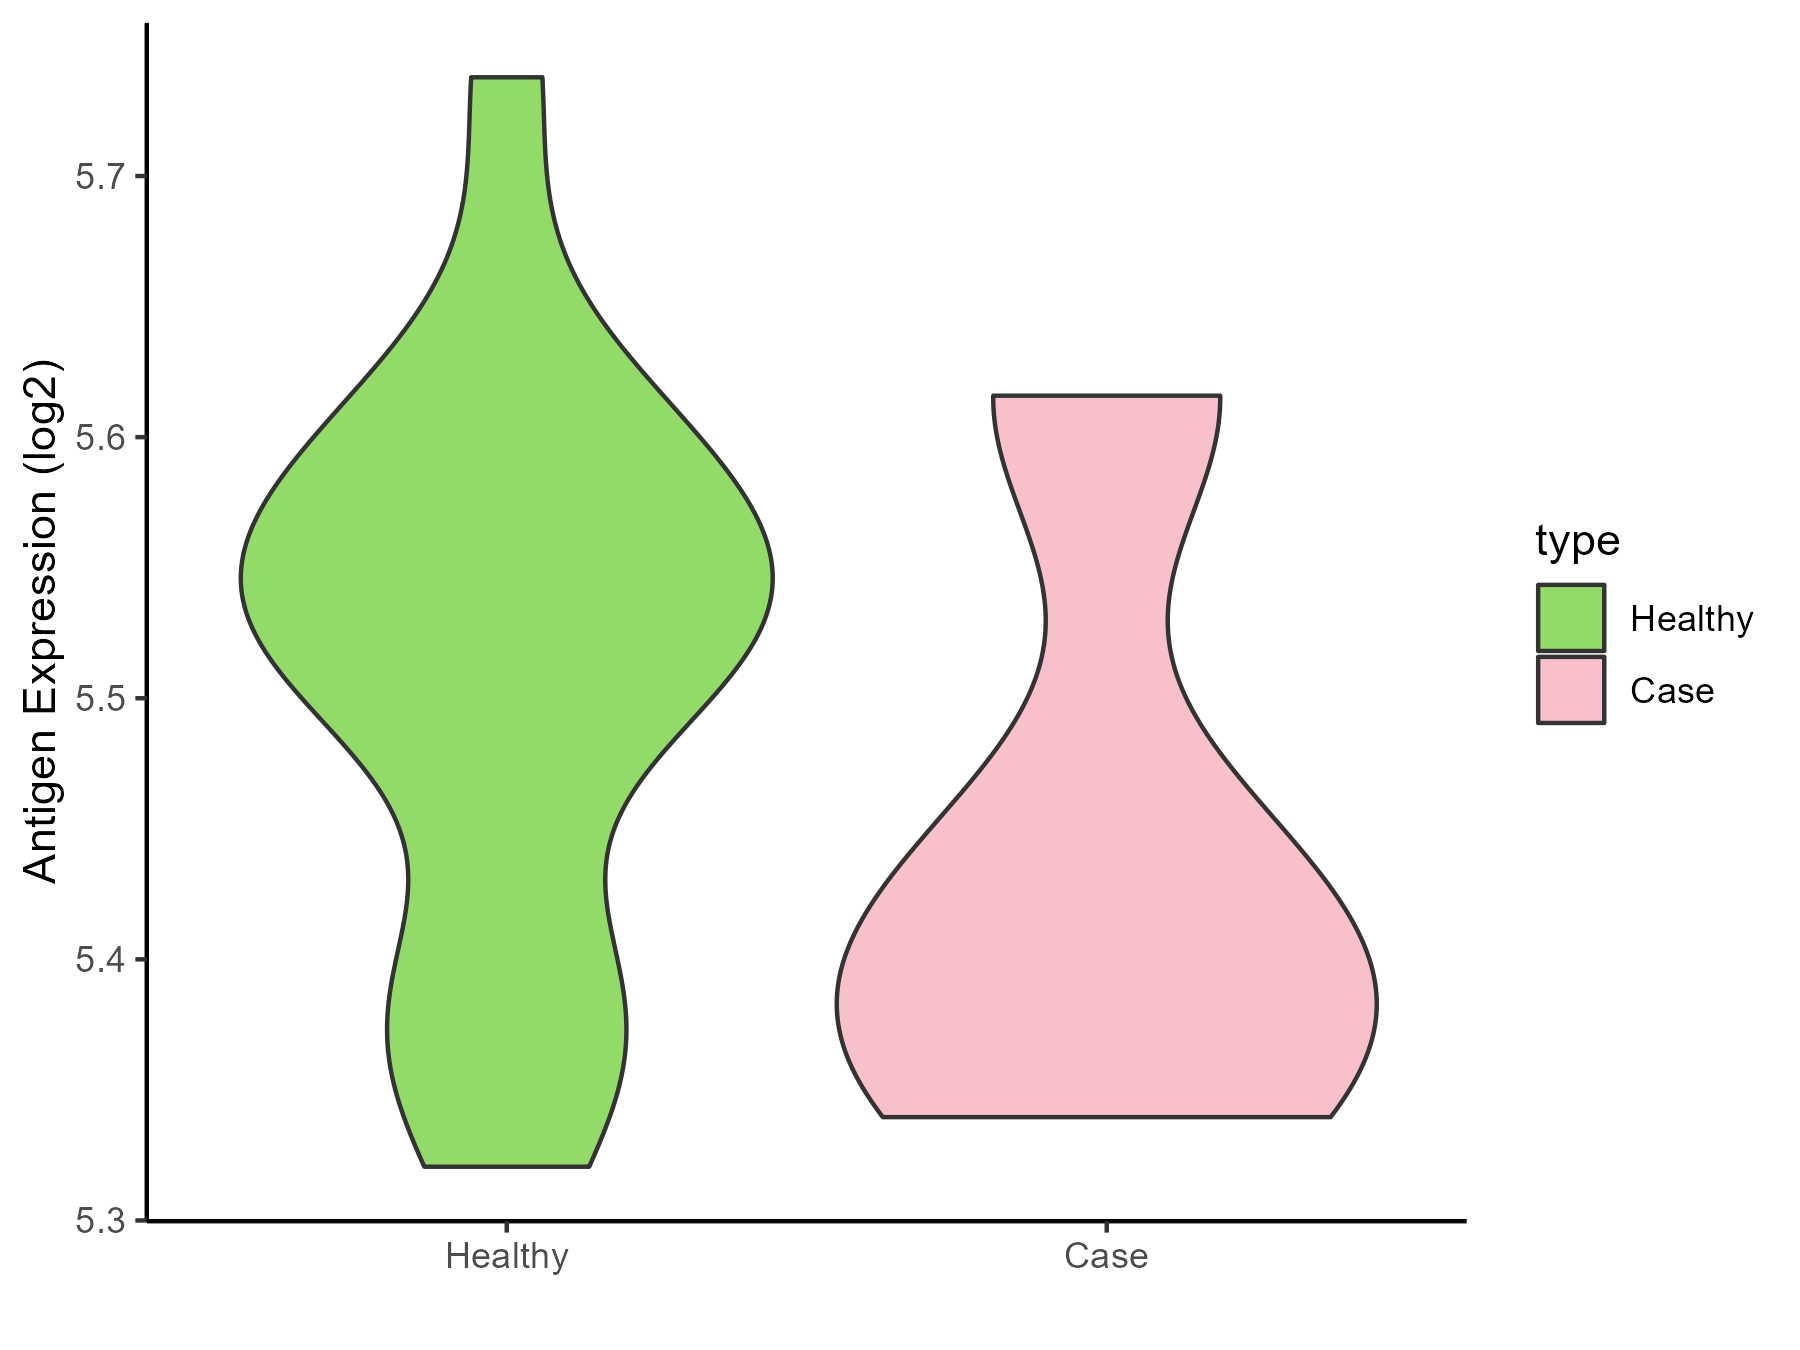
| The Studied Tissue | Peripheral monocyte | |
| The Specific Disease | Autoimmune uveitis | |
| The Expression Level of Disease Section Compare with the Healthy Individual Tissue | p-value: 0.339188558; Fold-change: -0.110916703; Z-score: -1.012663508 | |
| Disease-specific Antigen Abundances |
|
Click to View the Clearer Original Diagram |
ICD Disease Classification 05
| Differential expression pattern of antigen in diseases | ||
| The Studied Tissue | Whole blood | |
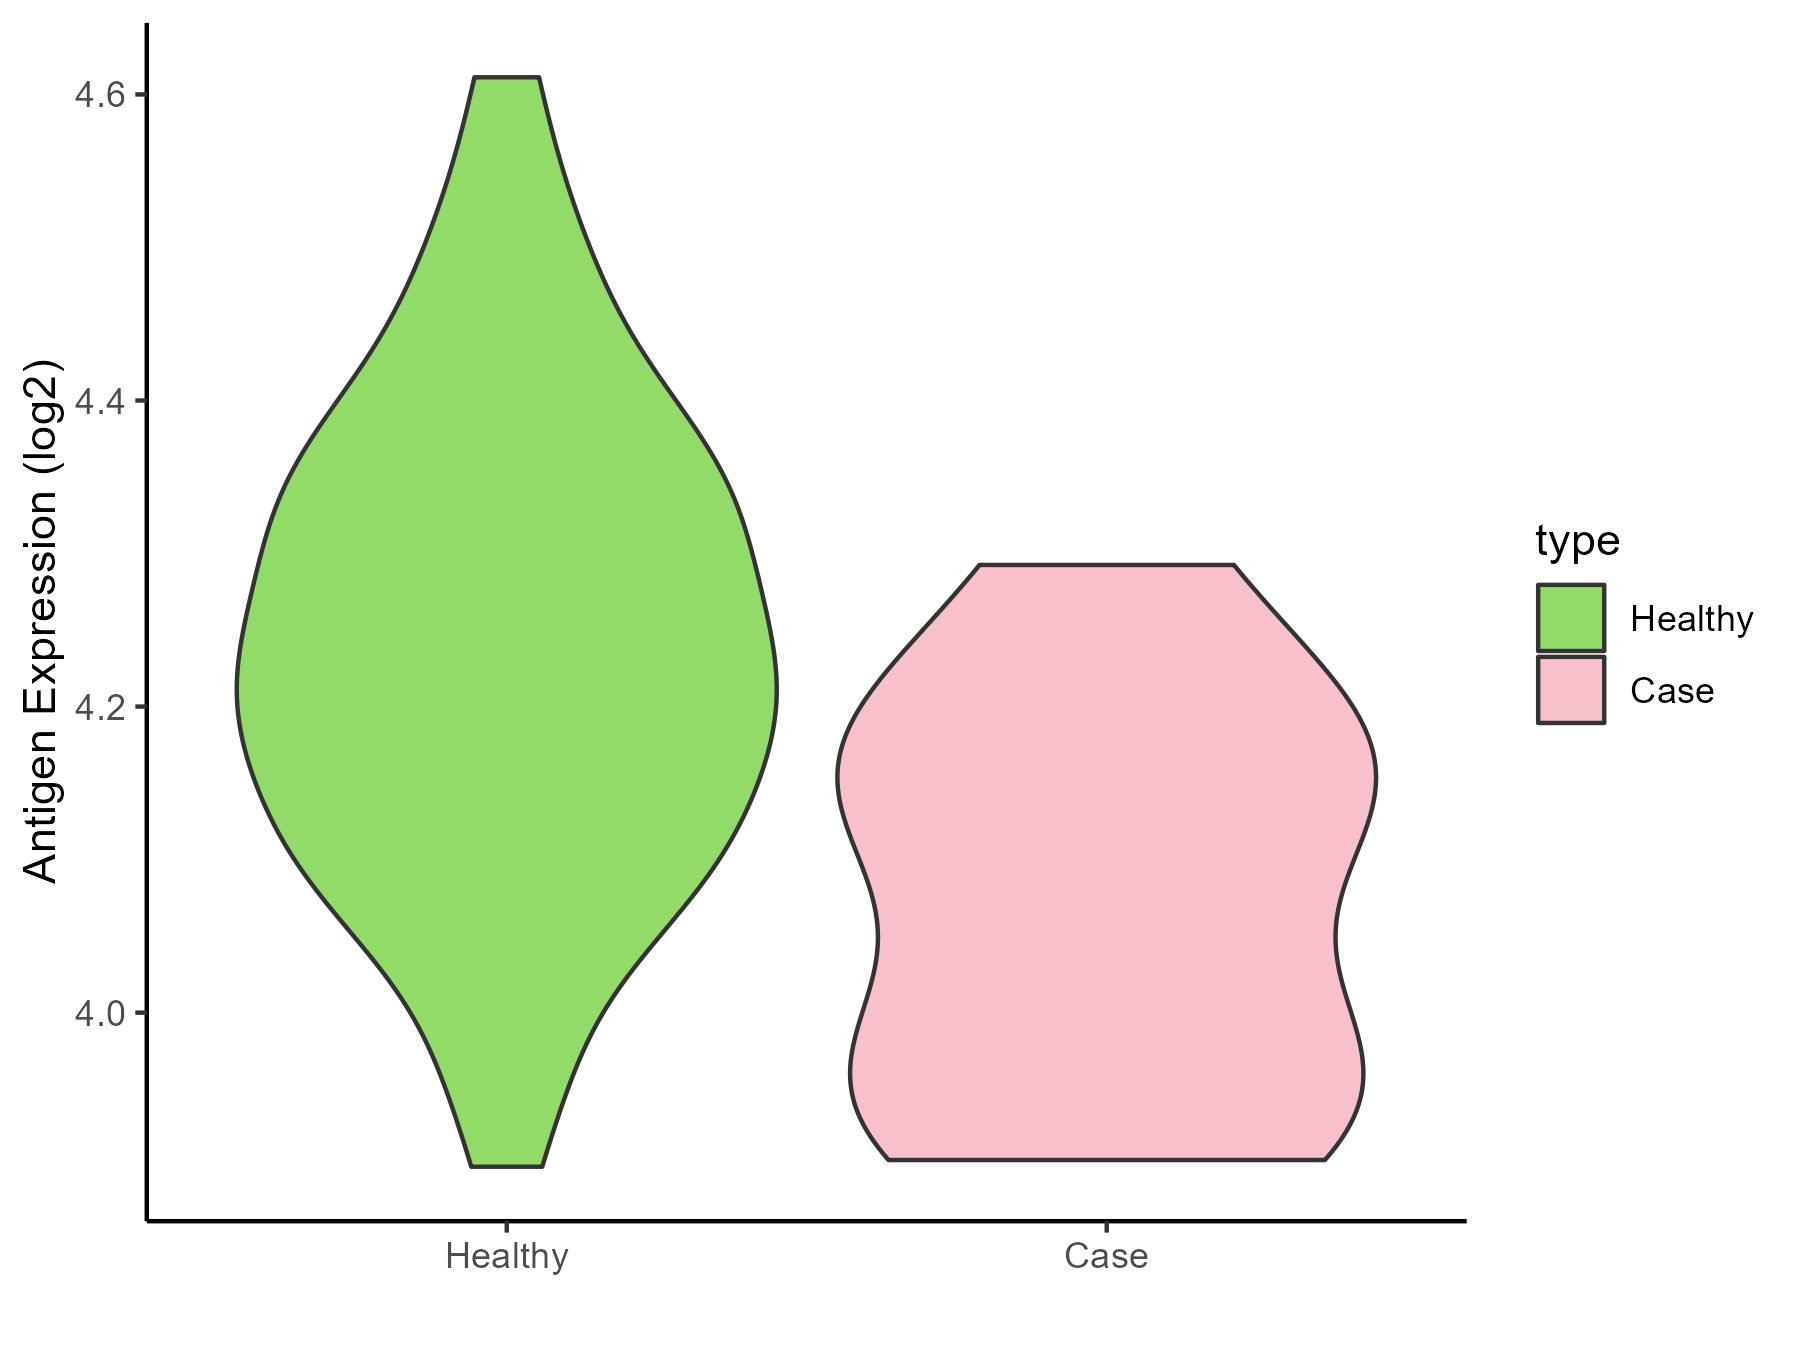
| The Specific Disease | Familial hypercholesterolemia | |
| The Expression Level of Disease Section Compare with the Healthy Individual Tissue | p-value: 0.006198308; Fold-change: -0.122720461; Z-score: -0.786699326 | |
| Disease-specific Antigen Abundances |
|
Click to View the Clearer Original Diagram |
ICD Disease Classification 06
| Differential expression pattern of antigen in diseases | ||
| The Studied Tissue | Superior temporal cortex | |
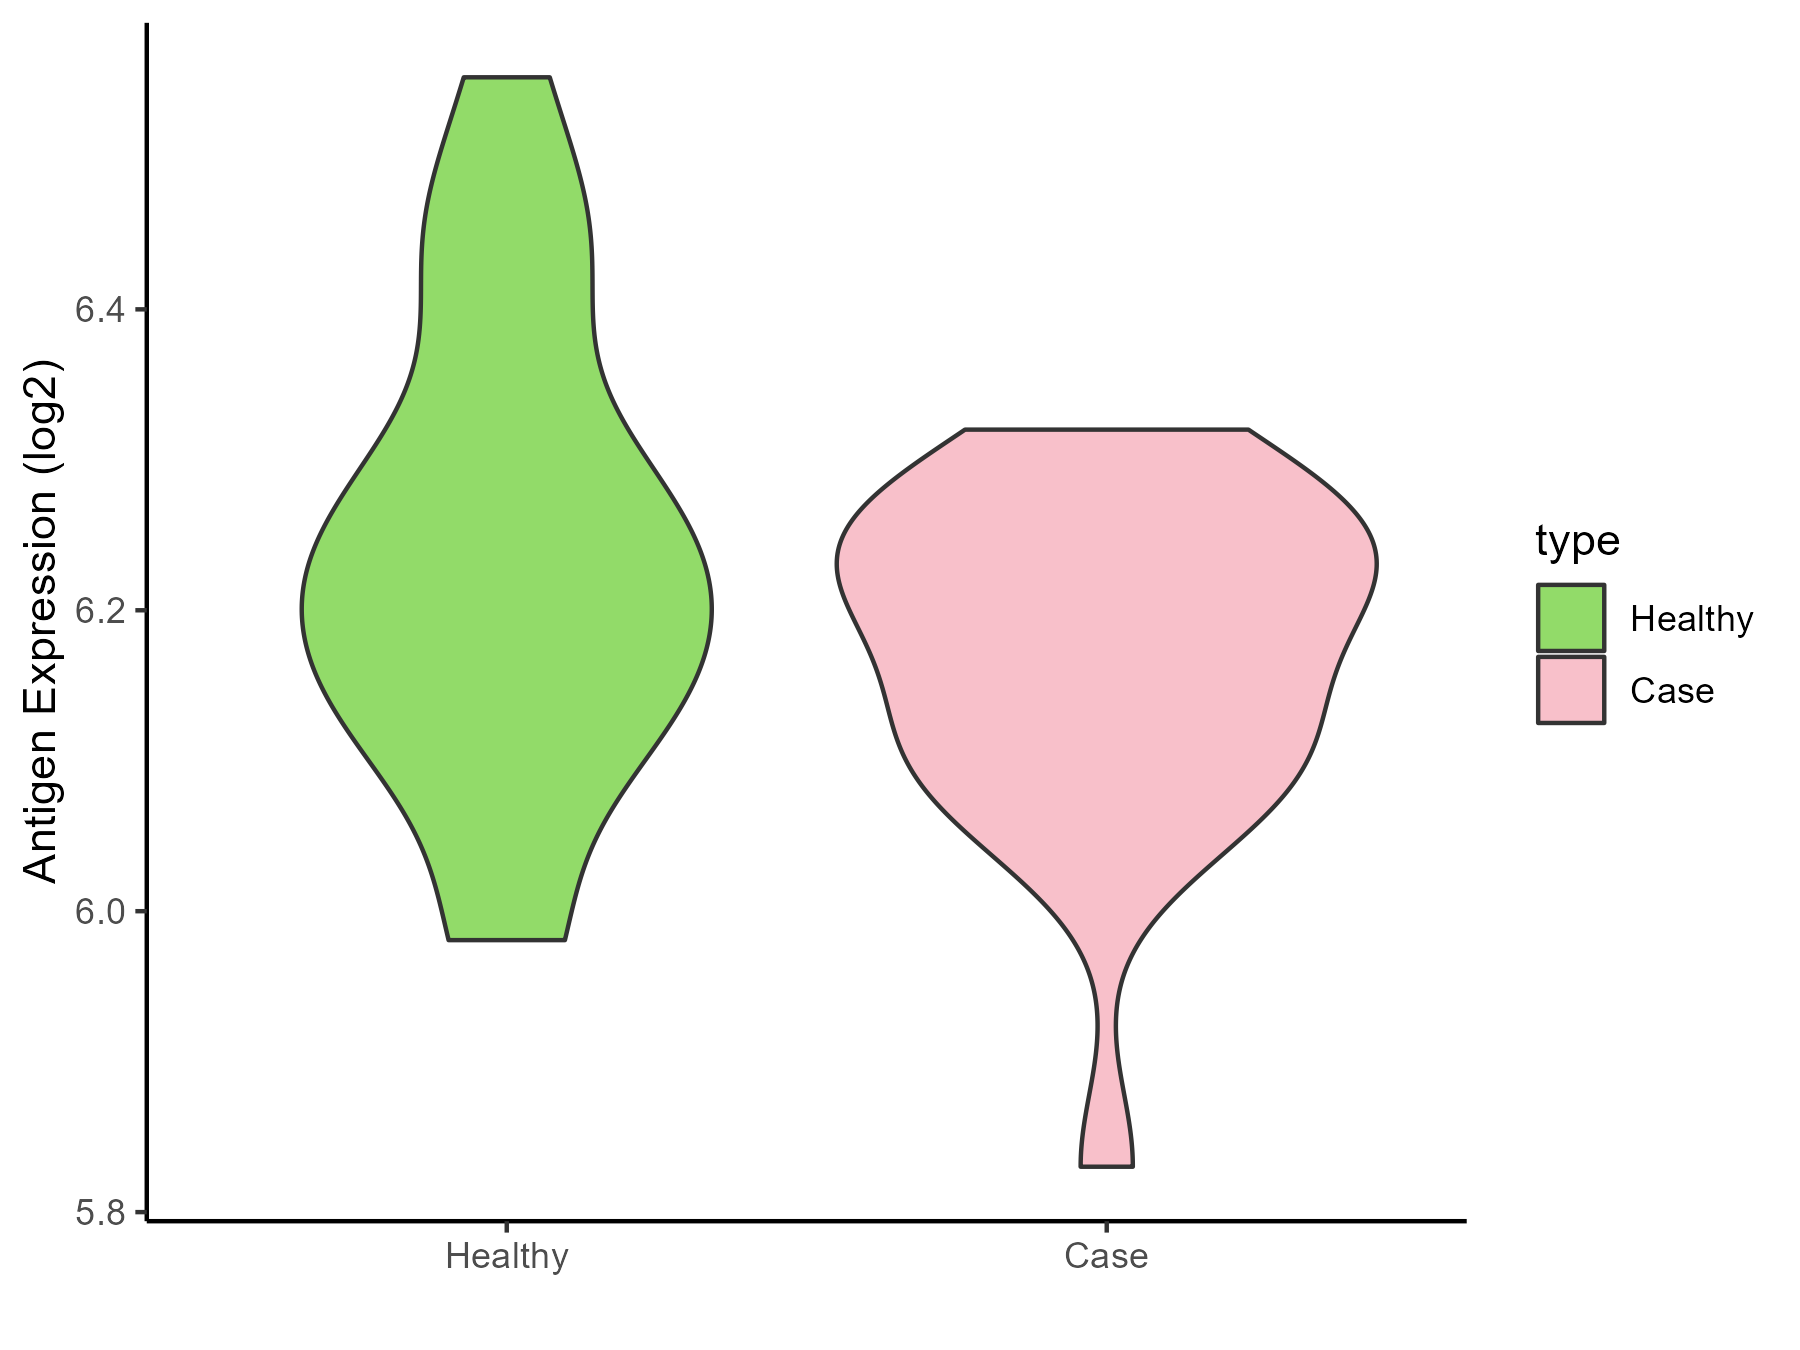
| The Specific Disease | Schizophrenia | |
| The Expression Level of Disease Section Compare with the Healthy Individual Tissue | p-value: 0.129135876; Fold-change: -0.013426015; Z-score: -0.086514838 | |
| Disease-specific Antigen Abundances |
|
Click to View the Clearer Original Diagram |
ICD Disease Classification 08
| Differential expression pattern of antigen in diseases | ||
| The Studied Tissue | Spinal cord | |
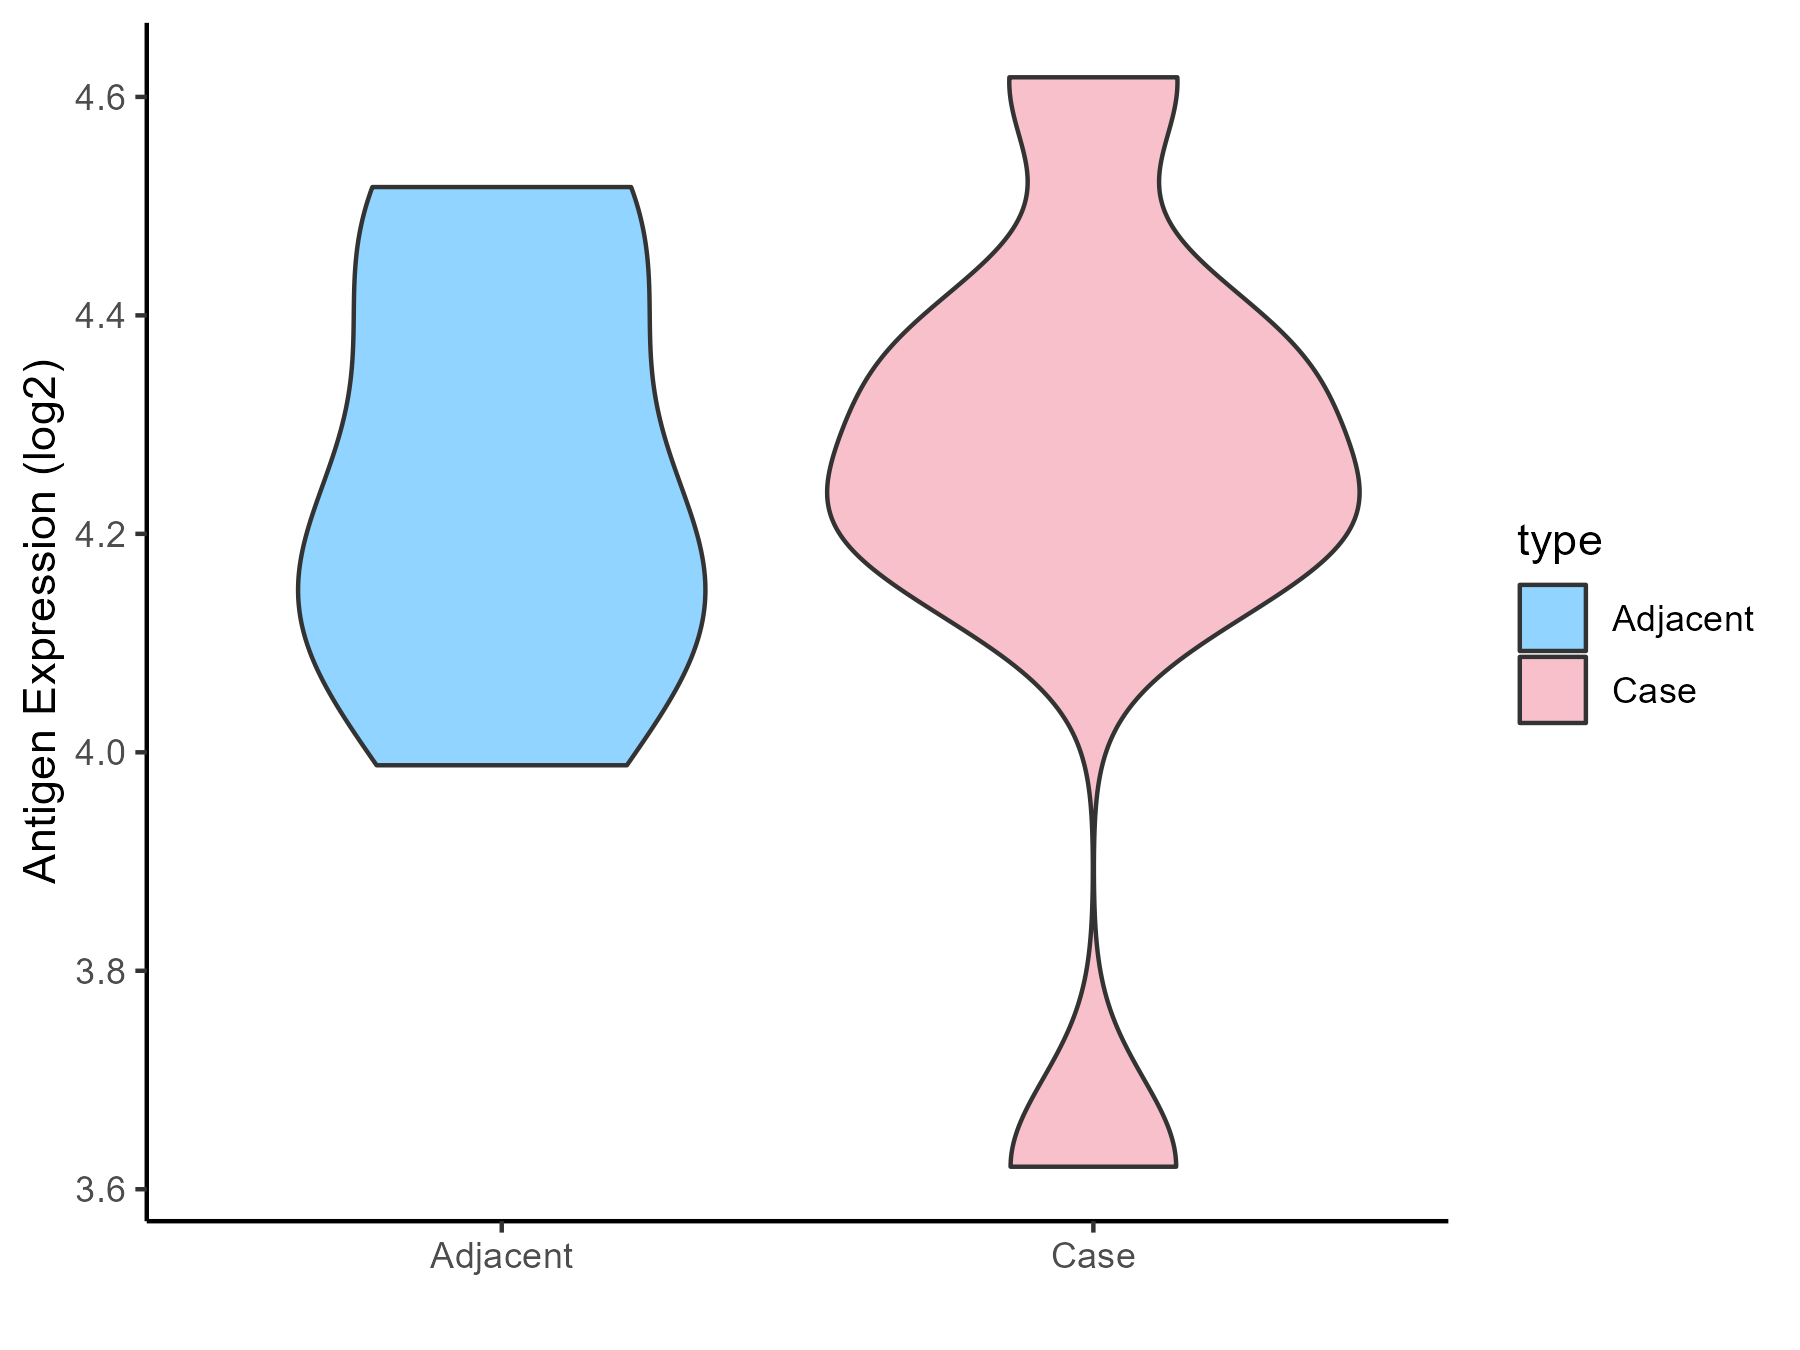
| The Specific Disease | Multiple sclerosis | |
| The Expression Level of Disease Section Compare with the Adjacent Tissue | p-value: 0.846918093; Fold-change: 0.072188901; Z-score: 0.365464221 | |
| Disease-specific Antigen Abundances |
|
Click to View the Clearer Original Diagram |
| The Studied Tissue | Plasmacytoid dendritic cells | |
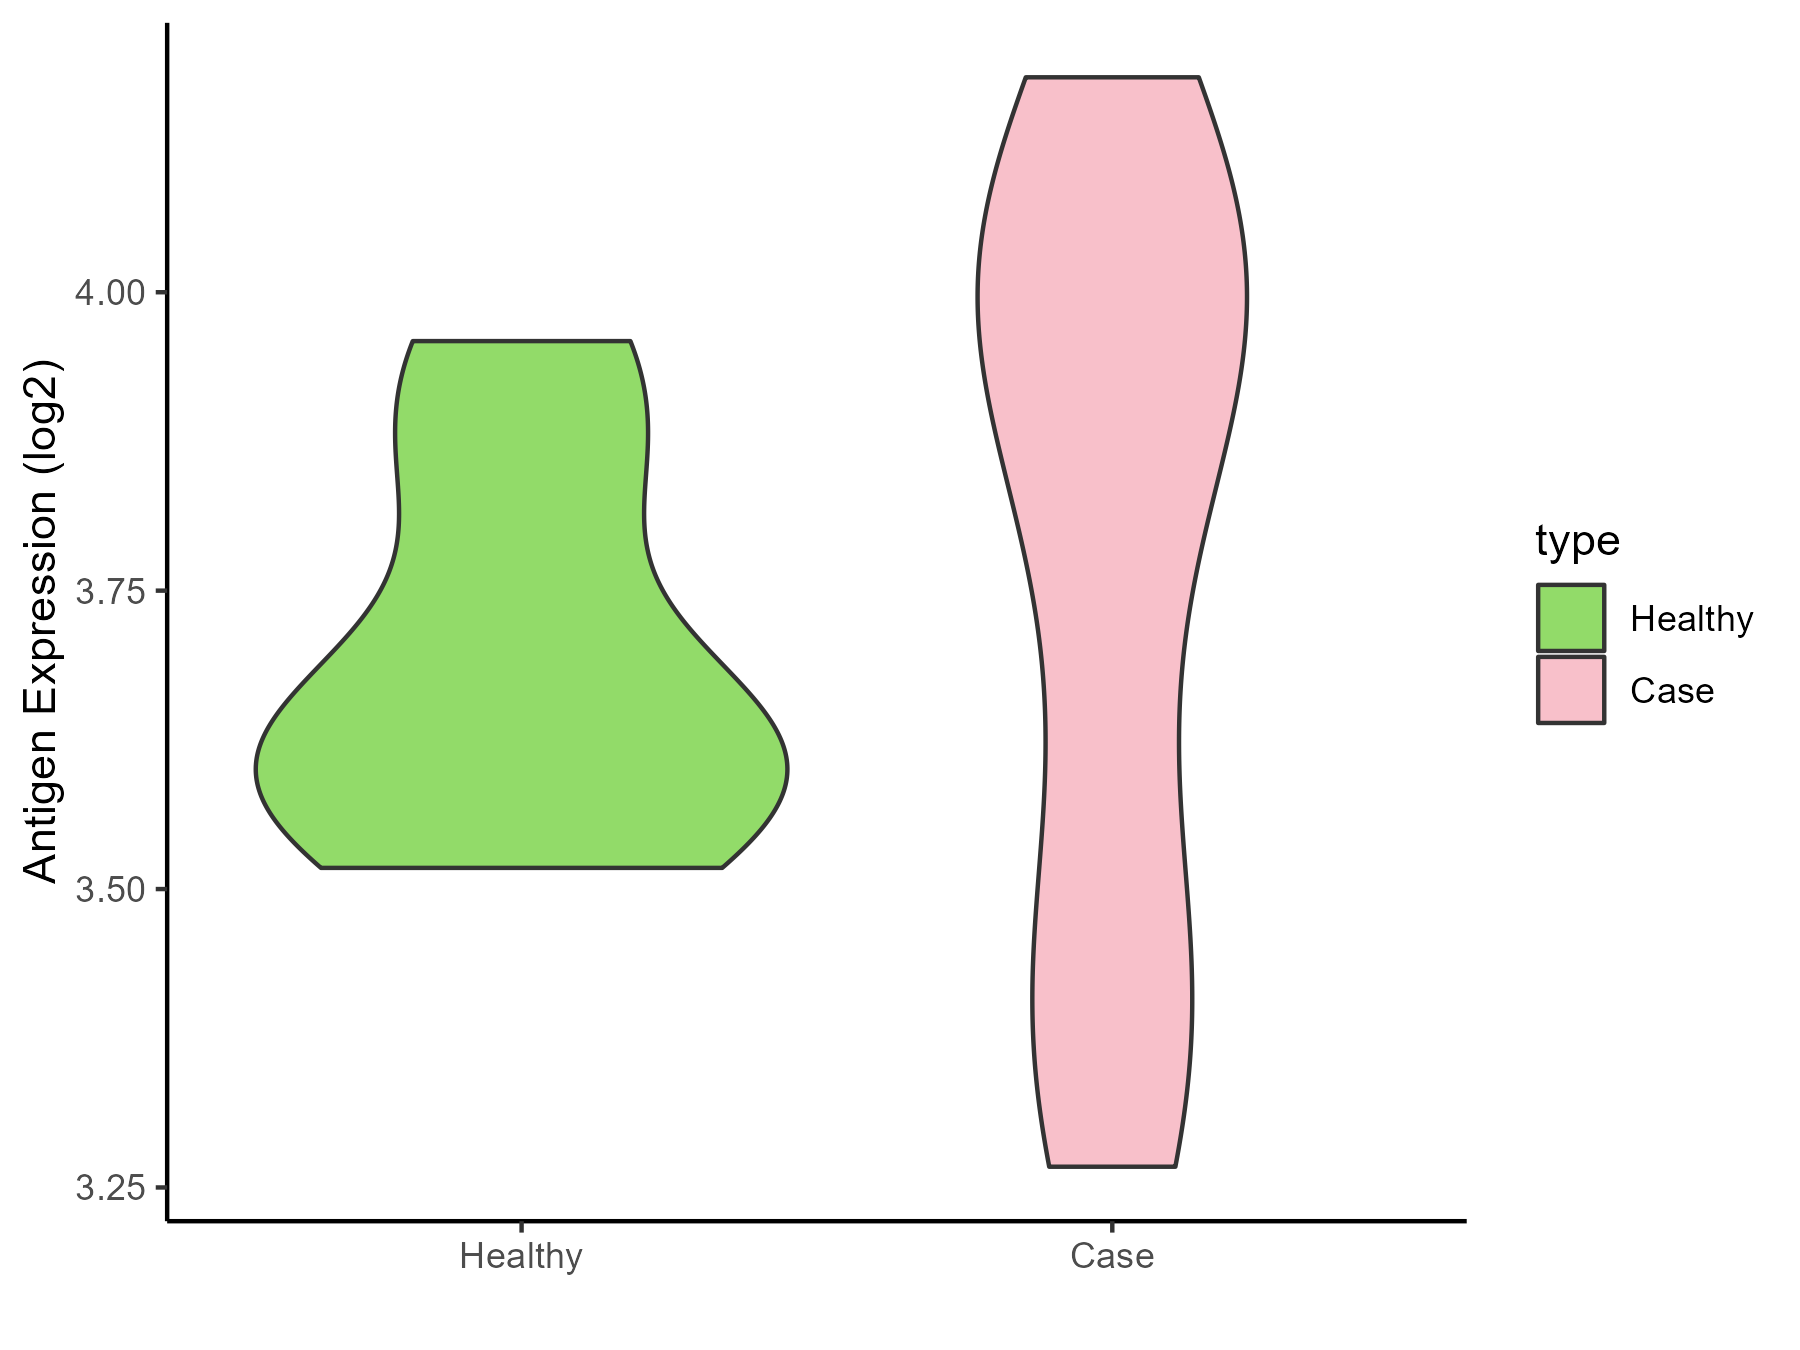
| The Specific Disease | Multiple sclerosis | |
| The Expression Level of Disease Section Compare with the Healthy Individual Tissue | p-value: 0.455906438; Fold-change: 0.249869862; Z-score: 1.483402182 | |
| Disease-specific Antigen Abundances |
|
Click to View the Clearer Original Diagram |
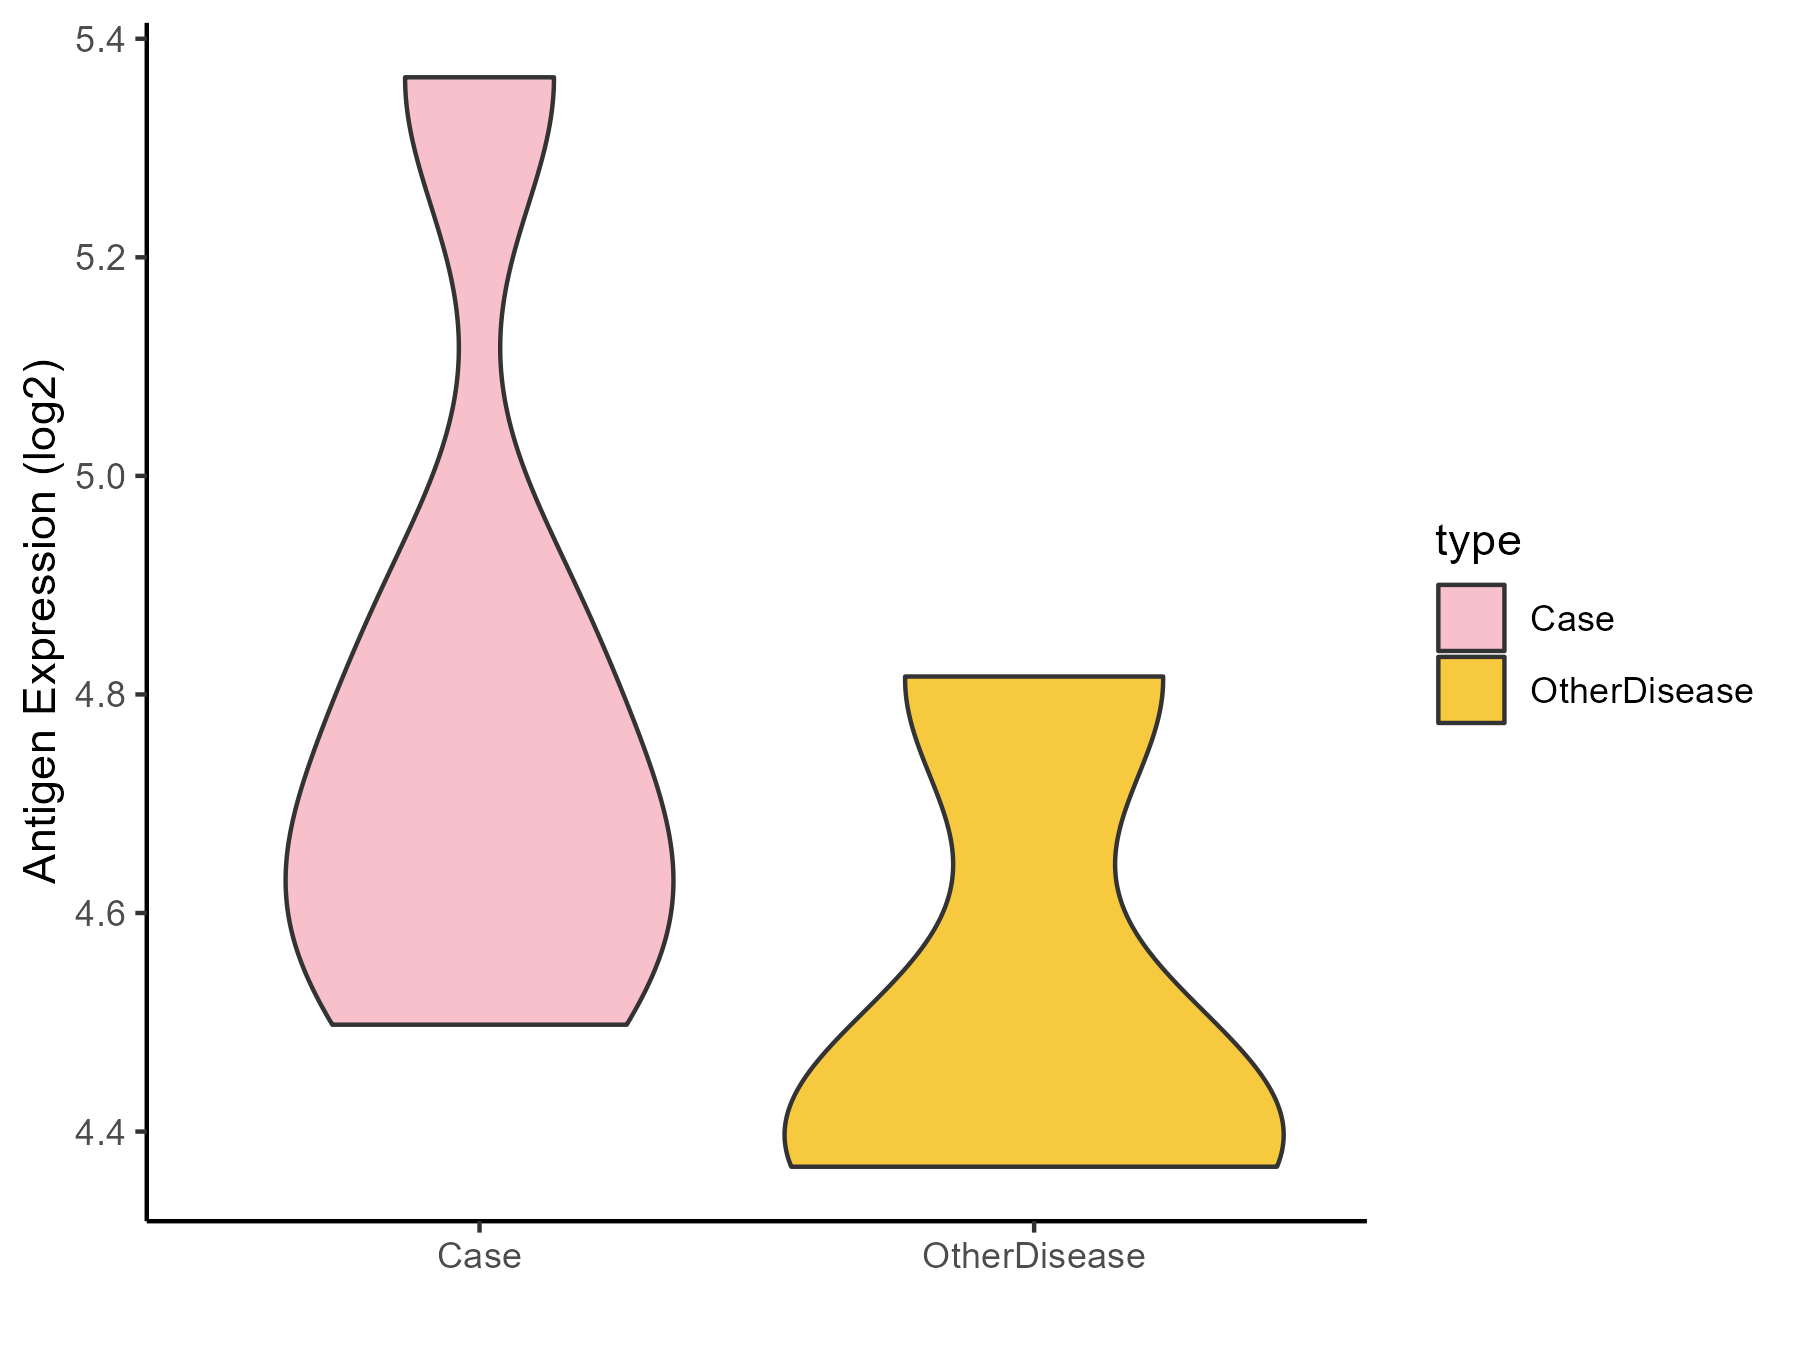
| Differential expression pattern of antigen in diseases | ||
| The Studied Tissue | Peritumoral cortex | |
| The Specific Disease | Epilepsy | |
| The Expression Level of Disease Section Compare with the Other Disease Section | p-value: 0.244012402; Fold-change: 0.26852391; Z-score: 1.099930347 | |
| Disease-specific Antigen Abundances |
|
Click to View the Clearer Original Diagram |
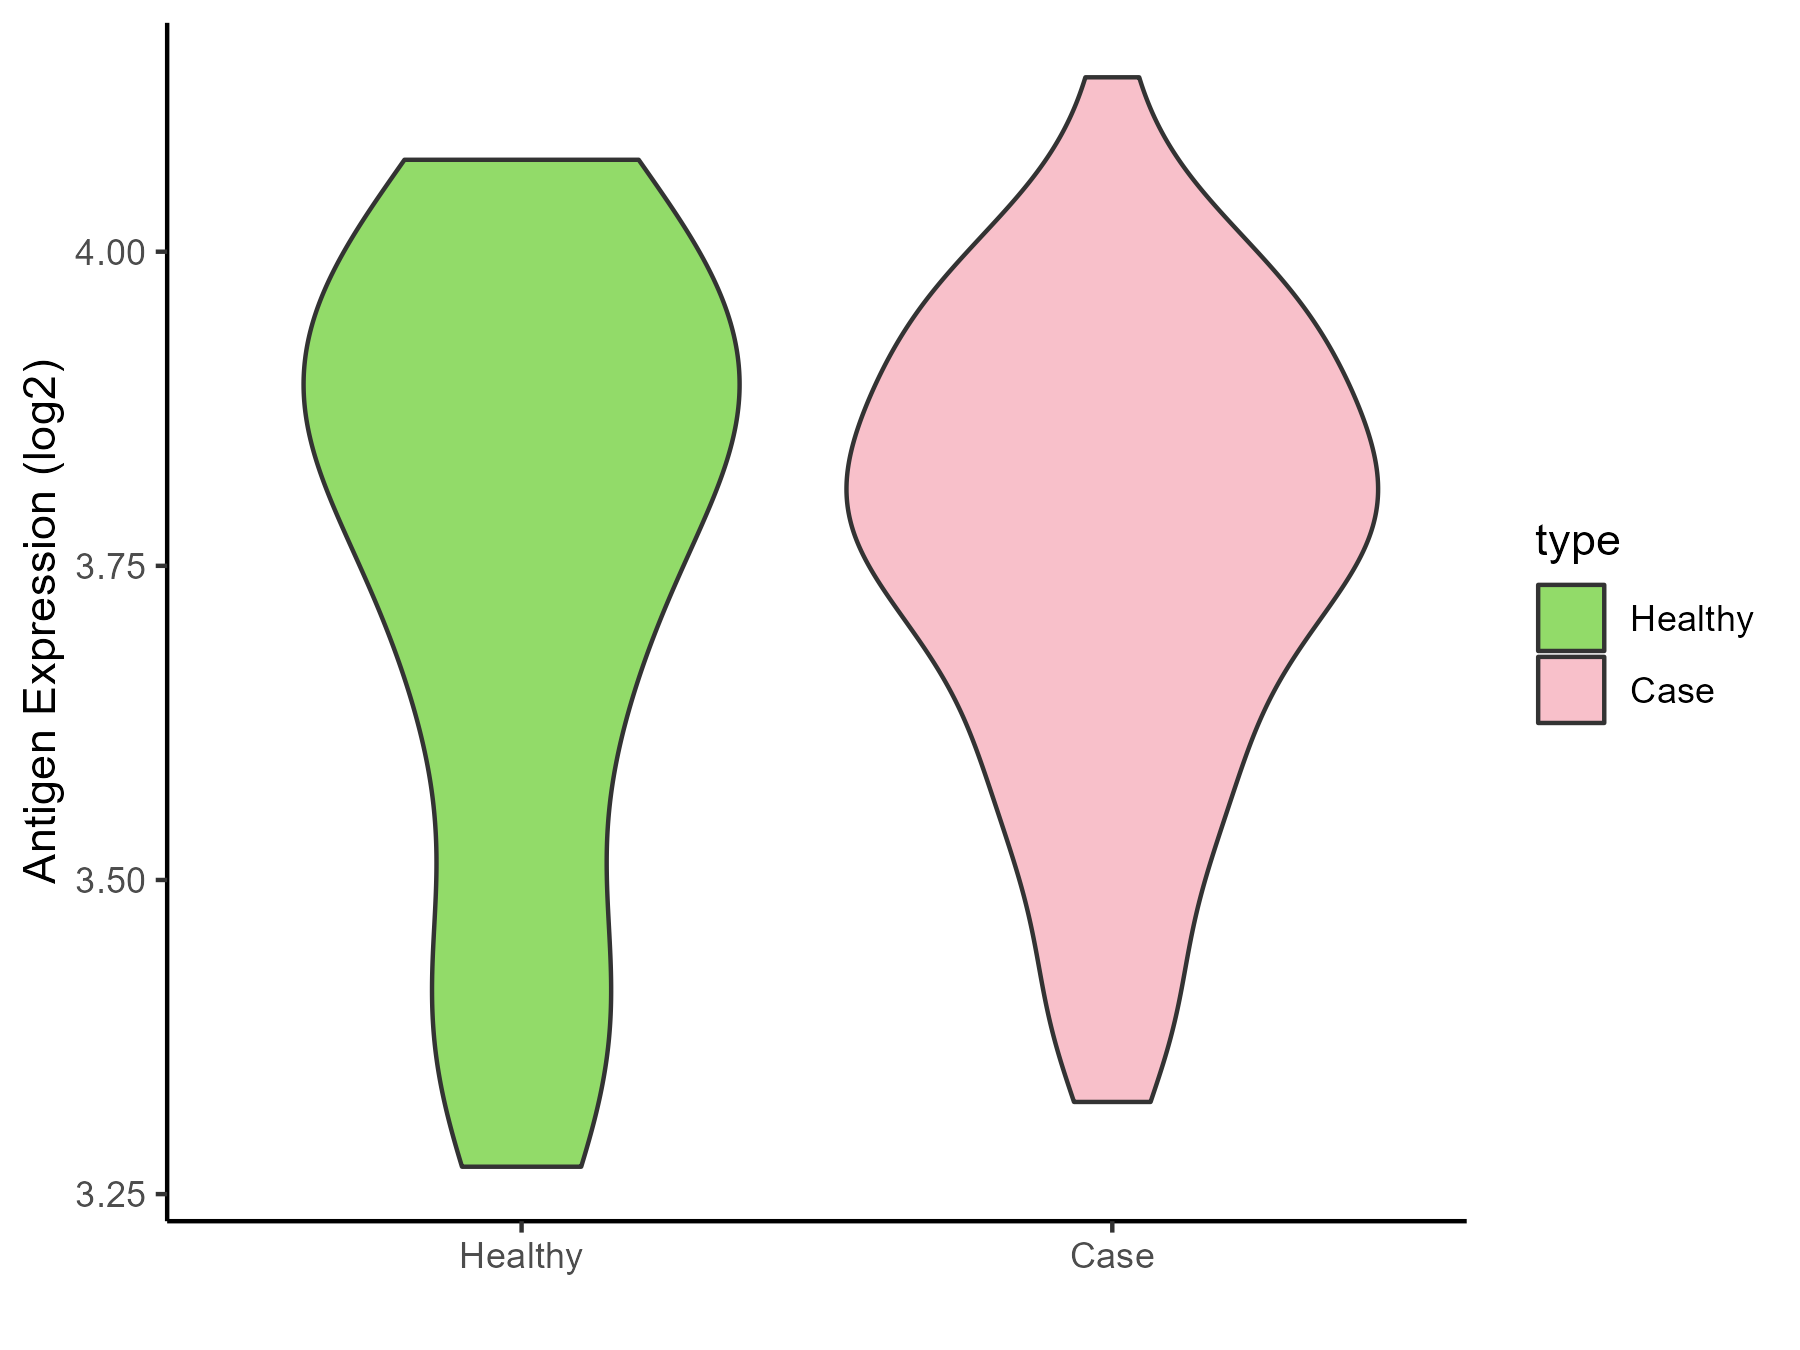
| Differential expression pattern of antigen in diseases | ||
| The Studied Tissue | Whole blood | |
| The Specific Disease | Cardioembolic Stroke | |
| The Expression Level of Disease Section Compare with the Healthy Individual Tissue | p-value: 0.899195203; Fold-change: -0.027728594; Z-score: -0.115046359 | |
| Disease-specific Antigen Abundances |
|
Click to View the Clearer Original Diagram |
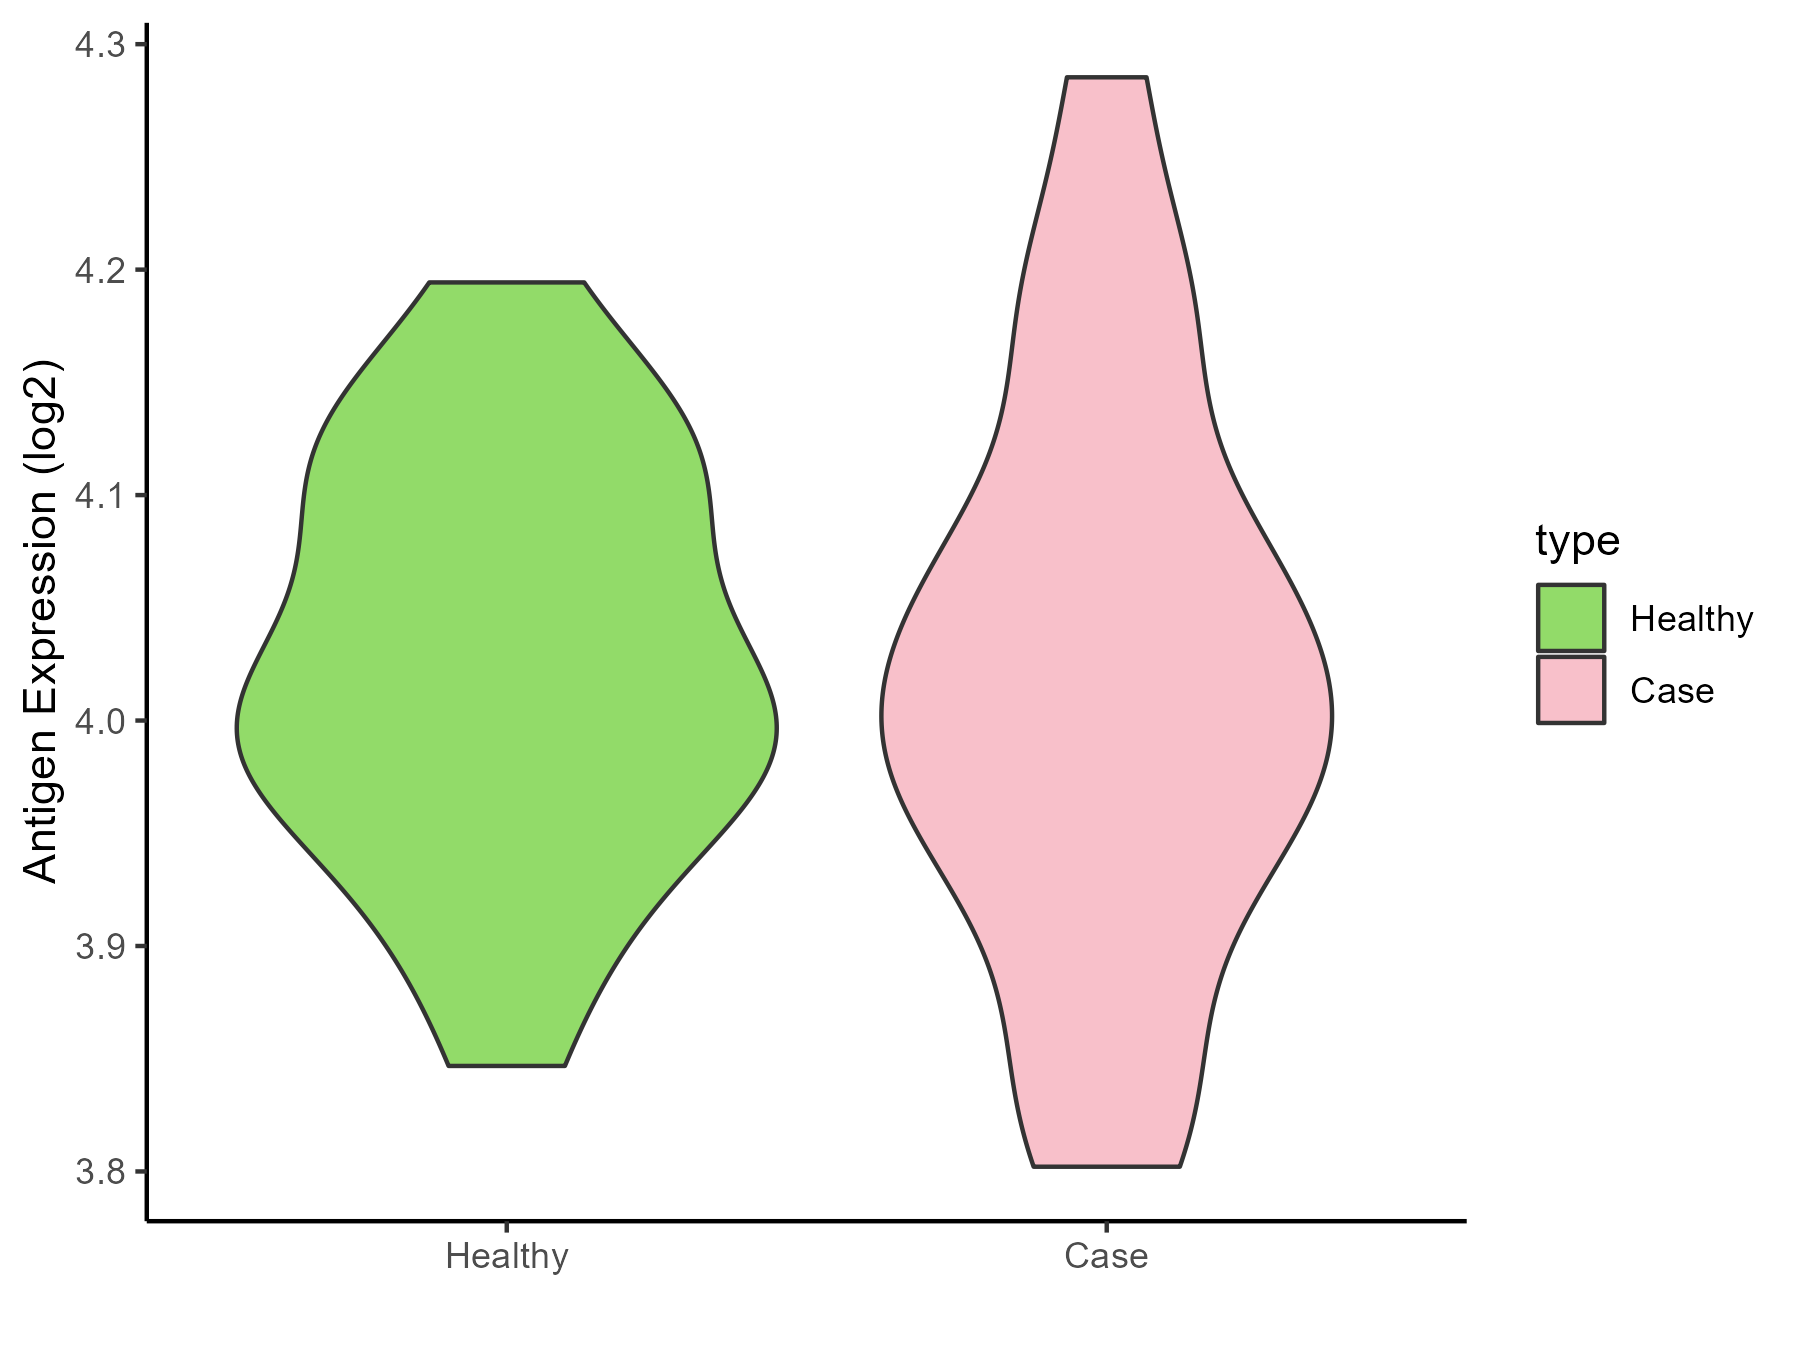
| The Studied Tissue | Peripheral blood | |
| The Specific Disease | Ischemic stroke | |
| The Expression Level of Disease Section Compare with the Healthy Individual Tissue | p-value: 0.806917714; Fold-change: -0.009390322; Z-score: -0.103742308 | |
| Disease-specific Antigen Abundances |
|
Click to View the Clearer Original Diagram |
ICD Disease Classification 1
| Differential expression pattern of antigen in diseases | ||
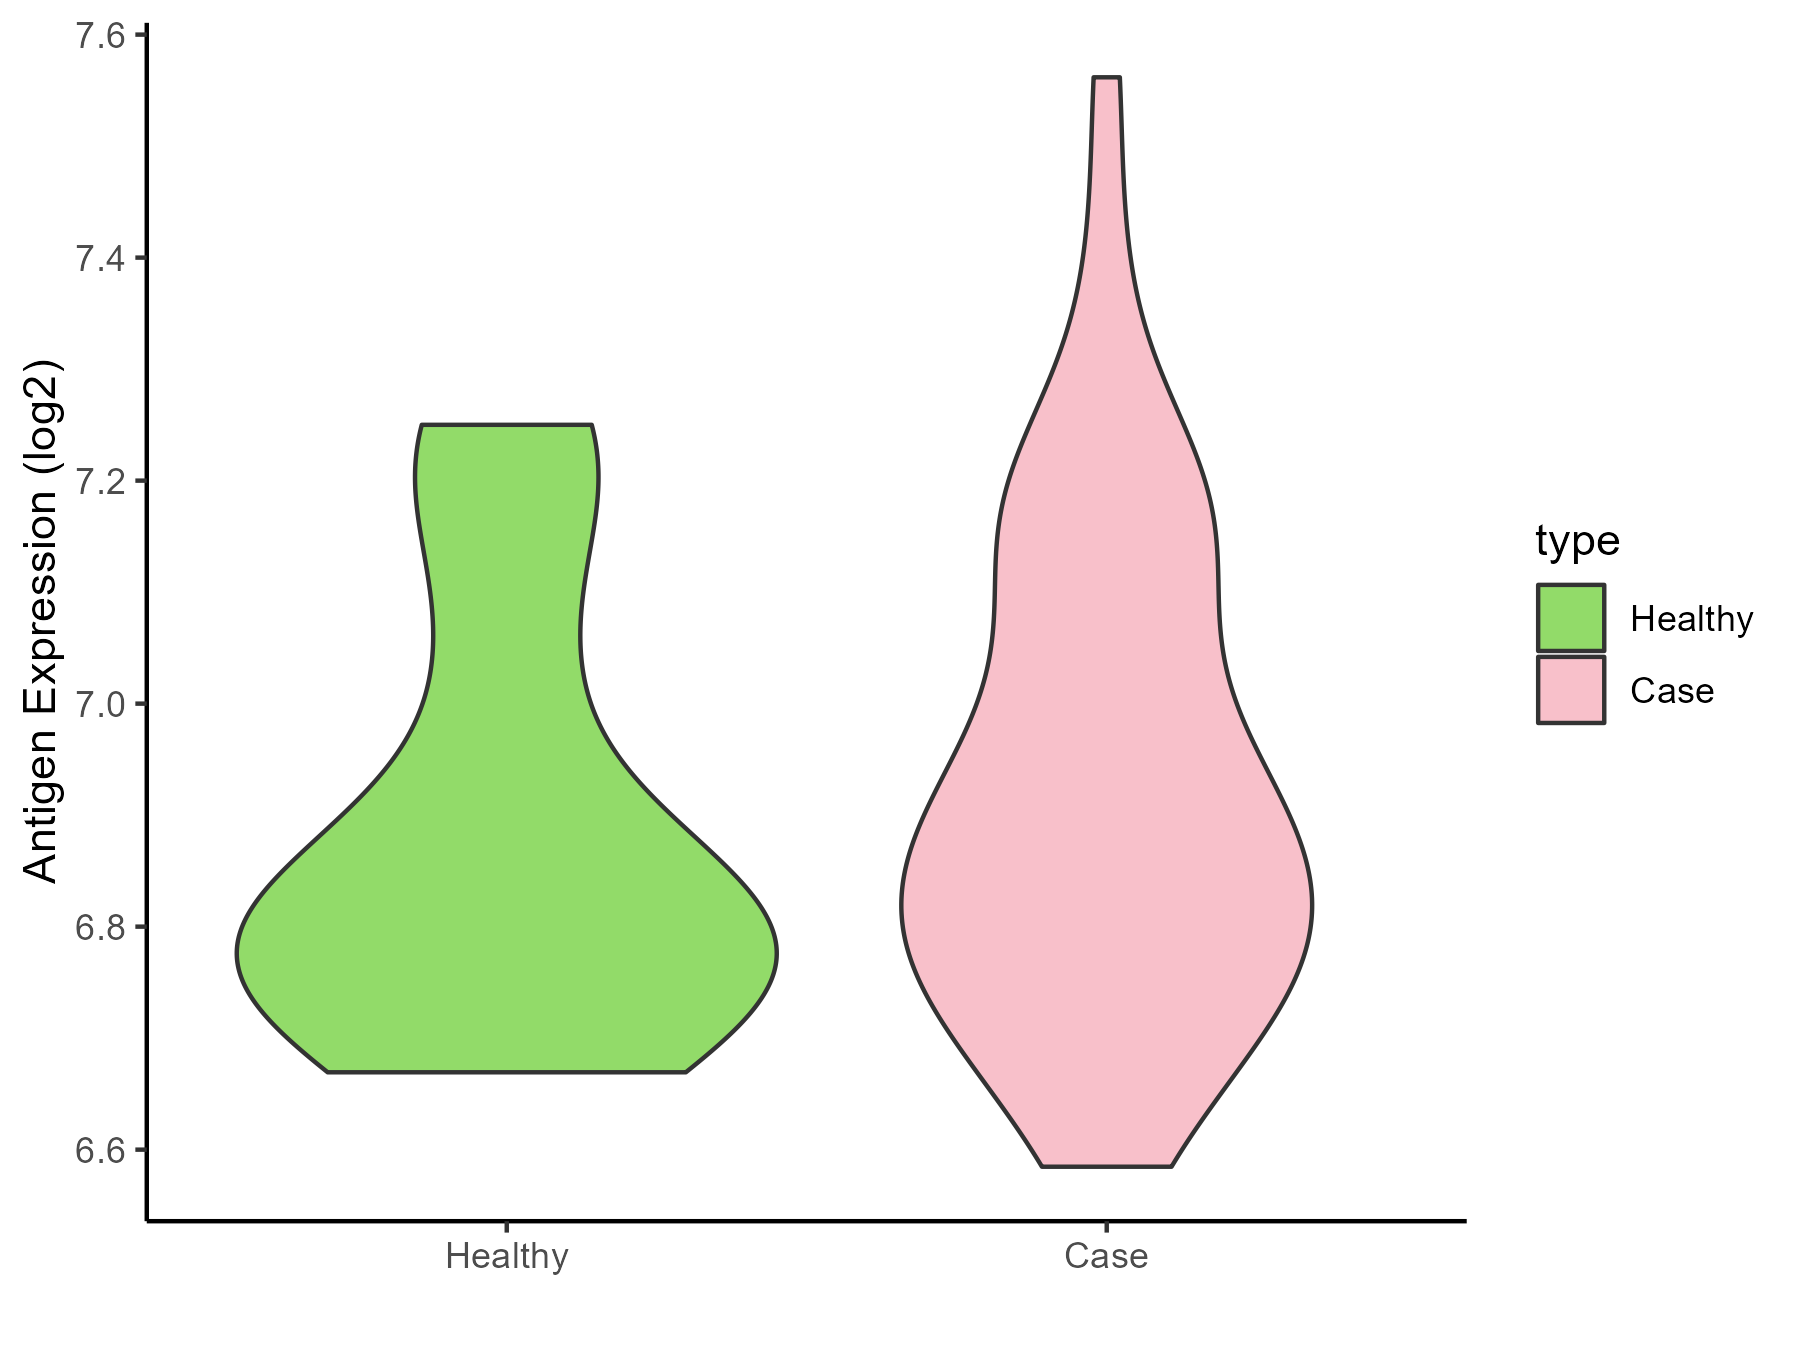
| The Studied Tissue | White matter | |
| The Specific Disease | HIV | |
| The Expression Level of Disease Section Compare with the Healthy Individual Tissue | p-value: 0.439692679; Fold-change: 0.062560046; Z-score: 0.318035192 | |
| Disease-specific Antigen Abundances |
|
Click to View the Clearer Original Diagram |
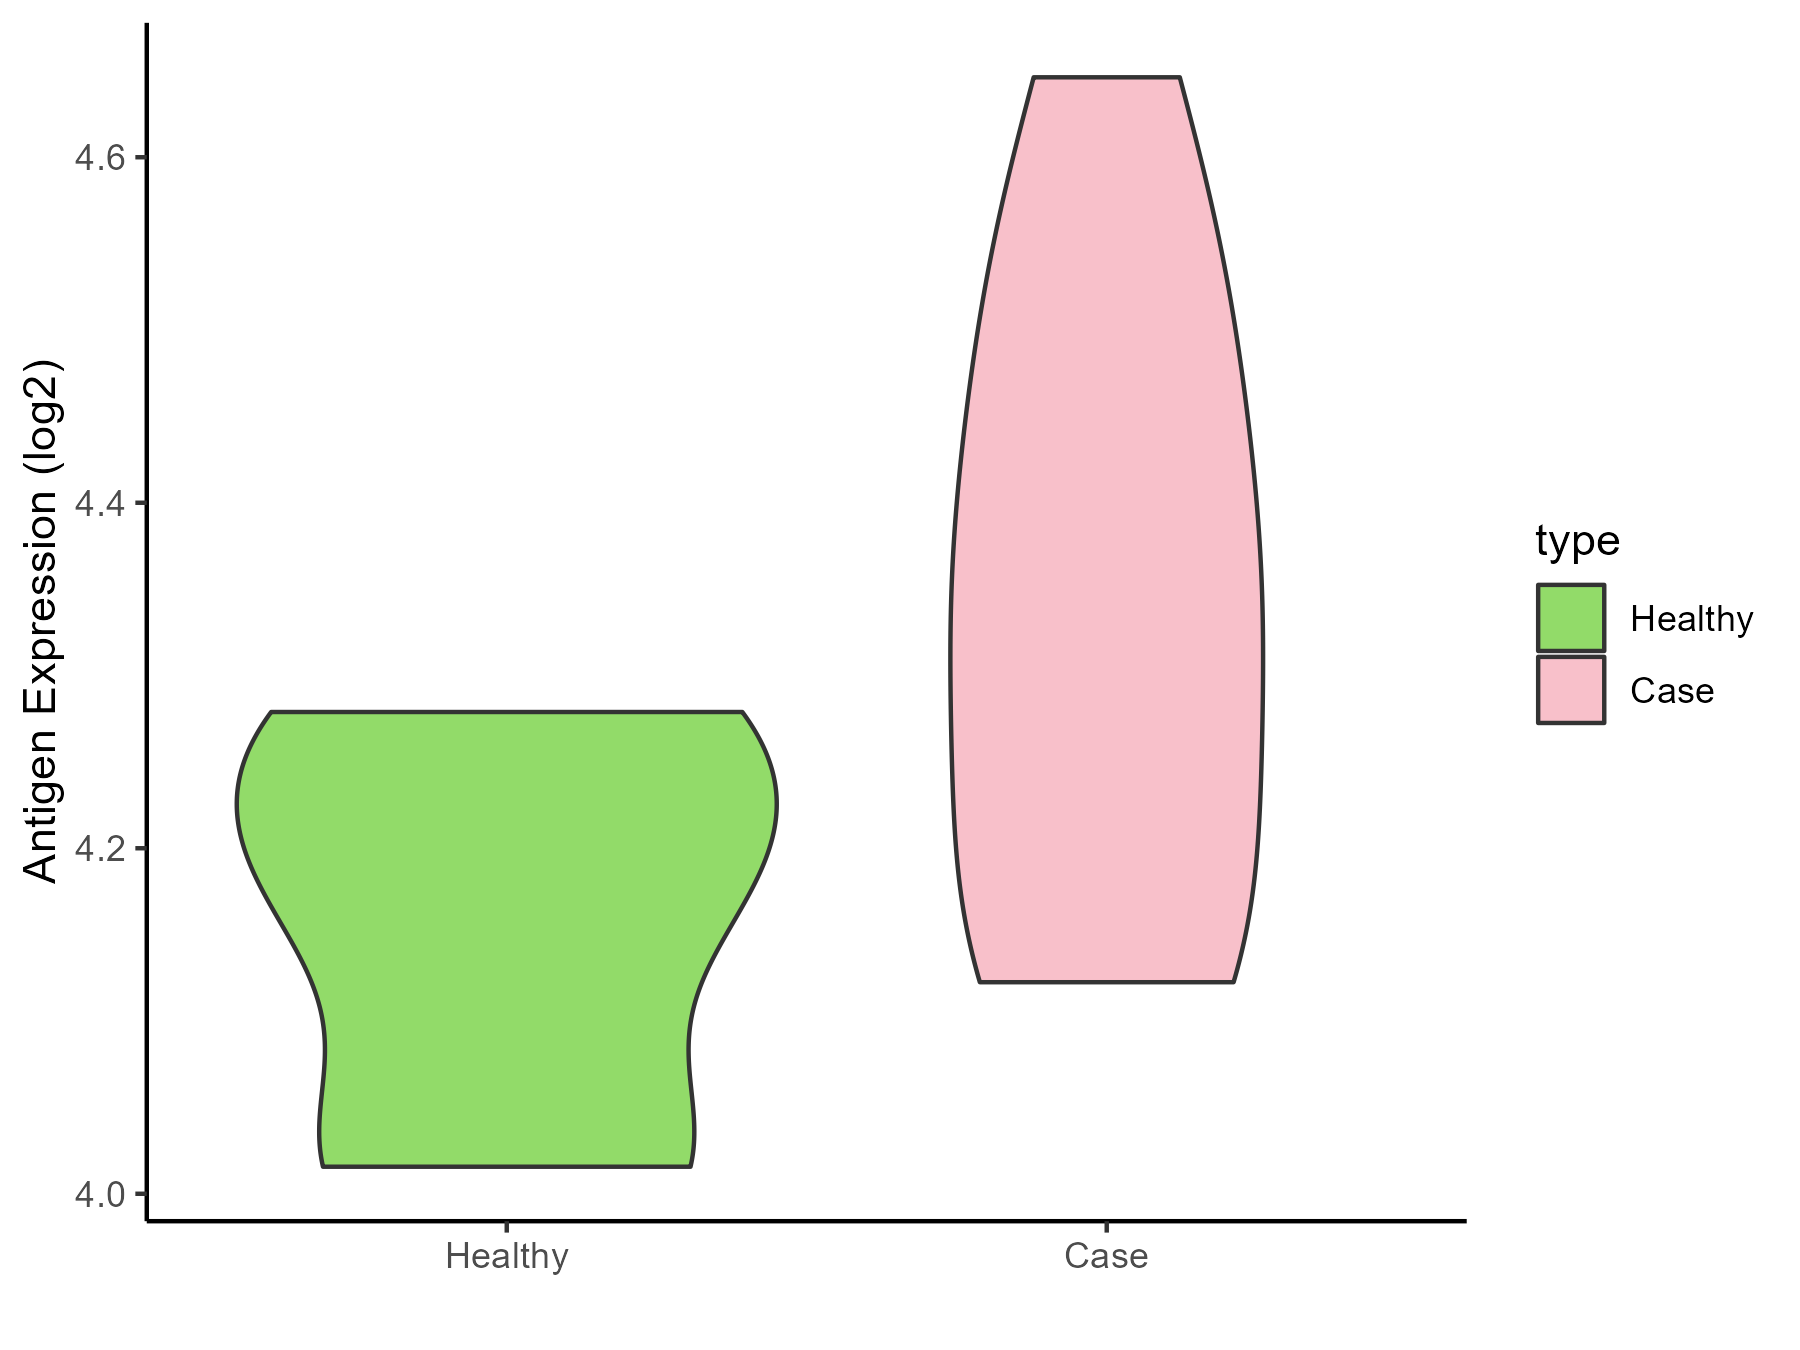
| Differential expression pattern of antigen in diseases | ||
| The Studied Tissue | Whole blood | |
| The Specific Disease | Influenza | |
| The Expression Level of Disease Section Compare with the Healthy Individual Tissue | p-value: 0.115153667; Fold-change: 0.148566472; Z-score: 1.117987336 | |
| Disease-specific Antigen Abundances |
|
Click to View the Clearer Original Diagram |
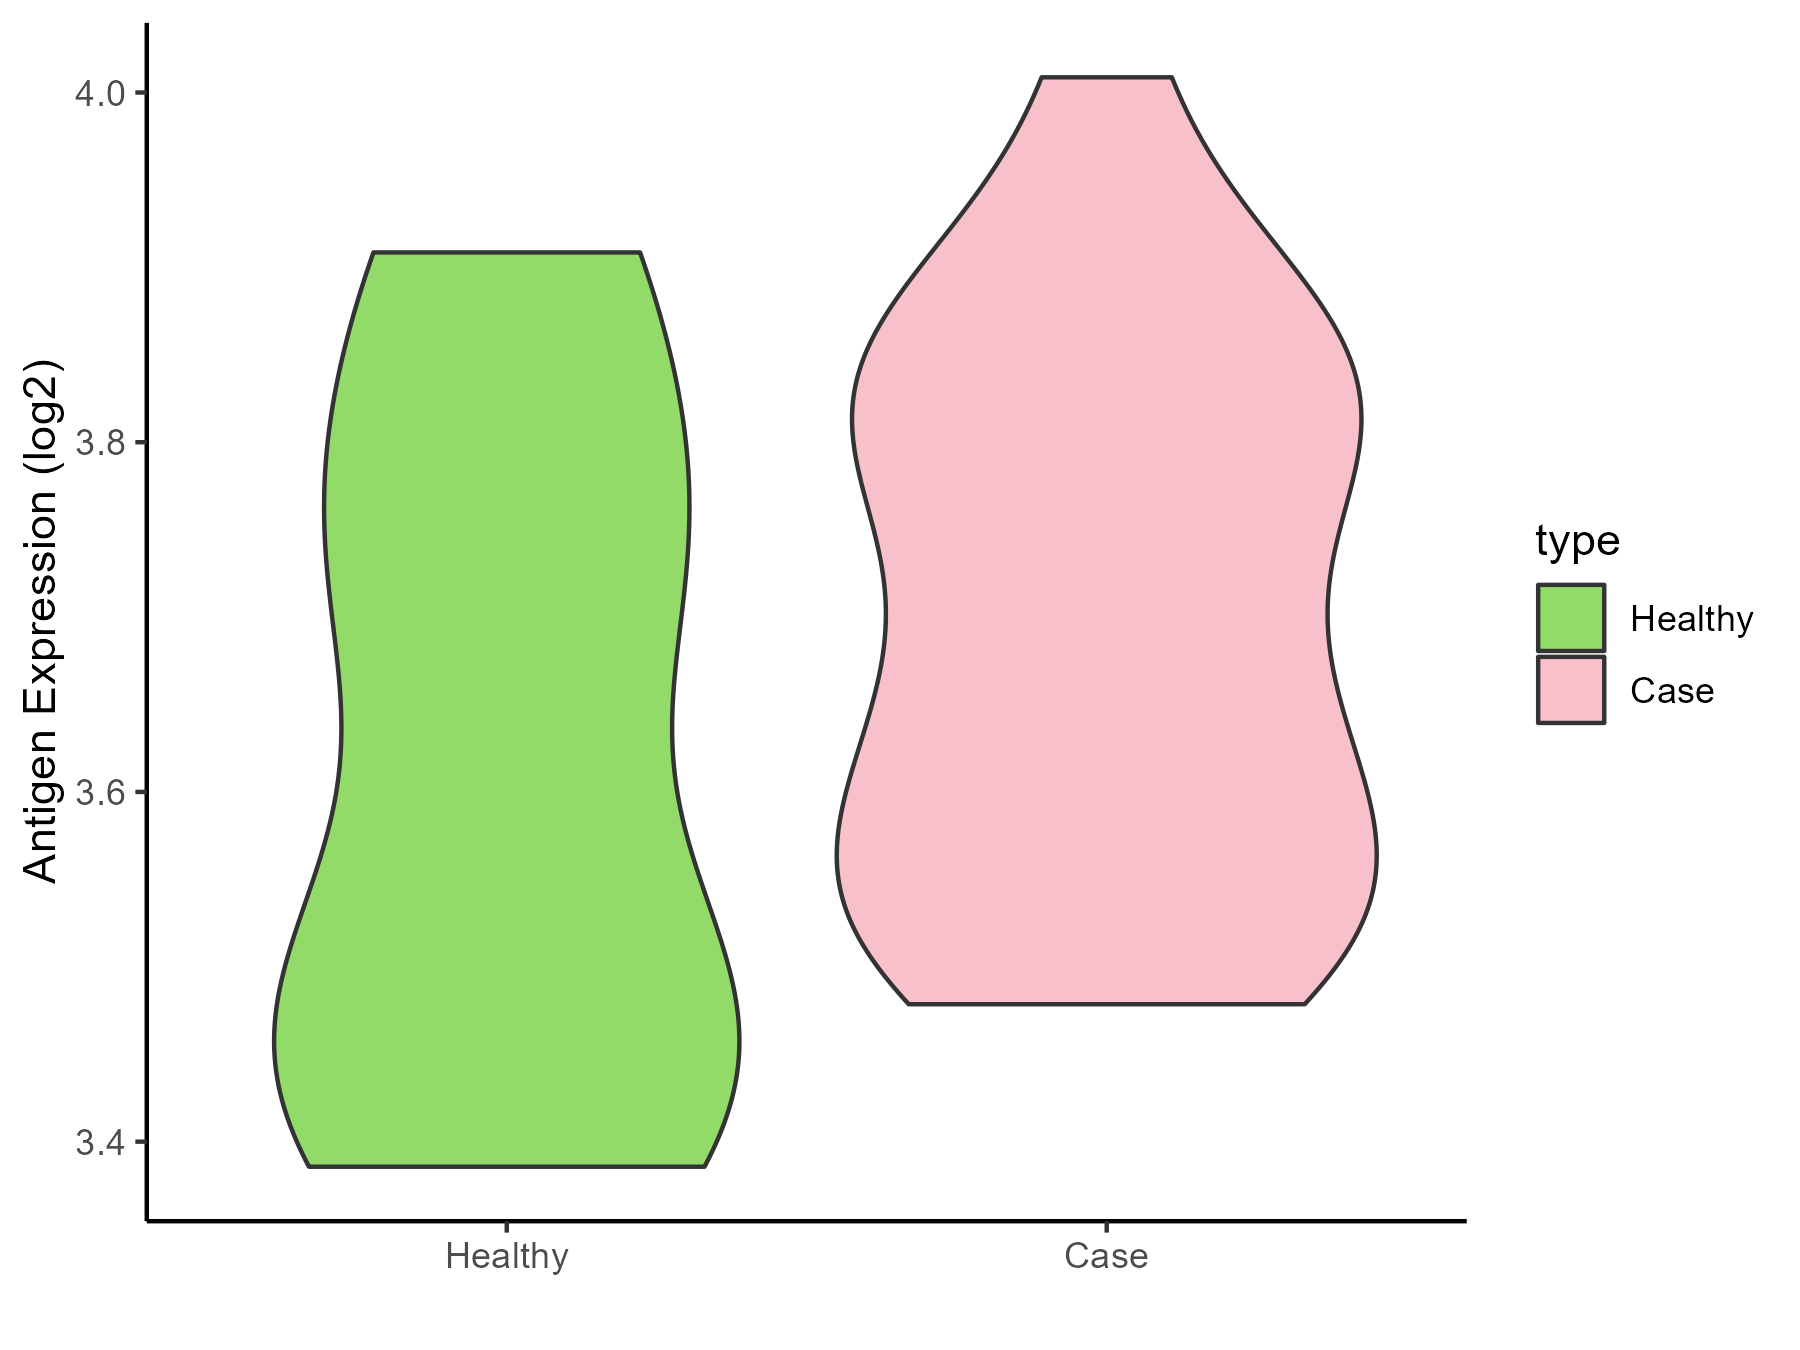
| Differential expression pattern of antigen in diseases | ||
| The Studied Tissue | Whole blood | |
| The Specific Disease | Chronic hepatitis C | |
| The Expression Level of Disease Section Compare with the Healthy Individual Tissue | p-value: 0.30737415; Fold-change: 0.08243531; Z-score: 0.41696538 | |
| Disease-specific Antigen Abundances |
|
Click to View the Clearer Original Diagram |
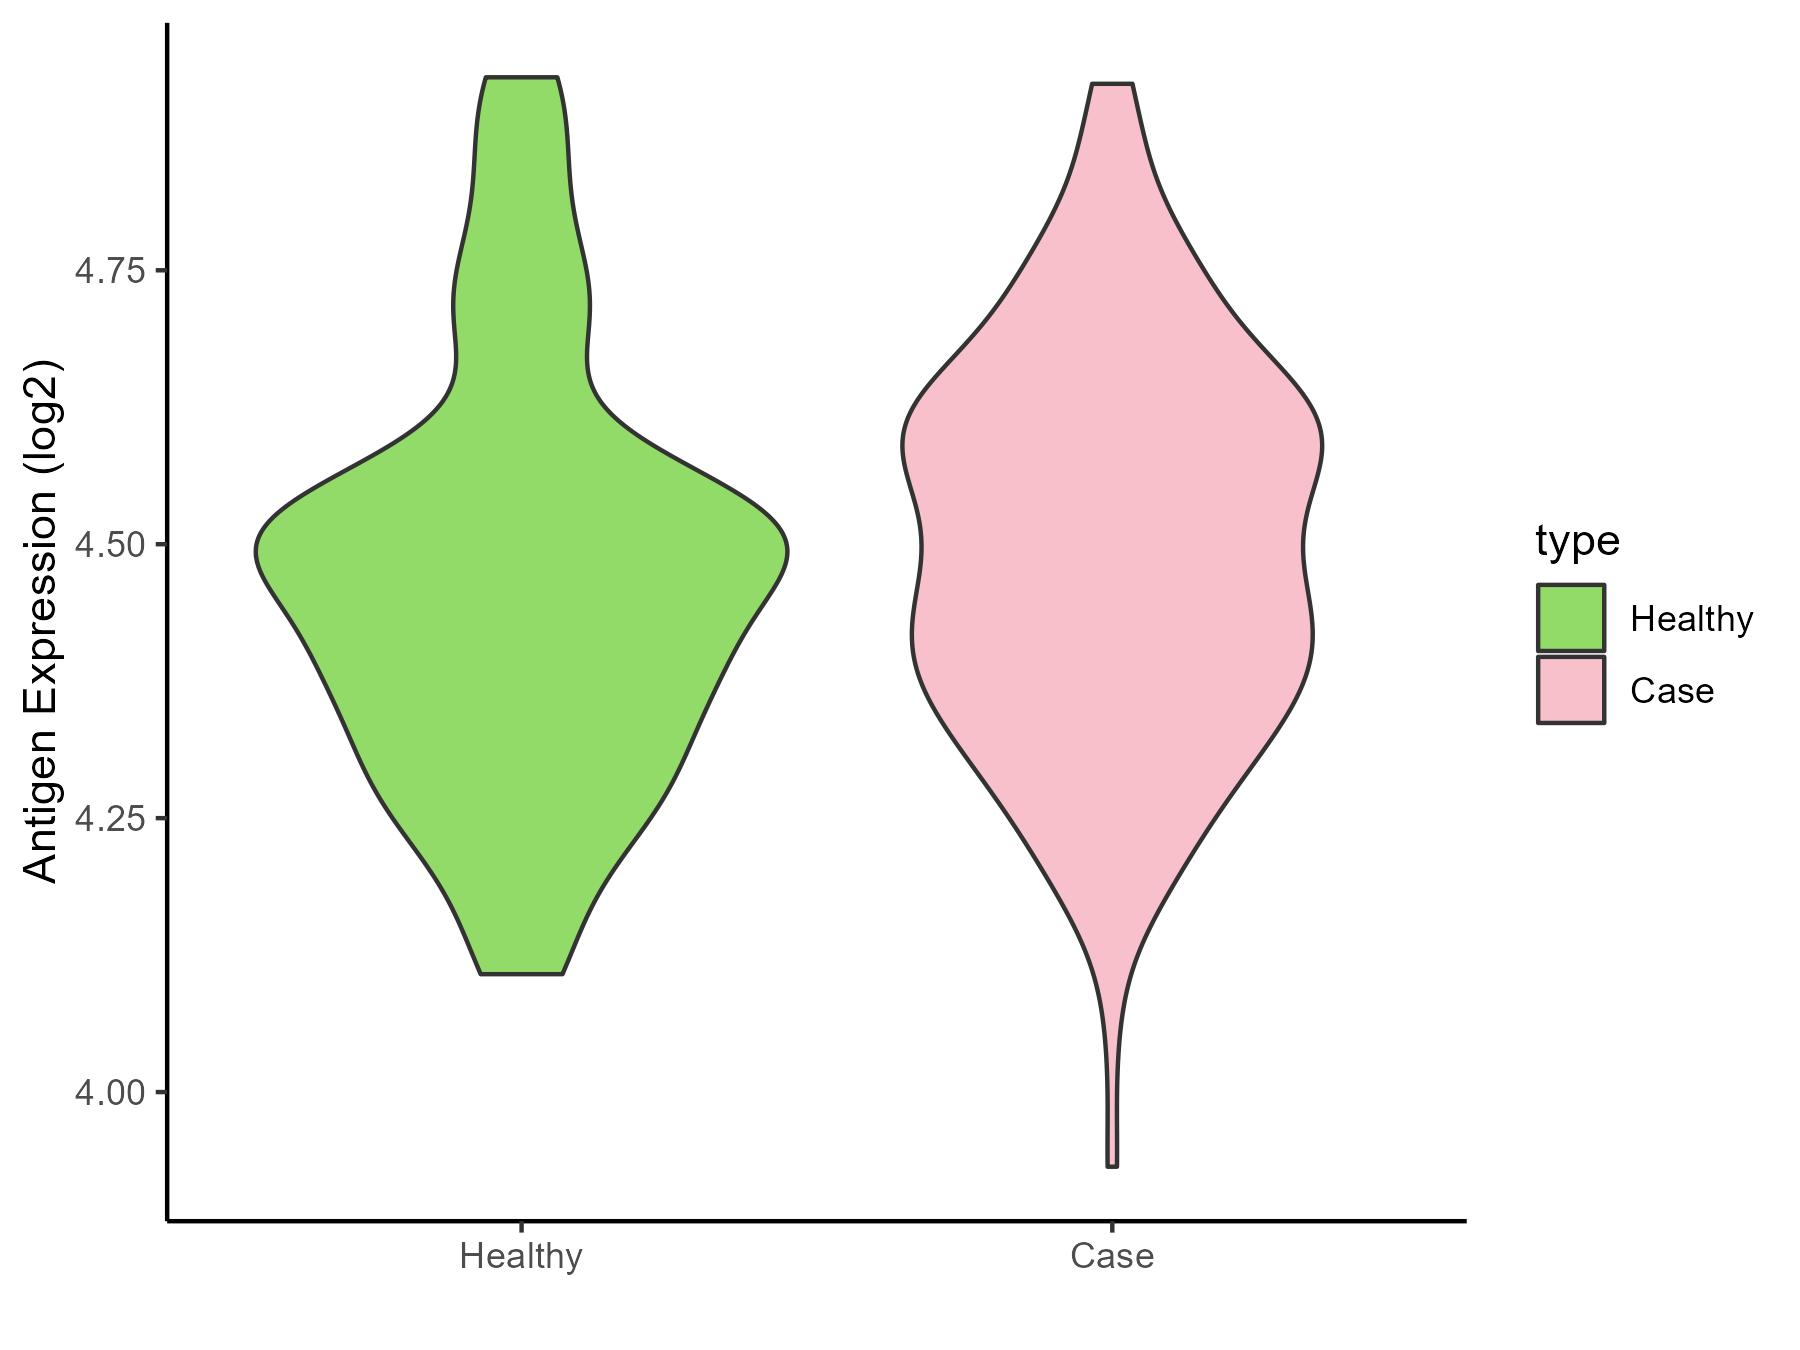
| Differential expression pattern of antigen in diseases | ||
| The Studied Tissue | Whole blood | |
| The Specific Disease | Sepsis | |
| The Expression Level of Disease Section Compare with the Healthy Individual Tissue | p-value: 0.236179745; Fold-change: 0.023122013; Z-score: 0.122587156 | |
| Disease-specific Antigen Abundances |
|
Click to View the Clearer Original Diagram |
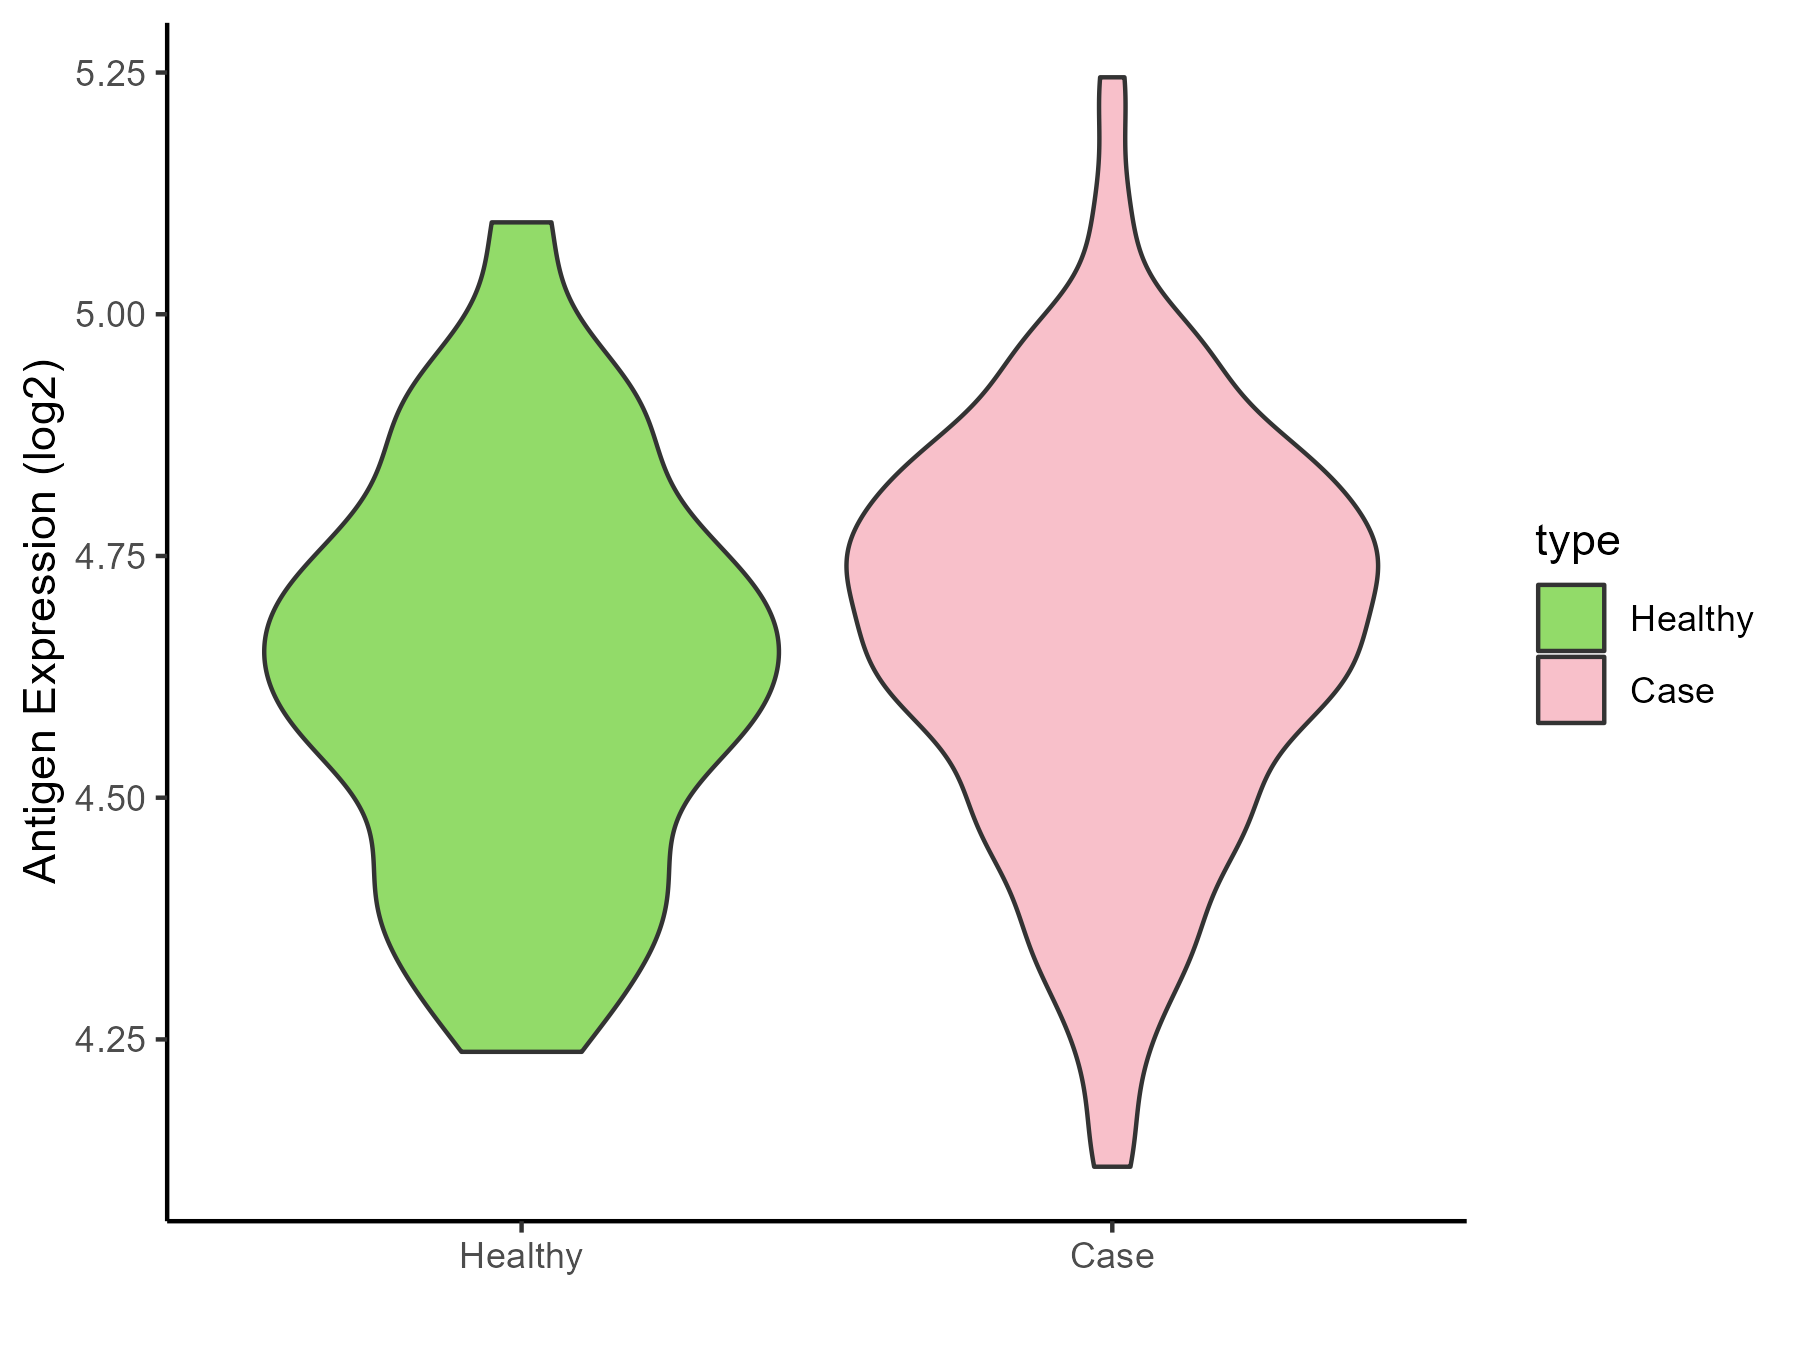
| Differential expression pattern of antigen in diseases | ||
| The Studied Tissue | Whole blood | |
| The Specific Disease | Septic shock | |
| The Expression Level of Disease Section Compare with the Healthy Individual Tissue | p-value: 0.03560455; Fold-change: 0.050348102; Z-score: 0.246263617 | |
| Disease-specific Antigen Abundances |
|
Click to View the Clearer Original Diagram |
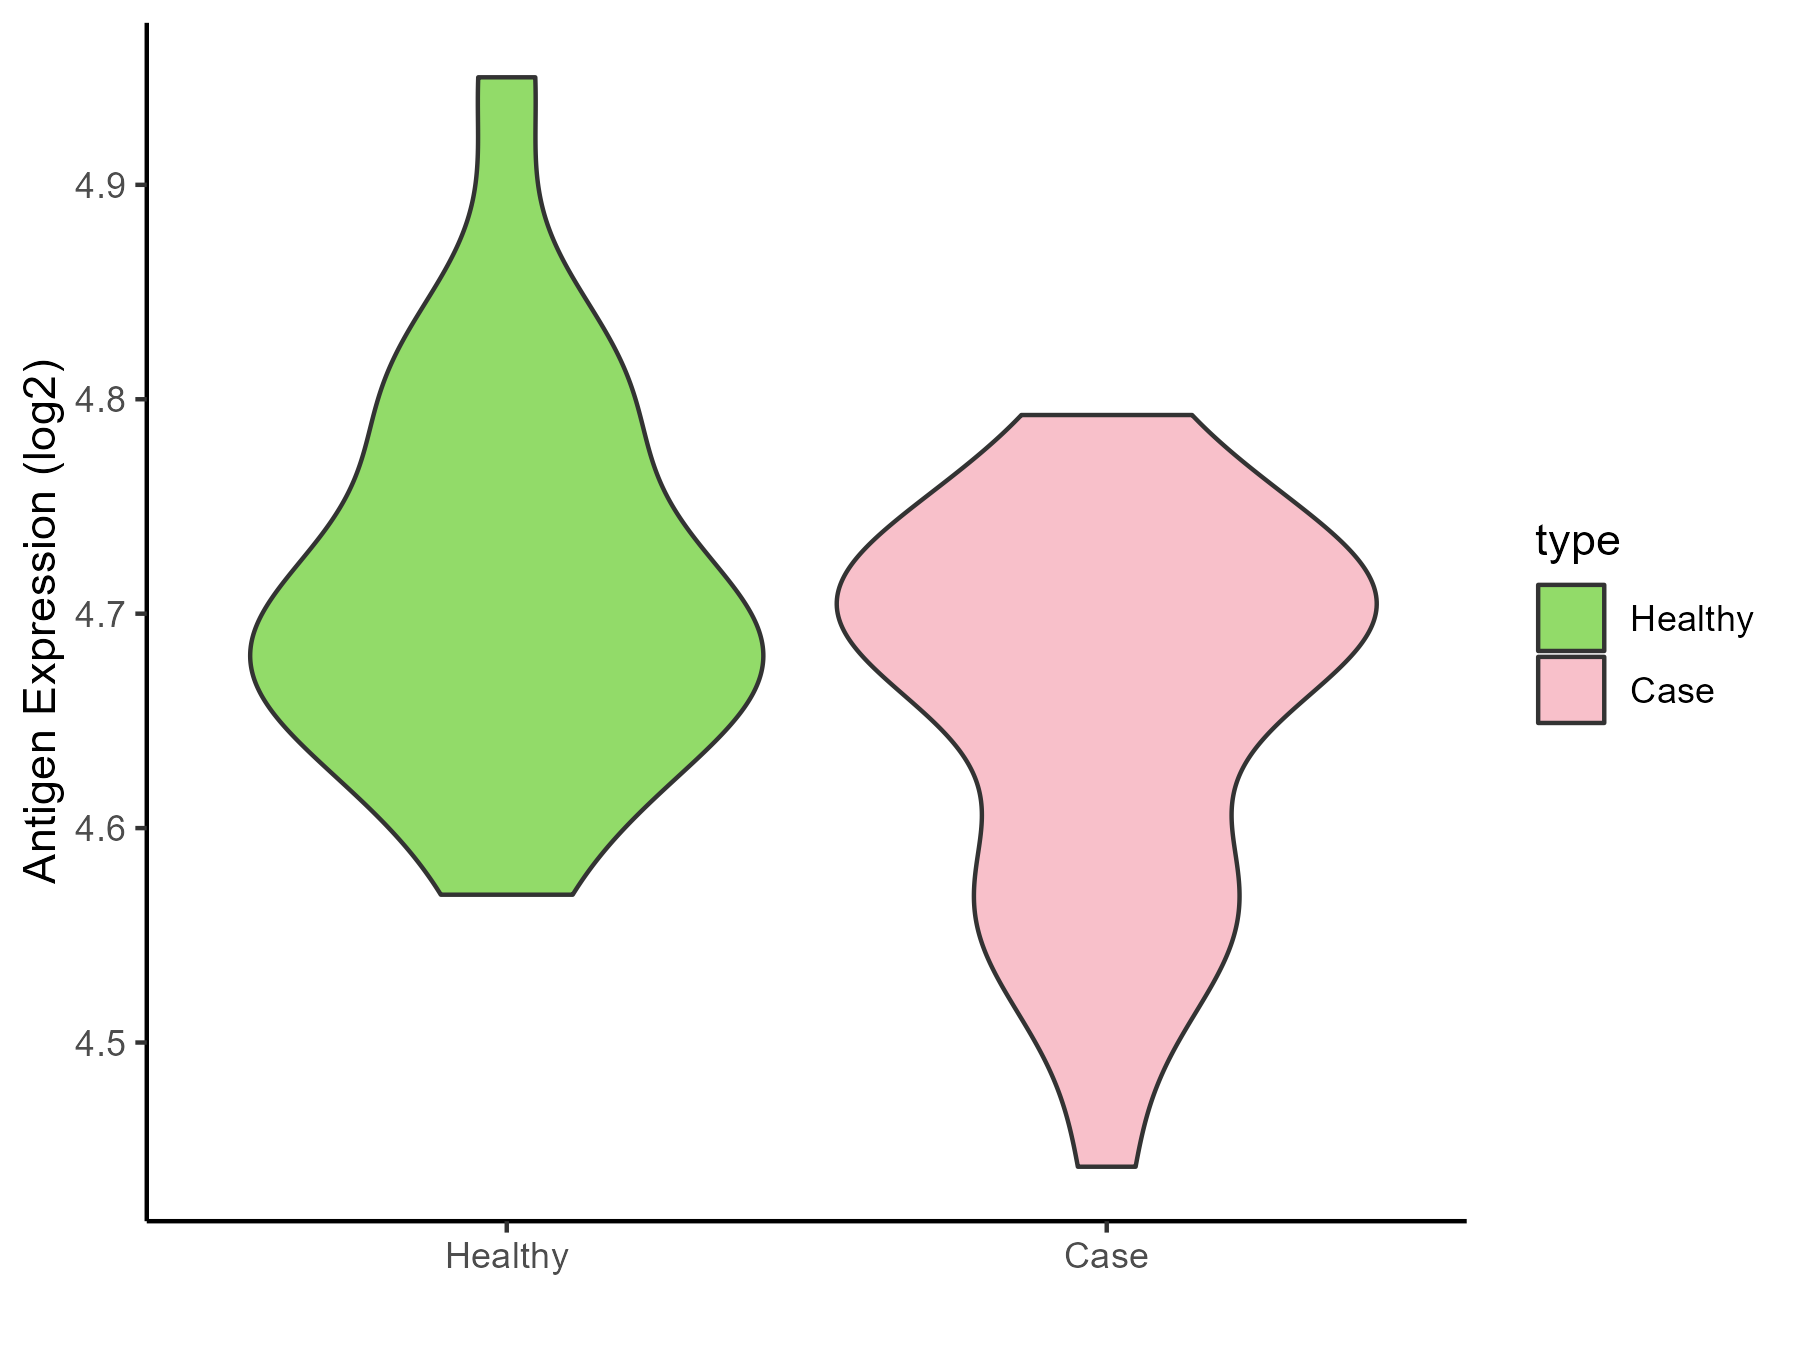
| Differential expression pattern of antigen in diseases | ||
| The Studied Tissue | Peripheral blood | |
| The Specific Disease | Pediatric respiratory syncytial virus infection | |
| The Expression Level of Disease Section Compare with the Healthy Individual Tissue | p-value: 0.037573612; Fold-change: 0.004637459; Z-score: 0.050456431 | |
| Disease-specific Antigen Abundances |
|
Click to View the Clearer Original Diagram |
ICD Disease Classification 11
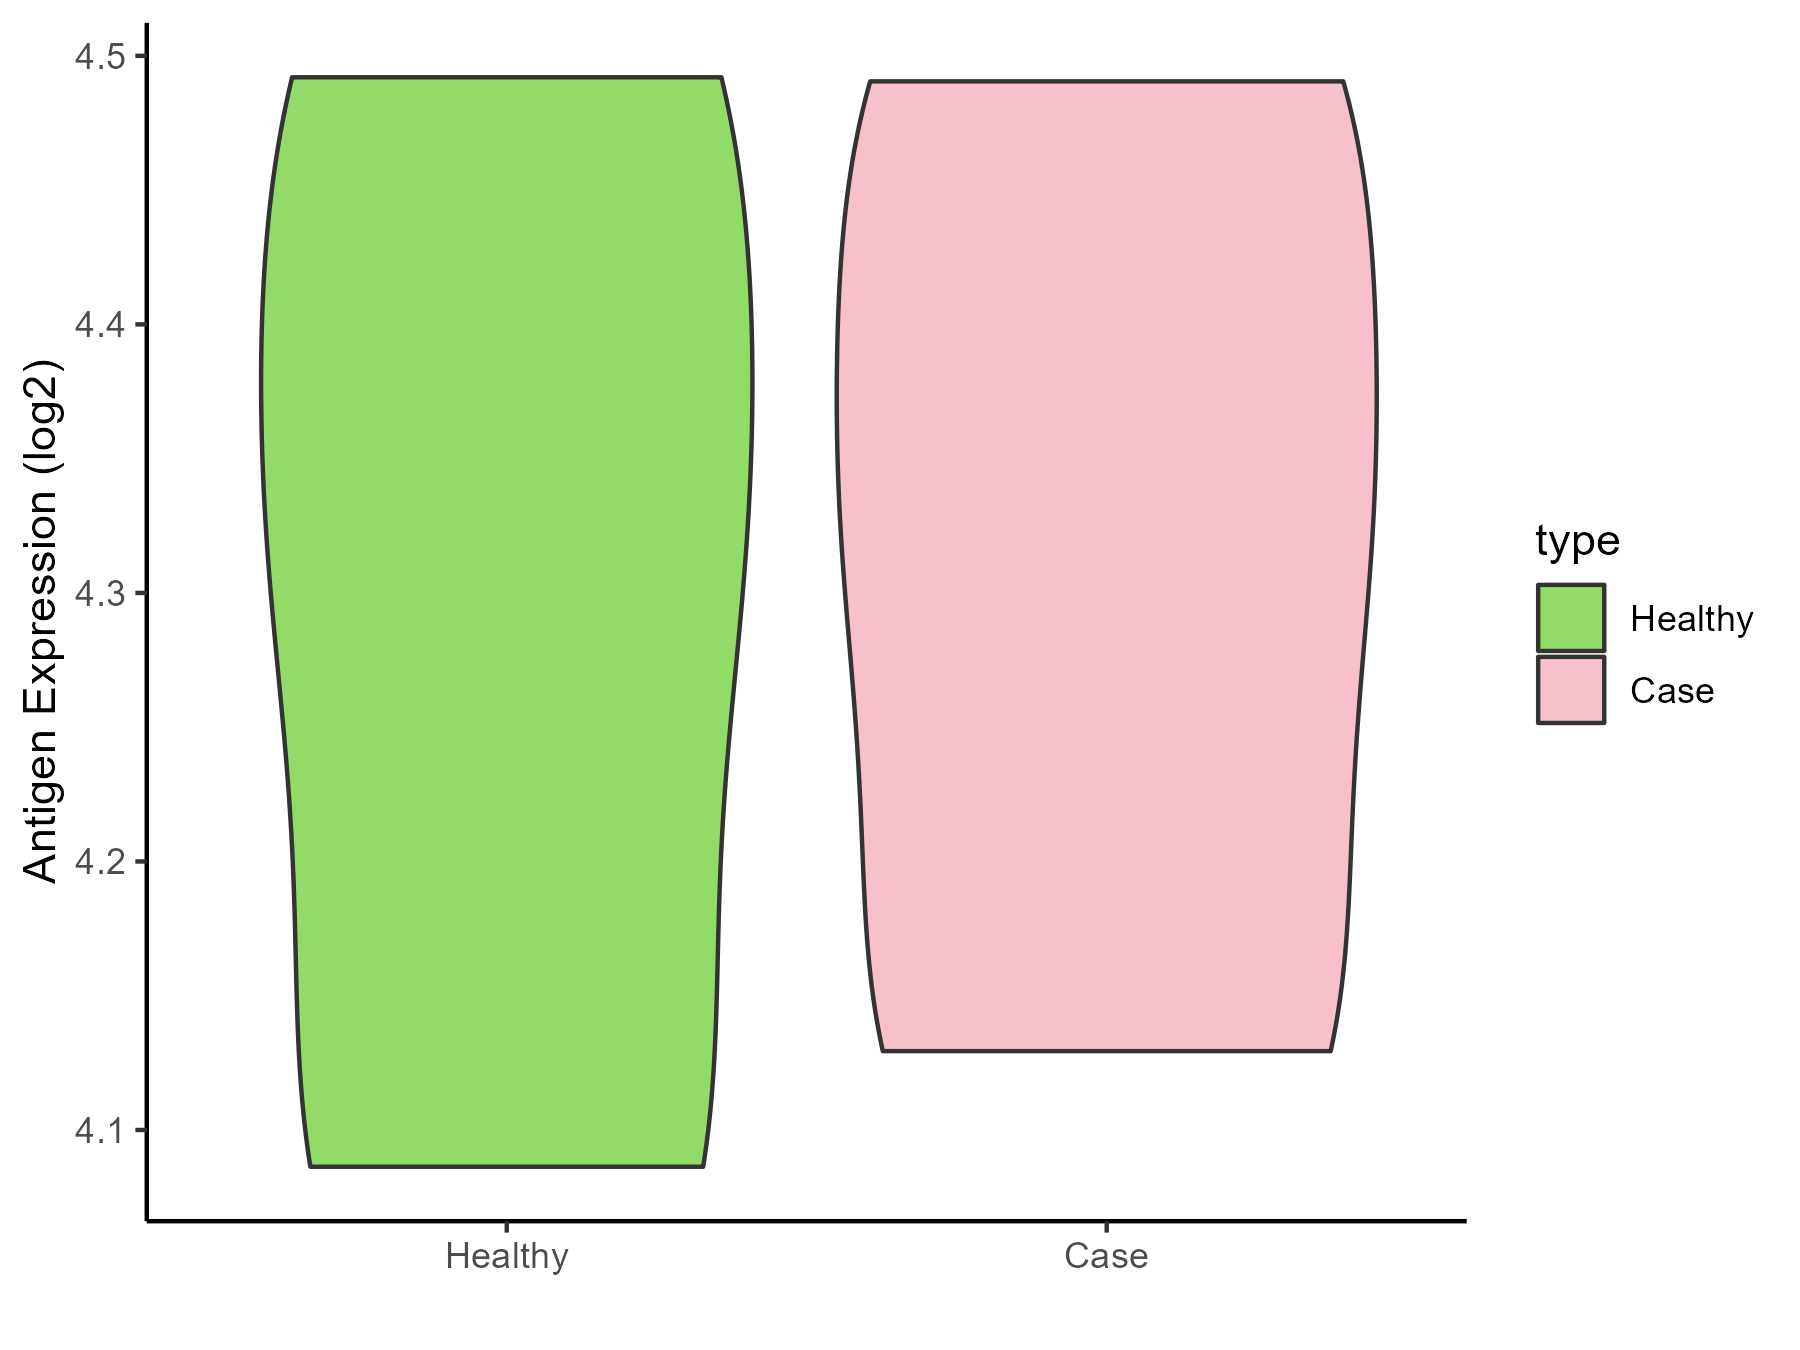
| Differential expression pattern of antigen in diseases | ||
| The Studied Tissue | Peripheral blood | |
| The Specific Disease | Essential hypertension | |
| The Expression Level of Disease Section Compare with the Healthy Individual Tissue | p-value: 0.913480935; Fold-change: 0.012973326; Z-score: 0.063879385 | |
| Disease-specific Antigen Abundances |
|
Click to View the Clearer Original Diagram |
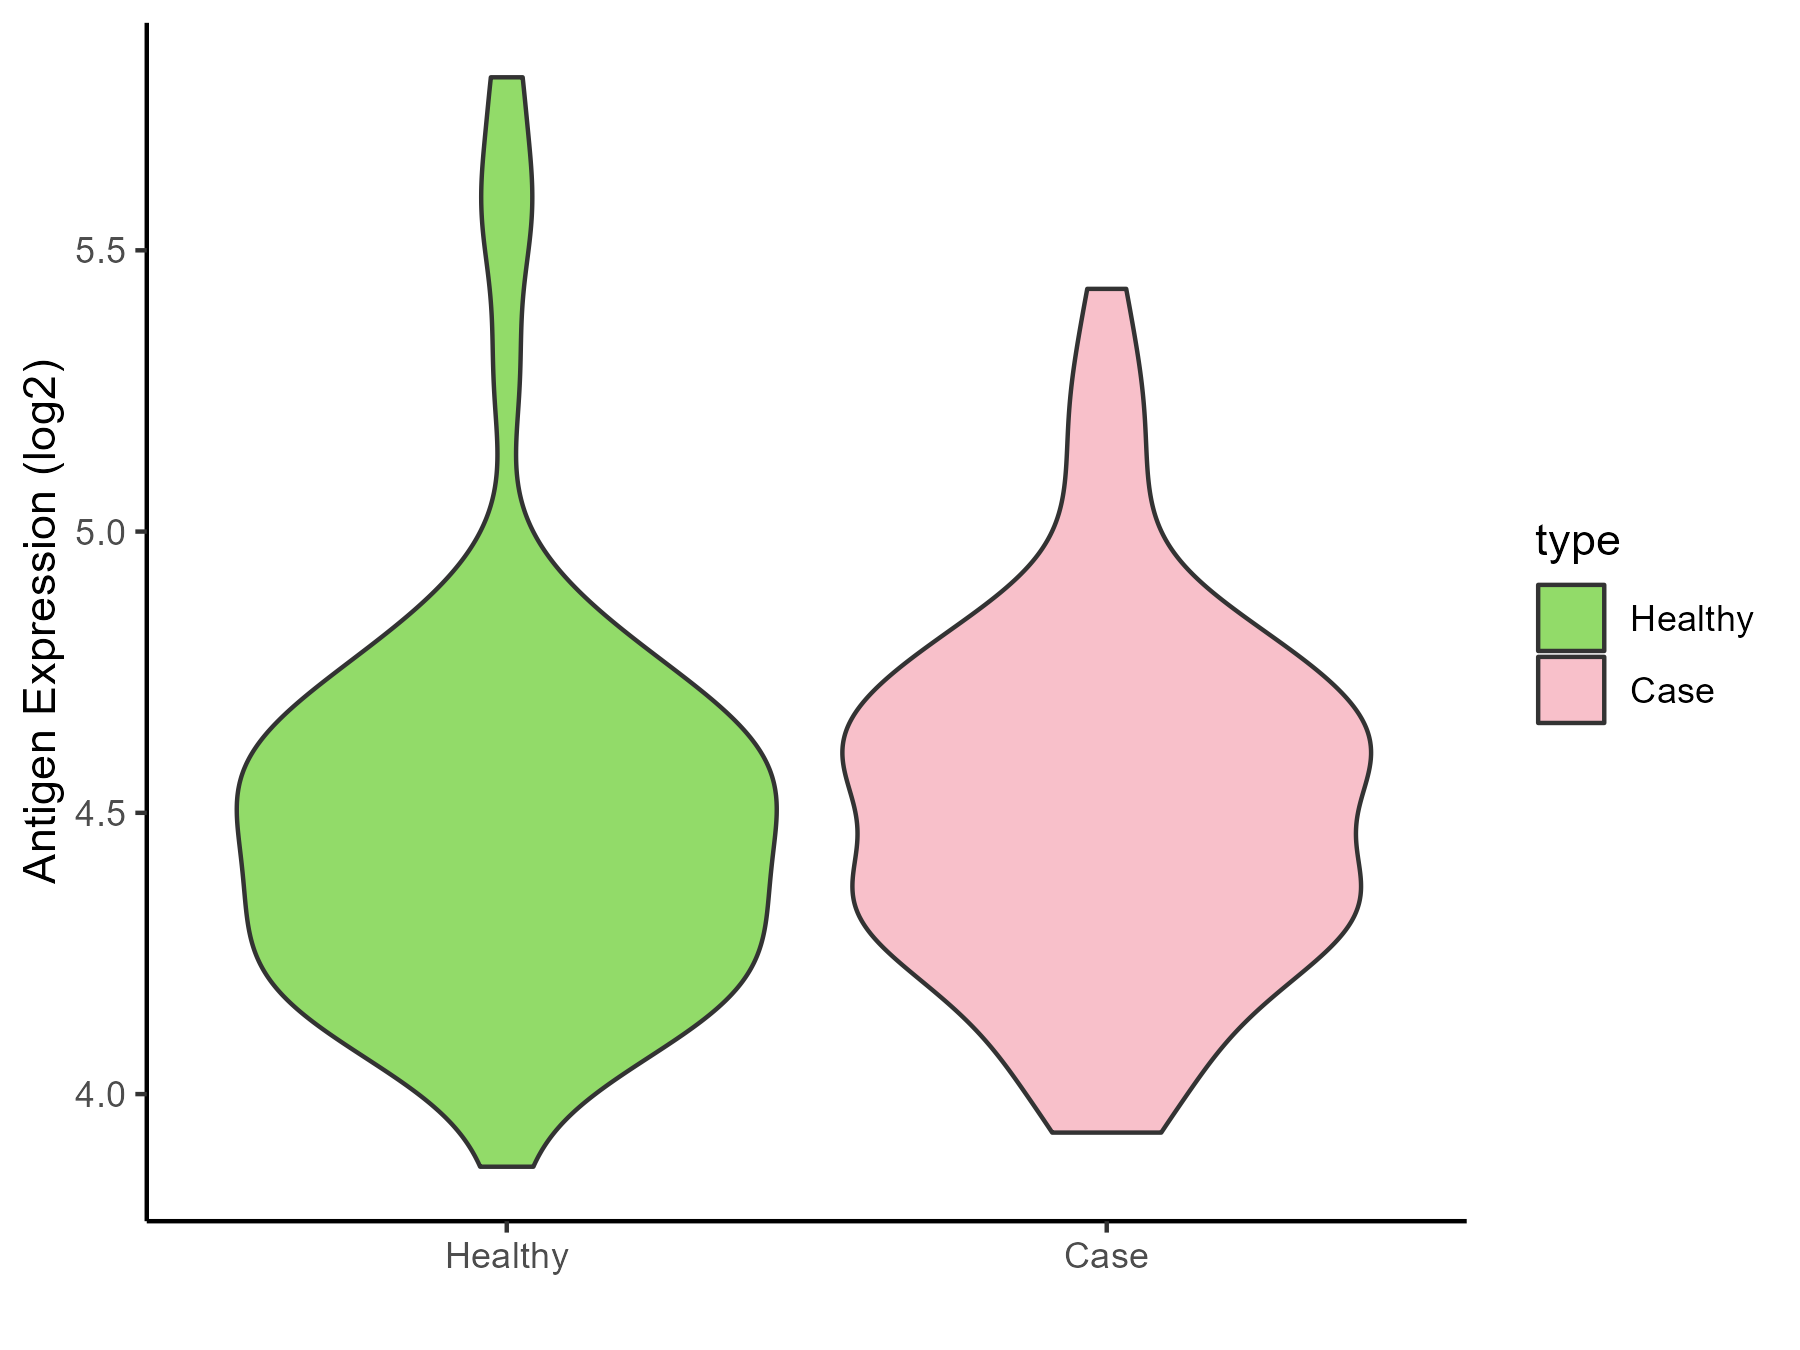
| Differential expression pattern of antigen in diseases | ||
| The Studied Tissue | Peripheral blood | |
| The Specific Disease | Myocardial infarction | |
| The Expression Level of Disease Section Compare with the Healthy Individual Tissue | p-value: 0.724345703; Fold-change: 0.071815685; Z-score: 0.196778611 | |
| Disease-specific Antigen Abundances |
|
Click to View the Clearer Original Diagram |
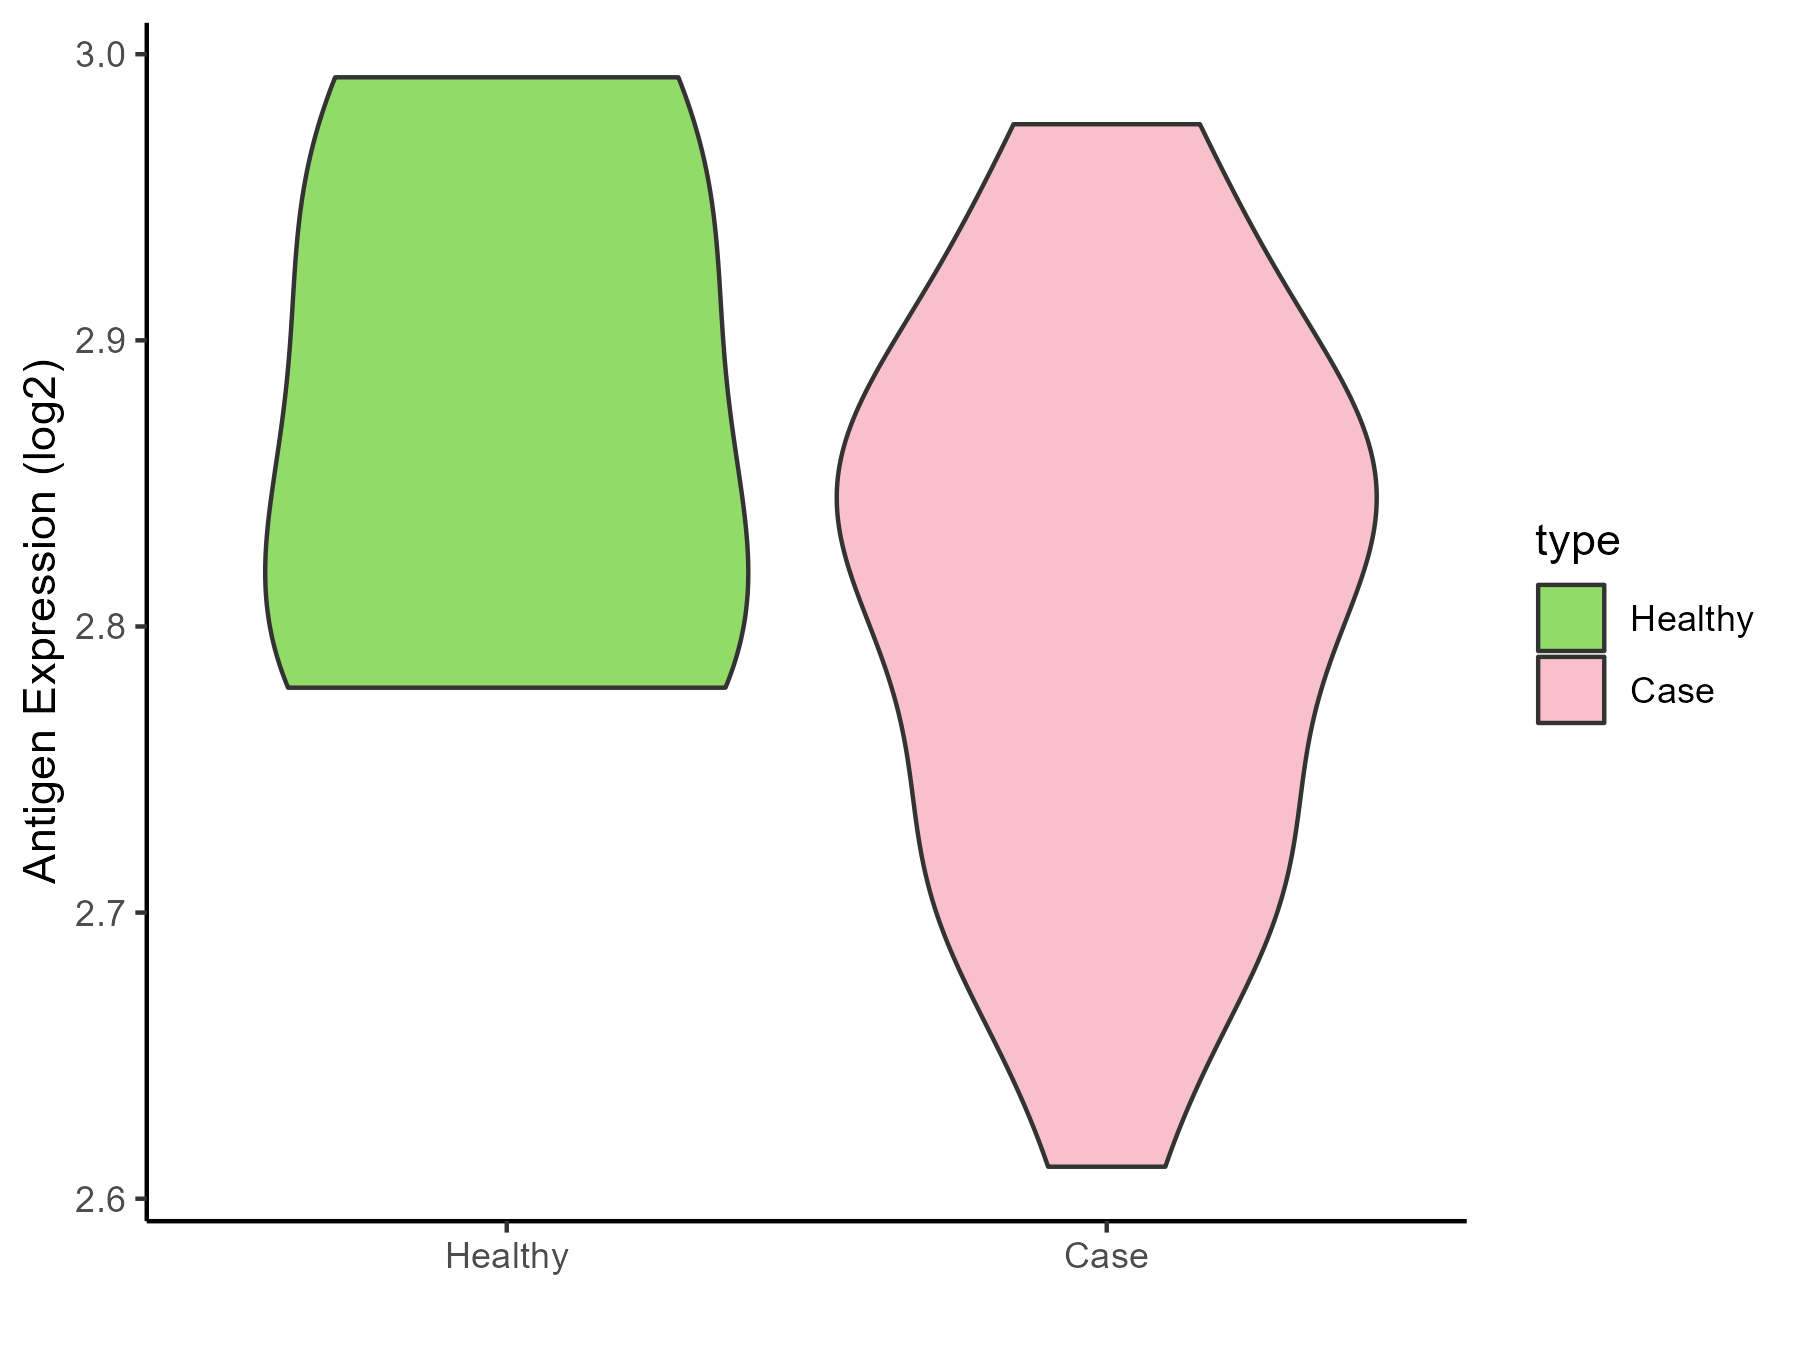
| Differential expression pattern of antigen in diseases | ||
| The Studied Tissue | Peripheral blood | |
| The Specific Disease | Coronary artery disease | |
| The Expression Level of Disease Section Compare with the Healthy Individual Tissue | p-value: 0.28036272; Fold-change: -0.034419253; Z-score: -0.353055543 | |
| Disease-specific Antigen Abundances |
|
Click to View the Clearer Original Diagram |
| Differential expression pattern of antigen in diseases | ||
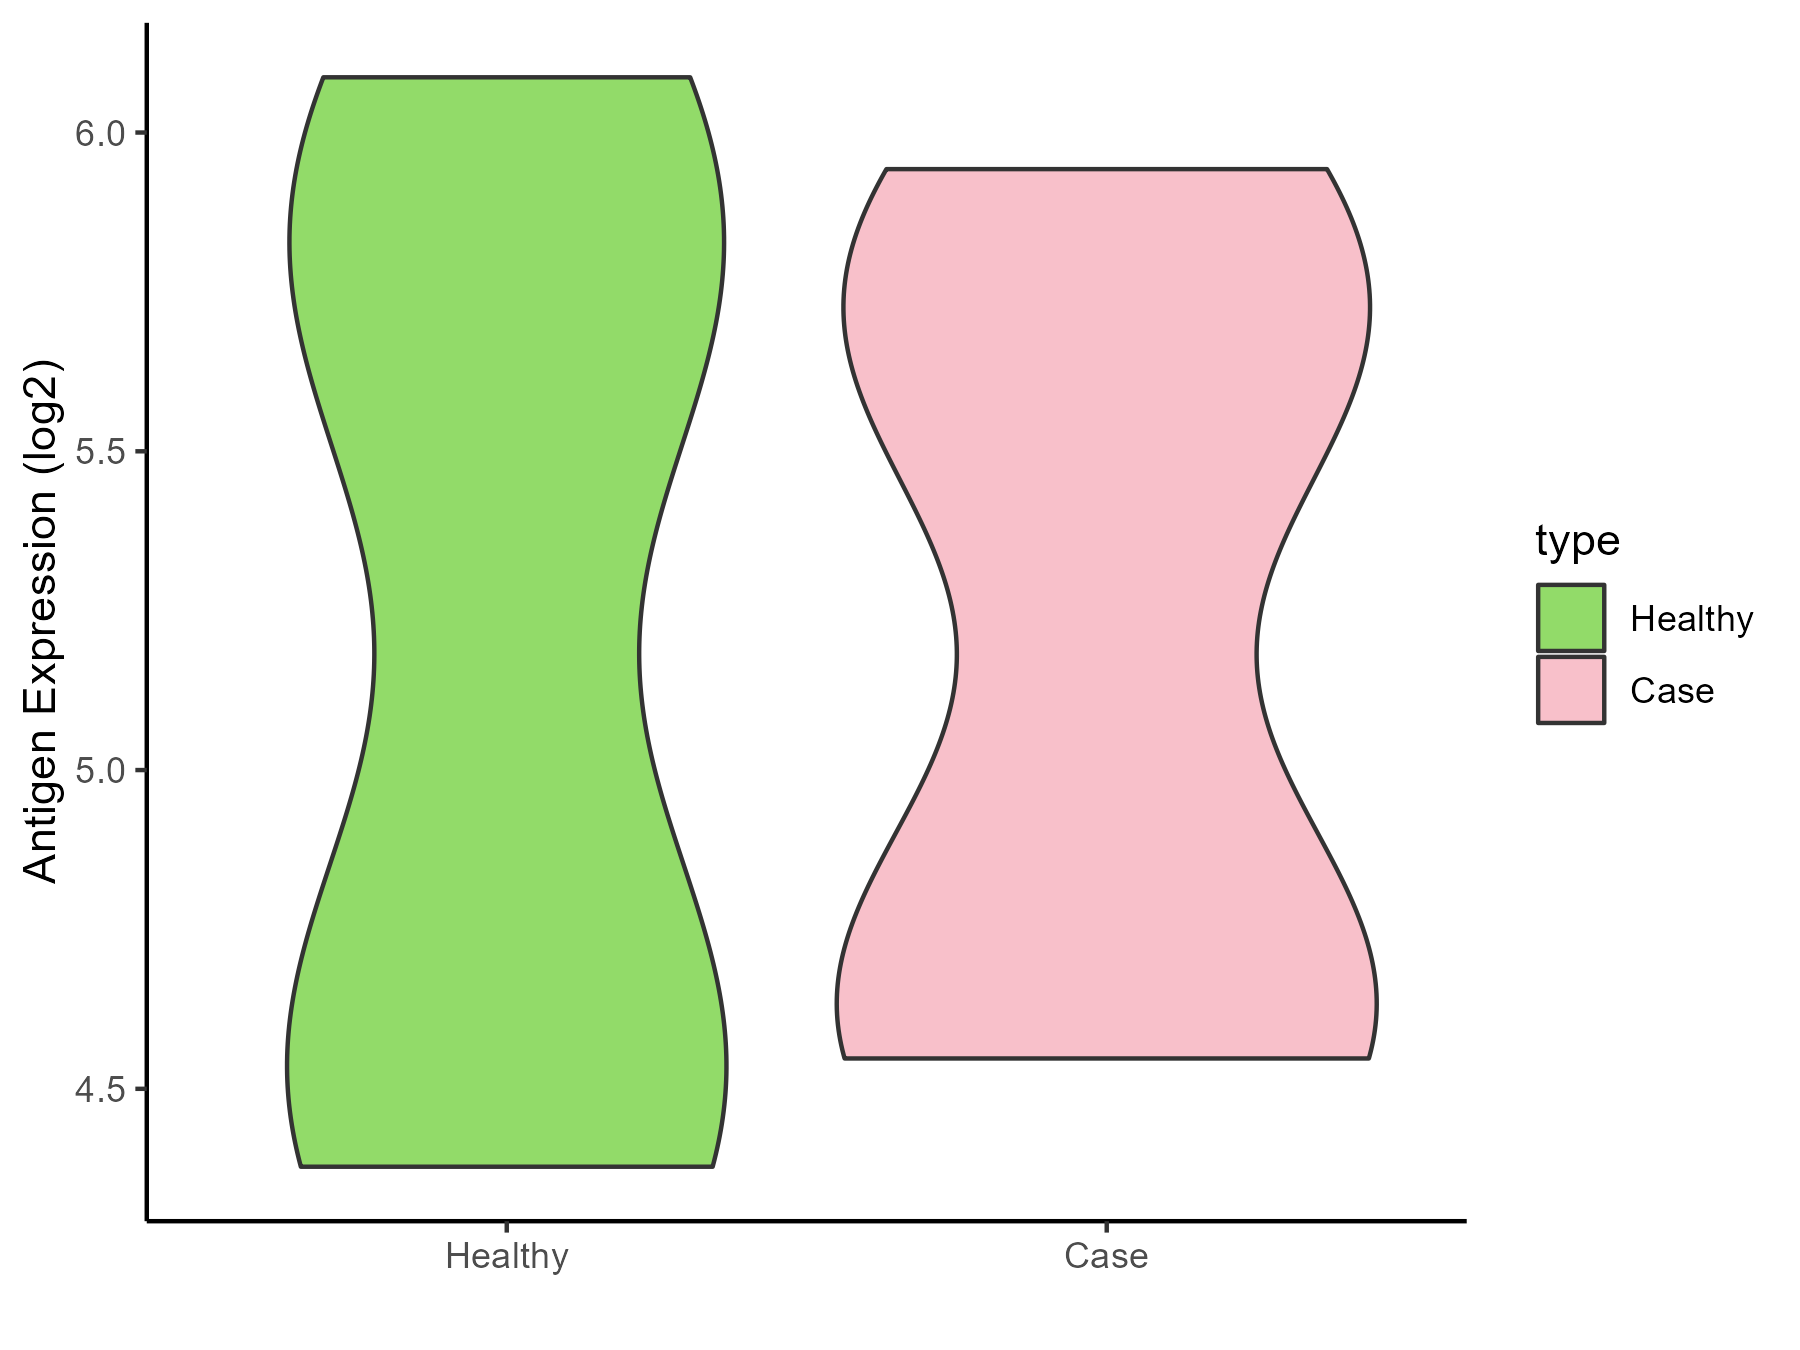
| The Studied Tissue | Calcified aortic valve | |
| The Specific Disease | Aortic stenosis | |
| The Expression Level of Disease Section Compare with the Healthy Individual Tissue | p-value: 0.993440948; Fold-change: -0.010575025; Z-score: -0.014896372 | |
| Disease-specific Antigen Abundances |
|
Click to View the Clearer Original Diagram |
| Differential expression pattern of antigen in diseases | ||
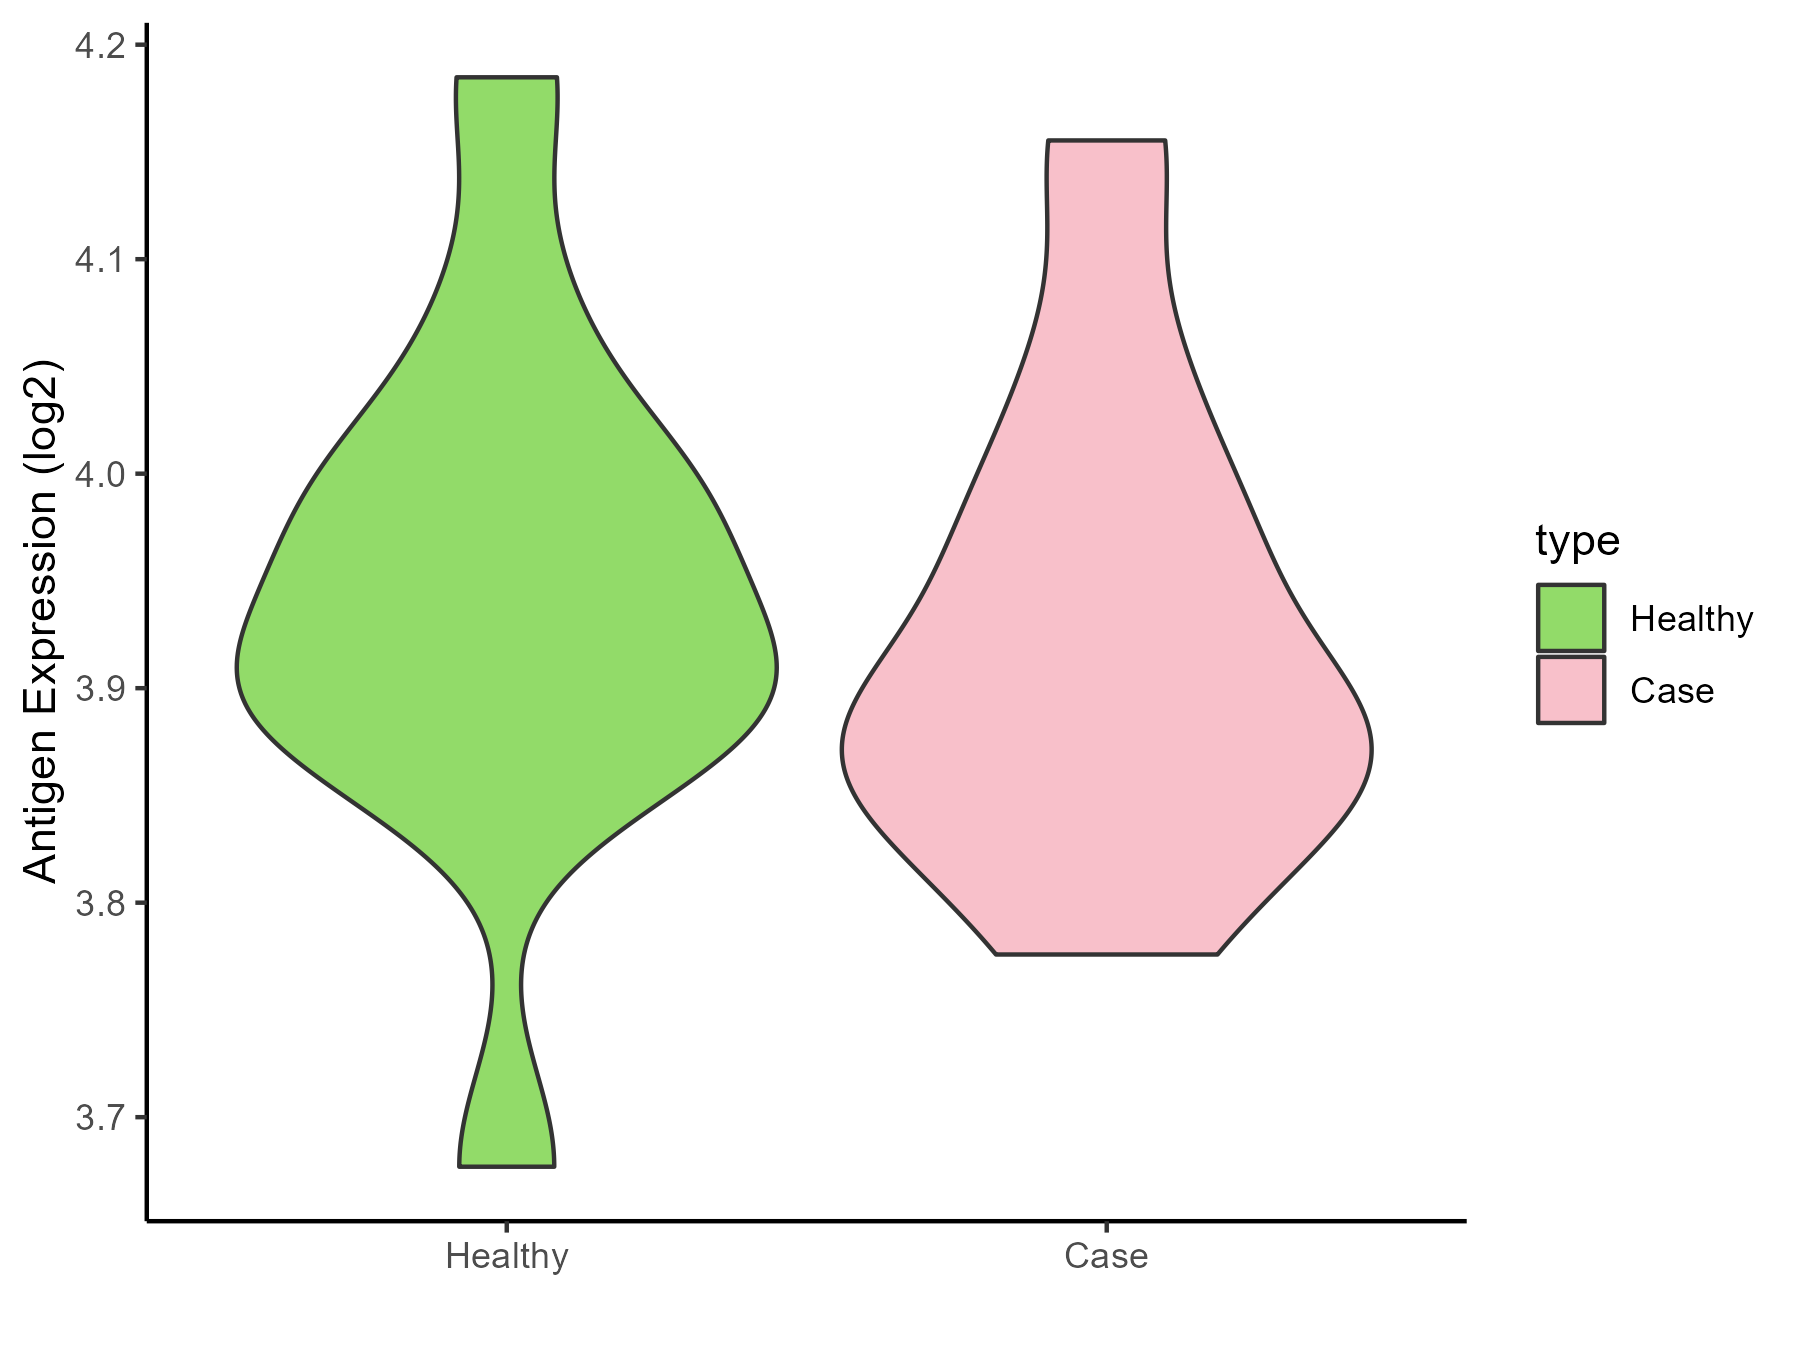
| The Studied Tissue | Peripheral blood | |
| The Specific Disease | Arteriosclerosis | |
| The Expression Level of Disease Section Compare with the Healthy Individual Tissue | p-value: 0.726180523; Fold-change: -0.046131698; Z-score: -0.371604572 | |
| Disease-specific Antigen Abundances |
|
Click to View the Clearer Original Diagram |
| Differential expression pattern of antigen in diseases | ||
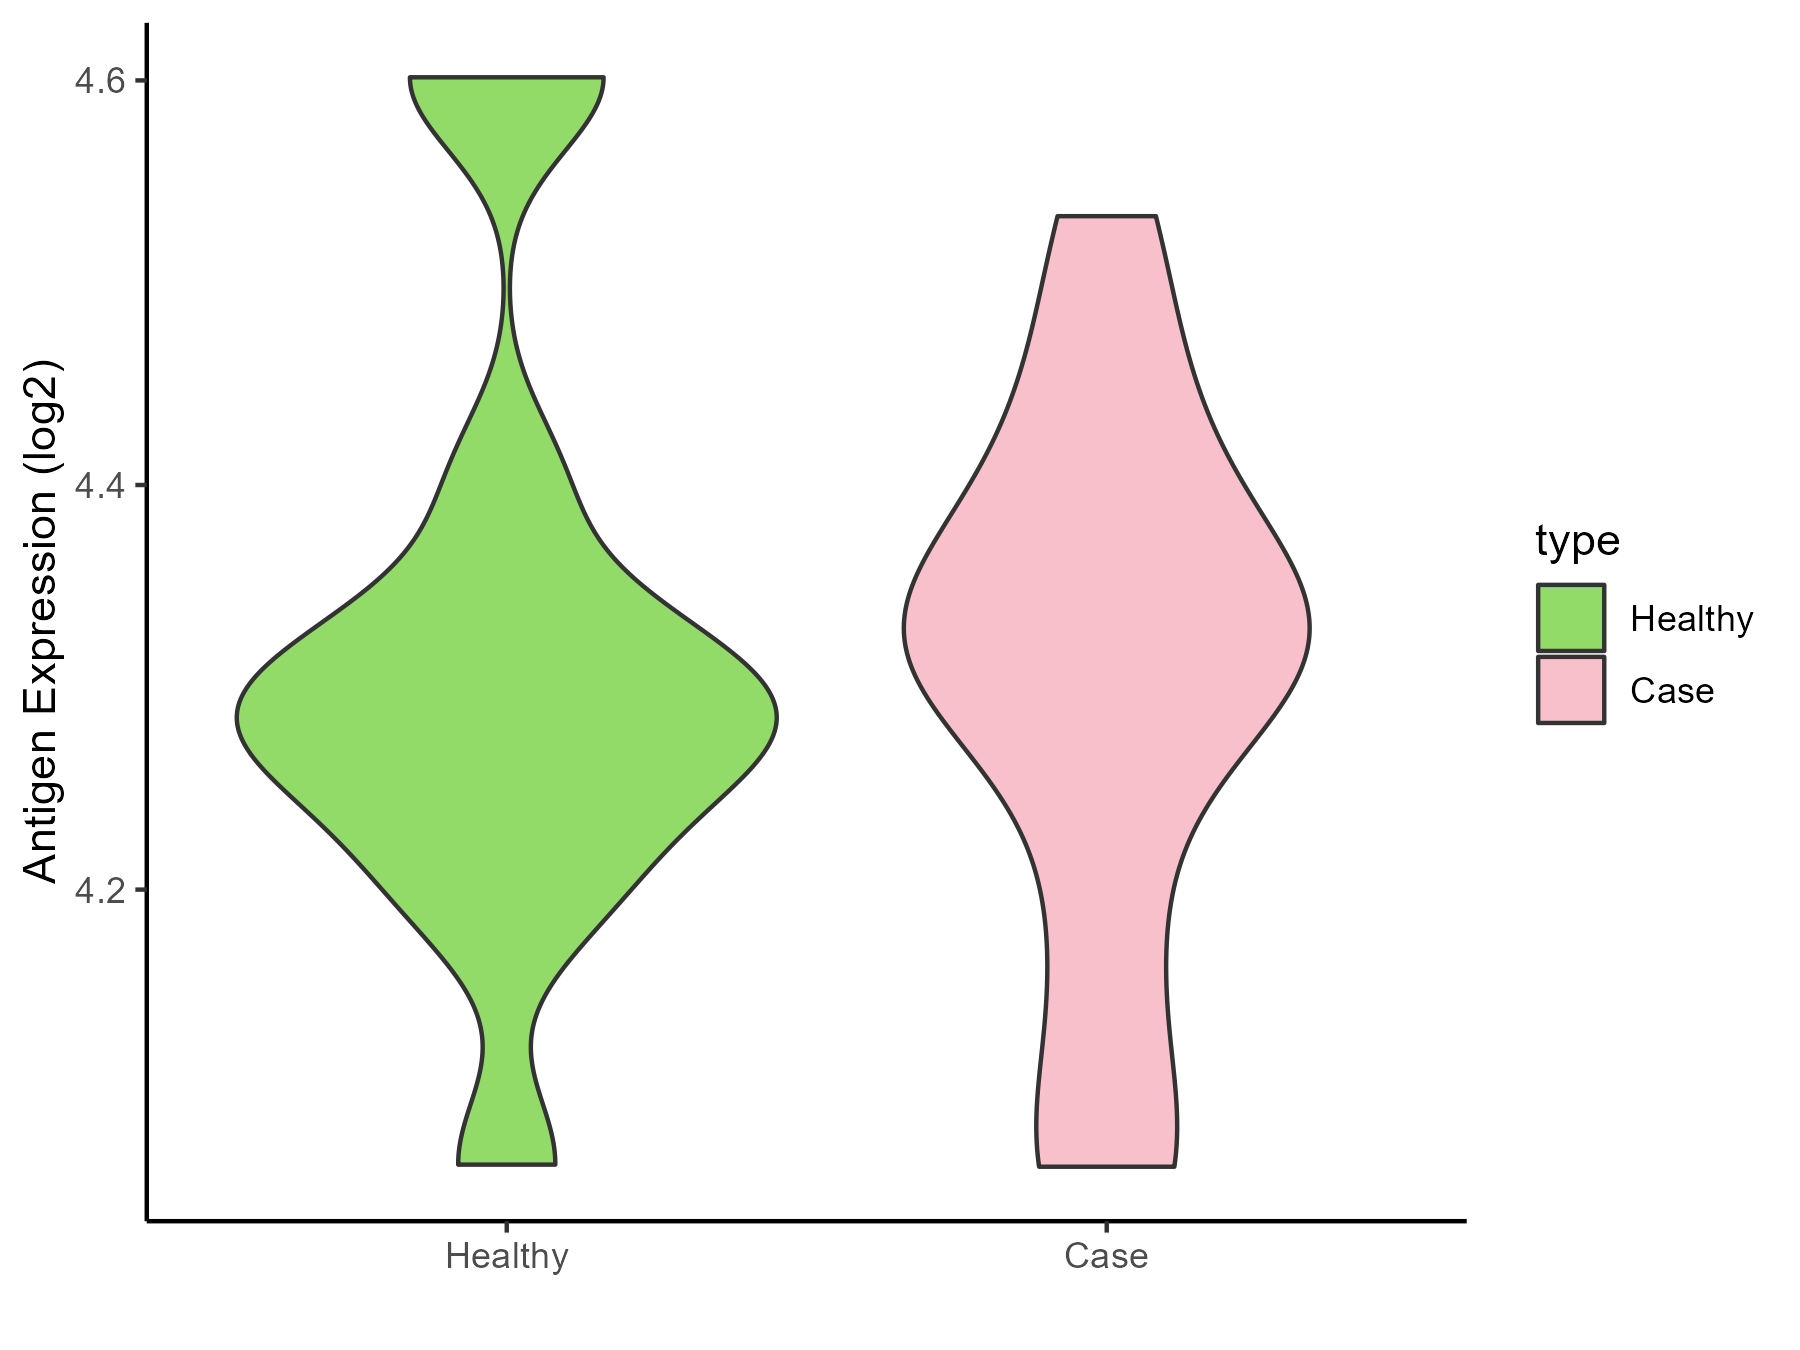
| The Studied Tissue | Intracranial artery | |
| The Specific Disease | Aneurysm | |
| The Expression Level of Disease Section Compare with the Healthy Individual Tissue | p-value: 0.813187804; Fold-change: 0.032535269; Z-score: 0.216844563 | |
| Disease-specific Antigen Abundances |
|
Click to View the Clearer Original Diagram |
ICD Disease Classification 12
| Differential expression pattern of antigen in diseases | ||
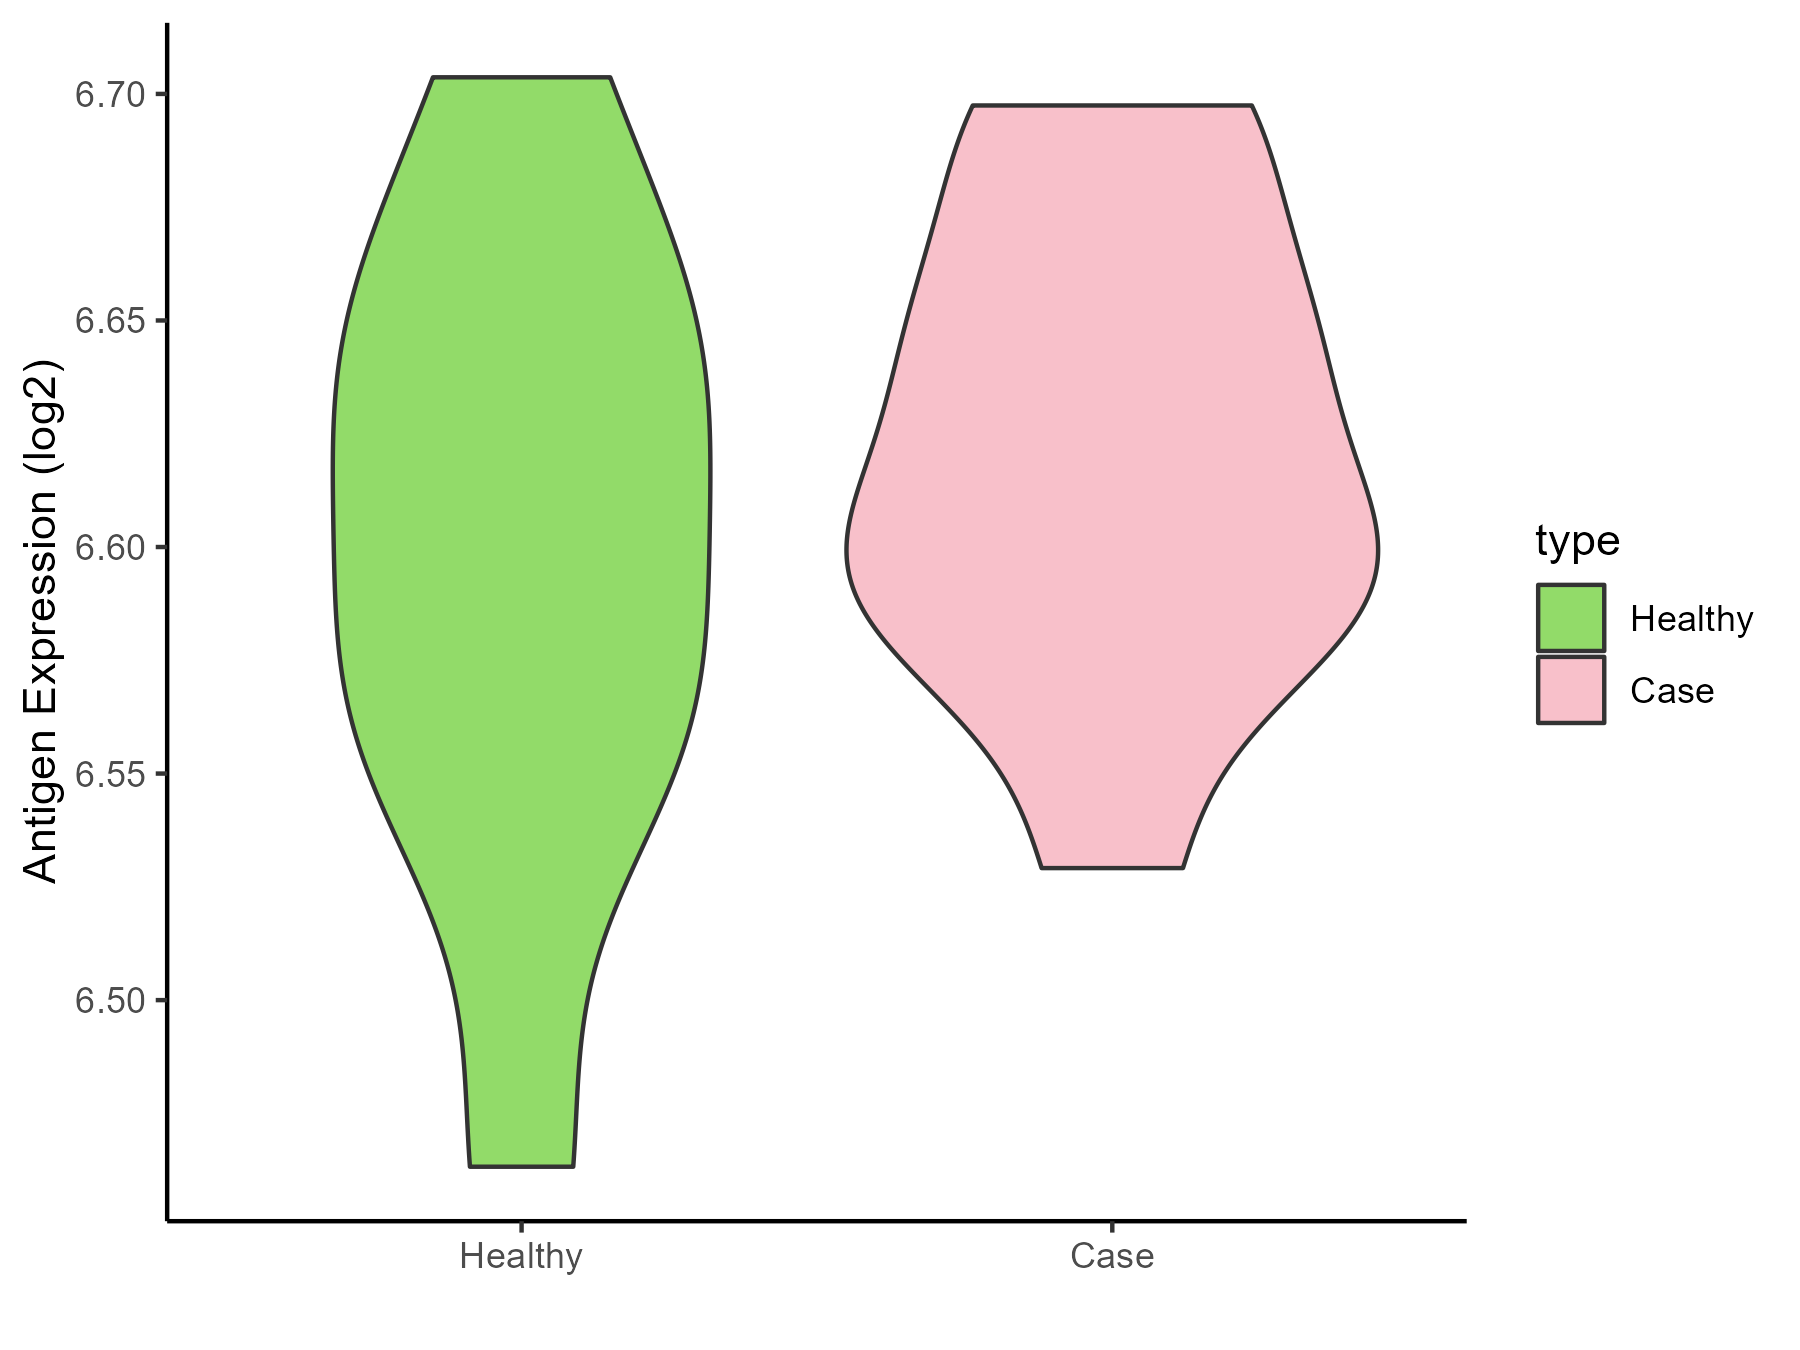
| The Studied Tissue | Peripheral blood | |
| The Specific Disease | Immunodeficiency | |
| The Expression Level of Disease Section Compare with the Healthy Individual Tissue | p-value: 0.427153064; Fold-change: 0.013534942; Z-score: 0.188399871 | |
| Disease-specific Antigen Abundances |
|
Click to View the Clearer Original Diagram |
| Differential expression pattern of antigen in diseases | ||
| The Studied Tissue | Hyperplastic tonsil | |
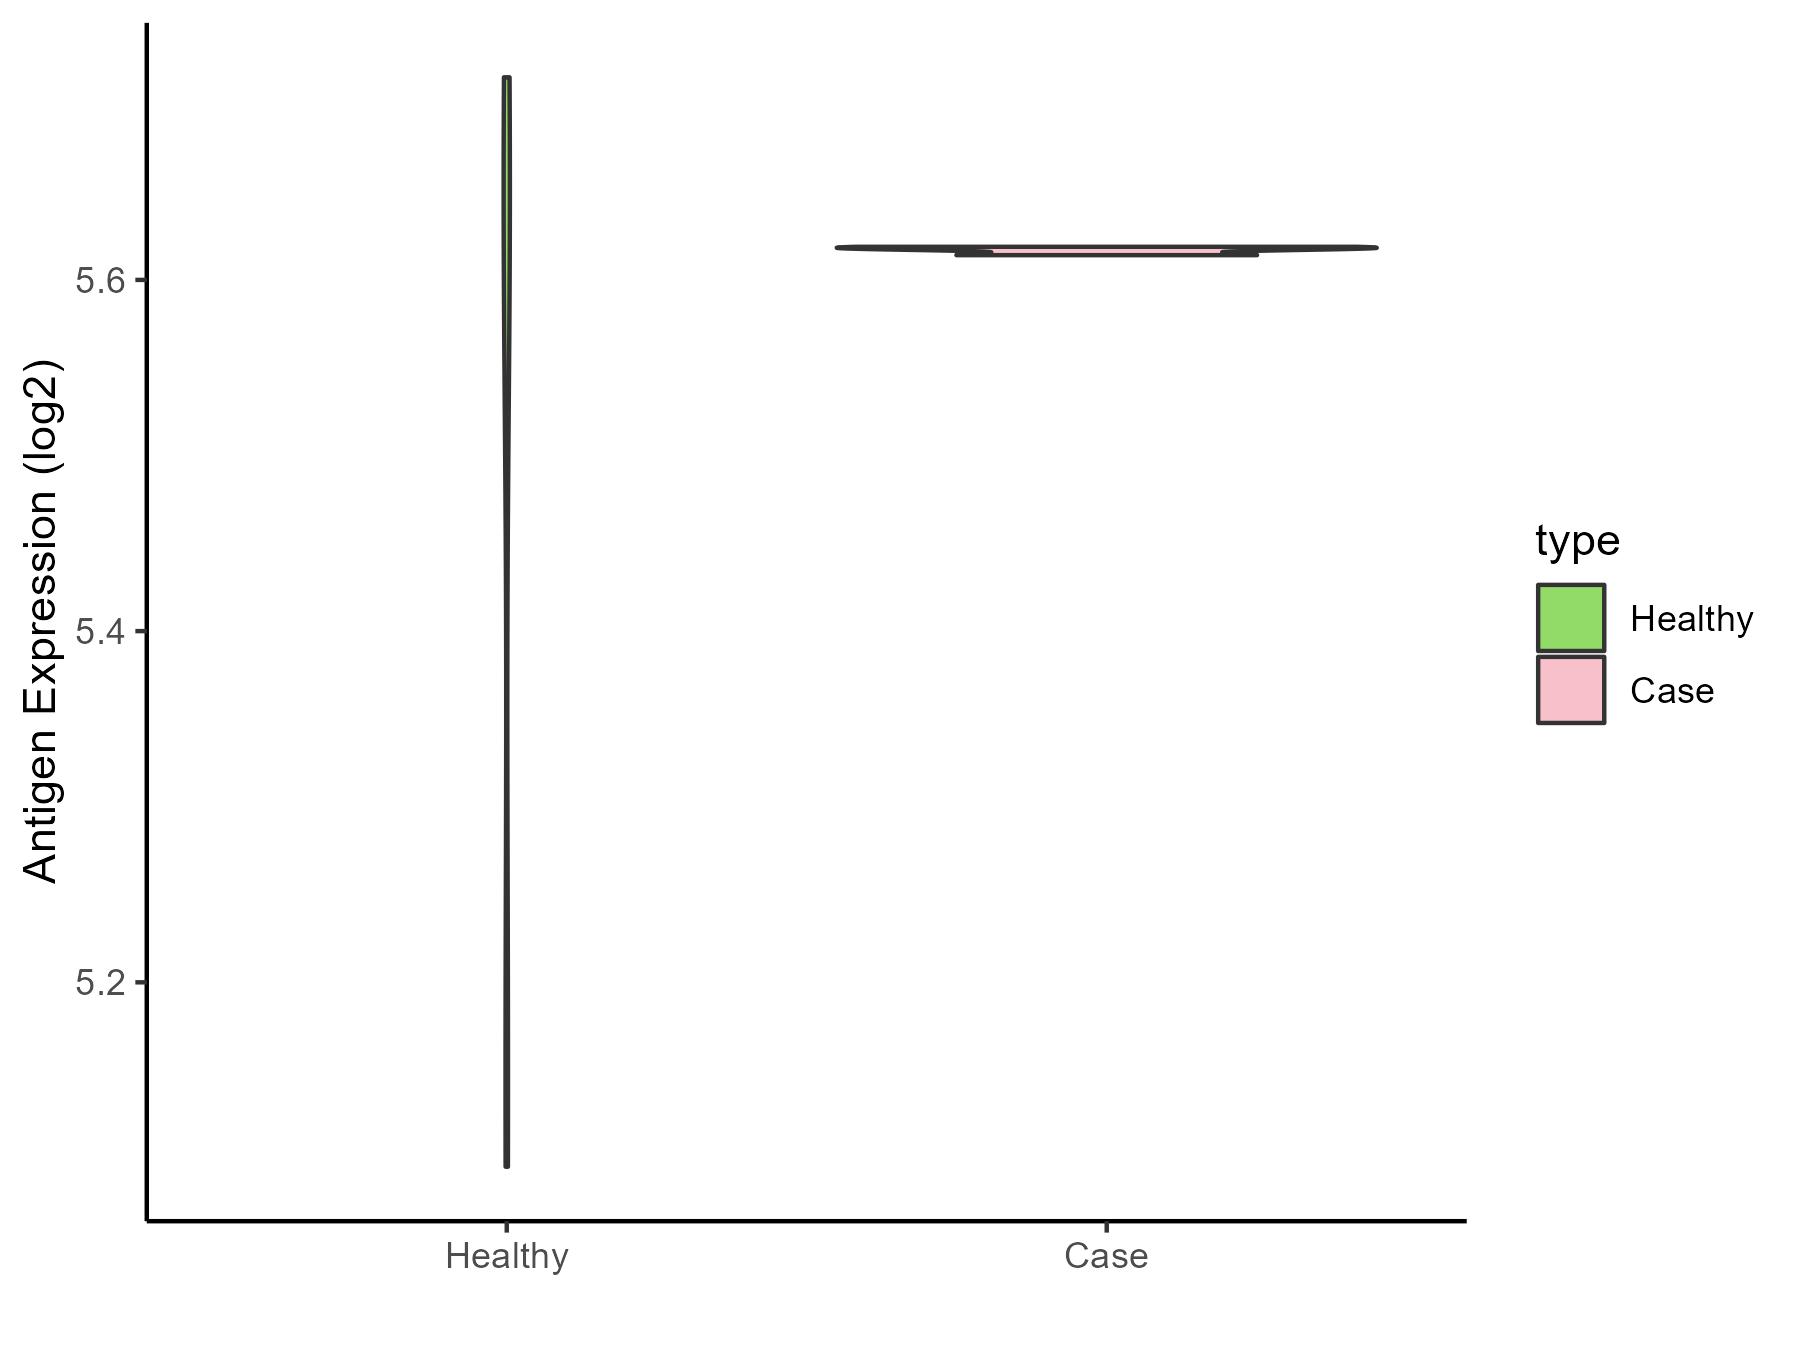
| The Specific Disease | Apnea | |
| The Expression Level of Disease Section Compare with the Healthy Individual Tissue | p-value: 0.299778571; Fold-change: -0.008718758; Z-score: -0.034373537 | |
| Disease-specific Antigen Abundances |
|
Click to View the Clearer Original Diagram |
| Differential expression pattern of antigen in diseases | ||
| The Studied Tissue | Peripheral blood | |
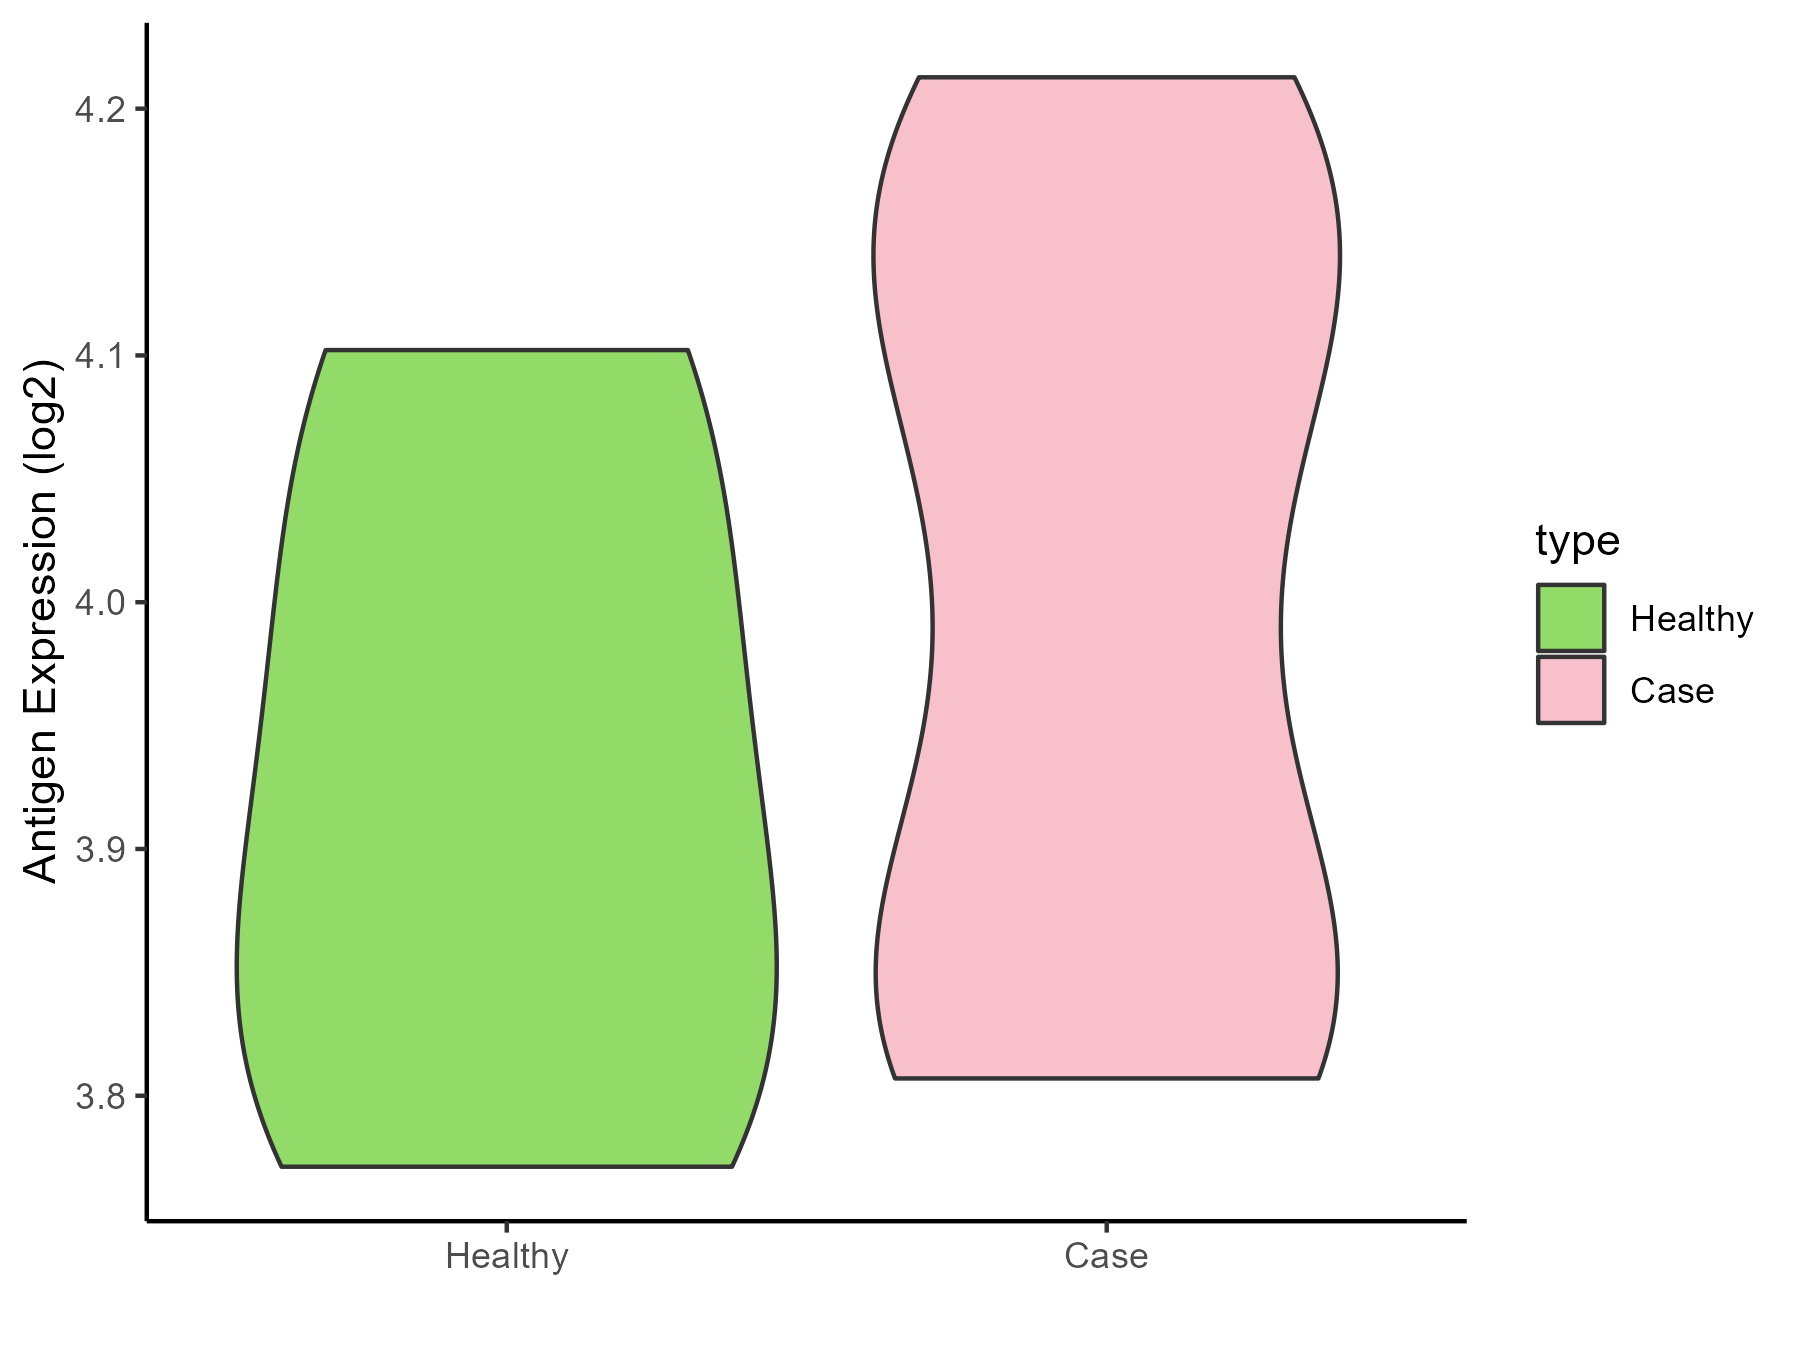
| The Specific Disease | Olive pollen allergy | |
| The Expression Level of Disease Section Compare with the Healthy Individual Tissue | p-value: 0.398097973; Fold-change: 0.084406568; Z-score: 0.5844075 | |
| Disease-specific Antigen Abundances |
|
Click to View the Clearer Original Diagram |
| Differential expression pattern of antigen in diseases | ||
| The Studied Tissue | Sinus mucosa | |
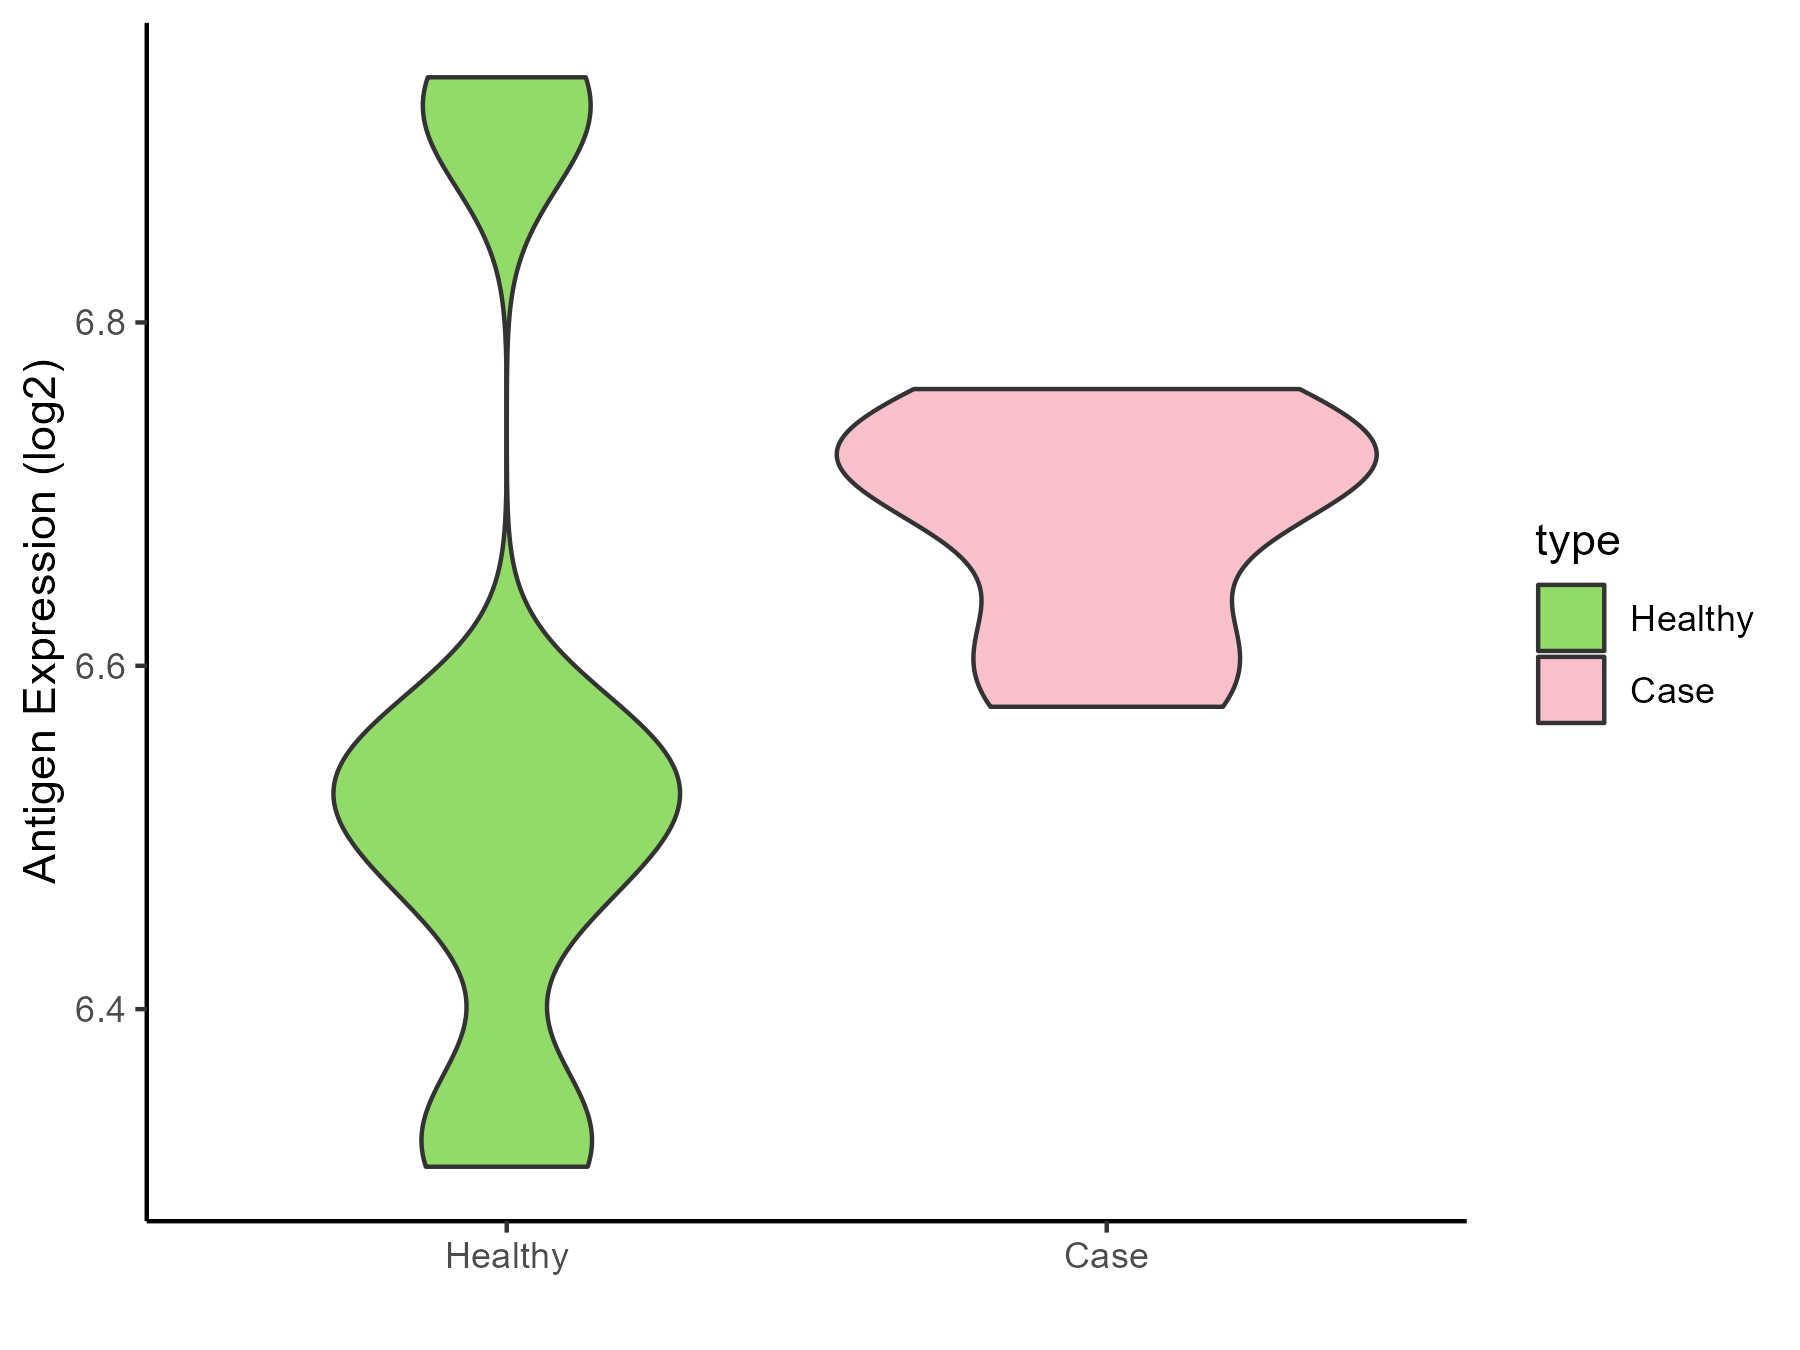
| The Specific Disease | Chronic rhinosinusitis | |
| The Expression Level of Disease Section Compare with the Healthy Individual Tissue | p-value: 0.170273484; Fold-change: 0.180933715; Z-score: 0.81445724 | |
| Disease-specific Antigen Abundances |
|
Click to View the Clearer Original Diagram |
| Differential expression pattern of antigen in diseases | ||
| The Studied Tissue | Lung | |
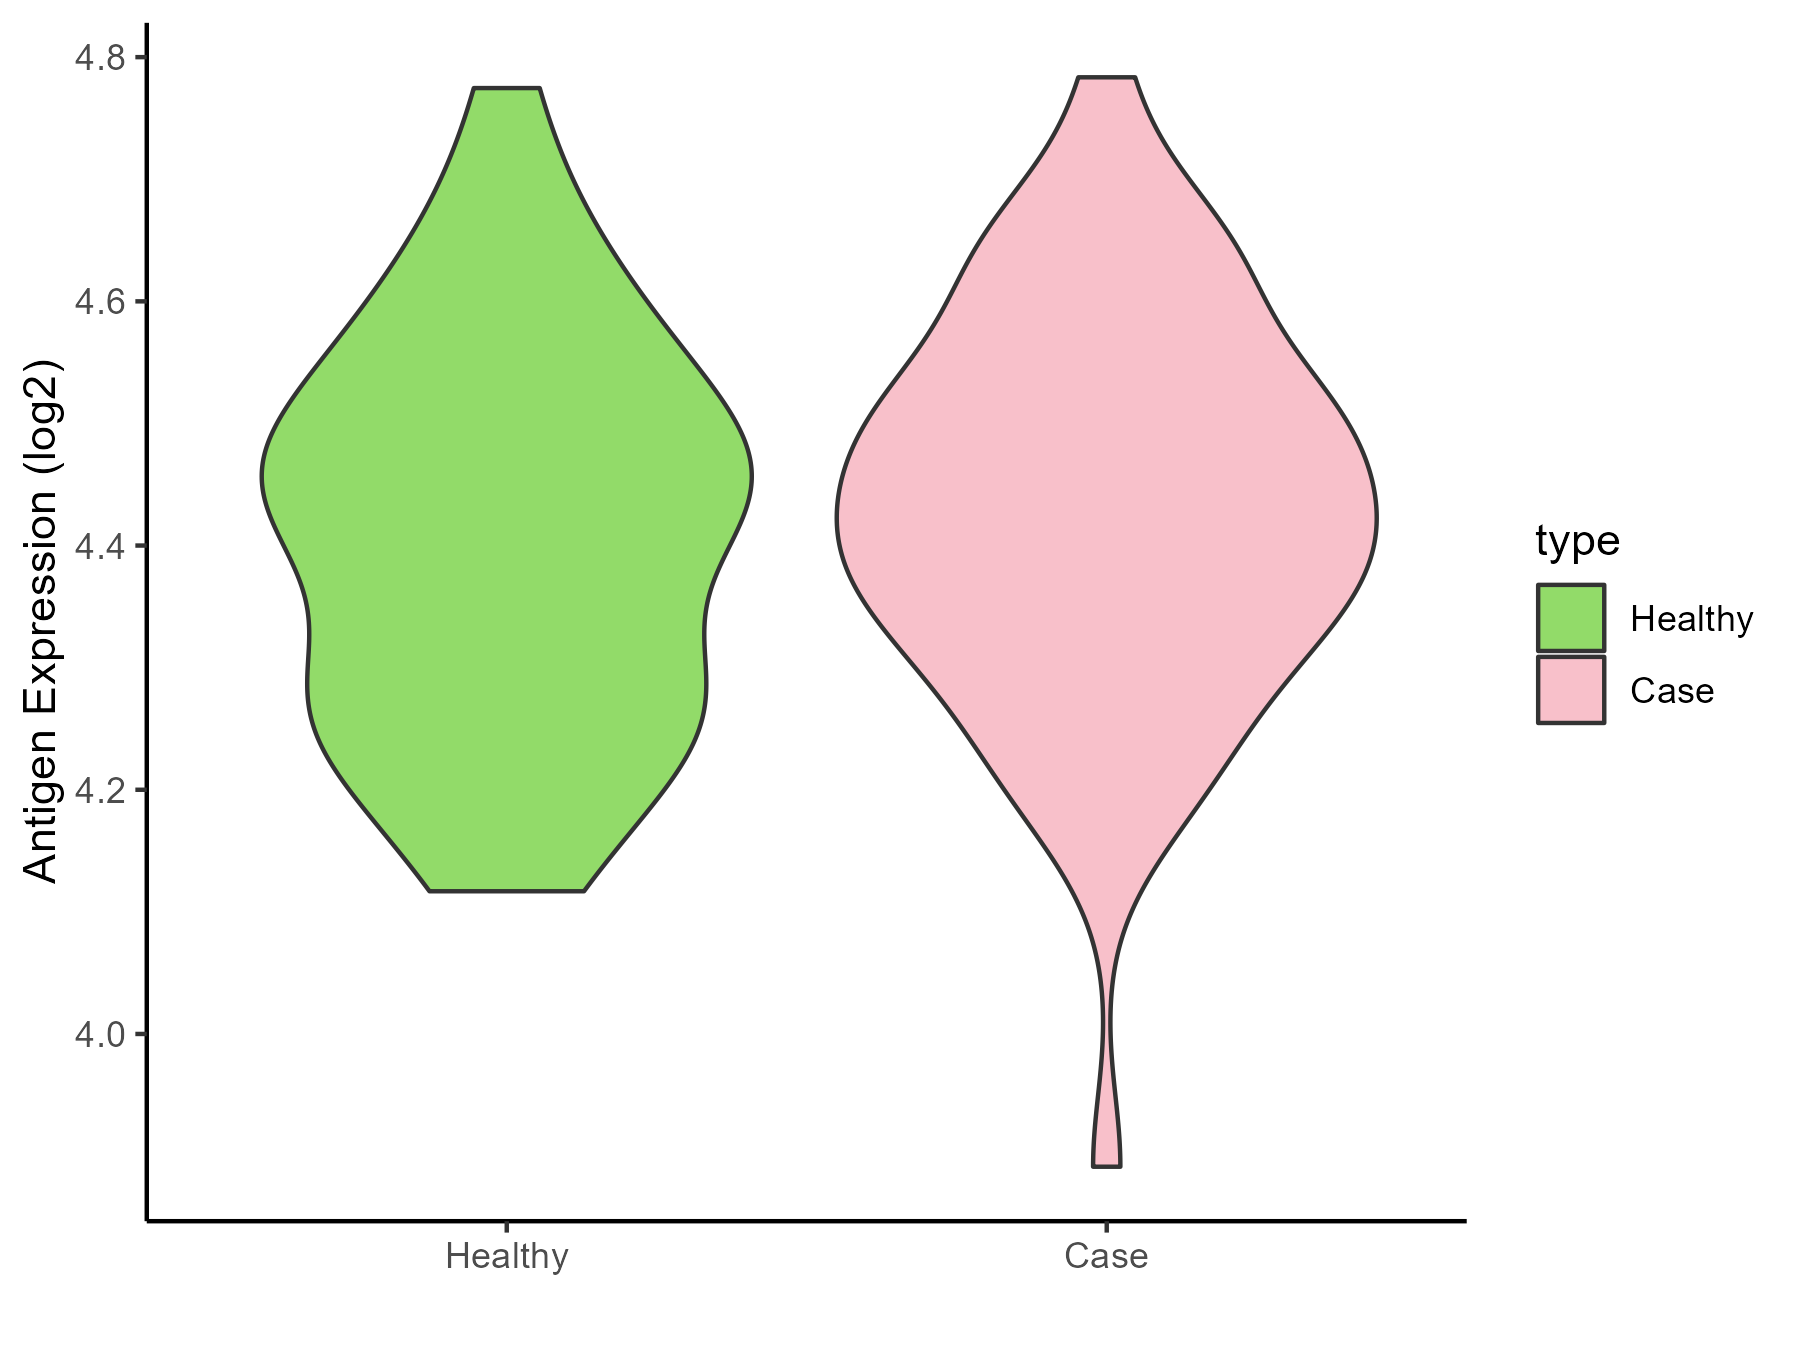
| The Specific Disease | Chronic obstructive pulmonary disease | |
| The Expression Level of Disease Section Compare with the Healthy Individual Tissue | p-value: 0.534392565; Fold-change: 0.001226143; Z-score: 0.007570047 | |
| Disease-specific Antigen Abundances |
|
Click to View the Clearer Original Diagram |
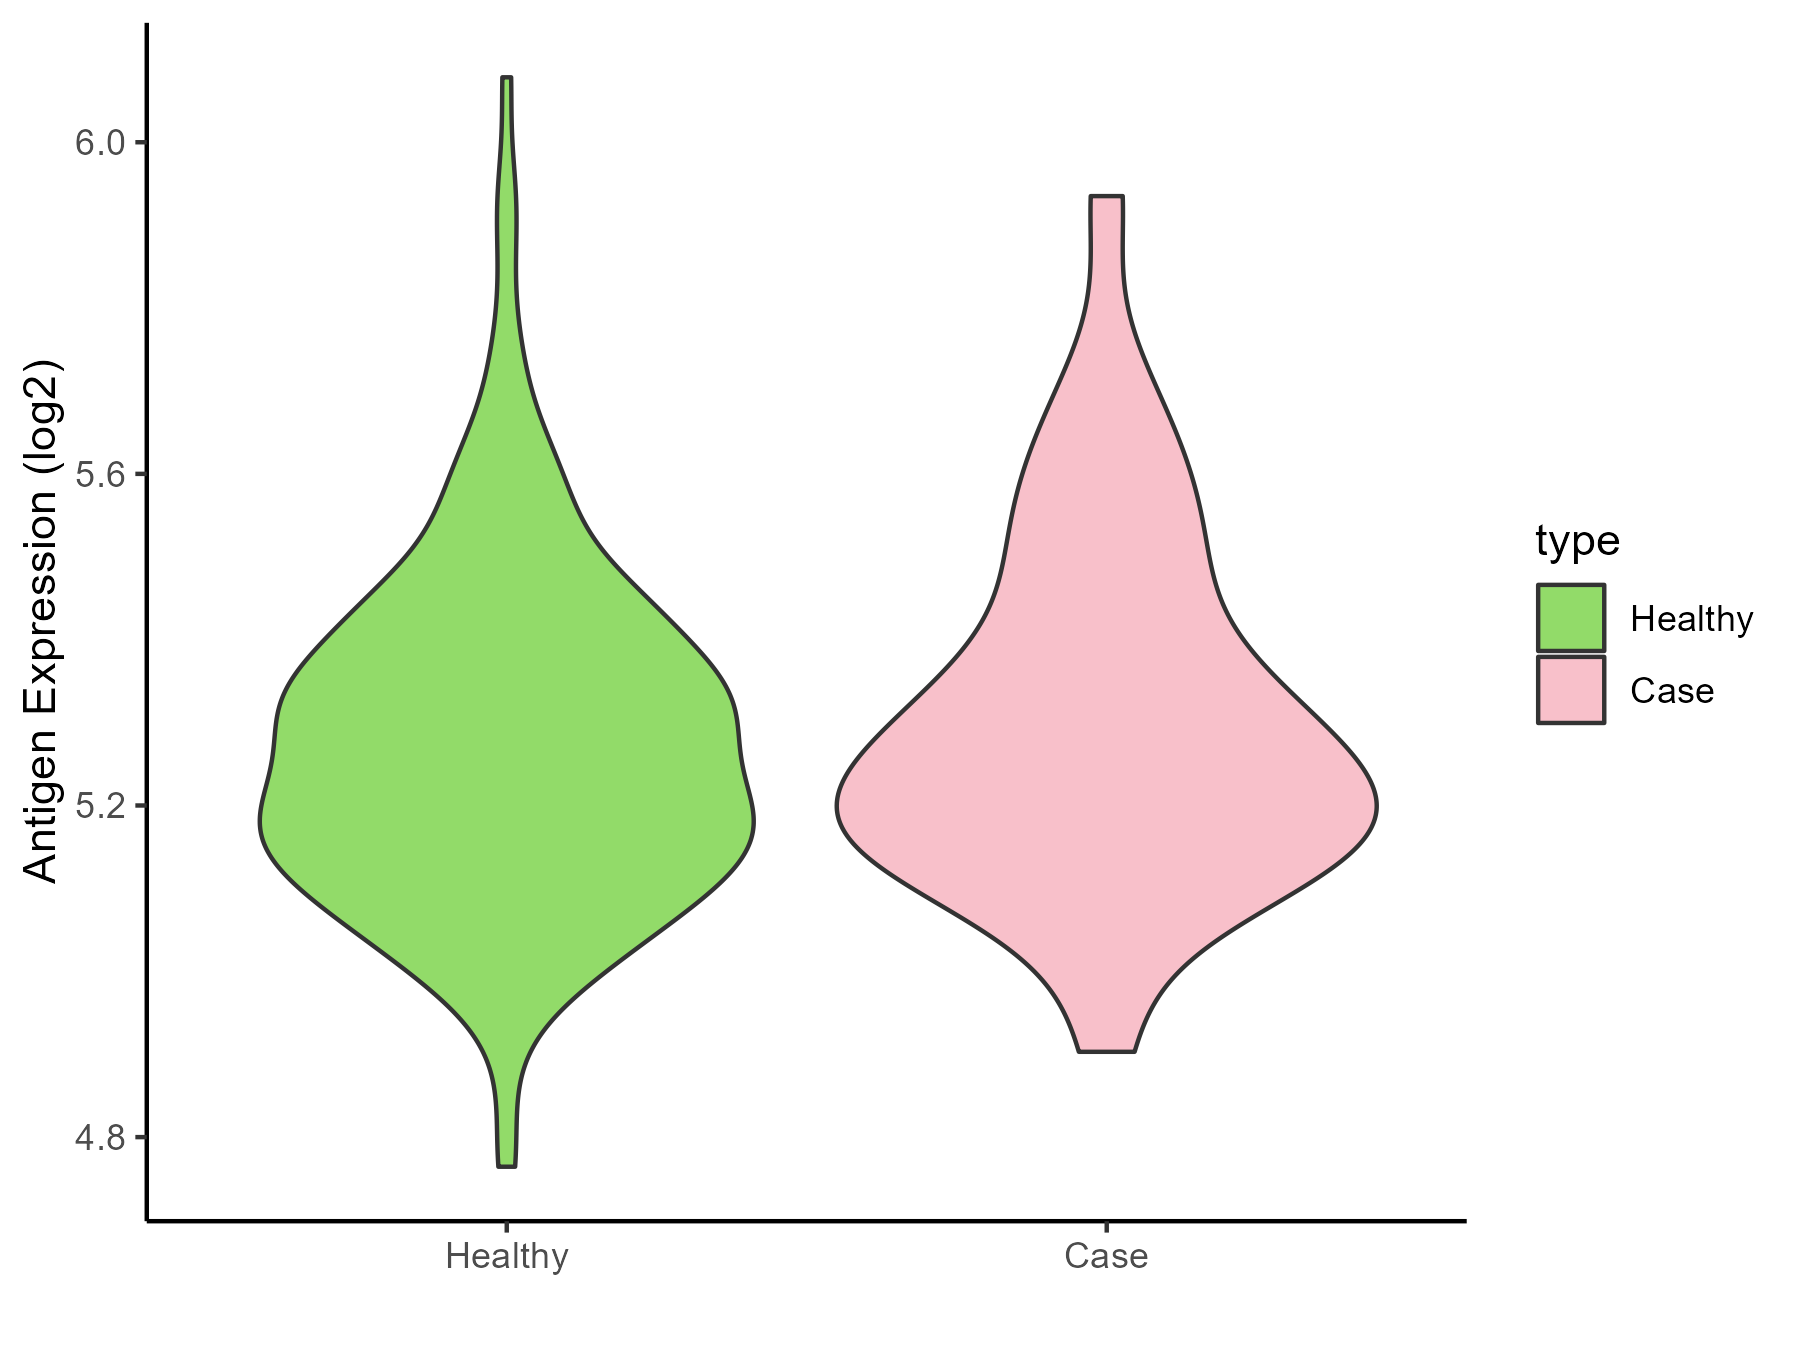
| The Studied Tissue | Small airway epithelium | |
| The Specific Disease | Chronic obstructive pulmonary disease | |
| The Expression Level of Disease Section Compare with the Healthy Individual Tissue | p-value: 0.452501437; Fold-change: -0.005712383; Z-score: -0.028316996 | |
| Disease-specific Antigen Abundances |
|
Click to View the Clearer Original Diagram |
| Differential expression pattern of antigen in diseases | ||
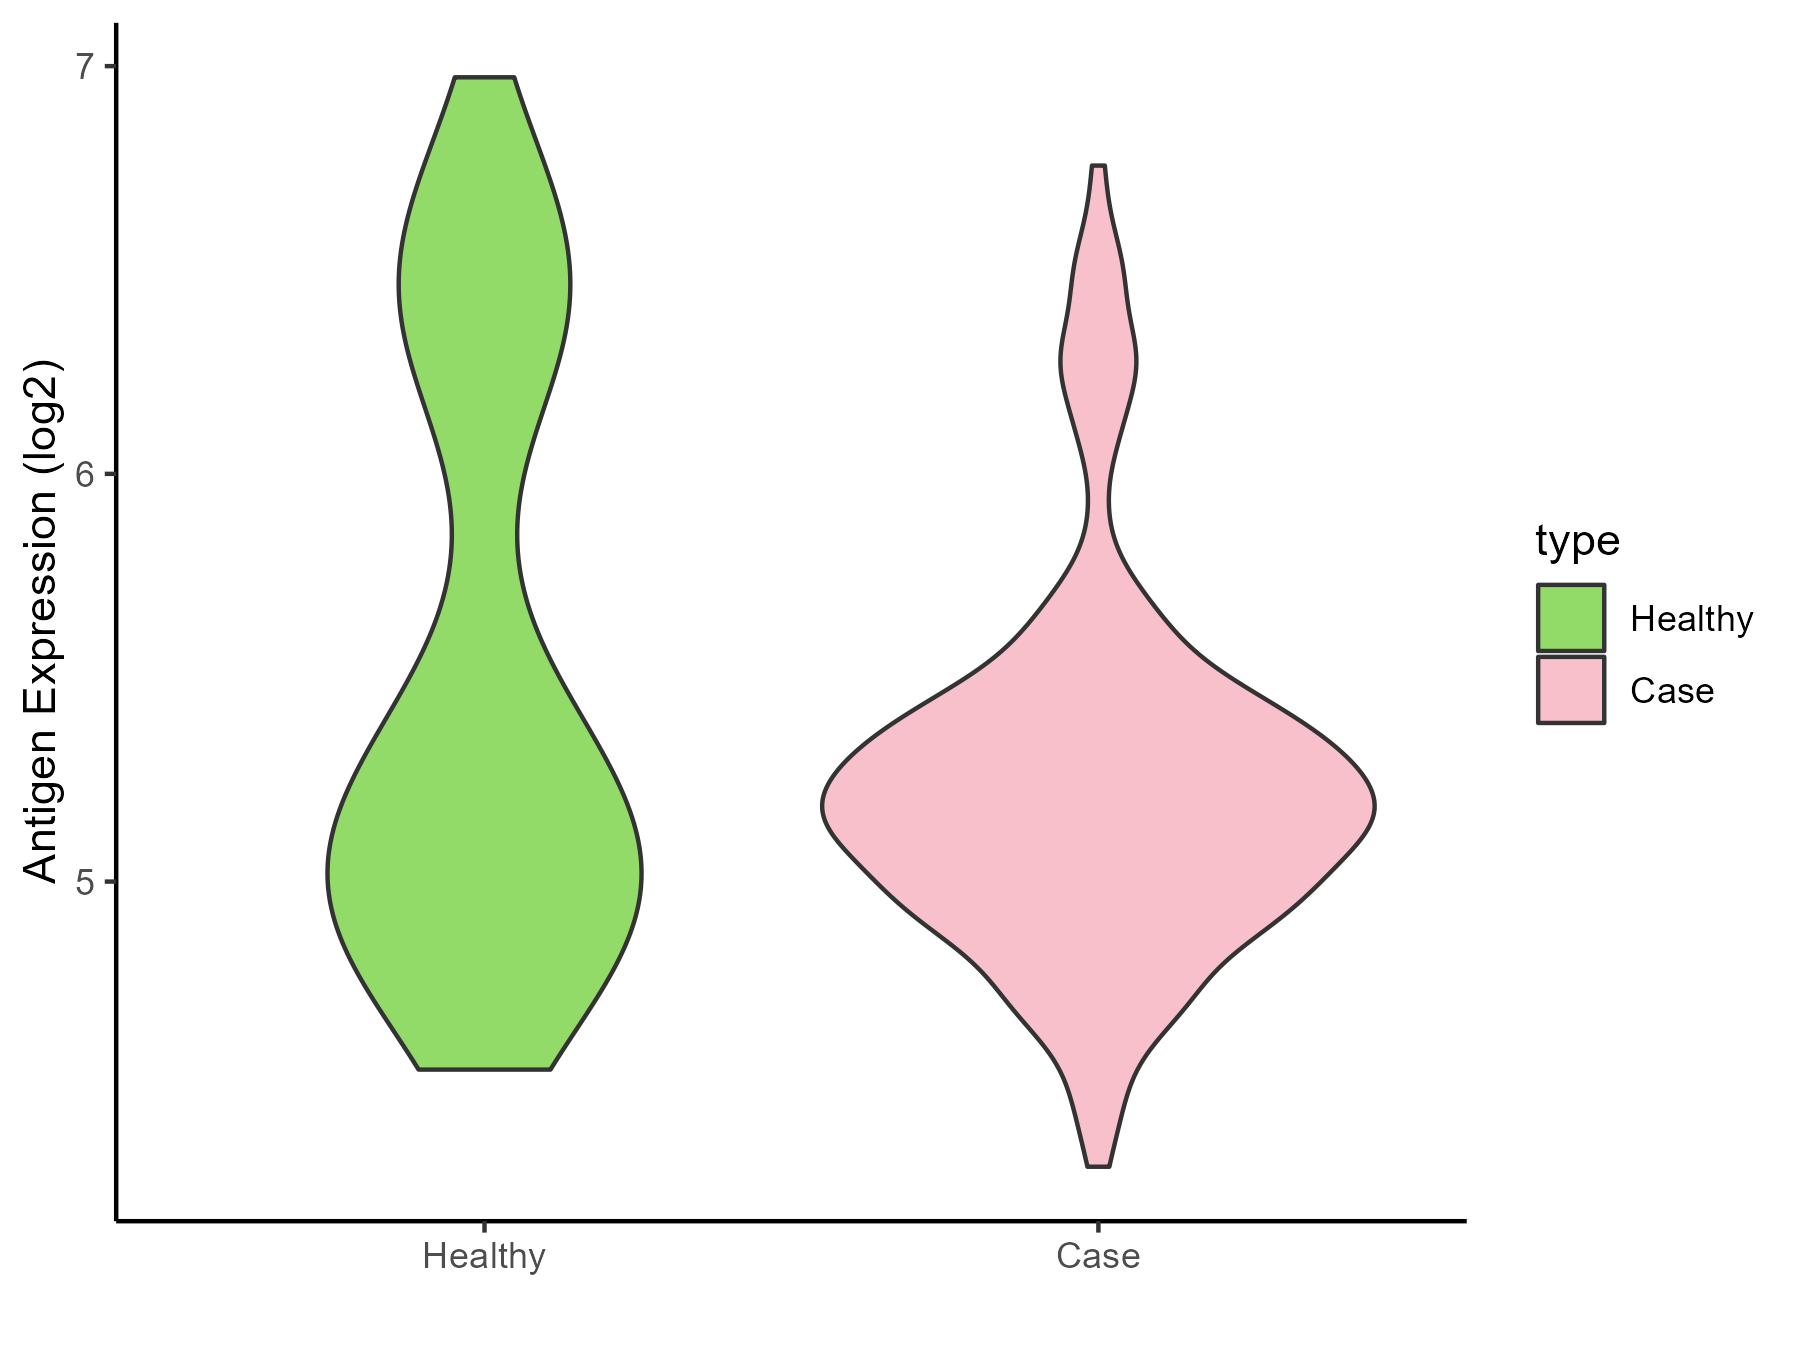
| The Studied Tissue | Nasal and bronchial airway | |
| The Specific Disease | Asthma | |
| The Expression Level of Disease Section Compare with the Healthy Individual Tissue | p-value: 0.000298889; Fold-change: -0.073858152; Z-score: -0.102293689 | |
| Disease-specific Antigen Abundances |
|
Click to View the Clearer Original Diagram |
| Differential expression pattern of antigen in diseases | ||
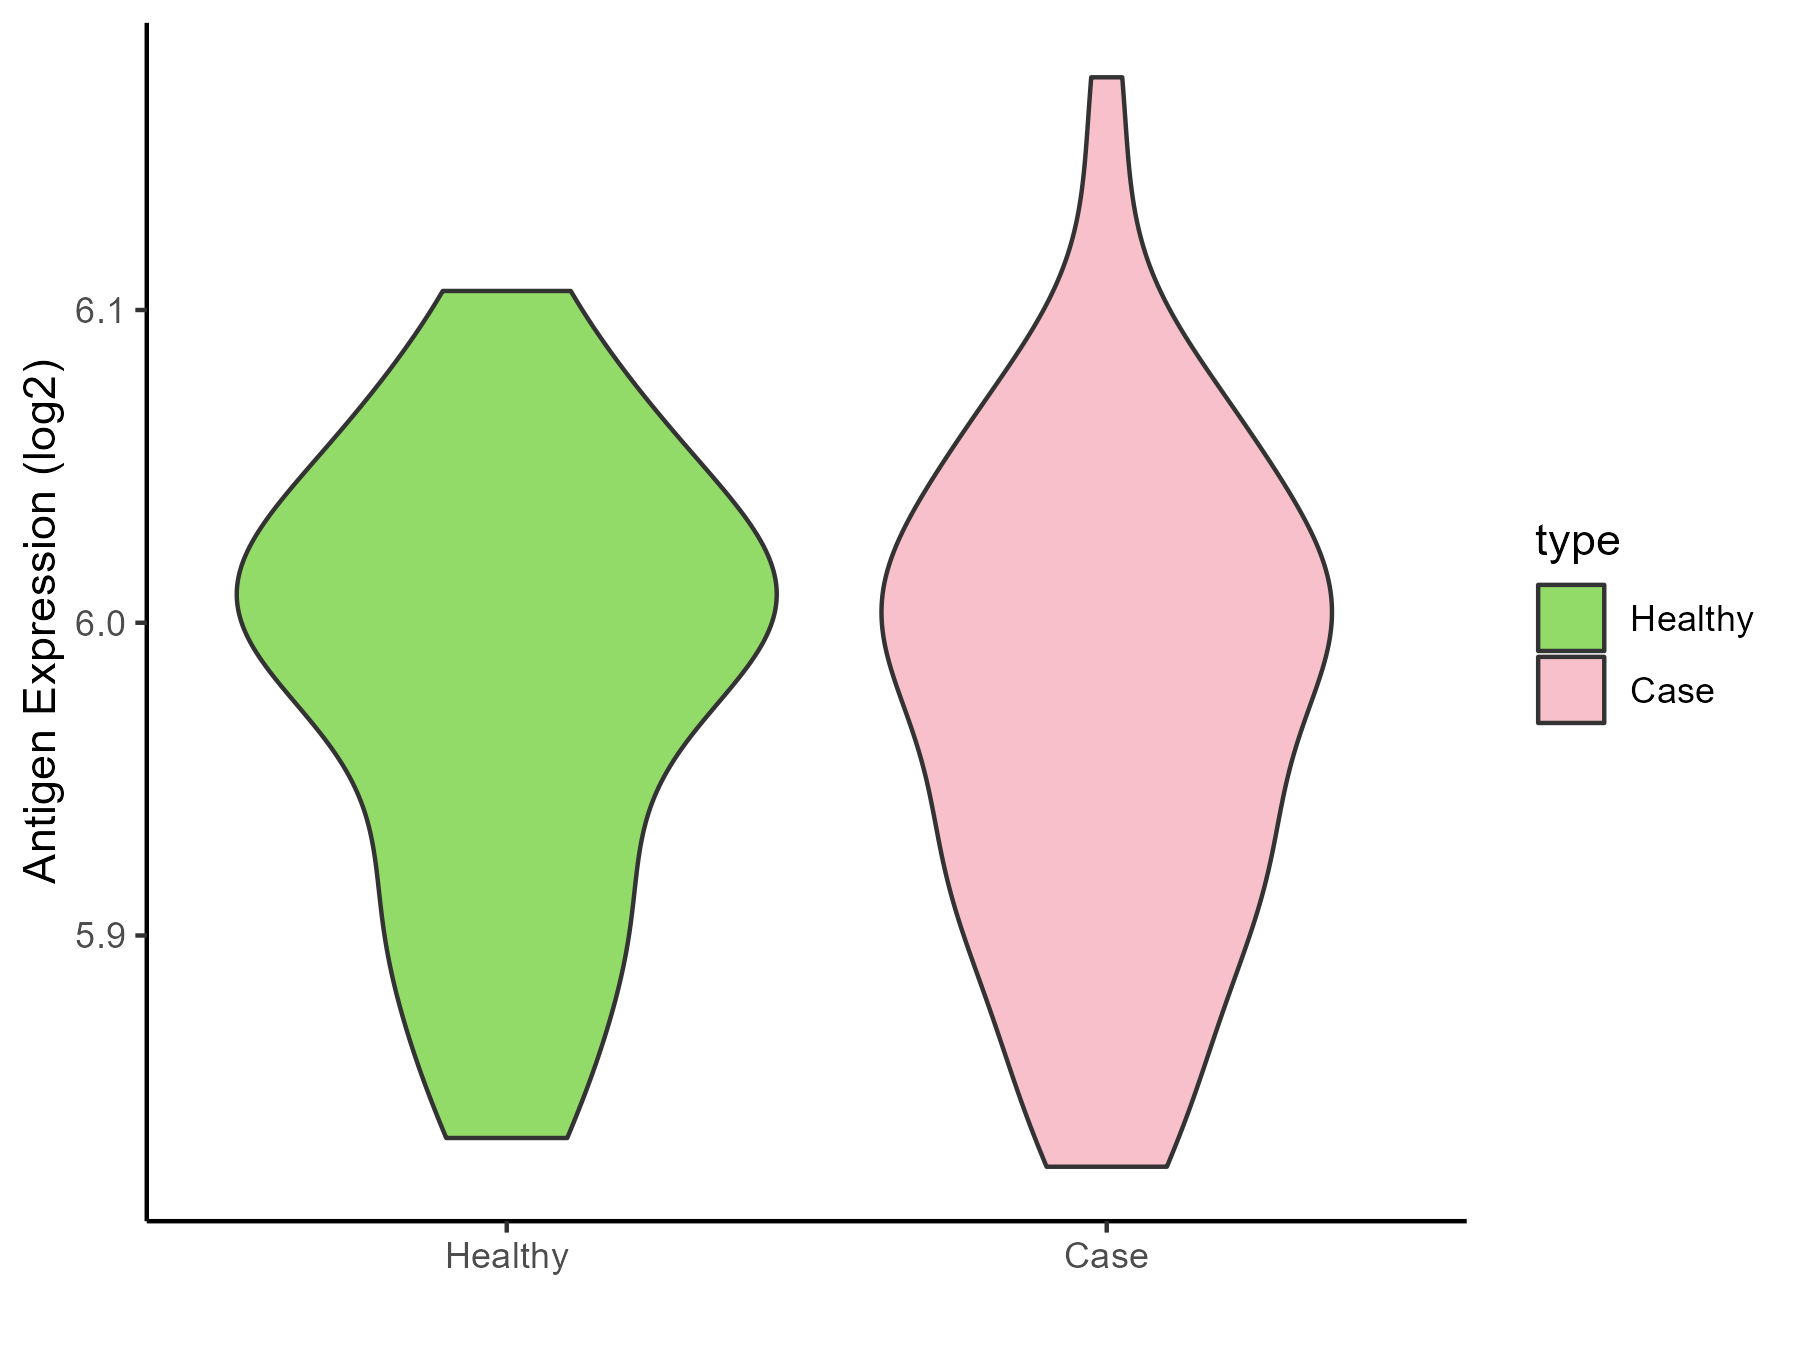
| The Studied Tissue | Nasal Epithelium | |
| The Specific Disease | Human rhinovirus infection | |
| The Expression Level of Disease Section Compare with the Healthy Individual Tissue | p-value: 0.681542671; Fold-change: -0.014670232; Z-score: -0.207880389 | |
| Disease-specific Antigen Abundances |
|
Click to View the Clearer Original Diagram |
| Differential expression pattern of antigen in diseases | ||
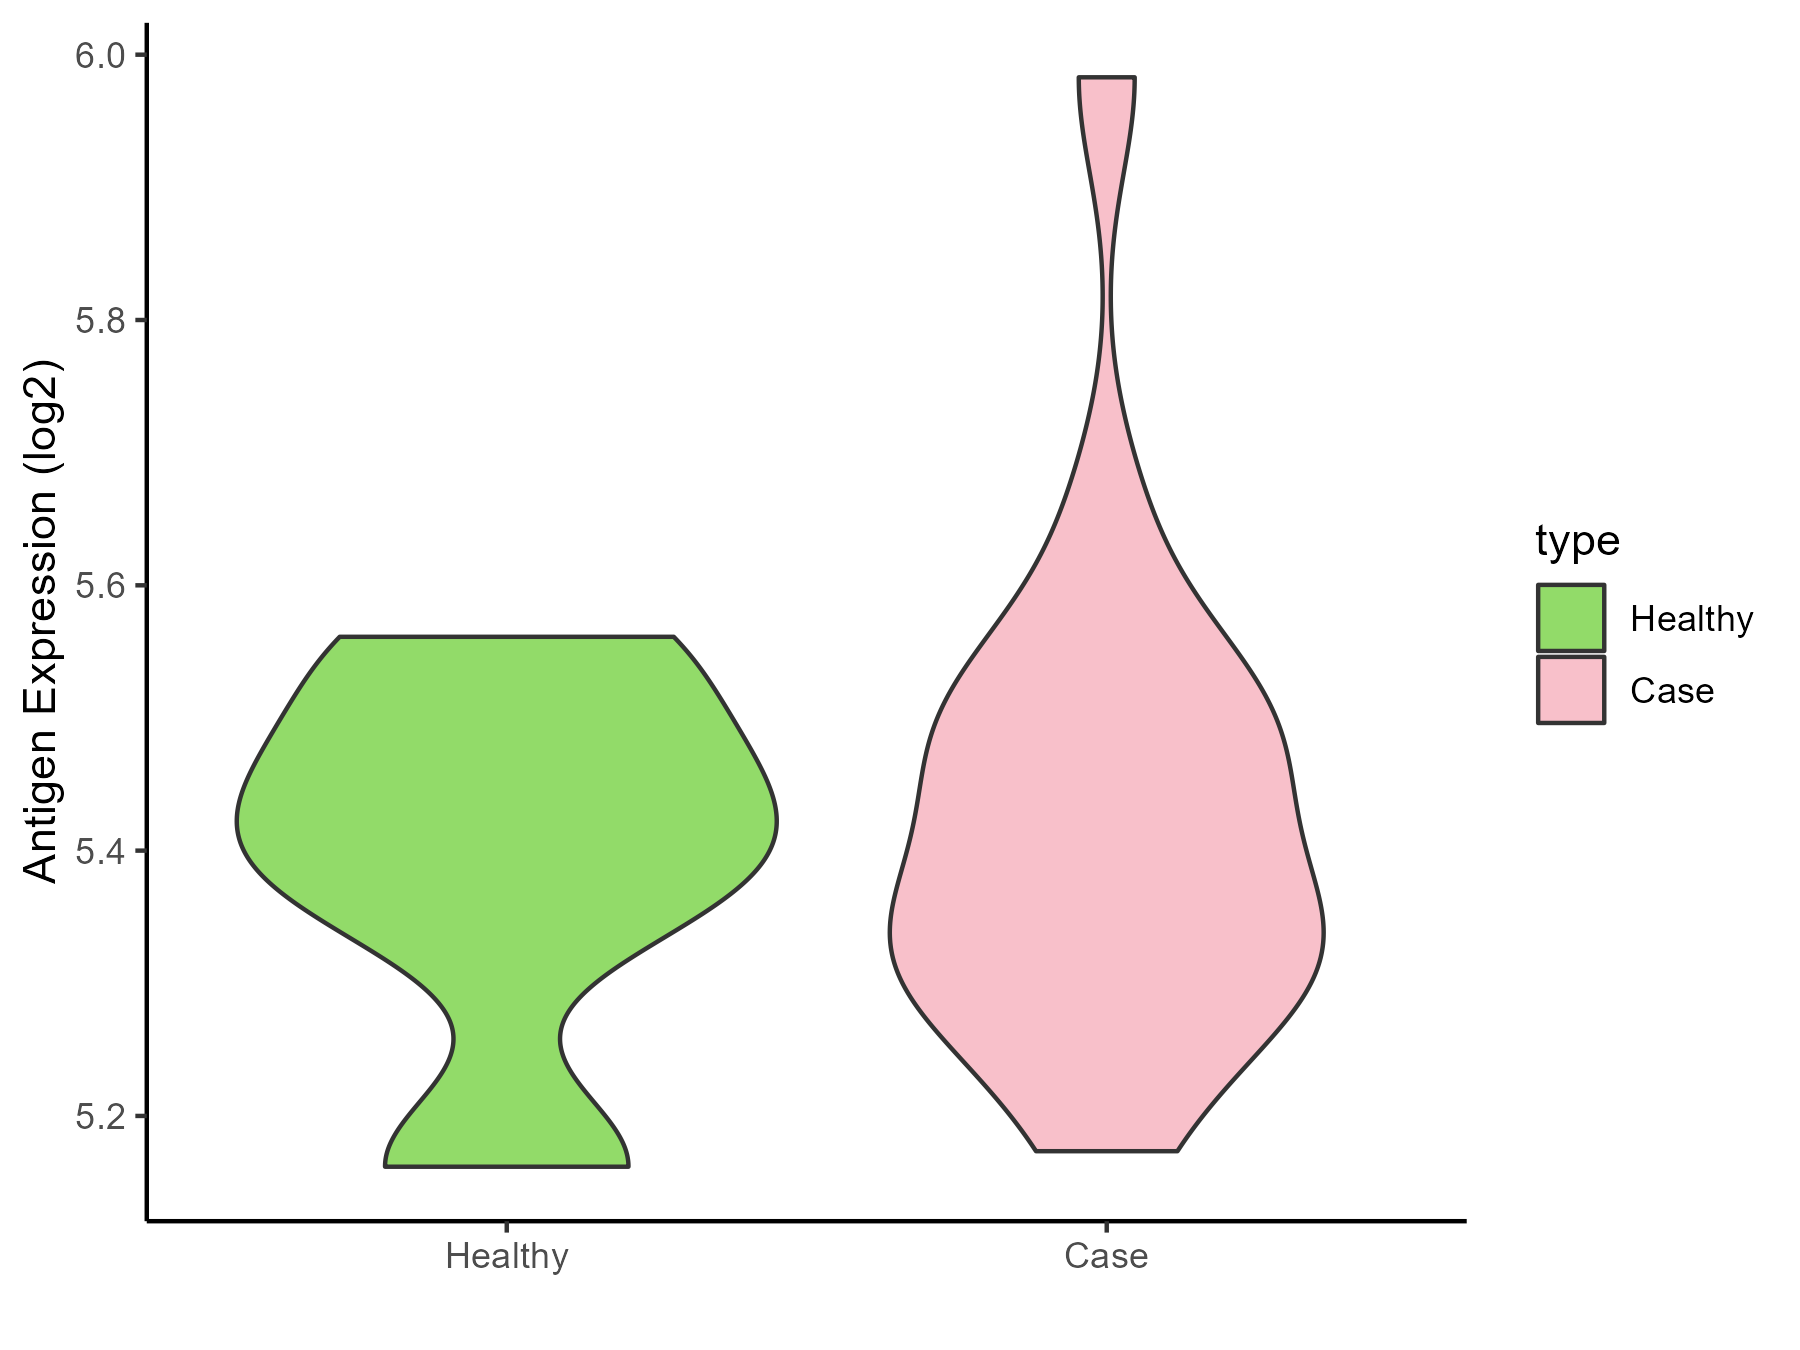
| The Studied Tissue | Lung | |
| The Specific Disease | Idiopathic pulmonary fibrosis | |
| The Expression Level of Disease Section Compare with the Healthy Individual Tissue | p-value: 0.686316691; Fold-change: -0.026770397; Z-score: -0.178060907 | |
| Disease-specific Antigen Abundances |
|
Click to View the Clearer Original Diagram |
ICD Disease Classification 13
| Differential expression pattern of antigen in diseases | ||
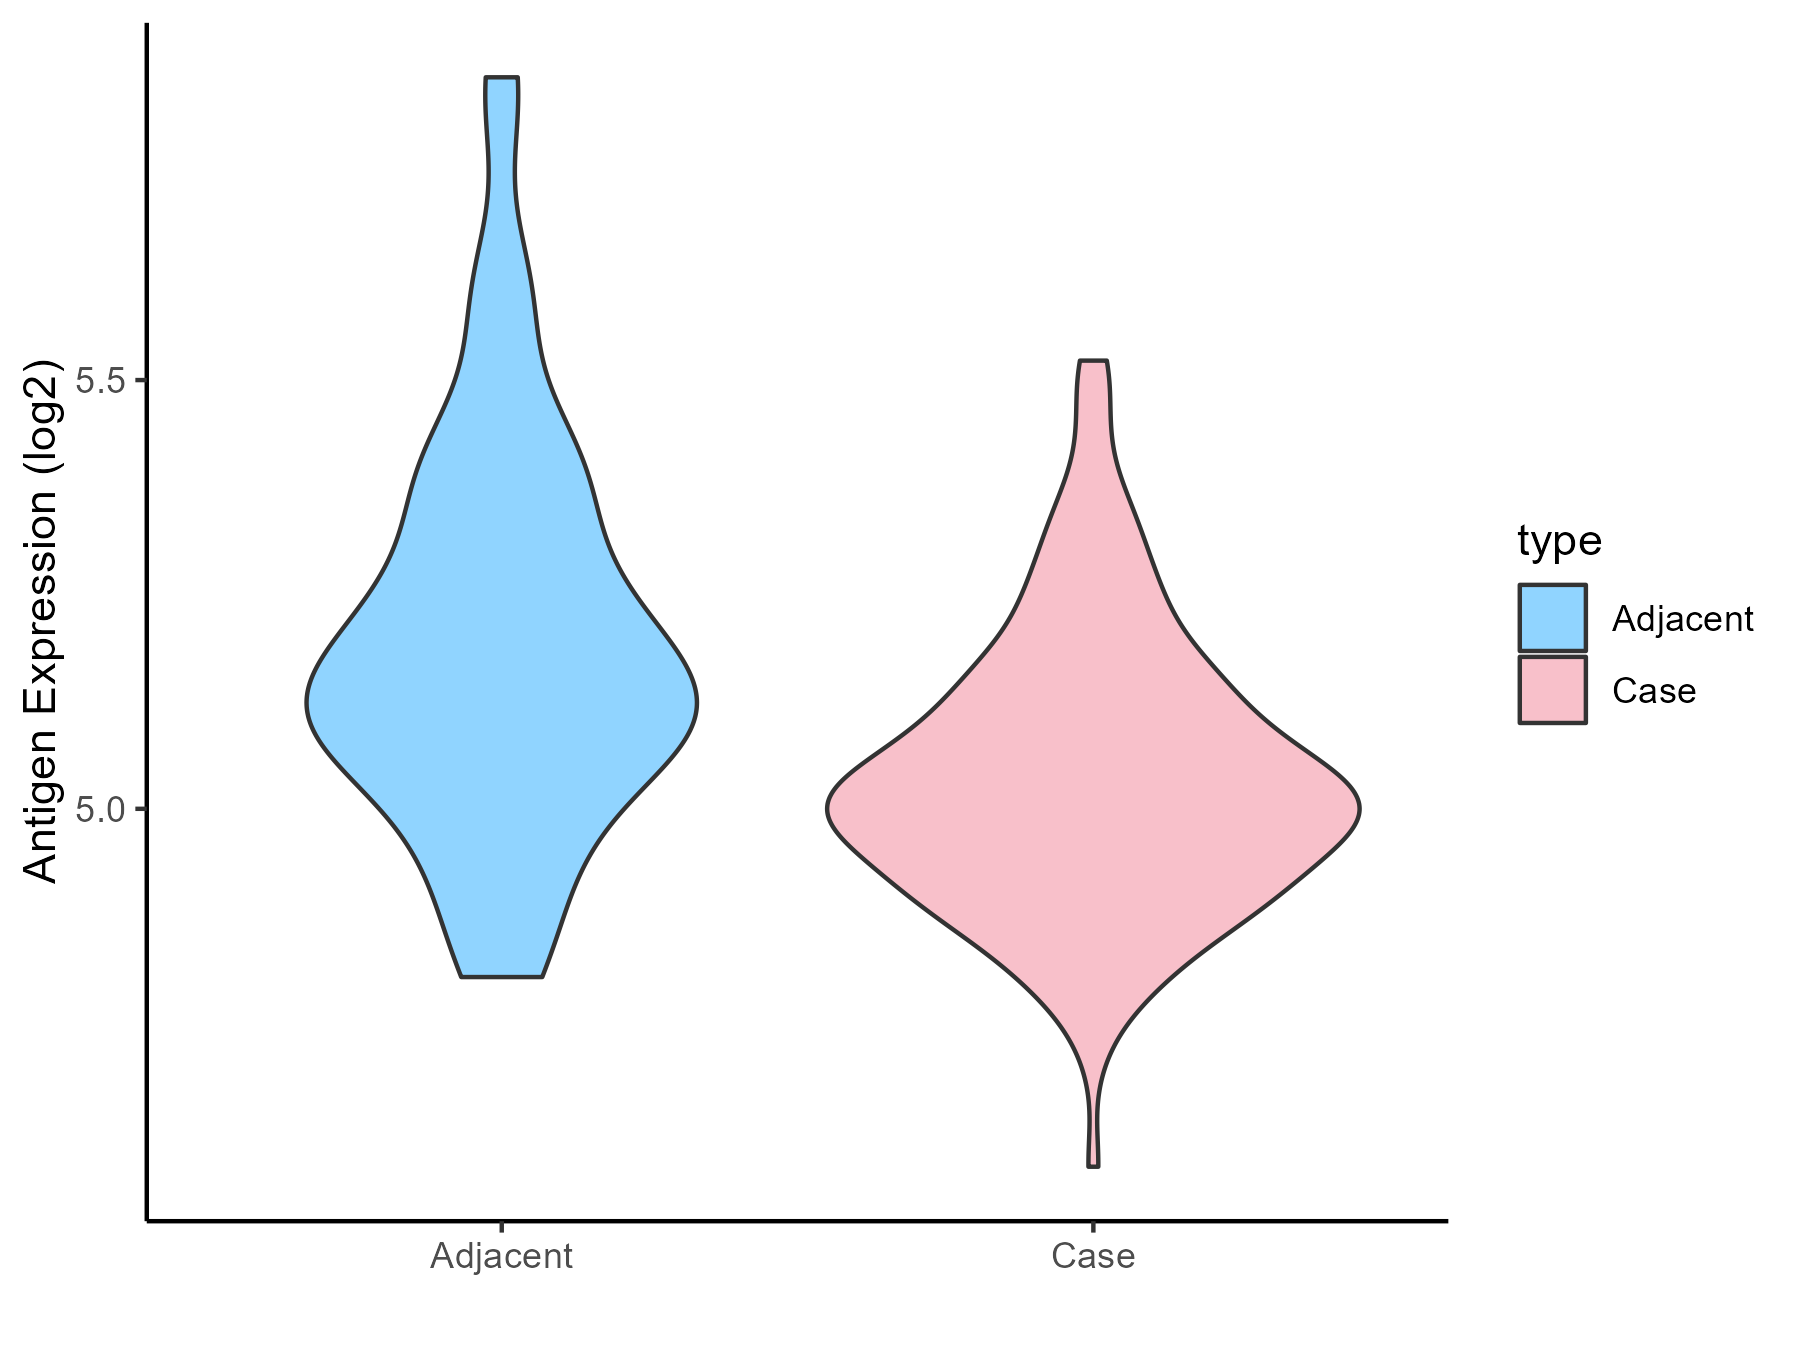
| The Studied Tissue | Gingival | |
| The Specific Disease | Periodontal disease | |
| The Expression Level of Disease Section Compare with the Adjacent Tissue | p-value: 5.35E-06; Fold-change: -0.122451884; Z-score: -0.537174558 | |
| Disease-specific Antigen Abundances |
|
Click to View the Clearer Original Diagram |
| Differential expression pattern of antigen in diseases | ||
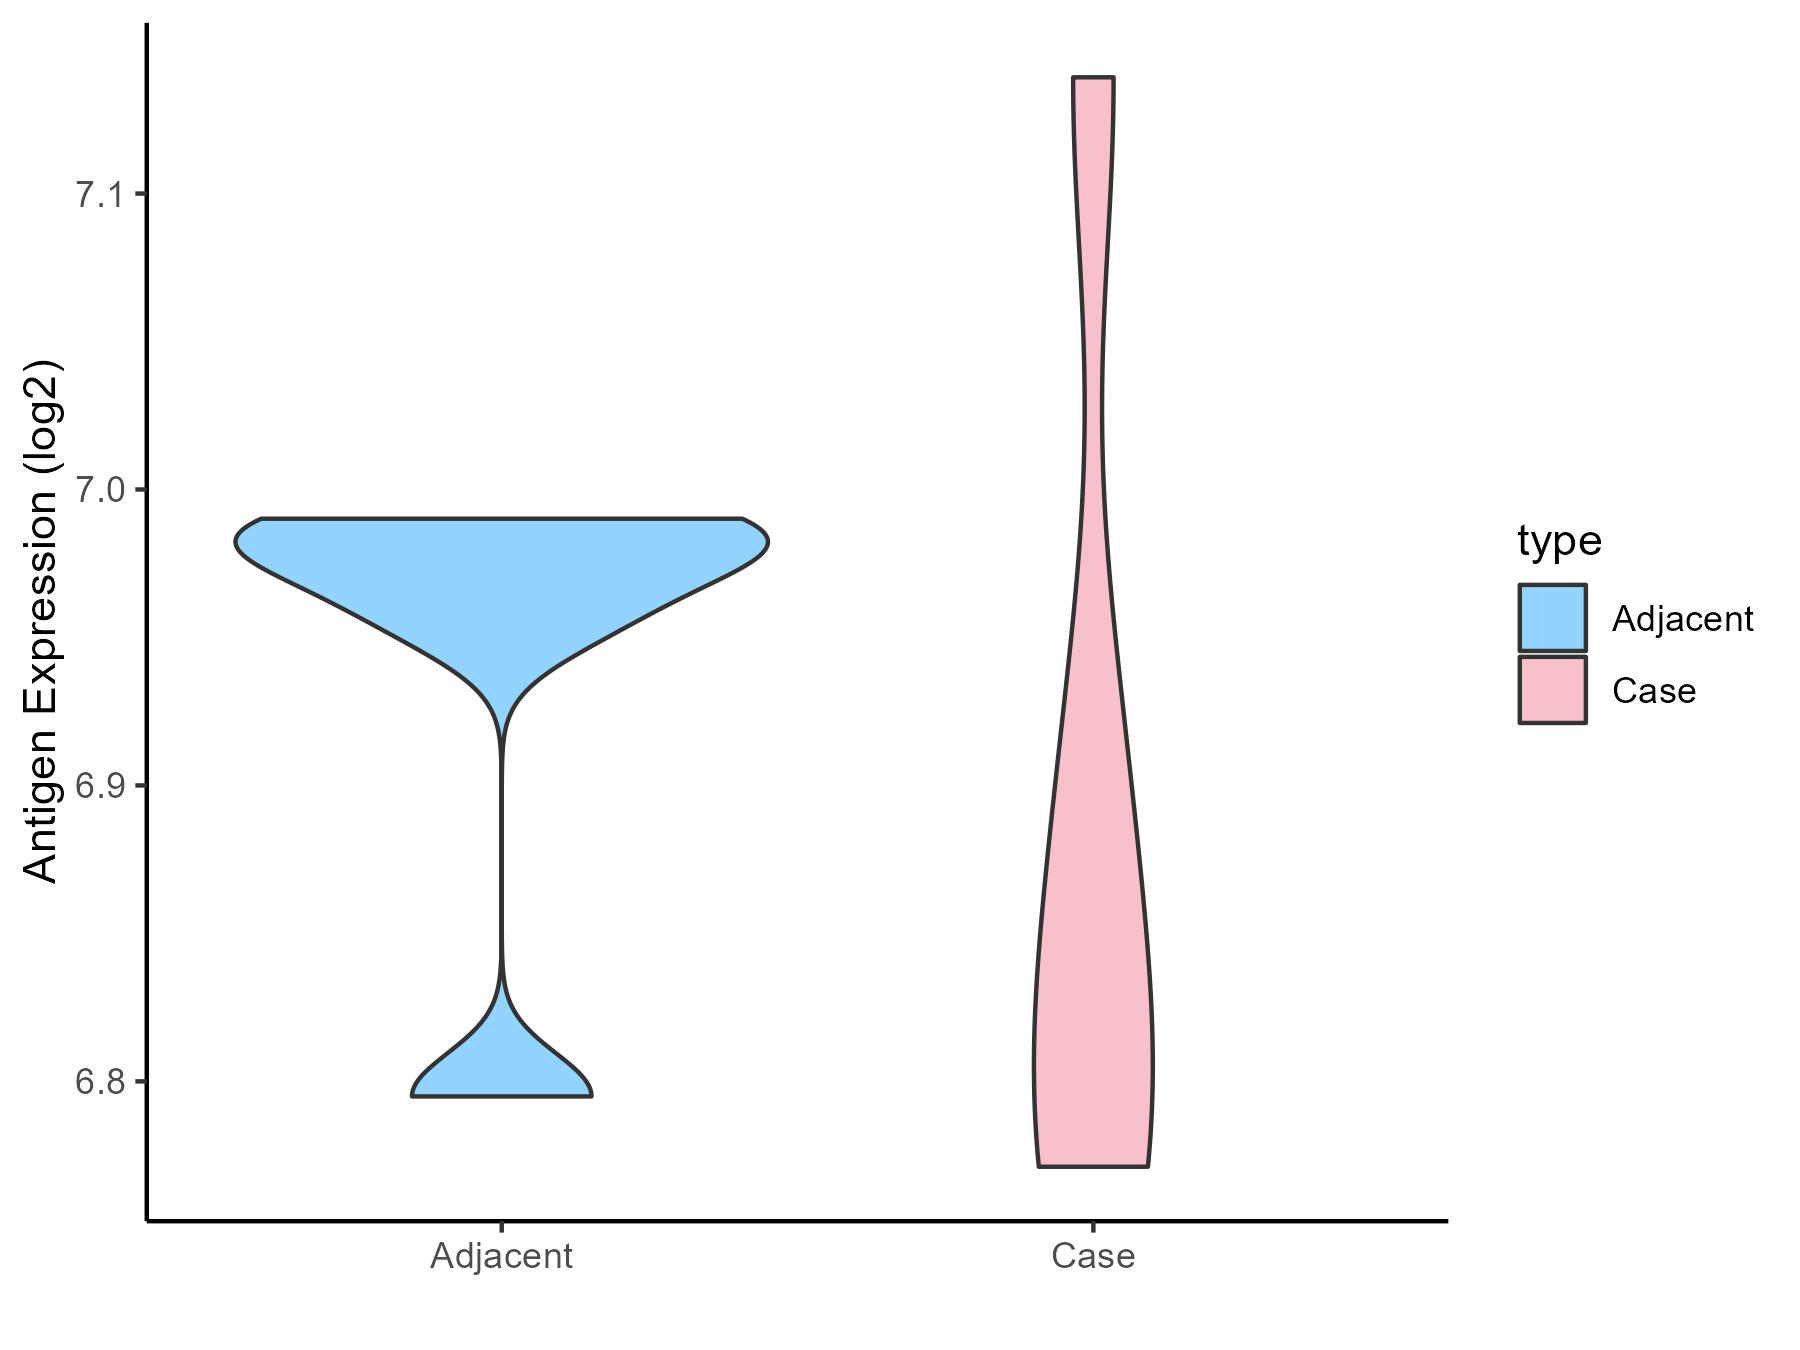
| The Studied Tissue | Gastric antrum | |
| The Specific Disease | Eosinophilic gastritis | |
| The Expression Level of Disease Section Compare with the Adjacent Tissue | p-value: 0.510467068; Fold-change: -0.141640365; Z-score: -1.716042084 | |
| Disease-specific Antigen Abundances |
|
Click to View the Clearer Original Diagram |
| Differential expression pattern of antigen in diseases | ||
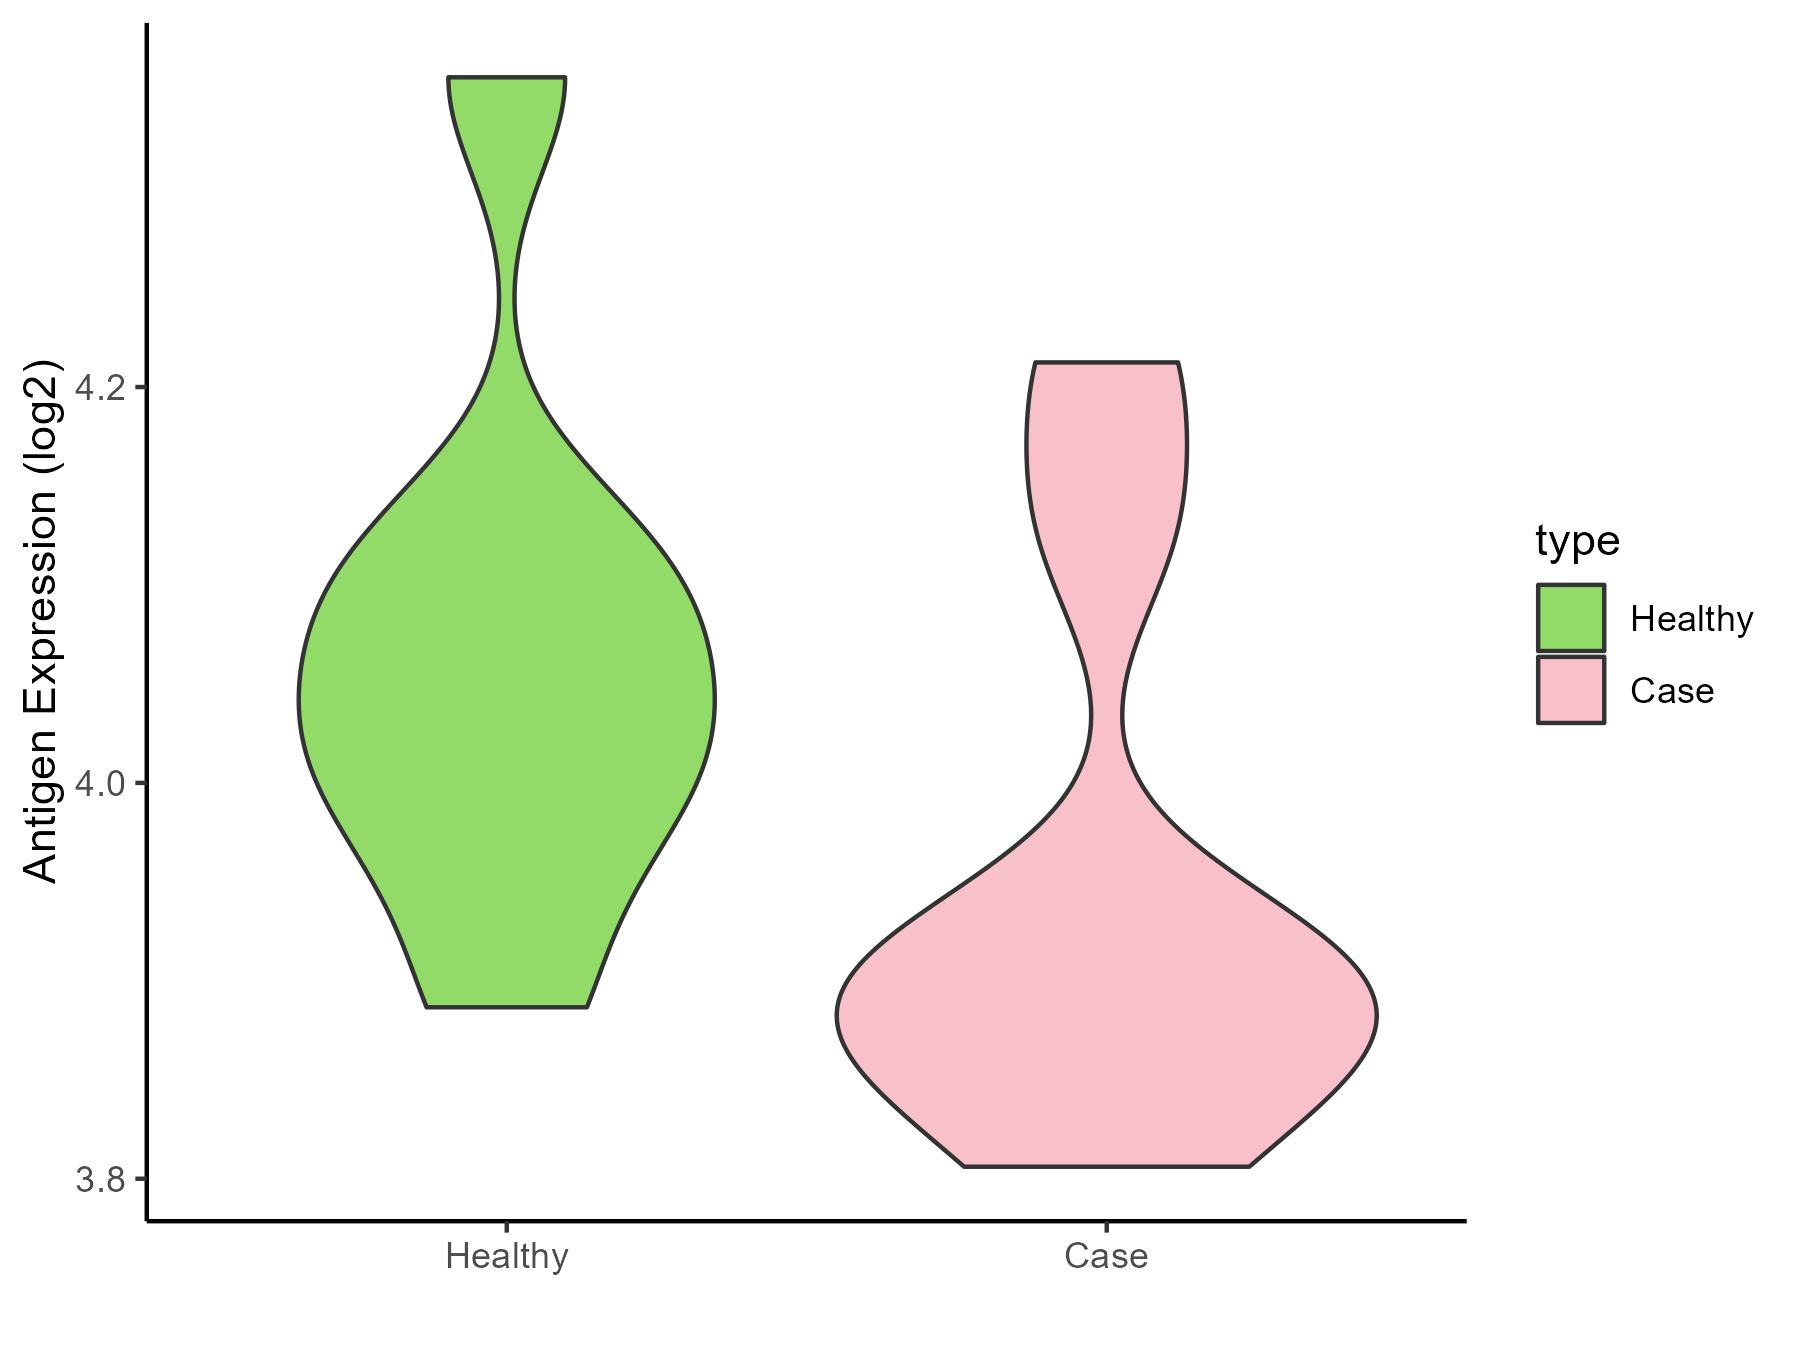
| The Studied Tissue | Liver | |
| The Specific Disease | Liver failure | |
| The Expression Level of Disease Section Compare with the Healthy Individual Tissue | p-value: 0.122453094; Fold-change: -0.141710973; Z-score: -1.009794308 | |
| Disease-specific Antigen Abundances |
|
Click to View the Clearer Original Diagram |
| Differential expression pattern of antigen in diseases | ||
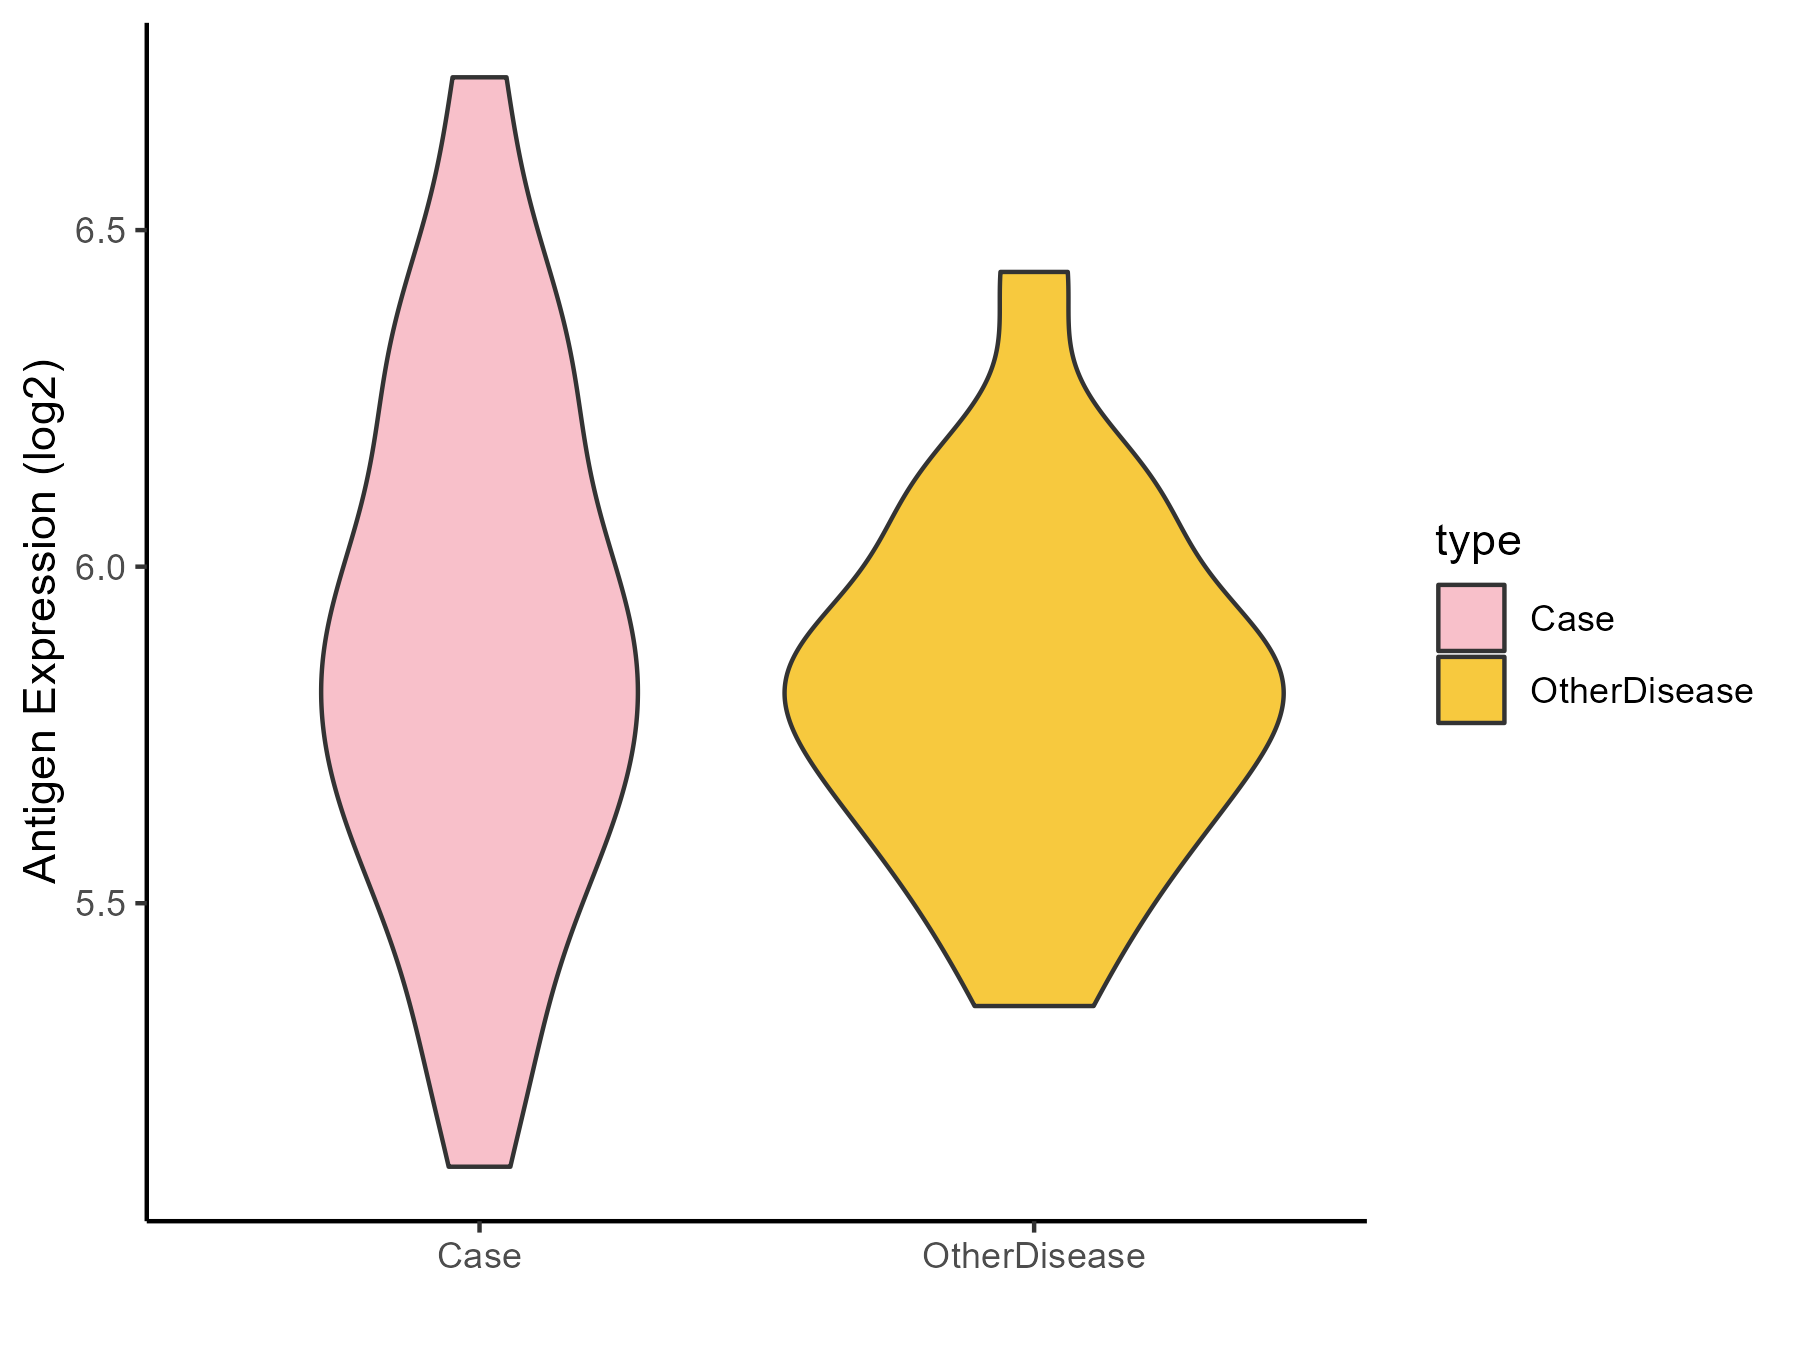
| The Studied Tissue | Colon mucosal | |
| The Specific Disease | Ulcerative colitis | |
| The Expression Level of Disease Section Compare with the Adjacent Tissue | p-value: 0.457680193; Fold-change: 0.037832223; Z-score: 0.142528359 | |
| Disease-specific Antigen Abundances |
|
Click to View the Clearer Original Diagram |
| Differential expression pattern of antigen in diseases | ||
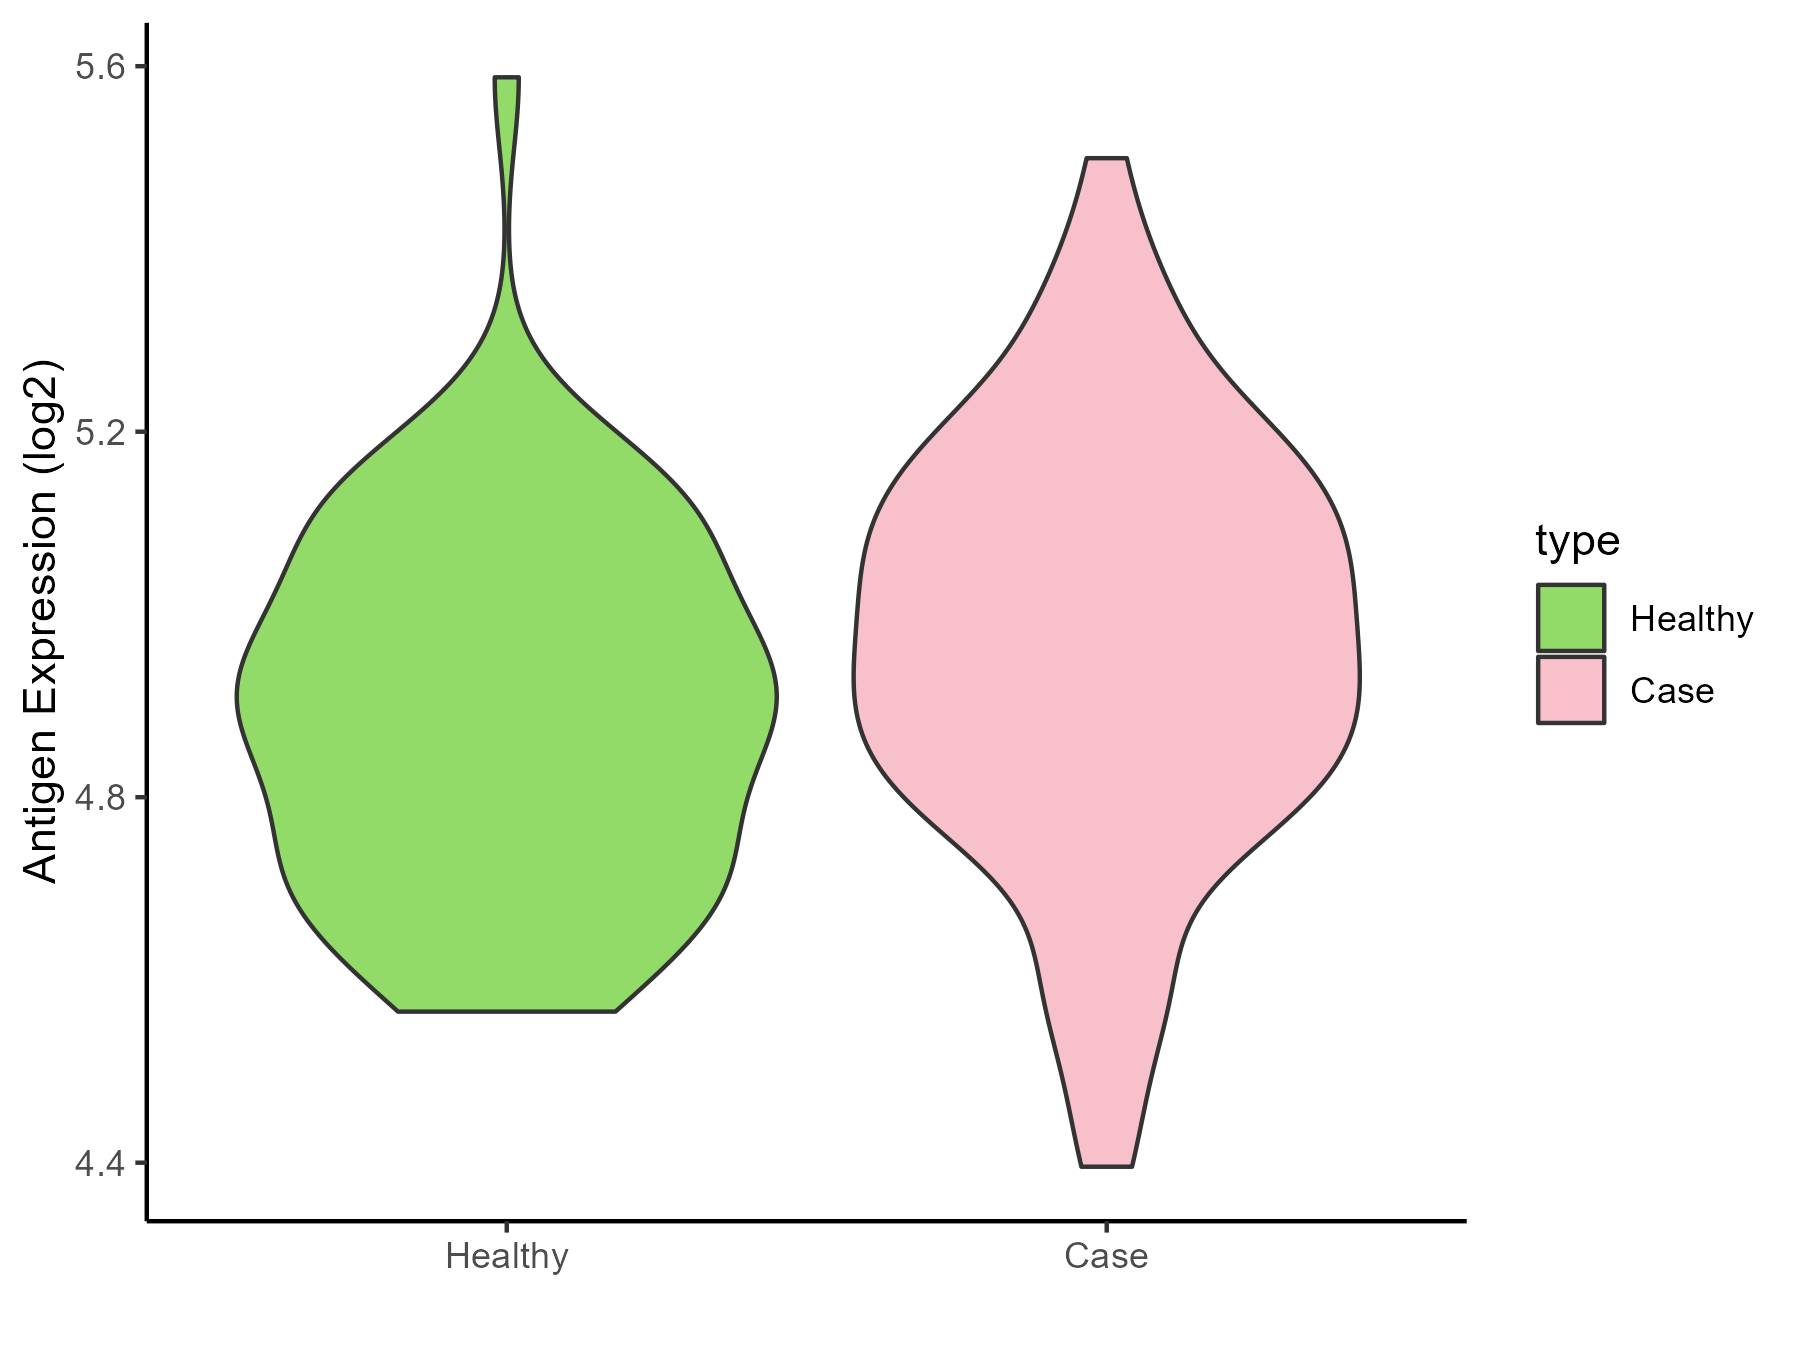
| The Studied Tissue | Rectal colon | |
| The Specific Disease | Irritable bowel syndrome | |
| The Expression Level of Disease Section Compare with the Healthy Individual Tissue | p-value: 0.024910562; Fold-change: 0.051688011; Z-score: 0.259084202 | |
| Disease-specific Antigen Abundances |
|
Click to View the Clearer Original Diagram |
ICD Disease Classification 14
| Differential expression pattern of antigen in diseases | ||
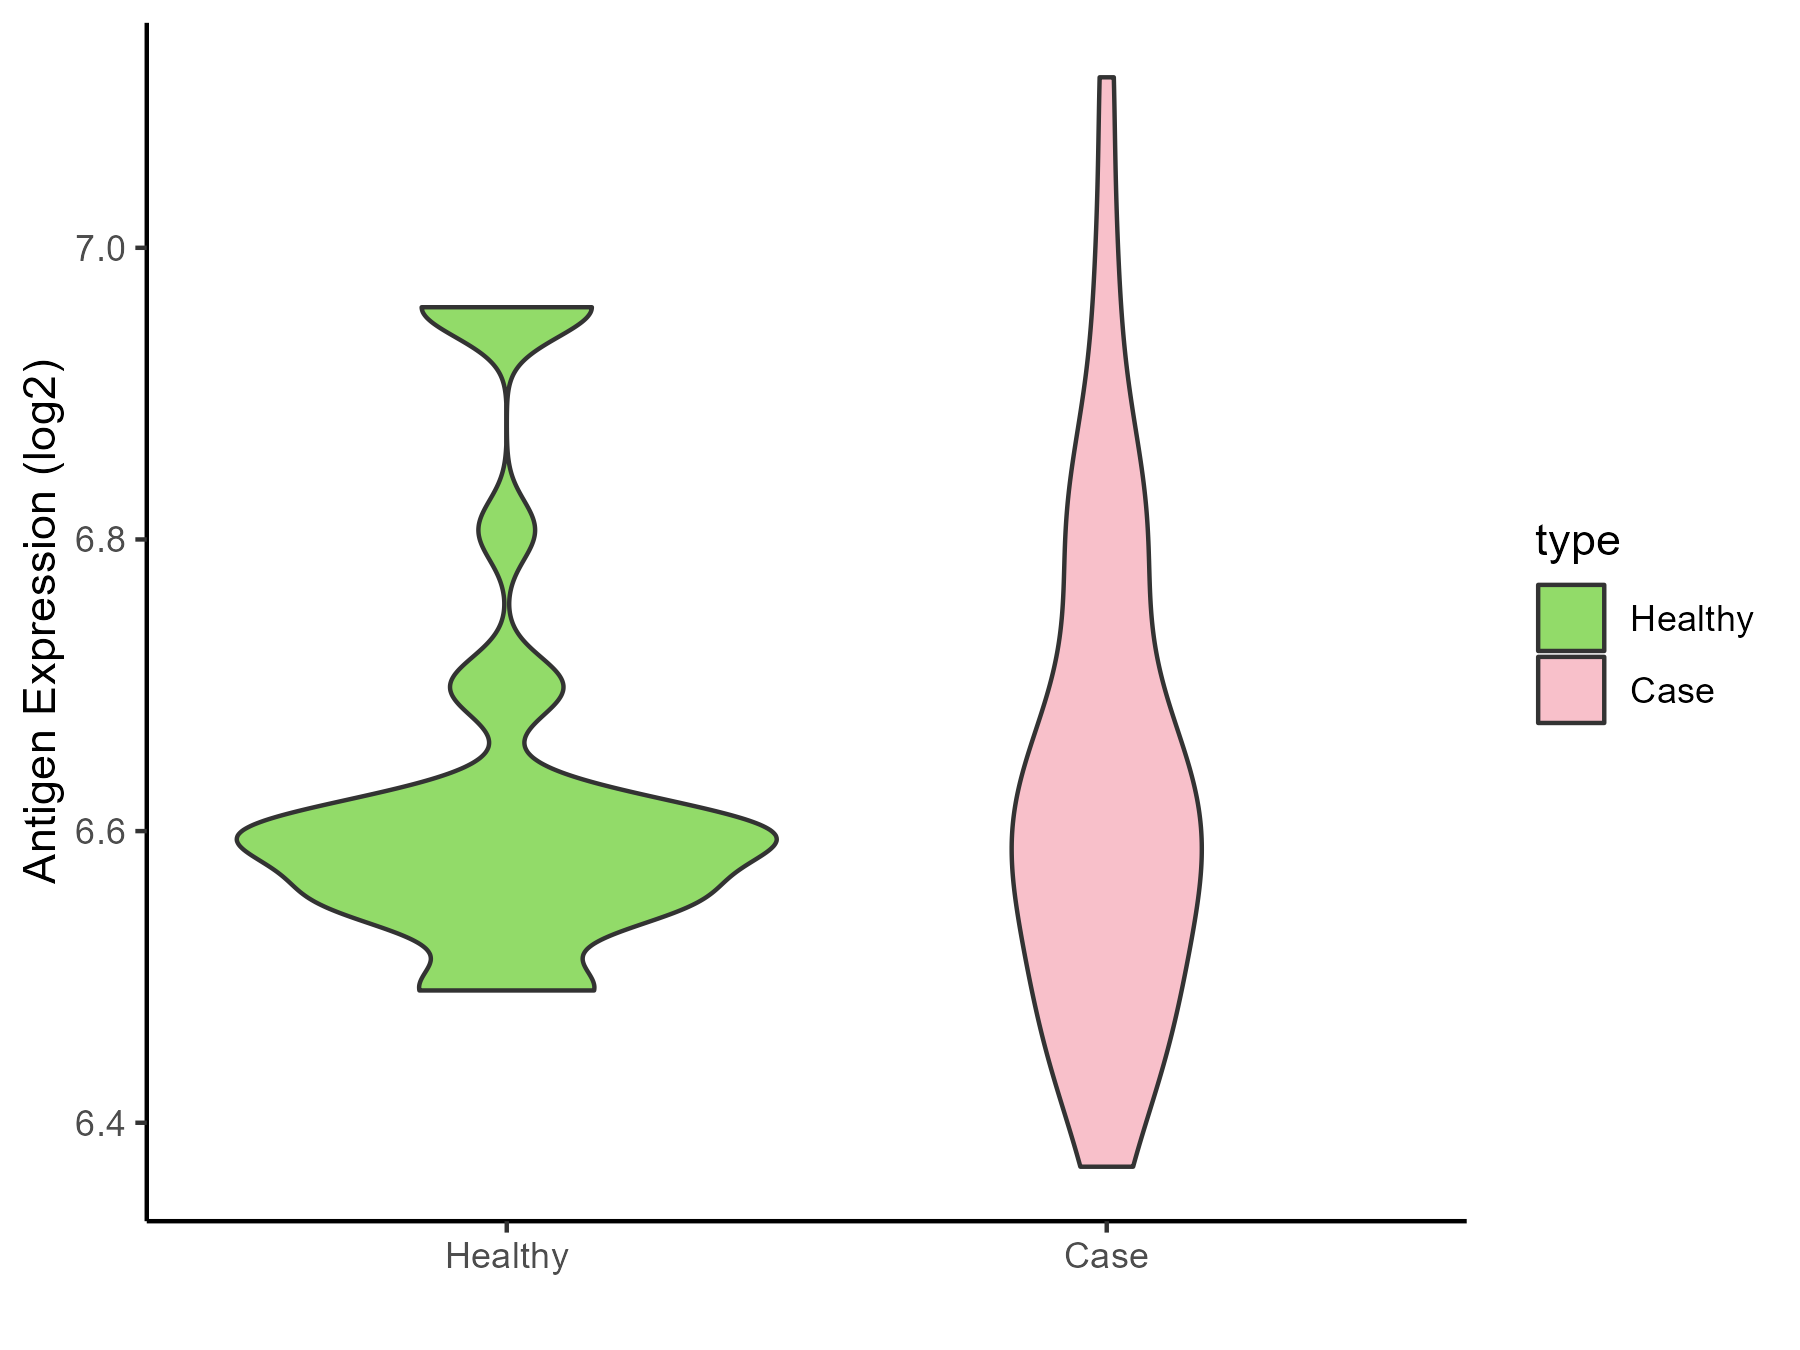
| The Studied Tissue | Skin | |
| The Specific Disease | Atopic dermatitis | |
| The Expression Level of Disease Section Compare with the Healthy Individual Tissue | p-value: 0.952497556; Fold-change: 0.011258354; Z-score: 0.080449476 | |
| Disease-specific Antigen Abundances |
|
Click to View the Clearer Original Diagram |
| Differential expression pattern of antigen in diseases | ||
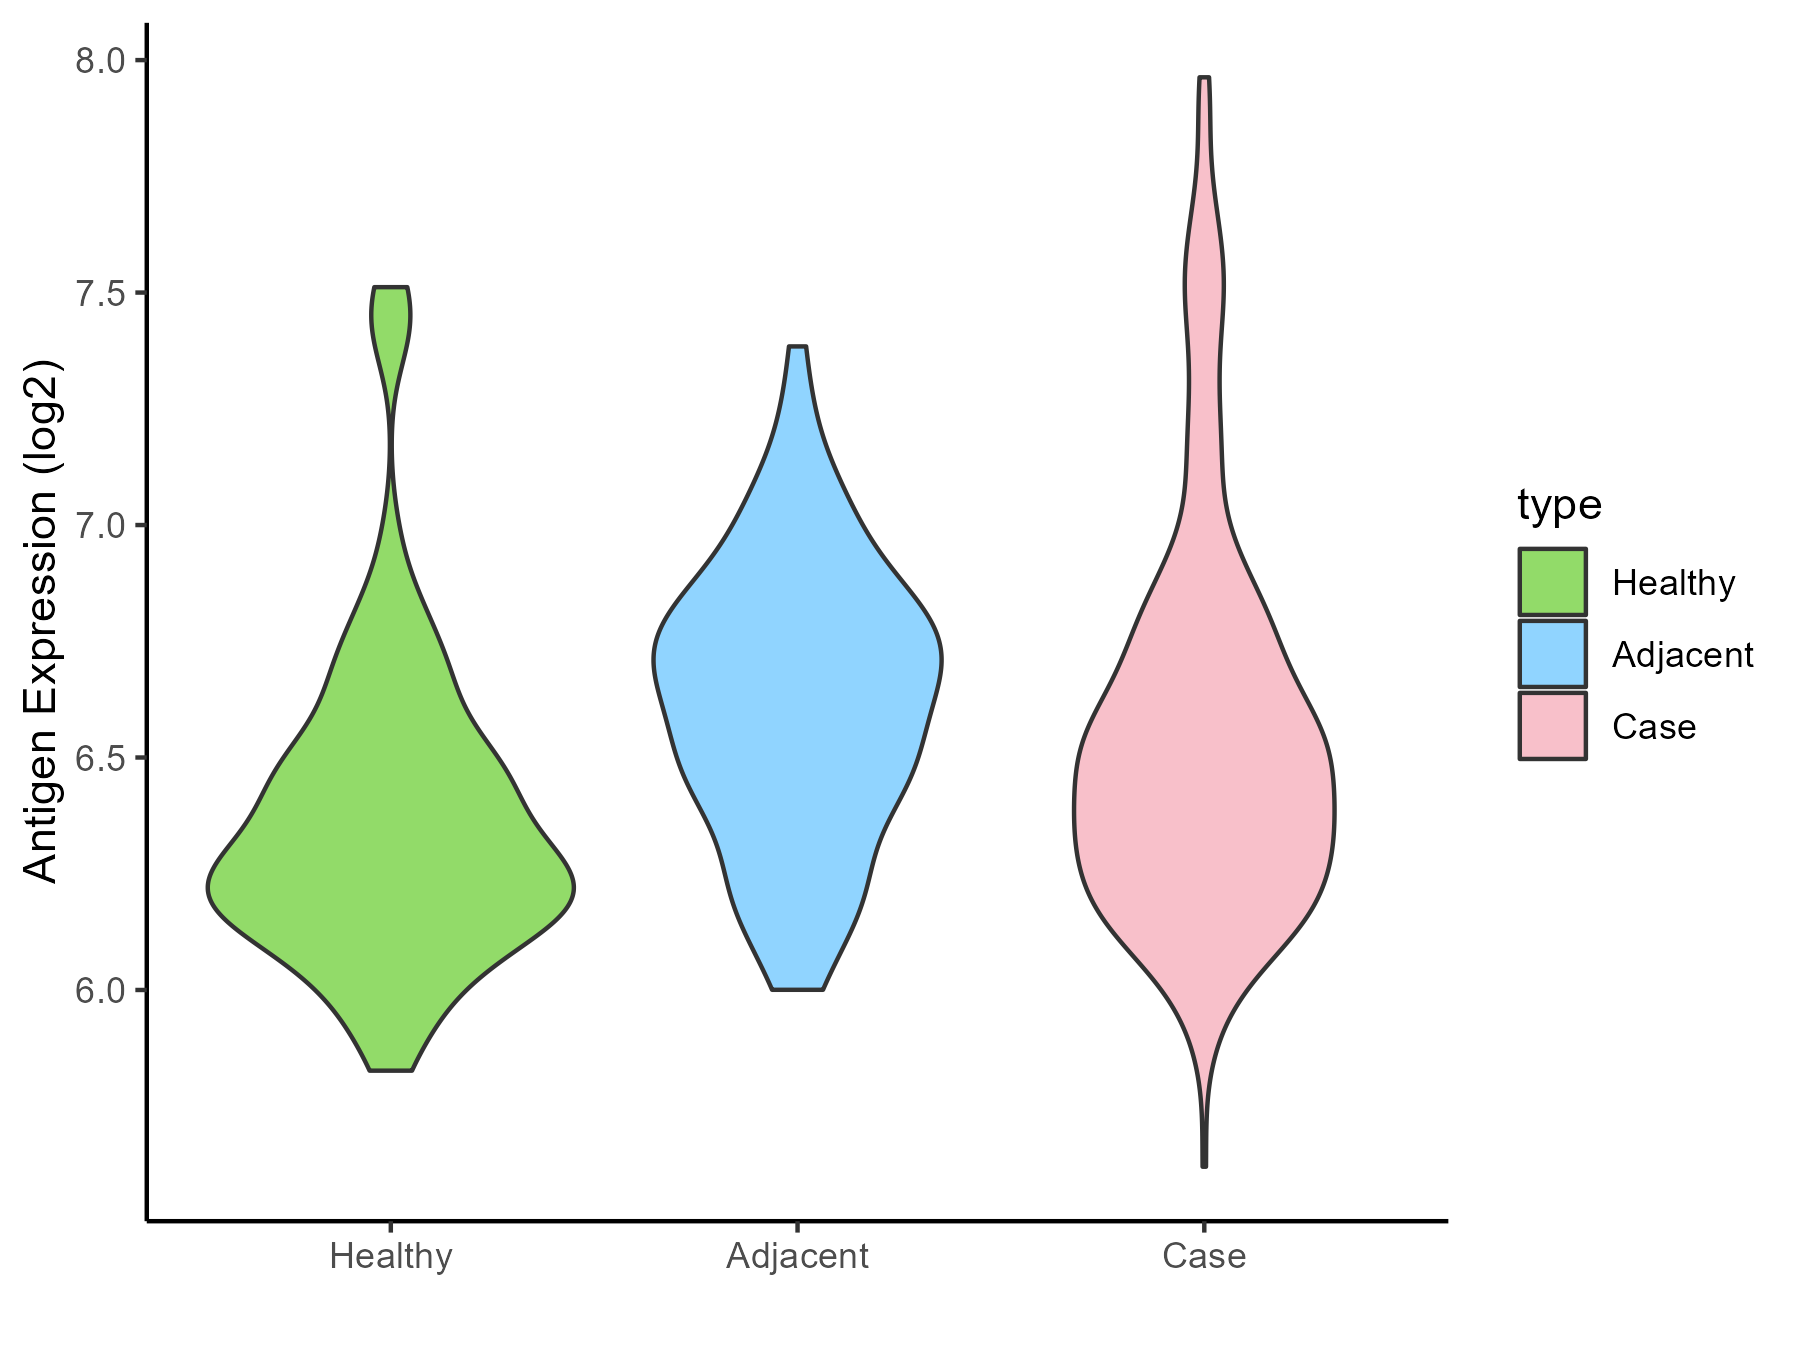
| The Studied Tissue | Skin | |
| The Specific Disease | Psoriasis | |
| The Expression Level of Disease Section Compare with the Healthy Individual Tissue | p-value: 5.63E-05; Fold-change: 0.202432295; Z-score: 0.607905916 | |
| The Expression Level of Disease Section Compare with the Adjacent Tissue | p-value: 0.114119894; Fold-change: -0.15654965; Z-score: -0.527058726 | |
| Disease-specific Antigen Abundances |
|
Click to View the Clearer Original Diagram |
| Differential expression pattern of antigen in diseases | ||
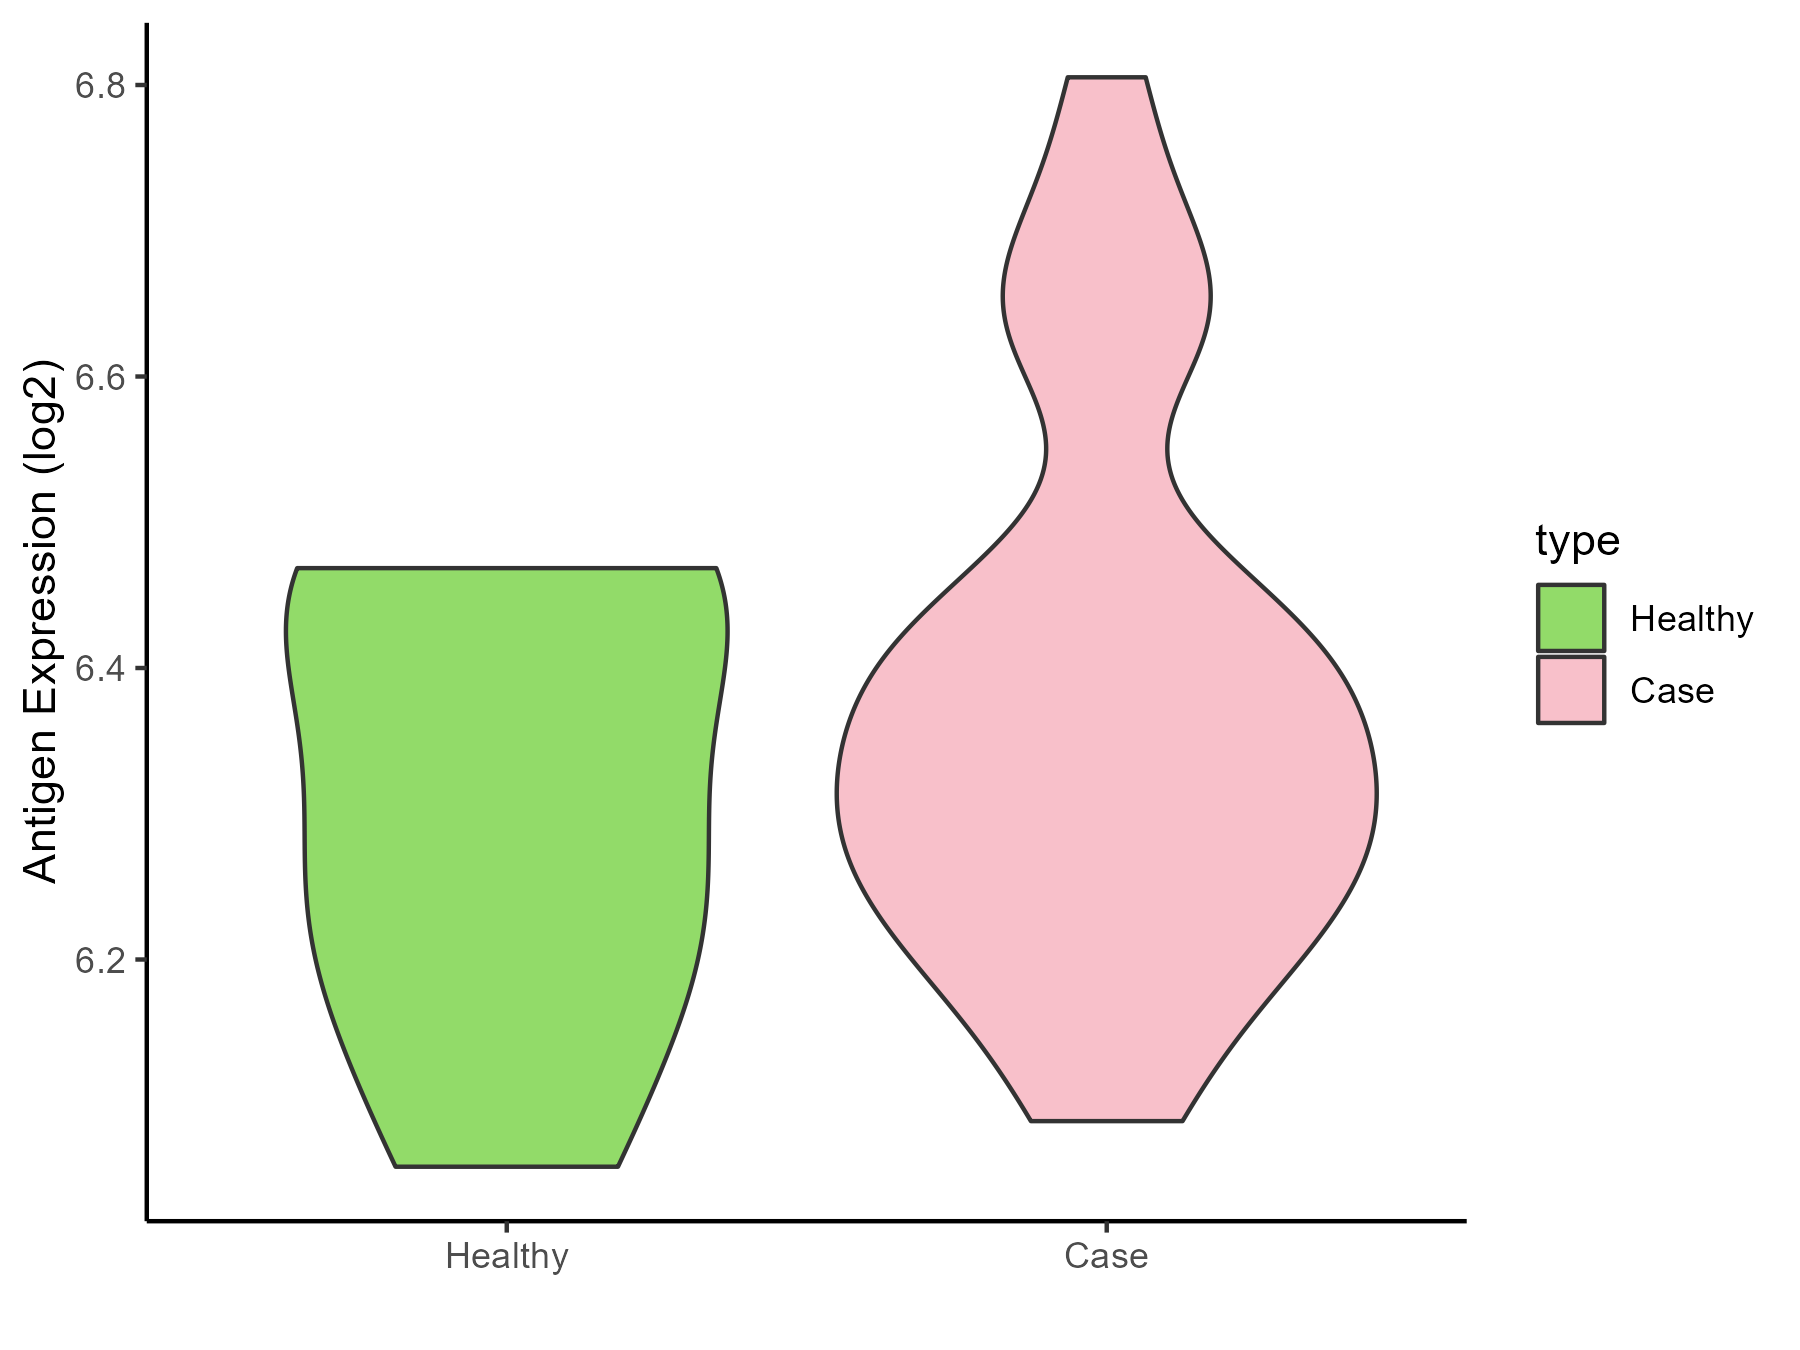
| The Studied Tissue | Skin | |
| The Specific Disease | Vitiligo | |
| The Expression Level of Disease Section Compare with the Healthy Individual Tissue | p-value: 0.324691277; Fold-change: 0.045321378; Z-score: 0.283367703 | |
| Disease-specific Antigen Abundances |
|
Click to View the Clearer Original Diagram |
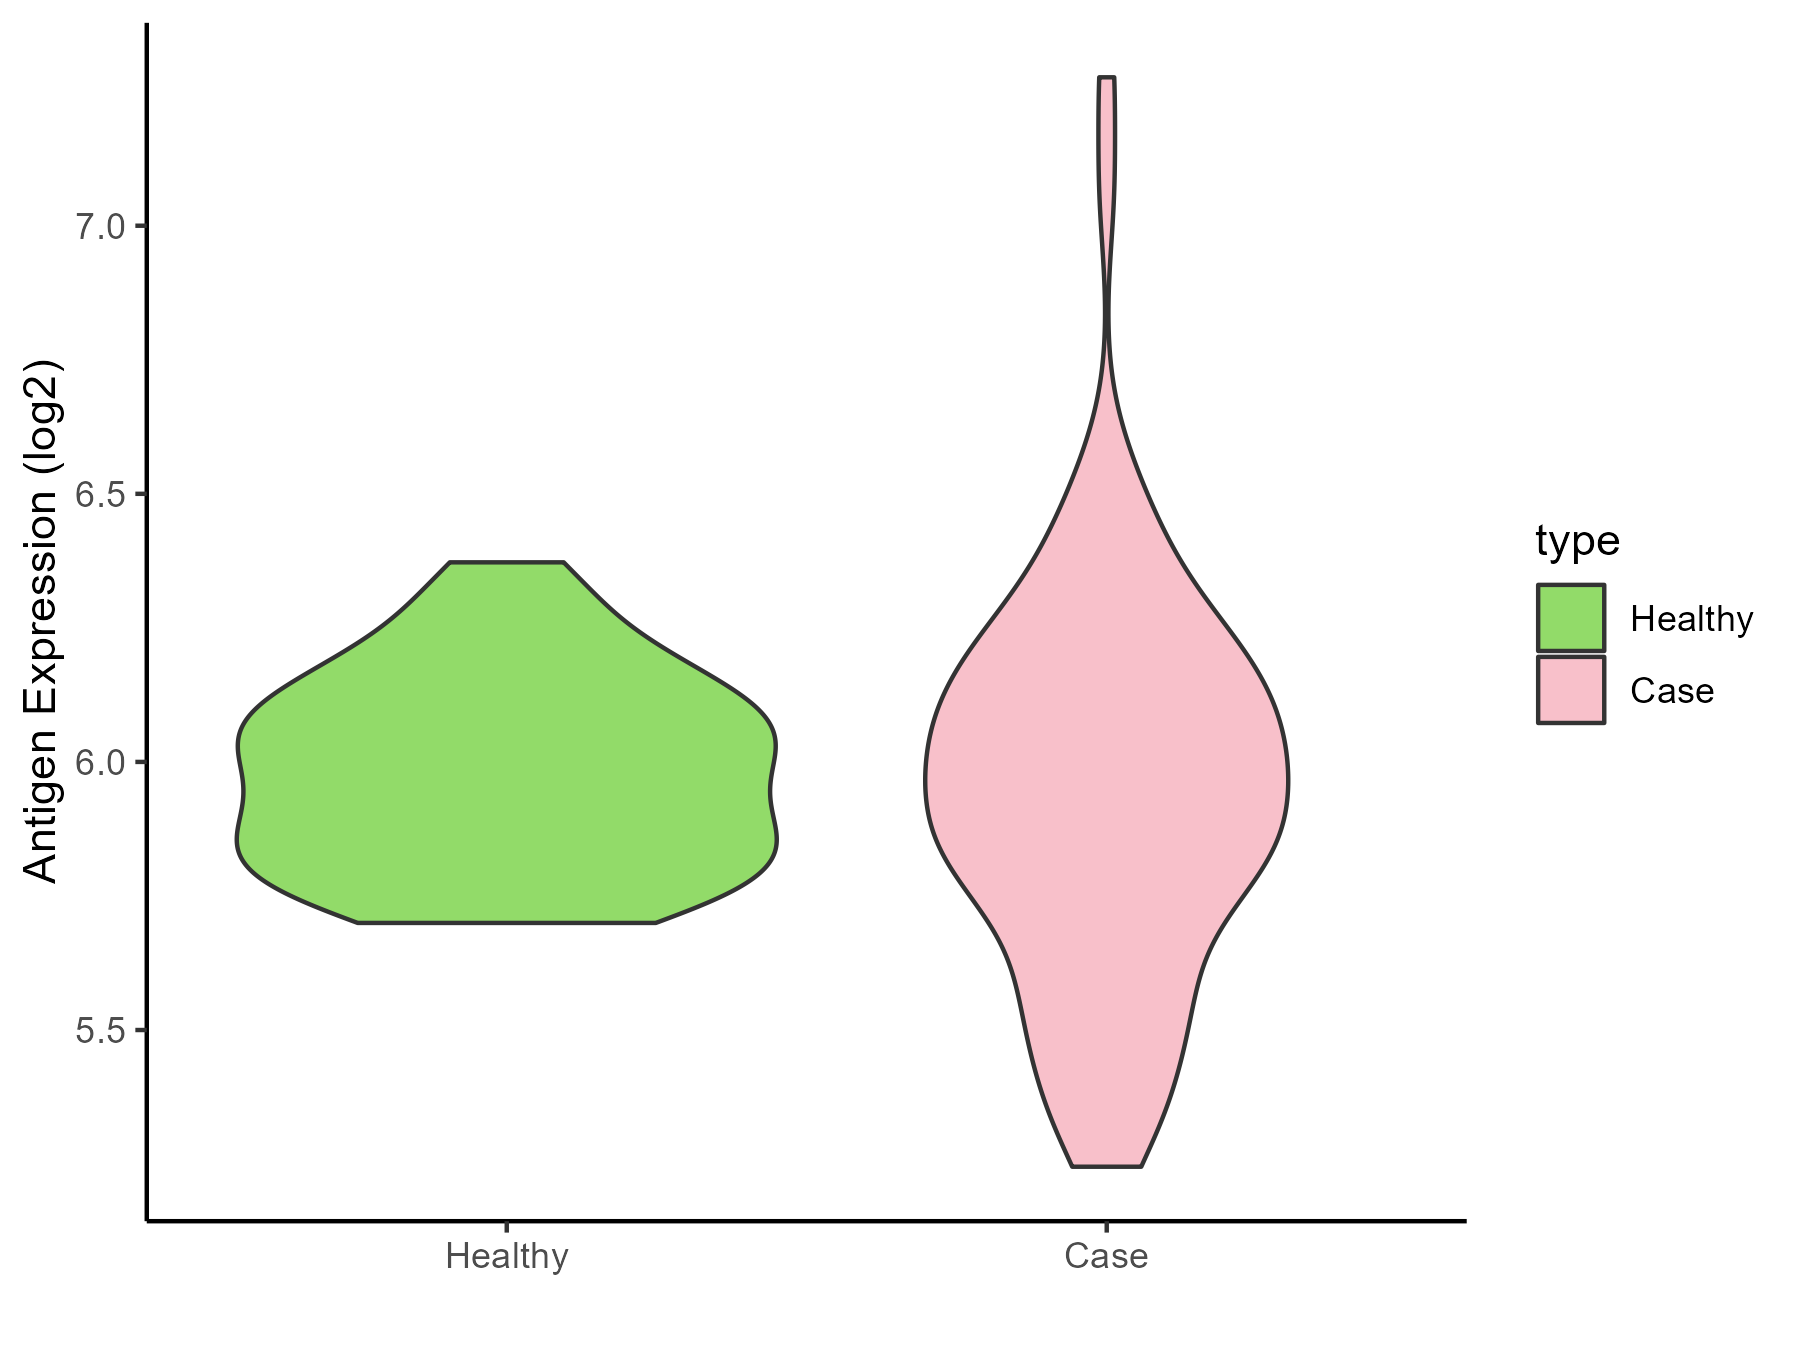
| Differential expression pattern of antigen in diseases | ||
| The Studied Tissue | Skin from scalp | |
| The Specific Disease | Alopecia | |
| The Expression Level of Disease Section Compare with the Healthy Individual Tissue | p-value: 0.499163168; Fold-change: -0.022822536; Z-score: -0.126604471 | |
| Disease-specific Antigen Abundances |
|
Click to View the Clearer Original Diagram |
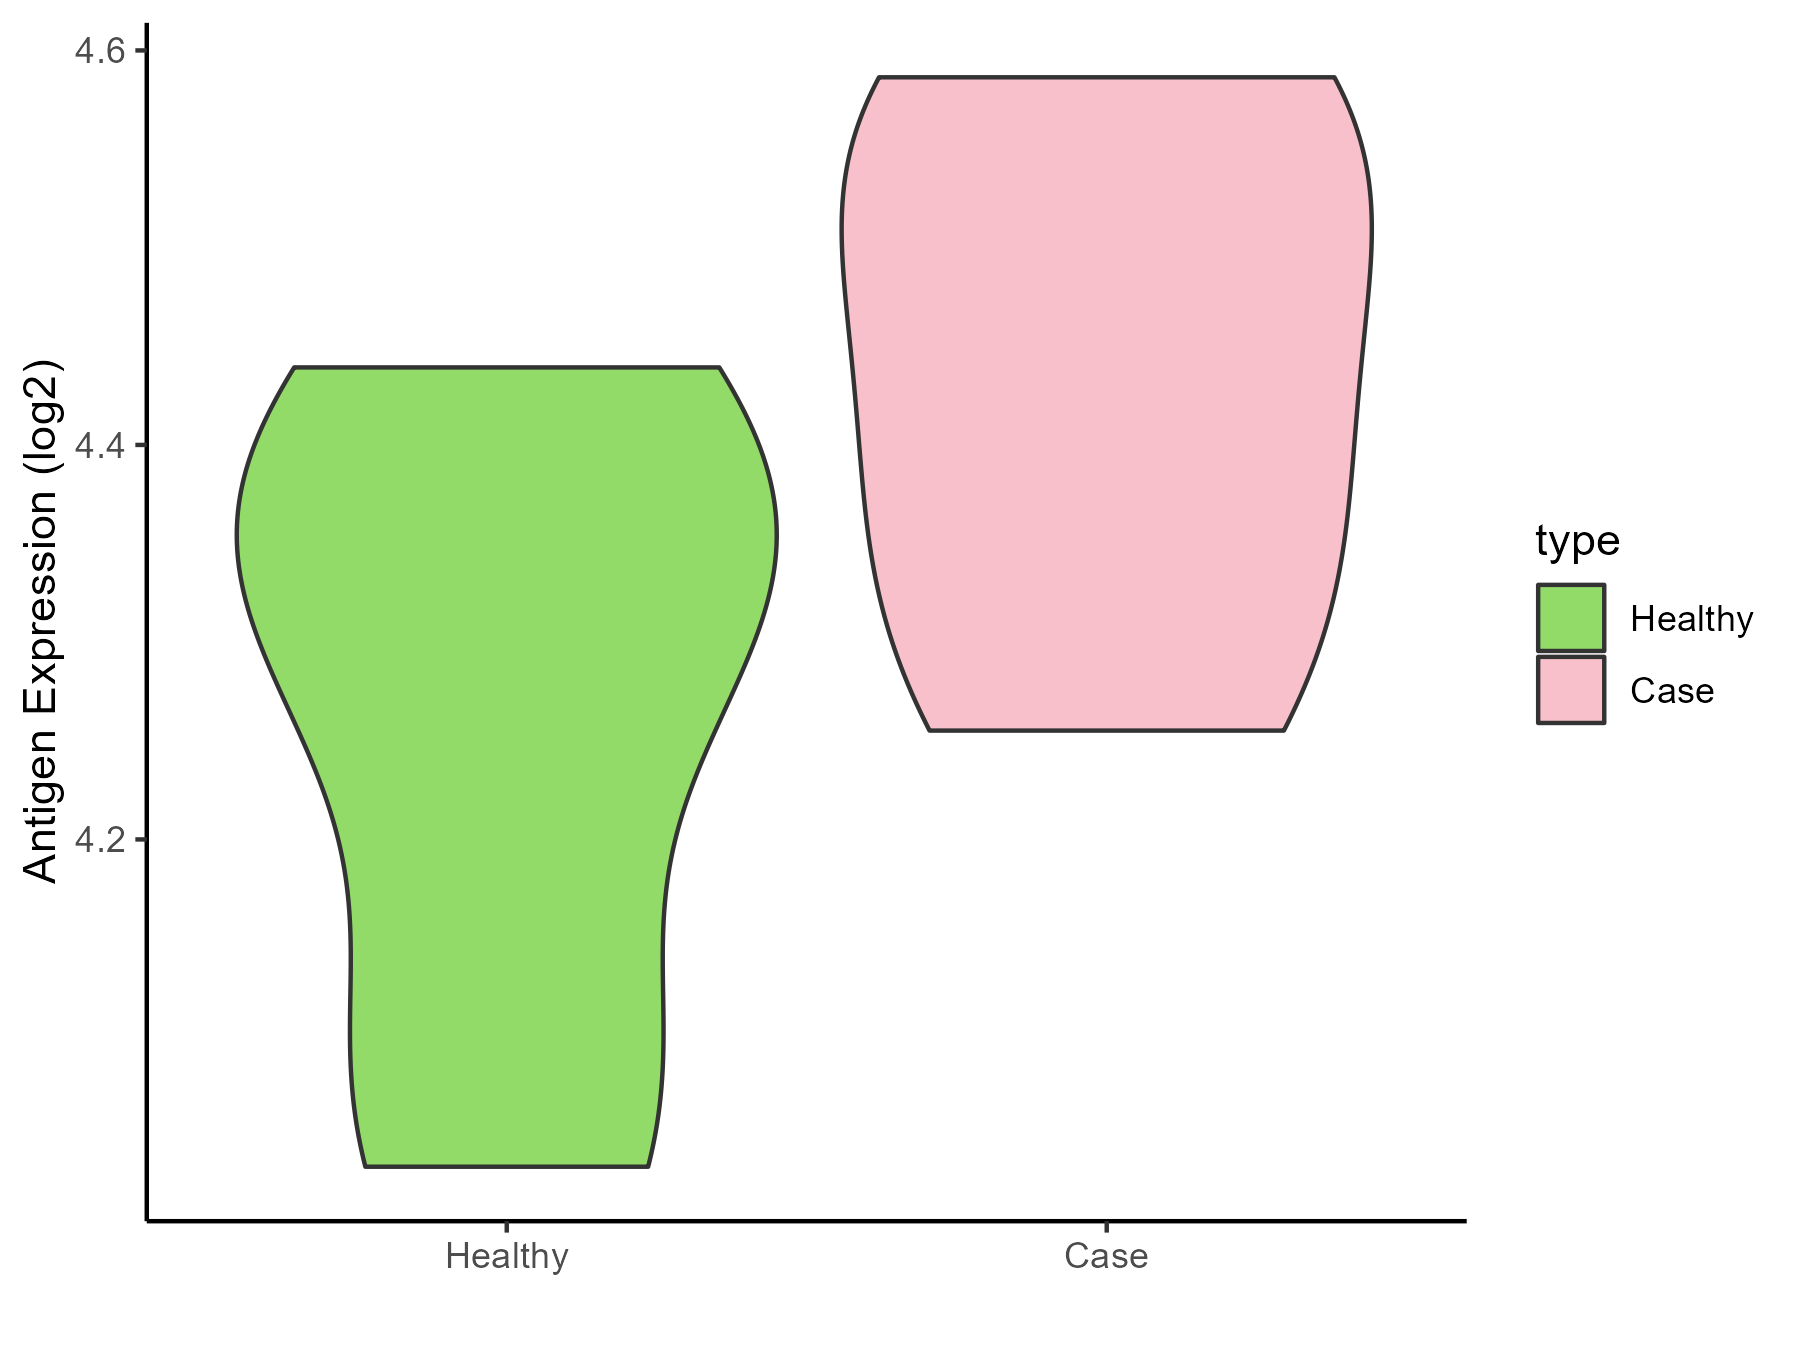
| Differential expression pattern of antigen in diseases | ||
| The Studied Tissue | Skin | |
| The Specific Disease | Sensitive skin | |
| The Expression Level of Disease Section Compare with the Healthy Individual Tissue | p-value: 0.089572634; Fold-change: 0.127285923; Z-score: 0.790270736 | |
| Disease-specific Antigen Abundances |
|
Click to View the Clearer Original Diagram |
ICD Disease Classification 15
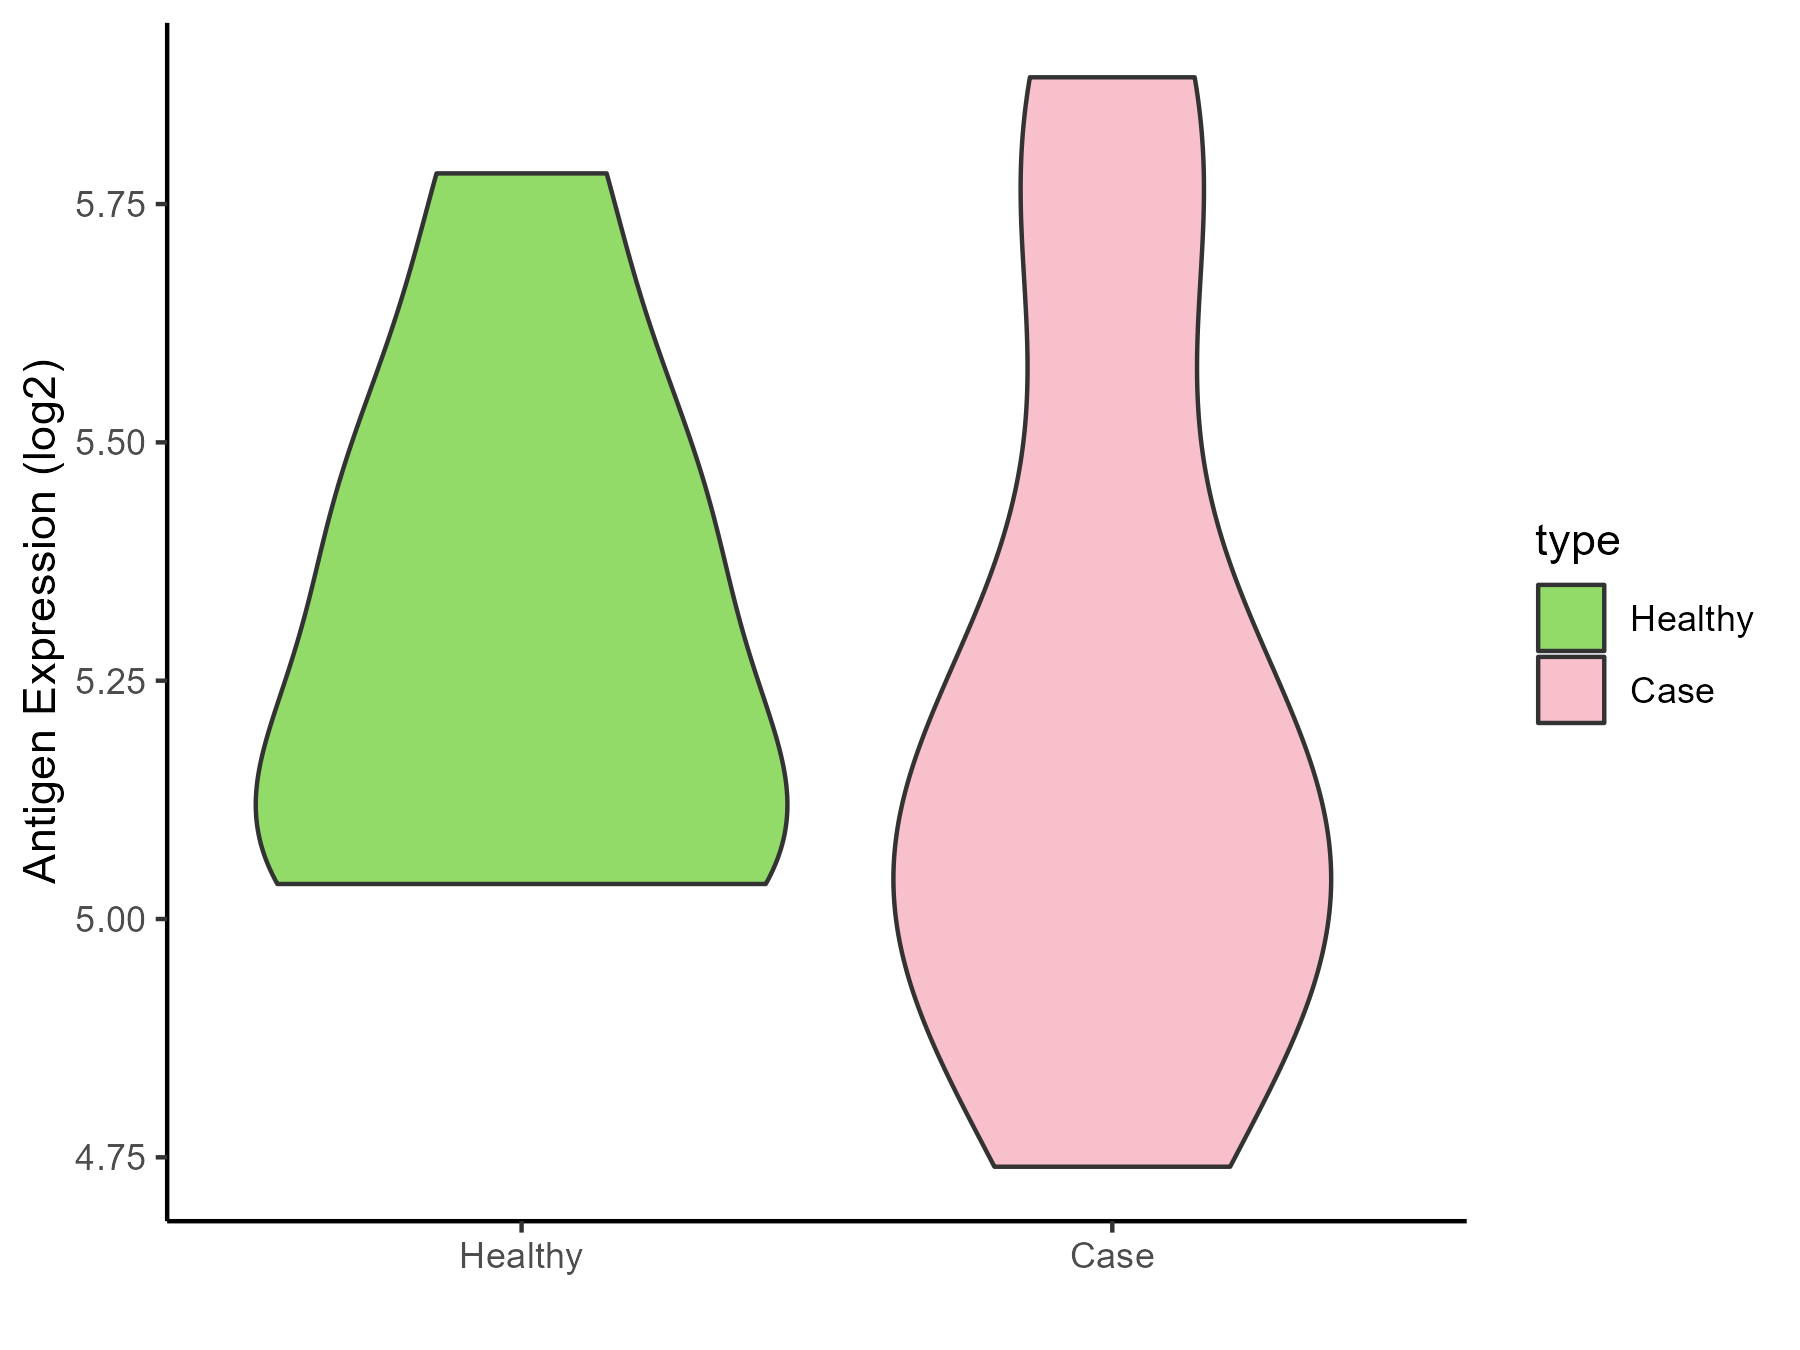
| Differential expression pattern of antigen in diseases | ||
| The Studied Tissue | Synovial | |
| The Specific Disease | Osteoarthritis | |
| The Expression Level of Disease Section Compare with the Healthy Individual Tissue | p-value: 0.608128192; Fold-change: -0.11070391; Z-score: -0.411853087 | |
| Disease-specific Antigen Abundances |
|
Click to View the Clearer Original Diagram |
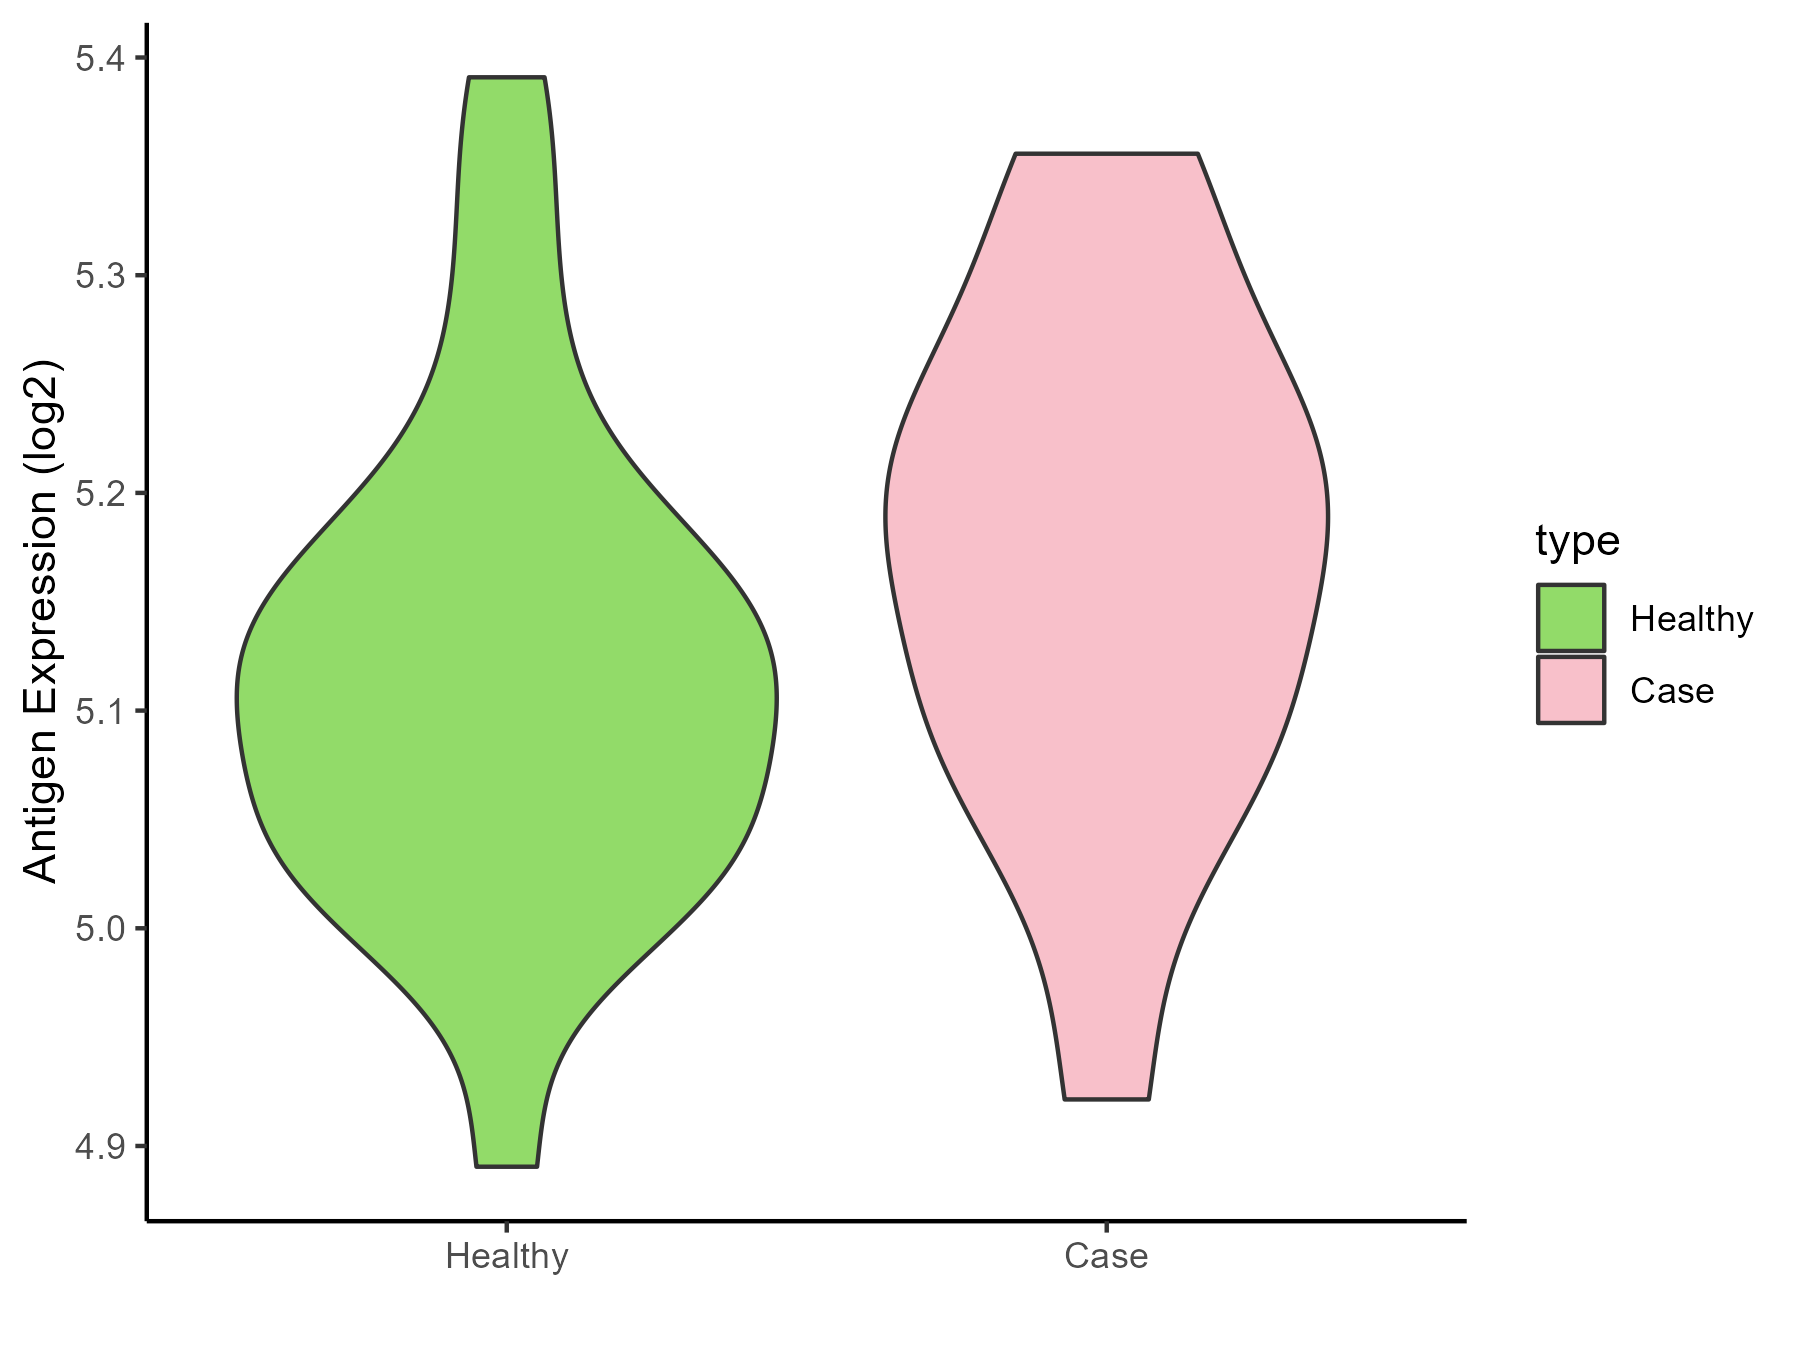
| Differential expression pattern of antigen in diseases | ||
| The Studied Tissue | Peripheral blood | |
| The Specific Disease | Arthropathy | |
| The Expression Level of Disease Section Compare with the Healthy Individual Tissue | p-value: 0.18880413; Fold-change: 0.072743466; Z-score: 0.652652345 | |
| Disease-specific Antigen Abundances |
|
Click to View the Clearer Original Diagram |
| Differential expression pattern of antigen in diseases | ||
| The Studied Tissue | Peripheral blood | |
| The Specific Disease | Arthritis | |
| The Expression Level of Disease Section Compare with the Healthy Individual Tissue | p-value: 0.018156226; Fold-change: 0.043357089; Z-score: 0.245610827 | |
| Disease-specific Antigen Abundances |

|
Click to View the Clearer Original Diagram |
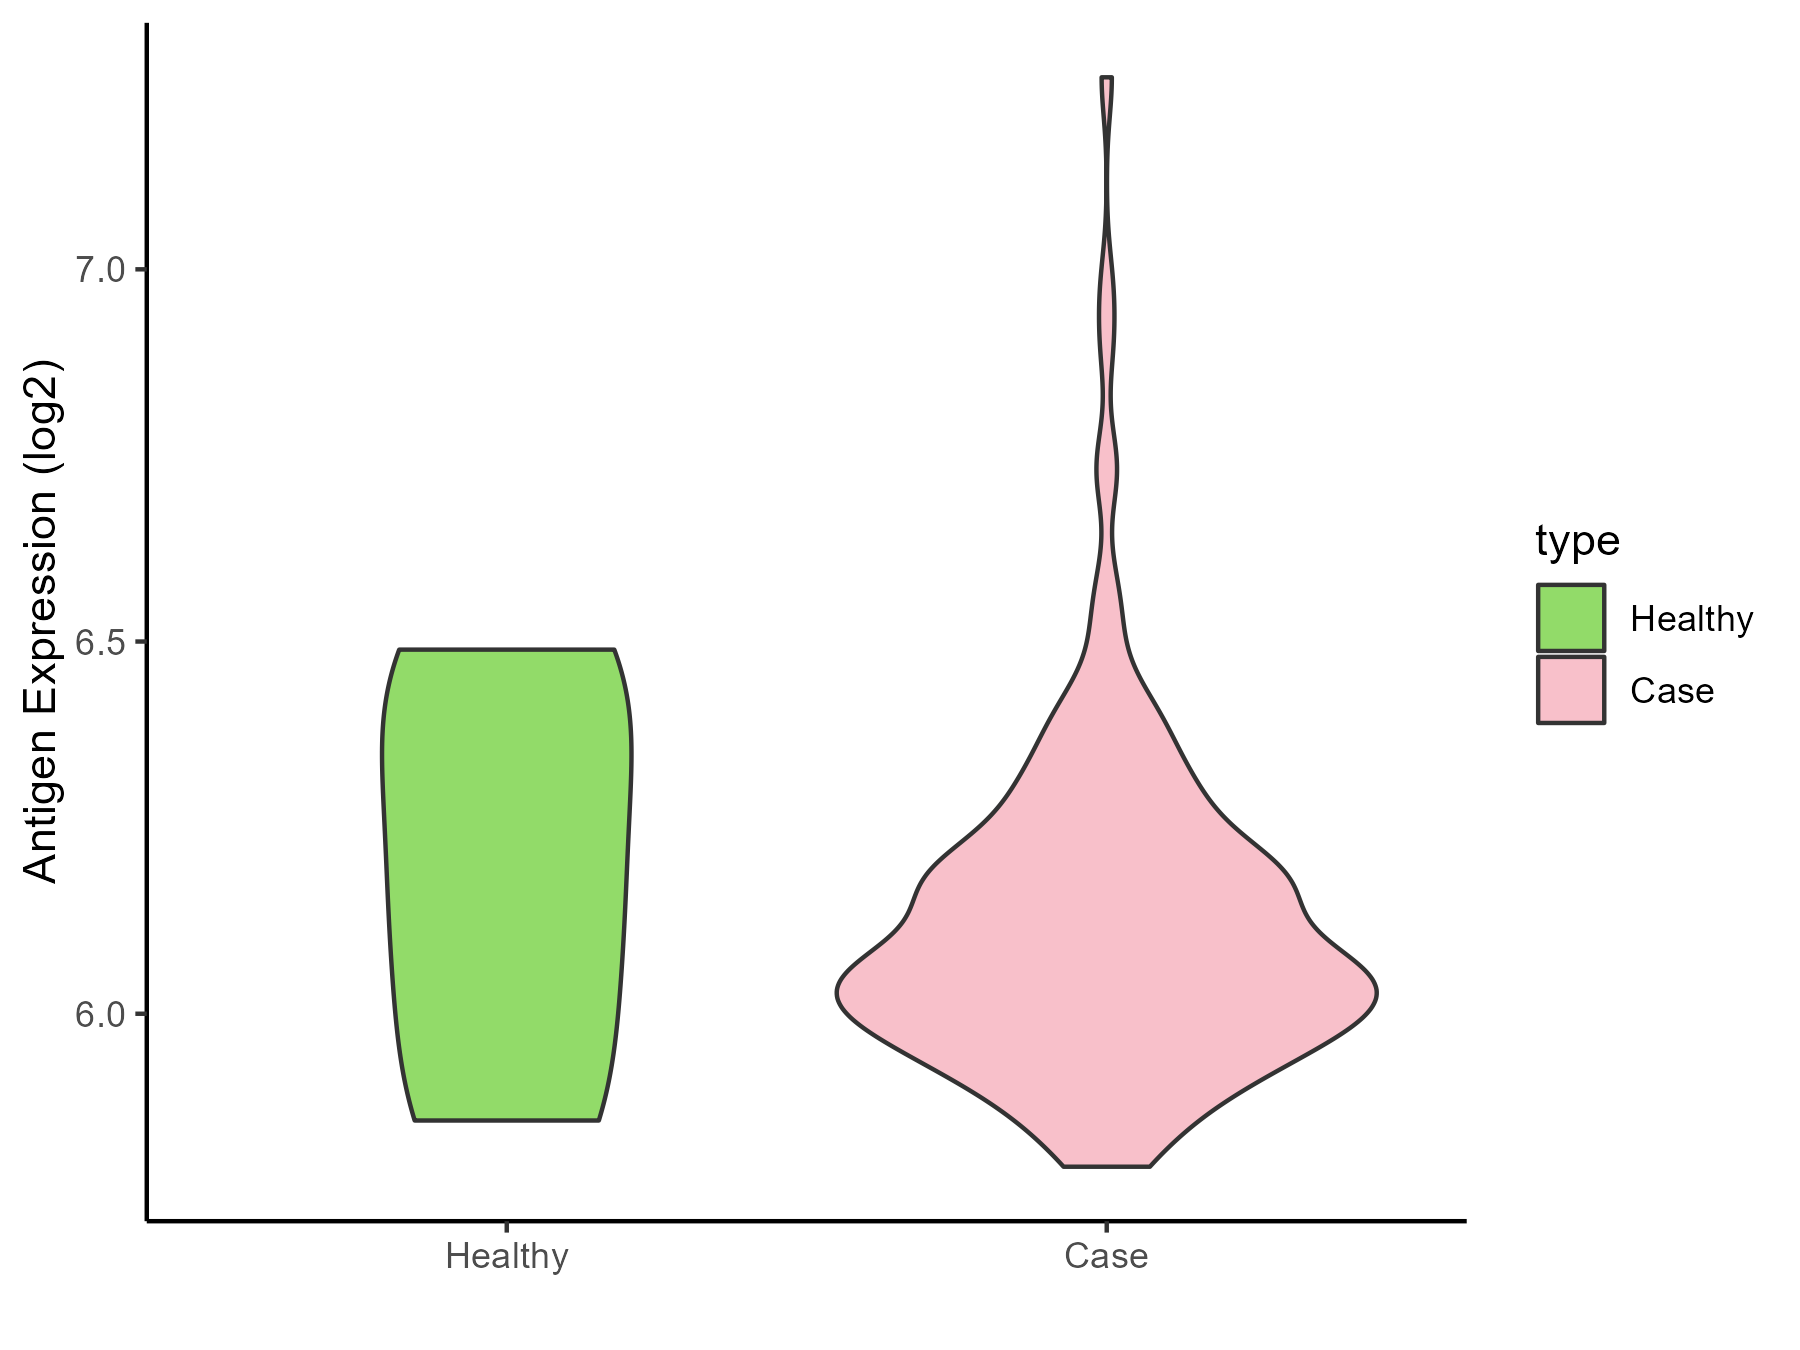
| Differential expression pattern of antigen in diseases | ||
| The Studied Tissue | Synovial | |
| The Specific Disease | Rheumatoid arthritis | |
| The Expression Level of Disease Section Compare with the Healthy Individual Tissue | p-value: 0.528337381; Fold-change: -0.063314838; Z-score: -0.245560553 | |
| Disease-specific Antigen Abundances |
|
Click to View the Clearer Original Diagram |
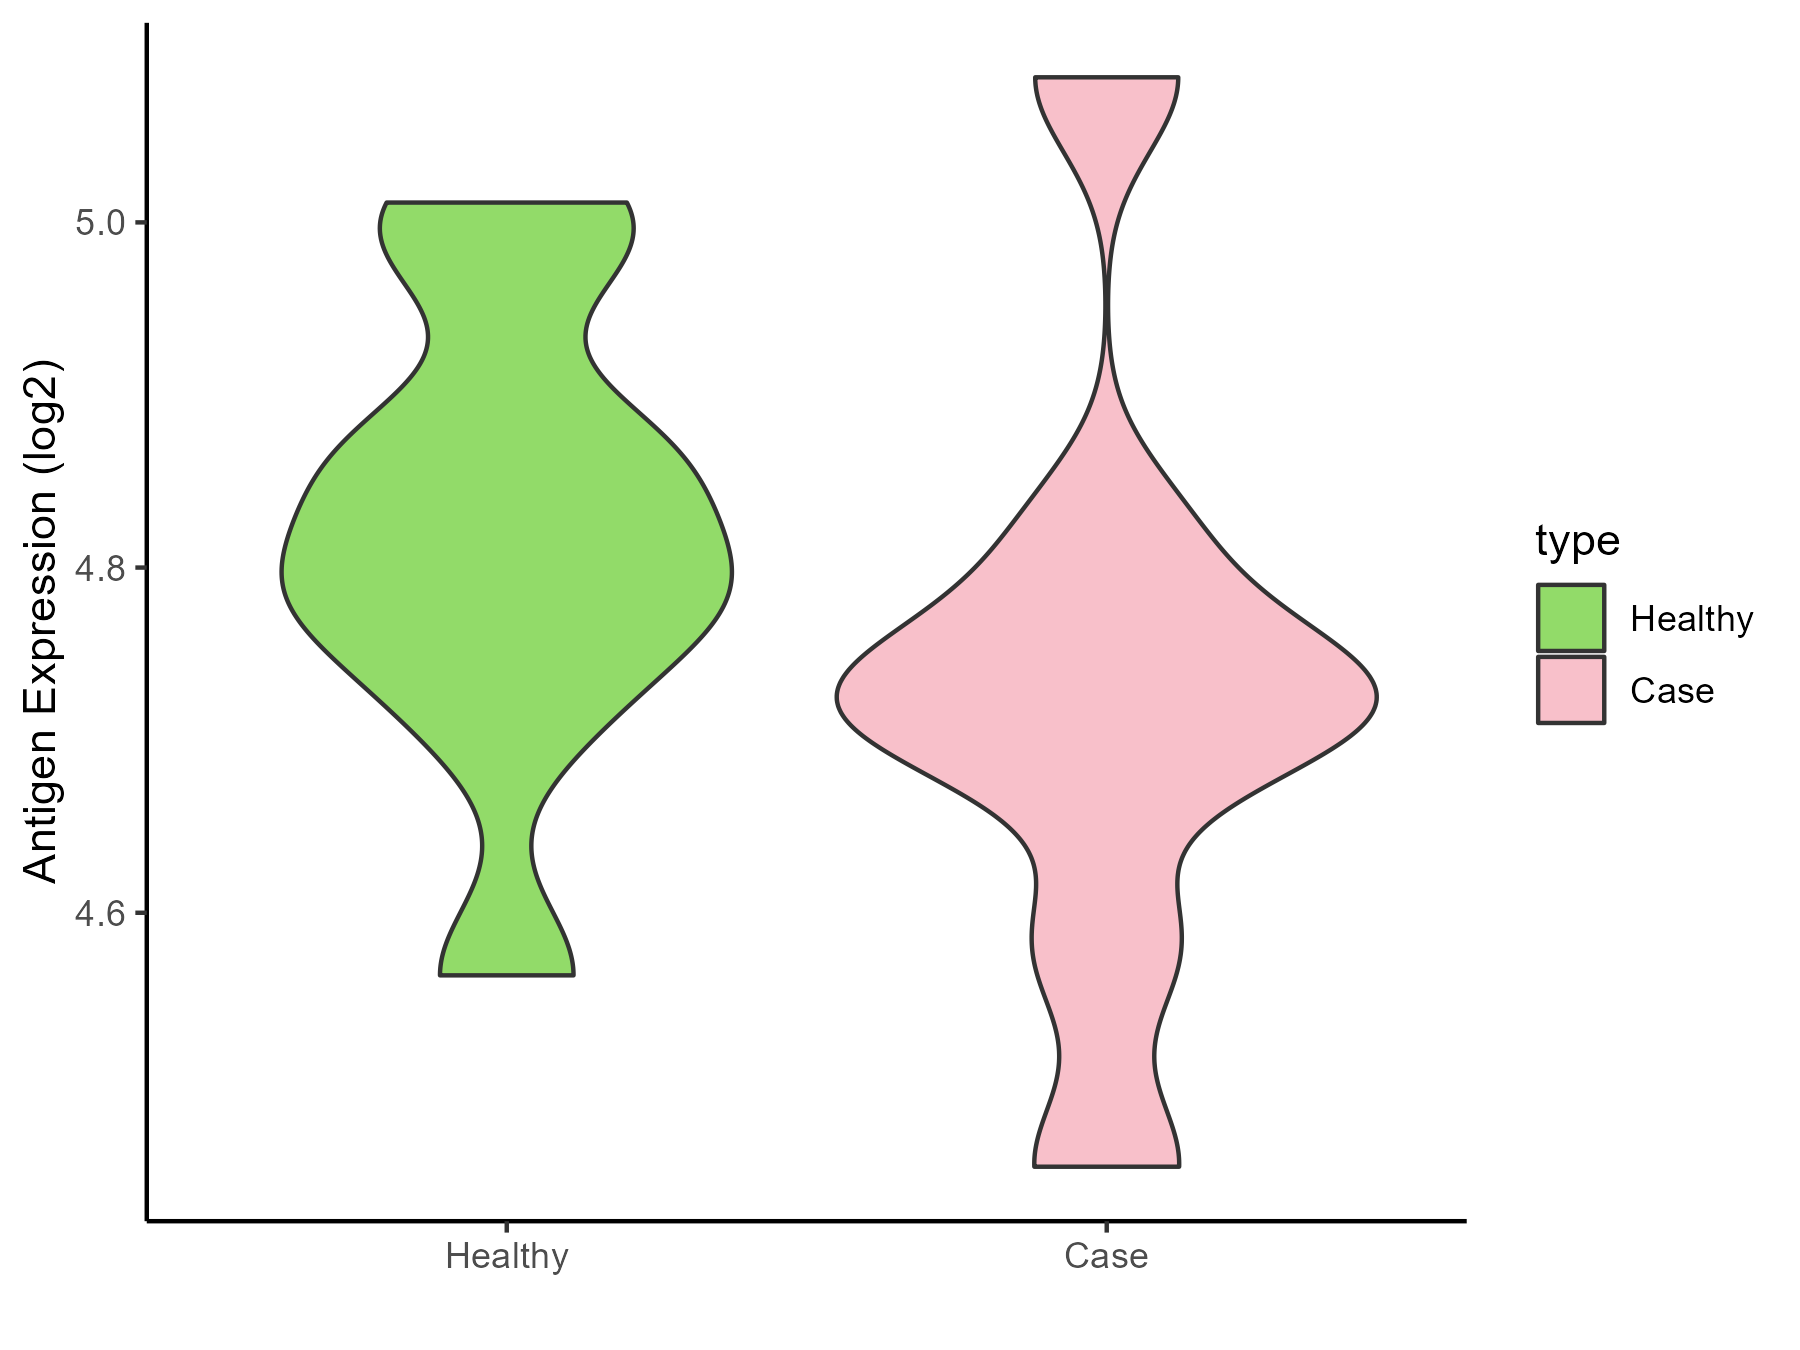
| Differential expression pattern of antigen in diseases | ||
| The Studied Tissue | Pheripheral blood | |
| The Specific Disease | Ankylosing spondylitis | |
| The Expression Level of Disease Section Compare with the Healthy Individual Tissue | p-value: 0.27176568; Fold-change: -0.088075177; Z-score: -0.647660438 | |
| Disease-specific Antigen Abundances |
|
Click to View the Clearer Original Diagram |
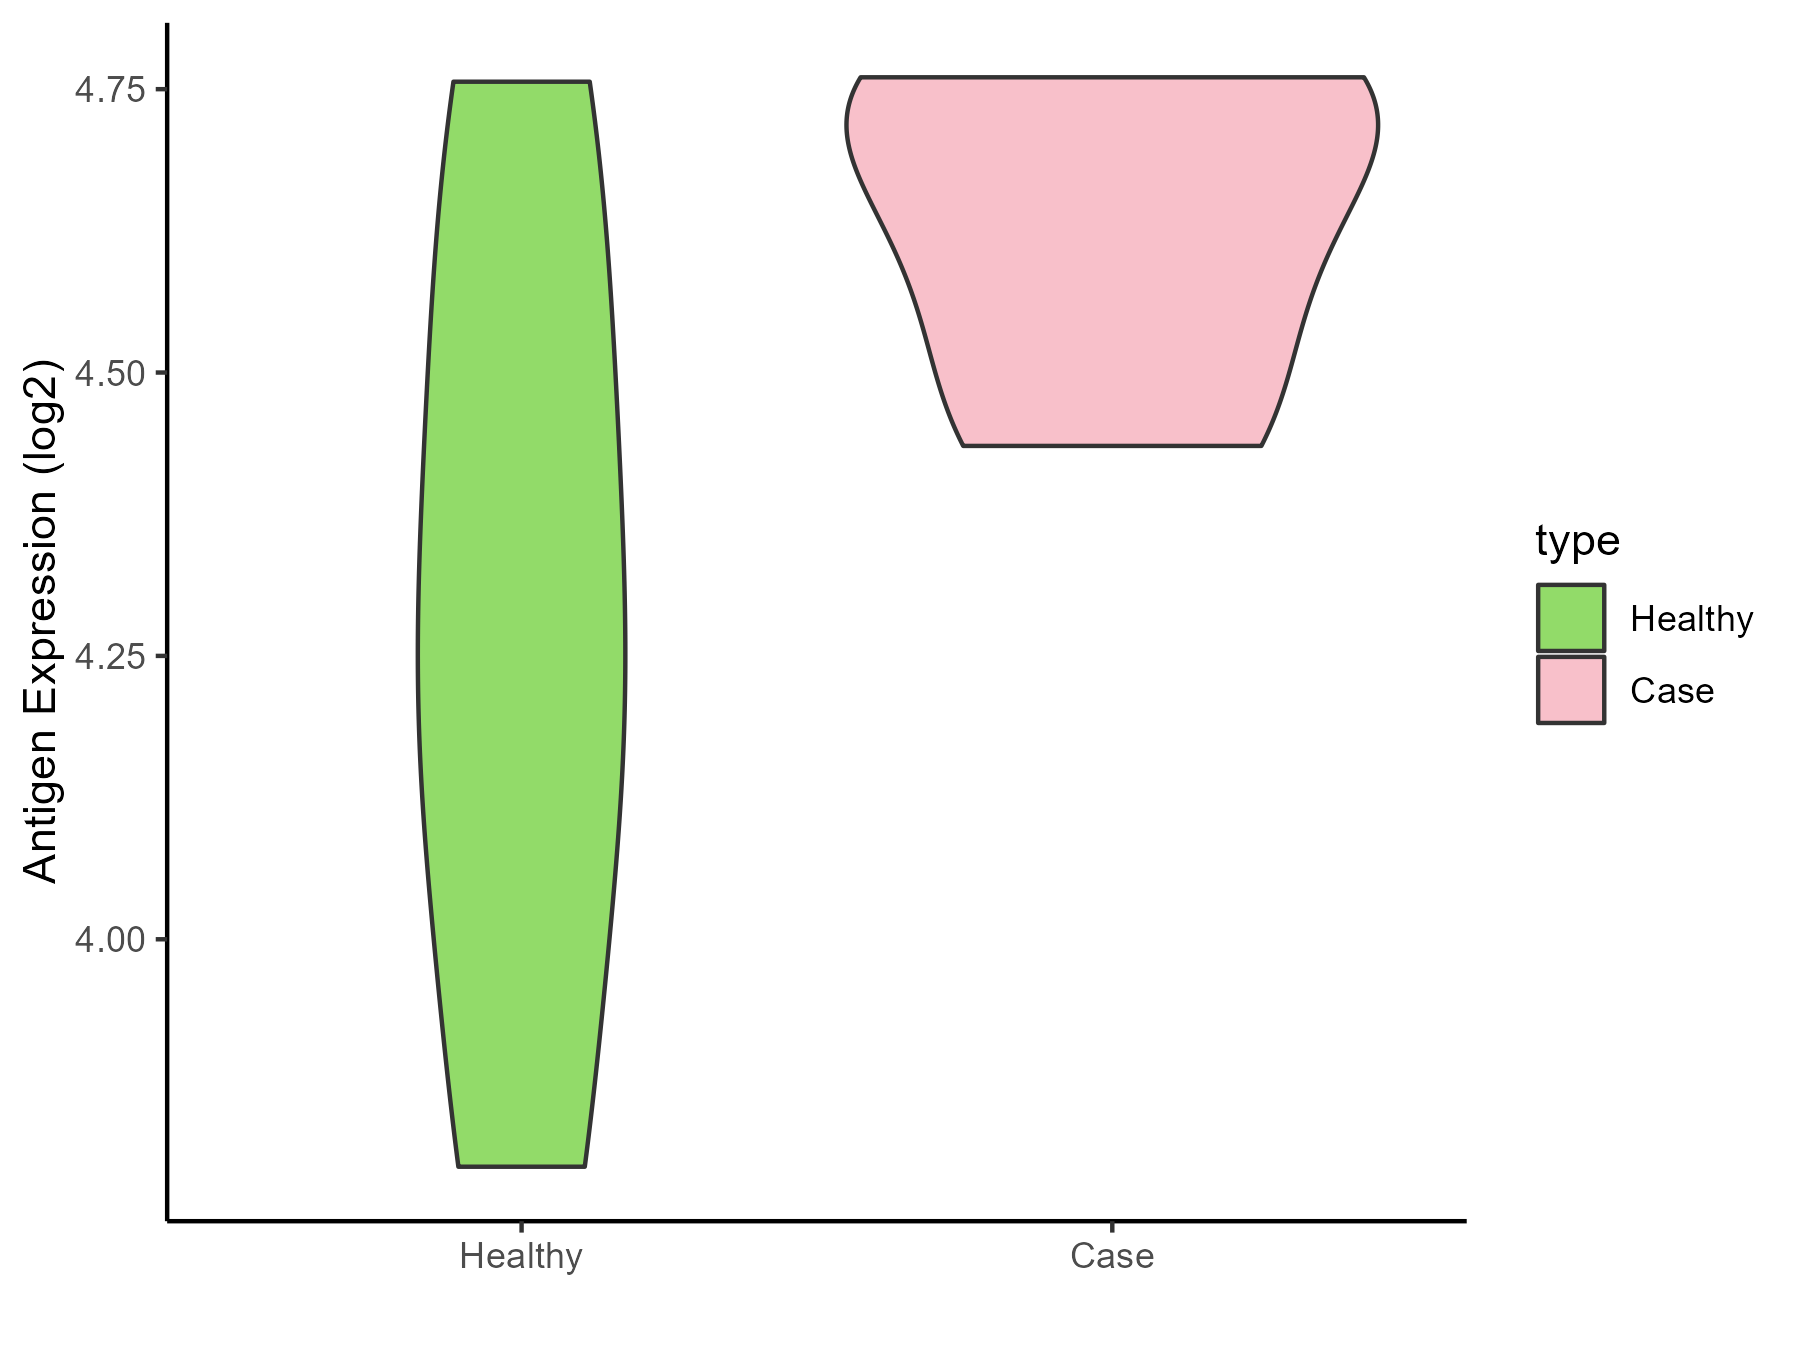
| Differential expression pattern of antigen in diseases | ||
| The Studied Tissue | Bone marrow | |
| The Specific Disease | Osteoporosis | |
| The Expression Level of Disease Section Compare with the Healthy Individual Tissue | p-value: 0.108595033; Fold-change: 0.397633135; Z-score: 1.079064549 | |
| Disease-specific Antigen Abundances |
|
Click to View the Clearer Original Diagram |
ICD Disease Classification 16
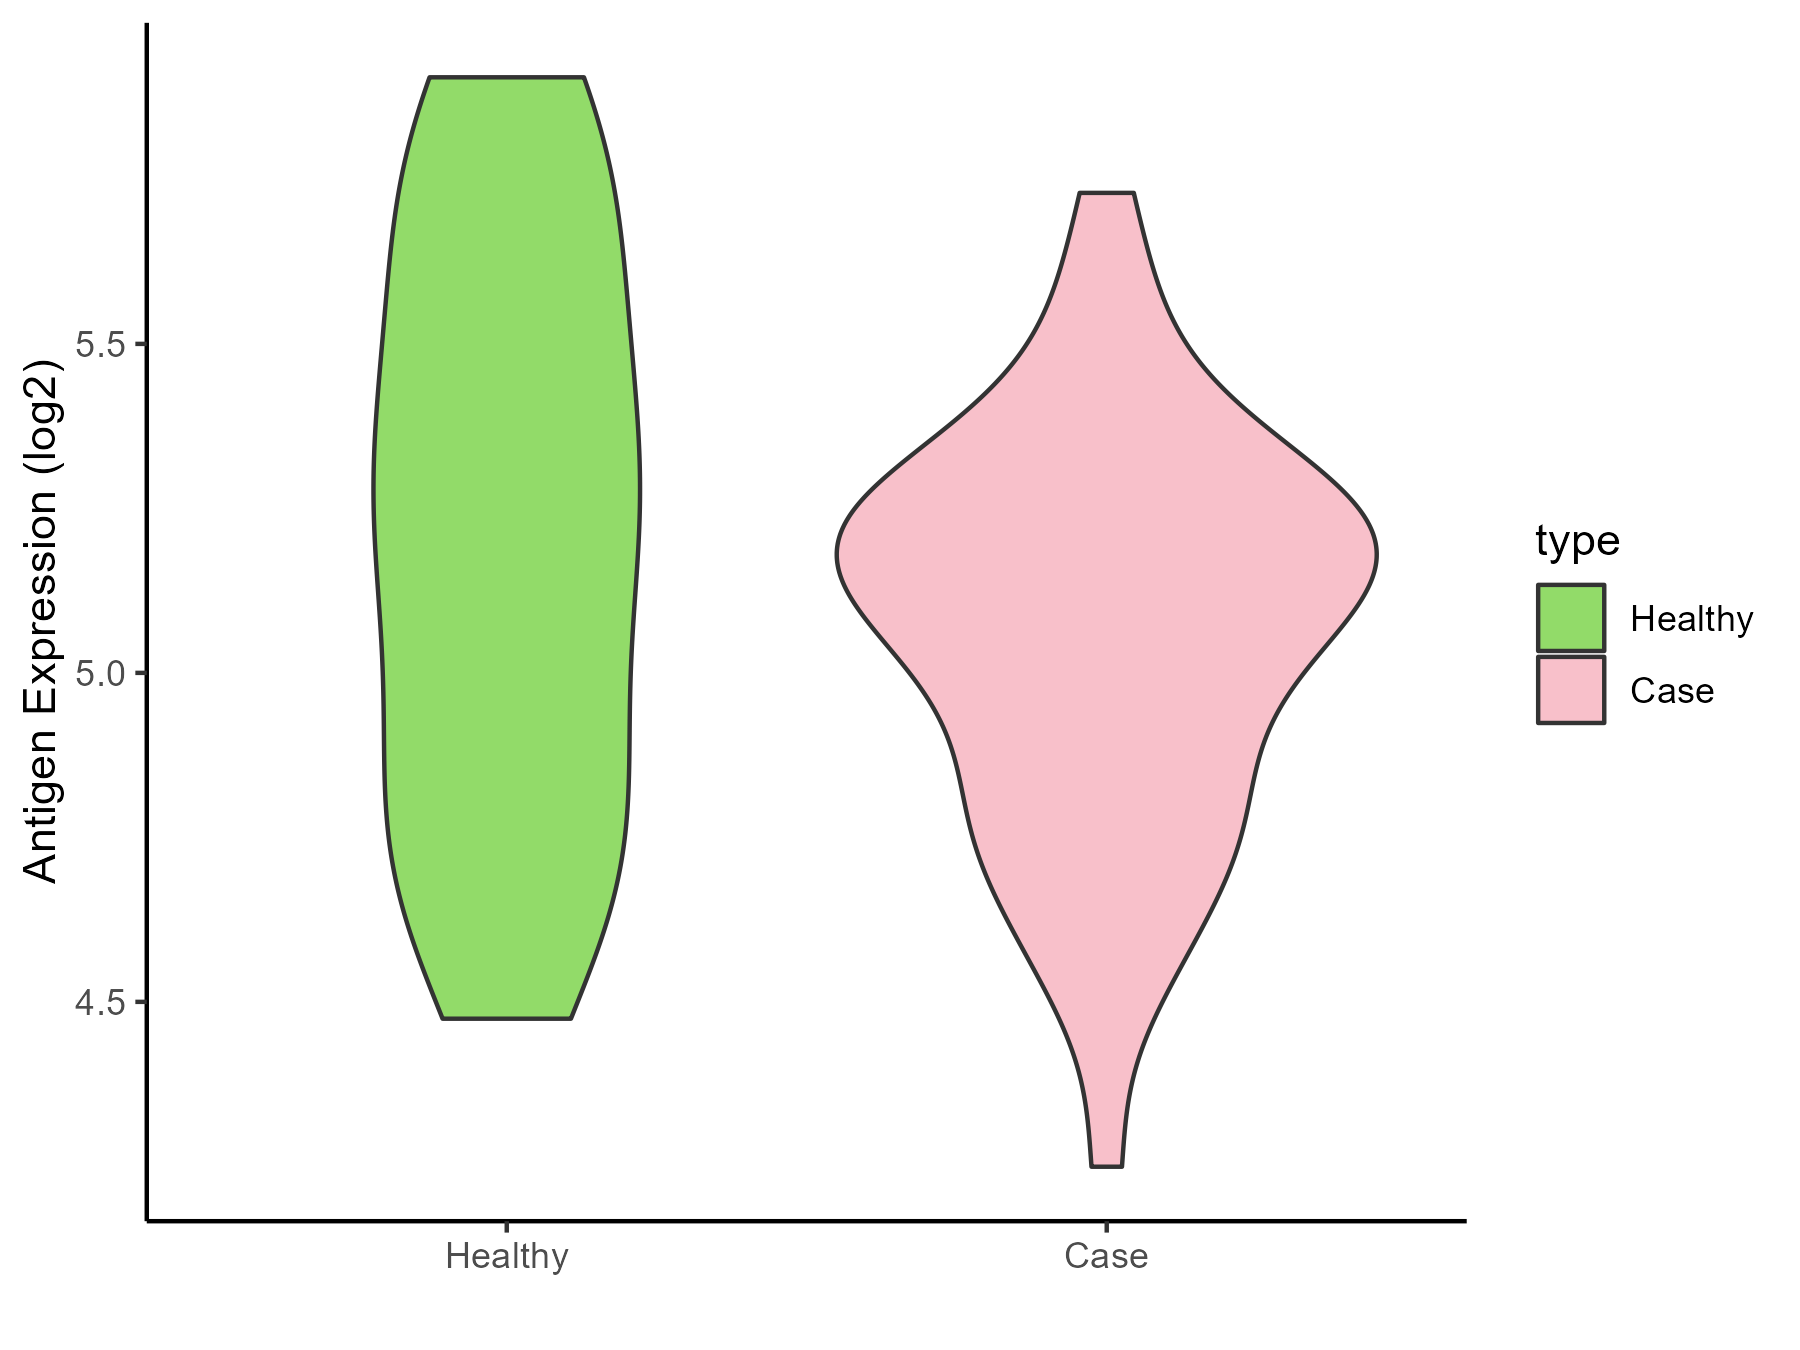
| Differential expression pattern of antigen in diseases | ||
| The Studied Tissue | Endometrium | |
| The Specific Disease | Endometriosis | |
| The Expression Level of Disease Section Compare with the Healthy Individual Tissue | p-value: 0.123425173; Fold-change: -0.111367932; Z-score: -0.255222162 | |
| Disease-specific Antigen Abundances |
|
Click to View the Clearer Original Diagram |
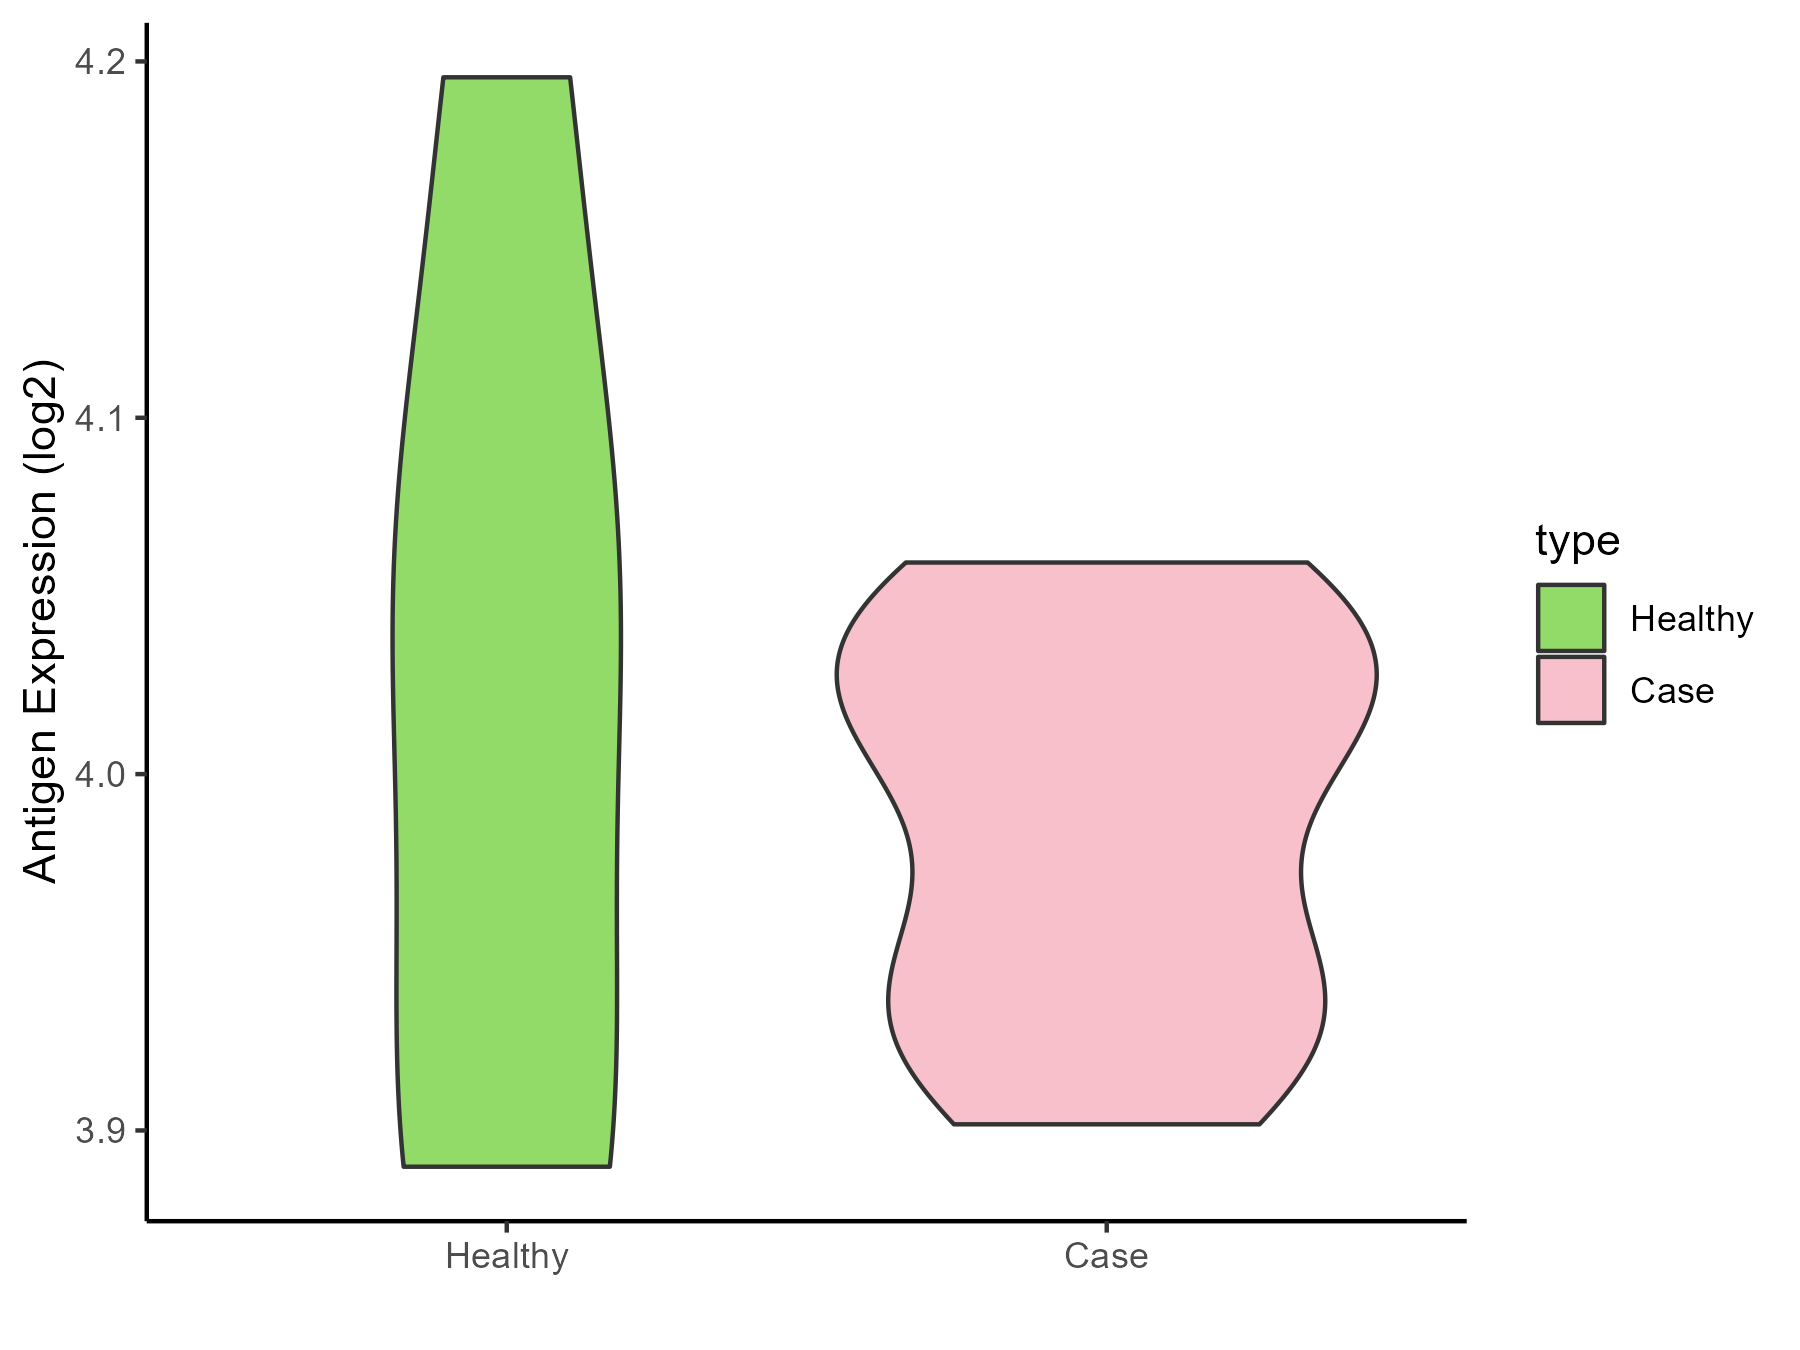
| Differential expression pattern of antigen in diseases | ||
| The Studied Tissue | Bladder | |
| The Specific Disease | Interstitial cystitis | |
| The Expression Level of Disease Section Compare with the Healthy Individual Tissue | p-value: 0.615395872; Fold-change: -0.049180488; Z-score: -0.389515672 | |
| Disease-specific Antigen Abundances |
|
Click to View the Clearer Original Diagram |
ICD Disease Classification 19
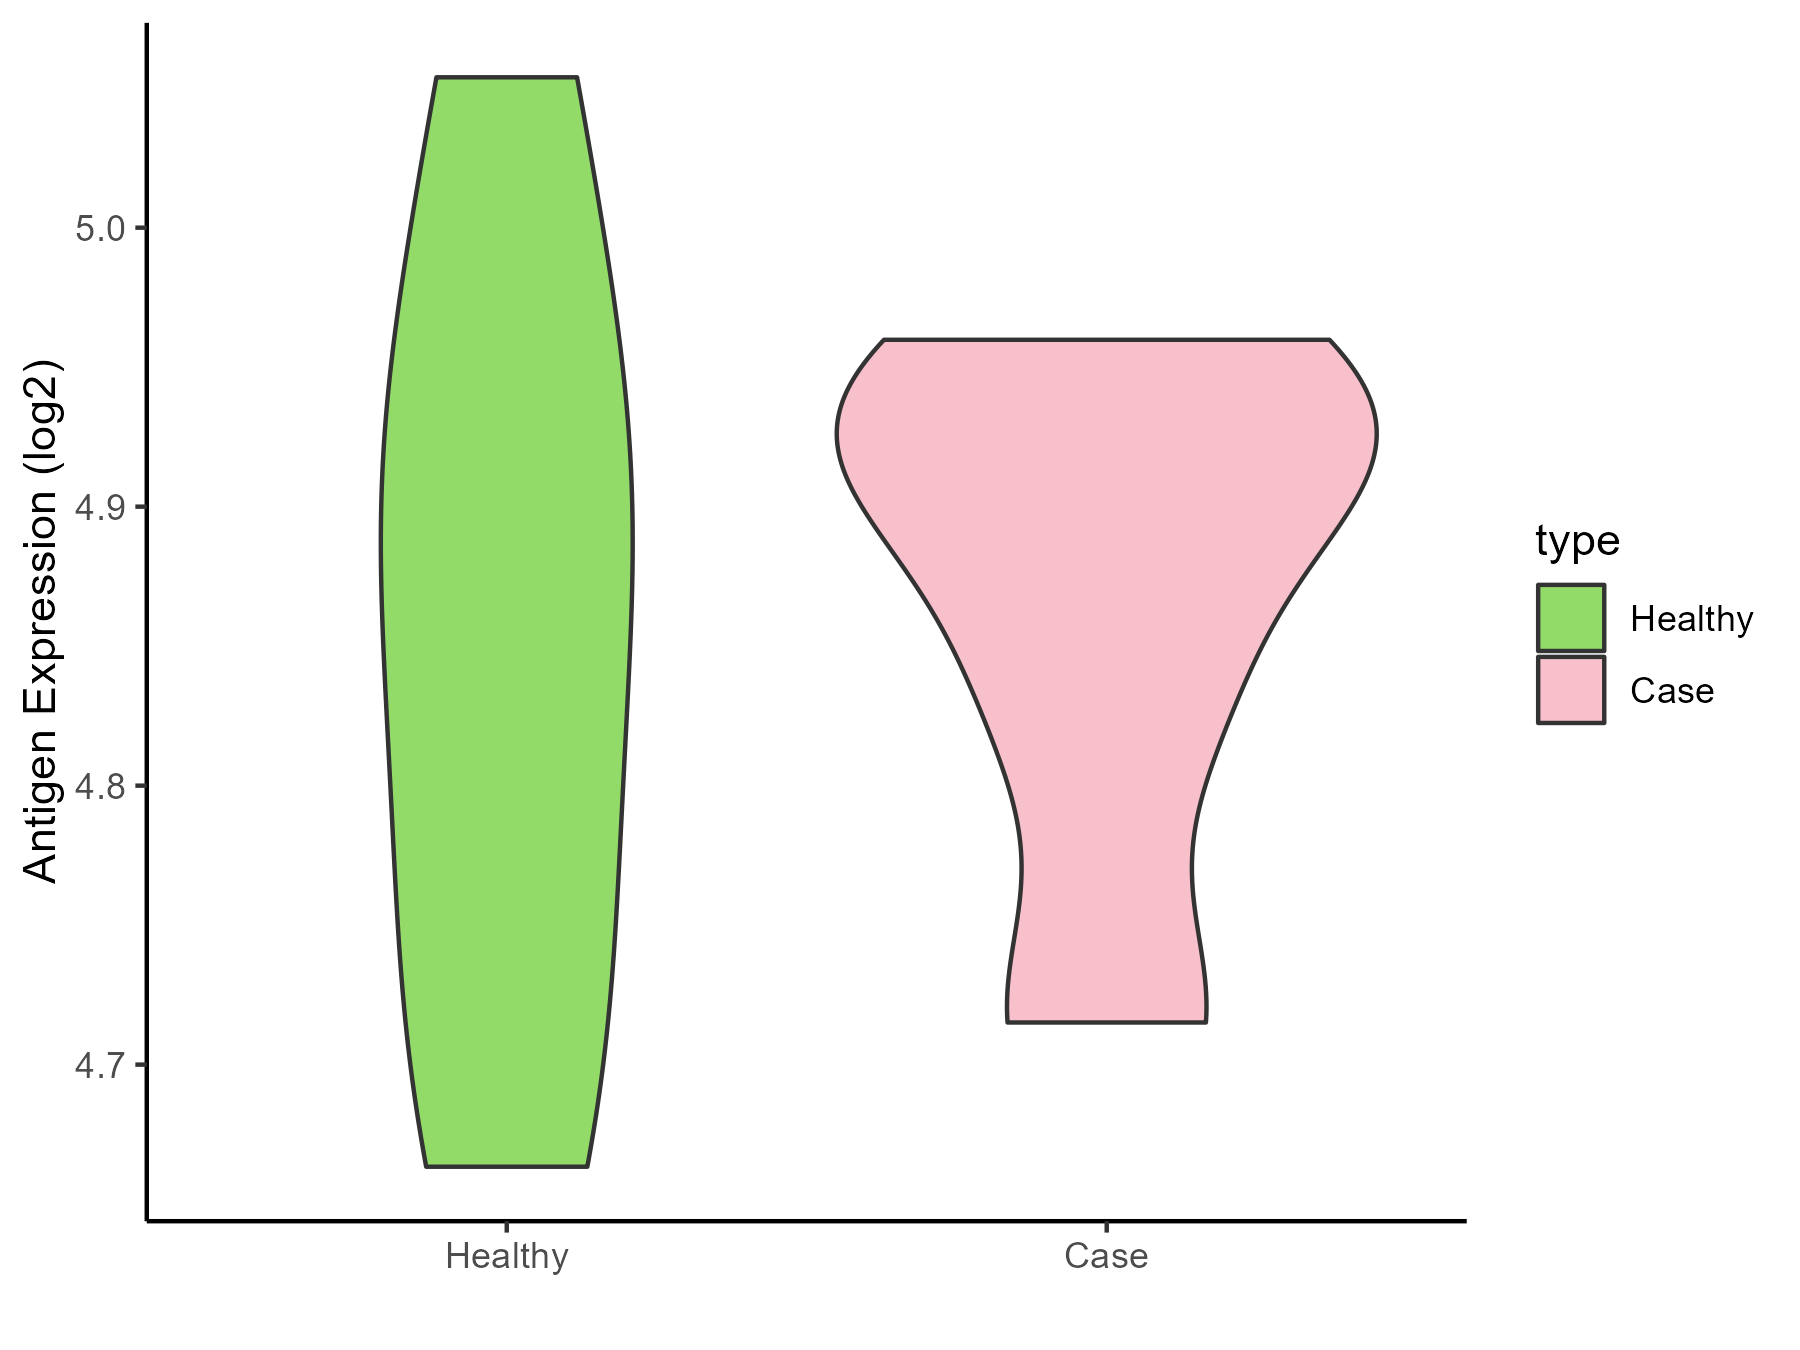
| Differential expression pattern of antigen in diseases | ||
| The Studied Tissue | Myometrium | |
| The Specific Disease | Preterm birth | |
| The Expression Level of Disease Section Compare with the Healthy Individual Tissue | p-value: 0.845156552; Fold-change: 0.049678037; Z-score: 0.349782014 | |
| Disease-specific Antigen Abundances |
|
Click to View the Clearer Original Diagram |
ICD Disease Classification 2
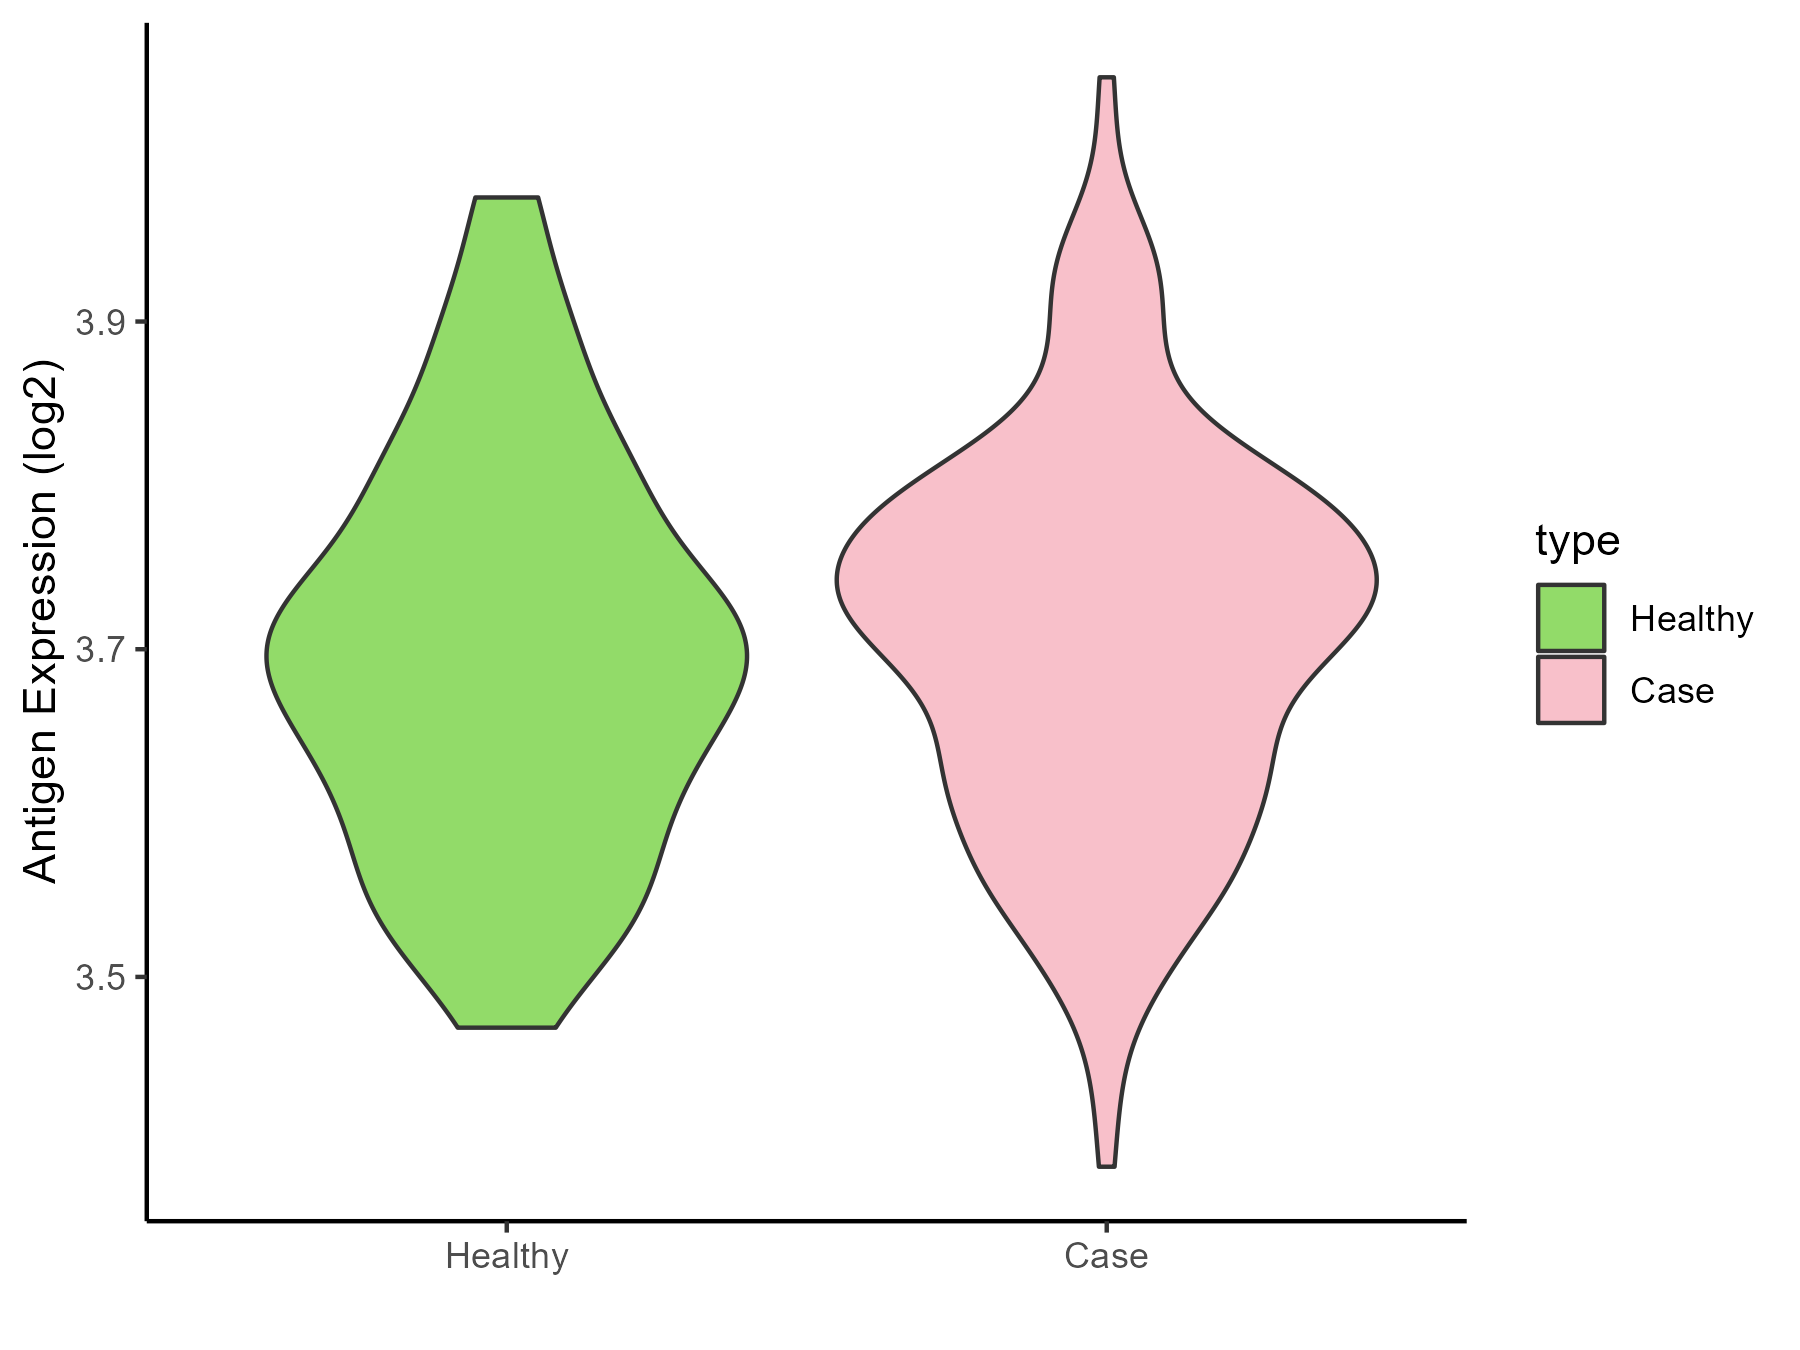
| Differential expression pattern of antigen in diseases | ||
| The Studied Tissue | Bone marrow | |
| The Specific Disease | Acute myelocytic leukemia | |
| The Expression Level of Disease Section Compare with the Healthy Individual Tissue | p-value: 0.30541375; Fold-change: 0.023888573; Z-score: 0.199673301 | |
| Disease-specific Antigen Abundances |
|
Click to View the Clearer Original Diagram |
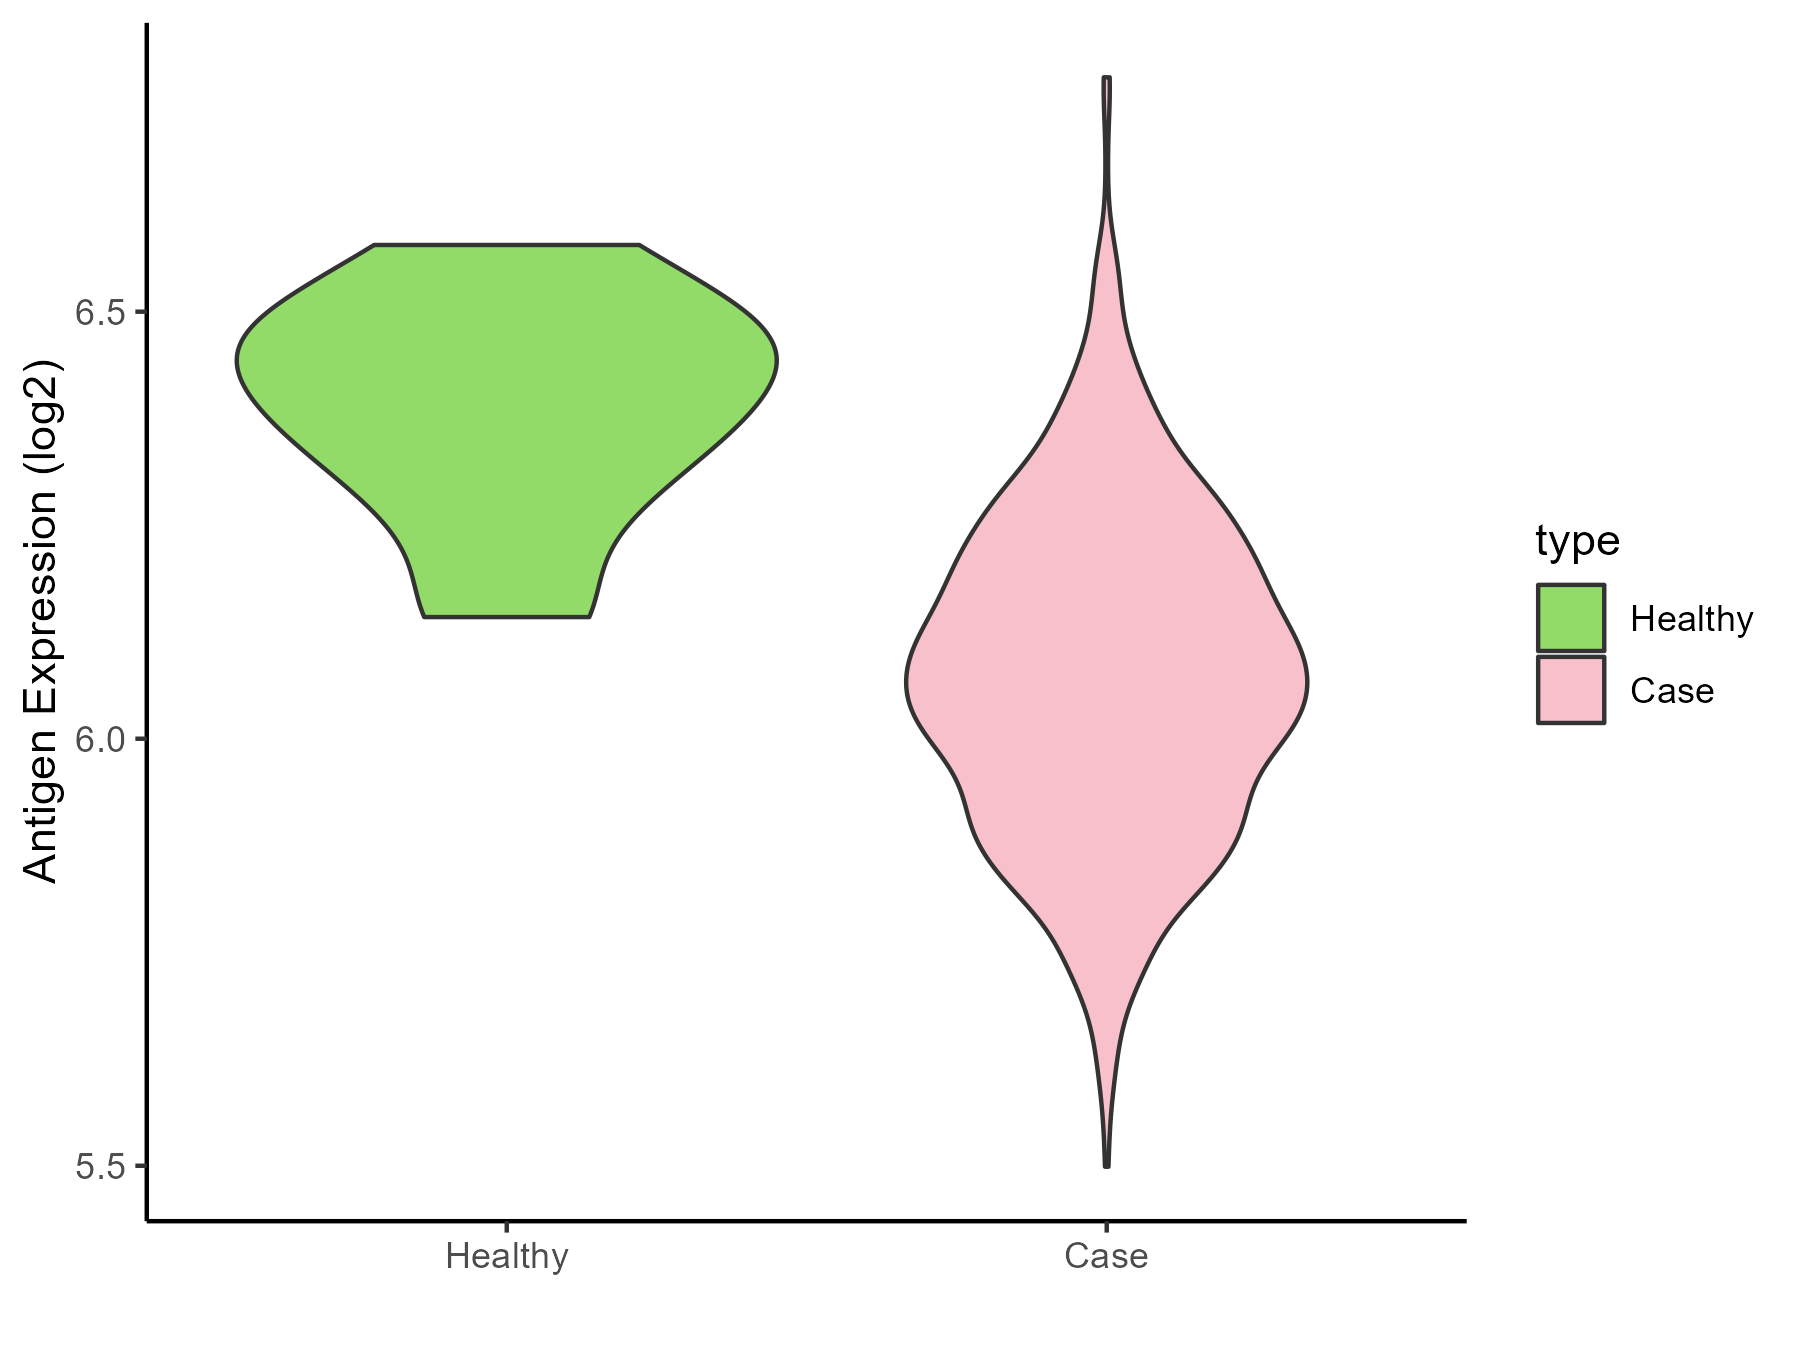
| Differential expression pattern of antigen in diseases | ||
| The Studied Tissue | Bone marrow | |
| The Specific Disease | Myeloma | |
| The Expression Level of Disease Section Compare with the Healthy Individual Tissue | p-value: 0.00031428; Fold-change: -0.338759172; Z-score: -2.455636663 | |
| Disease-specific Antigen Abundances |
|
Click to View the Clearer Original Diagram |
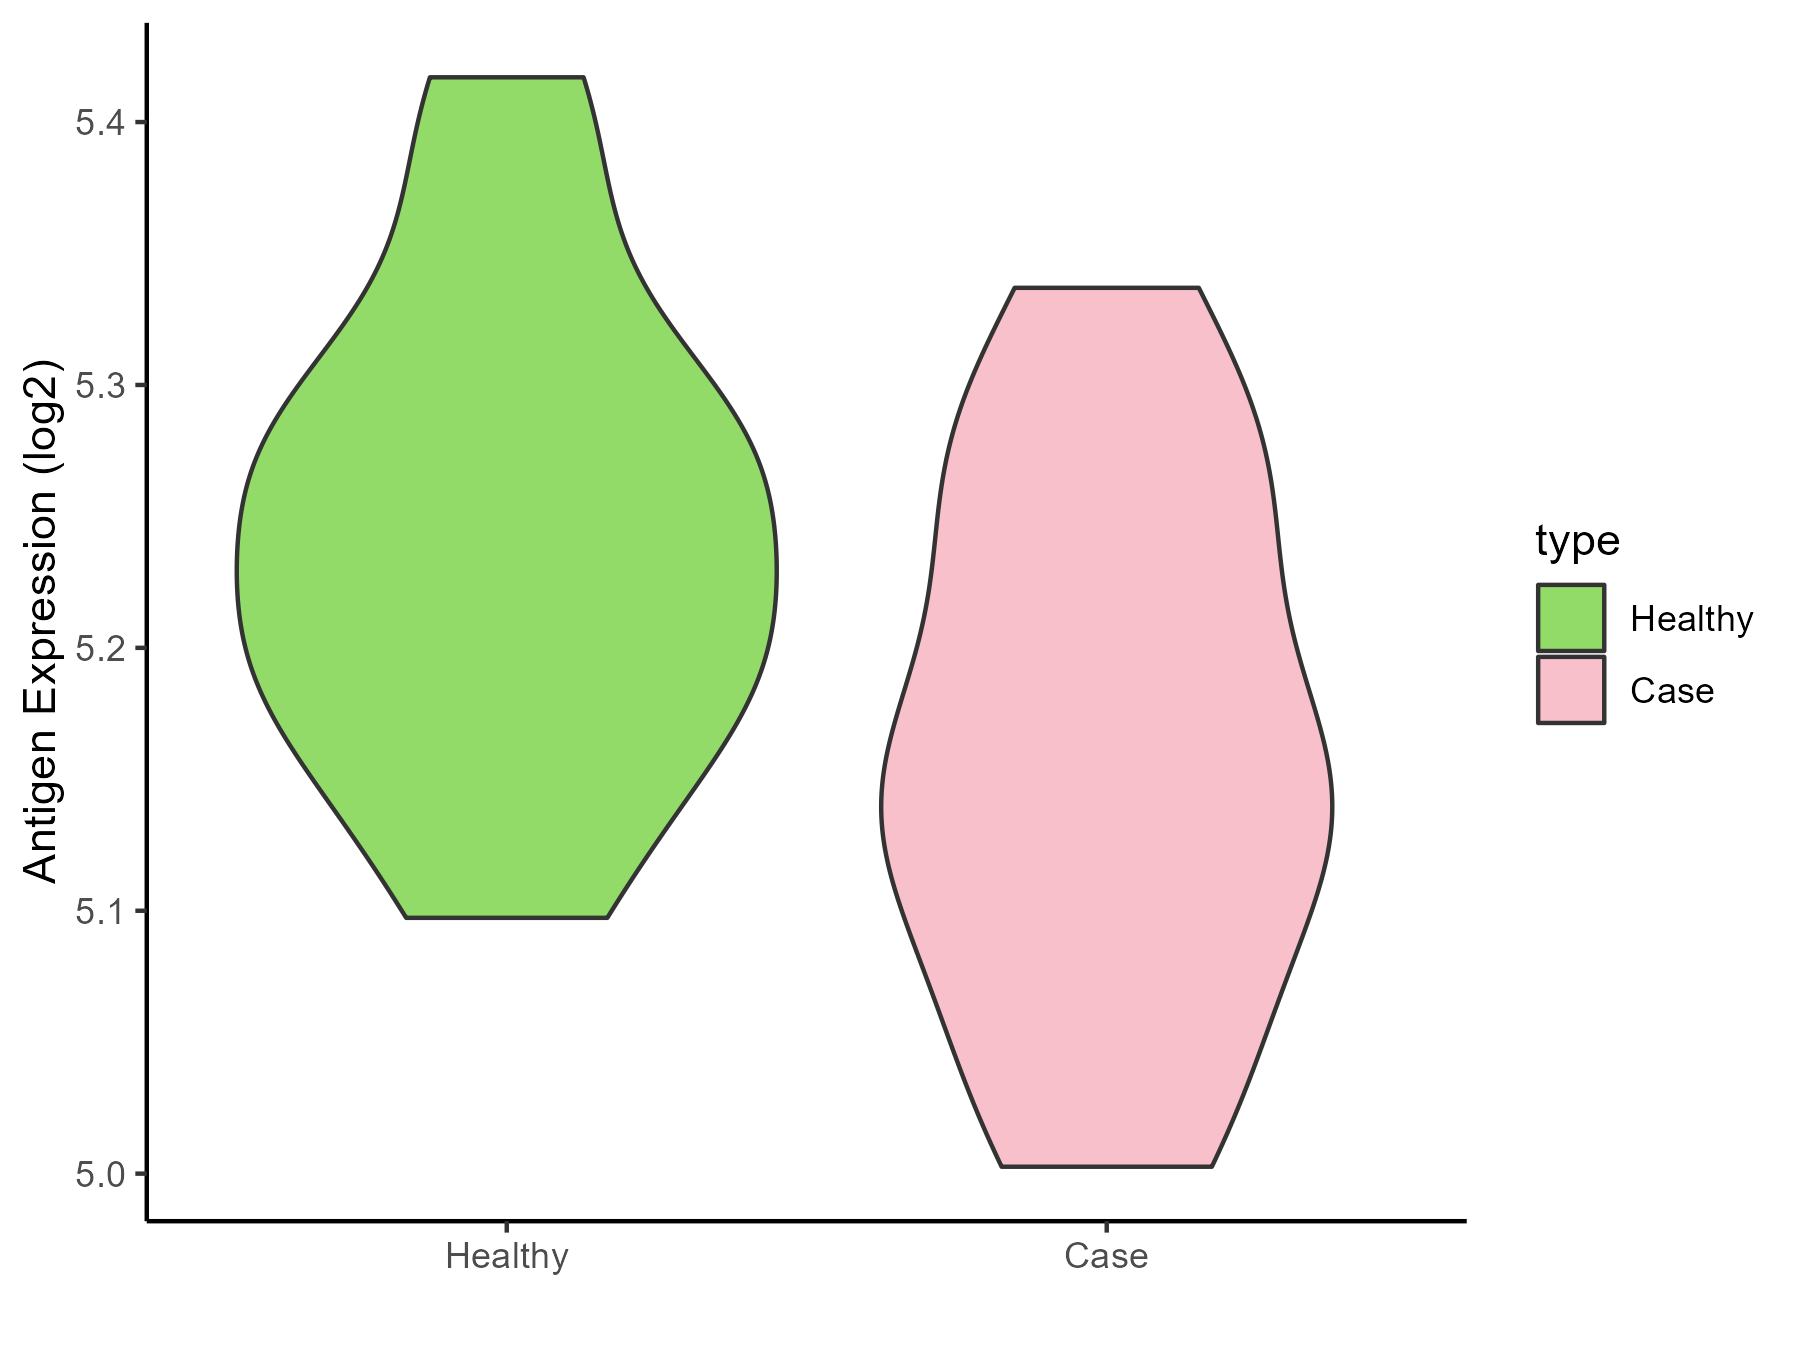
| The Studied Tissue | Peripheral blood | |
| The Specific Disease | Myeloma | |
| The Expression Level of Disease Section Compare with the Healthy Individual Tissue | p-value: 0.045179117; Fold-change: -0.092876203; Z-score: -1.018961026 | |
| Disease-specific Antigen Abundances |
|
Click to View the Clearer Original Diagram |
| Differential expression pattern of antigen in diseases | ||
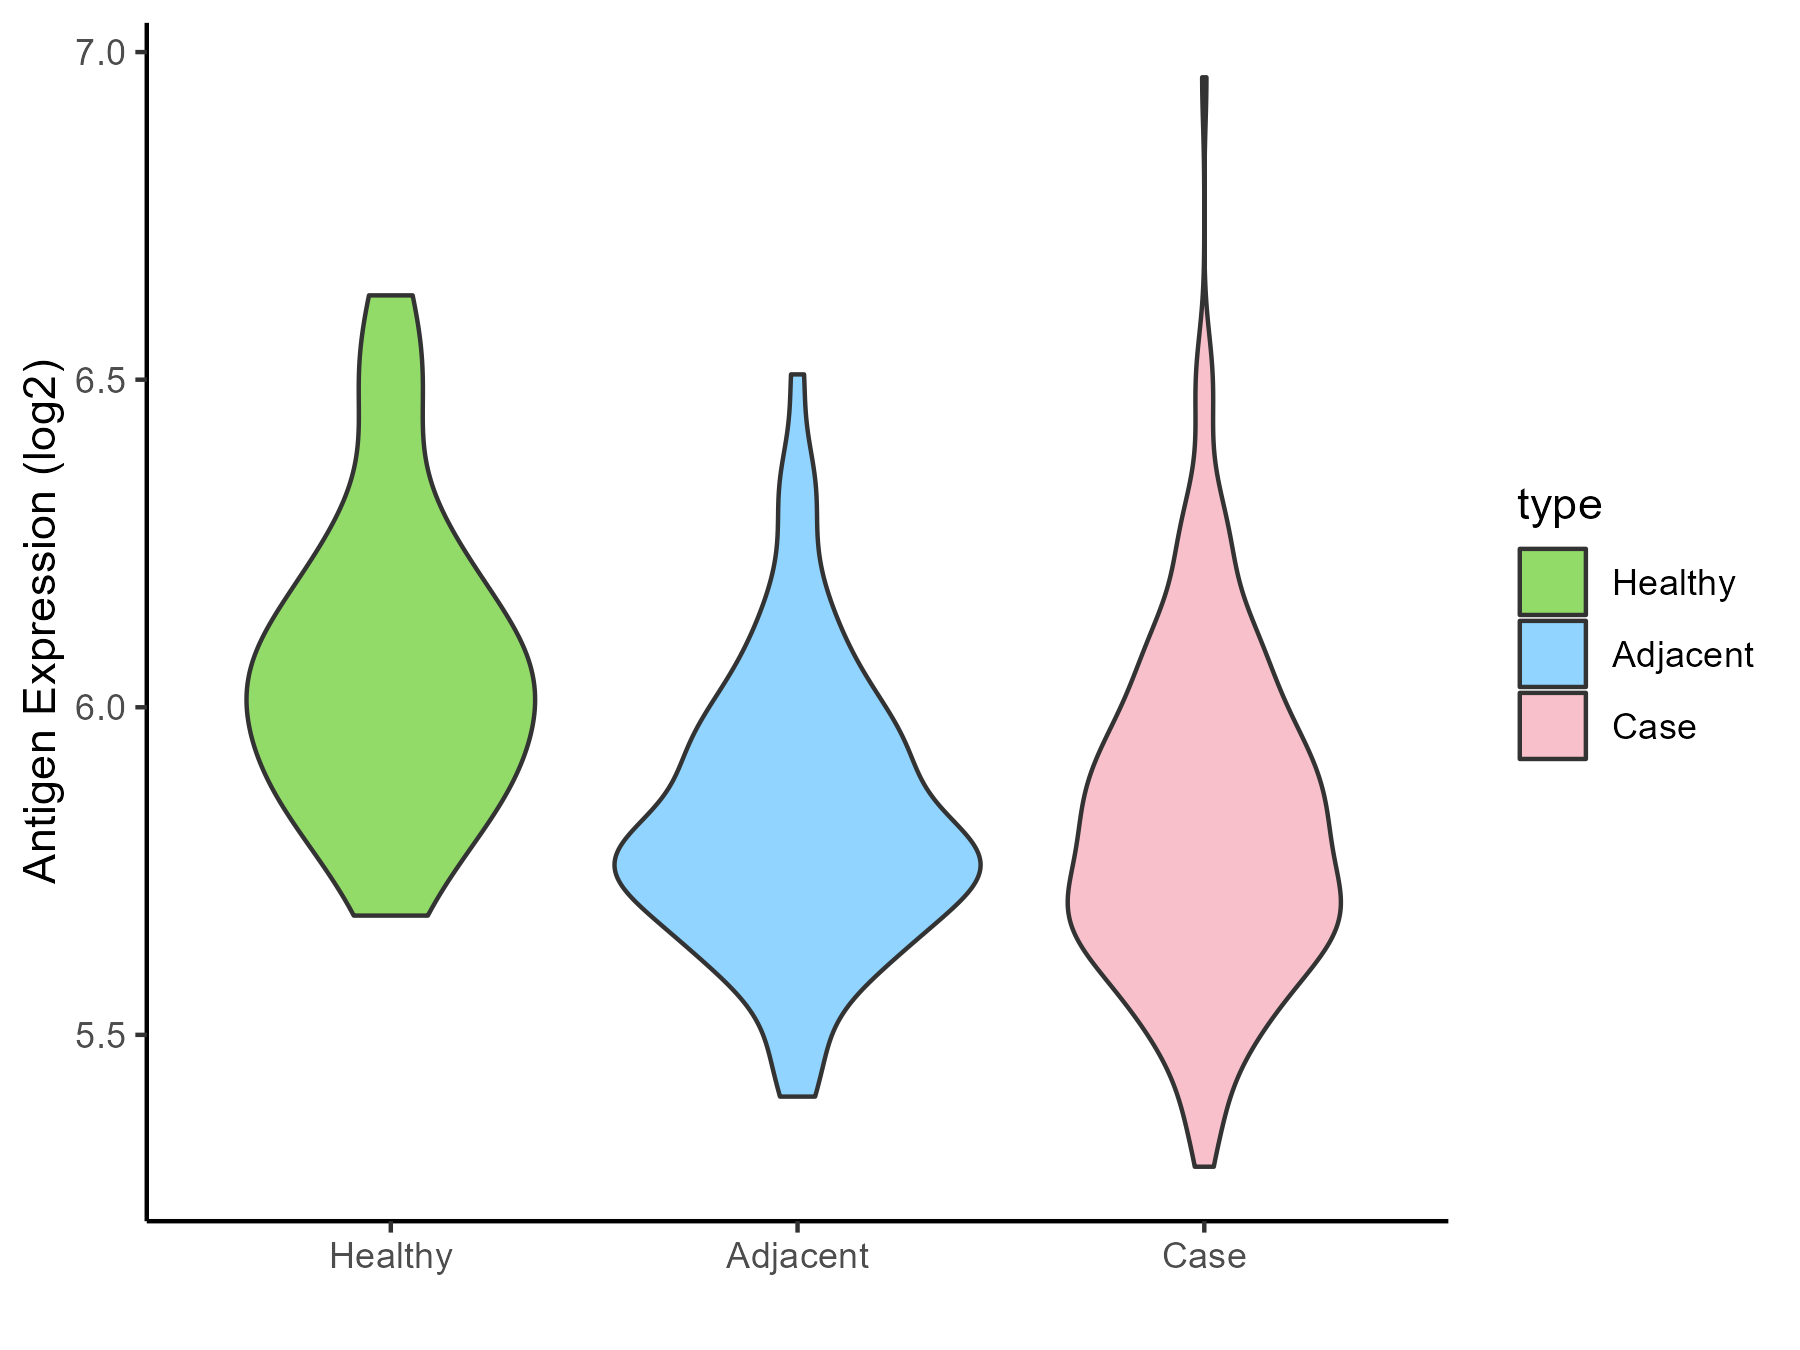
| The Studied Tissue | Oral | |
| The Specific Disease | Oral cancer | |
| The Expression Level of Disease Section Compare with the Healthy Individual Tissue | p-value: 1.45E-05; Fold-change: -0.224314068; Z-score: -0.972713633 | |
| The Expression Level of Disease Section Compare with the Adjacent Tissue | p-value: 0.73504812; Fold-change: 0.015321173; Z-score: 0.073229136 | |
| Disease-specific Antigen Abundances |
|
Click to View the Clearer Original Diagram |
| Differential expression pattern of antigen in diseases | ||
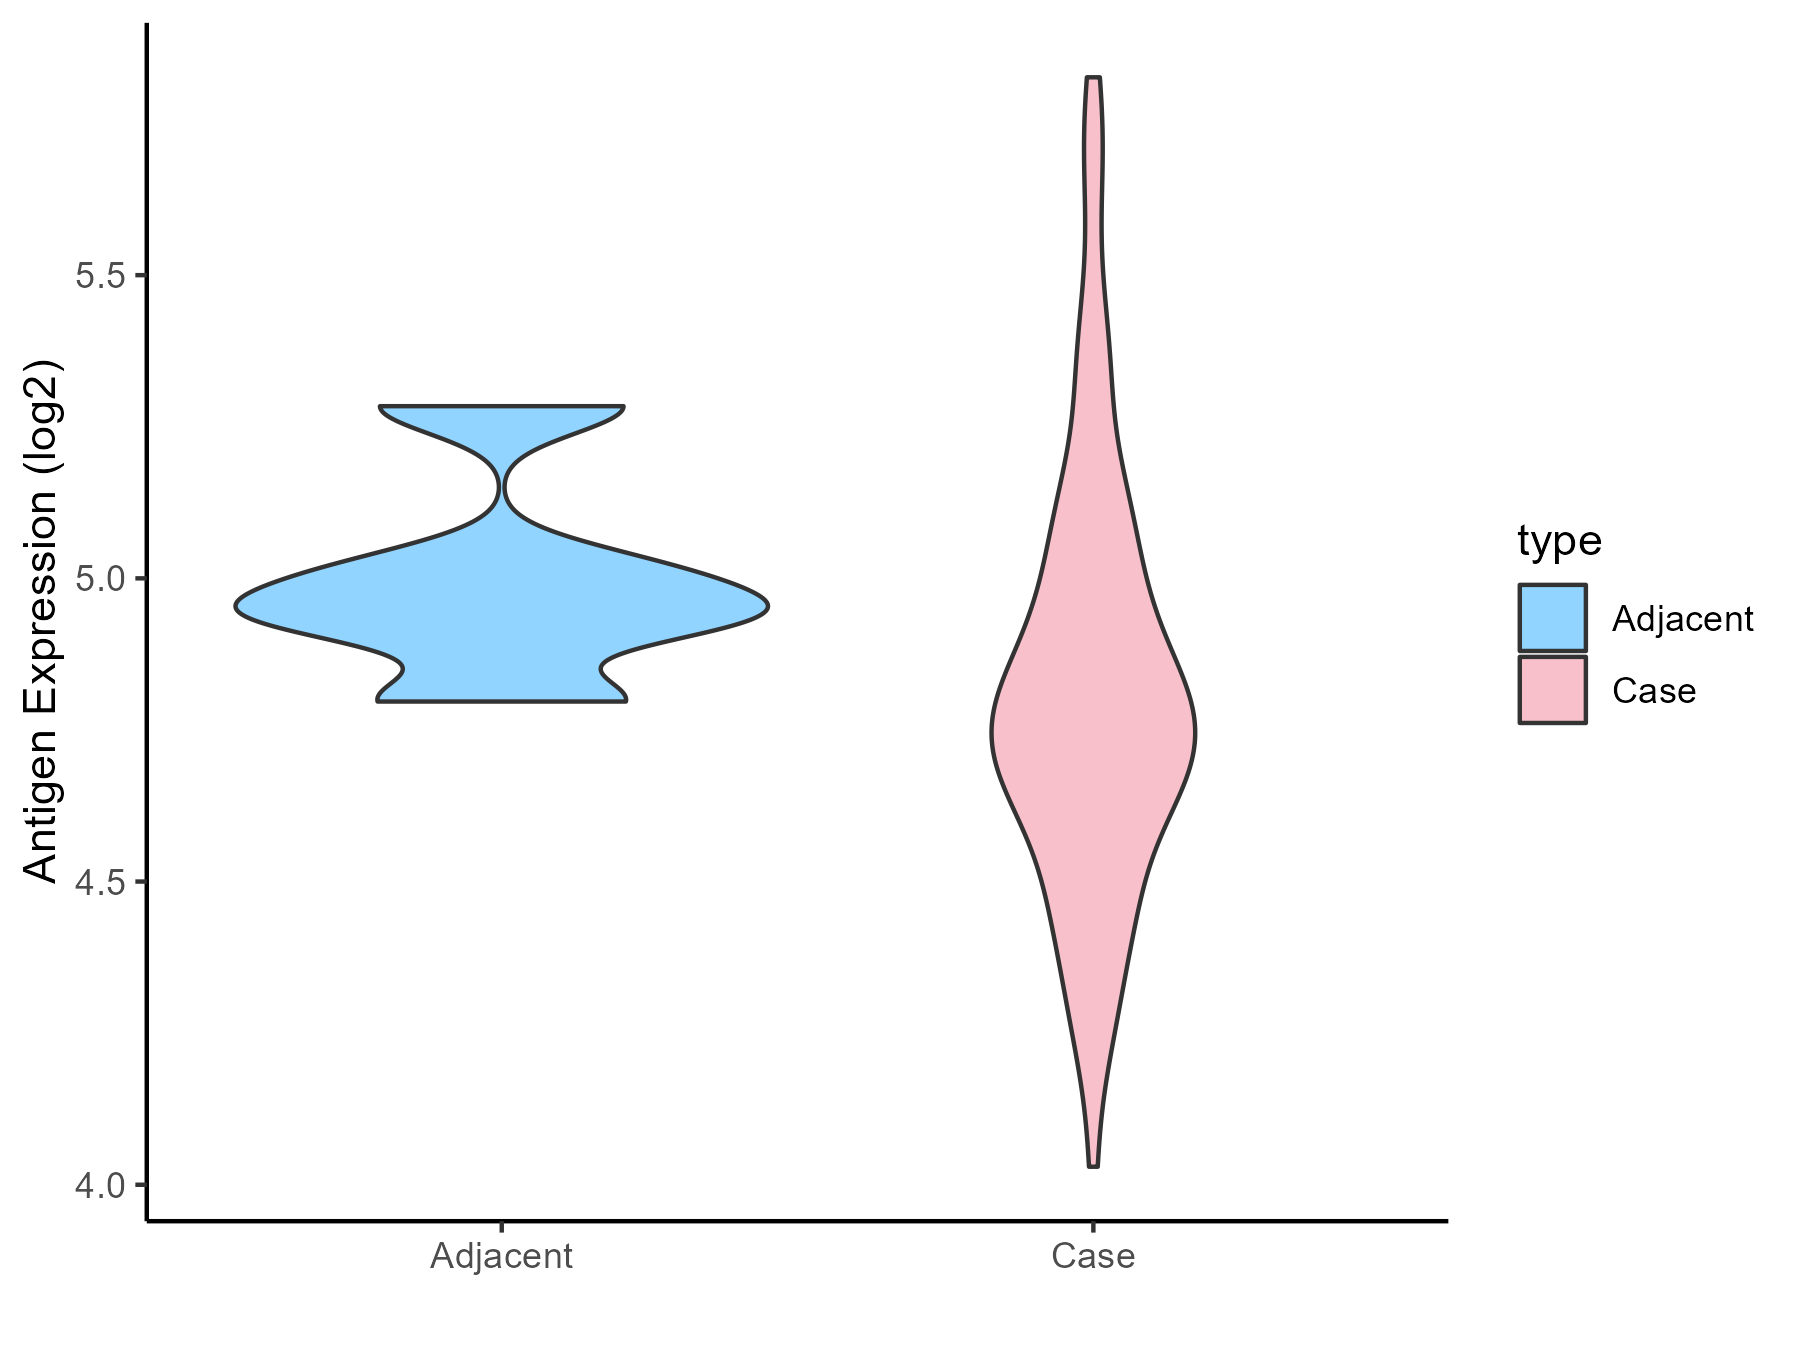
| The Studied Tissue | Esophagus | |
| The Specific Disease | Esophagal cancer | |
| The Expression Level of Disease Section Compare with the Adjacent Tissue | p-value: 0.080927156; Fold-change: -0.18415031; Z-score: -1.022316977 | |
| Disease-specific Antigen Abundances |
|
Click to View the Clearer Original Diagram |
| Differential expression pattern of antigen in diseases | ||
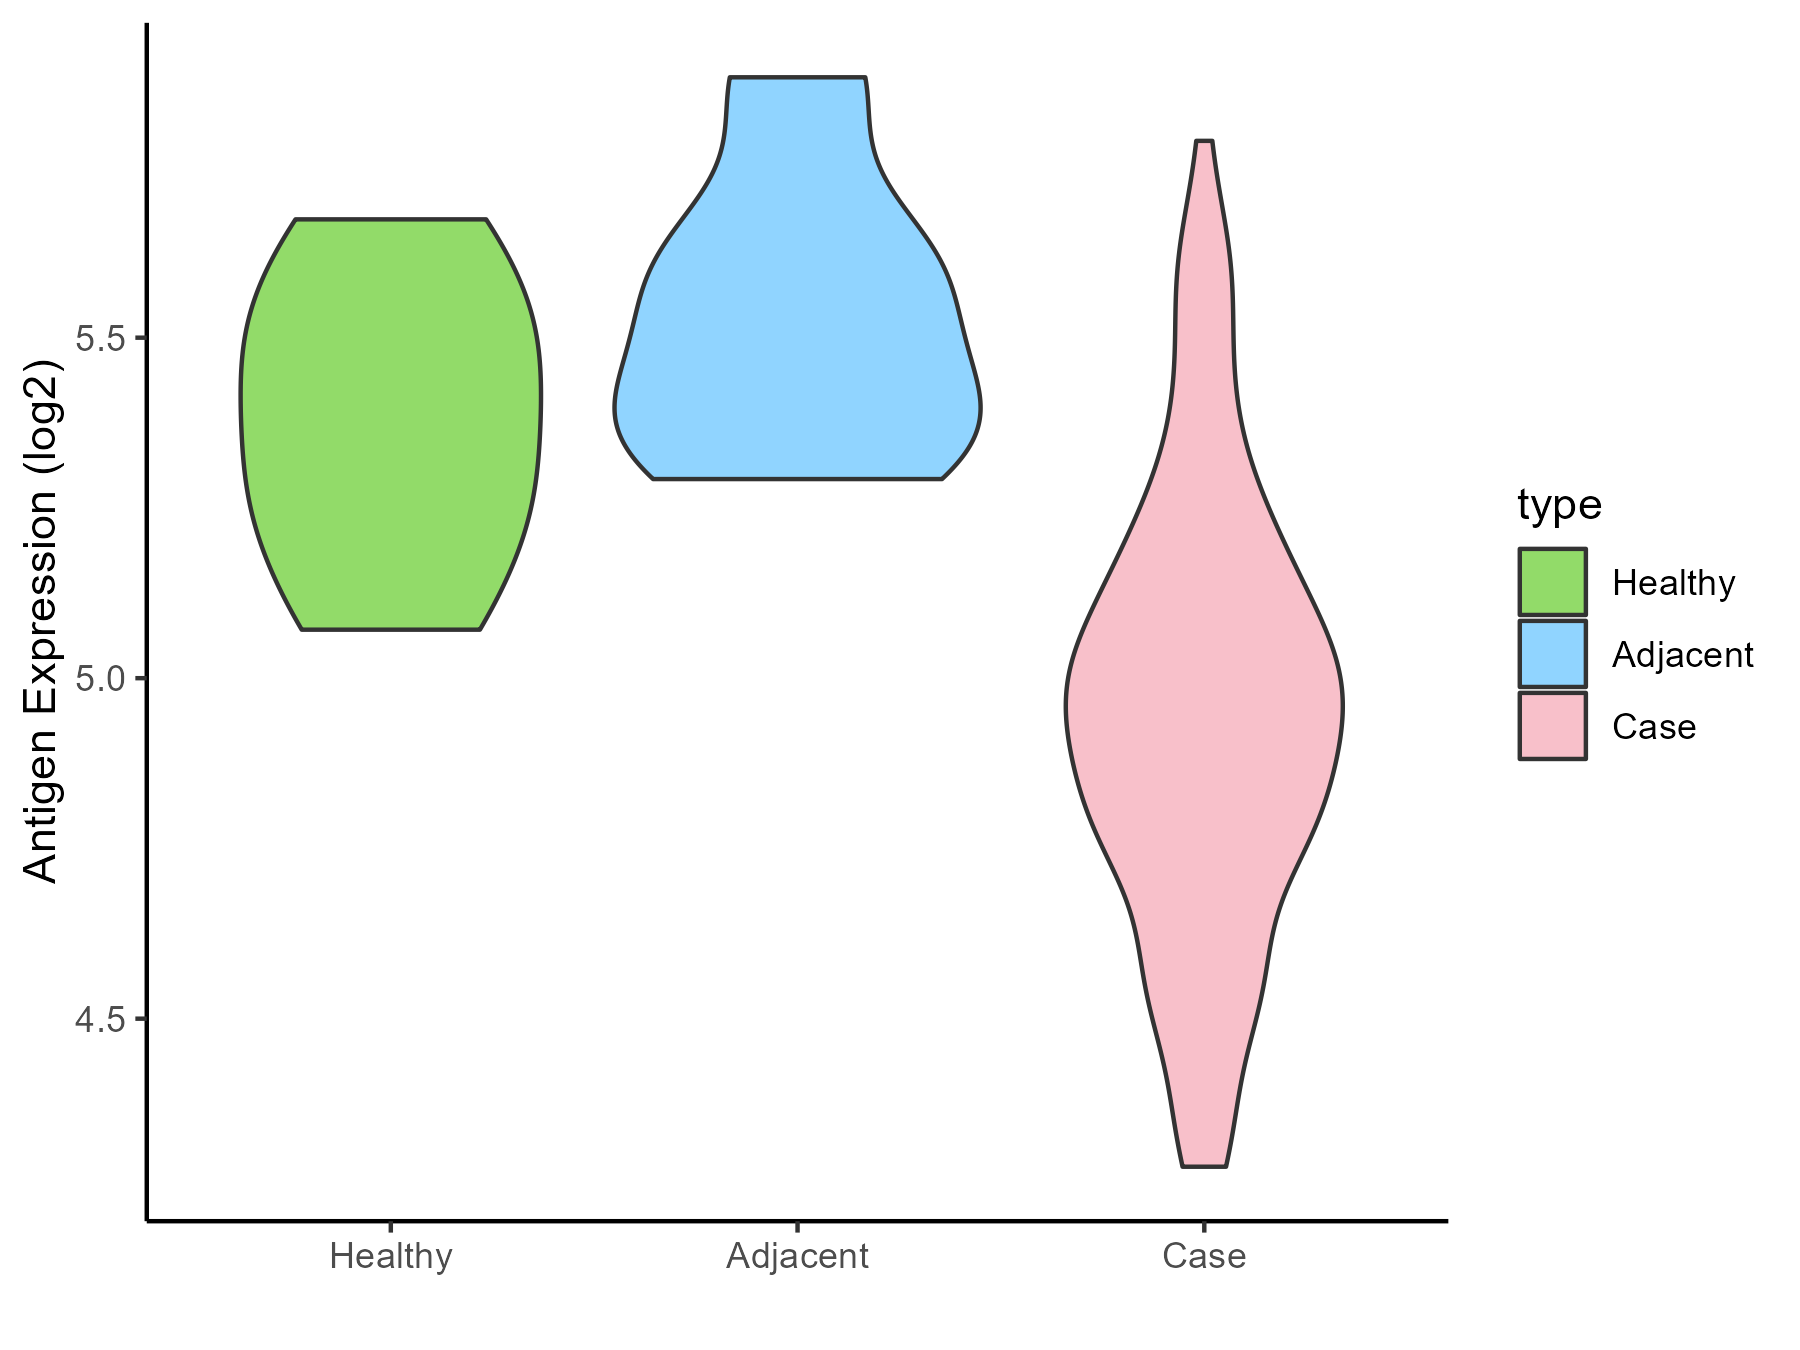
| The Studied Tissue | Rectal colon | |
| The Specific Disease | Rectal cancer | |
| The Expression Level of Disease Section Compare with the Healthy Individual Tissue | p-value: 0.003506304; Fold-change: -0.440365714; Z-score: -2.0147083 | |
| The Expression Level of Disease Section Compare with the Adjacent Tissue | p-value: 0.000656685; Fold-change: -0.55794303; Z-score: -2.600957109 | |
| Disease-specific Antigen Abundances |
|
Click to View the Clearer Original Diagram |
| Differential expression pattern of antigen in diseases | ||
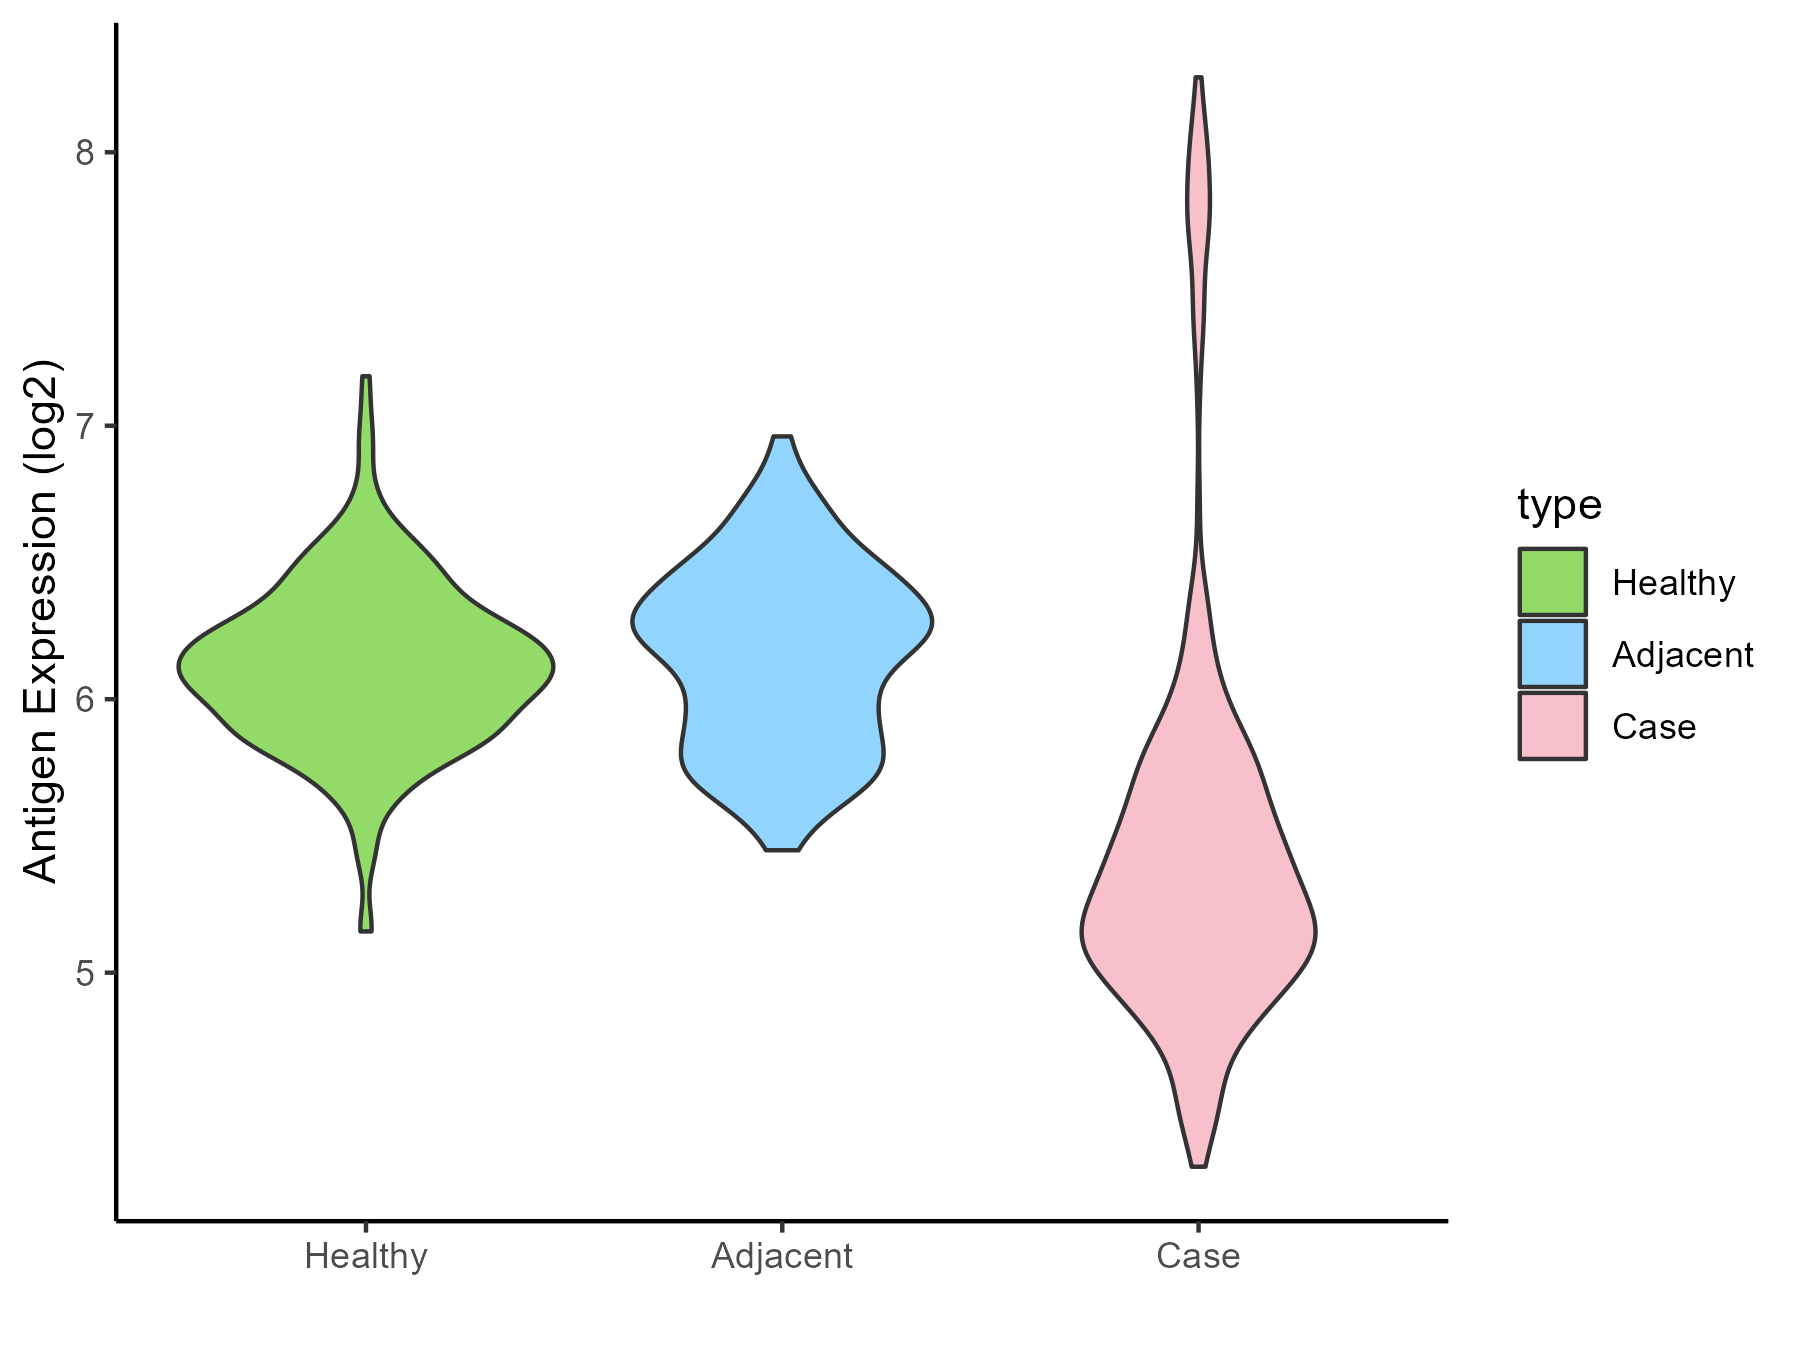
| The Studied Tissue | Skin | |
| The Specific Disease | Skin cancer | |
| The Expression Level of Disease Section Compare with the Healthy Individual Tissue | p-value: 2.94E-43; Fold-change: -0.805552266; Z-score: -2.705760445 | |
| The Expression Level of Disease Section Compare with the Adjacent Tissue | p-value: 4.94E-44; Fold-change: -0.895329643; Z-score: -2.703428639 | |
| Disease-specific Antigen Abundances |
|
Click to View the Clearer Original Diagram |
| Differential expression pattern of antigen in diseases | ||
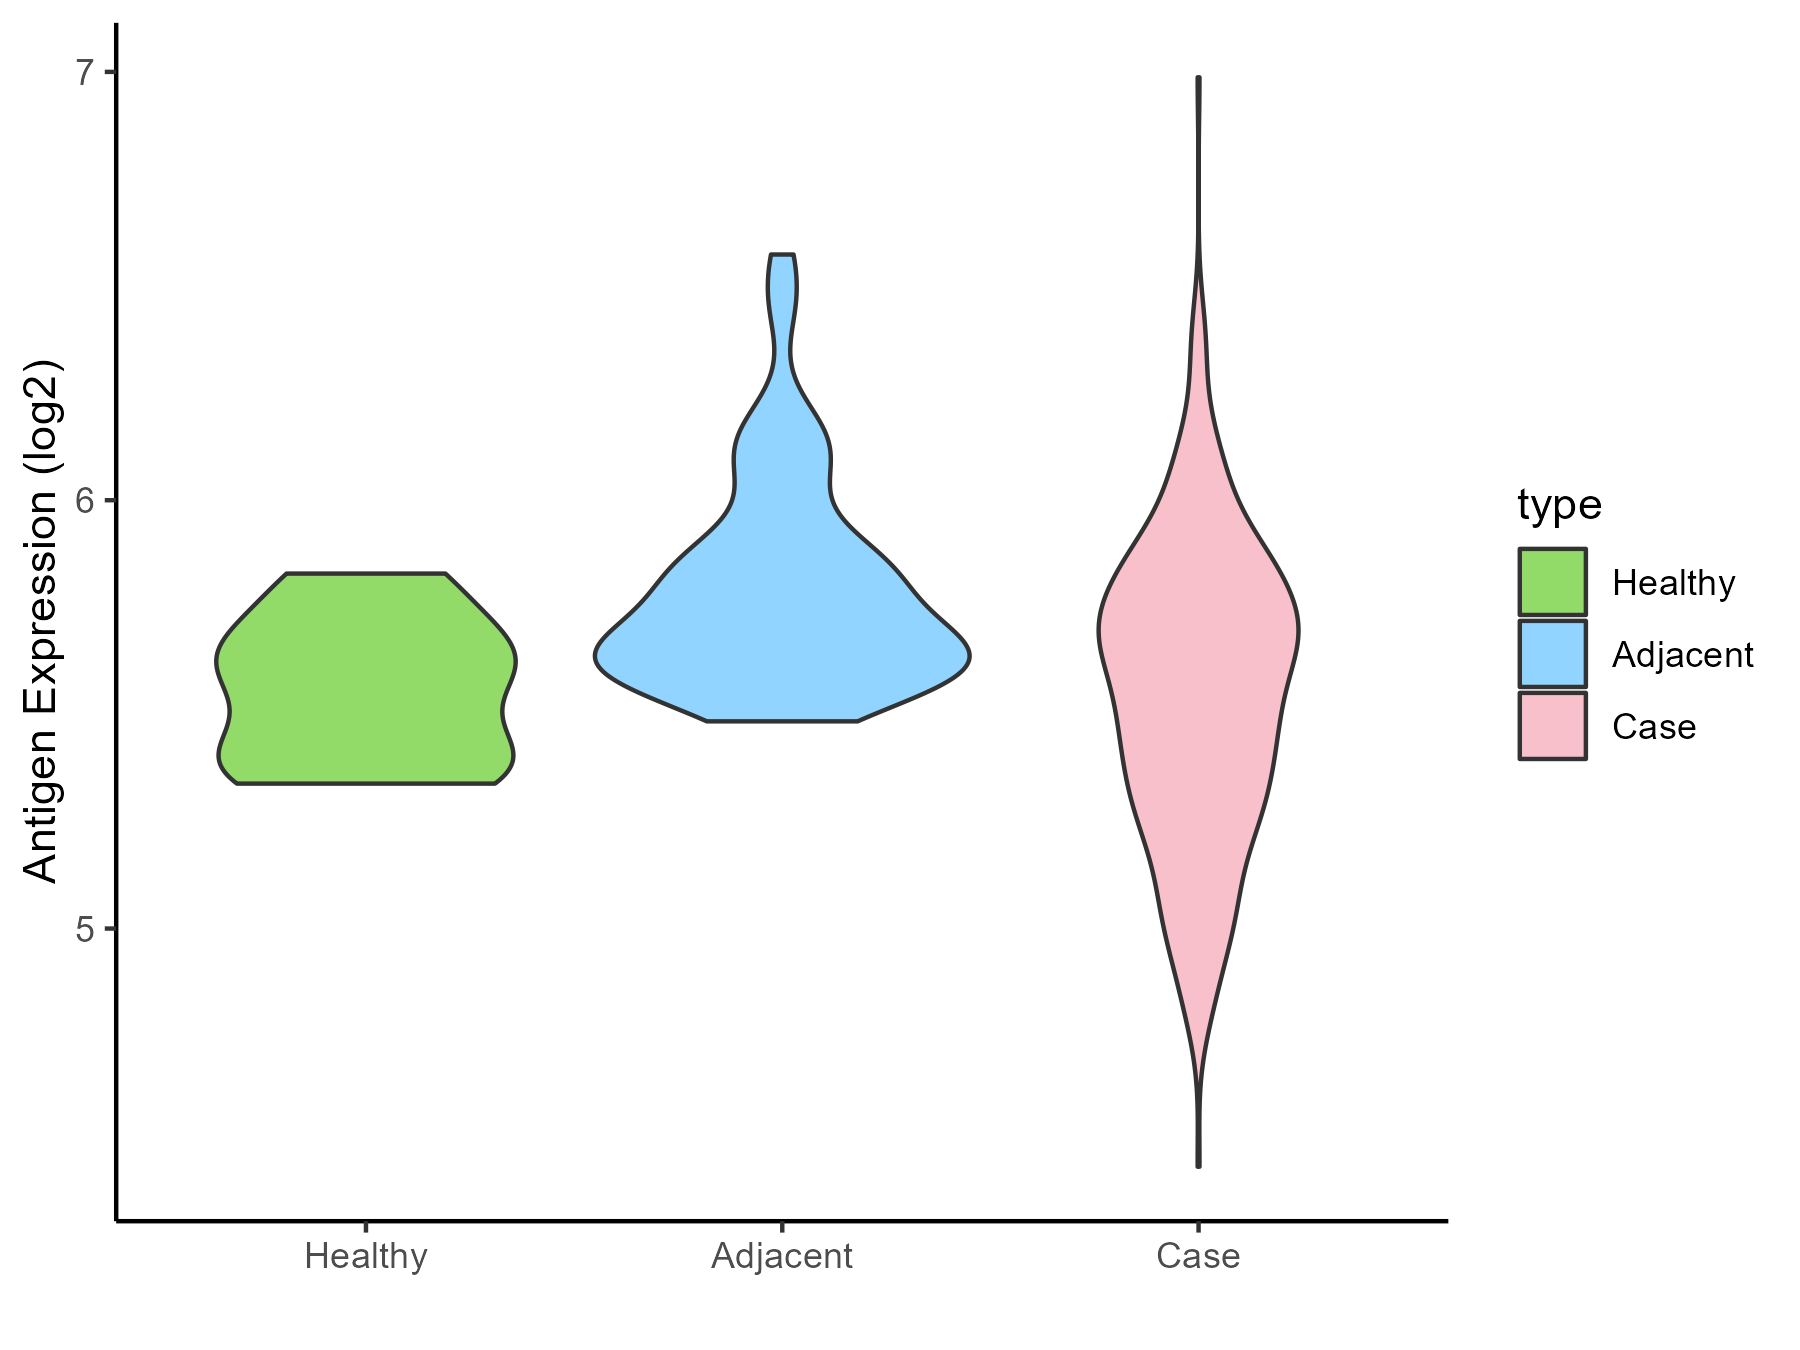
| The Studied Tissue | Kidney | |
| The Specific Disease | Renal cancer | |
| The Expression Level of Disease Section Compare with the Healthy Individual Tissue | p-value: 0.918148422; Fold-change: -0.021874906; Z-score: -0.125812689 | |
| The Expression Level of Disease Section Compare with the Adjacent Tissue | p-value: 1.10E-10; Fold-change: -0.126741422; Z-score: -0.527596092 | |
| Disease-specific Antigen Abundances |
|
Click to View the Clearer Original Diagram |
| Differential expression pattern of antigen in diseases | ||
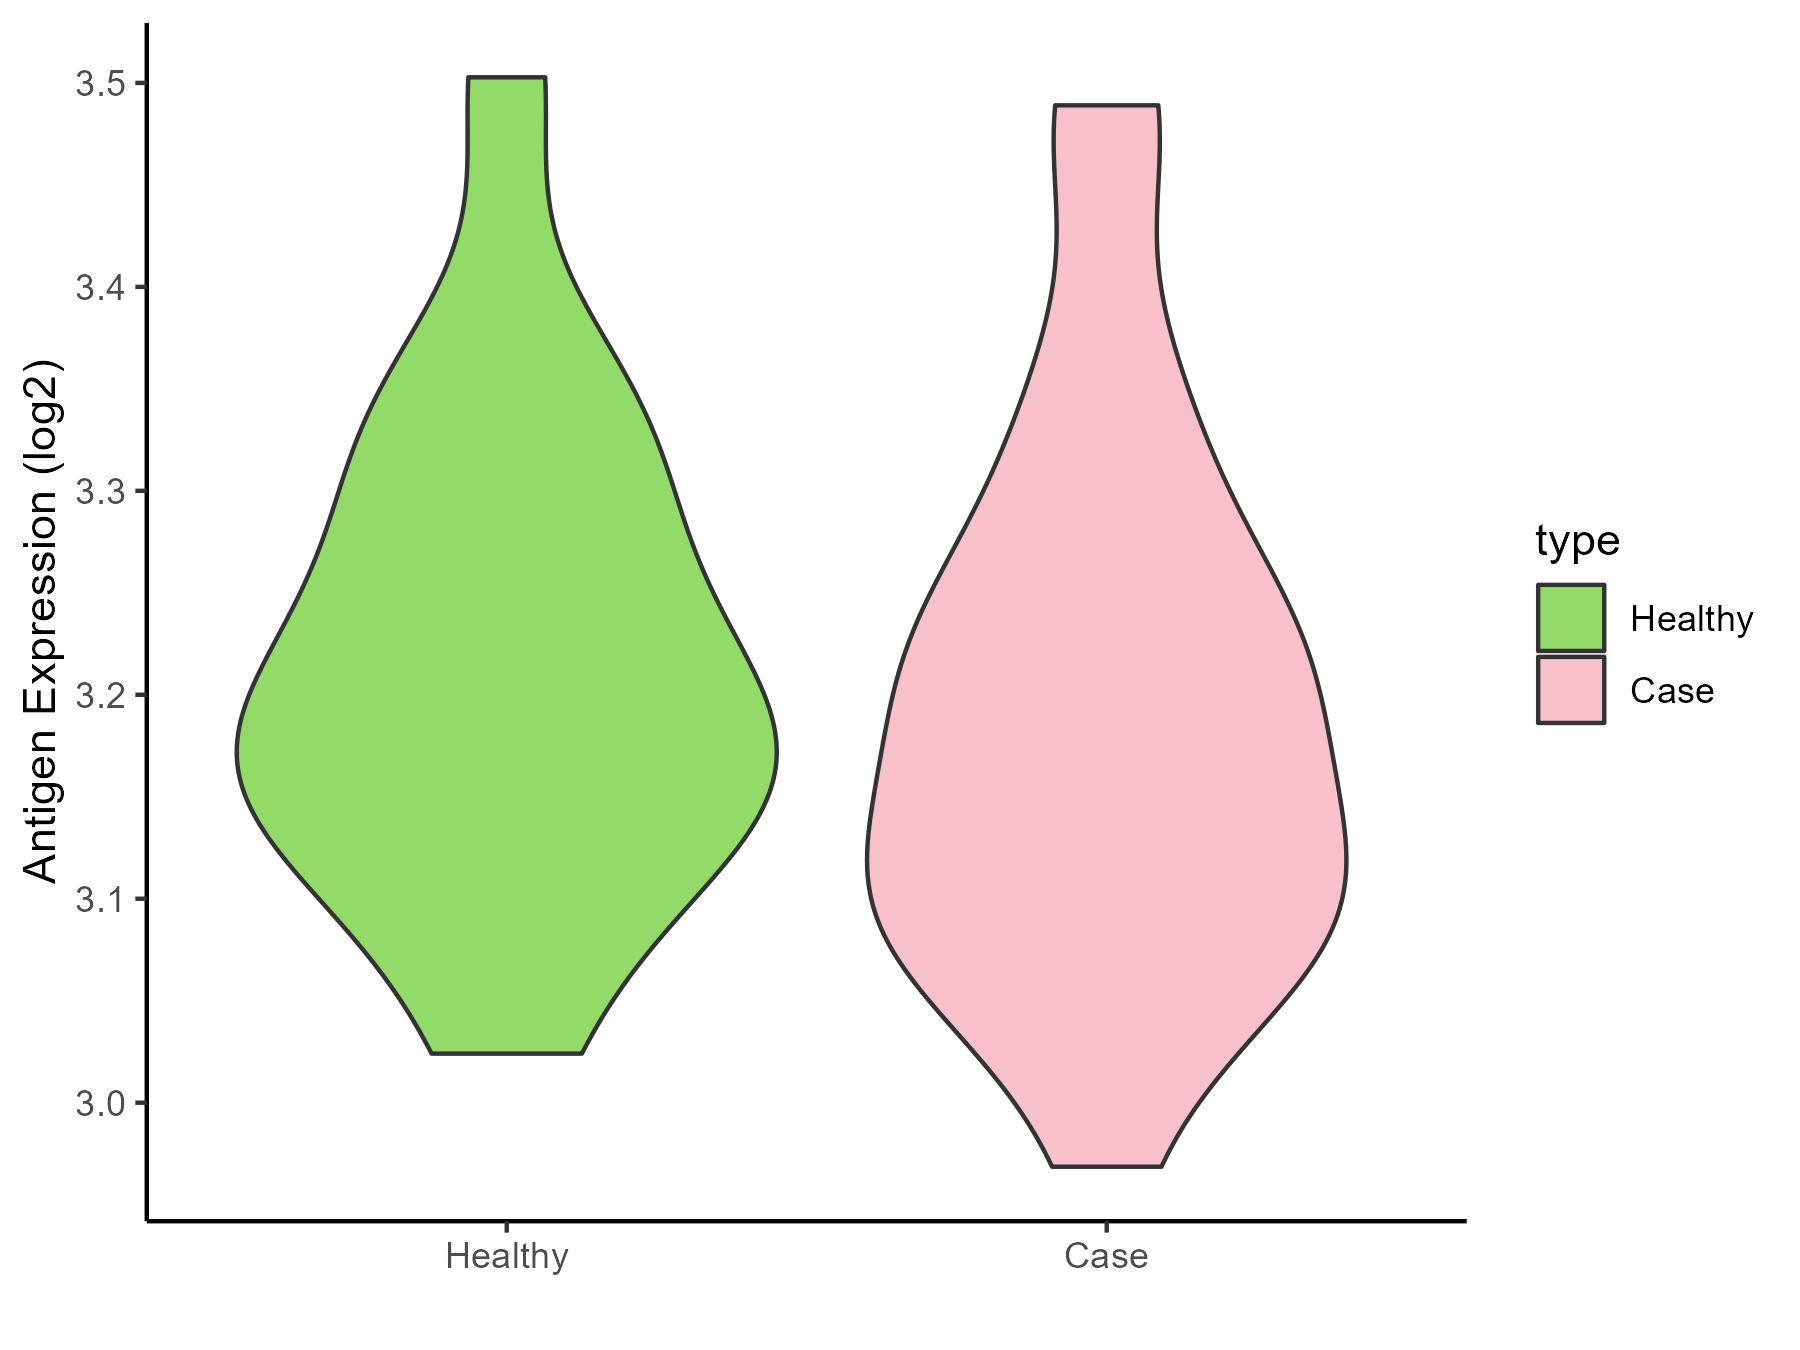
| The Studied Tissue | Urothelium | |
| The Specific Disease | Ureter cancer | |
| The Expression Level of Disease Section Compare with the Healthy Individual Tissue | p-value: 0.516934937; Fold-change: 0.003254873; Z-score: 0.026898036 | |
| Disease-specific Antigen Abundances |
|
Click to View the Clearer Original Diagram |
ICD Disease Classification 20
| Differential expression pattern of antigen in diseases | ||
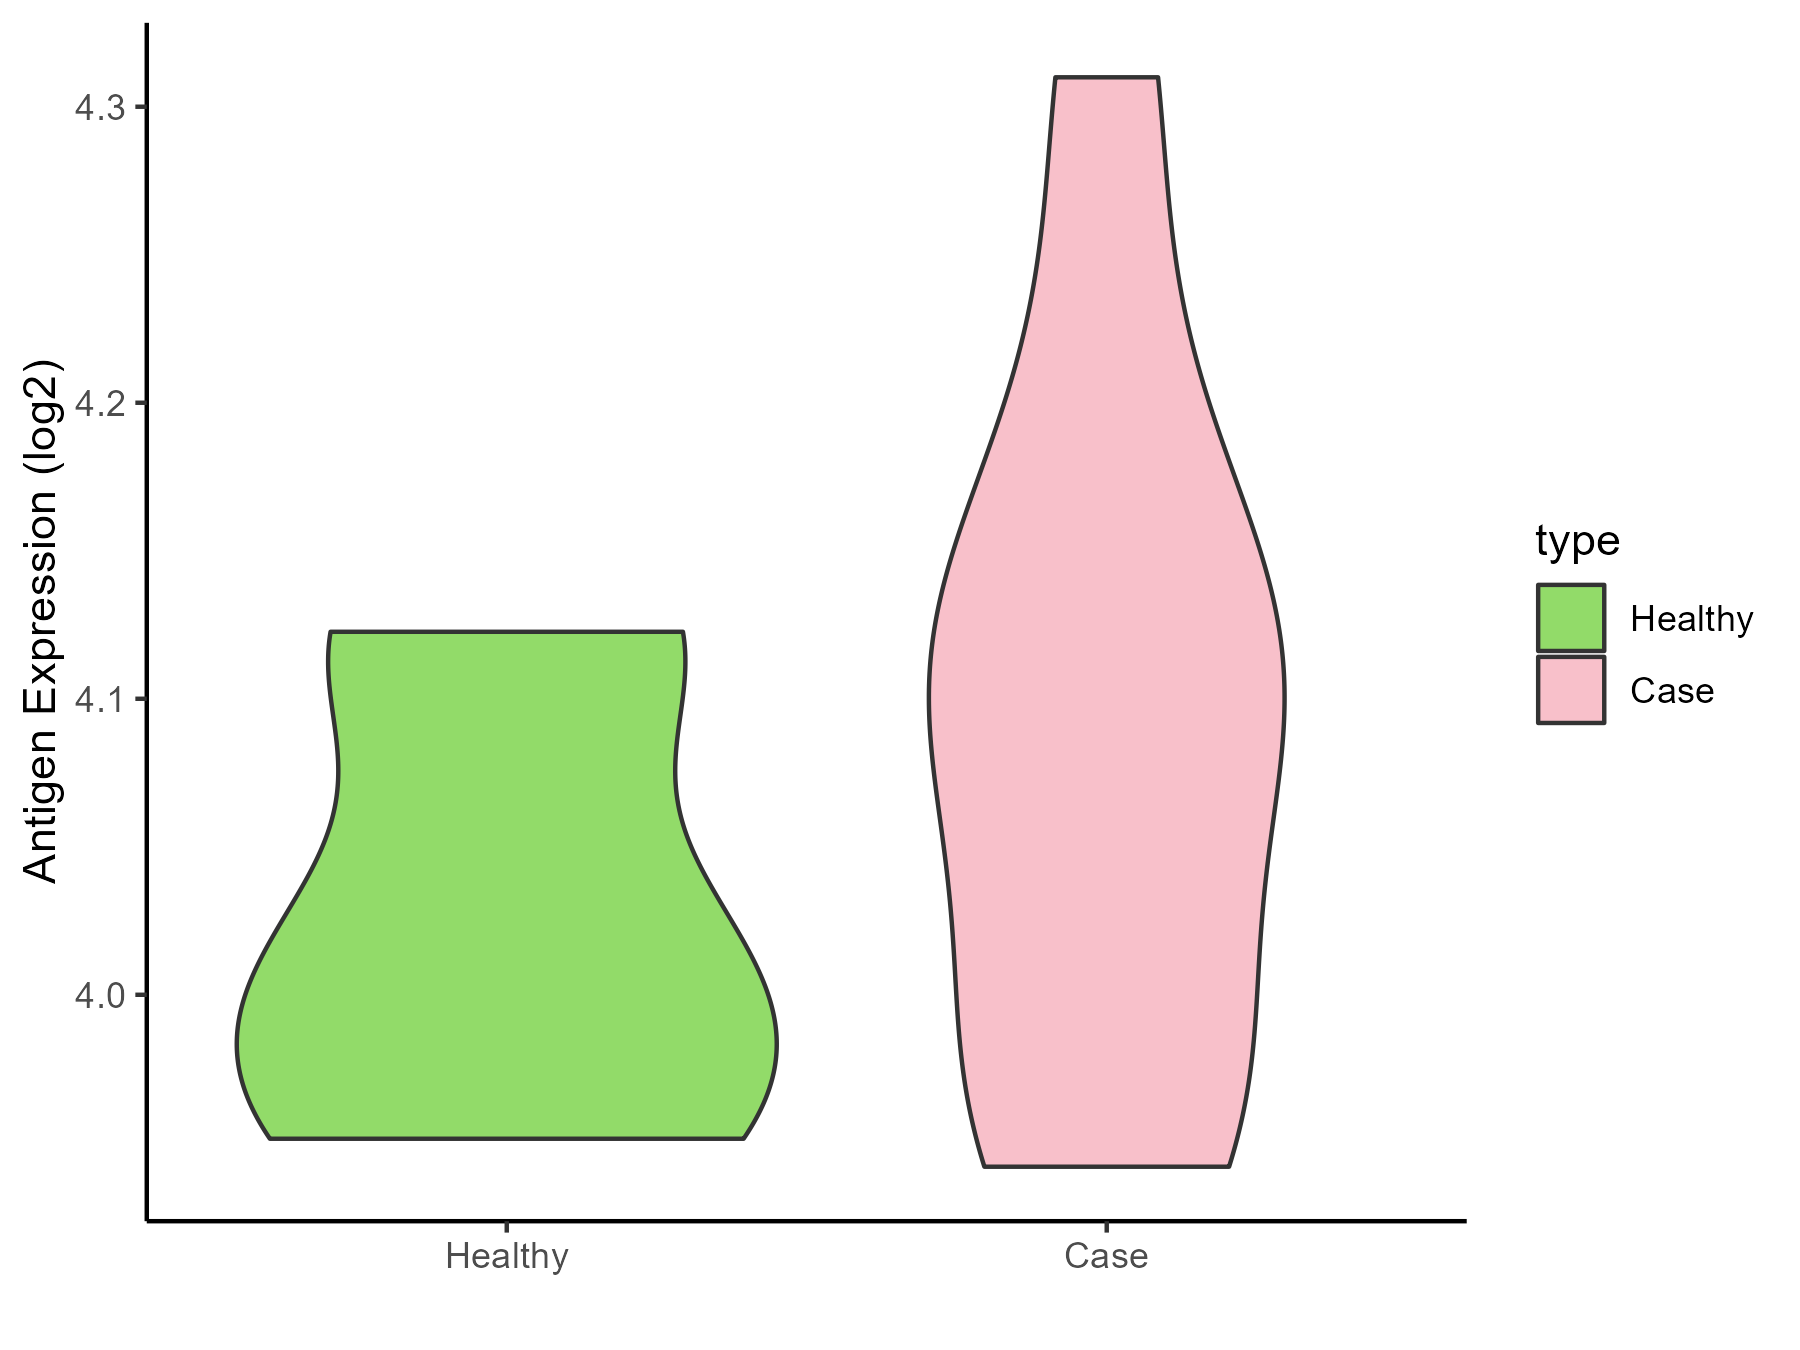
| The Studied Tissue | Adipose | |
| The Specific Disease | Simpson golabi behmel syndrome | |
| The Expression Level of Disease Section Compare with the Healthy Individual Tissue | p-value: 0.382826438; Fold-change: 0.08914019; Z-score: 1.02662201 | |
| Disease-specific Antigen Abundances |
|
Click to View the Clearer Original Diagram |
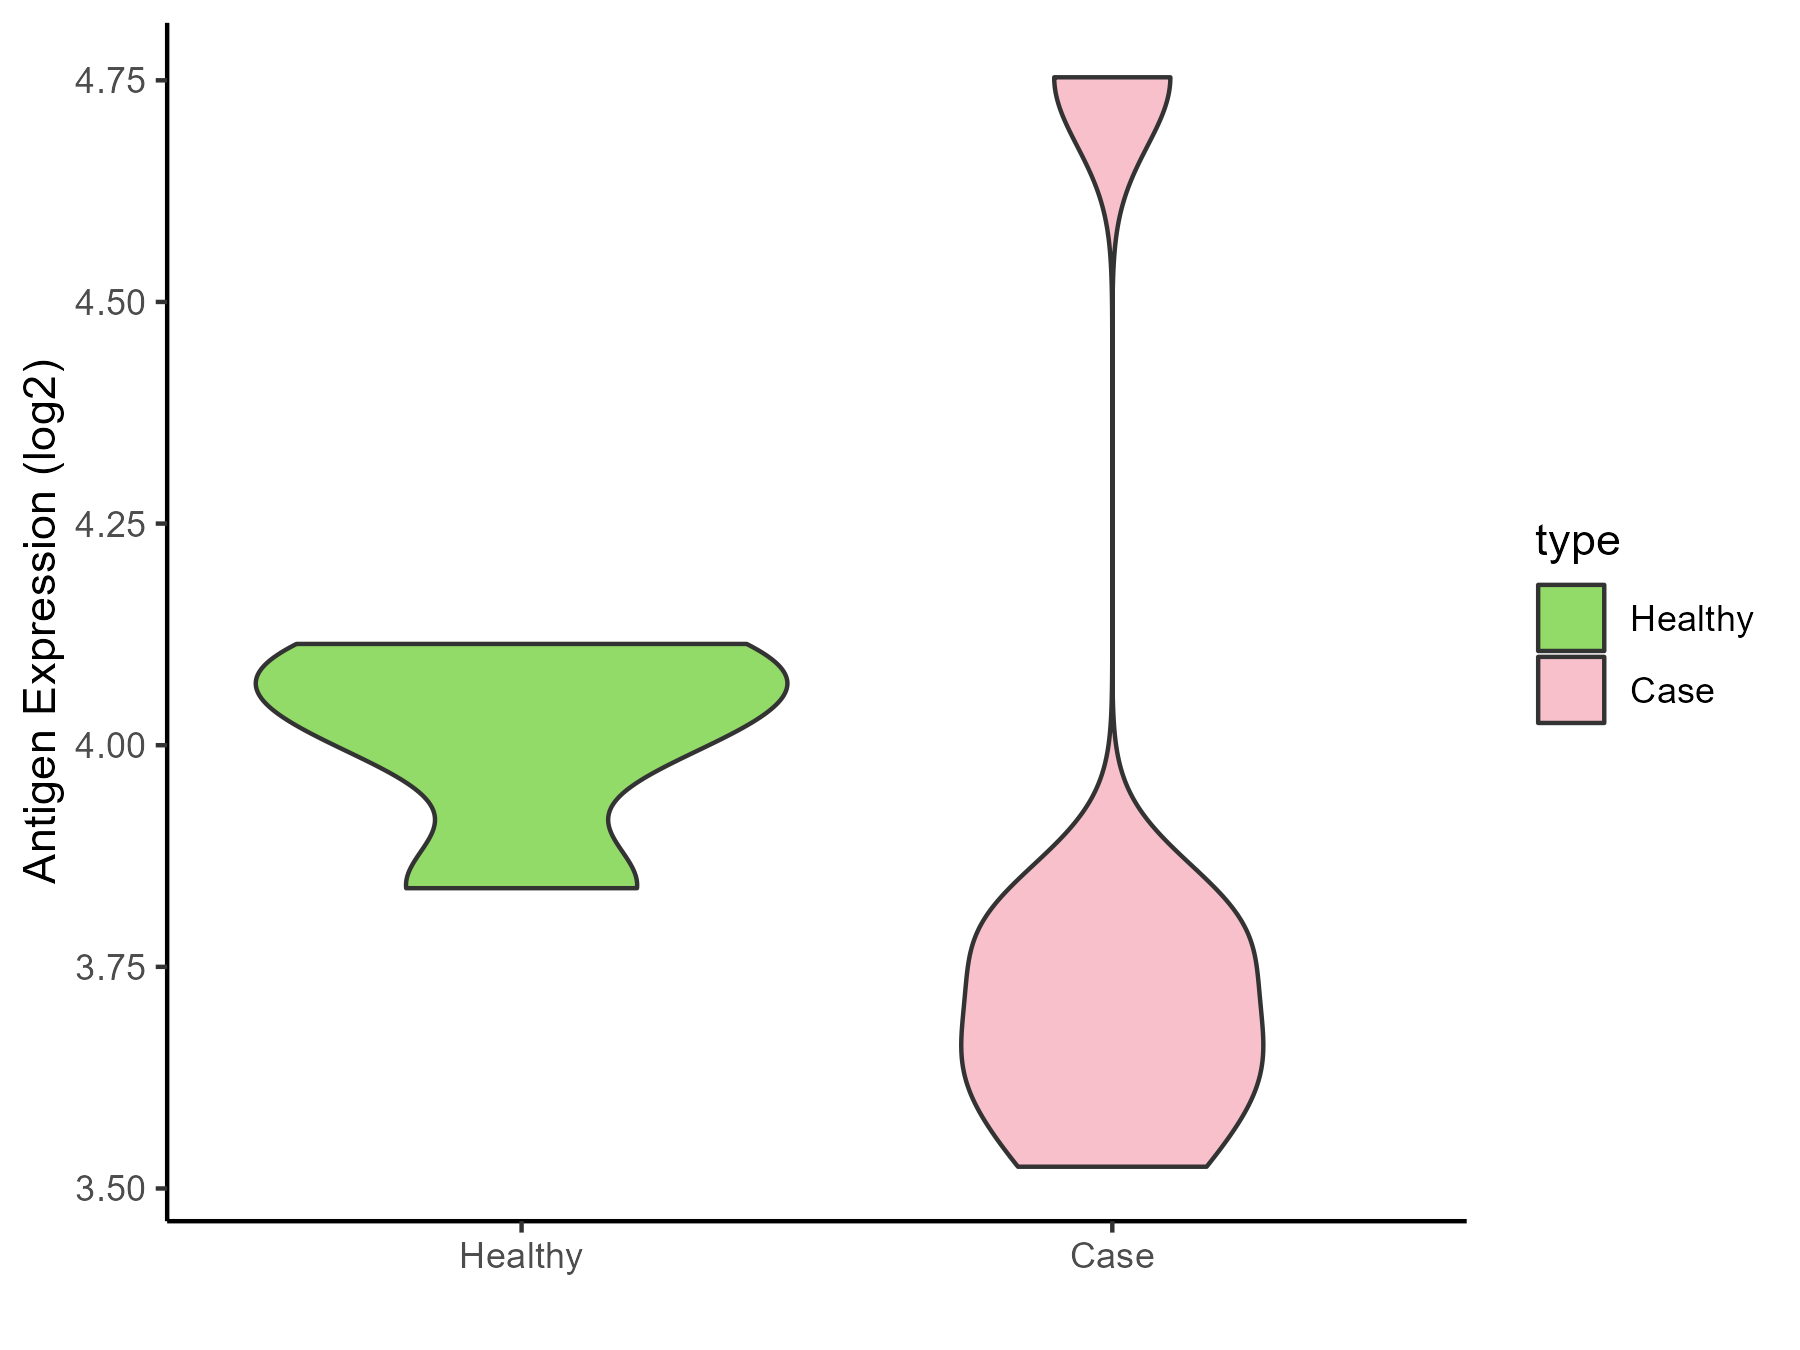
| Differential expression pattern of antigen in diseases | ||
| The Studied Tissue | Perituberal | |
| The Specific Disease | Tuberous sclerosis complex | |
| The Expression Level of Disease Section Compare with the Healthy Individual Tissue | p-value: 0.469994653; Fold-change: -0.321024725; Z-score: -2.649015092 | |
| Disease-specific Antigen Abundances |
|
Click to View the Clearer Original Diagram |
ICD Disease Classification 3
| Differential expression pattern of antigen in diseases | ||
| The Studied Tissue | Bone marrow | |
| The Specific Disease | Anemia | |
| The Expression Level of Disease Section Compare with the Healthy Individual Tissue | p-value: 0.413481188; Fold-change: 0.119208135; Z-score: 0.477721876 | |
| Disease-specific Antigen Abundances |

|
Click to View the Clearer Original Diagram |
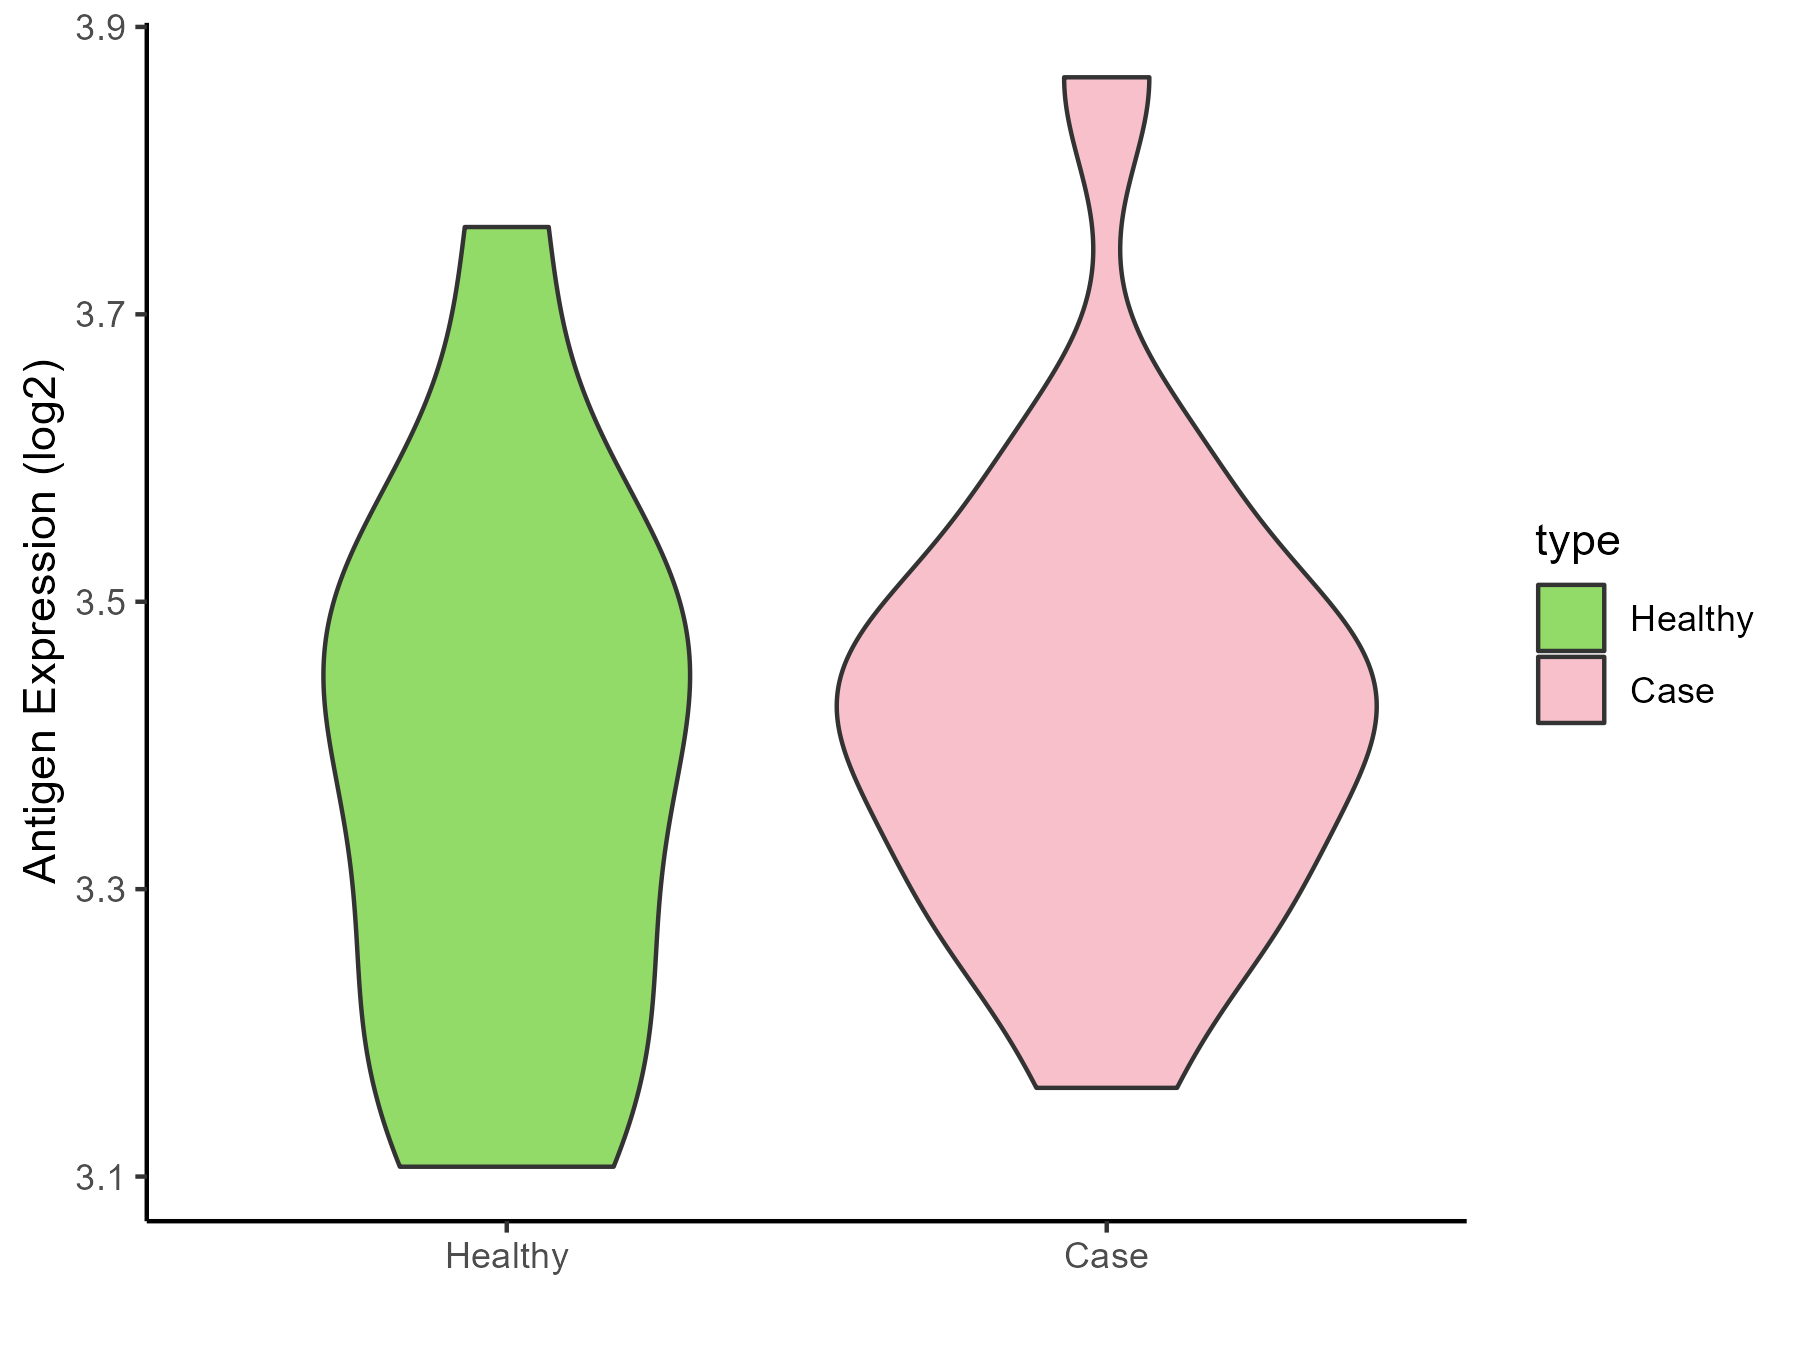
| Differential expression pattern of antigen in diseases | ||
| The Studied Tissue | Peripheral blood | |
| The Specific Disease | Sickle cell disease | |
| The Expression Level of Disease Section Compare with the Healthy Individual Tissue | p-value: 0.500098789; Fold-change: 0.007565328; Z-score: 0.038870904 | |
| Disease-specific Antigen Abundances |
|
Click to View the Clearer Original Diagram |
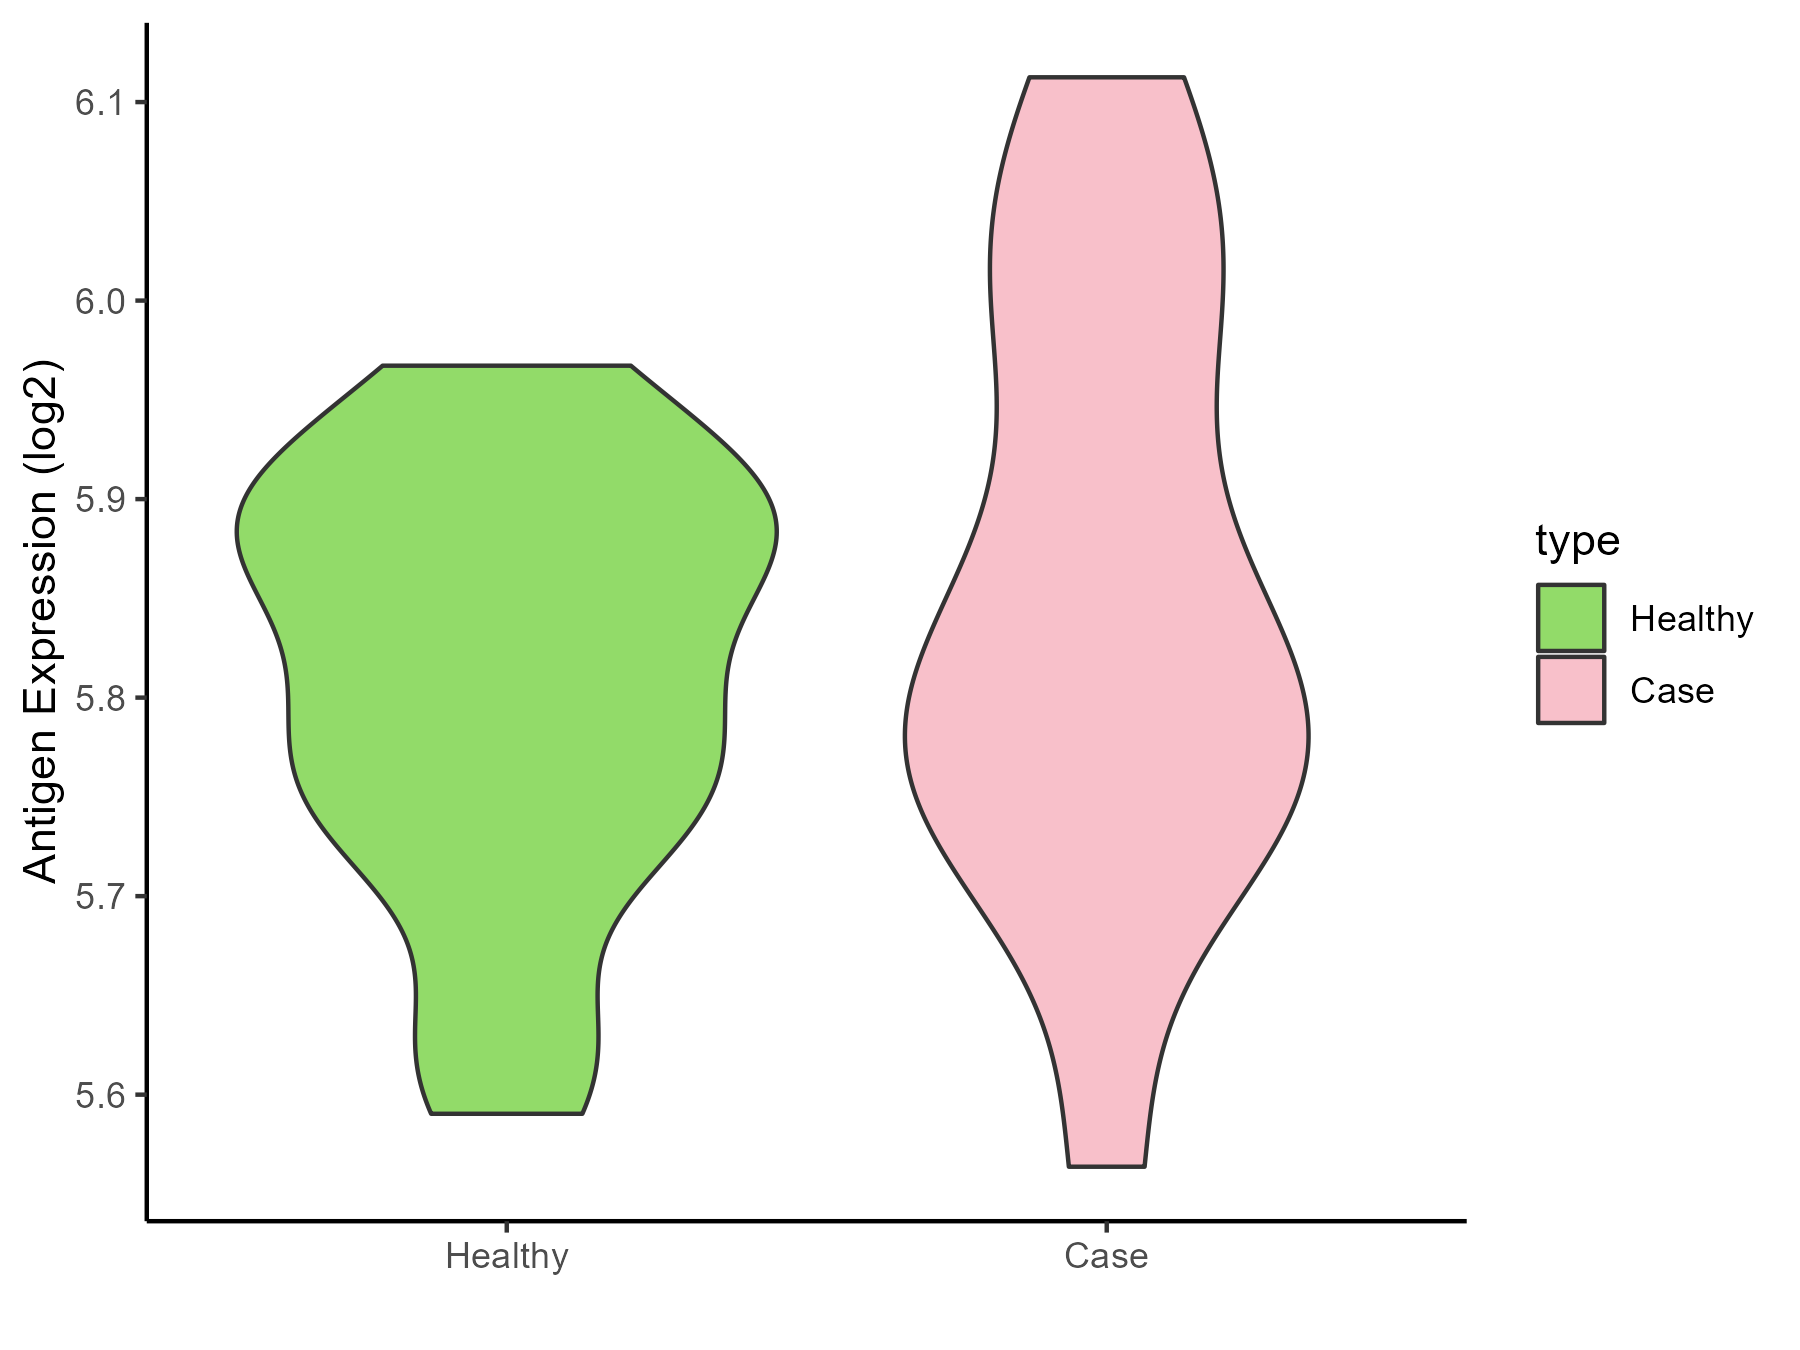
| Differential expression pattern of antigen in diseases | ||
| The Studied Tissue | Whole blood | |
| The Specific Disease | Thrombocythemia | |
| The Expression Level of Disease Section Compare with the Healthy Individual Tissue | p-value: 0.207883238; Fold-change: 0.013406564; Z-score: 0.125978688 | |
| Disease-specific Antigen Abundances |
|
Click to View the Clearer Original Diagram |
ICD Disease Classification 4
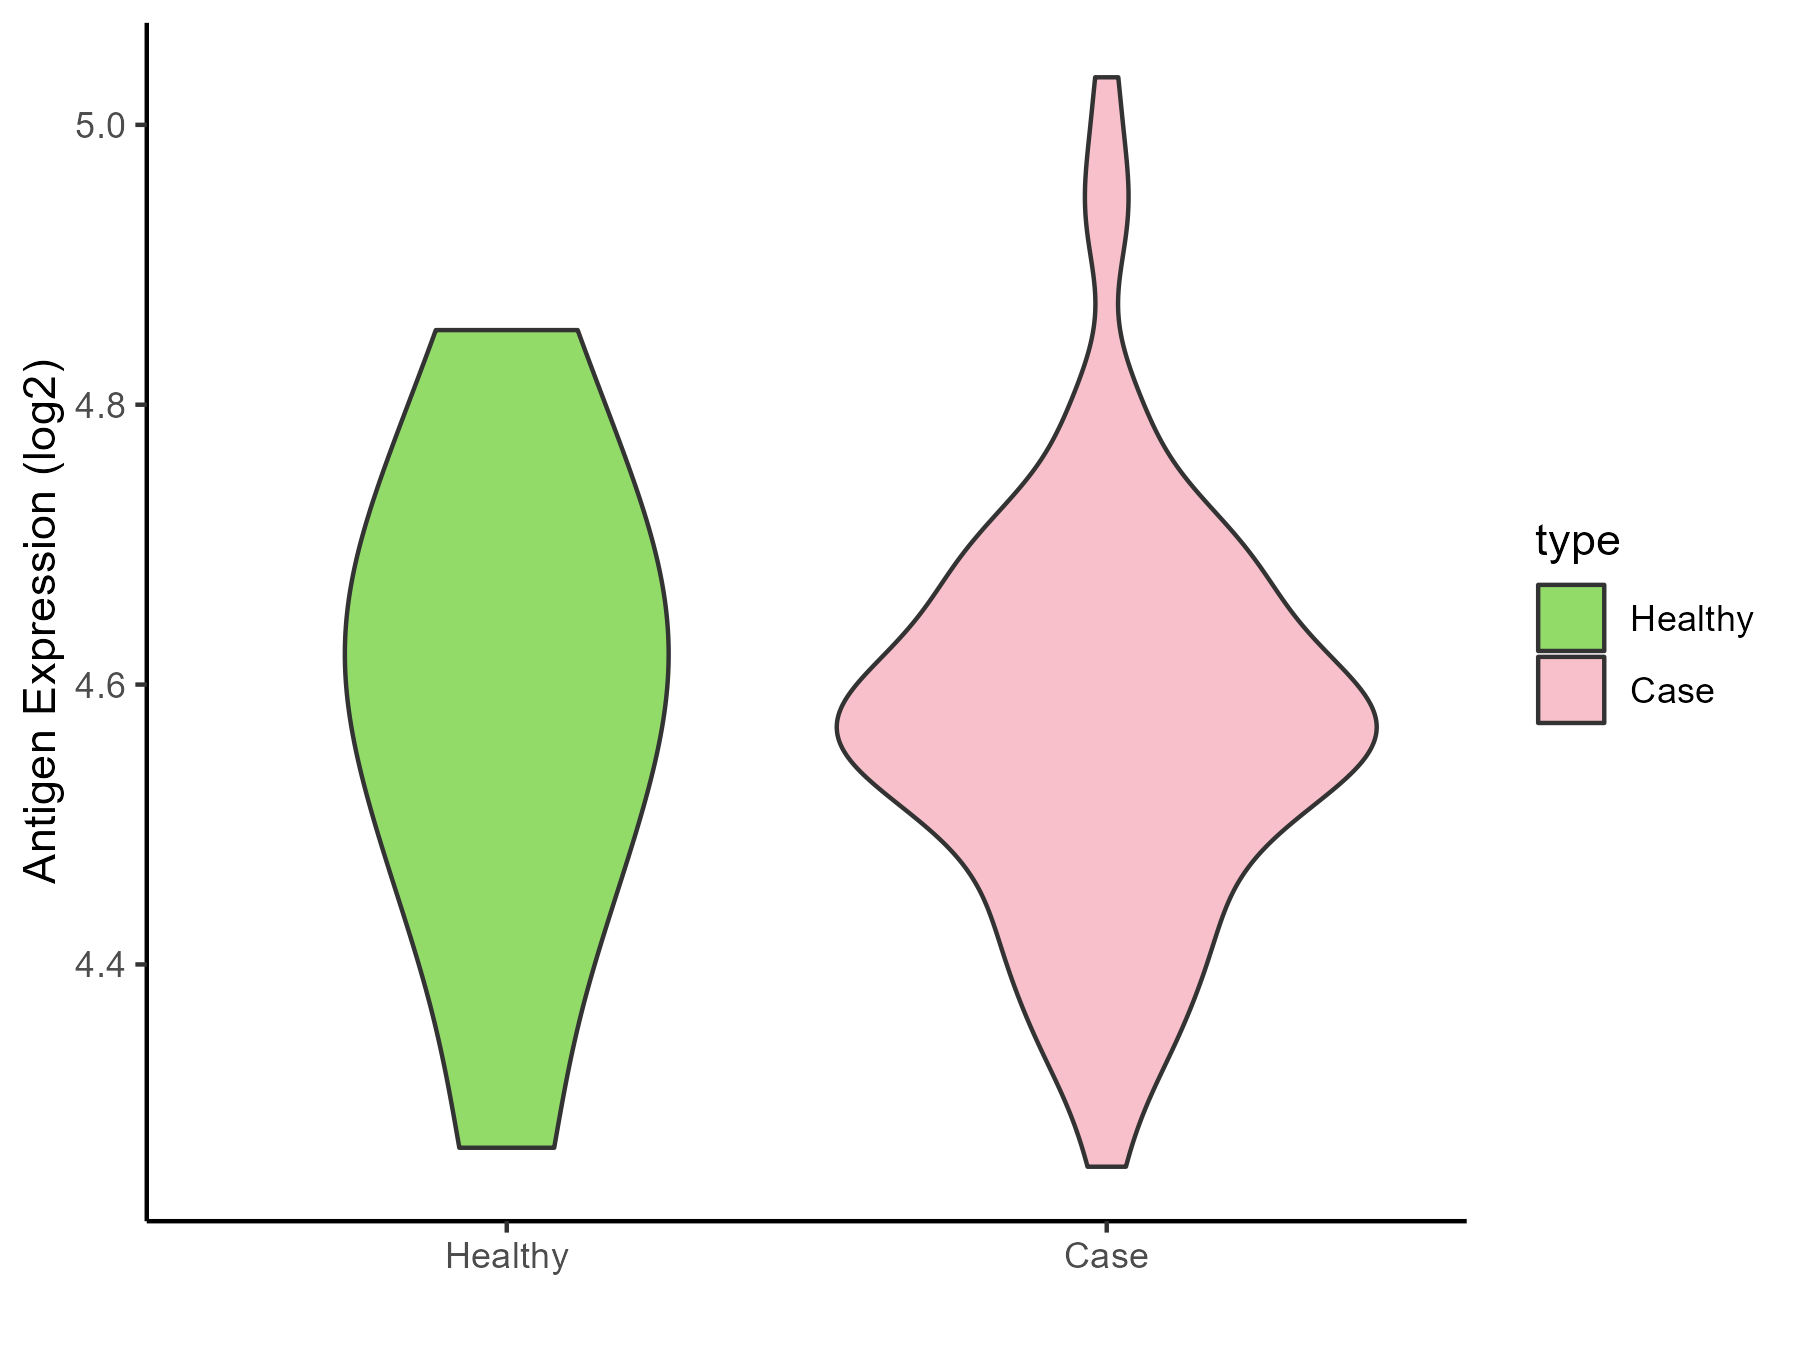
| Differential expression pattern of antigen in diseases | ||
| The Studied Tissue | Whole blood | |
| The Specific Disease | Scleroderma | |
| The Expression Level of Disease Section Compare with the Healthy Individual Tissue | p-value: 0.827443214; Fold-change: -0.025605921; Z-score: -0.145838424 | |
| Disease-specific Antigen Abundances |
|
Click to View the Clearer Original Diagram |
| Differential expression pattern of antigen in diseases | ||
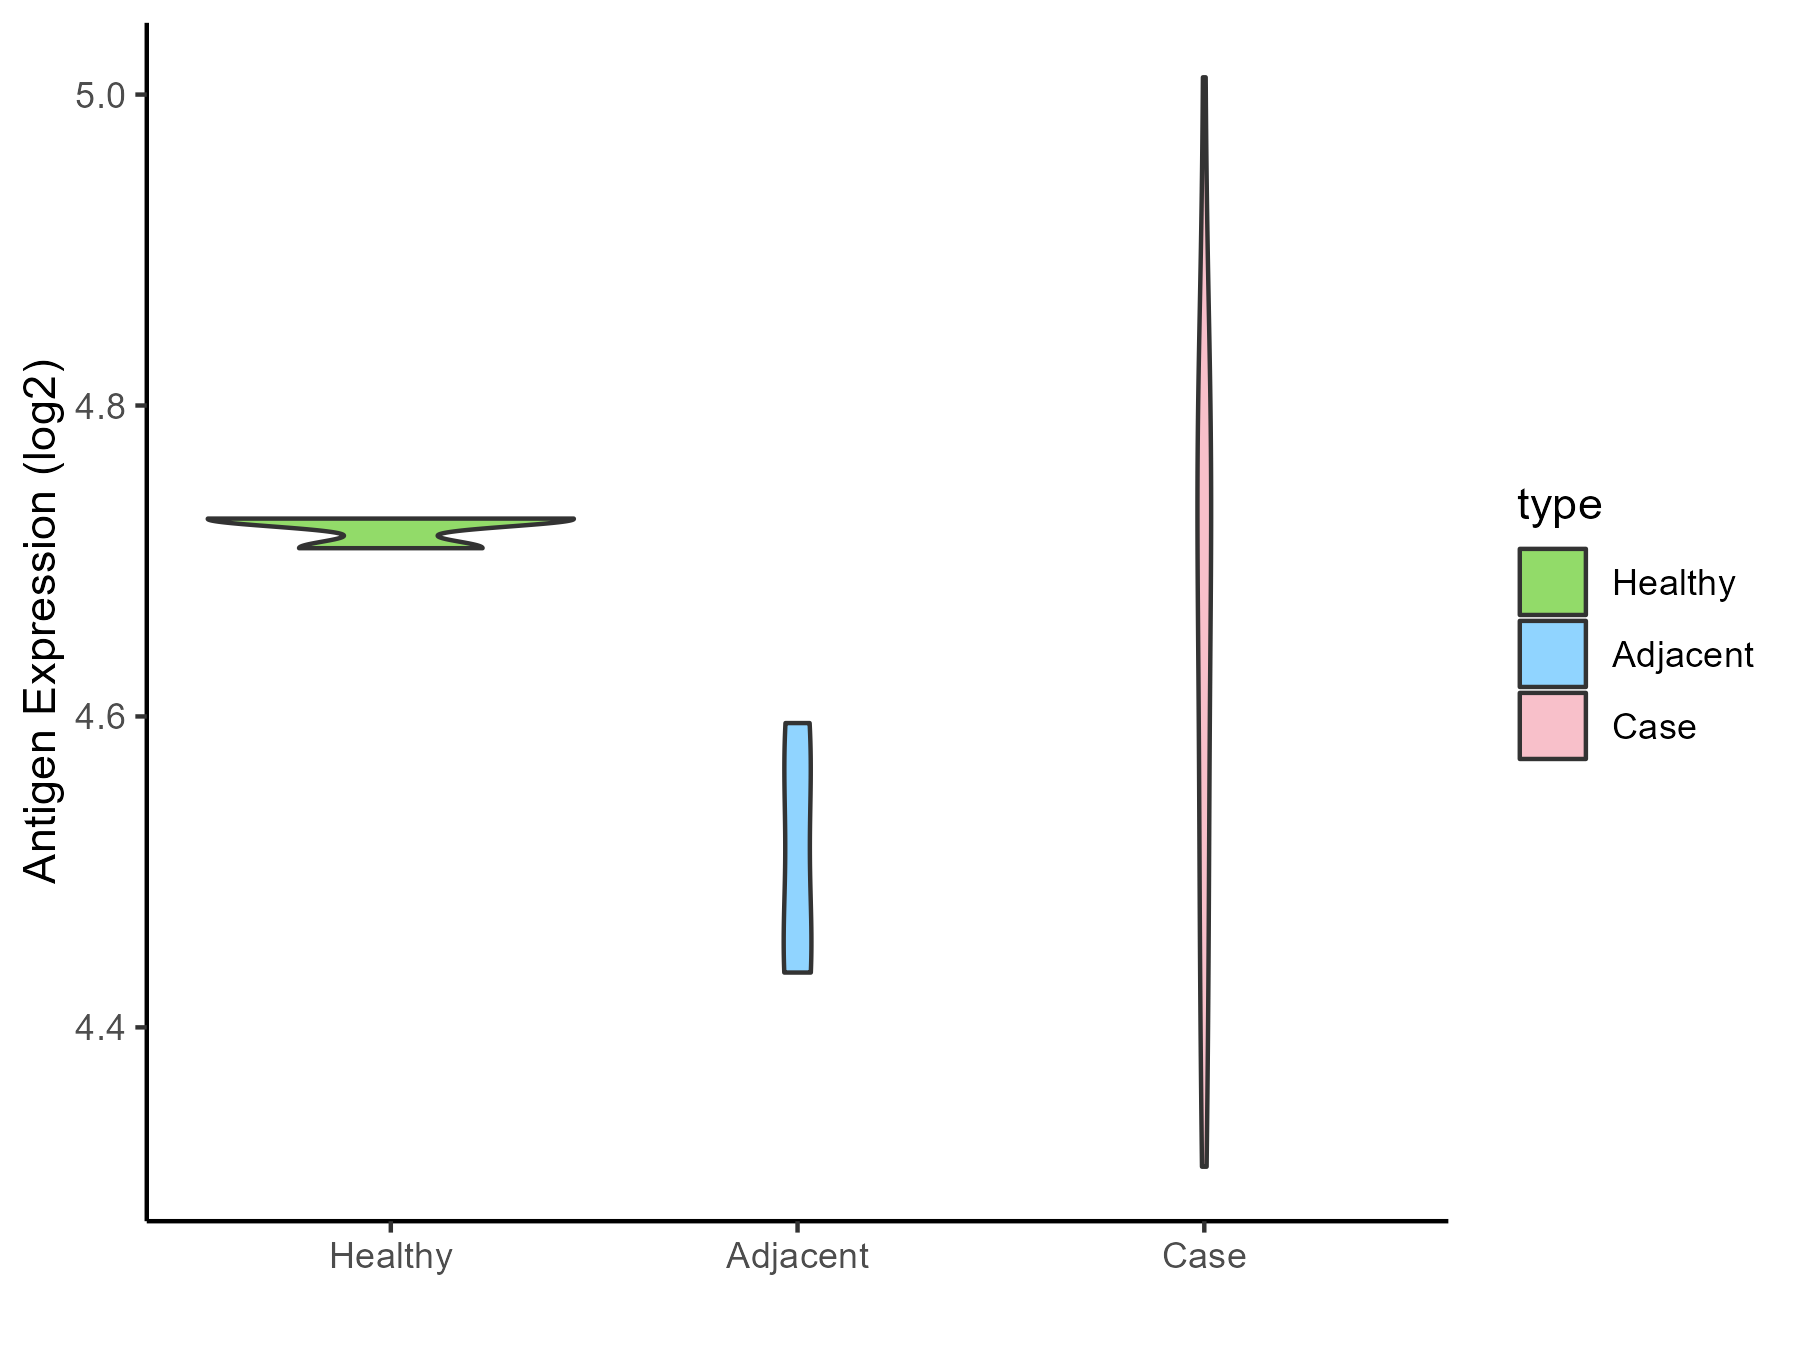
| The Studied Tissue | Salivary gland | |
| The Specific Disease | Sjogren syndrome | |
| The Expression Level of Disease Section Compare with the Healthy Individual Tissue | p-value: 0.114301602; Fold-change: -0.034954982; Z-score: -3.208966614 | |
| The Expression Level of Disease Section Compare with the Adjacent Tissue | p-value: 0.03599285; Fold-change: 0.185464766; Z-score: 2.350355086 | |
| Disease-specific Antigen Abundances |
|
Click to View the Clearer Original Diagram |
| Differential expression pattern of antigen in diseases | ||
| The Studied Tissue | Peripheral blood | |
| The Specific Disease | Behcet disease | |
| The Expression Level of Disease Section Compare with the Healthy Individual Tissue | p-value: 0.173768677; Fold-change: 0.085270385; Z-score: 0.811493238 | |
| Disease-specific Antigen Abundances |

|
Click to View the Clearer Original Diagram |
| Differential expression pattern of antigen in diseases | ||
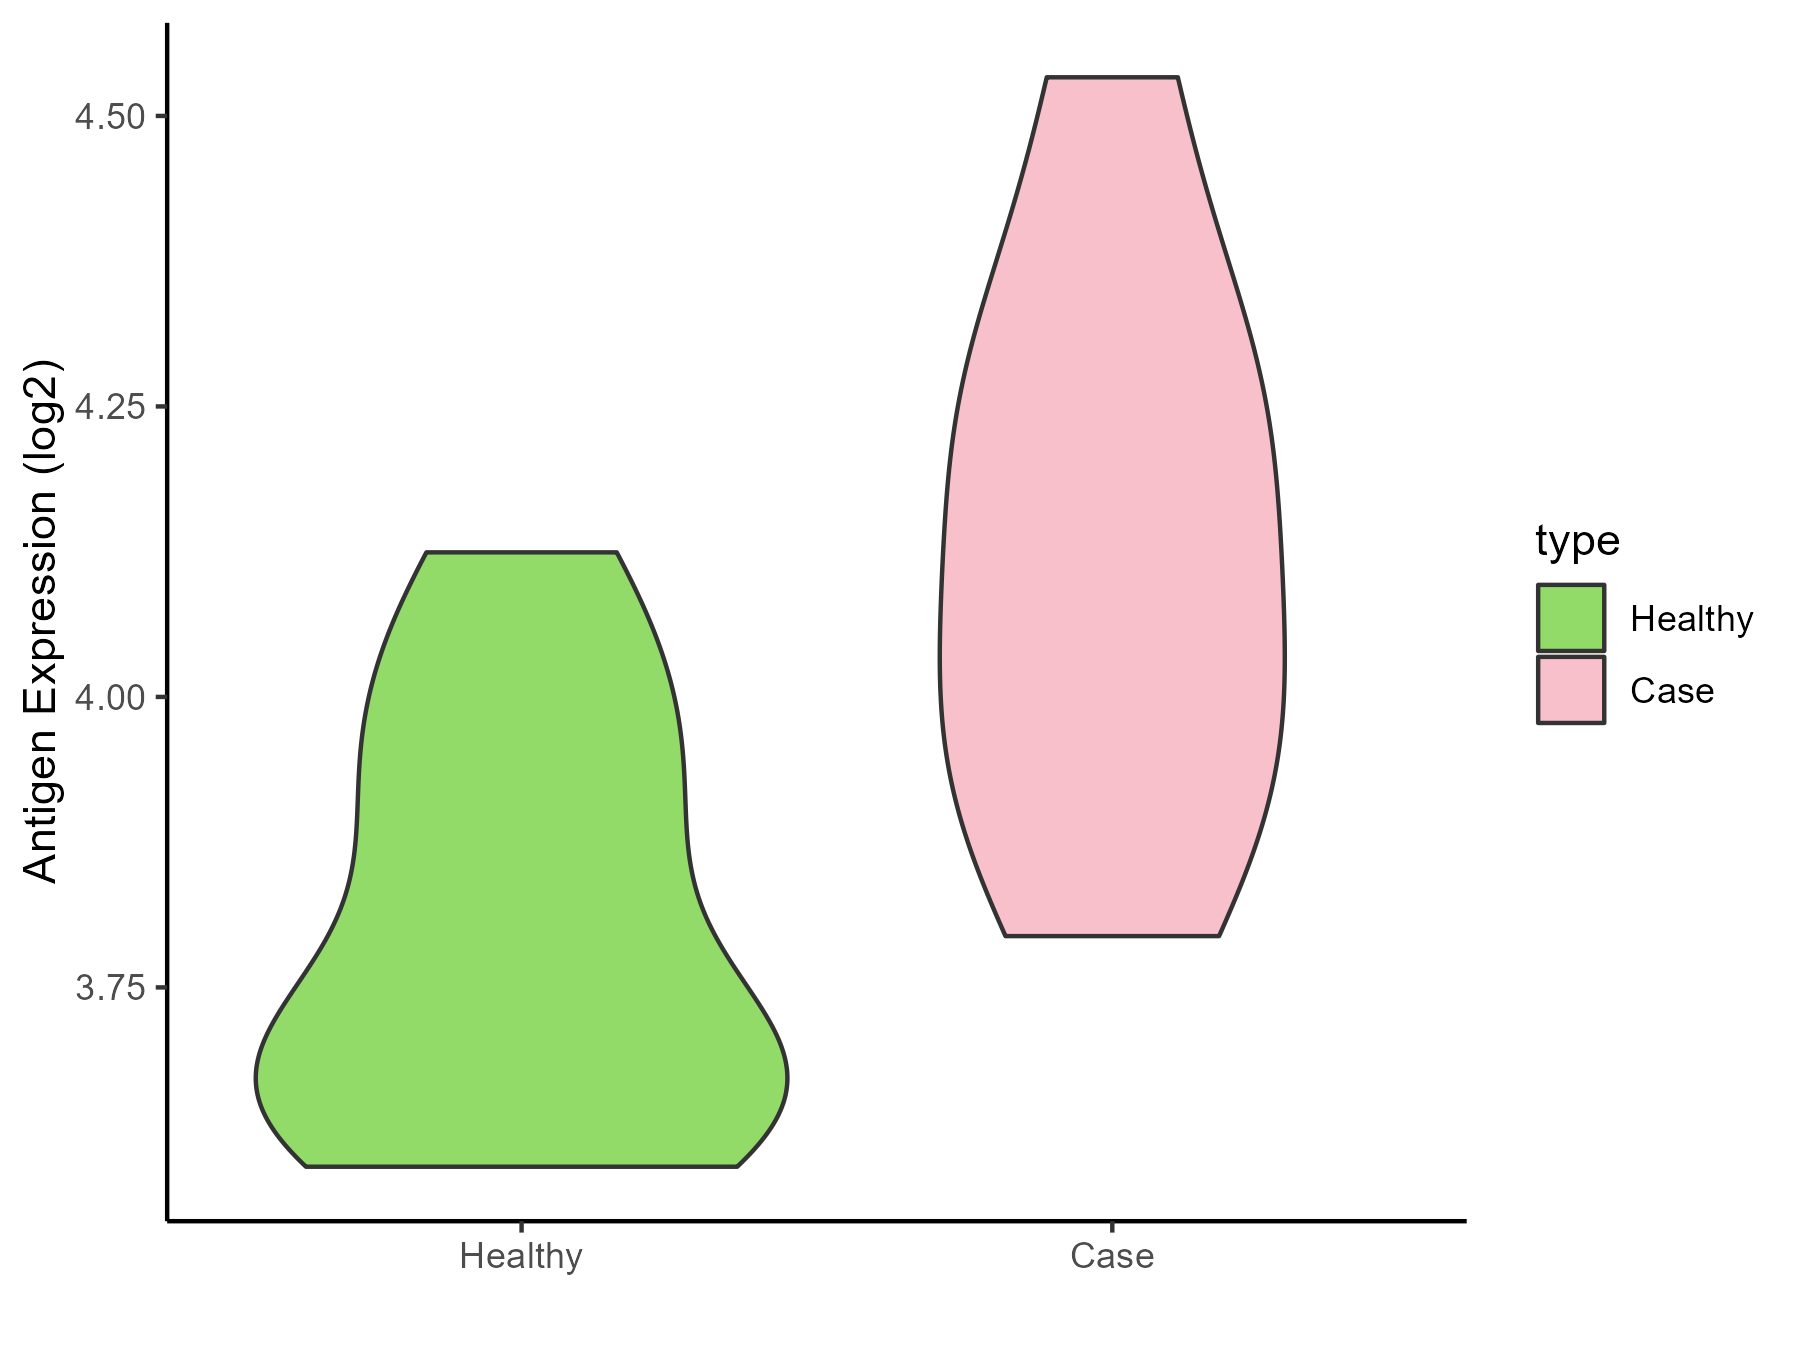
| The Studied Tissue | Whole blood | |
| The Specific Disease | Autosomal dominant monocytopenia | |
| The Expression Level of Disease Section Compare with the Healthy Individual Tissue | p-value: 0.007500476; Fold-change: 0.405875331; Z-score: 2.235572767 | |
| Disease-specific Antigen Abundances |
|
Click to View the Clearer Original Diagram |
ICD Disease Classification 5
| Differential expression pattern of antigen in diseases | ||
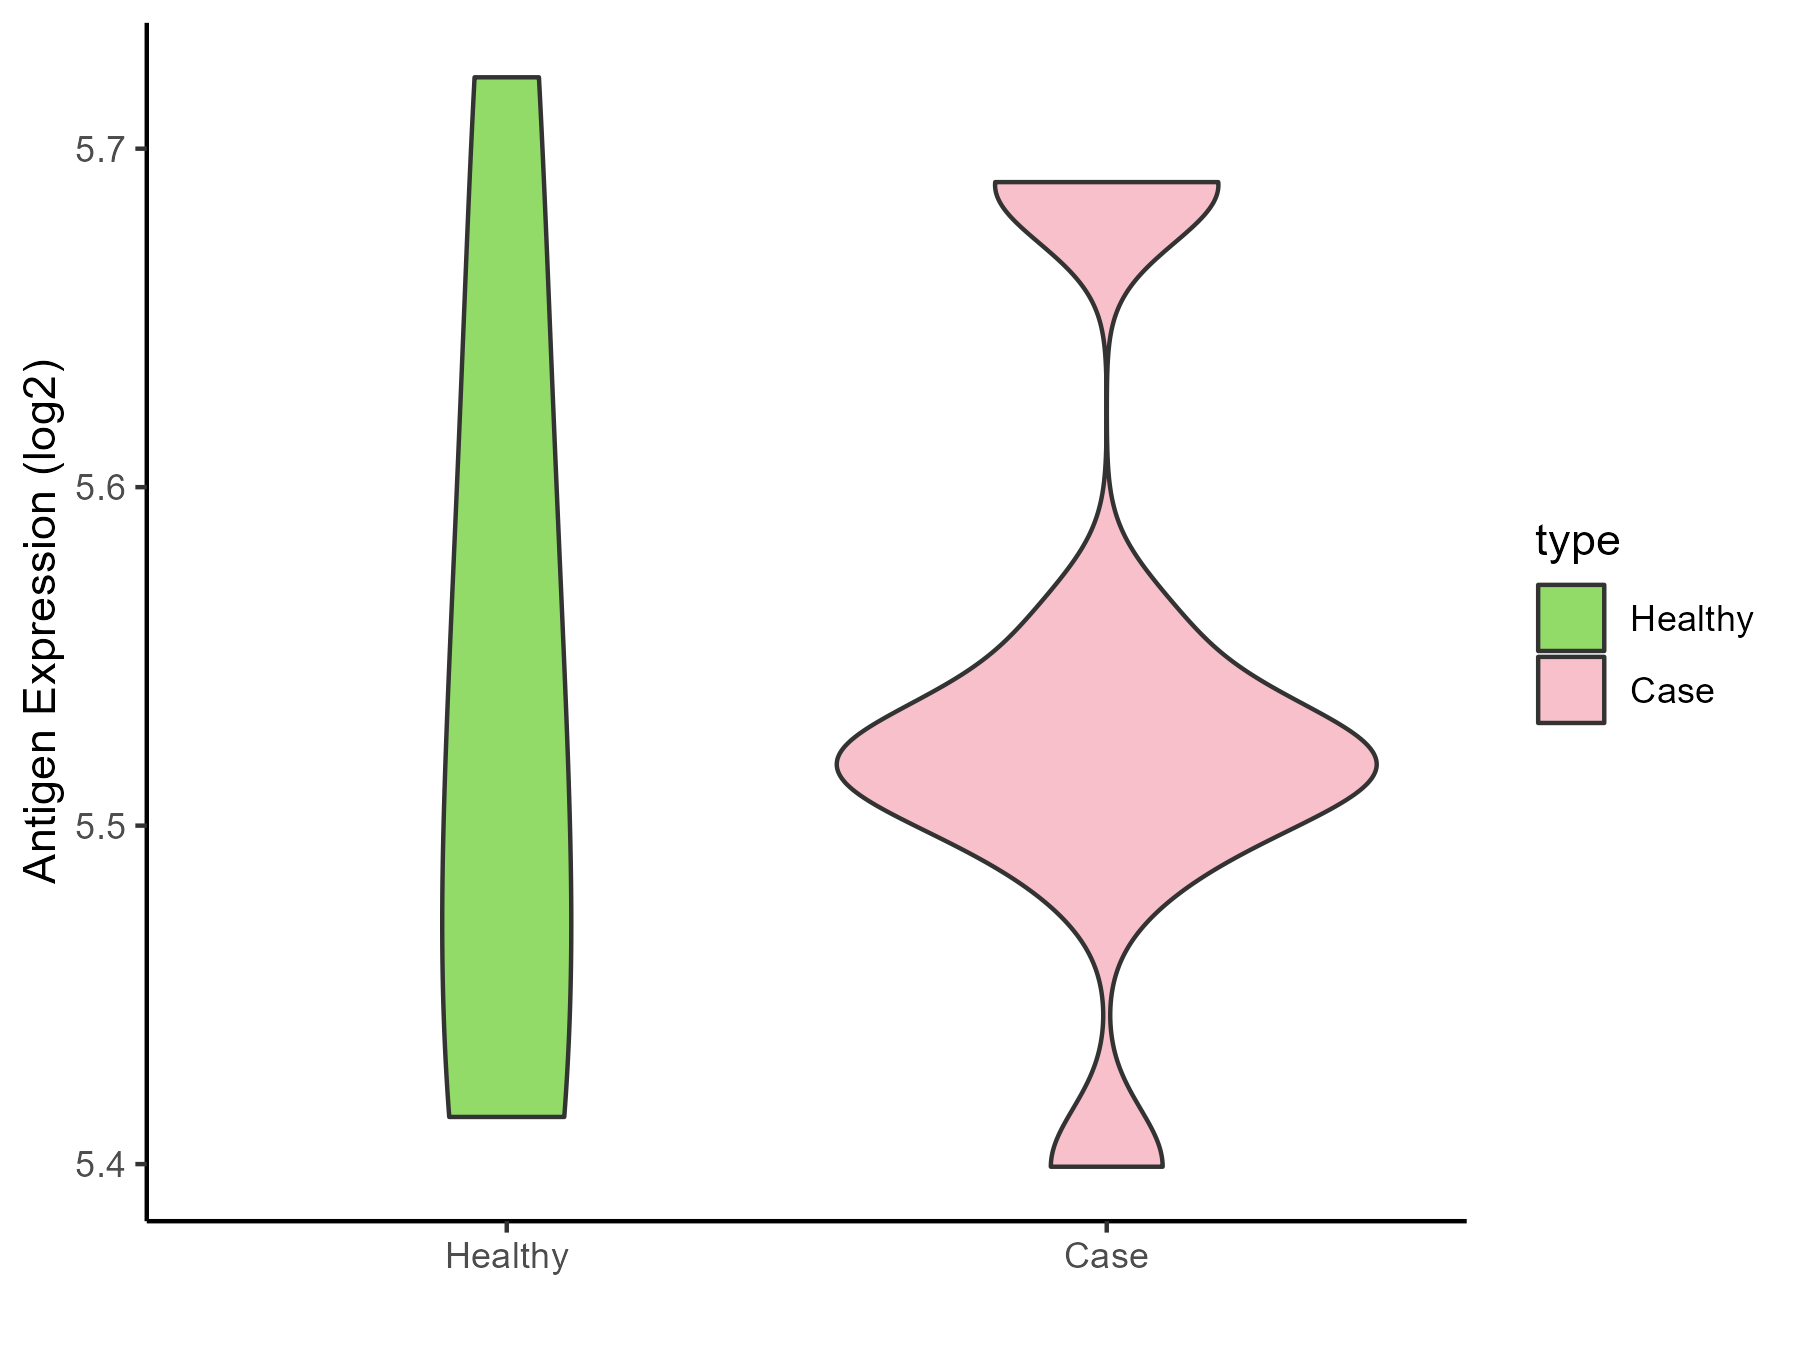
| The Studied Tissue | Liver | |
| The Specific Disease | Type 2 diabetes | |
| The Expression Level of Disease Section Compare with the Healthy Individual Tissue | p-value: 0.927455727; Fold-change: 7.73E-05; Z-score: 0.000605516 | |
| Disease-specific Antigen Abundances |
|
Click to View the Clearer Original Diagram |
| Differential expression pattern of antigen in diseases | ||
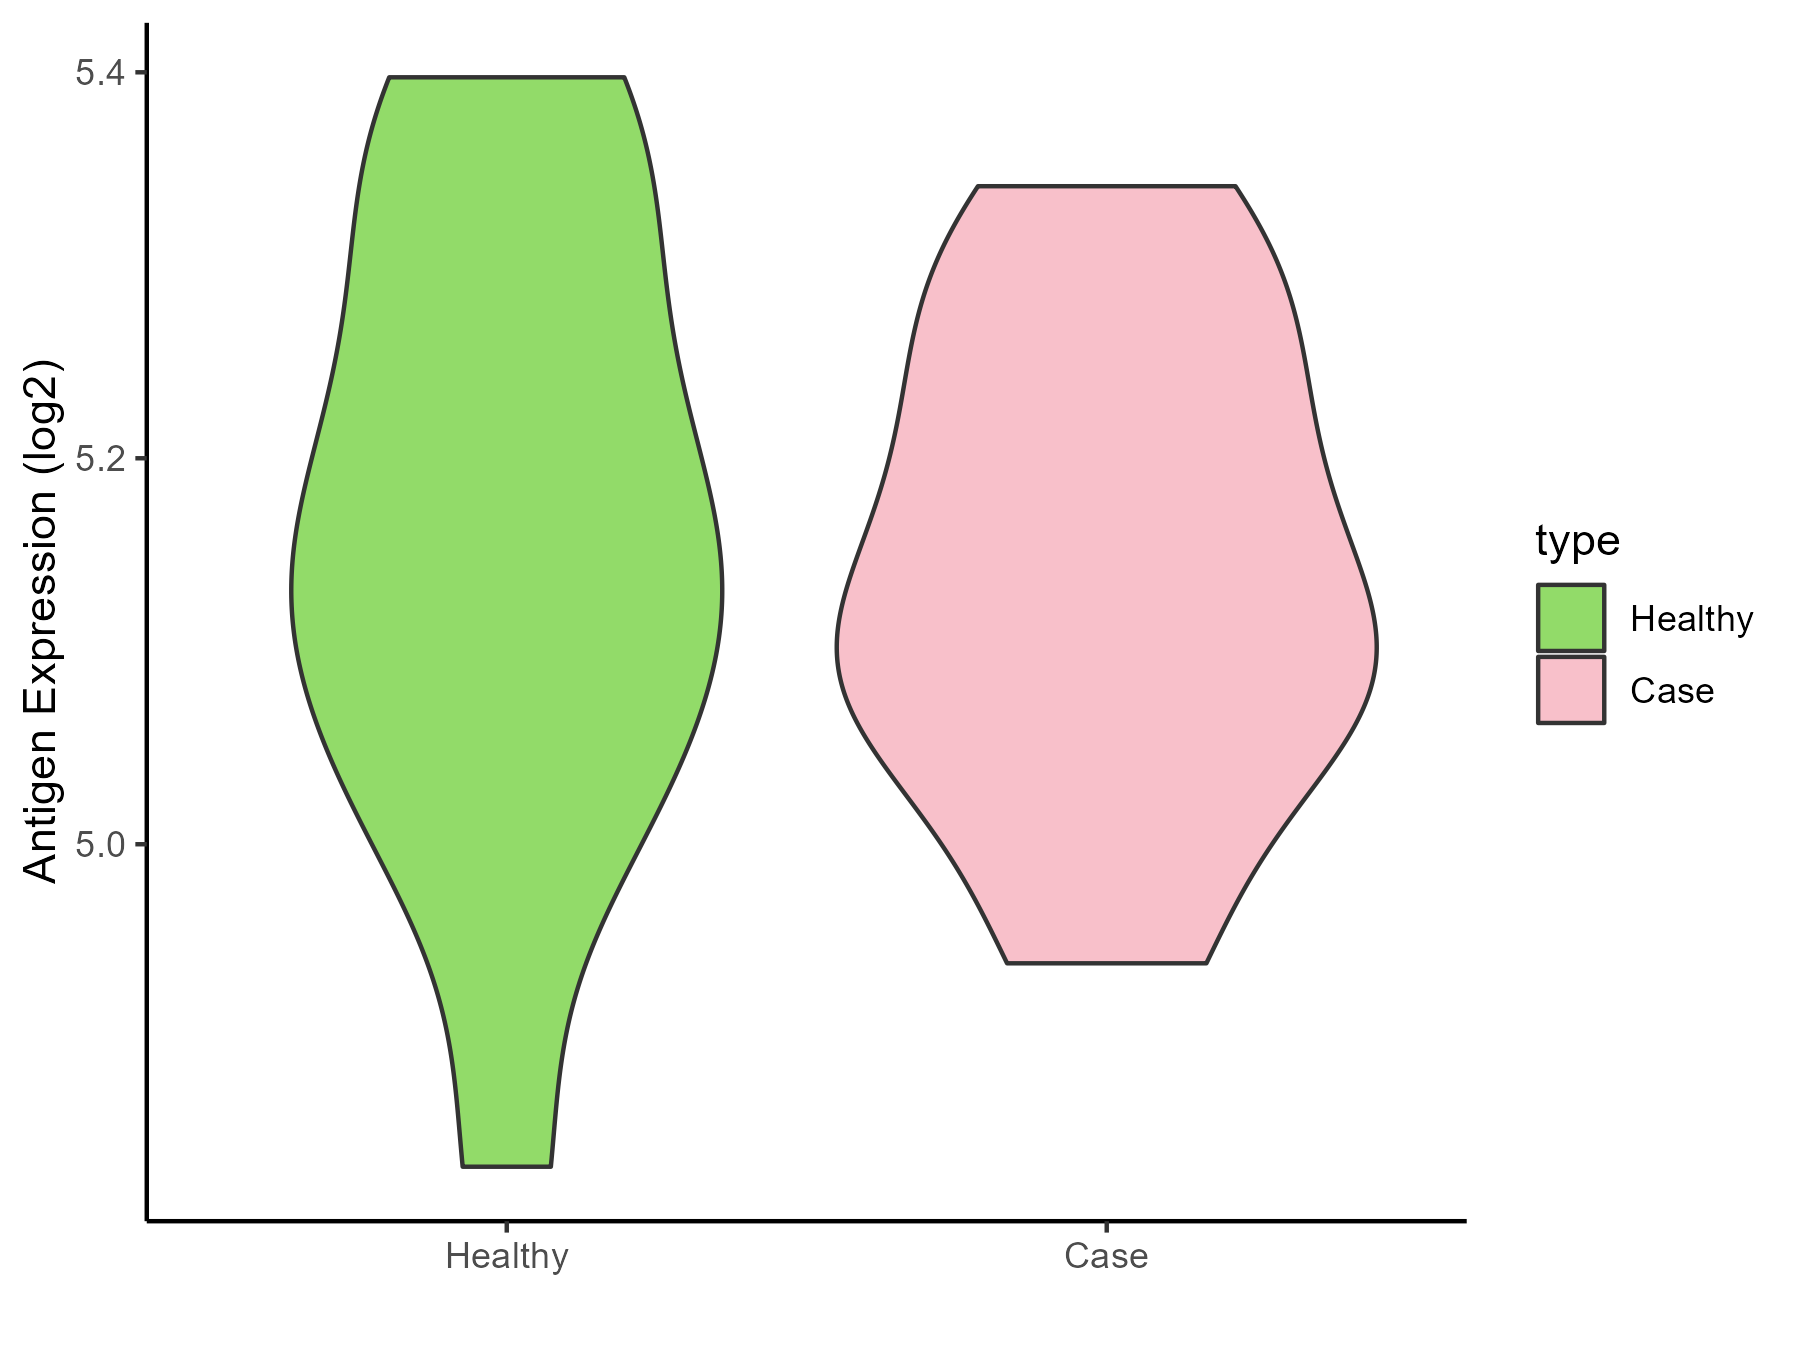
| The Studied Tissue | Vastus lateralis muscle | |
| The Specific Disease | Polycystic ovary syndrome | |
| The Expression Level of Disease Section Compare with the Healthy Individual Tissue | p-value: 0.748150311; Fold-change: -0.029422407; Z-score: -0.180671294 | |
| Disease-specific Antigen Abundances |
|
Click to View the Clearer Original Diagram |
| Differential expression pattern of antigen in diseases | ||
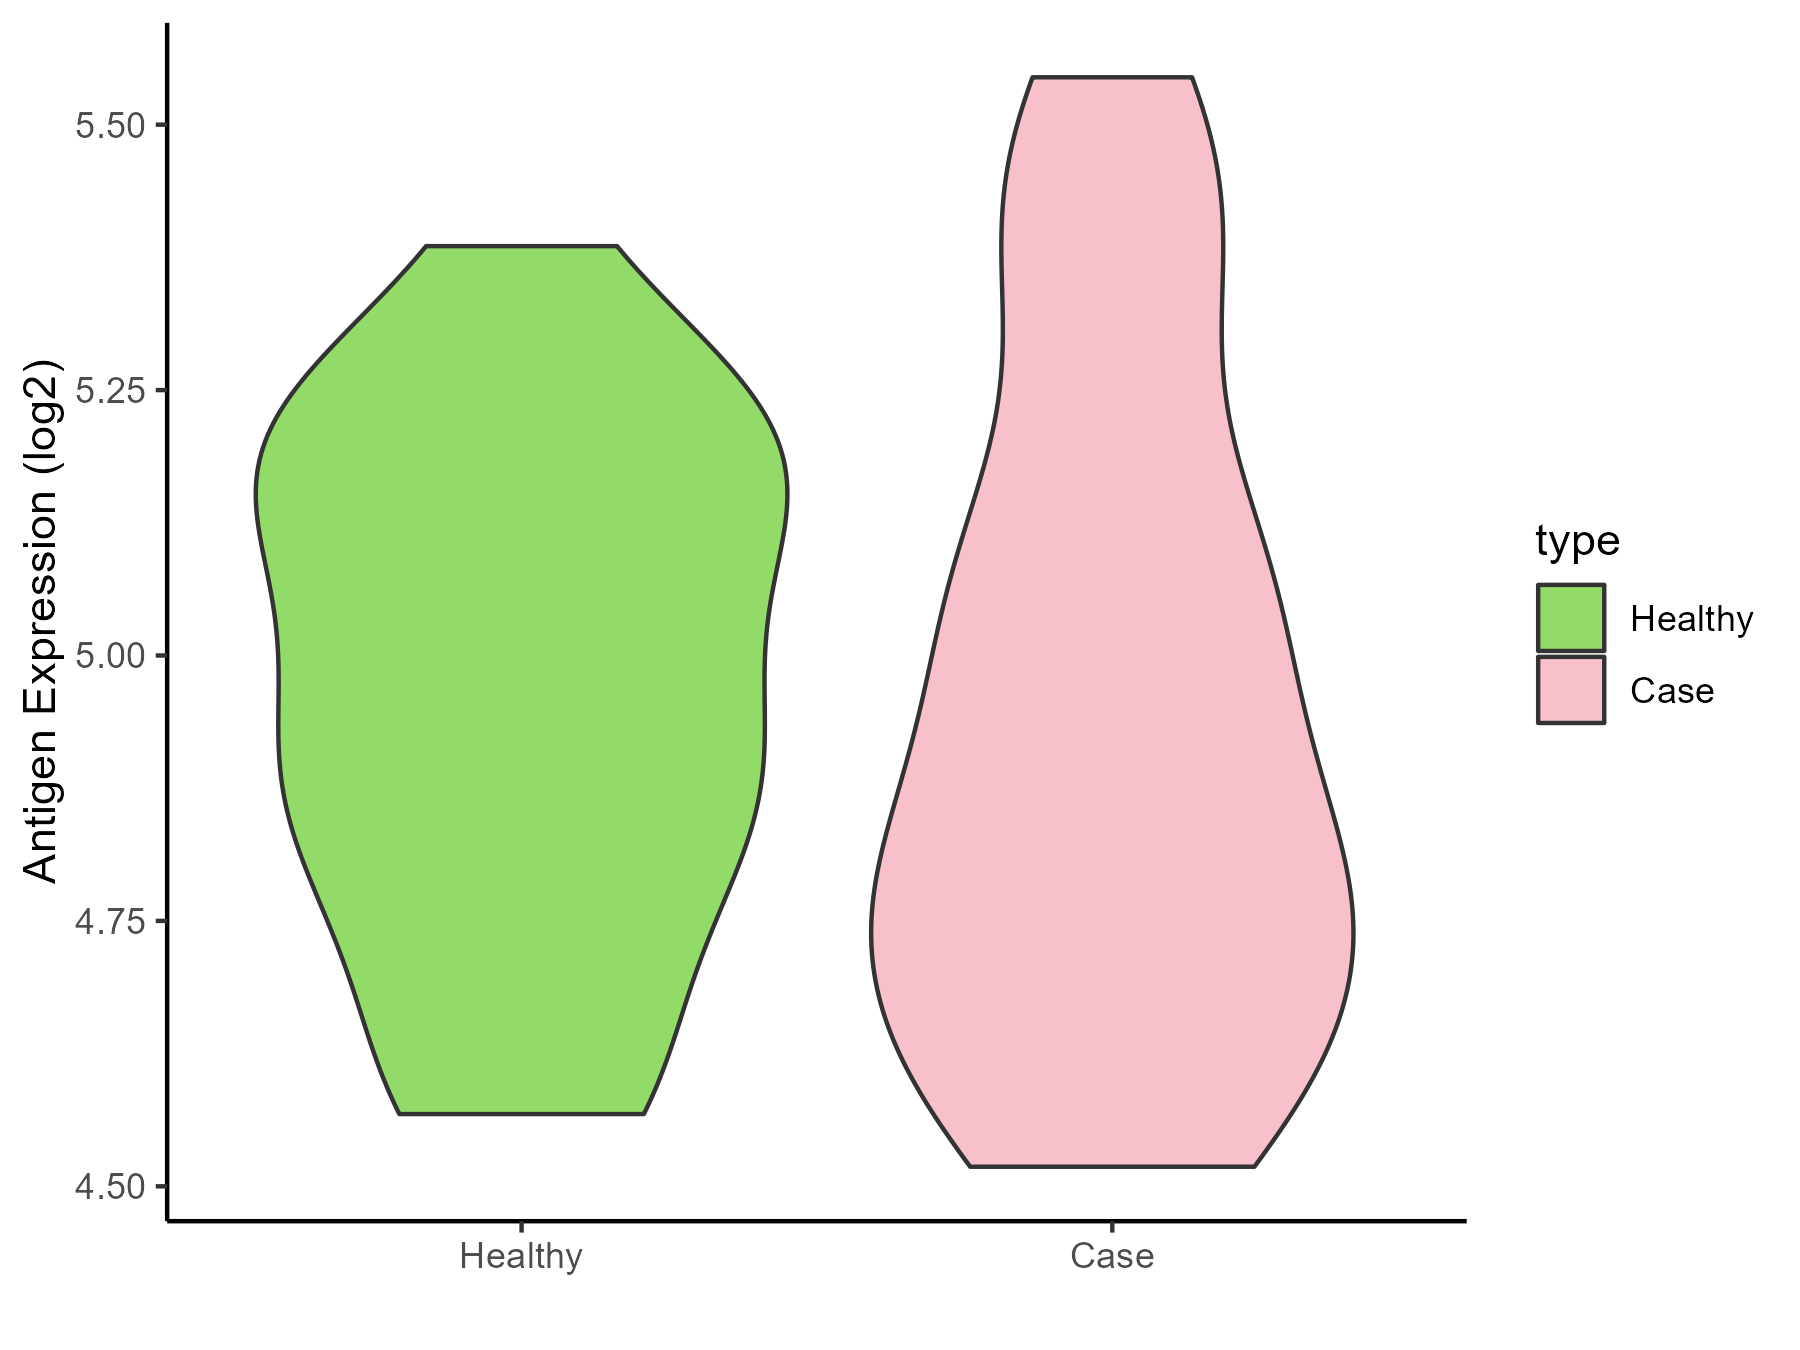
| The Studied Tissue | Subcutaneous Adipose | |
| The Specific Disease | Obesity | |
| The Expression Level of Disease Section Compare with the Healthy Individual Tissue | p-value: 0.700887055; Fold-change: -0.094796699; Z-score: -0.397169204 | |
| Disease-specific Antigen Abundances |
|
Click to View the Clearer Original Diagram |
| Differential expression pattern of antigen in diseases | ||
| The Studied Tissue | Biceps muscle | |
| The Specific Disease | Pompe disease | |
| The Expression Level of Disease Section Compare with the Healthy Individual Tissue | p-value: 0.002185487; Fold-change: -0.13920683; Z-score: -4.086078644 | |
| Disease-specific Antigen Abundances |

|
Click to View the Clearer Original Diagram |
| Differential expression pattern of antigen in diseases | ||
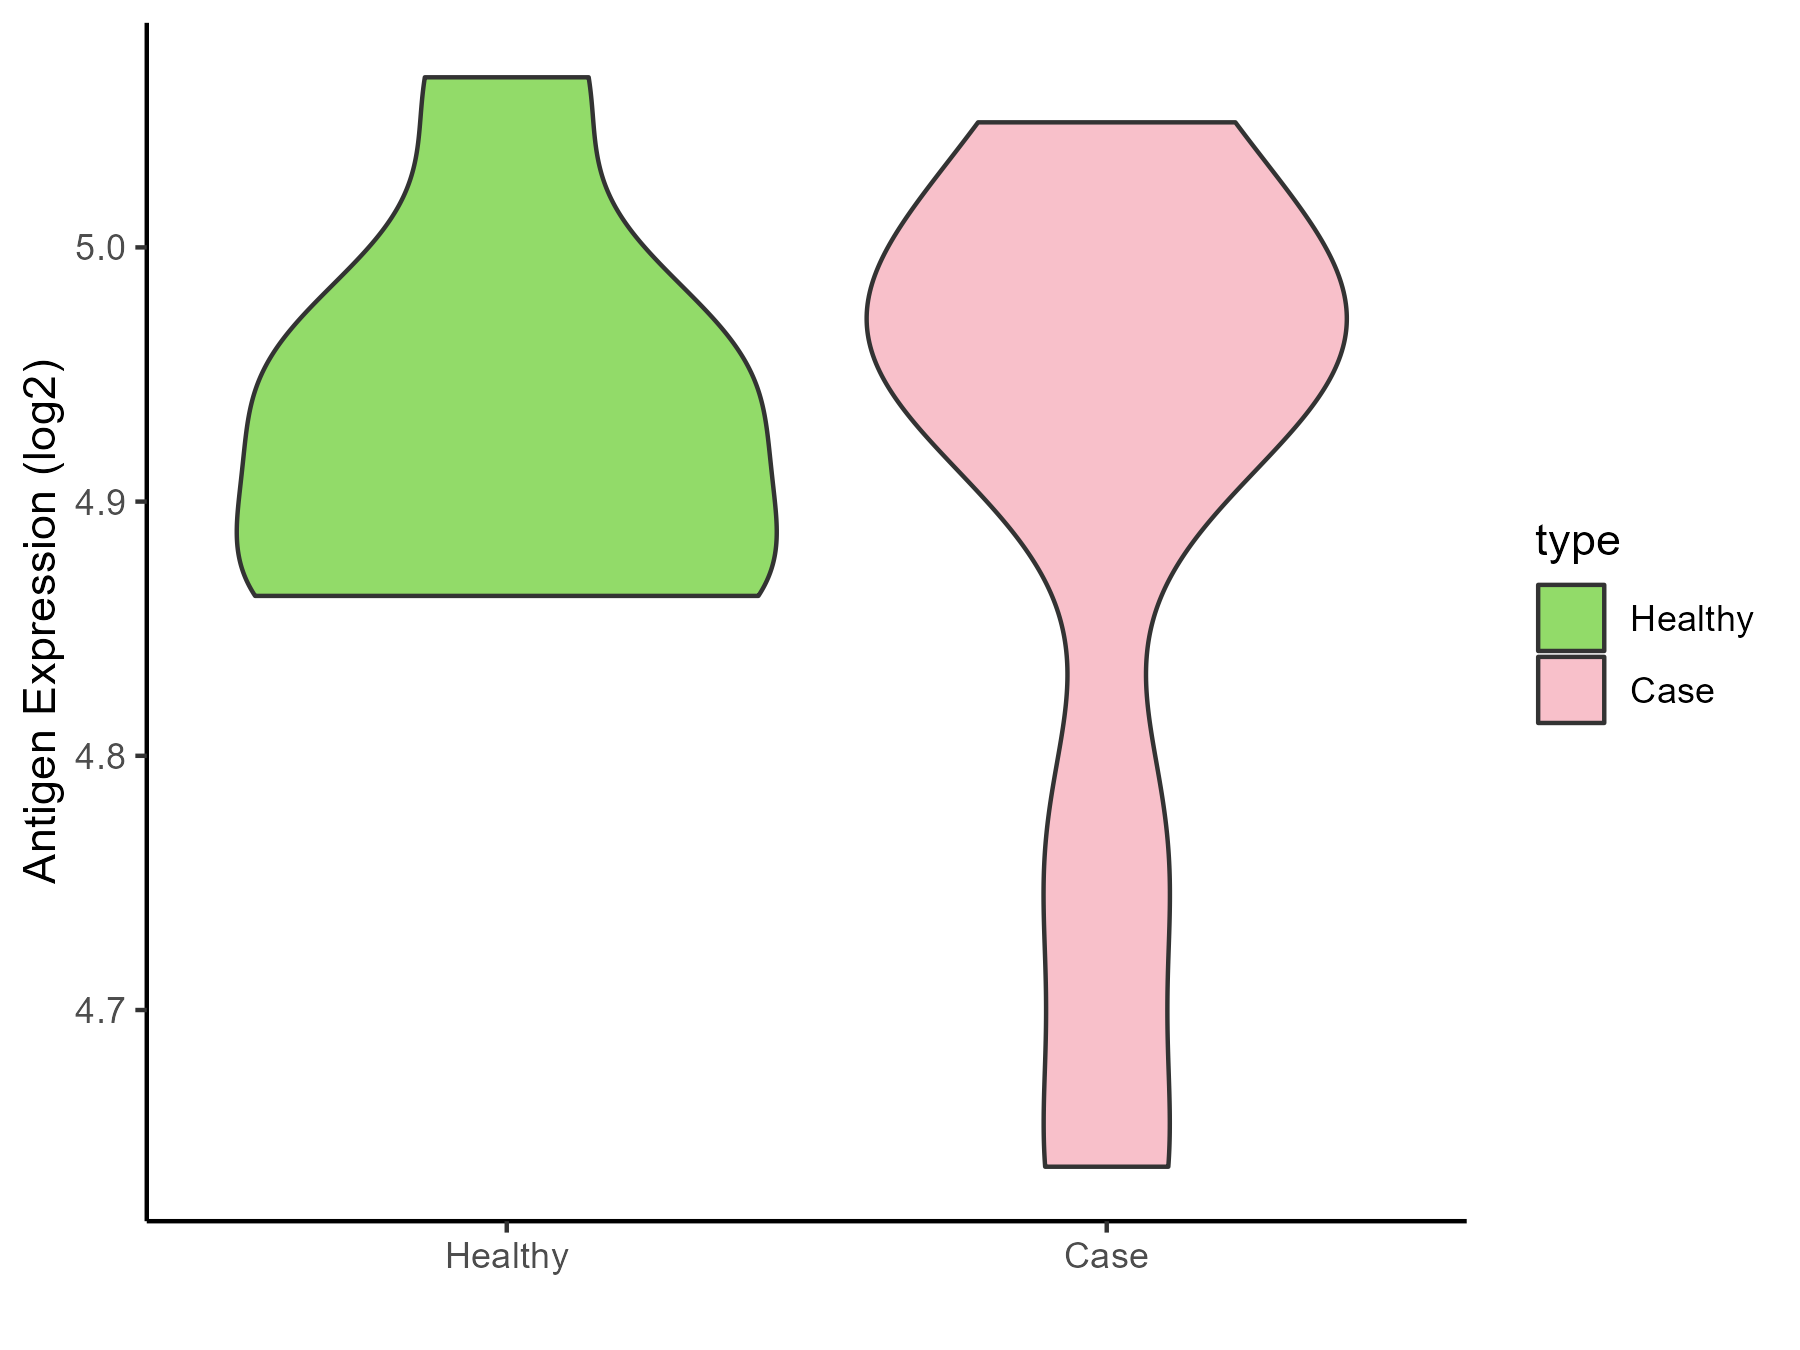
| The Studied Tissue | Whole blood | |
| The Specific Disease | Batten disease | |
| The Expression Level of Disease Section Compare with the Healthy Individual Tissue | p-value: 0.633292157; Fold-change: 0.015334129; Z-score: 0.20674027 | |
| Disease-specific Antigen Abundances |
|
Click to View the Clearer Original Diagram |
ICD Disease Classification 6
| Differential expression pattern of antigen in diseases | ||
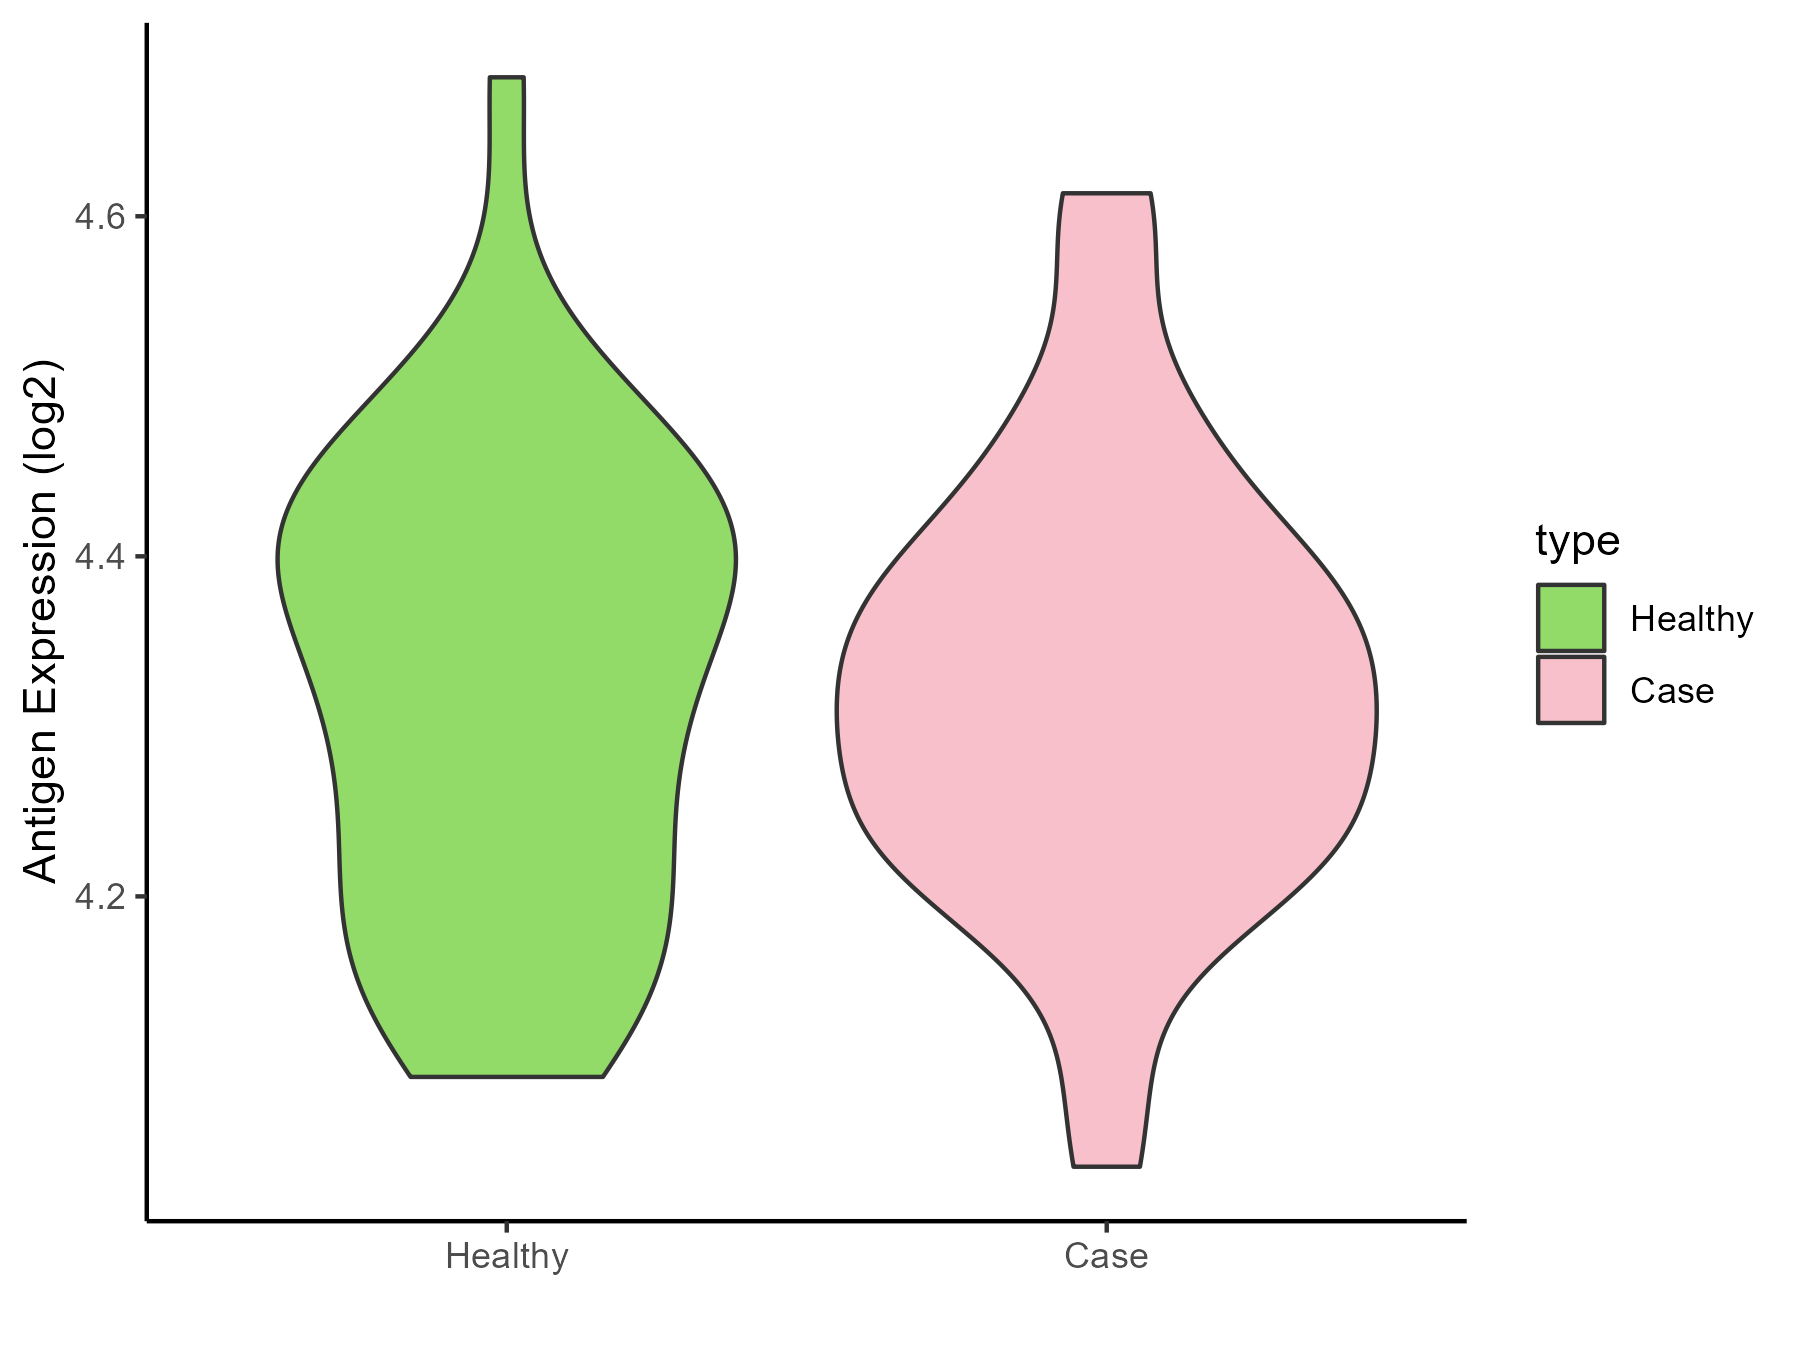
| The Studied Tissue | Whole blood | |
| The Specific Disease | Autism | |
| The Expression Level of Disease Section Compare with the Healthy Individual Tissue | p-value: 0.966759607; Fold-change: -0.017021812; Z-score: -0.12382067 | |
| Disease-specific Antigen Abundances |
|
Click to View the Clearer Original Diagram |
| Differential expression pattern of antigen in diseases | ||
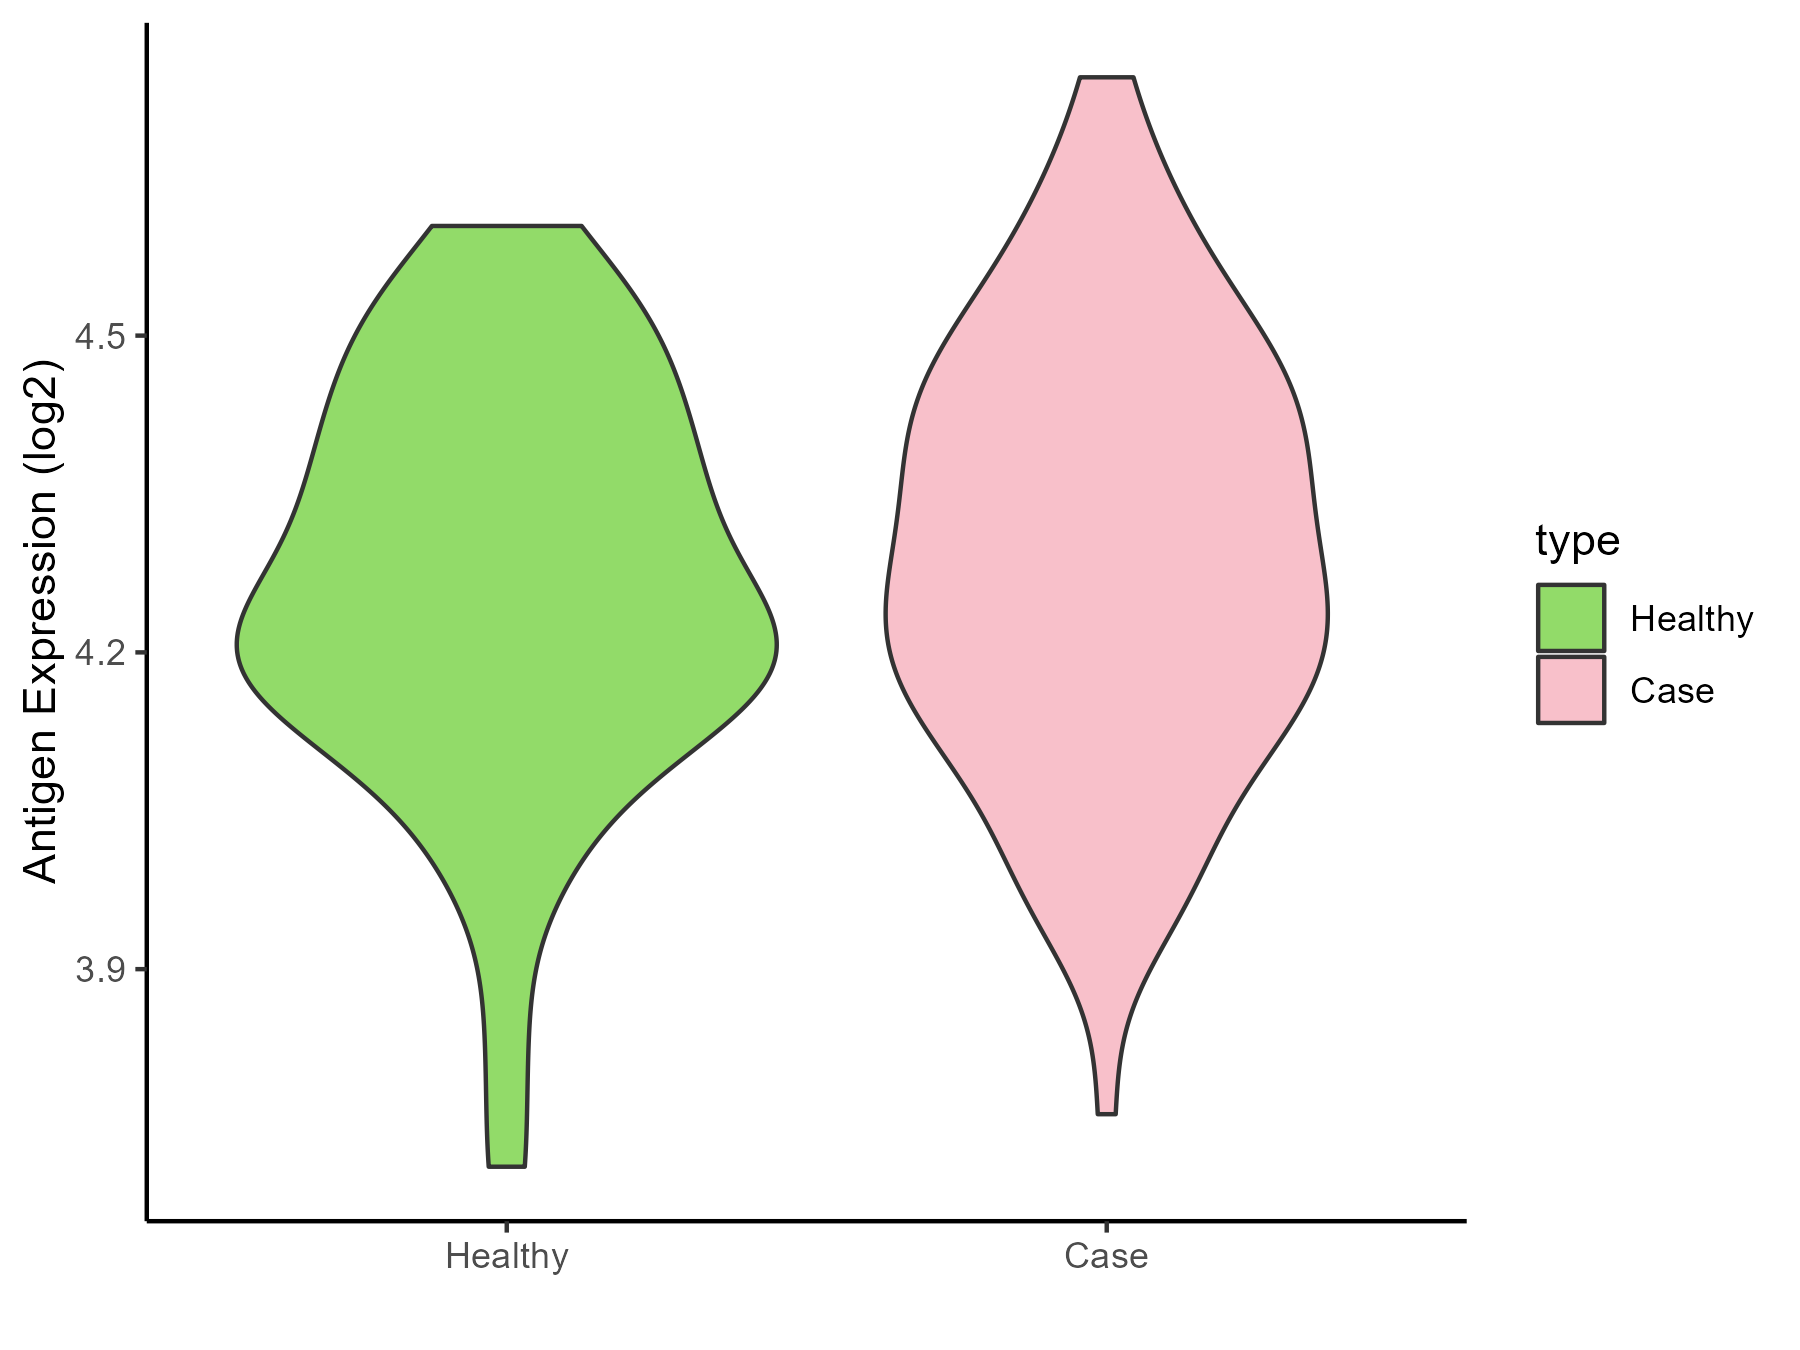
| The Studied Tissue | Whole blood | |
| The Specific Disease | Anxiety disorder | |
| The Expression Level of Disease Section Compare with the Healthy Individual Tissue | p-value: 0.456931238; Fold-change: 0.041053378; Z-score: 0.216434851 | |
| Disease-specific Antigen Abundances |
|
Click to View the Clearer Original Diagram |
ICD Disease Classification 8
| Differential expression pattern of antigen in diseases | ||
| The Studied Tissue | Substantia nigra | |
| The Specific Disease | Parkinson disease | |
| The Expression Level of Disease Section Compare with the Healthy Individual Tissue | p-value: 0.730148457; Fold-change: -0.001211718; Z-score: -0.0072584 | |
| Disease-specific Antigen Abundances |

|
Click to View the Clearer Original Diagram |
| Differential expression pattern of antigen in diseases | ||
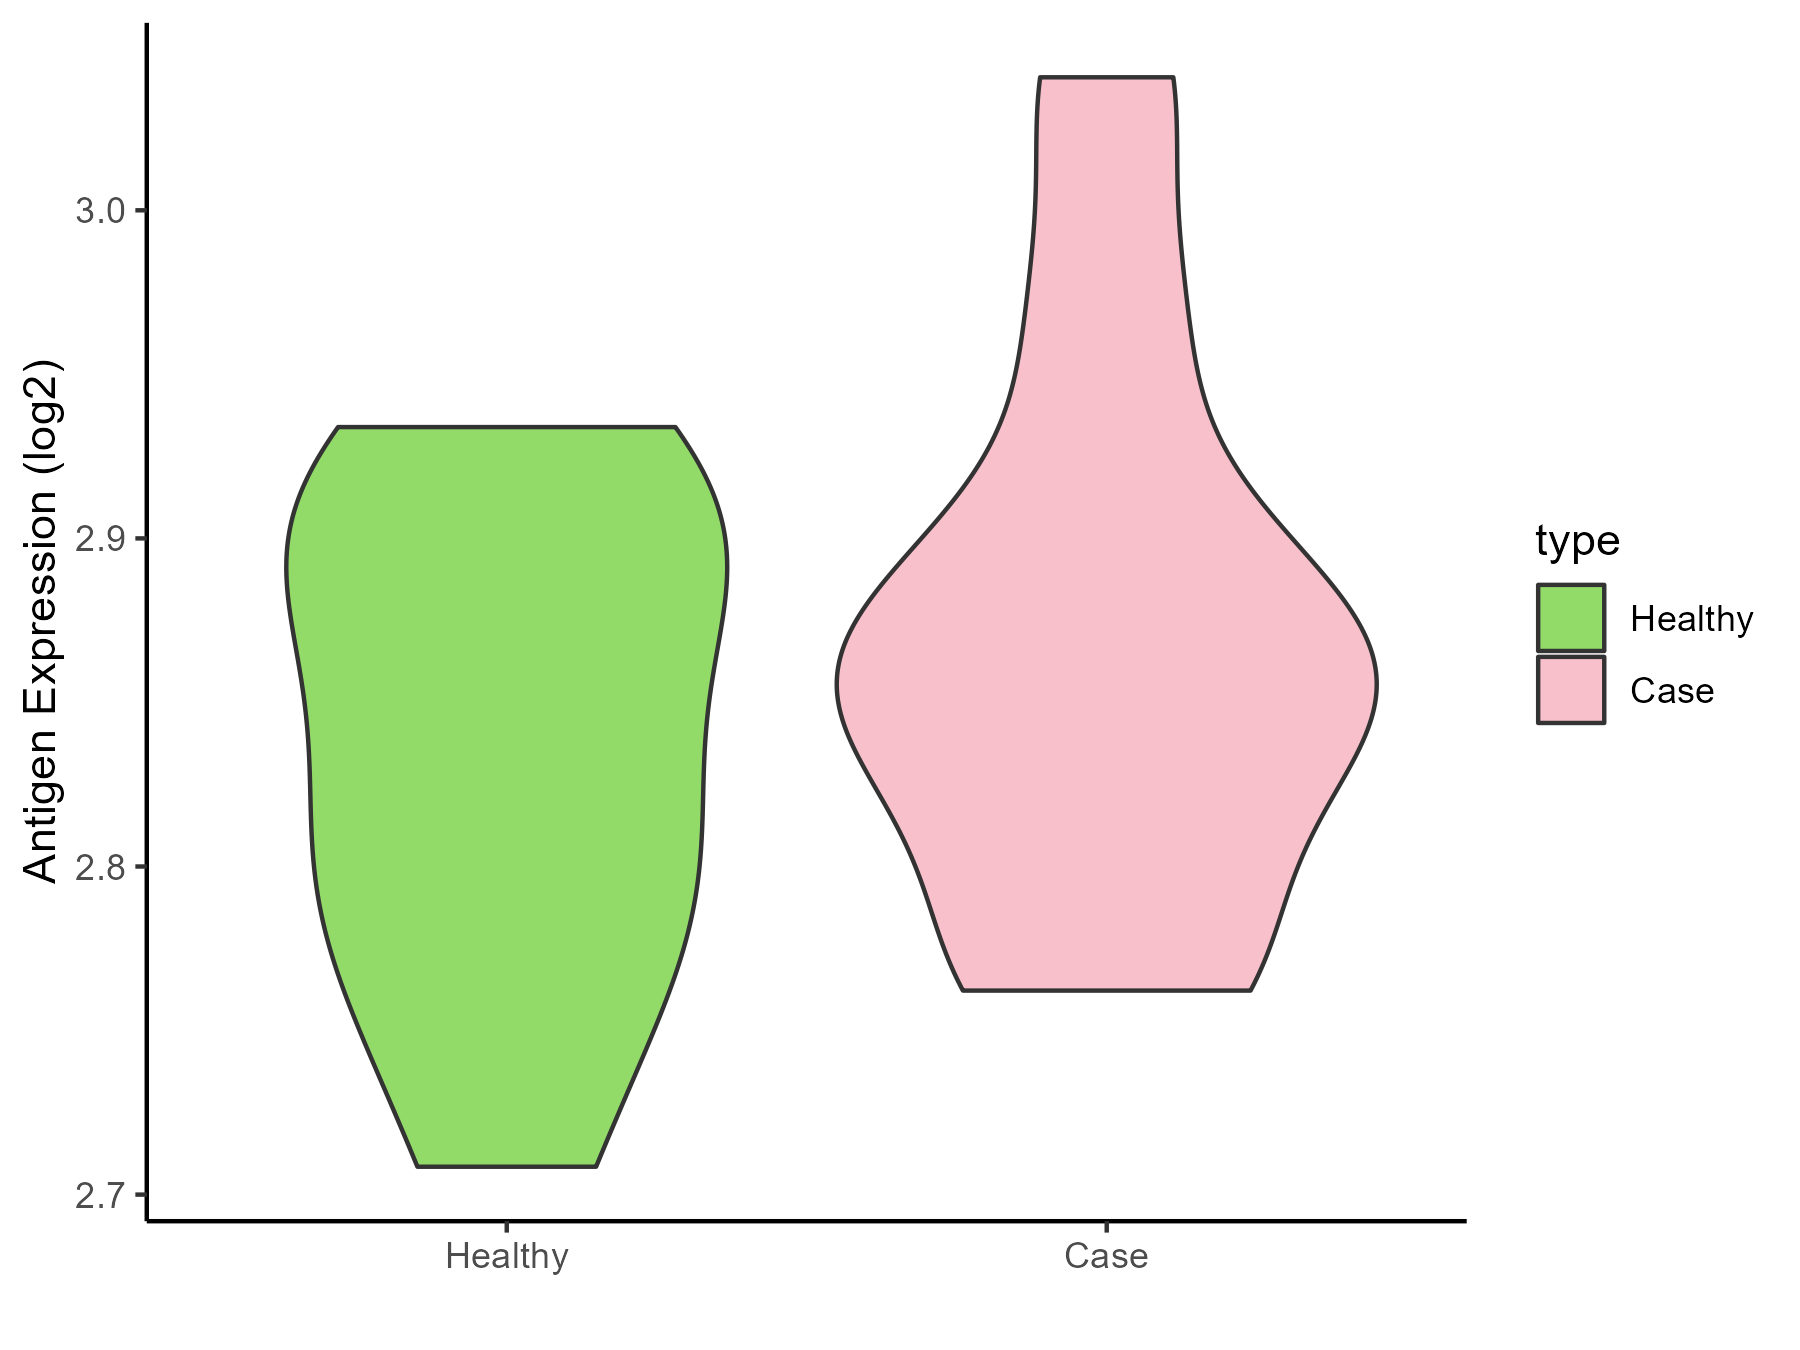
| The Studied Tissue | Whole blood | |
| The Specific Disease | Huntington disease | |
| The Expression Level of Disease Section Compare with the Healthy Individual Tissue | p-value: 0.390094221; Fold-change: 0.029552171; Z-score: 0.390796174 | |
| Disease-specific Antigen Abundances |
|
Click to View the Clearer Original Diagram |
| Differential expression pattern of antigen in diseases | ||
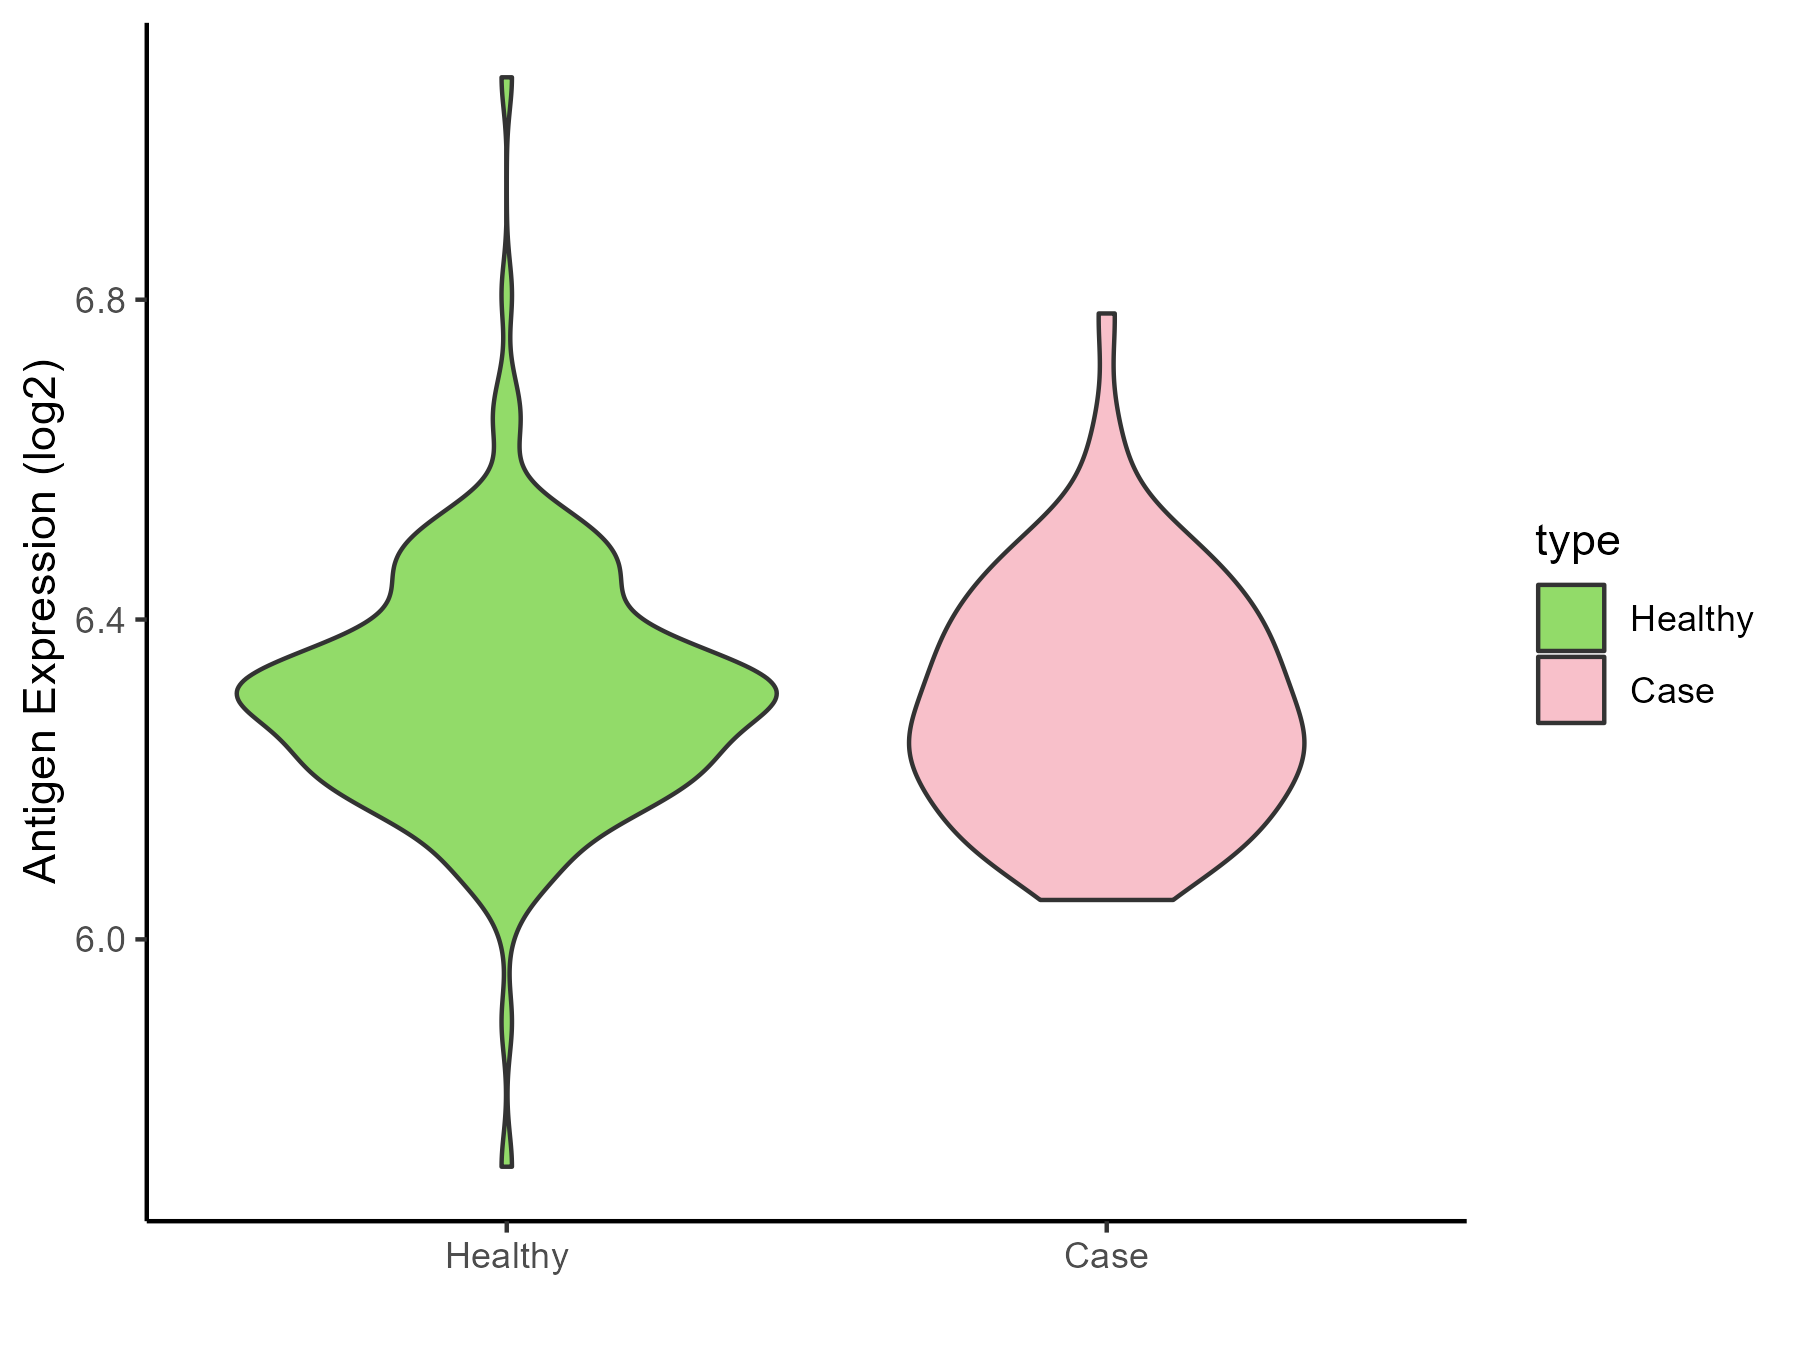
| The Studied Tissue | Entorhinal cortex | |
| The Specific Disease | Alzheimer disease | |
| The Expression Level of Disease Section Compare with the Healthy Individual Tissue | p-value: 0.482260266; Fold-change: -0.030646135; Z-score: -0.198808171 | |
| Disease-specific Antigen Abundances |
|
Click to View the Clearer Original Diagram |
| Differential expression pattern of antigen in diseases | ||
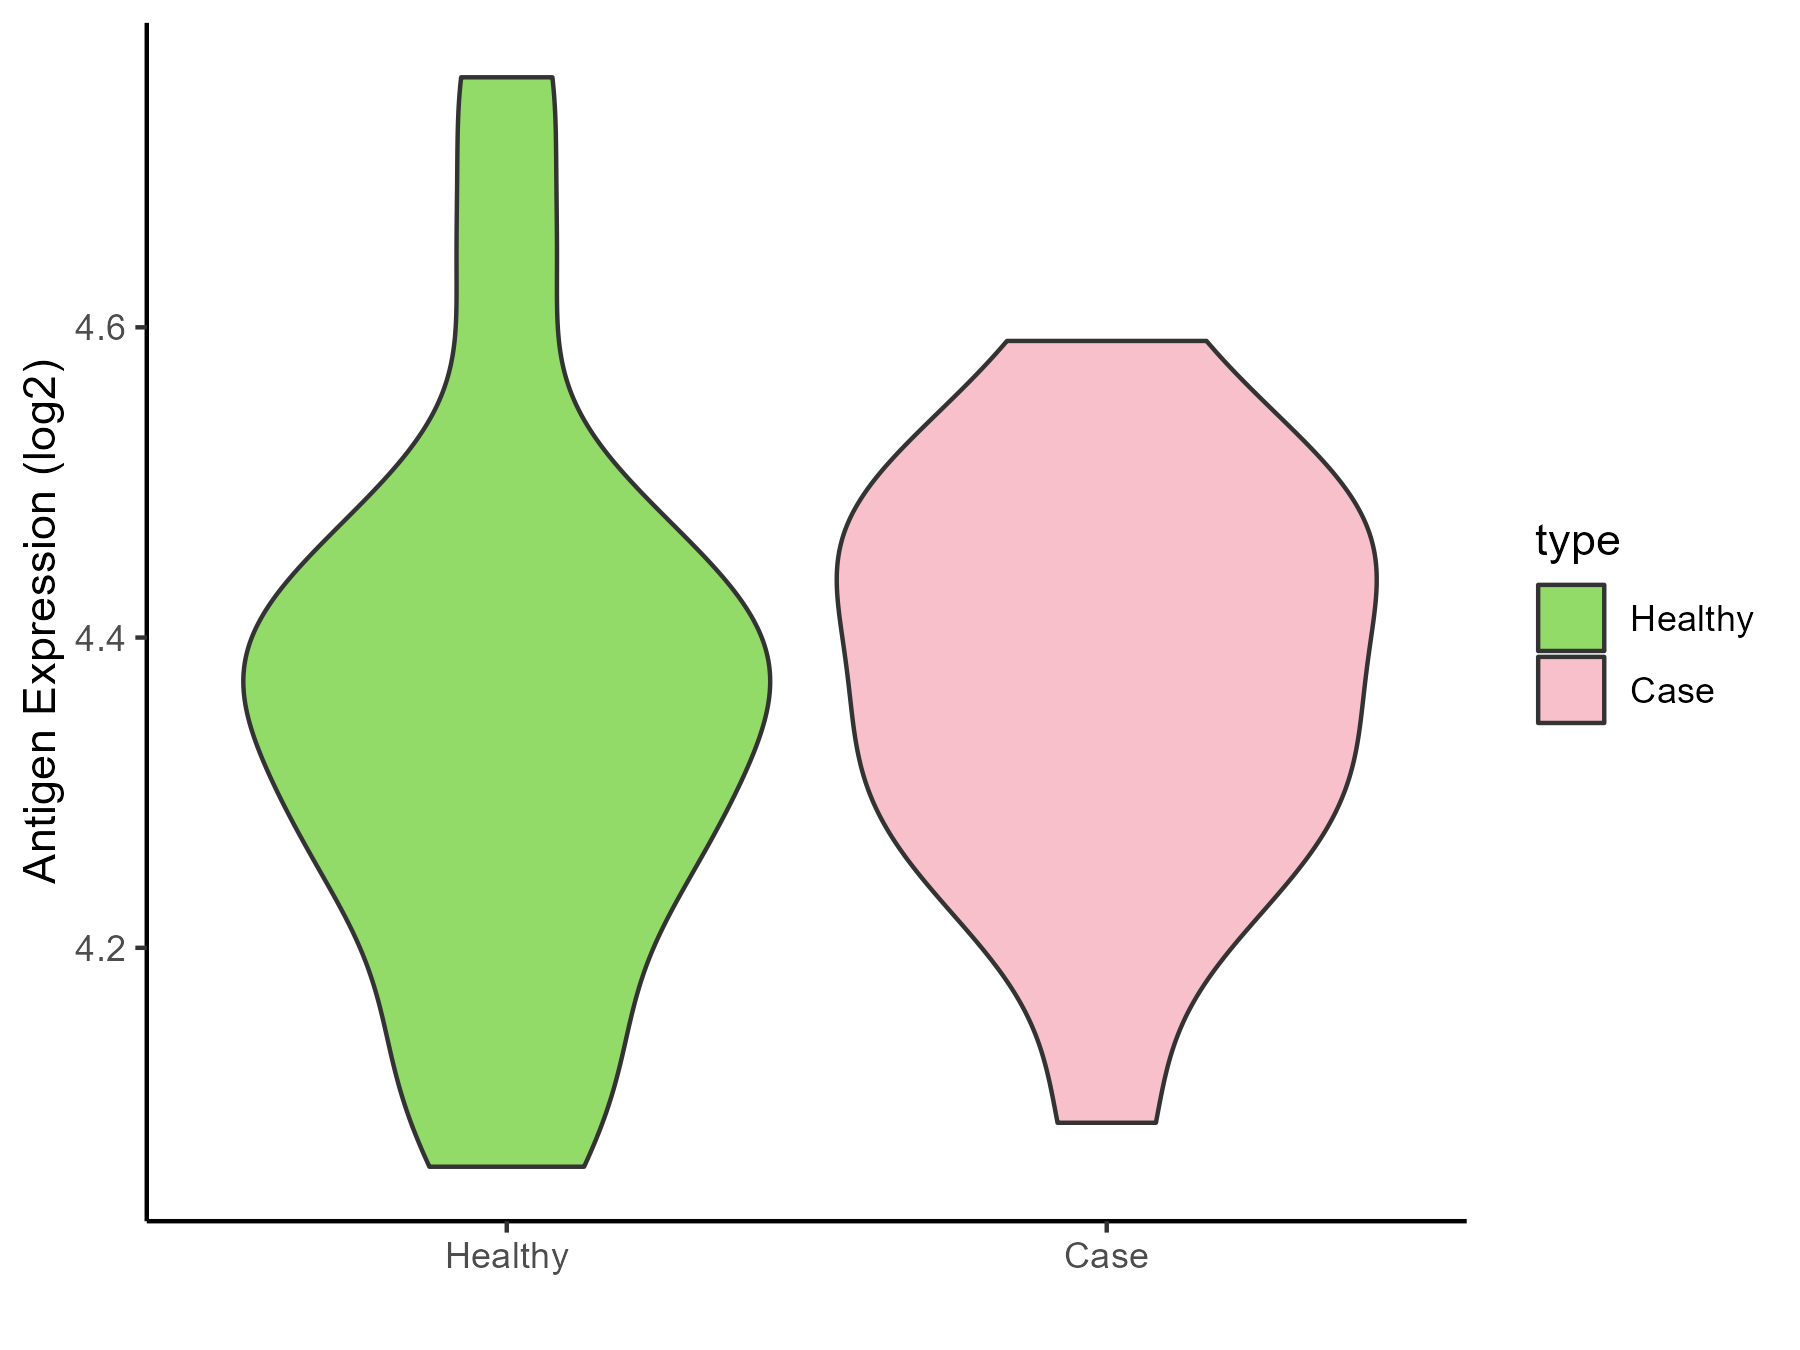
| The Studied Tissue | Whole blood | |
| The Specific Disease | Seizure | |
| The Expression Level of Disease Section Compare with the Healthy Individual Tissue | p-value: 0.767480608; Fold-change: 0.002766197; Z-score: 0.015332646 | |
| Disease-specific Antigen Abundances |
|
Click to View the Clearer Original Diagram |
| Differential expression pattern of antigen in diseases | ||
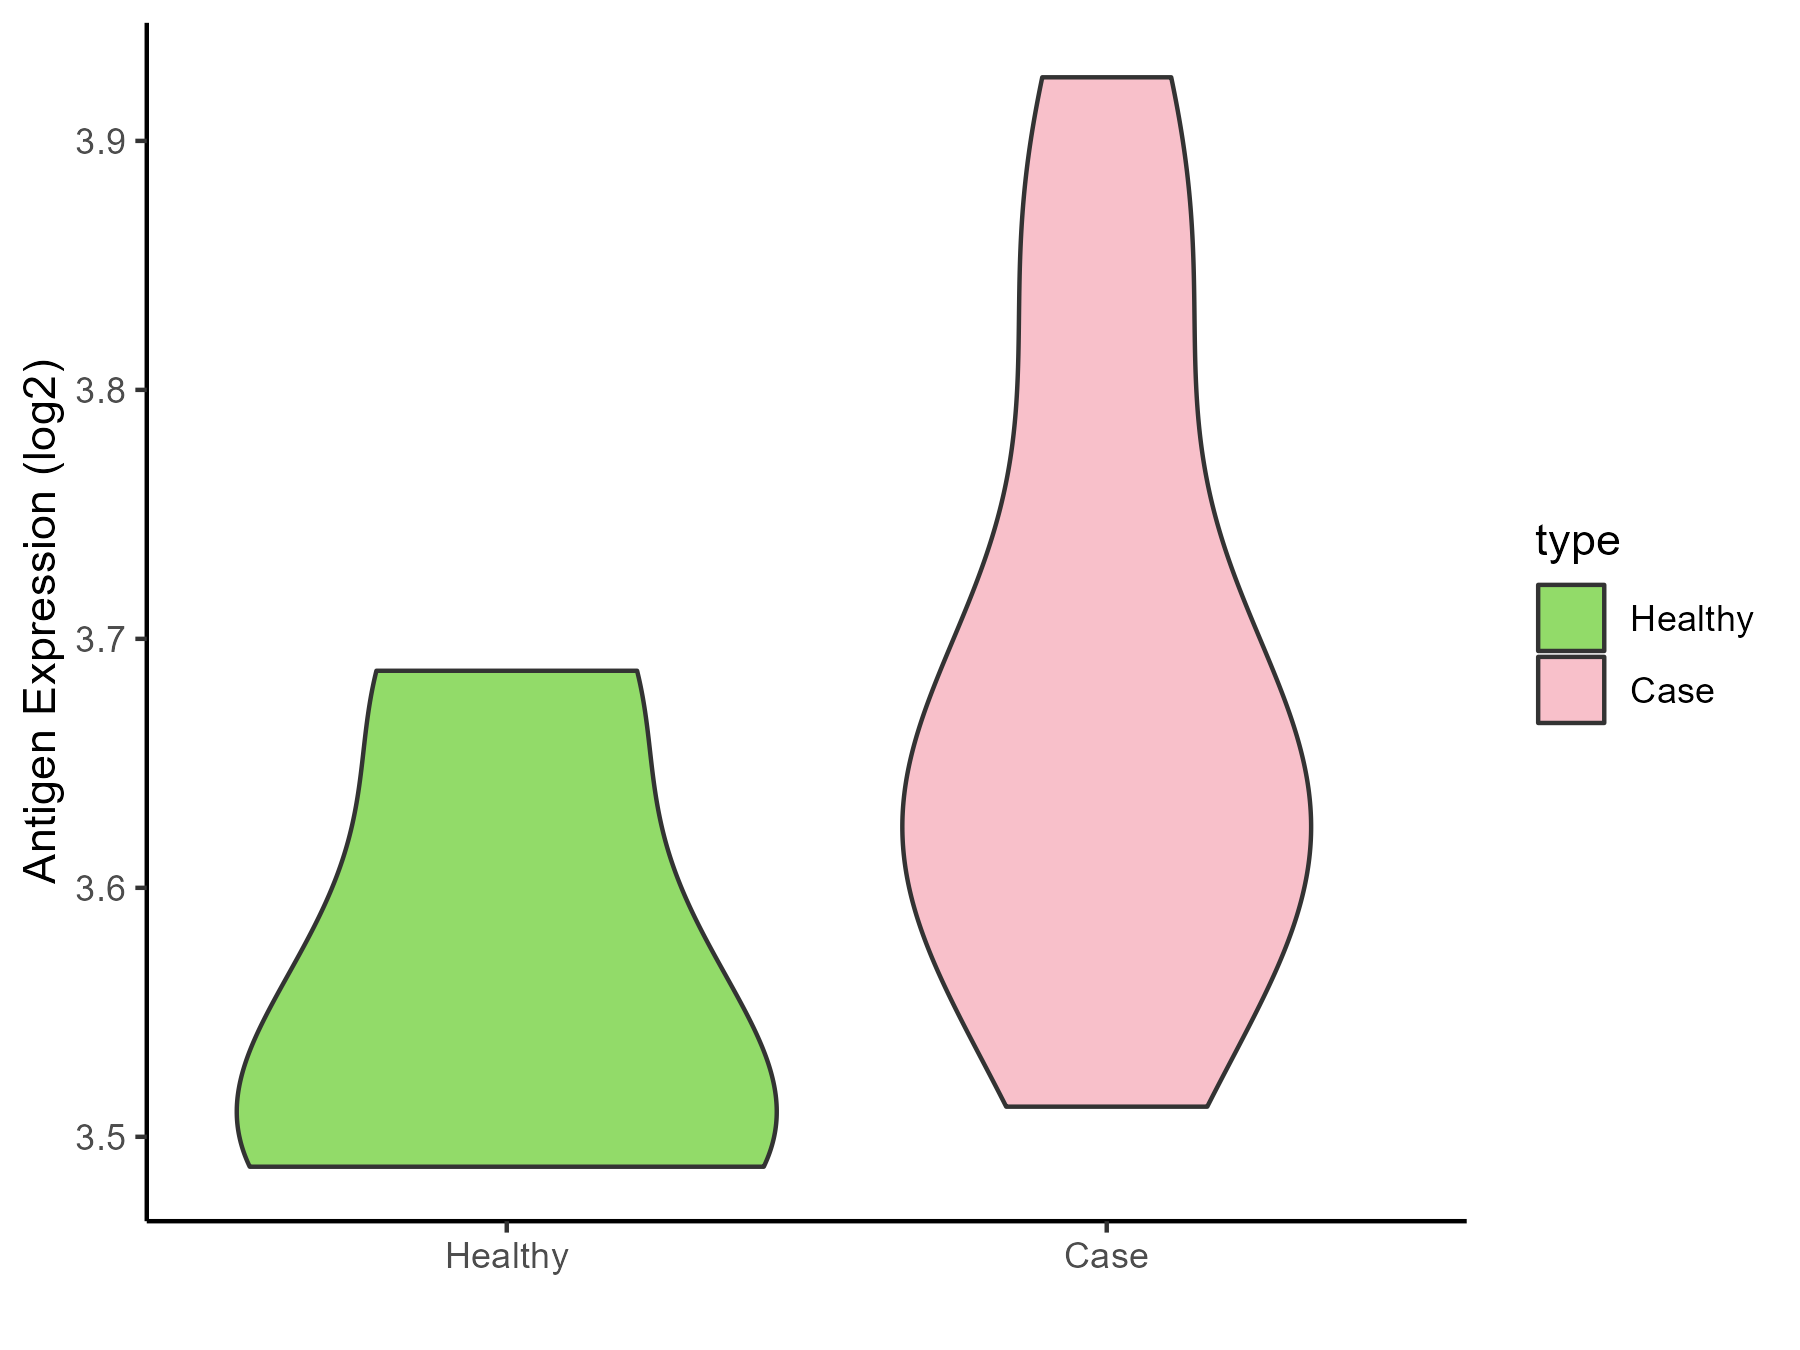
| The Studied Tissue | Skin | |
| The Specific Disease | Lateral sclerosis | |
| The Expression Level of Disease Section Compare with the Healthy Individual Tissue | p-value: 0.072311493; Fold-change: 0.116205592; Z-score: 1.253386143 | |
| Disease-specific Antigen Abundances |
|
Click to View the Clearer Original Diagram |
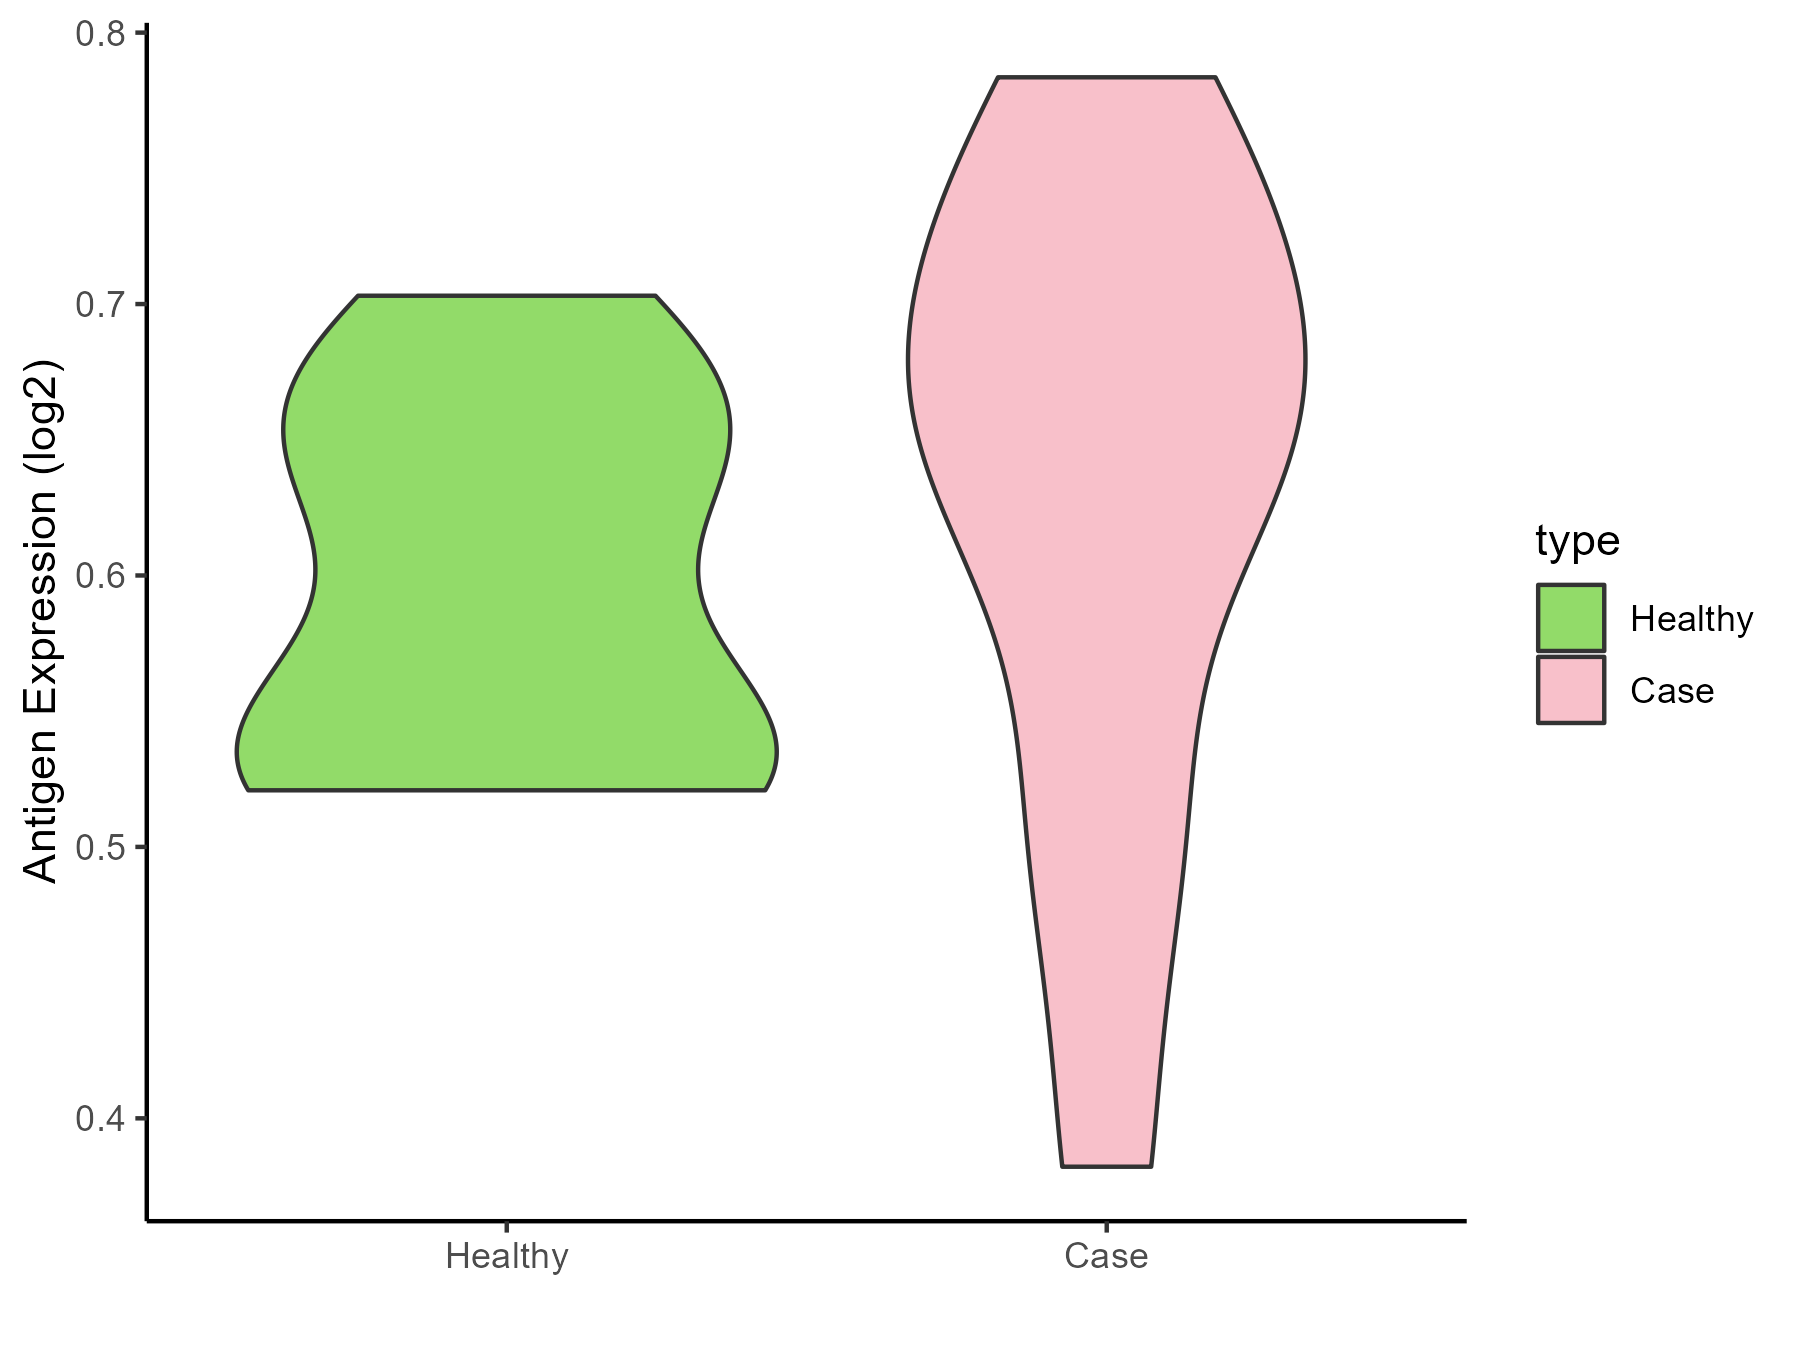
| The Studied Tissue | Cervical spinal cord | |
| The Specific Disease | Lateral sclerosis | |
| The Expression Level of Disease Section Compare with the Healthy Individual Tissue | p-value: 0.432492233; Fold-change: 0.085627272; Z-score: 1.200927278 | |
| Disease-specific Antigen Abundances |
|
Click to View the Clearer Original Diagram |
| Differential expression pattern of antigen in diseases | ||
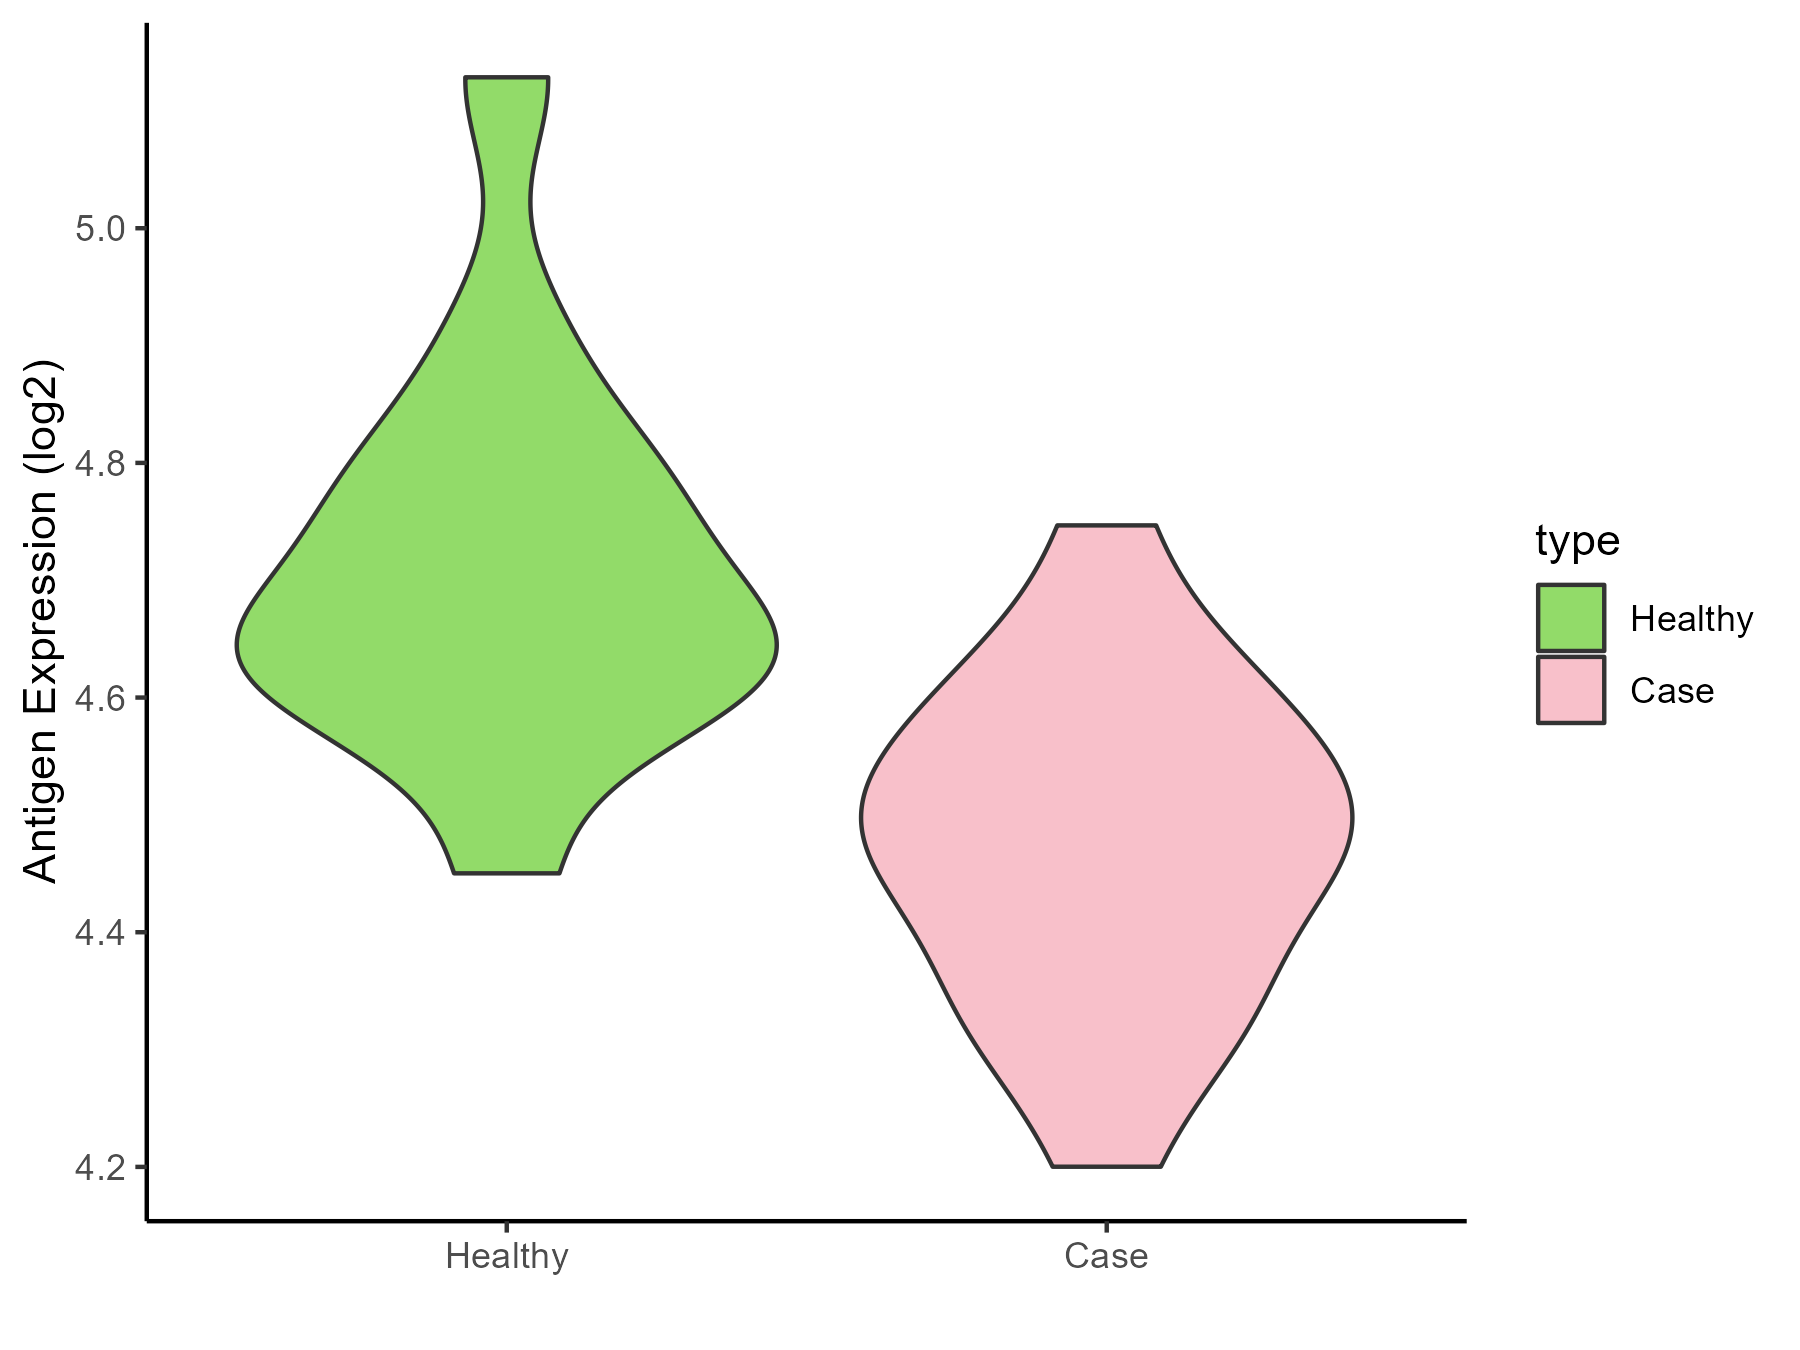
| The Studied Tissue | Muscle | |
| The Specific Disease | Muscular atrophy | |
| The Expression Level of Disease Section Compare with the Healthy Individual Tissue | p-value: 0.000347009; Fold-change: -0.18159912; Z-score: -1.070064603 | |
| Disease-specific Antigen Abundances |
|
Click to View the Clearer Original Diagram |
| Differential expression pattern of antigen in diseases | ||
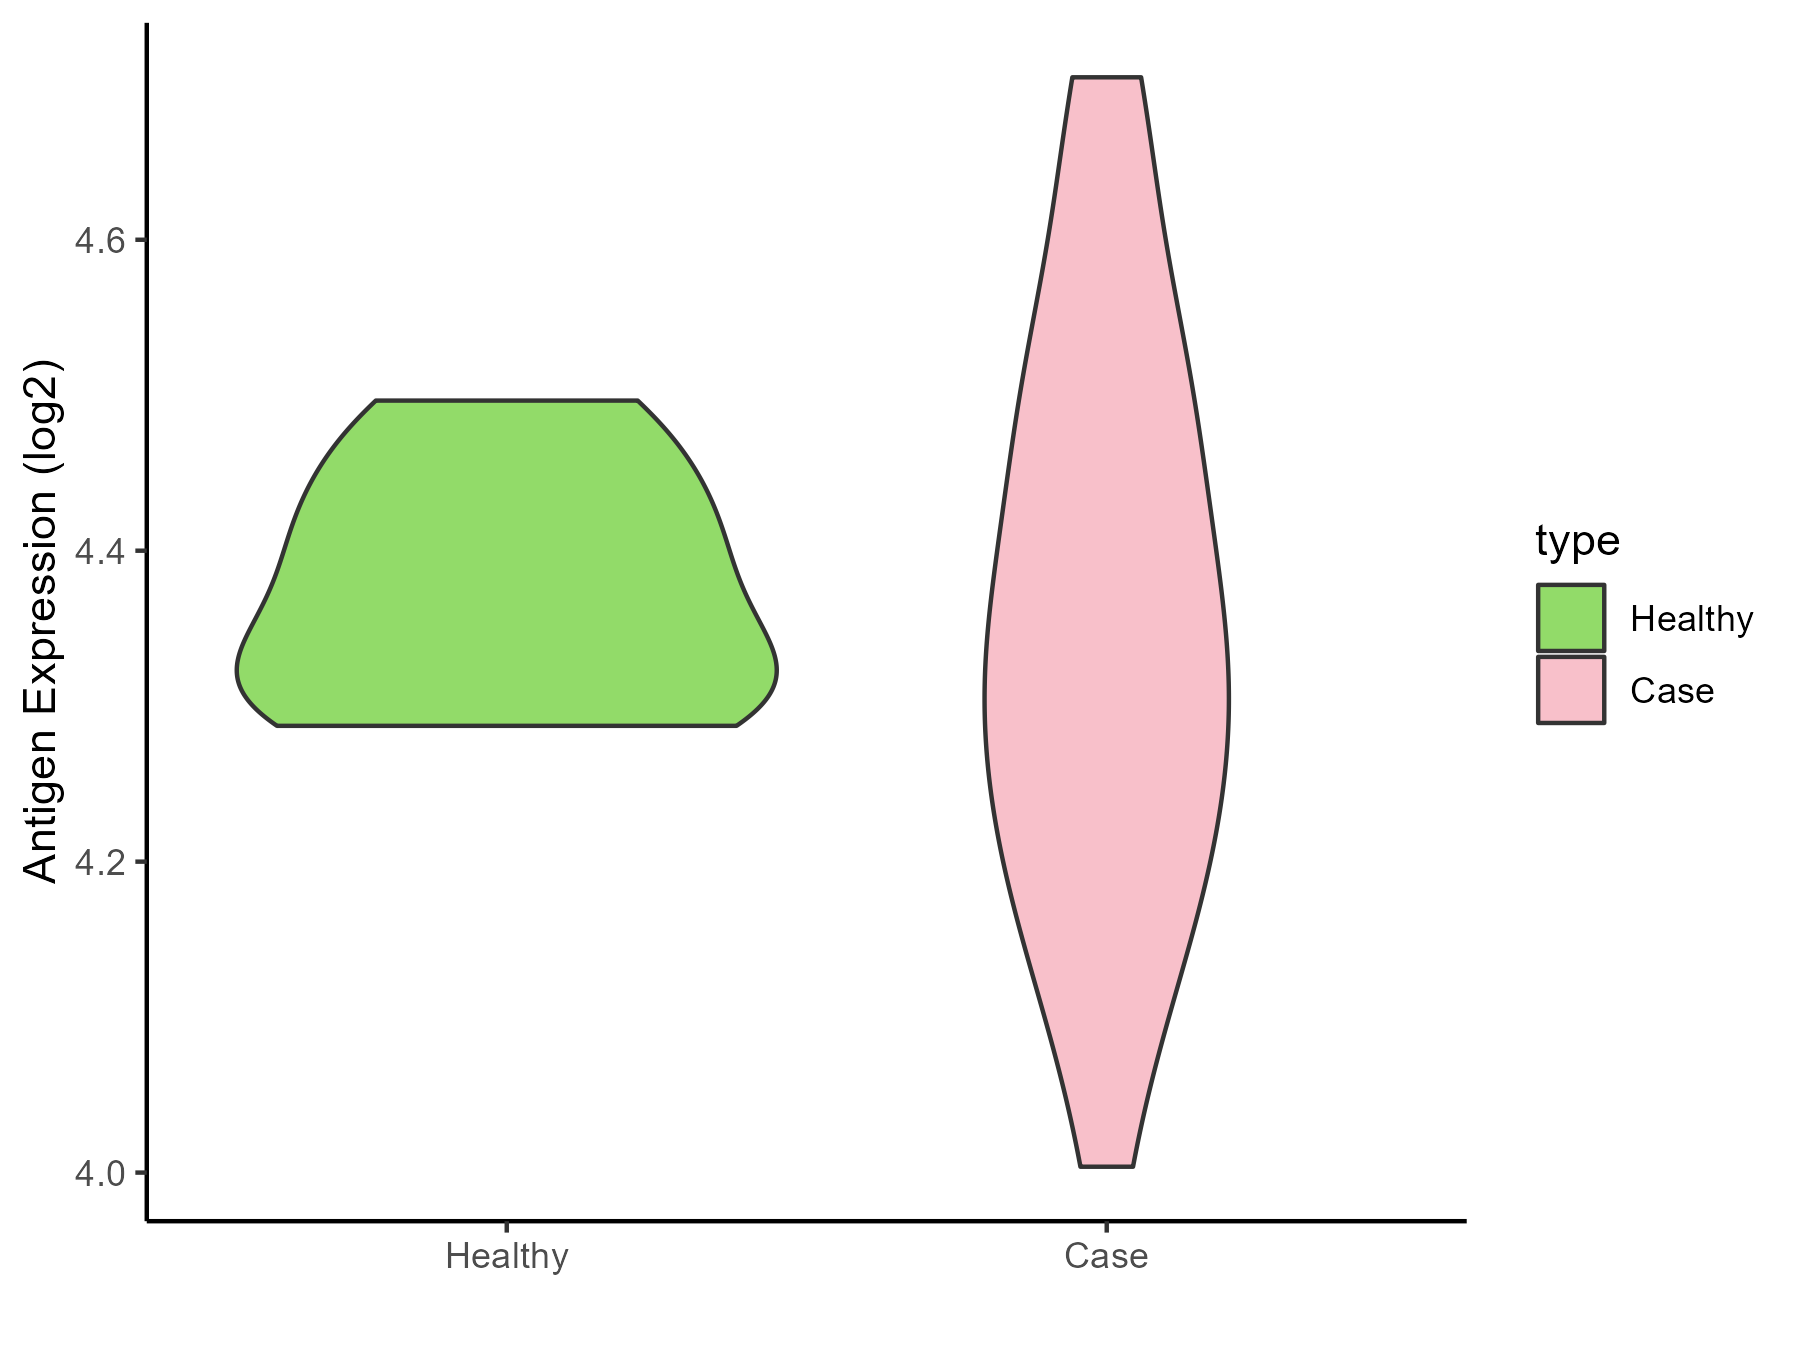
| The Studied Tissue | Muscle | |
| The Specific Disease | Myopathy | |
| The Expression Level of Disease Section Compare with the Healthy Individual Tissue | p-value: 0.623916221; Fold-change: -0.034074071; Z-score: -0.442522756 | |
| Disease-specific Antigen Abundances |
|
Click to View the Clearer Original Diagram |
References
