
Payload Information
General Information of This Payload (ID: PAY0GQQXD)
| Name |
PBD-butanamide derivative
|
|||||
|---|---|---|---|---|---|---|
| Synonyms |
compound 19
Click to Show/Hide
|
|||||
| Target | DNA topoisomerase I (TOP1) | |||||
| Structure |
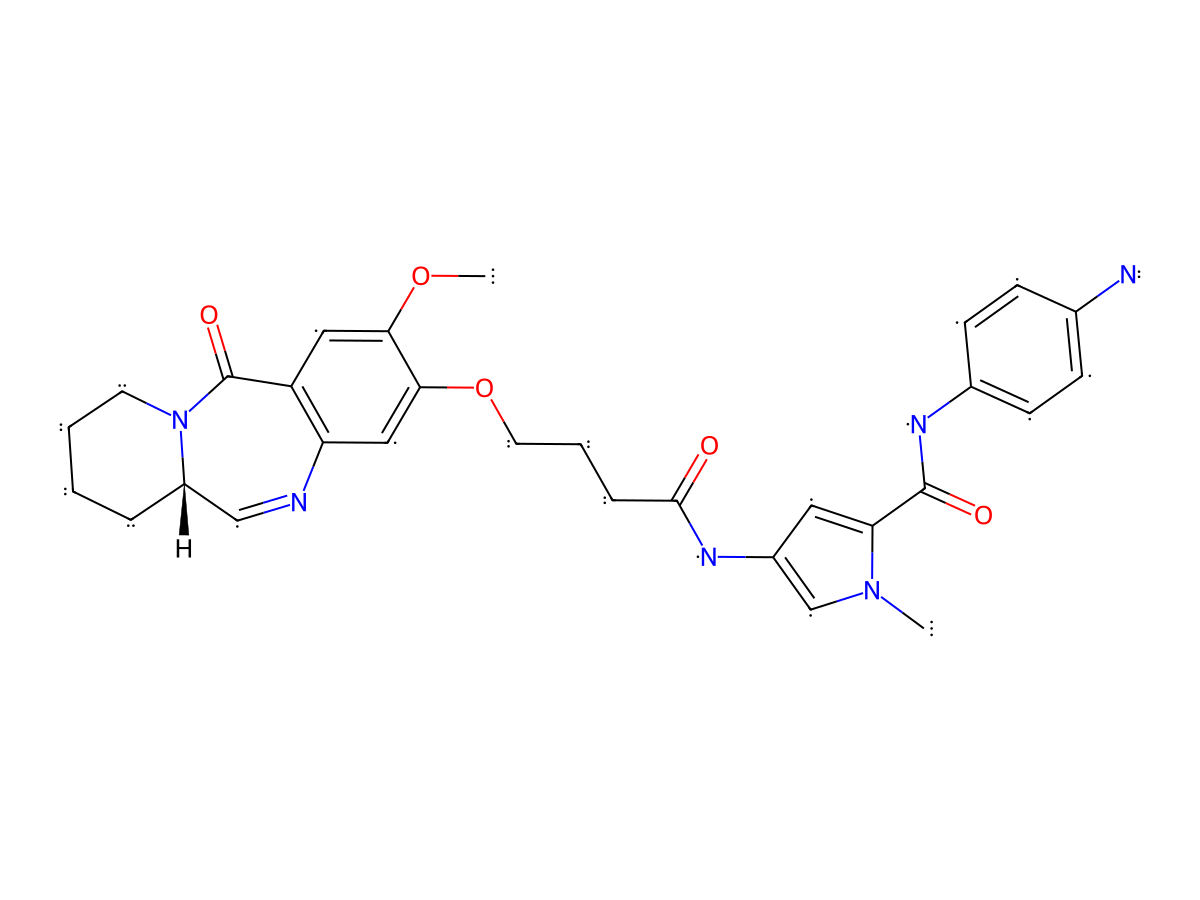
|
|||||
| Formula | C30H34N6O5 |
|||||
| Isosmiles | O=C(C1=CC(NC(CCCOC2=C(OC)C=C3C(N=C[C@@](CCCC4)([H])N4C3=O)=C2)=O)=CN1C)NC5=CC=C(N)C=C5 |
|||||
| PubChem CID | ||||||
| InChI |
InChI=1S/C30H34N6O5/c1-35-18-21(14-25(35)29(38)34-20-10-8-19(31)9-11-20)33-28(37)7-5-13-41-27-16-24-23(15-26(27)40-2)30(39)36-12-4-3-6-22(36)17-32-24/h8-11,14-18,22H,3-7,12-13,31H2,1-2H3,(H,33,37)(H,34,38)/t22-/m0/s1
|
|||||
| InChIKey |
FCZHEPZAEOWCRU-QFIPXVFZSA-N
|
|||||
| Pharmaceutical Properties | Molecule Weight |
558.639 |
Polar area |
140.28 |
||
Complexity |
1483.475584 |
xlogp Value |
4.3765 |
|||
Heavy Count |
41 |
Rot Bonds |
9 |
|||
Hbond acc |
8 |
Hbond Donor |
3 |
|||
Each Antibody-drug Conjugate Related to This Payload
Full Information of The Activity Data of The ADC(s) Related to This Payload
AU2023308528A1 ADC2 [Investigative]
Discovered Using Cell Line-derived Xenograft Model
| Experiment 1 Reporting the Activity Date of This ADC | [1] | ||||
| Efficacy Data | Tumor Growth lnhibition value (TGl) | > 50% | |||
| Method Description |
mean tumour volume versus time after multiple doses of ADC2 (either Days 1, 8 and 15 or Days 1, 22 and 43) against MDA-MB-231 at 5 mg/kg.
|
||||
| In Vivo Model | MDA-MB-231 Xenograft Model | ||||
| Experiment 2 Reporting the Activity Date of This ADC | [1] | ||||
| Efficacy Data | Tumor Growth lnhibition value (TGl) | > 75% | |||
| Method Description |
one dose of ADC2 (Day 1) against MDA-MB-231 at 5 mg/kg, single IV.
|
||||
| In Vivo Model | MDA-MB-231 Xenograft Model | ||||
| Experiment 3 Reporting the Activity Date of This ADC | [1] | ||||
| Efficacy Data | Complete Remission (CR) | . . . | |||
| Method Description |
one dose of ADC2 (Day 1) against MDA-MB-231 at 10 mg/kg, single IV.
|
||||
| In Vivo Model | MDA-MB-231 Xenograft Model | ||||
| Experiment 4 Reporting the Activity Date of This ADC | [1] | ||||
| Efficacy Data | Complete Remission (CR) | . . . | |||
| Method Description |
mean tumour volume versus time after multiple doses of ADC2 (either Days 1, 8 and 15 or Days 1, 22 and 43) against MDA-MB-231 at 10 mg/kg.
|
||||
| In Vivo Model | MDA-MB-231 Xenograft Model | ||||
Trastuzumab 20 [Investigative]
Revealed Based on the Cell Line Data
| Experiment 1 Reporting the Activity Date of This ADC | [2] | ||||
| Efficacy Data | Half Maximal inhibitory Concentration (lC50) |
1.3۪.04 nM
|
Positive HER2 expression (HER2+++/++) | ||
| Method Description |
Tumor cell lines were maintained in RPMI1640 medium supplemented with 10% heat-inactivated fetal bovine serum, 2 mM L-glutamine and 1 mM sodium pyruvate. 1800 cells per well were seeded in a volume of 180 uL in a 96-well flat bottom polystyrene plate. The cells were allowed to adhere overnight at 37 °C in a CO2 incubator. Ligands were initially formulated in dimethyl sulphoxide, and stocks stored at -80 °C. They were then further formulated at 10× concentration in RPMI1640 medium. 20 uL of diluted samples were added into each treatment well. On each plate, blank wells with no cells, and untreated wells containing cells, were included. Plates were then cultured at 37 °C in a CO2 incubator for 96 h. Cytotoxicity was evaluated in triplicate using a tetrazolium salt-based assay, the MTT assay. After 96 h, the supernatant was removed from each well and 200 uL of a sterile filtered 500 ug mL-1 MTT solution in water added to each well. The plates were then incubated at 37 °C in a CO2 incubator for 4 h. The supernatant was then removed and the formazan crystals formed solubilized by adding 150 uL of dimethyl sulphoxide to each well. The plate was then read on a plate reader at 540 nm, and percentage cell survival calculated as follows: ((mean absorbance treated wells at concentration x - mean absorbance blank wells) ÷ (mean absorbance untreated wells at concentration x - mean absorbance blank wells)) × 100. Data were plotted as concentration in nM vs. % cell survival, and IC50 values for inhibition of cell growth were determined with the GraphPad Prism software using non-linear regression.
Click to Show/Hide
|
||||
| In Vitro Model | Pancreatic ductal adenocarcinoma | Capan-1 cells | CVCL_0237 | ||
| Experiment 2 Reporting the Activity Date of This ADC | [2] | ||||
| Efficacy Data | Half Maximal inhibitory Concentration (lC50) |
29.7۫.55 nM
|
Negative HER2 expression (HER2-) | ||
| Method Description |
Tumor cell lines were maintained in RPMI1640 medium supplemented with 10% heat-inactivated fetal bovine serum, 2 mM L-glutamine and 1 mM sodium pyruvate. 1800 cells per well were seeded in a volume of 180 uL in a 96-well flat bottom polystyrene plate. The cells were allowed to adhere overnight at 37 °C in a CO2 incubator. Ligands were initially formulated in dimethyl sulphoxide, and stocks stored at -80 °C. They were then further formulated at 10× concentration in RPMI1640 medium. 20 uL of diluted samples were added into each treatment well. On each plate, blank wells with no cells, and untreated wells containing cells, were included. Plates were then cultured at 37 °C in a CO2 incubator for 96 h. Cytotoxicity was evaluated in triplicate using a tetrazolium salt-based assay, the MTT assay. After 96 h, the supernatant was removed from each well and 200 uL of a sterile filtered 500 ug mL-1 MTT solution in water added to each well. The plates were then incubated at 37 °C in a CO2 incubator for 4 h. The supernatant was then removed and the formazan crystals formed solubilized by adding 150 uL of dimethyl sulphoxide to each well. The plate was then read on a plate reader at 540 nm, and percentage cell survival calculated as follows: ((mean absorbance treated wells at concentration x - mean absorbance blank wells) ÷ (mean absorbance untreated wells at concentration x - mean absorbance blank wells)) × 100. Data were plotted as concentration in nM vs. % cell survival, and IC50 values for inhibition of cell growth were determined with the GraphPad Prism software using non-linear regression.
Click to Show/Hide
|
||||
| In Vitro Model | Invasive breast carcinoma | MCF-7 cells | CVCL_0031 | ||
References