
Linker Information
General Information of This Linker (ID: LIN0TDJYJ)
| Name |
DBCO-PEG4-Val-Cit-PABC
|
|||||
|---|---|---|---|---|---|---|
| Linker Type |
Cathepsin-cleavable linker
|
|||||
| Antibody-Linker Relation |
Cleavable
|
|||||
| Structure |
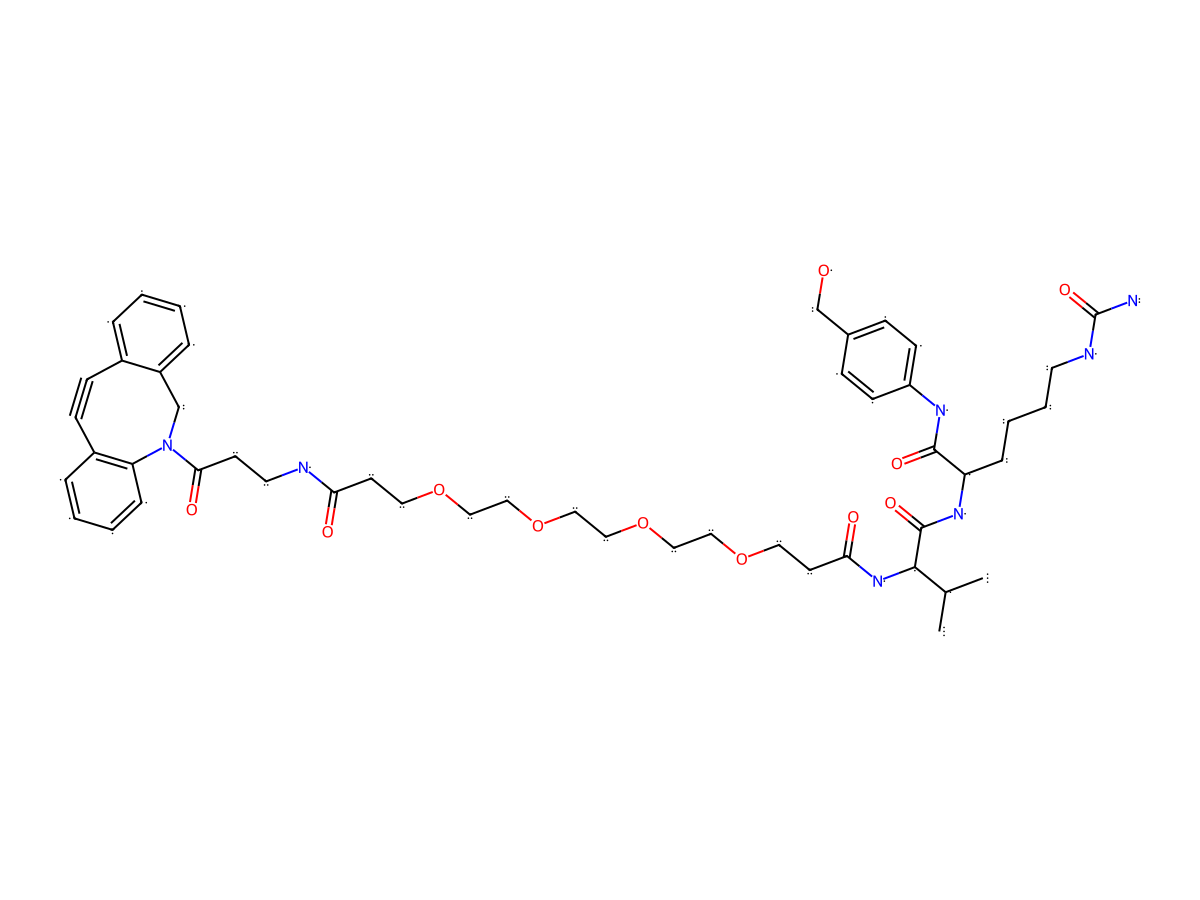
|
|||||
| Formula |
C48H63N7O11
|
|||||
| Isosmiles |
CC(C)[C@@H](C(N[C@H](C(NC1=CC=C(CO)C=C1)=O)CCCNC(N)=O)=O)NC(CCOCCOCCOCCOCCC(NCCC(N2CC3=C(C#CC4=C2C=CC=C4)C=CC=C3)=O)=O)=O
|
|||||
| InChI |
InChI=1S/C48H63N7O11/c1-34(2)45(47(61)53-40(11-7-22-51-48(49)62)46(60)52-39-17-13-35(33-56)14-18-39)54-43(58)21-25-64-27-29-66-31-30-65-28-26-63-24-20-42(57)50-23-19-44(59)55-32-38-10-4-3-8-36(38)15-16-37-9-5-6-12-41(37)55/h3-6,8-10,12-14,17-18,34,40,45,56H,7,11,19-33H2,1-2H3,(H,50,57)(H,52,60)(H,53,61)(H,54,58)(H3,49,51,62)/t40-,45-/m0/s1
|
|||||
| InChIKey |
NYXPHZOLQUKWLQ-FQDNZFBXSA-N
|
|||||
| Pharmaceutical Properties |
Molecule Weight
|
914.07
|
Polar area
|
248.98
|
||
|
Complexity
|
2032.450432
|
xlogp Value
|
2.491
|
|||
|
Heavy Count
|
66
|
Rot Bonds
|
29
|
|||
|
Hbond acc
|
11
|
Hbond Donor
|
7
|
|||
Each Antibody-drug Conjugate Related to This Linker
Full Information of The Activity Data of The ADC(s) Related to This Linker
chMC-813-70-VC-PAB-MMAE [Investigative]
Revealed Based on the Cell Line Data
| Experiment 1 Reporting the Activity Date of This ADC | [1] | ||||
| Efficacy Data | Half Maximal inhibitory Concentration (lC50) |
0.211 nM
|
Positive HER2 expression (HER2+++/++) | ||
| Method Description |
Having ADCs with cleavable and non-cleavable linkers in place, we next assessed there in vitro cytotoxicity activities using SSEA4-expressing ovarian SKVO3 cells and breast cancer cells SKBR3 with a negligible expression of SSEA4 and 293T cells as a control. SK-OV3, SKBR3, and 293T cells (2×10³ cells/well) were incubated with ADC-1, ADC-2, and chMC-813-70 for 72 h and then treated with MTS at 37 °C. The conversion of the tetrazolium salt MTS (3- (4,5-dimethylthiazol-2-yl)-5- (3-carboxymethoxyphenyl)-2- (4-sulfophenyl)-2H-tetrazolium) to a purple formazan, as a measure of the percentage of viable cells, was measured by absorbance at 490 nm after 4 h. The untreated cells' absorbance was considered 100 % survival (Figure 4).
Click to Show/Hide
|
||||
| In Vitro Model | Ovarian serous adenocarcinoma | SKOV-3 cells | CVCL_0532 | ||
FL1-PNU [Investigative]
Revealed Based on the Cell Line Data
| Experiment 1 Reporting the Activity Date of This ADC | [2] | ||||
| Efficacy Data | Half Maximal Effective Concentration (EC50) |
0.005 nM
|
High uPAR expression (uPAR +++) | ||
| Method Description |
Cells, plated in triplicates at 3 × 10³ cells per well in 96-well plates, were dosed with eight series of fourfold serially diluted PNU conjugates, unconjugated FL1, and free toxin (Creative Biolabs, #ADC-P-025) in 100 ul of complete growth media. Control cells were incubated with PBS-supplemented media. Cell viability was measured after 3 or 5 days of incubation, using CellTiter 96 Aqueous one-solution cell-proliferation assay reagent (MTS, Promega, #G358), as per the vendor's recommendations. Plate absorbance was then measured at 490 and 650 nm (for background subtraction) using a Spectra Max Plus plate reader (Molecular Devices). Data were plotted as a function of drug concentration (nanomolar) in GraphPad Prism 9 and fitted to a four-parameter nonlinear regression function, from which EC50 values were derived.
Click to Show/Hide
|
||||
| In Vitro Model | Breast adenocarcinoma | MDA-MB-231 cells | CVCL_0062 | ||
| Experiment 2 Reporting the Activity Date of This ADC | [2] | ||||
| Efficacy Data | Half Maximal Effective Concentration (EC50) |
0.02 nM
|
High uPAR expression (uPAR +++) | ||
| Method Description |
Cells, plated in triplicates at 3 × 10³ cells per well in 96-well plates, were dosed with eight series of fourfold serially diluted PNU conjugates, unconjugated FL1, and free toxin (Creative Biolabs, #ADC-P-025) in 100 ul of complete growth media. Control cells were incubated with PBS-supplemented media. Cell viability was measured after 3 or 5 days of incubation, using CellTiter 96 Aqueous one-solution cell-proliferation assay reagent (MTS, Promega, #G358), as per the vendor's recommendations. Plate absorbance was then measured at 490 and 650 nm (for background subtraction) using a Spectra Max Plus plate reader (Molecular Devices). Data were plotted as a function of drug concentration (nanomolar) in GraphPad Prism 9 and fitted to a four-parameter nonlinear regression function, from which EC50 values were derived.
Click to Show/Hide
|
||||
| In Vitro Model | Pancreatic ductal adenocarcinoma | KPC2 cells | Mus musculus | ||
| Experiment 3 Reporting the Activity Date of This ADC | [2] | ||||
| Efficacy Data | Half Maximal Effective Concentration (EC50) |
0.03 nM
|
High uPAR expression (uPAR +++) | ||
| Method Description |
Cells, plated in triplicates at 3 × 10³ cells per well in 96-well plates, were dosed with eight series of fourfold serially diluted PNU conjugates, unconjugated FL1, and free toxin (Creative Biolabs, #ADC-P-025) in 100 ul of complete growth media. Control cells were incubated with PBS-supplemented media. Cell viability was measured after 3 or 5 days of incubation, using CellTiter 96 Aqueous one-solution cell-proliferation assay reagent (MTS, Promega, #G358), as per the vendor's recommendations. Plate absorbance was then measured at 490 and 650 nm (for background subtraction) using a Spectra Max Plus plate reader (Molecular Devices). Data were plotted as a function of drug concentration (nanomolar) in GraphPad Prism 9 and fitted to a four-parameter nonlinear regression function, from which EC50 values were derived.
Click to Show/Hide
|
||||
| In Vitro Model | Pancreatic ductal adenocarcinoma | KPC1 cells | Mus musculus | ||
| Experiment 4 Reporting the Activity Date of This ADC | [2] | ||||
| Efficacy Data | Half Maximal Effective Concentration (EC50) |
0.05 nM
|
Moderate uPAR expression (uPAR++) | ||
| Method Description |
Cells, plated in triplicates at 3 × 10³ cells per well in 96-well plates, were dosed with eight series of fourfold serially diluted PNU conjugates, unconjugated FL1, and free toxin (Creative Biolabs, #ADC-P-025) in 100 ul of complete growth media. Control cells were incubated with PBS-supplemented media. Cell viability was measured after 3 or 5 days of incubation, using CellTiter 96 Aqueous one-solution cell-proliferation assay reagent (MTS, Promega, #G358), as per the vendor's recommendations. Plate absorbance was then measured at 490 and 650 nm (for background subtraction) using a Spectra Max Plus plate reader (Molecular Devices). Data were plotted as a function of drug concentration (nanomolar) in GraphPad Prism 9 and fitted to a four-parameter nonlinear regression function, from which EC50 values were derived.
Click to Show/Hide
|
||||
| In Vitro Model | Pancreatic ductal adenocarcinoma | BxPC-3 cells | CVCL_0186 | ||
| Experiment 5 Reporting the Activity Date of This ADC | [2] | ||||
| Efficacy Data | Half Maximal Effective Concentration (EC50) |
0.08 nM
|
High uPAR expression (uPAR +++) | ||
| Method Description |
Cells, plated in triplicates at 3 × 10³ cells per well in 96-well plates, were dosed with eight series of fourfold serially diluted PNU conjugates, unconjugated FL1, and free toxin (Creative Biolabs, #ADC-P-025) in 100 ul of complete growth media. Control cells were incubated with PBS-supplemented media. Cell viability was measured after 3 or 5 days of incubation, using CellTiter 96 Aqueous one-solution cell-proliferation assay reagent (MTS, Promega, #G358), as per the vendor's recommendations. Plate absorbance was then measured at 490 and 650 nm (for background subtraction) using a Spectra Max Plus plate reader (Molecular Devices). Data were plotted as a function of drug concentration (nanomolar) in GraphPad Prism 9 and fitted to a four-parameter nonlinear regression function, from which EC50 values were derived.
Click to Show/Hide
|
||||
| In Vitro Model | Pancreatic ductal adenocarcinoma | AsPc1 cells | CVCL_0152 | ||
| Experiment 6 Reporting the Activity Date of This ADC | [2] | ||||
| Efficacy Data | Half Maximal Effective Concentration (EC50) |
0.3 nM
|
Moderate uPAR expression (uPAR++) | ||
| Method Description |
Cells, plated in triplicates at 3 × 10³ cells per well in 96-well plates, were dosed with eight series of fourfold serially diluted PNU conjugates, unconjugated FL1, and free toxin (Creative Biolabs, #ADC-P-025) in 100 ul of complete growth media. Control cells were incubated with PBS-supplemented media. Cell viability was measured after 3 or 5 days of incubation, using CellTiter 96 Aqueous one-solution cell-proliferation assay reagent (MTS, Promega, #G358), as per the vendor's recommendations. Plate absorbance was then measured at 490 and 650 nm (for background subtraction) using a Spectra Max Plus plate reader (Molecular Devices). Data were plotted as a function of drug concentration (nanomolar) in GraphPad Prism 9 and fitted to a four-parameter nonlinear regression function, from which EC50 values were derived.
Click to Show/Hide
|
||||
| In Vitro Model | Pancreatic ductal adenocarcinoma | MIA PaCa-2 cells | CVCL_0428 | ||
| Experiment 7 Reporting the Activity Date of This ADC | [2] | ||||
| Efficacy Data | Half Maximal Effective Concentration (EC50) |
12 nM
|
Negative uPAR expression (uPAR-) | ||
| Method Description |
Cells, plated in triplicates at 3 × 10³ cells per well in 96-well plates, were dosed with eight series of fourfold serially diluted PNU conjugates, unconjugated FL1, and free toxin (Creative Biolabs, #ADC-P-025) in 100 ul of complete growth media. Control cells were incubated with PBS-supplemented media. Cell viability was measured after 3 or 5 days of incubation, using CellTiter 96 Aqueous one-solution cell-proliferation assay reagent (MTS, Promega, #G358), as per the vendor's recommendations. Plate absorbance was then measured at 490 and 650 nm (for background subtraction) using a Spectra Max Plus plate reader (Molecular Devices). Data were plotted as a function of drug concentration (nanomolar) in GraphPad Prism 9 and fitted to a four-parameter nonlinear regression function, from which EC50 values were derived.
Click to Show/Hide
|
||||
| In Vitro Model | Pancreatic ductal adenocarcinoma | KPC2 cells (uPAR KO) | Mus musculus | ||
| Experiment 8 Reporting the Activity Date of This ADC | [2] | ||||
| Efficacy Data | Half Maximal Effective Concentration (EC50) |
17 nM
|
Negative uPAR expression (uPAR-) | ||
| Method Description |
Cells, plated in triplicates at 3 × 10³ cells per well in 96-well plates, were dosed with eight series of fourfold serially diluted PNU conjugates, unconjugated FL1, and free toxin (Creative Biolabs, #ADC-P-025) in 100 ul of complete growth media. Control cells were incubated with PBS-supplemented media. Cell viability was measured after 3 or 5 days of incubation, using CellTiter 96 Aqueous one-solution cell-proliferation assay reagent (MTS, Promega, #G358), as per the vendor's recommendations. Plate absorbance was then measured at 490 and 650 nm (for background subtraction) using a Spectra Max Plus plate reader (Molecular Devices). Data were plotted as a function of drug concentration (nanomolar) in GraphPad Prism 9 and fitted to a four-parameter nonlinear regression function, from which EC50 values were derived.
Click to Show/Hide
|
||||
| In Vitro Model | Pancreatic ductal adenocarcinoma | KPC1 cells (uPAR KO) | Mus musculus | ||
aTCRA6 DAR2-8 [Investigative]
Revealed Based on the Cell Line Data
| Experiment 1 Reporting the Activity Date of This ADC | [3] | ||||
| Efficacy Data | Half Maximal Effective Concentration (EC50) |
0.1 nM
|
Positive TCRA6 expression (TCRA6+++/++) | ||
| Method Description |
Cytotoxic effects of aTCRA6 DAR2 and aTCRA6 DAR52-8 ADCs were estimated by exposing Jurkat WT and Jurkat TCRA6 T cells to different ADC concentrations. Cell viability was analyzed 72 h post ADC addition by a fluorometric method using CellTiter-Blue Cell Viability Assay (Promega, Wisconsin, USA) according to the manufacturer's instructions. Briefly, cells were seeded in a 96-well plate (1 × 10⁴ cells/well) with the desired ADC concentrations ranging from 0.06-400 nM (for DAR2 ADC) or 0.005-30 nM (for DAR52-8 ADC) in a serial dilution. After 72 h, redox dye (resazurin) was added to the cells, and the plate was incubated for 3-4 h. Fluorescence of resorufin (560Ex/590Em) was recorded using CLARIOstar plus microplate reader (BMG LABTECH, Offenburg, Germany). Cell proliferation was normalized to untreated control cell fluorescence values. The resulting curves were fitted with a variable slope four-parameter fit, and EC50s were calculated using GraphPad Prism.
Click to Show/Hide
|
||||
| In Vitro Model | Childhood T acute lymphoblastic leukemia, Precursor T-cell acute lymphoblastic leukemia | Jurkat cells (TCRA6+) | CVCL_0065 | ||
| Experiment 2 Reporting the Activity Date of This ADC | [3] | ||||
| Efficacy Data | Half Maximal Effective Concentration (EC50) | > 100 nM | Negative TCRA6 expression (TCRA6-) | ||
| Method Description |
Cytotoxic effects of aTCRA6 DAR2 and aTCRA6 DAR52-8 ADCs were estimated by exposing Jurkat WT and Jurkat TCRA6 T cells to different ADC concentrations. Cell viability was analyzed 72 h post ADC addition by a fluorometric method using CellTiter-Blue Cell Viability Assay (Promega, Wisconsin, USA) according to the manufacturer's instructions. Briefly, cells were seeded in a 96-well plate (1 × 10⁴ cells/well) with the desired ADC concentrations ranging from 0.06-400 nM (for DAR2 ADC) or 0.005-30 nM (for DAR52-8 ADC) in a serial dilution. After 72 h, redox dye (resazurin) was added to the cells, and the plate was incubated for 3-4 h. Fluorescence of resorufin (560Ex/590Em) was recorded using CLARIOstar plus microplate reader (BMG LABTECH, Offenburg, Germany). Cell proliferation was normalized to untreated control cell fluorescence values. The resulting curves were fitted with a variable slope four-parameter fit, and EC50s were calculated using GraphPad Prism.
Click to Show/Hide
|
||||
| In Vitro Model | Childhood T acute lymphoblastic leukemia, Precursor T-cell acute lymphoblastic leukemia | Jurkat cells (TCRA6-) | CVCL_0065 | ||
algM ADC [Investigative]
Revealed Based on the Cell Line Data
| Experiment 1 Reporting the Activity Date of This ADC | [4] | ||||
| Efficacy Data | Half Maximal Effective Concentration (EC50) |
0.66 nM
|
|||
| Method Description |
Cytotoxic effects of aIgM ADCs were evaluated by exposing IgM+ lymphoma B cells or off-target (IgM-) cells to different ADC concentrations. Cell viability was analyzed 72 h post ADC addition by a colorimetric method using CellTiter 96® AQueous One Solution Cell Proliferation Assay (Promega). Briefly, cells were seeded (1x10⁴ cells/well) in a 96-well plate with the desired antibody concentrations ranging from 0.014-90 nM in a serial dilution. After 72 h, MTS solution was added to the cells and plate was incubated for 2 h. Absorption was measured at 490 nm using CLARIOstar plus microplate reader (BMG LABTECH). Cell proliferation was normalized to untreated control cell absorption values. The resulting curves were fitted with a variable slope four-parameter fit and EC50s were calculated using GraphPad Prism.
Click to Show/Hide
|
||||
| In Vitro Model | Burkitt lymphoma | Ramos cells | CVCL_0597 | ||
aTCRA6 DAR2 [Investigative]
Revealed Based on the Cell Line Data
| Experiment 1 Reporting the Activity Date of This ADC | [3] | ||||
| Efficacy Data | Half Maximal Effective Concentration (EC50) |
3.6 nM
|
Positive TCRA6 expression (TCRA6+++/++) | ||
| Method Description |
Cytotoxic effects of aTCRA6 DAR2 and aTCRA6 DAR52-8 ADCs were estimated by exposing Jurkat WT and Jurkat TCRA6 T cells to different ADC concentrations. Cell viability was analyzed 72 h post ADC addition by a fluorometric method using CellTiter-Blue Cell Viability Assay (Promega, Wisconsin, USA) according to the manufacturer's instructions. Briefly, cells were seeded in a 96-well plate (1 × 10⁴ cells/well) with the desired ADC concentrations ranging from 0.06-400 nM (for DAR2 ADC) or 0.005-30 nM (for DAR52-8 ADC) in a serial dilution. After 72 h, redox dye (resazurin) was added to the cells, and the plate was incubated for 3-4 h. Fluorescence of resorufin (560Ex/590Em) was recorded using CLARIOstar plus microplate reader (BMG LABTECH, Offenburg, Germany). Cell proliferation was normalized to untreated control cell fluorescence values. The resulting curves were fitted with a variable slope four-parameter fit, and EC50s were calculated using GraphPad Prism.
Click to Show/Hide
|
||||
| In Vitro Model | Childhood T acute lymphoblastic leukemia, Precursor T-cell acute lymphoblastic leukemia | Jurkat cells (TCRA6+) | CVCL_0065 | ||
| Experiment 2 Reporting the Activity Date of This ADC | [3] | ||||
| Efficacy Data | Half Maximal Effective Concentration (EC50) | > 100 nM | Negative TCRA6 expression (TCRA6-) | ||
| Method Description |
Cytotoxic effects of aTCRA6 DAR2 and aTCRA6 DAR52-8 ADCs were estimated by exposing Jurkat WT and Jurkat TCRA6 T cells to different ADC concentrations. Cell viability was analyzed 72 h post ADC addition by a fluorometric method using CellTiter-Blue Cell Viability Assay (Promega, Wisconsin, USA) according to the manufacturer's instructions. Briefly, cells were seeded in a 96-well plate (1 × 10⁴ cells/well) with the desired ADC concentrations ranging from 0.06-400 nM (for DAR2 ADC) or 0.005-30 nM (for DAR52-8 ADC) in a serial dilution. After 72 h, redox dye (resazurin) was added to the cells, and the plate was incubated for 3-4 h. Fluorescence of resorufin (560Ex/590Em) was recorded using CLARIOstar plus microplate reader (BMG LABTECH, Offenburg, Germany). Cell proliferation was normalized to untreated control cell fluorescence values. The resulting curves were fitted with a variable slope four-parameter fit, and EC50s were calculated using GraphPad Prism.
Click to Show/Hide
|
||||
| In Vitro Model | Childhood T acute lymphoblastic leukemia, Precursor T-cell acute lymphoblastic leukemia | Jurkat cells (TCRA6-) | CVCL_0065 | ||
References