
Linker Information
General Information of This Linker (ID: LIN0ENDIF)
| Name |
Mc-Val-Ala
|
|||||
|---|---|---|---|---|---|---|
| Linker Type |
Cathepsin-cleavable linker
|
|||||
| Antibody-Linker Relation |
Cleavable
|
|||||
| Structure |
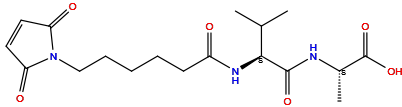
|
|||||
| Formula |
C18H27N3O6
|
|||||
| Isosmiles |
C[C@@H](C(=O)O)NC(=O)[C@H](C(C)C)NC(=O)CCCCCN1C(=O)C=CC1=O
|
|||||
| PubChem CID | ||||||
| InChI |
InChI=1S/C18H27N3O6/c1-11(2)16(17(25)19-12(3)18(26)27)20-13(22)7-5-4-6-10-21-14(23)8-9-15(21)24/h8-9,11-12,16H,4-7,10H2,1-3H3,(H,19,25)(H,20,22)(H,26,27)/t12-,16-/m0/s1
|
|||||
| InChIKey |
GSWKJIWKGSPISH-LRDDRELGSA-N
|
|||||
| IUPAC Name |
(2S)-2-[[(2S)-2-[6-(2,5-dioxopyrrol-1-yl)hexanoylamino]-3-methylbutanoyl]amino]propanoic acid
|
|||||
| Pharmaceutical Properties |
Molecule Weight
|
381.4
|
Polar area
|
133
|
||
|
Complexity
|
611
|
xlogp Value
|
0.5
|
|||
|
Heavy Count
|
27
|
Rot Bonds
|
11
|
|||
|
Hbond acc
|
6
|
Hbond Donor
|
3
|
|||
Each Antibody-drug Conjugate Related to This Linker
Full Information of The Activity Data of The ADC(s) Related to This Linker
T-VDXd [Investigative]
Revealed Based on the Cell Line Data
| Experiment 1 Reporting the Activity Date of This ADC | [1] | ||||
| Efficacy Data | Half Maximal Inhibitory Concentration (IC50) |
0.025 nM
|
|||
| In Vitro Model | Breast adenocarcinoma | MDA-MB-453 cells | CVCL_0418 | ||
| Experiment 2 Reporting the Activity Date of This ADC | [1] | ||||
| Efficacy Data | Half Maximal Inhibitory Concentration (IC50) |
0.052 nM
|
|||
| In Vitro Model | Gastric tubular adenocarcinoma | NCI-N87 cells | CVCL_1603 | ||
| Experiment 3 Reporting the Activity Date of This ADC | [1] | ||||
| Efficacy Data | Half Maximal Inhibitory Concentration (IC50) |
0.513 nM
|
|||
| In Vitro Model | Breast adenocarcinoma | SK-BR-3 cells | CVCL_0033 | ||
| Experiment 4 Reporting the Activity Date of This ADC | [1] | ||||
| Efficacy Data | Half Maximal Inhibitory Concentration (IC50) | > 50 nM | |||
| In Vitro Model | Breast adenocarcinoma | MDA-MB-231 cells | CVCL_0062 | ||
Vadastuximab talirine [Phase 3 (discontinued)]
Identified from the Human Clinical Data
| Experiment 1 Reporting the Activity Date of This ADC | [2] | ||||
| Patients Enrolled |
Eligibility required untreated MDS (WHO 2008) patients ≥18 years with ECOG ≤2 and adequate organ function, excluding prior lenalidomide/HMA treatment, active secondary malignancies (except hormonal therapies), or candidates for immediate stem cell transplant.
|
||||
| Administration Dosage |
Intravenous (IV) push every 4 weeks
|
||||
| Related Clinical Trial | |||||
| NCT Number | NCT02706899 | Clinical Status | PHASE1|||PHASE2 | ||
| Clinical Description |
A Phase 1/2 Study of Vadastuximab Talirine (SGN-CD33A) in Combination With Azacitidine in Patients With Previously Untreated International Prognostic Scoring System (IPSS) Intermediate-2 or High Risk Myelodysplastic Syndrome (MDS)
|
||||
| Primary Endpoint |
The phase 1 study evaluating vadastuximab talirine was terminated before establishing a recommended phase 2 dose, with only dose delays/reductions reported, while phase 2 efficacy endpoints (ORR, CR, HI, DOR, PFS, AML transformation, OS) were not assessed due to study discontinuation.
|
||||
| Other Endpoint |
Safety analysis captured adverse events and lab abnormalities over 1 year, though all planned phase 2 efficacy comparisons per IWG 2006 criteria (including CR rate, hematologic improvement, and survival outcomes) remained unevaluated following early trial termination.
|
||||
| Experiment 2 Reporting the Activity Date of This ADC | [3] | ||||
| Patients Enrolled |
Eligible patients had untreated intermediate/adverse-risk AML (WHO-classified, excluding APL/favorable karyotypes) suitable for HMA therapy, while excluding prior MDS treatment recipients, transplant candidates, and those with myeloproliferative neoplasm histories.
|
||||
| Administration Dosage |
33A, 10 mcg/kg, every 4 weeks via intravenous (IV) push
|
||||
| Related Clinical Trial | |||||
| NCT Number | NCT02785900 | Clinical Status | PHASE3 | ||
| Clinical Description |
A Randomized, Double-blind Phase 3 Study of Vadastuximab Talirine (SGN-CD33A) Versus Placebo in Combination With Azacitidine or Decitabine in the Treatment of Older Patients With Newly Diagnosed Acute Myeloid Leukemia (AML)
|
||||
| Primary Endpoint |
The study evaluated overall survival (1.5 years) and composite complete remission (CRc) rate per Cheson 2003 criteria, while assessing MRD-negative CRc status and time to CR/CRi within the same timeframe.
|
||||
| Other Endpoint |
Secondary endpoints included duration of remission (9.5 months), event-free survival (11.24 months), leukemia-free survival (9.49 months), safety profile (TEAEs, grade ≥3 lab abnormalities over 1.5 years), and 30-/60-day mortality rates, with censoring rules applied for patients receiving subsequent therapies.
|
||||
| Experiment 3 Reporting the Activity Date of This ADC | [4] | ||||
| Patients Enrolled |
Eligible participants had CD33+ AML with ECOG 0-1, adequate organ function, and either relapsed after ≥12-week remission or were untreated with ≥20% blasts, excluding recent transplant recipients (except designated cohort) or those receiving recent antileukemic therapy.
|
||||
| Administration Dosage |
Given intravenously on Day 1 or Days 1 and 4 every 3 weeks (SGN-CD33A Monotherapy) or given intravenously on the final HMA dosing day every 4 weeks (SGN-CD33A+HMA)
|
||||
| Related Clinical Trial | |||||
| NCT Number | NCT01902329 | Clinical Status | PHASE1 | ||
| Clinical Description |
A Phase 1 Trial of SGN-CD33A in Patients With CD33-positive Acute Myeloid Leukemia
|
||||
| Primary Endpoint |
The study monitored adverse events and laboratory abnormalities through 1 month post-treatment, while evaluating pharmacokinetics (SGN-CD33A blood concentrations for 3 weeks) and immunogenicity (antitherapeutic antibody incidence).
|
||||
| Other Endpoint |
Efficacy assessments included complete remission rate (3 months), duration of response (3 years), relapse-free survival (3 years), and overall survival (3 years) in CD33-positive AML patients.
|
||||
| Experiment 4 Reporting the Activity Date of This ADC | [5] | ||||
| Patients Enrolled |
The trial enrolled AML patients (excluding APL) with ECOG 0-1 and adequate organ function, stratifying by treatment phase (induction/consolidation/maintenance), while excluding those with prior MDS/MPN therapy or cardiopulmonary dysfunction in dose-escalation cohorts.
|
||||
| Administration Dosage |
7+3 (Standard dose cytarabine for induction and daunorubicin) + SGN-CD33A Drug: SGN-CD33A, Given intravenously Day 1 or Days 1 and 4 of each cycle
|
||||
| Related Clinical Trial | |||||
| NCT Number | NCT02326584 | Clinical Status | PHASE1 | ||
| Clinical Description |
A Phase 1b Dose-escalation Study of SGN-CD33A in Combination With Standard-of-care for Patients With Newly Diagnosed Acute Myeloid Leukemia
|
||||
| Primary Endpoint |
Safety assessments included adverse events, laboratory abnormalities, and dose-limiting toxicities monitored through 1 month post-treatment, establishing the preliminary safety profile of SGN-CD33A in AML patients.
|
||||
| Other Endpoint |
Efficacy outcomes measured CR rate post-induction, leukemia-free survival, and overall survival (up to 3 years), while pharmacokinetic parameters (drug concentrations, ATA incidence) and MRD clearance rates were tracked longitudinally throughout the study duration.
|
||||
| Experiment 5 Reporting the Activity Date of This ADC | [6] | ||||
| Patients Enrolled |
Inclusion criteria: Adults ≥18 with isolated distal femur fractures requiring LISS plating, compliant with 1-year MGH follow-ups. Exclusion: Life expectancy <1 year, pre-injury non-ambulatory status, pregnancy, non-LISS implants, bone disorders, neoplasm-related fractures, severe open fractures with vascular damage, or inability to attend follow-ups.
Click to Show/Hide
|
||||
| Related Clinical Trial | |||||
| NCT Number | NCT01593176 | Clinical Status | N.A. | ||
| Clinical Description |
Radiostereometric Analysis of Fracture Healing in Distal Femur Fractures
|
||||
| Primary Endpoint |
The study evaluates inter-fragmentary motion changes in distal femoral fractures using radiostereometric analysis at postoperative intervals (2 weeks, 6 weeks, 3/6/12 months) to assess healing dynamics.
|
||||
| Experiment 6 Reporting the Activity Date of This ADC | [7] | ||||
| Efficacy Data | Incomplete Count Recovery (CRi) |
26%
|
|||
| Patients Enrolled |
Older patients with newly diagnosed acute myeloid leukemia (AML).
|
||||
| Administration Dosage |
33A, iv, 10 mcg/kg, every 4 weeks plus azacitidine 75 mg/m2, SC or IV x 7 days, every 4 weeks or decitabine 20 mg/m2, iv x 5 days, every 4 weeks; placebo plus plus azacitidine 75 mg/m2, SC or IV x 7 days, every 4 weeks or decitabine 20 mg/m2, iv x 5 days, every 4 weeks.
|
||||
| Related Clinical Trial | |||||
| NCT Number | NCT02326584 | Clinical Status | Phase 1 | ||
| Clinical Description |
A phase 1b dose-escalation study of SGN-CD33A in combination with standard-of-care for patients with newly diagnosed acute myeloid leukemia.
|
||||
| Experiment 7 Reporting the Activity Date of This ADC | [8] | ||||
| Efficacy Data | Complete Remission (CR) |
66.70%
|
|||
| Patients Enrolled |
Patients With Relapsed or Refractory AmL.
|
||||
| Administration Dosage |
Post-allo after stem cell transplant in Day 1 of each cycle; Pre-allo in Day 1 of each cycle plus melphalan 30 mg/m2/day iv and fludarabine 140 mg/m2 iv before stem cell transplant.
|
||||
| Related Clinical Trial | |||||
| NCT Number | NCT02785900 | Clinical Status | Phase 3 | ||
| Clinical Description |
A randomized, double-blind phase 3 study of vadastuximab talirine (SGN-CD33A) versus placebo in combination with azacitidine or decitabine in the treatment of older patients with newly diagnosed acute myeloid leukemia (AML).
|
||||
| Experiment 8 Reporting the Activity Date of This ADC | [9] | ||||
| Efficacy Data | Complete Remission (CR) |
11.00
12.00 22.00 23.00 % |
|||
| Patients Enrolled |
CD33-positive AmL (any level of CD33 expression as detected by local flow cytometric assessment) and had either newly diagnosed AmL (declining intensive induction/consolidation chemotherapy) or AmL relapsed after a minimum remission duration of 12 weeks after intensive induction/consolidation.
|
||||
| Administration Dosage |
Slow IV push on day 1 (5-60 ug/kg) or on days 1 and 4 (20 ug/kg) of 21-day cycles.
|
||||
| Related Clinical Trial | |||||
| NCT Number | NCT01902329 | Clinical Status | Phase 1 | ||
| Clinical Description |
A phase 1 trial of SGN-CD33A in patients with CD33-positive acute myeloid leukemia.
|
||||
| Primary Endpoint |
The recommended monotherapy dose is 4.00 mg/kg.
|
||||
| Other Endpoint |
The complete remission rate (CRc) among the 69 patients in the dose-finding cohorts, was 19.00% (6.00% CR + 13.00% CRi, 95% confidence interval [CI], 10.40-30.10).
|
||||
| Experiment 9 Reporting the Activity Date of This ADC | [7] | ||||
| Efficacy Data | Complete Remission (CR) |
30.00
26.00 % |
|||
| Patients Enrolled |
Older patients with newly diagnosed acute myeloid leukemia (AML).
|
||||
| Administration Dosage |
33A, iv, 10 mcg/kg, every 4 weeks plus azacitidine 75 mg/m2, SC or IV x 7 days, every 4 weeks or decitabine 20 mg/m2, iv x 5 days, every 4 weeks; placebo plus plus azacitidine 75 mg/m2, SC or IV x 7 days, every 4 weeks or decitabine 20 mg/m2, iv x 5 days, every 4 weeks.
|
||||
| Related Clinical Trial | |||||
| NCT Number | NCT02326584 | Clinical Status | Phase 1 | ||
| Clinical Description |
A phase 1b dose-escalation study of SGN-CD33A in combination with standard-of-care for patients with newly diagnosed acute myeloid leukemia.
|
||||
| Experiment 10 Reporting the Activity Date of This ADC | [10] | ||||
| Efficacy Data | Complete Remission (CR) |
43.00
42.00 34.00 80.00 50.00 39.00 % |
|||
| Patients Enrolled |
New diagnosis of CD33-expressing AmL, they could not have received prior therapy with HMAs; however, prior low-intensity treatment, such as hydroxyurea for cytoreduction or other low-intensity therapies for preceding myelodysplastic syndrome (MDS), an Eastern Cooperative Oncology Group (ECOG) performance status 0 or 1, with adequate baseline renal, hepatic, and pulmonary function.
Click to Show/Hide
|
||||
| Administration Dosage |
Azacitidine (75 mg/m2 subcutaneous/intravenous 7 days) or decitabine (20 mg/m2 intravenous 5 days) was administered per institutional standard. On the final day of HMA administration (day 7 of azacitidine treatment and day 5 of decitabine treatment), vadastuximab talirine (10 ug/kg) was administered via slow intravenous push (1-2 mL/min), after infusion of the HMA, as 28-day cycles for up to 4 cycles of treatment.
Click to Show/Hide
|
||||
| Related Clinical Trial | |||||
| NCT Number | NCT01902329 | Clinical Status | Phase 1 | ||
| Clinical Description |
A phase 1 trial of SGN-CD33A in patients with CD33-positive acute myeloid leukemia.
|
||||
| Primary Endpoint |
The 30- and 60-day mortality rates were 2% and 8%, respectively. No DLTs or infusion-related reactions were observed in the combination cohort of this study.
|
||||
| Other Endpoint |
CR and CRi, was 70.00% (43% CR + 26% CRi, 95% CI, 55.70-81.70). Median RFS was 7.70 months (95% CI, 4.90-15.40) with 11.30 months (95% CI, 8.80-13.20) median OS.
|
||||
| Experiment 11 Reporting the Activity Date of This ADC | [11] | ||||
| Patients Enrolled |
Patients with operable HER2-positive primary breast cancer.
|
||||
| Administration Dosage |
Anthracycline then Trastuzumab Emtansine and Pertuzumab ; Anthracycline then Trastuzumab, Pertuzumab, and Taxane.
|
||||
| Related Clinical Trial | |||||
| NCT Number | NCT02614560 | Clinical Status | Phase 1/2 | ||
| Clinical Description |
A phase 1/2 study of vadastuximab talirine administered in sequence with allogeneic hematopoietic stem cell transplant in patients with relapsed or refractory acute myeloid leukemia (AML).
|
||||
| Experiment 12 Reporting the Activity Date of This ADC | [12] | ||||
| Patients Enrolled |
Patients With acute myeloid leukemia (AML).
|
||||
| Administration Dosage |
SGN-CD33A iv in Day 1 or Days 1 and 4 of each cycle; High dose cytarabine + SGN-CD33A (28-day cycles); Standard dose cytarabine and daunorubicin + SGN-CD33A; standard dose cytarabine and daunorubicin + SGN-CD33A and High dose cytarabine + SGN-CD33A.
|
||||
| Related Clinical Trial | |||||
| NCT Number | NCT01902329 | Clinical Status | Phase 1 | ||
| Clinical Description |
A phase 1 trial of SGN-CD33A in patients with CD33-positive acute myeloid leukemia.
|
||||
Discovered Using Cell Line-derived Xenograft Model
| Experiment 1 Reporting the Activity Date of This ADC | [13] | ||||
| Efficacy Data | Tumor Growth Inhibition value (TGI) | ≈ 0% | High CD33 expression (CD33+++; 23,000 CD33 receptor copy number) | ||
| Method Description |
The inhibitory activity of SGN-CD33A against cancer cell growth was compared with control ADC against various human cancer cell lines in vivo. The cells were treated with 100mcg/kg.
|
||||
| In Vitro Model | Erythroleukemia | HEL 92.1.7 cells (Multidrug resistance) | CVCL_2481 | ||
| Experiment 2 Reporting the Activity Date of This ADC | [13] | ||||
| Efficacy Data | Tumor Growth Inhibition value (TGI) | ≈ 29.44% | High CD33 expression (CD33+++; 23,000 CD33 receptor copy number) | ||
| Method Description |
The inhibitory activity of SGN-CD33A against cancer cell growth was compared with control ADC against various human cancer cell lines in vivo. The cells were treated with 30mcg/kg.
|
||||
| In Vitro Model | Adult acute myeloid leukemia | HL-60 cells | CVCL_0002 | ||
| Experiment 3 Reporting the Activity Date of This ADC | [13] | ||||
| Efficacy Data | Tumor Growth Inhibition value (TGI) | ≈ 47.77% | High CD33 expression (CD33+++; 23,000 CD33 receptor copy number) | ||
| Method Description |
The inhibitory activity of SGN-CD33A against cancer cell growth was compared with control ADC against various human cancer cell lines in vivo. The cells were treated with 300mcg/kg.
|
||||
| In Vitro Model | Erythroleukemia | HEL 92.1.7 cells (Multidrug resistance) | CVCL_2481 | ||
| Experiment 4 Reporting the Activity Date of This ADC | [13] | ||||
| Efficacy Data | Tumor Growth Inhibition value (TGI) | ≈ 78.95% | Negative CD33 expression (CD33-) | ||
| Method Description |
The inhibitory activity of SGN-CD33A against cancer cell growth was compared with control ADC against various human cancer cell lines in vivo. The cells were treated with 100mcg/kg.
|
||||
| In Vitro Model | Anaplastic thyroid cancer | TF1-alpha cells (Multidrug resistance) | Homo sapiens | ||
| Experiment 5 Reporting the Activity Date of This ADC | [13] | ||||
| Efficacy Data | Tumor Growth Inhibition value (TGI) | ≈ 98.41% | High CD33 expression (CD33+++; 23,000 CD33 receptor copy number) | ||
| Method Description |
The inhibitory activity of SGN-CD33A against cancer cell growth was compared with control ADC against various human cancer cell lines in vivo. The cells were treated with 1000mcg/kg.
|
||||
| In Vitro Model | Erythroleukemia | HEL 92.1.7 cells (Multidrug resistance) | CVCL_2481 | ||
| Experiment 6 Reporting the Activity Date of This ADC | [13] | ||||
| Efficacy Data | Tumor Growth Inhibition value (TGI) | ≈ 98.53% | Negative CD33 expression (CD33-) | ||
| Method Description |
The inhibitory activity of SGN-CD33A against cancer cell growth was compared with control ADC against various human cancer cell lines in vivo. The cells were treated with 300mcg/kg.
|
||||
| In Vitro Model | Anaplastic thyroid cancer | TF1-alpha cells (Multidrug resistance) | Homo sapiens | ||
| Experiment 7 Reporting the Activity Date of This ADC | [13] | ||||
| Efficacy Data | Tumor Growth Inhibition value (TGI) | ≈ 99.99% | Negative CD33 expression (CD33-) | ||
| Method Description |
The inhibitory activity of SGN-CD33A against cancer cell growth was compared with control ADC against various human cancer cell lines in vivo. The cells were treated with 300mcg/kg.
|
||||
| In Vitro Model | Anaplastic thyroid cancer | TF1-alpha cells (Multidrug resistance) | Homo sapiens | ||
| Experiment 8 Reporting the Activity Date of This ADC | [13] | ||||
| Efficacy Data | Tumor Growth Inhibition value (TGI) | ≈ 99.99% | High CD33 expression (CD33+++; 23,000 CD33 receptor copy number) | ||
| Method Description |
The inhibitory activity of SGN-CD33A against cancer cell growth was compared with control ADC against various human cancer cell lines in vivo. The cells were treated with 100mcg/kg.
|
||||
| In Vitro Model | Adult acute myeloid leukemia | HL-60 cells | CVCL_0002 | ||
Revealed Based on the Cell Line Data
| Experiment 1 Reporting the Activity Date of This ADC | [13] | ||||
| Efficacy Data | Half Maximal Inhibitory Concentration (IC50) |
0.1 ng/mL
|
Moderate CD33 expression (CD33++; CD33 MFI=3,919) | ||
| Method Description |
The inhibitory activity of SGN-CD33A against cancer cell growth was evaluated in primary AmL samples in vitro.
|
||||
| In Vitro Model | Acute myeloid leukemia | Acute myeloid leukemia cells #SG019 | Homo sapiens | ||
| Experiment 2 Reporting the Activity Date of This ADC | [13] | ||||
| Efficacy Data | Half Maximal Inhibitory Concentration (IC50) |
0.1 ng/mL
|
Moderate CD33 expression (CD33++; 6,000 CD33 receptor copy number) | ||
| Method Description |
The inhibitory activity of SGN-CD33A against cancer cell growth was evaluated in various human cancer cell lines in vitro.
|
||||
| In Vitro Model | Childhood acute monocytic leukemia | MV4-11 cells | CVCL_0064 | ||
| Experiment 3 Reporting the Activity Date of This ADC | [13] | ||||
| Efficacy Data | Half Maximal Inhibitory Concentration (IC50) |
0.2 ng/mL
|
High CD33 expression (CD33+++; CD33 MFI=11,850) | ||
| Method Description |
The inhibitory activity of SGN-CD33A against cancer cell growth was evaluated in primary AmL samples in vitro.
|
||||
| In Vitro Model | Acute myeloid leukemia | Acute myeloid leukemia cells #SG015 | Homo sapiens | ||
| Experiment 4 Reporting the Activity Date of This ADC | [13] | ||||
| Efficacy Data | Half Maximal Inhibitory Concentration (IC50) |
0.2 ng/mL
|
High CD33 expression (CD33+++; CD33 MFI=10,762) | ||
| Method Description |
The inhibitory activity of SGN-CD33A against cancer cell growth was evaluated in primary AmL samples in vitro.
|
||||
| In Vitro Model | Acute myeloid leukemia | Acute myeloid leukemia cells #SG018 | Homo sapiens | ||
| Experiment 5 Reporting the Activity Date of This ADC | [13] | ||||
| Efficacy Data | Half Maximal Inhibitory Concentration (IC50) |
0.2 ng/mL
|
High CD33 expression (CD33+++; 23,000 CD33 receptor copy number) | ||
| Method Description |
The inhibitory activity of SGN-CD33A against cancer cell growth was evaluated in primary AmL samples in vitro.
|
||||
| In Vitro Model | Acute myeloid leukemia | Acute myeloid leukemia cells #SG023 | Homo sapiens | ||
| Experiment 6 Reporting the Activity Date of This ADC | [13] | ||||
| Efficacy Data | Half Maximal Inhibitory Concentration (IC50) |
0.2 ng/mL
|
Moderate CD33 expression (CD33++; CD33 MFI=1,355) | ||
| Method Description |
The inhibitory activity of SGN-CD33A against cancer cell growth was evaluated in primary AmL samples in vitro.
|
||||
| In Vitro Model | Acute myeloid leukemia | Acute myeloid leukemia cells #SG014 | Homo sapiens | ||
| Experiment 7 Reporting the Activity Date of This ADC | [13] | ||||
| Efficacy Data | Half Maximal Inhibitory Concentration (IC50) |
0.2 ng/mL
|
High CD33 expression (CD33+++; 23,000 CD33 receptor copy number) | ||
| Method Description |
The inhibitory activity of SGN-CD33A against cancer cell growth was evaluated in primary AmL samples in vitro.
|
||||
| In Vitro Model | Acute myeloid leukemia | Acute myeloid leukemia cells #SG022 | Homo sapiens | ||
| Experiment 8 Reporting the Activity Date of This ADC | [13] | ||||
| Efficacy Data | Half Maximal Inhibitory Concentration (IC50) |
0.4 ng/mL
|
Low CD33 expression (CD33+; CD33 MFI=107) | ||
| Method Description |
The inhibitory activity of SGN-CD33A against cancer cell growth was evaluated in primary AmL samples in vitro.
|
||||
| In Vitro Model | Acute myeloid leukemia | Acute myeloid leukemia cells #SG003 | Homo sapiens | ||
| Experiment 9 Reporting the Activity Date of This ADC | [13] | ||||
| Efficacy Data | Half Maximal Inhibitory Concentration (IC50) |
0.9 ng/mL
|
Moderate CD33 expression (CD33++; CD33 MFI=5,817) | ||
| Method Description |
The inhibitory activity of SGN-CD33A against cancer cell growth was evaluated in primary AmL samples in vitro.
|
||||
| In Vitro Model | Acute myeloid leukemia | Acute myeloid leukemia cells #SG002 | Homo sapiens | ||
| Experiment 10 Reporting the Activity Date of This ADC | [13] | ||||
| Efficacy Data | Half Maximal Inhibitory Concentration (IC50) |
1 ng/mL
|
High CD33 expression (CD33+++; 23,000 CD33 receptor copy number) | ||
| Method Description |
The inhibitory activity of SGN-CD33A against cancer cell growth was evaluated in various human cancer cell lines in vitro.
|
||||
| In Vitro Model | Adult acute myeloid leukemia | HL-60 cells | CVCL_0002 | ||
| Experiment 11 Reporting the Activity Date of This ADC | [13] | ||||
| Efficacy Data | Half Maximal Inhibitory Concentration (IC50) |
3 ng/mL
|
High CD33 expression (CD33+++; 23,000 CD33 receptor copy number) | ||
| Method Description |
The inhibitory activity of SGN-CD33A against cancer cell growth was evaluated in various human cancer cell lines in vitro.
|
||||
| In Vitro Model | Adult acute myeloid leukemia | KG-1 cells | CVCL_0374 | ||
| Experiment 12 Reporting the Activity Date of This ADC | [13] | ||||
| Efficacy Data | Half Maximal Inhibitory Concentration (IC50) |
5 ng/mL
|
Negative CD33 expression (CD33-; CD33 MFI=20) | ||
| Method Description |
The inhibitory activity of SGN-CD33A against cancer cell growth was evaluated in primary AmL samples in vitro.
|
||||
| In Vitro Model | Acute myeloid leukemia | Acute myeloid leukemia cells #SG017 | Homo sapiens | ||
| Experiment 13 Reporting the Activity Date of This ADC | [13] | ||||
| Efficacy Data | Half Maximal Inhibitory Concentration (IC50) |
6 ng/mL
|
Negative CD33 expression (CD33-; CD33 MFI=49) | ||
| Method Description |
The inhibitory activity of SGN-CD33A against cancer cell growth was evaluated in primary AmL samples in vitro.
|
||||
| In Vitro Model | Acute myeloid leukemia | Acute myeloid leukemia cells #SG001 | Homo sapiens | ||
| Experiment 14 Reporting the Activity Date of This ADC | [13] | ||||
| Efficacy Data | Half Maximal Inhibitory Concentration (IC50) |
6 ng/mL
|
High CD33 expression (CD33+++; 23,000 CD33 receptor copy number) | ||
| Method Description |
The inhibitory activity of SGN-CD33A against cancer cell growth was evaluated in various human cancer cell lines in vitro.
|
||||
| In Vitro Model | Acute myeloid leukemia | SH-1 cells | CVCL_2191 | ||
| Experiment 15 Reporting the Activity Date of This ADC | [13] | ||||
| Efficacy Data | Half Maximal Inhibitory Concentration (IC50) |
7 ng/mL
|
High CD33 expression (CD33+++; 23,000 CD33 receptor copy number) | ||
| Method Description |
The inhibitory activity of SGN-CD33A against cancer cell growth was evaluated in various human cancer cell lines in vitro.
|
||||
| In Vitro Model | Childhood acute monocytic leukemia | THP-1 cells | CVCL_0006 | ||
| Experiment 16 Reporting the Activity Date of This ADC | [13] | ||||
| Efficacy Data | Half Maximal Inhibitory Concentration (IC50) |
7 ng/mL
|
High CD33 expression (CD33+++; CD33 MFI=23,223) | ||
| Method Description |
The inhibitory activity of SGN-CD33A against cancer cell growth was evaluated in various human cancer cell lines in vitro.
|
||||
| In Vitro Model | Erythroleukemia | HEL 92.1.7 cells | CVCL_2481 | ||
| Experiment 17 Reporting the Activity Date of This ADC | [13] | ||||
| Efficacy Data | Half Maximal Inhibitory Concentration (IC50) | > 7.5 ng/mL | High CD33 expression (CD33+++; 23,000 CD33 receptor copy number) | ||
| Method Description |
The inhibitory activity of SGN-CD33A against cancer cell growth was evaluated in various human cancer cell lines in vitro.
|
||||
| In Vitro Model | Acute myeloid leukemia | SIG-M5 cells | CVCL_1694 | ||
| Experiment 18 Reporting the Activity Date of This ADC | [13] | ||||
| Efficacy Data | Half Maximal Inhibitory Concentration (IC50) |
11 ng/mL
|
Low CD33 expression (CD33+; CD33 MFI=216) | ||
| Method Description |
The inhibitory activity of SGN-CD33A against cancer cell growth was evaluated in primary AmL samples in vitro.
|
||||
| In Vitro Model | Acute myeloid leukemia | Acute myeloid leukemia cells #SG013 | Homo sapiens | ||
| Experiment 19 Reporting the Activity Date of This ADC | [13] | ||||
| Efficacy Data | Half Maximal Inhibitory Concentration (IC50) |
11 ng/mL
|
Moderate CD33 expression (CD33++; CD33 MFI=1,035) | ||
| Method Description |
The inhibitory activity of SGN-CD33A against cancer cell growth was evaluated in primary AmL samples in vitro.
|
||||
| In Vitro Model | Acute myeloid leukemia | Acute myeloid leukemia cells #SG008 | Homo sapiens | ||
| Experiment 20 Reporting the Activity Date of This ADC | [13] | ||||
| Efficacy Data | Half Maximal Inhibitory Concentration (IC50) |
22 ng/mL
|
High CD33 expression (CD33+++; 23,000 CD33 receptor copy number) | ||
| Method Description |
The inhibitory activity of SGN-CD33A against cancer cell growth was evaluated in various human cancer cell lines in vitro.
|
||||
| In Vitro Model | Adult acute monocytic leukemia | U-937 cells | CVCL_0007 | ||
| Experiment 21 Reporting the Activity Date of This ADC | [13] | ||||
| Efficacy Data | Half Maximal Inhibitory Concentration (IC50) |
23 ng/mL
|
Low CD33 expression (CD33+; CD33 MFI=299) | ||
| Method Description |
The inhibitory activity of SGN-CD33A against cancer cell growth was evaluated in primary AmL samples in vitro.
|
||||
| In Vitro Model | Acute myeloid leukemia | Acute myeloid leukemia cells #SG010 | Homo sapiens | ||
| Experiment 22 Reporting the Activity Date of This ADC | [13] | ||||
| Efficacy Data | Half Maximal Inhibitory Concentration (IC50) |
26 ng/mL
|
High CD33 expression (CD33+++; 23,000 CD33 receptor copy number) | ||
| Method Description |
The inhibitory activity of SGN-CD33A against cancer cell growth was evaluated in various human cancer cell lines in vitro.
|
||||
| In Vitro Model | Acute myeloid leukemia | HNT-34 cells | CVCL_2071 | ||
| Experiment 23 Reporting the Activity Date of This ADC | [13] | ||||
| Efficacy Data | Half Maximal Inhibitory Concentration (IC50) |
32 ng/mL
|
Moderate CD33 expression (CD33++; CD33 MFI=1,184) | ||
| Method Description |
The inhibitory activity of SGN-CD33A against cancer cell growth was evaluated in primary AmL samples in vitro.
|
||||
| In Vitro Model | Acute myeloid leukemia | Acute myeloid leukemia cells #SG004 | Homo sapiens | ||
| Experiment 24 Reporting the Activity Date of This ADC | [13] | ||||
| Efficacy Data | Half Maximal Inhibitory Concentration (IC50) |
33 ng/mL
|
Moderate CD33 expression (CD33++; CD33 MFI=6,598) | ||
| Method Description |
The inhibitory activity of SGN-CD33A against cancer cell growth was evaluated in primary AmL samples in vitro.
|
||||
| In Vitro Model | Acute myeloid leukemia | Acute myeloid leukemia cells #SG011 | Homo sapiens | ||
| Experiment 25 Reporting the Activity Date of This ADC | [13] | ||||
| Efficacy Data | Half Maximal Inhibitory Concentration (IC50) |
49 ng/mL
|
Moderate CD33 expression (CD33++; CD33 MFI=2,278) | ||
| Method Description |
The inhibitory activity of SGN-CD33A against cancer cell growth was evaluated in various human cancer cell lines in vitro.
|
||||
| In Vitro Model | Anaplastic thyroid cancer | TF1-alpha cells (Multidrug resistance) | Homo sapiens | ||
| Experiment 26 Reporting the Activity Date of This ADC | [13] | ||||
| Efficacy Data | Half Maximal Inhibitory Concentration (IC50) |
61 ng/mL
|
Moderate CD33 expression (CD33++; 7,000 CD33 receptor copy number) | ||
| Method Description |
The inhibitory activity of SGN-CD33A against cancer cell growth was evaluated in various human cancer cell lines in vitro.
|
||||
| In Vitro Model | Esophageal squamous cell carcinoma | TF-1 cells | CVCL_1759 | ||
| Experiment 27 Reporting the Activity Date of This ADC | [13] | ||||
| Efficacy Data | Half Maximal Inhibitory Concentration (IC50) |
68 ng/mL
|
High CD33 expression (CD33+++; 23,000 CD33 receptor copy number) | ||
| Method Description |
The inhibitory activity of SGN-CD33A against cancer cell growth was evaluated in various human cancer cell lines in vitro.
|
||||
| In Vitro Model | Adult acute myeloid leukemia | SH-2 cells | CVCL_2190 | ||
| Experiment 28 Reporting the Activity Date of This ADC | [13] | ||||
| Efficacy Data | Half Maximal Inhibitory Concentration (IC50) | > 100 ng/mL | Negative CD33 expression (CD33-; CD33 MFI=0) | ||
| Method Description |
The inhibitory activity of SGN-CD33A against cancer cell growth was evaluated in primary AmL samples in vitro.
|
||||
| In Vitro Model | Acute myeloid leukemia | Acute myeloid leukemia cells #SG009 | Homo sapiens | ||
| Experiment 29 Reporting the Activity Date of This ADC | [13] | ||||
| Efficacy Data | Half Maximal Inhibitory Concentration (IC50) | > 110 ng/mL | Low CD33 expression (CD33+; CD33 MFI=353) | ||
| Method Description |
The inhibitory activity of SGN-CD33A against cancer cell growth was evaluated in primary AmL samples in vitro.
|
||||
| In Vitro Model | Acute myeloid leukemia | Acute myeloid leukemia cells #SG012 | Homo sapiens | ||
| Experiment 30 Reporting the Activity Date of This ADC | [13] | ||||
| Efficacy Data | Half Maximal Inhibitory Concentration (IC50) | > 110 ng/mL | High CD33 expression (CD33+++; 23,000 CD33 receptor copy number) | ||
| Method Description |
The inhibitory activity of SGN-CD33A against cancer cell growth was evaluated in primary AmL samples in vitro.
|
||||
| In Vitro Model | Acute myeloid leukemia | Acute myeloid leukemia cells #SG020 | Homo sapiens | ||
| Experiment 31 Reporting the Activity Date of This ADC | [13] | ||||
| Efficacy Data | Half Maximal Inhibitory Concentration (IC50) | > 1000 ng/mL | Low CD33 expression (CD33+; CD33 MFI=318) | ||
| Method Description |
The inhibitory activity of SGN-CD33A against cancer cell growth was evaluated in various human cancer cell lines in vitro.
|
||||
| In Vitro Model | Ovarian clear cell adenocarcinoma | ES-2 cells | CVCL_3509 | ||
| Experiment 32 Reporting the Activity Date of This ADC | [13] | ||||
| Efficacy Data | Half Maximal Inhibitory Concentration (IC50) | > 1000 ng/mL | High CD33 expression (CD33+++; 23,000 CD33 receptor copy number) | ||
| Method Description |
The inhibitory activity of SGN-CD33A against cancer cell growth was evaluated in various human cancer cell lines in vitro.
|
||||
| In Vitro Model | Burkitt lymphoma | Ramos cells | CVCL_0597 | ||
| Experiment 33 Reporting the Activity Date of This ADC | [13] | ||||
| Efficacy Data | Half Maximal Inhibitory Concentration (IC50) | > 5000 ng/mL | High CD33 expression (CD33+++; 23,000 CD33 receptor copy number) | ||
| Method Description |
The inhibitory activity of SGN-CD33A against cancer cell growth was evaluated in various human cancer cell lines in vitro.
|
||||
| In Vitro Model | Ovarian serous cystadenocarcinoma | SK-OV-3 cells | CVCL_0532 | ||
SC-006 [Phase 1 (discontinued)]
Identified from the Human Clinical Data
| Experiment 1 Reporting the Activity Date of This ADC | [14] | ||||
| Efficacy Data | stable disease (SD) |
34%
|
|||
| Patients Enrolled |
Eligible participants must have advanced metastatic CRC refractory to ≥2 prior systemic therapies, ECOG 0-1, and adequate organ function. Key exclusions include prior PBD/IND-based drug exposure, autoimmune/immunodeficiency disorders, IBD history, or recent immunosuppressant use within 14 days prior to treatment. Combination therapy excludes patients with immune-mediated pneumonitis or transplant history.
Click to Show/Hide
|
||||
| Administration Dosage |
As of April 2019, 29 patients were enrolled (n=20 in part A and n=9 in part B). All patients experienced at least one treatment-emergent adverse event (TEAE). Two patients (7%) had dose-limiting toxicities of grade 4 thrombocytopenia. All 29 patients discontinued from the study, with study drug being discontinued for 76% of patients due to progressive disease. One death occurred in part A due to gastrointestinal hemorrhage with possible relation to SC-006. Serious TEAEs occurred in 8 patients (28%); these included thrombocytopenia and malignant neoplasm progression in 2 patients (7%) each.
Click to Show/Hide
|
||||
| Related Clinical Trial | |||||
| NCT Number | NCT03035279 | Clinical Status | PHASE1 | ||
| Clinical Description |
An Open Label Phase 1 Study of SC-006 as a Single Agent and in Combination With ABBV-181 in Subjects With Advanced Colorectal Cancer
|
||||
| Primary Endpoint |
Safety assessment focuses on dose-limiting toxicities (DLTs) graded per NCI CTCAE v4.03 during the initial 21-day treatment cycle.
|
||||
| Other Endpoint |
Efficacy endpoints include overall survival (OS) and progression-free survival (PFS) over approximately 2 years, along with pharmacokinetic parameters (Tmax, AUC, T1/2, Cmax, Ctrough) of SC-006 evaluated over 1 year. Tumor response is measured via objective response rate (ORR), clinical benefit rate (CBR), and duration of response (DOR) using RECIST v1.1 criteria.
Click to Show/Hide
|
||||
| Experiment 2 Reporting the Activity Date of This ADC | [14] | ||||
| Efficacy Data | progressive disease (PD) |
62%
|
|||
| Patients Enrolled |
Eligible participants must have advanced metastatic CRC refractory to ≥2 prior systemic therapies, ECOG 0-1, and adequate organ function. Key exclusions include prior PBD/IND-based drug exposure, autoimmune/immunodeficiency disorders, IBD history, or recent immunosuppressant use within 14 days prior to treatment. Combination therapy excludes patients with immune-mediated pneumonitis or transplant history.
Click to Show/Hide
|
||||
| Administration Dosage |
As of April 2019, 29 patients were enrolled (n=20 in part A and n=9 in part B). All patients experienced at least one treatment-emergent adverse event (TEAE). Two patients (7%) had dose-limiting toxicities of grade 4 thrombocytopenia. All 29 patients discontinued from the study, with study drug being discontinued for 76% of patients due to progressive disease. One death occurred in part A due to gastrointestinal hemorrhage with possible relation to SC-006. Serious TEAEs occurred in 8 patients (28%); these included thrombocytopenia and malignant neoplasm progression in 2 patients (7%) each.
Click to Show/Hide
|
||||
| Related Clinical Trial | |||||
| NCT Number | NCT03035279 | Clinical Status | PHASE1 | ||
| Clinical Description |
An Open Label Phase 1 Study of SC-006 as a Single Agent and in Combination With ABBV-181 in Subjects With Advanced Colorectal Cancer
|
||||
| Primary Endpoint |
Safety assessment focuses on dose-limiting toxicities (DLTs) graded per NCI CTCAE v4.03 during the initial 21-day treatment cycle.
|
||||
| Other Endpoint |
Efficacy endpoints include overall survival (OS) and progression-free survival (PFS) over approximately 2 years, along with pharmacokinetic parameters (Tmax, AUC, T1/2, Cmax, Ctrough) of SC-006 evaluated over 1 year. Tumor response is measured via objective response rate (ORR), clinical benefit rate (CBR), and duration of response (DOR) using RECIST v1.1 criteria.
Click to Show/Hide
|
||||
| Experiment 3 Reporting the Activity Date of This ADC | [20] | ||||
| Efficacy Data | Objective Response Rate (ORR) |
0%
|
|||
| Patients Enrolled |
Patients with advanced metastatic or unresectable colorectal cancer.
|
||||
| Administration Dosage |
SC-006-monotherapy, 2 to 12 ug/kg IV every 3 weeks.
|
||||
| Related Clinical Trial | |||||
| NCT Number | NCT03035279 | Clinical Status | Phase 1 | ||
| Clinical Description |
An open label phase 1 study of SC-006 as a single agent and in combination with ABBV-181 in subjects with advanced colorectal cancer.
|
||||
SGN-CD123A [Phase 1 (discontinued)]
Identified from the Human Clinical Data
| Experiment 1 Reporting the Activity Date of This ADC | [15] | ||||
| Patients Enrolled |
Eligibility requires CD123-positive AML patients with 1-3 prior regimens (high-risk cases may qualify after 1 regimen), adequate organ function and ECOG 0-1, excluding those with CNS involvement, promyelocytic leukemia, significant pulmonary dysfunction, recent transplants, or recent antileukemia/experimental treatments within 4 weeks (hydroxyurea/6-MP allowed).
Click to Show/Hide
|
||||
| Administration Dosage |
Intravenous infusion in 3-week cycles
|
||||
| Related Clinical Trial | |||||
| NCT Number | NCT02848248 | Clinical Status | PHASE1 | ||
| Clinical Description |
A Phase 1 Study of SGN-CD123A in Patients With Relapsed or Refractory Acute Myeloid Leukemia (AML)
|
||||
| Primary Endpoint |
The primary safety endpoints assess adverse event profiles (type/incidence/severity/seriousness/relatedness) and lab abnormalities during treatment and 1-month post-treatment, along with dose-limiting toxicity incidence during the initial 3-week cycle.
|
||||
| Other Endpoint |
Secondary objectives include pharmacokinetic analysis (SGN-CD123A blood concentrations), immunogenicity (antitherapeutic antibodies), and efficacy measures (remission rate, complete remission duration, leukemia-free survival, and overall survival) monitored for approximately 1 year in relapsed/refractory AML patients.
|
||||
SGN-CD19B [Phase 1 (discontinued)]
Identified from the Human Clinical Data
| Experiment 1 Reporting the Activity Date of This ADC | [16] | ||||
| Patients Enrolled |
Eligibility requires measurable disease after ≥2 prior systemic therapies with ECOG 0-1 and adequate organ function, excluding patients with prior CD19-targeted therapy (unless CD19+ confirmed), active infections, allogeneic transplants, or recent anticancer treatments within 4 weeks (2 weeks if progressive disease).
|
||||
| Administration Dosage |
Given intravenously Day 1 of 28-day or 42-day cycles
|
||||
| Related Clinical Trial | |||||
| NCT Number | NCT02702141 | Clinical Status | PHASE1 | ||
| Clinical Description |
A Phase 1, Open-label, Dose-escalation Study of SGN-CD19B in Patients With Relapsed or Refractory Aggressive B-cell Non-Hodgkin Lymphoma
|
||||
| Primary Endpoint |
The primary endpoints evaluate safety profiles including adverse event incidence and laboratory abnormalities monitored through 1 month post-treatment in relapsed/refractory patients.
|
||||
| Other Endpoint |
Secondary objectives assess pharmacokinetics (SGN-CD19B blood concentrations for 3 weeks), immunogenicity (antitherapeutic antibodies), and efficacy measures (objective response rate, progression-free survival up to 3 years) in this heavily pretreated population.
|
||||
Serclutamab talirine [Phase 1 (discontinued)]
Identified from the Human Clinical Data
| Experiment 1 Reporting the Activity Date of This ADC | [17] | ||||
| Patients Enrolled |
Eligibility requires ECOG 0-1 patients with progressive EGFR+ tumors (GBM/CRC/HNSCC/NSCLC/others) refractory to prior therapies (≤3 cytotoxic lines), measurable disease, and ≥12-week life expectancy, excluding those with uncontrolled CNS metastases, cardiac dysfunction (NYHA III-IV/EF<40%), active infections (CTCAE≥G3), recent major surgery (21 days), or significant effusions/keratitis. Washout periods apply for prior therapies (21 days for most, 5 half-lives for targeted agents).
Click to Show/Hide
|
||||
| Administration Dosage |
ABBV-321 will be administered via intravenous infusion at escalating dose levels until the maximum tolerated dose is reached and a recommended Phase 2 dose is determined.
|
||||
| Related Clinical Trial | |||||
| NCT Number | NCT03234712 | Clinical Status | PHASE1 | ||
| Clinical Description |
A Phase 1 Study Evaluating the Safety, Pharmacokinetics, and Anti-tumor Activity of ABBV-321 in Subjects With Advanced Solid Tumors Associated With Overexpression of the Epidermal Growth Factor Receptor (EGFR)
|
||||
| Primary Endpoint |
The primary pharmacokinetic endpoints evaluate ABBV-321 exposure (AUCt, AUC), peak concentration (Cmax), time to peak (Tmax), elimination characteristics (beta, t1/2) over 78 days, along with dose-escalation outcomes (MTD, RPTD) during the first 28-day cycle in EGFR-overexpressing solid tumor patients.
|
||||
| Other Endpoint |
Secondary efficacy measures assess long-term outcomes (PFS, DOR, DCR, TTP, OS up to 5 years) using RECIST 1.1/RANO criteria, QTcF interval changes through 61 days, and ORR in both solid tumors and glioblastoma populations.
|
||||
| Experiment 2 Reporting the Activity Date of This ADC | [19] | ||||
| Efficacy Data | Partial Response (PR) |
4.17%
|
High EGFR expression (EGFR+++) | ||
| Patients Enrolled |
Advanced, histologically confirmed solid tumors associated with EGFR overexpression (centralized testing).
|
||||
| Administration Dosage |
Ser-T intravenously once every 4 weeks (Q4W; 5-50 ug/kg) in the dose-escalation phase.
|
||||
| Related Clinical Trial | |||||
| NCT Number | NCT03234712 | Clinical Status | Phase 1 | ||
| Clinical Description |
A phase 1 study evaluating the safety, pharmacokinetics, and anti-tumor activity of ABBV-321 in subjects with advanced solid tumors associated with overexpression of the epidermal growth factor receptor (EGFR).
|
||||
| Primary Endpoint |
One patient was PR (N=1/24, 4.17%), 6 patients was SD (N=6/24,25.00%). Median DOR (CR + PR + SD)=6.40 months (95% CI 3.0not reached). The median PFS=1.8 months (95% CI 1.3-5.8), median OS=7.10 months (95% CI: 4.1-12.3).
|
||||
| Other Endpoint |
Ser-T RP2D regimen=25 ug/kg Q4W.
|
||||
| Experiment 3 Reporting the Activity Date of This ADC | [19] | ||||
| Efficacy Data | Partial Response (PR) |
4.20%
|
High EGFR expression (EGFR+++) | ||
| Patients Enrolled |
Advanced, histologically confirmed solid tumors associated with EGFR overexpression (centralized testing).
|
||||
| Administration Dosage |
Ser-T intravenously once every 4 weeks (Q4W; 5-50 ug/kg) in the dose-escalation phase.
|
||||
| Related Clinical Trial | |||||
| NCT Number | NCT03234712 | Clinical Status | Phase 1 | ||
| Clinical Description |
A phase 1 study evaluating the safety, pharmacokinetics, and anti-tumor activity of ABBV-321 in subjects with advanced solid tumors associated with overexpression of the epidermal growth factor receptor (EGFR).
|
||||
| Primary Endpoint |
Responses included 1 partial response (PR), 6 stable disease (SD), 14 progressive disease (PD); 3 patients were not evaluable for response. Median duration of clinical benefit (complete response + PR + SD) was 6.40 months (95% CI: 3.00-not reached).
|
||||
| Other Endpoint |
The median PFS was 1.80 months (95% CI: 1.30-5.80) and the median OS was 7.10 months (95% CI: 4.10-12.30).
|
||||
| Experiment 4 Reporting the Activity Date of This ADC | [22] | ||||
| Related Clinical Trial | |||||
| NCT Number | NCT03234712 | Clinical Status | Phase 1 | ||
| Clinical Description |
A phase 1 study evaluating the safety, pharmacokinetics, and anti-tumor activity of ABBV-321 in subjects with advanced solid tumors associated with overexpression of the epidermal growth factor receptor (EGFR).
|
||||
Discovered Using Patient-derived Xenograft Model
| Experiment 1 Reporting the Activity Date of This ADC | [23] | ||||
| Efficacy Data | Tumor Growth Inhibition value (TGI) | ≈ 34% | High EGFR expression (EGFR+++) | ||
| Method Description |
ABBV-321 induces efficient tumor cell killing in cell line-derived models of SNO199 and U87NG cells with mAb806 expression with high expression.
|
||||
| In Vivo Model | Glioblastoma PDX model (PDX: SNO199) | ||||
| Experiment 2 Reporting the Activity Date of This ADC | [23] | ||||
| Efficacy Data | Tumor Growth Inhibition value (TGI) | ≈ 40% | Low EGFR expression (EGFR+) | ||
| Method Description |
ABBV-321 induces efficient tumor cell killing in cell line-derived models of SNO199 and U87NG cells with mAb806 expression with high expression.
|
||||
| In Vivo Model | Glioblastoma PDX model (PDX: SNO199) | ||||
| Experiment 3 Reporting the Activity Date of This ADC | [23] | ||||
| Efficacy Data | Tumor Growth Inhibition value (TGI) | ≈ 76% | High EGFR expression (EGFR+++) | ||
| Method Description |
Serclutamab talirine induces efficient tumor cell killing in PDX models of head and neck cancer cell with EGFR expression,demonstrated with ABBV-321 dosed at 0.15 mg/kg 2 every seven days 3.
|
||||
| In Vivo Model | EGFR-expressing malignant mesothelioma PDX model (PDX: 1174) | ||||
| Experiment 4 Reporting the Activity Date of This ADC | [23] | ||||
| Efficacy Data | Tumor Growth Inhibition value (TGI) | ≈ 88.57% | Moderate EGFR expression (EGFR++) | ||
| Method Description |
ABBV-321 induces efficient tumor cell killing in cell line-derived models of SNO199 and U87NG cells with mAb806 expression with high expression.
|
||||
| In Vivo Model | Glioblastoma PDX model (PDX: SNO207) | ||||
| Experiment 5 Reporting the Activity Date of This ADC | [23] | ||||
| Efficacy Data | Tumor Growth Inhibition value (TGI) | ≈ 90.20% | Moderate EGFR expression (EGFR++) | ||
| Method Description |
Serclutamab talirine induces efficient tumor cell killing in PDX models of brain cancer cell with EGFR expression,dosed 0.2 mg/kg,every seven days 3.
|
||||
| In Vivo Model | EGFR-expressing GBM brain cancer PDX model (PDX: SNO199) | ||||
| Experiment 6 Reporting the Activity Date of This ADC | [23] | ||||
| Efficacy Data | Tumor Growth Inhibition value (TGI) | ≈ 91.60% | Moderate EGFR expression (EGFR++) | ||
| Method Description |
ABBV-321 induces efficient tumor cell killing in cell line-derived models of SNO199 and U87NG cells with mAb806 expression with high expression.
|
||||
| In Vivo Model | Glioblastoma PDX model (PDX: SNO207) | ||||
| Experiment 7 Reporting the Activity Date of This ADC | [23] | ||||
| Efficacy Data | Tumor Growth Inhibition value (TGI) | ≈ 93.70% | High EGFR expression (EGFR+++) | ||
| Method Description |
Serclutamab talirine induces efficient tumor cell killing in PDX models of brain cancer cell with EGFR expression,dosed 0.2 mg/kg,every seven days 3.
|
||||
| In Vivo Model | EGFR-expressing GBM brain cancer PDX model (PDX: SNO207) | ||||
| Experiment 8 Reporting the Activity Date of This ADC | [23] | ||||
| Efficacy Data | Tumor Growth Inhibition value (TGI) | ≈ 93.80% | High EGFR expression (EGFR+++) | ||
| Method Description |
Serclutamab talirine induces efficient tumor cell killing in PDX models of head and neck cancer cell with EGFR expression, administered at 0.5 mg/kg on a Q7D 6 regimen.
|
||||
| In Vivo Model | EGFR-expressing colorectal adenocarcinoma PDX model (PDX: LoVo) | ||||
| Experiment 9 Reporting the Activity Date of This ADC | [23] | ||||
| Efficacy Data | Tumor Growth Inhibition value (TGI) | ≈ 96.40% | Moderate EGFR expression (EGFR++) | ||
| Method Description |
Serclutamab talirine induces efficient tumor cell killing in PDX models of brain cancer cell with EGFR expression,dosed 0.4 mg/kg,every seven days 3.
|
||||
| In Vivo Model | EGFR-expressing GBM brain cancer PDX model (PDX: SNO207) | ||||
| Experiment 10 Reporting the Activity Date of This ADC | [23] | ||||
| Efficacy Data | Tumor Growth Inhibition value (TGI) | ≈ 97.20% | High EGFR expression (EGFR+++) | ||
| Method Description |
Serclutamab talirine induces efficient tumor cell killing in PDX models of brain cancer cell with EGFR expression,dosed 0.4 mg/kg,every seven days 3.
|
||||
| In Vivo Model | EGFR-expressing GBM brain cancer PDX model (PDX: SNO199) | ||||
Discovered Using Cell Line-derived Xenograft Model
| Experiment 1 Reporting the Activity Date of This ADC | [23] | ||||
| Efficacy Data | Tumor Growth Inhibition value (TGI) | ≈ 52.40% | Moderate EGFR expression (EGFR++) | ||
| Method Description |
Serclutamab talirine induces efficient tumor cell killing in PDX models of head and neck cancer cell with EGFR expression,a single dose of 0.0125 mg/kg.
|
||||
| In Vivo Model | EGFR-expressing SW48 CDX model | ||||
| In Vitro Model | Colon adenocarcinoma | SW48 cells | CVCL_1724 | ||
| Experiment 2 Reporting the Activity Date of This ADC | [23] | ||||
| Efficacy Data | Tumor Growth Inhibition value (TGI) | ≈ 55.30% | Low EGFR expression (EGFR+) | ||
| Method Description |
Serclutamab talirine induces efficient tumor cell killing in PDX models of lung squamous cell carcinoma cell with EGFR expression,a single dose of 0.1 mg/kg.
|
||||
| In Vivo Model | EGFR-expressing EBC-1 CDX model | ||||
| In Vitro Model | Lung squamous cell carcinoma | EBC-1 cells | CVCL_2891 | ||
| Experiment 3 Reporting the Activity Date of This ADC | [23] | ||||
| Efficacy Data | Tumor Growth Inhibition value (TGI) | ≈ 70.60% | High EGFR expression (EGFR+++) | ||
| Method Description |
Serclutamab talirine induces efficient tumor cell killing in PDX models of head and neck cancer cell with EGFR expression,a single dose of 0.025 mg/kg.
|
||||
| In Vivo Model | EGFR-expressing SW48 CDX model | ||||
| In Vitro Model | Colon adenocarcinoma | SW48 cells | CVCL_1724 | ||
| Experiment 4 Reporting the Activity Date of This ADC | [23] | ||||
| Efficacy Data | Tumor Growth Inhibition value (TGI) | ≈ 73.80% | High EGFR expression (EGFR+++) | ||
| Method Description |
Serclutamab talirine induces efficient tumor cell killing in PDX models of head and neck cancer cell with EGFR expression,a single dose of 0.1 mg/kg.
|
||||
| In Vivo Model | EGFR-expressing A-253 CDX model | ||||
| In Vitro Model | Submandibular gland squamous cell carcinoma | A-253 cells | CVCL_1060 | ||
| Experiment 5 Reporting the Activity Date of This ADC | [23] | ||||
| Efficacy Data | Tumor Growth Inhibition value (TGI) | ≈ 81.10% | Moderate EGFR expression (EGFR++) | ||
| Method Description |
Serclutamab talirine induces efficient tumor cell killing in PDX models of head and neck cancer cell with EGFR expression,a single dose of 0.3 mg/kg.
|
||||
| In Vivo Model | EGFR-expressing A-253 CDX model | ||||
| In Vitro Model | Submandibular gland squamous cell carcinoma | A-253 cells | CVCL_1060 | ||
| Experiment 6 Reporting the Activity Date of This ADC | [23] | ||||
| Efficacy Data | Tumor Growth Inhibition value (TGI) | ≈ 82.80% | Moderate EGFR expression (EGFR++) | ||
| Method Description |
Serclutamab talirine induces efficient tumor cell killing in PDX models of head and neck cancer cell with EGFR expression,a single dose of 0.1 mg/kg.
|
||||
| In Vivo Model | EGFR-expressing SW48 CDX model | ||||
| In Vitro Model | Colon adenocarcinoma | SW48 cells | CVCL_1724 | ||
| Experiment 7 Reporting the Activity Date of This ADC | [23] | ||||
| Efficacy Data | Tumor Growth Inhibition value (TGI) | ≈ 82.80% | High EGFR expression (EGFR+++) | ||
| Method Description |
Serclutamab talirine induces efficient tumor cell killing in PDX models of head and neck cancer cell with EGFR expression,a single dose of 0.05 mg/kg.
|
||||
| In Vivo Model | EGFR-expressing SW48 CDX model | ||||
| In Vitro Model | Colon adenocarcinoma | SW48 cells | CVCL_1724 | ||
| Experiment 8 Reporting the Activity Date of This ADC | [23] | ||||
| Efficacy Data | Tumor Growth Inhibition value (TGI) | ≈ 83.10% | Moderate EGFR expression (EGFR++) | ||
| Method Description |
Serclutamab talirine induces efficient tumor cell killing in PDX models of head and neck cancer cell with EGFR expression,a single dose of 0.1 mg/kg.
|
||||
| In Vivo Model | EGFR-expressing FaDu CDX model | ||||
| In Vitro Model | Hypopharyngeal squamous cell carcinoma | FaDu cells | CVCL_1218 | ||
| Experiment 9 Reporting the Activity Date of This ADC | [23] | ||||
| Efficacy Data | Tumor Growth Inhibition value (TGI) | ≈ 89.90% | Low EGFR expression (EGFR+) | ||
| Method Description |
Serclutamab talirine induces efficient tumor cell killing in PDX models of head and neck cancer cell with EGFR expression,administered 0.4 mg/kg,at every seven days 3.
|
||||
| In Vivo Model | EGFR-expressing HCT 116 CDX model | ||||
| In Vitro Model | Colon carcinoma | HCT 116 cells | CVCL_0291 | ||
| Experiment 10 Reporting the Activity Date of This ADC | [23] | ||||
| Efficacy Data | Tumor Growth Inhibition value (TGI) | ≈ 89.90% | High EGFR expression (EGFR+++) | ||
| Method Description |
Serclutamab talirine induces efficient tumor cell killing in PDX models of head and neck cancer cell with EGFR expression,a single dose of 0.1 mg/kg.
|
||||
| In Vivo Model | EGFR-expressing HCT 116 CDX model | ||||
| In Vitro Model | Colon carcinoma | HCT 116 cells | CVCL_0291 | ||
| Experiment 11 Reporting the Activity Date of This ADC | [23] | ||||
| Efficacy Data | Tumor Growth Inhibition value (TGI) | ≈ 91.80% | Negative EGFR expression (EGFR-) | ||
| Method Description |
Serclutamab talirine induces efficient tumor cell killing in PDX models of head and neck cancer cell with EGFR expression,a single dose of 0.3 mg/kg.
|
||||
| In Vivo Model | EGFR-expressing FaDu CDX model | ||||
| In Vitro Model | Hypopharyngeal squamous cell carcinoma | FaDu cells | CVCL_1218 | ||
| Experiment 12 Reporting the Activity Date of This ADC | [23] | ||||
| Efficacy Data | Tumor Growth Inhibition value (TGI) | ≈ 100% | High EGFR expression (EGFR+++) | ||
| Method Description |
ABBV-321 induces efficient tumor cell killing in cell line-derived models of SNO199 and U87NG cells with mAb806 expression with high expression.
|
||||
| In Vivo Model | Glioblastoma U-87MG CDX model | ||||
| In Vitro Model | Glioblastoma | U-87MG ATCC cells | CVCL_0022 | ||
| Experiment 13 Reporting the Activity Date of This ADC | [23] | ||||
| Efficacy Data | Tumor Growth Inhibition value (TGI) | ≈ 100% | Low EGFR expression (EGFR+) | ||
| Method Description |
ABBV-321 induces efficient tumor cell killing in cell line-derived models of SNO199 and U87NG cells with mAb806 expression with high expression.
|
||||
| In Vivo Model | Glioblastoma U-87MG CDX model | ||||
| In Vitro Model | Glioblastoma | U-87MG ATCC cells | CVCL_0022 | ||
| Experiment 14 Reporting the Activity Date of This ADC | [23] | ||||
| Efficacy Data | Tumor Growth Inhibition value (TGI) | ≈ 100% | Low EGFR expression (EGFR+) | ||
| Method Description |
Serclutamab talirine induces efficient tumor cell killing in PDX models of lung squamous cell carcinoma cell with EGFR expression,a single dose of 0.3 mg/kg.
|
||||
| In Vivo Model | EGFR-expressing EBC-1 CDX model | ||||
| In Vitro Model | Lung squamous cell carcinoma | EBC-1 cells | CVCL_2891 | ||
| Experiment 15 Reporting the Activity Date of This ADC | [23] | ||||
| Efficacy Data | Tumor Growth Inhibition value (TGI) | ≈ 100% | High EGFR expression (EGFR+++) | ||
| Method Description |
Serclutamab talirine induces efficient tumor cell killing in PDX models of brain cancer cell with EGFR expression,dosed 0.4 mg/kg,every seven days 3.
|
||||
| In Vivo Model | EGFR-expressing U-87MG CDX model | ||||
| In Vitro Model | Glioblastoma | U-87MG ATCC cells | CVCL_0022 | ||
| Experiment 16 Reporting the Activity Date of This ADC | [23] | ||||
| Efficacy Data | Tumor Growth Inhibition value (TGI) | ≈ 100% | High EGFR expression (EGFR+++) | ||
| Method Description |
Serclutamab talirine induces efficient tumor cell killing in PDX models of brain cancer cell with EGFR expression,dosed 0.2 mg/kg,every seven days 3.
|
||||
| In Vivo Model | EGFR-expressing U-87MG CDX model | ||||
| In Vitro Model | Glioblastoma | U-87MG ATCC cells | CVCL_0022 | ||
Revealed Based on the Cell Line Data
| Experiment 1 Reporting the Activity Date of This ADC | [23] | ||||
| Efficacy Data | Half Maximal Inhibitory Concentration (IC50) |
15 pM
|
|||
| Method Description |
The inhibitory activity of serclutamab talirine against cancer cell growth was compared with ABBV-221 against various human cancer cell lines in vitro. The cells were treated with serclutamab talirine and ABBV-221.
|
||||
| In Vitro Model | Colon adenocarcinoma | SW48 cells | CVCL_1724 | ||
| Experiment 2 Reporting the Activity Date of This ADC | [23] | ||||
| Efficacy Data | Half Maximal Inhibitory Concentration (IC50) |
0.23 nM
|
Negative EGFR expression (EGFR-) | ||
| Method Description |
The inhibitory activity of serclutamab talirine against cancer cell growth was compared with ABBV-221 against various human cancer cell lines in vitro. The cells were treated with serclutamab talirine and ABBV-221.
|
||||
| In Vitro Model | Glioblastoma | U-87 MGvIII cells | CVCL_0022 | ||
| Experiment 3 Reporting the Activity Date of This ADC | [23] | ||||
| Efficacy Data | Half Maximal Inhibitory Concentration (IC50) |
0.7 nM
|
High EGFR expression (EGFR+++; IHC 3+) | ||
| Method Description |
The inhibitory activity of serclutamab talirine against cancer cell growth was compared with ABBV-221 against various human cancer cell lines in vitro. The cells were treated with serclutamab talirine and ABBV-221.
|
||||
| In Vitro Model | Colon adenocarcinoma | LoVo cells | CVCL_0399 | ||
| Experiment 4 Reporting the Activity Date of This ADC | [23] | ||||
| Efficacy Data | Half Maximal Inhibitory Concentration (IC50) |
0.7 nM
|
High EGFR expression (EGFR+++; IHC 3+) | ||
| Method Description |
The inhibitory activity of serclutamab talirine against cancer cell growth was compared with ABBV-221 against various human cancer cell lines in vitro. The cells were treated with serclutamab talirine and ABBV-221.
|
||||
| In Vitro Model | Astrocytoma | U-251MG cells | CVCL_0021 | ||
| Experiment 5 Reporting the Activity Date of This ADC | [23] | ||||
| Efficacy Data | Half Maximal Inhibitory Concentration (IC50) |
1 nM
|
Moderate EGFR expression (EGFR++; IHC 2+) | ||
| Method Description |
The inhibitory activity of serclutamab talirine against cancer cell growth was compared with ABBV-221 against various human cancer cell lines in vitro. The cells were treated with serclutamab talirine and ABBV-221.
|
||||
| In Vitro Model | Colon adenocarcinoma | LS174T cells | CVCL_1384 | ||
| Experiment 6 Reporting the Activity Date of This ADC | [23] | ||||
| Efficacy Data | Half Maximal Inhibitory Concentration (IC50) |
1.1 nM
|
High EGFR expression (EGFR+++; IHC 3+) | ||
| Method Description |
The inhibitory activity of serclutamab talirine against cancer cell growth was compared with ABBV-221 against various human cancer cell lines in vitro. The cells were treated with serclutamab talirine and ABBV-221.
|
||||
| In Vitro Model | Colon adenocarcinoma | SK-CO-1 cells | CVCL_0626 | ||
| Experiment 7 Reporting the Activity Date of This ADC | [23] | ||||
| Efficacy Data | Half Maximal Inhibitory Concentration (IC50) |
1.4 nM
|
Negative EGFR expression (EGFR-) | ||
| Method Description |
The inhibitory activity of serclutamab talirine against cancer cell growth was compared with ABBV-221 against various human cancer cell lines in vitro. The cells were treated with serclutamab talirine and ABBV-221.
|
||||
| In Vitro Model | Astrocytoma | SF268 cells | CVCL_1689 | ||
| Experiment 8 Reporting the Activity Date of This ADC | [23] | ||||
| Efficacy Data | Half Maximal Inhibitory Concentration (IC50) |
1.5 nM
|
Moderate EGFR expression (EGFR++) | ||
| Method Description |
The inhibitory activity of serclutamab talirine against cancer cell growth was compared with ABBV-221 against various human cancer cell lines in vitro. The cells were treated with serclutamab talirine and ABBV-221.
|
||||
| In Vitro Model | Colon cancer | HT29 cells | CVCL_A8EZ | ||
| Experiment 9 Reporting the Activity Date of This ADC | [23] | ||||
| Efficacy Data | Half Maximal Inhibitory Concentration (IC50) |
1.5 nM
|
Low EGFR expression (EGFR+; IHC 1+) | ||
| Method Description |
The inhibitory activity of serclutamab talirine against cancer cell growth was compared with ABBV-221 against various human cancer cell lines in vitro. The cells were treated with serclutamab talirine and ABBV-221.
|
||||
| In Vitro Model | Glioblastoma | M059K cells | CVCL_0401 | ||
| Experiment 10 Reporting the Activity Date of This ADC | [23] | ||||
| Efficacy Data | Half Maximal Inhibitory Concentration (IC50) |
1.8 nM
|
Moderate EGFR expression (EGFR++; IHC 2+) | ||
| Method Description |
The inhibitory activity of serclutamab talirine against cancer cell growth was compared with ABBV-221 against various human cancer cell lines in vitro. The cells were treated with serclutamab talirine and ABBV-221.
|
||||
| In Vitro Model | Colon adenocarcinoma | SW403 cells | CVCL_0545 | ||
| Experiment 11 Reporting the Activity Date of This ADC | [23] | ||||
| Efficacy Data | Half Maximal Inhibitory Concentration (IC50) |
1.9 nM
|
High EGFR expression (EGFR+++) | ||
| Method Description |
The inhibitory activity of serclutamab talirine against cancer cell growth was compared with ABBV-221 against various human cancer cell lines in vitro. The cells were treated with serclutamab talirine and ABBV-221.
|
||||
| In Vitro Model | Primitive neuroectodermal tumor | PFSK-1 cells | CVCL_1642 | ||
| Experiment 12 Reporting the Activity Date of This ADC | [23] | ||||
| Efficacy Data | Half Maximal Inhibitory Concentration (IC50) |
2.5 nM
|
High EGFR expression (EGFR+++) | ||
| Method Description |
The inhibitory activity of serclutamab talirine against cancer cell growth was compared with ABBV-221 against various human cancer cell lines in vitro. The cells were treated with serclutamab talirine and ABBV-221.
|
||||
| In Vitro Model | Gliosarcoma | SF539 cells | CVCL_1691 | ||
| Experiment 13 Reporting the Activity Date of This ADC | [23] | ||||
| Efficacy Data | Half Maximal Inhibitory Concentration (IC50) |
2.6 nM
|
Moderate EGFR expression (EGFR++) | ||
| Method Description |
The inhibitory activity of serclutamab talirine against cancer cell growth was compared with ABBV-221 against various human cancer cell lines in vitro. The cells were treated with serclutamab talirine and ABBV-221.
|
||||
| In Vitro Model | Colon adenocarcinoma | COLO 201 cells | CVCL_1987 | ||
| Experiment 14 Reporting the Activity Date of This ADC | [23] | ||||
| Efficacy Data | Half Maximal Inhibitory Concentration (IC50) |
2.8 nM
|
High EGFR expression (EGFR+++; IHC 3+) | ||
| Method Description |
The inhibitory activity of serclutamab talirine against cancer cell growth was compared with ABBV-221 against various human cancer cell lines in vitro. The cells were treated with serclutamab talirine and ABBV-221.
|
||||
| In Vitro Model | Glioblastoma | M059J cells | CVCL_0400 | ||
| Experiment 15 Reporting the Activity Date of This ADC | [23] | ||||
| Efficacy Data | Half Maximal Inhibitory Concentration (IC50) |
3.3 nM
|
High EGFR expression (EGFR+++; IHC 3+) | ||
| Method Description |
The inhibitory activity of serclutamab talirine against cancer cell growth was compared with ABBV-221 against various human cancer cell lines in vitro. The cells were treated with serclutamab talirine and ABBV-221.
|
||||
| In Vitro Model | Colon adenocarcinoma | COLO 205 cells | CVCL_0218 | ||
| Experiment 16 Reporting the Activity Date of This ADC | [23] | ||||
| Efficacy Data | Half Maximal Inhibitory Concentration (IC50) |
3.7 nM
|
High EGFR expression (EGFR+++; IHC 3+) | ||
| Method Description |
The inhibitory activity of serclutamab talirine against cancer cell growth was compared with ABBV-221 against various human cancer cell lines in vitro. The cells were treated with serclutamab talirine and ABBV-221.
|
||||
| In Vitro Model | Astrocytoma | SNB-19 cells | CVCL_0535 | ||
| Experiment 17 Reporting the Activity Date of This ADC | [23] | ||||
| Efficacy Data | Half Maximal Inhibitory Concentration (IC50) |
4.3 nM
|
High EGFR expression (EGFR+++; IHC 3+) | ||
| Method Description |
The inhibitory activity of serclutamab talirine against cancer cell growth was compared with ABBV-221 against various human cancer cell lines in vitro. The cells were treated with serclutamab talirine and ABBV-221.
|
||||
| In Vitro Model | Colon adenocarcinoma | SW620 cells | CVCL_0547 | ||
| Experiment 18 Reporting the Activity Date of This ADC | [23] | ||||
| Efficacy Data | Half Maximal Inhibitory Concentration (IC50) |
4.6 nM
|
High EGFR expression (EGFR+++; IHC 3+) | ||
| Method Description |
The inhibitory activity of serclutamab talirine against cancer cell growth was compared with ABBV-221 against various human cancer cell lines in vitro. The cells were treated with serclutamab talirine and ABBV-221.
|
||||
| In Vitro Model | Colon adenocarcinoma | SW1116 cells | CVCL_0544 | ||
| Experiment 19 Reporting the Activity Date of This ADC | [23] | ||||
| Efficacy Data | Half Maximal Inhibitory Concentration (IC50) |
4.6 nM
|
Low EGFR expression (EGFR+; IHC 1+) | ||
| Method Description |
The inhibitory activity of serclutamab talirine against cancer cell growth was compared with ABBV-221 against various human cancer cell lines in vitro. The cells were treated with serclutamab talirine and ABBV-221.
|
||||
| In Vitro Model | Glioblastoma | U-87MG cells | CVCL_0022 | ||
| Experiment 20 Reporting the Activity Date of This ADC | [23] | ||||
| Efficacy Data | Half Maximal Inhibitory Concentration (IC50) |
4.7 nM
|
Low EGFR expression (EGFR+; IHC 1+) | ||
| Method Description |
The inhibitory activity of serclutamab talirine against cancer cell growth was compared with ABBV-221 against various human cancer cell lines in vitro. The cells were treated with serclutamab talirine and ABBV-221.
|
||||
| In Vitro Model | Colon carcinoma | RKO cells | CVCL_0504 | ||
| Experiment 21 Reporting the Activity Date of This ADC | [23] | ||||
| Efficacy Data | Half Maximal Inhibitory Concentration (IC50) |
4.8 nM
|
Moderate EGFR expression (EGFR++) | ||
| Method Description |
The inhibitory activity of serclutamab talirine against cancer cell growth was compared with ABBV-221 against various human cancer cell lines in vitro. The cells were treated with serclutamab talirine and ABBV-221.
|
||||
| In Vitro Model | Rectal adenocarcinoma | SW1463 cells | CVCL_1718 | ||
| Experiment 22 Reporting the Activity Date of This ADC | [23] | ||||
| Efficacy Data | Half Maximal Inhibitory Concentration (IC50) |
4.8 nM
|
Negative EGFR expression (EGFR-) | ||
| Method Description |
The inhibitory activity of serclutamab talirine against cancer cell growth was compared with ABBV-221 against various human cancer cell lines in vitro. The cells were treated with serclutamab talirine and ABBV-221.
|
||||
| In Vitro Model | Anaplastic astrocytoma | CHLA-03-AA cells | CVCL_U616 | ||
| Experiment 23 Reporting the Activity Date of This ADC | [23] | ||||
| Efficacy Data | Half Maximal Inhibitory Concentration (IC50) |
5.5 nM
|
Moderate EGFR expression (EGFR++) | ||
| Method Description |
The inhibitory activity of serclutamab talirine against cancer cell growth was compared with ABBV-221 against various human cancer cell lines in vitro. The cells were treated with serclutamab talirine and ABBV-221.
|
||||
| In Vitro Model | Colon adenocarcinoma | WiDr cells | CVCL_2760 | ||
| Experiment 24 Reporting the Activity Date of This ADC | [23] | ||||
| Efficacy Data | Half Maximal Inhibitory Concentration (IC50) |
8 nM
|
Moderate EGFR expression (EGFR++; IHC 2+) | ||
| Method Description |
The inhibitory activity of serclutamab talirine against cancer cell growth was compared with ABBV-221 against various human cancer cell lines in vitro. The cells were treated with serclutamab talirine and ABBV-221.
|
||||
| In Vitro Model | Colon adenocarcinoma | SW480 cells | CVCL_0546 | ||
| Experiment 25 Reporting the Activity Date of This ADC | [23] | ||||
| Efficacy Data | Half Maximal Inhibitory Concentration (IC50) |
8.4 nM
|
High EGFR expression (EGFR+++; IHC 3+) | ||
| Method Description |
The inhibitory activity of serclutamab talirine against cancer cell growth was compared with ABBV-221 against various human cancer cell lines in vitro. The cells were treated with serclutamab talirine and ABBV-221.
|
||||
| In Vitro Model | Glioblastoma | LN-18 cells | CVCL_0392 | ||
| Experiment 26 Reporting the Activity Date of This ADC | [23] | ||||
| Efficacy Data | Half Maximal Inhibitory Concentration (IC50) |
9 nM
|
High EGFR expression (EGFR+++; IHC 3+) | ||
| Method Description |
The inhibitory activity of serclutamab talirine against cancer cell growth was compared with ABBV-221 against various human cancer cell lines in vitro. The cells were treated with serclutamab talirine and ABBV-221.
|
||||
| In Vitro Model | Colon adenocarcinoma | DLD-1 cells | CVCL_0248 | ||
| Experiment 27 Reporting the Activity Date of This ADC | [23] | ||||
| Efficacy Data | Half Maximal Inhibitory Concentration (IC50) |
9.5 nM
|
Moderate EGFR expression (EGFR++; IHC 2+) | ||
| Method Description |
The inhibitory activity of serclutamab talirine against cancer cell growth was compared with ABBV-221 against various human cancer cell lines in vitro. The cells were treated with serclutamab talirine and ABBV-221.
|
||||
| In Vitro Model | Cecum adenocarcinoma | LS1034 cells | CVCL_1382 | ||
| Experiment 28 Reporting the Activity Date of This ADC | [23] | ||||
| Efficacy Data | Half Maximal Inhibitory Concentration (IC50) |
10.6 nM
|
Negative EGFR expression (EGFR-) | ||
| Method Description |
The inhibitory activity of serclutamab talirine against cancer cell growth was compared with ABBV-221 against various human cancer cell lines in vitro. The cells were treated with serclutamab talirine and ABBV-221.
|
||||
| In Vitro Model | Glioblastoma | SNB-75 cells | CVCL_1706 | ||
| Experiment 29 Reporting the Activity Date of This ADC | [23] | ||||
| Efficacy Data | Half Maximal Inhibitory Concentration (IC50) |
11.8 nM
|
High EGFR expression (EGFR+++; IHC 3+) | ||
| Method Description |
The inhibitory activity of serclutamab talirine against cancer cell growth was compared with ABBV-221 against various human cancer cell lines in vitro. The cells were treated with serclutamab talirine and ABBV-221.
|
||||
| In Vitro Model | Colon adenocarcinoma | T84 cells | CVCL_0555 | ||
| Experiment 30 Reporting the Activity Date of This ADC | [23] | ||||
| Efficacy Data | Half Maximal Inhibitory Concentration (IC50) |
12 nM
|
High EGFR expression (EGFR+++; IHC 3+) | ||
| Method Description |
The inhibitory activity of serclutamab talirine against cancer cell growth was compared with ABBV-221 against various human cancer cell lines in vitro. The cells were treated with serclutamab talirine and ABBV-221.
|
||||
| In Vitro Model | Colon carcinoma | HCT 116 cells | CVCL_0291 | ||
| Experiment 31 Reporting the Activity Date of This ADC | [23] | ||||
| Efficacy Data | Half Maximal Inhibitory Concentration (IC50) |
13.9 nM
|
Low EGFR expression (EGFR+; IHC 1+) | ||
| Method Description |
The inhibitory activity of serclutamab talirine against cancer cell growth was compared with ABBV-221 against various human cancer cell lines in vitro. The cells were treated with serclutamab talirine and ABBV-221.
|
||||
| In Vitro Model | Colon adenocarcinoma | Caco-2 cells | CVCL_0025 | ||
| Experiment 32 Reporting the Activity Date of This ADC | [23] | ||||
| Efficacy Data | Half Maximal Inhibitory Concentration (IC50) |
14.5 nM
|
High EGFR expression (EGFR+++; IHC 3+) | ||
| Method Description |
The inhibitory activity of serclutamab talirine against cancer cell growth was compared with ABBV-221 against various human cancer cell lines in vitro. The cells were treated with serclutamab talirine and ABBV-221.
|
||||
| In Vitro Model | Glioblastoma | T98G cells | CVCL_0556 | ||
| Experiment 33 Reporting the Activity Date of This ADC | [23] | ||||
| Efficacy Data | Half Maximal Inhibitory Concentration (IC50) |
16.1 nM
|
Low EGFR expression (EGFR+; IHC 1+) | ||
| Method Description |
The inhibitory activity of serclutamab talirine against cancer cell growth was compared with ABBV-221 against various human cancer cell lines in vitro. The cells were treated with serclutamab talirine and ABBV-221.
|
||||
| In Vitro Model | Astrocytoma | U-138MG cells | CVCL_0020 | ||
| Experiment 34 Reporting the Activity Date of This ADC | [23] | ||||
| Efficacy Data | Half Maximal Inhibitory Concentration (IC50) |
17.6 nM
|
Low EGFR expression (EGFR+; IHC 1+) | ||
| Method Description |
The inhibitory activity of serclutamab talirine against cancer cell growth was compared with ABBV-221 against various human cancer cell lines in vitro. The cells were treated with serclutamab talirine and ABBV-221.
|
||||
| In Vitro Model | Colon adenocarcinoma | COLO 320DM cells | CVCL_0219 | ||
| Experiment 35 Reporting the Activity Date of This ADC | [23] | ||||
| Efficacy Data | Half Maximal Inhibitory Concentration (IC50) |
18 nM
|
High EGFR expression (EGFR+++; IHC 3+) | ||
| Method Description |
The inhibitory activity of serclutamab talirine against cancer cell growth was compared with ABBV-221 against various human cancer cell lines in vitro. The cells were treated with serclutamab talirine and ABBV-221.
|
||||
| In Vitro Model | Anaplastic astrocytoma | DBTRG-05MG cells | CVCL_1169 | ||
| Experiment 36 Reporting the Activity Date of This ADC | [23] | ||||
| Efficacy Data | Half Maximal Inhibitory Concentration (IC50) |
23.2 nM
|
|||
| Method Description |
The inhibitory activity of serclutamab talirine against cancer cell growth was compared with ABBV-221 against various human cancer cell lines in vitro. The cells were treated with serclutamab talirine and ABBV-221.
|
||||
| In Vitro Model | Glioblastoma | A-172 cells | CVCL_0131 | ||
| Experiment 37 Reporting the Activity Date of This ADC | [23] | ||||
| Efficacy Data | Half Maximal Inhibitory Concentration (IC50) |
24.9 nM
|
High EGFR expression (EGFR+++; IHC 3+) | ||
| Method Description |
The inhibitory activity of serclutamab talirine against cancer cell growth was compared with ABBV-221 against various human cancer cell lines in vitro. The cells were treated with serclutamab talirine and ABBV-221.
|
||||
| In Vitro Model | Colon adenocarcinoma | COLO 320HSR cells | CVCL_0220 | ||
| Experiment 38 Reporting the Activity Date of This ADC | [23] | ||||
| Efficacy Data | Half Maximal Inhibitory Concentration (IC50) |
28.4 nM
|
High EGFR expression (EGFR+++; IHC 3+) | ||
| Method Description |
The inhibitory activity of serclutamab talirine against cancer cell growth was compared with ABBV-221 against various human cancer cell lines in vitro. The cells were treated with serclutamab talirine and ABBV-221.
|
||||
| In Vitro Model | Colon adenocarcinoma | HCT 15 cells | CVCL_0292 | ||
Rolinsatamab talirine [Phase 1 (discontinued)]
Identified from the Human Clinical Data
| Experiment 1 Reporting the Activity Date of This ADC | [18] | ||||
| Patients Enrolled |
Eligibility requires ECOG 0-1 patients with PRLR+ advanced tumors (breast/colorectal/adrenocortical/chromophobe RCC in escalation; breast cancer in expansion) refractory to ≤4 cytotoxic lines, excluding prior PBD agents, uncontrolled comorbidities, significant immunotherapy reactions, active gallbladder disease, major liver resection, or ongoing CTCAE >G1 toxicities, with 21-day washout for most prior therapies (14 days for targeted agents).
Click to Show/Hide
|
||||
| Administration Dosage |
ABBV-176 will be administered via intravenous infusion at escalating dose levels until the maximum tolerated dose is reached.
|
||||
| Related Clinical Trial | |||||
| NCT Number | NCT03145909 | Clinical Status | PHASE1 | ||
| Clinical Description |
A Phase 1 Study Evaluating the Safety, Pharmacokinetics and Anti-Tumor Activity of ABBV-176 in Subjects With Advanced Solid Tumors Likely to Express Prolactin Receptor (PRLR)
|
||||
| Primary Endpoint |
The dose escalation phase evaluates ABBV-176 pharmacokinetics over 57 days and establishes safety parameters (MTD/RPTD) during the first 21-day cycle in PRLR-expressing solid tumors, with expanded cohort assessing ORR per RECIST 1.1 over 2 years.
|
||||
| Other Endpoint |
Secondary endpoints include PK monitoring (AUCt, Cmax, Tmax) over 15 days and long-term efficacy outcomes (PFS, DOR, OS up to 2 years) in expanded cohort, alongside ECOG status changes and cardiac safety (QTcF changes over 47 days) in dose escalation phase.
|
||||
| Experiment 2 Reporting the Activity Date of This ADC | [21] | ||||
| Efficacy Data | Objective Response Rate (ORR) |
0%
|
|||
| Patients Enrolled |
Locally advanced or metastatic solid tumor types associated with PRLR expression, including breast cancer, colorectal cancer, and adrenocortical carcinoma. Patients had progressed on prior treatment, were not amenable to treatment with curative intent, and had no other therapy options known to provide clinical benefit, or were ineligible for such therapies. Patients had an Eastern Cooperative Oncology Group performance status of 0 or 1, and adequate bone marrow, renal, and hepatic function.
Click to Show/Hide
|
||||
| Administration Dosage |
Initial dose was 2.70 ug/kg, dose increment was capped at a 100% increase, or at a 50% increase if a grade2 drug-related toxicity had been observed, intravenously every 21 days.
|
||||
| Related Clinical Trial | |||||
| NCT Number | NCT03145909 | Clinical Status | Phase 1 | ||
| Clinical Description |
A phase 1 study evaluating the safety, pharmacokinetics and anti-tumor activity of ABBV-176 in subjects with advanced solid tumors likely to express prolactin receptor (PRLR).
|
||||
| Primary Endpoint |
MtD was not formally determined, as identification of a tolerable dose was confounded by late-onset toxicities. ABBV-176 was associated with significant toxicity in this phase 1, dose-escalation study.
|
||||
| Other Endpoint |
No patient had an objective response.
|
||||
Discovered Using Cell Line-derived Xenograft Model
| Experiment 1 Reporting the Activity Date of This ADC | [24] | ||||
| Efficacy Data | Tumor Growth Inhibition value (TGI) | ≈ 90.50% | |||
| Method Description |
Mice implanted with BT-474 breast cancer model and dosed with a single dose of ABBV-176 at 0.5 mg/kg.
|
||||
| In Vivo Model | BT-474 CDX | ||||
| In Vitro Model | Invasive breast carcinoma | BT-474 cells | CVCL_0179 | ||
| Experiment 2 Reporting the Activity Date of This ADC | [24] | ||||
| Efficacy Data | Tumor Growth Inhibition value (TGI) | ≈ 100% | |||
| Method Description |
Mice implanted with BT-474 breast cancer model and dosed with a single dose of ABBV-176 at 0.1 mg/kg.
|
||||
| In Vivo Model | BT-474 CDX | ||||
| In Vitro Model | Invasive breast carcinoma | BT-474 cells | CVCL_0179 | ||
| Experiment 3 Reporting the Activity Date of This ADC | [24] | ||||
| Efficacy Data | Tumor Growth Inhibition value (TGI) | ≈ 100% | |||
| Method Description |
Mice implanted with BT-474 breast cancer model and dosed with a single dose of ABBV-176 at 0.3 mg/kg.
|
||||
| In Vivo Model | BT-474 CDX | ||||
| In Vitro Model | Invasive breast carcinoma | BT-474 cells | CVCL_0179 | ||
Revealed Based on the Cell Line Data
| Experiment 1 Reporting the Activity Date of This ADC | [24] | ||||
| Efficacy Data | Half Maximal Inhibitory Concentration (IC50) |
5.5 pM
|
|||
| Method Description |
The inhibitory activity of ABBV-176 against cancer cell growth was evaluated in various human cancer cell lines in vitro. The cells were treated 144 hours.
|
||||
| In Vitro Model | Invasive breast carcinoma | T-47D cells | CVCL_0553 | ||
| Experiment 2 Reporting the Activity Date of This ADC | [24] | ||||
| Efficacy Data | Half Maximal Inhibitory Concentration (IC50) |
0.01 nM
|
|||
| Method Description |
The inhibitory activity of ABBV-176 against cancer cell growth was evaluated in various human cancer cell lines in vitro. The cells were treated 144 hours.
|
||||
| In Vitro Model | Prostate carcinoma | 22RV1 cells | CVCL_1045 | ||
| Experiment 3 Reporting the Activity Date of This ADC | [24] | ||||
| Efficacy Data | Half Maximal Inhibitory Concentration (IC50) |
0.01 nM
|
|||
| Method Description |
The inhibitory activity of ABBV-176 against cancer cell growth was evaluated in various human cancer cell lines in vitro. The cells were treated 144 hours.
|
||||
| In Vitro Model | Breast adenocarcinoma | CAMA-1 cells | CVCL_1115 | ||
| Experiment 4 Reporting the Activity Date of This ADC | [24] | ||||
| Efficacy Data | Half Maximal Inhibitory Concentration (IC50) |
0.11 nM
|
|||
| Method Description |
The inhibitory activity of ABBV-176 against cancer cell growth was evaluated in various human cancer cell lines in vitro. The cells were treated 144 hours.
|
||||
| In Vitro Model | Colon adenocarcinoma | SW403 cells | CVCL_0545 | ||
| Experiment 5 Reporting the Activity Date of This ADC | [24] | ||||
| Efficacy Data | Half Maximal Inhibitory Concentration (IC50) |
0.16 nM
|
|||
| Method Description |
The inhibitory activity of ABBV-176 against cancer cell growth was evaluated in various human cancer cell lines in vitro. The cells were treated 144 hours.
|
||||
| In Vitro Model | Ovarian clear cell adenocarcinoma | SMOV-2 cells | CVCL_S920 | ||
| Experiment 6 Reporting the Activity Date of This ADC | [24] | ||||
| Efficacy Data | Half Maximal Inhibitory Concentration (IC50) |
0.24 nM
|
|||
| Method Description |
The inhibitory activity of ABBV-176 against cancer cell growth was evaluated in various human cancer cell lines in vitro. The cells were treated 144 hours.
|
||||
| In Vitro Model | Invasive breast carcinoma | BT-474 cells | CVCL_0179 | ||
| Experiment 7 Reporting the Activity Date of This ADC | [24] | ||||
| Efficacy Data | Half Maximal Inhibitory Concentration (IC50) |
0.26 nM
|
|||
| Method Description |
The inhibitory activity of ABBV-176 against cancer cell growth was evaluated in various human cancer cell lines in vitro. The cells were treated 144 hours.
|
||||
| In Vitro Model | Breast adenocarcinoma | SK-BR-3 cells | CVCL_0033 | ||
| Experiment 8 Reporting the Activity Date of This ADC | [24] | ||||
| Efficacy Data | Half Maximal Inhibitory Concentration (IC50) |
0.32 nM
|
|||
| Method Description |
The inhibitory activity of ABBV-176 against cancer cell growth was evaluated in various human cancer cell lines in vitro. The cells were treated 144 hours.
|
||||
| In Vitro Model | Invasive breast carcinoma | MCF-7 cells | CVCL_0031 | ||
| Experiment 9 Reporting the Activity Date of This ADC | [24] | ||||
| Efficacy Data | Half Maximal Inhibitory Concentration (IC50) |
0.6 nM
|
|||
| Method Description |
The inhibitory activity of ABBV-176 against cancer cell growth was evaluated in various human cancer cell lines in vitro. The cells were treated 144 hours.
|
||||
| In Vitro Model | Endometrial adenocarcinoma | AN3-CA cells | CVCL_0028 | ||
| Experiment 10 Reporting the Activity Date of This ADC | [24] | ||||
| Efficacy Data | Half Maximal Inhibitory Concentration (IC50) |
0.77 nM
|
|||
| Method Description |
The inhibitory activity of ABBV-176 against cancer cell growth was evaluated in various human cancer cell lines in vitro. The cells were treated 144 hours.
|
||||
| In Vitro Model | Breast adenocarcinoma | MDA-MB-231 cells | CVCL_0062 | ||
| Experiment 11 Reporting the Activity Date of This ADC | [24] | ||||
| Efficacy Data | Half Maximal Inhibitory Concentration (IC50) |
5.2 nM
|
|||
| Method Description |
The inhibitory activity of ABBV-176 against cancer cell growth was evaluated in various human cancer cell lines in vitro. The cells were treated 144 hours.
|
||||
| In Vitro Model | Adult hepatocellular carcinoma | Huh-7 cells | CVCL_0336 | ||
| Experiment 12 Reporting the Activity Date of This ADC | [24] | ||||
| Efficacy Data | Half Maximal Inhibitory Concentration (IC50) |
8.6 nM
|
|||
| Method Description |
The inhibitory activity of ABBV-176 against cancer cell growth was evaluated in various human cancer cell lines in vitro. The cells were treated 144 hours.
|
||||
| In Vitro Model | Hepatoblastoma | Hep-G2 cells | CVCL_0027 | ||
| Experiment 13 Reporting the Activity Date of This ADC | [24] | ||||
| Efficacy Data | Half Maximal Inhibitory Concentration (IC50) | > 22 nM | |||
| Method Description |
The inhibitory activity of ABBV-176 against cancer cell growth was evaluated in various human cancer cell lines in vitro. The cells were treated 144 hours.
|
||||
| In Vitro Model | Breast adenocarcinoma | MDA-MB-231 cells | CVCL_0062 | ||
| Experiment 14 Reporting the Activity Date of This ADC | [24] | ||||
| Efficacy Data | Half Maximal Inhibitory Concentration (IC50) | > 22 nM | |||
| Method Description |
The inhibitory activity of ABBV-176 against cancer cell growth was evaluated in various human cancer cell lines in vitro. The cells were treated 144 hours.
|
||||
| In Vitro Model | Invasive breast carcinoma of no special type | UACC-812 cells | CVCL_1781 | ||
ABBV-322 [Investigative]
Discovered Using Patient-derived Xenograft Model
| Experiment 1 Reporting the Activity Date of This ADC | [25] | ||||
| Efficacy Data | Tumor Growth Inhibition value (TGI) | ≈ 34.60% | Positive EGFR expression (EGFR+++/++) | ||
| Method Description |
For the PDX 14R091 and PDX MPM36 studies, mice received ABBV-322 (0.03 mg/kg) or control ADC (0.03 mg/kg) every 4 days, for a total of 12 treatments.
|
||||
| In Vivo Model | Malignant Mesothelioma PDX model (PDX: MPM36) | ||||
| Experiment 2 Reporting the Activity Date of This ADC | [25] | ||||
| Efficacy Data | Tumor Growth Inhibition value (TGI) | ≈ 65.80% | Positive EGFR expression (EGFR+++/++) | ||
| Method Description |
For the PDX 14R091 and PDX MPM36 studies, mice received ABBV-322 (0.03 mg/kg) or control ADC (0.03 mg/kg) every 4 days, for a total of 12 treatments.
|
||||
| In Vivo Model | Malignant Mesothelioma PDX model (PDX: 14R091) | ||||
Revealed Based on the Cell Line Data
| Experiment 1 Reporting the Activity Date of This ADC | [25] | ||||
| Efficacy Data | Half Maximal Inhibitory Concentration (IC50) |
10.00 - 35.00 ug/mL
|
Positive EGFR expression (EGFR+++/++) | ||
| Method Description |
Cells lines were plated at 1,000-3,000 cells per well in complete growth medium containing 10% FCS in 96-well plates and allowed to adhere overnight.
|
||||
| In Vitro Model | Pleural mesothelioma | NCI-H2052 cells | CVCL_1518 | ||
| Experiment 2 Reporting the Activity Date of This ADC | [25] | ||||
| Efficacy Data | Half Maximal Inhibitory Concentration (IC50) |
10.00 - 35.00 ug/mL
|
Positive EGFR expression (EGFR+++/++) | ||
| Method Description |
Cells lines were plated at 1,000-3,000 cells per well in complete growth medium containing 10% FCS in 96-well plates and allowed to adhere overnight.
|
||||
| In Vitro Model | Pleural mesothelioma | NCI-H2052 cells | CVCL_1518 | ||
| Experiment 3 Reporting the Activity Date of This ADC | [25] | ||||
| Efficacy Data | Half Maximal Inhibitory Concentration (IC50) |
10.00 - 35.00 ug/mL
|
Positive EGFR expression (EGFR+++/++) | ||
| Method Description |
Cells lines were plated at 1,000-3,000 cells per well in complete growth medium containing 10% FCS in 96-well plates and allowed to adhere overnight.
|
||||
| In Vitro Model | Pleural mesothelioma | NCI-H28 cells | CVCL_1555 | ||
| Experiment 4 Reporting the Activity Date of This ADC | [25] | ||||
| Efficacy Data | Half Maximal Inhibitory Concentration (IC50) |
10.00 - 35.00 ug/mL
|
Positive EGFR expression (EGFR+++/++) | ||
| Method Description |
Cells lines were plated at 1,000-3,000 cells per well in complete growth medium containing 10% FCS in 96-well plates and allowed to adhere overnight.
|
||||
| In Vitro Model | Pleural biphasic mesothelioma | MSTO-211H cells | CVCL_1430 | ||
ABT-700 (S238C)-PBD [Investigative]
Discovered Using Patient-derived Xenograft Model
| Experiment 1 Reporting the Activity Date of This ADC | [26] | ||||
| Efficacy Data | Tumor Growth Inhibition value (TGI) |
70.68%
|
Low MET expression (MET+; IHC 1+) | ||
| Method Description |
Tumor fragments of 3 to 5 mm at passage 3 were implanted subcutaneously in the right rear flank of NSG mice with a trochar. ABT-700 PBD was administered 0.3 mg/kg every seven days for a total of six doses.
|
||||
| In Vivo Model | Non-small cell lung cancer PDX model (PDX: CTG-0363) | ||||
| Experiment 2 Reporting the Activity Date of This ADC | [26] | ||||
| Efficacy Data | Tumor Growth Inhibition value (TGI) |
75.79%
|
High MET expression (MET+++; IHC 3+) | ||
| Method Description |
Tumor fragments of 3 to 5 mm at passage 3 were implanted subcutaneously in the right rear flank of NSG mice with a trochar. ABT-700 PBD was administered 0.3 mg/kg every seven days for a total of six doses.
|
||||
| In Vivo Model | Non-small cell lung cancer PDX model (PDX: CTG-0170) | ||||
| Experiment 3 Reporting the Activity Date of This ADC | [26] | ||||
| Efficacy Data | Tumor Growth Inhibition value (TGI) |
88.94%
|
Moderate MET expression (MET++; IHC 2+) | ||
| Method Description |
Tumor fragments of 3 to 5 mm at passage 3 were implanted subcutaneously in the right rear flank of NSG mice with a trochar. ABT-700 PBD was administered 0.3 mg/kg every seven days for a total of six doses.
|
||||
| In Vivo Model | Non-small cell lung cancer PDX model (PDX: CTG-0159) | ||||
Discovered Using Cell Line-derived Xenograft Model
| Experiment 1 Reporting the Activity Date of This ADC | [26] | ||||
| Efficacy Data | Tumor Growth Inhibition value (TGI) |
92.94%
|
Positive MET expression (MET +++/++) | ||
| Method Description |
Mice were randomized when the tumors reached -200 mm and dosed on day 0 with isotype or ADC at 0.3 mg/kg intraperitoneally.
|
||||
| In Vivo Model | SW48 CDX model | ||||
| In Vitro Model | Colon adenocarcinoma | SW48 cells | CVCL_1724 | ||
Revealed Based on the Cell Line Data
| Experiment 1 Reporting the Activity Date of This ADC | [26] | ||||
| Efficacy Data | Half Maximal Inhibitory Concentration (IC50) | < 1 pM | Positive MET expression (MET +++/++) | ||
| Method Description |
Cancer cell lines were incubated with compounds for 72 h. IC50 values were determined by quantitating viable cells using a CellTiter-Glo luminescent assay.
|
||||
| In Vitro Model | Anaplastic astrocytoma | DBTRG-05MG cells | CVCL_1169 | ||
| Experiment 2 Reporting the Activity Date of This ADC | [26] | ||||
| Efficacy Data | Half Maximal Inhibitory Concentration (IC50) | < 1 pM | Positive MET expression (MET +++/++) | ||
| Method Description |
Cancer cell lines were incubated with compounds for 72 h. IC50 values were determined by quantitating viable cells using a CellTiter-Glo luminescent assay.
|
||||
| In Vitro Model | Glioblastoma | M059K cells | CVCL_0401 | ||
| Experiment 3 Reporting the Activity Date of This ADC | [26] | ||||
| Efficacy Data | Half Maximal Inhibitory Concentration (IC50) | < 1 pM | Positive MET expression (MET +++/++) | ||
| Method Description |
Cancer cell lines were incubated with compounds for 72 h. IC50 values were determined by quantitating viable cells using a CellTiter-Glo luminescent assay.
|
||||
| In Vitro Model | Glioblastoma | M059J cells | CVCL_0400 | ||
| Experiment 4 Reporting the Activity Date of This ADC | [26] | ||||
| Efficacy Data | Half Maximal Inhibitory Concentration (IC50) | < 1 pM | Positive MET expression (MET +++/++) | ||
| Method Description |
Cancer cell lines were incubated with compounds for 72 h. IC50 values were determined by quantitating viable cells using a CellTiter-Glo luminescent assay.
|
||||
| In Vitro Model | Astrocytoma | U-138MG cells | CVCL_0020 | ||
| Experiment 5 Reporting the Activity Date of This ADC | [26] | ||||
| Efficacy Data | Half Maximal Inhibitory Concentration (IC50) |
1 pM
|
Positive MET expression (MET +++/++) | ||
| Method Description |
Cancer cell lines were incubated with compounds for 72 h. IC50 values were determined by quantitating viable cells using a CellTiter-Glo luminescent assay.
|
||||
| In Vitro Model | Colon adenocarcinoma | LS174T cells | CVCL_1384 | ||
| Experiment 6 Reporting the Activity Date of This ADC | [26] | ||||
| Efficacy Data | Half Maximal Inhibitory Concentration (IC50) |
1 pM
|
Positive MET expression (MET +++/++) | ||
| Method Description |
Cancer cell lines were incubated with compounds for 72 h. IC50 values were determined by quantitating viable cells using a CellTiter-Glo luminescent assay.
|
||||
| In Vitro Model | Colon adenocarcinoma | SK-CO-1 cells | CVCL_0626 | ||
| Experiment 7 Reporting the Activity Date of This ADC | [26] | ||||
| Efficacy Data | Half Maximal Inhibitory Concentration (IC50) |
2.9 pM
|
Low MET expression (MET+) | ||
| Method Description |
Cancer cell lines were incubated with compounds for 72 h. IC50 values were determined by quantitating viable cells using a CellTiter-Glo luminescent assay.
|
||||
| In Vitro Model | Colon adenocarcinoma | SW48 cells | CVCL_1724 | ||
| Experiment 8 Reporting the Activity Date of This ADC | [26] | ||||
| Efficacy Data | Half Maximal Inhibitory Concentration (IC50) |
3 pM
|
Positive MET expression (MET +++/++) | ||
| Method Description |
Cancer cell lines were incubated with compounds for 72 h. IC50 values were determined by quantitating viable cells using a CellTiter-Glo luminescent assay.
|
||||
| In Vitro Model | Lung squamous cell carcinoma | HCC15 cells | CVCL_2057 | ||
| Experiment 9 Reporting the Activity Date of This ADC | [26] | ||||
| Efficacy Data | Half Maximal Inhibitory Concentration (IC50) |
4 pM
|
Positive MET expression (MET +++/++) | ||
| Method Description |
Cancer cell lines were incubated with compounds for 72 h. IC50 values were determined by quantitating viable cells using a CellTiter-Glo luminescent assay.
|
||||
| In Vitro Model | Colon adenocarcinoma | HT-29 cells | CVCL_0320 | ||
| Experiment 10 Reporting the Activity Date of This ADC | [26] | ||||
| Efficacy Data | Half Maximal Inhibitory Concentration (IC50) |
4 pM
|
Positive MET expression (MET +++/++) | ||
| Method Description |
Cancer cell lines were incubated with compounds for 72 h. IC50 values were determined by quantitating viable cells using a CellTiter-Glo luminescent assay.
|
||||
| In Vitro Model | Colon adenocarcinoma | DLD-1 cells | CVCL_0248 | ||
| Experiment 11 Reporting the Activity Date of This ADC | [26] | ||||
| Efficacy Data | Half Maximal Inhibitory Concentration (IC50) |
5 pM
|
Positive MET expression (MET +++/++) | ||
| Method Description |
Cancer cell lines were incubated with compounds for 72 h. IC50 values were determined by quantitating viable cells using a CellTiter-Glo luminescent assay.
|
||||
| In Vitro Model | Gliosarcoma | SF264 cells | Homo sapiens | ||
| Experiment 12 Reporting the Activity Date of This ADC | [26] | ||||
| Efficacy Data | Half Maximal Inhibitory Concentration (IC50) |
5 pM
|
Positive MET expression (MET +++/++) | ||
| Method Description |
Cancer cell lines were incubated with compounds for 72 h. IC50 values were determined by quantitating viable cells using a CellTiter-Glo luminescent assay.
|
||||
| In Vitro Model | Colon adenocarcinoma | SW620 cells | CVCL_0547 | ||
| Experiment 13 Reporting the Activity Date of This ADC | [26] | ||||
| Efficacy Data | Half Maximal Inhibitory Concentration (IC50) |
5 pM
|
Positive MET expression (MET +++/++) | ||
| Method Description |
Cancer cell lines were incubated with compounds for 72 h. IC50 values were determined by quantitating viable cells using a CellTiter-Glo luminescent assay.
|
||||
| In Vitro Model | Colon carcinoma | HCT 116 cells | CVCL_0291 | ||
| Experiment 14 Reporting the Activity Date of This ADC | [26] | ||||
| Efficacy Data | Half Maximal Inhibitory Concentration (IC50) |
6 pM
|
Positive MET expression (MET +++/++) | ||
| Method Description |
Cancer cell lines were incubated with compounds for 72 h. IC50 values were determined by quantitating viable cells using a CellTiter-Glo luminescent assay.
|
||||
| In Vitro Model | Astrocytoma | SNB-19 cells | CVCL_0535 | ||
| Experiment 15 Reporting the Activity Date of This ADC | [26] | ||||
| Efficacy Data | Half Maximal Inhibitory Concentration (IC50) |
6 pM
|
Positive MET expression (MET +++/++) | ||
| Method Description |
Cancer cell lines were incubated with compounds for 72 h. IC50 values were determined by quantitating viable cells using a CellTiter-Glo luminescent assay.
|
||||
| In Vitro Model | Colon adenocarcinoma | SW403 cells | CVCL_0545 | ||
| Experiment 16 Reporting the Activity Date of This ADC | [26] | ||||
| Efficacy Data | Half Maximal Inhibitory Concentration (IC50) | < 7 pM | Positive MET expression (MET +++/++) | ||
| Method Description |
Cancer cell lines were incubated with compounds for 72 h. IC50 values were determined by quantitating viable cells using a CellTiter-Glo luminescent assay.
|
||||
| In Vitro Model | Astrocytoma | U-251MG cells | CVCL_0021 | ||
| Experiment 17 Reporting the Activity Date of This ADC | [26] | ||||
| Efficacy Data | Half Maximal Inhibitory Concentration (IC50) |
7 pM
|
Positive MET expression (MET +++/++) | ||
| Method Description |
Cancer cell lines were incubated with compounds for 72 h. IC50 values were determined by quantitating viable cells using a CellTiter-Glo luminescent assay.
|
||||
| In Vitro Model | Colon adenocarcinoma | COLO 201 cells | CVCL_1987 | ||
| Experiment 18 Reporting the Activity Date of This ADC | [26] | ||||
| Efficacy Data | Half Maximal Inhibitory Concentration (IC50) |
0.01 nM
|
Positive MET expression (MET +++/++) | ||
| Method Description |
Cancer cell lines were incubated with compounds for 72 h. IC50 values were determined by quantitating viable cells using a CellTiter-Glo luminescent assay.
|
||||
| In Vitro Model | Colon adenocarcinoma | WiDr cells | CVCL_2760 | ||
| Experiment 19 Reporting the Activity Date of This ADC | [26] | ||||
| Efficacy Data | Half Maximal Inhibitory Concentration (IC50) |
0.01 nM
|
Positive MET expression (MET +++/++) | ||
| Method Description |
Cancer cell lines were incubated with compounds for 72 h. IC50 values were determined by quantitating viable cells using a CellTiter-Glo luminescent assay.
|
||||
| In Vitro Model | Rectal adenocarcinoma | SW1463 cells | CVCL_1718 | ||
| Experiment 20 Reporting the Activity Date of This ADC | [26] | ||||
| Efficacy Data | Half Maximal Inhibitory Concentration (IC50) |
0.01 nM
|
Positive MET expression (MET +++/++) | ||
| Method Description |
Cancer cell lines were incubated with compounds for 72 h. IC50 values were determined by quantitating viable cells using a CellTiter-Glo luminescent assay.
|
||||
| In Vitro Model | Colon carcinoma | RKO cells | CVCL_0504 | ||
| Experiment 21 Reporting the Activity Date of This ADC | [26] | ||||
| Efficacy Data | Half Maximal Inhibitory Concentration (IC50) |
0.01 nM
|
High MET expression (MET+++) | ||
| Method Description |
Cancer cell lines were incubated with compounds for 72 h. IC50 values were determined by quantitating viable cells using a CellTiter-Glo luminescent assay.
|
||||
| In Vitro Model | Lung papillary adenocarcinoma | NCI-H441 cells | CVCL_1561 | ||
| Experiment 22 Reporting the Activity Date of This ADC | [26] | ||||
| Efficacy Data | Half Maximal Inhibitory Concentration (IC50) |
0.02 nM
|
Positive MET expression (MET +++/++) | ||
| Method Description |
Cancer cell lines were incubated with compounds for 72 h. IC50 values were determined by quantitating viable cells using a CellTiter-Glo luminescent assay.
|
||||
| In Vitro Model | Colon adenocarcinoma | COLO 320DM cells | CVCL_0219 | ||
| Experiment 23 Reporting the Activity Date of This ADC | [26] | ||||
| Efficacy Data | Half Maximal Inhibitory Concentration (IC50) |
0.02 nM
|
Positive MET expression (MET +++/++) | ||
| Method Description |
Cancer cell lines were incubated with compounds for 72 h. IC50 values were determined by quantitating viable cells using a CellTiter-Glo luminescent assay.
|
||||
| In Vitro Model | Colon adenocarcinoma | COLO 205 cells | CVCL_0218 | ||
| Experiment 24 Reporting the Activity Date of This ADC | [26] | ||||
| Efficacy Data | Half Maximal Inhibitory Concentration (IC50) |
0.02 nM
|
Positive MET expression (MET +++/++) | ||
| Method Description |
Cancer cell lines were incubated with compounds for 72 h. IC50 values were determined by quantitating viable cells using a CellTiter-Glo luminescent assay.
|
||||
| In Vitro Model | Lung squamous cell carcinoma | SW900 cells | CVCL_1731 | ||
| Experiment 25 Reporting the Activity Date of This ADC | [26] | ||||
| Efficacy Data | Half Maximal Inhibitory Concentration (IC50) |
0.02 nM
|
Positive MET expression (MET +++/++) | ||
| Method Description |
Cancer cell lines were incubated with compounds for 72 h. IC50 values were determined by quantitating viable cells using a CellTiter-Glo luminescent assay.
|
||||
| In Vitro Model | Lung papillary adenocarcinoma | NCI-H820 cells | CVCL_1592 | ||
| Experiment 26 Reporting the Activity Date of This ADC | [26] | ||||
| Efficacy Data | Half Maximal Inhibitory Concentration (IC50) |
0.02 nM
|
Low MET expression (MET+) | ||
| Method Description |
Cancer cell lines were incubated with compounds for 72 h. IC50 values were determined by quantitating viable cells using a CellTiter-Glo luminescent assay.
|
||||
| In Vitro Model | Pancreatic carcinoma | KP-4 cells | CVCL_1338 | ||
| Experiment 27 Reporting the Activity Date of This ADC | [26] | ||||
| Efficacy Data | Half Maximal Inhibitory Concentration (IC50) |
0.02 nM
|
Low MET expression (MET+) | ||
| Method Description |
Cancer cell lines were incubated with compounds for 72 h. IC50 values were determined by quantitating viable cells using a CellTiter-Glo luminescent assay.
|
||||
| In Vitro Model | Glioblastoma | M059J cells | CVCL_0400 | ||
| Experiment 28 Reporting the Activity Date of This ADC | [26] | ||||
| Efficacy Data | Half Maximal Inhibitory Concentration (IC50) |
0.02 nM
|
High MET expression (MET+++) | ||
| Method Description |
Cancer cell lines were incubated with compounds for 72 h. IC50 values were determined by quantitating viable cells using a CellTiter-Glo luminescent assay.
|
||||
| In Vitro Model | Gastric adenocarcinoma | Hs 746.T cells | CVCL_0333 | ||
| Experiment 29 Reporting the Activity Date of This ADC | [26] | ||||
| Efficacy Data | Half Maximal Inhibitory Concentration (IC50) |
0.03 nM
|
Positive MET expression (MET +++/++) | ||
| Method Description |
Cancer cell lines were incubated with compounds for 72 h. IC50 values were determined by quantitating viable cells using a CellTiter-Glo luminescent assay.
|
||||
| In Vitro Model | Colon adenocarcinoma | SW1116 cells | CVCL_0544 | ||
| Experiment 30 Reporting the Activity Date of This ADC | [26] | ||||
| Efficacy Data | Half Maximal Inhibitory Concentration (IC50) |
0.04 nM
|
Positive MET expression (MET +++/++) | ||
| Method Description |
Cancer cell lines were incubated with compounds for 72 h. IC50 values were determined by quantitating viable cells using a CellTiter-Glo luminescent assay.
|
||||
| In Vitro Model | Gliosarcoma | SF539 cells | CVCL_1691 | ||
| Experiment 31 Reporting the Activity Date of This ADC | [26] | ||||
| Efficacy Data | Half Maximal Inhibitory Concentration (IC50) |
0.04 nM
|
Positive MET expression (MET +++/++) | ||
| Method Description |
Cancer cell lines were incubated with compounds for 72 h. IC50 values were determined by quantitating viable cells using a CellTiter-Glo luminescent assay.
|
||||
| In Vitro Model | Colon adenocarcinoma | COLO 320HSR cells | CVCL_0220 | ||
| Experiment 32 Reporting the Activity Date of This ADC | [26] | ||||
| Efficacy Data | Half Maximal Inhibitory Concentration (IC50) |
0.04 nM
|
Positive MET expression (MET +++/++) | ||
| Method Description |
Cancer cell lines were incubated with compounds for 72 h. IC50 values were determined by quantitating viable cells using a CellTiter-Glo luminescent assay.
|
||||
| In Vitro Model | Cecum adenocarcinoma | LS1034 cells | CVCL_1382 | ||
| Experiment 33 Reporting the Activity Date of This ADC | [26] | ||||
| Efficacy Data | Half Maximal Inhibitory Concentration (IC50) |
0.04 nM
|
Positive MET expression (MET +++/++) | ||
| Method Description |
Cancer cell lines were incubated with compounds for 72 h. IC50 values were determined by quantitating viable cells using a CellTiter-Glo luminescent assay.
|
||||
| In Vitro Model | Pleural epithelioid mesothelioma | NCI-H226 cells | CVCL_1544 | ||
| Experiment 34 Reporting the Activity Date of This ADC | [26] | ||||
| Efficacy Data | Half Maximal Inhibitory Concentration (IC50) |
0.07 nM
|
Positive MET expression (MET +++/++) | ||
| Method Description |
Cancer cell lines were incubated with compounds for 72 h. IC50 values were determined by quantitating viable cells using a CellTiter-Glo luminescent assay.
|
||||
| In Vitro Model | Colon adenocarcinoma | LoVo cells | CVCL_0399 | ||
| Experiment 35 Reporting the Activity Date of This ADC | [26] | ||||
| Efficacy Data | Half Maximal Inhibitory Concentration (IC50) |
0.07 nM
|
Positive MET expression (MET +++/++) | ||
| Method Description |
Cancer cell lines were incubated with compounds for 72 h. IC50 values were determined by quantitating viable cells using a CellTiter-Glo luminescent assay.
|
||||
| In Vitro Model | Lung adenocarcinoma | NCI-H1573 cells | CVCL_1478 | ||
| Experiment 36 Reporting the Activity Date of This ADC | [26] | ||||
| Efficacy Data | Half Maximal Inhibitory Concentration (IC50) |
0.1 nM
|
Positive MET expression (MET +++/++) | ||
| Method Description |
Cancer cell lines were incubated with compounds for 72 h. IC50 values were determined by quantitating viable cells using a CellTiter-Glo luminescent assay.
|
||||
| In Vitro Model | Colon adenocarcinoma | T84 cells | CVCL_0555 | ||
| Experiment 37 Reporting the Activity Date of This ADC | [26] | ||||
| Efficacy Data | Half Maximal Inhibitory Concentration (IC50) |
0.1 nM
|
Low MET expression (MET+) | ||
| Method Description |
Cancer cell lines were incubated with compounds for 72 h. IC50 values were determined by quantitating viable cells using a CellTiter-Glo luminescent assay.
|
||||
| In Vitro Model | Lung adenocarcinoma | A-549 cells | CVCL_0023 | ||
| Experiment 38 Reporting the Activity Date of This ADC | [26] | ||||
| Efficacy Data | Half Maximal Inhibitory Concentration (IC50) |
0.1 nM
|
Low MET expression (MET+) | ||
| Method Description |
Cancer cell lines were incubated with compounds for 72 h. IC50 values were determined by quantitating viable cells using a CellTiter-Glo luminescent assay.
|
||||
| In Vitro Model | Invasive breast carcinoma of no special type | BT-20 cells | CVCL_0178 | ||
| Experiment 39 Reporting the Activity Date of This ADC | [26] | ||||
| Efficacy Data | Half Maximal Inhibitory Concentration (IC50) |
0.1 nM
|
High MET expression (MET+++) | ||
| Method Description |
Cancer cell lines were incubated with compounds for 72 h. IC50 values were determined by quantitating viable cells using a CellTiter-Glo luminescent assay.
|
||||
| In Vitro Model | Lung squamous cell carcinoma | EBC-1 cells | CVCL_2891 | ||
| Experiment 40 Reporting the Activity Date of This ADC | [26] | ||||
| Efficacy Data | Half Maximal Inhibitory Concentration (IC50) |
0.17 nM
|
Positive MET expression (MET +++/++) | ||
| Method Description |
Cancer cell lines were incubated with compounds for 72 h. IC50 values were determined by quantitating viable cells using a CellTiter-Glo luminescent assay.
|
||||
| In Vitro Model | Lung squamous cell carcinoma | SK-MES-1 cells | CVCL_0630 | ||
| Experiment 41 Reporting the Activity Date of This ADC | [26] | ||||
| Efficacy Data | Half Maximal Inhibitory Concentration (IC50) |
0.2 nM
|
Low MET expression (MET+) | ||
| Method Description |
Cancer cell lines were incubated with compounds for 72 h. IC50 values were determined by quantitating viable cells using a CellTiter-Glo luminescent assay.
|
||||
| In Vitro Model | Astrocytoma | U-118MG cells | CVCL_0633 | ||
| Experiment 42 Reporting the Activity Date of This ADC | [26] | ||||
| Efficacy Data | Half Maximal Inhibitory Concentration (IC50) |
0.21 nM
|
Low MET expression (MET+) | ||
| Method Description |
Cancer cell lines were incubated with compounds for 72 h. IC50 values were determined by quantitating viable cells using a CellTiter-Glo luminescent assay.
|
||||
| In Vitro Model | Glioblastoma | U-87MG cells | CVCL_0022 | ||
| Experiment 43 Reporting the Activity Date of This ADC | [26] | ||||
| Efficacy Data | Half Maximal Inhibitory Concentration (IC50) |
0.4 nM
|
Positive MET expression (MET +++/++) | ||
| Method Description |
Cancer cell lines were incubated with compounds for 72 h. IC50 values were determined by quantitating viable cells using a CellTiter-Glo luminescent assay.
|
||||
| In Vitro Model | Lung adenocarcinoma | NCI-H1650 cells | CVCL_1483 | ||
| Experiment 44 Reporting the Activity Date of This ADC | [26] | ||||
| Efficacy Data | Half Maximal Inhibitory Concentration (IC50) |
0.7 nM
|
Positive MET expression (MET +++/++) | ||
| Method Description |
Cancer cell lines were incubated with compounds for 72 h. IC50 values were determined by quantitating viable cells using a CellTiter-Glo luminescent assay.
|
||||
| In Vitro Model | Lung squamous cell carcinoma | NCI-H1703 cells | CVCL_1490 | ||
| Experiment 45 Reporting the Activity Date of This ADC | [26] | ||||
| Efficacy Data | Half Maximal Inhibitory Concentration (IC50) |
0.97 nM
|
Positive MET expression (MET +++/++) | ||
| Method Description |
Cancer cell lines were incubated with compounds for 72 h. IC50 values were determined by quantitating viable cells using a CellTiter-Glo luminescent assay.
|
||||
| In Vitro Model | Anaplastic astrocytoma | CHLA-03-AA cells | CVCL_U616 | ||
| Experiment 46 Reporting the Activity Date of This ADC | [26] | ||||
| Efficacy Data | Half Maximal Inhibitory Concentration (IC50) |
2.45 nM
|
Positive MET expression (MET +++/++) | ||
| Method Description |
Cancer cell lines were incubated with compounds for 72 h. IC50 values were determined by quantitating viable cells using a CellTiter-Glo luminescent assay.
|
||||
| In Vitro Model | Primitive neuroectodermal tumor | PFSK-1 cells | CVCL_1642 | ||
| Experiment 47 Reporting the Activity Date of This ADC | [26] | ||||
| Efficacy Data | Half Maximal Inhibitory Concentration (IC50) |
26 nM
|
Positive MET expression (MET +++/++) | ||
| Method Description |
Cancer cell lines were incubated with compounds for 72 h. IC50 values were determined by quantitating viable cells using a CellTiter-Glo luminescent assay.
|
||||
| In Vitro Model | Colon adenocarcinoma | SW480 cells | CVCL_0546 | ||
| Experiment 48 Reporting the Activity Date of This ADC | [26] | ||||
| Efficacy Data | Half Maximal Inhibitory Concentration (IC50) |
28.2 nM
|
Positive MET expression (MET +++/++) | ||
| Method Description |
Cancer cell lines were incubated with compounds for 72 h. IC50 values were determined by quantitating viable cells using a CellTiter-Glo luminescent assay.
|
||||
| In Vitro Model | Glioblastoma | SNB-75 cells | CVCL_1706 | ||
| Experiment 49 Reporting the Activity Date of This ADC | [26] | ||||
| Efficacy Data | Half Maximal Inhibitory Concentration (IC50) | > 67 nM | Positive MET expression (MET +++/++) | ||
| Method Description |
Cancer cell lines were incubated with compounds for 72 h. IC50 values were determined by quantitating viable cells using a CellTiter-Glo luminescent assay.
|
||||
| In Vitro Model | Glioblastoma | A-172 cells | CVCL_0131 | ||
| Experiment 50 Reporting the Activity Date of This ADC | [26] | ||||
| Efficacy Data | Half Maximal Inhibitory Concentration (IC50) | > 67 nM | Positive MET expression (MET +++/++) | ||
| Method Description |
Cancer cell lines were incubated with compounds for 72 h. IC50 values were determined by quantitating viable cells using a CellTiter-Glo luminescent assay.
|
||||
| In Vitro Model | Colon adenocarcinoma | HCT 15 cells | CVCL_0292 | ||
| Experiment 51 Reporting the Activity Date of This ADC | [26] | ||||
| Efficacy Data | Half Maximal Inhibitory Concentration (IC50) | > 67 nM | Positive MET expression (MET +++/++) | ||
| Method Description |
Cancer cell lines were incubated with compounds for 72 h. IC50 values were determined by quantitating viable cells using a CellTiter-Glo luminescent assay.
|
||||
| In Vitro Model | Colon adenocarcinoma | Caco-2 cells | CVCL_0025 | ||
| Experiment 52 Reporting the Activity Date of This ADC | [26] | ||||
| Efficacy Data | Half Maximal Inhibitory Concentration (IC50) |
141 nM
|
Positive MET expression (MET +++/++) | ||
| Method Description |
Cancer cell lines were incubated with compounds for 72 h. IC50 values were determined by quantitating viable cells using a CellTiter-Glo luminescent assay.
|
||||
| In Vitro Model | Glioblastoma | T98G cells | CVCL_0556 | ||
HuM25-S239C-PBD-E2 [Investigative]
Discovered Using Cell Line-derived Xenograft Model
| Experiment 1 Reporting the Activity Date of This ADC | [27] | ||||
| Efficacy Data | Tumor Growth Inhibition value (TGI) |
60.13%
|
High LRRC15 expression (LRRC15+++; IHC 3+) | ||
| Method Description |
EBC-1 squamous NSCLC cells (5 million) were implanted subcutaneously into SCID mice, and micewere randomized when the tumors reached 175 mm and dosed with ADC or isotype antibody at 0.6 mg/kg intraperitoneally on day 0.
|
||||
| In Vivo Model | EBC-1 CDX model | ||||
| In Vitro Model | Lung squamous cell carcinoma | EBC-1 cells | CVCL_2891 | ||
| Experiment 2 Reporting the Activity Date of This ADC | [27] | ||||
| Efficacy Data | Tumor Growth Inhibition value (TGI) |
73.58%
|
High LRRC15 expression (LRRC15+++; IHC 3+) | ||
| Method Description |
NCI-H1650 NSCLC cancer cells (5 million) were implanted subcutaneously into SCID/Beigemice. and mice were randomized when the tumors reached -200 mm and dosed on day 0 with isotype orADC at 0.1 mg/kg intraperitoneally.
|
||||
| In Vivo Model | NCI-H1650 CDX model | ||||
| In Vitro Model | Lung adenocarcinoma | NCI-H1650 cells | CVCL_1483 | ||
| Experiment 3 Reporting the Activity Date of This ADC | [27] | ||||
| Efficacy Data | Tumor Growth Inhibition value (TGI) |
92.33%
|
High LRRC15 expression (LRRC15+++; IHC 3+) | ||
| Method Description |
NCI-H1650 NSCLC cancer cells (5 million) were implanted subcutaneously into SCID/Beigemice. and mice were randomized when the tumors reached -200 mm and dosed on day 0 with isotype orADC at 0.3 mg/kg intraperitoneally.
|
||||
| In Vivo Model | NCI-H1650 CDX model | ||||
| In Vitro Model | Lung adenocarcinoma | NCI-H1650 cells | CVCL_1483 | ||
| Experiment 4 Reporting the Activity Date of This ADC | [27] | ||||
| Efficacy Data | Tumor Growth Inhibition value (TGI) |
94.51%
|
High LRRC15 expression (LRRC15+++; IHC 3+) | ||
| Method Description |
NCI-H1650 NSCLC cancer cells (5 million) were implanted subcutaneously into SCID/Beigemice. and mice were randomized when the tumors reached -200 mm and dosed on day 0 with isotype orADC at 6 mg/kg intraperitoneally.
|
||||
| In Vivo Model | NCI-H1650 CDX model | ||||
| In Vitro Model | Lung adenocarcinoma | NCI-H1650 cells | CVCL_1483 | ||
Revealed Based on the Cell Line Data
| Experiment 1 Reporting the Activity Date of This ADC | [27] | ||||
| Efficacy Data | Half Maximal Inhibitory Concentration (IC50) |
1 pM
|
Positive LRRC15 expression (LRRC15 +++/++) | ||
| Method Description |
In vitro cell killing in LRRC15 transfected 3T12 cells by isotype-S239C-PBD-E2 or huM25-S239CPBD-E2. IC50 values were determined by quantitating viable cells using a CellTiter-Glo luminescent assay.
|
||||
| In Vitro Model | Squamous non-small cell lung cancer | BALB/3T12-3 cells (huLRRC15 transfection) | CVCL_0637 | ||
| Experiment 2 Reporting the Activity Date of This ADC | [27] | ||||
| Efficacy Data | Half Maximal Inhibitory Concentration (IC50) |
10.00 - 100.00 nM
|
Positive LRRC15 expression (LRRC15 +++/++) | ||
| Method Description |
In vitro cell killing in A549 cells that have undergone epithelial tomesenchymal transition (EMT) in the presence of 10 ng/mL TGFB by isotype-S239C-PBD-E2huM25-S239C-PBD-E2, or huM25-S239C antibody.
|
||||
| In Vitro Model | Lung adenocarcinoma | A-549 cells | CVCL_0023 | ||
| Experiment 3 Reporting the Activity Date of This ADC | [27] | ||||
| Efficacy Data | Half Maximal Inhibitory Concentration (IC50) |
10.00 - 100.00 nM
|
Positive LRRC15 expression (LRRC15 +++/++) | ||
| Method Description |
In vitro cell killing in A549 lung cancer cells in the presence of 10 ng/mL TGFB by isotype-S239C-PBD-E2huM25-S239C-PBD-E2, or huM25-S239C antibody.
|
||||
| In Vitro Model | Lung adenocarcinoma | A-549 cells | CVCL_0023 | ||
B7H3-EC3 DAR4.1 [Investigative]
Discovered Using Cell Line-derived Xenograft Model
| Experiment 1 Reporting the Activity Date of This ADC | [28] | ||||
| Efficacy Data | Tumor Growth Inhibition value (TGI) | ≈ 90.90% | High CD276 expression (CD276+++) | ||
| Method Description |
The in vivo antitumor efficacy and tolerability of the selected NAMPTi-ADCs were evaluated in the cell line-derived THP-1 human AmL xenograft model.Treatment with the low-DAR B7H3-EC3 (5 mg/kg,iv,Q7Dx3).
|
||||
| In Vivo Model | Monocytic leukemia CDX model | ||||
| In Vitro Model | Childhood acute monocytic leukemia | THP-1 cells | CVCL_0006 | ||
Revealed Based on the Cell Line Data
| Experiment 1 Reporting the Activity Date of This ADC | [28] | ||||
| Efficacy Data | Half Maximal Inhibitory Concentration (IC50) |
0.04 nM
|
High LYPD3 expression (LYPD3+++); High HER2 expression (HER2+++) | ||
| Method Description |
The in vitro potency of NAMPTi-SMOLs and NAMPTi-ADCs was determined in human tumor cell lines. Cells (2000-4000 cells/well, were incubated at 37°C, 5% CO2 for 24 h and the compounds were added at concentrations of 3x10-12 - 3x10⁻⁸ Min triplicates. Cell viability was determined at the beginning (day 0) and after 72-96 h incubation in the presence or absence of NAMPTi-SMOLs or NAMPTi-ADCs.
Click to Show/Hide
|
||||
| In Vitro Model | Childhood acute monocytic leukemia | THP-1 cells | CVCL_0006 | ||
| Experiment 2 Reporting the Activity Date of This ADC | [28] | ||||
| Efficacy Data | Half Maximal Inhibitory Concentration (IC50) | > 10 uM | High LYPD3 expression (LYPD3+++) | ||
| Method Description |
The in vitro potency of NAMPTi-SMOLs and NAMPTi-ADCs was determined in human tumor cell lines. Cells (2000-4000 cells/well, were incubated at 37°C, 5% CO2 for 24 h and the compounds were added at concentrations of 3x10-12 - 3x10⁻⁸ Min triplicates. Cell viability was determined at the beginning (day 0) and after 72-96 h incubation in the presence or absence of NAMPTi-SMOLs or NAMPTi-ADCs.
Click to Show/Hide
|
||||
| In Vitro Model | Lung adenocarcinoma | A549-C4.4a cells | CVCL_0023 | ||
| Experiment 3 Reporting the Activity Date of This ADC | [28] | ||||
| Efficacy Data | Half Maximal Inhibitory Concentration (IC50) | > 10 uM | High CD276 expression (CD276+++) | ||
| Method Description |
The in vitro potency of NAMPTi-SMOLs and NAMPTi-ADCs was determined in human tumor cell lines. Cells (2000-4000 cells/well, were incubated at 37°C, 5% CO2 for 24 h and the compounds were added at concentrations of 3x10-12 - 3x10⁻⁸ Min triplicates. Cell viability was determined at the beginning (day 0) and after 72-96 h incubation in the presence or absence of NAMPTi-SMOLs or NAMPTi-ADCs.
Click to Show/Hide
|
||||
| In Vitro Model | Breast adenocarcinoma | MDA-MB-453 cells | CVCL_0418 | ||
HuAD208.4.1-PBD-DAR2 [Investigative]
Discovered Using Cell Line-derived Xenograft Model
| Experiment 1 Reporting the Activity Date of This ADC | [27] | ||||
| Efficacy Data | Tumor Growth Inhibition value (TGI) |
91%
|
High LRRC15 expression (LRRC15+++; IHC 3+) | ||
| Method Description |
EBC-1 squamous NSCLC cells (5 million) were implanted subcutaneously into SCID mice, and mice were randomized when the tumors reached 225 mm and dosed with ADC at 0.6 mg/kg Q7Dx2 (one dose given every 7 days for a total of 2 doses) or isotype antibody at 6 mg/kg intraperitoneally starting on day 0.
|
||||
| In Vivo Model | EBC-1 CDX model | ||||
| In Vitro Model | Lung squamous cell carcinoma | EBC-1 cells | CVCL_2891 | ||
| Experiment 2 Reporting the Activity Date of This ADC | [27] | ||||
| Efficacy Data | Tumor Growth Inhibition value (TGI) |
95.80%
|
High LRRC15 expression (LRRC15+++; IHC 3+) | ||
| Method Description |
NCI-H1650 adeno NSCLCcells (5 million) were implanted subcutaneously into SCID/Beige mice, and mice were randomized whenthe tumors reached 225 mm and dosed with ADC at 0.6 mg/kg or isotype antibody at 12 mg/kg intraperitoneally once on day 0.
|
||||
| In Vivo Model | NCI-H1650 CDX model | ||||
| In Vitro Model | Lung adenocarcinoma | NCI-H1650 cells | CVCL_1483 | ||
Revealed Based on the Cell Line Data
| Experiment 1 Reporting the Activity Date of This ADC | [27] | ||||
| Efficacy Data | Half Maximal Inhibitory Concentration (IC50) |
10 nM
|
Positive LRRC15 expression (LRRC15 +++/++) | ||
| Method Description |
In vitro cell killing in murine Balb/c BM-MSC (Cyagen) mesenchymal stem cells in thepresence of 10 ng/mL TGF by isotype-PBD-DAR2 or huAD208.4.1-PBD-DAR2. IC50 values were determined by quantitating viable cells using a CellTiter-Glo luminescent assay.
|
||||
| In Vitro Model | Normal | Mouse bone marrow-derived mesenchymal stem (BM-MSC) cells | Mus musculus | ||
| Experiment 2 Reporting the Activity Date of This ADC | [27] | ||||
| Efficacy Data | Half Maximal Inhibitory Concentration (IC50) |
10.00 - 100.00 nM
|
Positive LRRC15 expression (LRRC15 +++/++) | ||
| Method Description |
In vitro cell killing in human BM-MSC (Lonza) mesenchymalstem cells in the presence of 10 ng/mL TGFB by isotype-PBD-DAR2 or huAD208.4.1-PBD-DAR2. IC50 values were determined by quantitating viable cells using a CellTiter-Glo luminescent assay.
|
||||
| In Vitro Model | Normal | Human bone marrow-derived mesenchymal stem (BM-MSC) cells | Homo sapiens | ||
T-PBA [Investigative]
Discovered Using Cell Line-derived Xenograft Model
| Experiment 1 Reporting the Activity Date of This ADC | [29] | ||||
| Efficacy Data | Tumor Growth Inhibition value (TGI) | ≈ 93.10% | High HER2 expression (HER2+++) | ||
| Method Description |
The efficacy of T-PBA was evaluated in two HER2-positive xenograft models at different doses and schedules. T-PBA (10 mg/kg), trastuzumab (10 mg/kg), and saline were injected by tail vein to balb/C nude mice for 0, 3, 6, and 9 days.
|
||||
| In Vivo Model | NCI-N87 CDX model | ||||
| In Vitro Model | Gastric tubular adenocarcinoma | NCI-N87 cells | CVCL_1603 | ||
| Experiment 2 Reporting the Activity Date of This ADC | [29] | ||||
| Efficacy Data | Tumor Growth Inhibition value (TGI) | ≈ 95.20% | High HER2 expression (HER2+++) | ||
| Method Description |
The efficacy of T-PBA was evaluated in two HER2-positive xenograft models at different doses and schedules. T-PBA (10 mg/kg), trastuzumab (10 mg/kg), and saline were injected by tail vein to balb/C nude mice for 0, 3, 6, and 9 days.
|
||||
| In Vivo Model | SK-OV-3 CDX model | ||||
| In Vitro Model | Ovarian serous cystadenocarcinoma | SK-OV-3 cells | CVCL_0532 | ||
Revealed Based on the Cell Line Data
| Experiment 1 Reporting the Activity Date of This ADC | [29] | ||||
| Efficacy Data | Half Maximal Inhibitory Concentration (IC50) |
5.4 nM
|
High HER2 expression (HER2+++) | ||
| Method Description |
Cell Counting Kit-8 (Dojindo Laboratories) was used to measure cell viability. Exponentially growing cells were seeded in 96-well plates (100 muL/well) and incubated at 37°C for 24 h.
|
||||
| In Vitro Model | Ovarian serous cystadenocarcinoma | SK-OV-3 cells | CVCL_0532 | ||
| Experiment 2 Reporting the Activity Date of This ADC | [29] | ||||
| Efficacy Data | Half Maximal Inhibitory Concentration (IC50) |
56.1 nM
|
High HER2 expression (HER2+++) | ||
| Method Description |
Cell Counting Kit-8 (Dojindo Laboratories) was used to measure cell viability. Exponentially growing cells were seeded in 96-well plates (100 muL/well) and incubated at 37°C for 24 h.
|
||||
| In Vitro Model | Gastric tubular adenocarcinoma | NCI-N87 cells | CVCL_1603 | ||
| Experiment 3 Reporting the Activity Date of This ADC | [29] | ||||
| Efficacy Data | Half Maximal Inhibitory Concentration (IC50) |
344.6 nM
|
High HER2 expression (HER2+++) | ||
| Method Description |
Cell Counting Kit-8 (Dojindo Laboratories) was used to measure cell viability. Exponentially growing cells were seeded in 96-well plates (100 muL/well) and incubated at 37°C for 24 h.
|
||||
| In Vitro Model | Breast adenocarcinoma | MDA-MB-231 cells | CVCL_0062 | ||
B7H3-EC3 DAR7.8 [Investigative]
Discovered Using Cell Line-derived Xenograft Model
| Experiment 1 Reporting the Activity Date of This ADC | [28] | ||||
| Efficacy Data | Tumor Growth Inhibition value (TGI) | ≈ 98.50% | High CD276 expression (CD276+++) | ||
| Method Description |
The in vivo antitumor efficacy and tolerability of the selected NAMPTi-ADCs were evaluated in the cell line-derived THP-1 human AmL xenograft model.Treatment with the high-DAR B7H3-EC3 (DAR 7.8; 5 mg/kg,iv,Q7Dx3).
|
||||
| In Vivo Model | Monocytic leukemia CDX model | ||||
| In Vitro Model | Childhood acute monocytic leukemia | THP-1 cells | CVCL_0006 | ||
HER2-EC3 [Investigative]
Revealed Based on the Cell Line Data
| Experiment 1 Reporting the Activity Date of This ADC | [28] | ||||
| Efficacy Data | Half Maximal Inhibitory Concentration (IC50) |
0.06 nM
|
High CD276 expression (CD276+++) | ||
| Method Description |
The in vitro potency of NAMPTi-SMOLs and NAMPTi-ADCs was determined in human tumor cell lines. Cells (2000-4000 cells/well, were incubated at 37°C, 5% CO2 for 24 h and the compounds were added at concentrations of 3x10-12 - 3x10⁻⁸ Min triplicates. Cell viability was determined at the beginning (day 0) and after 72-96 h incubation in the presence or absence of NAMPTi-SMOLs or NAMPTi-ADCs.
Click to Show/Hide
|
||||
| In Vitro Model | Breast adenocarcinoma | MDA-MB-453 cells | CVCL_0418 | ||
| Experiment 2 Reporting the Activity Date of This ADC | [28] | ||||
| Efficacy Data | Half Maximal Inhibitory Concentration (IC50) |
300 nM
|
High LYPD3 expression (LYPD3+++) | ||
| Method Description |
The in vitro potency of NAMPTi-SMOLs and NAMPTi-ADCs was determined in human tumor cell lines. Cells (2000-4000 cells/well, were incubated at 37°C, 5% CO2 for 24 h and the compounds were added at concentrations of 3x10-12 - 3x10⁻⁸ Min triplicates. Cell viability was determined at the beginning (day 0) and after 72-96 h incubation in the presence or absence of NAMPTi-SMOLs or NAMPTi-ADCs.
Click to Show/Hide
|
||||
| In Vitro Model | Lung adenocarcinoma | A549-C4.4a cells | CVCL_0023 | ||
| Experiment 3 Reporting the Activity Date of This ADC | [28] | ||||
| Efficacy Data | Half Maximal Inhibitory Concentration (IC50) | > 10 uM | High LYPD3 expression (LYPD3+++); High HER2 expression (HER2+++) | ||
| Method Description |
The in vitro potency of NAMPTi-SMOLs and NAMPTi-ADCs was determined in human tumor cell lines. Cells (2000-4000 cells/well, were incubated at 37°C, 5% CO2 for 24 h and the compounds were added at concentrations of 3x10-12 - 3x10⁻⁸ Min triplicates. Cell viability was determined at the beginning (day 0) and after 72-96 h incubation in the presence or absence of NAMPTi-SMOLs or NAMPTi-ADCs.
Click to Show/Hide
|
||||
| In Vitro Model | Childhood acute monocytic leukemia | THP-1 cells | CVCL_0006 | ||
C4.4A-EC3 [Investigative]
Revealed Based on the Cell Line Data
| Experiment 1 Reporting the Activity Date of This ADC | [28] | ||||
| Efficacy Data | Half Maximal Inhibitory Concentration (IC50) |
7.1 nM
|
High LYPD3 expression (LYPD3+++) | ||
| Method Description |
The in vitro potency of NAMPTi-SMOLs and NAMPTi-ADCs was determined in human tumor cell lines. Cells (2000-4000 cells/well, were incubated at 37°C, 5% CO2 for 24 h and the compounds were added at concentrations of 3x10-12 - 3x10⁻⁸ Min triplicates. Cell viability was determined at the beginning (day 0) and after 72-96 h incubation in the presence or absence of NAMPTi-SMOLs or NAMPTi-ADCs.
Click to Show/Hide
|
||||
| In Vitro Model | Lung adenocarcinoma | A549-C4.4a cells | CVCL_0023 | ||
| Experiment 2 Reporting the Activity Date of This ADC | [28] | ||||
| Efficacy Data | Half Maximal Inhibitory Concentration (IC50) |
23 nM
|
High CD276 expression (CD276+++) | ||
| Method Description |
The in vitro potency of NAMPTi-SMOLs and NAMPTi-ADCs was determined in human tumor cell lines. Cells (2000-4000 cells/well, were incubated at 37°C, 5% CO2 for 24 h and the compounds were added at concentrations of 3x10-12 - 3x10⁻⁸ Min triplicates. Cell viability was determined at the beginning (day 0) and after 72-96 h incubation in the presence or absence of NAMPTi-SMOLs or NAMPTi-ADCs.
Click to Show/Hide
|
||||
| In Vitro Model | Breast adenocarcinoma | MDA-MB-453 cells | CVCL_0418 | ||
| Experiment 3 Reporting the Activity Date of This ADC | [28] | ||||
| Efficacy Data | Half Maximal Inhibitory Concentration (IC50) | > 10 uM | High LYPD3 expression (LYPD3+++); High HER2 expression (HER2+++) | ||
| Method Description |
The in vitro potency of NAMPTi-SMOLs and NAMPTi-ADCs was determined in human tumor cell lines. Cells (2000-4000 cells/well, were incubated at 37°C, 5% CO2 for 24 h and the compounds were added at concentrations of 3x10-12 - 3x10⁻⁸ Min triplicates. Cell viability was determined at the beginning (day 0) and after 72-96 h incubation in the presence or absence of NAMPTi-SMOLs or NAMPTi-ADCs.
Click to Show/Hide
|
||||
| In Vitro Model | Childhood acute monocytic leukemia | THP-1 cells | CVCL_0006 | ||
T-VEd9 [Investigative]
Discovered Using Cell Line-derived Xenograft Model
| Experiment 1 Reporting the Activity Date of This ADC | [1] | ||||
| Efficacy Data | Tumor Growth Inhibition value (TGI) |
99.30%
|
|||
| In Vivo Model | NCI-N87/MDA-MB-231 co-incubation model 2 mpk | ||||
| Experiment 2 Reporting the Activity Date of This ADC | [1] | ||||
| Efficacy Data | Tumor Growth Inhibition value (TGI) |
100%
|
|||
| In Vivo Model | NCI-N87 CDX model 3 mpk | ||||
| Experiment 3 Reporting the Activity Date of This ADC | [1] | ||||
| Efficacy Data | Tumor Growth Inhibition value (TGI) |
100%
|
|||
| In Vivo Model | NCI-N87 CDX model 1 mpk | ||||
Revealed Based on the Cell Line Data
| Experiment 1 Reporting the Activity Date of This ADC | [1] | ||||
| Efficacy Data | Half Maximal Inhibitory Concentration (IC50) |
0.071 nM
|
|||
| In Vitro Model | Breast adenocarcinoma | MDA-MB-453 cells | CVCL_0418 | ||
| Experiment 2 Reporting the Activity Date of This ADC | [1] | ||||
| Efficacy Data | Half Maximal Inhibitory Concentration (IC50) |
0.091 nM
|
|||
| In Vitro Model | Gastric tubular adenocarcinoma | NCI-N87 cells | CVCL_1603 | ||
| Experiment 3 Reporting the Activity Date of This ADC | [1] | ||||
| Efficacy Data | Half Maximal Inhibitory Concentration (IC50) |
0.674 nM
|
|||
| In Vitro Model | Breast adenocarcinoma | SK-BR-3 cells | CVCL_0033 | ||
| Experiment 4 Reporting the Activity Date of This ADC | [1] | ||||
| Efficacy Data | Half Maximal Inhibitory Concentration (IC50) | > 50 nM | |||
| In Vitro Model | Breast adenocarcinoma | MDA-MB-231 cells | CVCL_0062 | ||
Trastuzumab 20 [Investigative]
Revealed Based on the Cell Line Data
| Experiment 1 Reporting the Activity Date of This ADC | [30] | ||||
| Efficacy Data | Half Maximal inhibitory Concentration (lC50) |
1.3۪.04 nM
|
Positive HER2 expression (HER2+++/++) | ||
| Method Description |
Tumor cell lines were maintained in RPMI1640 medium supplemented with 10% heat-inactivated fetal bovine serum, 2 mM L-glutamine and 1 mM sodium pyruvate. 1800 cells per well were seeded in a volume of 180 uL in a 96-well flat bottom polystyrene plate. The cells were allowed to adhere overnight at 37 °C in a CO2 incubator. Ligands were initially formulated in dimethyl sulphoxide, and stocks stored at -80 °C. They were then further formulated at 10× concentration in RPMI1640 medium. 20 uL of diluted samples were added into each treatment well. On each plate, blank wells with no cells, and untreated wells containing cells, were included. Plates were then cultured at 37 °C in a CO2 incubator for 96 h. Cytotoxicity was evaluated in triplicate using a tetrazolium salt-based assay, the MTT assay. After 96 h, the supernatant was removed from each well and 200 uL of a sterile filtered 500 ug mL-1 MTT solution in water added to each well. The plates were then incubated at 37 °C in a CO2 incubator for 4 h. The supernatant was then removed and the formazan crystals formed solubilized by adding 150 uL of dimethyl sulphoxide to each well. The plate was then read on a plate reader at 540 nm, and percentage cell survival calculated as follows: ((mean absorbance treated wells at concentration x - mean absorbance blank wells) ÷ (mean absorbance untreated wells at concentration x - mean absorbance blank wells)) × 100. Data were plotted as concentration in nM vs. % cell survival, and IC50 values for inhibition of cell growth were determined with the GraphPad Prism software using non-linear regression.
Click to Show/Hide
|
||||
| In Vitro Model | Pancreatic ductal adenocarcinoma | Capan-1 cells | CVCL_0237 | ||
| Experiment 2 Reporting the Activity Date of This ADC | [30] | ||||
| Efficacy Data | Half Maximal inhibitory Concentration (lC50) |
29.7۫.55 nM
|
Negative HER2 expression (HER2-) | ||
| Method Description |
Tumor cell lines were maintained in RPMI1640 medium supplemented with 10% heat-inactivated fetal bovine serum, 2 mM L-glutamine and 1 mM sodium pyruvate. 1800 cells per well were seeded in a volume of 180 uL in a 96-well flat bottom polystyrene plate. The cells were allowed to adhere overnight at 37 °C in a CO2 incubator. Ligands were initially formulated in dimethyl sulphoxide, and stocks stored at -80 °C. They were then further formulated at 10× concentration in RPMI1640 medium. 20 uL of diluted samples were added into each treatment well. On each plate, blank wells with no cells, and untreated wells containing cells, were included. Plates were then cultured at 37 °C in a CO2 incubator for 96 h. Cytotoxicity was evaluated in triplicate using a tetrazolium salt-based assay, the MTT assay. After 96 h, the supernatant was removed from each well and 200 uL of a sterile filtered 500 ug mL-1 MTT solution in water added to each well. The plates were then incubated at 37 °C in a CO2 incubator for 4 h. The supernatant was then removed and the formazan crystals formed solubilized by adding 150 uL of dimethyl sulphoxide to each well. The plate was then read on a plate reader at 540 nm, and percentage cell survival calculated as follows: ((mean absorbance treated wells at concentration x - mean absorbance blank wells) ÷ (mean absorbance untreated wells at concentration x - mean absorbance blank wells)) × 100. Data were plotted as concentration in nM vs. % cell survival, and IC50 values for inhibition of cell growth were determined with the GraphPad Prism software using non-linear regression.
Click to Show/Hide
|
||||
| In Vitro Model | Invasive breast carcinoma | MCF-7 cells | CVCL_0031 | ||
WO2024181570A1 ADC7 [Investigative]
Revealed Based on the Cell Line Data
| Experiment 1 Reporting the Activity Date of This ADC | [31] | ||||
| Efficacy Data | Half Maximal inhibitory Concentration (lC50) |
10 ng/mL
|
Negative CD138 expression (CD138-) | ||
| Method Description |
1000 cells/well of Jurkat in 96 well, 37 °C for 5 days.
|
||||
| In Vitro Model | T acute lymphoblastic leukemia | Jurkat cells | CVCL_0065 | ||
| Experiment 2 Reporting the Activity Date of This ADC | [31] | ||||
| Efficacy Data | Half Maximal inhibitory Concentration (lC50) |
20 ng/mL
|
Positive CD138 expression (CD138+++/++) | ||
| Method Description |
1000 cells/well of Capan-1 in 96 well, 37 °C for 5 days.
|
||||
| In Vitro Model | Pancreatic ductal adenocarcinoma | Capan-1 cells | CVCL_0237 | ||
References