
Antibody-drug Conjugate Information
General Information of This Antibody-drug Conjugate (ID: DRG0ARIWN)
| ADC Name |
CMD-193
|
|||||
|---|---|---|---|---|---|---|
| Synonyms |
CMD-193
Click to Show/Hide
|
|||||
| Organization |
Wyeth (Top20 MNC) (Originator)
|
|||||
| Drug Status |
Phase 1 (discontinued)
|
|||||
| Drug-to-Antibody Ratio |
2~3
|
|||||
| Structure |
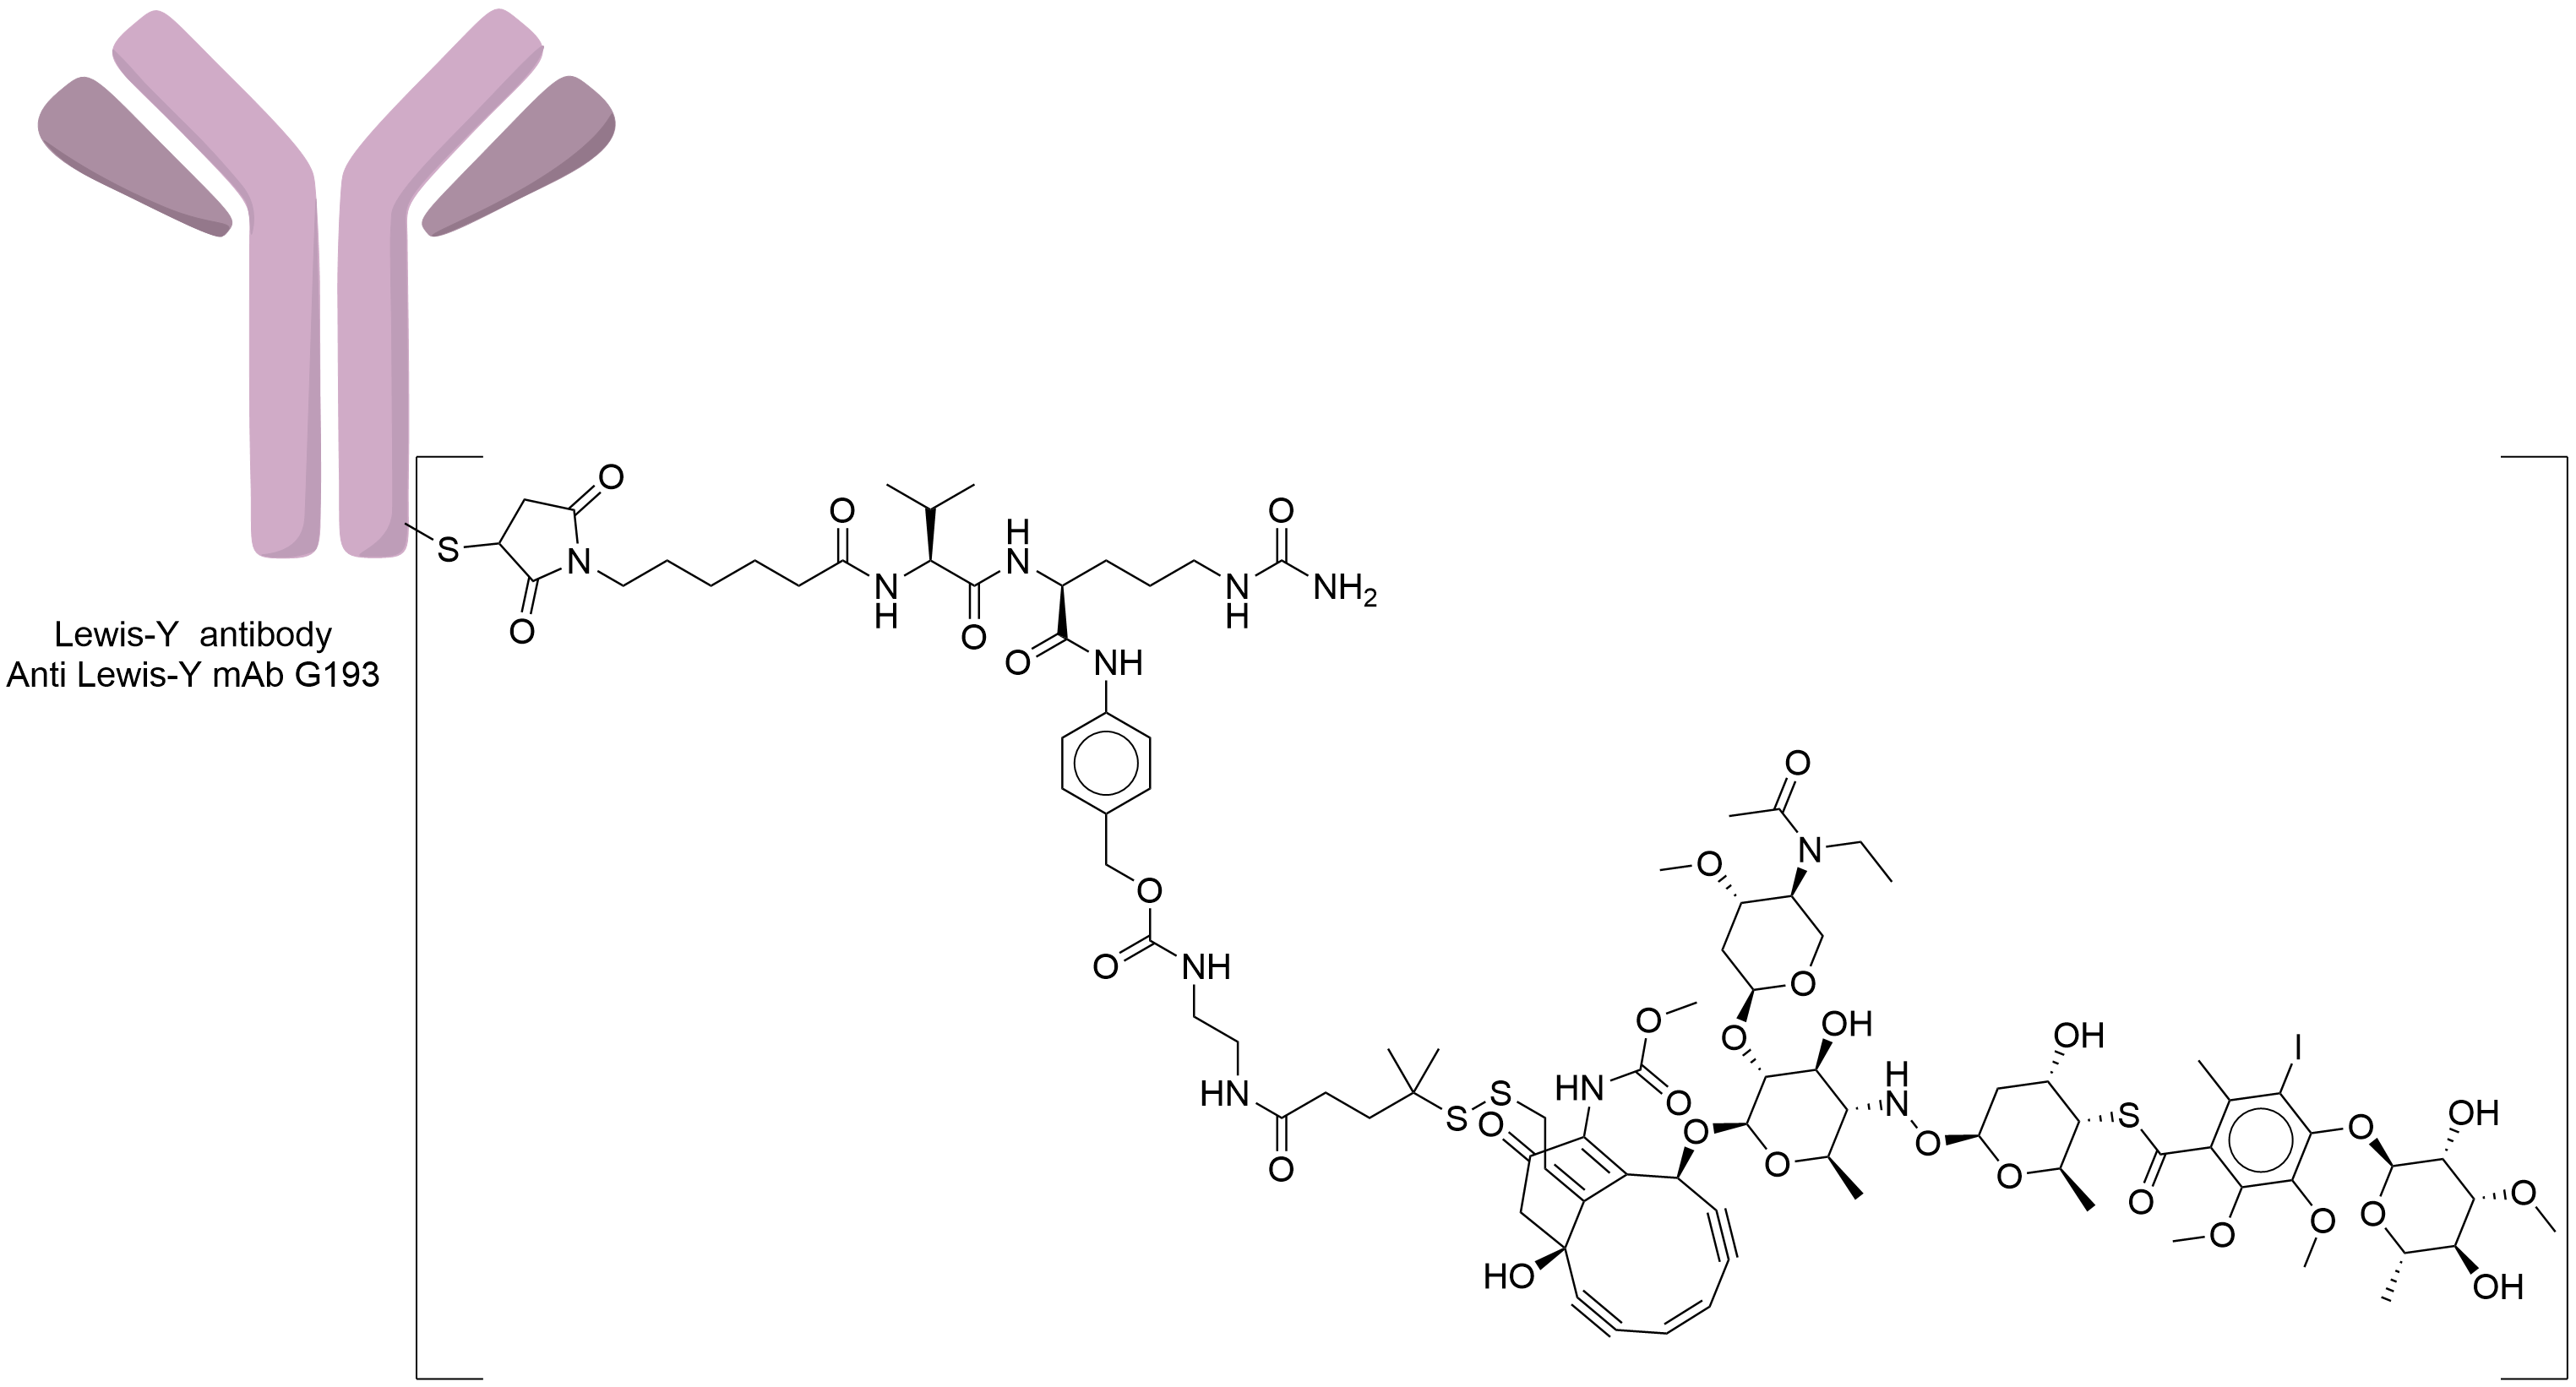
|
|||||
| Antibody Name |
G193
|
Antibody Info | ||||
| Antigen Name |
Lewis Y
|
Antigen Info | ||||
| Payload Name |
N-acetyl-gamma-calicheamicin
|
Payload Info | ||||
| Payload Target |
Human deoxyribonucleic acid (hDNA)
|
Target Info | ||||
| Linker Name |
AcButDMH
|
Linker Info | ||||
| Conjugate Type |
Random Lysines
|
|||||
| Combination Type |
ozogamicin
|
|||||
2027 Update
The disease landscape of This ADC
2027 Update
The clinical trial pipelines of This ADC
2027 Update
General Information of The ADMET Data Related to This ADC
Absorption
| Standard Type | Value | Units | Description | Reference |
|---|---|---|---|---|
| Area Under the Concentration-Time Curve (AUC) | 29.93 | ug·h/mL |
111In-CMD-193 serum pharmacokinetic analysis results, All (n=9).
|
[1] |
| Area Under the Concentration-Time Curve (AUC) | 16.37 | ug·h/mL |
111In-CMD-193 serum pharmacokinetic analysis results, 1 mg/m2 (n=6).
|
[1] |
| Area Under the Concentration-Time Curve (AUC) | 56.45 | ug·h/mL |
111In-CMD-193 serum pharmacokinetic analysis results, 2.6 mg/m2 (n=3).
|
[1] |
| Area Under the Concentration-Time Curve (AUC) | 80.2 | ug·h/mL |
Mean CMD-193 PK parameters in rat following intravenous dosing of CMD-193 for four cycles, cycle 1, 0.094 mg/kg, Male, AUC0-336.
|
[2] |
| Area Under the Concentration-Time Curve (AUC) | 258 | ug·h/mL |
Mean CMD-193 PK parameters in rat following intravenous dosing of CMD-193 for four cycles, cycle 1, 0.336 mg/kg, Female, AUC0-336.
|
[2] |
| Area Under the Concentration-Time Curve (AUC) | 271 | ug·h/mL |
Mean CMD-193 PK parameters in rat following intravenous dosing of CMD-193 for four cycles, cycle 1, 0.336 mg/kg, Male, AUC0-336.
|
[2] |
| Area Under the Concentration-Time Curve (AUC) | 905 | ug·h/mL |
Mean CMD-193 PK parameters in rat following intravenous dosing of CMD-193 for four cycles, cycle 1, 0.94 mg/kg, Male, AUC0-336.
|
[2] |
| Area Under the Concentration-Time Curve (AUC) | 74.3 | ug·h/mL |
Mean CMD-193 PK parameters in rat following intravenous dosing of CMD-193 for four cycles, Cycle 3, 0.094 mg/kg, Male, AUC0-336.
|
[2] |
| Area Under the Concentration-Time Curve (AUC) | 264 | ug·h/mL |
Mean CMD-193 PK parameters in rat following intravenous dosing of CMD-193 for four cycles, Cycle 3, 0.336 mg/kg, Female, AUC0-336.
|
[2] |
| Area Under the Concentration-Time Curve (AUC) | 232 | ug·h/mL |
Mean CMD-193 PK parameters in rat following intravenous dosing of CMD-193 for four cycles, Cycle 3, 0.336 mg/kg, Male, AUC0-336.
|
[2] |
| Area Under the Concentration-Time Curve (AUC) | 184 | ug·h/mL |
Mean CMD-193 PK parameters in rat following intravenous dosing of CMD-193 for four cycles, Cycle 3, 0.94 mg/kg, Male, AUC0-336.
|
[2] |
| Area Under the Concentration-Time Curve (AUC) | 82 | ug·h/mL |
Mean CMD-193 PK parameters in rat following intravenous dosing of CMD-193 for four cycles, cycle 1, 0.094 mg/kg, Male, AUCINF.
|
[2] |
| Area Under the Concentration-Time Curve (AUC) | 268 | ug·h/mL |
Mean CMD-193 PK parameters in rat following intravenous dosing of CMD-193 for four cycles, cycle 1, 0.336 mg/kg, Female, AUCINF.
|
[2] |
| Area Under the Concentration-Time Curve (AUC) | 283 | ug·h/mL |
Mean CMD-193 PK parameters in rat following intravenous dosing of CMD-193 for four cycles, cycle 1, 0.336 mg/kg, Male, AUCINF.
|
[2] |
| Area Under the Concentration-Time Curve (AUC) | 915 | ug·h/mL |
Mean CMD-193 PK parameters in rat following intravenous dosing of CMD-193 for four cycles, cycle 1, 0.94 mg/kg, Male, AUCINF.
|
[2] |
| Area Under the Concentration-Time Curve (AUC) | 121 | ug·h/mL |
Mean CMD-193 PK parameters in rat derived from total calicheamicin following intravenous dosing of CMD-193 for four cycles, cycle 1, 0.094 mg/kg, Male, AUC0-336.
|
[2] |
| Area Under the Concentration-Time Curve (AUC) | 364 | ug·h/mL |
Mean CMD-193 PK parameters in rat derived from total calicheamicin following intravenous dosing of CMD-193 for four cycles, cycle 1, 0.336 mg/kg, Female, AUC0-336.
|
[2] |
| Area Under the Concentration-Time Curve (AUC) | 278 | ug·h/mL |
Mean CMD-193 PK parameters in rat derived from total calicheamicin following intravenous dosing of CMD-193 for four cycles, cycle 1, 0.336 mg/kg, Male, AUC0-336.
|
[2] |
| Area Under the Concentration-Time Curve (AUC) | 890 | ug·h/mL |
Mean CMD-193 PK parameters in rat derived from total calicheamicin following intravenous dosing of CMD-193 for four cycles, cycle 1, 0.94 mg/kg, Male, AUC0-336.
|
[2] |
| Area Under the Concentration-Time Curve (AUC) | 110 | ug·h/mL |
Mean CMD-193 PK parameters in rat derived from total calicheamicin following intravenous dosing of CMD-193 for four cycles, Cycle 3, 0.094 mg/kg, Male, AUC0-336.
|
[2] |
| Area Under the Concentration-Time Curve (AUC) | 335 | ug·h/mL |
Mean CMD-193 PK parameters in rat derived from total calicheamicin following intravenous dosing of CMD-193 for four cycles, Cycle 3, 0.336 mg/kg, Female, AUC0-336.
|
[2] |
| Area Under the Concentration-Time Curve (AUC) | 269 | ug·h/mL |
Mean CMD-193 PK parameters in rat derived from total calicheamicin following intravenous dosing of CMD-193 for four cycles, Cycle 3, 0.336 mg/kg, Male, AUC0-336.
|
[2] |
| Area Under the Concentration-Time Curve (AUC) | 274 | ug·h/mL |
Mean CMD-193 PK parameters in rat derived from total calicheamicin following intravenous dosing of CMD-193 for four cycles, Cycle 3, 0.94 mg/kg, Male, AUC0-336.
|
[2] |
| Area Under the Concentration-Time Curve (AUC) | 121 | ug·h/mL |
Mean CMD-193 PK parameters in rat derived from total calicheamicin following intravenous dosing of CMD-193 for four cycles, cycle 1, 0.094 mg/kg, Male, AUCINF.
|
[2] |
| Area Under the Concentration-Time Curve (AUC) | 383 | ug·h/mL |
Mean CMD-193 PK parameters in rat derived from total calicheamicin following intravenous dosing of CMD-193 for four cycles, cycle 1, 0.336 mg/kg, Female, AUCINF.
|
[2] |
| Area Under the Concentration-Time Curve (AUC) | 405 | ug·h/mL |
Mean CMD-193 PK parameters in rat derived from total calicheamicin following intravenous dosing of CMD-193 for four cycles, cycle 1, 0.336 mg/kg, Male, AUCINF.
|
[2] |
| Area Under the Concentration-Time Curve (AUC) | 930 | ug·h/mL |
Mean CMD-193 PK parameters in rat derived from total calicheamicin following intravenous dosing of CMD-193 for four cycles, cycle 1, 0.94 mg/kg, Male, AUCINF.
|
[2] |
Distribution
| Standard Type | Value | Units | Description | Reference |
|---|---|---|---|---|
| Volume of Distribution (Vd) | 4071.22 | mL |
111In-CMD-193 serum pharmacokinetic analysis results, All (n=9).
|
[1] |
| Volume of Distribution (Vd) | 4366.18 | mL |
111In-CMD-193 serum pharmacokinetic analysis results, 1 mg/m2 (n=6).
|
[1] |
| Volume of Distribution (Vd) | 3481.31 | mL |
111In-CMD-193 serum pharmacokinetic analysis results, 2.6 mg/m2 (n=3).
|
[1] |
| Volume of Distribution (Vd) | 84.1 | mL/kg |
Mean CMD-193 PK parameters in rat following intravenous dosing of CMD-193 for four cycles, cycle 1, 0.094 mg/kg, Male.
|
[2] |
| Volume of Distribution (Vd) | 102 | mL/kg |
Mean CMD-193 PK parameters in rat following intravenous dosing of CMD-193 for four cycles, cycle 1, 0.336 mg/kg, Female.
|
[2] |
| Volume of Distribution (Vd) | 109 | mL/kg |
Mean CMD-193 PK parameters in rat following intravenous dosing of CMD-193 for four cycles, cycle 1, 0.336 mg/kg, Male.
|
[2] |
| Volume of Distribution (Vd) | 73.1 | mL/kg |
Mean CMD-193 PK parameters in rat following intravenous dosing of CMD-193 for four cycles, cycle 1, 0.94 mg/kg, Male.
|
[2] |
| Volume of Distribution (Vd) | 87.2 | mL/kg |
Mean CMD-193 PK parameters in rat following intravenous dosing of CMD-193 for four cycles, Cycle 3, 0.094 mg/kg, Male.
|
[2] |
| Volume of Distribution (Vd) | 92 | mL/kg |
Mean CMD-193 PK parameters in rat following intravenous dosing of CMD-193 for four cycles, Cycle 3, 0.336 mg/kg, Female.
|
[2] |
| Volume of Distribution (Vd) | 114 | mL/kg |
Mean CMD-193 PK parameters in rat following intravenous dosing of CMD-193 for four cycles, Cycle 3, 0.336 mg/kg, Male.
|
[2] |
| Volume of Distribution (Vd) | 66.8 | mL/kg |
Mean CMD-193 PK parameters in rat derived from total calicheamicin following intravenous dosing of CMD-193 for four cycles, cycle 1, 0.094 mg/kg, Male.
|
[2] |
| Volume of Distribution (Vd) | 93.6 | mL/kg |
Mean CMD-193 PK parameters in rat derived from total calicheamicin following intravenous dosing of CMD-193 for four cycles, cycle 1, 0.336 mg/kg, Female.
|
[2] |
| Volume of Distribution (Vd) | 95.5 | mL/kg |
Mean CMD-193 PK parameters in rat derived from total calicheamicin following intravenous dosing of CMD-193 for four cycles, cycle 1, 0.336 mg/kg, Male.
|
[2] |
| Volume of Distribution (Vd) | 100 | mL/kg |
Mean CMD-193 PK parameters in rat derived from total calicheamicin following intravenous dosing of CMD-193 for four cycles, cycle 1, 0.94 mg/kg, Male.
|
[2] |
| Volume of Distribution (Vd) | 66.6 | mL/kg |
Mean CMD-193 PK parameters in rat derived from total calicheamicin following intravenous dosing of CMD-193 for four cycles, Cycle 3, 0.094 mg/kg, Male.
|
[2] |
| Volume of Distribution (Vd) | 95.1 | mL/kg |
Mean CMD-193 PK parameters in rat derived from total calicheamicin following intravenous dosing of CMD-193 for four cycles, Cycle 3, 0.336 mg/kg, Female.
|
[2] |
| Volume of Distribution (Vd) | 156 | mL/kg |
Mean CMD-193 PK parameters in rat derived from total calicheamicin following intravenous dosing of CMD-193 for four cycles, Cycle 3, 0.336 mg/kg, Male.
|
[2] |
Excretion
| Standard Type | Value | Units | Description | Reference |
|---|---|---|---|---|
| Elimination Half-Life (t1/2) | 4.76 | h |
Halflife-alpha, 111In-CMD-193 serum pharmacokinetic analysis results, All (n=9).
|
[1] |
| Elimination Half-Life (t1/2) | 102.88 | h |
Halflife-beta, 111In-CMD-193 serum pharmacokinetic analysis results, All (n=9).
|
[1] |
| Clearance (CL) | 113.22 | mL/h |
111In-CMD-193 serum pharmacokinetic analysis results, All (n=9).
|
[1] |
| Elimination Half-Life (t1/2) | 5.47 | h |
Halflife-alpha, 111In-CMD-193 serum pharmacokinetic analysis results, 1 mg/m2 (n=6).
|
[1] |
| Elimination Half-Life (t1/2) | 104.42 | h |
Halflife-beta, 111In-CMD-193 serum pharmacokinetic analysis results, 1 mg/m2 (n=6).
|
[1] |
| Clearance (CL) | 130.04 | mL/h |
111In-CMD-193 serum pharmacokinetic analysis results, 1 mg/m2 (n=6).
|
[1] |
| Elimination Half-Life (t1/2) | 3.32 | h |
Halflife-alpha, 111In-CMD-193 serum pharmacokinetic analysis results, 2.6 mg/m2 (n=3).
|
[1] |
| Elimination Half-Life (t1/2) | 99.79 | h |
Halflife-beta, 111In-CMD-193 serum pharmacokinetic analysis results, 2.6 mg/m2 (n=3).
|
[1] |
| Clearance (CL) | 79.56 | mL/h |
111In-CMD-193 serum pharmacokinetic analysis results, 2.6 mg/m2 (n=3).
|
[1] |
| Clearance (CL) | 1.15 | mL/h/kg |
Mean CMD-193 PK parameters in rat following intravenous dosing of CMD-193 for four cycles, cycle 1, 0.094 mg/kg, Male.
|
[2] |
| Clearance (CL) | 1.26 | mL/h/kg |
Mean CMD-193 PK parameters in rat following intravenous dosing of CMD-193 for four cycles, cycle 1, 0.336 mg/kg, Female.
|
[2] |
| Clearance (CL) | 1.19 | mL/h/kg |
Mean CMD-193 PK parameters in rat following intravenous dosing of CMD-193 for four cycles, cycle 1, 0.336 mg/kg, Male.
|
[2] |
| Clearance (CL) | 1.03 | mL/h/kg |
Mean CMD-193 PK parameters in rat following intravenous dosing of CMD-193 for four cycles, cycle 1, 0.94 mg/kg, Male.
|
[2] |
| Clearance (CL) | 1.26 | mL/h/kg |
Mean CMD-193 PK parameters in rat following intravenous dosing of CMD-193 for four cycles, Cycle 3, 0.094 mg/kg, Male.
|
[2] |
| Clearance (CL) | 1.27 | mL/h/kg |
Mean CMD-193 PK parameters in rat following intravenous dosing of CMD-193 for four cycles, Cycle 3, 0.336 mg/kg, Female.
|
[2] |
| Clearance (CL) | 1.45 | mL/h/kg |
Mean CMD-193 PK parameters in rat following intravenous dosing of CMD-193 for four cycles, Cycle 3, 0.336 mg/kg, Male.
|
[2] |
| Clearance (CL) | 5.11 | mL/h/kg |
Mean CMD-193 PK parameters in rat following intravenous dosing of CMD-193 for four cycles, Cycle 3, 0.94 mg/kg, Male.
|
[2] |
| Elimination Half-Life (t1/2) | 66 | h |
Mean CMD-193 PK parameters in rat following intravenous dosing of CMD-193 for four cycles, cycle 1, 0.094 mg/kg, Male.
|
[2] |
| Elimination Half-Life (t1/2) | 78 | h |
Mean CMD-193 PK parameters in rat following intravenous dosing of CMD-193 for four cycles, cycle 1, 0.336 mg/kg, Female.
|
[2] |
| Elimination Half-Life (t1/2) | 79 | h |
Mean CMD-193 PK parameters in rat following intravenous dosing of CMD-193 for four cycles, cycle 1, 0.336 mg/kg, Male.
|
[2] |
| Elimination Half-Life (t1/2) | 53 | h |
Mean CMD-193 PK parameters in rat following intravenous dosing of CMD-193 for four cycles, cycle 1, 0.94 mg/kg, Male.
|
[2] |
| Elimination Half-Life (t1/2) | 49 | h |
Mean CMD-193 PK parameters in rat following intravenous dosing of CMD-193 for four cycles, Cycle 3, 0.094 mg/kg, Male.
|
[2] |
| Elimination Half-Life (t1/2) | 61 | h |
Mean CMD-193 PK parameters in rat following intravenous dosing of CMD-193 for four cycles, Cycle 3, 0.336 mg/kg, Female.
|
[2] |
| Elimination Half-Life (t1/2) | 74 | h |
Mean CMD-193 PK parameters in rat following intravenous dosing of CMD-193 for four cycles, Cycle 3, 0.336 mg/kg, Male.
|
[2] |
| Clearance (CL) | 0.777 | mL/h/kg |
Mean CMD-193 PK parameters in rat derived from total calicheamicin following intravenous dosing of CMD-193 for four cycles, cycle 1, 0.094 mg/kg, Male.
|
[2] |
| Clearance (CL) | 0.877 | mL/h/kg |
Mean CMD-193 PK parameters in rat derived from total calicheamicin following intravenous dosing of CMD-193 for four cycles, cycle 1, 0.336 mg/kg, Female.
|
[2] |
| Clearance (CL) | 0.815 | mL/h/kg |
Mean CMD-193 PK parameters in rat derived from total calicheamicin following intravenous dosing of CMD-193 for four cycles, cycle 1, 0.336 mg/kg, Male.
|
[2] |
| Clearance (CL) | 1.01 | mL/h/kg |
Mean CMD-193 PK parameters in rat derived from total calicheamicin following intravenous dosing of CMD-193 for four cycles, cycle 1, 0.94 mg/kg, Male.
|
[2] |
| Clearance (CL) | 0.854 | mL/h/kg |
Mean CMD-193 PK parameters in rat derived from total calicheamicin following intravenous dosing of CMD-193 for four cycles, Cycle 3, 0.094 mg/kg, Male.
|
[2] |
| Clearance (CL) | 1 | mL/h/kg |
Mean CMD-193 PK parameters in rat derived from total calicheamicin following intravenous dosing of CMD-193 for four cycles, Cycle 3, 0.336 mg/kg, Female.
|
[2] |
| Clearance (CL) | 1.25 | mL/h/kg |
Mean CMD-193 PK parameters in rat derived from total calicheamicin following intravenous dosing of CMD-193 for four cycles, Cycle 3, 0.336 mg/kg, Male.
|
[2] |
| Clearance (CL) | 3.44 | mL/h/kg |
Mean CMD-193 PK parameters in rat derived from total calicheamicin following intravenous dosing of CMD-193 for four cycles, Cycle 3, 0.94 mg/kg, Male.
|
[2] |
| Elimination Half-Life (t1/2) | 60 | h |
Mean CMD-193 PK parameters in rat derived from total calicheamicin following intravenous dosing of CMD-193 for four cycles, cycle 1, 0.094 mg/kg, Male.
|
[2] |
| Elimination Half-Life (t1/2) | 79 | h |
Mean CMD-193 PK parameters in rat derived from total calicheamicin following intravenous dosing of CMD-193 for four cycles, cycle 1, 0.336 mg/kg, Female.
|
[2] |
| Elimination Half-Life (t1/2) | 89 | h |
Mean CMD-193 PK parameters in rat derived from total calicheamicin following intravenous dosing of CMD-193 for four cycles, cycle 1, 0.336 mg/kg, Male.
|
[2] |
| Elimination Half-Life (t1/2) | 79 | h |
Mean CMD-193 PK parameters in rat derived from total calicheamicin following intravenous dosing of CMD-193 for four cycles, cycle 1, 0.94 mg/kg, Male.
|
[2] |
| Elimination Half-Life (t1/2) | 47 | h |
Mean CMD-193 PK parameters in rat derived from total calicheamicin following intravenous dosing of CMD-193 for four cycles, Cycle 3, 0.094 mg/kg, Male.
|
[2] |
| Elimination Half-Life (t1/2) | 76 | h |
Mean CMD-193 PK parameters in rat derived from total calicheamicin following intravenous dosing of CMD-193 for four cycles, Cycle 3, 0.336 mg/kg, Female.
|
[2] |
| Elimination Half-Life (t1/2) | 97 | h |
Mean CMD-193 PK parameters in rat derived from total calicheamicin following intravenous dosing of CMD-193 for four cycles, Cycle 3, 0.336 mg/kg, Male.
|
[2] |
General Information of The Activity Data Related to This ADC
Identified from the Human Clinical Data
Discovered Using Cell Line-derived Xenograft Model
| Standard Type | Value | Units | Cell Line | Disease Model |
|---|---|---|---|---|
| Tumor Growth Inhibition value (TGI) |
≈ 99
|
%
|
NCI-N87 cells
|
Gastric tubular adenocarcinoma
|
Full List of Activity Data of This Antibody-drug Conjugate
Identified from the Human Clinical Data
| Experiment 1 Reporting the Activity Date of This ADC | [3] | ||||
| Patients Enrolled |
Eligible patients must have histologically confirmed Lewis Y-positive (≥20%) solid tumors with ECOG 0-1, excluding those with recent cancer therapy (within 21-42 days), active CNS metastases, or severe prior protein allergies.
|
||||
| Administration Dosage |
.
|
||||
| Related Clinical Trial | |||||
| NCT Number | NCT00161642 | Clinical Status | PHASE1 | ||
| Clinical Description | A Phase 1 Dose Escalation Study of CMD-193 in Subjects With Advanced Malignant Tumors. | ||||
| Primary Endpoint |
The study monitors safety through physical exams, hematology panels, and ECG monitoring for all participants.
|
||||
| Other Endpoint |
Efficacy is assessed via radiographic tumor evaluations, while pharmacokinetic analyses are performed through blood sampling to measure drug exposure and response.
|
||||
| Experiment 2 Reporting the Activity Date of This ADC | [4] | ||||
| Patients Enrolled |
Eligible patients must have advanced Lewis Y-positive solid tumors; exclusions involve recent anticancer therapy (within 28 days), pregnancy, or unstable medical conditions, ensuring patient safety and protocol compliance.
|
||||
| Administration Dosage |
.
|
||||
| Related Clinical Trial | |||||
| NCT Number | NCT00257881 | Clinical Status | PHASE1 | ||
| Clinical Description | Phase 1 Dose-Escalation Study of Intravenous CMD-193 in Subjects With Advanced Malignant Solid Tumors | ||||
| Primary Endpoint |
The primary safety assessments focus on dose-limiting toxicities and adverse events to evaluate treatment tolerability.
|
||||
| Other Endpoint |
Secondary outcomes include pharmacokinetic measurements and tumor response evaluations to assess drug exposure and efficacy.
|
||||
| Experiment 3 Reporting the Activity Date of This ADC | [5] | ||||
| Patients Enrolled |
Eligibility required Lewis Y-positive (≥20%) solid tumors with ECOG 0-1, measurable lesions ≥2cm, and organ function thresholds. Exclusions included recent cancer therapy (<21-42 days), active CNS metastases, severe comorbidities, or prior protein allergies, ensuring protocol safety.
|
||||
| Administration Dosage |
Subjects received 111-In-CMD-193 on Day 1 of Cycle 1. Subjects received CMD-193 at a dose of 1.0 mg/m^2 on Day 1 of subsequent 21-day cycles; Subjects received 111-In-CMD-193 on Day 1 of Cycle 1. Subjects received CMD-193 at a dose of 2.6 mg/m^2 on Day 1 of subsequent 21-day cycles.
|
||||
| Related Clinical Trial | |||||
| NCT Number | NCT00293215 | Clinical Status | PHASE1 | ||
| Clinical Description | Phase I Biodistribution Study of 111-Indium-CMD-193 in Patients With Advanced Tumours Expressing the Lewis-Y Antigen | ||||
| Primary Endpoint |
The study evaluated the biodistribution and pharmacokinetics of 111-In-CMD-193 using gamma camera imaging (Days 1-8) and serum sampling (Days 1-15). Key parameters included effective half-life, volume of central compartment, total clearance, and AUC extrapolated via a two-compartment model analyzed with WinNonLin 5.2.
|
||||
| Other Endpoint |
Tumor response was assessed by RECIST (CT scans) and metabolic activity by EORTC criteria (18F-FDG-PET), tracking target lesion changes (CR, PR, SD, PD) and SUVmax variations at cycles 2, 4, and study completion.
|
||||
| Experiment 4 Reporting the Activity Date of This ADC | [6] | ||||
| Efficacy Data | Complete Remission (CR) |
0%
|
|||
| Patients Enrolled |
Patients with advanced tumours expressing the Lewis-Y antigen.
|
||||
| Administration Dosage |
111-In-CMD-193 iv then 1.00 mg/m^2, 2.60 mg/m^2 iv of CMD-193.
|
||||
| Related Clinical Trial | |||||
| NCT Number | NCT00293215 | Clinical Status | Phase 1 | ||
| Clinical Description | Biodistribution study of cmd-193 in patients with advanced tumours expressing the LEWIS-Y antigen. | ||||
| Experiment 5 Reporting the Activity Date of This ADC | [7] | ||||
| Patients Enrolled |
Patients with advanced malignant tumors.
|
||||
| Administration Dosage |
CMD-193 iv.
|
||||
| Related Clinical Trial | |||||
| NCT Number | NCT00161642 | Clinical Status | Phase 1 | ||
| Clinical Description | Phase 1 dose-escalation study of intravenous CMD-193 in subjects with advanced malignant solid tumors. | ||||
| Experiment 6 Reporting the Activity Date of This ADC | [8] | ||||
| Patients Enrolled |
Patients with advanced malignant tumors.
|
||||
| Administration Dosage |
CMD-193 iv.
|
||||
| Related Clinical Trial | |||||
| NCT Number | NCT00257881 | Clinical Status | Phase 1 | ||
| Clinical Description | Phase 1 biodistribution study of 111-indium-CMD-193 in patients with advanced tumours expressing the LEWIS-Y antigen. | ||||
Discovered Using Cell Line-derived Xenograft Model
| Experiment 1 Reporting the Activity Date of This ADC | [9] | ||||
| Efficacy Data | Tumor Growth Inhibition value (TGI) | ≈ 99% | Positive Lewis-Y expression (Lewis-Y +++/++) | ||
| Method Description |
hu3S193-CalichDMH (4 ug) induces efficient tumor cell killing in cell line-derived models of PV-1 cells with CD28 expression.
|
||||
| In Vivo Model | N193 CDX model | ||||
| In Vitro Model | Gastric tubular adenocarcinoma | NCI-N87 cells | CVCL_1603 | ||
References