Antigen Information
General Information of This Antigen
| Antigen ID | TAR0WGRJX |
|||||
|---|---|---|---|---|---|---|
| Antigen Name | Mucin-16 (MUC16) |
|||||
| Gene Name | MUC16 |
|||||
| Gene ID | ||||||
| Synonym | Ovarian cancer-related tumor marker CA125;Ovarian carcinoma antigen CA125 |
|||||
| Sequence |
MLKPSGLPGSSSPTRSLMTGSRSTKATPEMDSGLTGATLSPKTSTGAIVVTEHTLPFTSP
DKTLASPTSSVVGRTTQSLGVMSSALPESTSRGMTHSEQRTSPSLSPQVNGTPSRNYPAT SMVSGLSSPRTRTSSTEGNFTKEASTYTLTVETTSGPVTEKYTVPTETSTTEGDSTETPW DTRYIPVKITSPMKTFADSTASKENAPVSMTPAETTVTDSHTPGRTNPSFGTLYSSFLDL SPKGTPNSRGETSLELILSTTGYPFSSPEPGSAGHSRISTSAPLSSSASVLDNKISETSI FSGQSLTSPLSPGVPEARASTMPNSAIPFSMTLSNAETSAERVRSTISSLGTPSISTKQT AETILTFHAFAETMDIPSTHIAKTLASEWLGSPGTLGGTSTSALTTTSPSTTLVSEETNT HHSTSGKETEGTLNTSMTPLETSAPGEESEMTATLVPTLGFTTLDSKIRSPSQVSSSHPT RELRTTGSTSGRQSSSTAAHGSSDILRATTSSTSKASSWTSESTAQQFSEPQHTQWVETS PSMKTERPPASTSVAAPITTSVPSVVSGFTTLKTSSTKGIWLEETSADTLIGESTAGPTT HQFAVPTGISMTGGSSTRGSQGTTHLLTRATASSETSADLTLATNGVPVSVSPAVSKTAA GSSPPGGTKPSYTMVSSVIPETSSLQSSAFREGTSLGLTPLNTRHPFSSPEPDSAGHTKI STSIPLLSSASVLEDKVSATSTFSHHKATSSITTGTPEISTKTKPSSAVLSSMTLSNAAT SPERVRNATSPLTHPSPSGEETAGSVLTLSTSAETTDSPNIHPTGTLTSESSESPSTLSL PSVSGVKTTFSSSTPSTHLFTSGEETEETSNPSVSQPETSVSRVRTTLASTSVPTPVFPT MDTWPTRSAQFSSSHLVSELRATSSTSVTNSTGSALPKISHLTGTATMSQTNRDTFNDSA APQSTTWPETSPRFKTGLPSATTTVSTSATSLSATVMVSKFTSPATSSMEATSIREPSTT ILTTETTNGPGSMAVASTNIPIGKGYITEGRLDTSHLPIGTTASSETSMDFTMAKESVSM SVSPSQSMDAAGSSTPGRTSQFVDTFSDDVYHLTSREITIPRDGTSSALTPQMTATHPPS PDPGSARSTWLGILSSSPSSPTPKVTMSSTFSTQRVTTSMIMDTVETSRWNMPNLPSTTS LTPSNIPTSGAIGKSTLVPLDTPSPATSLEASEGGLPTLSTYPESTNTPSIHLGAHASSE SPSTIKLTMASVVKPGSYTPLTFPSIETHIHVS.MAYSSGSSPEMTAPGETNTGSTWDPT TYITTTDPKDTSSAQVSTPHSVRTLRTTENHPKTESATPAAYSGSPKISSSPNLTSPATK AWTITDTTEHSTQLHYTKLAEKSSGFETQSAPGPVSVVIPTSPTIGSSTLELTSDVPGEP LVLAPSEQTTITLPMATWLSTSLTEEMASTDLDISSPSSPMSTFAIFPPMSTPSHELSKS EADTSAIRNTDSTTLDQHLGIRSLGRTGDLTTVPITPLTTTWTSVIEHSTQAQDTLSATM SPTHVTQSLKDQTSIPASASPSHLTEVYPELGTQGRSSSEATTFWKPSTDTLSREIETGP TNIQSTPPMDNTTTGSSSSGVTLGIAHLPIGTSSPAETSTNMALERRSSTATVSMAGTMG LLVTSAPGRSISQSLGRVSSVLSESTTEGVTDSSKGSSPRLNTQGNTALSSSLEPSYAEG SQMSTSIPLTSSPTTPDVEFIGGSTFWTKEVTTVMTSDISKSSARTESSSATLMSTALGS TENTGKEKLRTASMDLPSPTPSMEVTPWISLTLSNAPNTTDSLDLSHGVHTSSAGTLATD RSLNTGVTRASRLENGSDTSSKSLSMGNSTHTSMTYTEKSEVSSSIHPRPETSAPGAETT LTSTPGNRAISLTLPFSSIPVEEVISTGITSGPDINSAPMTHSPITPPTIVWTSTGTIEQ STQPLHAVSSEKVSVQTQSTPYVNSVAVSASPTHENSVSSGSSTSSPYSSASLESLDSTI SRRNAITSWLWDLTTSLPTTTWPSTSLSEALSSGHSGVSNPSSTTTEFPLFSAASTSAAK QRNPETETHGPQNTAASTLNTDASSVTGLSETPVGASISSEVPLPMAITSRSDVSGLTSE STANPSLGTASSAGTKLTRTISLPTSESLVSFRMNKDPWTVSIPLGSHPTTNTETSIPVN SAGPPGLSTVASDVIDTPSDGAESIPTVSFSPSPDTEVTTISHFPEKTTHSFRTISSLTH ELTSRVTPIPGDWMSSAMSTKPTGASPSITLGERRTITSAAPTTSPIVLTASFTETSTVS LDNETTVKTSDILDARKTNELPSDSSSSSDLINTSIASSTMDVTKTASISPTSISGMTAS SSPSLFSSDRPQVPTSTTETNTATSPSVSSNTYSLDGGSNVGGTPSTLPPFTITHPVETS SALLAWSRPVRTFSTMVSTDTASGENPTSSNSVVTSVPAPGTWTSVGSTTDLPAMGFLKT SPAGEAHSLLASTIEPATAFTPHLSAAVVTGSSATSEASLLTTSESKAIHSSPQTPTTPT SGANWETSATPESLLVVTETSDTTLTSKILVTDTILFSTVSTPPSKFPSTGTLSGASFPT LLPDTPAIPLTATEPTSSLATSFDSTPLVTIASDSLGTVPETTLTMSETSNGDALVLKTV SNPDRSIPGITIQGVTESPLHPSSTSPSKIVAPRNTTYEGSITVALSTLPAGTTGSLVFS QSSENSETTALVDSSAGLERASVMPLTTGSQGMASSGGIRSGSTHSTGTKTFSSLPLTMN PGEVTAMSEITTNRLTATQSTAPKGIPVKPTSAESGLLTPVSASSSPSKAFASLTTAPPT WGIPQSTLTFEFSEVPSLDTKSASLPTPGQSLNTIPDSDASTASSSLSKSPEKNPRARMM TSTKAISASSFQSTGFTETPEGSASPSMAGHEPRVPTSGTGDPRYASESMSYPDPSKASS AMTSTSLASKLTTLFSTGQAARSGSSSSPISLSTEKETSFLSPTASTSRKTSLFLGPSMA RQPNILVHLQTSALTLSPTSTLNMSQEEPPELTSSQTIAEEEGTTAETQTLTFTPSETPT SLLPVSSPTEP.RKSSPETWASSISVPAKTSLVETTDGTLVTTIKMSSQAAQGNSTWPAP AEETGSSPAGTSPGSPEMSTTLKIMSSKEPSISPEIRSTVRNSPWKTPETTVPMETTVEP VTLQSTALGSGSTSISHLPTGTTSPTKSPTENMLATERVSLSPSPPEAWTNLYSGTPGGT RQSLATMSSVSLESP.SITGTGQQSSPELVSKTTGMEFSMWHGSTGGTTGDTHVSLSTSS NILEDPVTSPNSVSSLTDKSKHKTETWVSTTAIPSTVLNNKIMAAEQQTSRSVDEAYSST SSWSDQTSGSDITLGASPDVTNTLYITSTAQTTSLVSLPSGDQGITSLTNPSGGKTSSAS SVTSPSIGLETLRANVSAVKSDIAPTAGHLSQTSSPAEVSILDVTTAPTPGISTTITTMG TNSISTTTPNPEVGMSTMDSTPATERRTTSTEHPSTWSSTAASDSWTVTDMTSNLKVARS PGTISTMHTTSFLASSTELDSMSTPHGRITVIGTSLVTPSSDASAVKTETSTSERTLSPS DTTASTPISTFSRVQRMSISVPDILSTSWTPSSTEAEDVPVSMVSTDHASTKTDPNTPLS TFLFDSLSTLDWDTGRSLSSATATTSAPQGATTPQELTLETMISPATSQLPFSIGHITSA VTPAAMARSSGVTFSRPDPTSKKAEQTSTQLPTTTSAHPGQVPRSAATTLDVIPHTAKTP DATFQRQGQTALTTEARATSDSWNEKEKSTPSAPWITEMMNSVSEDTIKEVTSSSSVLRT LNTLDINLESGTTSSPSWKSSPYERIAPSESTTDKEAIHPSTNTVETTGWVTSSEHASHS TIPAHSASSKLTSPVVTTSTREQAIVSMSTTTWPESTRARTEPNSFLTIELRDVSPYMDT SSTTQTSIISSPGSTAITKGPRTEITSSKRISSSFLAQSMRSSDSPSEAITRLSNFPAMT ESGGMILAMQTSPPGATSLSAPTLDTSATASWTGTPLATTQRFTYSEKTTLFSKGPEDTS QPSPPSVEETSSSSSLVPIHATTSPSNILLTSQGHSPSSTPPVTSVFLSETSGLGKTTDM SRISLEPGTSLPPNLSSTAGEALSTYEASRDTKAIHHSADTAVTNMEATSSEYSPIPGHT KPSKATSPLVTSHIMGDITSSTSVFGSSETTEIETVSSVNQGLQERSTSQVASSATETST VITHVSSGDATTHVTKTQATFSSGTSISSPHQFITSTNTFTDVSTNPSTSLIMTESSGVT ITTQTGPTGAATQGPYLLDTSTMPYLTETPLAVTPDFMQSEKTTLISKGPKDVSWTSPPS VAETSYPSSLTPFLVTTIPPATSTLQGQHTSSPVSATSVLTSGLVKTTDMLNTSMEPVTN SPQNLNNPSNEILATLAATTDIETIHPSINKAVTNMGTASSAHVLHSTLPVSSEPSTATS PMVPASSMGDALASISIPGSETTDIEGEPTSSLTAGRKENSTLQEMNSTTESNIILSNVS VGAITEATKMEVPSFDATFIPTPAQSTKFPDIFSVASSRLSNSPPMTISTHMTTTQTGSS GATSKIPLALDTSTLETSAGTPSVVTEGFAHSKITTAMNNDVKDVSQTNPPFQDEASSPS SQAPVLVTTLPSSVAFTPQWHSTSSPVSMSSVLTSSLVKTAGKVDTSLETVTSSPQSMSN TLDDISVTSAATTDIETTHPSINTVVTNVGTTGSAFESHSTVSAYPEPSKVTSPNVTTST MEDTTISRSIPKSSKTTRTETETTSSLTPKLRETSISQEITSSTETSTVPYKELTGATTE VSRTDVTSSSSTSFPGPDQSTVSLDISTETNTRLSTSPIMTESAEITITTQTGPHGATSQ DTFTMDPSNTTPQAGIHSAMTHGFSQLDVTTLMSRIPQDVSWTSPPSVDKTSSPSSFLSS PAMTTPSLISSTLPEDKLSSPMTSLLTSGLVKITDILRTRLEPVTSSLPNFSSTSDKILA TSKDSKDTKEIFPSINTEETNVKANNSGHESHSPALADSETPKATTQMVITTTVGDPAPS TSMPVHGSSETTNIKREPTYFLTPRLRETSTSQESSFPTDTSFLLSKVPTGTITEVSSTG VNSSSKISTPDHDKSTVPPDTFTGEIPRVFTSSIKTKSAEMTITTQASPPESASHSTLPL DTSTTLSQGGTHSTVTQGFPYSEVTTLMGMGPGNVSWMTTPPVEETSSVSSLMSSPAMTS PSPVSSTSPQSIPSSPLPVTALPTSVLVTTTDVLGTTSPESVTSSPPNLSSITHERPATY KDTAHTEAAMHHSTNTAVTNVGTSGSGHKSQSSVLADSETSKATPLMSTTSTLGDTSVST STPNISQTNQIQTEPTASLSPRLRESSTSEKTSSTTETNTAFSYVPTGAITQASRTEISS SRTSISDLDRPTIAPDISTGMITRLFTSPIMTKSAEMTVTTQTTTPGATSQGILPWDTST TLFQGGTHSTVSQGFPHSEITTLRSRTPGDVSWMTTPPVEETSSGFSLMSPSMTSPSPVS STSPESIPSSPLPVTALLTSVLVTTTNVLGTTSPEPVTSSPPNLSSPTQERLTTYKDTAH TEAMHASMHTNTAVANVGTSISGHESQSSVPADSHTSKATSPMGITFAMGDTSVSTSTPA FFETRIQTESTSSLIPGLRDTRTSEEINTVTETSTVLSEVPTTTTTEVSRTEVITSSRTT ISGPDHSKMSPYISTETITRLSTFPFVTGSTEMAITNQTGPIGTISQATLTLDTSSTASW EGTHSPVTQRFPHSEETTTMSRSTKGVSWQSPPSVEETSSPSSPVPLPAITSHSSLYSAV SGSSPTSALPVTSLLTSGRRKTIDMLDTHSELVTSSLPSASSFSGEILTSEASTNTETIH FSENTAETNMGTTNSMHKLHSSVSIHSQPSGHTPPKVTGSMMEDAIVSTSTPGSPETKNV DRDSTSPLTPELKEDSTALVMNSTTESNTVFSSVSLDAATEVSRAEVTYYDPTFMPASAQ STKSPDISPEASSSHSNSPPLTISTHKTIATQTGPSGVTSLGQLTLDTSTIATSAGTPSA RTQDFVDSETTSVMNNDLNDVLKTSPFSAEEANSLSSQAPLLVTTSPSPVTSTLQEHSTS SLVSVTSVPTPTLAKITDMDTNLEPVTRSPQNLRNTLATSEATTDTHTMHPSINTAVANV GTTSSPNEFYFTVSPDSDPYKATSAVVITSTSGDSIVSTSMPRSSAMKKIESETTFSLIF RLRETSTSQKIGSSSDTSTVFDKAFTAATTEVSRTELTSSSRTSIQGTEKPTMSPDTSTR SVTMLSTFAGLTKSEERTIATQTGPHRATSQGTLTWDTSITTSQAGTHSAMTHGFSQLDL STLTSRVPEYISGTSPPSVEKTSSSSSLLSLPAITSPSPVPTTLPESRPSSPVHLTSLPT SGLVKTTDMLASVASLPPNLGSTSHKIPTTSEDIKDTEKMYPSTNIAVTNVGTTTSEKES YSSVPAYSEPPKVTSPMVTSFNIRDTIVSTSMPGSSEITRIEMESTFSLAHGLKGTSTSQ DPIVSTEKSAVLHKLTTGATETSRTEVASSRRTSIPGPDHSTESPDISTEVIPSLPISLG ITESSNMTIITRTGPPLGSTSQGTFTLDTPTTSSRAGTHSMATQEFPHSEMTTVMNKDPE ILSWTIPPSIEKTSFSSSLMPSPAMTSPPVSSTLPKTIHTTPSPMTSLLTPSLVMTTDTL GTSPEPTTSSPPNLSSTSHEILTTDEDTTAIEAMHPSTSTAATNVETTSSGHGSQSSVLA DSEKTKATAPMDTTSTMGHTTVSTSMSVSSETTKIKRESTYSLTPGLRETSISQNASFST DTSIVLSEVPTGTTAEVSRTEVTSSGRTSIPGPSQSTVLPEISTRTMTRLFASPTMTESA EMTIPTQTGPSGSTSQDTLTLDTSTTKSQAKTHSTLTQRFPHSEMTTLMSRGPGDMSWQS SPSLENPSSLPSLLSLPATTSPPPISSTLPVTISSSPLPVTSLLTSSPVTTTDMLHTSPE LVTSSPPKLSHTSDERLTTGKDTTNTEAVHPSTNTAASNVEIPSSGHESPSSALADSETS KATSPMFITSTQEDTTVAISTPHFLETSRIQKESISSLSPKLRETGSSVETSSAIETSAV LSEVSIGATTEISRTEVTSSSRTSISGSAESTMLPEISTTRKIIKFPTSPILAESSEMTI KTQTSPPGSTSESTFTLDTSTTPSLVITHSTMTQRLPHSEITTLVSRGAGDVPRPSSLPV EETSPPSSQLSLSAMISPSPVSSTLPASSHSSSASVTSLLTPGQVKTTEVLDASAEPETS SPPSLSSTSVEILATSEVTTDTEKIHPFSNTAVTKVGTSSSGHESPSSVLPDSETTKATS AMGTISIMGDTSVSTLTPALSNTRKIQSEPASSLTTRLRETSTSEETSLATEANTVLSKV STGATTEVSRTEAISFSRTSMSGPEQSTMSQDISIGTIPRISASSVLTESAKMTITTQTG PSESTLESTLNLNTATTPSWVETHSIVIQGFPHPEMTTSMGRGPGGVSWPSPPFVKETSP PSSPLSLPAVTSPHPVSTTFLAHIPPSPLPVTSLLTSGPATTTDILGTSTEPGTSSSSSL STTSHERLTTYKDTAHTEAVHPSTNTGGTNVATTSSGYKSQSSVLADSSPMCTTSTMGDT SVLTSTPAFLETRRIQTELASSLTPGLRESSGSEGTSSGTKMSTVLSKVPTGATTEISKE DVTSIPGPAQSTISPDISTRTVSWFSTSPVMTESAEITMNTHTSPLGATTQGTSTLDTSS TTSLTMTHSTISQGFSHSQMSTLMRRGPEDVSWMSPPLLEKTRPSFSLMSSPATTSPSPV SSTLPESISSSPLPVTSLLTSGLAKTTDMLHKSSEPVTNSPANLSSTSVEILATSEVTTD TEKTHPSSNRTVTDVGTSSSGHESTSFVLADSQTSKVTSPMVITSTMEDTSVSTSTPGFF ETSRIQTEPTSSLTLGLRKTSSSEGTSLATEMSTVLSGVPTGATAEVSRTEVTSSSRTSI SGFAQLTVSPETSTETITRLPTSSIMTESAEMMIKTQTDPPGSTPESTHTVDISTTPNWV ETHSTVTQRFSHSEMTTLVSRSPGDMLWPSQSSVEETSSASSLLSLPATTSPSPVSSTLV EDFPSASLPVTSLLNPGLVITTDRMGISREPGTSSTSNLSSTSHERLTTLEDTVDTEDMQ PSTHTAVTNVRTSISGHESQSSVLSDSETPKATSPMGTTYTMGETSVSISTSDFFETSRI QIEPTSSLTSGLRETSSSERISSATEGSTVLSEVPSGATTEVSRTEVISSRGTSMSGPDQ FTISPDISTEAITRLSTSPIMTESAESAITIETGSPGATSEGTLTLDTSTTTFWSGTHST ASPGFSHSEMTTLMSRTPGDVPWPSLPSVEEASSVSSSLSSPAMTSTSFFSTLPESISSS PHPVTALLTLGPVKTTDMLRTSSEPETSSPPNLSSTSAEILATSEVTKDREKIHPSSNTP VVNVGTVIYKHLSPSSVLADLVTTKPTSPMATTSTLGNTSVSTSTPAFPETMMTQPTSSL TSGLREISTSQETSSATERSASLSGMPTGATTKVSRTEALSLGRTSTPGPAQSTISPEIS TETITRISTPLTTTGSAEMTITPKTGHSGASSQGTFTLDTSSRASWPGTHSAATHRSPHS GMTTPMSRGPEDVSWPSRPSVEKTSPPSSLVSLSAVTSPSPLYSTPSESSHSSPLRVTSL FTPVMMKTTDMLDTSLEPVTTSPPSMNITSDESLATSKATMETEAIQLSENTAVTQMGTI SARQEFYSSYPGLPEPSKVTSPVVTSSTIKDIVSTTIPASSEITRIEMESTSTLTPTPRE TSTSQEIHSATKPSTVPYKALTSATIEDSMTQVMSSSRGPSPDQSTMSQDISTEVITRLS TSPIKTESTEMTITTQTGSPGATSRGTLTLDTSTTFMSGTHSTASQGFSHSQMTALMSRT PGDVPWLSHPSVEEASSASFSLSSPVMTSSSPVSSTLPDSIHSSSLPVTSLLTSGLVKTT ELLGTSSEPETSSPPNLSSTSAEILAITEVTTDTEKLEMTNVVTSGYTHESPSSVLADSV TTKATSSMGITYPTGDTNVLTSTPAFSDTSRIQTKSKLSLTPGLMETSISEETSSATEKS TVLSSVPTGATTEVSRTEAISSSRTSIPGPAQSTMSSDTSMETITRISTPLTRKESTDMA ITPKTGPSGATSQGTFTLDSSSTASWPGTHSATTQRFPQSVVTTPMSRGPEDVSWPSPLS VEKNSPPSSLVSSSSVTSPSPLYSTPSGSSHSSPVPVTSLFTSIMMKATDMLDASLEPET TSAPNMNITSDESLAASKATTETEAIHVFENTAASHVETTSATEELYSSSPGFSEPTKVI SPVVTSSSIRDNMVSTTMPGSSGITRIEIESMSSLTPGLRETRTSQDITSSTETSTVLYK MPSGATPEVSRTEVMPSSRTSIPGPAQSTMSLDISDEVVTRLSTSPIMTESAEITITTQT GYSLATSQVTLPLGTSMTFLSGTHSTMSQGLSHSEMTNLMSRGPESLSWTSPRFVETTRS SSSLTSLPLTTSLSPVSSTLLDSSPSSPLPVTSLILPGLVKTTEVLDTSSEPKTSSSPNL SSTSVEIPATSEIMTDTEKIHPSSNTAVAKVRTSSSVHESHSSVLADSETTITIPSMGIT SAVDDTTVFTSNPAFSETRRIPTEPTFSLTPGFRETSTSEETTSITETSAVLYGVPTSAT TEVSMTEIMSSNRIHIPDSDQSTMSPDIITEVITRLSSSSMMSESTQMTITTQKSSPGAT AQSTLTLATTTAPLARTHSTVPPRFLHSEMTTLMSRSPENPSWKSSLFVEKTSSSSSLLS LPVTTSPSVSSTLPQSIPSSSFSVTSLLTPGMVKTTDTSTEPGTSLSPNLSGTSVEILAA SEVTTDTEKIHPSSSMAVTNVGTTSSGHELYSSVSIHSEPSKATYPVGTPSSMAETSIST SMPANFETTGFEAEPFSHLTSGFRKTNMSLDTSSVTPTNTPSSPGSTHLLQSSKTDFTSS AKTSSPDWPPASQYTEIPVDIITPFNASPSITESTGITSFPESRFTMSVTESTHHLSTDL LPSAETISTGTVMPSLSEAMTSFATTGVPRAISGSGSPFSRTESGPGDATLSTIAESLPS STPVPFSSSTFTTTDSSTIPALHEITSSSATPYRVDTSLGTESSTTEGRLVMVSTLDTSS QPGRTSSSPILDTRMTESVELGTVTSAYQVPSLSTRLTRTDGIMEHITKIPNEAAHRGTI RPVKGPQTSTSPASPKGLHTGGTKRMETTTTALKTTTTALKTTSRATLTTSVYTPTLGTL TPLNASMQMASTIPTEMMITTPYVFPDVPETTSSLATSLGAETSTALPRTTPSVFNRESE TTASLVSRSGAERSPVIQTLDVSSSEPDTTASWVIHPAETIPTVSKTTPNFFHSELDTVS STATSHGADVSSAIPTNISPSELDALTPLVTISGTDTSTTFPTLTKSPHETETRTTWLTH PAETSSTIPRTIPNFSHHESDATPSIATSPGAETSSAIPIMTVSPGAEDLVTSQVTSSGT DRNMTIPTLTLSPGEPKTIASLVTHPEAQTSSAIPTSTISPAVSRLVTSMVTSLAAKTST TNRALTNSPGEPATTVSLVTHPAQTSPTVPWTTSIFFHSKSDTTPSMTTSHGAESSSAVP TPTVSTEVPGVVTPLVTSSRAVISTTIPILTLSPGEPETTPSMATSHGEEASSAIPTPTV SPGVPGVVTSLVTSSRAVTSTTIPILTFSLGEPETTPSMATSHGTEAGSAVPTVLPEVPG MVTSLVASSRAVTSTTLPTLTLSPGEPETTPSMATSHGAEASSTVPTVSPEVPGVVTSLV TSSSGVNSTSIPTLILSPGELETTPSMATSHGAEASSAVPTPTVSPGVSGVVTPLVTSSR AVTSTTIPILTLSSSEPETTPSMATSHGVEASSAVLTVSPEVPGMVTSLVTSSRAVTSTT IPTLTISSDEPETTTSLVTHSEAKMISAIPTLAVSPTVQGLVTSLVTSSGSETSAFSNLT VASSQPETIDSWVAHPGTEASSVVPTLTVSTGEPFTNISLVTHPAESSSTLPRTTSRFSH SELDTMPSTVTSPEAESSSAISTTISPGIPGVLTSLVTSSGRDISATFPTVPESPHESEA TASWVTHPAVTSTTVPRTTPNYSHSEPDTTPSIATSPGAEATSDFPTITVSPDVPDMVTS QVTSSGTDTSITIPTLTLSSGEPETTTSFITYSETHTSSAIPTLPVSPGASKMLTSLVIS SGTDSTTTFPTLTETPYEPETTAIQLIHPAETNTMVPRTTPKFSHSKSDTTLPVAITSPG PEASSAVSTTTISPDMSDLVTSLVPSSGTDTSTTFPTLSETPYEPETTATWLTHPAETST TVSGTIPNFSHRGSDTAPSMVTSPGVDTRSGVPTTTIPPSIPGVVTSQVTSSATDTSTAI PTLTPSPGEPETTASSATHPGTQTGFTVPIRTVPSSEPDTMASWVTHPPQTSTPVSRTTS SFSHSSPDATPVMATSPRTEASSAVLTTISPGAPEMVTSQITSSGAATSTTVPTLTHSPG MPETTALLSTHPRTETSKTFPASTVFPQVSETTASLTIRPGAETSTALPTQTTSSLFTLL VTGTSRVDLSPTASPGVSAKTAPLSTHPGTETSTMIPTSTLSLGLLETTGLLATSSSAET STSTLTLTVSPAVSGLSSASITTDKPQTVTSWNTETSPSVTSVGPPEFSRTVTGTTMTLI PSEMPTPPKTSHGEGVSPTTILRTTMVEATNLATTGSSPTVAKTTTTFNTLAGSLFTPLT TPGMSTLASESVTSRTSYNHRSWISTTSSYNRRYWTPATSTPVTSTFSPGISTSSIPSST AATVPFMVPFTLNFTITNLQYEEDMRHPGSRKFNATERELQGLLKPLFRNSSLEYLYSGC RLASLRPEKDSSATAVDAICTHRPDPEDLGLDRERLYWELSNLTNGIQELGPYTLDRNSL YVNGFTHRSSMPTTSTPGTSTVDVGTSGTPSSSPSPTTAGPLLMPFTLNFTITNLQYEED MRRTGSRKFNTMESVLQGLLKPLFKNTSVGPLYSGCRLTLLRPEKDGAATGVDAICTHRL DPKSPGLNREQLYWELSKLTNDIEELGPYTLDRNSLYVNGFTHQSSVSTTSTPGTSTVDL RTSGTPSSLSSPTIMAAGPLLVPFTLNFTITNLQYGEDMGHPGSRKFNTTERVLQGLLGP IFKNTSVGPLYSGCRLTSLRSEKDGAATGVDAICIHHLDPKSPGLNRERLYWELSQLTNG IKELGPYTLDRNSLYVNGFTHRTSVPTSSTPGTSTVDLGTSGTPFSLPSPATAGPLLVLF TLNFTITNLKYEEDMHRPGSRKFNTTERVLQTLLGPMFKNTSVGLLYSGCRLTLLRSEKD GAATGVDAICTHRLDPKSPGVDREQLYWELSQLTNGIKELGPYTLDRNSLYVNGFTHWIP VPTSSTPGTSTVDLGSGTPSSLPSPTTAGPLLVPFTLNFTITNLKYEEDMHCPGSRKFNT TERVLQSLLGPMFKNTSVGPLYSGCRLTLLRSEKDGAATGVDAICTHRLDPKSPGVDREQ LYWELSQLTNGIKELGPYTLDRNSLYVNGFTHQTSAPNTSTPGTSTVDLGTSGTPSSLPS PTSAGPLLVPFTLNFTITNLQYEEDMHHPGSRKFNTTERVLQGLLGPMFKNTSVGLLYSG CRLTLLRPEKNGAATGMDAICSHRLDPKSPGLNREQLYWELSQLTHGIKELGPYTLDRNS LYVNGFTHRSSVAPTSTPGTSTVDLGTSGTPSSLPSPTTAVPLLVPFTLNFTITNLQYGE DMRHPGSRKFNTTERVLQGLLGPLFKNSSVGPLYSGCRLISLRSEKDGAATGVDAICTHH LNPQSPGLDREQLYWQLSQMTNGIKELGPYTLDRNSLYVNGFTHRSSGLTTSTPWTSTVD LGTSGTPSPVPSPTTTGPLLVPFTLNFTITNLQYEENMGHPGSRKFNITESVLQGLLKPL FKSTSVGPLYSGCRLTLLRPEKDGVATRVDAICTHRPDPKIPGLDRQQLYWELSQLTHSI TELGPYTLDRDSLYVNGFTQRSSVPTTSTPGTFTVQPETSETPSSLPGPTATGPVLLPFT LNFTITNLQYEEDMRRPGSRKFNTTERVLQGLLMPLFKNTSVSSLYSGCRLTLLRPEKDG AATRVDAVCTHRPDPKSPGLDRERLYWKLSQLTHGITELGPYTLDRHSLYVNGFTHQSSM TTTRTPDTSTMHLATSRTPASLSGPMTASPLLVLFTINFTITNLRYEENMHHPGSRKFNT TERVLQGLLRPVFKNTSVGPLYSGCRLTLLRPKKDGAATKVDAICTYRPDPKSPGLDREQ LYWELSQLTHSITELGPYTLDRDSLYVNGFTQRSSVPTTSIPGTPTVDLGTSGTPVSKPG PSAASPLLVLFTLNFTITNLRYEENMQHPGSRKFNTTERVLQGLLRSLFKSTSVGPLYSG CRLTLLRPEKDGTATGVDAICTHHPDPKSPRLDREQLYWELSQLTHNITELGPYALDNDS LFVNGFTHRSSVSTTSTPGTPTVYLGASKTPASIFGPSAASHLLILFTLNFTITNLRYEE NMWPGSRKFNTTERVLQGLLRPLFKNTSVGPLYSGCRLTLLRPEKDGEATGVDAICTHRP DPTGPGLDREQLYLELSQLTHSITELGPYTLDRDSLYVNGFTHRSSVPTTSTGVVSEEPF TLNFTINNLRYMADMGQPGSLKFNITDNVMQHLLSPLFQRSSLGARYTGCRVIALRSVKN GAETRVDLLCTYLQPLSGPGLPIKQVFHELSQQTHGITRLGPYSLDKDSLYLNGYNEPGP DEPPTTPKPATTFLPPLSEATTAMGYHLKTLTLNFTISNLQYSPDMGKGSATFNSTEGVL QHLLRPLFQKSSMGPFYLGCQLISLRPEKDGAATGVDTTCTYHPDPVGPGLDIQQLYWEL SQLTHGVTQLGFYVLDRDSLFINGYAPQNLSIRGEYQINFHIVNWNLSNPDPTSSEYITL LRDIQDKVTTLYKGSQLHDTFRFCLVTNLTMDSVLVTVKALFSSNLDPSLVEQVFLDKTL NASFHWLGSTYQLVDIHVTEMESSVYQPTSSSSTQHFYLNFTITNLPYSQDKAQPGTTNY QRNKRNIEDALNQLFRNSSIKSYFSDCQVSTFRSVPNRHHTGVDSLCNFSPLARRVDRVA IYEEFLRMTRNGTQLQNFTLDRSSVLVDGYSPNRNEPLTGNSDLPFWAVILIGLAGLLGV ITCLICGVLVTTRRRKKEGEYNVQQQCPGYYQSHLDLEDLQ Click to Show/Hide
|
|||||
| Function |
Thought to provide a protective, lubricating barrier against particles and infectious agents at mucosal surfaces.
Click to Show/Hide
|
|||||
| Uniprot Entry | ||||||
| HGNC ID | ||||||
| KEGG ID | ||||||
Each Antibody-drug Conjuate AND It's Component Related to This Antigen
Full List of The ADC Related to This Antigen
Anti-MUC16 Anti-ody 3A5
| ADC Info | ADC Name | Payload | Target | Linker | Ref |
|---|---|---|---|---|---|
Sofituzumab vedotin |
Monomethyl auristatin E |
Microtubule (MT) |
Mc-Val-Cit-PABC |
[1] | |
3A5-55 ADC |
Maytansine derivative 55 |
Microtubule (MT) |
Mal-EBE-Mal |
[2] | |
3A5-56 ADC |
Maytansine derivative 56 |
Microtubule (MT) |
Mal-EBE-Mal |
[2] | |
3A5-57 ADC |
Maytansine derivative 57 |
Microtubule (MT) |
Maleimido-caproyl |
[2] | |
3A5-mc-VC-PAB-MMAE |
Monomethyl auristatin E |
Microtubule (MT) |
Mc-Val-Cit-PABC |
[2] | |
MUC16 PNU ADC2-4 |
MUC16 PNU ADC2-4 payload |
Undisclosed |
MUC16 PNU ADC2-4 linker |
[3] | |
MUC16-PNU-LD1 |
MUC16-PNU-LD1 payload |
Undisclosed |
MUC16-PNU-LD1 linker |
[3] | |
MUC16-PNU-LD3 |
MUC16-PNU-LD3 payload |
Undisclosed |
MUC16-PNU-LD3 linker |
[3] | |
MUC16-PNU-LD4 |
MUC16-PNU-LD4 payload |
Undisclosed |
MUC16-PNU-LD4 linker |
[3] | |
MUC16-PNU-LD5 |
MUC16-PNU-LD5 payload |
Undisclosed |
MUC16-PNU-LD5 linker |
[3] | |
MUC16-PNU-LD6 |
MUC16-PNU-LD6 payload |
Undisclosed |
MUC16-PNU-LD6 linker |
[3] | |
MUC16-PNU-LD7 |
MUC16-PNU-LD7 payload |
Undisclosed |
MUC16-PNU-LD7 linker |
[3] |
Anti-MUC16 antibody 3A5
| ADC Info | ADC Name | Payload | Target | Linker | Ref |
|---|---|---|---|---|---|
Anti-MUC16 antibody 3A5-BMPEO-DM1 |
Maytansinoid DM1 |
Microtubule (MT) |
Anti-MUC16 antibody 3A5-BMPEO-DM1 linker |
[4] |
Anti-MUC16 mAb
| ADC Info | ADC Name | Payload | Target | Linker | Ref |
|---|---|---|---|---|---|
MUC16-55 ADC |
Maytansine derivative 55 |
Microtubule (MT) |
Mal-EBE-Mal |
[2] | |
MUC16-56 ADC |
Maytansine derivative 56 |
Microtubule (MT) |
Mal-EBE-Mal |
[2] |
CN105828840B_ADC-126 antibody
| ADC Info | ADC Name | Payload | Target | Linker | Ref |
|---|---|---|---|---|---|
CN105828840B ADC-126 |
CN105828840B_ADC-126 payload |
Undisclosed |
CN105828840B_ADC-126 linker |
[5] |
CN105828840B_ADC-128 antibody
| ADC Info | ADC Name | Payload | Target | Linker | Ref |
|---|---|---|---|---|---|
CN105828840B ADC-128 |
CN105828840B_ADC-128 payload |
Undisclosed |
CN105828840B_ADC-128 linker |
[5] |
CN105828840B_ADC-130 antibody
| ADC Info | ADC Name | Payload | Target | Linker | Ref |
|---|---|---|---|---|---|
CN105828840B ADC-130 |
CN105828840B_ADC-130 payload |
Undisclosed |
CN105828840B_ADC-130 linker |
[5] |
CN105828840B_ADC-132 antibody
| ADC Info | ADC Name | Payload | Target | Linker | Ref |
|---|---|---|---|---|---|
CN105828840B ADC-132 |
CN105828840B_ADC-132 payload |
Undisclosed |
CN105828840B_ADC-132 linker |
[5] |
MMUC3333A
| ADC Info | ADC Name | Payload | Target | Linker | Ref |
|---|---|---|---|---|---|
DMUC-4064A |
Monomethyl auristatin E |
Microtubule (MT) |
Mc-Val-Cit-PABC |
[6] |
Thio hu Anti-MUC16
| ADC Info | ADC Name | Payload | Target | Linker | Ref |
|---|---|---|---|---|---|
MUC16-Mc-Val-Cit-PABC-CBI dimer |
seco-CBI-dimer |
Human Deoxyribonucleic acid (hDNA) |
Mc-Val-Cit-PABC |
[7] |
Thio hu Anti-MUC16 3A5 HC A118C
| ADC Info | ADC Name | Payload | Target | Linker | Ref |
|---|---|---|---|---|---|
WO2014159981A2 ADC-214 |
WO2014159981A2_ADC-214 payload |
Undisclosed |
WO2014159981A2_ADC-214 linker |
[8] | |
WO2014159981A2 ADC-MUC16-24 |
WO2014159981A2_ADC-MUC16-24 payload |
Undisclosed |
WO2014159981A2_ADC-MUC16-24 linker |
[8] | |
WO2014159981A2 ADC-MUC16-25 |
WO2014159981A2_ADC-MUC16-25 payload |
Undisclosed |
WO2014159981A2_ADC-MUC16-25 linker |
[8] |
Thio-3A5 (A121C)
| ADC Info | ADC Name | Payload | Target | Linker | Ref |
|---|---|---|---|---|---|
Thio-3A5 (A121C)-BMPEO-DM1 |
Maytansinoid DM1 |
Microtubule (MT) |
Thio-3A5 (A121C)-BMPEO-DM1 linker |
[4] |
USRE47194 ADC-1 antibody
| ADC Info | ADC Name | Payload | Target | Linker | Ref |
|---|---|---|---|---|---|
USRE47194 ADC-1 |
USRE47194 ADC-1 payload |
Undisclosed |
USRE47194 ADC-1 linker |
[9] |
USRE47194 ADC-2 antibody
| ADC Info | ADC Name | Payload | Target | Linker | Ref |
|---|---|---|---|---|---|
USRE47194 ADC-2 |
USRE47194 ADC-2 payload |
Undisclosed |
USRE47194 ADC-2 linker |
[9] |
USRE47194 ADC-3 antibody
| ADC Info | ADC Name | Payload | Target | Linker | Ref |
|---|---|---|---|---|---|
USRE47194 ADC-3 |
USRE47194 ADC-3 payload |
Undisclosed |
USRE47194 ADC-3 linker |
[9] |
USRE47194 ADC-4 antibody
| ADC Info | ADC Name | Payload | Target | Linker | Ref |
|---|---|---|---|---|---|
USRE47194 ADC-4 |
USRE47194 ADC-4 payload |
Undisclosed |
USRE47194 ADC-4 linker |
[9] |
Undisclosed
| ADC Info | ADC Name | Payload | Target | Linker | Ref |
|---|---|---|---|---|---|
MagSense CA125 |
Undisclosed |
Undisclosed |
Undisclosed |
[10] | |
CA125/MUC16 targeting antibody-drug conjugate |
Undisclosed |
Undisclosed |
Undisclosed |
[11] | |
EDO-772P |
Undisclosed |
Undisclosed |
Undisclosed |
[12] |
Tissue/Disease specific Abundances of This Antigen
Tissue specific Abundances of This Antigen
ICD Disease Classification 01
| Differential expression pattern of antigen in diseases | ||
| The Studied Tissue | Gingival | |
| The Specific Disease | Bacterial infection of gingival | |
| The Expression Level of Disease Section Compare with the Healthy Individual Tissue | p-value: 0.108629607; Fold-change: 0.093249322; Z-score: 0.311321513 | |
| Disease-specific Antigen Abundances |
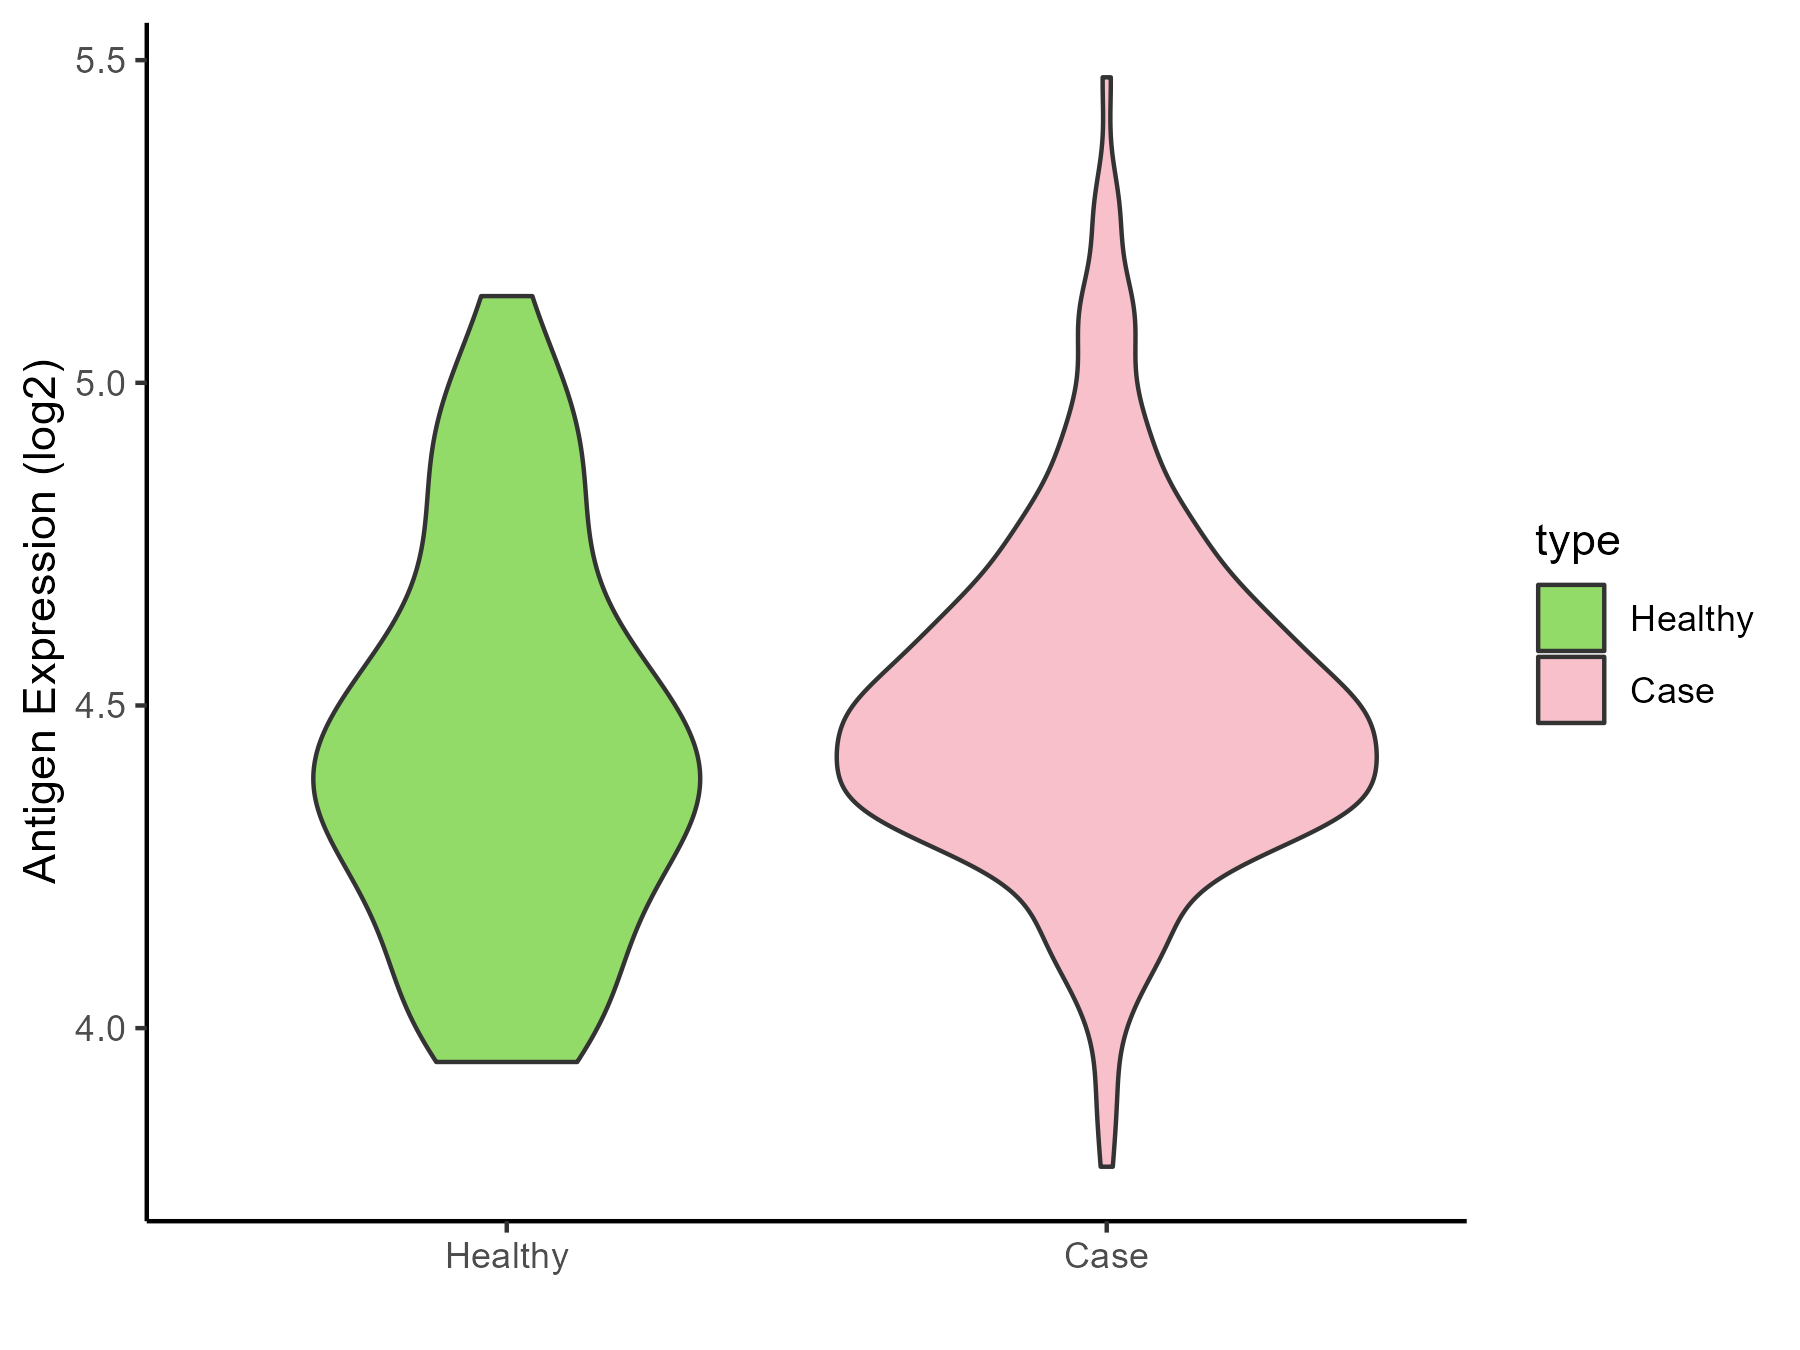
|
Click to View the Clearer Original Diagram |
ICD Disease Classification 02
| Differential expression pattern of antigen in diseases | ||
| The Studied Tissue | Brainstem | |
| The Specific Disease | Glioma | |
| The Expression Level of Disease Section Compare with the Healthy Individual Tissue | p-value: 0.585809241; Fold-change: -0.054871811; Z-score: -0.56296588 | |
| Disease-specific Antigen Abundances |
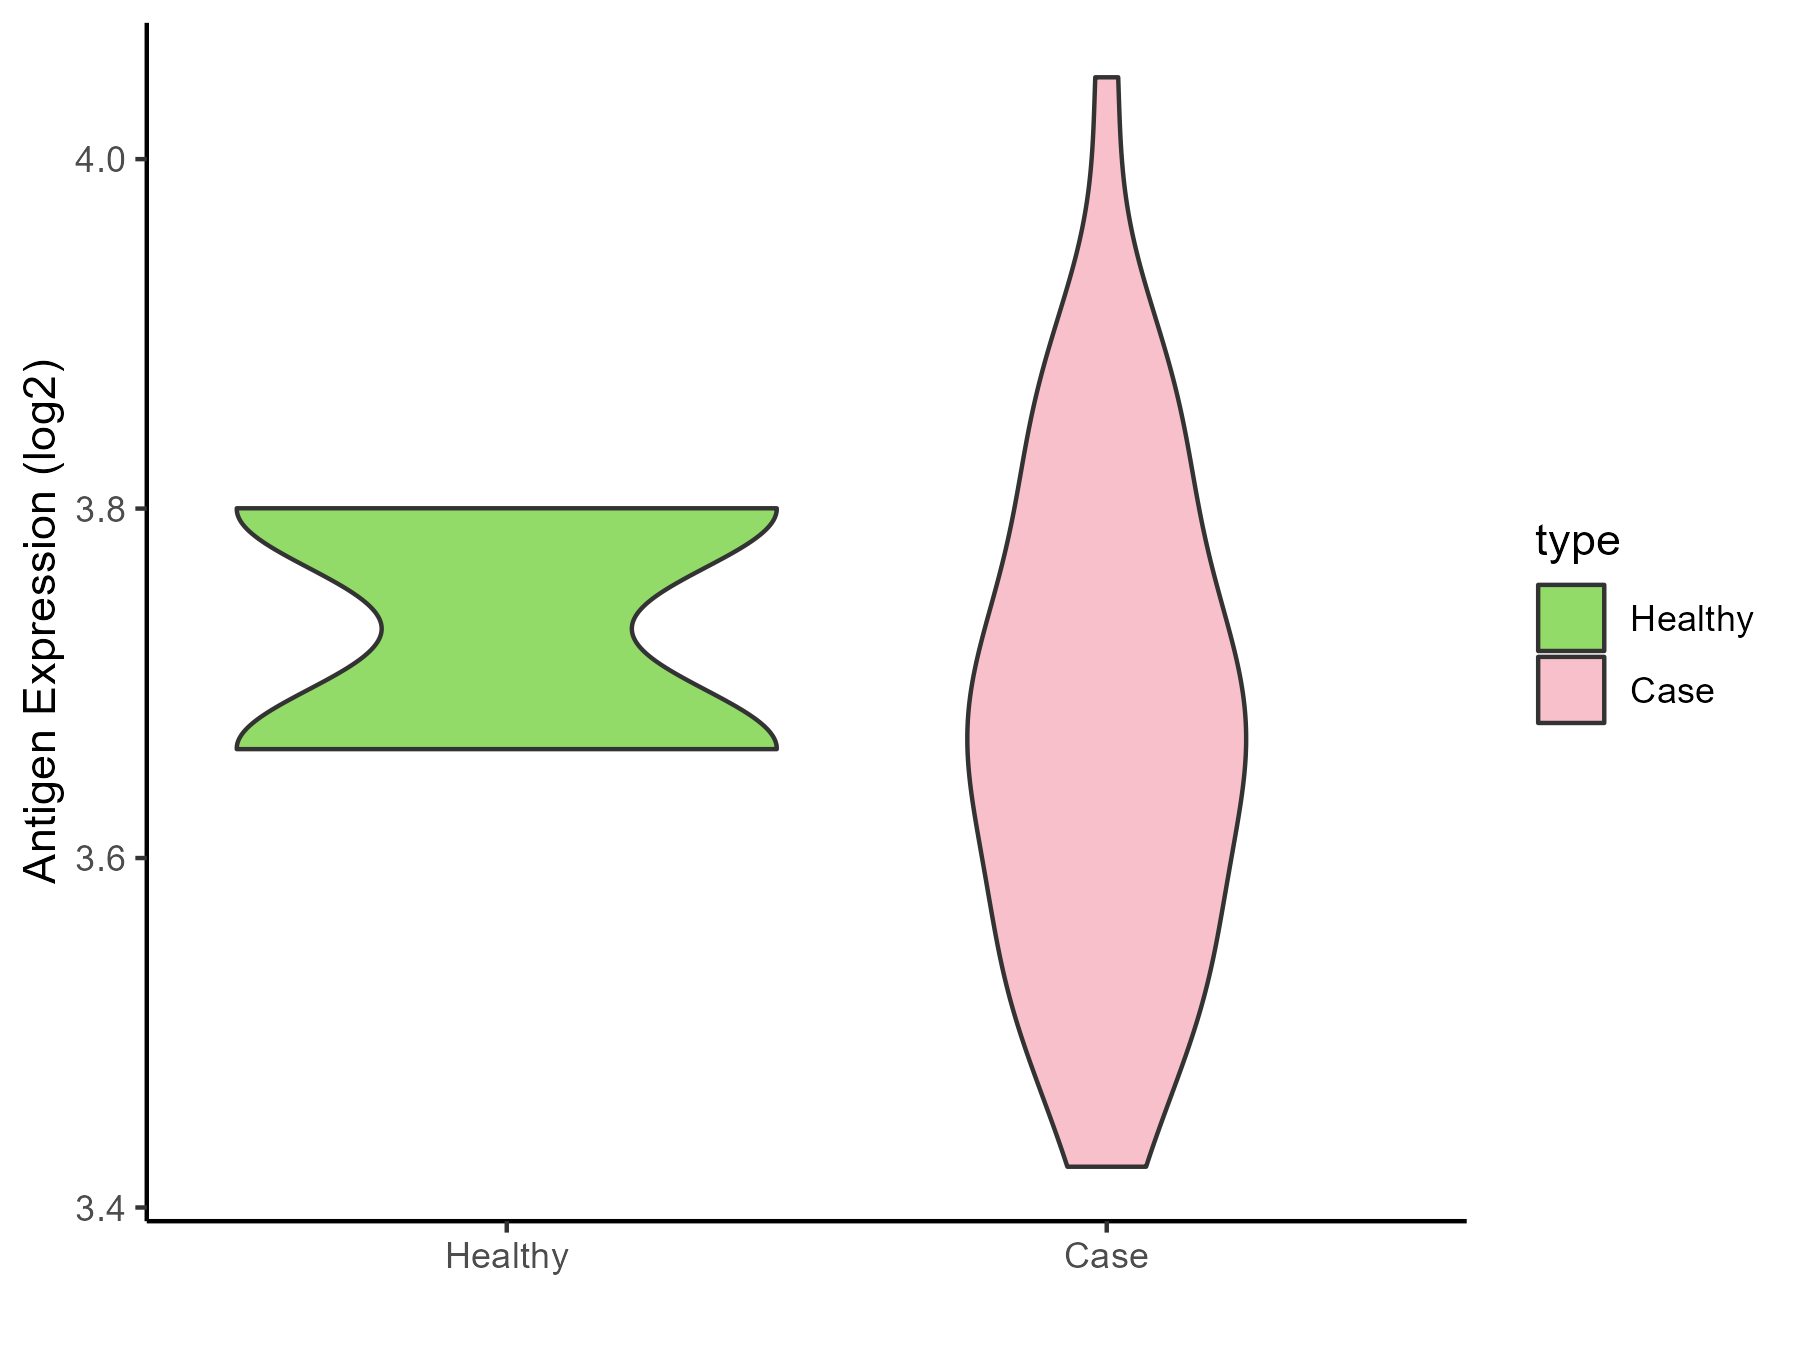
|
Click to View the Clearer Original Diagram |
| The Studied Tissue | White matter | |
| The Specific Disease | Glioma | |
| The Expression Level of Disease Section Compare with the Healthy Individual Tissue | p-value: 0.018471408; Fold-change: -0.4457143; Z-score: -1.255902283 | |
| Disease-specific Antigen Abundances |
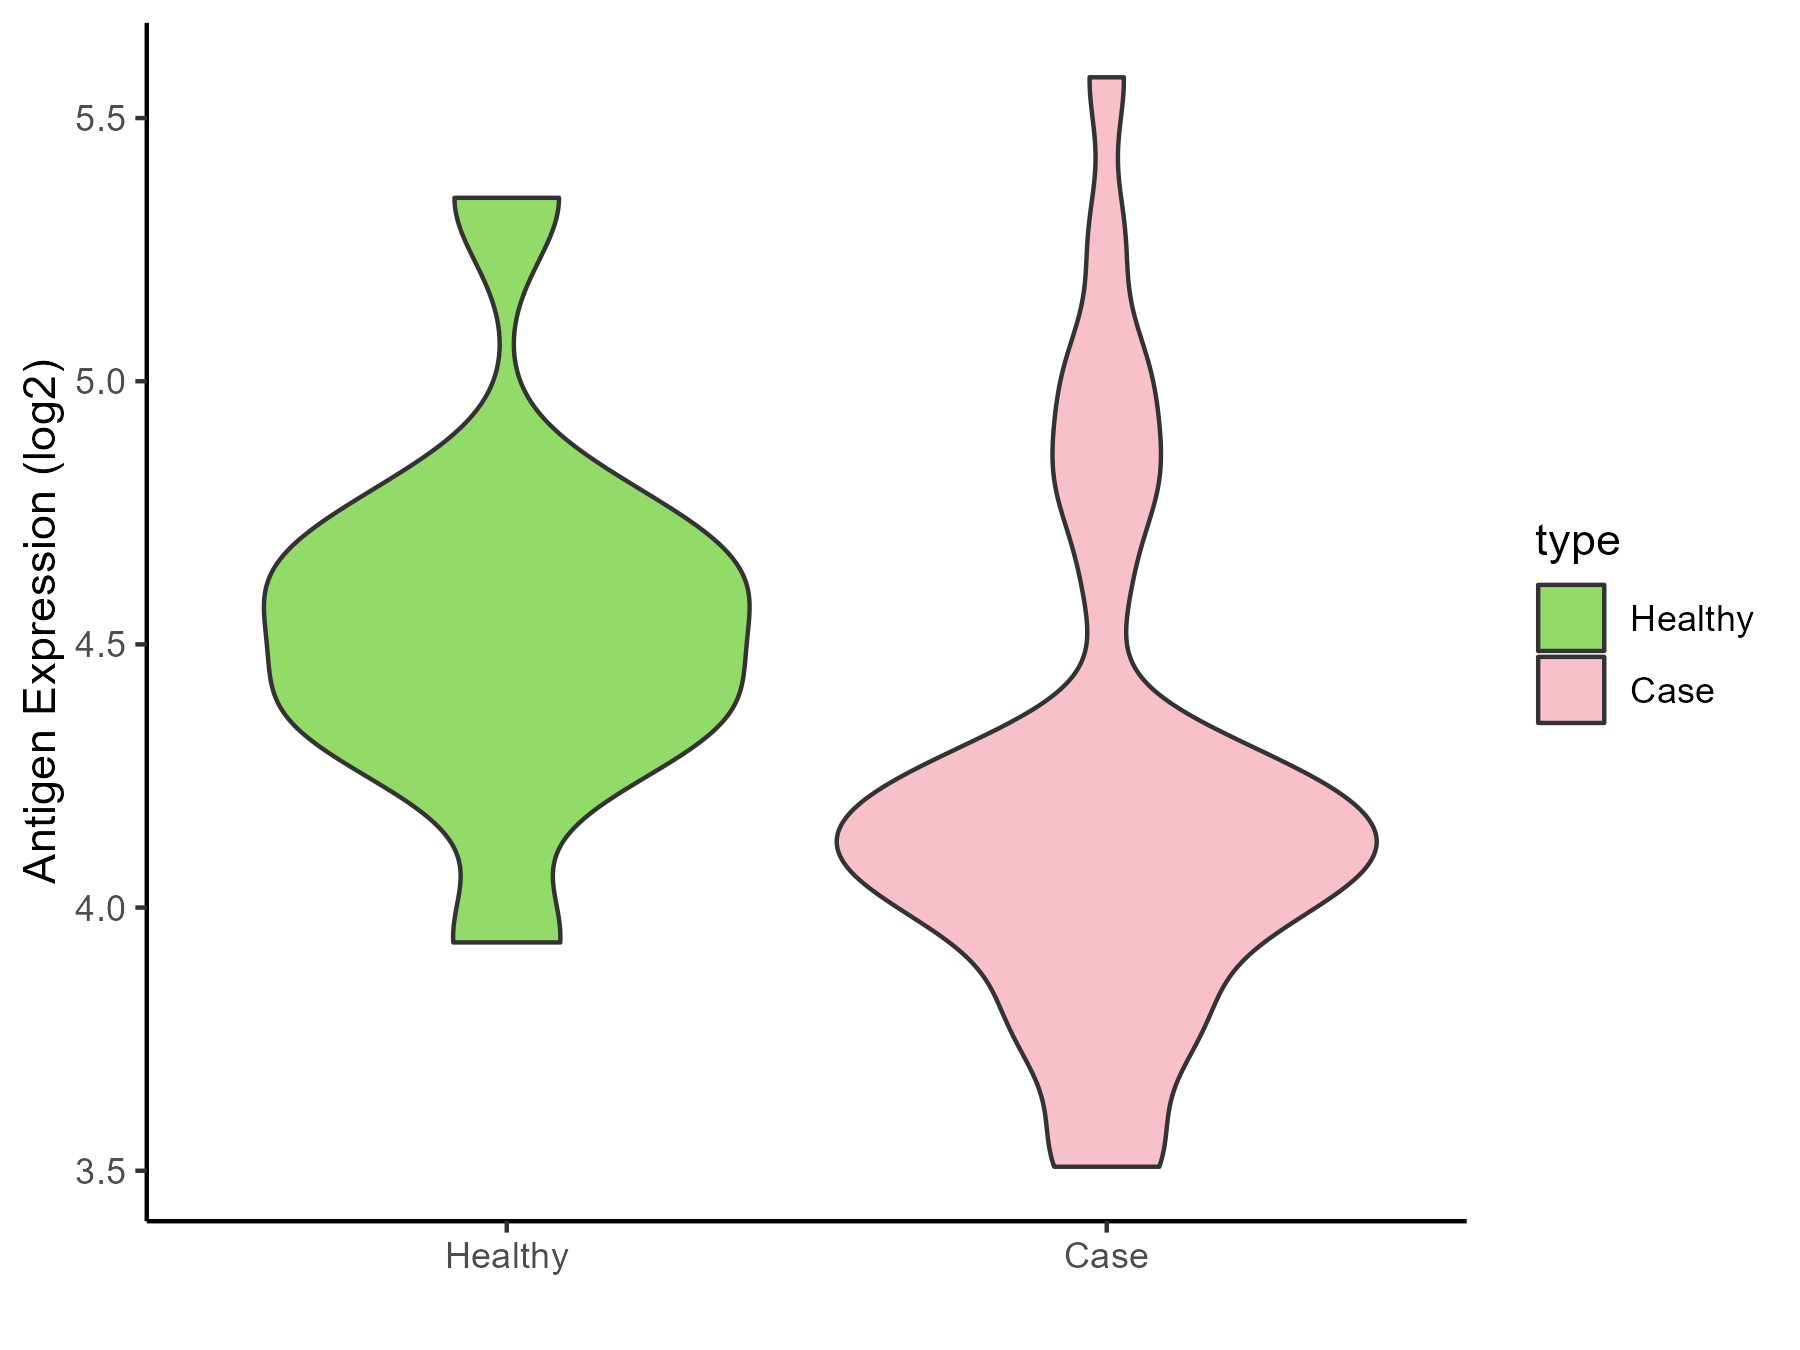
|
Click to View the Clearer Original Diagram |
| The Studied Tissue | Brainstem | |
| The Specific Disease | Neuroectodermal tumor | |
| The Expression Level of Disease Section Compare with the Healthy Individual Tissue | p-value: 0.006118524; Fold-change: -0.48268475; Z-score: -1.751245097 | |
| Disease-specific Antigen Abundances |
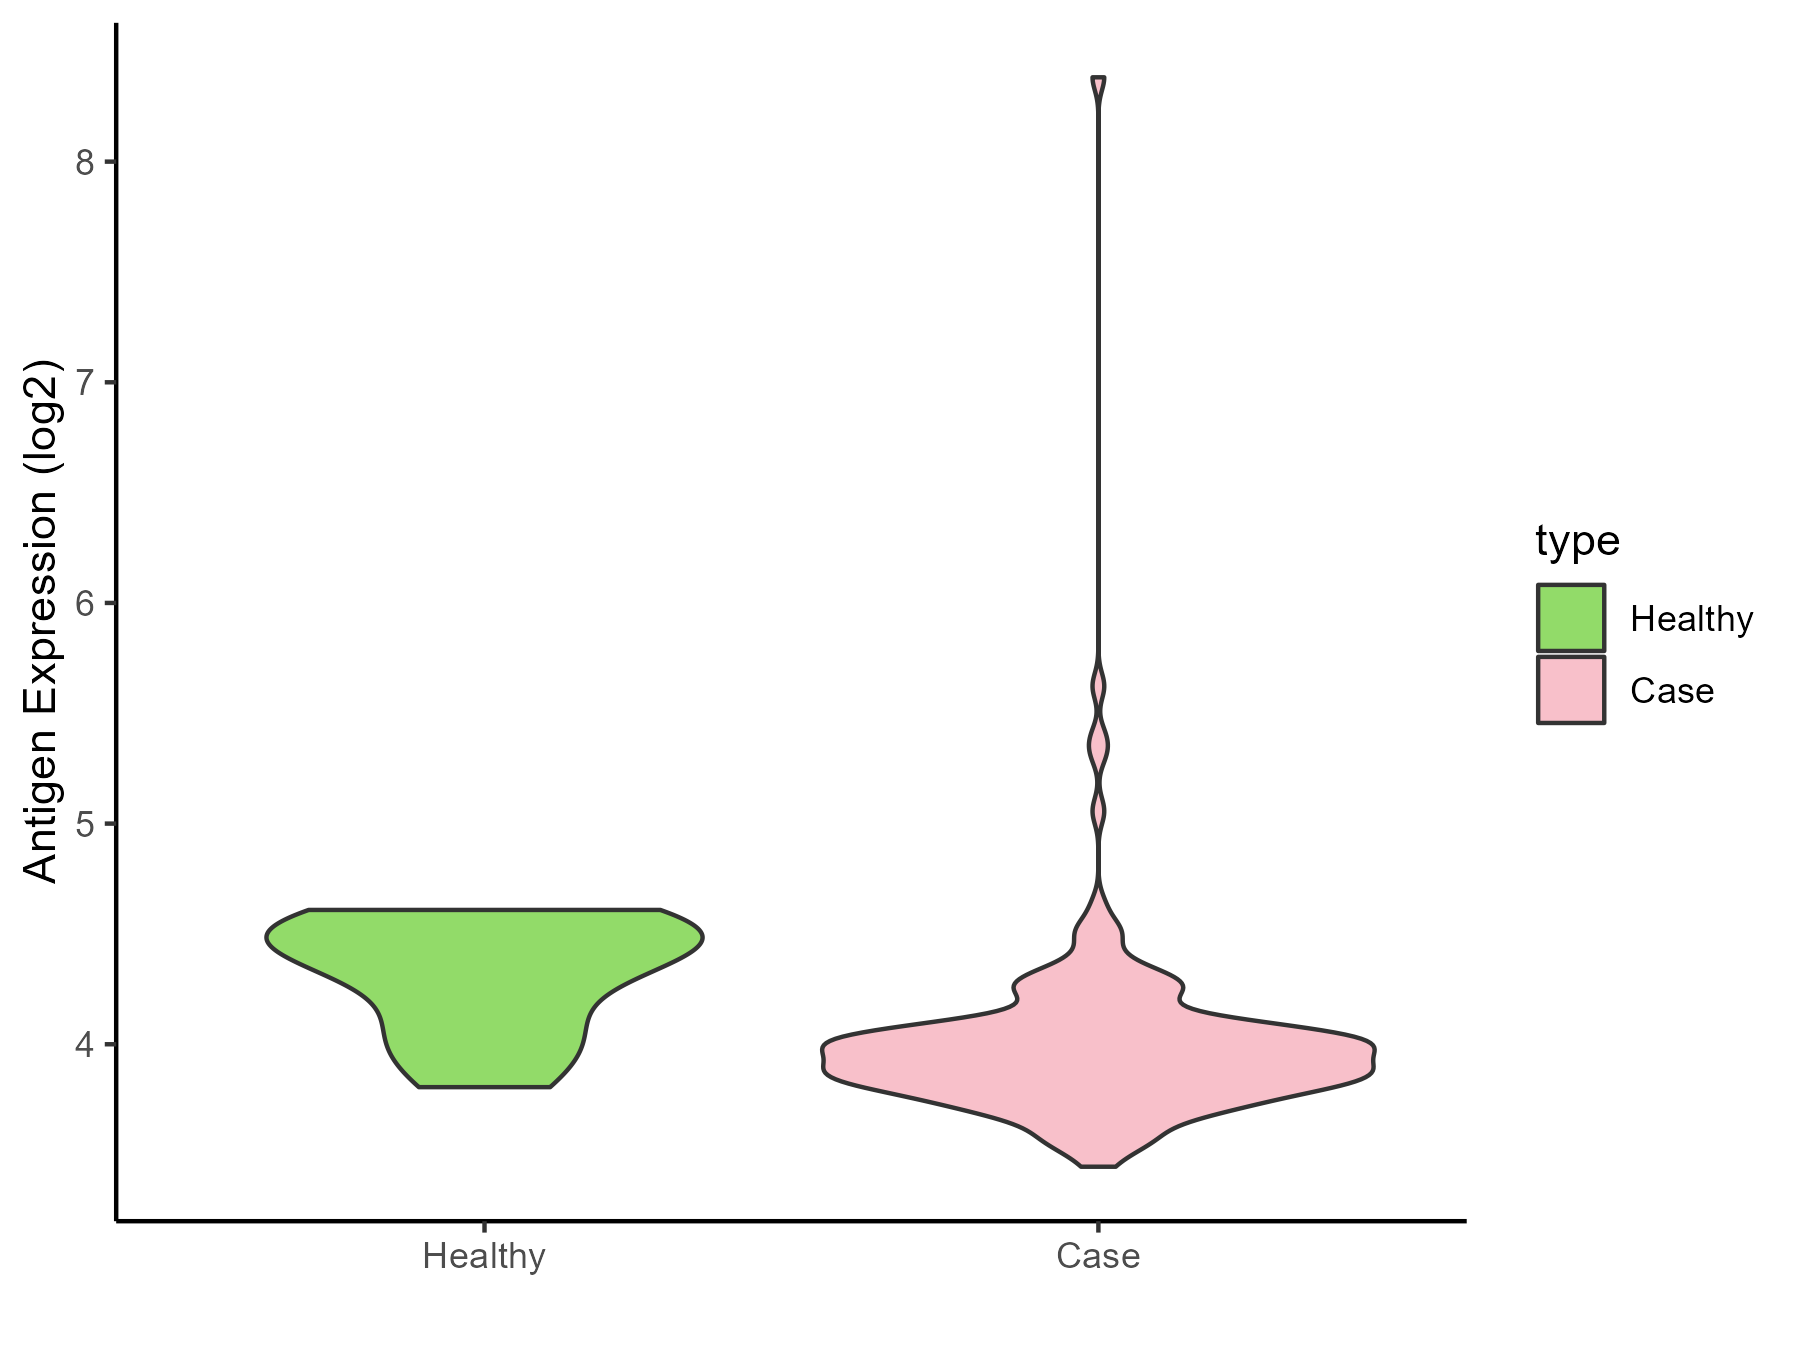
|
Click to View the Clearer Original Diagram |
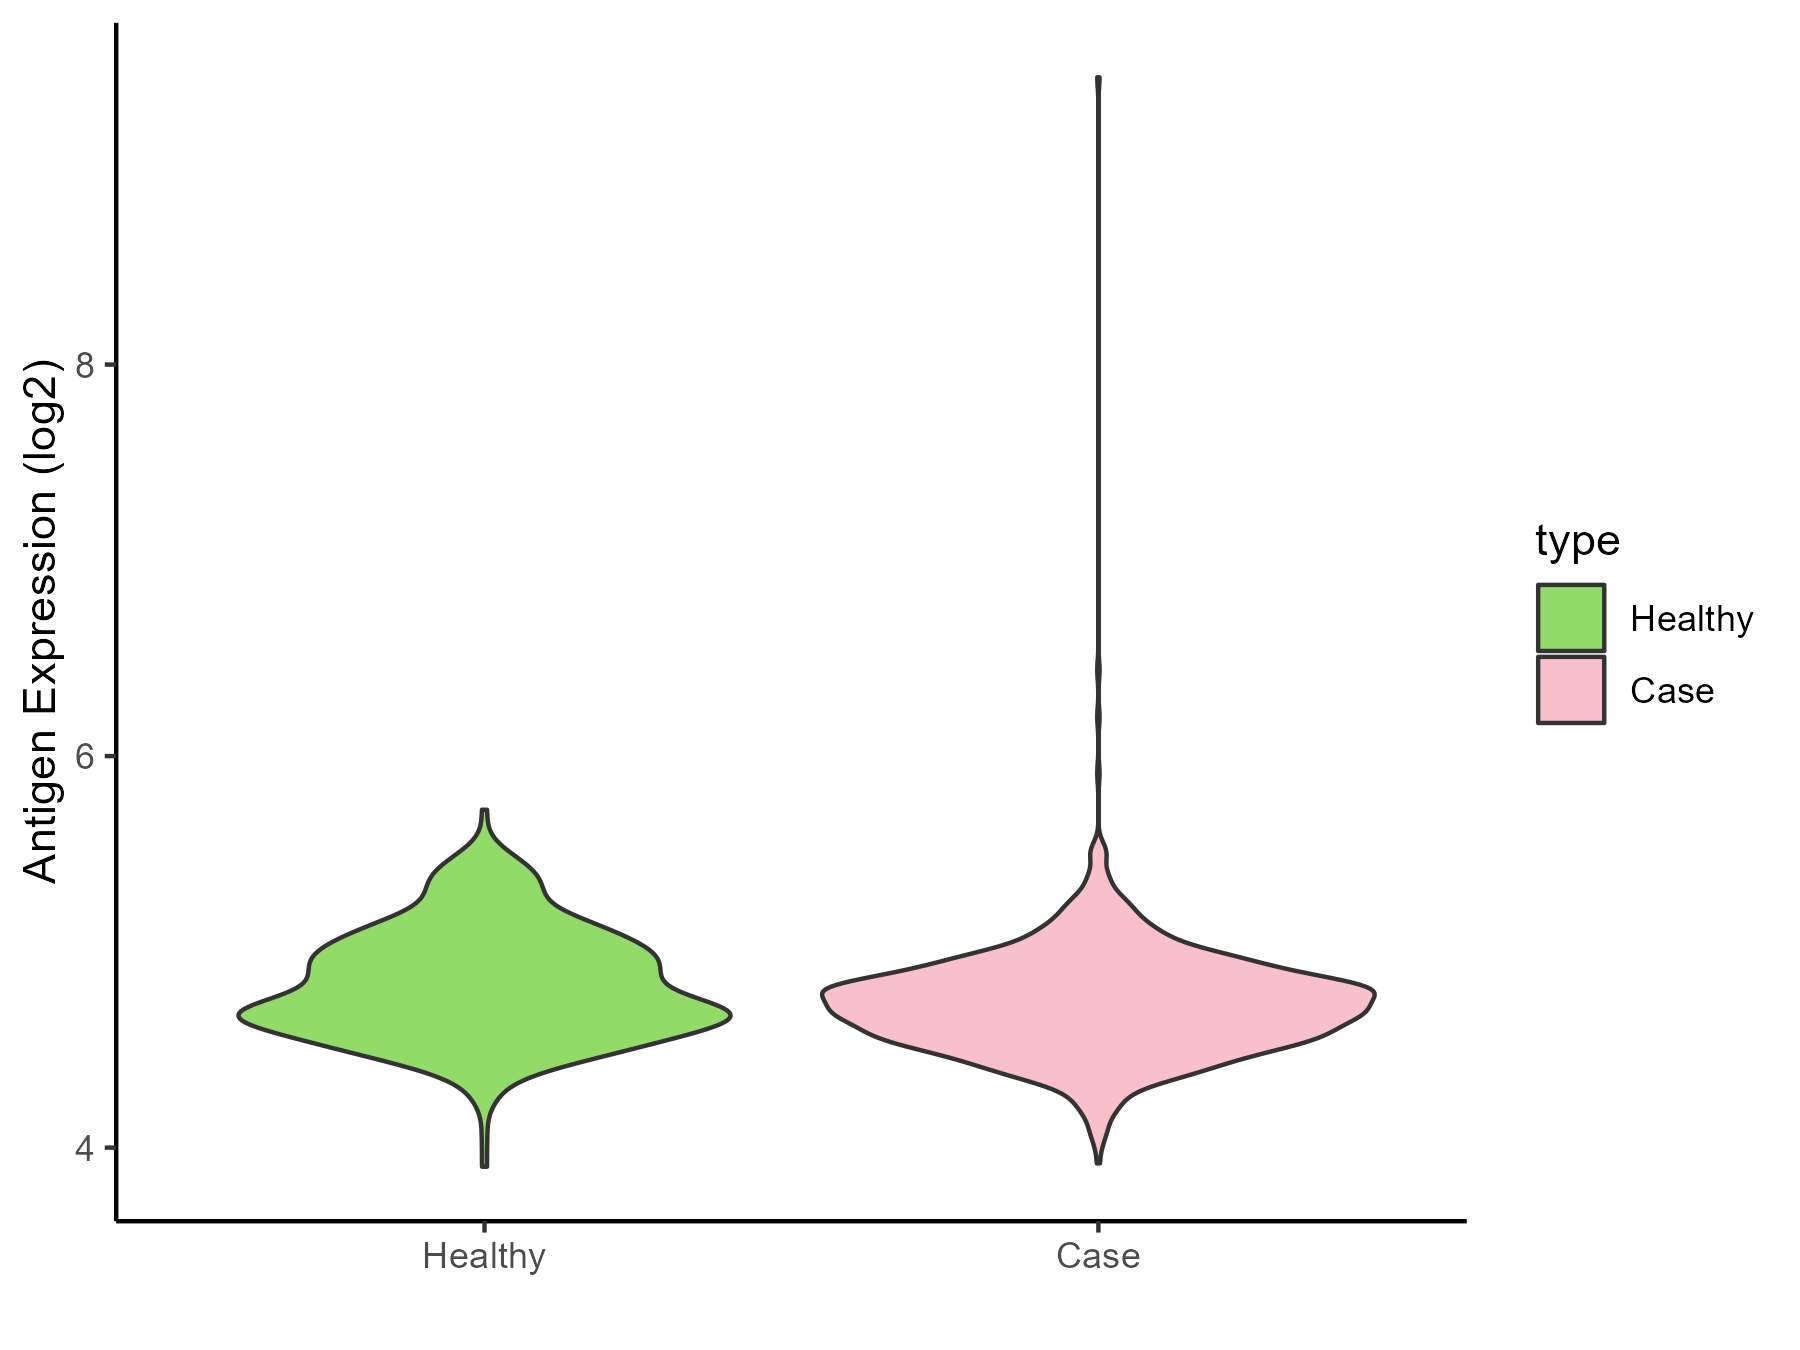
| The Studied Tissue | Nervous | |
| The Specific Disease | Brain cancer | |
| The Expression Level of Disease Section Compare with the Healthy Individual Tissue | p-value: 3.27E-08; Fold-change: -0.064495368; Z-score: -0.228394287 | |
| Disease-specific Antigen Abundances |
|
Click to View the Clearer Original Diagram |
| Differential expression pattern of antigen in diseases | ||
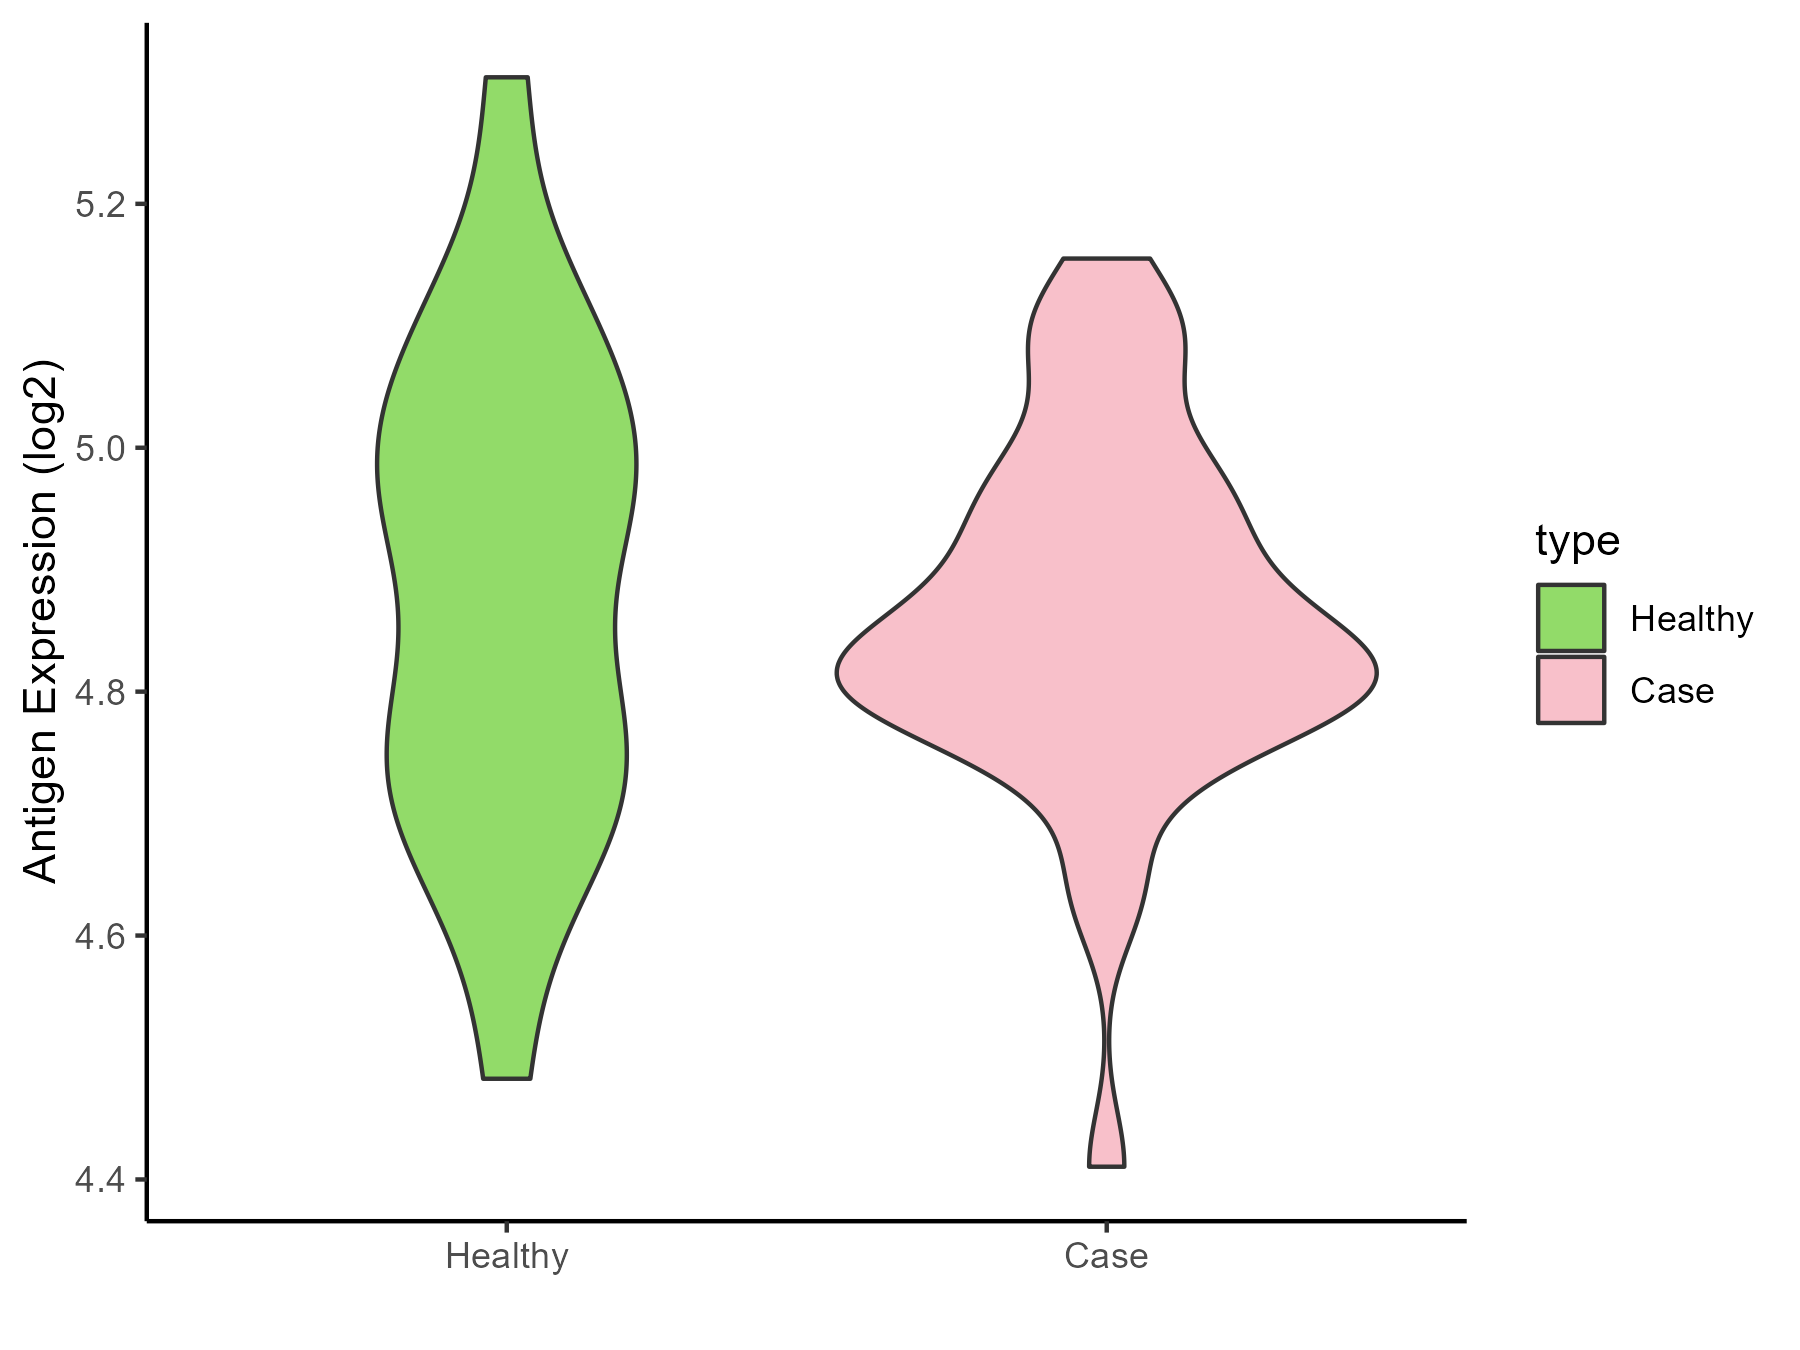
| The Studied Tissue | Whole blood | |
| The Specific Disease | Polycythemia vera | |
| The Expression Level of Disease Section Compare with the Healthy Individual Tissue | p-value: 0.528752002; Fold-change: -0.094206357; Z-score: -0.476431803 | |
| Disease-specific Antigen Abundances |
|
Click to View the Clearer Original Diagram |
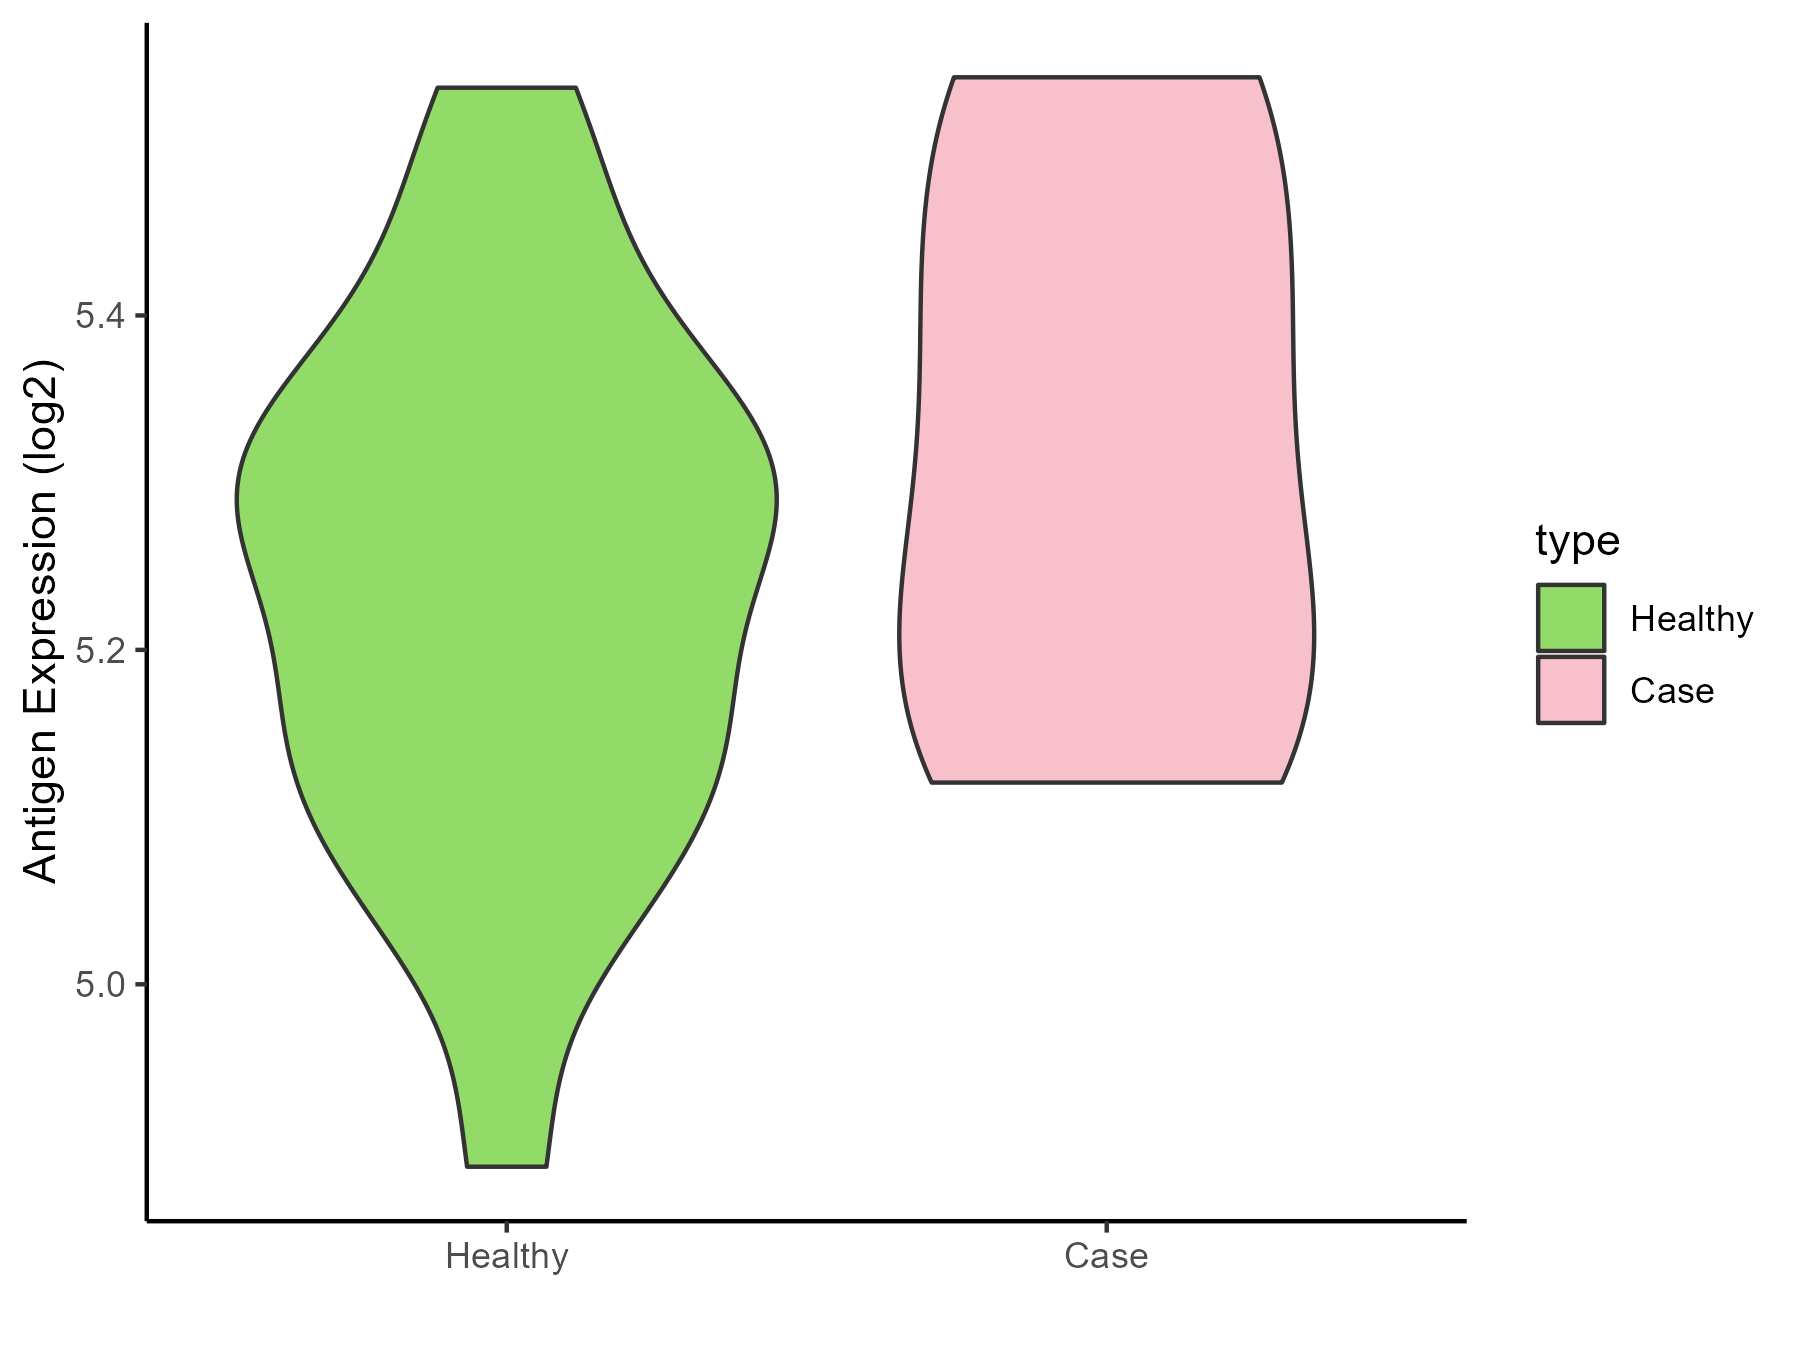
| The Studied Tissue | Whole blood | |
| The Specific Disease | Myelofibrosis | |
| The Expression Level of Disease Section Compare with the Healthy Individual Tissue | p-value: 0.226869723; Fold-change: 0.042292353; Z-score: 0.26835487 | |
| Disease-specific Antigen Abundances |
|
Click to View the Clearer Original Diagram |
| Differential expression pattern of antigen in diseases | ||
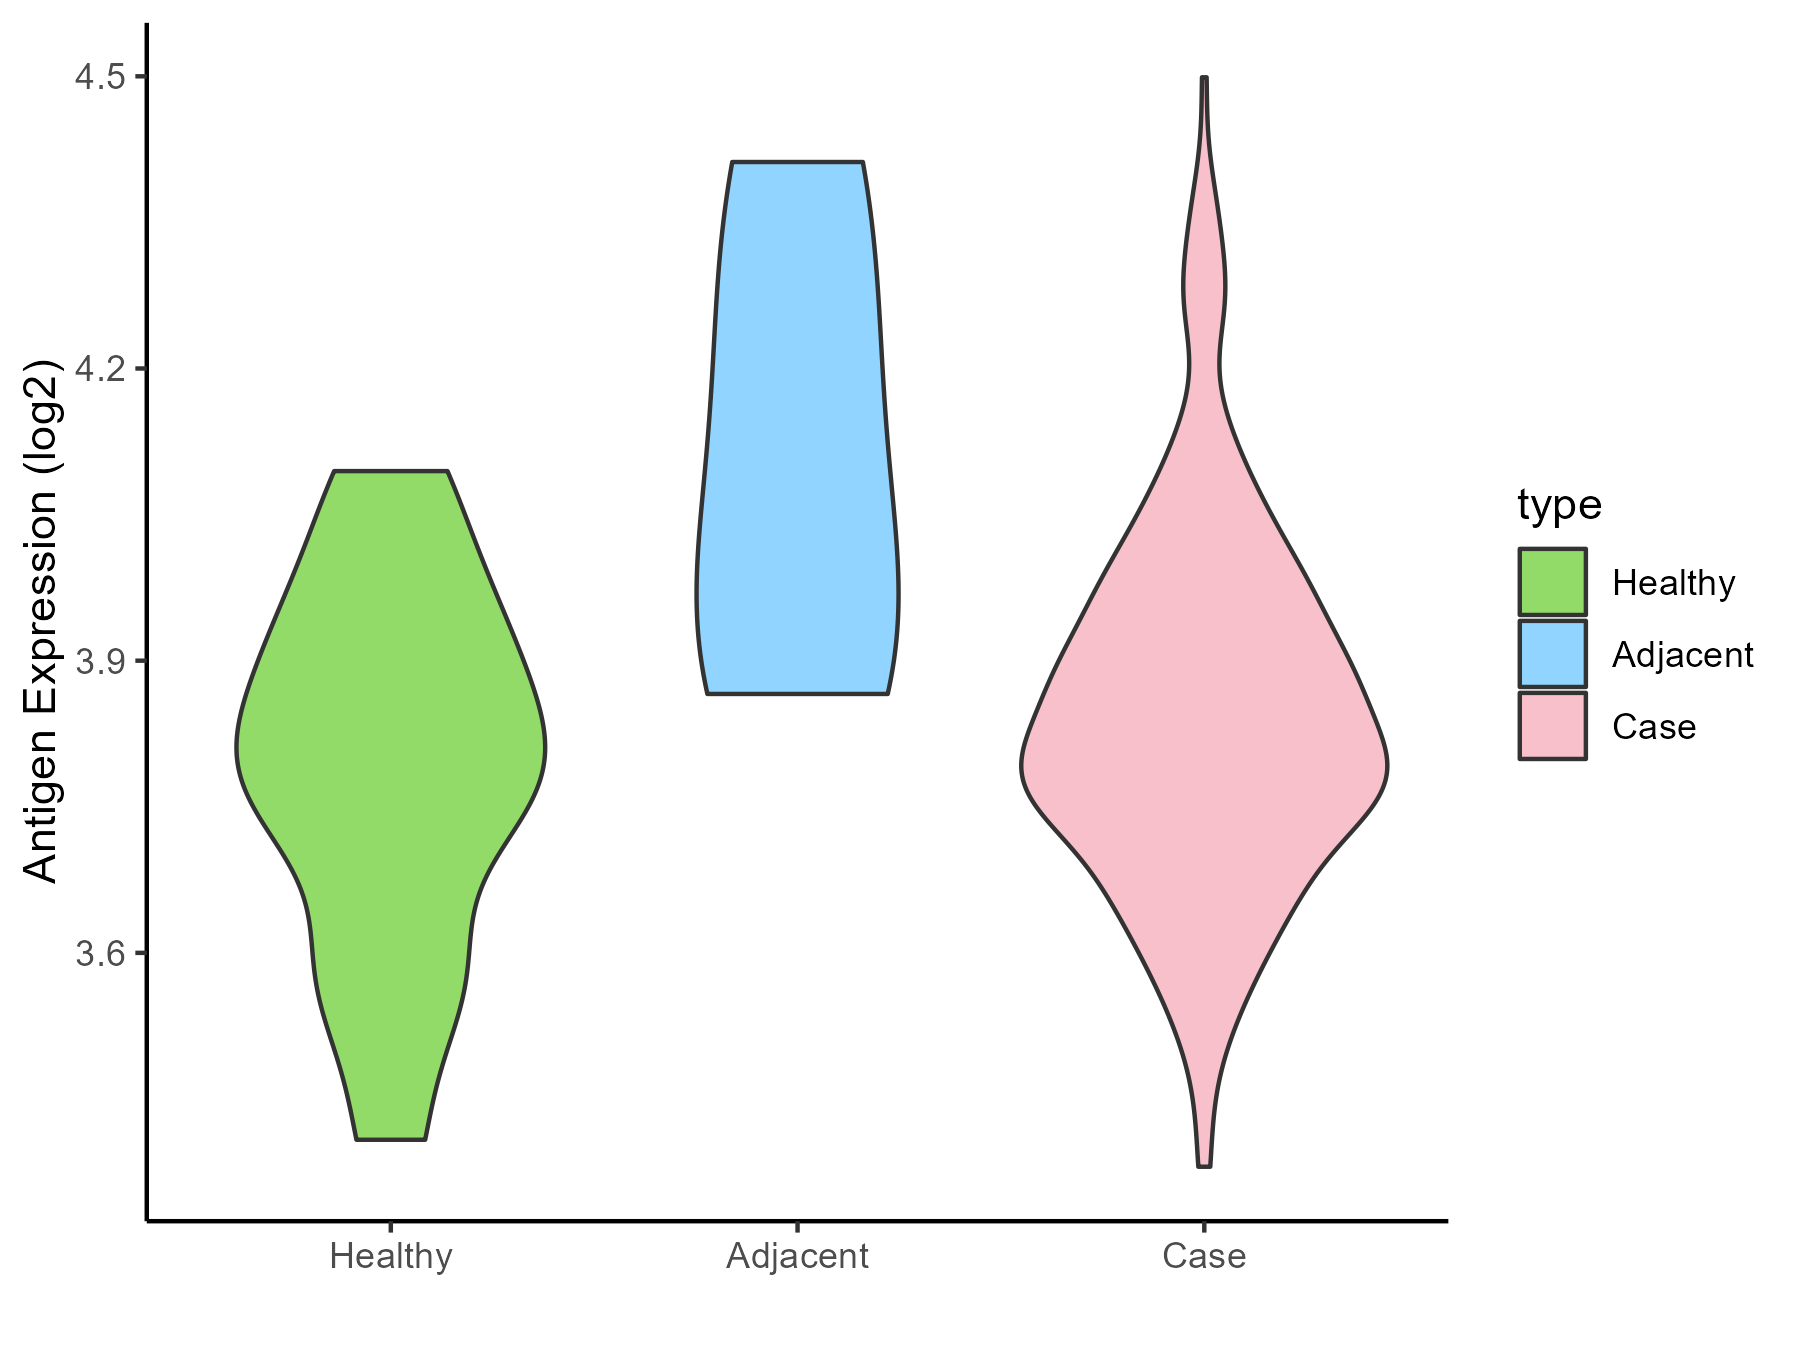
| The Studied Tissue | Bone marrow | |
| The Specific Disease | Myelodysplastic syndromes | |
| The Expression Level of Disease Section Compare with the Healthy Individual Tissue | p-value: 0.14699065; Fold-change: 0.033664785; Z-score: 0.177889023 | |
| The Expression Level of Disease Section Compare with the Adjacent Tissue | p-value: 0.120828399; Fold-change: -0.254836446; Z-score: -1.038750008 | |
| Disease-specific Antigen Abundances |
|
Click to View the Clearer Original Diagram |
| Differential expression pattern of antigen in diseases | ||
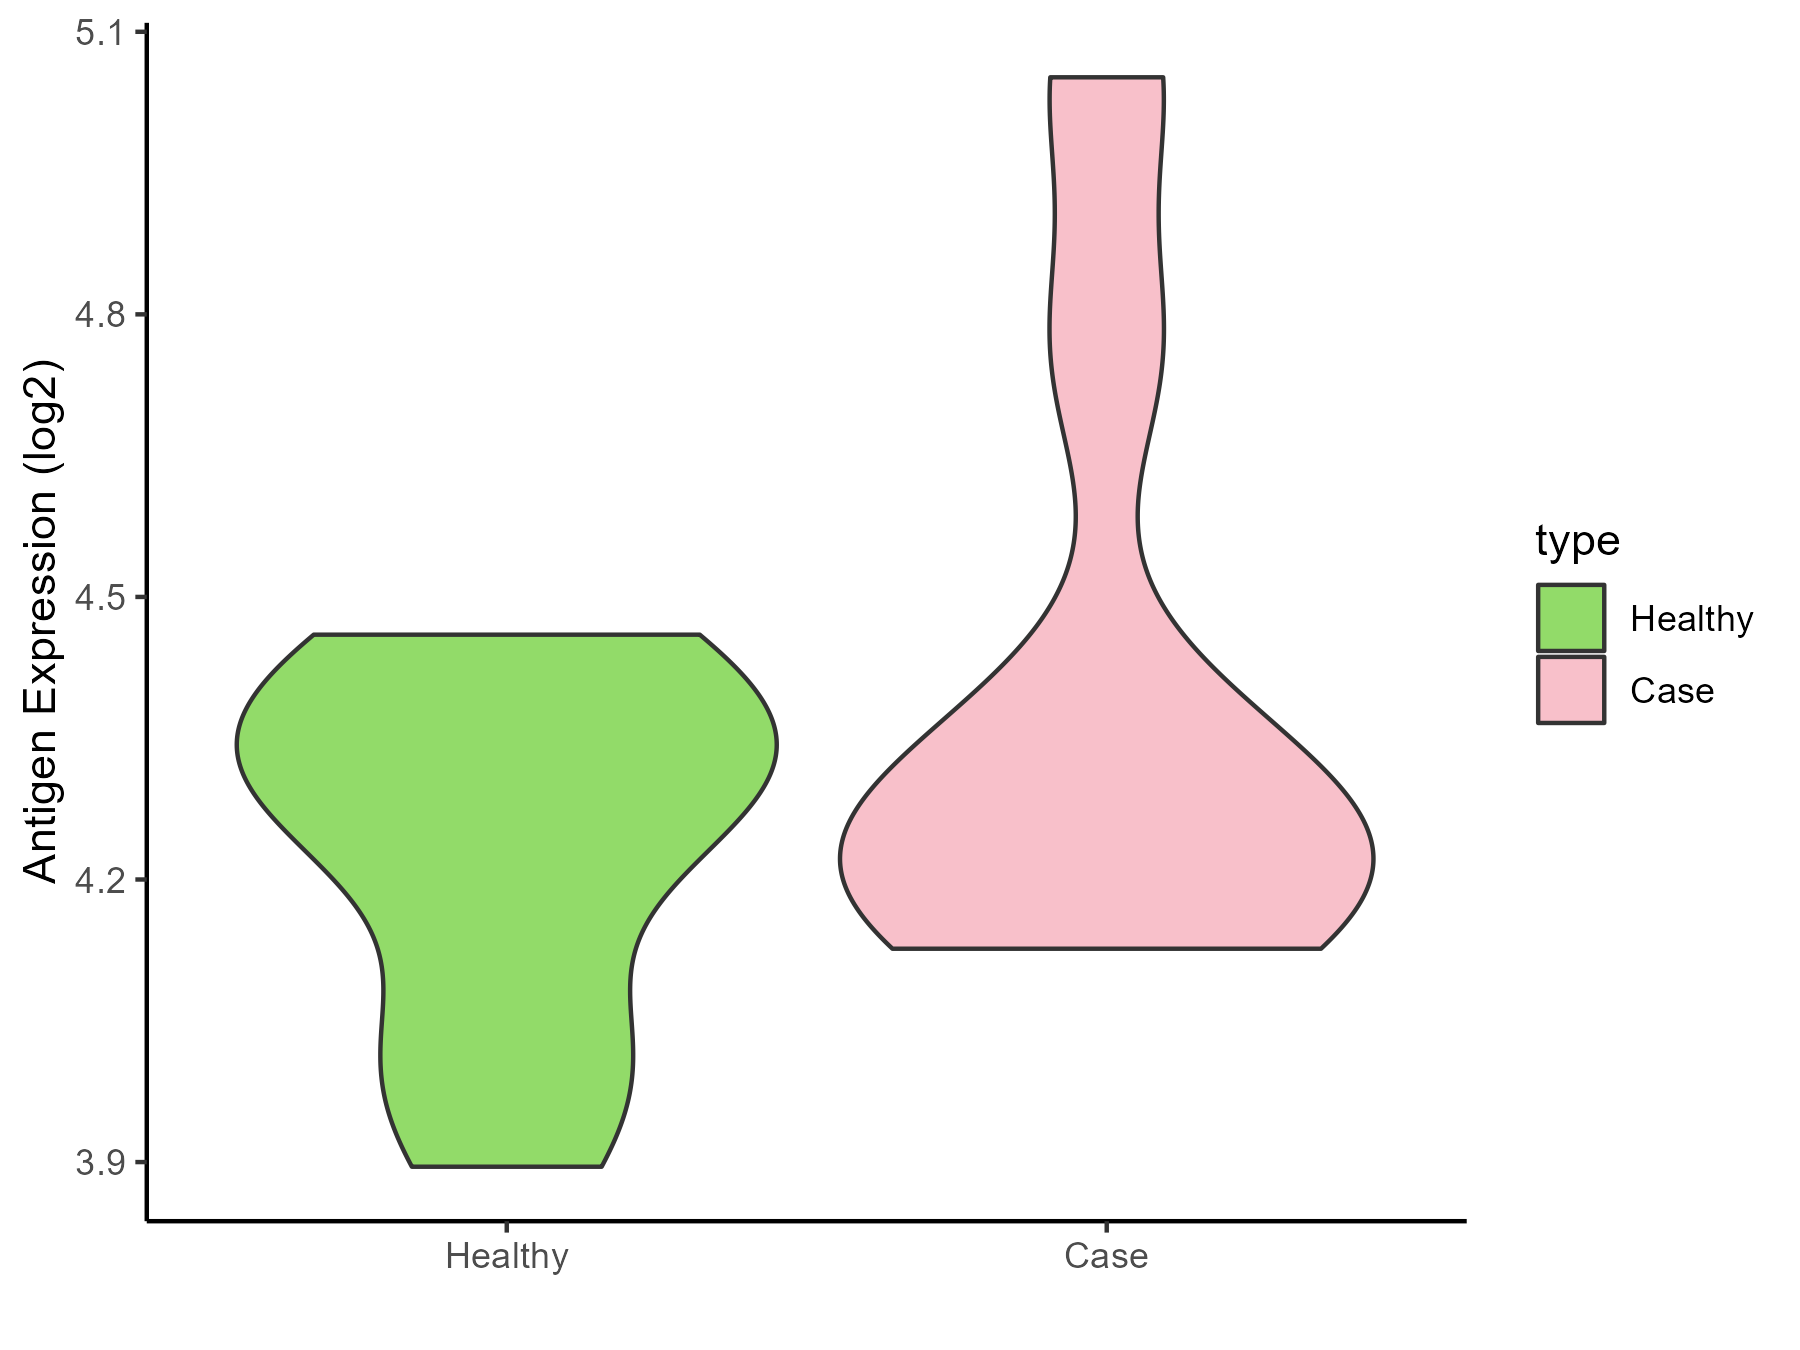
| The Studied Tissue | Tonsil | |
| The Specific Disease | Lymphoma | |
| The Expression Level of Disease Section Compare with the Healthy Individual Tissue | p-value: 0.259897954; Fold-change: -0.028711891; Z-score: -0.14813749 | |
| Disease-specific Antigen Abundances |
|
Click to View the Clearer Original Diagram |
| Differential expression pattern of antigen in diseases | ||
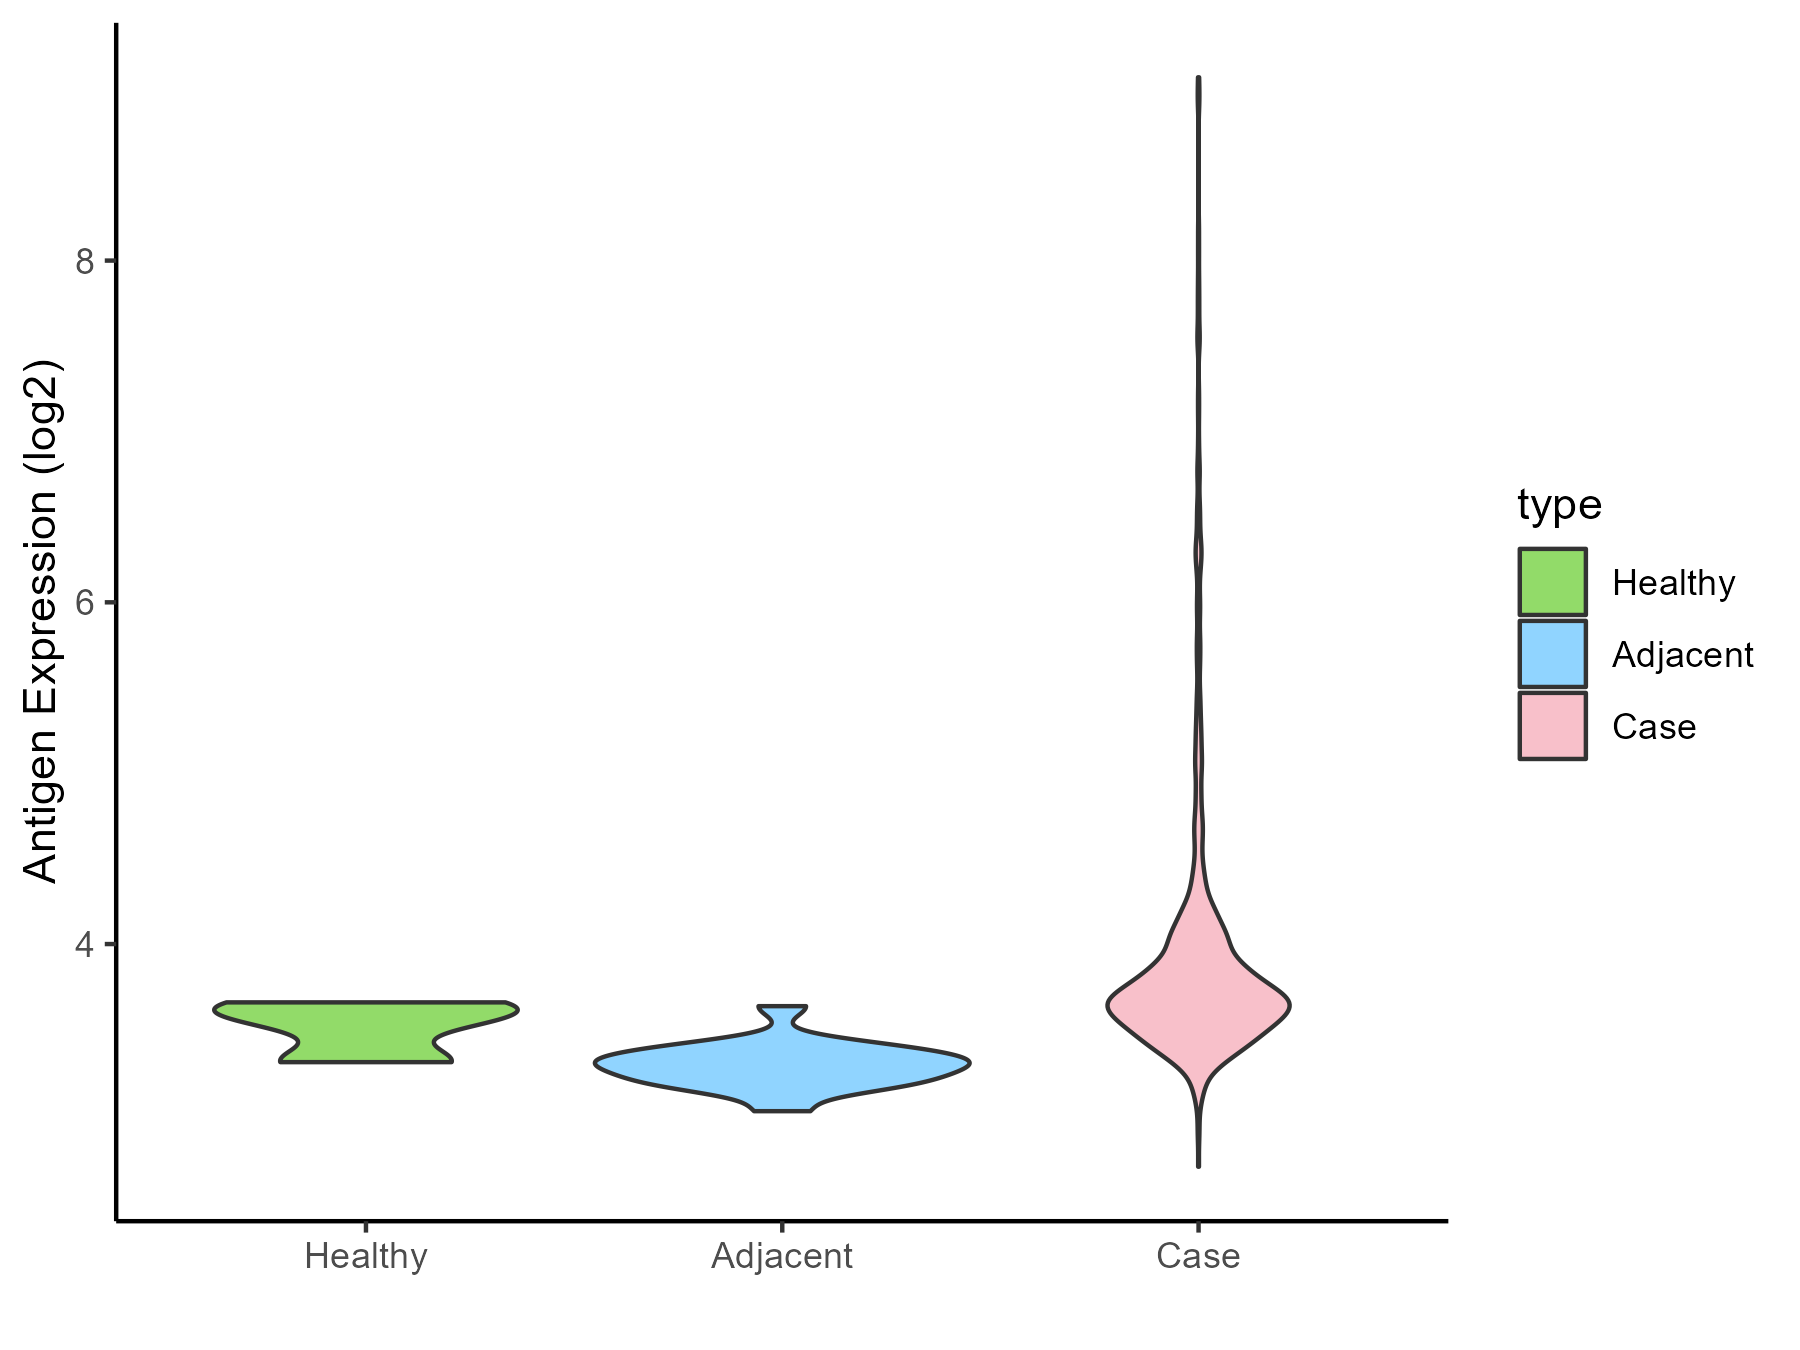
| The Studied Tissue | Gastric | |
| The Specific Disease | Gastric cancer | |
| The Expression Level of Disease Section Compare with the Healthy Individual Tissue | p-value: 0.054302895; Fold-change: 0.117777347; Z-score: 0.646059967 | |
| The Expression Level of Disease Section Compare with the Adjacent Tissue | p-value: 1.23E-18; Fold-change: 0.392484143; Z-score: 2.896088384 | |
| Disease-specific Antigen Abundances |
|
Click to View the Clearer Original Diagram |
| Differential expression pattern of antigen in diseases | ||
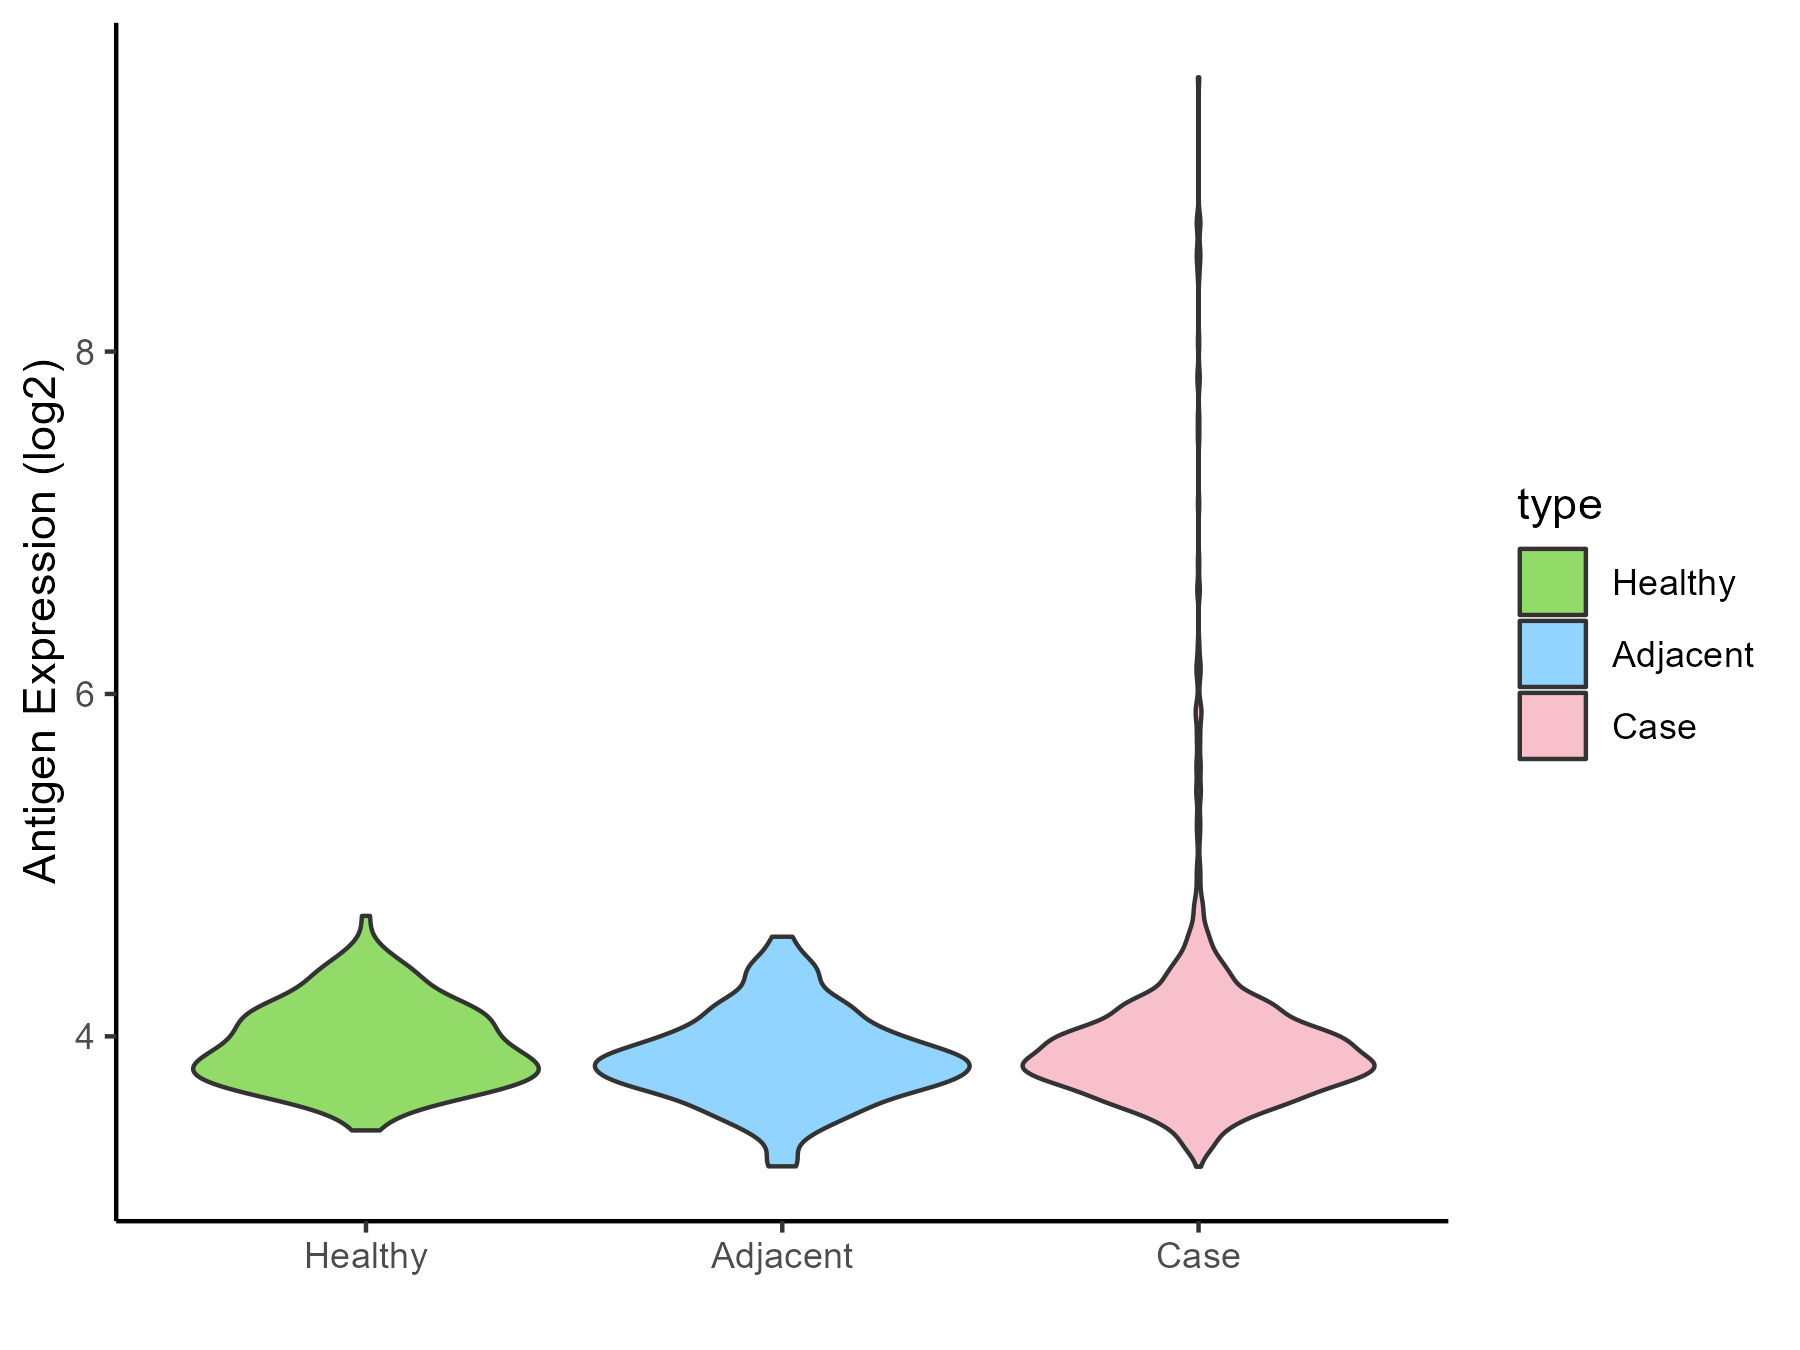
| The Studied Tissue | Colon | |
| The Specific Disease | Colon cancer | |
| The Expression Level of Disease Section Compare with the Healthy Individual Tissue | p-value: 0.066933062; Fold-change: -0.018563036; Z-score: -0.076920416 | |
| The Expression Level of Disease Section Compare with the Adjacent Tissue | p-value: 1.71E-05; Fold-change: 0.035048762; Z-score: 0.133698509 | |
| Disease-specific Antigen Abundances |
|
Click to View the Clearer Original Diagram |
| Differential expression pattern of antigen in diseases | ||
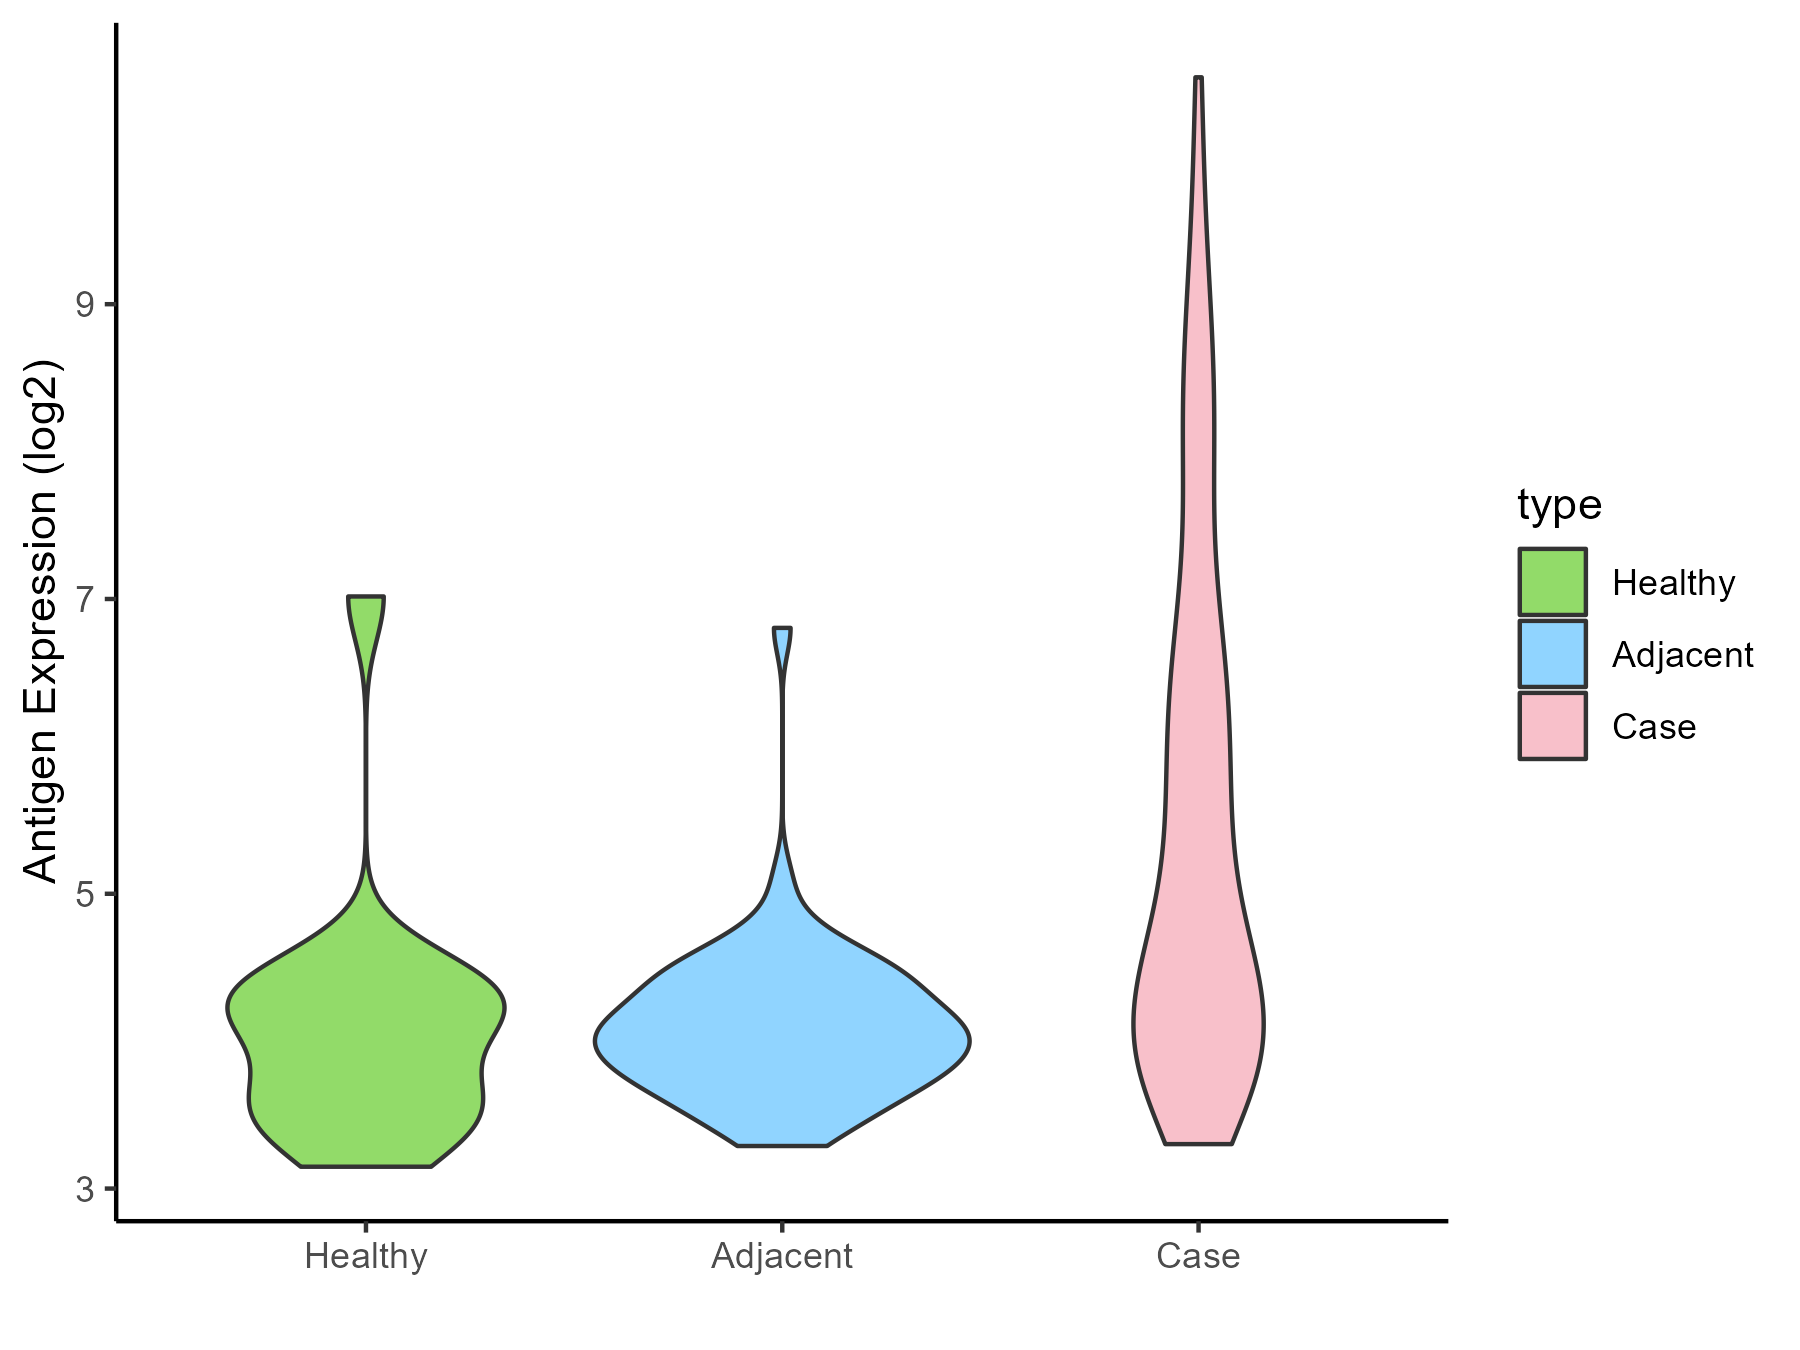
| The Studied Tissue | Pancreas | |
| The Specific Disease | Pancreatic cancer | |
| The Expression Level of Disease Section Compare with the Healthy Individual Tissue | p-value: 1.09E-05; Fold-change: 0.71356675; Z-score: 0.805287454 | |
| The Expression Level of Disease Section Compare with the Adjacent Tissue | p-value: 4.83E-17; Fold-change: 0.799012149; Z-score: 1.49833034 | |
| Disease-specific Antigen Abundances |
|
Click to View the Clearer Original Diagram |
| Differential expression pattern of antigen in diseases | ||
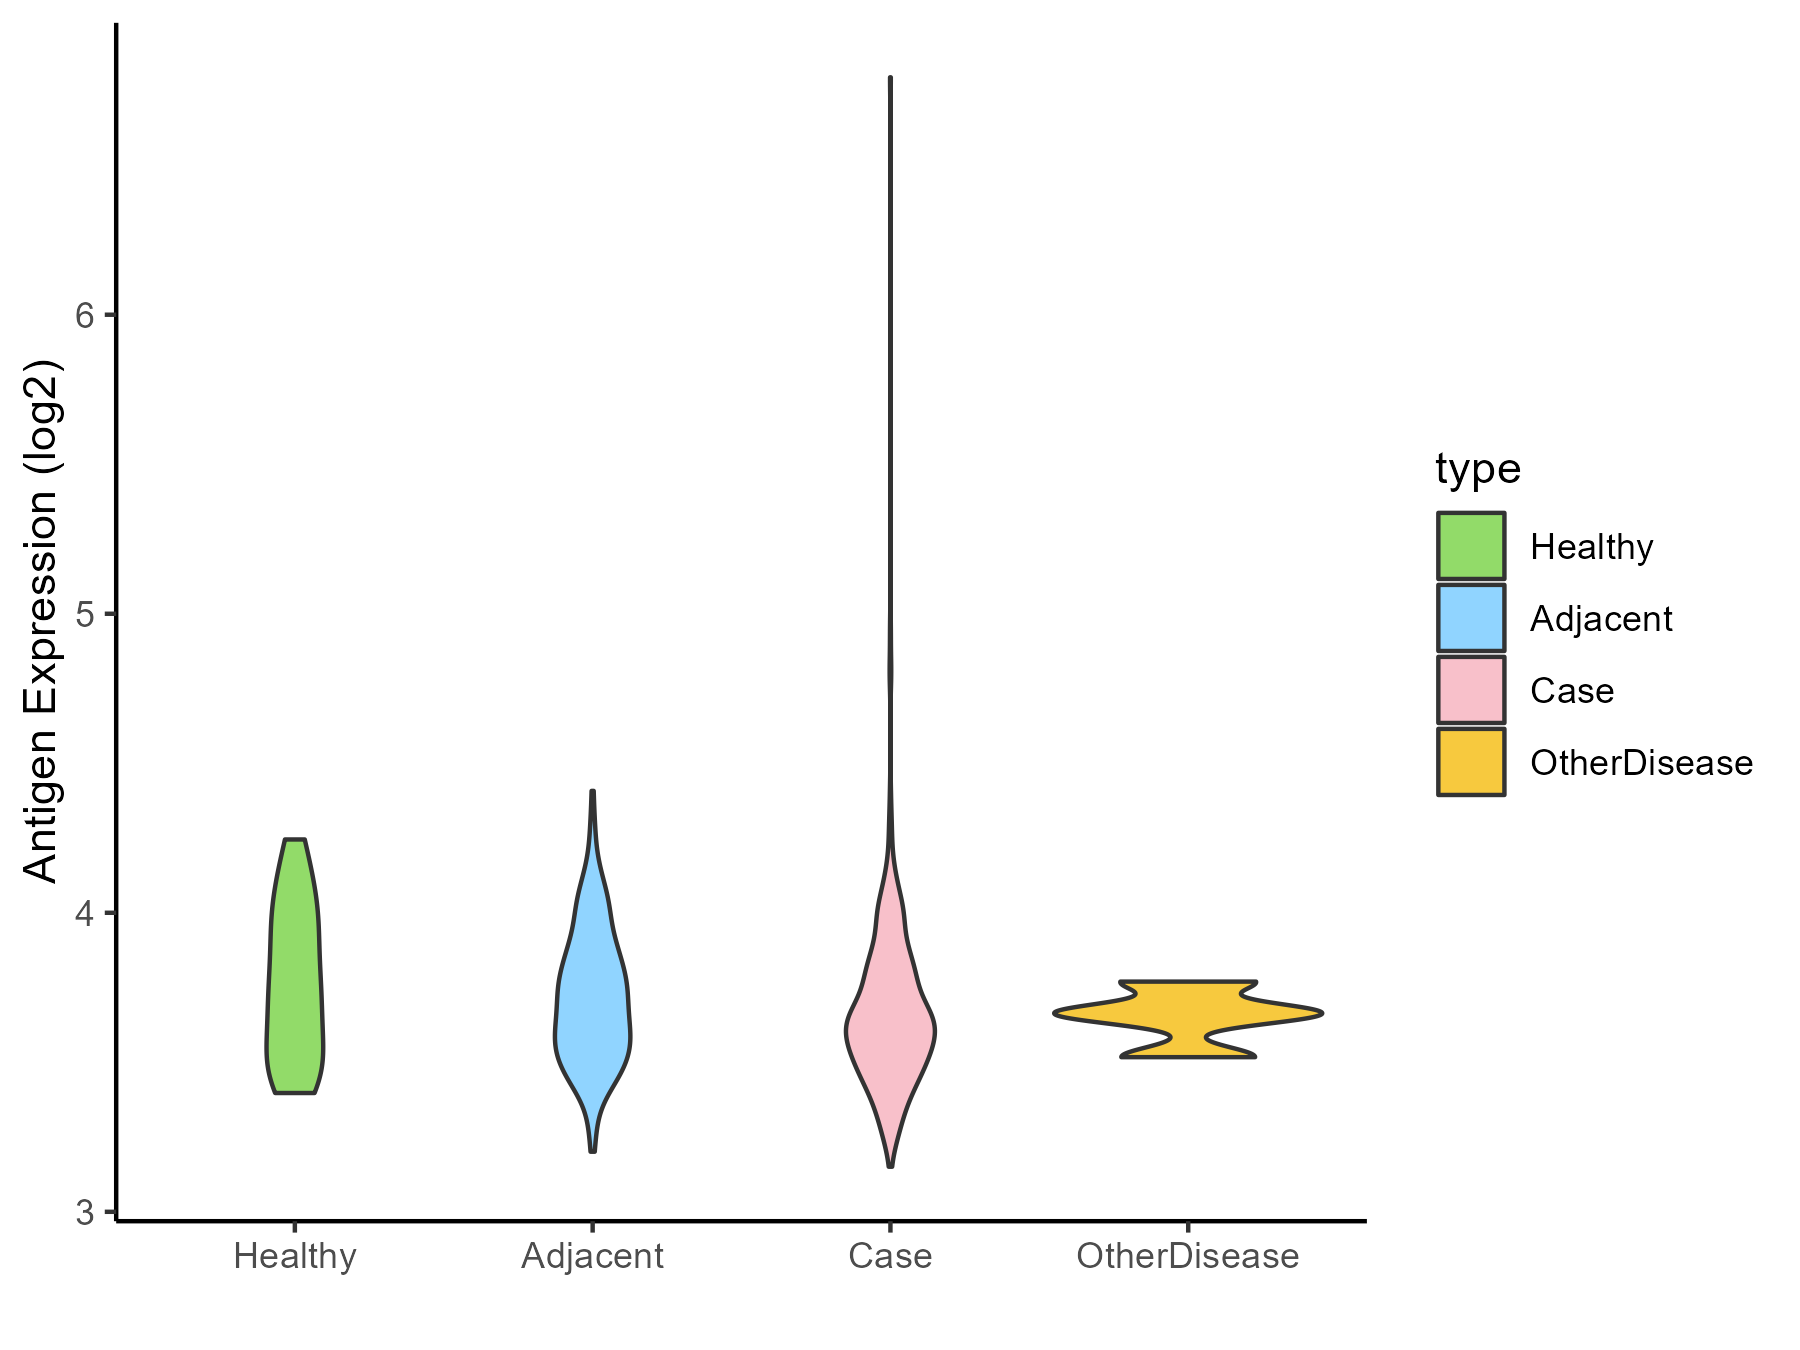
| The Studied Tissue | Liver | |
| The Specific Disease | Liver cancer | |
| The Expression Level of Disease Section Compare with the Healthy Individual Tissue | p-value: 0.025908395; Fold-change: -0.109151701; Z-score: -0.429272375 | |
| The Expression Level of Disease Section Compare with the Adjacent Tissue | p-value: 0.034209192; Fold-change: -0.07131619; Z-score: -0.319041894 | |
| The Expression Level of Disease Section Compare with the Other Disease Section | p-value: 0.760191242; Fold-change: -0.032696476; Z-score: -0.314948288 | |
| Disease-specific Antigen Abundances |
|
Click to View the Clearer Original Diagram |
| Differential expression pattern of antigen in diseases | ||
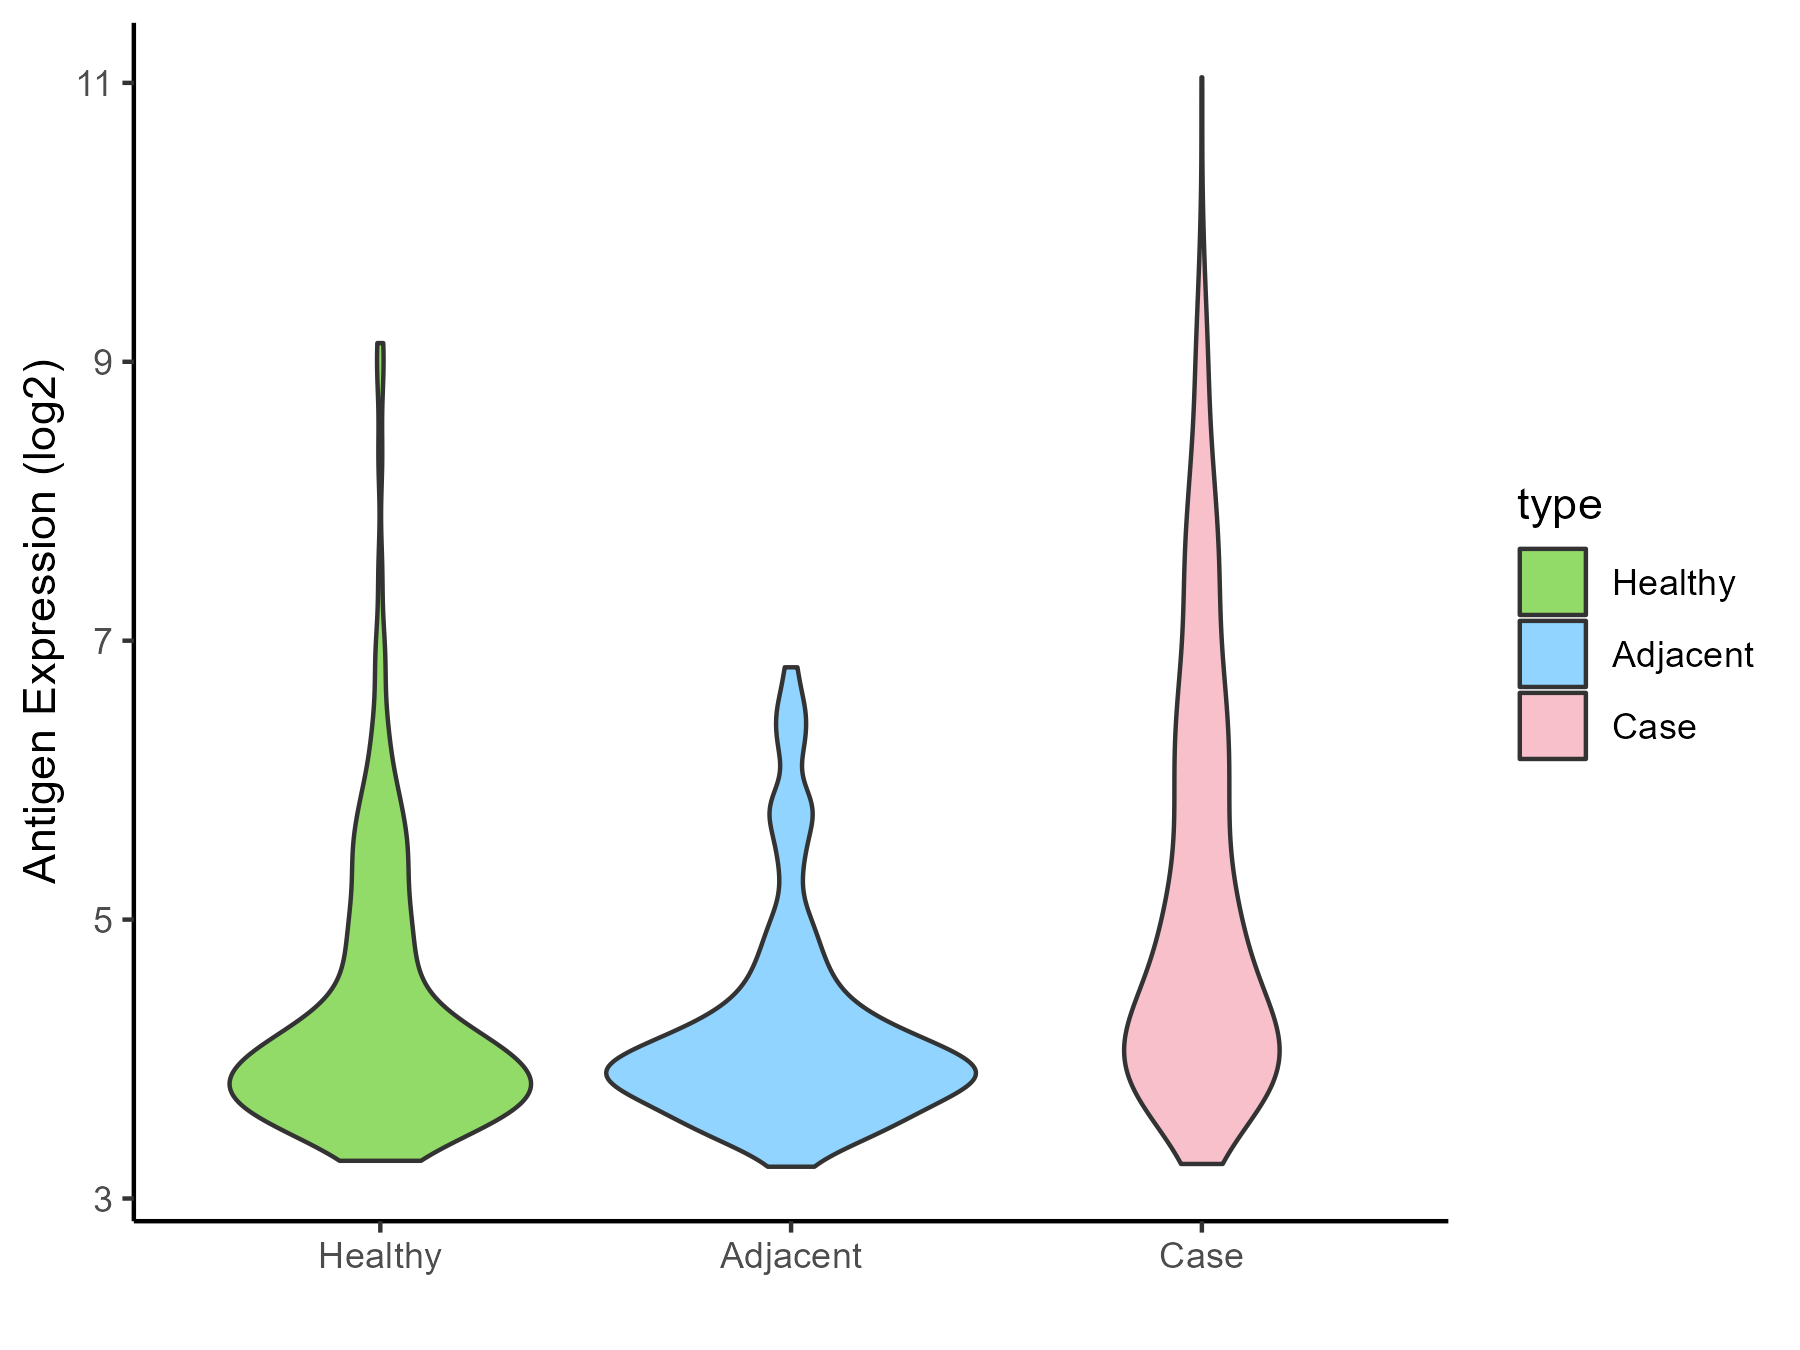
| The Studied Tissue | Lung | |
| The Specific Disease | Lung cancer | |
| The Expression Level of Disease Section Compare with the Healthy Individual Tissue | p-value: 1.19E-21; Fold-change: 0.738592924; Z-score: 0.737695824 | |
| The Expression Level of Disease Section Compare with the Adjacent Tissue | p-value: 1.66E-26; Fold-change: 0.761370107; Z-score: 0.987890368 | |
| Disease-specific Antigen Abundances |
|
Click to View the Clearer Original Diagram |
| Differential expression pattern of antigen in diseases | ||
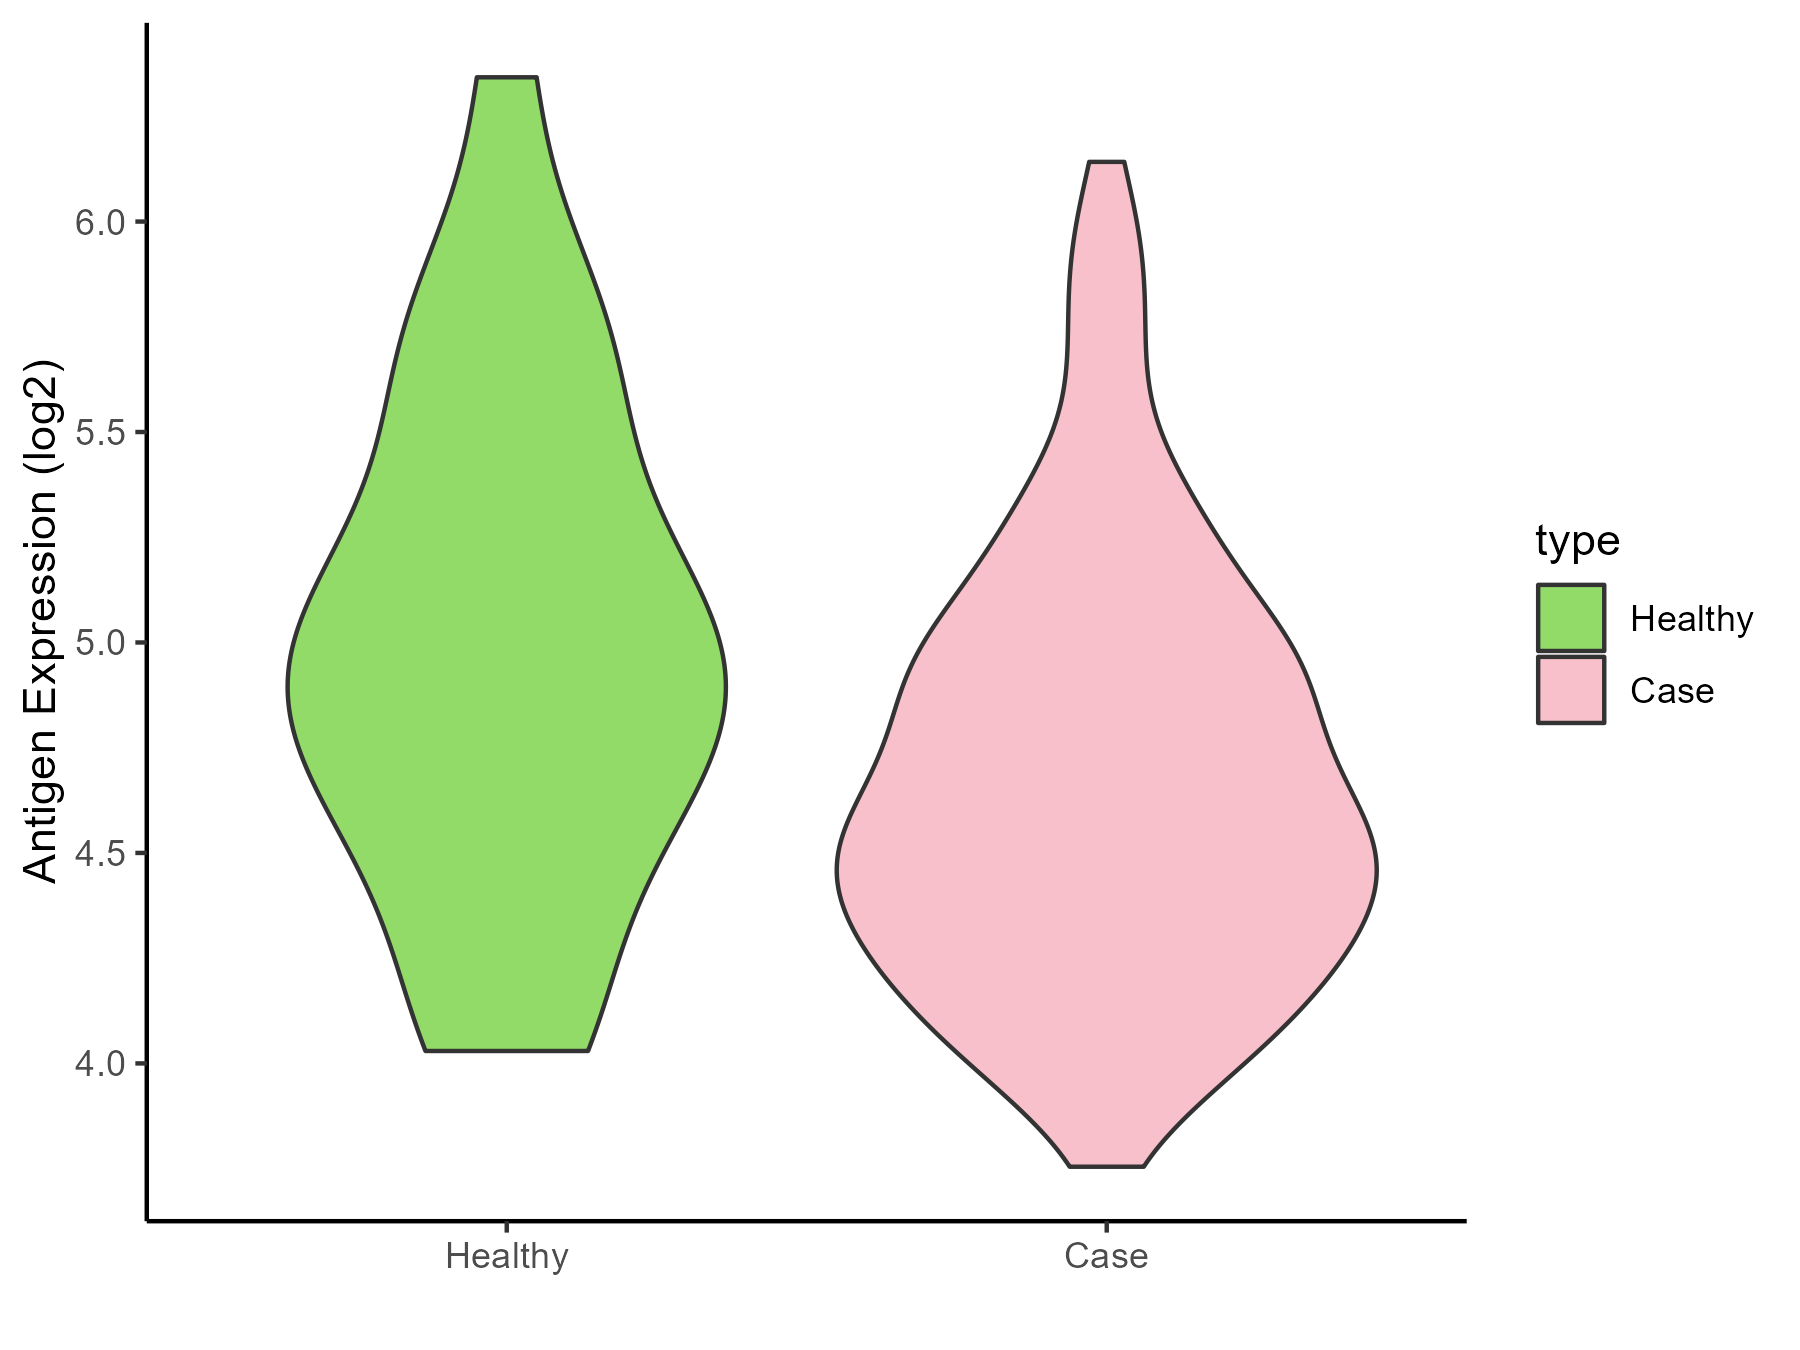
| The Studied Tissue | Skin | |
| The Specific Disease | Melanoma | |
| The Expression Level of Disease Section Compare with the Healthy Individual Tissue | p-value: 0.022121727; Fold-change: -0.381137191; Z-score: -0.637069393 | |
| Disease-specific Antigen Abundances |
|
Click to View the Clearer Original Diagram |
| Differential expression pattern of antigen in diseases | ||
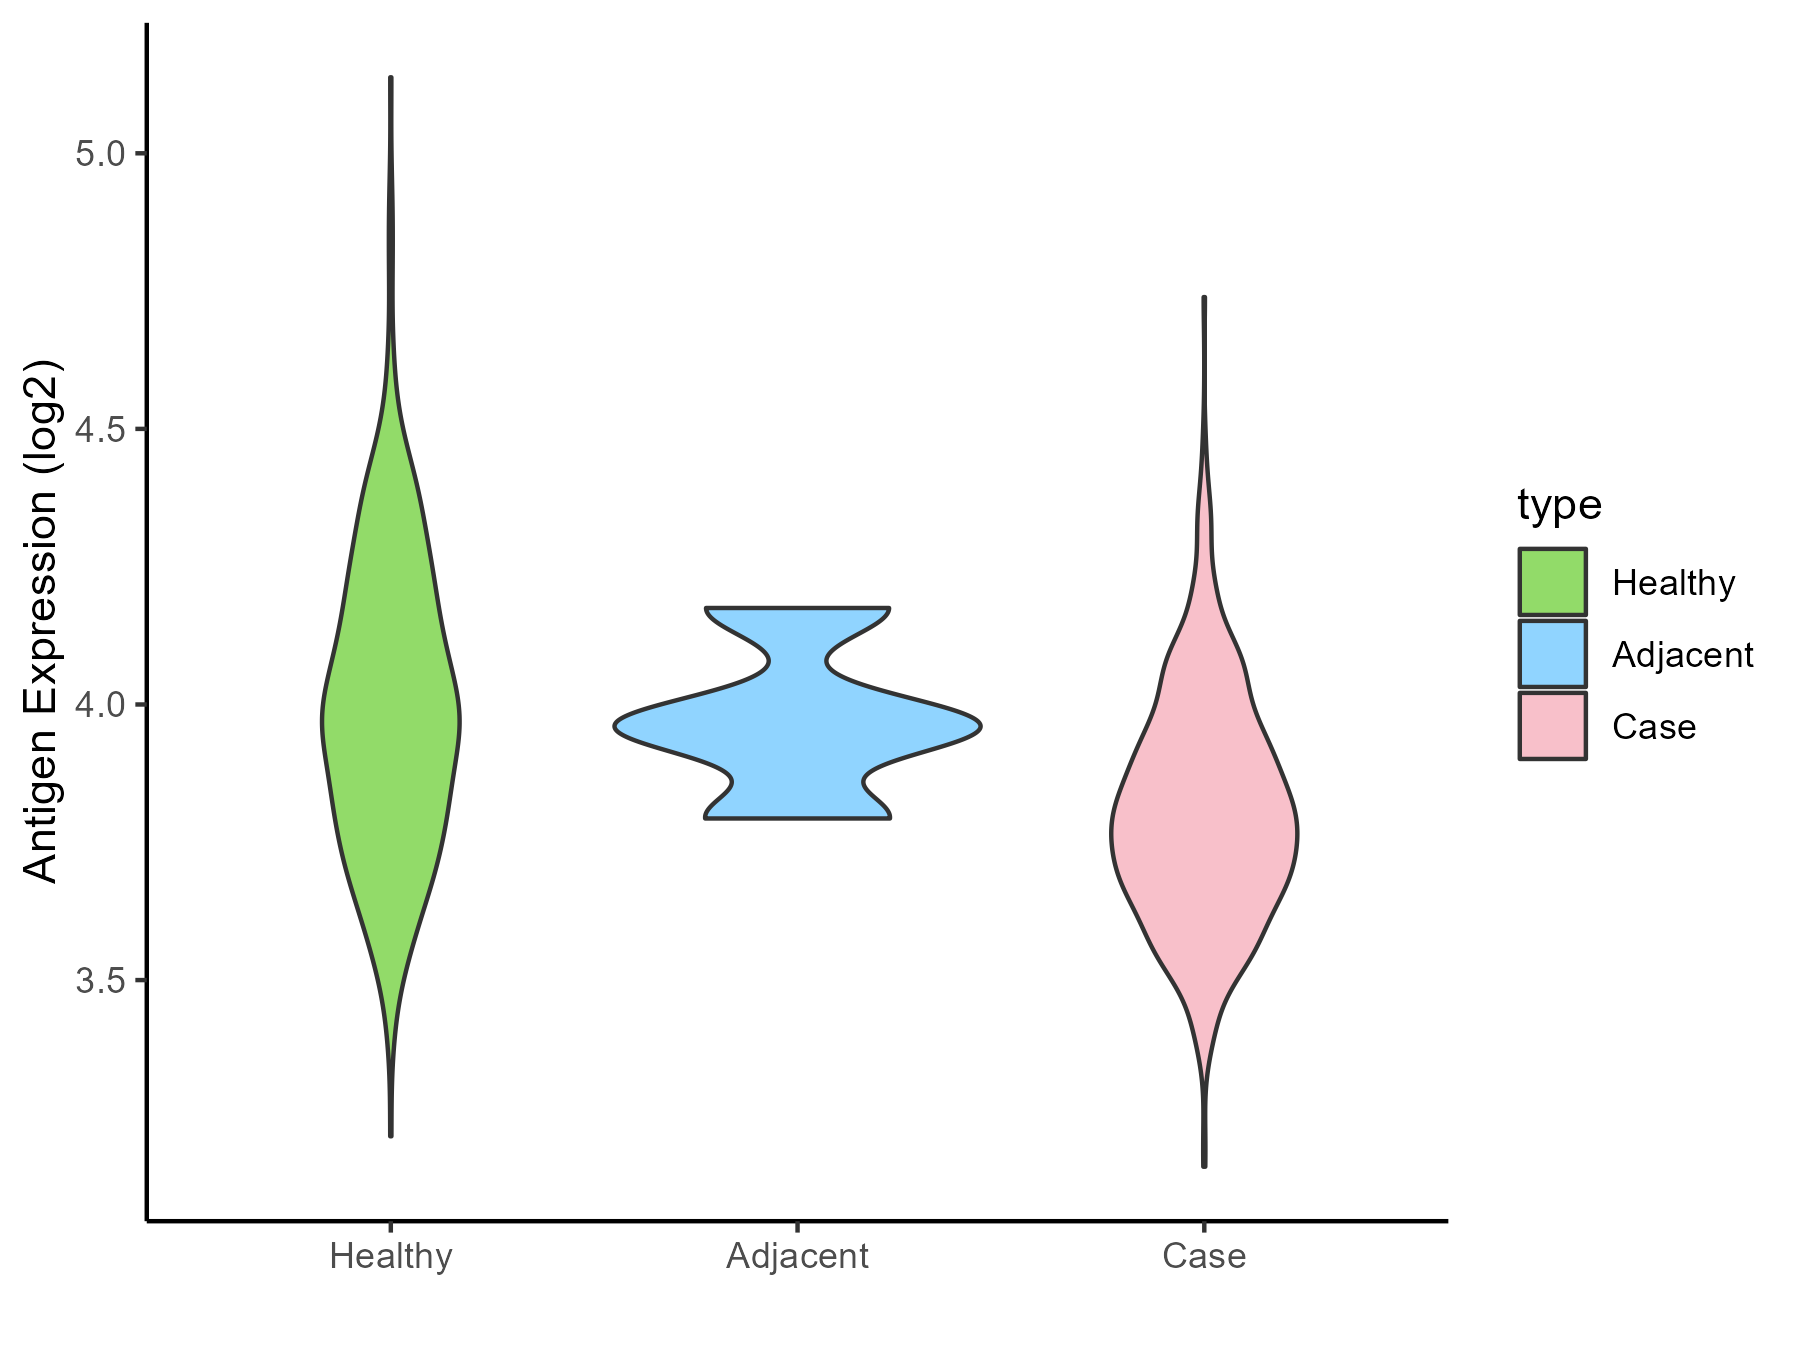
| The Studied Tissue | Muscle | |
| The Specific Disease | Sarcoma | |
| The Expression Level of Disease Section Compare with the Healthy Individual Tissue | p-value: 2.50E-33; Fold-change: -0.184690146; Z-score: -0.677791336 | |
| The Expression Level of Disease Section Compare with the Adjacent Tissue | p-value: 0.12408887; Fold-change: -0.169751341; Z-score: -1.084666812 | |
| Disease-specific Antigen Abundances |
|
Click to View the Clearer Original Diagram |
| Differential expression pattern of antigen in diseases | ||
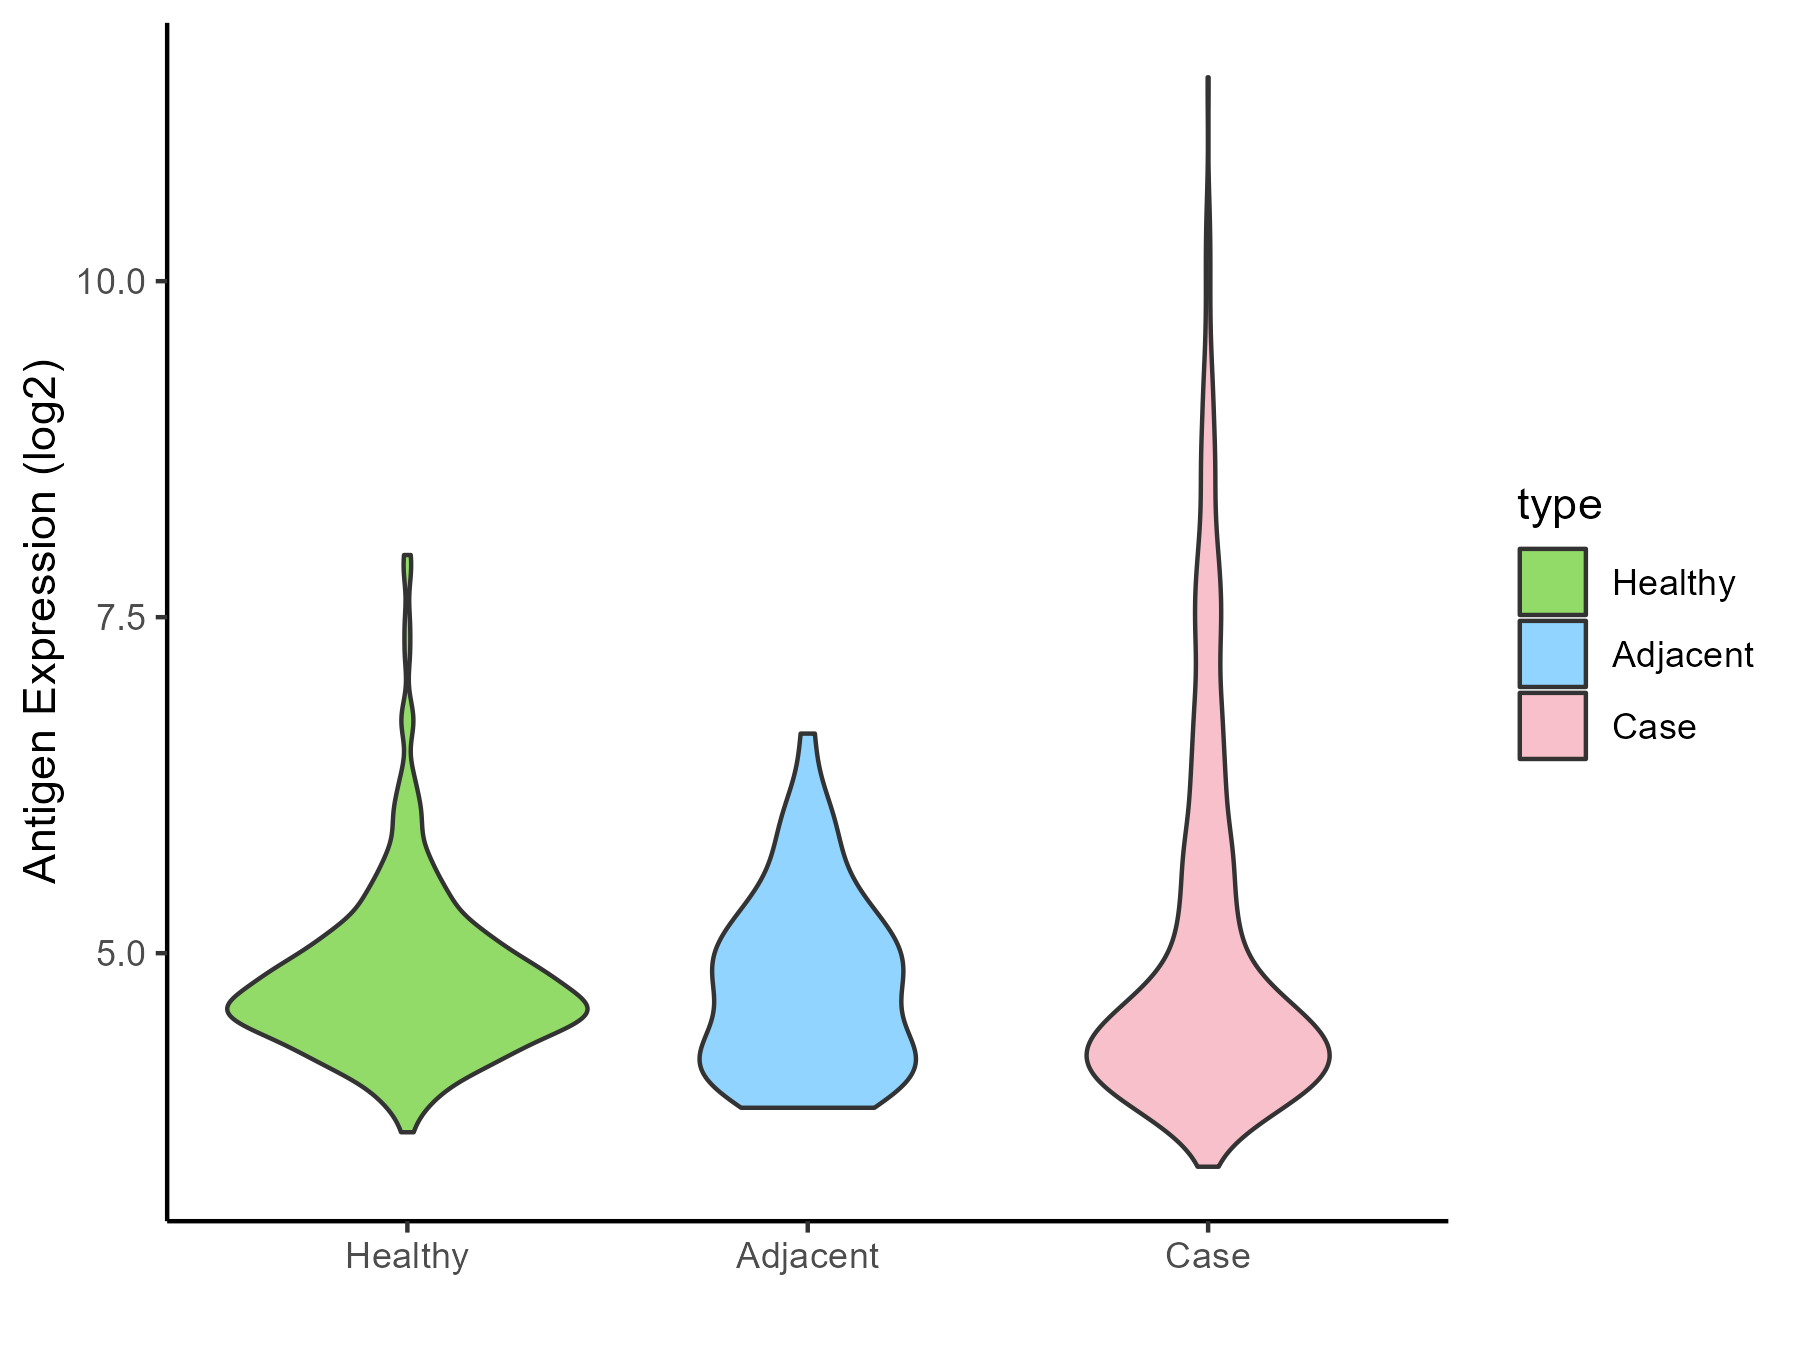
| The Studied Tissue | Breast | |
| The Specific Disease | Breast cancer | |
| The Expression Level of Disease Section Compare with the Healthy Individual Tissue | p-value: 9.10E-09; Fold-change: -0.150999534; Z-score: -0.240952289 | |
| The Expression Level of Disease Section Compare with the Adjacent Tissue | p-value: 0.000422717; Fold-change: -0.21522459; Z-score: -0.324076742 | |
| Disease-specific Antigen Abundances |
|
Click to View the Clearer Original Diagram |
| Differential expression pattern of antigen in diseases | ||
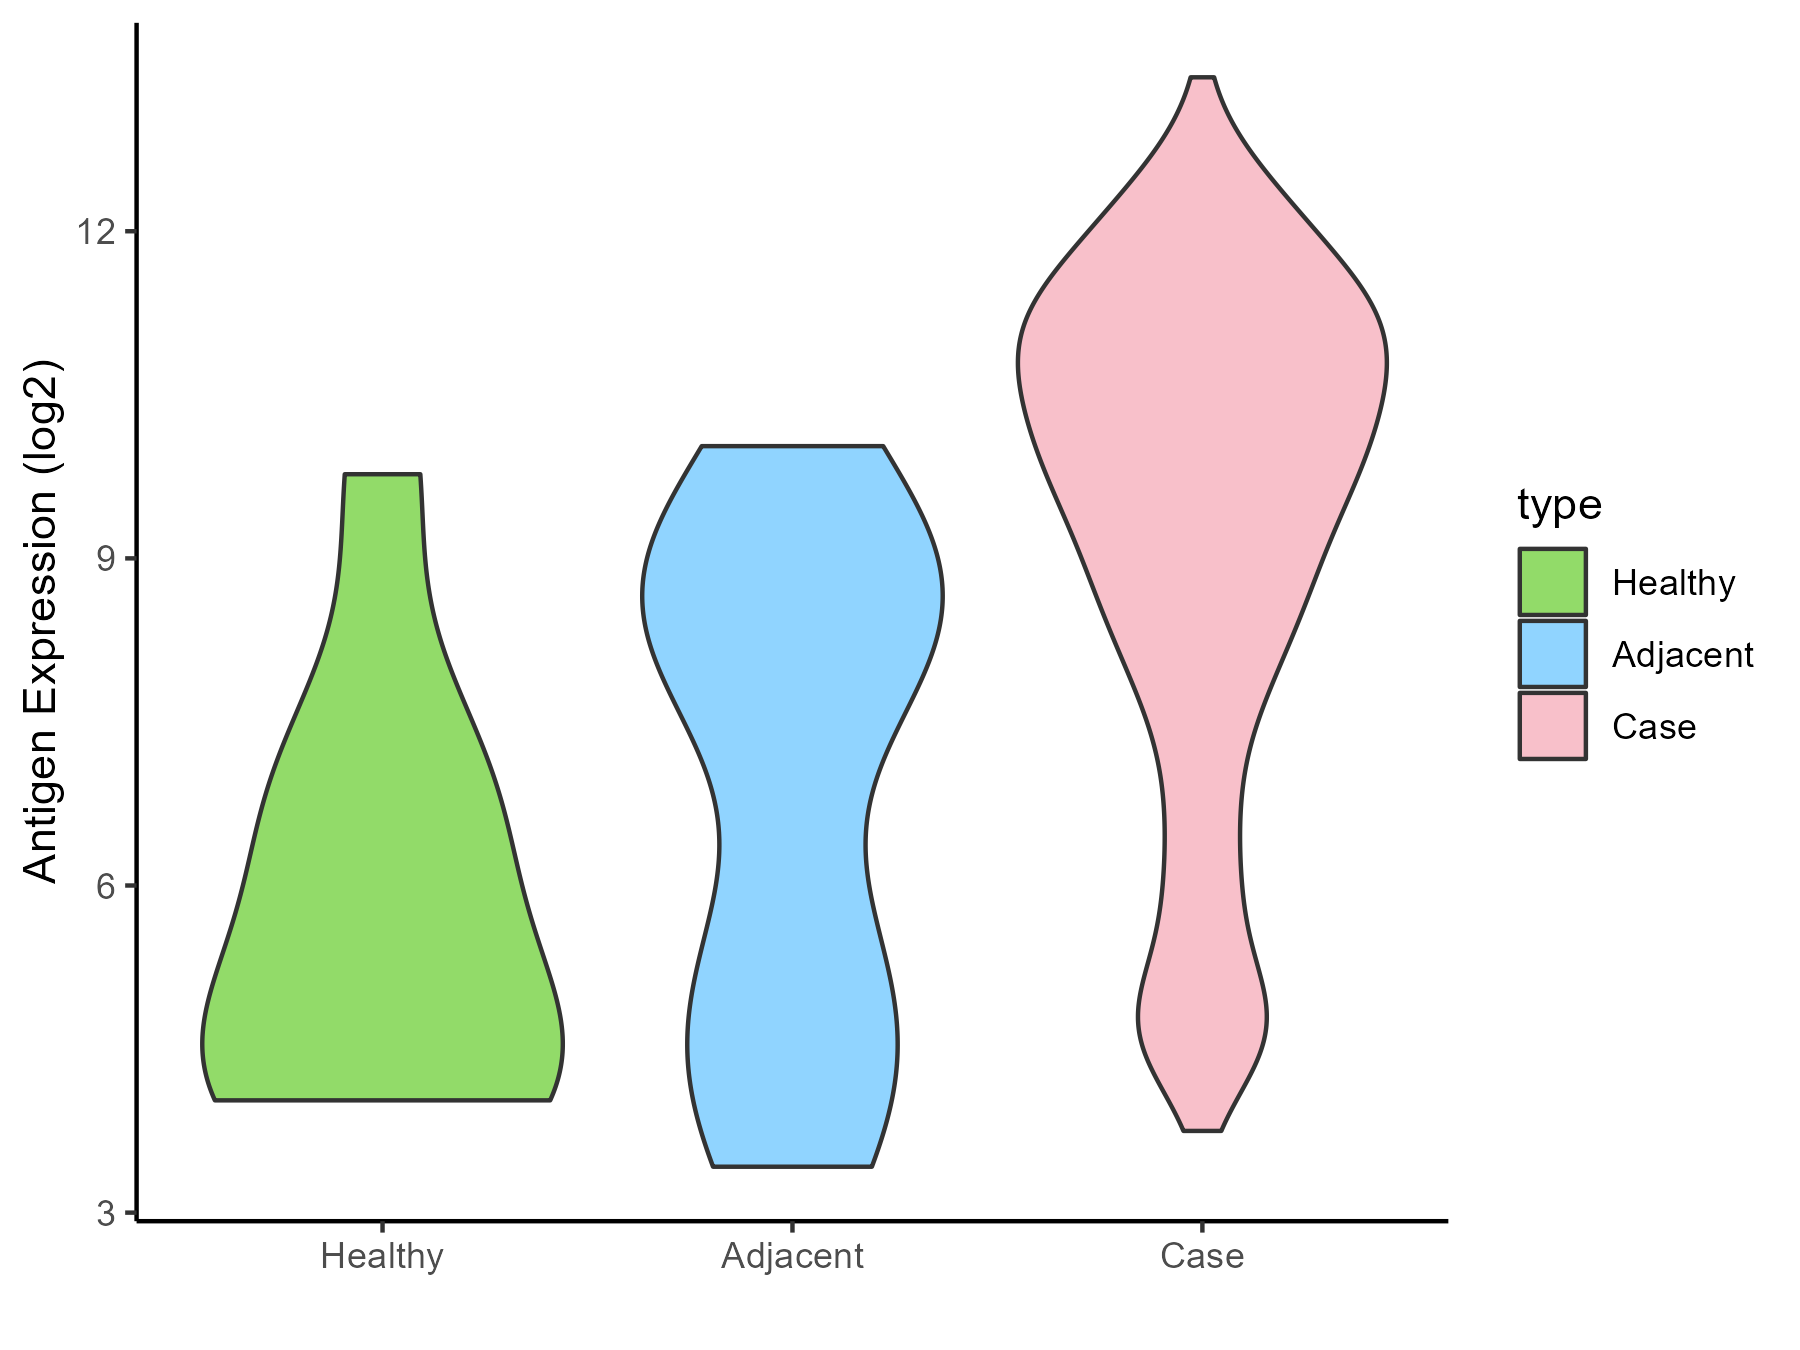
| The Studied Tissue | Ovarian | |
| The Specific Disease | Ovarian cancer | |
| The Expression Level of Disease Section Compare with the Healthy Individual Tissue | p-value: 0.000485959; Fold-change: 5.023844415; Z-score: 2.60194028 | |
| The Expression Level of Disease Section Compare with the Adjacent Tissue | p-value: 0.001618847; Fold-change: 1.614658663; Z-score: 0.704336758 | |
| Disease-specific Antigen Abundances |
|
Click to View the Clearer Original Diagram |
| Differential expression pattern of antigen in diseases | ||
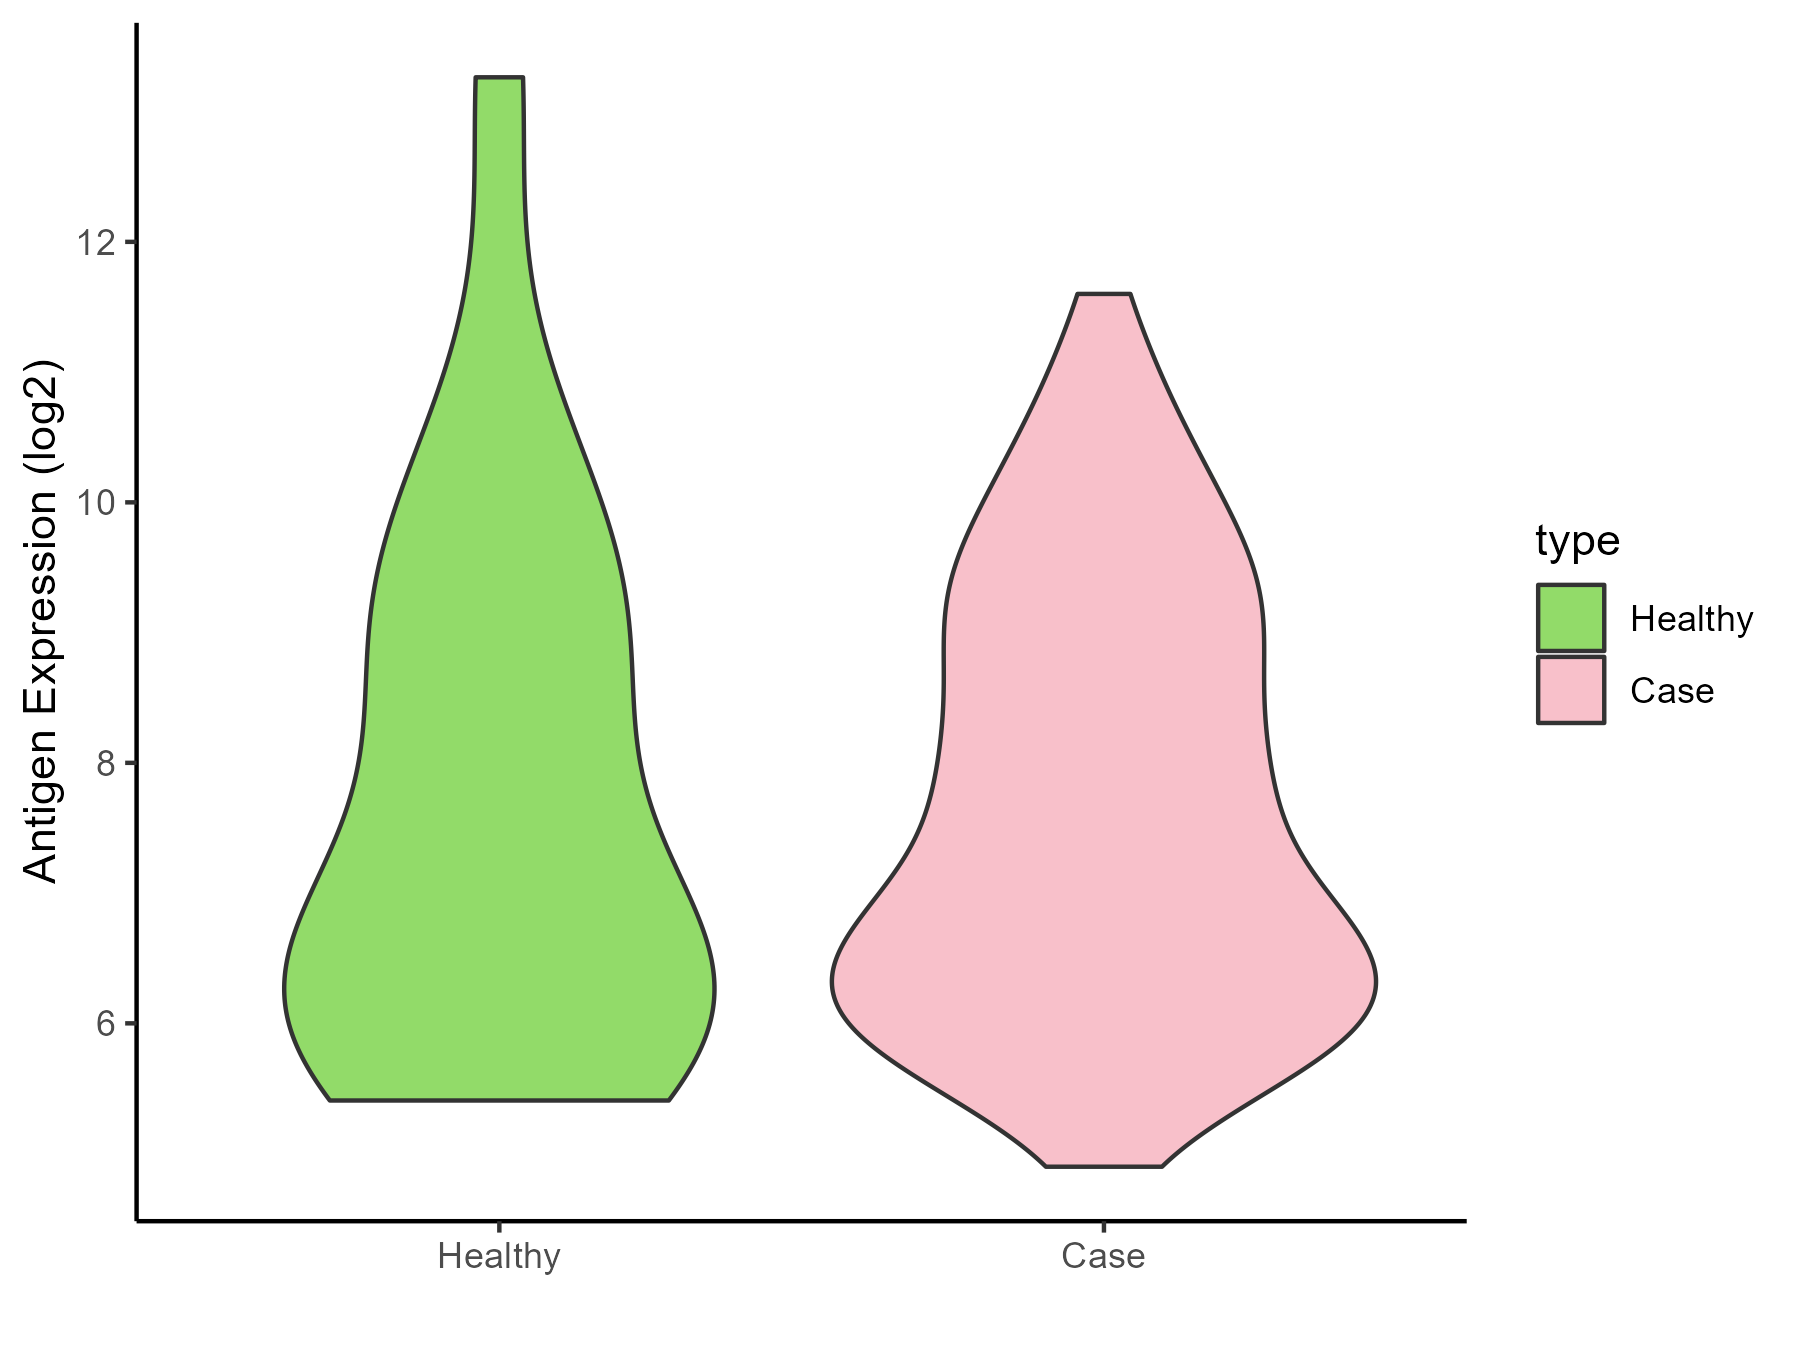
| The Studied Tissue | Cervical | |
| The Specific Disease | Cervical cancer | |
| The Expression Level of Disease Section Compare with the Healthy Individual Tissue | p-value: 0.890097317; Fold-change: 0.648827809; Z-score: 0.302997642 | |
| Disease-specific Antigen Abundances |
|
Click to View the Clearer Original Diagram |
| Differential expression pattern of antigen in diseases | ||
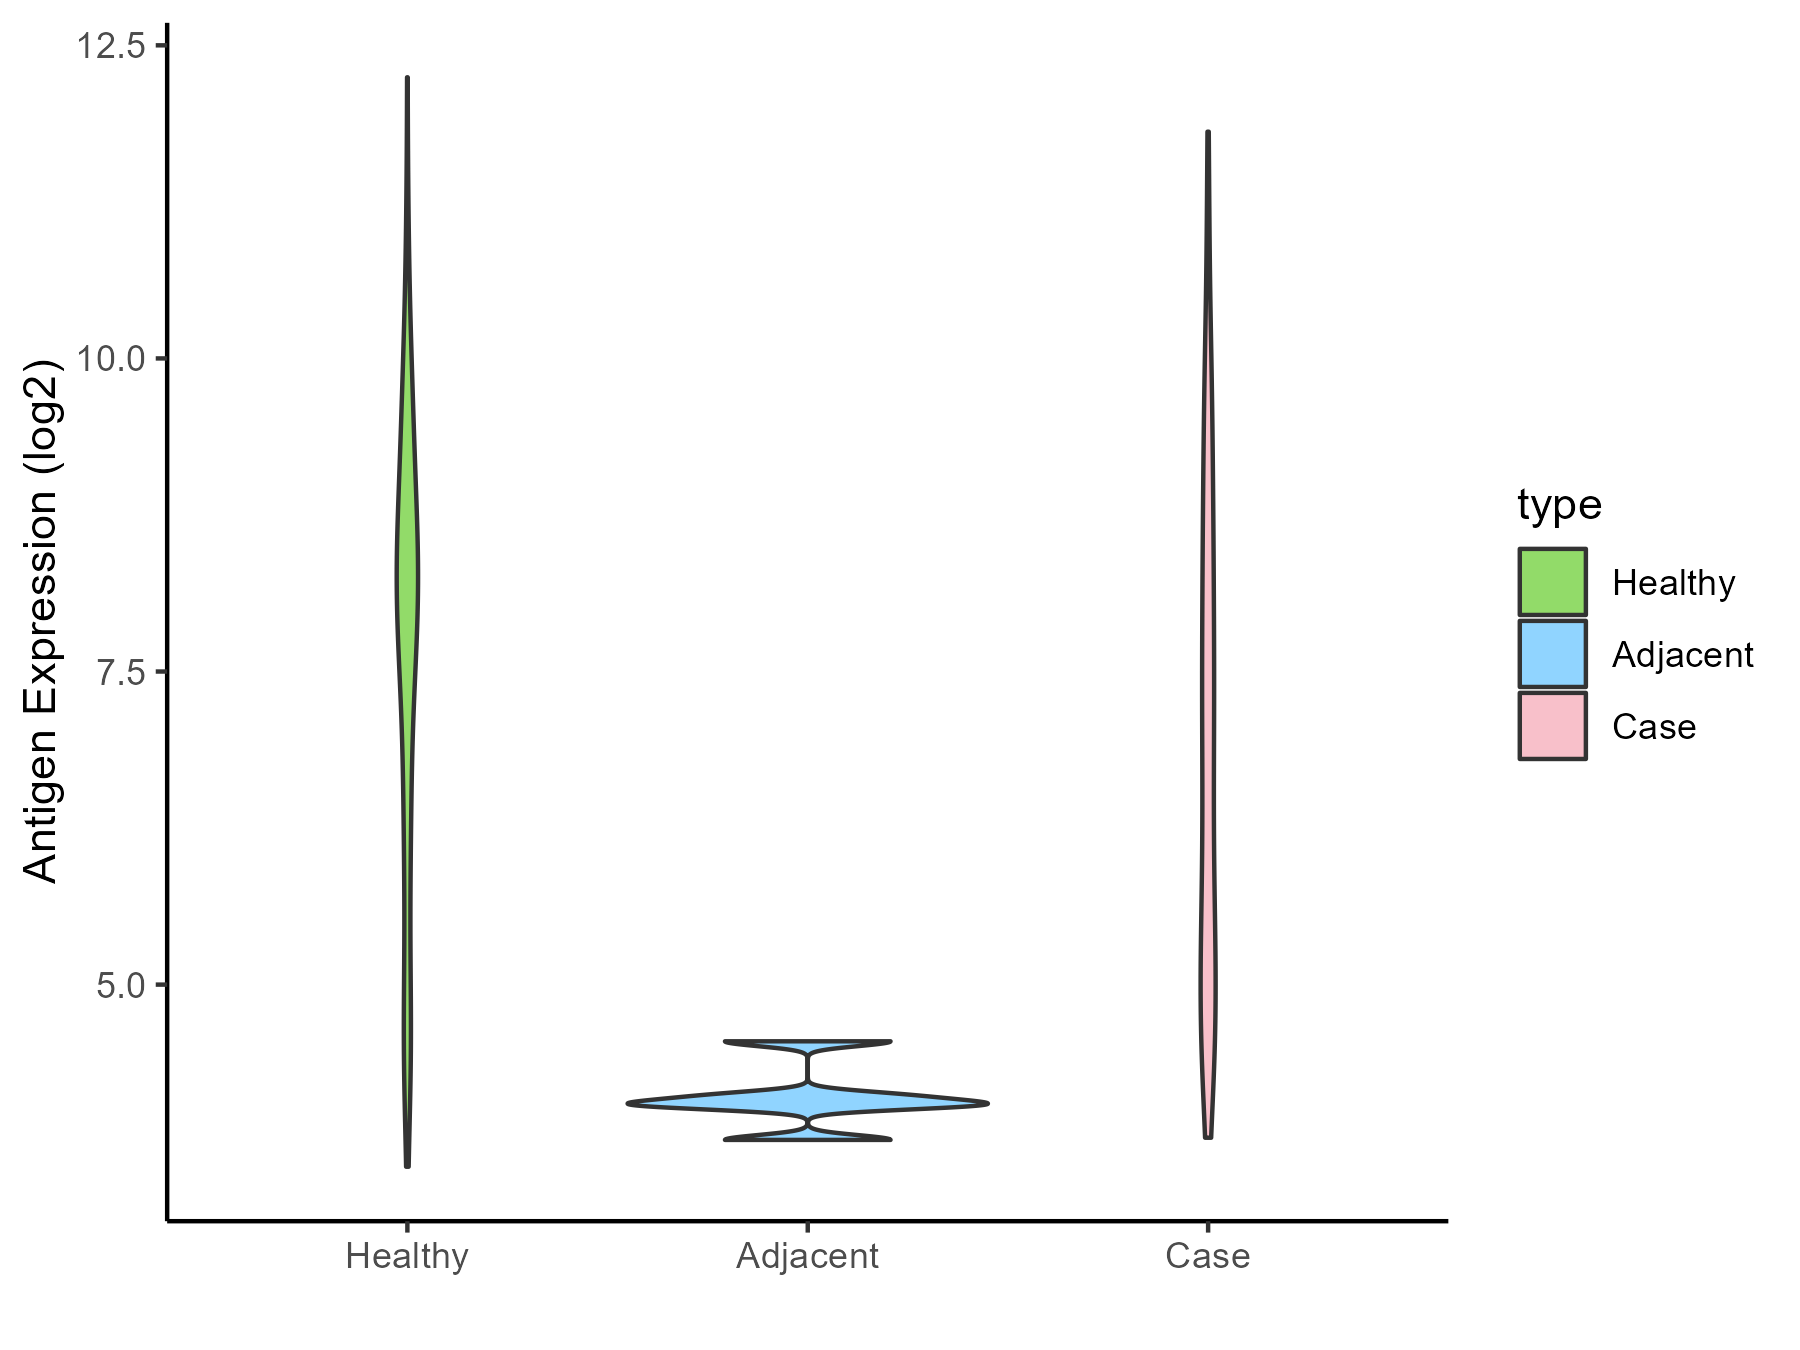
| The Studied Tissue | Endometrium | |
| The Specific Disease | Uterine cancer | |
| The Expression Level of Disease Section Compare with the Healthy Individual Tissue | p-value: 0.000112375; Fold-change: -1.244804936; Z-score: -0.689186821 | |
| The Expression Level of Disease Section Compare with the Adjacent Tissue | p-value: 8.24E-10; Fold-change: 2.802792335; Z-score: 9.864504094 | |
| Disease-specific Antigen Abundances |
|
Click to View the Clearer Original Diagram |
| Differential expression pattern of antigen in diseases | ||
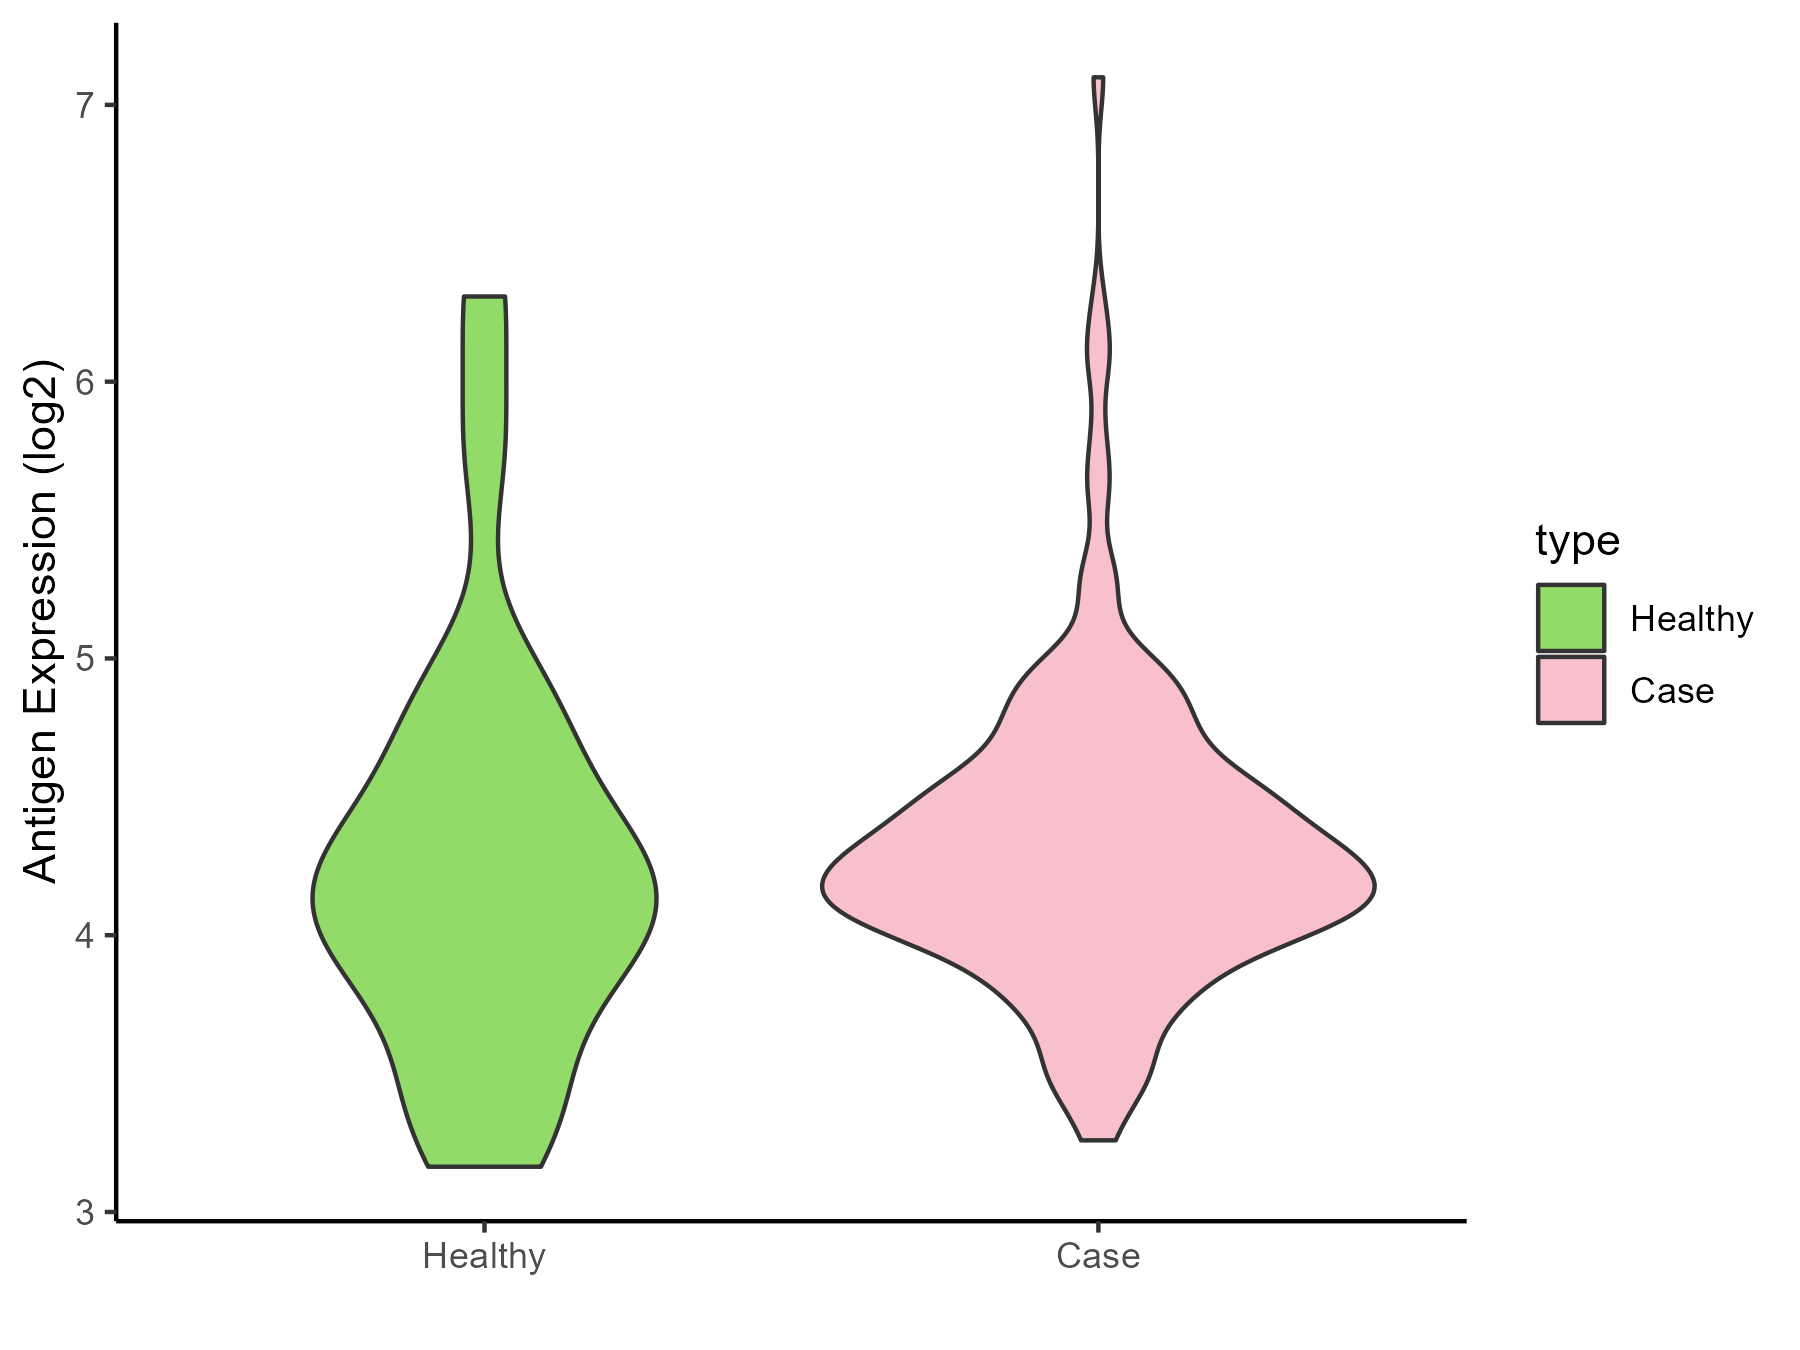
| The Studied Tissue | Prostate | |
| The Specific Disease | Prostate cancer | |
| The Expression Level of Disease Section Compare with the Healthy Individual Tissue | p-value: 0.721544302; Fold-change: 0.065235947; Z-score: 0.08594452 | |
| Disease-specific Antigen Abundances |
|
Click to View the Clearer Original Diagram |
| Differential expression pattern of antigen in diseases | ||
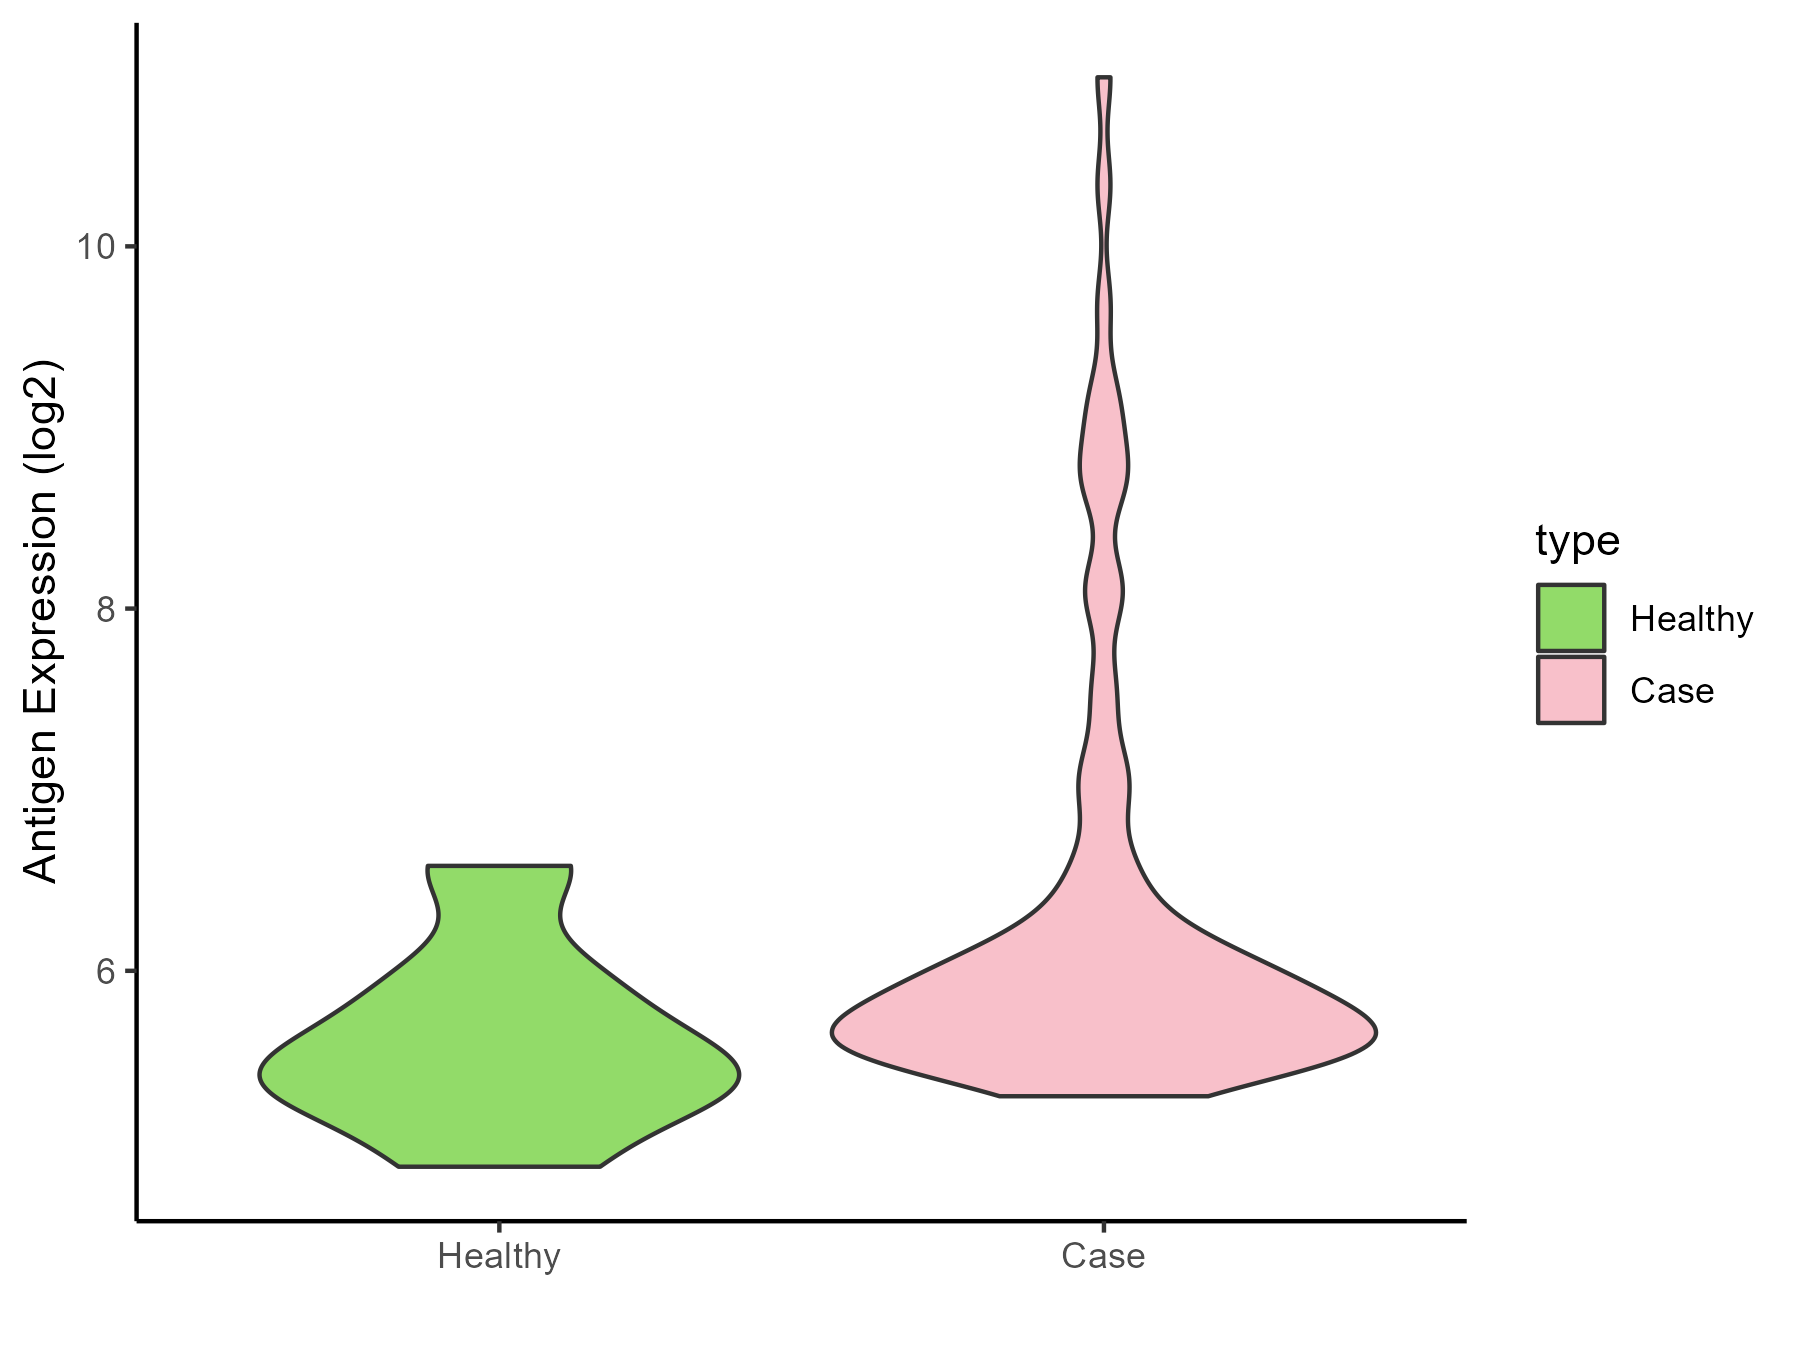
| The Studied Tissue | Bladder | |
| The Specific Disease | Bladder cancer | |
| The Expression Level of Disease Section Compare with the Healthy Individual Tissue | p-value: 0.013793274; Fold-change: 0.367679686; Z-score: 0.683949118 | |
| Disease-specific Antigen Abundances |
|
Click to View the Clearer Original Diagram |
| Differential expression pattern of antigen in diseases | ||
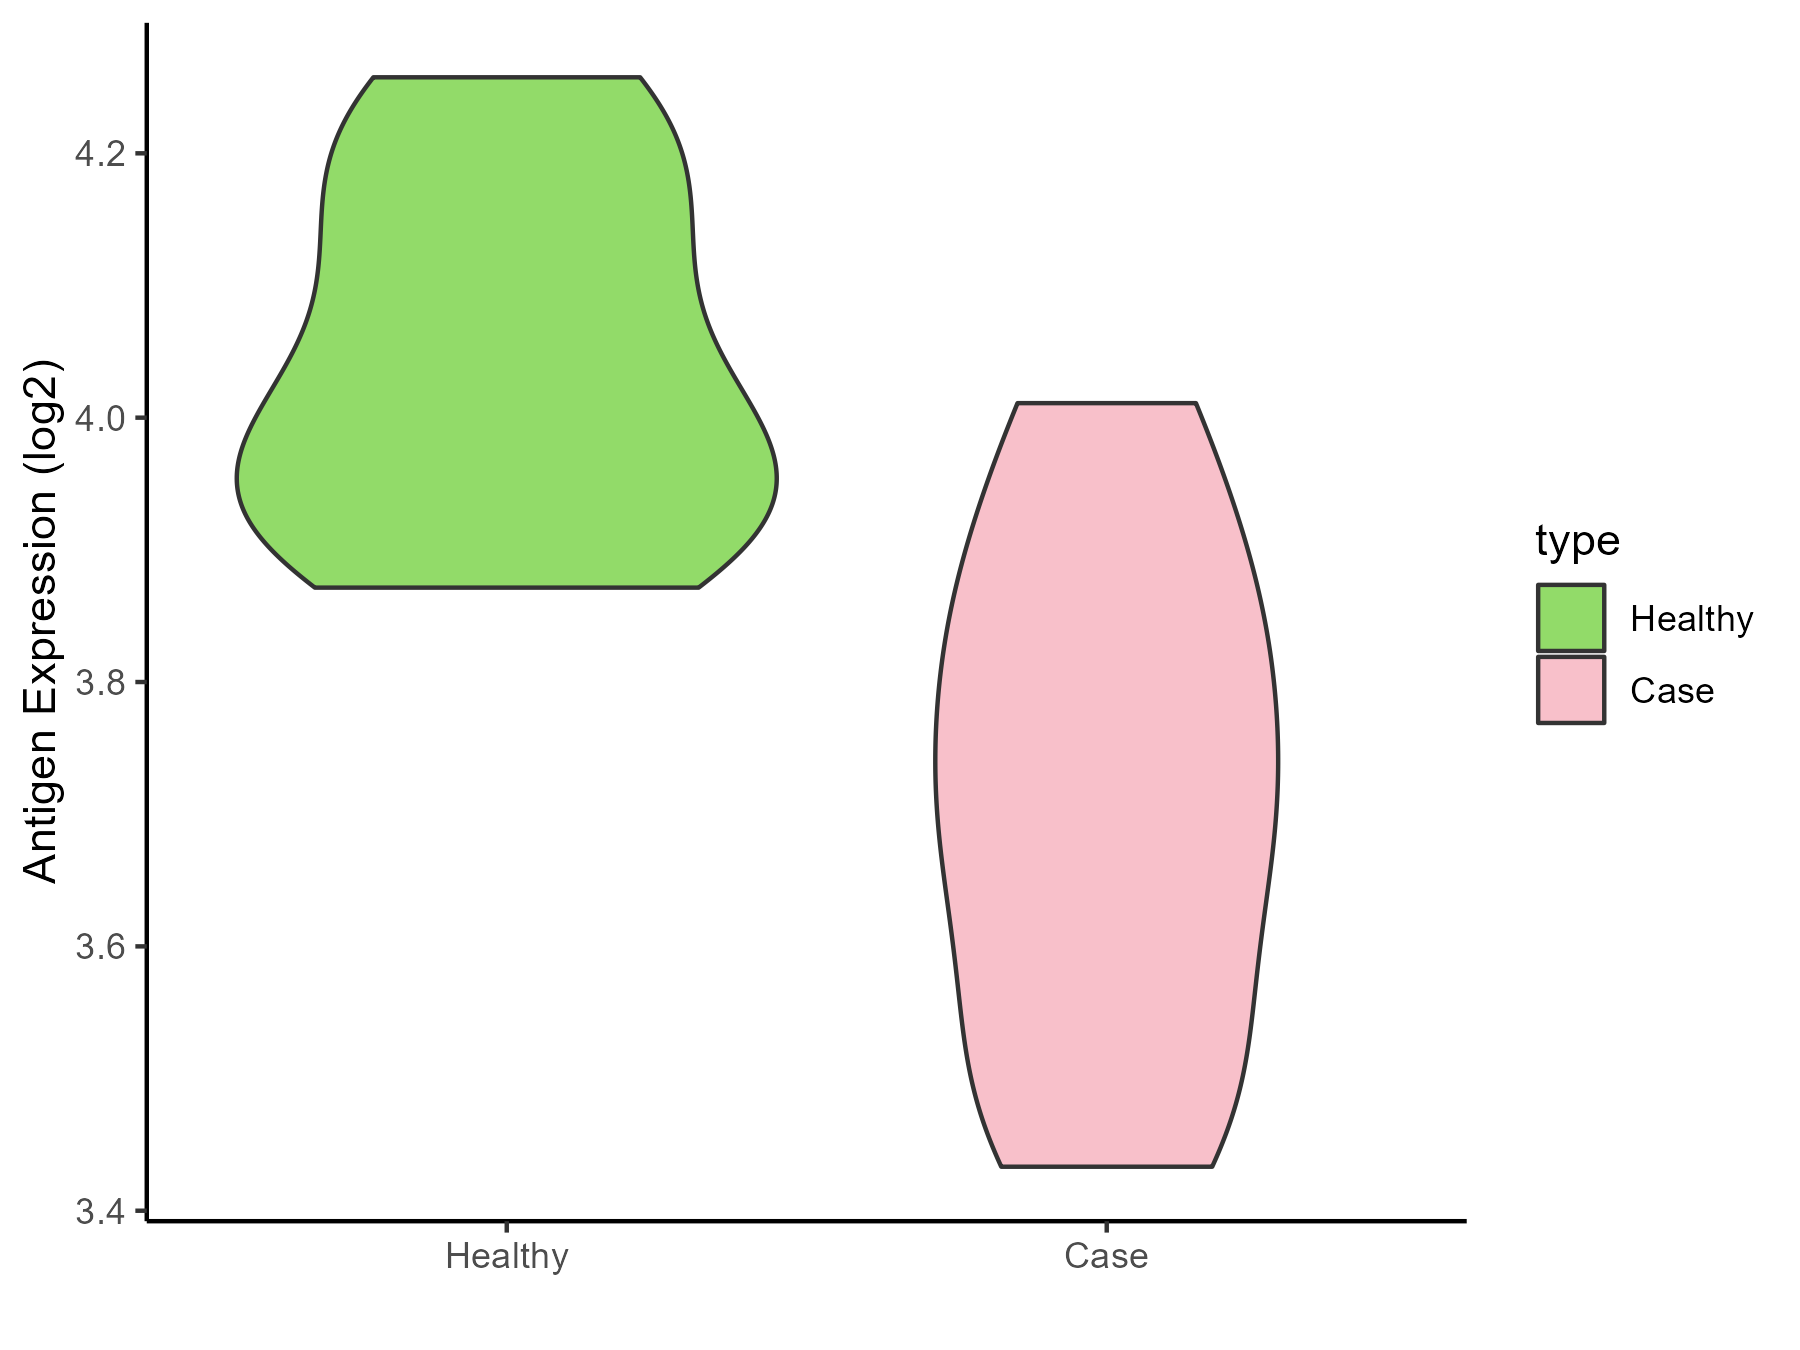
| The Studied Tissue | Uvea | |
| The Specific Disease | Retinoblastoma tumor | |
| The Expression Level of Disease Section Compare with the Healthy Individual Tissue | p-value: 2.81E-05; Fold-change: -0.310492699; Z-score: -2.339398516 | |
| Disease-specific Antigen Abundances |
|
Click to View the Clearer Original Diagram |
| Differential expression pattern of antigen in diseases | ||
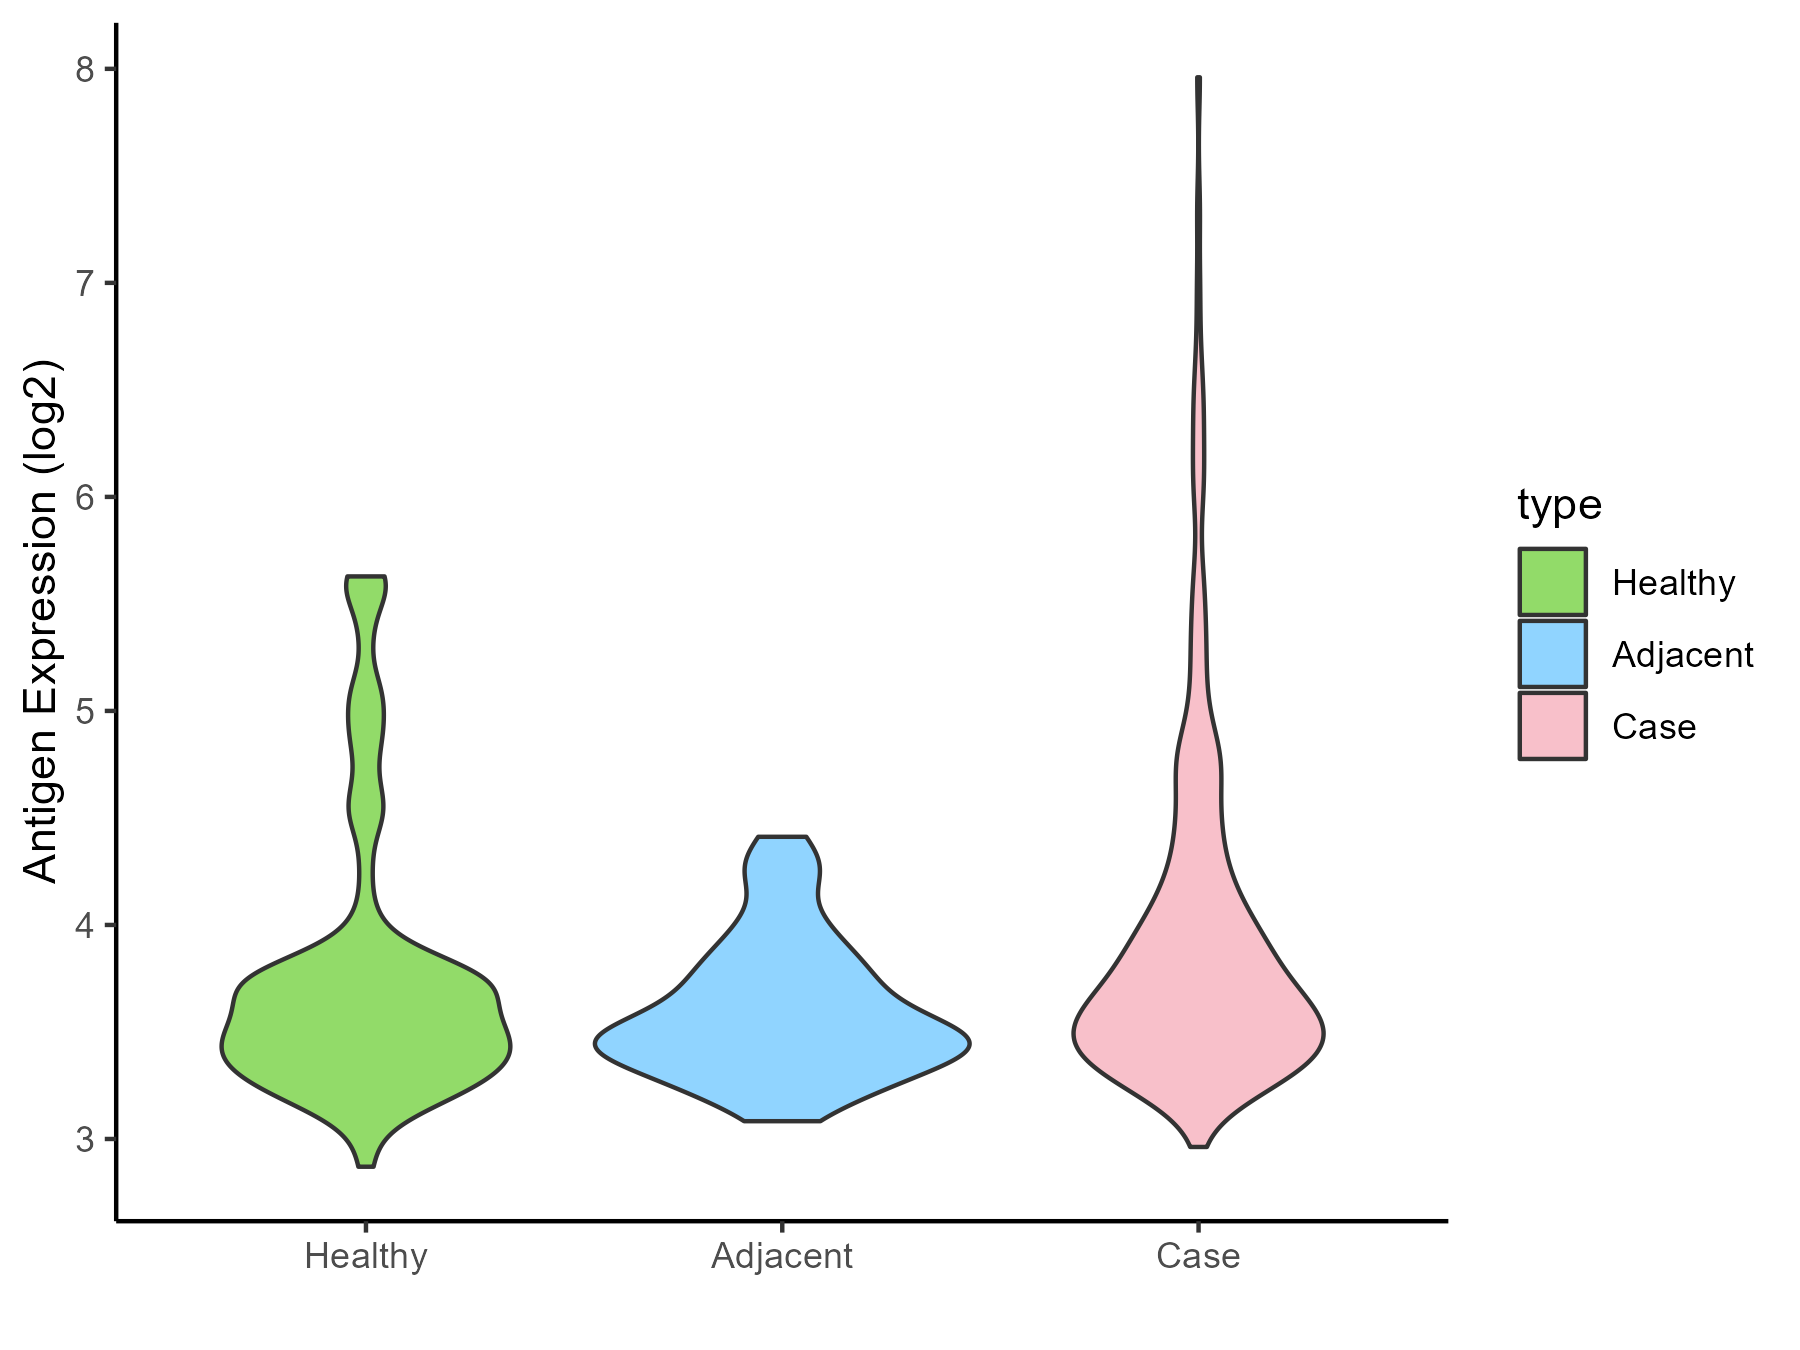
| The Studied Tissue | Thyroid | |
| The Specific Disease | Thyroid cancer | |
| The Expression Level of Disease Section Compare with the Healthy Individual Tissue | p-value: 0.014972388; Fold-change: 0.124933412; Z-score: 0.196747025 | |
| The Expression Level of Disease Section Compare with the Adjacent Tissue | p-value: 1.79E-06; Fold-change: 0.197782259; Z-score: 0.613781493 | |
| Disease-specific Antigen Abundances |
|
Click to View the Clearer Original Diagram |
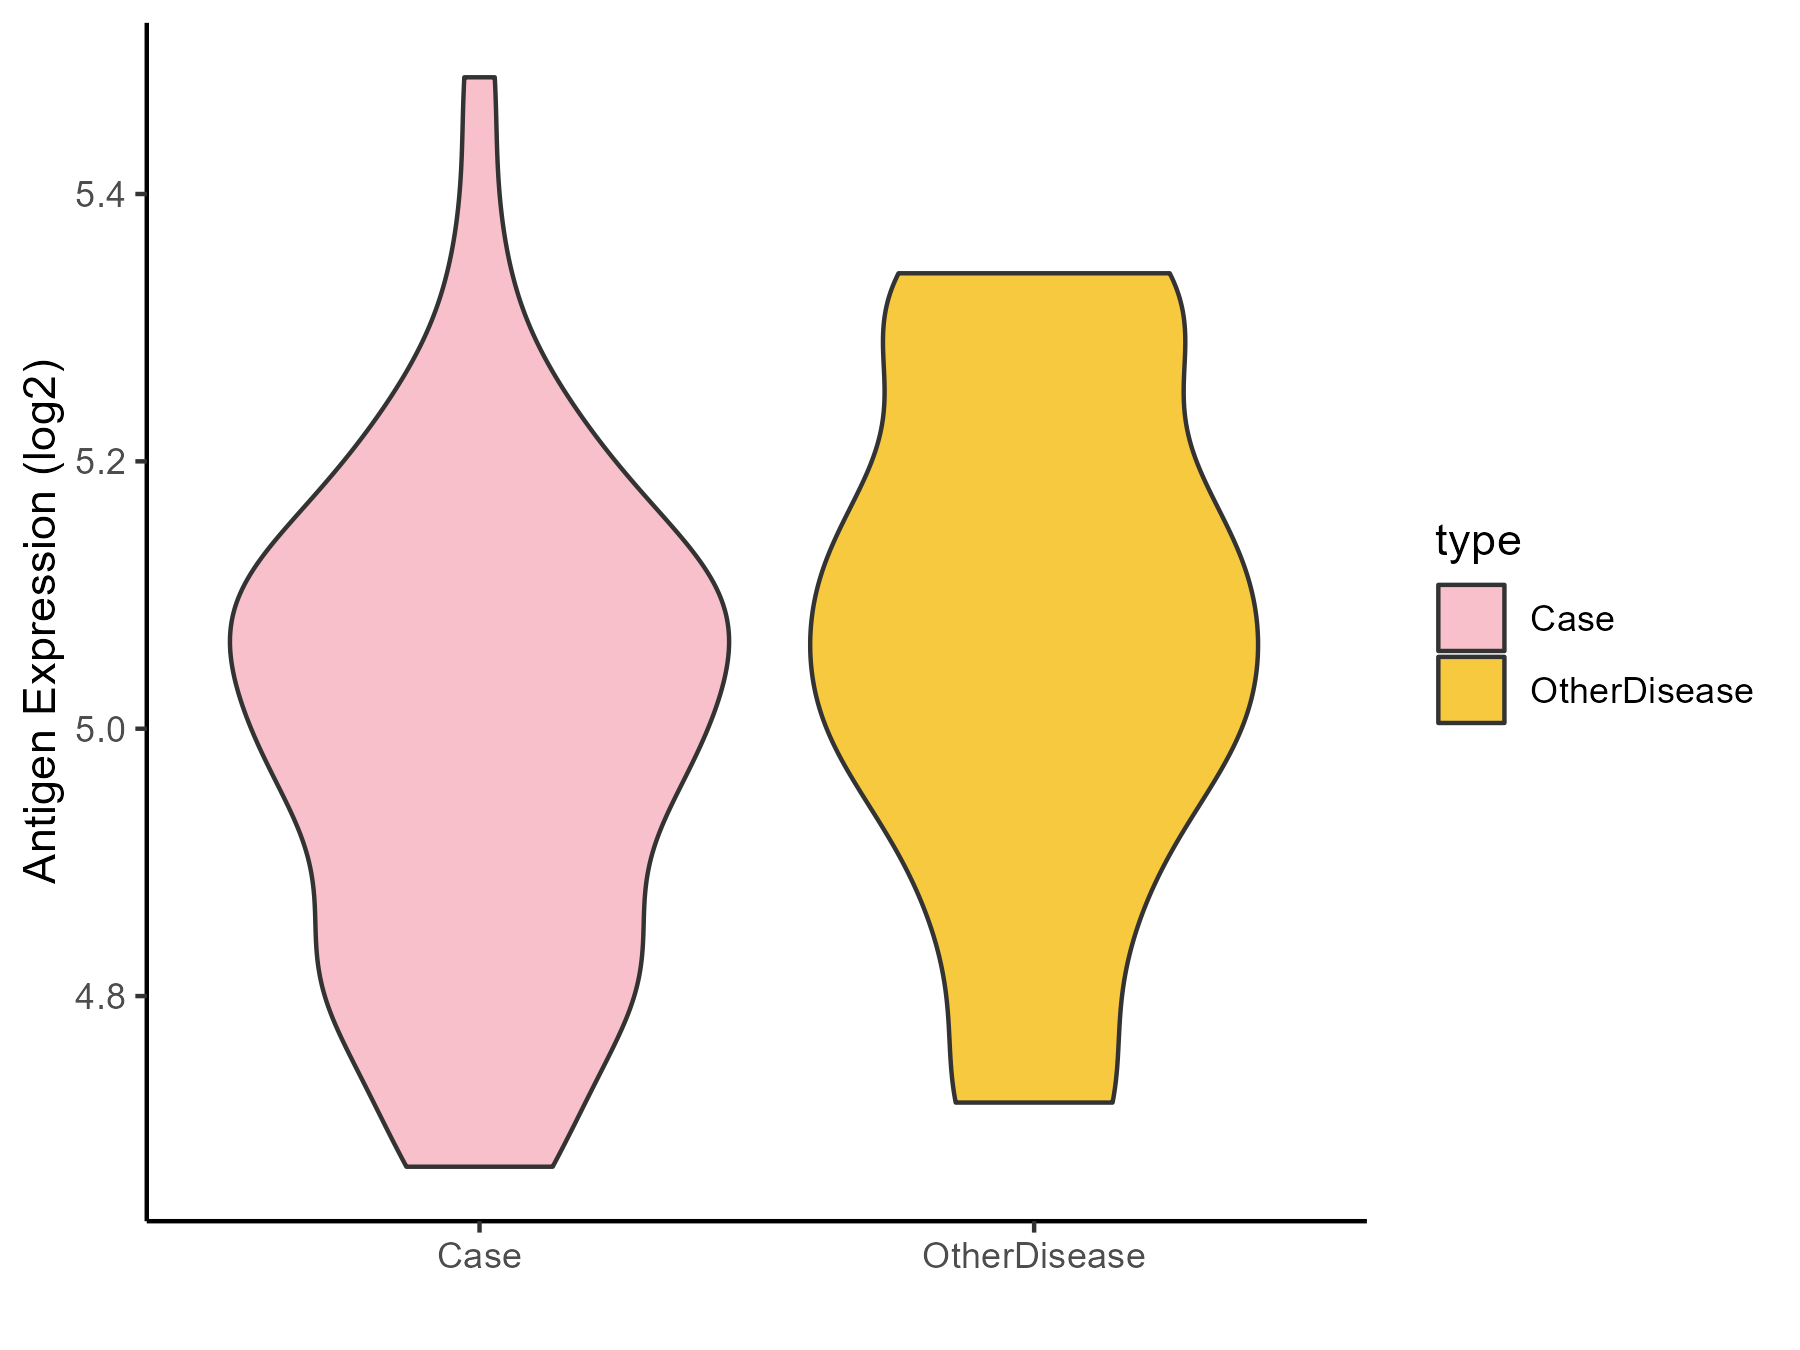
| Differential expression pattern of antigen in diseases | ||
| The Studied Tissue | Adrenal cortex | |
| The Specific Disease | Adrenocortical carcinoma | |
| The Expression Level of Disease Section Compare with the Other Disease Section | p-value: 0.173782937; Fold-change: -0.080842263; Z-score: -0.418334453 | |
| Disease-specific Antigen Abundances |
|
Click to View the Clearer Original Diagram |
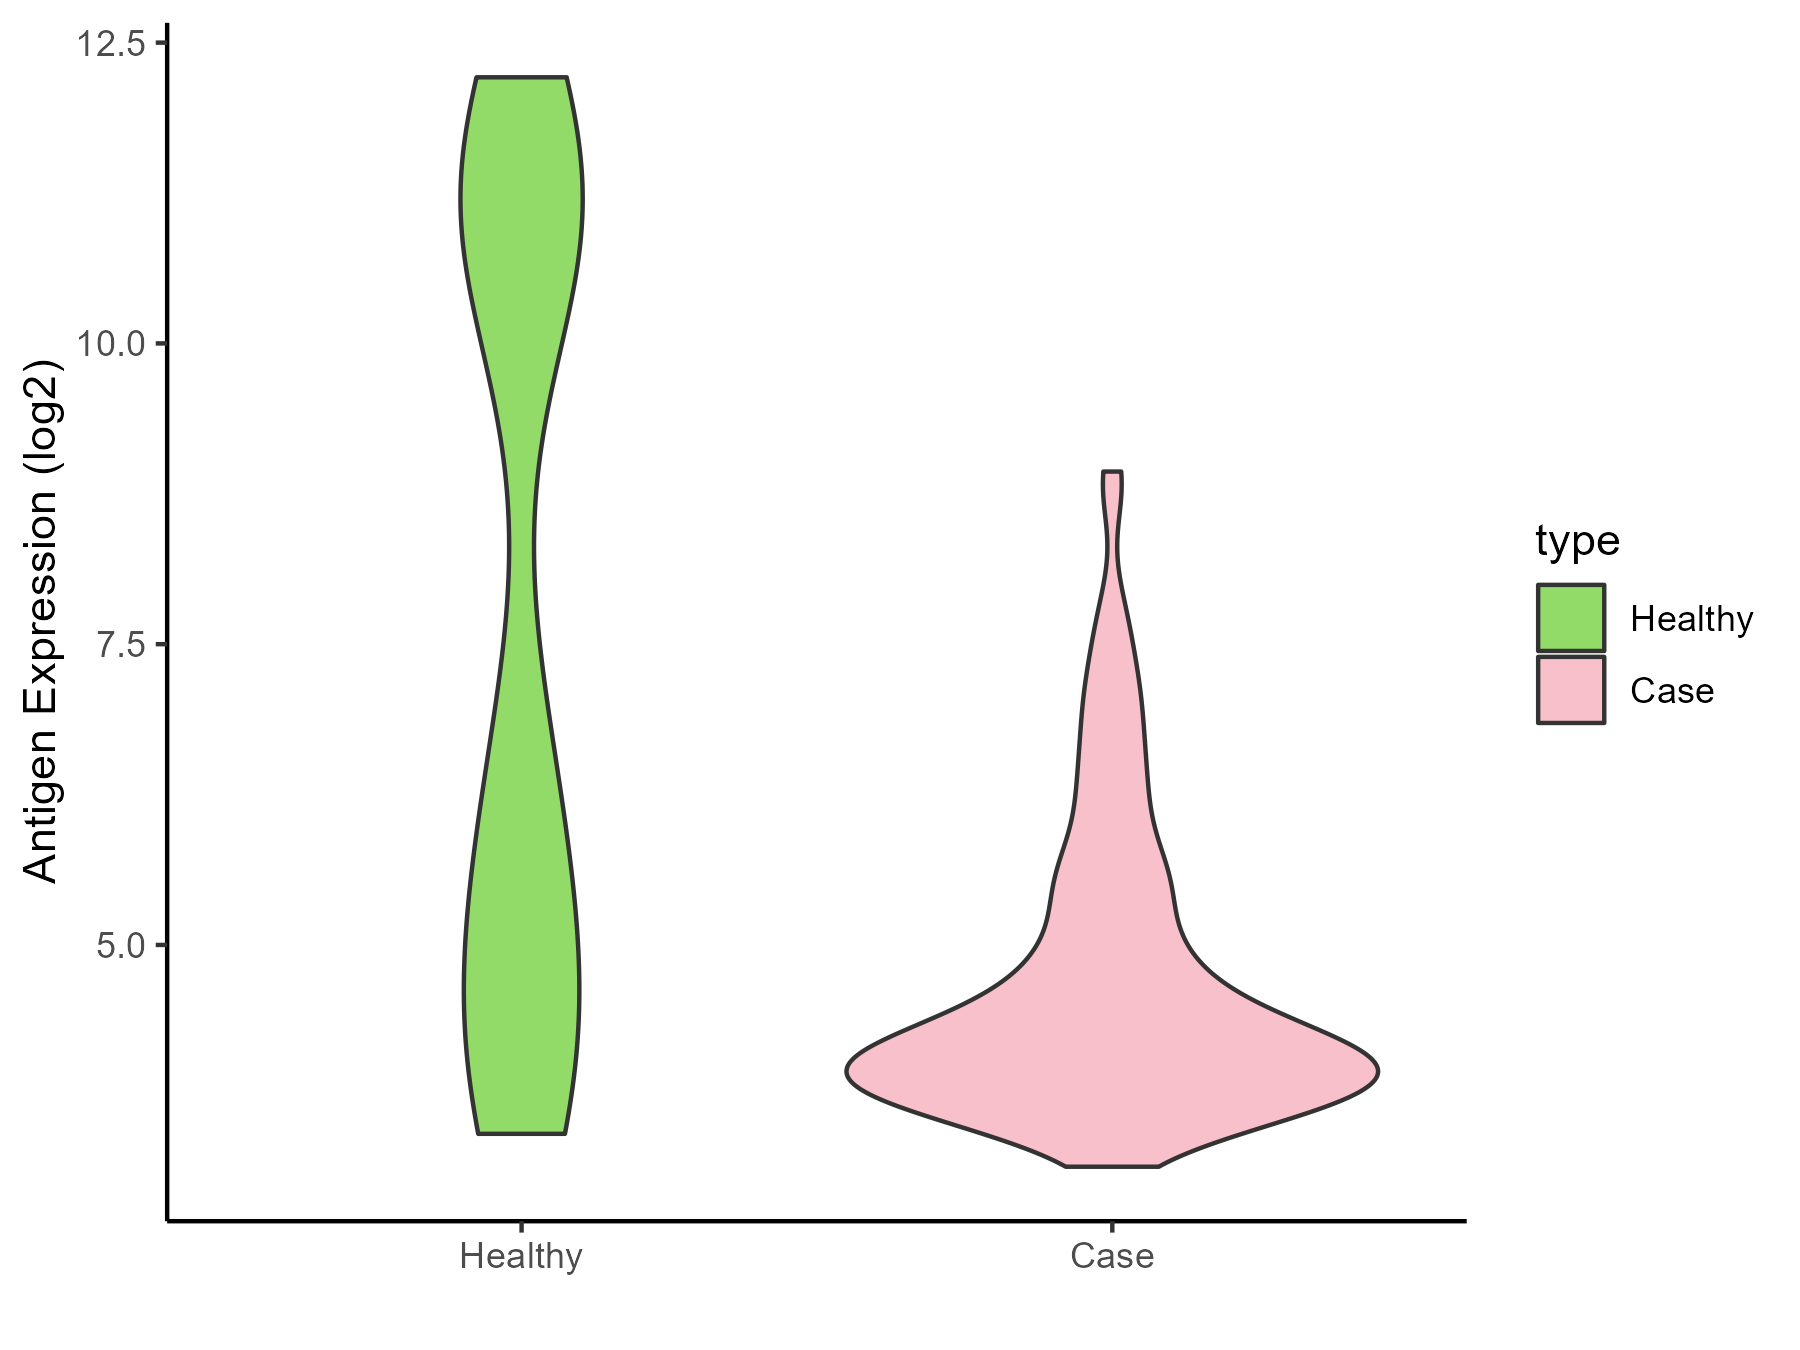
| Differential expression pattern of antigen in diseases | ||
| The Studied Tissue | Head and neck | |
| The Specific Disease | Head and neck cancer | |
| The Expression Level of Disease Section Compare with the Healthy Individual Tissue | p-value: 2.87E-13; Fold-change: -2.432426903; Z-score: -0.744775087 | |
| Disease-specific Antigen Abundances |
|
Click to View the Clearer Original Diagram |
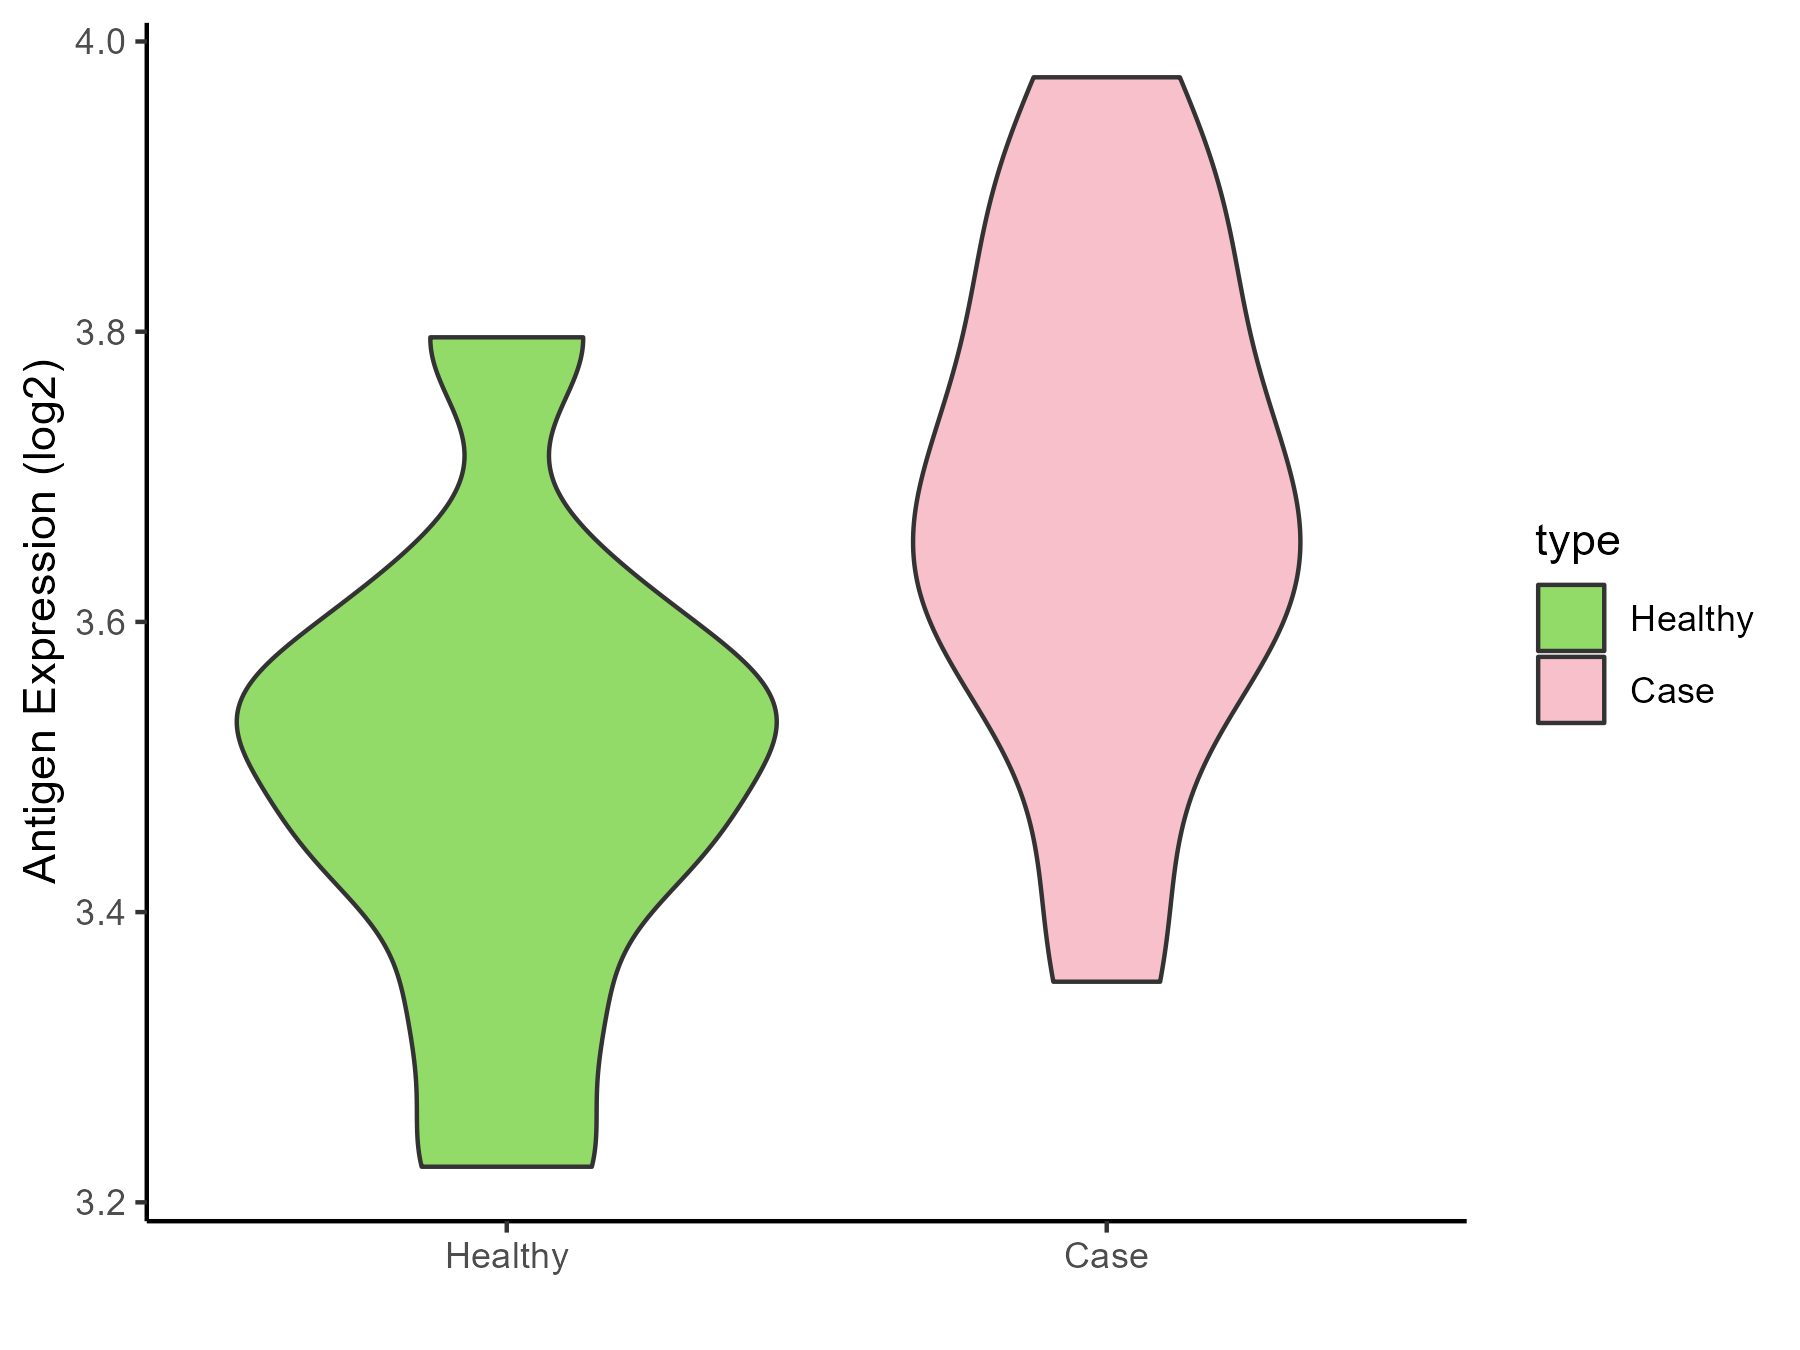
| Differential expression pattern of antigen in diseases | ||
| The Studied Tissue | Pituitary | |
| The Specific Disease | Pituitary gonadotrope tumor | |
| The Expression Level of Disease Section Compare with the Healthy Individual Tissue | p-value: 0.020154558; Fold-change: 0.158926189; Z-score: 0.958967287 | |
| Disease-specific Antigen Abundances |
|
Click to View the Clearer Original Diagram |
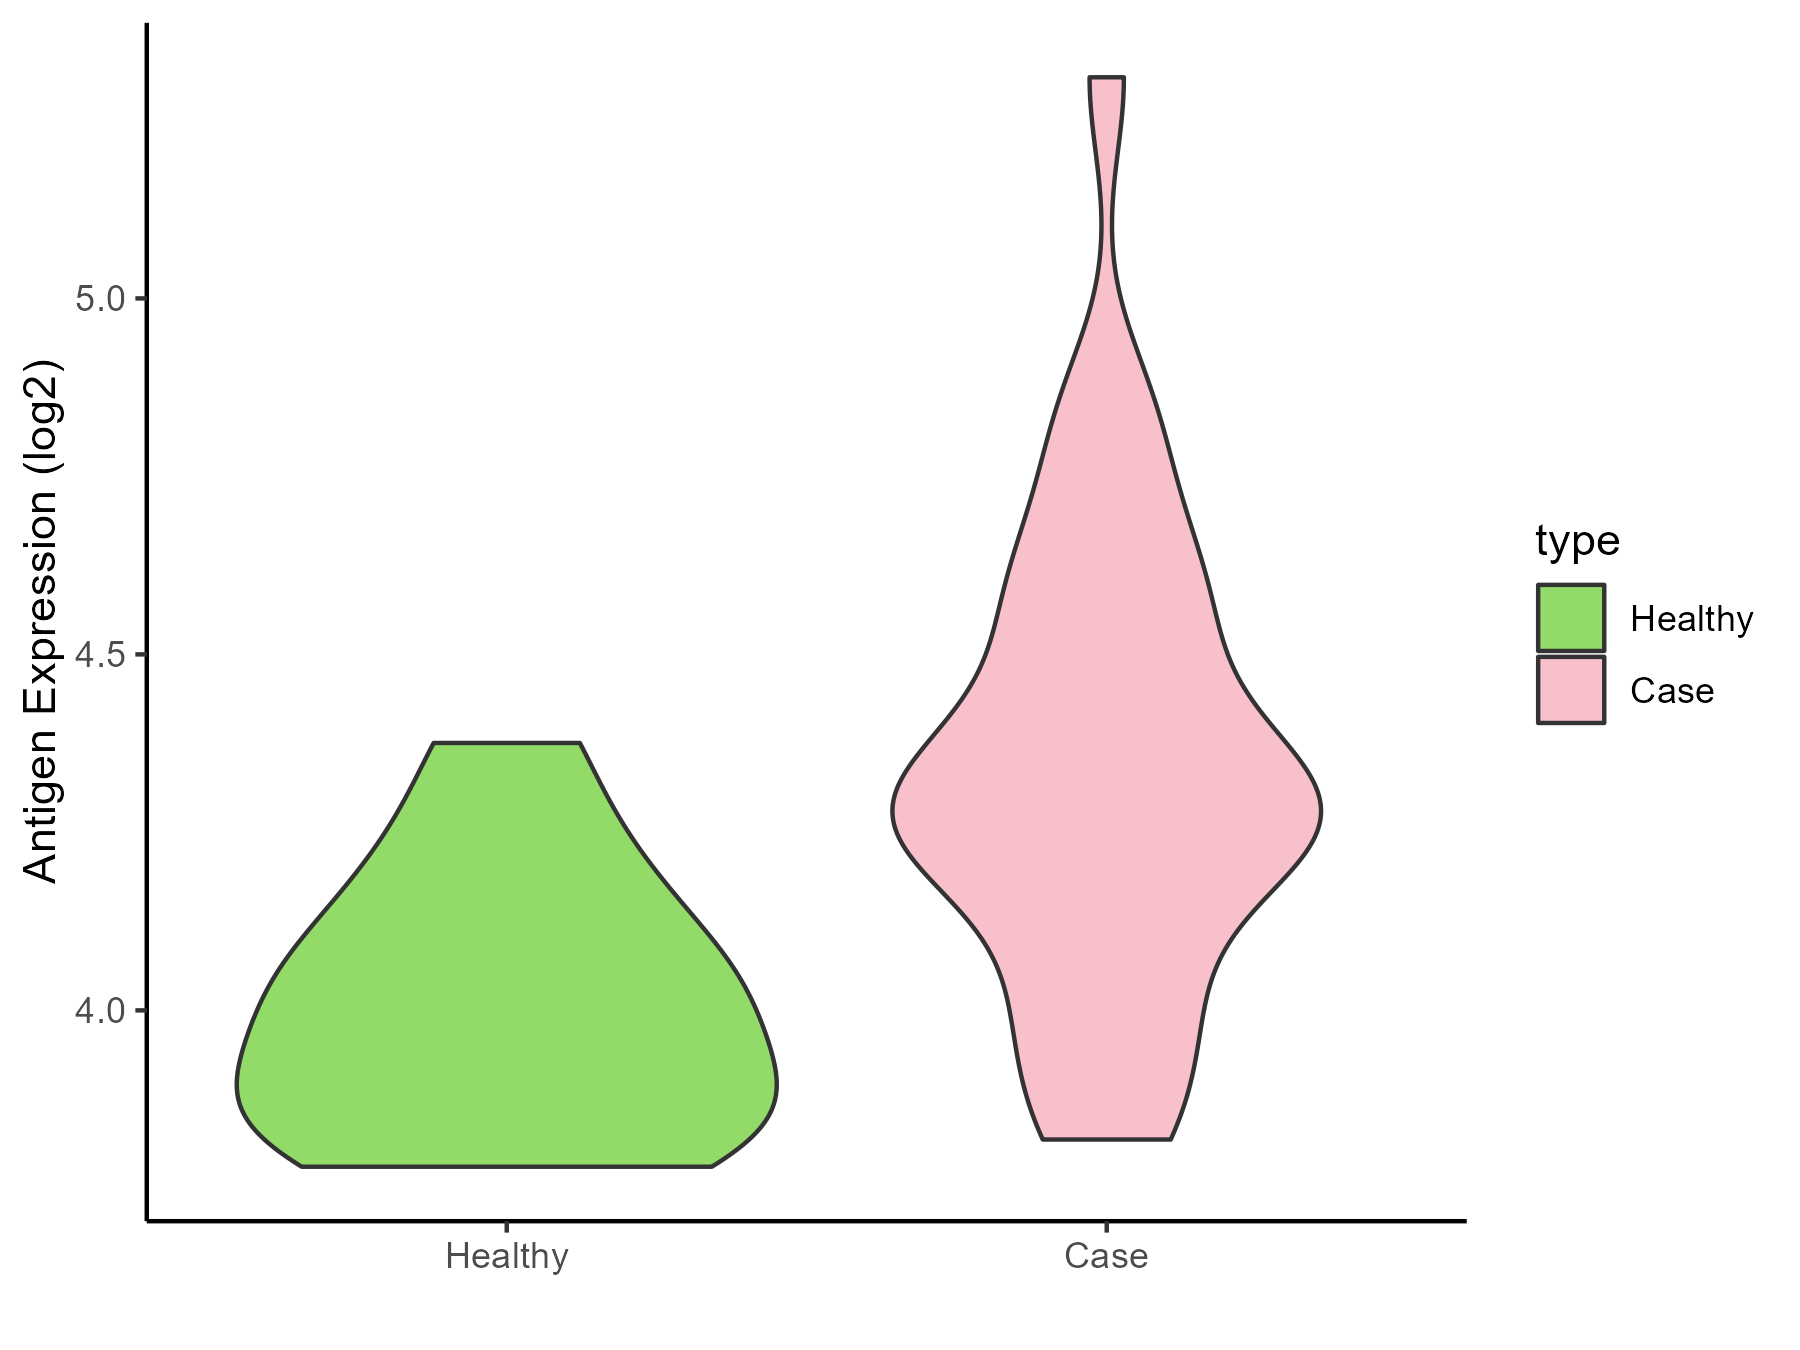
| The Studied Tissue | Pituitary | |
| The Specific Disease | Pituitary cancer | |
| The Expression Level of Disease Section Compare with the Healthy Individual Tissue | p-value: 0.000280246; Fold-change: 0.265112403; Z-score: 1.412860286 | |
| Disease-specific Antigen Abundances |
|
Click to View the Clearer Original Diagram |
ICD Disease Classification 03
| Differential expression pattern of antigen in diseases | ||
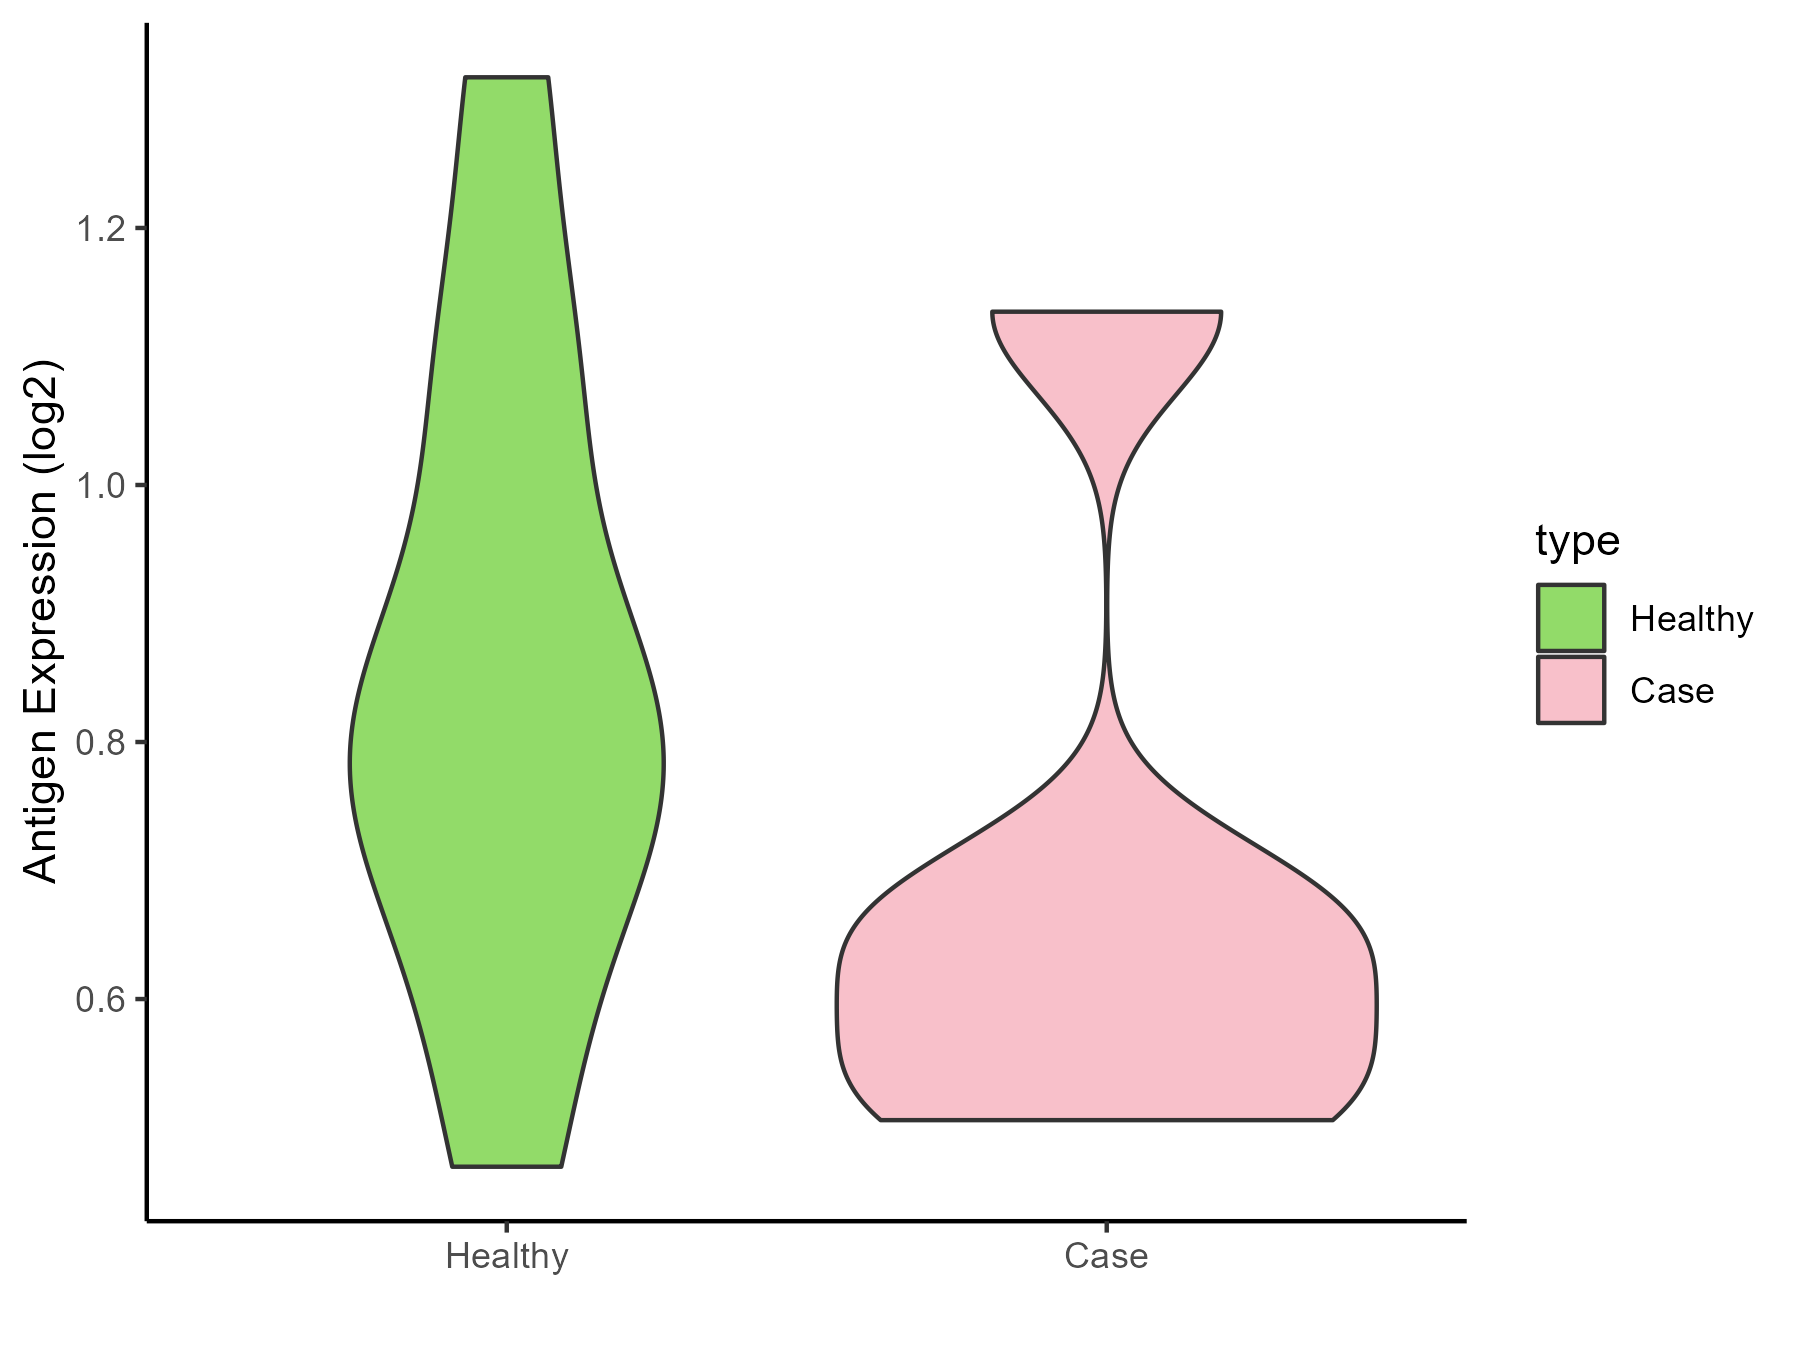
| The Studied Tissue | Whole blood | |
| The Specific Disease | Thrombocytopenia | |
| The Expression Level of Disease Section Compare with the Healthy Individual Tissue | p-value: 0.304637184; Fold-change: -0.165259712; Z-score: -0.659030068 | |
| Disease-specific Antigen Abundances |
|
Click to View the Clearer Original Diagram |
ICD Disease Classification 04
| Differential expression pattern of antigen in diseases | ||
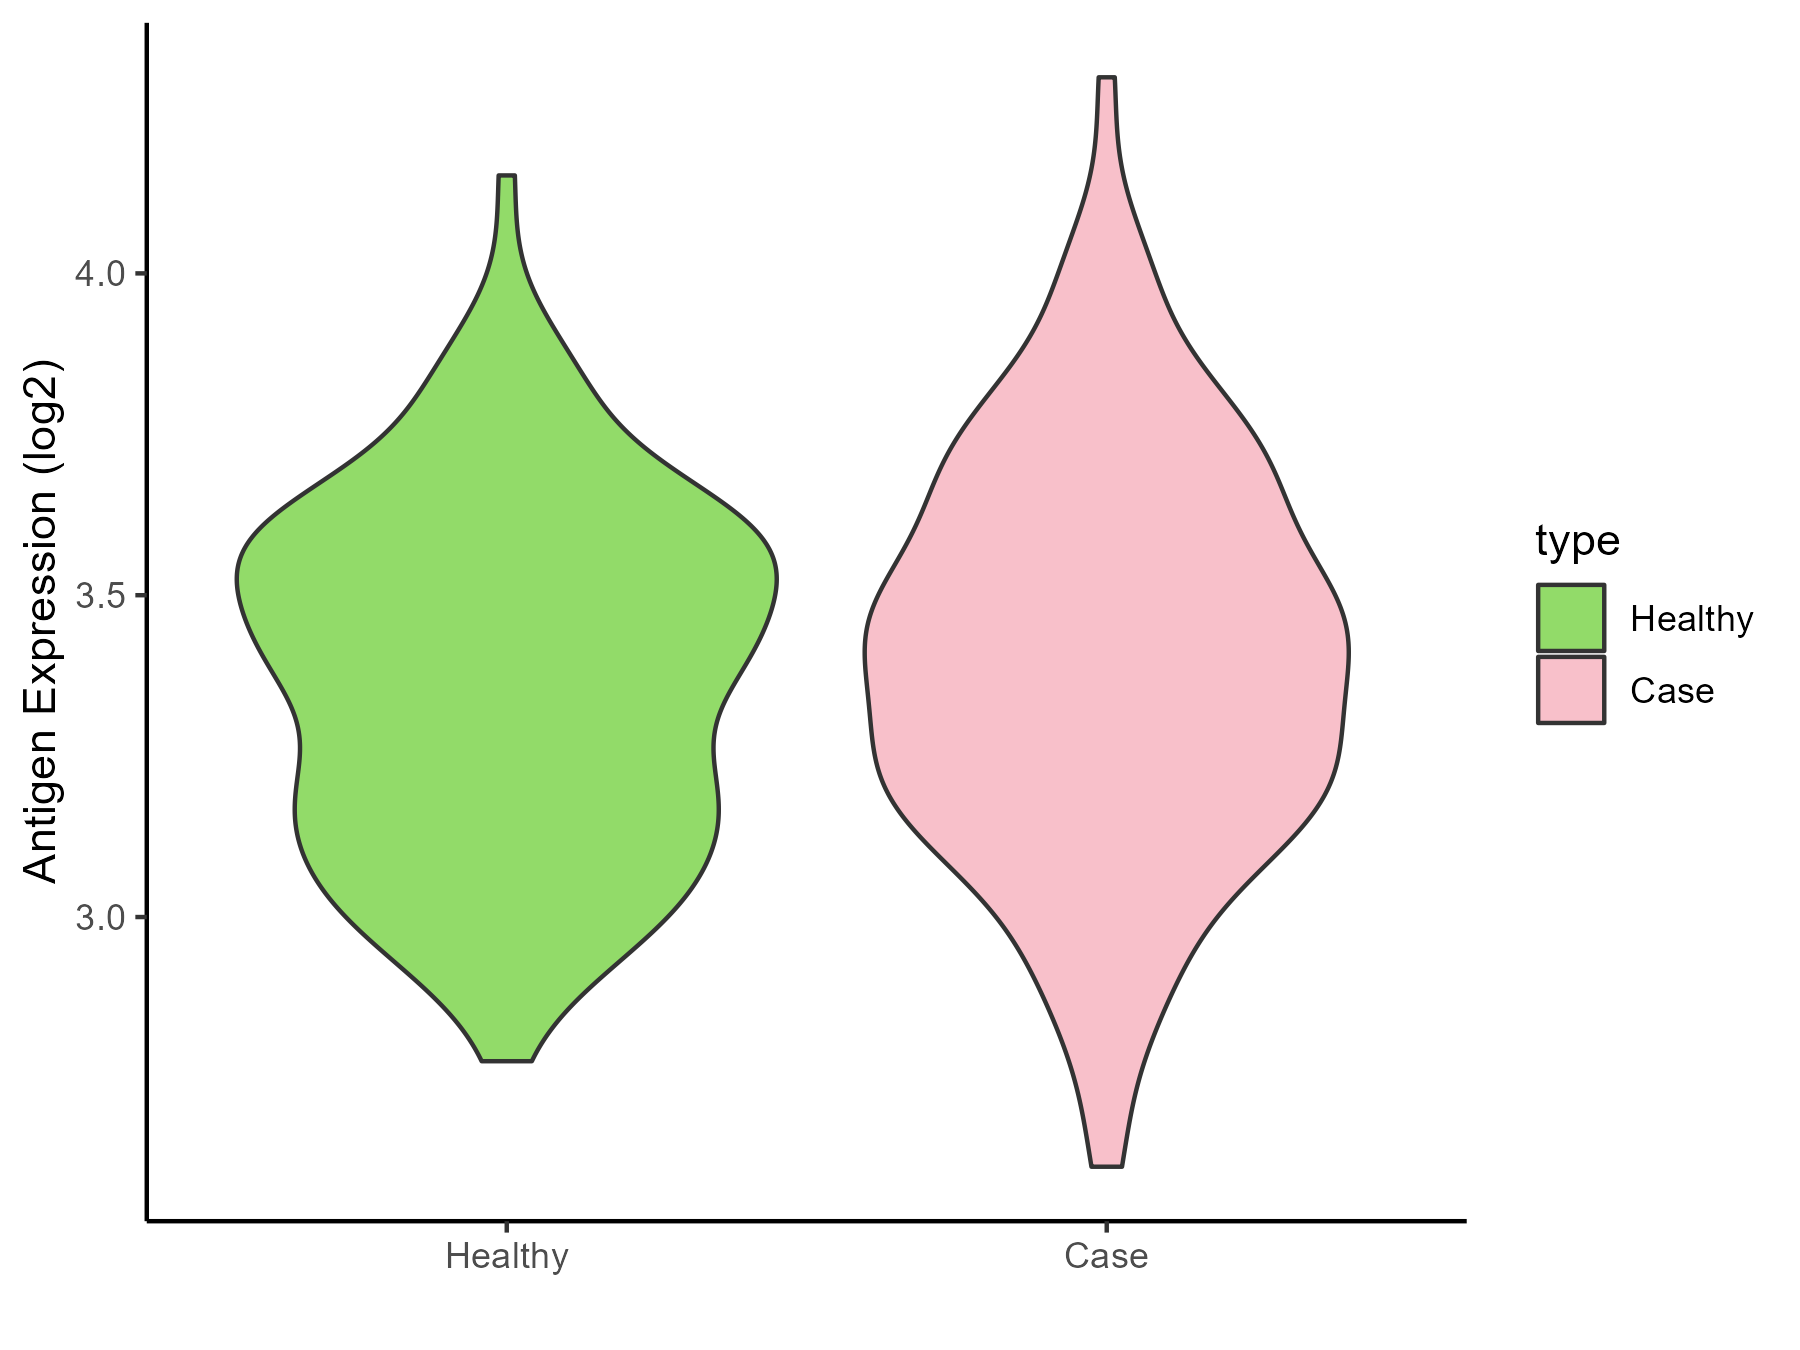
| The Studied Tissue | Whole blood | |
| The Specific Disease | Lupus erythematosus | |
| The Expression Level of Disease Section Compare with the Healthy Individual Tissue | p-value: 0.392856343; Fold-change: -0.002819771; Z-score: -0.010349637 | |
| Disease-specific Antigen Abundances |
|
Click to View the Clearer Original Diagram |
| Differential expression pattern of antigen in diseases | ||
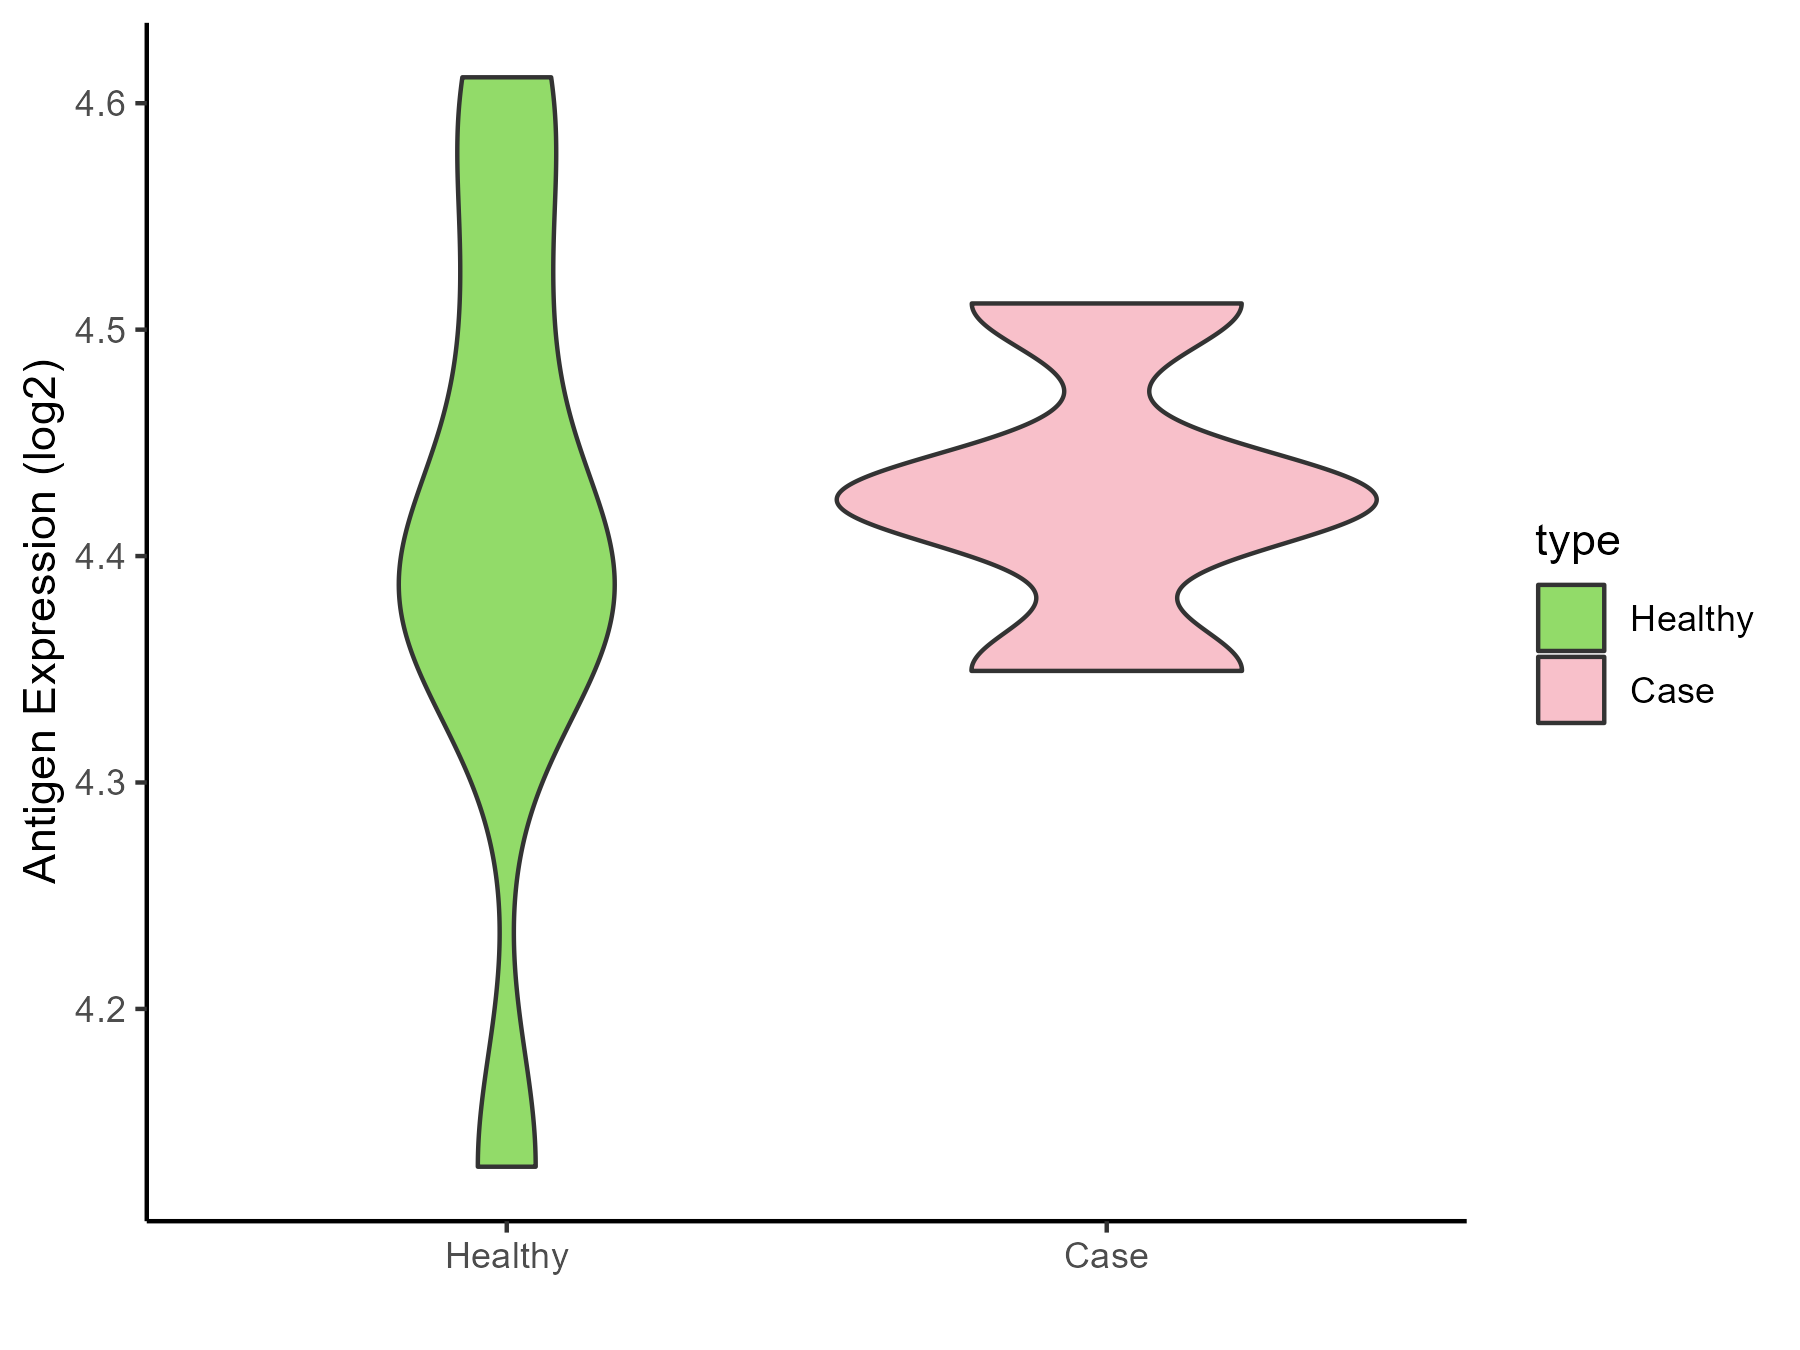
| The Studied Tissue | Peripheral monocyte | |
| The Specific Disease | Autoimmune uveitis | |
| The Expression Level of Disease Section Compare with the Healthy Individual Tissue | p-value: 0.706029957; Fold-change: 0.035446841; Z-score: 0.246398098 | |
| Disease-specific Antigen Abundances |
|
Click to View the Clearer Original Diagram |
ICD Disease Classification 05
| Differential expression pattern of antigen in diseases | ||
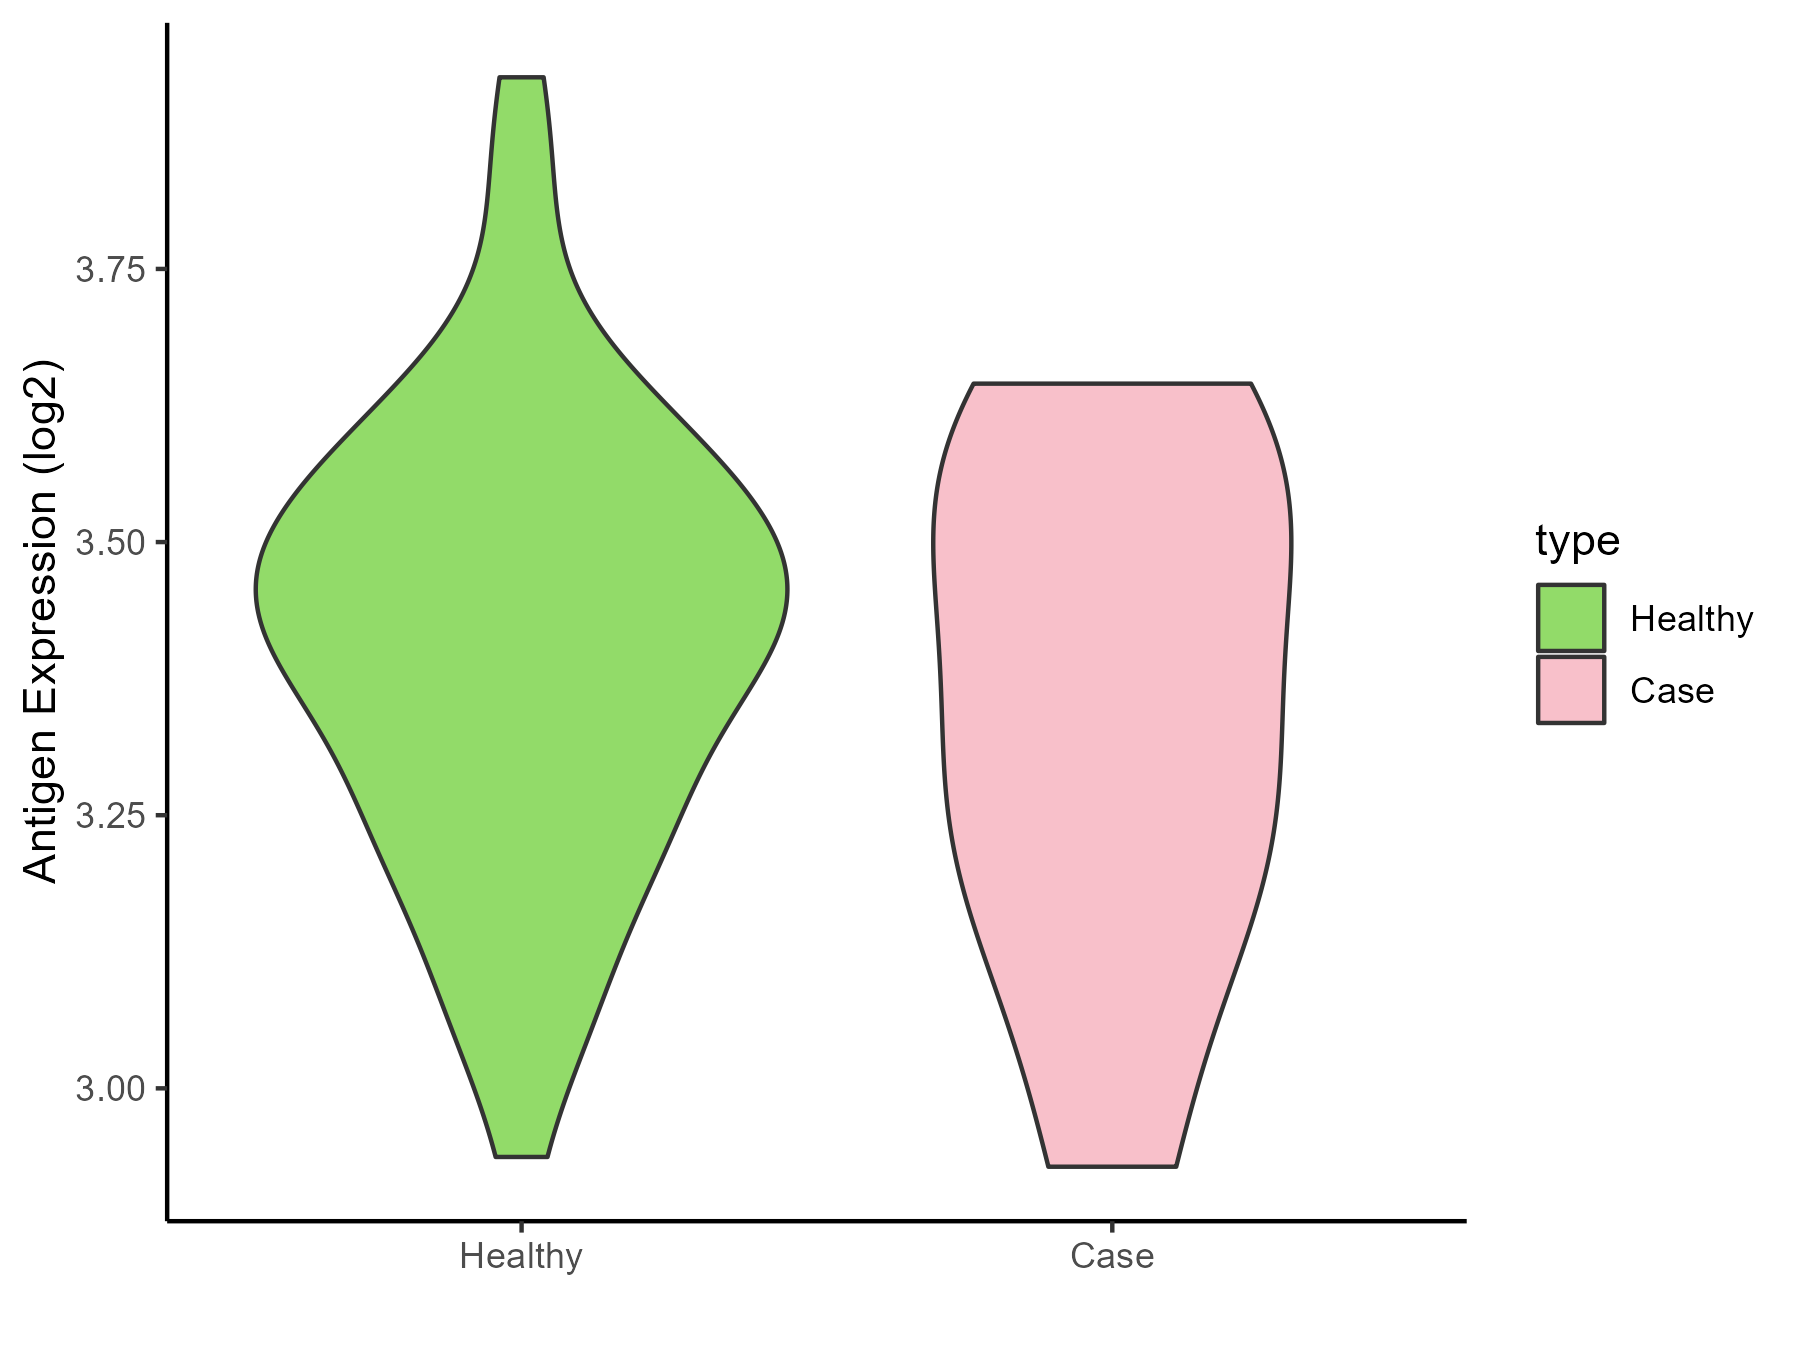
| The Studied Tissue | Whole blood | |
| The Specific Disease | Familial hypercholesterolemia | |
| The Expression Level of Disease Section Compare with the Healthy Individual Tissue | p-value: 0.467403103; Fold-change: -0.082020708; Z-score: -0.406352805 | |
| Disease-specific Antigen Abundances |
|
Click to View the Clearer Original Diagram |
ICD Disease Classification 06
| Differential expression pattern of antigen in diseases | ||
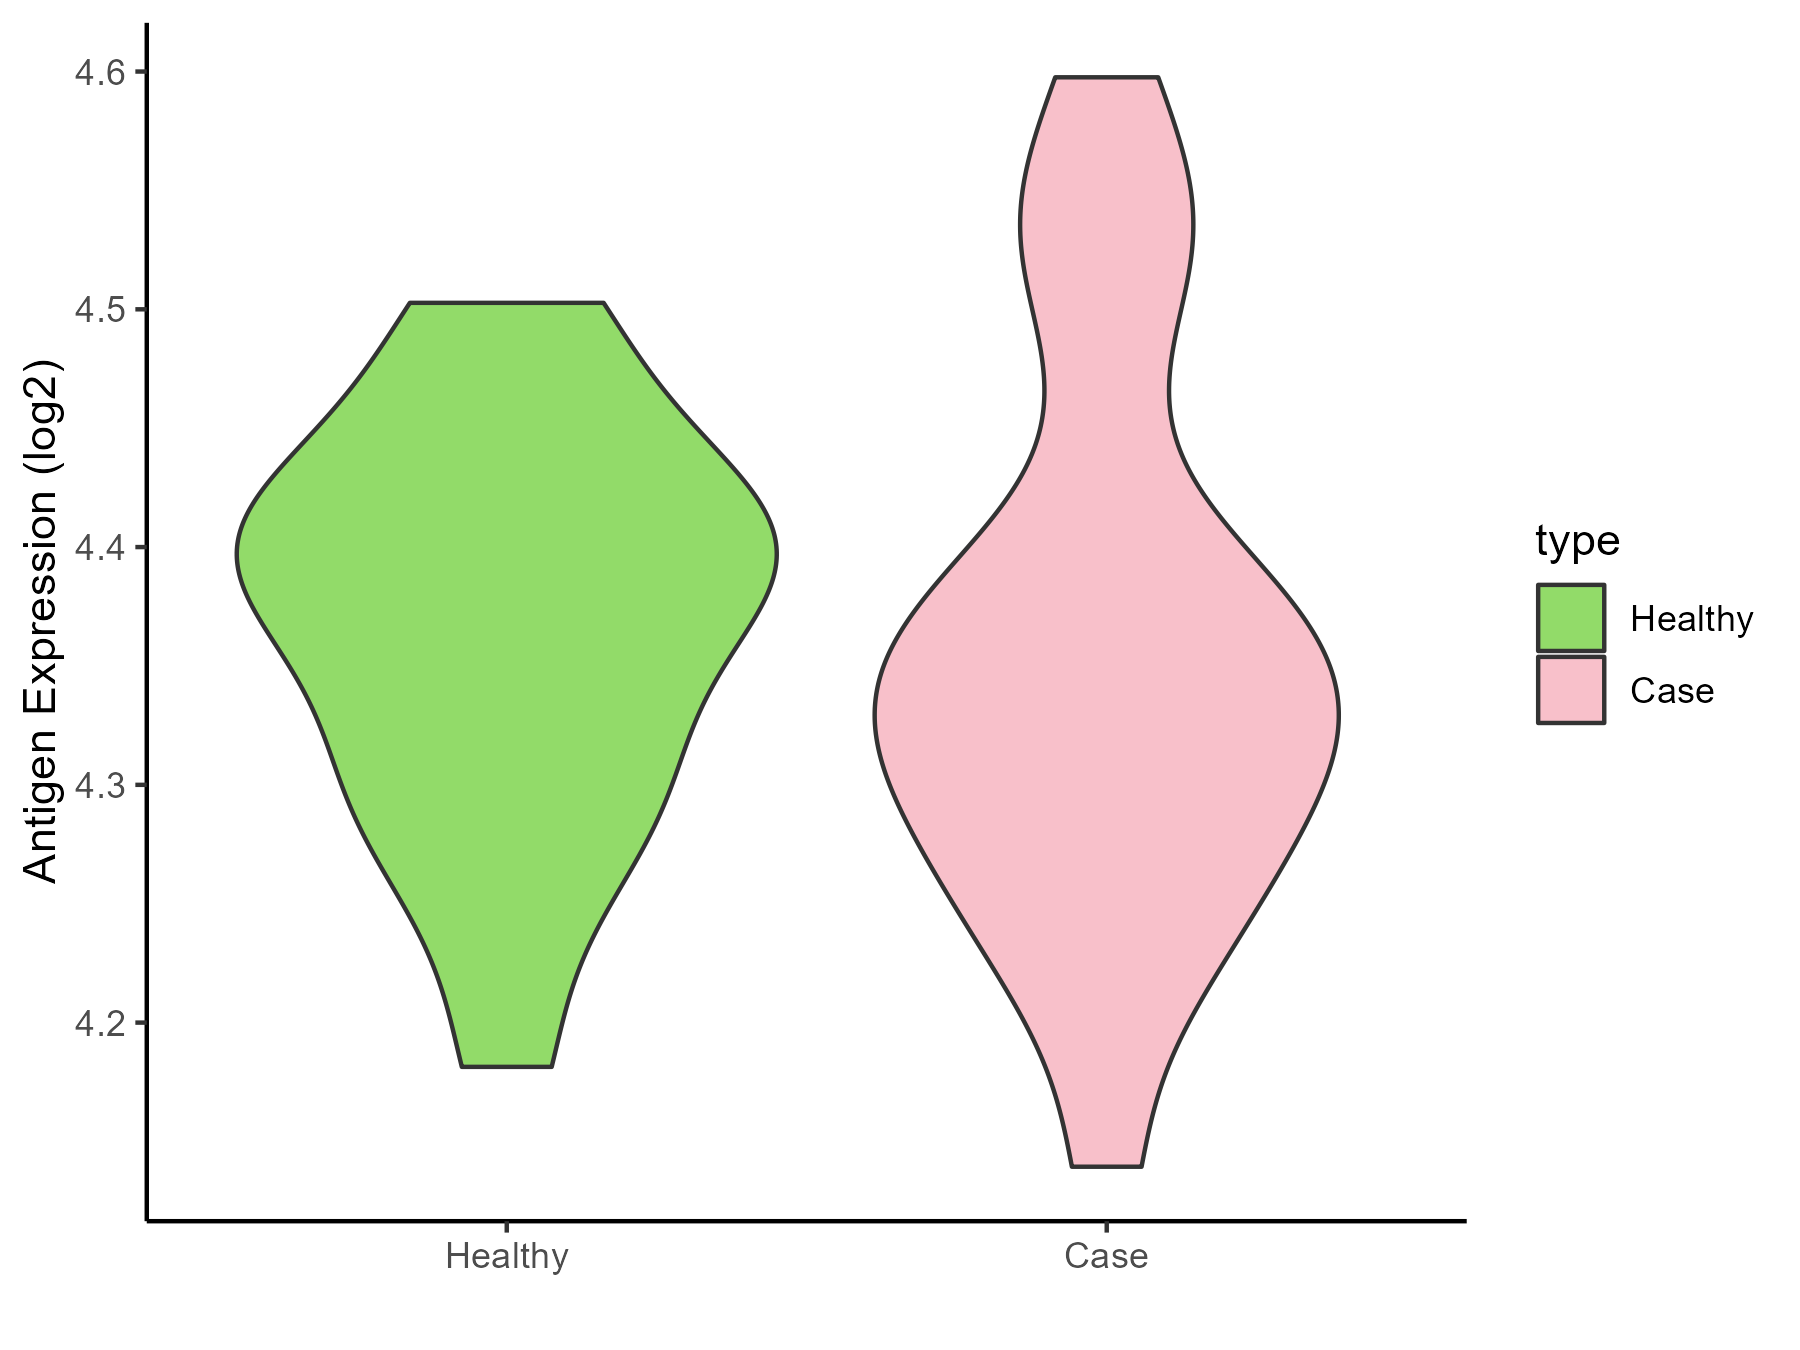
| The Studied Tissue | Superior temporal cortex | |
| The Specific Disease | Schizophrenia | |
| The Expression Level of Disease Section Compare with the Healthy Individual Tissue | p-value: 0.70540473; Fold-change: -0.045797134; Z-score: -0.537251542 | |
| Disease-specific Antigen Abundances |
|
Click to View the Clearer Original Diagram |
ICD Disease Classification 08
| Differential expression pattern of antigen in diseases | ||
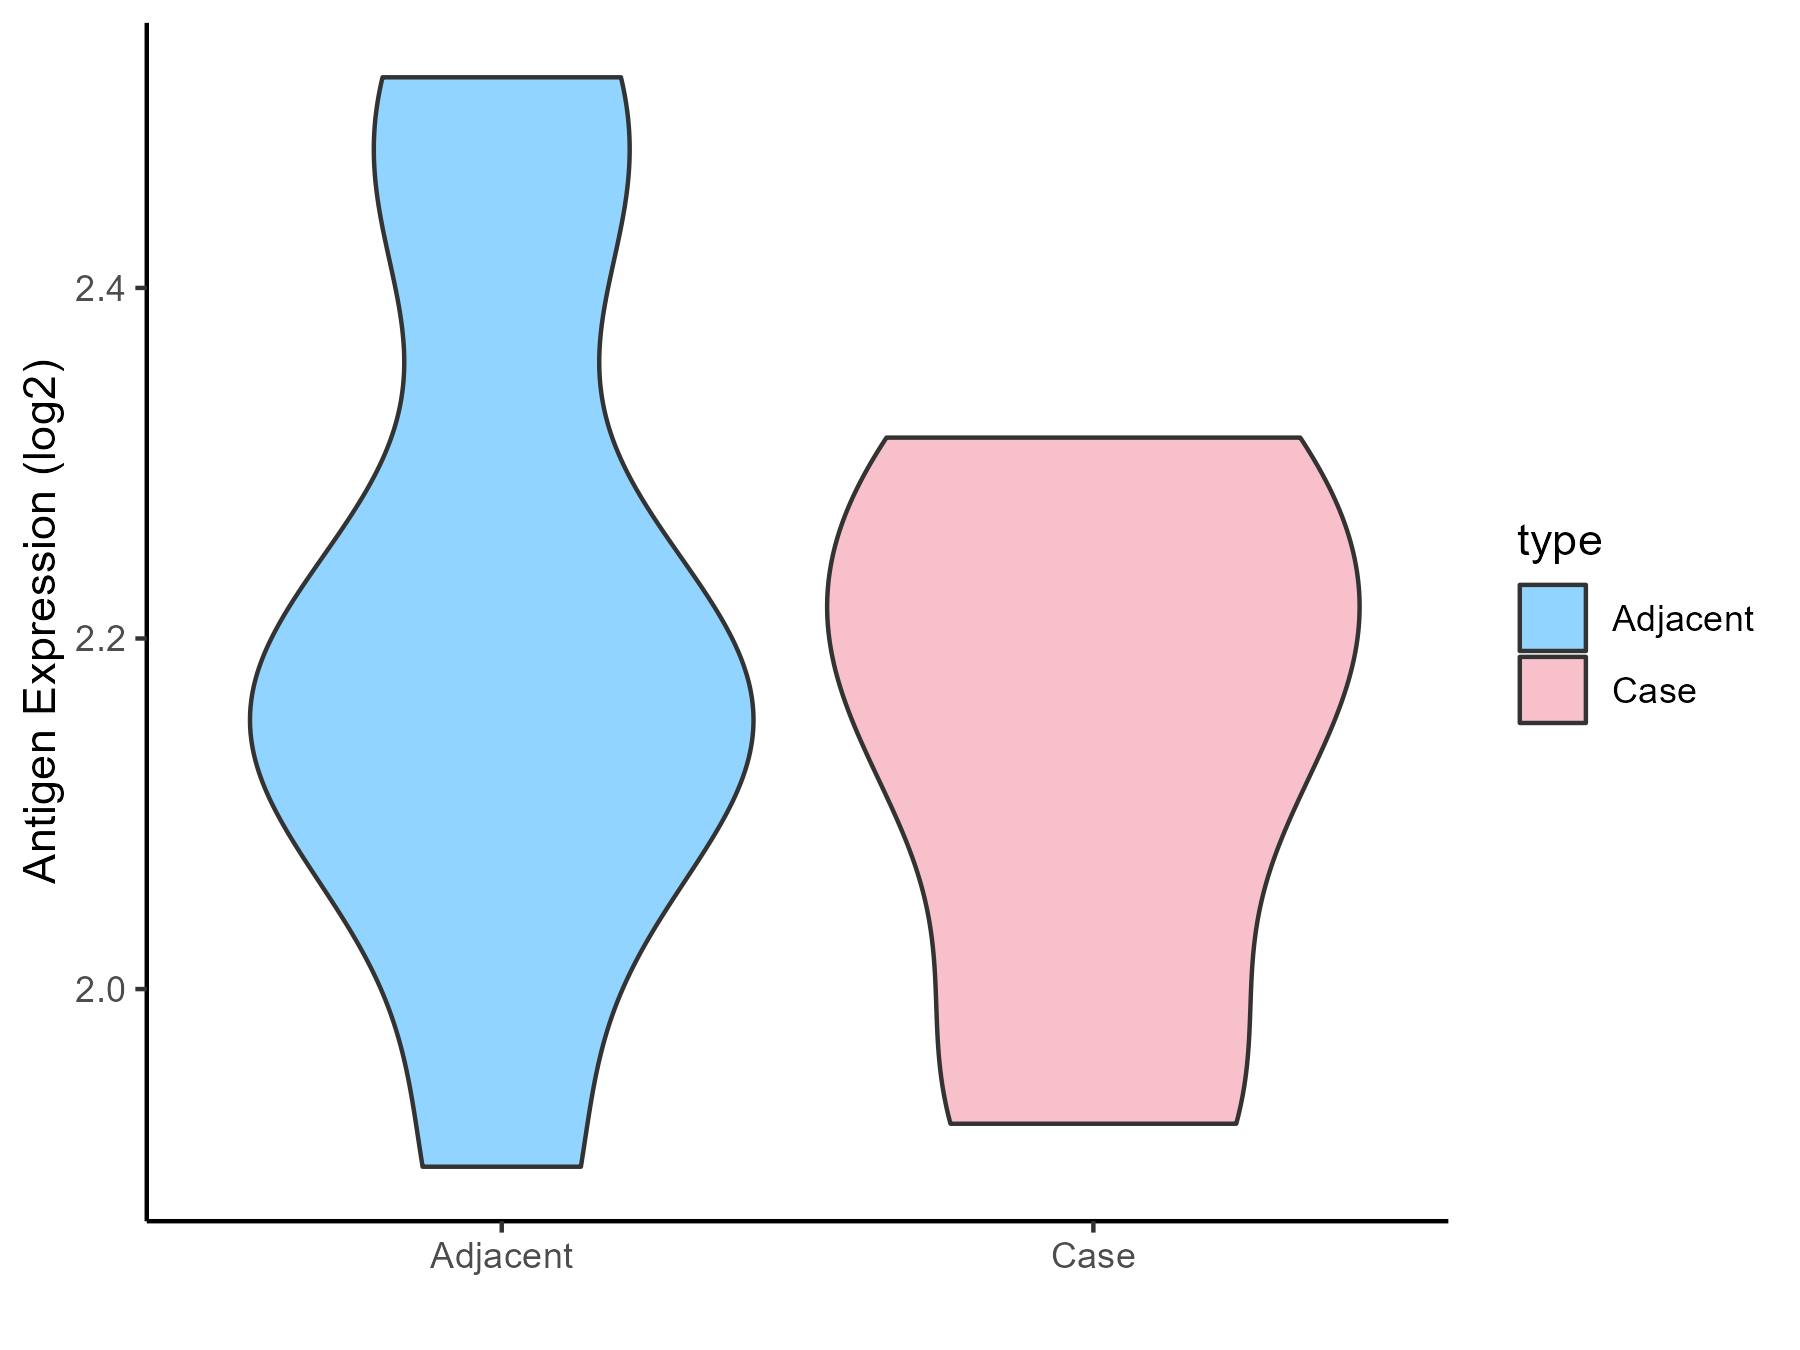
| The Studied Tissue | Spinal cord | |
| The Specific Disease | Multiple sclerosis | |
| The Expression Level of Disease Section Compare with the Adjacent Tissue | p-value: 0.496186496; Fold-change: -0.022905267; Z-score: -0.108427759 | |
| Disease-specific Antigen Abundances |
|
Click to View the Clearer Original Diagram |
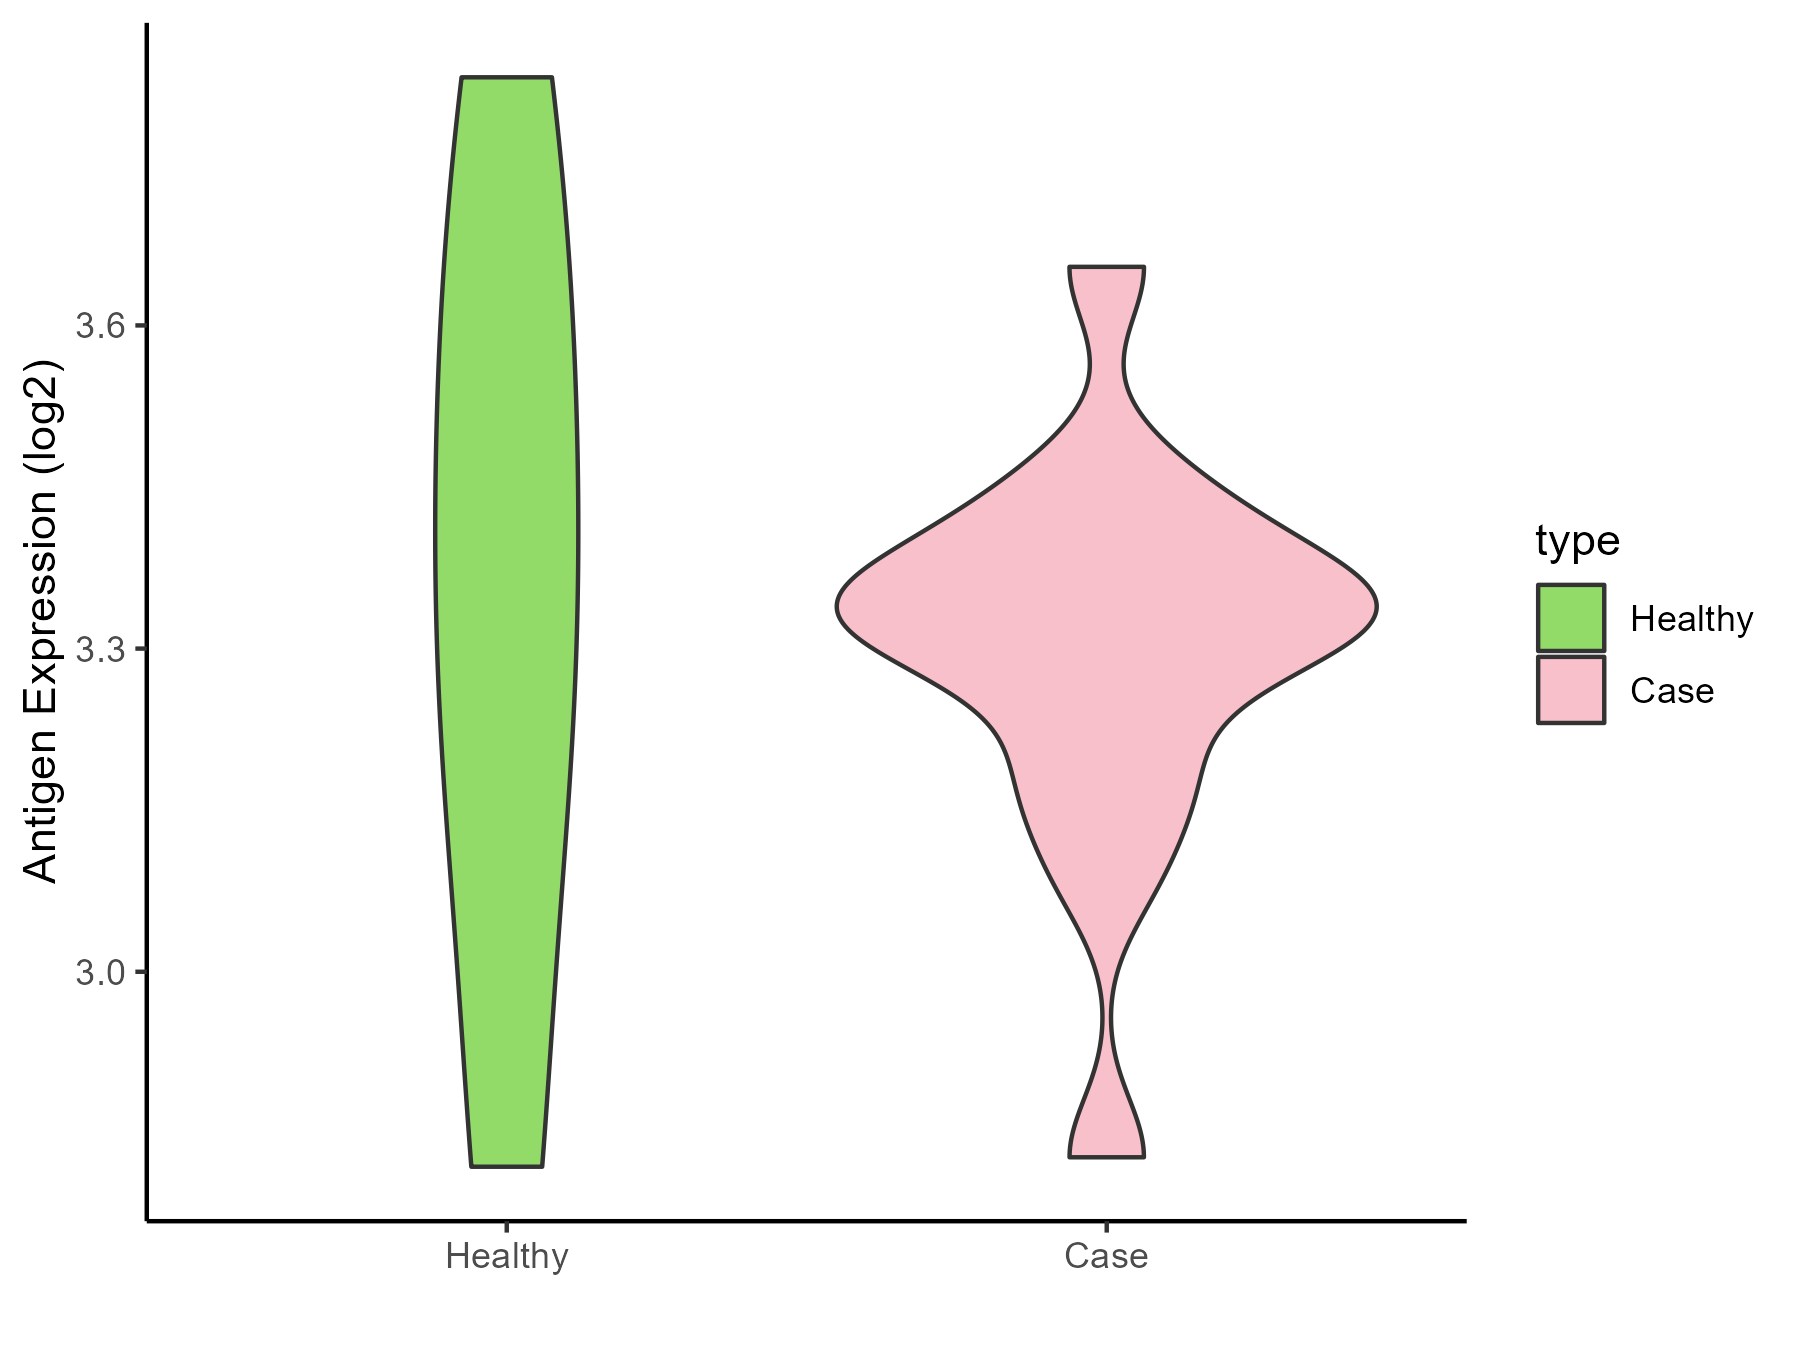
| The Studied Tissue | Plasmacytoid dendritic cells | |
| The Specific Disease | Multiple sclerosis | |
| The Expression Level of Disease Section Compare with the Healthy Individual Tissue | p-value: 0.725887013; Fold-change: -0.038865242; Z-score: -0.107253197 | |
| Disease-specific Antigen Abundances |
|
Click to View the Clearer Original Diagram |
| Differential expression pattern of antigen in diseases | ||
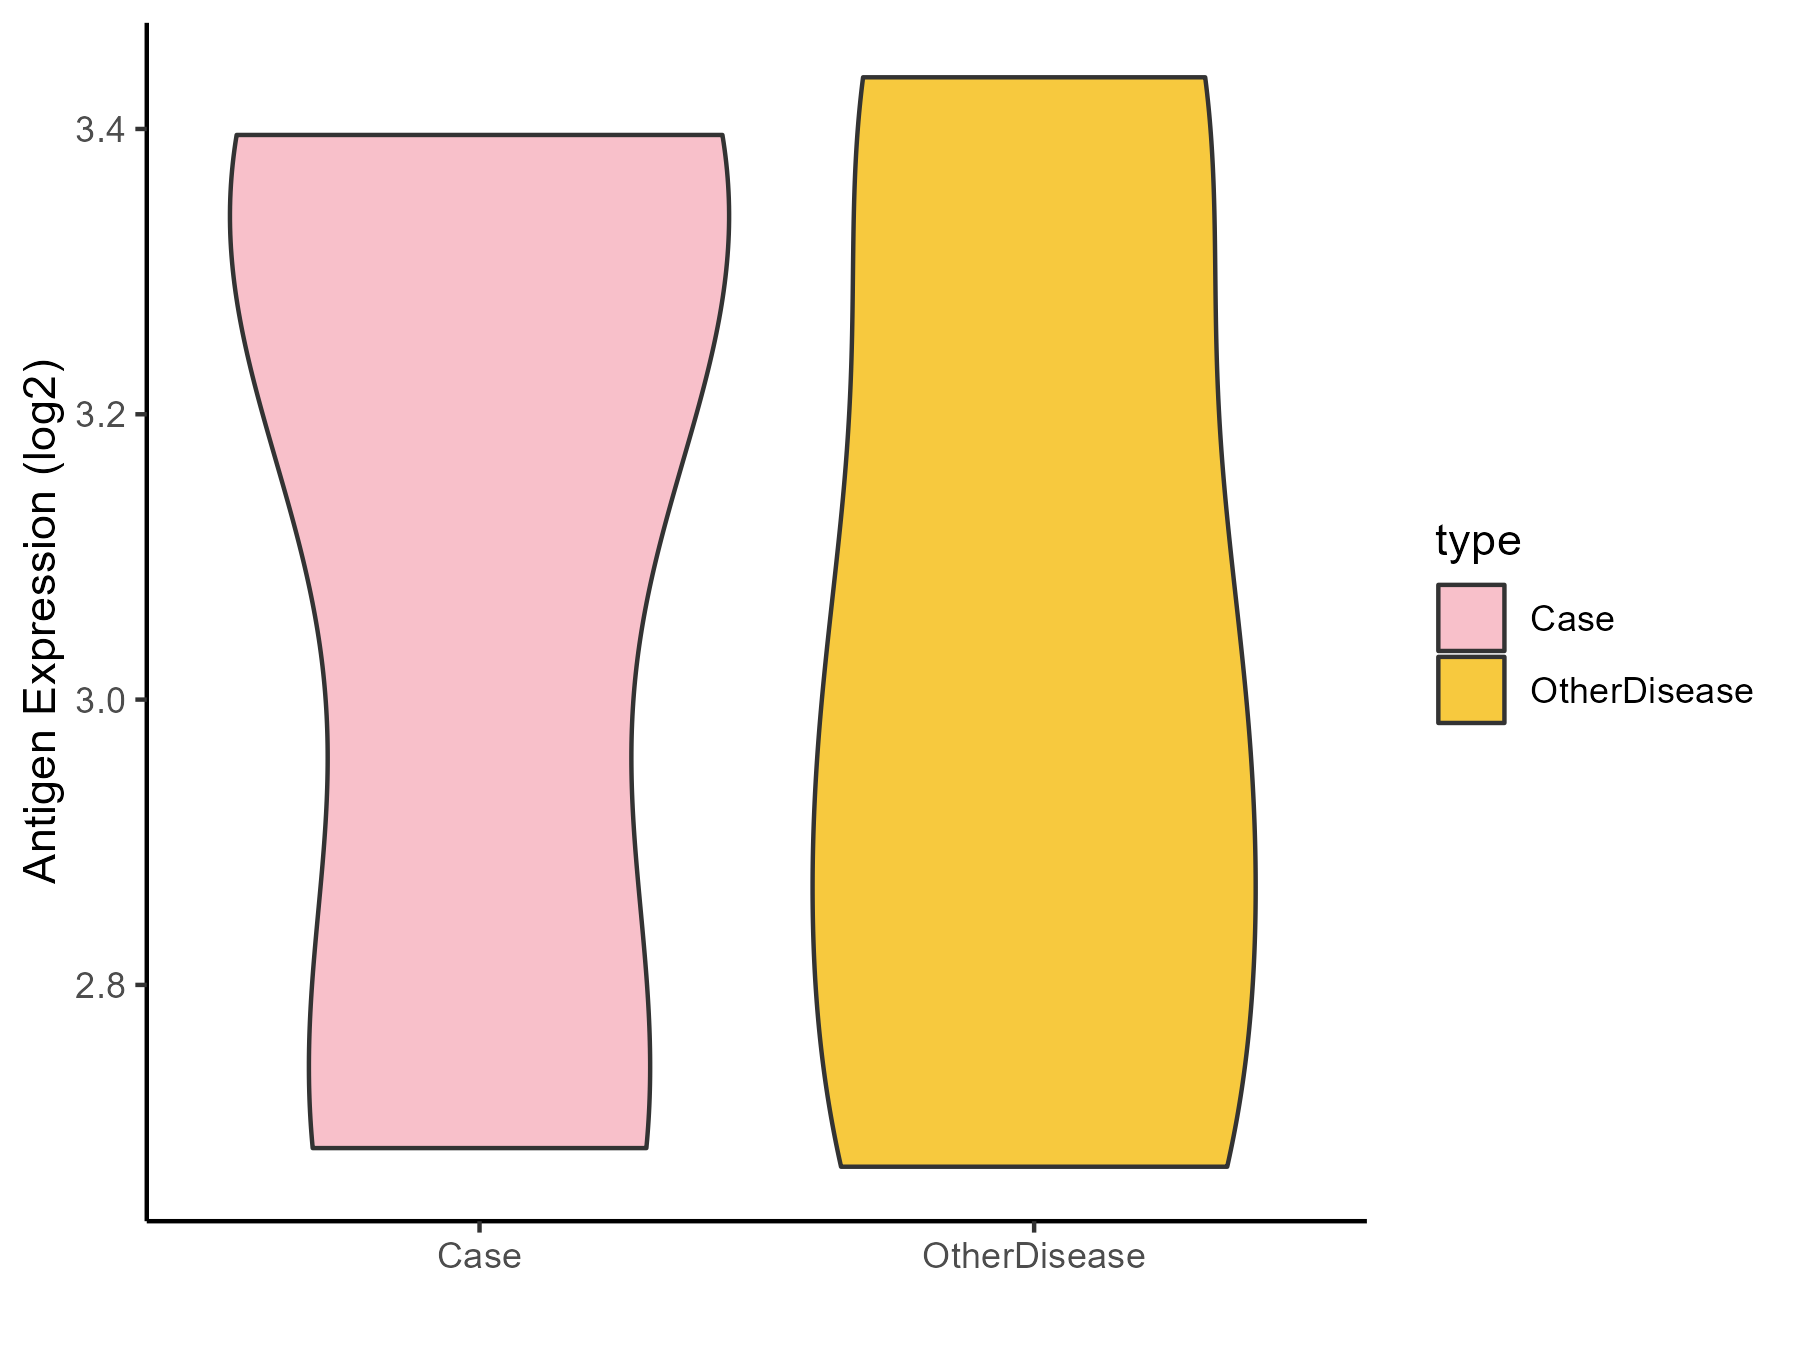
| The Studied Tissue | Peritumoral cortex | |
| The Specific Disease | Epilepsy | |
| The Expression Level of Disease Section Compare with the Other Disease Section | p-value: 0.846391853; Fold-change: 0.316910171; Z-score: 0.82810899 | |
| Disease-specific Antigen Abundances |
|
Click to View the Clearer Original Diagram |
| Differential expression pattern of antigen in diseases | ||
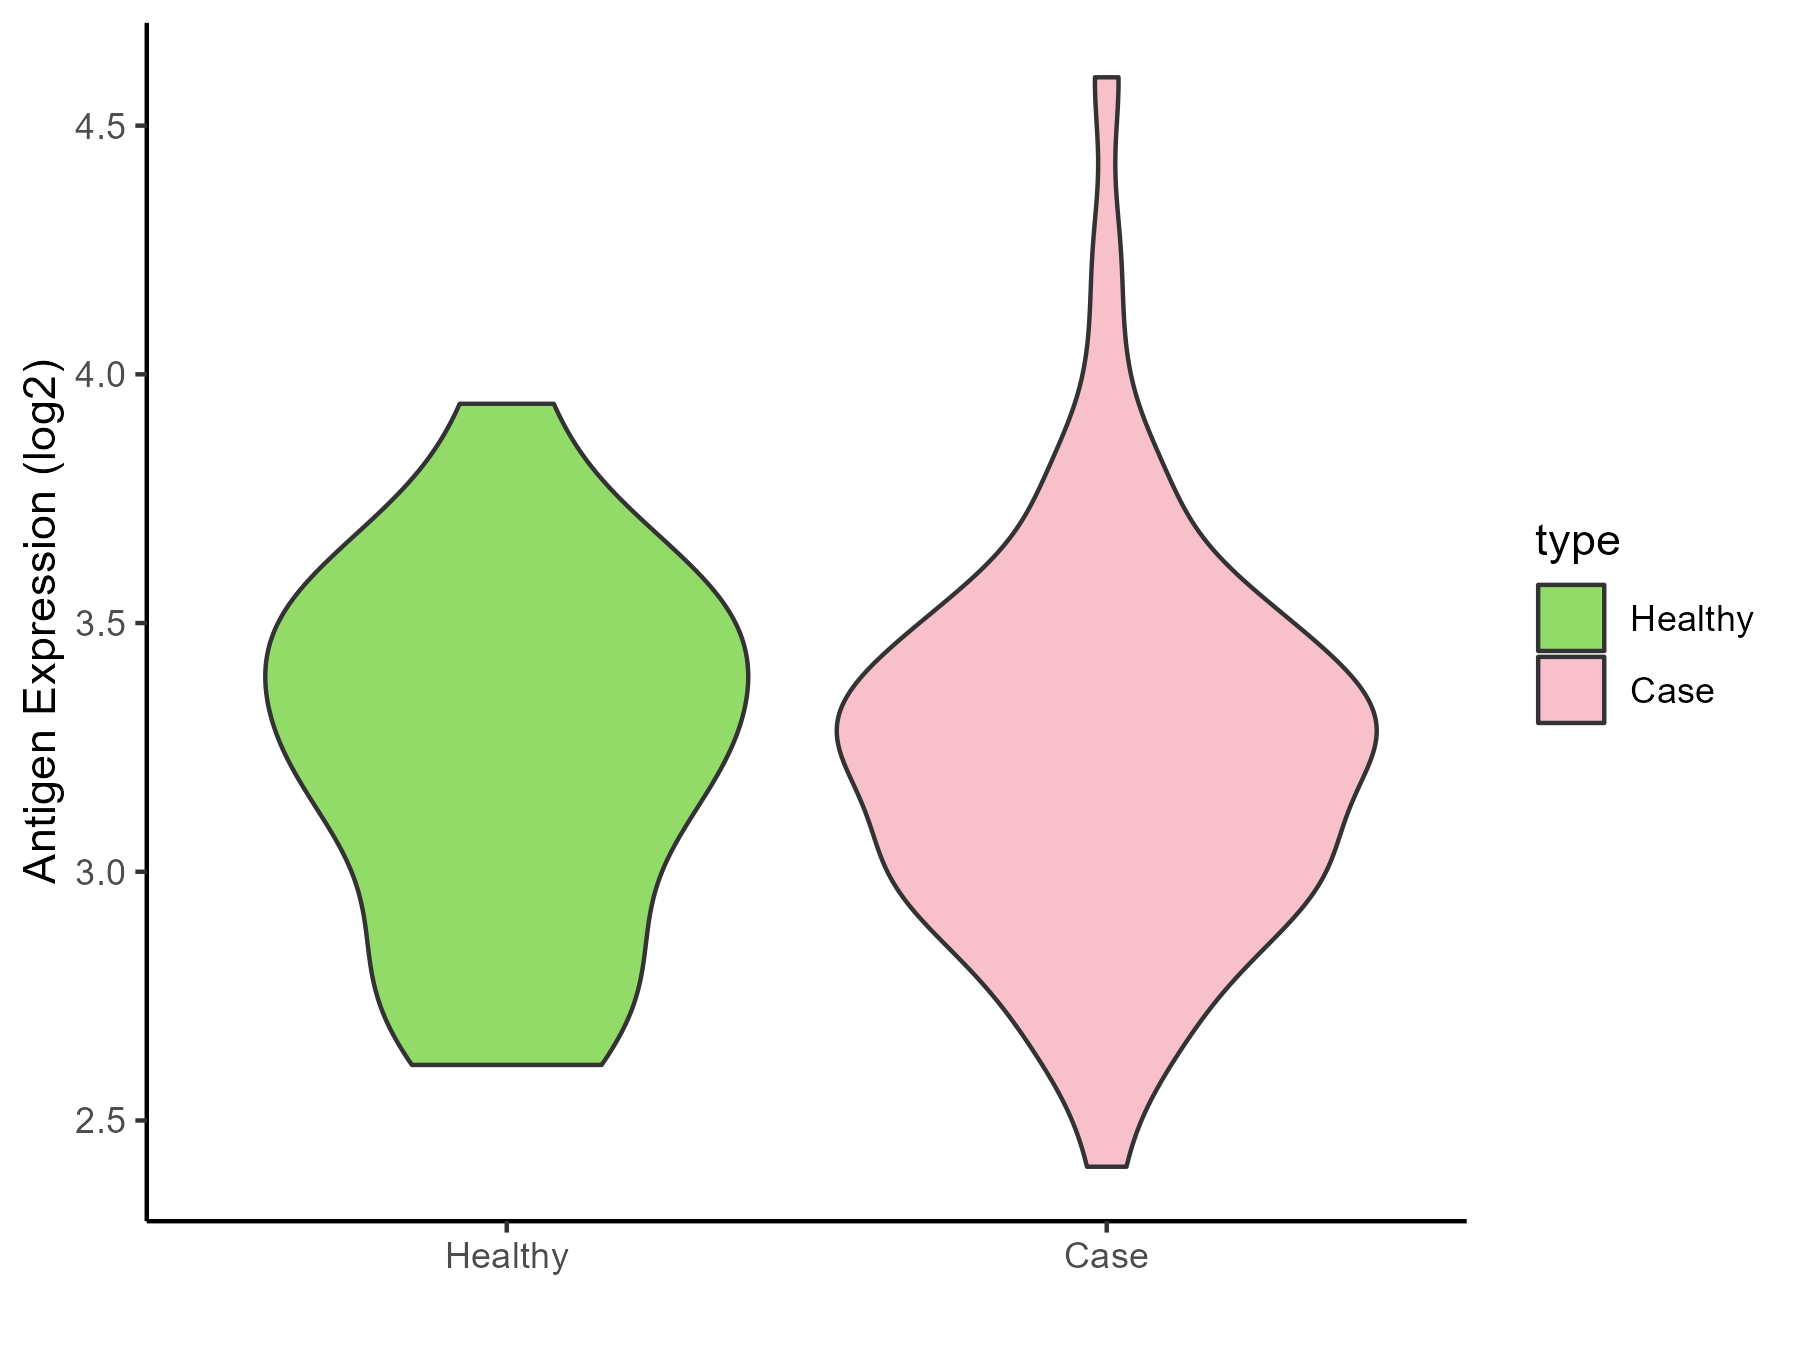
| The Studied Tissue | Whole blood | |
| The Specific Disease | Cardioembolic Stroke | |
| Disease-specific Antigen Abundances |
|
Click to View the Clearer Original Diagram |
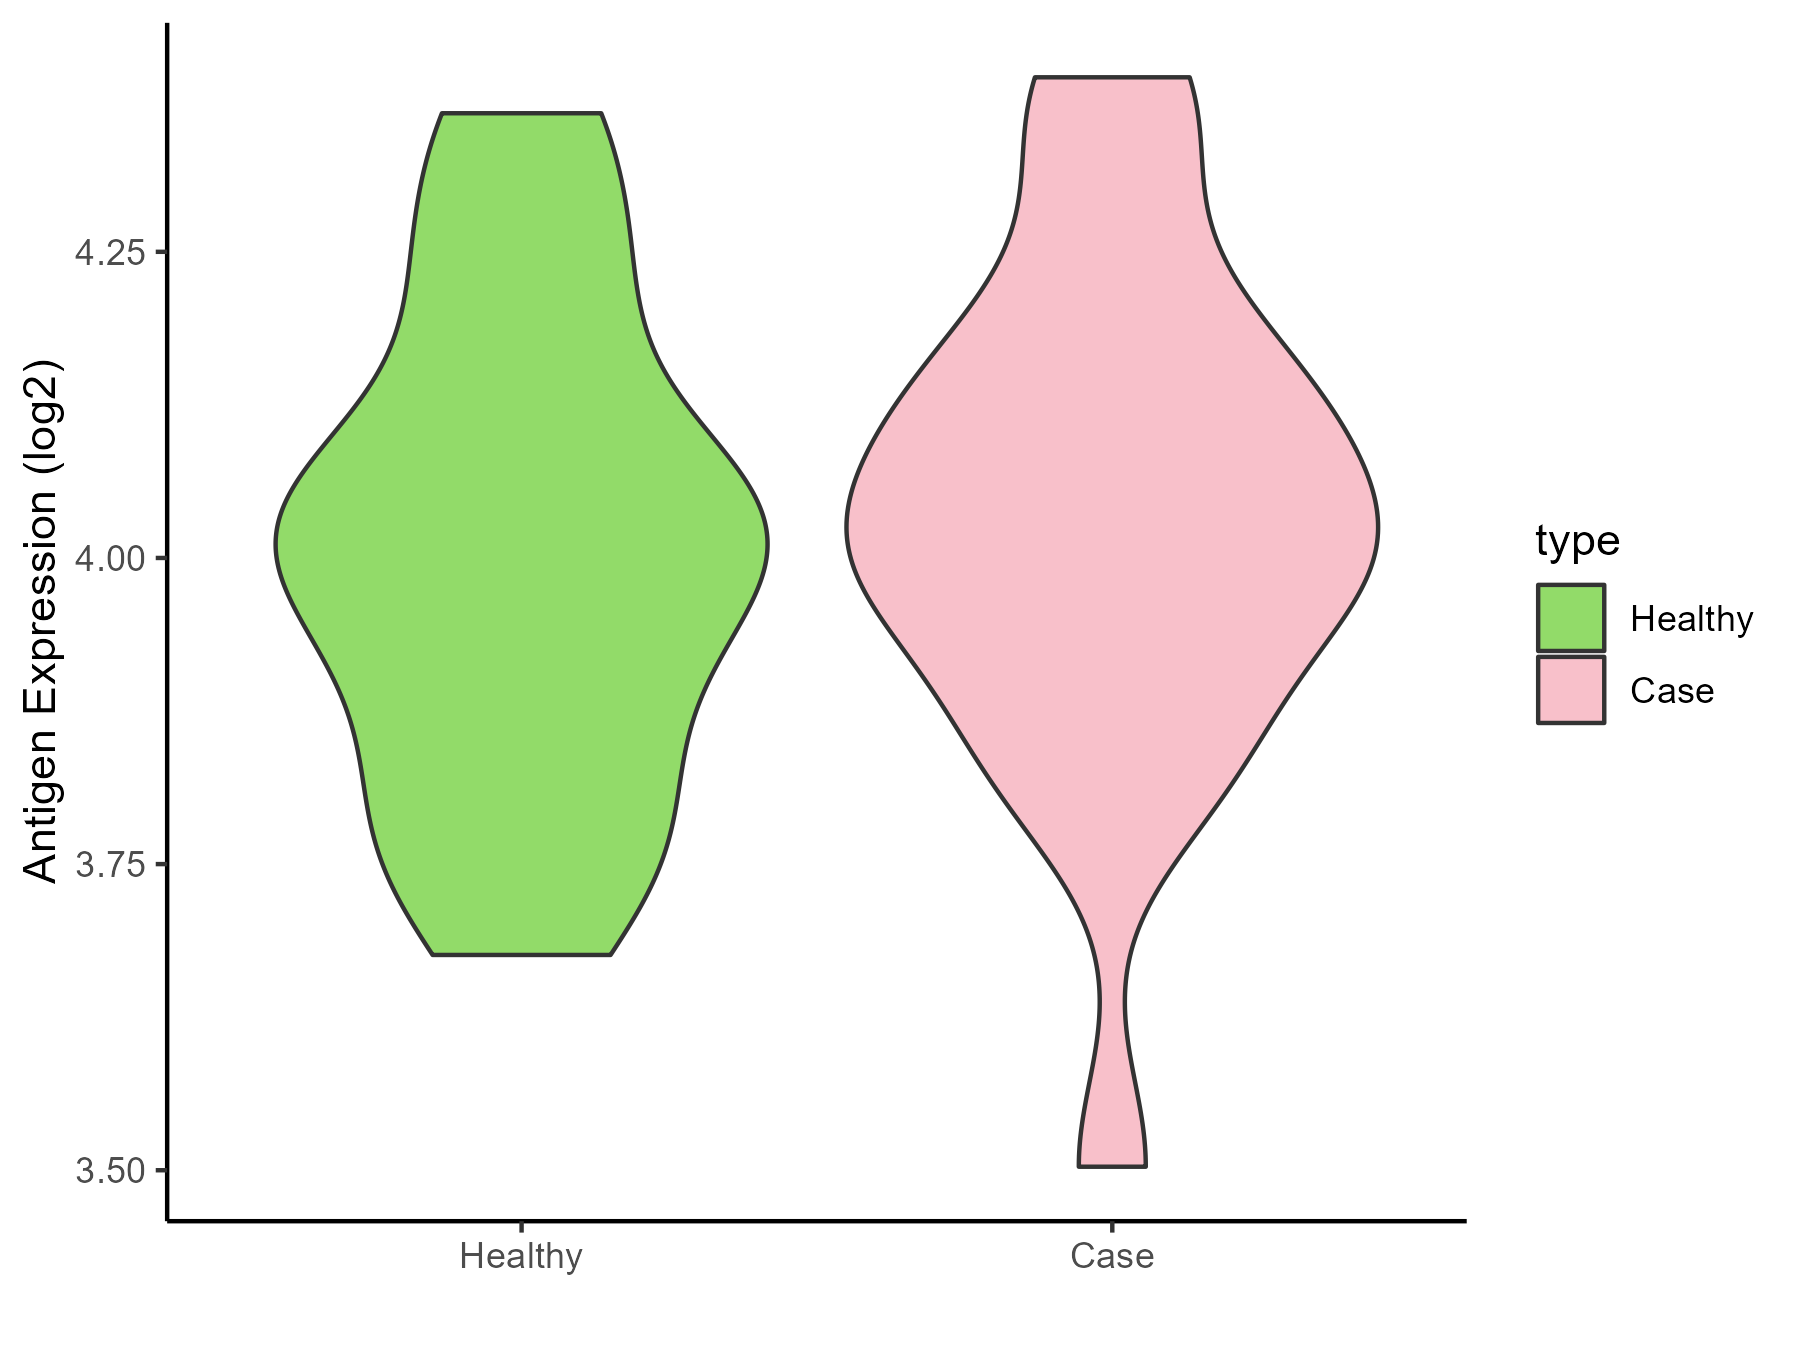
| The Studied Tissue | Peripheral blood | |
| The Specific Disease | Ischemic stroke | |
| The Expression Level of Disease Section Compare with the Healthy Individual Tissue | p-value: 0.666448418; Fold-change: 0.010793333; Z-score: 0.054782171 | |
| Disease-specific Antigen Abundances |
|
Click to View the Clearer Original Diagram |
ICD Disease Classification 1
| Differential expression pattern of antigen in diseases | ||
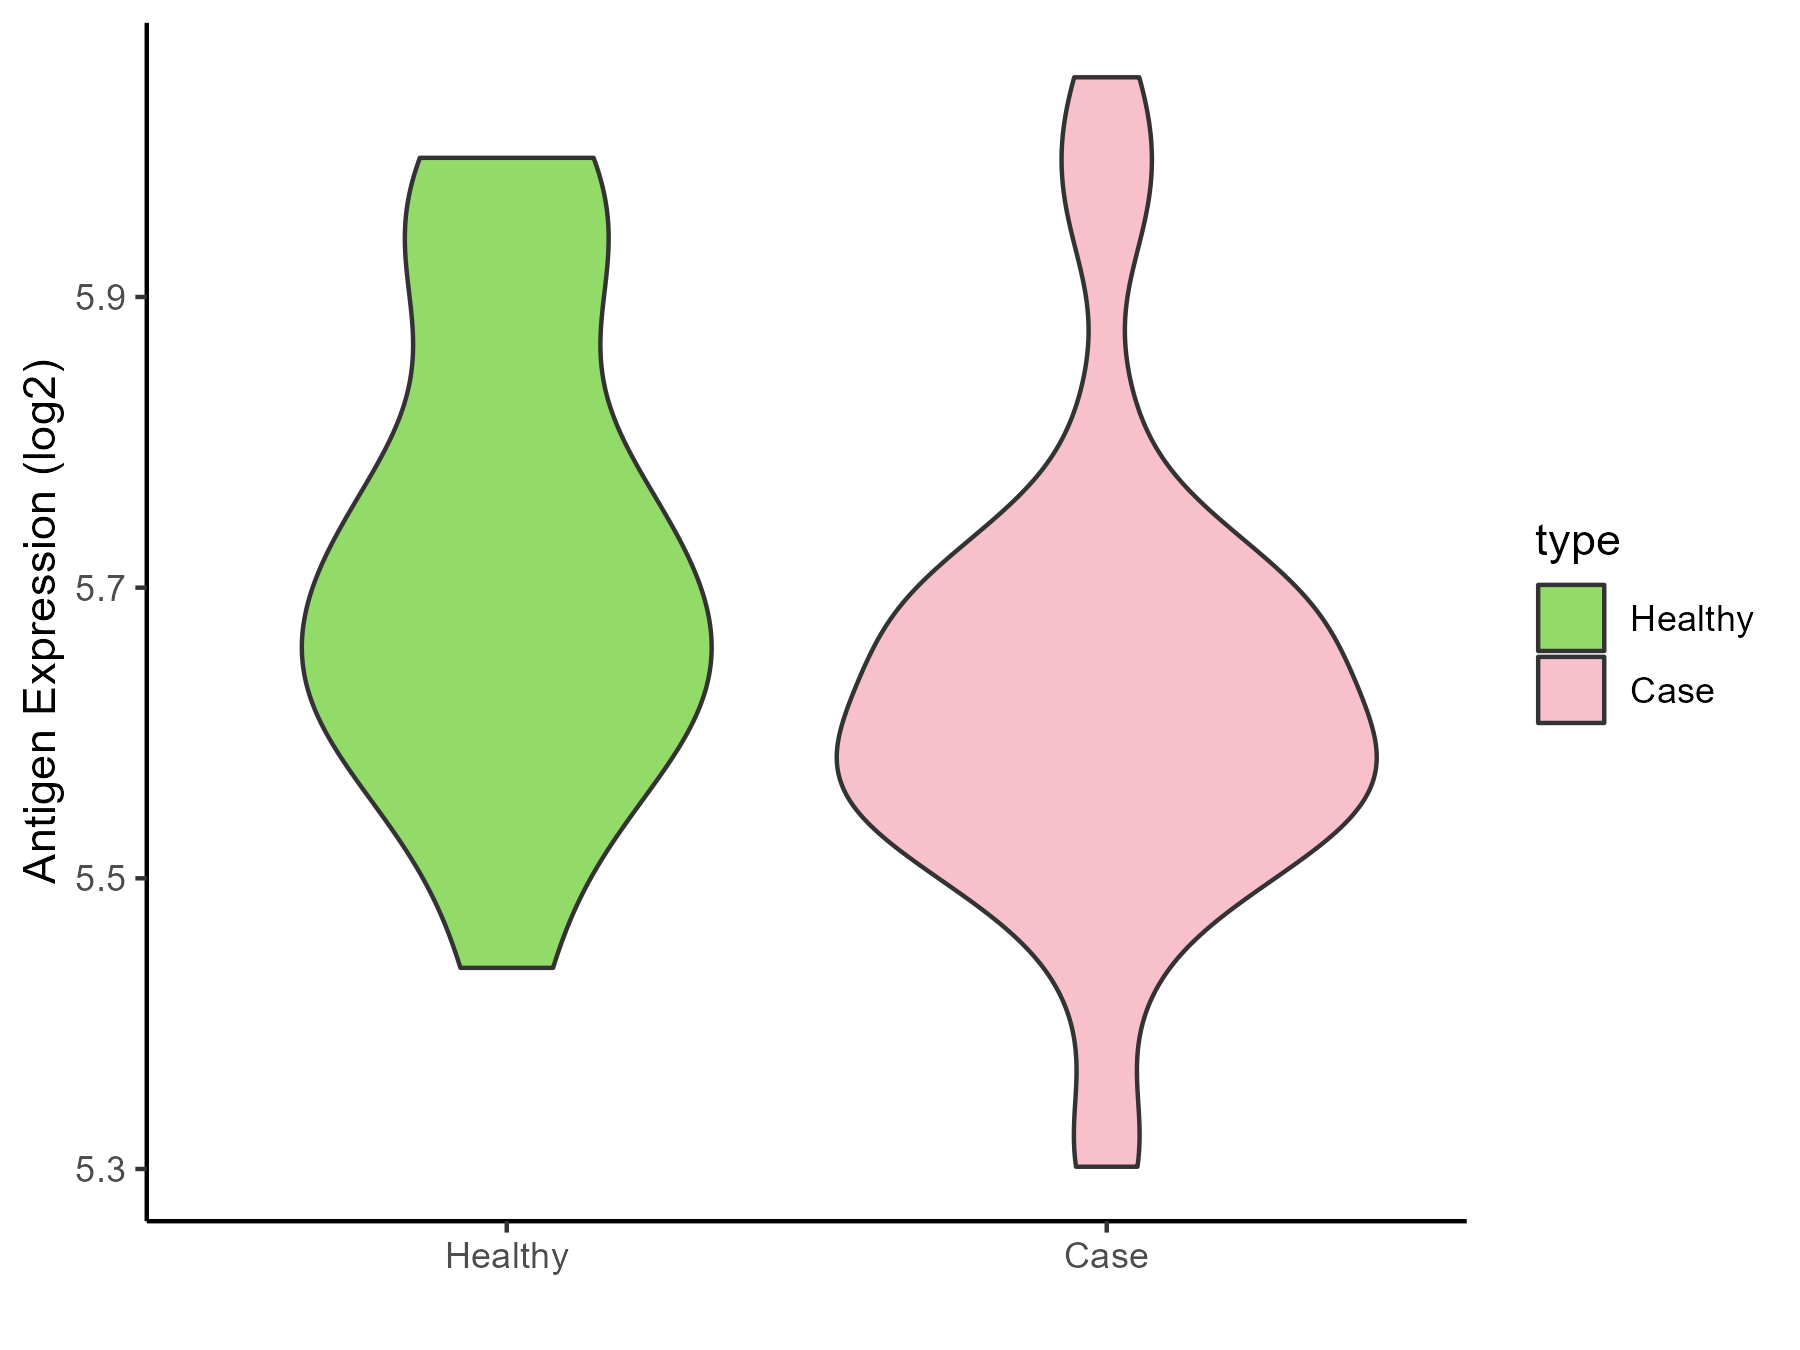
| The Studied Tissue | White matter | |
| The Specific Disease | HIV | |
| The Expression Level of Disease Section Compare with the Healthy Individual Tissue | p-value: 0.058182492; Fold-change: -0.104508974; Z-score: -0.647315863 | |
| Disease-specific Antigen Abundances |
|
Click to View the Clearer Original Diagram |
| Differential expression pattern of antigen in diseases | ||
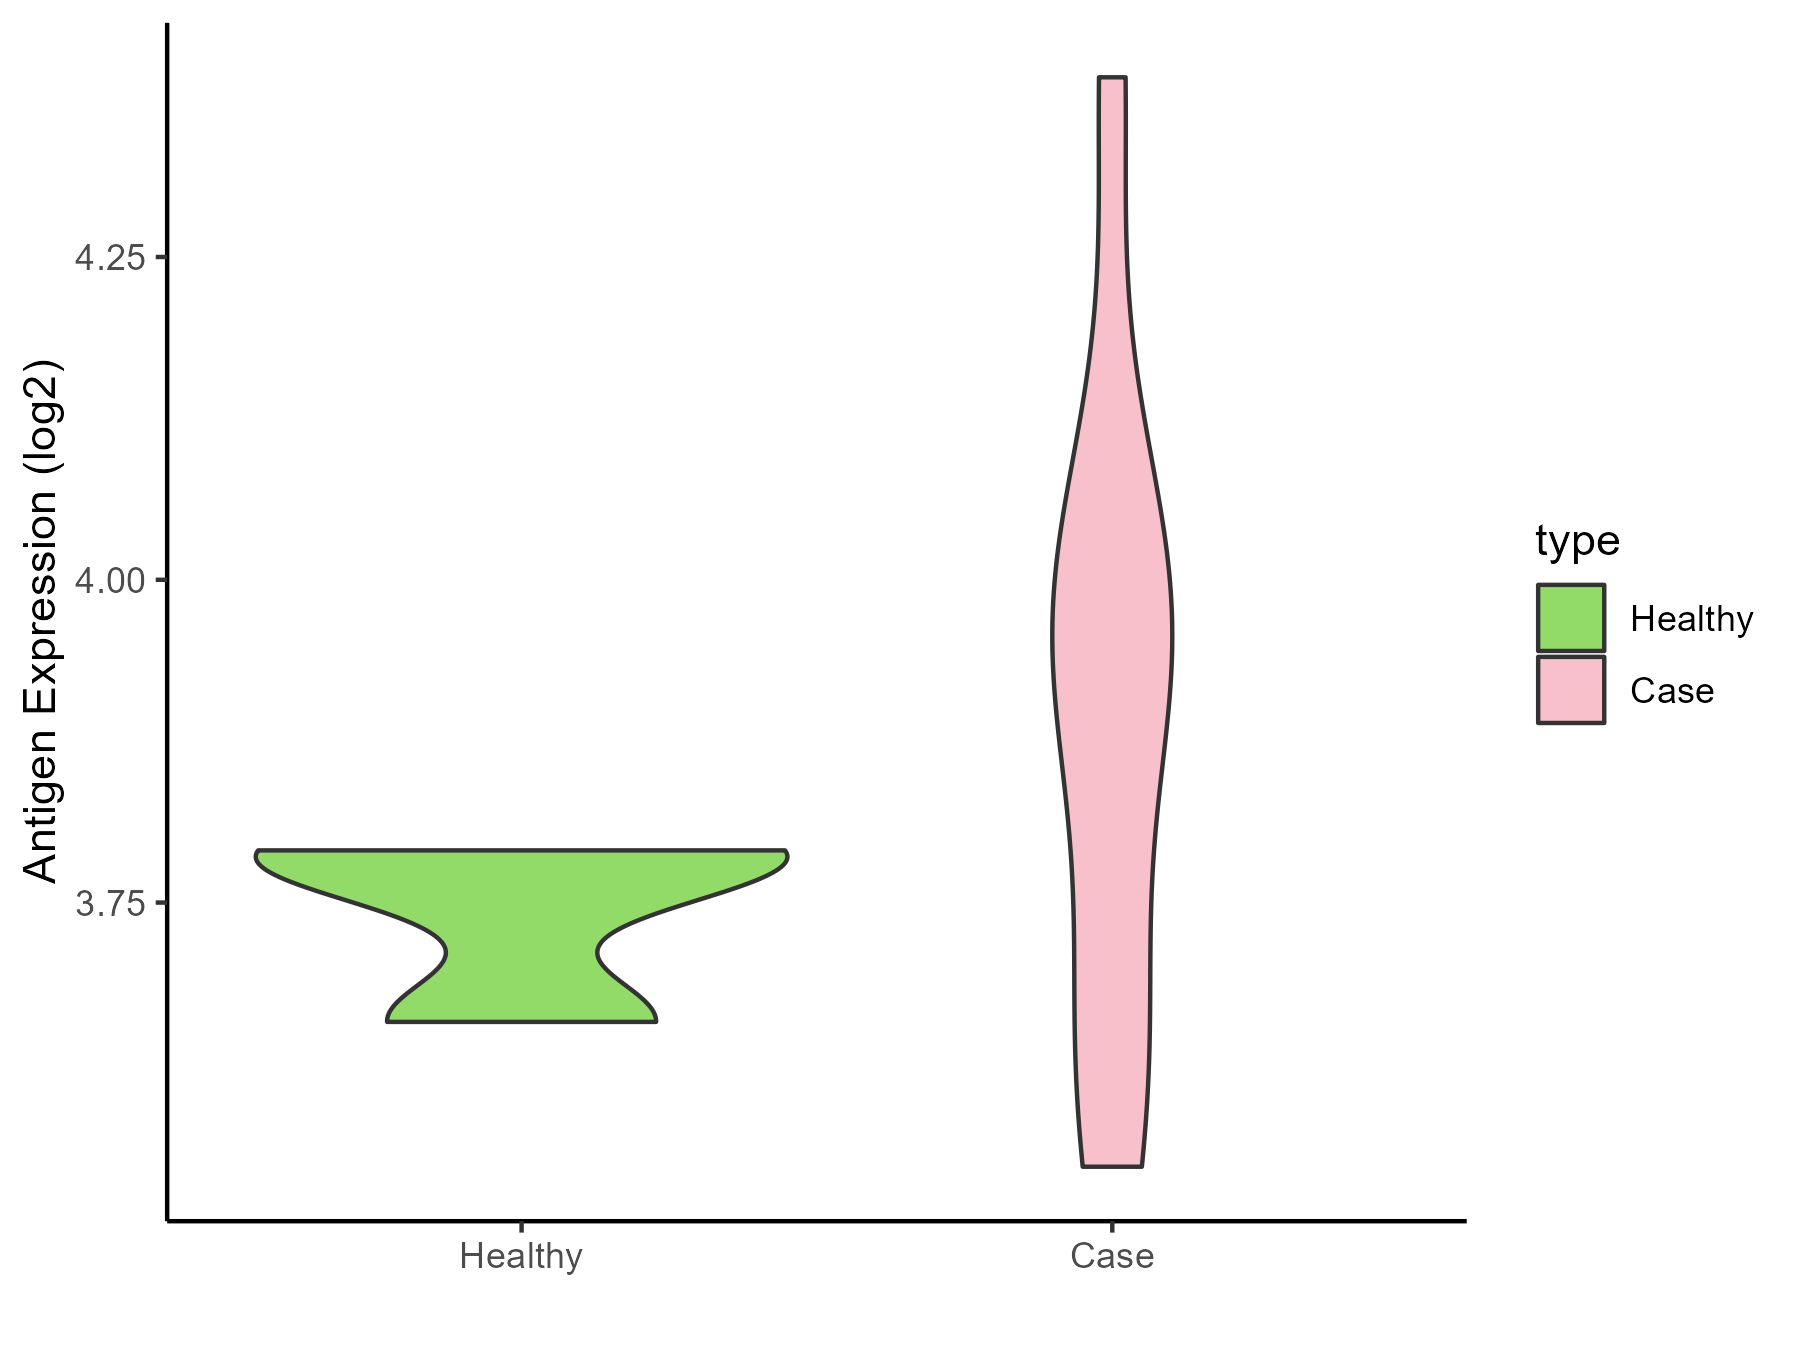
| The Studied Tissue | Whole blood | |
| The Specific Disease | Influenza | |
| The Expression Level of Disease Section Compare with the Healthy Individual Tissue | p-value: 0.124992038; Fold-change: 0.168257322; Z-score: 2.27110095 | |
| Disease-specific Antigen Abundances |
|
Click to View the Clearer Original Diagram |
| Differential expression pattern of antigen in diseases | ||
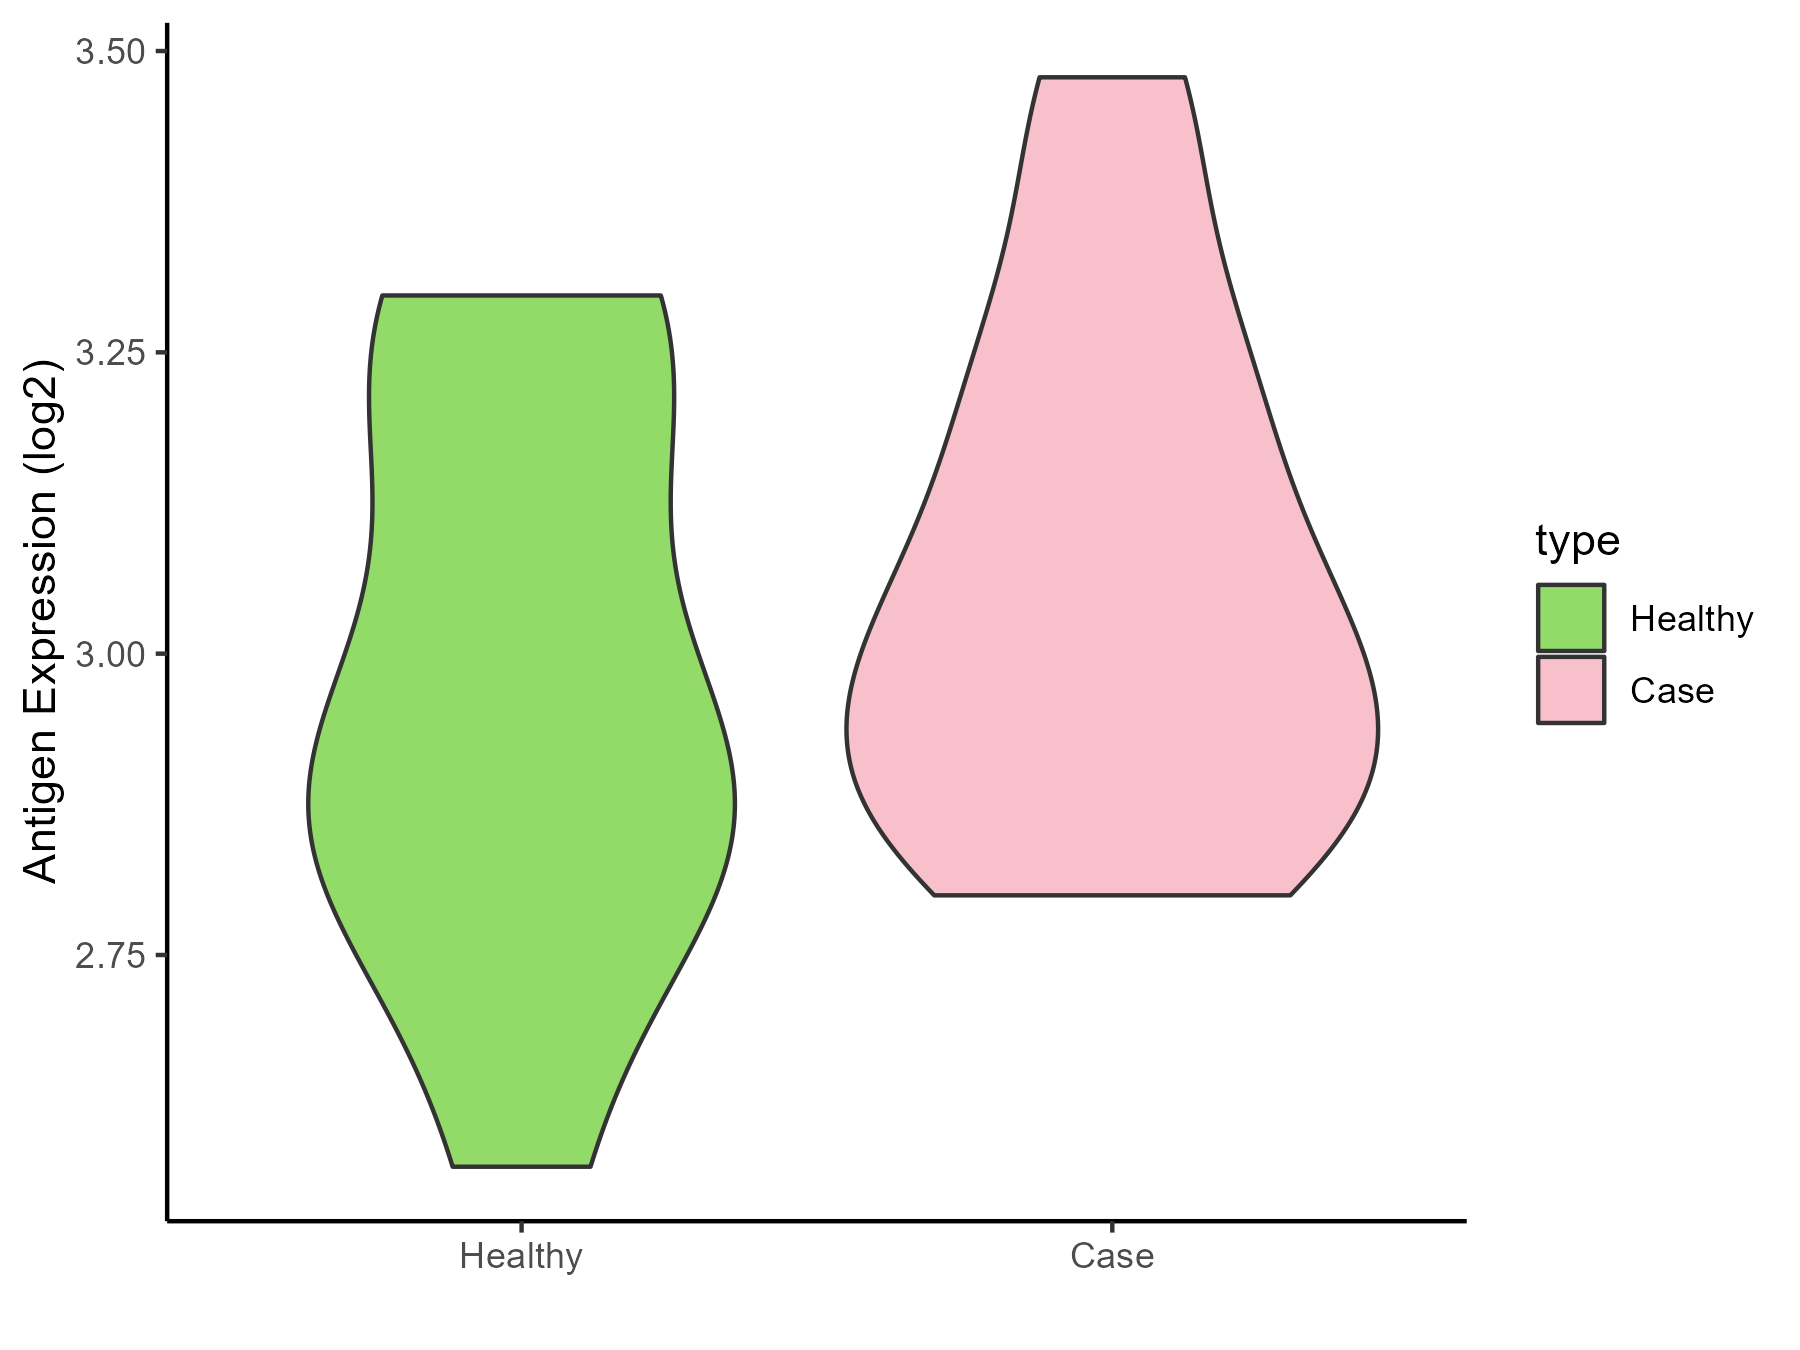
| The Studied Tissue | Whole blood | |
| The Specific Disease | Chronic hepatitis C | |
| The Expression Level of Disease Section Compare with the Healthy Individual Tissue | p-value: 0.382863381; Fold-change: 0.097478253; Z-score: 0.405086739 | |
| Disease-specific Antigen Abundances |
|
Click to View the Clearer Original Diagram |
| Differential expression pattern of antigen in diseases | ||
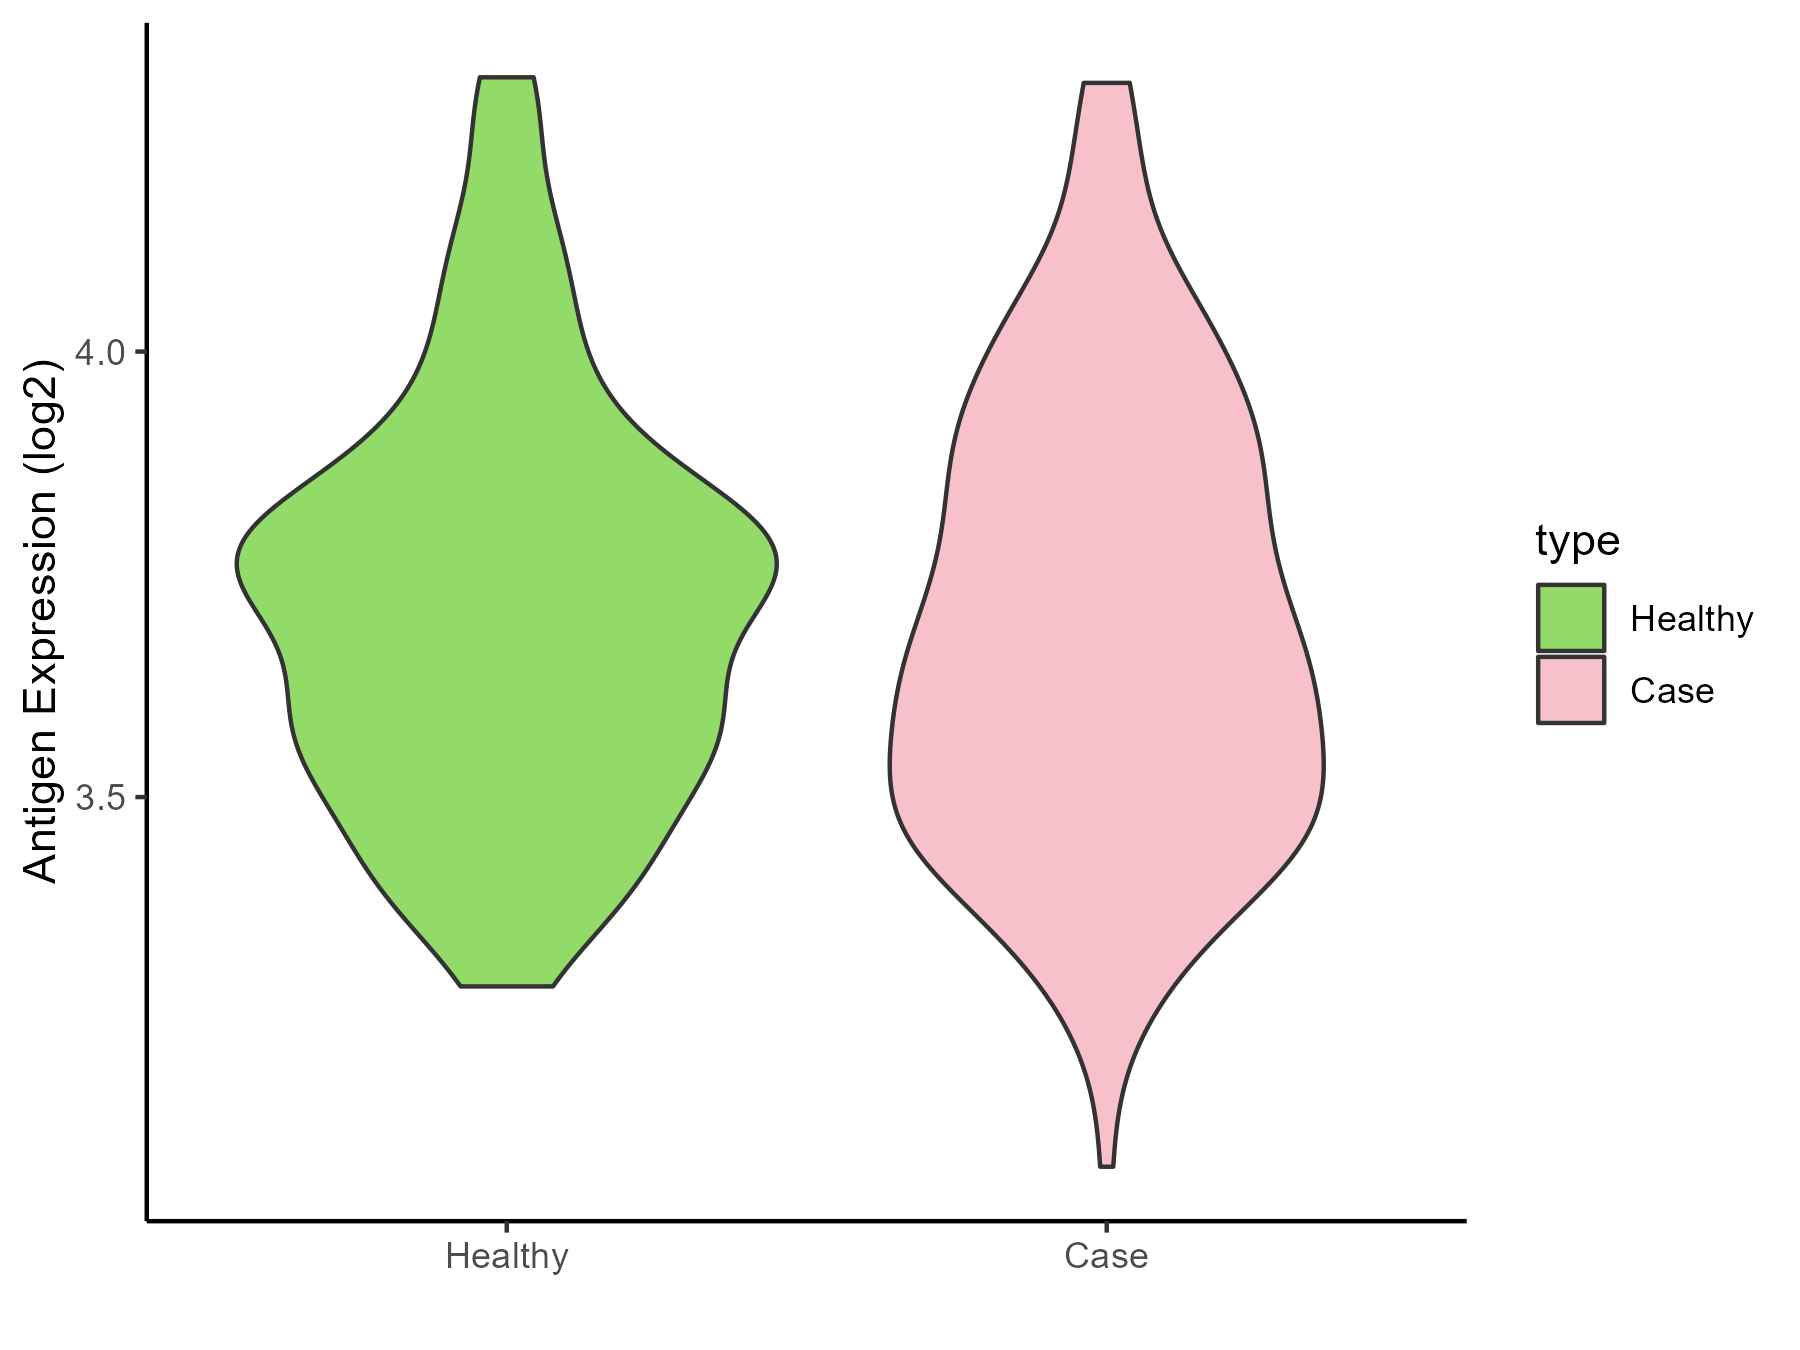
| The Studied Tissue | Whole blood | |
| The Specific Disease | Sepsis | |
| The Expression Level of Disease Section Compare with the Healthy Individual Tissue | p-value: 0.456525418; Fold-change: -0.068179913; Z-score: -0.30149387 | |
| Disease-specific Antigen Abundances |
|
Click to View the Clearer Original Diagram |
| Differential expression pattern of antigen in diseases | ||
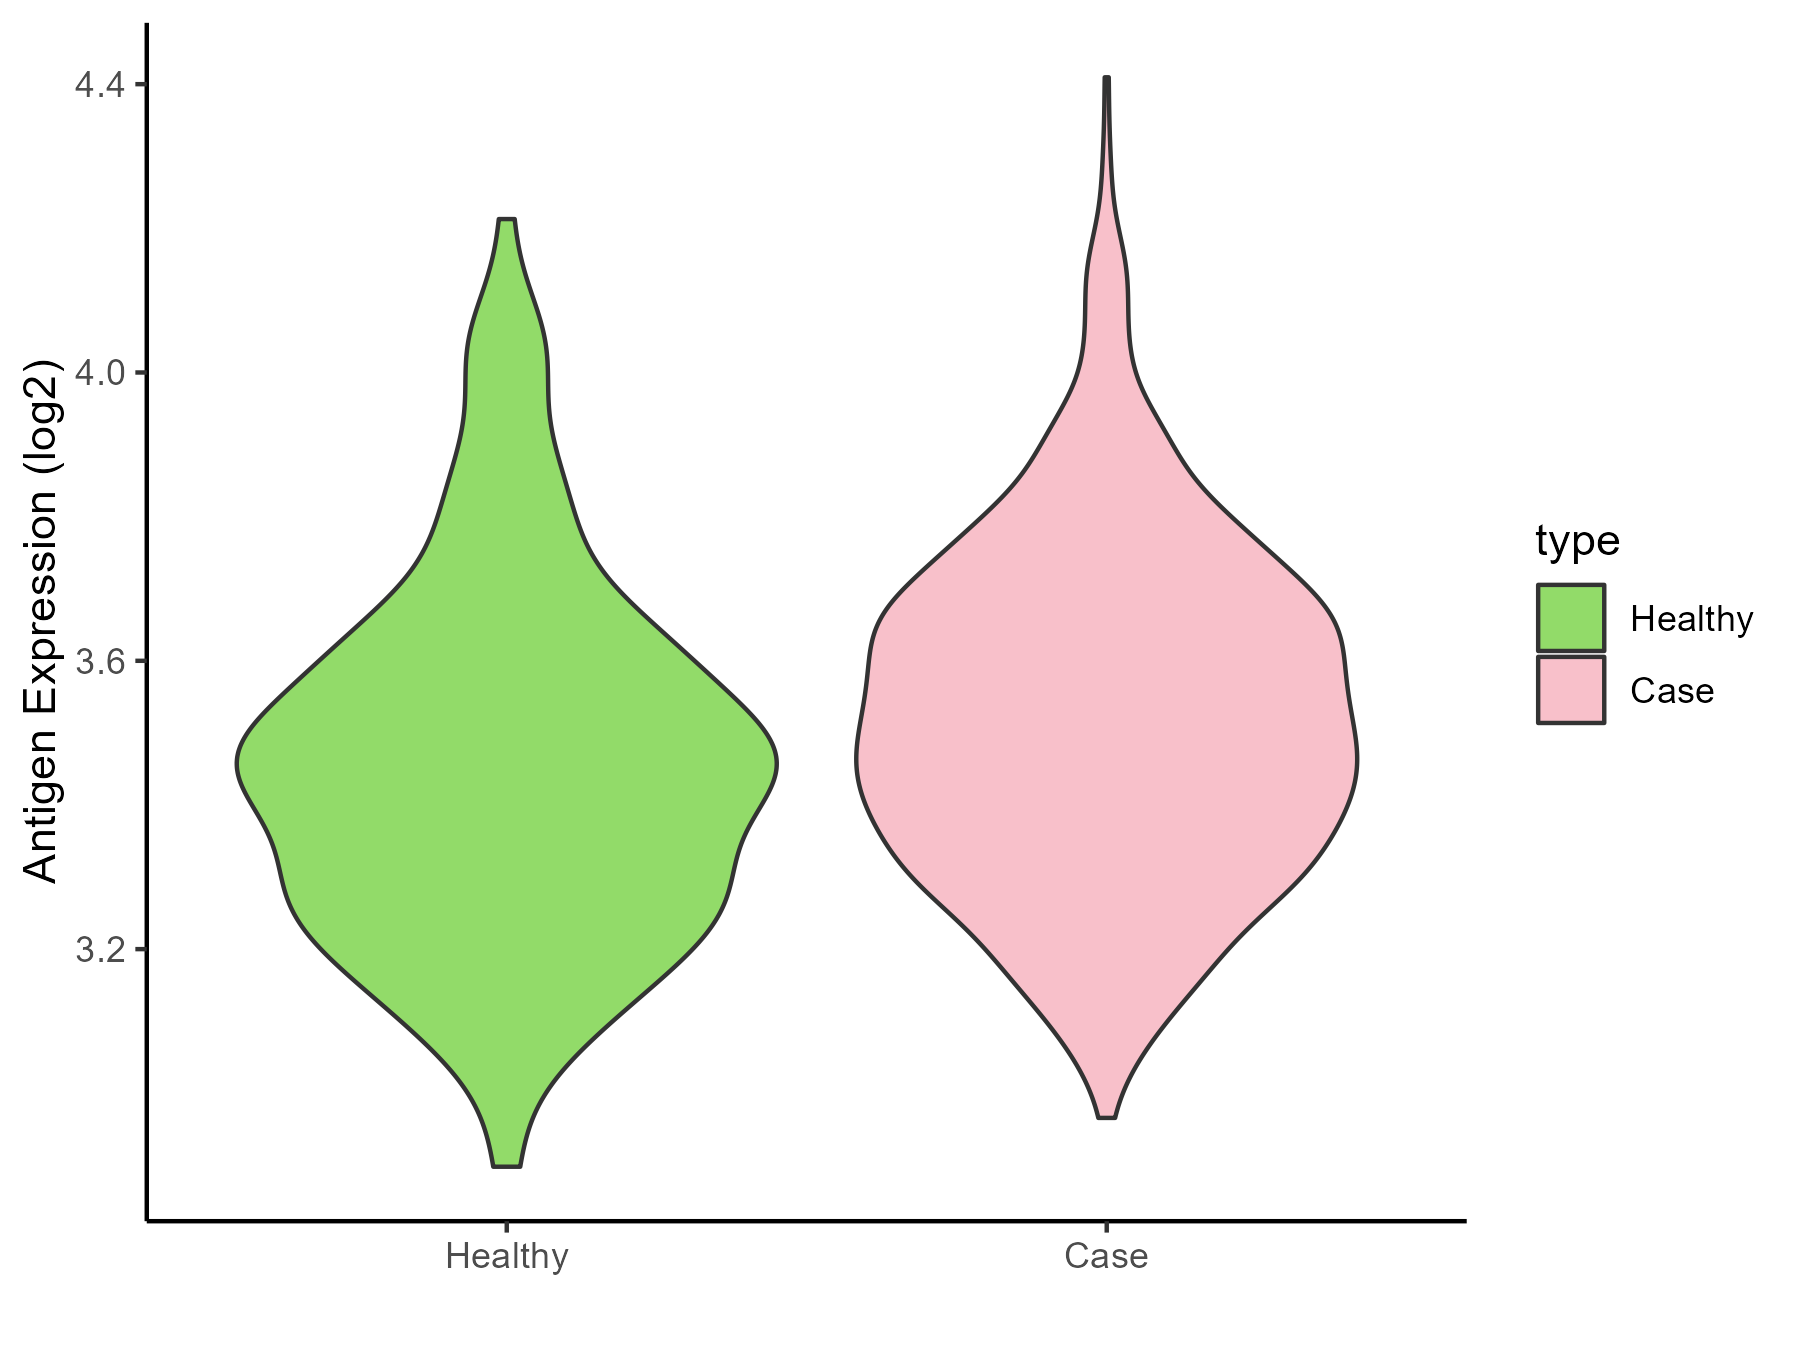
| The Studied Tissue | Whole blood | |
| The Specific Disease | Septic shock | |
| The Expression Level of Disease Section Compare with the Healthy Individual Tissue | p-value: 0.001795933; Fold-change: 0.060501233; Z-score: 0.244962788 | |
| Disease-specific Antigen Abundances |
|
Click to View the Clearer Original Diagram |
| Differential expression pattern of antigen in diseases | ||
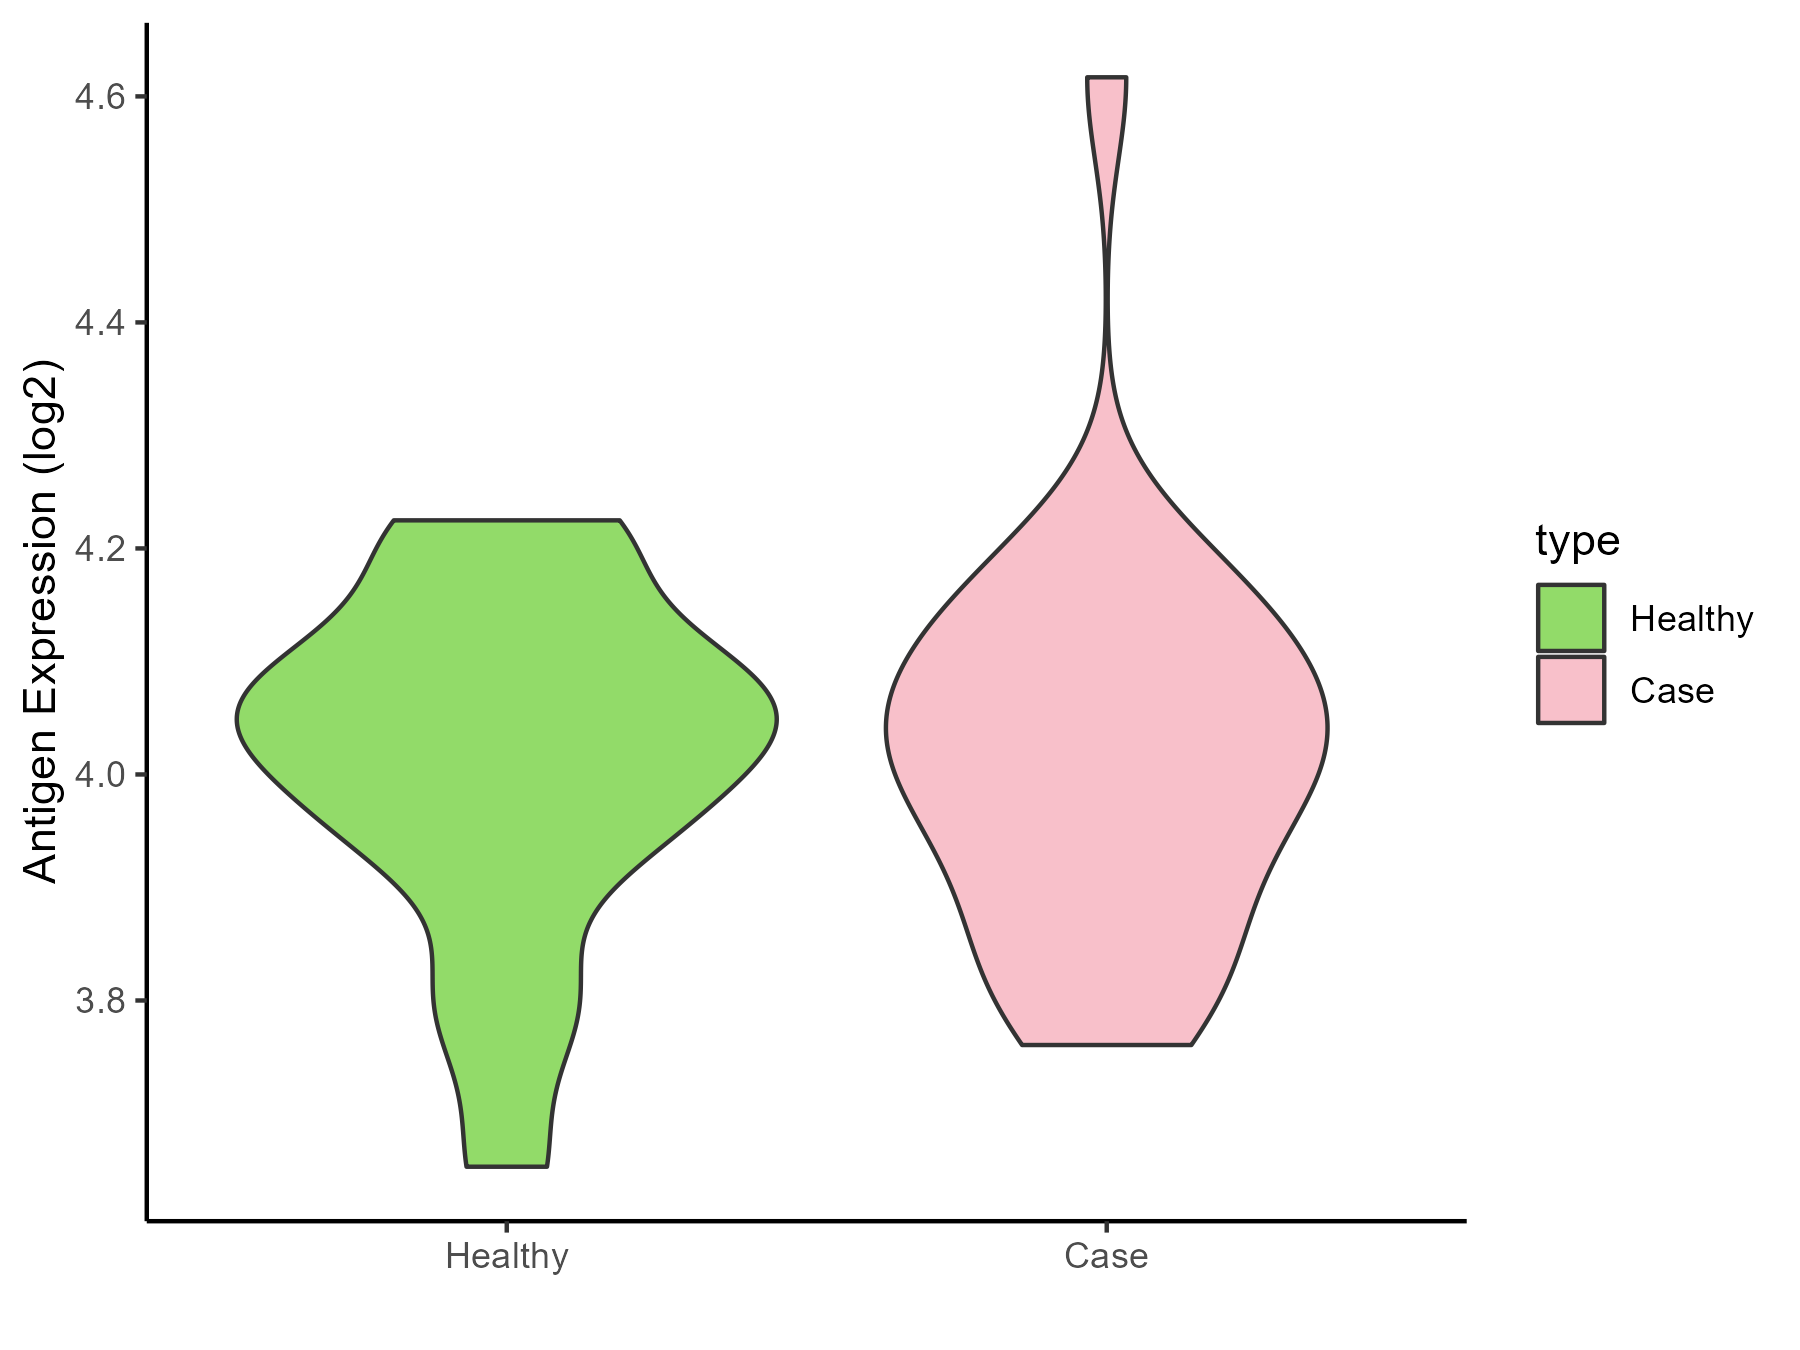
| The Studied Tissue | Peripheral blood | |
| The Specific Disease | Pediatric respiratory syncytial virus infection | |
| The Expression Level of Disease Section Compare with the Healthy Individual Tissue | p-value: 0.838366314; Fold-change: -0.00757515; Z-score: -0.049123437 | |
| Disease-specific Antigen Abundances |
|
Click to View the Clearer Original Diagram |
ICD Disease Classification 11
| Differential expression pattern of antigen in diseases | ||
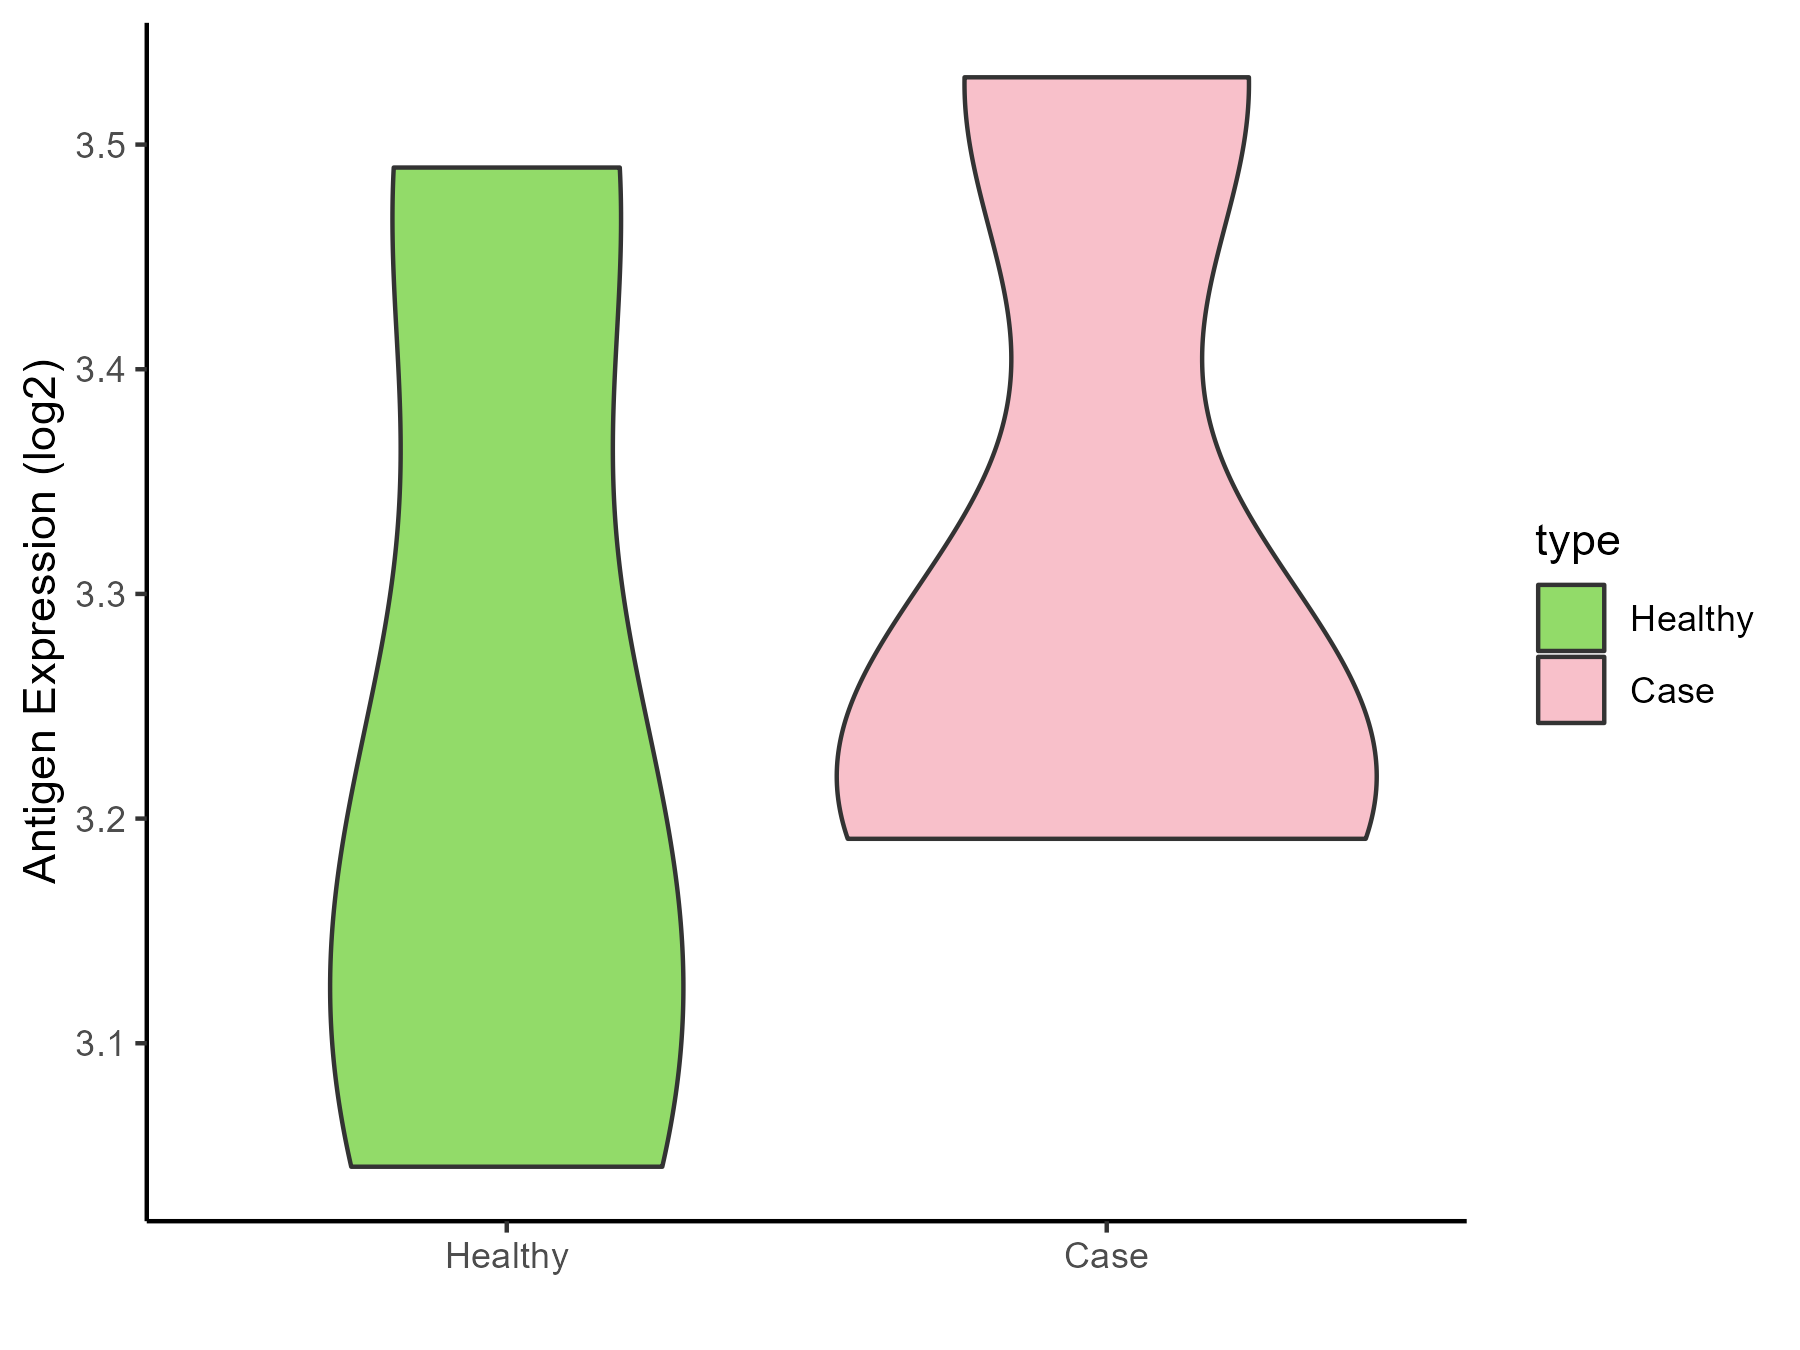
| The Studied Tissue | Peripheral blood | |
| The Specific Disease | Essential hypertension | |
| The Expression Level of Disease Section Compare with the Healthy Individual Tissue | p-value: 0.666345056; Fold-change: 0.048222117; Z-score: 0.213357032 | |
| Disease-specific Antigen Abundances |
|
Click to View the Clearer Original Diagram |
| Differential expression pattern of antigen in diseases | ||
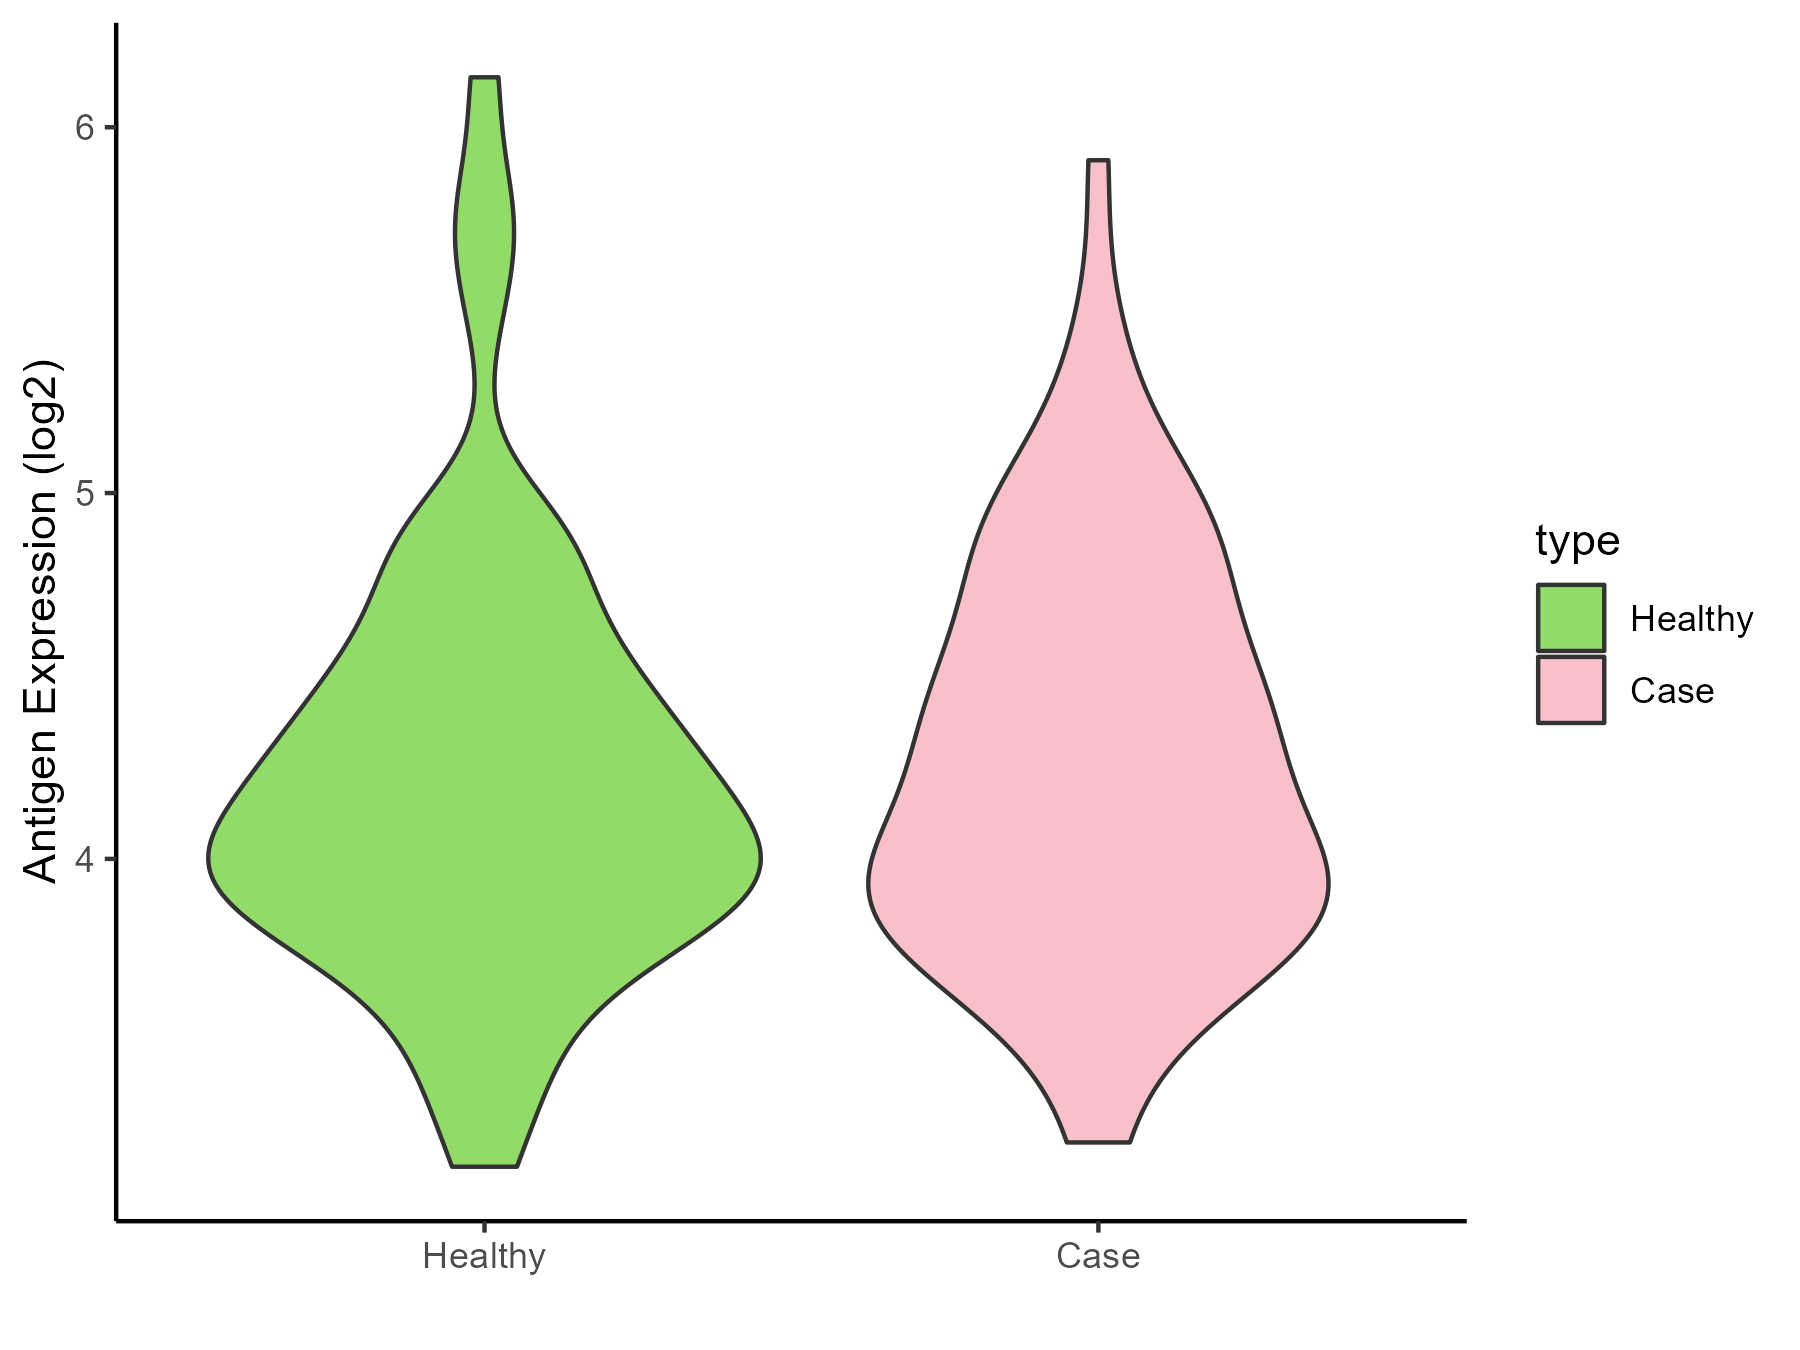
| The Studied Tissue | Peripheral blood | |
| The Specific Disease | Myocardial infarction | |
| The Expression Level of Disease Section Compare with the Healthy Individual Tissue | p-value: 0.680308254; Fold-change: 0.093630492; Z-score: 0.160483015 | |
| Disease-specific Antigen Abundances |
|
Click to View the Clearer Original Diagram |
| Differential expression pattern of antigen in diseases | ||
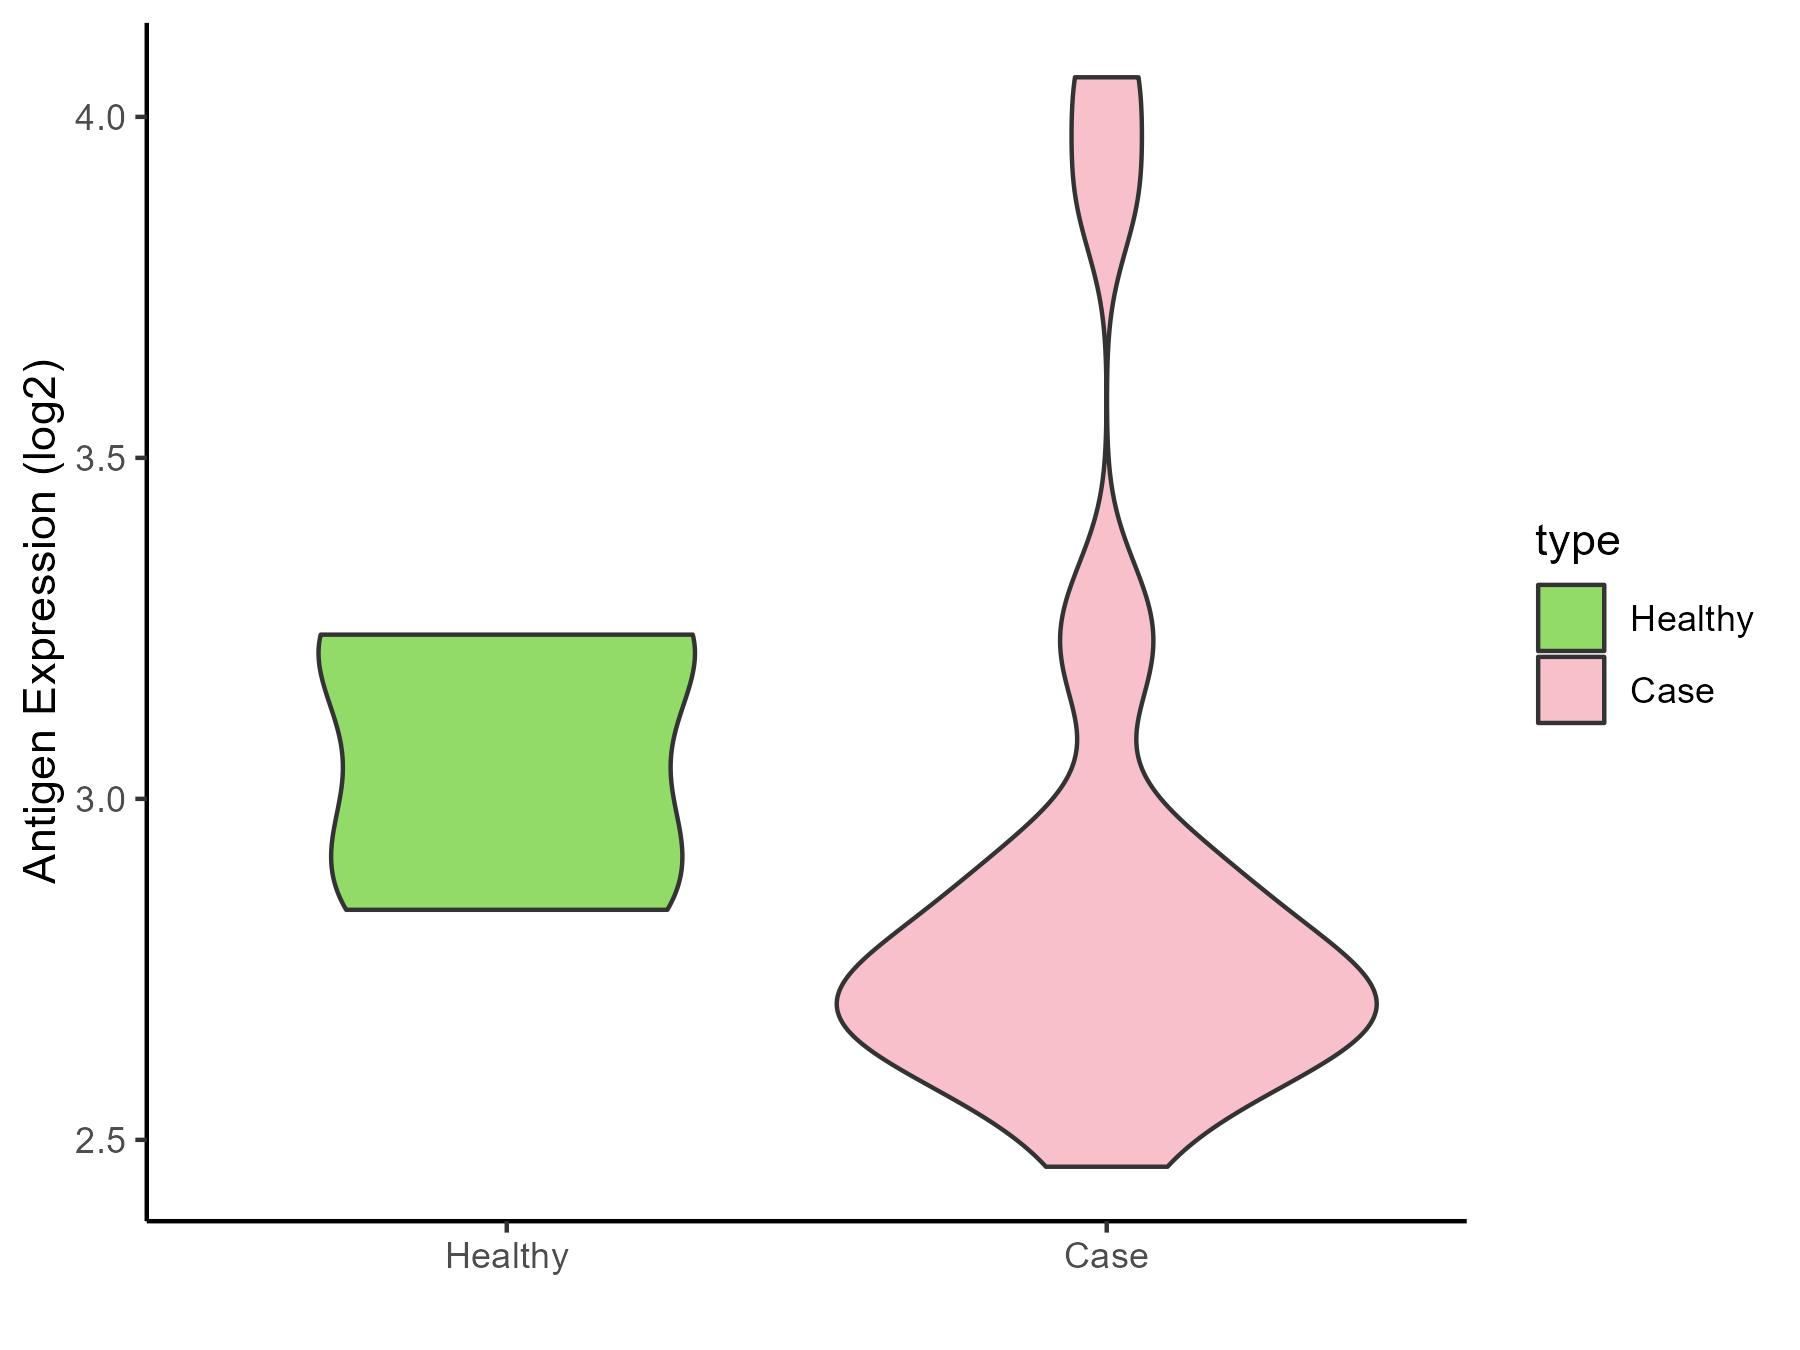
| The Studied Tissue | Peripheral blood | |
| The Specific Disease | Coronary artery disease | |
| The Expression Level of Disease Section Compare with the Healthy Individual Tissue | p-value: 0.254516475; Fold-change: -0.348461956; Z-score: -1.67237154 | |
| Disease-specific Antigen Abundances |
|
Click to View the Clearer Original Diagram |
| Differential expression pattern of antigen in diseases | ||
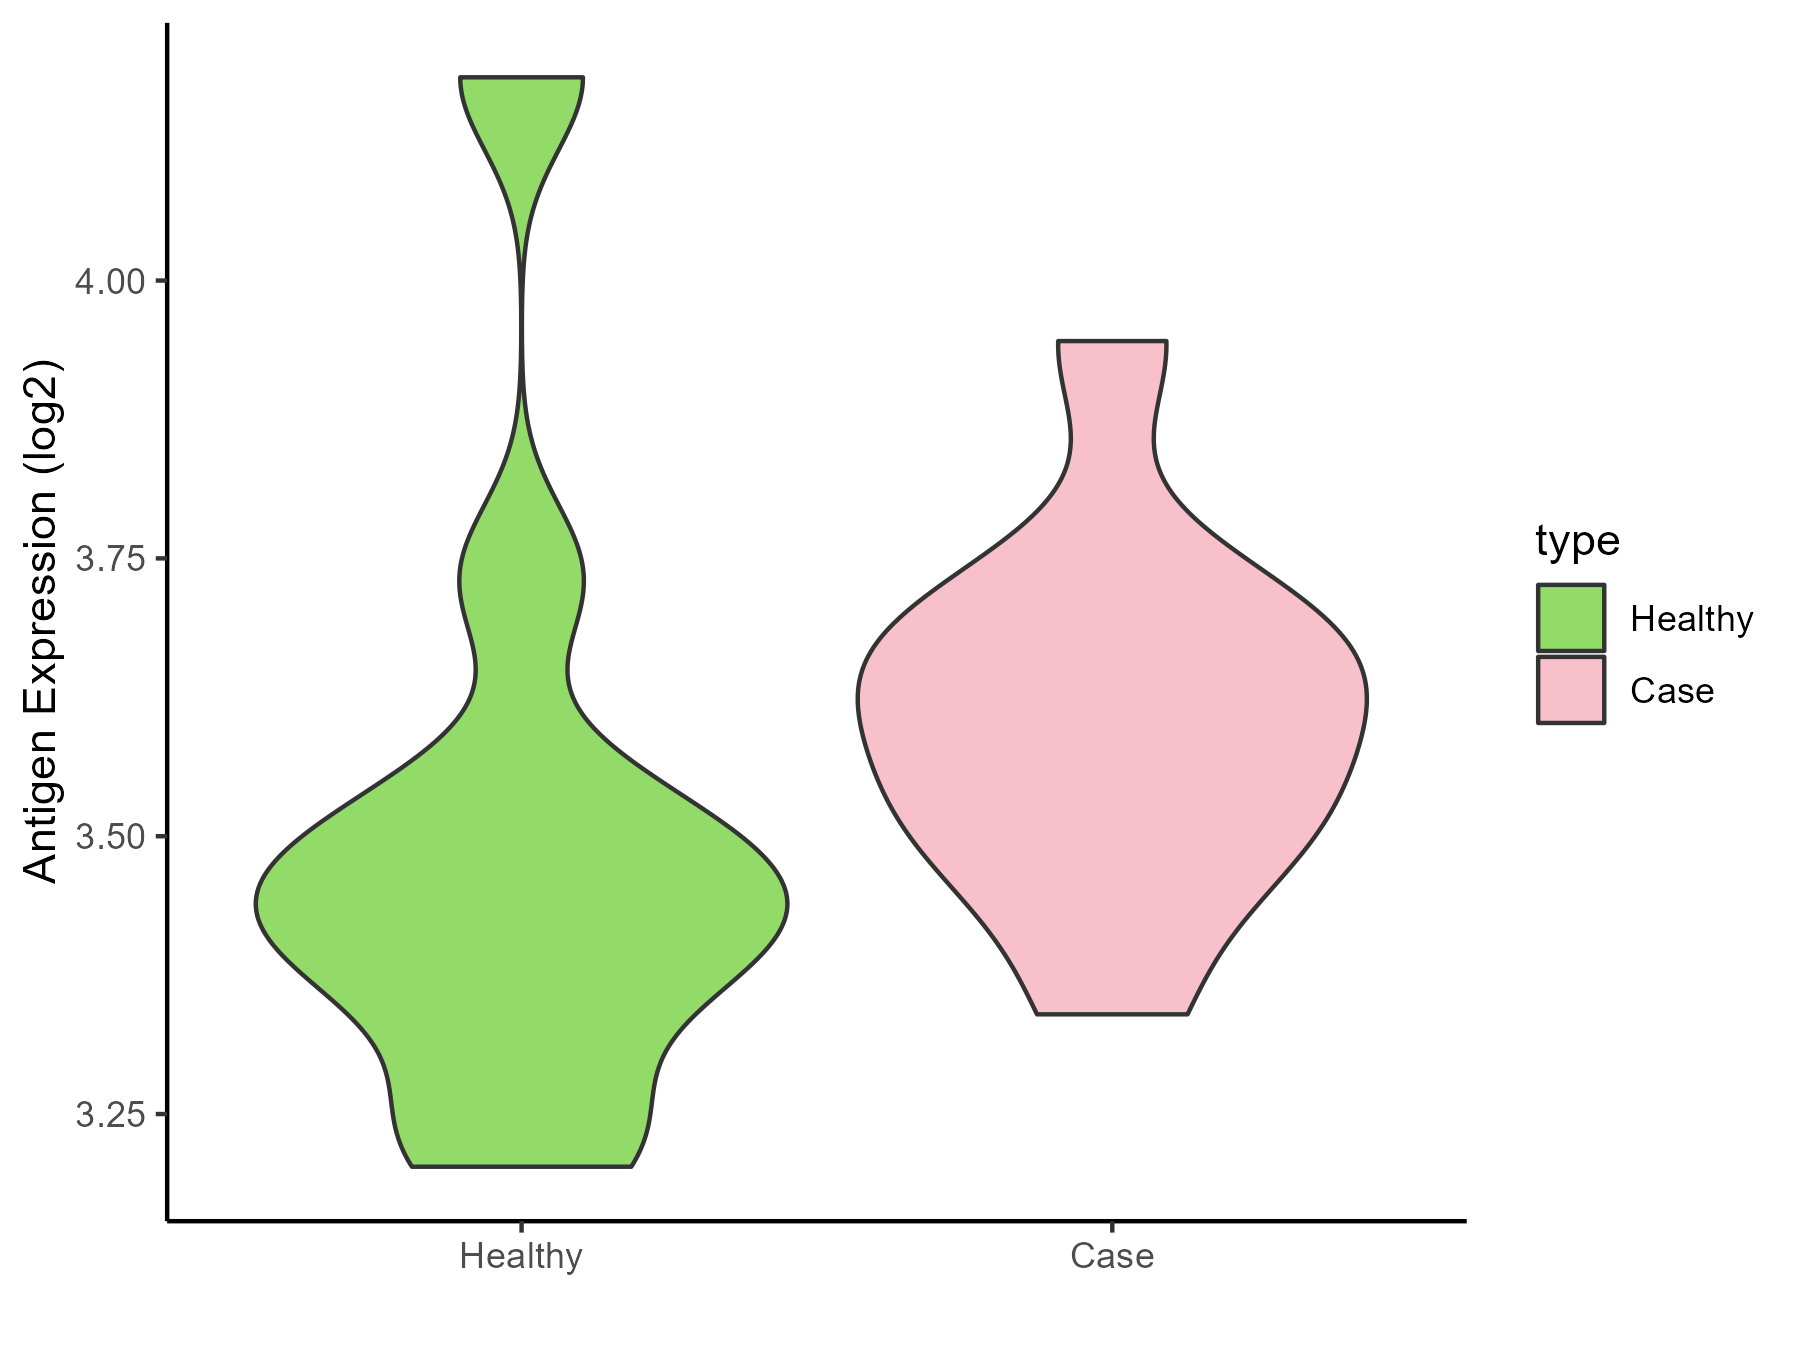
| The Studied Tissue | Calcified aortic valve | |
| The Specific Disease | Aortic stenosis | |
| The Expression Level of Disease Section Compare with the Healthy Individual Tissue | p-value: 0.342212577; Fold-change: 0.160170307; Z-score: 0.571477999 | |
| Disease-specific Antigen Abundances |
|
Click to View the Clearer Original Diagram |
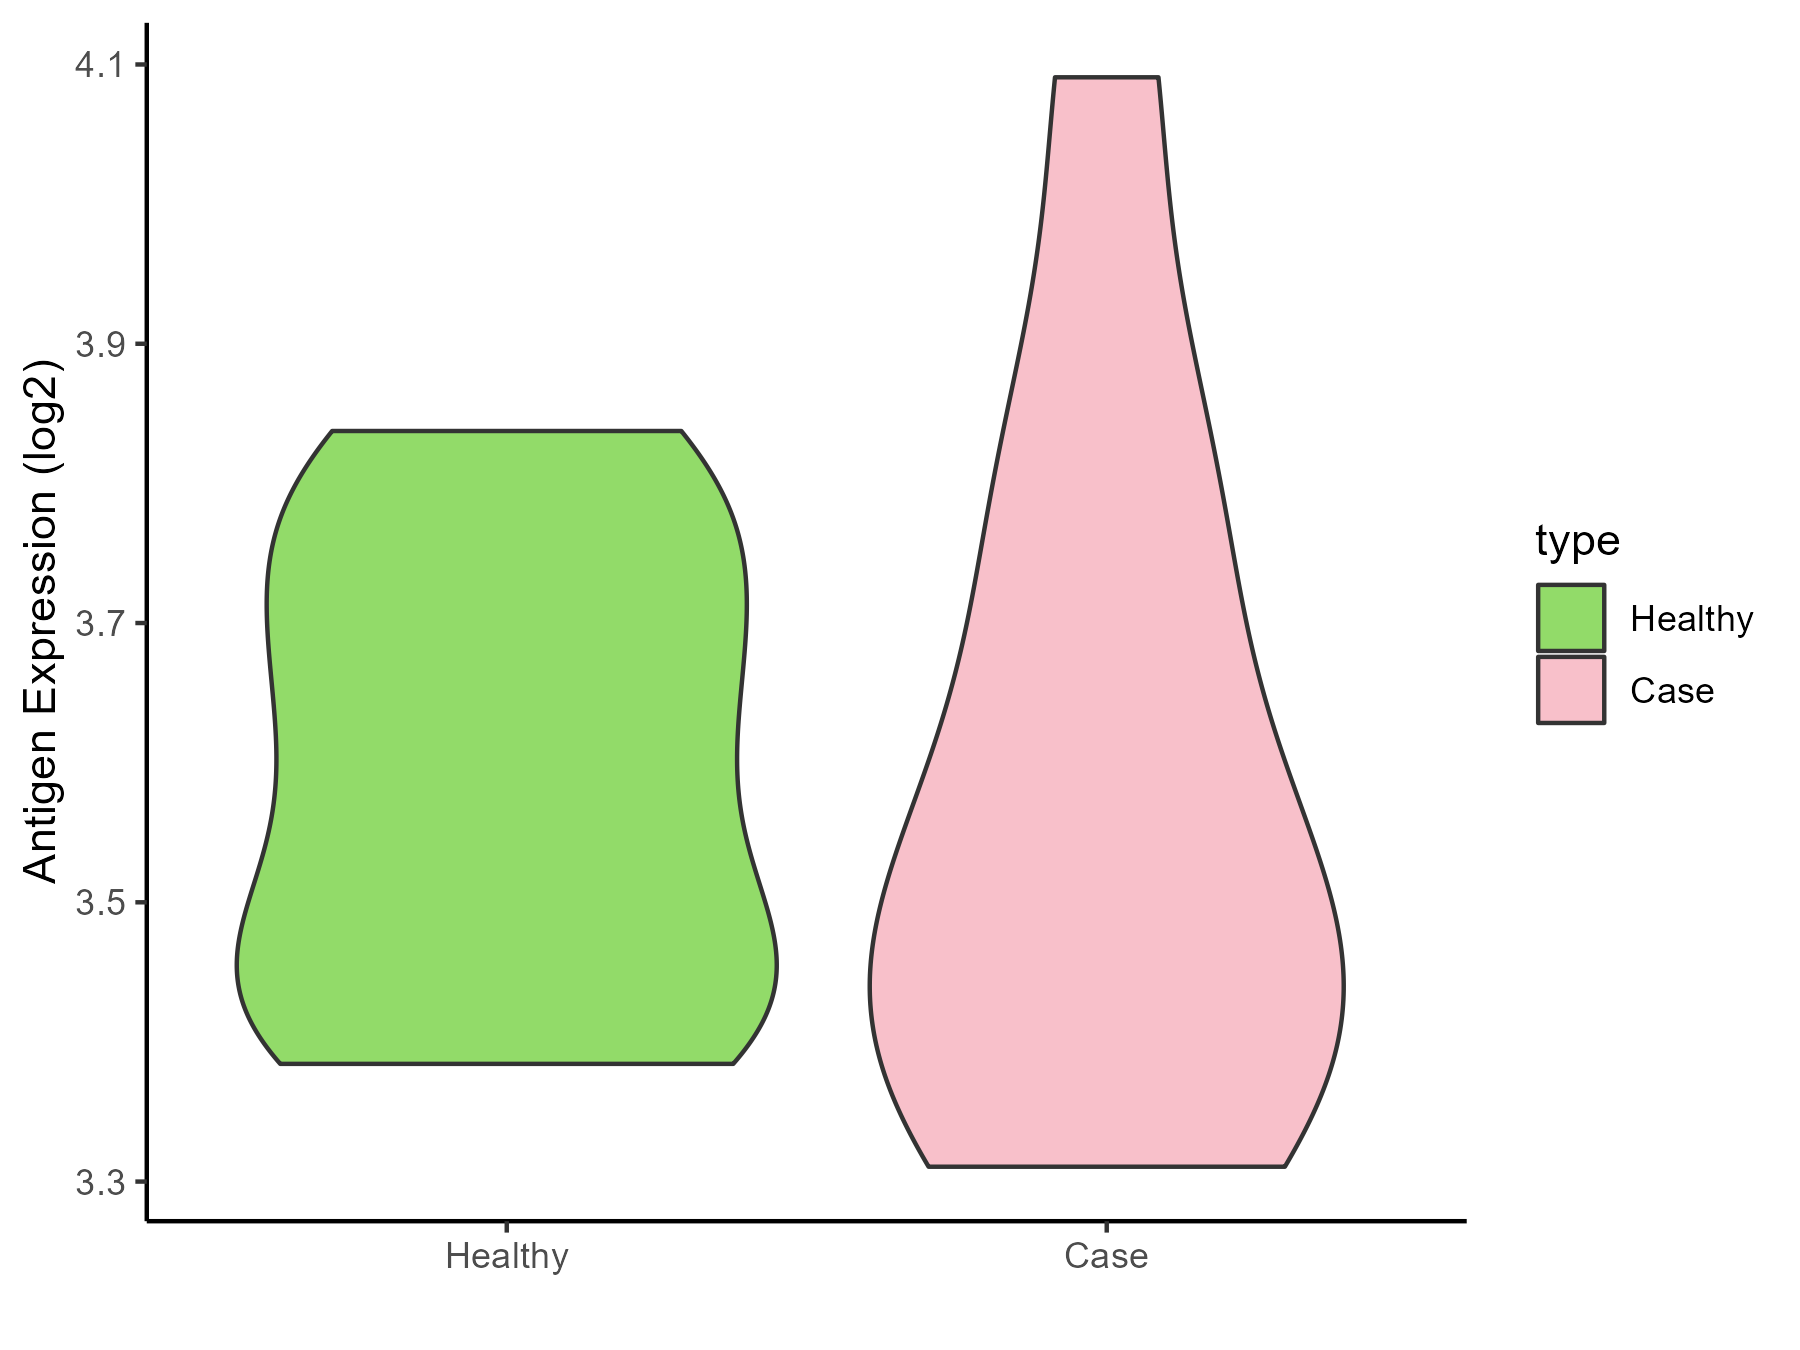
| Differential expression pattern of antigen in diseases | ||
| The Studied Tissue | Peripheral blood | |
| The Specific Disease | Arteriosclerosis | |
| The Expression Level of Disease Section Compare with the Healthy Individual Tissue | p-value: 0.89656882; Fold-change: -0.103076985; Z-score: -0.625616099 | |
| Disease-specific Antigen Abundances |
|
Click to View the Clearer Original Diagram |
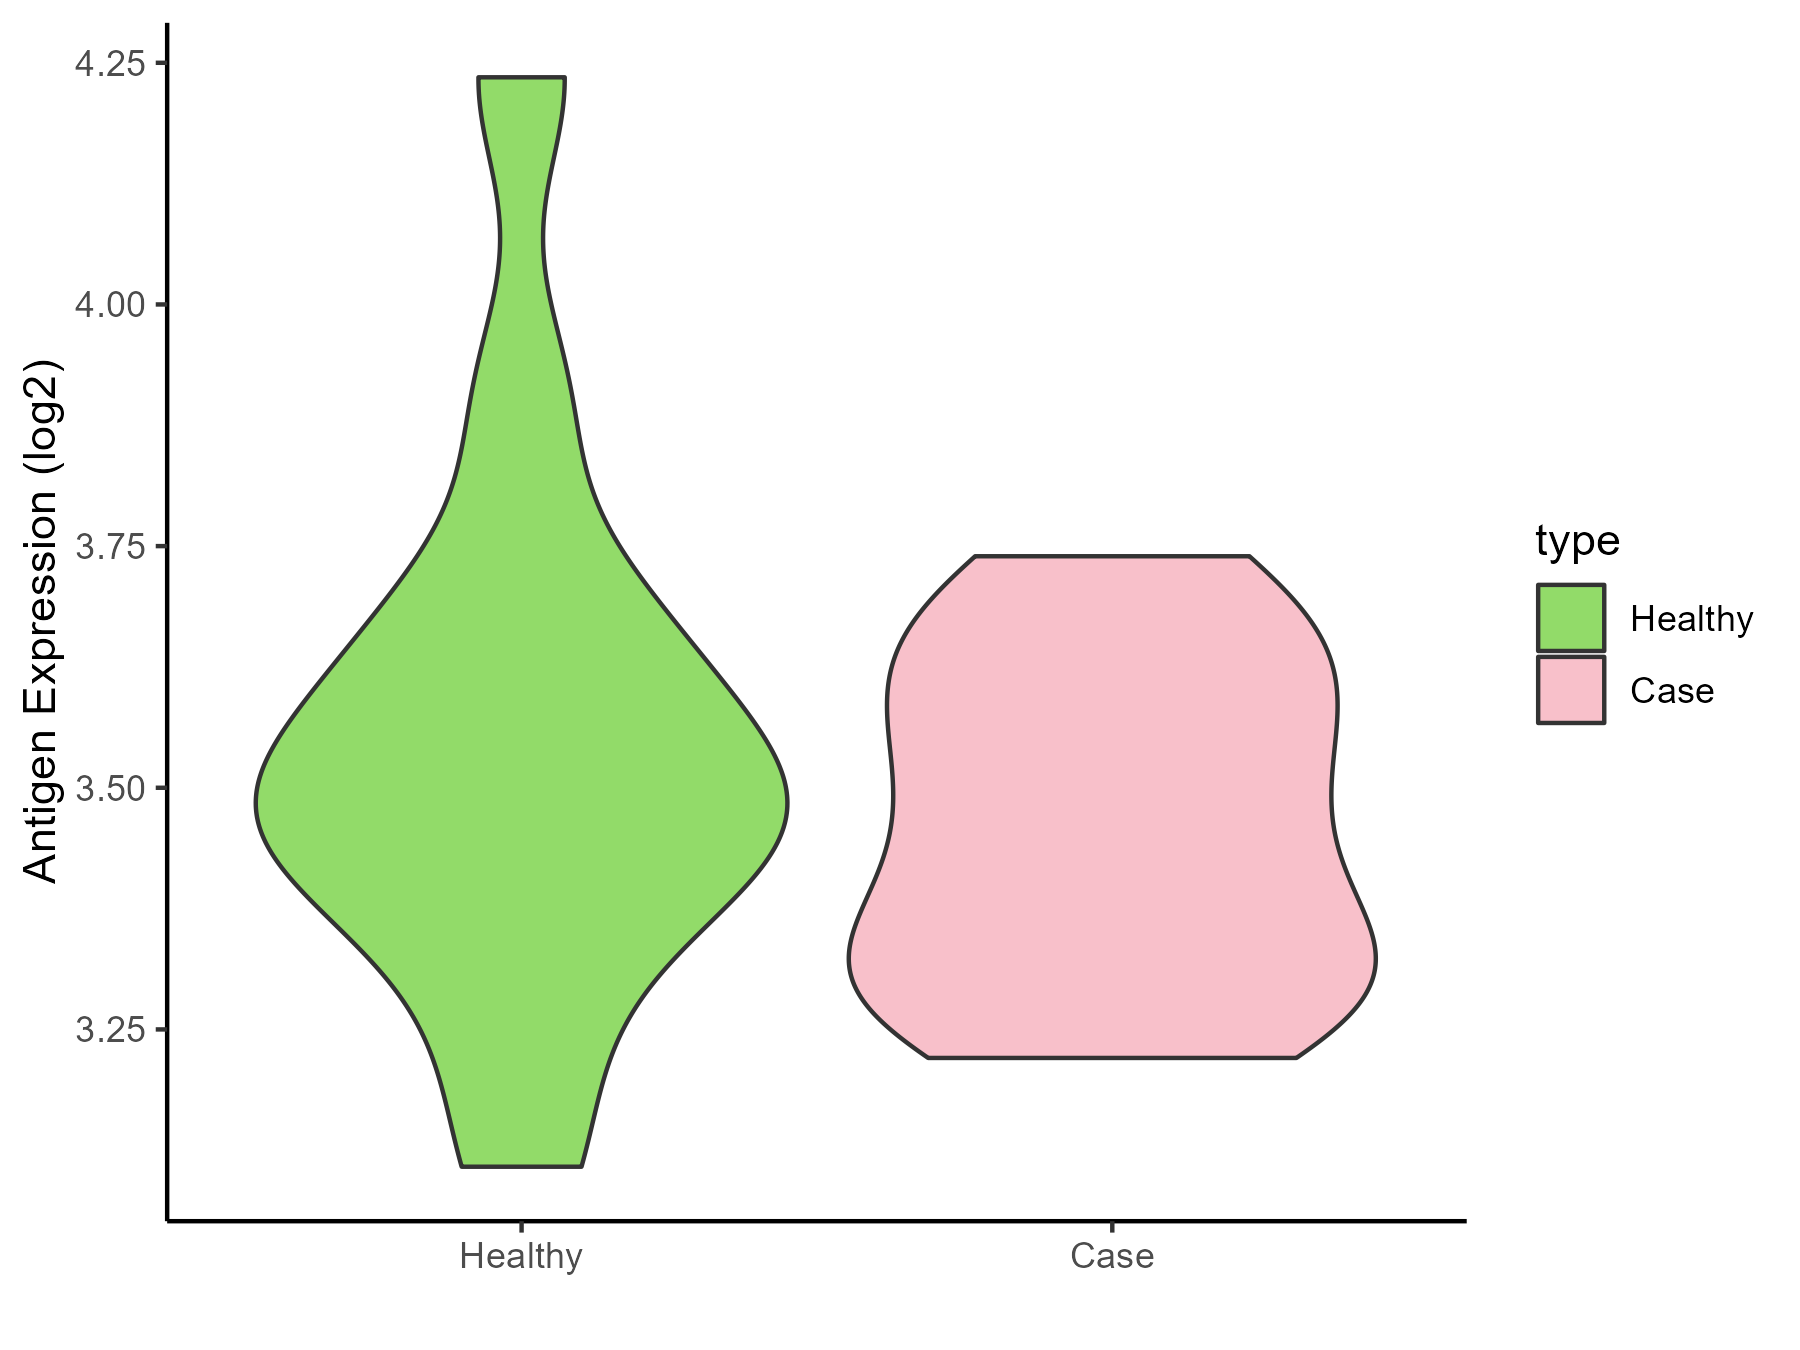
| Differential expression pattern of antigen in diseases | ||
| The Studied Tissue | Intracranial artery | |
| The Specific Disease | Aneurysm | |
| The Expression Level of Disease Section Compare with the Healthy Individual Tissue | p-value: 0.33589828; Fold-change: -0.041420149; Z-score: -0.145054665 | |
| Disease-specific Antigen Abundances |
|
Click to View the Clearer Original Diagram |
ICD Disease Classification 12
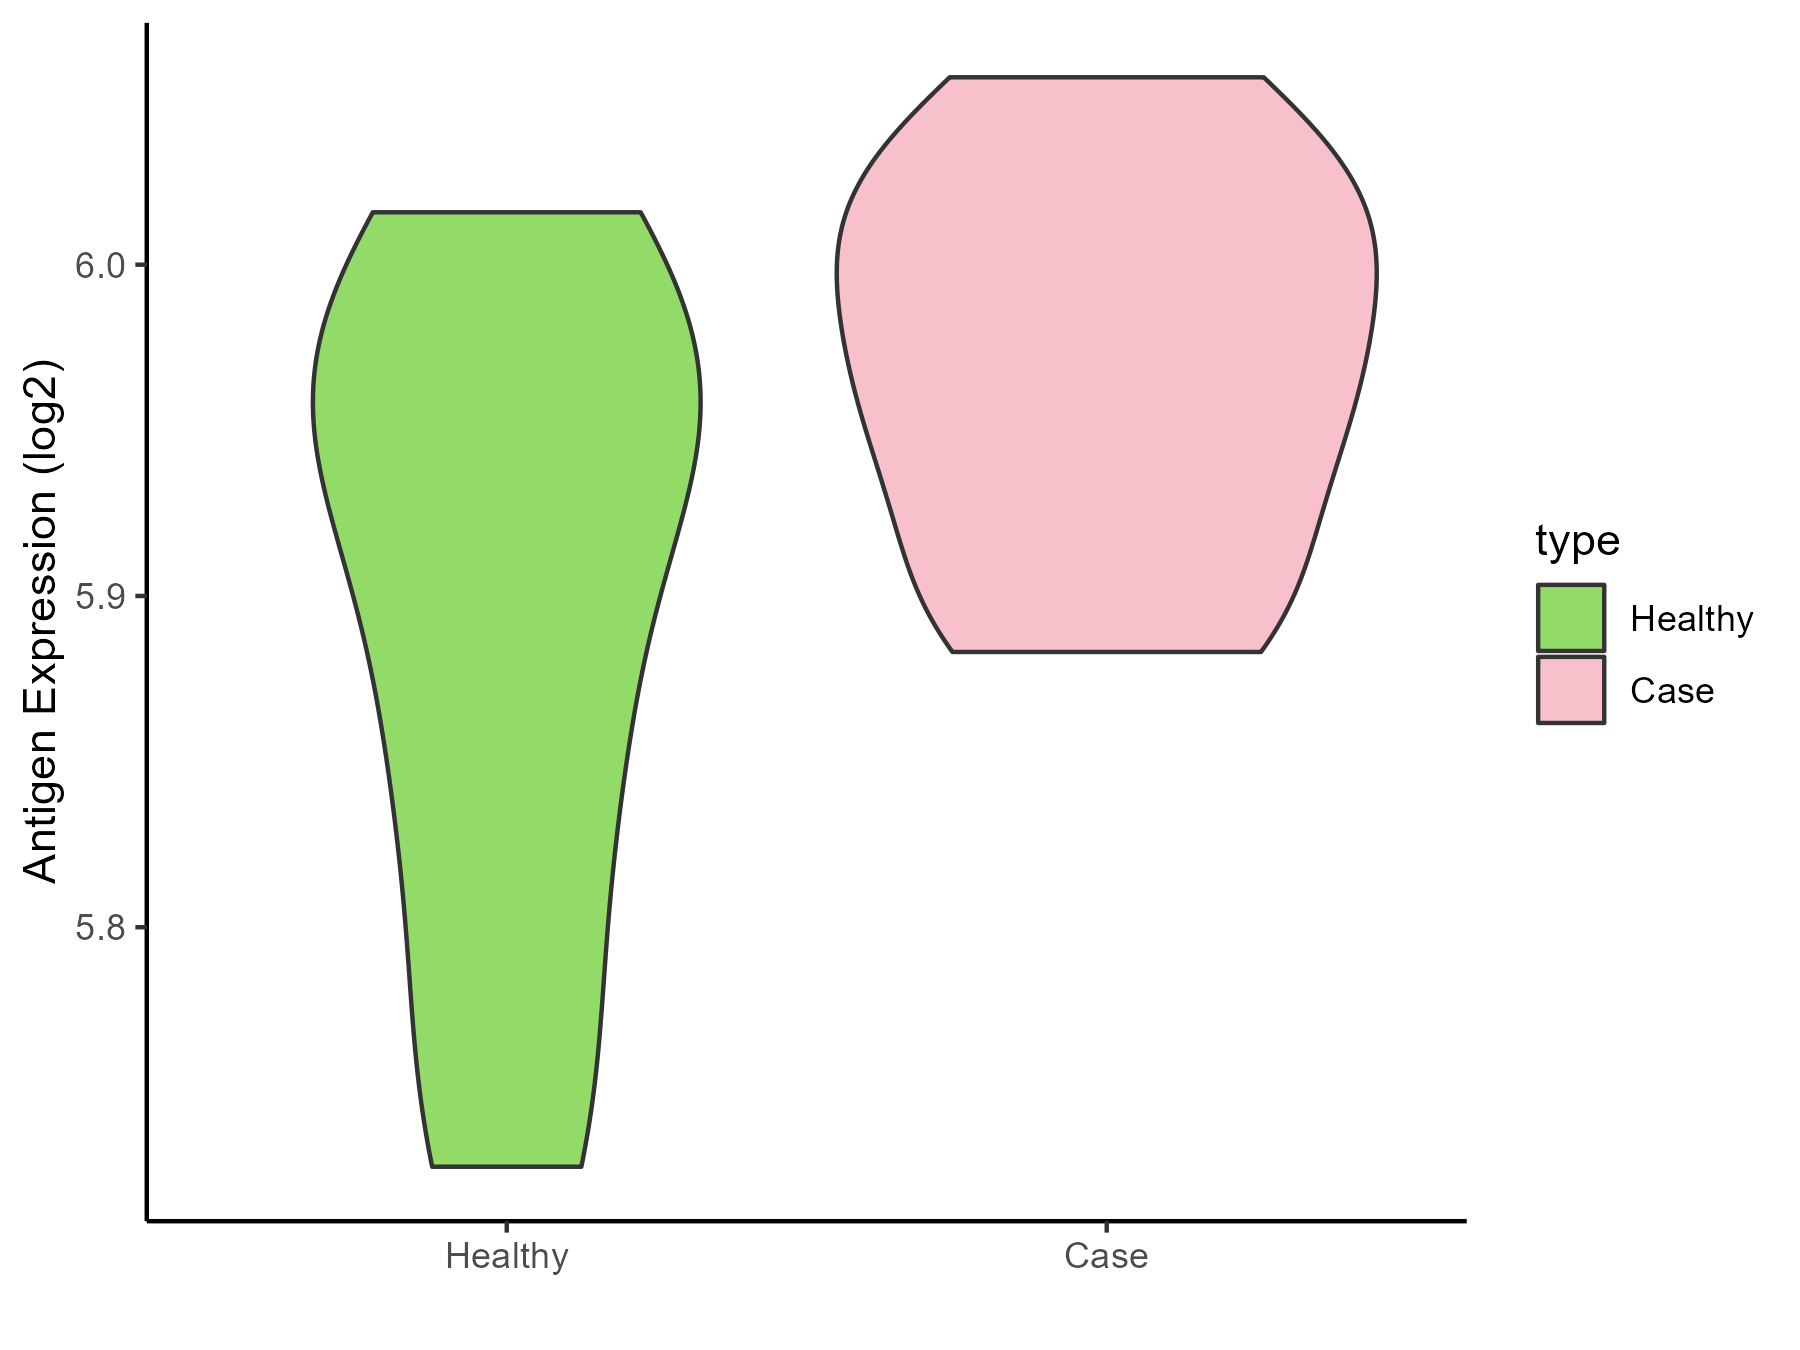
| Differential expression pattern of antigen in diseases | ||
| The Studied Tissue | Peripheral blood | |
| The Specific Disease | Immunodeficiency | |
| The Expression Level of Disease Section Compare with the Healthy Individual Tissue | p-value: 0.065983966; Fold-change: 0.025189735; Z-score: 0.255173476 | |
| Disease-specific Antigen Abundances |
|
Click to View the Clearer Original Diagram |
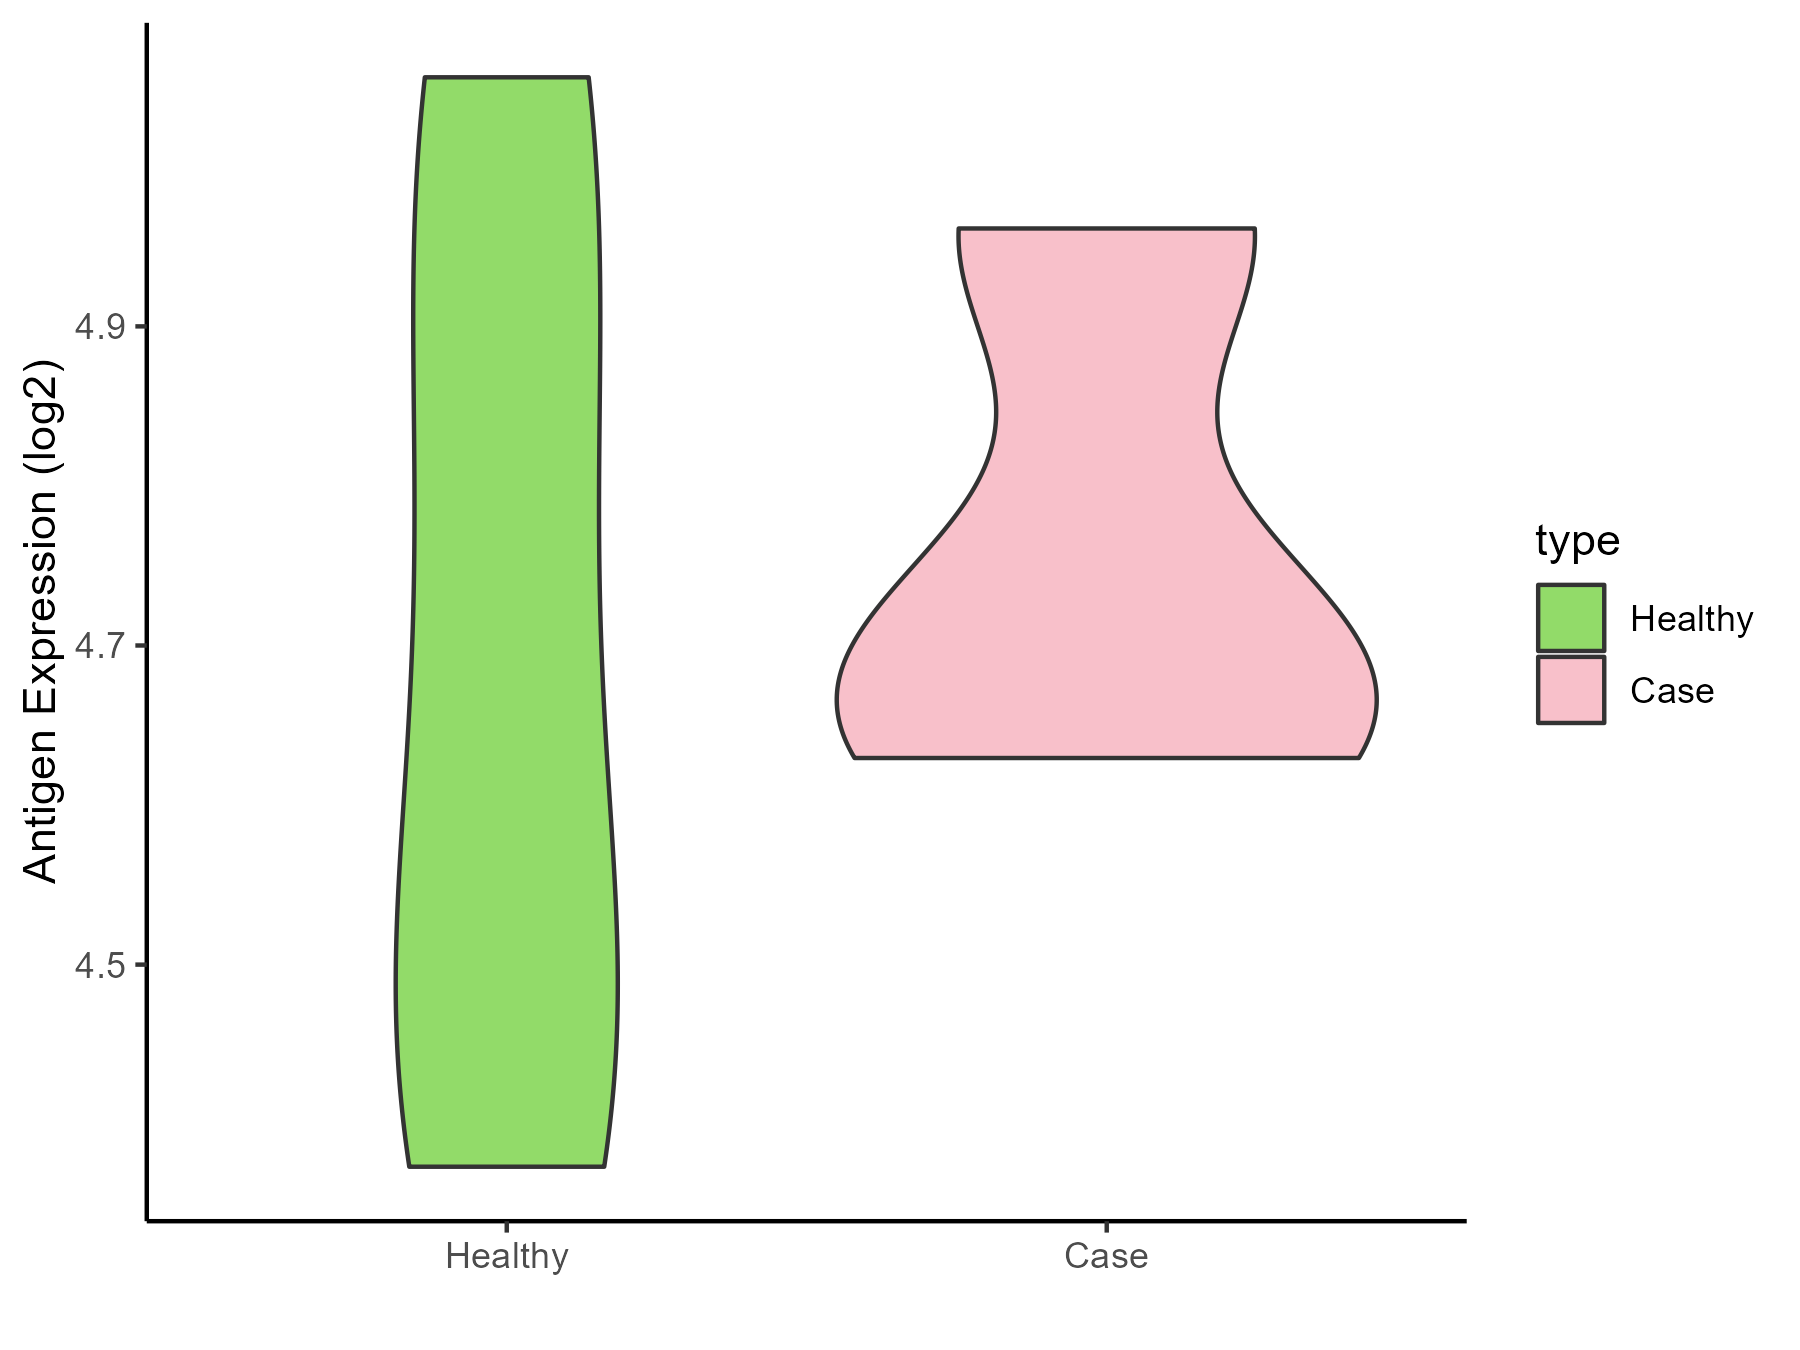
| Differential expression pattern of antigen in diseases | ||
| The Studied Tissue | Hyperplastic tonsil | |
| The Specific Disease | Apnea | |
| The Expression Level of Disease Section Compare with the Healthy Individual Tissue | p-value: 0.672665737; Fold-change: 0.013626754; Z-score: 0.04811245 | |
| Disease-specific Antigen Abundances |
|
Click to View the Clearer Original Diagram |
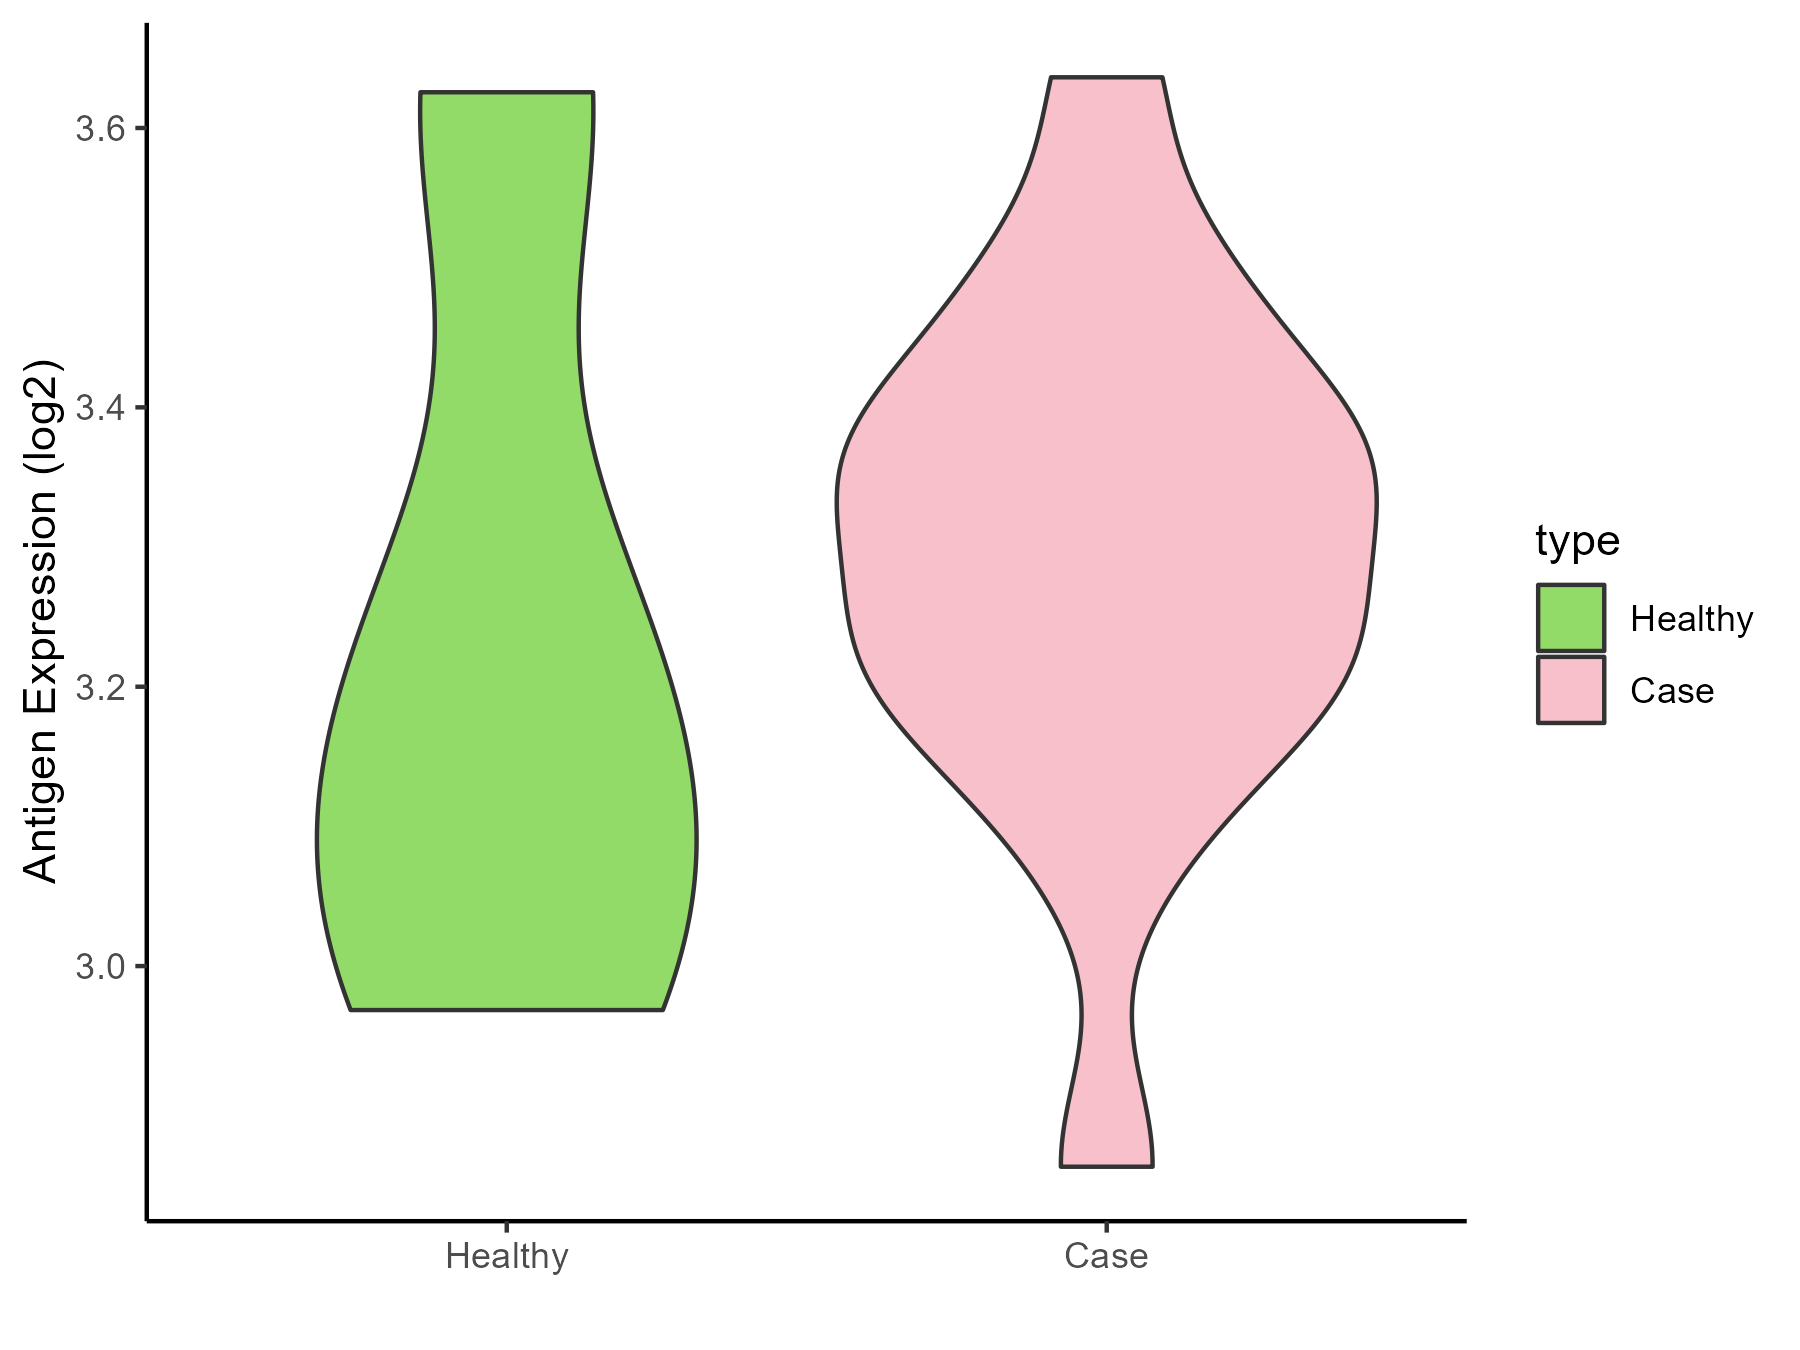
| Differential expression pattern of antigen in diseases | ||
| The Studied Tissue | Peripheral blood | |
| The Specific Disease | Olive pollen allergy | |
| The Expression Level of Disease Section Compare with the Healthy Individual Tissue | p-value: 0.69518052; Fold-change: 0.141022551; Z-score: 0.493453992 | |
| Disease-specific Antigen Abundances |
|
Click to View the Clearer Original Diagram |
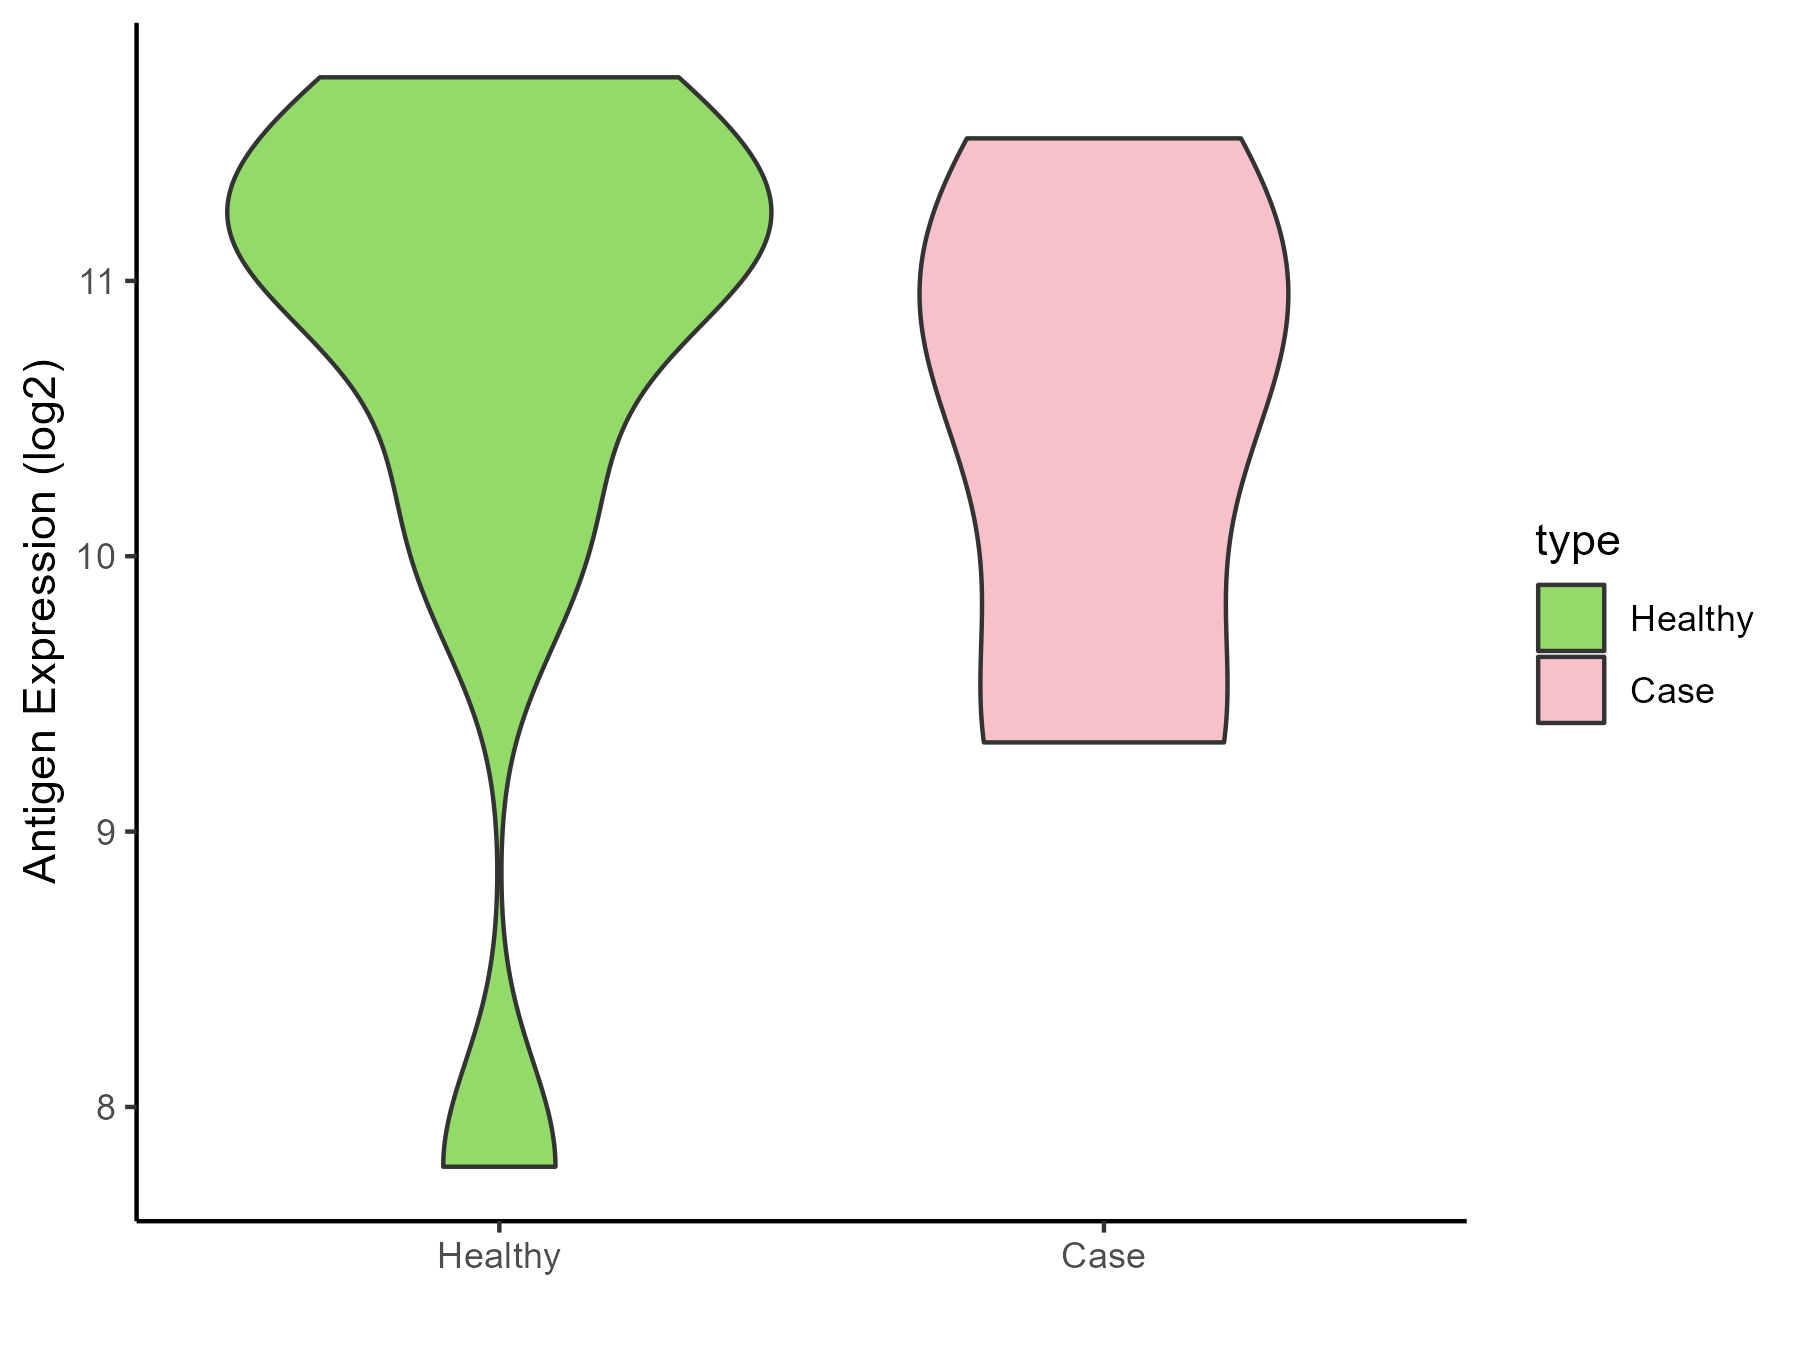
| Differential expression pattern of antigen in diseases | ||
| The Studied Tissue | Sinus mucosa | |
| The Specific Disease | Chronic rhinosinusitis | |
| The Expression Level of Disease Section Compare with the Healthy Individual Tissue | p-value: 0.66499695; Fold-change: -0.42402892; Z-score: -0.346321282 | |
| Disease-specific Antigen Abundances |
|
Click to View the Clearer Original Diagram |
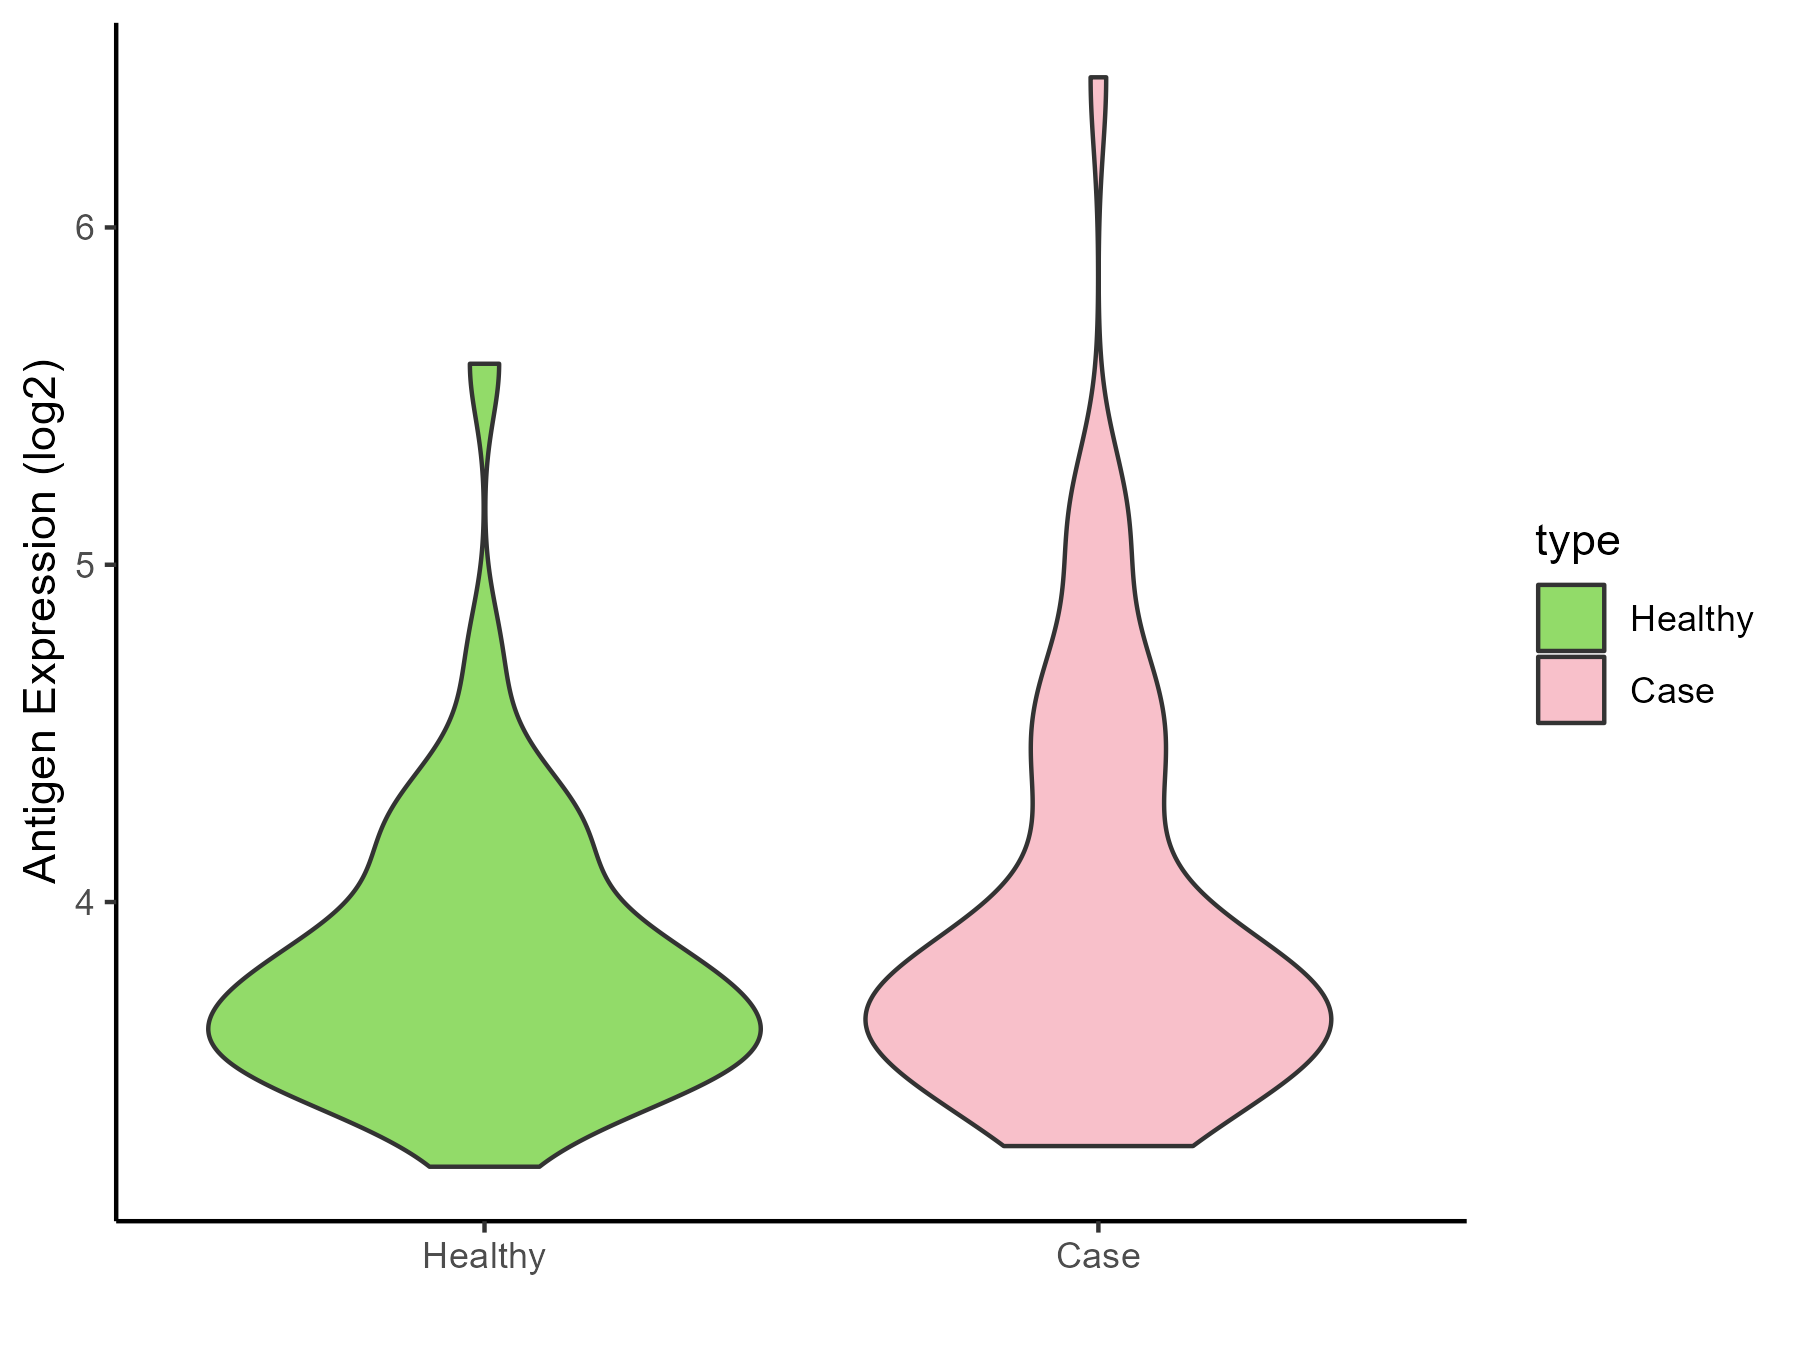
| Differential expression pattern of antigen in diseases | ||
| The Studied Tissue | Lung | |
| The Specific Disease | Chronic obstructive pulmonary disease | |
| The Expression Level of Disease Section Compare with the Healthy Individual Tissue | p-value: 0.238924089; Fold-change: 0.013660429; Z-score: 0.030987879 | |
| Disease-specific Antigen Abundances |
|
Click to View the Clearer Original Diagram |
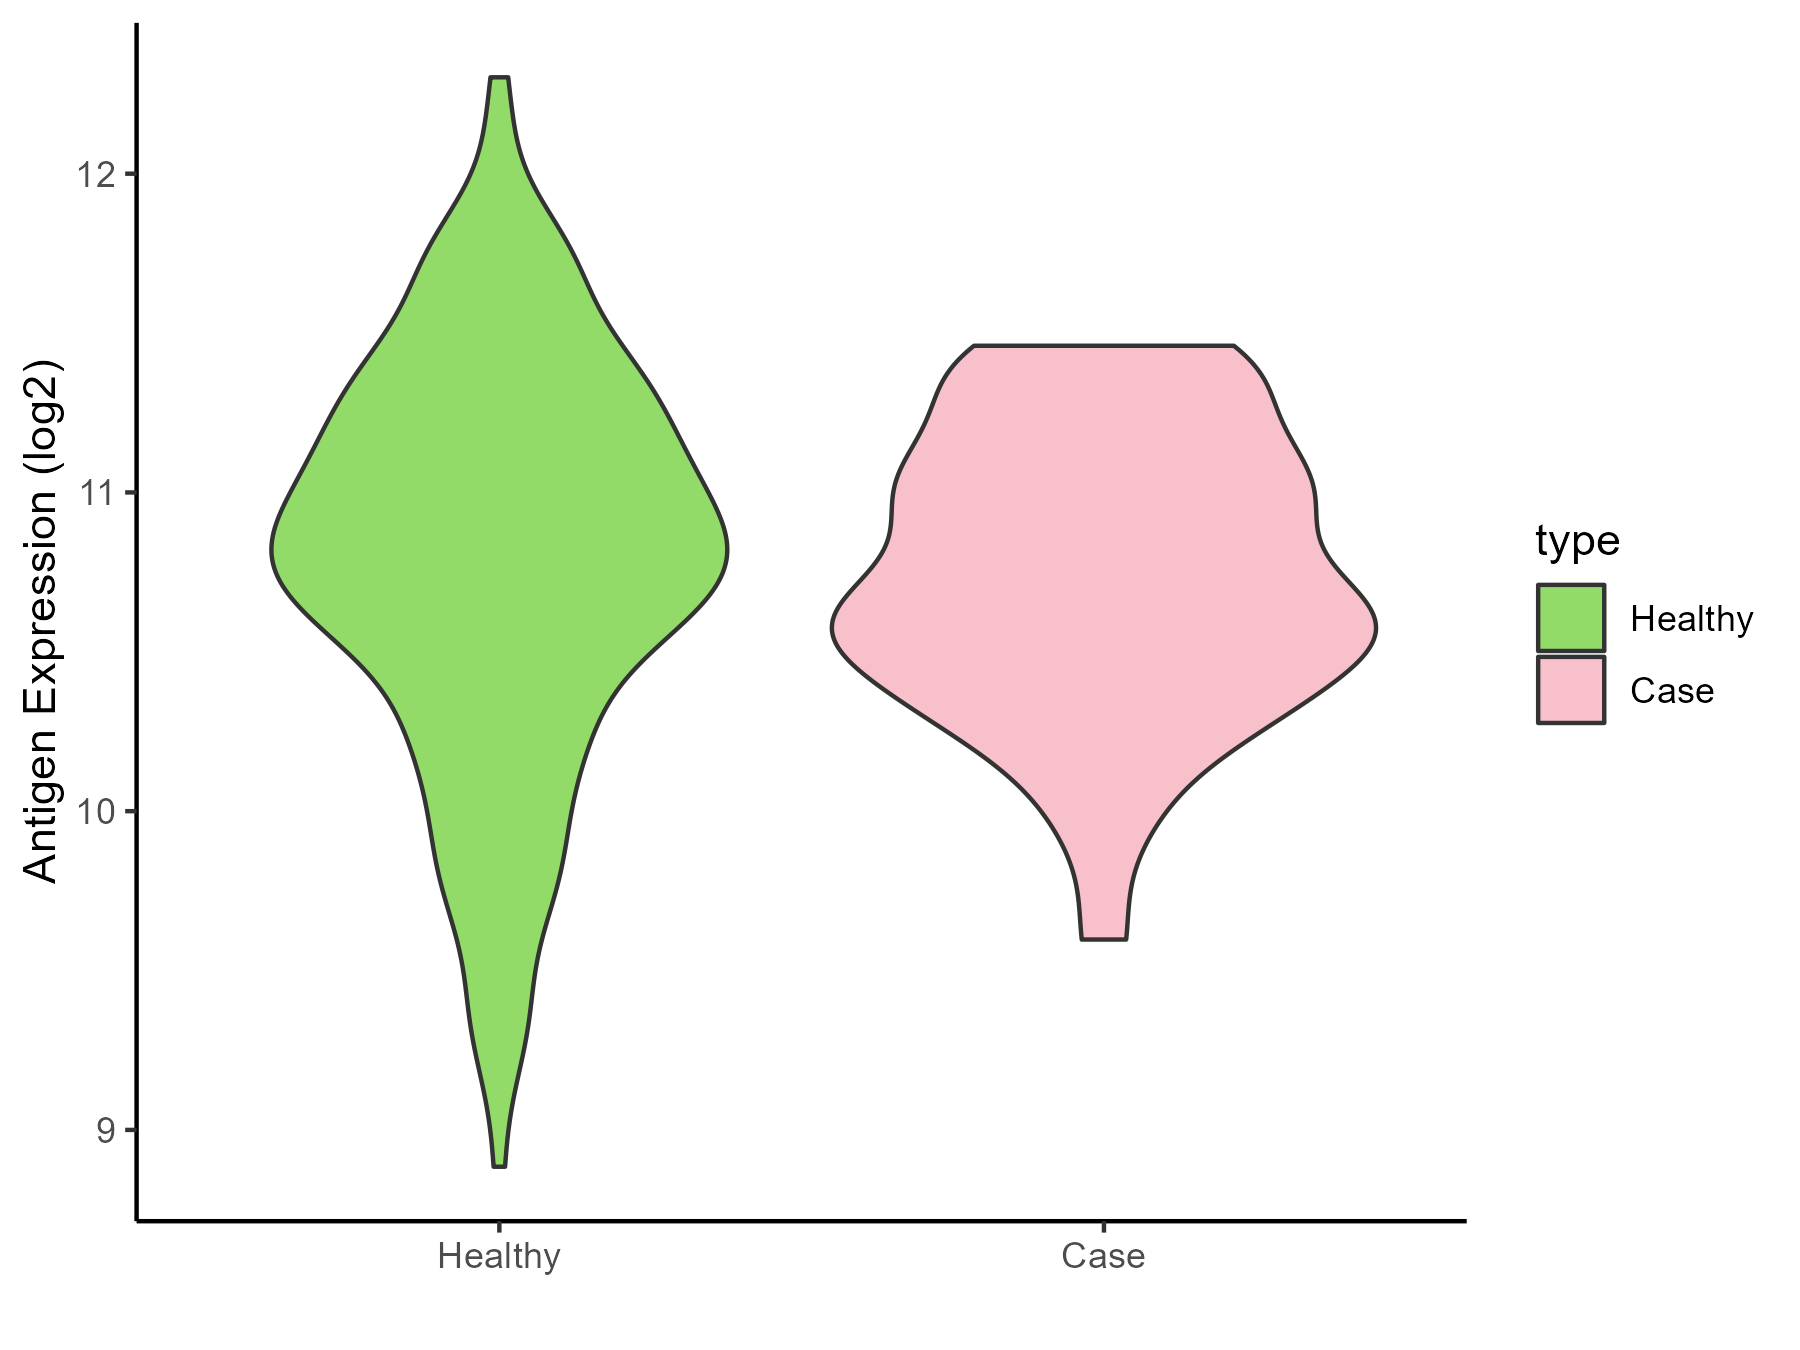
| The Studied Tissue | Small airway epithelium | |
| The Specific Disease | Chronic obstructive pulmonary disease | |
| The Expression Level of Disease Section Compare with the Healthy Individual Tissue | p-value: 0.626821713; Fold-change: -0.124988827; Z-score: -0.196479175 | |
| Disease-specific Antigen Abundances |
|
Click to View the Clearer Original Diagram |
| Differential expression pattern of antigen in diseases | ||
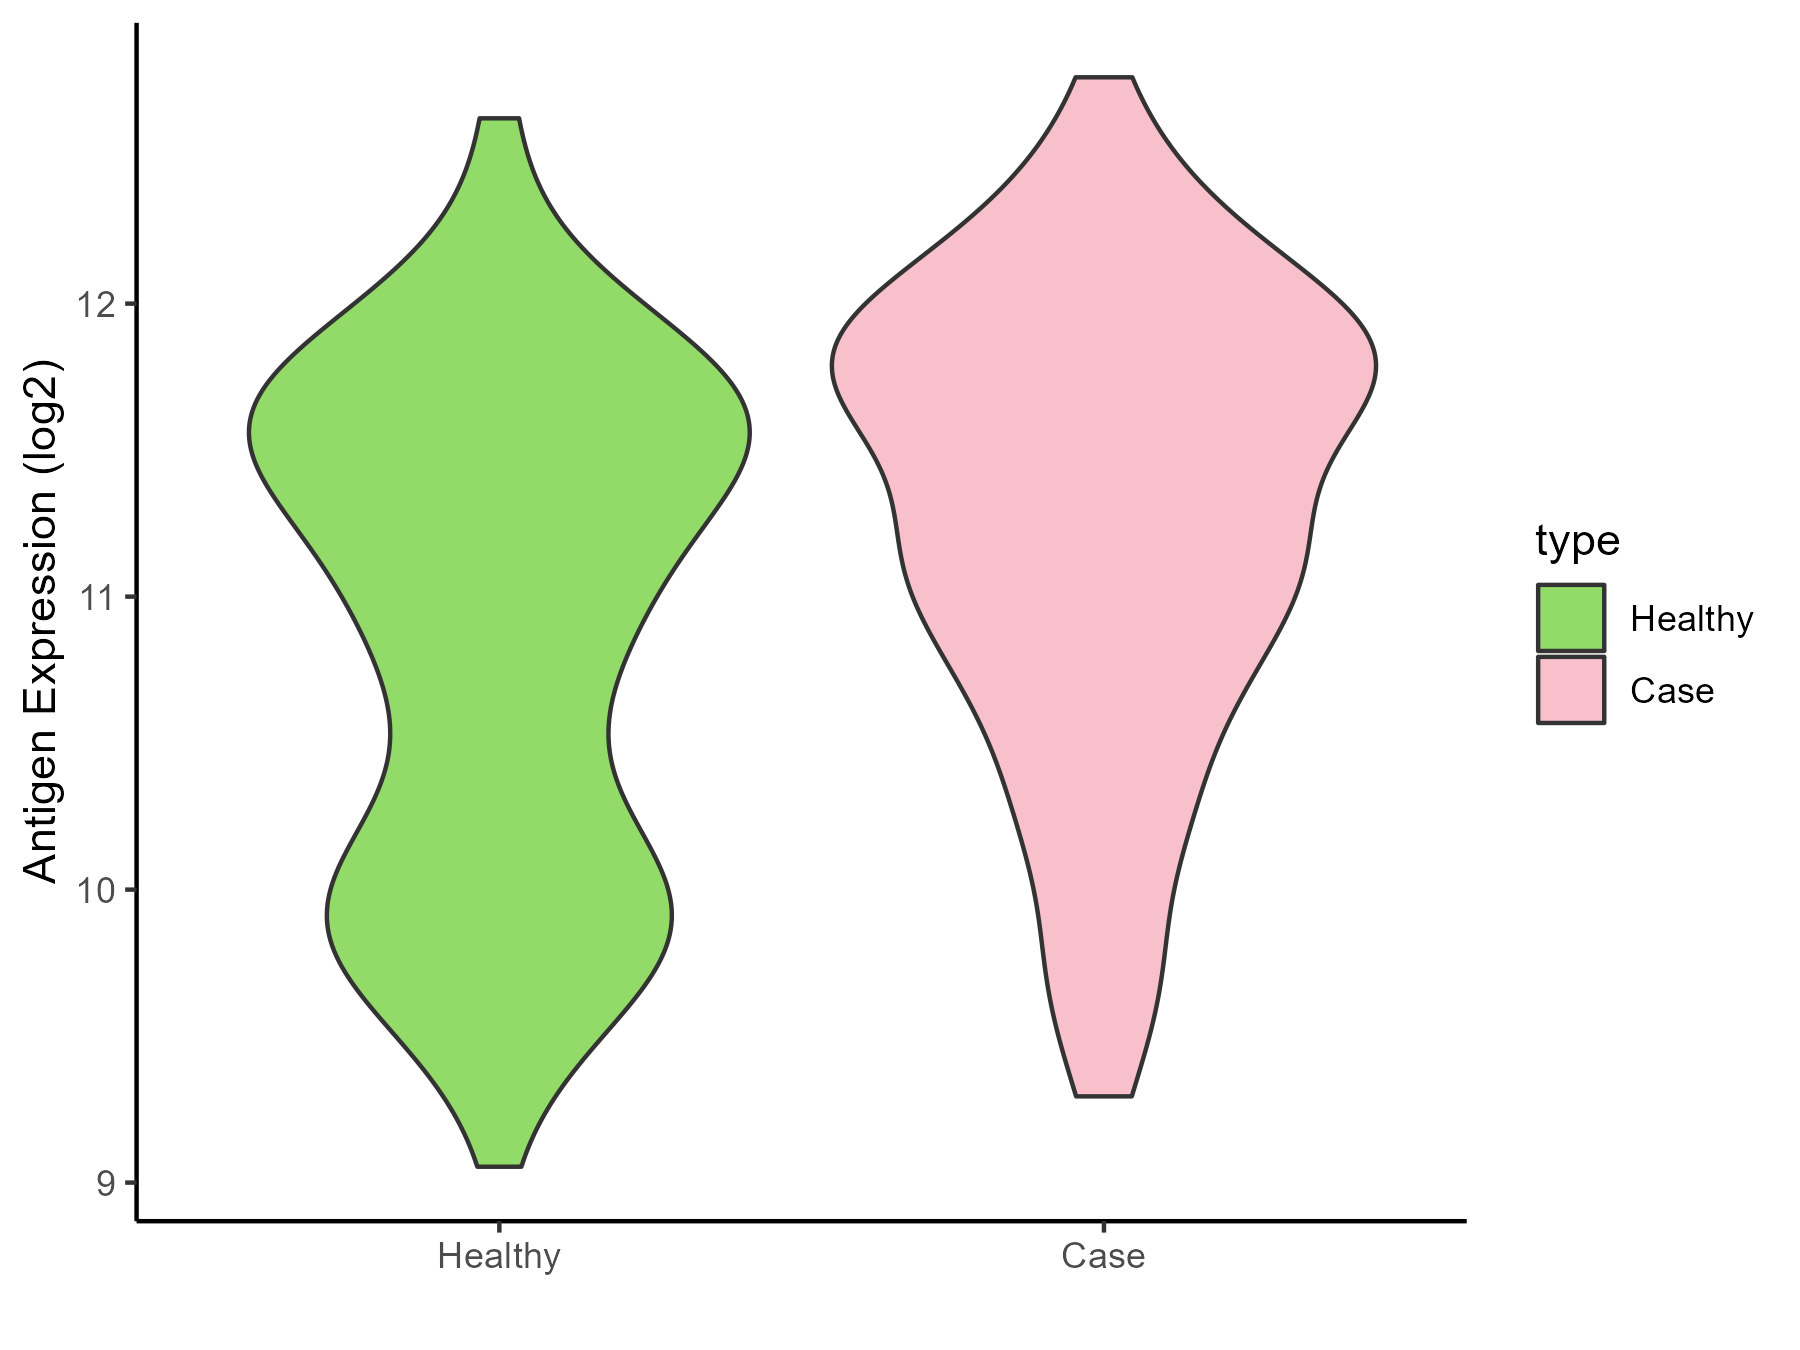
| The Studied Tissue | Nasal and bronchial airway | |
| The Specific Disease | Asthma | |
| The Expression Level of Disease Section Compare with the Healthy Individual Tissue | p-value: 0.00013714; Fold-change: 0.342524776; Z-score: 0.402833567 | |
| Disease-specific Antigen Abundances |
|
Click to View the Clearer Original Diagram |
| Differential expression pattern of antigen in diseases | ||
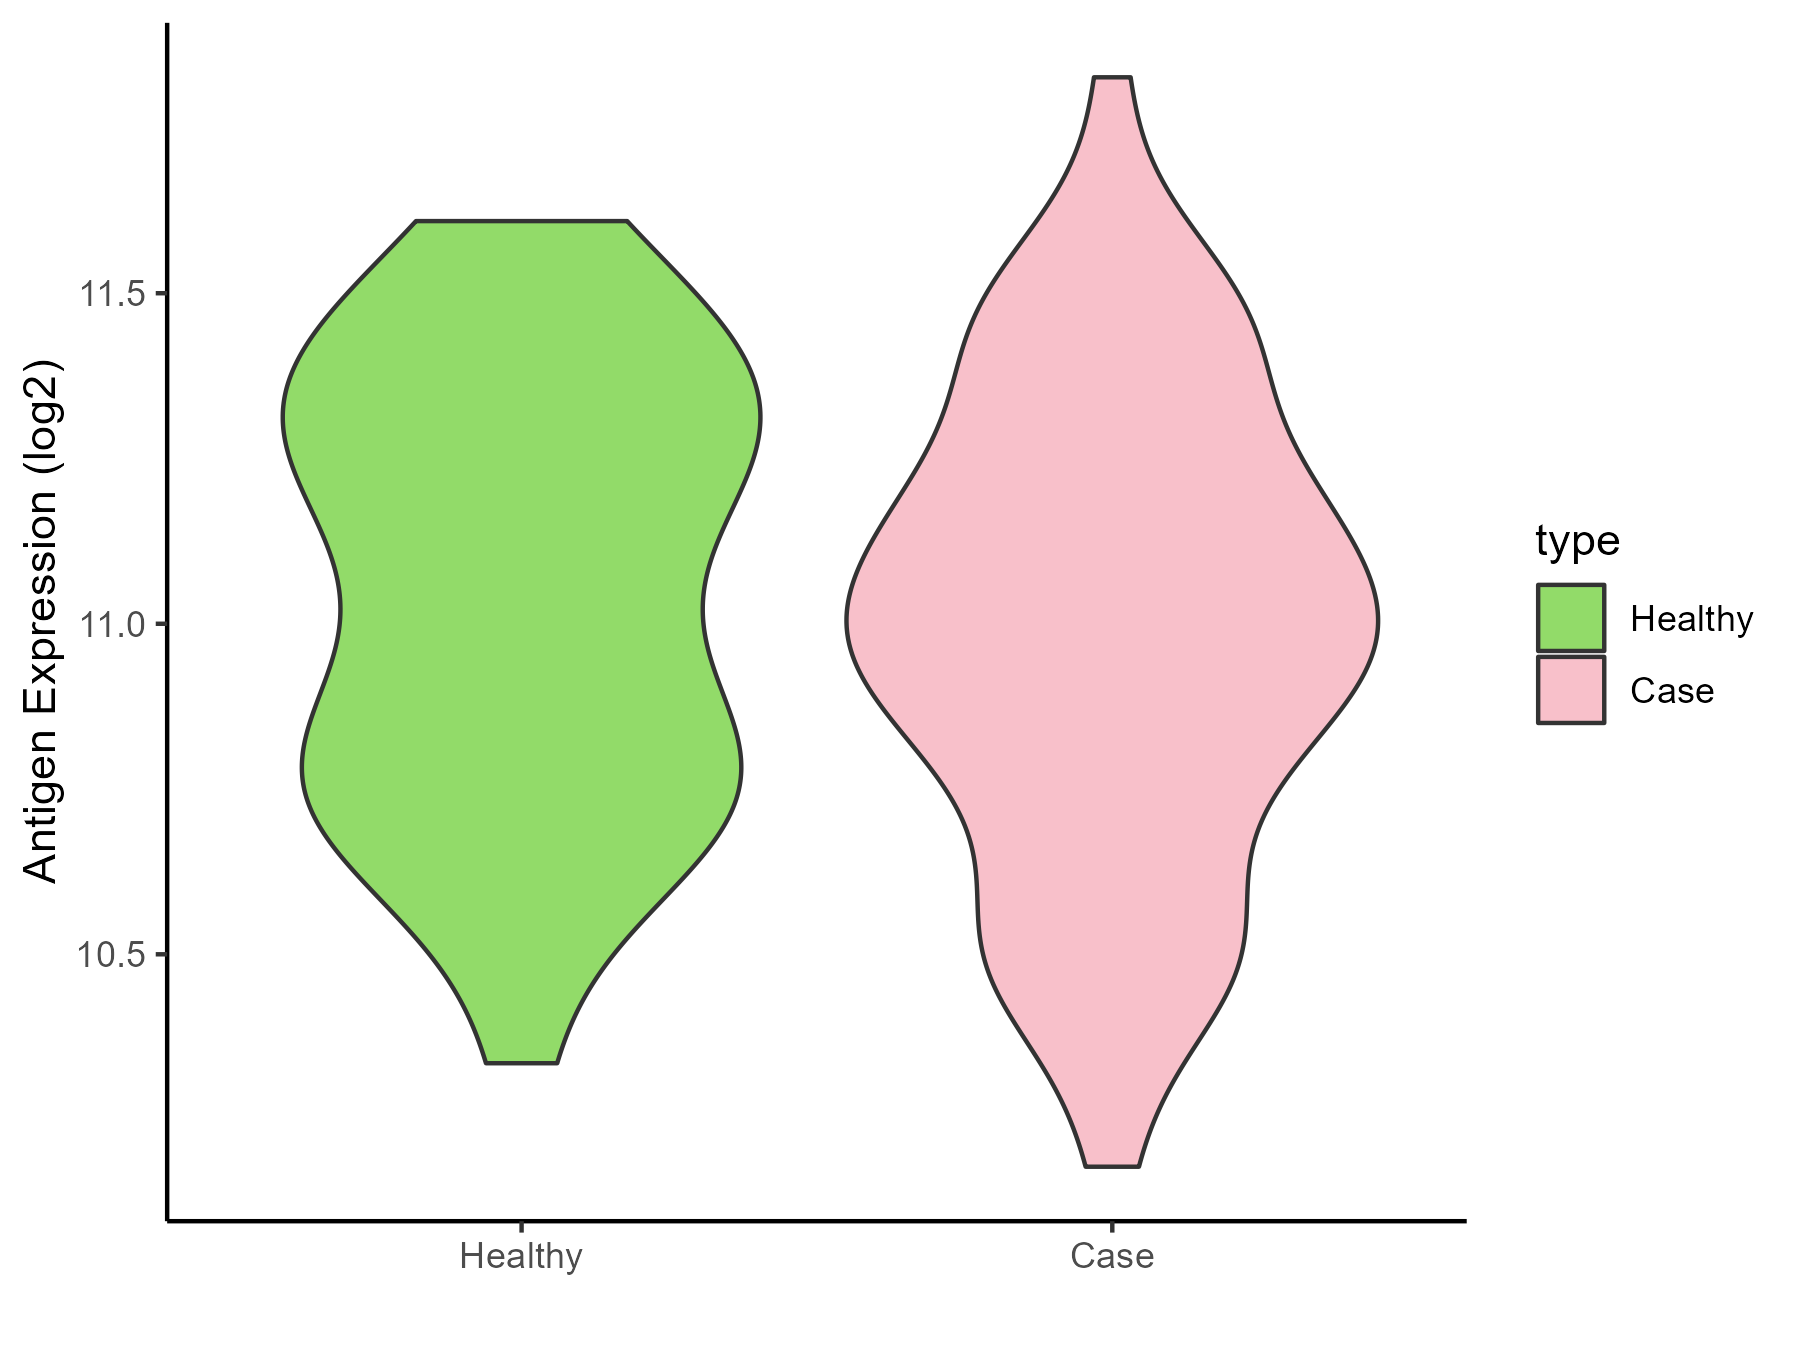
| The Studied Tissue | Nasal Epithelium | |
| The Specific Disease | Human rhinovirus infection | |
| The Expression Level of Disease Section Compare with the Healthy Individual Tissue | p-value: 0.394093487; Fold-change: -0.056734976; Z-score: -0.168603415 | |
| Disease-specific Antigen Abundances |
|
Click to View the Clearer Original Diagram |
| Differential expression pattern of antigen in diseases | ||
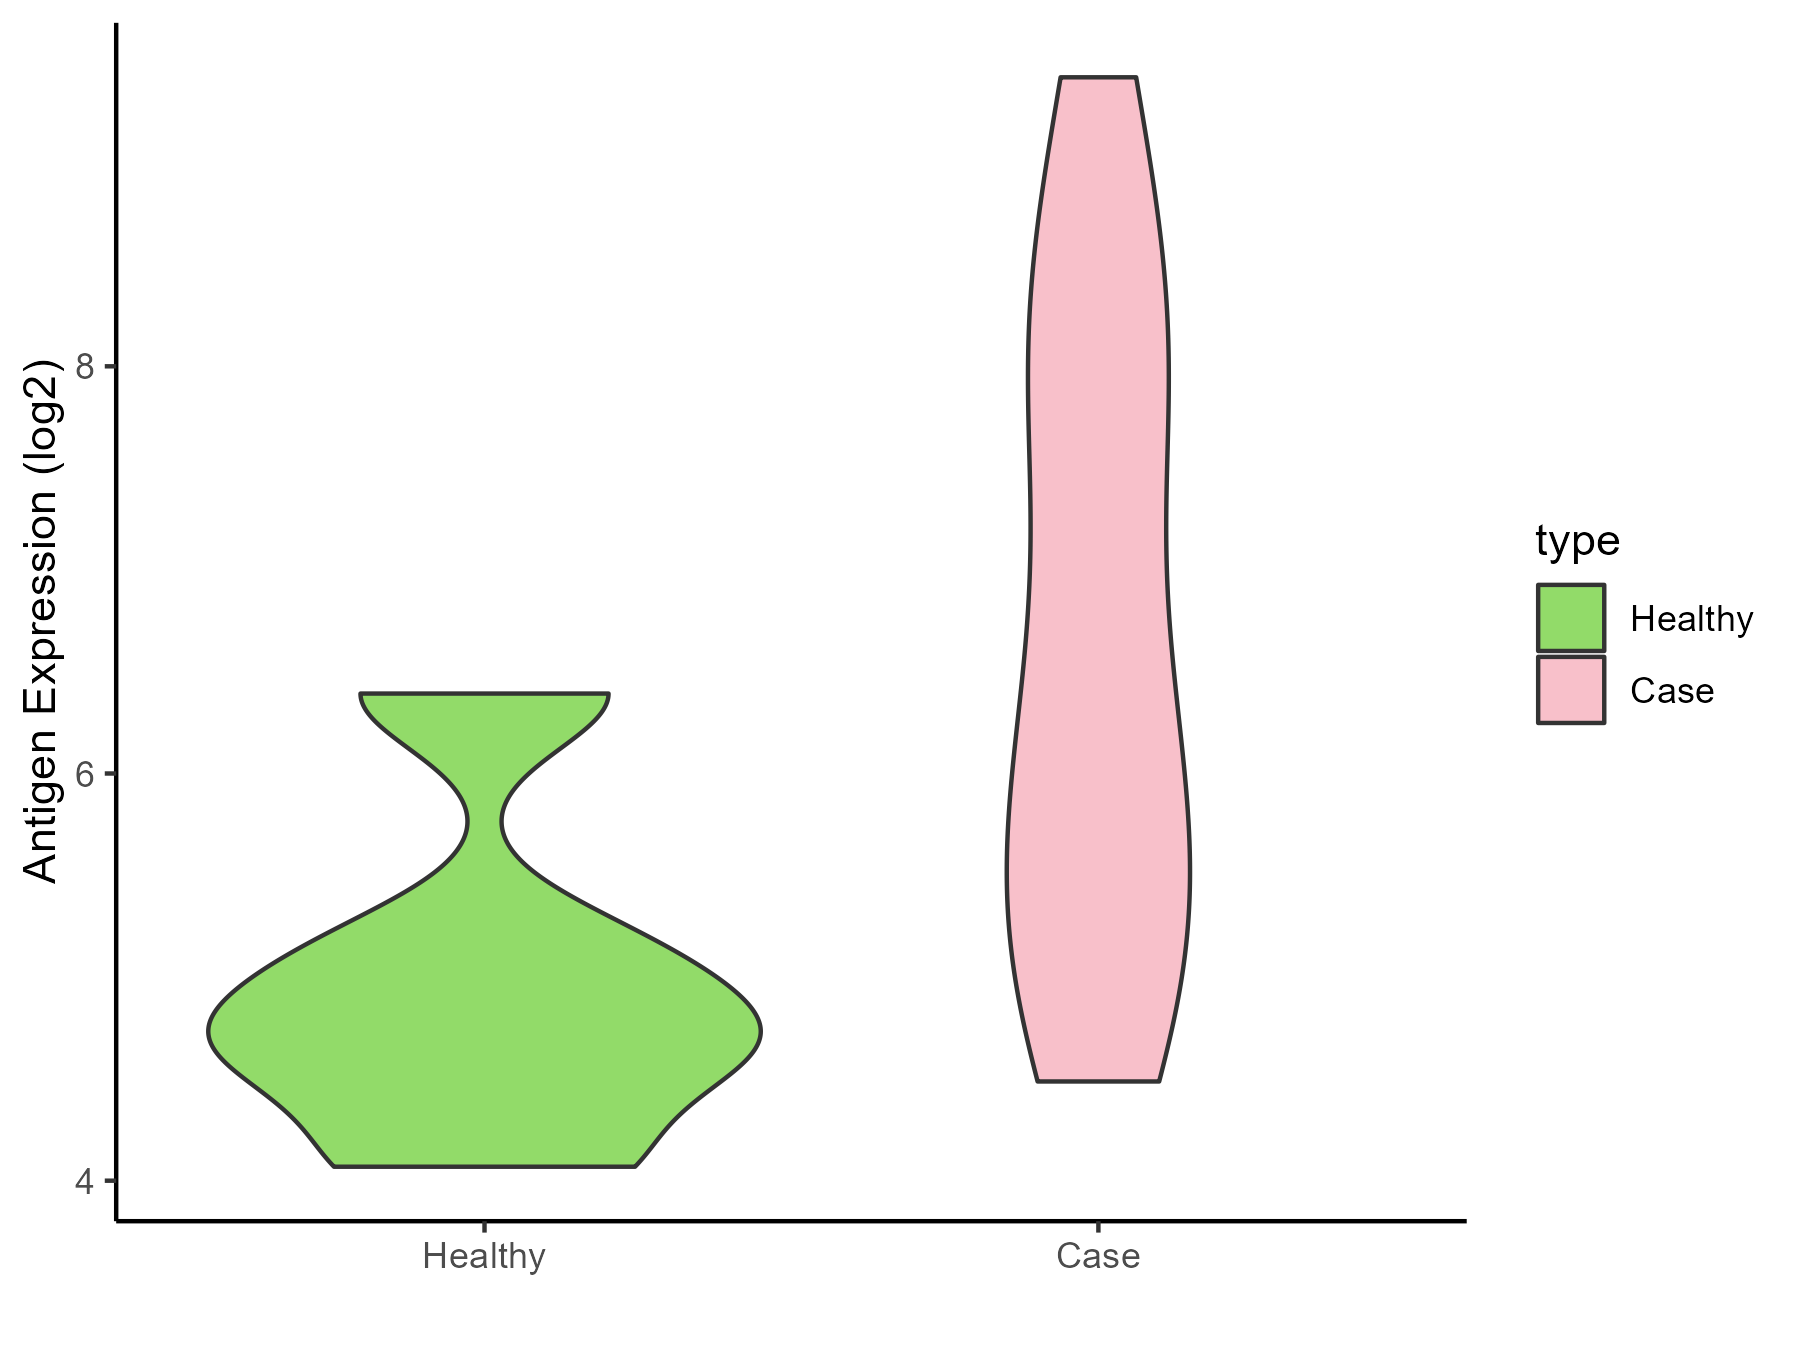
| The Studied Tissue | Lung | |
| The Specific Disease | Idiopathic pulmonary fibrosis | |
| The Expression Level of Disease Section Compare with the Healthy Individual Tissue | p-value: 0.008918712; Fold-change: 1.663455025; Z-score: 1.902067788 | |
| Disease-specific Antigen Abundances |
|
Click to View the Clearer Original Diagram |
ICD Disease Classification 13
| Differential expression pattern of antigen in diseases | ||
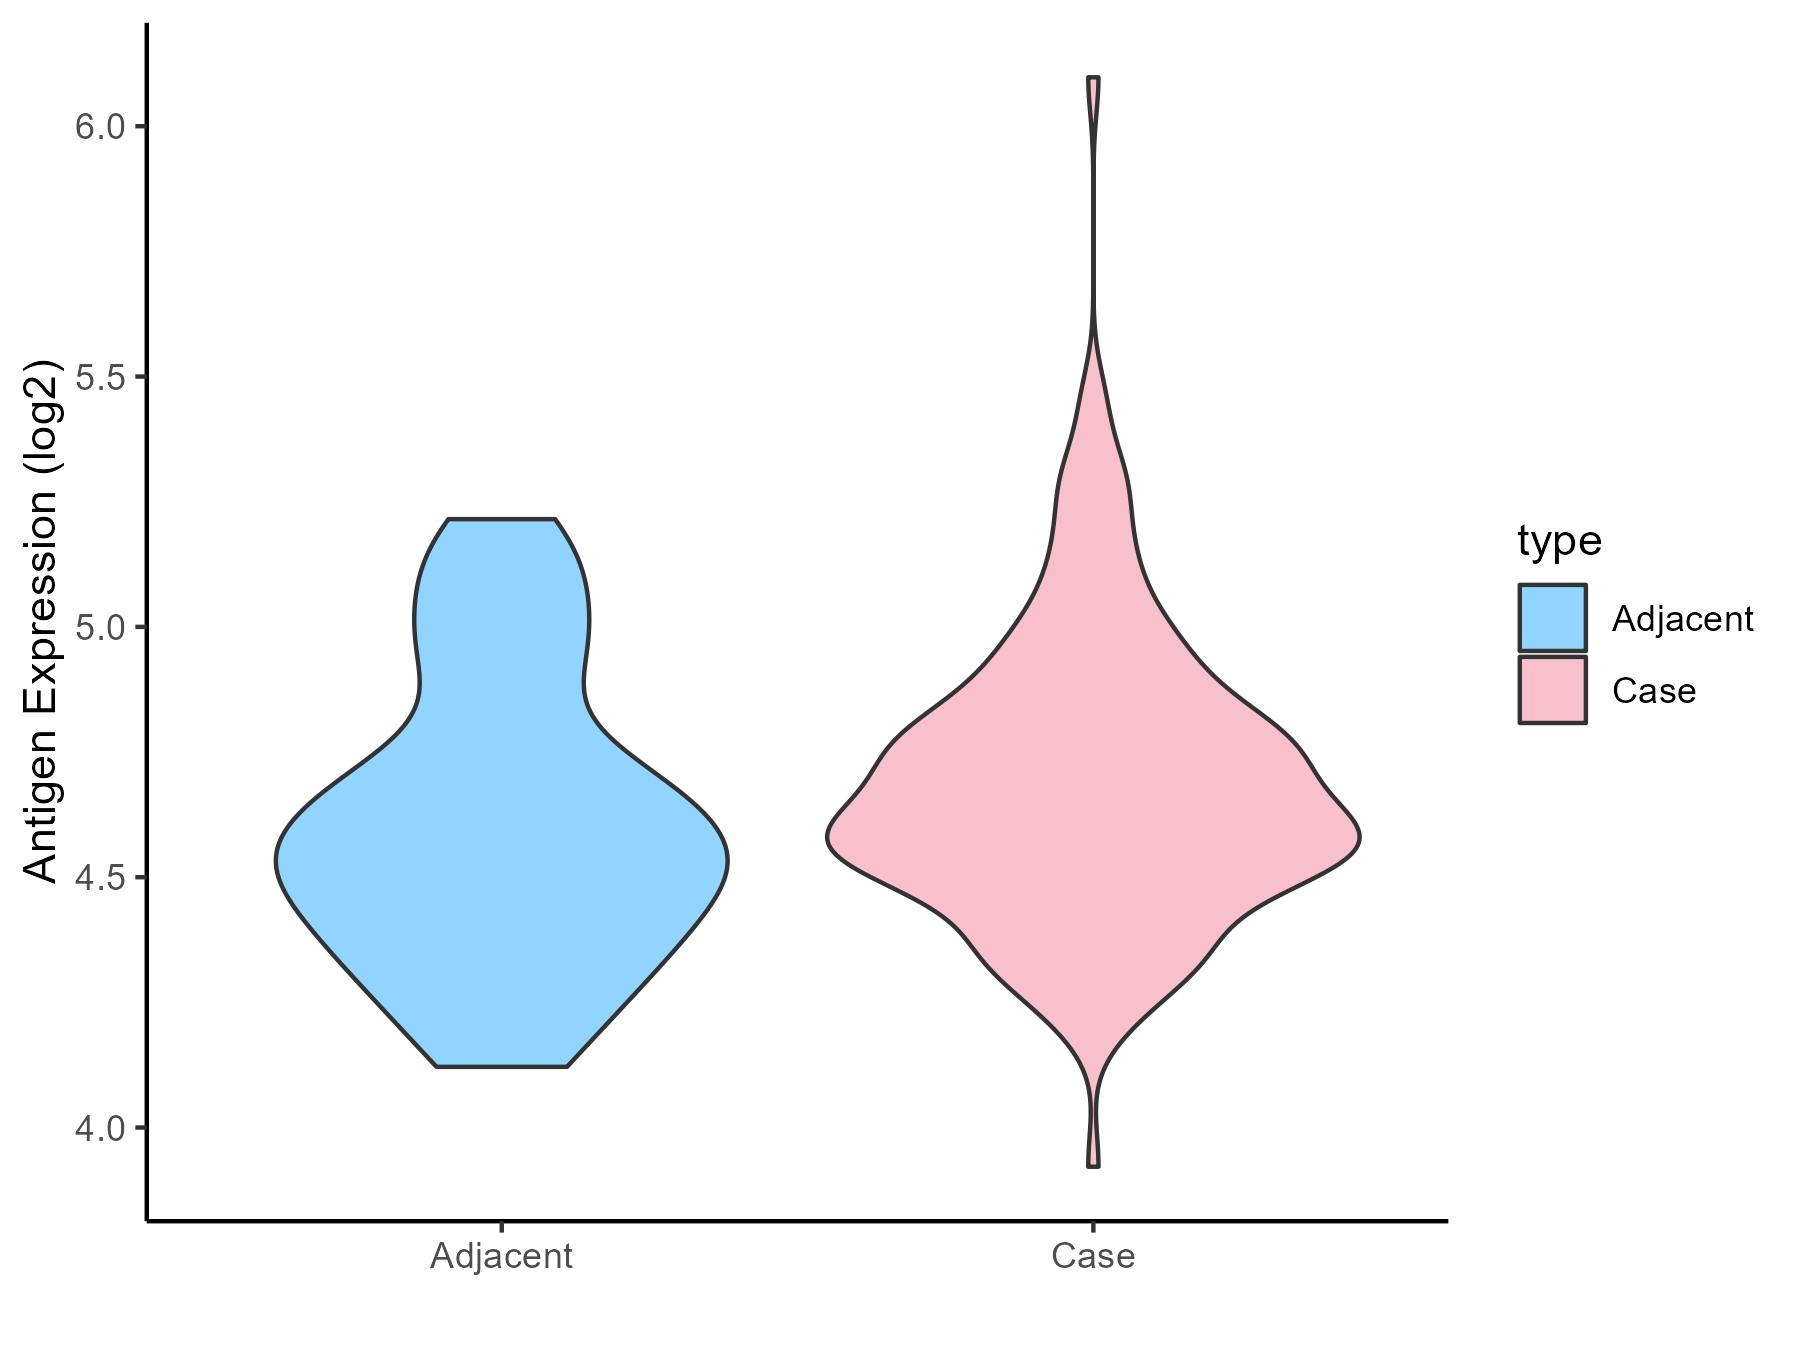
| The Studied Tissue | Gingival | |
| The Specific Disease | Periodontal disease | |
| The Expression Level of Disease Section Compare with the Adjacent Tissue | p-value: 0.062963605; Fold-change: 0.08841391; Z-score: 0.304156482 | |
| Disease-specific Antigen Abundances |
|
Click to View the Clearer Original Diagram |
| Differential expression pattern of antigen in diseases | ||
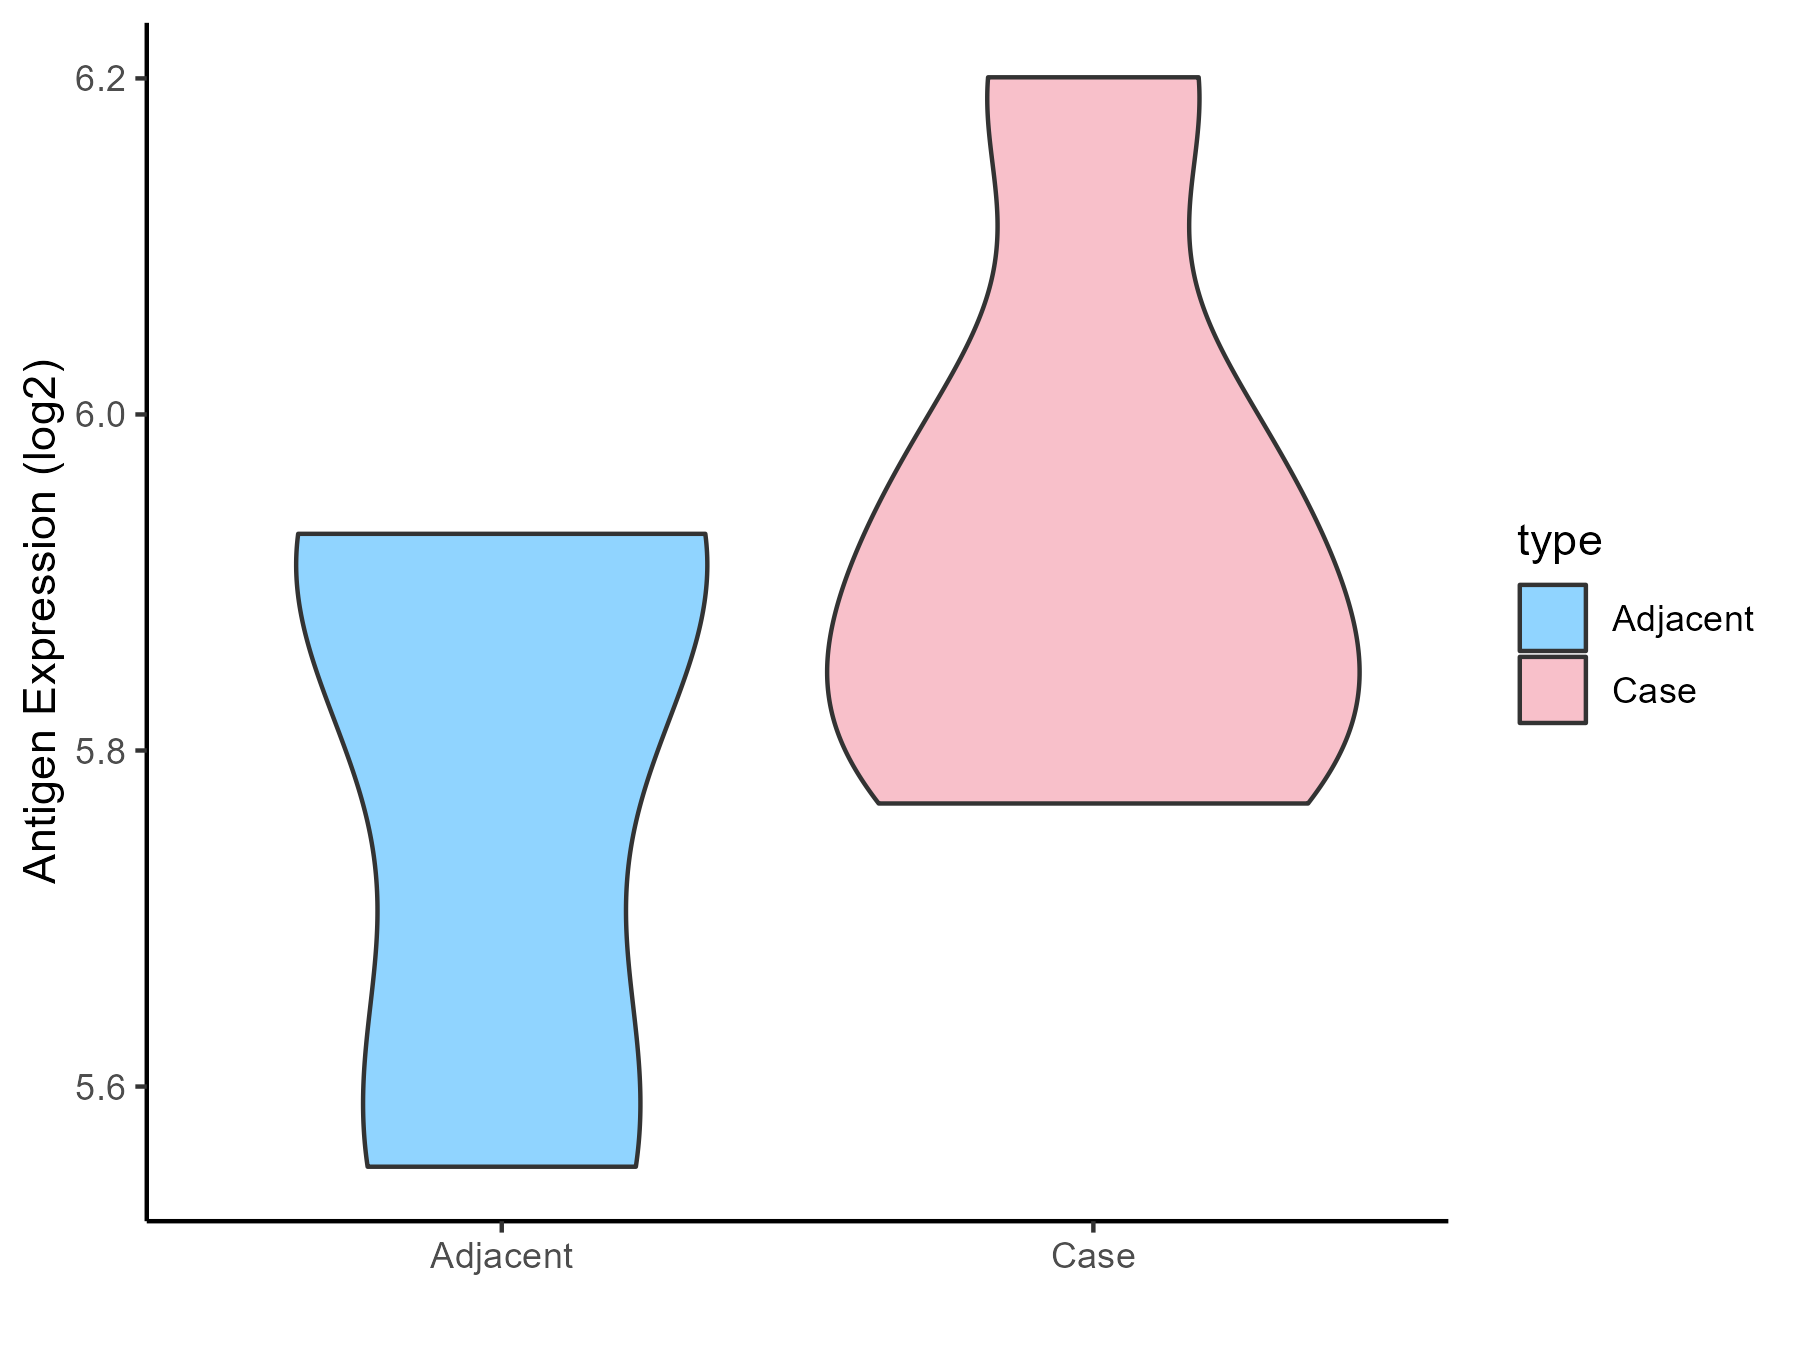
| The Studied Tissue | Gastric antrum | |
| The Specific Disease | Eosinophilic gastritis | |
| The Expression Level of Disease Section Compare with the Adjacent Tissue | p-value: 0.204574329; Fold-change: -0.000332718; Z-score: -0.001766266 | |
| Disease-specific Antigen Abundances |
|
Click to View the Clearer Original Diagram |
| Differential expression pattern of antigen in diseases | ||
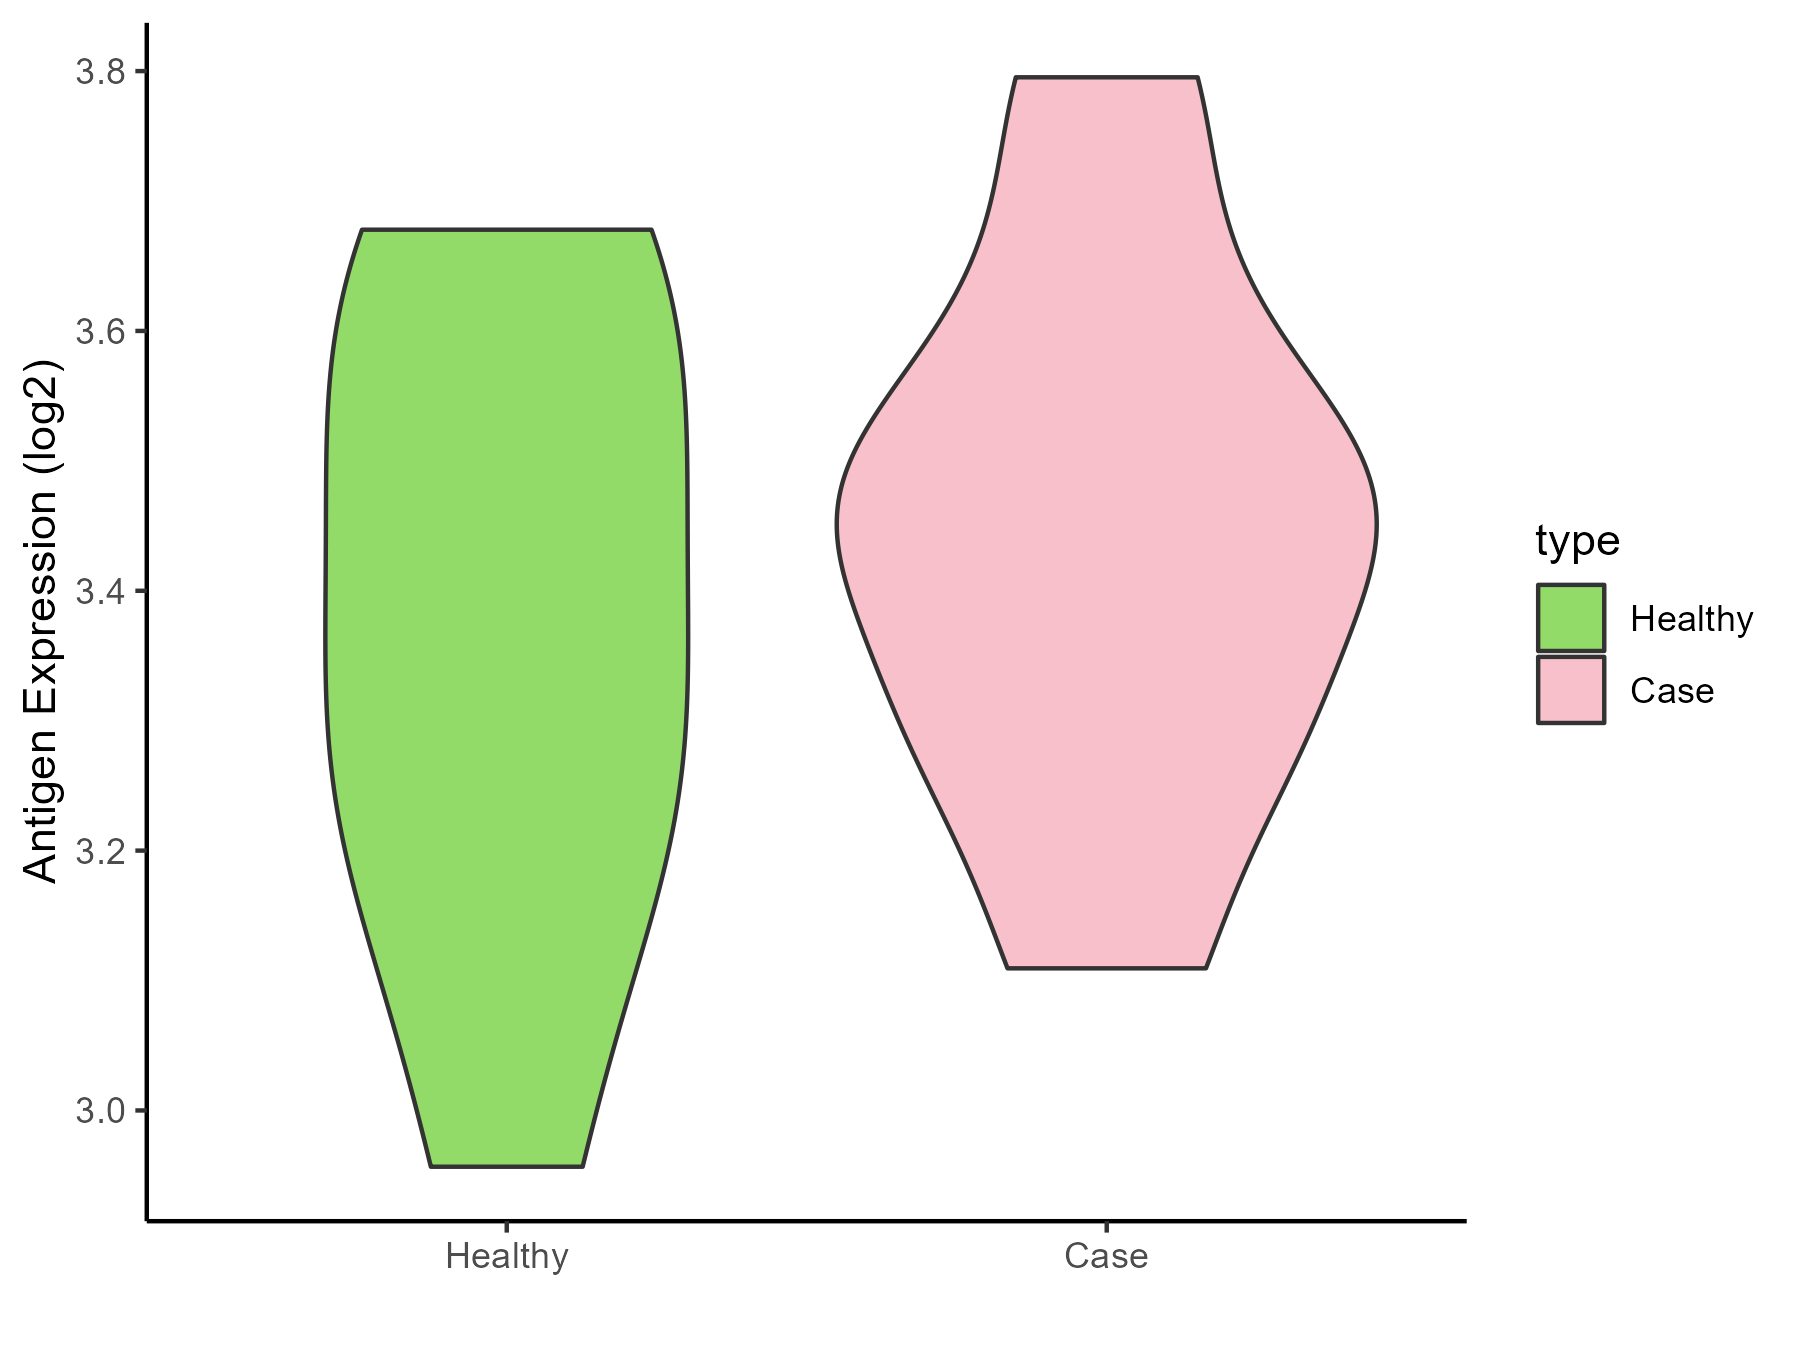
| The Studied Tissue | Liver | |
| The Specific Disease | Liver failure | |
| The Expression Level of Disease Section Compare with the Healthy Individual Tissue | p-value: 0.575049879; Fold-change: 0.08511546; Z-score: 0.340814398 | |
| Disease-specific Antigen Abundances |
|
Click to View the Clearer Original Diagram |
| Differential expression pattern of antigen in diseases | ||
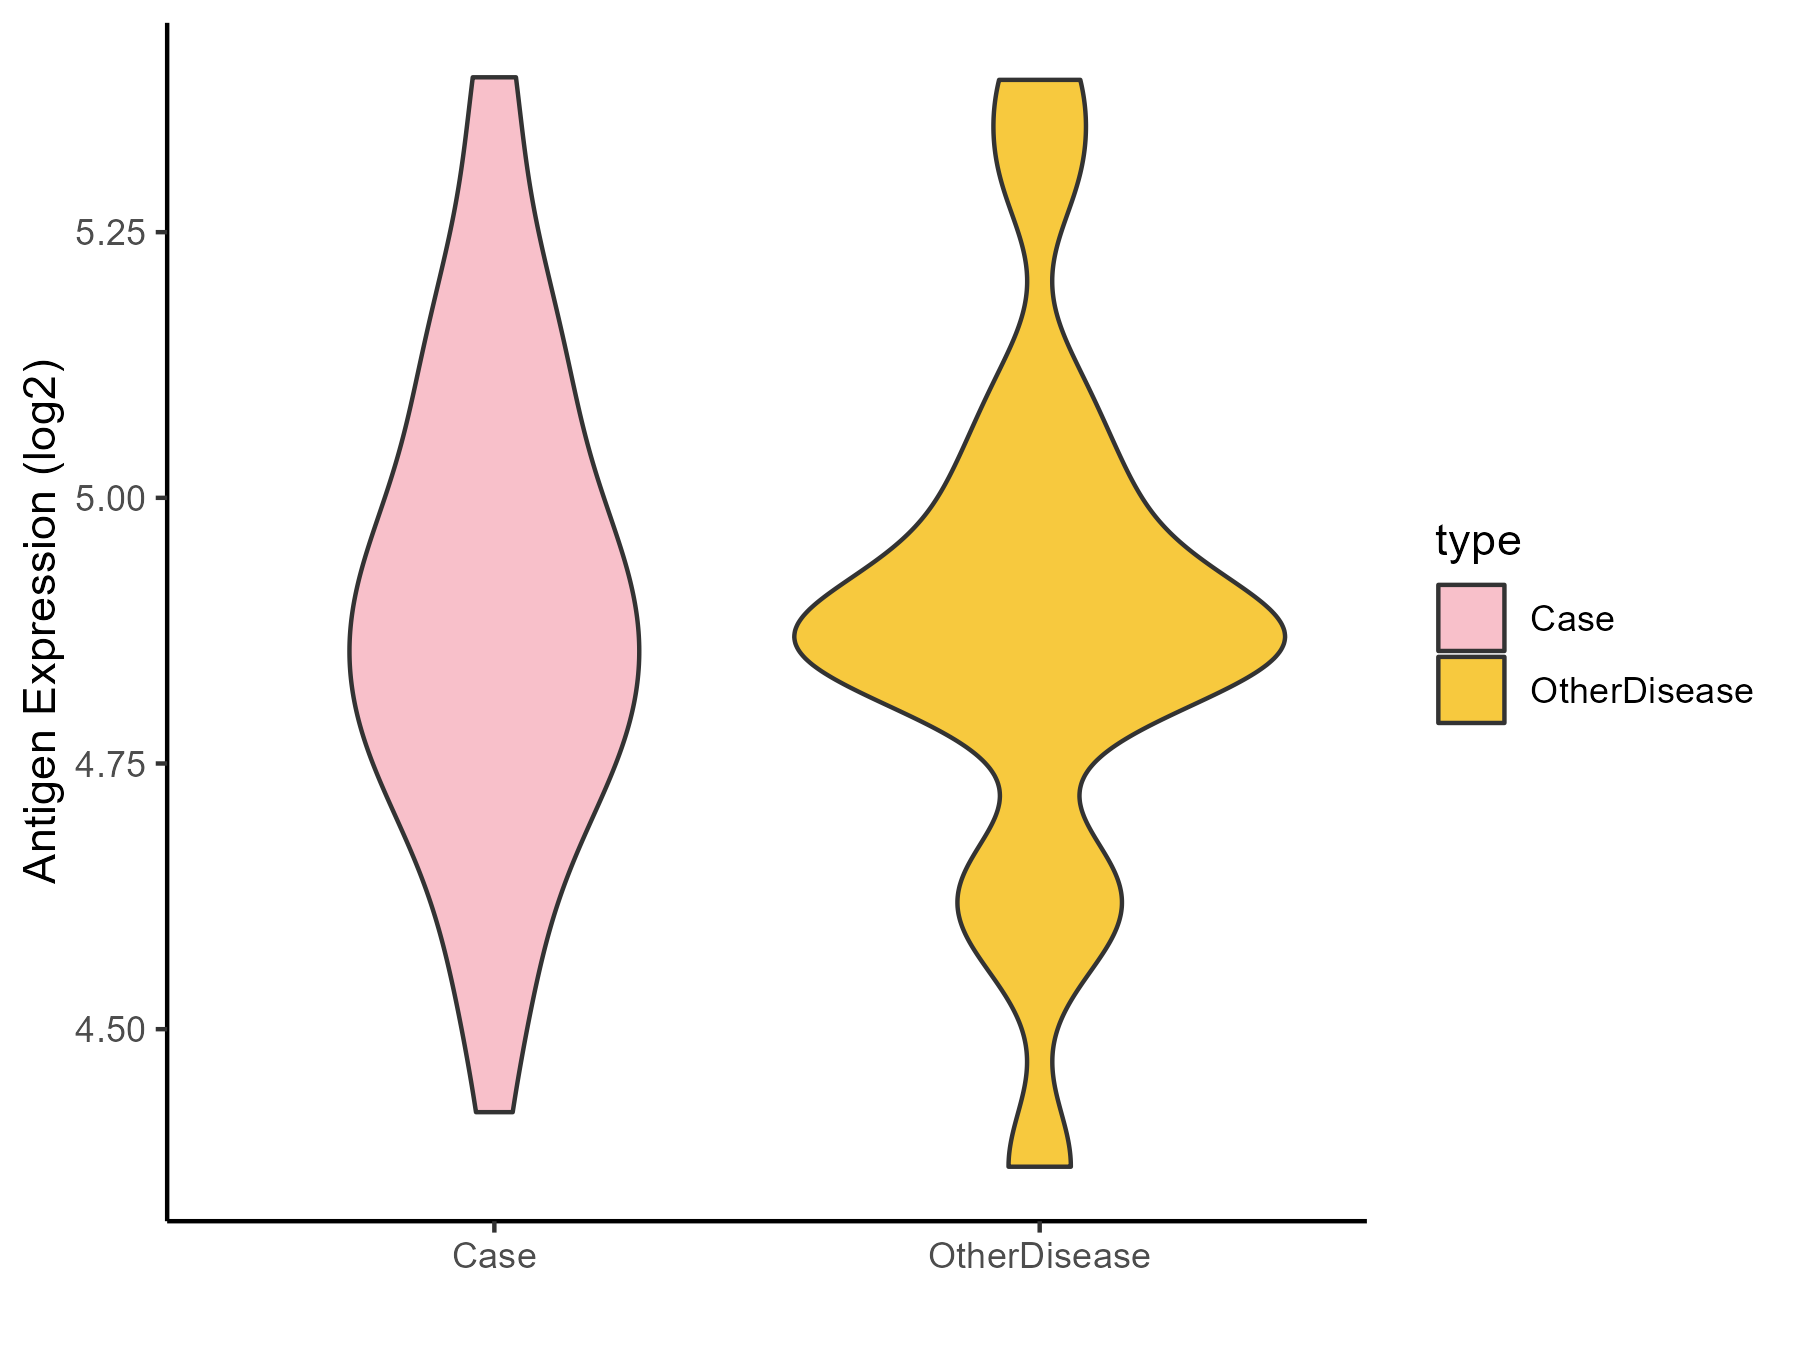
| The Studied Tissue | Colon mucosal | |
| The Specific Disease | Ulcerative colitis | |
| The Expression Level of Disease Section Compare with the Adjacent Tissue | p-value: 0.792997676; Fold-change: 0.024658342; Z-score: 0.101340461 | |
| Disease-specific Antigen Abundances |
|
Click to View the Clearer Original Diagram |
| Differential expression pattern of antigen in diseases | ||
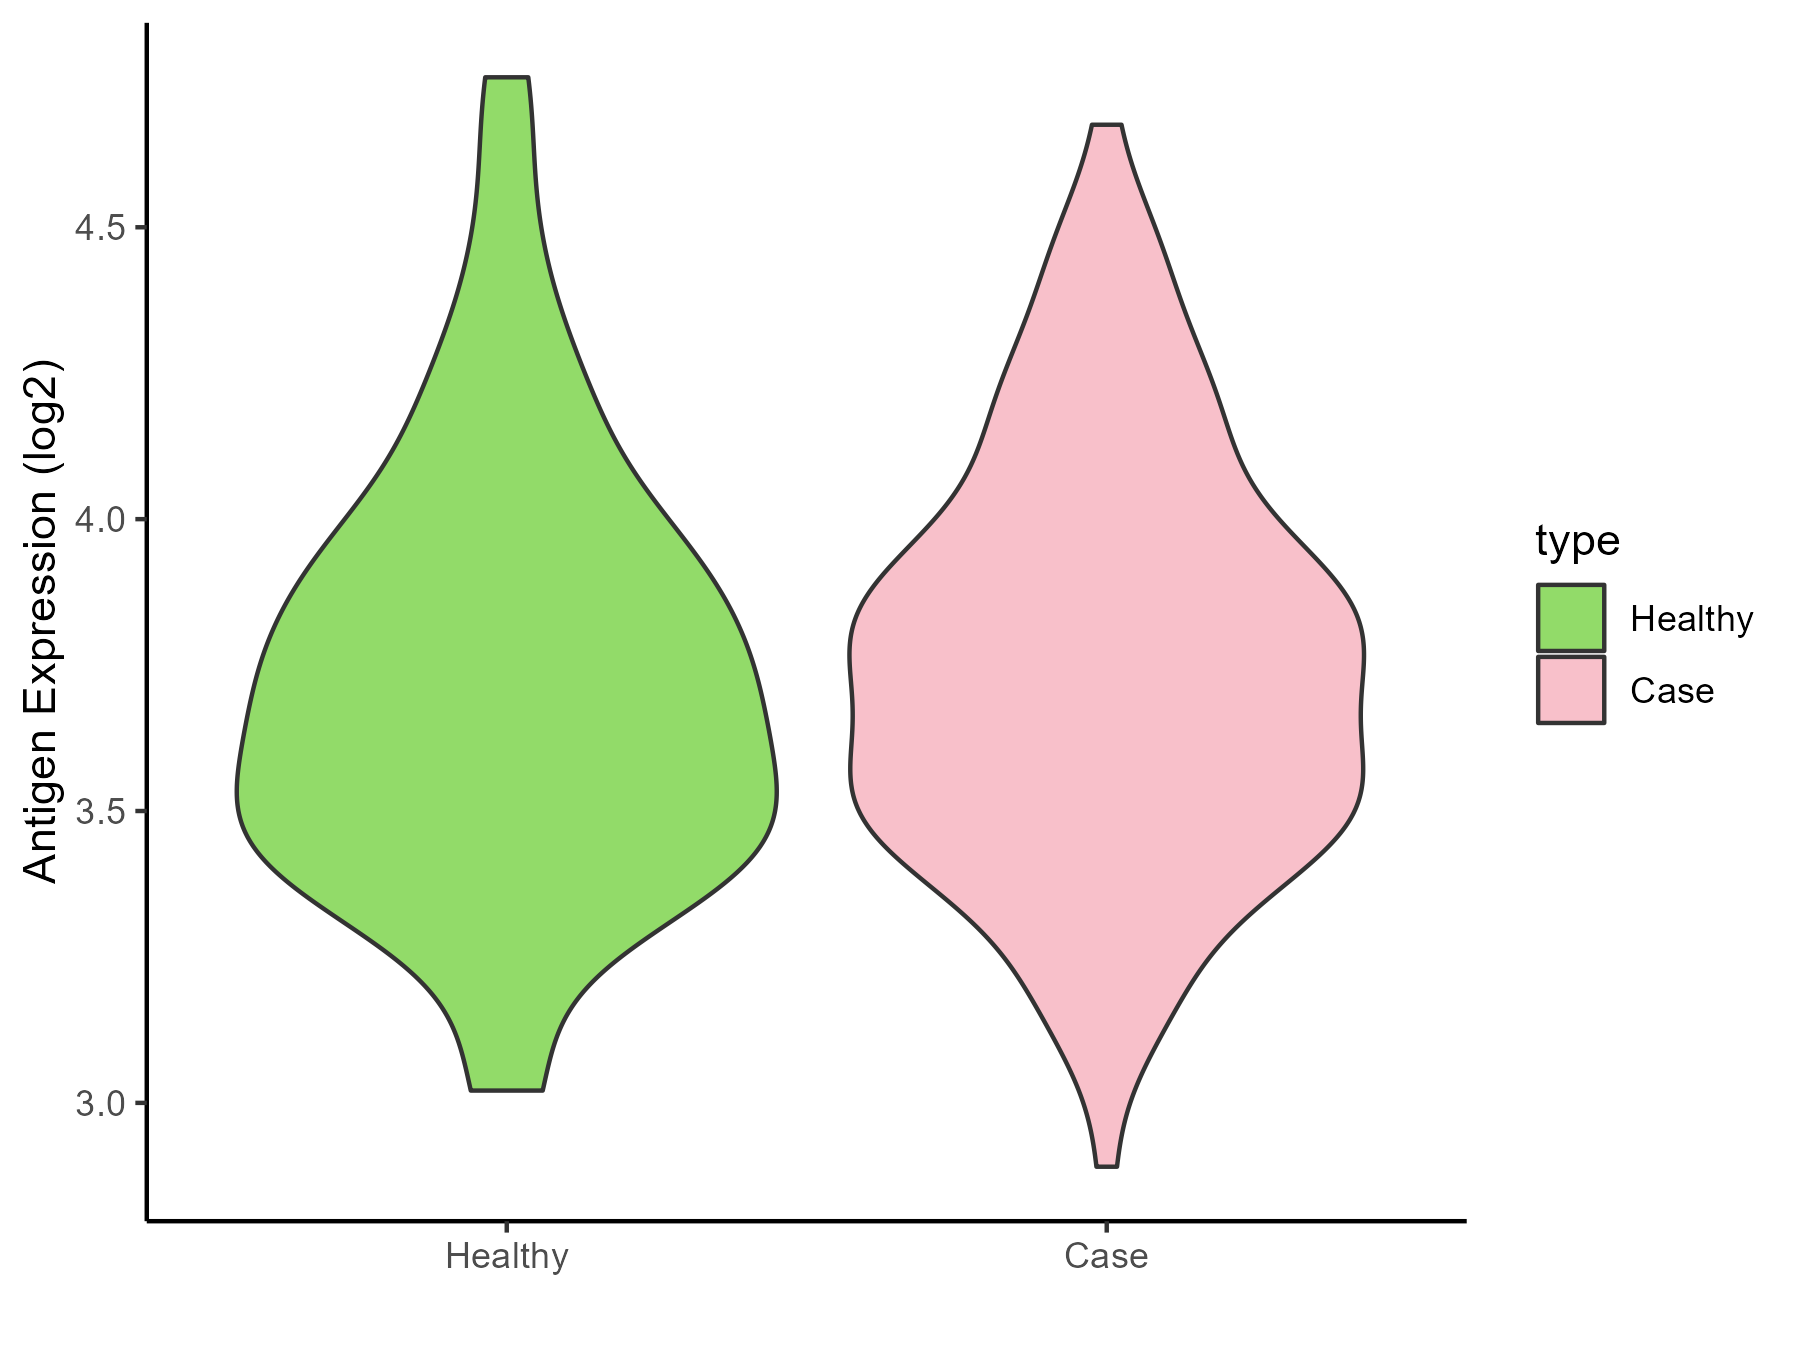
| The Studied Tissue | Rectal colon | |
| The Specific Disease | Irritable bowel syndrome | |
| The Expression Level of Disease Section Compare with the Healthy Individual Tissue | p-value: 0.642406269; Fold-change: 0.034978885; Z-score: 0.096854339 | |
| Disease-specific Antigen Abundances |
|
Click to View the Clearer Original Diagram |
ICD Disease Classification 14
| Differential expression pattern of antigen in diseases | ||
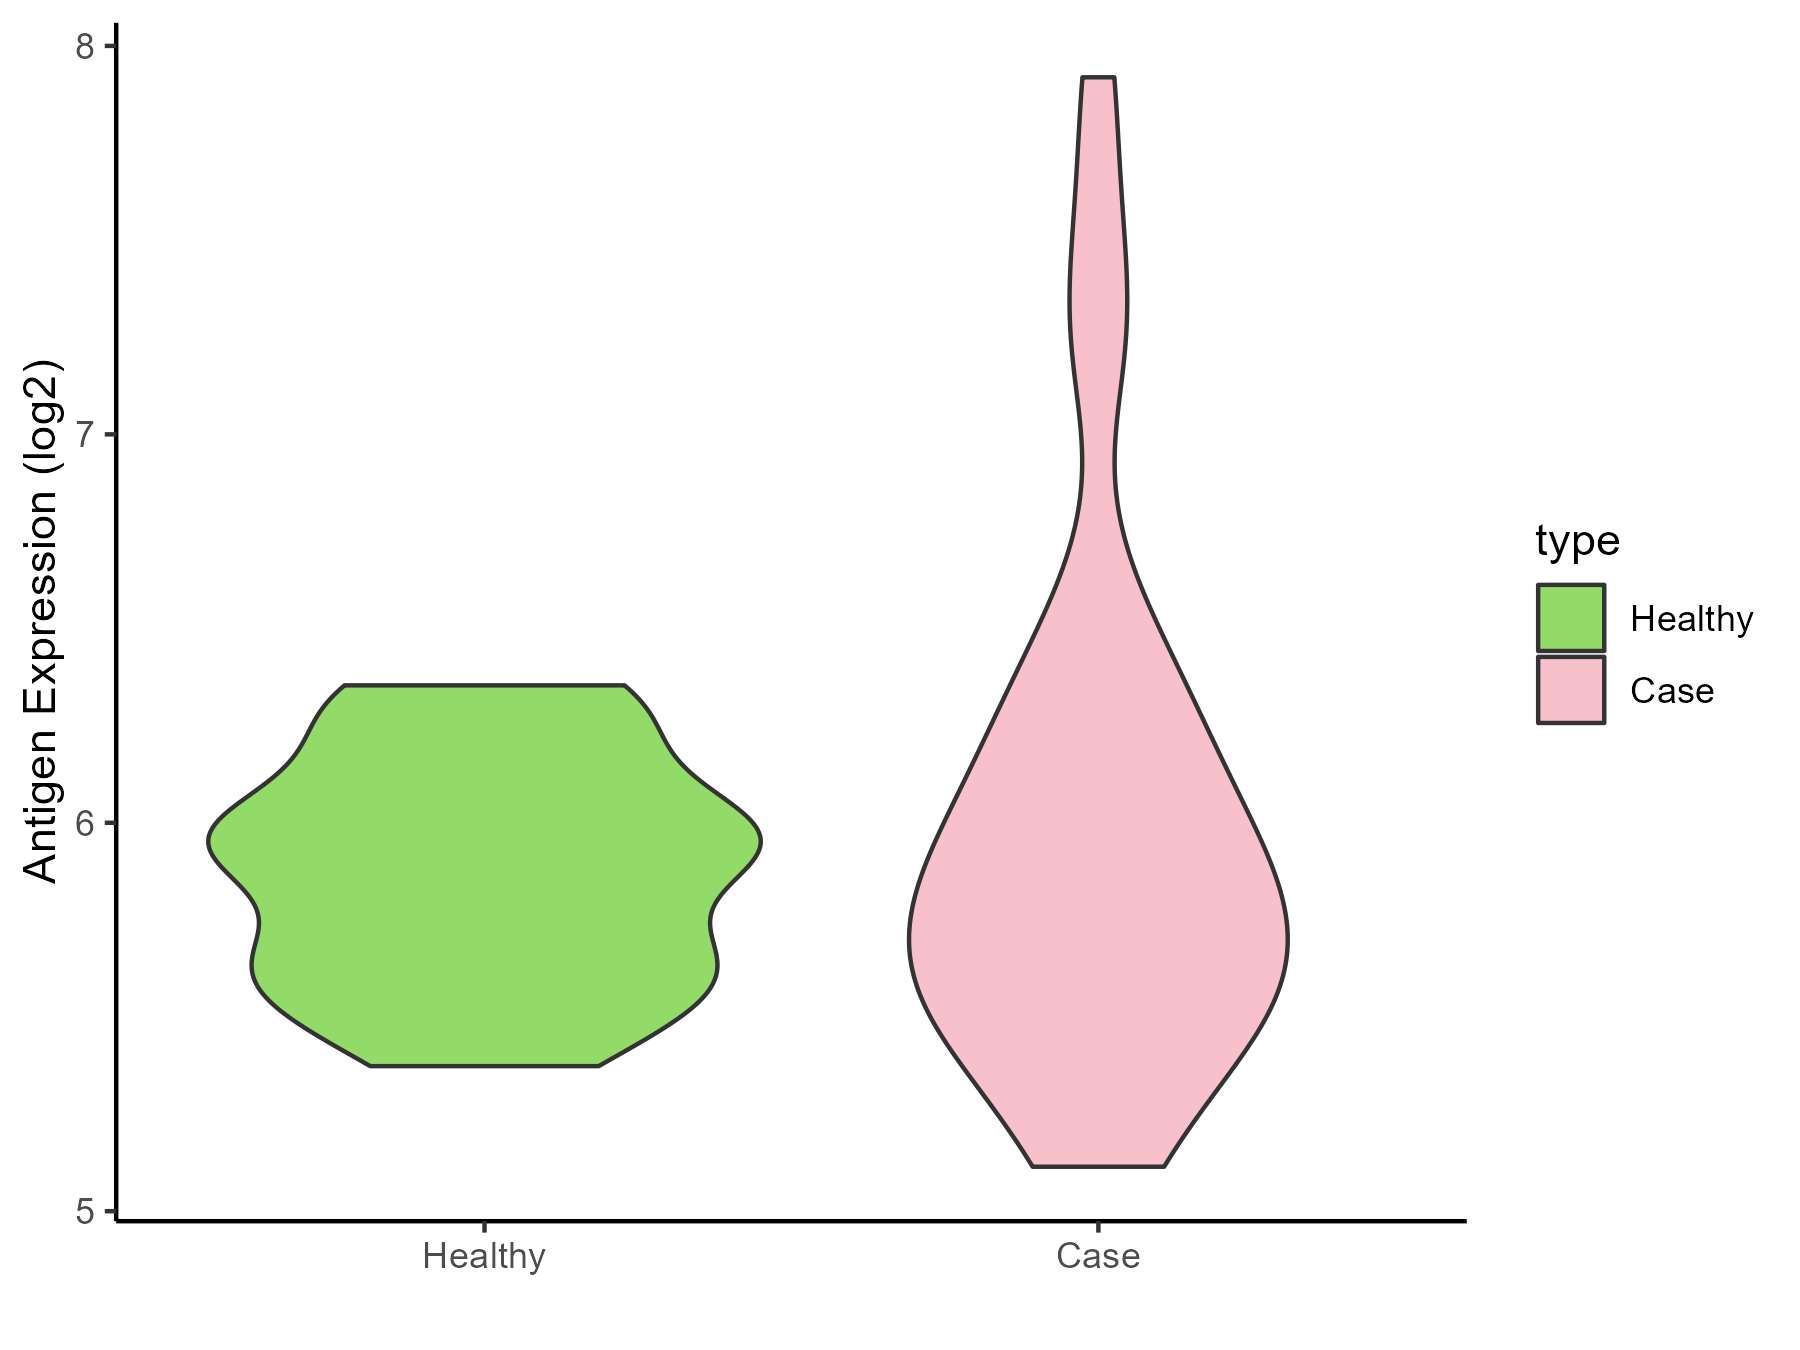
| The Studied Tissue | Skin | |
| The Specific Disease | Atopic dermatitis | |
| The Expression Level of Disease Section Compare with the Healthy Individual Tissue | p-value: 0.436268021; Fold-change: -0.122058517; Z-score: -0.408888309 | |
| Disease-specific Antigen Abundances |
|
Click to View the Clearer Original Diagram |
| Differential expression pattern of antigen in diseases | ||
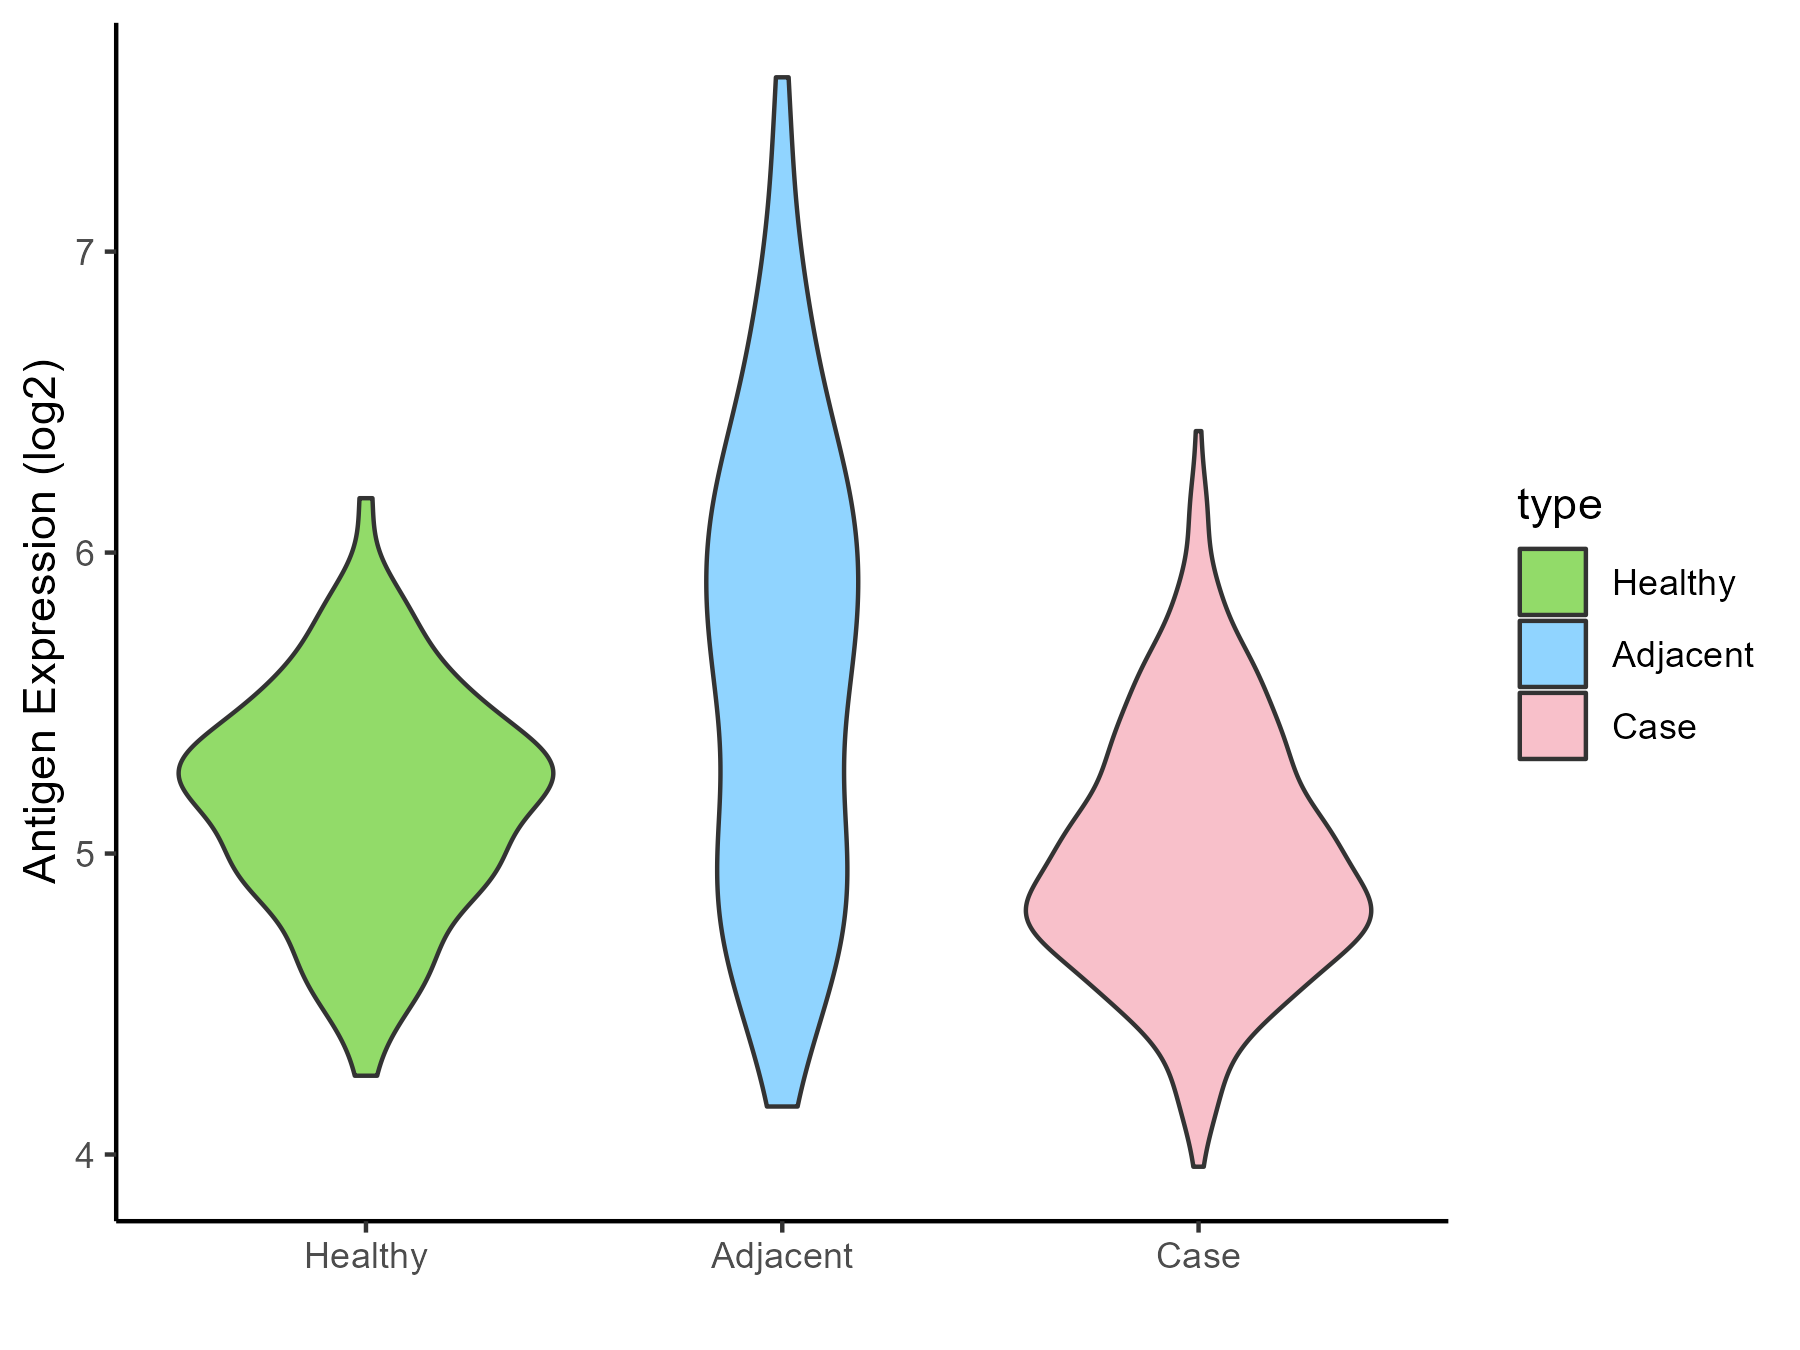
| The Studied Tissue | Skin | |
| The Specific Disease | Psoriasis | |
| The Expression Level of Disease Section Compare with the Healthy Individual Tissue | p-value: 0.000178455; Fold-change: -0.255945422; Z-score: -0.698635275 | |
| The Expression Level of Disease Section Compare with the Adjacent Tissue | p-value: 9.62E-11; Fold-change: -0.68434778; Z-score: -0.895496778 | |
| Disease-specific Antigen Abundances |
|
Click to View the Clearer Original Diagram |
| Differential expression pattern of antigen in diseases | ||
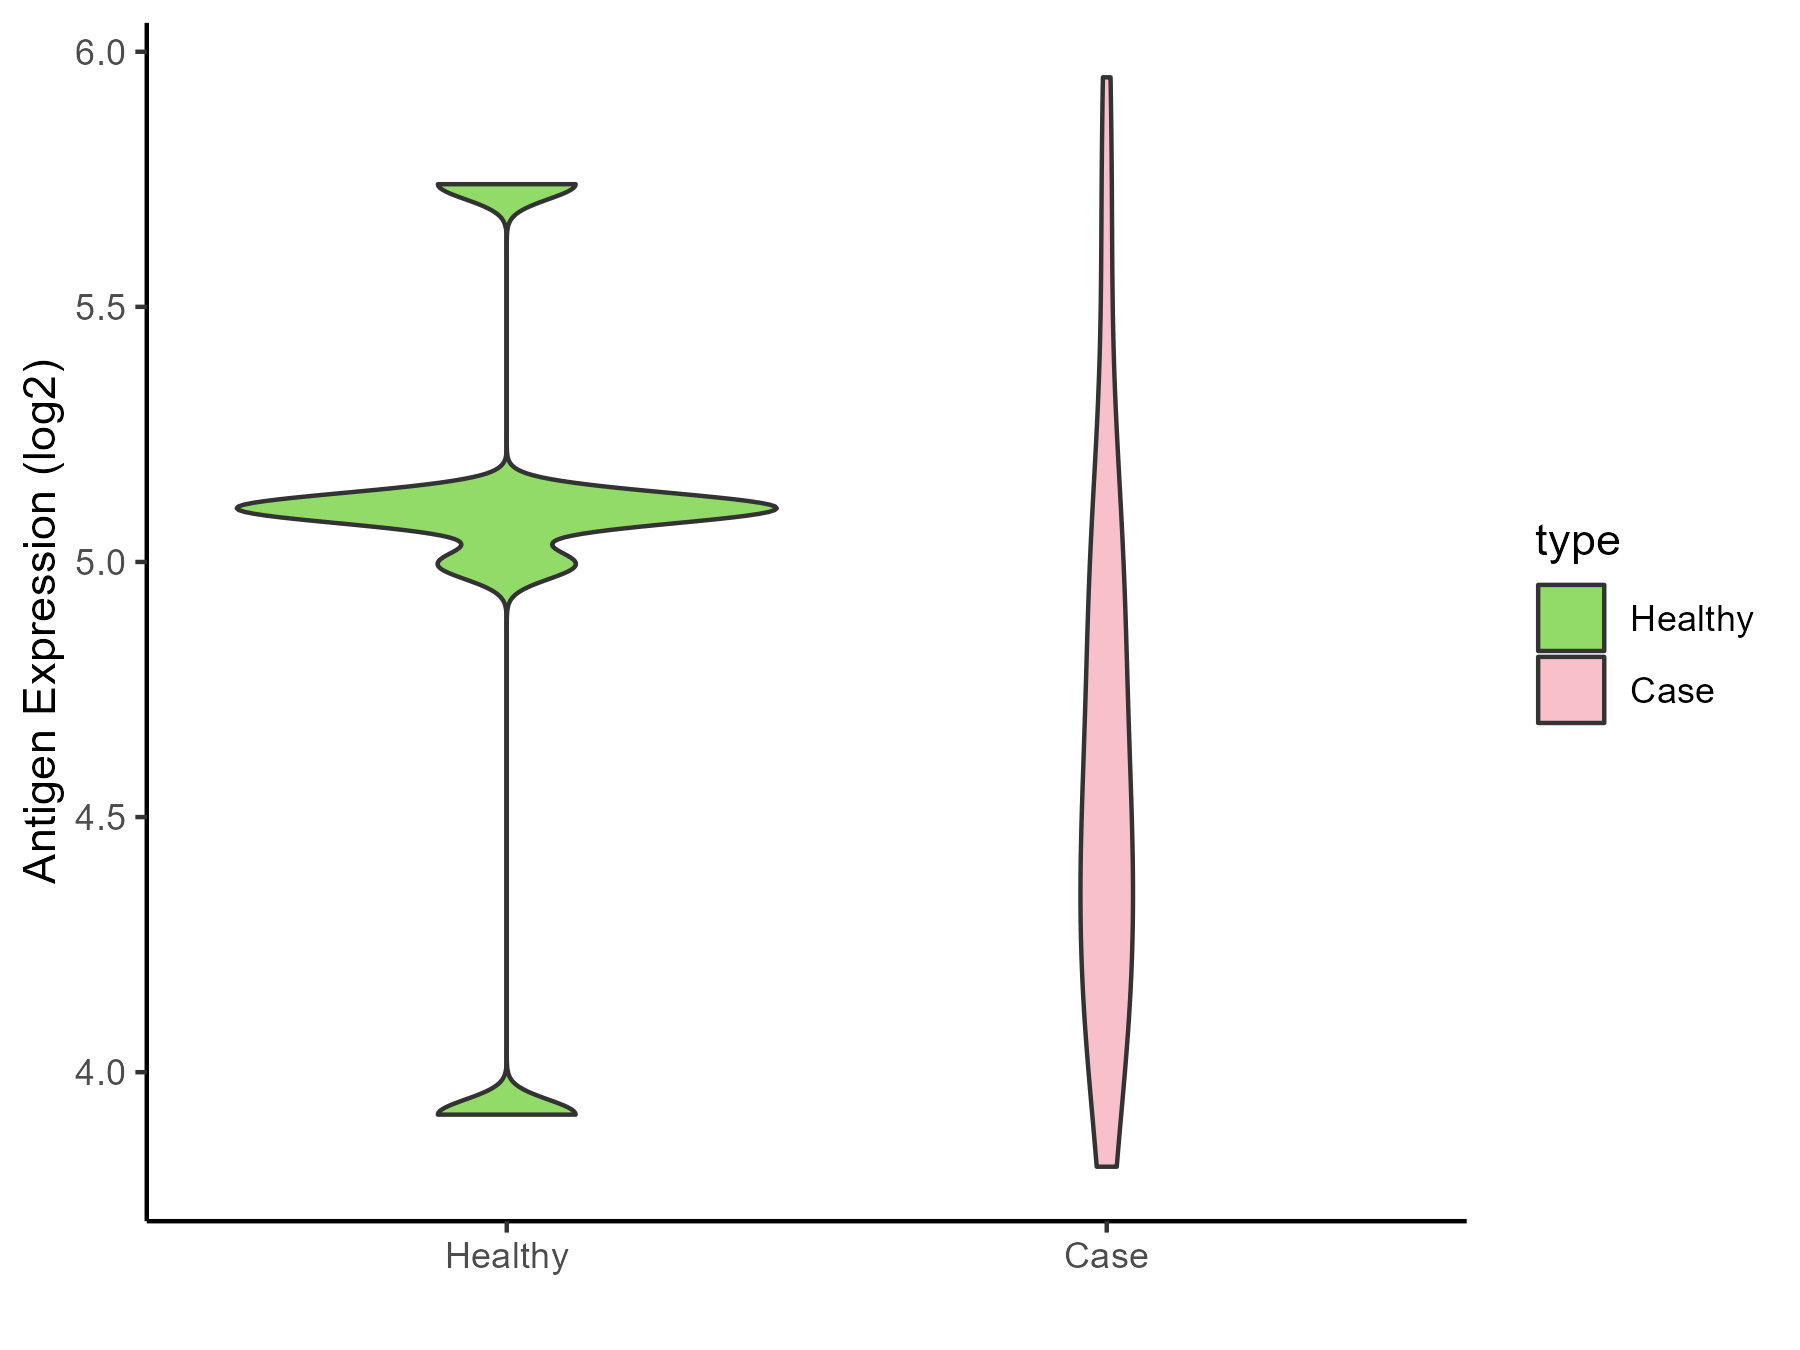
| The Studied Tissue | Skin | |
| The Specific Disease | Vitiligo | |
| The Expression Level of Disease Section Compare with the Healthy Individual Tissue | p-value: 0.125867651; Fold-change: -0.577695689; Z-score: -1.065085934 | |
| Disease-specific Antigen Abundances |
|
Click to View the Clearer Original Diagram |
| Differential expression pattern of antigen in diseases | ||
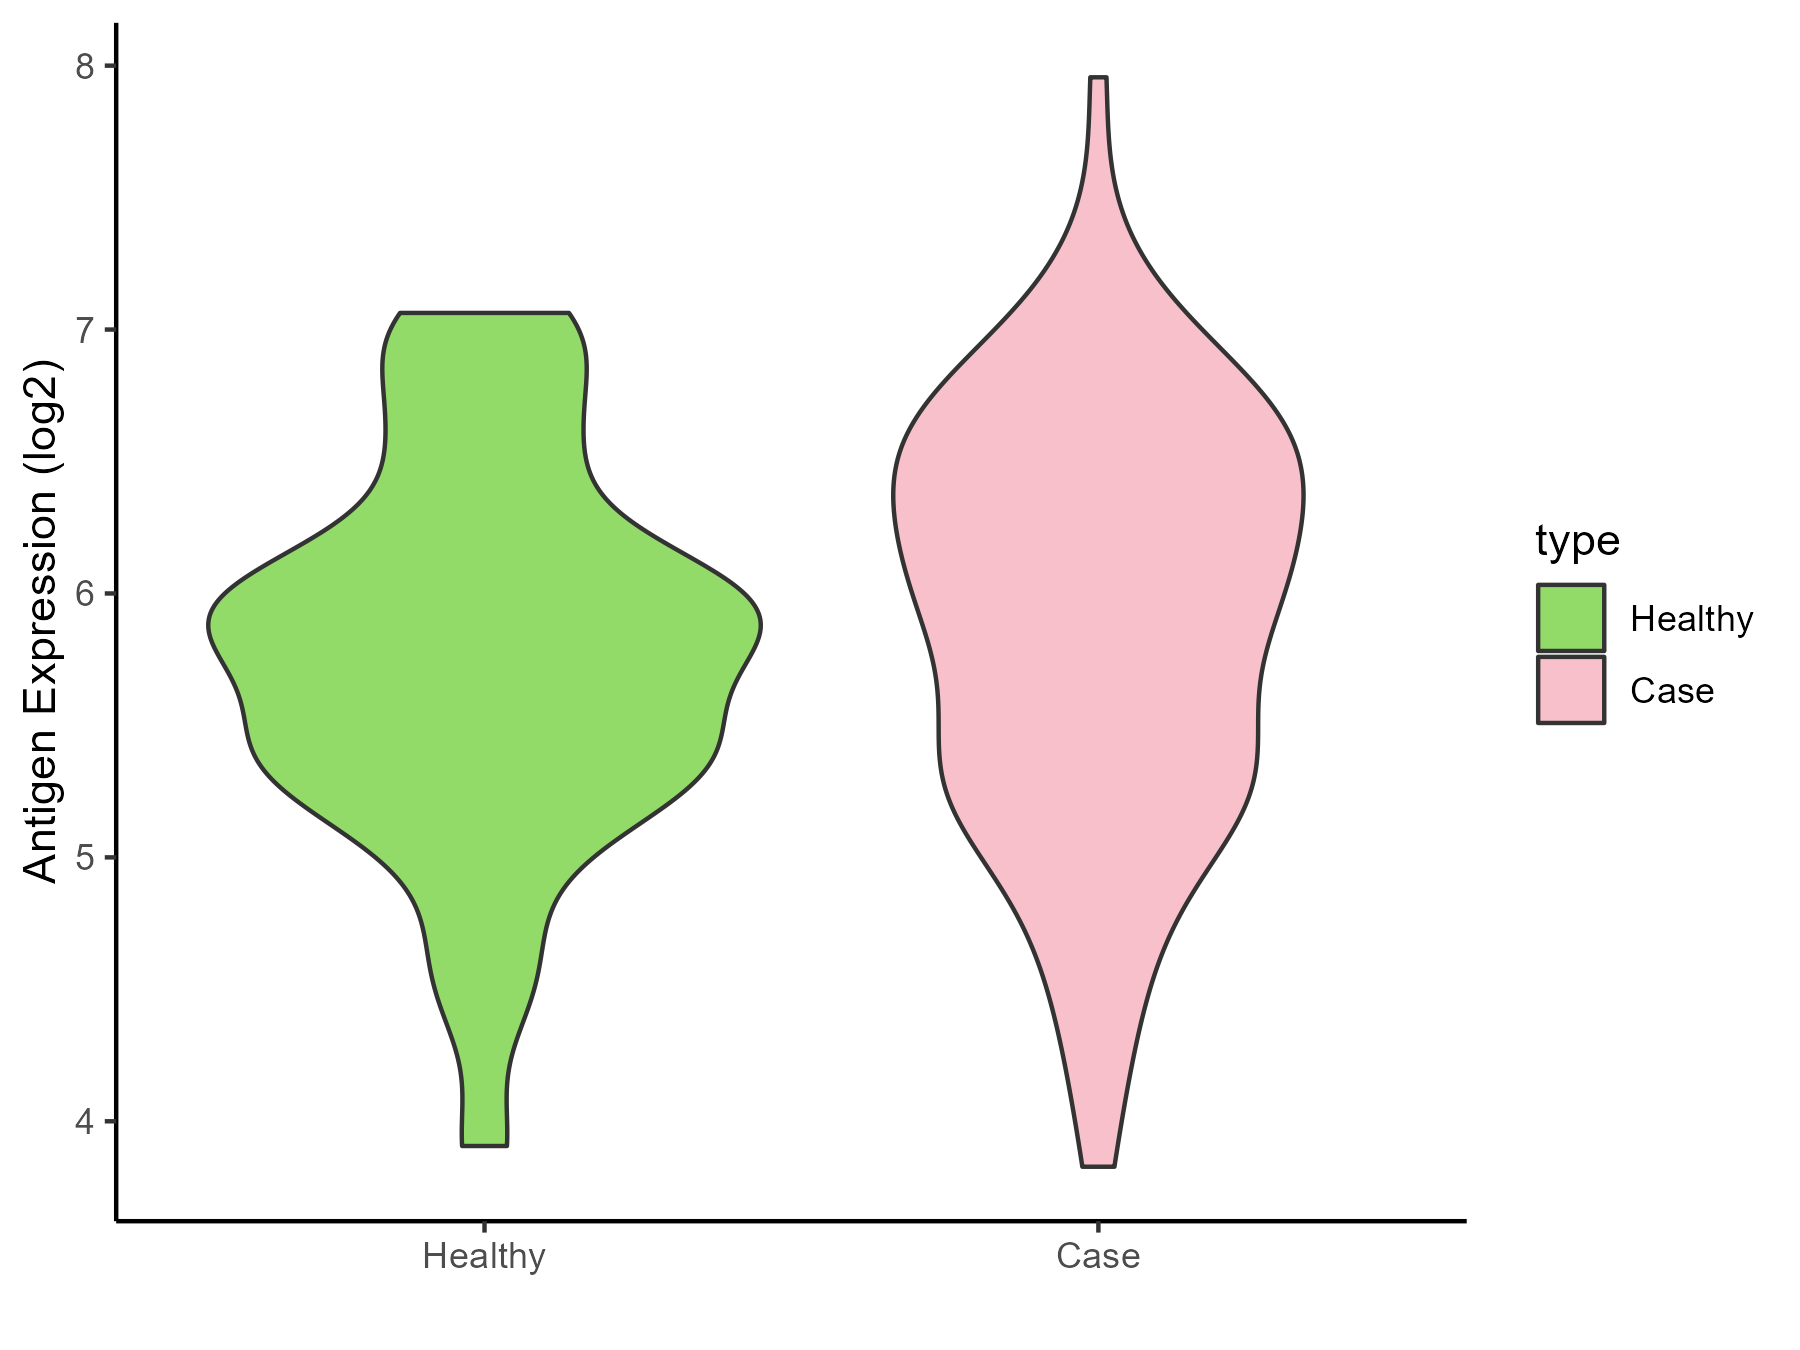
| The Studied Tissue | Skin from scalp | |
| The Specific Disease | Alopecia | |
| The Expression Level of Disease Section Compare with the Healthy Individual Tissue | p-value: 0.325366937; Fold-change: 0.177545169; Z-score: 0.248047664 | |
| Disease-specific Antigen Abundances |
|
Click to View the Clearer Original Diagram |
| Differential expression pattern of antigen in diseases | ||
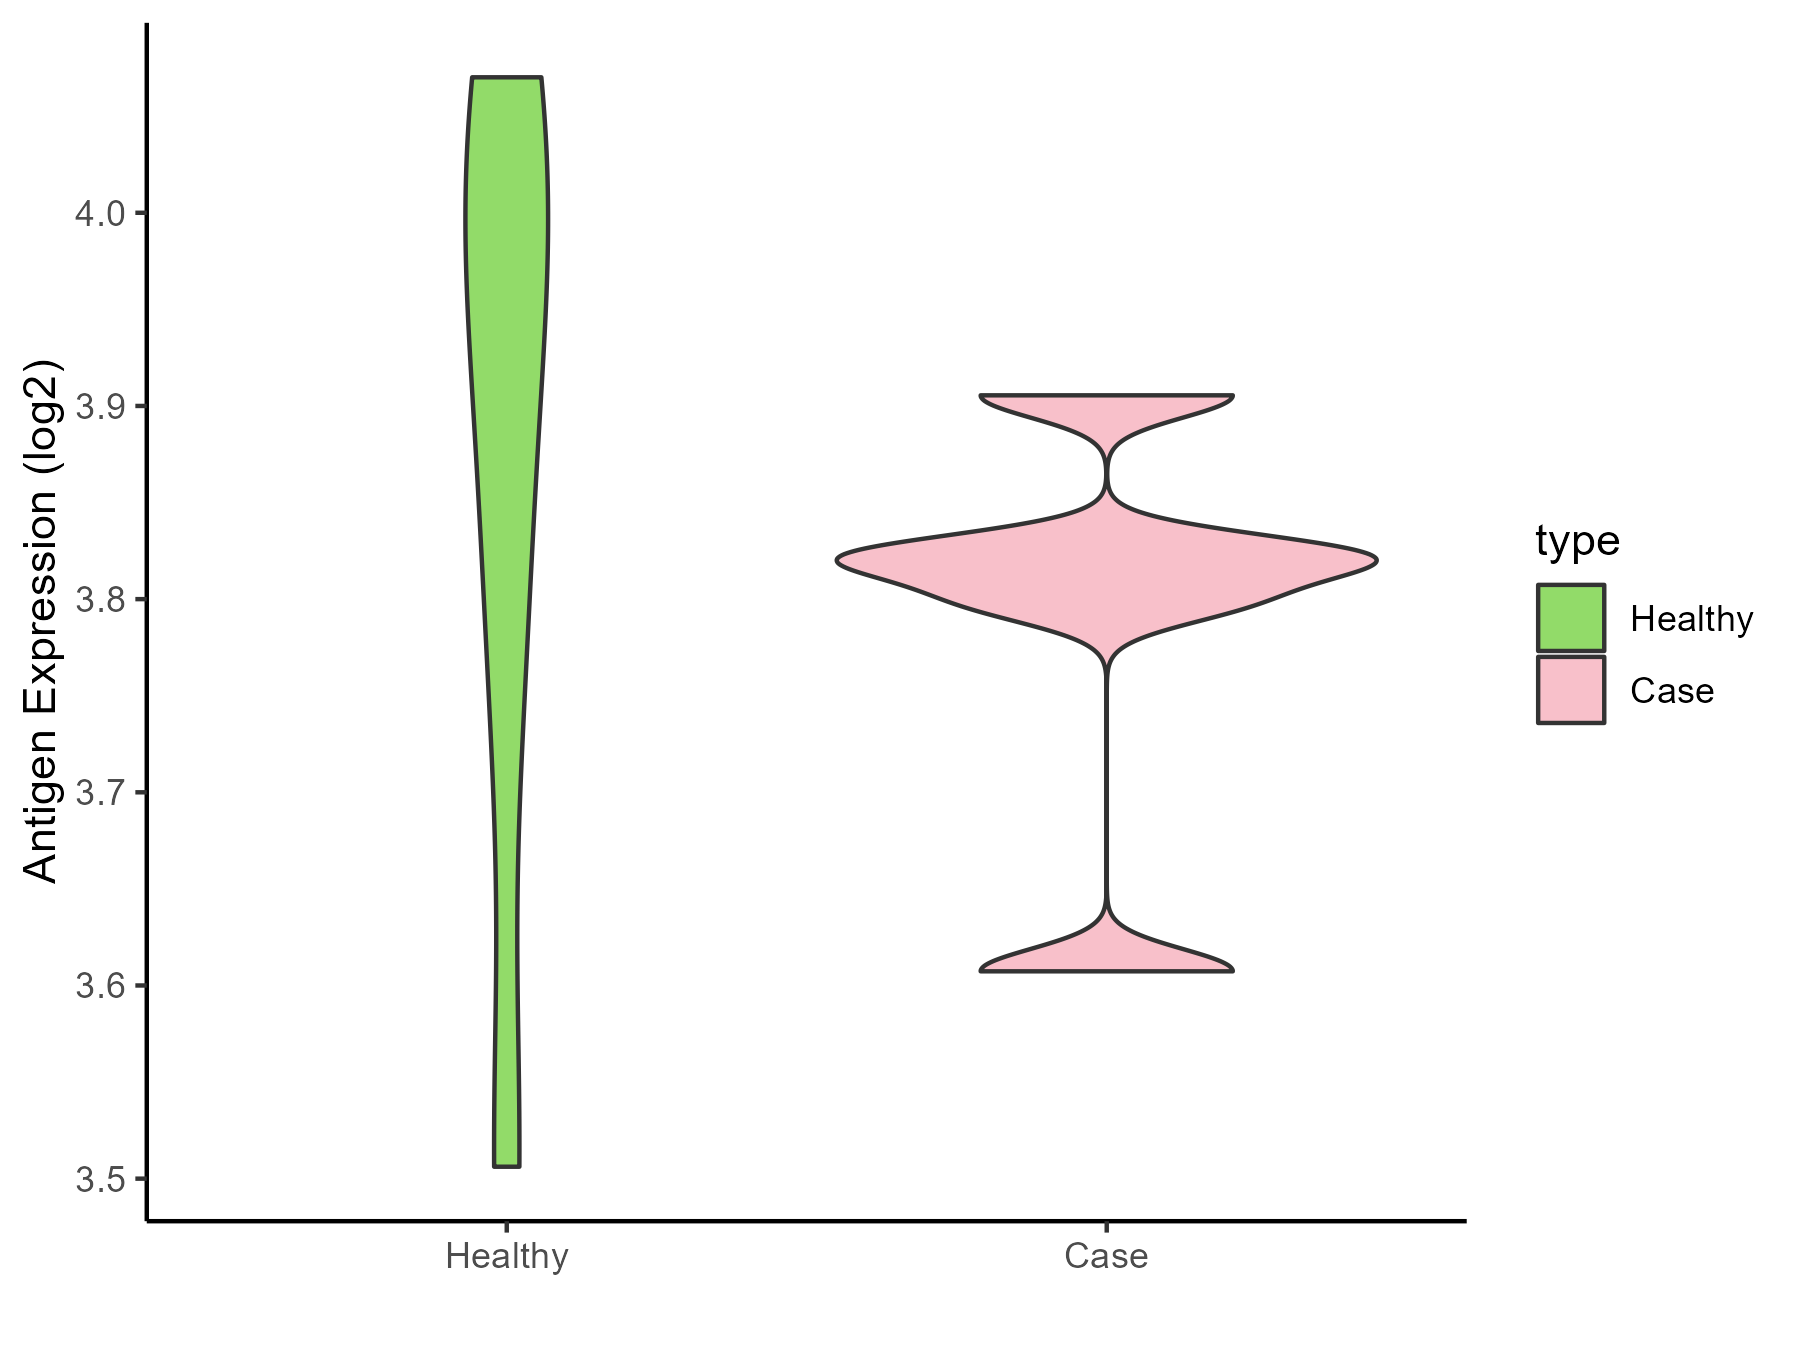
| The Studied Tissue | Skin | |
| The Specific Disease | Sensitive skin | |
| The Expression Level of Disease Section Compare with the Healthy Individual Tissue | p-value: 0.422808431; Fold-change: -0.123920271; Z-score: -0.590378091 | |
| Disease-specific Antigen Abundances |
|
Click to View the Clearer Original Diagram |
ICD Disease Classification 15
| Differential expression pattern of antigen in diseases | ||
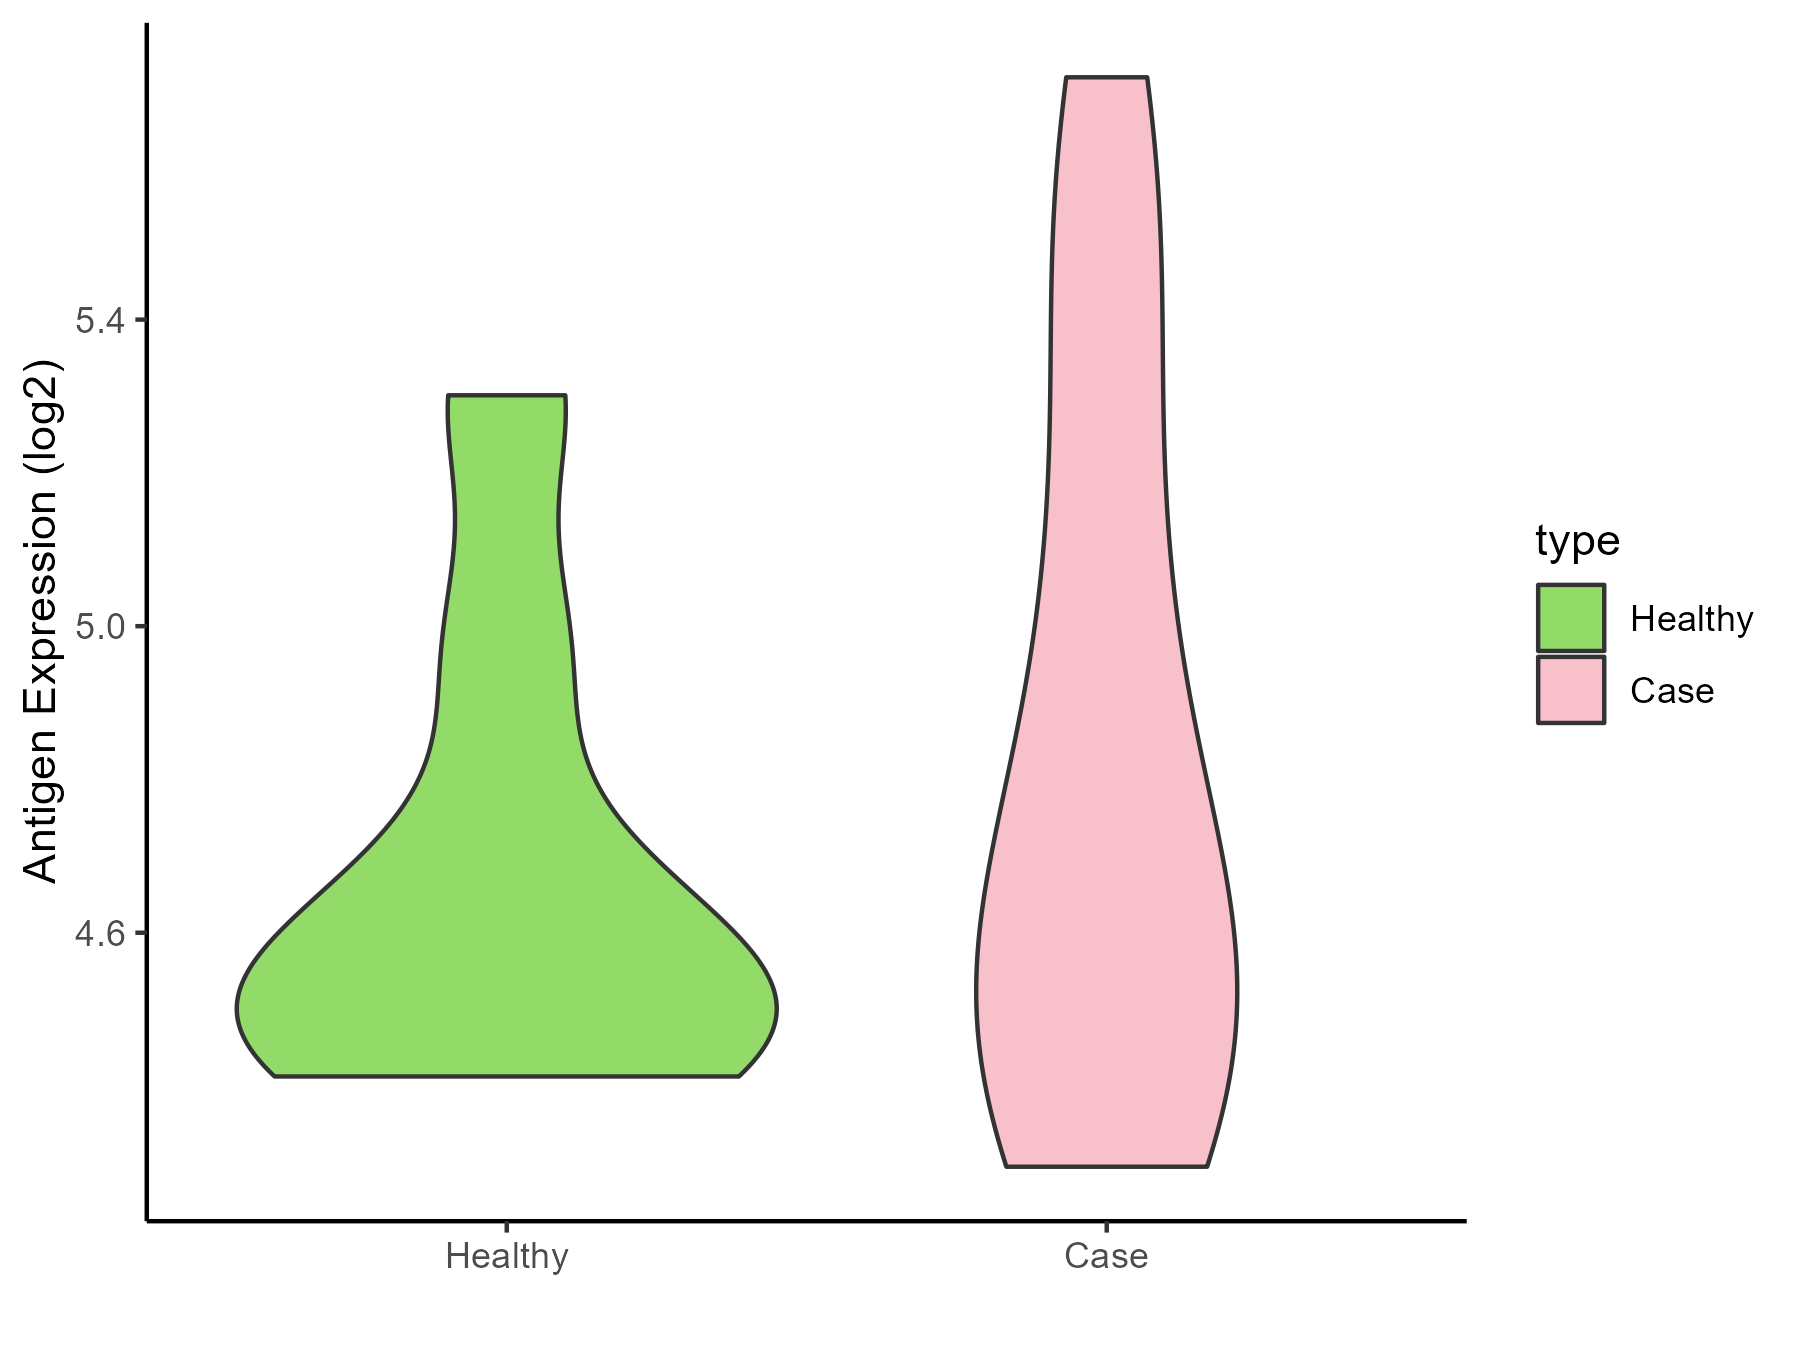
| The Studied Tissue | Synovial | |
| The Specific Disease | Osteoarthritis | |
| The Expression Level of Disease Section Compare with the Healthy Individual Tissue | p-value: 0.38089922; Fold-change: 0.10059084; Z-score: 0.321543288 | |
| Disease-specific Antigen Abundances |
|
Click to View the Clearer Original Diagram |
| Differential expression pattern of antigen in diseases | ||
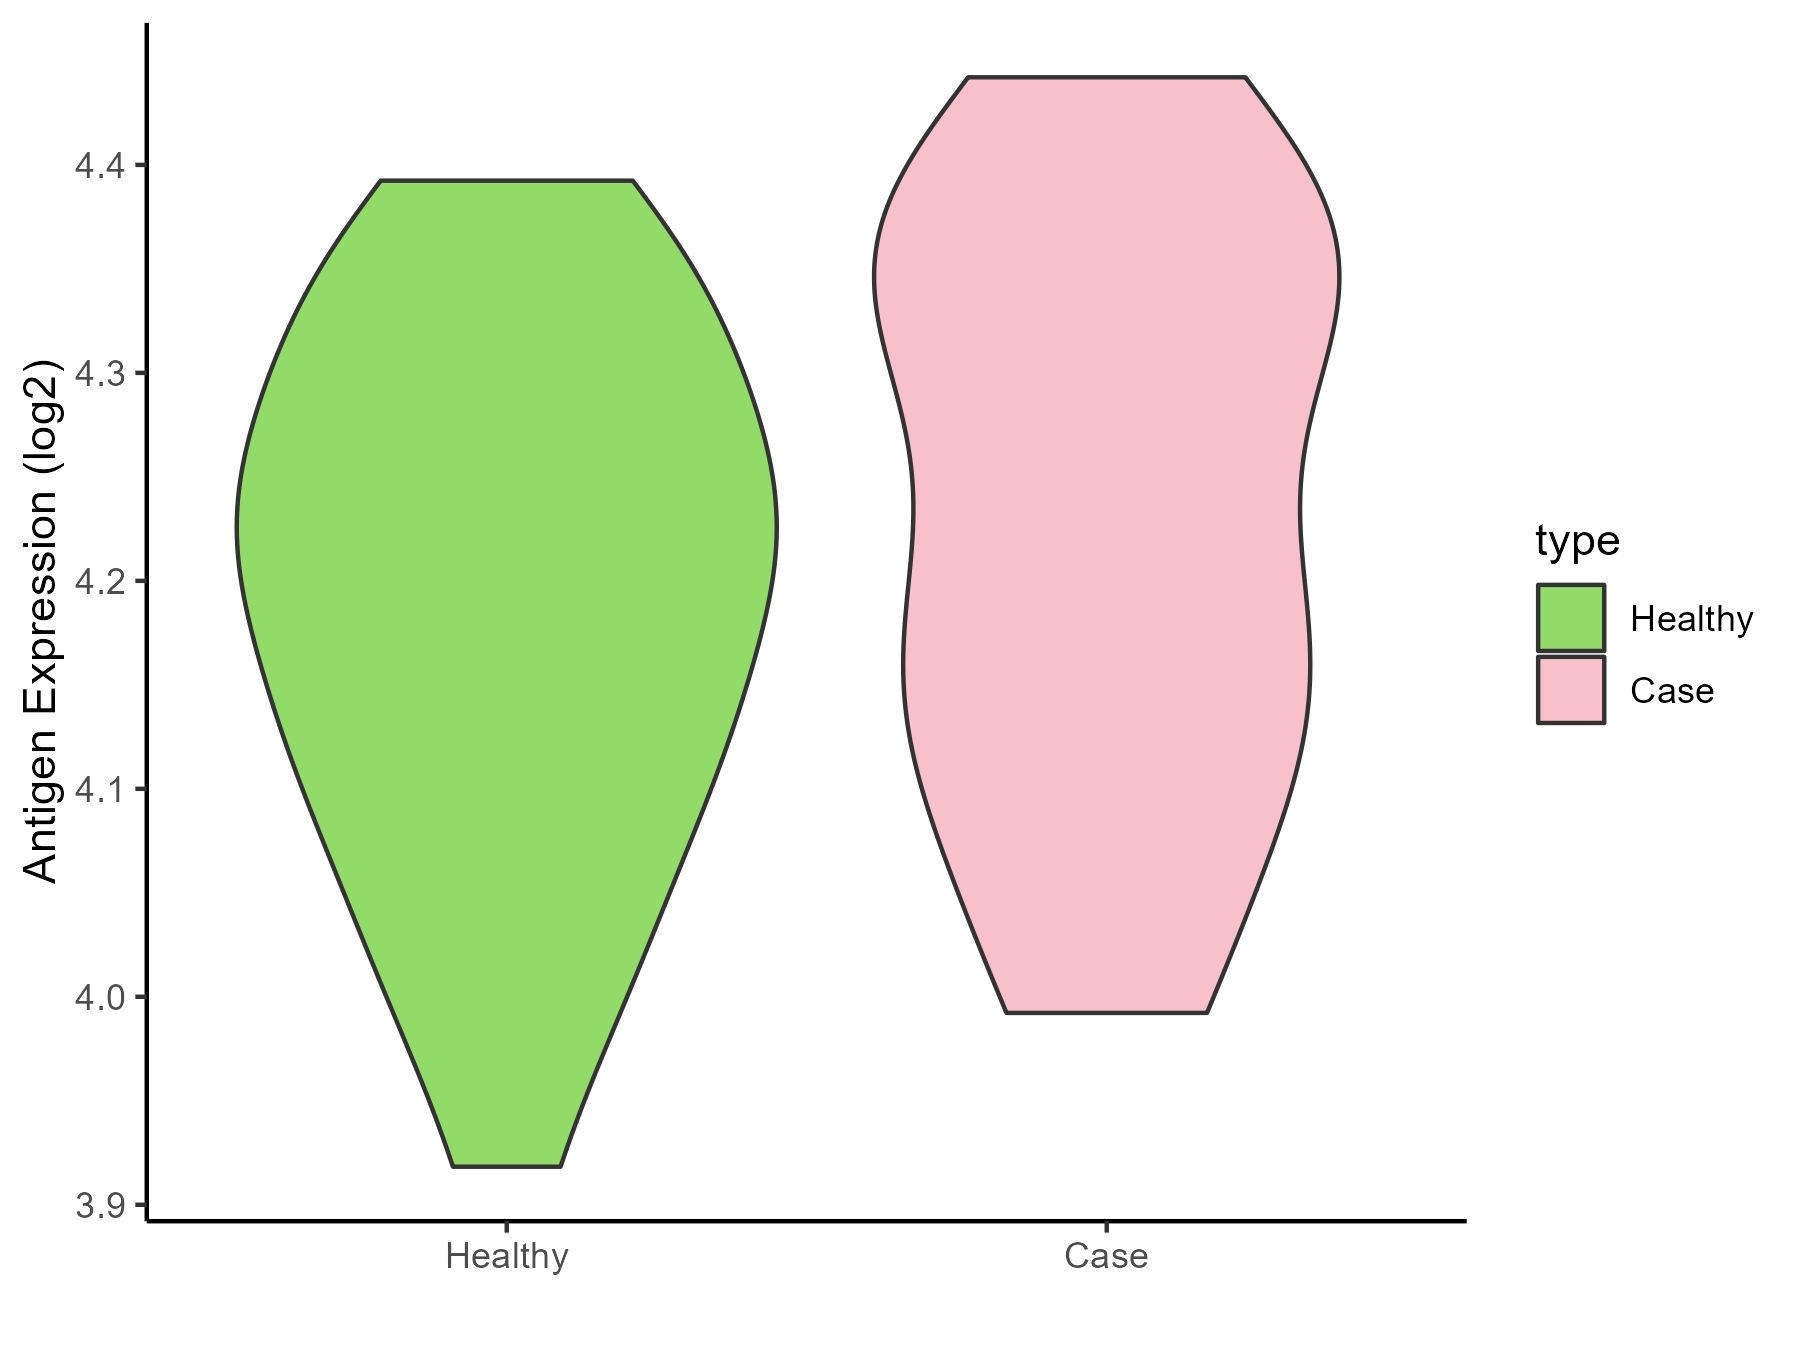
| The Studied Tissue | Peripheral blood | |
| The Specific Disease | Arthropathy | |
| The Expression Level of Disease Section Compare with the Healthy Individual Tissue | p-value: 0.369396748; Fold-change: 0.000647658; Z-score: 0.00508948 | |
| Disease-specific Antigen Abundances |
|
Click to View the Clearer Original Diagram |
| Differential expression pattern of antigen in diseases | ||
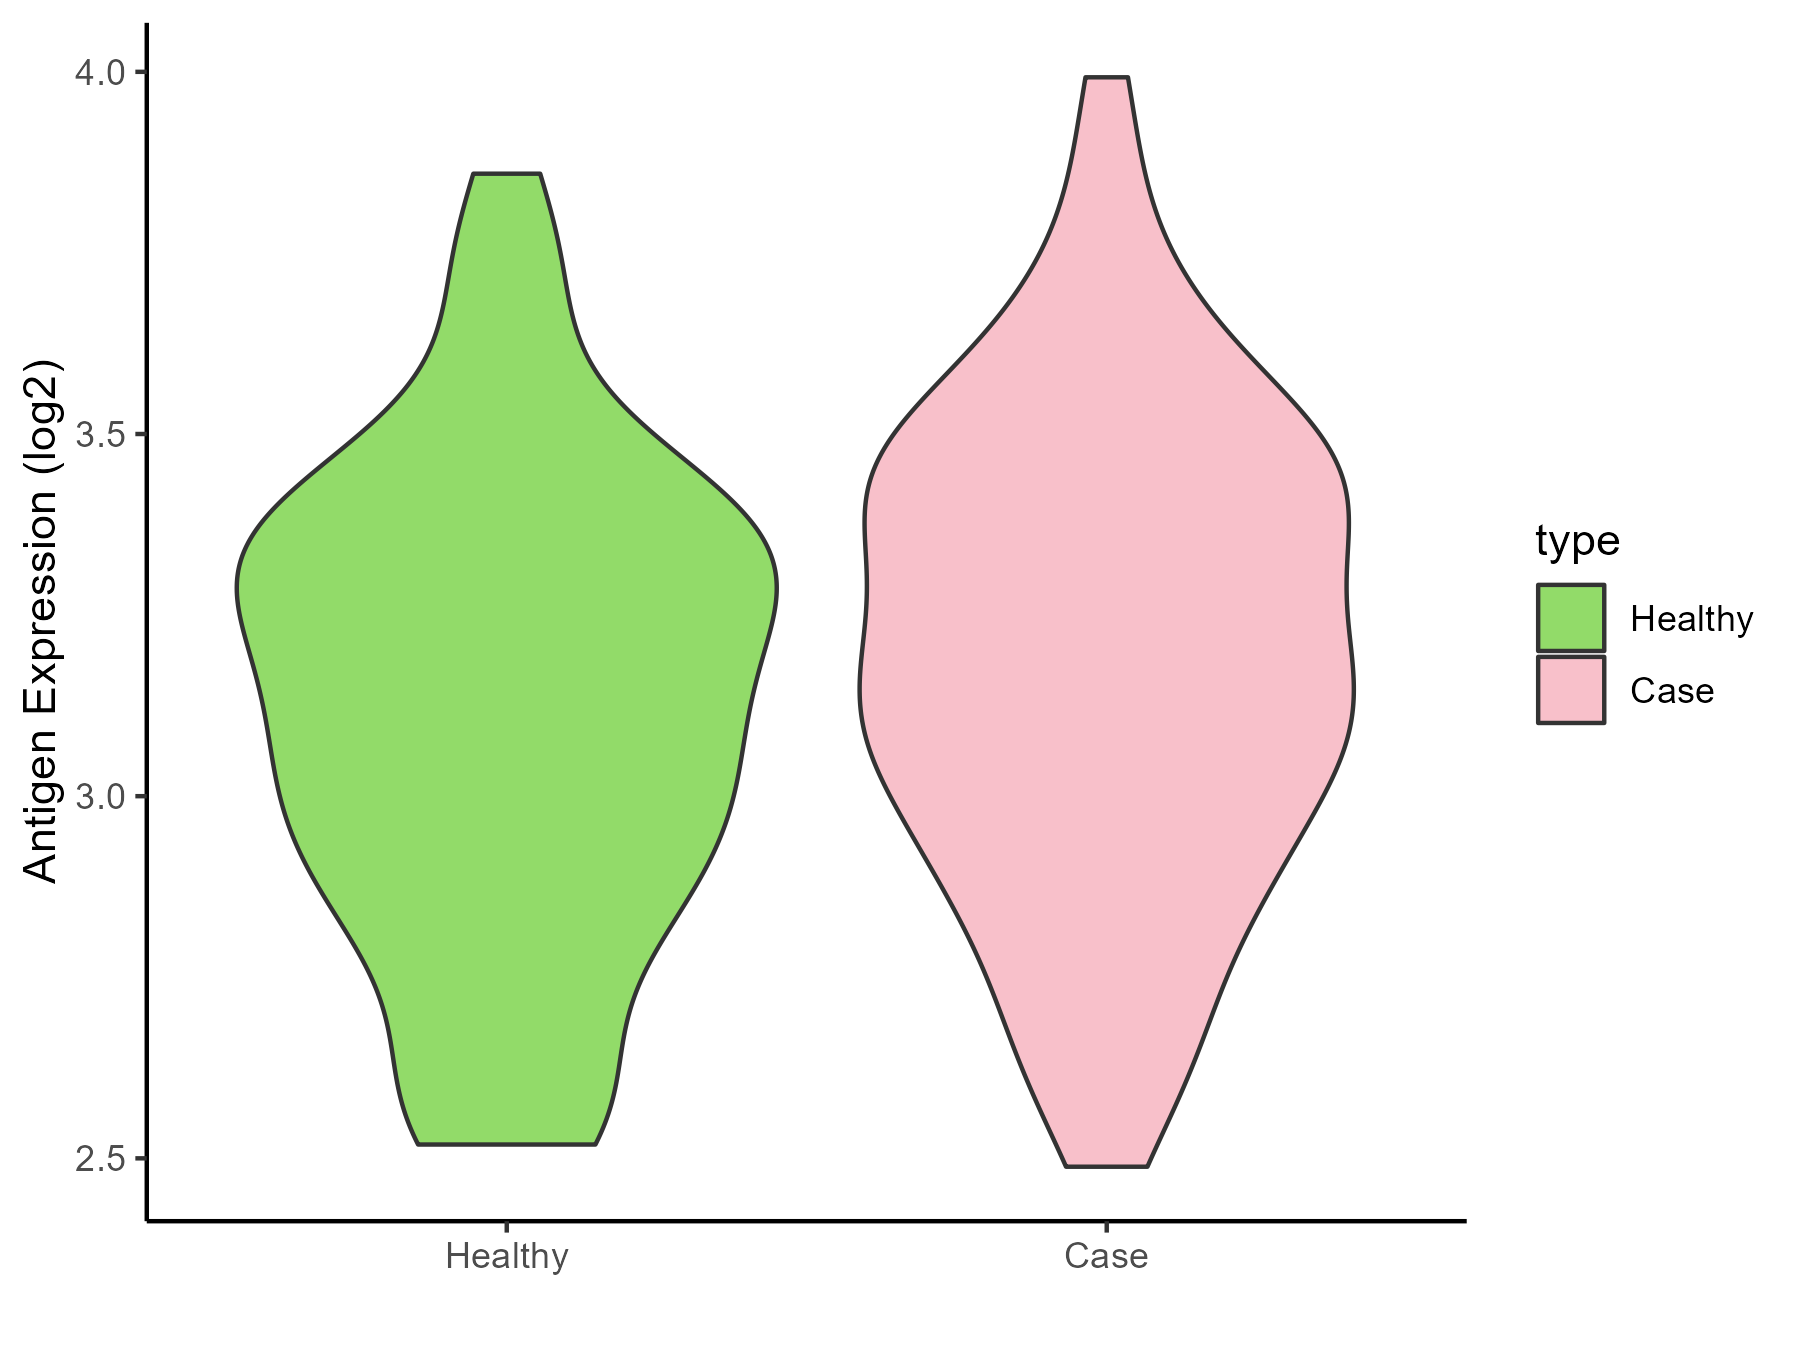
| The Studied Tissue | Peripheral blood | |
| The Specific Disease | Arthritis | |
| The Expression Level of Disease Section Compare with the Healthy Individual Tissue | p-value: 0.098642923; Fold-change: 0.066320158; Z-score: 0.20552621 | |
| Disease-specific Antigen Abundances |
|
Click to View the Clearer Original Diagram |
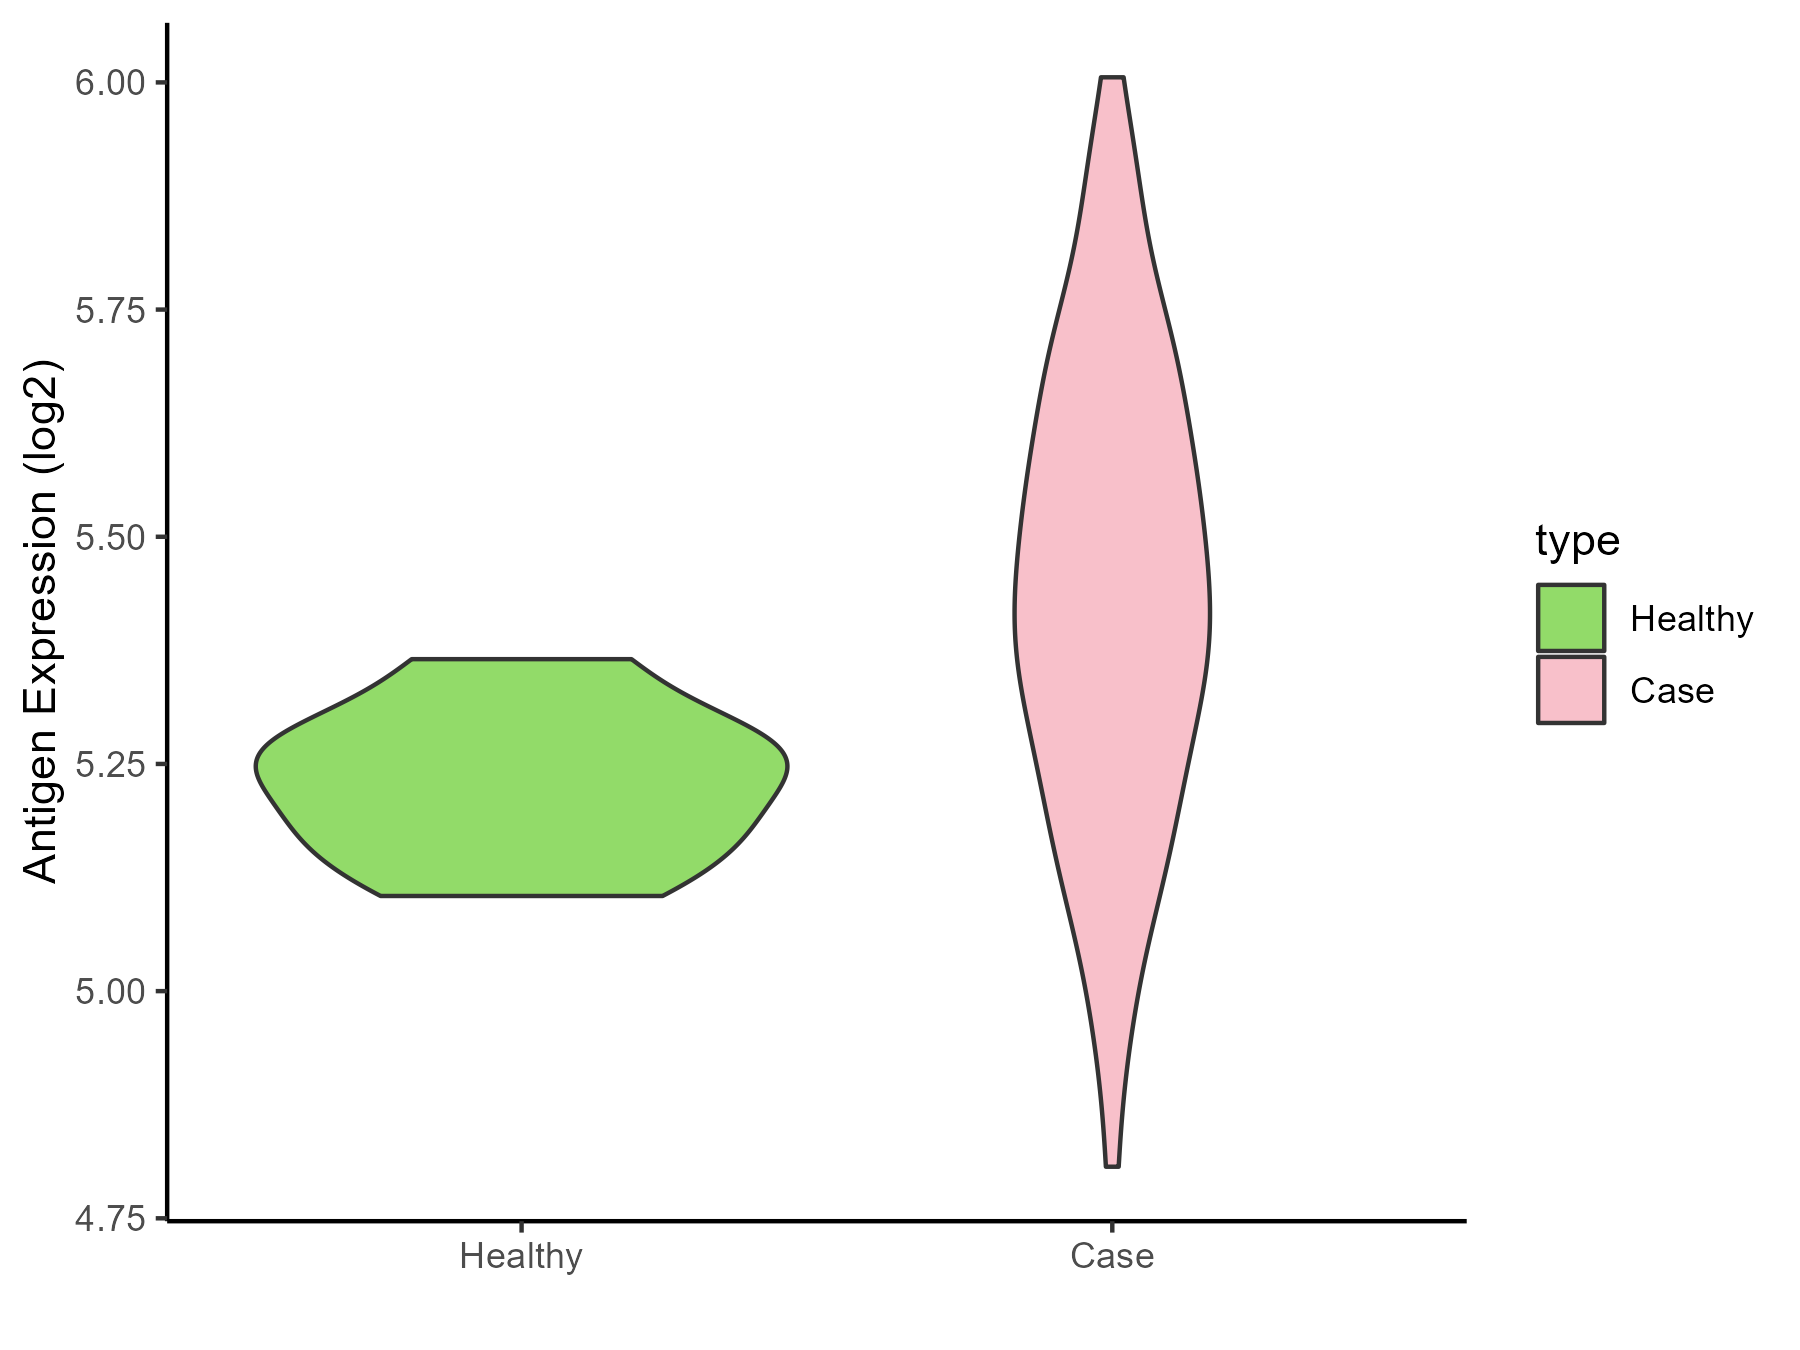
| Differential expression pattern of antigen in diseases | ||
| The Studied Tissue | Synovial | |
| The Specific Disease | Rheumatoid arthritis | |
| The Expression Level of Disease Section Compare with the Healthy Individual Tissue | p-value: 0.00019641; Fold-change: 0.190395926; Z-score: 2.189511458 | |
| Disease-specific Antigen Abundances |
|
Click to View the Clearer Original Diagram |
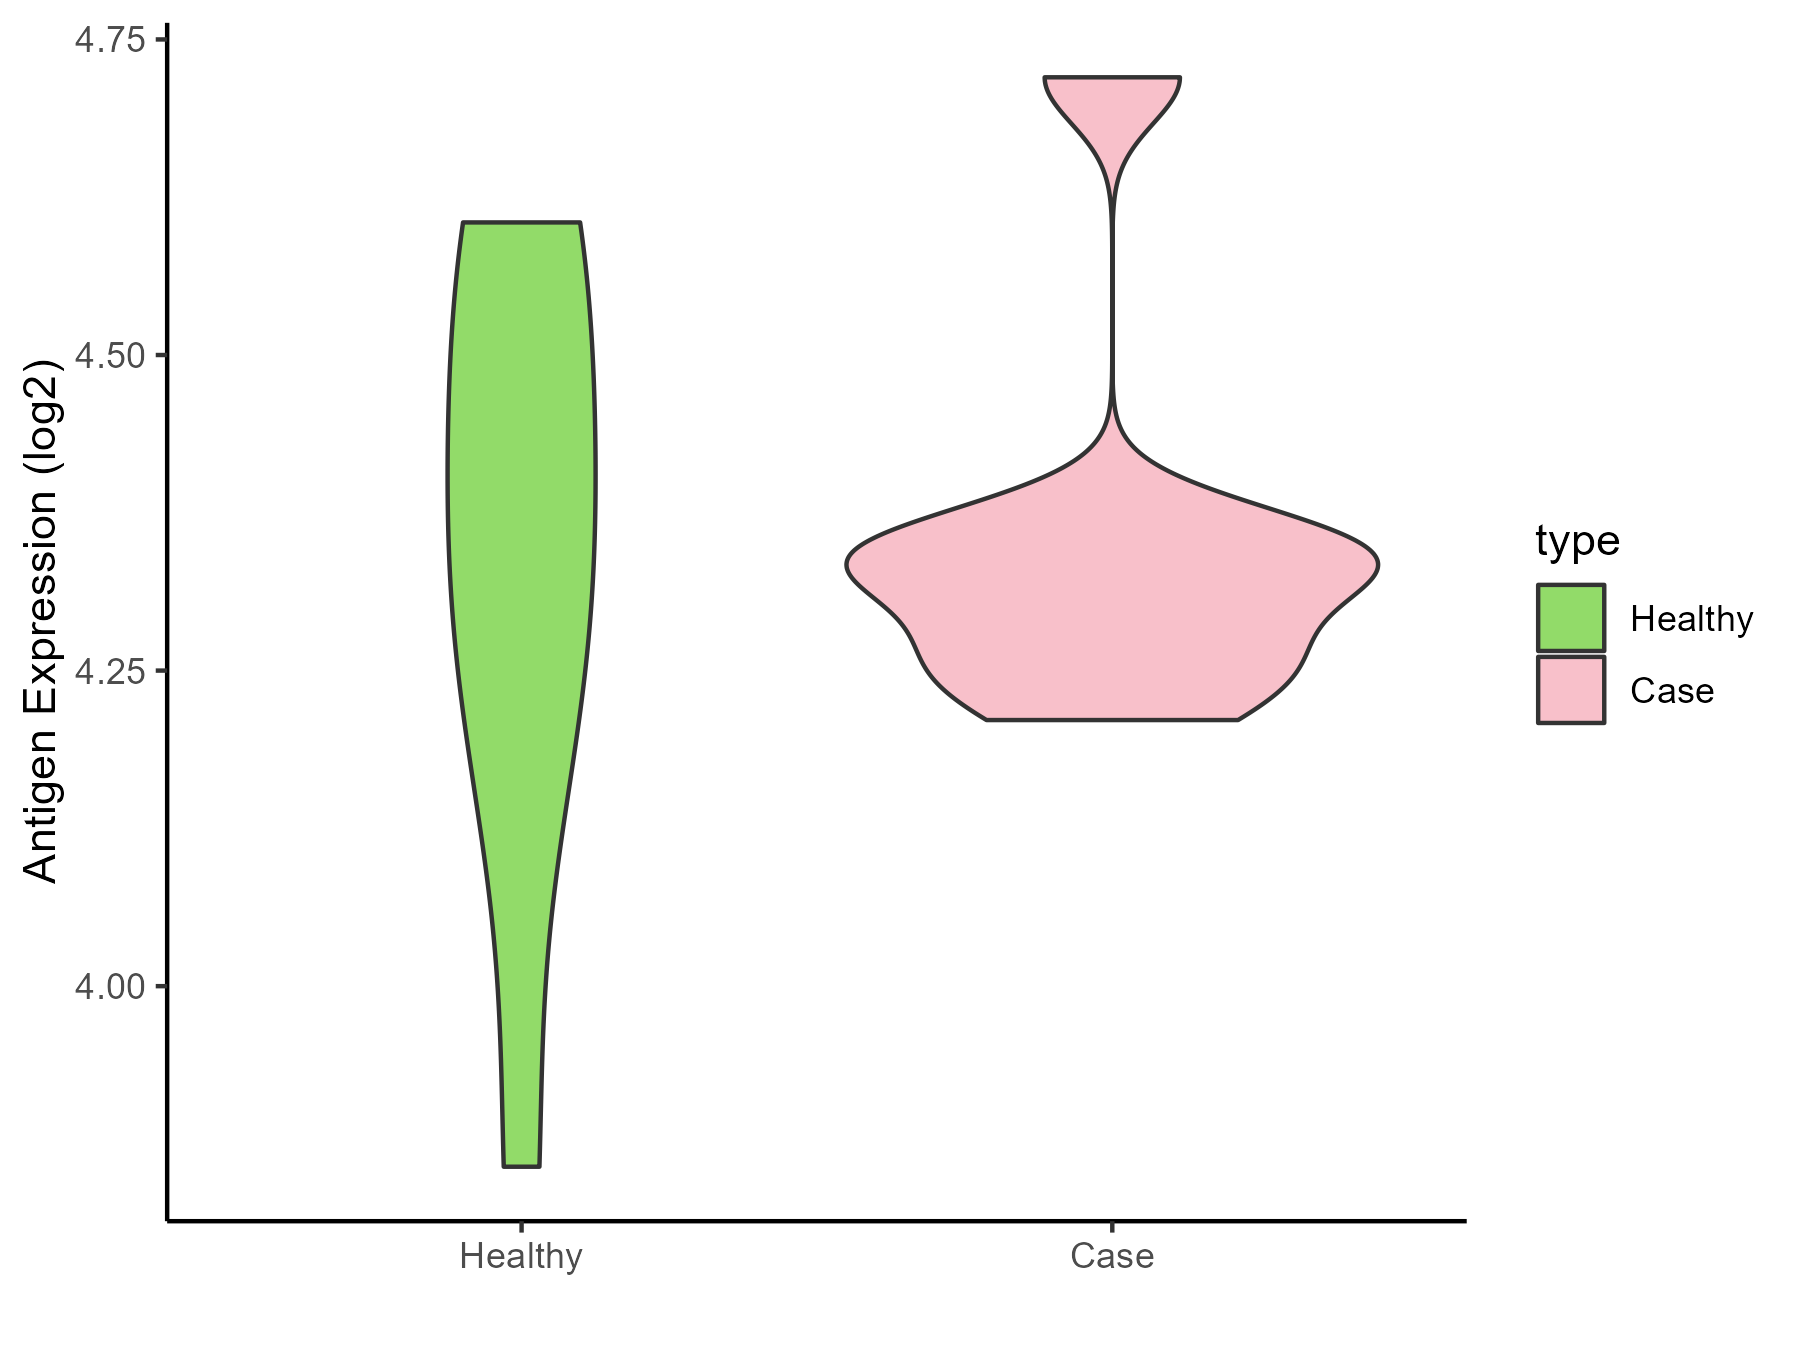
| Differential expression pattern of antigen in diseases | ||
| The Studied Tissue | Pheripheral blood | |
| The Specific Disease | Ankylosing spondylitis | |
| The Expression Level of Disease Section Compare with the Healthy Individual Tissue | p-value: 0.954004172; Fold-change: -0.011864186; Z-score: -0.048768154 | |
| Disease-specific Antigen Abundances |
|
Click to View the Clearer Original Diagram |
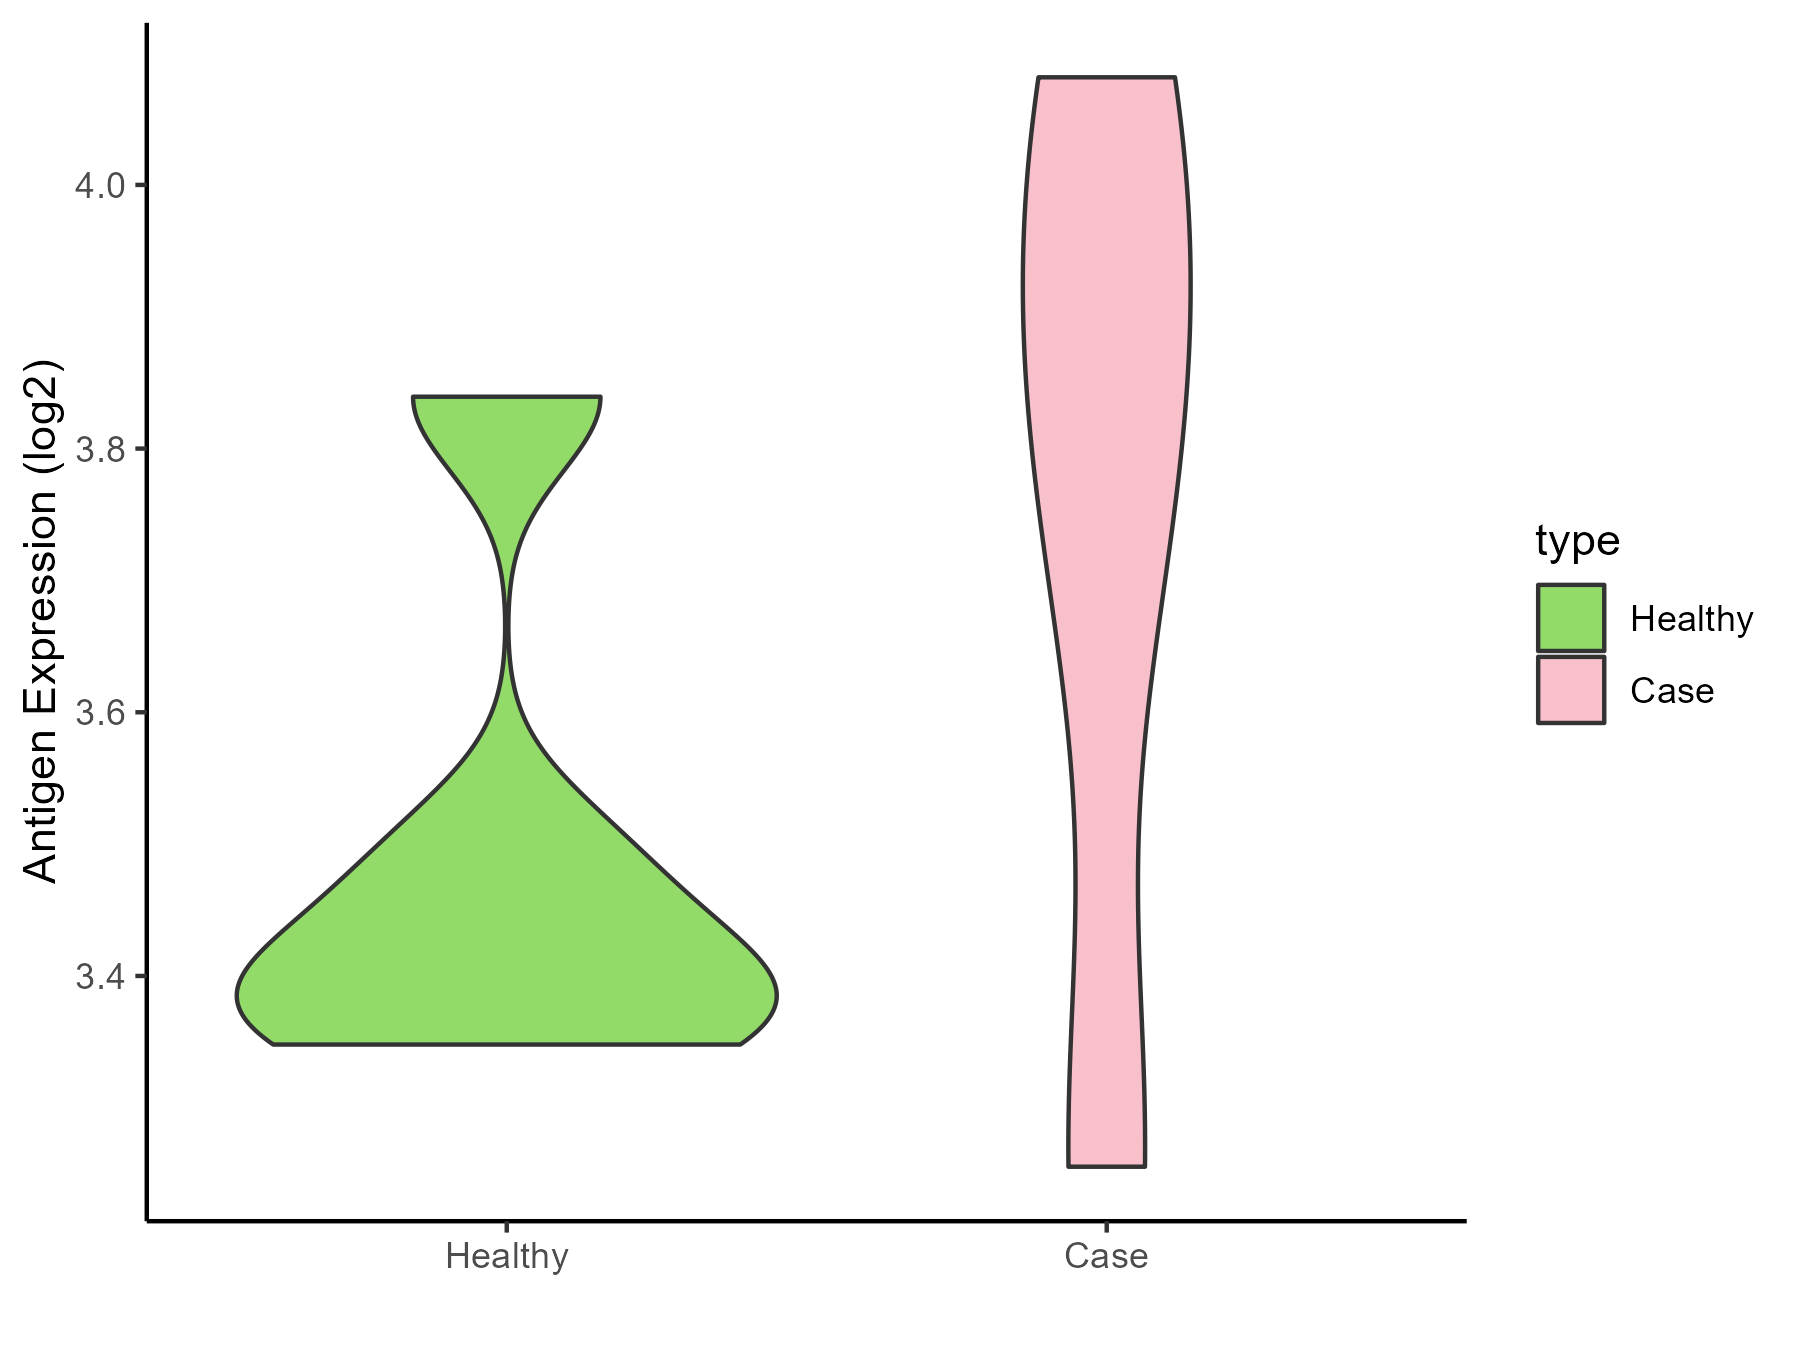
| Differential expression pattern of antigen in diseases | ||
| The Studied Tissue | Bone marrow | |
| The Specific Disease | Osteoporosis | |
| The Expression Level of Disease Section Compare with the Healthy Individual Tissue | p-value: 0.2615527; Fold-change: 0.423584629; Z-score: 2.105170331 | |
| Disease-specific Antigen Abundances |
|
Click to View the Clearer Original Diagram |
ICD Disease Classification 16
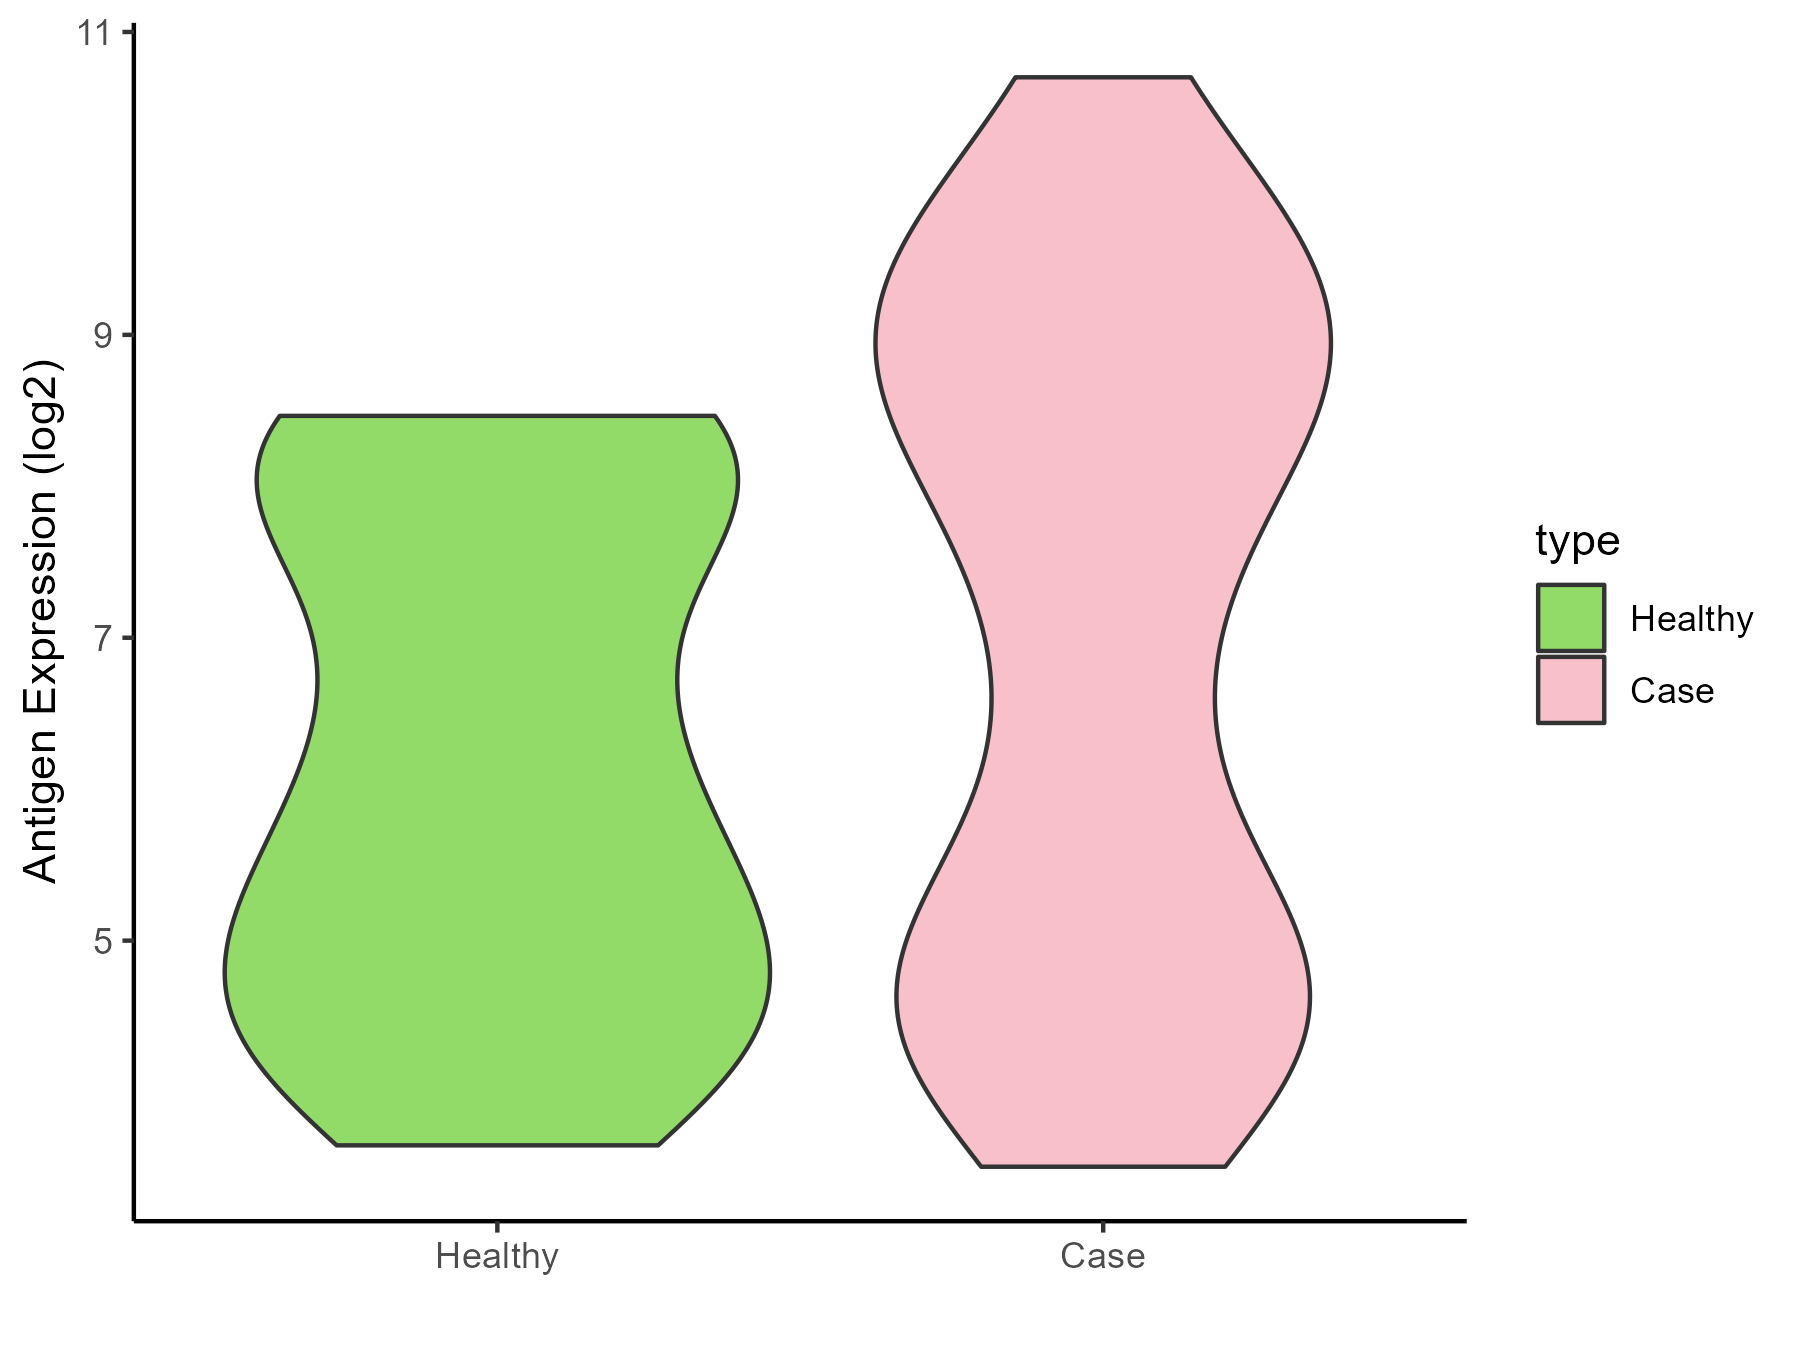
| Differential expression pattern of antigen in diseases | ||
| The Studied Tissue | Endometrium | |
| The Specific Disease | Endometriosis | |
| The Expression Level of Disease Section Compare with the Healthy Individual Tissue | p-value: 0.064286378; Fold-change: 1.473129573; Z-score: 0.879754961 | |
| Disease-specific Antigen Abundances |
|
Click to View the Clearer Original Diagram |
| Differential expression pattern of antigen in diseases | ||
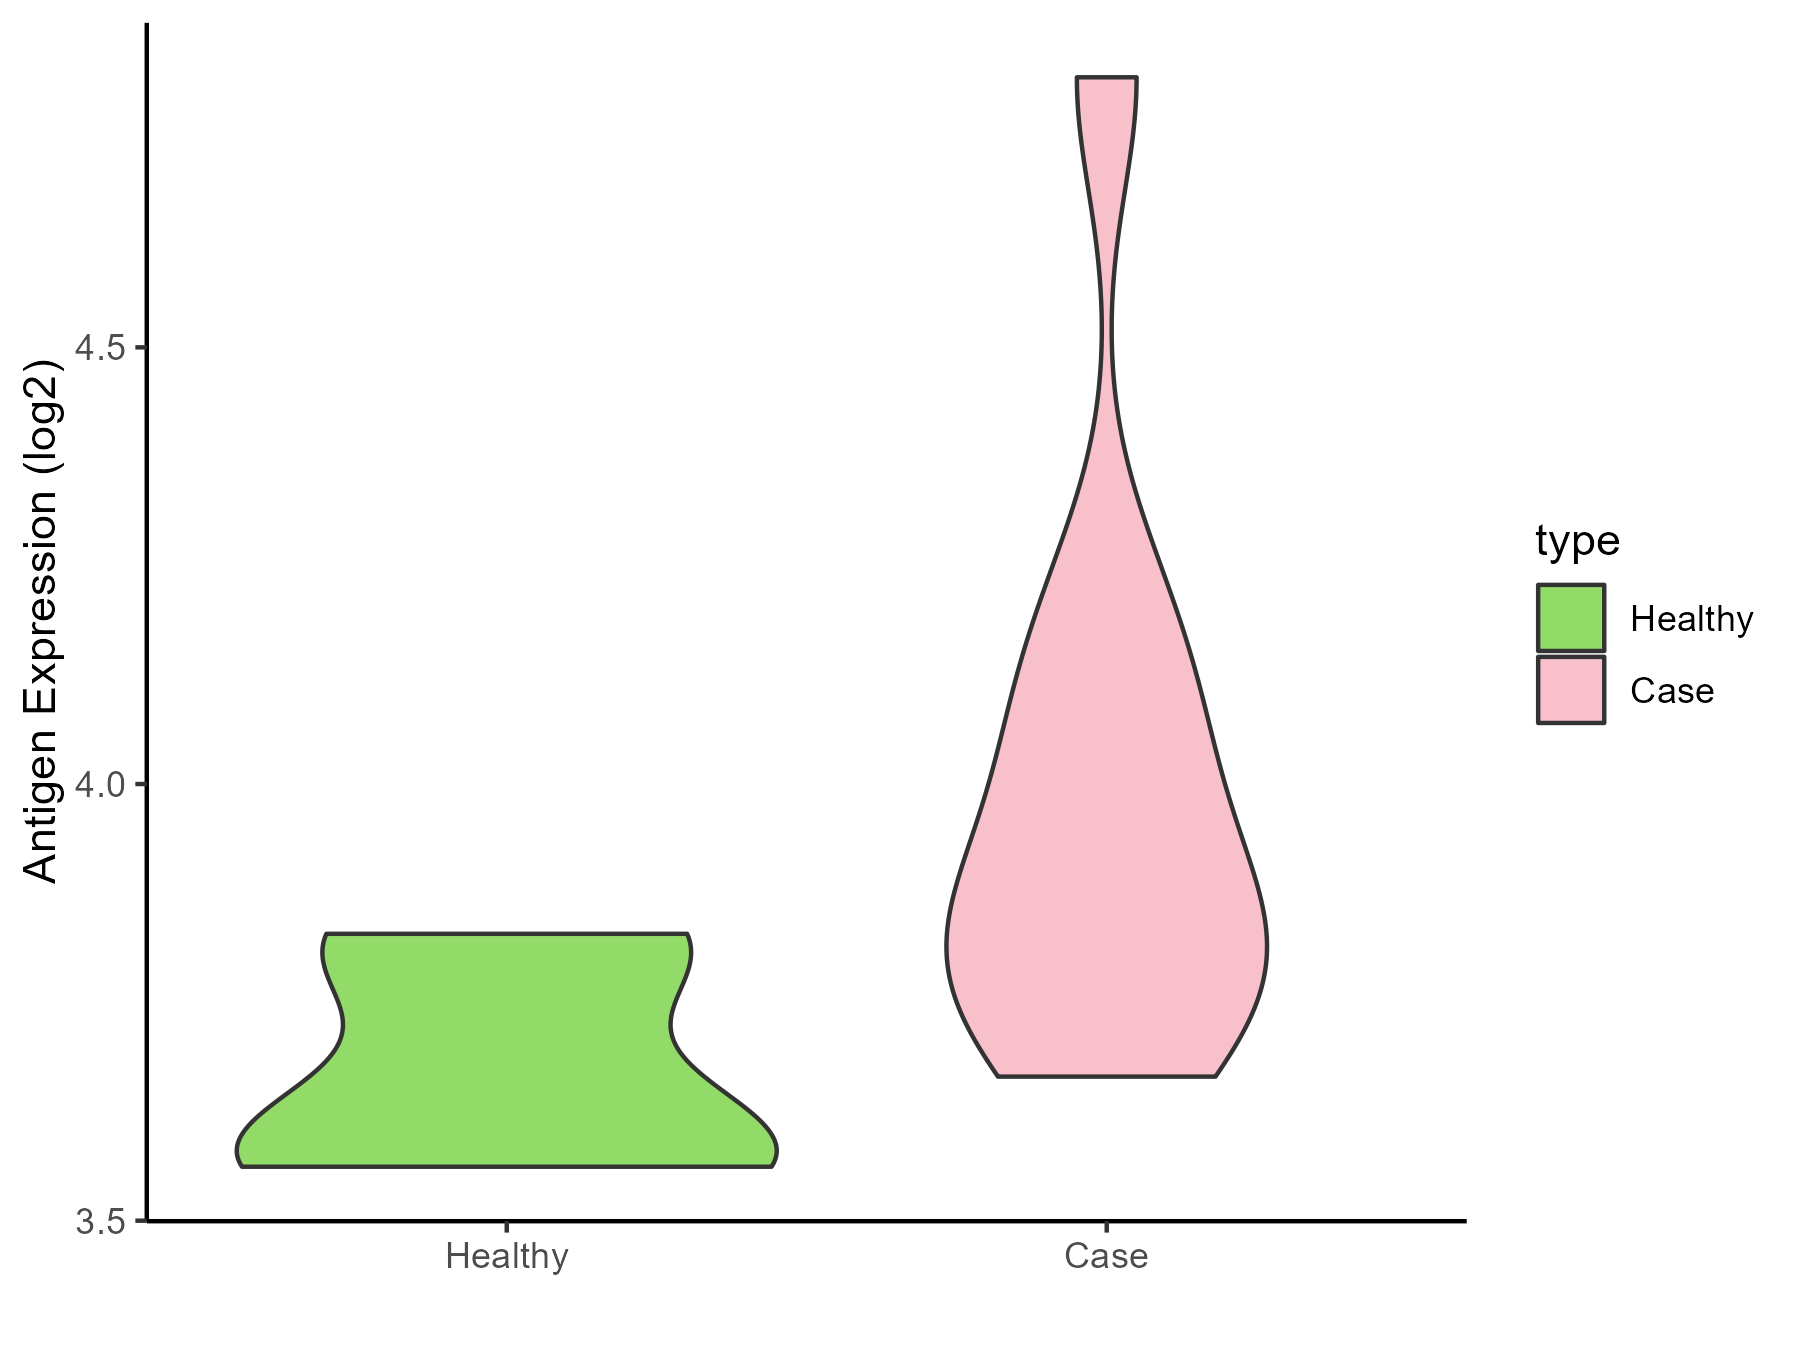
| The Studied Tissue | Bladder | |
| The Specific Disease | Interstitial cystitis | |
| The Expression Level of Disease Section Compare with the Healthy Individual Tissue | p-value: 0.021178512; Fold-change: 0.281852963; Z-score: 2.118751339 | |
| Disease-specific Antigen Abundances |
|
Click to View the Clearer Original Diagram |
ICD Disease Classification 19
| Differential expression pattern of antigen in diseases | ||
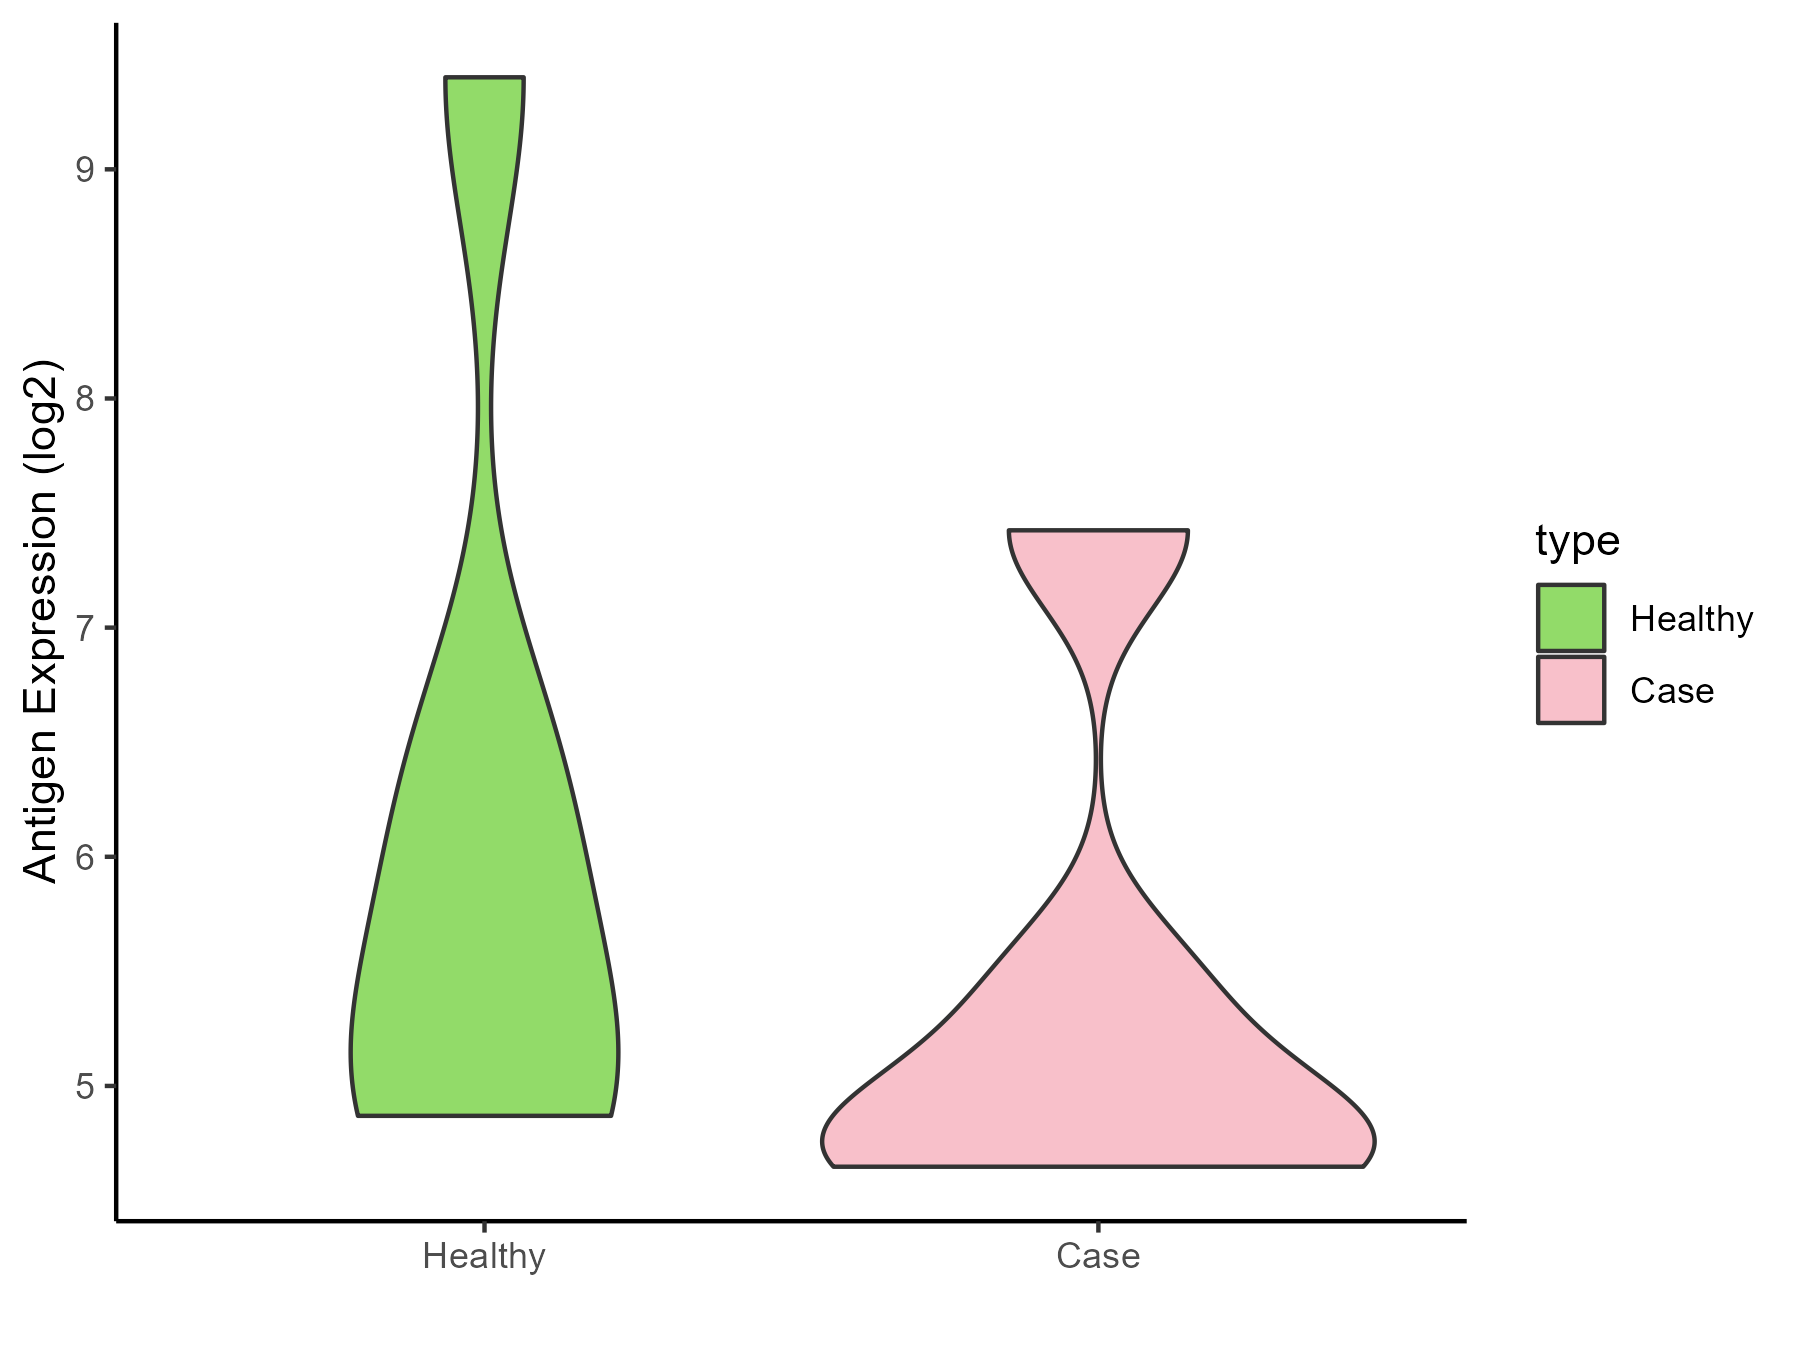
| The Studied Tissue | Myometrium | |
| The Specific Disease | Preterm birth | |
| The Expression Level of Disease Section Compare with the Healthy Individual Tissue | p-value: 0.439099995; Fold-change: -0.731865586; Z-score: -0.422421194 | |
| Disease-specific Antigen Abundances |
|
Click to View the Clearer Original Diagram |
ICD Disease Classification 2
| Differential expression pattern of antigen in diseases | ||
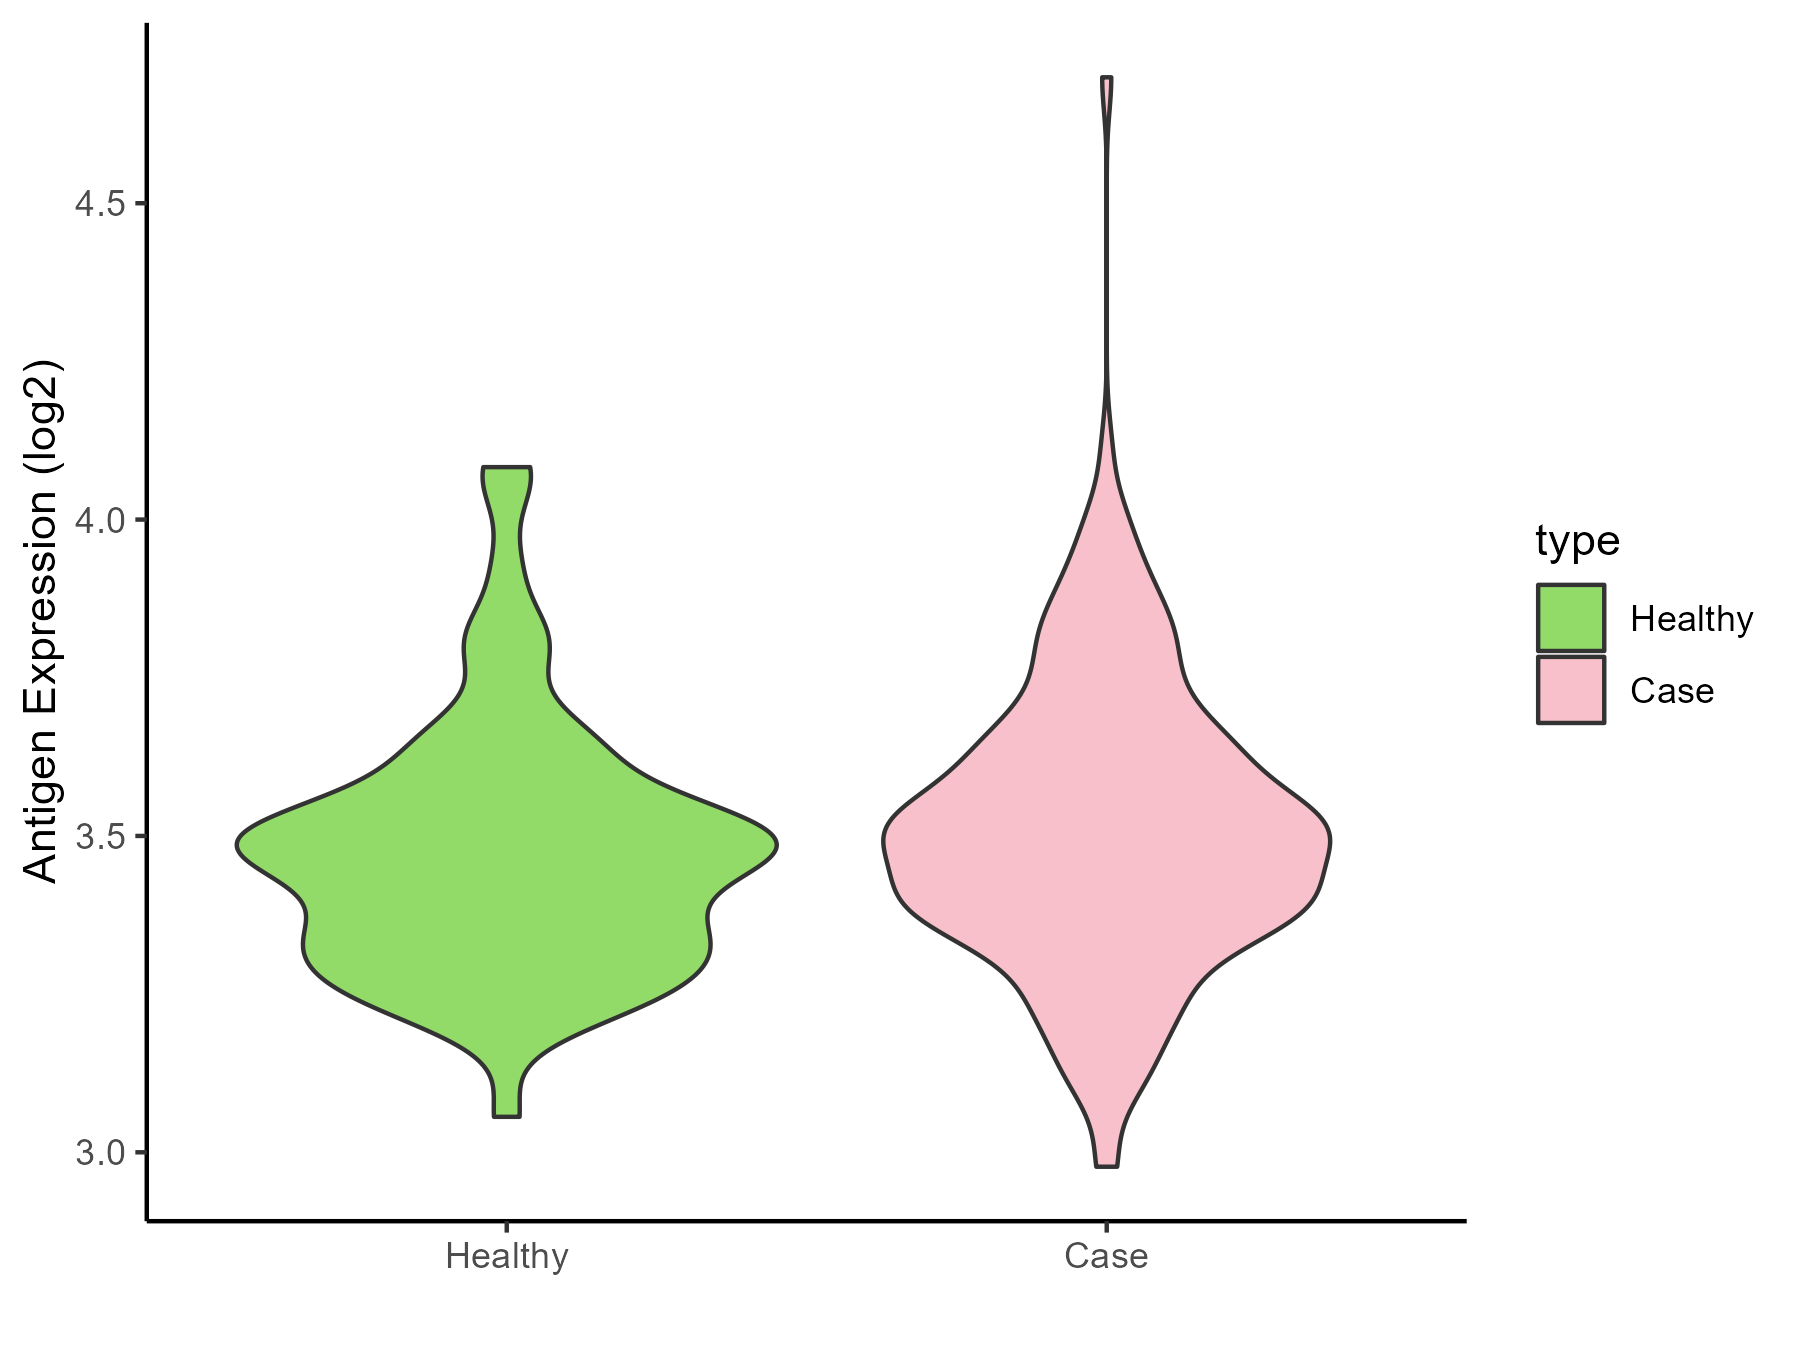
| The Studied Tissue | Bone marrow | |
| The Specific Disease | Acute myelocytic leukemia | |
| The Expression Level of Disease Section Compare with the Healthy Individual Tissue | p-value: 0.056400905; Fold-change: 0.031392621; Z-score: 0.160272116 | |
| Disease-specific Antigen Abundances |
|
Click to View the Clearer Original Diagram |
| Differential expression pattern of antigen in diseases | ||
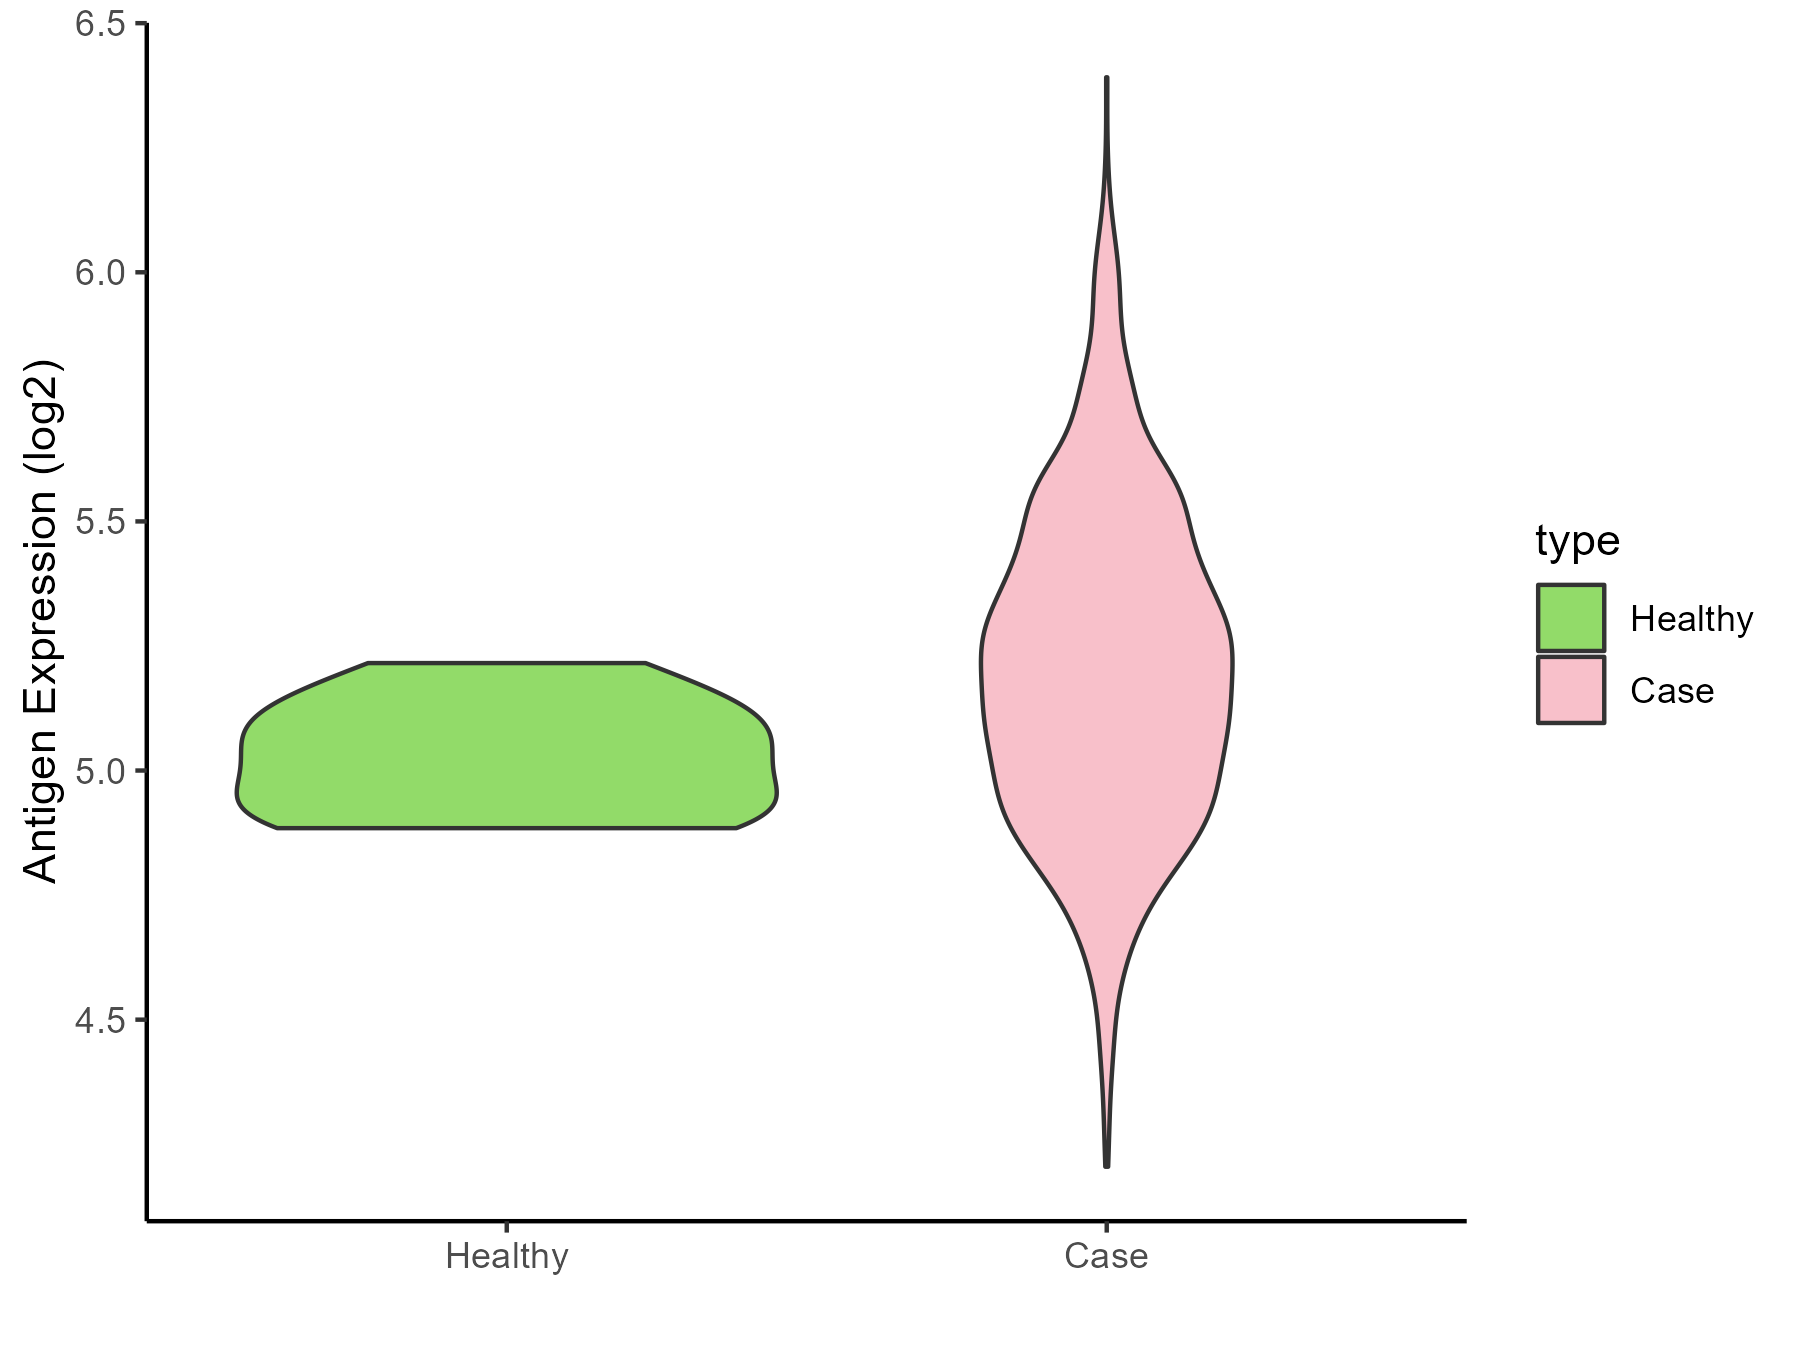
| The Studied Tissue | Bone marrow | |
| The Specific Disease | Myeloma | |
| The Expression Level of Disease Section Compare with the Healthy Individual Tissue | p-value: 0.003702686; Fold-change: 0.165993793; Z-score: 1.383863102 | |
| Disease-specific Antigen Abundances |
|
Click to View the Clearer Original Diagram |
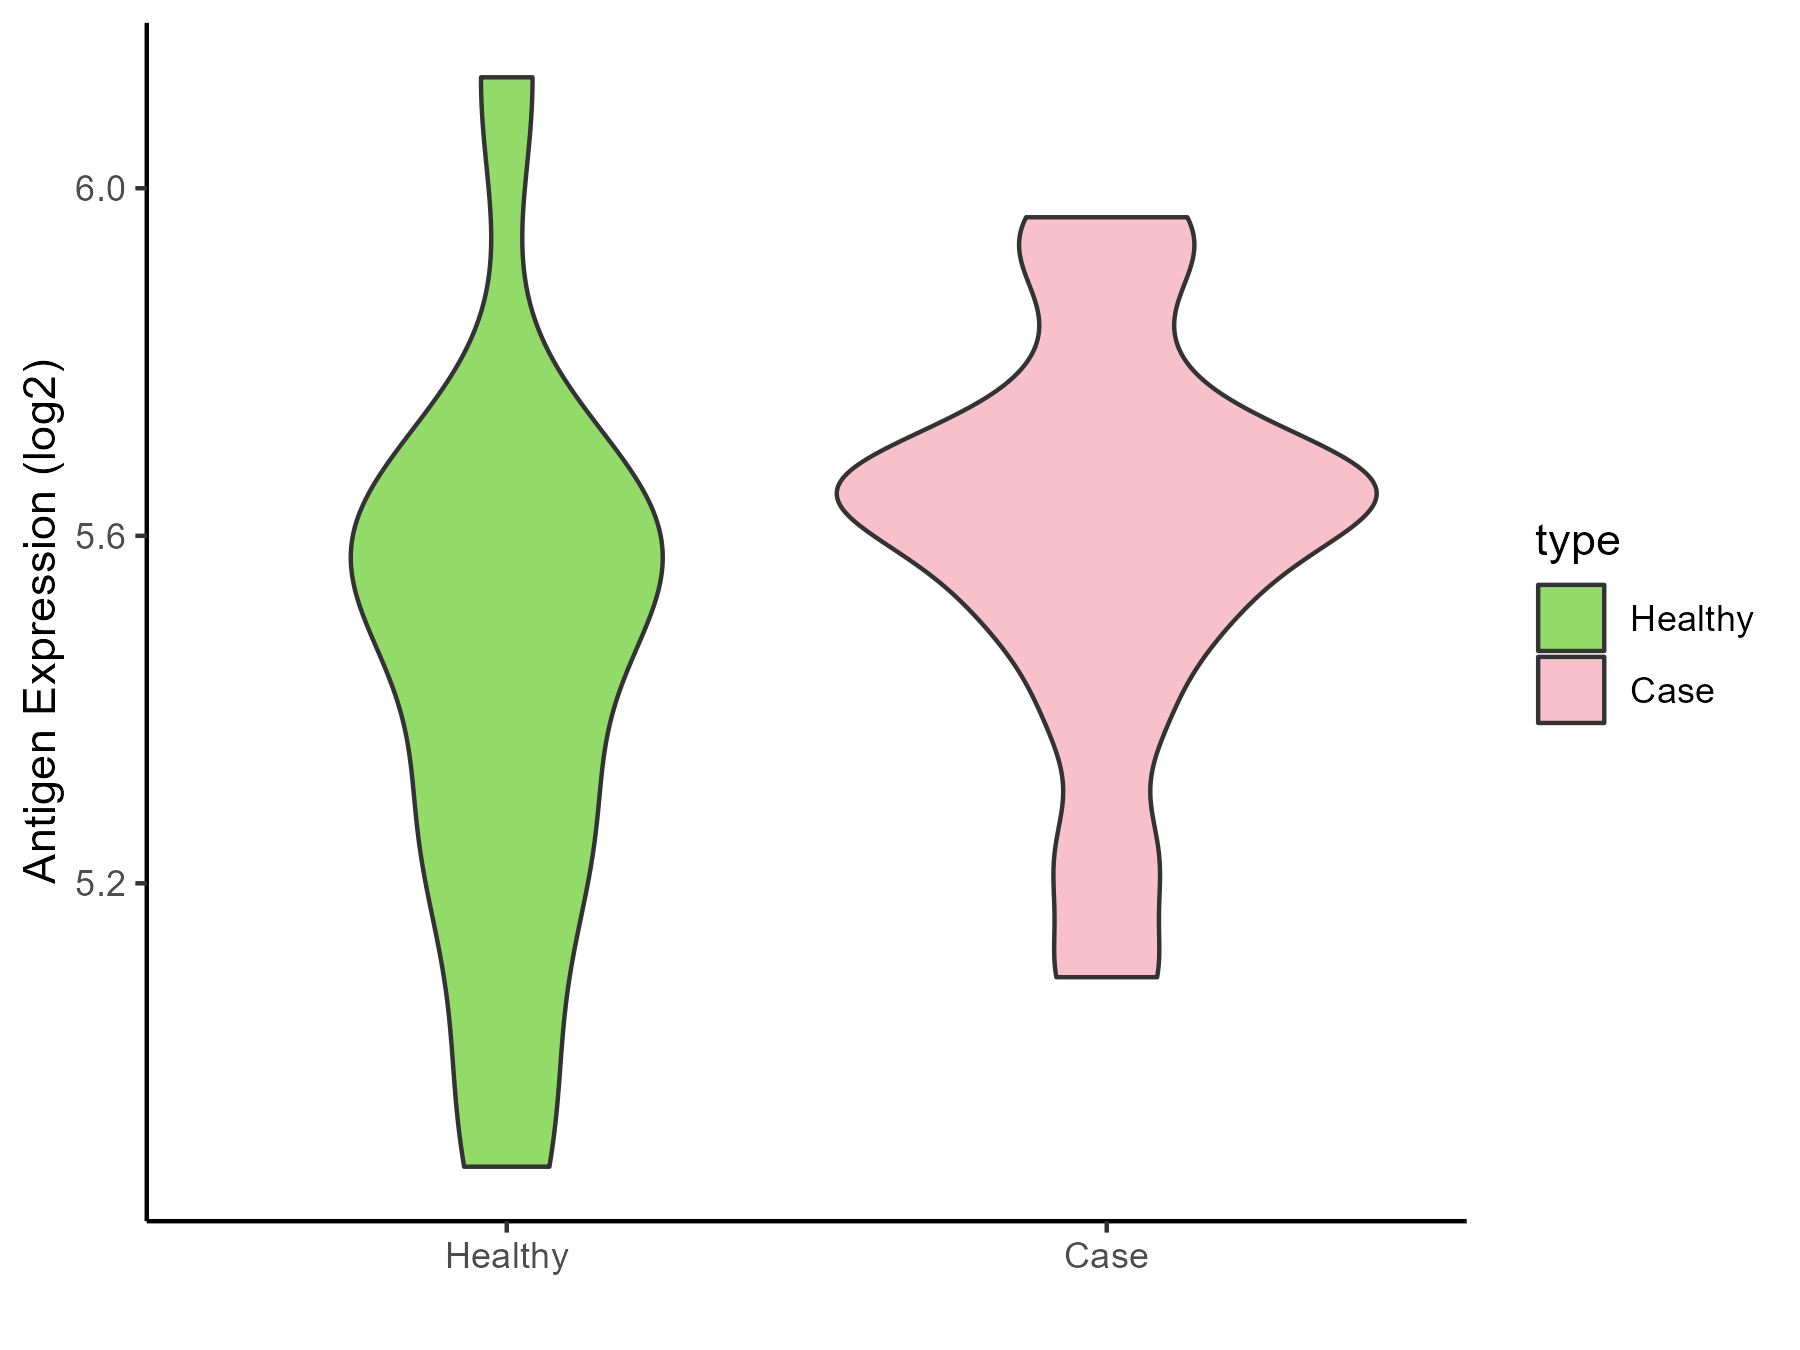
| The Studied Tissue | Peripheral blood | |
| The Specific Disease | Myeloma | |
| The Expression Level of Disease Section Compare with the Healthy Individual Tissue | p-value: 0.209461482; Fold-change: 0.098063402; Z-score: 0.295688039 | |
| Disease-specific Antigen Abundances |
|
Click to View the Clearer Original Diagram |
| Differential expression pattern of antigen in diseases | ||
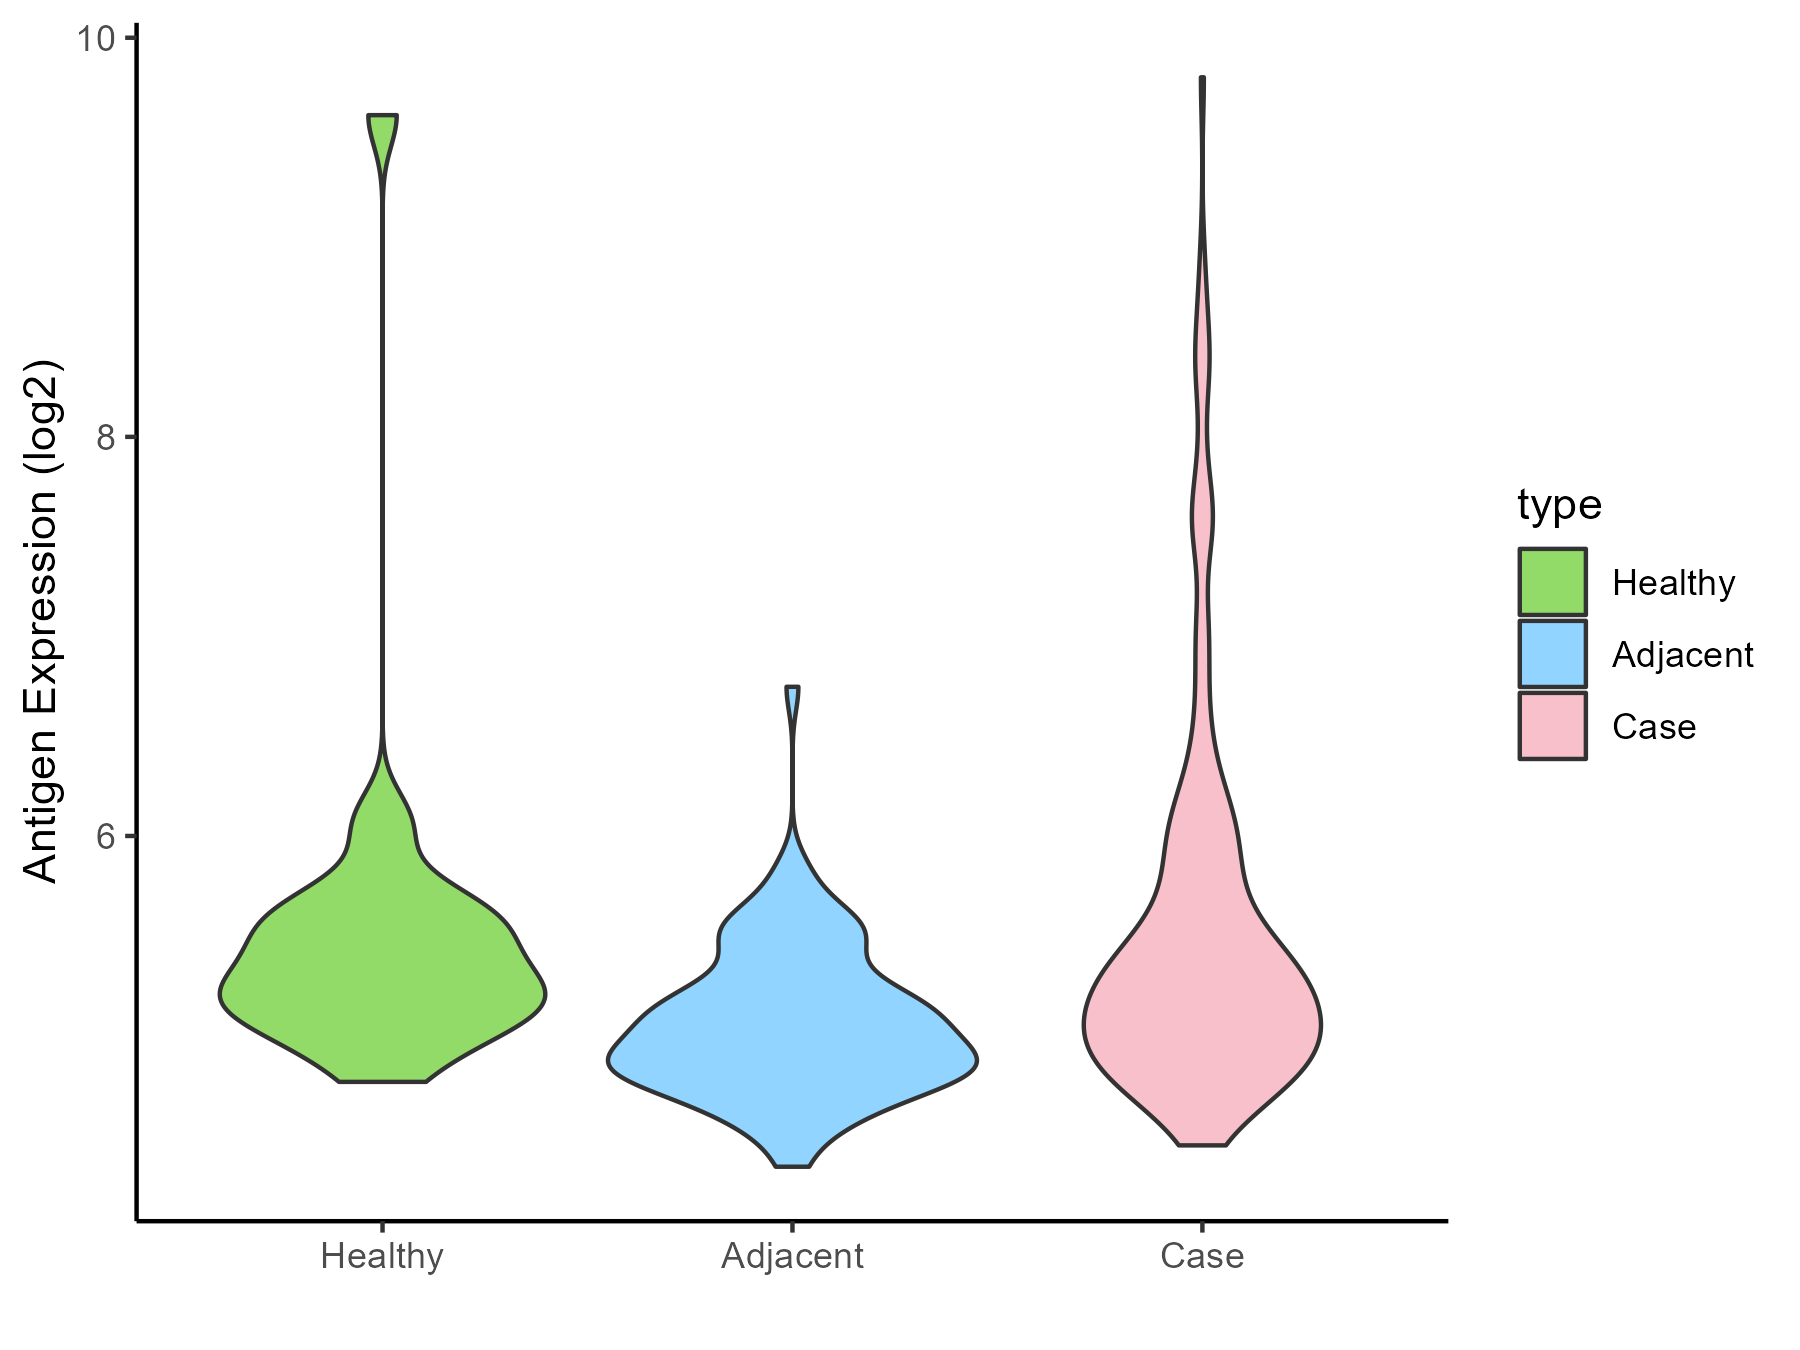
| The Studied Tissue | Oral | |
| The Specific Disease | Oral cancer | |
| The Expression Level of Disease Section Compare with the Healthy Individual Tissue | p-value: 0.88781077; Fold-change: -0.039581327; Z-score: -0.044866766 | |
| The Expression Level of Disease Section Compare with the Adjacent Tissue | p-value: 1.74E-09; Fold-change: 0.253421136; Z-score: 0.672669628 | |
| Disease-specific Antigen Abundances |
|
Click to View the Clearer Original Diagram |
| Differential expression pattern of antigen in diseases | ||
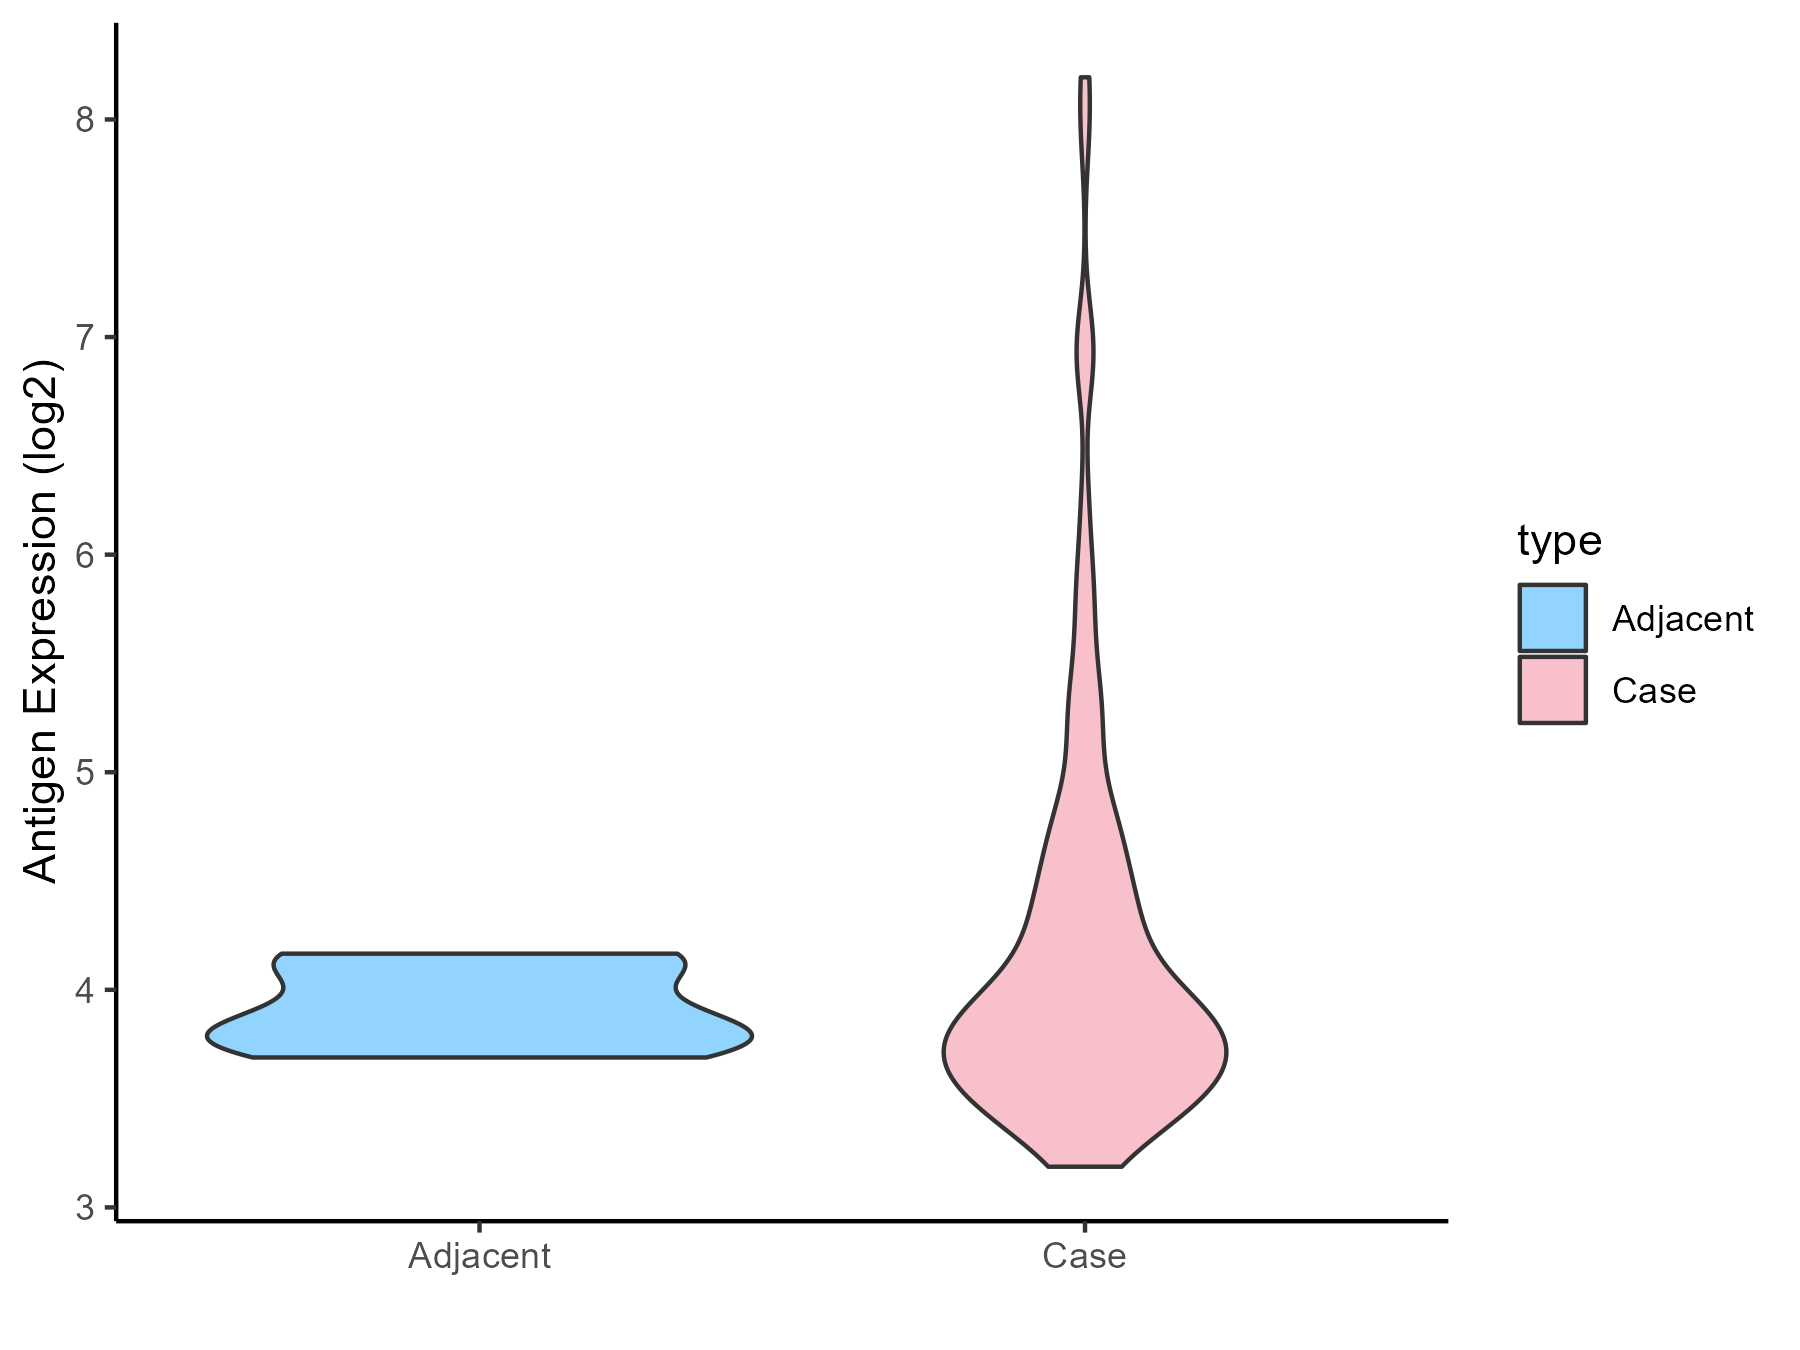
| The Studied Tissue | Esophagus | |
| The Specific Disease | Esophagal cancer | |
| The Expression Level of Disease Section Compare with the Adjacent Tissue | p-value: 0.051353282; Fold-change: 0.046179113; Z-score: 0.217956501 | |
| Disease-specific Antigen Abundances |
|
Click to View the Clearer Original Diagram |
| Differential expression pattern of antigen in diseases | ||
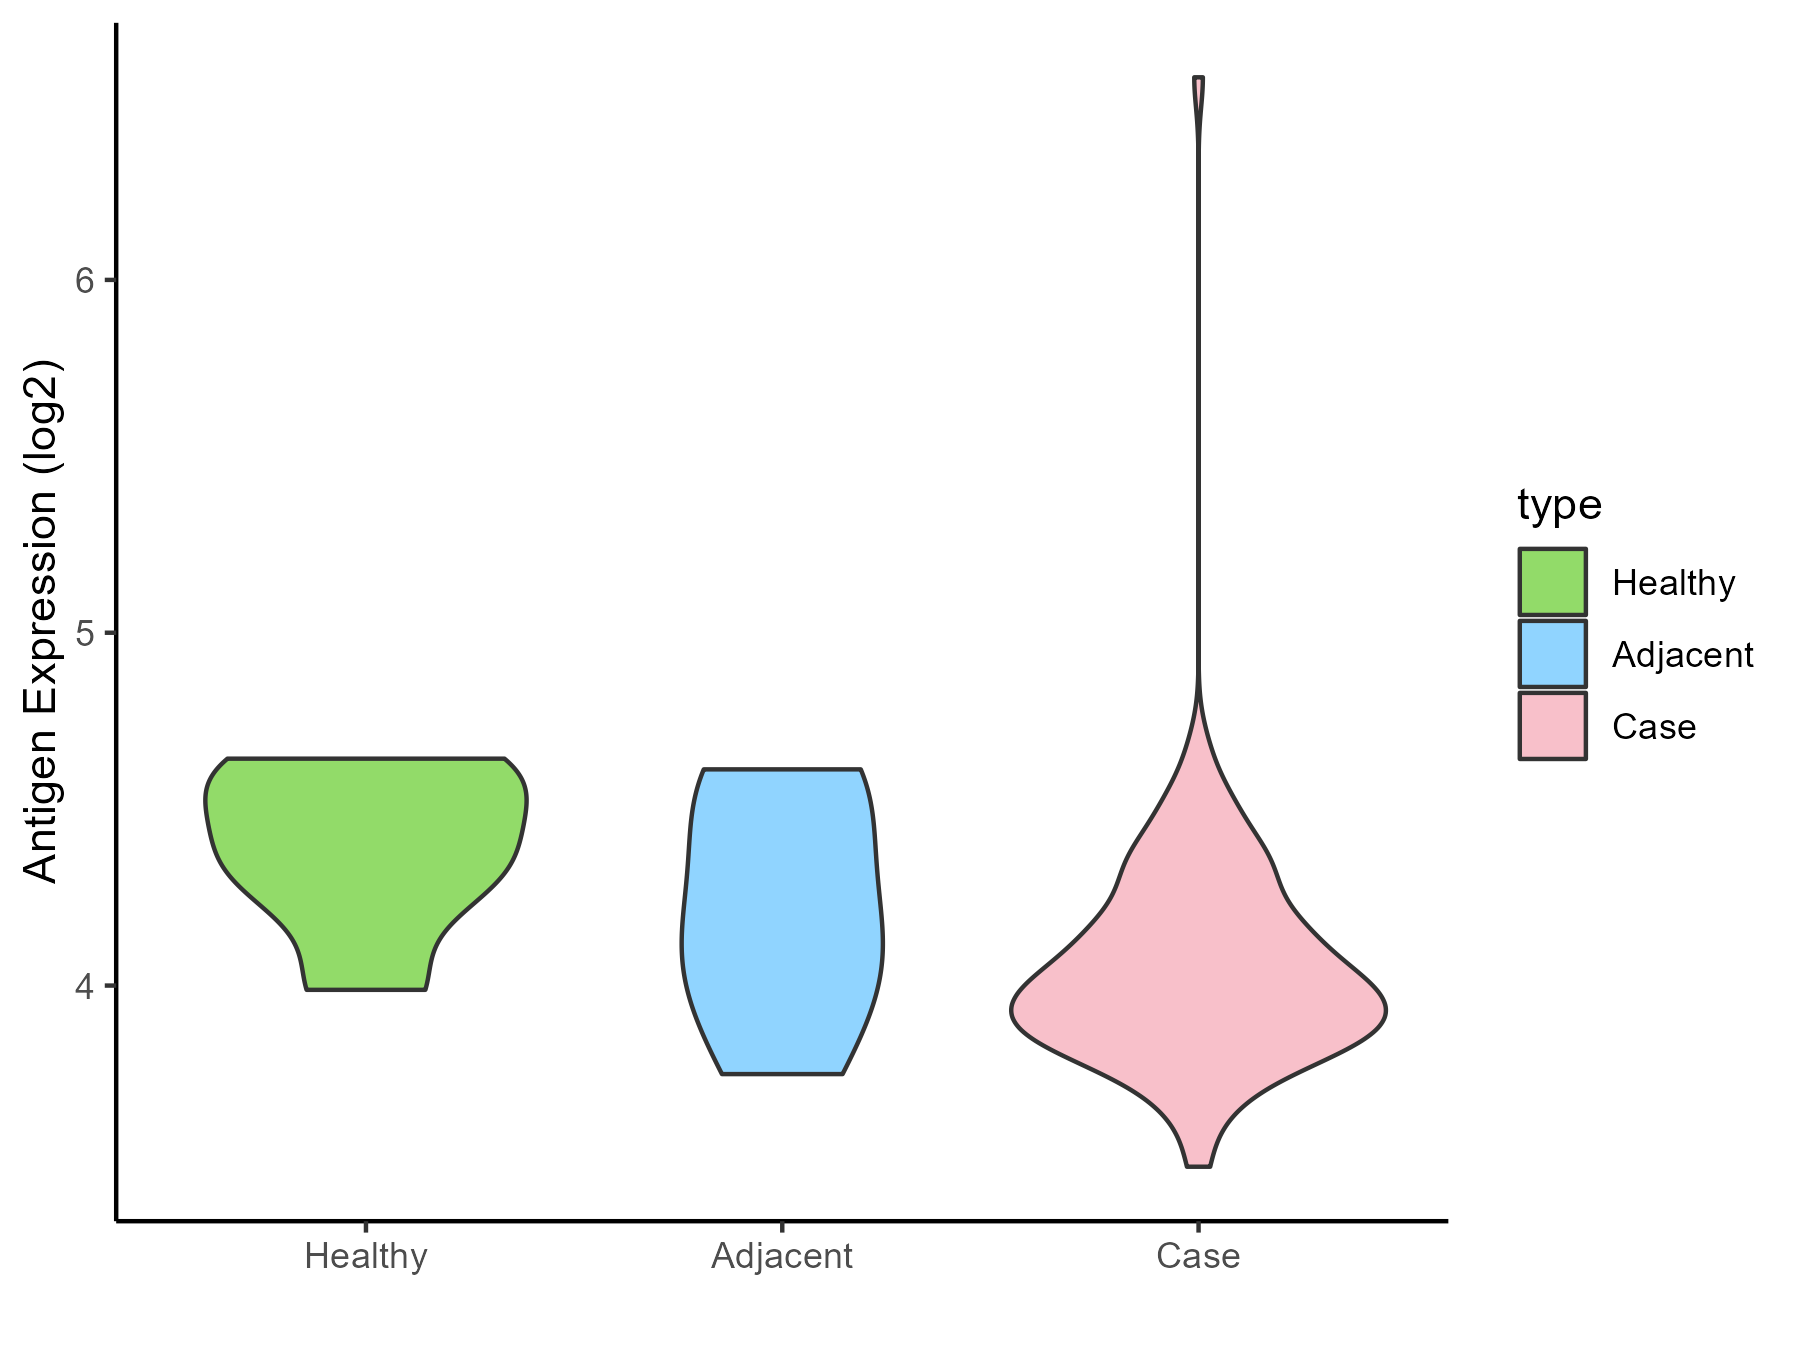
| The Studied Tissue | Rectal colon | |
| The Specific Disease | Rectal cancer | |
| The Expression Level of Disease Section Compare with the Healthy Individual Tissue | p-value: 0.019008907; Fold-change: -0.422214013; Z-score: -1.726736286 | |
| The Expression Level of Disease Section Compare with the Adjacent Tissue | p-value: 0.311436008; Fold-change: -0.200379097; Z-score: -0.602317468 | |
| Disease-specific Antigen Abundances |
|
Click to View the Clearer Original Diagram |
| Differential expression pattern of antigen in diseases | ||
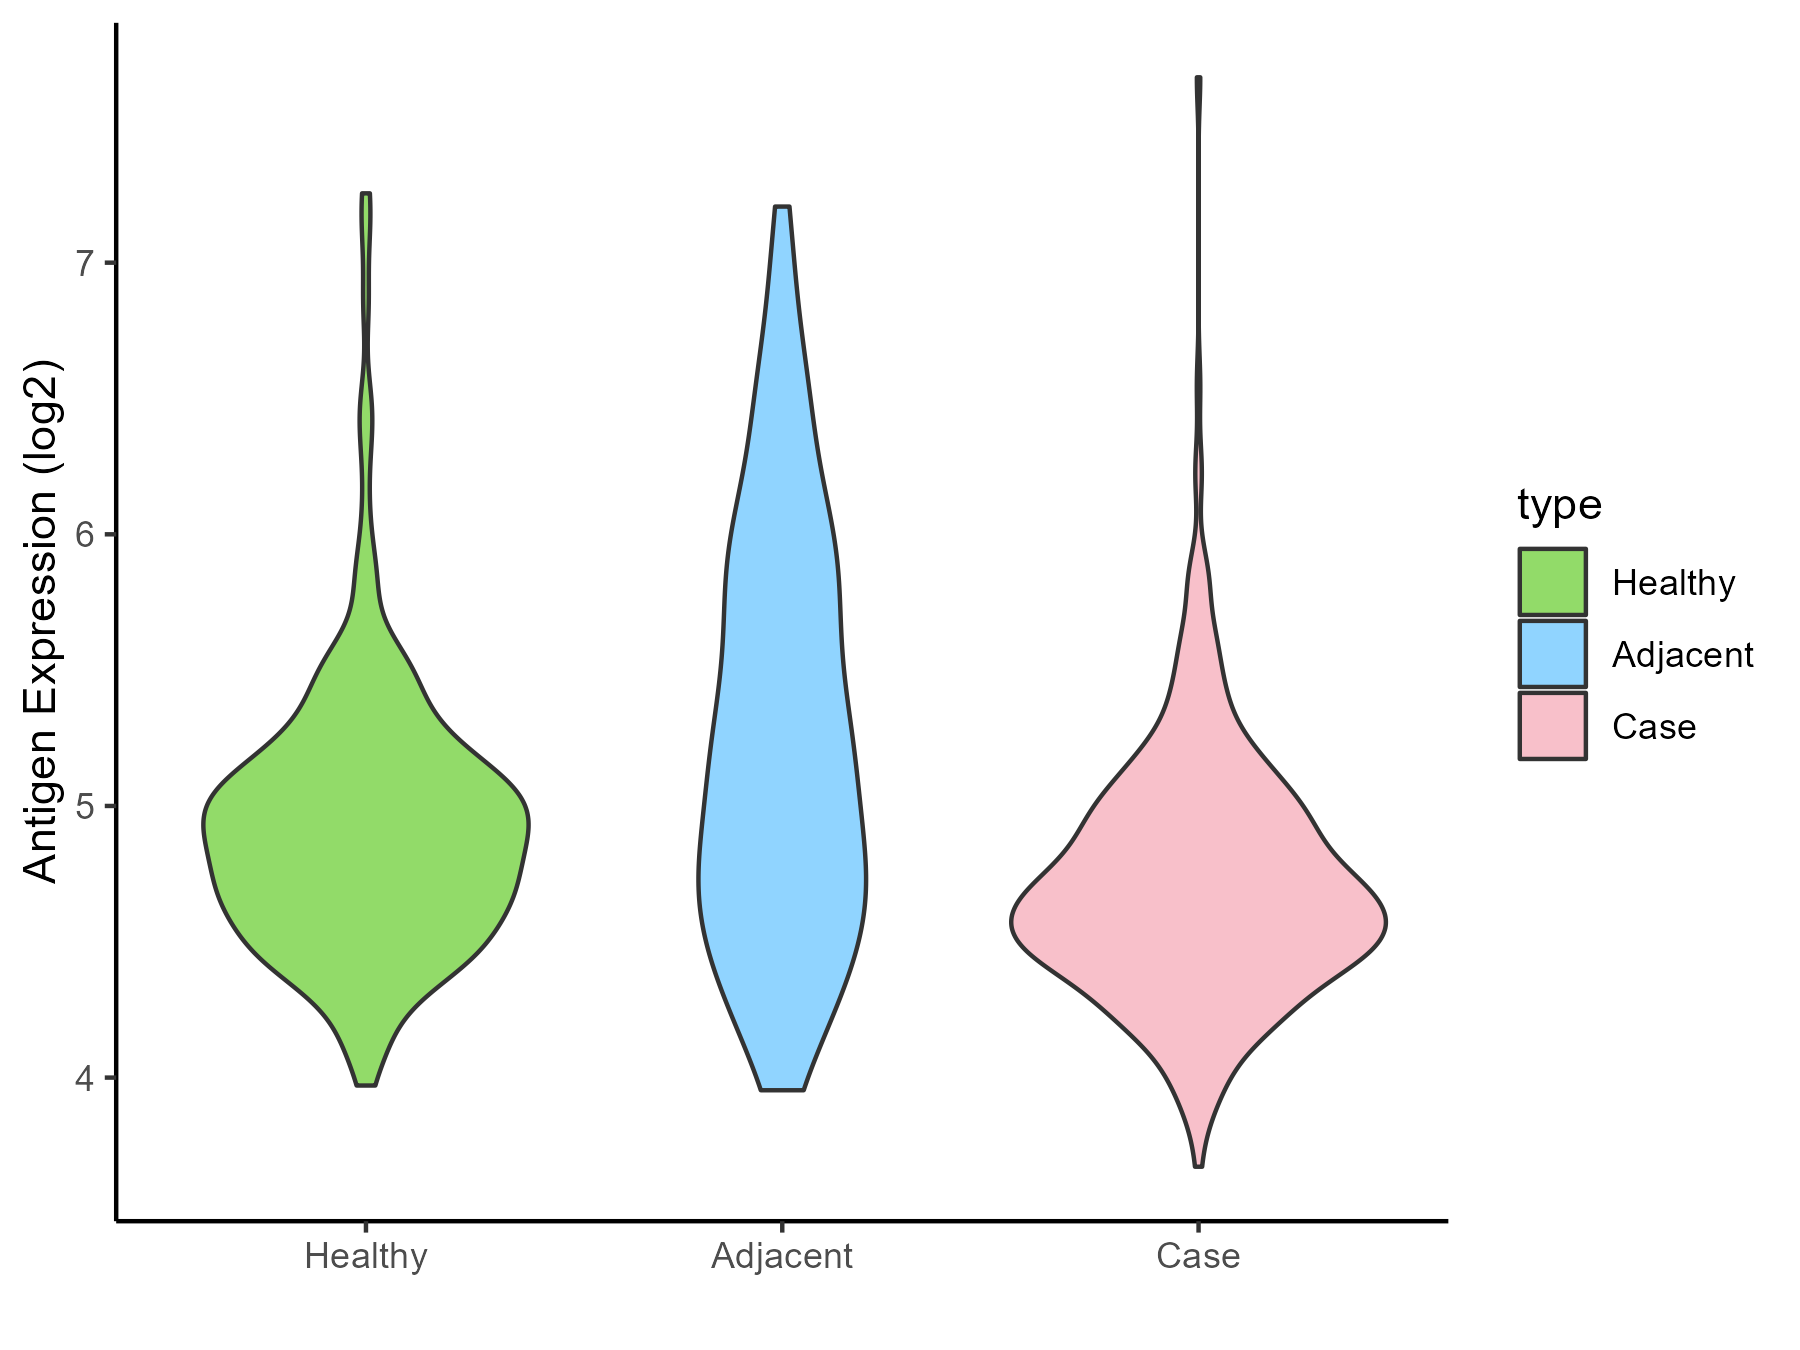
| The Studied Tissue | Skin | |
| The Specific Disease | Skin cancer | |
| The Expression Level of Disease Section Compare with the Healthy Individual Tissue | p-value: 2.01E-07; Fold-change: -0.220904604; Z-score: -0.455107802 | |
| The Expression Level of Disease Section Compare with the Adjacent Tissue | p-value: 4.66E-17; Fold-change: -0.498160227; Z-score: -0.653986584 | |
| Disease-specific Antigen Abundances |
|
Click to View the Clearer Original Diagram |
| Differential expression pattern of antigen in diseases | ||
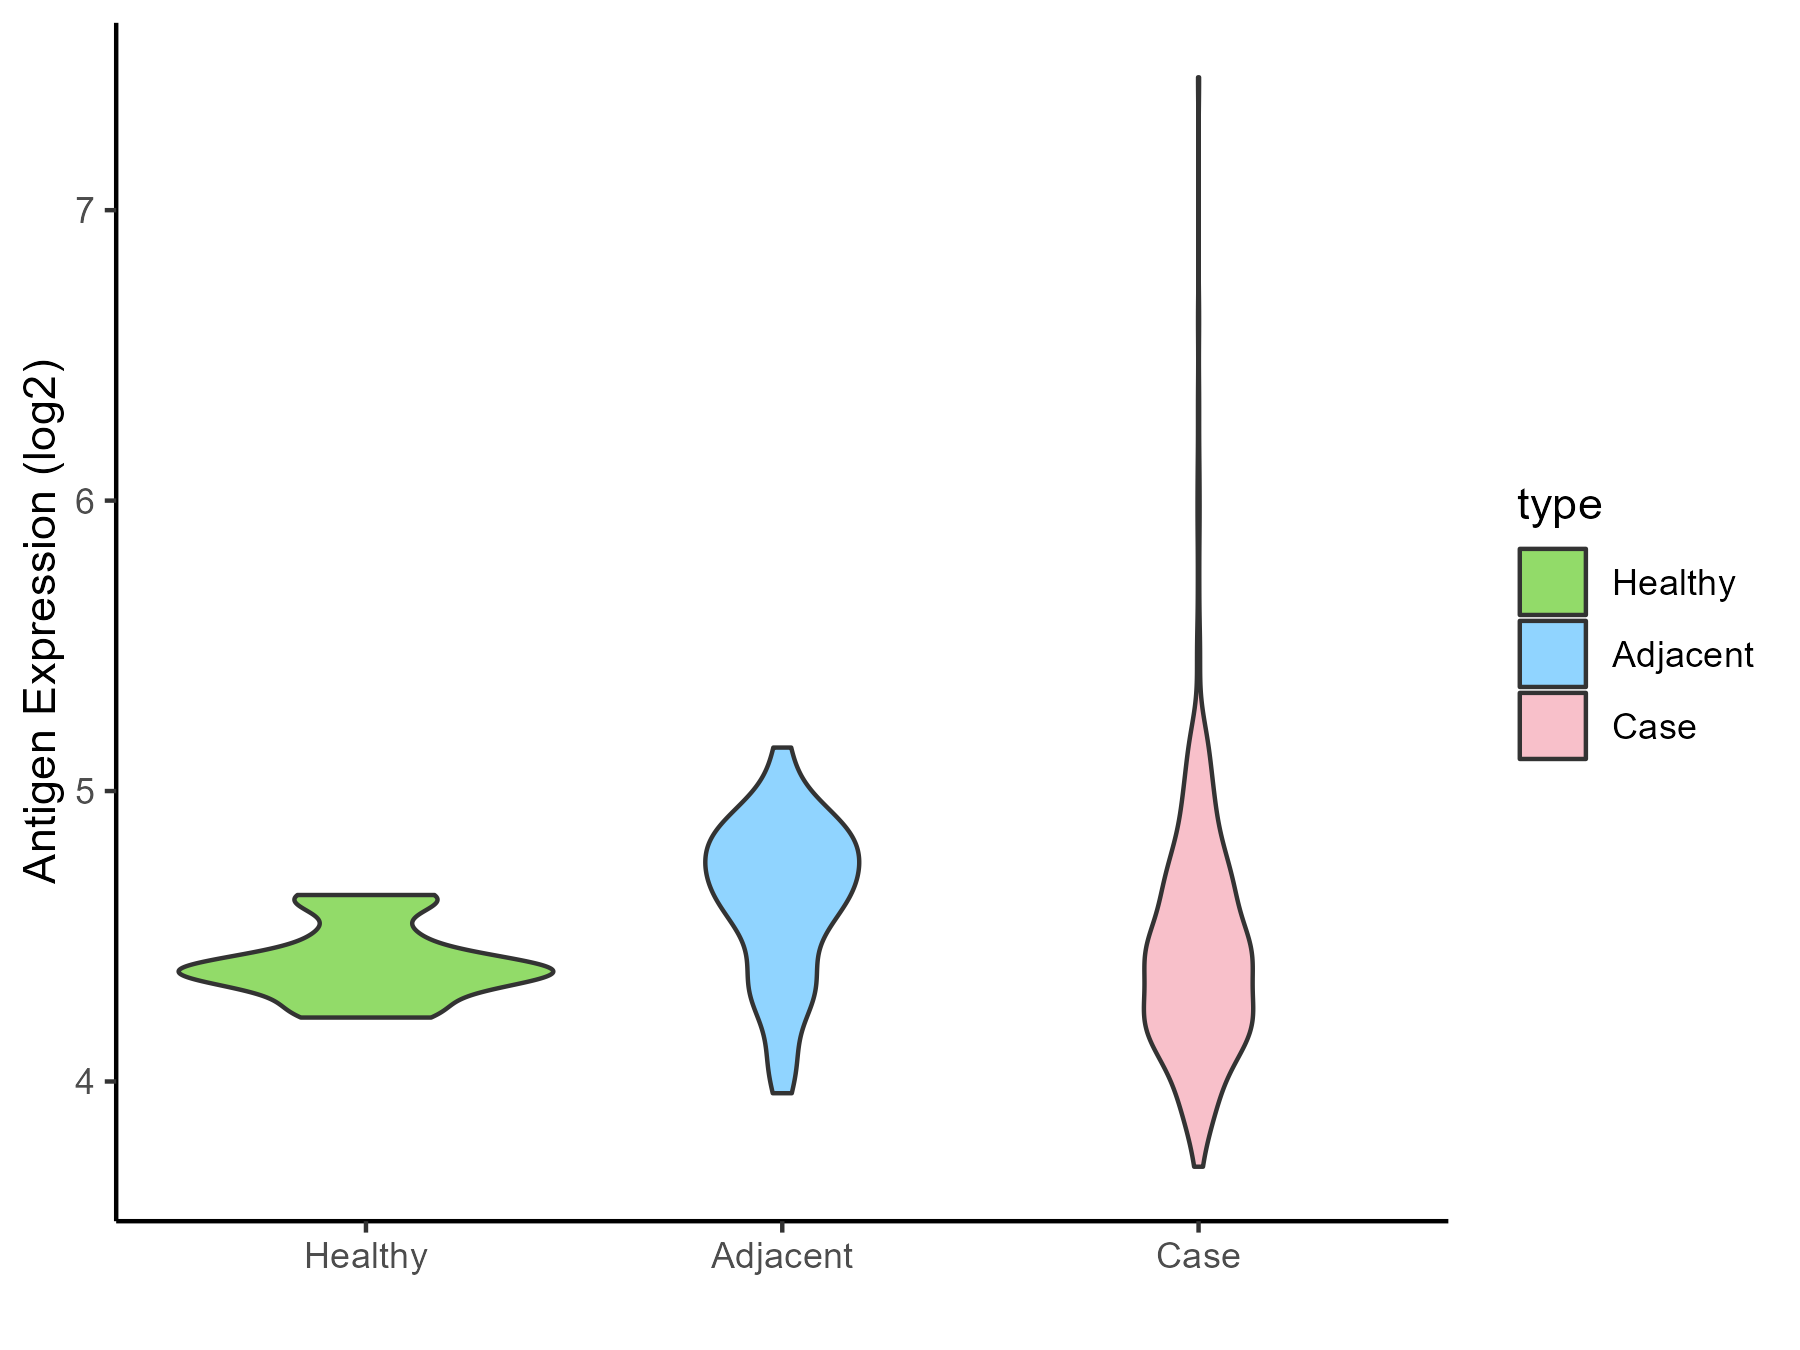
| The Studied Tissue | Kidney | |
| The Specific Disease | Renal cancer | |
| The Expression Level of Disease Section Compare with the Healthy Individual Tissue | p-value: 0.231888581; Fold-change: 0.04389543; Z-score: 0.331907429 | |
| The Expression Level of Disease Section Compare with the Adjacent Tissue | p-value: 6.50E-05; Fold-change: -0.252352567; Z-score: -0.936403545 | |
| Disease-specific Antigen Abundances |
|
Click to View the Clearer Original Diagram |
| Differential expression pattern of antigen in diseases | ||
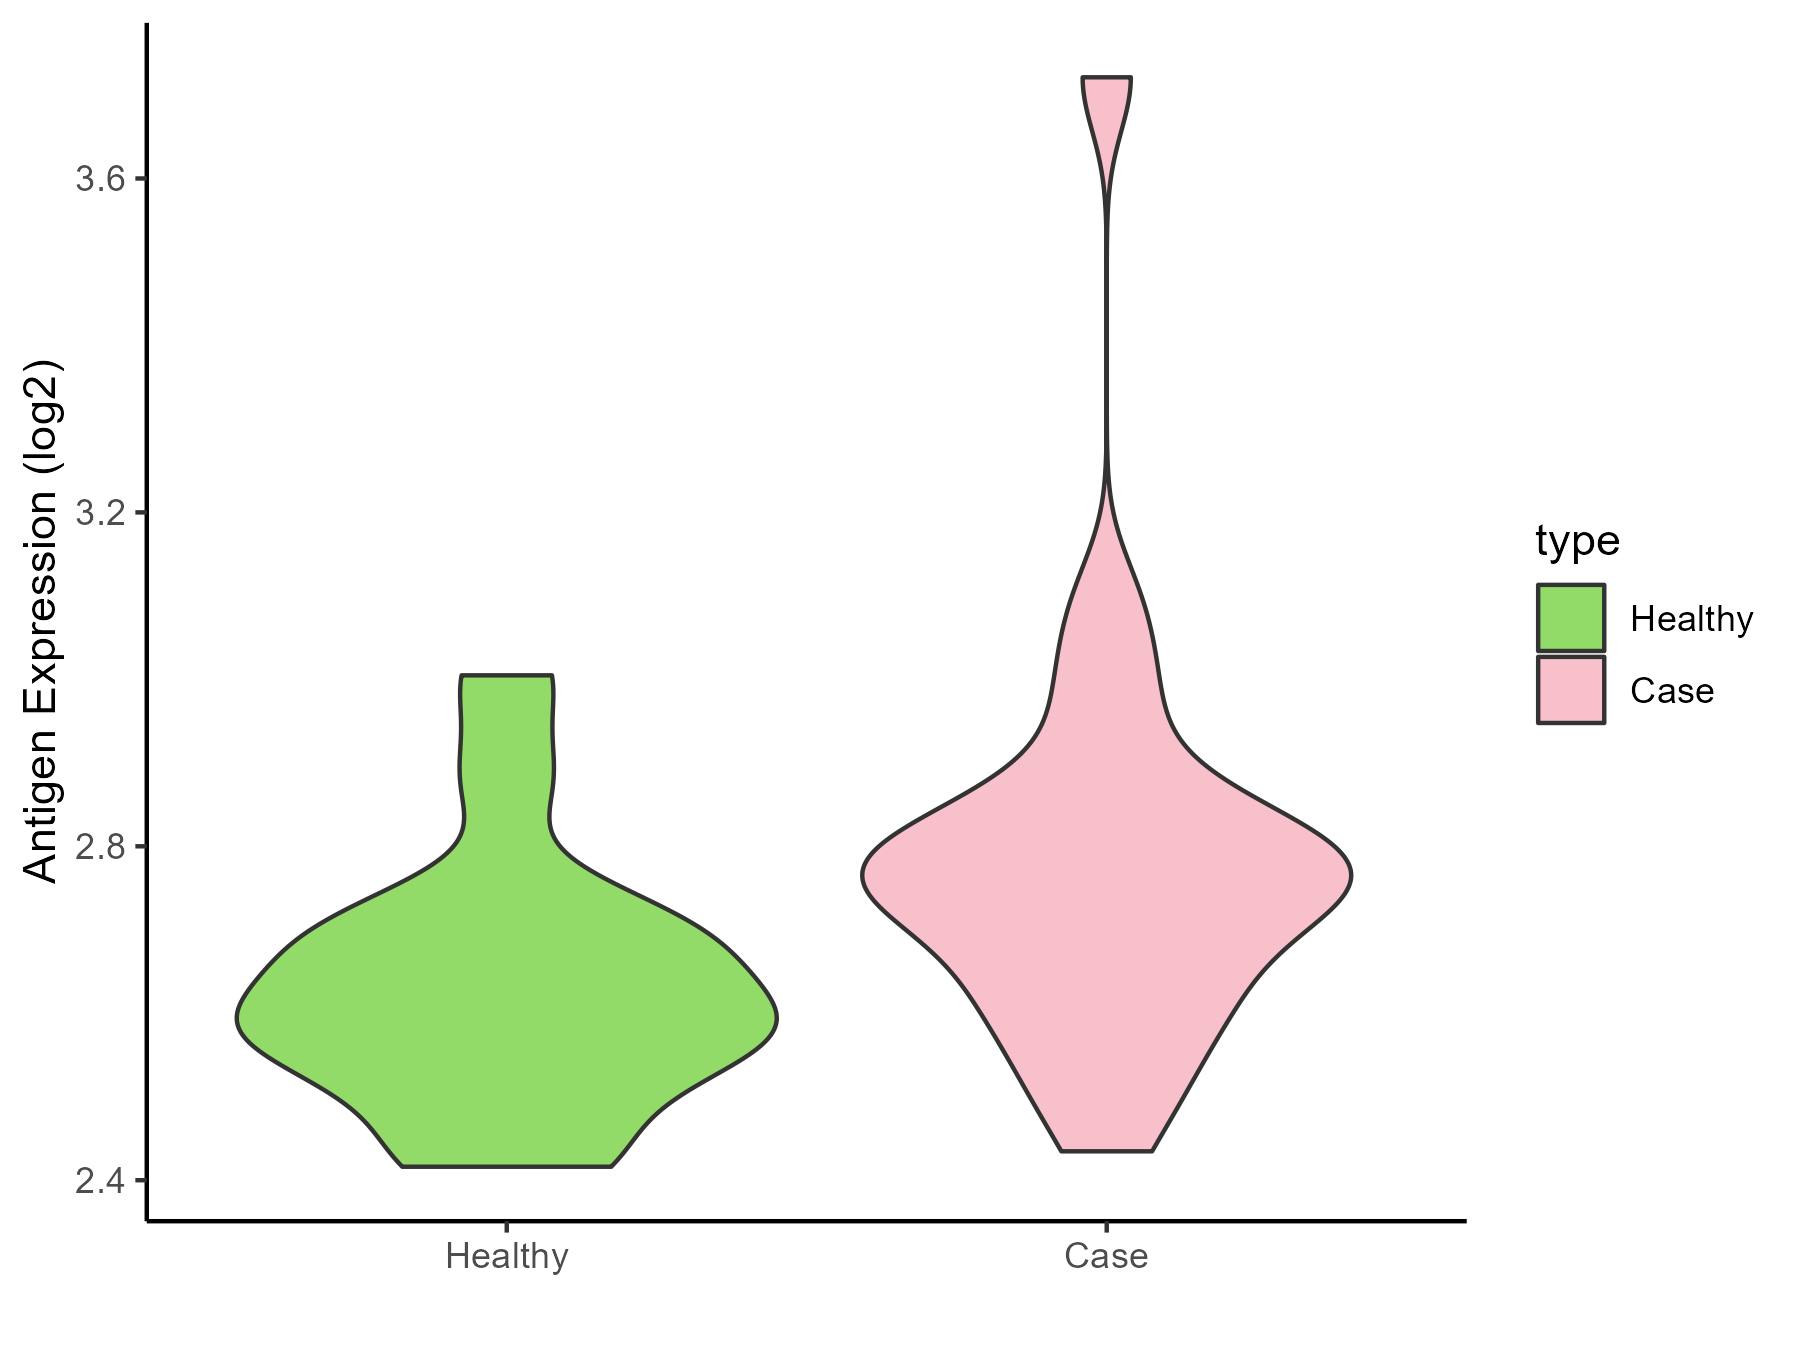
| The Studied Tissue | Urothelium | |
| The Specific Disease | Ureter cancer | |
| The Expression Level of Disease Section Compare with the Healthy Individual Tissue | p-value: 0.028889818; Fold-change: 0.160152853; Z-score: 1.021649661 | |
| Disease-specific Antigen Abundances |
|
Click to View the Clearer Original Diagram |
ICD Disease Classification 20
| Differential expression pattern of antigen in diseases | ||
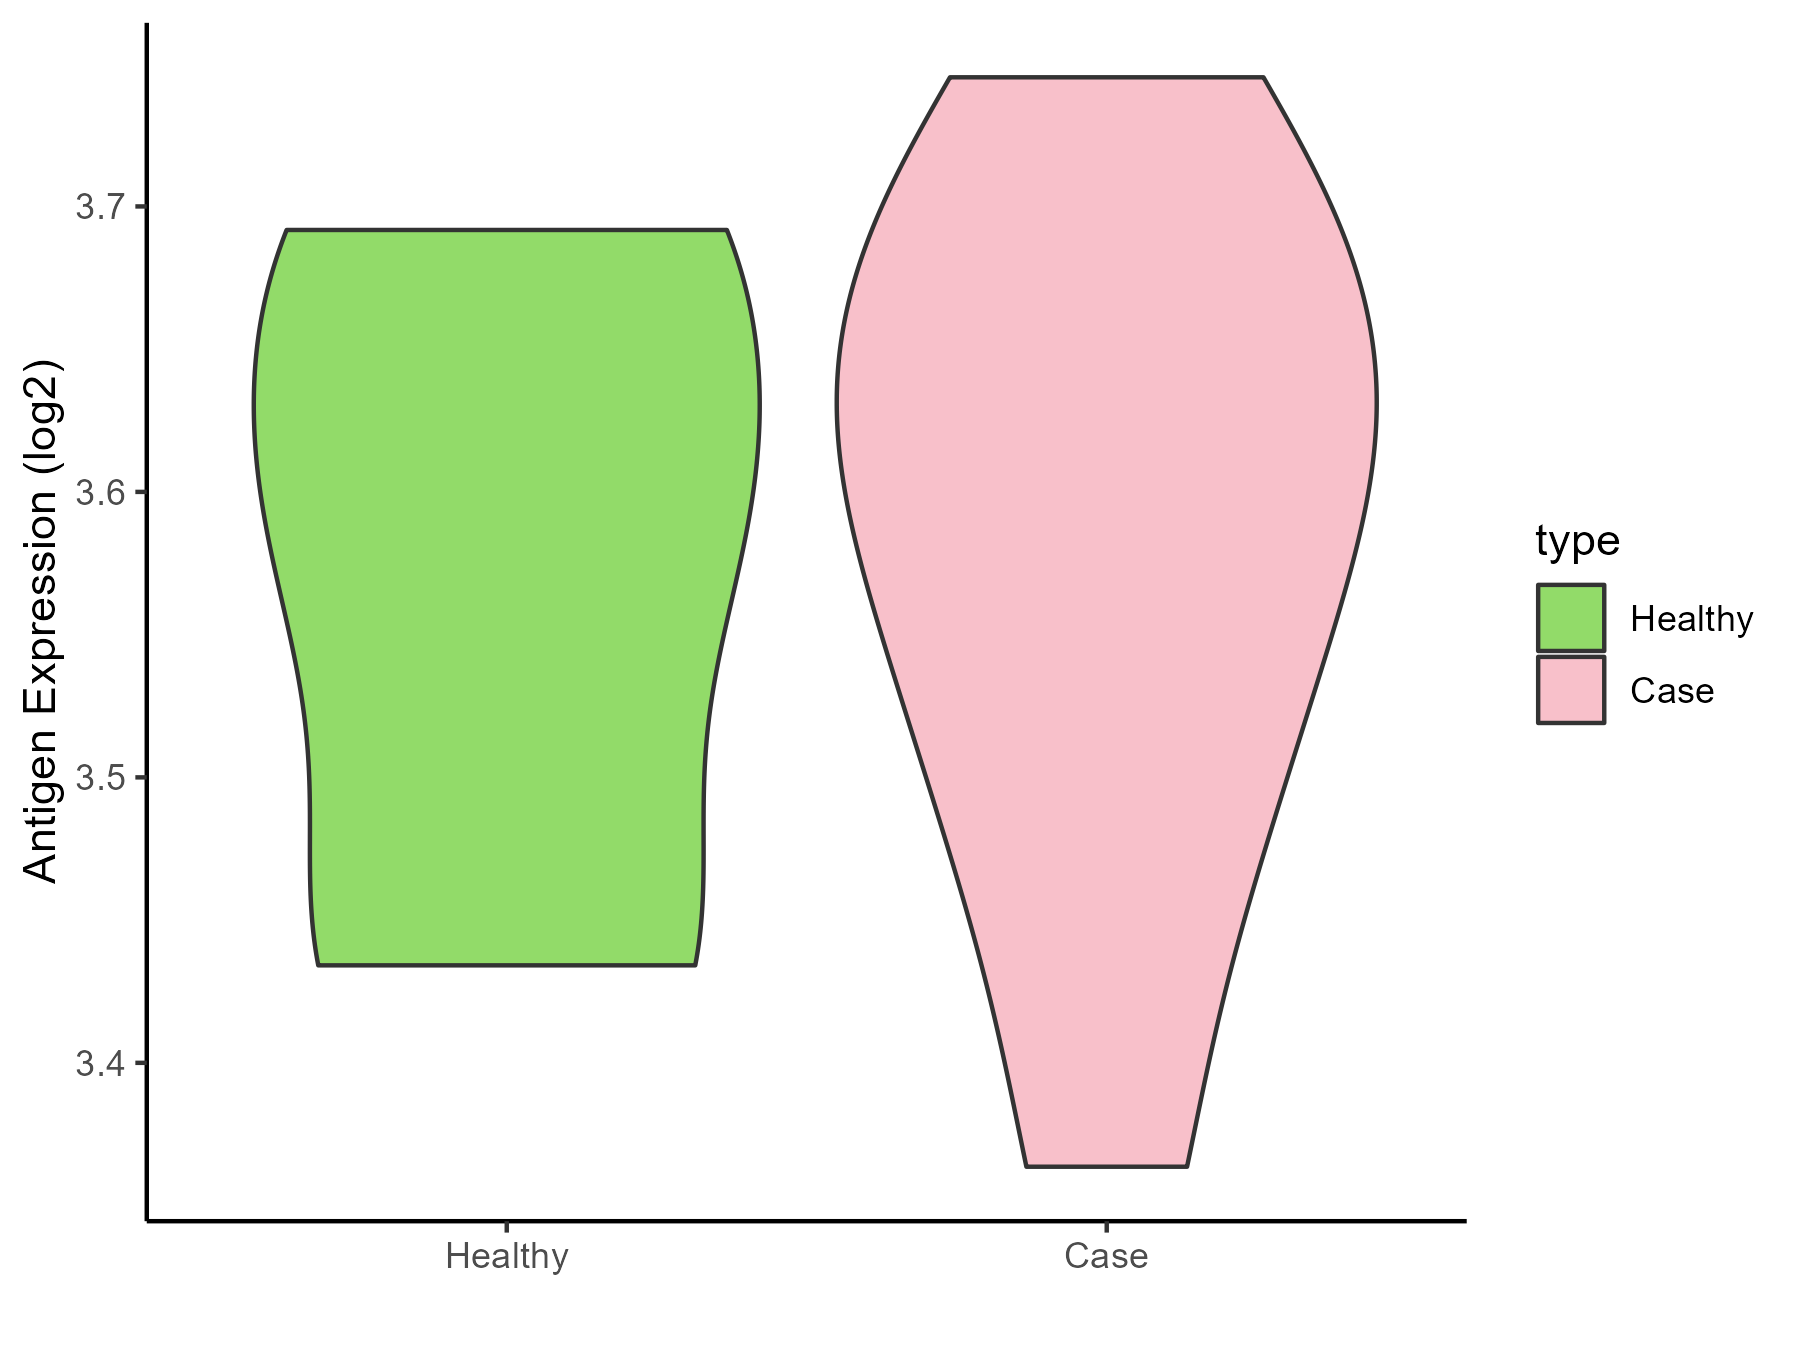
| The Studied Tissue | Adipose | |
| The Specific Disease | Simpson golabi behmel syndrome | |
| The Expression Level of Disease Section Compare with the Healthy Individual Tissue | p-value: 0.8638783; Fold-change: 0.009459608; Z-score: 0.073171994 | |
| Disease-specific Antigen Abundances |
|
Click to View the Clearer Original Diagram |
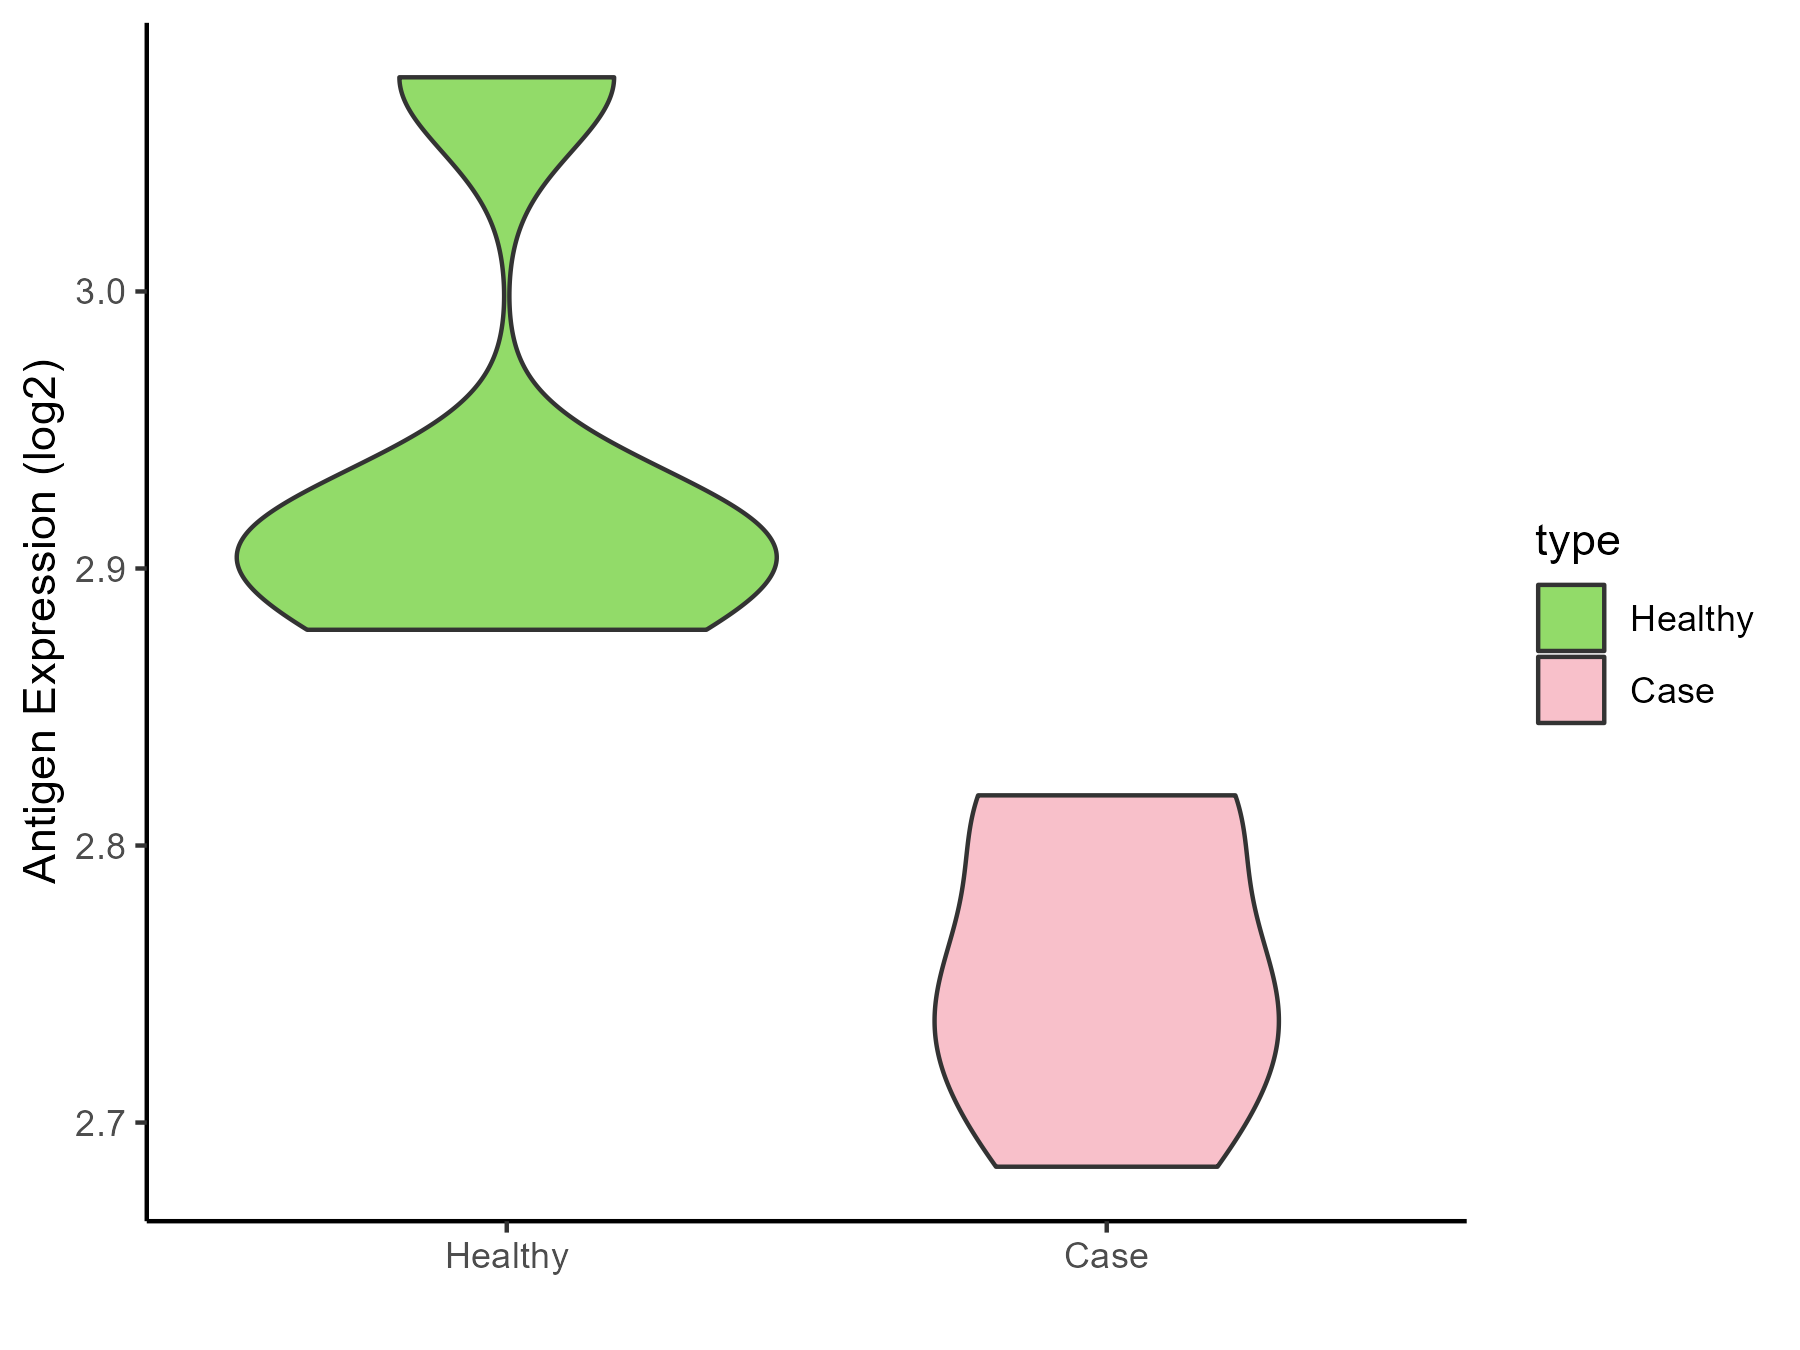
| Differential expression pattern of antigen in diseases | ||
| The Studied Tissue | Perituberal | |
| The Specific Disease | Tuberous sclerosis complex | |
| The Expression Level of Disease Section Compare with the Healthy Individual Tissue | p-value: 0.015736574; Fold-change: -0.162416133; Z-score: -1.811657728 | |
| Disease-specific Antigen Abundances |
|
Click to View the Clearer Original Diagram |
ICD Disease Classification 3
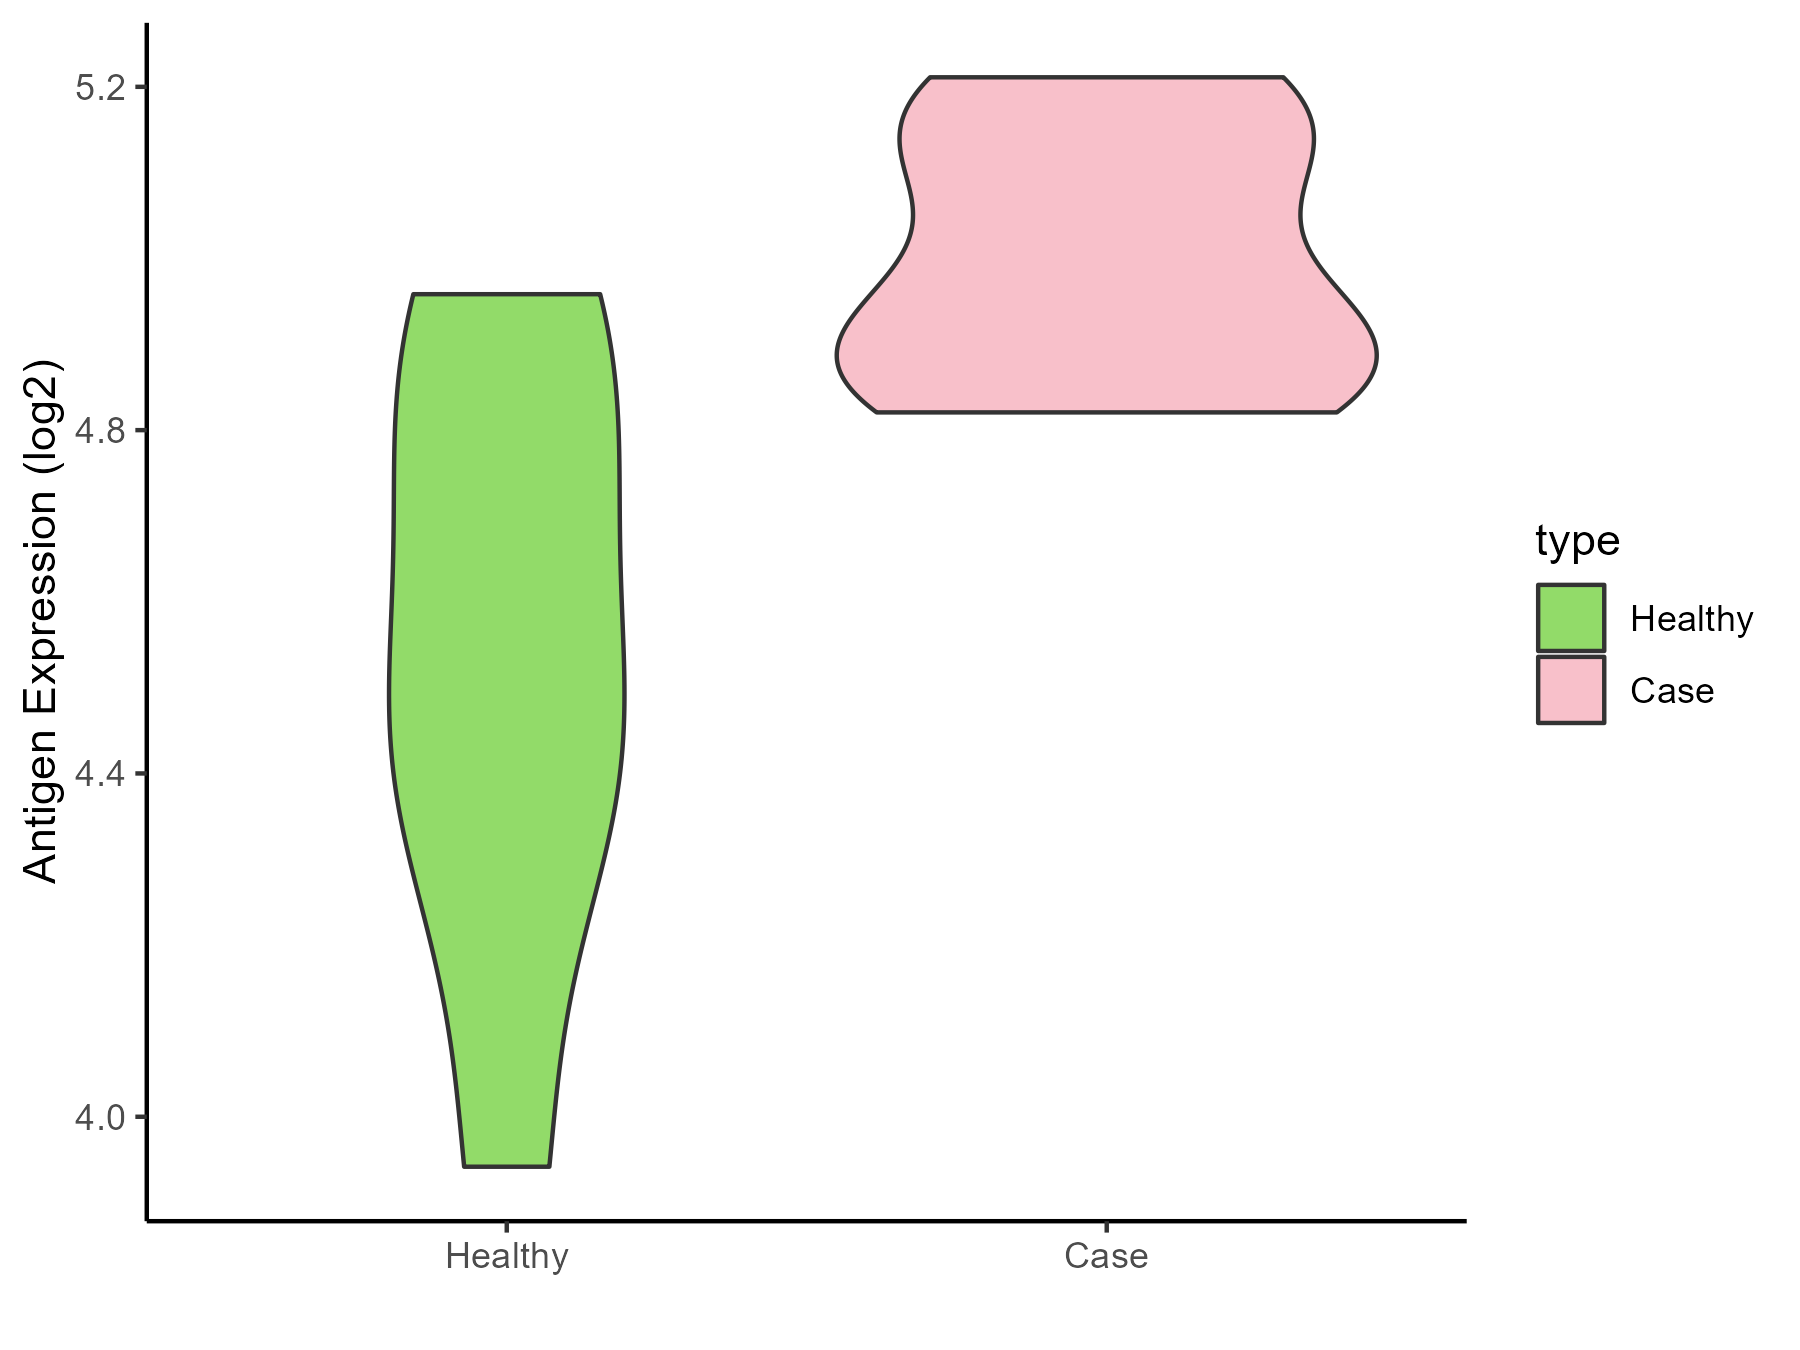
| Differential expression pattern of antigen in diseases | ||
| The Studied Tissue | Bone marrow | |
| The Specific Disease | Anemia | |
| The Expression Level of Disease Section Compare with the Healthy Individual Tissue | p-value: 0.014057466; Fold-change: 0.431168792; Z-score: 1.216582426 | |
| Disease-specific Antigen Abundances |
|
Click to View the Clearer Original Diagram |
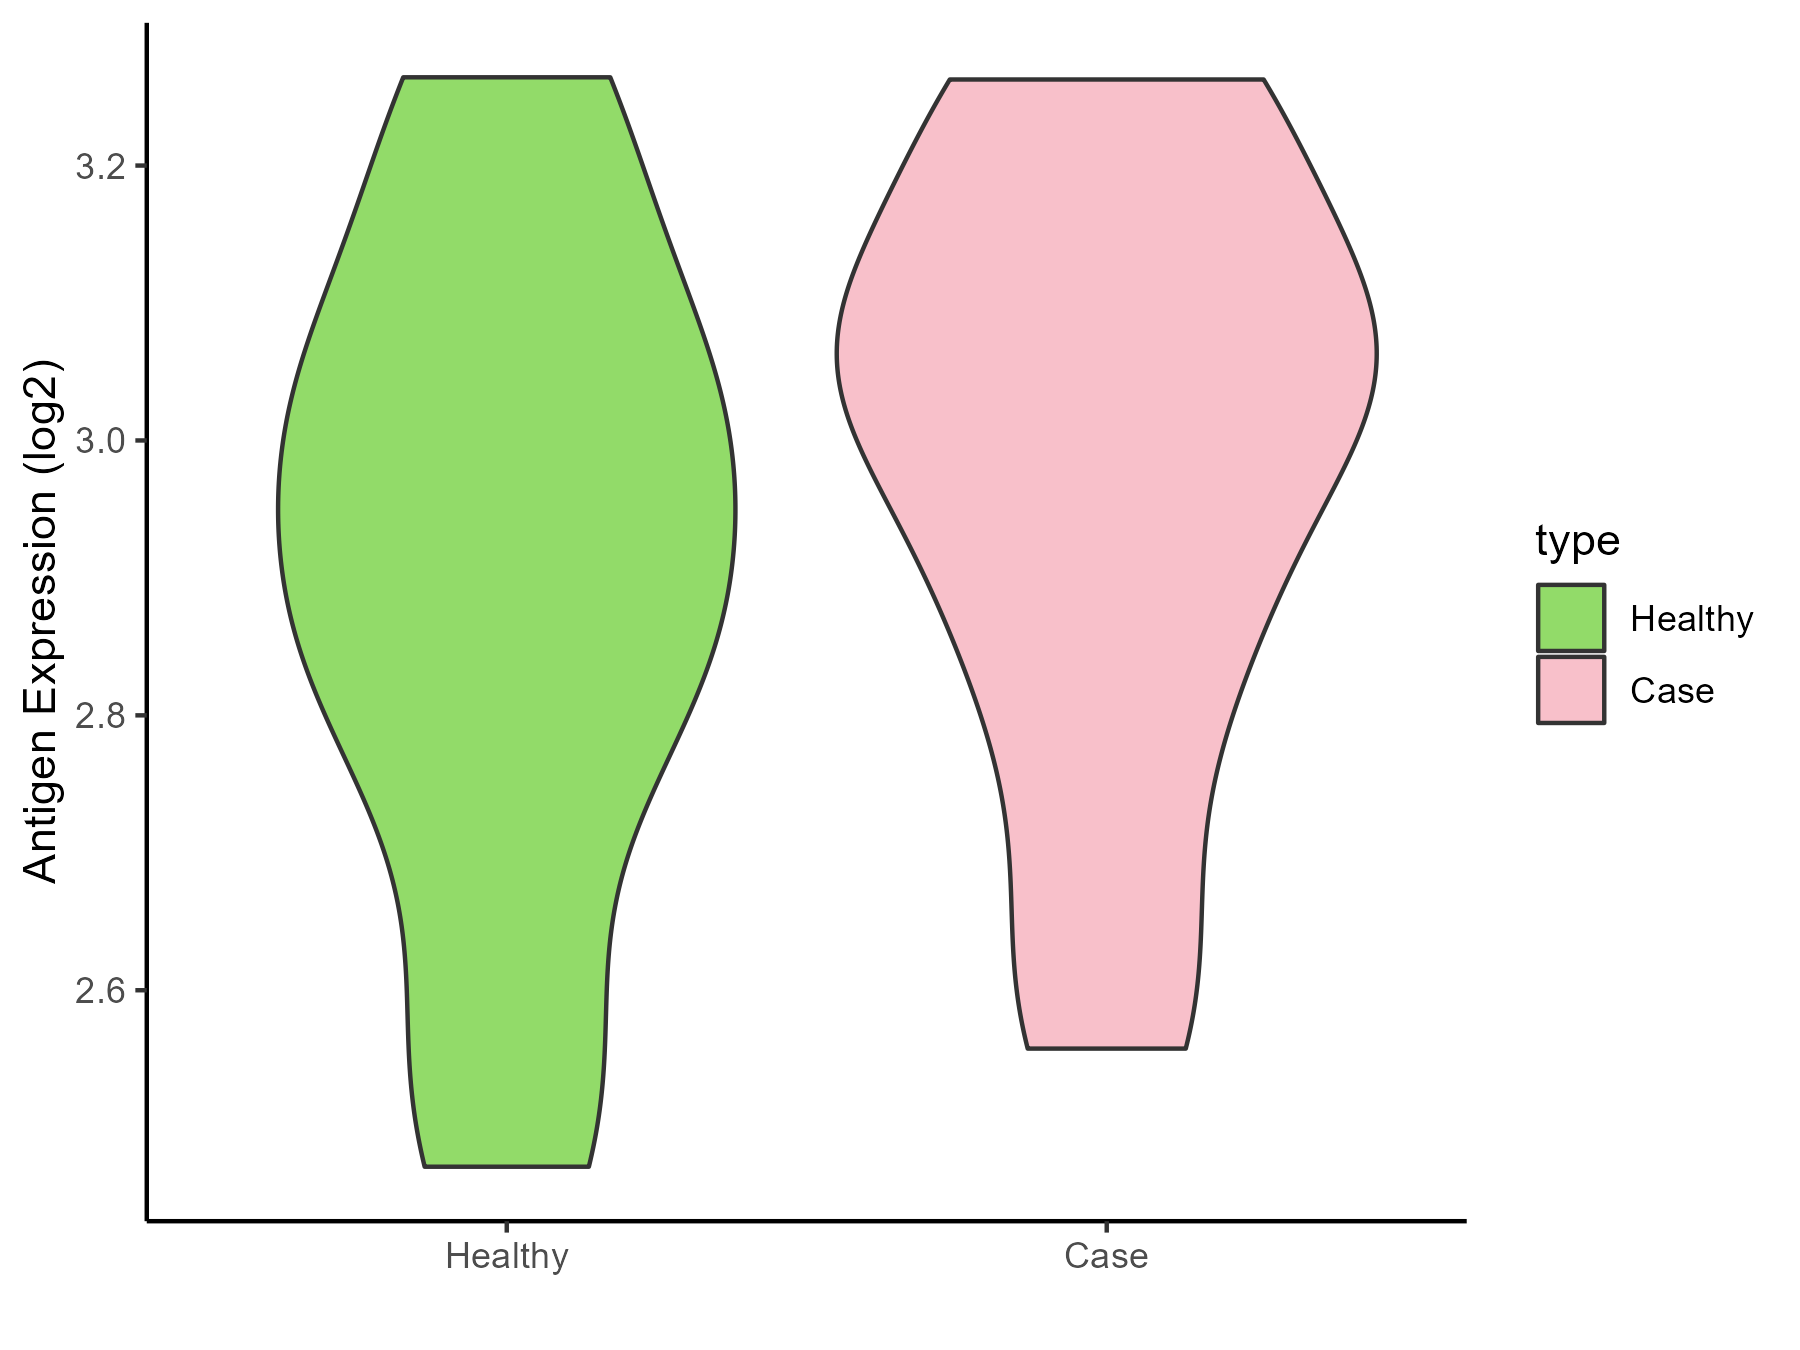
| Differential expression pattern of antigen in diseases | ||
| The Studied Tissue | Peripheral blood | |
| The Specific Disease | Sickle cell disease | |
| The Expression Level of Disease Section Compare with the Healthy Individual Tissue | p-value: 0.395232965; Fold-change: 0.147560755; Z-score: 0.607082268 | |
| Disease-specific Antigen Abundances |
|
Click to View the Clearer Original Diagram |
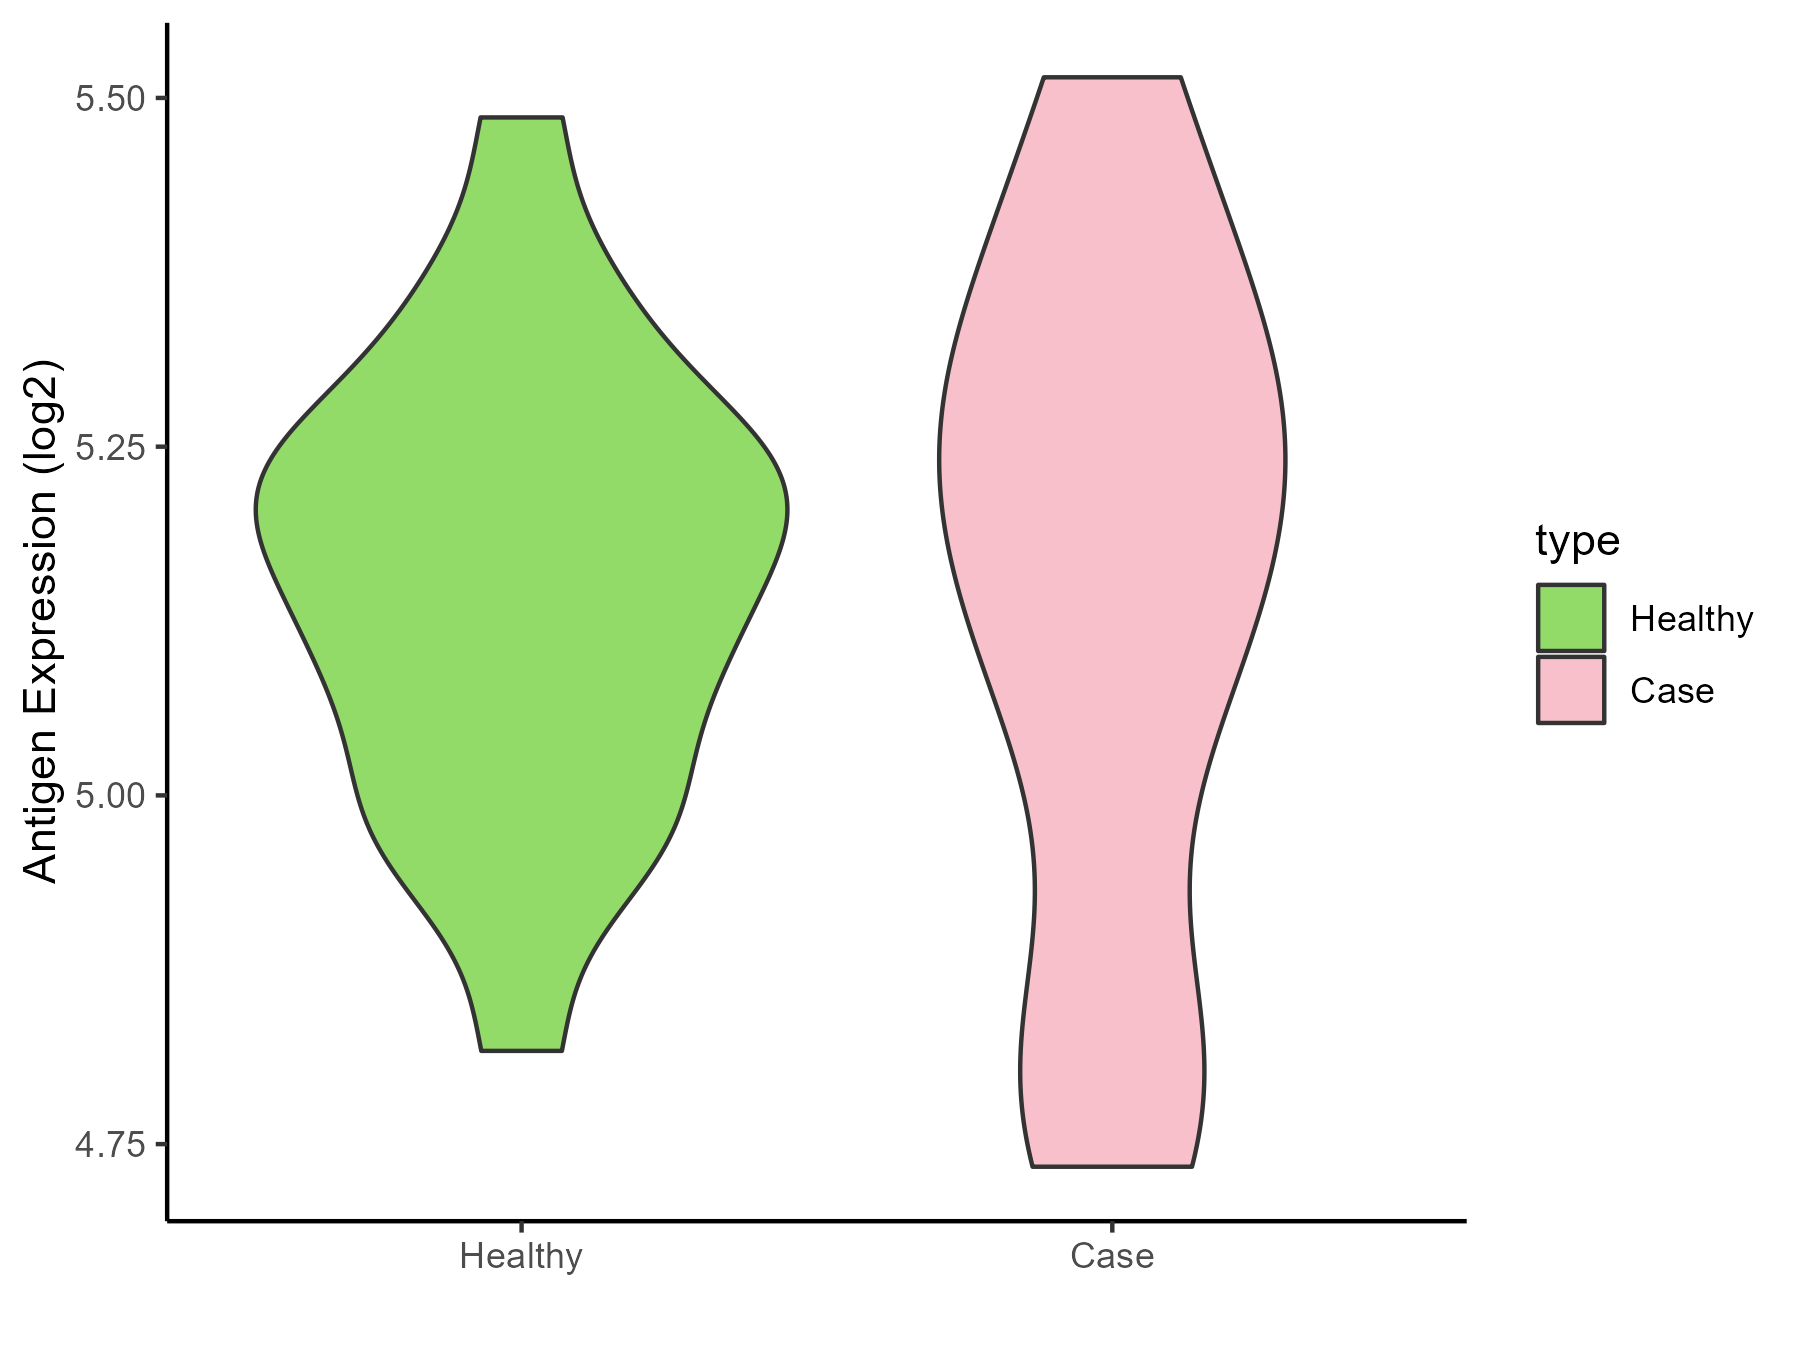
| Differential expression pattern of antigen in diseases | ||
| The Studied Tissue | Whole blood | |
| The Specific Disease | Thrombocythemia | |
| The Expression Level of Disease Section Compare with the Healthy Individual Tissue | p-value: 0.848918758; Fold-change: 0.023701523; Z-score: 0.149556839 | |
| Disease-specific Antigen Abundances |
|
Click to View the Clearer Original Diagram |
ICD Disease Classification 4
| Differential expression pattern of antigen in diseases | ||
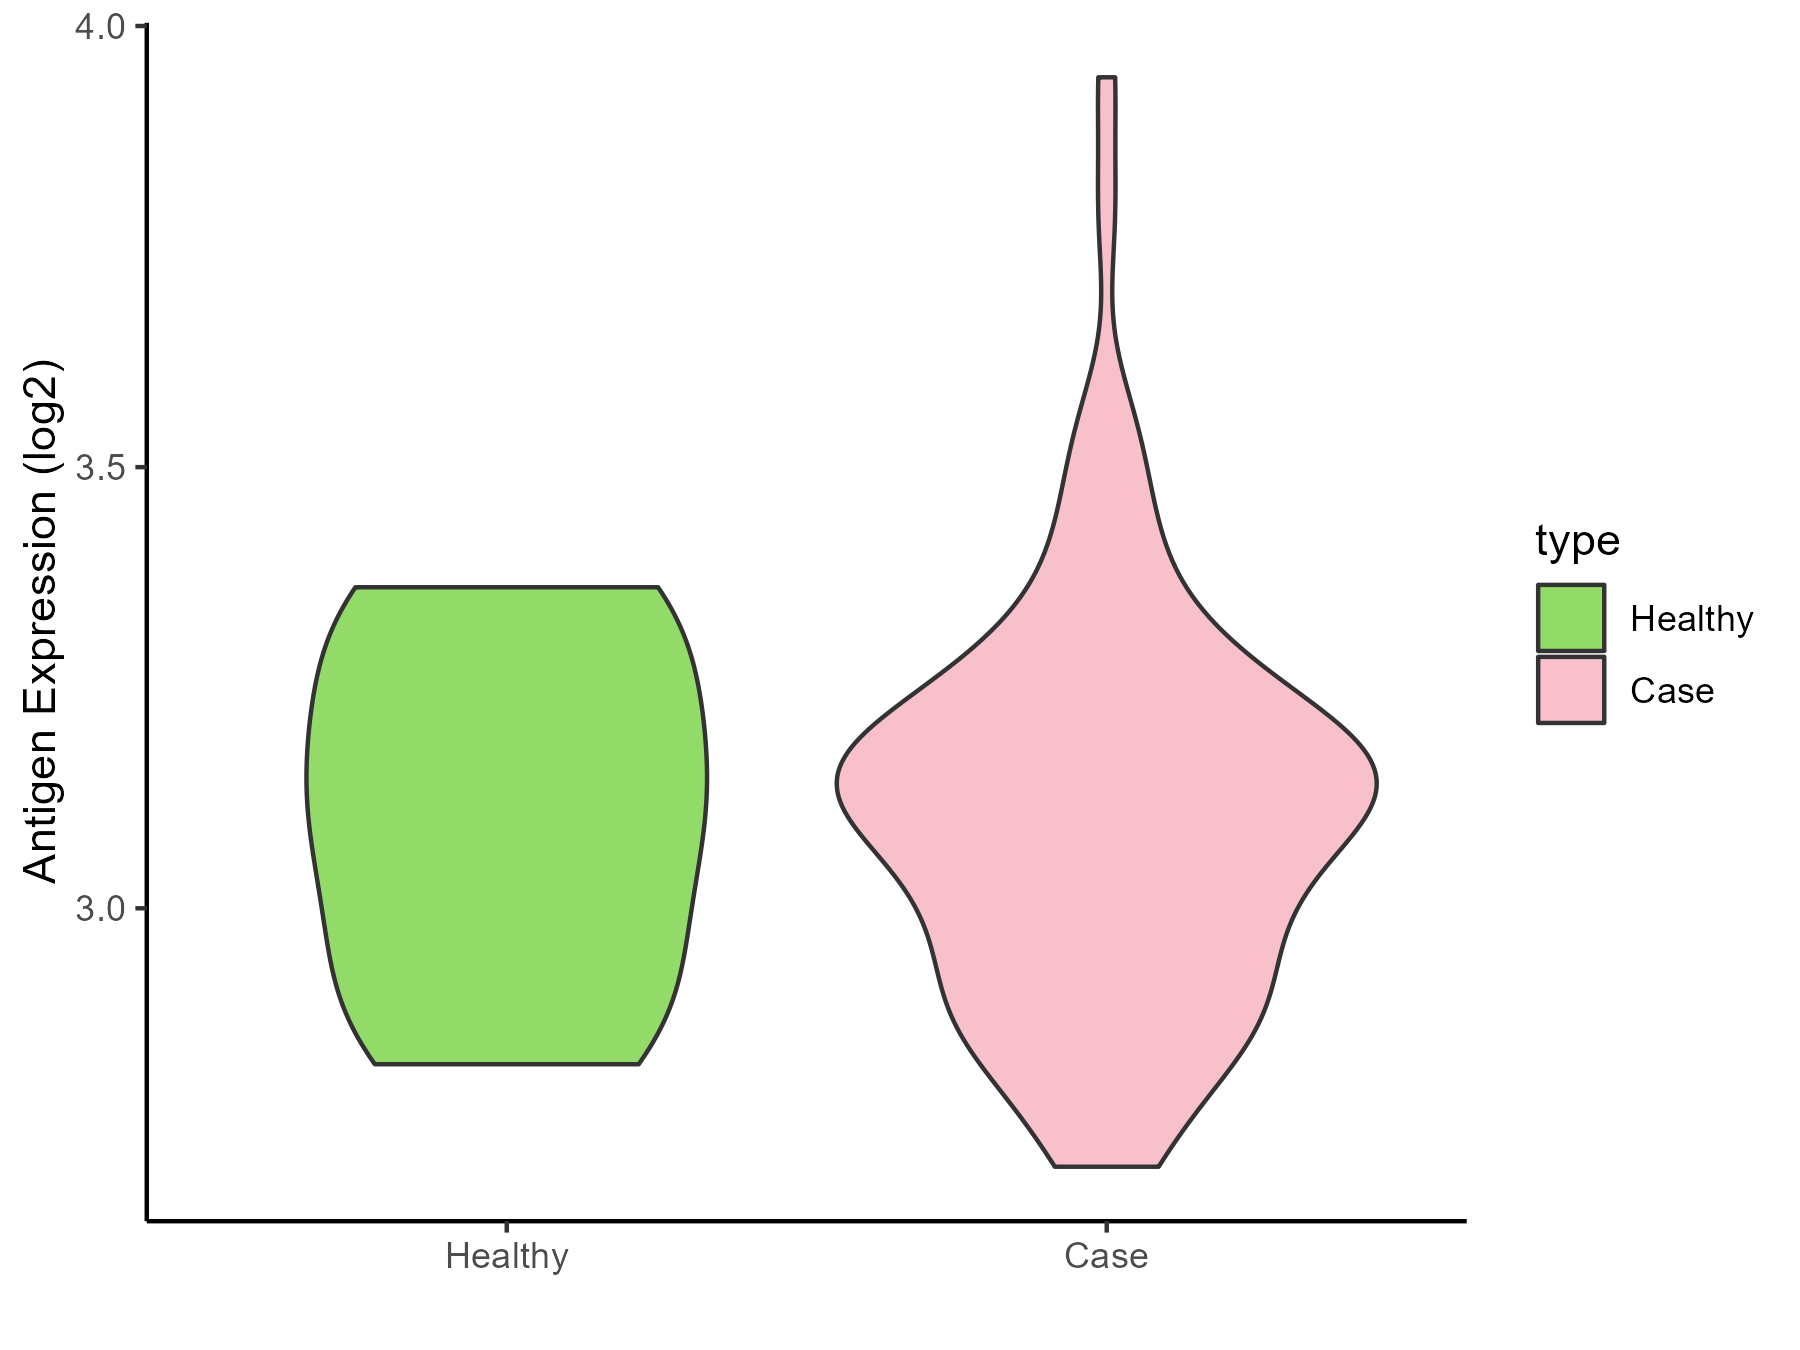
| The Studied Tissue | Whole blood | |
| The Specific Disease | Scleroderma | |
| The Expression Level of Disease Section Compare with the Healthy Individual Tissue | p-value: 0.982673194; Fold-change: 0.012947059; Z-score: 0.065399749 | |
| Disease-specific Antigen Abundances |
|
Click to View the Clearer Original Diagram |
| Differential expression pattern of antigen in diseases | ||
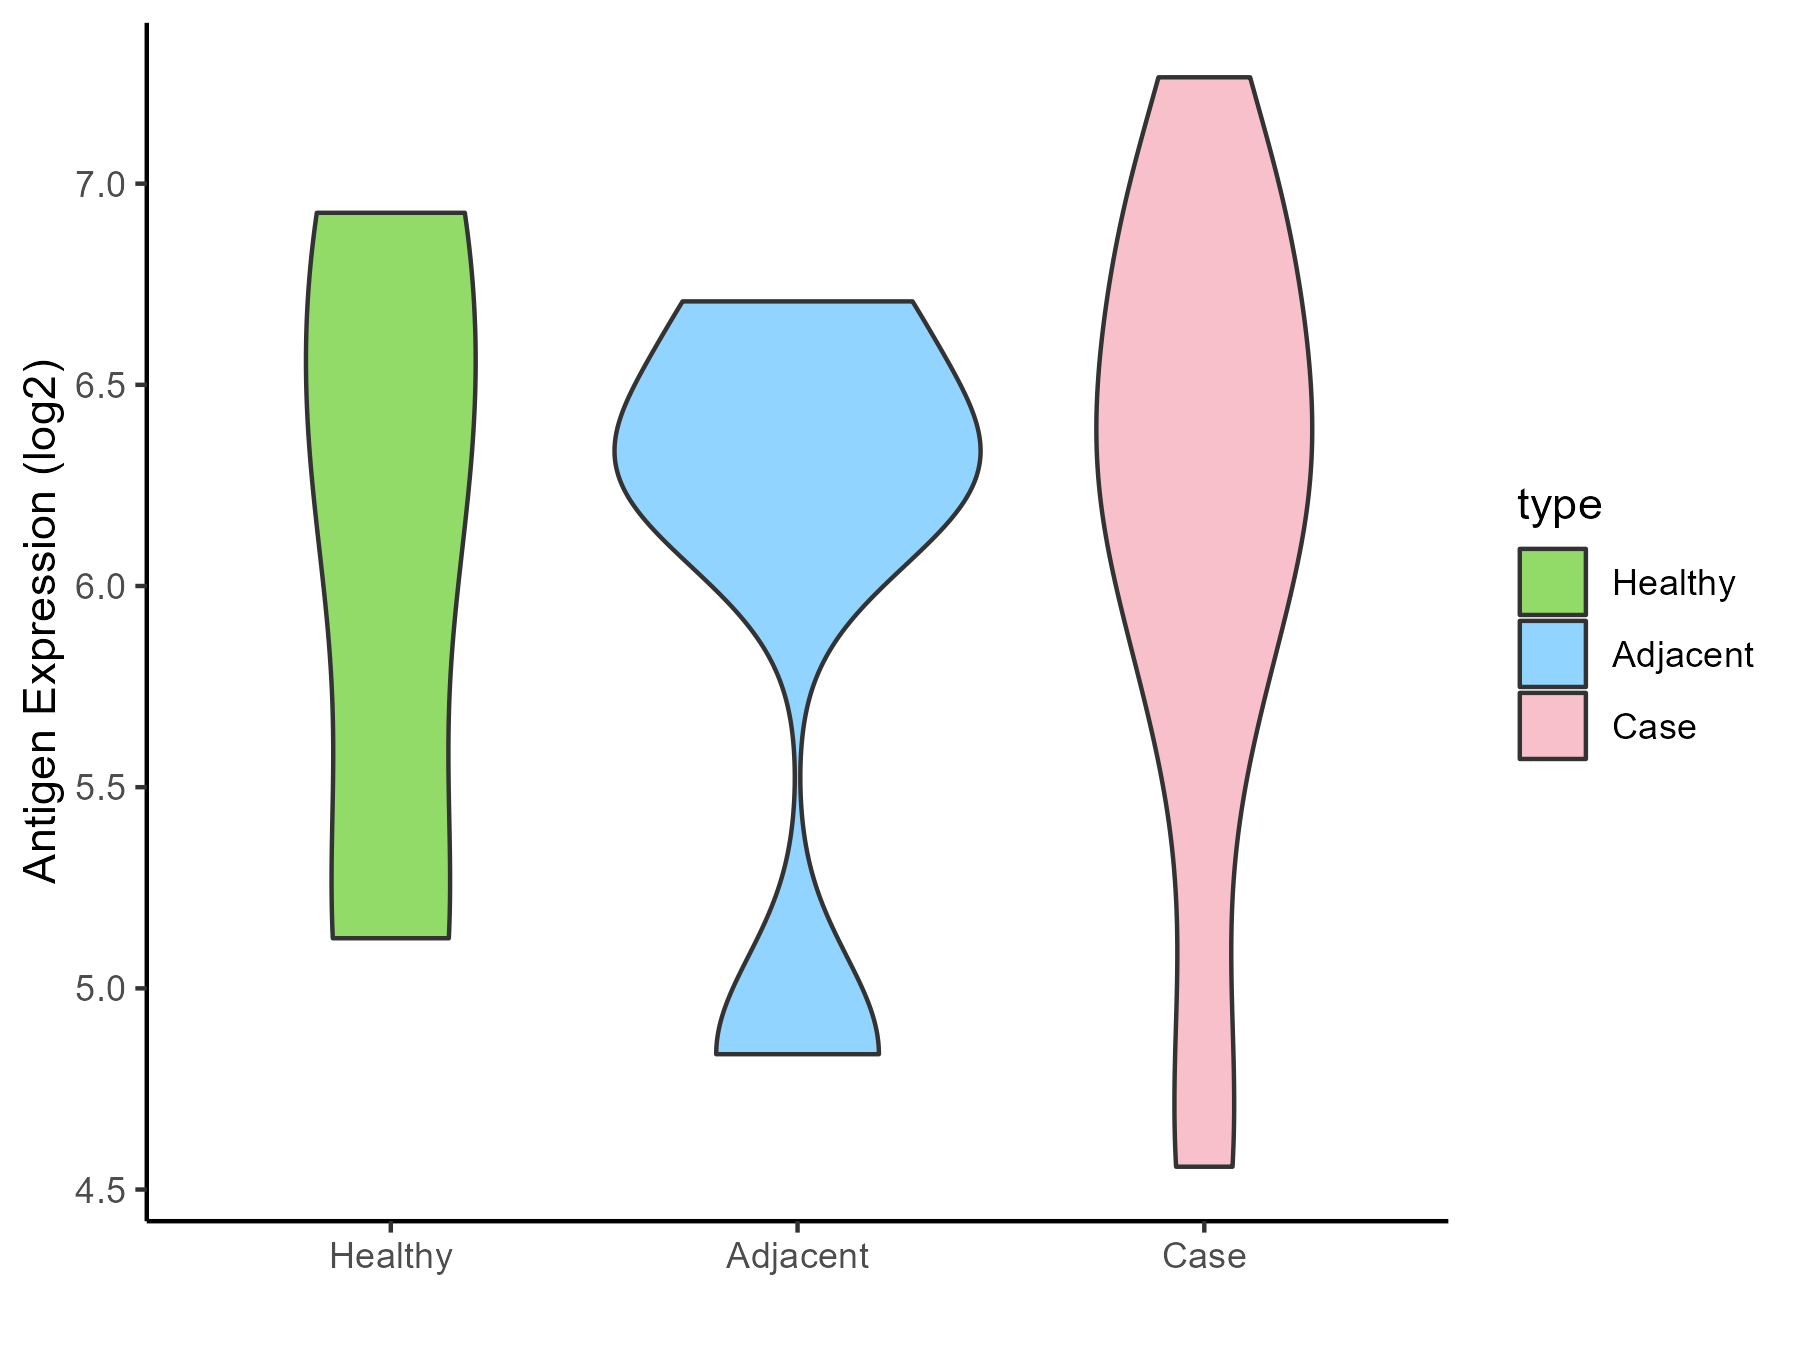
| The Studied Tissue | Salivary gland | |
| The Specific Disease | Sjogren syndrome | |
| The Expression Level of Disease Section Compare with the Healthy Individual Tissue | p-value: 0.916392036; Fold-change: 0.099655124; Z-score: 0.109523668 | |
| The Expression Level of Disease Section Compare with the Adjacent Tissue | p-value: 0.772625328; Fold-change: 0.06273094; Z-score: 0.076728899 | |
| Disease-specific Antigen Abundances |
|
Click to View the Clearer Original Diagram |
| Differential expression pattern of antigen in diseases | ||
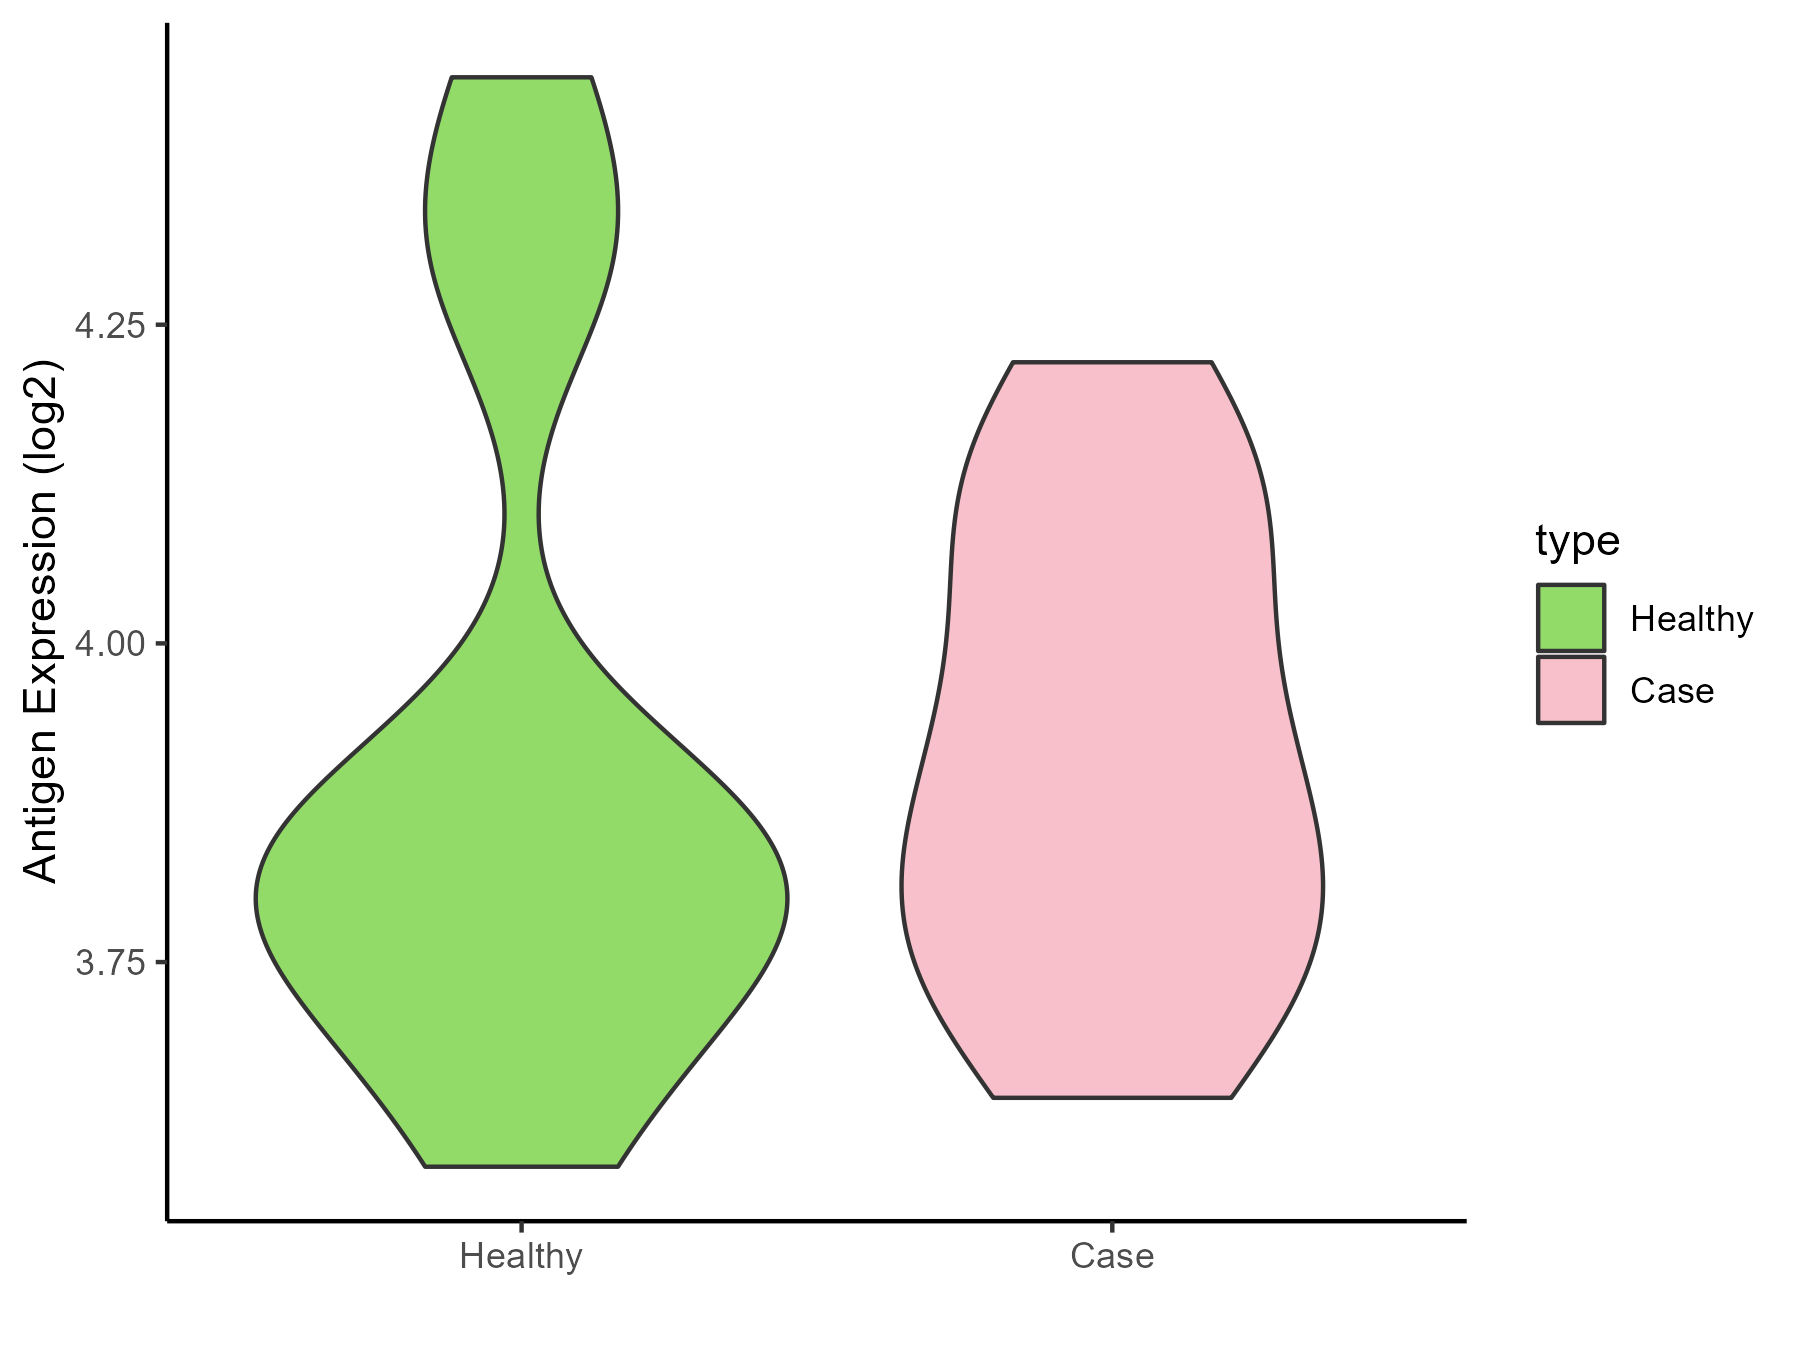
| The Studied Tissue | Peripheral blood | |
| The Specific Disease | Behcet disease | |
| The Expression Level of Disease Section Compare with the Healthy Individual Tissue | p-value: 0.962442203; Fold-change: 0.069902935; Z-score: 0.253350035 | |
| Disease-specific Antigen Abundances |
|
Click to View the Clearer Original Diagram |
| Differential expression pattern of antigen in diseases | ||
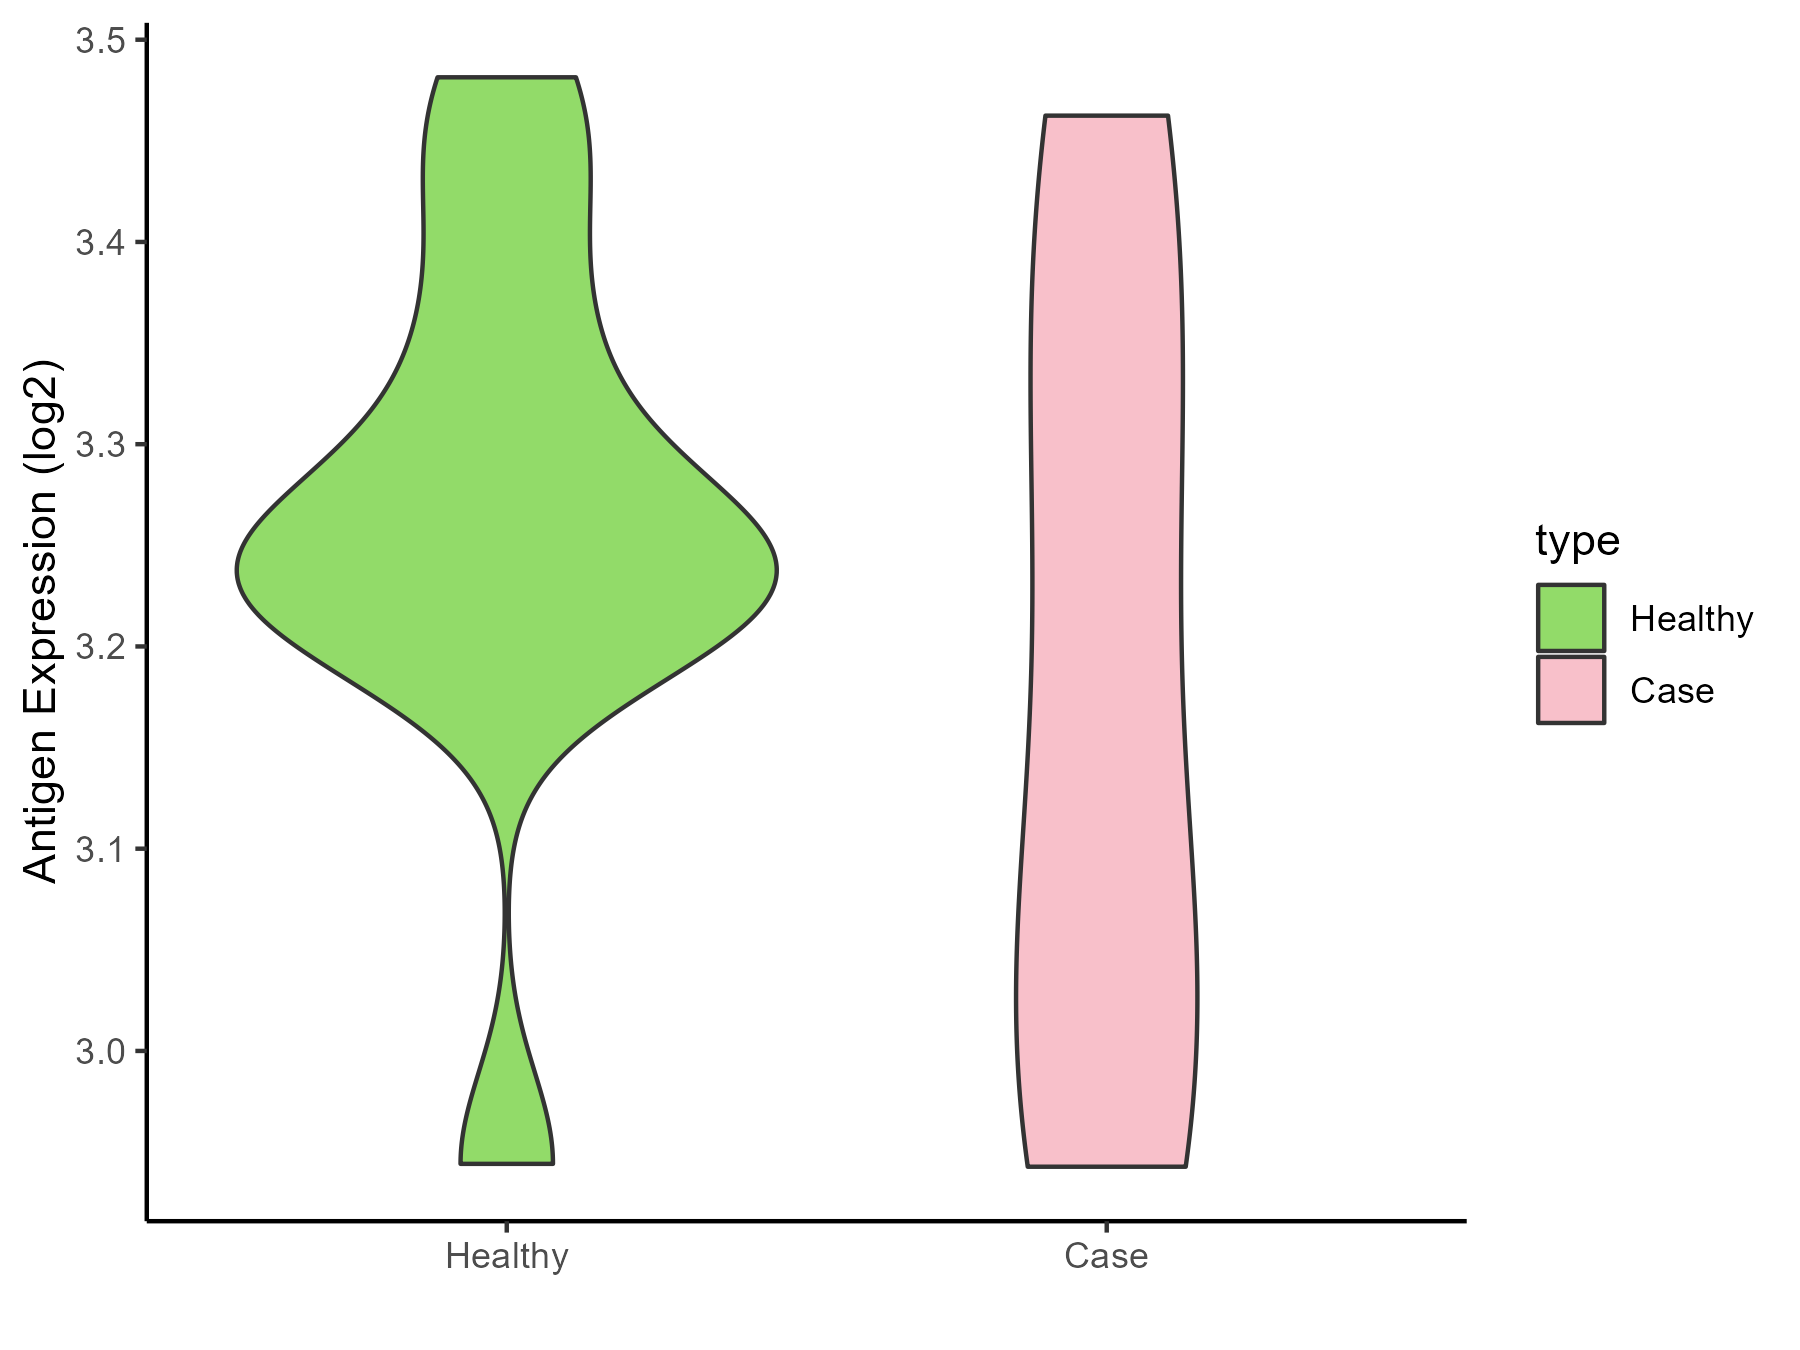
| The Studied Tissue | Whole blood | |
| The Specific Disease | Autosomal dominant monocytopenia | |
| The Expression Level of Disease Section Compare with the Healthy Individual Tissue | p-value: 0.342594961; Fold-change: -0.081647875; Z-score: -0.585502482 | |
| Disease-specific Antigen Abundances |
|
Click to View the Clearer Original Diagram |
ICD Disease Classification 5
| Differential expression pattern of antigen in diseases | ||
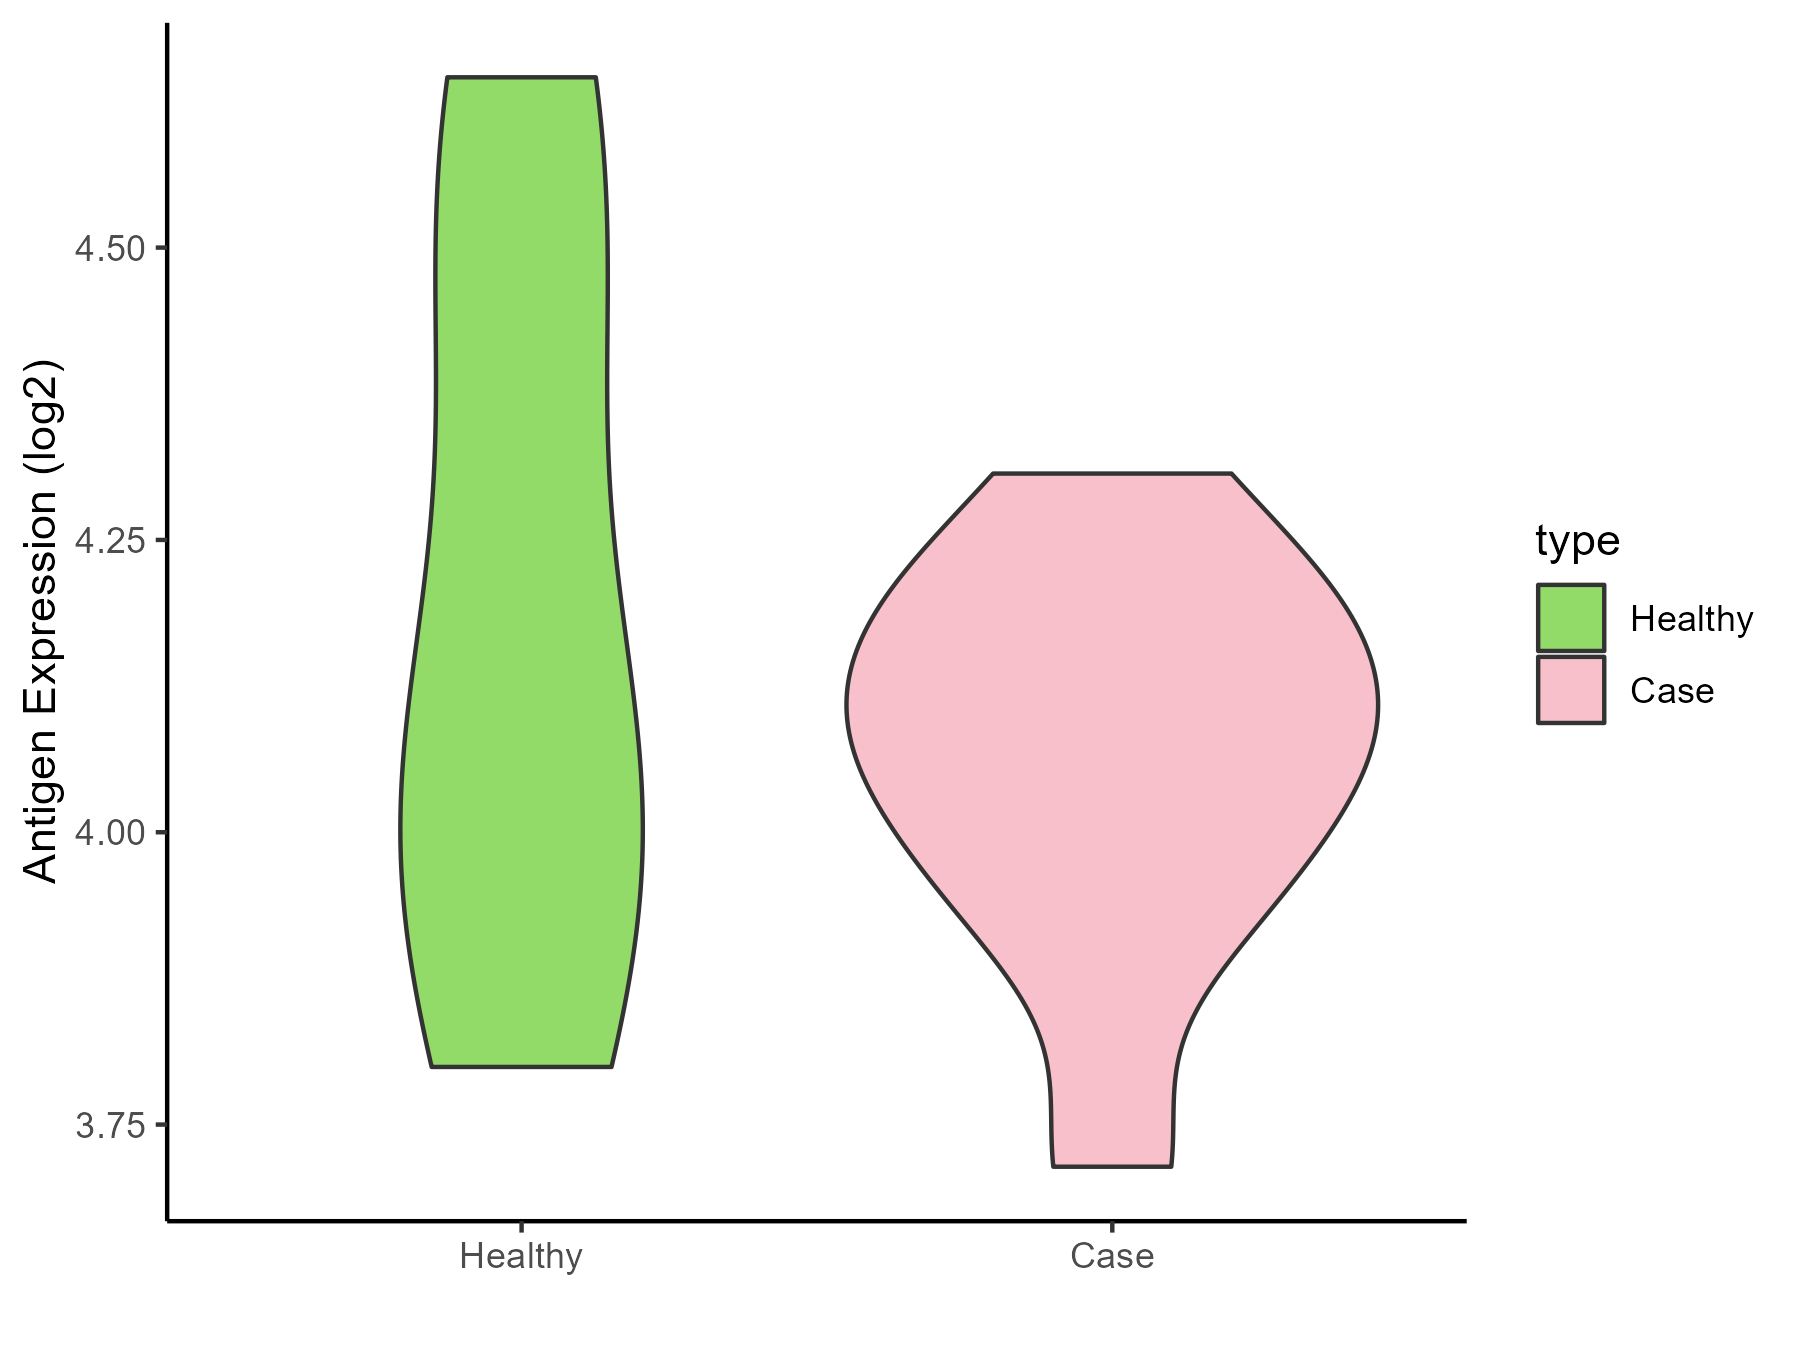
| The Studied Tissue | Liver | |
| The Specific Disease | Type 2 diabetes | |
| The Expression Level of Disease Section Compare with the Healthy Individual Tissue | p-value: 0.460234035; Fold-change: 0.025792532; Z-score: 0.075400377 | |
| Disease-specific Antigen Abundances |
|
Click to View the Clearer Original Diagram |
| Differential expression pattern of antigen in diseases | ||
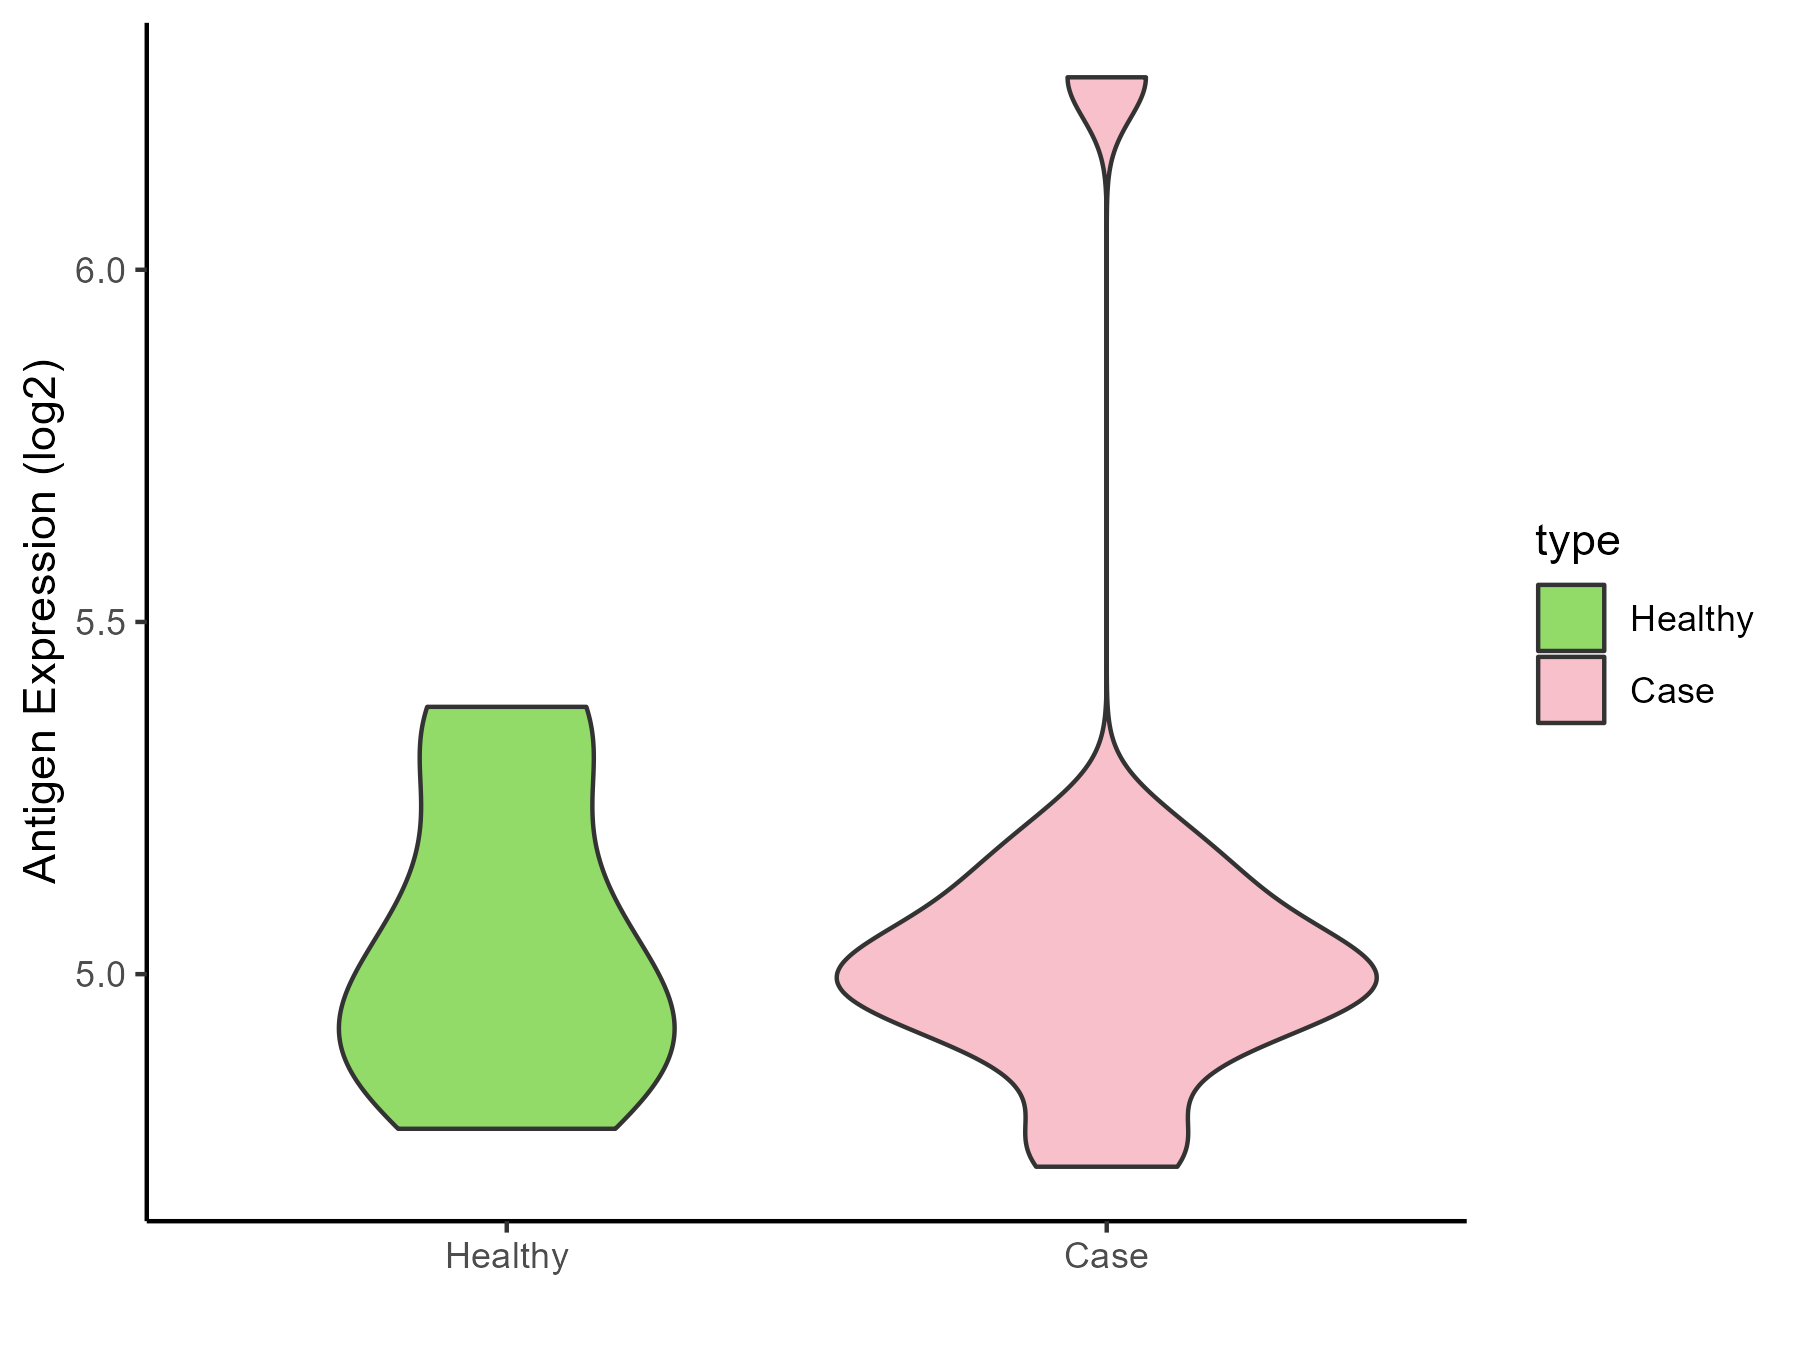
| The Studied Tissue | Vastus lateralis muscle | |
| The Specific Disease | Polycystic ovary syndrome | |
| The Expression Level of Disease Section Compare with the Healthy Individual Tissue | p-value: 0.837348113; Fold-change: 0.014109814; Z-score: 0.067569046 | |
| Disease-specific Antigen Abundances |
|
Click to View the Clearer Original Diagram |
| Differential expression pattern of antigen in diseases | ||
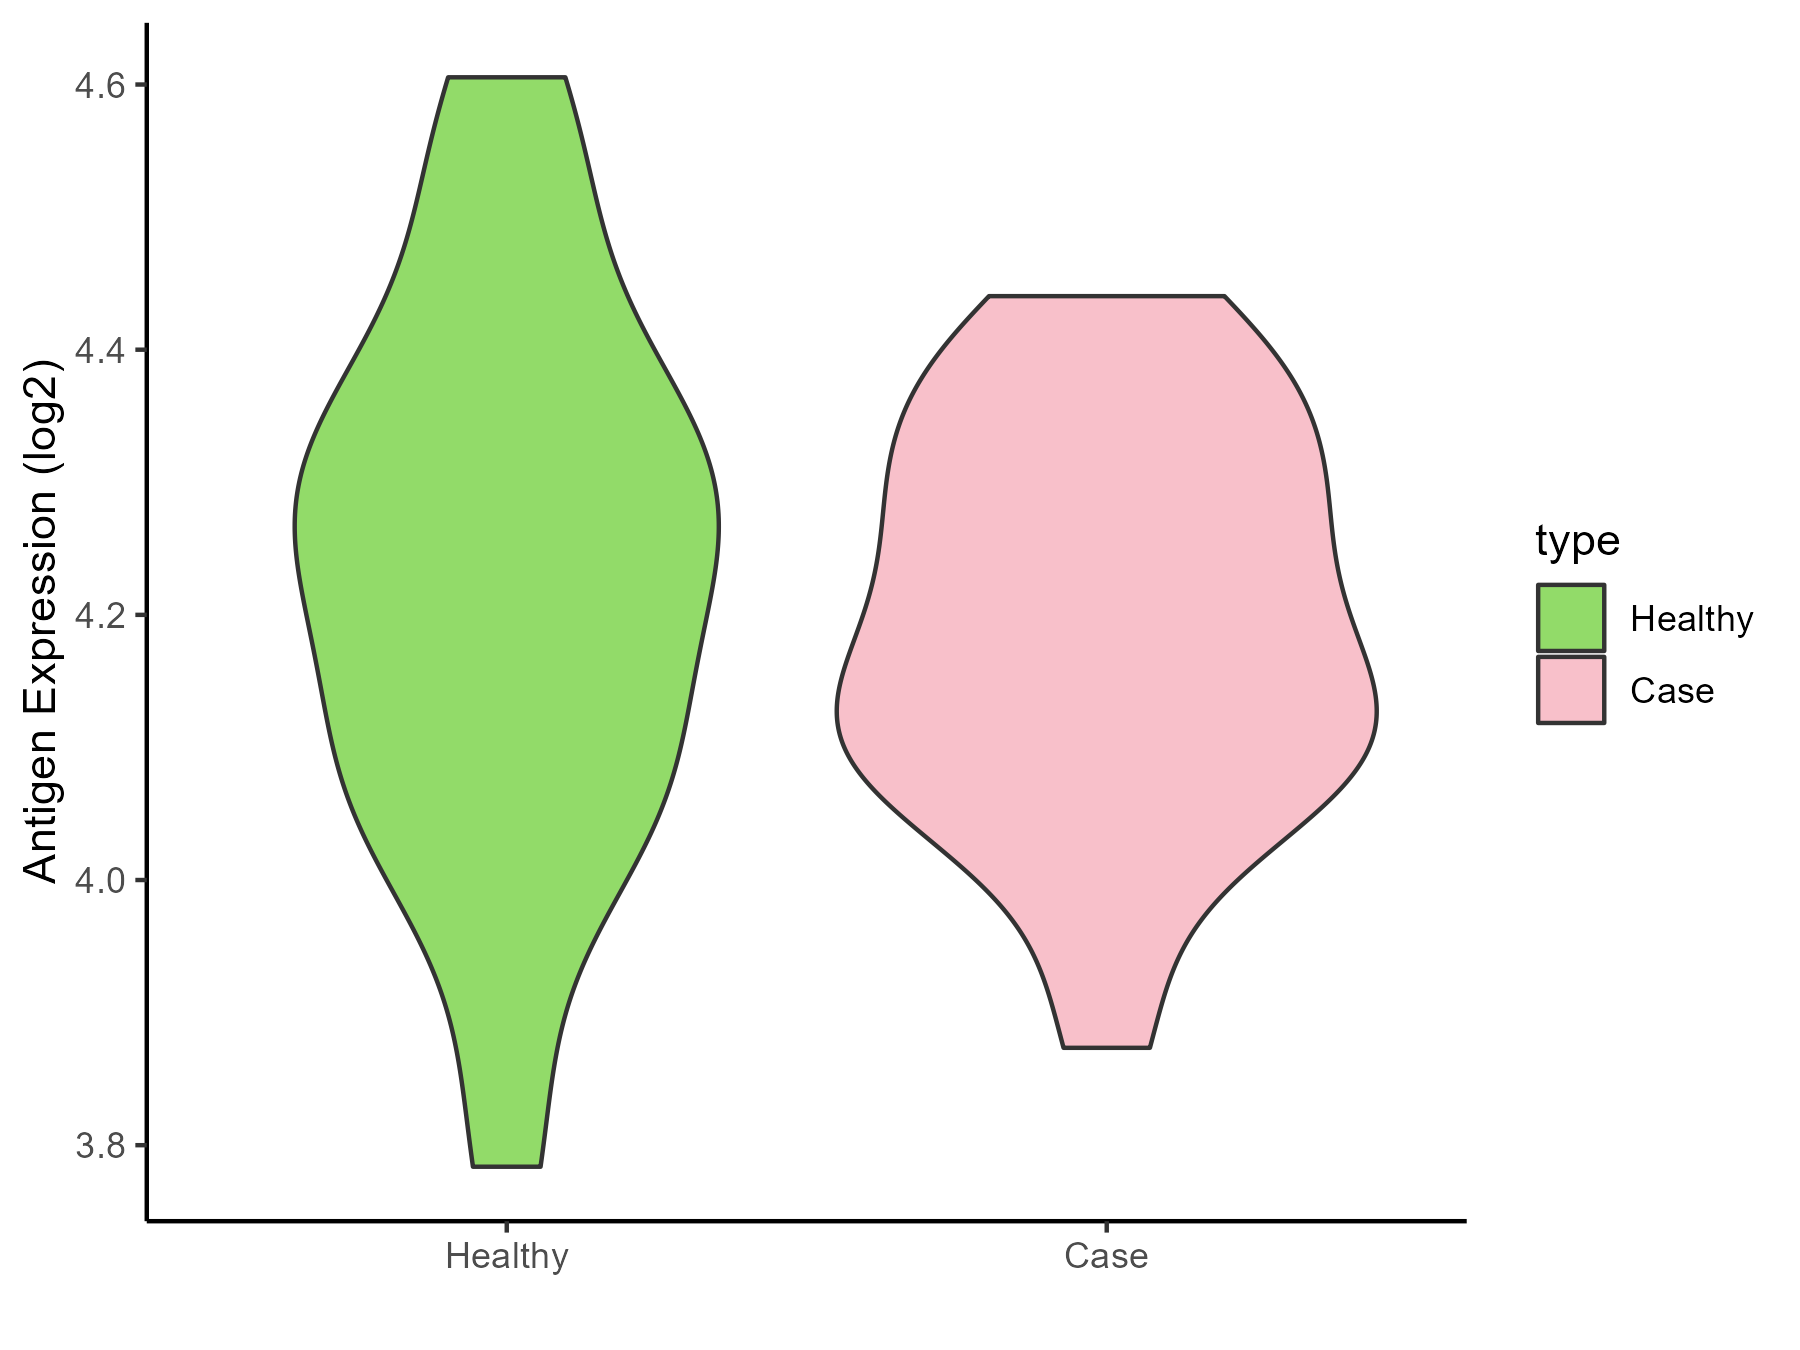
| The Studied Tissue | Subcutaneous Adipose | |
| The Specific Disease | Obesity | |
| The Expression Level of Disease Section Compare with the Healthy Individual Tissue | p-value: 0.520769351; Fold-change: -0.070034309; Z-score: -0.346286517 | |
| Disease-specific Antigen Abundances |
|
Click to View the Clearer Original Diagram |
| Differential expression pattern of antigen in diseases | ||
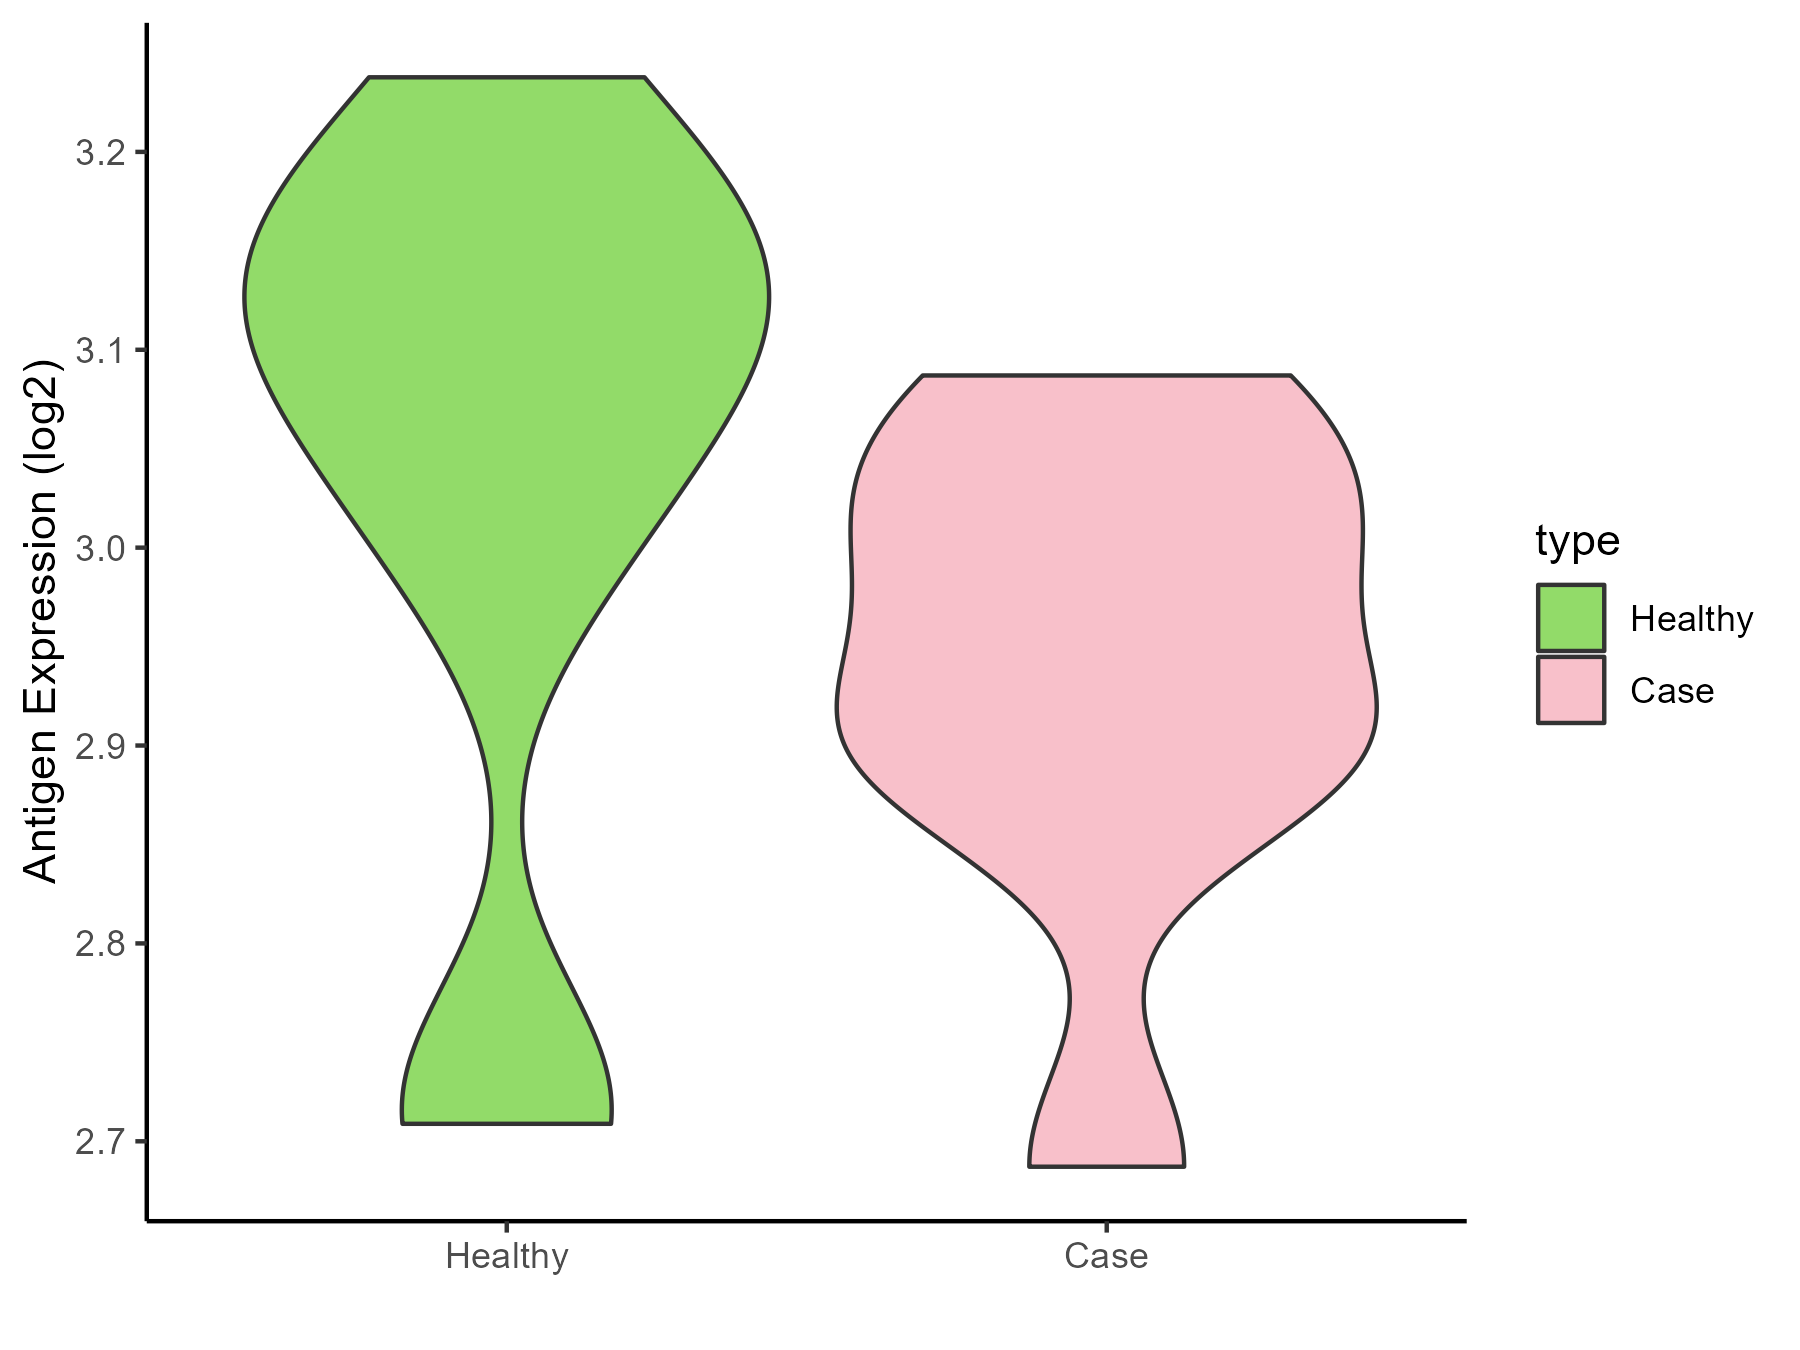
| The Studied Tissue | Biceps muscle | |
| The Specific Disease | Pompe disease | |
| The Expression Level of Disease Section Compare with the Healthy Individual Tissue | p-value: 0.204014628; Fold-change: -0.150021413; Z-score: -0.817389541 | |
| Disease-specific Antigen Abundances |
|
Click to View the Clearer Original Diagram |
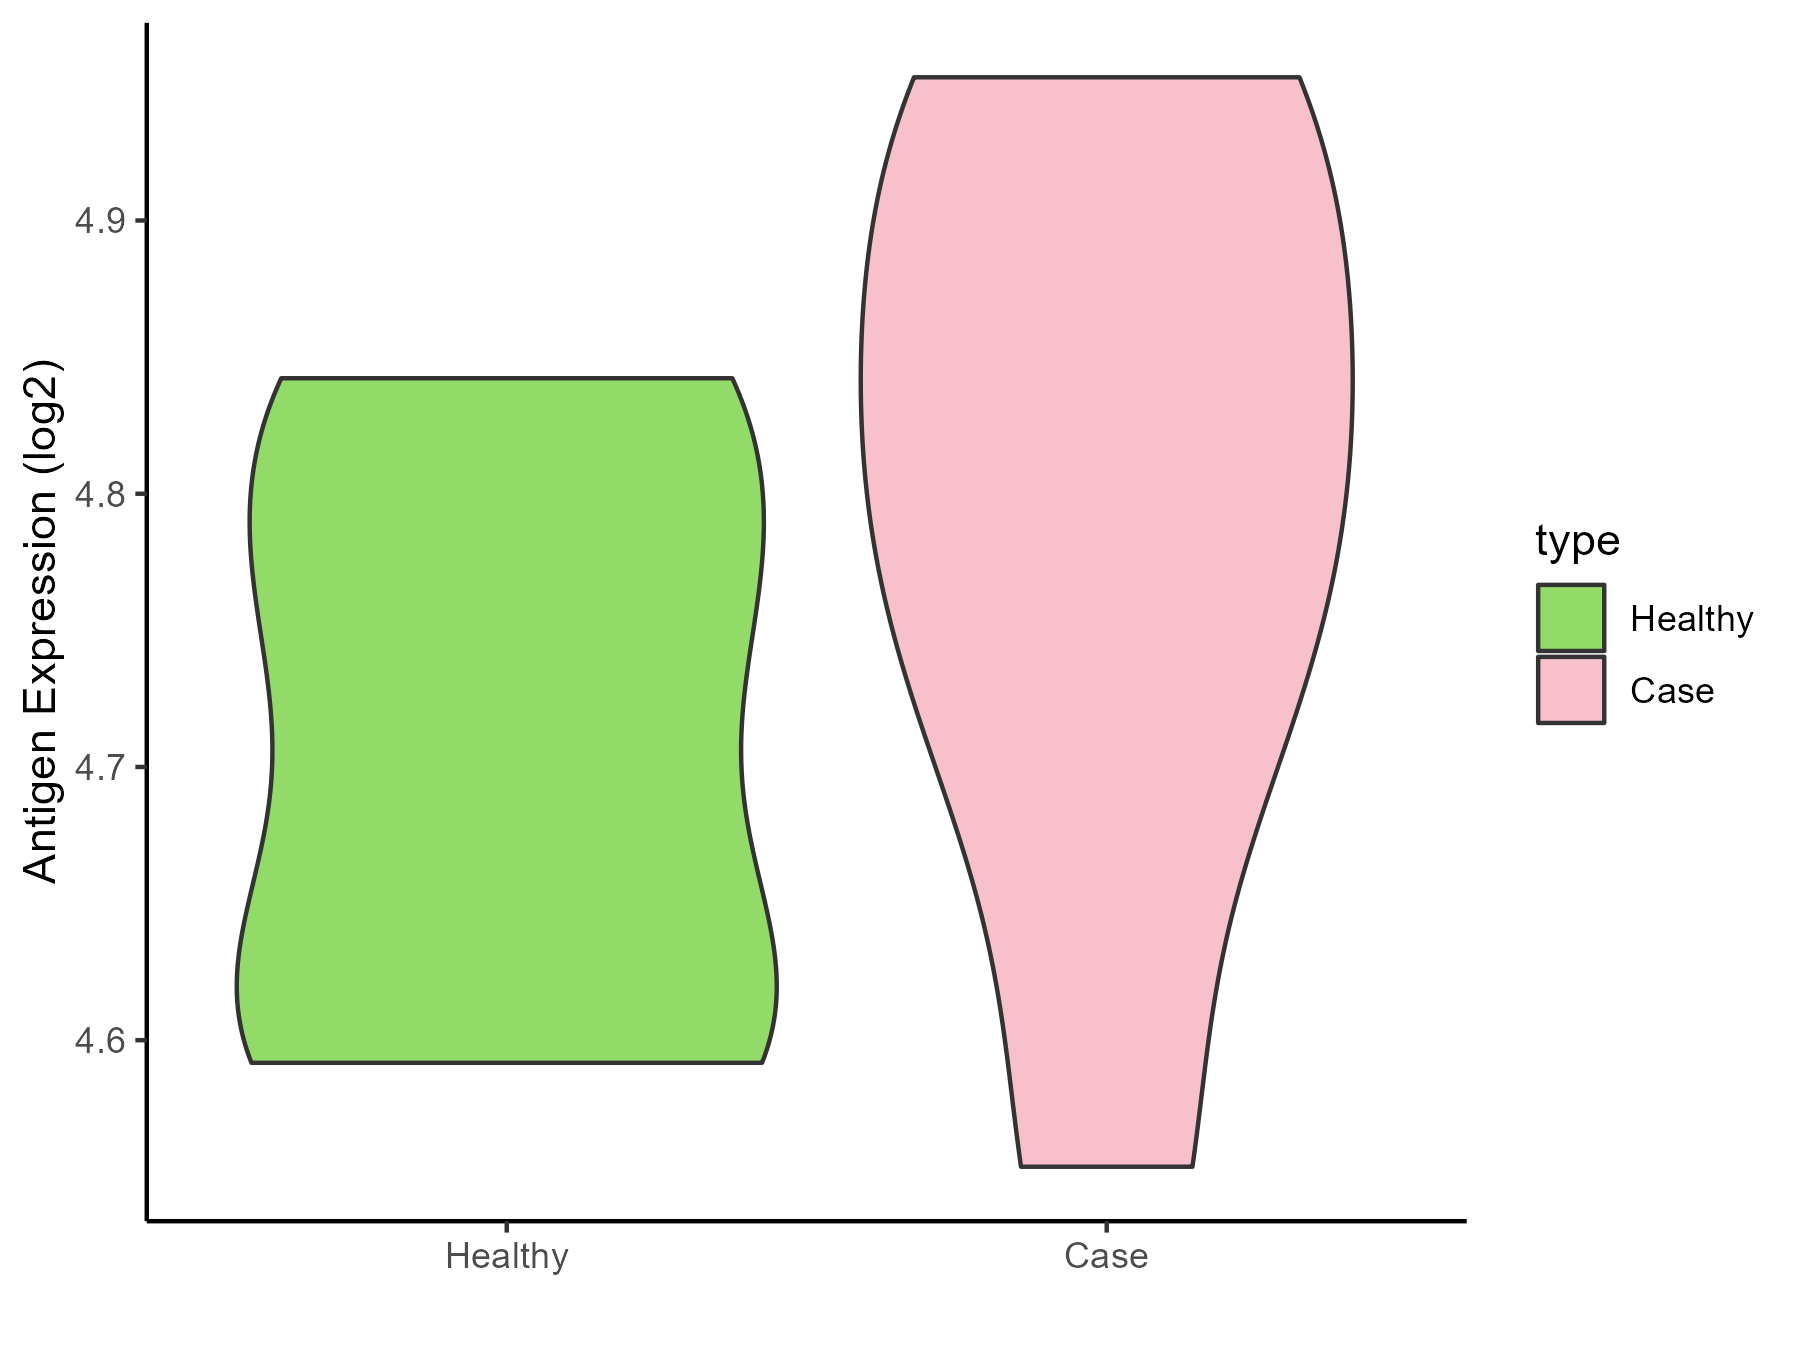
| Differential expression pattern of antigen in diseases | ||
| The Studied Tissue | Whole blood | |
| The Specific Disease | Batten disease | |
| The Expression Level of Disease Section Compare with the Healthy Individual Tissue | p-value: 0.235693547; Fold-change: 0.092314659; Z-score: 0.842306921 | |
| Disease-specific Antigen Abundances |
|
Click to View the Clearer Original Diagram |
ICD Disease Classification 6
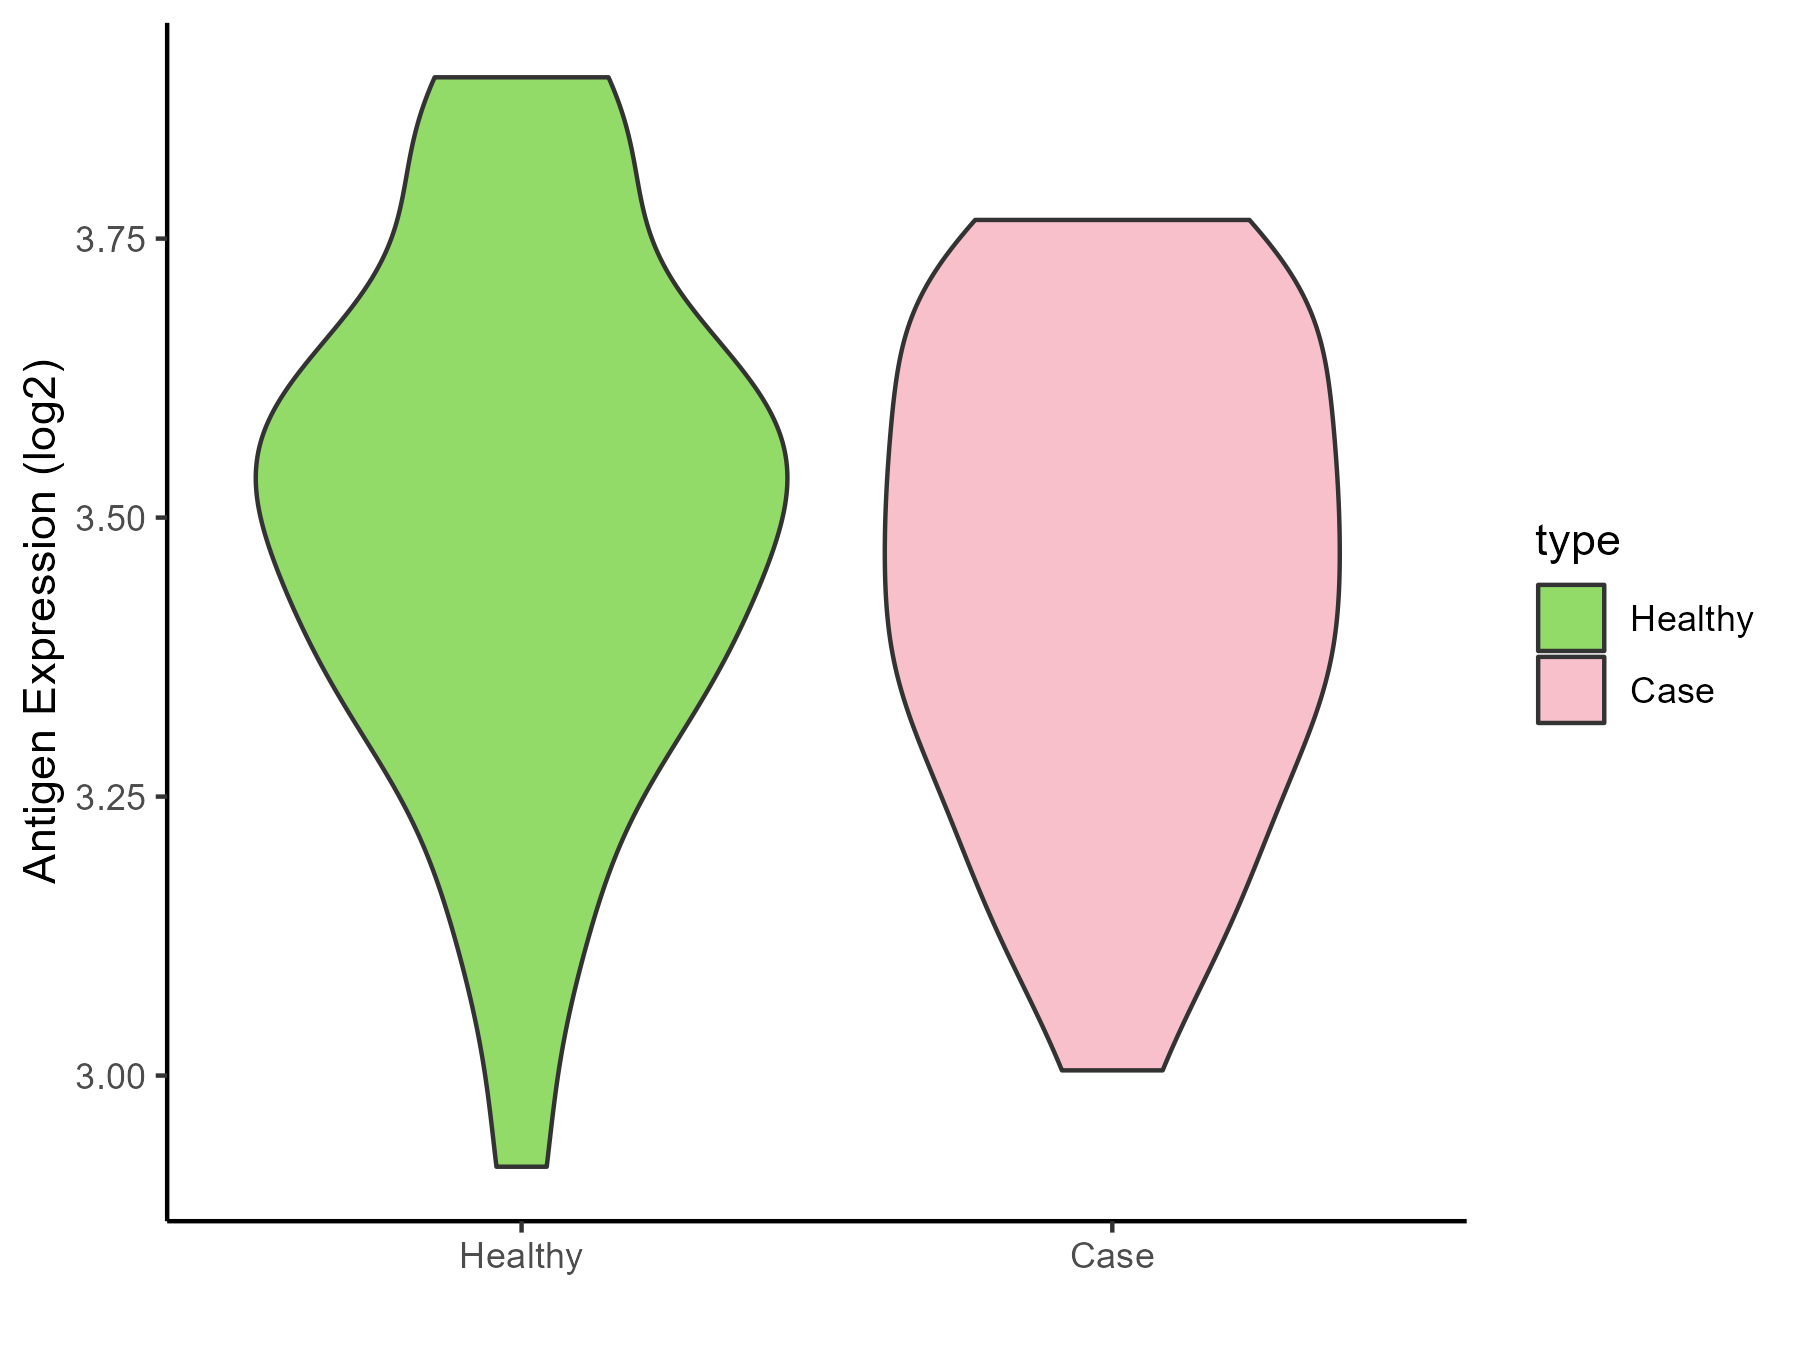
| Differential expression pattern of antigen in diseases | ||
| The Studied Tissue | Whole blood | |
| The Specific Disease | Autism | |
| The Expression Level of Disease Section Compare with the Healthy Individual Tissue | p-value: 0.359490478; Fold-change: -0.041476563; Z-score: -0.180114051 | |
| Disease-specific Antigen Abundances |
|
Click to View the Clearer Original Diagram |
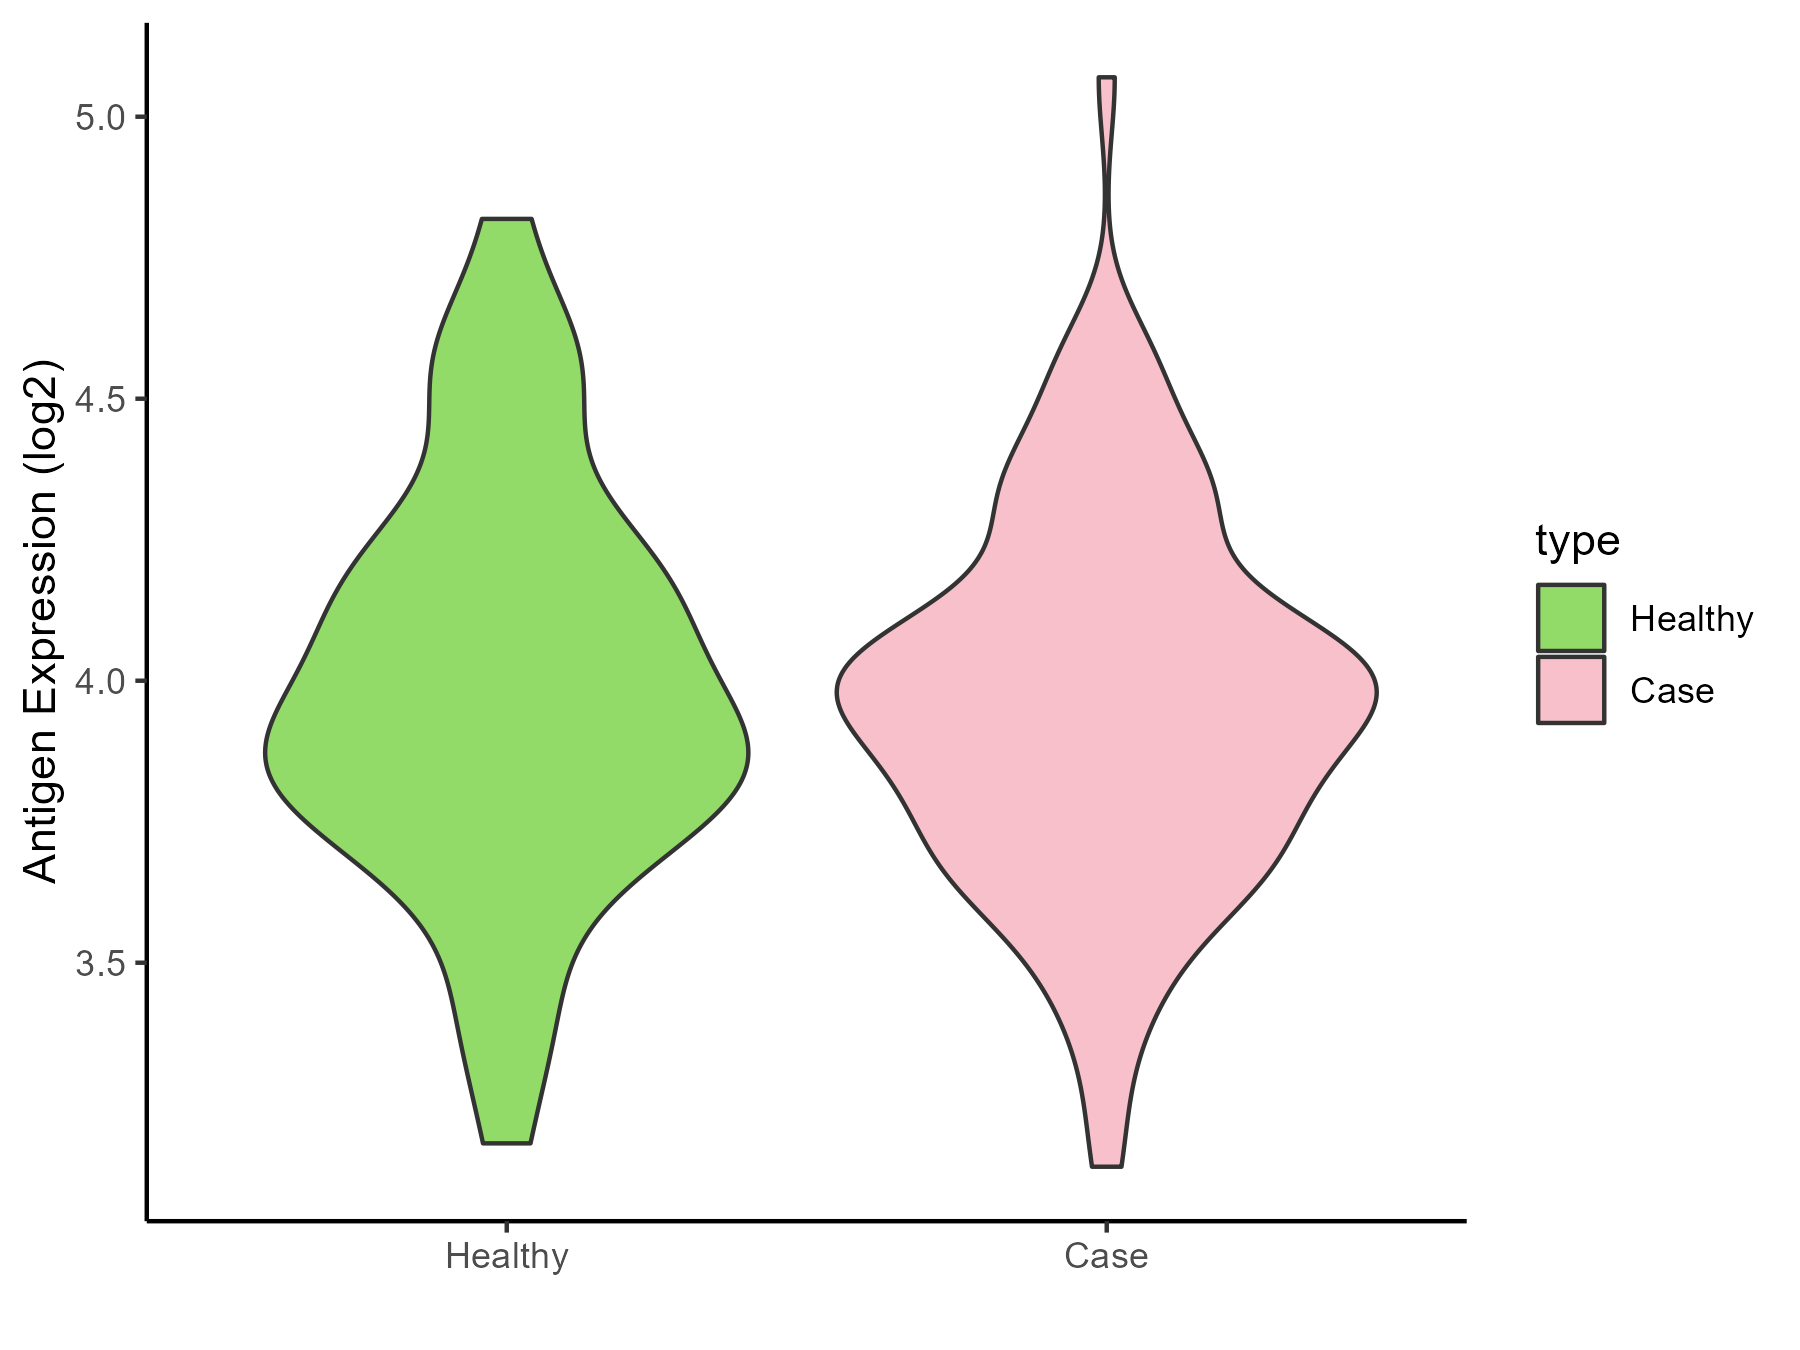
| Differential expression pattern of antigen in diseases | ||
| The Studied Tissue | Whole blood | |
| The Specific Disease | Anxiety disorder | |
| The Expression Level of Disease Section Compare with the Healthy Individual Tissue | p-value: 0.639075249; Fold-change: 0.034830647; Z-score: 0.098246555 | |
| Disease-specific Antigen Abundances |
|
Click to View the Clearer Original Diagram |
ICD Disease Classification 8
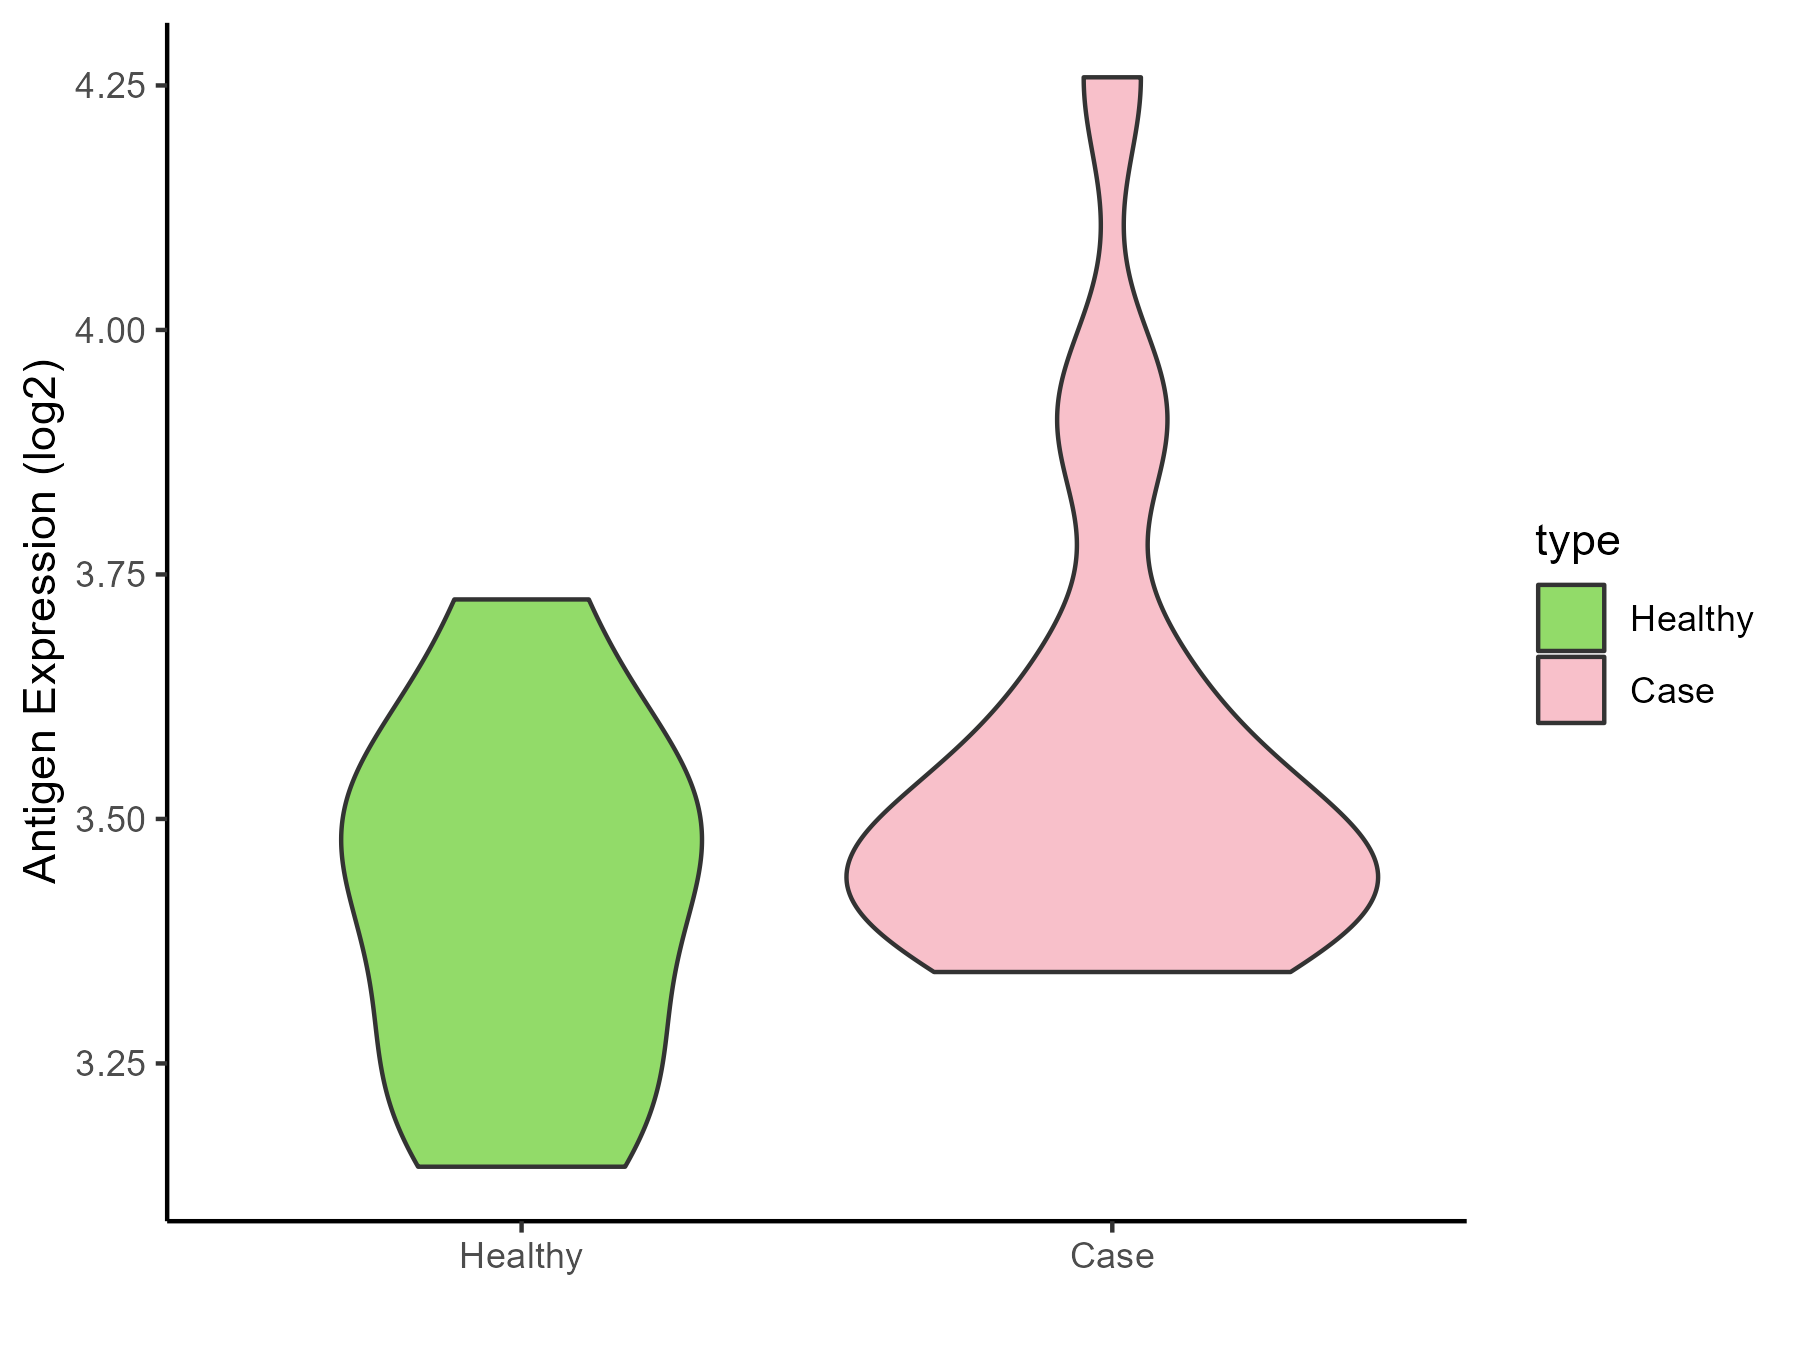
| Differential expression pattern of antigen in diseases | ||
| The Studied Tissue | Substantia nigra | |
| The Specific Disease | Parkinson disease | |
| The Expression Level of Disease Section Compare with the Healthy Individual Tissue | p-value: 0.088944118; Fold-change: 0.027139652; Z-score: 0.145815567 | |
| Disease-specific Antigen Abundances |
|
Click to View the Clearer Original Diagram |
| Differential expression pattern of antigen in diseases | ||
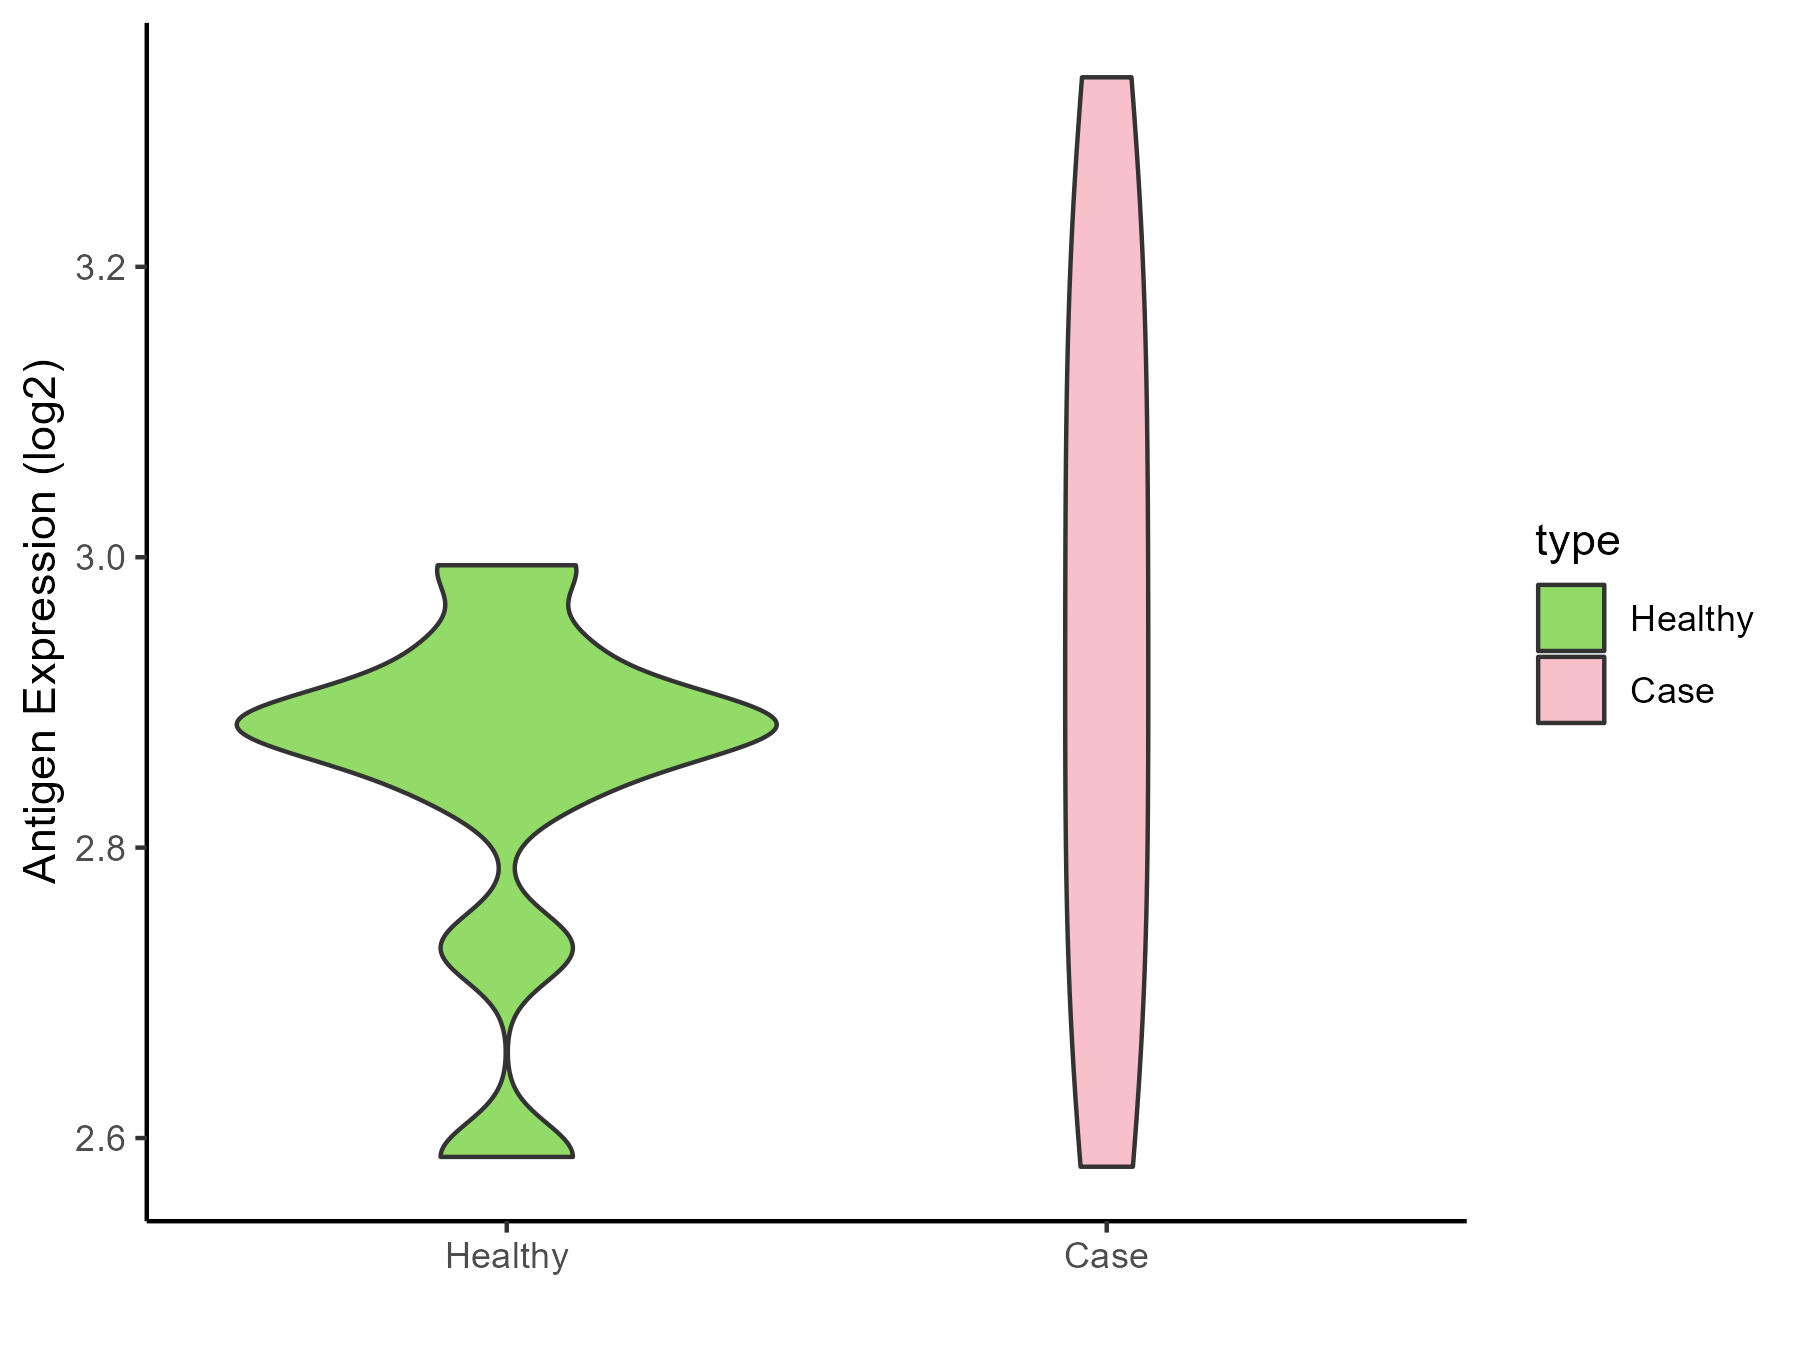
| The Studied Tissue | Whole blood | |
| The Specific Disease | Huntington disease | |
| The Expression Level of Disease Section Compare with the Healthy Individual Tissue | p-value: 0.272833024; Fold-change: 0.066179511; Z-score: 0.547286747 | |
| Disease-specific Antigen Abundances |
|
Click to View the Clearer Original Diagram |
| Differential expression pattern of antigen in diseases | ||
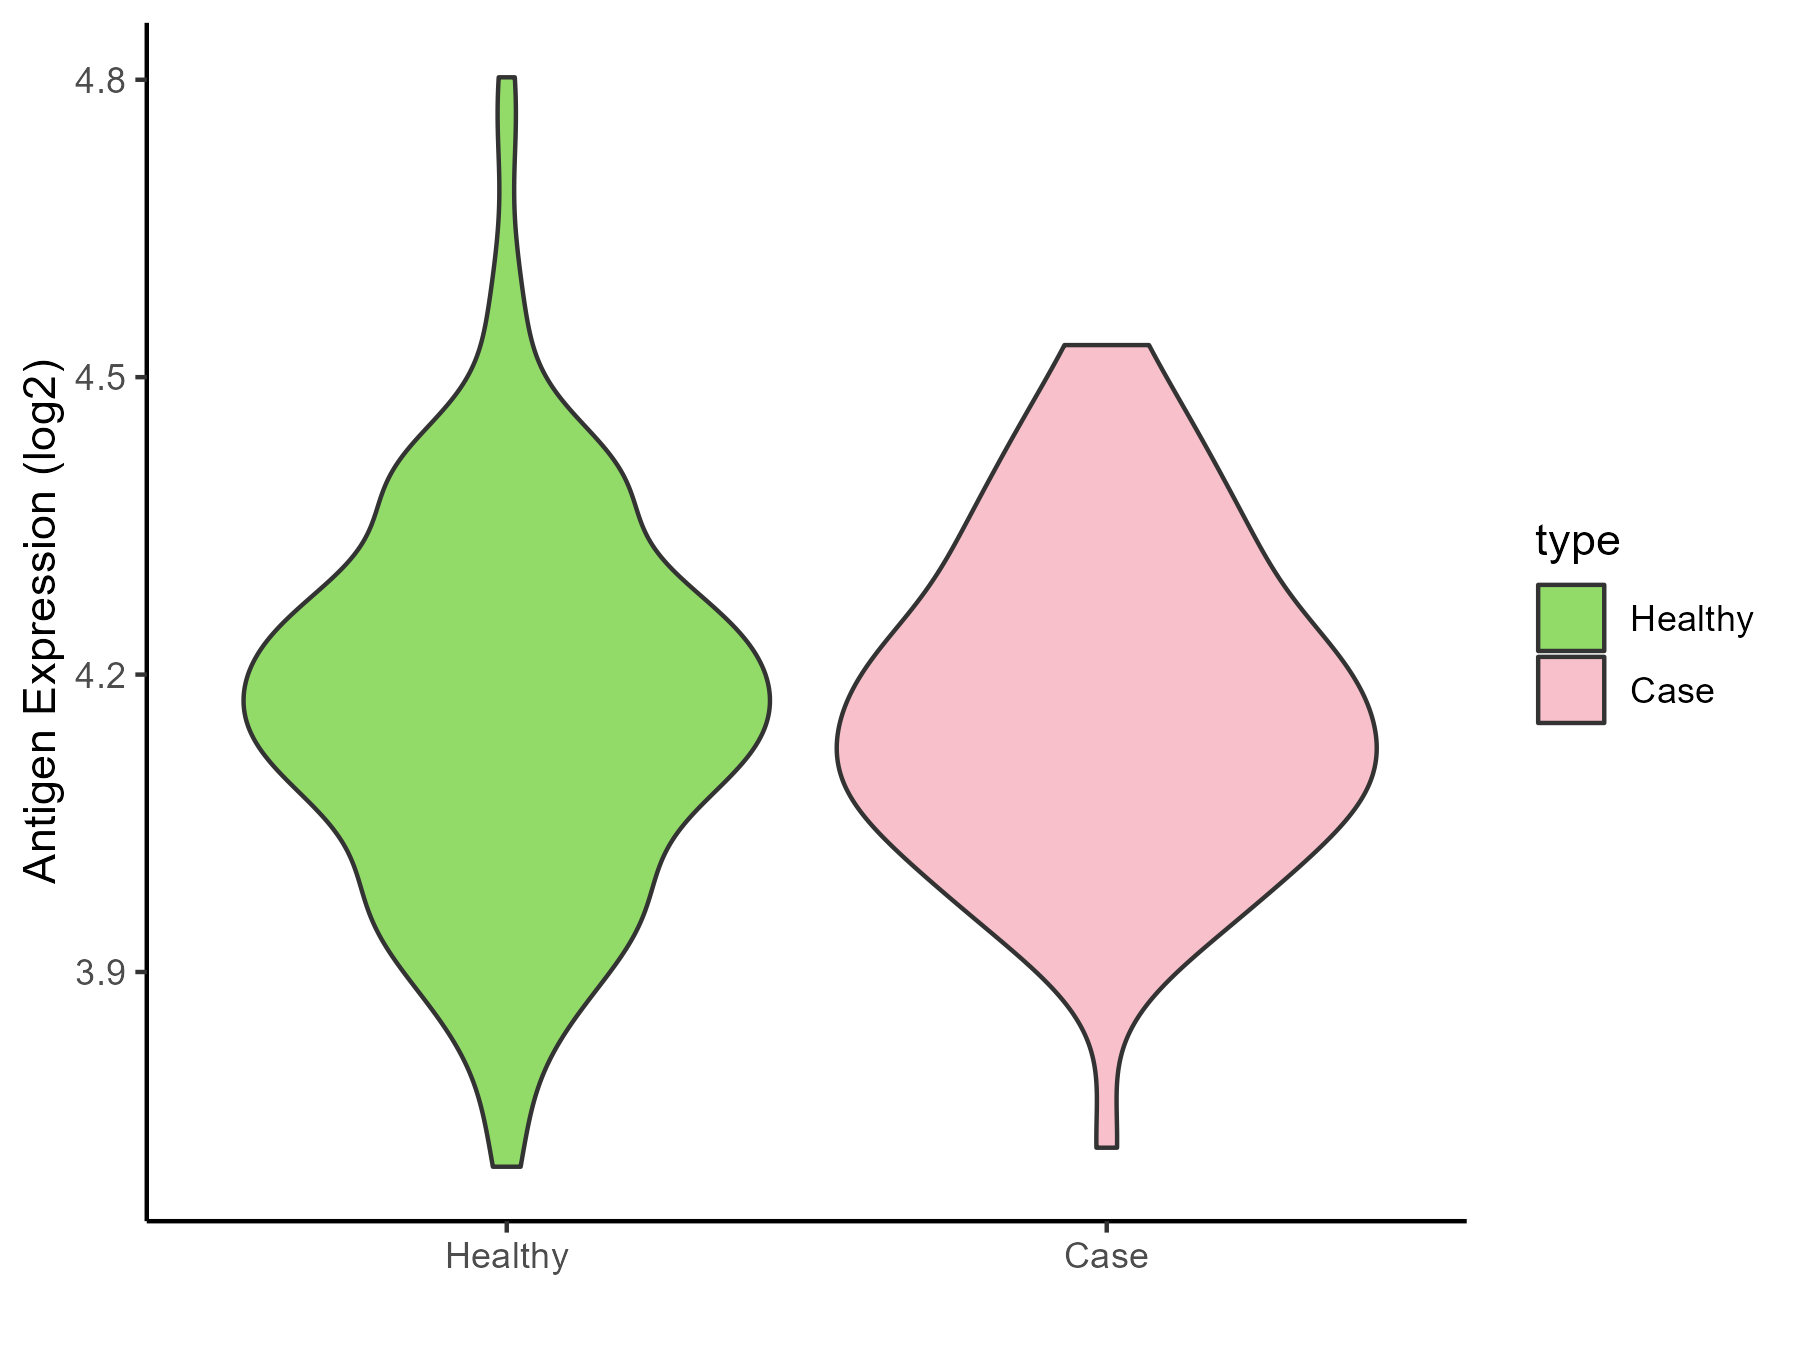
| The Studied Tissue | Entorhinal cortex | |
| The Specific Disease | Alzheimer disease | |
| The Expression Level of Disease Section Compare with the Healthy Individual Tissue | p-value: 0.796832885; Fold-change: -0.007831899; Z-score: -0.041754047 | |
| Disease-specific Antigen Abundances |
|
Click to View the Clearer Original Diagram |
| Differential expression pattern of antigen in diseases | ||
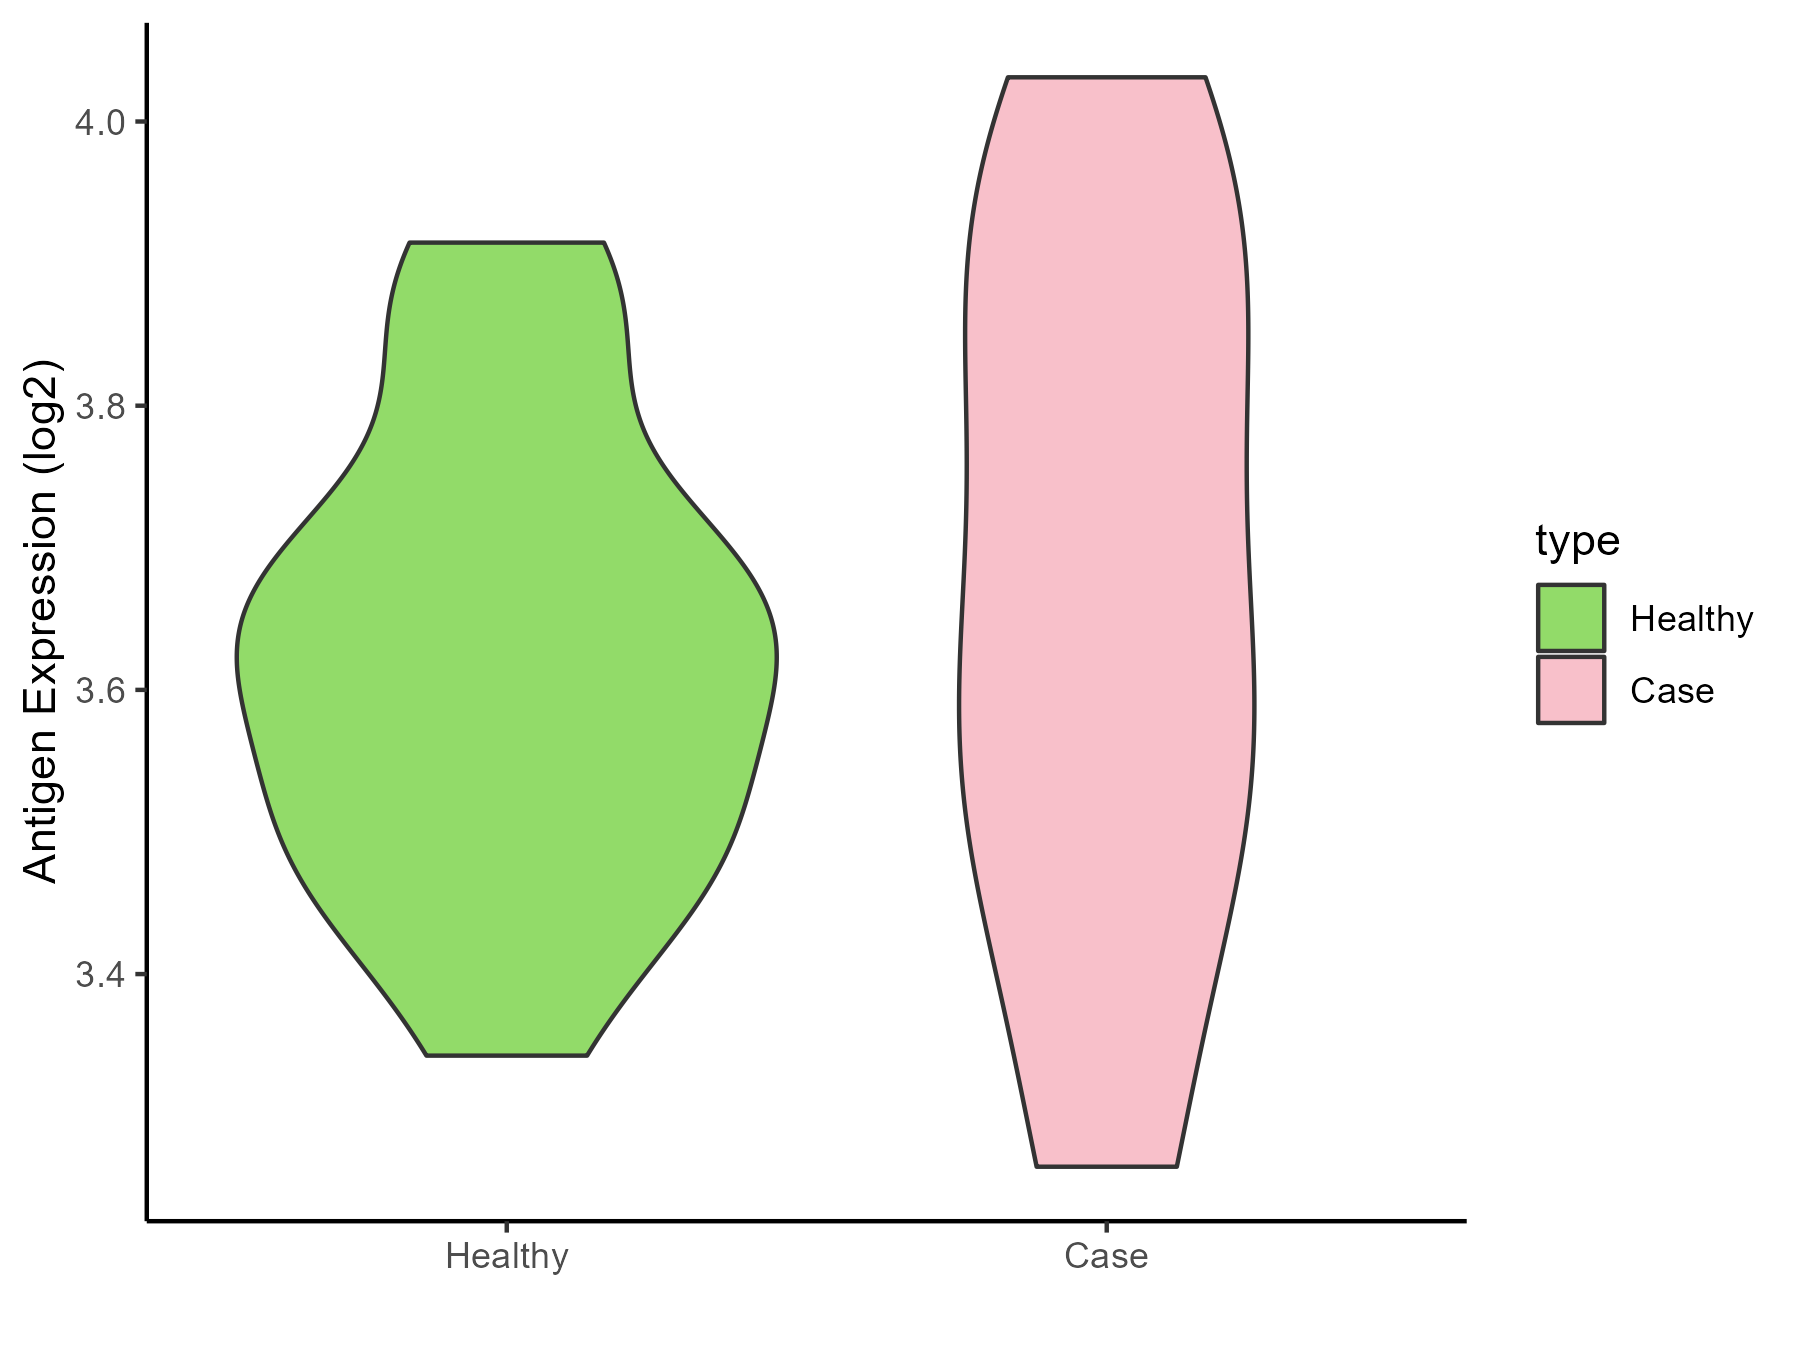
| The Studied Tissue | Whole blood | |
| The Specific Disease | Seizure | |
| The Expression Level of Disease Section Compare with the Healthy Individual Tissue | p-value: 0.540860162; Fold-change: 0.03014863; Z-score: 0.187162225 | |
| Disease-specific Antigen Abundances |
|
Click to View the Clearer Original Diagram |
| Differential expression pattern of antigen in diseases | ||
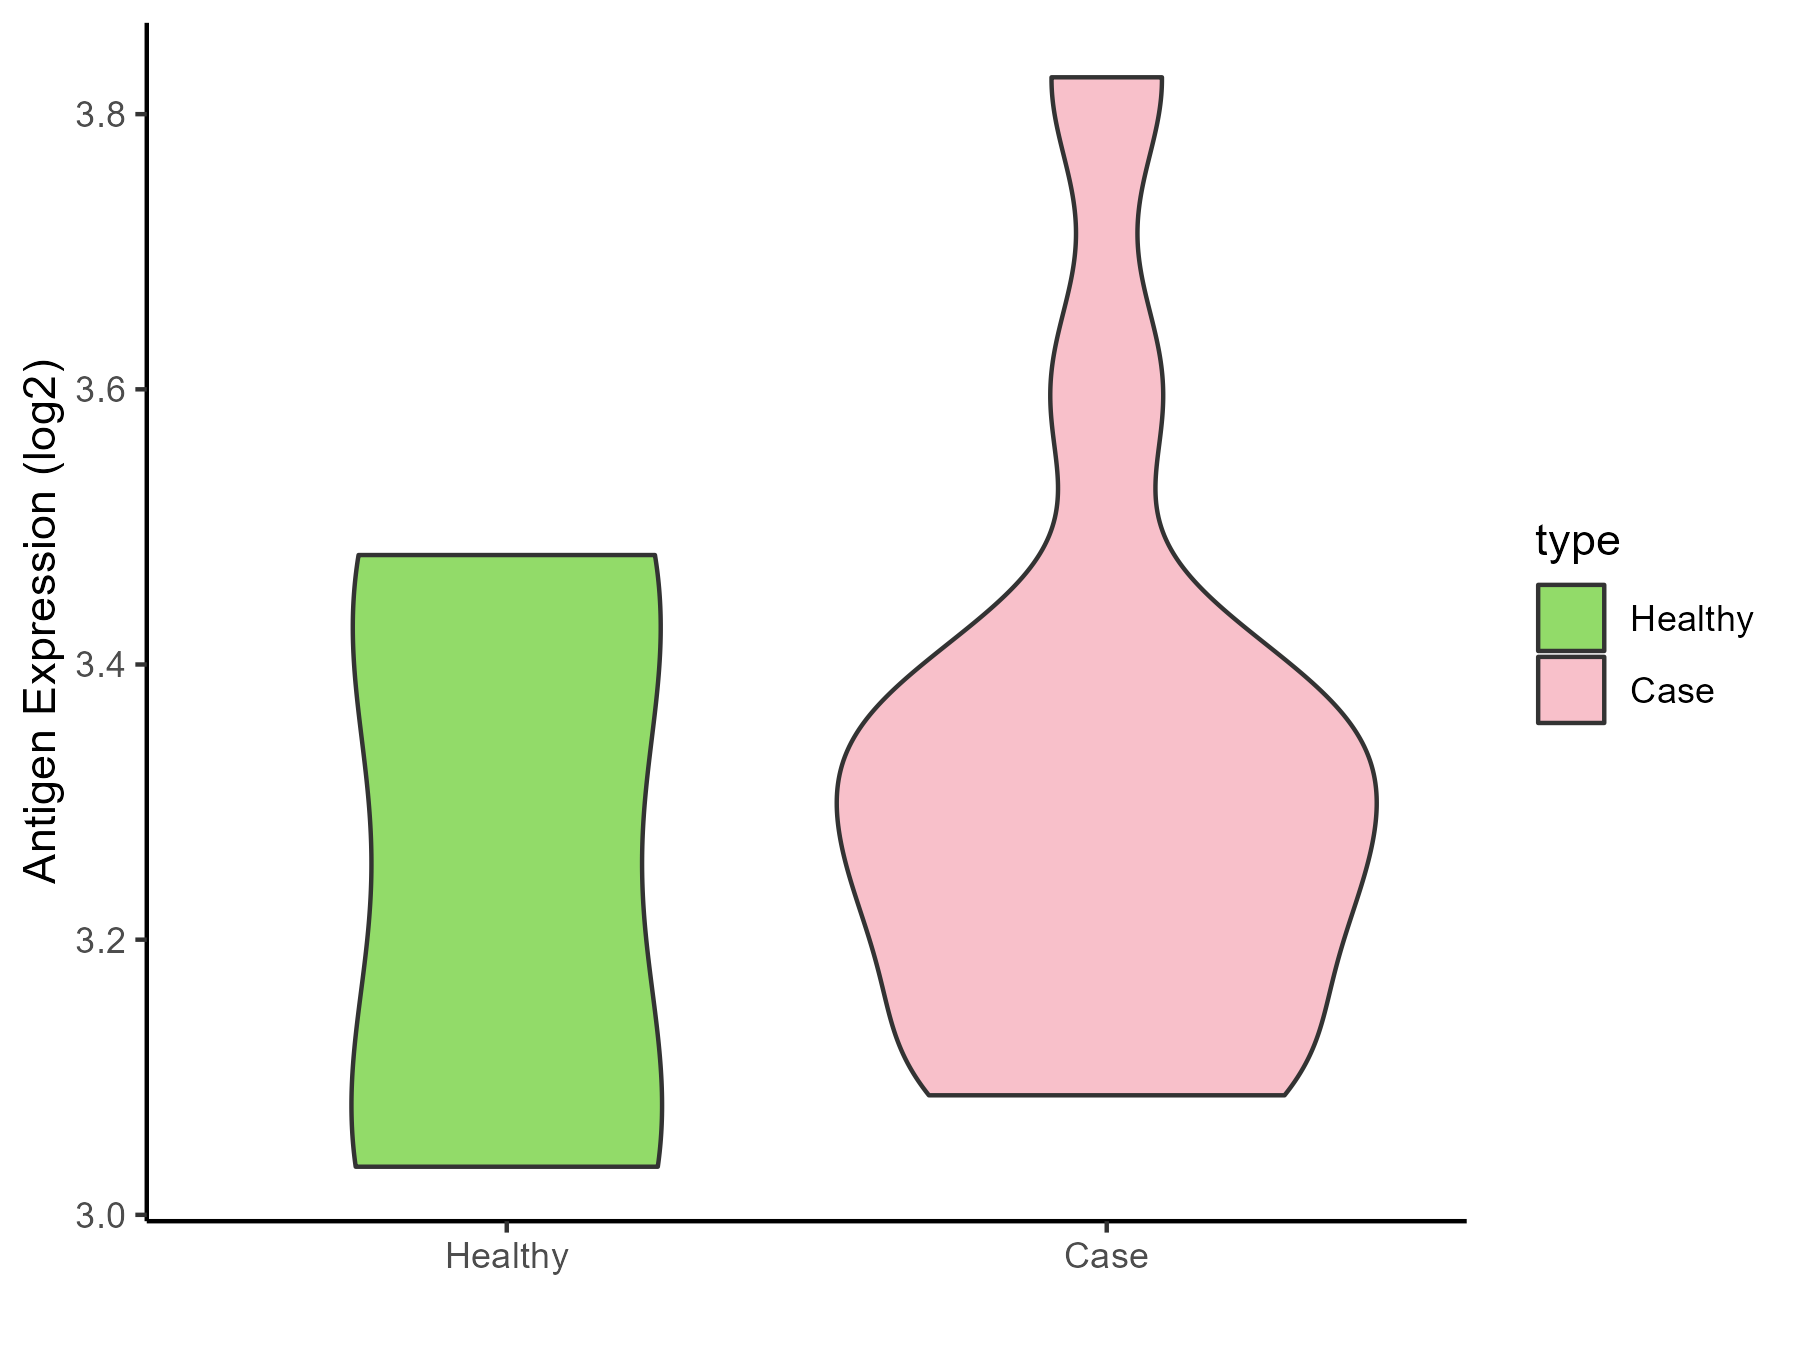
| The Studied Tissue | Skin | |
| The Specific Disease | Lateral sclerosis | |
| The Expression Level of Disease Section Compare with the Healthy Individual Tissue | p-value: 0.623897993; Fold-change: 0.037683126; Z-score: 0.163224148 | |
| Disease-specific Antigen Abundances |
|
Click to View the Clearer Original Diagram |
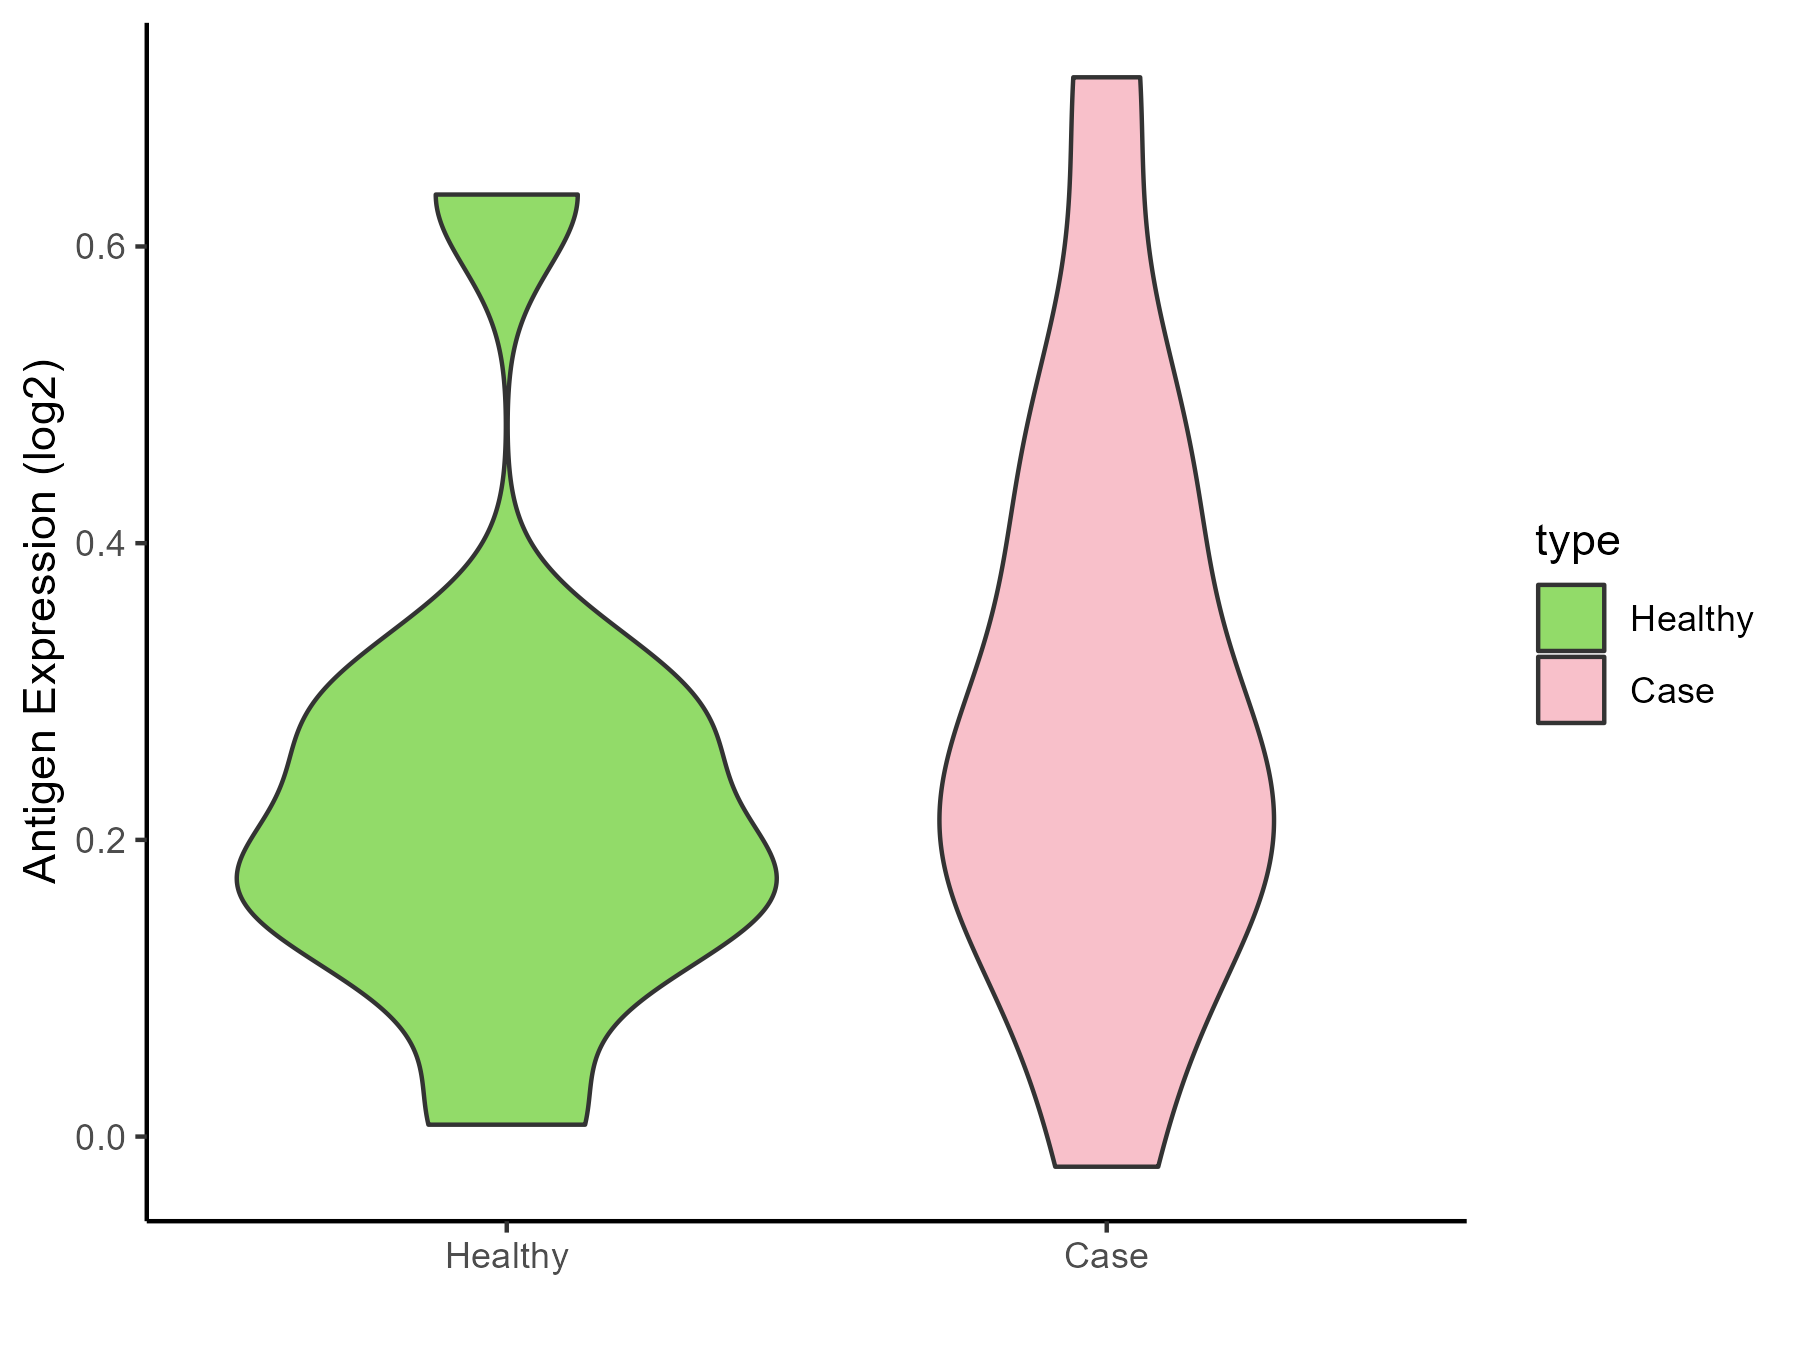
| The Studied Tissue | Cervical spinal cord | |
| The Specific Disease | Lateral sclerosis | |
| The Expression Level of Disease Section Compare with the Healthy Individual Tissue | p-value: 0.531194199; Fold-change: 0.061269727; Z-score: 0.348307812 | |
| Disease-specific Antigen Abundances |
|
Click to View the Clearer Original Diagram |
| Differential expression pattern of antigen in diseases | ||
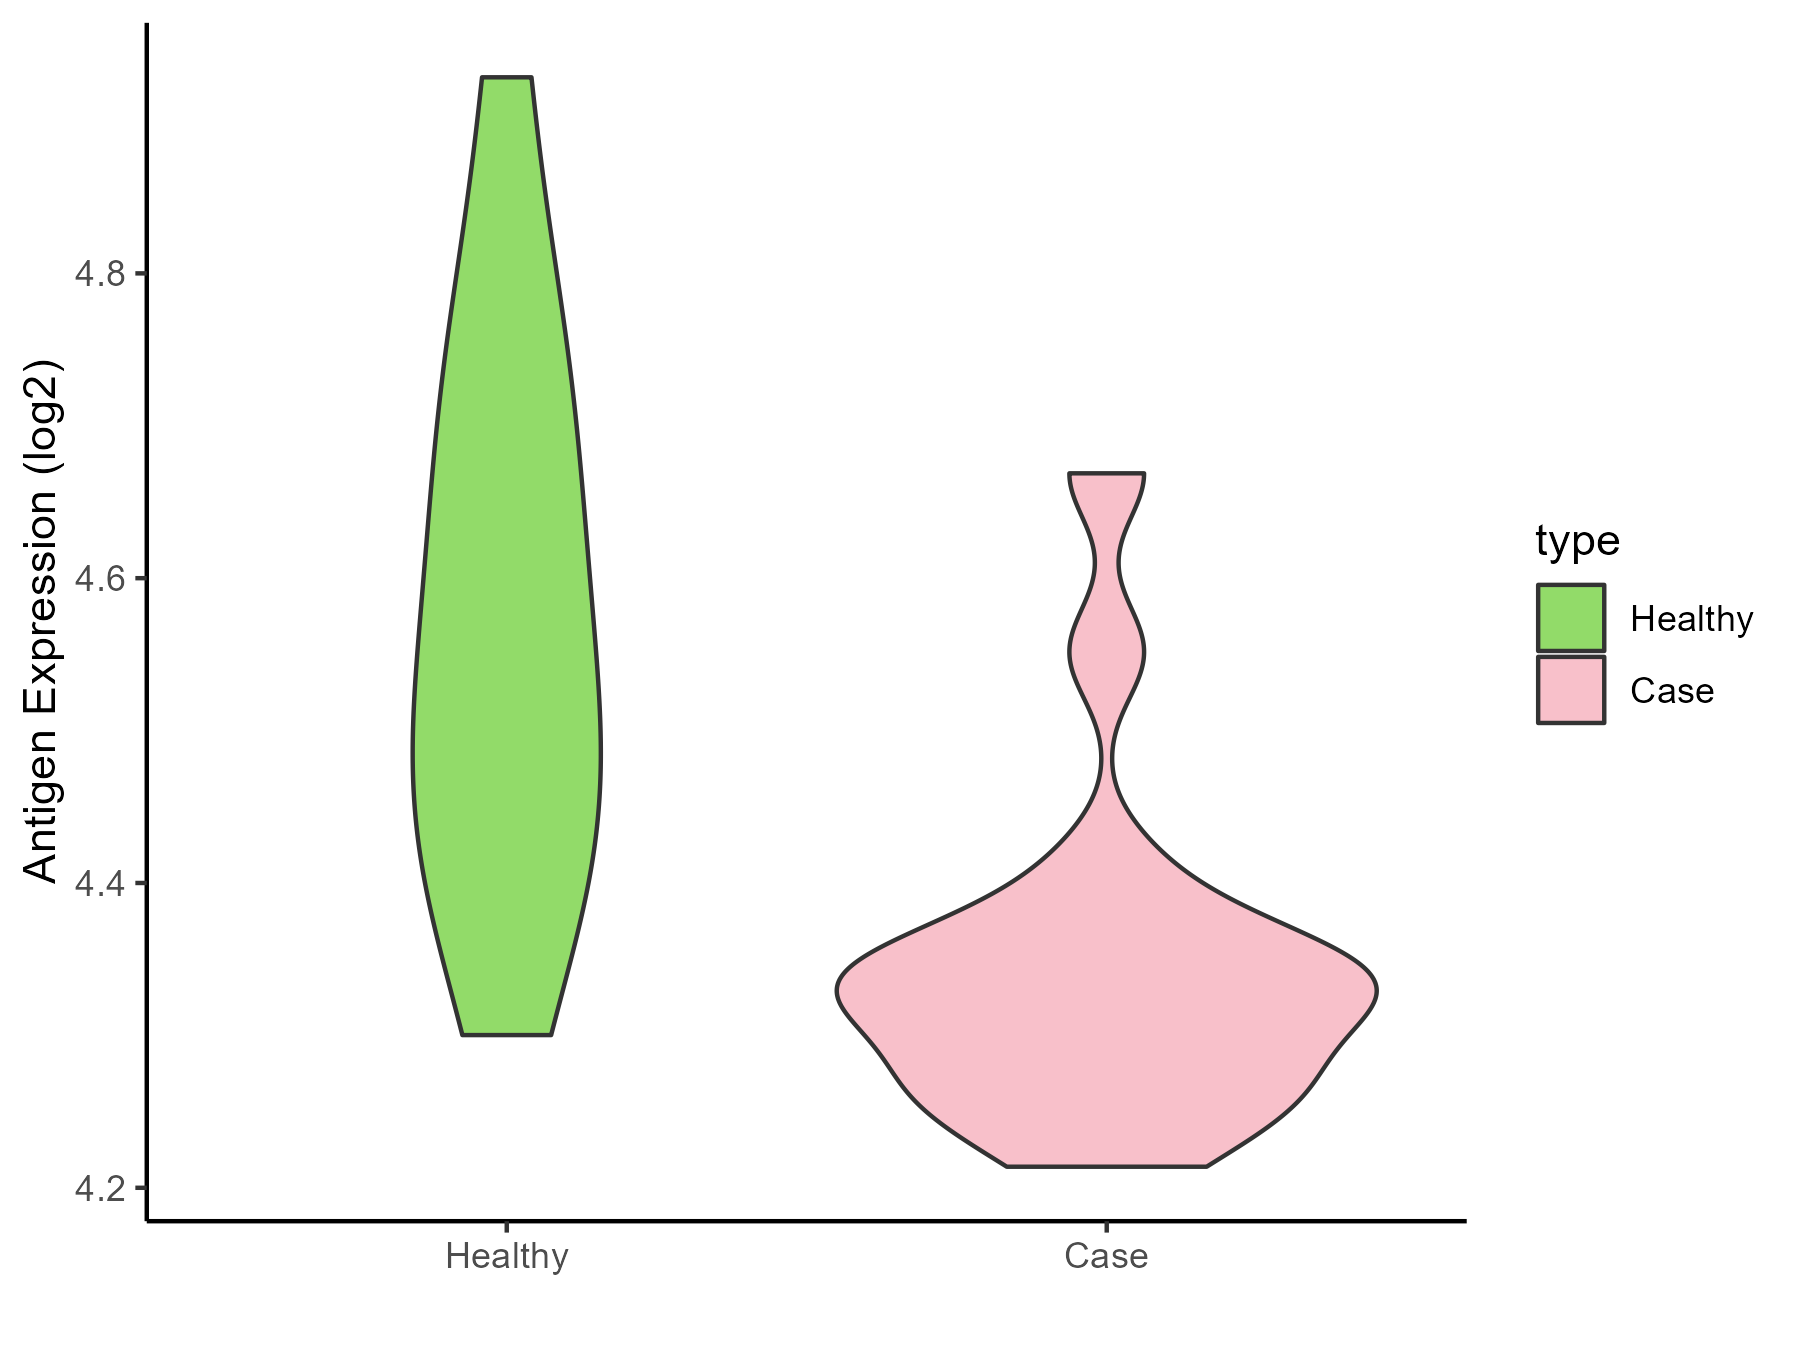
| The Studied Tissue | Muscle | |
| The Specific Disease | Muscular atrophy | |
| The Expression Level of Disease Section Compare with the Healthy Individual Tissue | p-value: 0.00073603; Fold-change: -0.206627023; Z-score: -1.145323965 | |
| Disease-specific Antigen Abundances |
|
Click to View the Clearer Original Diagram |
| Differential expression pattern of antigen in diseases | ||
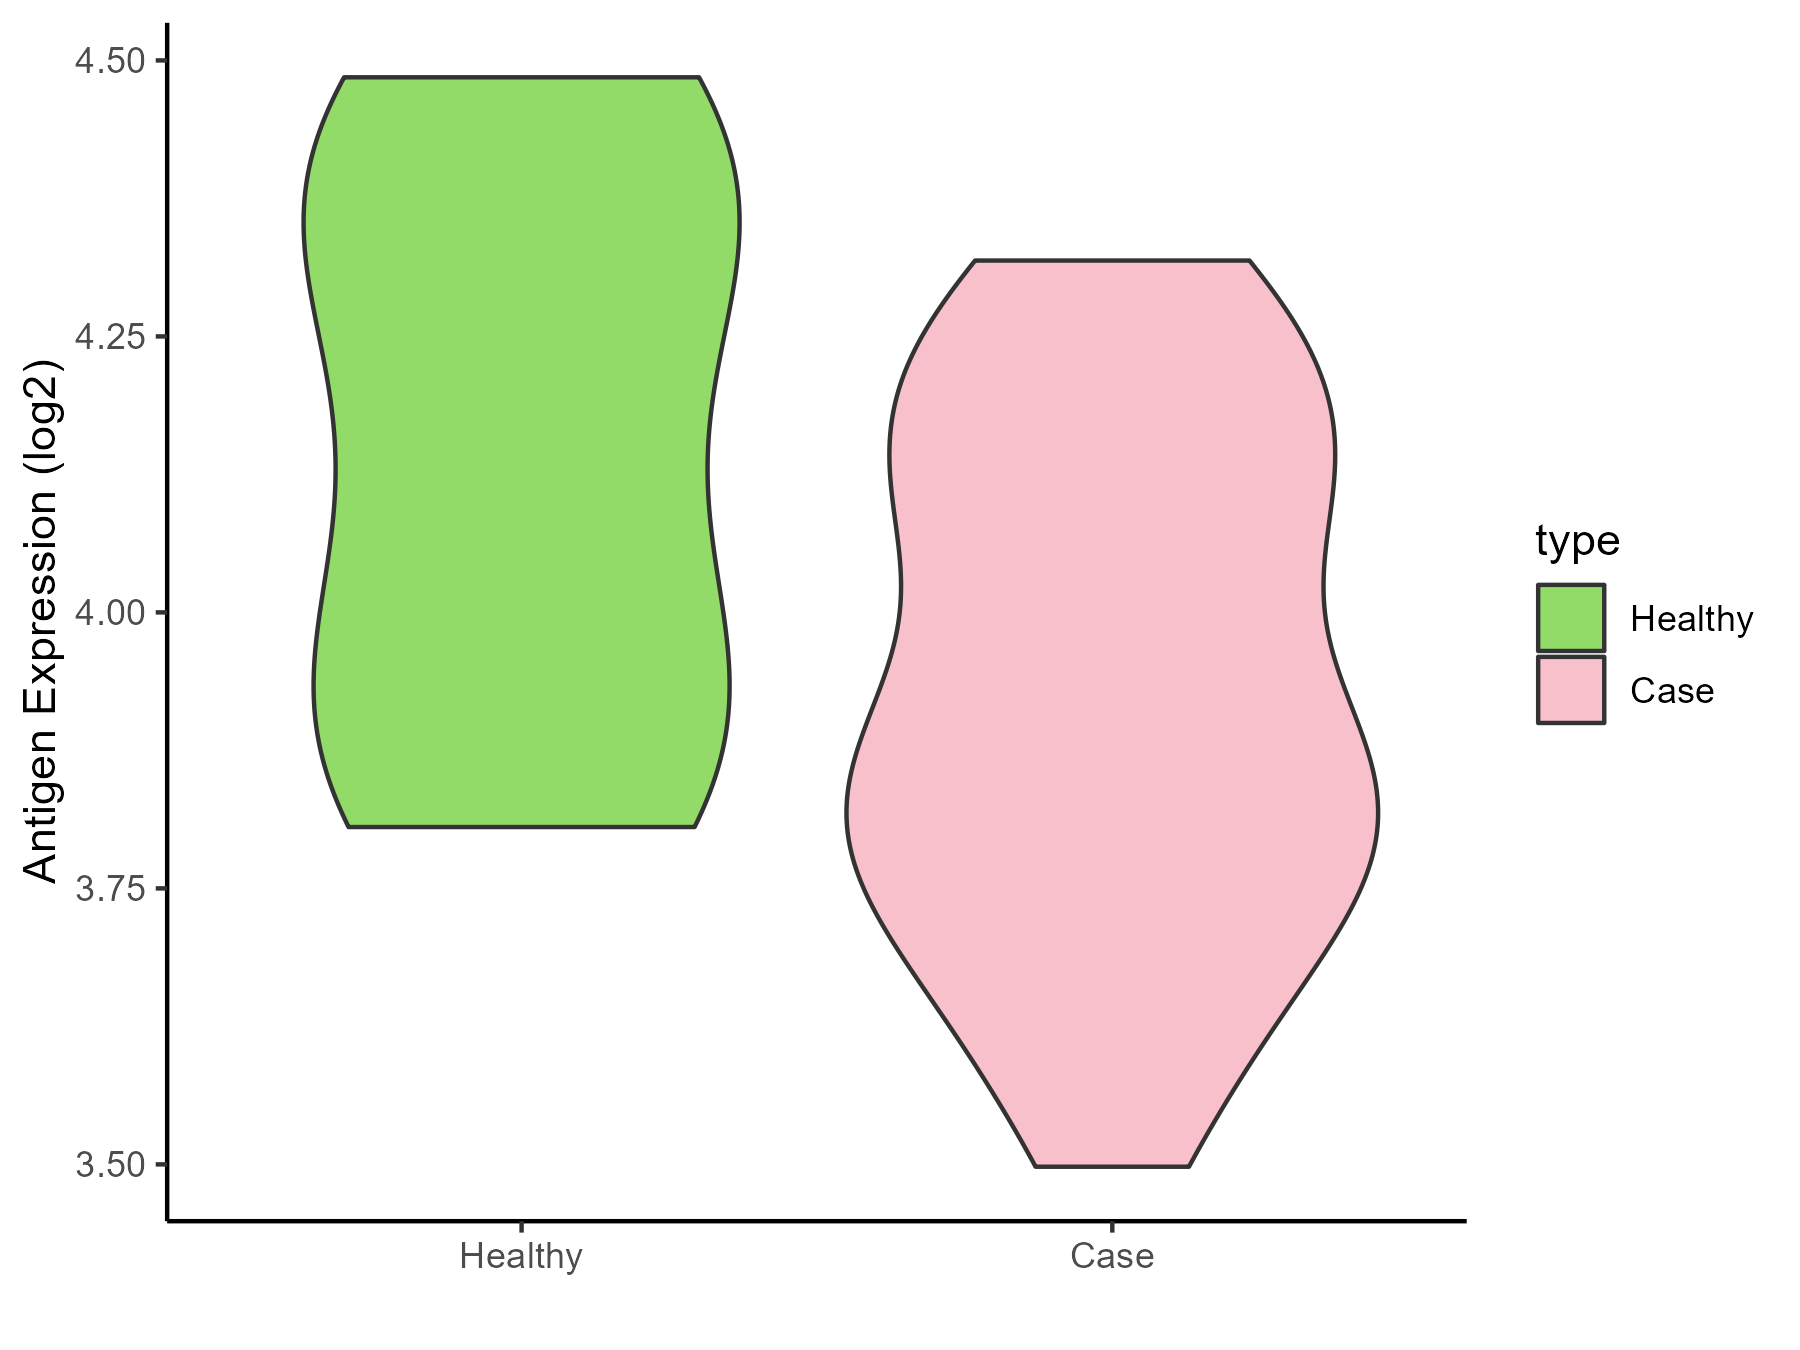
| The Studied Tissue | Muscle | |
| The Specific Disease | Myopathy | |
| The Expression Level of Disease Section Compare with the Healthy Individual Tissue | p-value: 0.067842282; Fold-change: -0.273606514; Z-score: -1.040326287 | |
| Disease-specific Antigen Abundances |
|
Click to View the Clearer Original Diagram |
References
