Tissue specific Abundances of This Antigen
ICD Disease Classification 01
Click to Show/Hide the 1 Disease of This Class
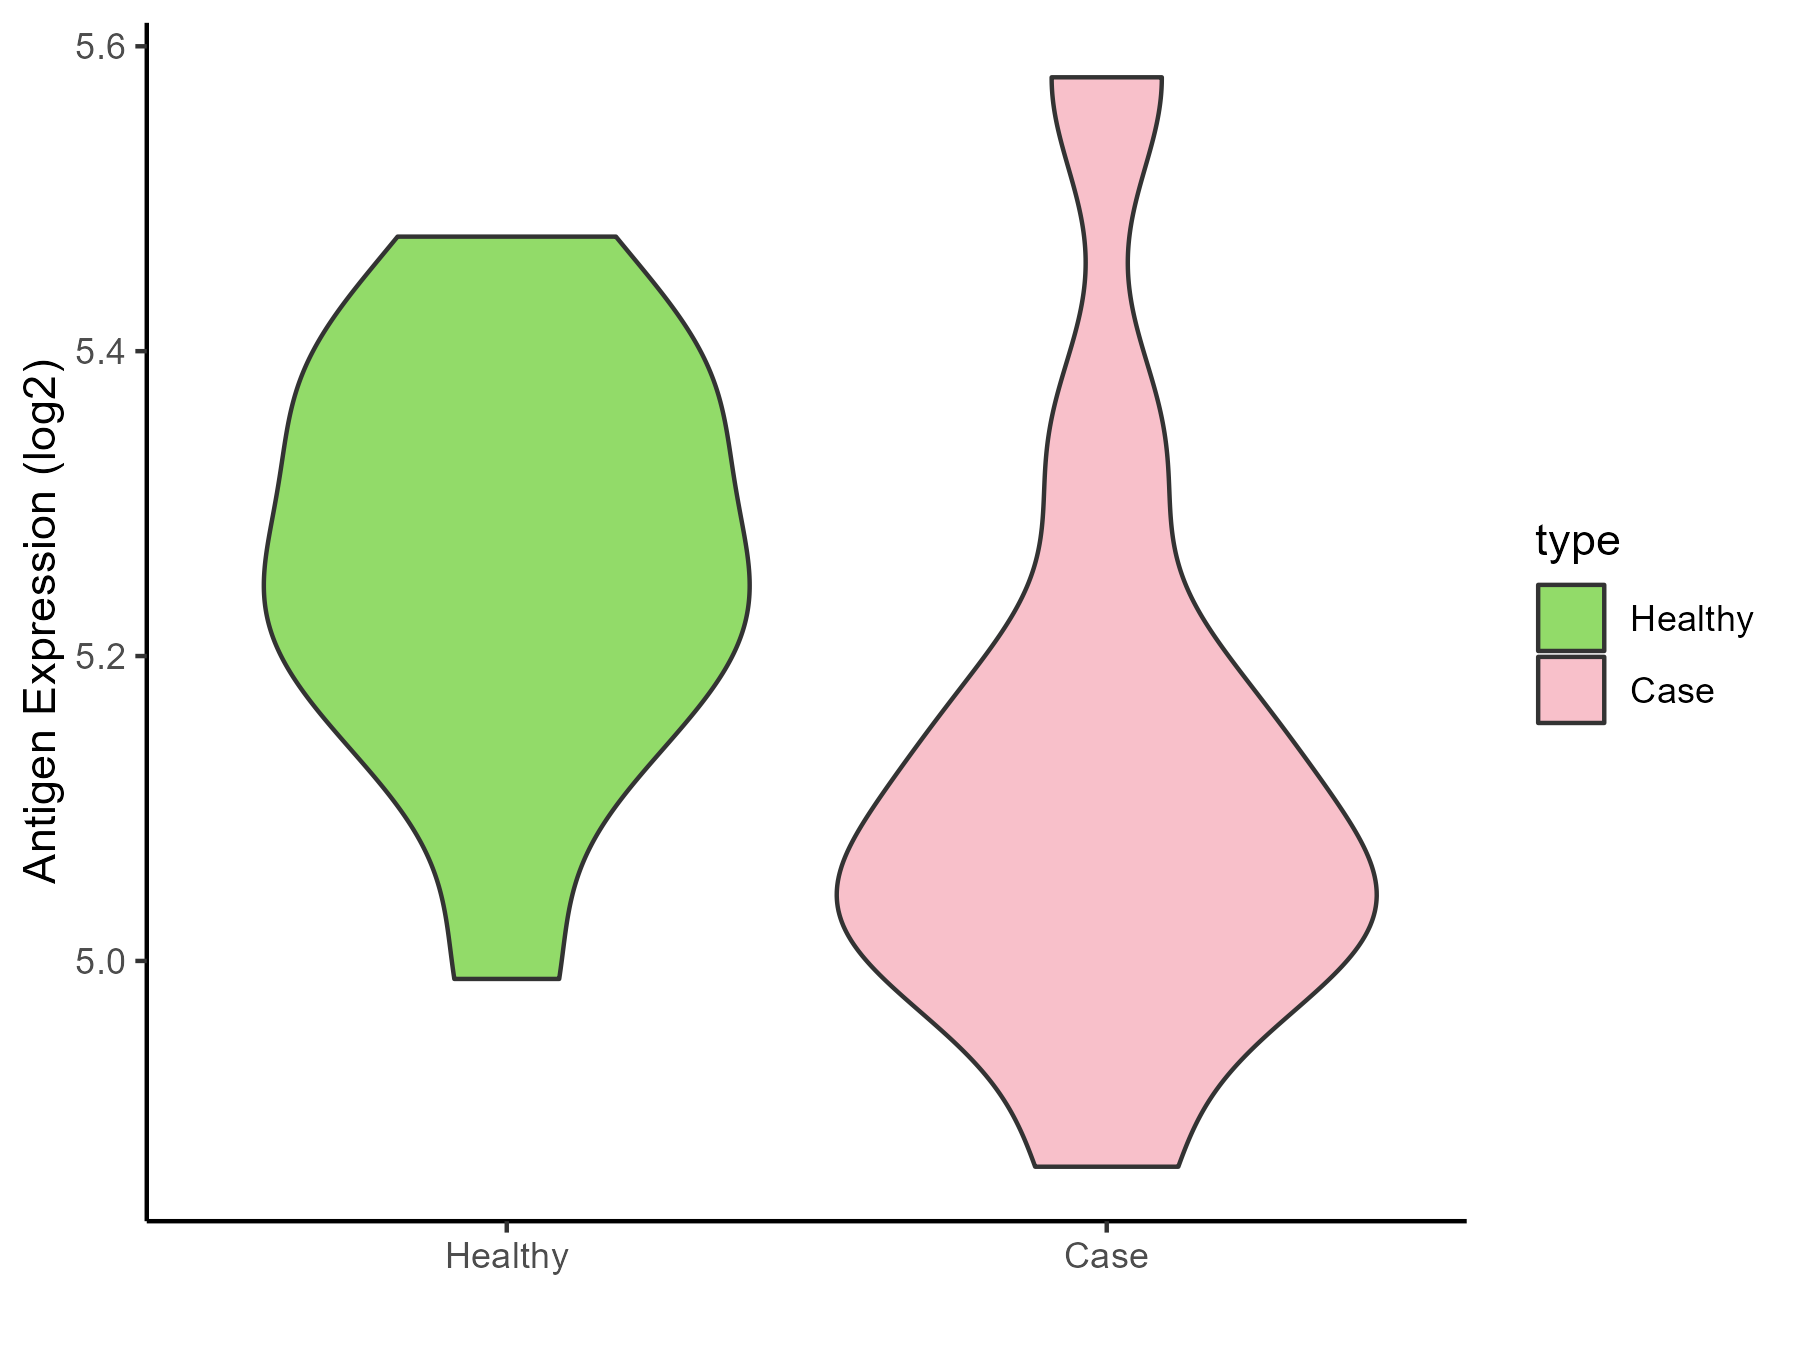
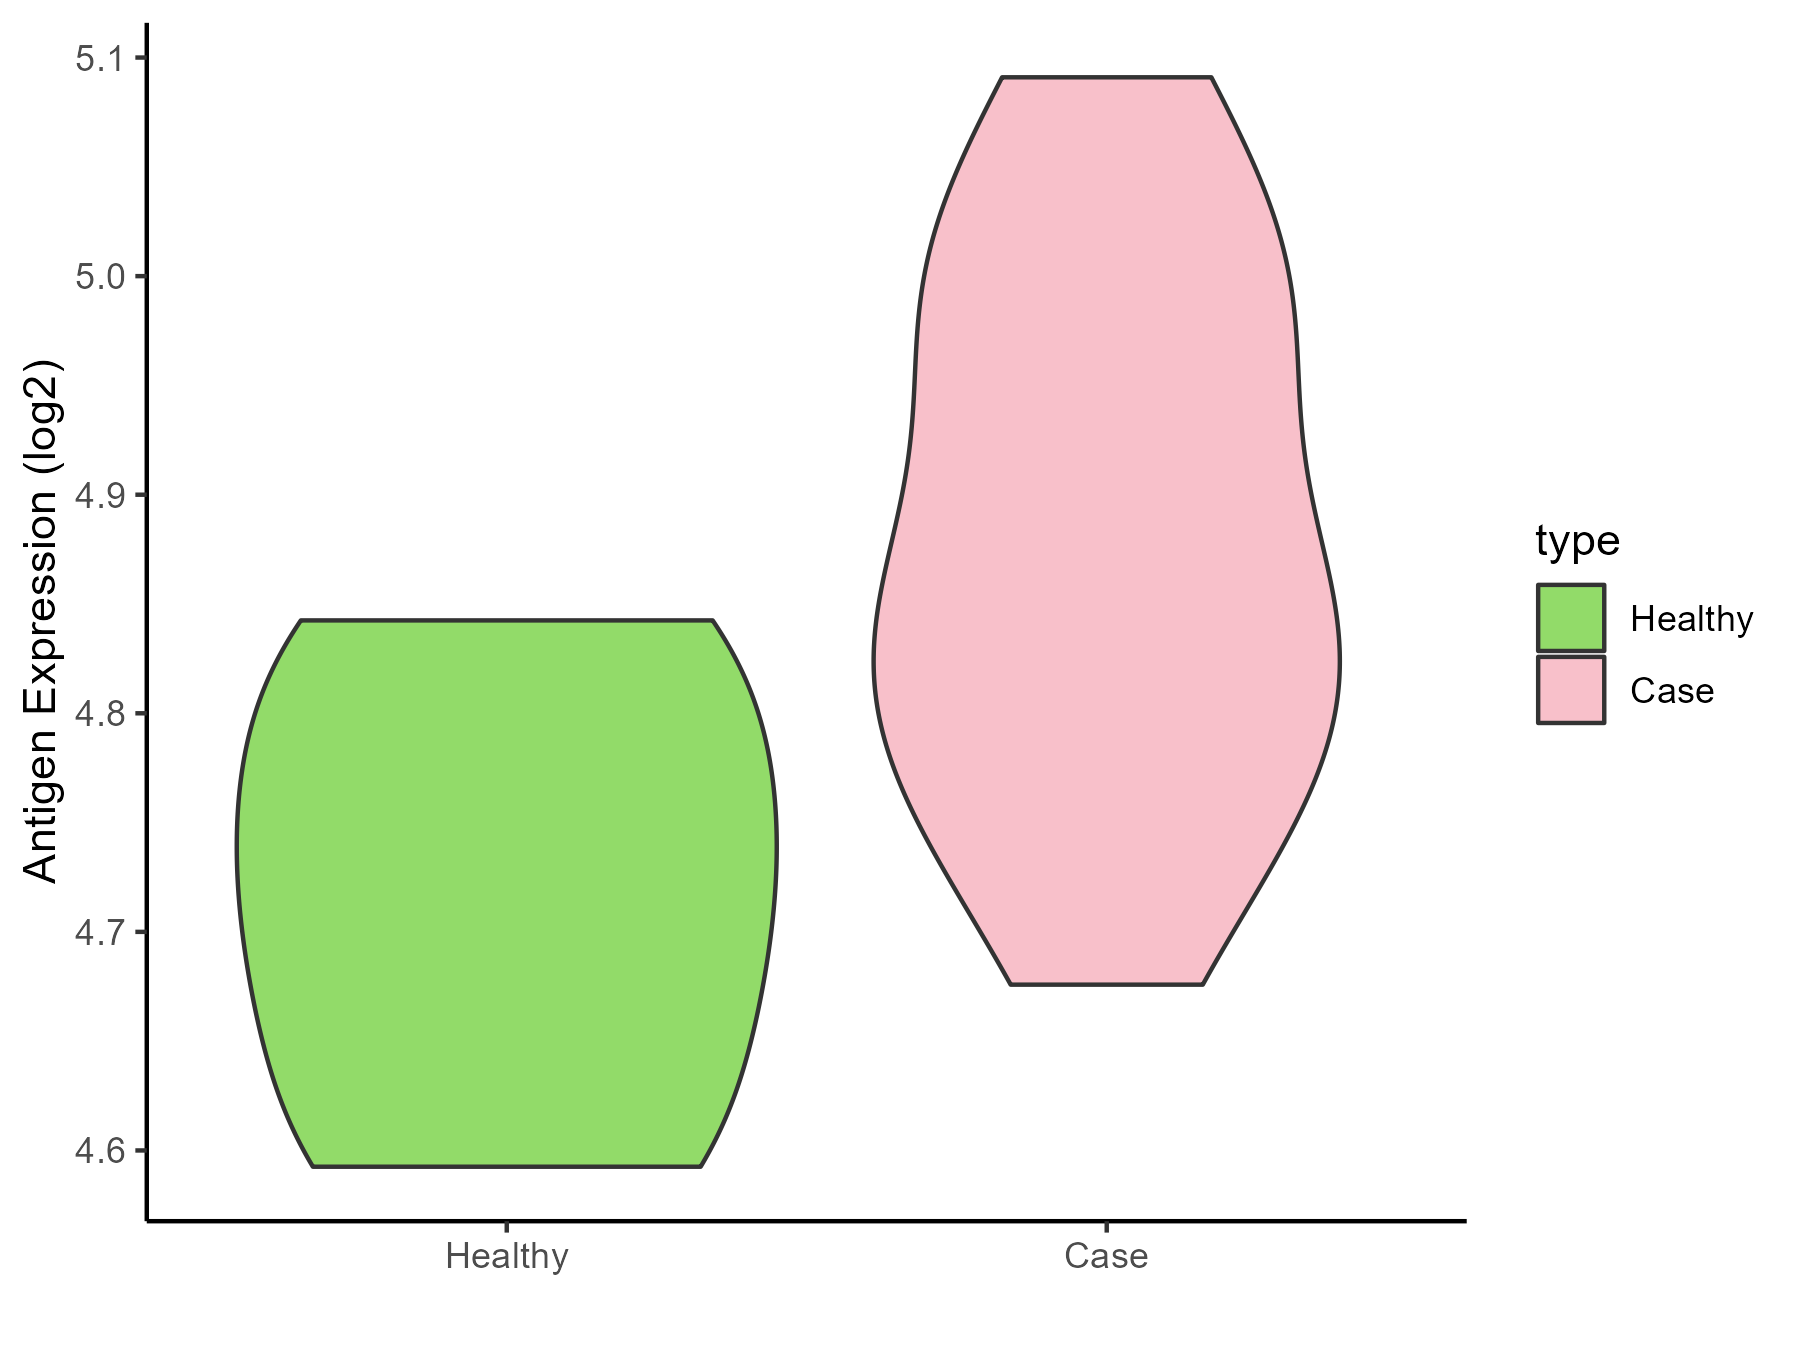
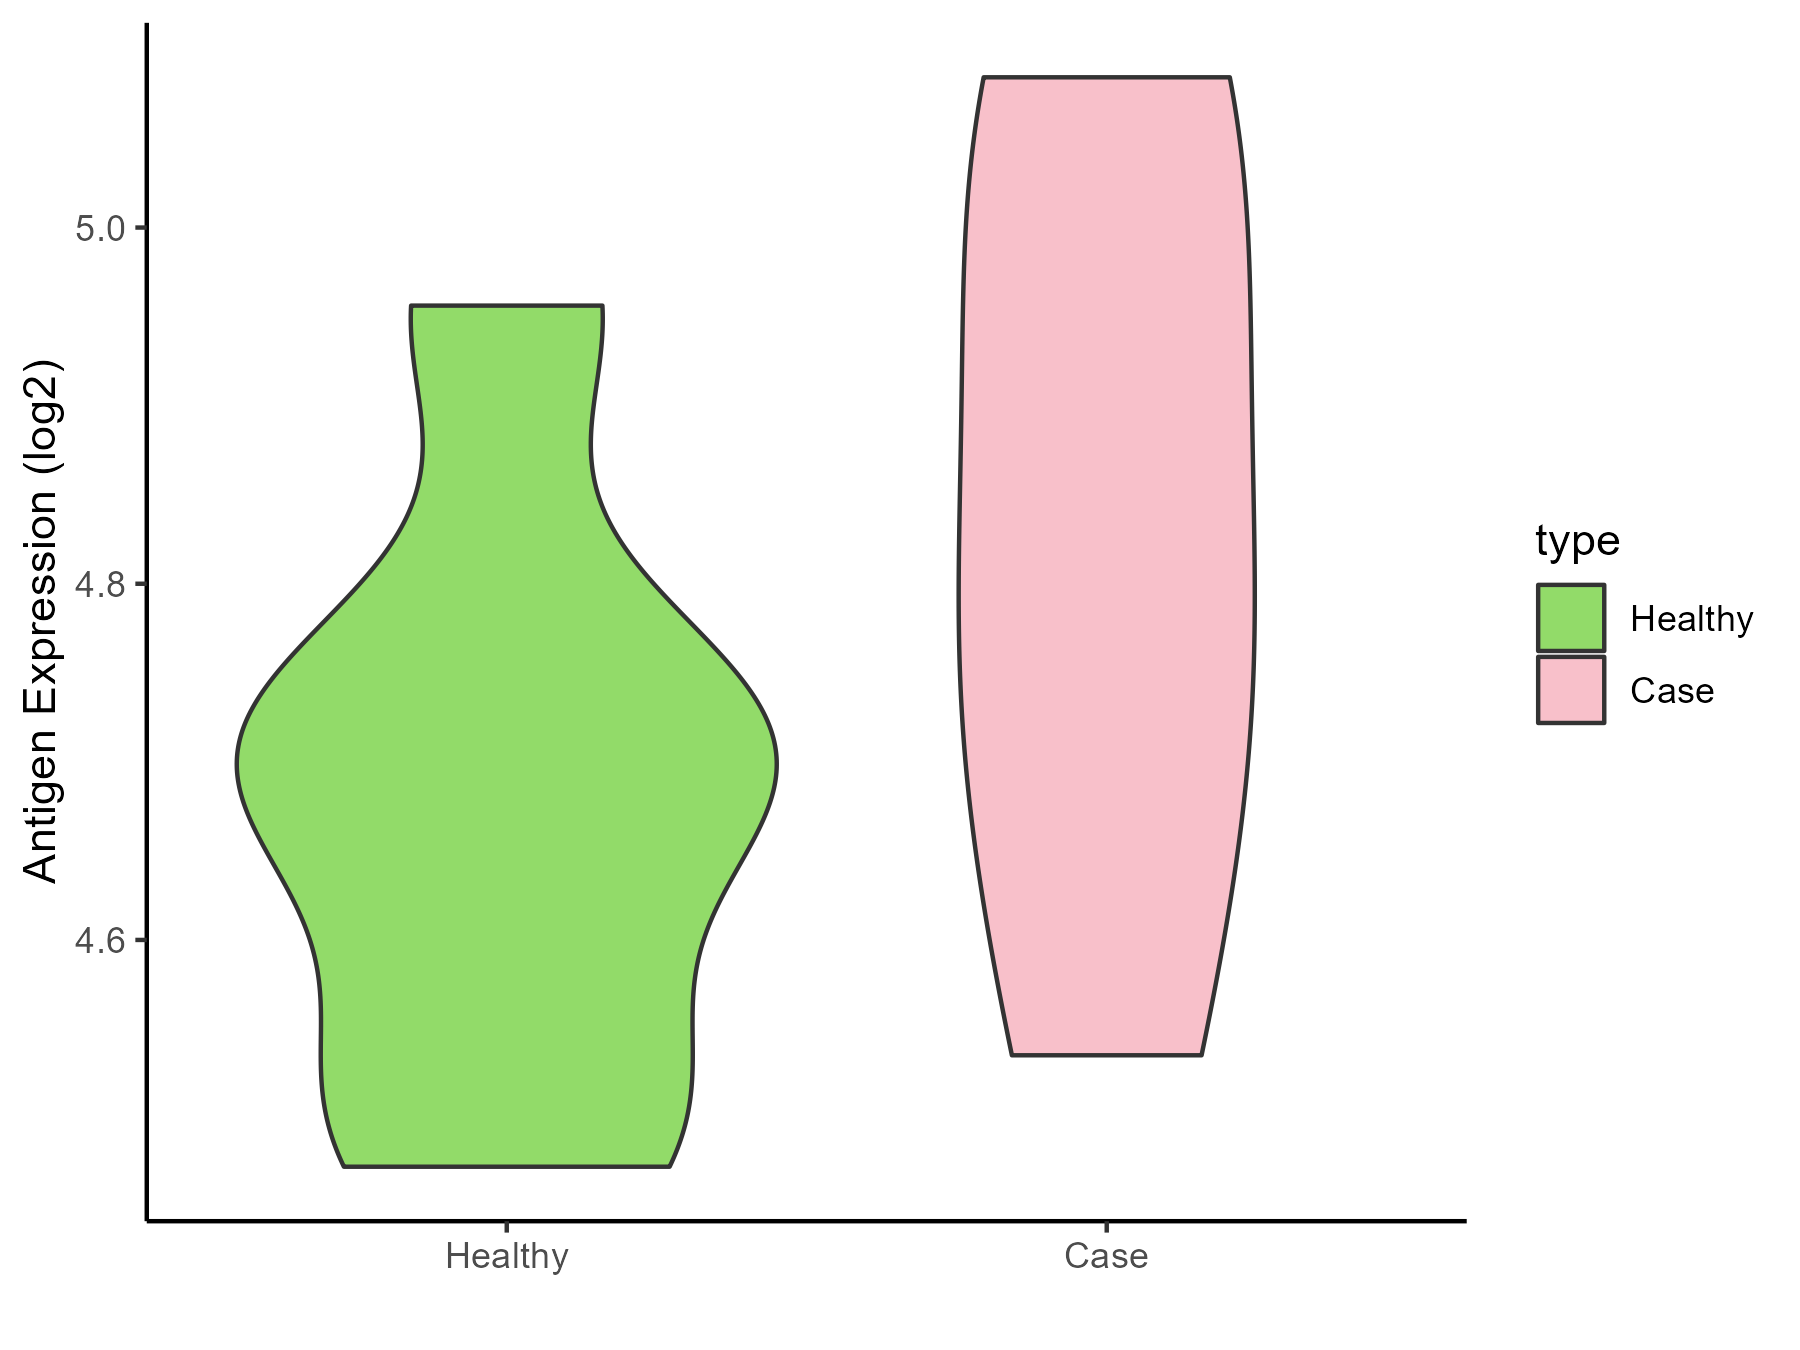
 Bacterial infection [ICD-11: 1A00-1C4Z]
Click to Show/Hide
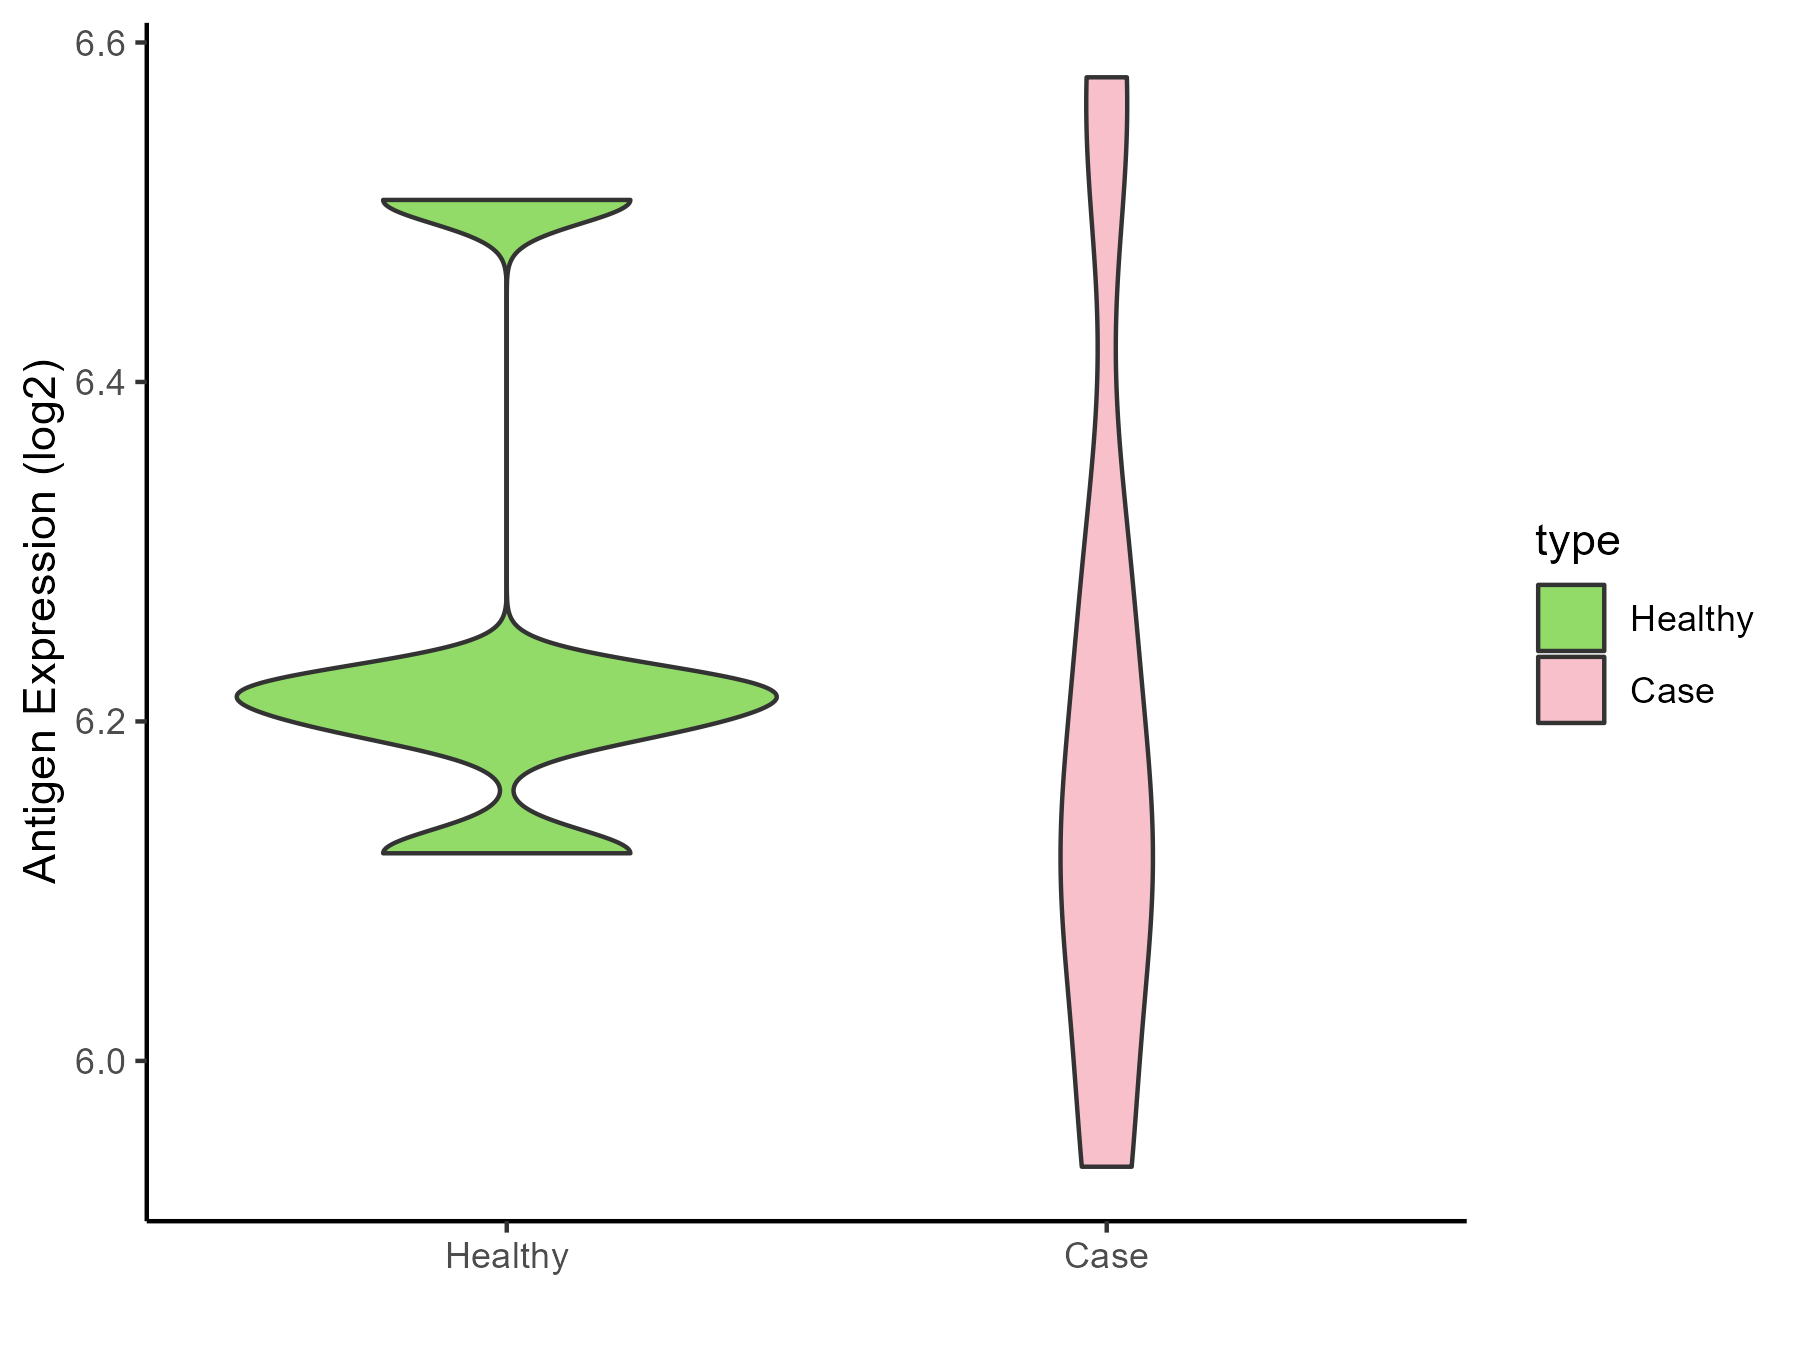
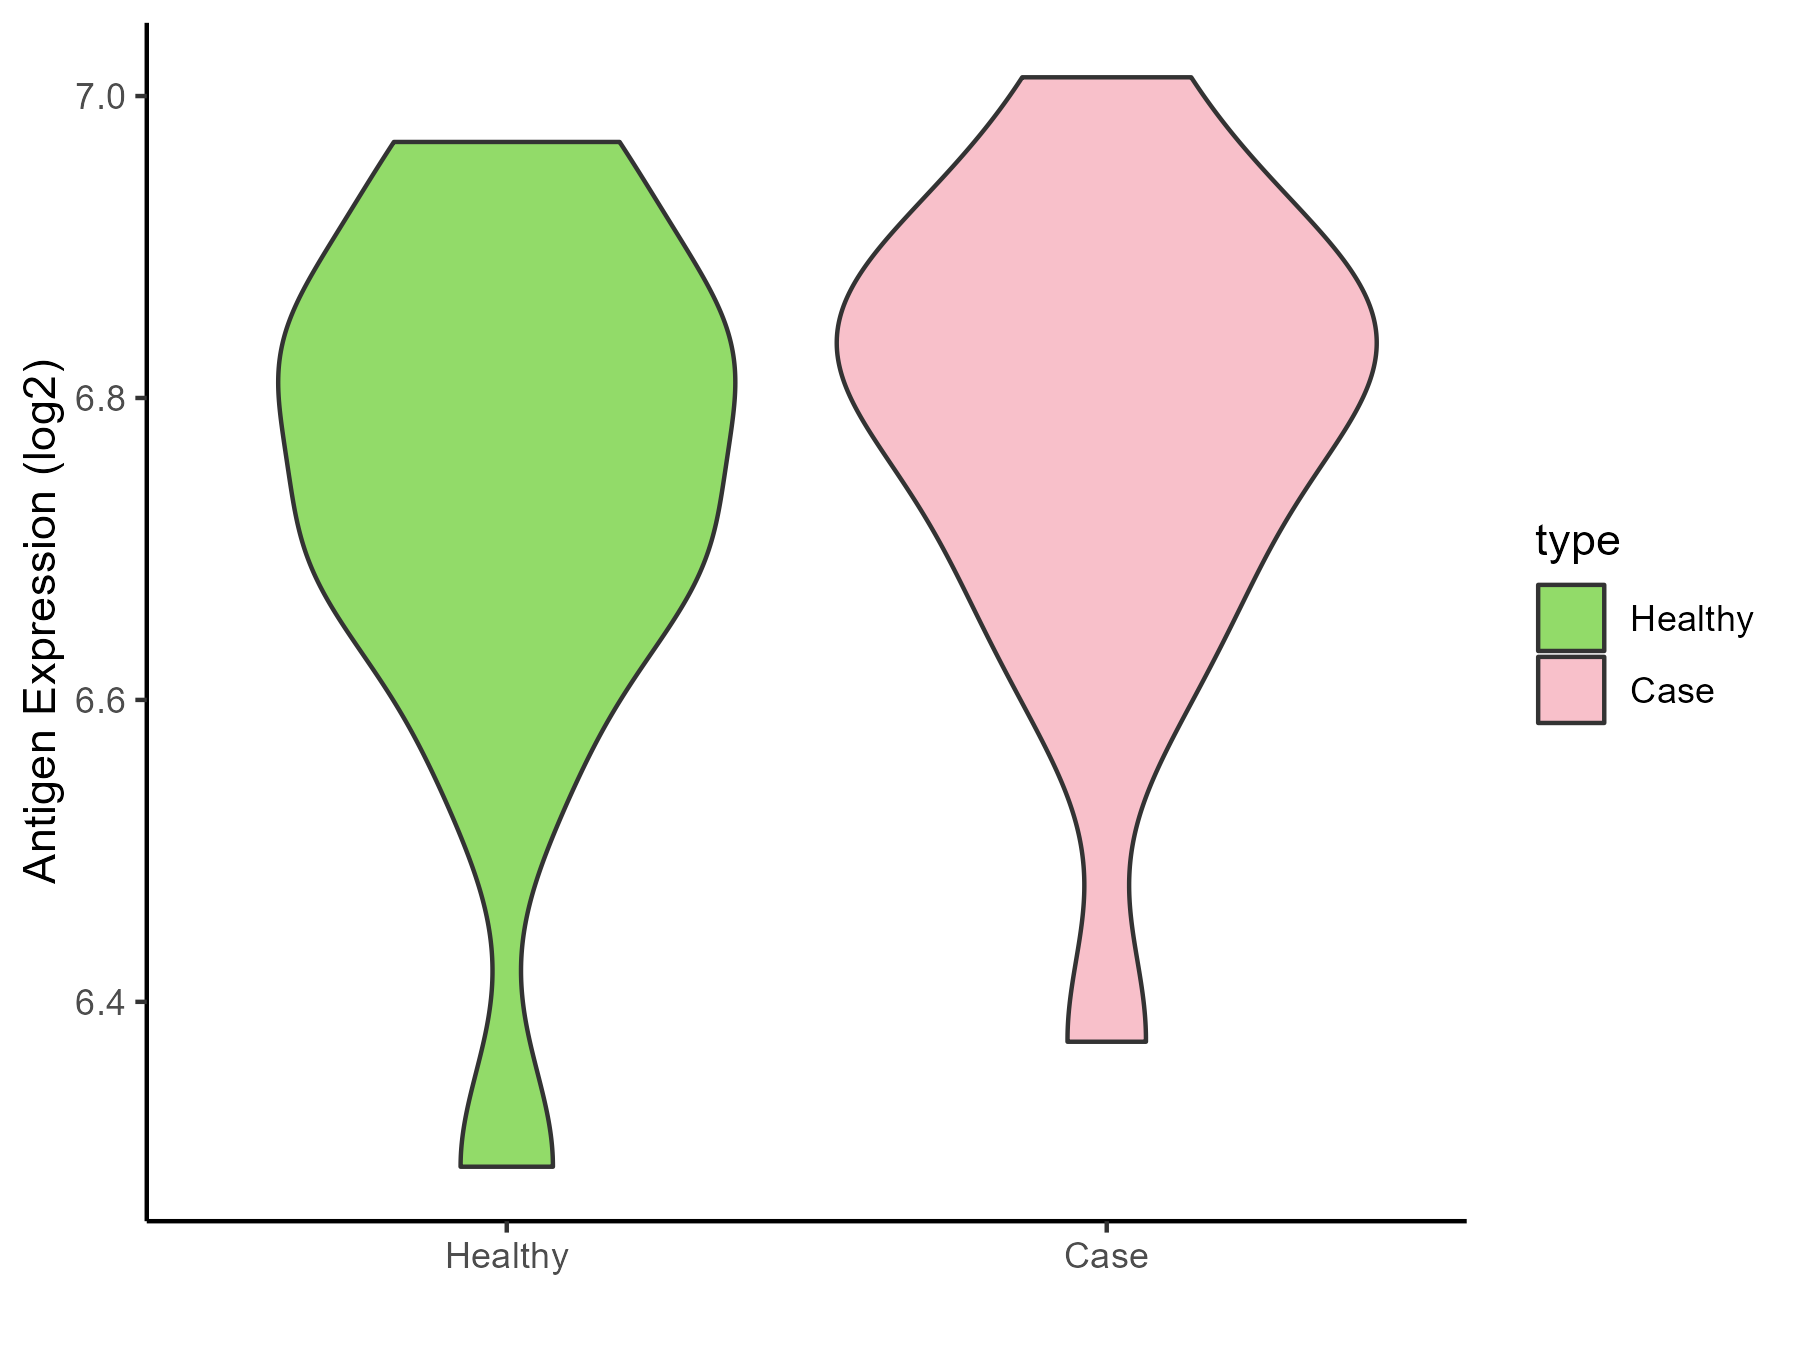
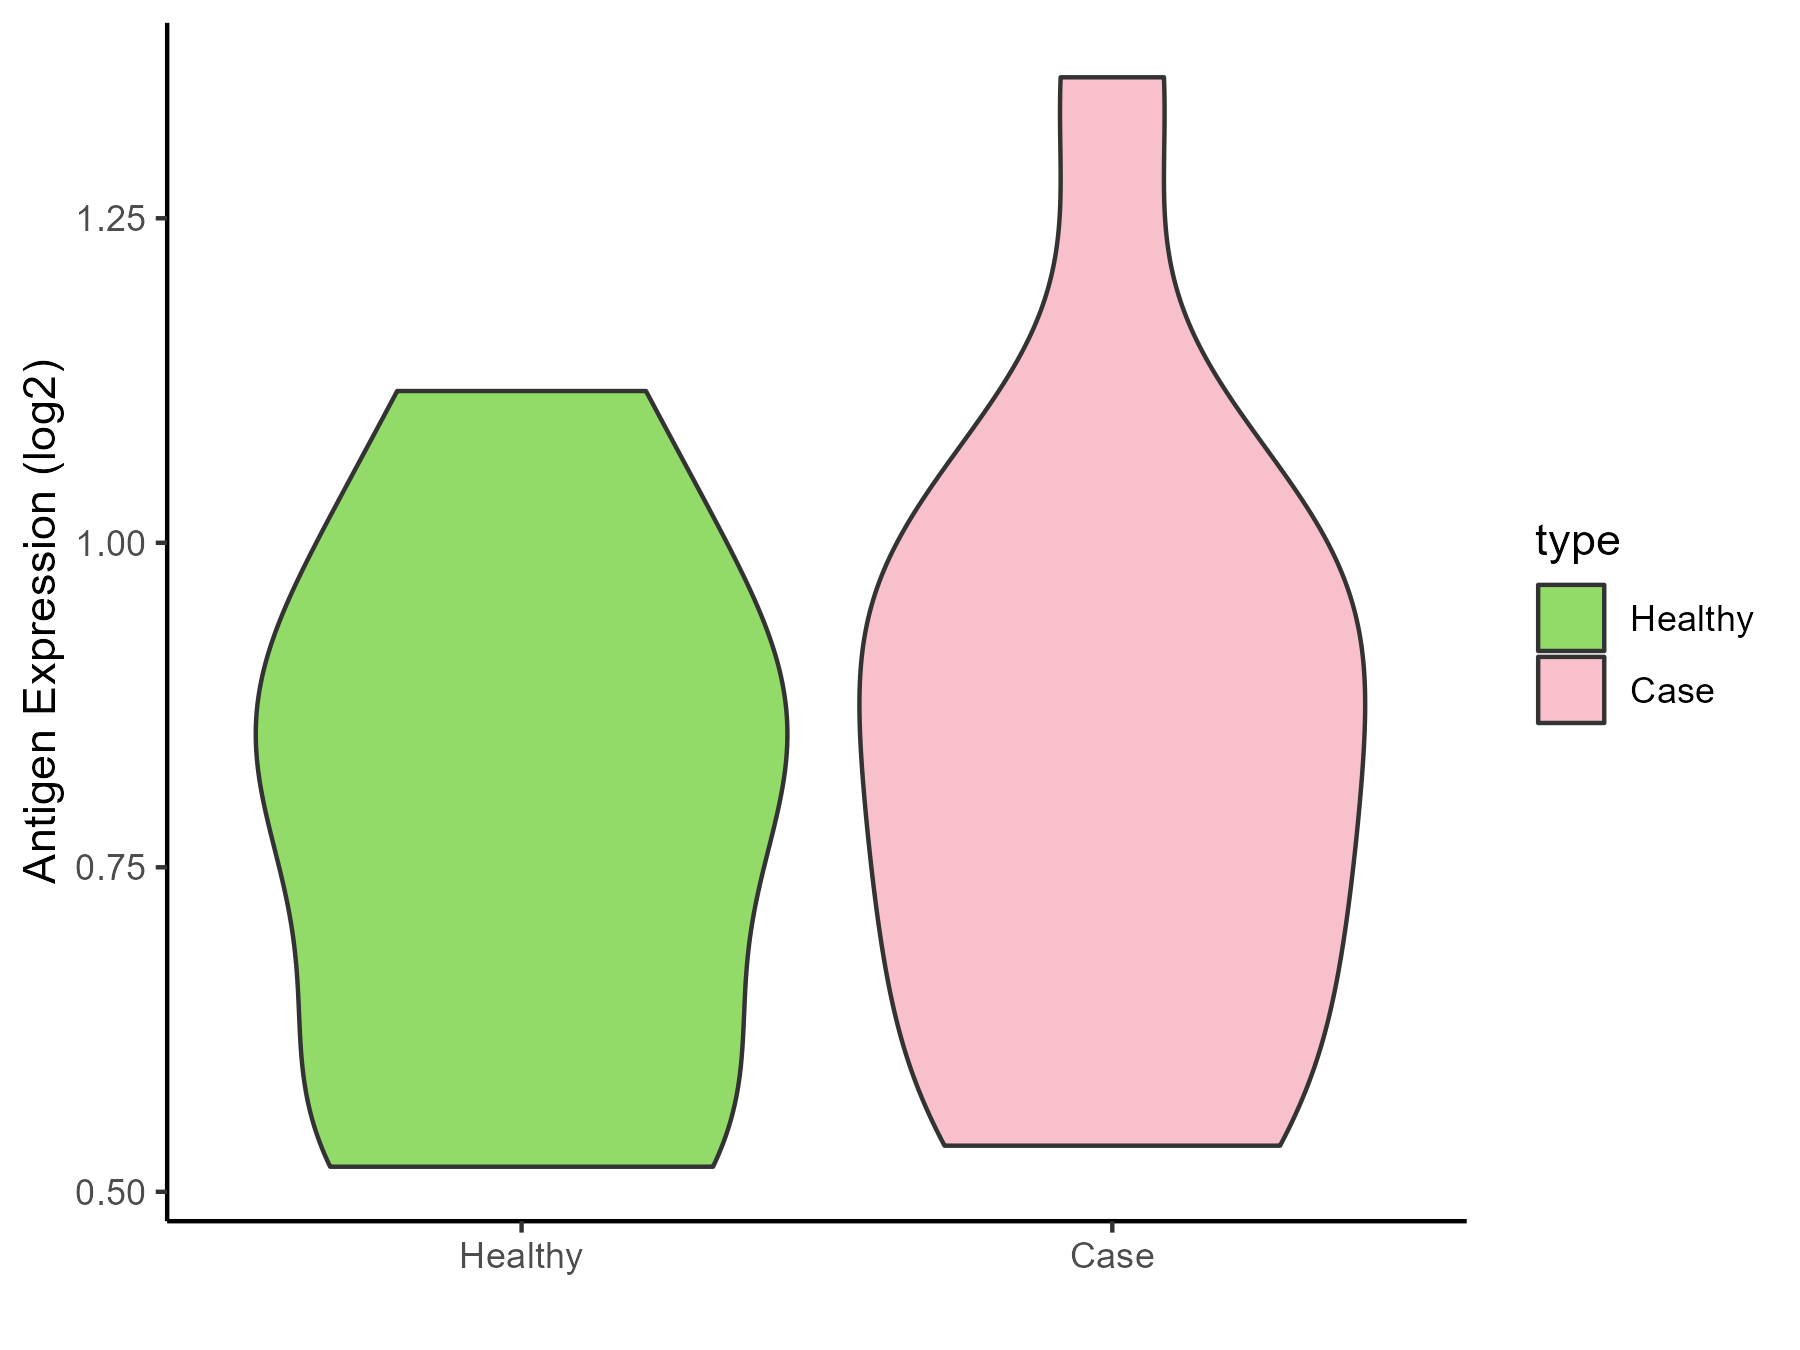
| Differential expression pattern of antigen in diseases |
| The Studied Tissue |
Gingival |
| The Specific Disease |
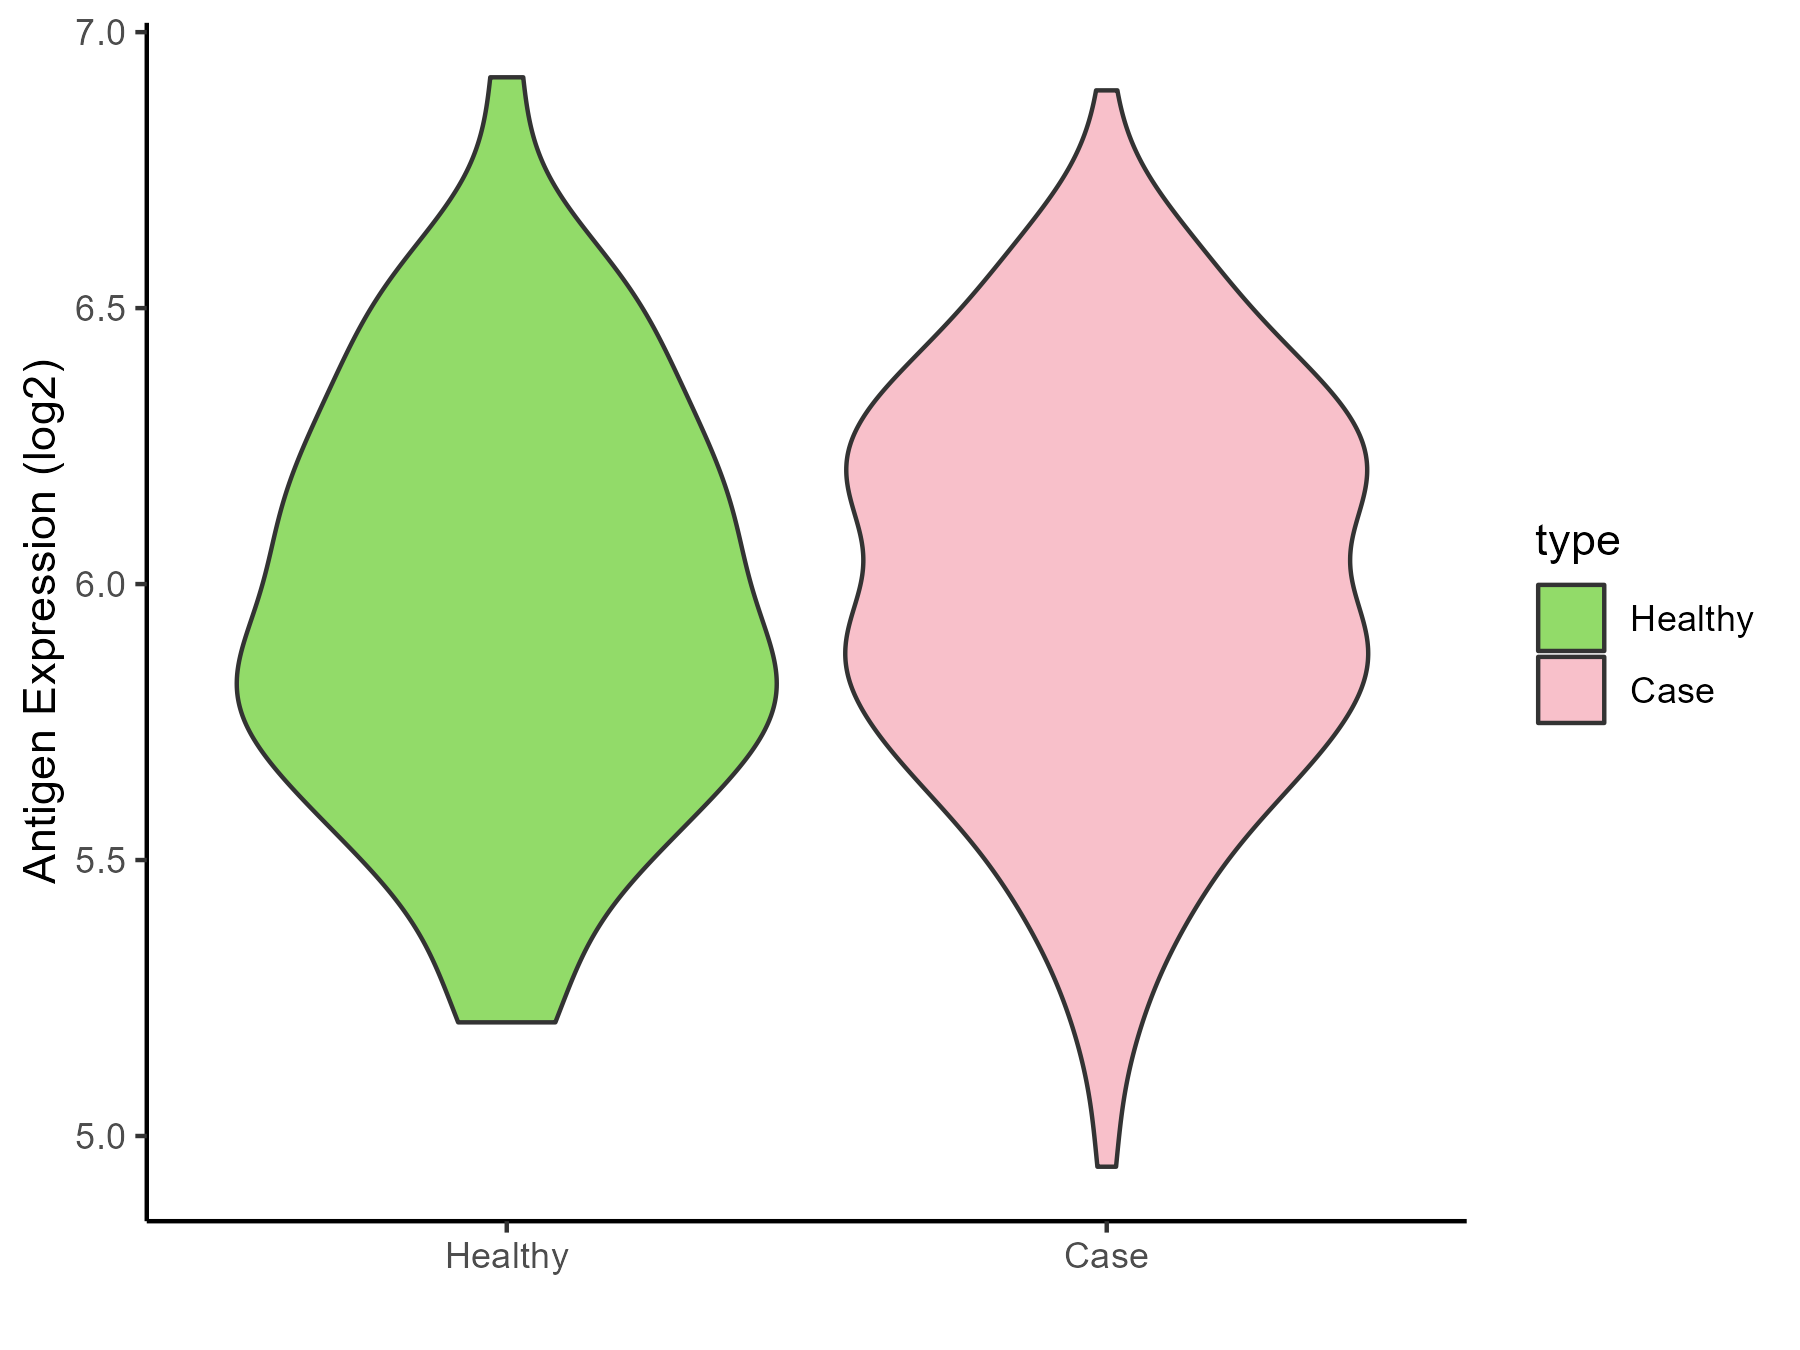
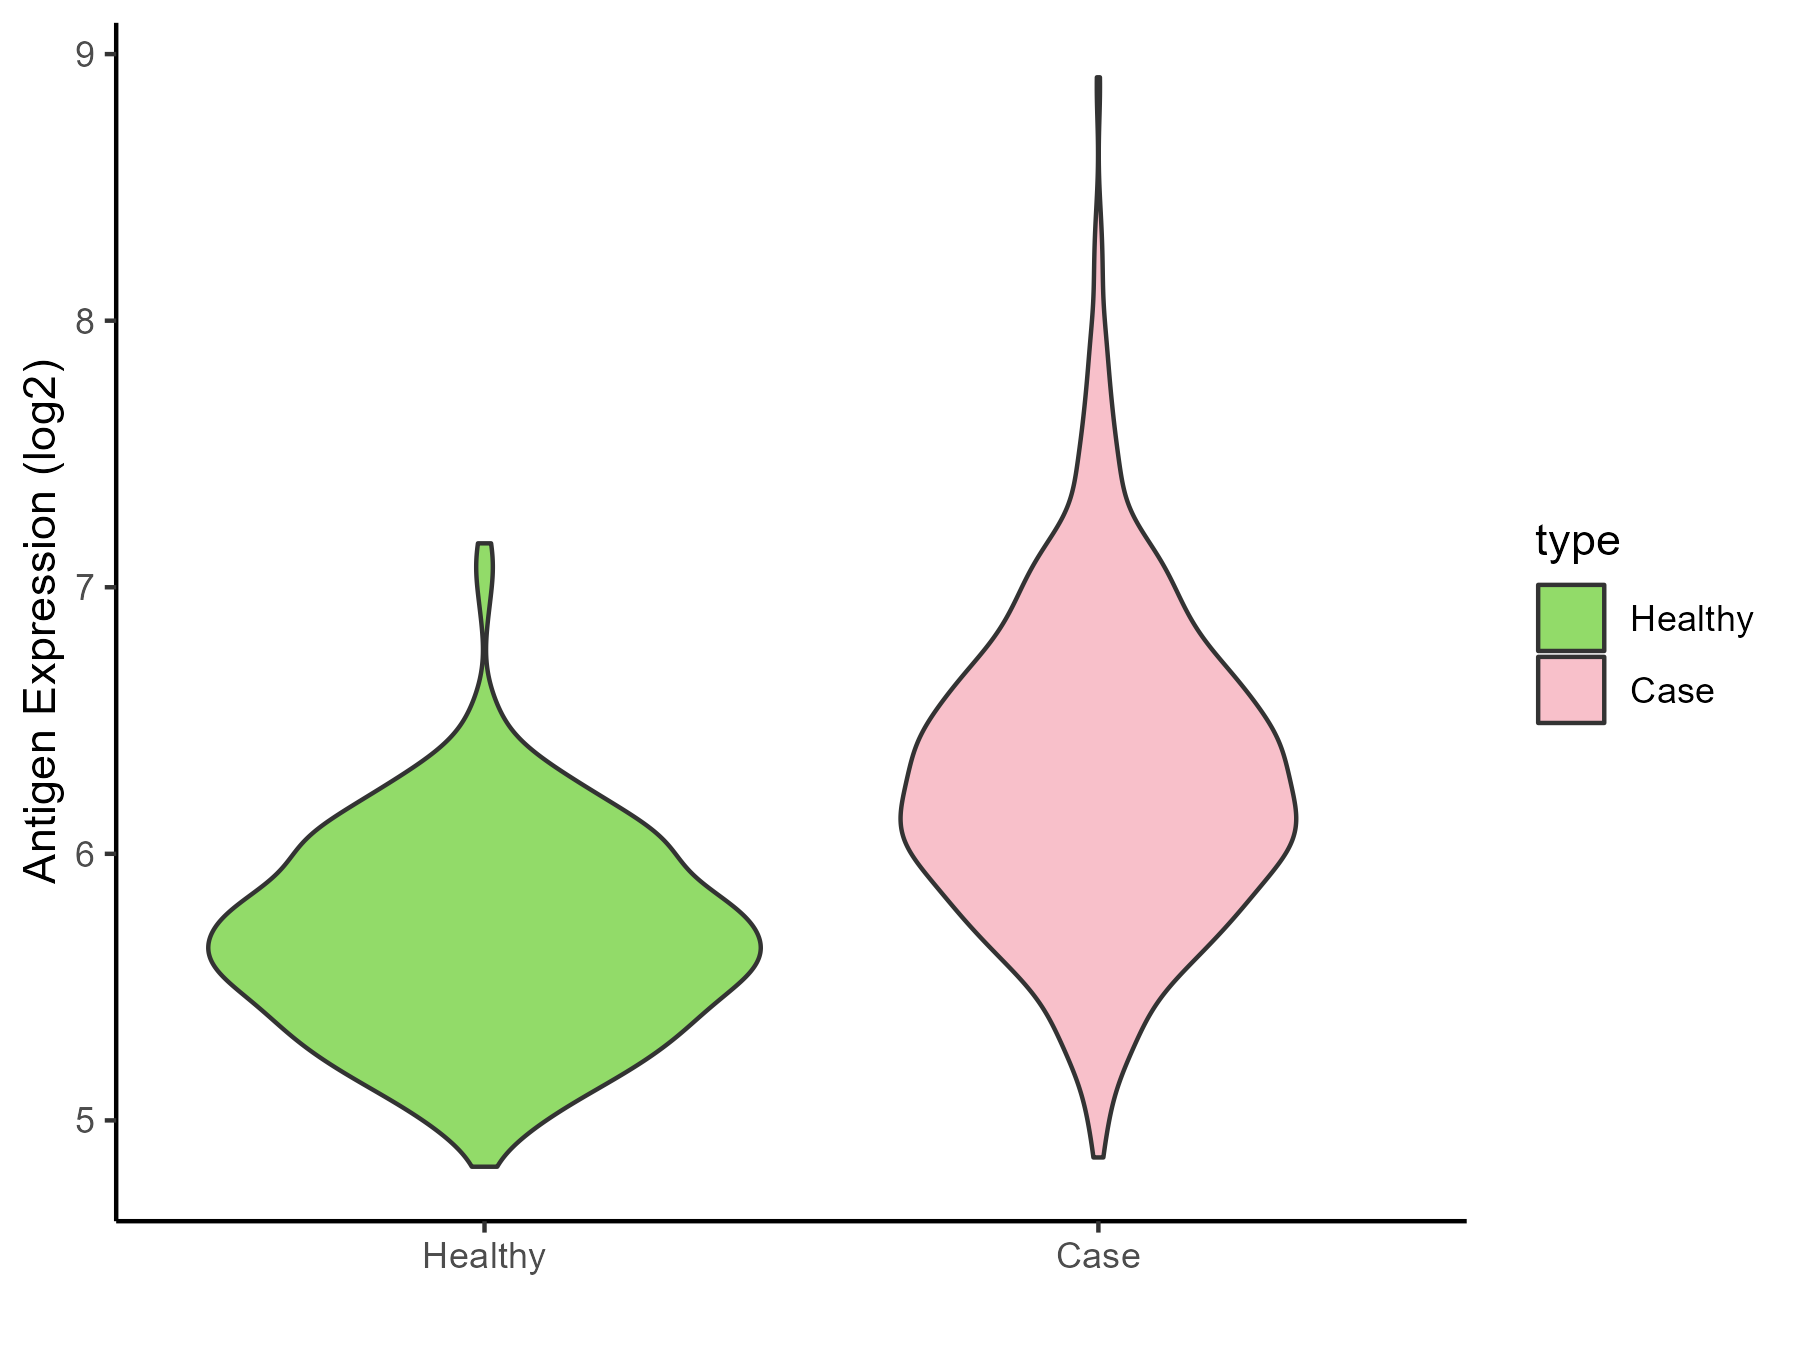
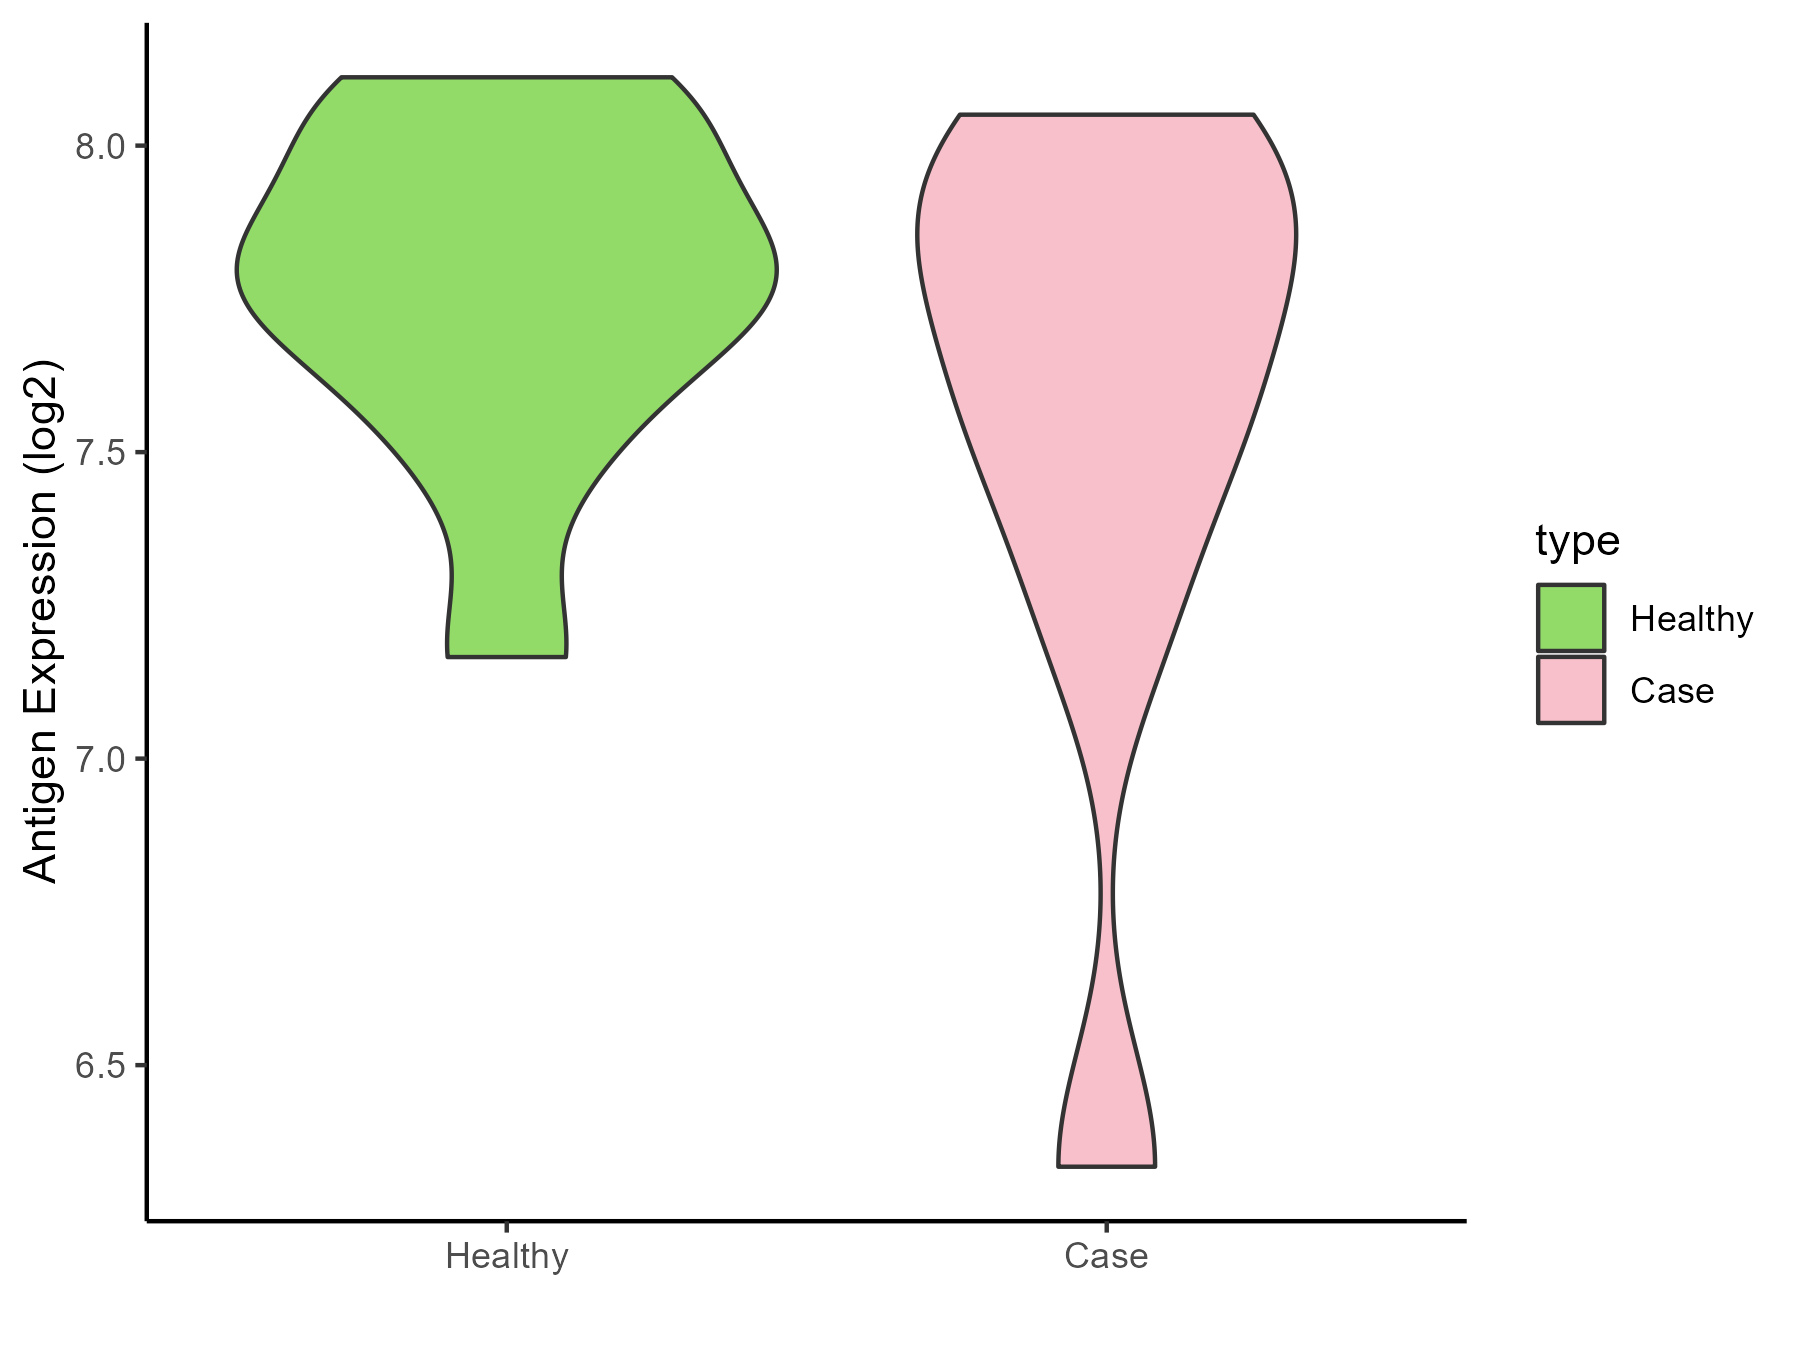
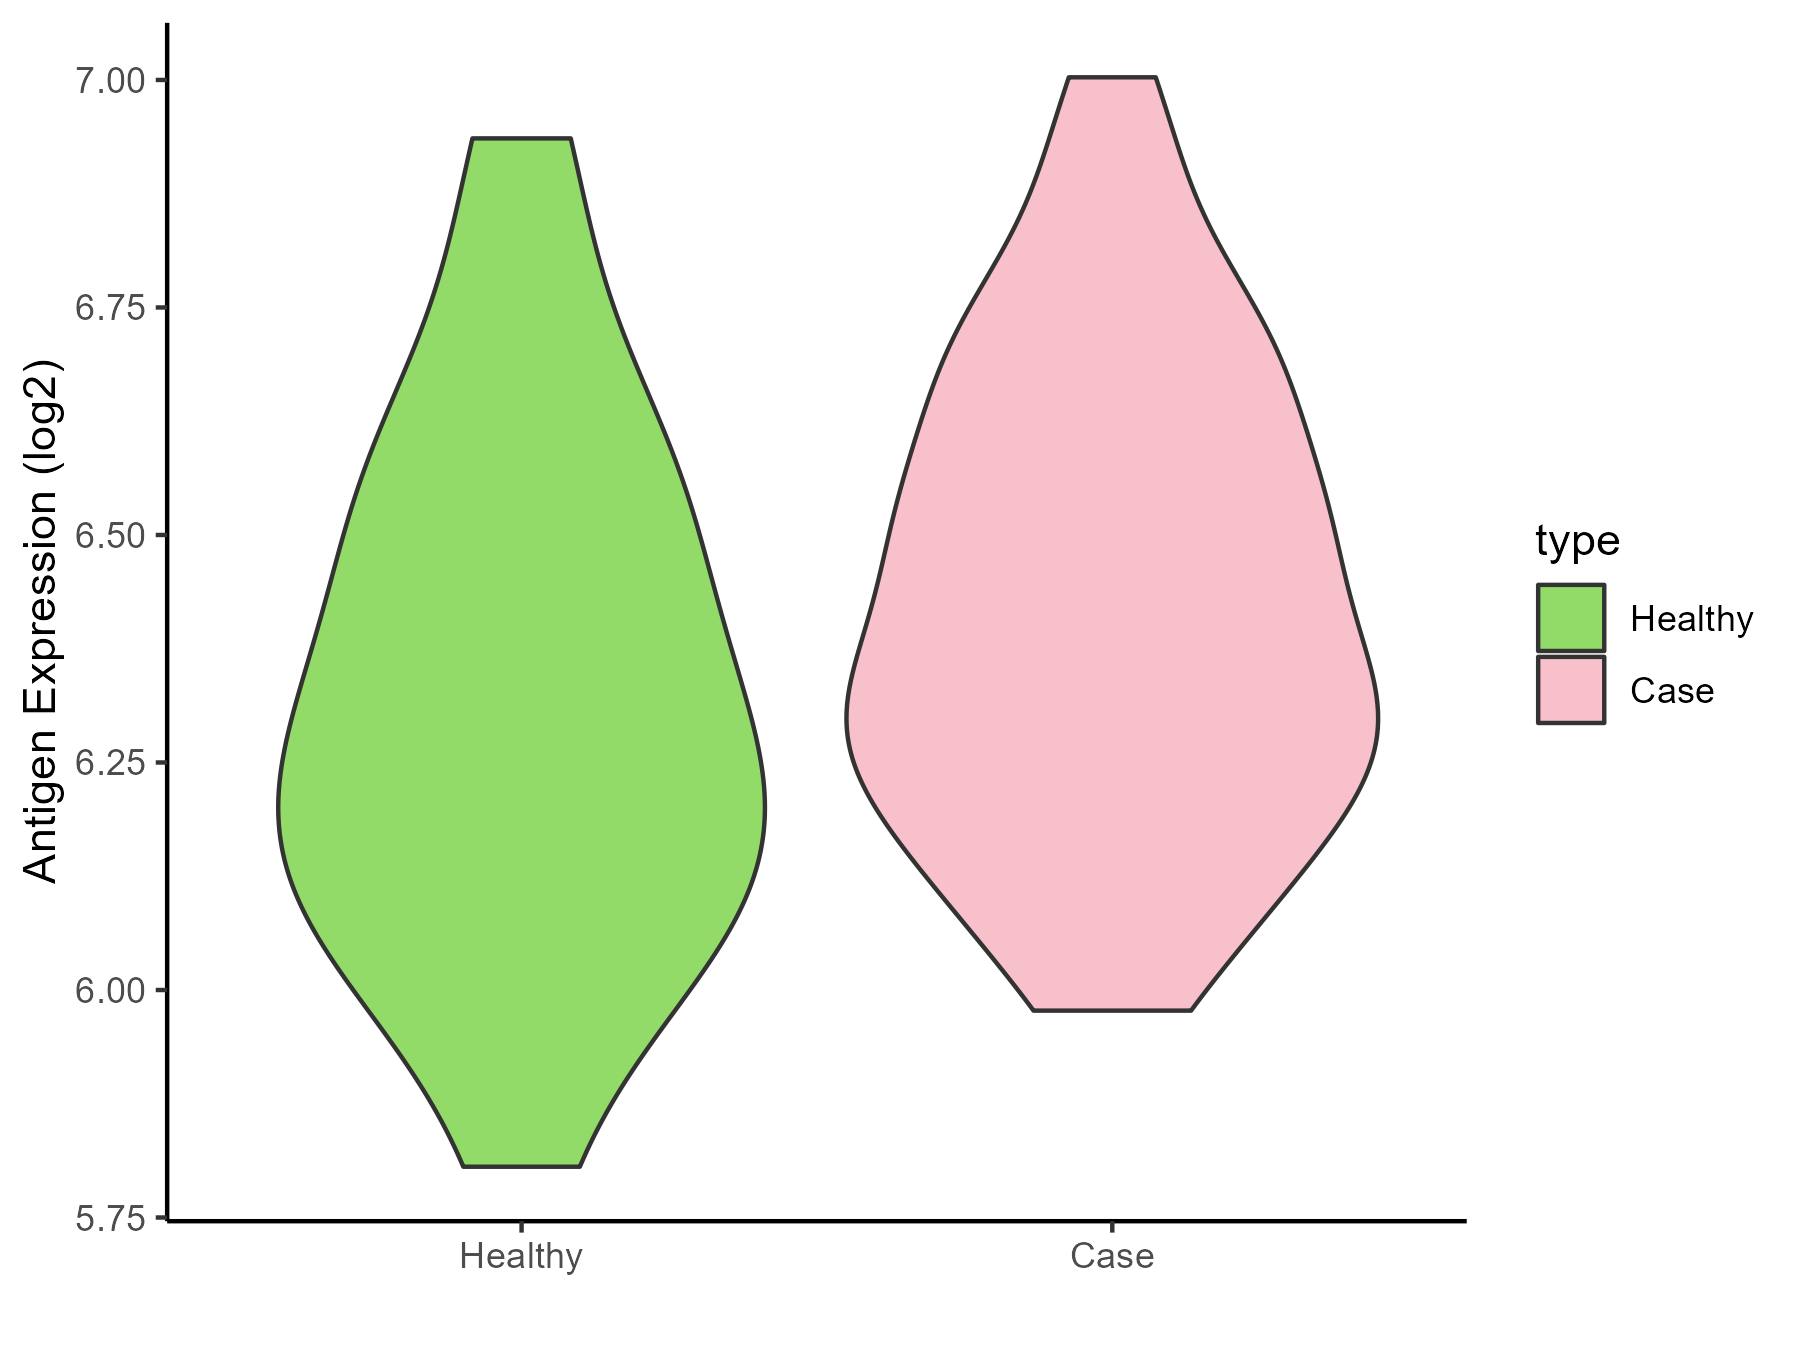
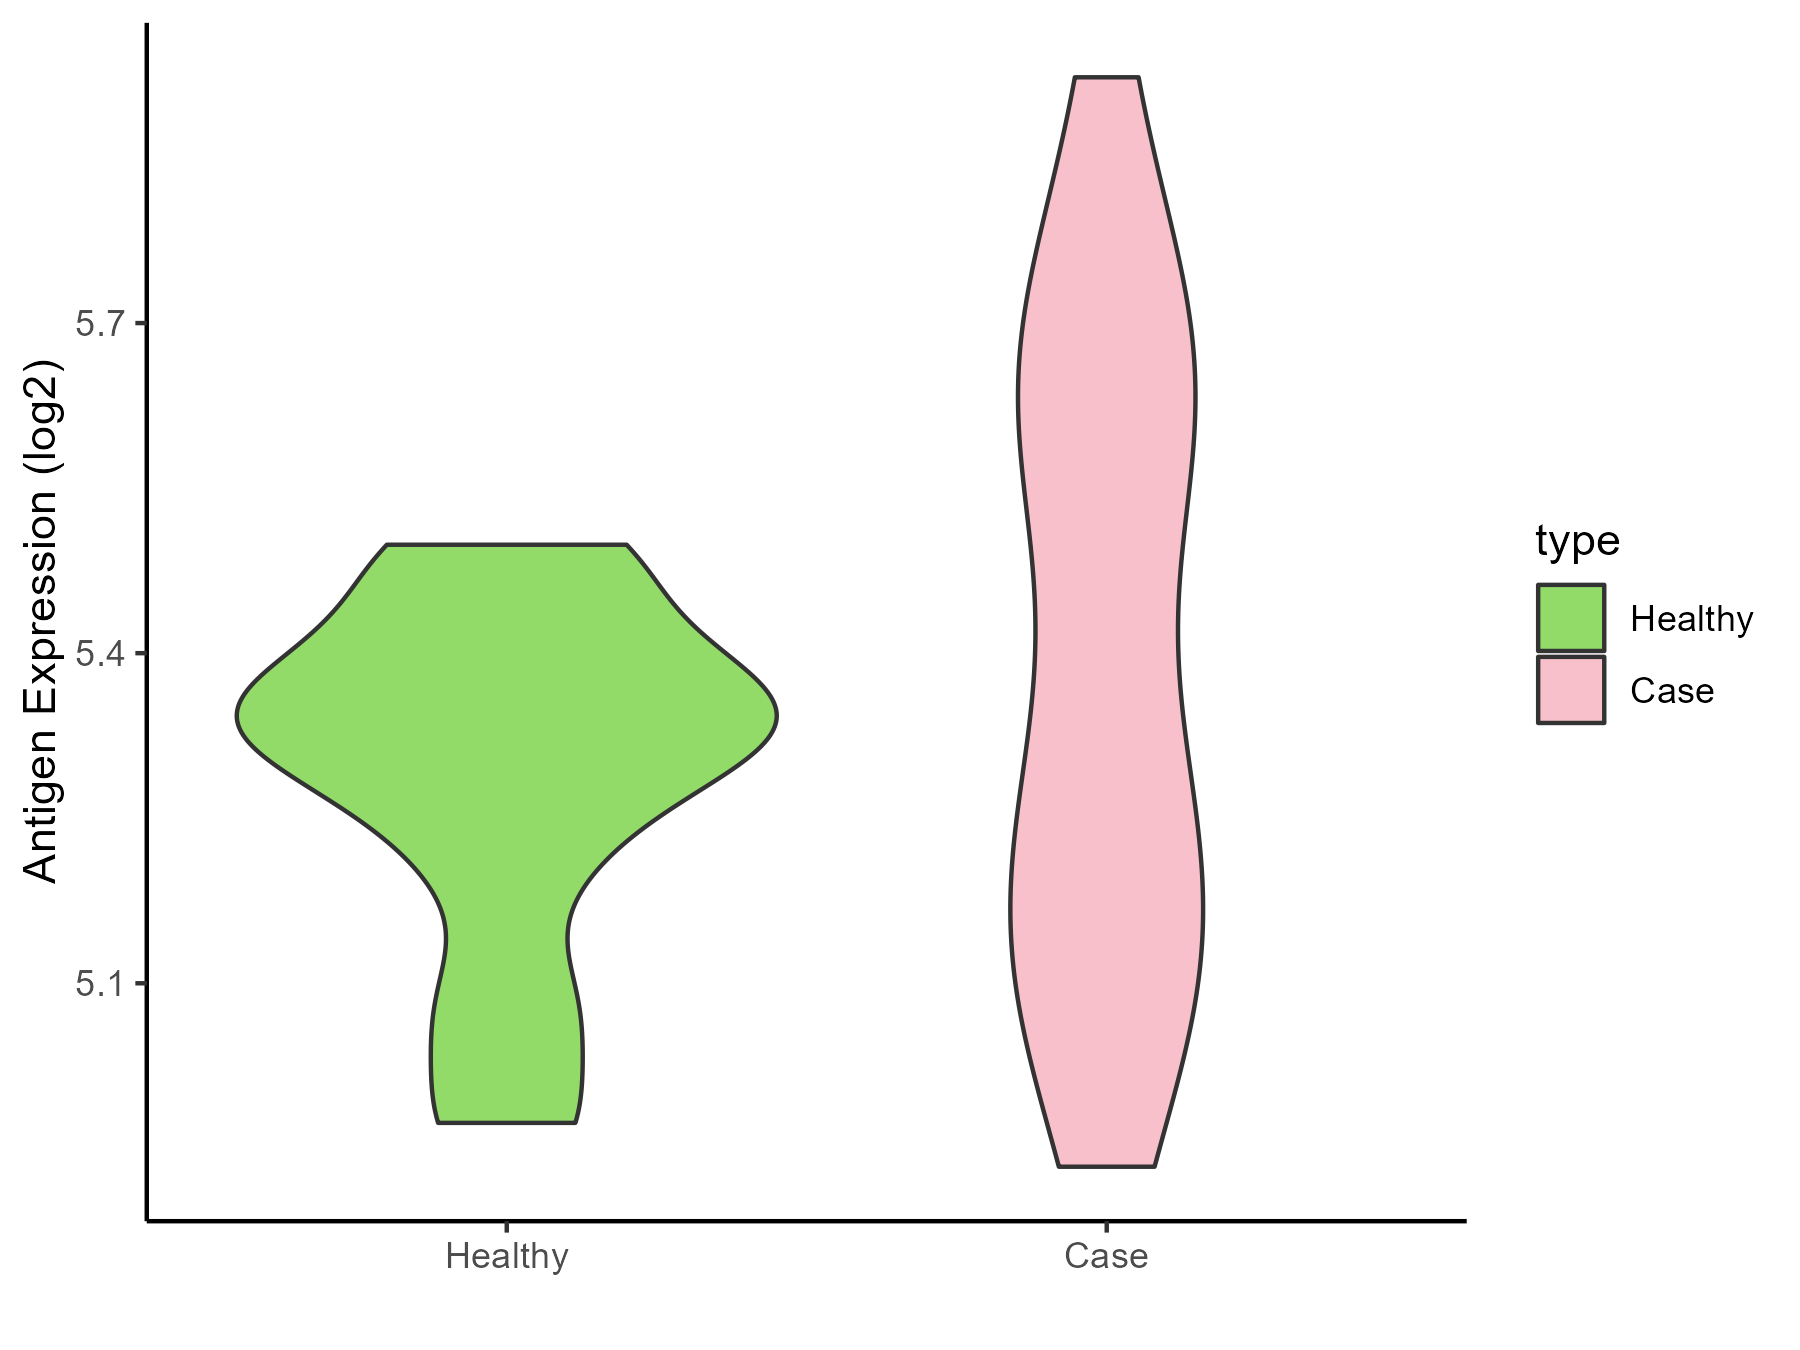
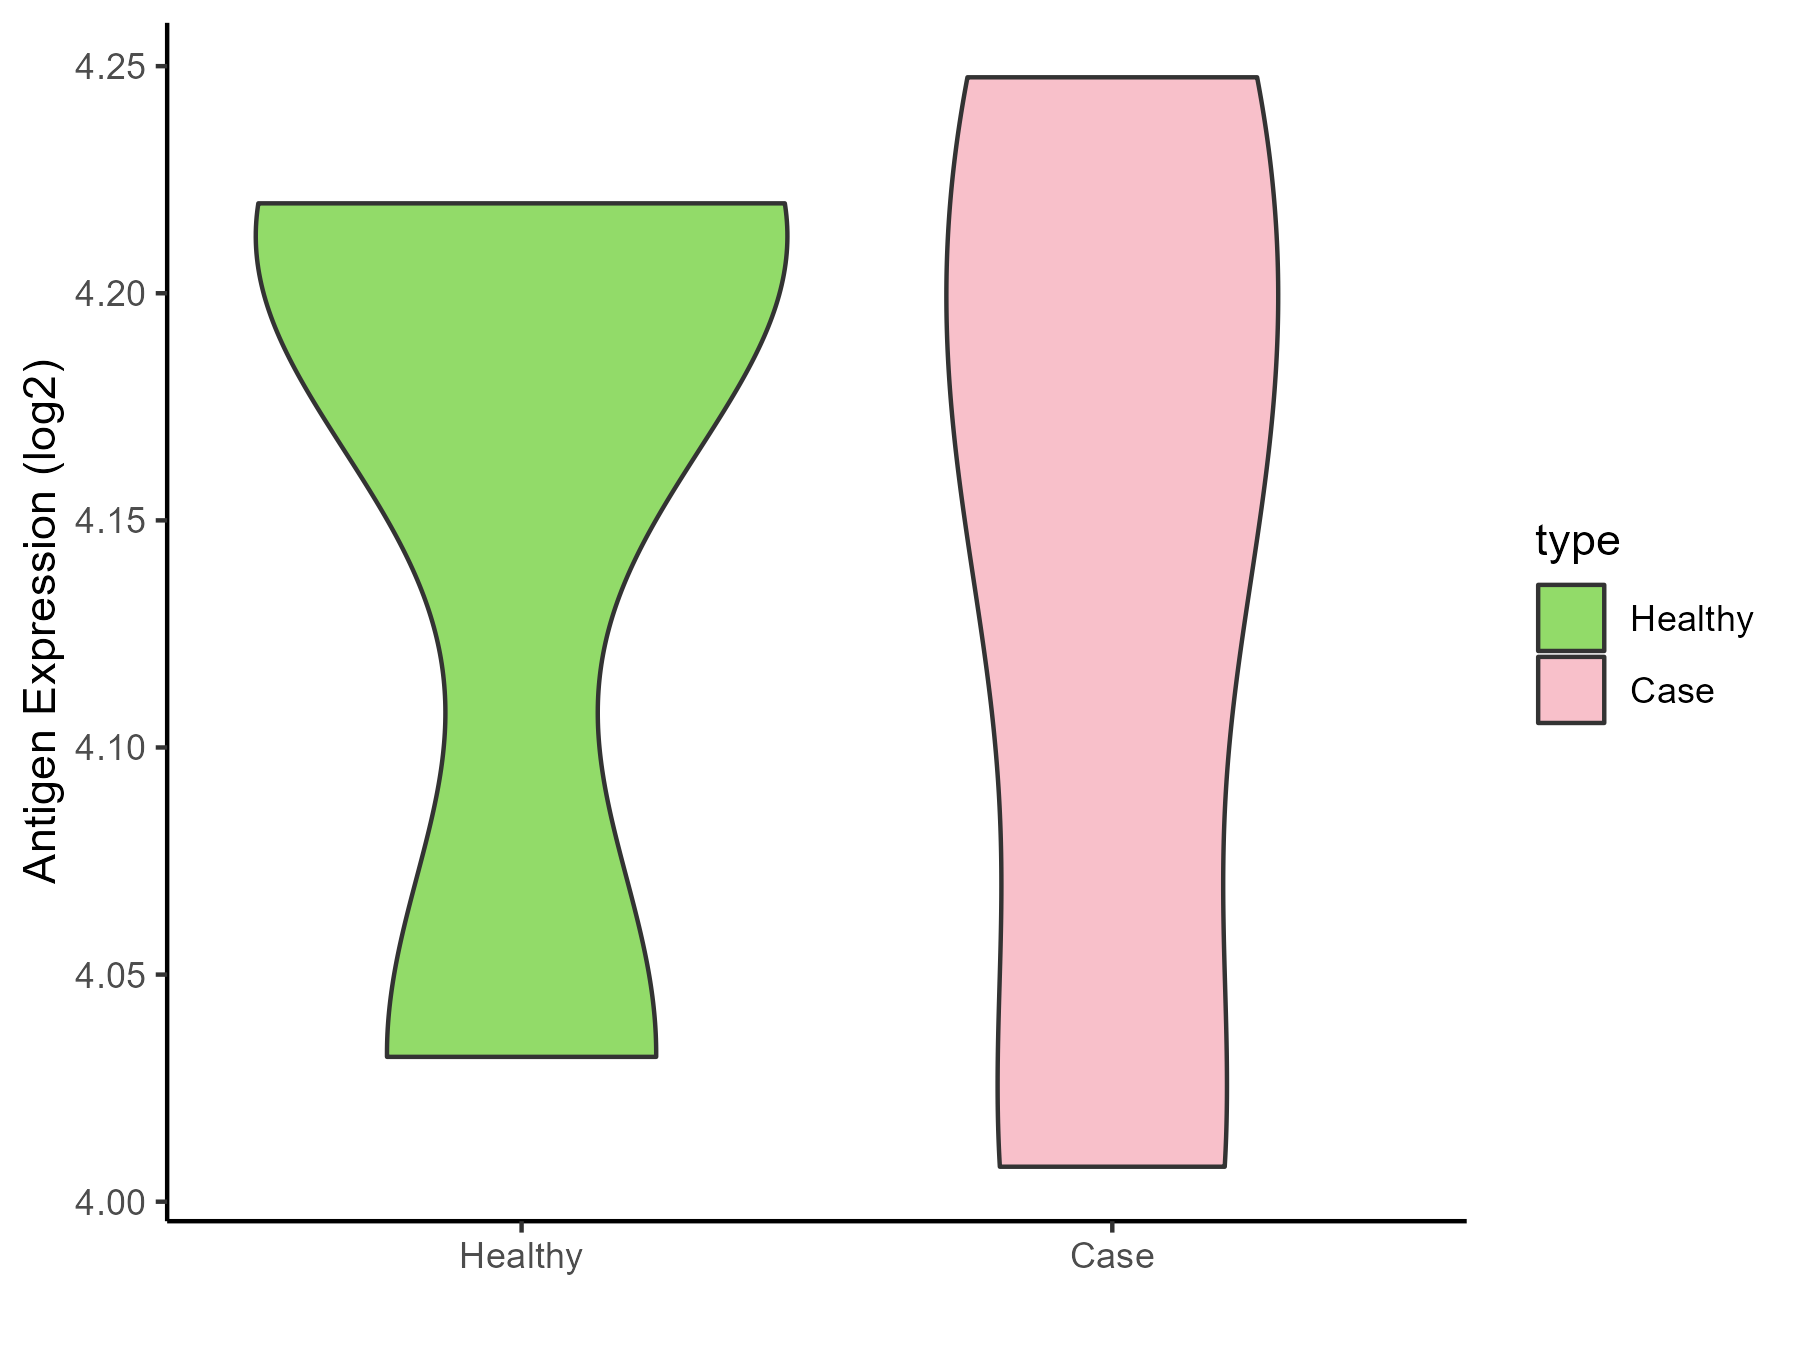
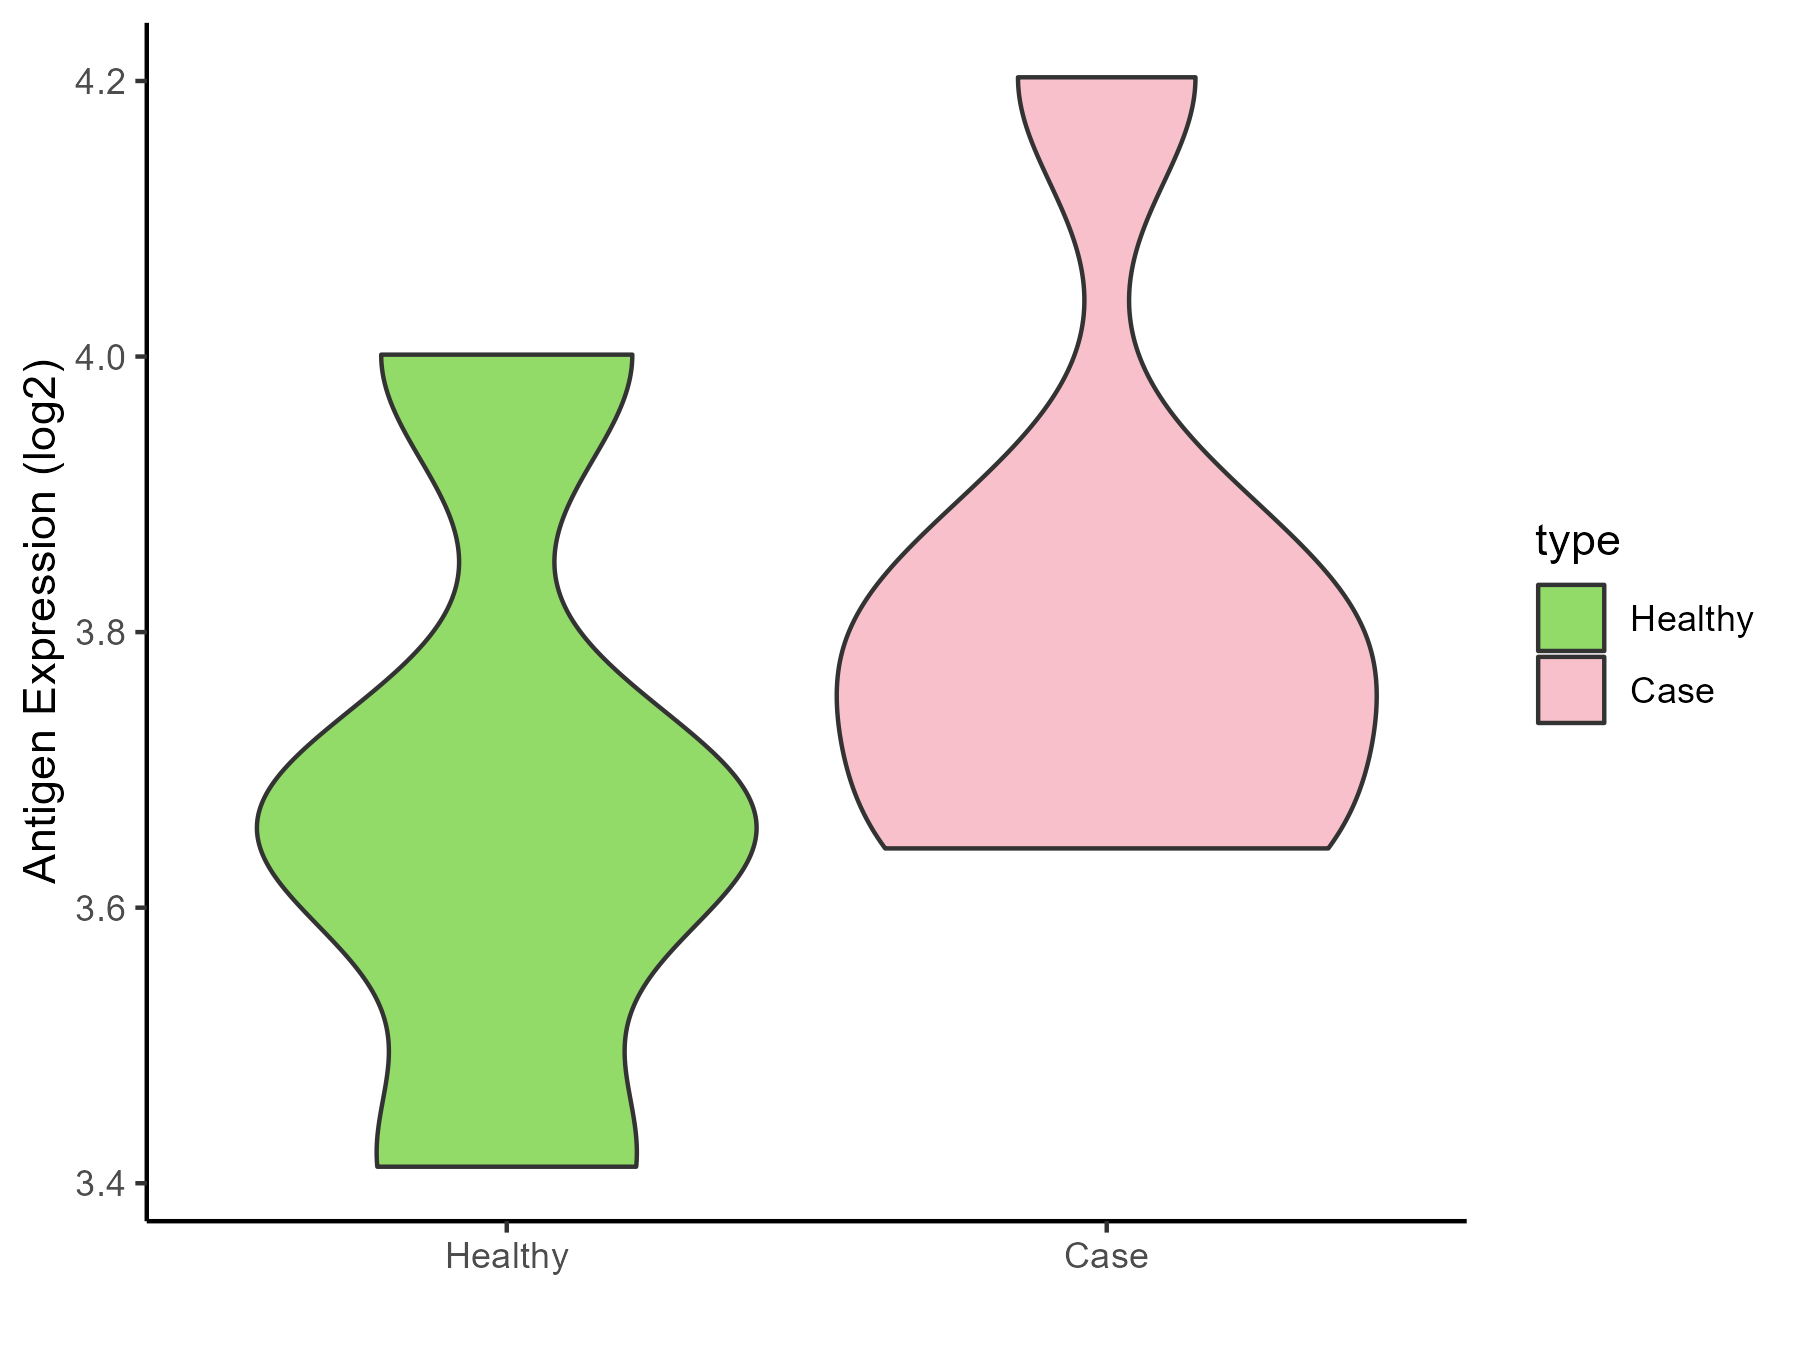
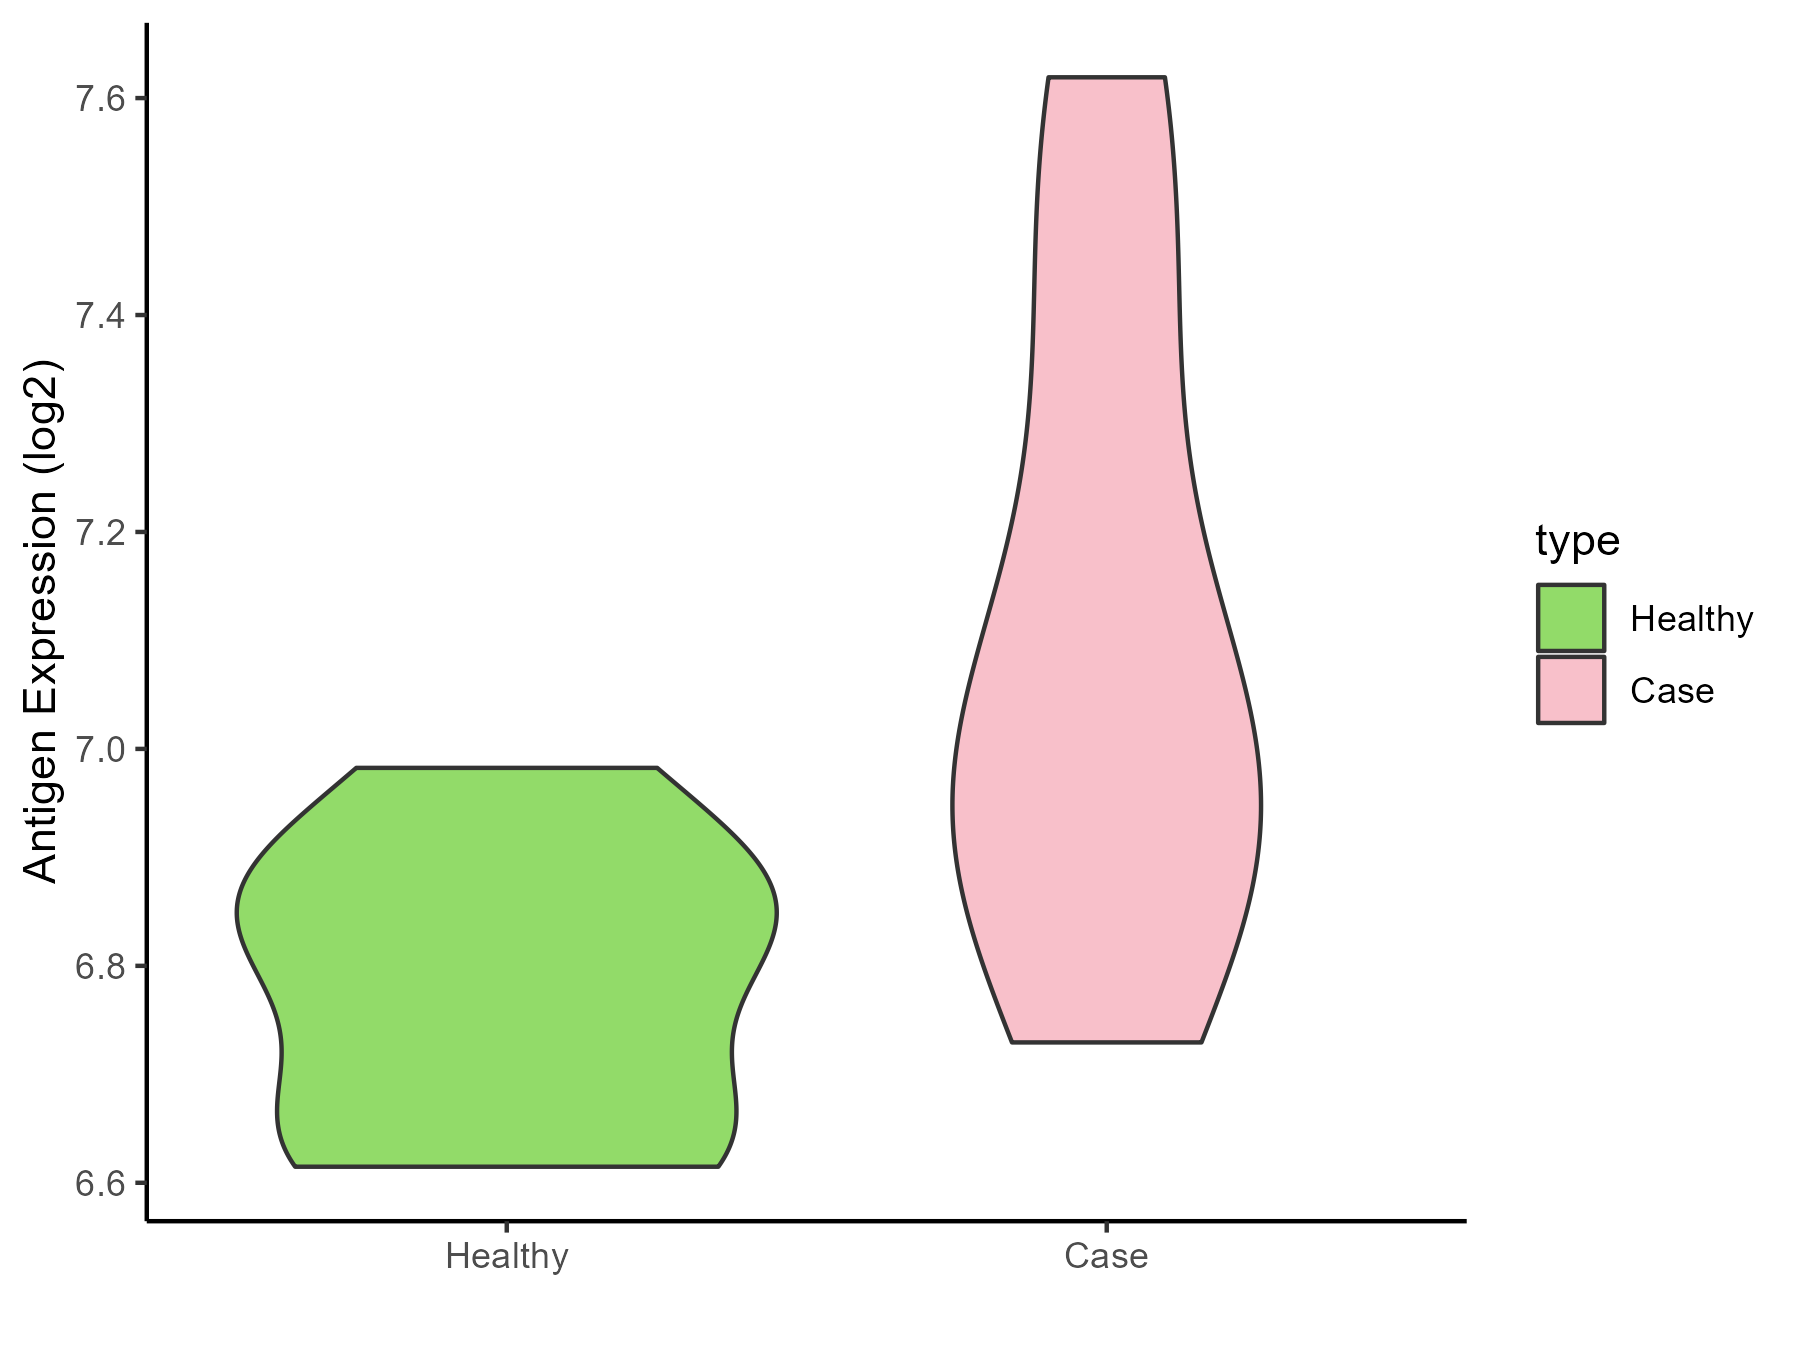
Bacterial infection of gingival |
| The Expression Level of Disease Section Compare with the Healthy Individual Tissue |
p-value: 0.585086779;
Fold-change: 0.055942127;
Z-score: 0.149033924
|
| Disease-specific Antigen Abundances |
|
Click to View the Clearer Original Diagram
|
|
|
ICD Disease Classification 02
Click to Show/Hide the 22 Disease of This Class
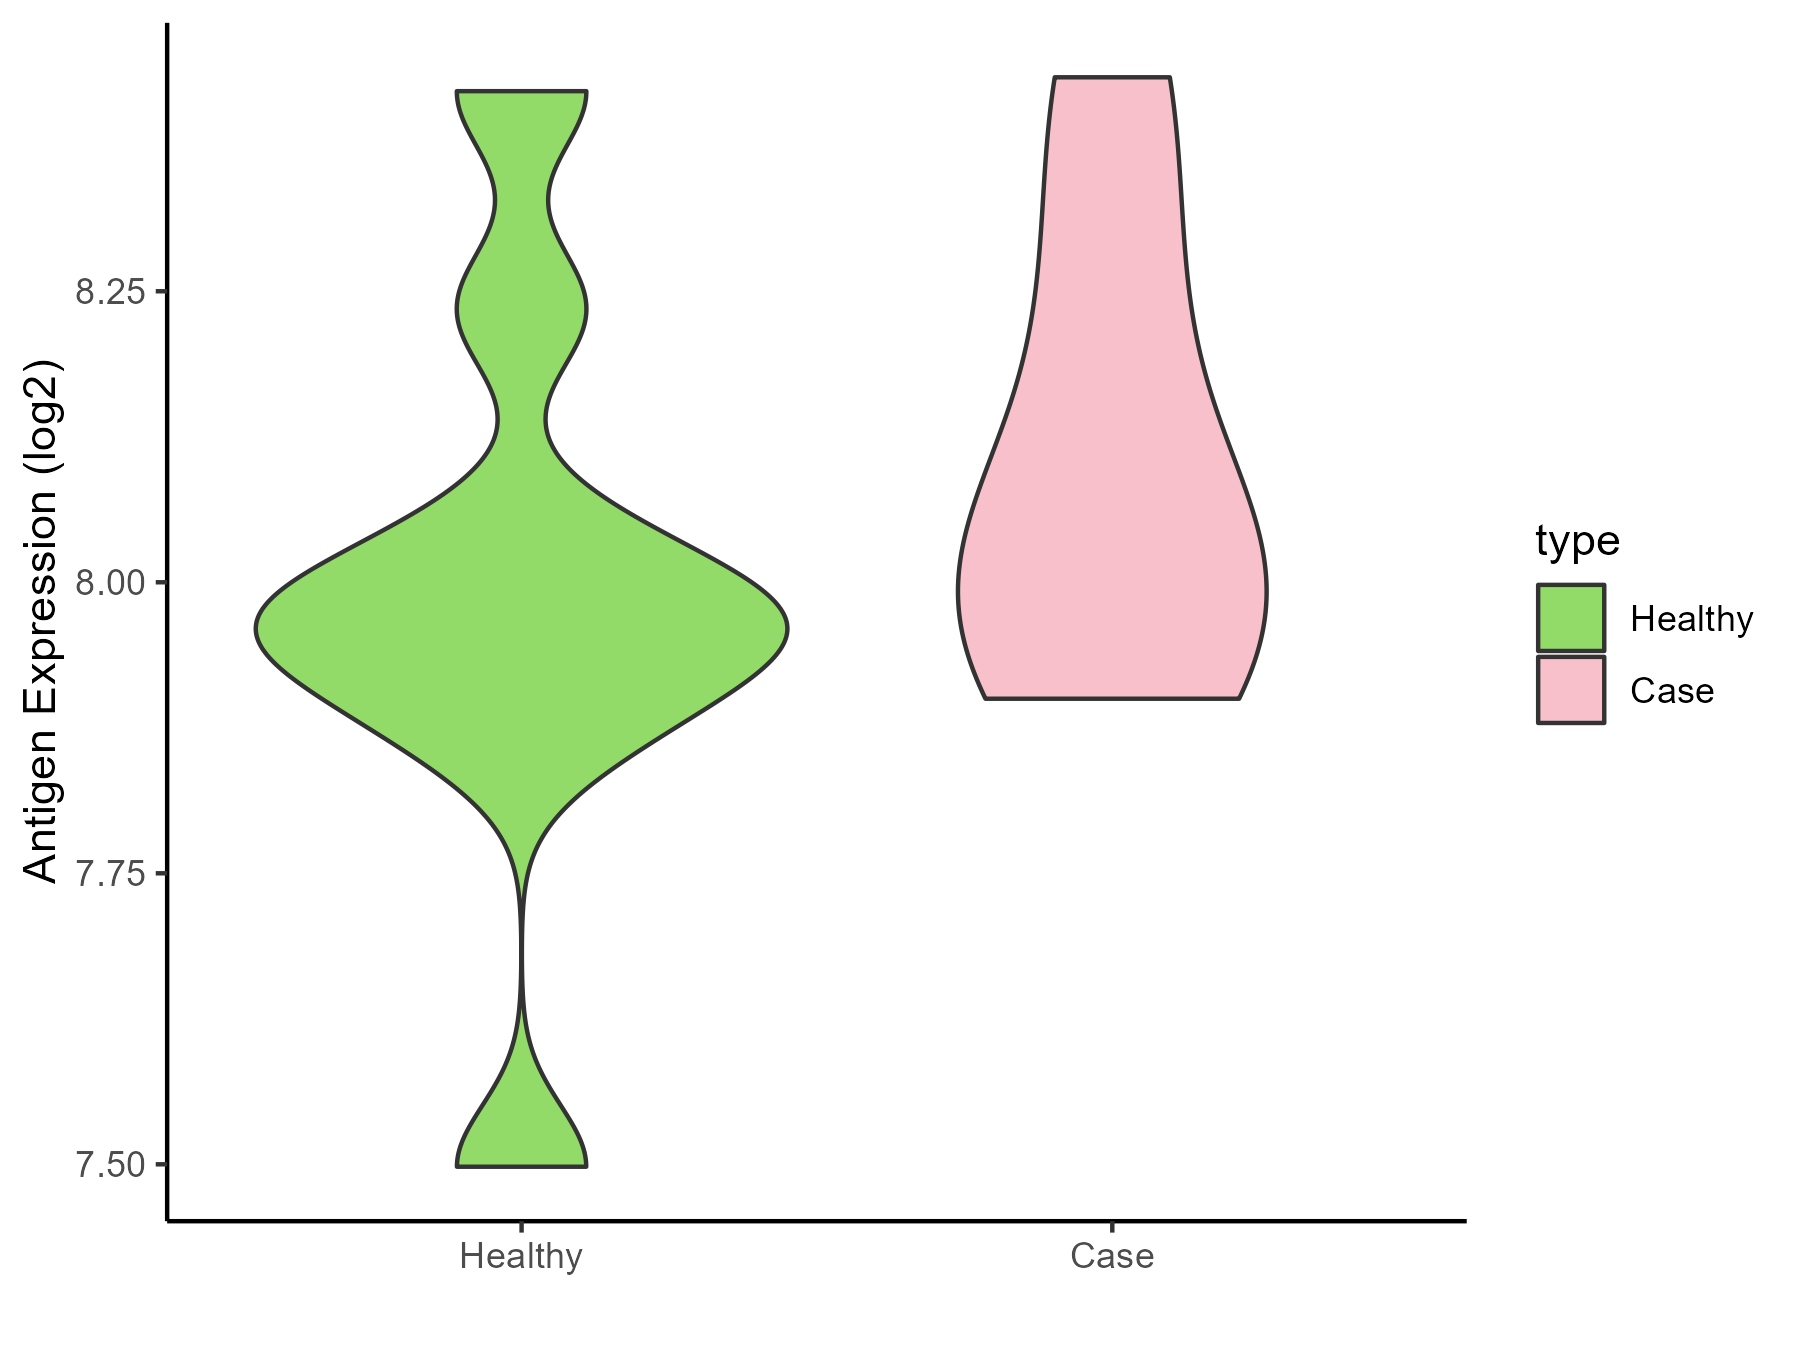
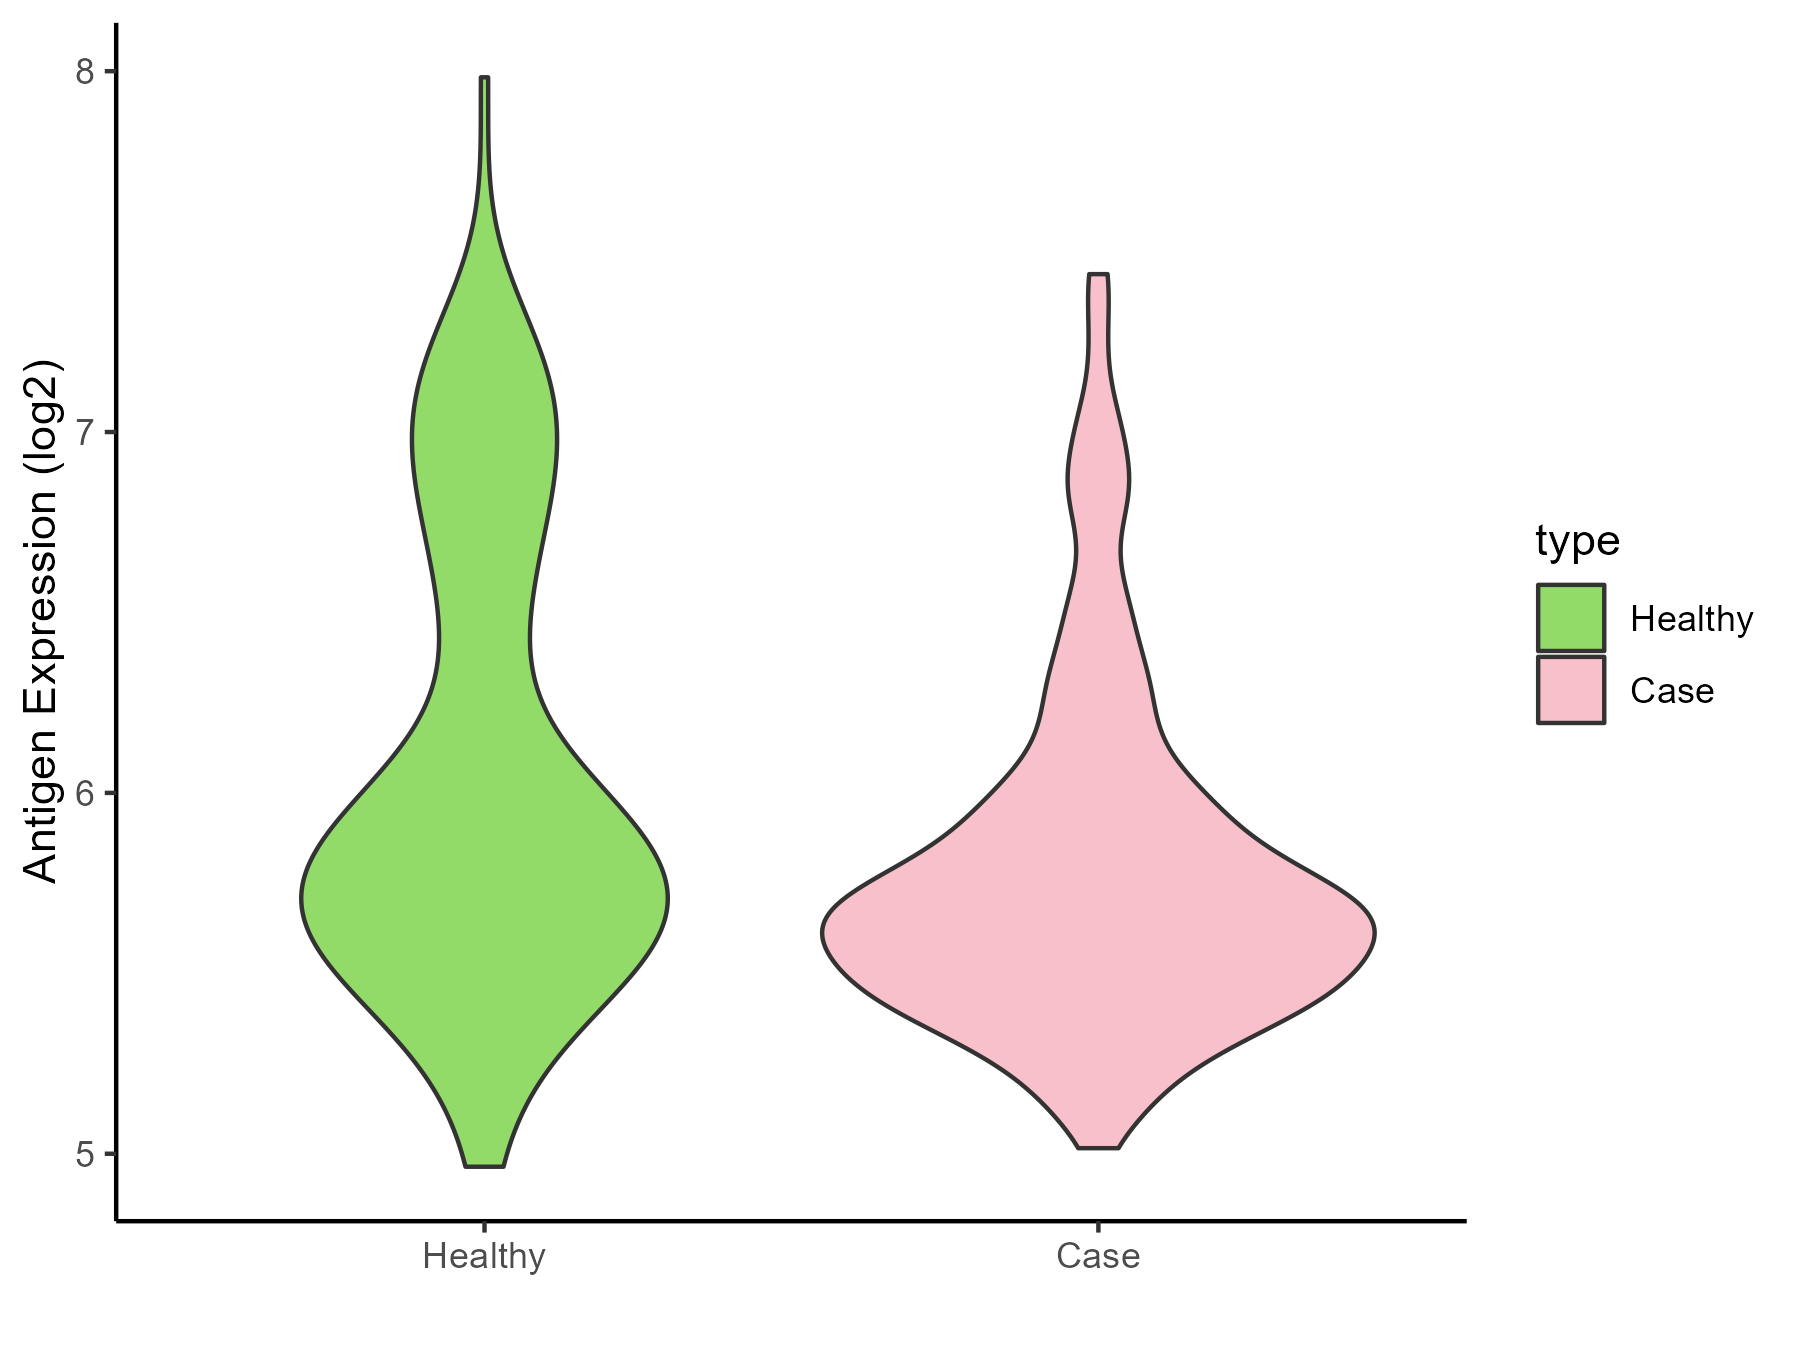
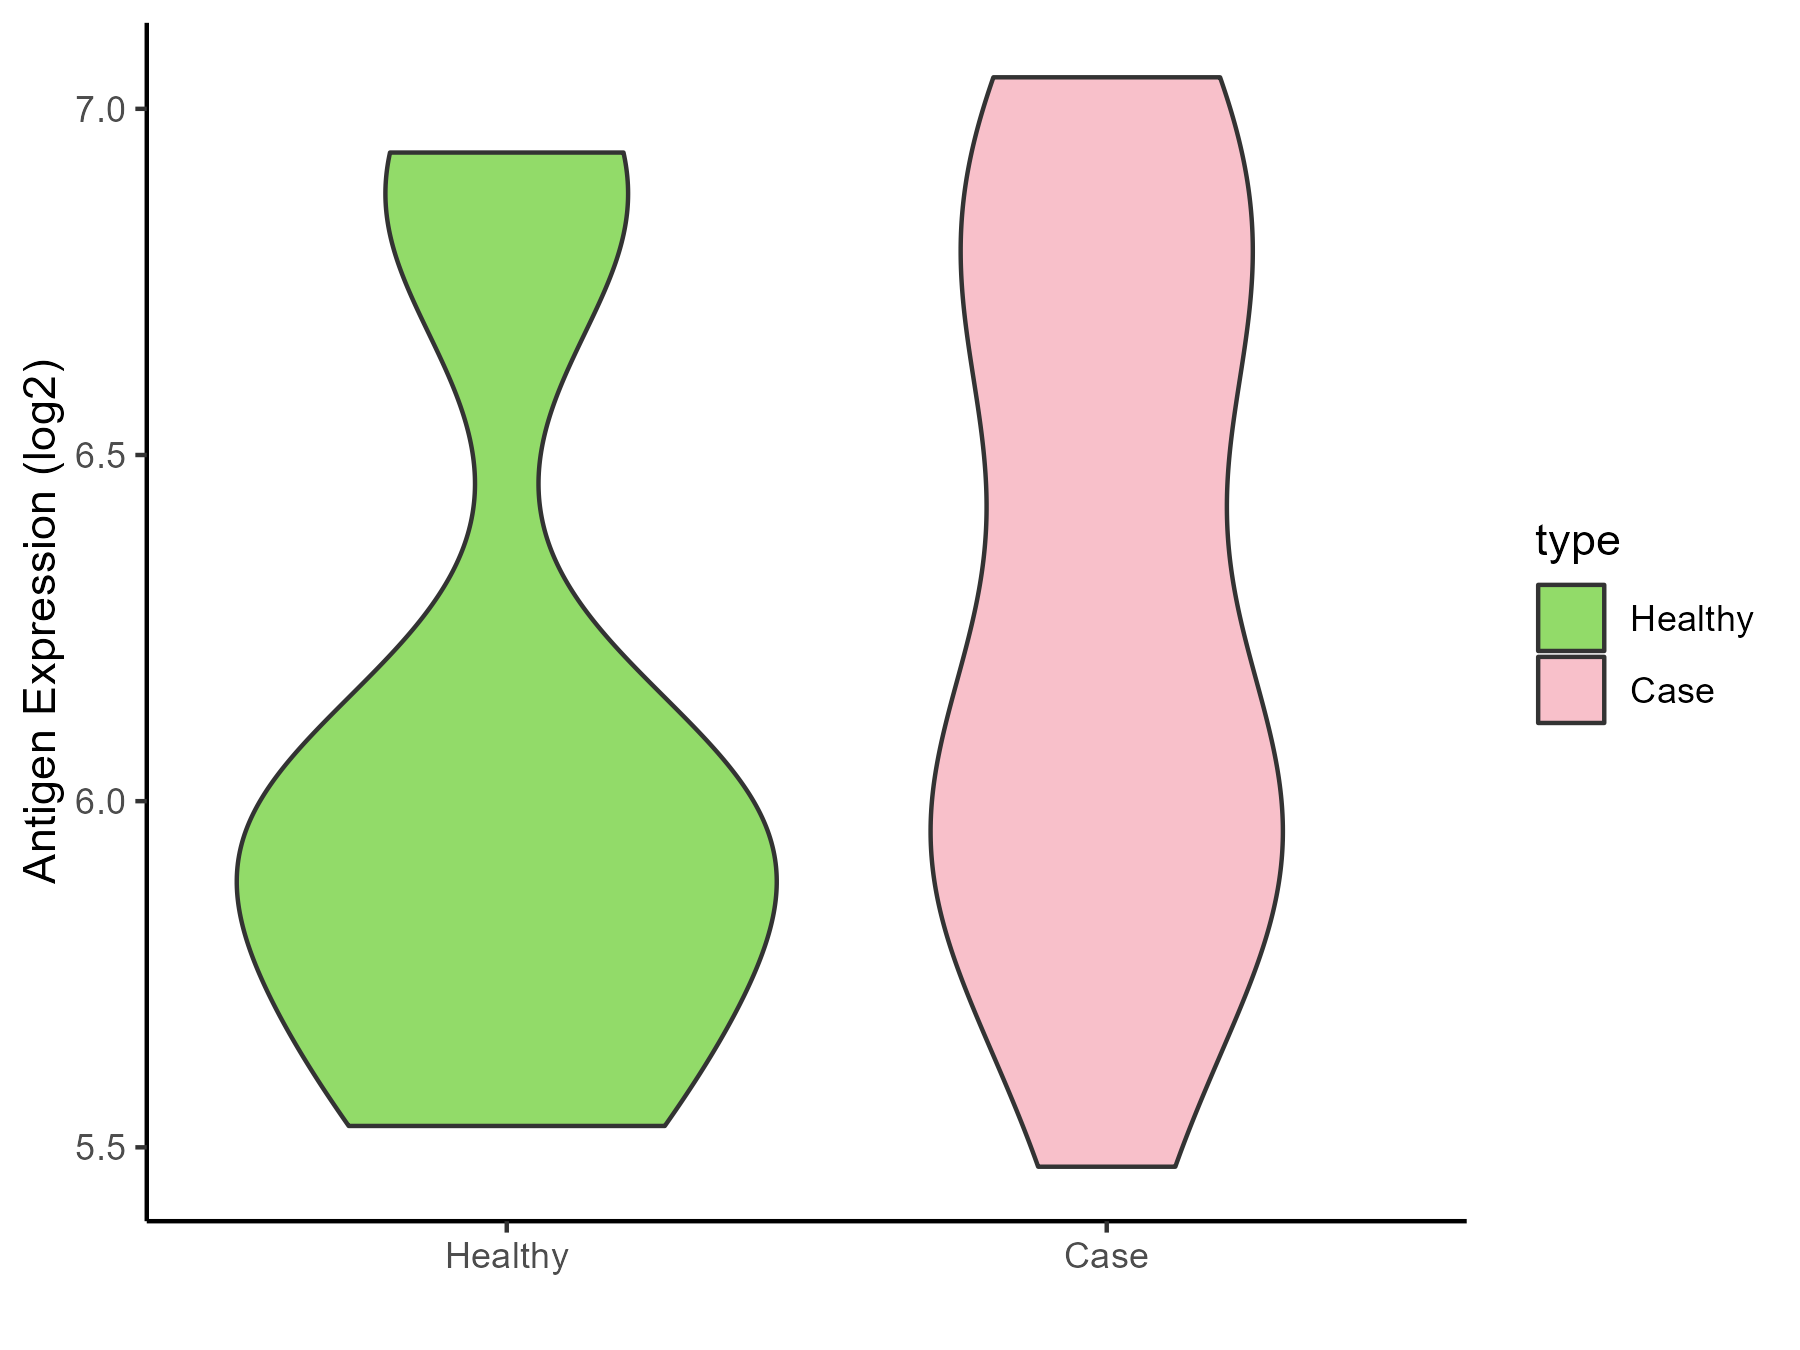
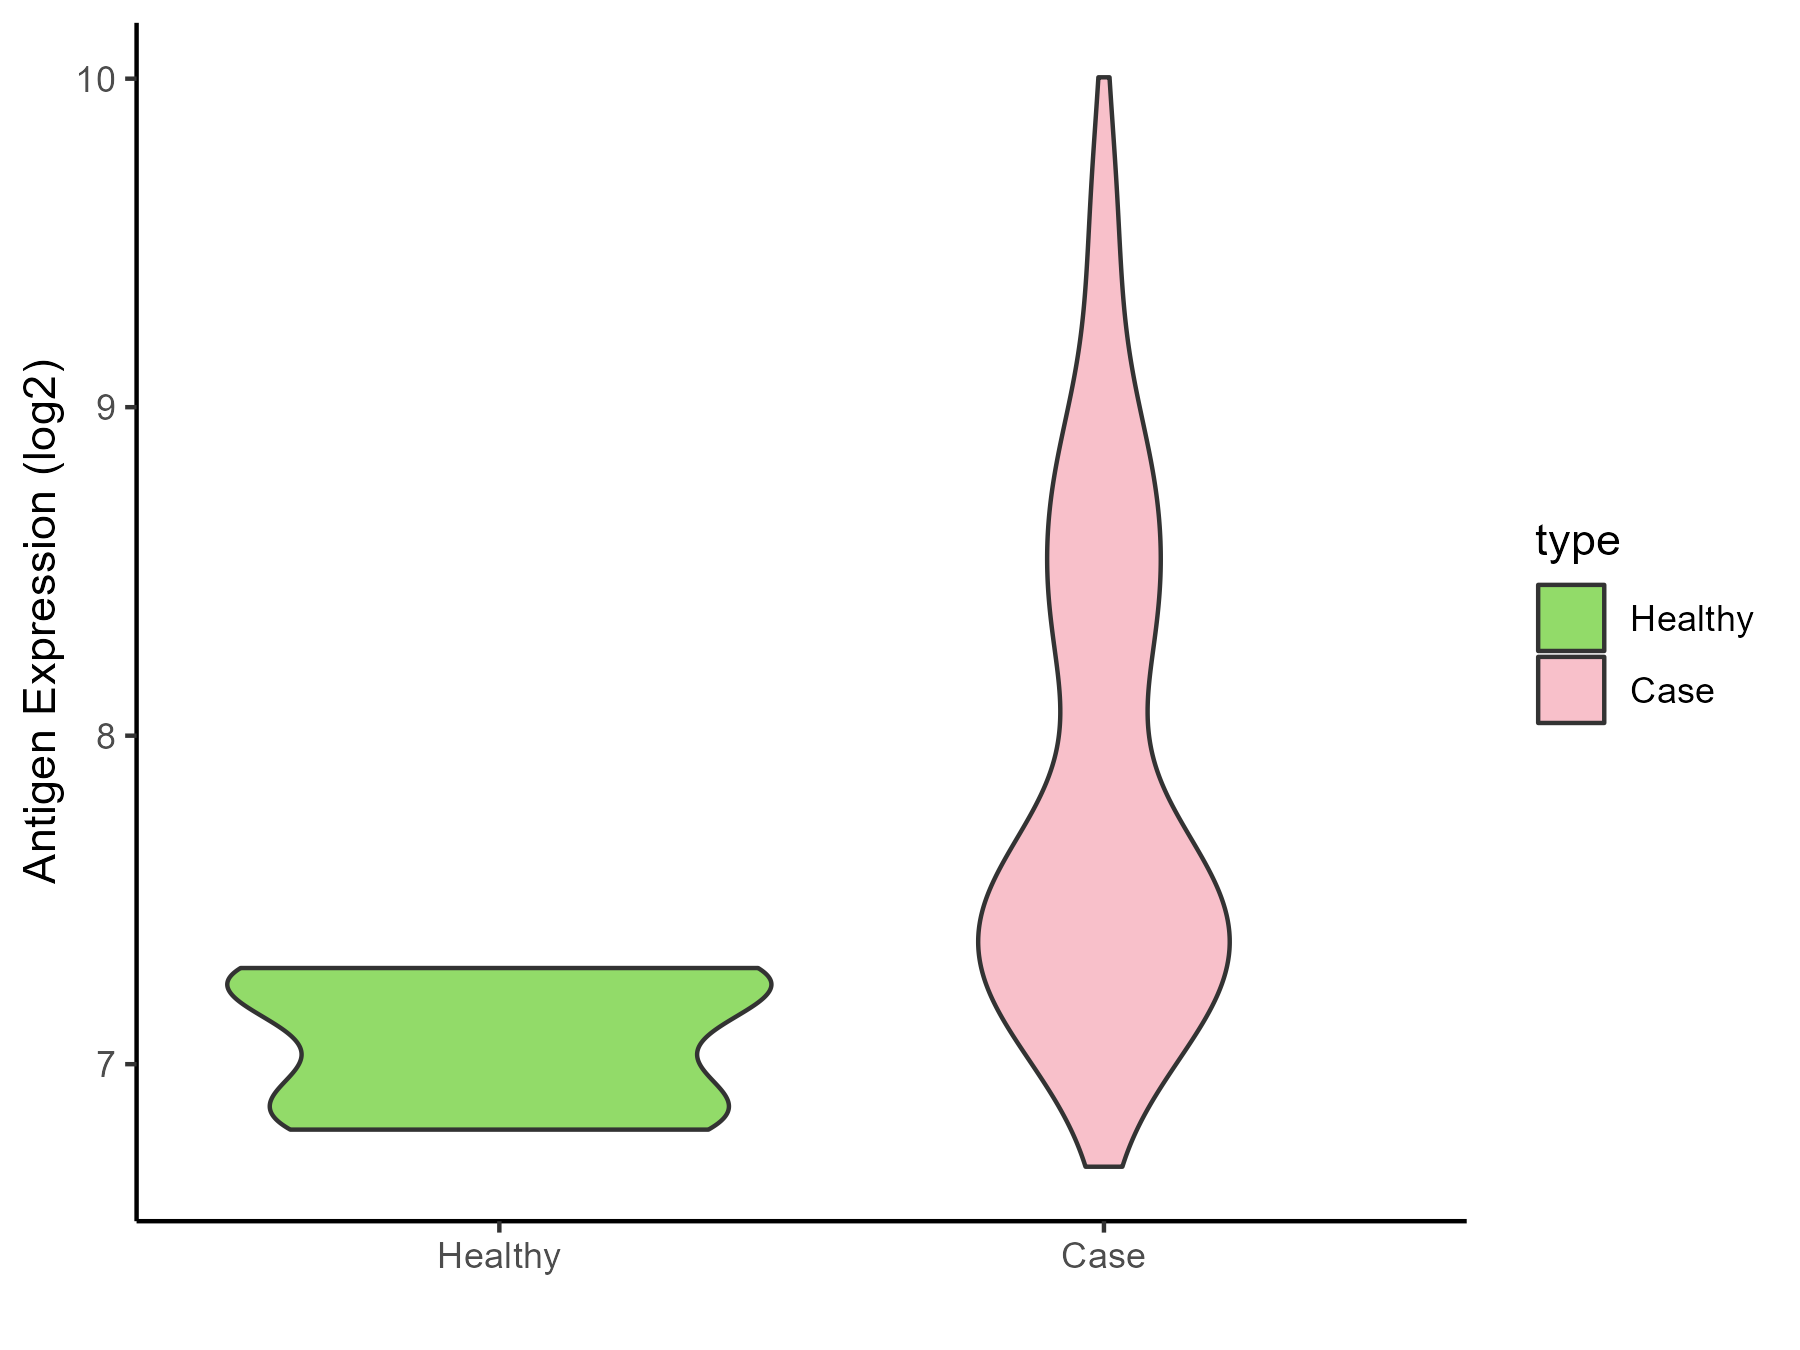
Brain cancer [ICD-11: 2A00]
Click to Show/Hide
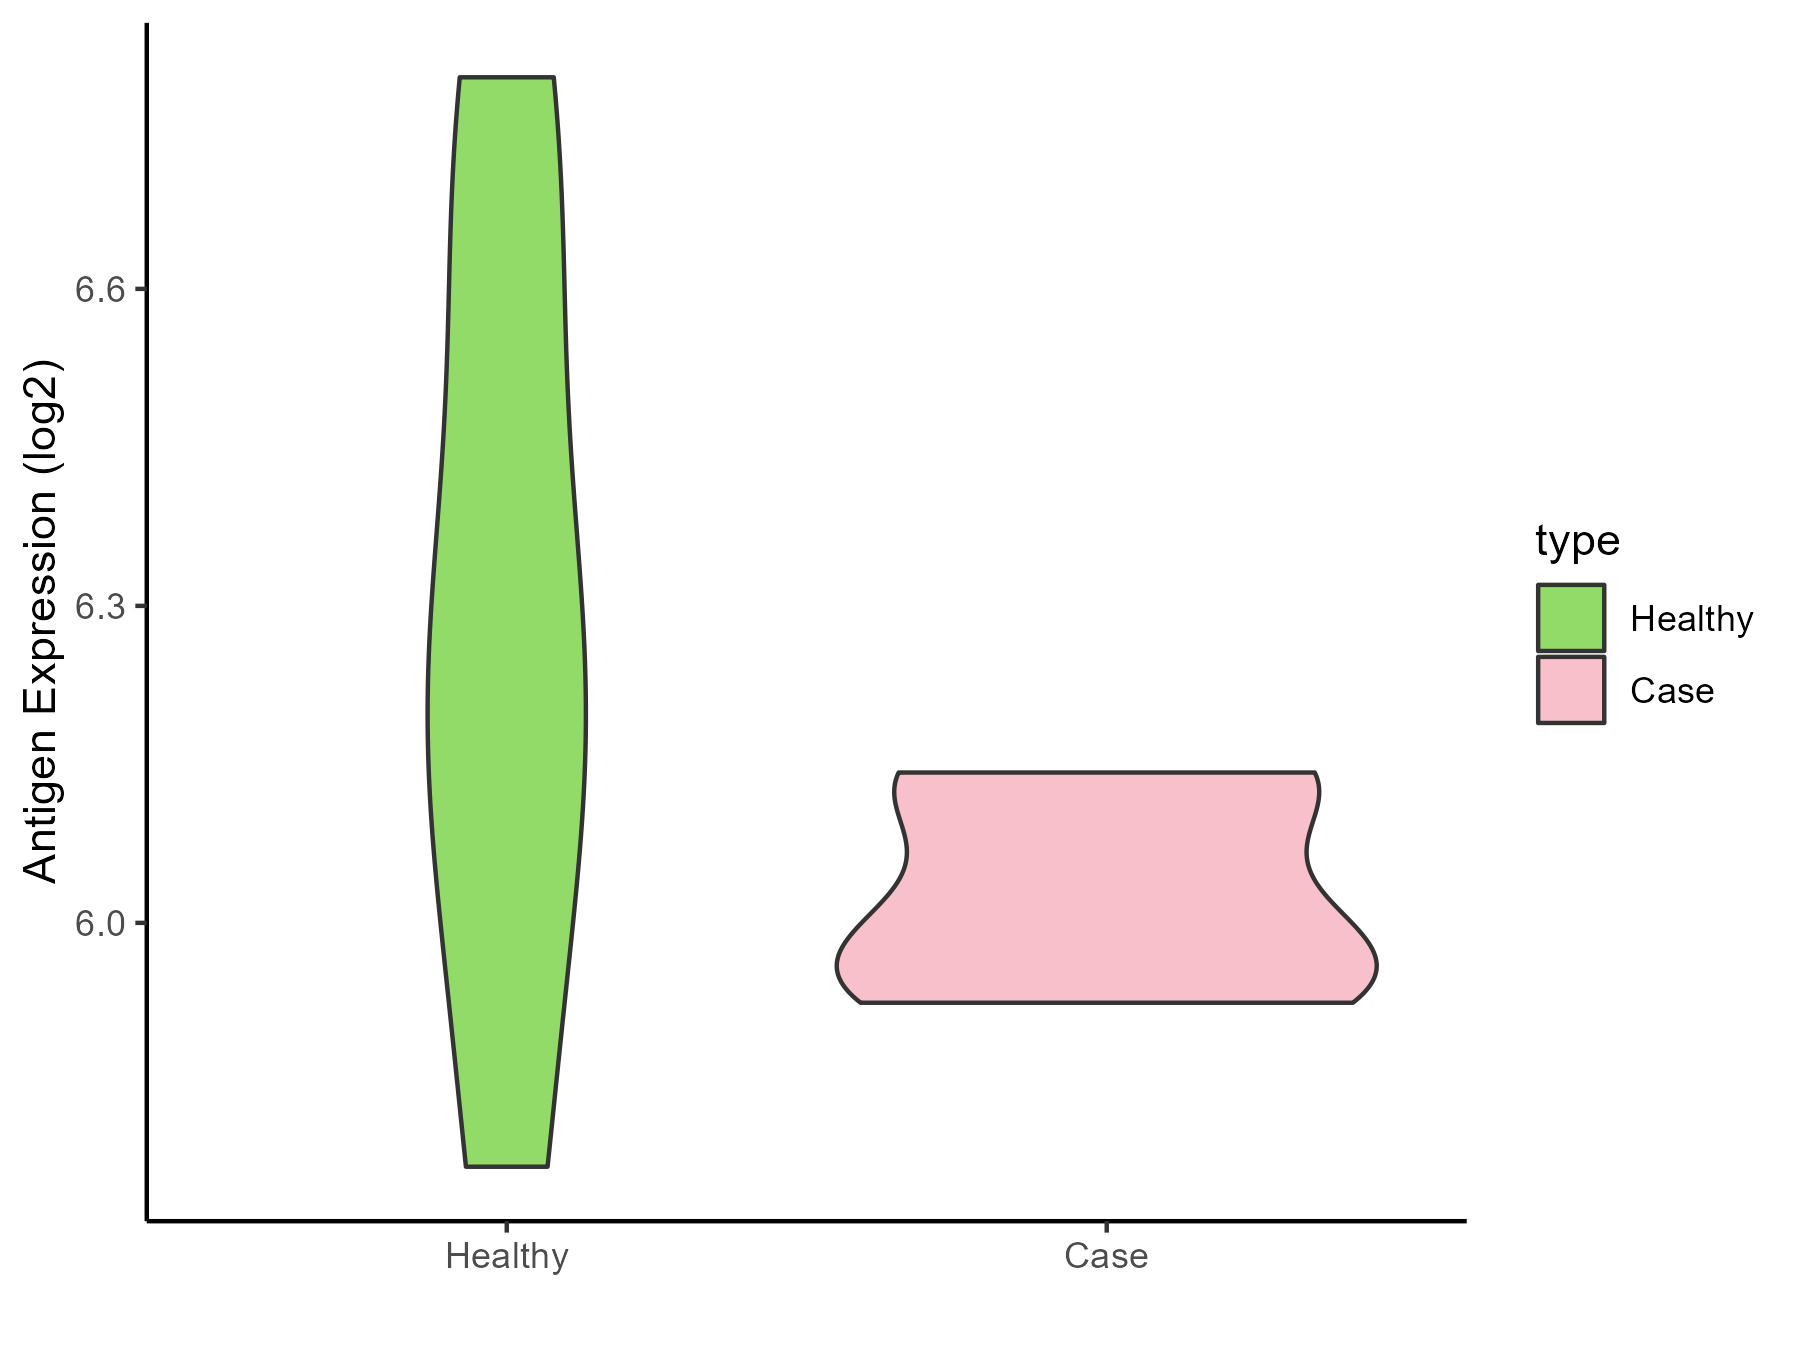
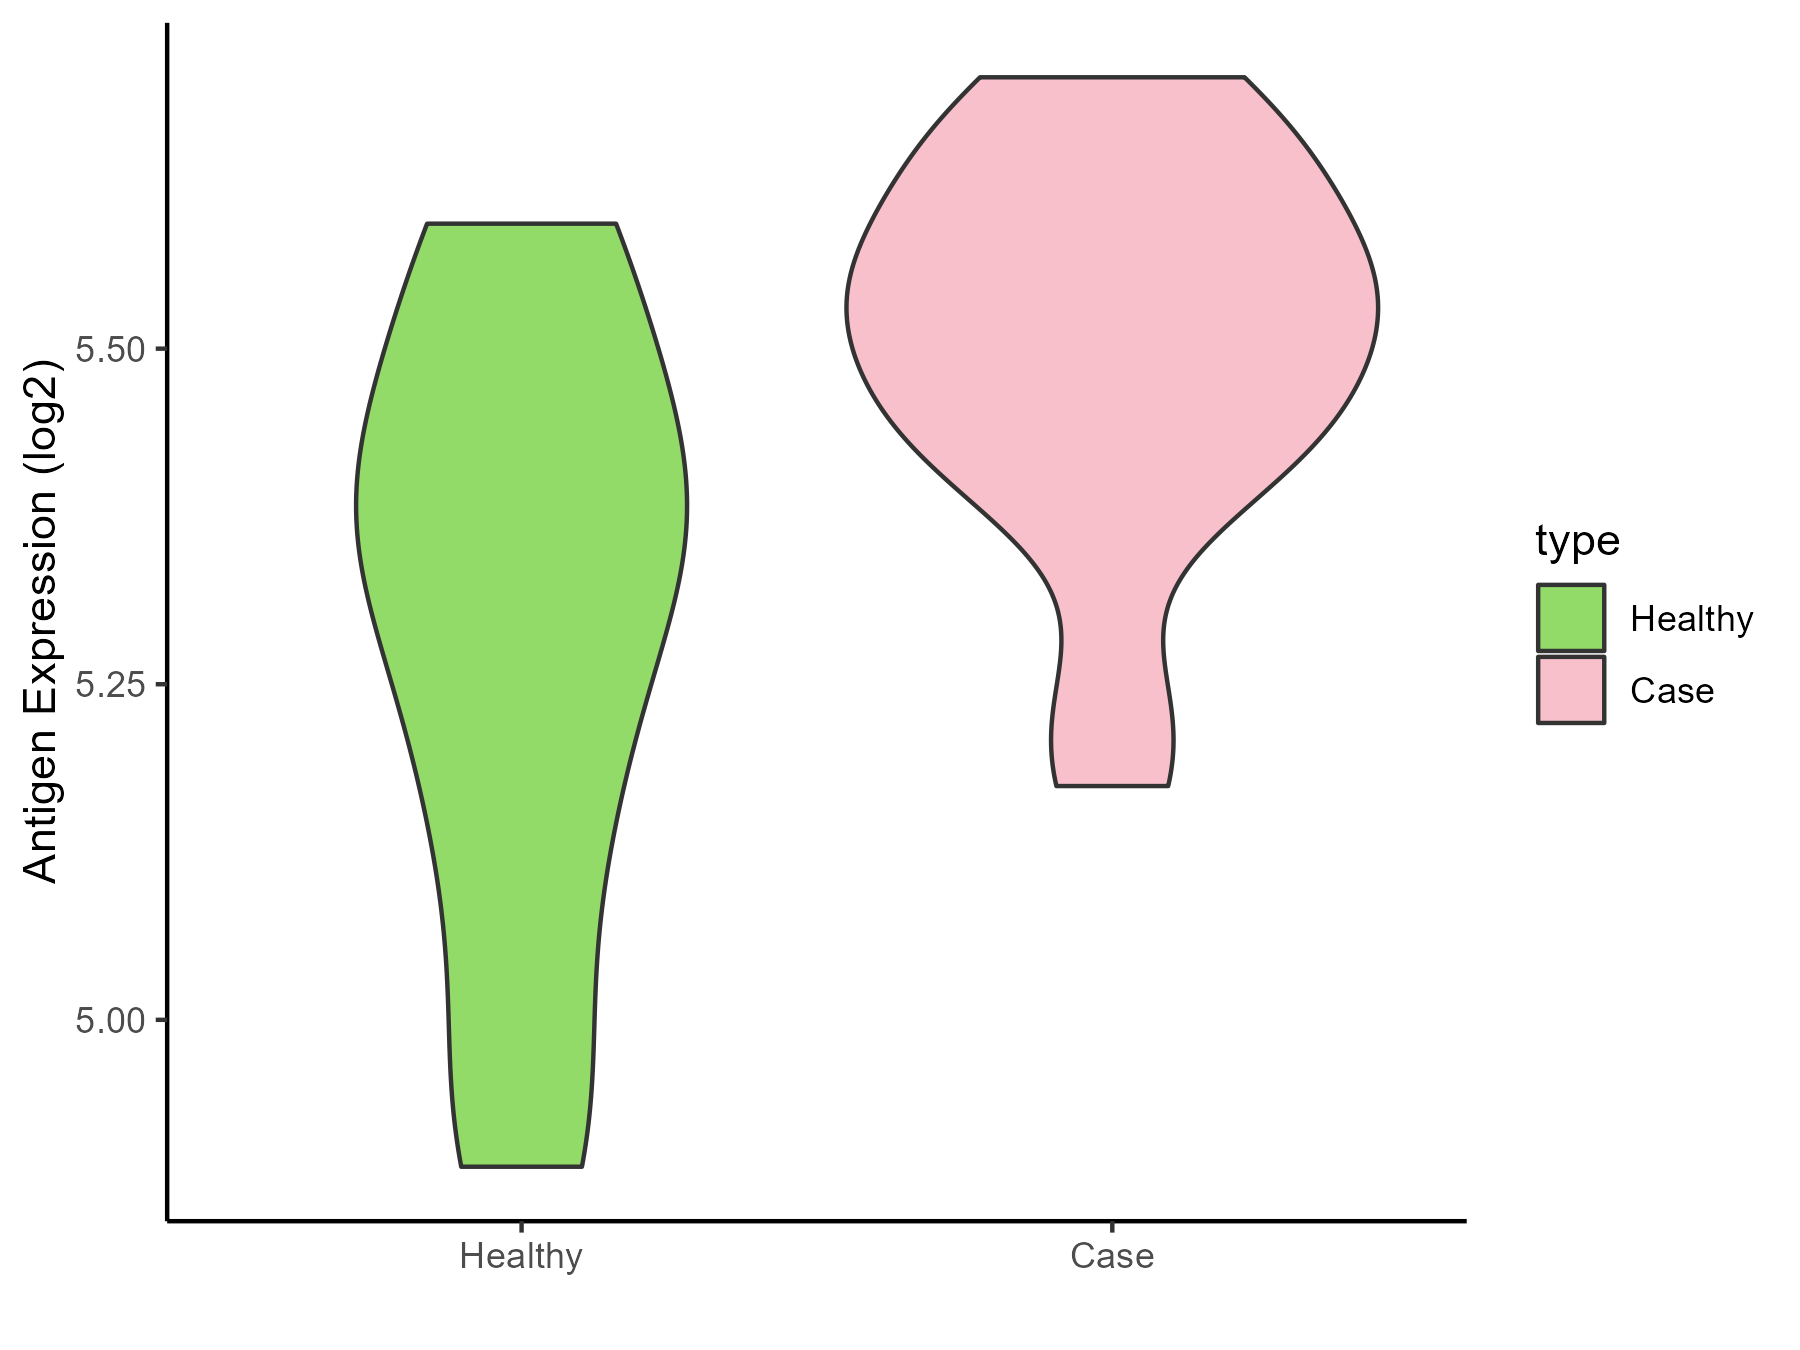
| Differential expression pattern of antigen in diseases |
| The Studied Tissue |
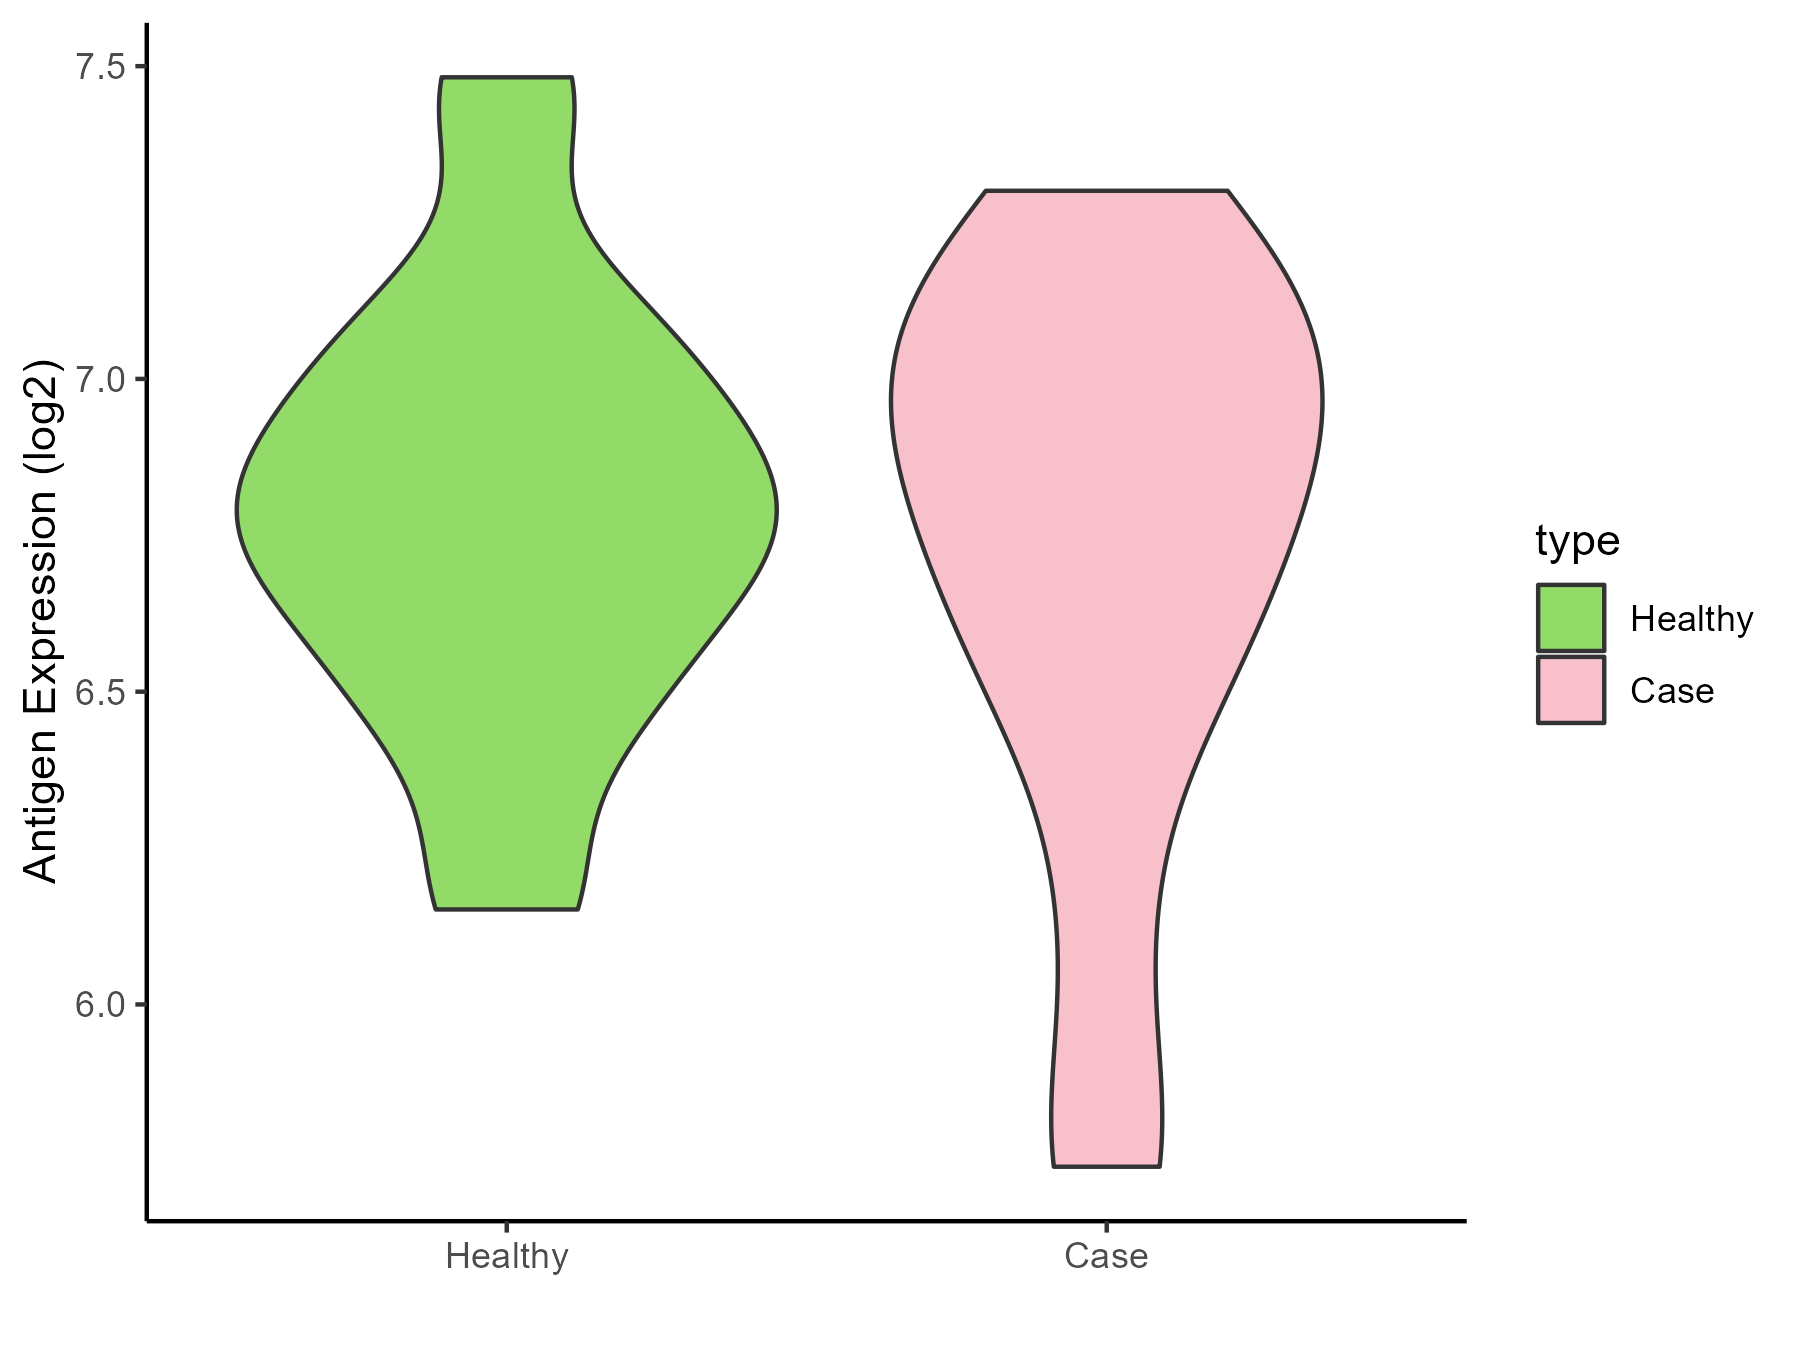
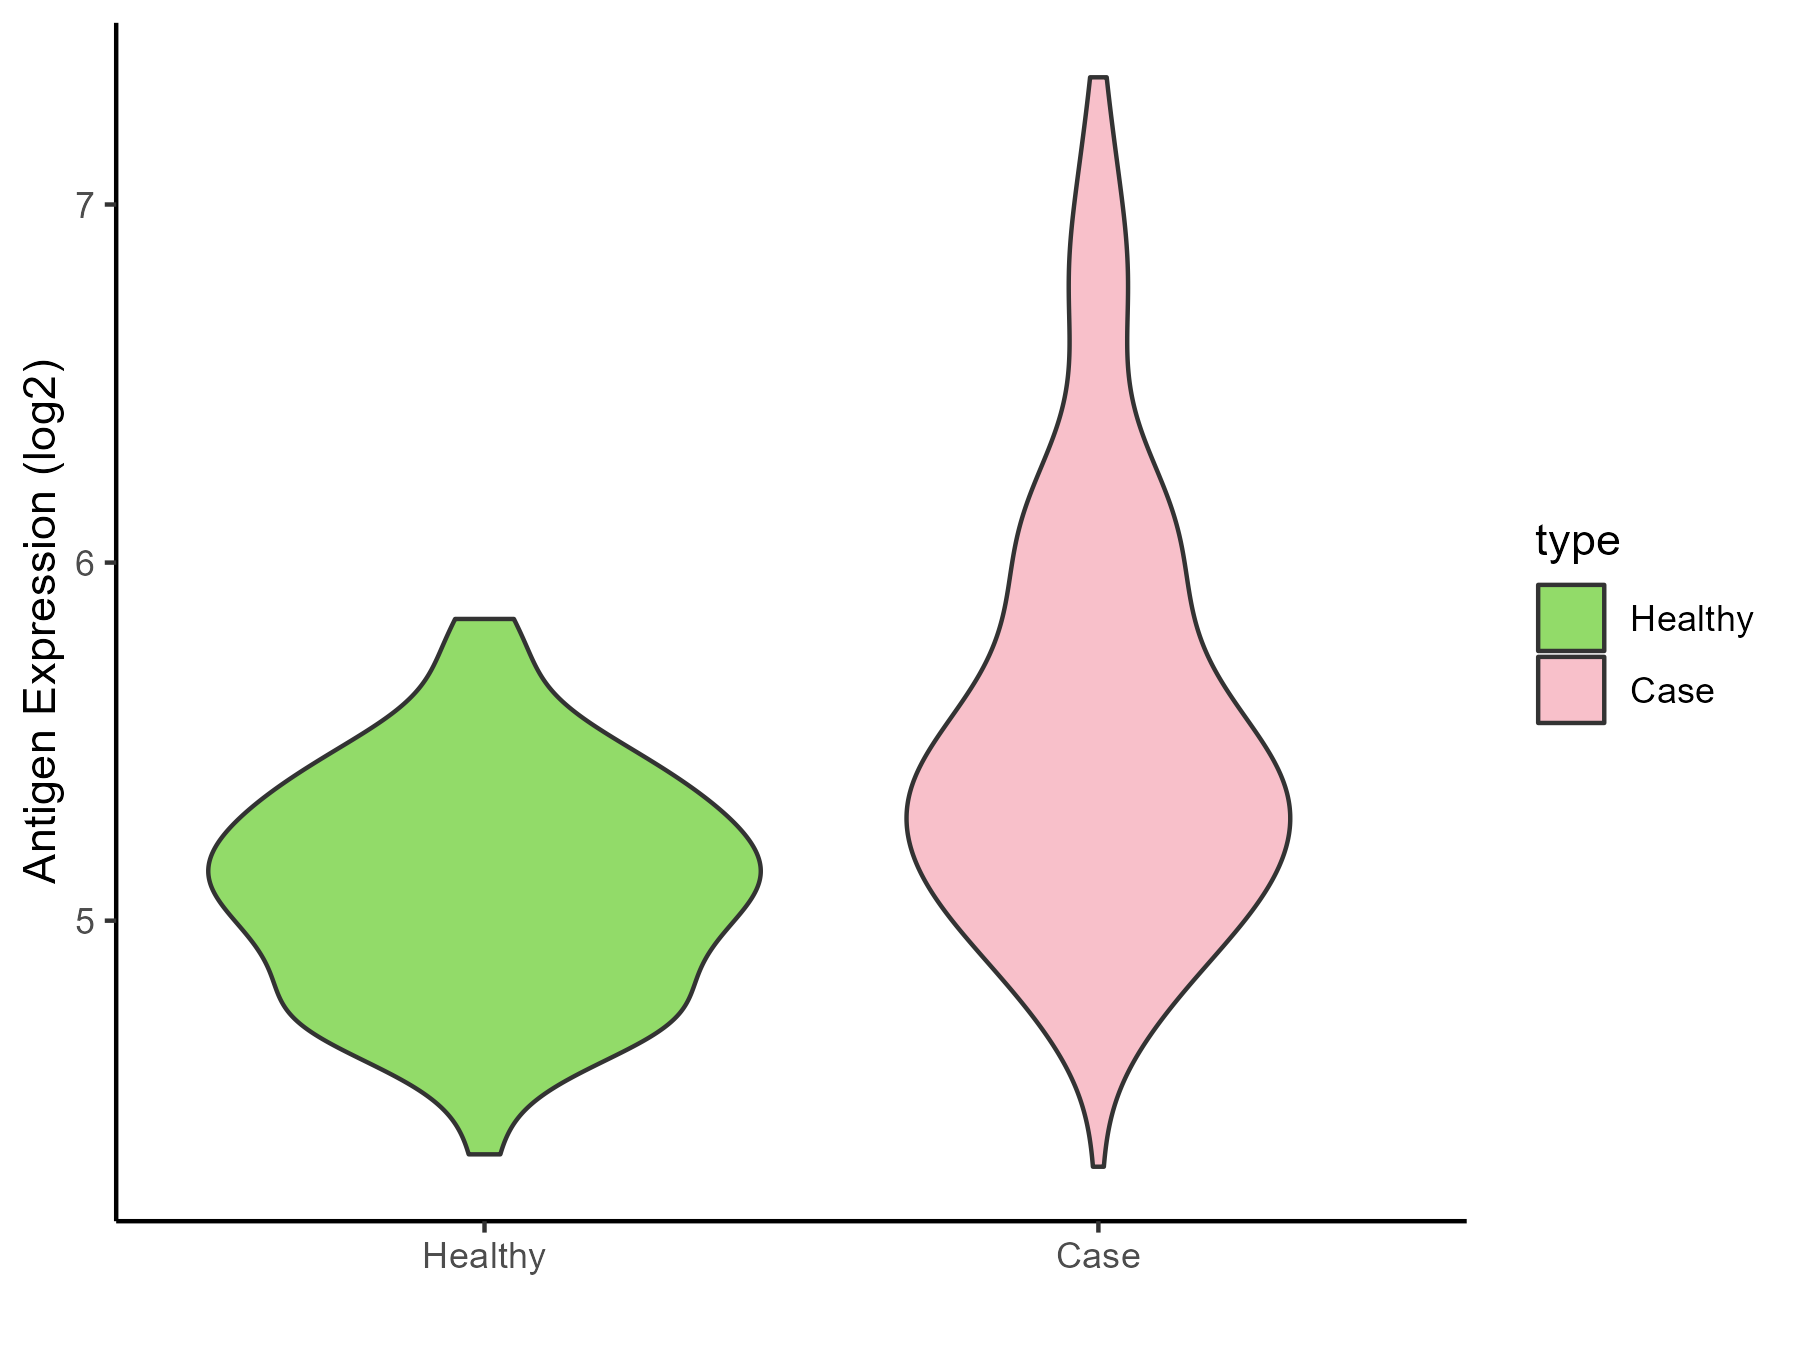
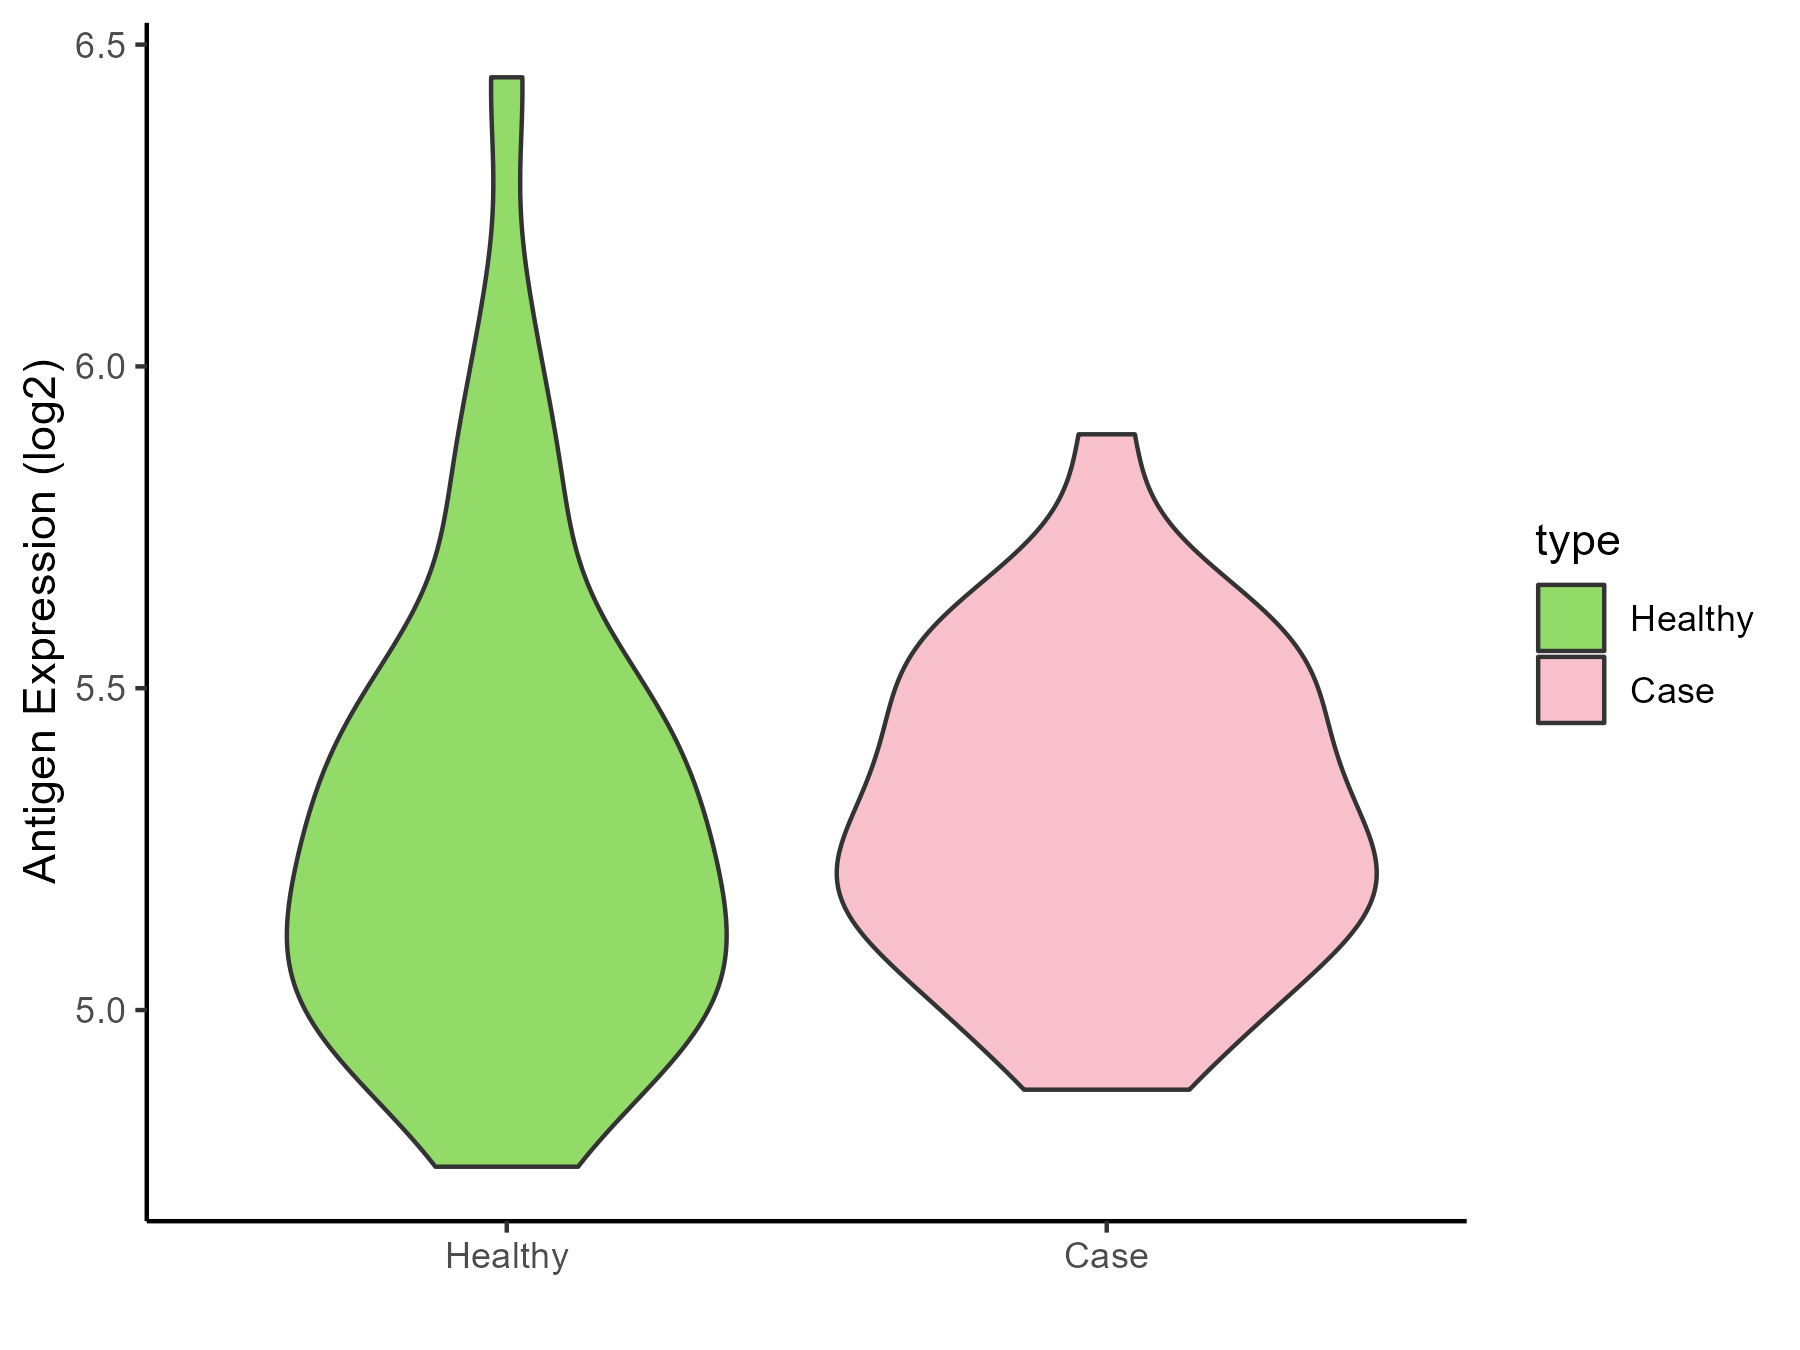
Brainstem |
| The Specific Disease |
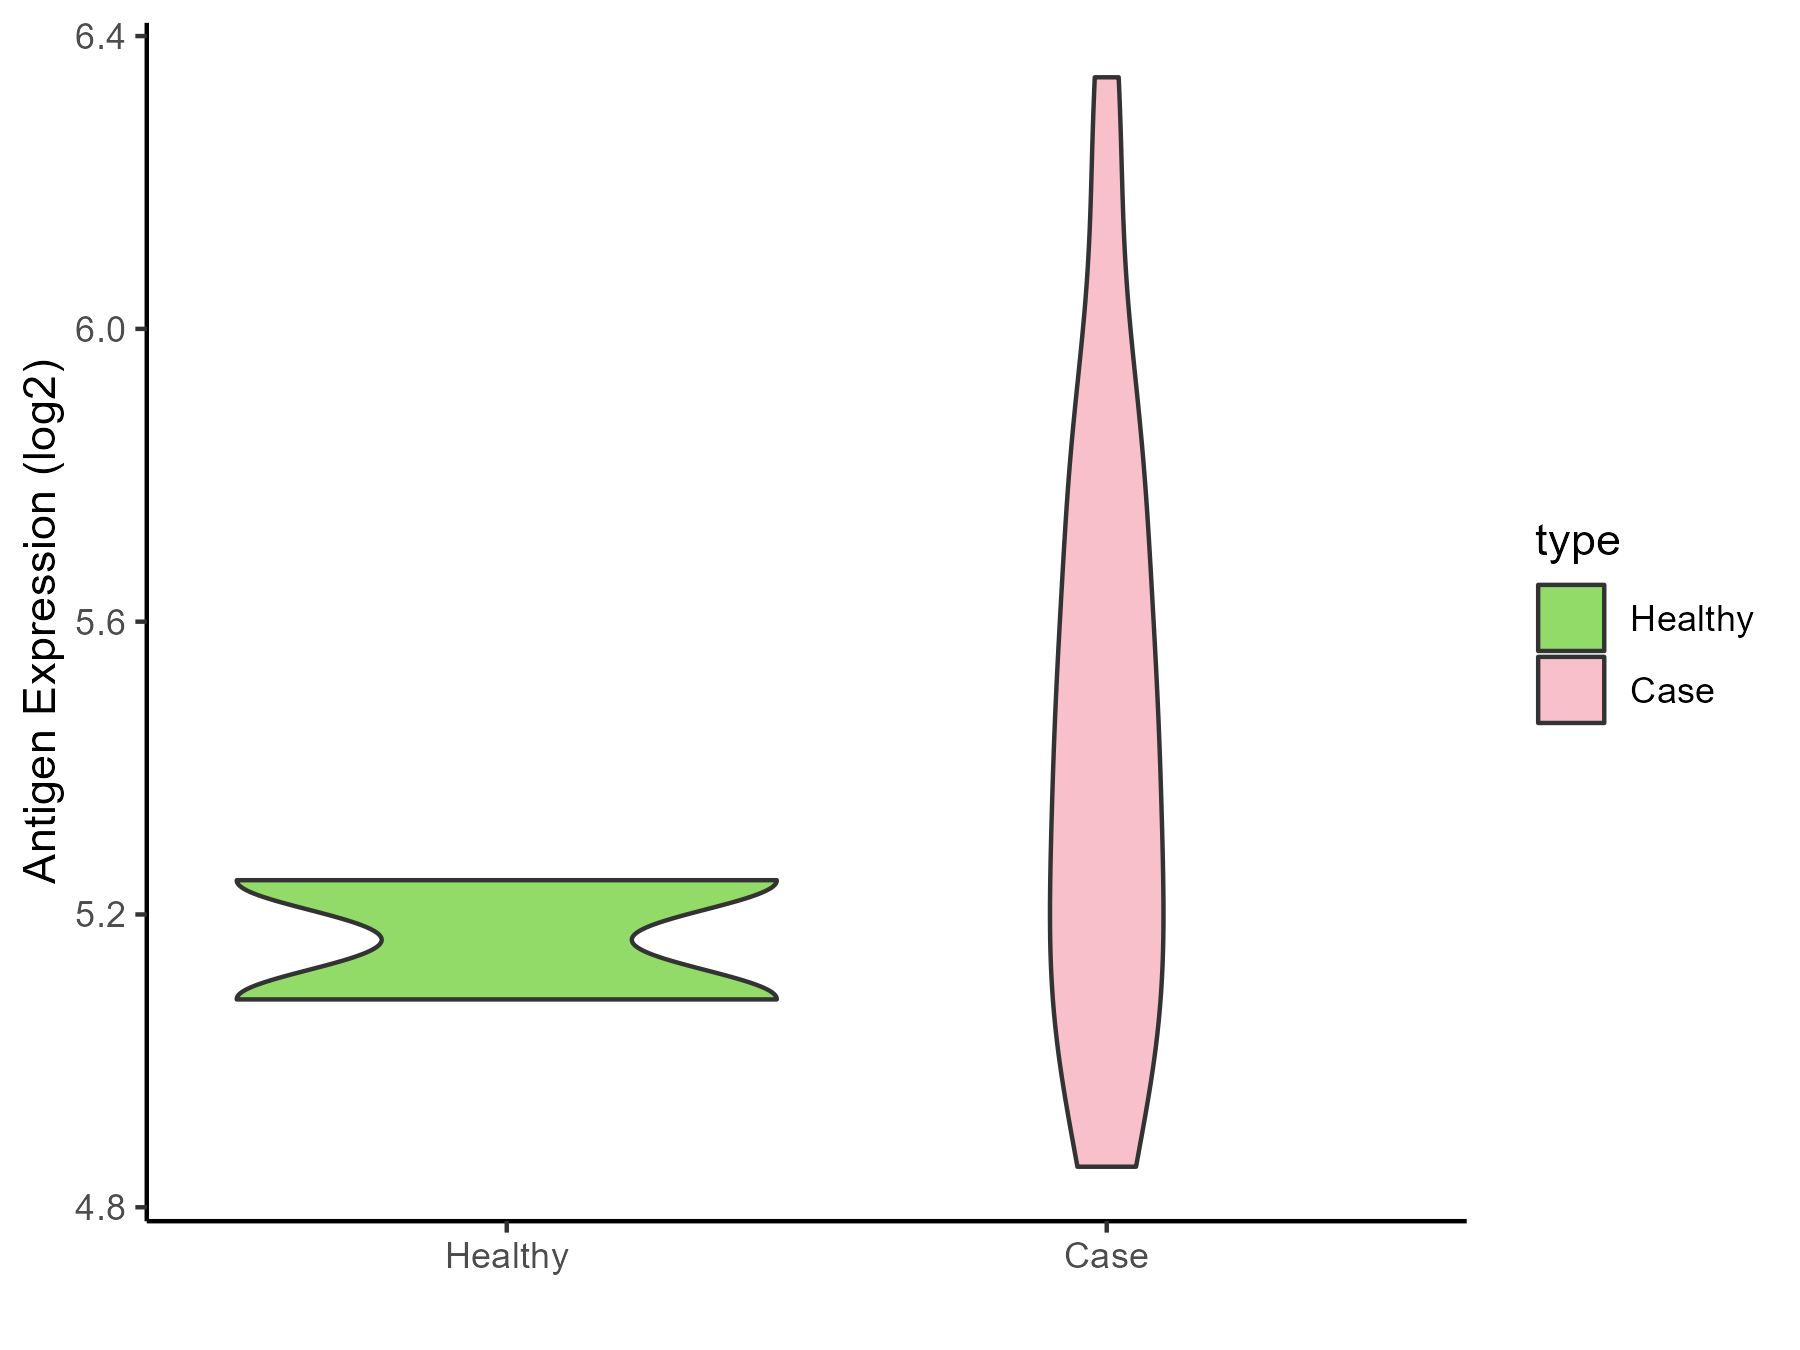
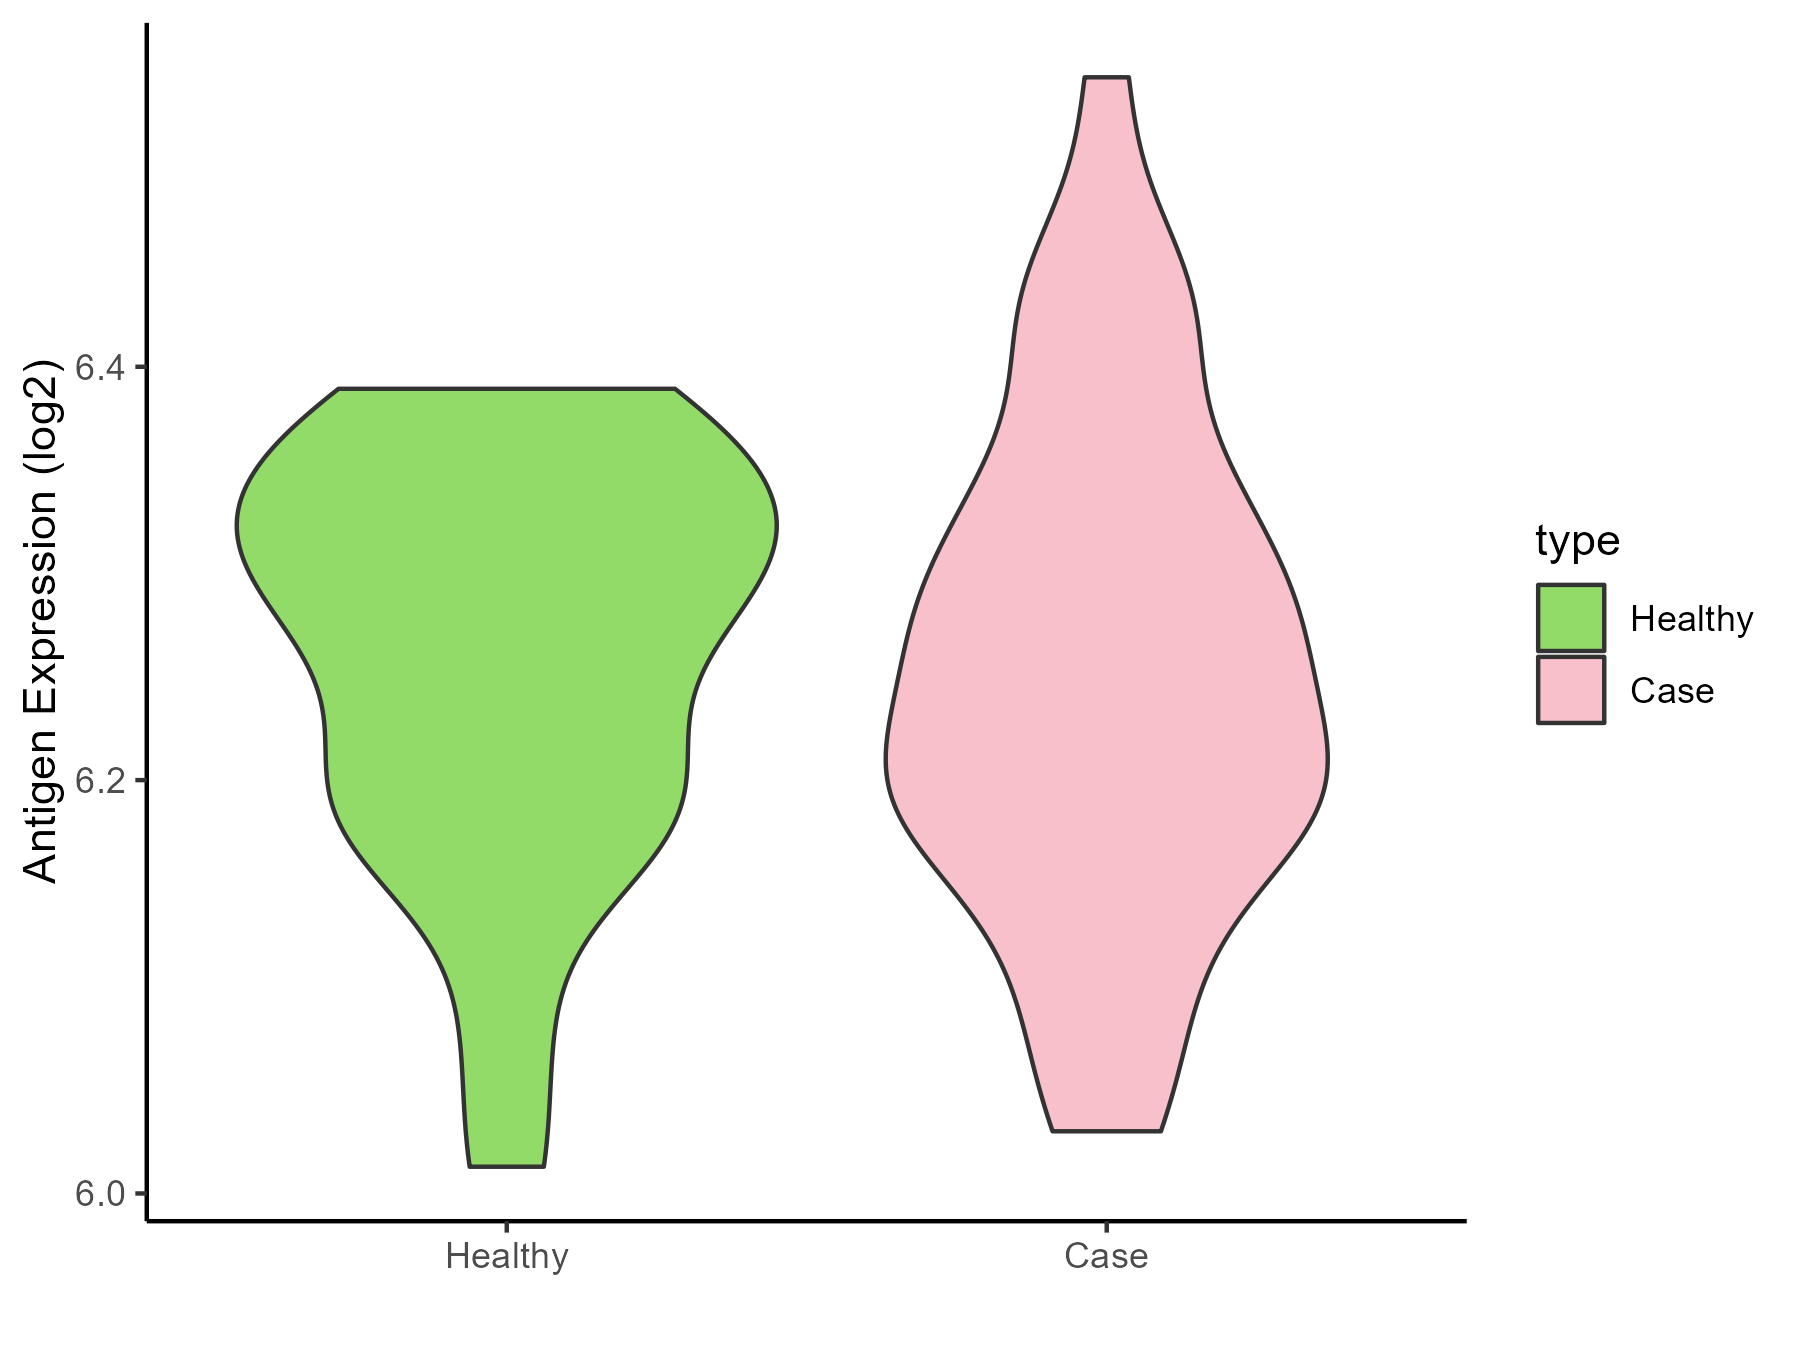
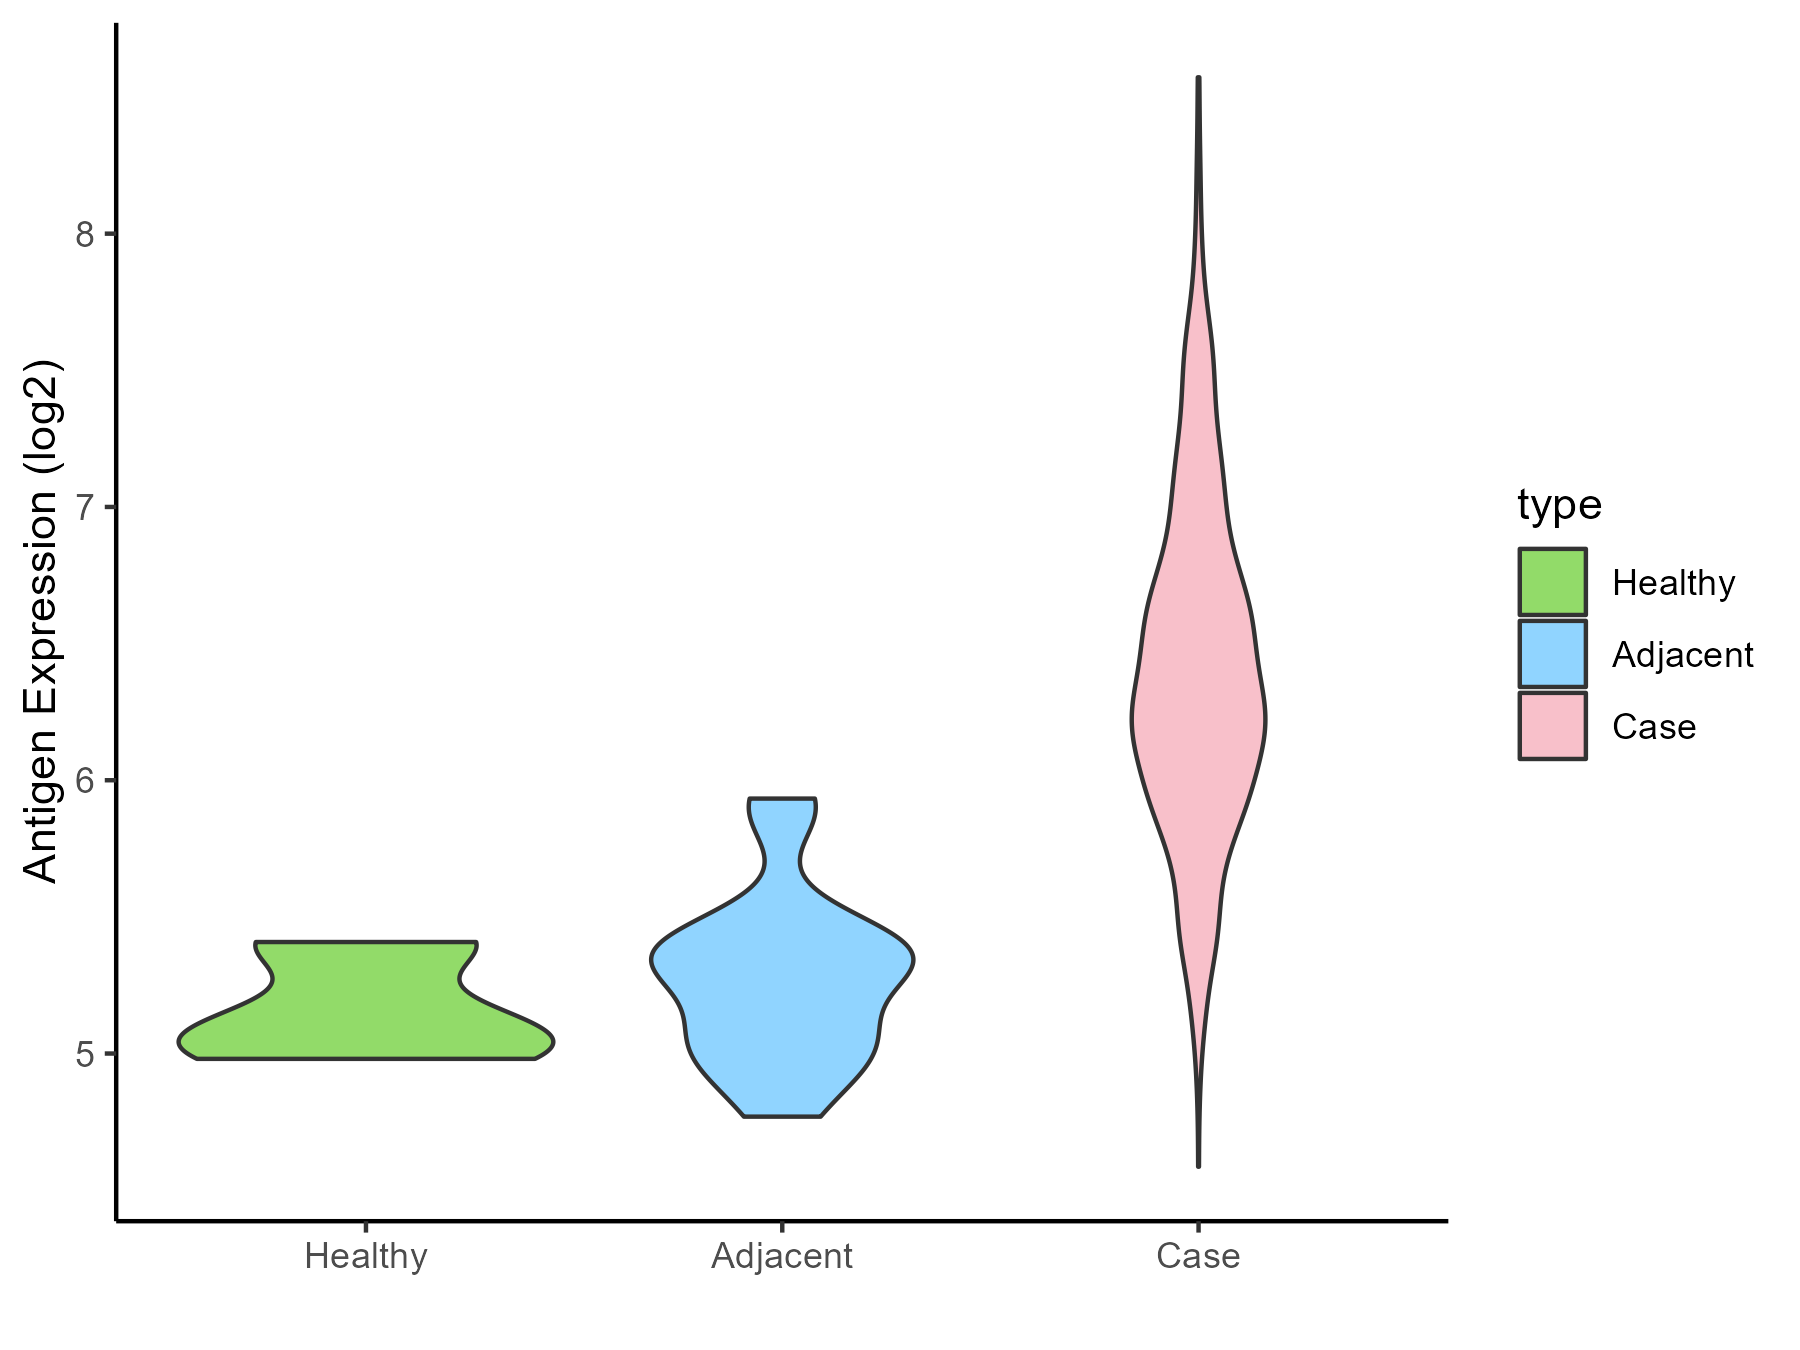
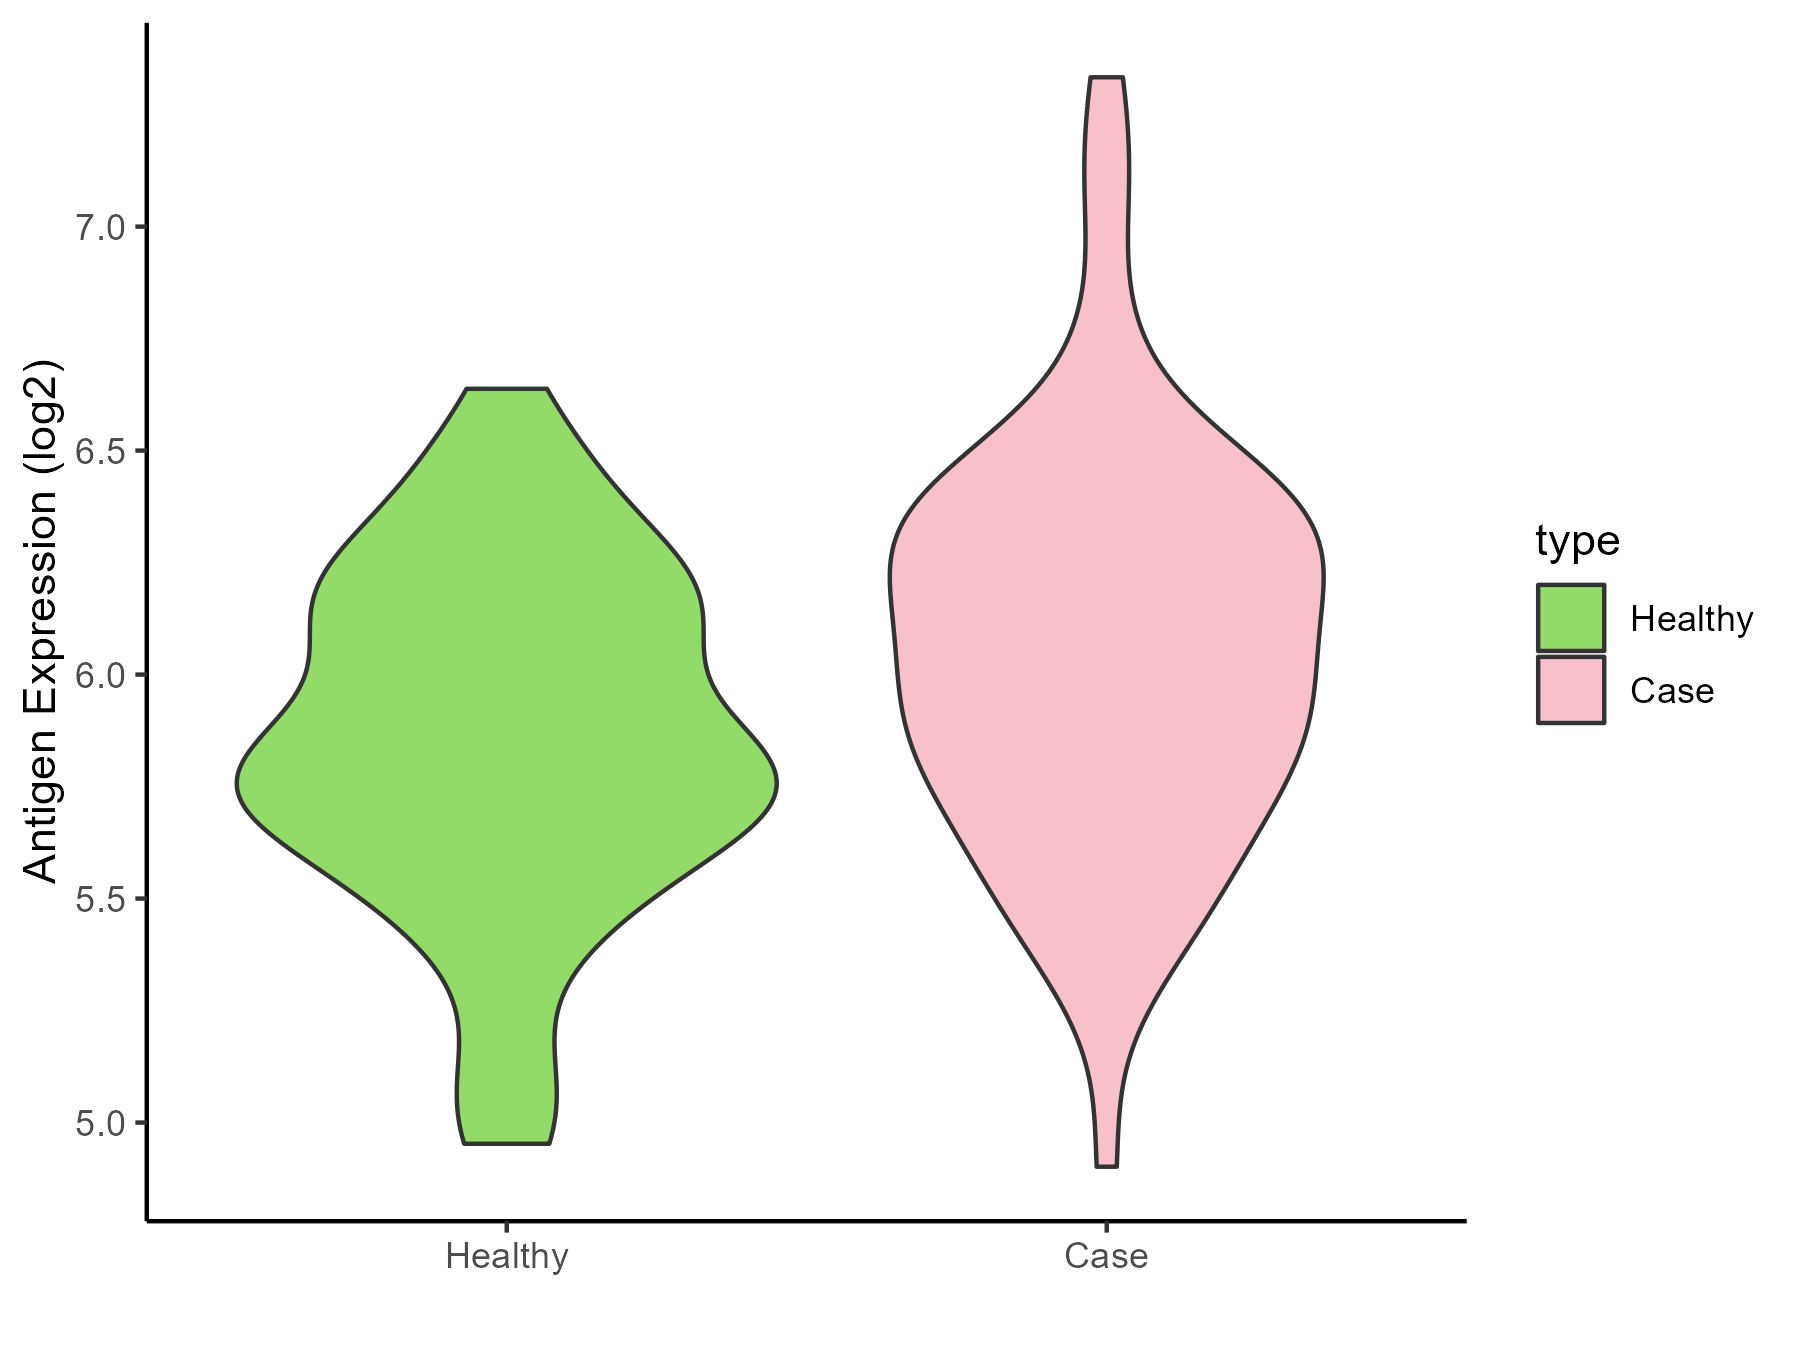
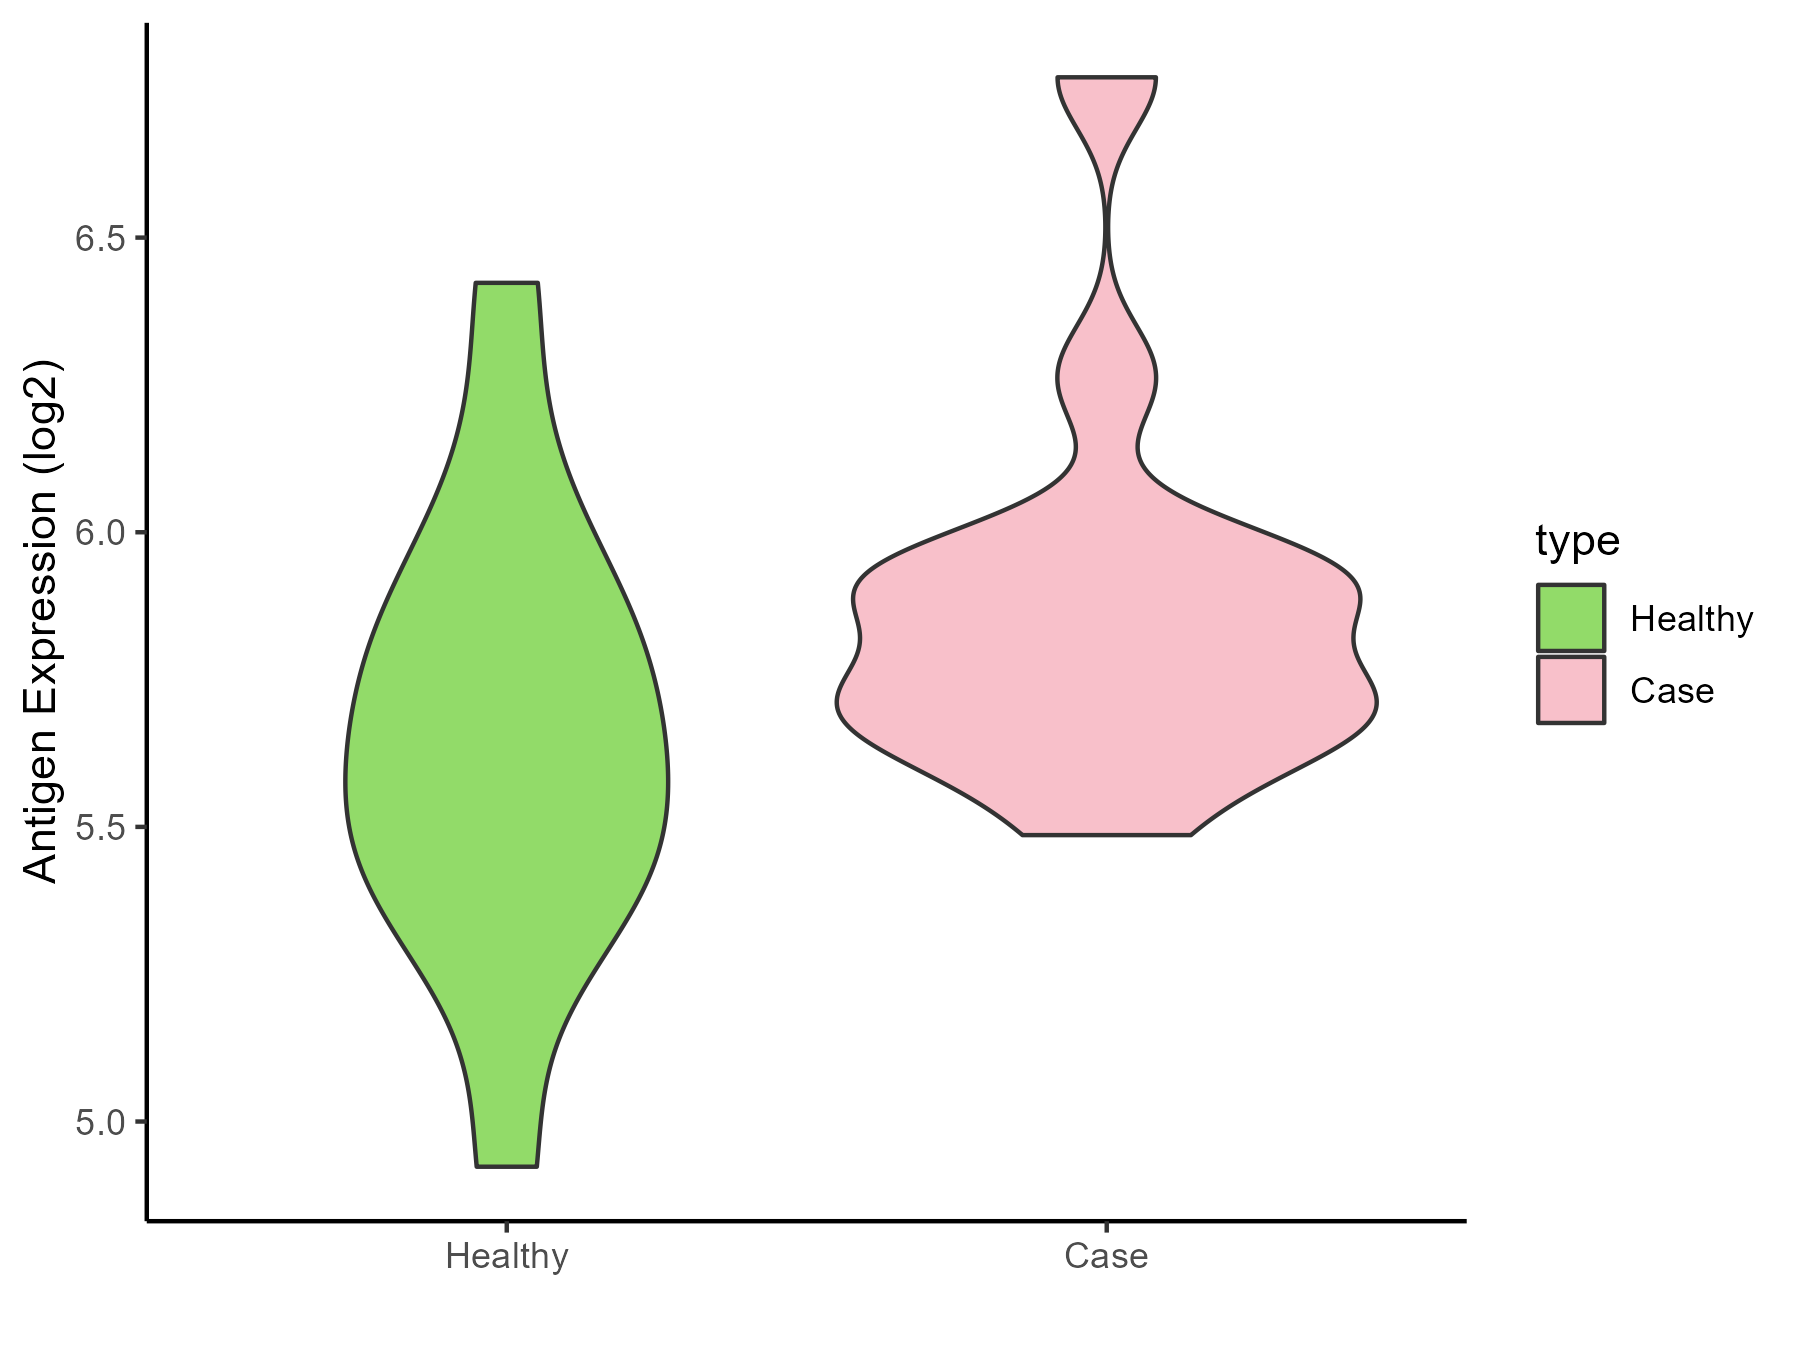
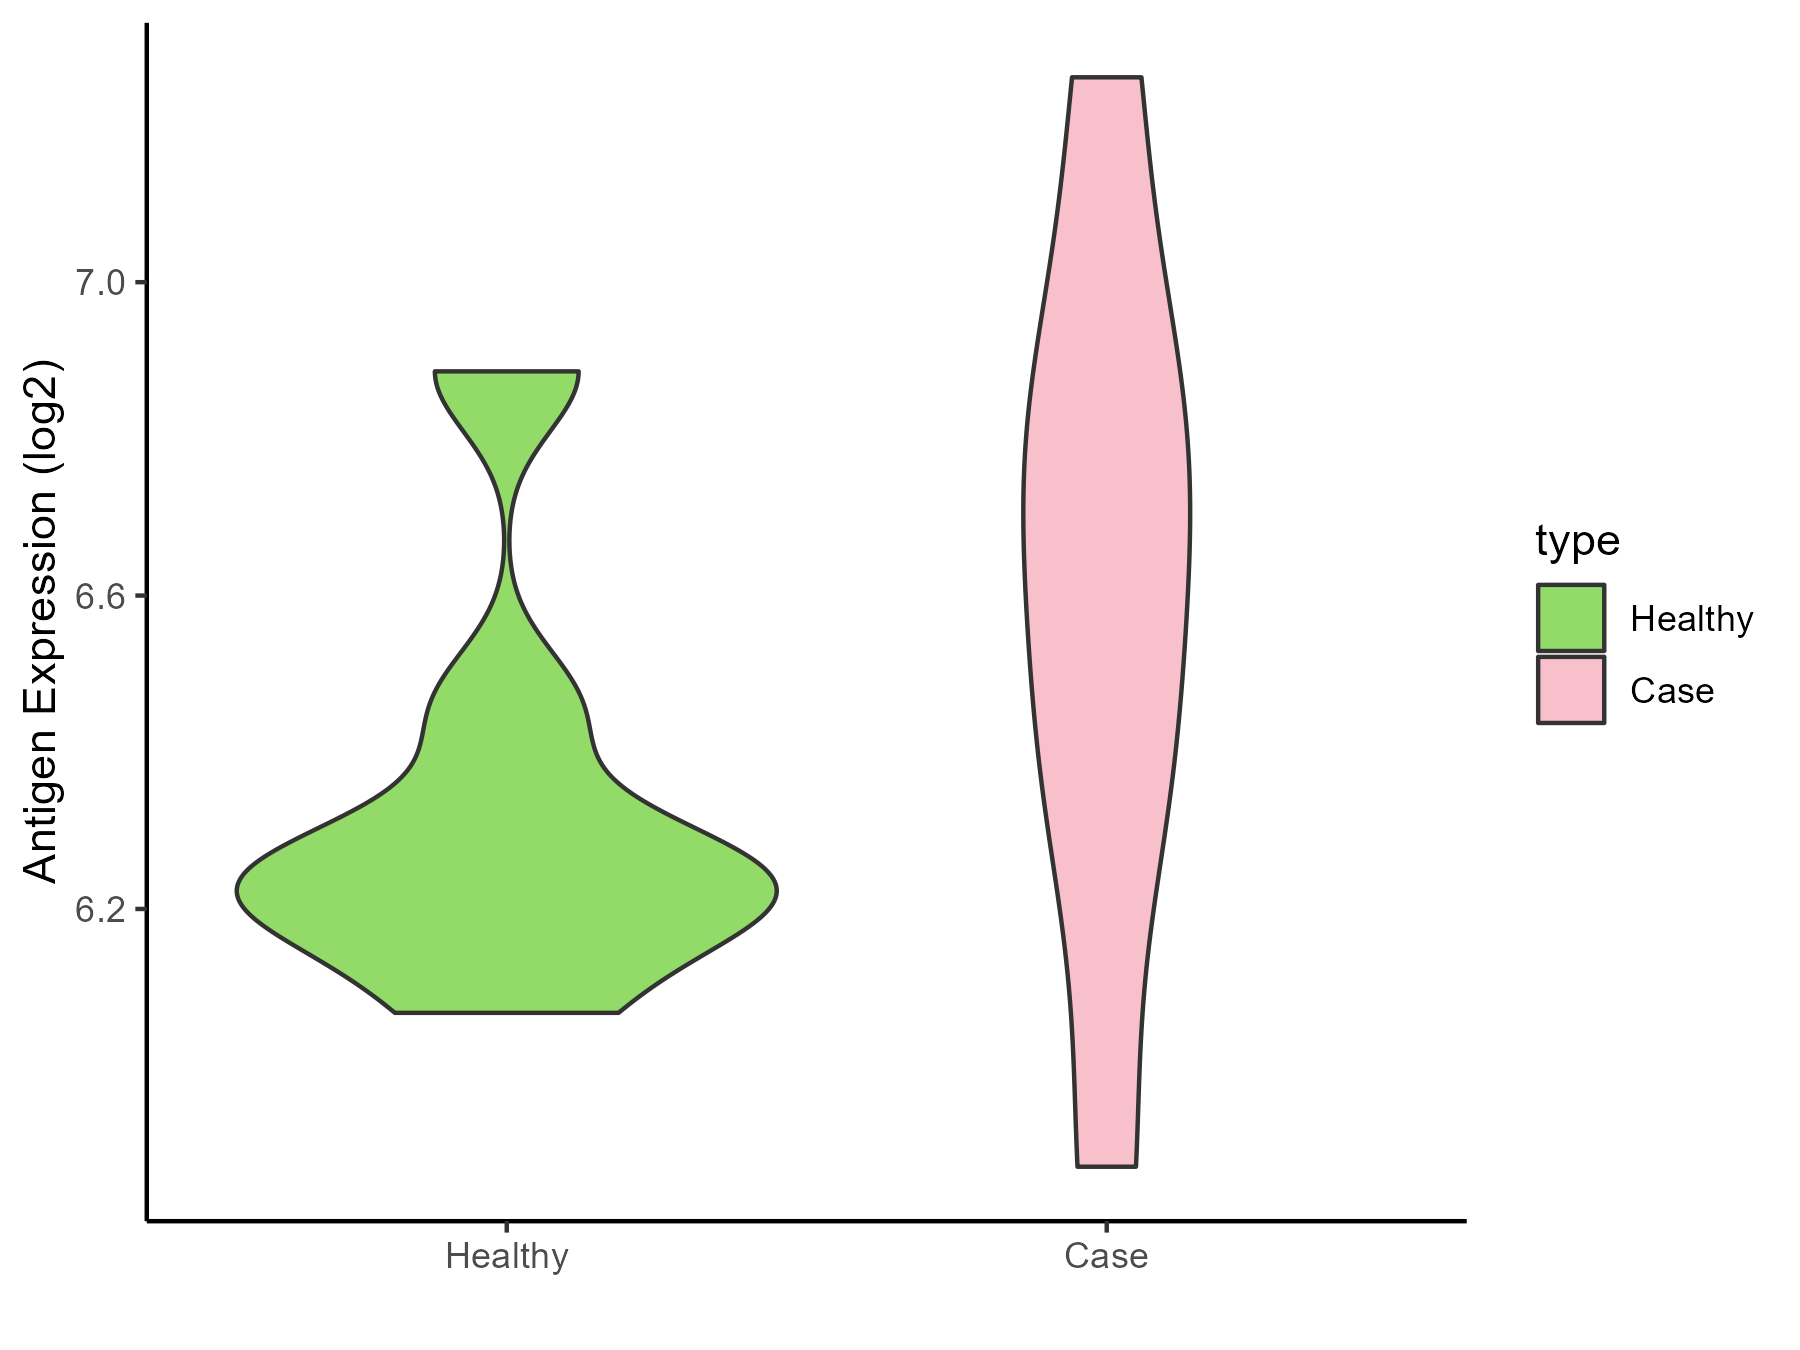
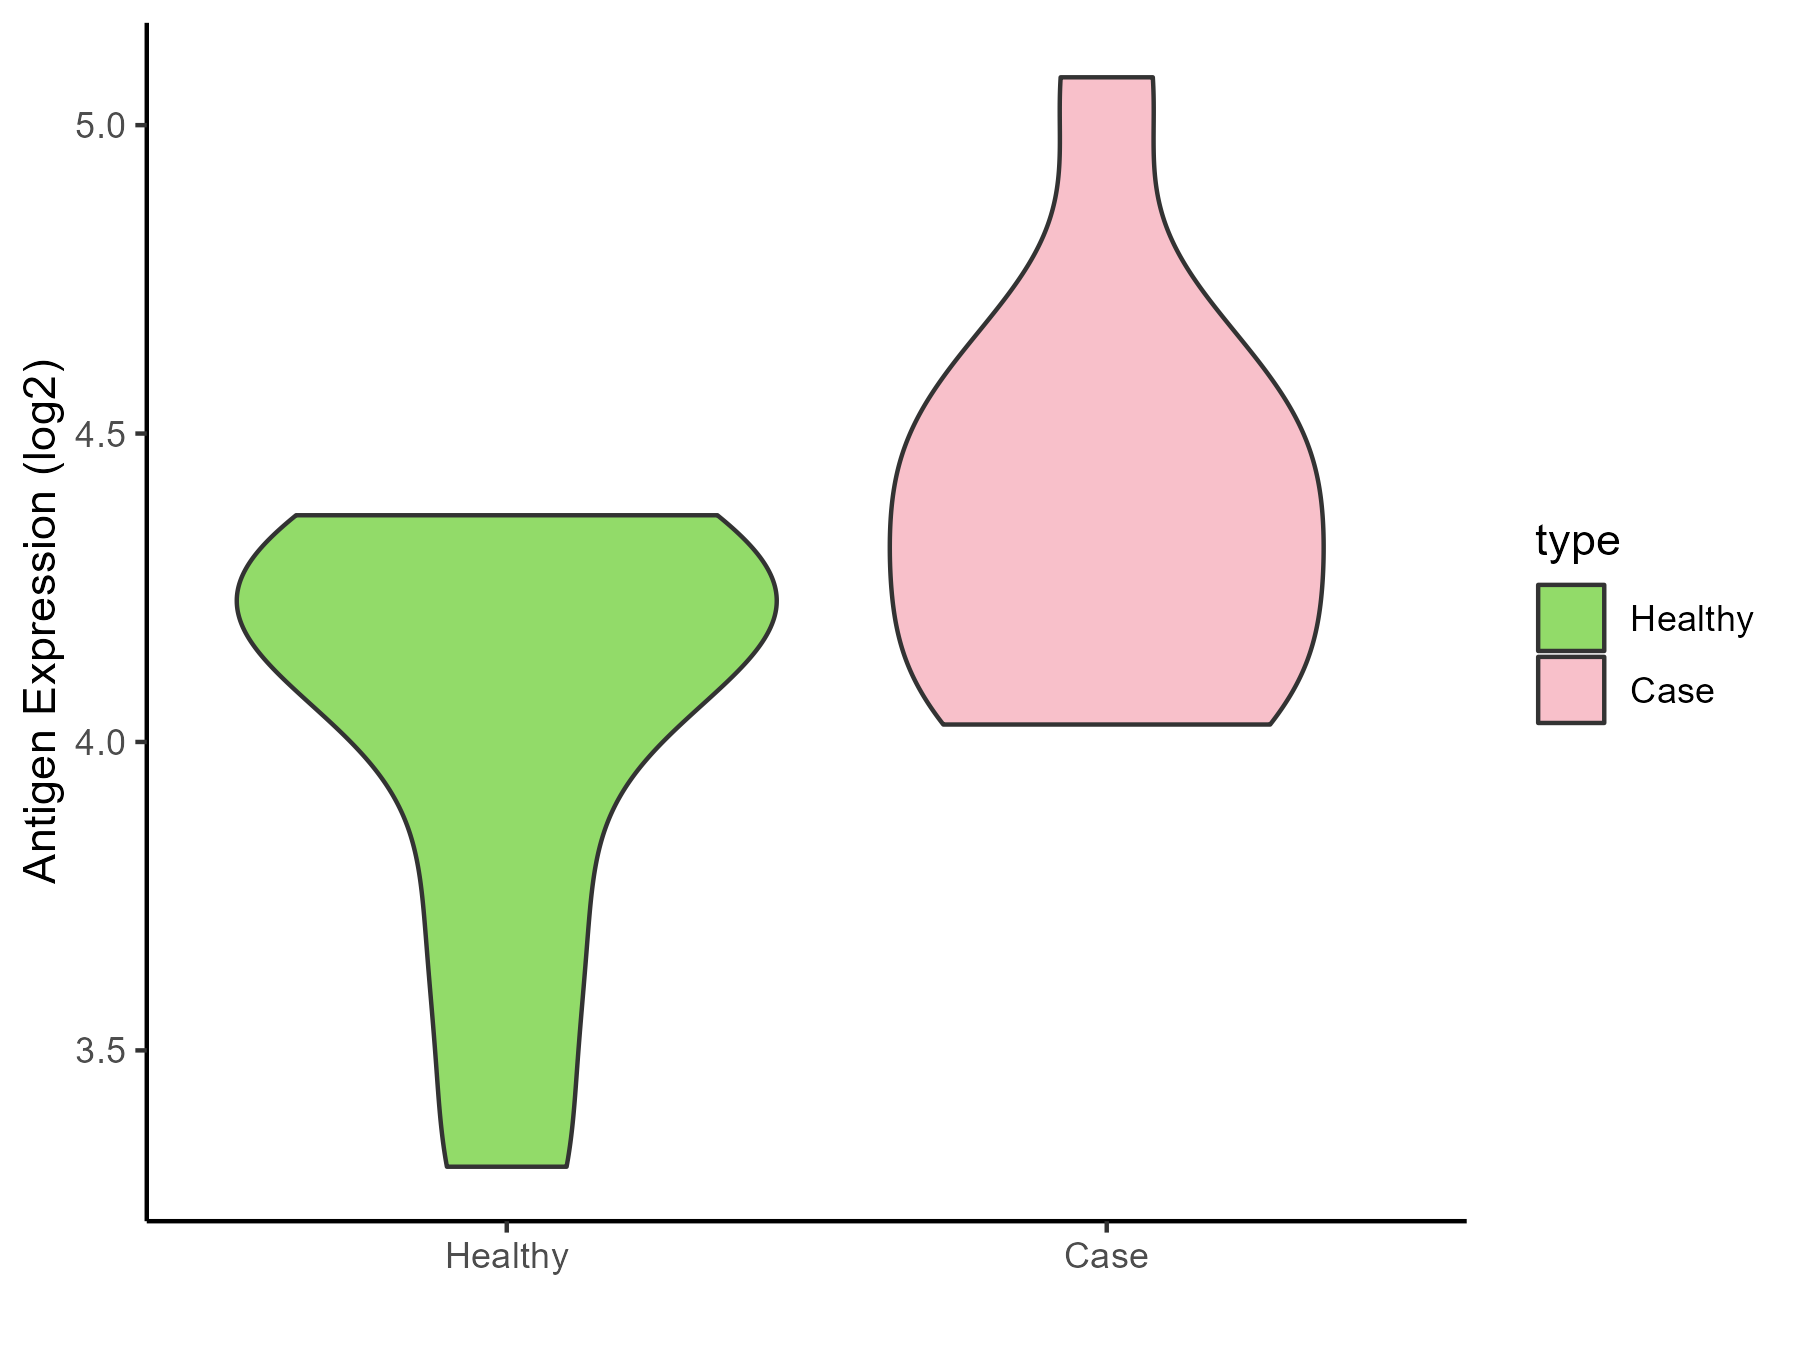
Glioma |
| The Expression Level of Disease Section Compare with the Healthy Individual Tissue |
p-value: 0.077011198;
Fold-change: 0.249772228;
Z-score: 2.168462713
|
| Disease-specific Antigen Abundances |
|
Click to View the Clearer Original Diagram
|
|
|
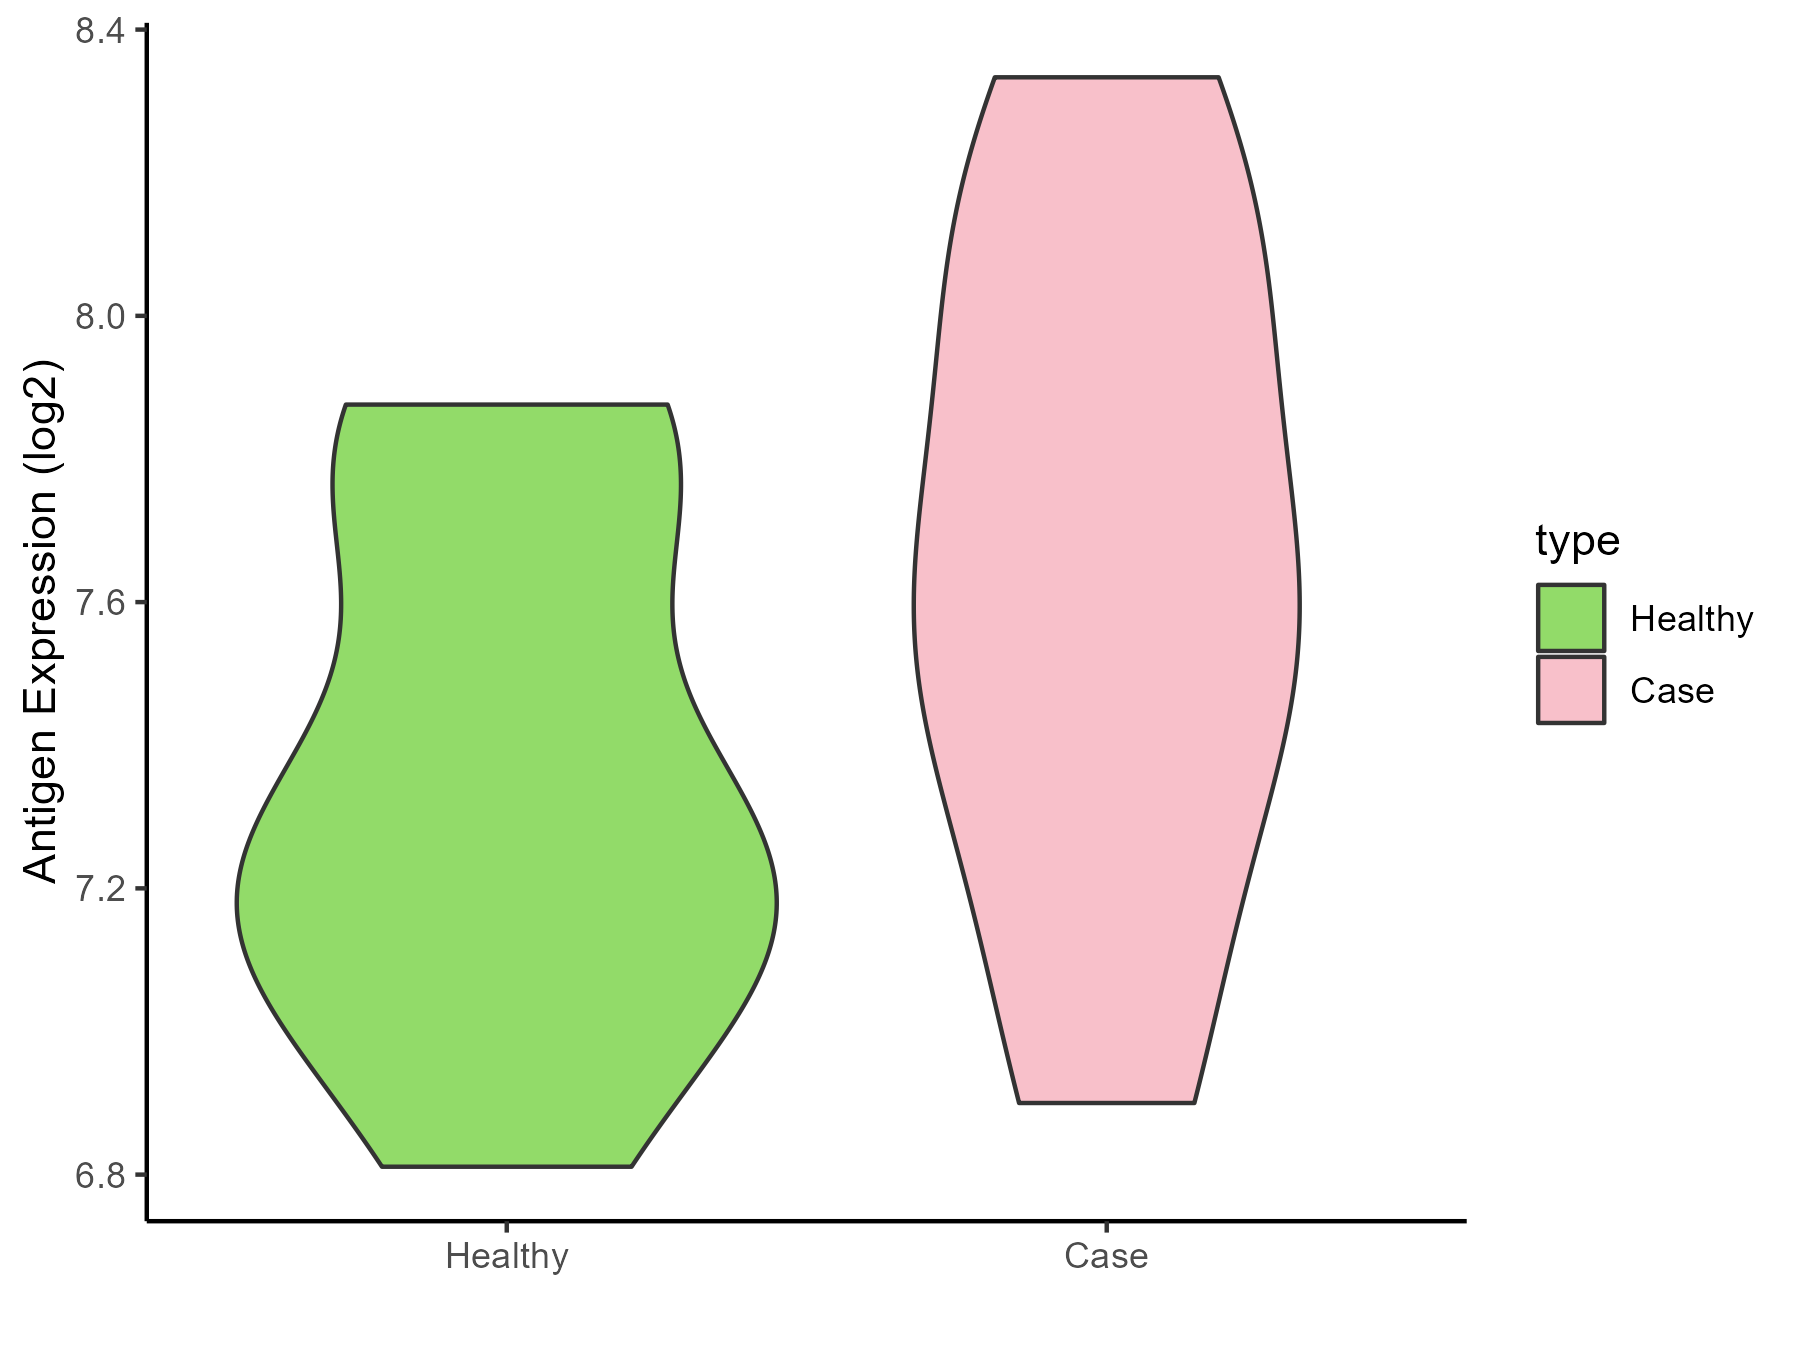
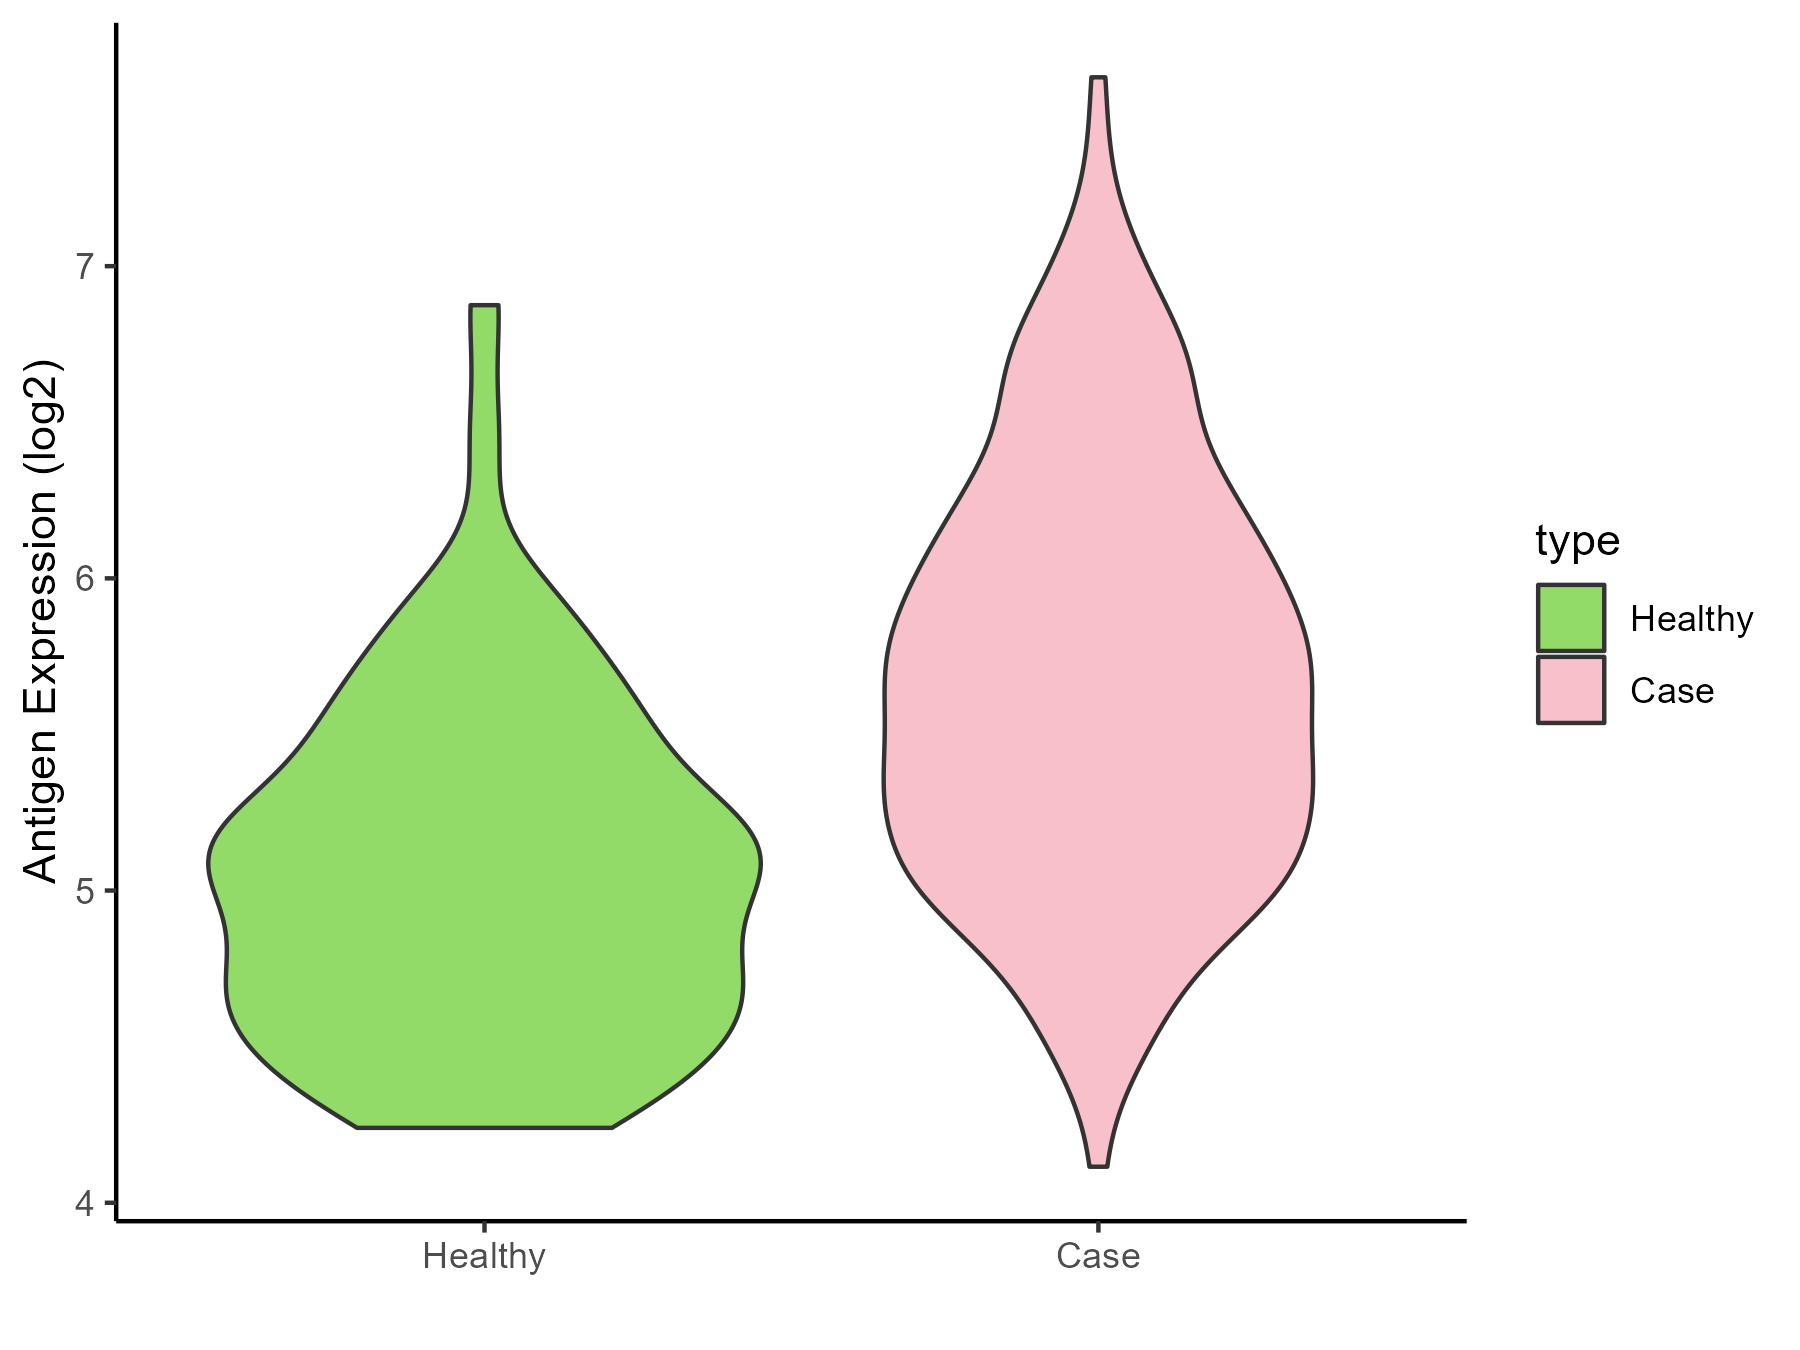
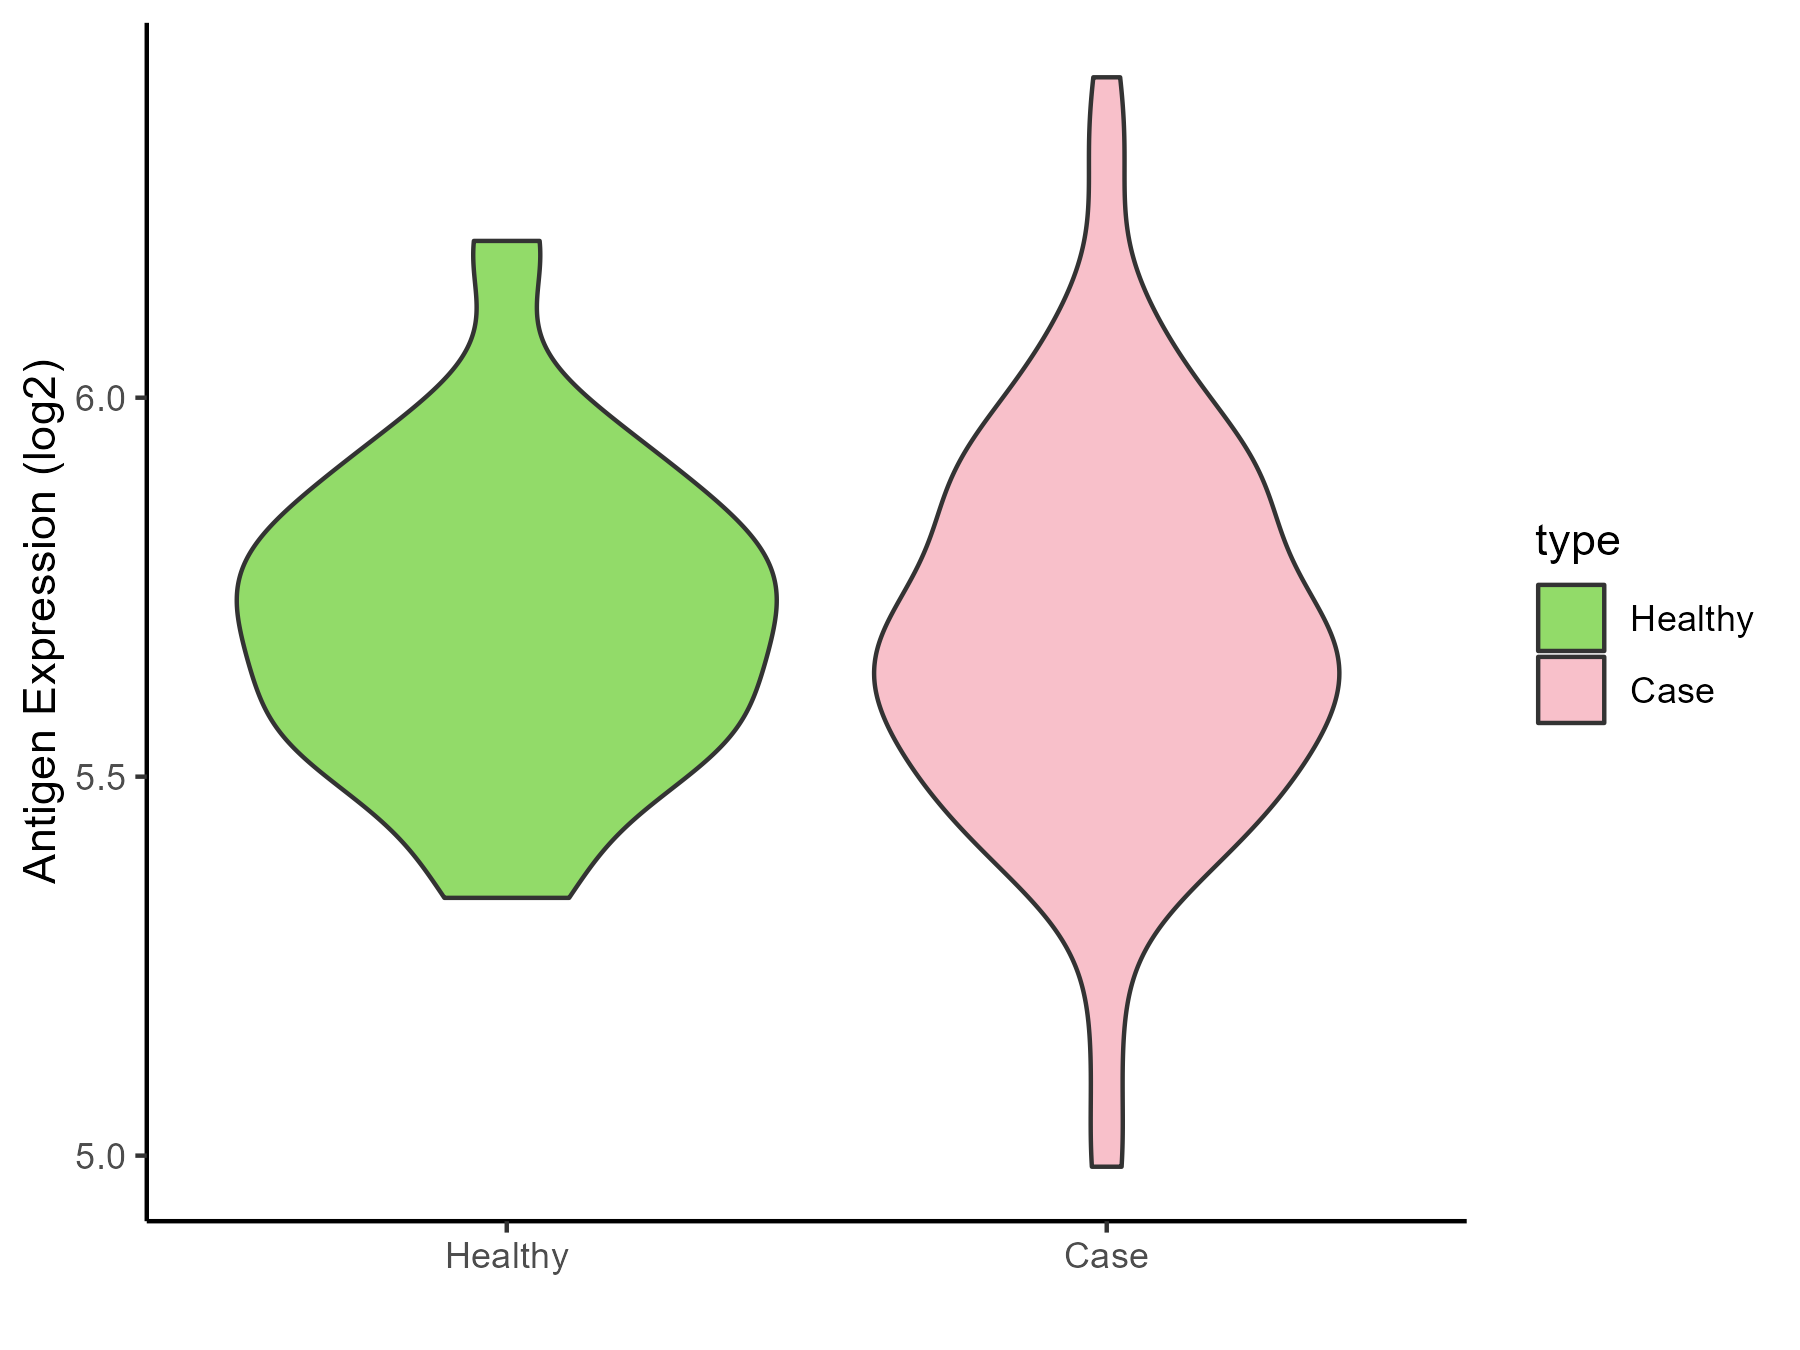
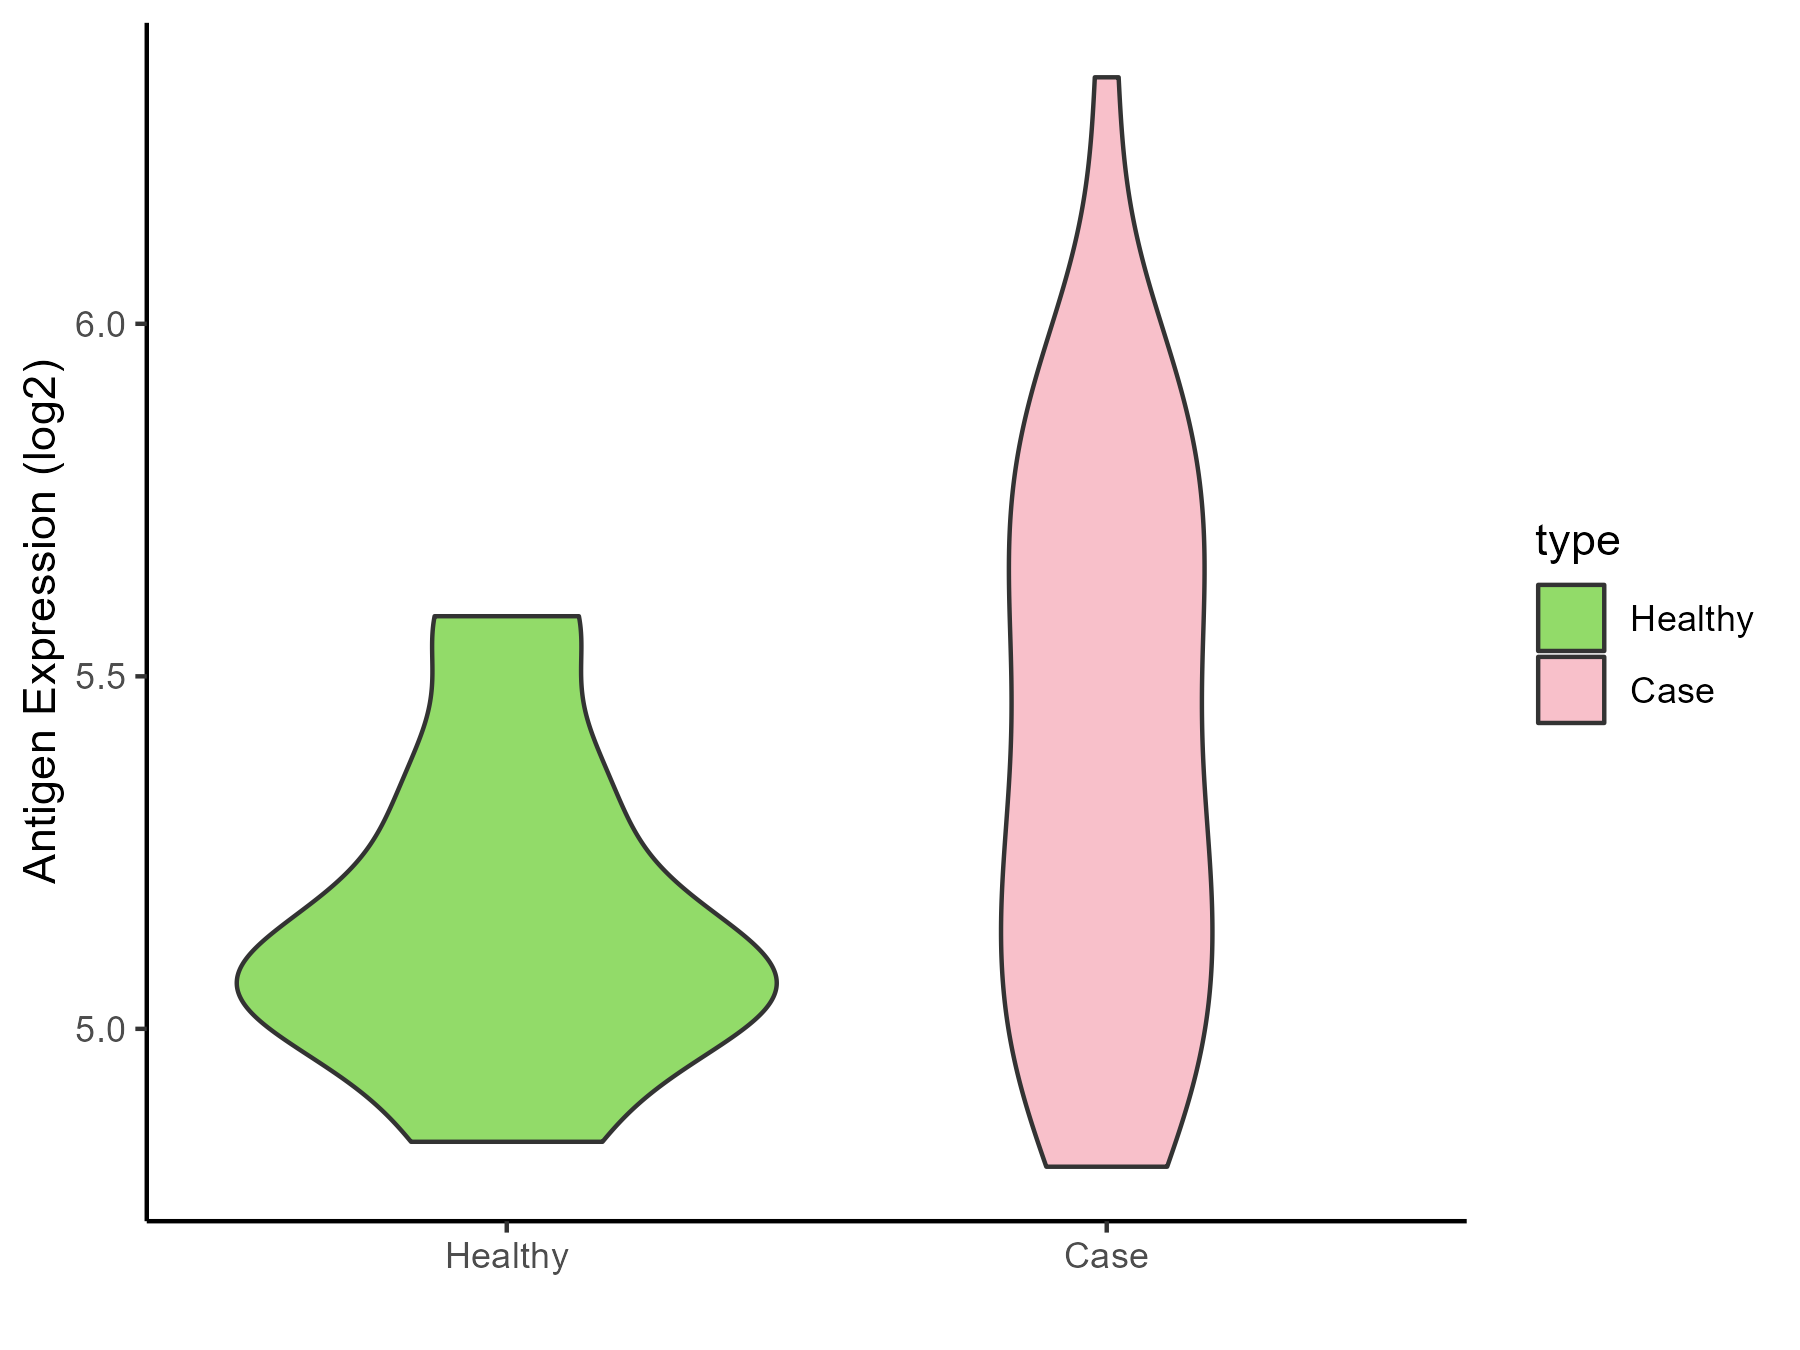
| The Studied Tissue |
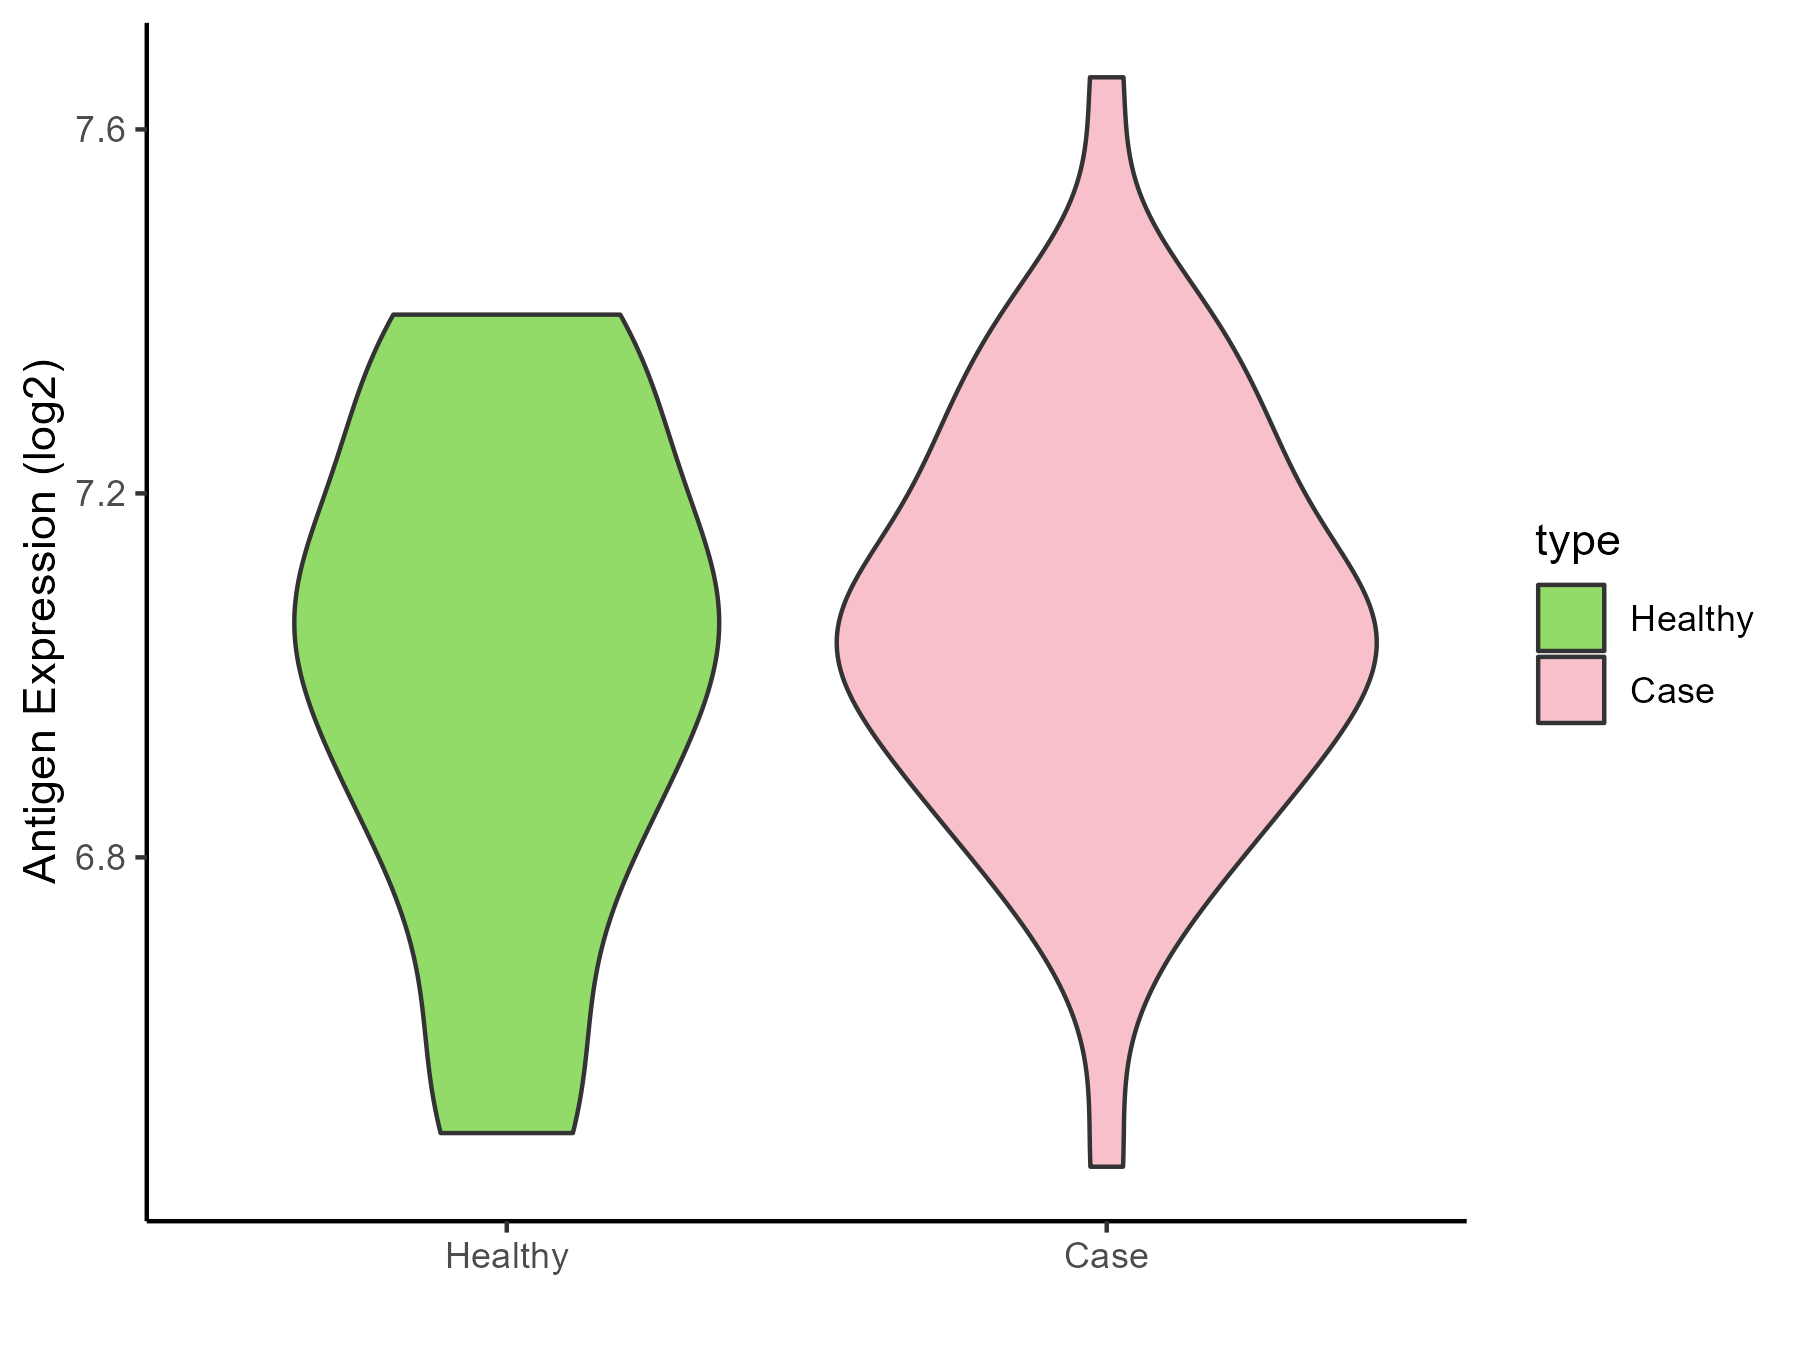
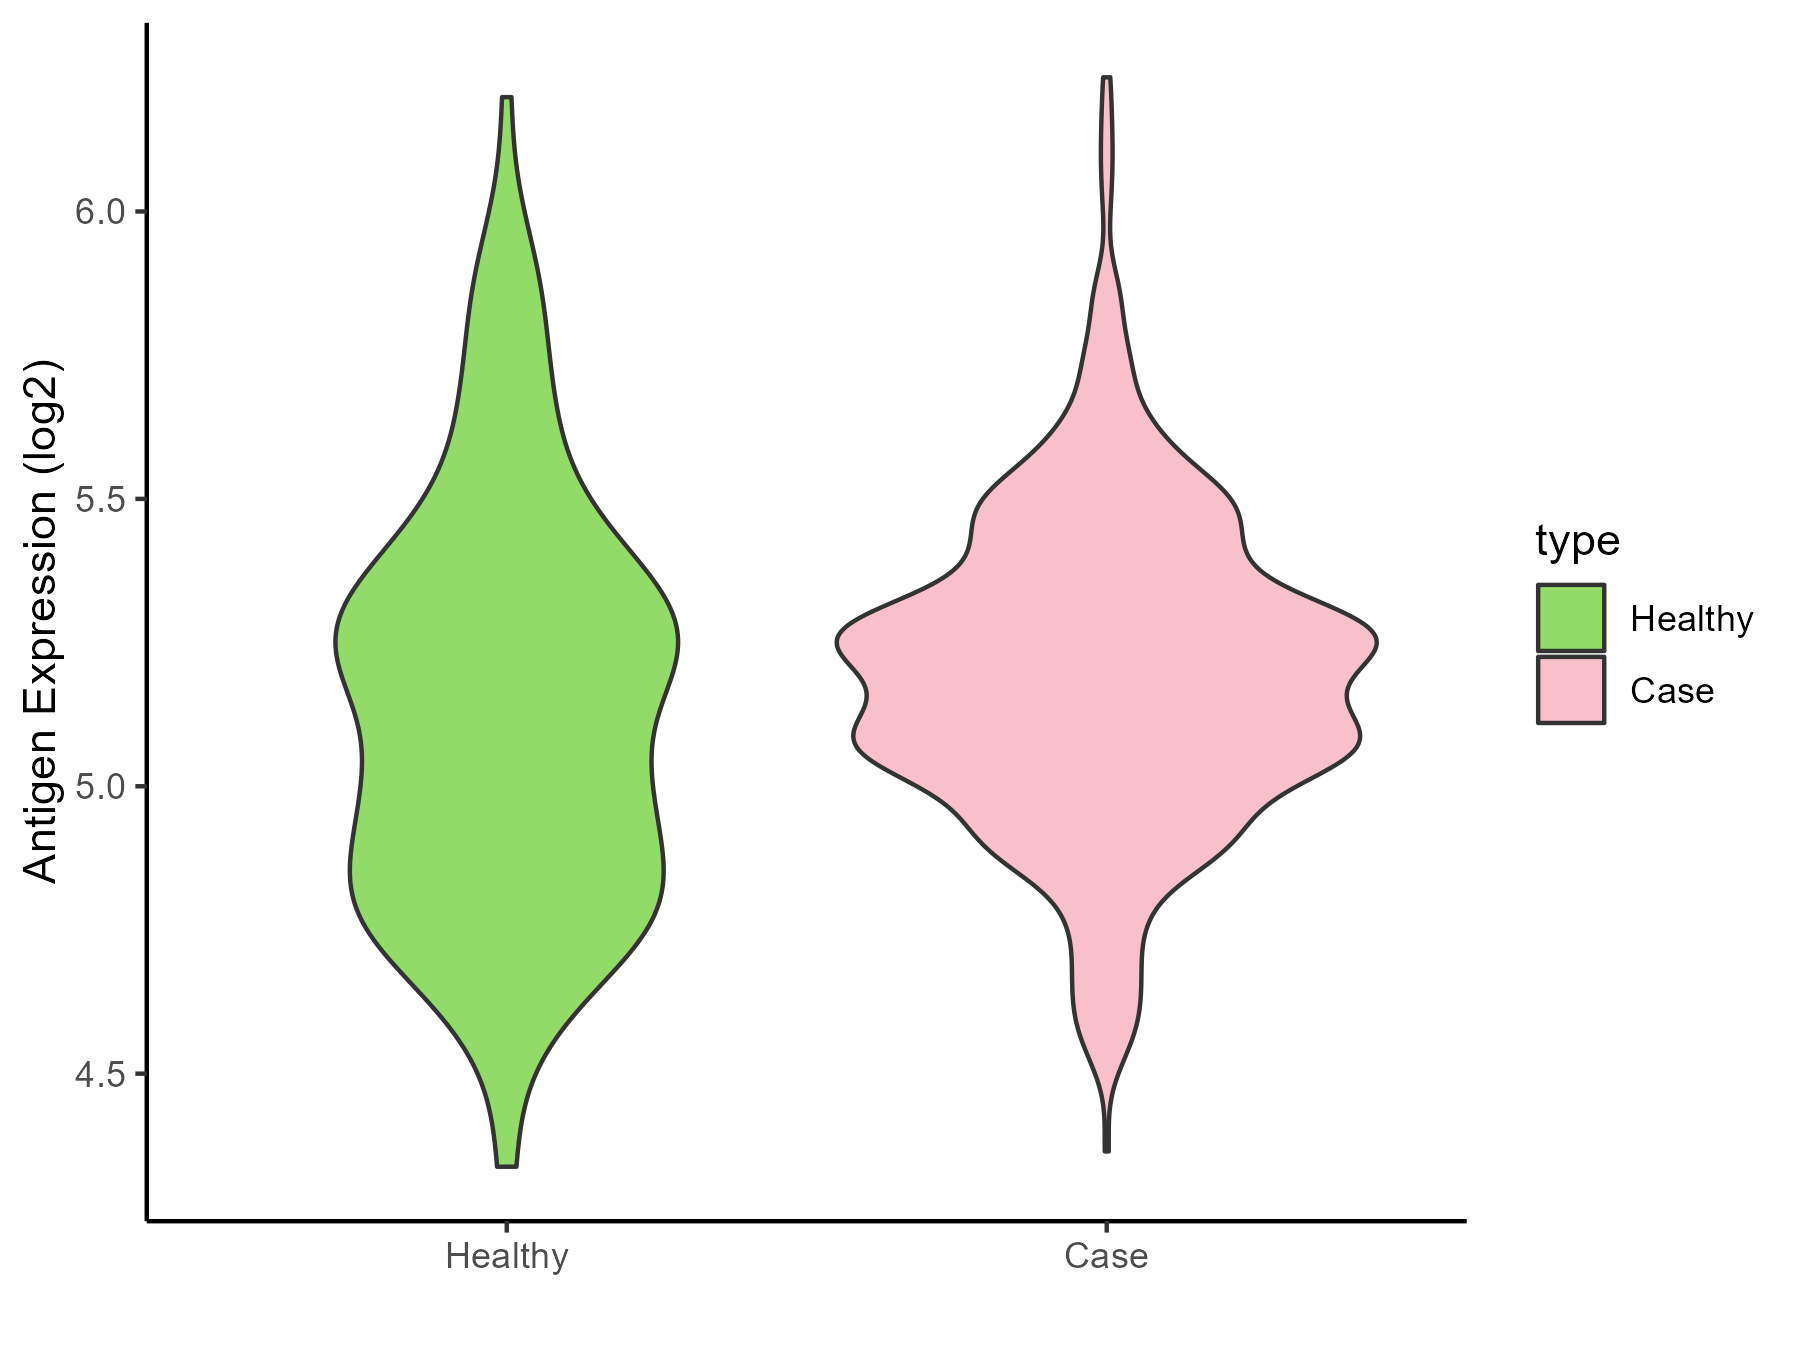
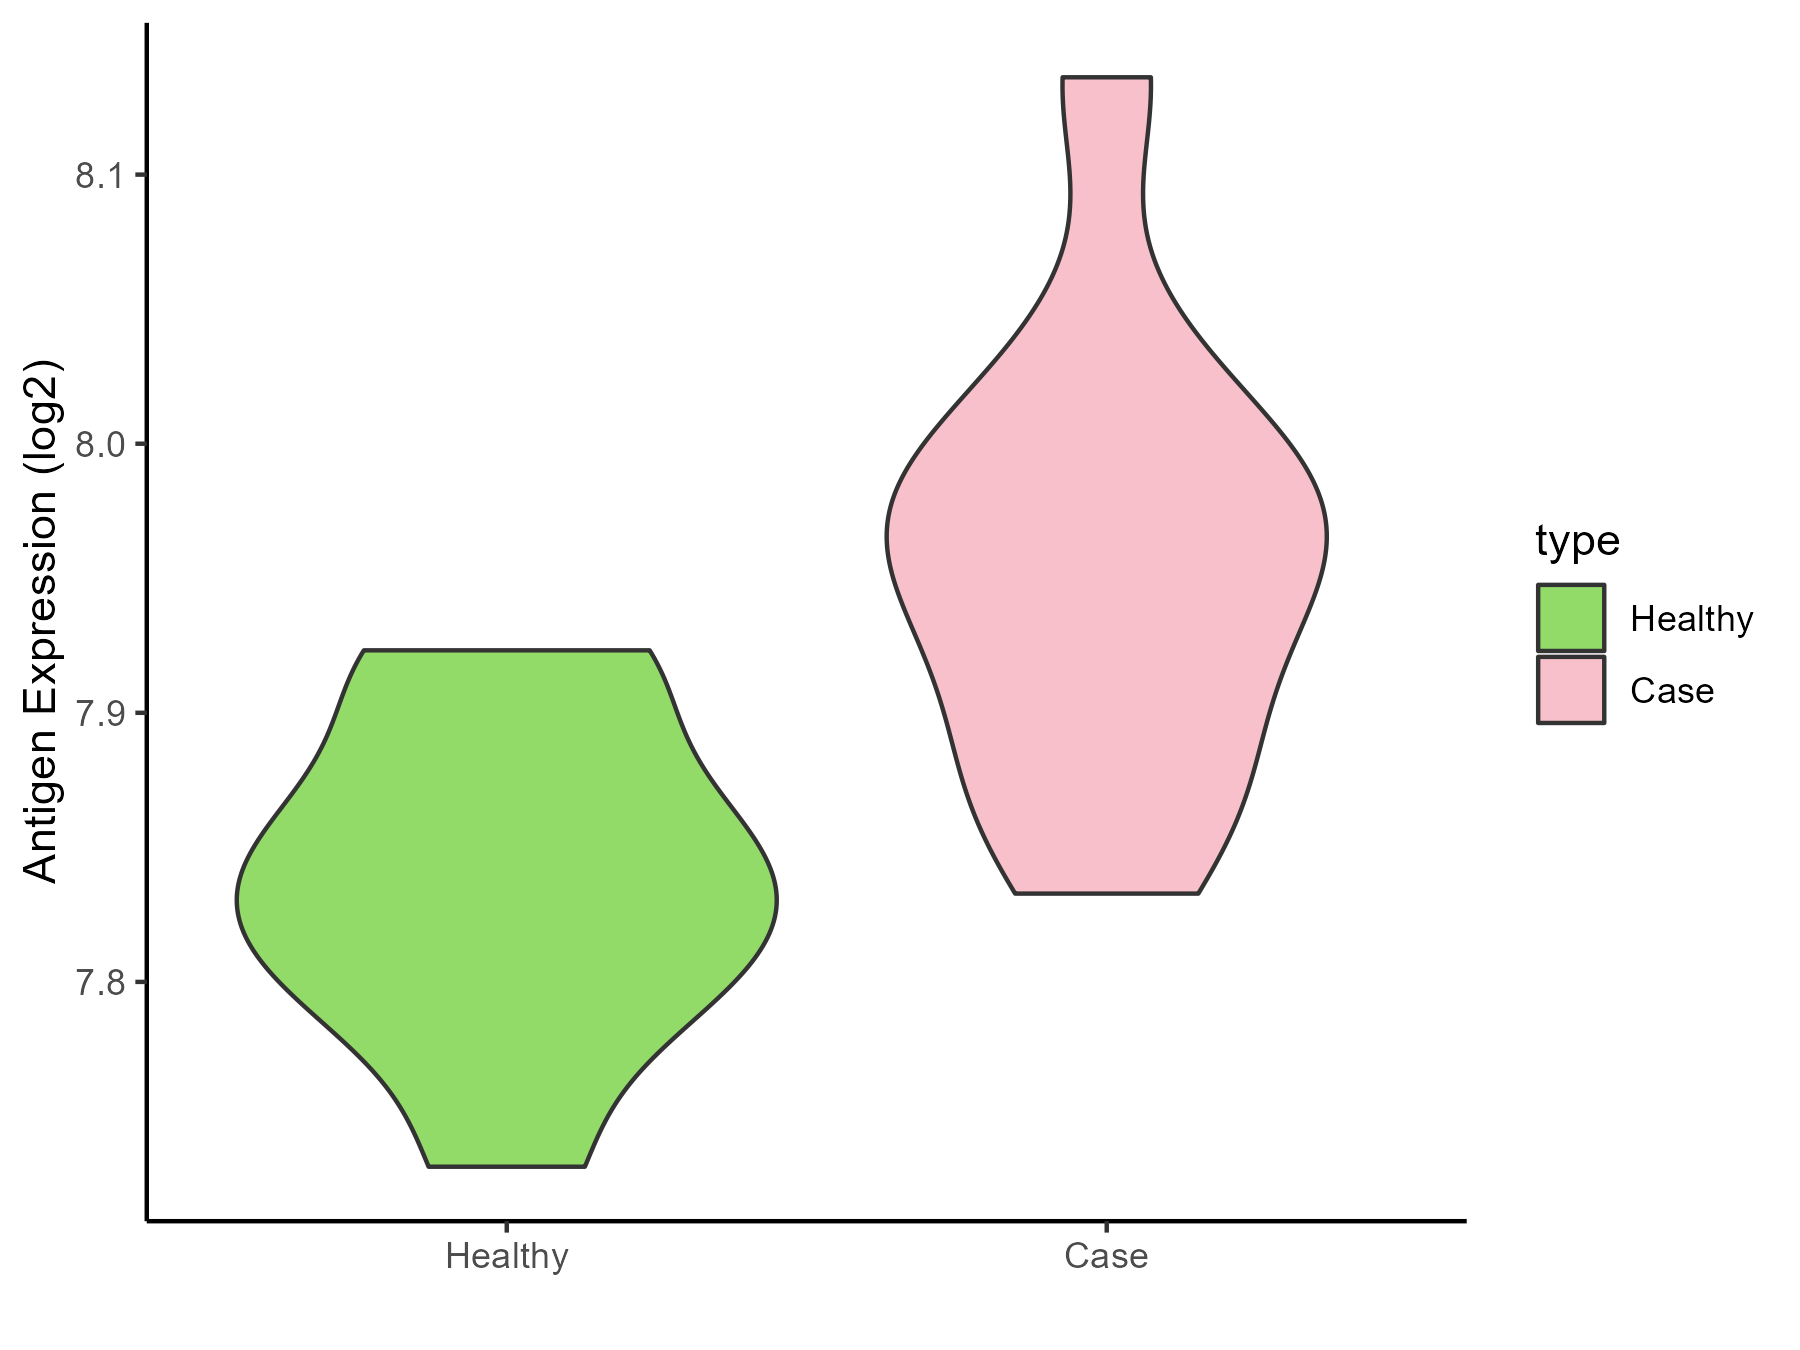
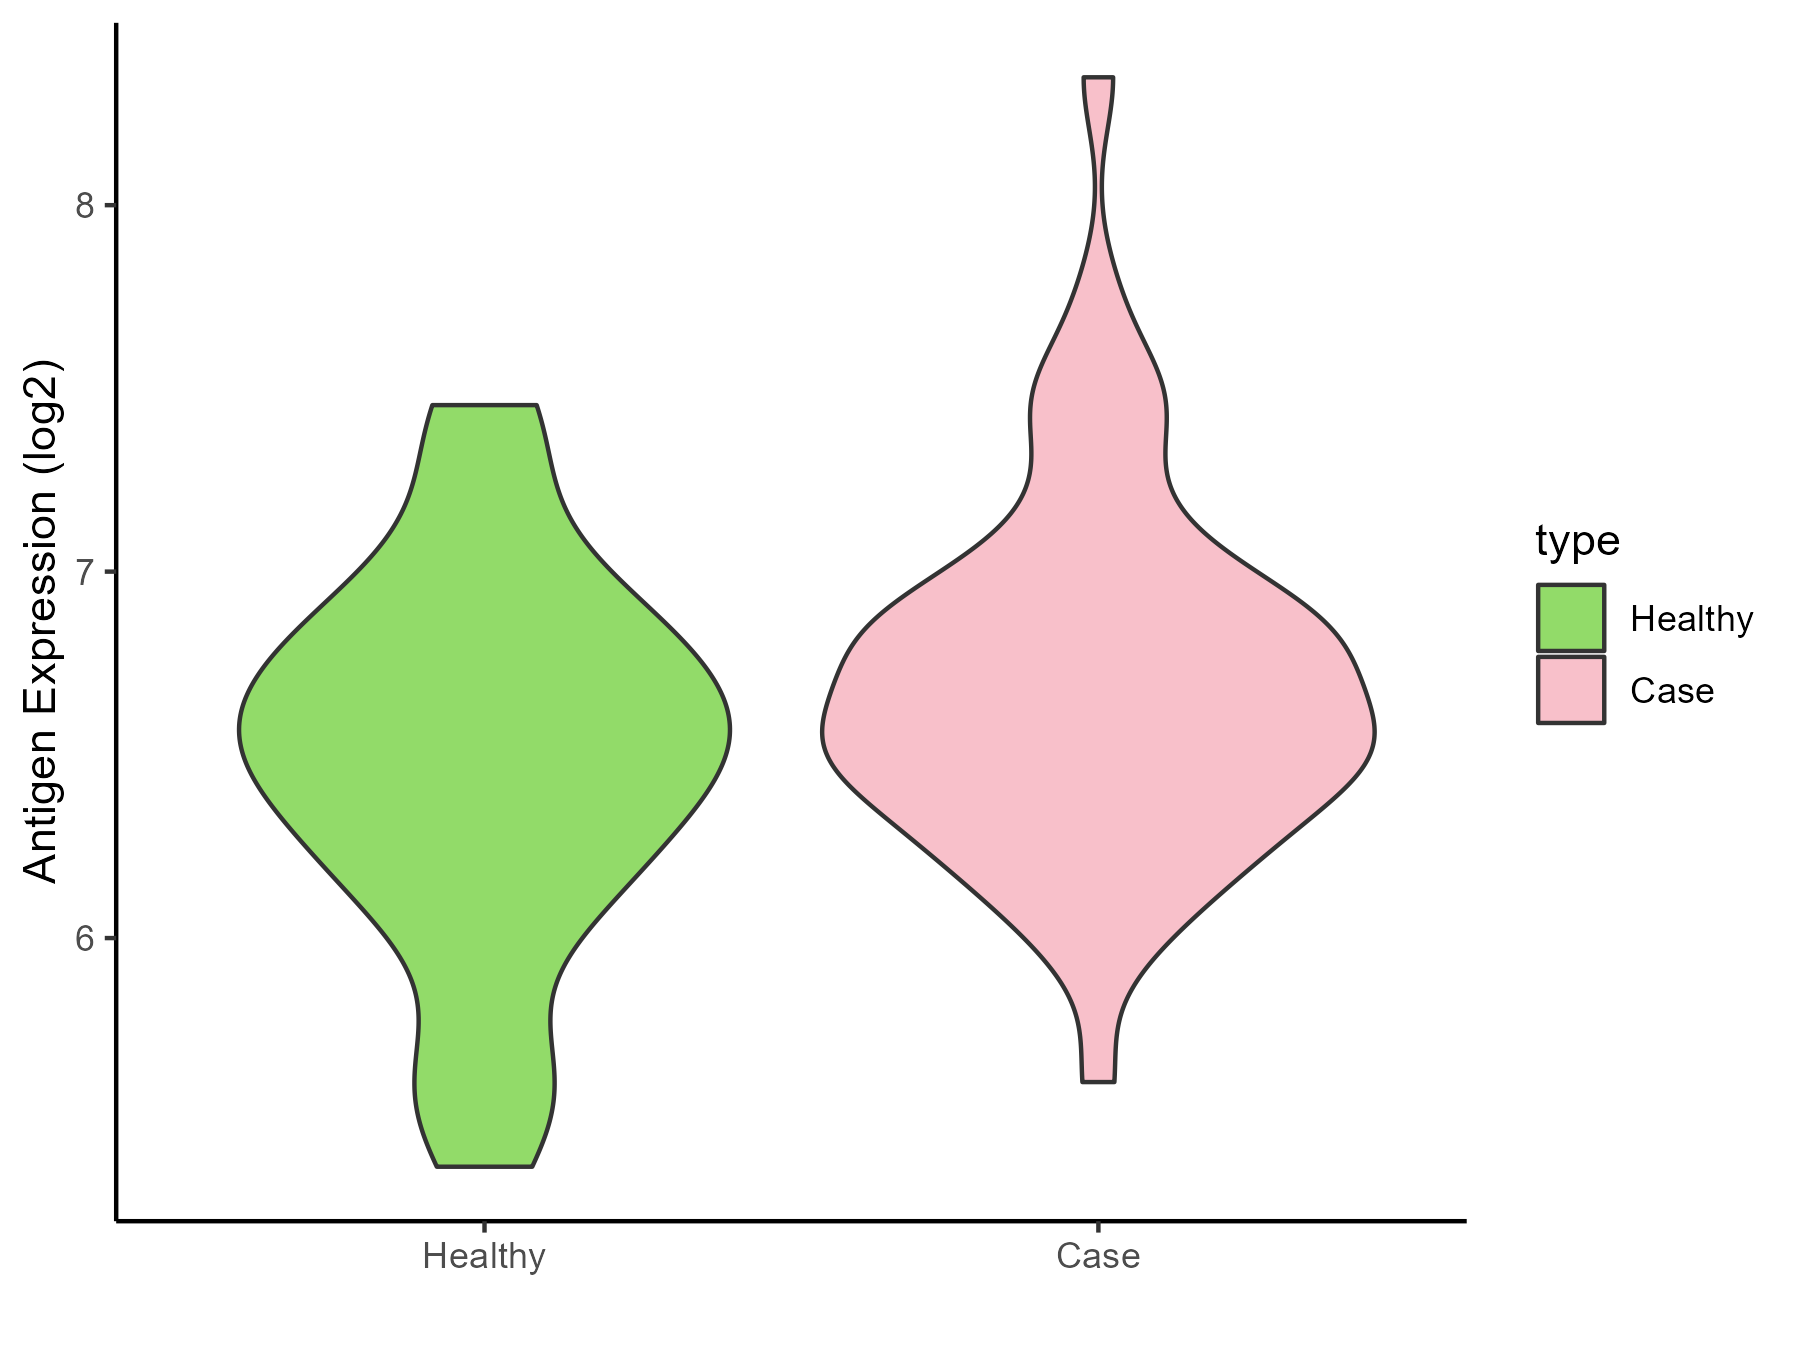
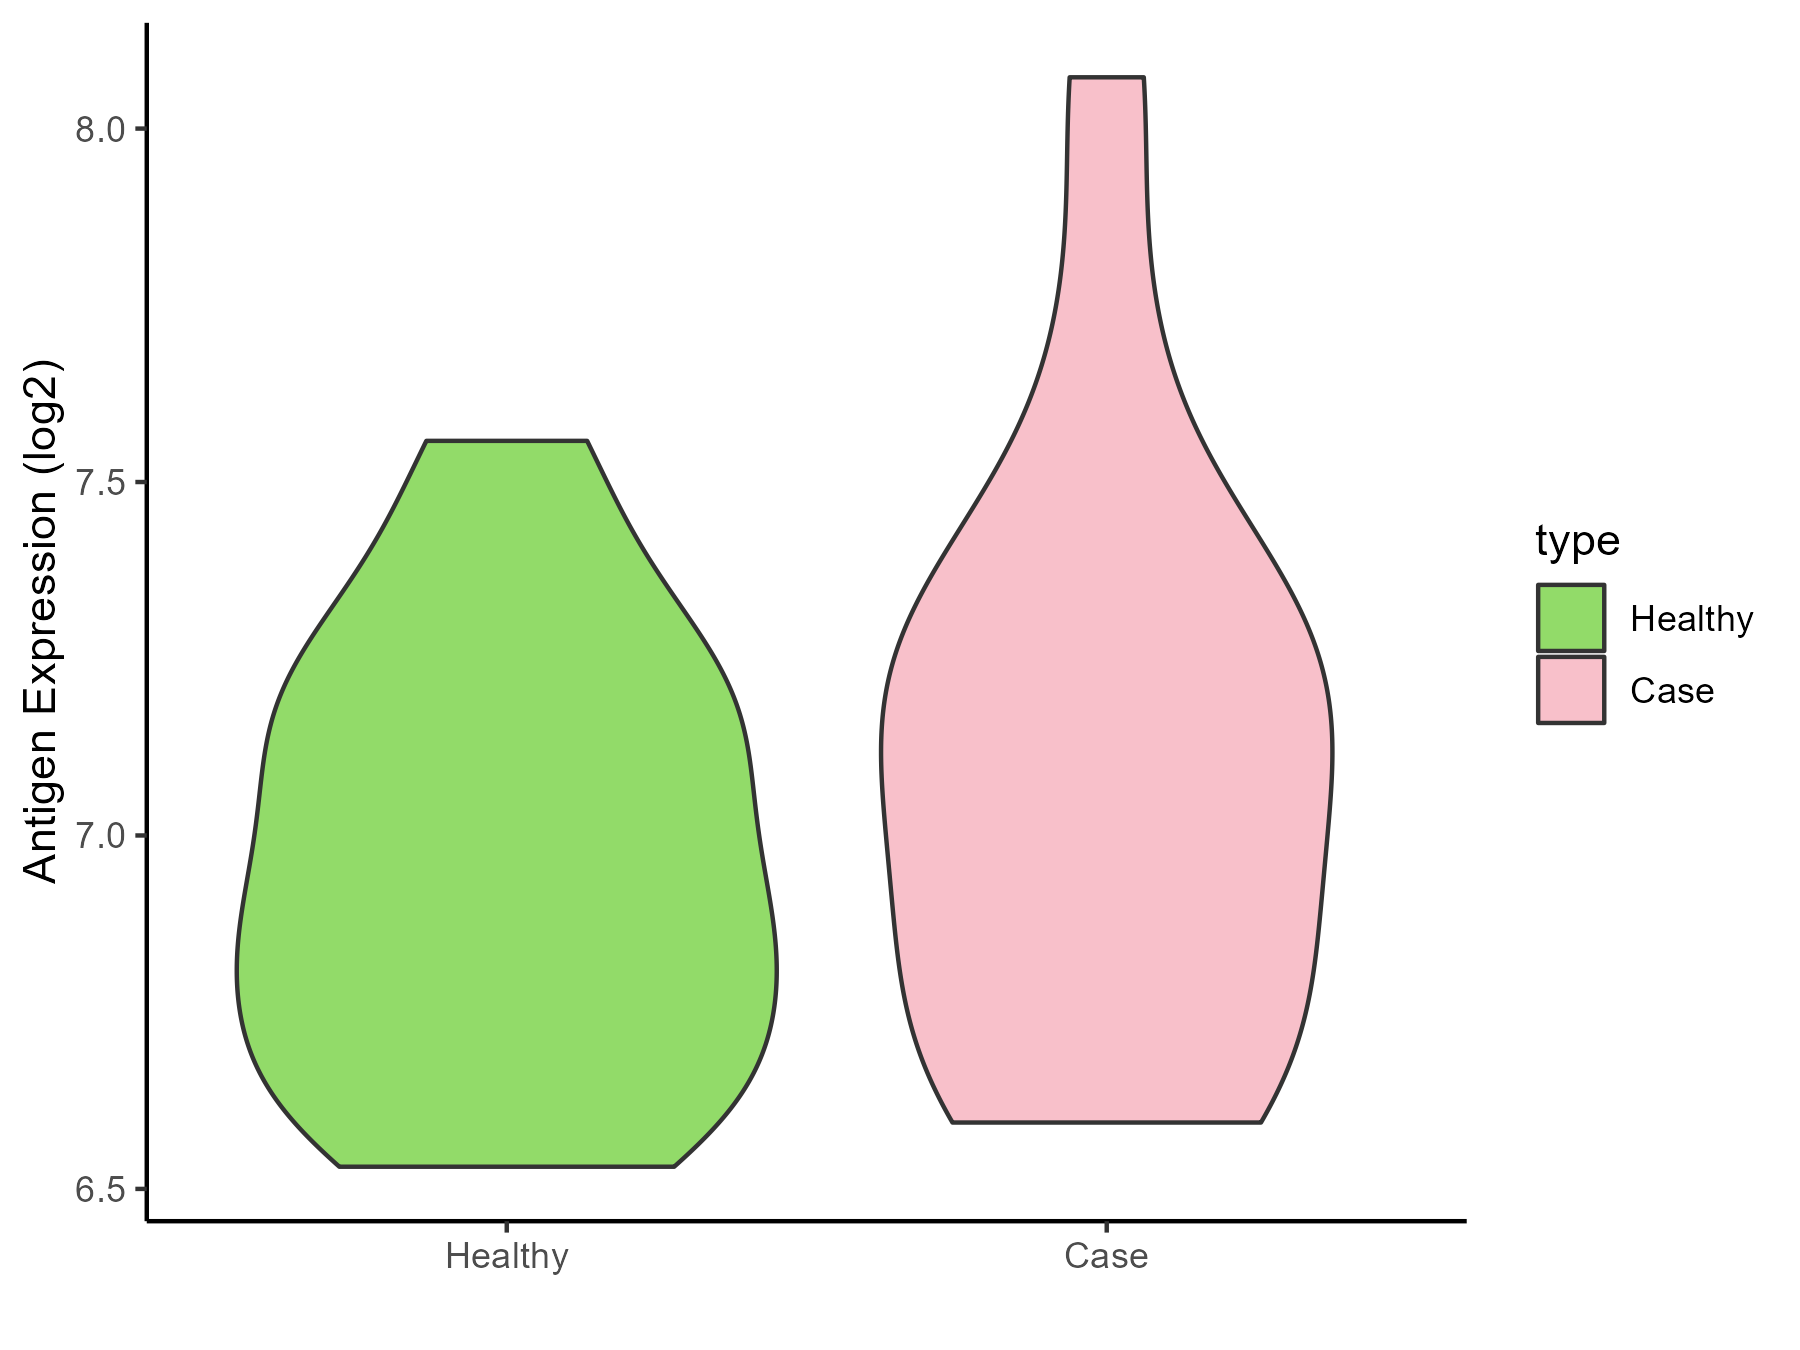
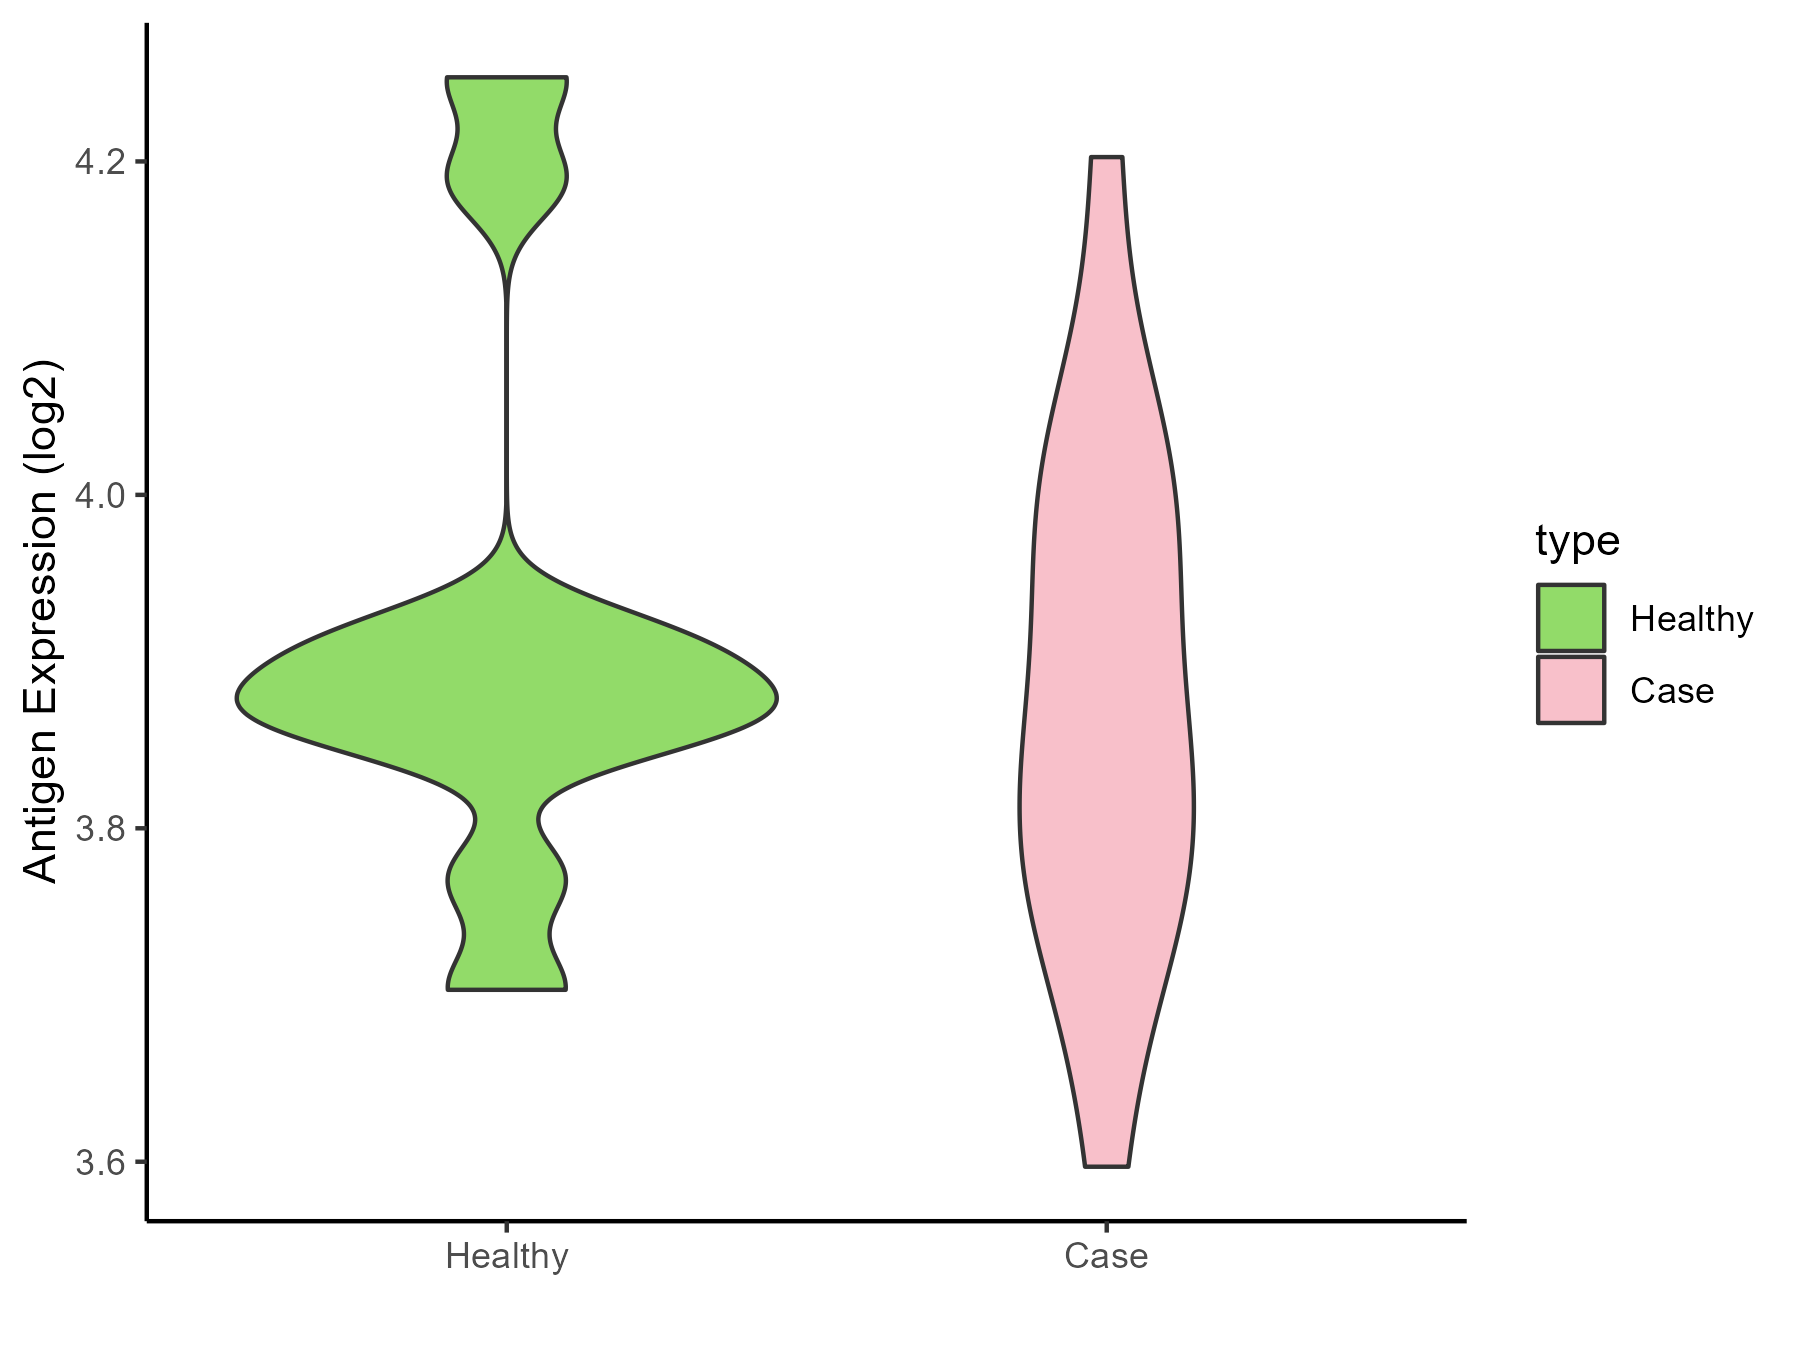
White matter |
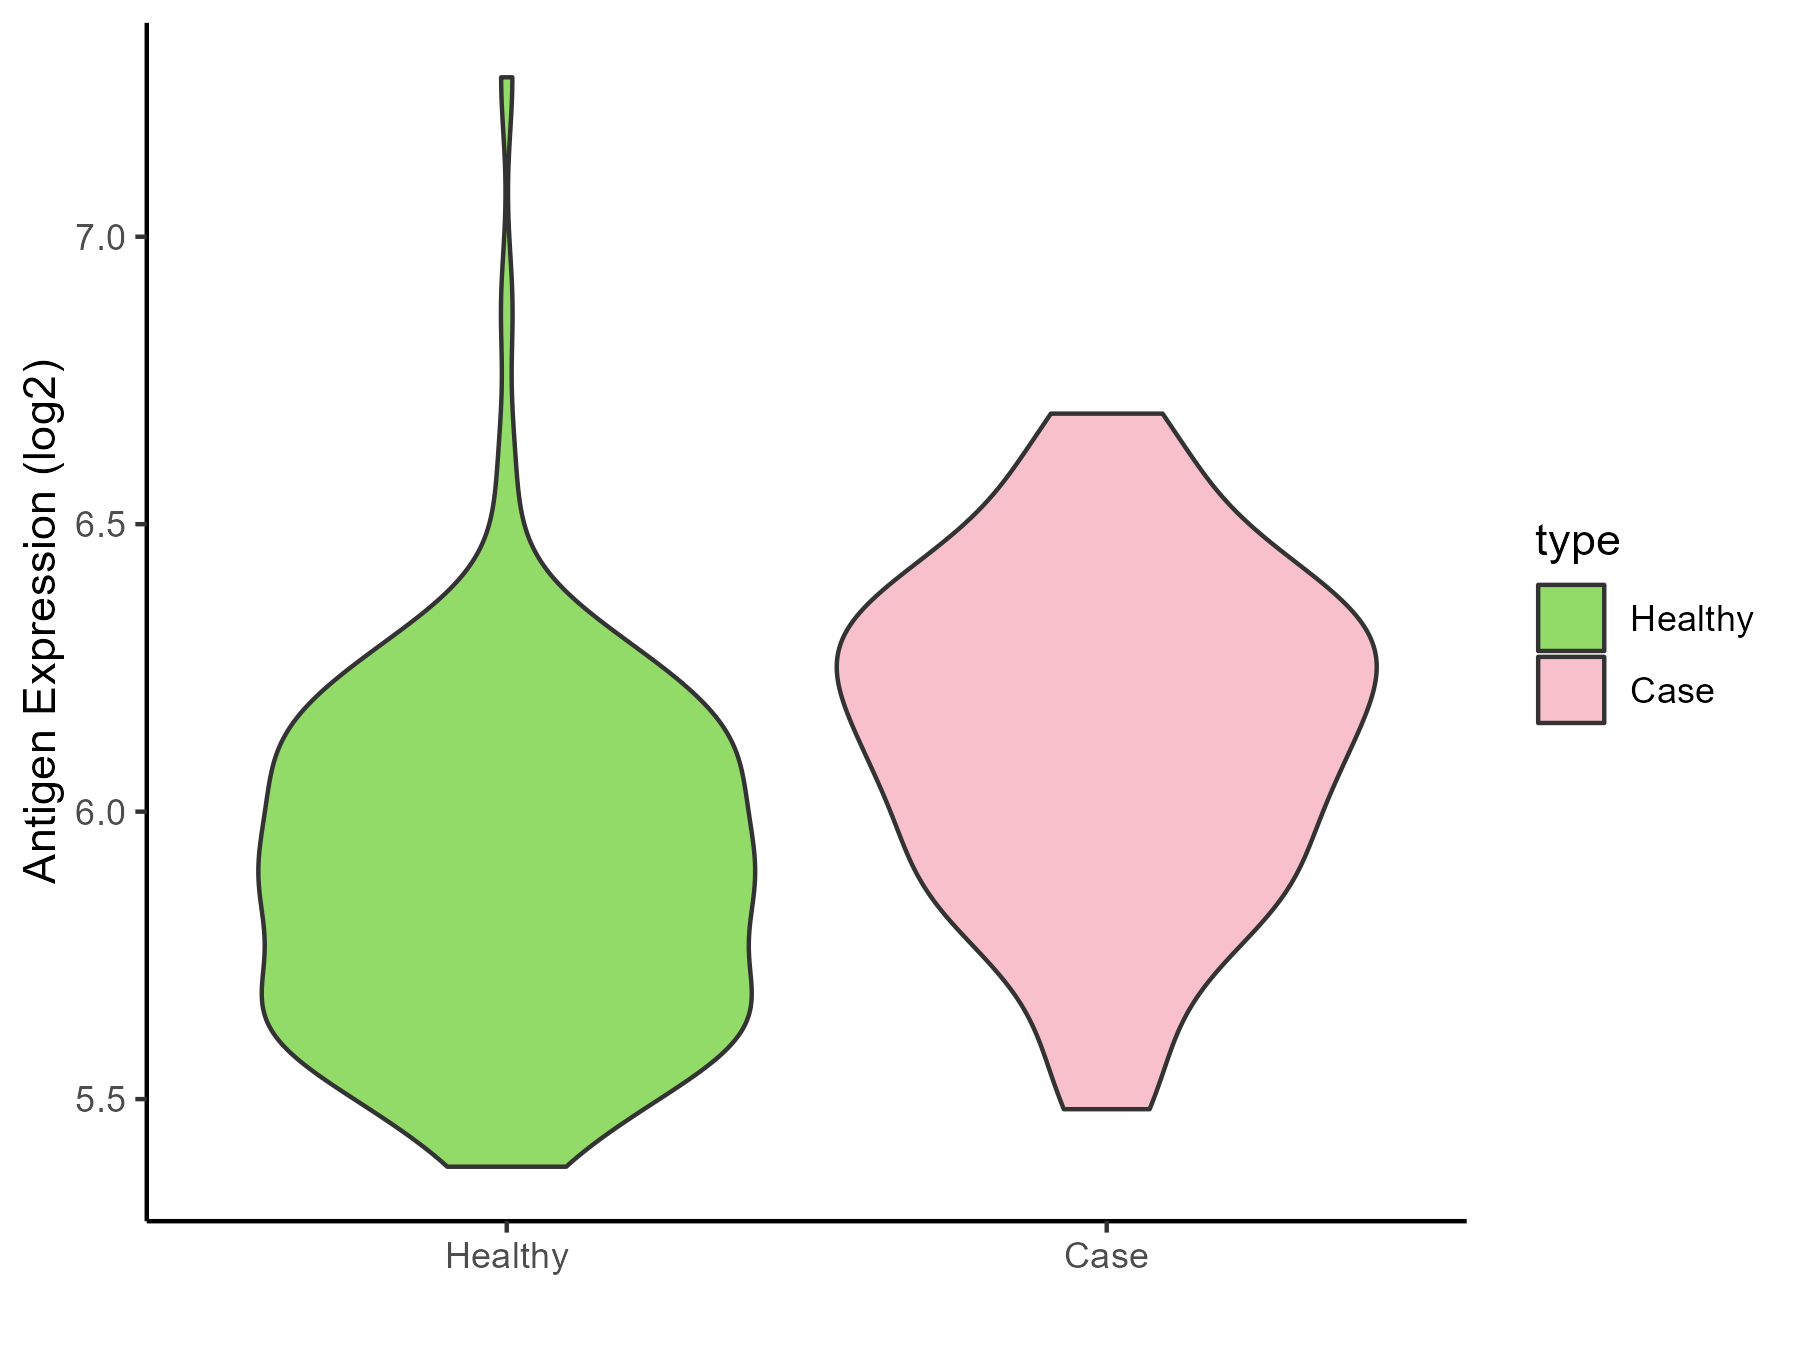
| The Specific Disease |
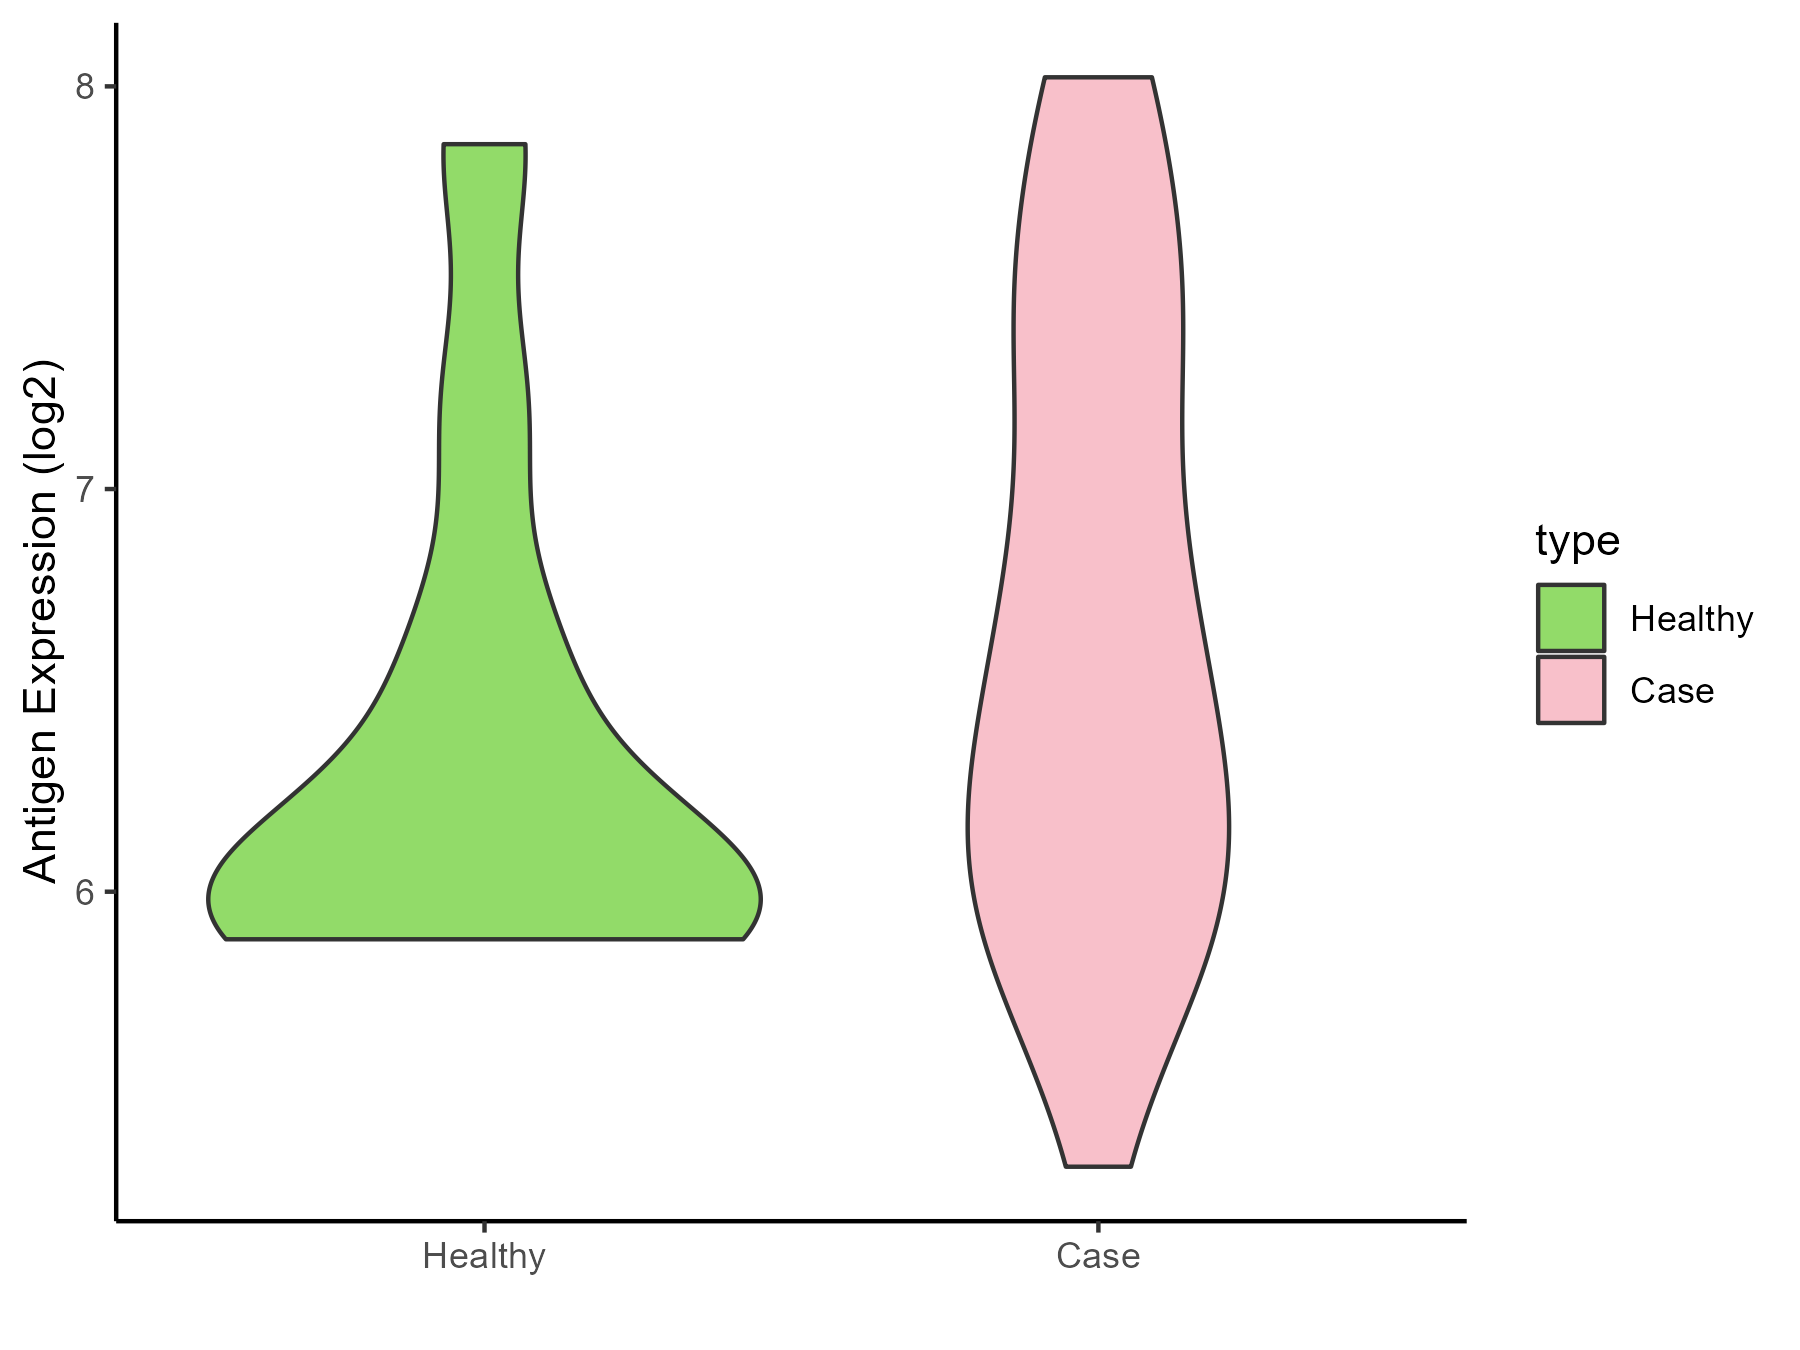
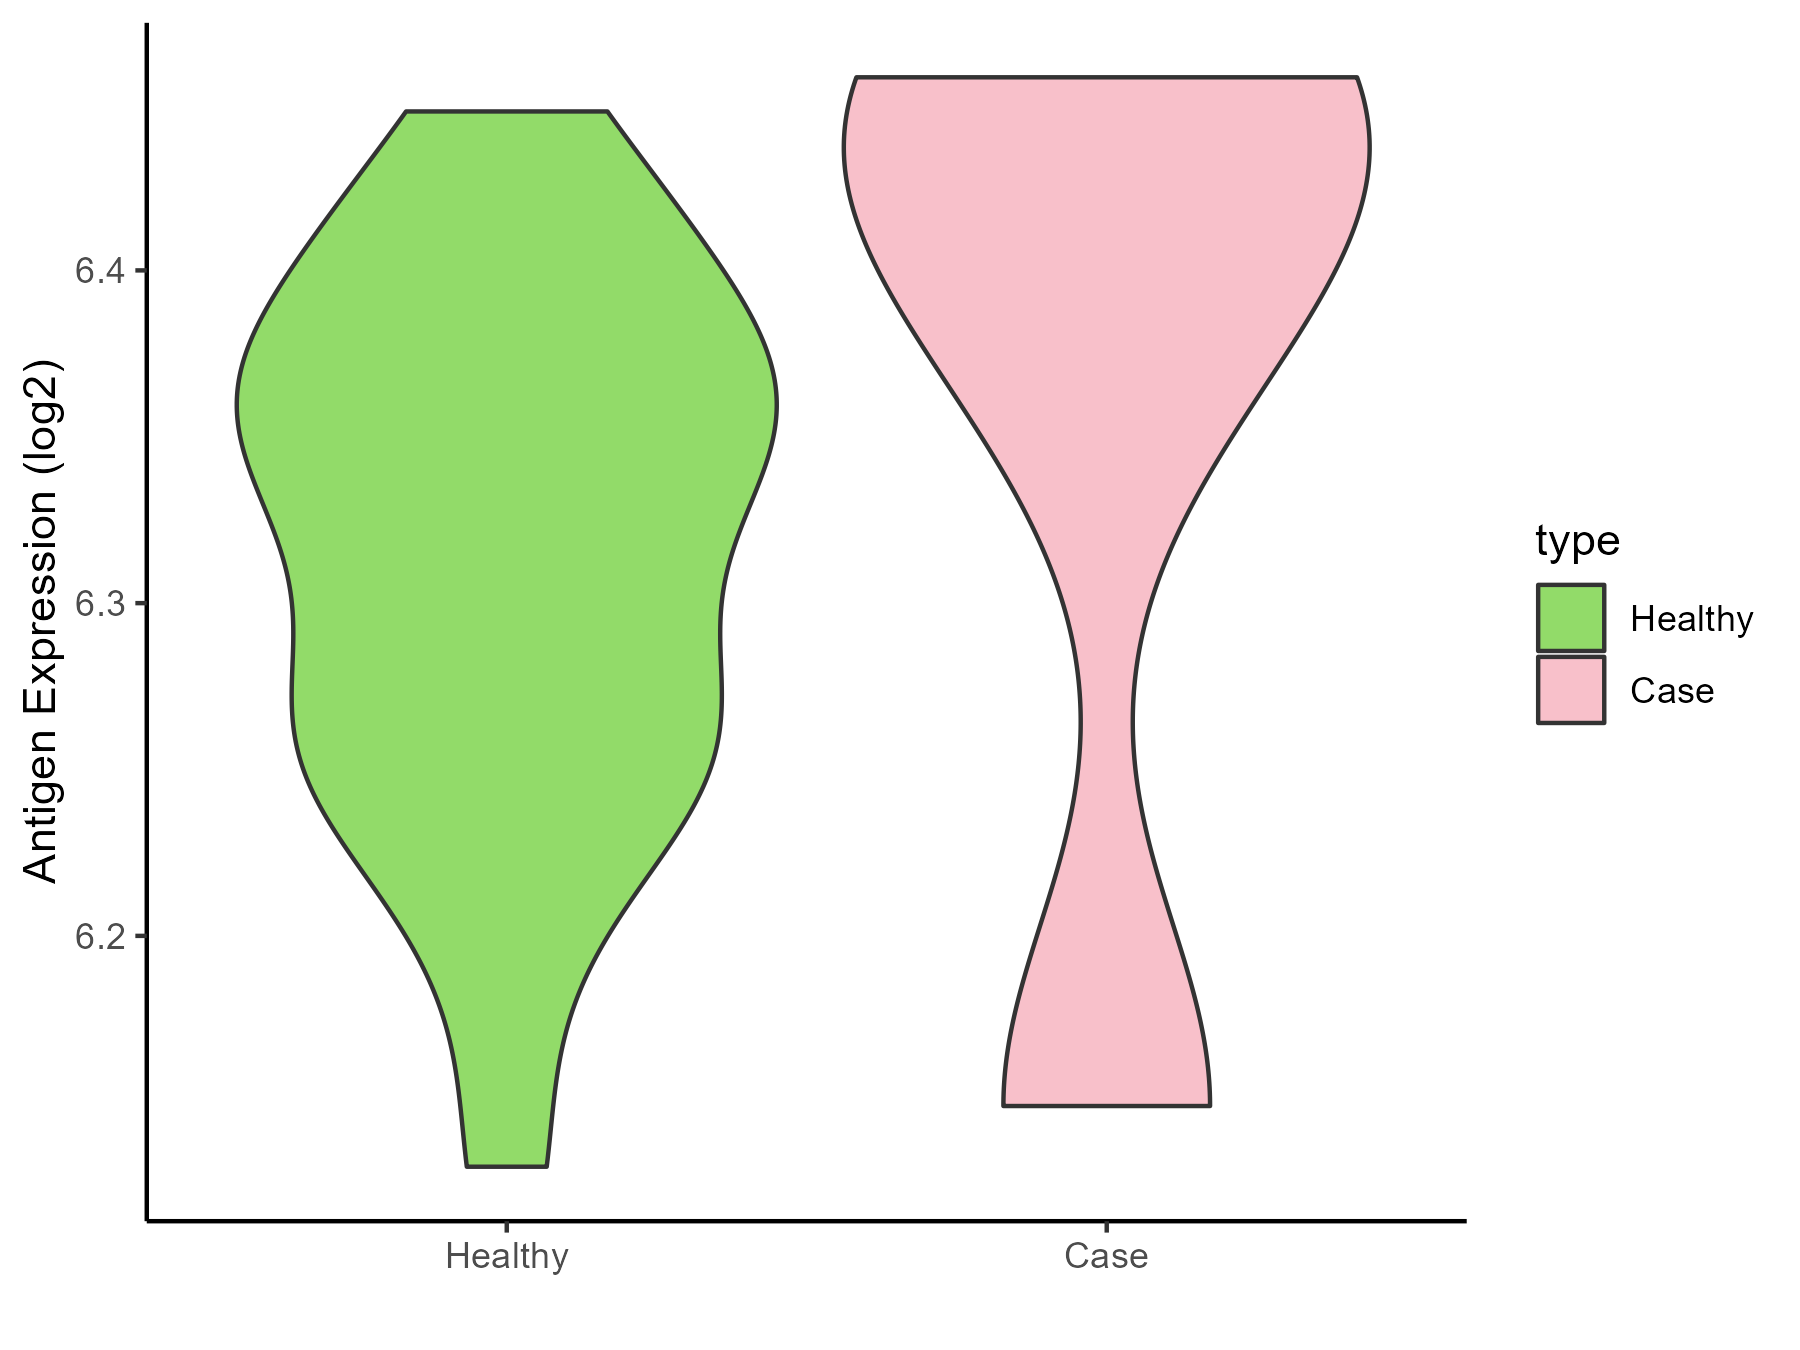
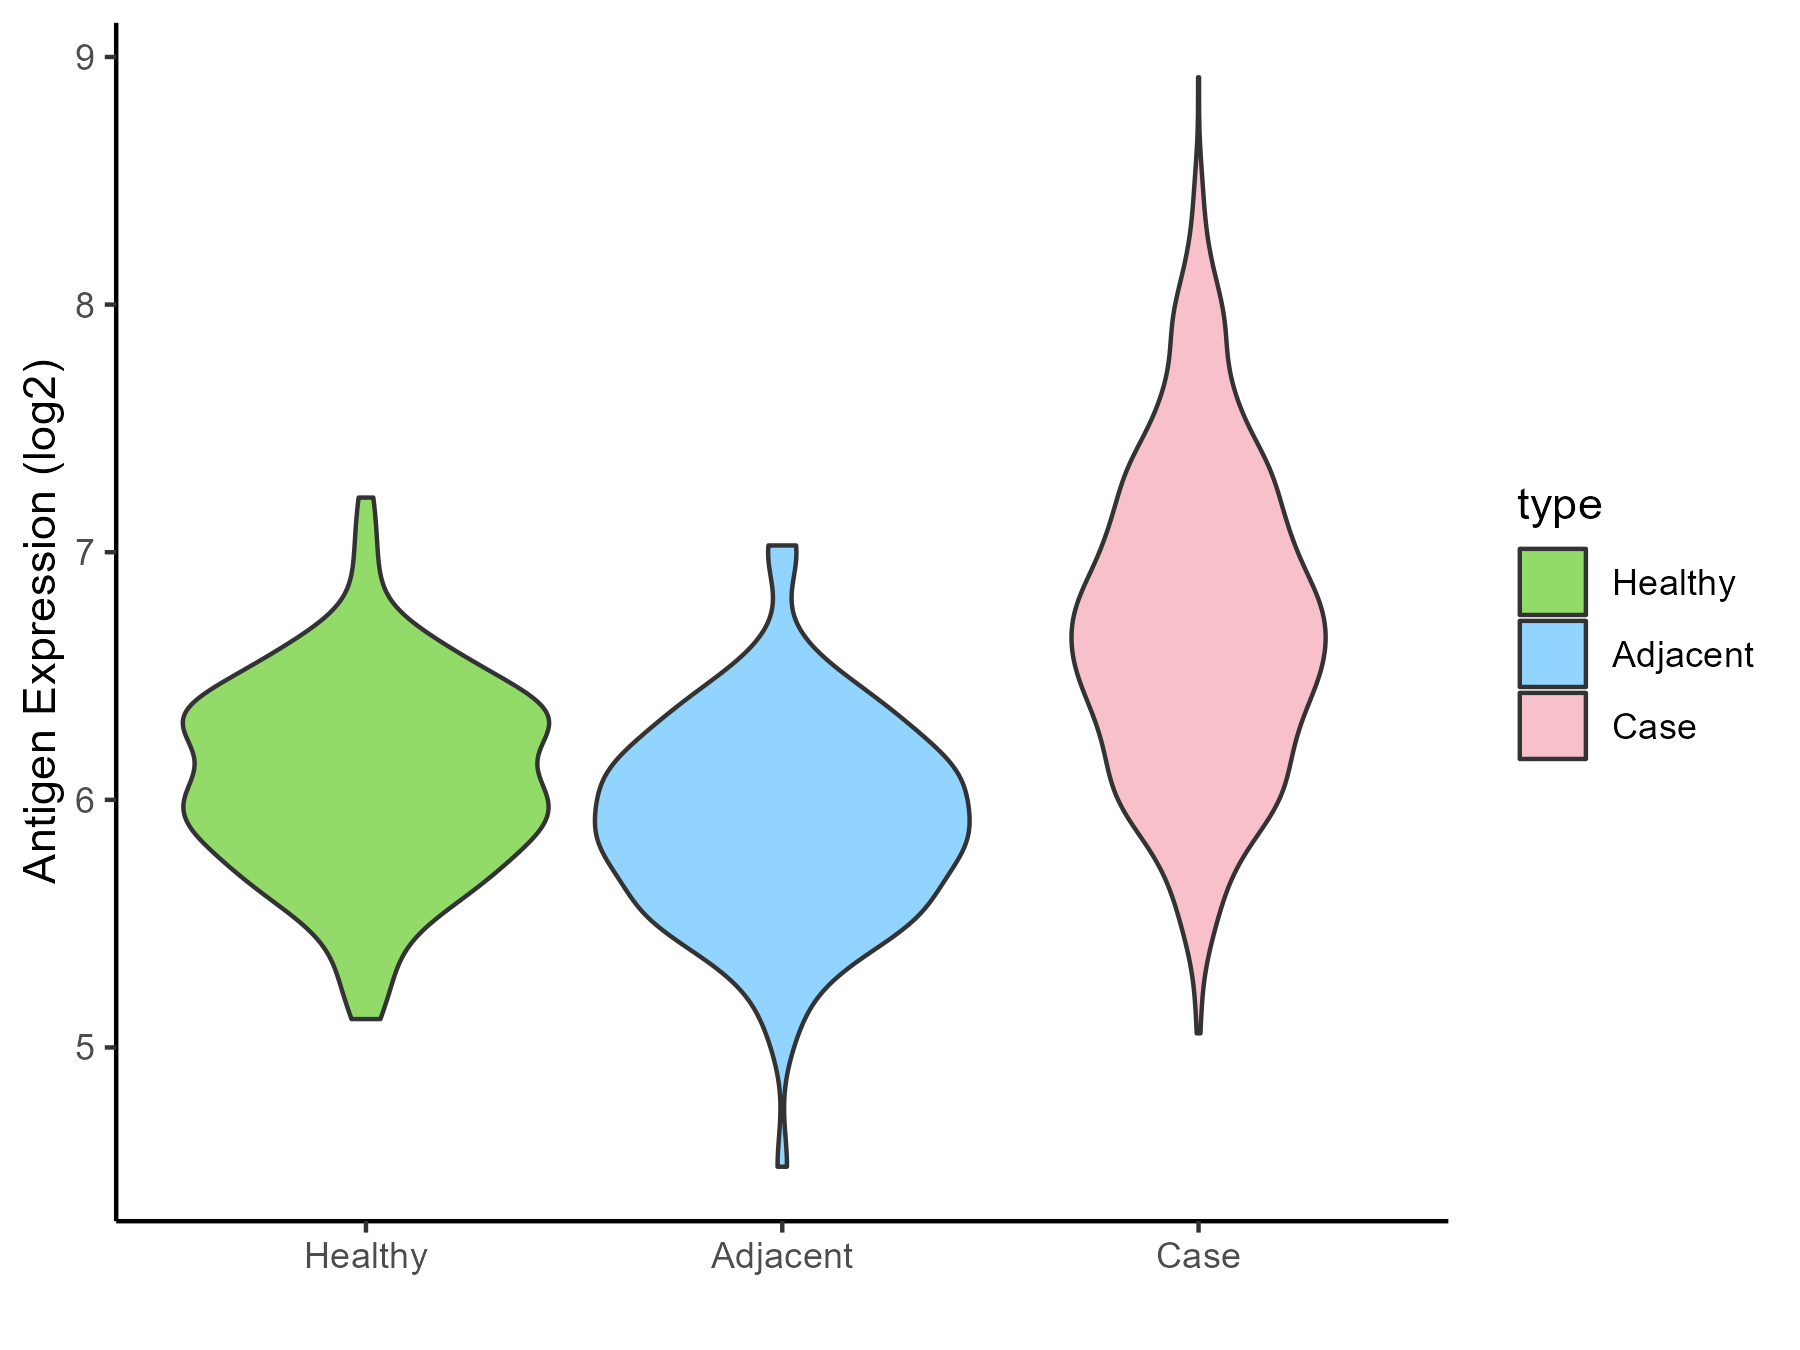
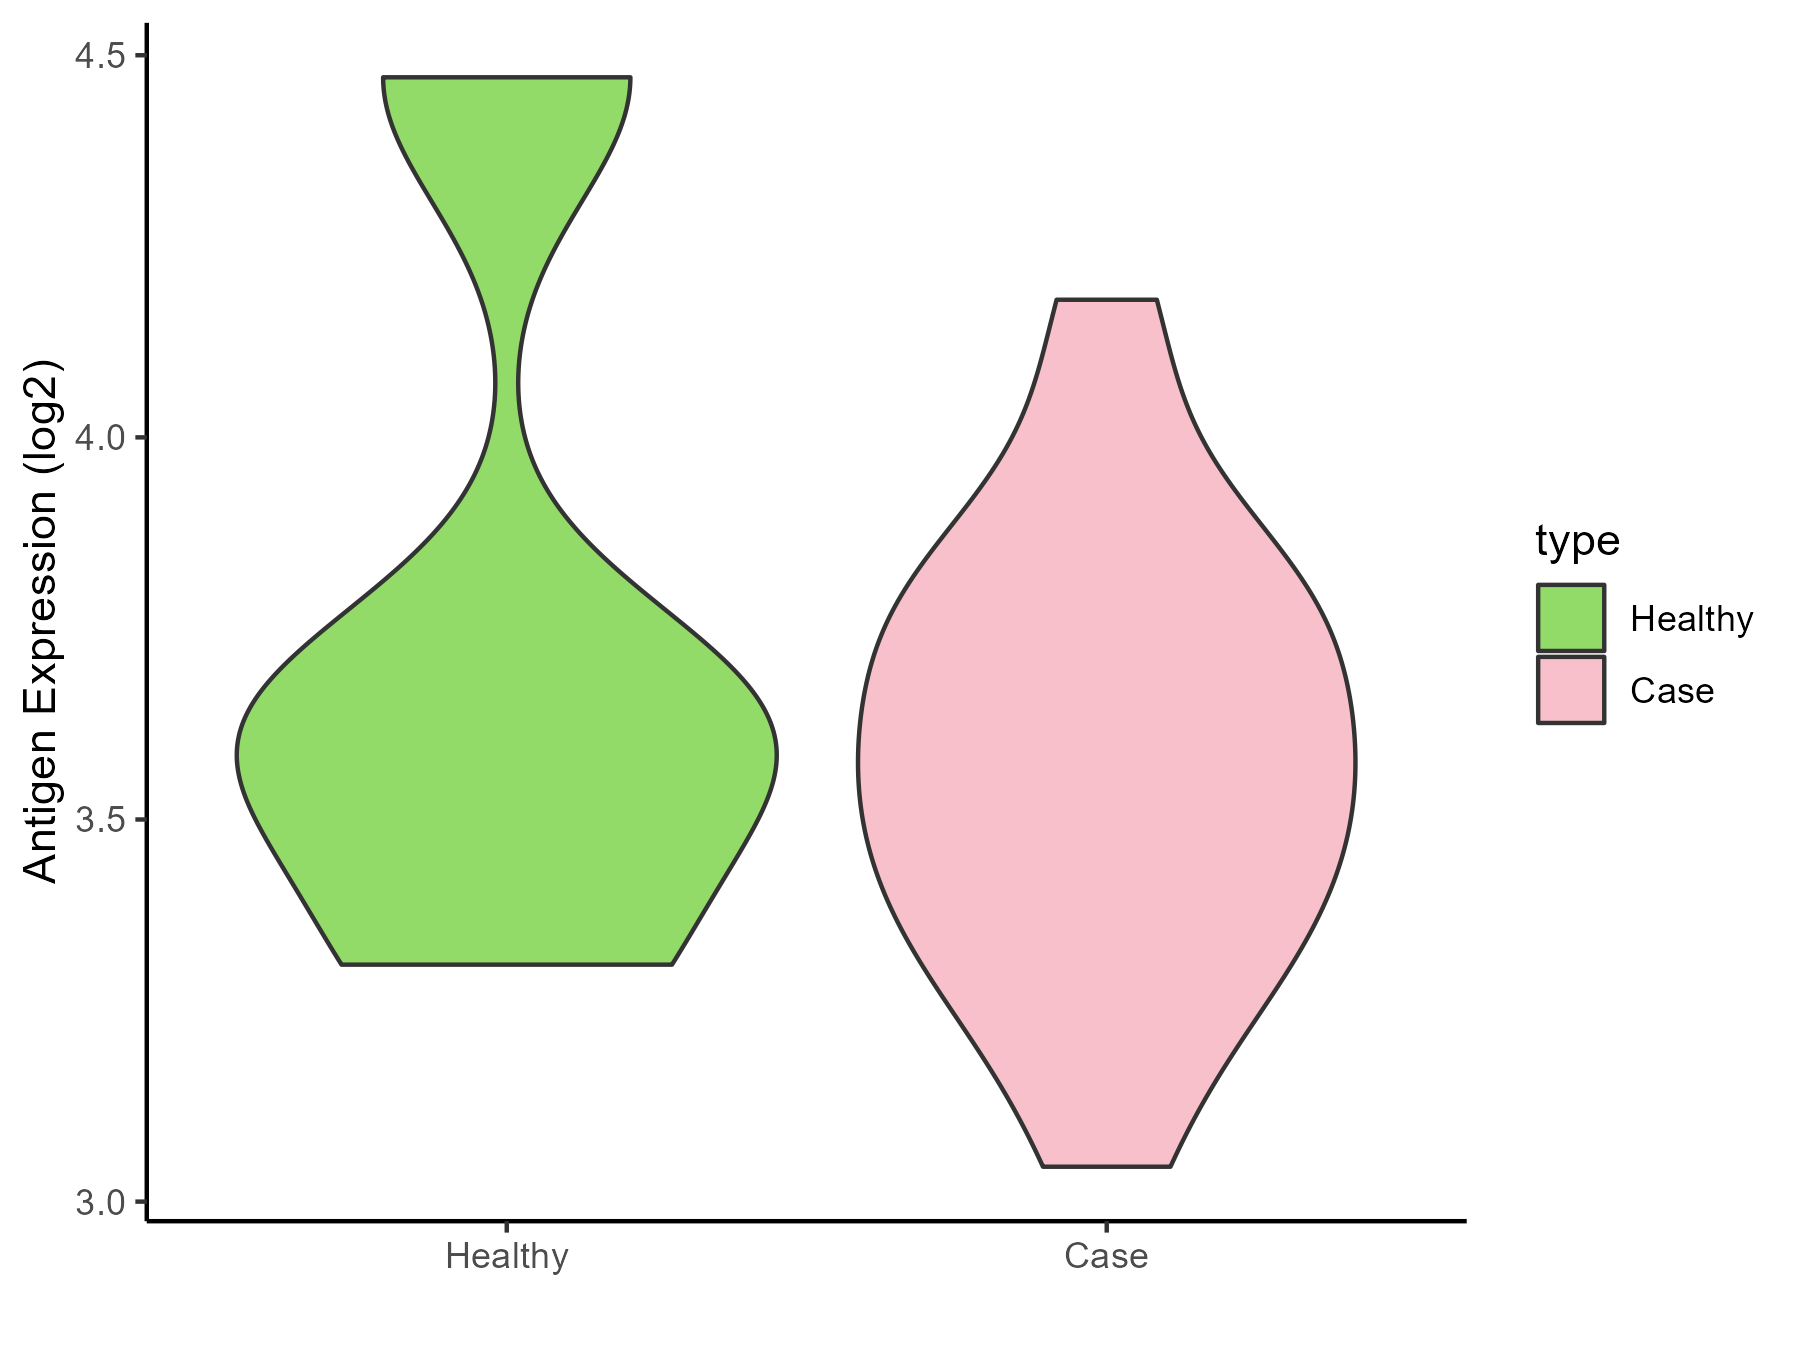
Glioma |
| The Expression Level of Disease Section Compare with the Healthy Individual Tissue |
p-value: 0.164577646;
Fold-change: 0.476429578;
Z-score: 0.738557327
|
| Disease-specific Antigen Abundances |
|
Click to View the Clearer Original Diagram
|
|
|
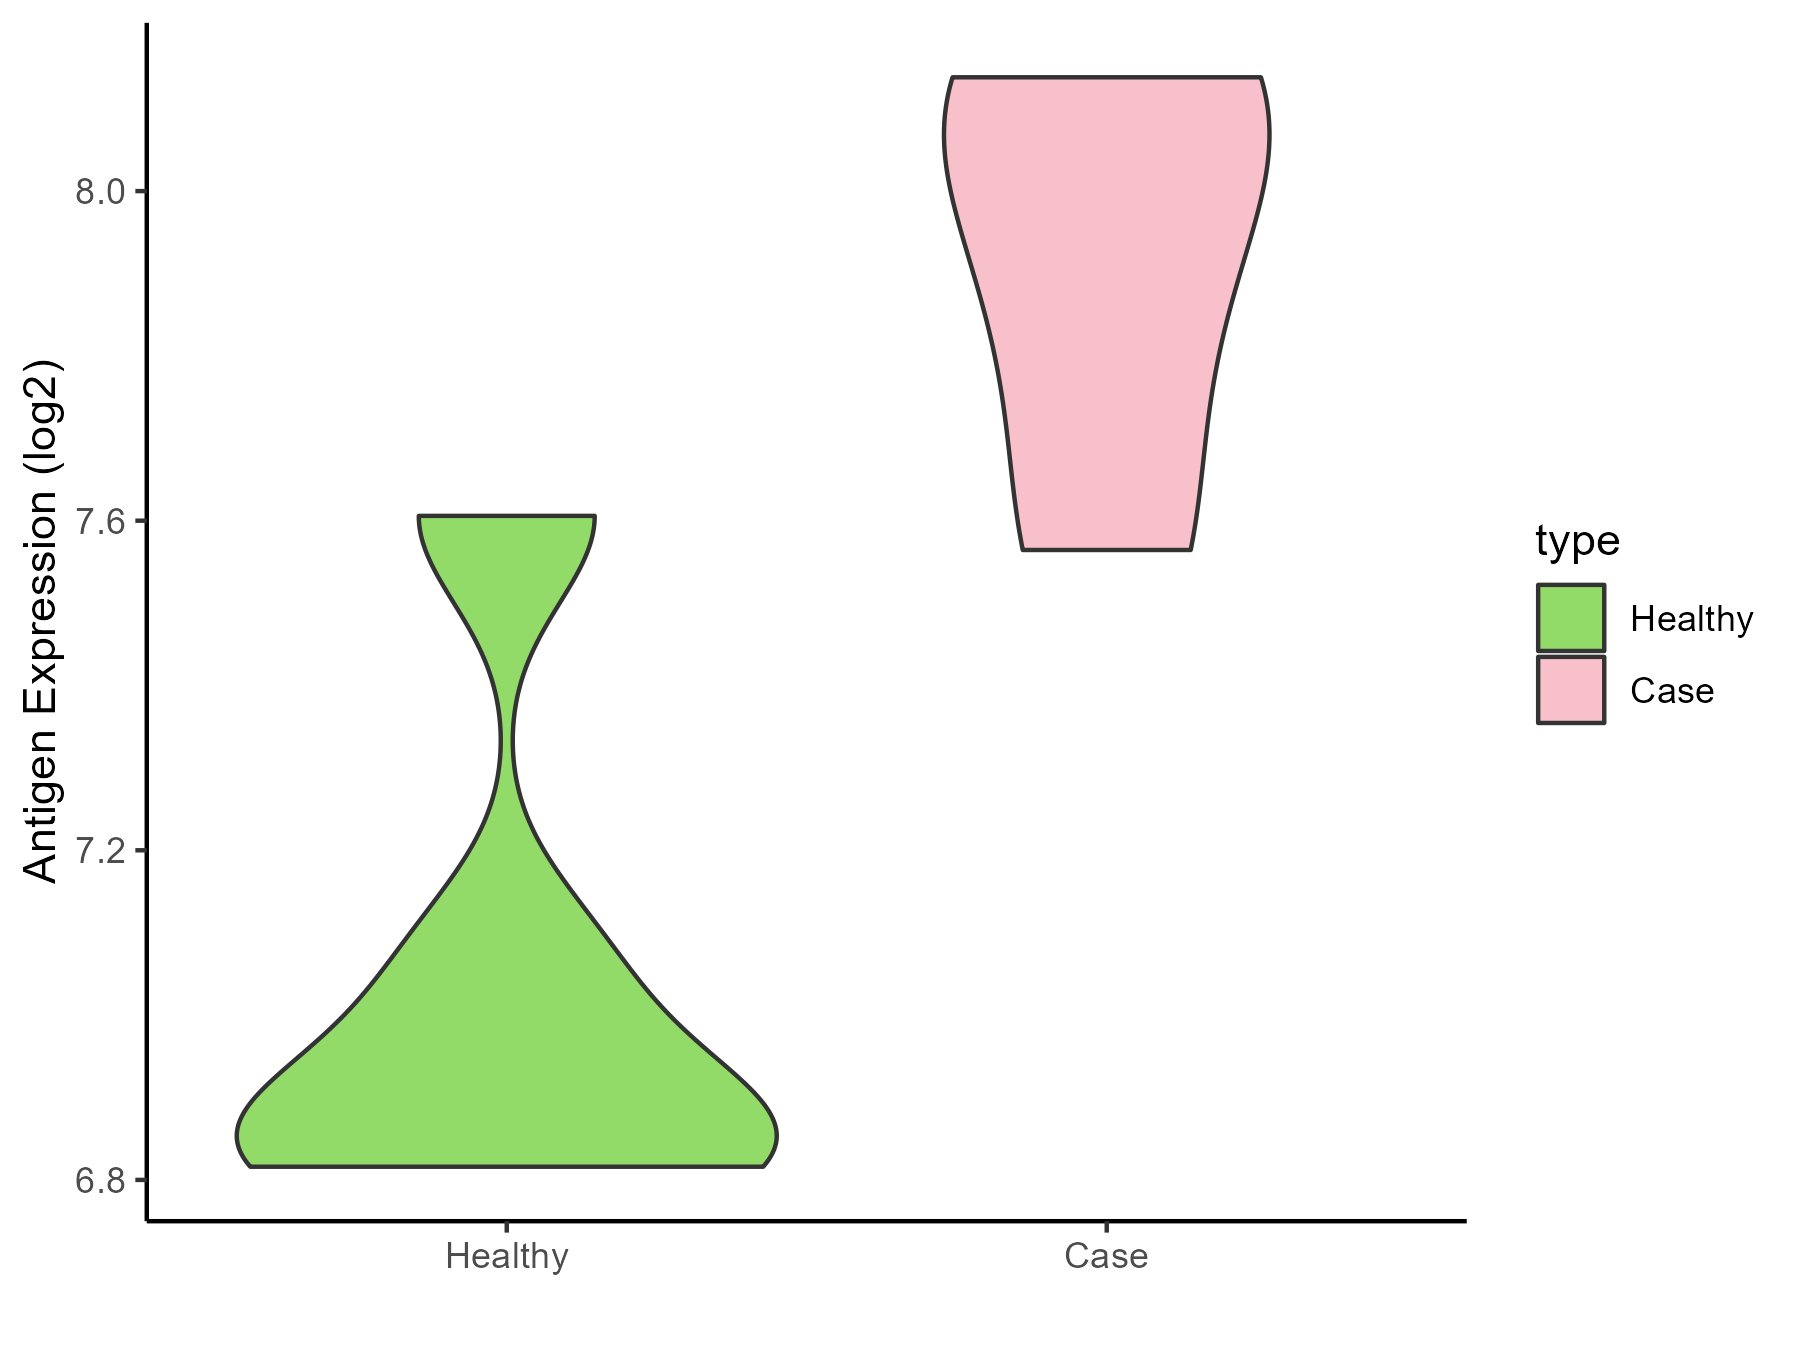
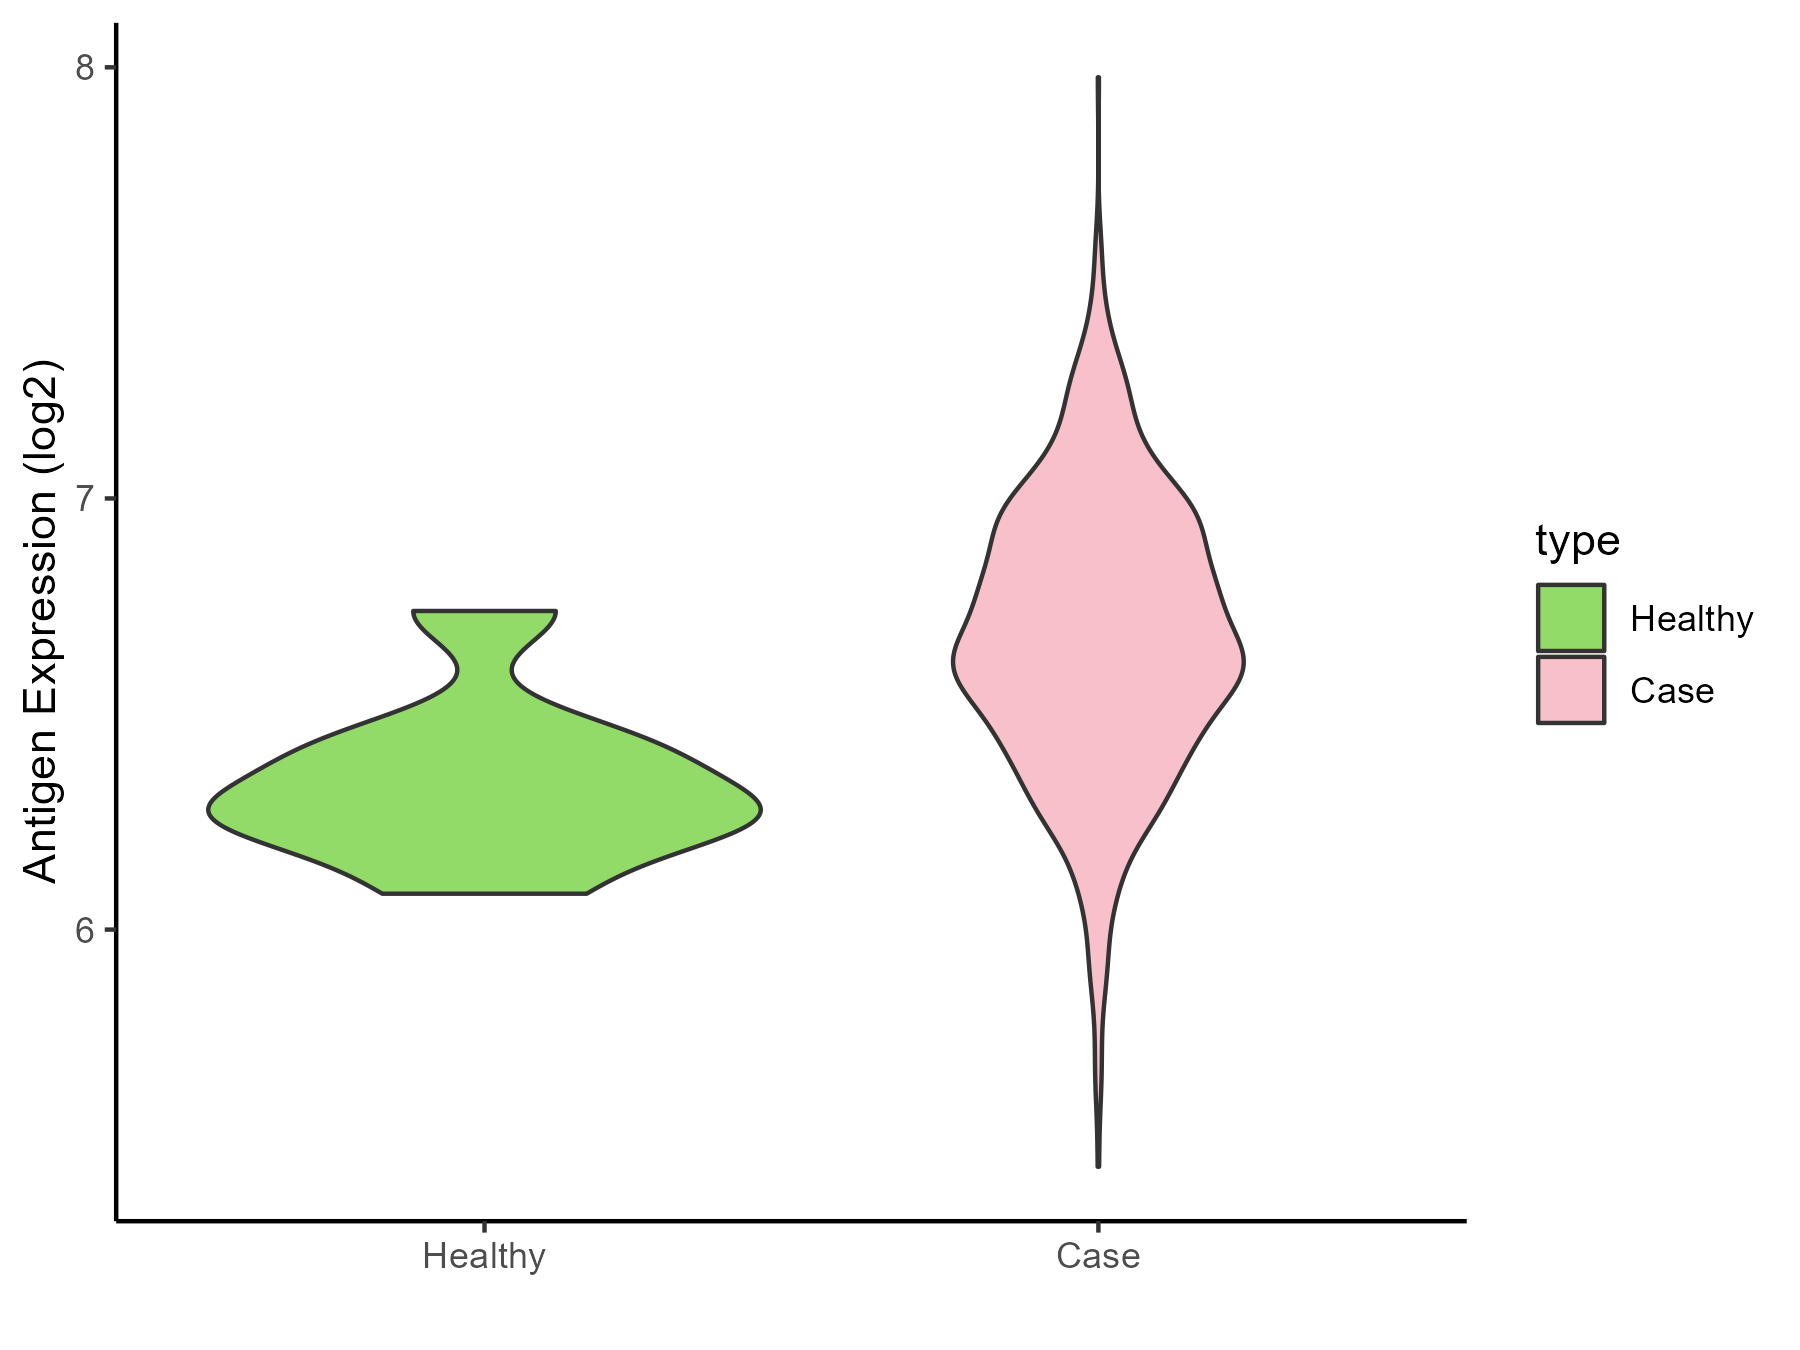
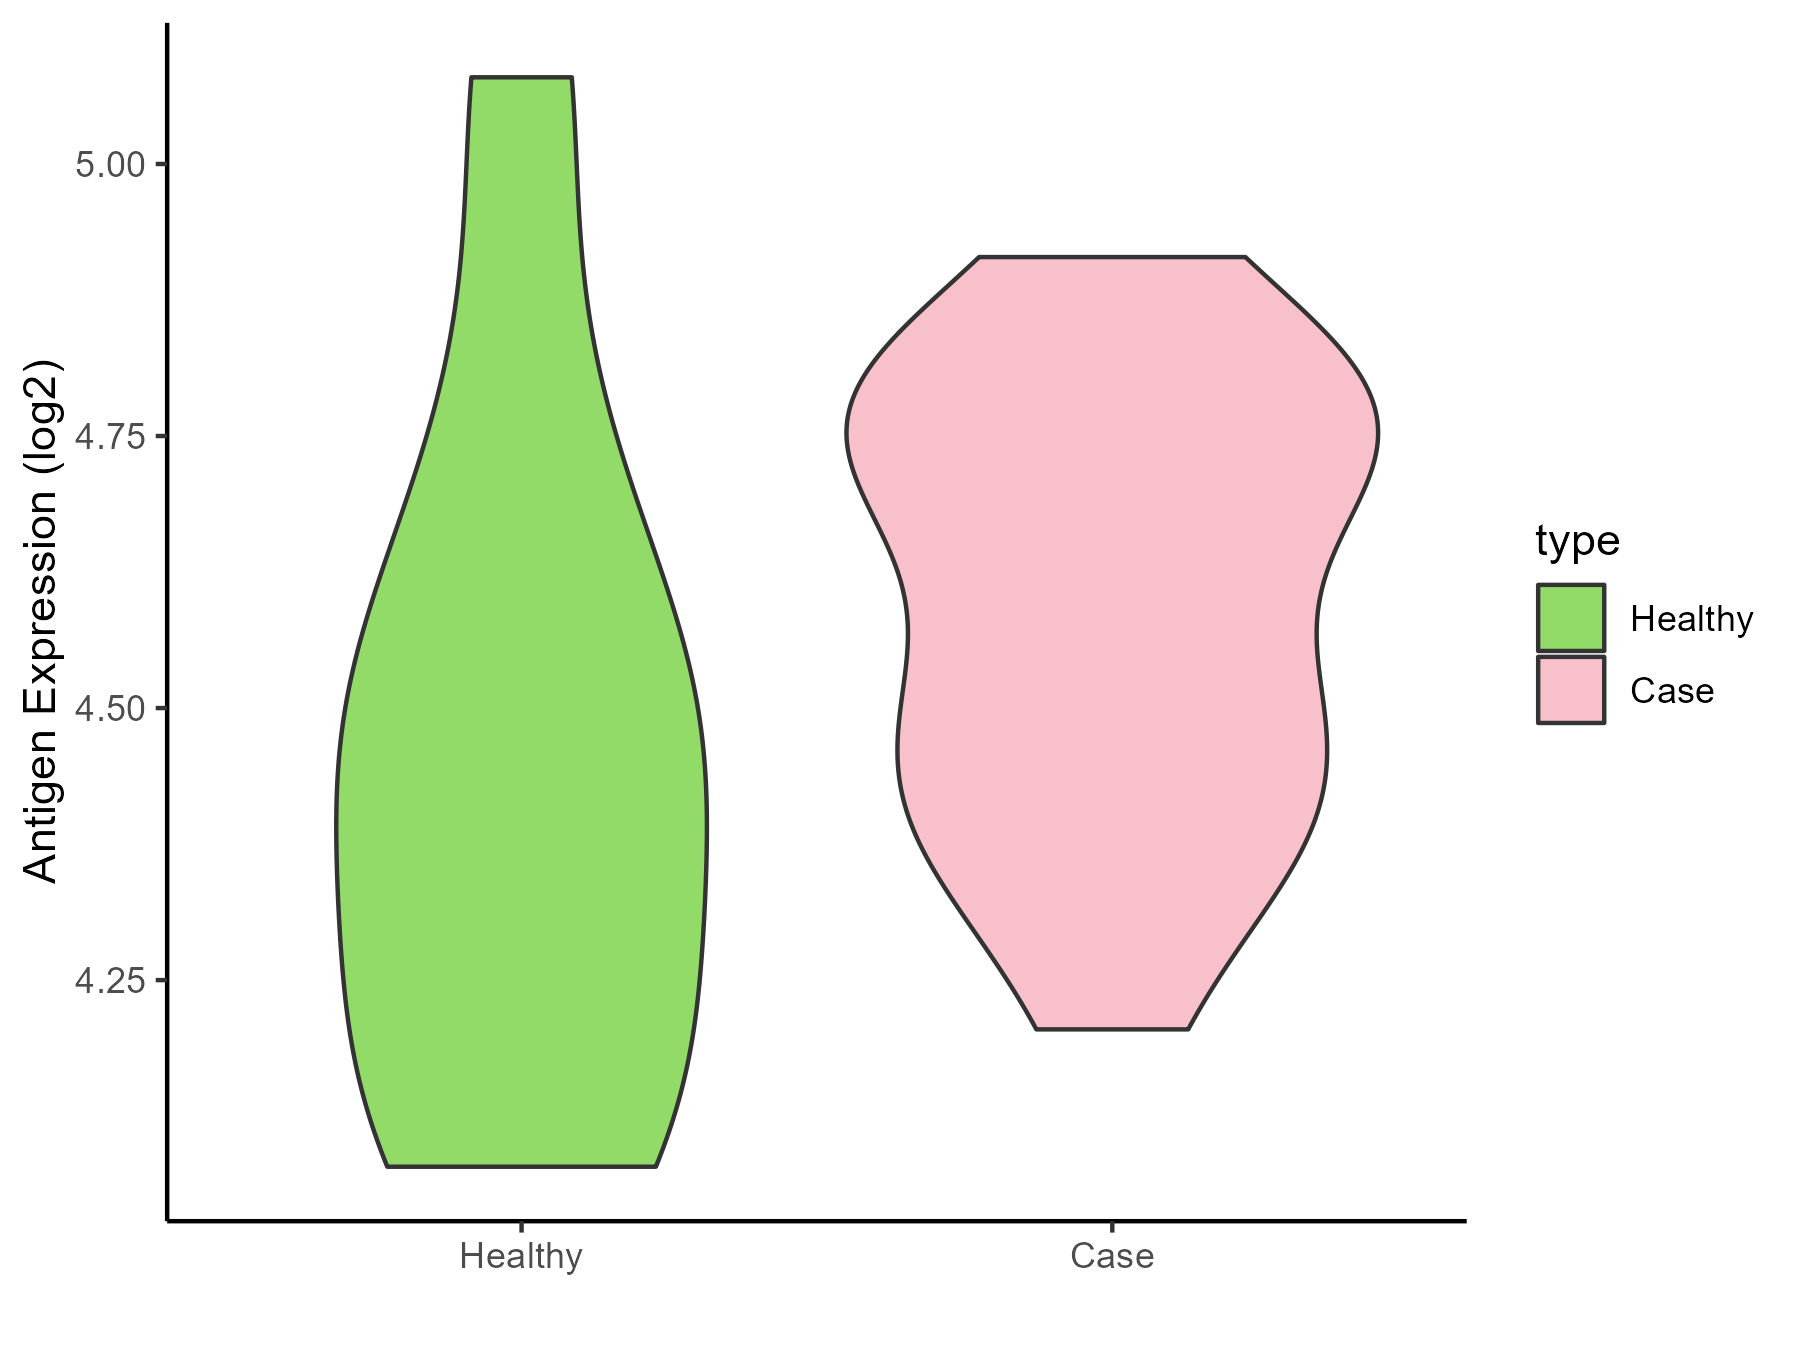
| The Studied Tissue |
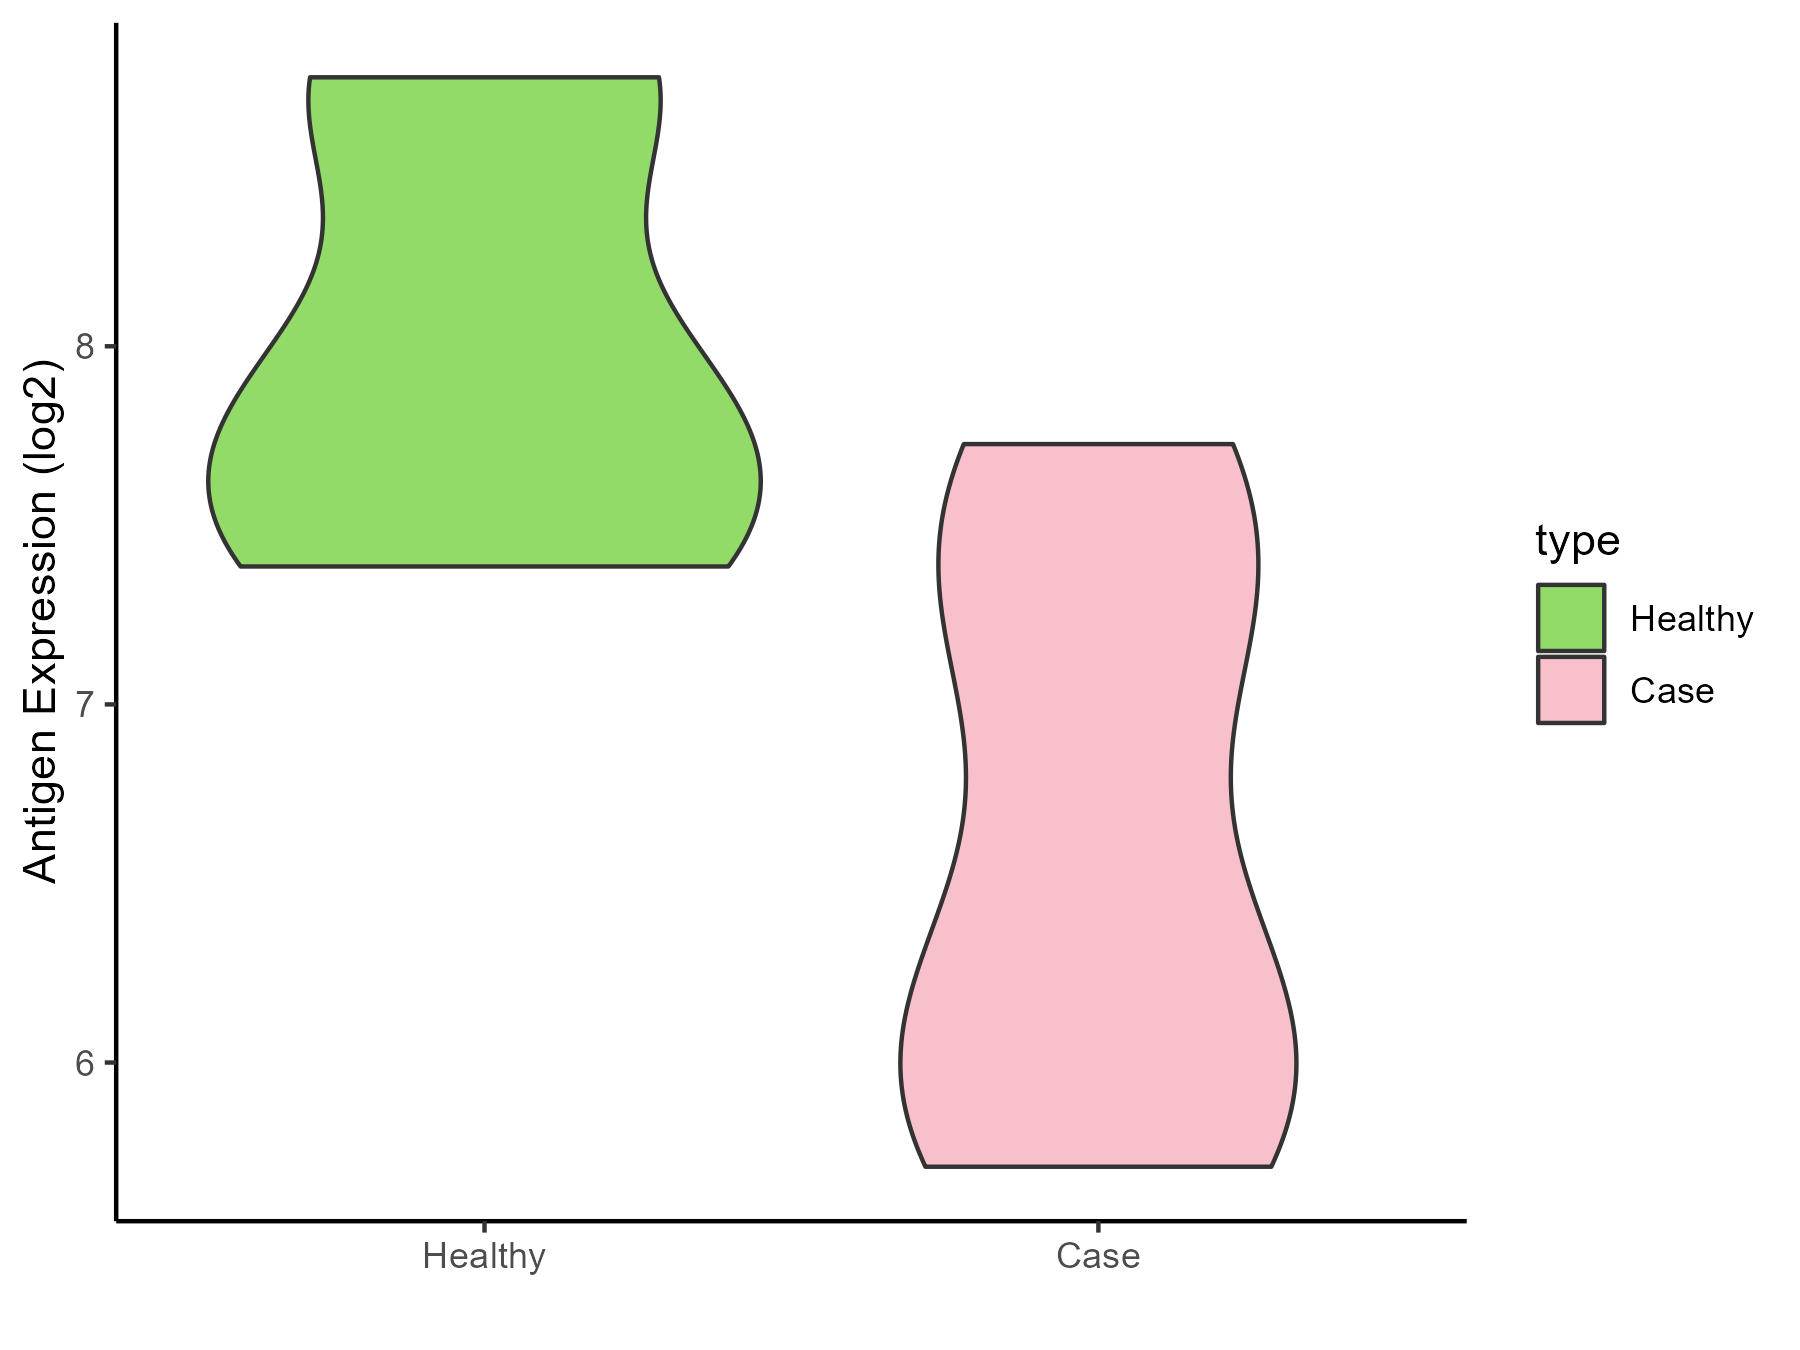
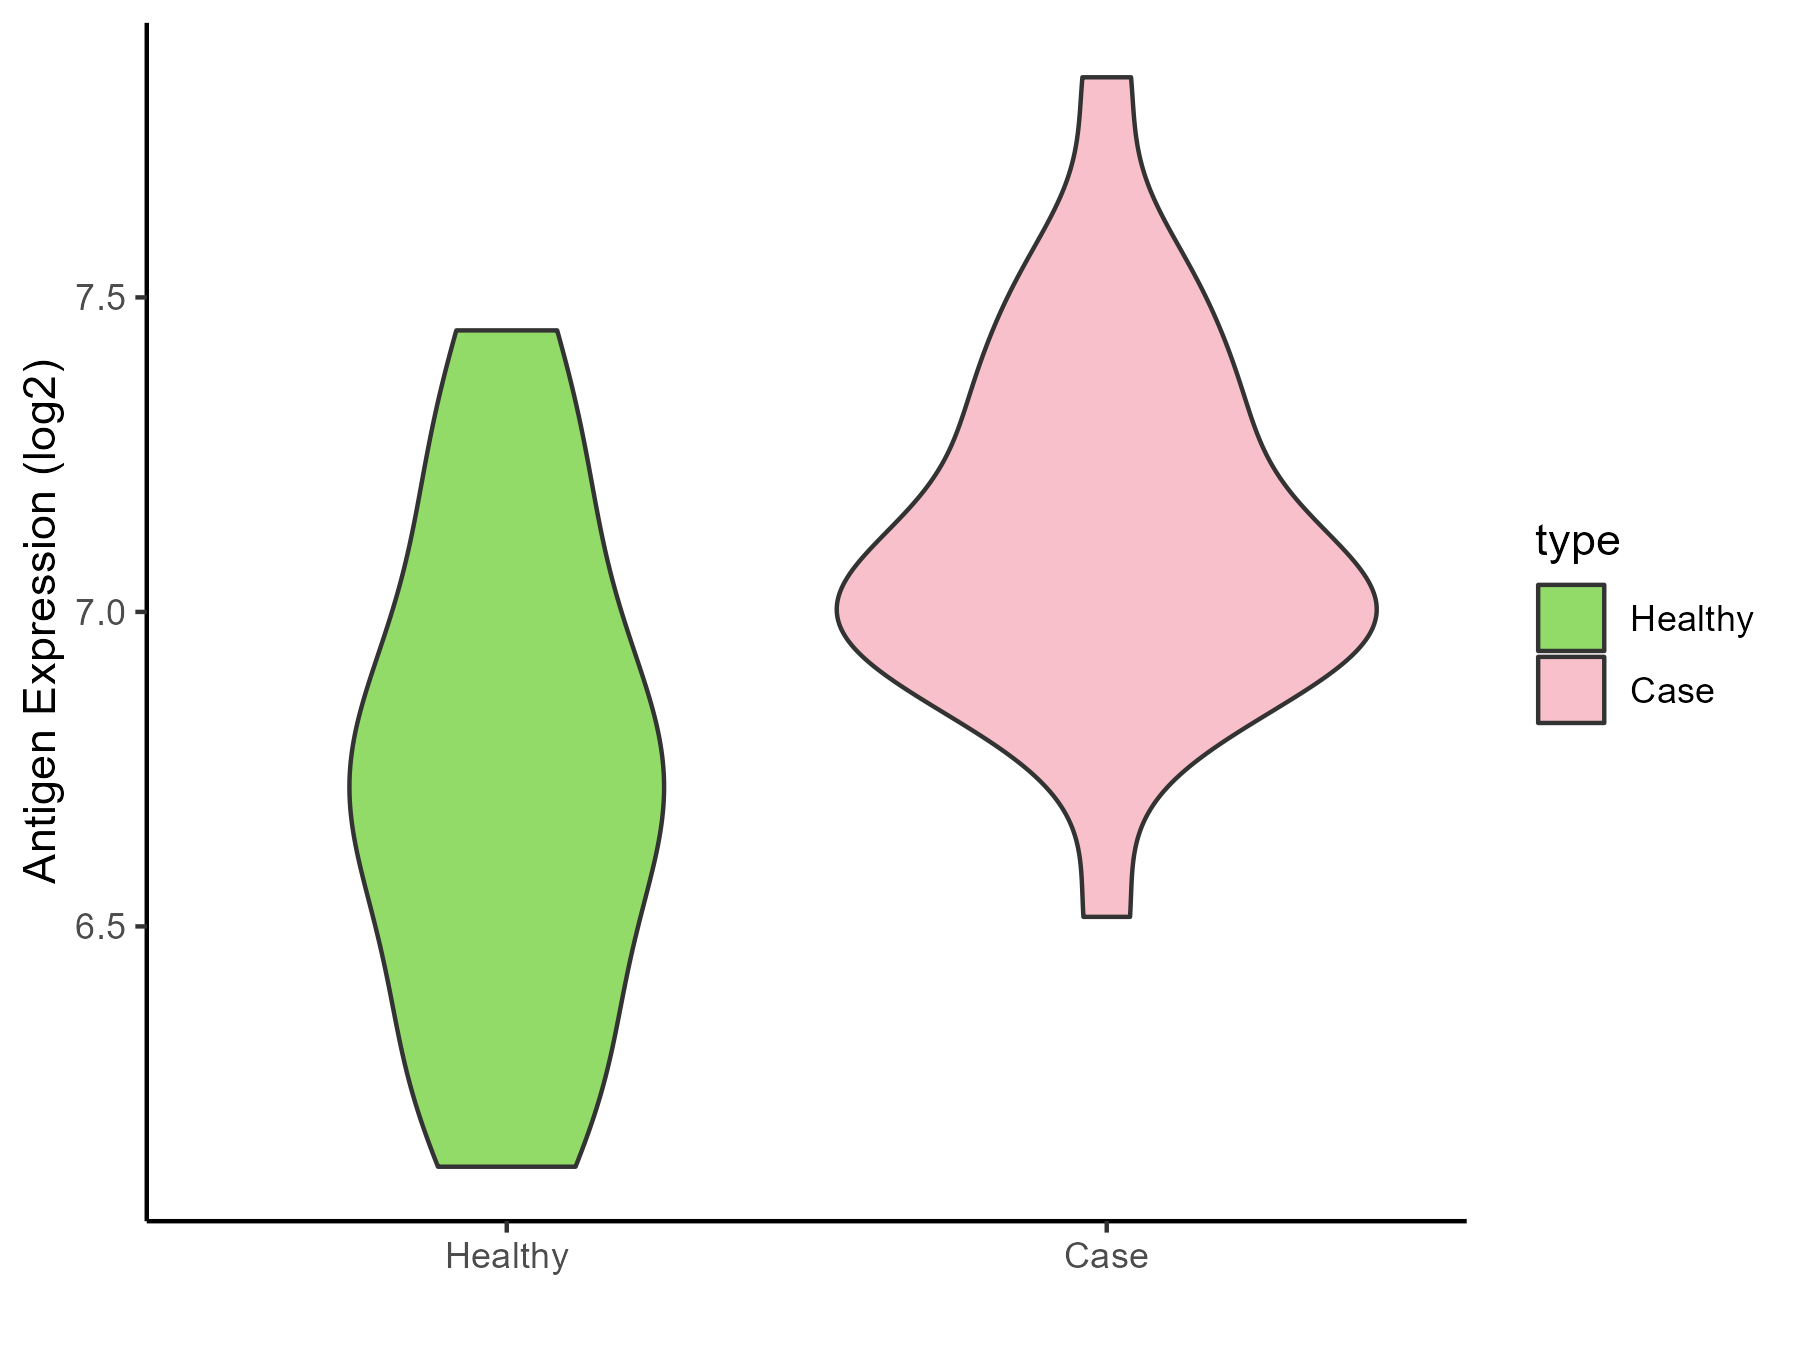
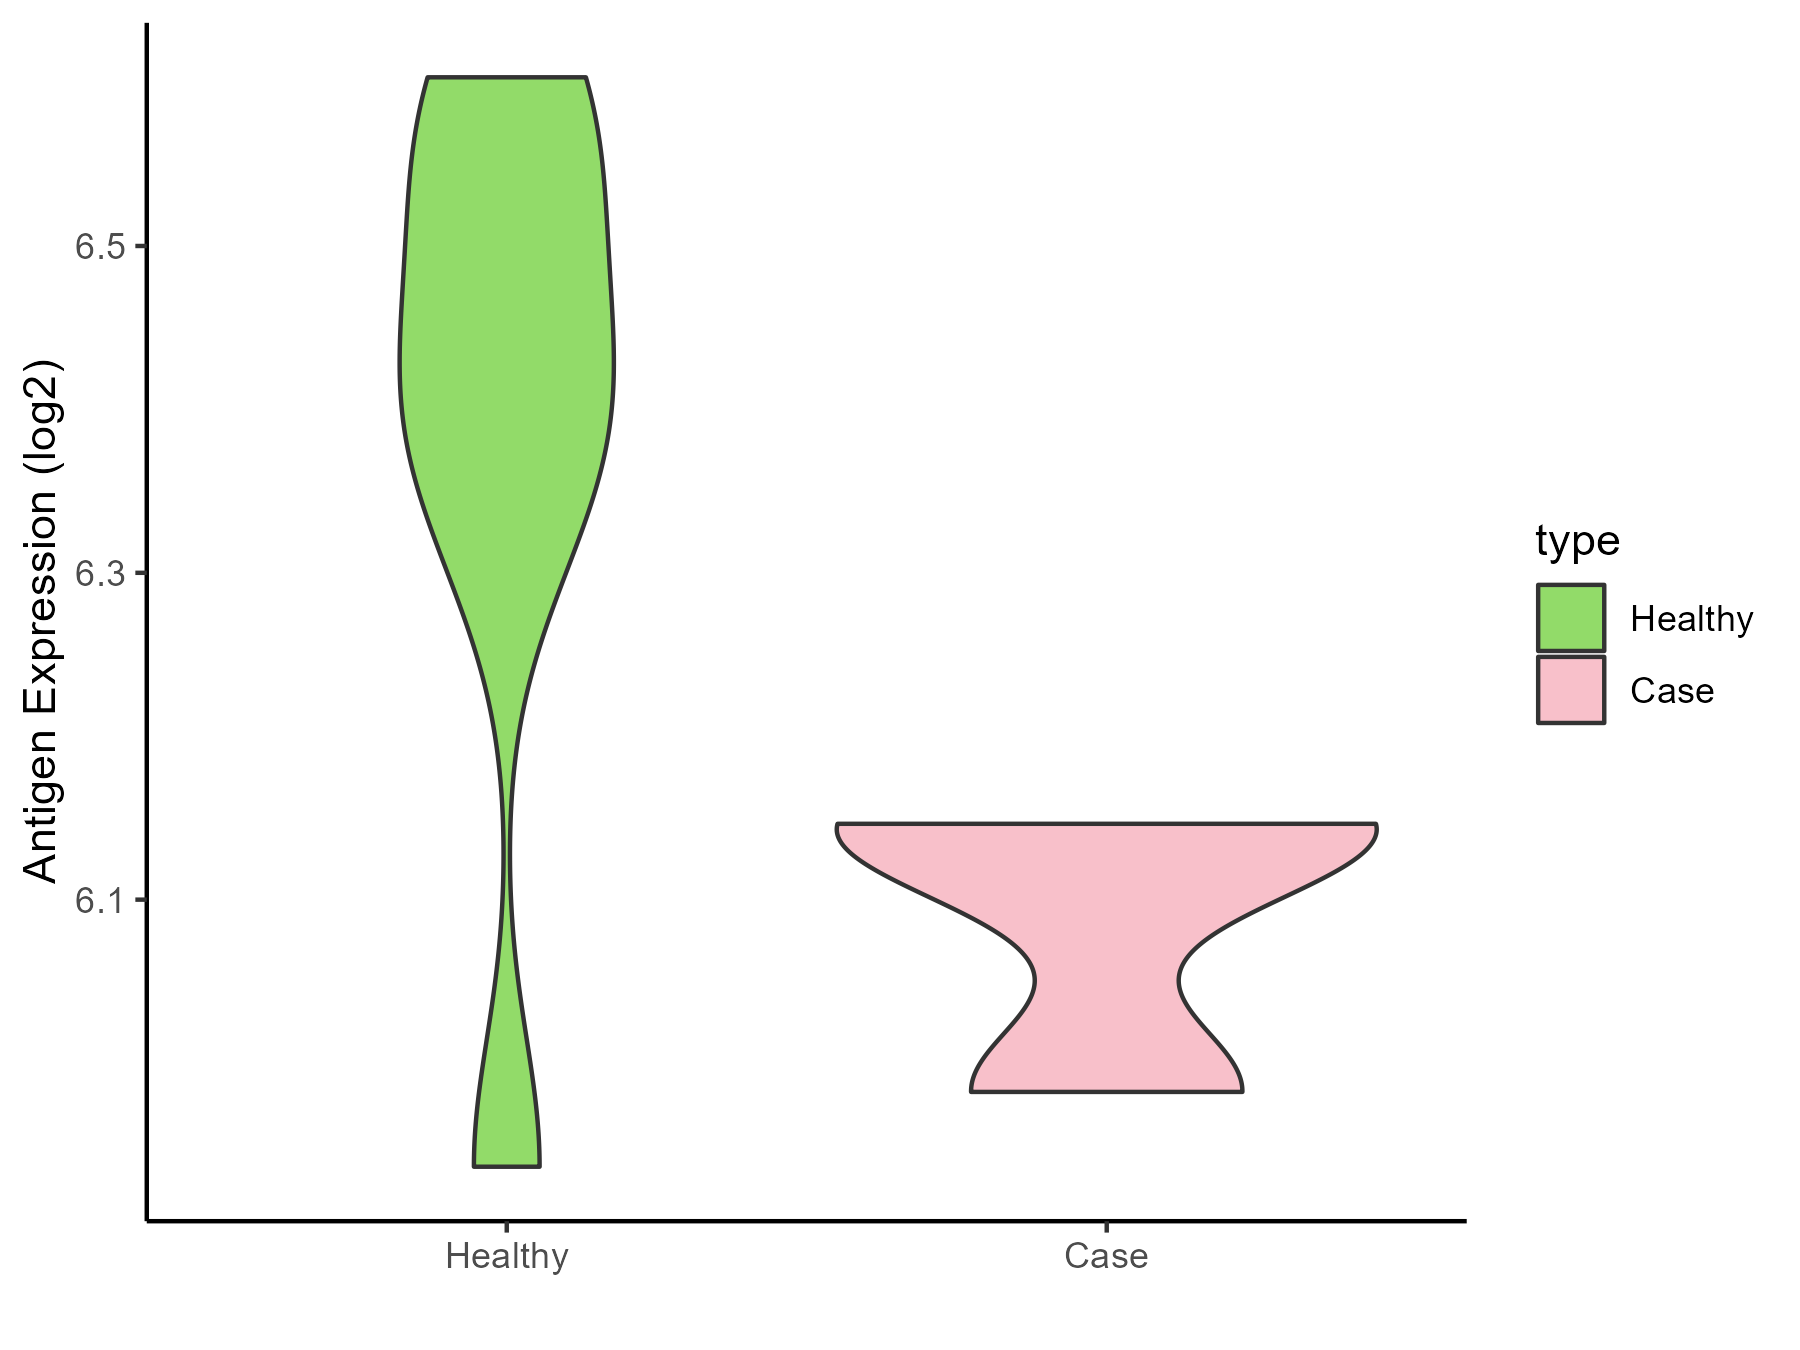
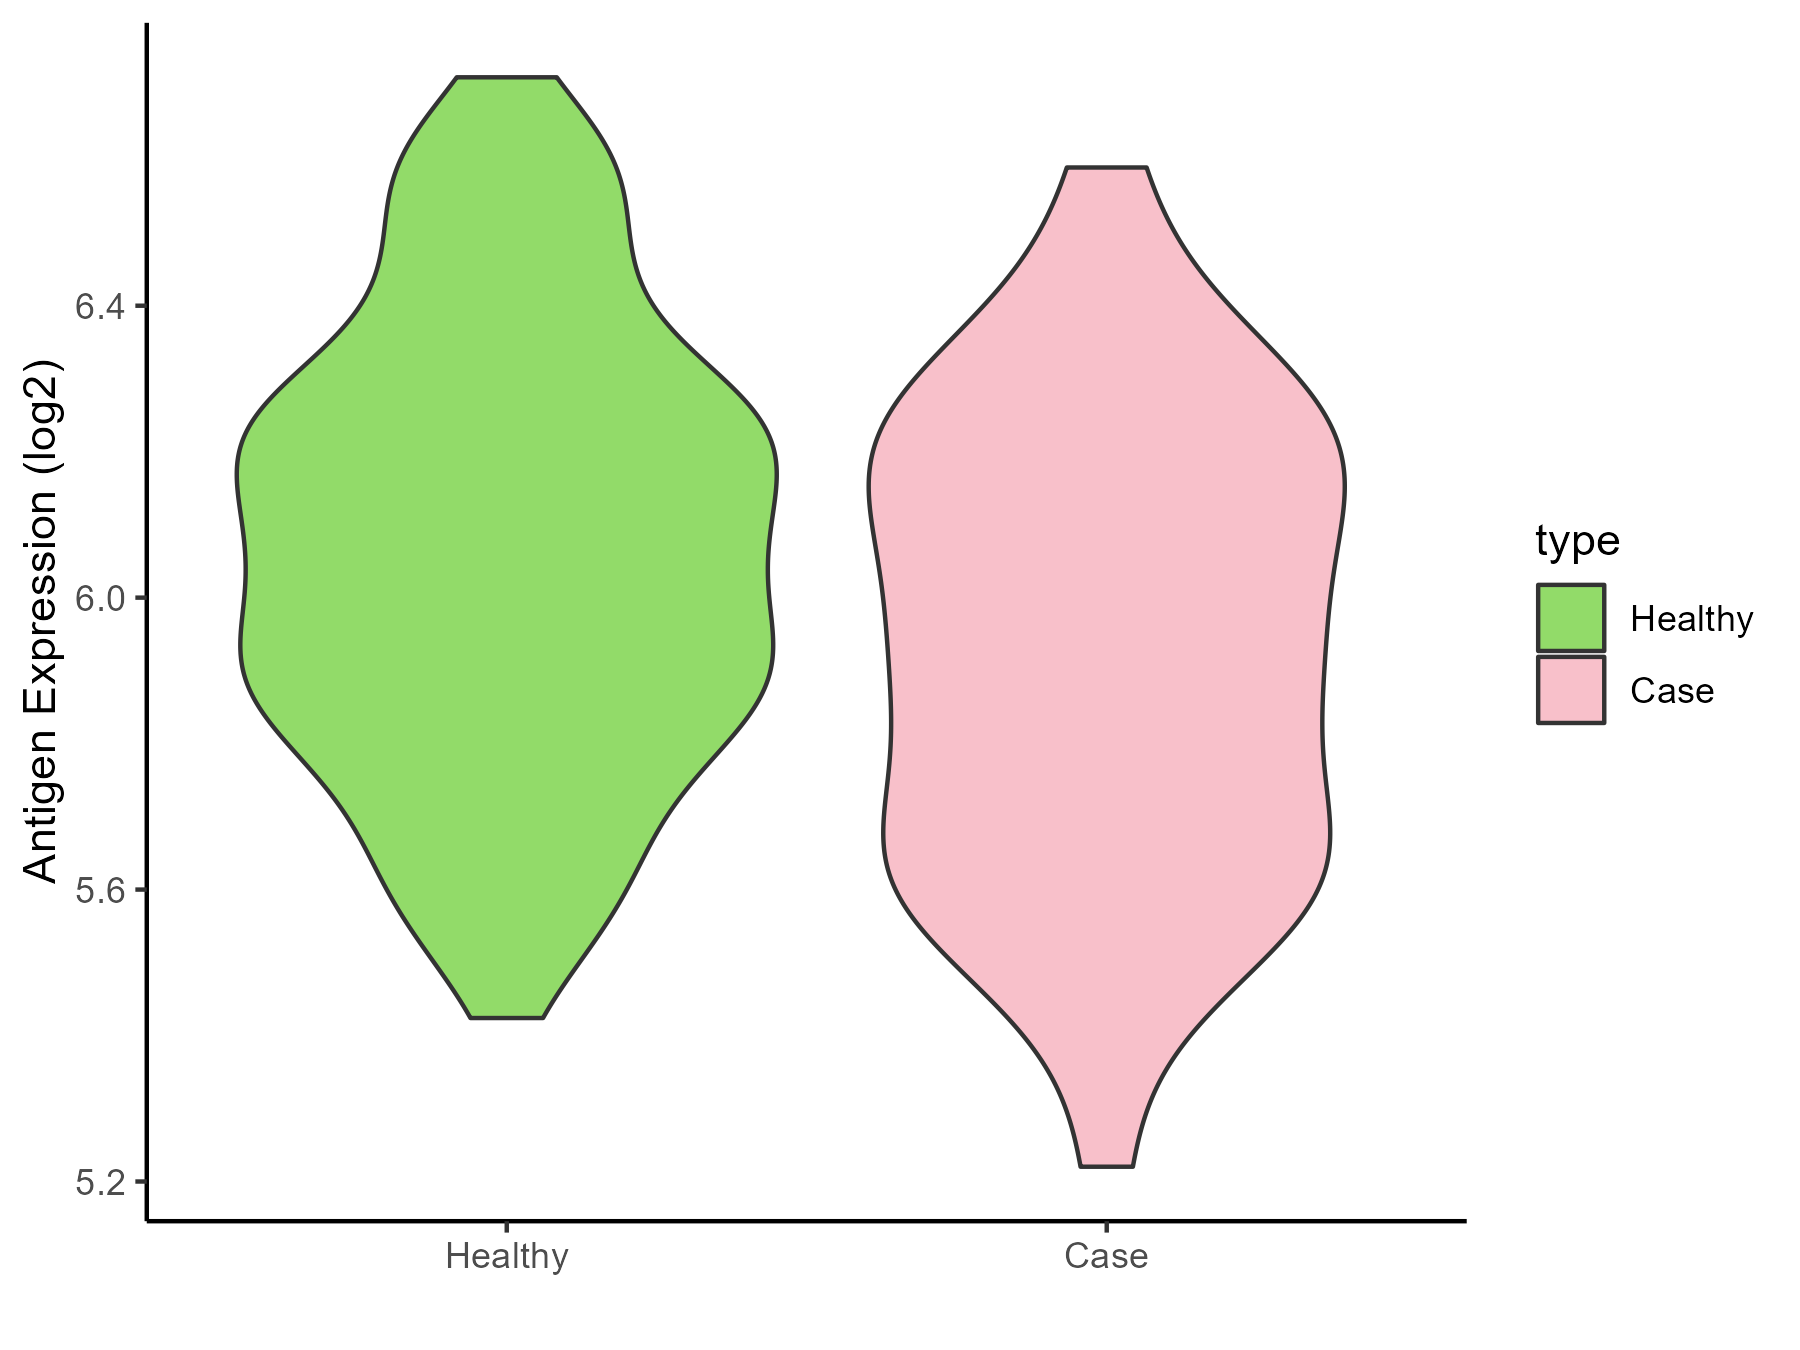
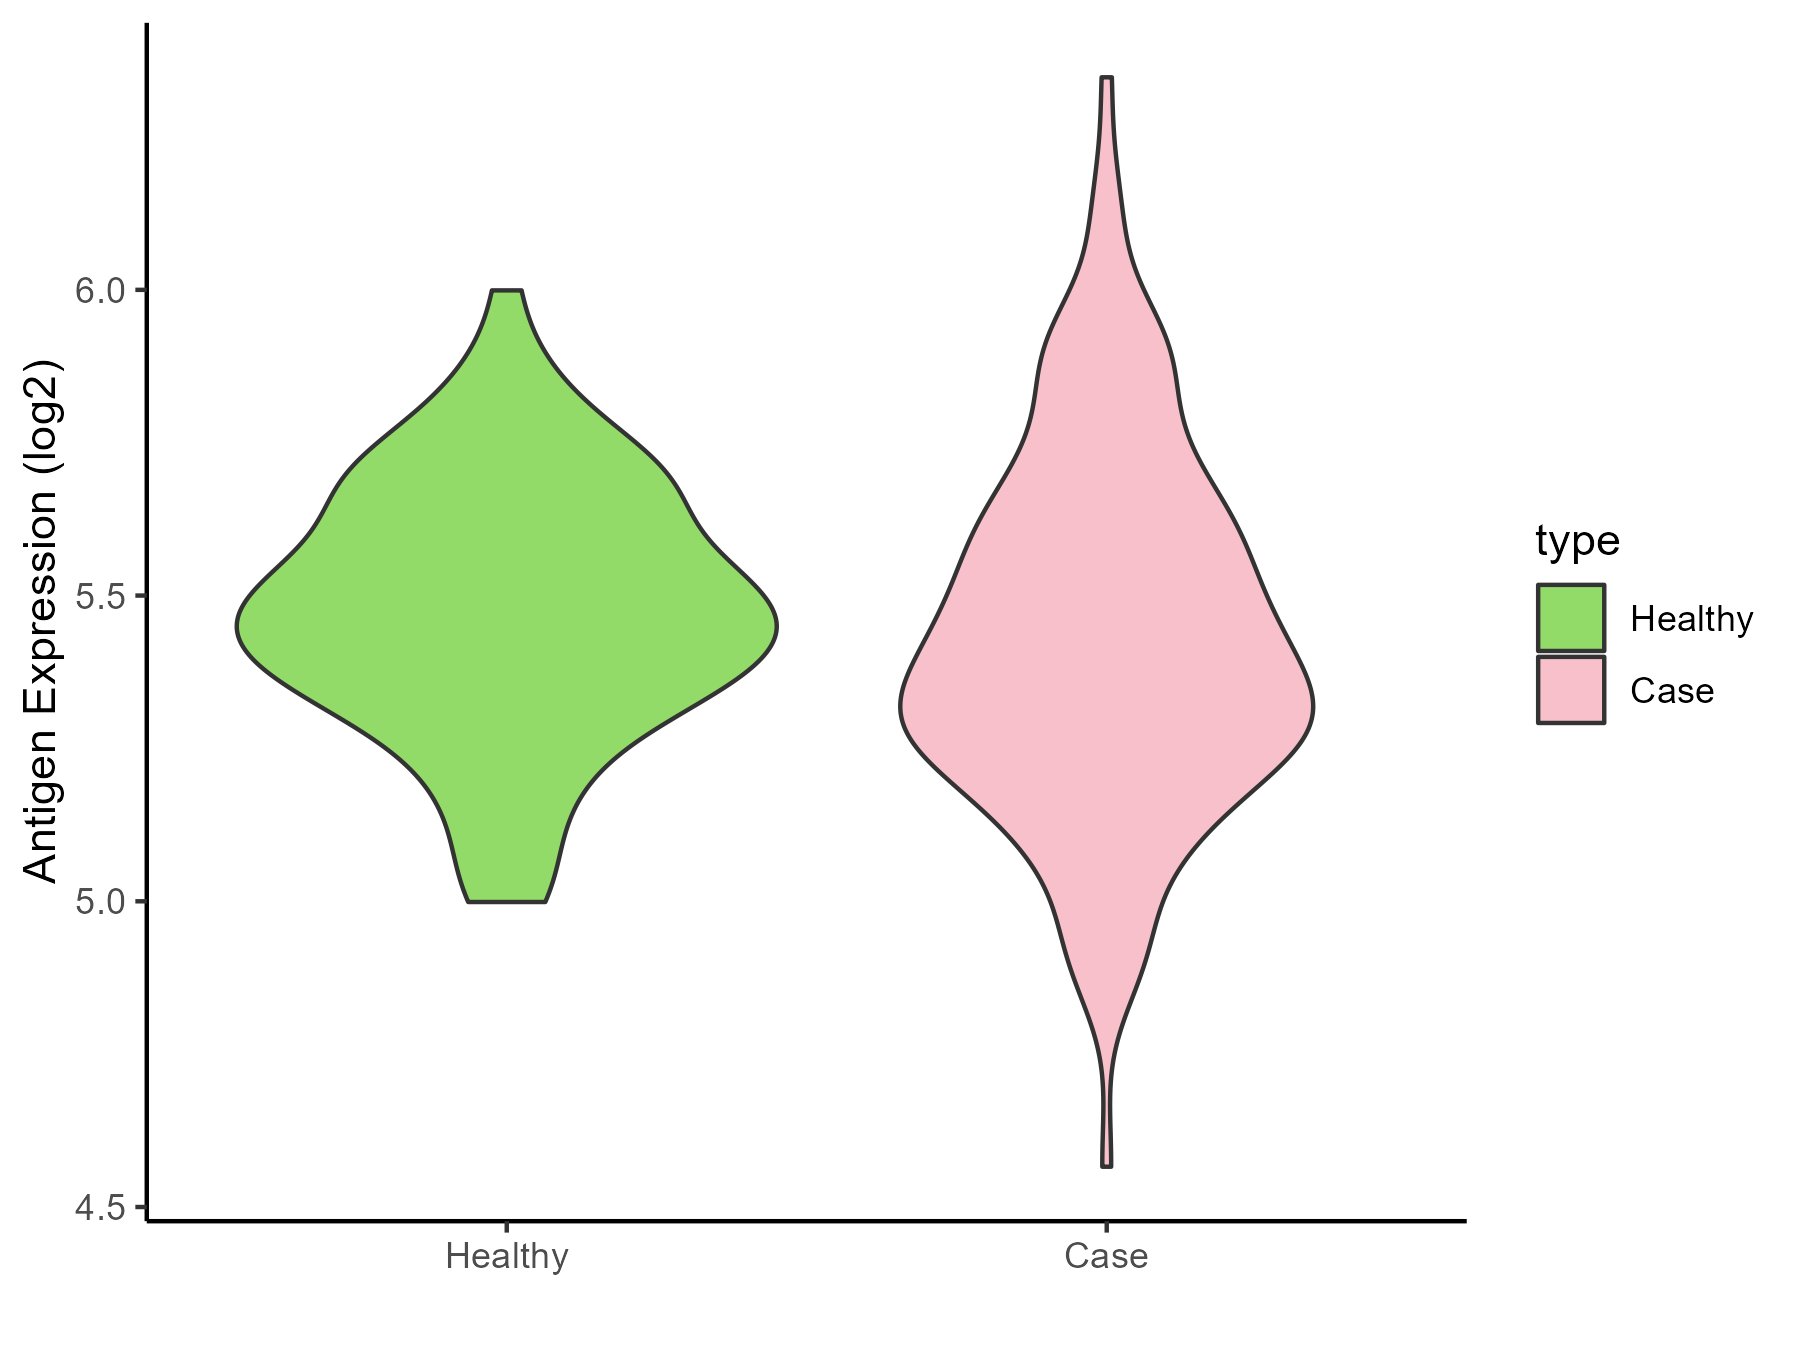
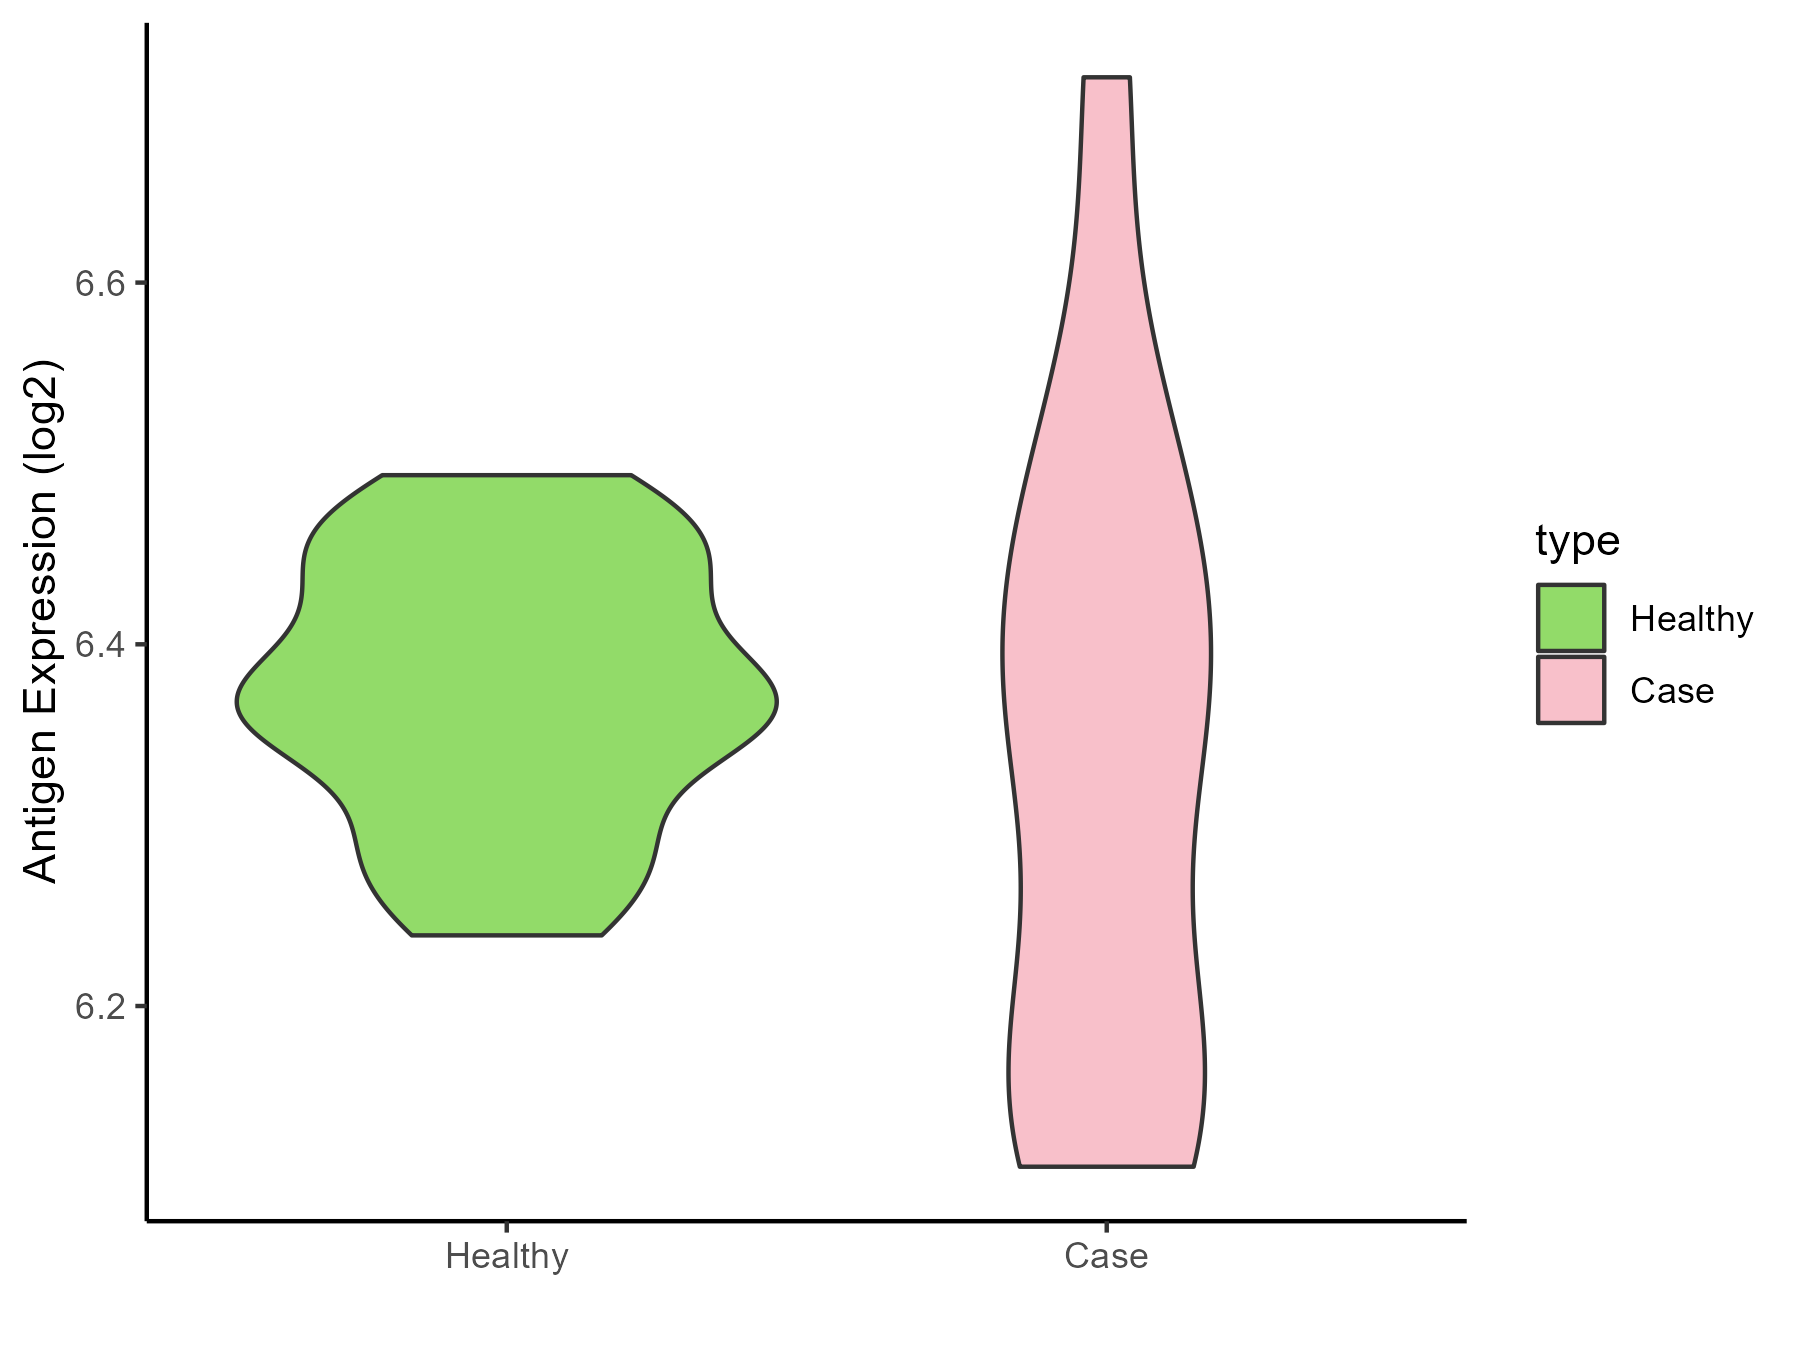
Brainstem |
| The Specific Disease |
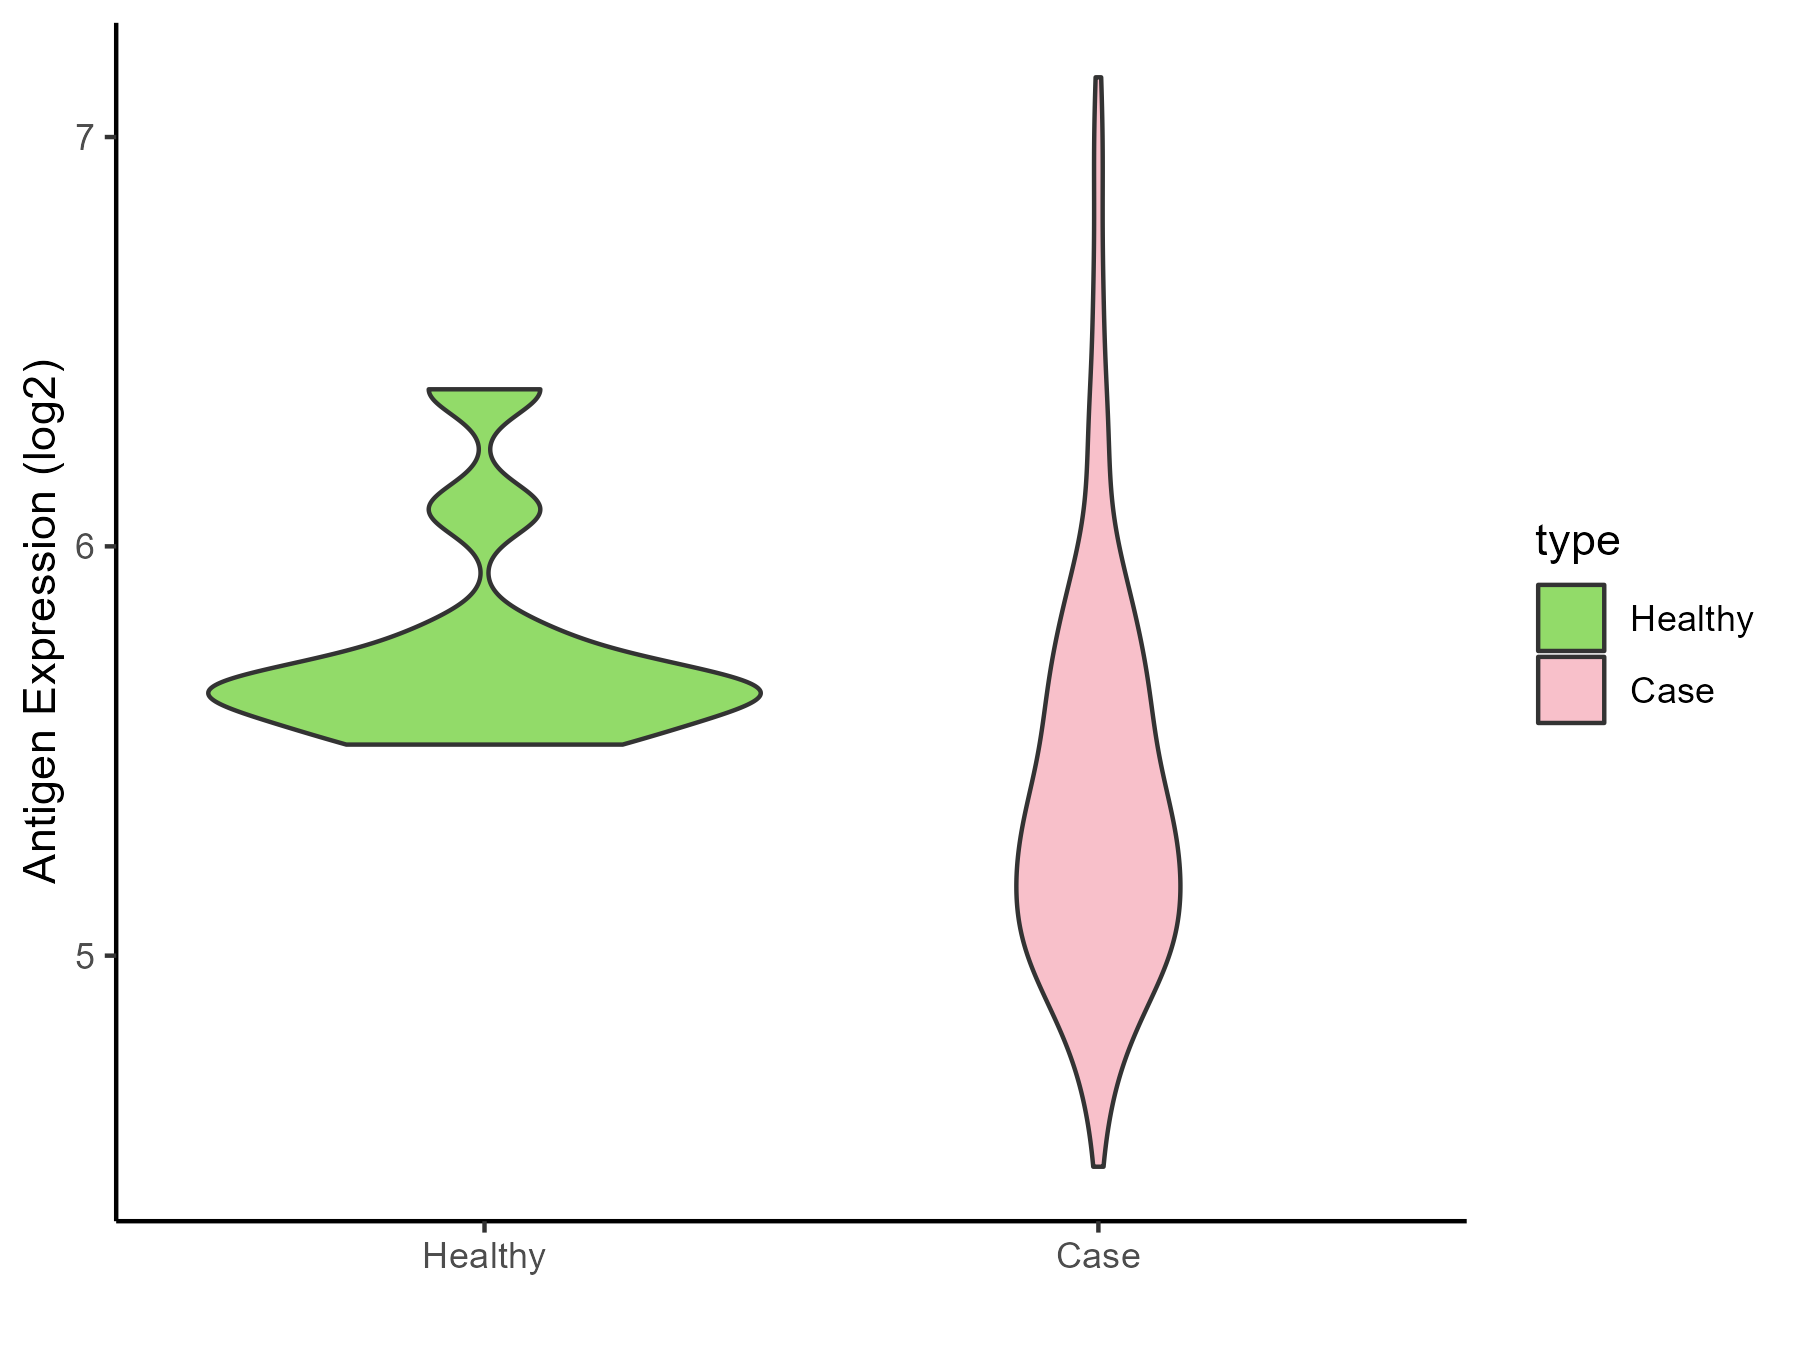
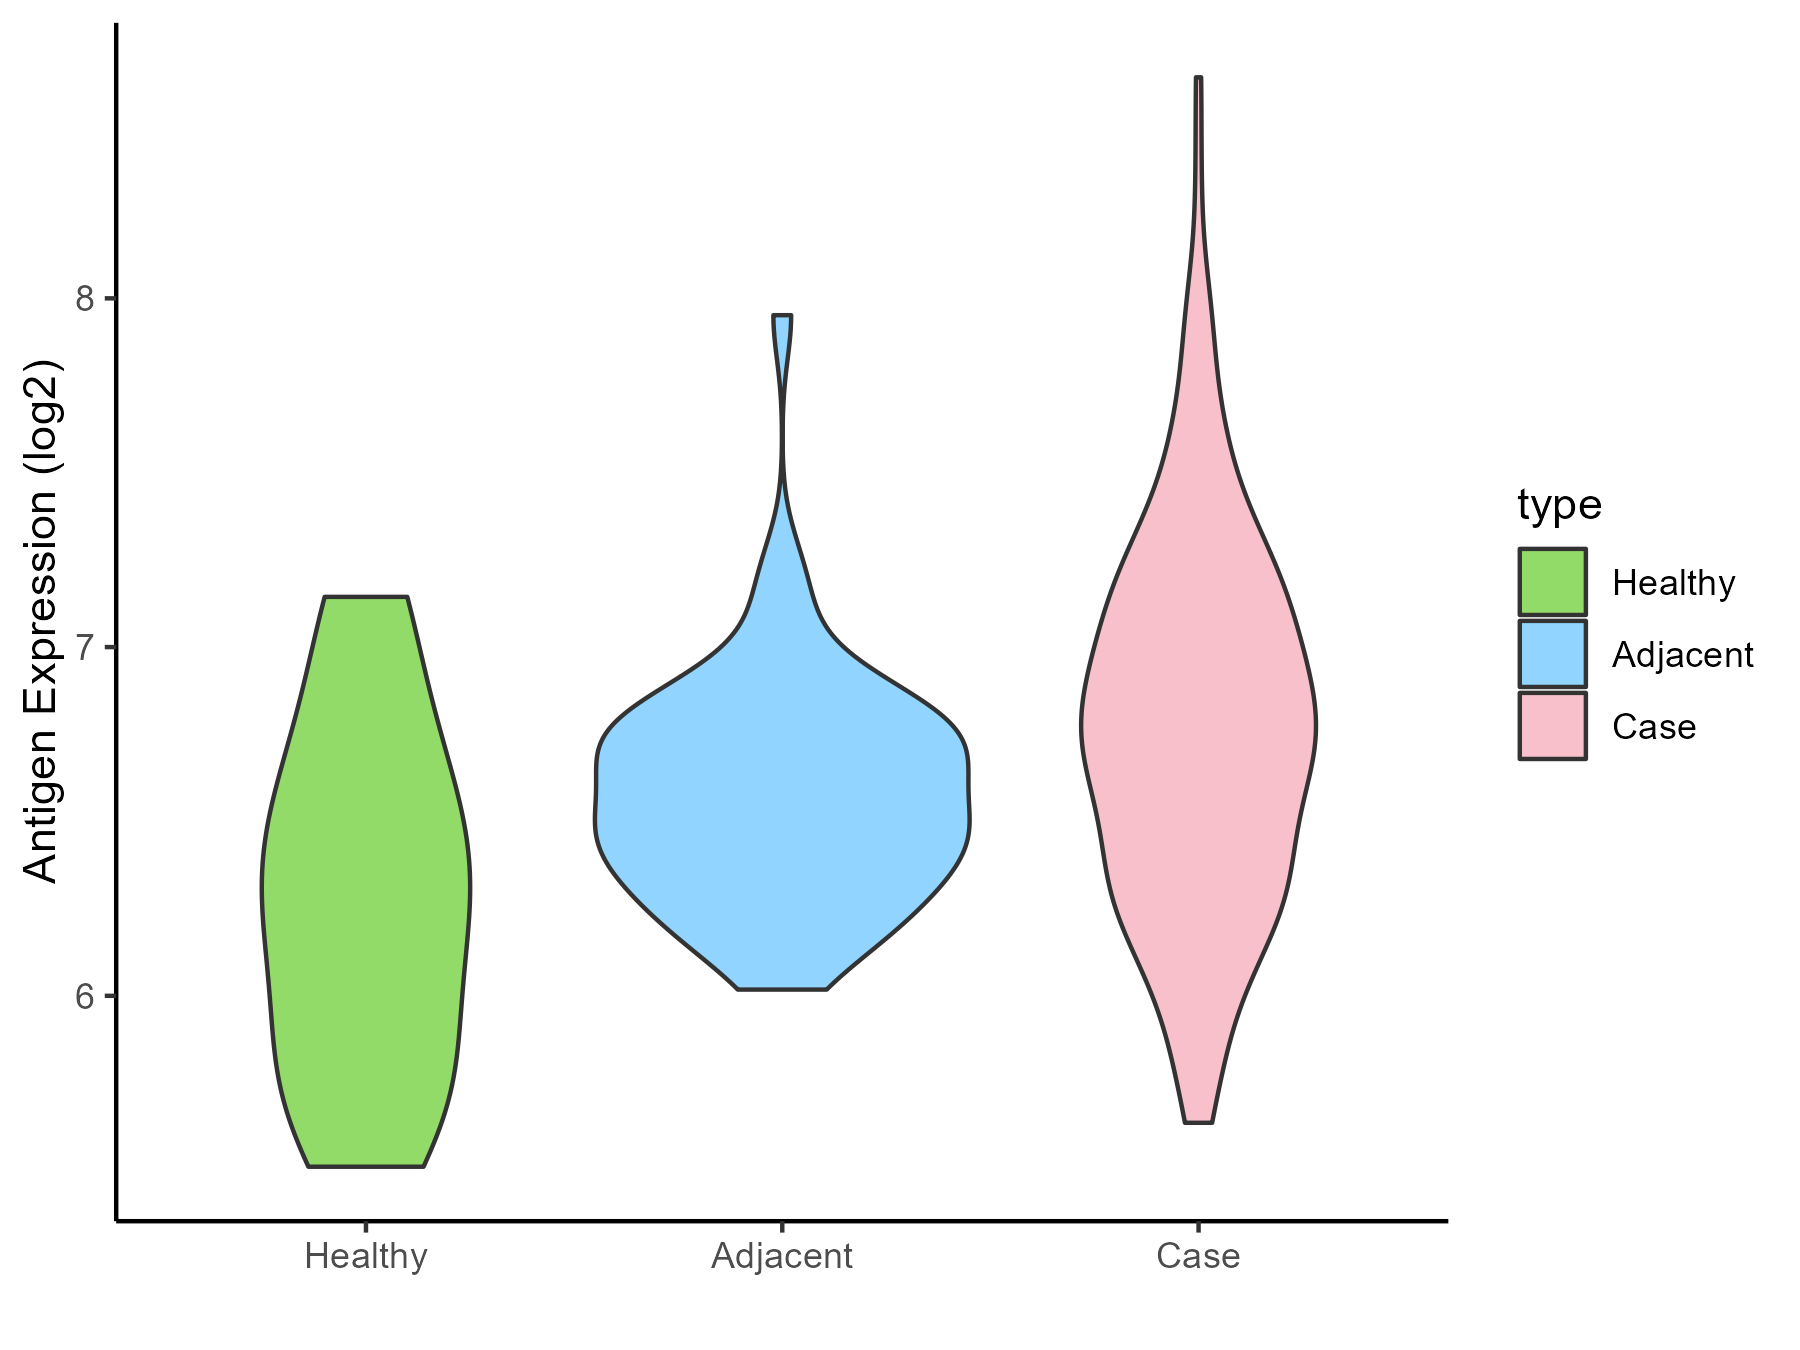
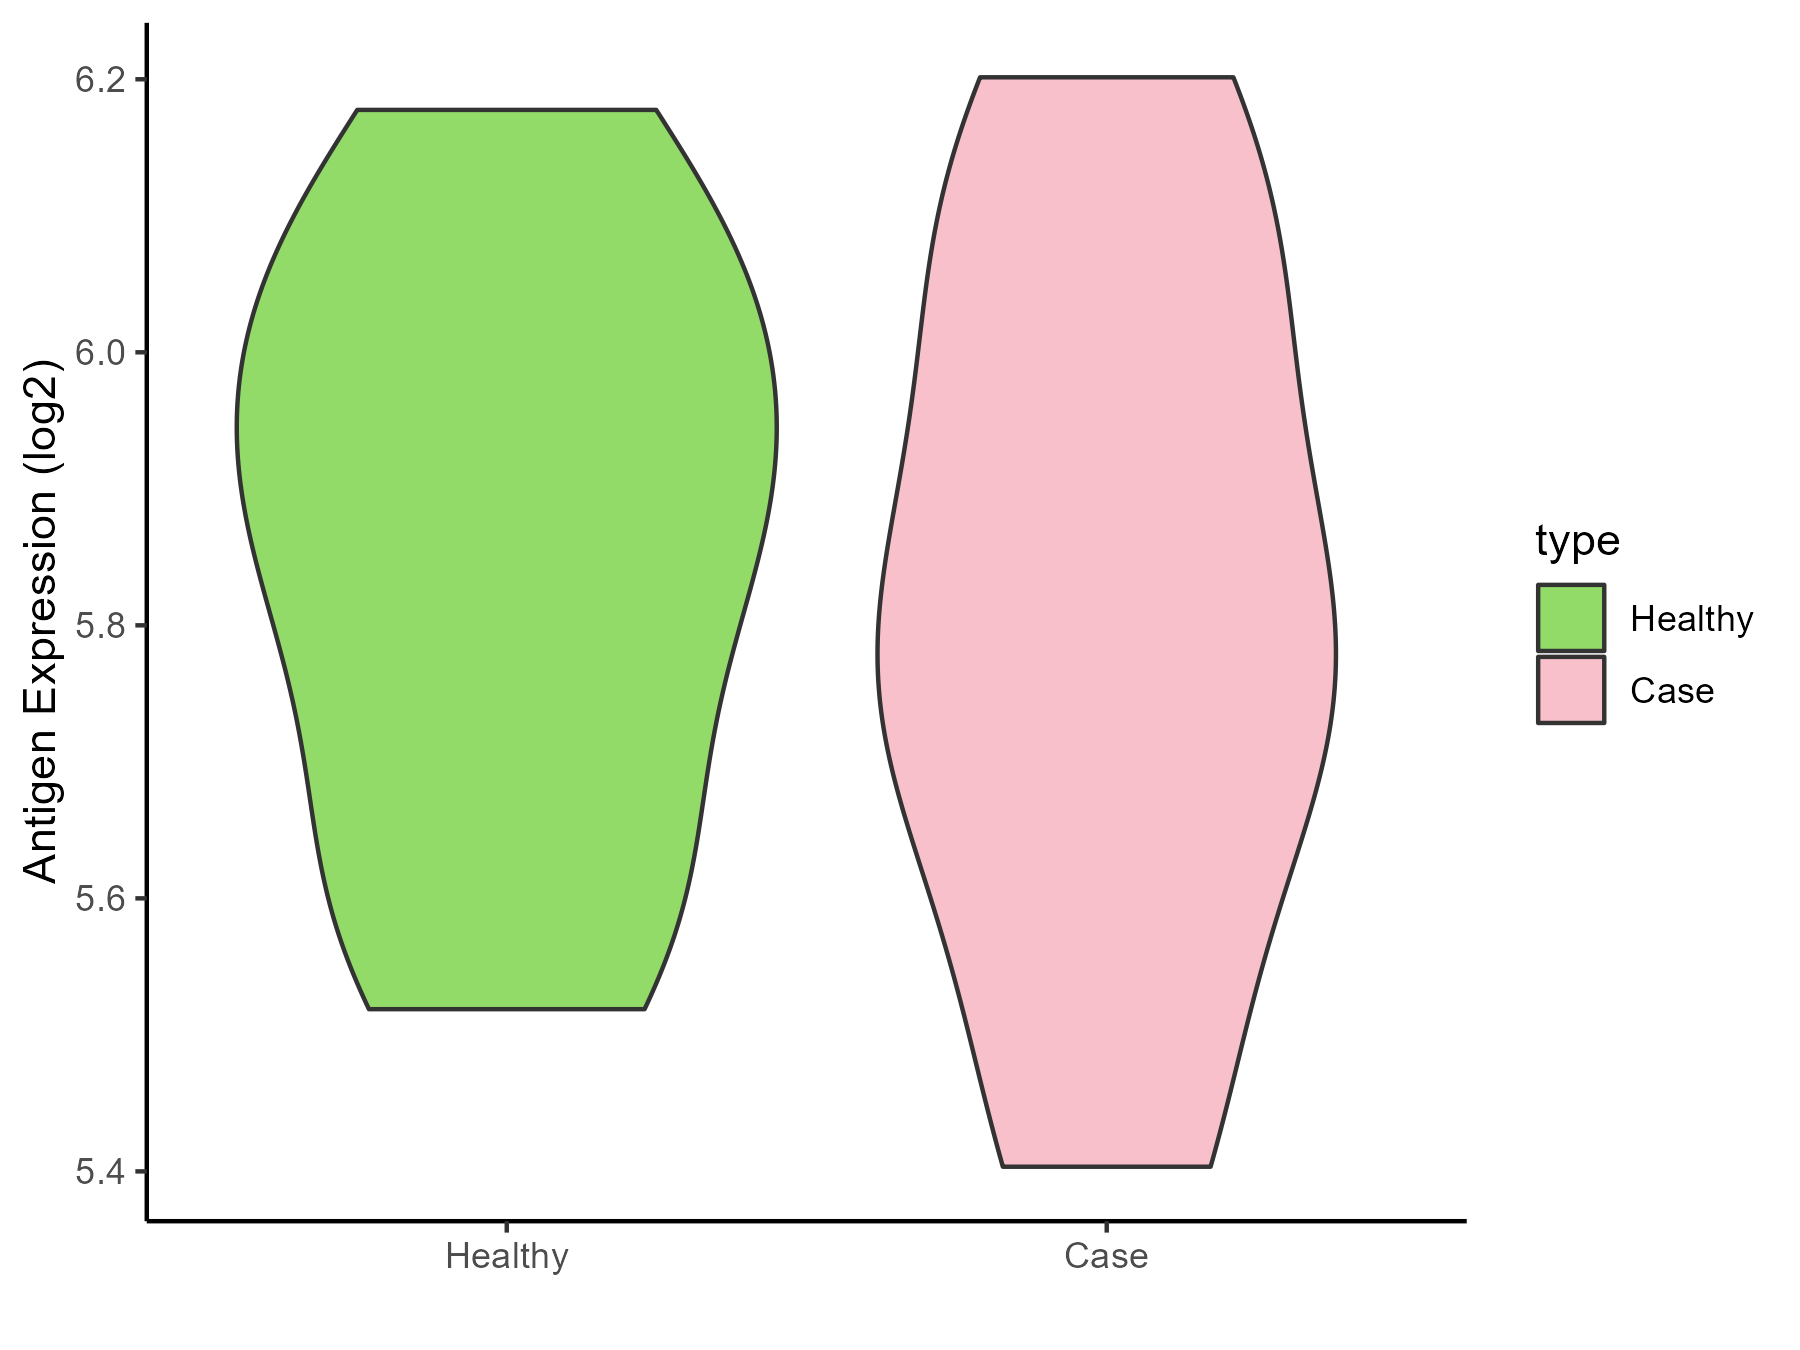
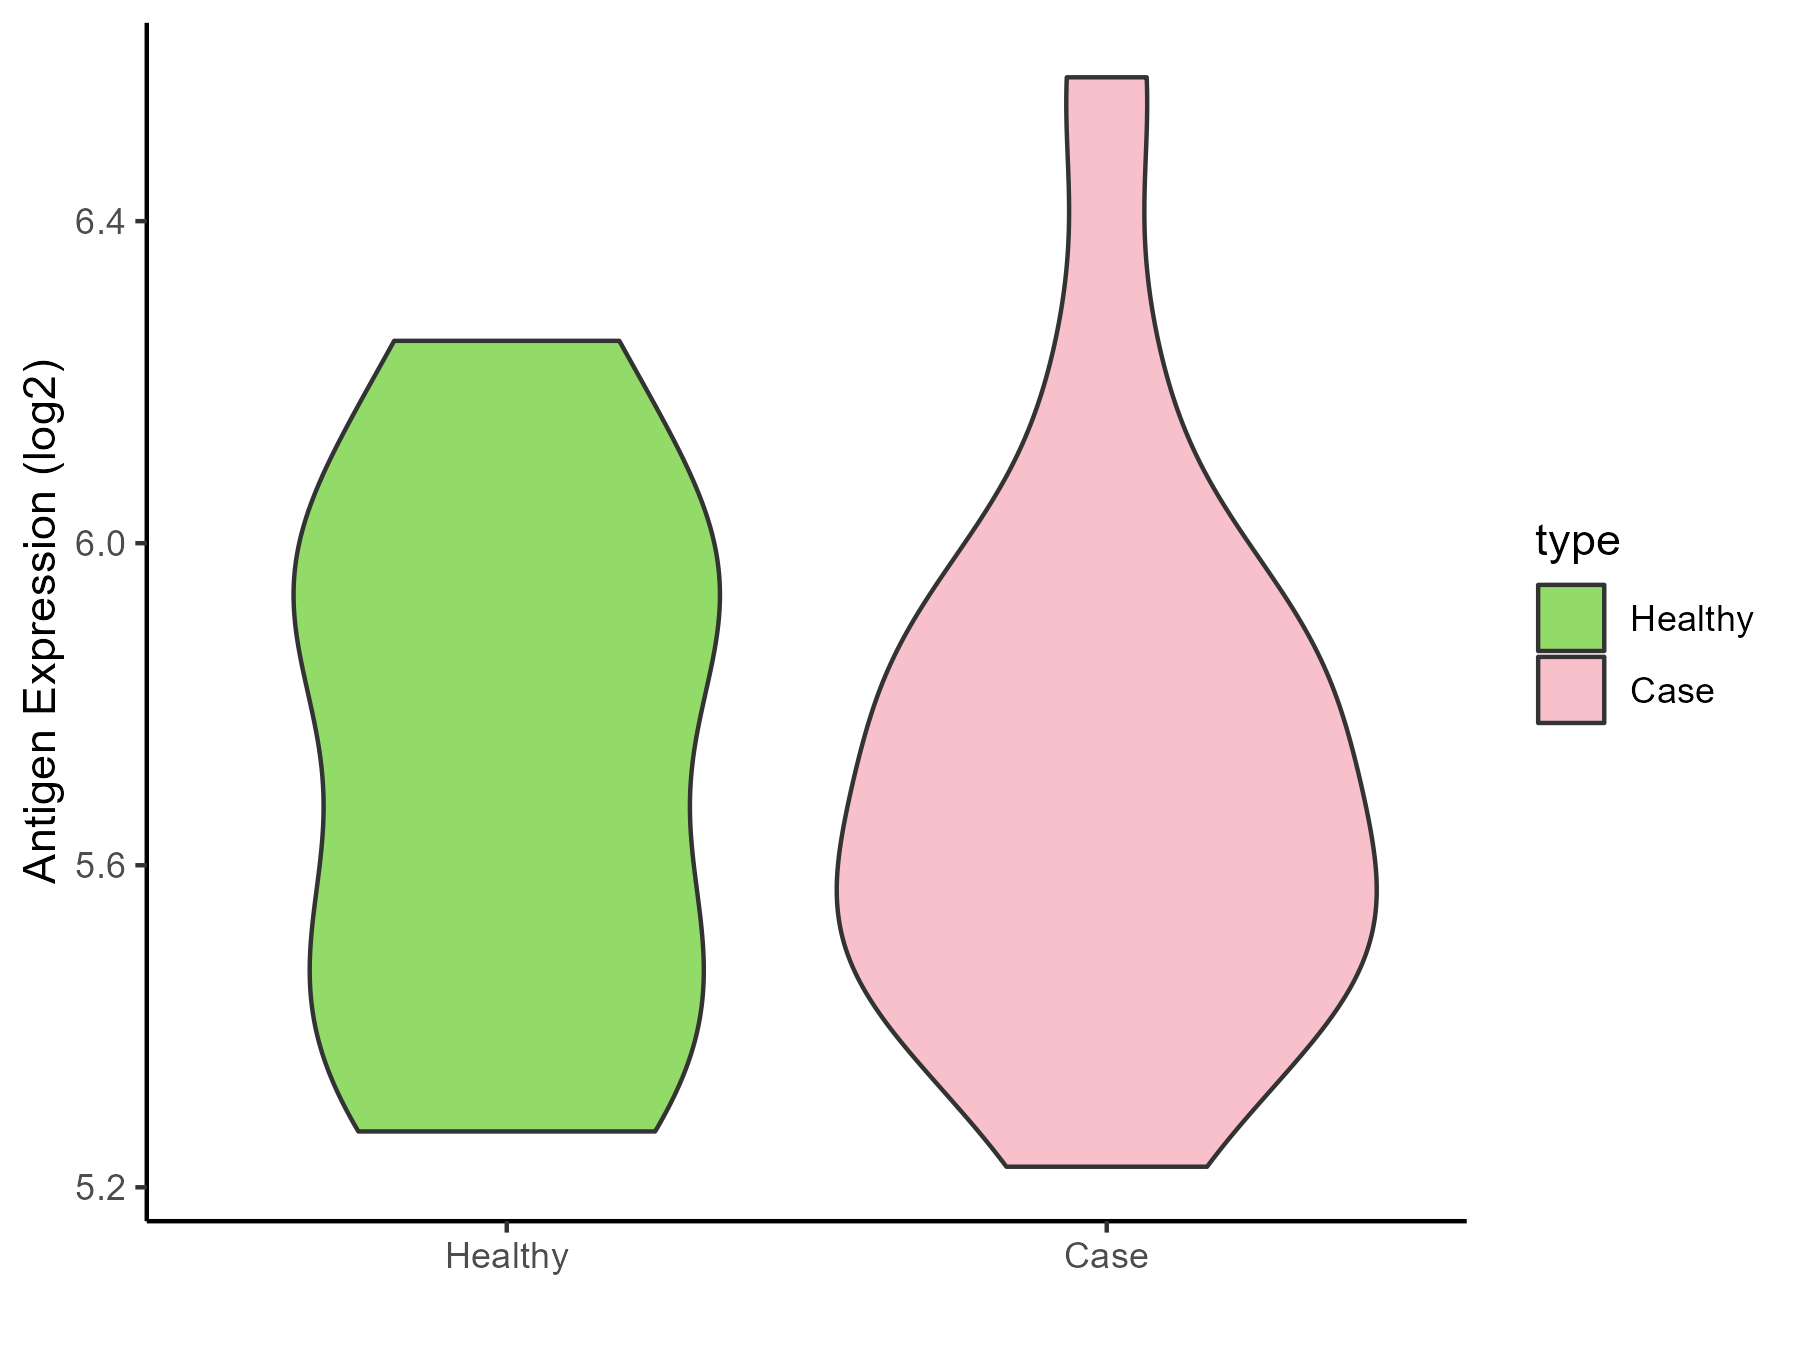
Neuroectodermal tumor |
| The Expression Level of Disease Section Compare with the Healthy Individual Tissue |
p-value: 0.002568443;
Fold-change: -0.356750678;
Z-score: -1.309215649
|
| Disease-specific Antigen Abundances |
|
Click to View the Clearer Original Diagram
|
|
|
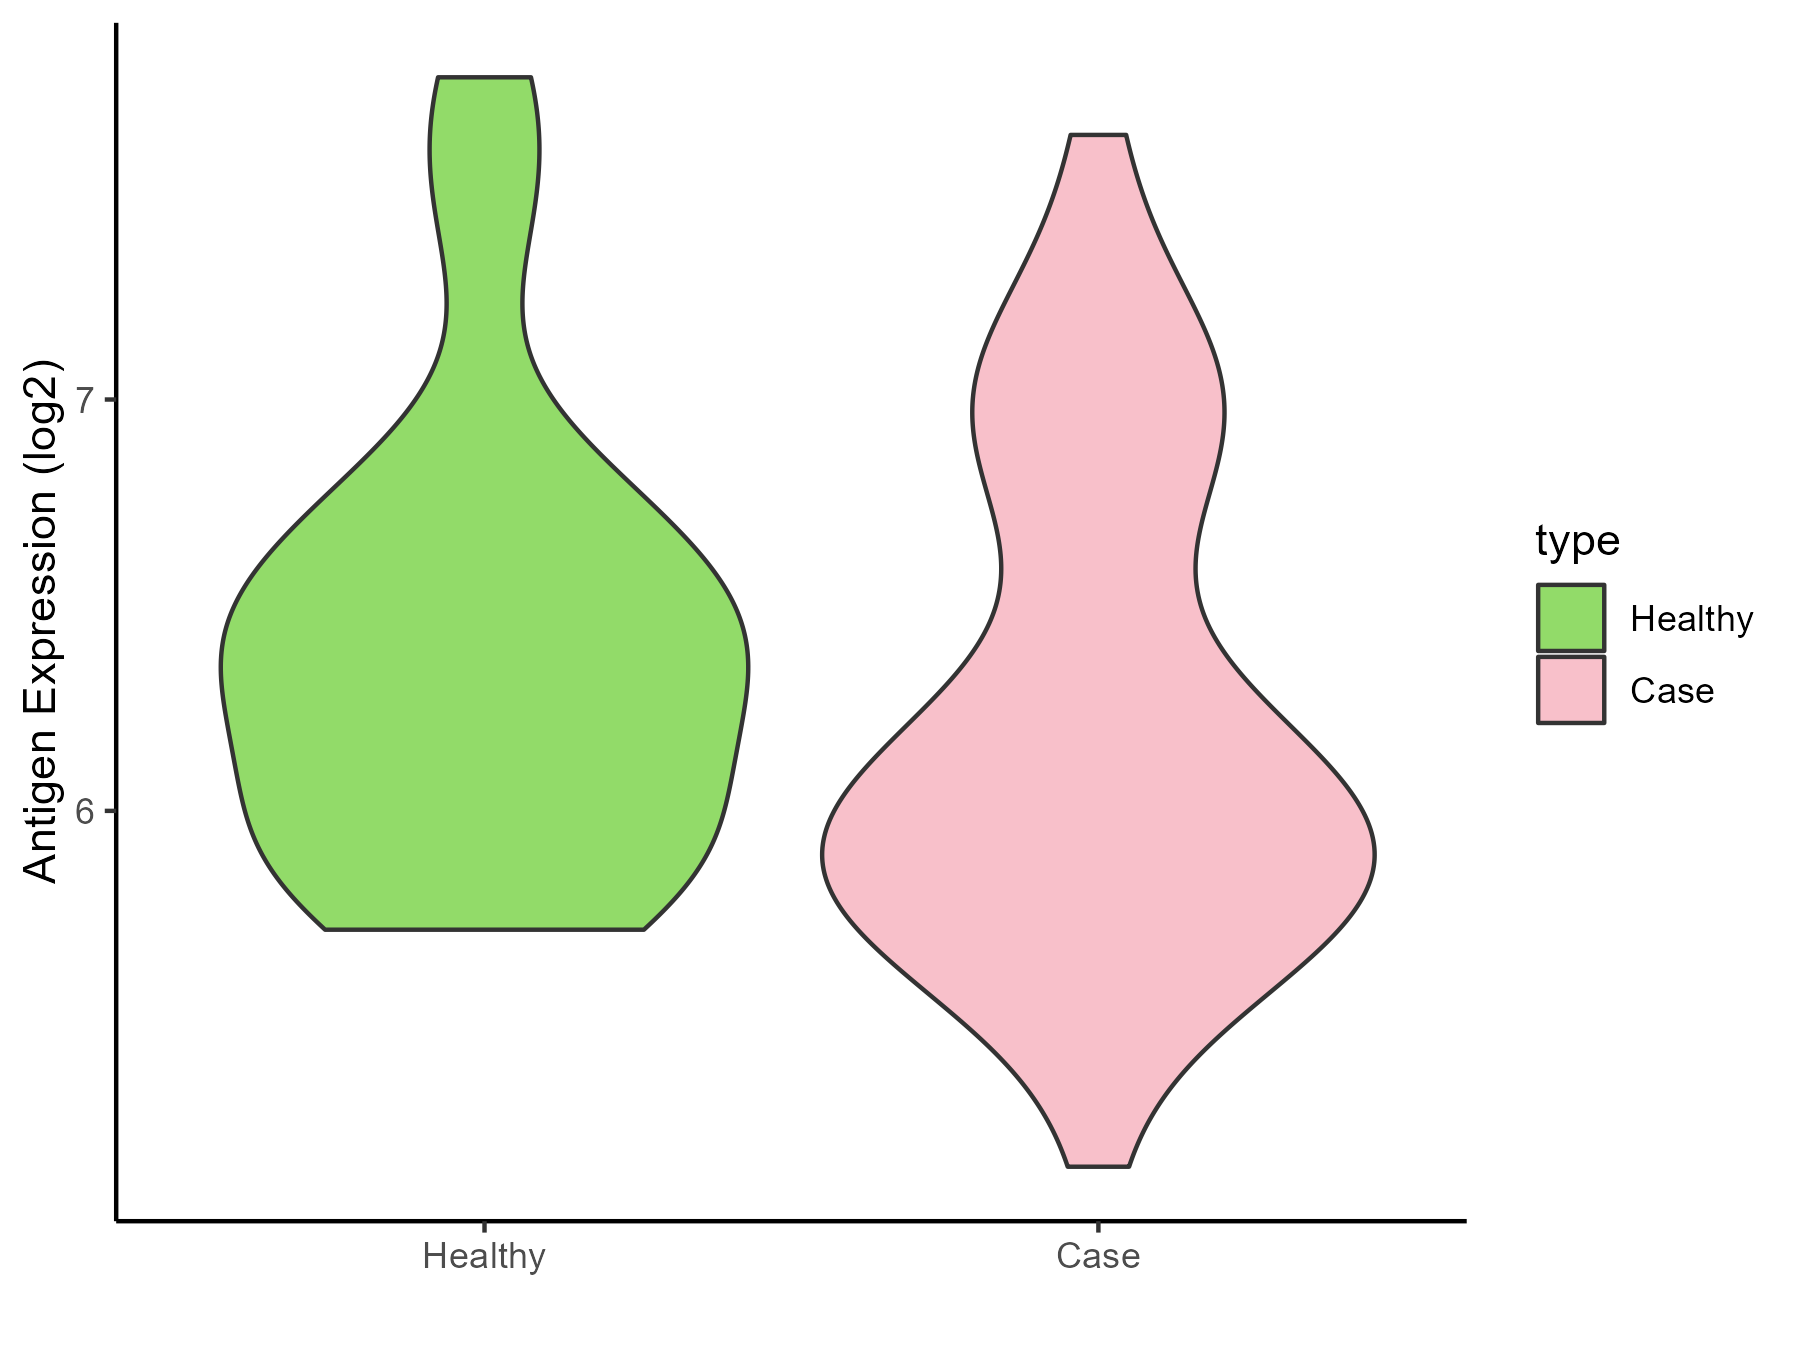
| The Studied Tissue |
Nervous |
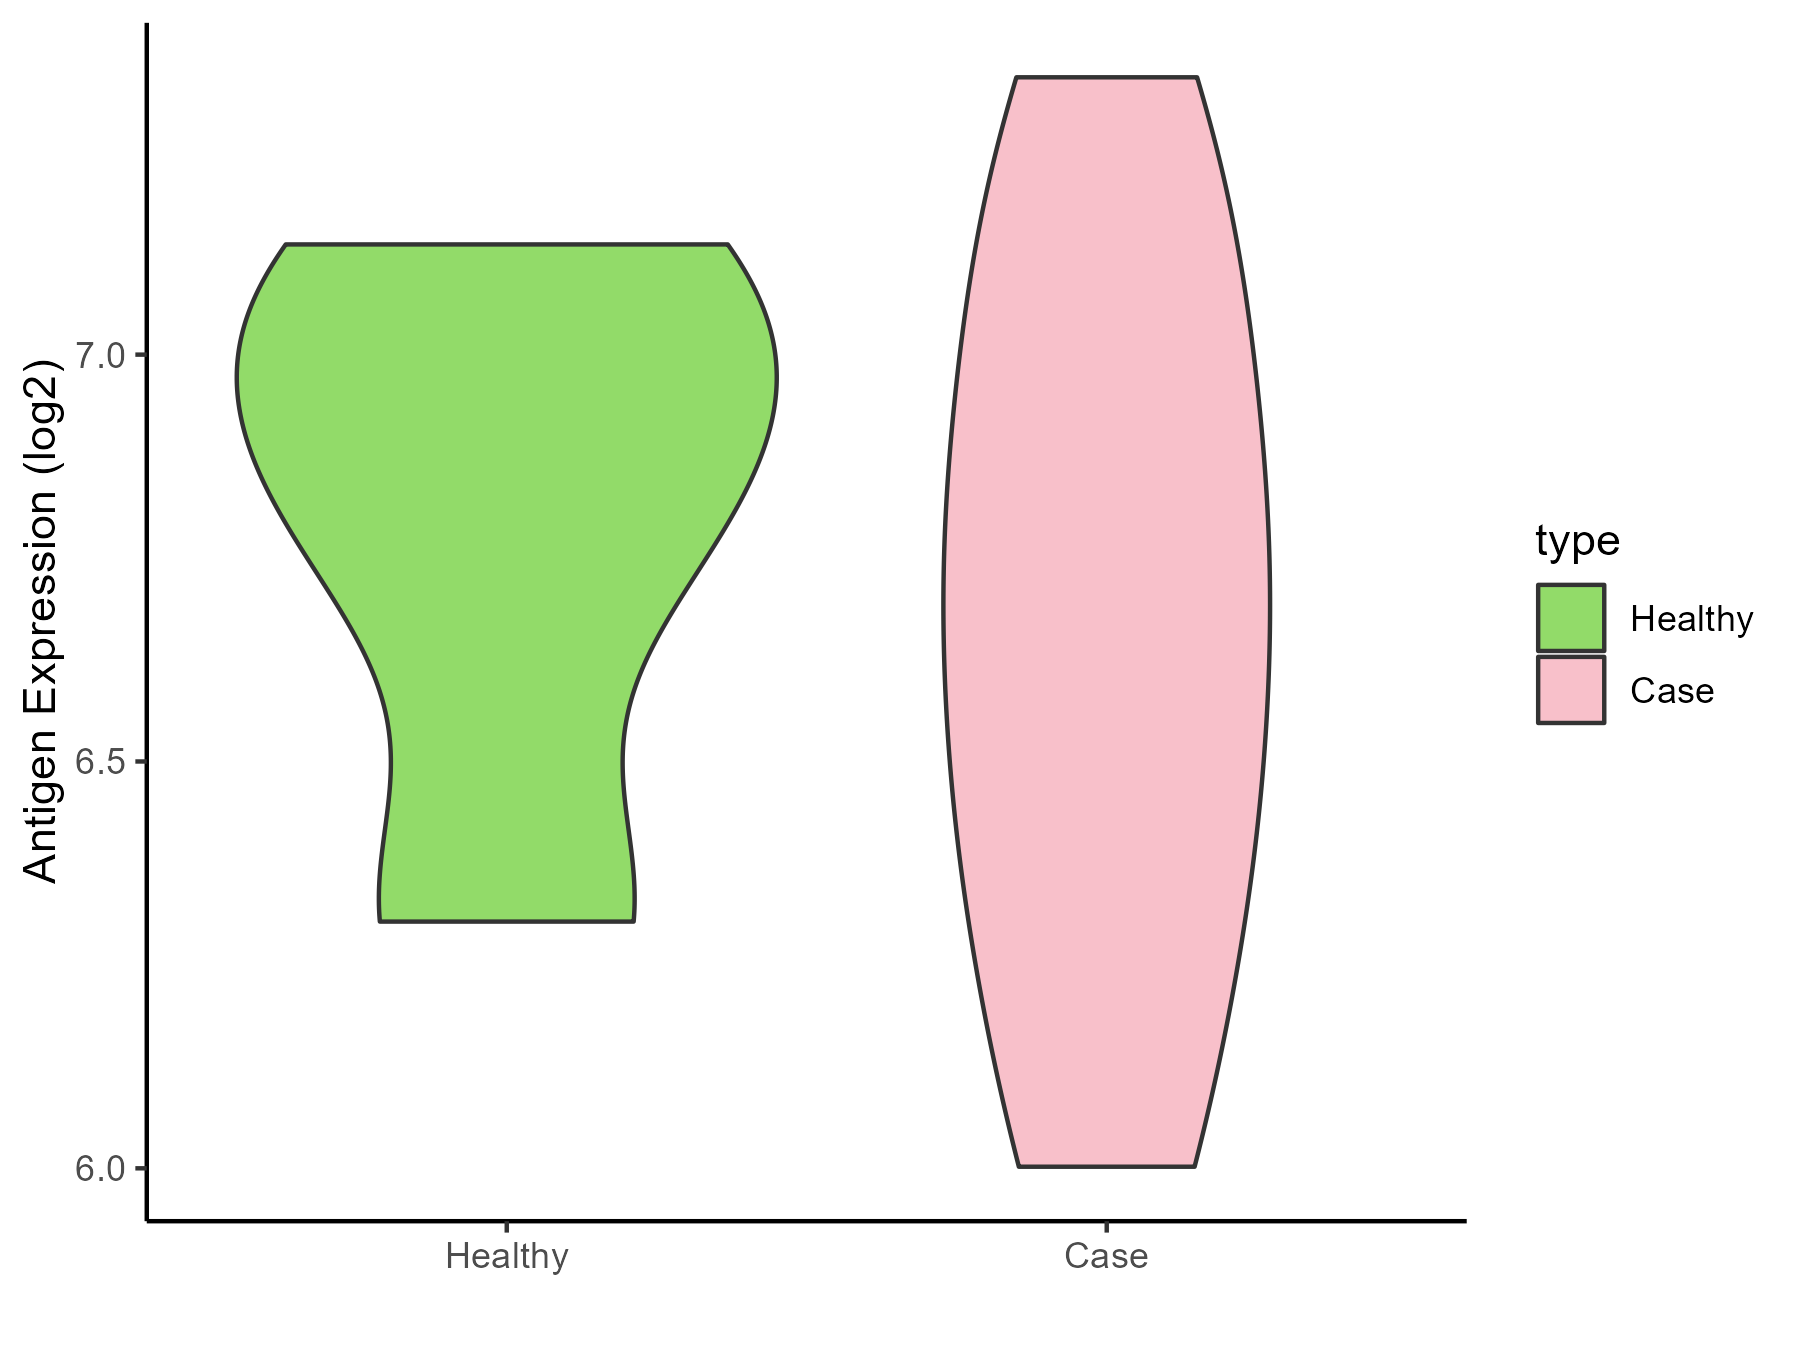
| The Specific Disease |
Brain cancer |
| The Expression Level of Disease Section Compare with the Healthy Individual Tissue |
p-value: 2.75E-97;
Fold-change: 0.576983669;
Z-score: 1.533974248
|
| Disease-specific Antigen Abundances |
|
Click to View the Clearer Original Diagram
|
|
|
Chronic myeloid leukemia [ICD-11: 2A20]
Click to Show/Hide
| Differential expression pattern of antigen in diseases |
| The Studied Tissue |
Whole blood |
| The Specific Disease |
Polycythemia vera |
| The Expression Level of Disease Section Compare with the Healthy Individual Tissue |
p-value: 0.673786161;
Fold-change: -0.024213283;
Z-score: -0.241699173
|
| Disease-specific Antigen Abundances |
|
Click to View the Clearer Original Diagram
|
|
|
| The Studied Tissue |
Whole blood |
| The Specific Disease |
Myelofibrosis |
| The Expression Level of Disease Section Compare with the Healthy Individual Tissue |
p-value: 0.39751767;
Fold-change: 0.08597931;
Z-score: 1.068467815
|
| Disease-specific Antigen Abundances |
|
Click to View the Clearer Original Diagram
|
|
|
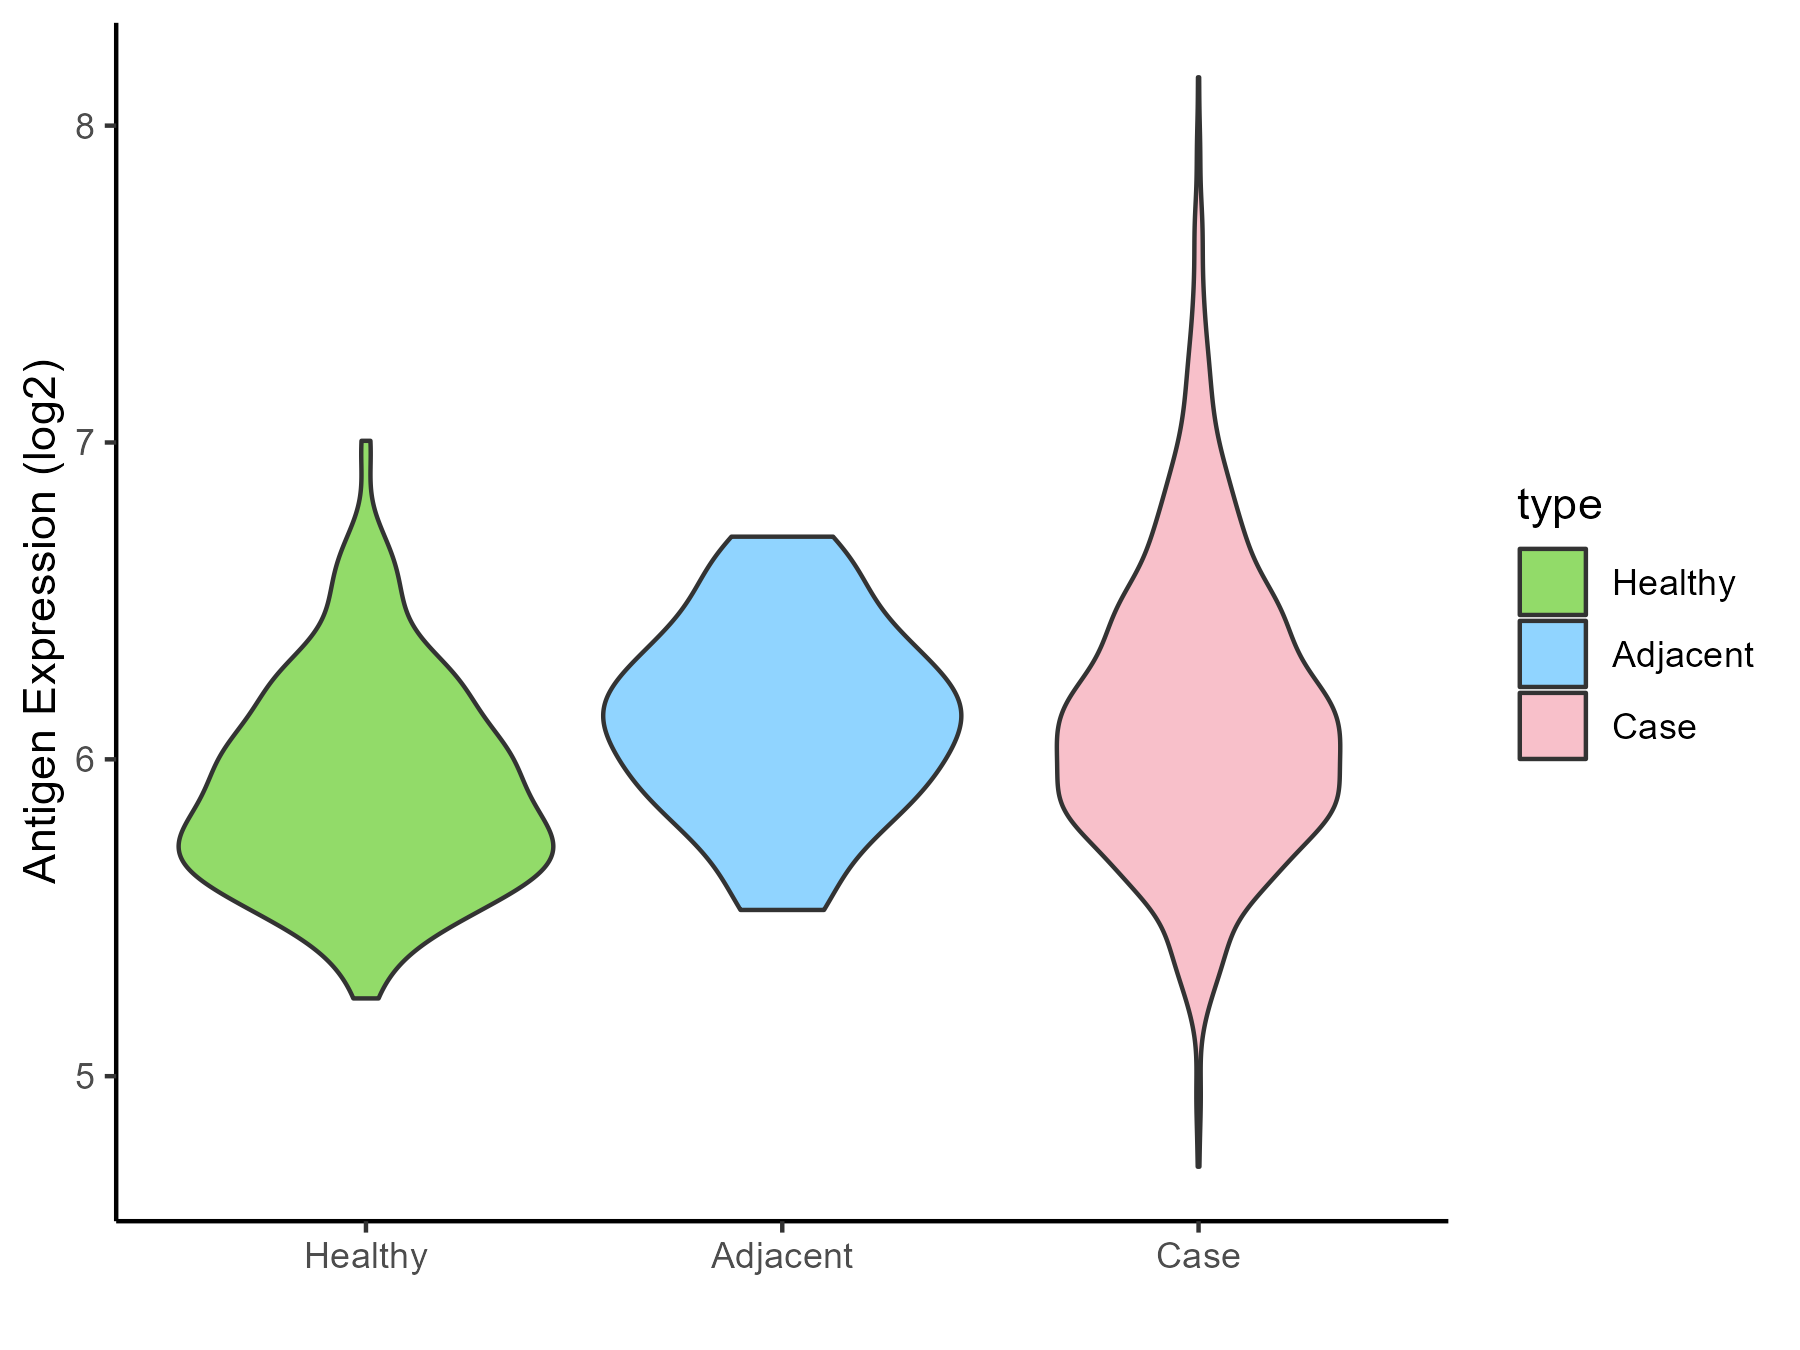
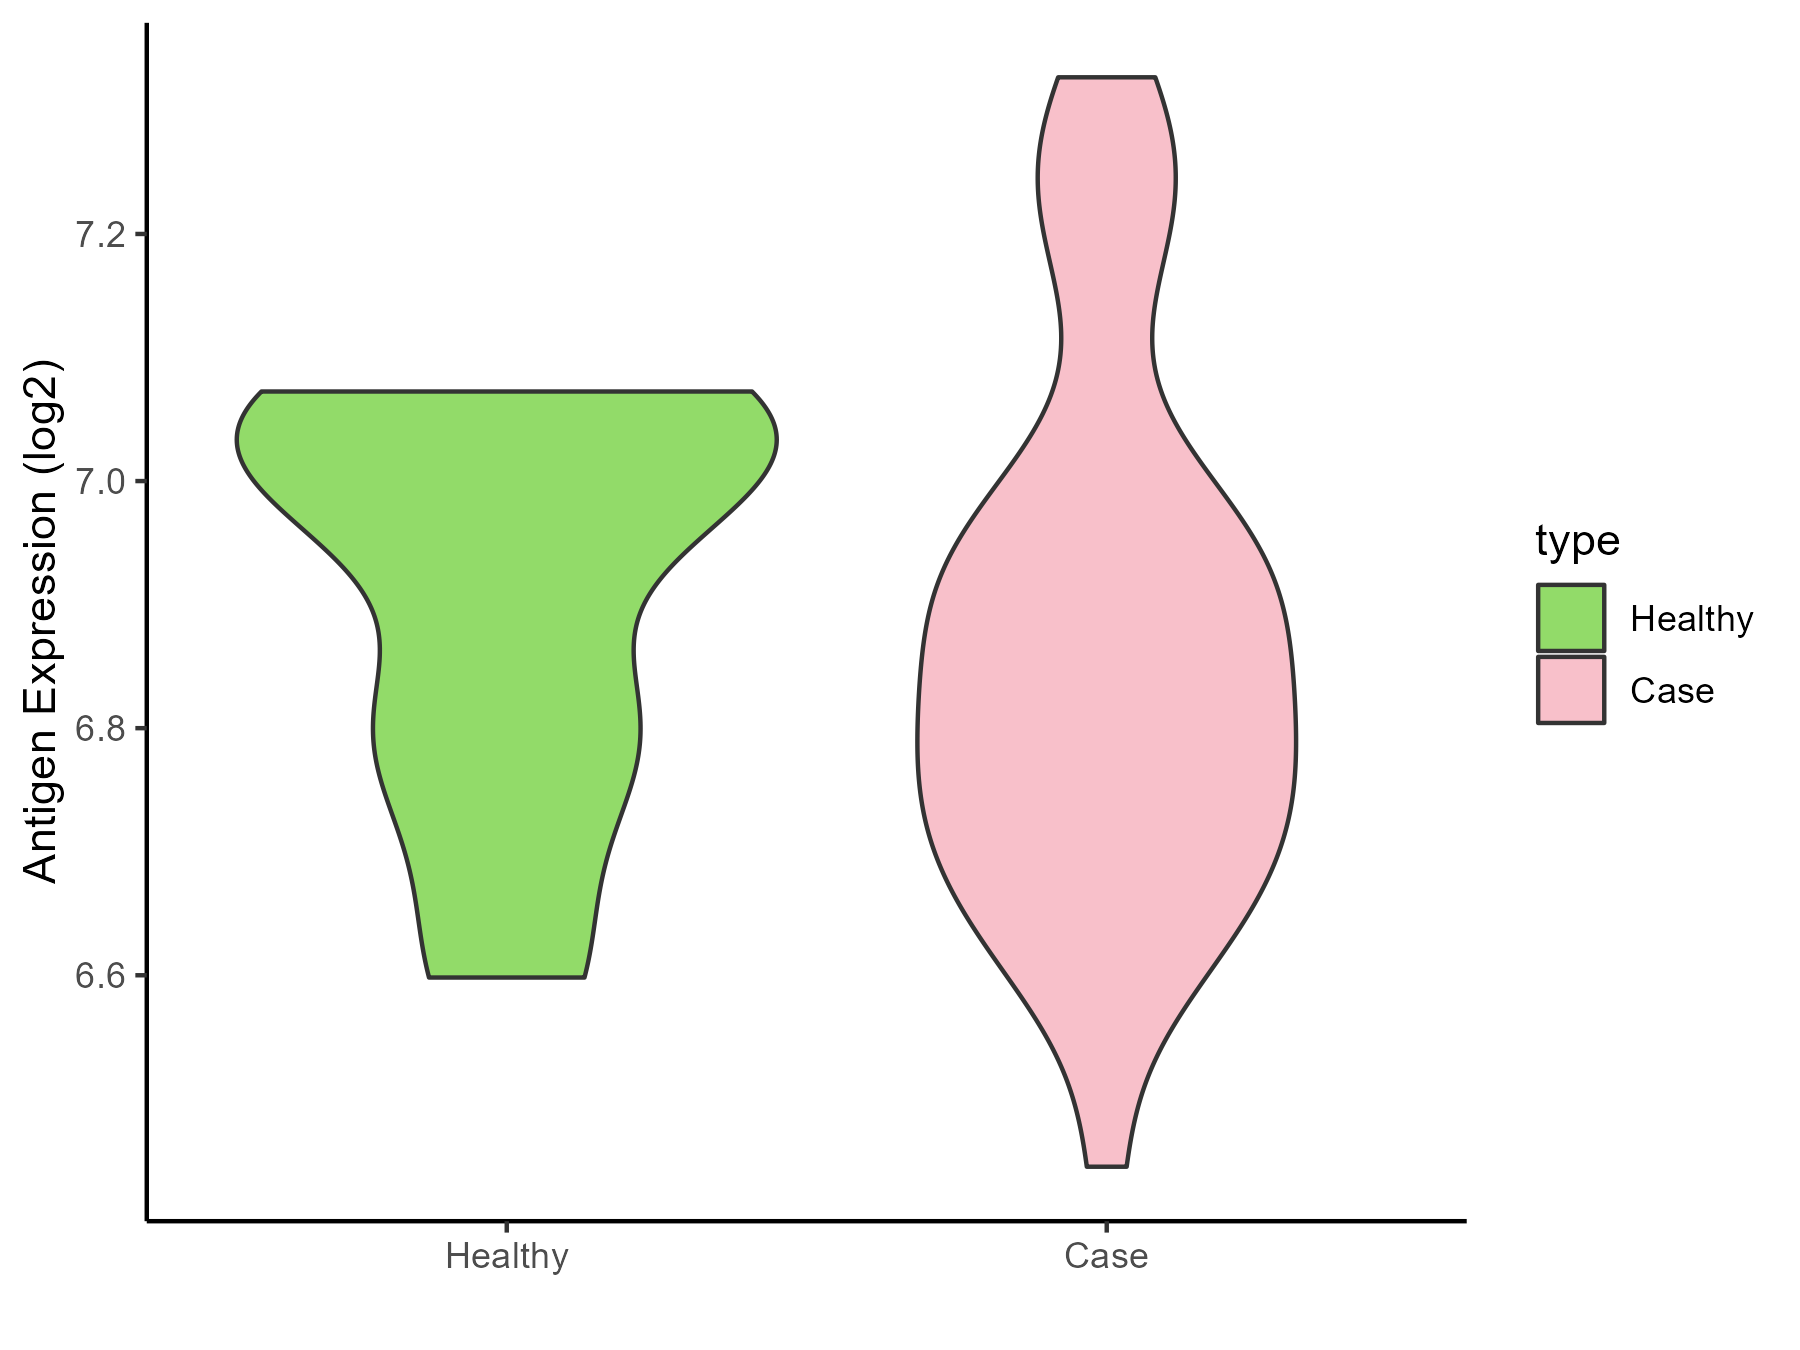
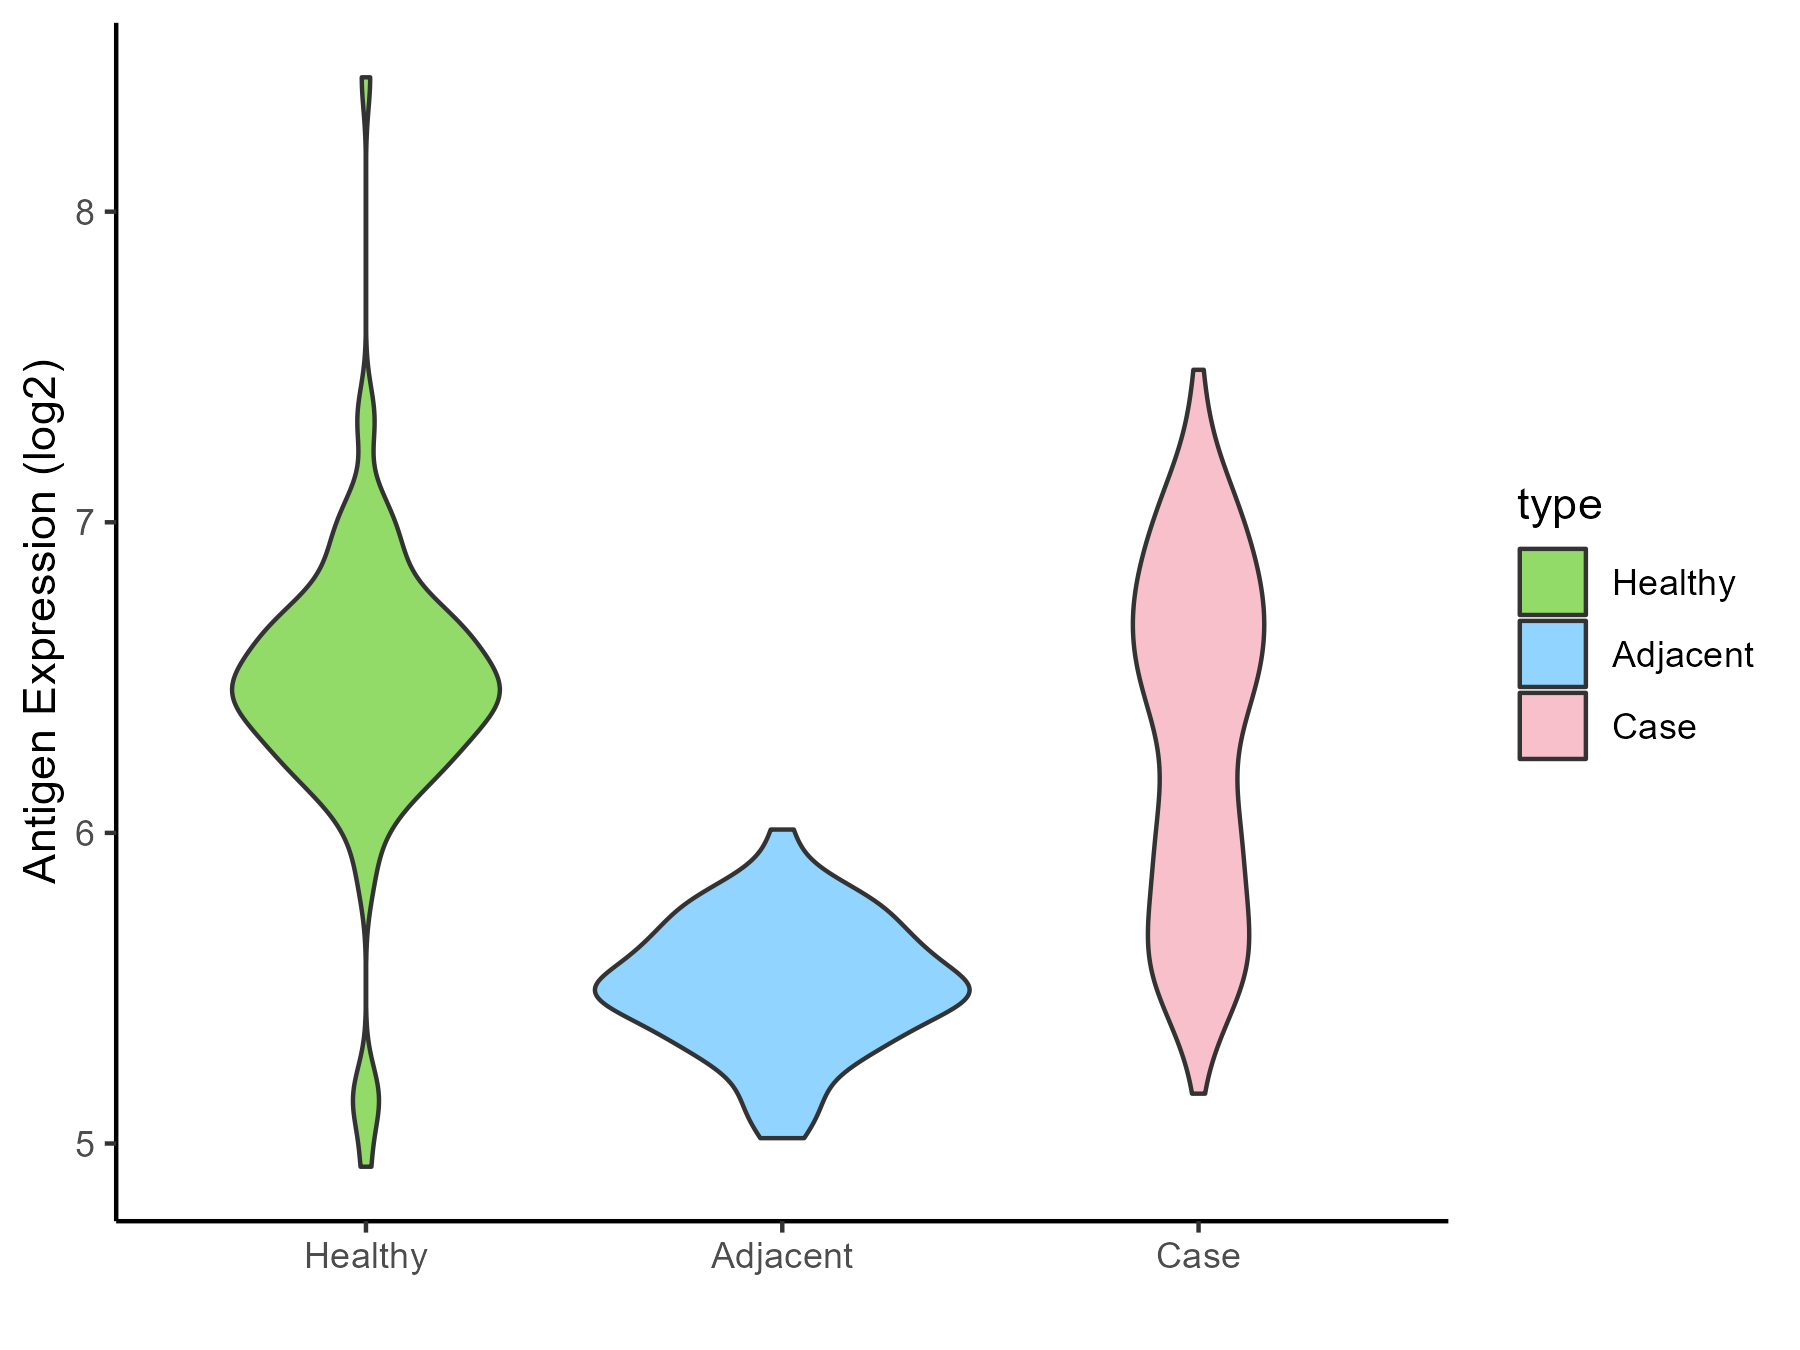
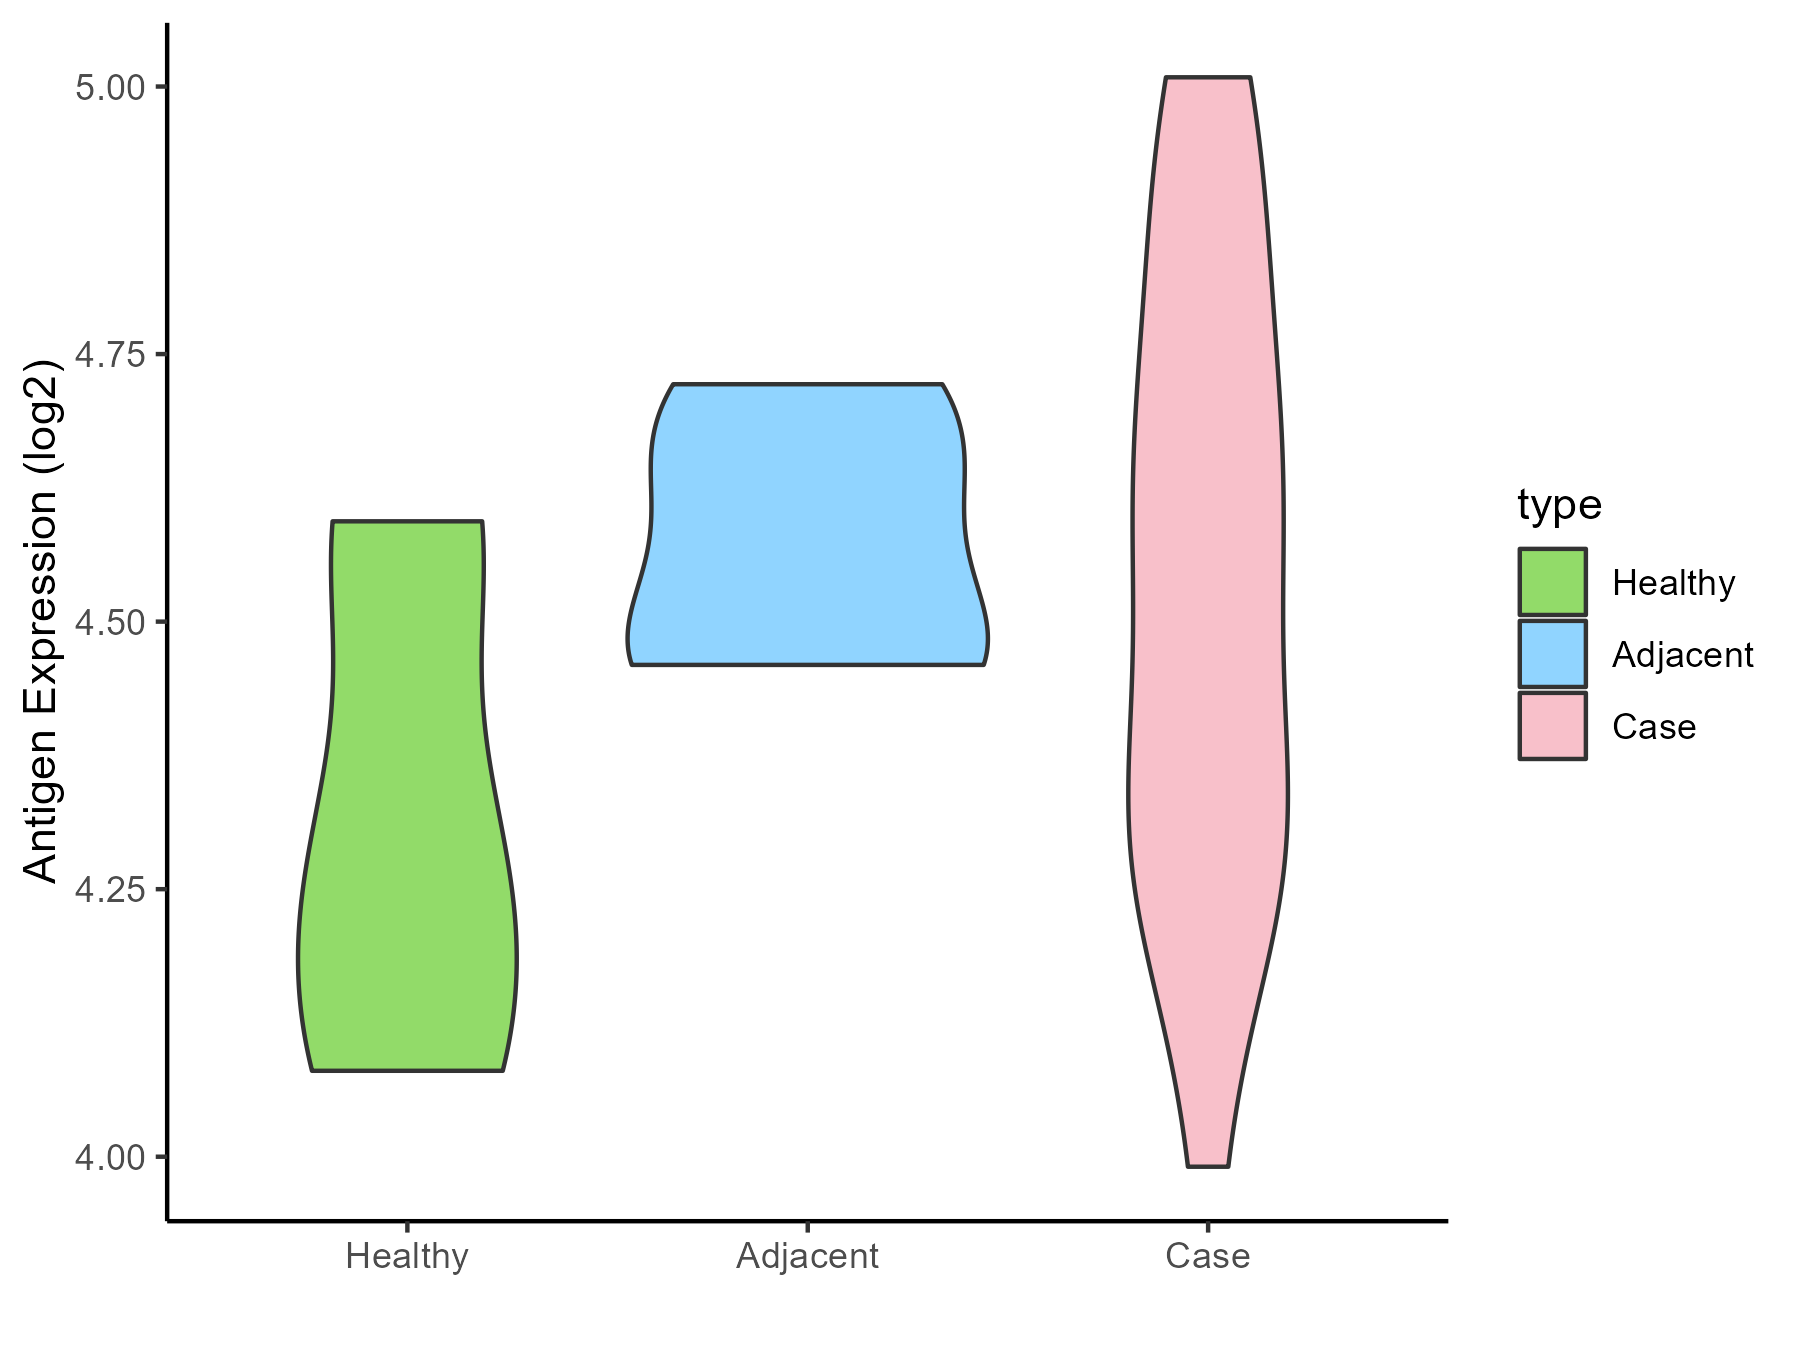
MyeloDysplastic syndromes [ICD-11: 2A37]
Click to Show/Hide
| Differential expression pattern of antigen in diseases |
| The Studied Tissue |
Bone marrow |
| The Specific Disease |
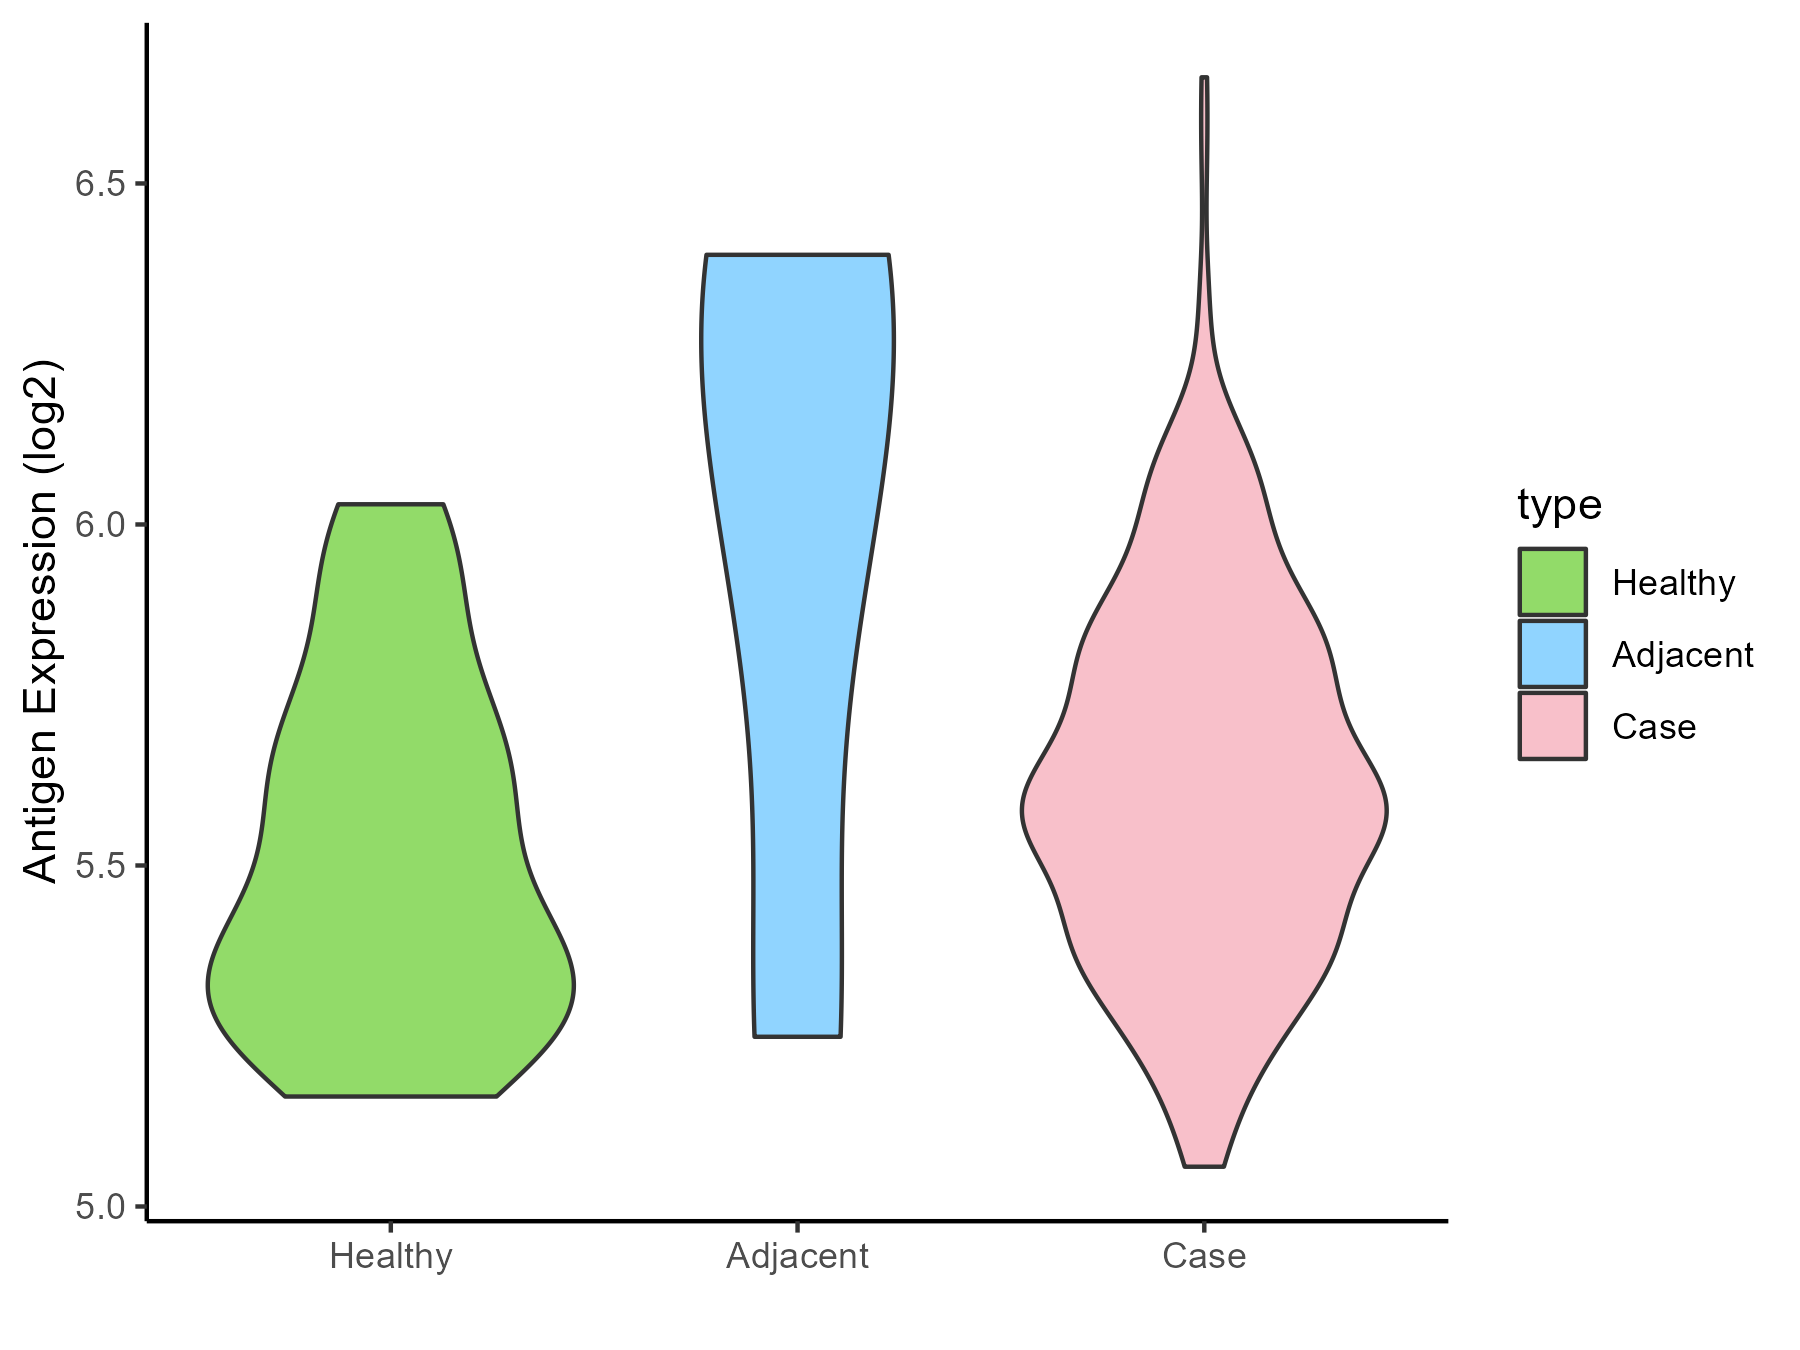
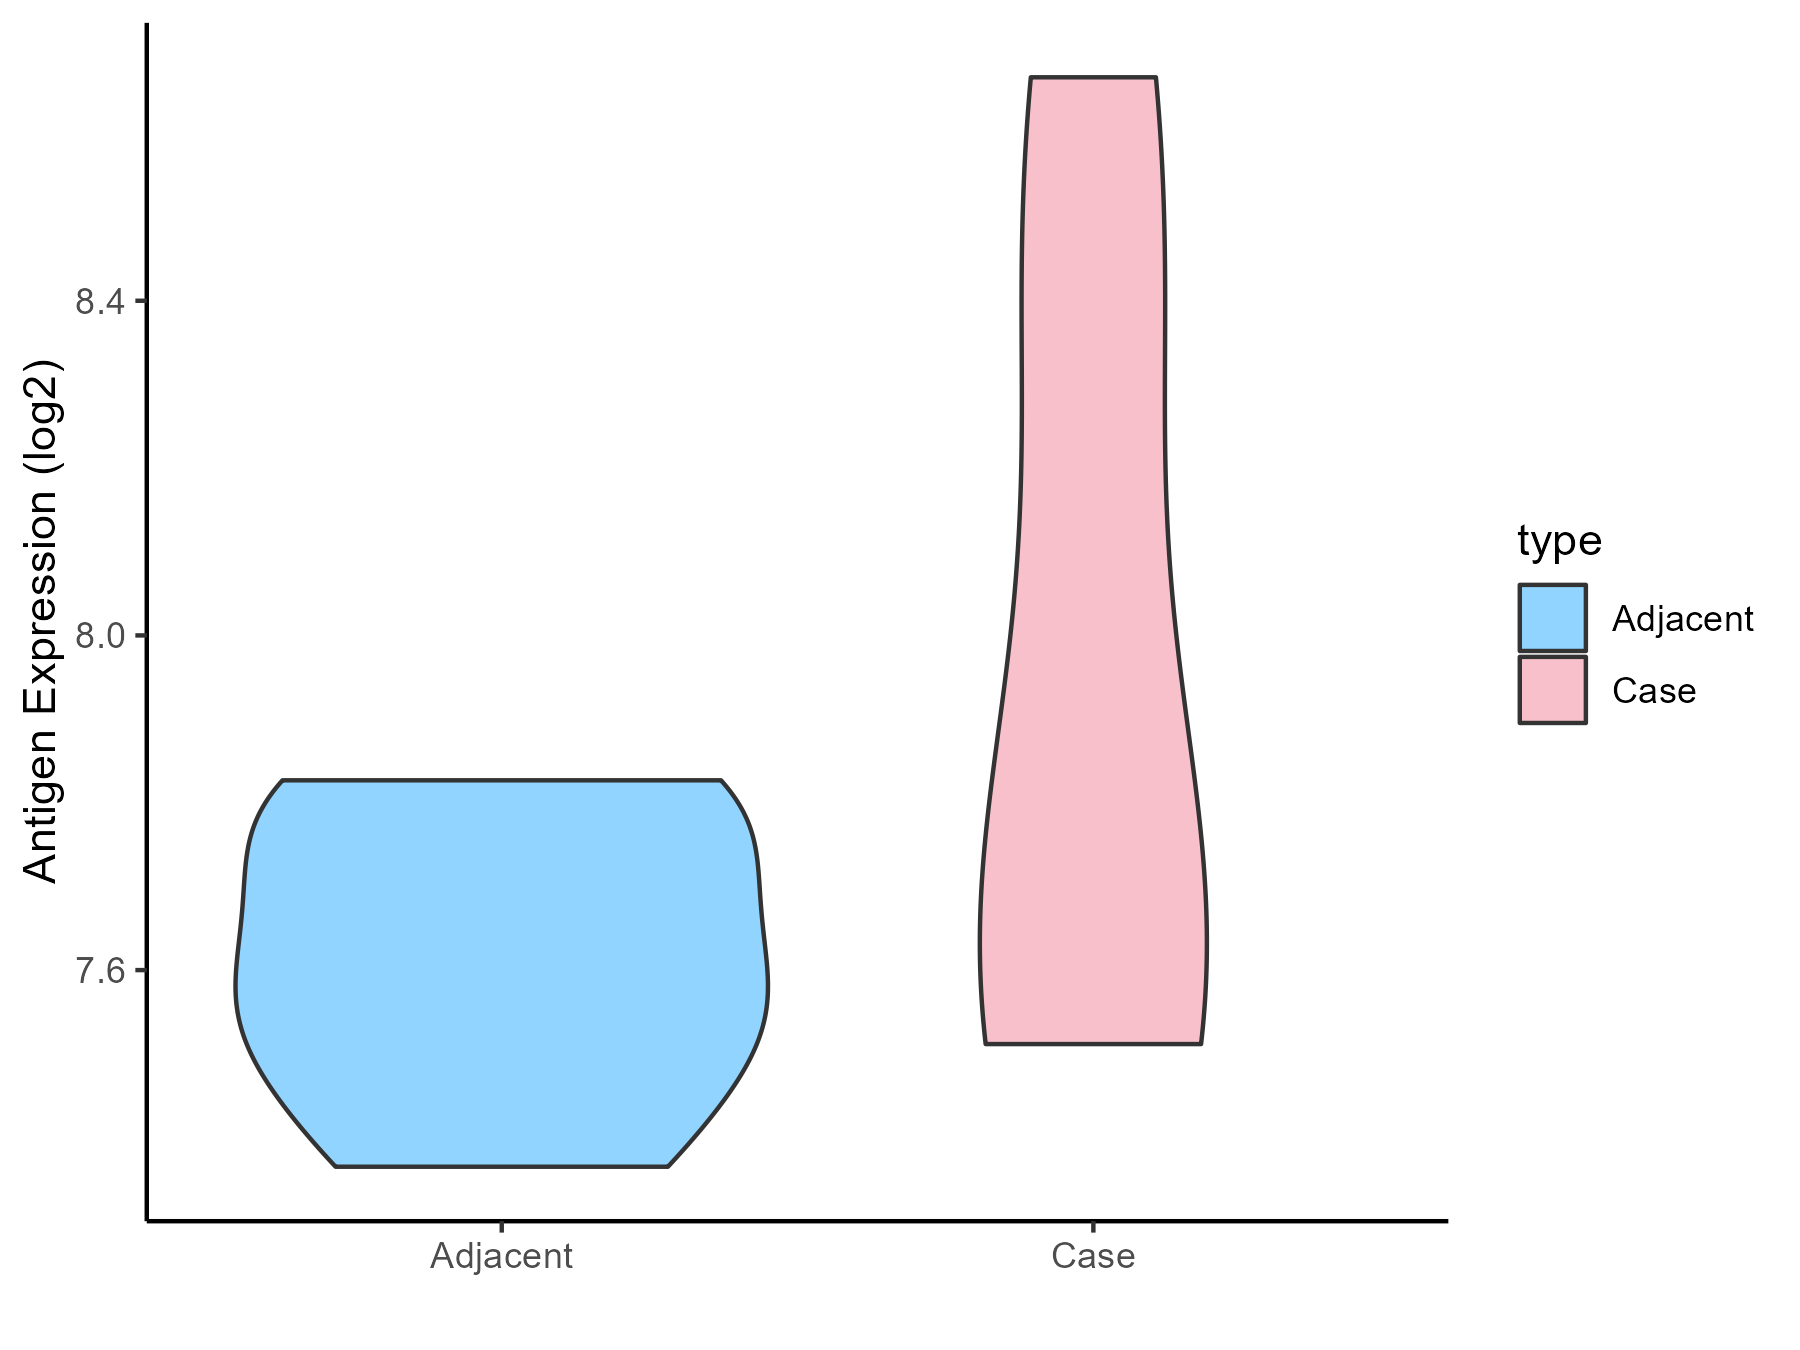
Myelodysplastic syndromes |
| The Expression Level of Disease Section Compare with the Healthy Individual Tissue |
p-value: 0.044437712;
Fold-change: 0.145244125;
Z-score: 0.560412344
|
| The Expression Level of Disease Section Compare with the Adjacent Tissue |
p-value: 0.271767975;
Fold-change: -0.543489306;
Z-score: -1.026117732
|
| Disease-specific Antigen Abundances |
|
Click to View the Clearer Original Diagram
|
|
|
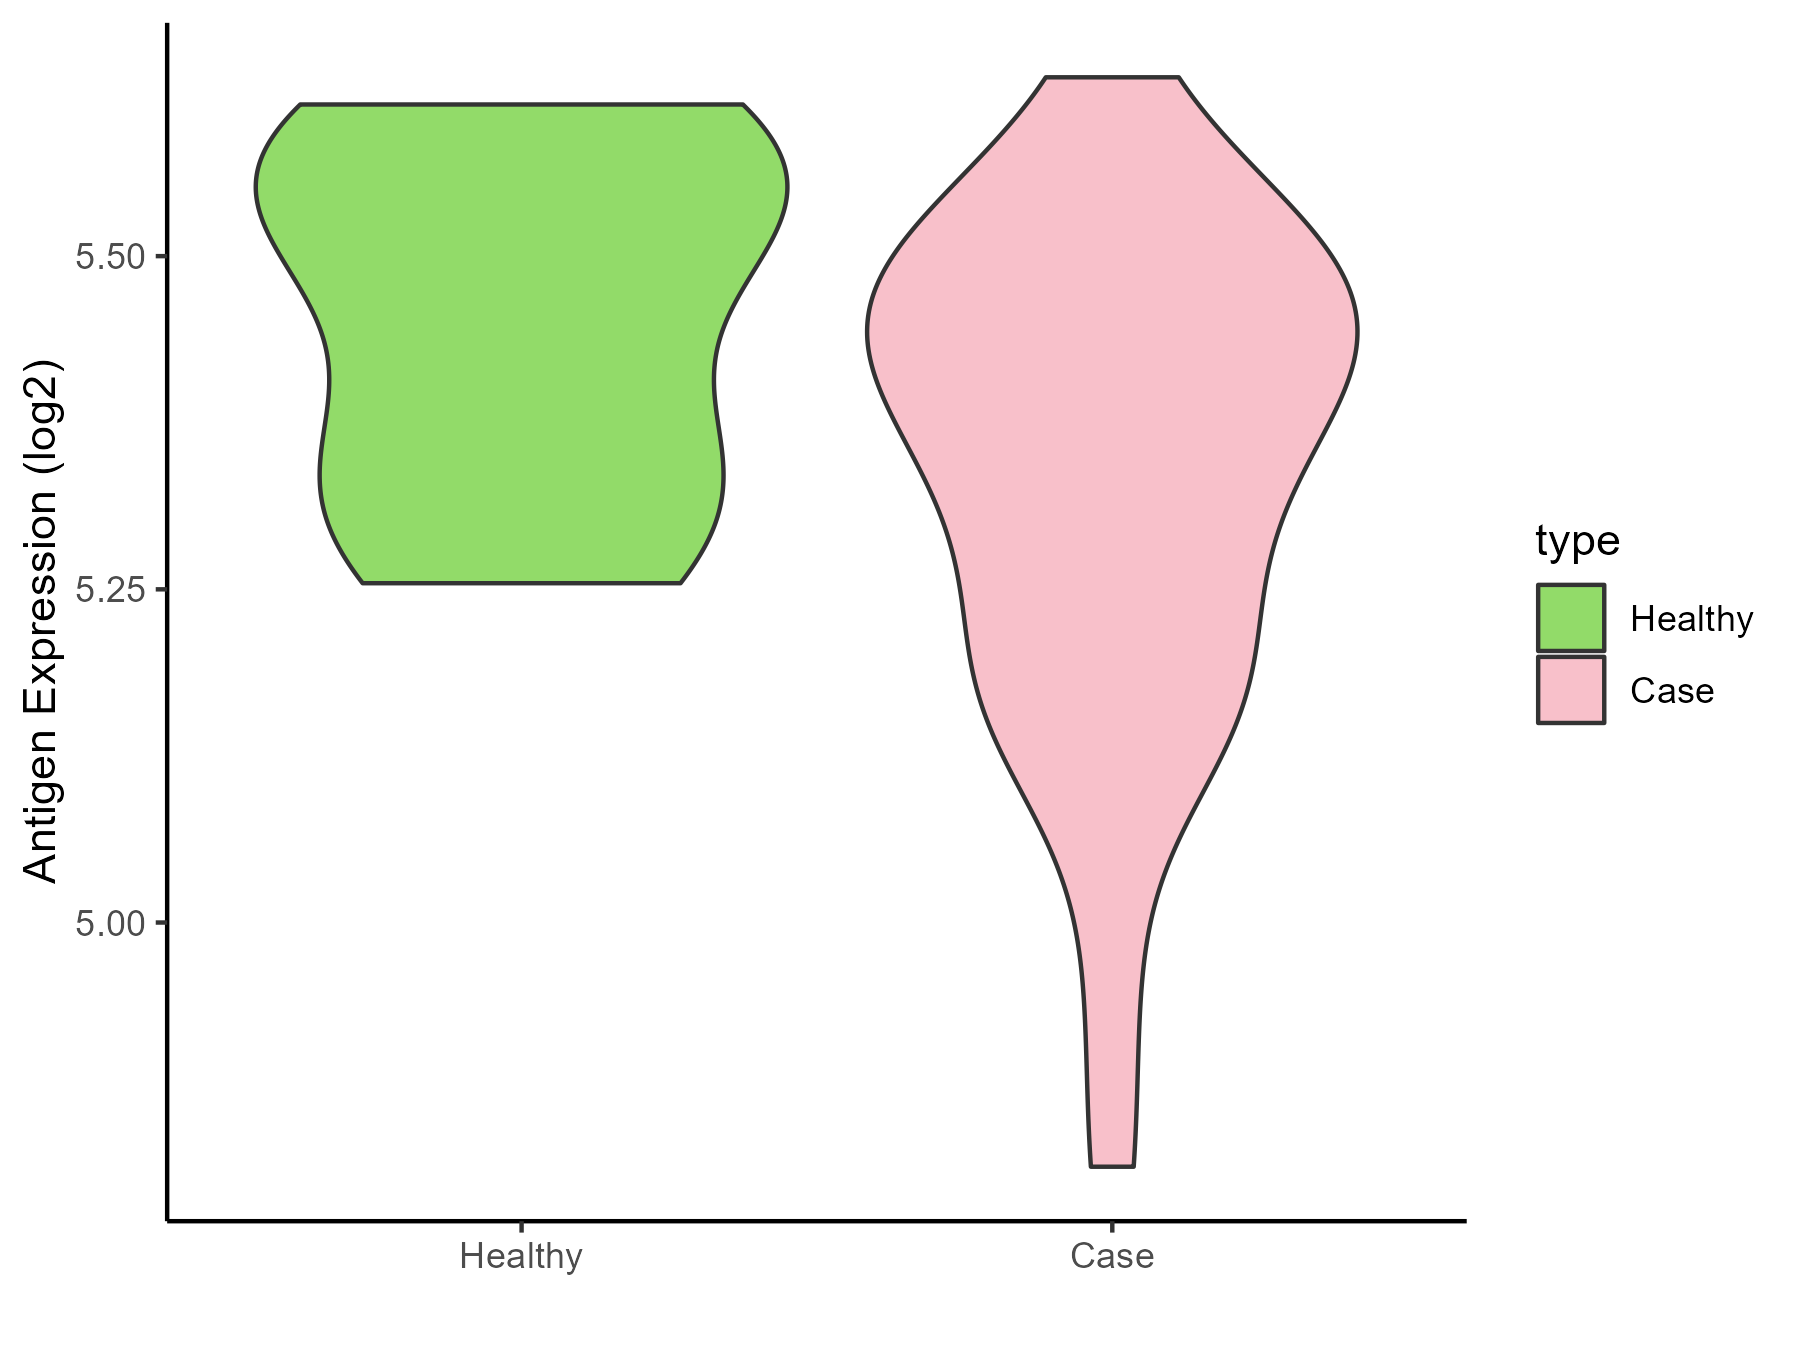
Lymphoma [ICD-11: 2A90- 2A85]
Click to Show/Hide
| Differential expression pattern of antigen in diseases |
| The Studied Tissue |
Tonsil |
| The Specific Disease |
Lymphoma |
| The Expression Level of Disease Section Compare with the Healthy Individual Tissue |
p-value: 0.334574356;
Fold-change: -0.109657024;
Z-score: -0.384645471
|
| Disease-specific Antigen Abundances |
|
Click to View the Clearer Original Diagram
|
|
|
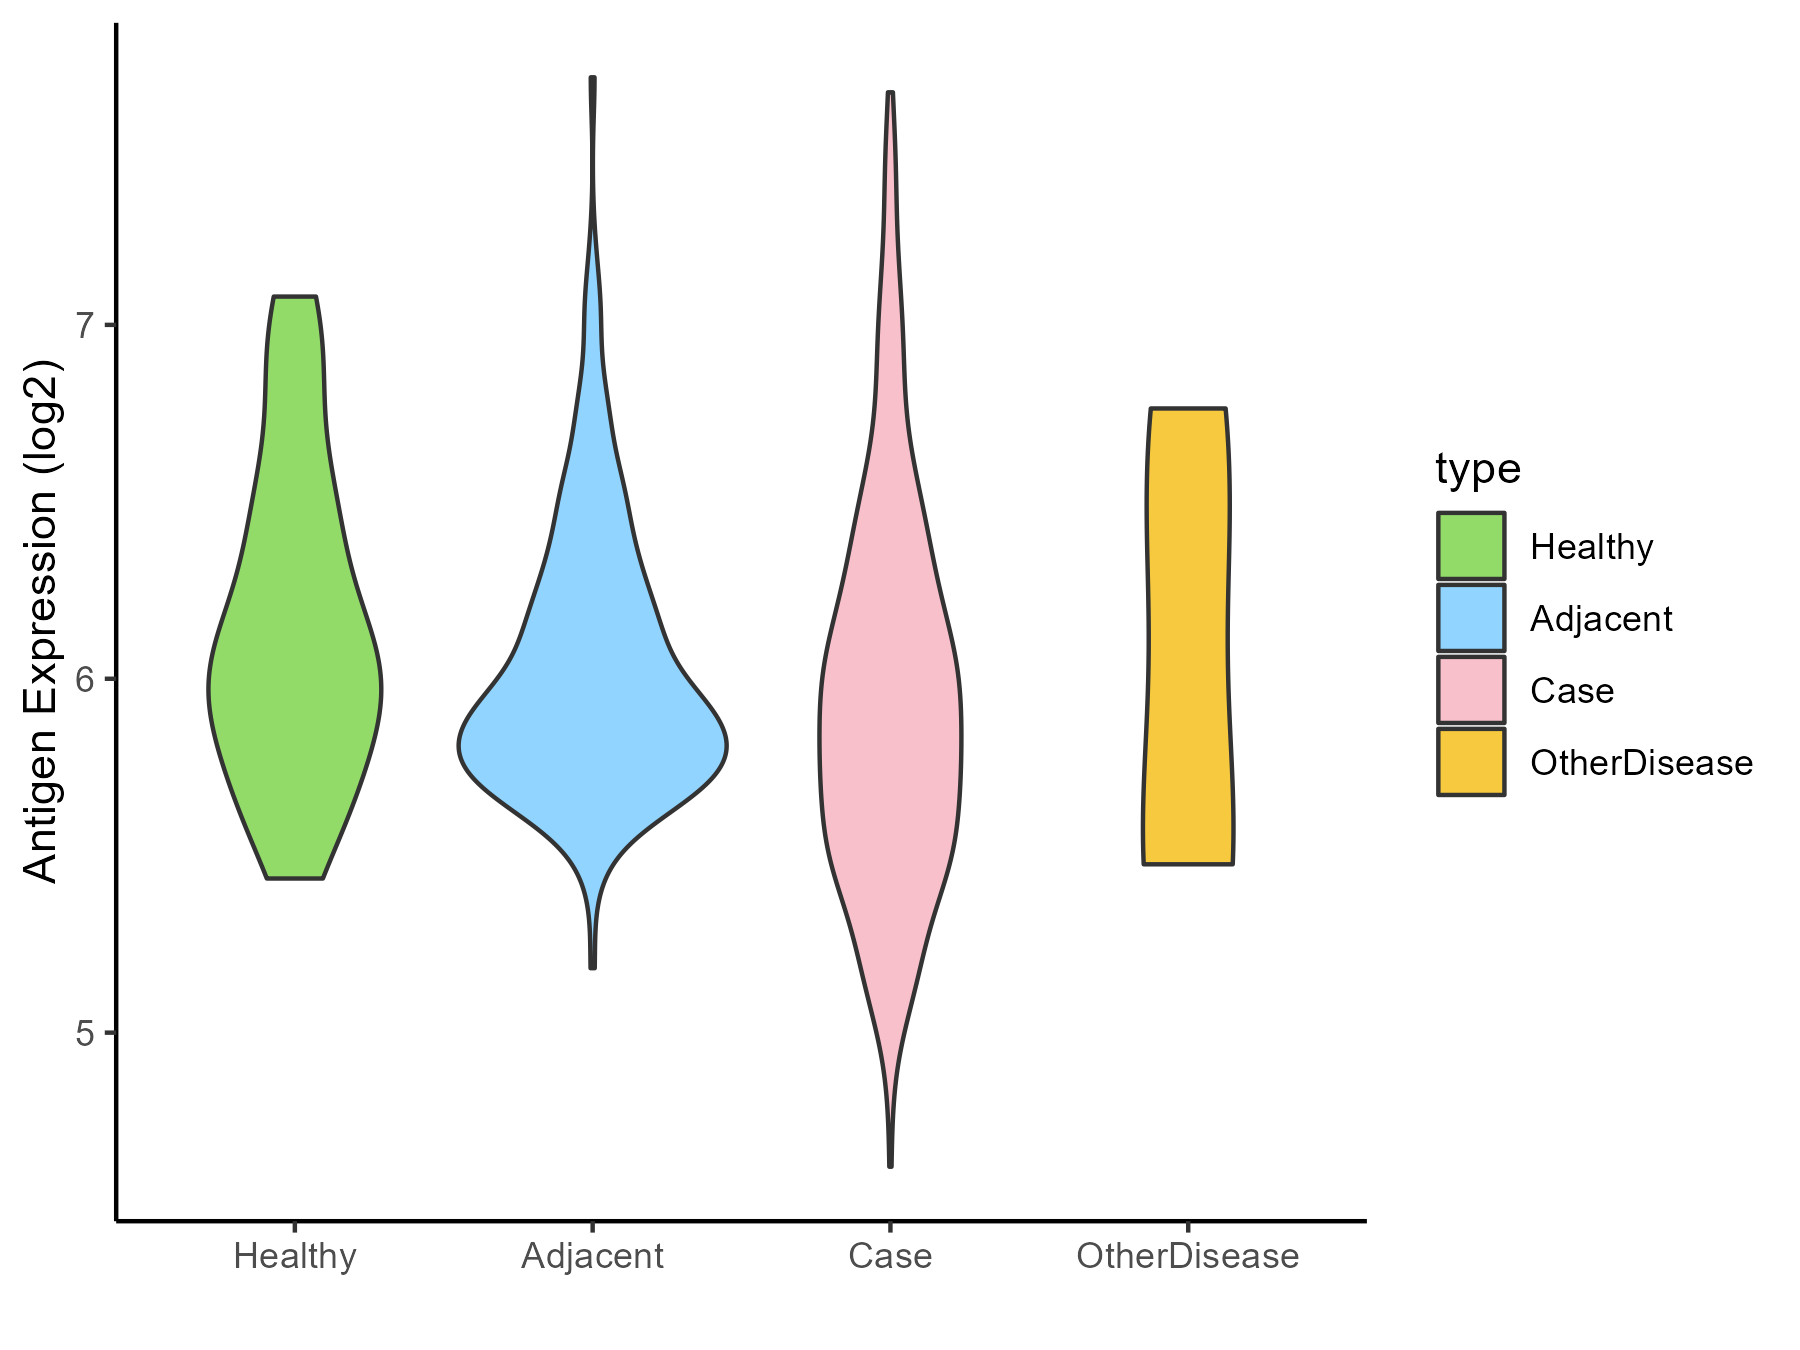
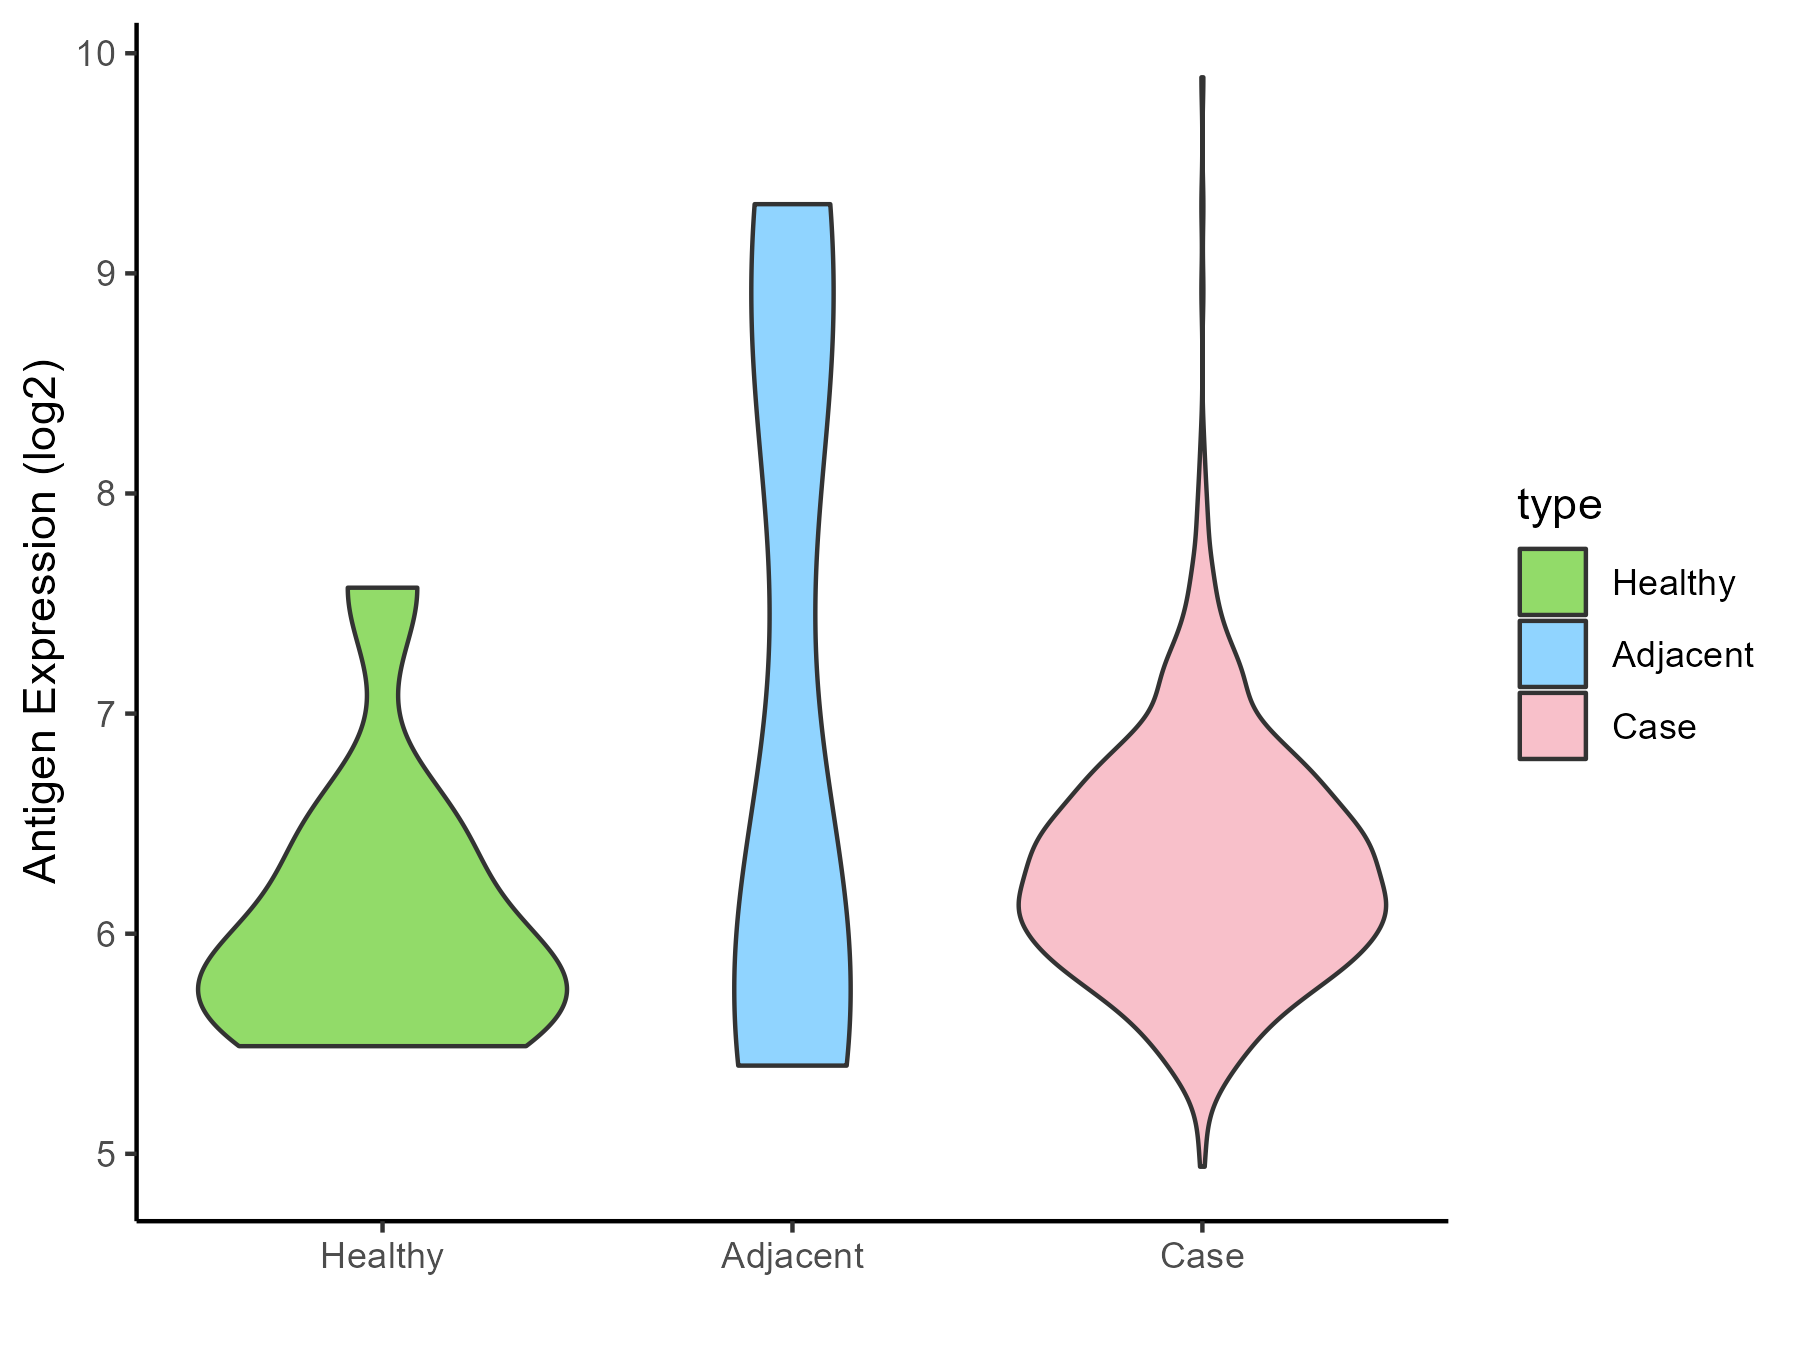
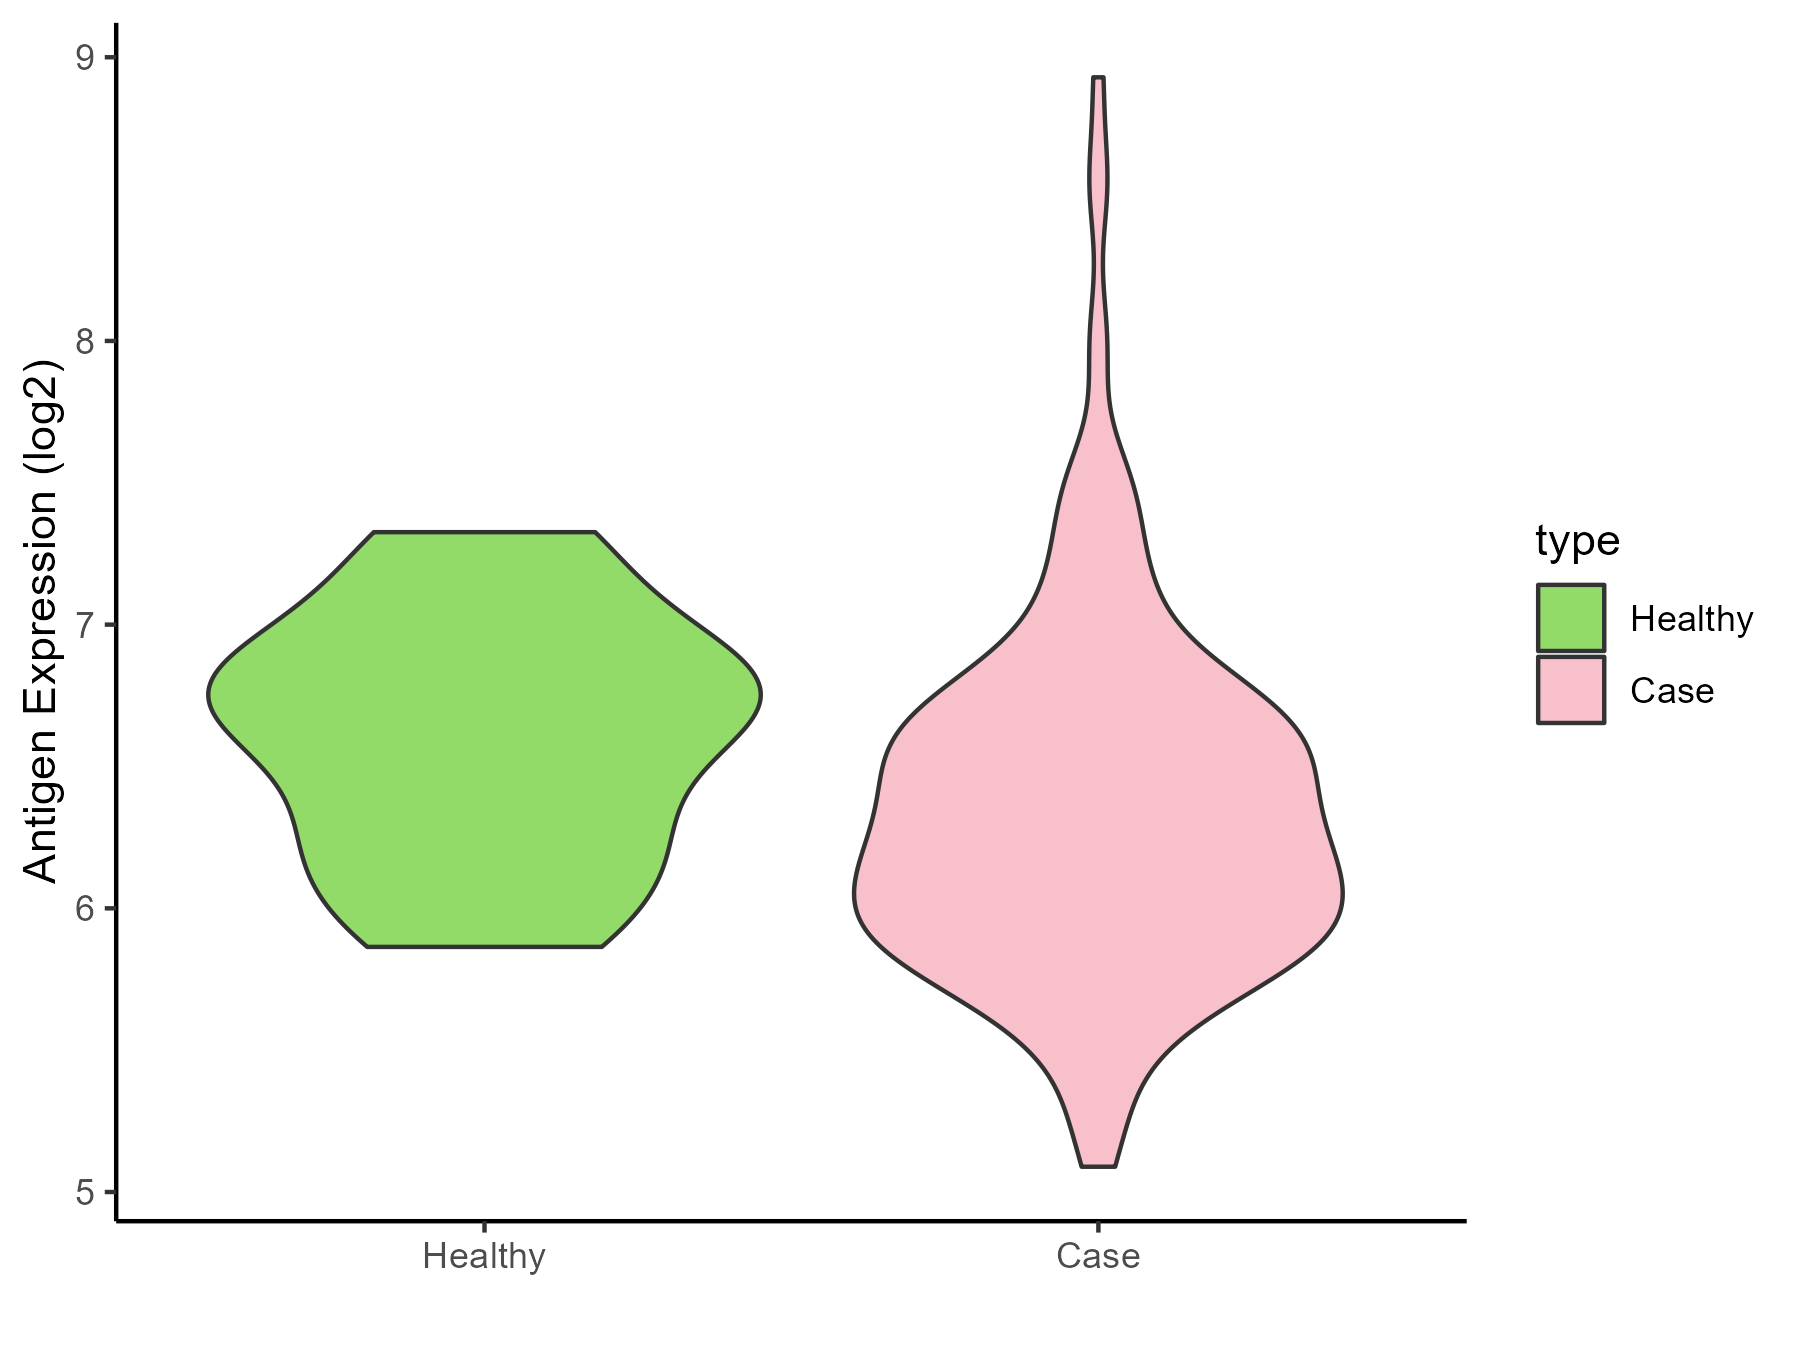
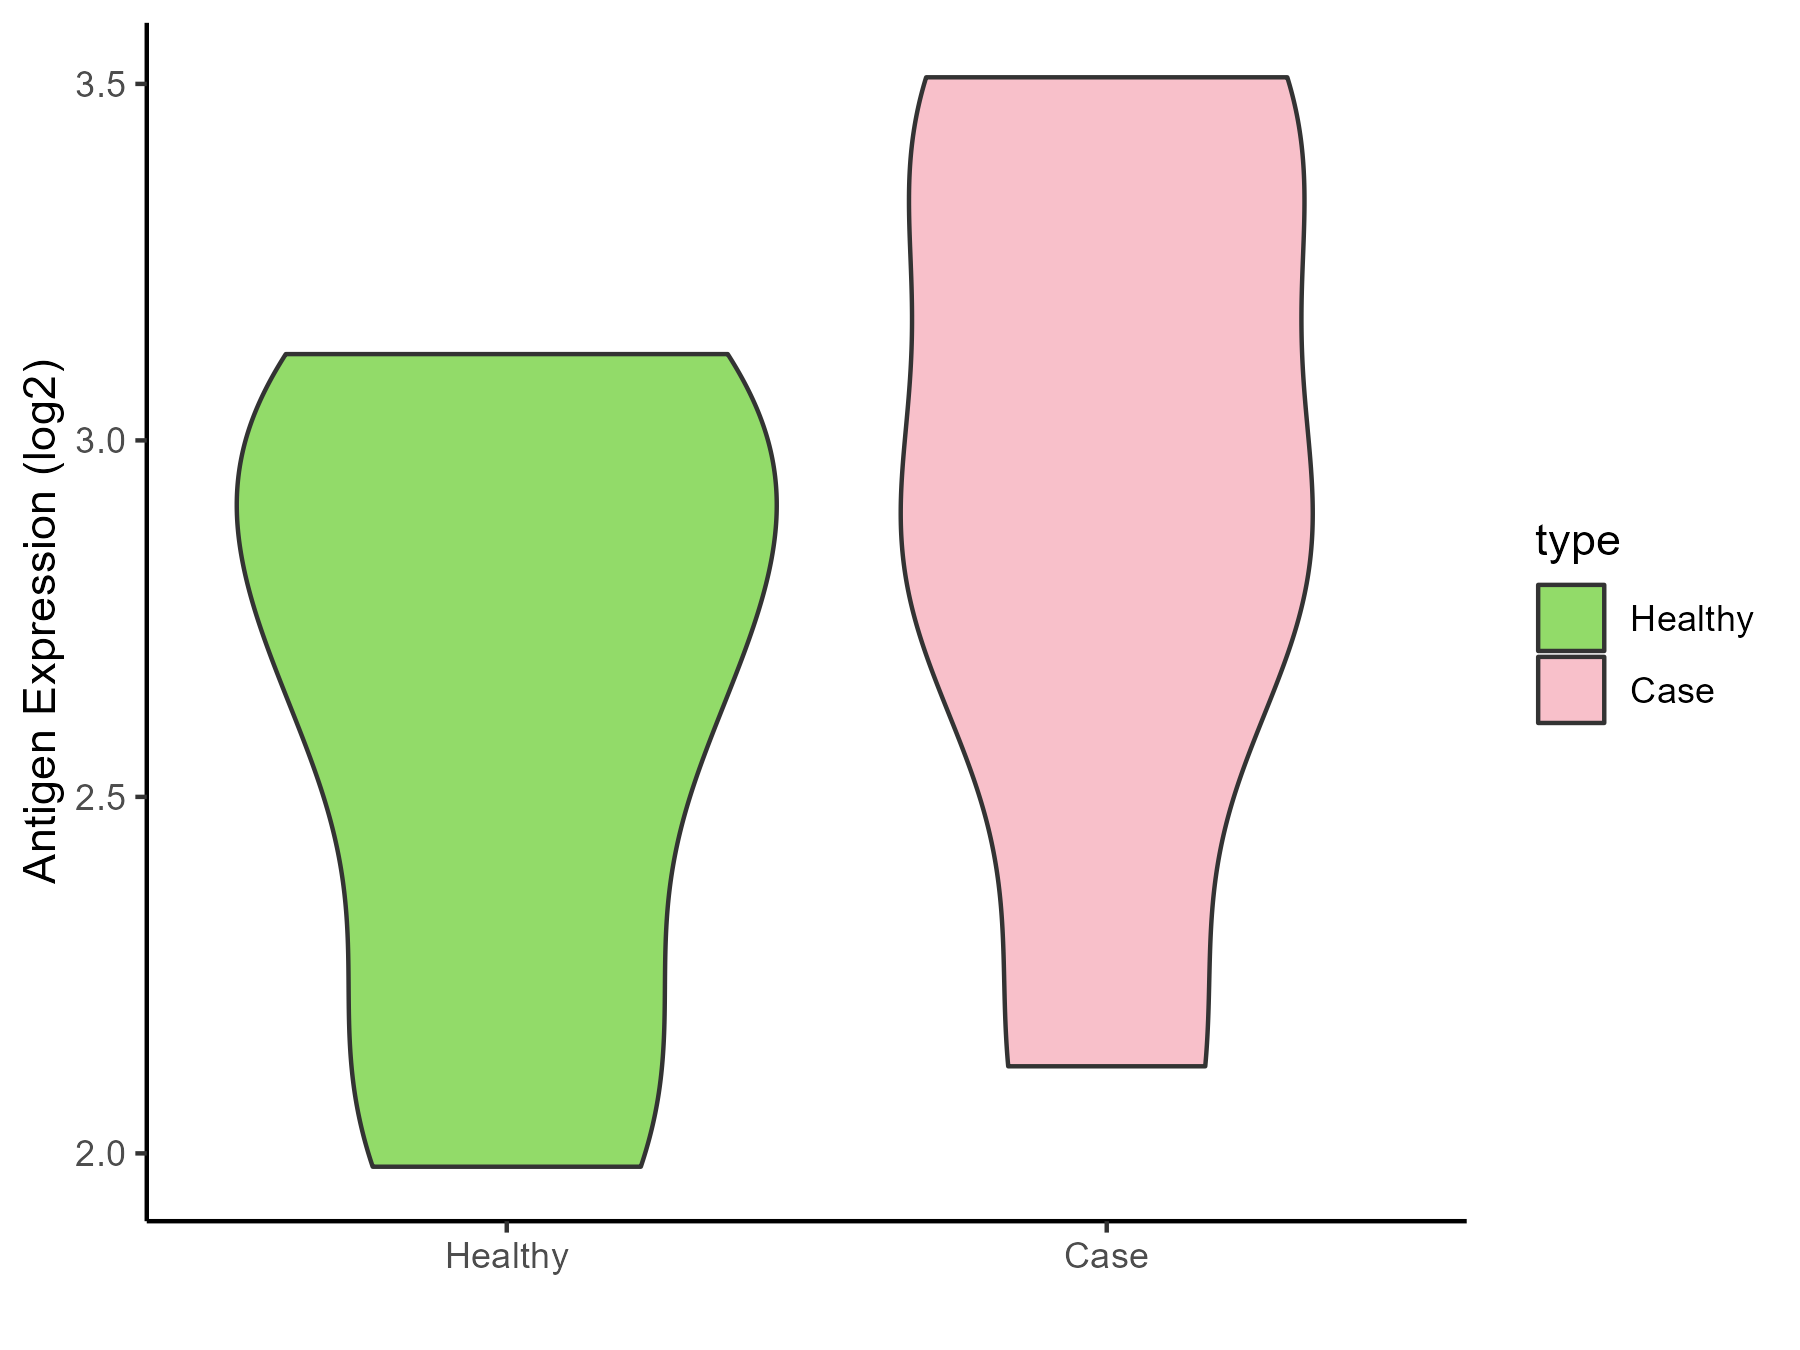
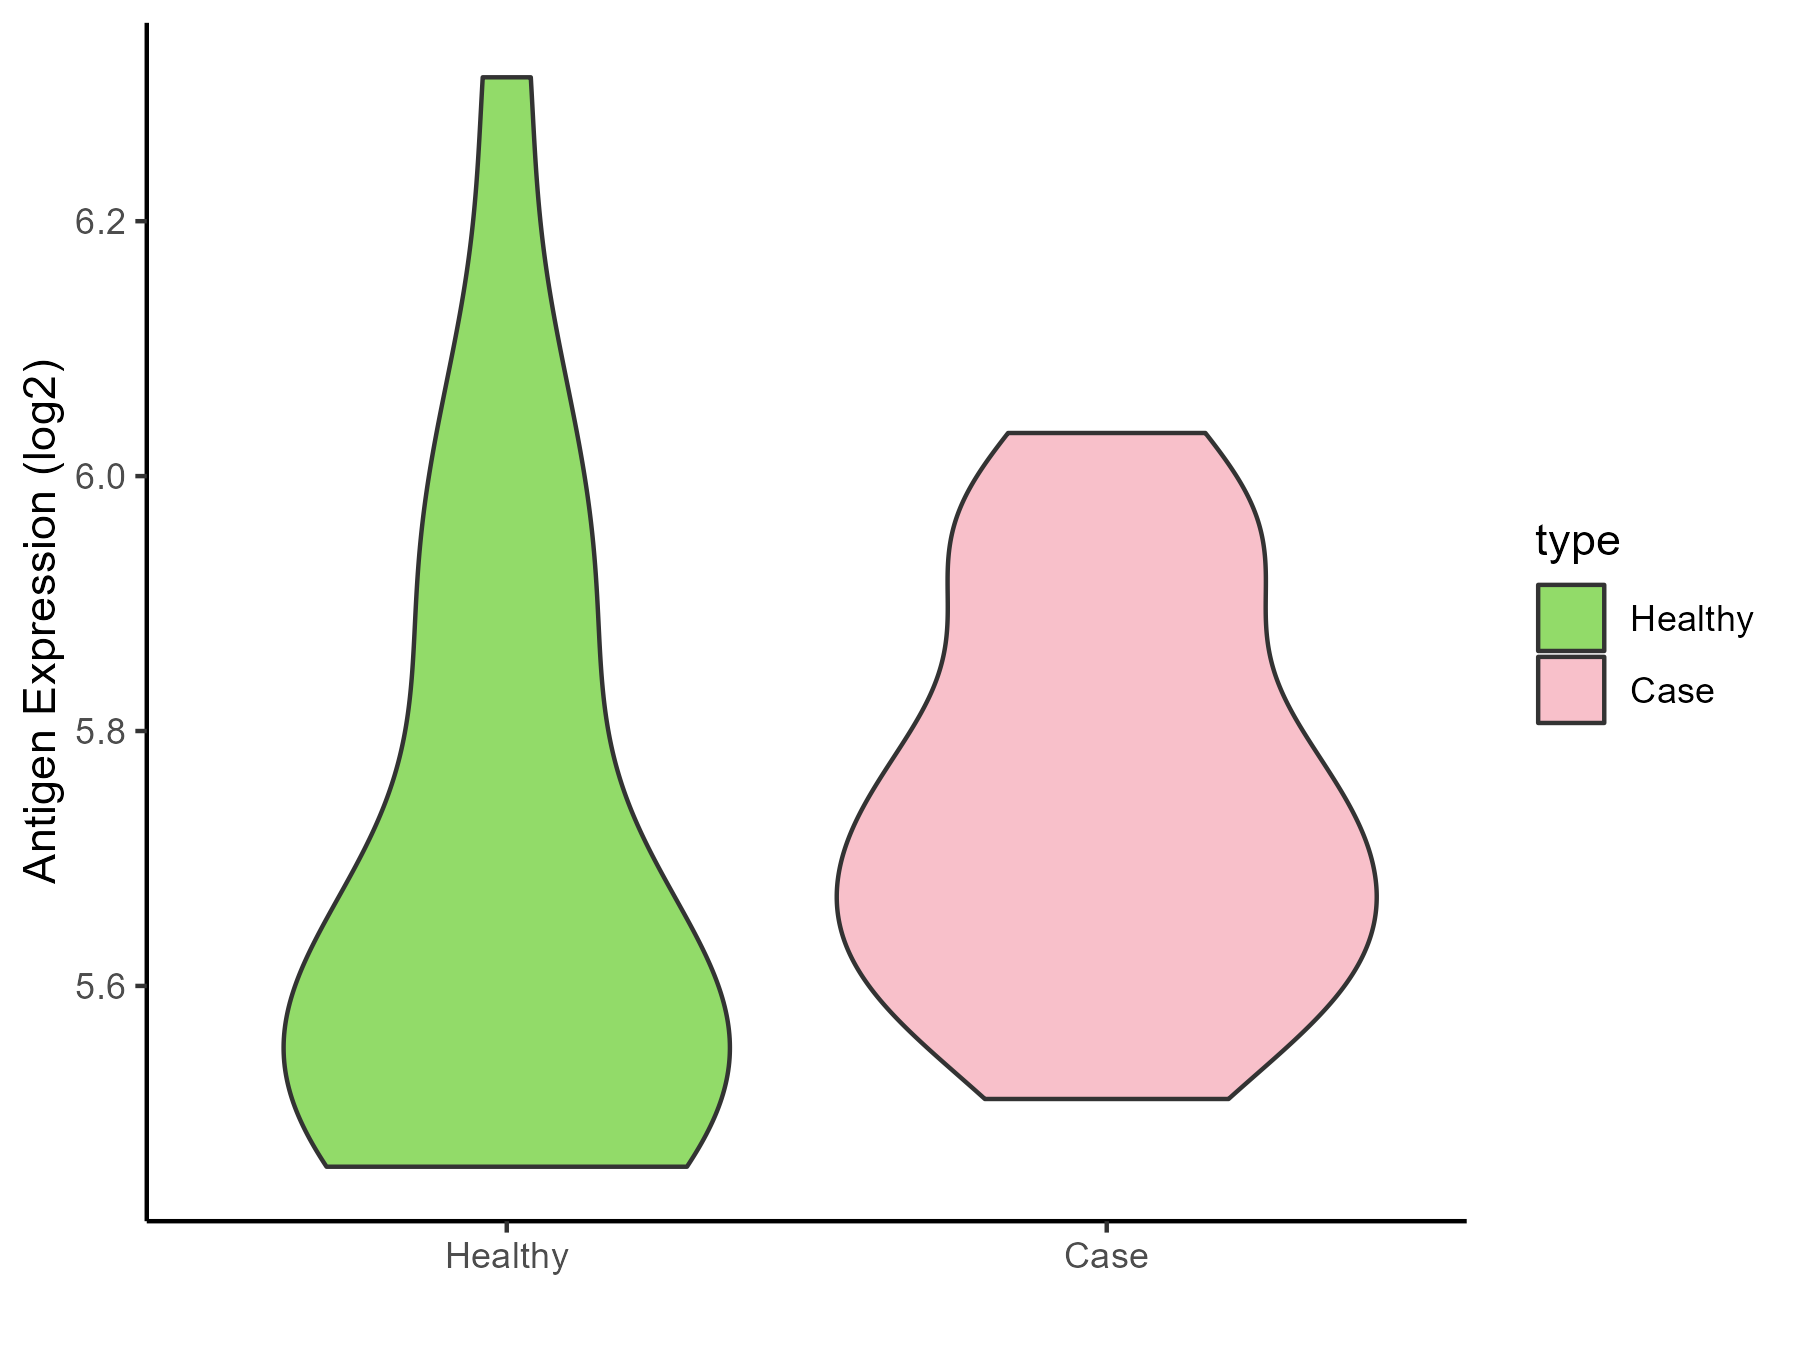
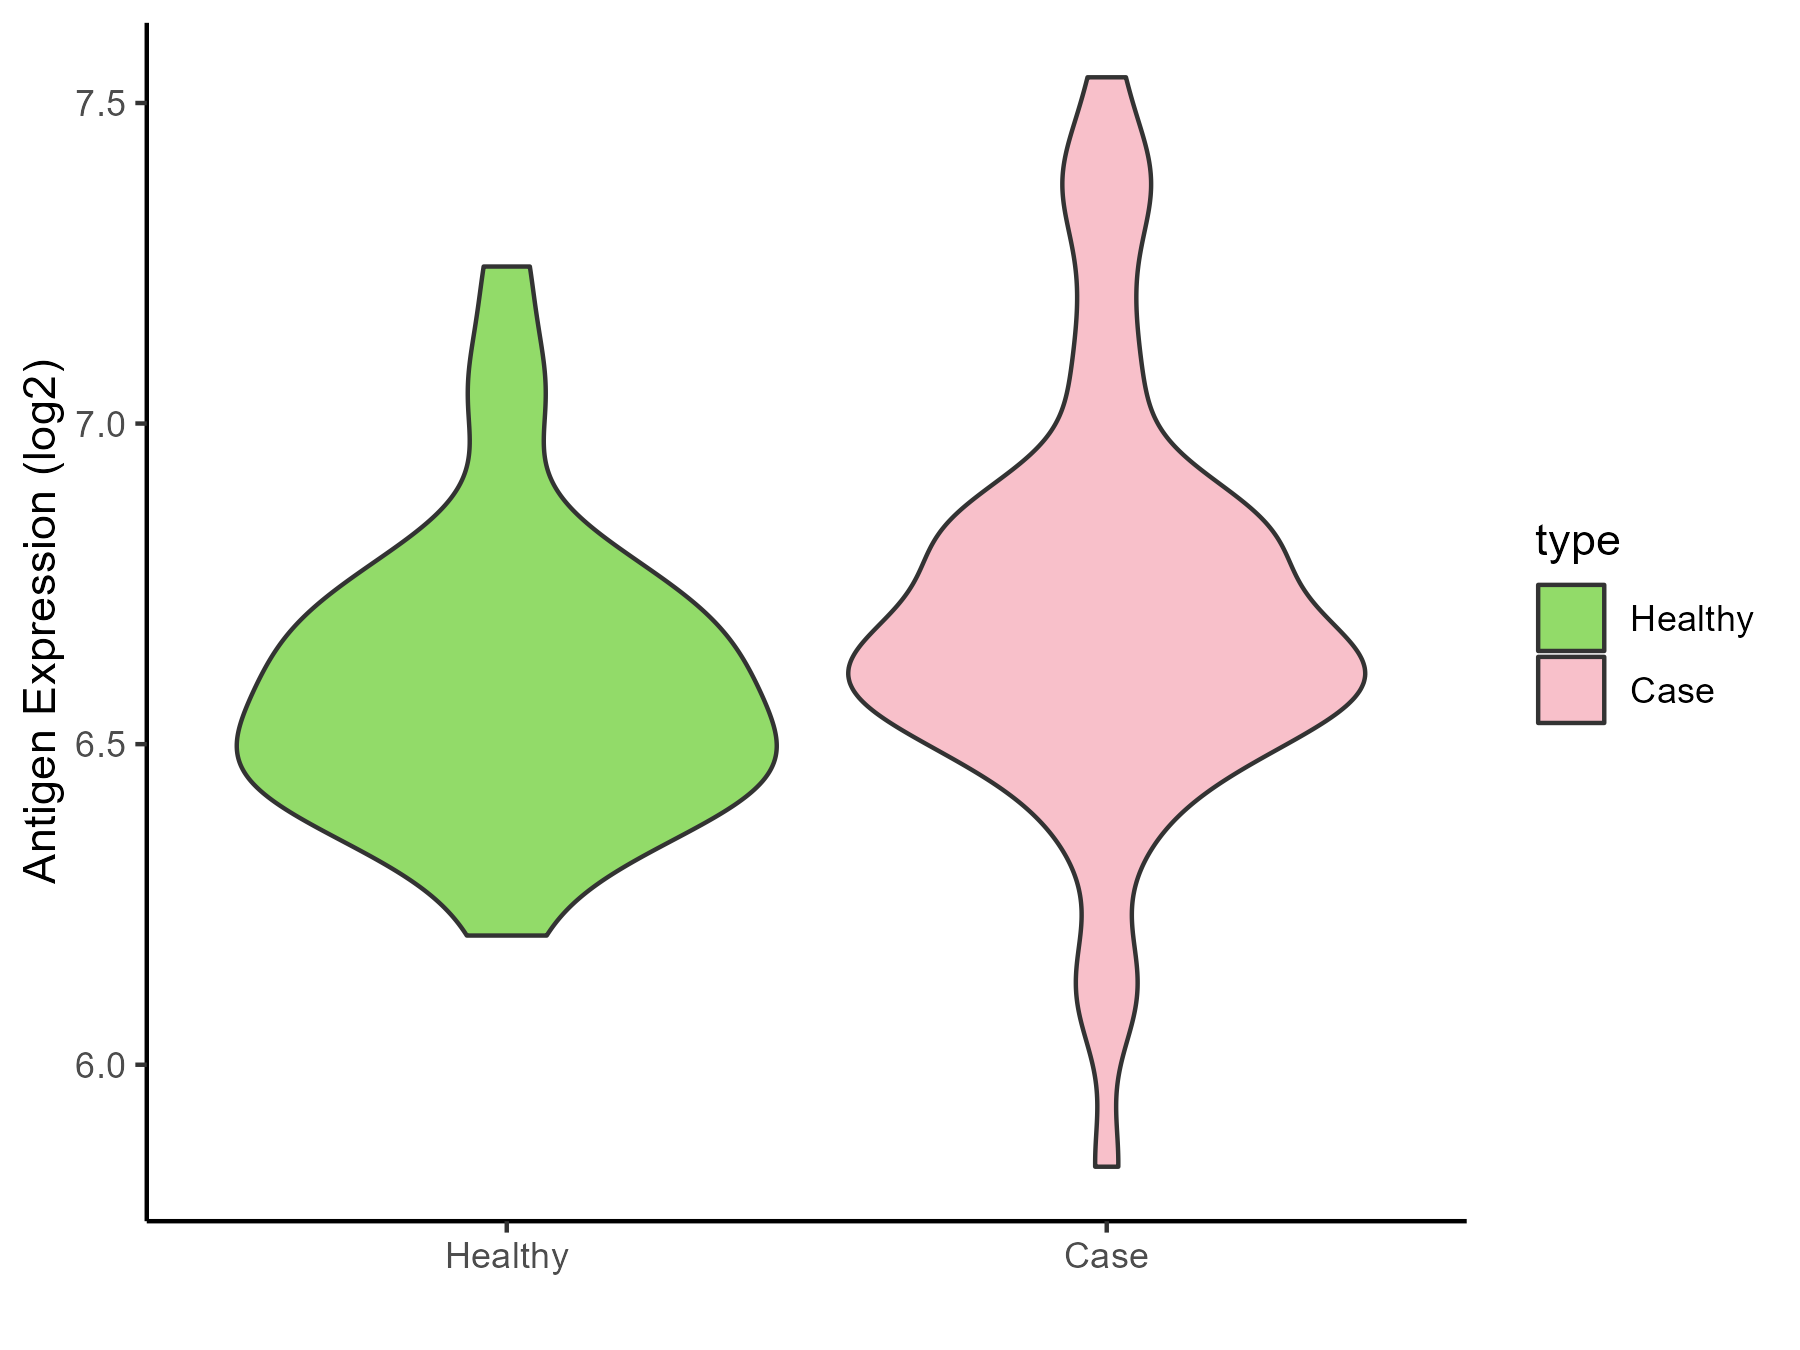
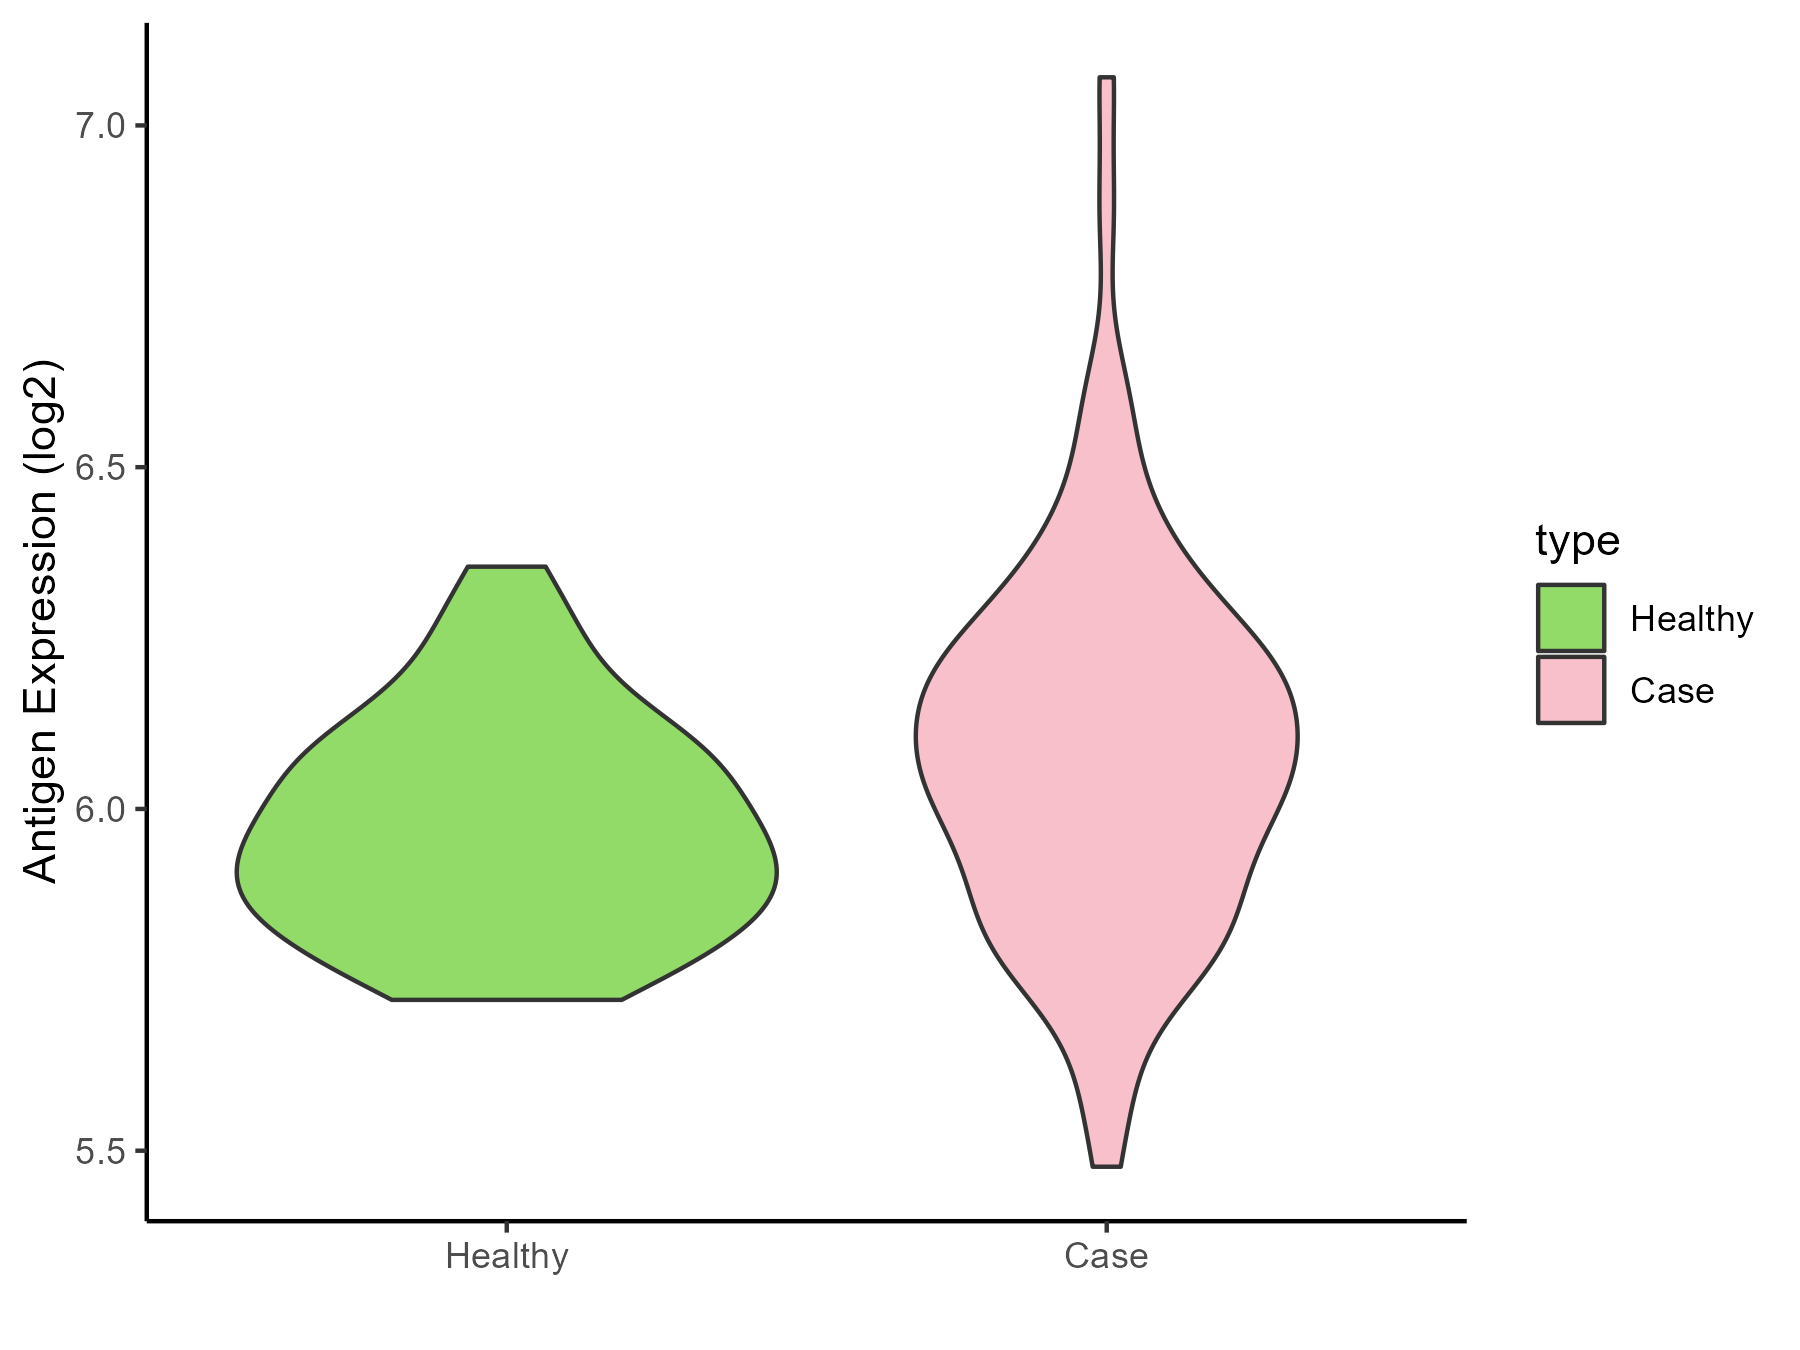
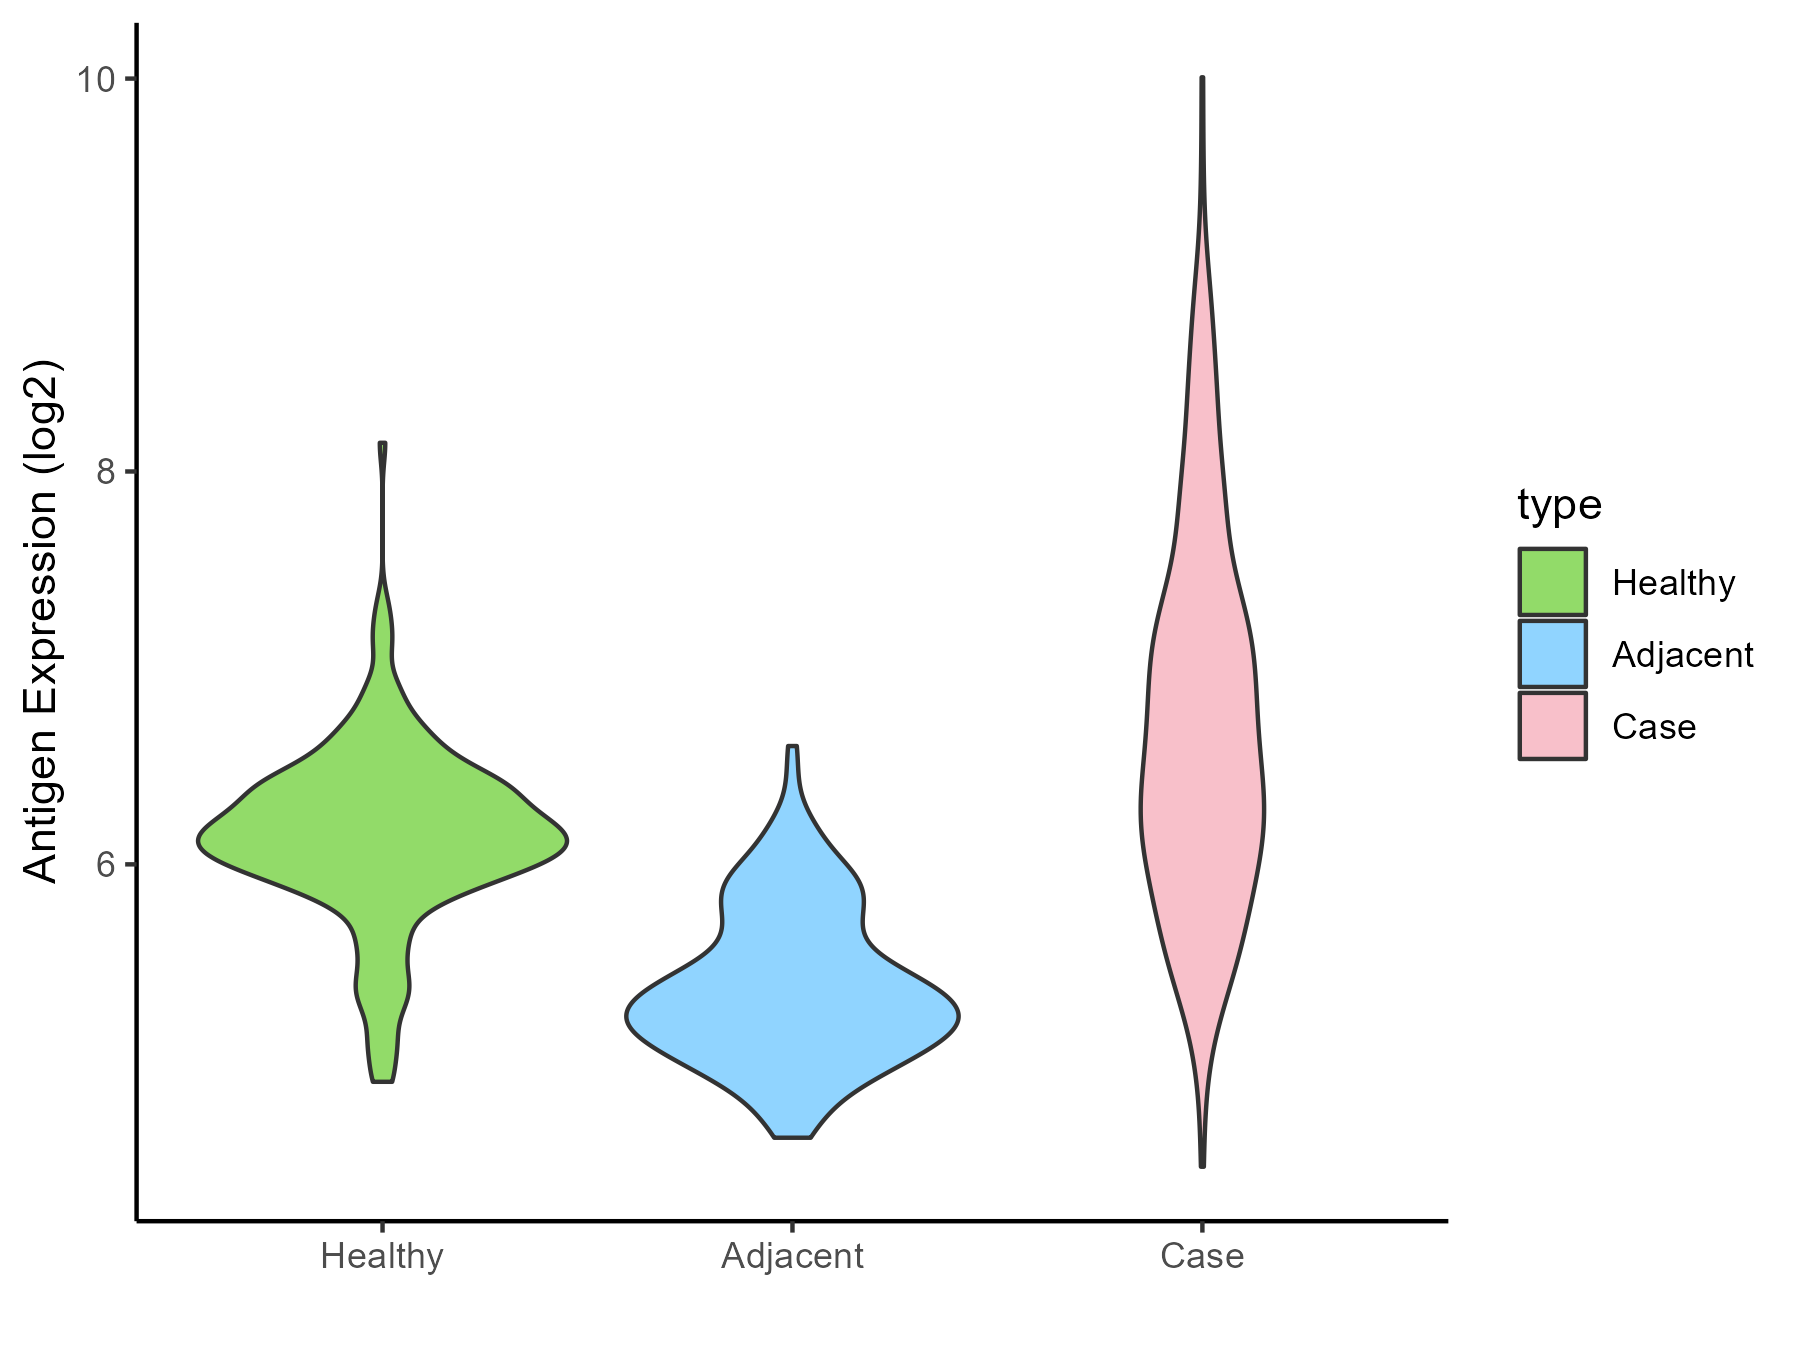
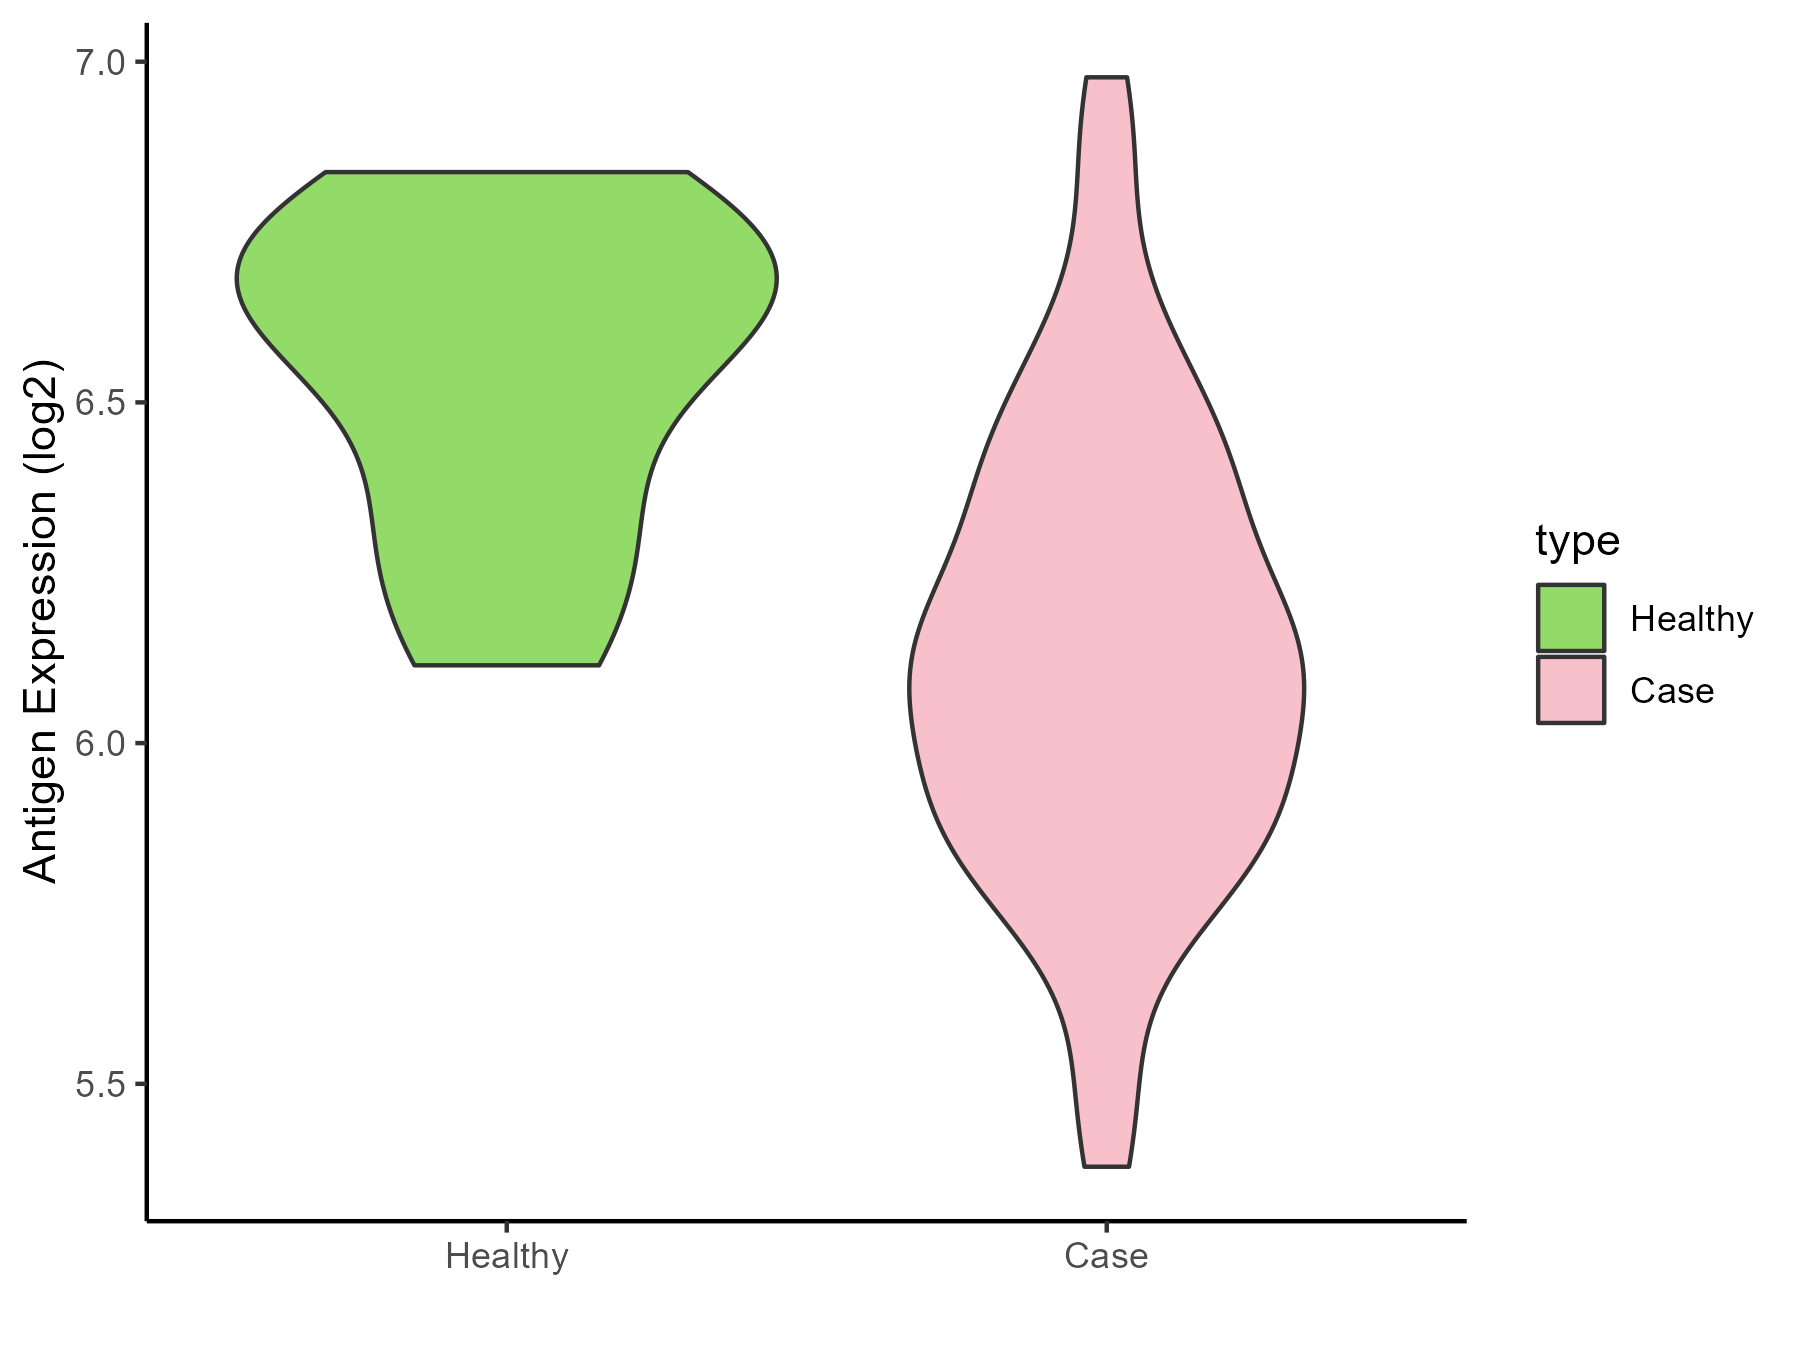
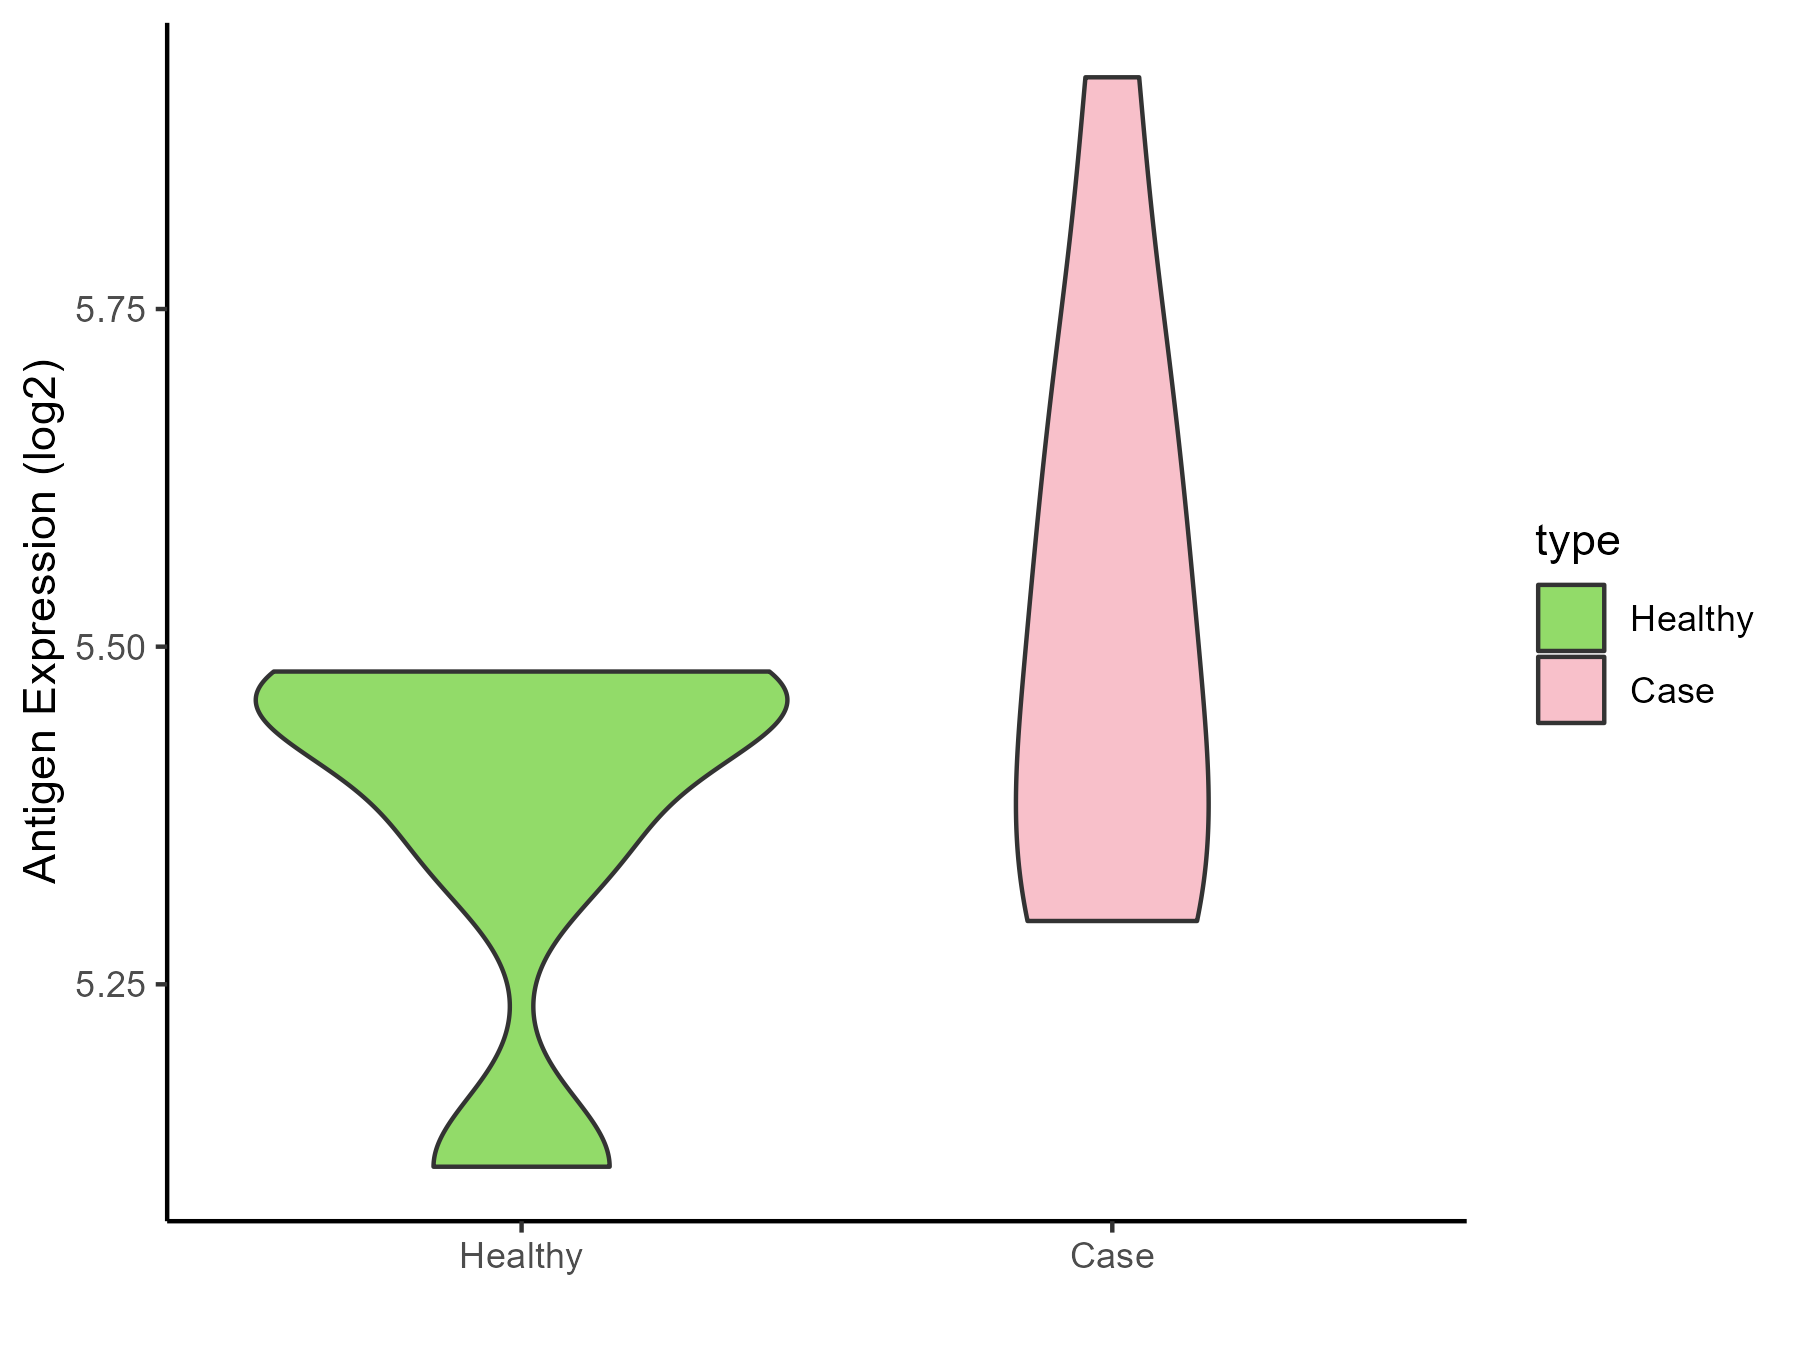
Gastric cancer [ICD-11: 2B72]
Click to Show/Hide
| Differential expression pattern of antigen in diseases |
| The Studied Tissue |
Gastric |
| The Specific Disease |
Gastric cancer |
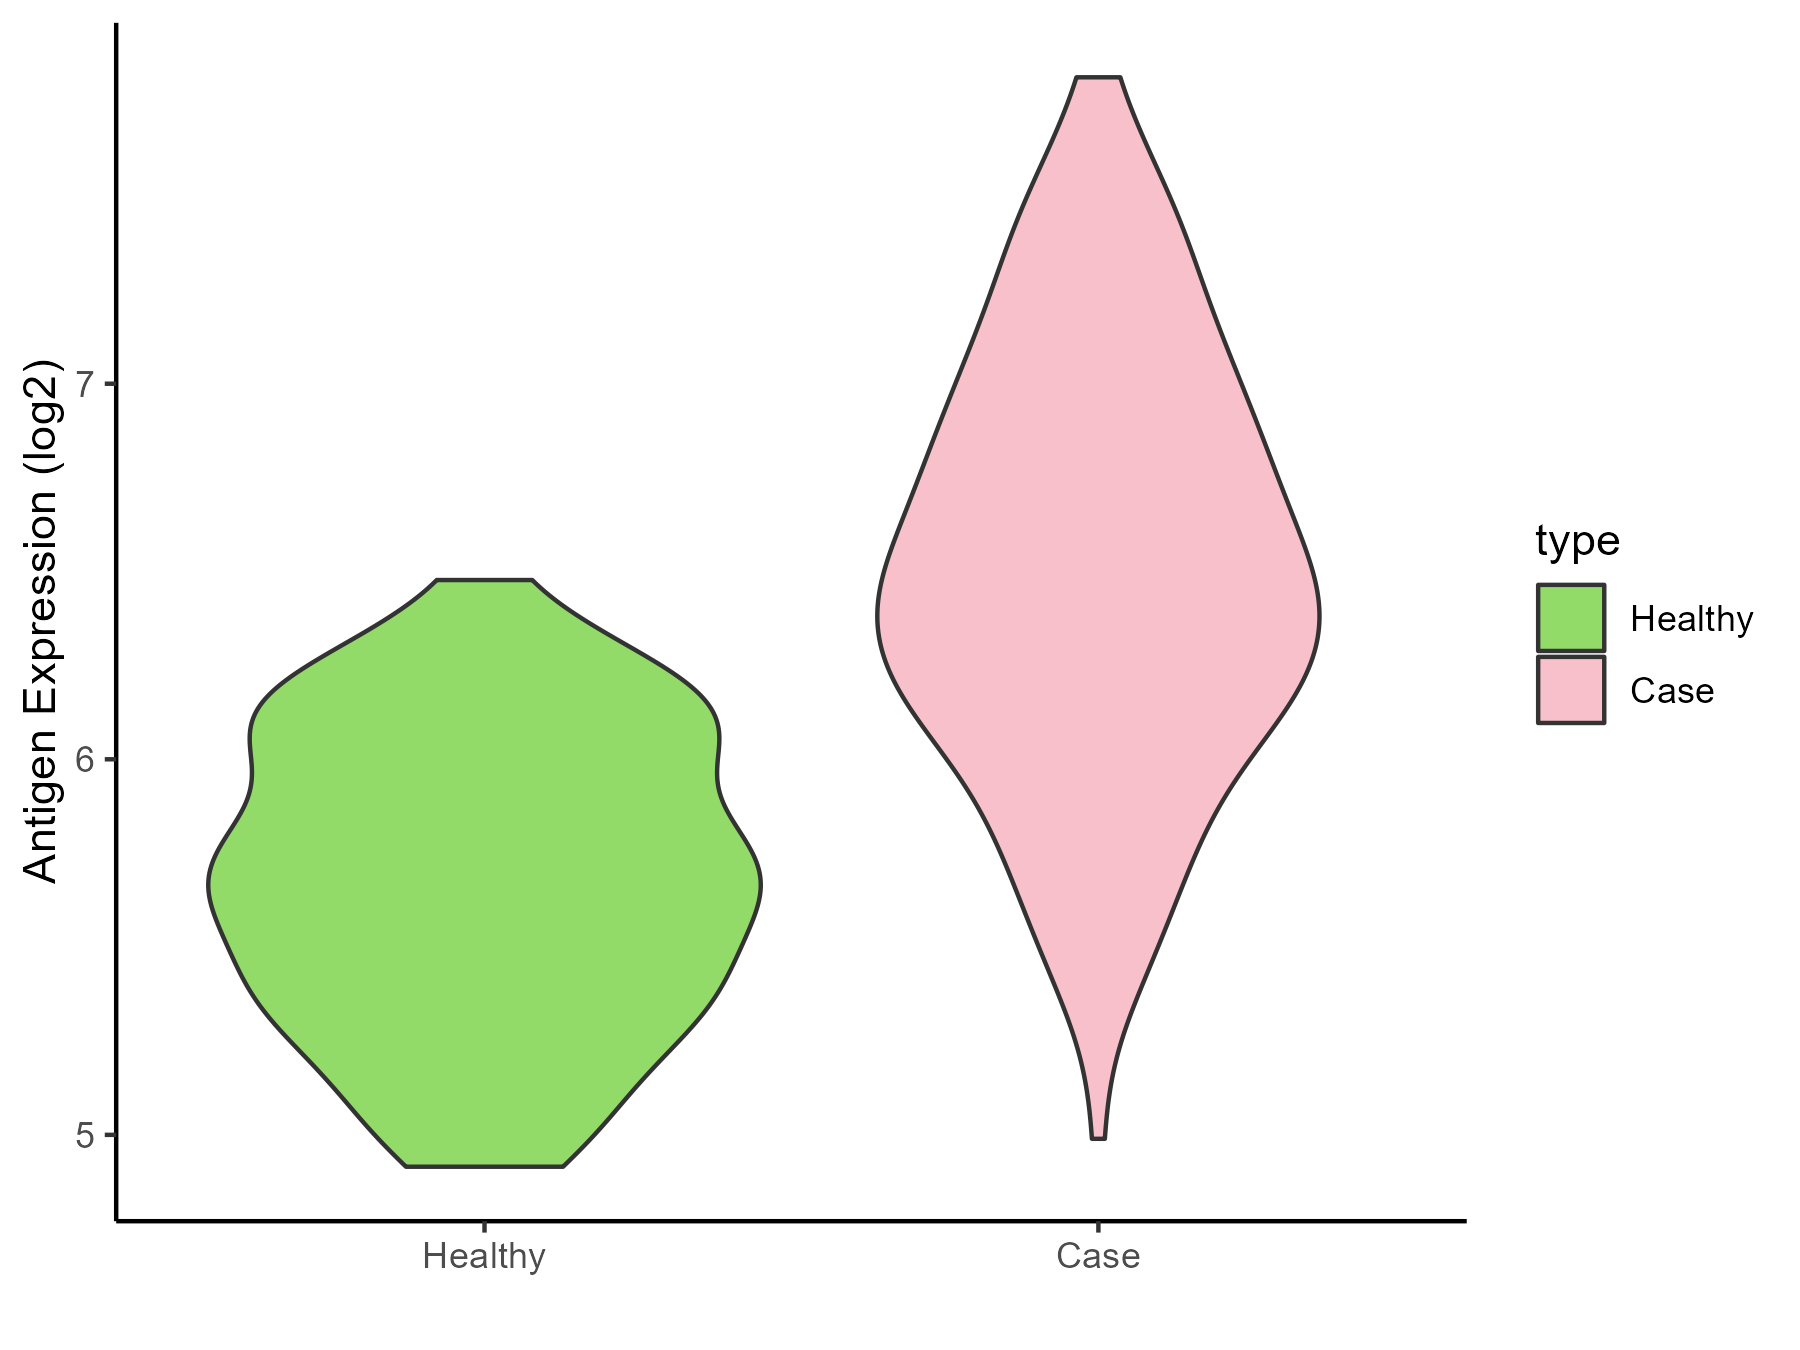
| The Expression Level of Disease Section Compare with the Healthy Individual Tissue |
p-value: 0.008861038;
Fold-change: 1.238045325;
Z-score: 5.616983286
|
| The Expression Level of Disease Section Compare with the Adjacent Tissue |
p-value: 1.60E-11;
Fold-change: 1.032999515;
Z-score: 3.307302315
|
| Disease-specific Antigen Abundances |
|
Click to View the Clearer Original Diagram
|
|
|
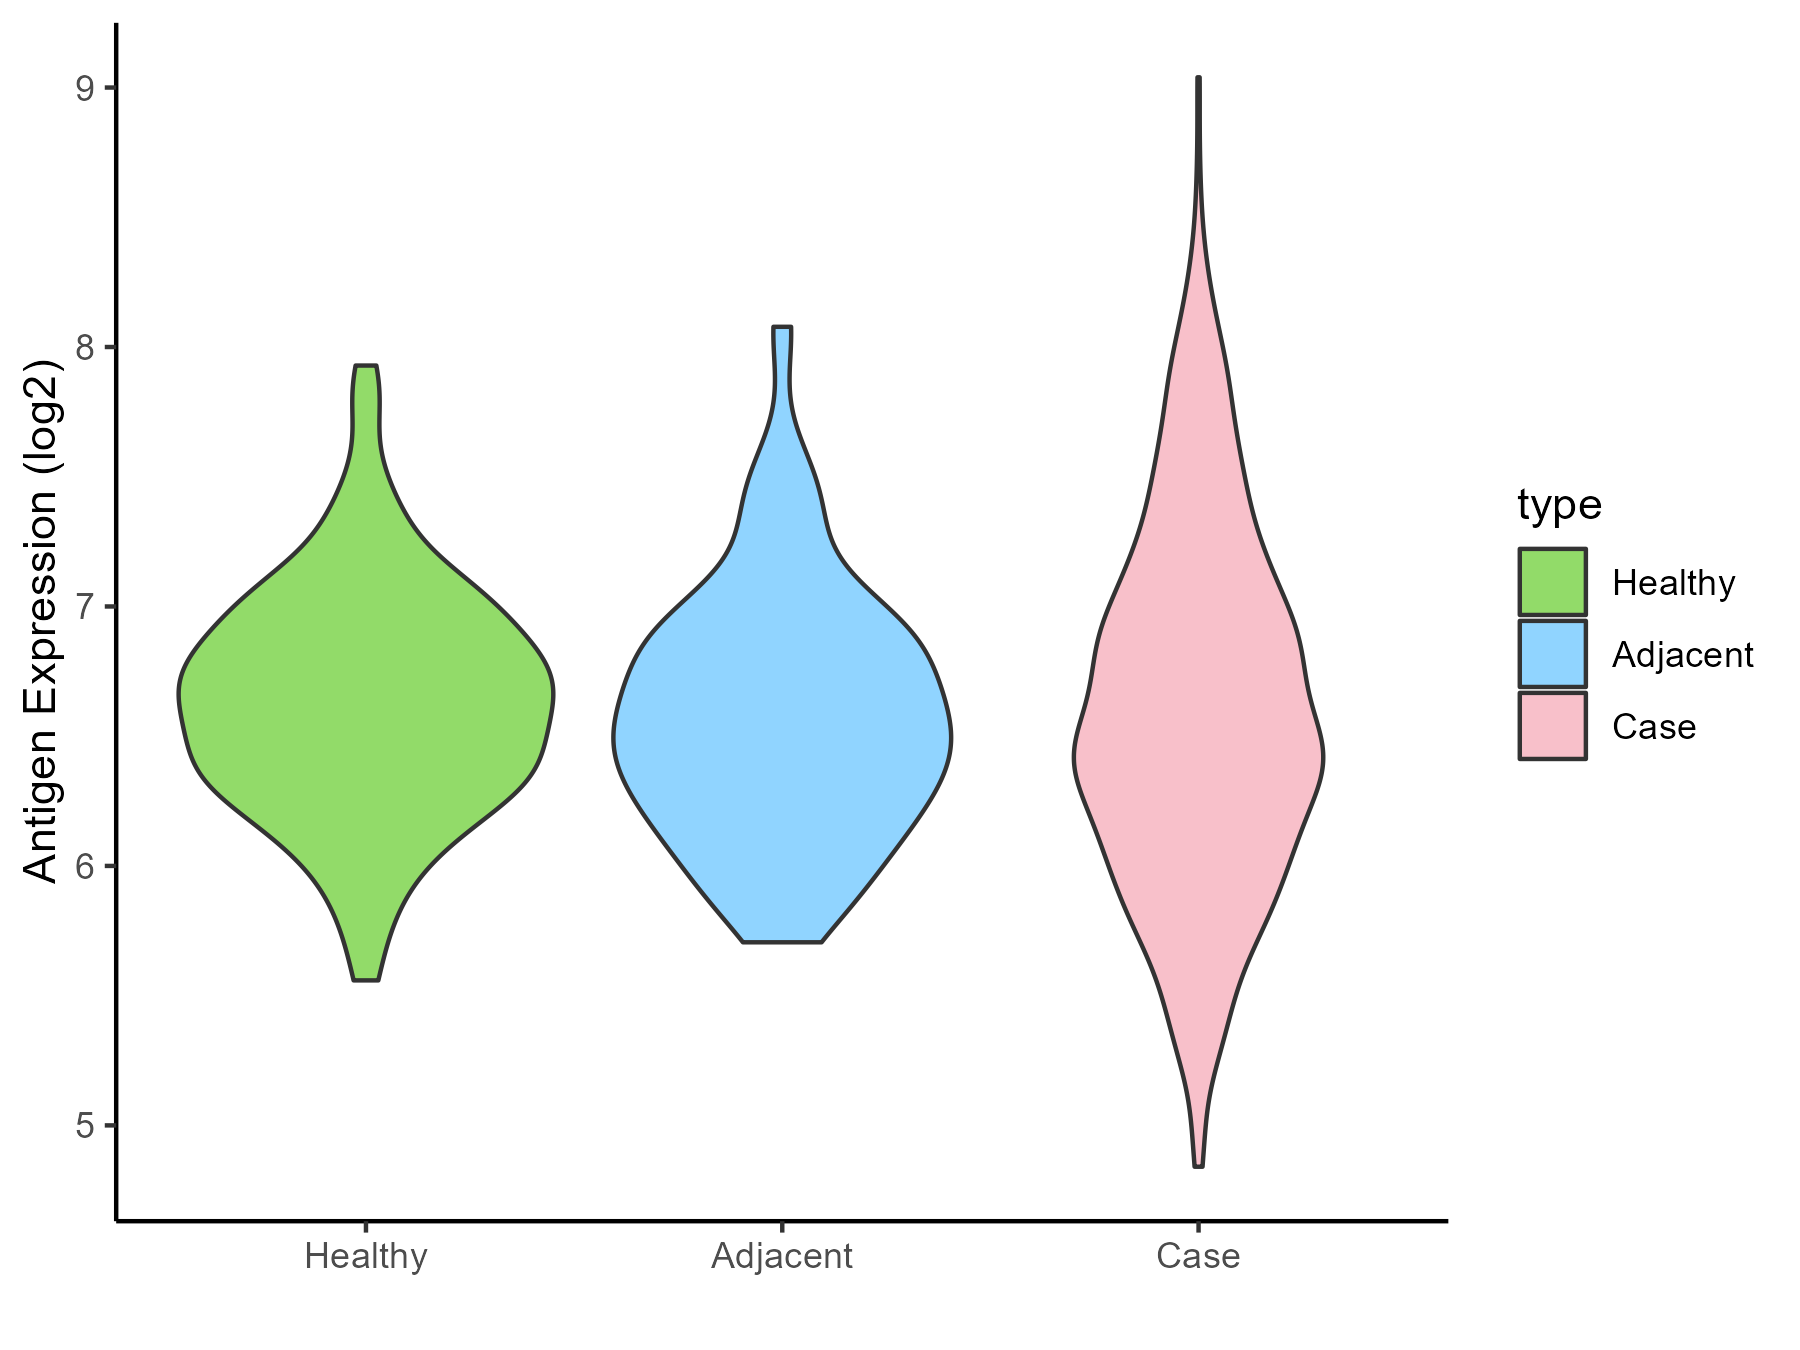
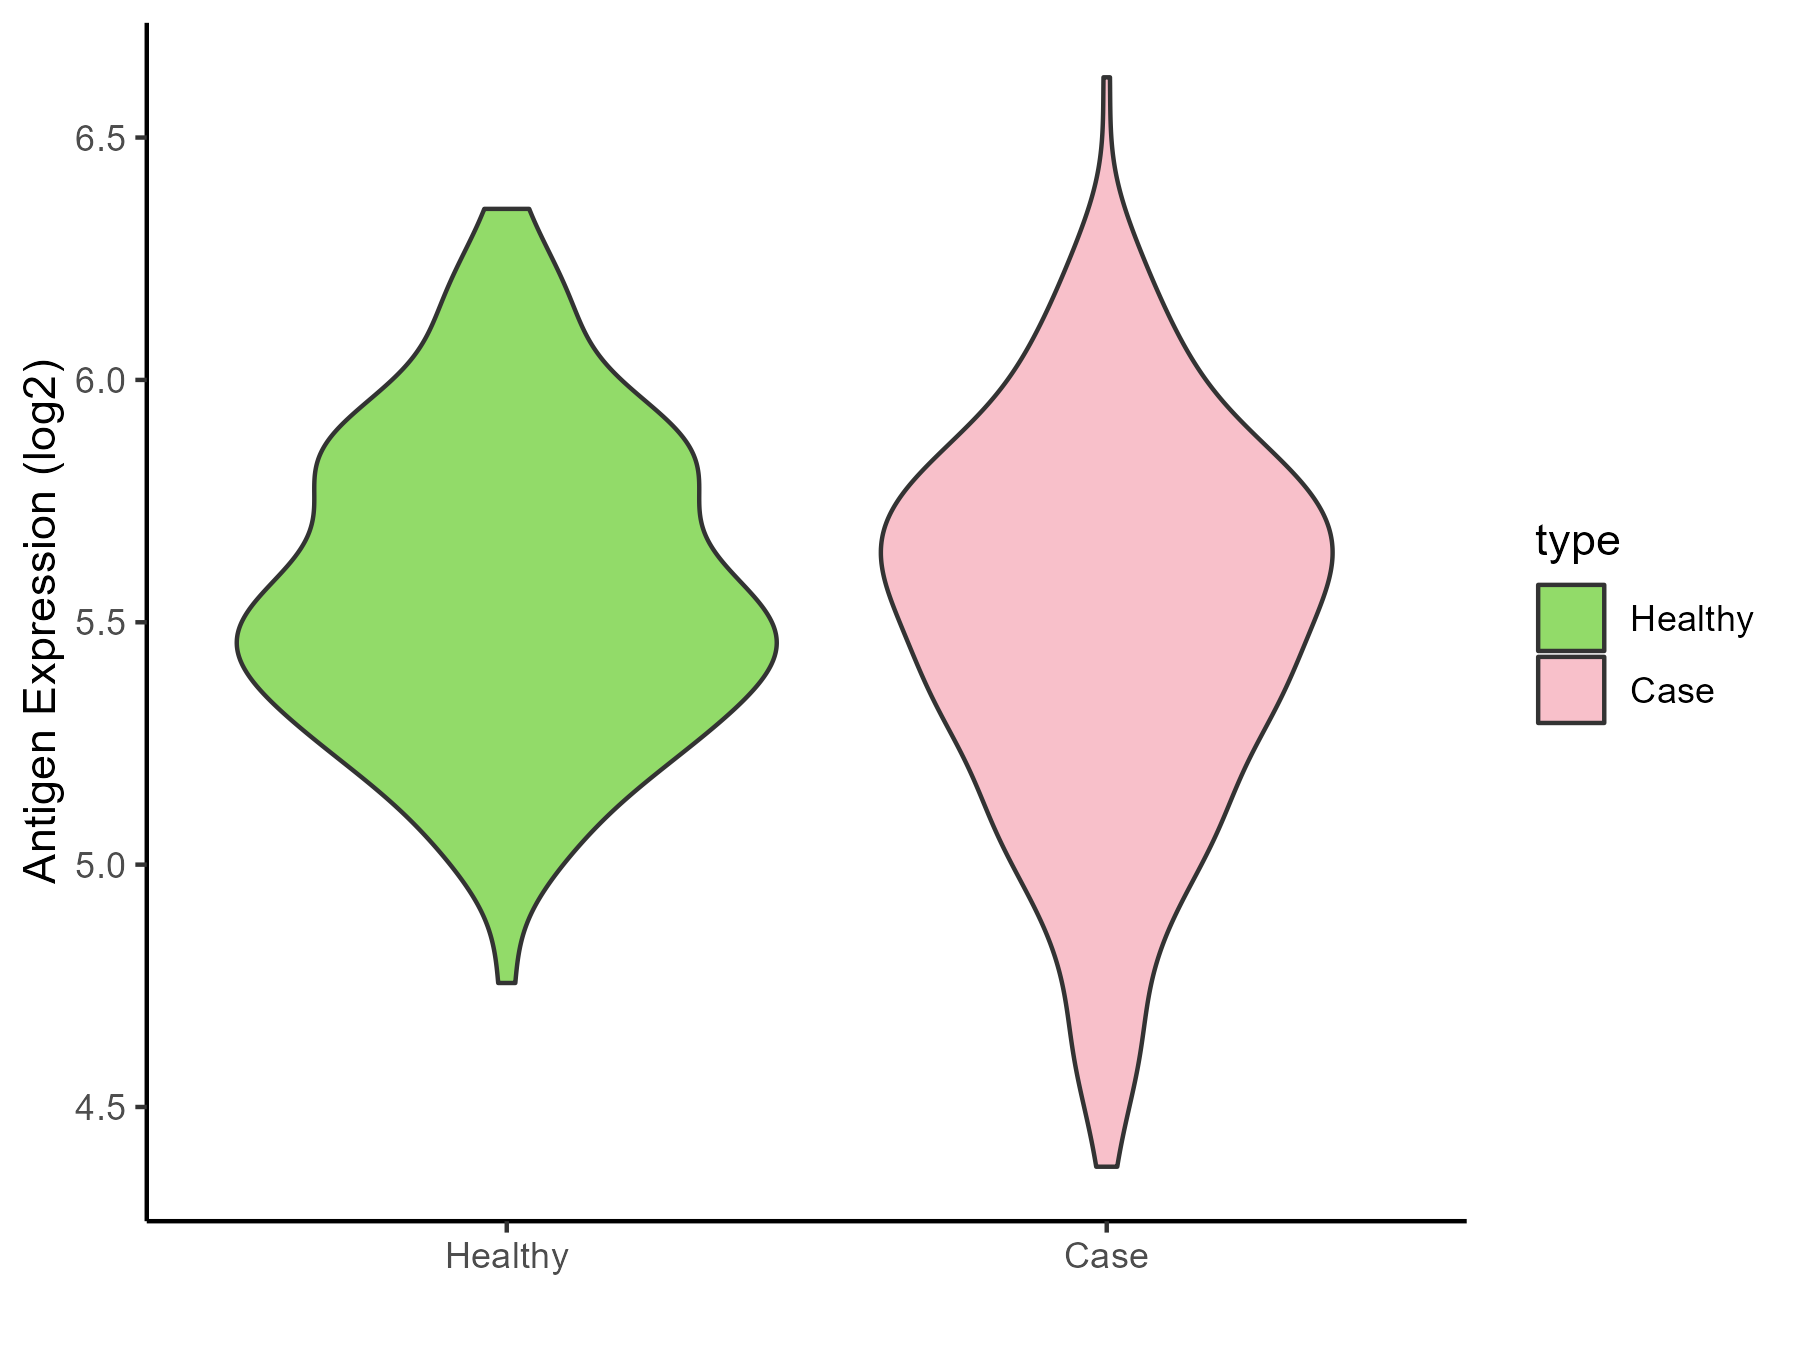
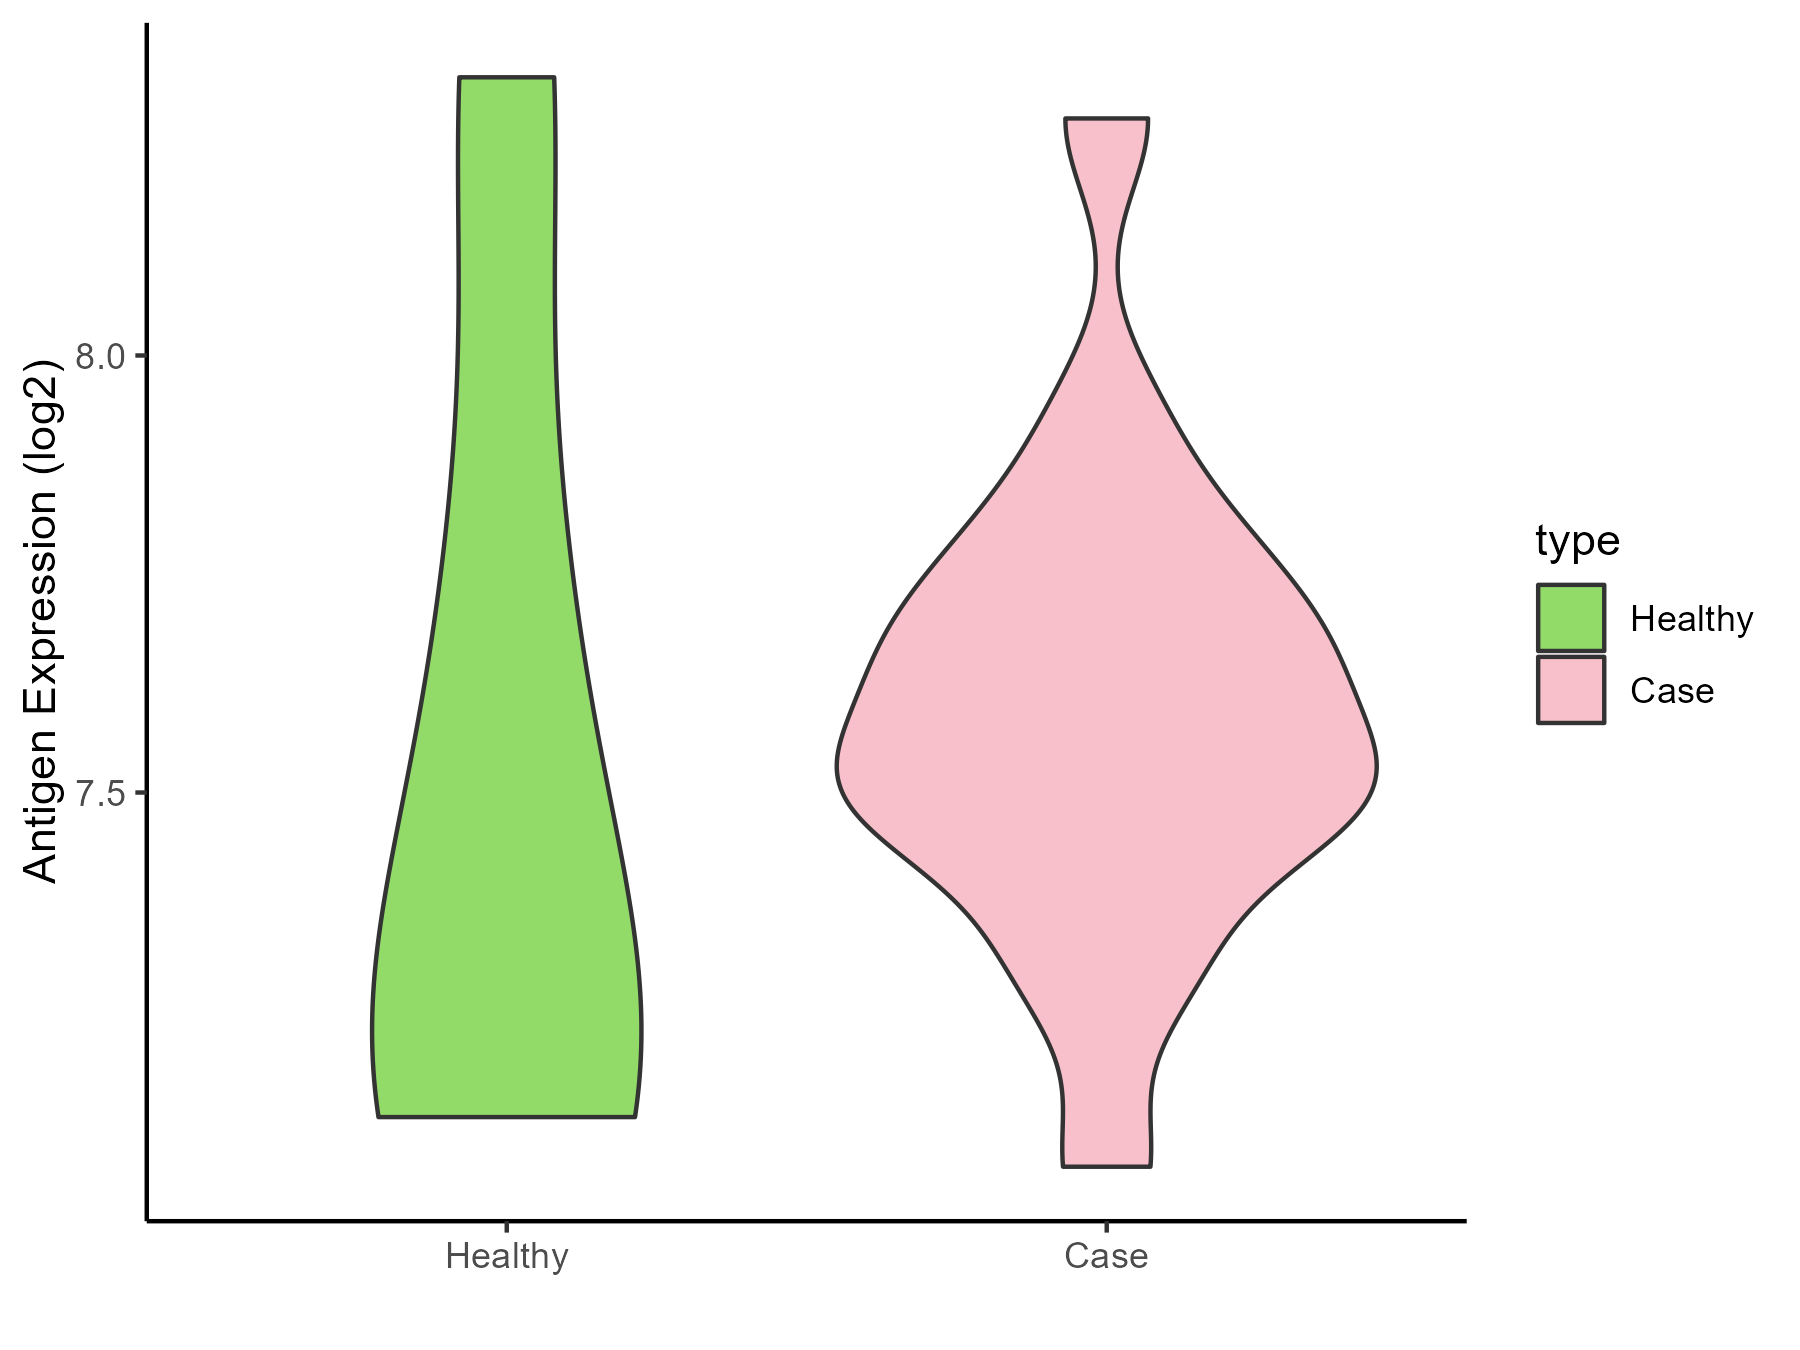
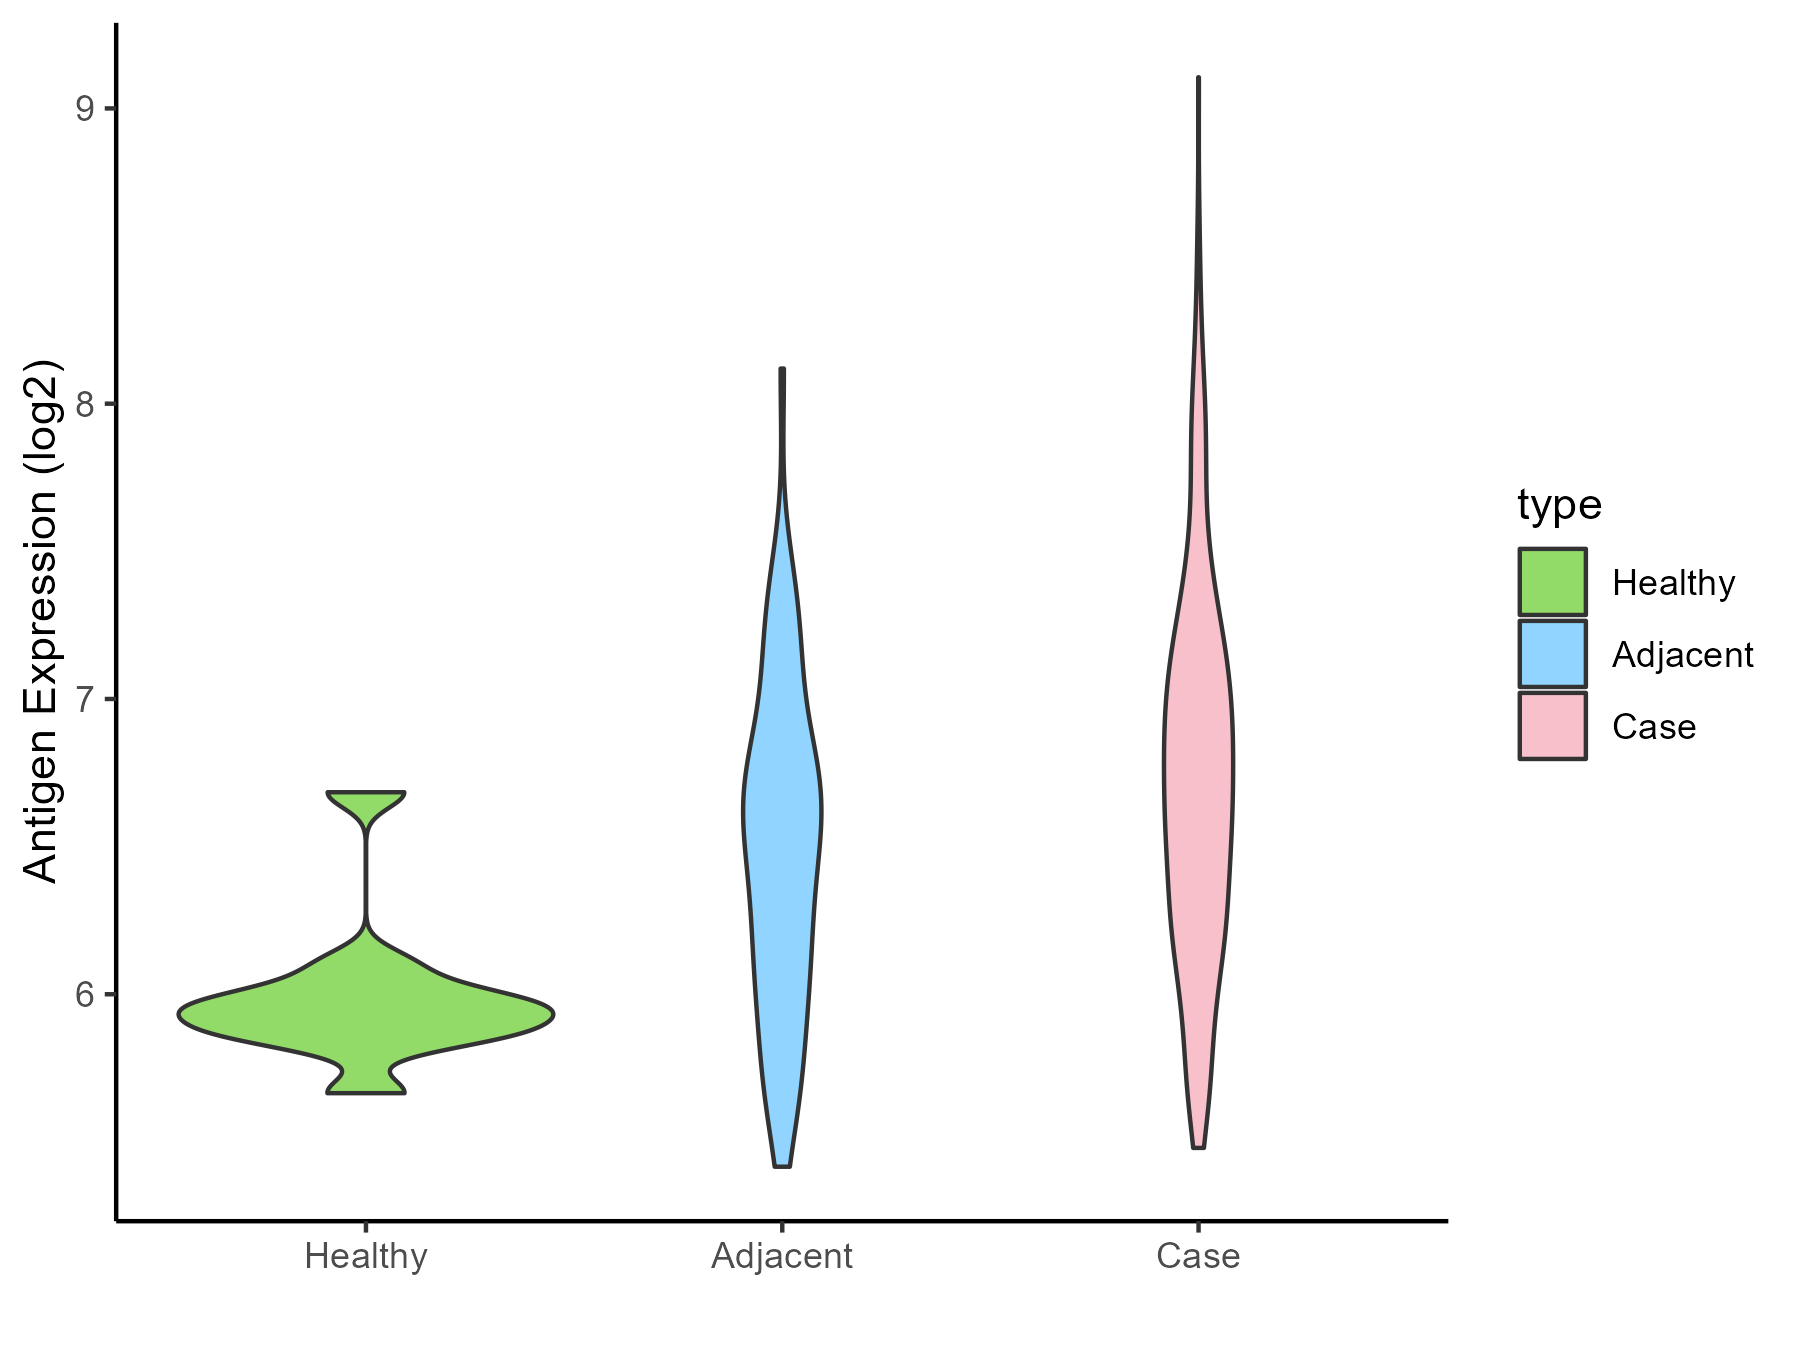
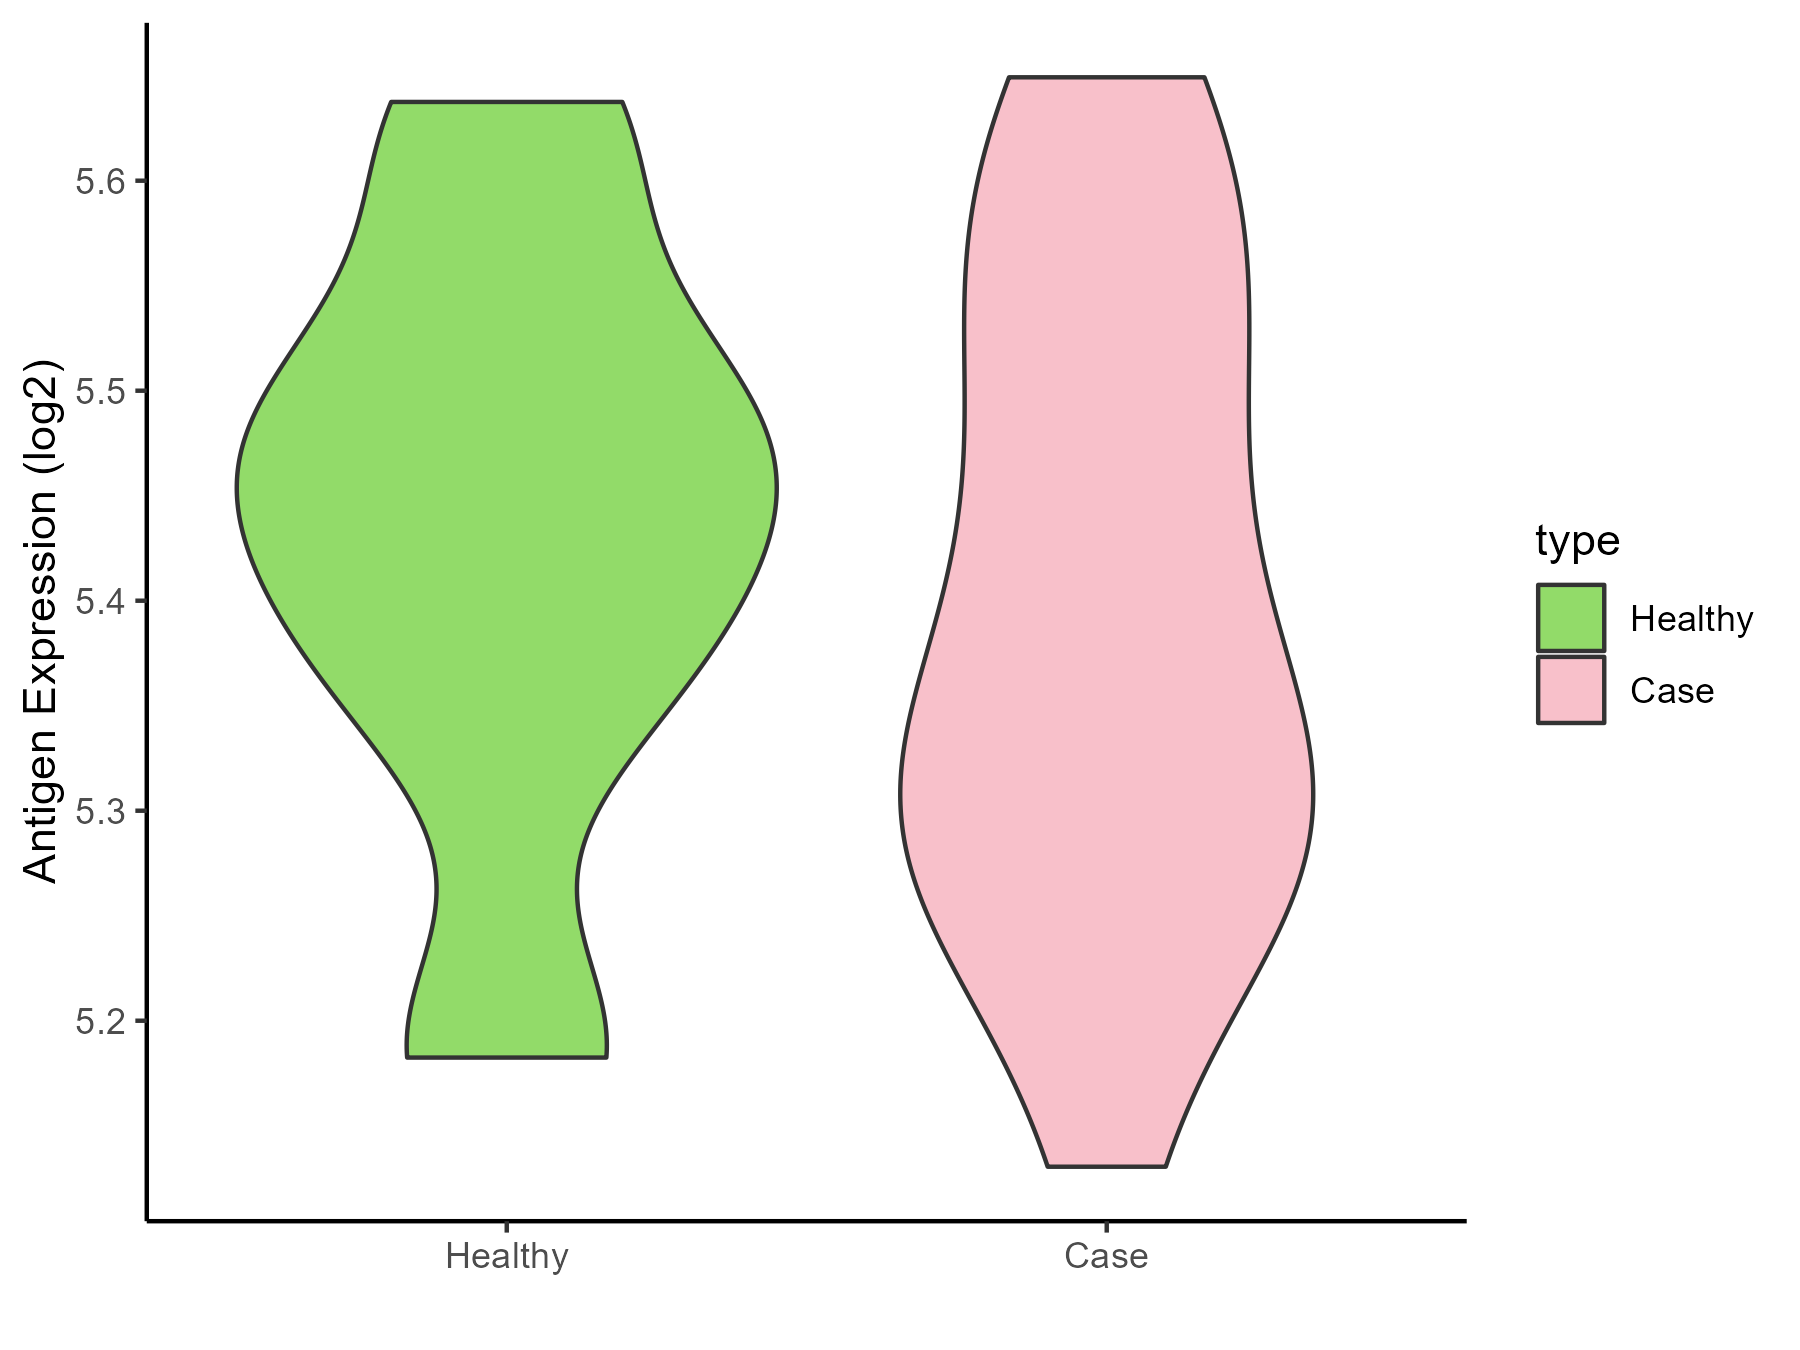
Colon cancer [ICD-11: 2B90]
Click to Show/Hide
| Differential expression pattern of antigen in diseases |
| The Studied Tissue |
Colon |
| The Specific Disease |
Colon cancer |
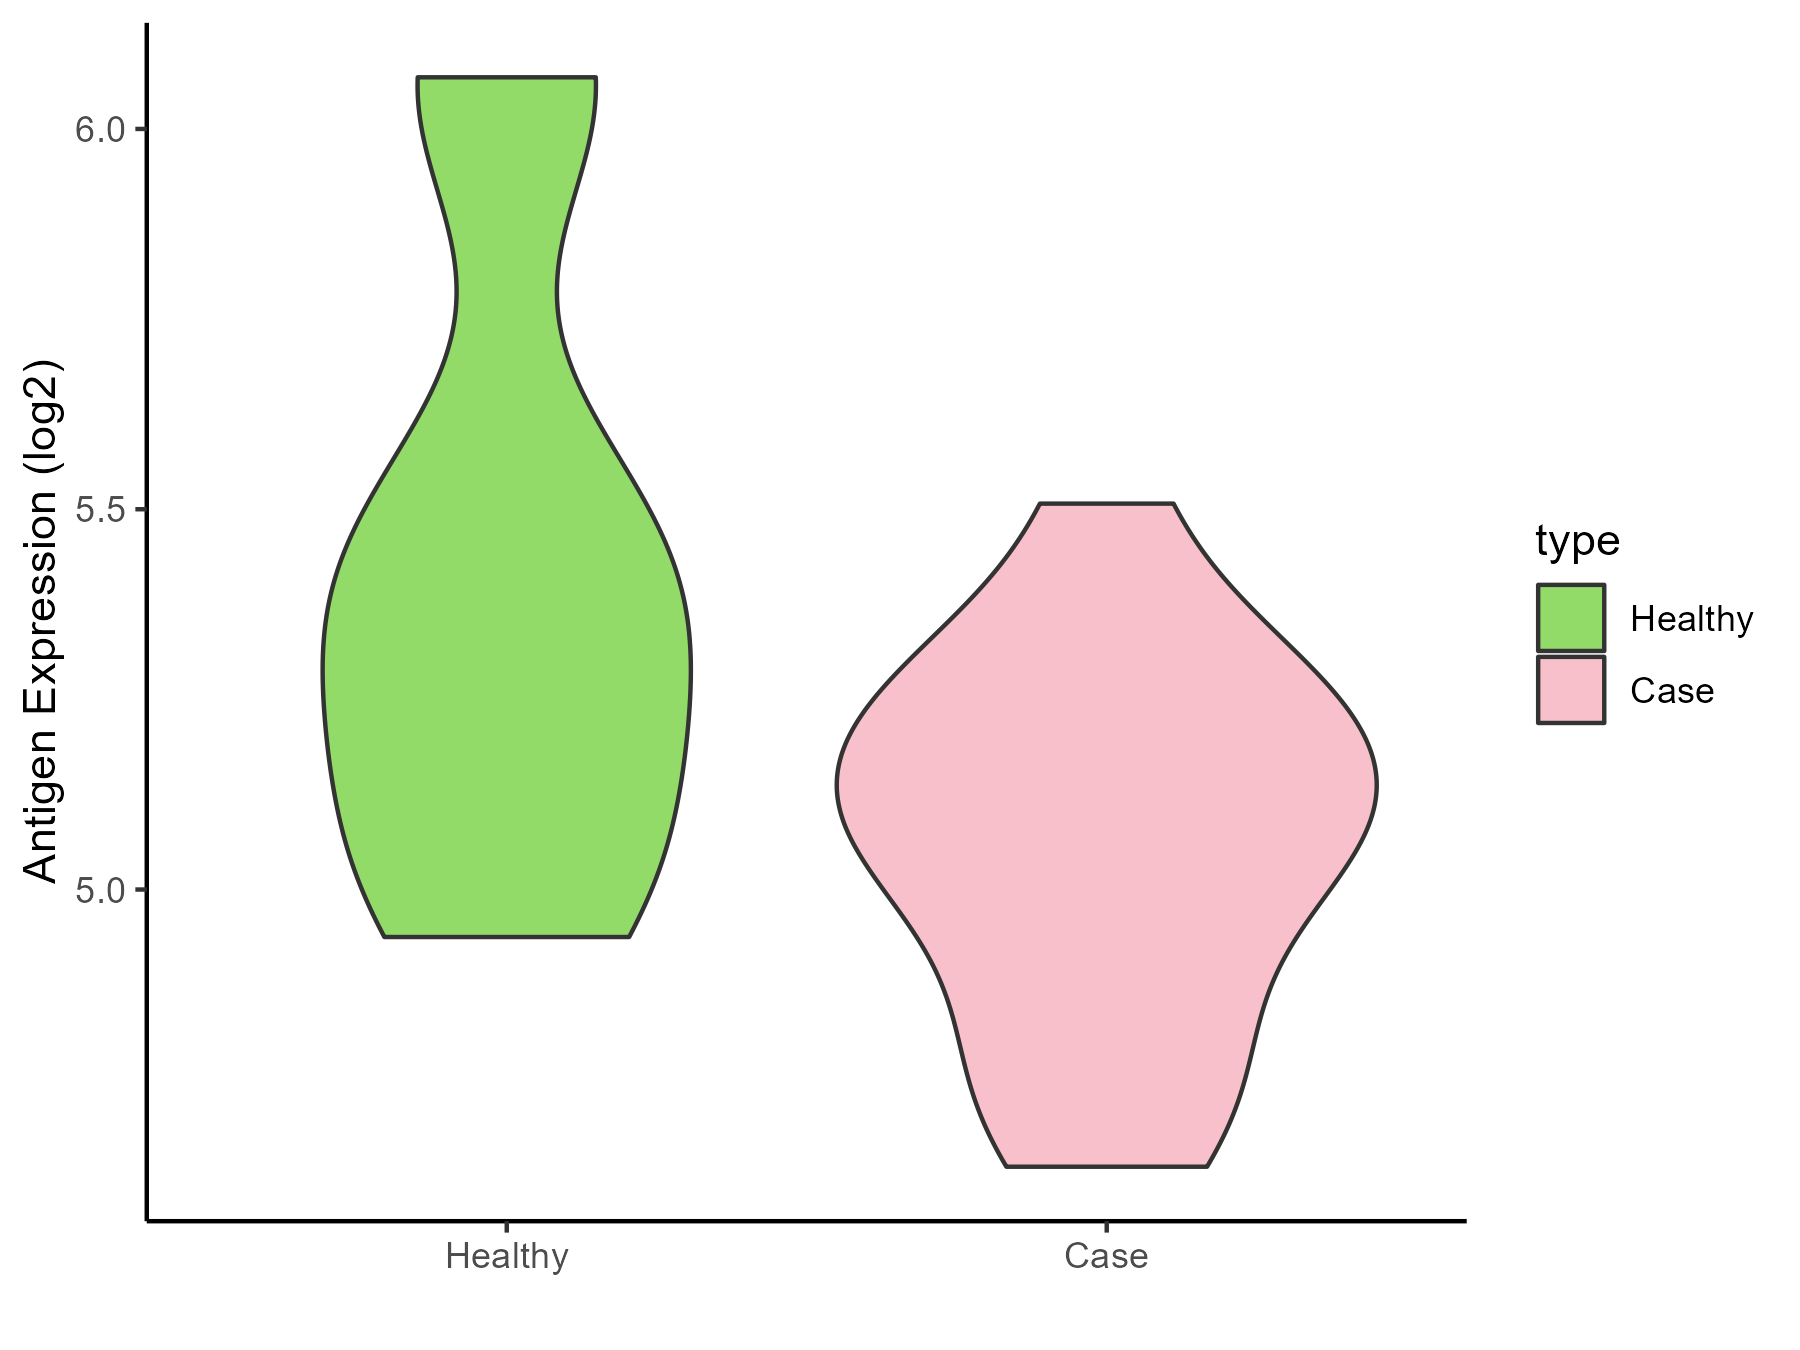
| The Expression Level of Disease Section Compare with the Healthy Individual Tissue |
p-value: 3.23E-46;
Fold-change: 0.609461086;
Z-score: 1.589662735
|
| The Expression Level of Disease Section Compare with the Adjacent Tissue |
p-value: 9.73E-49;
Fold-change: 0.783649221;
Z-score: 1.959997089
|
| Disease-specific Antigen Abundances |
|
Click to View the Clearer Original Diagram
|
|
|
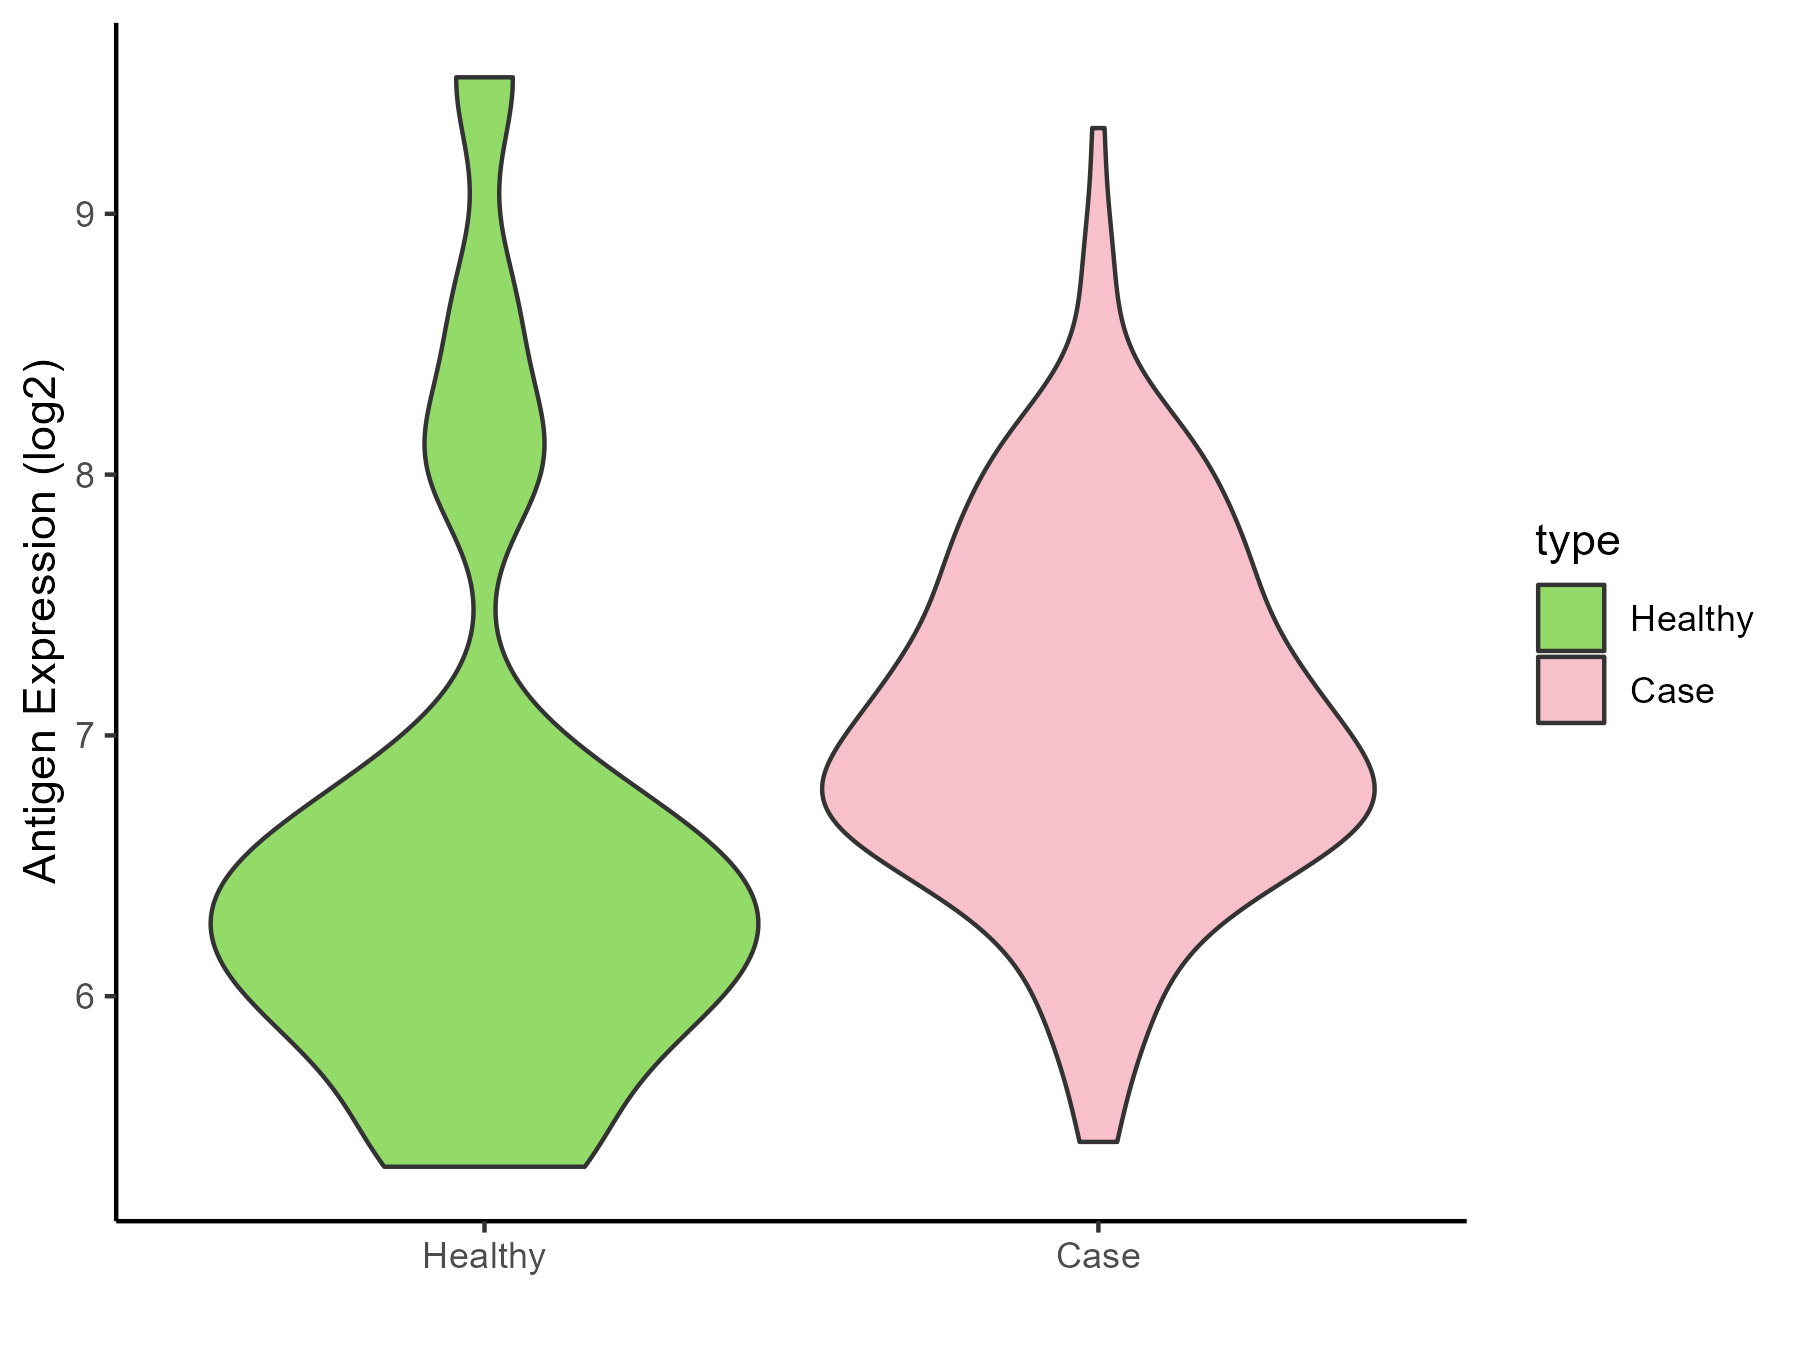
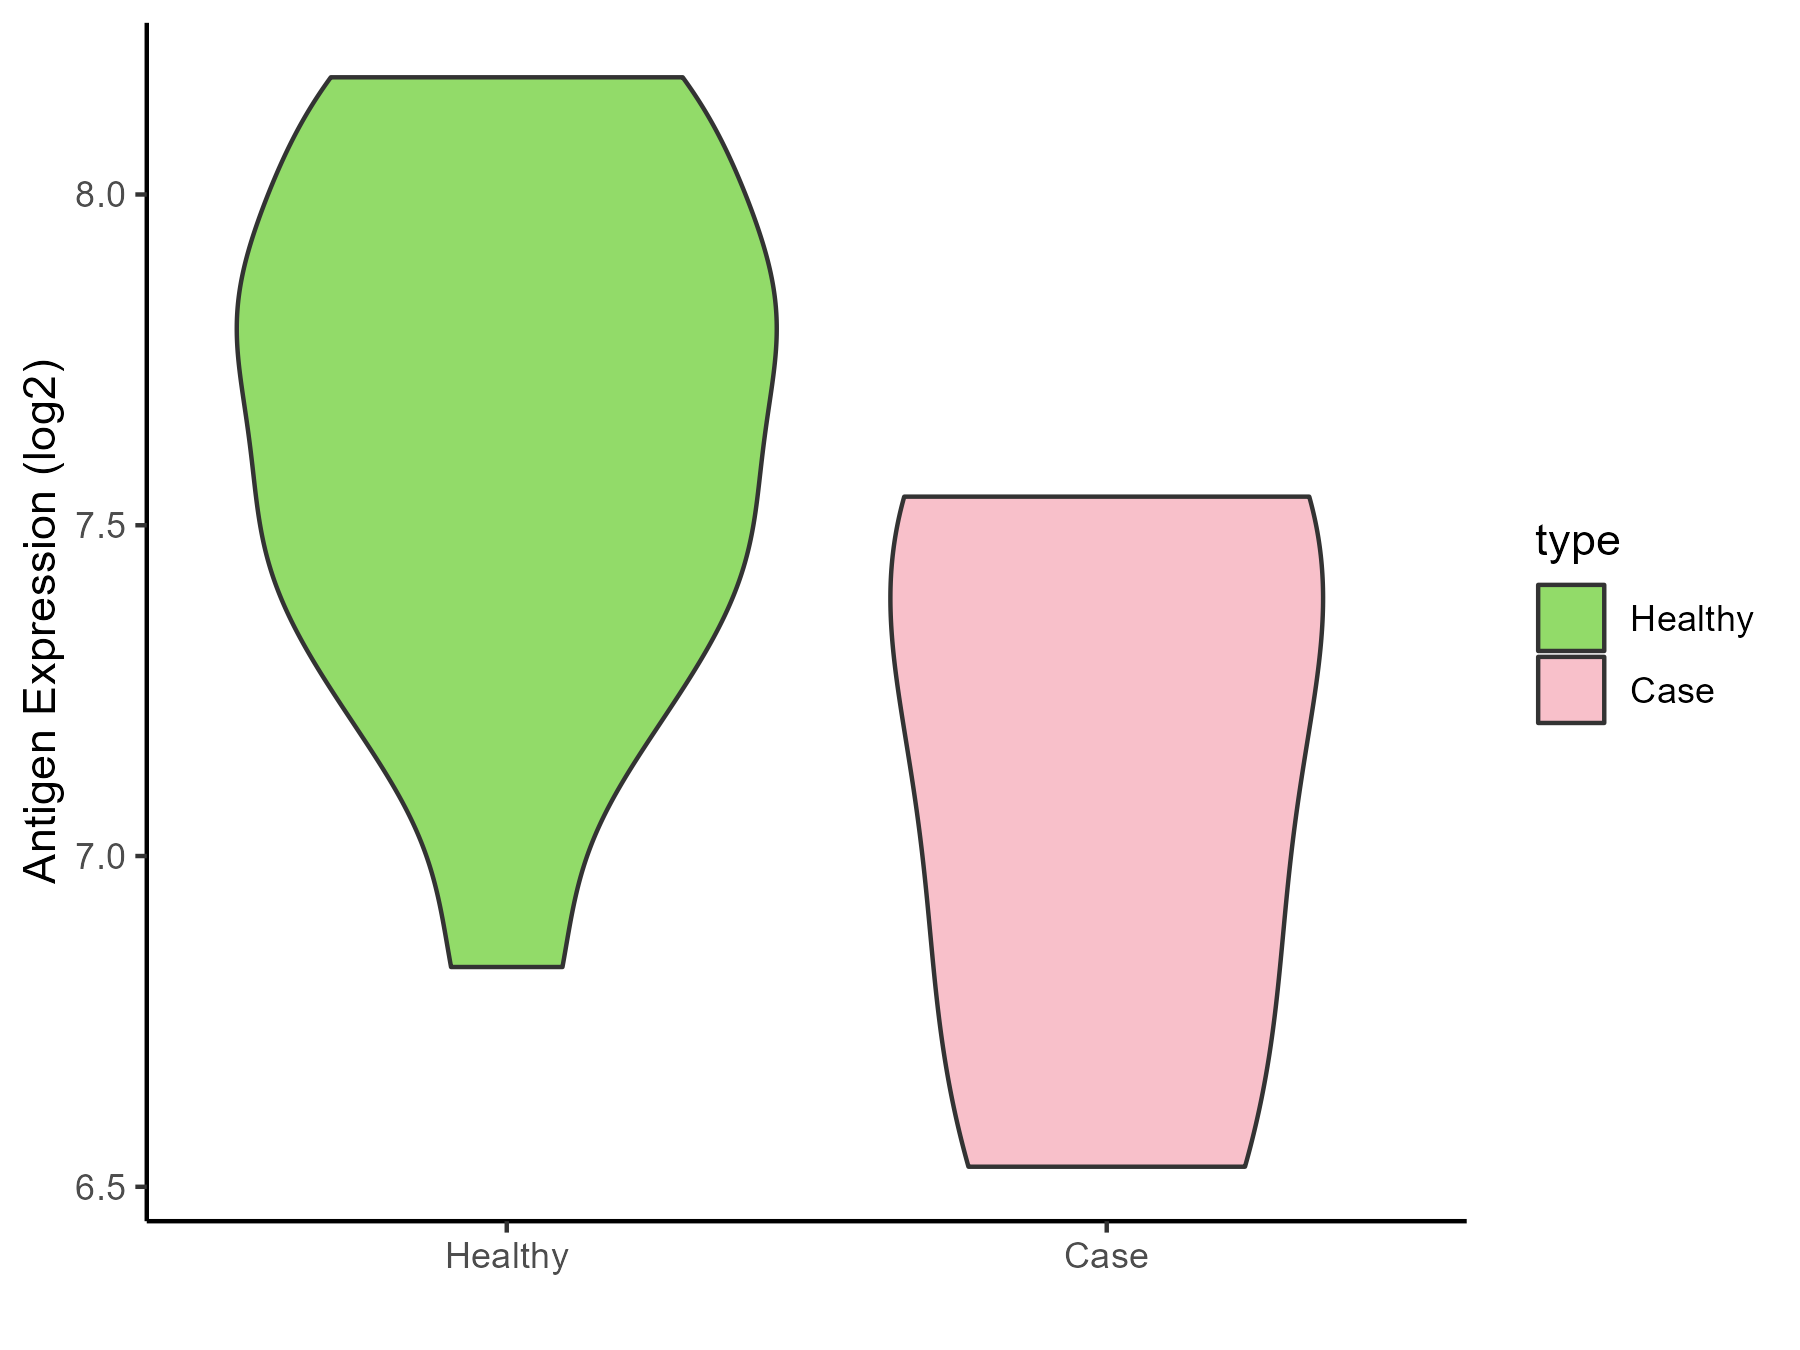
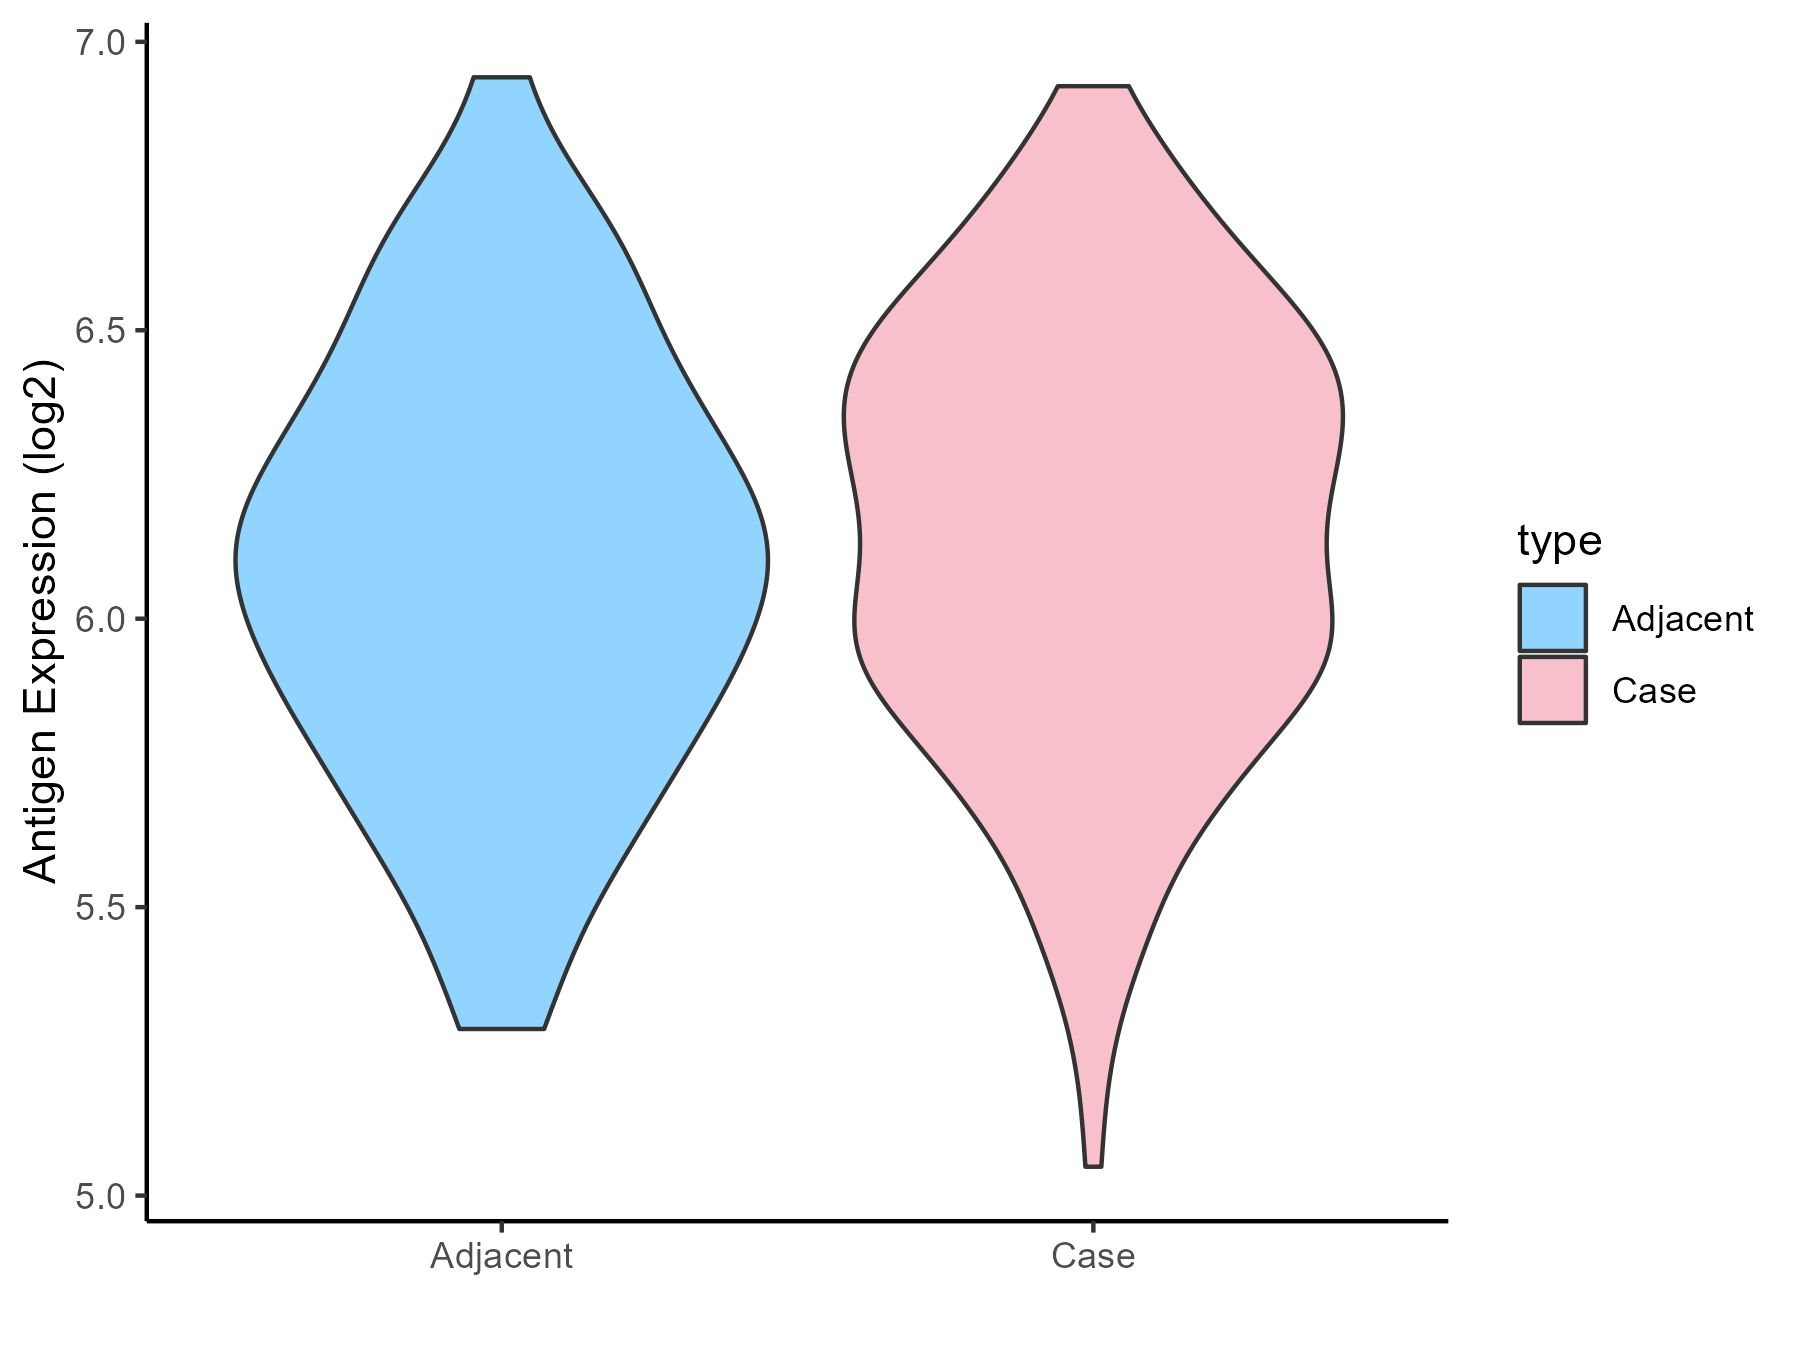
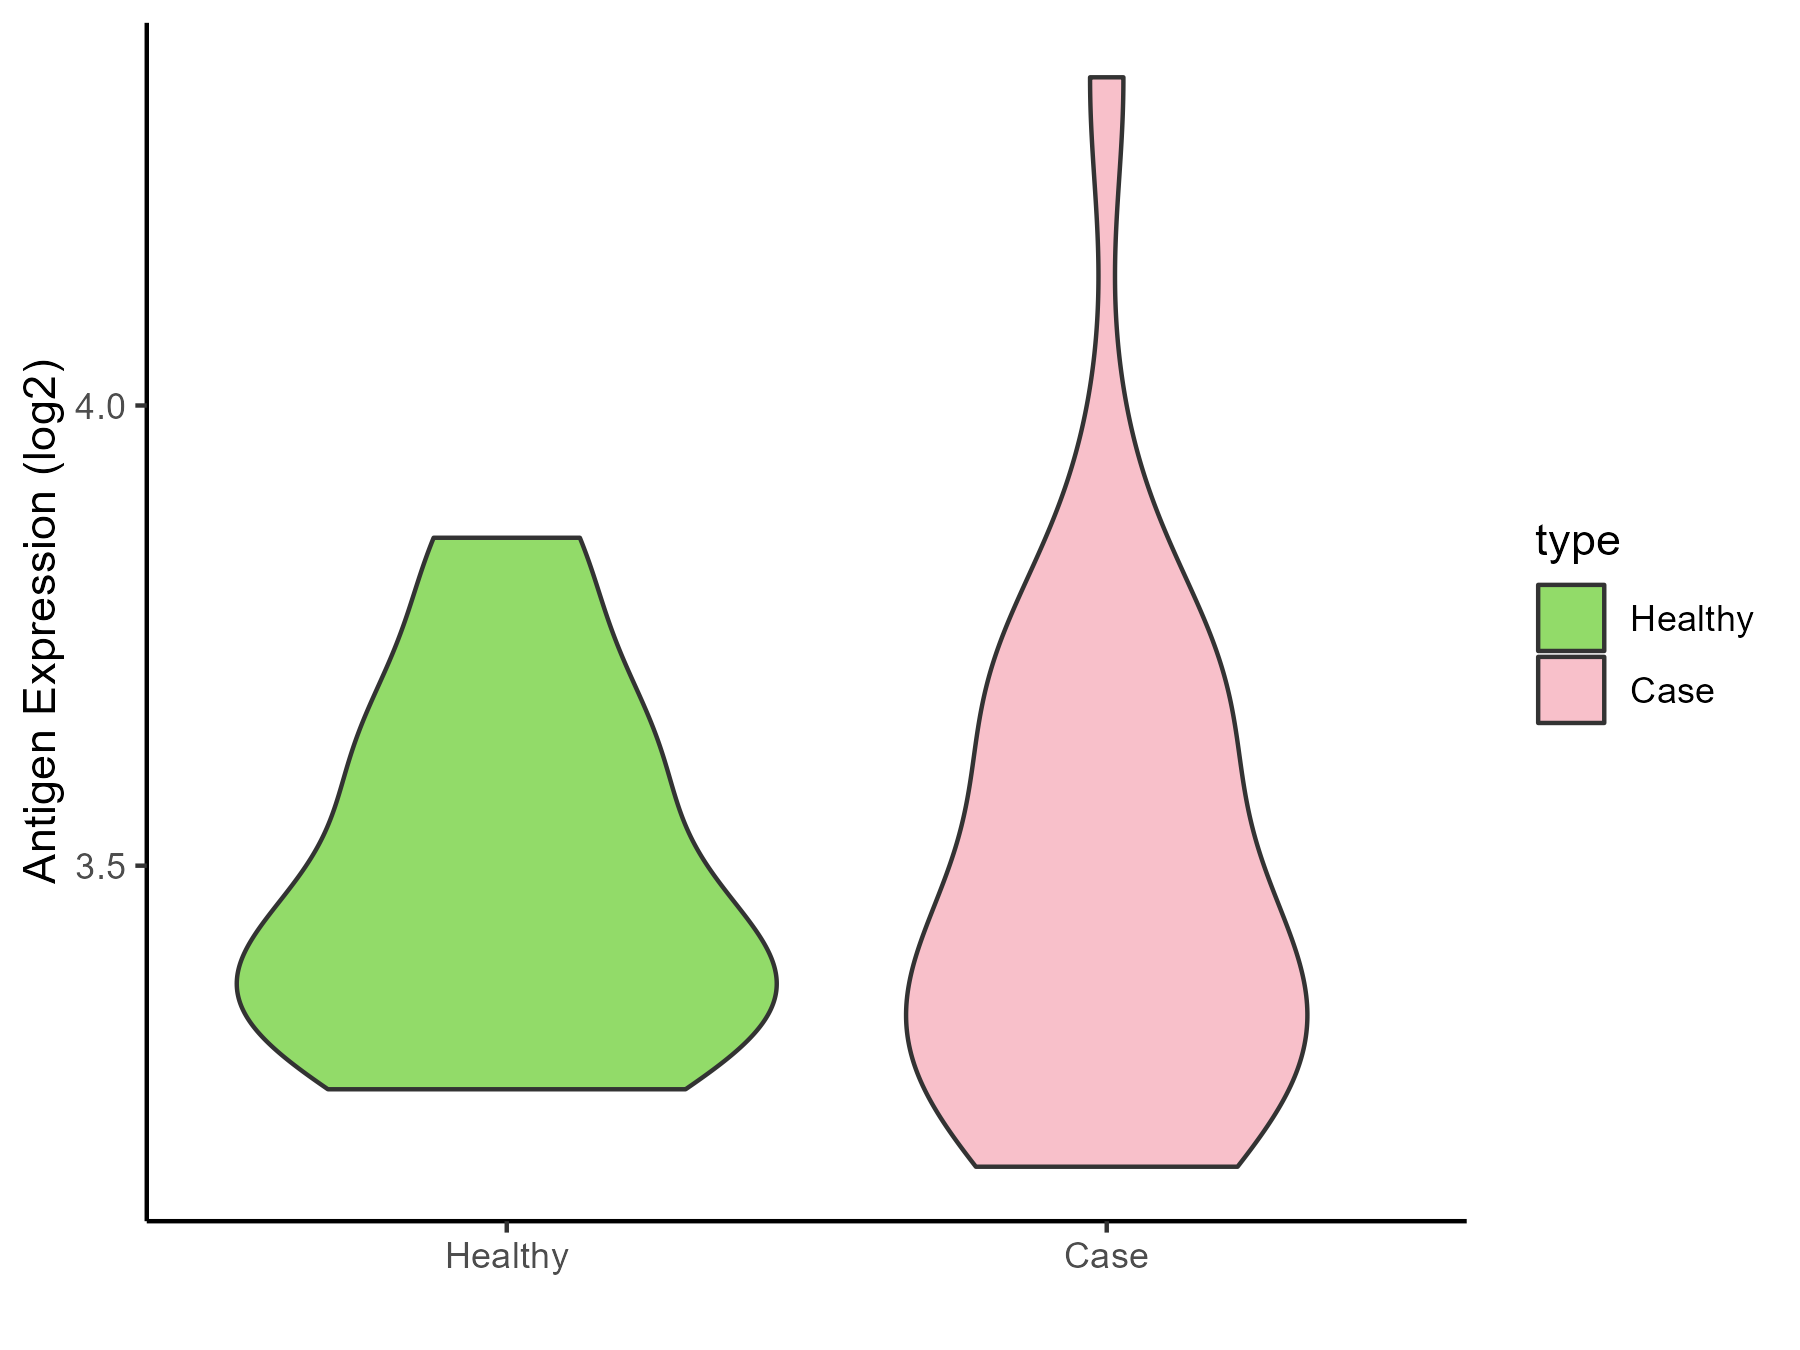
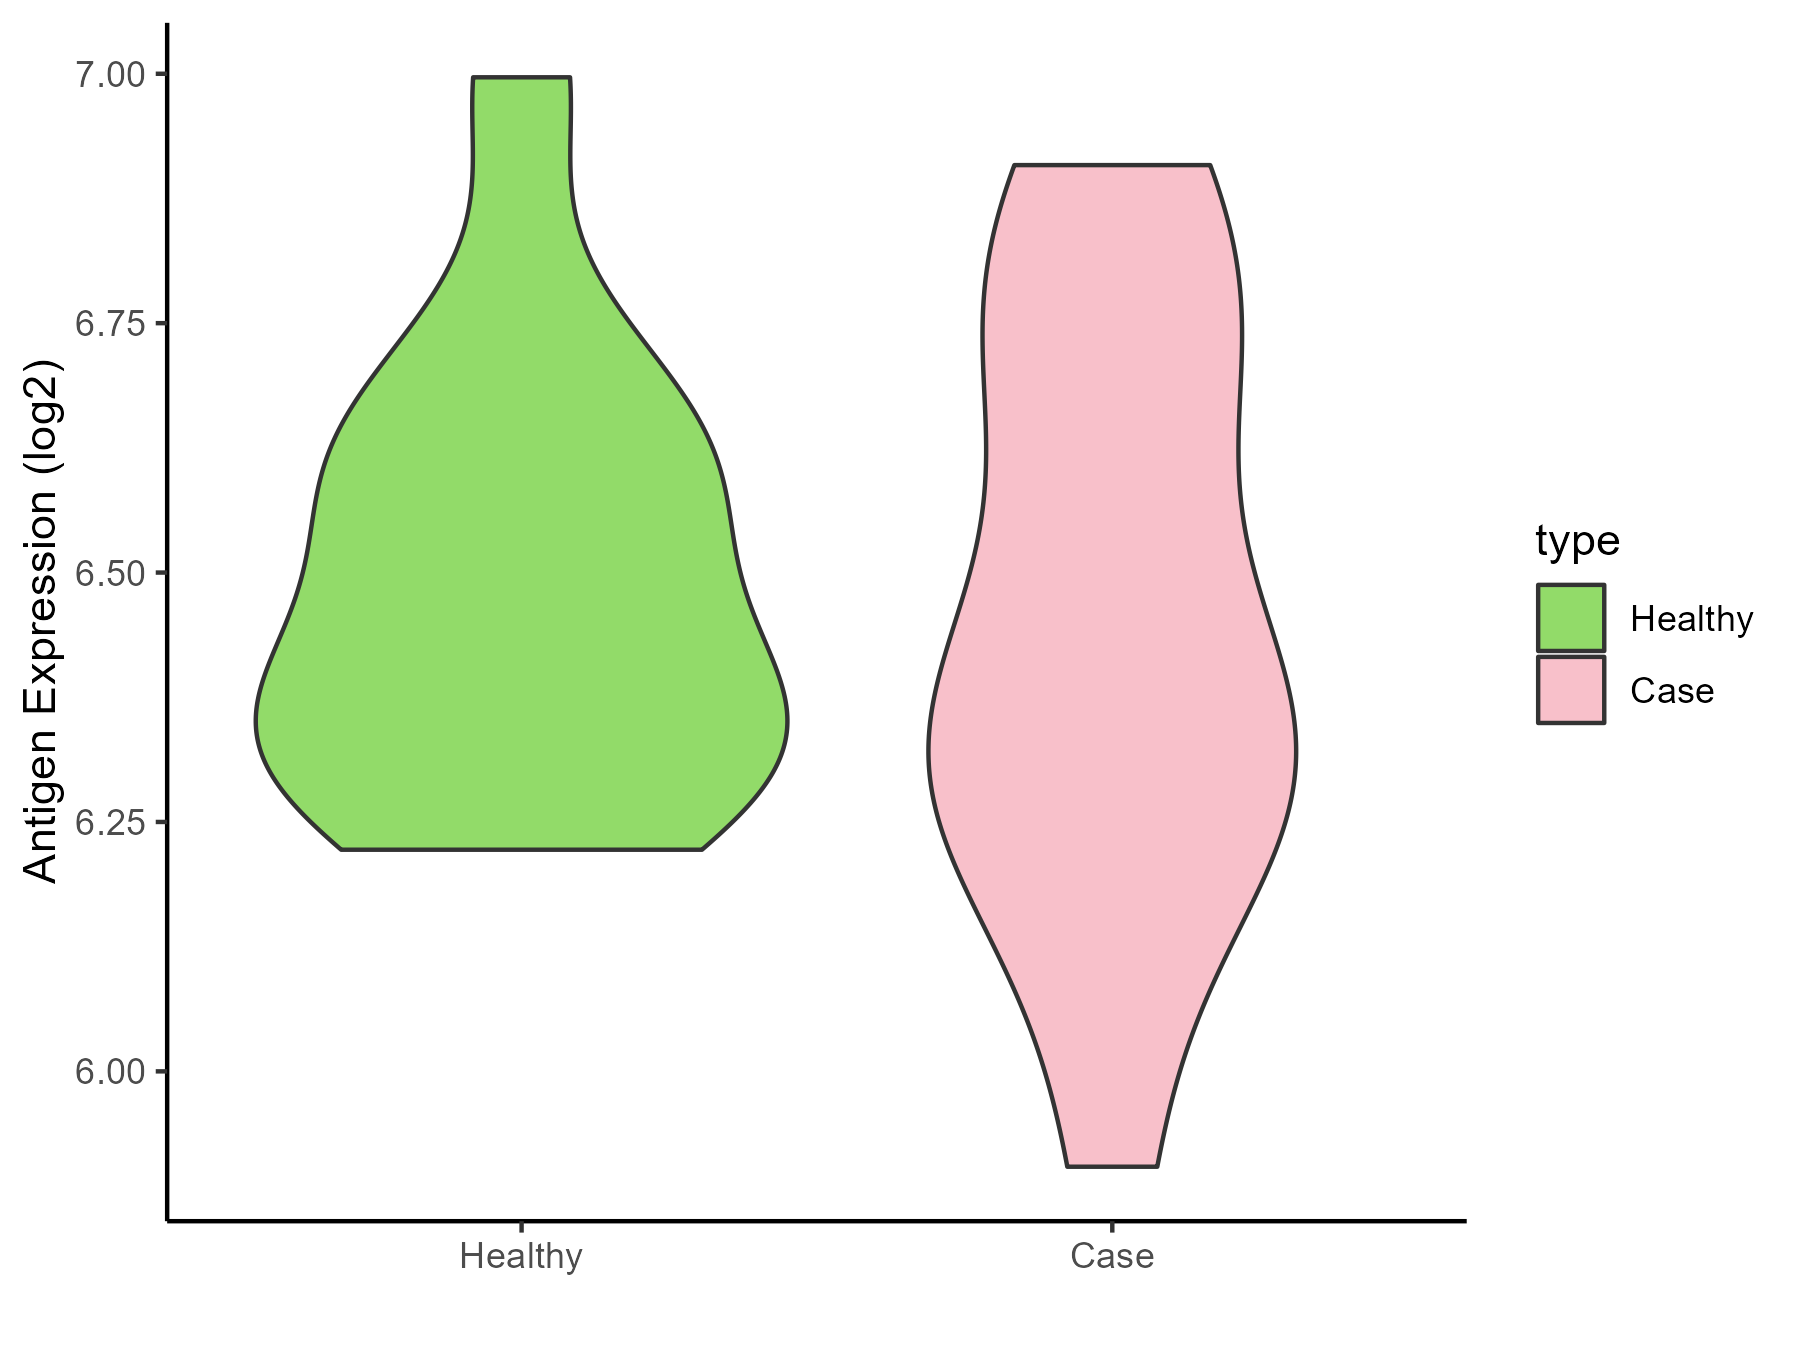
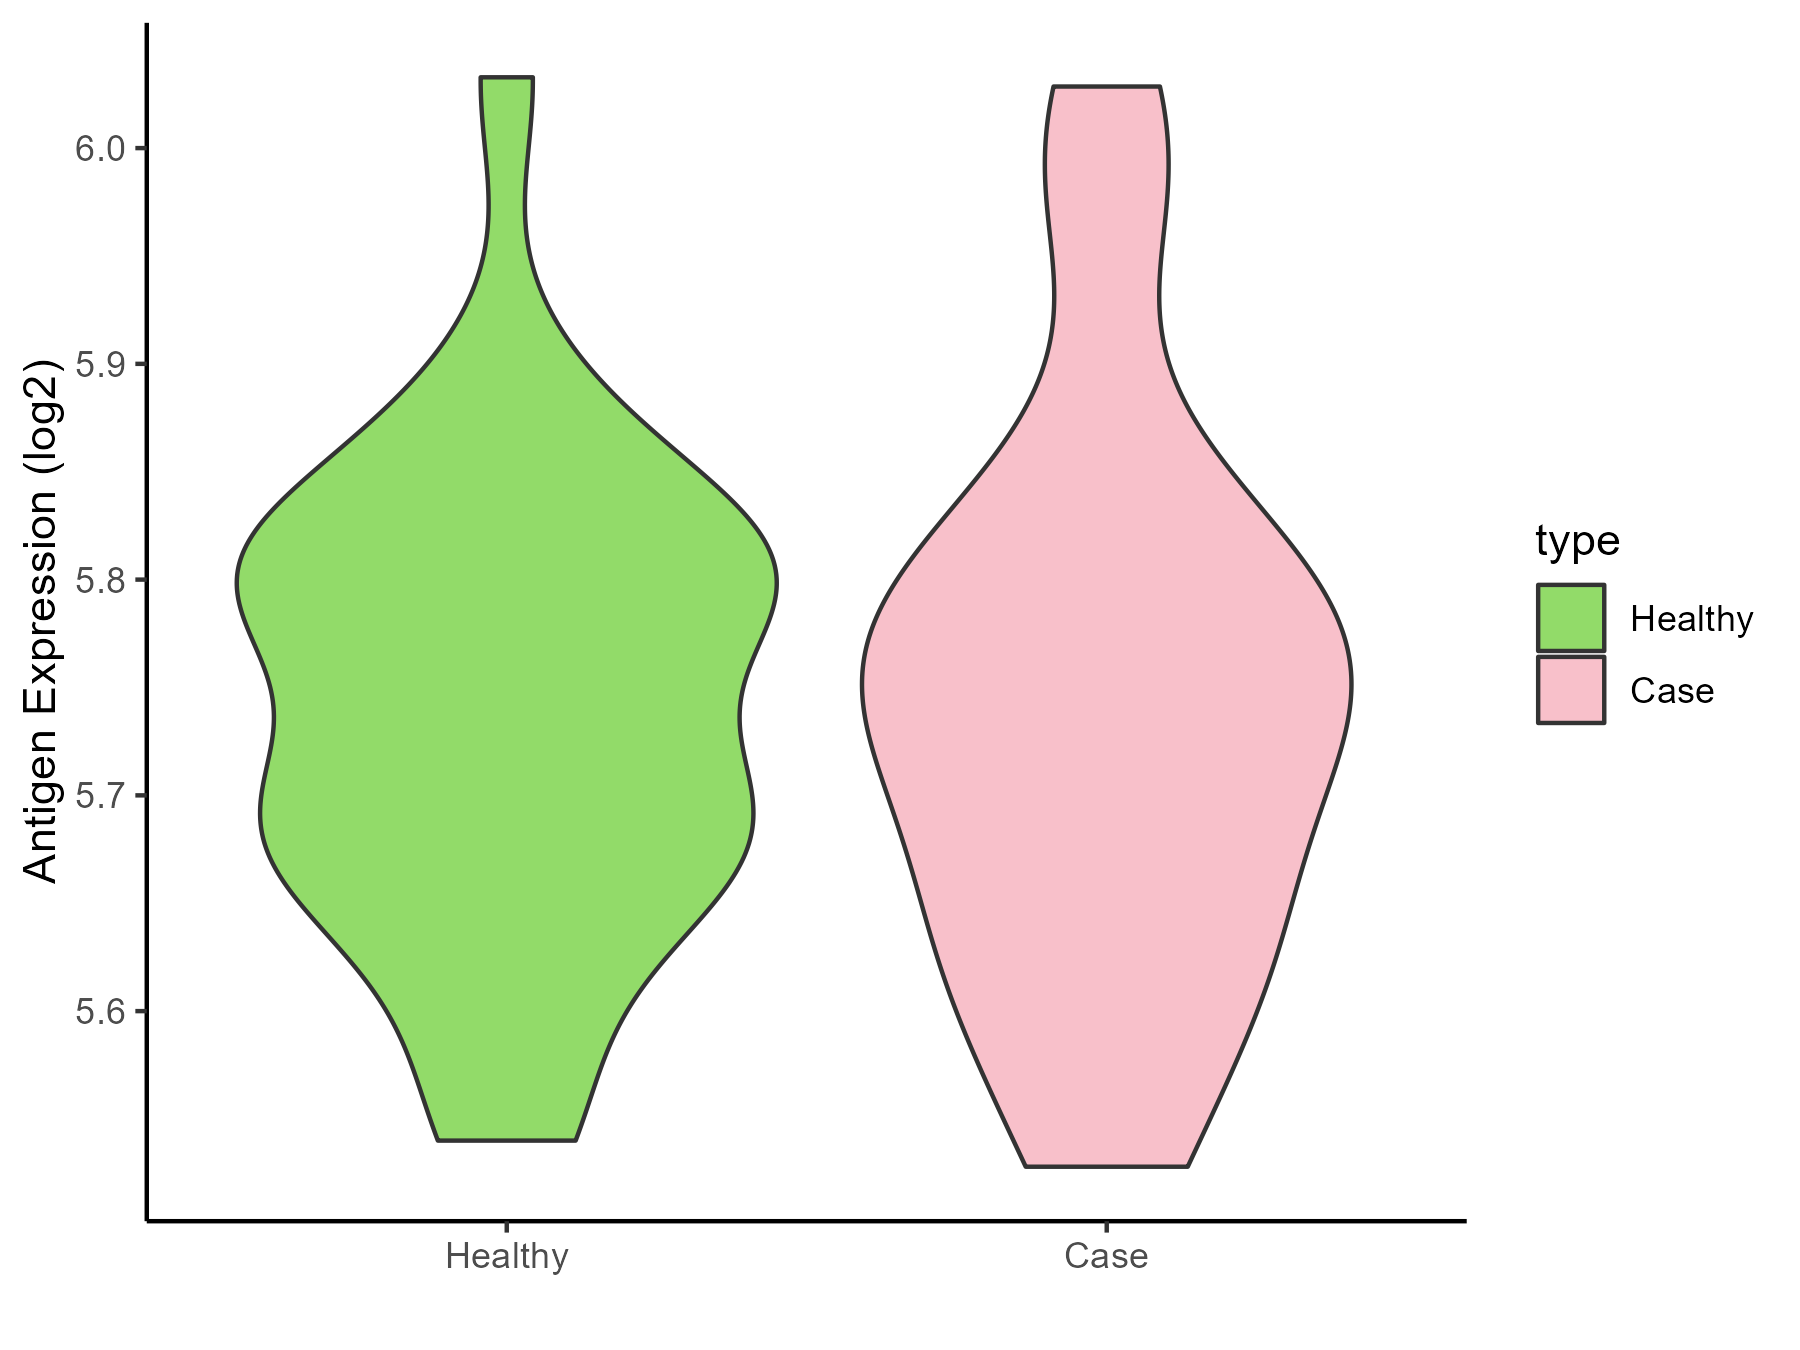
Pancreatic cancer [ICD-11: 2C10]
Click to Show/Hide
| Differential expression pattern of antigen in diseases |
| The Studied Tissue |
Pancreas |
| The Specific Disease |
Pancreatic cancer |
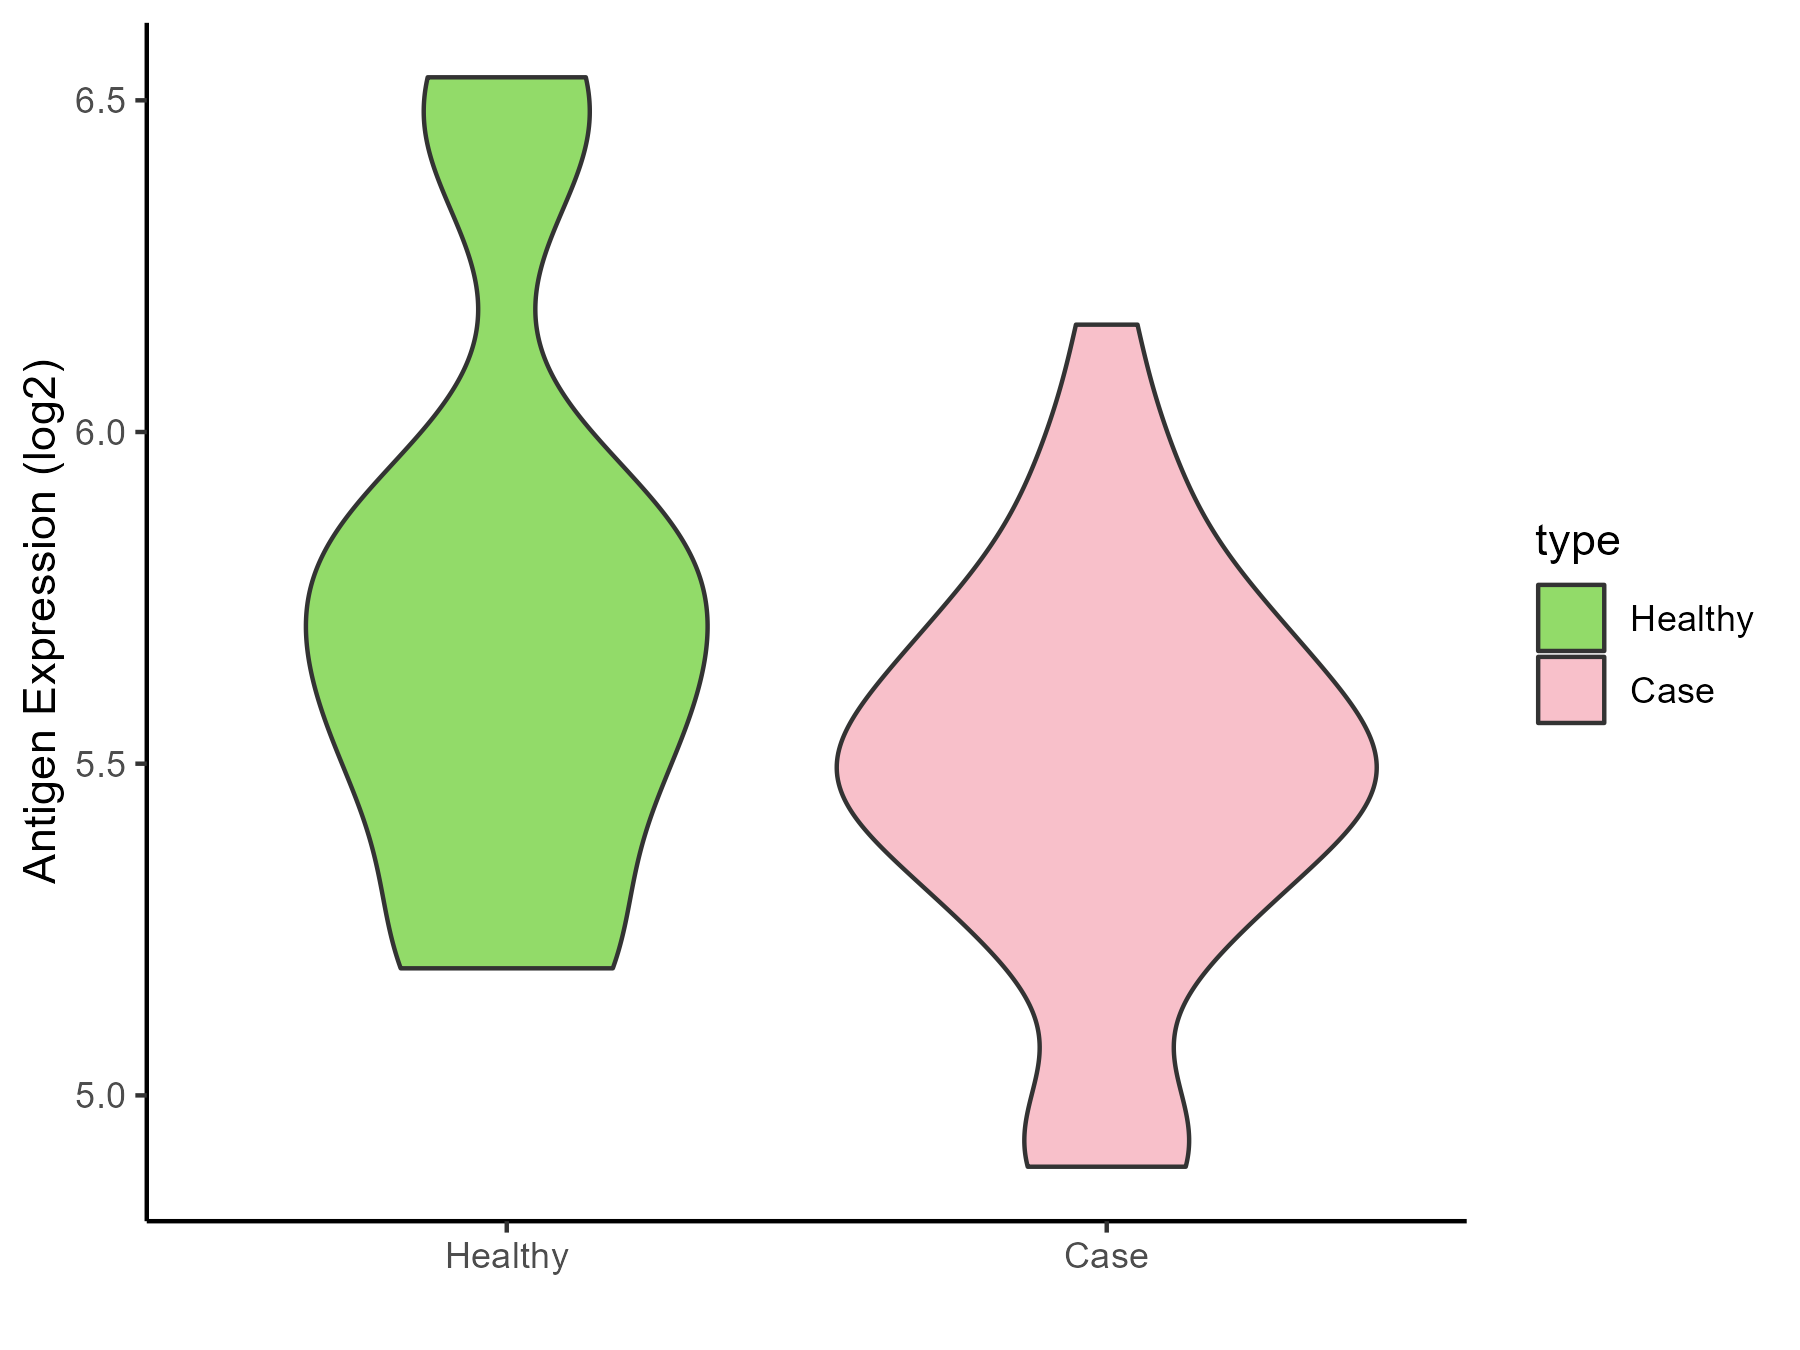
| The Expression Level of Disease Section Compare with the Healthy Individual Tissue |
p-value: 0.00129636;
Fold-change: 0.497335453;
Z-score: 0.998042233
|
| The Expression Level of Disease Section Compare with the Adjacent Tissue |
p-value: 0.00207088;
Fold-change: 0.209728669;
Z-score: 0.636467467
|
| Disease-specific Antigen Abundances |
|
Click to View the Clearer Original Diagram
|
|
|
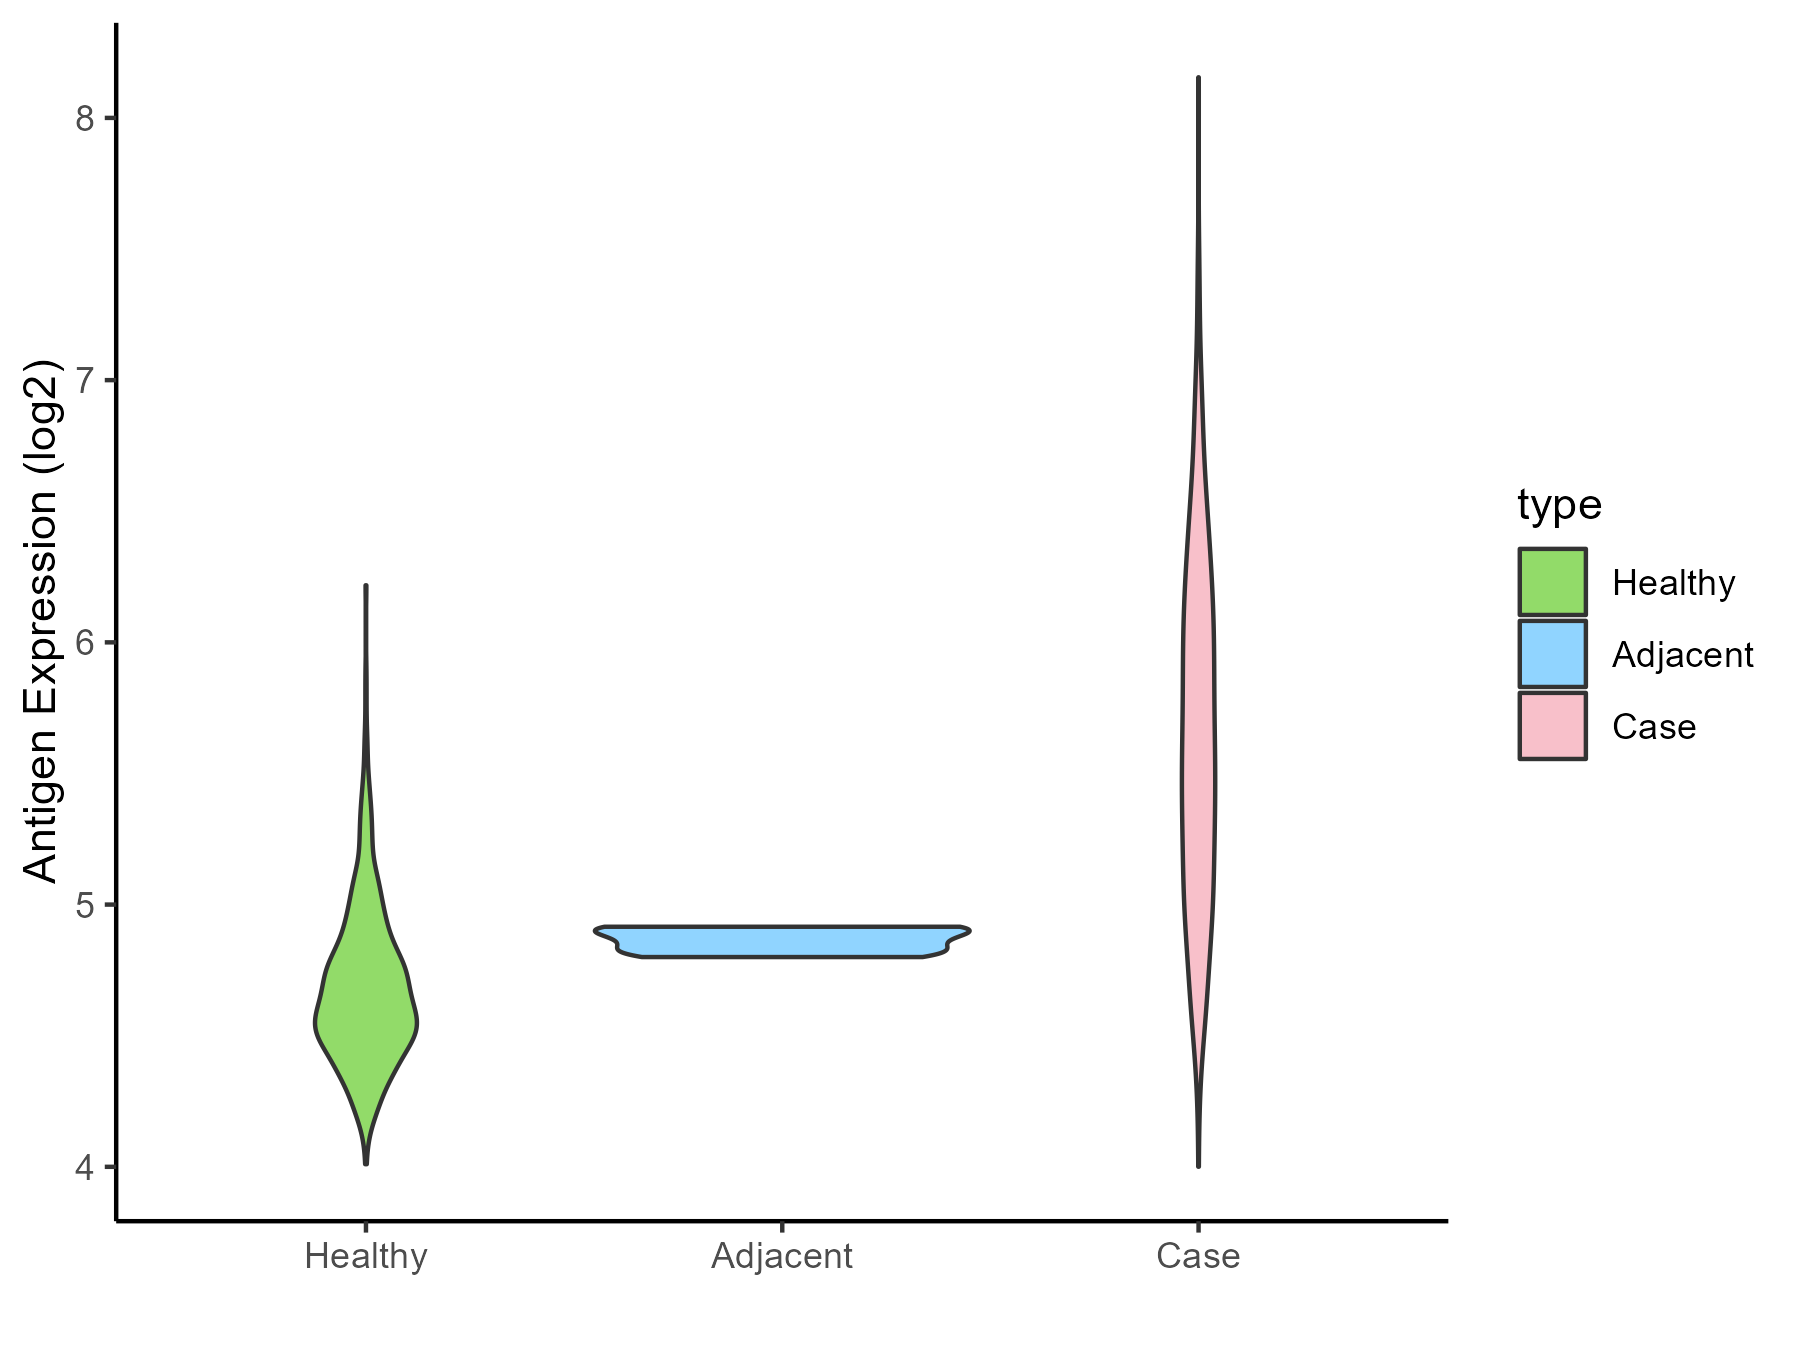
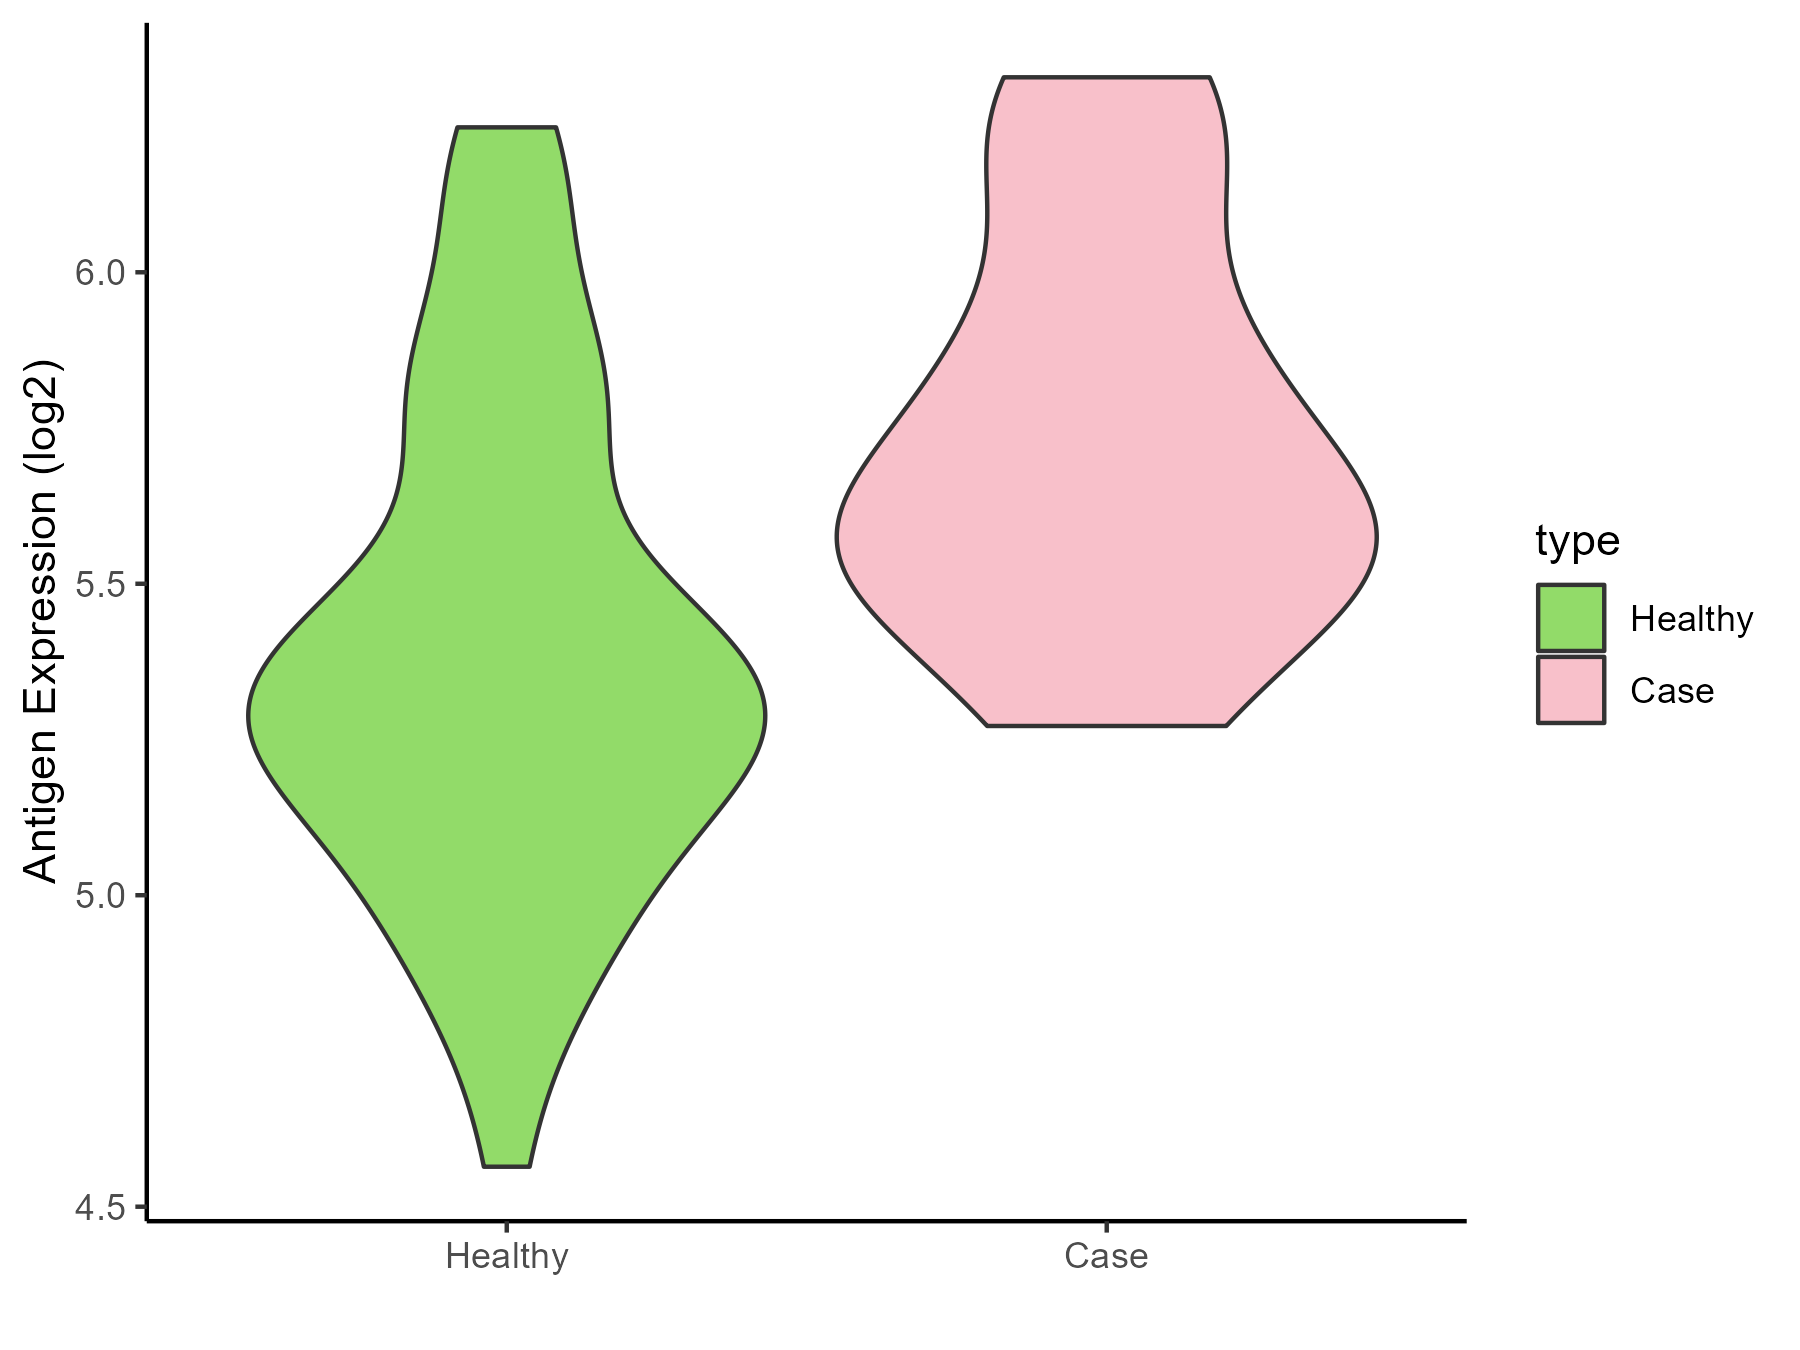
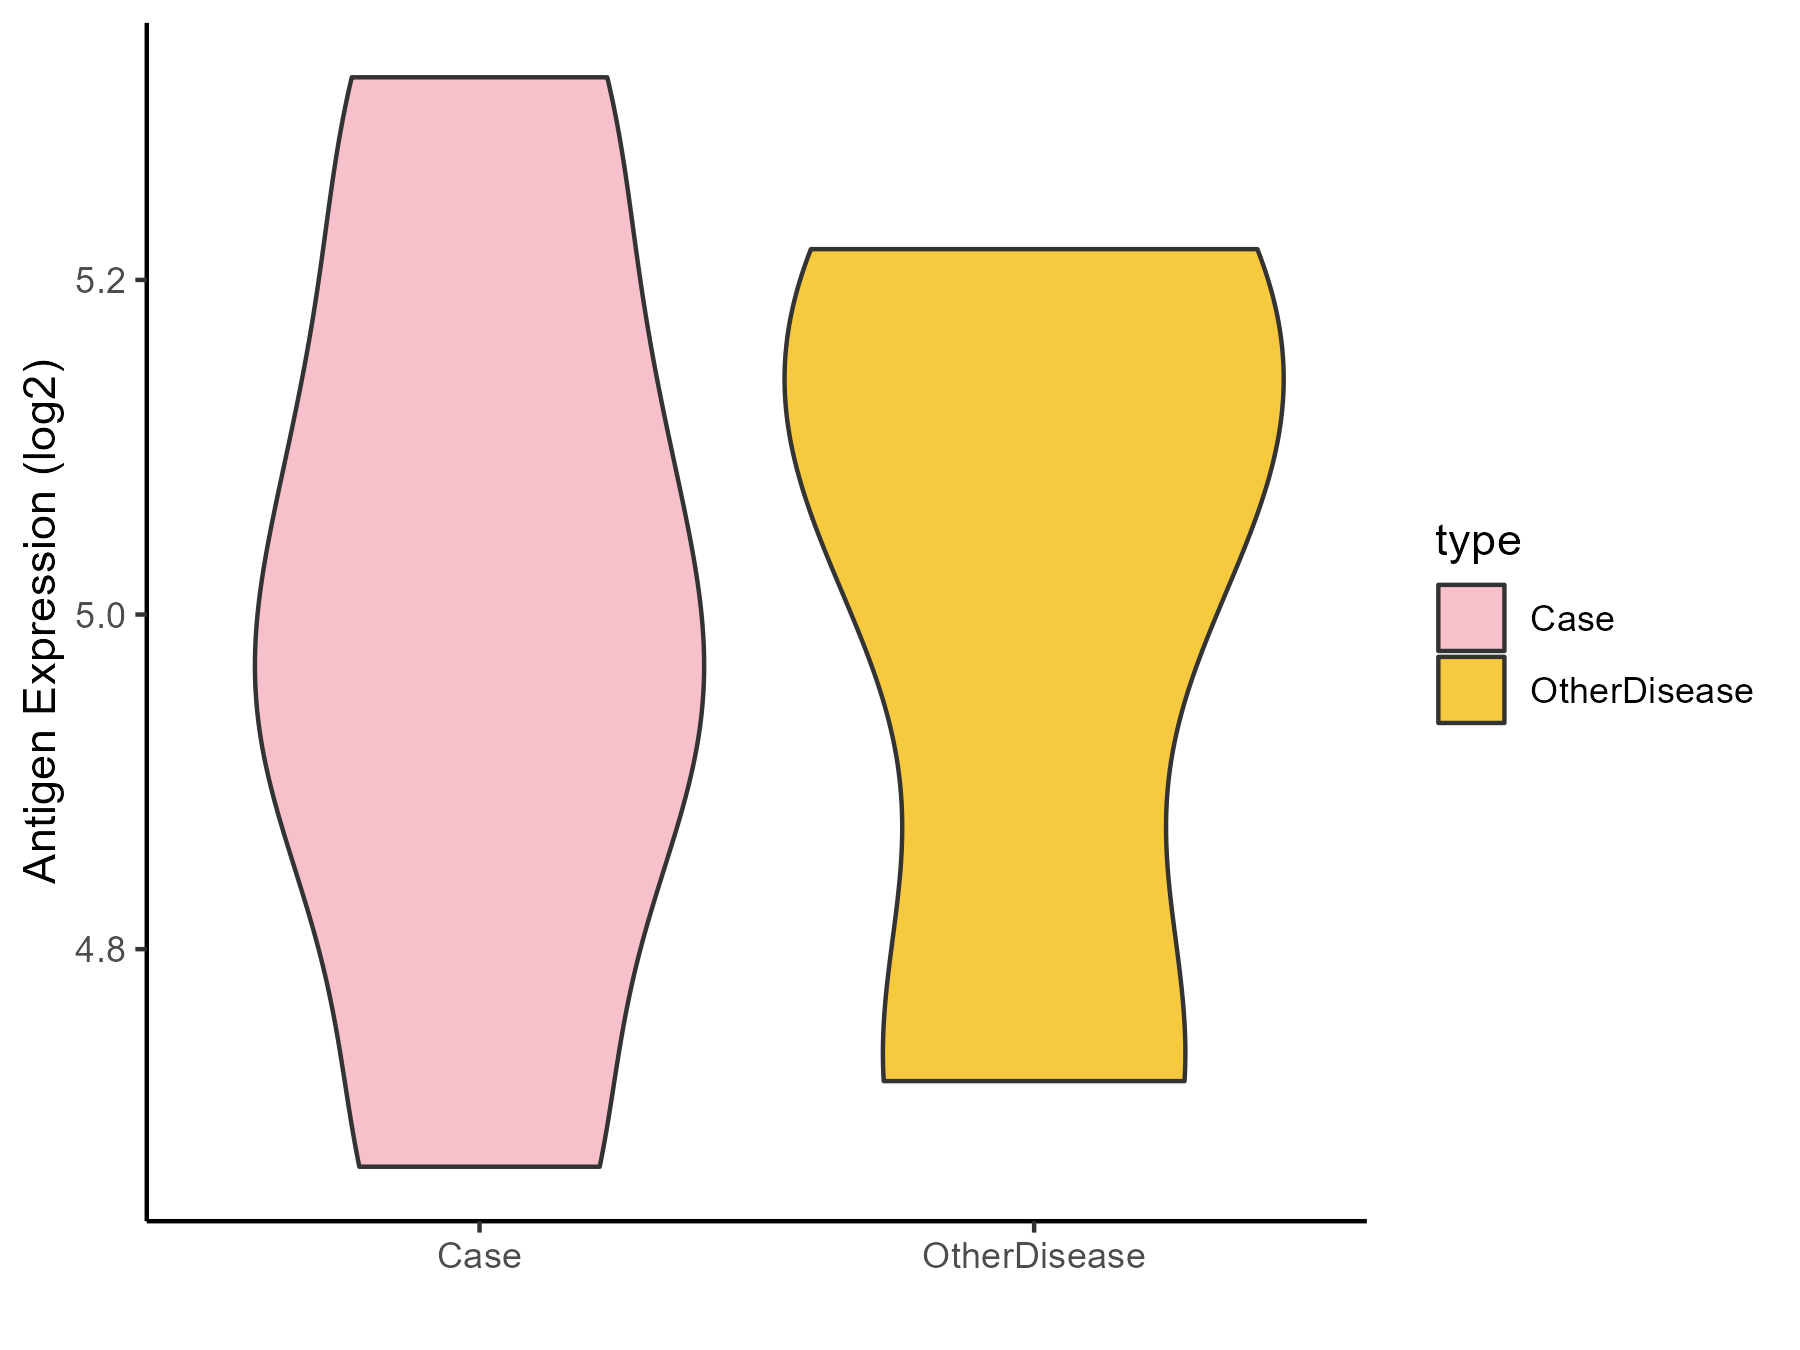
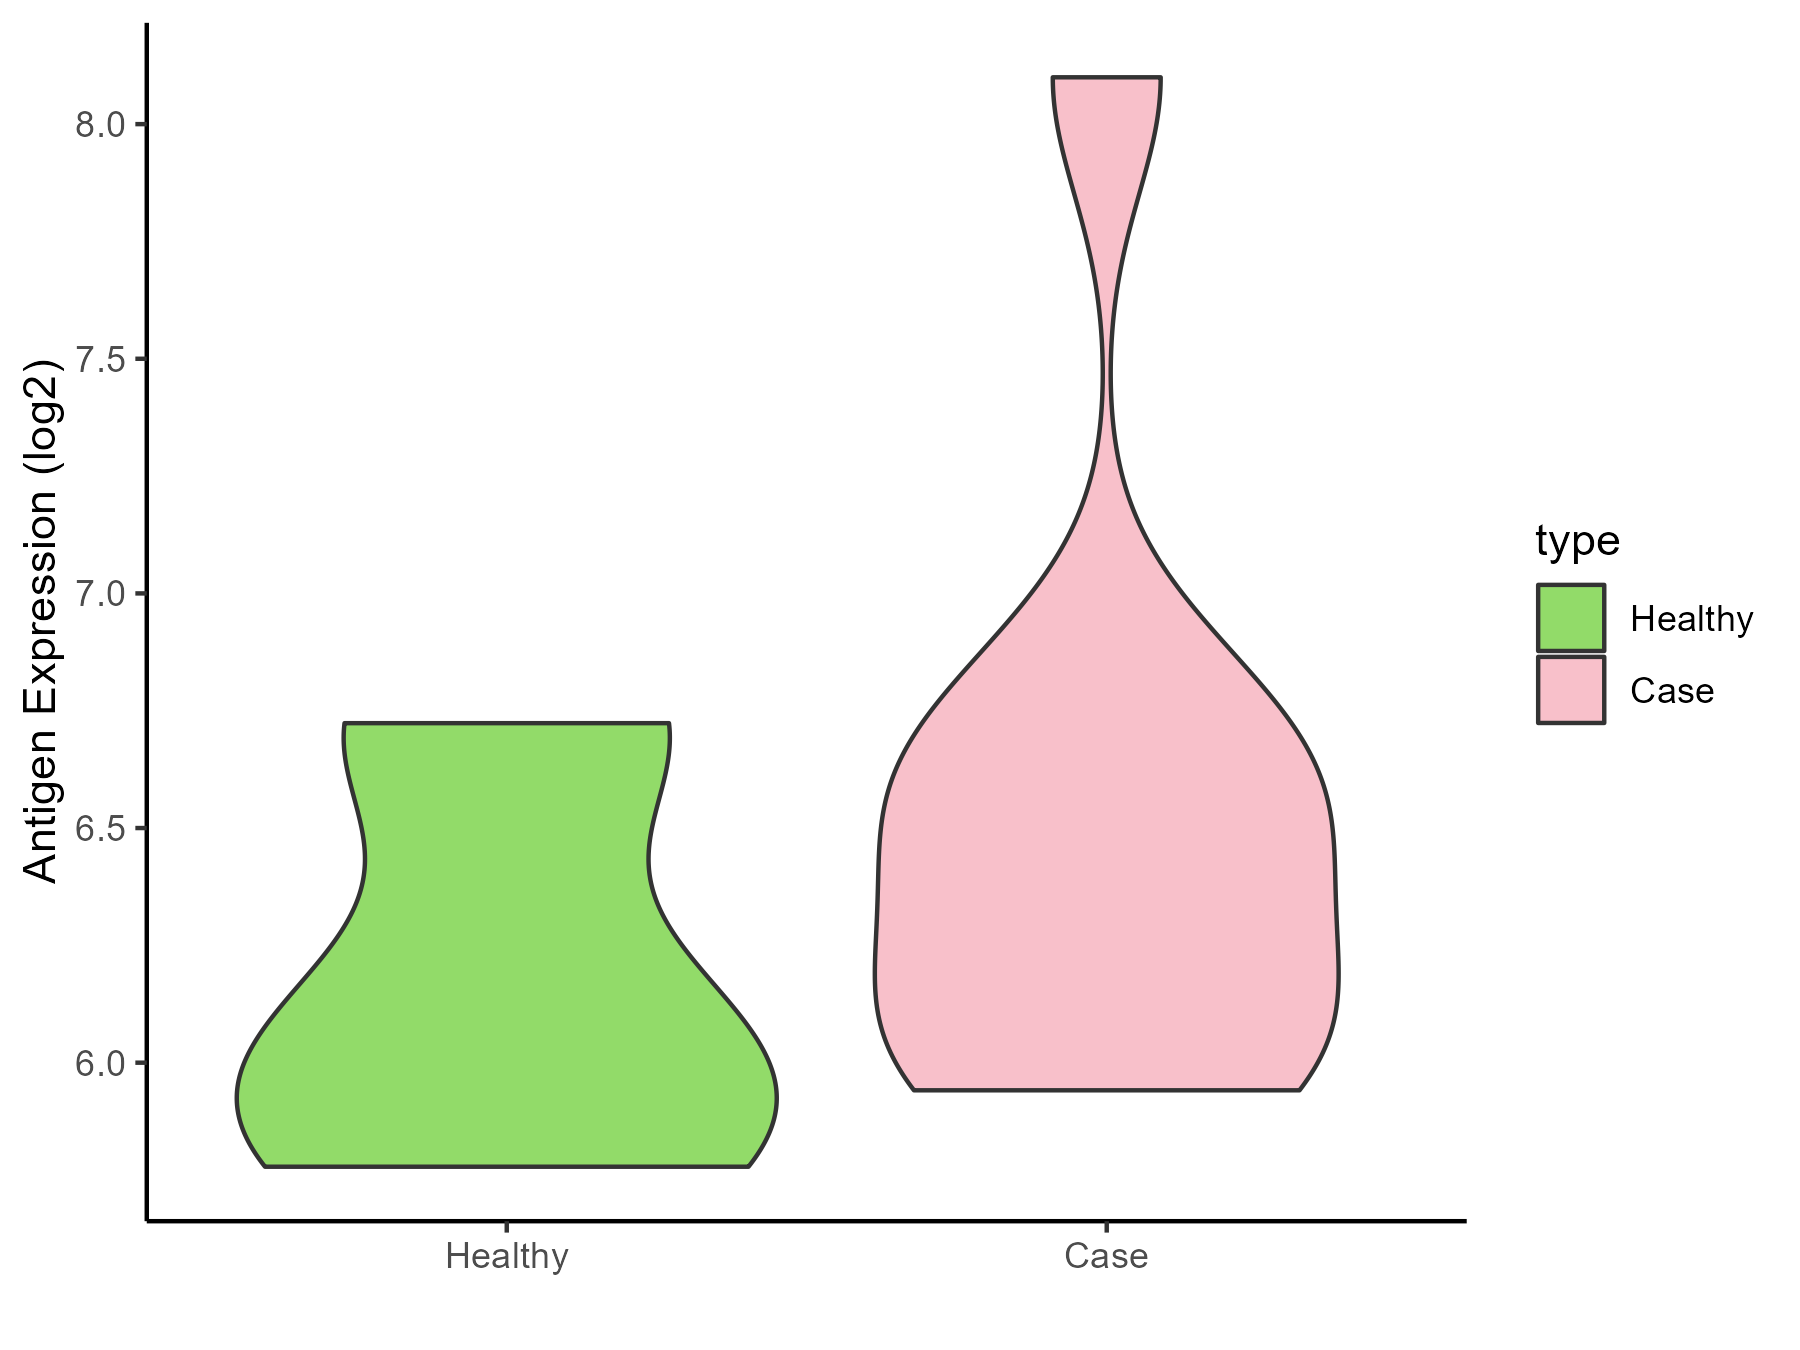
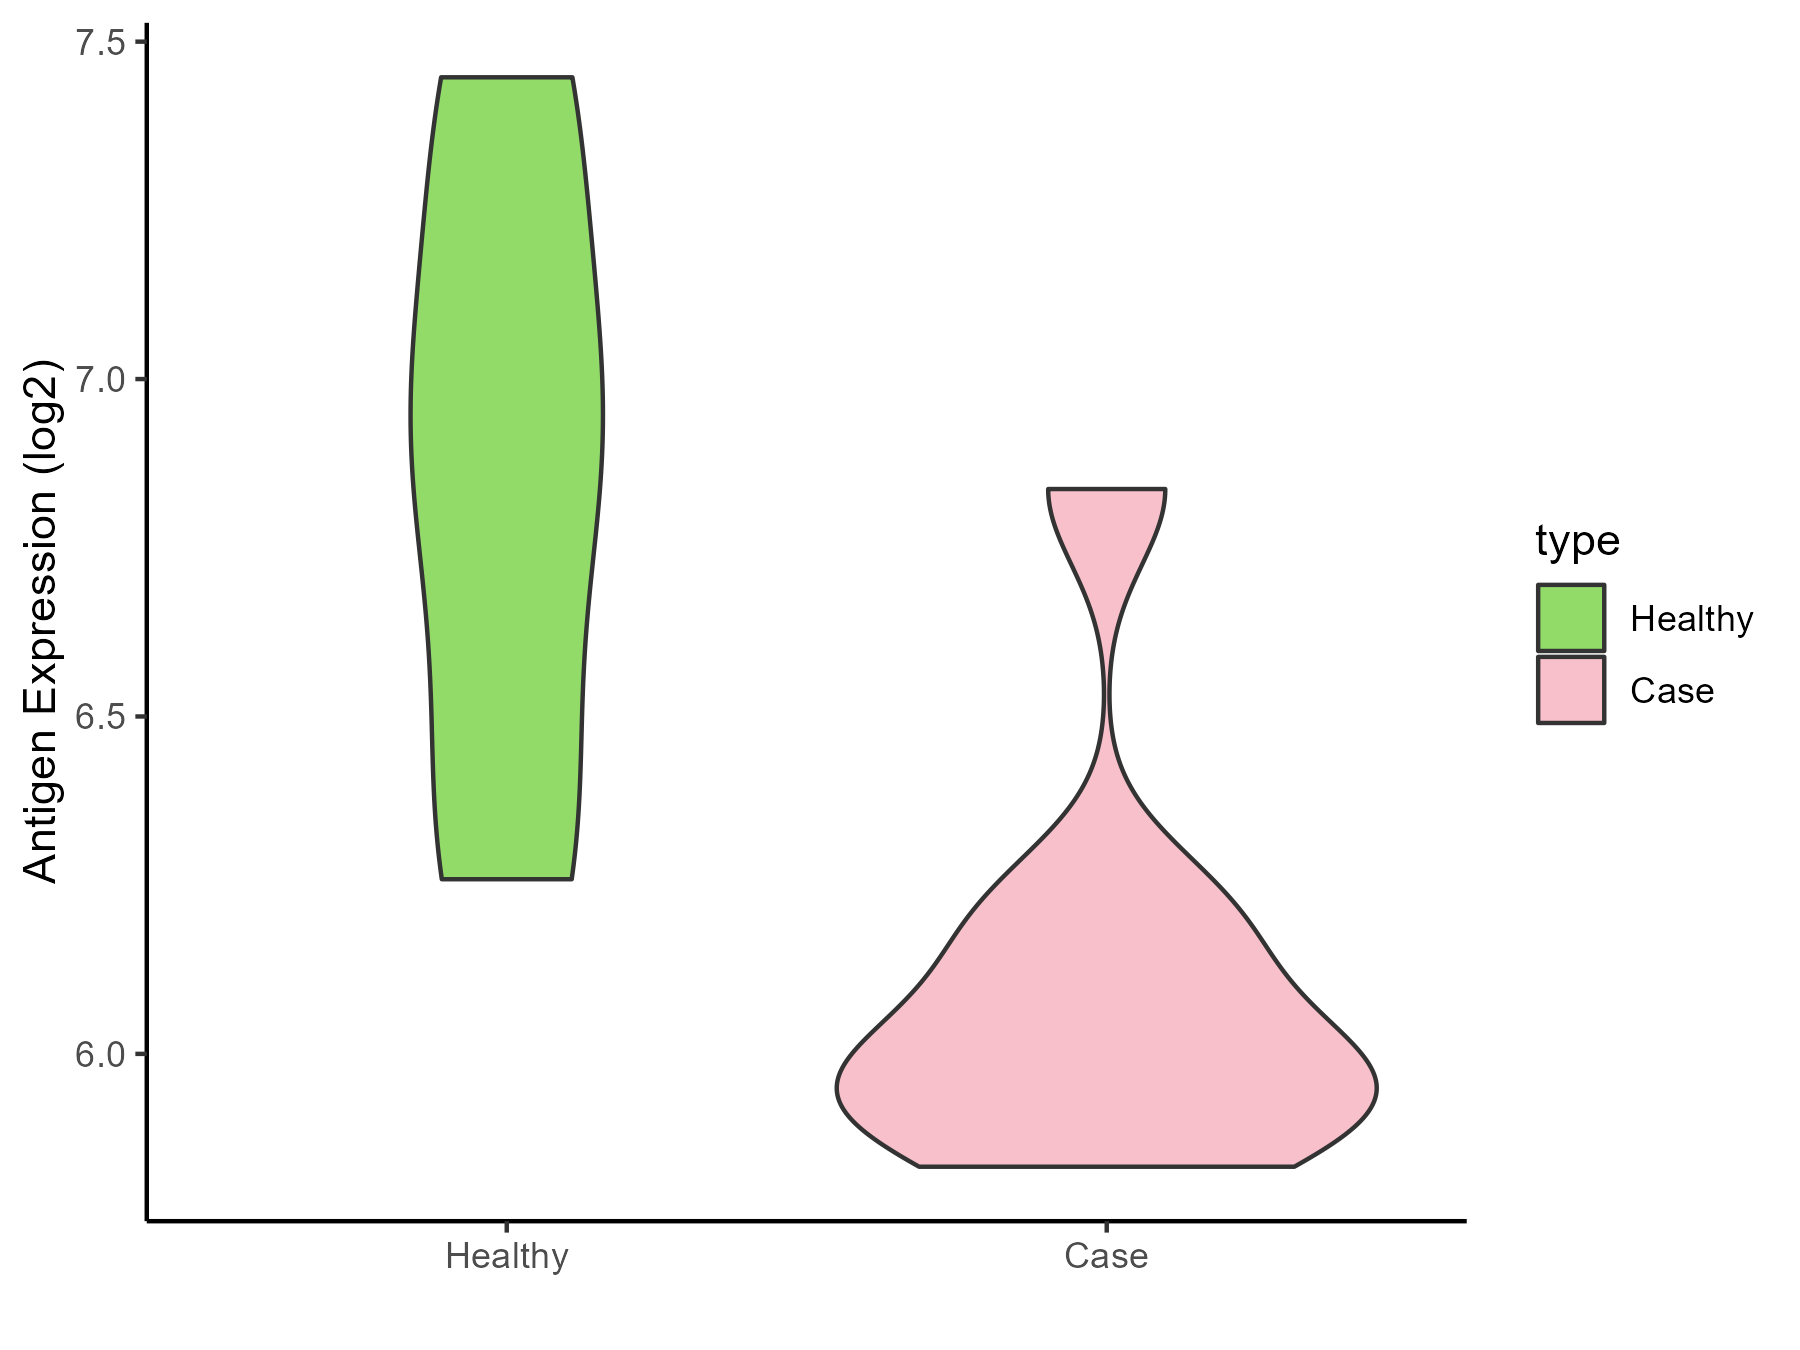
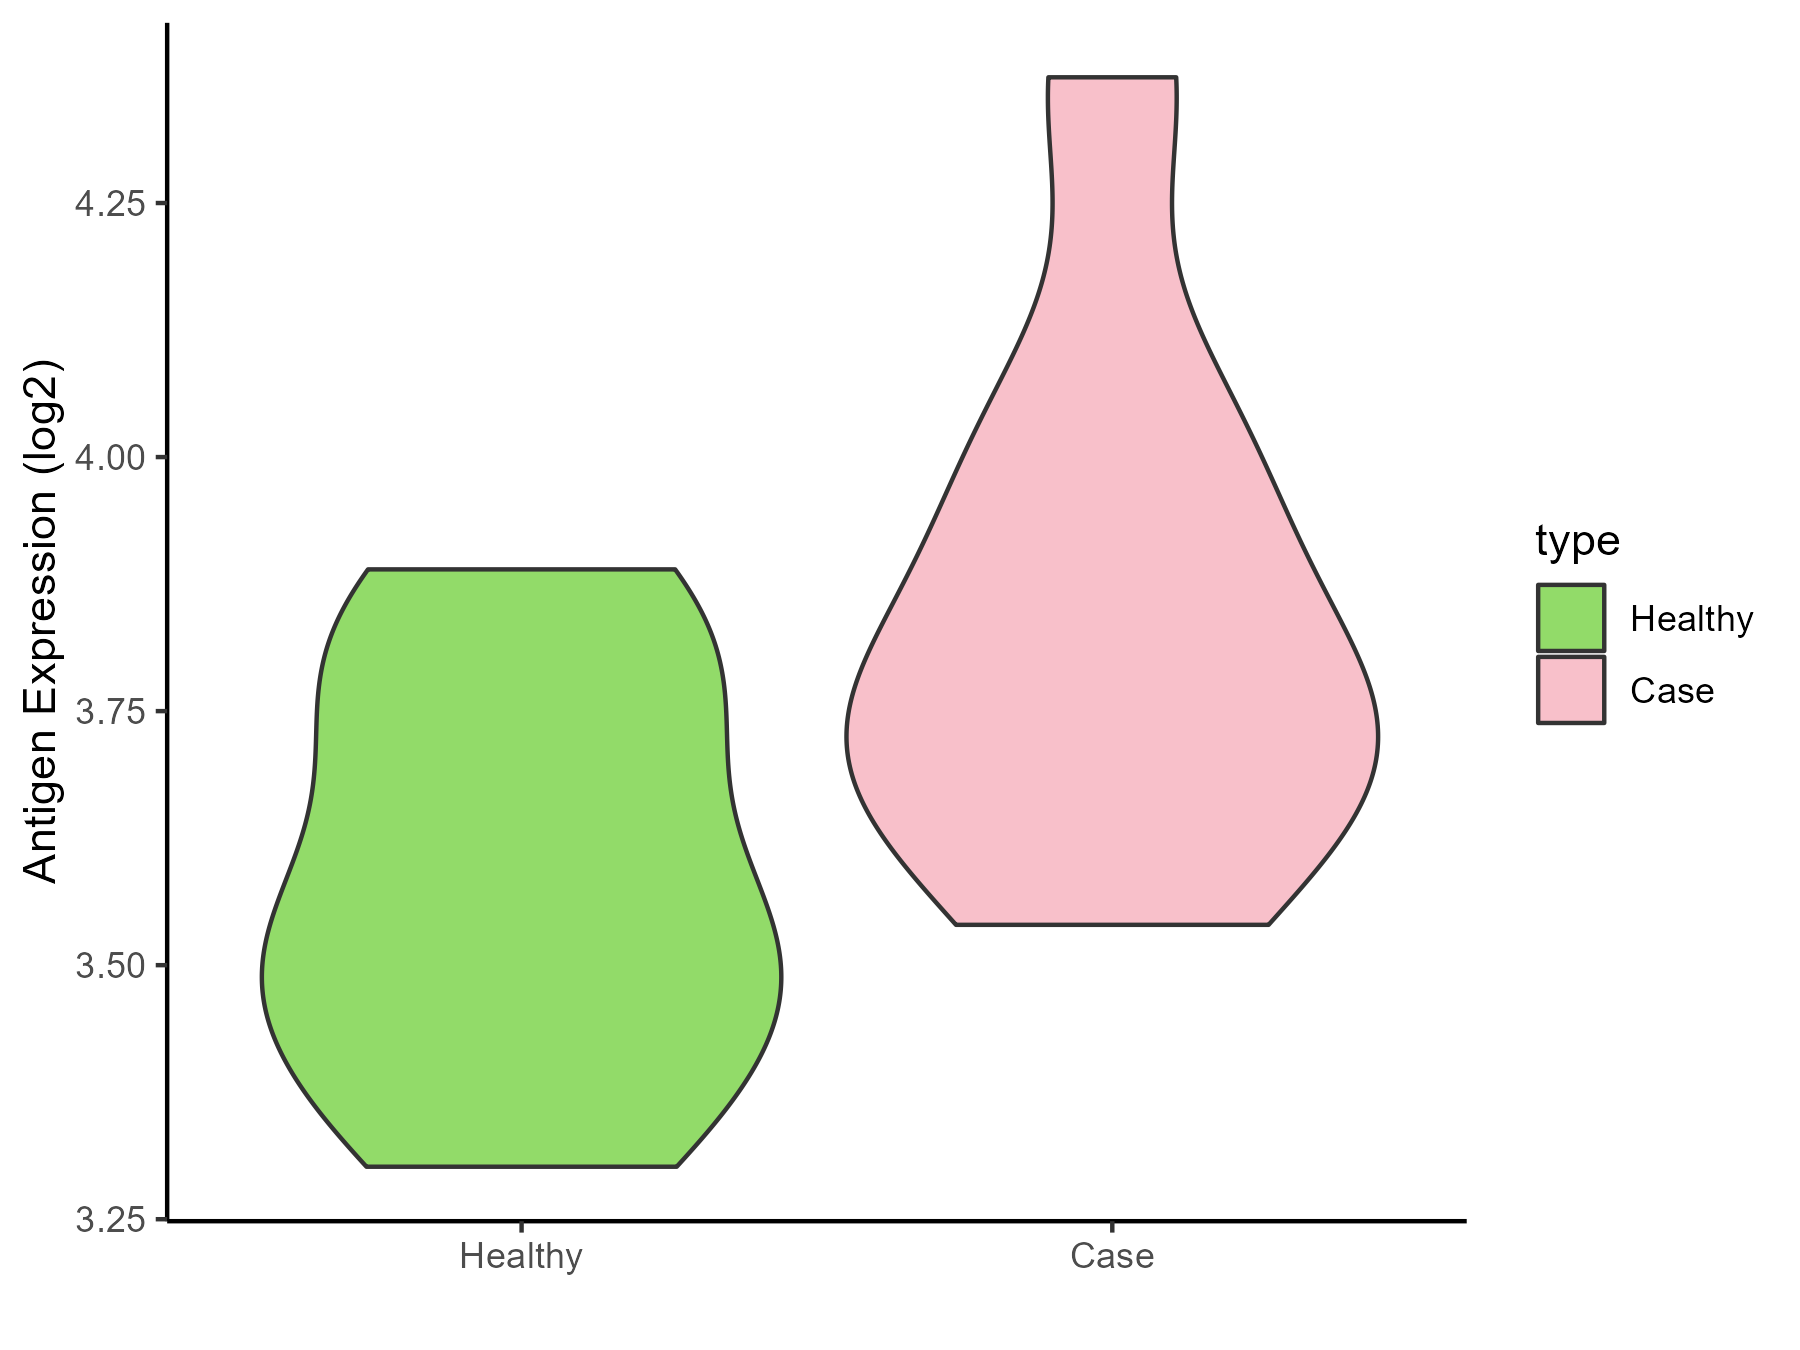
Liver cancer [ICD-11: 2C12]
Click to Show/Hide
| Differential expression pattern of antigen in diseases |
| The Studied Tissue |
Liver |
| The Specific Disease |
Liver cancer |
| The Expression Level of Disease Section Compare with the Healthy Individual Tissue |
p-value: 0.007139762;
Fold-change: -0.162279951;
Z-score: -0.36822792
|
| The Expression Level of Disease Section Compare with the Adjacent Tissue |
p-value: 0.022184812;
Fold-change: -0.03010412;
Z-score: -0.080098637
|
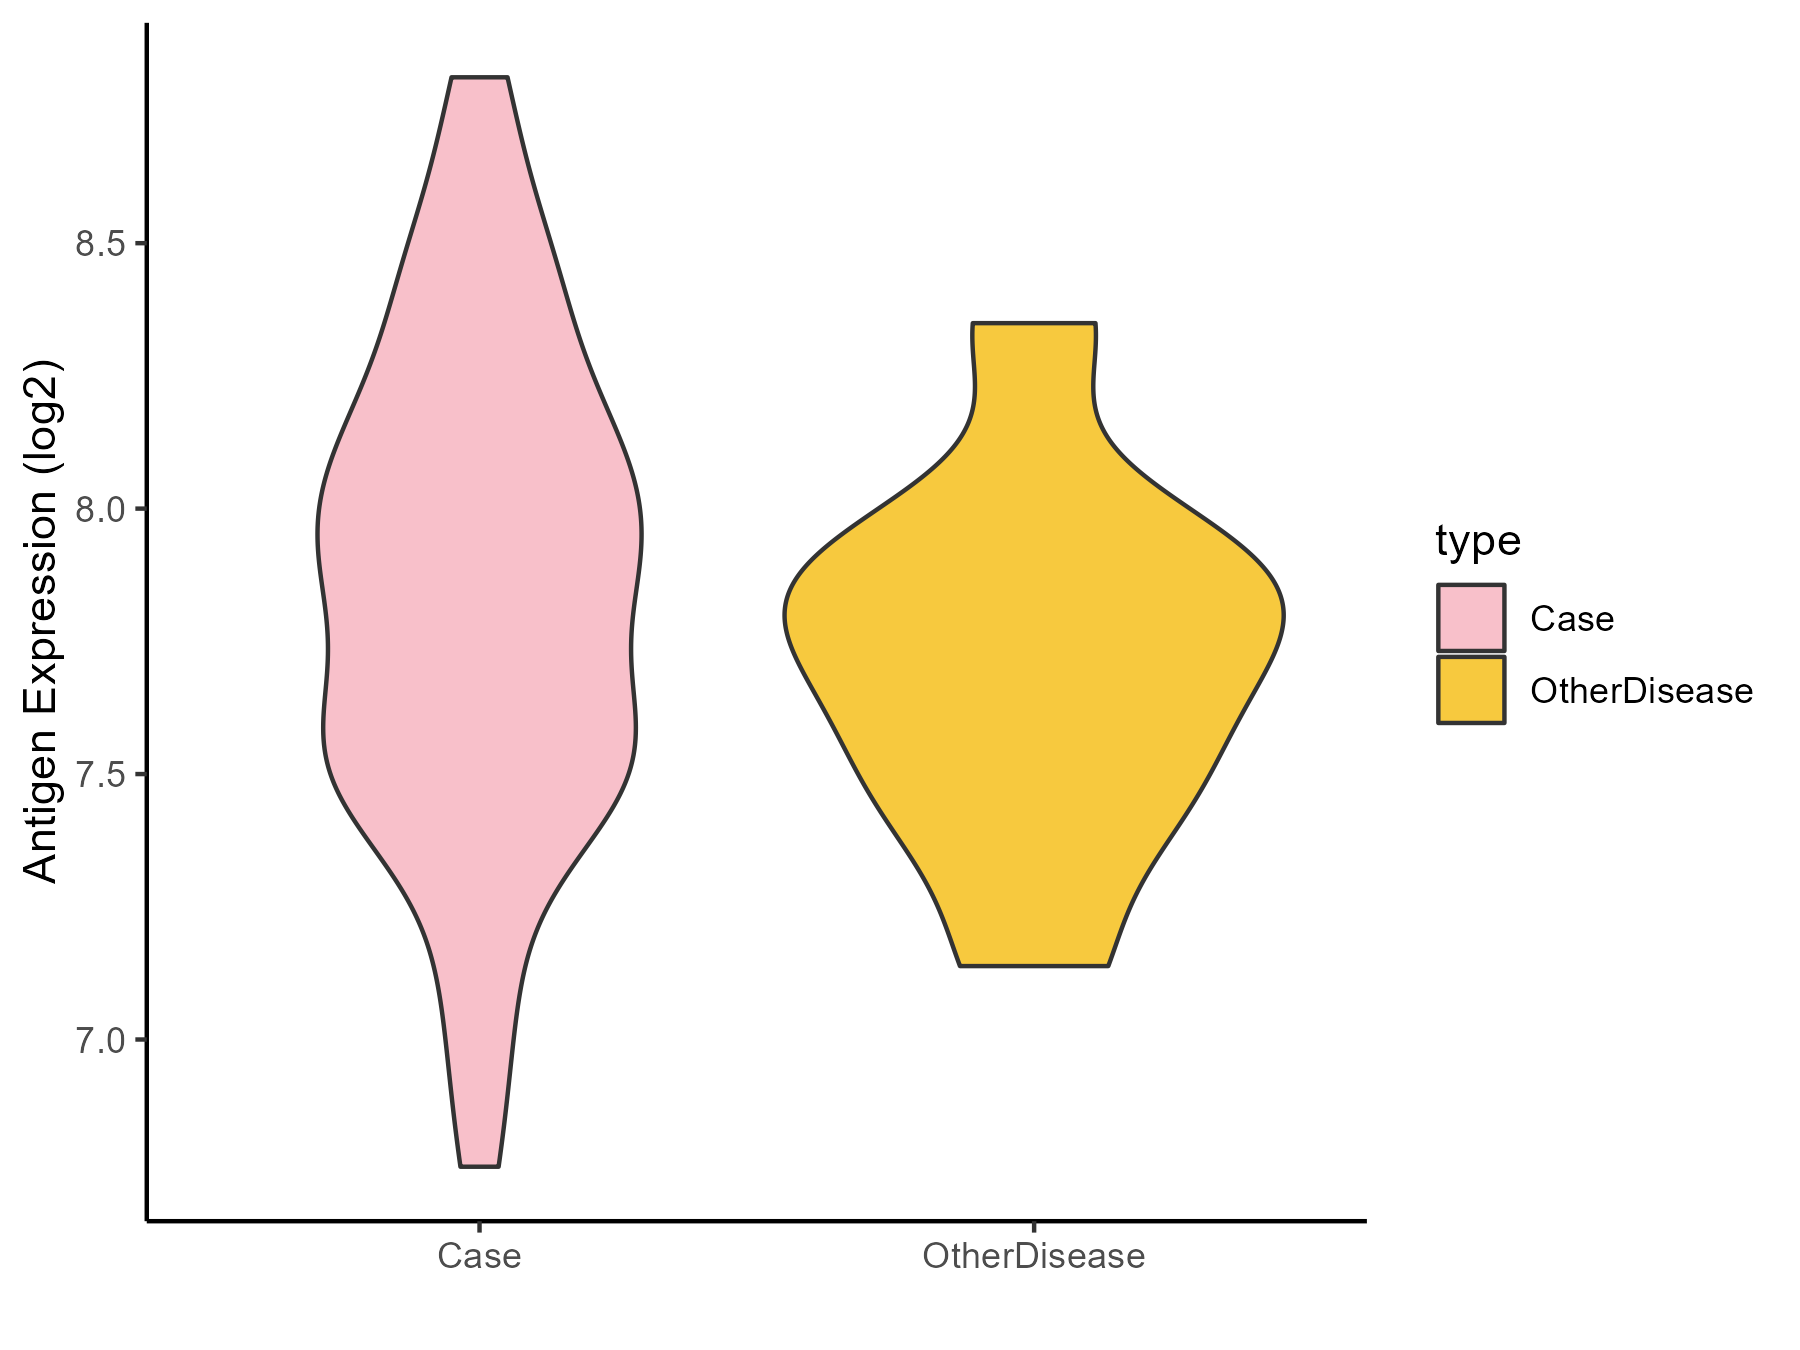
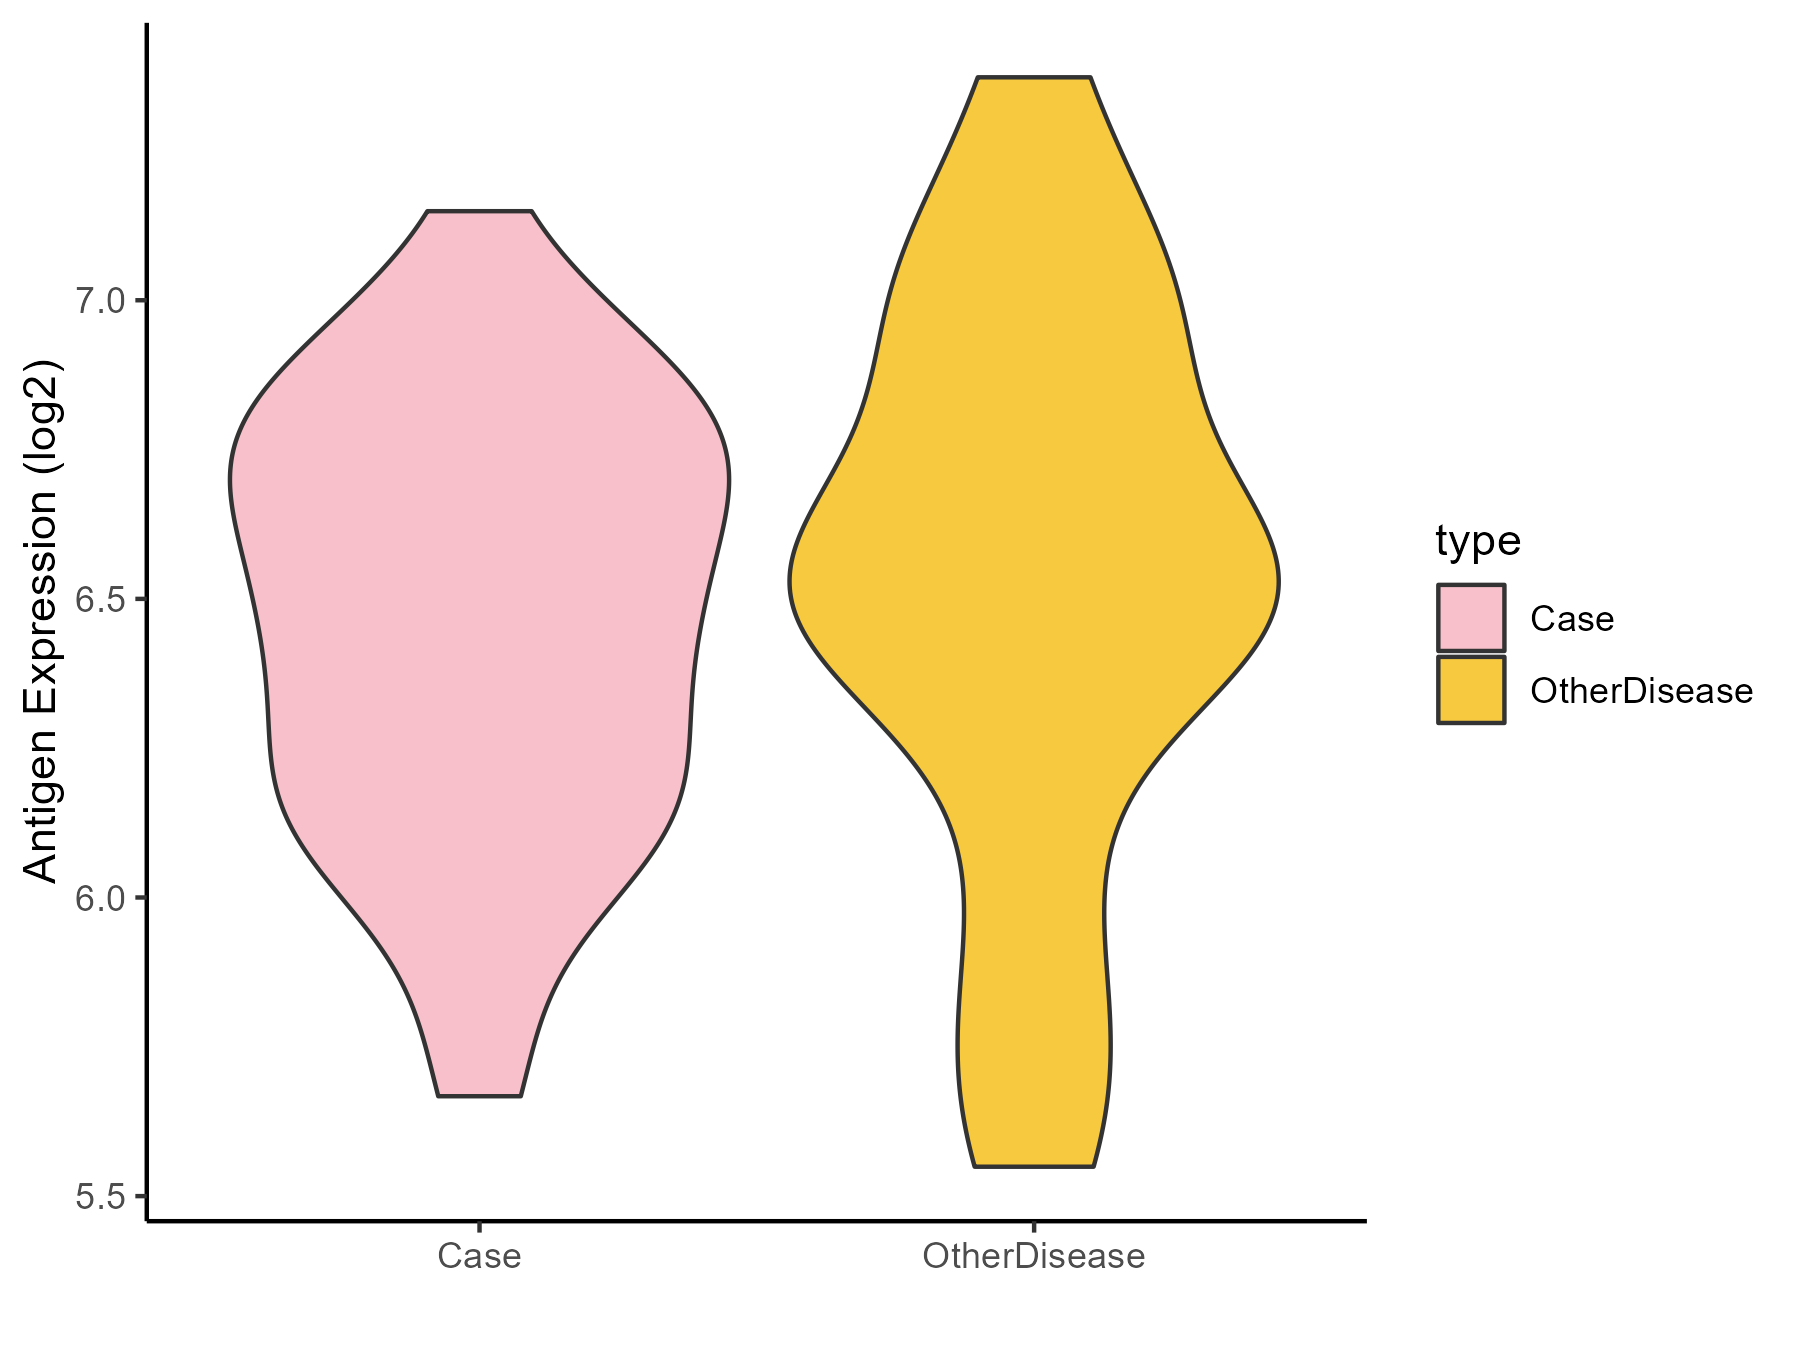
| The Expression Level of Disease Section Compare with the Other Disease Section |
p-value: 0.783569156;
Fold-change: -0.069175155;
Z-score: -0.105949029
|
| Disease-specific Antigen Abundances |
|
Click to View the Clearer Original Diagram
|
|
|
Lung cancer [ICD-11: 2C25]
Click to Show/Hide
| Differential expression pattern of antigen in diseases |
| The Studied Tissue |
Lung |
| The Specific Disease |
Lung cancer |
| The Expression Level of Disease Section Compare with the Healthy Individual Tissue |
p-value: 0.388566079;
Fold-change: -0.089551067;
Z-score: -0.206536516
|
| The Expression Level of Disease Section Compare with the Adjacent Tissue |
p-value: 0.649860281;
Fold-change: -0.010312485;
Z-score: -0.021525448
|
| Disease-specific Antigen Abundances |
|
Click to View the Clearer Original Diagram
|
|
|
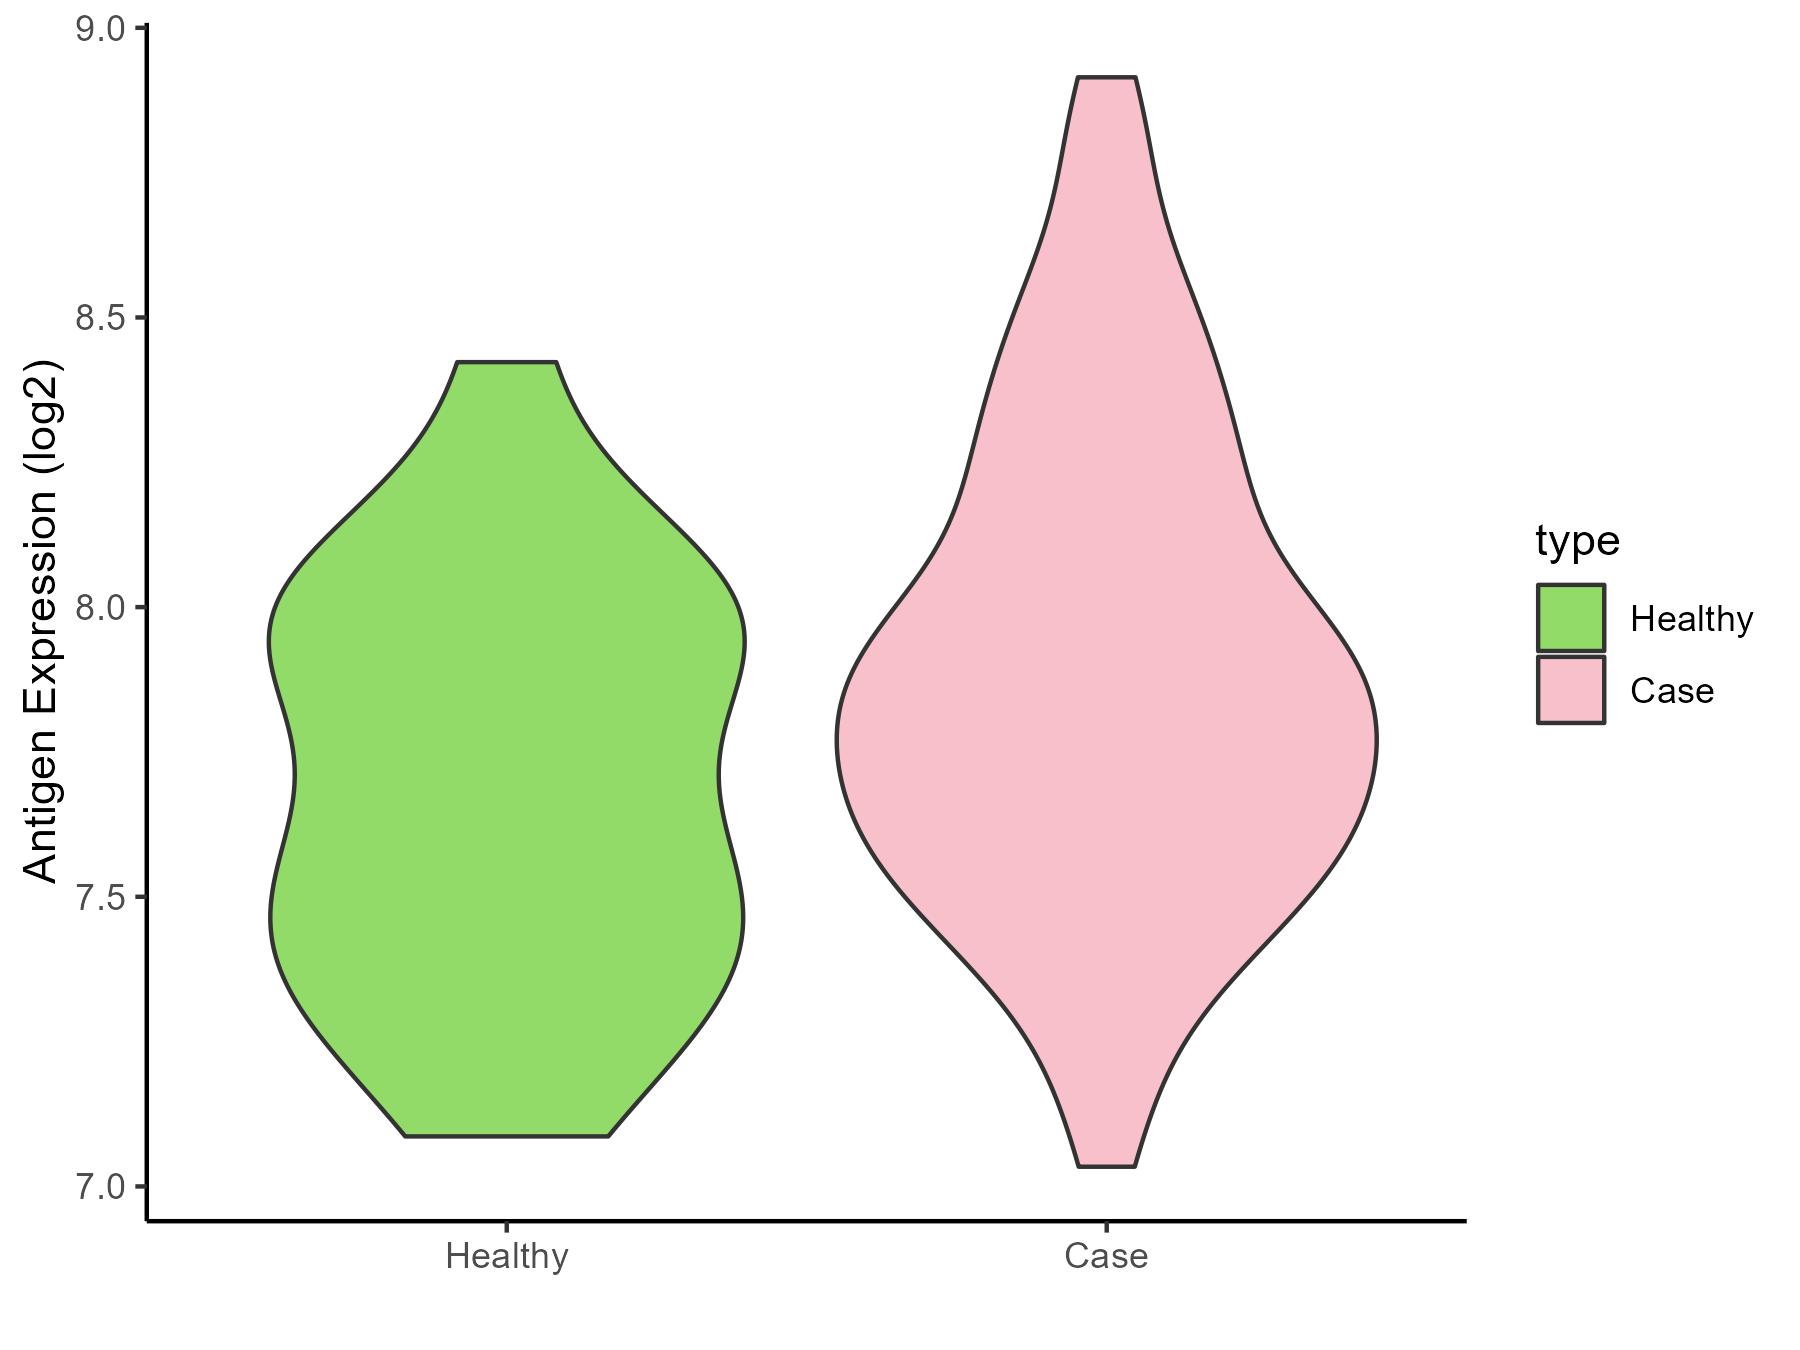
Melanoma [ICD-11: 2C30]
Click to Show/Hide
| Differential expression pattern of antigen in diseases |
| The Studied Tissue |
Skin |
| The Specific Disease |
Melanoma |
| The Expression Level of Disease Section Compare with the Healthy Individual Tissue |
p-value: 0.03589619;
Fold-change: 0.648198927;
Z-score: 0.615904006
|
| Disease-specific Antigen Abundances |
|
Click to View the Clearer Original Diagram
|
|
|
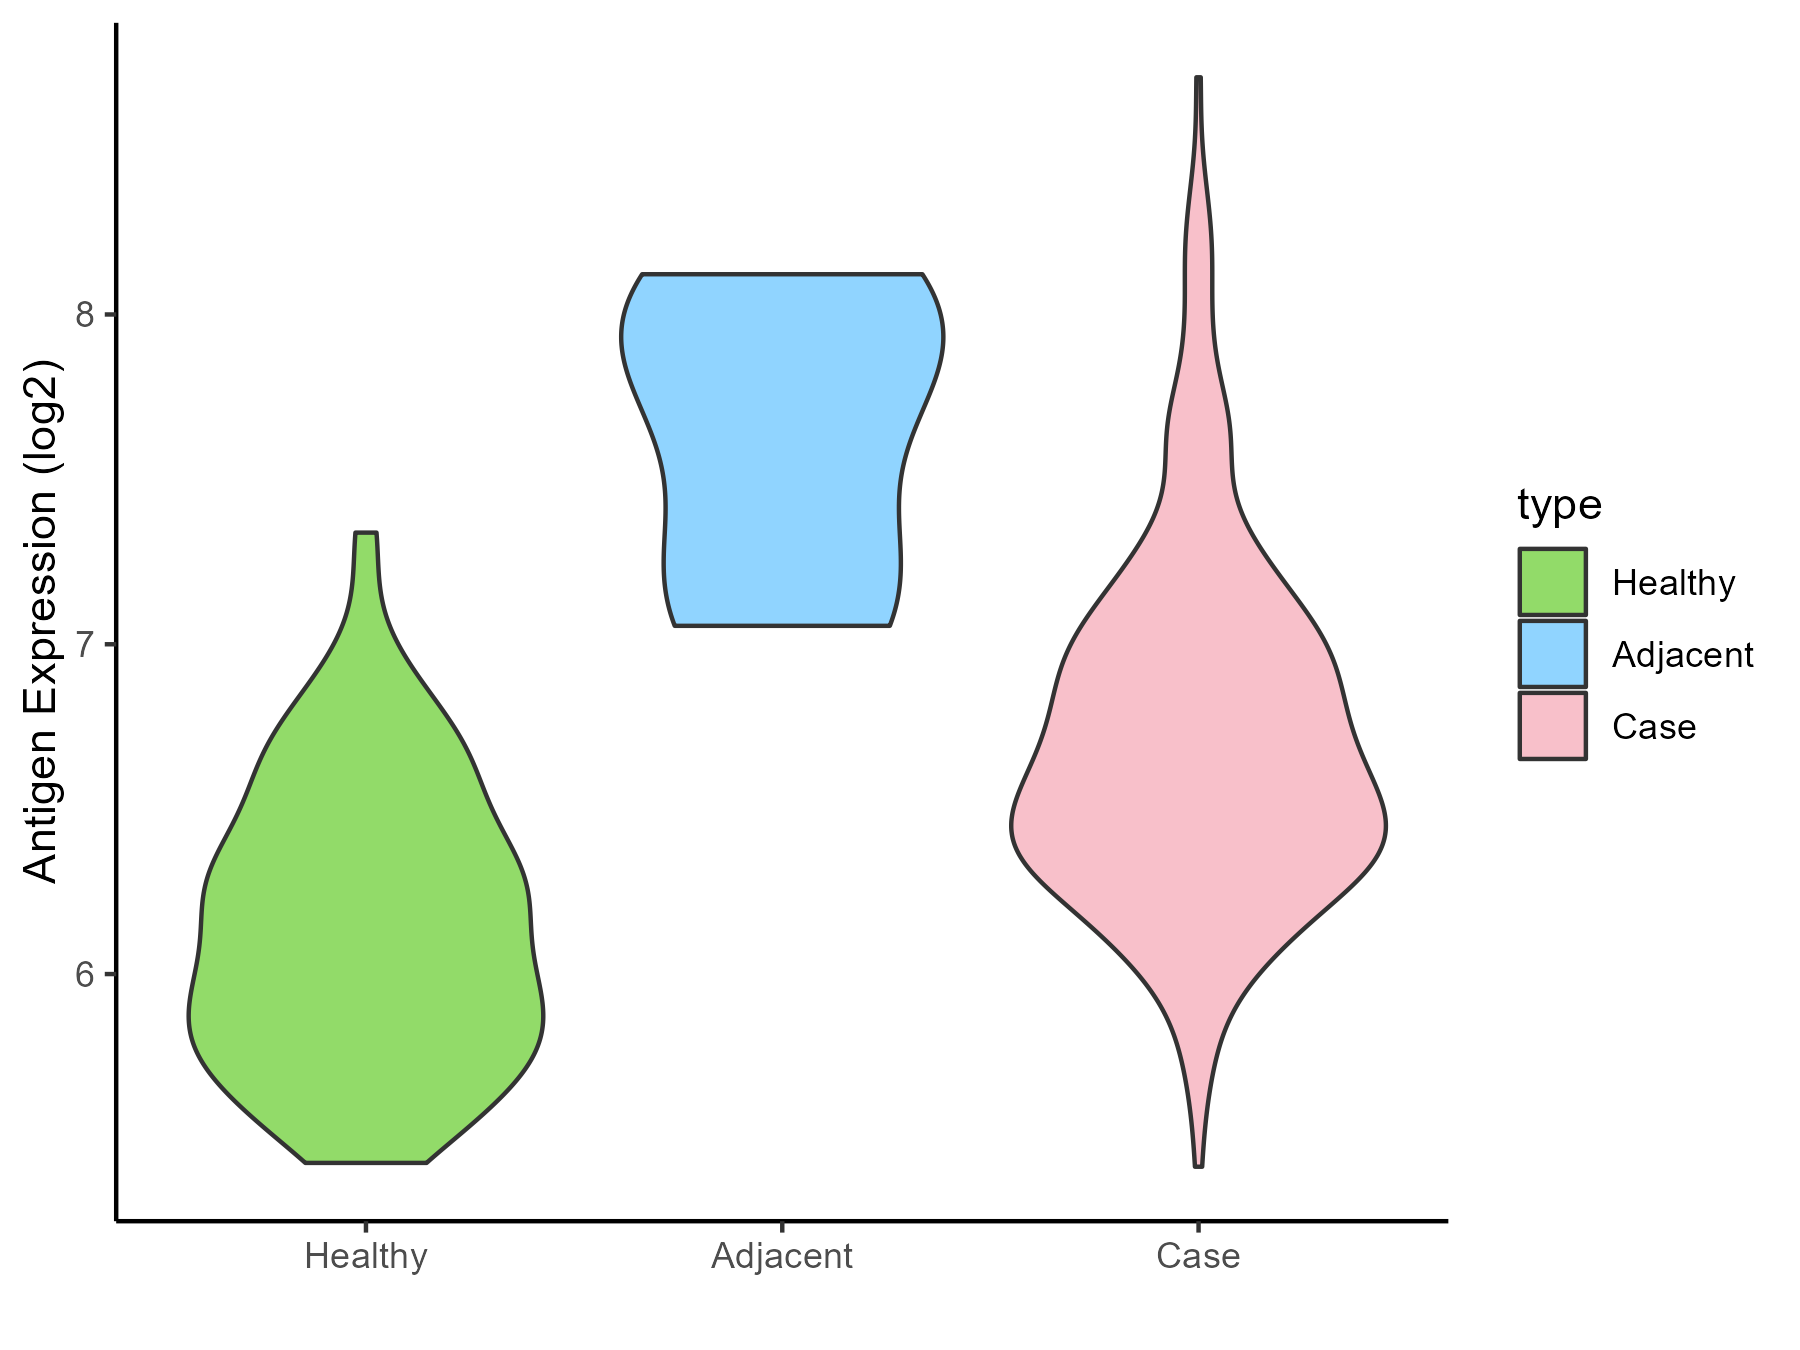
Sarcoma [ICD-11: 2C35]
Click to Show/Hide
| Differential expression pattern of antigen in diseases |
| The Studied Tissue |
Muscle |
| The Specific Disease |
Sarcoma |
| The Expression Level of Disease Section Compare with the Healthy Individual Tissue |
p-value: 3.70E-138;
Fold-change: 0.979688106;
Z-score: 3.24961539
|
| The Expression Level of Disease Section Compare with the Adjacent Tissue |
p-value: 5.78E-11;
Fold-change: 0.747735518;
Z-score: 13.59685628
|
| Disease-specific Antigen Abundances |
|
Click to View the Clearer Original Diagram
|
|
|
Breast cancer [ICD-11: 2C60]
Click to Show/Hide
| Differential expression pattern of antigen in diseases |
| The Studied Tissue |
Breast |
| The Specific Disease |
Breast cancer |
| The Expression Level of Disease Section Compare with the Healthy Individual Tissue |
p-value: 5.40E-21;
Fold-change: 0.222501495;
Z-score: 0.69030227
|
| The Expression Level of Disease Section Compare with the Adjacent Tissue |
p-value: 0.660967197;
Fold-change: -0.055803374;
Z-score: -0.183892143
|
| Disease-specific Antigen Abundances |
|
Click to View the Clearer Original Diagram
|
|
|
Ovarian cancer [ICD-11: 2C73]
Click to Show/Hide
| Differential expression pattern of antigen in diseases |
| The Studied Tissue |
Ovarian |
| The Specific Disease |
Ovarian cancer |
| The Expression Level of Disease Section Compare with the Healthy Individual Tissue |
p-value: 0.31987142;
Fold-change: 0.446101436;
Z-score: 0.682012909
|
| The Expression Level of Disease Section Compare with the Adjacent Tissue |
p-value: 0.103415208;
Fold-change: 0.255752613;
Z-score: 0.154503165
|
| Disease-specific Antigen Abundances |
|
Click to View the Clearer Original Diagram
|
|
|
Cervical cancer [ICD-11: 2C77]
Click to Show/Hide
| Differential expression pattern of antigen in diseases |
| The Studied Tissue |
Cervical |
| The Specific Disease |
Cervical cancer |
| The Expression Level of Disease Section Compare with the Healthy Individual Tissue |
p-value: 0.04258277;
Fold-change: 0.192199311;
Z-score: 0.532578099
|
| Disease-specific Antigen Abundances |
|
Click to View the Clearer Original Diagram
|
|
|
Uterine cancer [ICD-11: 2C78]
Click to Show/Hide
| Differential expression pattern of antigen in diseases |
| The Studied Tissue |
Endometrium |
| The Specific Disease |
Uterine cancer |
| The Expression Level of Disease Section Compare with the Healthy Individual Tissue |
p-value: 3.72E-26;
Fold-change: 0.520599516;
Z-score: 1.223848617
|
| The Expression Level of Disease Section Compare with the Adjacent Tissue |
p-value: 0.010980047;
Fold-change: -1.168014383;
Z-score: -2.521130909
|
| Disease-specific Antigen Abundances |
|
Click to View the Clearer Original Diagram
|
|
|
Prostate cancer [ICD-11: 2C82]
Click to Show/Hide
| Differential expression pattern of antigen in diseases |
| The Studied Tissue |
Prostate |
| The Specific Disease |
Prostate cancer |
| The Expression Level of Disease Section Compare with the Healthy Individual Tissue |
p-value: 0.023702341;
Fold-change: -0.399365796;
Z-score: -0.902320044
|
| Disease-specific Antigen Abundances |
|
Click to View the Clearer Original Diagram
|
|
|
Bladder cancer [ICD-11: 2C94]
Click to Show/Hide
| Differential expression pattern of antigen in diseases |
| The Studied Tissue |
Bladder |
| The Specific Disease |
Bladder cancer |
| The Expression Level of Disease Section Compare with the Healthy Individual Tissue |
p-value: 0.00010146;
Fold-change: -0.308400813;
Z-score: -2.672023894
|
| Disease-specific Antigen Abundances |
|
Click to View the Clearer Original Diagram
|
|
|
Retina cancer [ICD-11: 2D02]
Click to Show/Hide
| Differential expression pattern of antigen in diseases |
| The Studied Tissue |
Uvea |
| The Specific Disease |
Retinoblastoma tumor |
| The Expression Level of Disease Section Compare with the Healthy Individual Tissue |
p-value: 0.00180027;
Fold-change: 0.532731485;
Z-score: 2.137625704
|
| Disease-specific Antigen Abundances |
|
Click to View the Clearer Original Diagram
|
|
|
Thyroid cancer [ICD-11: 2D10]
Click to Show/Hide
| Differential expression pattern of antigen in diseases |
| The Studied Tissue |
Thyroid |
| The Specific Disease |
Thyroid cancer |
| The Expression Level of Disease Section Compare with the Healthy Individual Tissue |
p-value: 7.19E-60;
Fold-change: 0.963582881;
Z-score: 3.090066497
|
| The Expression Level of Disease Section Compare with the Adjacent Tissue |
p-value: 6.57E-19;
Fold-change: 0.776076491;
Z-score: 2.23346465
|
| Disease-specific Antigen Abundances |
|
Click to View the Clearer Original Diagram
|
|
|
Adrenal cancer [ICD-11: 2D11]
Click to Show/Hide
| Differential expression pattern of antigen in diseases |
| The Studied Tissue |
Adrenal cortex |
| The Specific Disease |
Adrenocortical carcinoma |
| The Expression Level of Disease Section Compare with the Other Disease Section |
p-value: 0.162305688;
Fold-change: 0.160173229;
Z-score: 0.474630461
|
| Disease-specific Antigen Abundances |
|
Click to View the Clearer Original Diagram
|
|
|
Head and neck cancer [ICD-11: 2D42]
Click to Show/Hide
| Differential expression pattern of antigen in diseases |
| The Studied Tissue |
Head and neck |
| The Specific Disease |
Head and neck cancer |
| The Expression Level of Disease Section Compare with the Healthy Individual Tissue |
p-value: 1.58E-31;
Fold-change: 0.798754537;
Z-score: 2.027534473
|
| Disease-specific Antigen Abundances |
|
Click to View the Clearer Original Diagram
|
|
|
Pituitary cancer [ICD-11: 2F37]
Click to Show/Hide
| Differential expression pattern of antigen in diseases |
| The Studied Tissue |
Pituitary |
| The Specific Disease |
Pituitary gonadotrope tumor |
| The Expression Level of Disease Section Compare with the Healthy Individual Tissue |
p-value: 0.03681625;
Fold-change: -0.263421112;
Z-score: -0.64386451
|
| Disease-specific Antigen Abundances |
|
Click to View the Clearer Original Diagram
|
|
|
| The Studied Tissue |
Pituitary |
| The Specific Disease |
Pituitary cancer |
| The Expression Level of Disease Section Compare with the Healthy Individual Tissue |
p-value: 0.092159336;
Fold-change: -0.217616393;
Z-score: -0.499919568
|
| Disease-specific Antigen Abundances |
|
Click to View the Clearer Original Diagram
|
|
|
ICD Disease Classification 03
Click to Show/Hide the 1 Disease of This Class
Thrombocytopenia [ICD-11: 3B64]
Click to Show/Hide
| Differential expression pattern of antigen in diseases |
| The Studied Tissue |
Whole blood |
| The Specific Disease |
Thrombocytopenia |
| The Expression Level of Disease Section Compare with the Healthy Individual Tissue |
p-value: 0.344171918;
Fold-change: 0.115535934;
Z-score: 0.273211622
|
| Disease-specific Antigen Abundances |
|
Click to View the Clearer Original Diagram
|
|
|
ICD Disease Classification 04
Click to Show/Hide the 2 Disease of This Class
Lupus erythematosus [ICD-11: 4A40]
Click to Show/Hide
| Differential expression pattern of antigen in diseases |
| The Studied Tissue |
Whole blood |
| The Specific Disease |
Lupus erythematosus |
| The Expression Level of Disease Section Compare with the Healthy Individual Tissue |
p-value: 0.032867704;
Fold-change: -0.000137966;
Z-score: -0.000437512
|
| Disease-specific Antigen Abundances |
|
Click to View the Clearer Original Diagram
|
|
|
Autoimmune disease [ICD-11: 4A4Z]
Click to Show/Hide
| Differential expression pattern of antigen in diseases |
| The Studied Tissue |
Peripheral monocyte |
| The Specific Disease |
Autoimmune uveitis |
| The Expression Level of Disease Section Compare with the Healthy Individual Tissue |
p-value: 0.101753671;
Fold-change: -0.573496282;
Z-score: -1.468482565
|
| Disease-specific Antigen Abundances |
|
Click to View the Clearer Original Diagram
|
|
|
ICD Disease Classification 05
Click to Show/Hide the 1 Disease of This Class
Hyperlipoproteinaemia [ICD-11: 5C80]
Click to Show/Hide
| Differential expression pattern of antigen in diseases |
| The Studied Tissue |
Whole blood |
| The Specific Disease |
Familial hypercholesterolemia |
| The Expression Level of Disease Section Compare with the Healthy Individual Tissue |
p-value: 0.016431838;
Fold-change: 0.319956074;
Z-score: 0.822545985
|
| Disease-specific Antigen Abundances |
|
Click to View the Clearer Original Diagram
|
|
|
ICD Disease Classification 06
Click to Show/Hide the 1 Disease of This Class
Schizophrenia [ICD-11: 6A20]
Click to Show/Hide
| Differential expression pattern of antigen in diseases |
| The Studied Tissue |
Superior temporal cortex |
| The Specific Disease |
Schizophrenia |
| The Expression Level of Disease Section Compare with the Healthy Individual Tissue |
p-value: 0.445146009;
Fold-change: 0.119884466;
Z-score: 0.492456291
|
| Disease-specific Antigen Abundances |
|
Click to View the Clearer Original Diagram
|
|
|
ICD Disease Classification 08
Click to Show/Hide the 3 Disease of This Class
Multiple sclerosis [ICD-11: 8A40]
Click to Show/Hide
| Differential expression pattern of antigen in diseases |
| The Studied Tissue |
Spinal cord |
| The Specific Disease |
Multiple sclerosis |
| The Expression Level of Disease Section Compare with the Adjacent Tissue |
p-value: 0.980872492;
Fold-change: 0.124146293;
Z-score: 0.328332675
|
| Disease-specific Antigen Abundances |
|
Click to View the Clearer Original Diagram
|
|
|
| The Studied Tissue |
Plasmacytoid dendritic cells |
| The Specific Disease |
Multiple sclerosis |
| The Expression Level of Disease Section Compare with the Healthy Individual Tissue |
p-value: 0.521800655;
Fold-change: -0.014965671;
Z-score: -0.07044471
|
| Disease-specific Antigen Abundances |
|
Click to View the Clearer Original Diagram
|
|
|
Epilepsy [ICD-11: 8A60]
Click to Show/Hide
| Differential expression pattern of antigen in diseases |
| The Studied Tissue |
Peritumoral cortex |
| The Specific Disease |
Epilepsy |
| The Expression Level of Disease Section Compare with the Other Disease Section |
p-value: 0.979243015;
Fold-change: -0.091645756;
Z-score: -0.359252962
|
| Disease-specific Antigen Abundances |
|
Click to View the Clearer Original Diagram
|
|
|
Cerebral ischaemic stroke [ICD-11: 8B11]
Click to Show/Hide
| Differential expression pattern of antigen in diseases |
| The Studied Tissue |
Whole blood |
| The Specific Disease |
Cardioembolic Stroke |
| The Expression Level of Disease Section Compare with the Healthy Individual Tissue |
p-value: 0.149612885;
Fold-change: 0.148247171;
Z-score: 0.517797152
|
| Disease-specific Antigen Abundances |
|
Click to View the Clearer Original Diagram
|
|
|
| The Studied Tissue |
Peripheral blood |
| The Specific Disease |
Ischemic stroke |
| The Expression Level of Disease Section Compare with the Healthy Individual Tissue |
p-value: 0.616860155;
Fold-change: 0.094358425;
Z-score: 0.268607556
|
| Disease-specific Antigen Abundances |
|
Click to View the Clearer Original Diagram
|
|
|
ICD Disease Classification 1
Click to Show/Hide the 6 Disease of This Class
HIV [ICD-11: 1C60-1C62]
Click to Show/Hide
| Differential expression pattern of antigen in diseases |
| The Studied Tissue |
White matter |
| The Specific Disease |
HIV |
| The Expression Level of Disease Section Compare with the Healthy Individual Tissue |
p-value: 0.464865808;
Fold-change: -0.00231328;
Z-score: -0.008545814
|
| Disease-specific Antigen Abundances |
|
Click to View the Clearer Original Diagram
|
|
|
Influenza [ICD-11: 1E30]
Click to Show/Hide
| Differential expression pattern of antigen in diseases |
| The Studied Tissue |
Whole blood |
| The Specific Disease |
Influenza |
| The Expression Level of Disease Section Compare with the Healthy Individual Tissue |
p-value: 0.047228097;
Fold-change: -1.516923773;
Z-score: -2.181314931
|
| Disease-specific Antigen Abundances |
|
Click to View the Clearer Original Diagram
|
|
|
Chronic hepatitis C [ICD-11: 1E51.1]
Click to Show/Hide
| Differential expression pattern of antigen in diseases |
| The Studied Tissue |
Whole blood |
| The Specific Disease |
Chronic hepatitis C |
| The Expression Level of Disease Section Compare with the Healthy Individual Tissue |
p-value: 0.235533436;
Fold-change: 0.01805901;
Z-score: 0.110578624
|
| Disease-specific Antigen Abundances |
|
Click to View the Clearer Original Diagram
|
|
|
Sepsis [ICD-11: 1G40-1G41]
Click to Show/Hide
| Differential expression pattern of antigen in diseases |
| The Studied Tissue |
Whole blood |
| The Specific Disease |
Sepsis |
| The Expression Level of Disease Section Compare with the Healthy Individual Tissue |
p-value: 2.43E-14;
Fold-change: 0.325767963;
Z-score: 1.051453276
|
| Disease-specific Antigen Abundances |
|
Click to View the Clearer Original Diagram
|
|
|
Septic shock [ICD-11: 1G41]
Click to Show/Hide
| Differential expression pattern of antigen in diseases |
| The Studied Tissue |
Whole blood |
| The Specific Disease |
Septic shock |
| The Expression Level of Disease Section Compare with the Healthy Individual Tissue |
p-value: 0.051353079;
Fold-change: 0.021067762;
Z-score: 0.05976143
|
| Disease-specific Antigen Abundances |
|
Click to View the Clearer Original Diagram
|
|
|
Pediatric respiratory syncytial virus infection [ICD-11: CA40.11]
Click to Show/Hide
| Differential expression pattern of antigen in diseases |
| The Studied Tissue |
Peripheral blood |
| The Specific Disease |
Pediatric respiratory syncytial virus infection |
| The Expression Level of Disease Section Compare with the Healthy Individual Tissue |
p-value: 0.001121544;
Fold-change: 0.369427328;
Z-score: 0.961871669
|
| Disease-specific Antigen Abundances |
|
Click to View the Clearer Original Diagram
|
|
|
ICD Disease Classification 11
Click to Show/Hide the 6 Disease of This Class
Essential hypertension [ICD-11: BA00]
Click to Show/Hide
| Differential expression pattern of antigen in diseases |
| The Studied Tissue |
Peripheral blood |
| The Specific Disease |
Essential hypertension |
| The Expression Level of Disease Section Compare with the Healthy Individual Tissue |
p-value: 0.879235092;
Fold-change: -0.048514245;
Z-score: -0.463501241
|
| Disease-specific Antigen Abundances |
|
Click to View the Clearer Original Diagram
|
|
|
Myocardial infarction [ICD-11: BA41]
Click to Show/Hide
| Differential expression pattern of antigen in diseases |
| The Studied Tissue |
Peripheral blood |
| The Specific Disease |
Myocardial infarction |
| The Expression Level of Disease Section Compare with the Healthy Individual Tissue |
p-value: 0.007674841;
Fold-change: 0.225085068;
Z-score: 0.58334535
|
| Disease-specific Antigen Abundances |
|
Click to View the Clearer Original Diagram
|
|
|
Coronary artery disease [ICD-11: BA8Z]
Click to Show/Hide
| Differential expression pattern of antigen in diseases |
| The Studied Tissue |
Peripheral blood |
| The Specific Disease |
Coronary artery disease |
| The Expression Level of Disease Section Compare with the Healthy Individual Tissue |
p-value: 0.547585723;
Fold-change: -0.037461717;
Z-score: -0.074990339
|
| Disease-specific Antigen Abundances |
|
Click to View the Clearer Original Diagram
|
|
|
Aortic stenosis [ICD-11: BB70]
Click to Show/Hide
| Differential expression pattern of antigen in diseases |
| The Studied Tissue |
Calcified aortic valve |
| The Specific Disease |
Aortic stenosis |
| The Expression Level of Disease Section Compare with the Healthy Individual Tissue |
p-value: 0.682254483;
Fold-change: -0.081336867;
Z-score: -0.375770334
|
| Disease-specific Antigen Abundances |
|
Click to View the Clearer Original Diagram
|
|
|
Arteriosclerosis [ICD-11: BD40]
Click to Show/Hide
| Differential expression pattern of antigen in diseases |
| The Studied Tissue |
Peripheral blood |
| The Specific Disease |
Arteriosclerosis |
| The Expression Level of Disease Section Compare with the Healthy Individual Tissue |
p-value: 0.084324421;
Fold-change: -0.187806067;
Z-score: -1.38169276
|
| Disease-specific Antigen Abundances |
|
Click to View the Clearer Original Diagram
|
|
|
Aneurysm [ICD-11: BD50]
Click to Show/Hide
| Differential expression pattern of antigen in diseases |
| The Studied Tissue |
Intracranial artery |
| The Specific Disease |
Aneurysm |
| The Expression Level of Disease Section Compare with the Healthy Individual Tissue |
p-value: 0.111435967;
Fold-change: 0.211943258;
Z-score: 0.560700638
|
| Disease-specific Antigen Abundances |
|
Click to View the Clearer Original Diagram
|
|
|
ICD Disease Classification 12
Click to Show/Hide the 8 Disease of This Class
Immunodeficiency [ICD-11: 4A00-4A20]
Click to Show/Hide
| Differential expression pattern of antigen in diseases |
| The Studied Tissue |
Peripheral blood |
| The Specific Disease |
Immunodeficiency |
| The Expression Level of Disease Section Compare with the Healthy Individual Tissue |
p-value: 0.001907177;
Fold-change: 0.108731128;
Z-score: 1.783227602
|
| Disease-specific Antigen Abundances |
|
Click to View the Clearer Original Diagram
|
|
|
Apnea [ICD-11: 7A40]
Click to Show/Hide
| Differential expression pattern of antigen in diseases |
| The Studied Tissue |
Hyperplastic tonsil |
| The Specific Disease |
Apnea |
| The Expression Level of Disease Section Compare with the Healthy Individual Tissue |
p-value: 0.016739745;
Fold-change: -0.266760844;
Z-score: -1.19056076
|
| Disease-specific Antigen Abundances |
|
Click to View the Clearer Original Diagram
|
|
|
Olive pollen allergy [ICD-11: CA08.00]
Click to Show/Hide
| Differential expression pattern of antigen in diseases |
| The Studied Tissue |
Peripheral blood |
| The Specific Disease |
Olive pollen allergy |
| The Expression Level of Disease Section Compare with the Healthy Individual Tissue |
p-value: 0.043986615;
Fold-change: 0.137241395;
Z-score: 1.283533078
|
| Disease-specific Antigen Abundances |
|
Click to View the Clearer Original Diagram
|
|
|
Chronic rhinosinusitis [ICD-11: CA0A]
Click to Show/Hide
| Differential expression pattern of antigen in diseases |
| The Studied Tissue |
Sinus mucosa |
| The Specific Disease |
Chronic rhinosinusitis |
| The Expression Level of Disease Section Compare with the Healthy Individual Tissue |
p-value: 0.34819277;
Fold-change: 0.072069629;
Z-score: 0.284429655
|
| Disease-specific Antigen Abundances |
|
Click to View the Clearer Original Diagram
|
|
|
Chronic obstructive pulmonary disease [ICD-11: CA22]
Click to Show/Hide
| Differential expression pattern of antigen in diseases |
| The Studied Tissue |
Lung |
| The Specific Disease |
Chronic obstructive pulmonary disease |
| The Expression Level of Disease Section Compare with the Healthy Individual Tissue |
p-value: 0.04984257;
Fold-change: 0.103636245;
Z-score: 0.203621166
|
| Disease-specific Antigen Abundances |
|
Click to View the Clearer Original Diagram
|
|
|
| The Studied Tissue |
Small airway epithelium |
| The Specific Disease |
Chronic obstructive pulmonary disease |
| The Expression Level of Disease Section Compare with the Healthy Individual Tissue |
p-value: 0.018023713;
Fold-change: -0.140223532;
Z-score: -0.467073895
|
| Disease-specific Antigen Abundances |
|
Click to View the Clearer Original Diagram
|
|
|
Asthma [ICD-11: CA23]
Click to Show/Hide
| Differential expression pattern of antigen in diseases |
| The Studied Tissue |
Nasal and bronchial airway |
| The Specific Disease |
Asthma |
| The Expression Level of Disease Section Compare with the Healthy Individual Tissue |
p-value: 3.11E-05;
Fold-change: -0.204996407;
Z-score: -0.319329148
|
| Disease-specific Antigen Abundances |
|
Click to View the Clearer Original Diagram
|
|
|
Human rhinovirus infection [ICD-11: CA42]
Click to Show/Hide
| Differential expression pattern of antigen in diseases |
| The Studied Tissue |
Nasal Epithelium |
| The Specific Disease |
Human rhinovirus infection |
| The Expression Level of Disease Section Compare with the Healthy Individual Tissue |
p-value: 0.058698347;
Fold-change: 0.117218151;
Z-score: 0.527256535
|
| Disease-specific Antigen Abundances |
|
Click to View the Clearer Original Diagram
|
|
|
Idiopathic pulmonary fibrosis [ICD-11: CB03.4]
Click to Show/Hide
| Differential expression pattern of antigen in diseases |
| The Studied Tissue |
Lung |
| The Specific Disease |
Idiopathic pulmonary fibrosis |
| The Expression Level of Disease Section Compare with the Healthy Individual Tissue |
p-value: 0.764507594;
Fold-change: 0.263035091;
Z-score: 0.522697686
|
| Disease-specific Antigen Abundances |
|
Click to View the Clearer Original Diagram
|
|
|
ICD Disease Classification 13
Click to Show/Hide the 5 Disease of This Class
Periodontal disease [ICD-11: DA0C]
Click to Show/Hide
| Differential expression pattern of antigen in diseases |
| The Studied Tissue |
Gingival |
| The Specific Disease |
Periodontal disease |
| The Expression Level of Disease Section Compare with the Adjacent Tissue |
p-value: 0.307342698;
Fold-change: 0.064623847;
Z-score: 0.173312462
|
| Disease-specific Antigen Abundances |
|
Click to View the Clearer Original Diagram
|
|
|
Eosinophilic gastritis [ICD-11: DA42.2]
Click to Show/Hide
| Differential expression pattern of antigen in diseases |
| The Studied Tissue |
Gastric antrum |
| The Specific Disease |
Eosinophilic gastritis |
| The Expression Level of Disease Section Compare with the Adjacent Tissue |
p-value: 0.208778958;
Fold-change: 0.101016303;
Z-score: 0.543117214
|
| Disease-specific Antigen Abundances |
|
Click to View the Clearer Original Diagram
|
|
|
Liver failure [ICD-11: DB99.7-DB99.8]
Click to Show/Hide
| Differential expression pattern of antigen in diseases |
| The Studied Tissue |
Liver |
| The Specific Disease |
Liver failure |
| The Expression Level of Disease Section Compare with the Healthy Individual Tissue |
p-value: 0.121026053;
Fold-change: -0.245468053;
Z-score: -0.96484986
|
| Disease-specific Antigen Abundances |
|
Click to View the Clearer Original Diagram
|
|
|
Ulcerative colitis [ICD-11: DD71]
Click to Show/Hide
| Differential expression pattern of antigen in diseases |
| The Studied Tissue |
Colon mucosal |
| The Specific Disease |
Ulcerative colitis |
| The Expression Level of Disease Section Compare with the Adjacent Tissue |
p-value: 0.620341891;
Fold-change: -0.038724621;
Z-score: -0.079299417
|
| Disease-specific Antigen Abundances |
|
Click to View the Clearer Original Diagram
|
|
|
Irritable bowel syndrome [ICD-11: DD91.0]
Click to Show/Hide
| Differential expression pattern of antigen in diseases |
| The Studied Tissue |
Rectal colon |
| The Specific Disease |
Irritable bowel syndrome |
| The Expression Level of Disease Section Compare with the Healthy Individual Tissue |
p-value: 0.375138003;
Fold-change: -0.071430965;
Z-score: -0.211778865
|
| Disease-specific Antigen Abundances |
|
Click to View the Clearer Original Diagram
|
|
|
ICD Disease Classification 14
Click to Show/Hide the 5 Disease of This Class
Atopic dermatitis [ICD-11: EA80]
Click to Show/Hide
| Differential expression pattern of antigen in diseases |
| The Studied Tissue |
Skin |
| The Specific Disease |
Atopic dermatitis |
| The Expression Level of Disease Section Compare with the Healthy Individual Tissue |
p-value: 0.393327078;
Fold-change: -0.134328575;
Z-score: -0.803582309
|
| Disease-specific Antigen Abundances |
|
Click to View the Clearer Original Diagram
|
|
|
Psoriasis [ICD-11: EA90]
Click to Show/Hide
| Differential expression pattern of antigen in diseases |
| The Studied Tissue |
Skin |
| The Specific Disease |
Psoriasis |
| The Expression Level of Disease Section Compare with the Healthy Individual Tissue |
p-value: 0.012904108;
Fold-change: -0.033145547;
Z-score: -0.072547429
|
| The Expression Level of Disease Section Compare with the Adjacent Tissue |
p-value: 3.58E-60;
Fold-change: 0.927527778;
Z-score: 4.485749312
|
| Disease-specific Antigen Abundances |
|
Click to View the Clearer Original Diagram
|
|
|
Vitiligo [ICD-11: ED63.0]
Click to Show/Hide
| Differential expression pattern of antigen in diseases |
| The Studied Tissue |
Skin |
| The Specific Disease |
Vitiligo |
| The Expression Level of Disease Section Compare with the Healthy Individual Tissue |
p-value: 0.088876172;
Fold-change: -0.095136554;
Z-score: -0.682747717
|
| Disease-specific Antigen Abundances |
|
Click to View the Clearer Original Diagram
|
|
|
Alopecia [ICD-11: ED70]
Click to Show/Hide
| Differential expression pattern of antigen in diseases |
| The Studied Tissue |
Skin from scalp |
| The Specific Disease |
Alopecia |
| The Expression Level of Disease Section Compare with the Healthy Individual Tissue |
p-value: 0.005090191;
Fold-change: 0.113005476;
Z-score: 0.708936062
|
| Disease-specific Antigen Abundances |
|
Click to View the Clearer Original Diagram
|
|
|
Sensitive skin [ICD-11: EK0Z]
Click to Show/Hide
| Differential expression pattern of antigen in diseases |
| The Studied Tissue |
Skin |
| The Specific Disease |
Sensitive skin |
| The Expression Level of Disease Section Compare with the Healthy Individual Tissue |
p-value: 0.251279039;
Fold-change: 0.116288393;
Z-score: 0.682985003
|
| Disease-specific Antigen Abundances |
|
Click to View the Clearer Original Diagram
|
|
|
ICD Disease Classification 15
Click to Show/Hide the 6 Disease of This Class
Osteoarthritis [ICD-11: FA00-FA0Z]
Click to Show/Hide
| Differential expression pattern of antigen in diseases |
| The Studied Tissue |
Synovial |
| The Specific Disease |
Osteoarthritis |
| The Expression Level of Disease Section Compare with the Healthy Individual Tissue |
p-value: 0.331904843;
Fold-change: 0.152256646;
Z-score: 0.294521246
|
| Disease-specific Antigen Abundances |
|
Click to View the Clearer Original Diagram
|
|
|
Arthropathy [ICD-11: FA00-FA5Z]
Click to Show/Hide
| Differential expression pattern of antigen in diseases |
| The Studied Tissue |
Peripheral blood |
| The Specific Disease |
Arthropathy |
| The Expression Level of Disease Section Compare with the Healthy Individual Tissue |
p-value: 0.303225743;
Fold-change: 0.144132352;
Z-score: 0.480702771
|
| Disease-specific Antigen Abundances |
|
Click to View the Clearer Original Diagram
|
|
|
Arthritis [ICD-11: FA20]
Click to Show/Hide
| Differential expression pattern of antigen in diseases |
| The Studied Tissue |
Peripheral blood |
| The Specific Disease |
Arthritis |
| The Expression Level of Disease Section Compare with the Healthy Individual Tissue |
p-value: 0.196179491;
Fold-change: -0.061459604;
Z-score: -0.295012626
|
| Disease-specific Antigen Abundances |
|
Click to View the Clearer Original Diagram
|
|
|
Rheumatoid arthritis [ICD-11: FA20]
Click to Show/Hide
| Differential expression pattern of antigen in diseases |
| The Studied Tissue |
Synovial |
| The Specific Disease |
Rheumatoid arthritis |
| The Expression Level of Disease Section Compare with the Healthy Individual Tissue |
p-value: 1.42E-06;
Fold-change: 0.466020344;
Z-score: 2.141977361
|
| Disease-specific Antigen Abundances |
|
Click to View the Clearer Original Diagram
|
|
|
Ankylosing spondylitis [ICD-11: FA92.0Z]
Click to Show/Hide
| Differential expression pattern of antigen in diseases |
| The Studied Tissue |
Pheripheral blood |
| The Specific Disease |
Ankylosing spondylitis |
| The Expression Level of Disease Section Compare with the Healthy Individual Tissue |
p-value: 0.186533885;
Fold-change: 0.376885717;
Z-score: 1.012773389
|
| Disease-specific Antigen Abundances |
|
Click to View the Clearer Original Diagram
|
|
|
Osteoporosis [ICD-11: FB83]
Click to Show/Hide
| Differential expression pattern of antigen in diseases |
| The Studied Tissue |
Bone marrow |
| The Specific Disease |
Osteoporosis |
| The Expression Level of Disease Section Compare with the Healthy Individual Tissue |
p-value: 0.00312037;
Fold-change: 1.116023726;
Z-score: 3.370578999
|
| Disease-specific Antigen Abundances |
|
Click to View the Clearer Original Diagram
|
|
|
ICD Disease Classification 16
Click to Show/Hide the 2 Disease of This Class
Endometriosis [ICD-11: GA10]
Click to Show/Hide
| Differential expression pattern of antigen in diseases |
| The Studied Tissue |
Endometrium |
| The Specific Disease |
Endometriosis |
| The Expression Level of Disease Section Compare with the Healthy Individual Tissue |
p-value: 0.233187767;
Fold-change: -0.32826024;
Z-score: -0.598074803
|
| Disease-specific Antigen Abundances |
|
Click to View the Clearer Original Diagram
|
|
|
Interstitial cystitis [ICD-11: GC00.3]
Click to Show/Hide
| Differential expression pattern of antigen in diseases |
| The Studied Tissue |
Bladder |
| The Specific Disease |
Interstitial cystitis |
| The Expression Level of Disease Section Compare with the Healthy Individual Tissue |
p-value: 0.615992718;
Fold-change: -0.07592995;
Z-score: -0.514201579
|
| Disease-specific Antigen Abundances |
|
Click to View the Clearer Original Diagram
|
|
|
ICD Disease Classification 19
Click to Show/Hide the 1 Disease of This Class
Preterm birth [ICD-11: KA21.4Z]
Click to Show/Hide
| Differential expression pattern of antigen in diseases |
| The Studied Tissue |
Myometrium |
| The Specific Disease |
Preterm birth |
| The Expression Level of Disease Section Compare with the Healthy Individual Tissue |
p-value: 0.152866217;
Fold-change: -0.253550219;
Z-score: -0.677342267
|
| Disease-specific Antigen Abundances |
|
Click to View the Clearer Original Diagram
|
|
|
ICD Disease Classification 2
Click to Show/Hide the 8 Disease of This Class
Acute myelocytic leukemia [ICD-11: 2A60]
Click to Show/Hide
| Differential expression pattern of antigen in diseases |
| The Studied Tissue |
Bone marrow |
| The Specific Disease |
Acute myelocytic leukemia |
| The Expression Level of Disease Section Compare with the Healthy Individual Tissue |
p-value: 9.76E-23;
Fold-change: 0.612581754;
Z-score: 1.132388756
|
| Disease-specific Antigen Abundances |
|
Click to View the Clearer Original Diagram
|
|
|
Myeloma [ICD-11: 2A83]
Click to Show/Hide
| Differential expression pattern of antigen in diseases |
| The Studied Tissue |
Bone marrow |
| The Specific Disease |
Myeloma |
| The Expression Level of Disease Section Compare with the Healthy Individual Tissue |
p-value: 0.00169924;
Fold-change: 0.370190178;
Z-score: 1.880474895
|
| Disease-specific Antigen Abundances |
|
Click to View the Clearer Original Diagram
|
|
|
| The Studied Tissue |
Peripheral blood |
| The Specific Disease |
Myeloma |
| The Expression Level of Disease Section Compare with the Healthy Individual Tissue |
p-value: 0.541641488;
Fold-change: 0.03963104;
Z-score: 0.214195652
|
| Disease-specific Antigen Abundances |
|
Click to View the Clearer Original Diagram
|
|
|
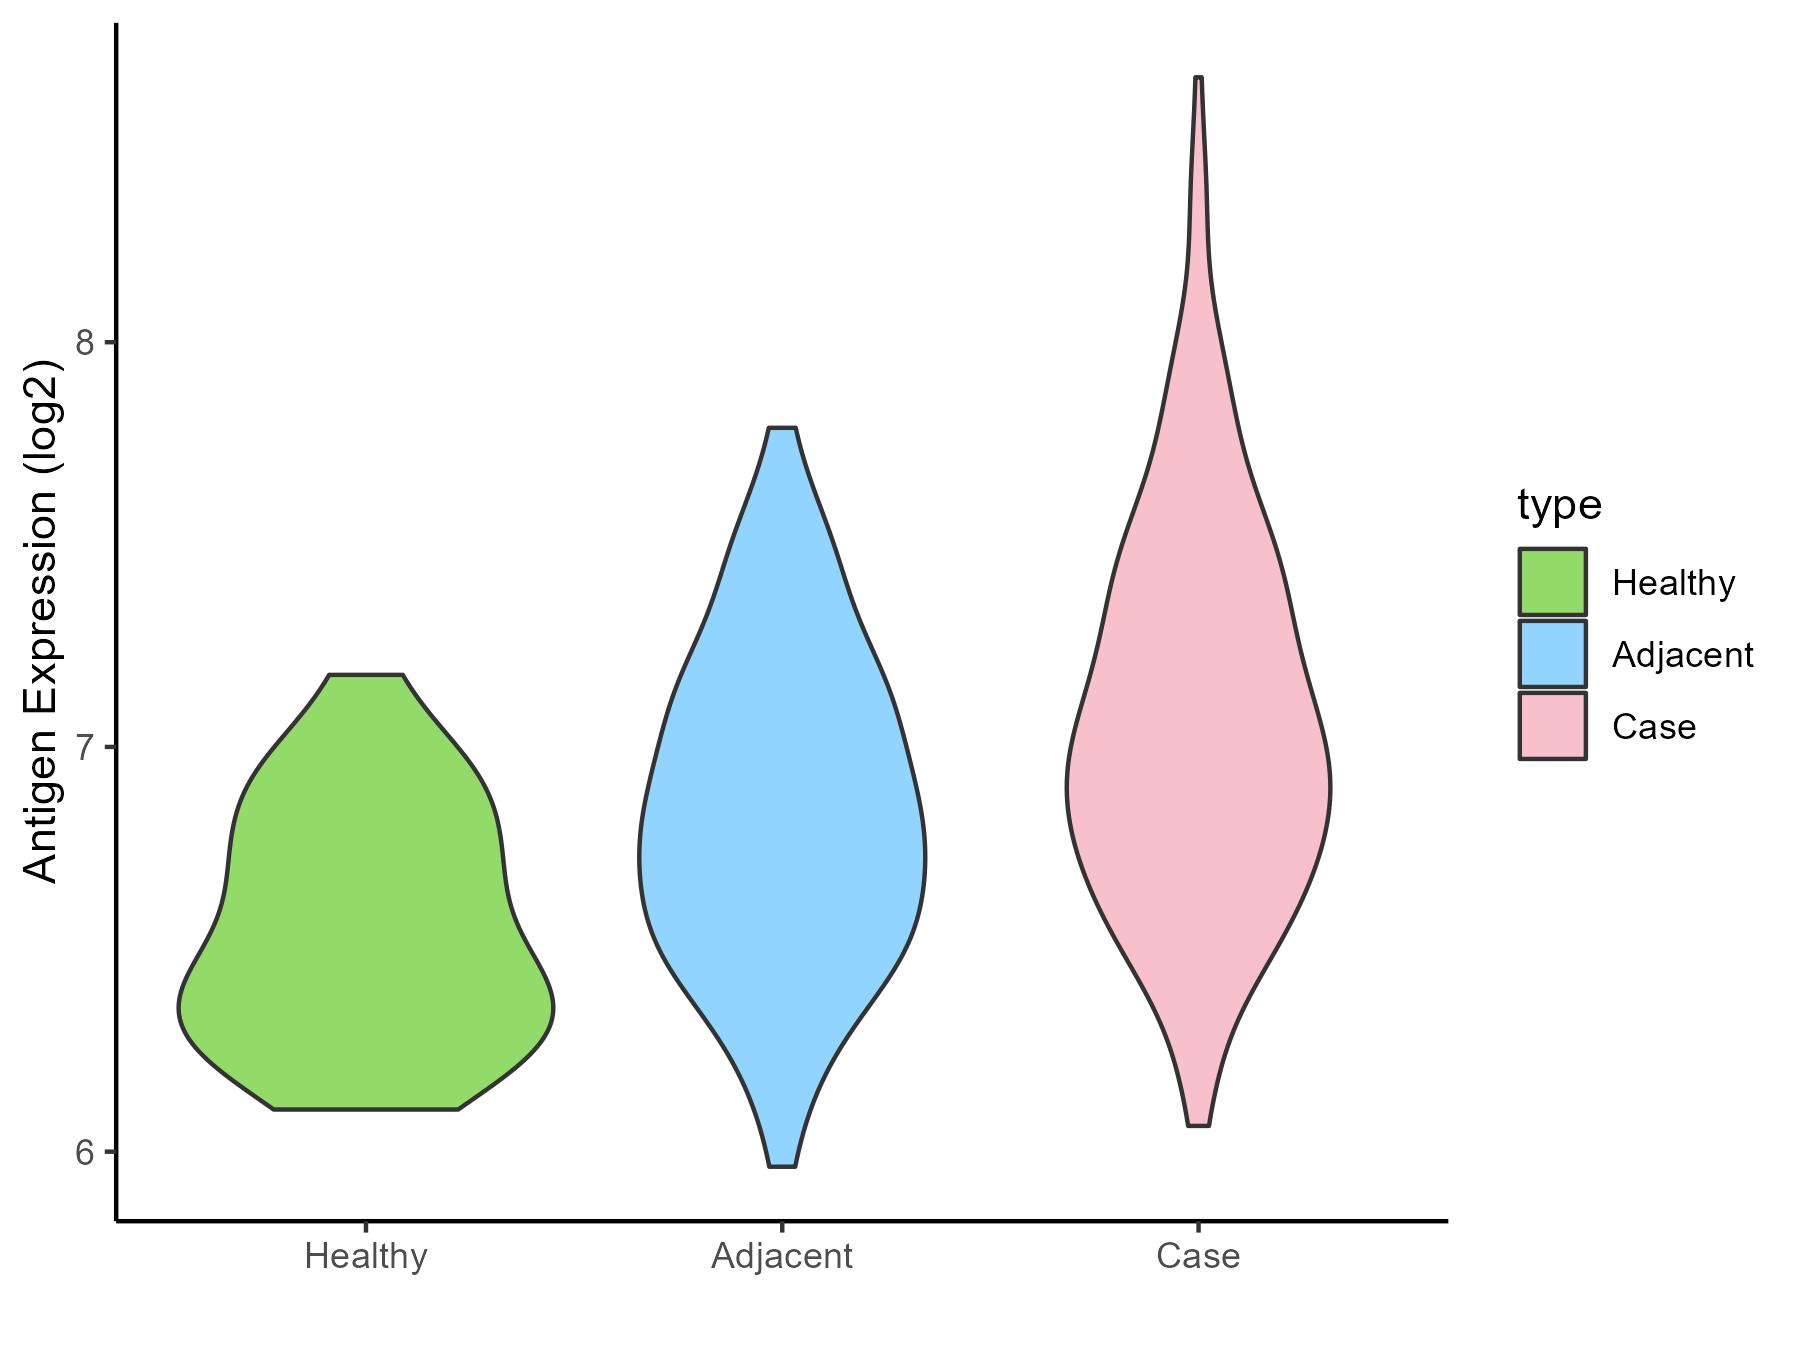
Oral cancer [ICD-11: 2B6E]
Click to Show/Hide
| Differential expression pattern of antigen in diseases |
| The Studied Tissue |
Oral |
| The Specific Disease |
Oral cancer |
| The Expression Level of Disease Section Compare with the Healthy Individual Tissue |
p-value: 4.30E-10;
Fold-change: 0.528151596;
Z-score: 1.790026838
|
| The Expression Level of Disease Section Compare with the Adjacent Tissue |
p-value: 3.56E-05;
Fold-change: 0.201547002;
Z-score: 0.517134082
|
| Disease-specific Antigen Abundances |
|
Click to View the Clearer Original Diagram
|
|
|
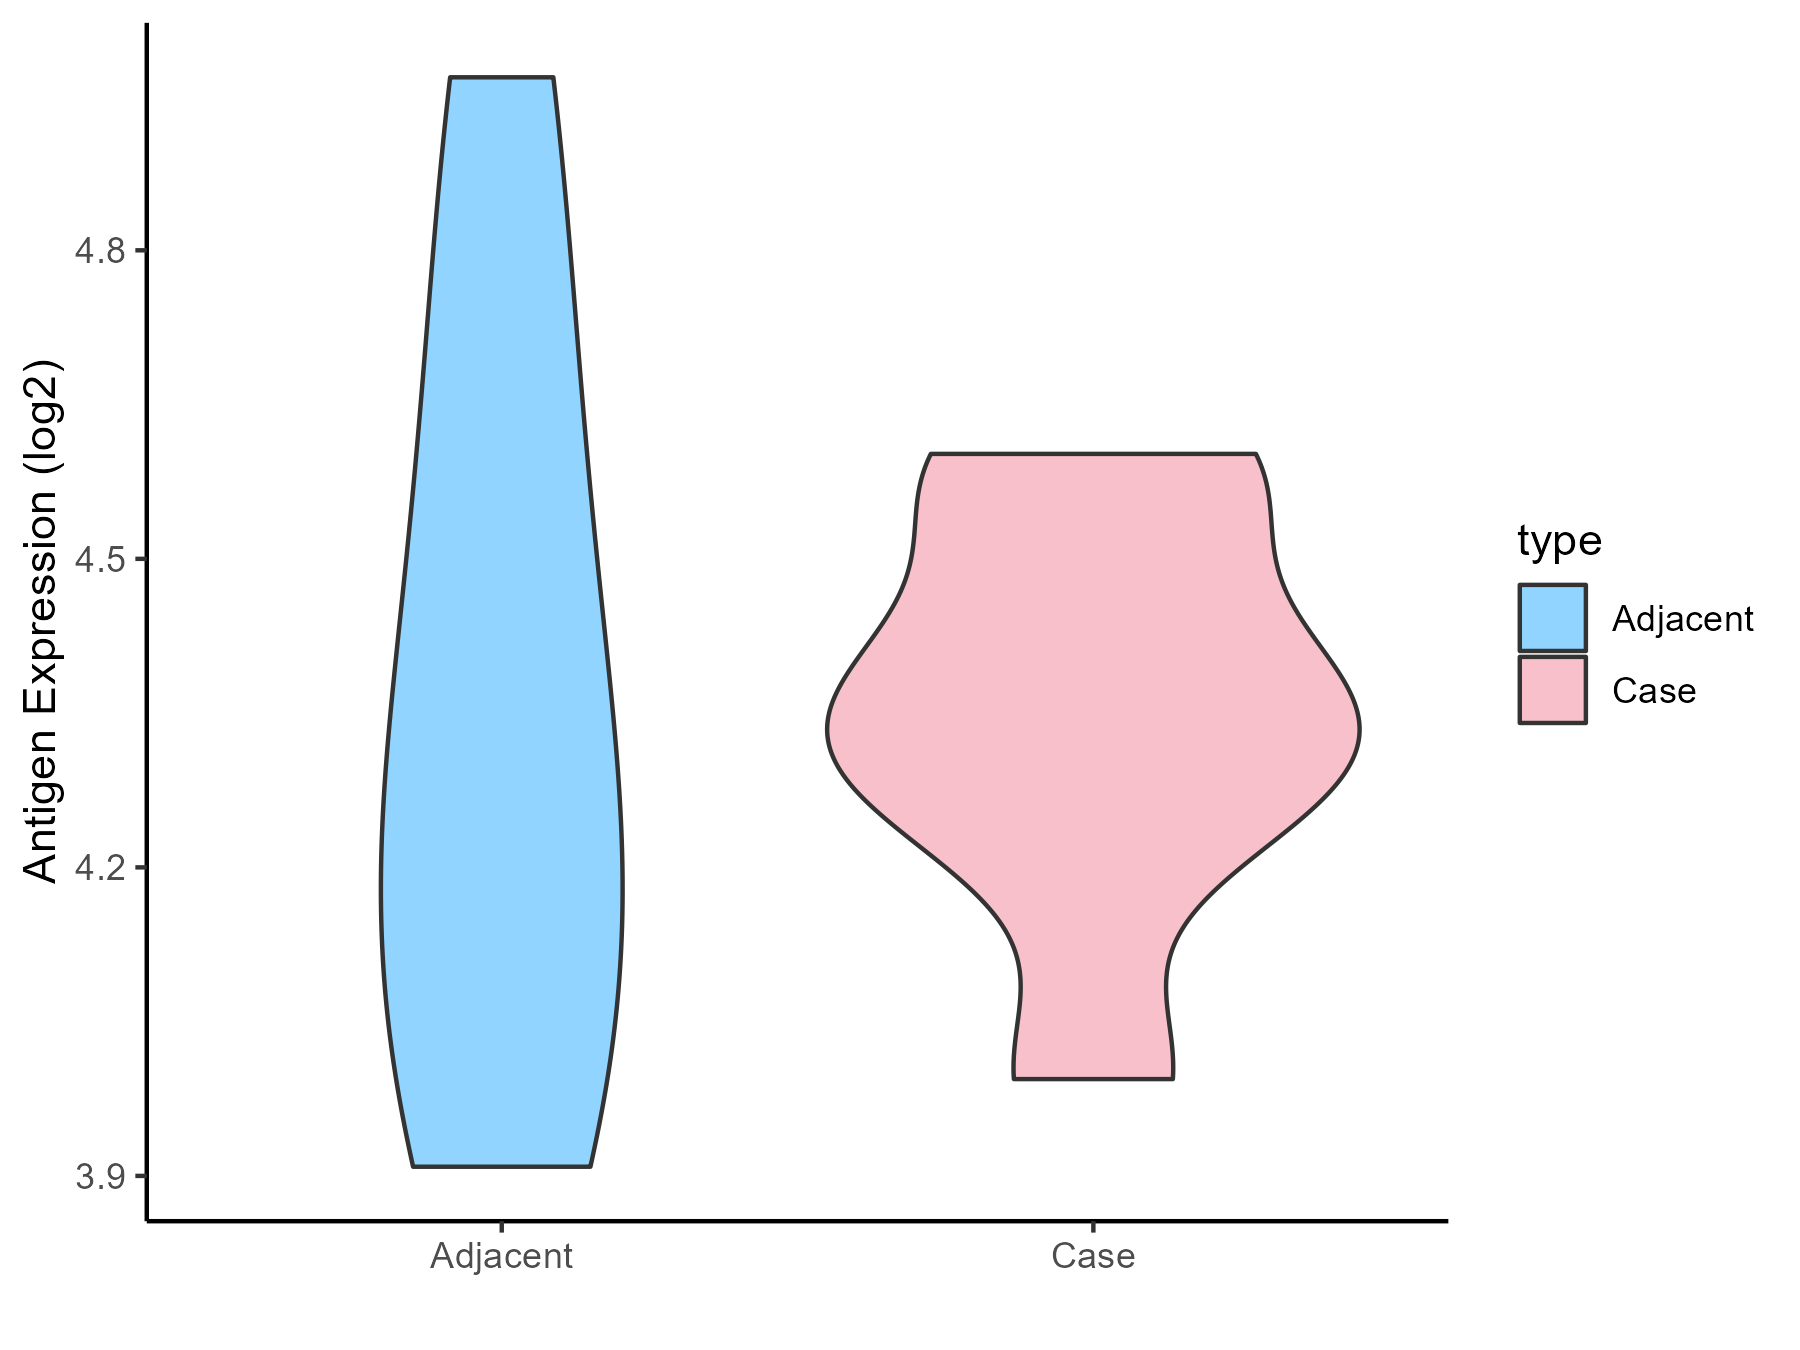
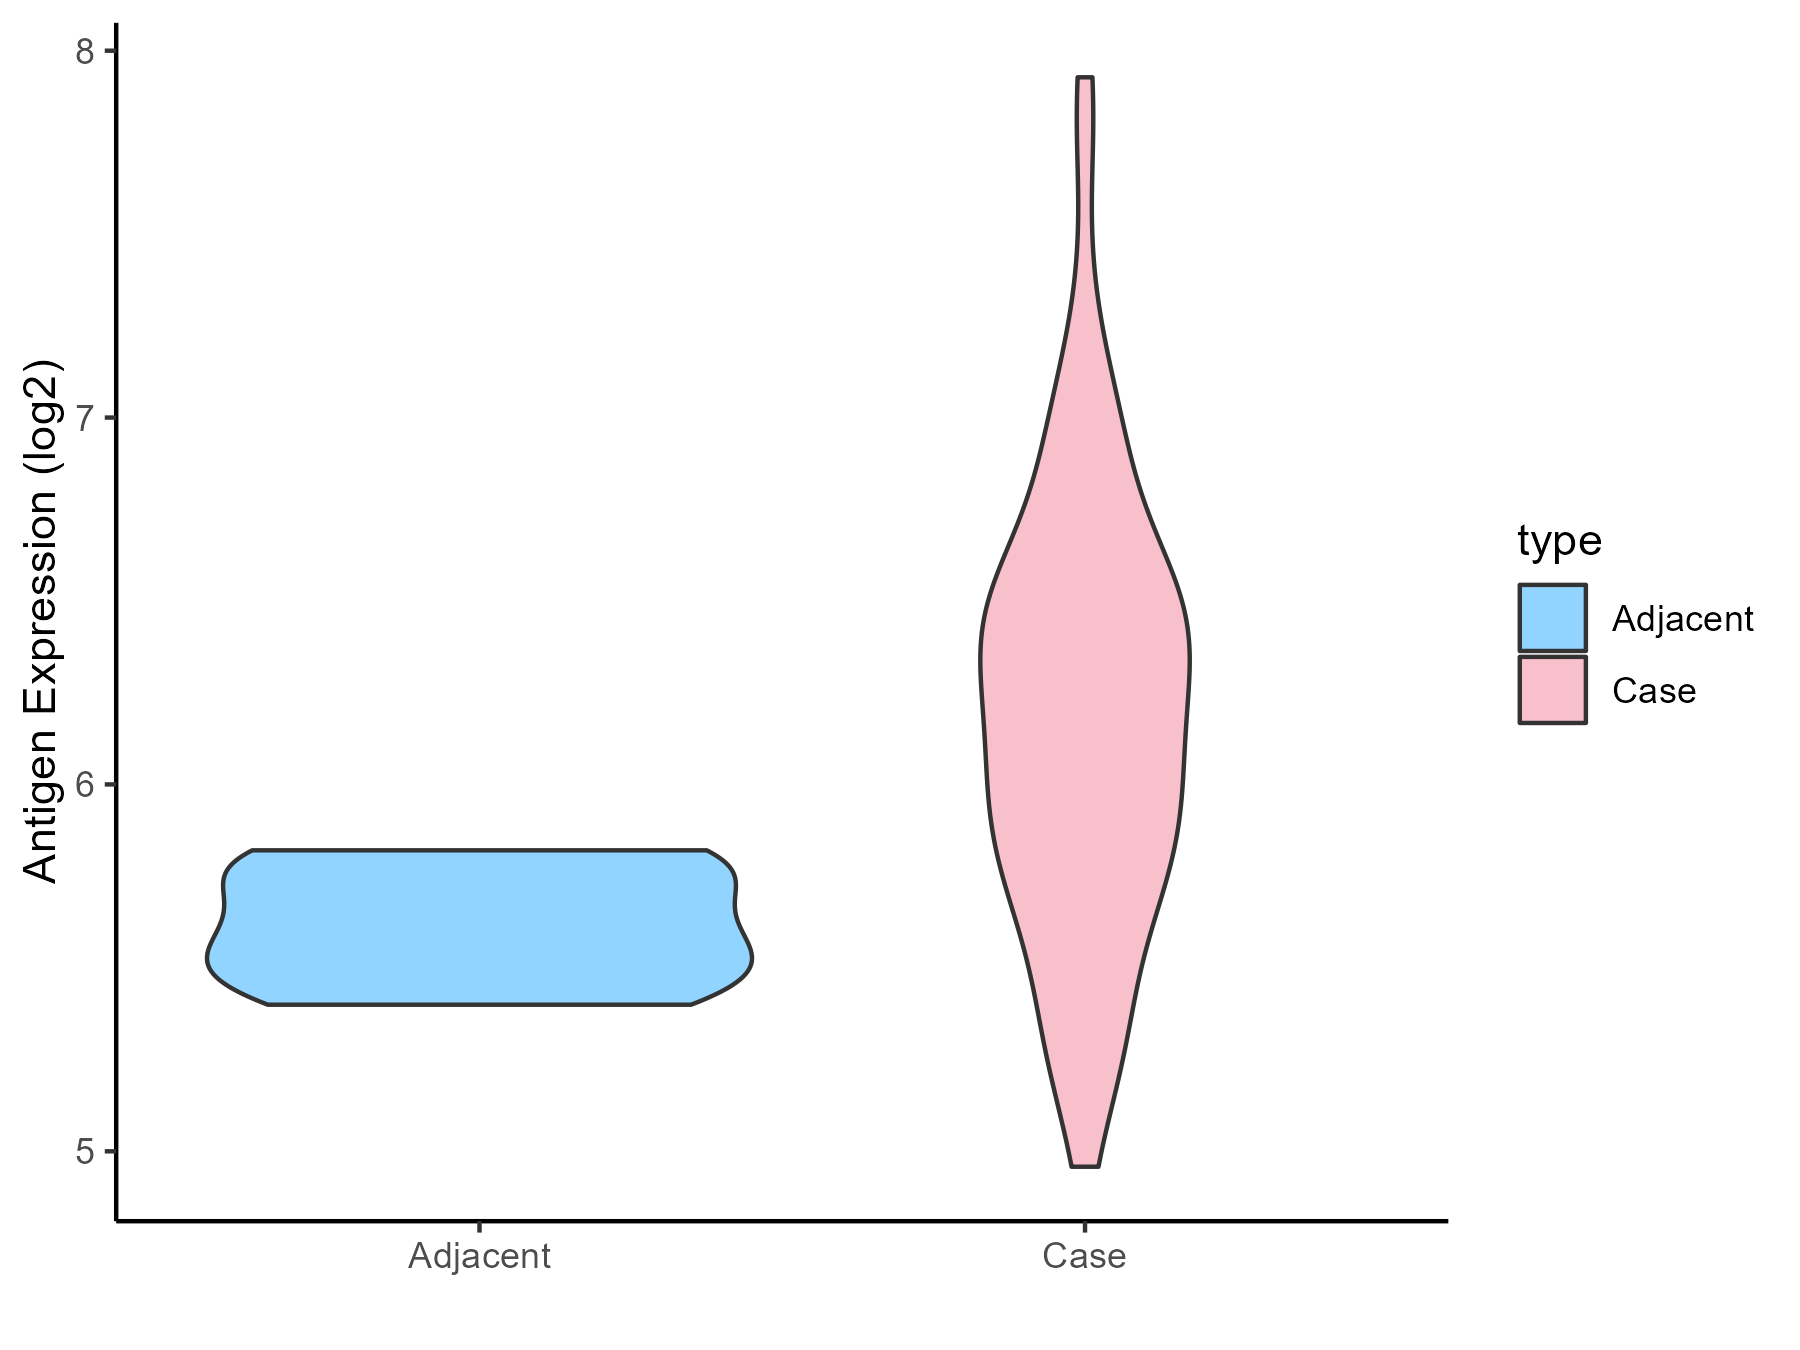
Esophagal cancer [ICD-11: 2B70]
Click to Show/Hide
| Differential expression pattern of antigen in diseases |
| The Studied Tissue |
Esophagus |
| The Specific Disease |
Esophagal cancer |
| The Expression Level of Disease Section Compare with the Adjacent Tissue |
p-value: 0.000250323;
Fold-change: 0.564518822;
Z-score: 3.173681995
|
| Disease-specific Antigen Abundances |
|
Click to View the Clearer Original Diagram
|
|
|
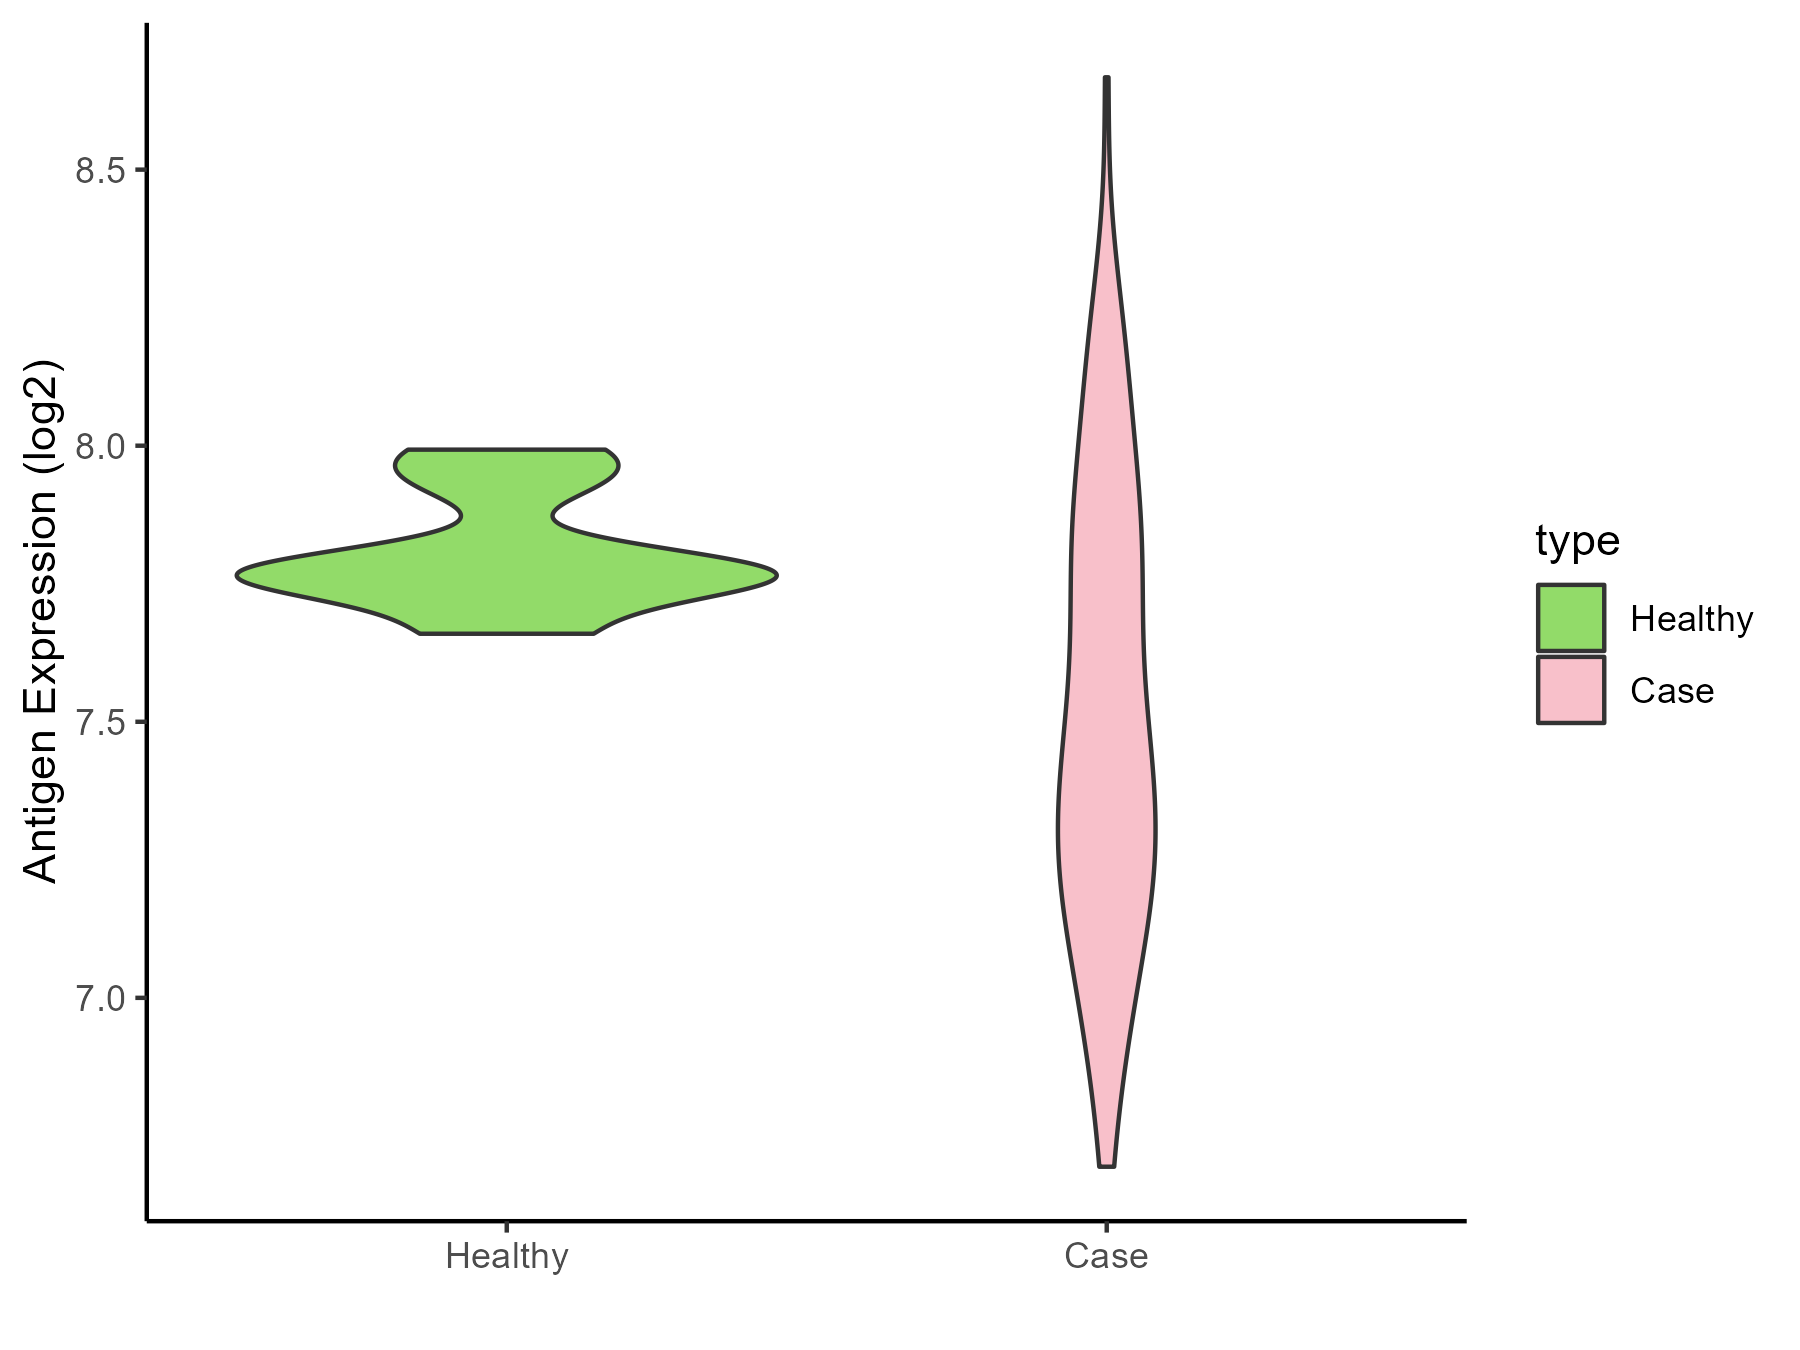
Rectal cancer [ICD-11: 2B92]
Click to Show/Hide
| Differential expression pattern of antigen in diseases |
| The Studied Tissue |
Rectal colon |
| The Specific Disease |
Rectal cancer |
| The Expression Level of Disease Section Compare with the Healthy Individual Tissue |
p-value: 1.03E-05;
Fold-change: 1.093915447;
Z-score: 4.713226218
|
| The Expression Level of Disease Section Compare with the Adjacent Tissue |
p-value: 0.013976476;
Fold-change: 0.462016408;
Z-score: 1.437342986
|
| Disease-specific Antigen Abundances |
|
Click to View the Clearer Original Diagram
|
|
|
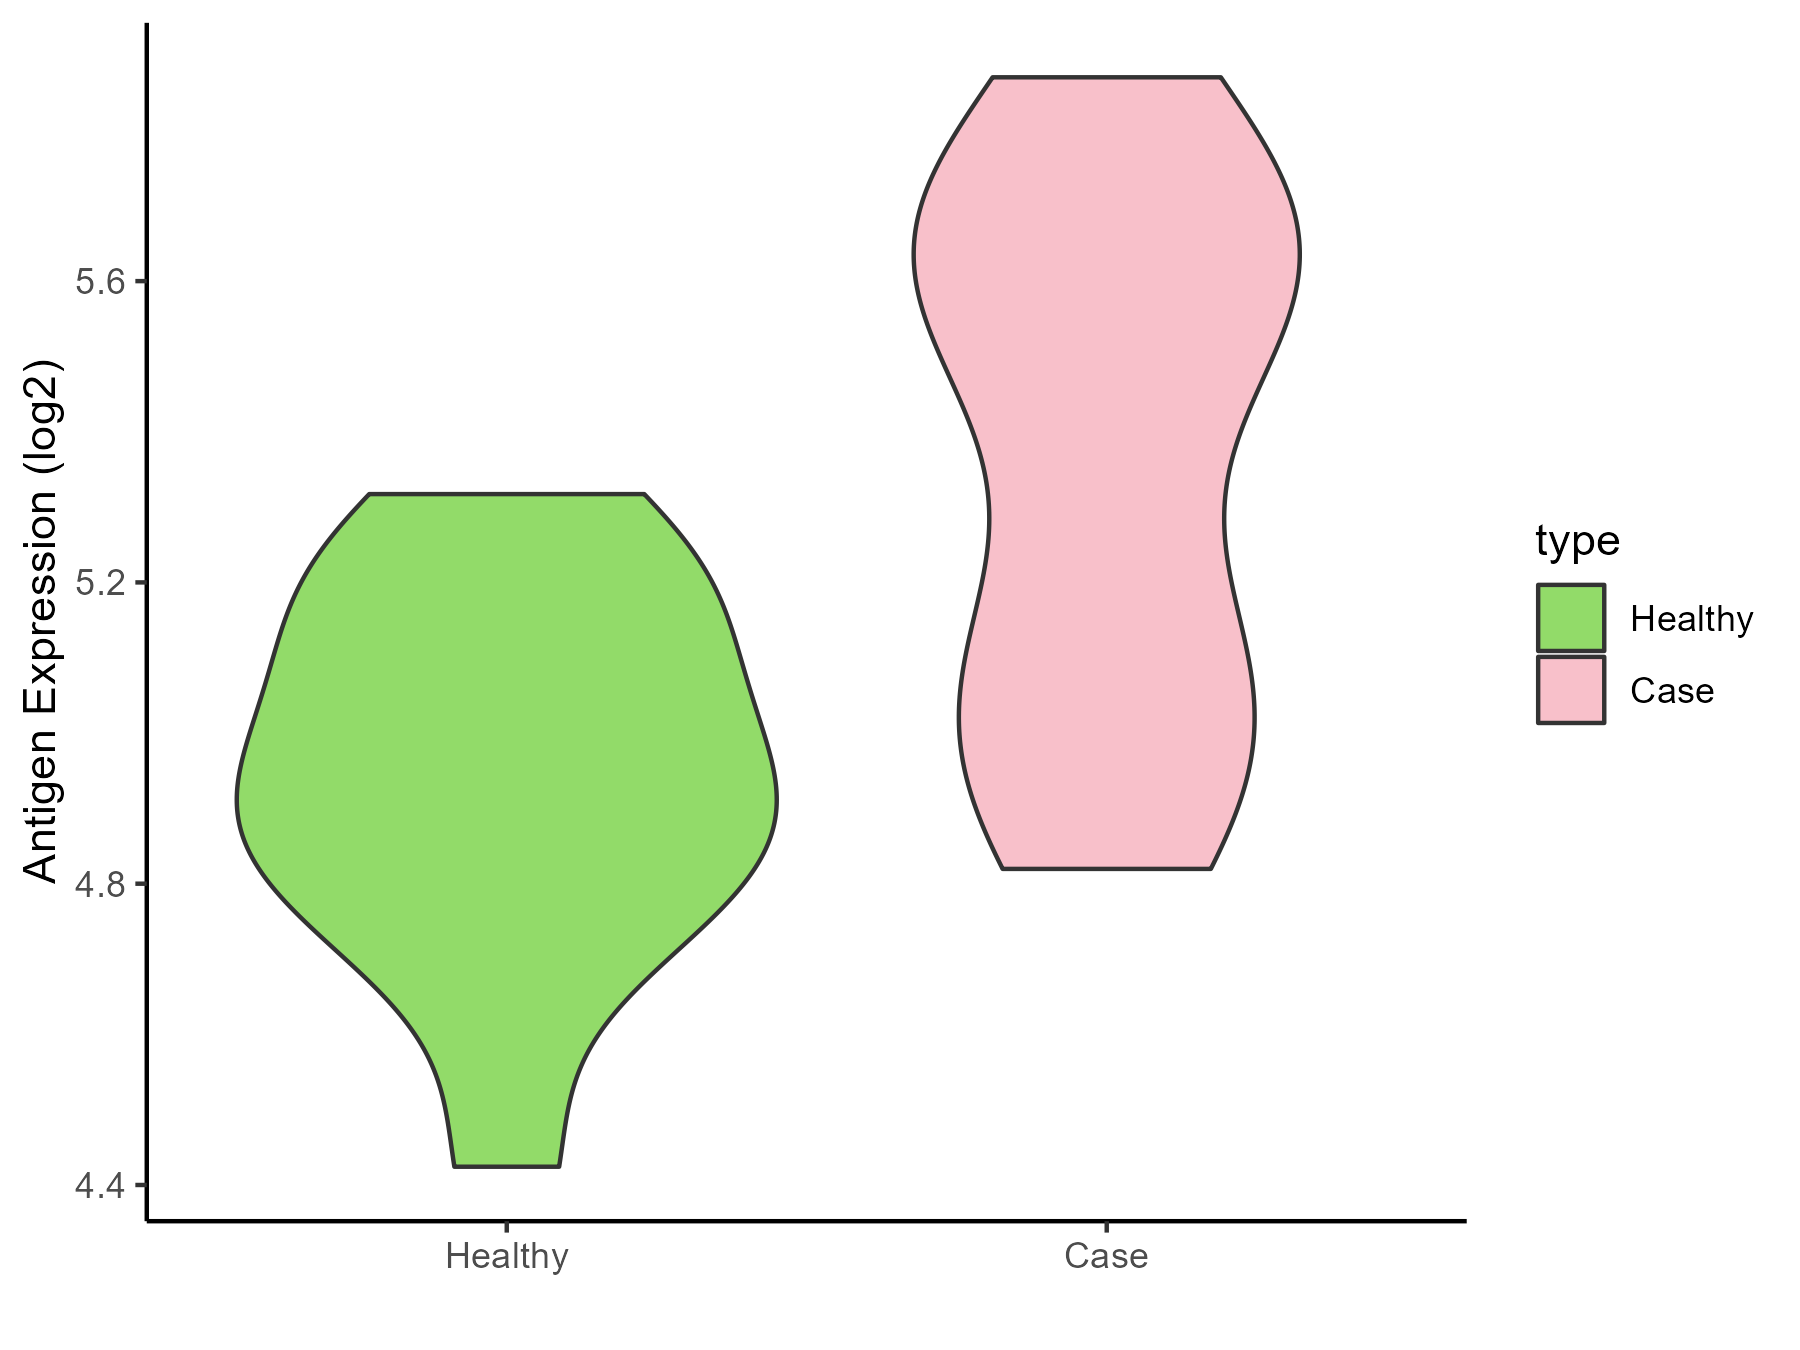
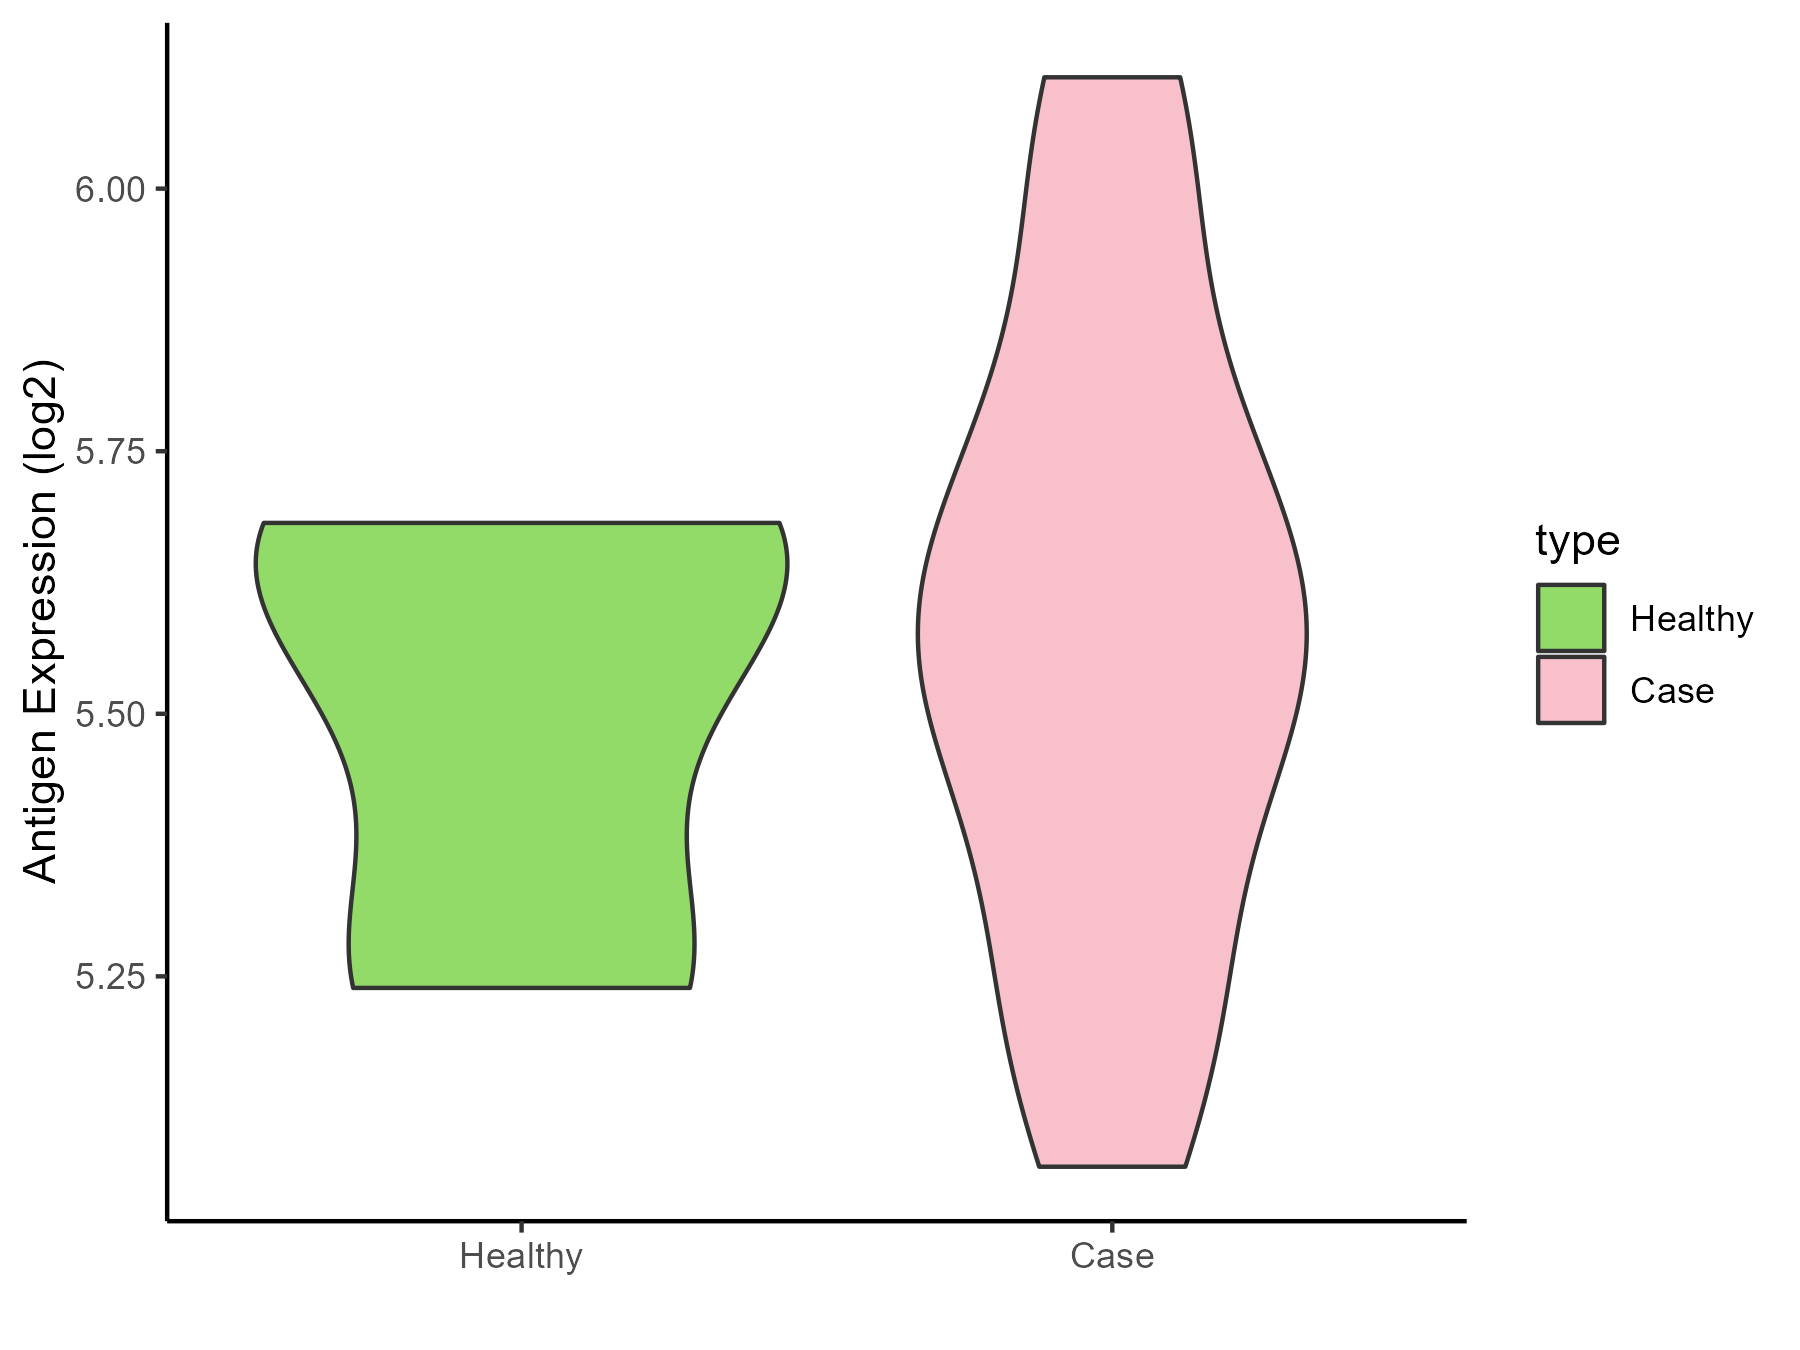
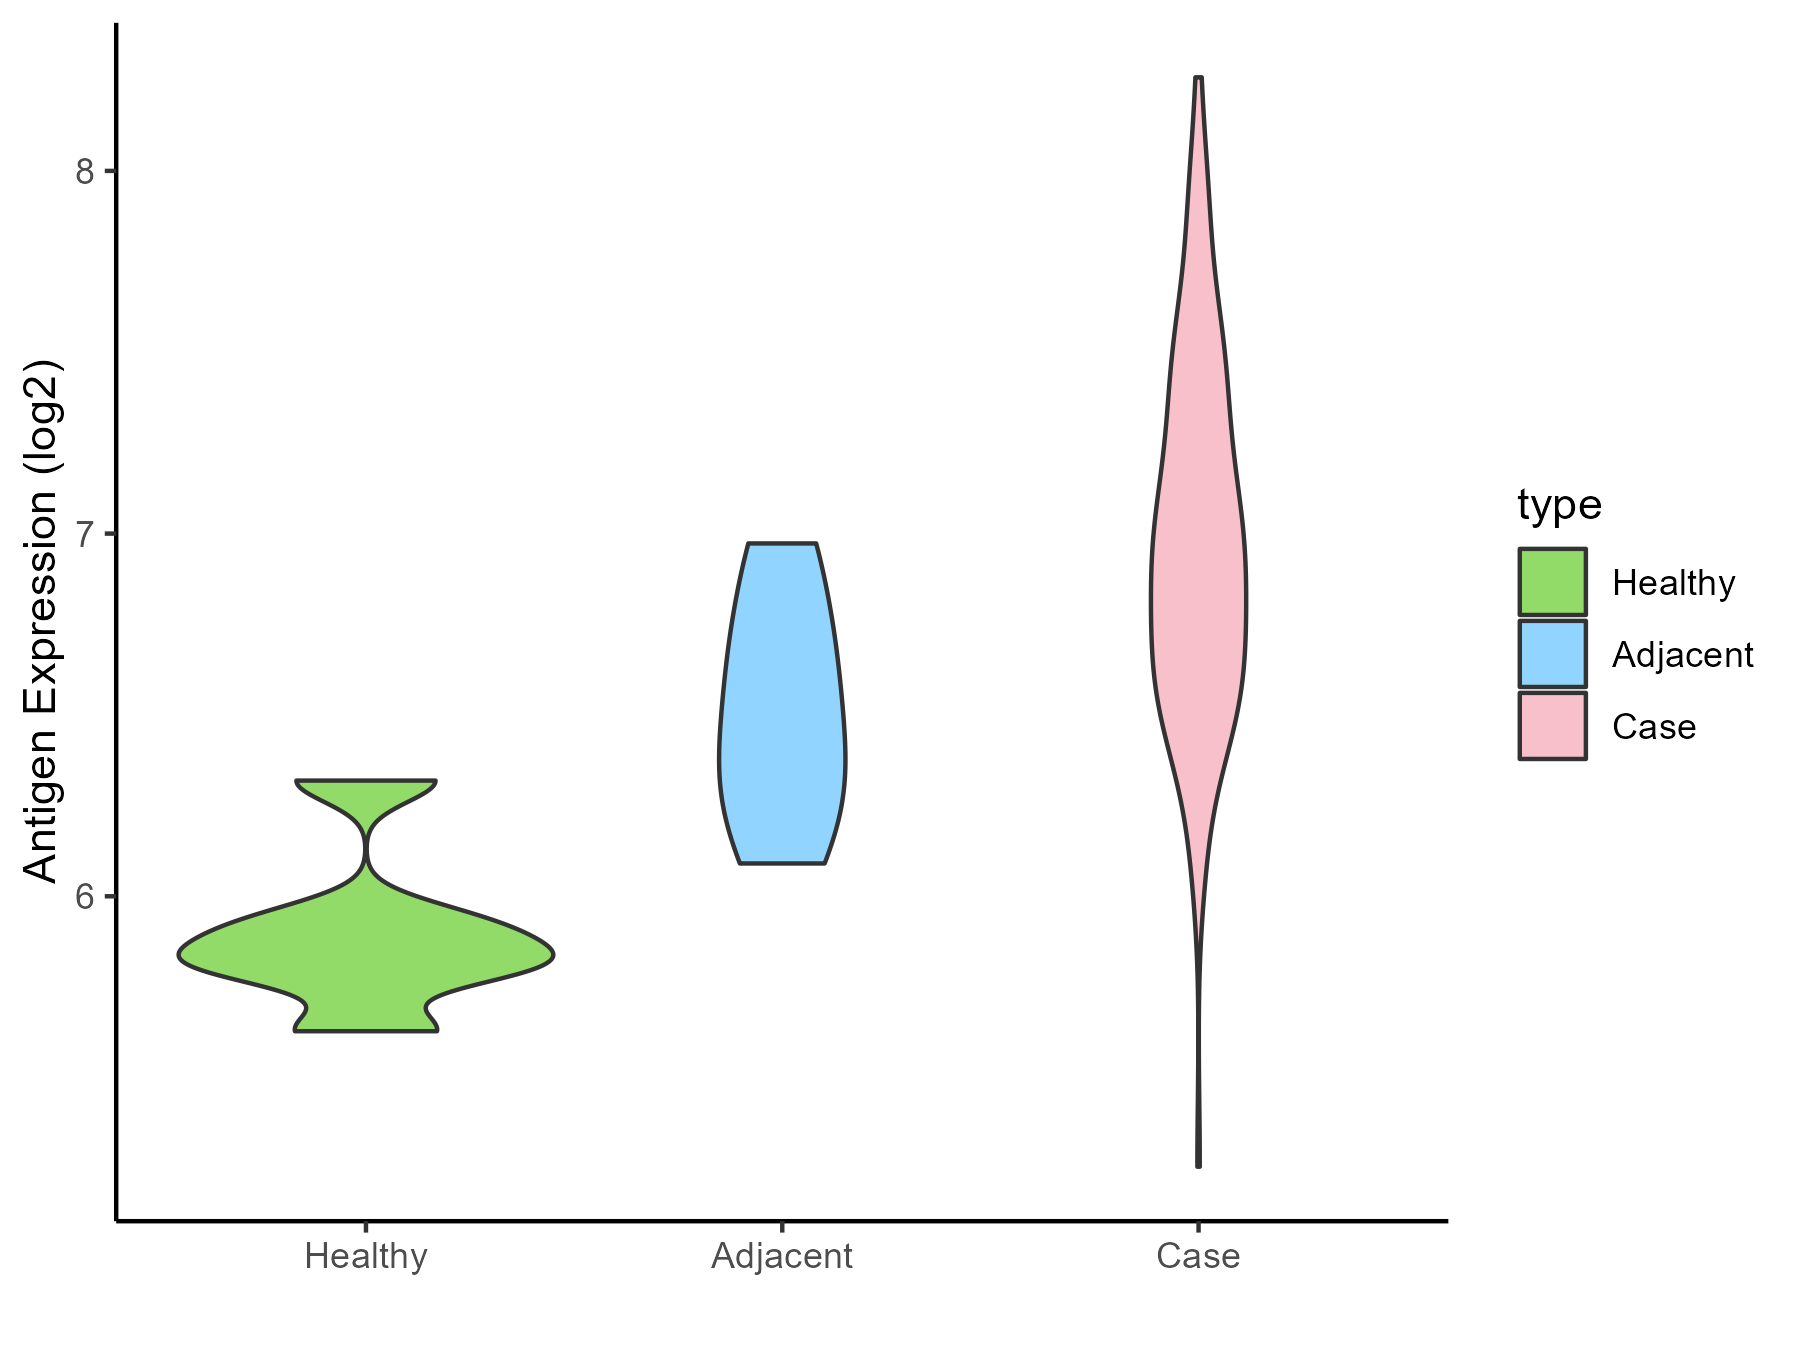
Skin cancer [ICD-11: 2C30-2C3Z]
Click to Show/Hide
| Differential expression pattern of antigen in diseases |
| The Studied Tissue |
Skin |
| The Specific Disease |
Skin cancer |
| The Expression Level of Disease Section Compare with the Healthy Individual Tissue |
p-value: 1.66E-21;
Fold-change: 0.435357015;
Z-score: 0.992164421
|
| The Expression Level of Disease Section Compare with the Adjacent Tissue |
p-value: 9.47E-86;
Fold-change: 1.289353773;
Z-score: 3.305841055
|
| Disease-specific Antigen Abundances |
|
Click to View the Clearer Original Diagram
|
|
|
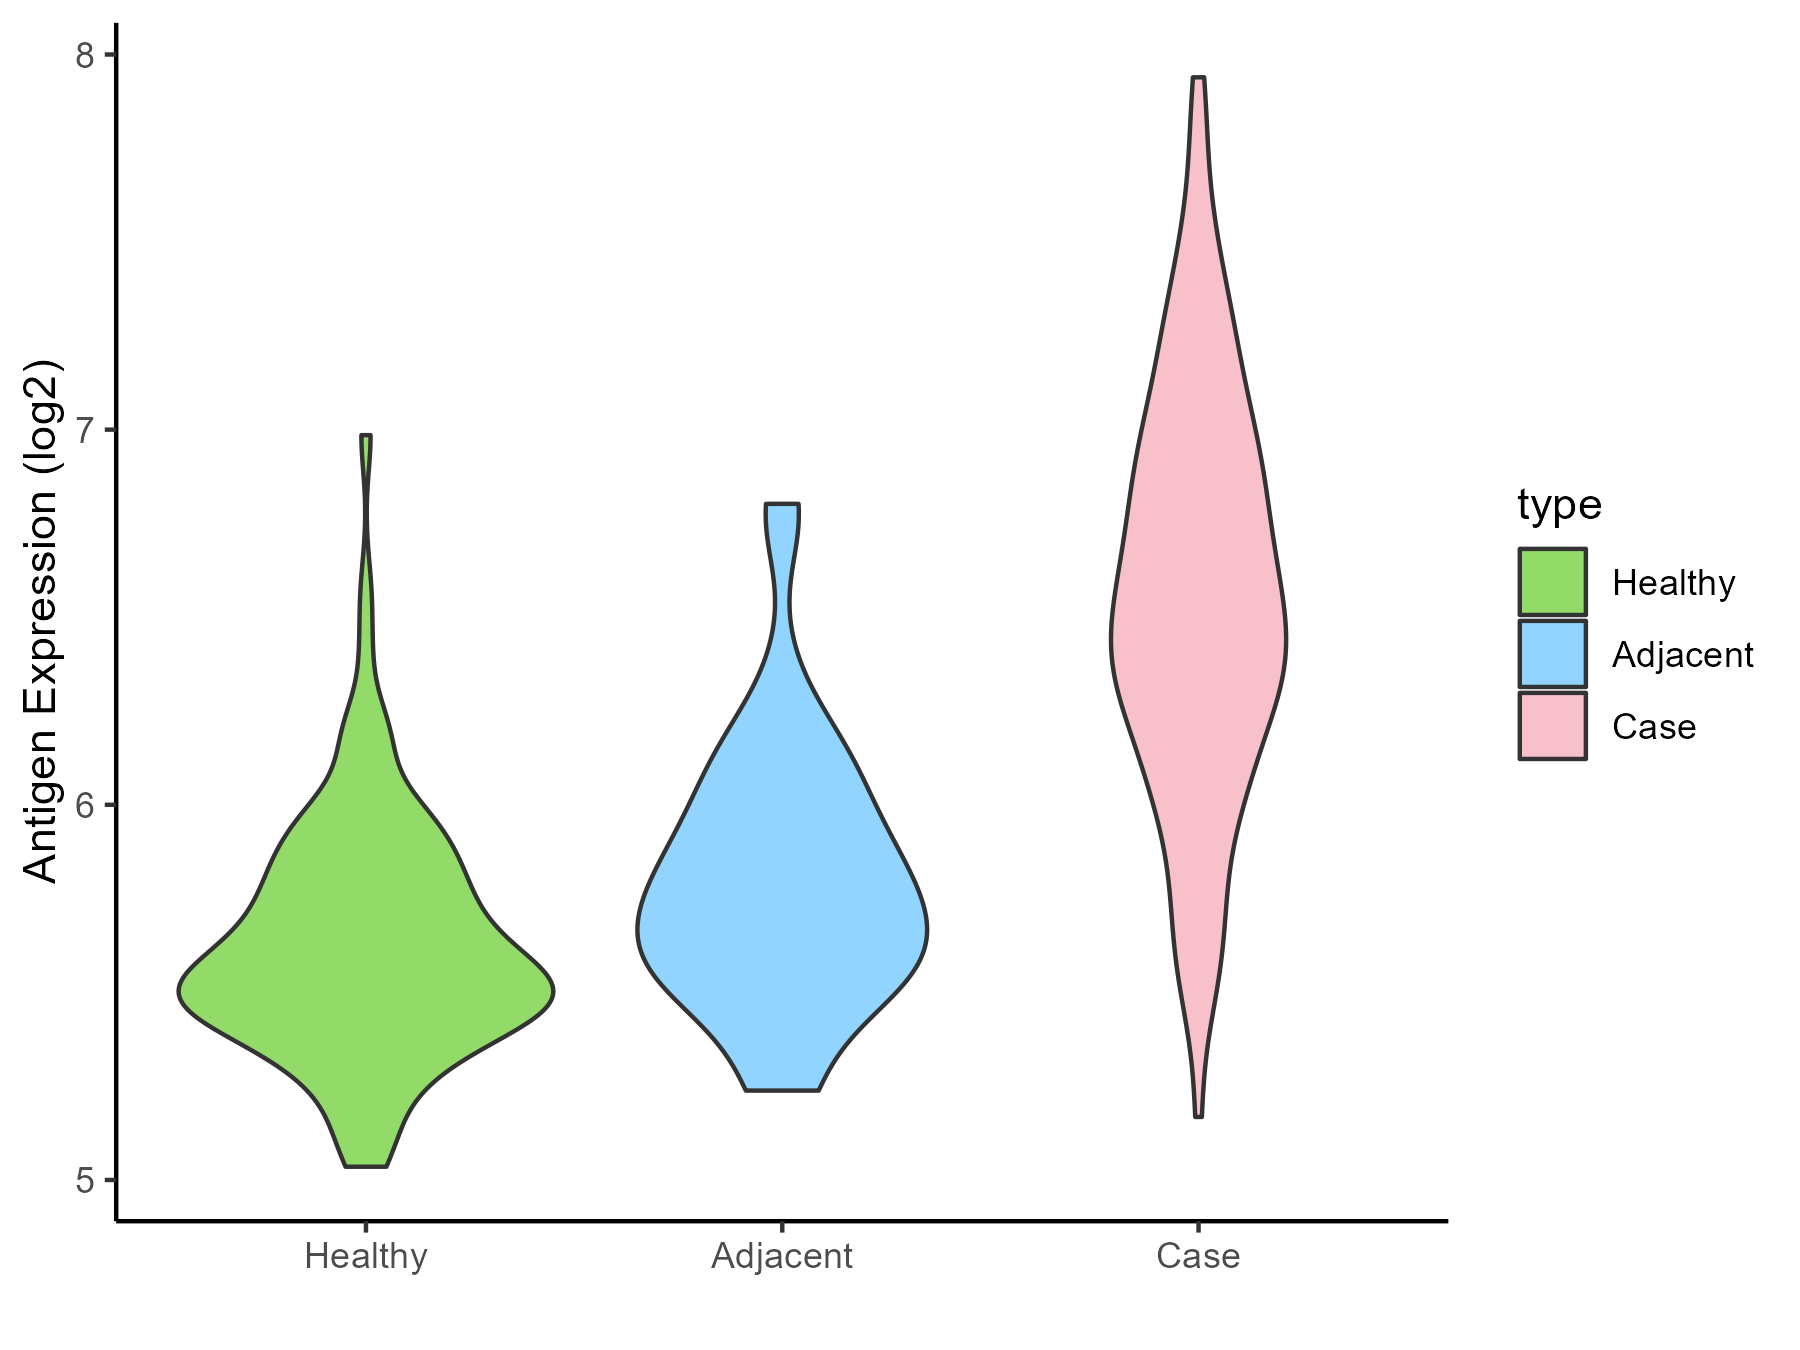
Renal cancer [ICD-11: 2C90-2C91]
Click to Show/Hide
| Differential expression pattern of antigen in diseases |
| The Studied Tissue |
Kidney |
| The Specific Disease |
Renal cancer |
| The Expression Level of Disease Section Compare with the Healthy Individual Tissue |
p-value: 4.78E-07;
Fold-change: 0.744941361;
Z-score: 2.897859228
|
| The Expression Level of Disease Section Compare with the Adjacent Tissue |
p-value: 0.001406946;
Fold-change: 0.213457213;
Z-score: 0.389690569
|
| Disease-specific Antigen Abundances |
|
Click to View the Clearer Original Diagram
|
|
|
Ureter cancer [ICD-11: 2C92]
Click to Show/Hide
| Differential expression pattern of antigen in diseases |
| The Studied Tissue |
Urothelium |
| The Specific Disease |
Ureter cancer |
| The Expression Level of Disease Section Compare with the Healthy Individual Tissue |
p-value: 0.974960822;
Fold-change: -0.010945732;
Z-score: -0.0587749
|
| Disease-specific Antigen Abundances |
|
Click to View the Clearer Original Diagram
|
|
|
ICD Disease Classification 20
Click to Show/Hide the 2 Disease of This Class
Simpson golabi behmel syndrome [ICD-11: LD2C]
Click to Show/Hide
| Differential expression pattern of antigen in diseases |
| The Studied Tissue |
Adipose |
| The Specific Disease |
Simpson golabi behmel syndrome |
| The Expression Level of Disease Section Compare with the Healthy Individual Tissue |
p-value: 0.37972019;
Fold-change: 0.41774818;
Z-score: 0.861026969
|
| Disease-specific Antigen Abundances |
|
Click to View the Clearer Original Diagram
|
|
|
Tuberous sclerosis complex [ICD-11: LD2D.2]
Click to Show/Hide
| Differential expression pattern of antigen in diseases |
| The Studied Tissue |
Perituberal |
| The Specific Disease |
Tuberous sclerosis complex |
| The Expression Level of Disease Section Compare with the Healthy Individual Tissue |
p-value: 0.389859289;
Fold-change: 0.118797742;
Z-score: 0.490148535
|
| Disease-specific Antigen Abundances |
|
Click to View the Clearer Original Diagram
|
|
|
ICD Disease Classification 3
Click to Show/Hide the 3 Disease of This Class
Anemia [ICD-11: 3A00-3A9Z]
Click to Show/Hide
| Differential expression pattern of antigen in diseases |
| The Studied Tissue |
Bone marrow |
| The Specific Disease |
Anemia |
| The Expression Level of Disease Section Compare with the Healthy Individual Tissue |
p-value: 0.19579047;
Fold-change: 0.441375678;
Z-score: 1.632472268
|
| Disease-specific Antigen Abundances |
|
Click to View the Clearer Original Diagram
|
|
|
Sickle cell disease [ICD-11: 3A51.0-3A51.3]
Click to Show/Hide
| Differential expression pattern of antigen in diseases |
| The Studied Tissue |
Peripheral blood |
| The Specific Disease |
Sickle cell disease |
| The Expression Level of Disease Section Compare with the Healthy Individual Tissue |
p-value: 0.536932985;
Fold-change: -0.017676882;
Z-score: -0.108858275
|
| Disease-specific Antigen Abundances |
|
Click to View the Clearer Original Diagram
|
|
|
Thrombocythemia [ICD-11: 3B63]
Click to Show/Hide
| Differential expression pattern of antigen in diseases |
| The Studied Tissue |
Whole blood |
| The Specific Disease |
Thrombocythemia |
| The Expression Level of Disease Section Compare with the Healthy Individual Tissue |
p-value: 0.323032735;
Fold-change: -0.030608454;
Z-score: -0.413887512
|
| Disease-specific Antigen Abundances |
|
Click to View the Clearer Original Diagram
|
|
|
ICD Disease Classification 4
Click to Show/Hide the 4 Disease of This Class
Scleroderma [ICD-11: 4A42.Z]
Click to Show/Hide
| Differential expression pattern of antigen in diseases |
| The Studied Tissue |
Whole blood |
| The Specific Disease |
Scleroderma |
| The Expression Level of Disease Section Compare with the Healthy Individual Tissue |
p-value: 0.000636606;
Fold-change: -0.534258814;
Z-score: -2.196528804
|
| Disease-specific Antigen Abundances |
|
Click to View the Clearer Original Diagram
|
|
|
Sjogren syndrome [ICD-11: 4A43]
Click to Show/Hide
| Differential expression pattern of antigen in diseases |
| The Studied Tissue |
Salivary gland |
| The Specific Disease |
Sjogren syndrome |
| The Expression Level of Disease Section Compare with the Healthy Individual Tissue |
p-value: 0.267359518;
Fold-change: 0.298791844;
Z-score: 1.153130369
|
| The Expression Level of Disease Section Compare with the Adjacent Tissue |
p-value: 0.762635818;
Fold-change: 0.024743174;
Z-score: 0.190980482
|
| Disease-specific Antigen Abundances |
|
Click to View the Clearer Original Diagram
|
|
|
Behcet disease [ICD-11: 4A62]
Click to Show/Hide
| Differential expression pattern of antigen in diseases |
| The Studied Tissue |
Peripheral blood |
| The Specific Disease |
Behcet disease |
| The Expression Level of Disease Section Compare with the Healthy Individual Tissue |
p-value: 0.718133389;
Fold-change: -0.096788936;
Z-score: -0.431117718
|
| Disease-specific Antigen Abundances |
|
Click to View the Clearer Original Diagram
|
|
|
Autosomal dominant monocytopenia [ICD-11: 4B04]
Click to Show/Hide
| Differential expression pattern of antigen in diseases |
| The Studied Tissue |
Whole blood |
| The Specific Disease |
Autosomal dominant monocytopenia |
| The Expression Level of Disease Section Compare with the Healthy Individual Tissue |
p-value: 0.000485902;
Fold-change: -0.96466522;
Z-score: -2.189610588
|
| Disease-specific Antigen Abundances |
|
Click to View the Clearer Original Diagram
|
|
|
ICD Disease Classification 5
Click to Show/Hide the 5 Disease of This Class
Type 2 diabetes [ICD-11: 5A11]
Click to Show/Hide
| Differential expression pattern of antigen in diseases |
| The Studied Tissue |
Liver |
| The Specific Disease |
Type 2 diabetes |
| The Expression Level of Disease Section Compare with the Healthy Individual Tissue |
p-value: 0.160220543;
Fold-change: 0.04308976;
Z-score: 0.282953929
|
| Disease-specific Antigen Abundances |
|
Click to View the Clearer Original Diagram
|
|
|
Polycystic ovary syndrome [ICD-11: 5A80.1]
Click to Show/Hide
| Differential expression pattern of antigen in diseases |
| The Studied Tissue |
Vastus lateralis muscle |
| The Specific Disease |
Polycystic ovary syndrome |
| The Expression Level of Disease Section Compare with the Healthy Individual Tissue |
p-value: 0.55602786;
Fold-change: -0.097787186;
Z-score: -0.691035244
|
| Disease-specific Antigen Abundances |
|
Click to View the Clearer Original Diagram
|
|
|
Obesity [ICD-11: 5B81]
Click to Show/Hide
| Differential expression pattern of antigen in diseases |
| The Studied Tissue |
Subcutaneous Adipose |
| The Specific Disease |
Obesity |
| The Expression Level of Disease Section Compare with the Healthy Individual Tissue |
p-value: 0.934937244;
Fold-change: -0.001170847;
Z-score: -0.010665393
|
| Disease-specific Antigen Abundances |
|
Click to View the Clearer Original Diagram
|
|
|
Pompe disease [ICD-11: 5C51.3]
Click to Show/Hide
| Differential expression pattern of antigen in diseases |
| The Studied Tissue |
Biceps muscle |
| The Specific Disease |
Pompe disease |
| The Expression Level of Disease Section Compare with the Healthy Individual Tissue |
p-value: 0.038895167;
Fold-change: 0.234126738;
Z-score: 1.160522389
|
| Disease-specific Antigen Abundances |
|
Click to View the Clearer Original Diagram
|
|
|
Batten disease [ICD-11: 5C56.1]
Click to Show/Hide
| Differential expression pattern of antigen in diseases |
| The Studied Tissue |
Whole blood |
| The Specific Disease |
Batten disease |
| The Expression Level of Disease Section Compare with the Healthy Individual Tissue |
p-value: 0.034480097;
Fold-change: 0.160564714;
Z-score: 1.147429416
|
| Disease-specific Antigen Abundances |
|
Click to View the Clearer Original Diagram
|
|
|
ICD Disease Classification 6
Click to Show/Hide the 2 Disease of This Class
Autism [ICD-11: 6A02]
Click to Show/Hide
| Differential expression pattern of antigen in diseases |
| The Studied Tissue |
Whole blood |
| The Specific Disease |
Autism |
| The Expression Level of Disease Section Compare with the Healthy Individual Tissue |
p-value: 0.939331924;
Fold-change: 0.046762764;
Z-score: 0.126258894
|
| Disease-specific Antigen Abundances |
|
Click to View the Clearer Original Diagram
|
|
|
Anxiety disorder [ICD-11: 6B00-6B0Z]
Click to Show/Hide
| Differential expression pattern of antigen in diseases |
| The Studied Tissue |
Whole blood |
| The Specific Disease |
Anxiety disorder |
| The Expression Level of Disease Section Compare with the Healthy Individual Tissue |
p-value: 0.597813507;
Fold-change: -0.025173199;
Z-score: -0.12831879
|
| Disease-specific Antigen Abundances |
|
Click to View the Clearer Original Diagram
|
|
|
ICD Disease Classification 8
Click to Show/Hide the 7 Disease of This Class
Parkinson disease [ICD-11: 8A00]
Click to Show/Hide
| Differential expression pattern of antigen in diseases |
| The Studied Tissue |
Substantia nigra |
| The Specific Disease |
Parkinson disease |
| The Expression Level of Disease Section Compare with the Healthy Individual Tissue |
p-value: 0.260579912;
Fold-change: 0.202340979;
Z-score: 0.632570311
|
| Disease-specific Antigen Abundances |
|
Click to View the Clearer Original Diagram
|
|
|
Huntington disease [ICD-11: 8A01]
Click to Show/Hide
| Differential expression pattern of antigen in diseases |
| The Studied Tissue |
Whole blood |
| The Specific Disease |
Huntington disease |
| The Expression Level of Disease Section Compare with the Healthy Individual Tissue |
p-value: 0.032499824;
Fold-change: 0.187396386;
Z-score: 0.522581655
|
| Disease-specific Antigen Abundances |
|
Click to View the Clearer Original Diagram
|
|
|
Alzheimer disease [ICD-11: 8A20]
Click to Show/Hide
| Differential expression pattern of antigen in diseases |
| The Studied Tissue |
Entorhinal cortex |
| The Specific Disease |
Alzheimer disease |
| The Expression Level of Disease Section Compare with the Healthy Individual Tissue |
p-value: 8.00E-08;
Fold-change: 0.260849543;
Z-score: 0.892921086
|
| Disease-specific Antigen Abundances |
|
Click to View the Clearer Original Diagram
|
|
|
Seizure [ICD-11: 8A60-8A6Z]
Click to Show/Hide
| Differential expression pattern of antigen in diseases |
| The Studied Tissue |
Whole blood |
| The Specific Disease |
Seizure |
| The Expression Level of Disease Section Compare with the Healthy Individual Tissue |
p-value: 0.920920294;
Fold-change: -0.109676172;
Z-score: -0.332890432
|
| Disease-specific Antigen Abundances |
|
Click to View the Clearer Original Diagram
|
|
|
Lateral sclerosis [ICD-11: 8B60.4]
Click to Show/Hide
| Differential expression pattern of antigen in diseases |
| The Studied Tissue |
Skin |
| The Specific Disease |
Lateral sclerosis |
| The Expression Level of Disease Section Compare with the Healthy Individual Tissue |
p-value: 0.596480669;
Fold-change: -0.149543137;
Z-score: -0.414642985
|
| Disease-specific Antigen Abundances |
|
Click to View the Clearer Original Diagram
|
|
|
| The Studied Tissue |
Cervical spinal cord |
| The Specific Disease |
Lateral sclerosis |
| The Expression Level of Disease Section Compare with the Healthy Individual Tissue |
p-value: 0.602257011;
Fold-change: -0.05459133;
Z-score: -0.262252568
|
| Disease-specific Antigen Abundances |
|
Click to View the Clearer Original Diagram
|
|
|
Muscular atrophy [ICD-11: 8C70]
Click to Show/Hide
| Differential expression pattern of antigen in diseases |
| The Studied Tissue |
Muscle |
| The Specific Disease |
Muscular atrophy |
| The Expression Level of Disease Section Compare with the Healthy Individual Tissue |
p-value: 0.009337238;
Fold-change: 0.186124467;
Z-score: 0.823569909
|
| Disease-specific Antigen Abundances |
|
Click to View the Clearer Original Diagram
|
|
|
Myopathy [ICD-11: 8C70.6]
Click to Show/Hide
| Differential expression pattern of antigen in diseases |
| The Studied Tissue |
Muscle |
| The Specific Disease |
Myopathy |
| The Expression Level of Disease Section Compare with the Healthy Individual Tissue |
p-value: 0.029334824;
Fold-change: 0.323057219;
Z-score: 1.387460012
|
| Disease-specific Antigen Abundances |
|
Click to View the Clearer Original Diagram
|
|
|
