Antigen Information
General Information of This Antigen
| Antigen ID | TAR0PNBPC |
|||||
|---|---|---|---|---|---|---|
| Antigen Name | Neurogenic locus notch homolog protein 3 (NOTCH3) |
|||||
| Gene Name | NOTCH3 |
|||||
| Gene ID | ||||||
| Sequence |
MGPGARGRRRRRRPMSPPPPPPPVRALPLLLLLAGPGAAAPPCLDGSPCANGGRCTQLPS
REAACLCPPGWVGERCQLEDPCHSGPCAGRGVCQSSVVAG.FSCRCPRGFRGPDCSLPDP CLSSPCAHGARCSVGPDGRFLCSCPPGYQGRSCRSDVDECRVGEPCRHGGTCLNTPGSFR CQCPAGYTGPLCENPAVPCAPSPCRNGGTCRQSGDLTYDCACLPGFEGQNCEVNVDDCPG HRCLNGGTCVDGVNTYNCQCPPEWTGQFCTEDVDECQLQPNACHNGGTCFNTLGGHSCVC VNGWTGESCSQNIDDCATAVCFHGATCHDRVASFYCACPMGKTGLLCHLDDACVSNPCHE DAICDTNPVNGRAICTCPPGFTGGACDQDVDECSIGANPCEHLGRCVNTQGSFLCQCGRG YTGPRCETDVNECLSGPCRNQATCLDRIGQFTCICMAGFTGTYCEVDIDECQSSPCVNGG VCKDRVNGFSCTCPSGFSGSTCQLDVDECASTPCRNGAKCVDQPDGYECRCAEGFEGTLC DRNVDDCSPDPCHHGRCVDGIASFSCACAPGYTGTRCESQVDECRSQPCRHGGKCLDLVD KYLCRCPSGTTGVNCEVNIDDCASNPCTFGVCRDGINRYDCVCQPGFTGPLCNVEINECA SSPCGEGGSCVDGENGFRCLCPPGSLPPLCLPPSHPCAHEPCSHGICYDAPGGFRCVCEP GWSGPRCSQSLARDACESQPCRAGGTCSSDGMGFHCTCPPGVQGRQCELLSPCTPNPCEH GGRCESAPGQLPVCSCPQGWQGPRCQQDVDECAGPAPCGPHGICTNLAGSFSCTCHGGYT GPSCDQDINDCDPNPCLNGGSCQDGVGSFSCSCLPGFAGPRCARDVDECLSNPCGPGTCT DHVASFTCTCPPGYGGFHCEQDLPDCSPSSCFNGGTCVDGVNSFSCLCRPGYTGAHCQHE ADPCLSRPCLHGGVCSAAHPGFRCTCLESFTGPQCQTLVDWCSRQPCQNGGRCVQTGAYC LCPPGWSGRLCDIRSLPCREAAAQIGVRLEQLCQAGGQCVDEDSSHYCVCPEGRTGSHCE QEVDPCLAQPCQHGGTCRGYMGGYMCECLPGYNGDNCEDDVDECASQPCQHGGSCIDLVA RYLCSCPPGTLGVLCEINEDDCGPGPPLDSGPRCLHNGTCVDLVGGFRCTCPPGYTGLRC EADINECRSGACHAAHTRDCLQDPGGGFRCLCHAGFSGPRCQTVLSPCESQPCQHGGQCR PSPGPGGGLTFTCHCAQPFWGPRCERVARSCRELQCPVGVPCQQTPRGPRCACPPGLSGP SCRSFPGSPPGASNASCAAAPCLHGGSCRPAPLAPFFRCACAQGWTGPRCEAPAAAPEVS EEPRCPRAACQAKRGDQRCDRECNSPGCGWDGGDCSLSVGDPWRQCEALQCWRLFNNSRC DPACSSPACLYDNFDCHAGGRERTCNPVYEKYCADHFADGRCDQGCNTEECGWDGLDCAS EVPALLARGVLVLTVLLPPEELLRSSADFLQRLSAILRTSLRFRLDAHGQAMVFPYHRPS PGSEPRARRELAPEVIGSVVMLEIDNRLCLQSPENDHCFPDAQSAADYLGALSAVERLDF PYPLRDVRGEPLEPPEPSVPLLPLLVAGAVLLLVILVLGVMVARRKREHSTLWFPEGFSL HKDVASGHKGRREPVGQDALGMKNMAKGESLMGEVATDWMDTECPEAKRLKVEEPGMGAE EAVDCRQWTQHHLVAADIRVAPAMALTPPQGDADADGMDVNVRGPDGFTPLMLASFCGGA LEPMPTEEDEADDTSASIISDLICQGAQLGARTDRTGETALHLAARYARADAAKRLLDAG ADTNAQDHSGRTPLHTAVTADAQGVFQILIRNRSTDLDARMADGSTALILAARLAVEGMV EELIASHADVNAVDELGKSALHWAAAVNNVEATLALLKNGANKDMQDSKEETPLFLAARE GSYEAAKLLLDHFANREITDHLDRLPRDVAQERLHQDIVRLLDQPSGPRSPPGPHGLGPL LCPPGAFLPGLKAAQSGSKKSRRPPGKAGLGPQGPRGRGKKLTLACPGPLADSSVTLSPV DSLDSPRPFGGPPASPGGFPLEGPYAAATATAVSLAQLGGPGRAGLGRQPPGGCVLSLGL LNPVAVPLDWARLPPPAPPGPSFLLPLAPGPQLLNPGTPVSPQERPPPYLAVPGHGEEYP AAGAHSSPPKARFLRVPSEHPYLTPSPESPEHWASPSPPSLSDWSESTPSPATATGAMAT TTGALPAQPLPLSVPSSLAQAQTQLGPQPEVTPKRQVLA Click to Show/Hide
|
|||||
| Family | Nectin family |
|||||
| Function |
Functions as a receptor for membrane-bound ligands Jagged1, Jagged2 and Delta1 to regulate cell-fate determination. Upon ligand activation through the released notch intracellular domain (NICD) it forms a transcriptional activator complex with RBPJ/RBPSUH and activates genes of the enhancer of split locus. Affects the implementation of differentiation, proliferation and apoptotic programs.
Click to Show/Hide
|
|||||
| Uniprot Entry | ||||||
| HGNC ID | ||||||
| KEGG ID | ||||||
Each Antibody-drug Conjuate AND It's Component Related to This Antigen
Full List of The ADC Related to This Antigen
Anti-NOTCH3 mAb
| ADC Info | ADC Name | Payload | Target | Linker | Ref |
|---|---|---|---|---|---|
Anti-N3-vc0101 |
Auristatin 0101 |
Microtubule (MT) |
Mc-Val-Cit-PABC |
[1] |
Anti-NOTCH3 mAb ch28
| ADC Info | ADC Name | Payload | Target | Linker | Ref |
|---|---|---|---|---|---|
ch28-mc0131 |
ch28-mc0131 payload |
Undisclosed |
ch28-mc0131 linker |
[2] | |
ch28-mc0131 |
ch28-mc0131 payload |
Undisclosed |
ch28-mc0131 linker |
[2] | |
ch28-m(H20)c-0131 |
ch28-m(H20)c-0131 payload |
Undisclosed |
ch28-m(H20)c-0131 linker |
[2] | |
ch28-MalPeg6C2-0131 |
ch28-MalPeg6C2-0131 payload |
Undisclosed |
ch28-MalPeg6C2-0131 linker |
[2] | |
ch28-MalPeg6C2-8261 |
ch28-MalPeg6C2-8261 payload |
Undisclosed |
ch28-MalPeg6C2-8261 linker |
[2] | |
ch28-mc0101 |
ch28-mc0101 payload |
Undisclosed |
ch28-mc0101 linker |
[2] | |
ch28-mc3377 |
ch28-mc3377 payload |
Undisclosed |
ch28-mc3377 linker |
[2] | |
ch28-mc8261 |
ch28-mc8261 payload |
Undisclosed |
ch28-mc8261 linker |
[2] | |
ch28-vc0101 |
ch28-vc0101 payload |
Undisclosed |
ch28-vc0101 linker |
[2] | |
ch28-vc6780 |
ch28-vc6780 payload |
Undisclosed |
ch28-vc6780 linker |
[2] |
Anti-NOTCH3 mAb ch2H6
| ADC Info | ADC Name | Payload | Target | Linker | Ref |
|---|---|---|---|---|---|
ch2H6-mc8261 |
ch2H6-mc8261 payload |
Undisclosed |
ch2H6-mc8261 linker |
[2] |
Anti-NOTCH3 mAb ch75
| ADC Info | ADC Name | Payload | Target | Linker | Ref |
|---|---|---|---|---|---|
ch75-m(H20)c-0131 |
ch75-m(H20)c-0131 payload |
Undisclosed |
ch75-m(H20)c-0131 linker |
[2] | |
ch75-MalPeg6C2-8261 |
ch75-MalPeg6C2-8261 payload |
Undisclosed |
ch75-MalPeg6C2-8261 linker |
[2] | |
ch75-MalPegC2-0131 |
ch75-MalPegC2-0131 payload |
Undisclosed |
ch75-MalPegC2-0131 linker |
[2] | |
ch75-mc0131 |
ch75-mc0131 payload |
Undisclosed |
ch75-mc0131 linker |
[2] | |
ch75-mc3377 |
ch75-mc3377 payload |
Undisclosed |
ch75-mc3377 linker |
[2] | |
ch75-me0131 |
ch75-me0131 payload |
Undisclosed |
ch75-me0131 linker |
[2] | |
ch75-vc0101 |
ch75-vc0101 payload |
Undisclosed |
ch75-vc0101 linker |
[2] | |
ch75-vc6780 |
ch75-vc6780 payload |
Undisclosed |
ch75-vc6780 linker |
[2] |
Anti-NOTCH3 mAb hu28
| ADC Info | ADC Name | Payload | Target | Linker | Ref |
|---|---|---|---|---|---|
PF-06650808 |
Auristatin 0101 |
Microtubule (MT) |
Mc-Val-Cit-PABC |
[3] | |
hu28-vc0101 |
hu28-vc0101 payload |
Undisclosed |
hu28-vc0101 linker |
[2] | |
hu28-vc6780 |
hu28-vc6780 payload |
Undisclosed |
hu28-vc6780 linker |
[2] |
Anti-NOTCH3 mAb hu75
| ADC Info | ADC Name | Payload | Target | Linker | Ref |
|---|---|---|---|---|---|
hu75-vc0101 |
hu75-vc0101 payload |
Undisclosed |
hu75-vc0101 linker |
[2] | |
hu75-vc6780 |
hu75-vc6780 payload |
Undisclosed |
hu75-vc6780 linker |
[2] |
Anti-NOTCH3 mAb huNeg8.8
| ADC Info | ADC Name | Payload | Target | Linker | Ref |
|---|---|---|---|---|---|
huNeg8.8-me0131 |
huNeg8.8-me0131 payload |
Undisclosed |
huNeg8.8-me0131 linker |
[2] | |
huNeg8.8-me0131 |
huNeg8.8-me0131 payload |
Undisclosed |
huNeg8.8-me0131 linker |
[2] | |
huNeg8.8-MalPeg6C2-8261 |
huNeg8.8-MalPeg6C2-8261 payload |
Undisclosed |
huNeg8.8-MalPeg6C2-8261 linker |
[2] | |
huNeg8.8-mc3377 |
huNeg8.8-mc3377 payload |
Undisclosed |
huNeg8.8-mc3377 linker |
[2] | |
huNeg8.8-vc0101 |
huNeg8.8-vc0101 payload |
Undisclosed |
huNeg8.8-vc0101 linker |
[2] | |
huNeg8.8-vc6780 |
huNeg8.8-vc6780 payload |
Undisclosed |
huNeg8.8-vc6780 linker |
[2] |
Anti-NOTCH3(i) mAb
| ADC Info | ADC Name | Payload | Target | Linker | Ref |
|---|---|---|---|---|---|
Anti-N3(i)-vc0101 |
Auristatin 0101 |
Microtubule (MT) |
Mc-Val-Cit-PABC |
[1] |
Tissue/Disease specific Abundances of This Antigen
Tissue specific Abundances of This Antigen
ICD Disease Classification 01
| Differential expression pattern of antigen in diseases | ||
| The Studied Tissue | Gingival | |
| The Specific Disease | Bacterial infection of gingival | |
| The Expression Level of Disease Section Compare with the Healthy Individual Tissue | p-value: 0.867266352; Fold-change: 0.034311487; Z-score: 0.077635503 | |
| Disease-specific Antigen Abundances |
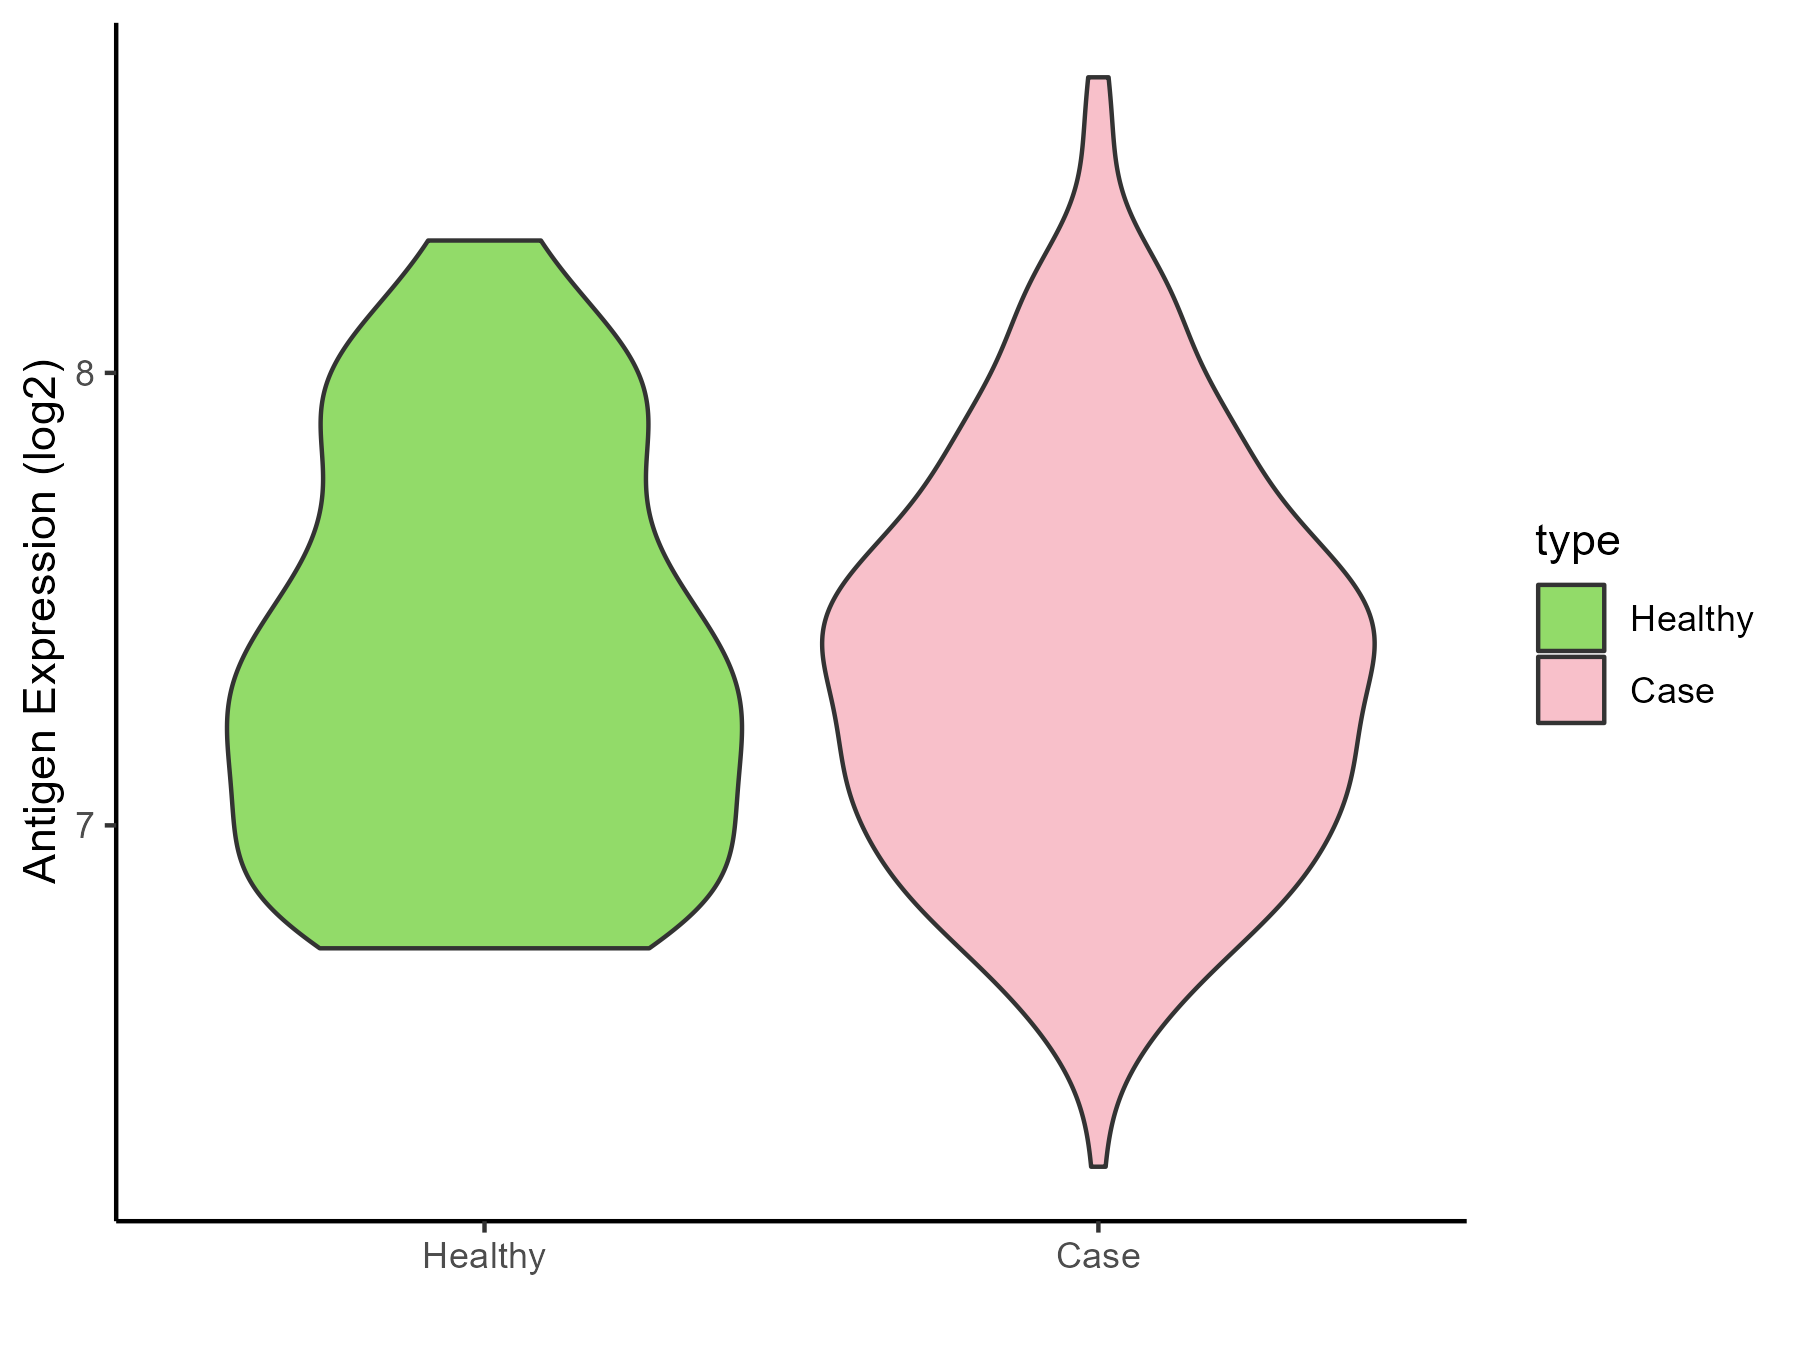
|
Click to View the Clearer Original Diagram |
ICD Disease Classification 02
| Differential expression pattern of antigen in diseases | ||
| The Studied Tissue | Brainstem | |
| The Specific Disease | Glioma | |
| The Expression Level of Disease Section Compare with the Healthy Individual Tissue | p-value: 0.045891062; Fold-change: 0.571061144; Z-score: 4.154075103 | |
| Disease-specific Antigen Abundances |
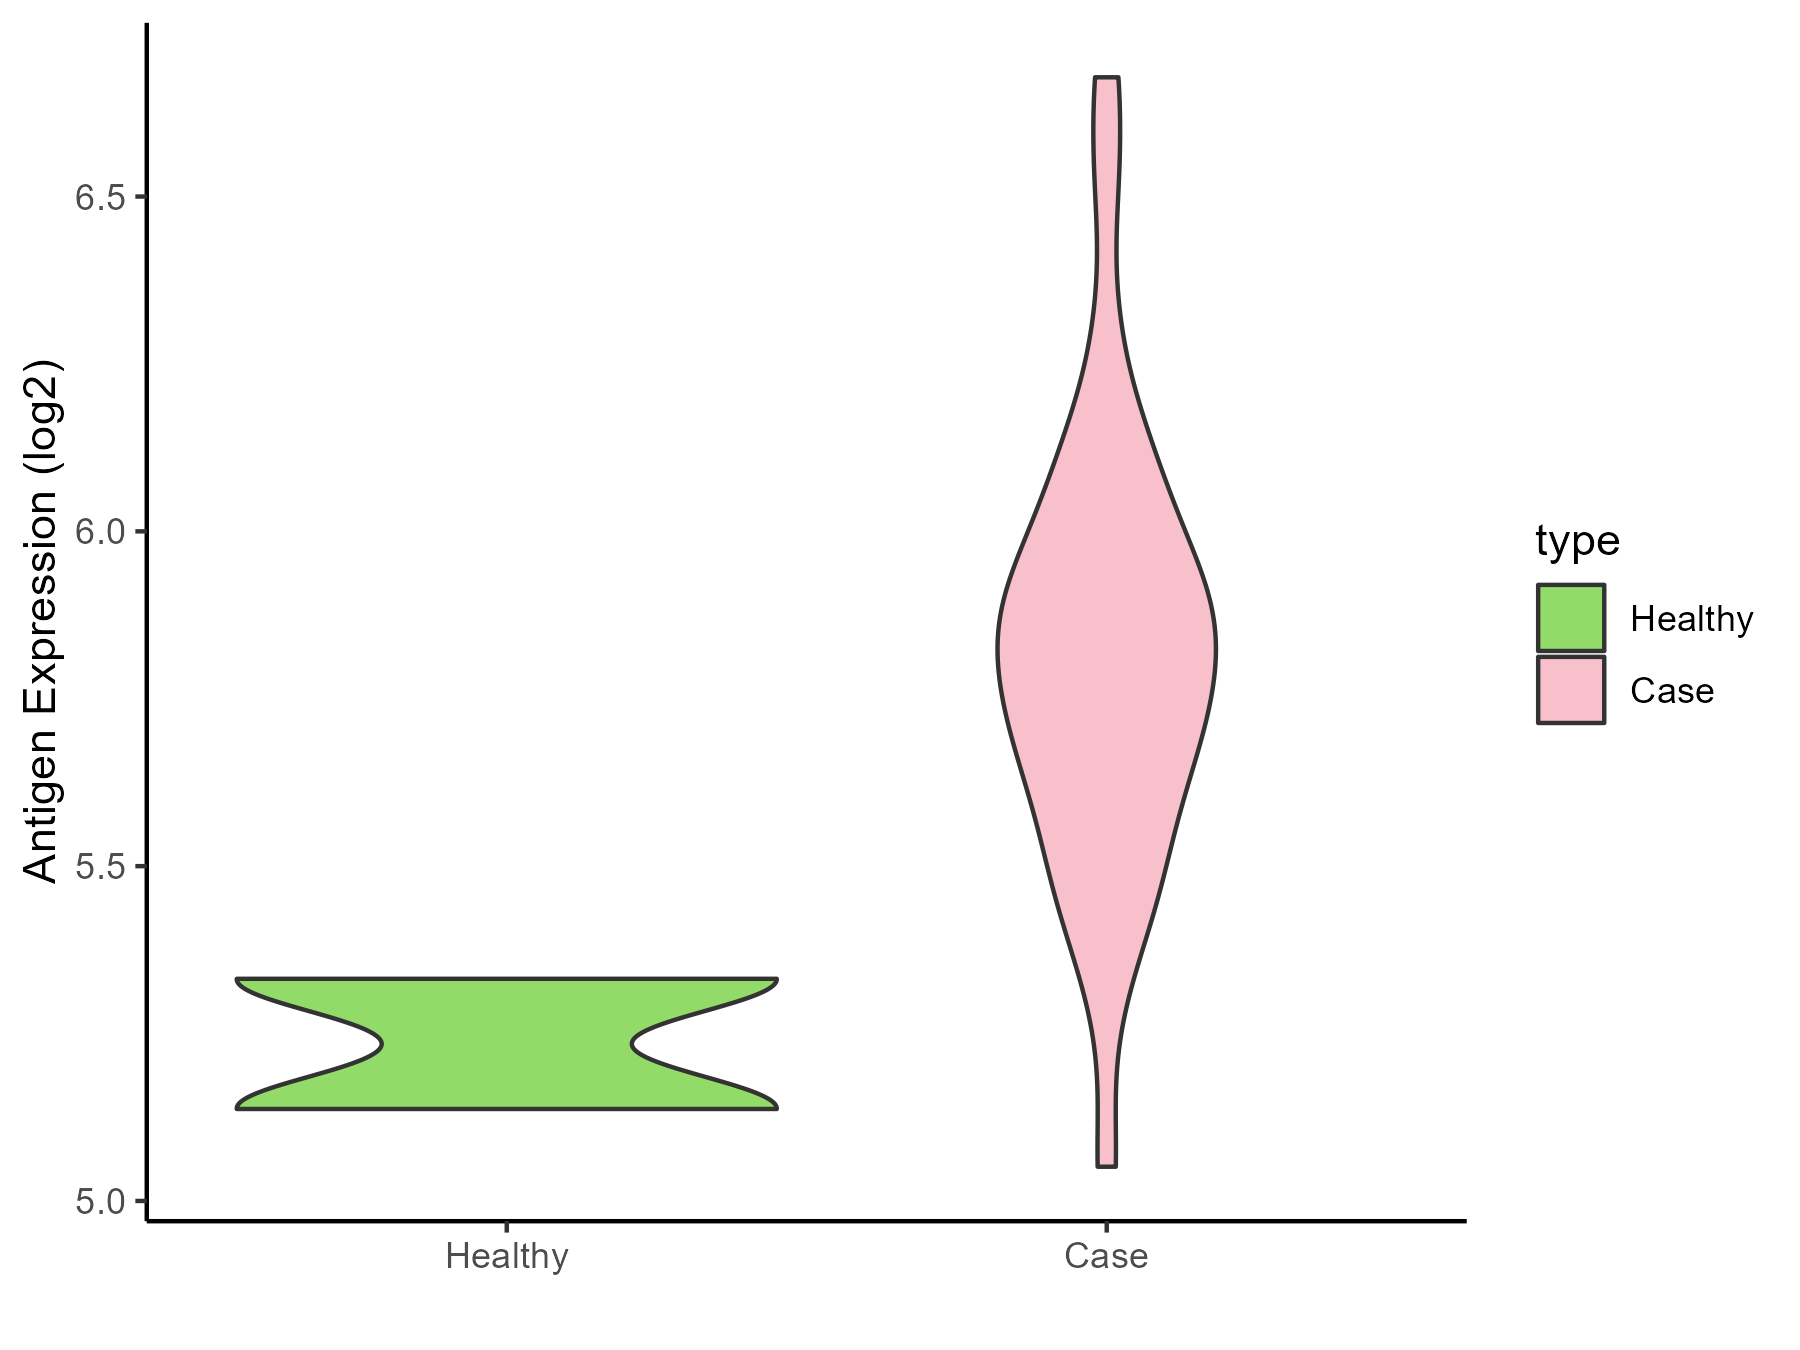
|
Click to View the Clearer Original Diagram |
| The Studied Tissue | White matter | |
| The Specific Disease | Glioma | |
| The Expression Level of Disease Section Compare with the Healthy Individual Tissue | p-value: 0.798395175; Fold-change: -0.057383162; Z-score: -0.084175332 | |
| Disease-specific Antigen Abundances |
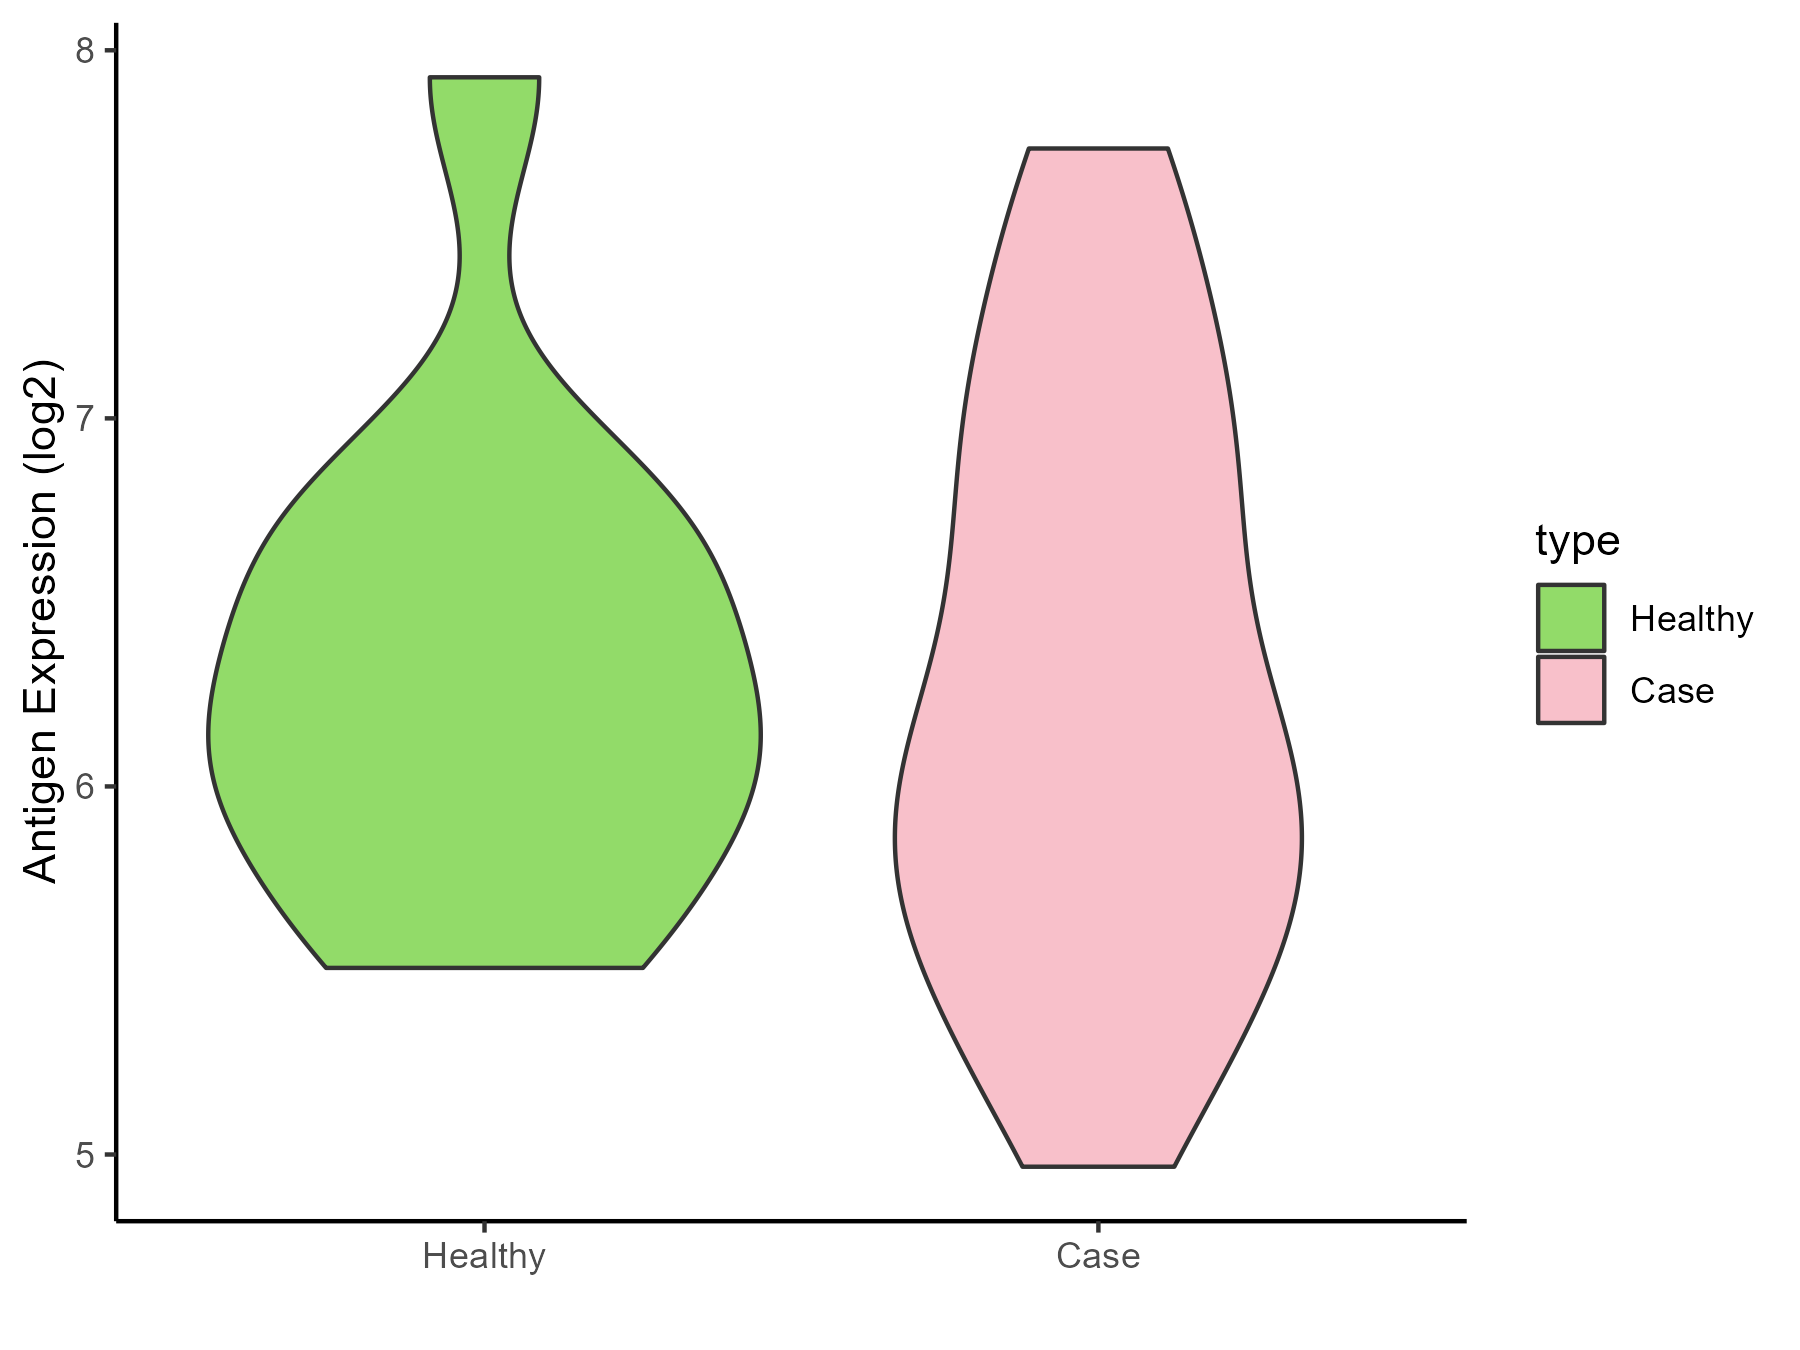
|
Click to View the Clearer Original Diagram |
| The Studied Tissue | Brainstem | |
| The Specific Disease | Neuroectodermal tumor | |
| The Expression Level of Disease Section Compare with the Healthy Individual Tissue | p-value: 0.024145037; Fold-change: -0.365204252; Z-score: -1.464900728 | |
| Disease-specific Antigen Abundances |
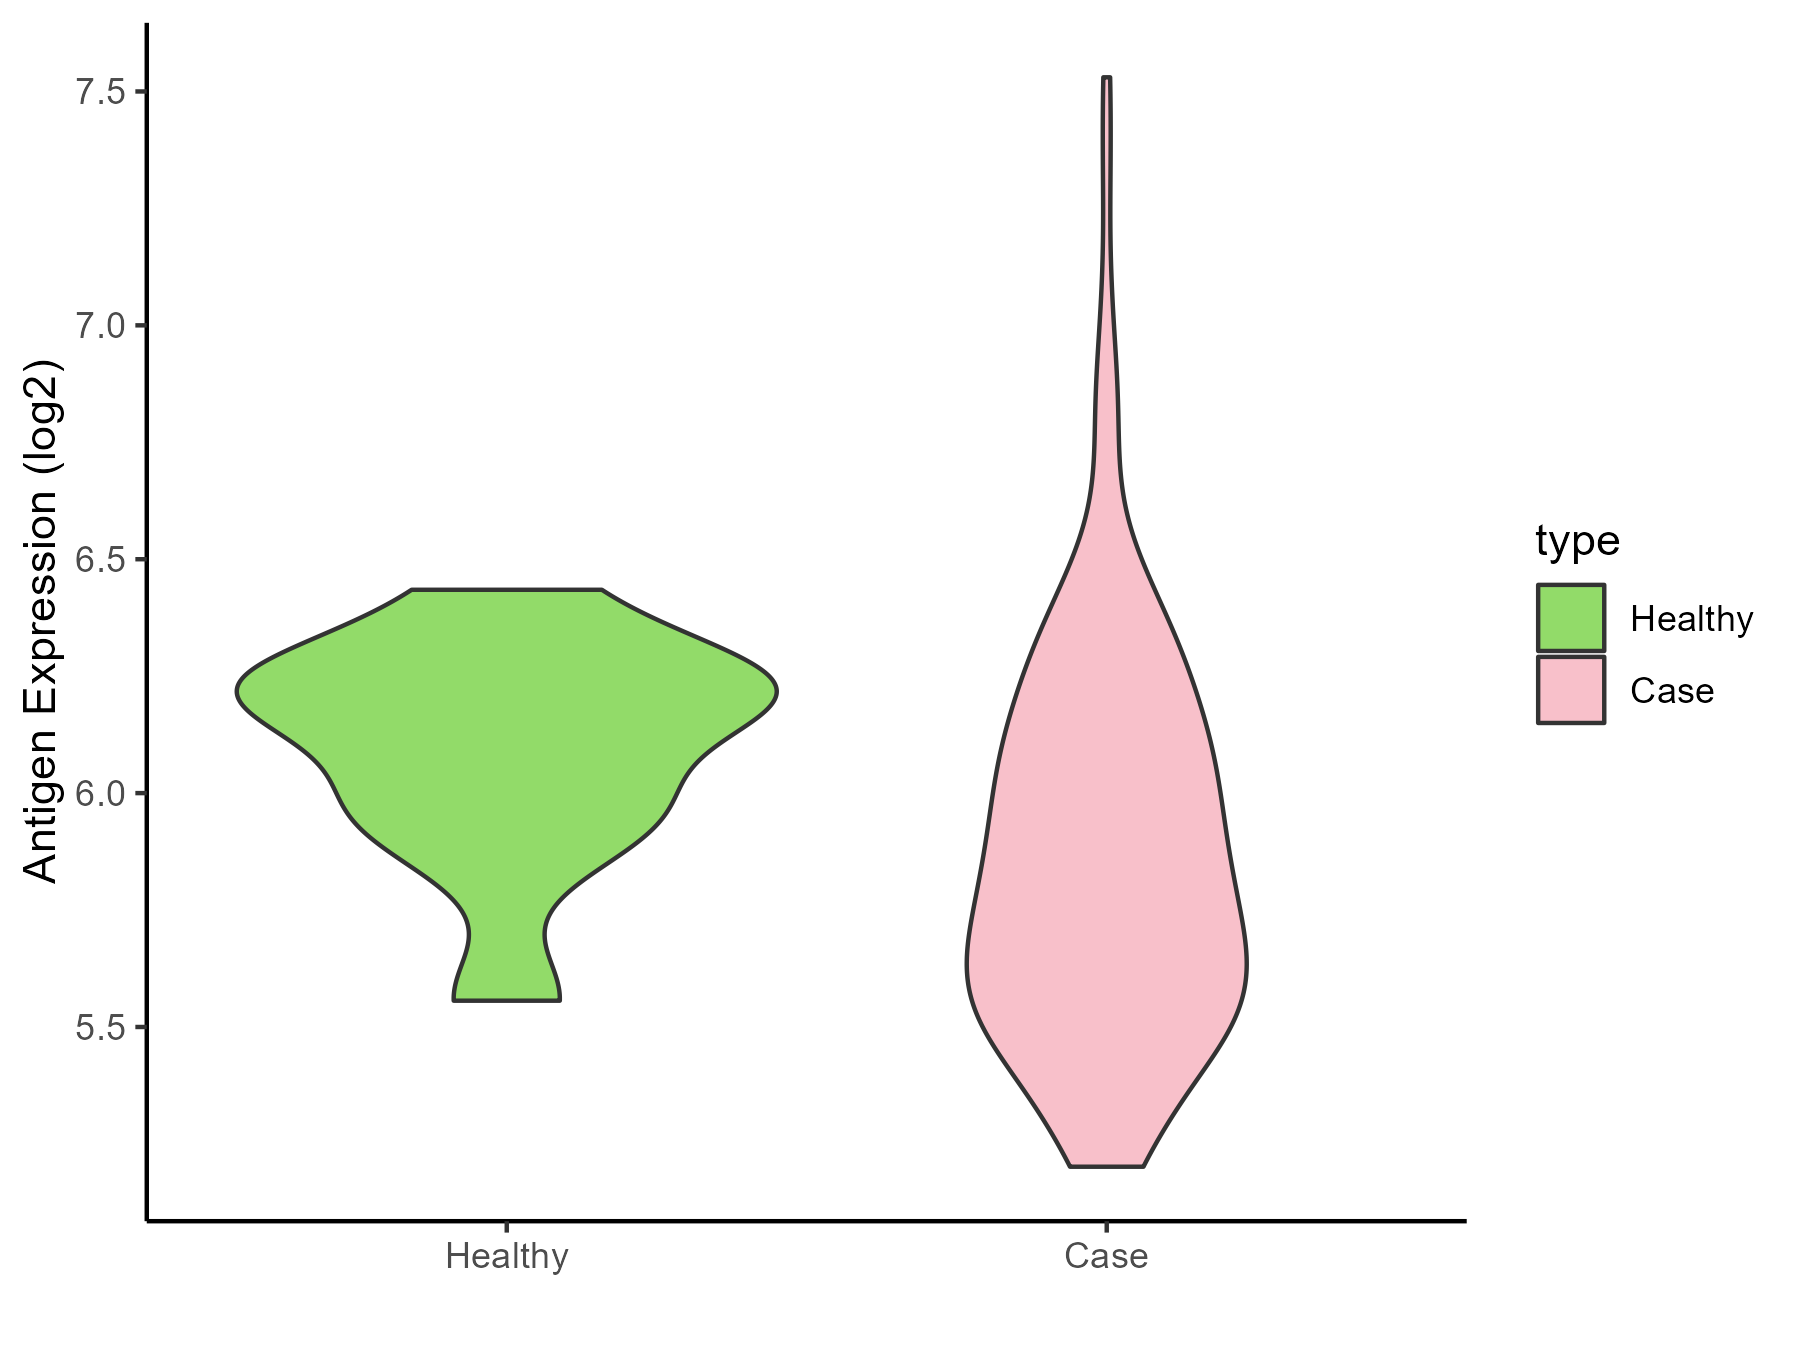
|
Click to View the Clearer Original Diagram |
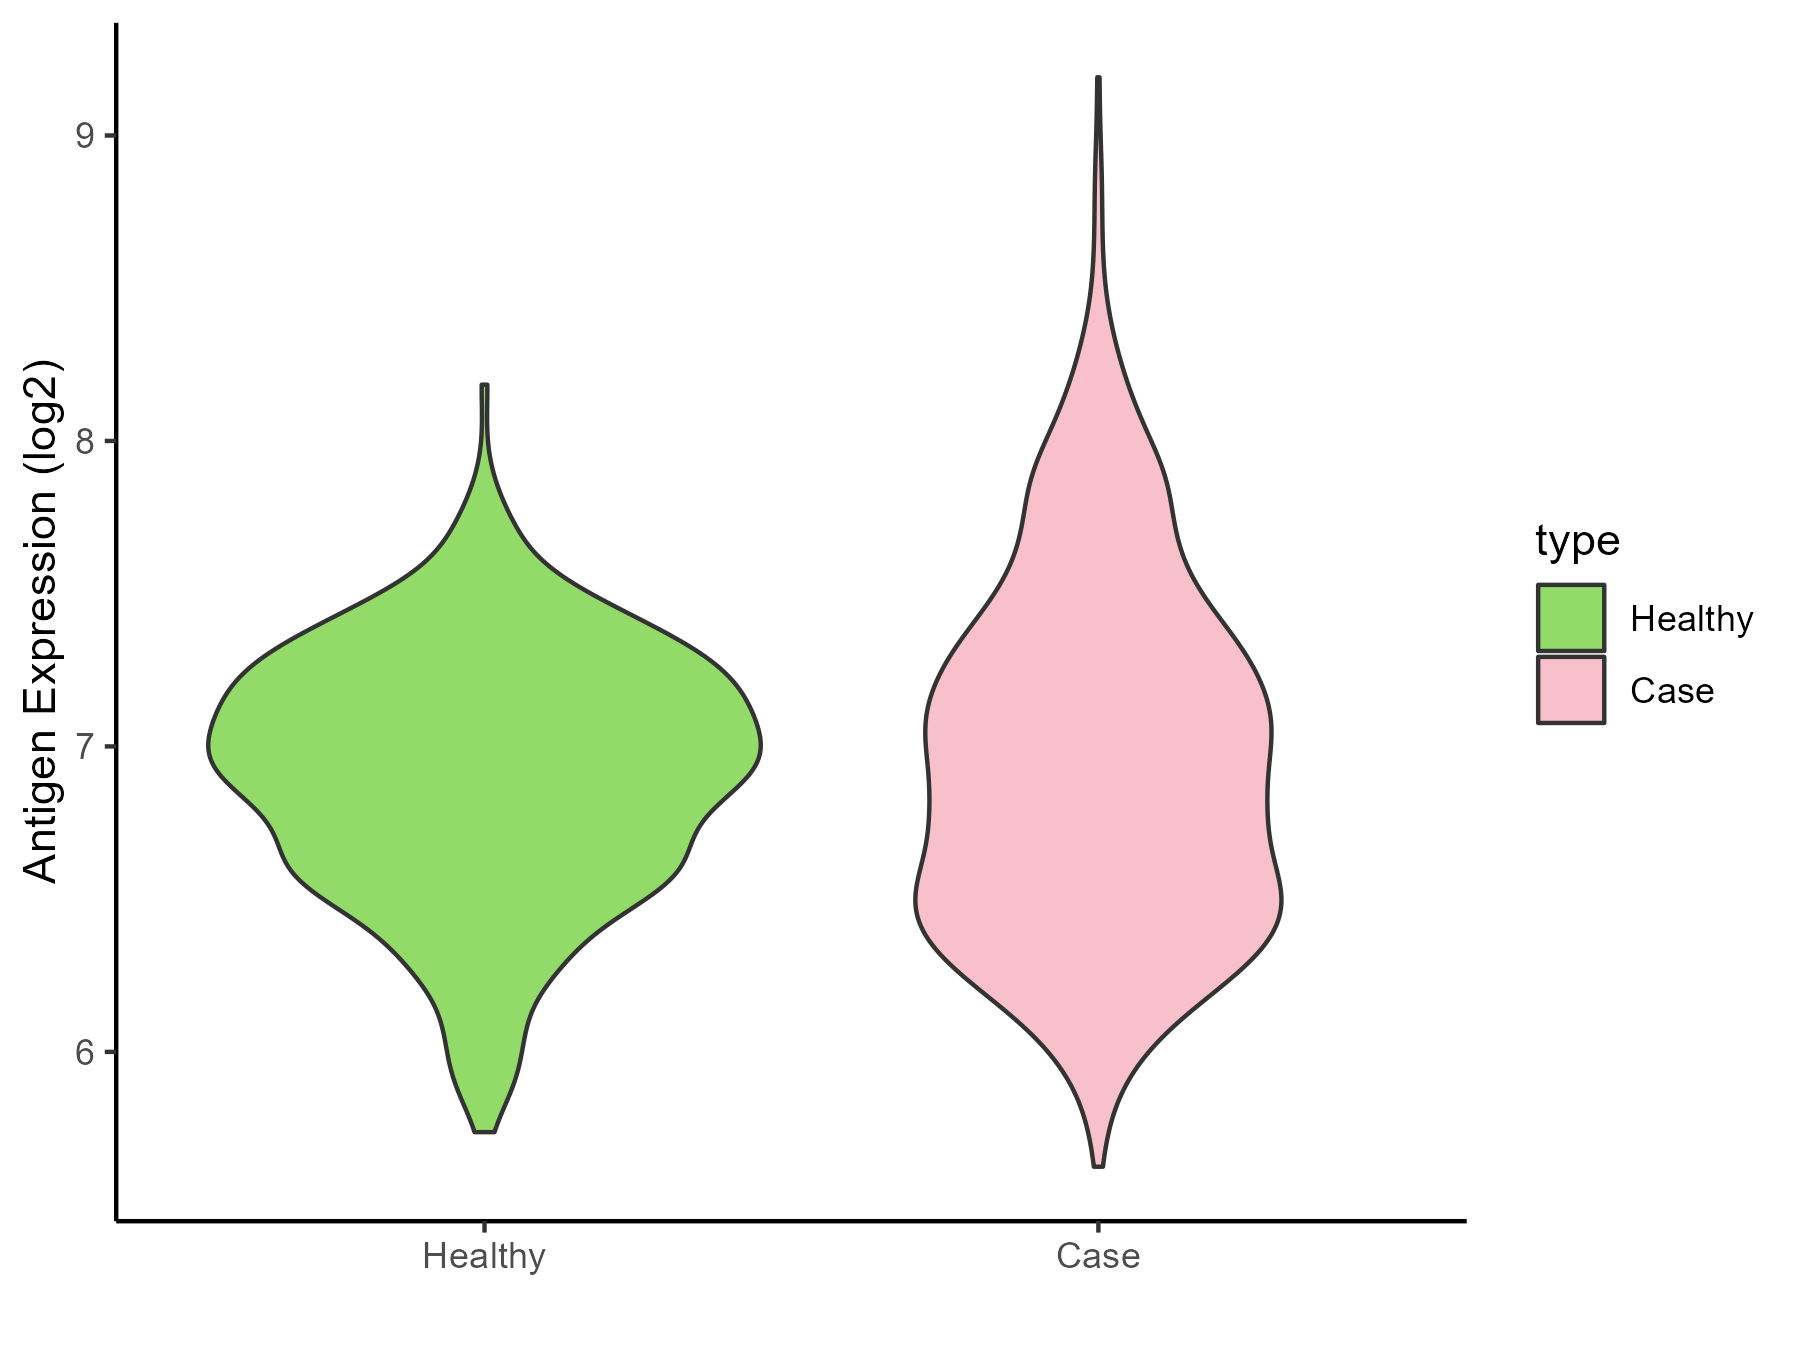
| The Studied Tissue | Nervous | |
| The Specific Disease | Brain cancer | |
| The Expression Level of Disease Section Compare with the Healthy Individual Tissue | p-value: 0.094259197; Fold-change: -0.045131237; Z-score: -0.111197321 | |
| Disease-specific Antigen Abundances |
|
Click to View the Clearer Original Diagram |
| Differential expression pattern of antigen in diseases | ||
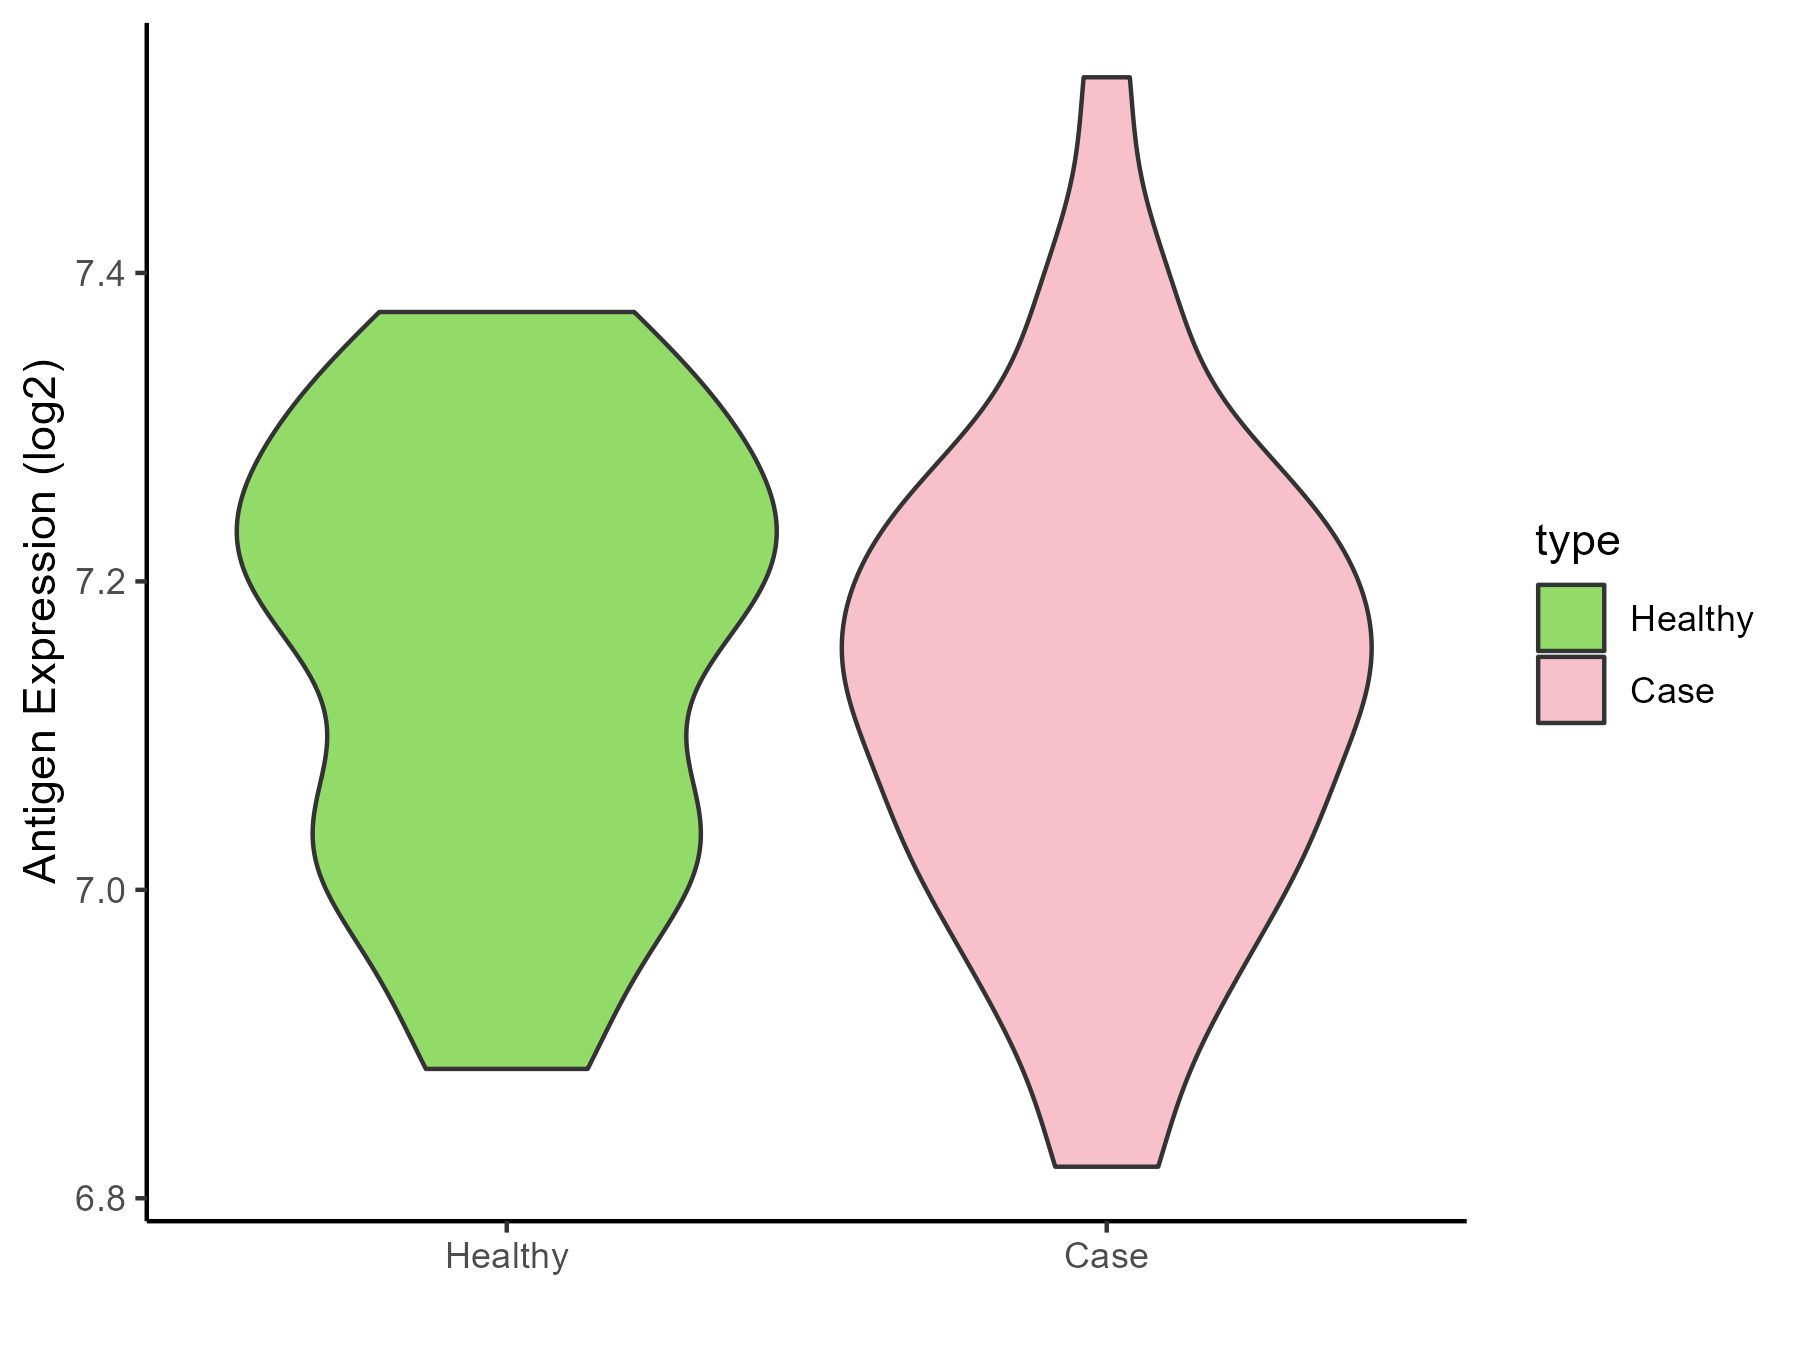
| The Studied Tissue | Whole blood | |
| The Specific Disease | Polycythemia vera | |
| The Expression Level of Disease Section Compare with the Healthy Individual Tissue | p-value: 0.461251991; Fold-change: -0.048472046; Z-score: -0.339351509 | |
| Disease-specific Antigen Abundances |
|
Click to View the Clearer Original Diagram |
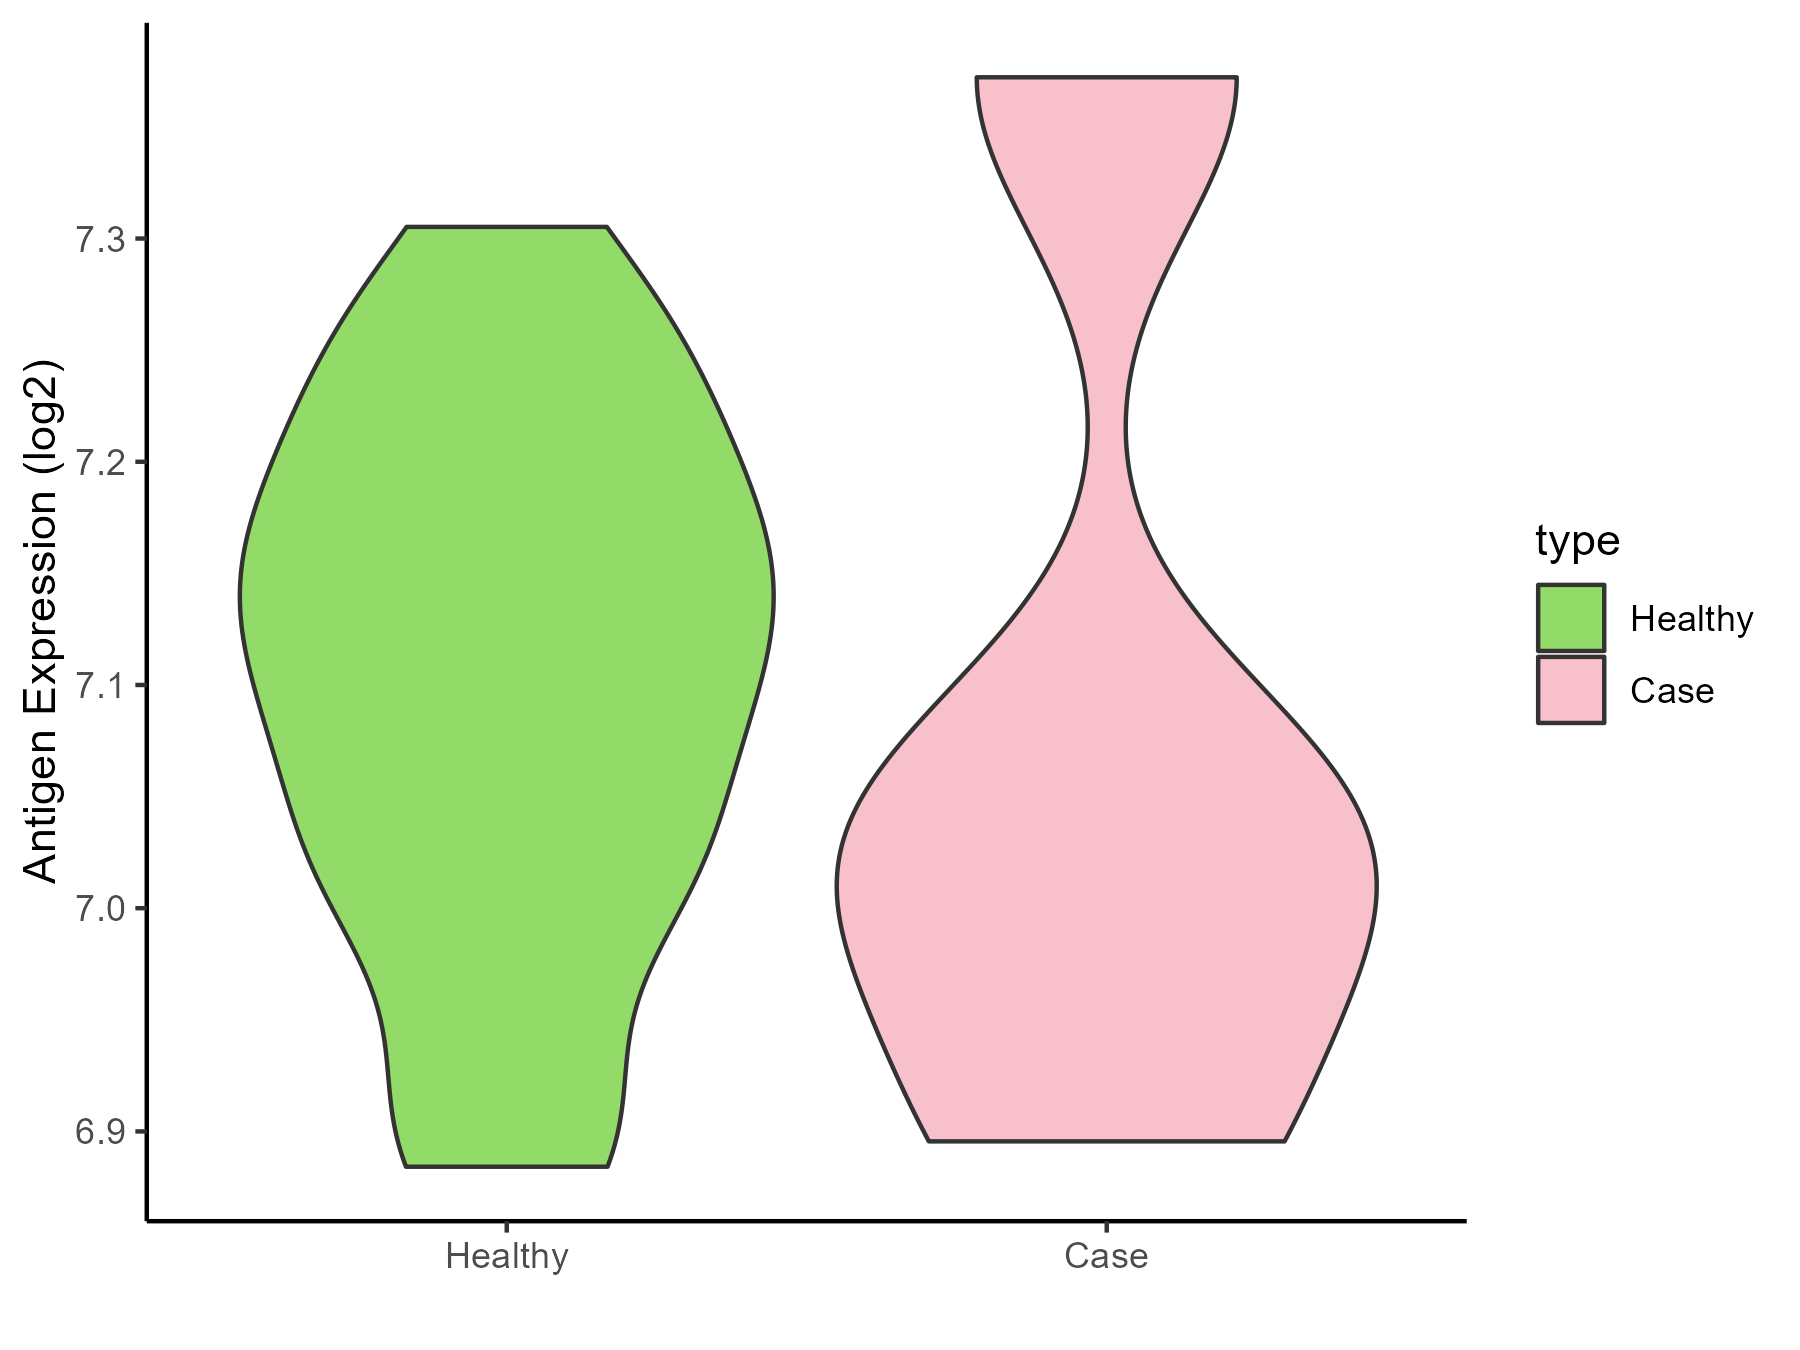
| The Studied Tissue | Whole blood | |
| The Specific Disease | Myelofibrosis | |
| The Expression Level of Disease Section Compare with the Healthy Individual Tissue | p-value: 0.74758758; Fold-change: -0.080690885; Z-score: -0.674050146 | |
| Disease-specific Antigen Abundances |
|
Click to View the Clearer Original Diagram |
| Differential expression pattern of antigen in diseases | ||
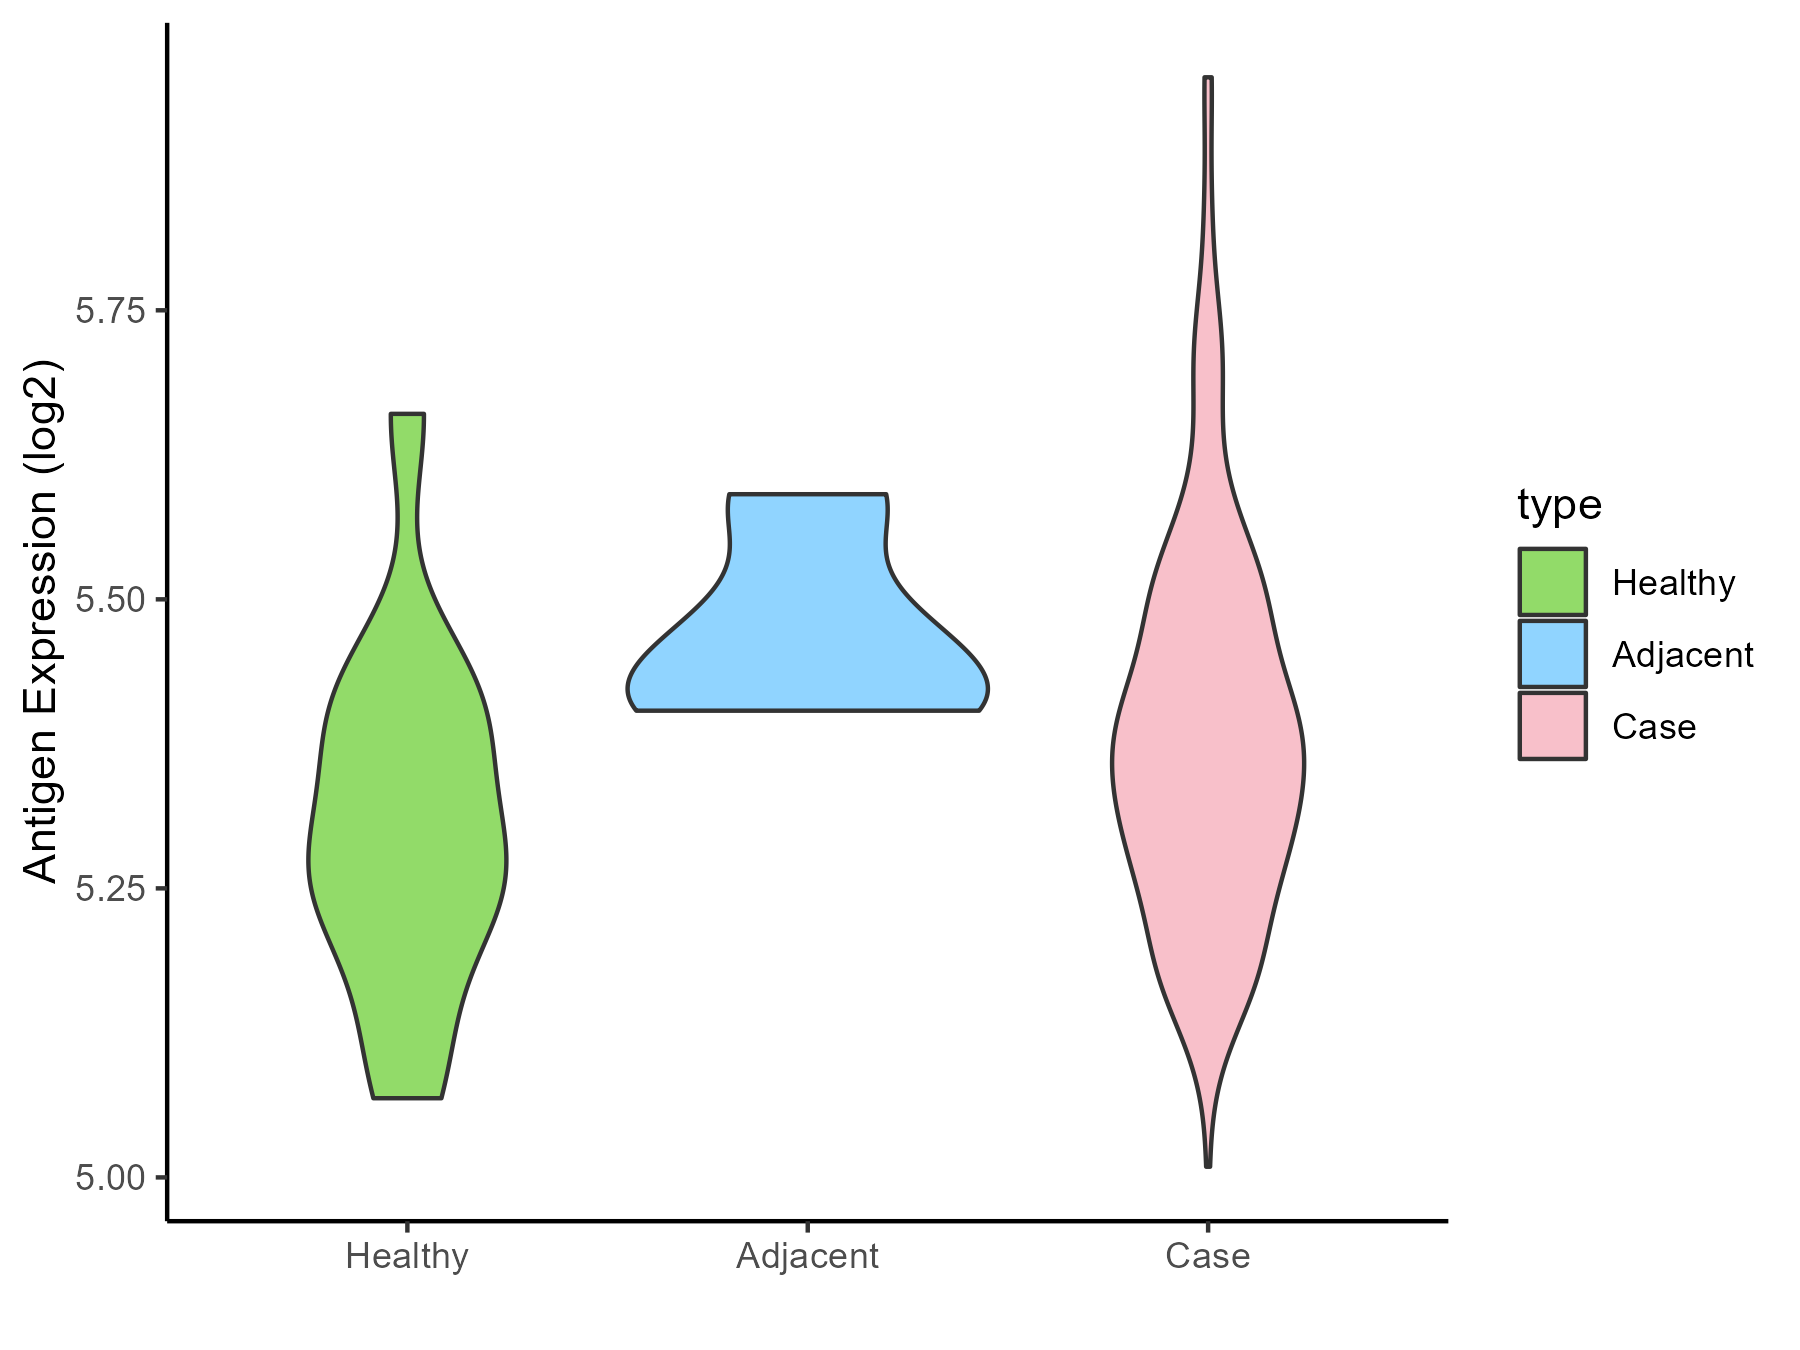
| The Studied Tissue | Bone marrow | |
| The Specific Disease | Myelodysplastic syndromes | |
| The Expression Level of Disease Section Compare with the Healthy Individual Tissue | p-value: 0.015876681; Fold-change: 0.096188502; Z-score: 0.648965113 | |
| The Expression Level of Disease Section Compare with the Adjacent Tissue | p-value: 0.13946312; Fold-change: -0.071734955; Z-score: -0.824542593 | |
| Disease-specific Antigen Abundances |
|
Click to View the Clearer Original Diagram |
| Differential expression pattern of antigen in diseases | ||
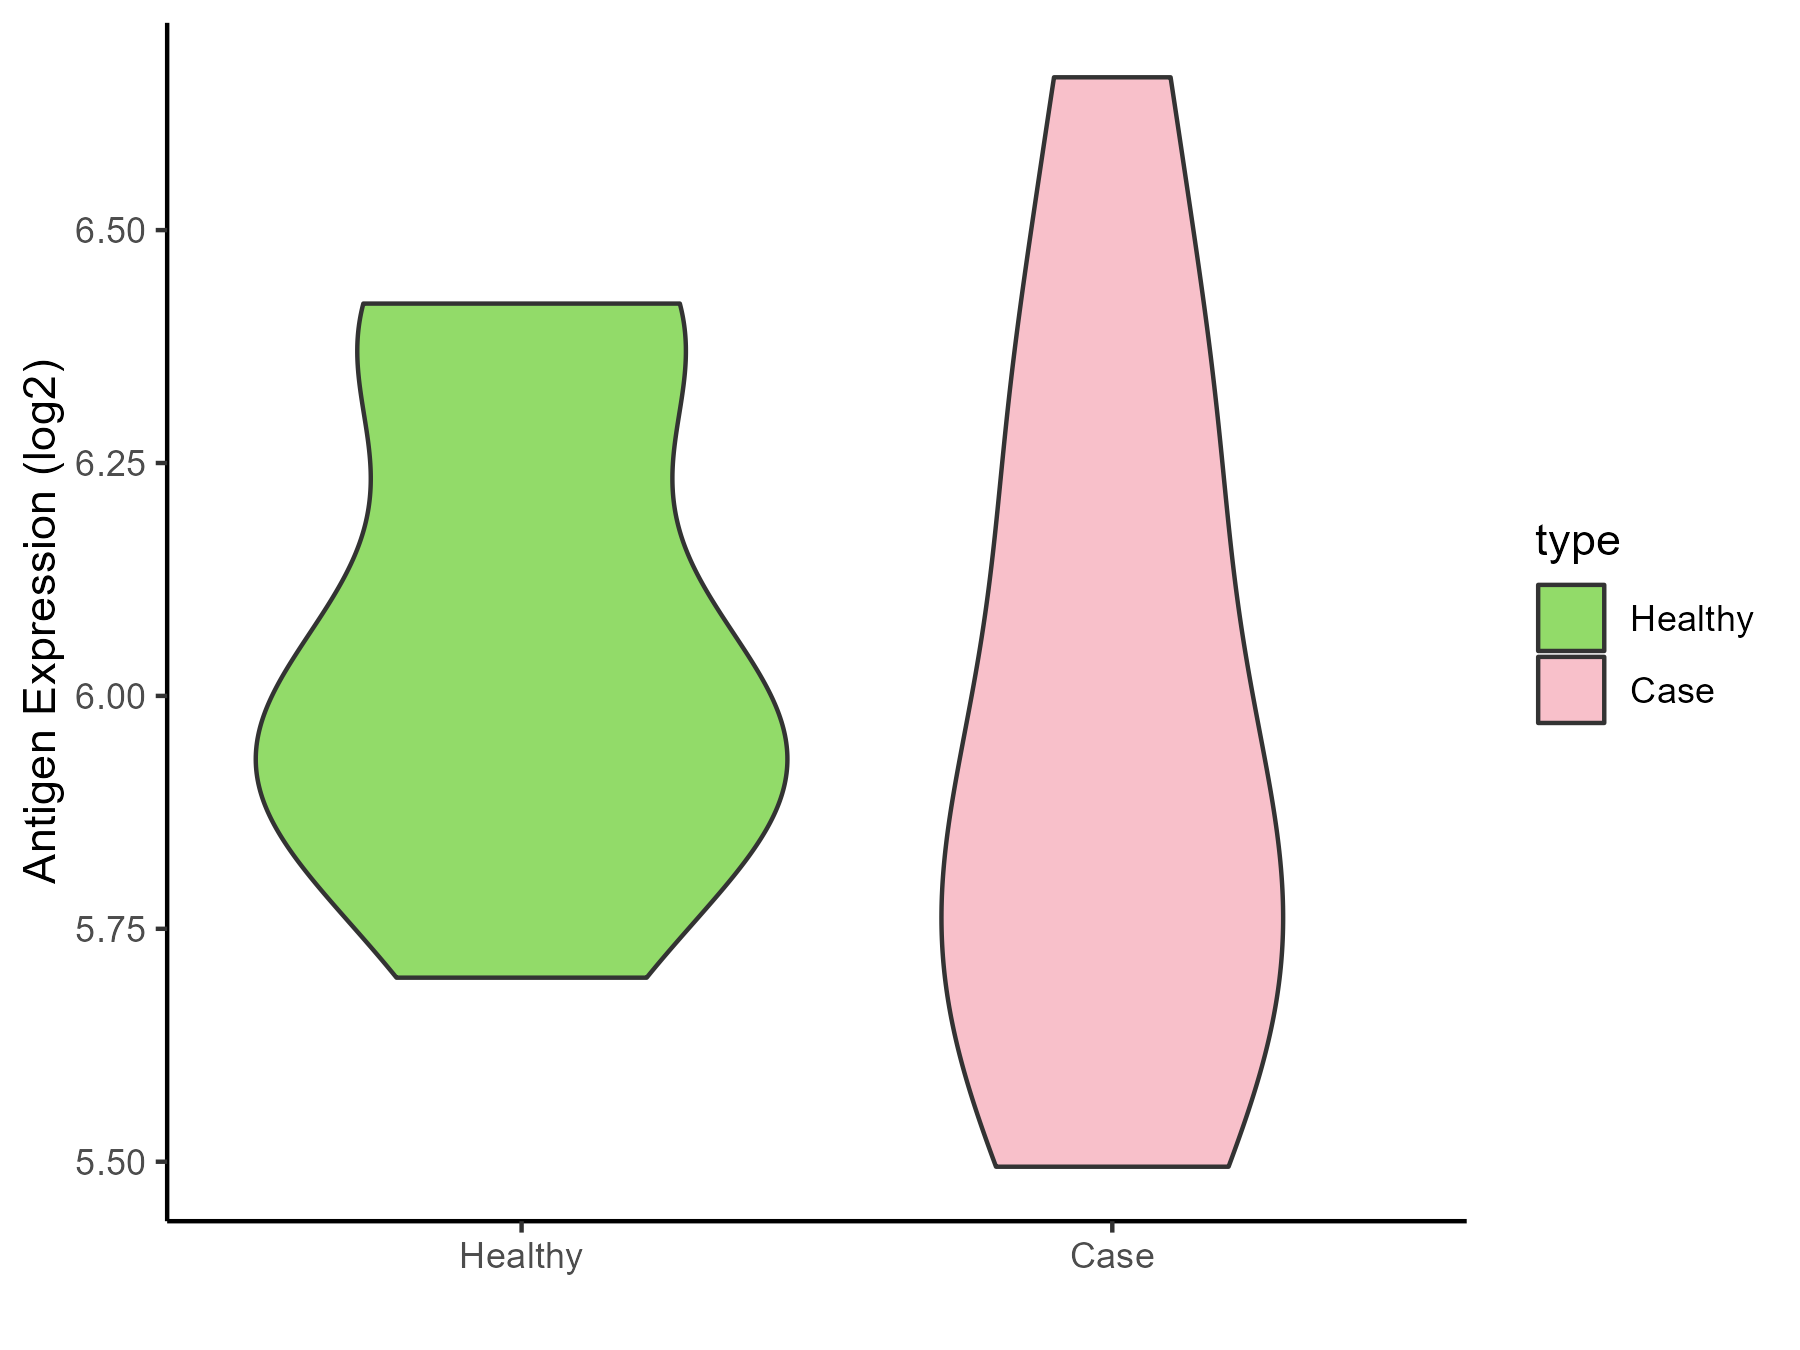
| The Studied Tissue | Tonsil | |
| The Specific Disease | Lymphoma | |
| The Expression Level of Disease Section Compare with the Healthy Individual Tissue | p-value: 0.562390108; Fold-change: -0.135017791; Z-score: -0.525355475 | |
| Disease-specific Antigen Abundances |
|
Click to View the Clearer Original Diagram |
| Differential expression pattern of antigen in diseases | ||
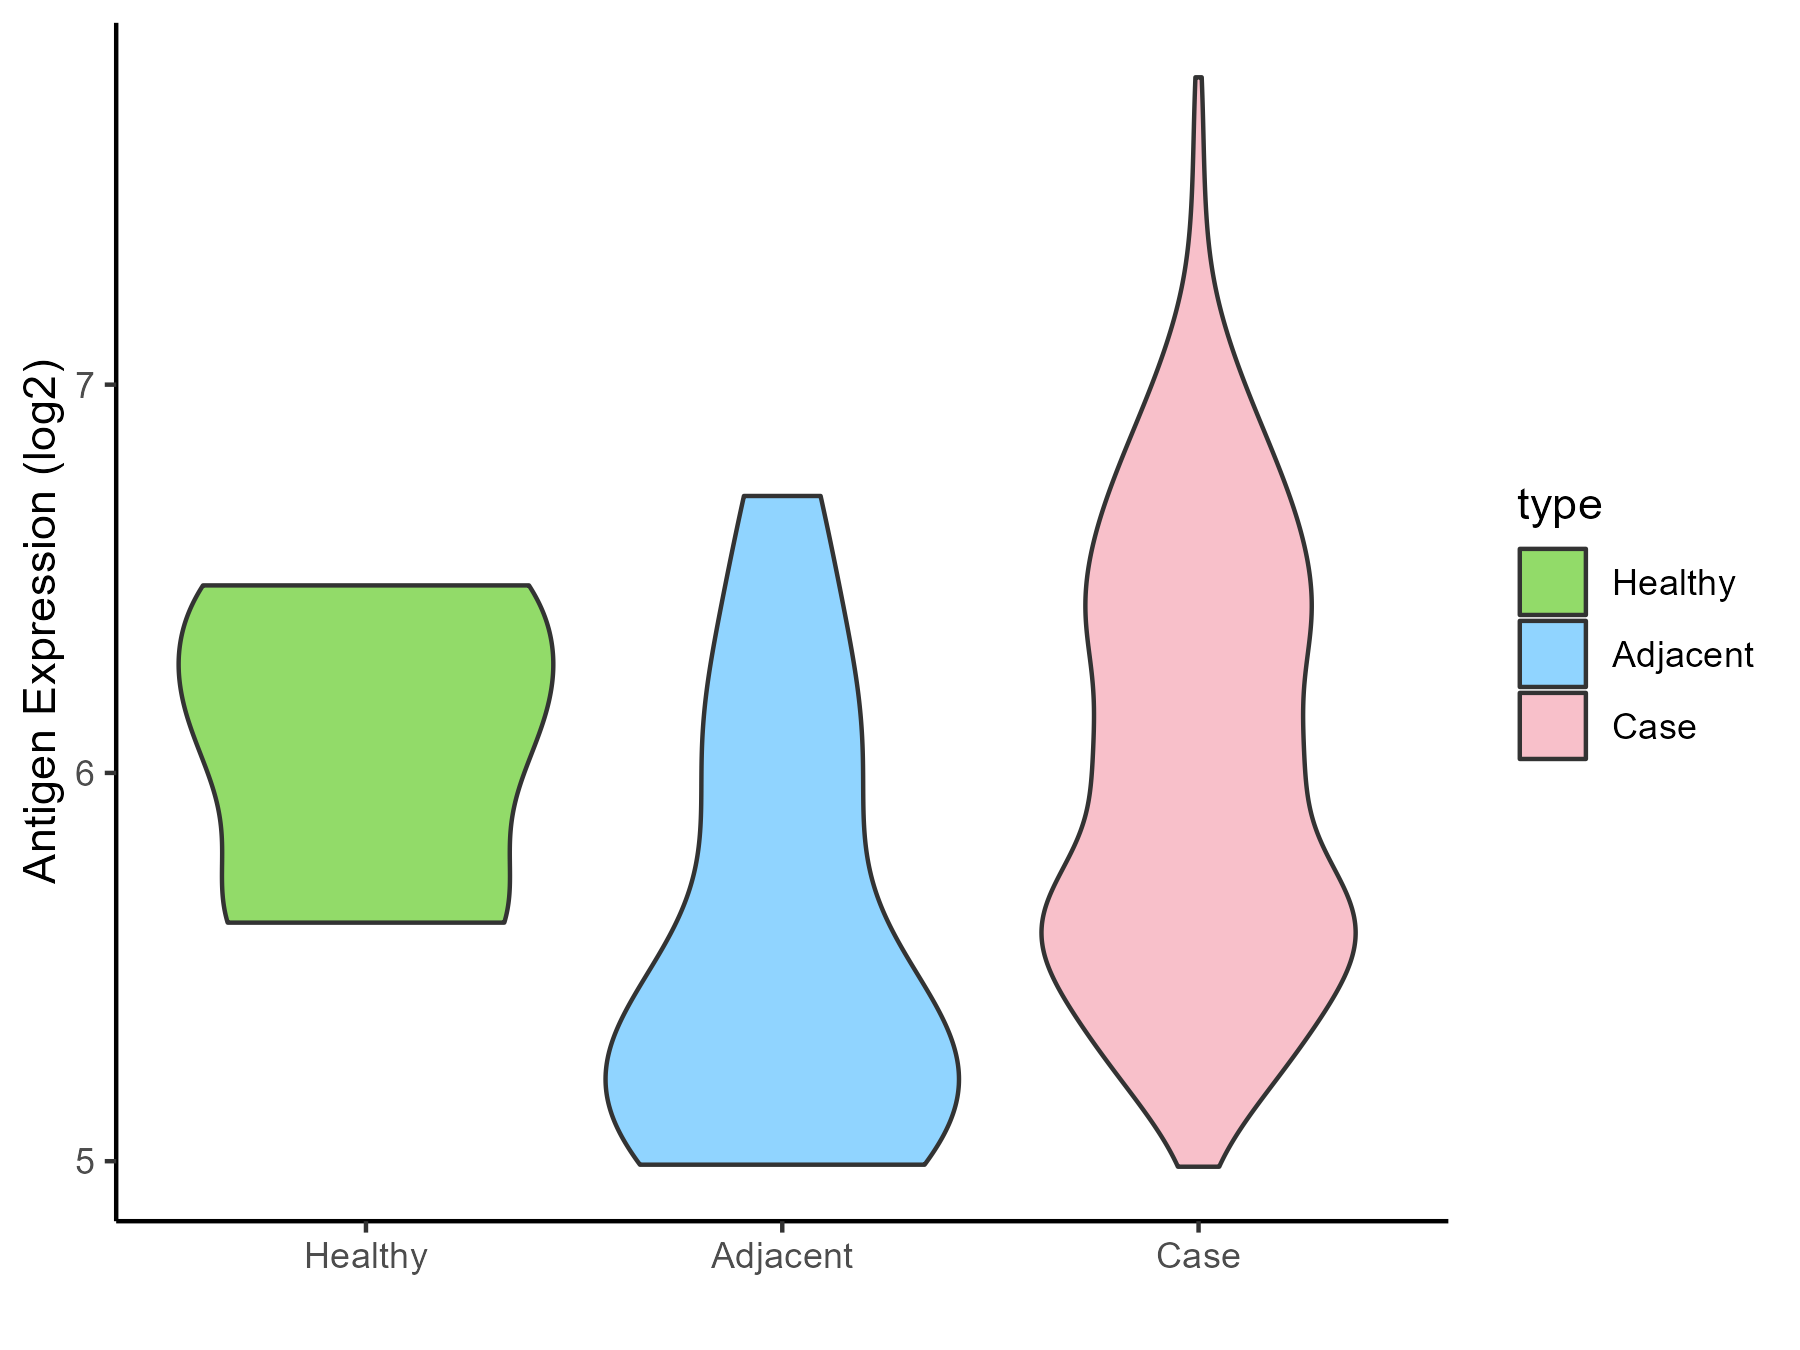
| The Studied Tissue | Gastric | |
| The Specific Disease | Gastric cancer | |
| The Expression Level of Disease Section Compare with the Healthy Individual Tissue | p-value: 0.898937349; Fold-change: -0.135989889; Z-score: -0.311844418 | |
| The Expression Level of Disease Section Compare with the Adjacent Tissue | p-value: 0.003150795; Fold-change: 0.597151386; Z-score: 1.08711223 | |
| Disease-specific Antigen Abundances |
|
Click to View the Clearer Original Diagram |
| Differential expression pattern of antigen in diseases | ||
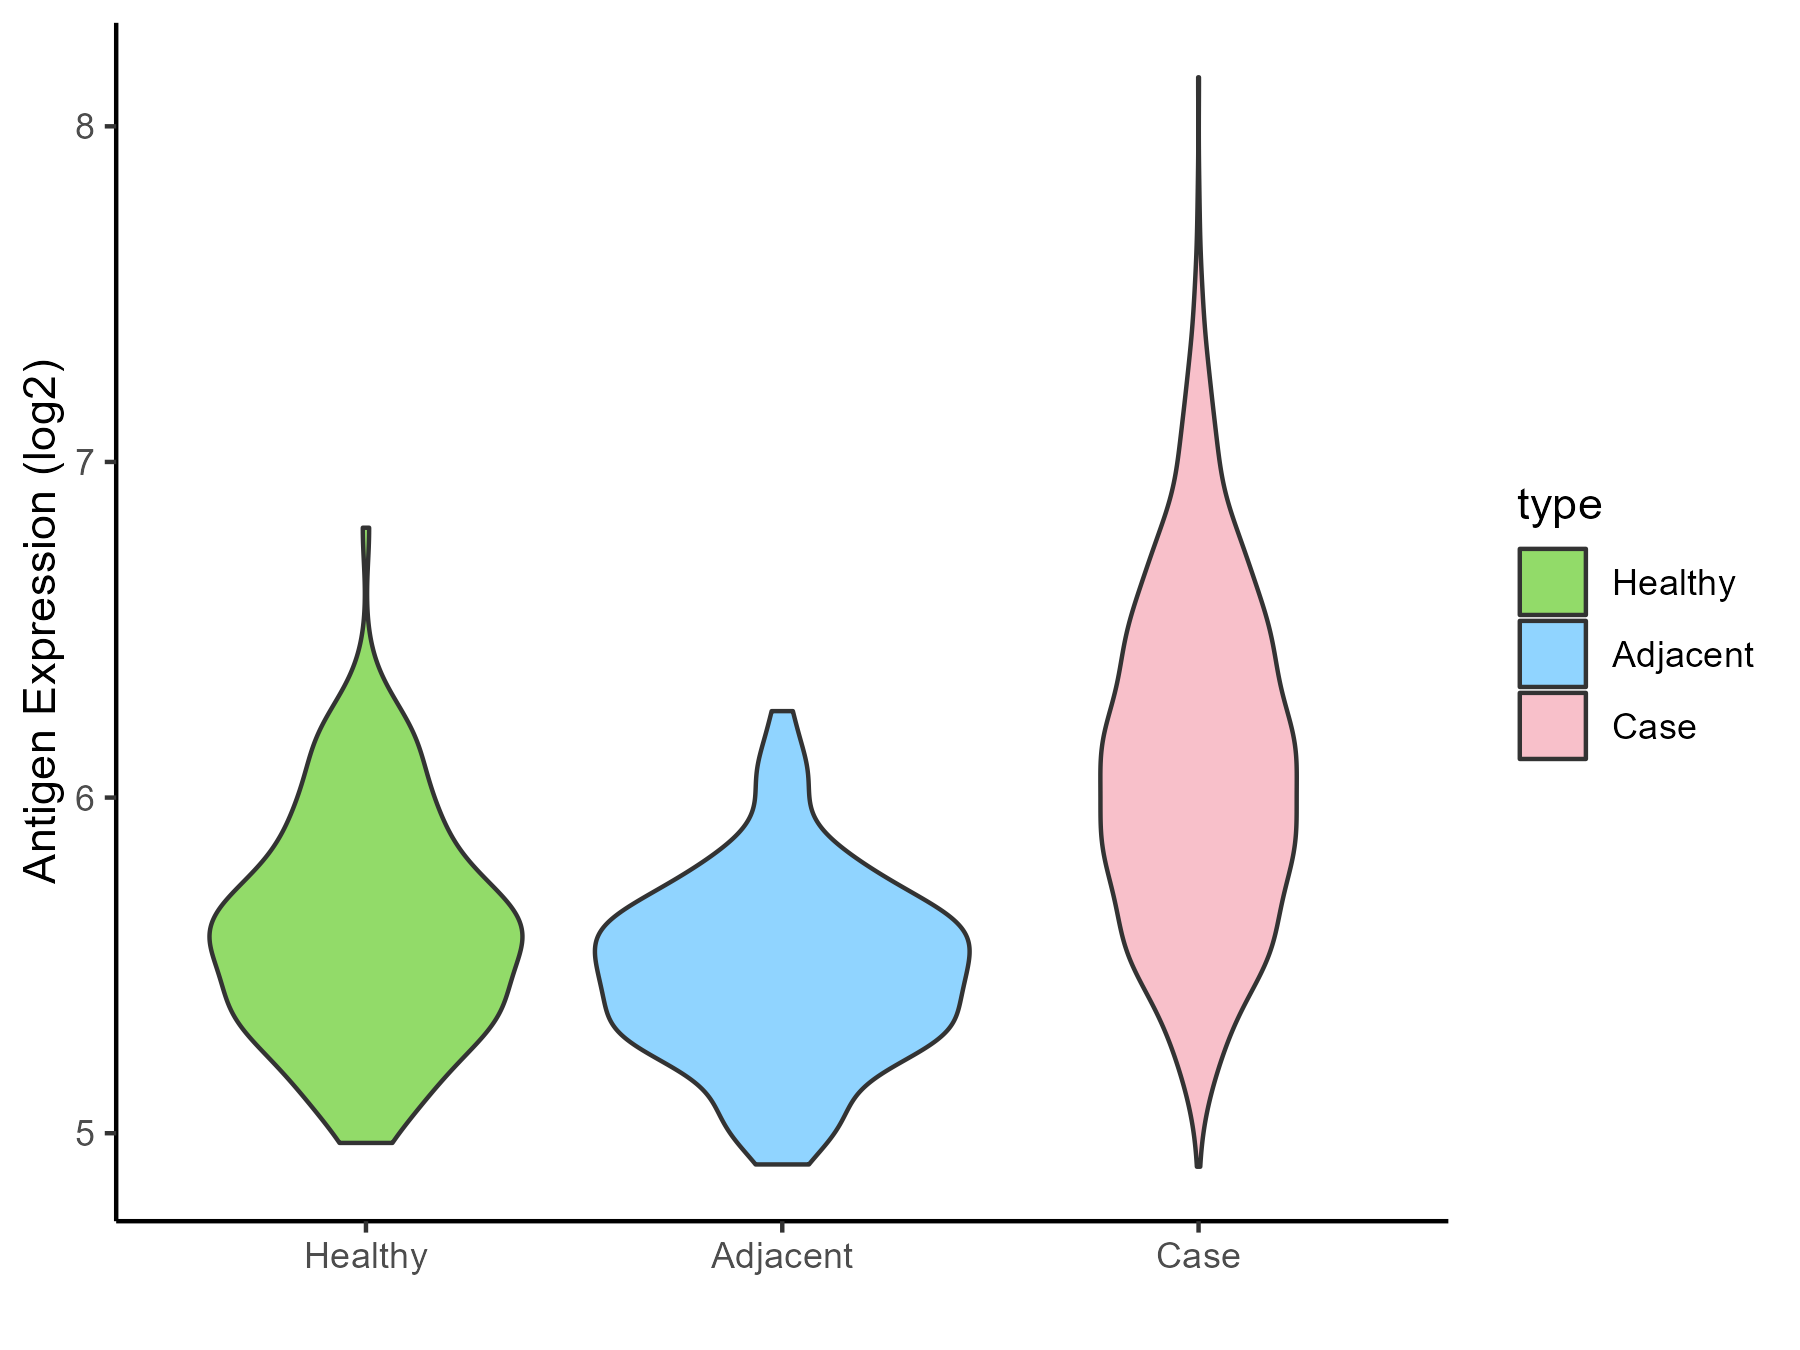
| The Studied Tissue | Colon | |
| The Specific Disease | Colon cancer | |
| The Expression Level of Disease Section Compare with the Healthy Individual Tissue | p-value: 5.24E-41; Fold-change: 0.478596662; Z-score: 1.443743403 | |
| The Expression Level of Disease Section Compare with the Adjacent Tissue | p-value: 7.31E-58; Fold-change: 0.606533461; Z-score: 2.245956653 | |
| Disease-specific Antigen Abundances |
|
Click to View the Clearer Original Diagram |
| Differential expression pattern of antigen in diseases | ||
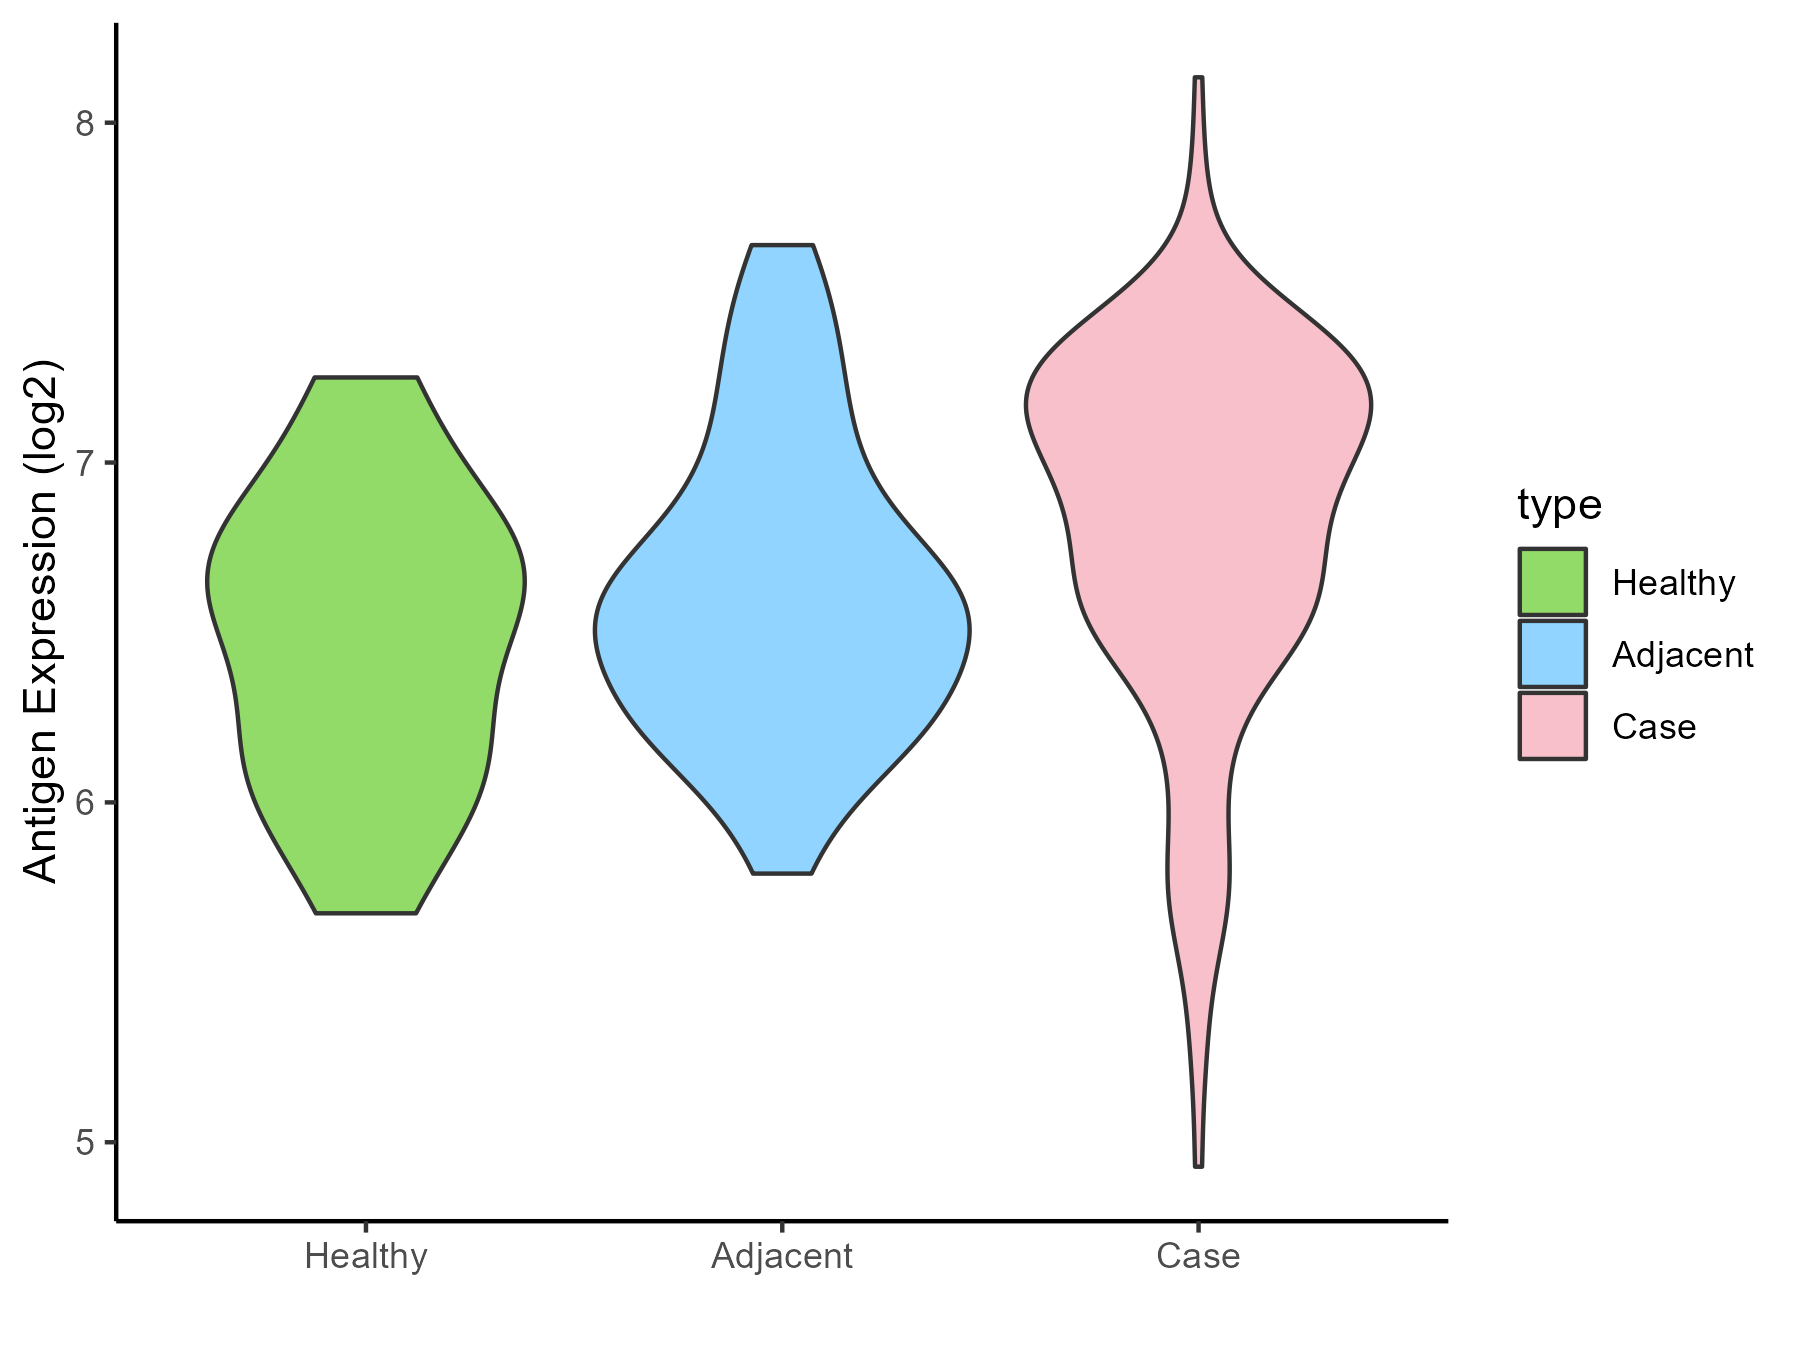
| The Studied Tissue | Pancreas | |
| The Specific Disease | Pancreatic cancer | |
| The Expression Level of Disease Section Compare with the Healthy Individual Tissue | p-value: 0.008219641; Fold-change: 0.395658286; Z-score: 0.899489549 | |
| The Expression Level of Disease Section Compare with the Adjacent Tissue | p-value: 0.006517999; Fold-change: 0.355347696; Z-score: 0.80824624 | |
| Disease-specific Antigen Abundances |
|
Click to View the Clearer Original Diagram |
| Differential expression pattern of antigen in diseases | ||
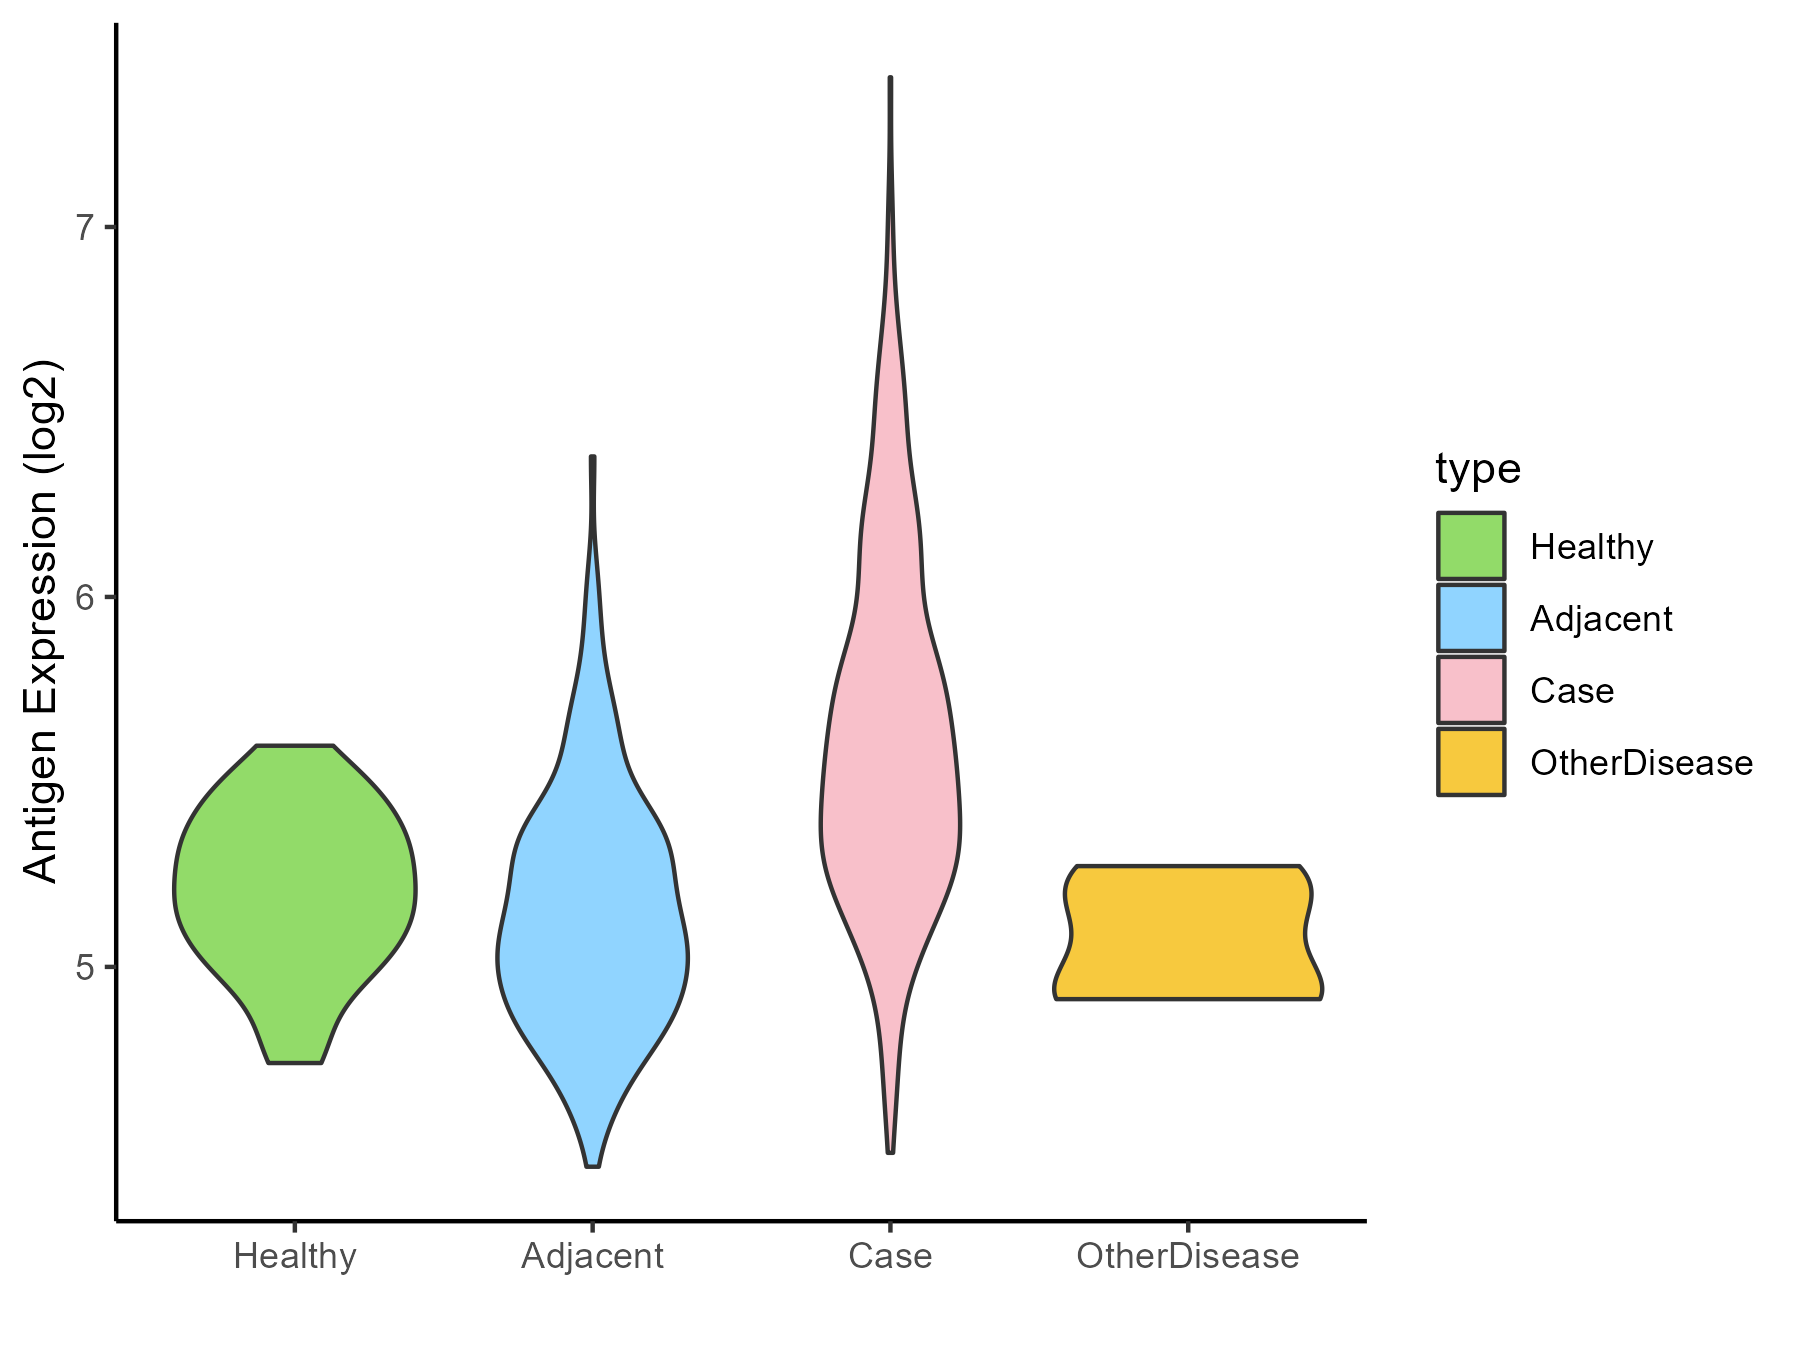
| The Studied Tissue | Liver | |
| The Specific Disease | Liver cancer | |
| The Expression Level of Disease Section Compare with the Healthy Individual Tissue | p-value: 3.32E-17; Fold-change: 0.365303963; Z-score: 1.669065478 | |
| The Expression Level of Disease Section Compare with the Adjacent Tissue | p-value: 7.75E-40; Fold-change: 0.460664988; Z-score: 1.421858837 | |
| The Expression Level of Disease Section Compare with the Other Disease Section | p-value: 0.006284799; Fold-change: 0.518241256; Z-score: 2.833584609 | |
| Disease-specific Antigen Abundances |
|
Click to View the Clearer Original Diagram |
| Differential expression pattern of antigen in diseases | ||
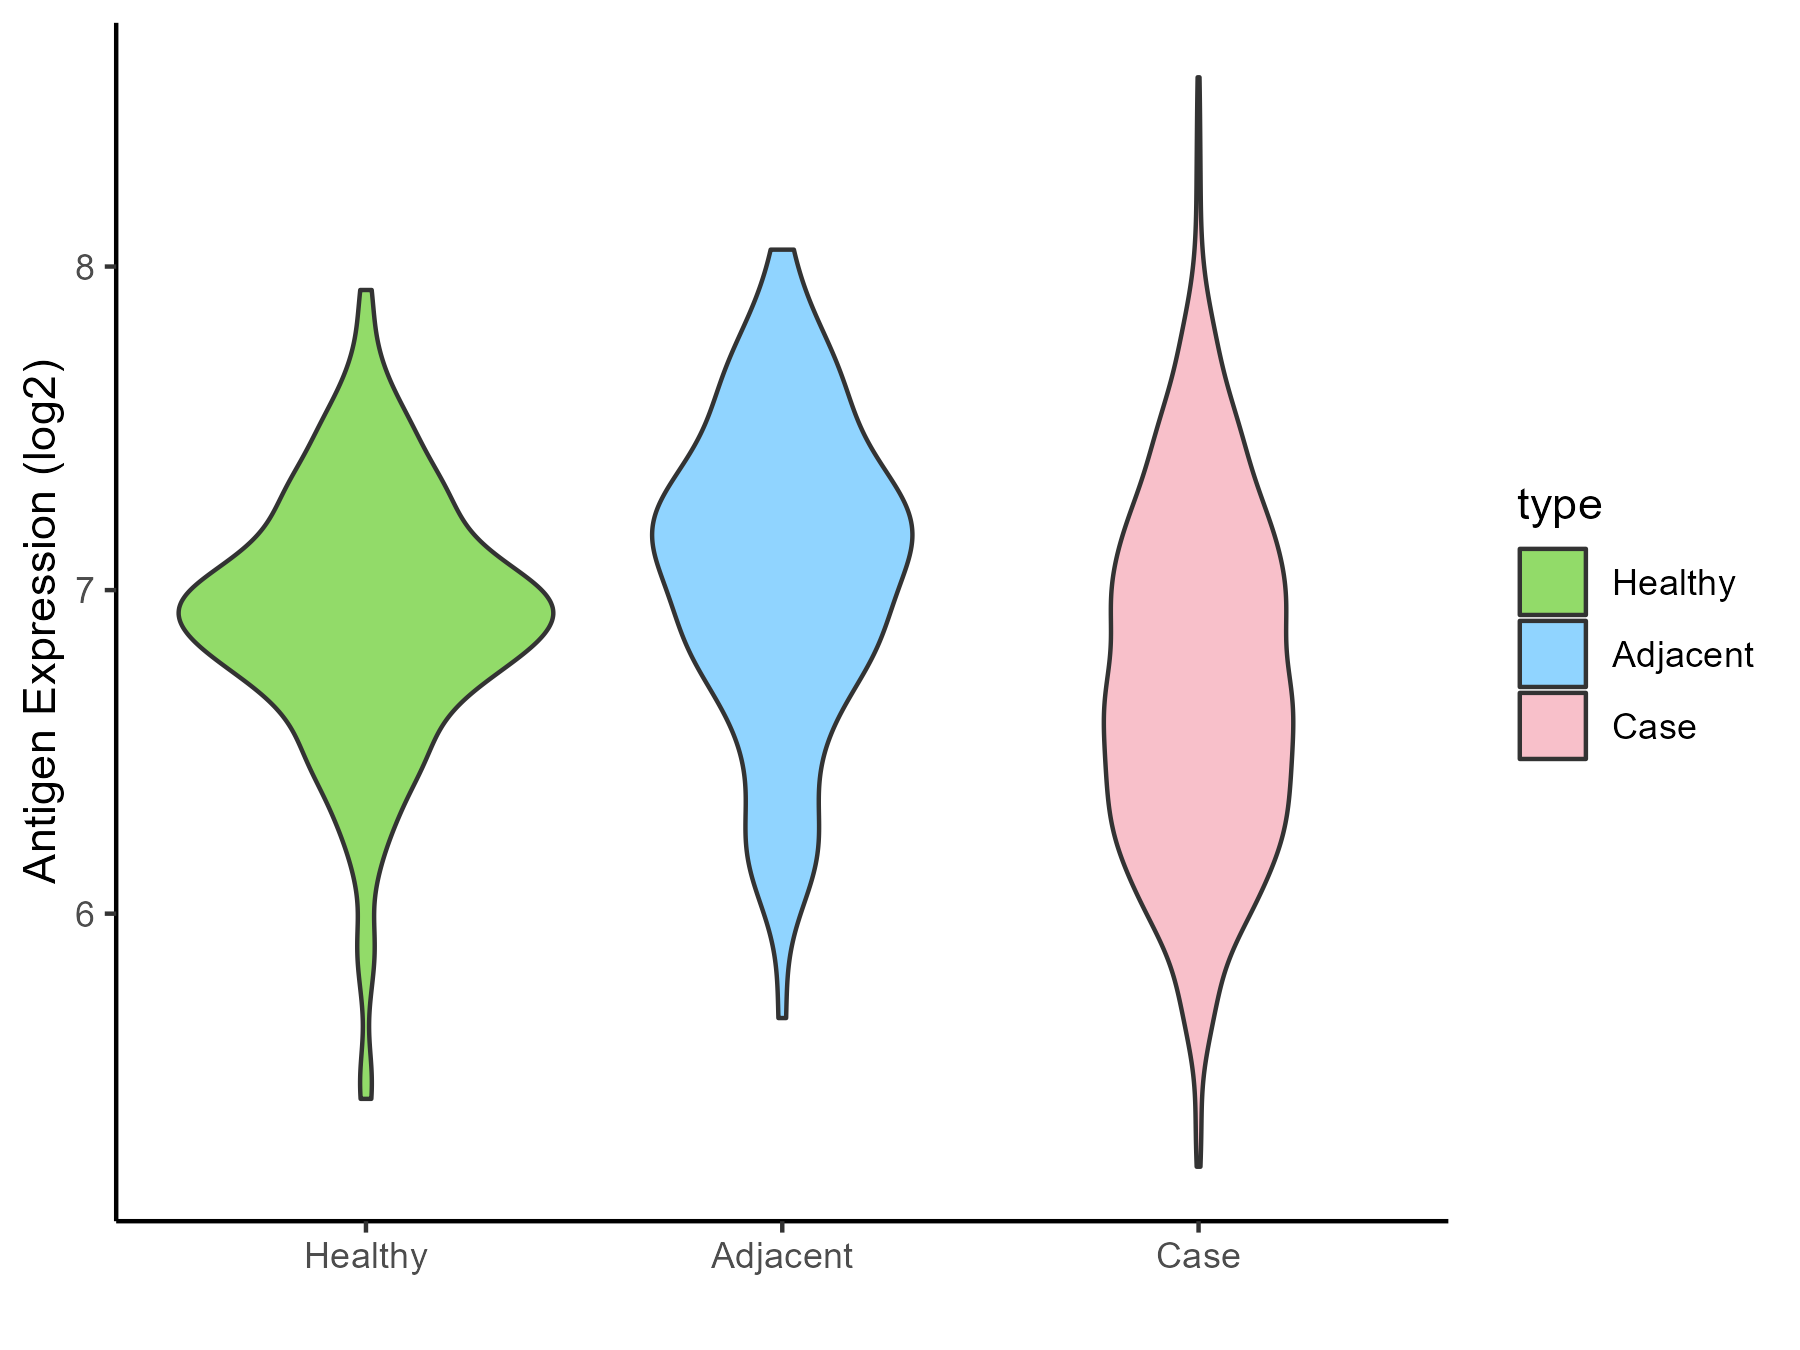
| The Studied Tissue | Lung | |
| The Specific Disease | Lung cancer | |
| The Expression Level of Disease Section Compare with the Healthy Individual Tissue | p-value: 3.31E-08; Fold-change: -0.243313759; Z-score: -0.615415662 | |
| The Expression Level of Disease Section Compare with the Adjacent Tissue | p-value: 6.91E-11; Fold-change: -0.42142993; Z-score: -0.895653793 | |
| Disease-specific Antigen Abundances |
|
Click to View the Clearer Original Diagram |
| Differential expression pattern of antigen in diseases | ||
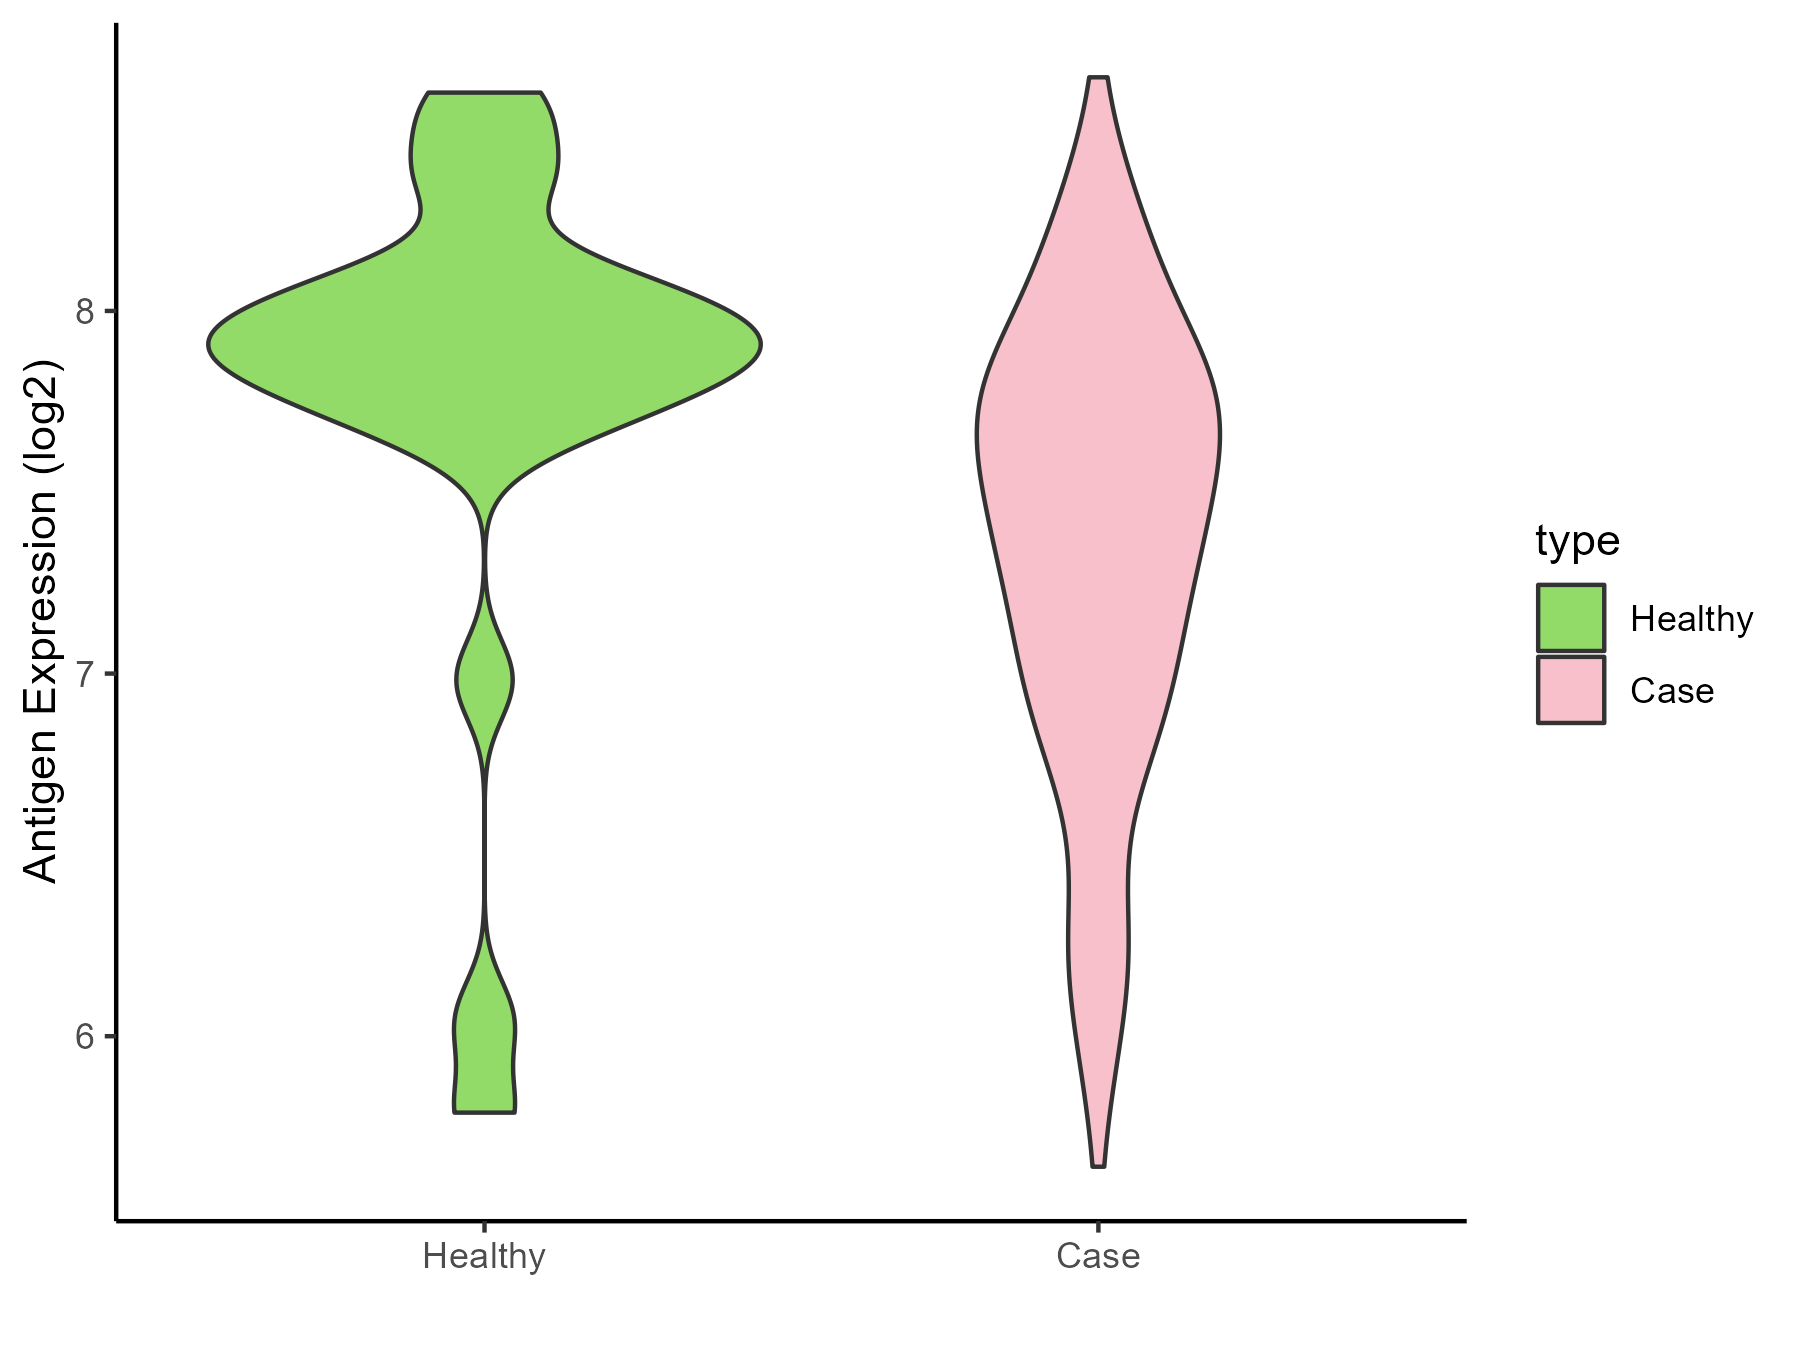
| The Studied Tissue | Skin | |
| The Specific Disease | Melanoma | |
| The Expression Level of Disease Section Compare with the Healthy Individual Tissue | p-value: 0.009555975; Fold-change: -0.467375511; Z-score: -0.692834027 | |
| Disease-specific Antigen Abundances |
|
Click to View the Clearer Original Diagram |
| Differential expression pattern of antigen in diseases | ||
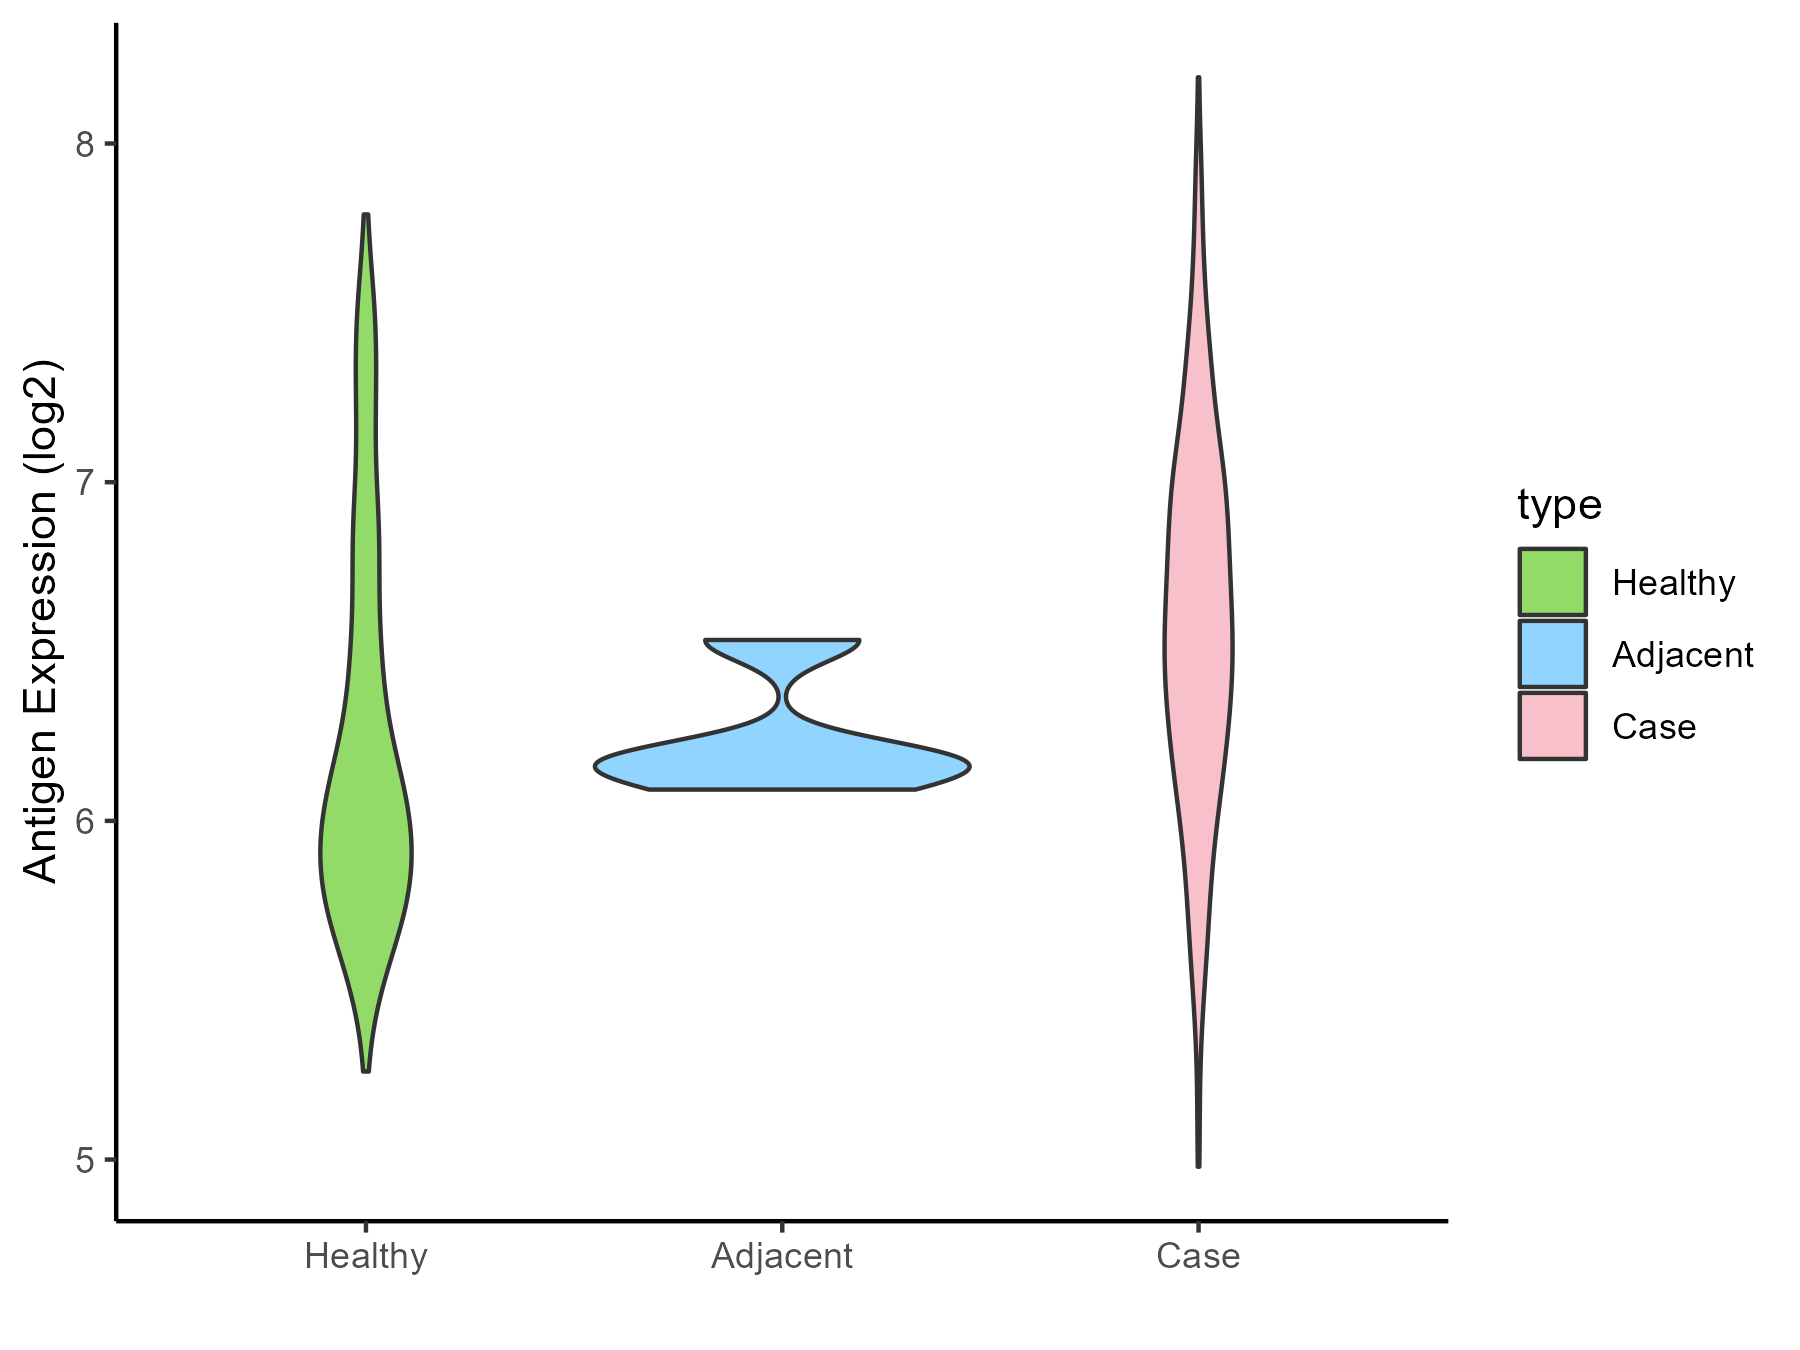
| The Studied Tissue | Muscle | |
| The Specific Disease | Sarcoma | |
| The Expression Level of Disease Section Compare with the Healthy Individual Tissue | p-value: 7.32E-22; Fold-change: 0.513919146; Z-score: 0.900639632 | |
| The Expression Level of Disease Section Compare with the Adjacent Tissue | p-value: 0.036768635; Fold-change: 0.391066887; Z-score: 1.994848816 | |
| Disease-specific Antigen Abundances |
|
Click to View the Clearer Original Diagram |
| Differential expression pattern of antigen in diseases | ||
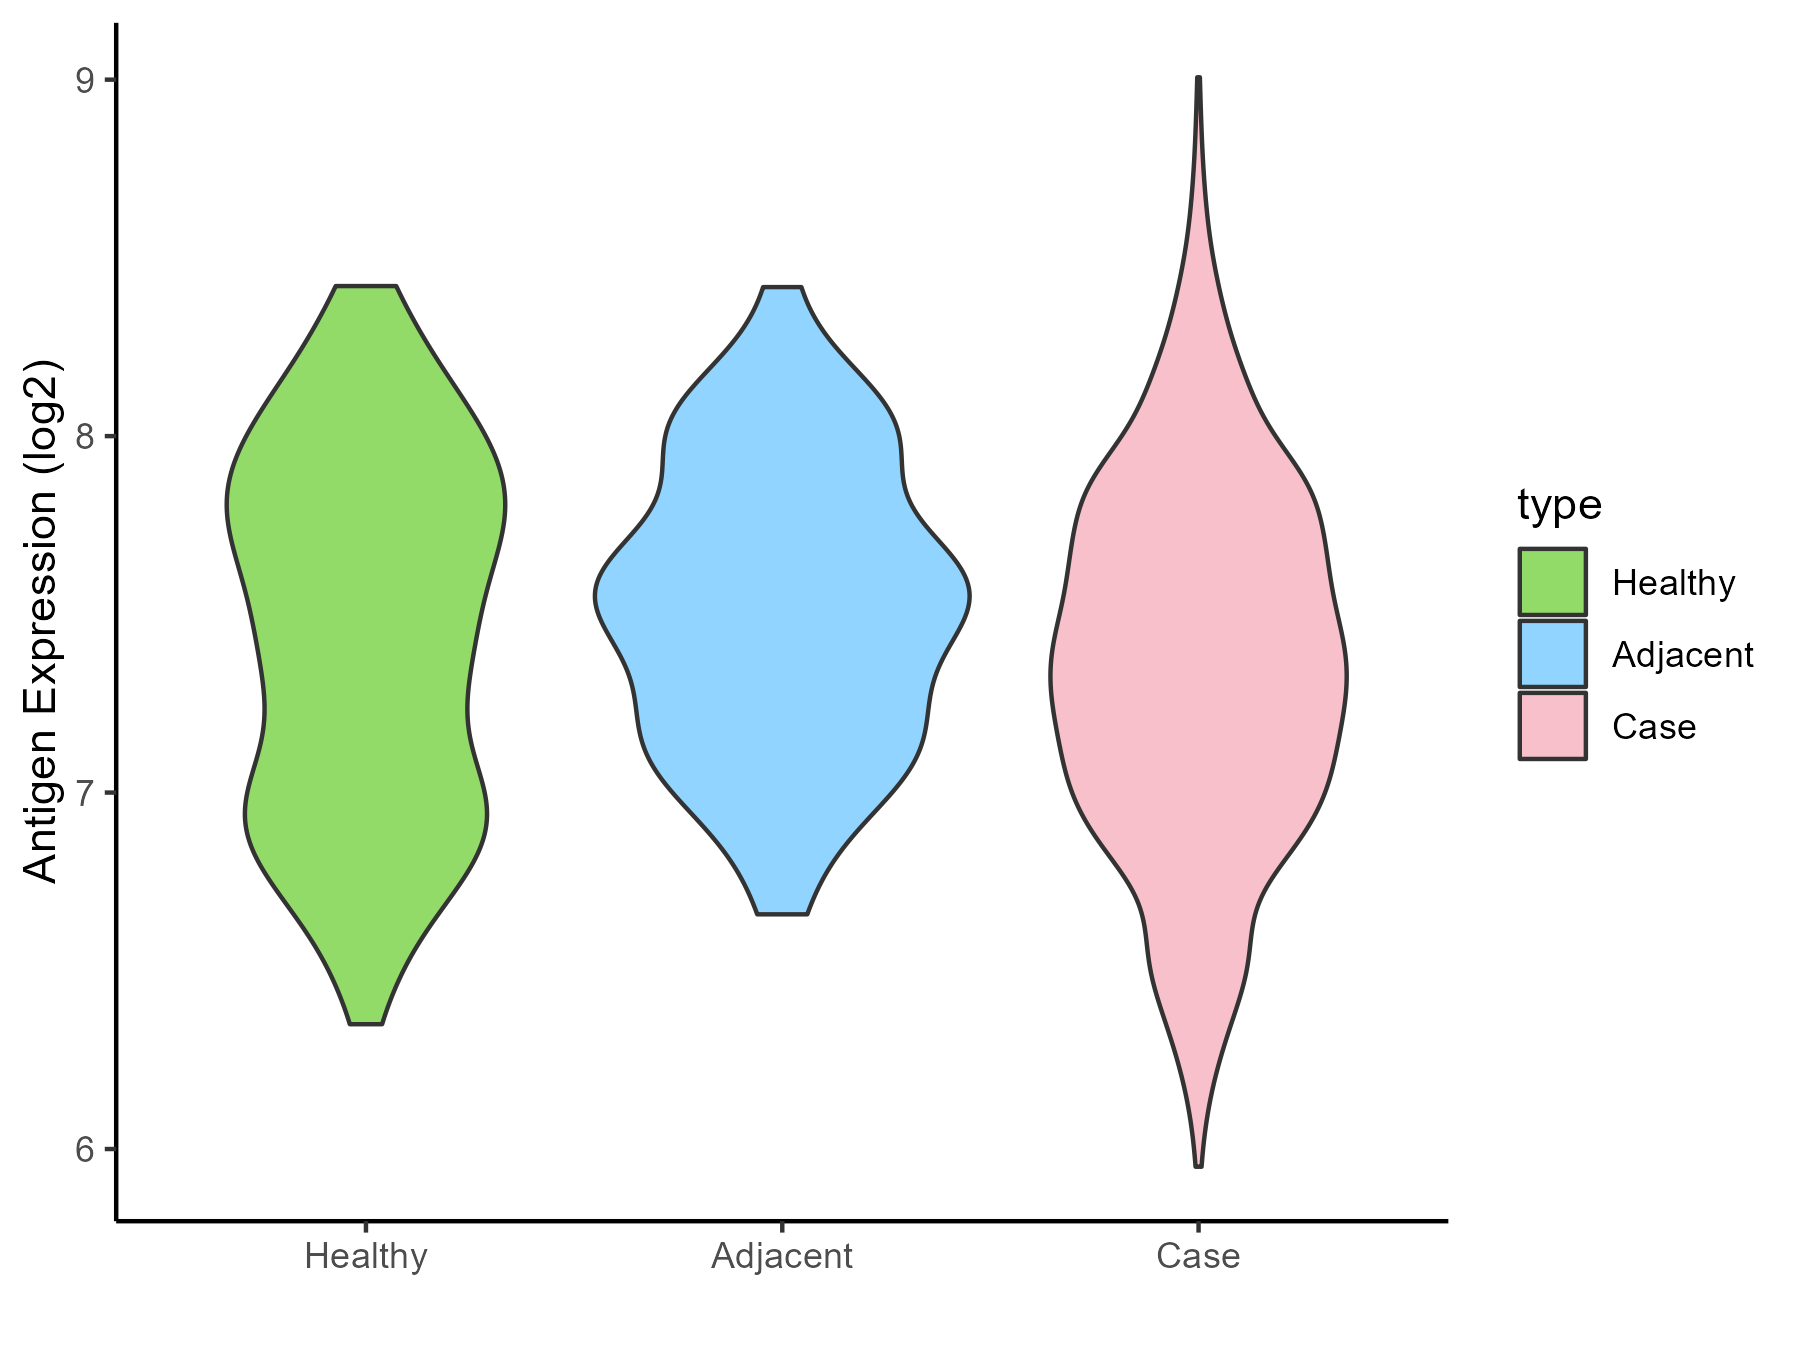
| The Studied Tissue | Breast | |
| The Specific Disease | Breast cancer | |
| The Expression Level of Disease Section Compare with the Healthy Individual Tissue | p-value: 0.009708548; Fold-change: -0.114774814; Z-score: -0.224464805 | |
| The Expression Level of Disease Section Compare with the Adjacent Tissue | p-value: 0.007196349; Fold-change: -0.206512244; Z-score: -0.515752893 | |
| Disease-specific Antigen Abundances |
|
Click to View the Clearer Original Diagram |
| Differential expression pattern of antigen in diseases | ||
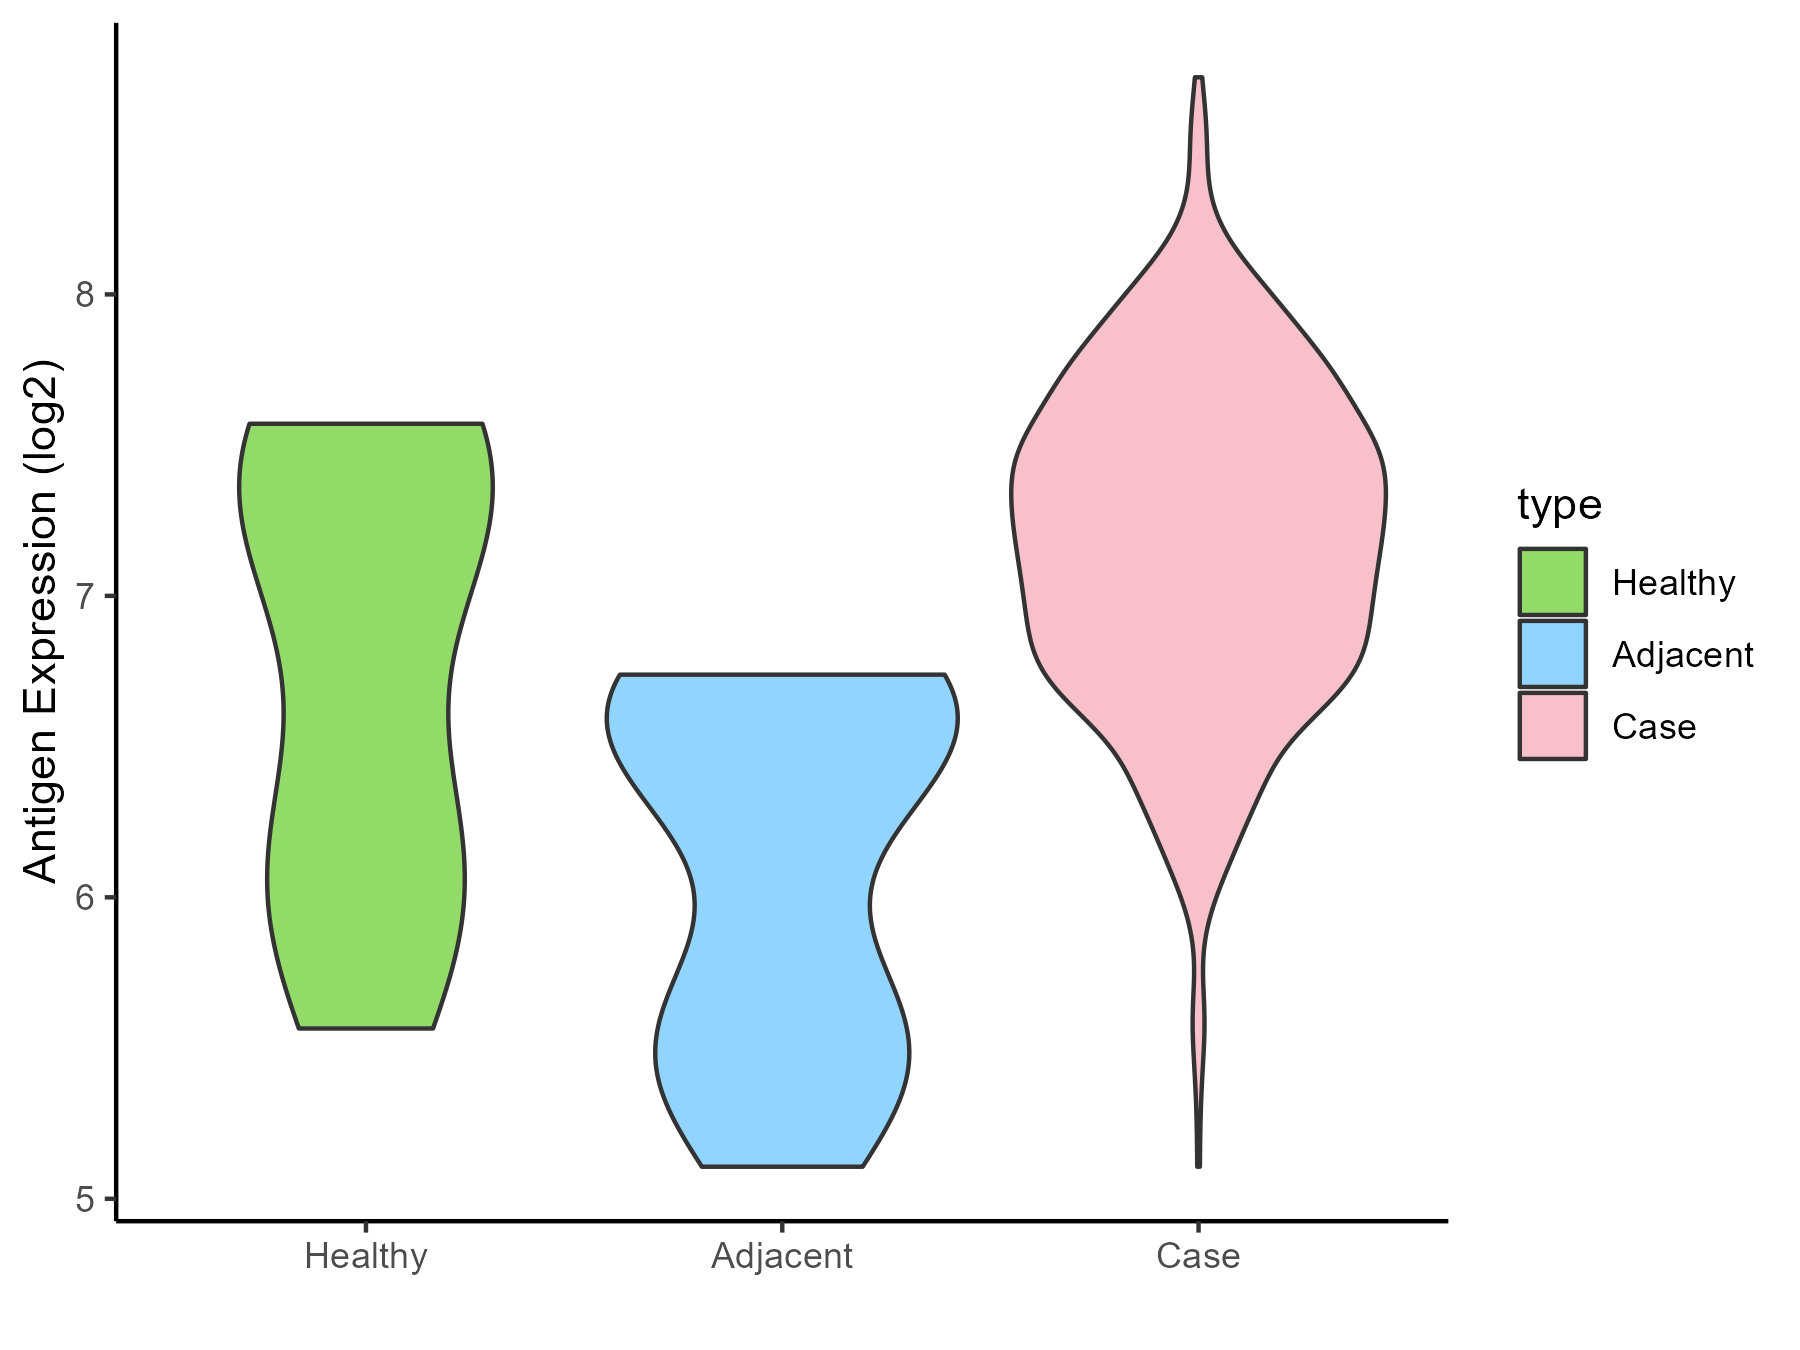
| The Studied Tissue | Ovarian | |
| The Specific Disease | Ovarian cancer | |
| The Expression Level of Disease Section Compare with the Healthy Individual Tissue | p-value: 0.132713216; Fold-change: 0.155348136; Z-score: 0.201478677 | |
| The Expression Level of Disease Section Compare with the Adjacent Tissue | p-value: 1.65E-05; Fold-change: 0.810678537; Z-score: 1.324928913 | |
| Disease-specific Antigen Abundances |
|
Click to View the Clearer Original Diagram |
| Differential expression pattern of antigen in diseases | ||
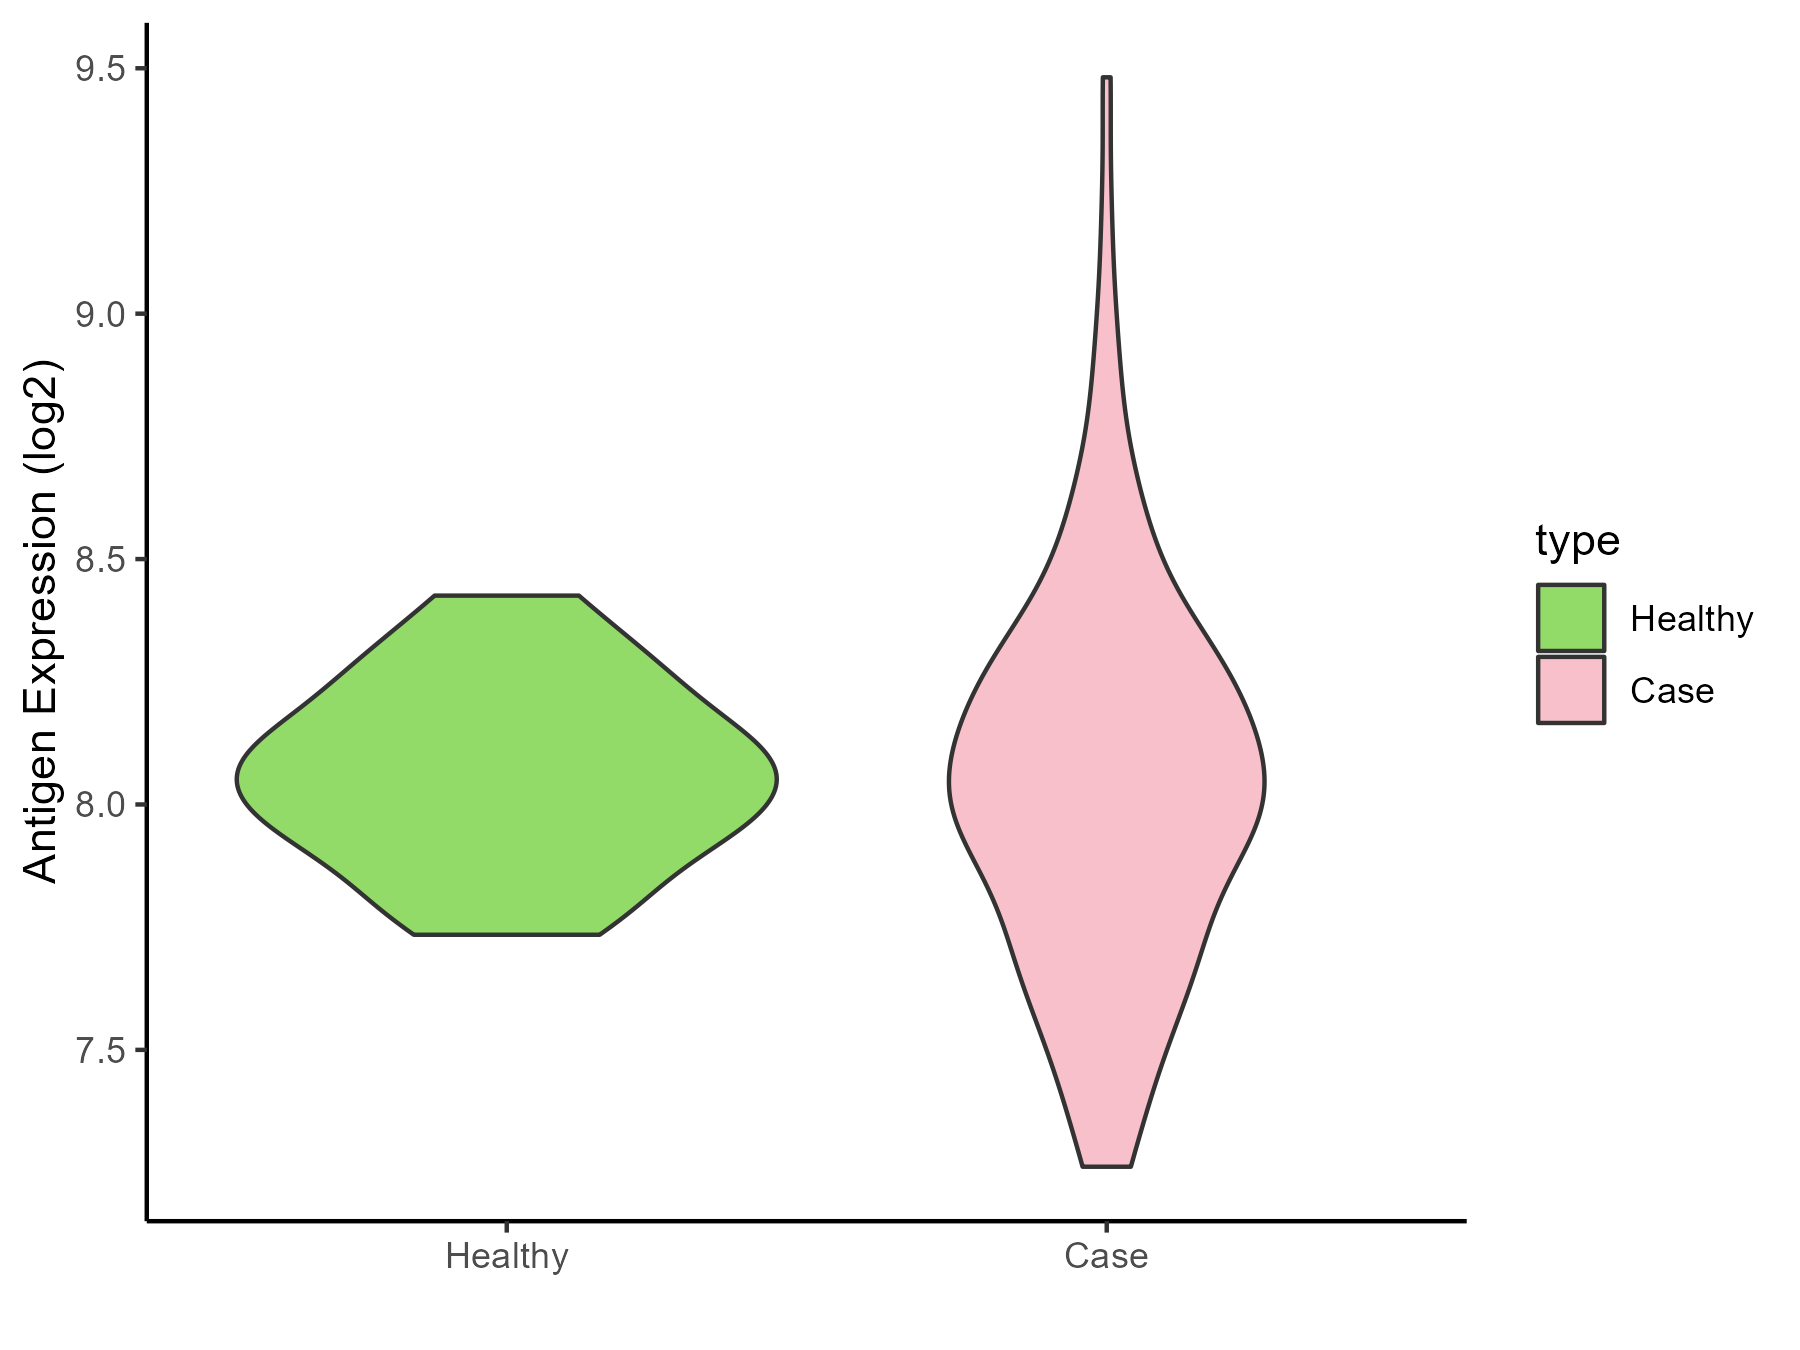
| The Studied Tissue | Cervical | |
| The Specific Disease | Cervical cancer | |
| The Expression Level of Disease Section Compare with the Healthy Individual Tissue | p-value: 0.71003161; Fold-change: -0.044268733; Z-score: -0.234475146 | |
| Disease-specific Antigen Abundances |
|
Click to View the Clearer Original Diagram |
| Differential expression pattern of antigen in diseases | ||
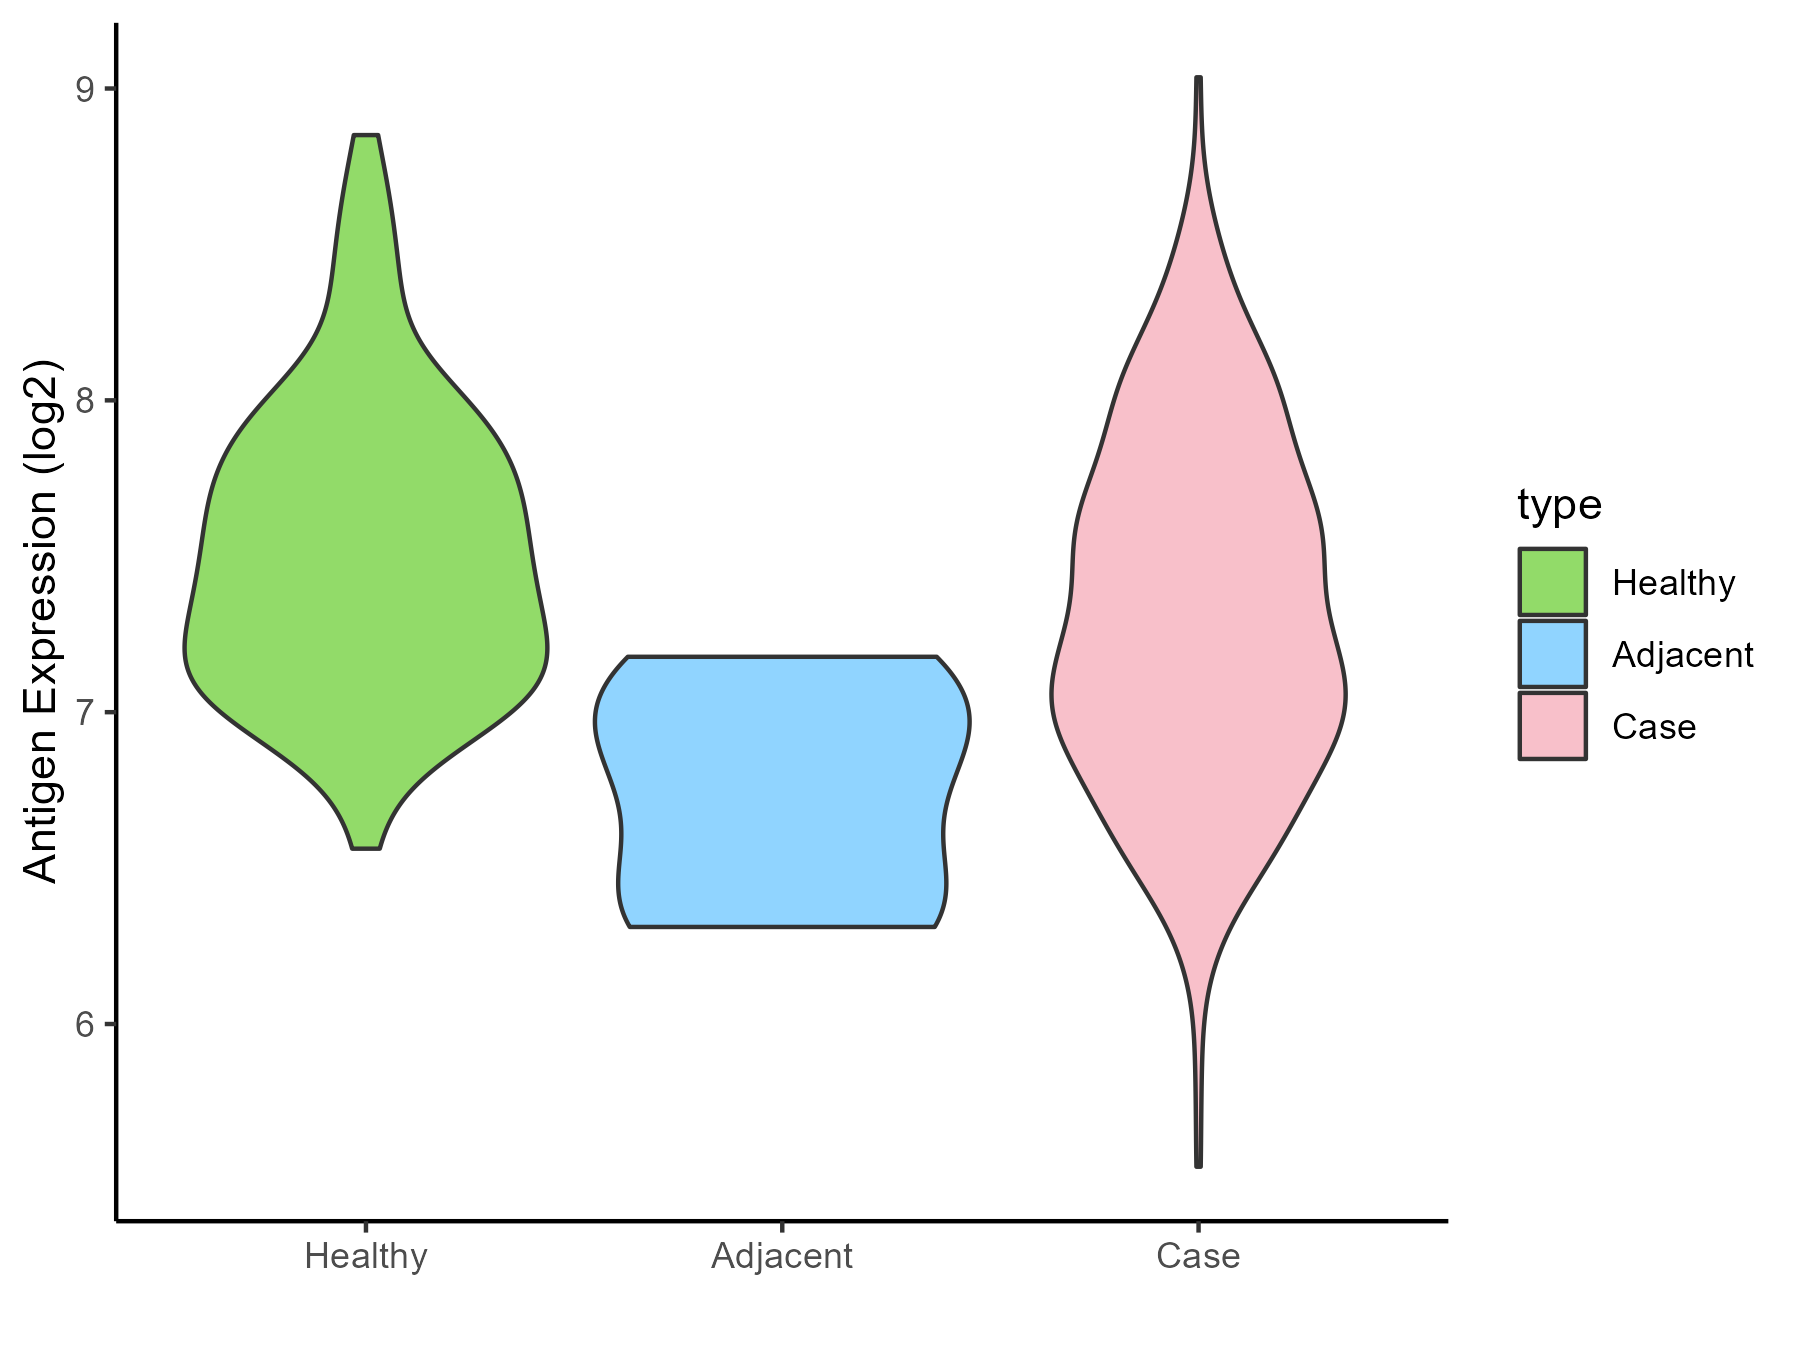
| The Studied Tissue | Endometrium | |
| The Specific Disease | Uterine cancer | |
| The Expression Level of Disease Section Compare with the Healthy Individual Tissue | p-value: 0.000157177; Fold-change: -0.195393549; Z-score: -0.422646913 | |
| The Expression Level of Disease Section Compare with the Adjacent Tissue | p-value: 0.02535486; Fold-change: 0.464796245; Z-score: 1.22356996 | |
| Disease-specific Antigen Abundances |
|
Click to View the Clearer Original Diagram |
| Differential expression pattern of antigen in diseases | ||
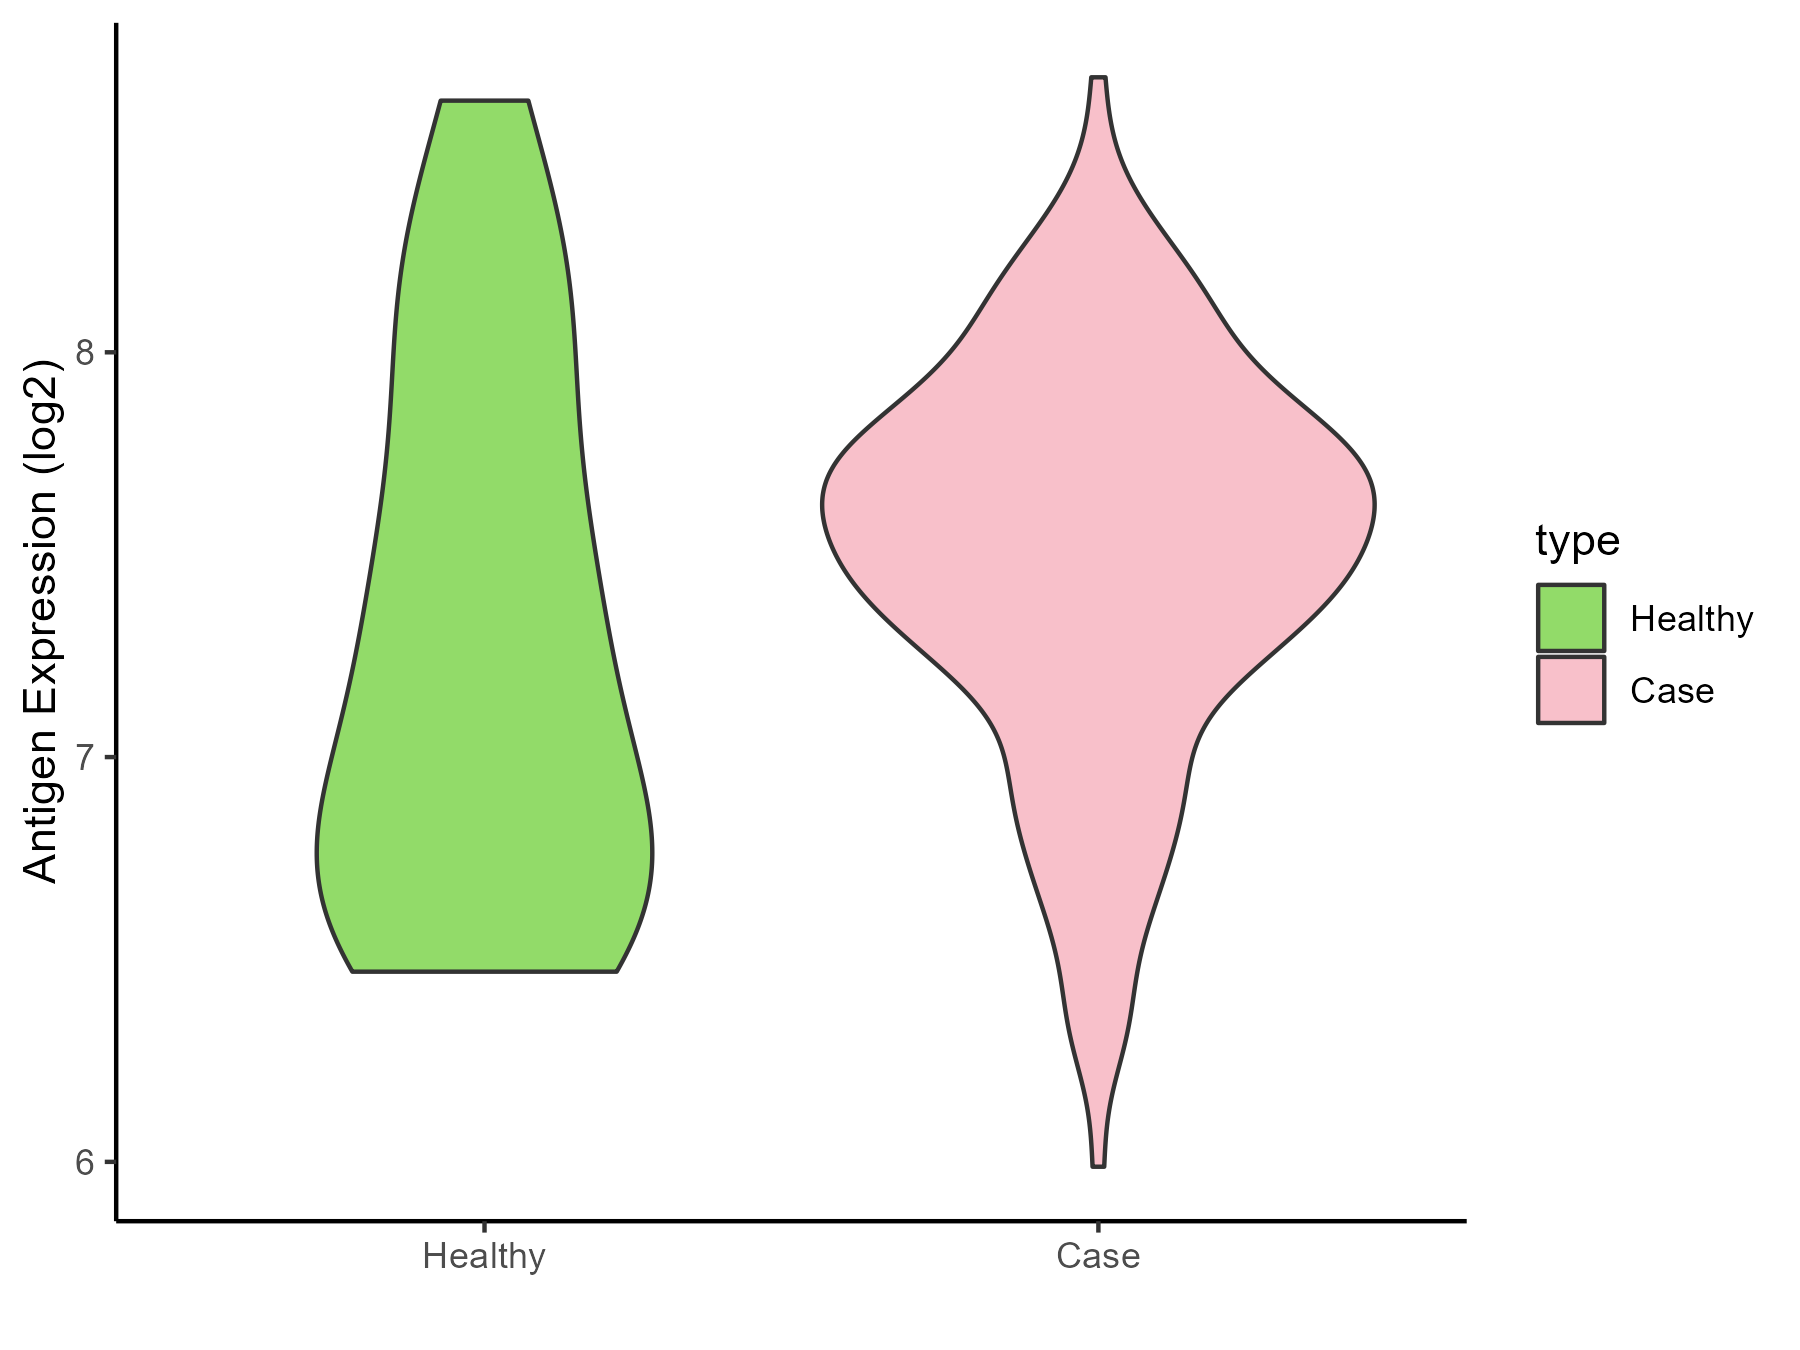
| The Studied Tissue | Prostate | |
| The Specific Disease | Prostate cancer | |
| The Expression Level of Disease Section Compare with the Healthy Individual Tissue | p-value: 0.14901724; Fold-change: 0.339195709; Z-score: 0.506493813 | |
| Disease-specific Antigen Abundances |
|
Click to View the Clearer Original Diagram |
| Differential expression pattern of antigen in diseases | ||
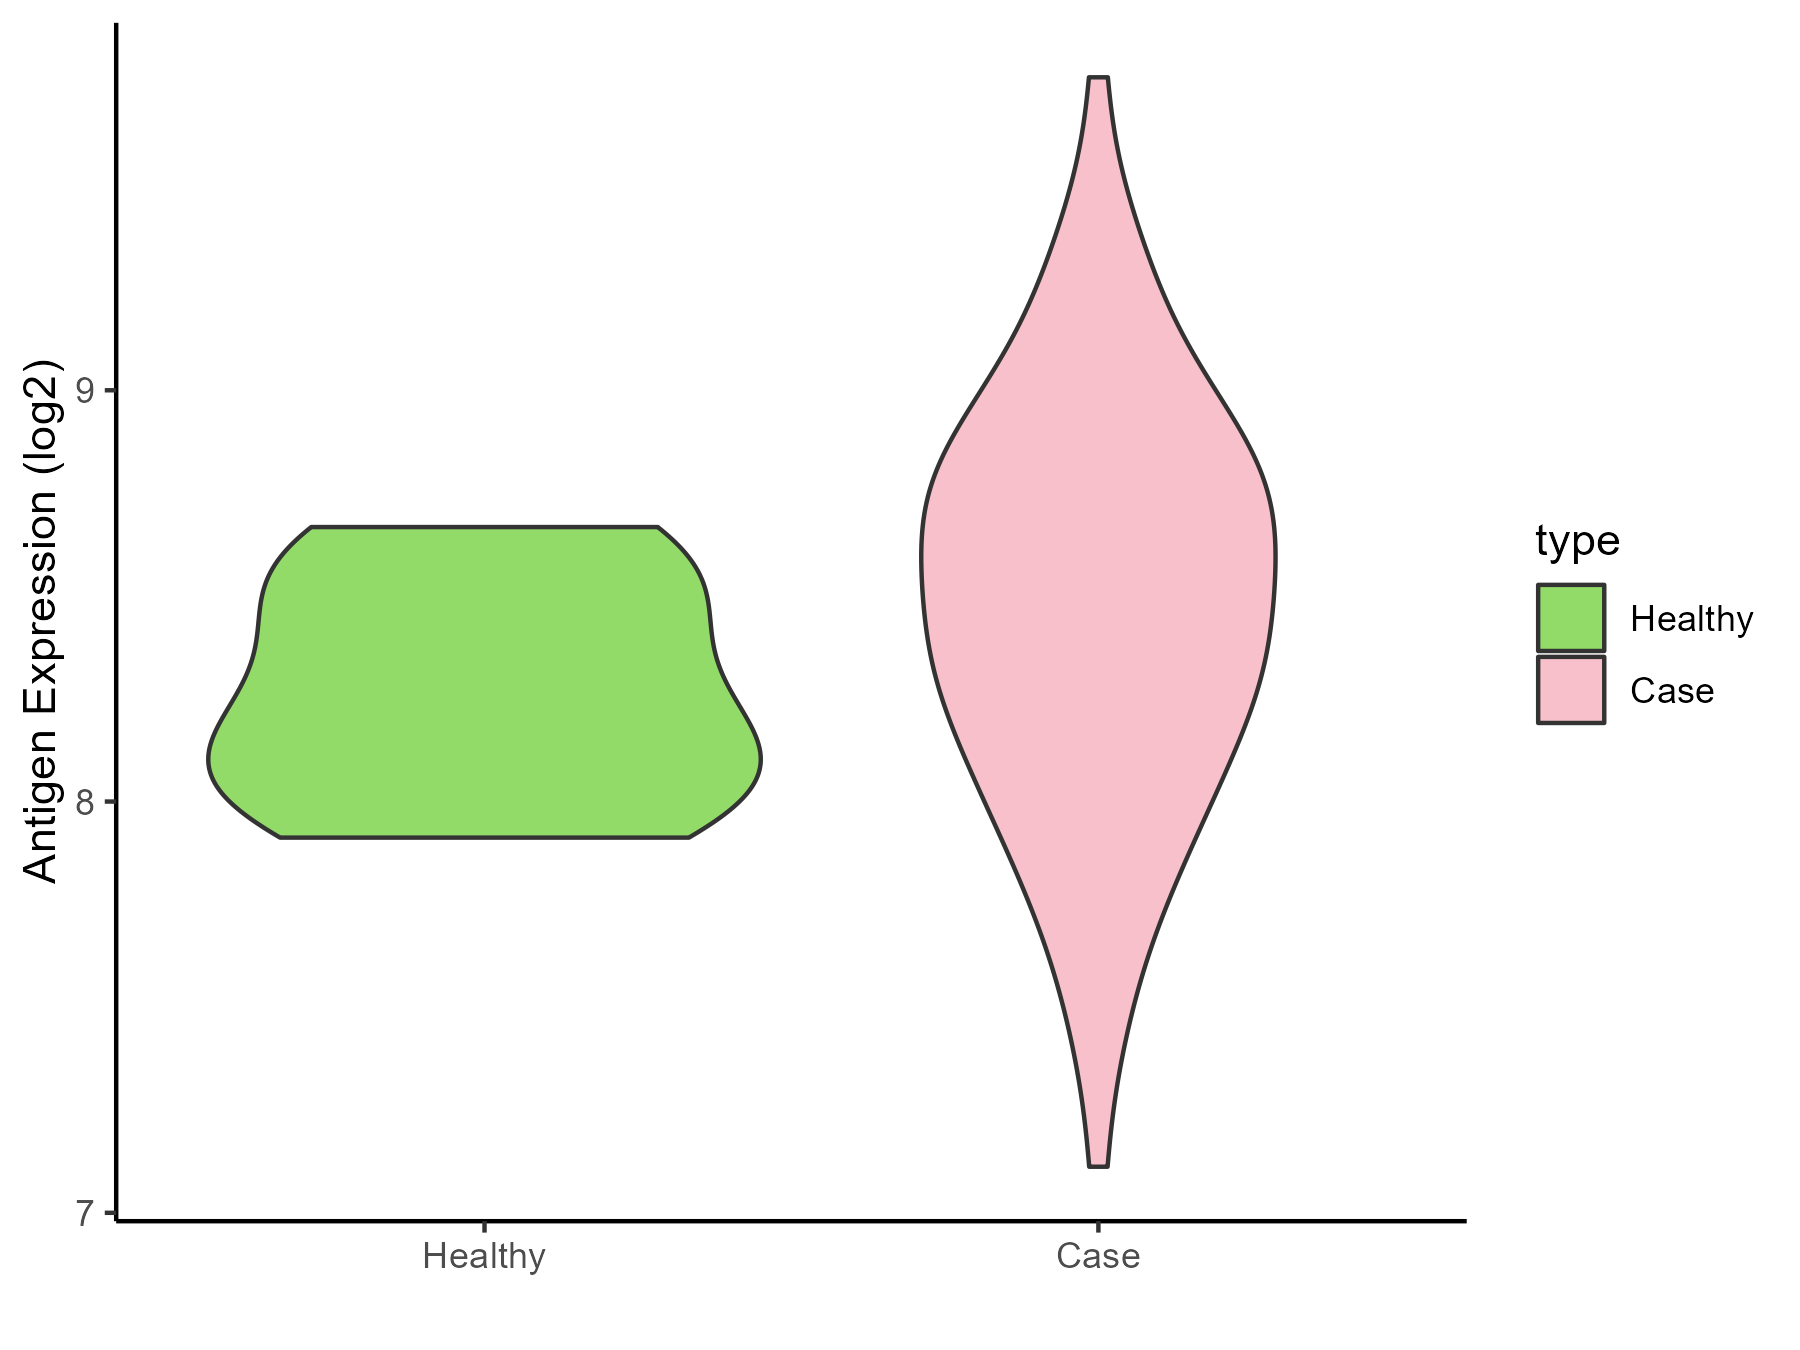
| The Studied Tissue | Bladder | |
| The Specific Disease | Bladder cancer | |
| The Expression Level of Disease Section Compare with the Healthy Individual Tissue | p-value: 0.111850792; Fold-change: 0.306276998; Z-score: 1.083055779 | |
| Disease-specific Antigen Abundances |
|
Click to View the Clearer Original Diagram |
| Differential expression pattern of antigen in diseases | ||
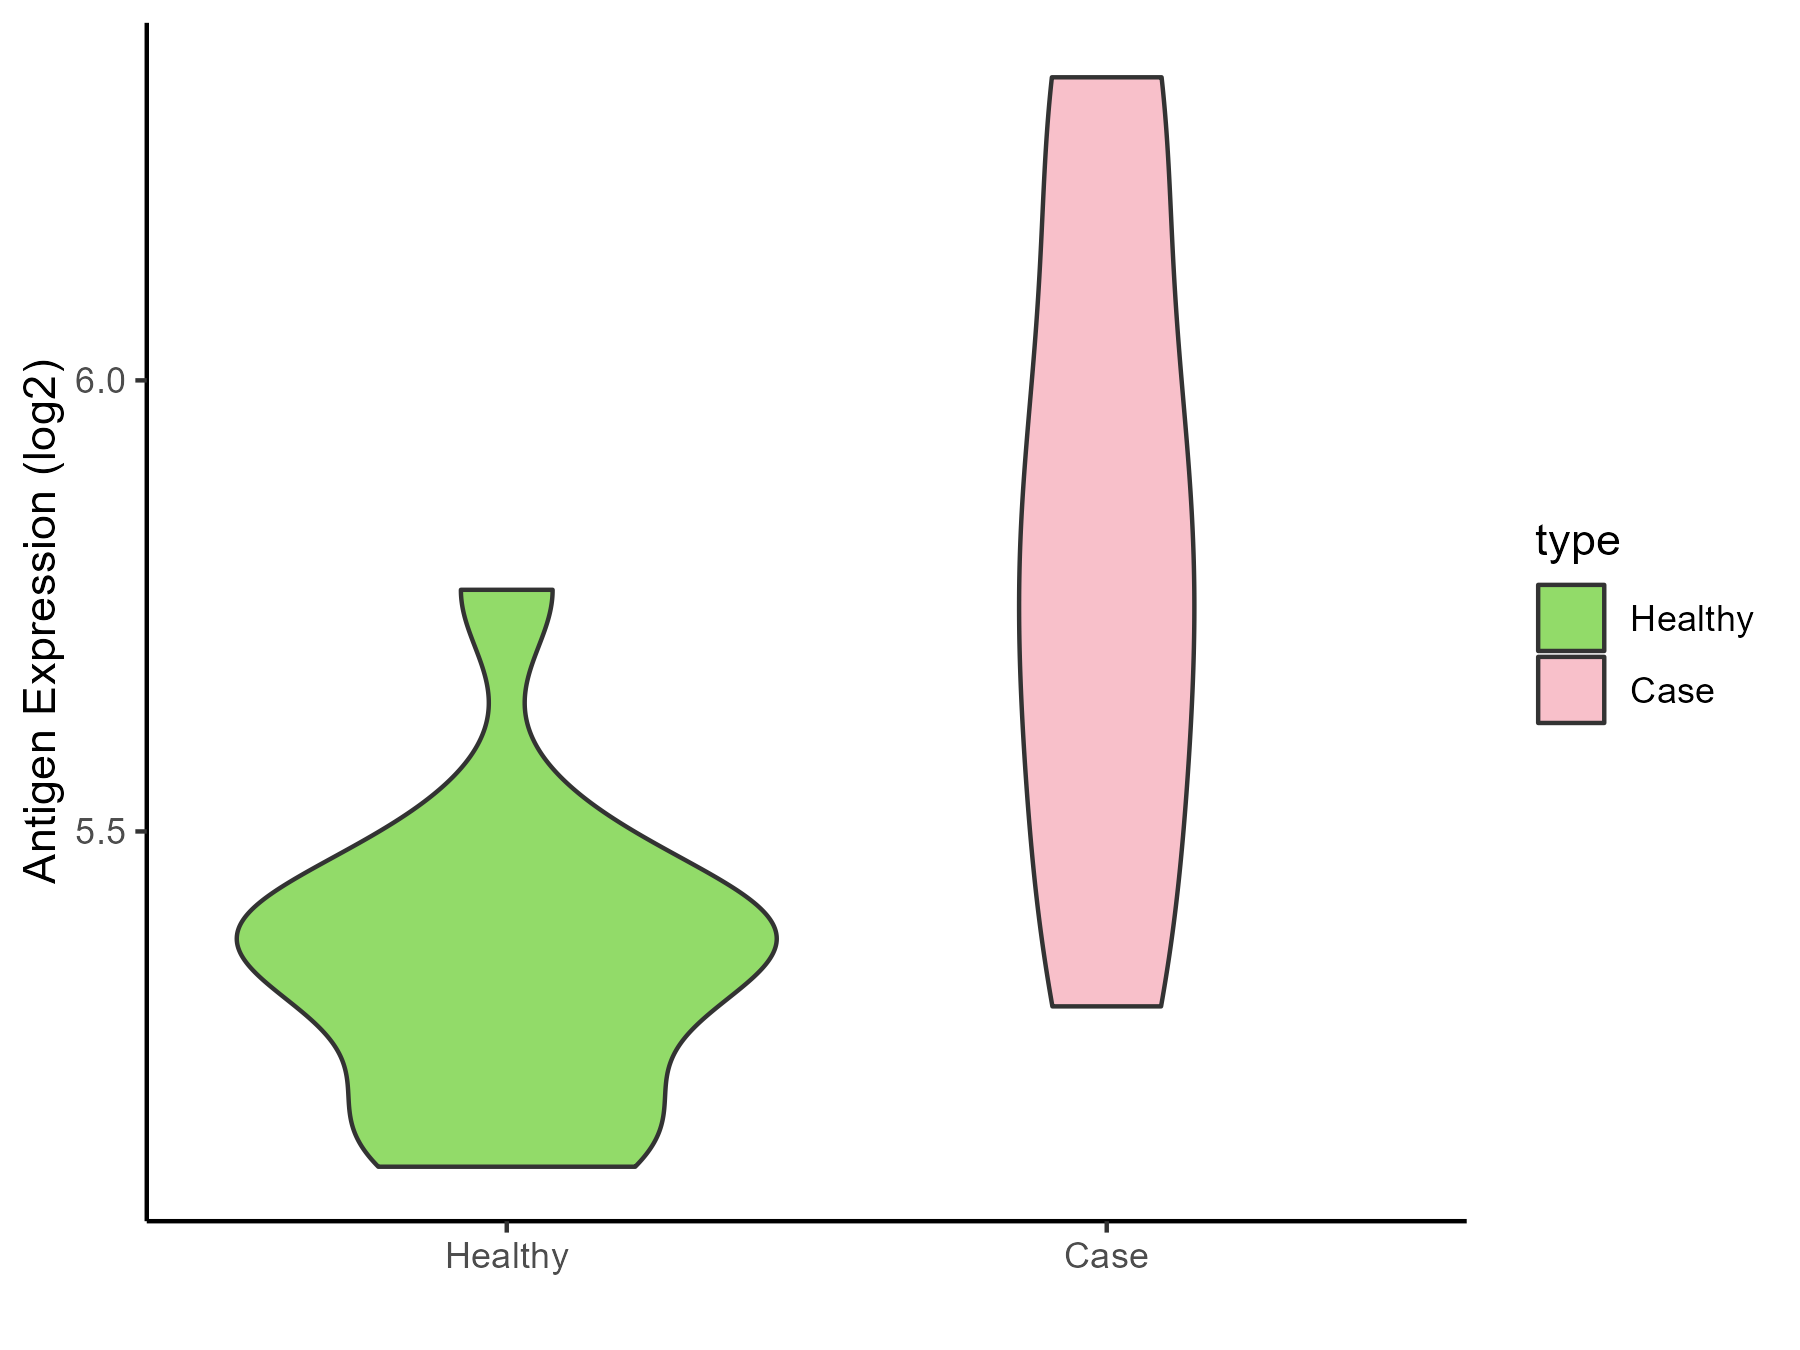
| The Studied Tissue | Uvea | |
| The Specific Disease | Retinoblastoma tumor | |
| The Expression Level of Disease Section Compare with the Healthy Individual Tissue | p-value: 0.000385302; Fold-change: 0.440280695; Z-score: 2.5396502 | |
| Disease-specific Antigen Abundances |
|
Click to View the Clearer Original Diagram |
| Differential expression pattern of antigen in diseases | ||
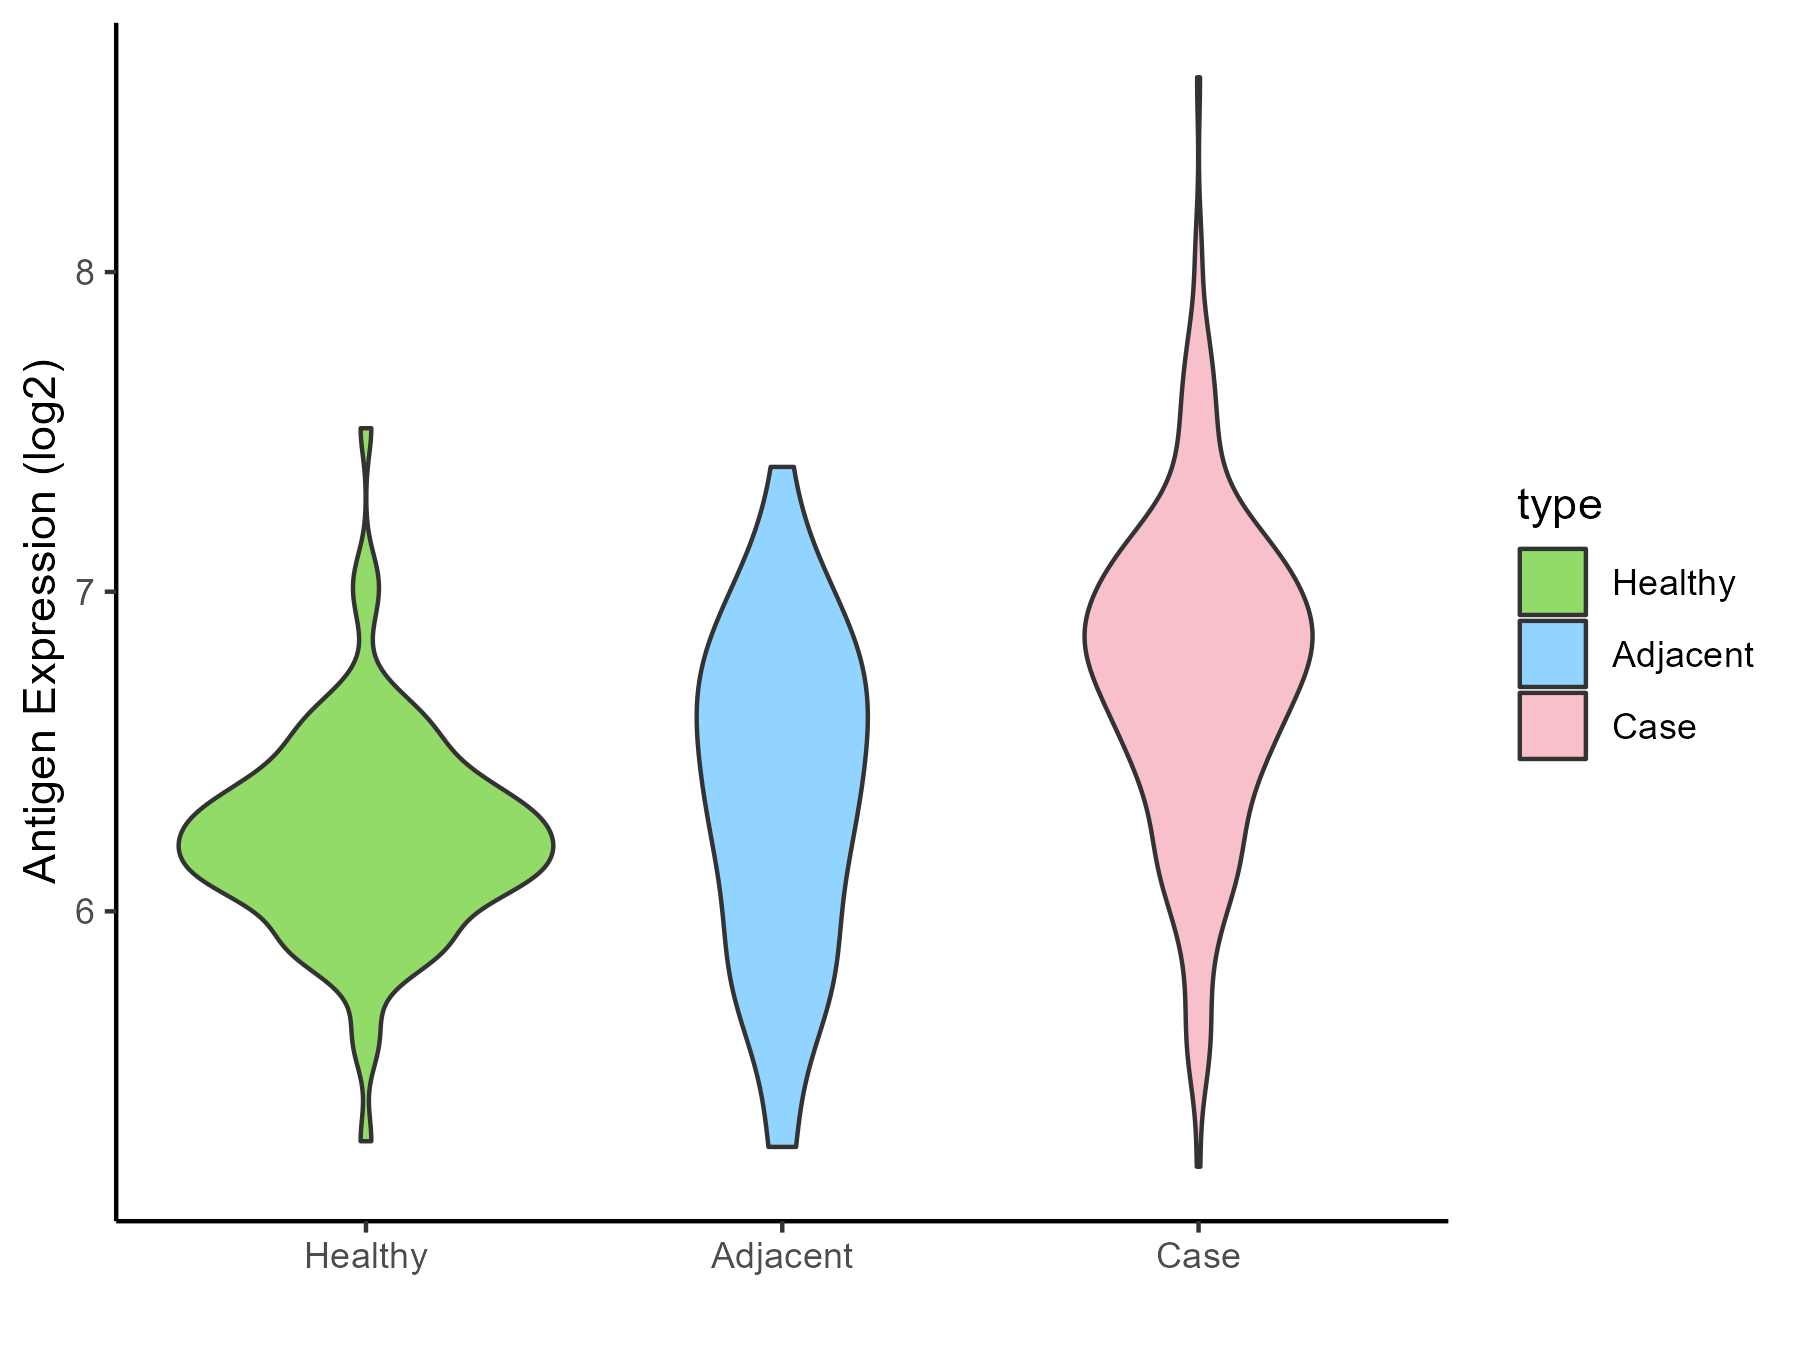
| The Studied Tissue | Thyroid | |
| The Specific Disease | Thyroid cancer | |
| The Expression Level of Disease Section Compare with the Healthy Individual Tissue | p-value: 1.75E-26; Fold-change: 0.553681203; Z-score: 1.790522628 | |
| The Expression Level of Disease Section Compare with the Adjacent Tissue | p-value: 3.99E-05; Fold-change: 0.369353144; Z-score: 0.737469048 | |
| Disease-specific Antigen Abundances |
|
Click to View the Clearer Original Diagram |
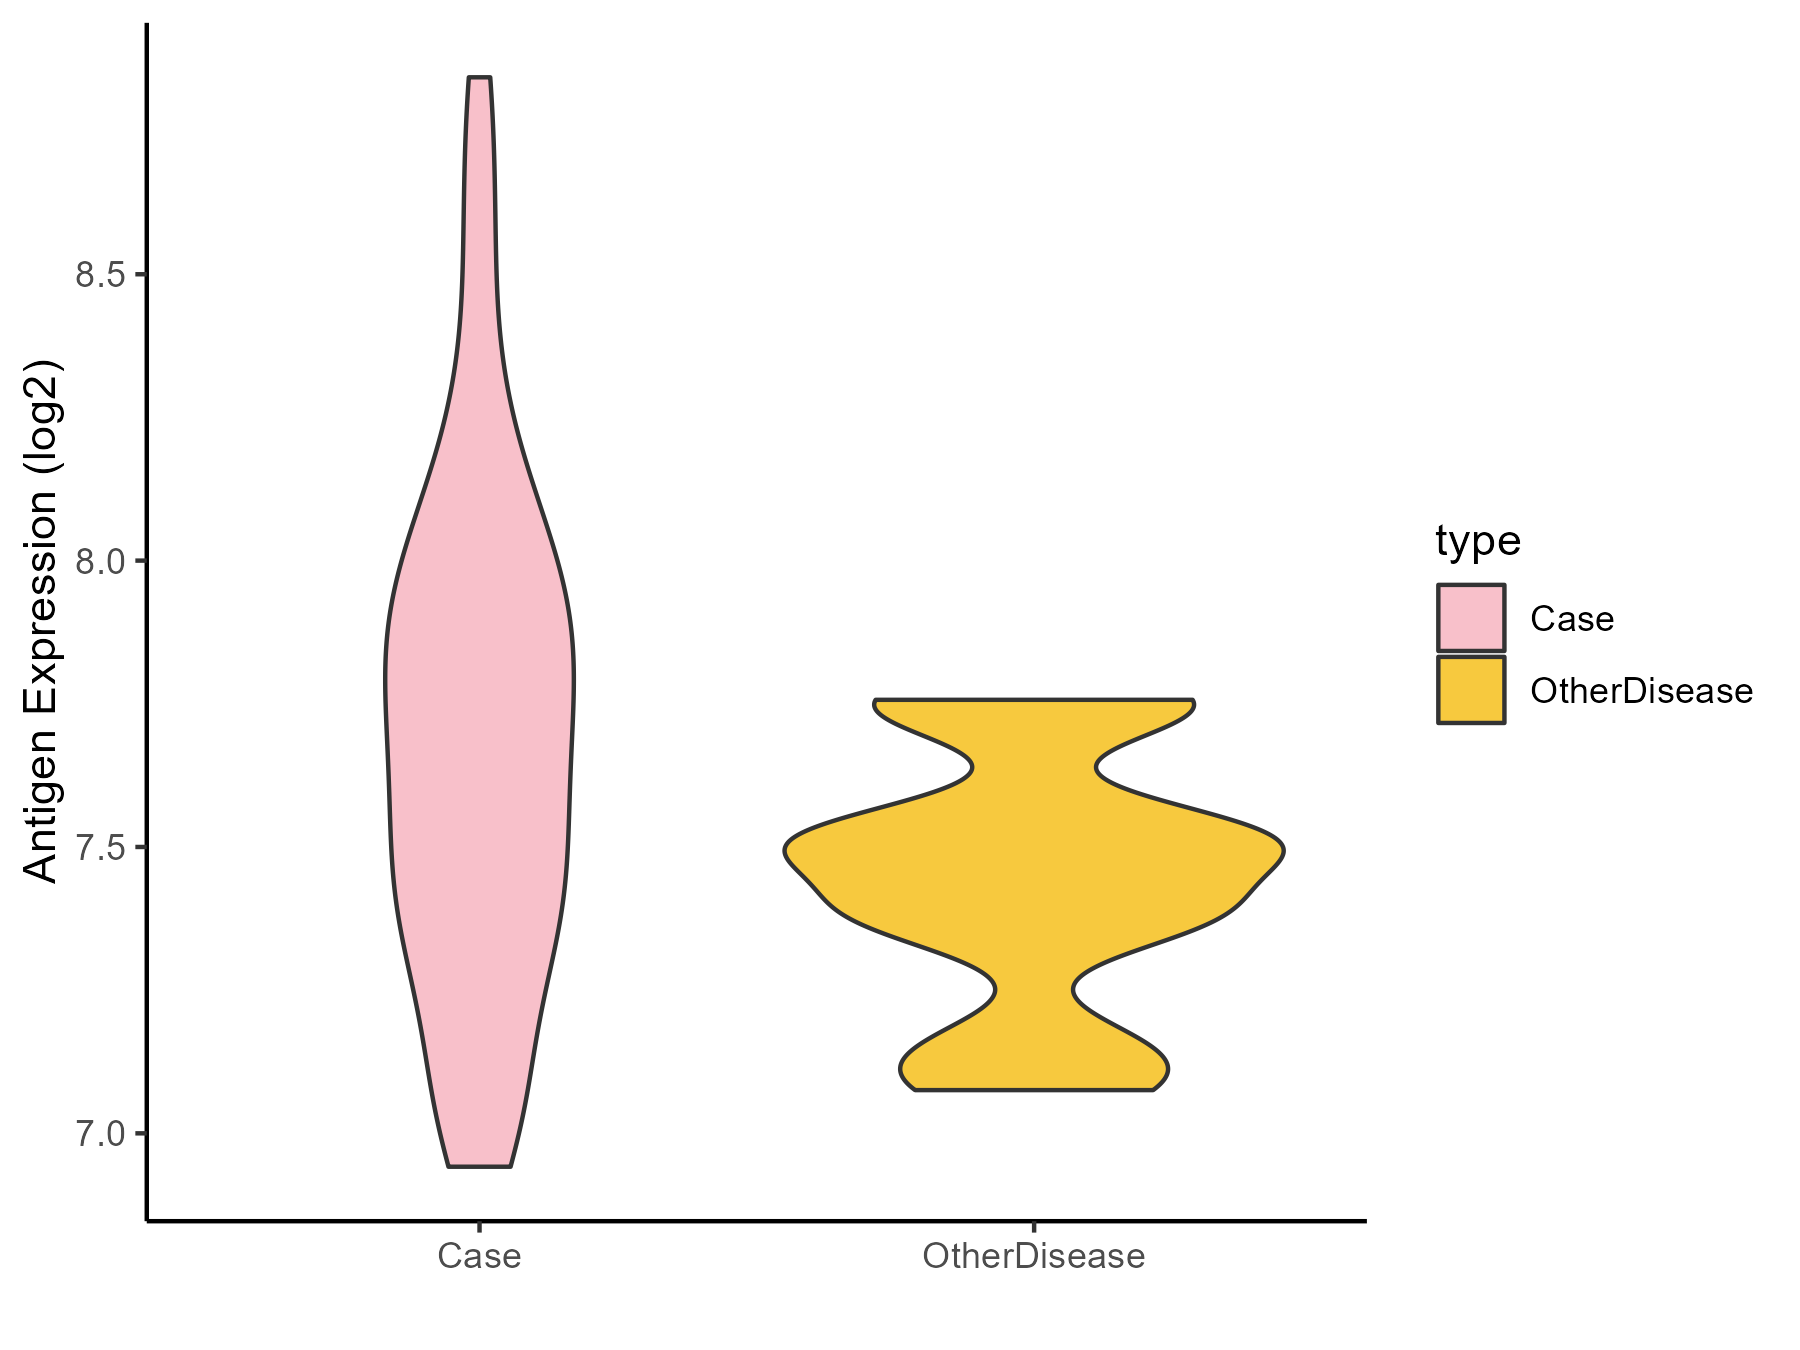
| Differential expression pattern of antigen in diseases | ||
| The Studied Tissue | Adrenal cortex | |
| The Specific Disease | Adrenocortical carcinoma | |
| The Expression Level of Disease Section Compare with the Other Disease Section | p-value: 0.00052437; Fold-change: 0.236639921; Z-score: 1.050761229 | |
| Disease-specific Antigen Abundances |
|
Click to View the Clearer Original Diagram |
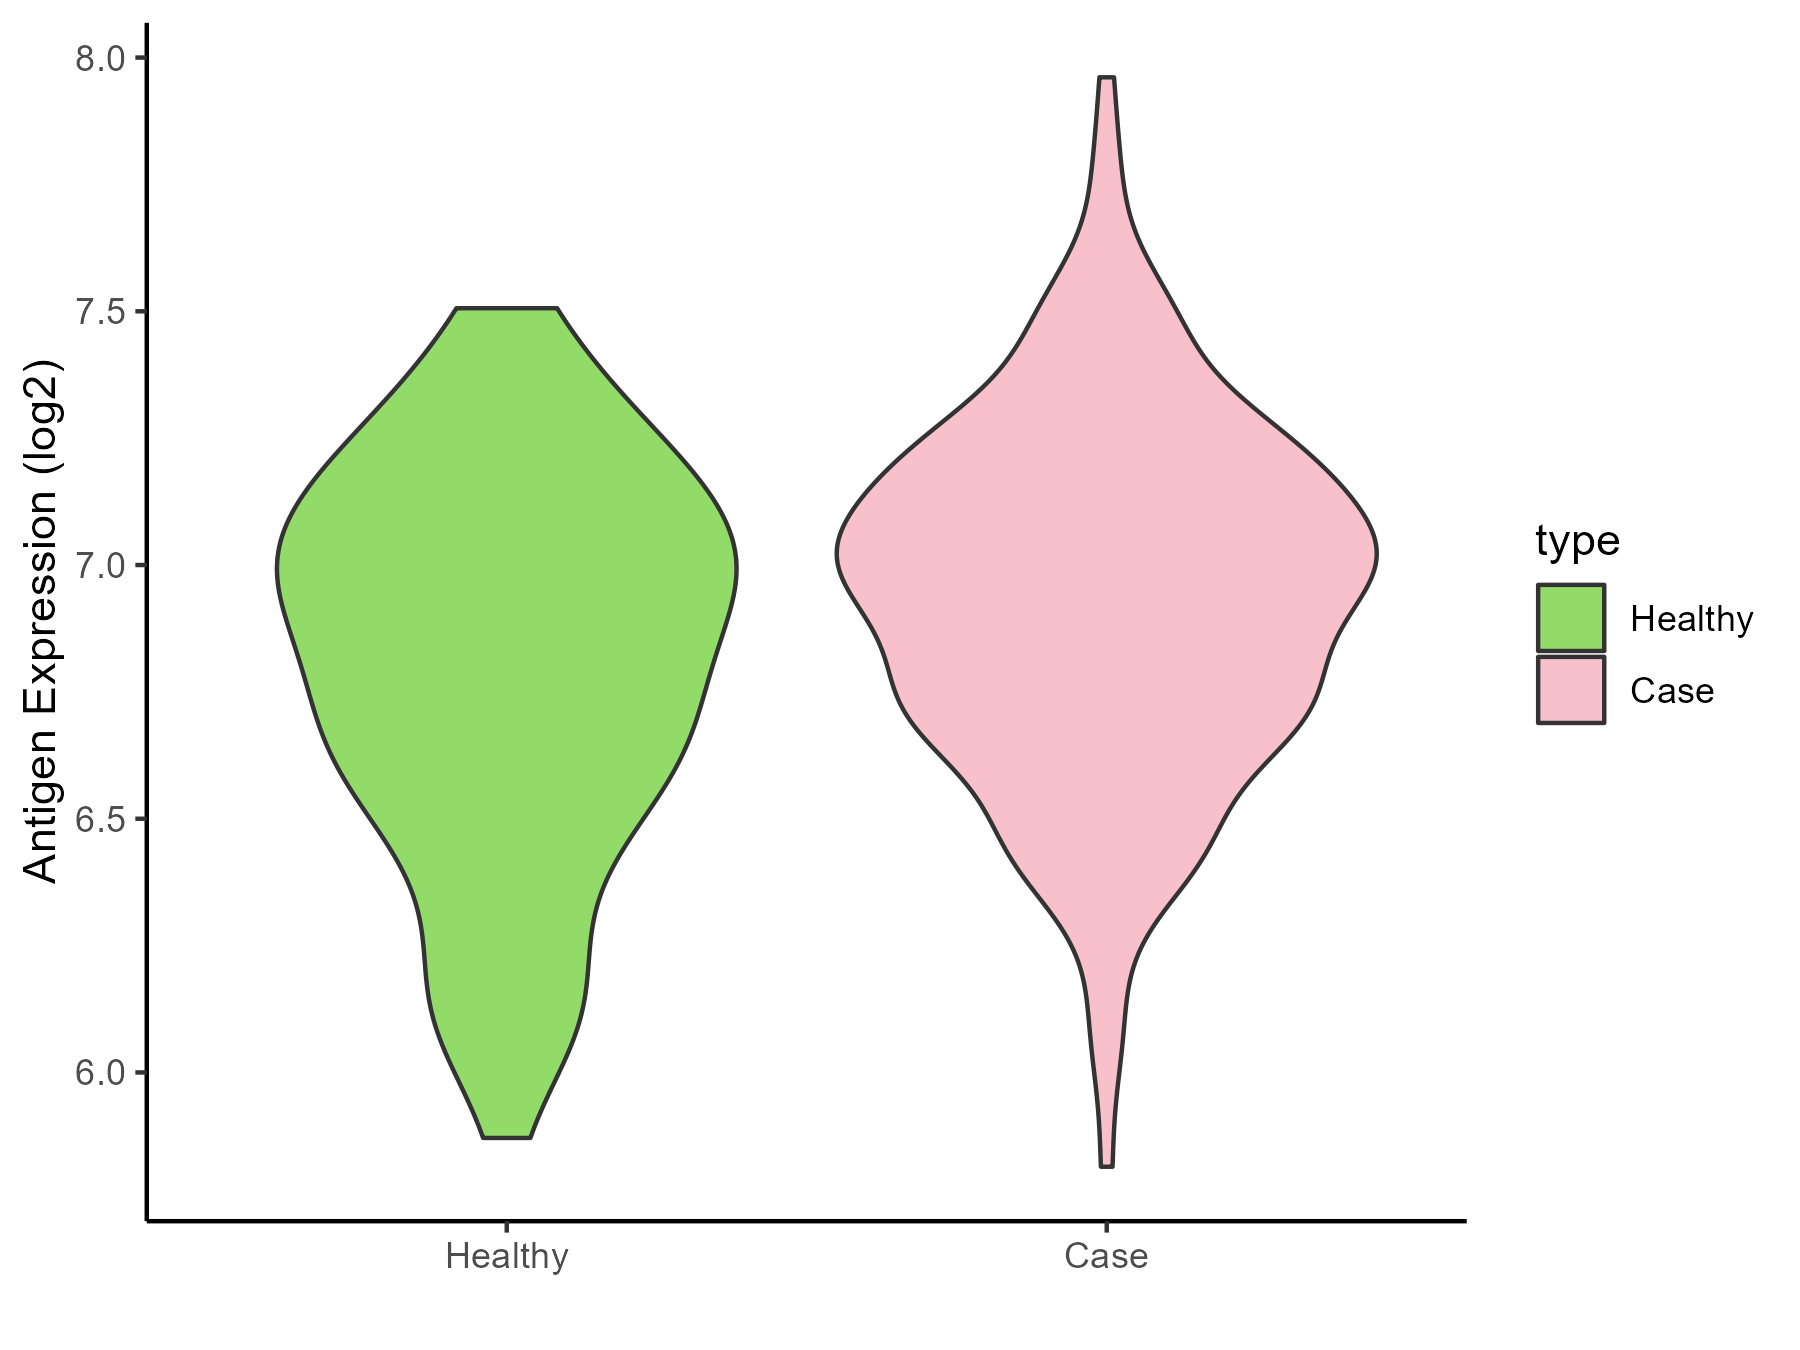
| Differential expression pattern of antigen in diseases | ||
| The Studied Tissue | Head and neck | |
| The Specific Disease | Head and neck cancer | |
| The Expression Level of Disease Section Compare with the Healthy Individual Tissue | p-value: 0.010928265; Fold-change: 0.10107822; Z-score: 0.264590364 | |
| Disease-specific Antigen Abundances |
|
Click to View the Clearer Original Diagram |
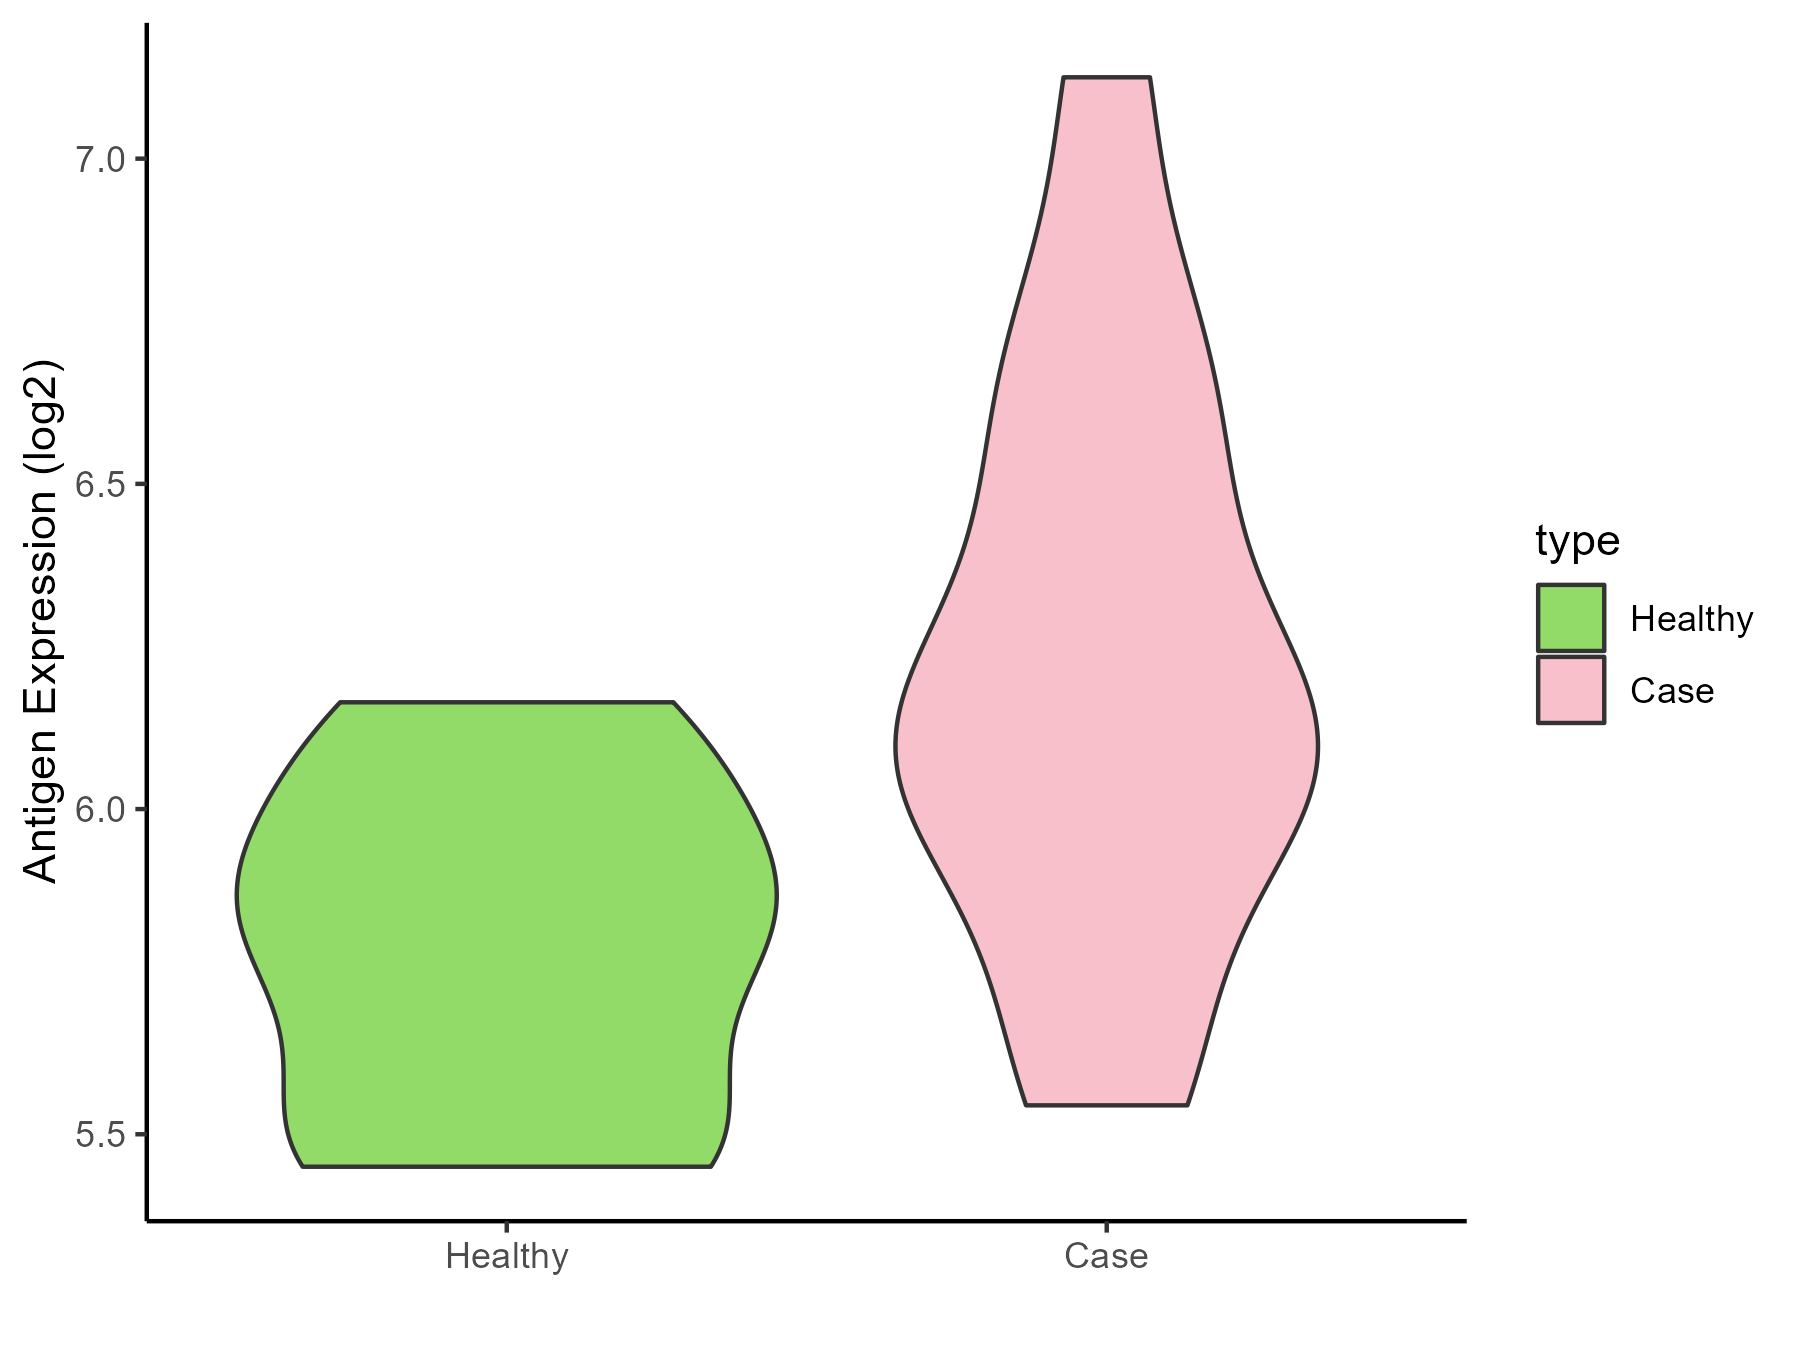
| Differential expression pattern of antigen in diseases | ||
| The Studied Tissue | Pituitary | |
| The Specific Disease | Pituitary gonadotrope tumor | |
| The Expression Level of Disease Section Compare with the Healthy Individual Tissue | p-value: 0.007733787; Fold-change: 0.345811353; Z-score: 1.298069246 | |
| Disease-specific Antigen Abundances |
|
Click to View the Clearer Original Diagram |
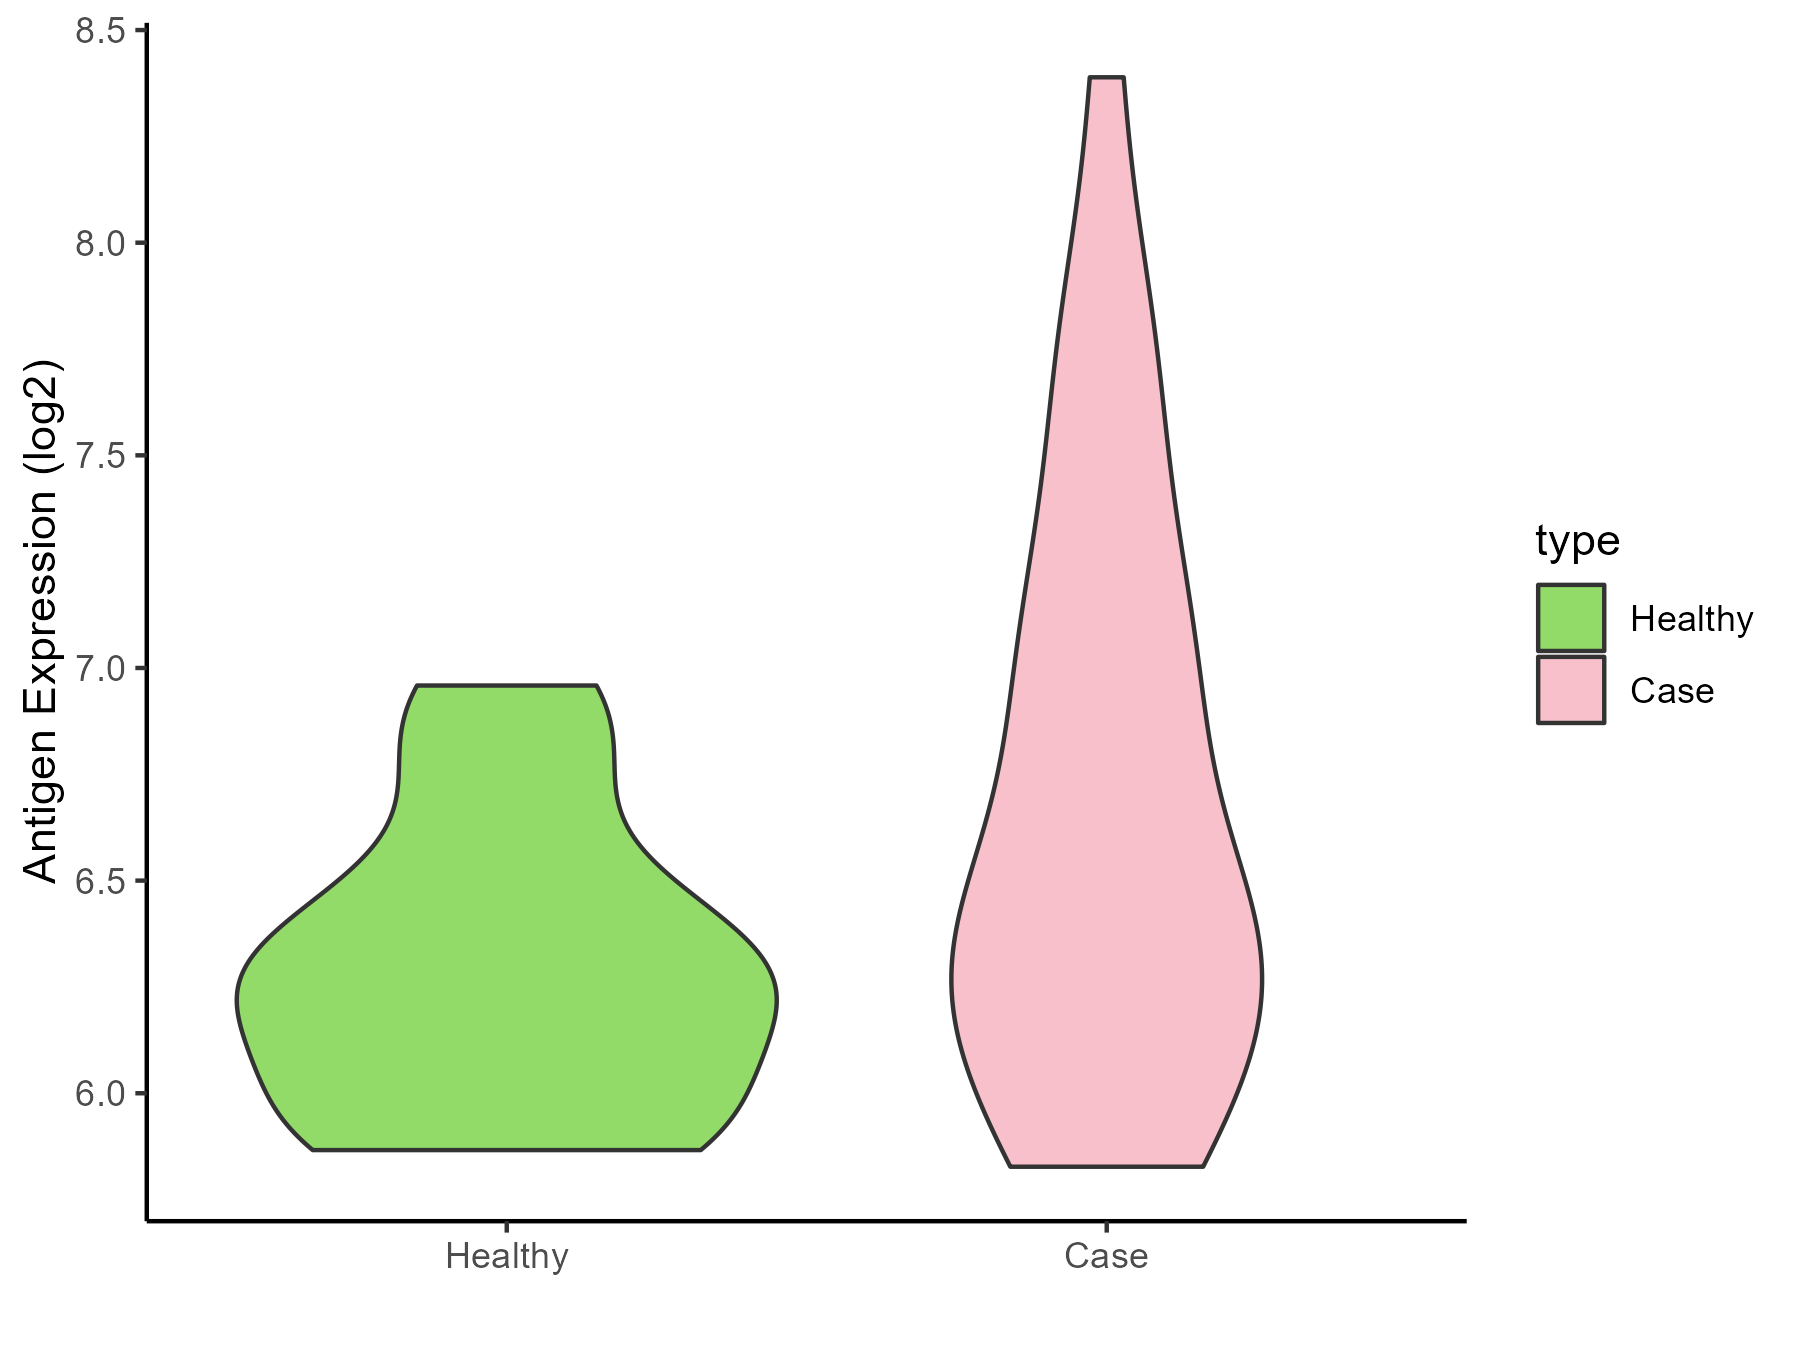
| The Studied Tissue | Pituitary | |
| The Specific Disease | Pituitary cancer | |
| The Expression Level of Disease Section Compare with the Healthy Individual Tissue | p-value: 0.023072284; Fold-change: 0.173248158; Z-score: 0.483606058 | |
| Disease-specific Antigen Abundances |
|
Click to View the Clearer Original Diagram |
ICD Disease Classification 03
| Differential expression pattern of antigen in diseases | ||
| The Studied Tissue | Whole blood | |
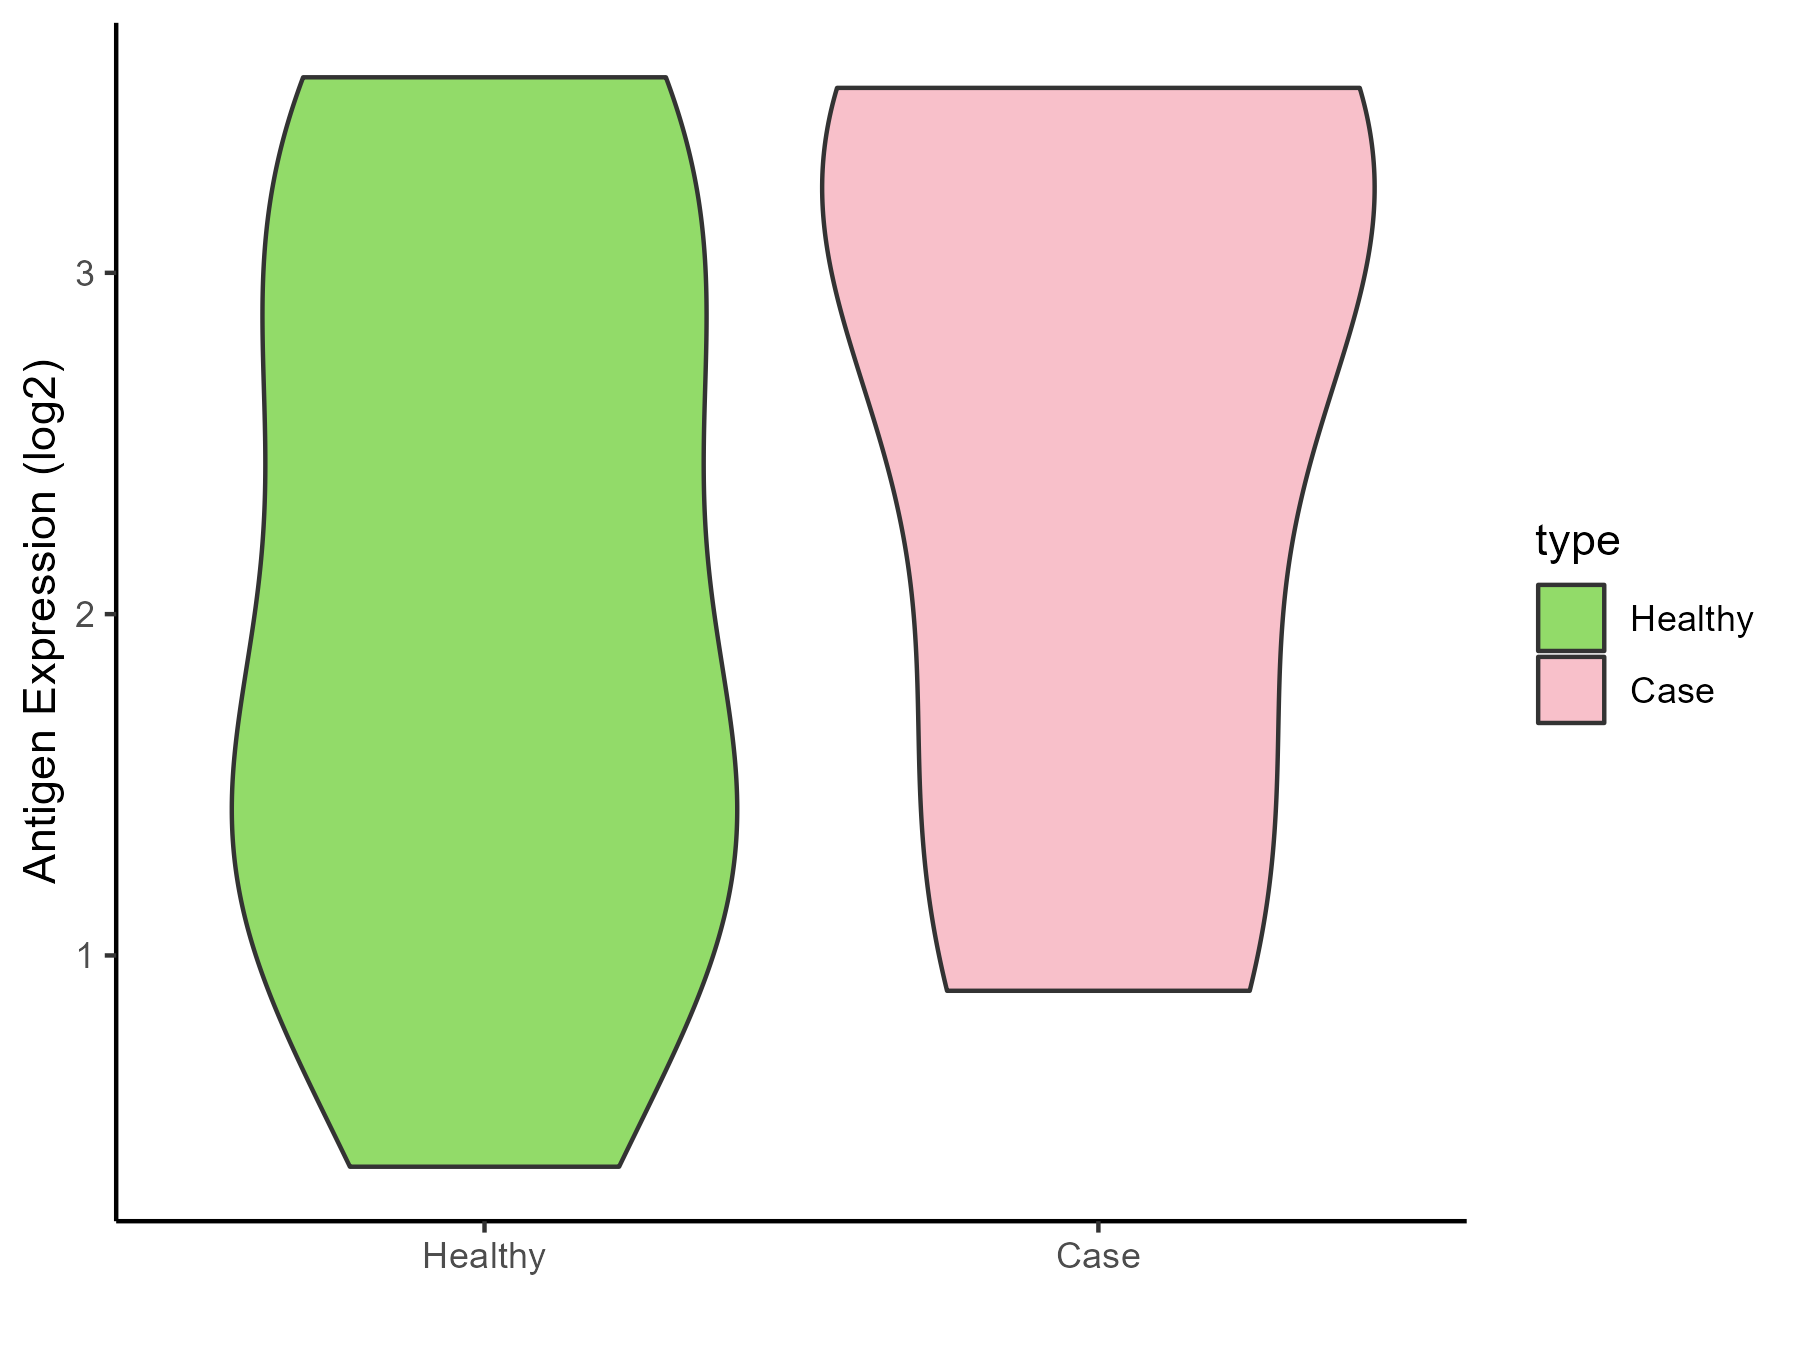
| The Specific Disease | Thrombocytopenia | |
| The Expression Level of Disease Section Compare with the Healthy Individual Tissue | p-value: 0.529219783; Fold-change: 1.021572706; Z-score: 0.916797321 | |
| Disease-specific Antigen Abundances |
|
Click to View the Clearer Original Diagram |
ICD Disease Classification 04
| Differential expression pattern of antigen in diseases | ||
| The Studied Tissue | Whole blood | |
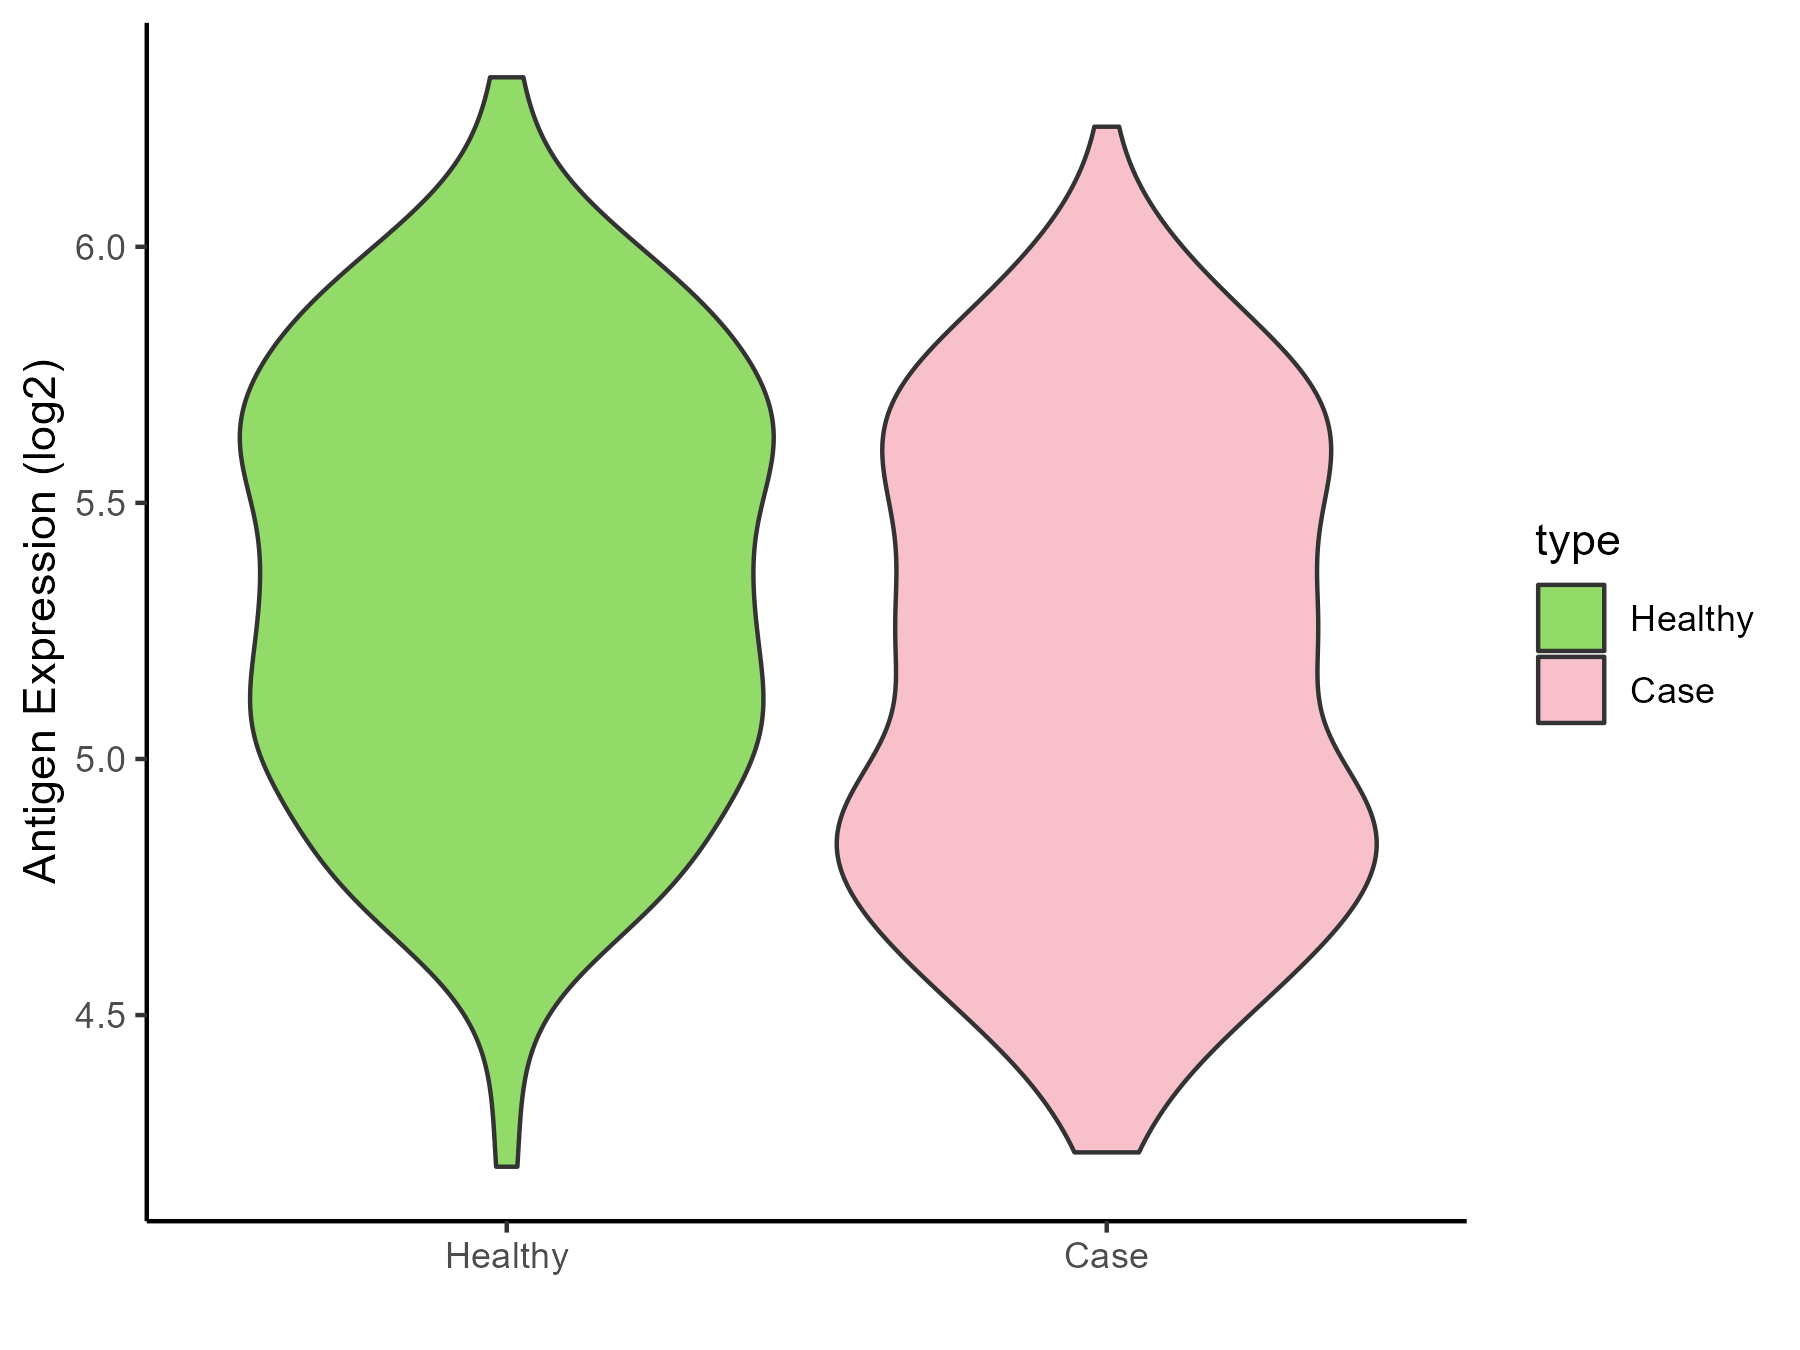
| The Specific Disease | Lupus erythematosus | |
| The Expression Level of Disease Section Compare with the Healthy Individual Tissue | p-value: 0.000272978; Fold-change: -0.184428926; Z-score: -0.437854811 | |
| Disease-specific Antigen Abundances |
|
Click to View the Clearer Original Diagram |
| Differential expression pattern of antigen in diseases | ||
| The Studied Tissue | Peripheral monocyte | |
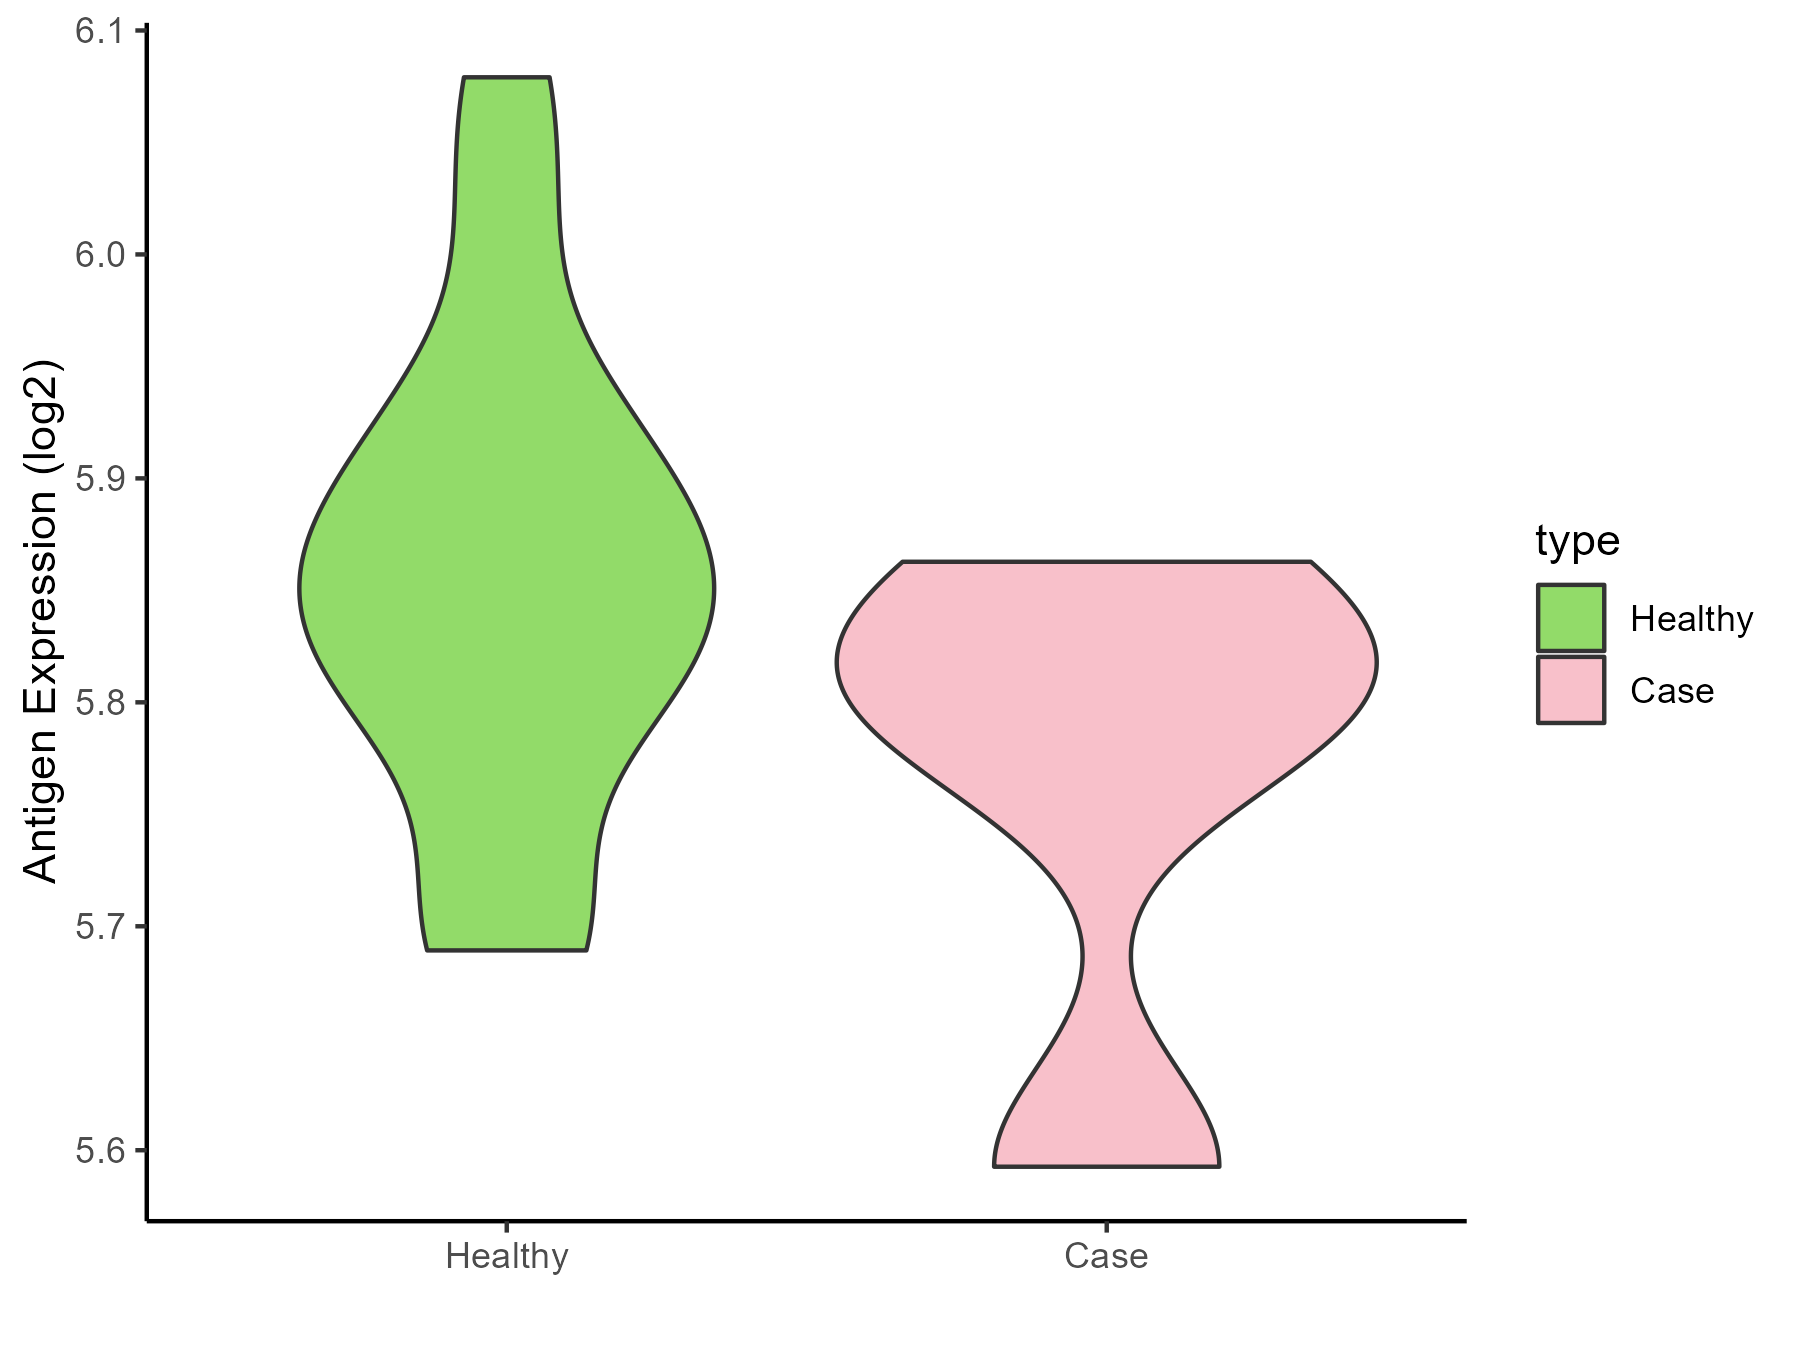
| The Specific Disease | Autoimmune uveitis | |
| The Expression Level of Disease Section Compare with the Healthy Individual Tissue | p-value: 0.2285273; Fold-change: -0.06423398; Z-score: -0.592626846 | |
| Disease-specific Antigen Abundances |
|
Click to View the Clearer Original Diagram |
ICD Disease Classification 05
| Differential expression pattern of antigen in diseases | ||
| The Studied Tissue | Whole blood | |
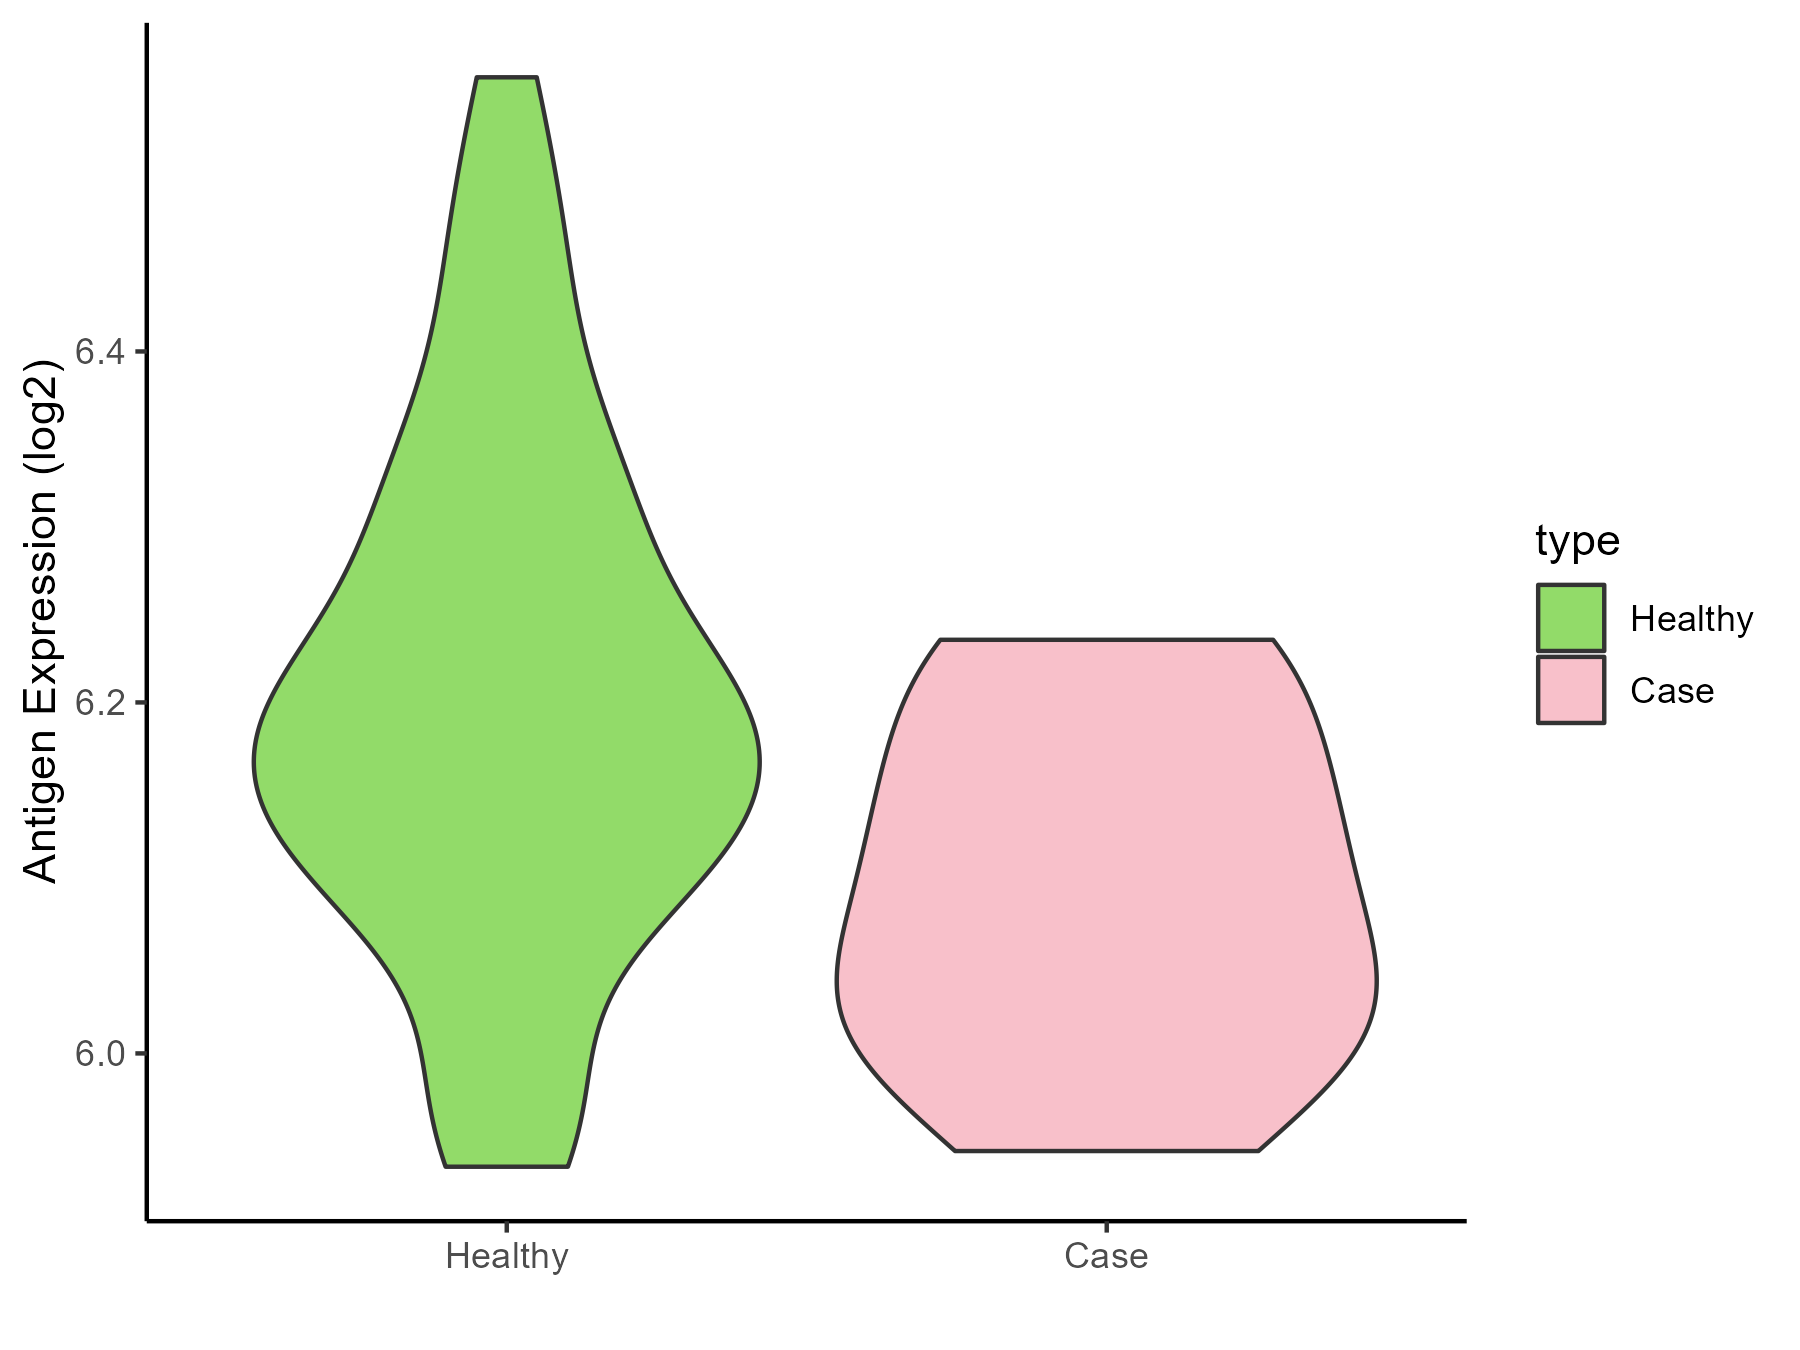
| The Specific Disease | Familial hypercholesterolemia | |
| The Expression Level of Disease Section Compare with the Healthy Individual Tissue | p-value: 0.013048374; Fold-change: -0.088424221; Z-score: -0.601326043 | |
| Disease-specific Antigen Abundances |
|
Click to View the Clearer Original Diagram |
ICD Disease Classification 06
| Differential expression pattern of antigen in diseases | ||
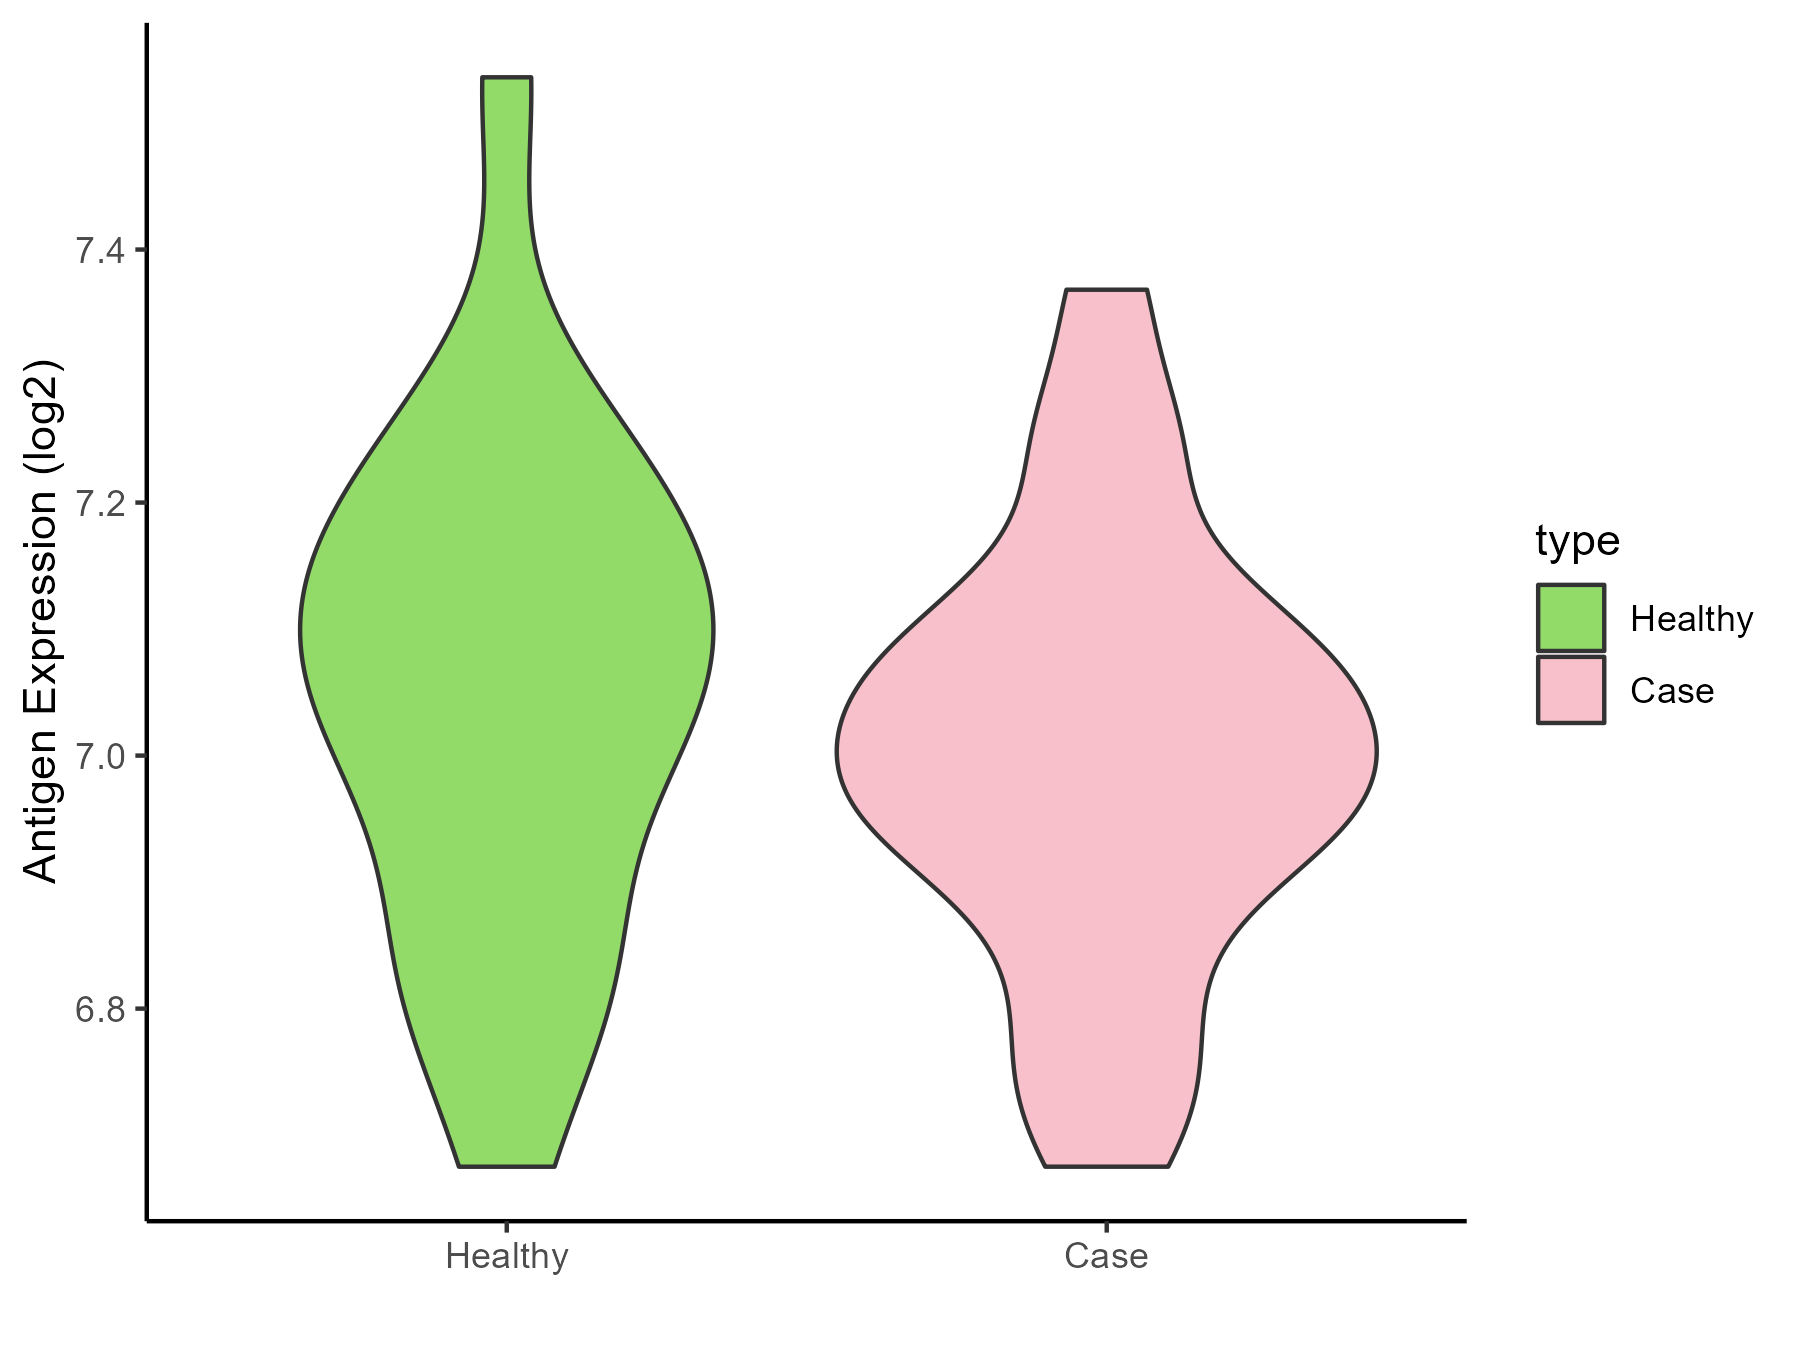
| The Studied Tissue | Superior temporal cortex | |
| The Specific Disease | Schizophrenia | |
| The Expression Level of Disease Section Compare with the Healthy Individual Tissue | p-value: 0.375373925; Fold-change: -0.068295045; Z-score: -0.336599013 | |
| Disease-specific Antigen Abundances |
|
Click to View the Clearer Original Diagram |
ICD Disease Classification 08
| Differential expression pattern of antigen in diseases | ||
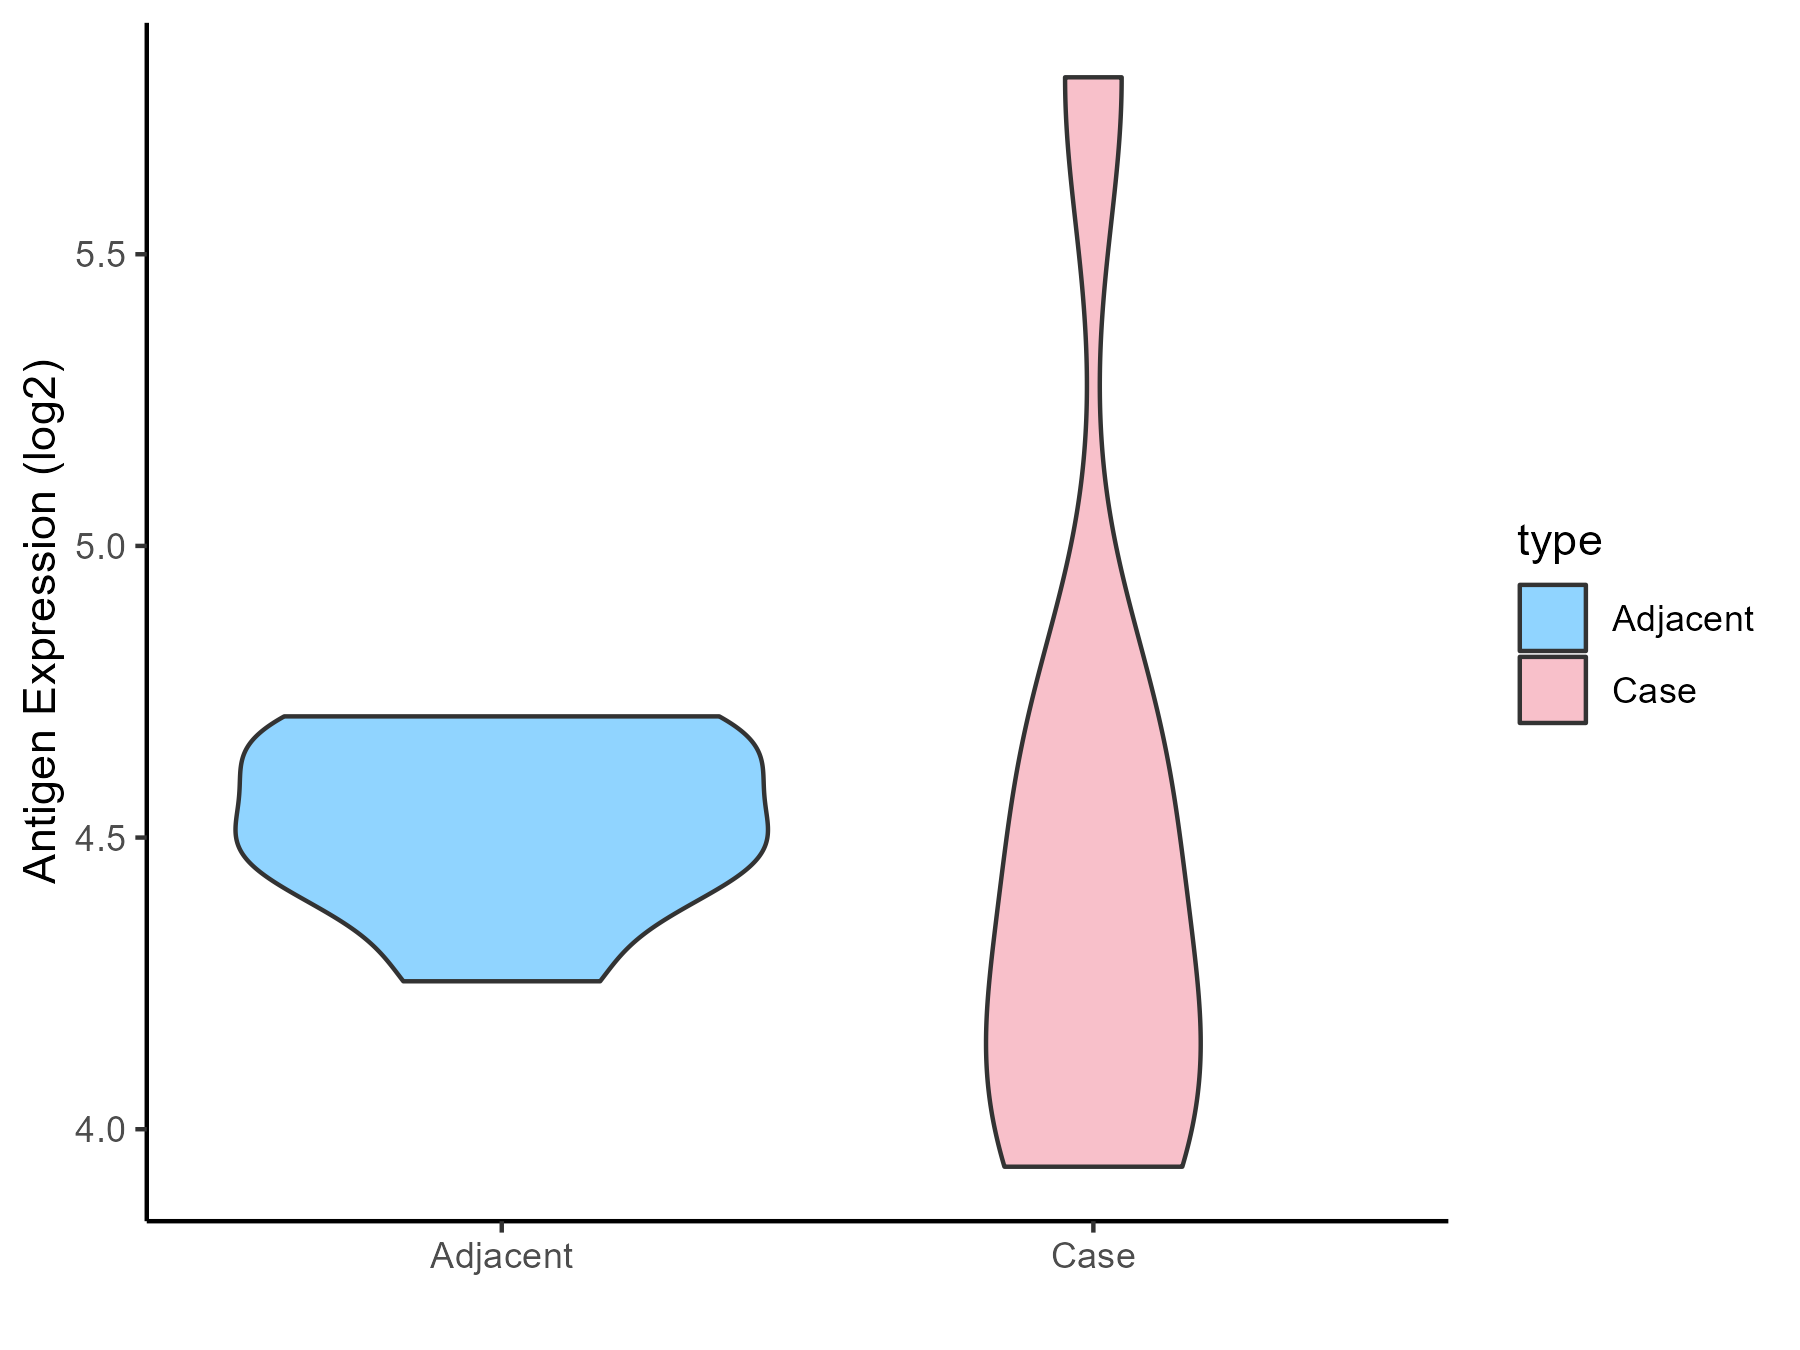
| The Studied Tissue | Spinal cord | |
| The Specific Disease | Multiple sclerosis | |
| The Expression Level of Disease Section Compare with the Adjacent Tissue | p-value: 0.912139979; Fold-change: -0.200904023; Z-score: -1.259458973 | |
| Disease-specific Antigen Abundances |
|
Click to View the Clearer Original Diagram |
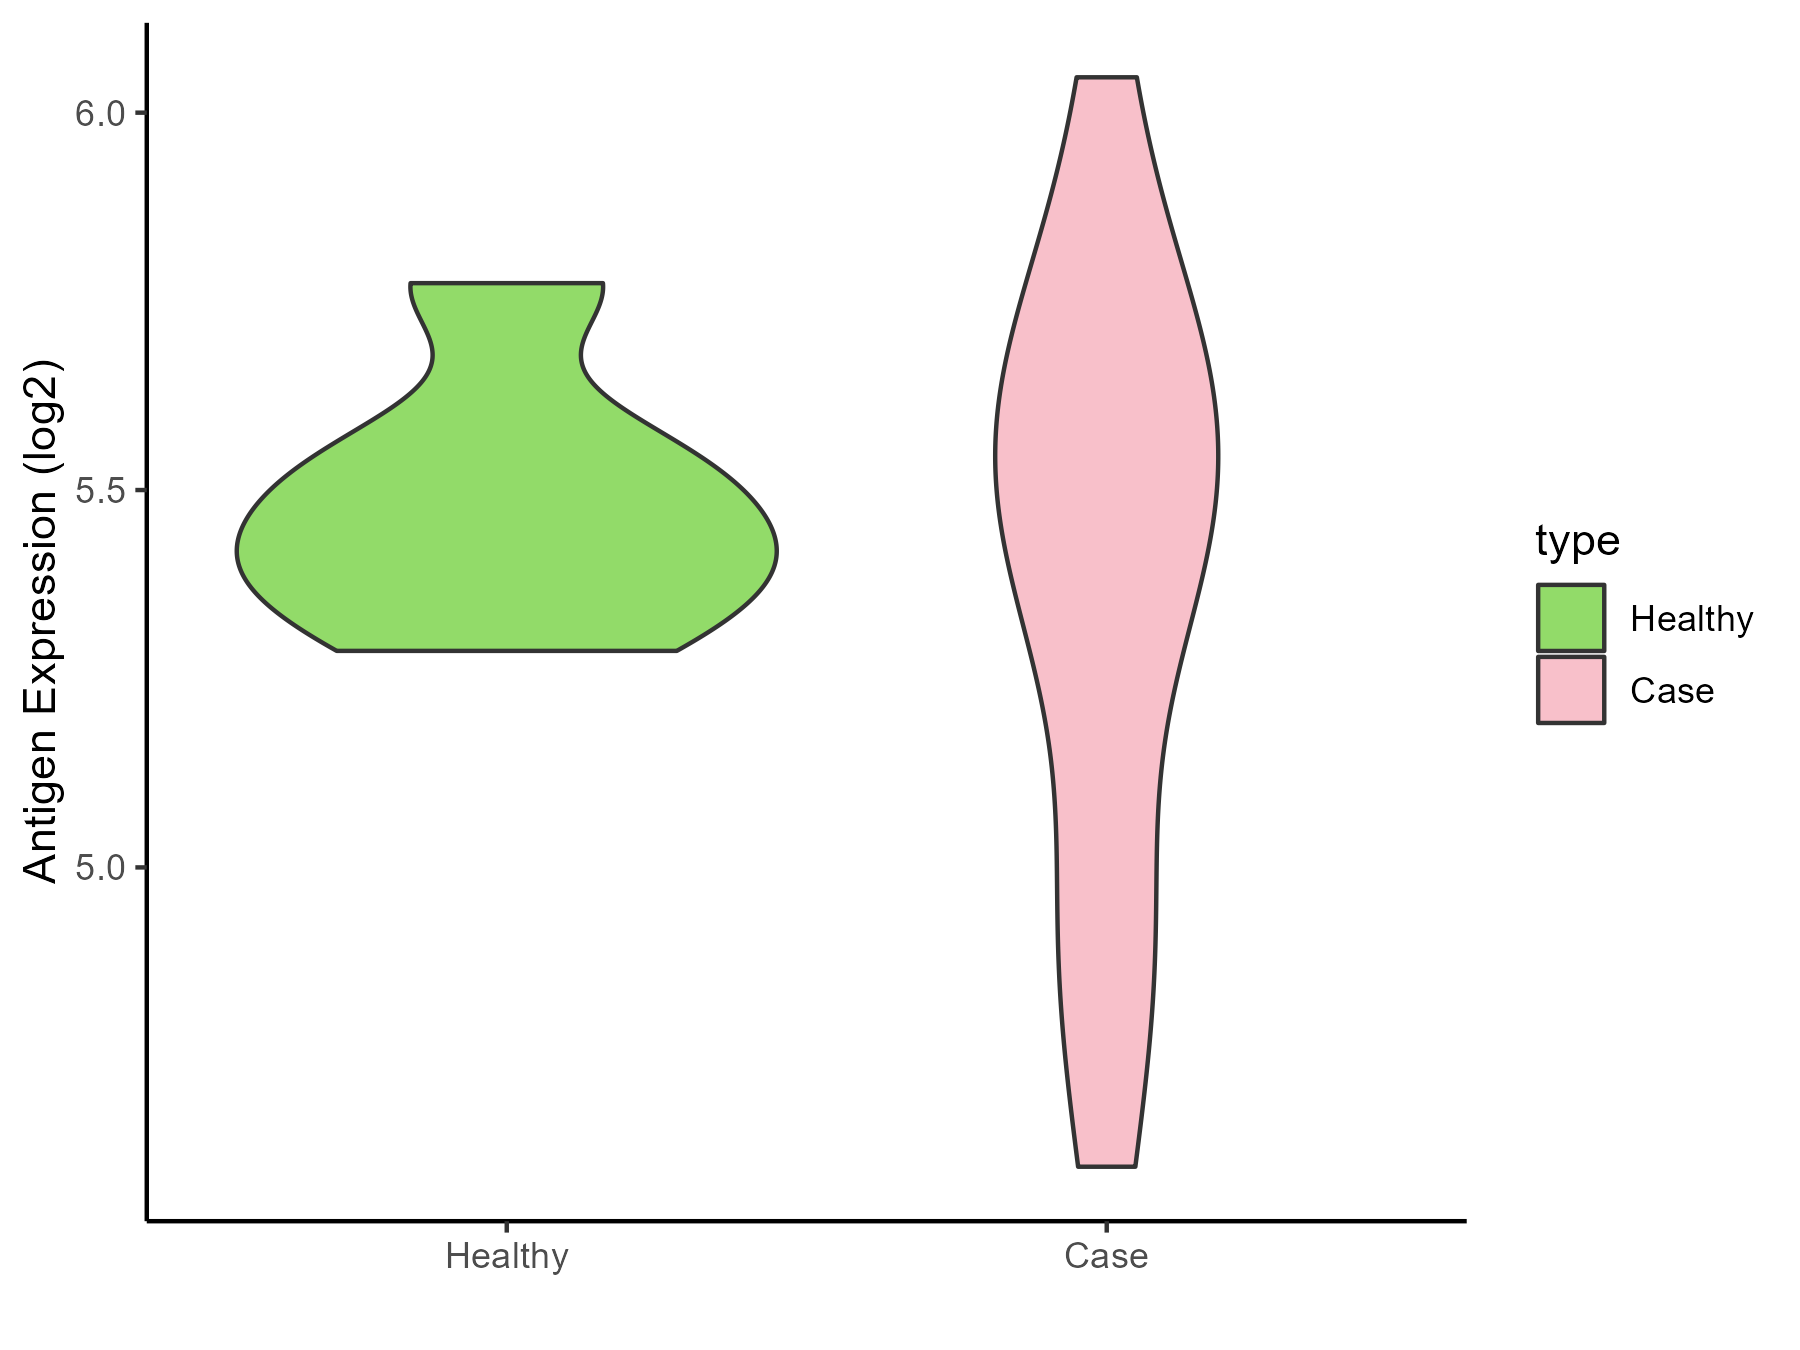
| The Studied Tissue | Plasmacytoid dendritic cells | |
| The Specific Disease | Multiple sclerosis | |
| The Expression Level of Disease Section Compare with the Healthy Individual Tissue | p-value: 0.456928803; Fold-change: 0.067849371; Z-score: 0.396562189 | |
| Disease-specific Antigen Abundances |
|
Click to View the Clearer Original Diagram |
| Differential expression pattern of antigen in diseases | ||
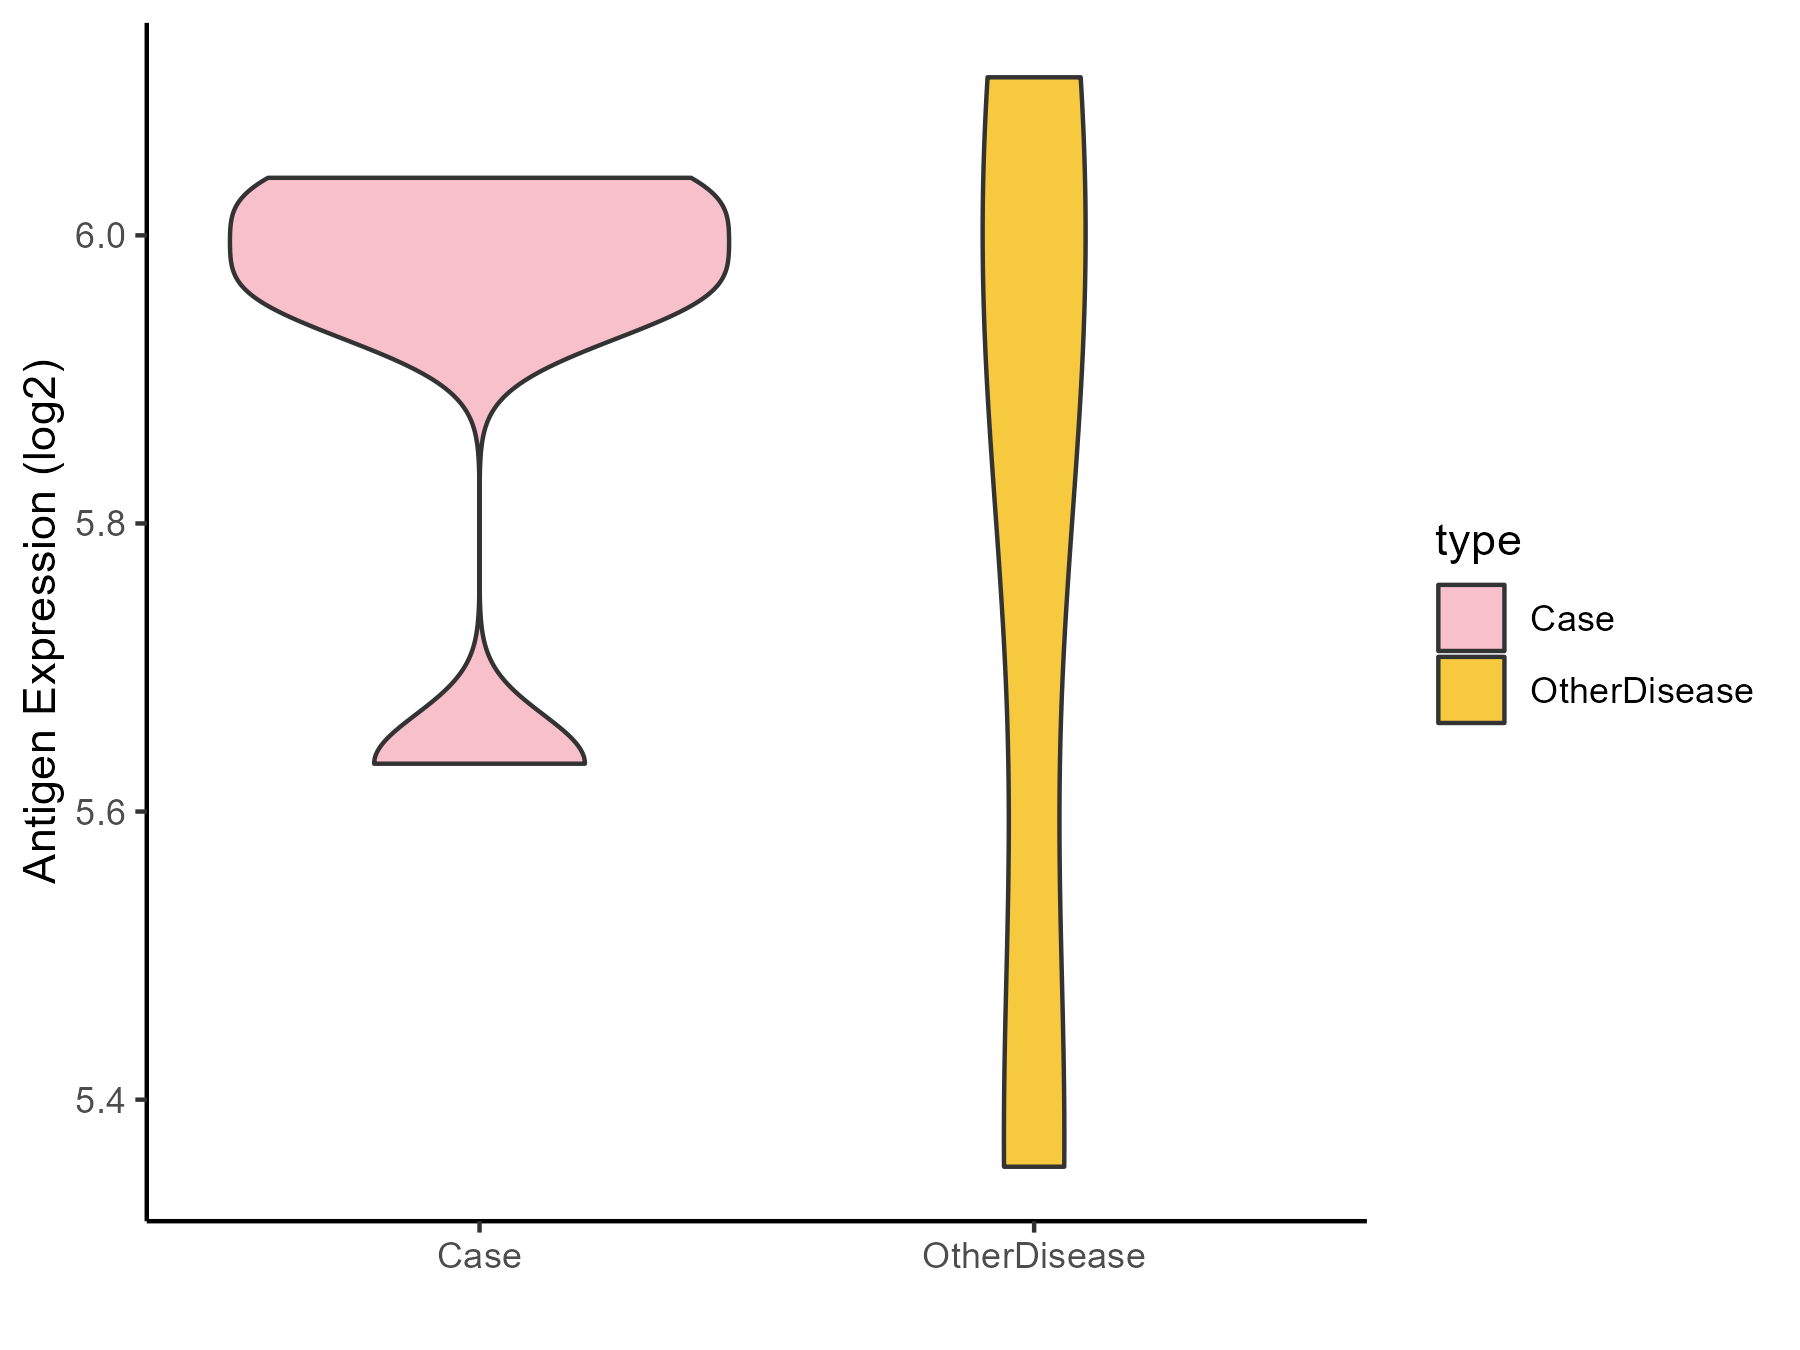
| The Studied Tissue | Peritumoral cortex | |
| The Specific Disease | Epilepsy | |
| The Expression Level of Disease Section Compare with the Other Disease Section | p-value: 0.616768762; Fold-change: 0.070255299; Z-score: 0.179940716 | |
| Disease-specific Antigen Abundances |
|
Click to View the Clearer Original Diagram |
| Differential expression pattern of antigen in diseases | ||
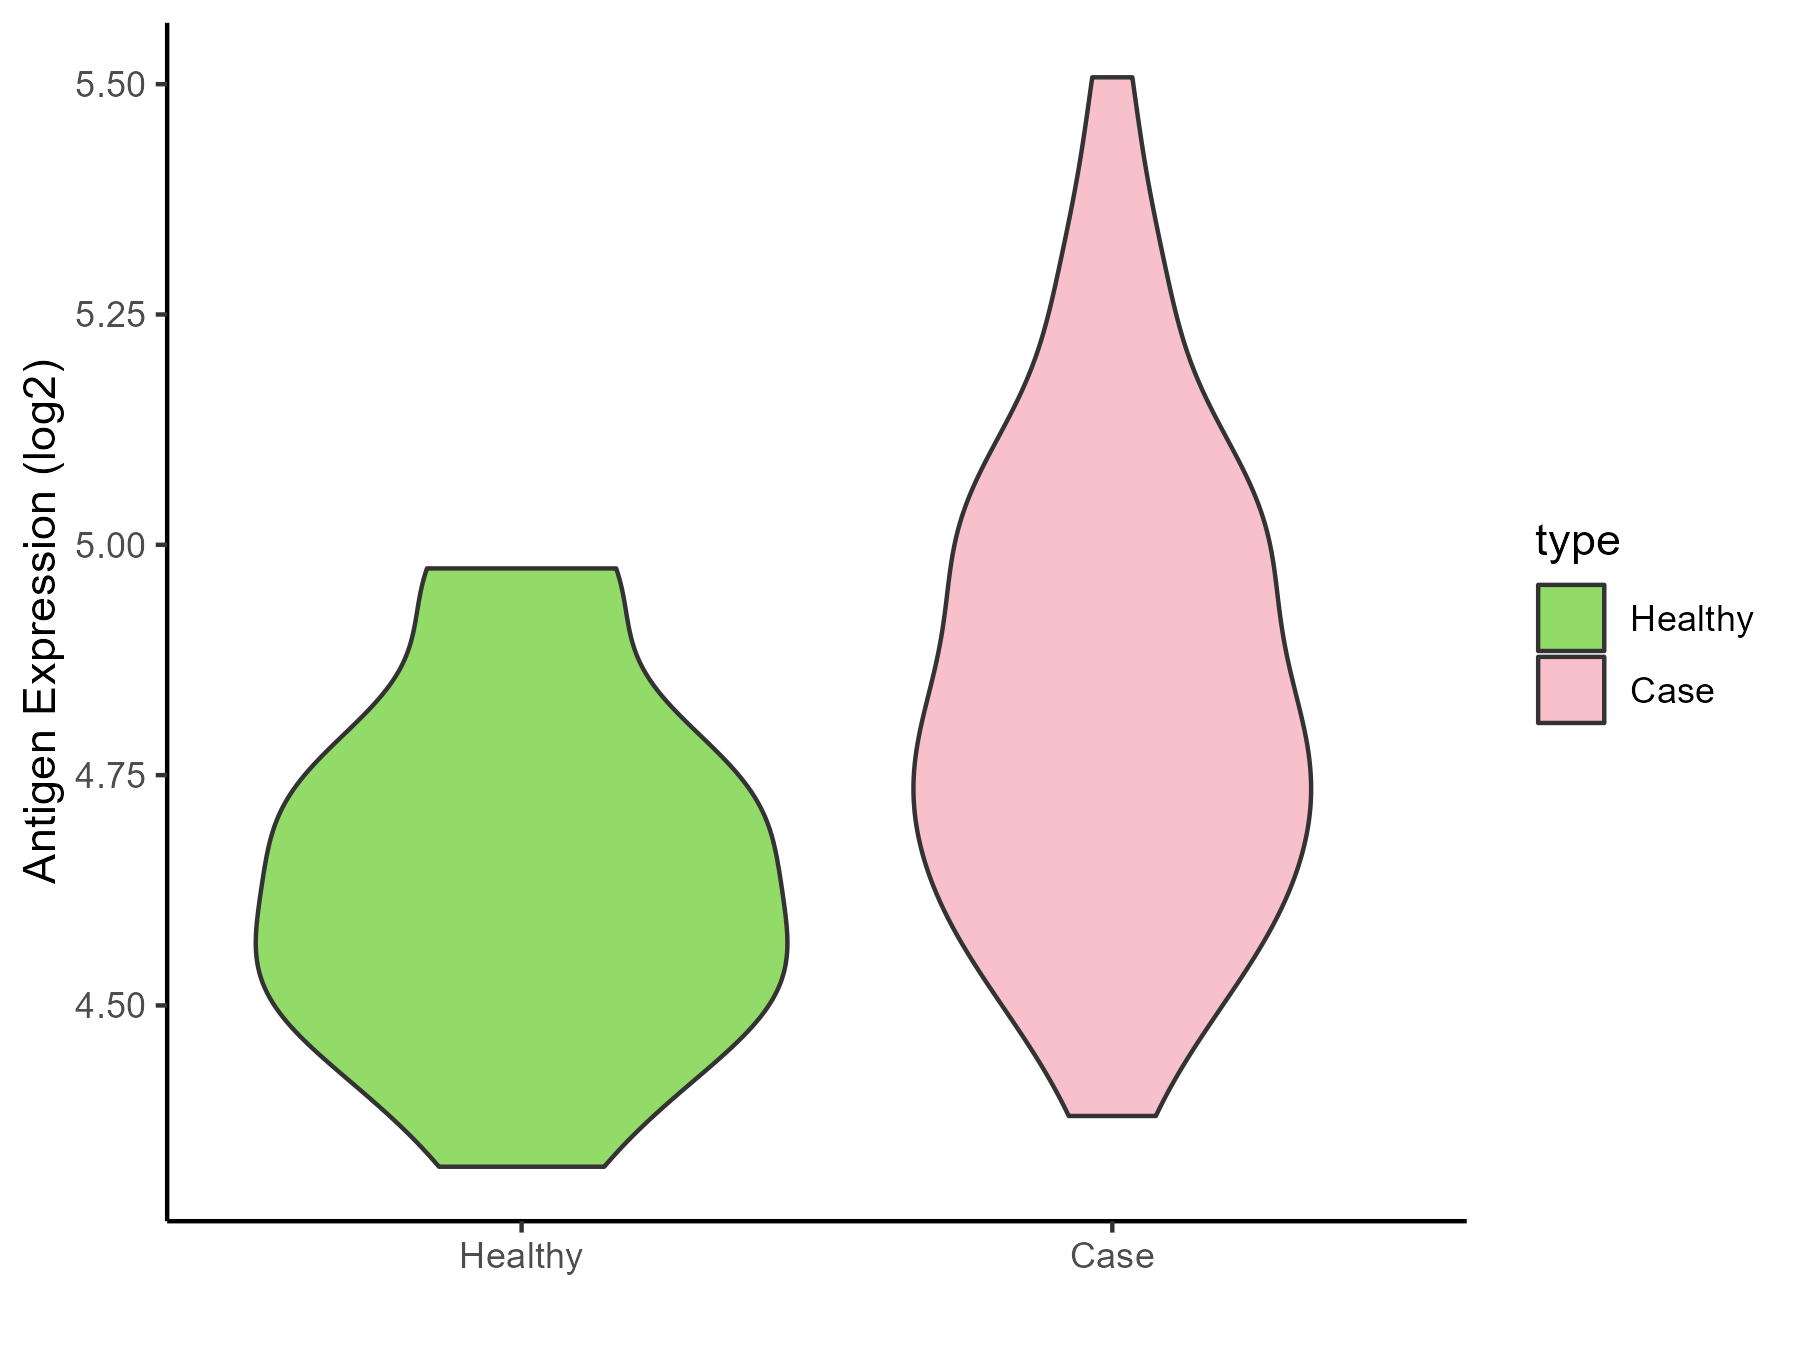
| The Studied Tissue | Whole blood | |
| The Specific Disease | Cardioembolic Stroke | |
| The Expression Level of Disease Section Compare with the Healthy Individual Tissue | p-value: 0.000176476; Fold-change: 0.202021408; Z-score: 1.103376542 | |
| Disease-specific Antigen Abundances |
|
Click to View the Clearer Original Diagram |
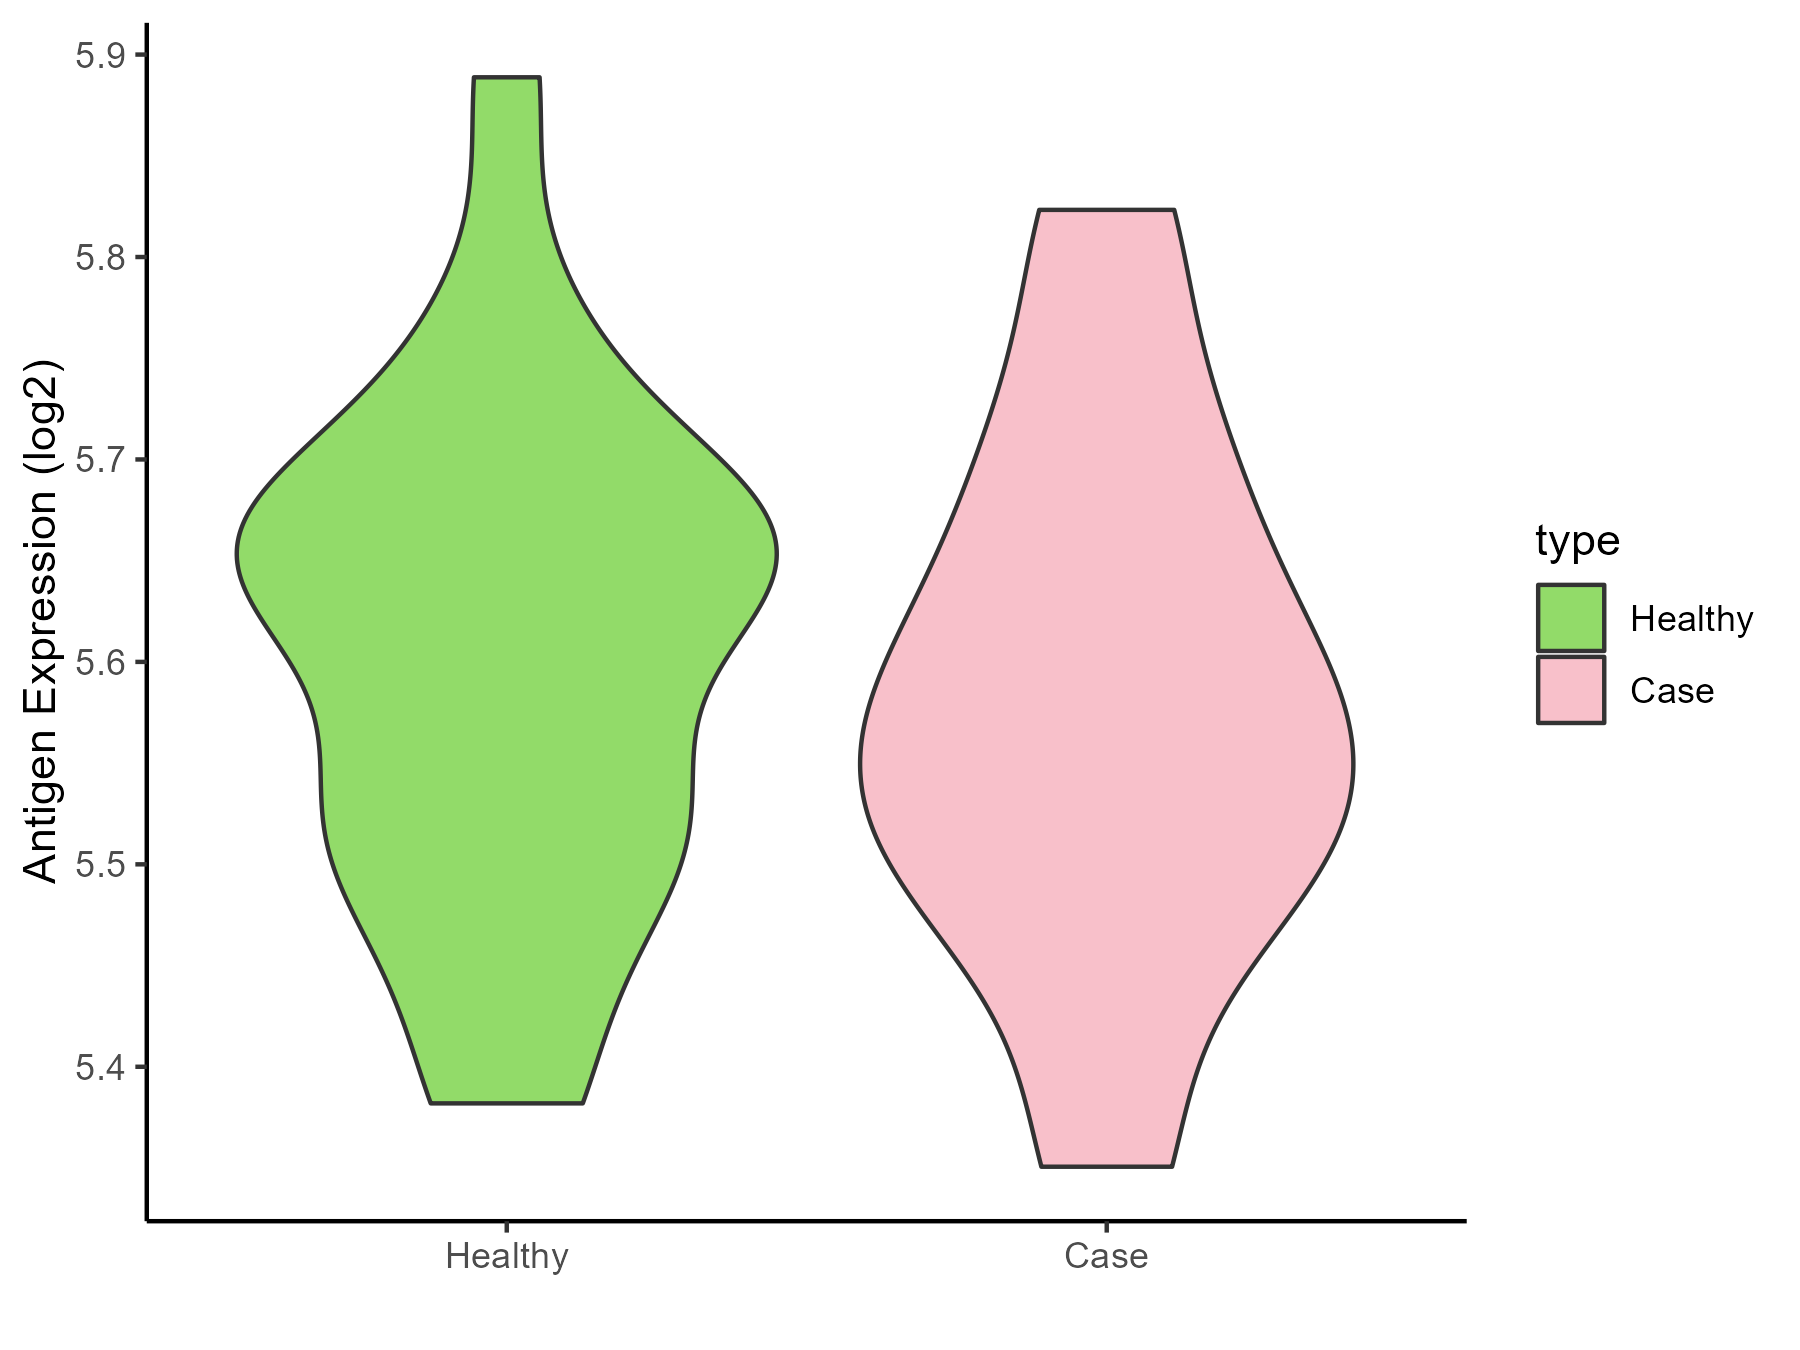
| The Studied Tissue | Peripheral blood | |
| The Specific Disease | Ischemic stroke | |
| The Expression Level of Disease Section Compare with the Healthy Individual Tissue | p-value: 0.561732343; Fold-change: -0.069271564; Z-score: -0.5512351 | |
| Disease-specific Antigen Abundances |
|
Click to View the Clearer Original Diagram |
ICD Disease Classification 1
| Differential expression pattern of antigen in diseases | ||
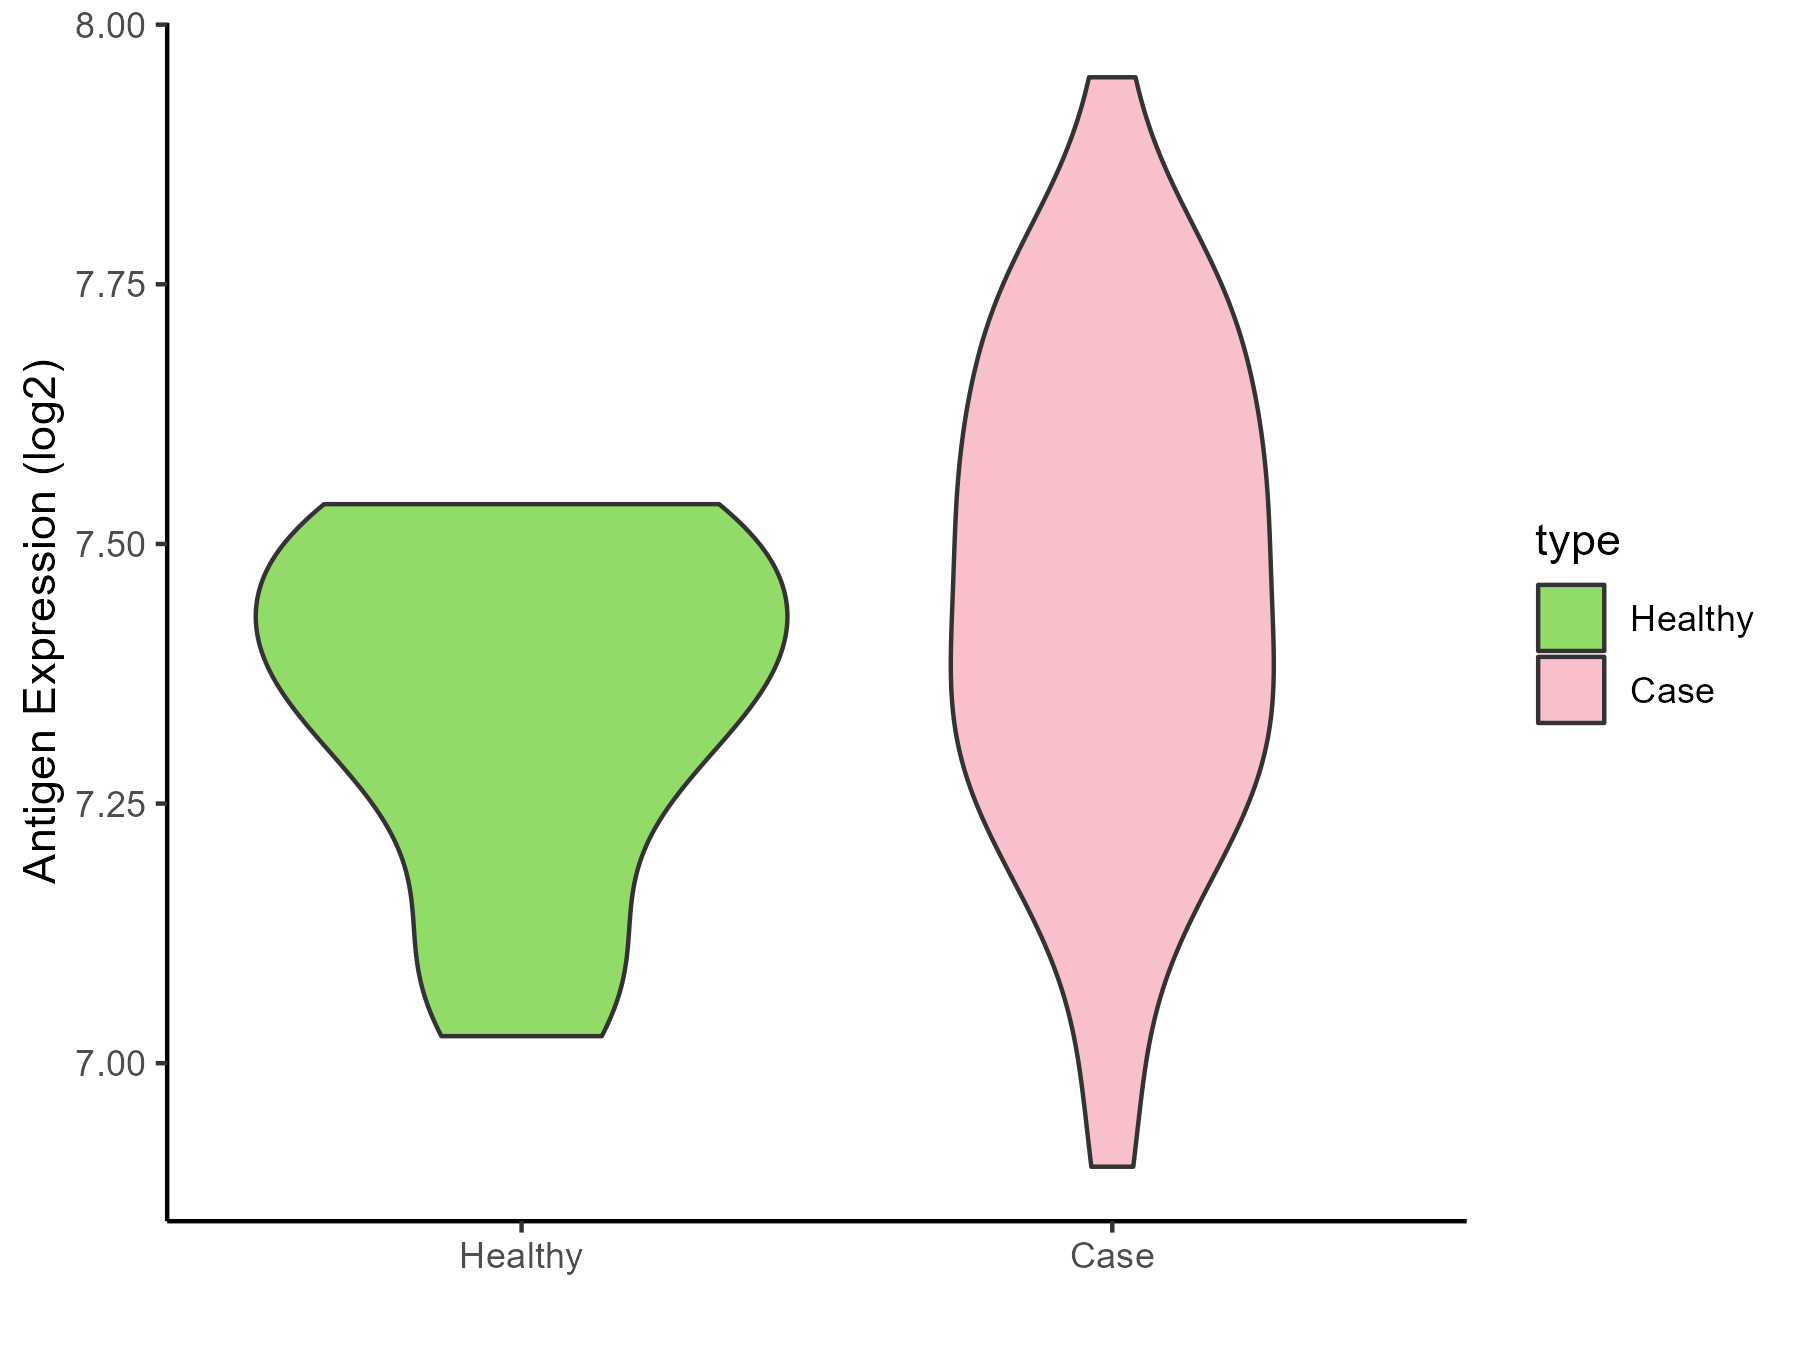
| The Studied Tissue | White matter | |
| The Specific Disease | HIV | |
| The Expression Level of Disease Section Compare with the Healthy Individual Tissue | p-value: 0.058054474; Fold-change: 0.071652924; Z-score: 0.437631509 | |
| Disease-specific Antigen Abundances |
|
Click to View the Clearer Original Diagram |
| Differential expression pattern of antigen in diseases | ||
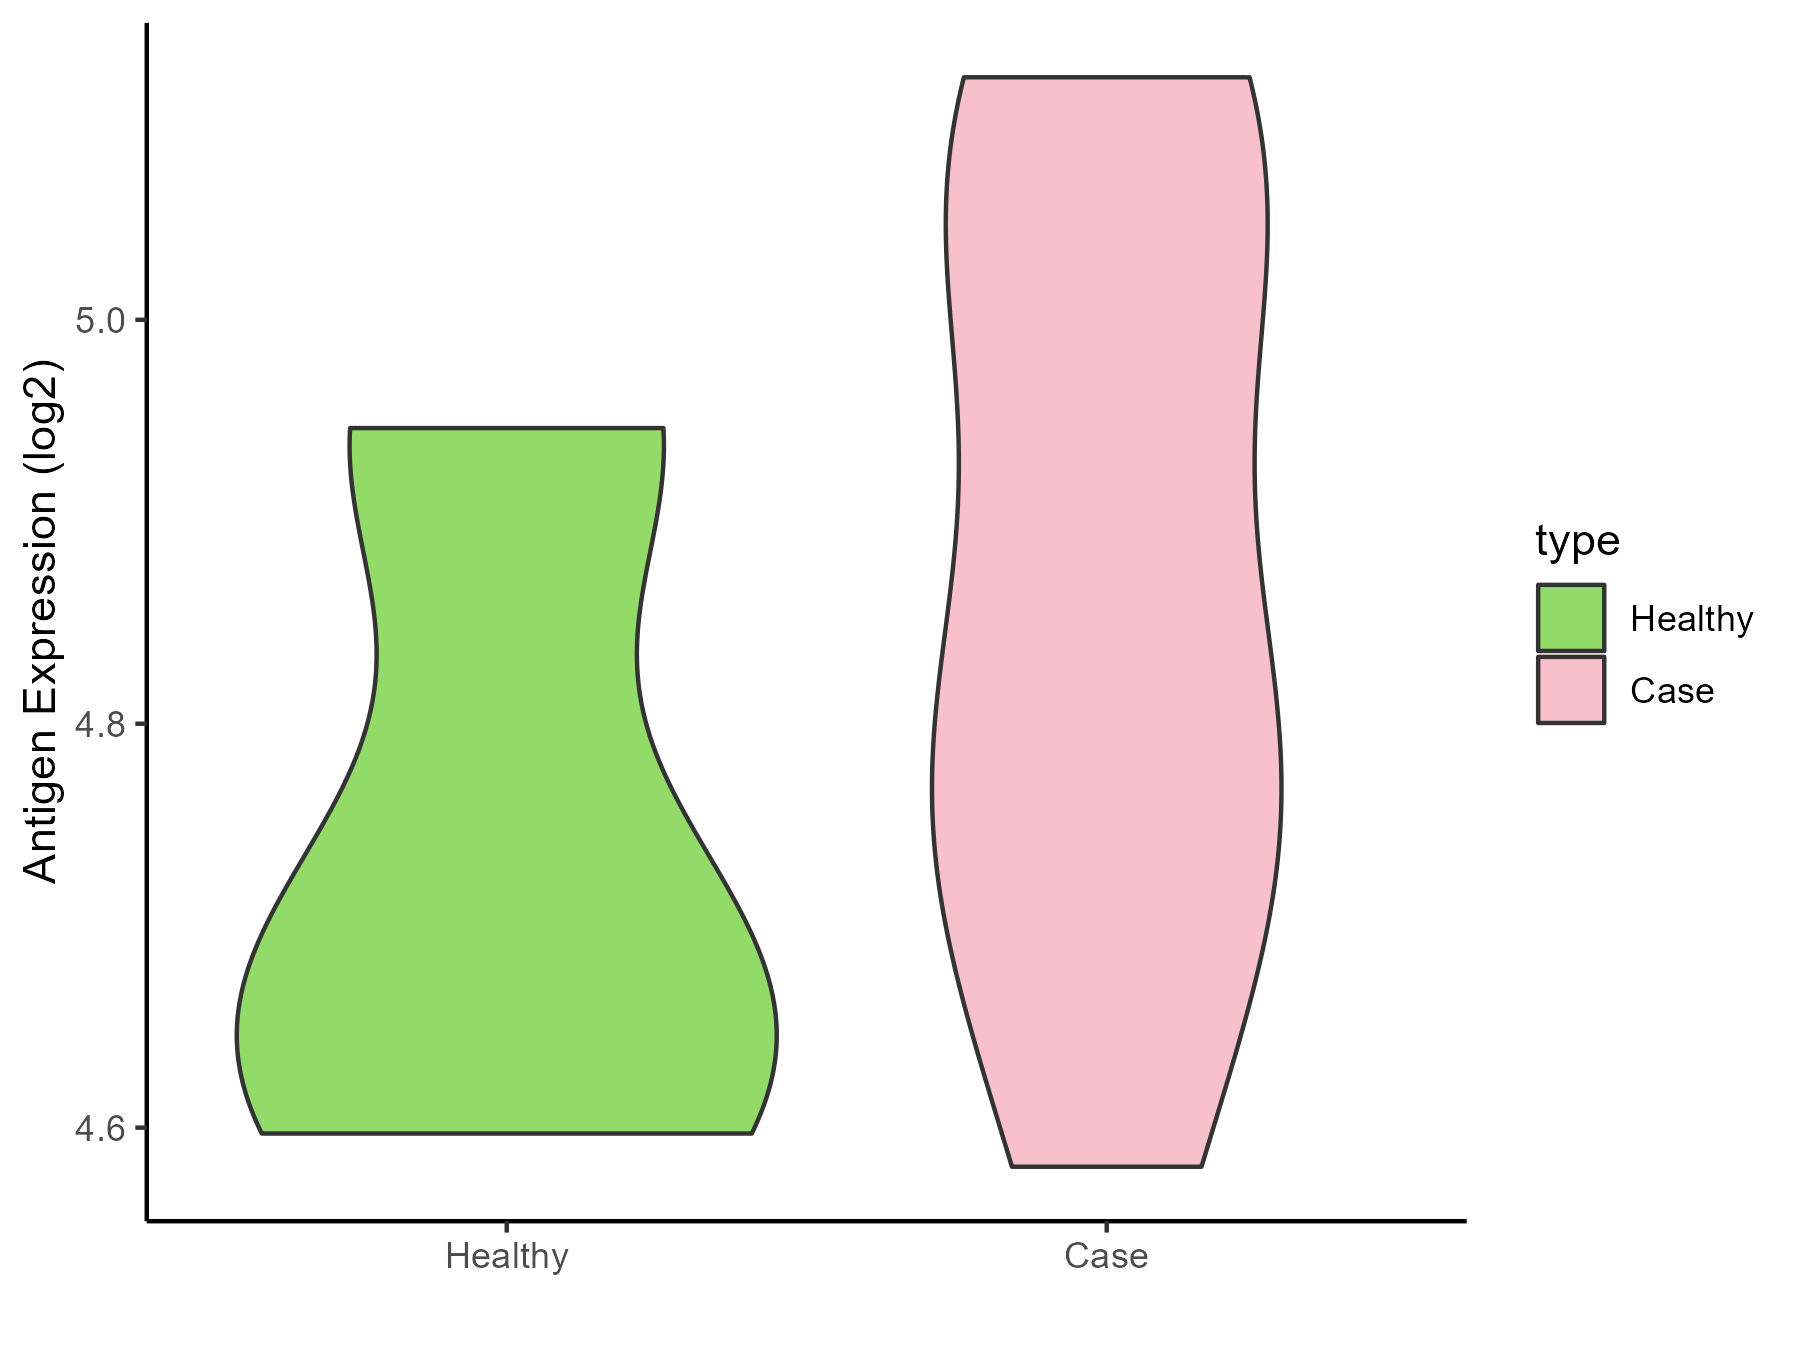
| The Studied Tissue | Whole blood | |
| The Specific Disease | Influenza | |
| The Expression Level of Disease Section Compare with the Healthy Individual Tissue | p-value: 0.347077933; Fold-change: 0.132198241; Z-score: 0.731632427 | |
| Disease-specific Antigen Abundances |
|
Click to View the Clearer Original Diagram |
| Differential expression pattern of antigen in diseases | ||
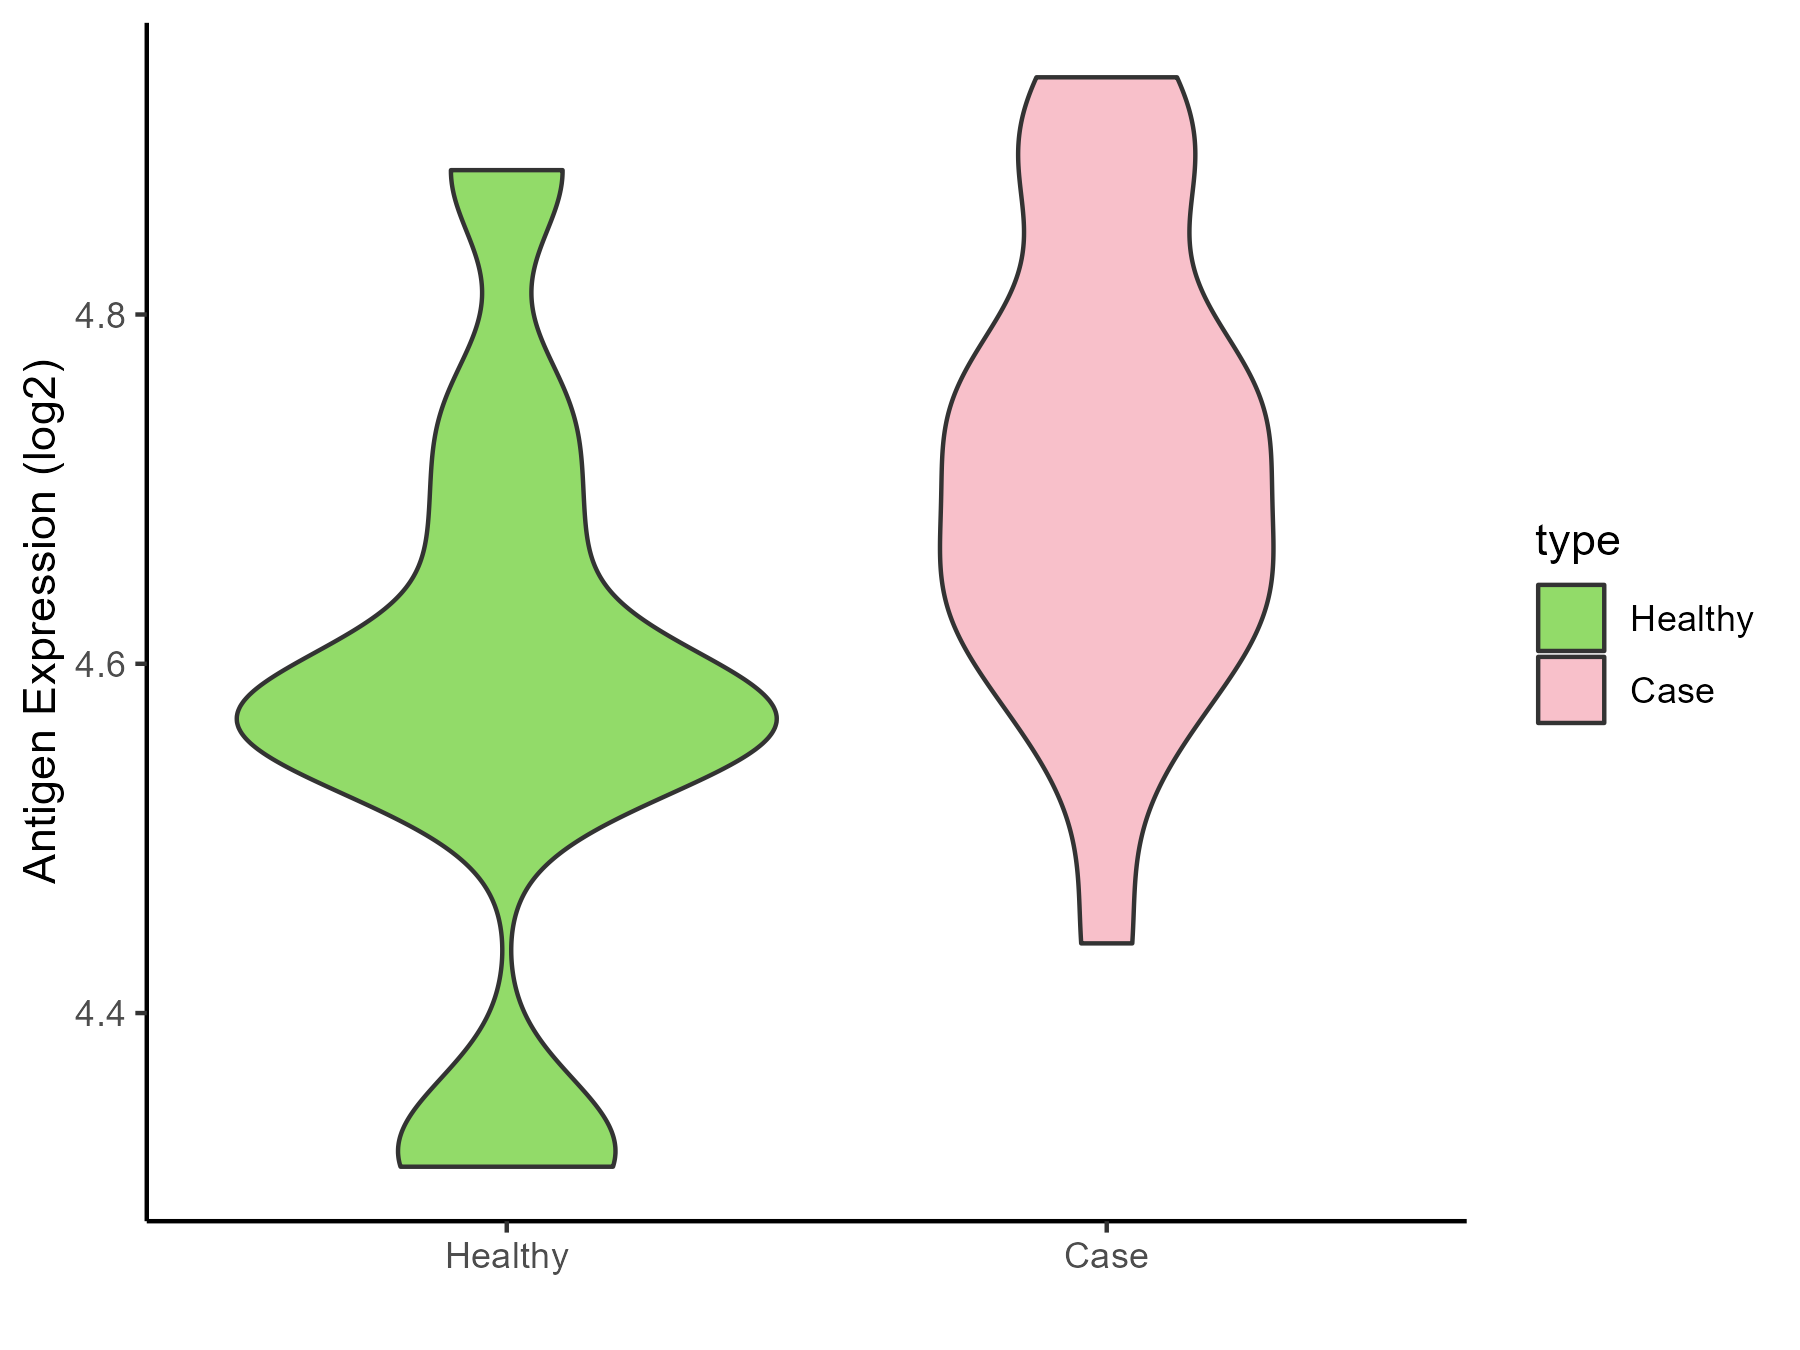
| The Studied Tissue | Whole blood | |
| The Specific Disease | Chronic hepatitis C | |
| The Expression Level of Disease Section Compare with the Healthy Individual Tissue | p-value: 0.041838351; Fold-change: 0.150533555; Z-score: 0.883176491 | |
| Disease-specific Antigen Abundances |
|
Click to View the Clearer Original Diagram |
| Differential expression pattern of antigen in diseases | ||
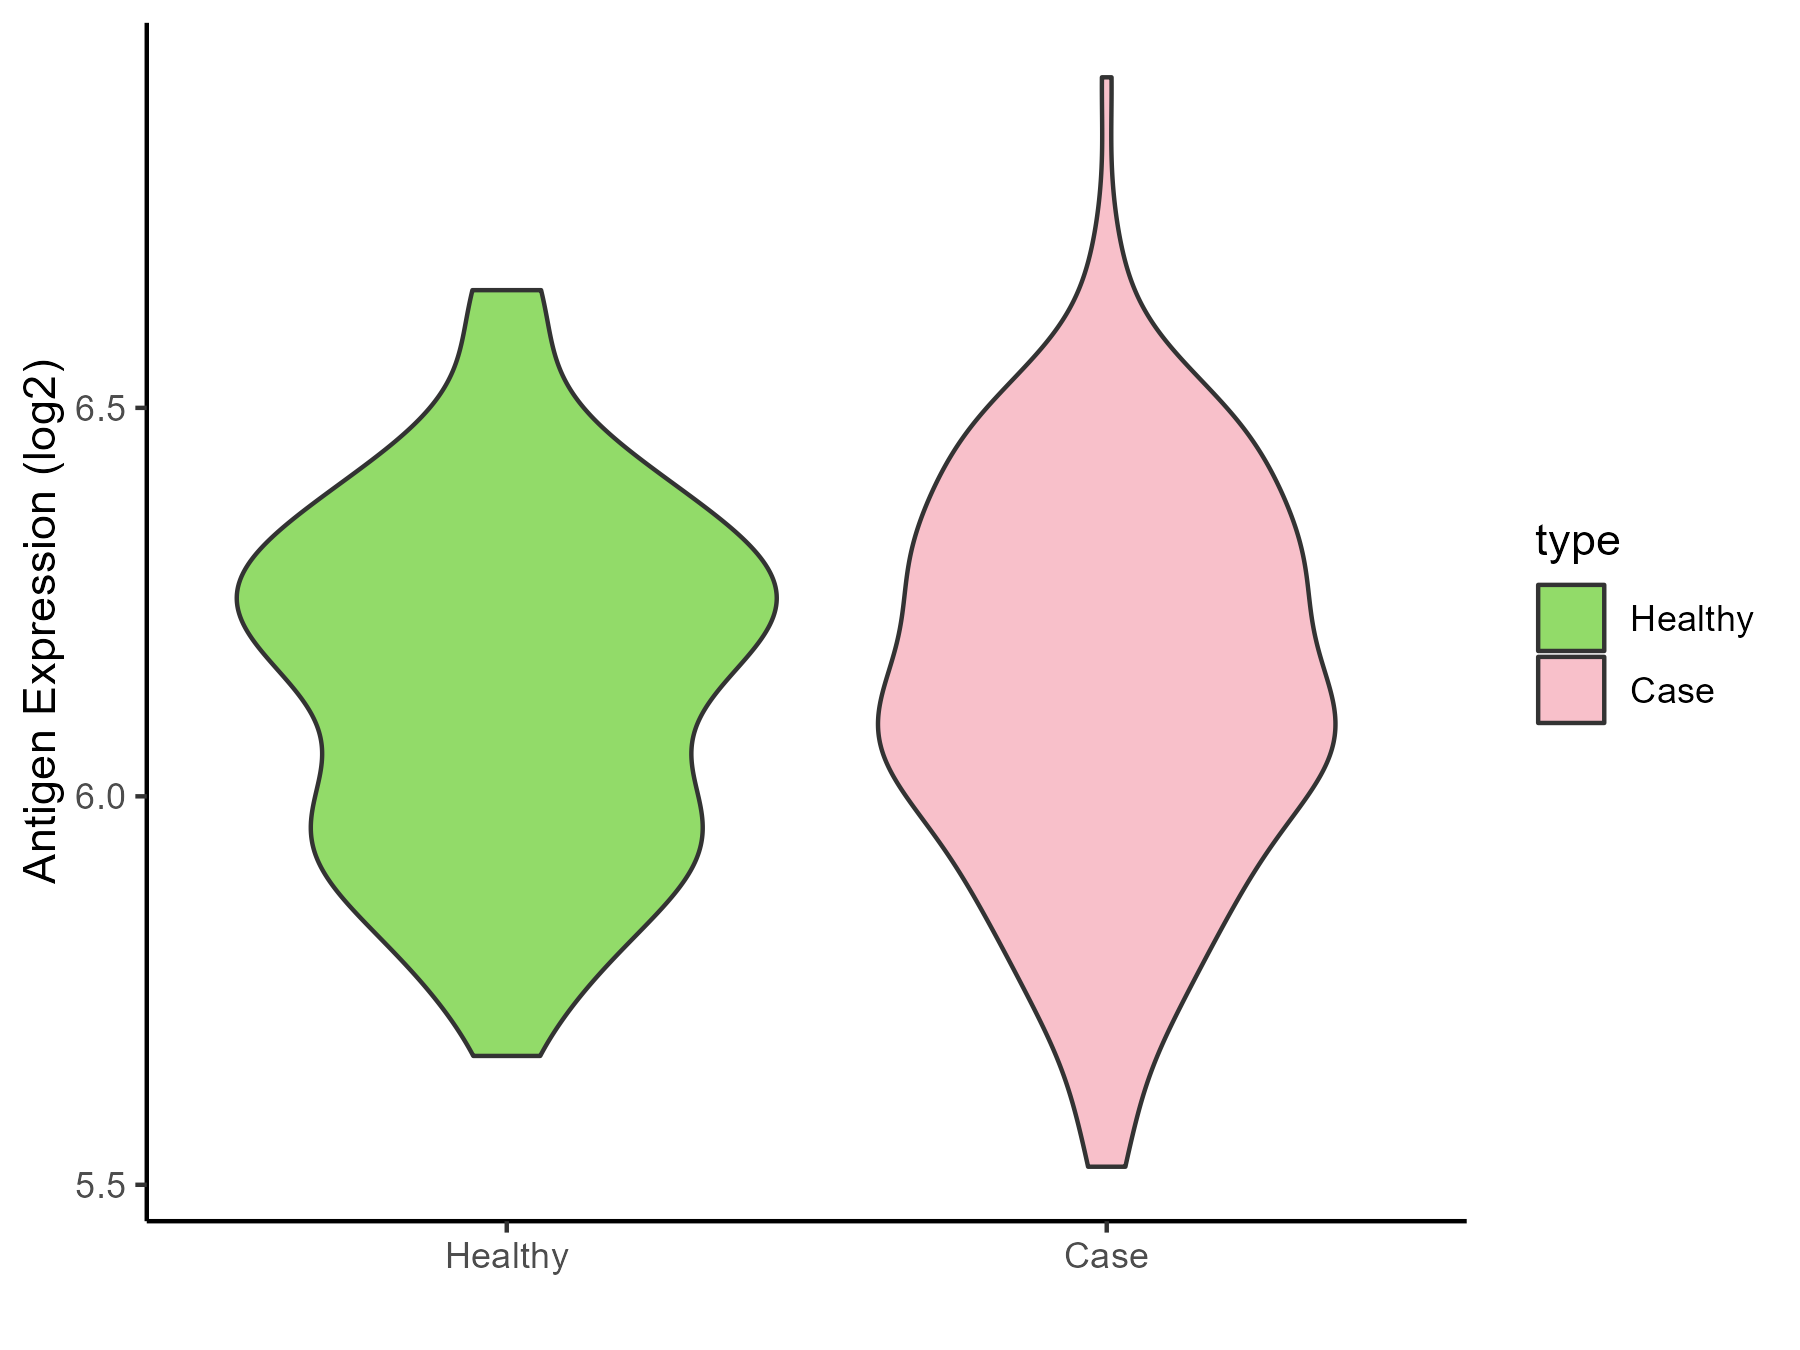
| The Studied Tissue | Whole blood | |
| The Specific Disease | Sepsis | |
| The Expression Level of Disease Section Compare with the Healthy Individual Tissue | p-value: 0.885953124; Fold-change: -0.056893171; Z-score: -0.253810951 | |
| Disease-specific Antigen Abundances |
|
Click to View the Clearer Original Diagram |
| Differential expression pattern of antigen in diseases | ||
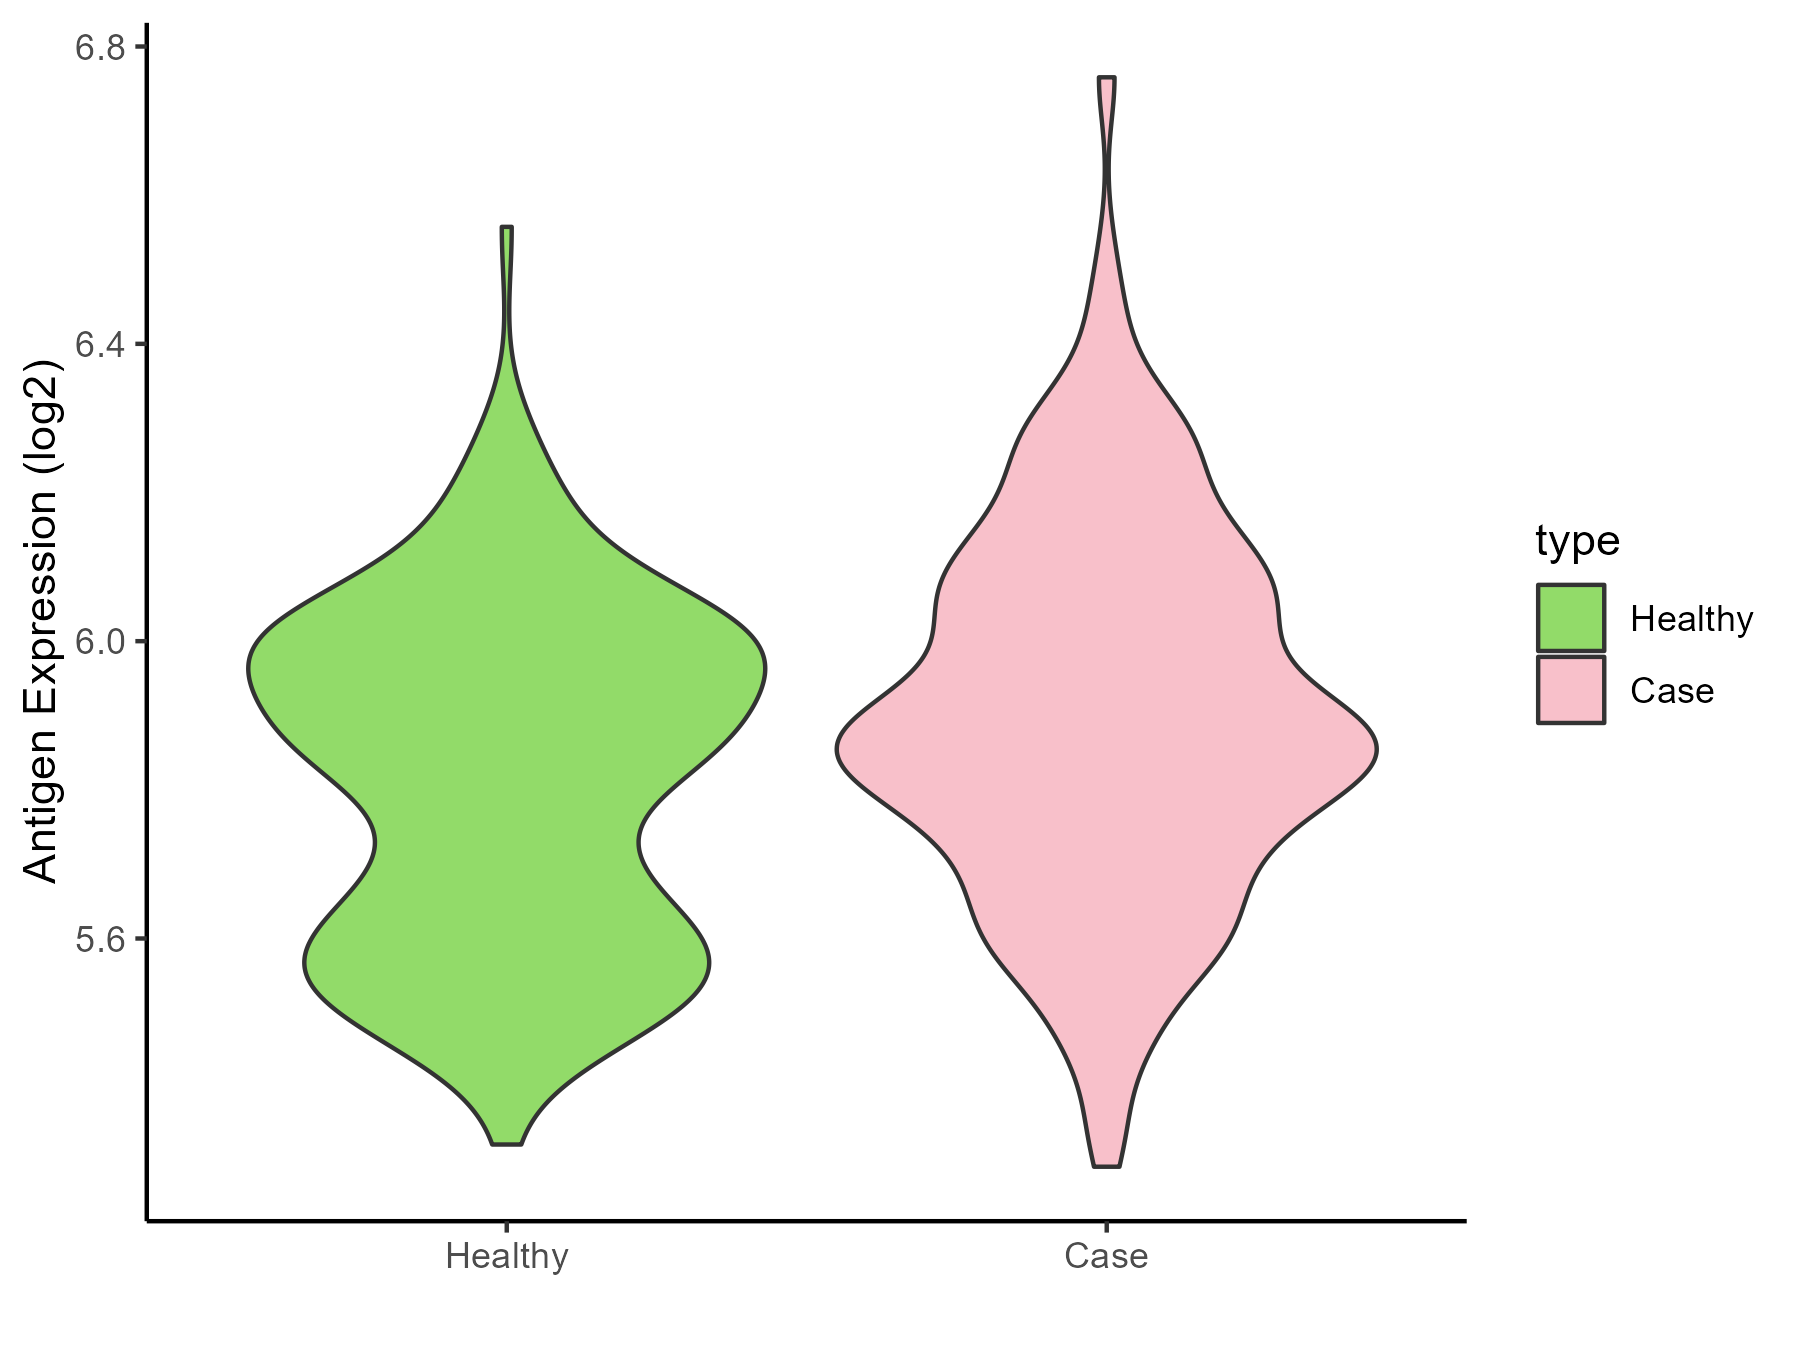
| The Studied Tissue | Whole blood | |
| The Specific Disease | Septic shock | |
| The Expression Level of Disease Section Compare with the Healthy Individual Tissue | p-value: 7.85E-05; Fold-change: 0.022133923; Z-score: 0.097452949 | |
| Disease-specific Antigen Abundances |
|
Click to View the Clearer Original Diagram |
| Differential expression pattern of antigen in diseases | ||
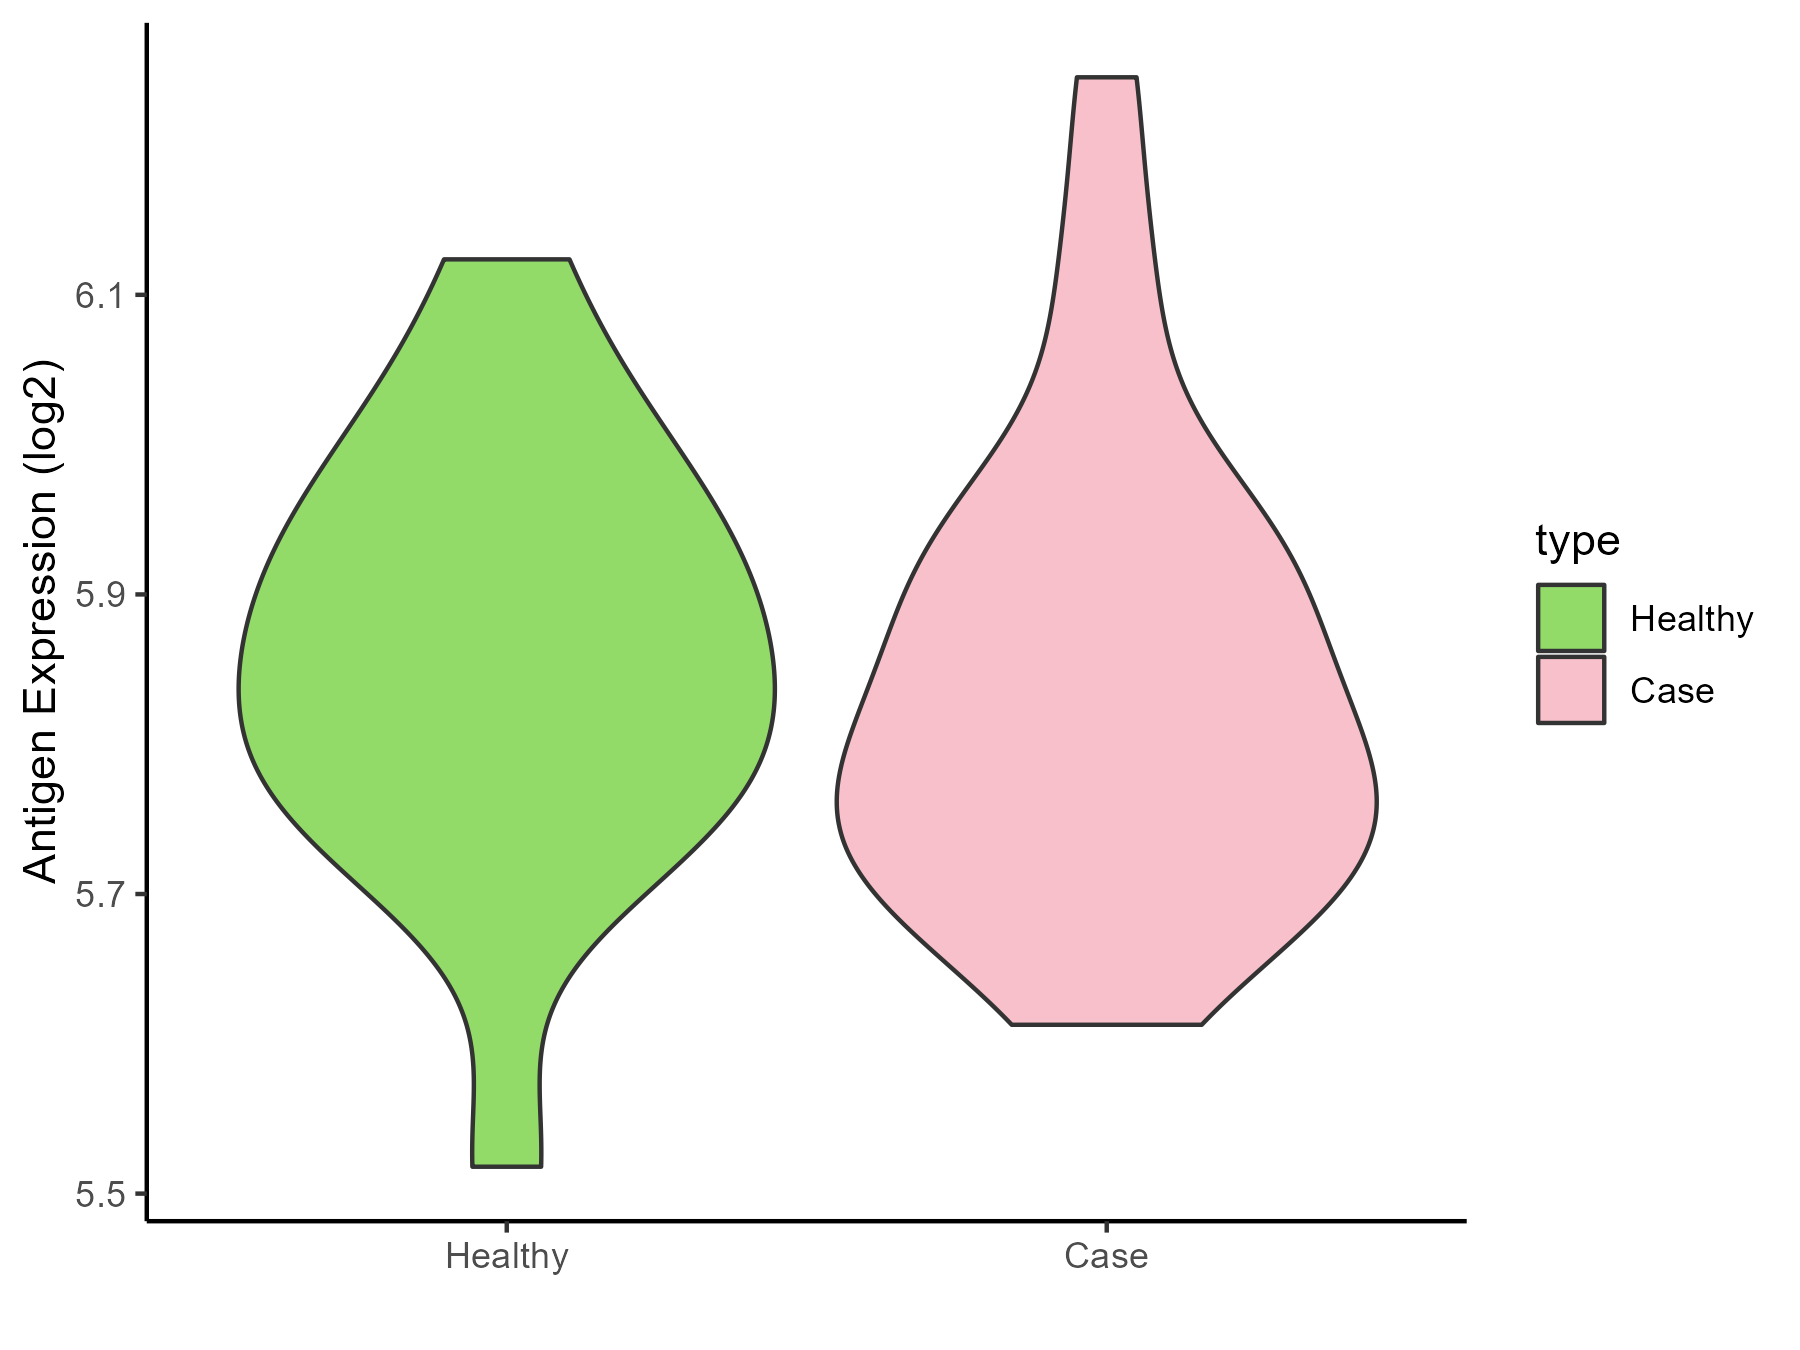
| The Studied Tissue | Peripheral blood | |
| The Specific Disease | Pediatric respiratory syncytial virus infection | |
| The Expression Level of Disease Section Compare with the Healthy Individual Tissue | p-value: 0.723420908; Fold-change: -0.048100336; Z-score: -0.337339505 | |
| Disease-specific Antigen Abundances |
|
Click to View the Clearer Original Diagram |
ICD Disease Classification 11
| Differential expression pattern of antigen in diseases | ||
| The Studied Tissue | Peripheral blood | |
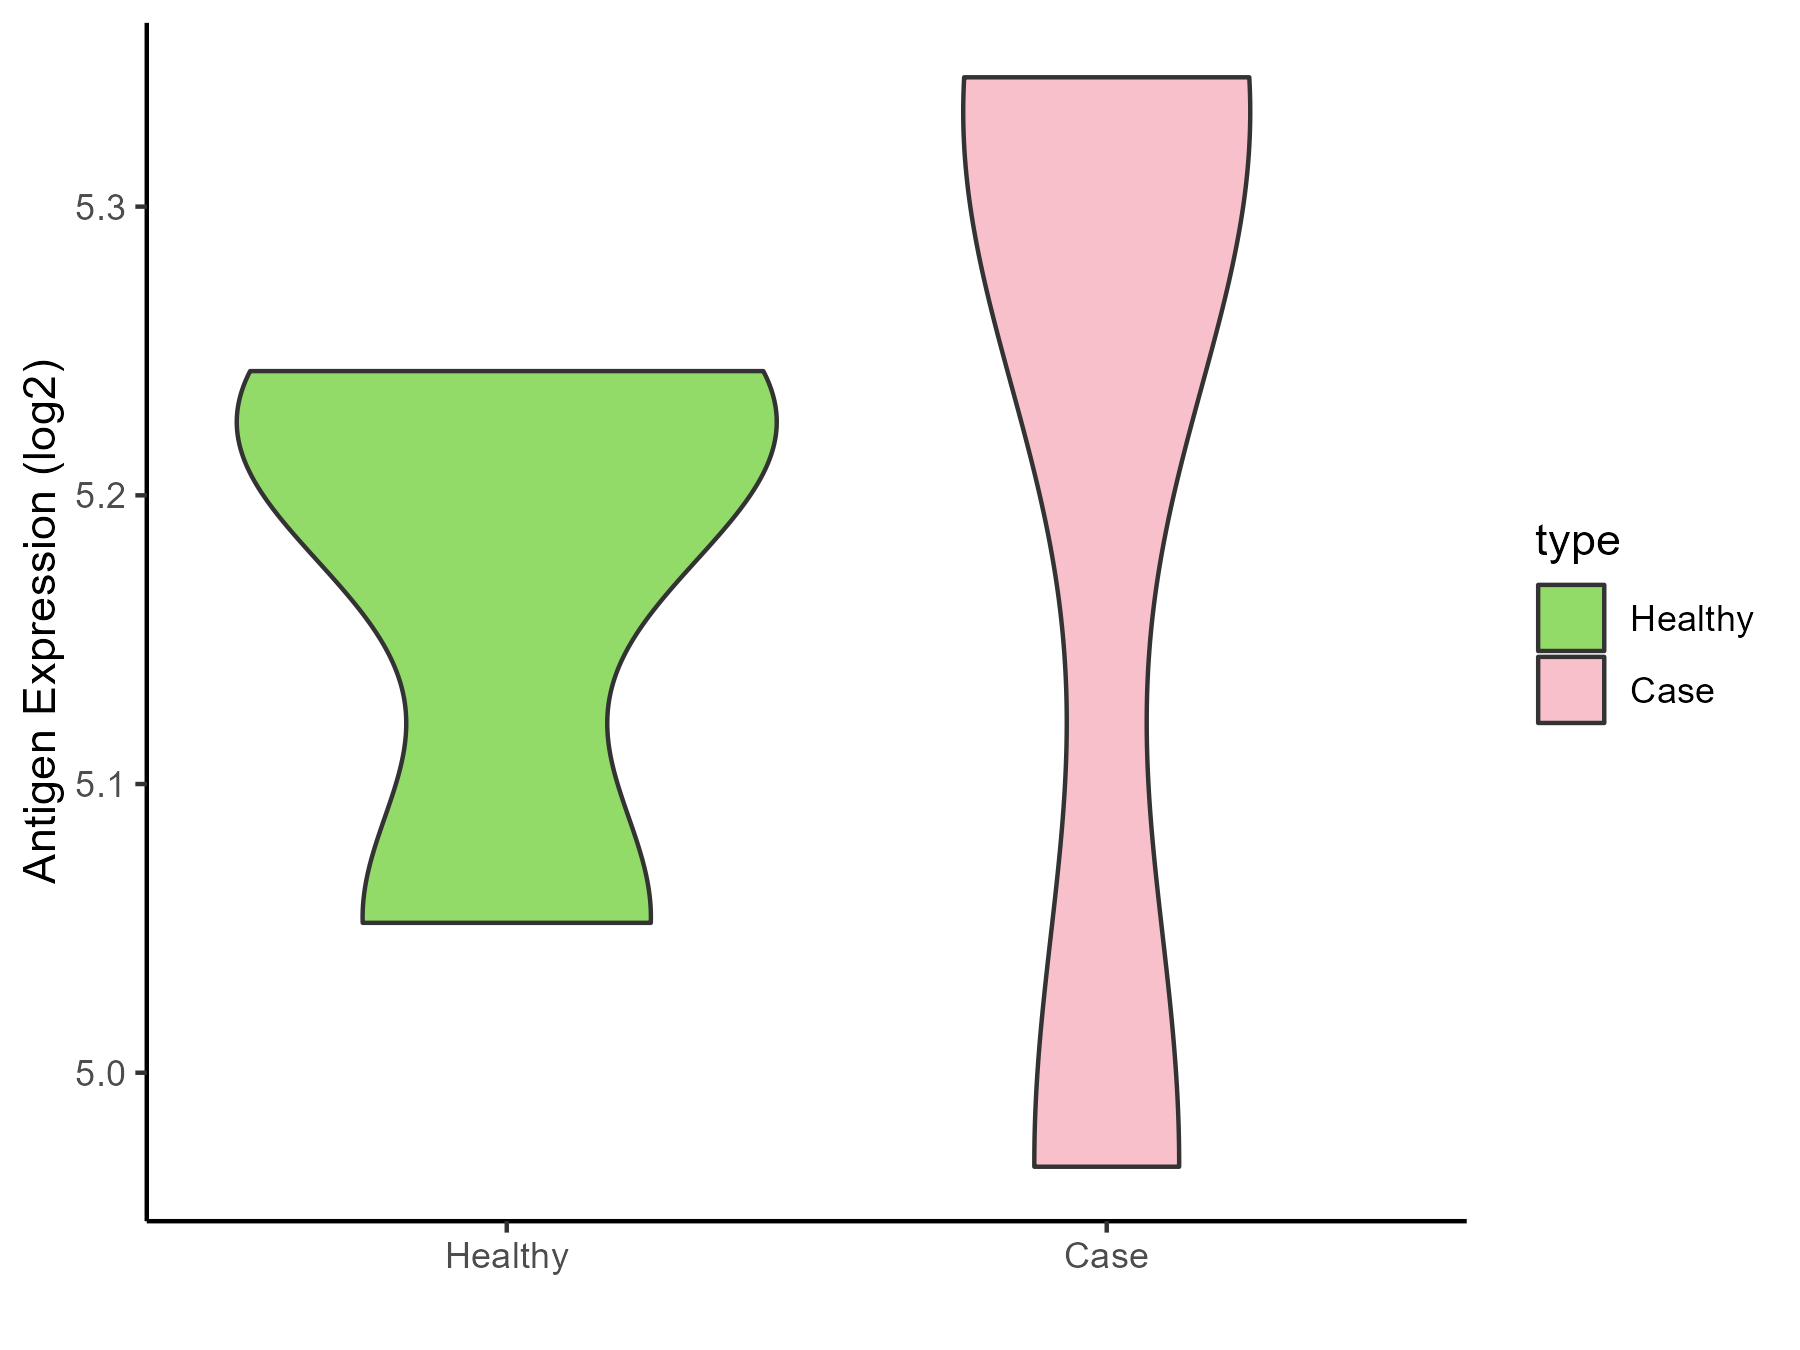
| The Specific Disease | Essential hypertension | |
| The Expression Level of Disease Section Compare with the Healthy Individual Tissue | p-value: 0.770413846; Fold-change: 0.113018345; Z-score: 1.109589639 | |
| Disease-specific Antigen Abundances |
|
Click to View the Clearer Original Diagram |
| Differential expression pattern of antigen in diseases | ||
| The Studied Tissue | Peripheral blood | |
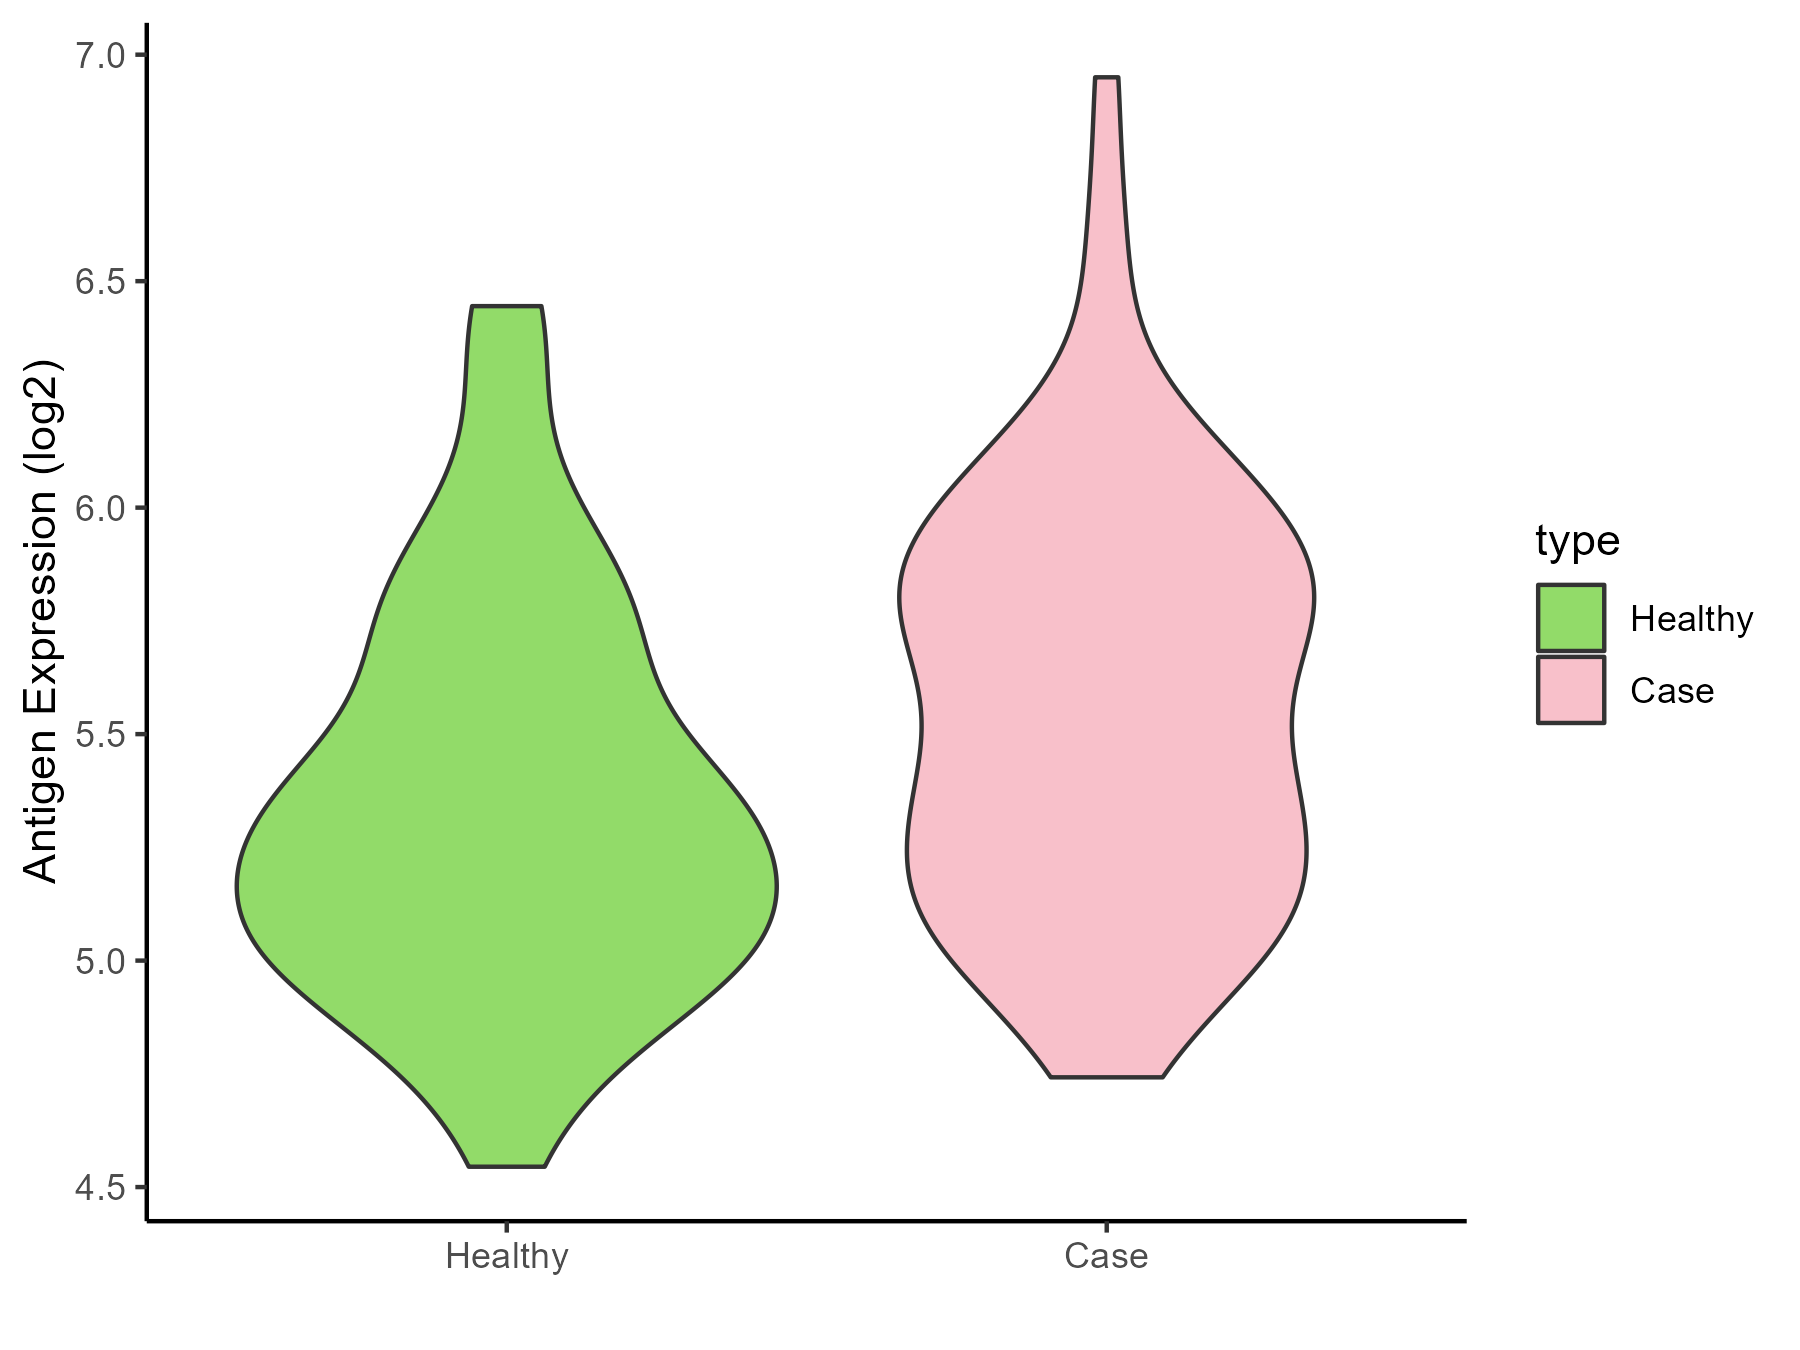
| The Specific Disease | Myocardial infarction | |
| The Expression Level of Disease Section Compare with the Healthy Individual Tissue | p-value: 0.007976371; Fold-change: 0.279136934; Z-score: 0.645226559 | |
| Disease-specific Antigen Abundances |
|
Click to View the Clearer Original Diagram |
| Differential expression pattern of antigen in diseases | ||
| The Studied Tissue | Peripheral blood | |
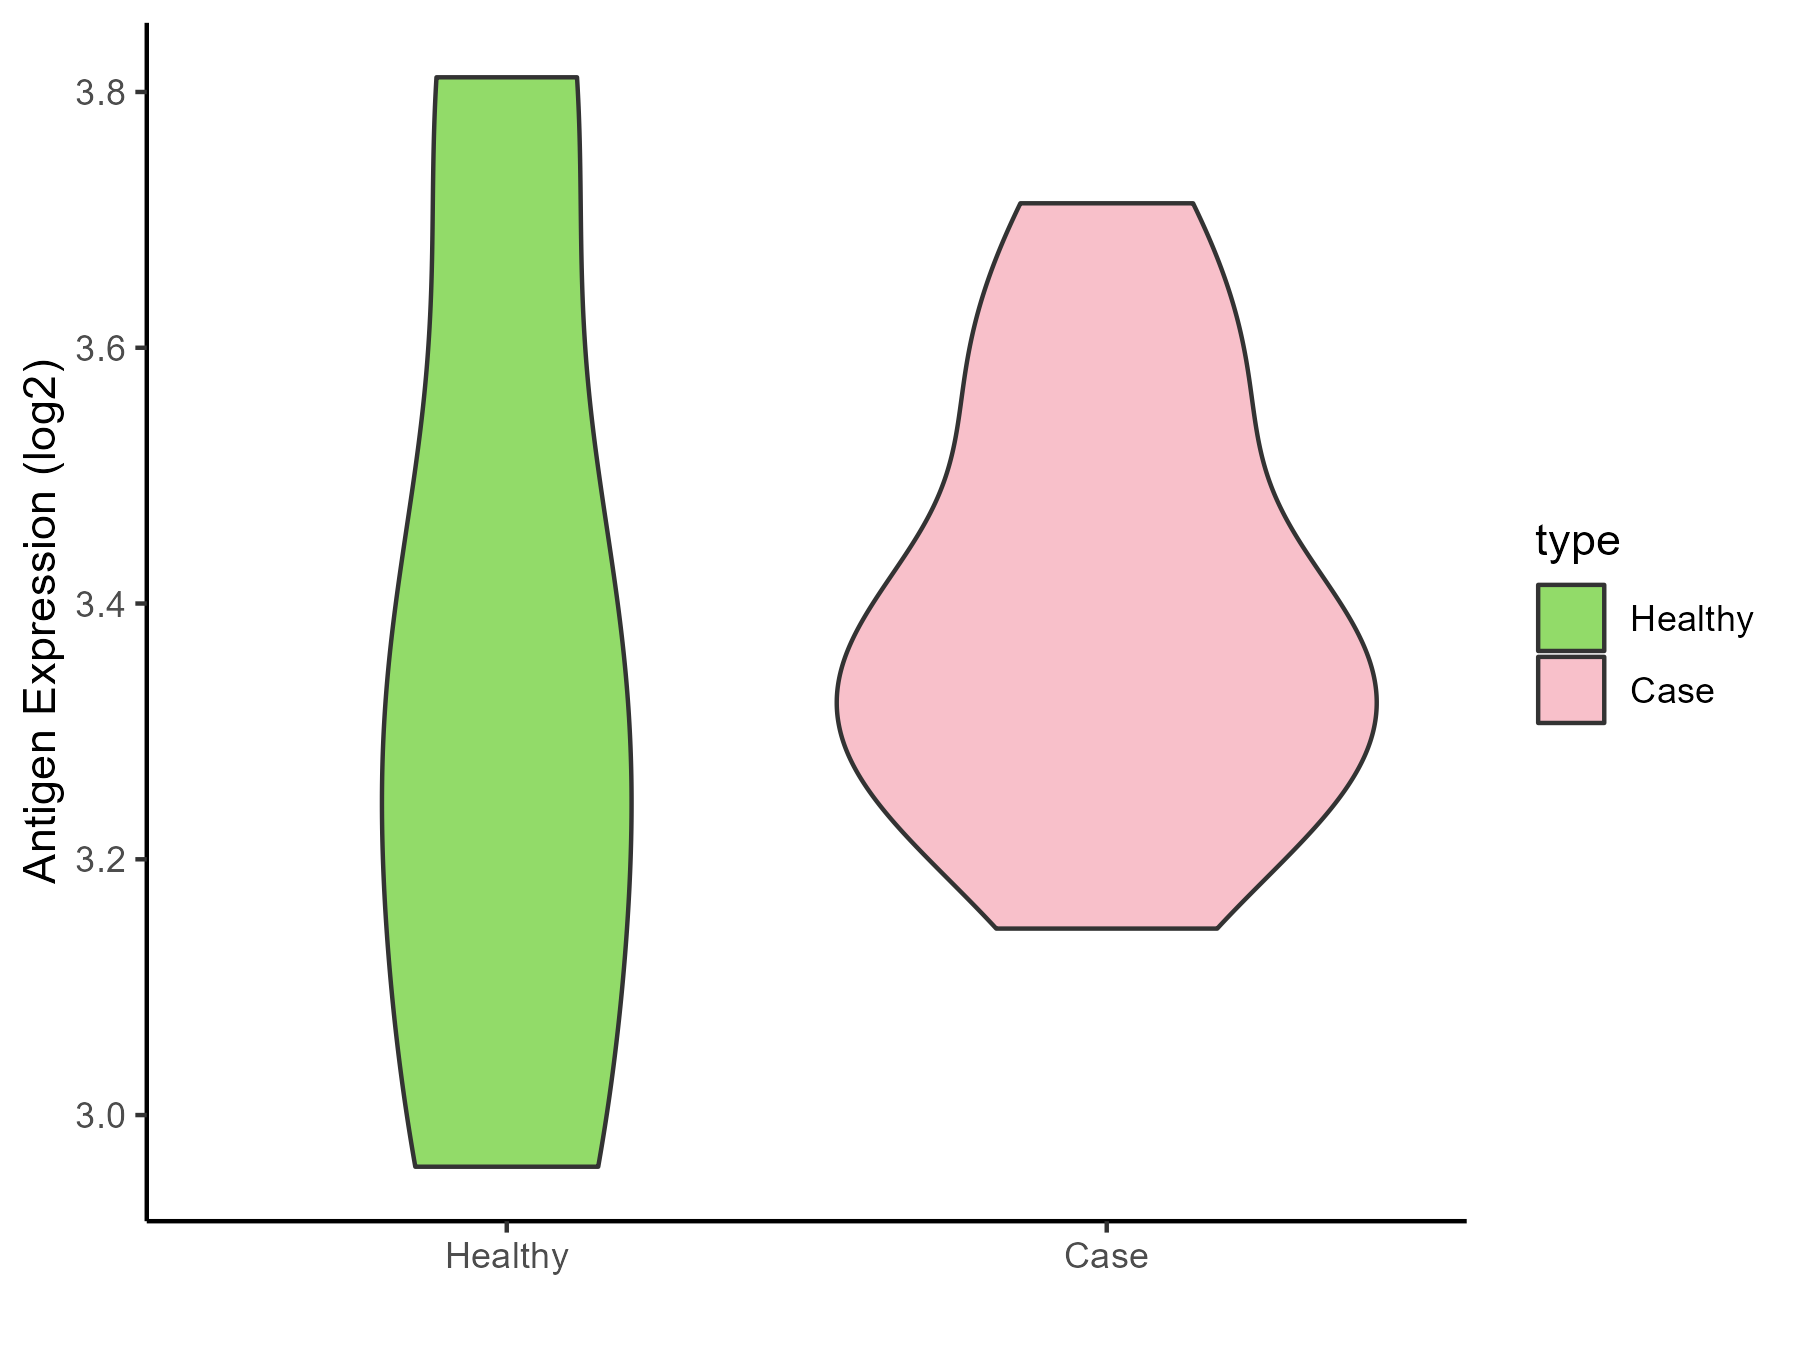
| The Specific Disease | Coronary artery disease | |
| The Expression Level of Disease Section Compare with the Healthy Individual Tissue | p-value: 0.794505155; Fold-change: 0.066087753; Z-score: 0.18381986 | |
| Disease-specific Antigen Abundances |
|
Click to View the Clearer Original Diagram |
| Differential expression pattern of antigen in diseases | ||
| The Studied Tissue | Calcified aortic valve | |
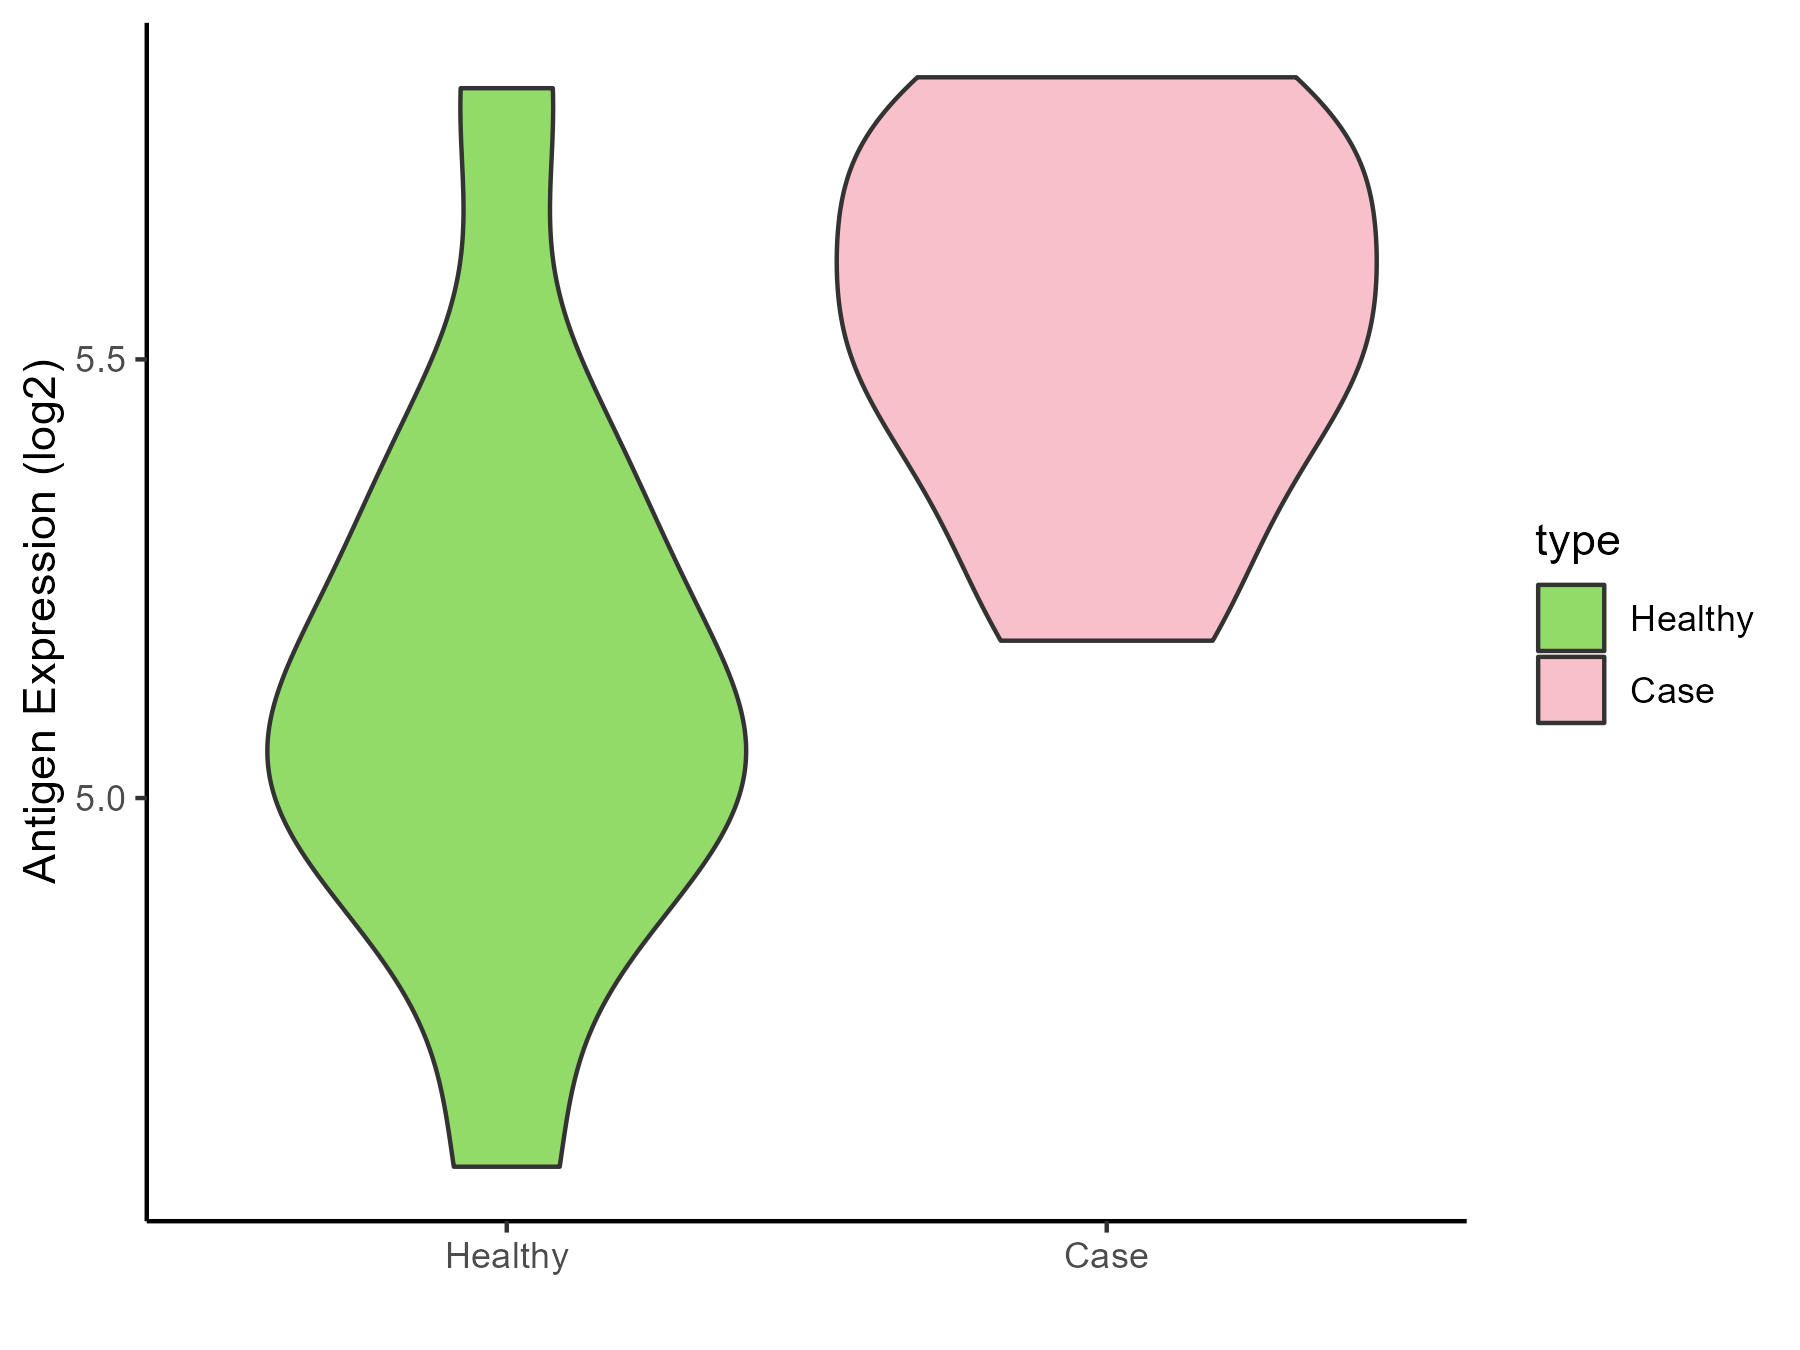
| The Specific Disease | Aortic stenosis | |
| The Expression Level of Disease Section Compare with the Healthy Individual Tissue | p-value: 0.004380559; Fold-change: 0.47513629; Z-score: 1.439327001 | |
| Disease-specific Antigen Abundances |
|
Click to View the Clearer Original Diagram |
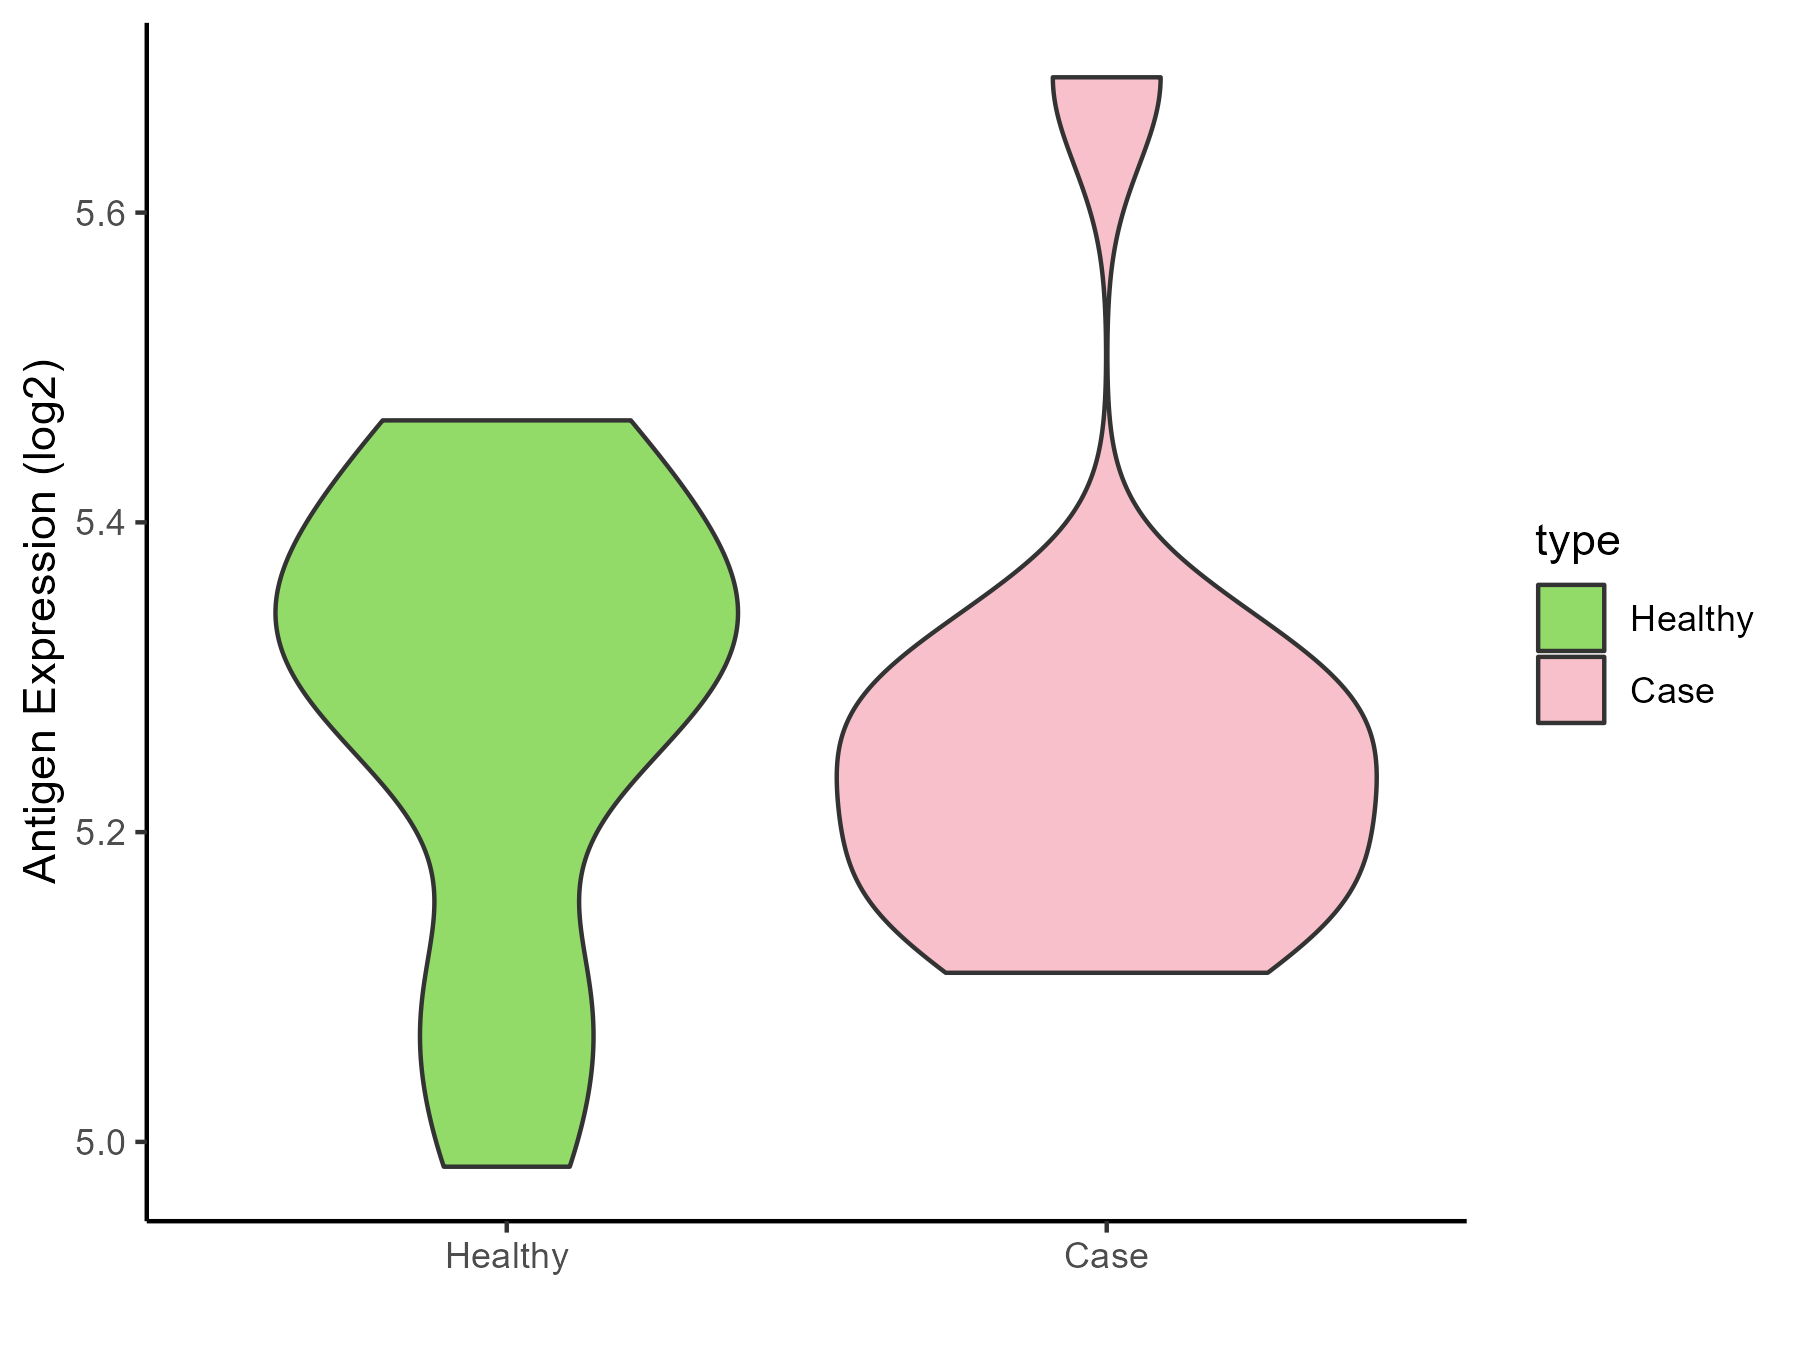
| Differential expression pattern of antigen in diseases | ||
| The Studied Tissue | Peripheral blood | |
| The Specific Disease | Arteriosclerosis | |
| The Expression Level of Disease Section Compare with the Healthy Individual Tissue | p-value: 0.873914261; Fold-change: -0.069716873; Z-score: -0.459667191 | |
| Disease-specific Antigen Abundances |
|
Click to View the Clearer Original Diagram |
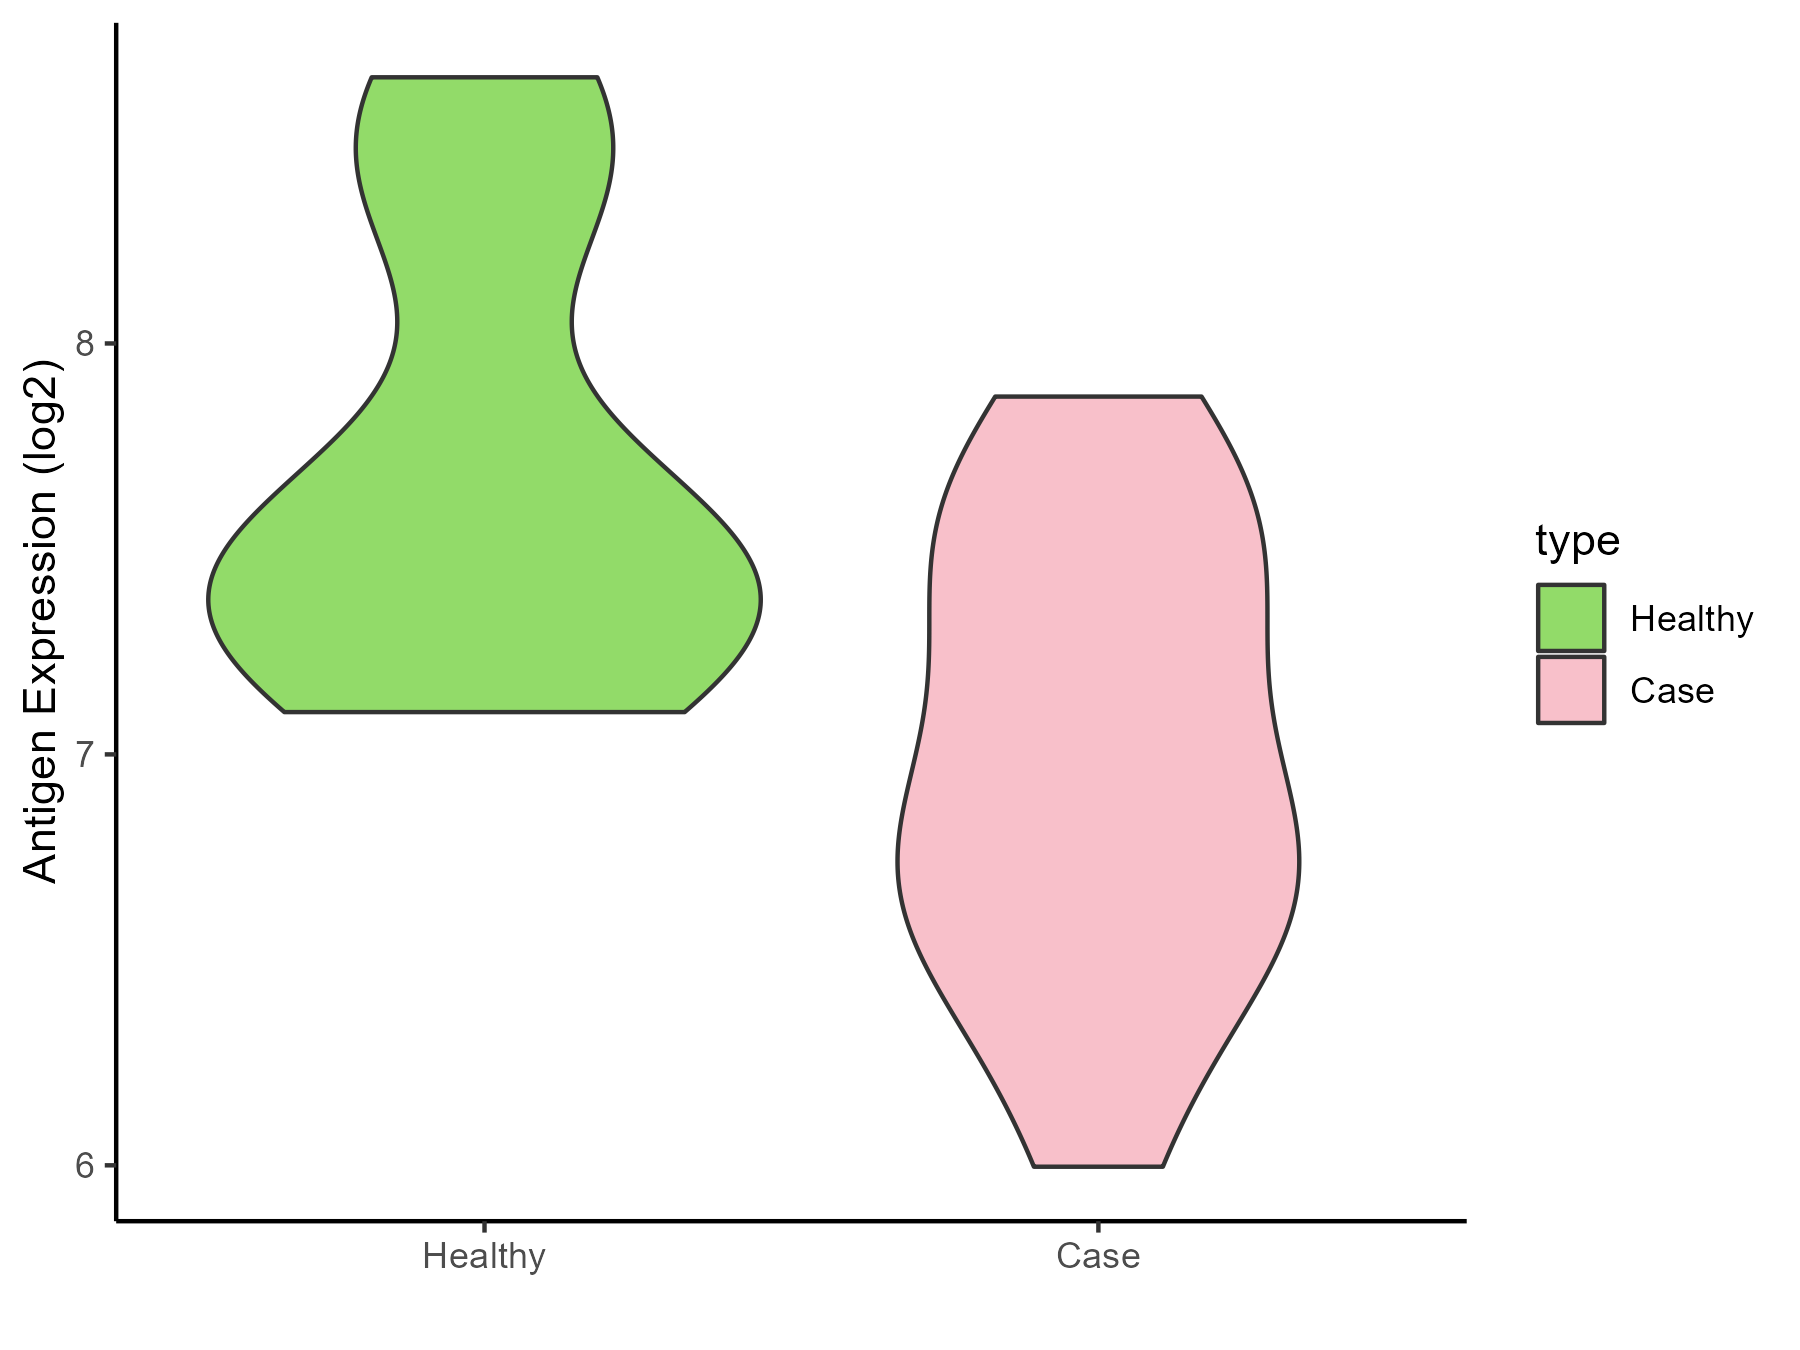
| Differential expression pattern of antigen in diseases | ||
| The Studied Tissue | Intracranial artery | |
| The Specific Disease | Aneurysm | |
| The Expression Level of Disease Section Compare with the Healthy Individual Tissue | p-value: 0.002373506; Fold-change: -0.552414493; Z-score: -0.994998901 | |
| Disease-specific Antigen Abundances |
|
Click to View the Clearer Original Diagram |
ICD Disease Classification 12
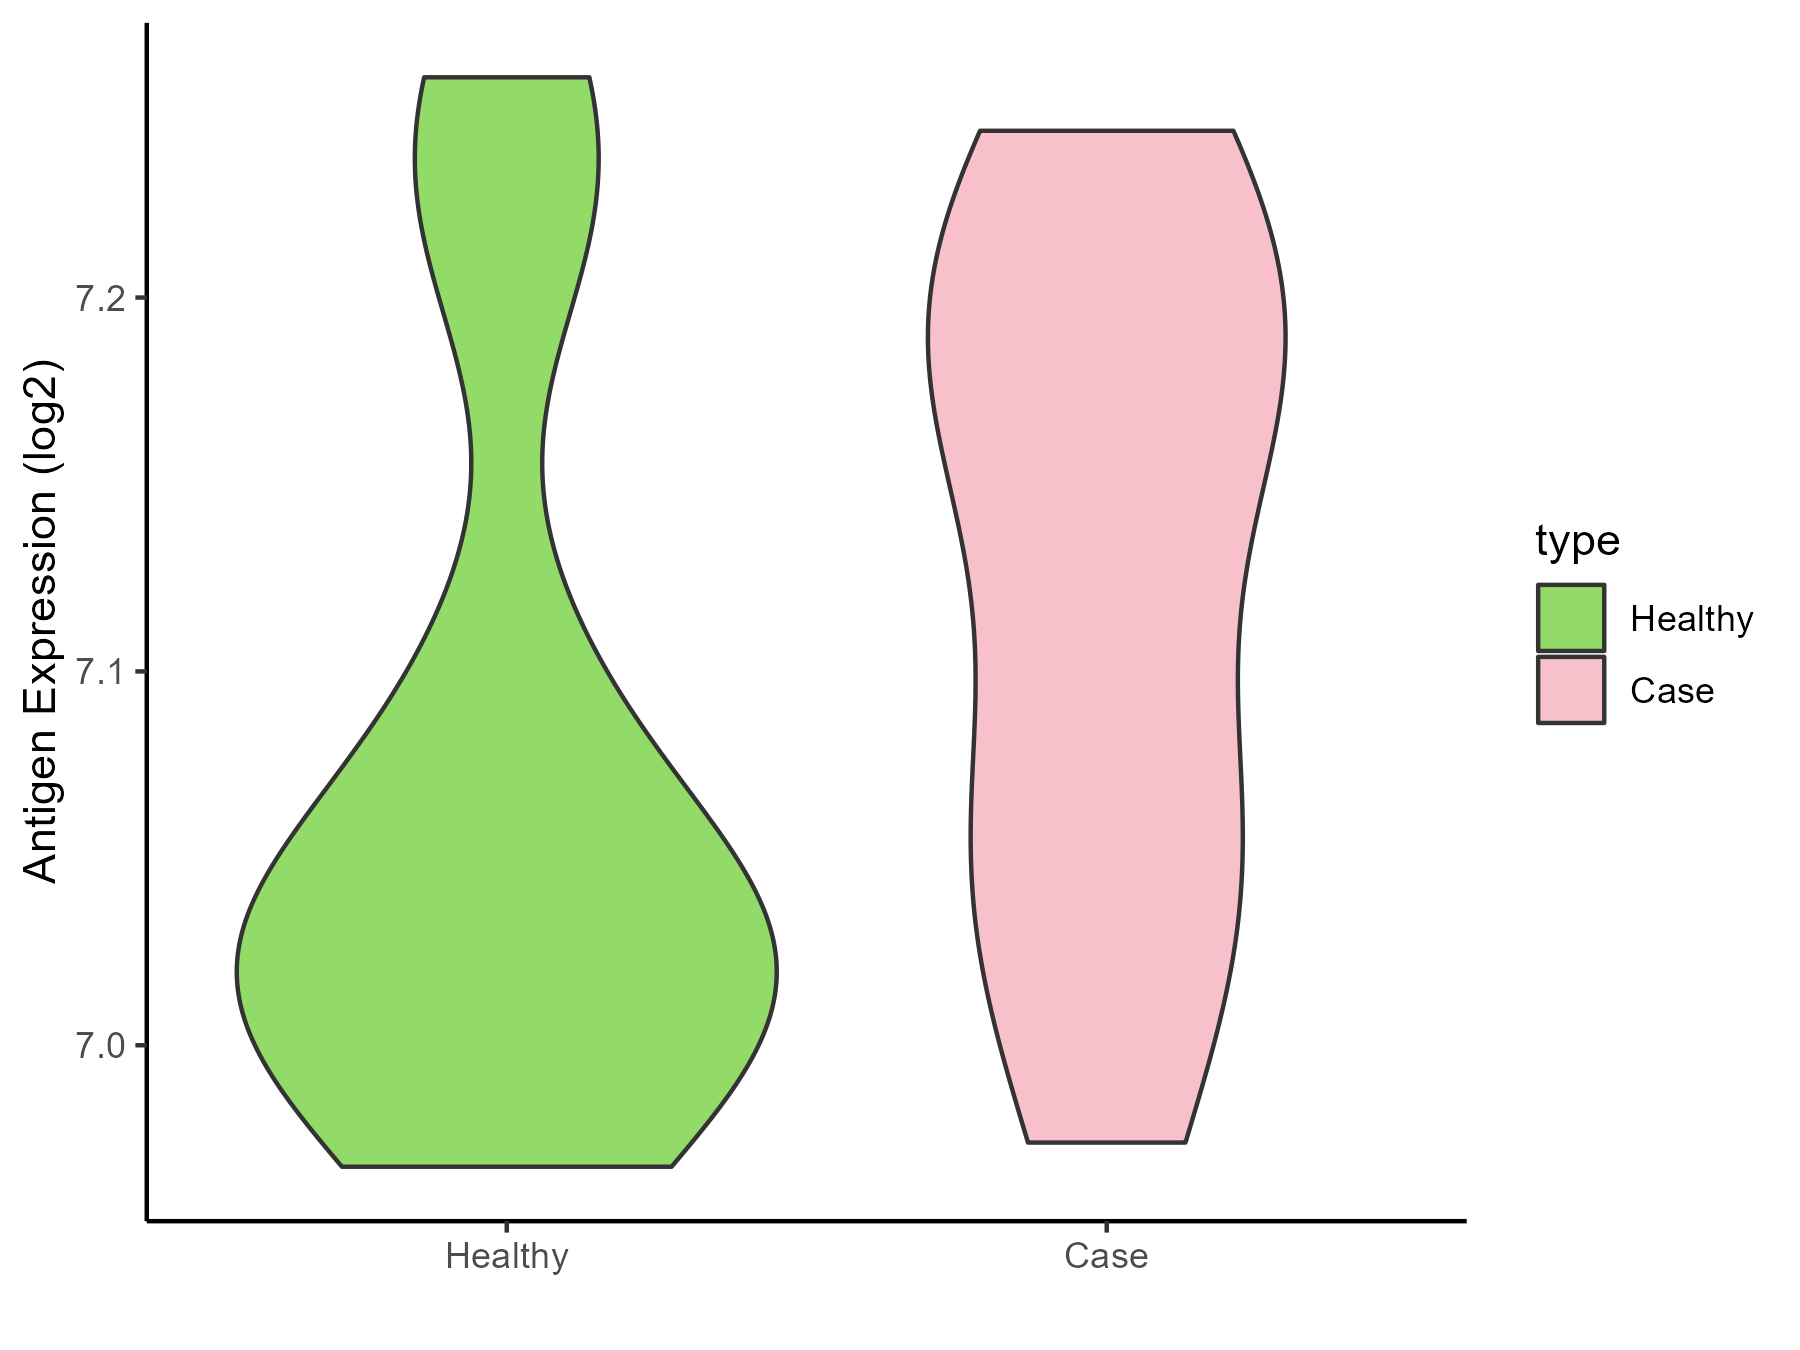
| Differential expression pattern of antigen in diseases | ||
| The Studied Tissue | Peripheral blood | |
| The Specific Disease | Immunodeficiency | |
| The Expression Level of Disease Section Compare with the Healthy Individual Tissue | p-value: 0.228799198; Fold-change: 0.133447256; Z-score: 1.322248729 | |
| Disease-specific Antigen Abundances |
|
Click to View the Clearer Original Diagram |
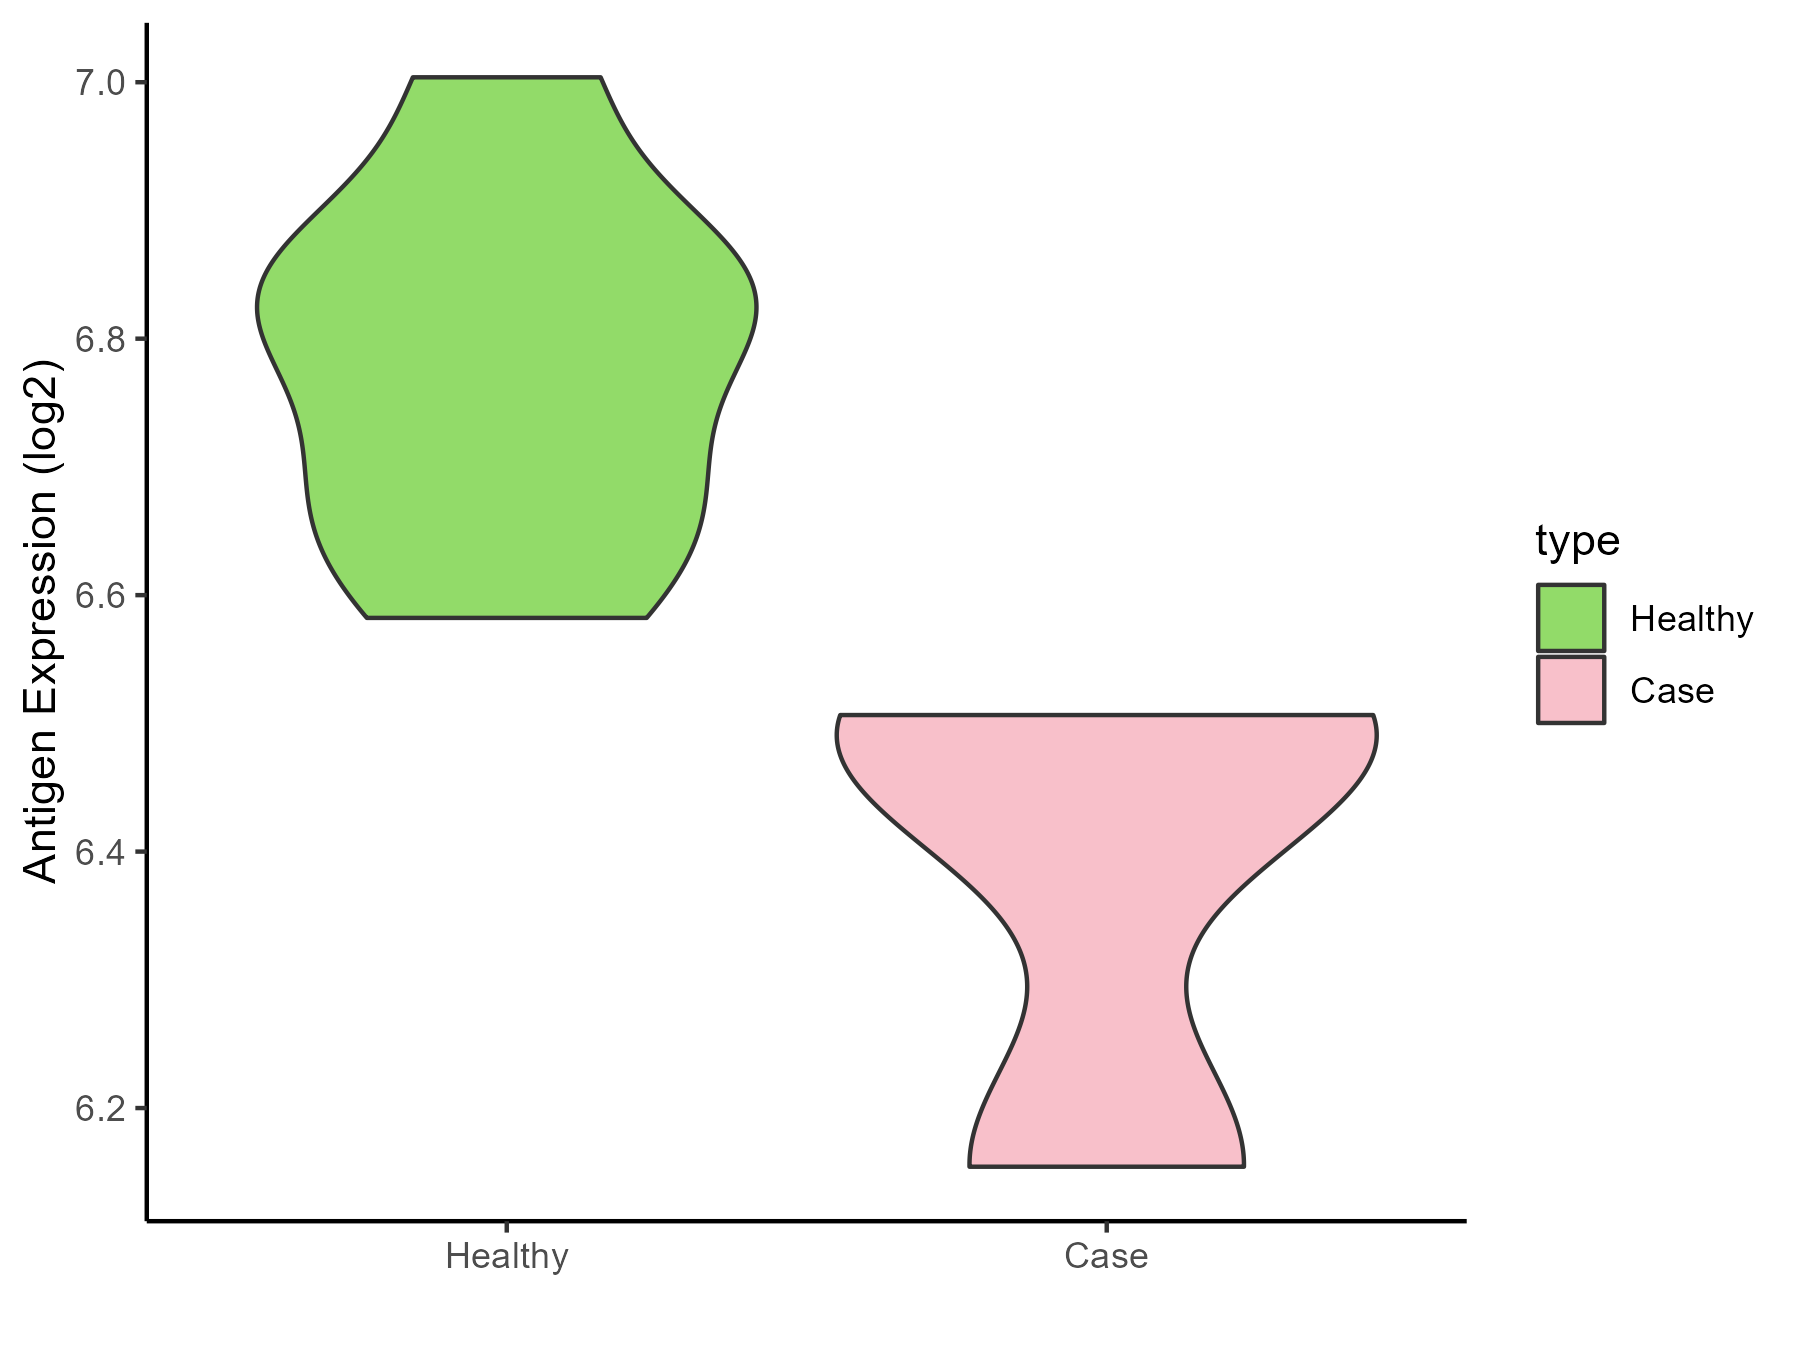
| Differential expression pattern of antigen in diseases | ||
| The Studied Tissue | Hyperplastic tonsil | |
| The Specific Disease | Apnea | |
| The Expression Level of Disease Section Compare with the Healthy Individual Tissue | p-value: 0.049816442; Fold-change: -0.349085464; Z-score: -2.467524723 | |
| Disease-specific Antigen Abundances |
|
Click to View the Clearer Original Diagram |
| Differential expression pattern of antigen in diseases | ||
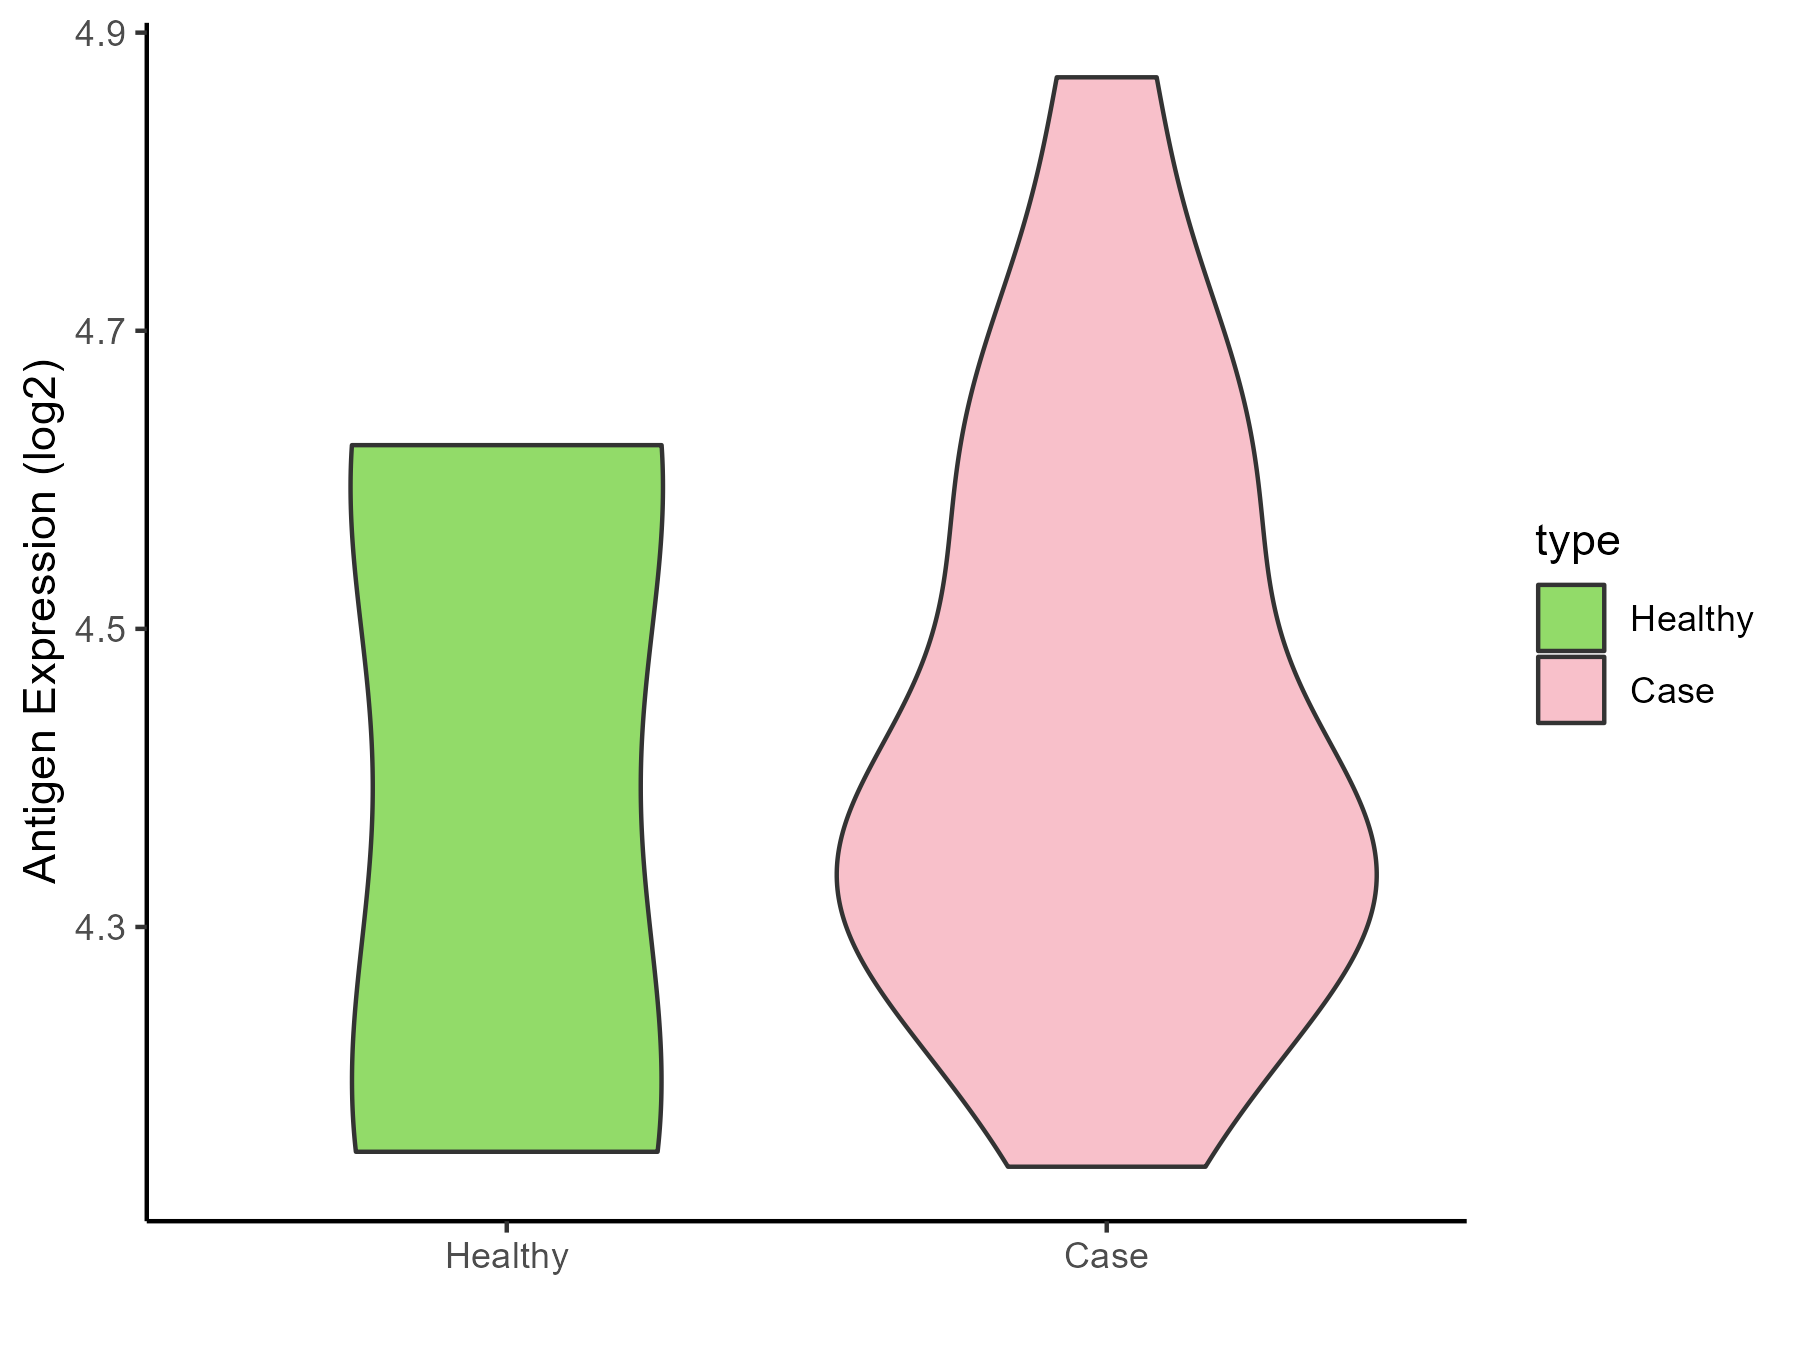
| The Studied Tissue | Peripheral blood | |
| The Specific Disease | Olive pollen allergy | |
| The Expression Level of Disease Section Compare with the Healthy Individual Tissue | p-value: 0.75395238; Fold-change: -0.025461286; Z-score: -0.09800215 | |
| Disease-specific Antigen Abundances |
|
Click to View the Clearer Original Diagram |
| Differential expression pattern of antigen in diseases | ||
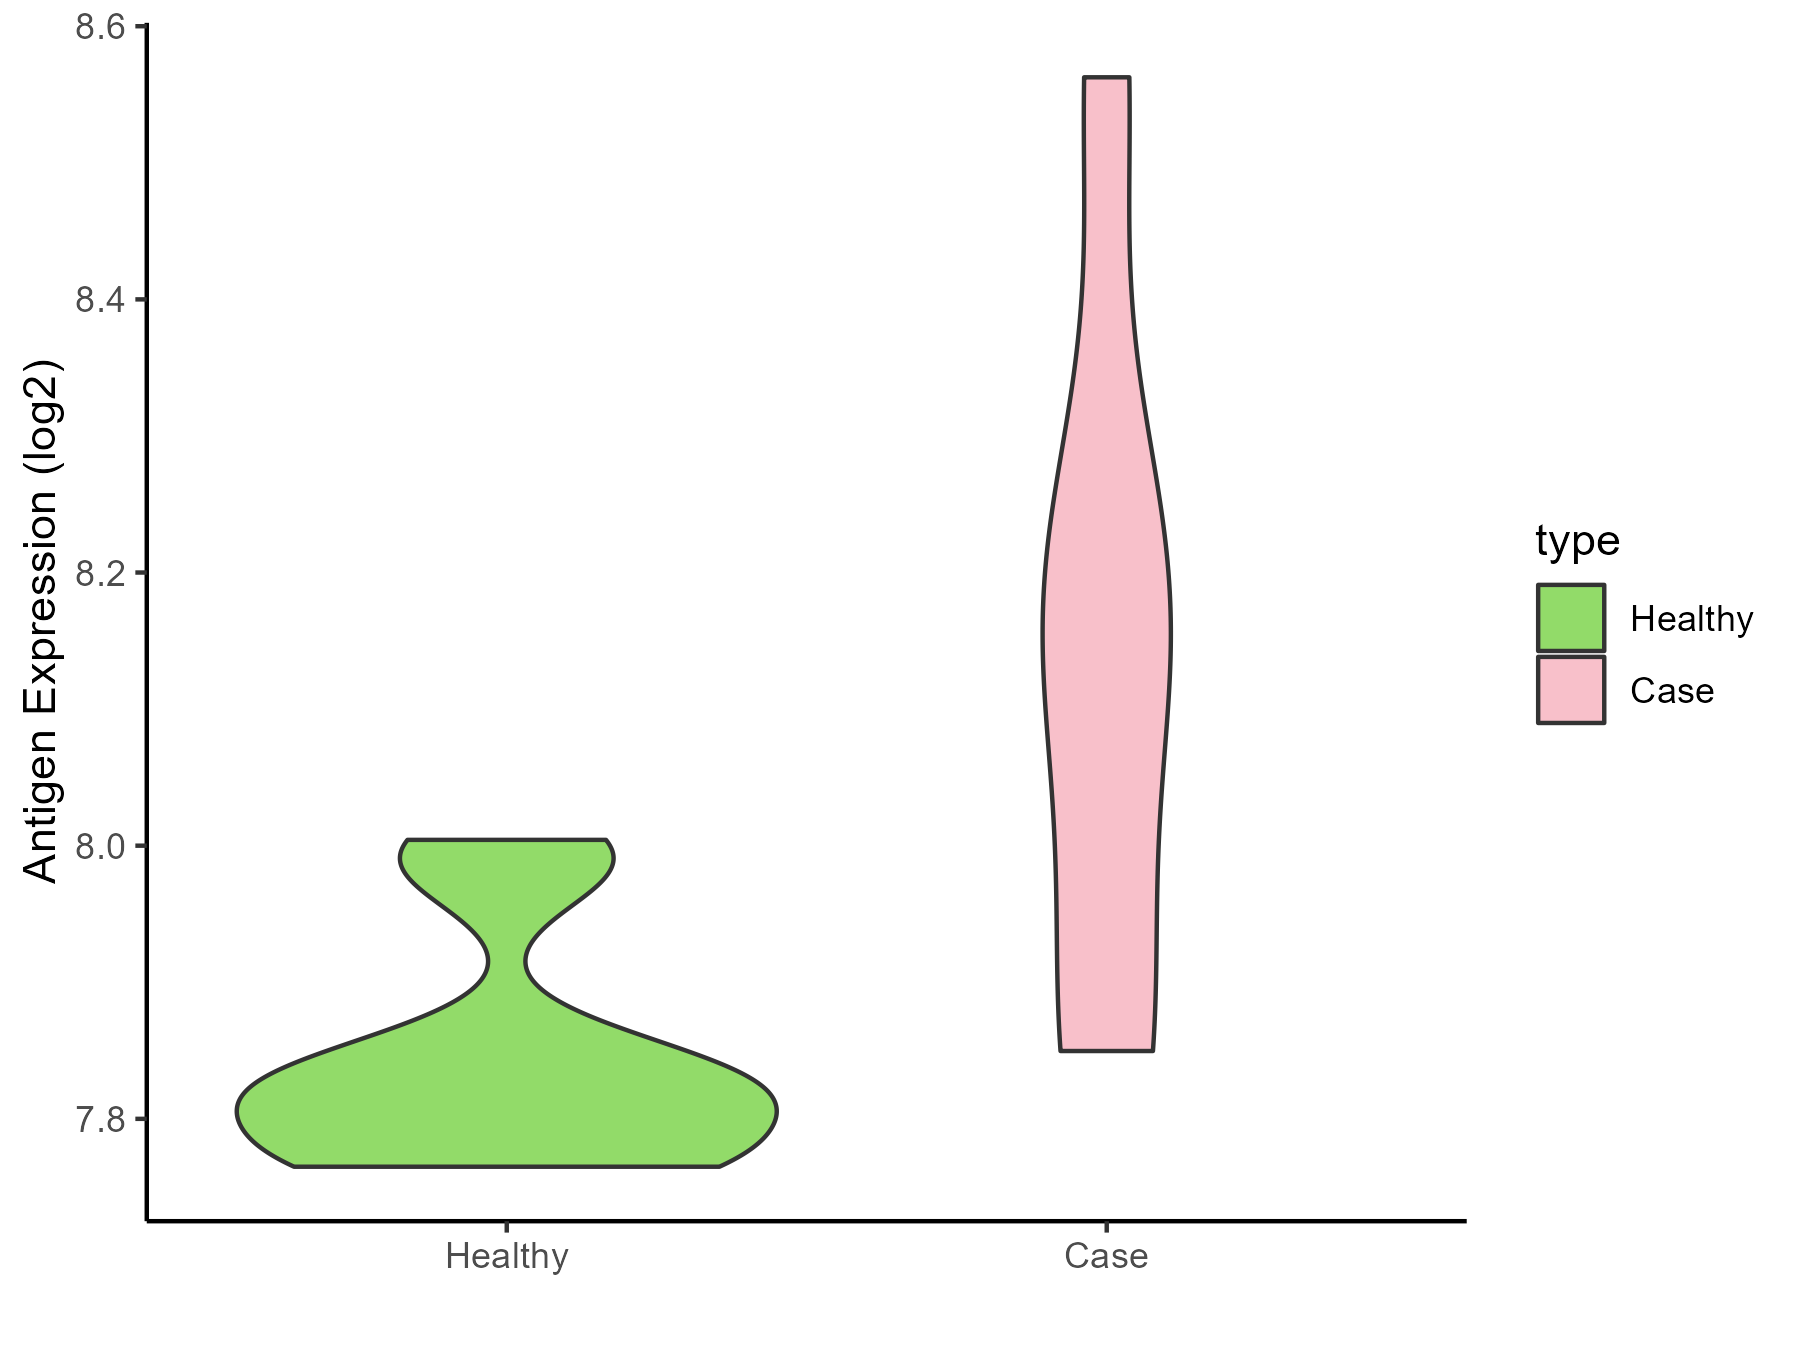
| The Studied Tissue | Sinus mucosa | |
| The Specific Disease | Chronic rhinosinusitis | |
| The Expression Level of Disease Section Compare with the Healthy Individual Tissue | p-value: 0.040980214; Fold-change: 0.320111811; Z-score: 3.63455823 | |
| Disease-specific Antigen Abundances |
|
Click to View the Clearer Original Diagram |
| Differential expression pattern of antigen in diseases | ||
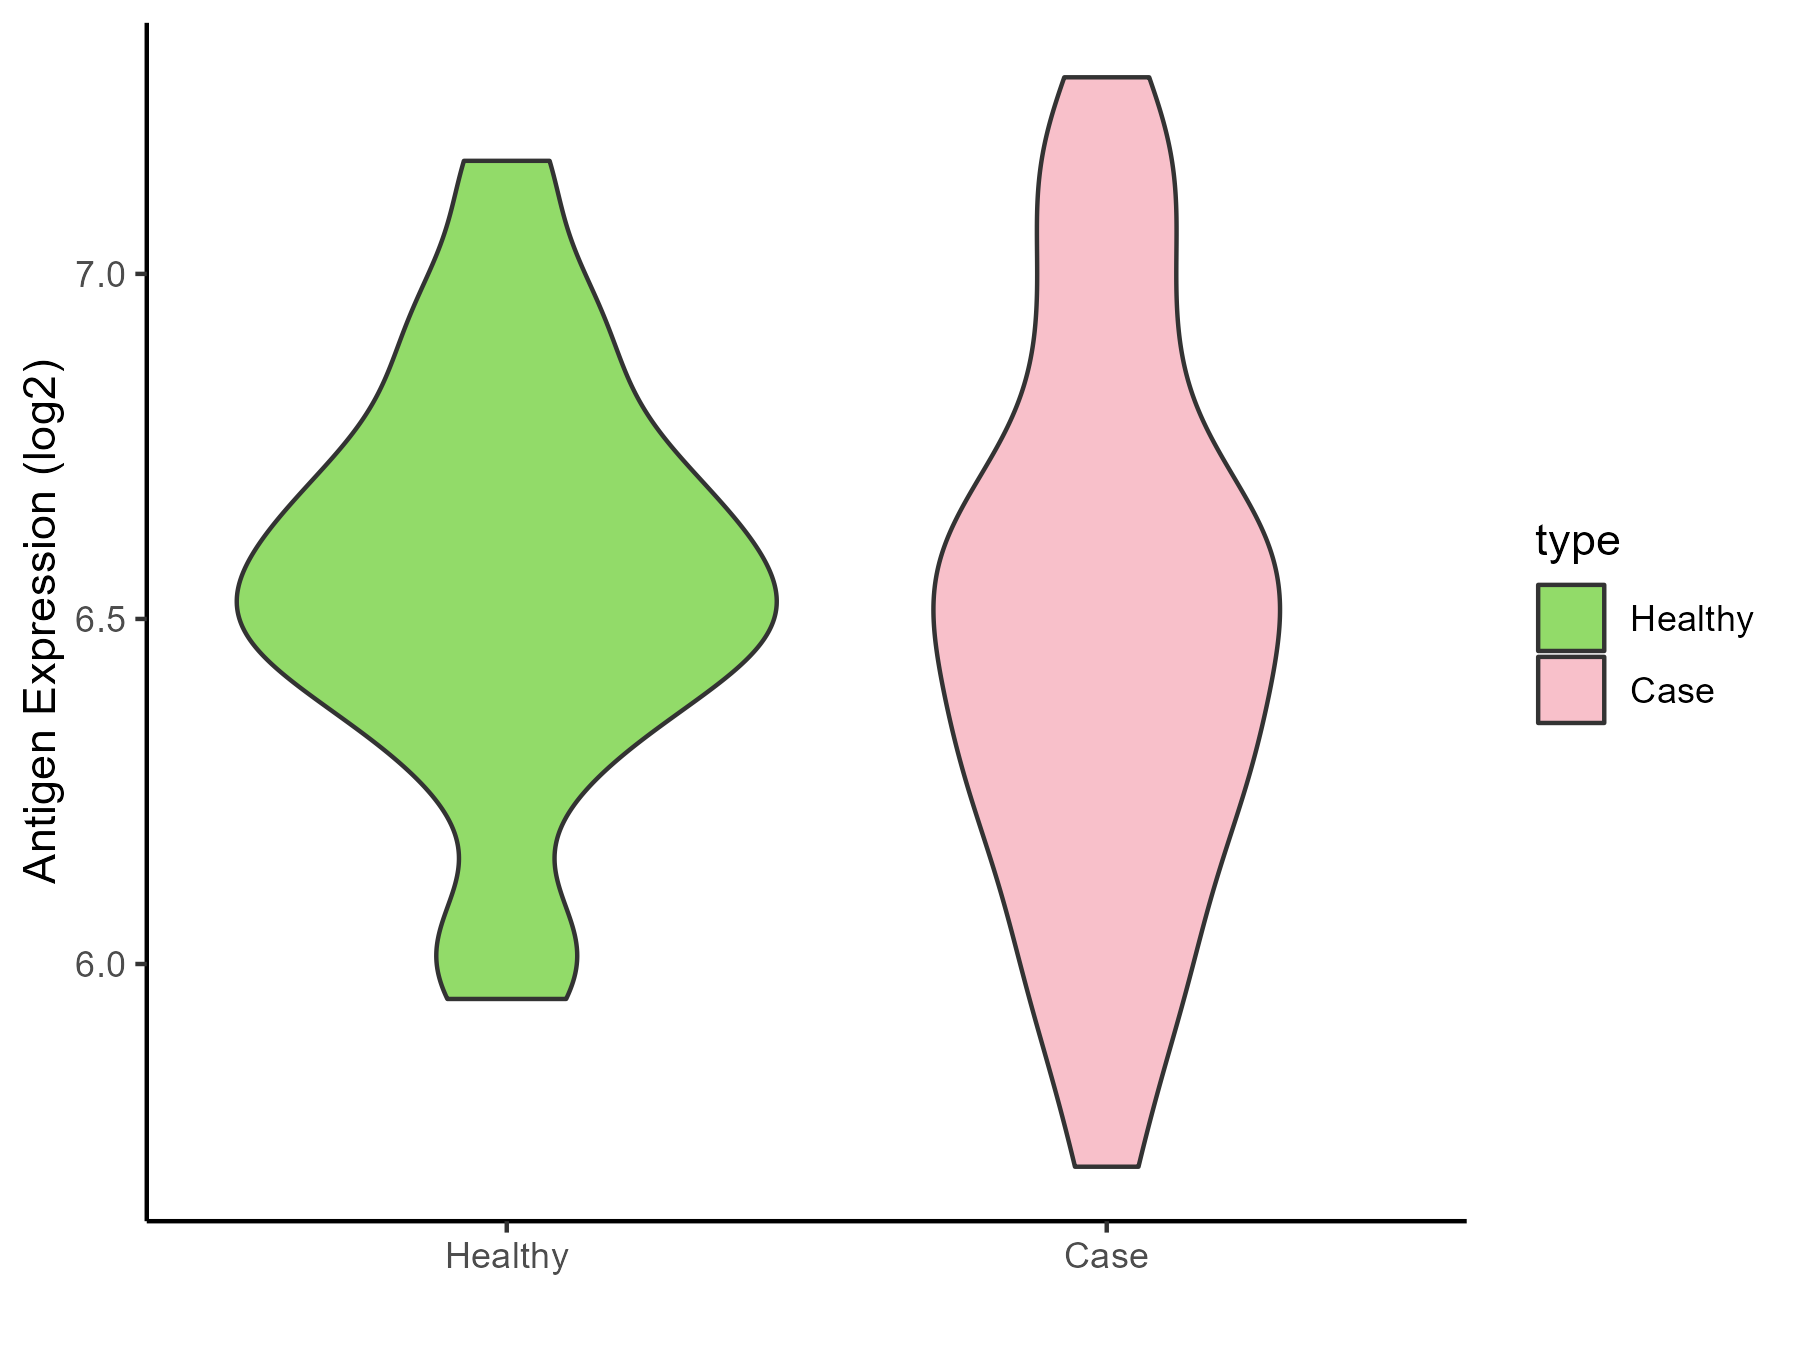
| The Studied Tissue | Lung | |
| The Specific Disease | Chronic obstructive pulmonary disease | |
| The Expression Level of Disease Section Compare with the Healthy Individual Tissue | p-value: 0.301620522; Fold-change: -0.070269033; Z-score: -0.241348587 | |
| Disease-specific Antigen Abundances |
|
Click to View the Clearer Original Diagram |
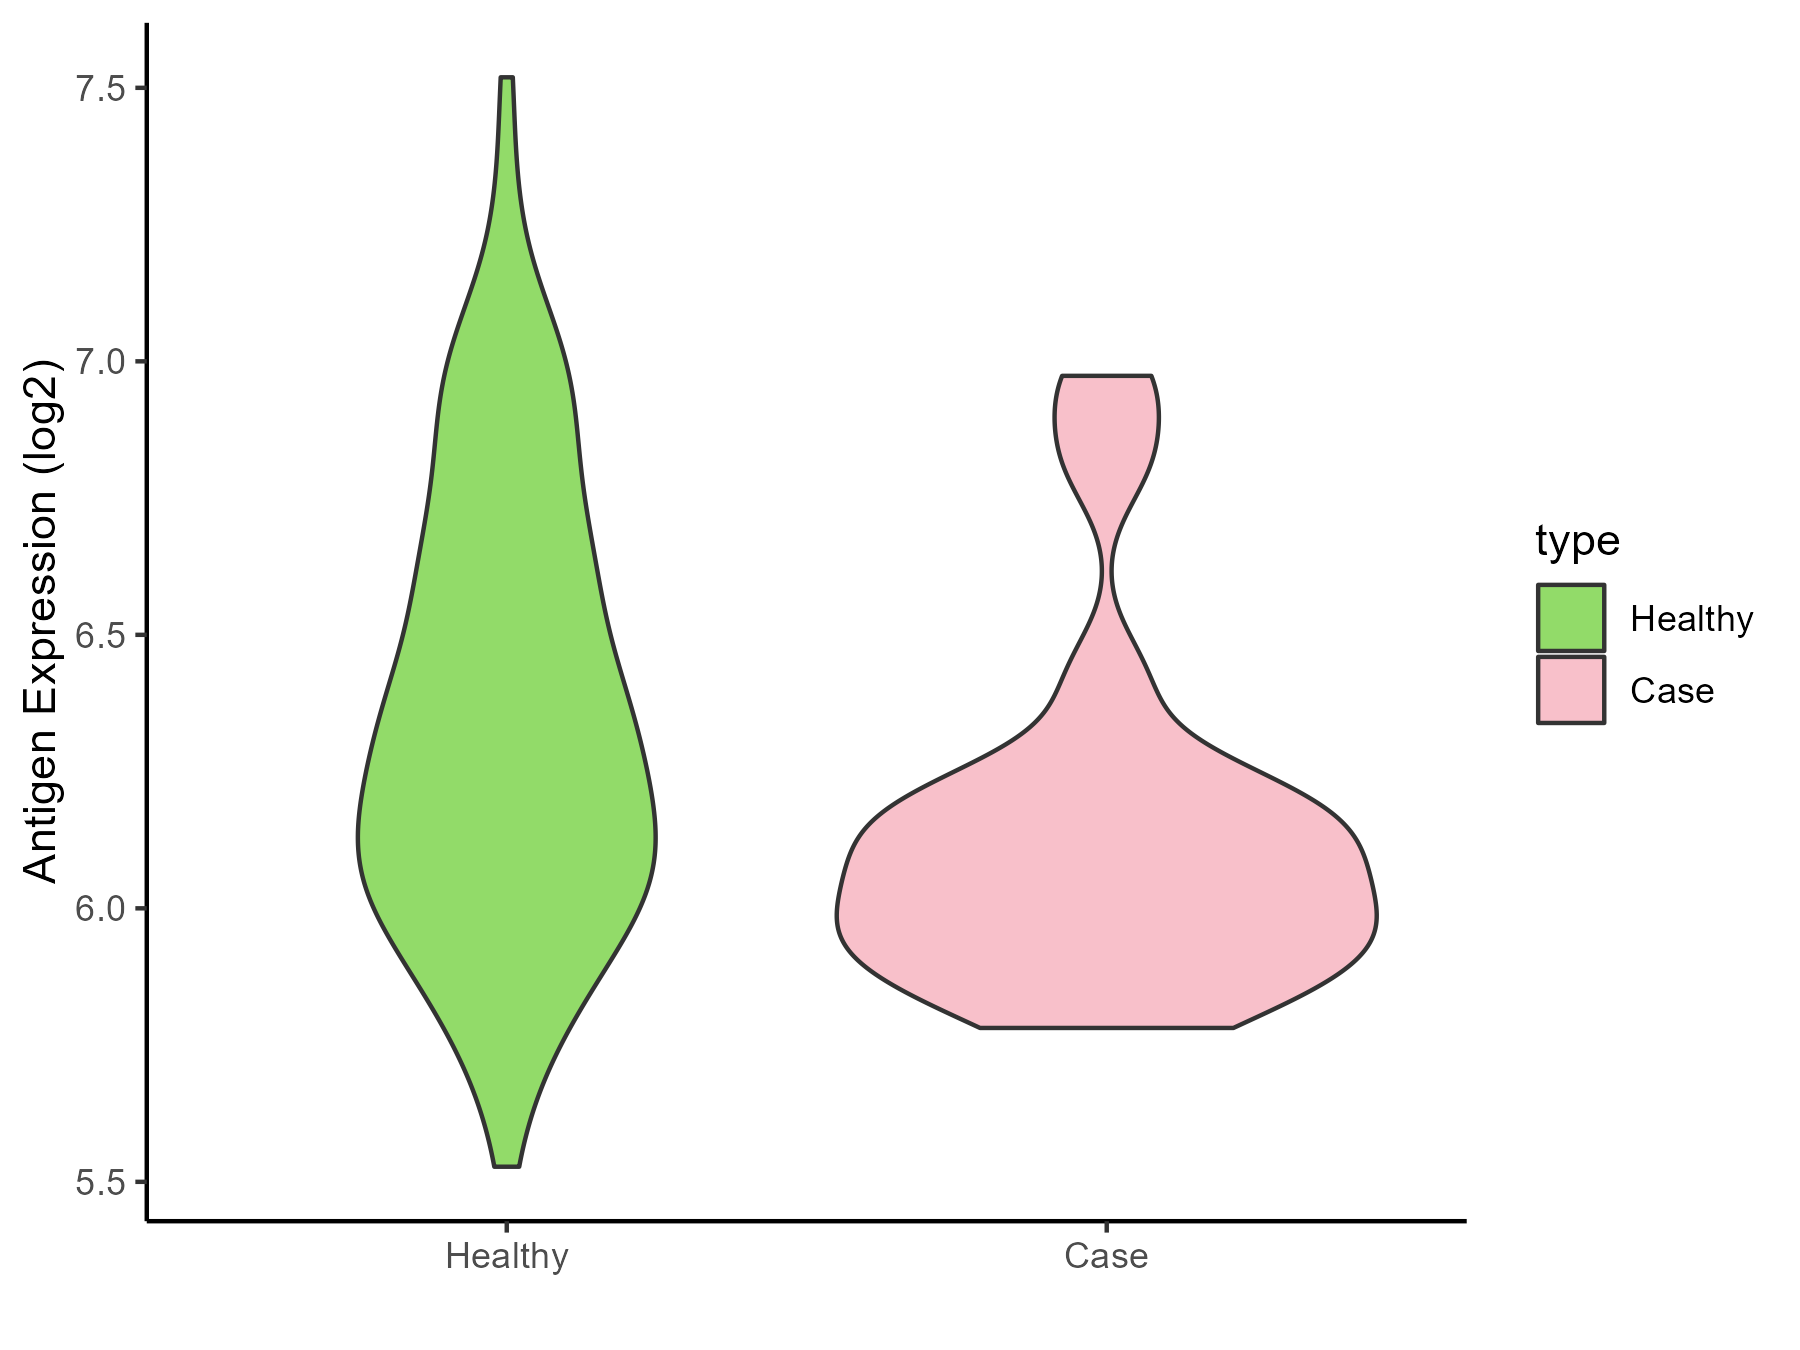
| The Studied Tissue | Small airway epithelium | |
| The Specific Disease | Chronic obstructive pulmonary disease | |
| The Expression Level of Disease Section Compare with the Healthy Individual Tissue | p-value: 0.000163137; Fold-change: -0.235545308; Z-score: -0.579761455 | |
| Disease-specific Antigen Abundances |
|
Click to View the Clearer Original Diagram |
| Differential expression pattern of antigen in diseases | ||
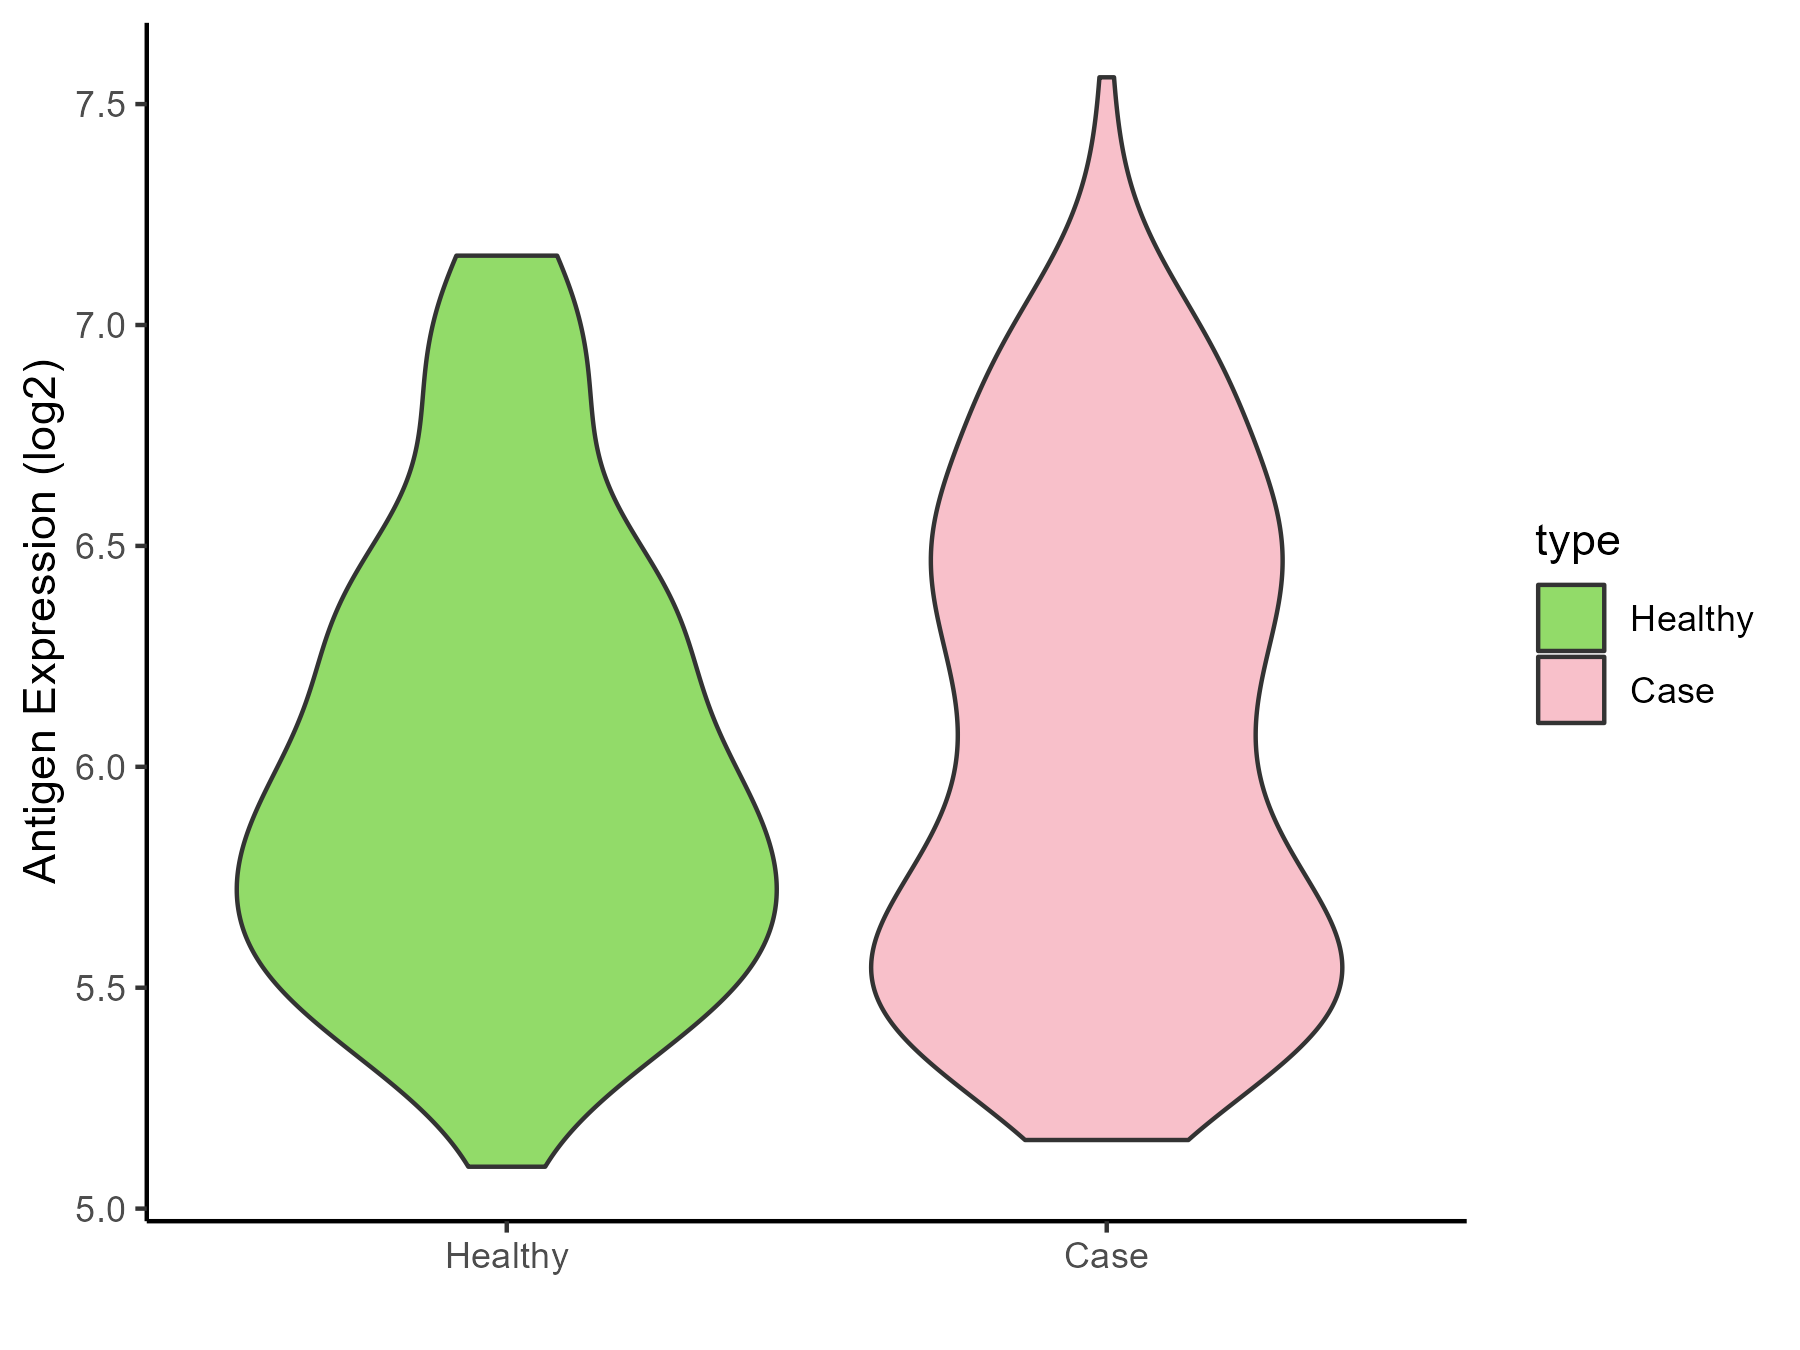
| The Studied Tissue | Nasal and bronchial airway | |
| The Specific Disease | Asthma | |
| The Expression Level of Disease Section Compare with the Healthy Individual Tissue | p-value: 0.357339962; Fold-change: 0.090741076; Z-score: 0.181951018 | |
| Disease-specific Antigen Abundances |
|
Click to View the Clearer Original Diagram |
| Differential expression pattern of antigen in diseases | ||
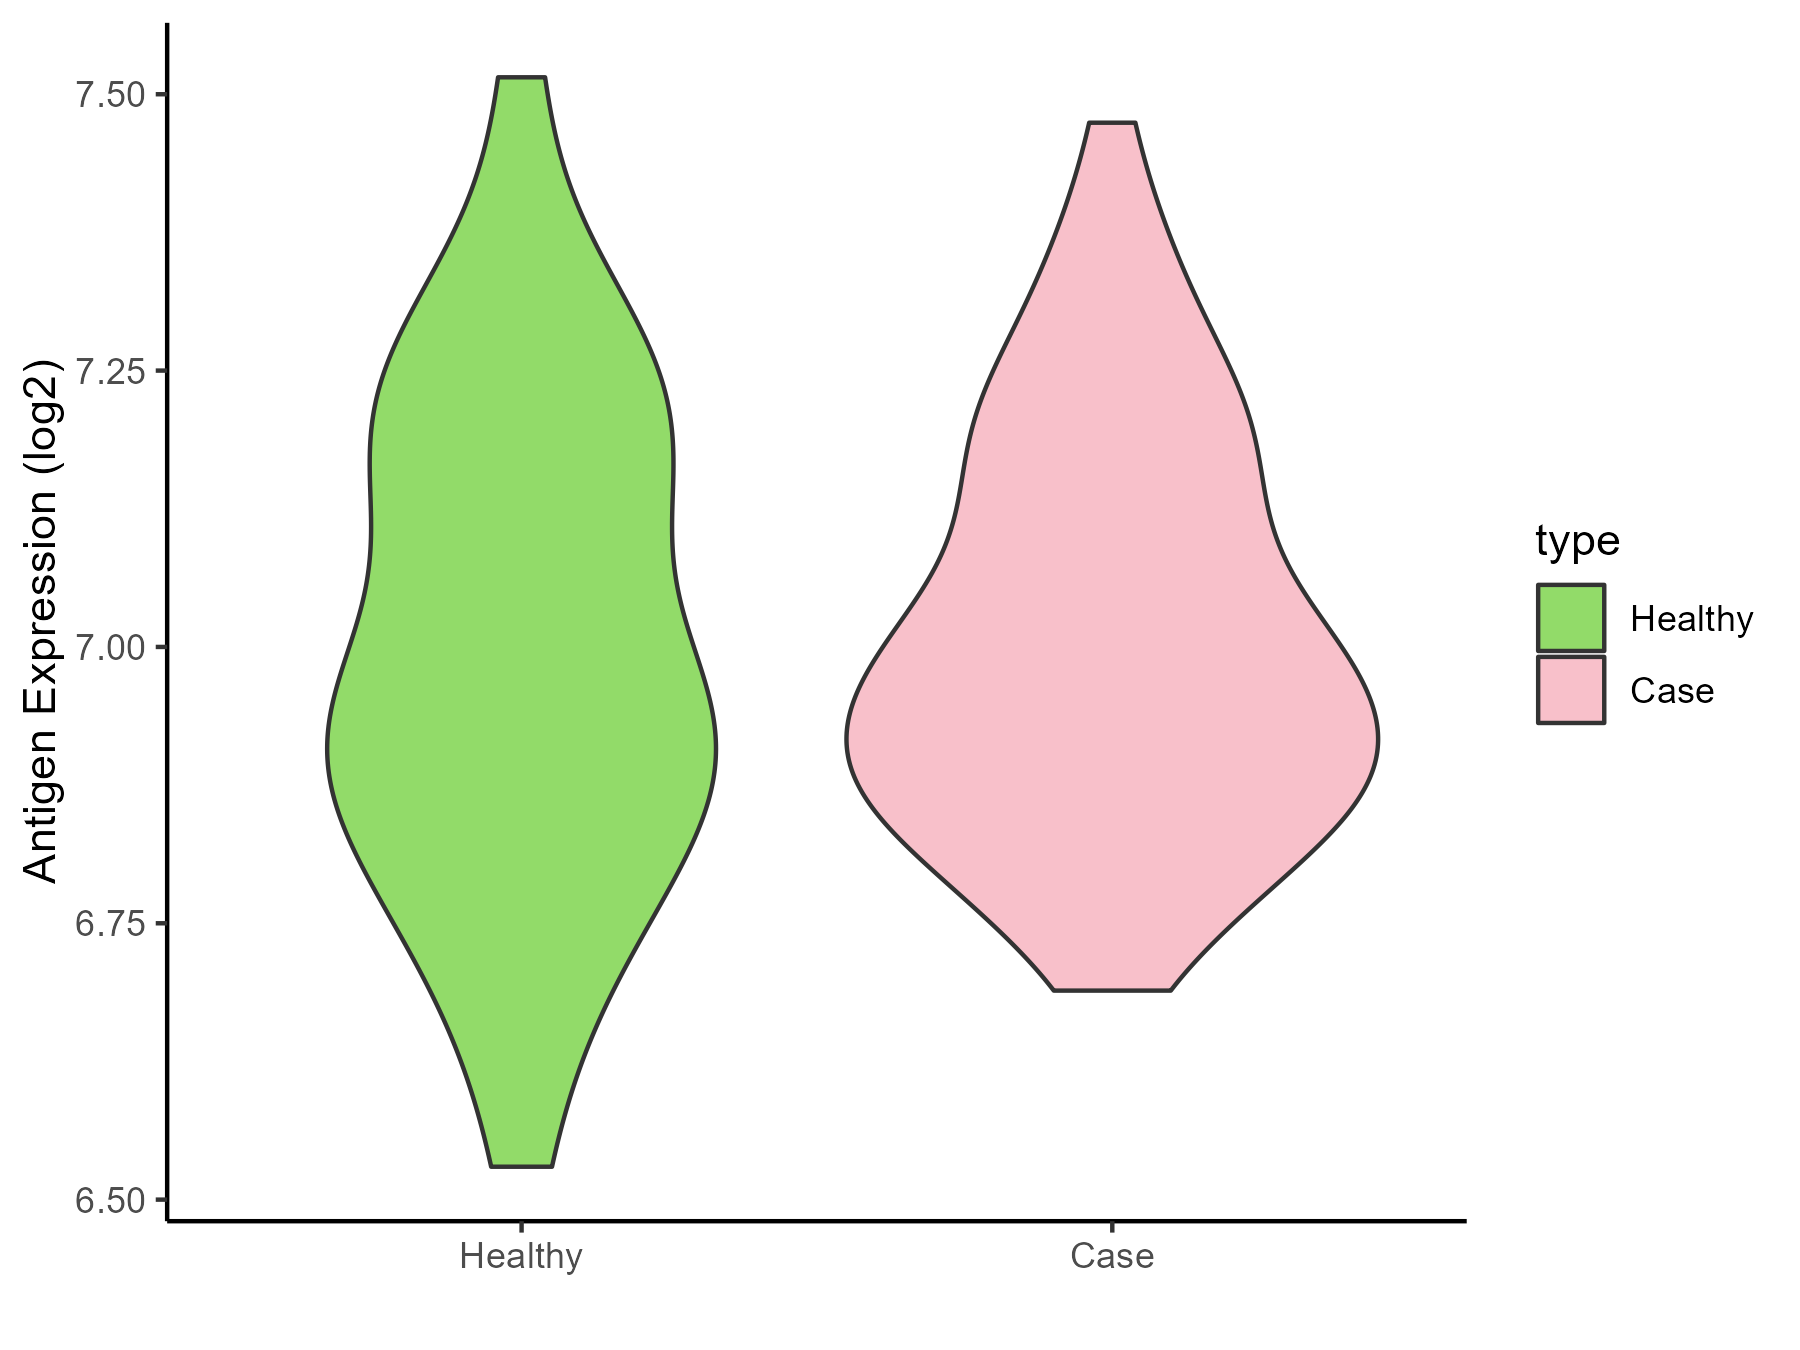
| The Studied Tissue | Nasal Epithelium | |
| The Specific Disease | Human rhinovirus infection | |
| The Expression Level of Disease Section Compare with the Healthy Individual Tissue | p-value: 0.891740785; Fold-change: 0.018305226; Z-score: 0.080528163 | |
| Disease-specific Antigen Abundances |
|
Click to View the Clearer Original Diagram |
| Differential expression pattern of antigen in diseases | ||
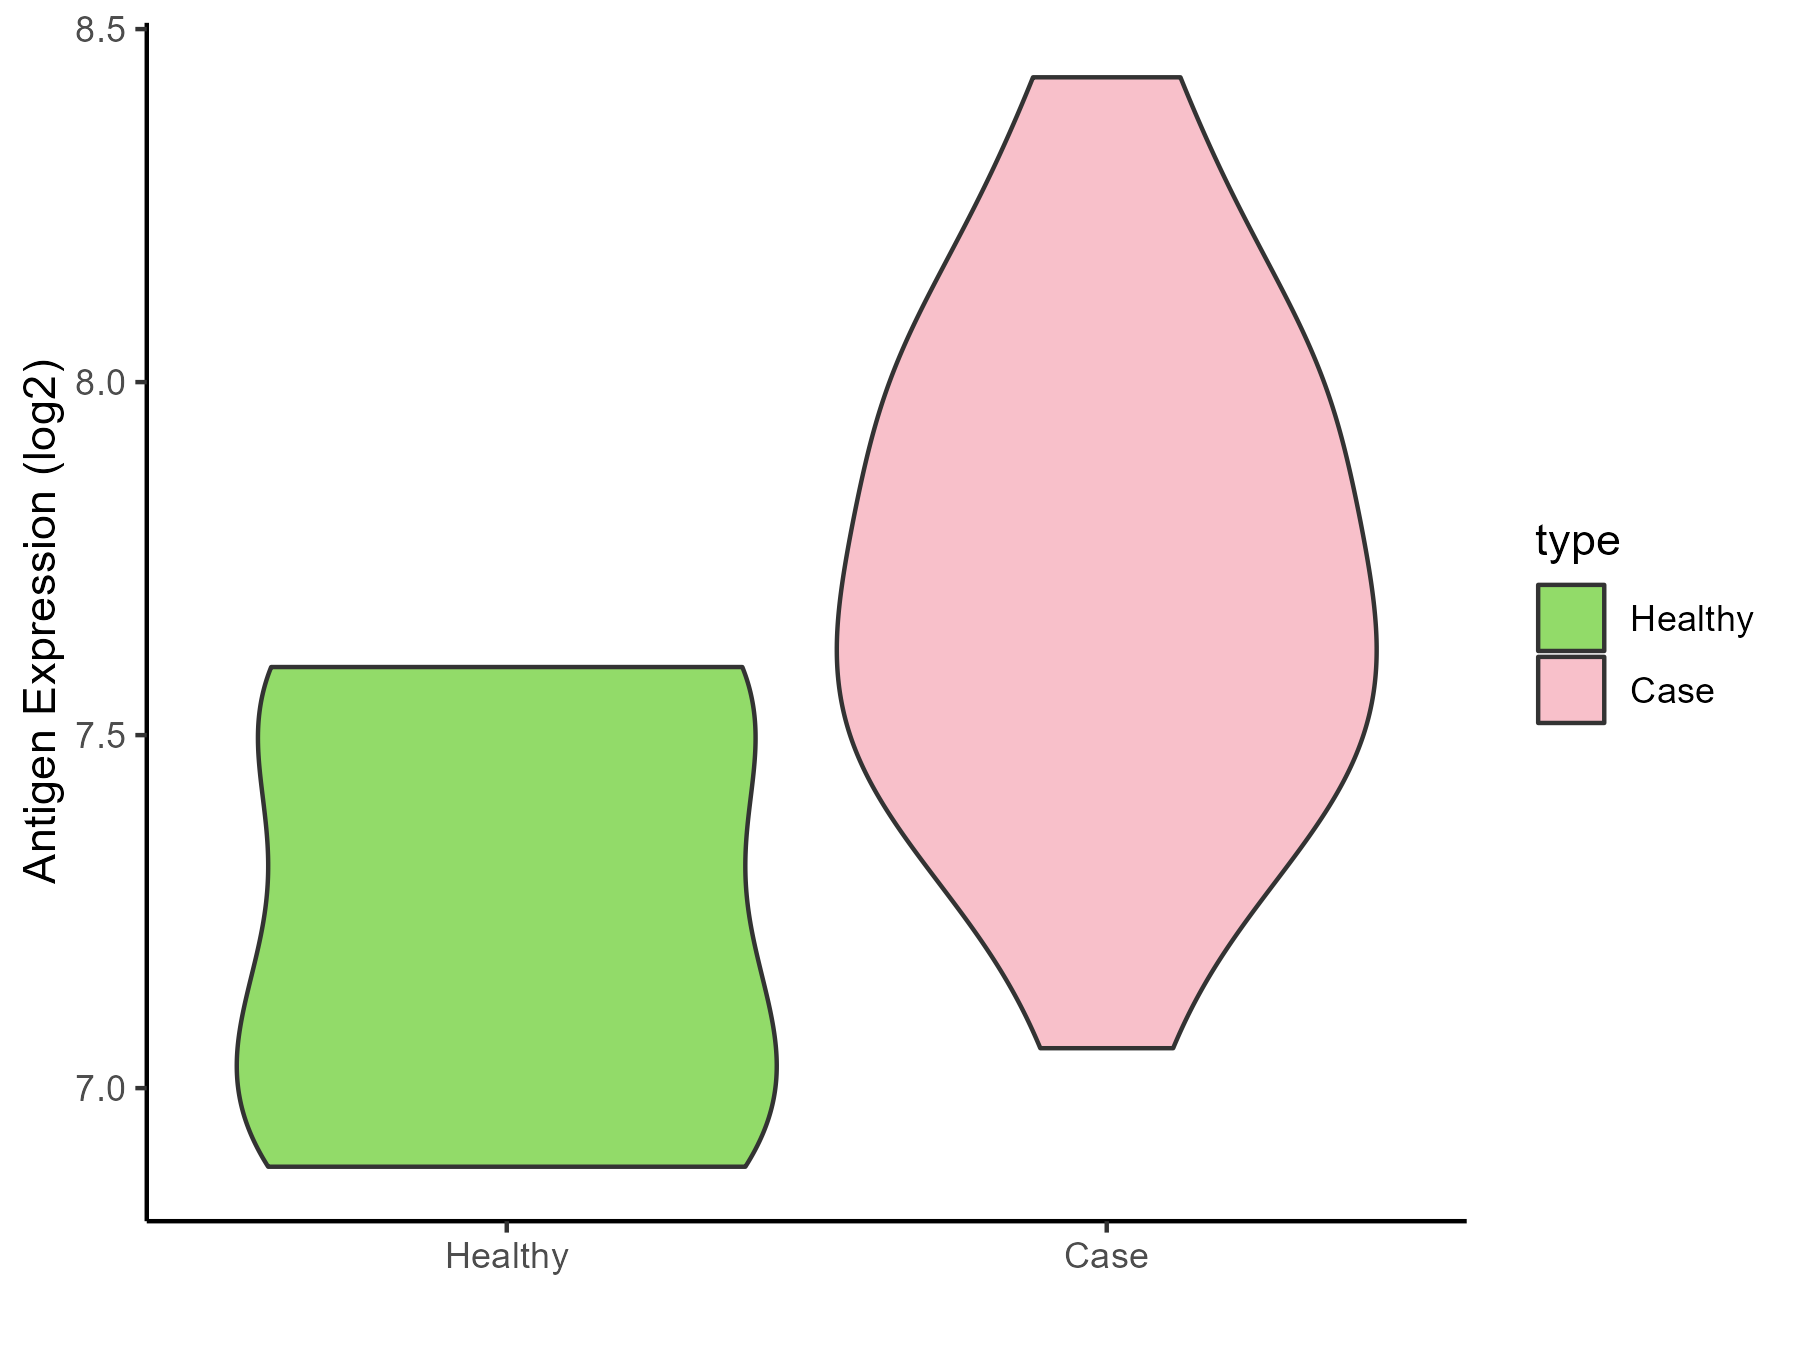
| The Studied Tissue | Lung | |
| The Specific Disease | Idiopathic pulmonary fibrosis | |
| The Expression Level of Disease Section Compare with the Healthy Individual Tissue | p-value: 0.02316815; Fold-change: 0.488896414; Z-score: 1.500828488 | |
| Disease-specific Antigen Abundances |
|
Click to View the Clearer Original Diagram |
ICD Disease Classification 13
| Differential expression pattern of antigen in diseases | ||
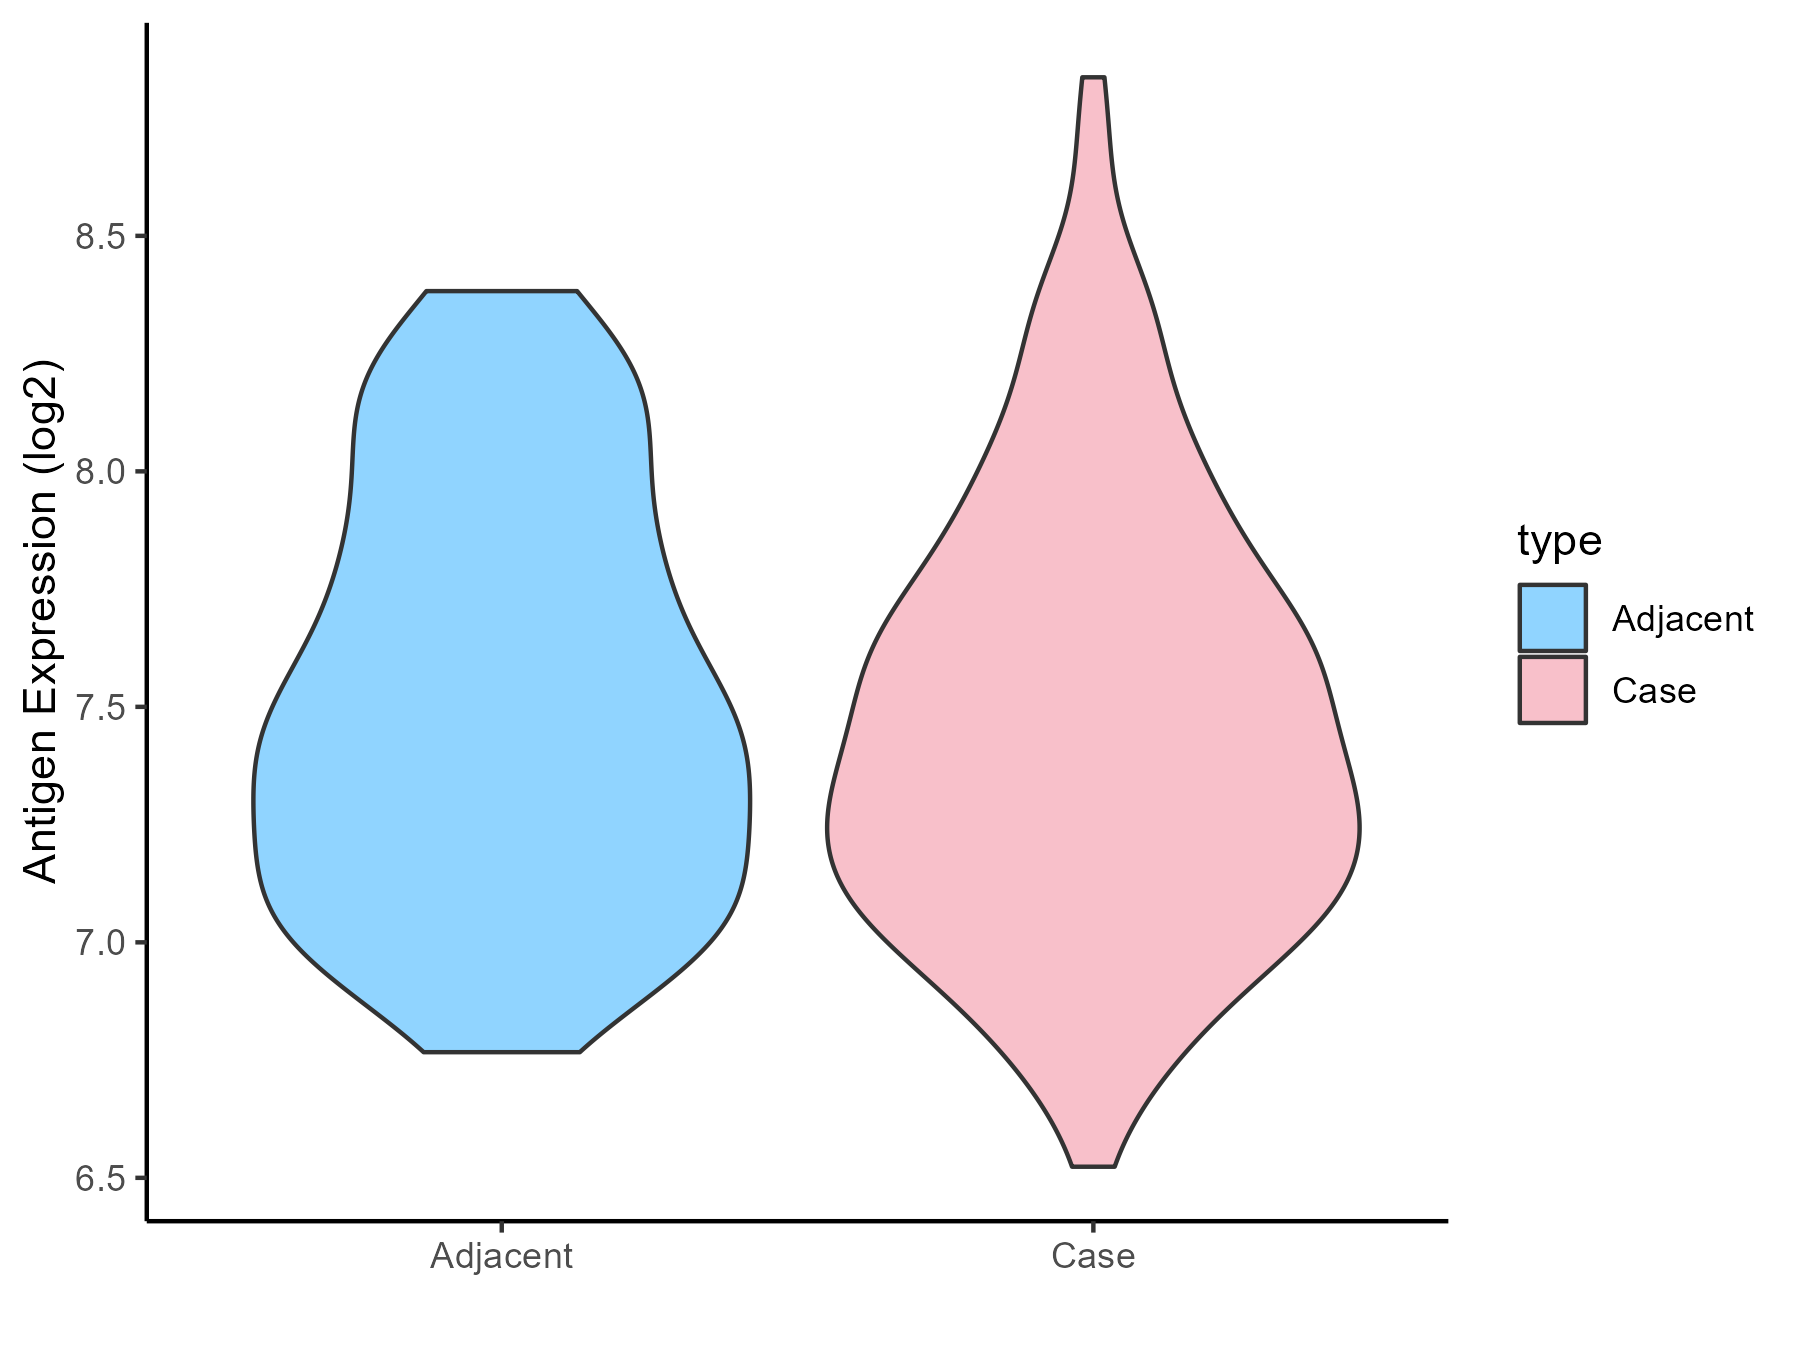
| The Studied Tissue | Gingival | |
| The Specific Disease | Periodontal disease | |
| The Expression Level of Disease Section Compare with the Adjacent Tissue | p-value: 0.491199496; Fold-change: -0.041664364; Z-score: -0.095677588 | |
| Disease-specific Antigen Abundances |
|
Click to View the Clearer Original Diagram |
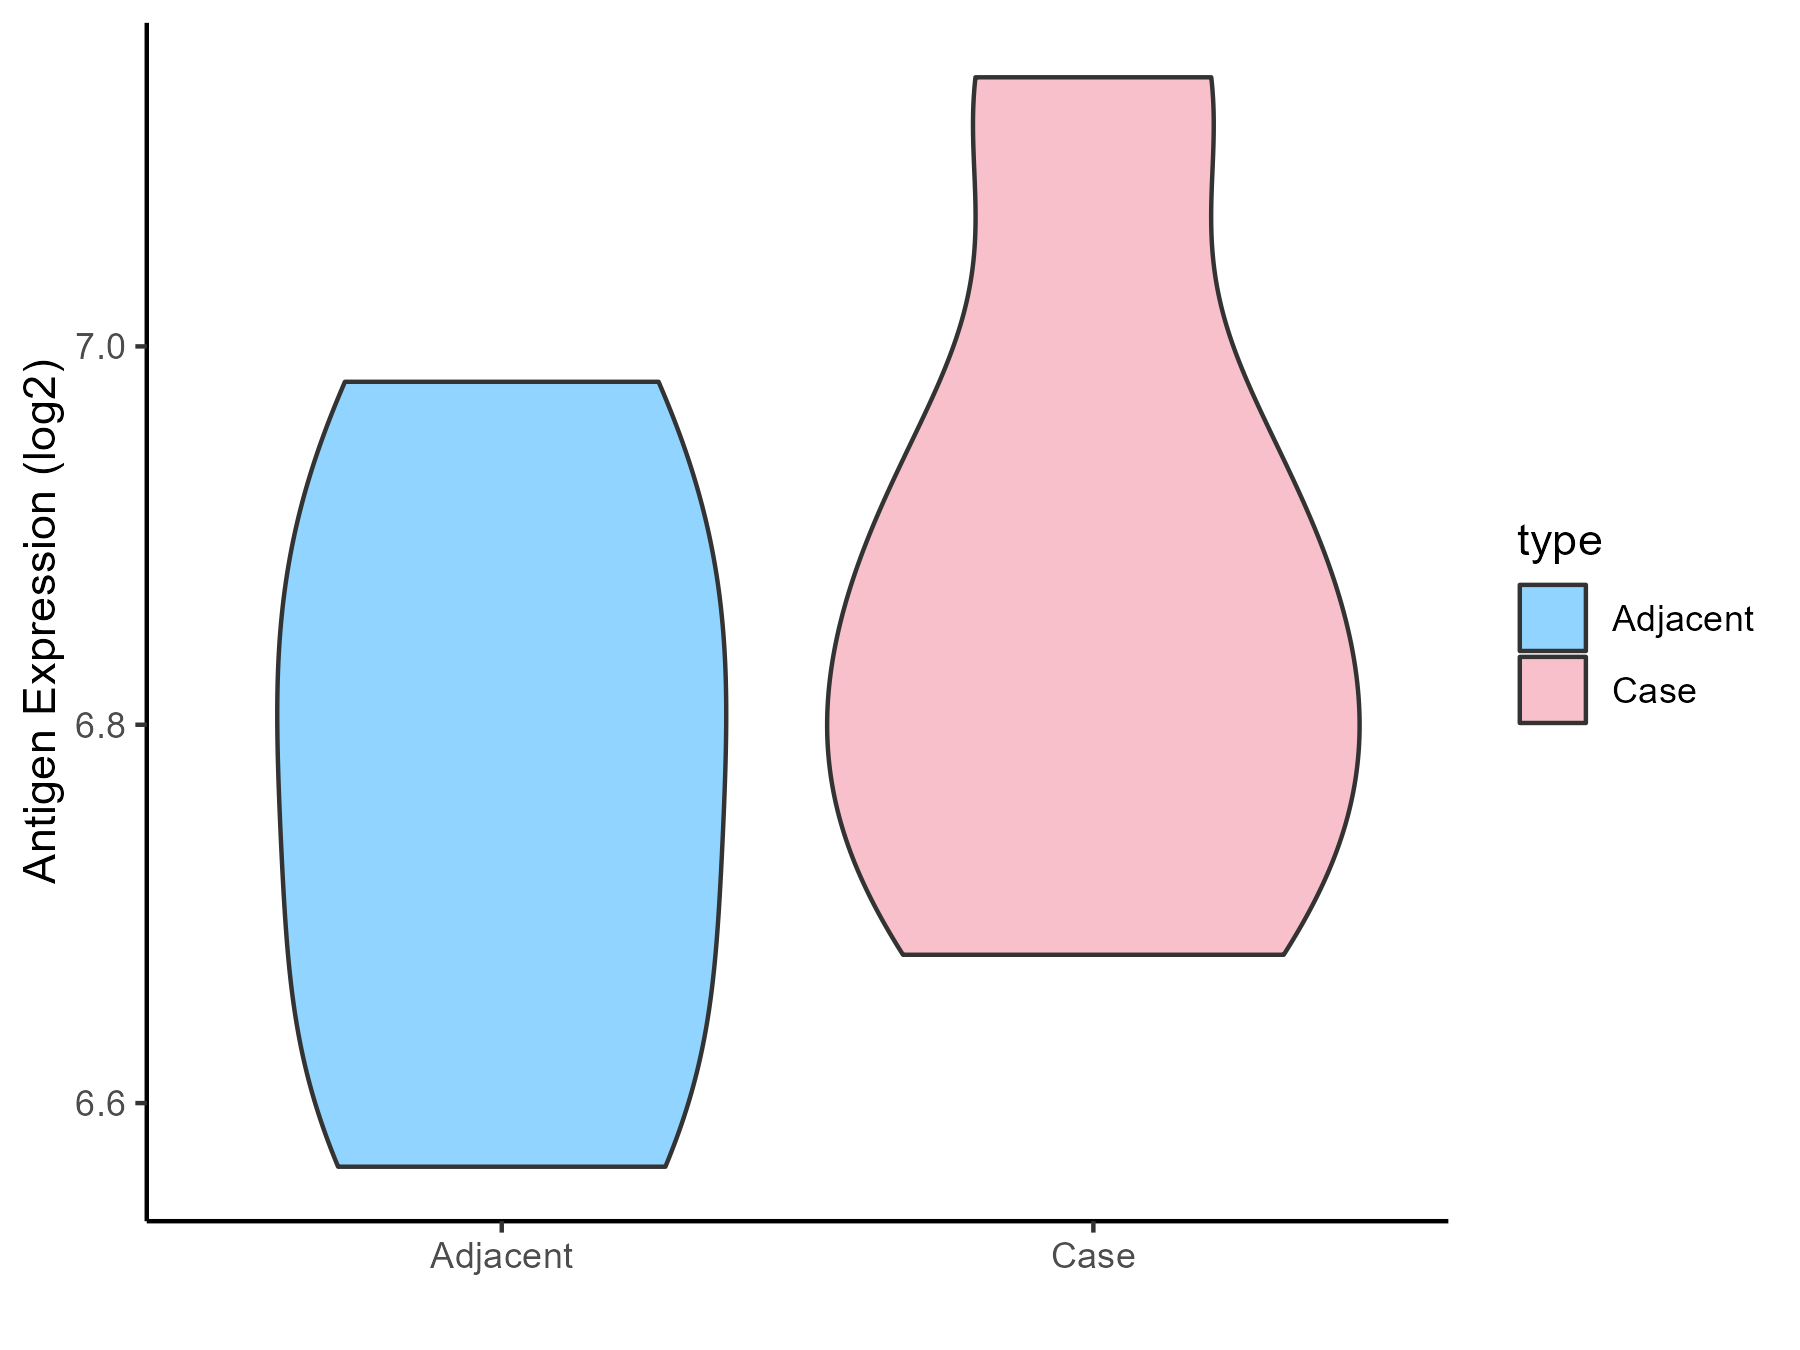
| Differential expression pattern of antigen in diseases | ||
| The Studied Tissue | Gastric antrum | |
| The Specific Disease | Eosinophilic gastritis | |
| The Expression Level of Disease Section Compare with the Adjacent Tissue | p-value: 0.366261907; Fold-change: 0.063271458; Z-score: 0.384357179 | |
| Disease-specific Antigen Abundances |
|
Click to View the Clearer Original Diagram |
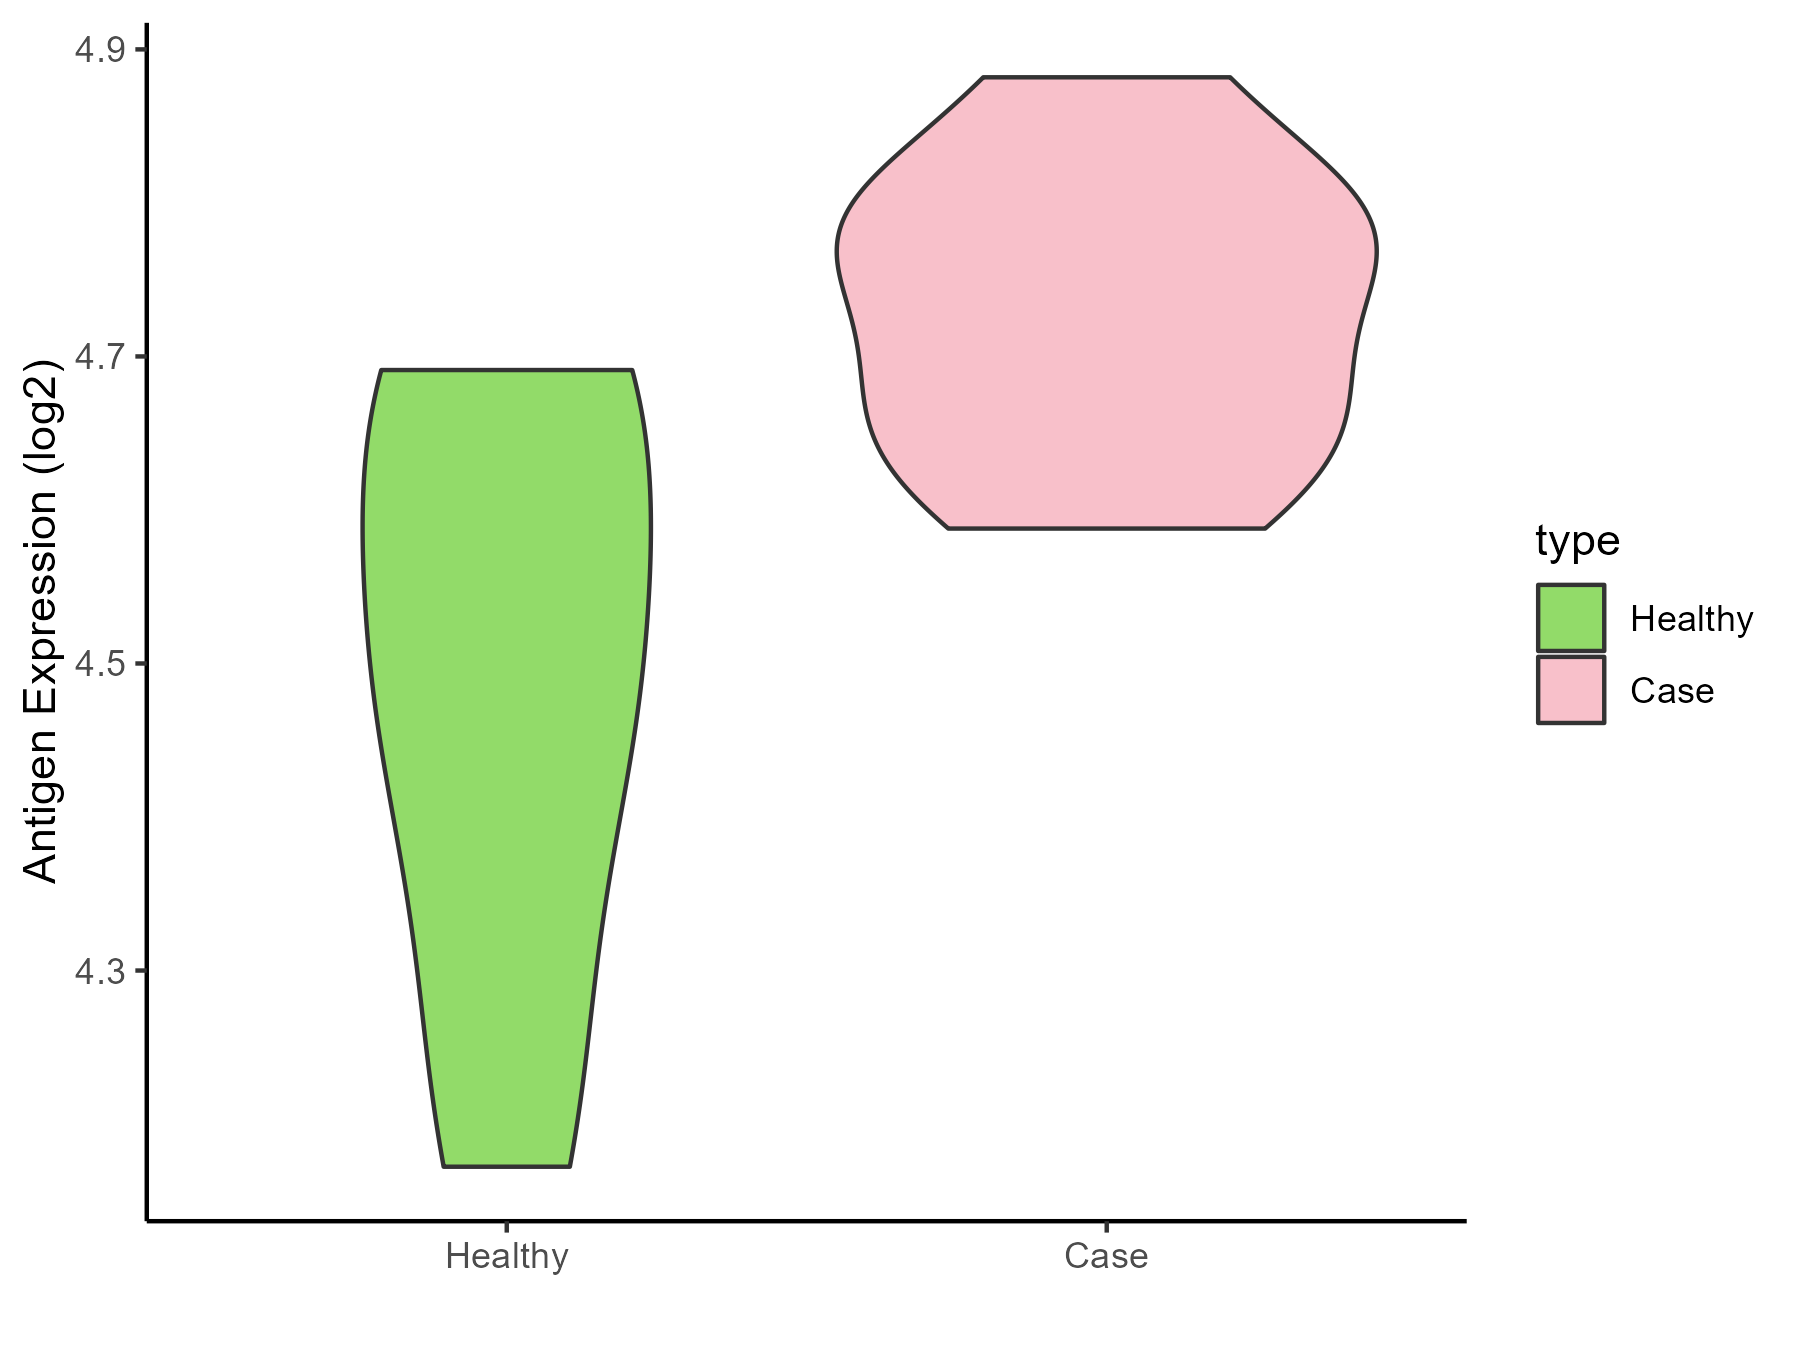
| Differential expression pattern of antigen in diseases | ||
| The Studied Tissue | Liver | |
| The Specific Disease | Liver failure | |
| The Expression Level of Disease Section Compare with the Healthy Individual Tissue | p-value: 0.009593374; Fold-change: 0.242595028; Z-score: 1.265626581 | |
| Disease-specific Antigen Abundances |
|
Click to View the Clearer Original Diagram |
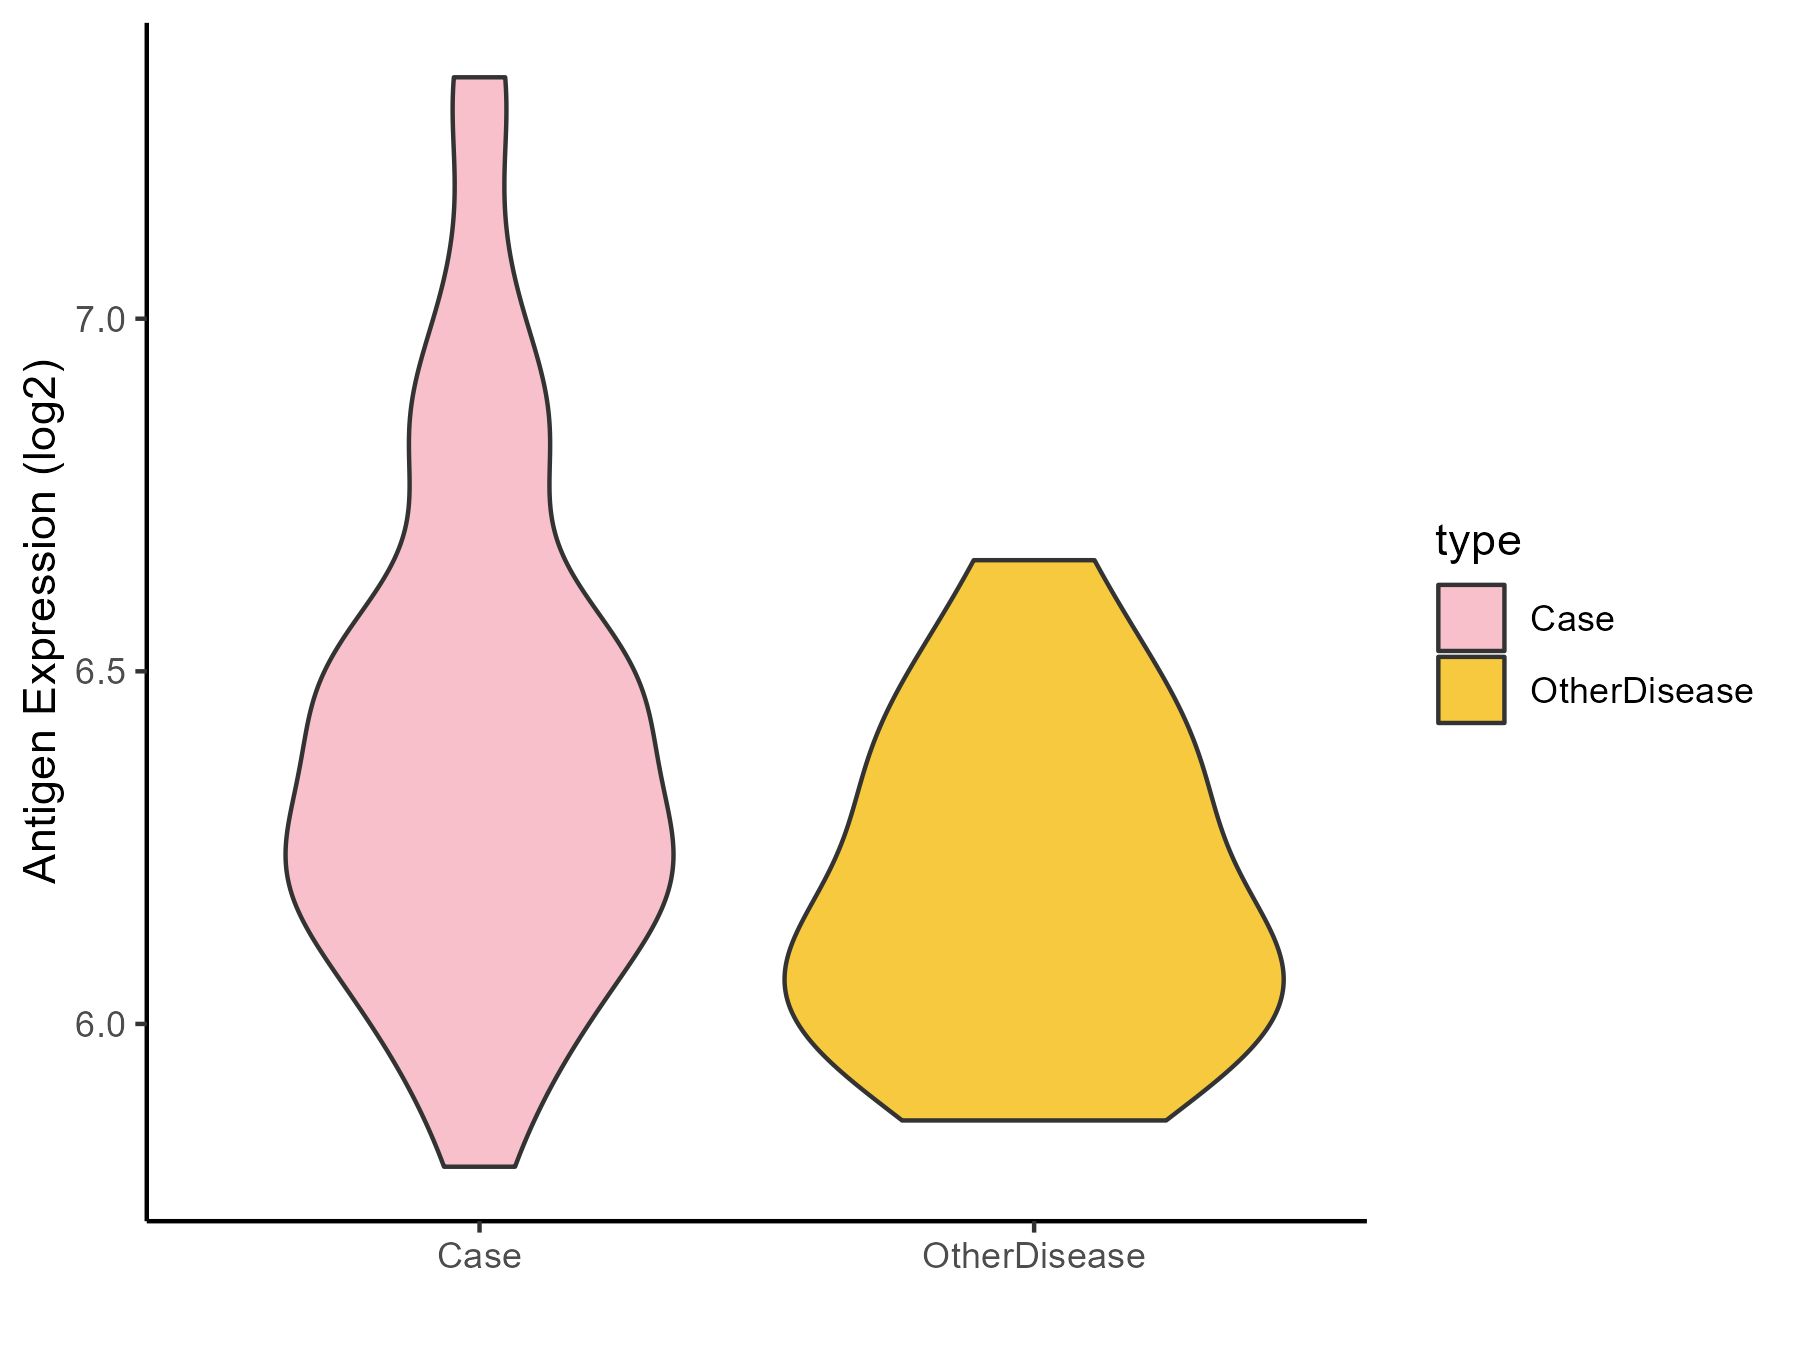
| Differential expression pattern of antigen in diseases | ||
| The Studied Tissue | Colon mucosal | |
| The Specific Disease | Ulcerative colitis | |
| The Expression Level of Disease Section Compare with the Adjacent Tissue | p-value: 0.005249573; Fold-change: 0.229446419; Z-score: 1.007463722 | |
| Disease-specific Antigen Abundances |
|
Click to View the Clearer Original Diagram |
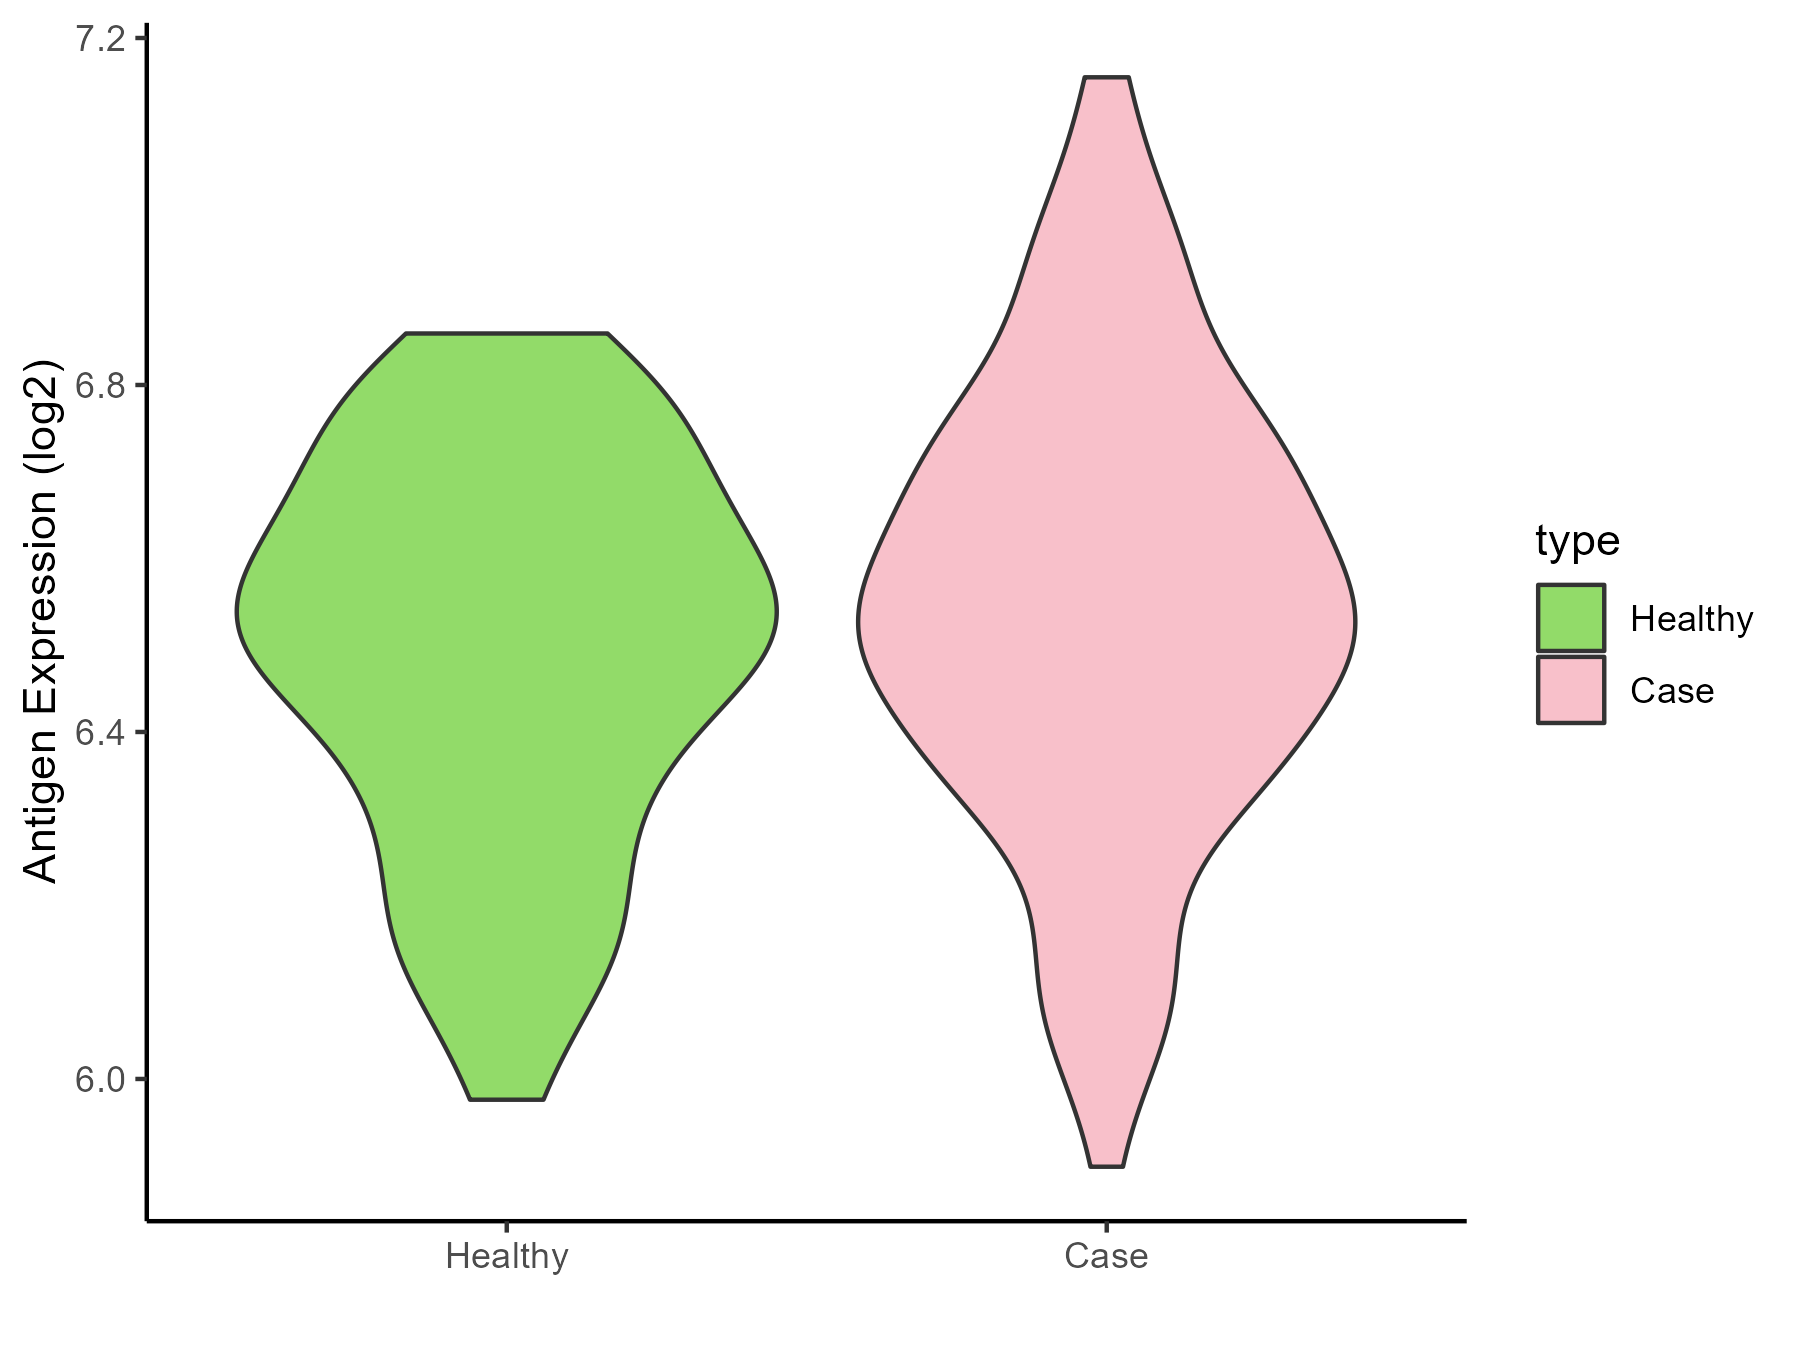
| Differential expression pattern of antigen in diseases | ||
| The Studied Tissue | Rectal colon | |
| The Specific Disease | Irritable bowel syndrome | |
| The Expression Level of Disease Section Compare with the Healthy Individual Tissue | p-value: 0.15559849; Fold-change: 0.019866079; Z-score: 0.088848184 | |
| Disease-specific Antigen Abundances |
|
Click to View the Clearer Original Diagram |
ICD Disease Classification 14
| Differential expression pattern of antigen in diseases | ||
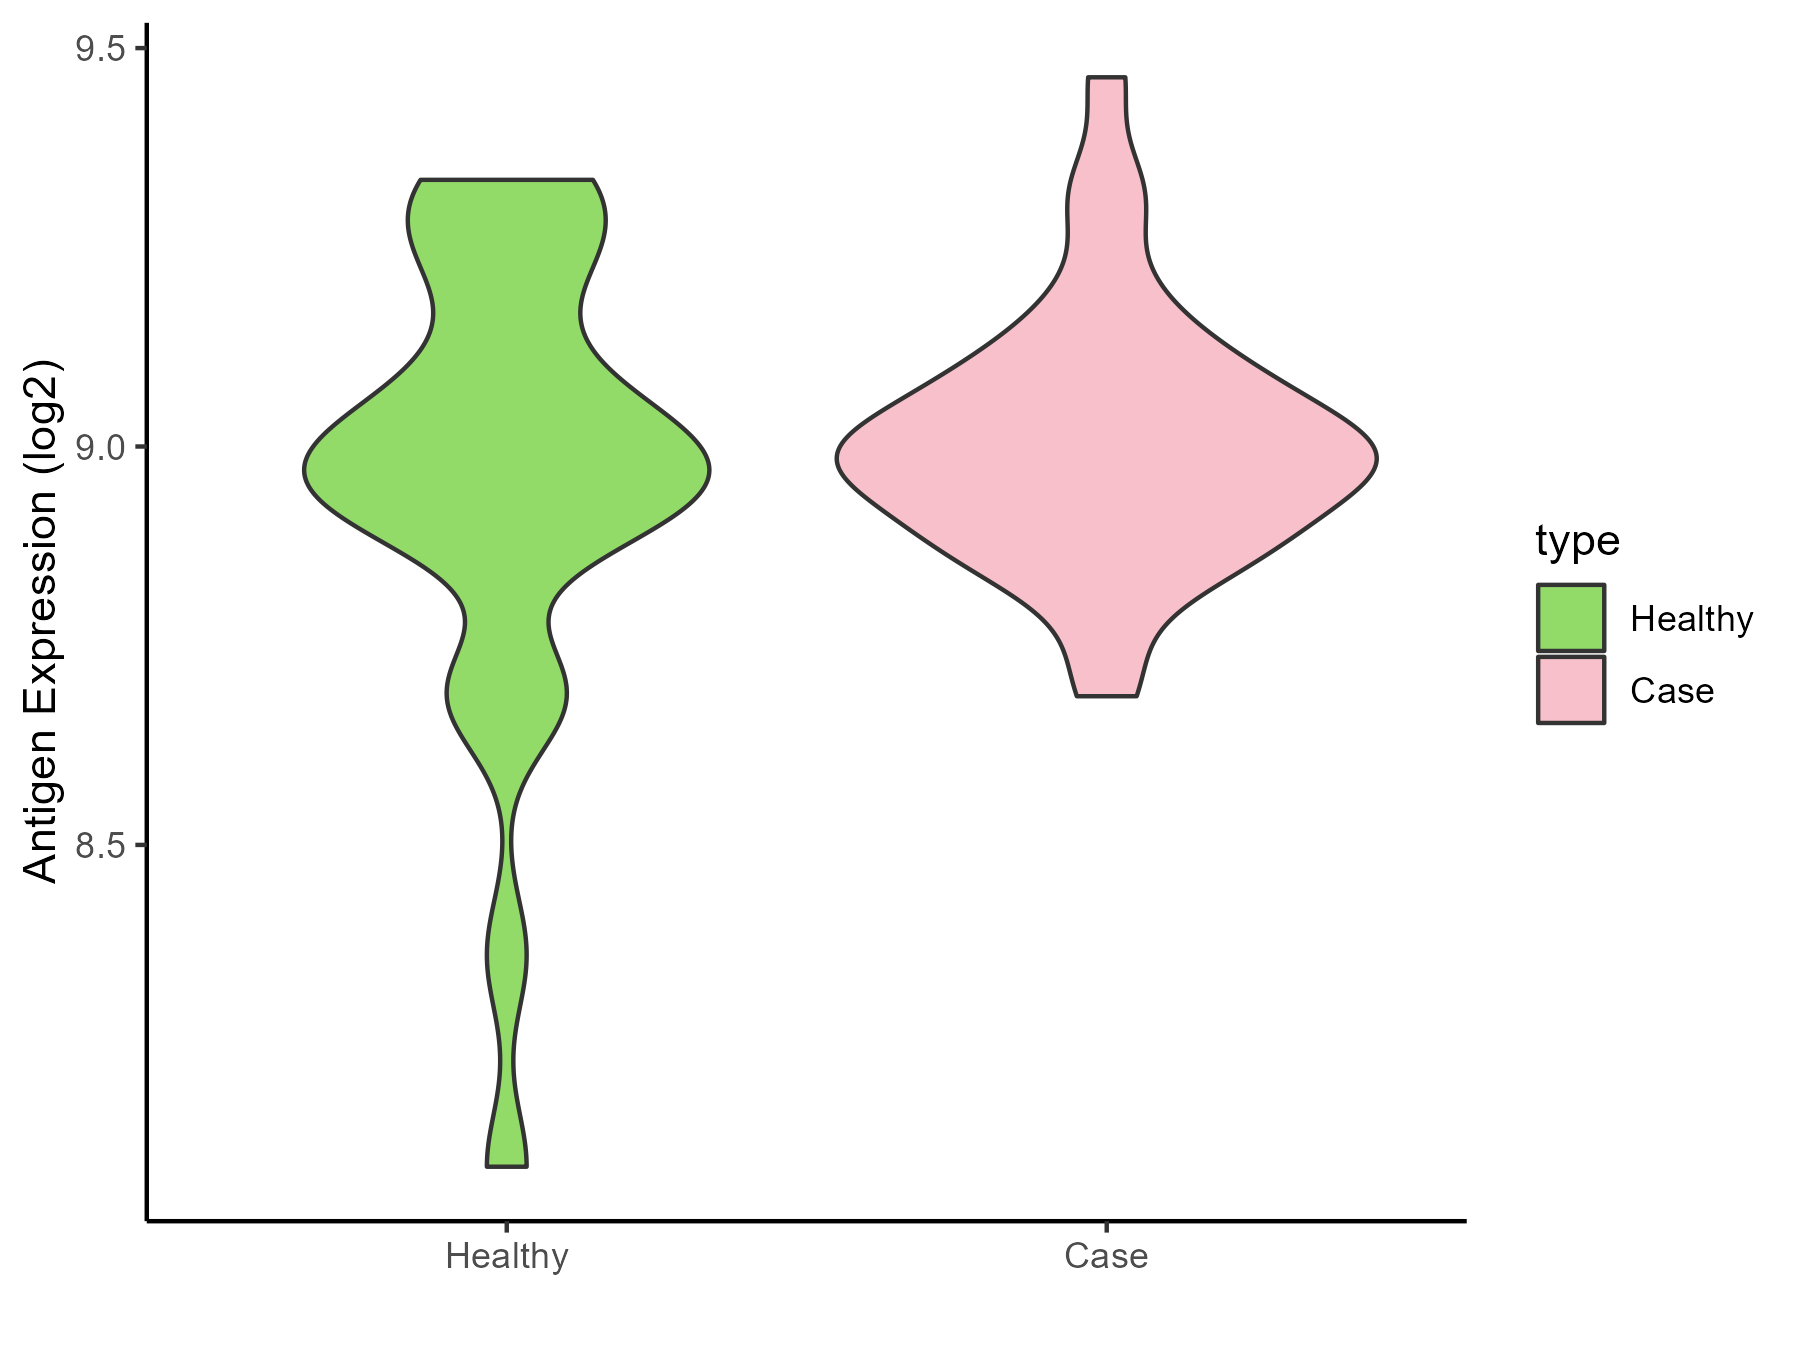
| The Studied Tissue | Skin | |
| The Specific Disease | Atopic dermatitis | |
| The Expression Level of Disease Section Compare with the Healthy Individual Tissue | p-value: 0.496116271; Fold-change: -0.005445234; Z-score: -0.018593297 | |
| Disease-specific Antigen Abundances |
|
Click to View the Clearer Original Diagram |
| Differential expression pattern of antigen in diseases | ||
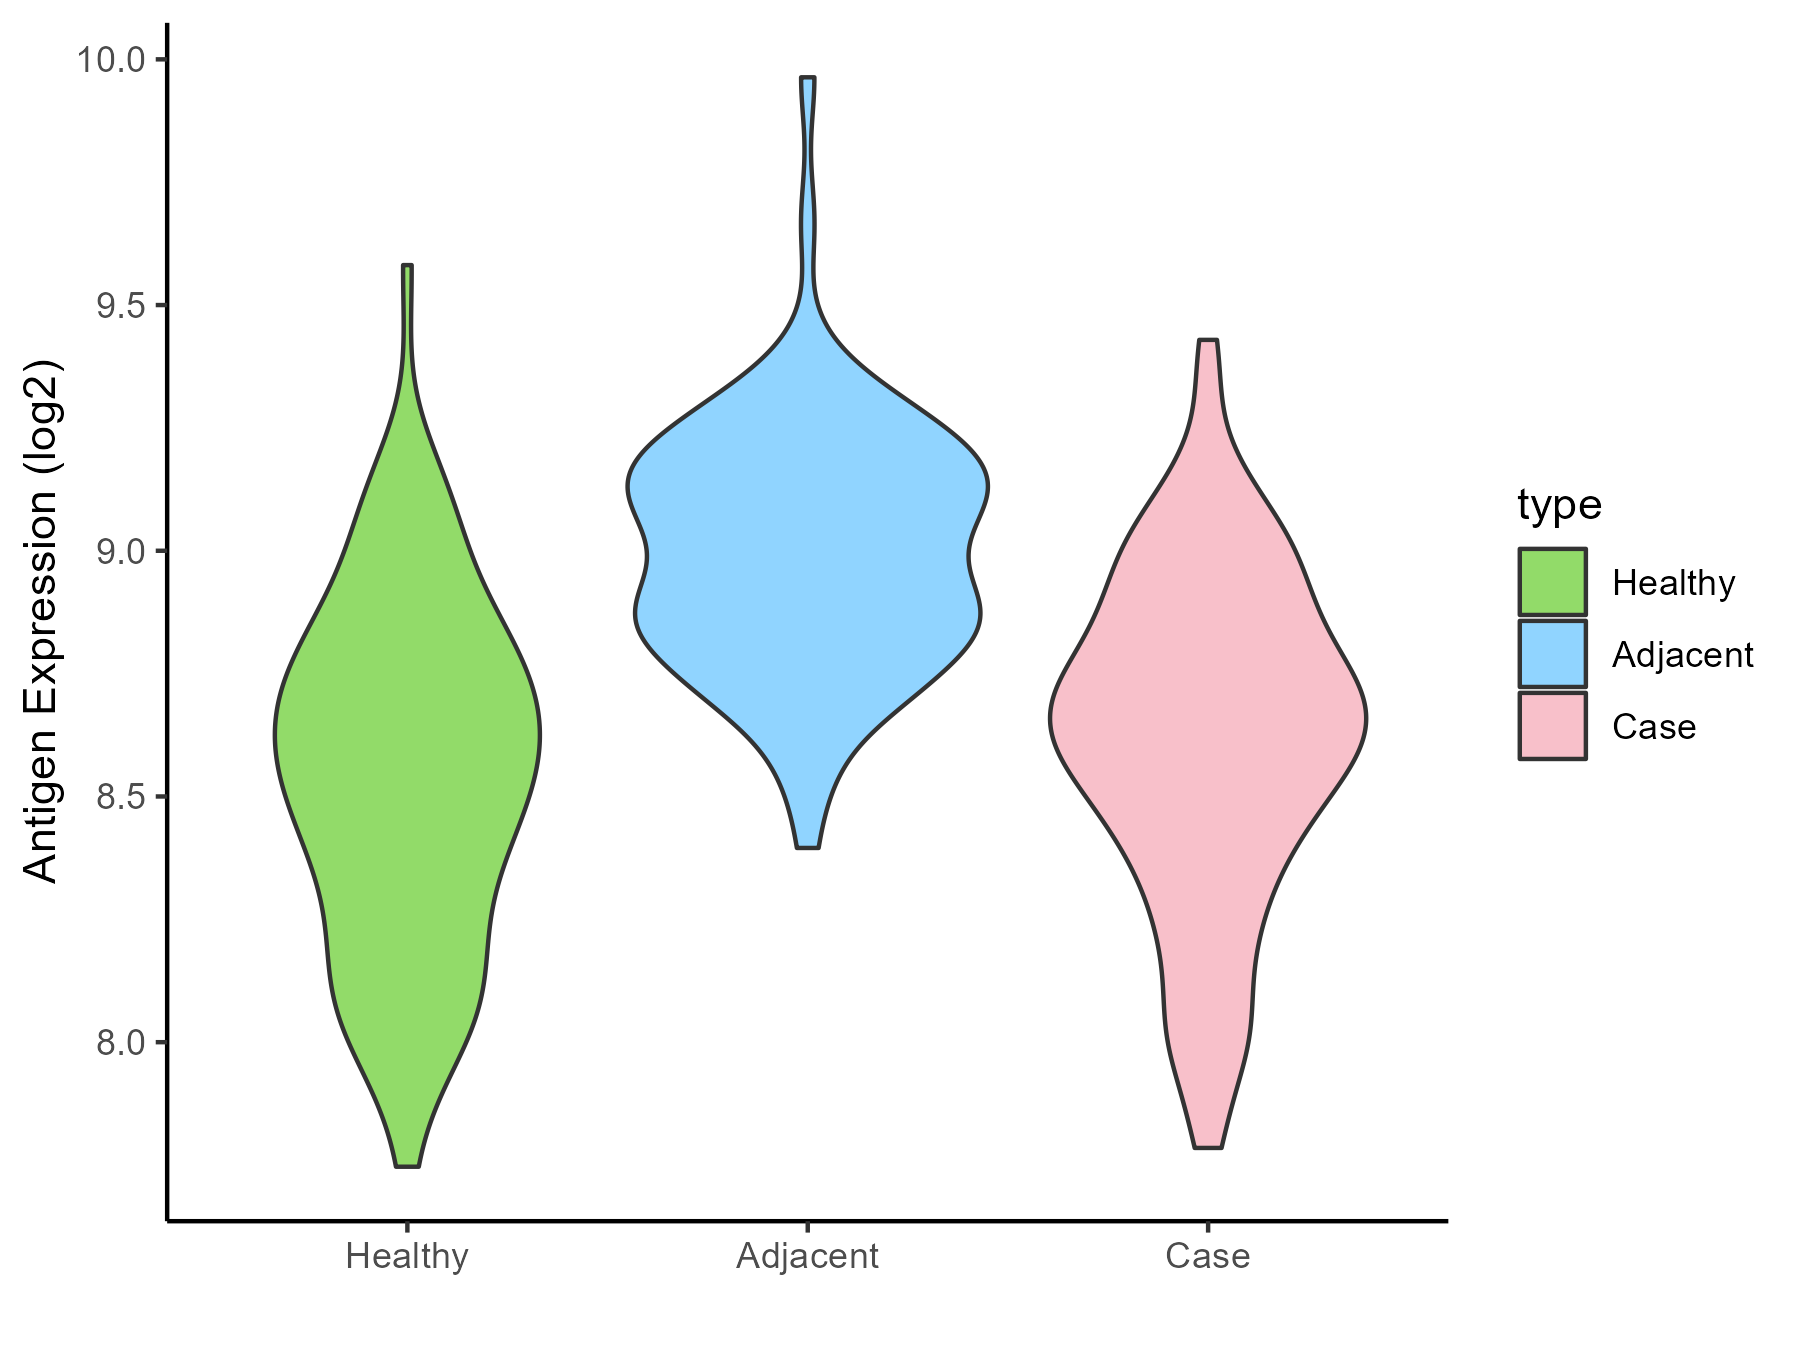
| The Studied Tissue | Skin | |
| The Specific Disease | Psoriasis | |
| The Expression Level of Disease Section Compare with the Healthy Individual Tissue | p-value: 0.078714308; Fold-change: 0.080137752; Z-score: 0.228446701 | |
| The Expression Level of Disease Section Compare with the Adjacent Tissue | p-value: 1.78E-22; Fold-change: -0.369965016; Z-score: -1.470799583 | |
| Disease-specific Antigen Abundances |
|
Click to View the Clearer Original Diagram |
| Differential expression pattern of antigen in diseases | ||
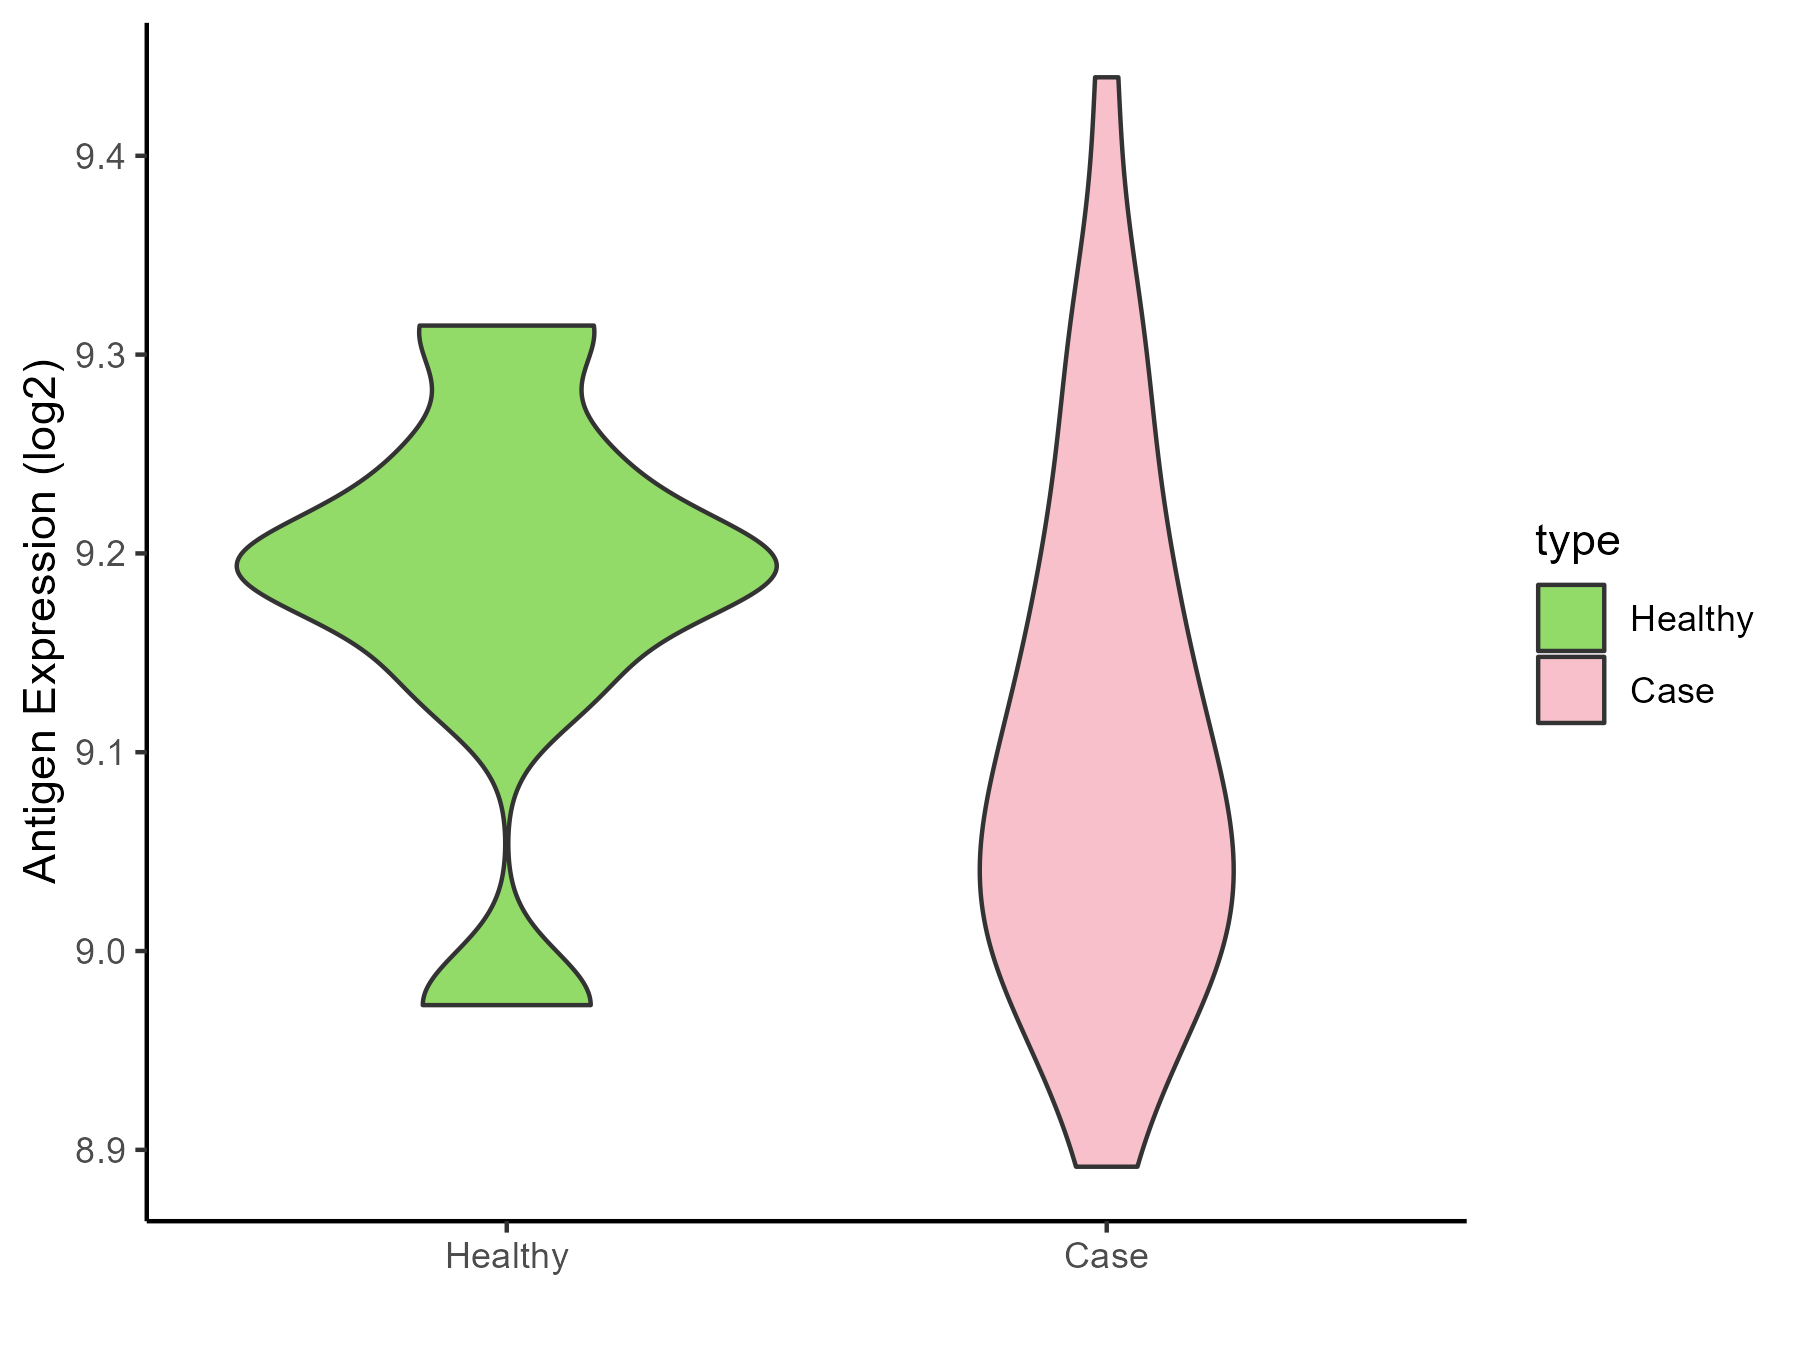
| The Studied Tissue | Skin | |
| The Specific Disease | Vitiligo | |
| The Expression Level of Disease Section Compare with the Healthy Individual Tissue | p-value: 0.146257371; Fold-change: -0.113933225; Z-score: -1.070422361 | |
| Disease-specific Antigen Abundances |
|
Click to View the Clearer Original Diagram |
| Differential expression pattern of antigen in diseases | ||
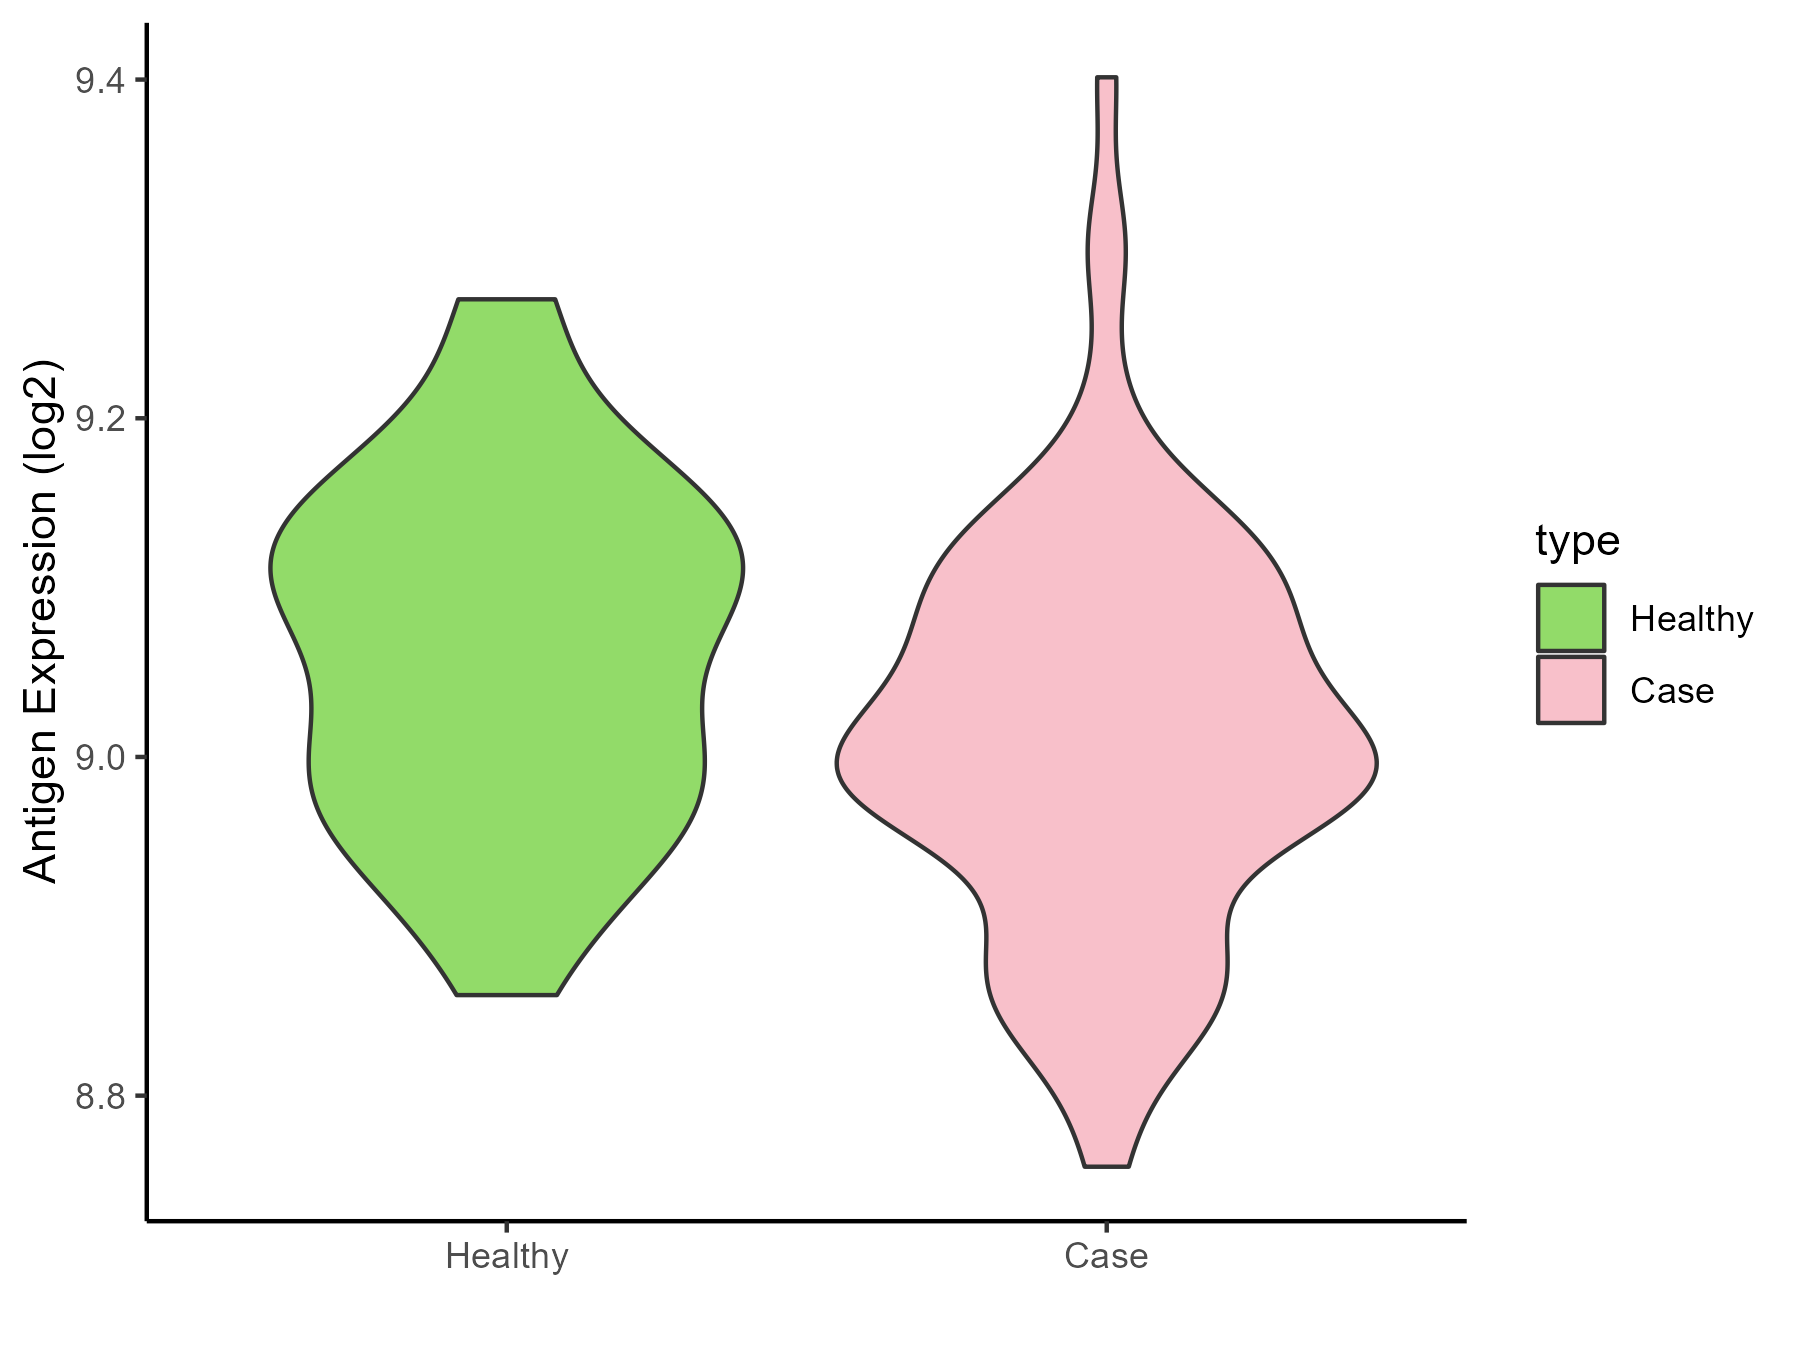
| The Studied Tissue | Skin from scalp | |
| The Specific Disease | Alopecia | |
| The Expression Level of Disease Section Compare with the Healthy Individual Tissue | p-value: 0.018241369; Fold-change: -0.080154013; Z-score: -0.782750652 | |
| Disease-specific Antigen Abundances |
|
Click to View the Clearer Original Diagram |
| Differential expression pattern of antigen in diseases | ||
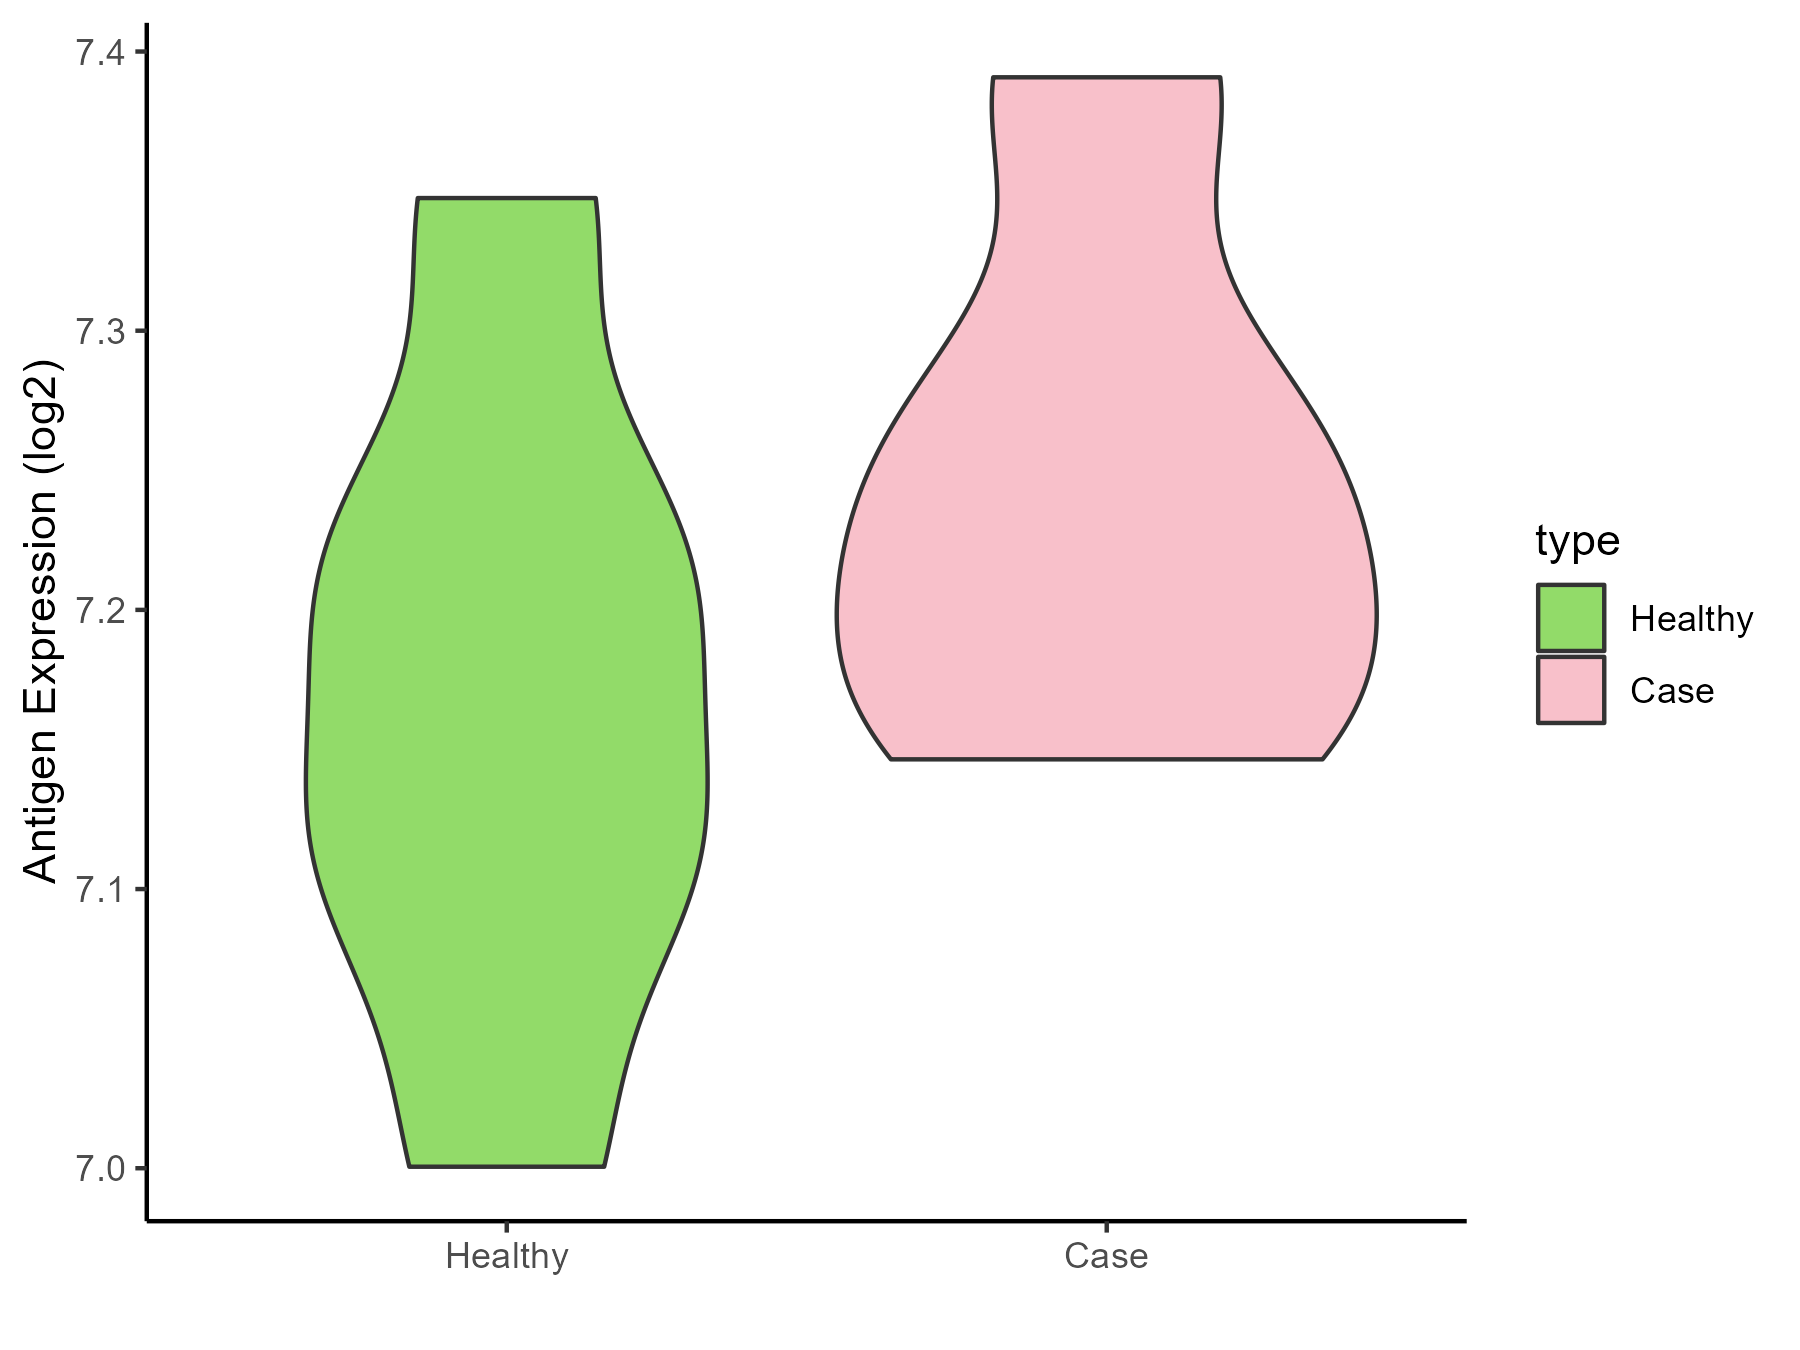
| The Studied Tissue | Skin | |
| The Specific Disease | Sensitive skin | |
| The Expression Level of Disease Section Compare with the Healthy Individual Tissue | p-value: 0.263917745; Fold-change: 0.070803548; Z-score: 0.593300604 | |
| Disease-specific Antigen Abundances |
|
Click to View the Clearer Original Diagram |
ICD Disease Classification 15
| Differential expression pattern of antigen in diseases | ||
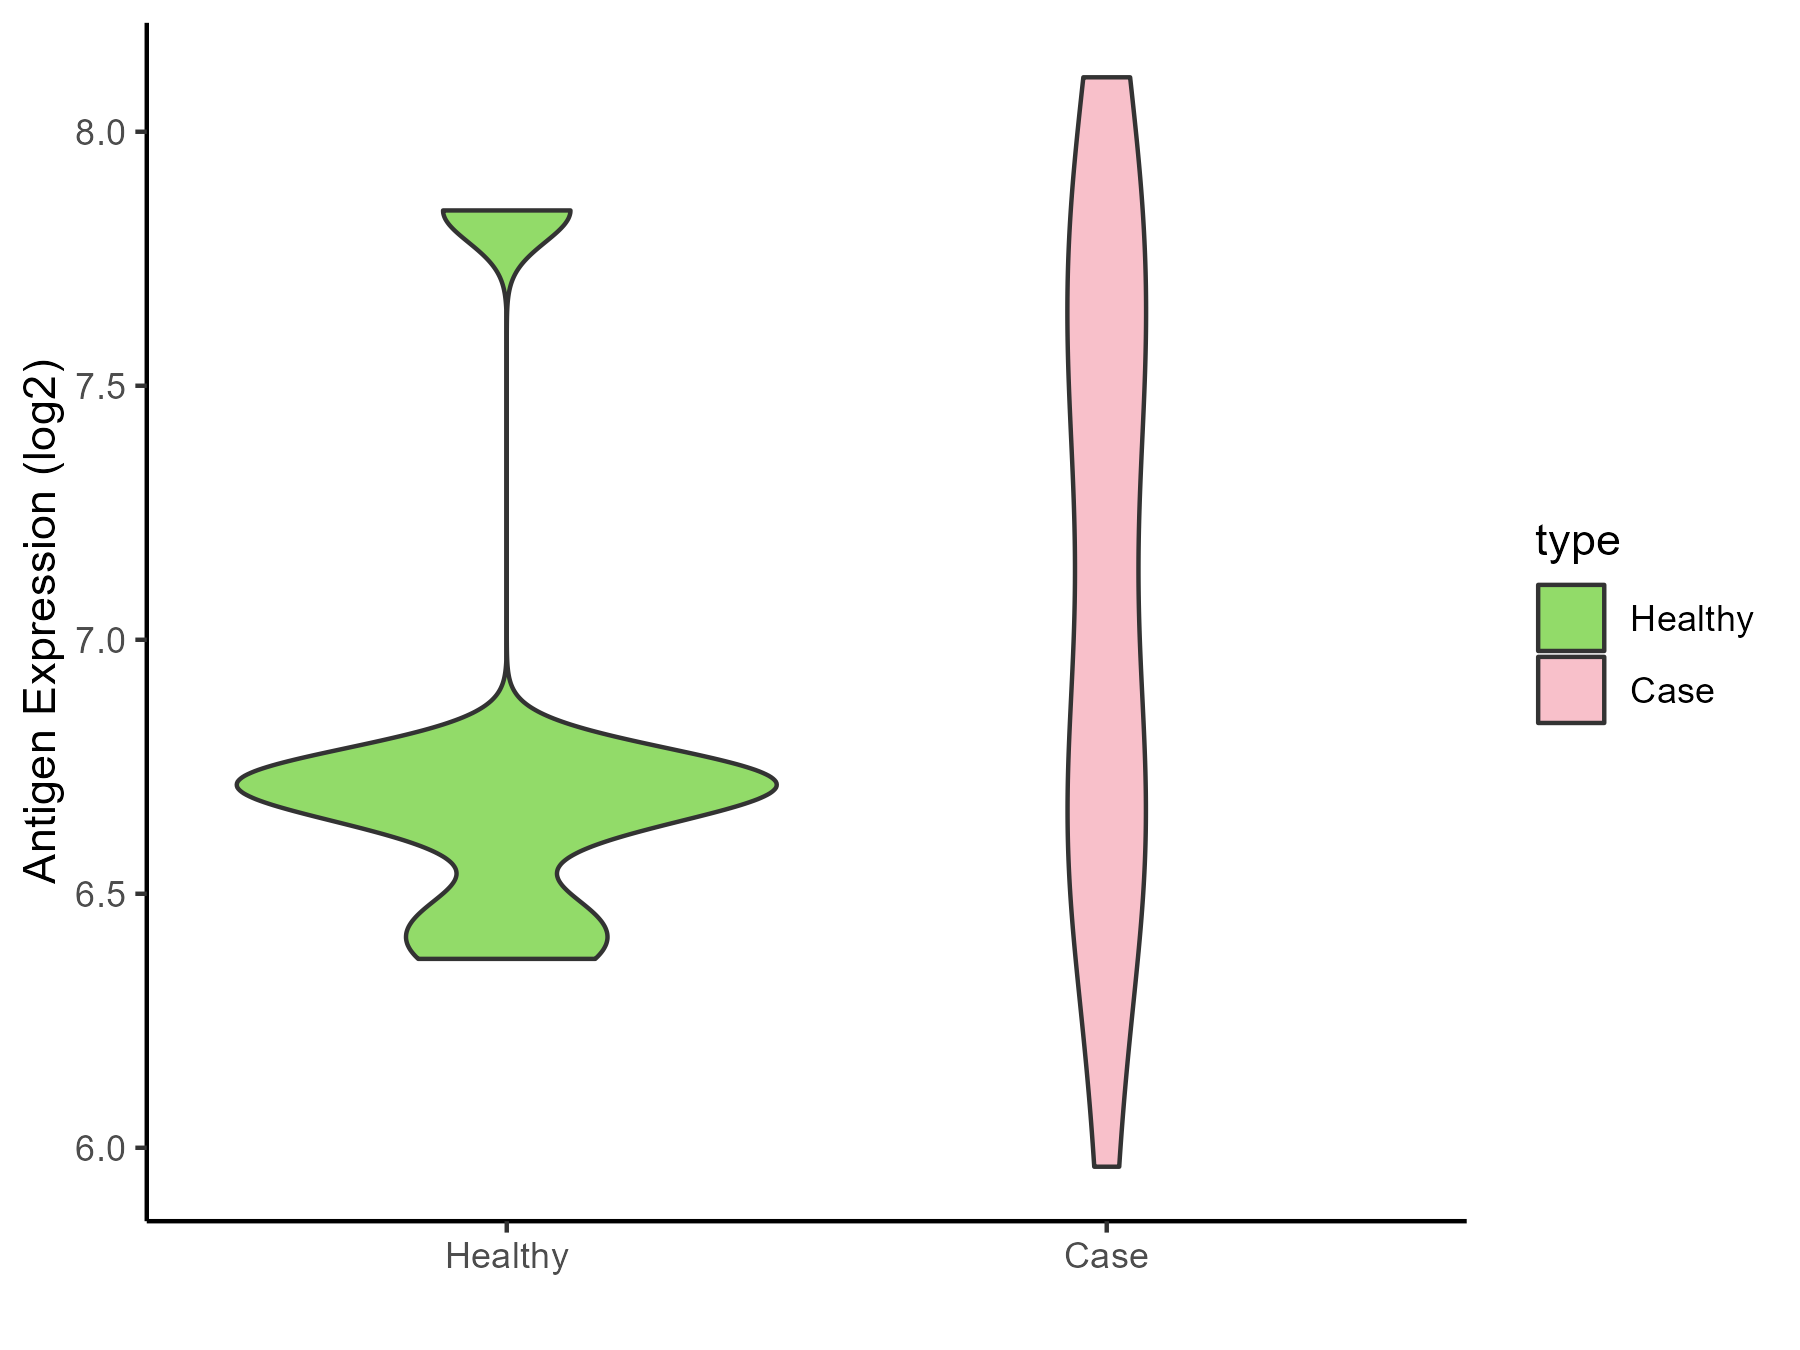
| The Studied Tissue | Synovial | |
| The Specific Disease | Osteoarthritis | |
| The Expression Level of Disease Section Compare with the Healthy Individual Tissue | p-value: 0.139449018; Fold-change: 0.550578577; Z-score: 1.214668591 | |
| Disease-specific Antigen Abundances |
|
Click to View the Clearer Original Diagram |
| Differential expression pattern of antigen in diseases | ||
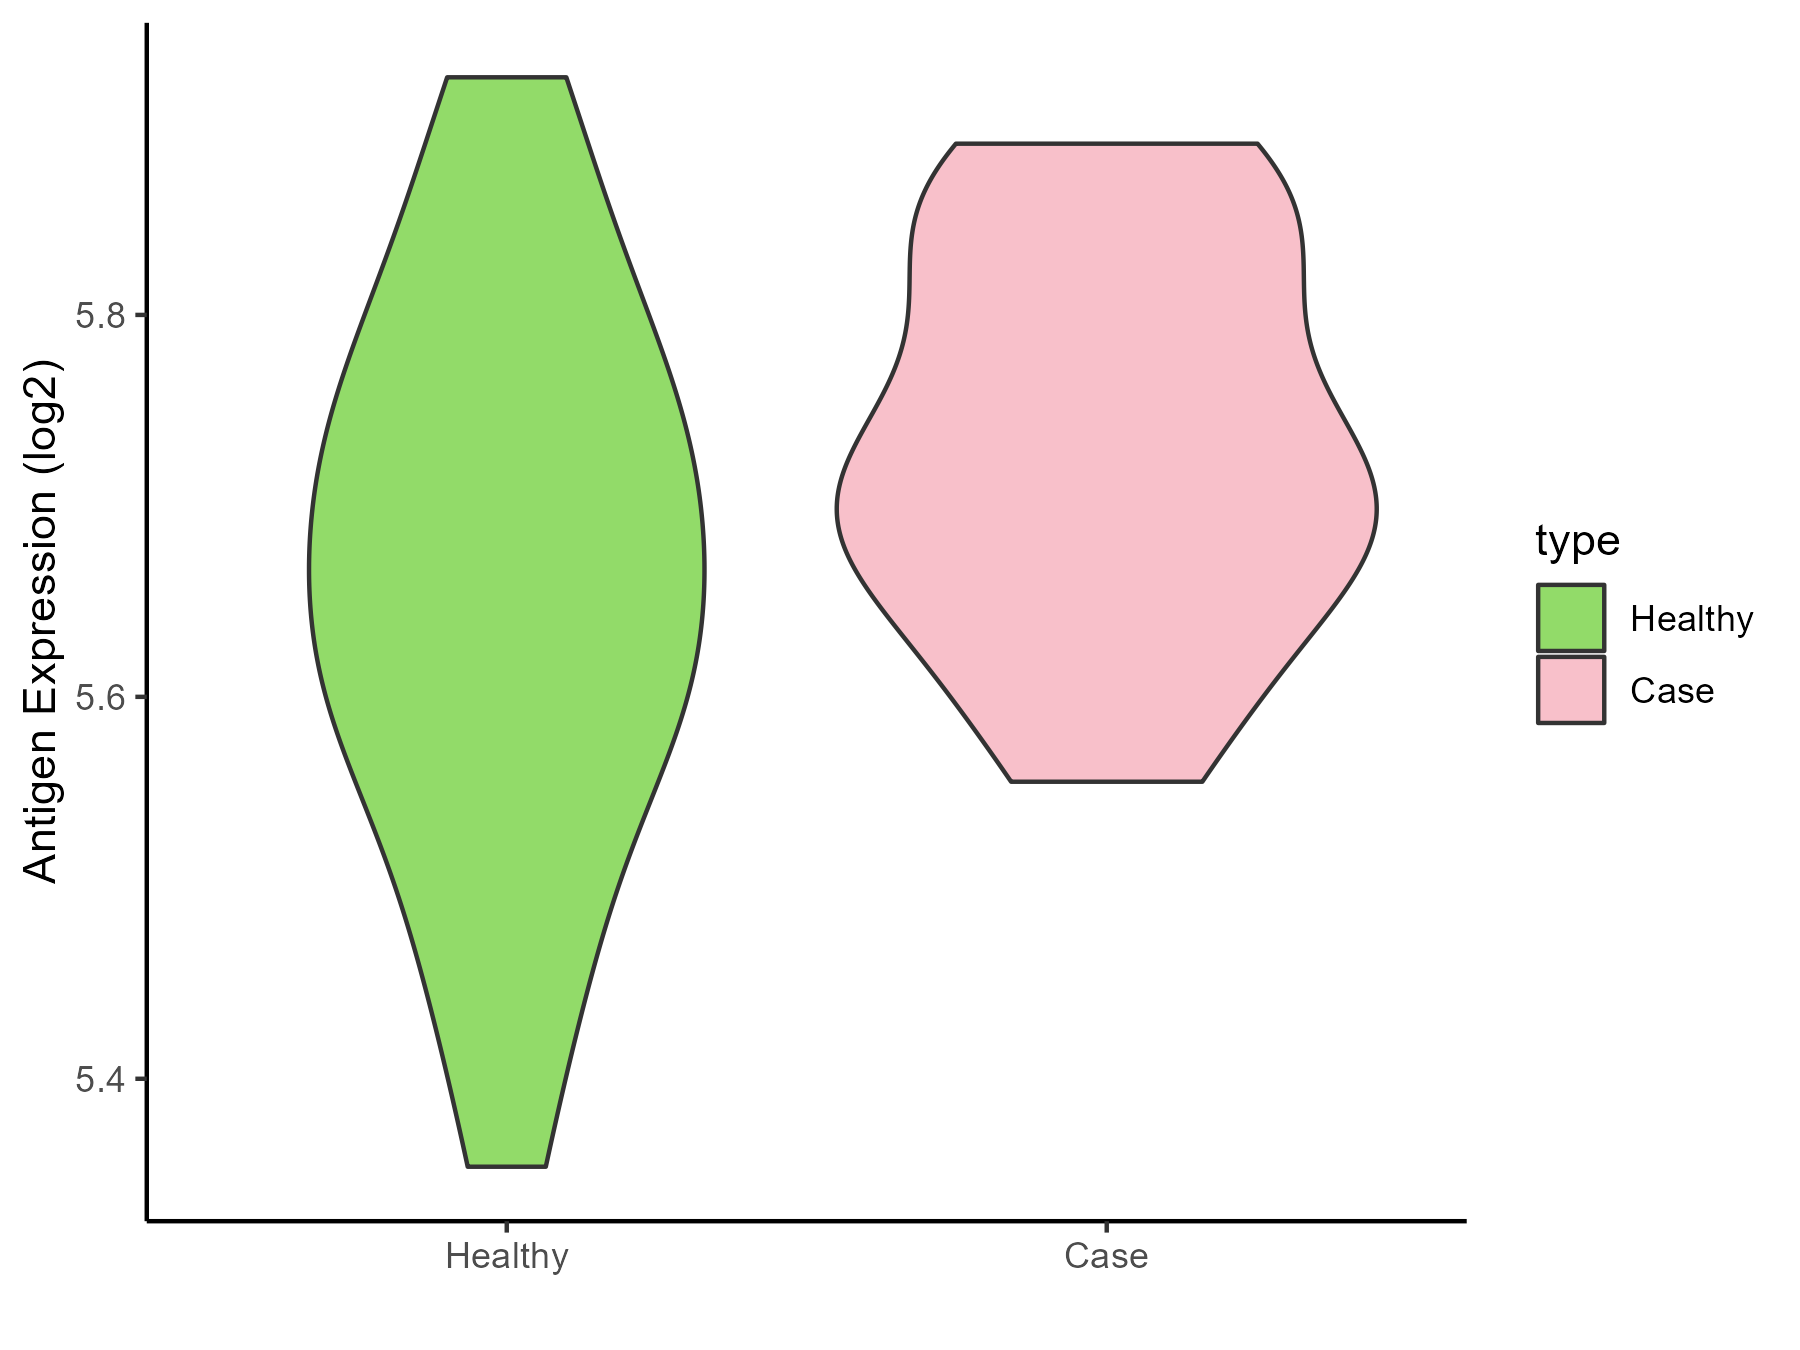
| The Studied Tissue | Peripheral blood | |
| The Specific Disease | Arthropathy | |
| The Expression Level of Disease Section Compare with the Healthy Individual Tissue | p-value: 0.079158671; Fold-change: 0.038297868; Z-score: 0.261437249 | |
| Disease-specific Antigen Abundances |
|
Click to View the Clearer Original Diagram |
| Differential expression pattern of antigen in diseases | ||
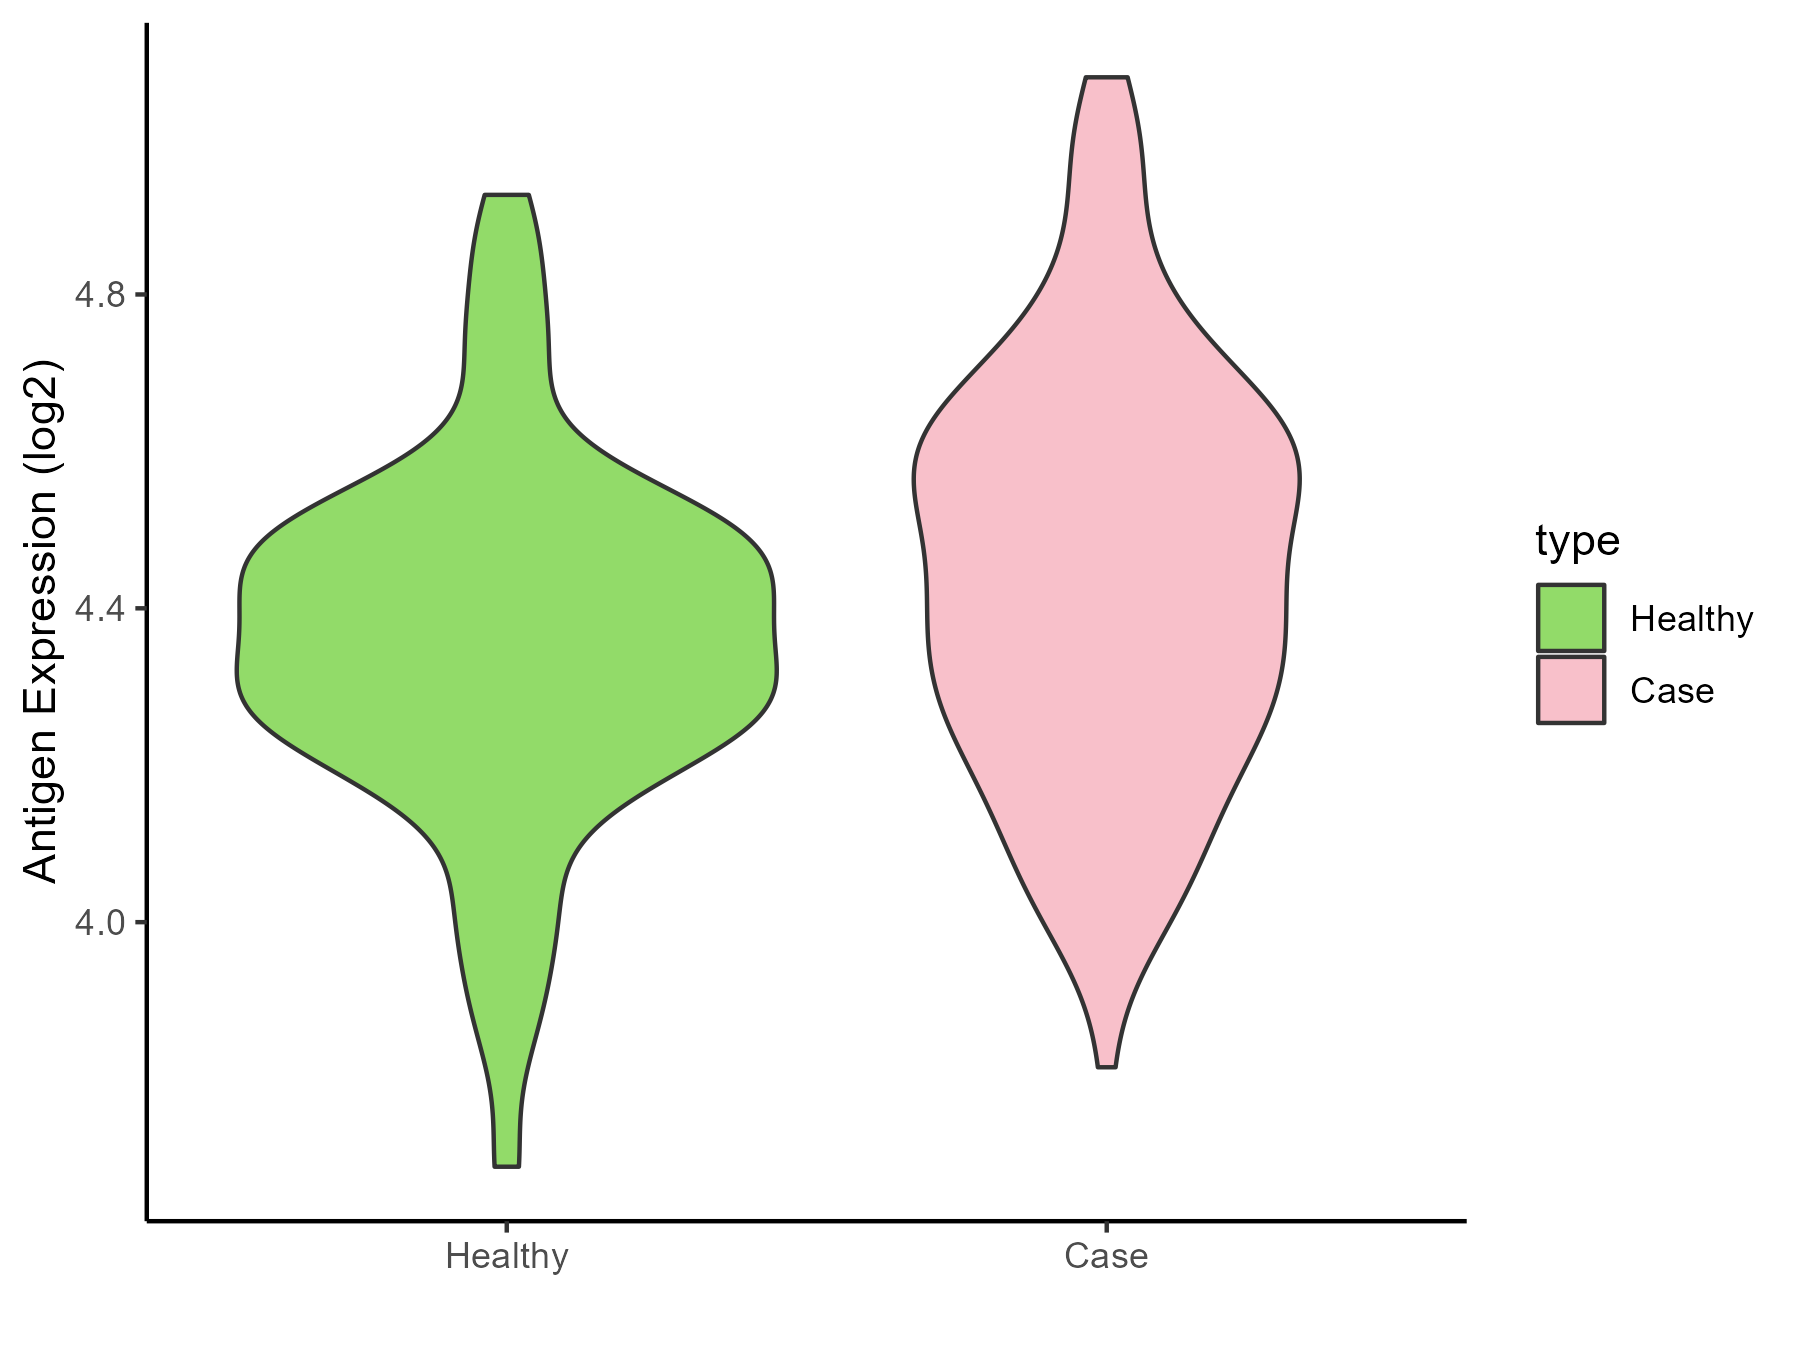
| The Studied Tissue | Peripheral blood | |
| The Specific Disease | Arthritis | |
| The Expression Level of Disease Section Compare with the Healthy Individual Tissue | p-value: 0.009276225; Fold-change: 0.08751373; Z-score: 0.389684512 | |
| Disease-specific Antigen Abundances |
|
Click to View the Clearer Original Diagram |
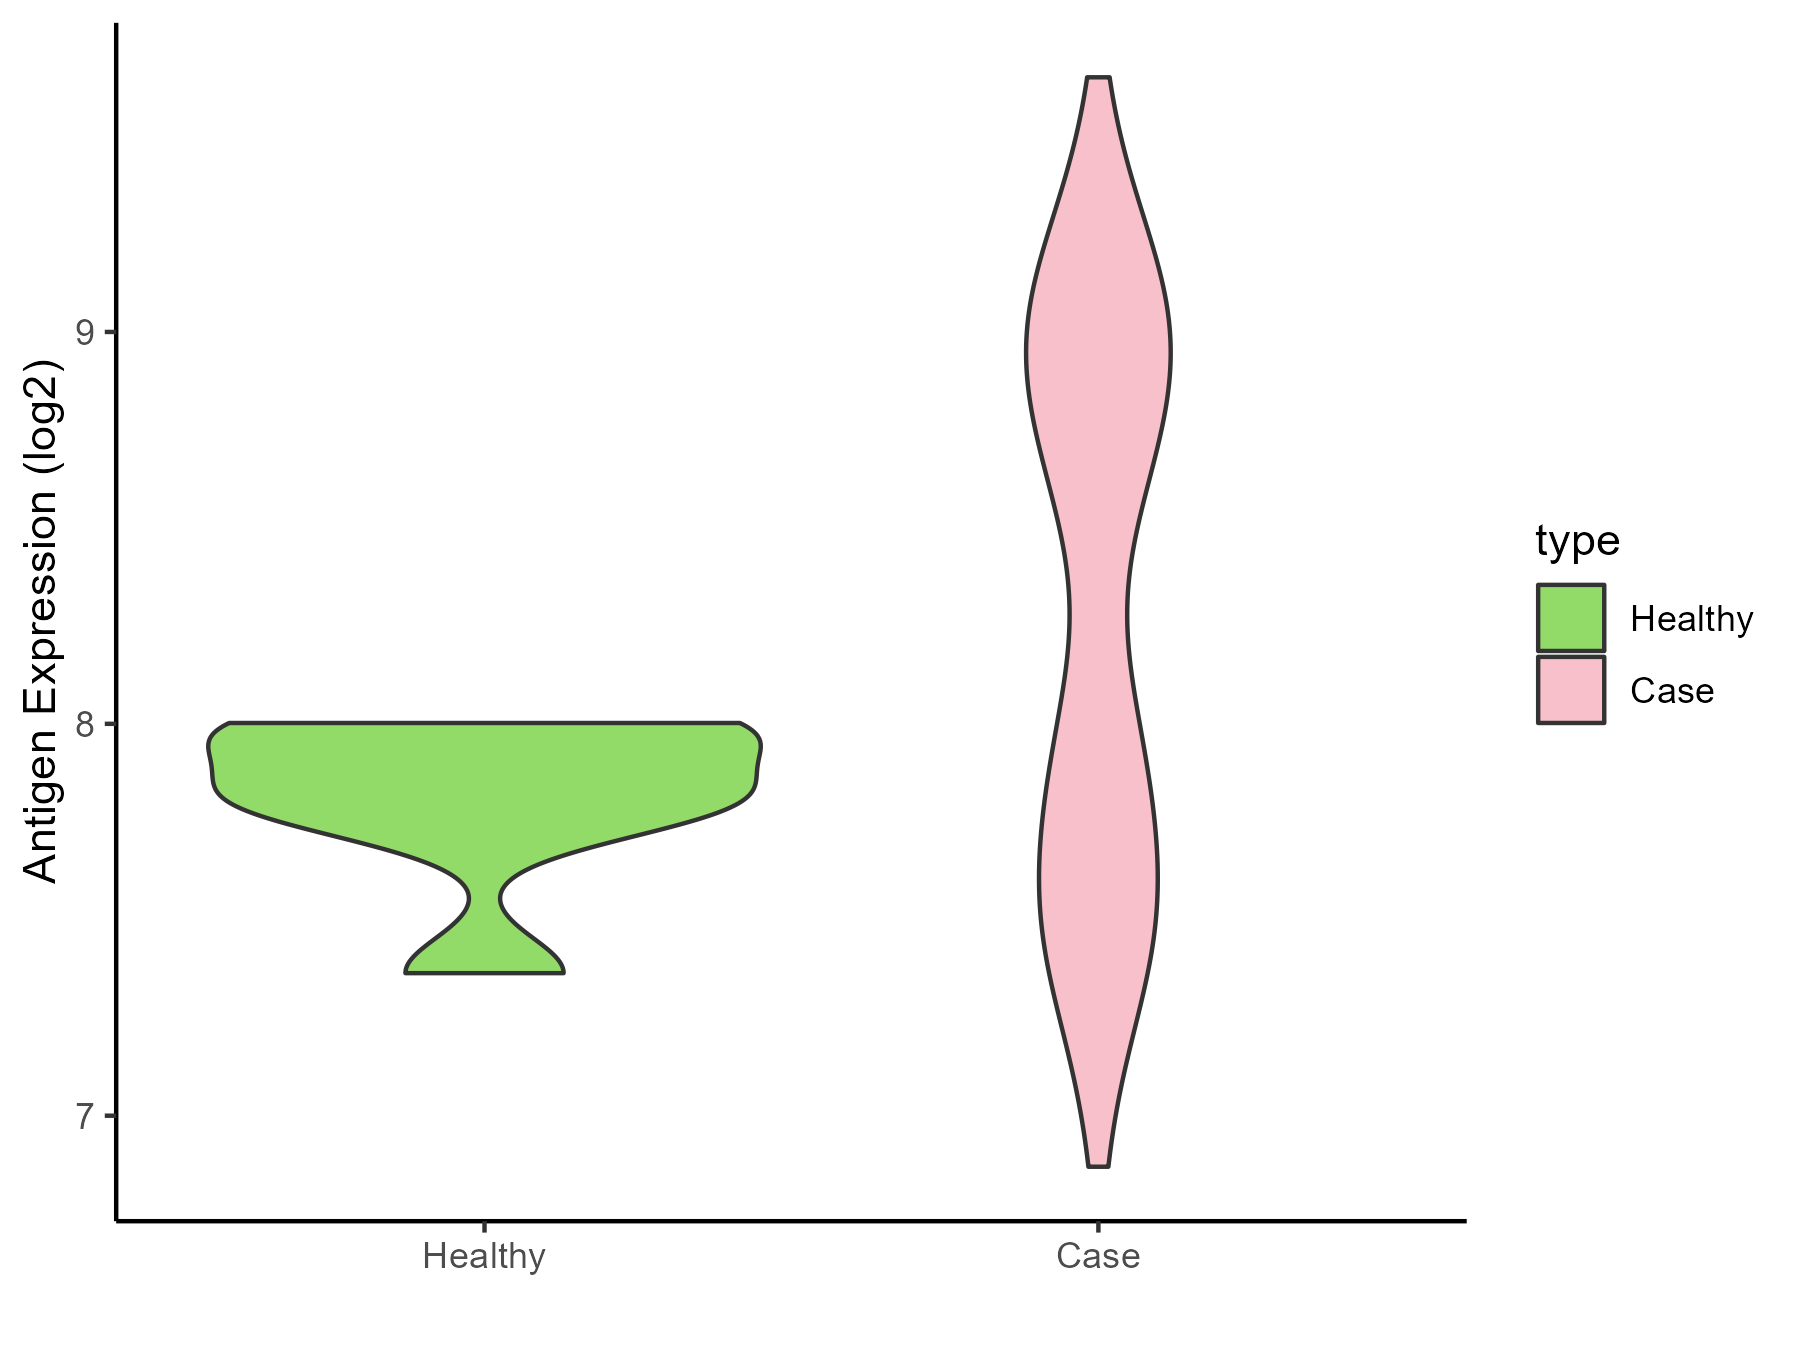
| Differential expression pattern of antigen in diseases | ||
| The Studied Tissue | Synovial | |
| The Specific Disease | Rheumatoid arthritis | |
| The Expression Level of Disease Section Compare with the Healthy Individual Tissue | p-value: 0.000337909; Fold-change: 0.650157002; Z-score: 2.910625949 | |
| Disease-specific Antigen Abundances |
|
Click to View the Clearer Original Diagram |
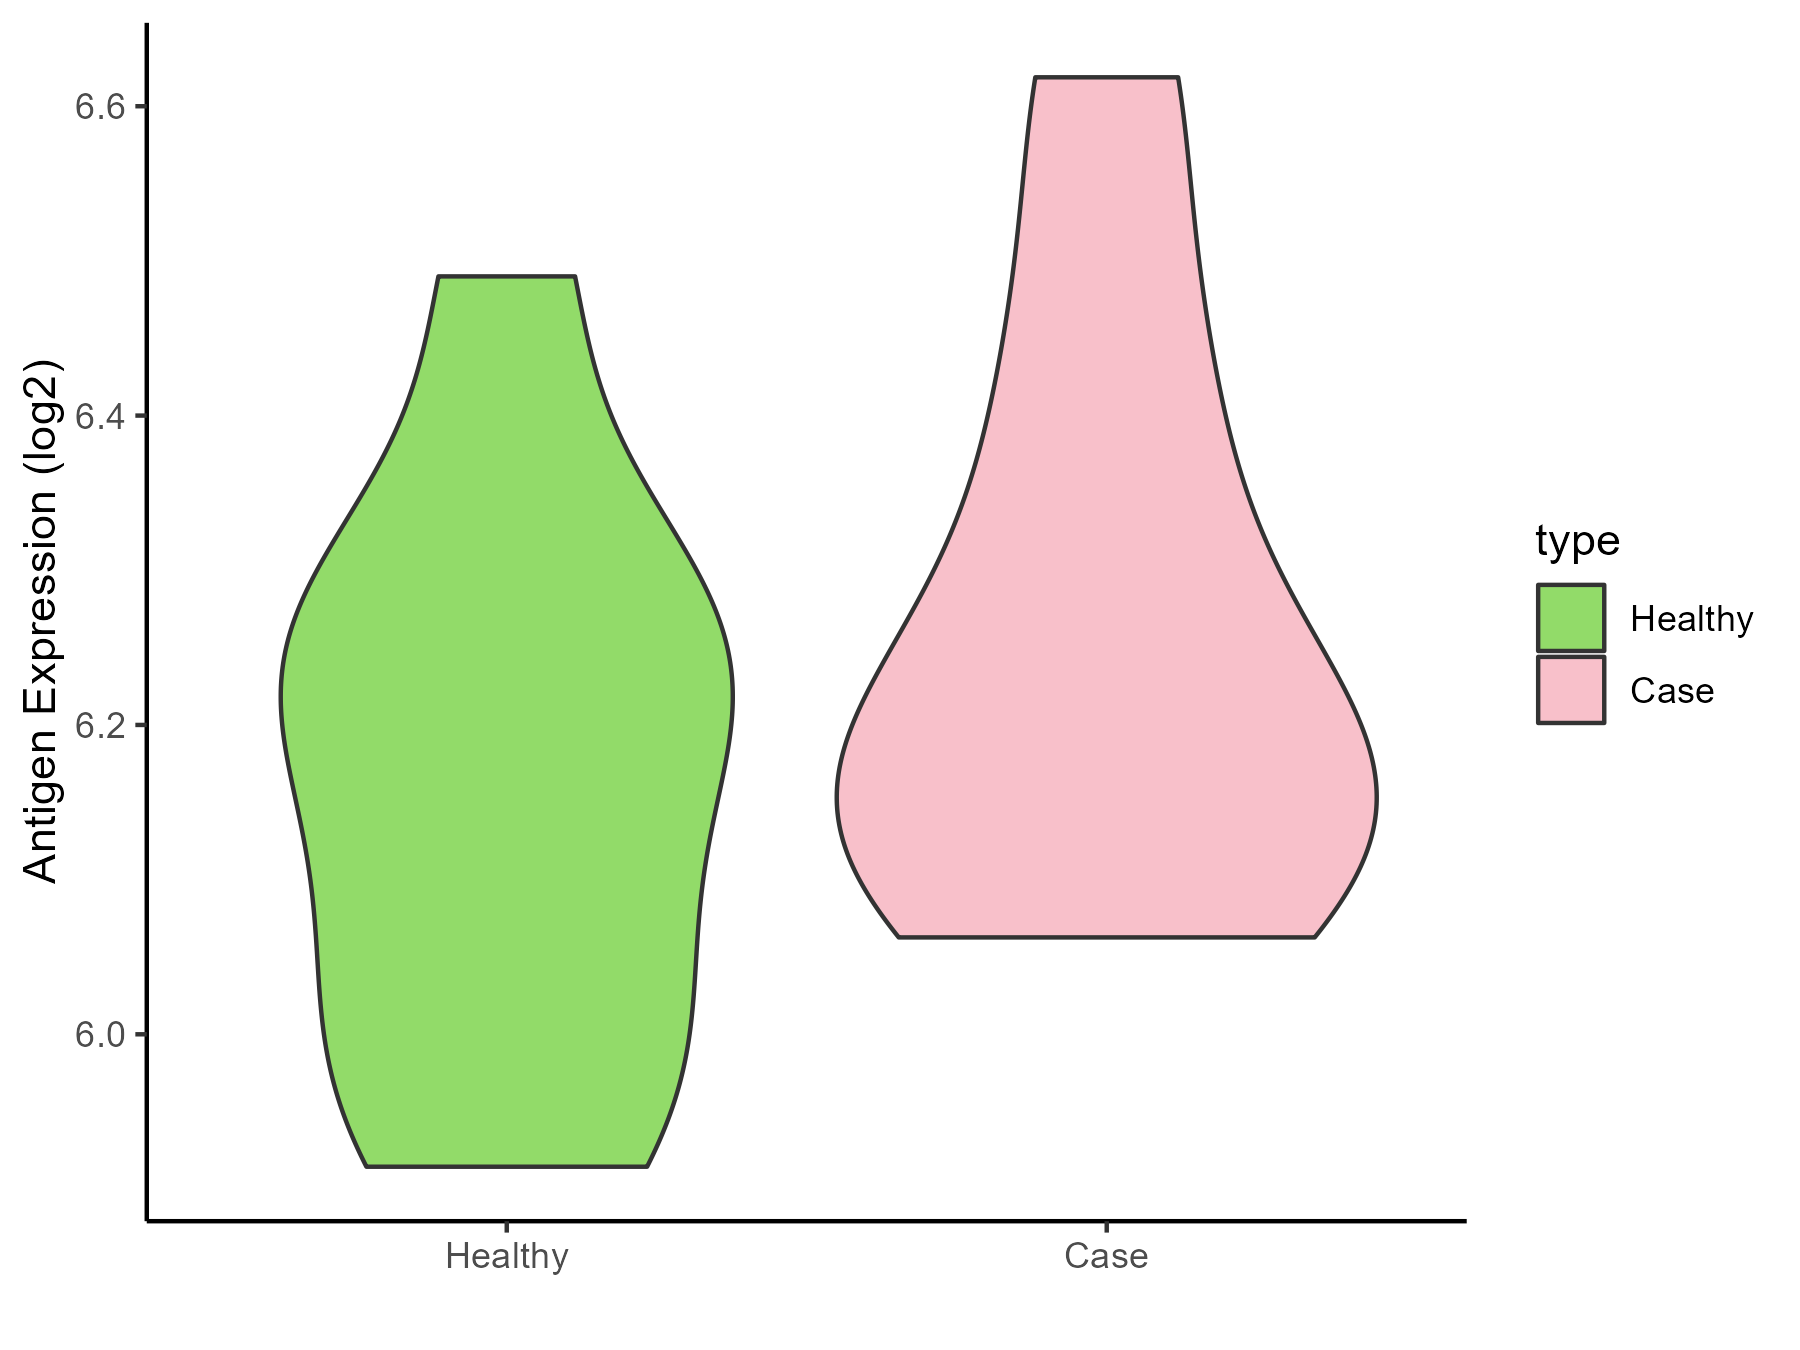
| Differential expression pattern of antigen in diseases | ||
| The Studied Tissue | Pheripheral blood | |
| The Specific Disease | Ankylosing spondylitis | |
| The Expression Level of Disease Section Compare with the Healthy Individual Tissue | p-value: 0.312308254; Fold-change: 0.004856815; Z-score: 0.026479528 | |
| Disease-specific Antigen Abundances |
|
Click to View the Clearer Original Diagram |
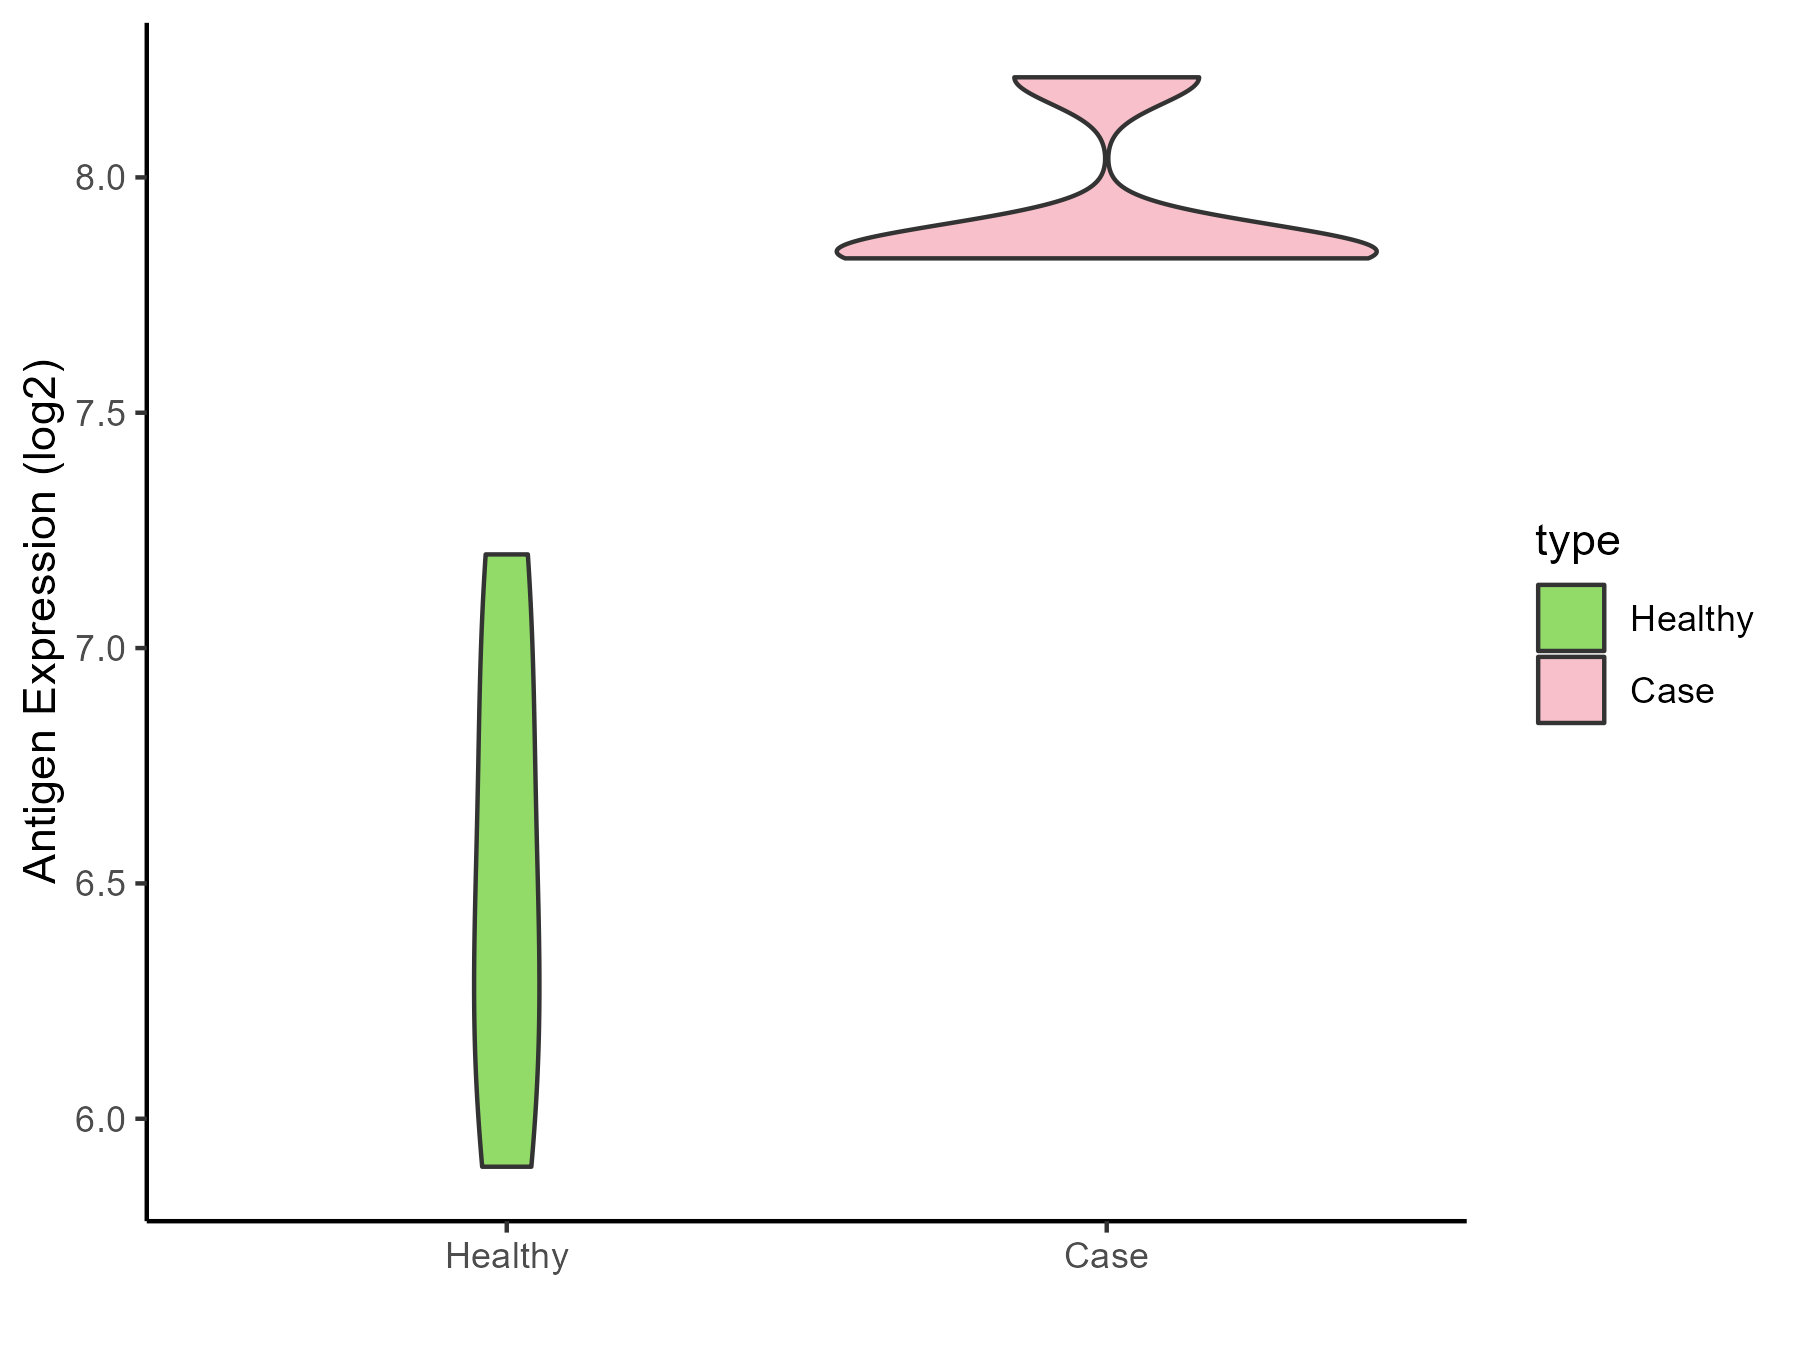
| Differential expression pattern of antigen in diseases | ||
| The Studied Tissue | Bone marrow | |
| The Specific Disease | Osteoporosis | |
| The Expression Level of Disease Section Compare with the Healthy Individual Tissue | p-value: 0.00209618; Fold-change: 1.404298539; Z-score: 2.703200557 | |
| Disease-specific Antigen Abundances |
|
Click to View the Clearer Original Diagram |
ICD Disease Classification 16
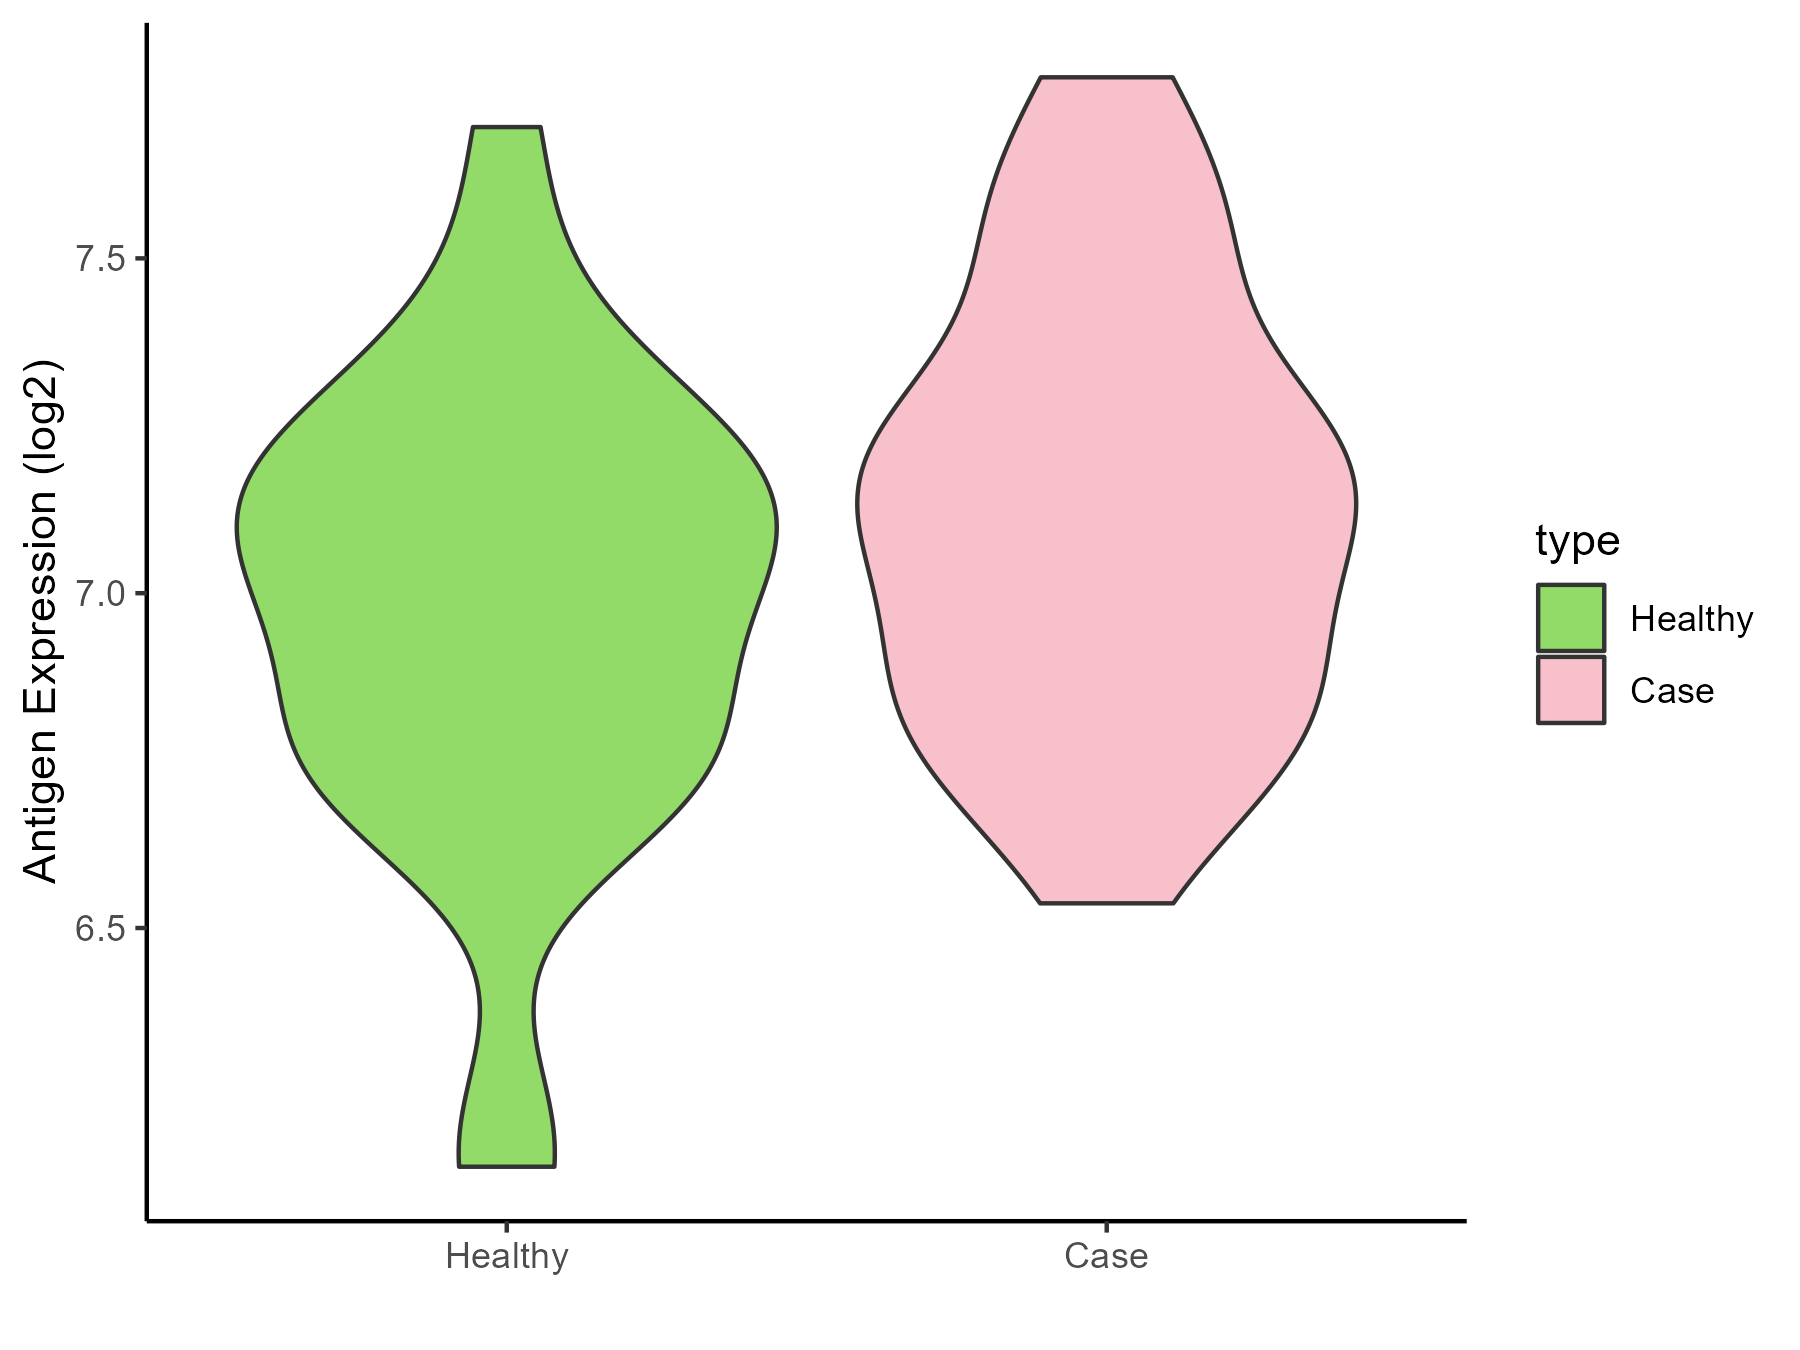
| Differential expression pattern of antigen in diseases | ||
| The Studied Tissue | Endometrium | |
| The Specific Disease | Endometriosis | |
| The Expression Level of Disease Section Compare with the Healthy Individual Tissue | p-value: 0.076420799; Fold-change: 0.104079196; Z-score: 0.296908551 | |
| Disease-specific Antigen Abundances |
|
Click to View the Clearer Original Diagram |
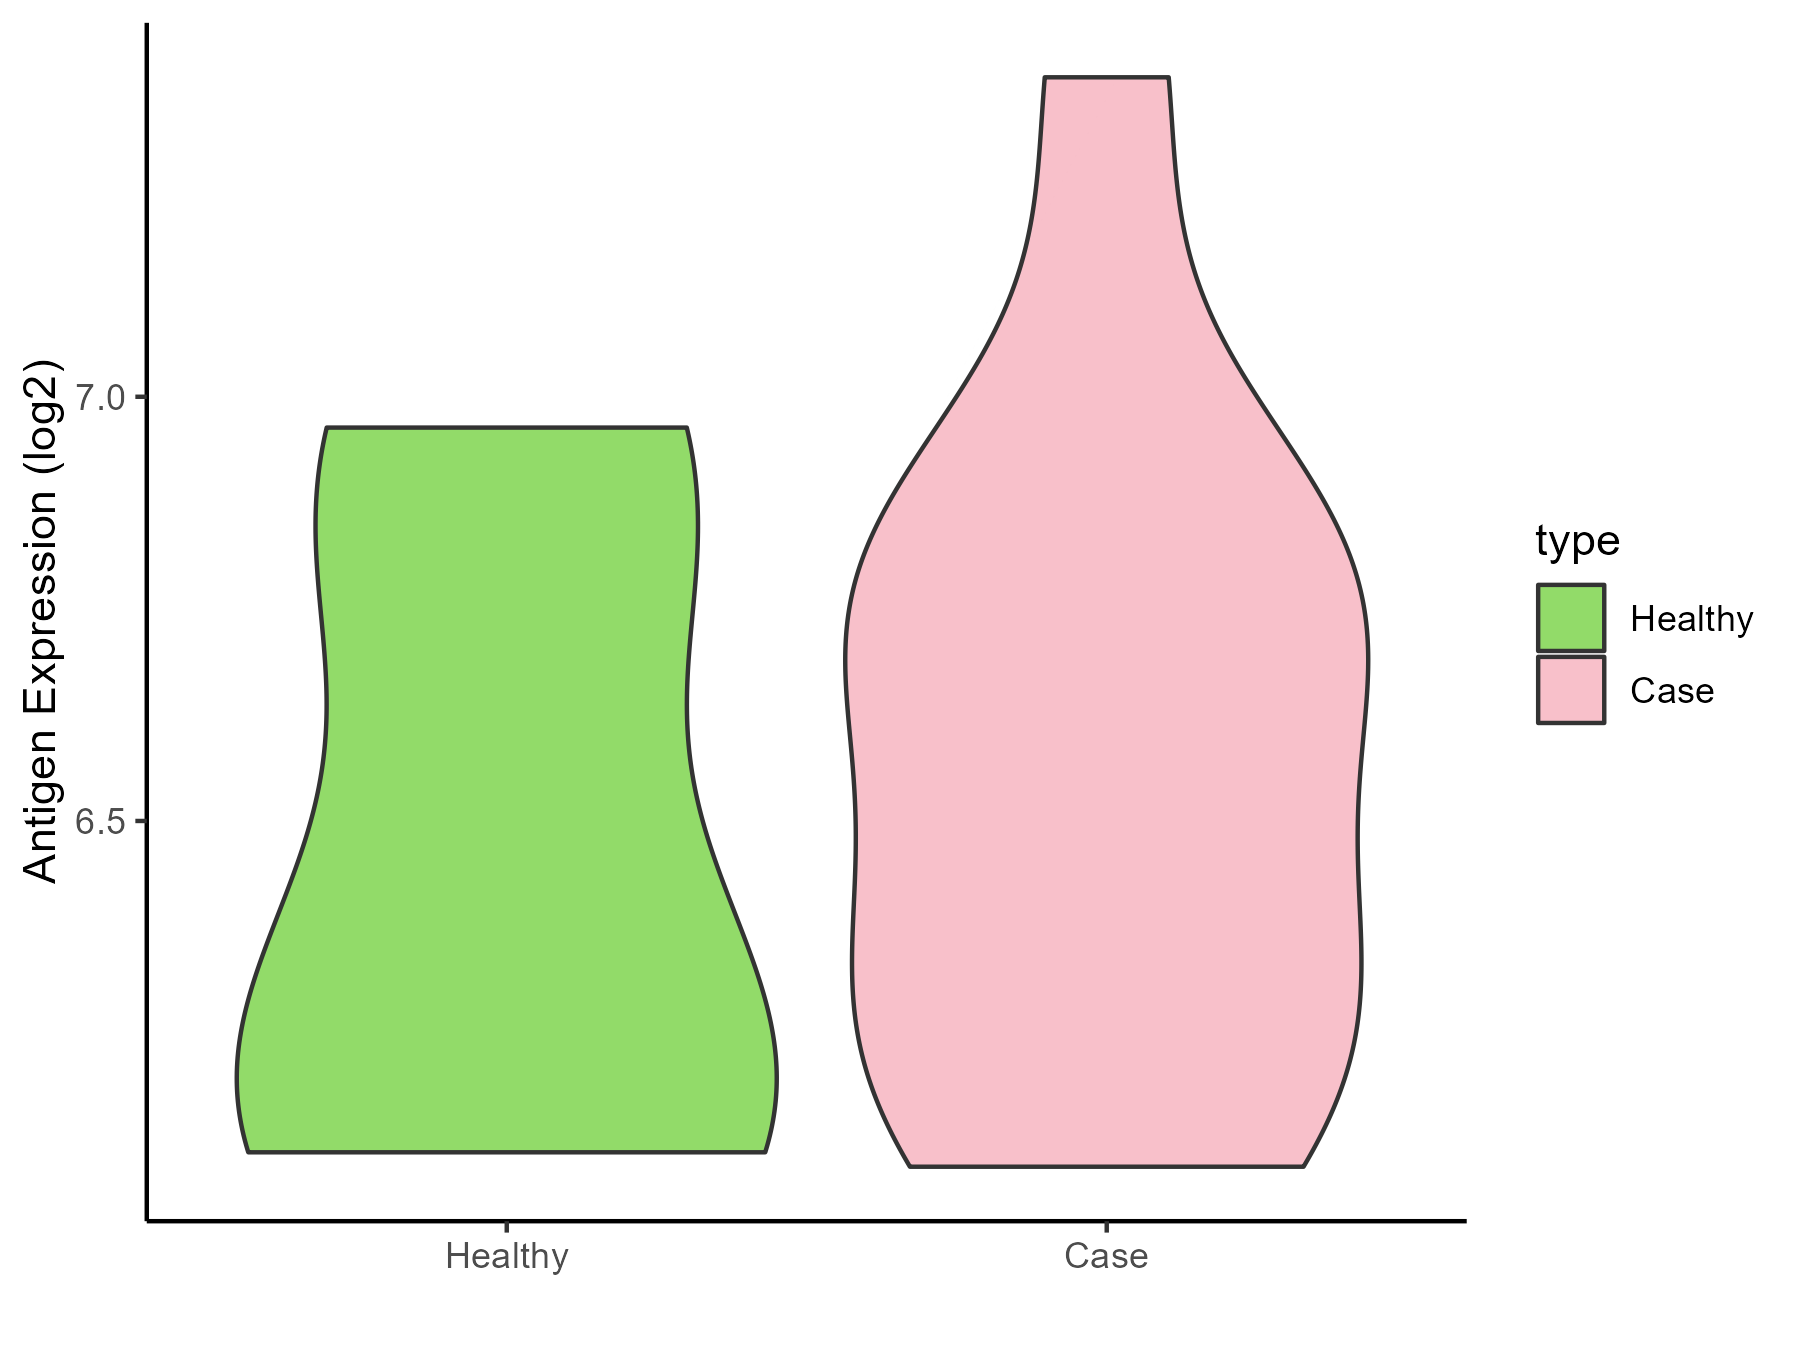
| Differential expression pattern of antigen in diseases | ||
| The Studied Tissue | Bladder | |
| The Specific Disease | Interstitial cystitis | |
| The Expression Level of Disease Section Compare with the Healthy Individual Tissue | p-value: 0.627130883; Fold-change: 0.291441931; Z-score: 0.724612056 | |
| Disease-specific Antigen Abundances |
|
Click to View the Clearer Original Diagram |
ICD Disease Classification 19
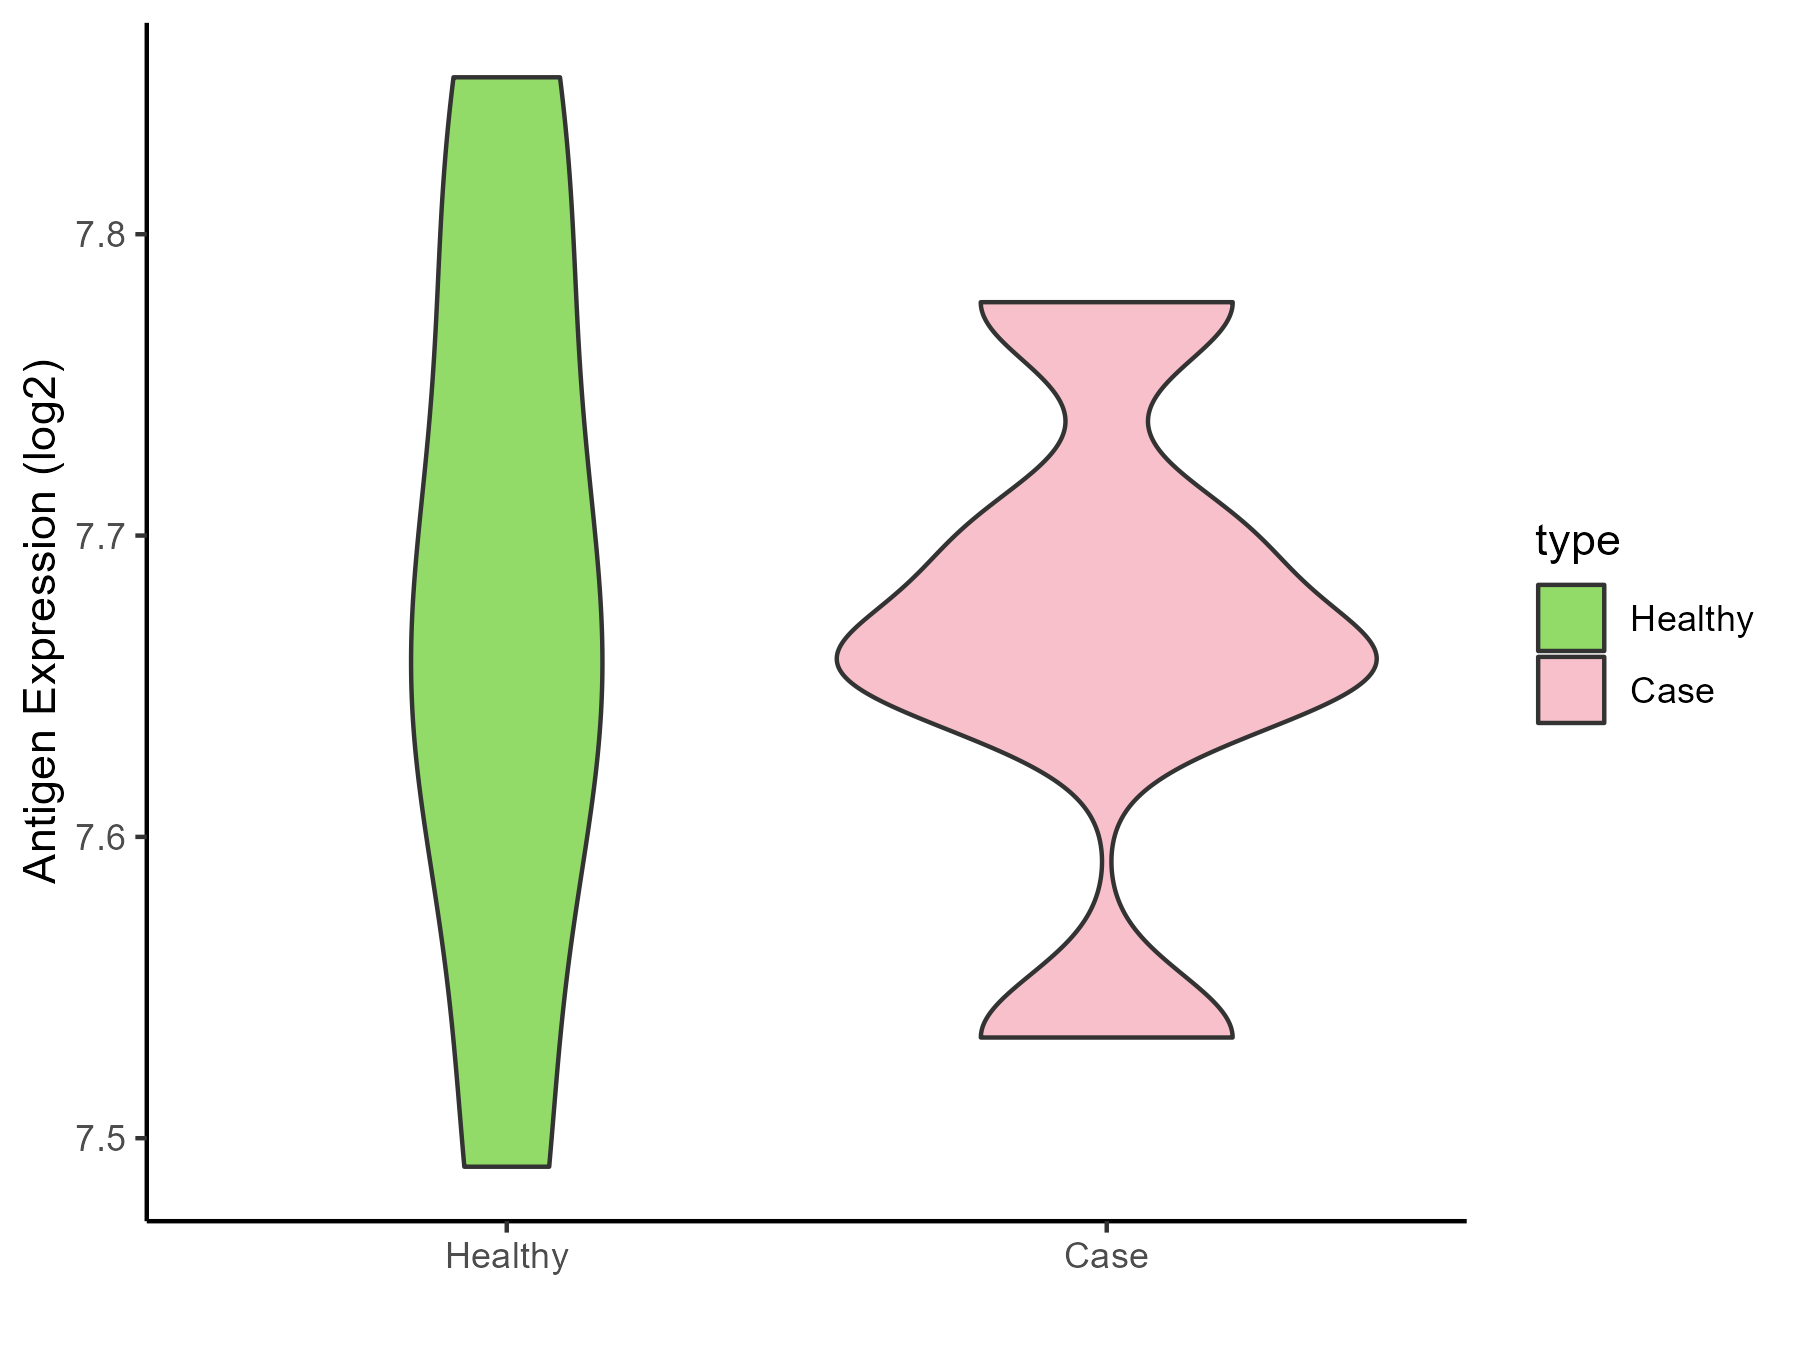
| Differential expression pattern of antigen in diseases | ||
| The Studied Tissue | Myometrium | |
| The Specific Disease | Preterm birth | |
| The Expression Level of Disease Section Compare with the Healthy Individual Tissue | p-value: 0.839096912; Fold-change: -0.013543964; Z-score: -0.105916963 | |
| Disease-specific Antigen Abundances |
|
Click to View the Clearer Original Diagram |
ICD Disease Classification 2
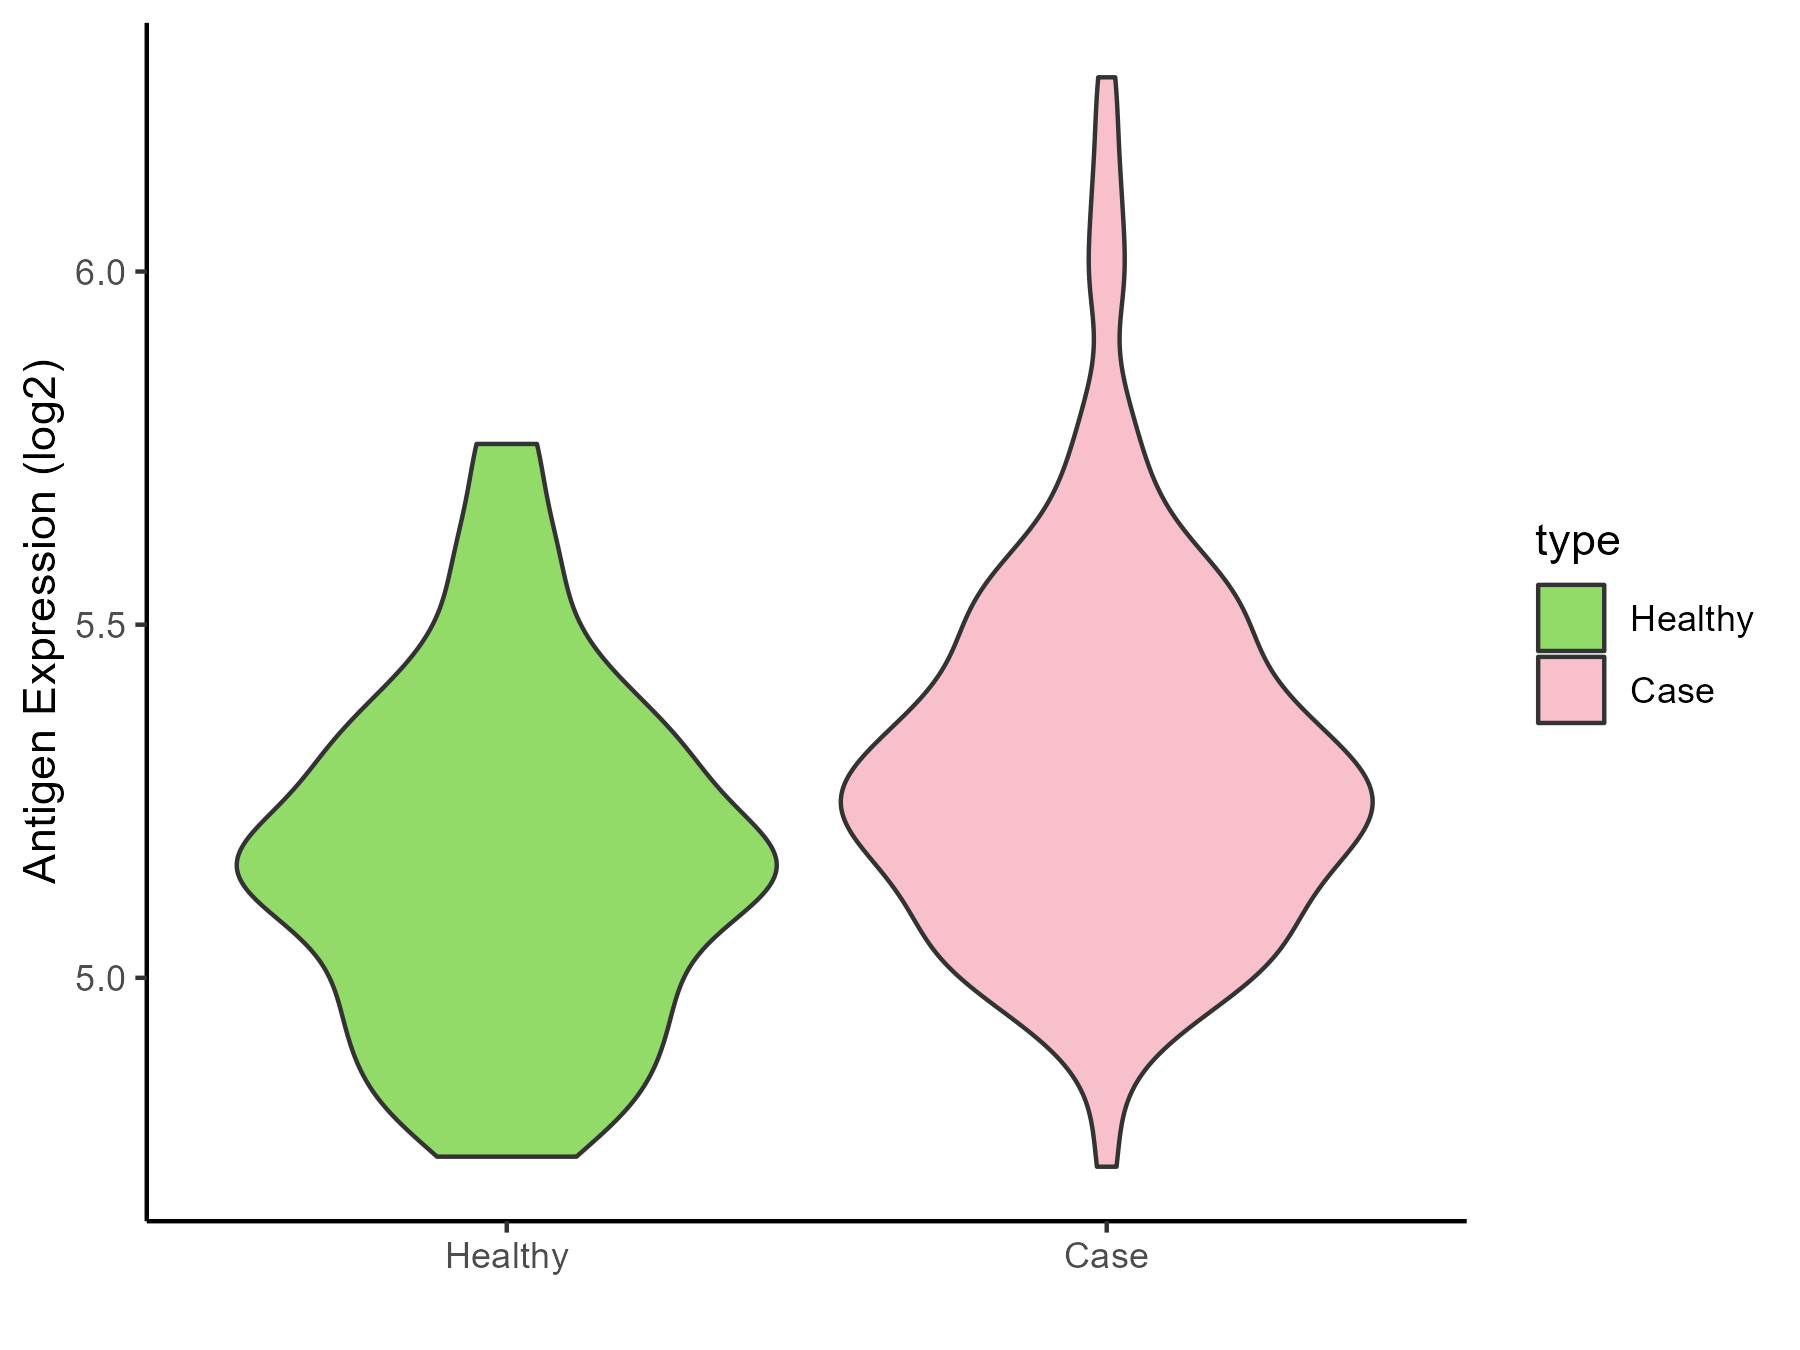
| Differential expression pattern of antigen in diseases | ||
| The Studied Tissue | Bone marrow | |
| The Specific Disease | Acute myelocytic leukemia | |
| The Expression Level of Disease Section Compare with the Healthy Individual Tissue | p-value: 3.97E-08; Fold-change: 0.115277635; Z-score: 0.488419576 | |
| Disease-specific Antigen Abundances |
|
Click to View the Clearer Original Diagram |
| Differential expression pattern of antigen in diseases | ||
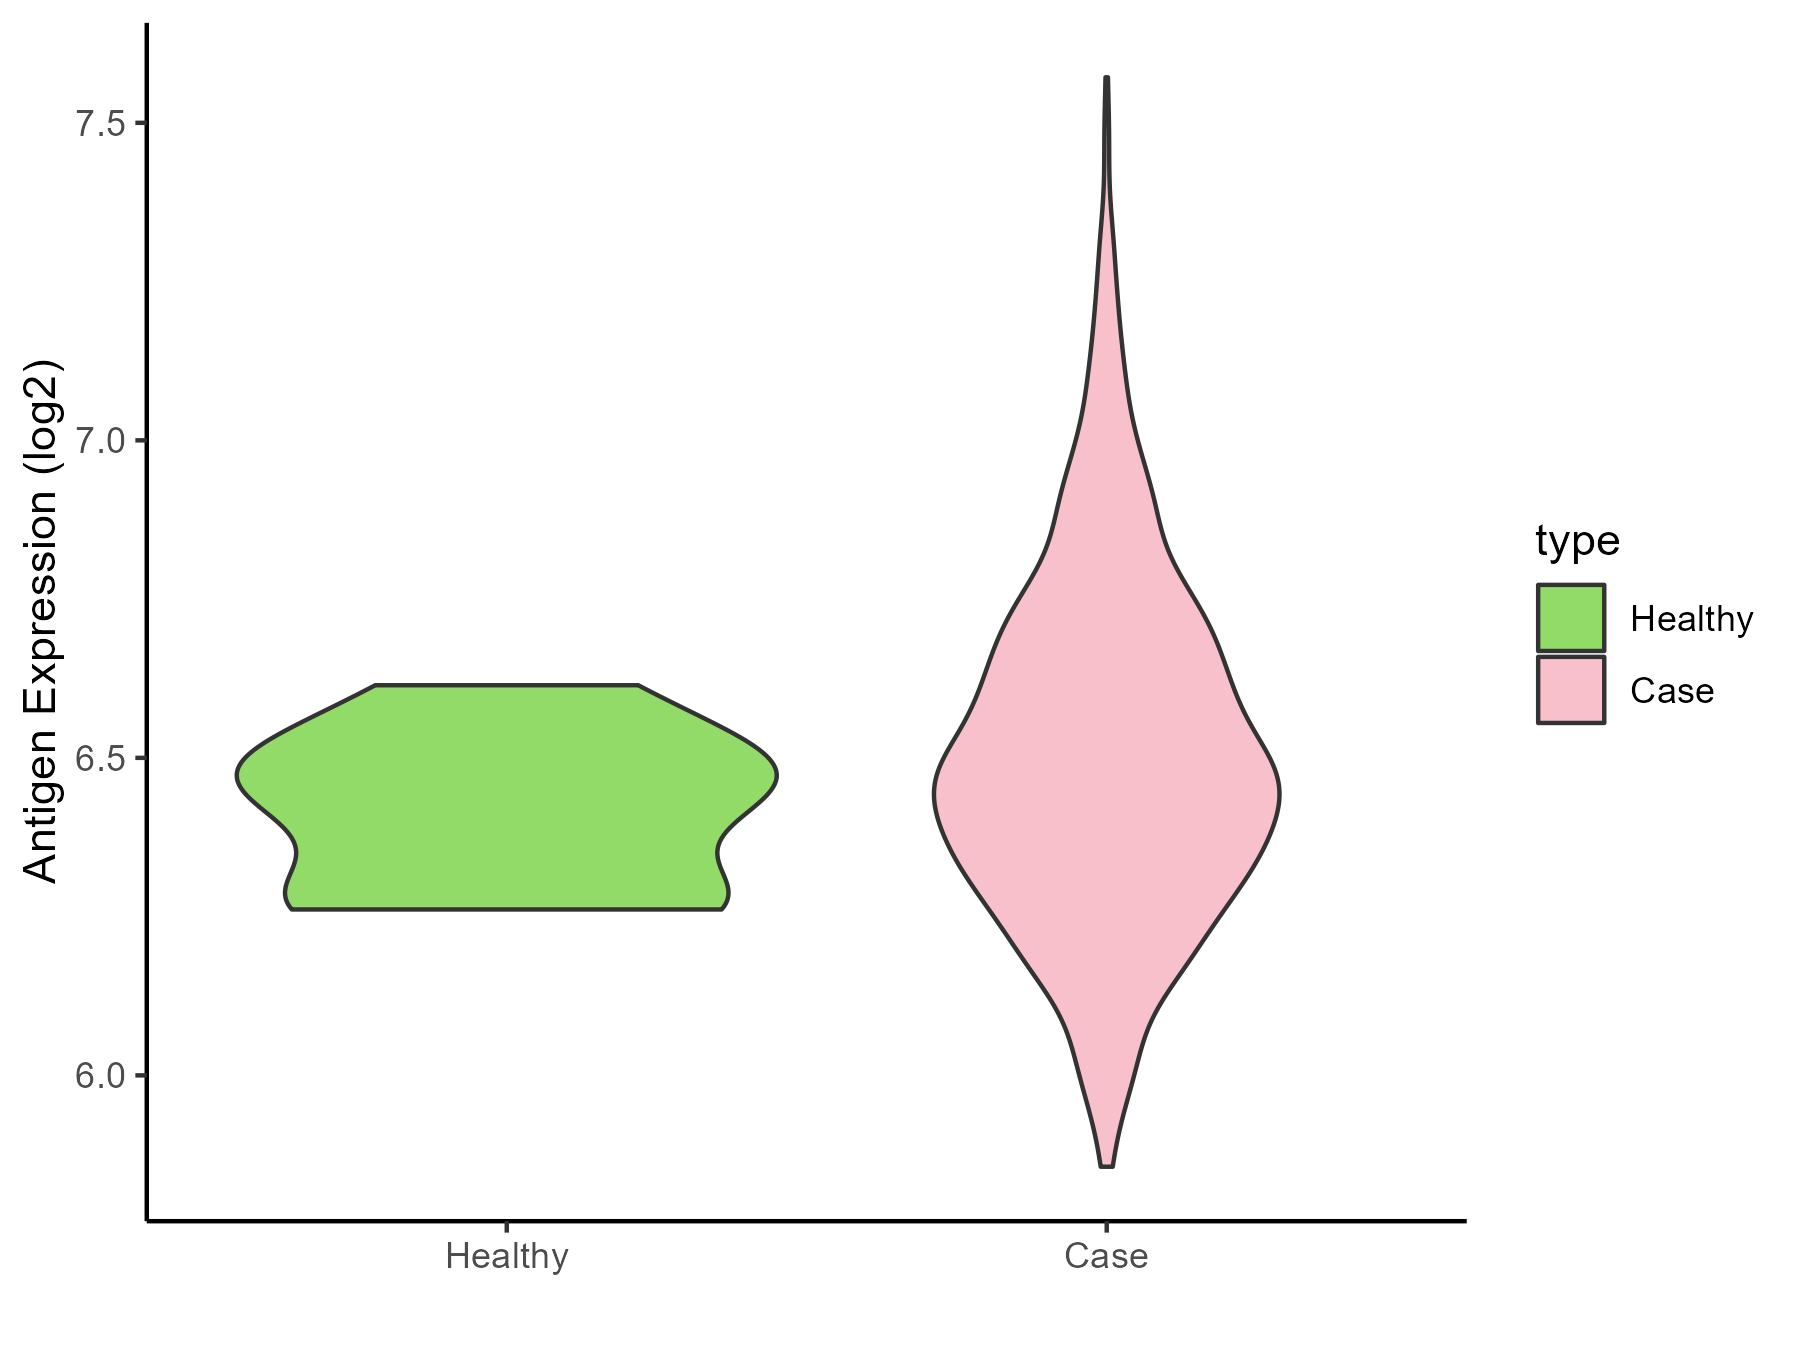
| The Studied Tissue | Bone marrow | |
| The Specific Disease | Myeloma | |
| The Expression Level of Disease Section Compare with the Healthy Individual Tissue | p-value: 0.082134531; Fold-change: 0.035640473; Z-score: 0.26940383 | |
| Disease-specific Antigen Abundances |
|
Click to View the Clearer Original Diagram |
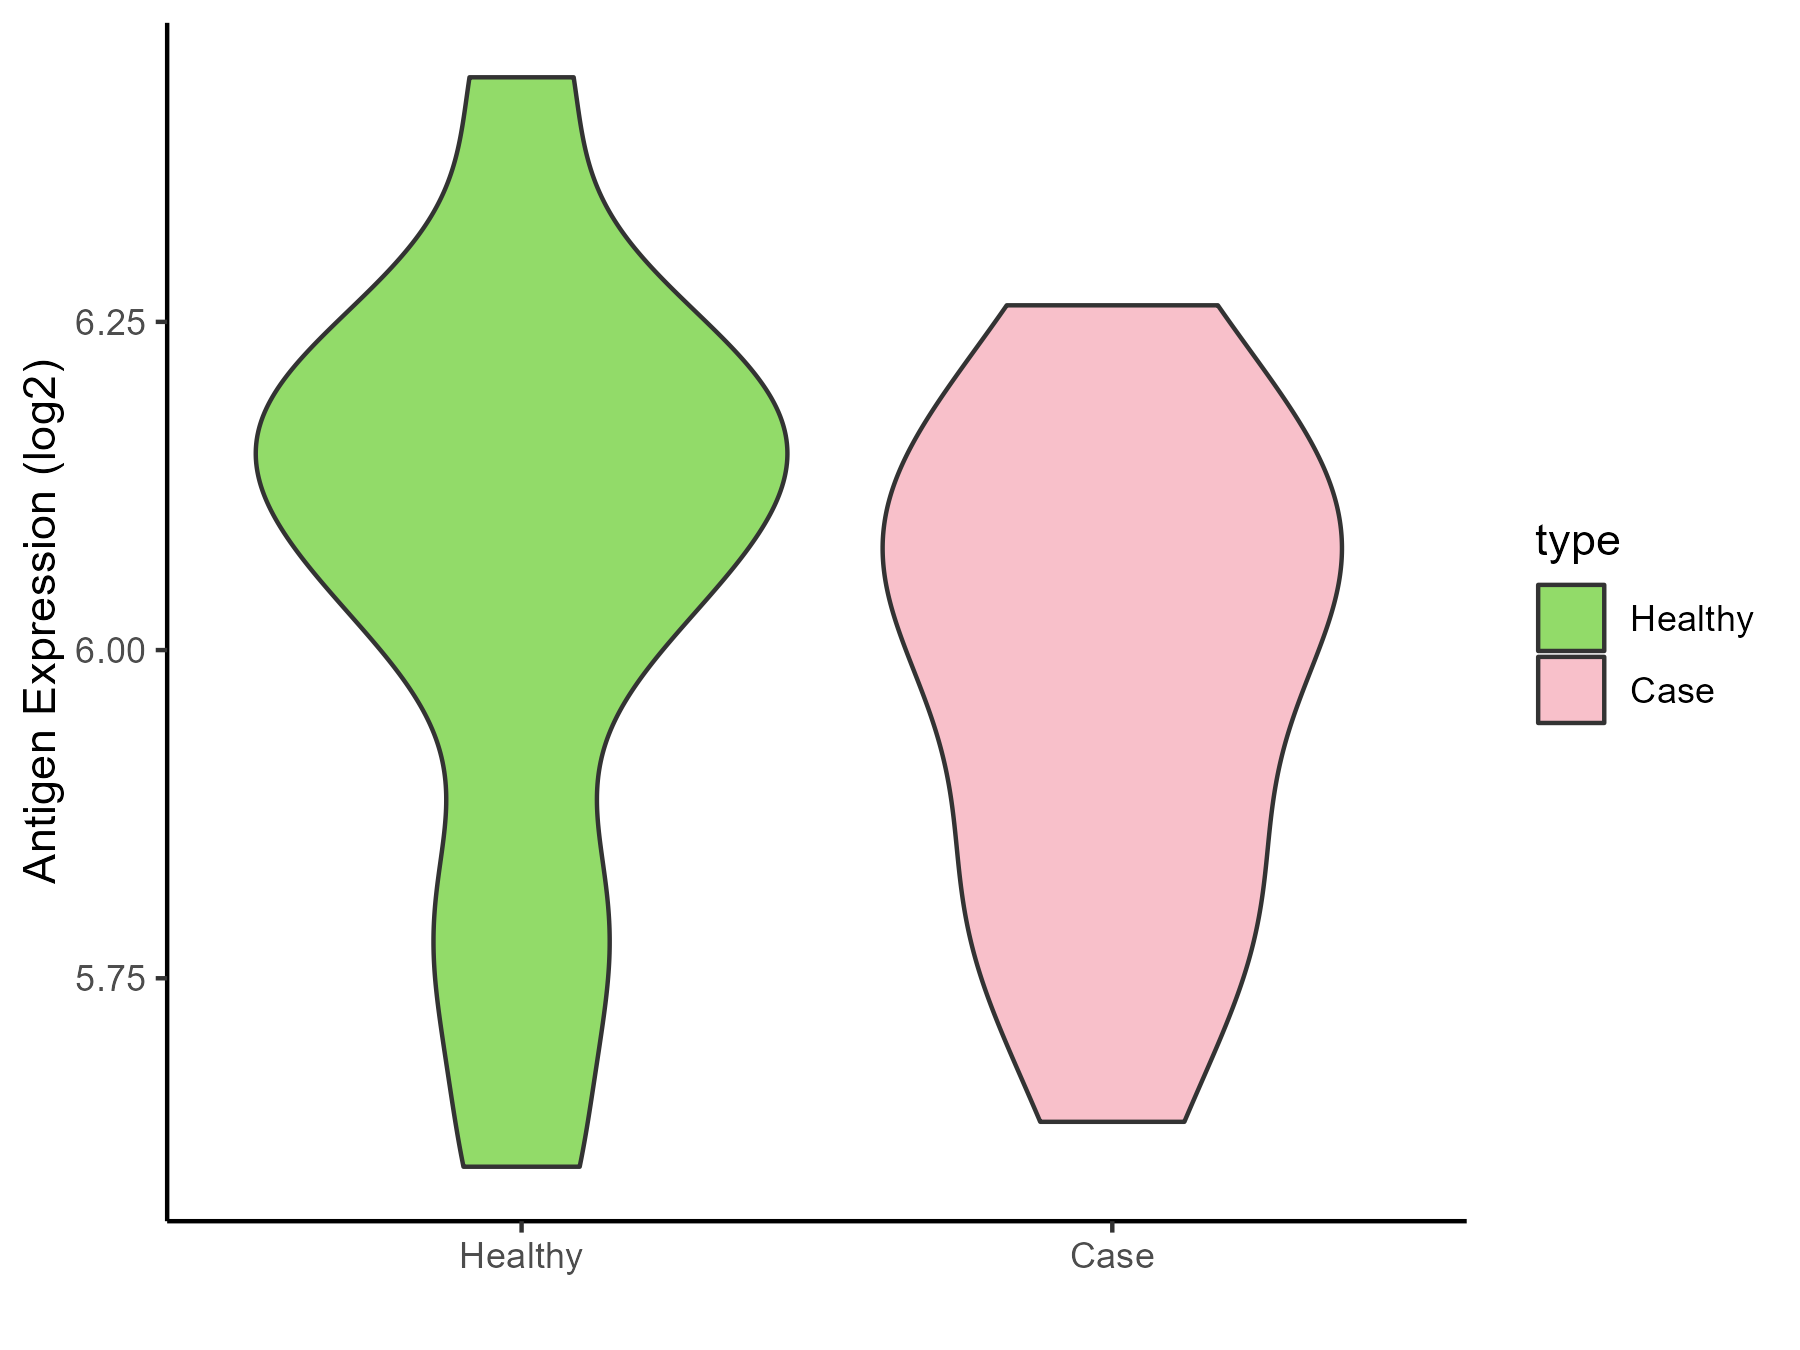
| The Studied Tissue | Peripheral blood | |
| The Specific Disease | Myeloma | |
| The Expression Level of Disease Section Compare with the Healthy Individual Tissue | p-value: 0.357637612; Fold-change: -0.09748931; Z-score: -0.420954734 | |
| Disease-specific Antigen Abundances |
|
Click to View the Clearer Original Diagram |
| Differential expression pattern of antigen in diseases | ||
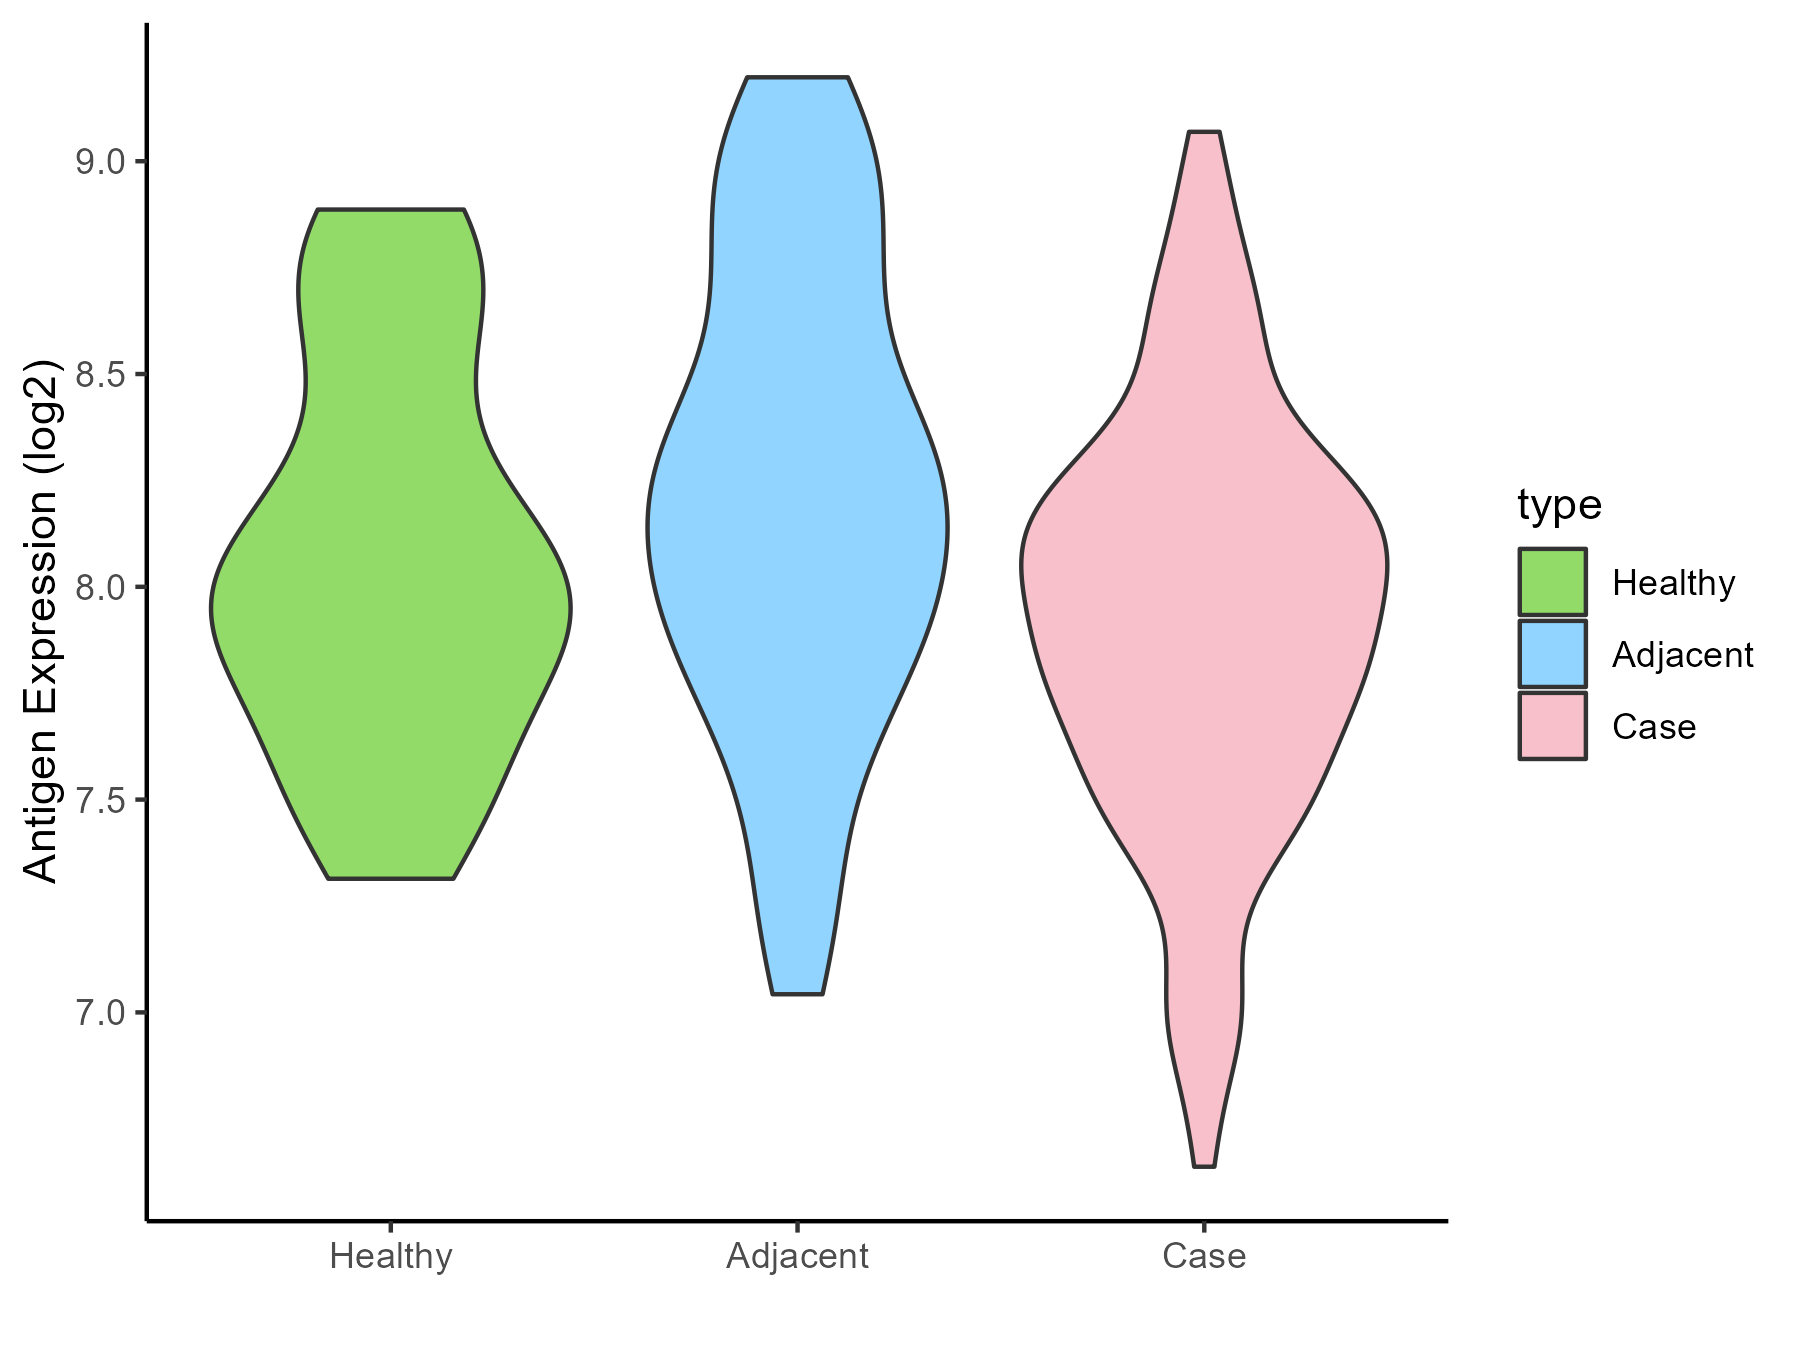
| The Studied Tissue | Oral | |
| The Specific Disease | Oral cancer | |
| The Expression Level of Disease Section Compare with the Healthy Individual Tissue | p-value: 0.119770296; Fold-change: -0.045563664; Z-score: -0.099053881 | |
| The Expression Level of Disease Section Compare with the Adjacent Tissue | p-value: 2.97E-05; Fold-change: -0.24085381; Z-score: -0.444174674 | |
| Disease-specific Antigen Abundances |
|
Click to View the Clearer Original Diagram |
| Differential expression pattern of antigen in diseases | ||
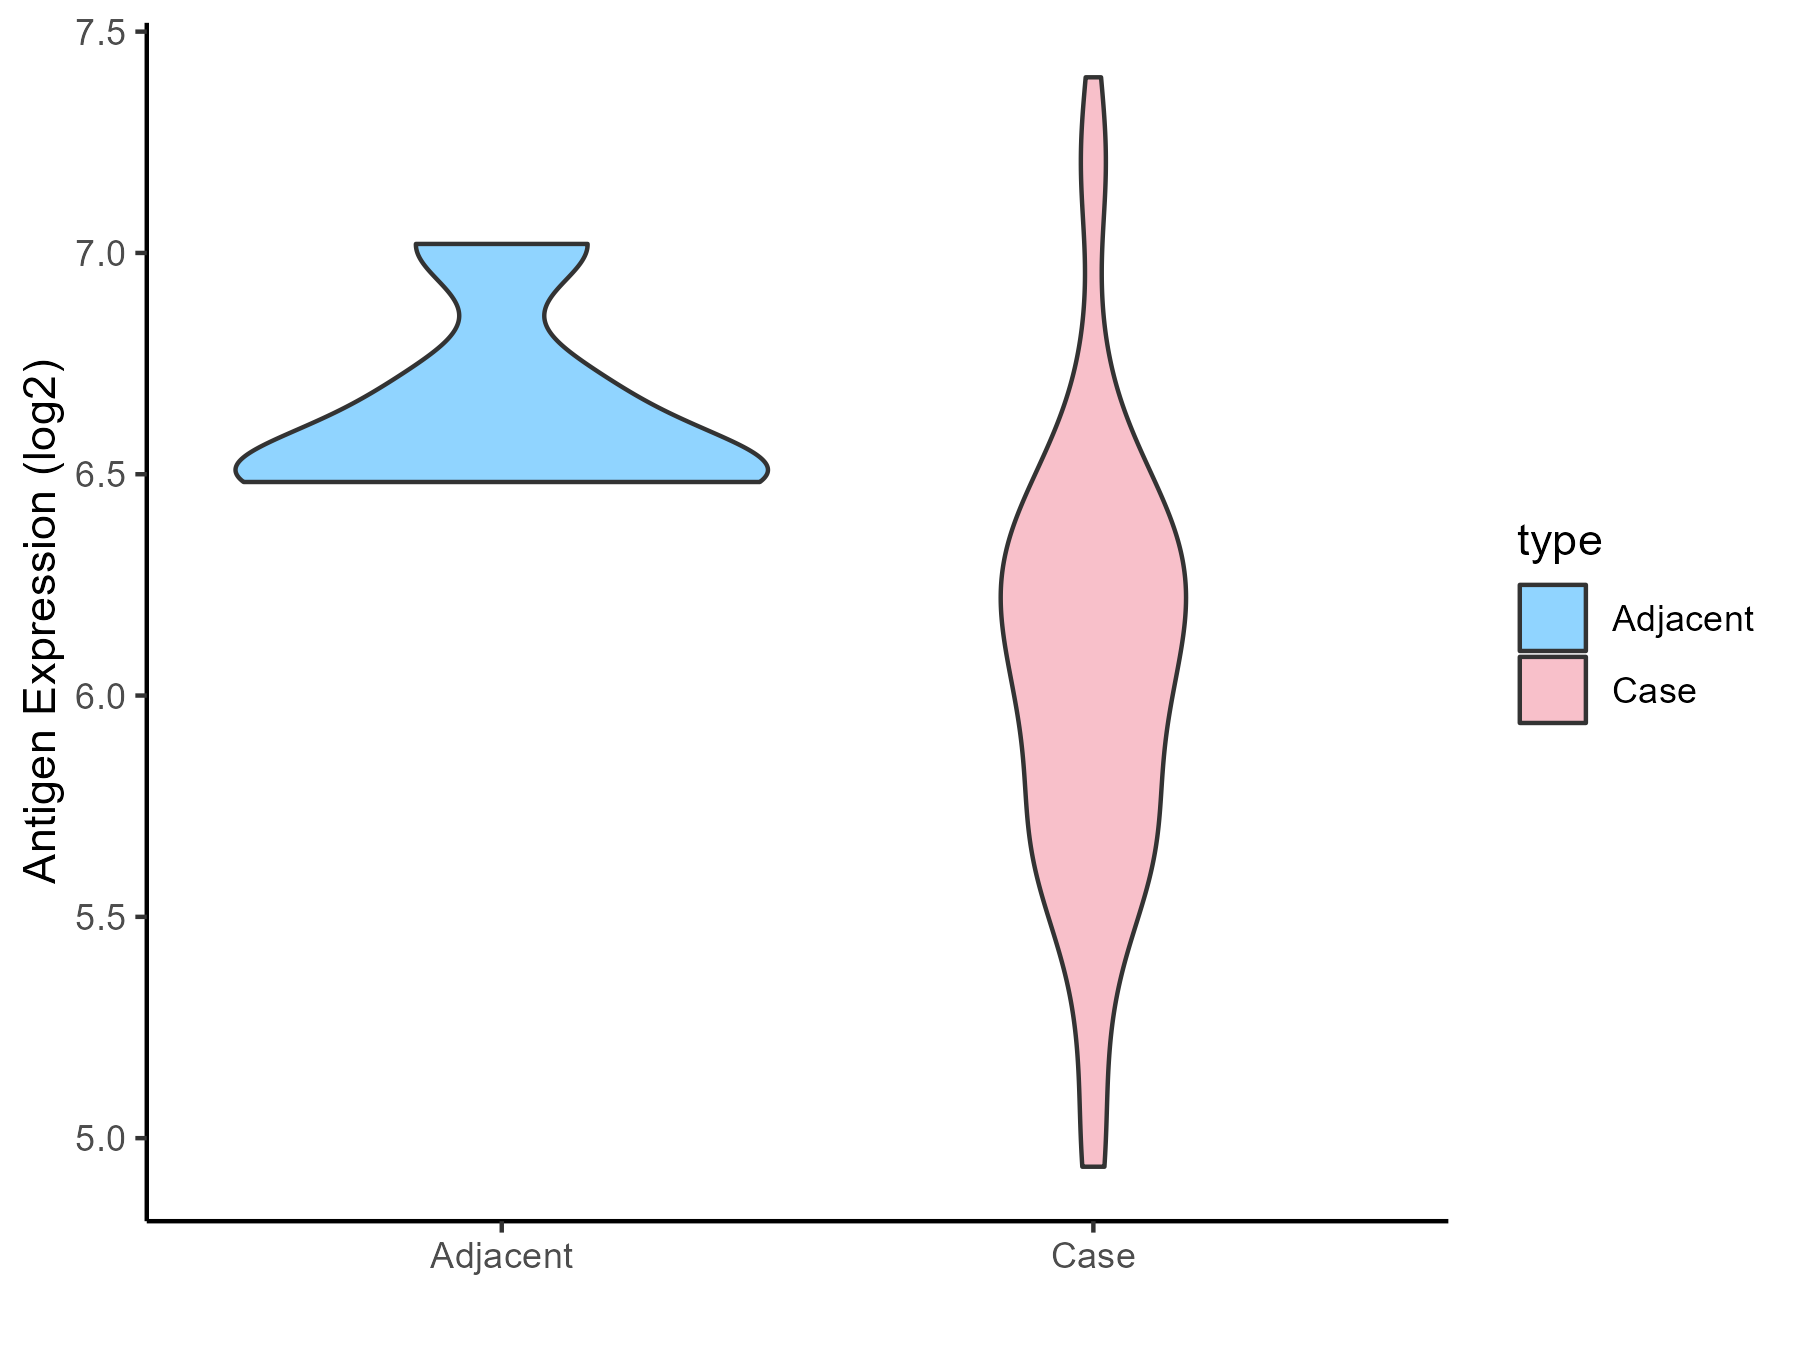
| The Studied Tissue | Esophagus | |
| The Specific Disease | Esophagal cancer | |
| The Expression Level of Disease Section Compare with the Adjacent Tissue | p-value: 0.00219575; Fold-change: -0.440415112; Z-score: -1.93060682 | |
| Disease-specific Antigen Abundances |
|
Click to View the Clearer Original Diagram |
| Differential expression pattern of antigen in diseases | ||
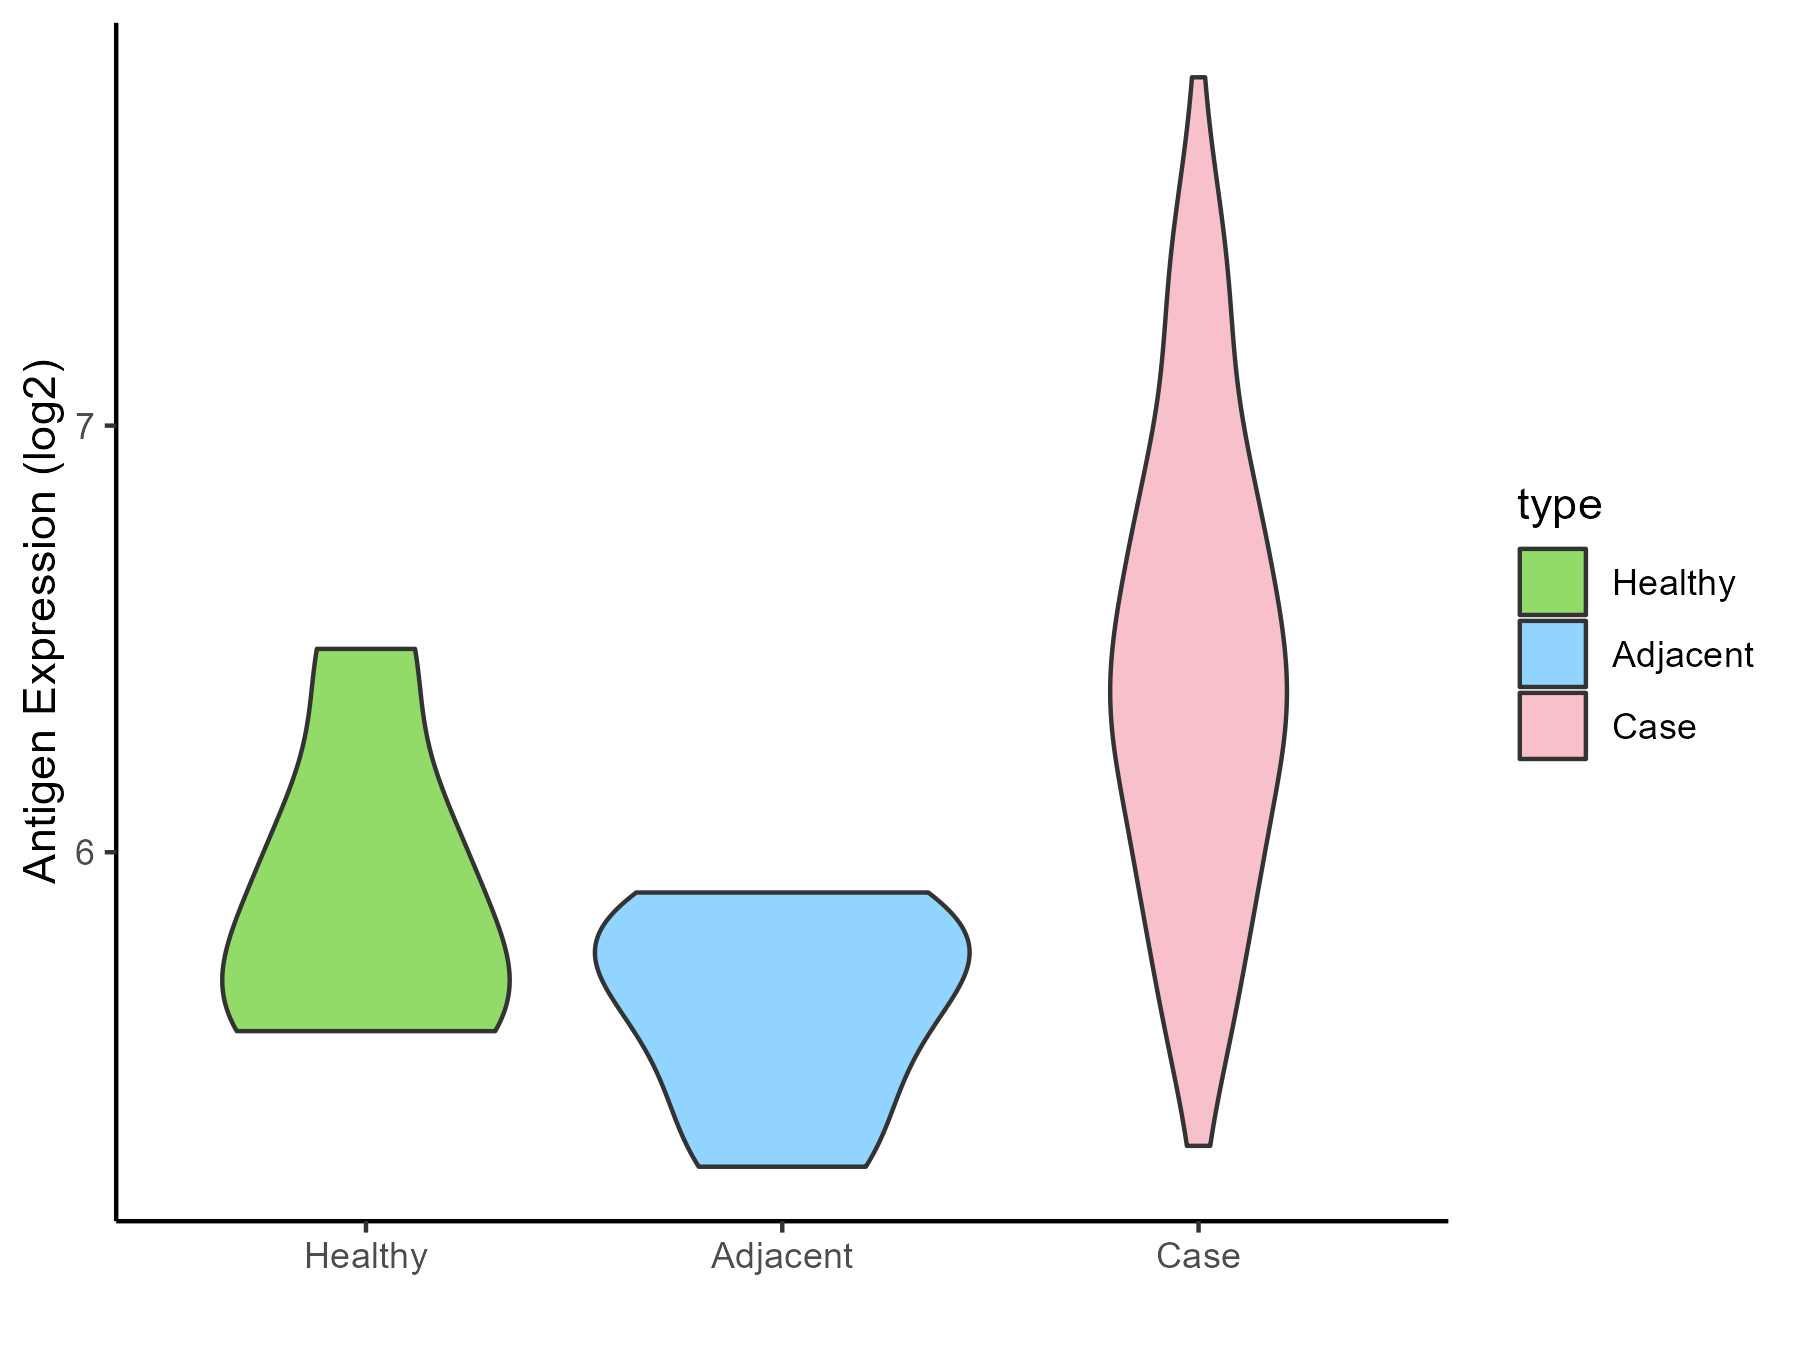
| The Studied Tissue | Rectal colon | |
| The Specific Disease | Rectal cancer | |
| The Expression Level of Disease Section Compare with the Healthy Individual Tissue | p-value: 0.009284328; Fold-change: 0.604890169; Z-score: 1.753805182 | |
| The Expression Level of Disease Section Compare with the Adjacent Tissue | p-value: 8.56E-05; Fold-change: 0.735034192; Z-score: 3.04638456 | |
| Disease-specific Antigen Abundances |
|
Click to View the Clearer Original Diagram |
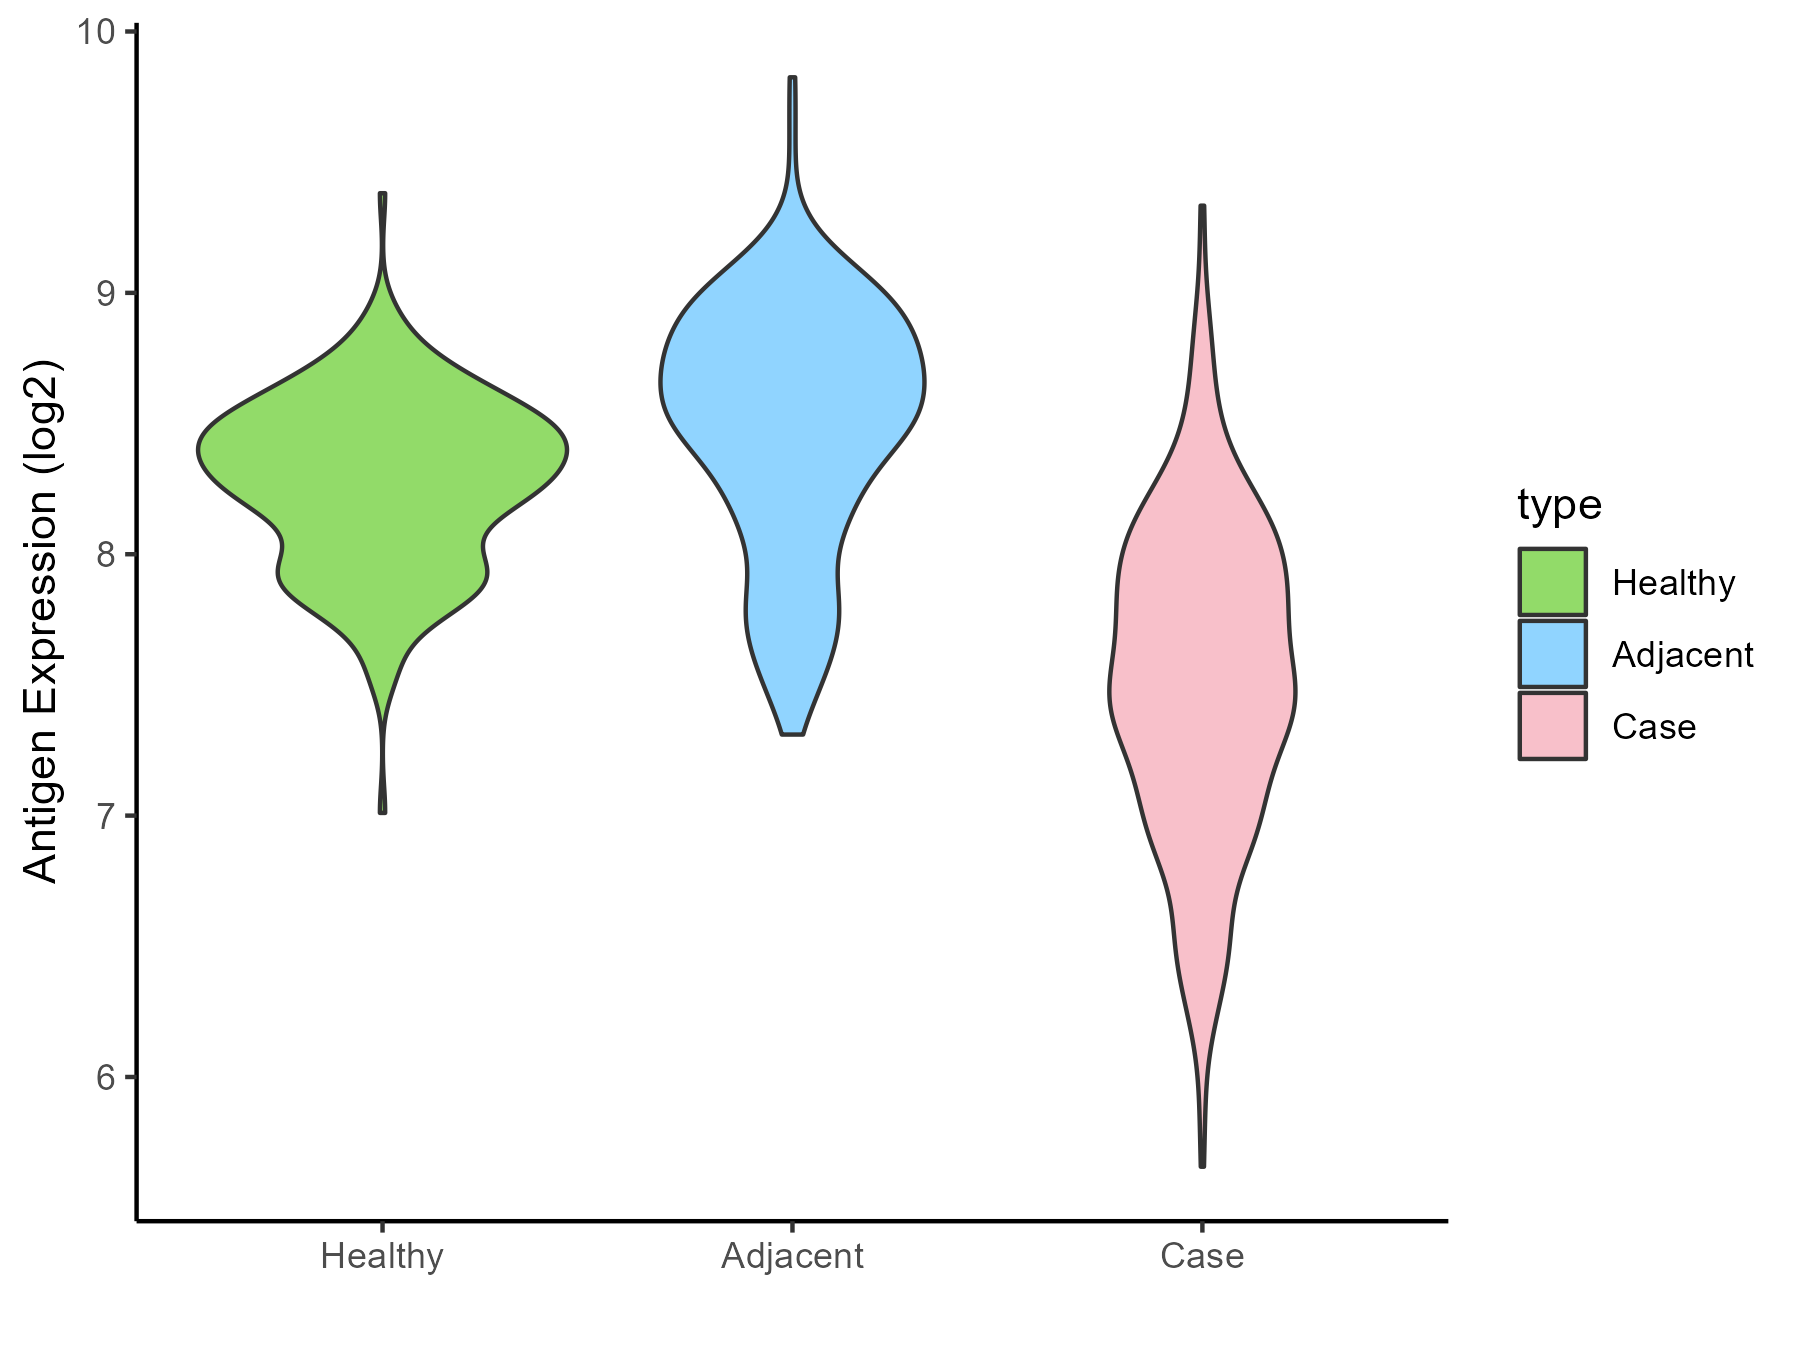
| Differential expression pattern of antigen in diseases | ||
| The Studied Tissue | Skin | |
| The Specific Disease | Skin cancer | |
| The Expression Level of Disease Section Compare with the Healthy Individual Tissue | p-value: 1.92E-67; Fold-change: -0.787711391; Z-score: -2.430413502 | |
| The Expression Level of Disease Section Compare with the Adjacent Tissue | p-value: 3.12E-68; Fold-change: -1.025949103; Z-score: -2.181298436 | |
| Disease-specific Antigen Abundances |
|
Click to View the Clearer Original Diagram |
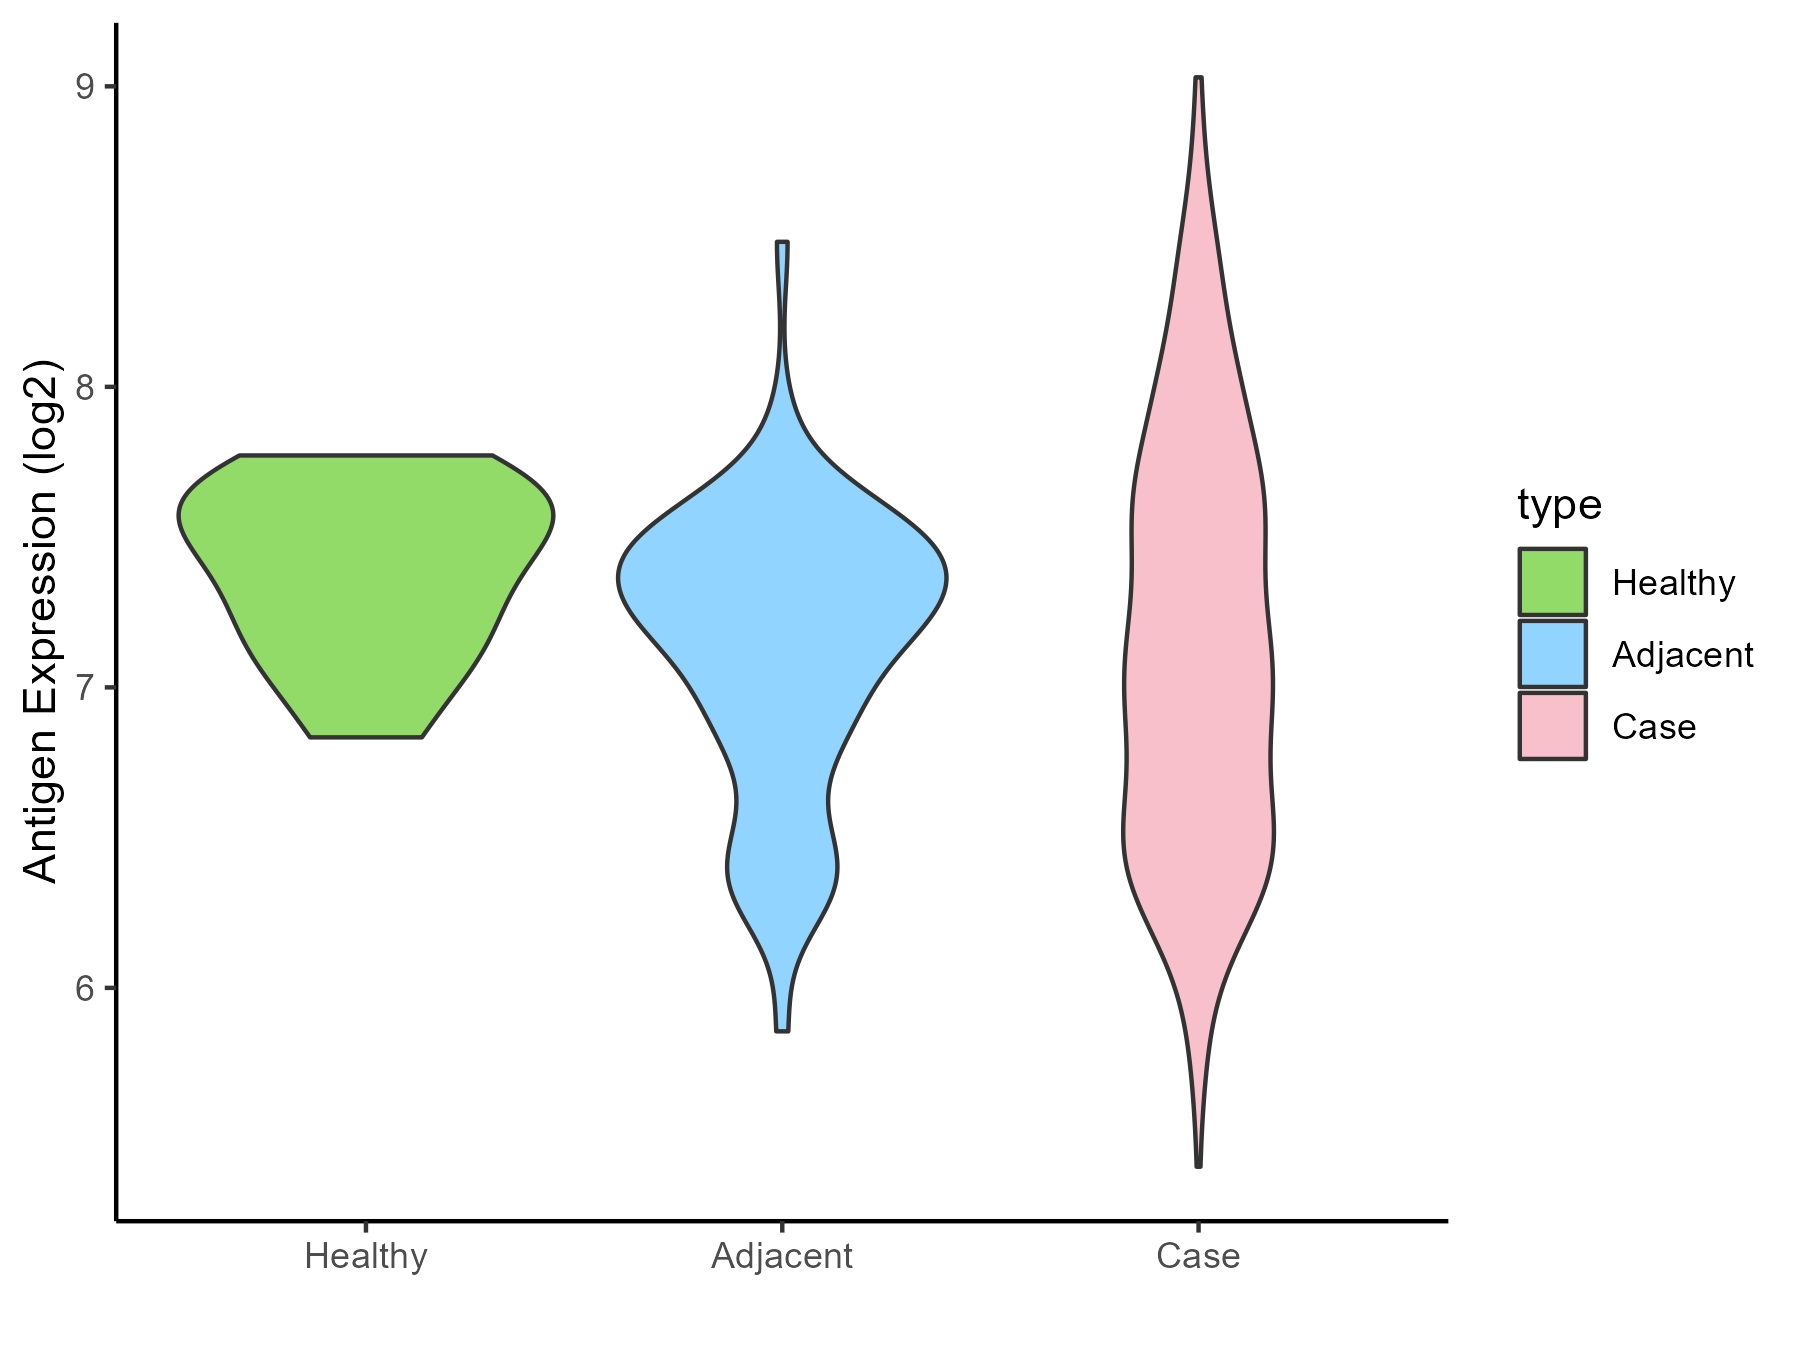
| Differential expression pattern of antigen in diseases | ||
| The Studied Tissue | Kidney | |
| The Specific Disease | Renal cancer | |
| The Expression Level of Disease Section Compare with the Healthy Individual Tissue | p-value: 0.022482525; Fold-change: -0.326416245; Z-score: -1.105702709 | |
| The Expression Level of Disease Section Compare with the Adjacent Tissue | p-value: 0.855510367; Fold-change: -0.131724343; Z-score: -0.28435846 | |
| Disease-specific Antigen Abundances |
|
Click to View the Clearer Original Diagram |
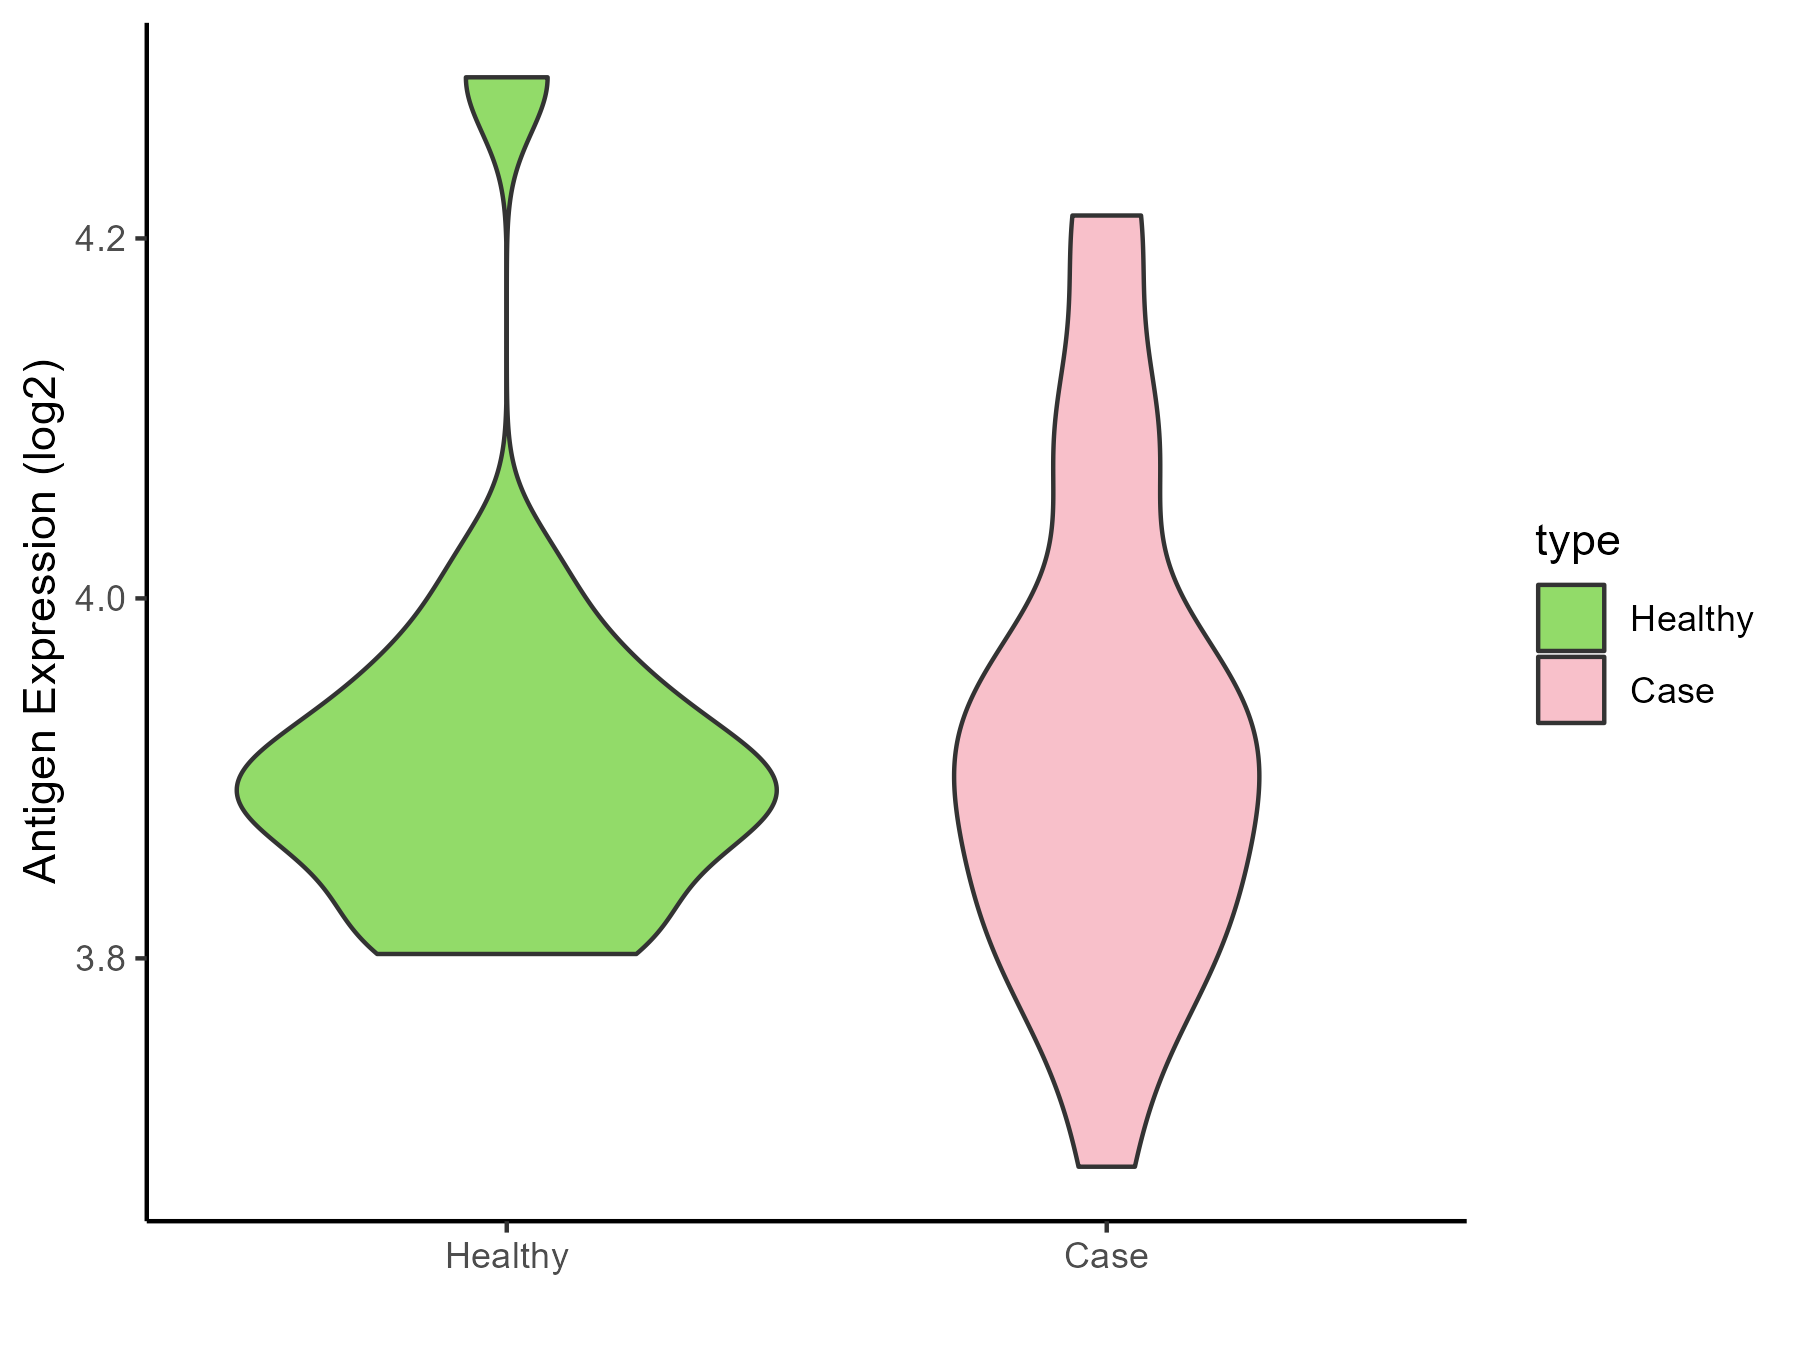
| Differential expression pattern of antigen in diseases | ||
| The Studied Tissue | Urothelium | |
| The Specific Disease | Ureter cancer | |
| The Expression Level of Disease Section Compare with the Healthy Individual Tissue | p-value: 0.914392499; Fold-change: 0.012209617; Z-score: 0.103436957 | |
| Disease-specific Antigen Abundances |
|
Click to View the Clearer Original Diagram |
ICD Disease Classification 20
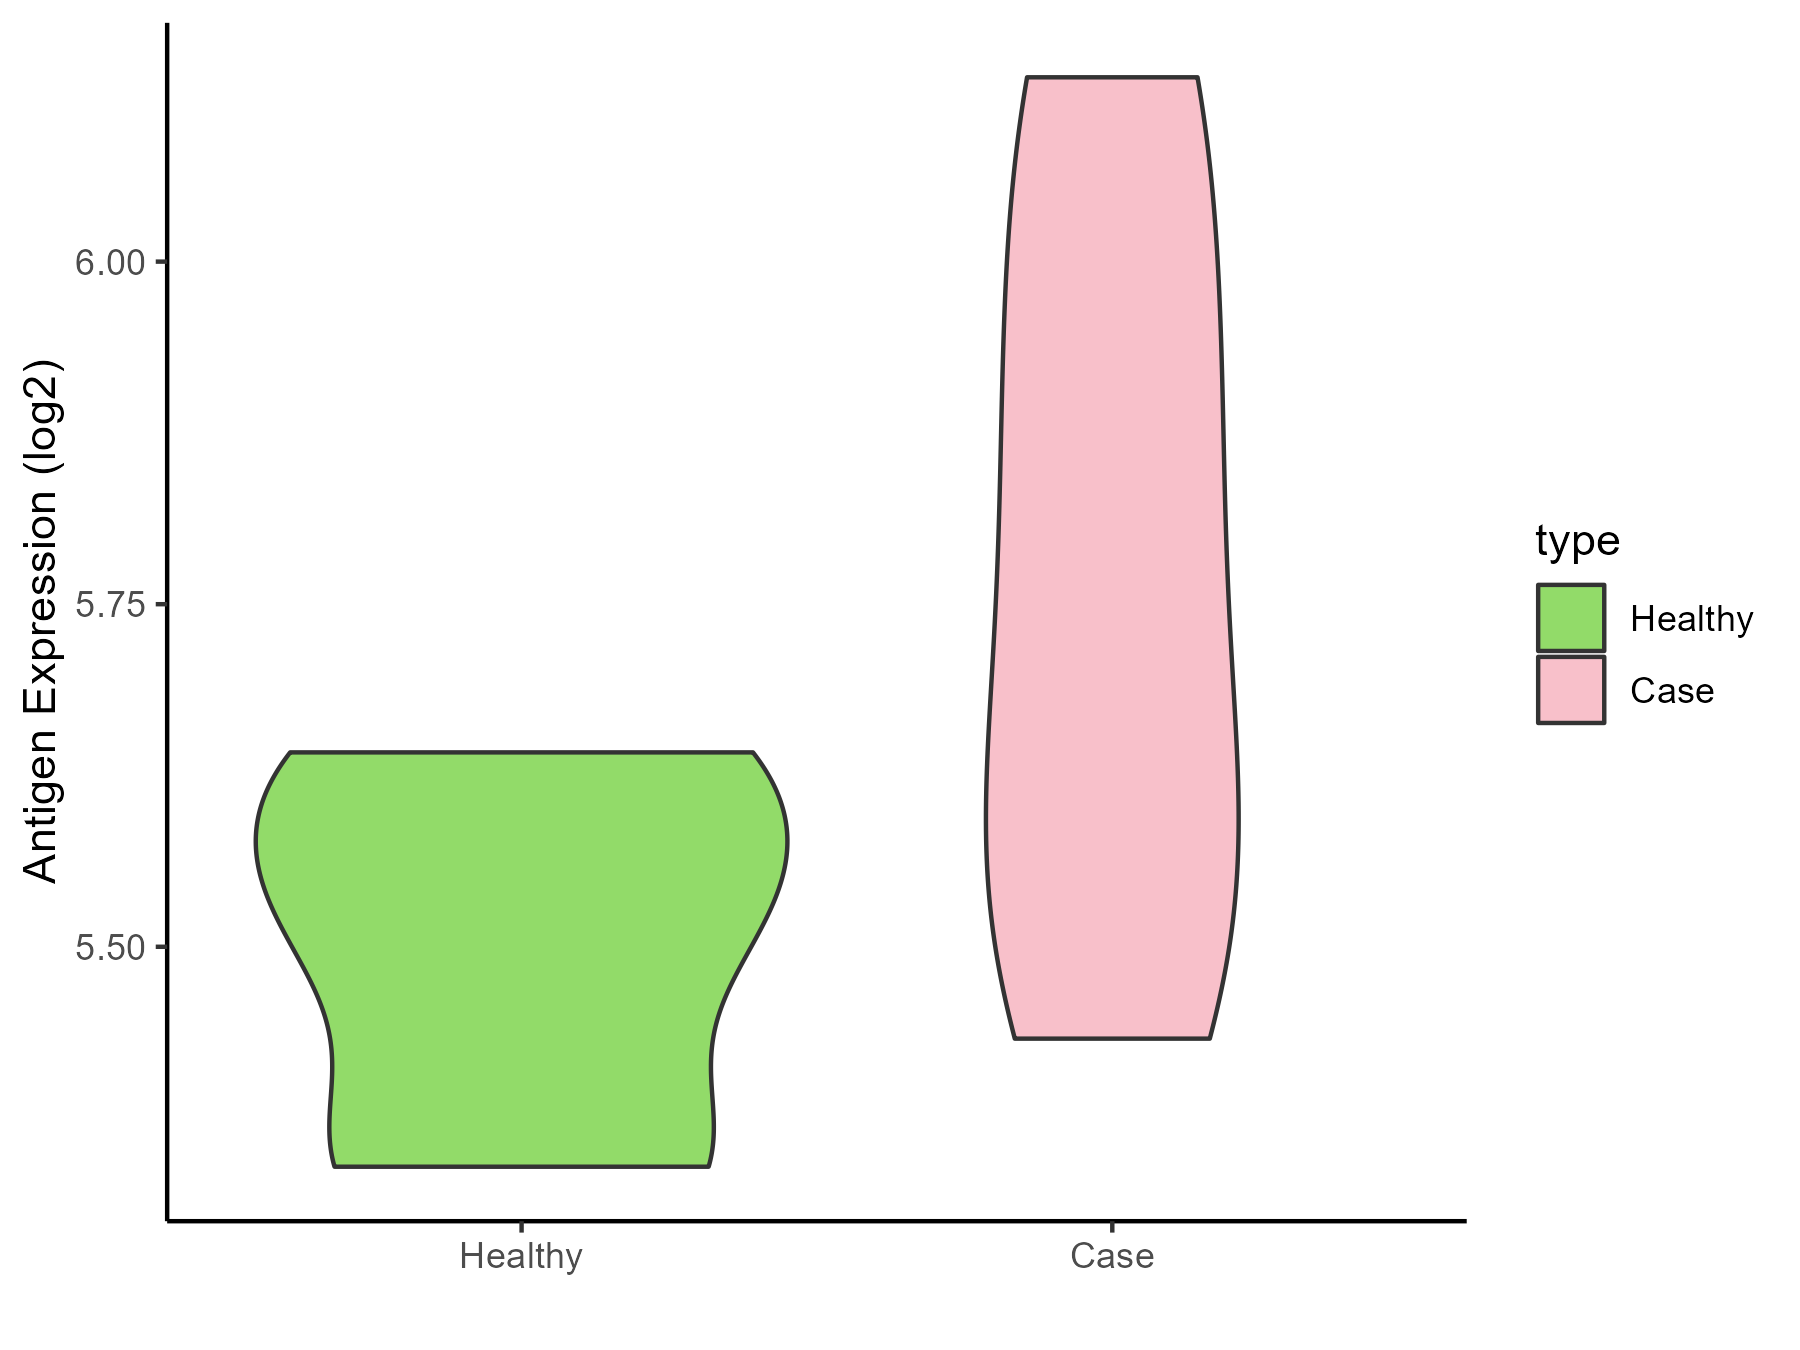
| Differential expression pattern of antigen in diseases | ||
| The Studied Tissue | Adipose | |
| The Specific Disease | Simpson golabi behmel syndrome | |
| The Expression Level of Disease Section Compare with the Healthy Individual Tissue | p-value: 0.066834585; Fold-change: 0.235814181; Z-score: 1.54883786 | |
| Disease-specific Antigen Abundances |
|
Click to View the Clearer Original Diagram |
| Differential expression pattern of antigen in diseases | ||
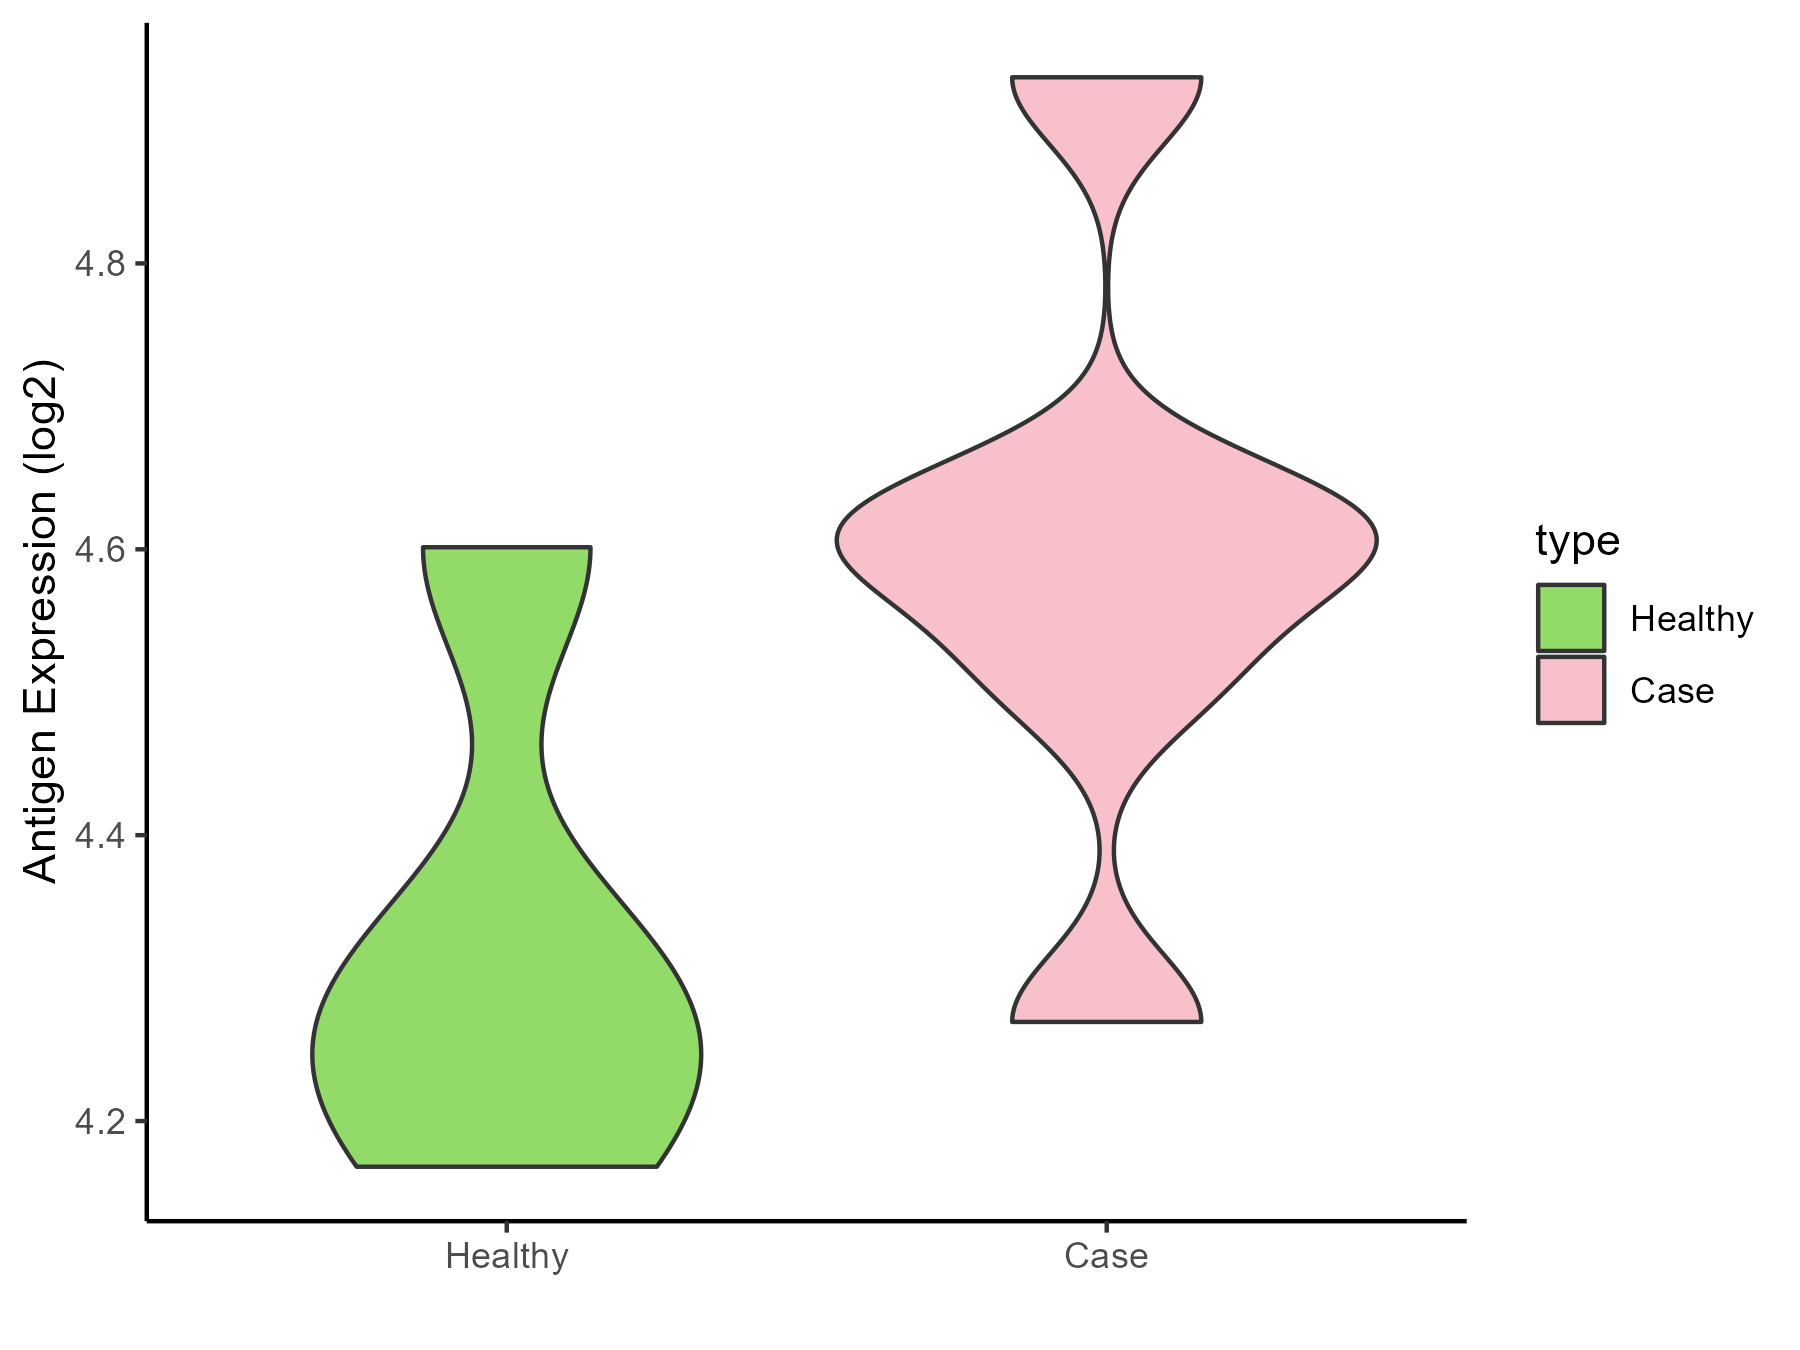
| The Studied Tissue | Perituberal | |
| The Specific Disease | Tuberous sclerosis complex | |
| The Expression Level of Disease Section Compare with the Healthy Individual Tissue | p-value: 0.083842091; Fold-change: 0.319559915; Z-score: 1.693133915 | |
| Disease-specific Antigen Abundances |
|
Click to View the Clearer Original Diagram |
ICD Disease Classification 3
| Differential expression pattern of antigen in diseases | ||
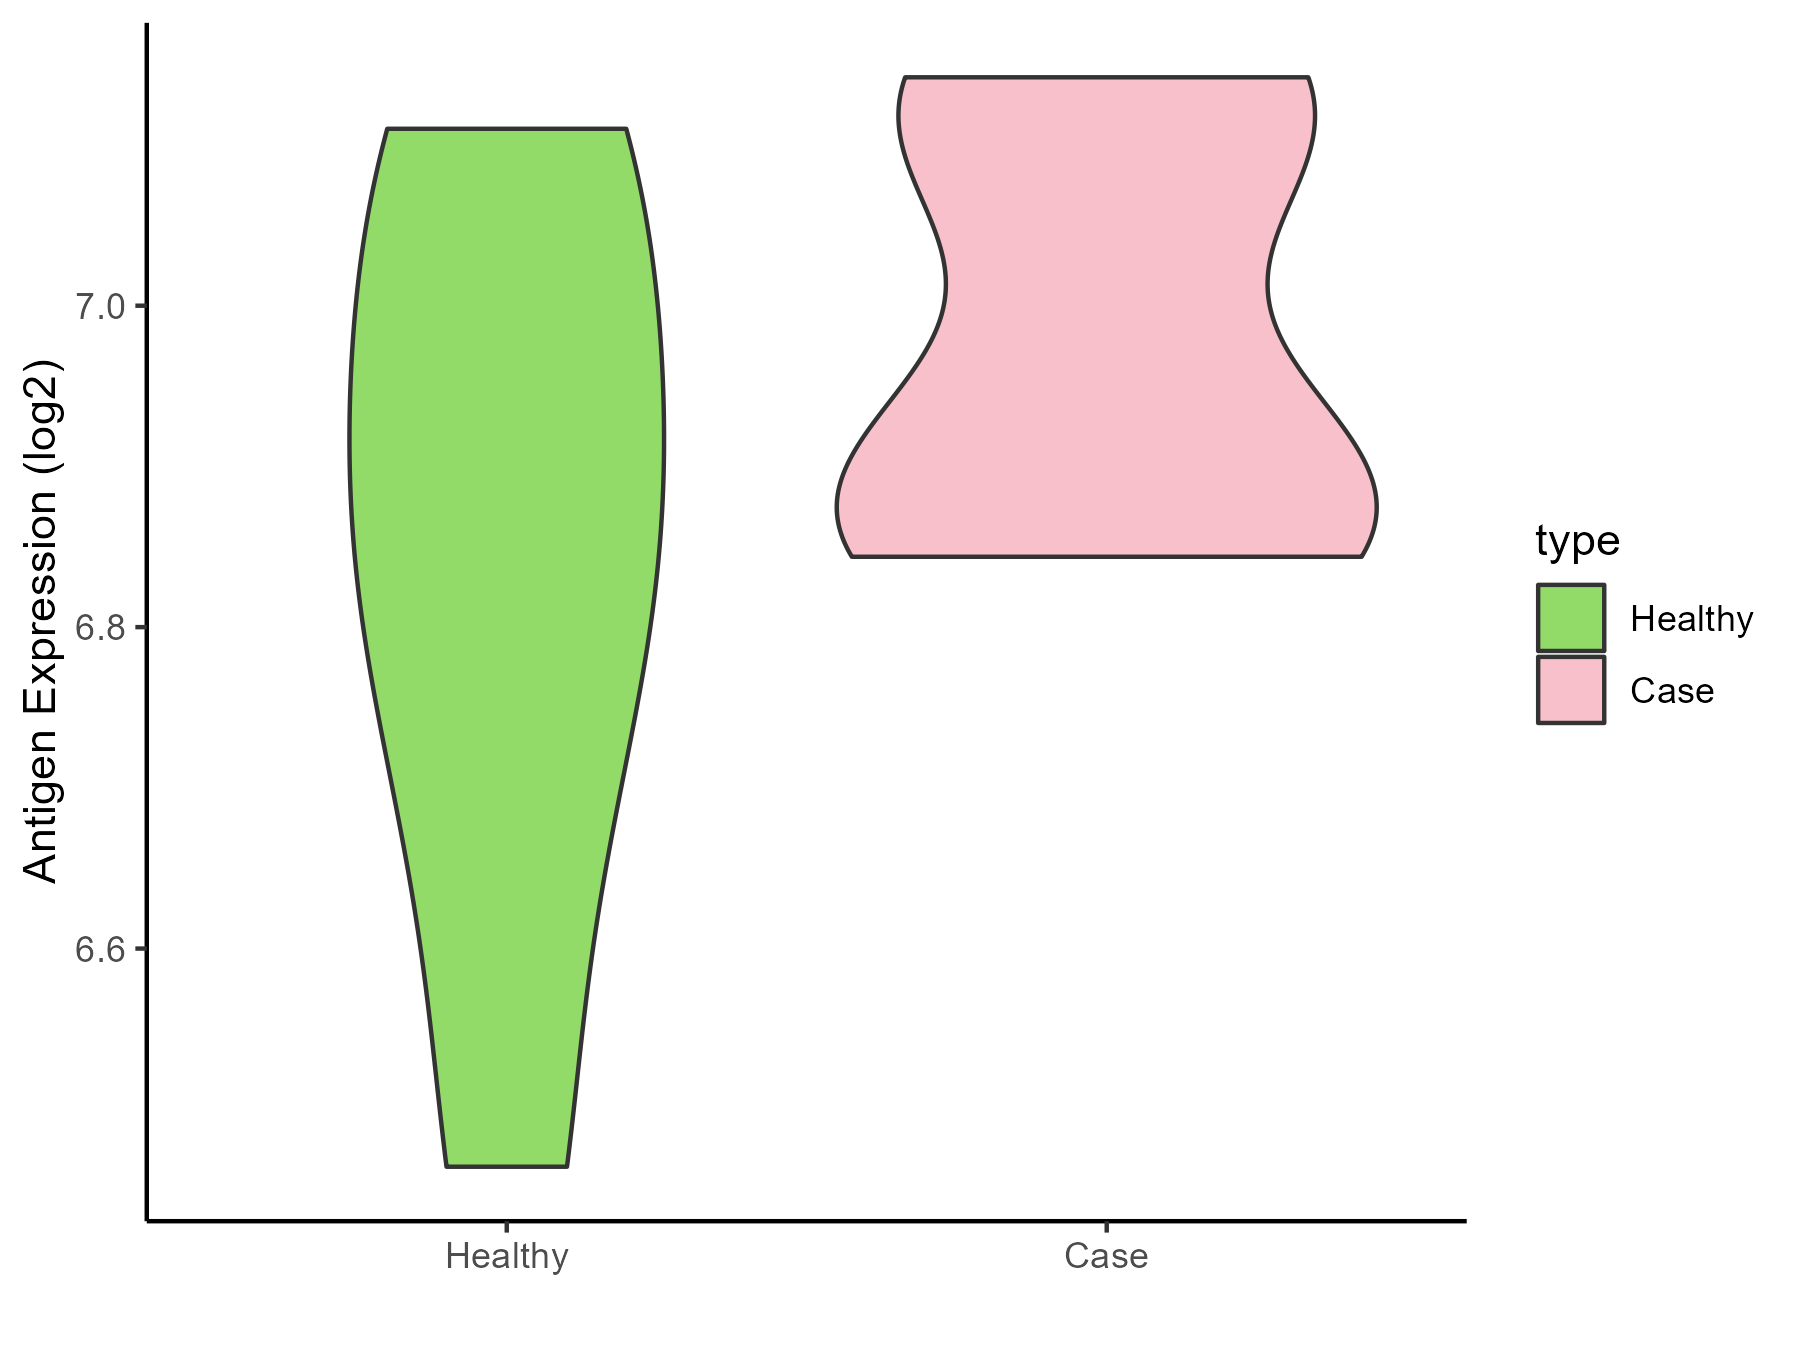
| The Studied Tissue | Bone marrow | |
| The Specific Disease | Anemia | |
| The Expression Level of Disease Section Compare with the Healthy Individual Tissue | p-value: 0.220109054; Fold-change: 0.031310506; Z-score: 0.136479895 | |
| Disease-specific Antigen Abundances |
|
Click to View the Clearer Original Diagram |
| Differential expression pattern of antigen in diseases | ||
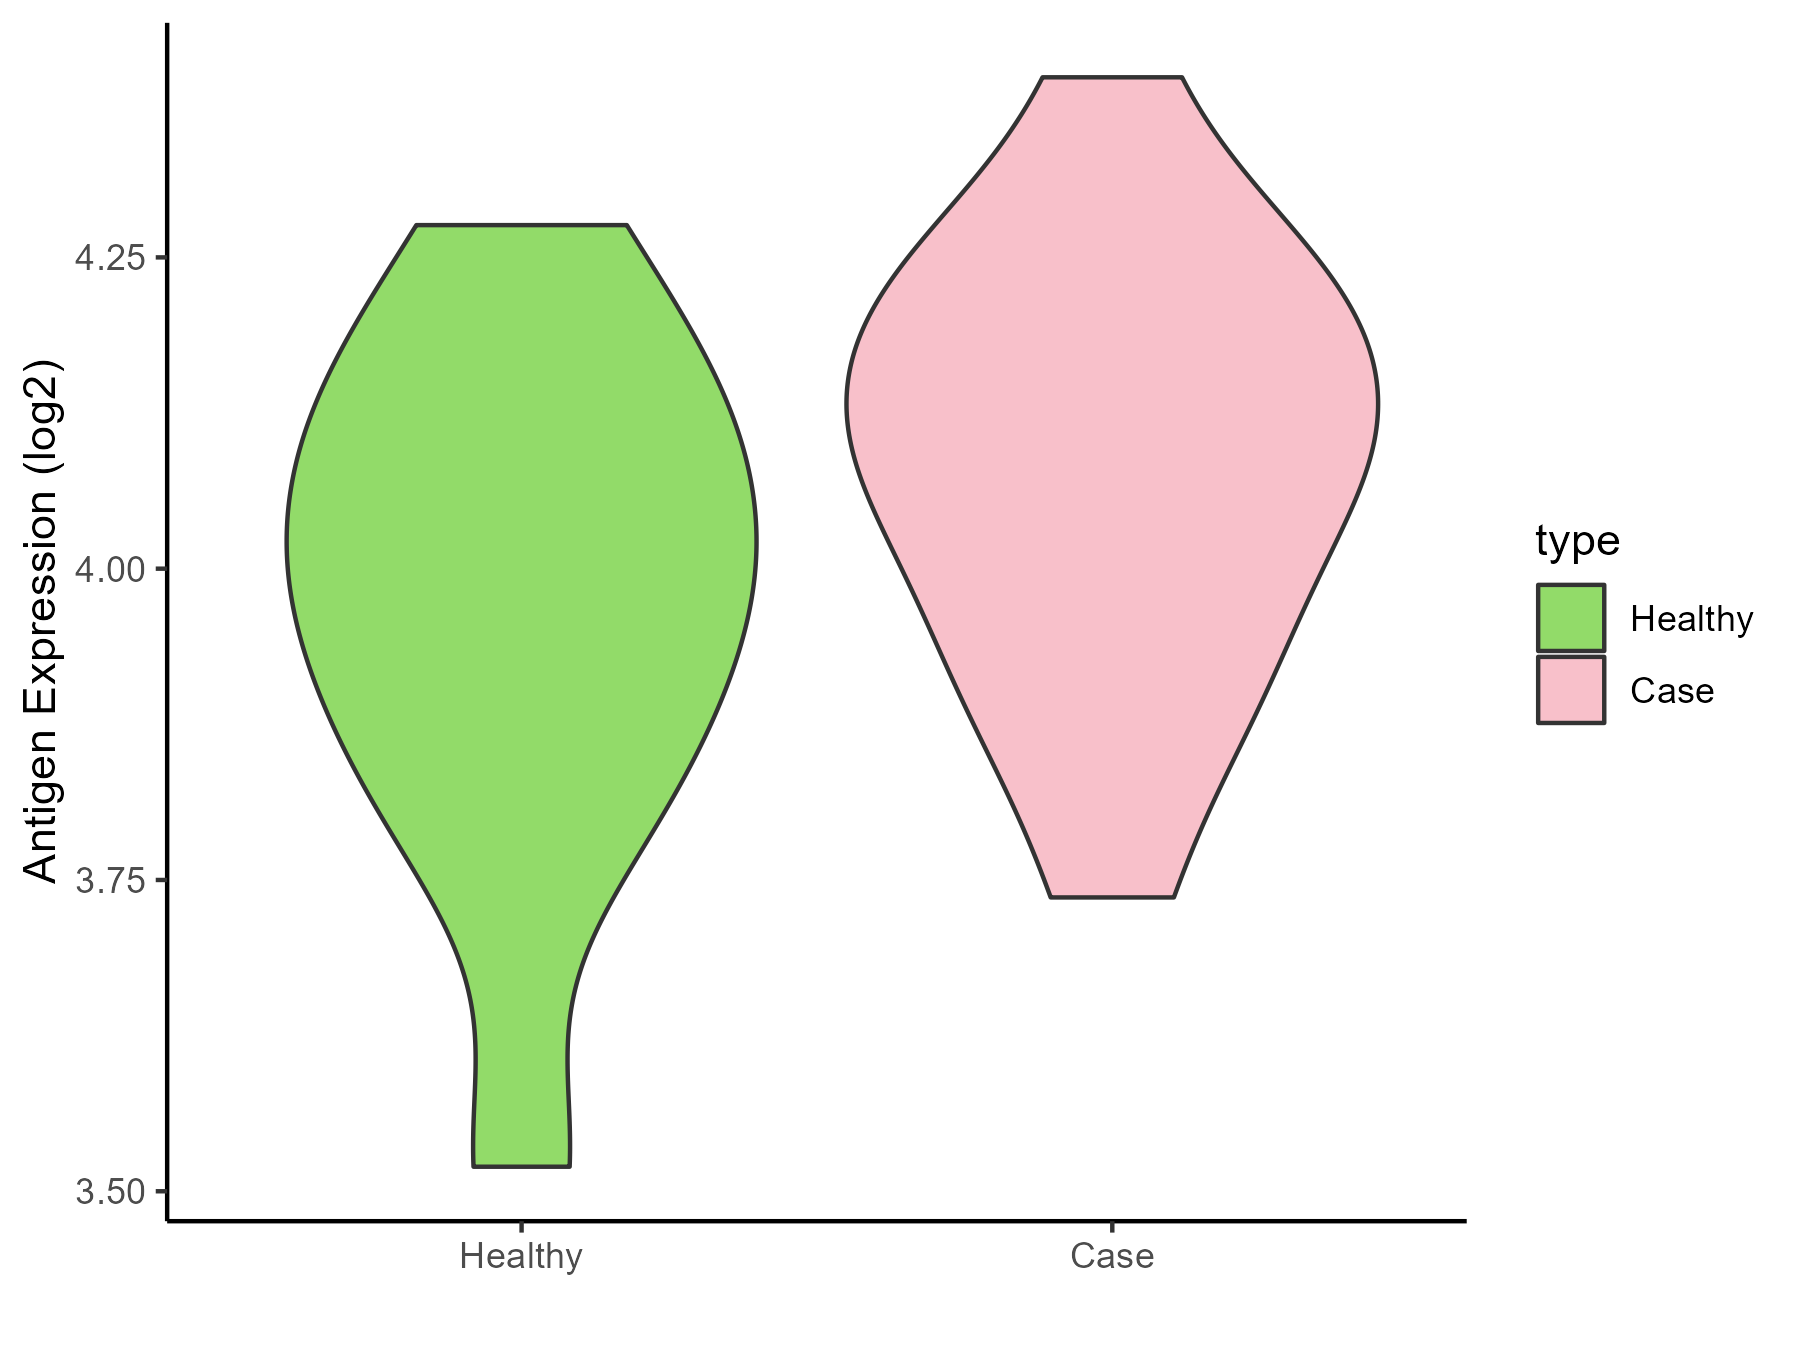
| The Studied Tissue | Peripheral blood | |
| The Specific Disease | Sickle cell disease | |
| The Expression Level of Disease Section Compare with the Healthy Individual Tissue | p-value: 0.175215552; Fold-change: 0.095595048; Z-score: 0.451398255 | |
| Disease-specific Antigen Abundances |
|
Click to View the Clearer Original Diagram |
| Differential expression pattern of antigen in diseases | ||
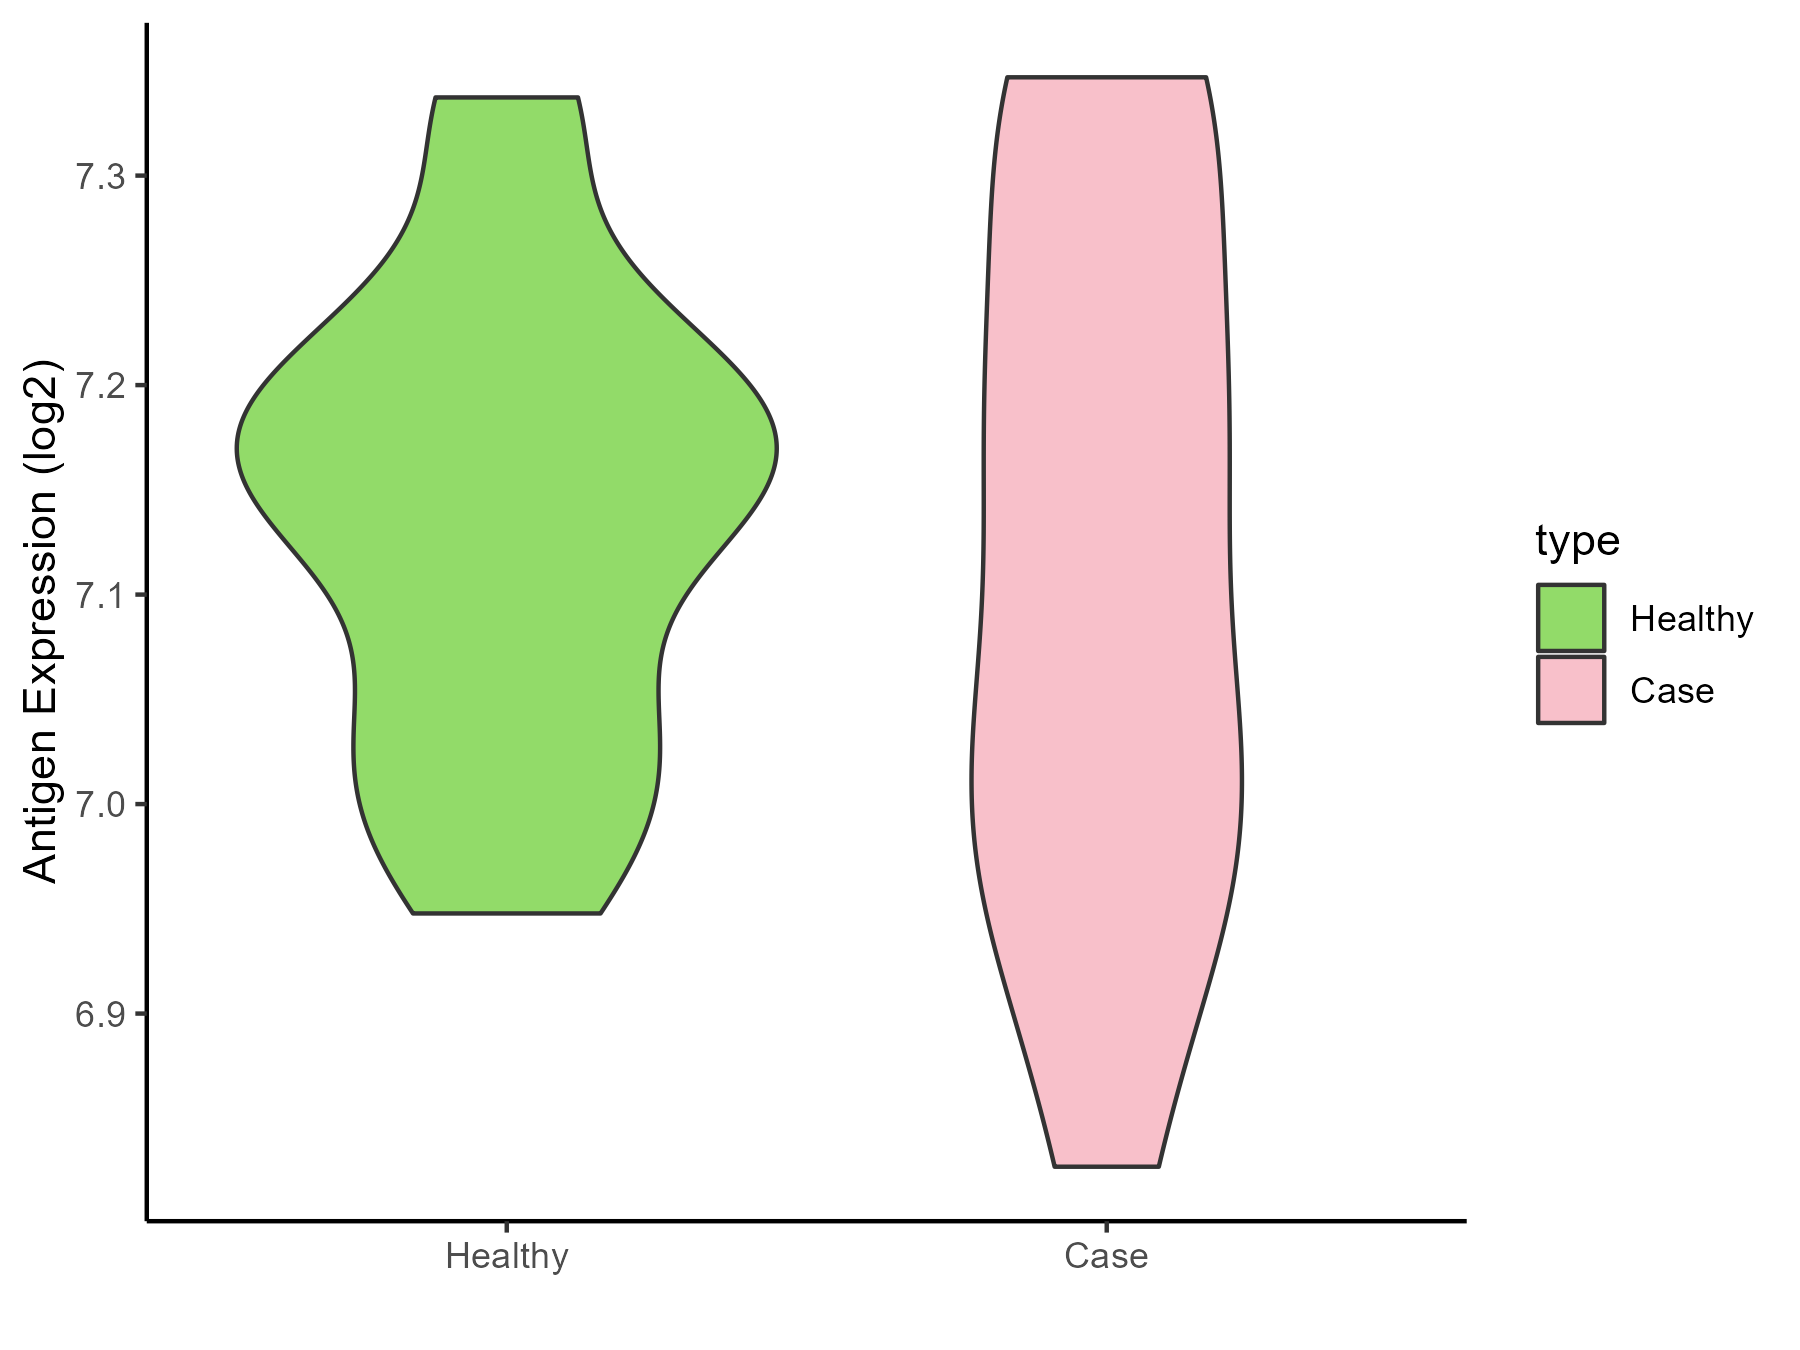
| The Studied Tissue | Whole blood | |
| The Specific Disease | Thrombocythemia | |
| The Expression Level of Disease Section Compare with the Healthy Individual Tissue | p-value: 0.557469608; Fold-change: -0.024281093; Z-score: -0.22287689 | |
| Disease-specific Antigen Abundances |
|
Click to View the Clearer Original Diagram |
ICD Disease Classification 4
| Differential expression pattern of antigen in diseases | ||
| The Studied Tissue | Whole blood | |
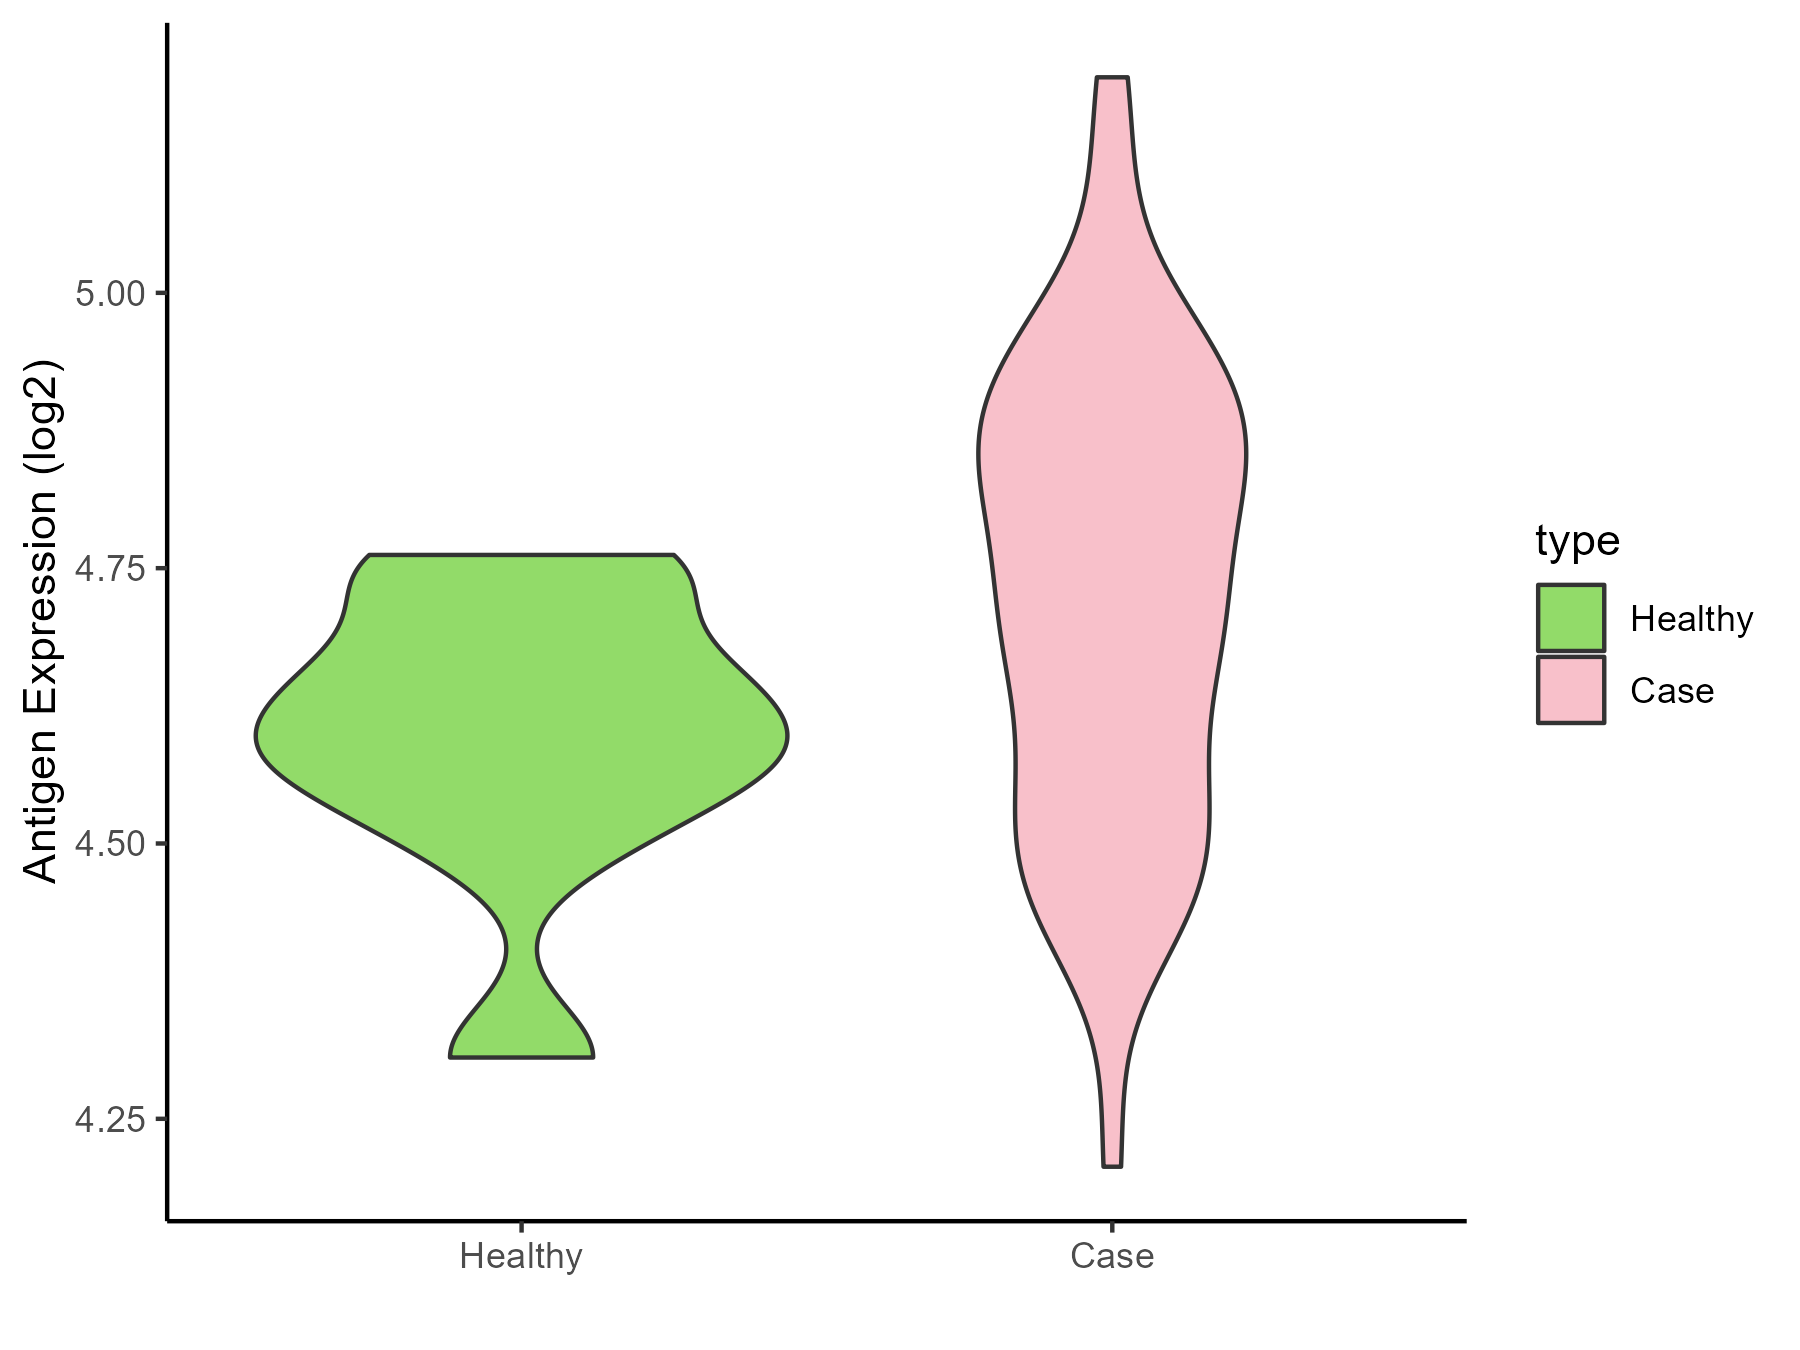
| The Specific Disease | Scleroderma | |
| The Expression Level of Disease Section Compare with the Healthy Individual Tissue | p-value: 0.025217458; Fold-change: 0.125374757; Z-score: 0.910801253 | |
| Disease-specific Antigen Abundances |
|
Click to View the Clearer Original Diagram |
| Differential expression pattern of antigen in diseases | ||
| The Studied Tissue | Salivary gland | |
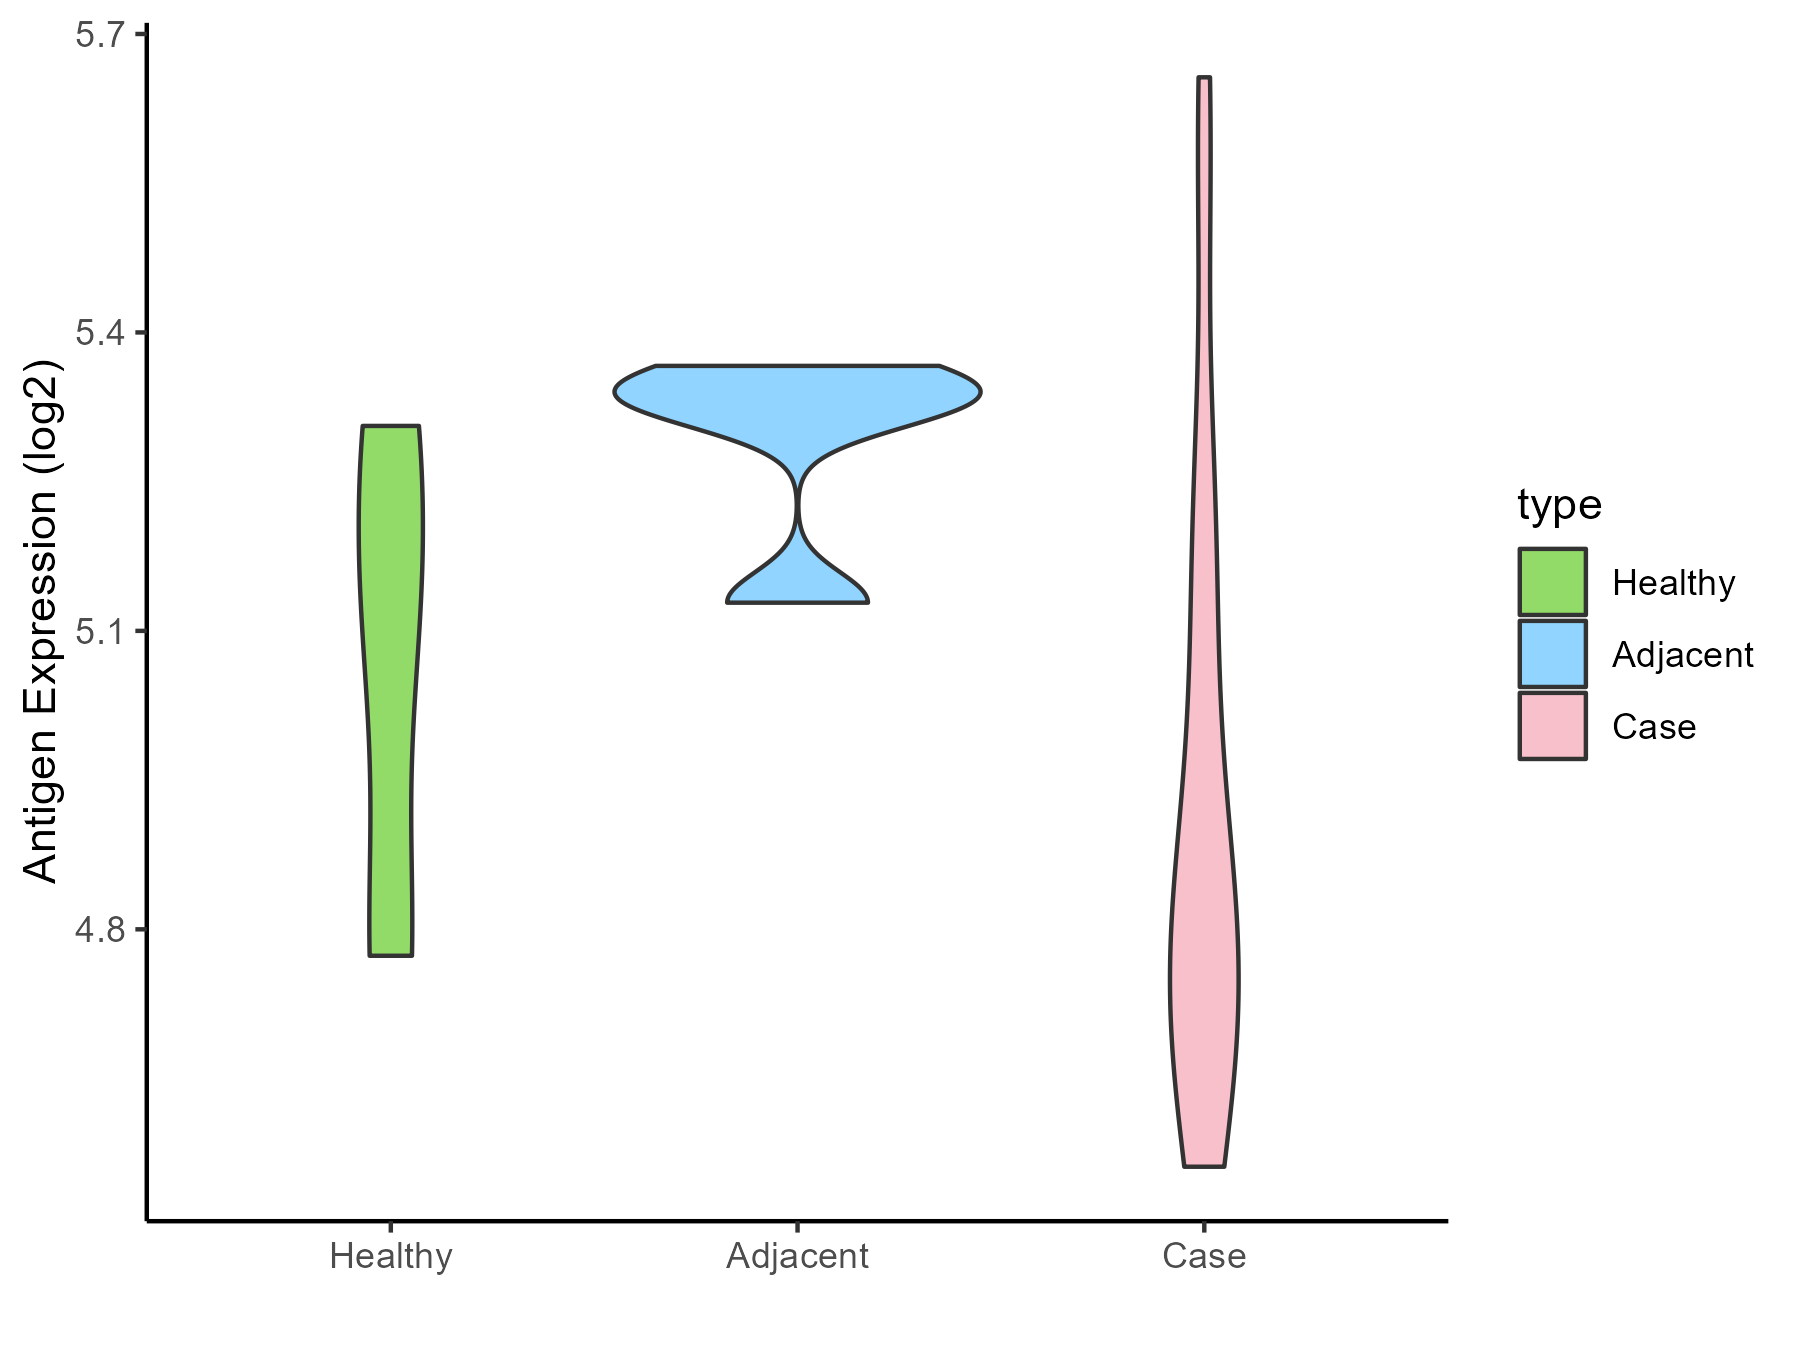
| The Specific Disease | Sjogren syndrome | |
| The Expression Level of Disease Section Compare with the Healthy Individual Tissue | p-value: 0.459605152; Fold-change: -0.306988094; Z-score: -1.138162021 | |
| The Expression Level of Disease Section Compare with the Adjacent Tissue | p-value: 0.000896787; Fold-change: -0.523877922; Z-score: -4.83011187 | |
| Disease-specific Antigen Abundances |
|
Click to View the Clearer Original Diagram |
| Differential expression pattern of antigen in diseases | ||
| The Studied Tissue | Peripheral blood | |
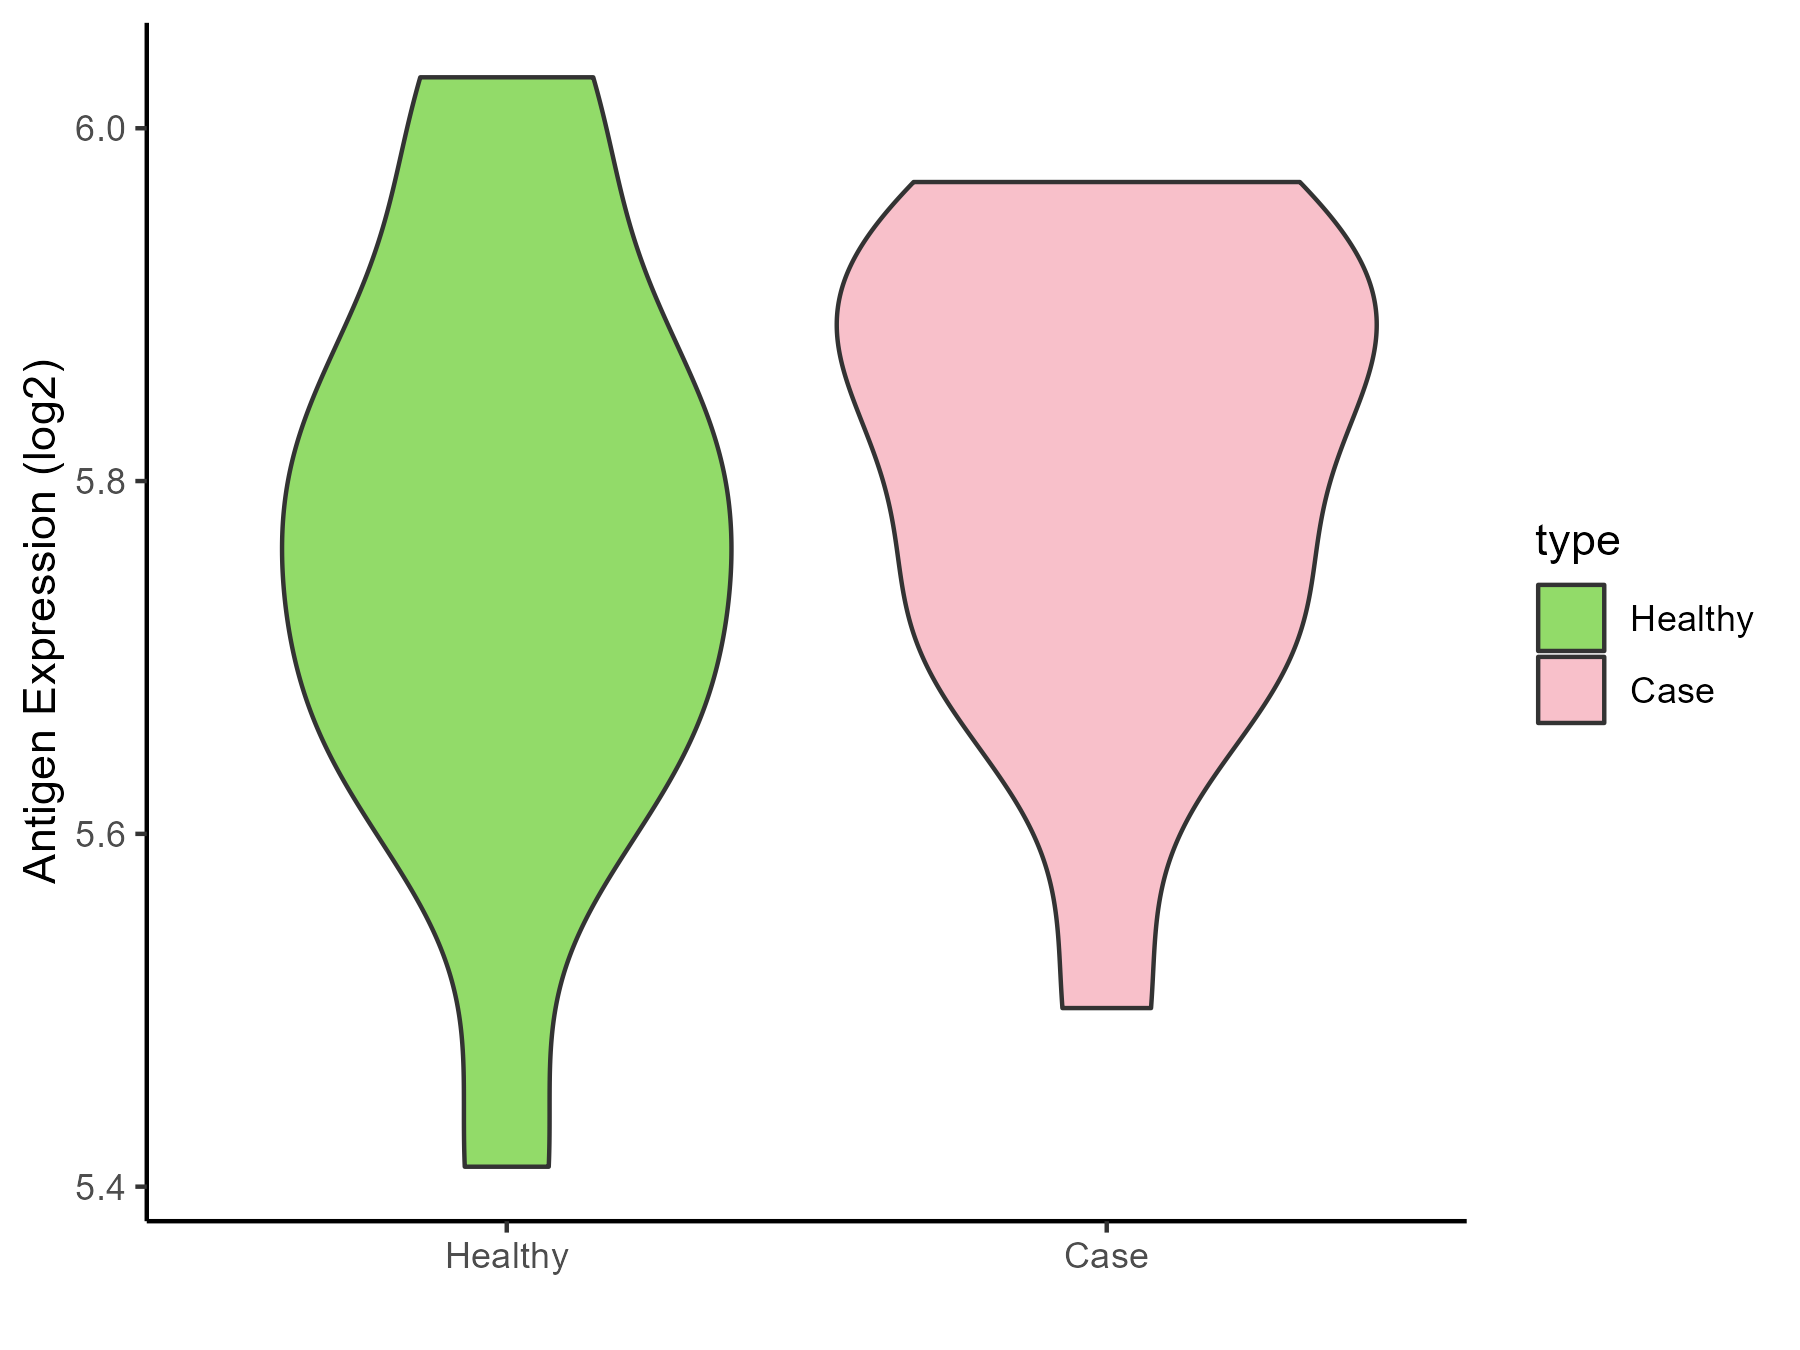
| The Specific Disease | Behcet disease | |
| The Expression Level of Disease Section Compare with the Healthy Individual Tissue | p-value: 0.471824606; Fold-change: 0.075922785; Z-score: 0.449643556 | |
| Disease-specific Antigen Abundances |
|
Click to View the Clearer Original Diagram |
| Differential expression pattern of antigen in diseases | ||
| The Studied Tissue | Whole blood | |
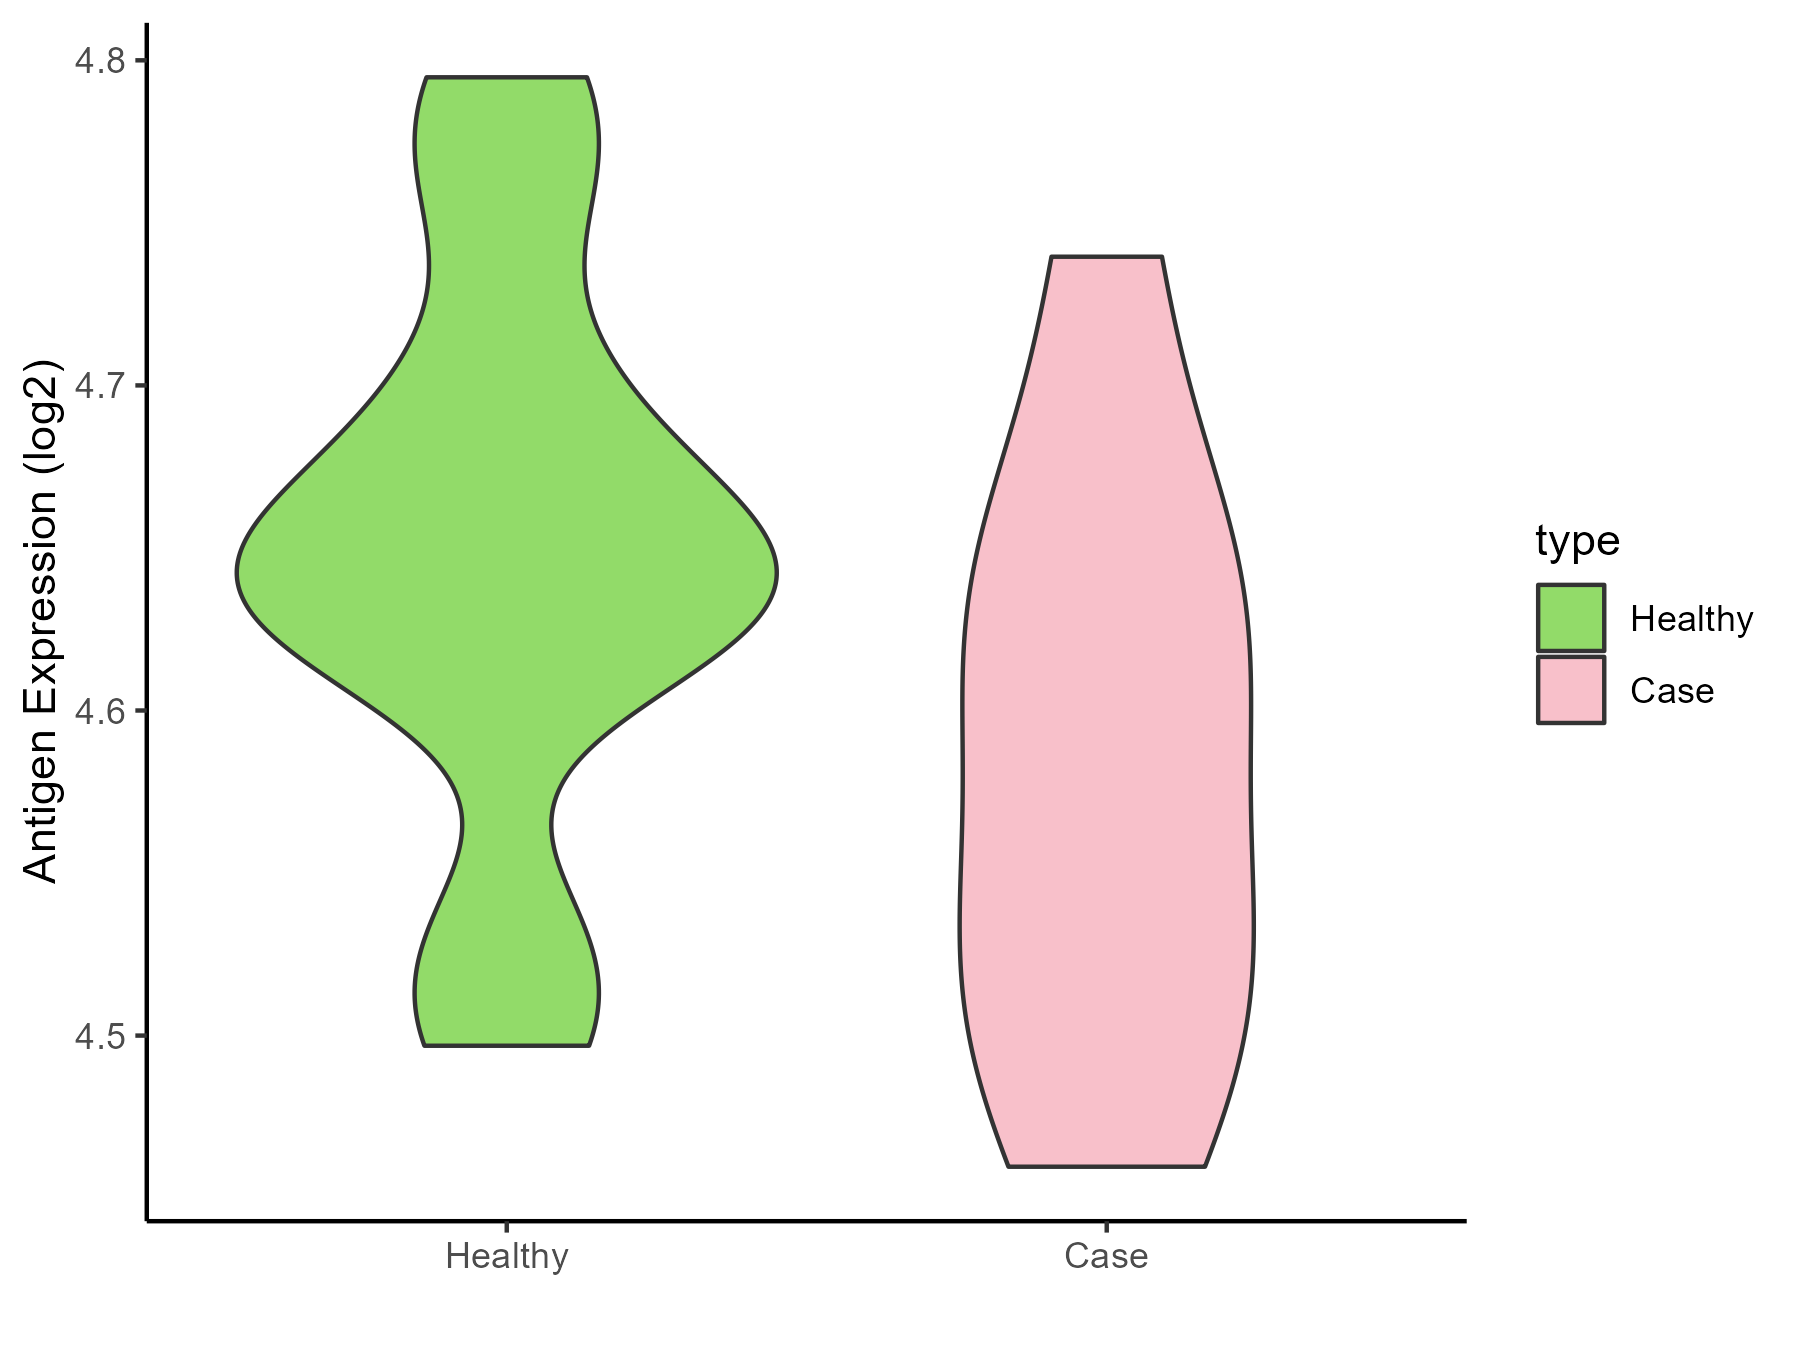
| The Specific Disease | Autosomal dominant monocytopenia | |
| The Expression Level of Disease Section Compare with the Healthy Individual Tissue | p-value: 0.136756565; Fold-change: -0.067601468; Z-score: -0.772344525 | |
| Disease-specific Antigen Abundances |
|
Click to View the Clearer Original Diagram |
ICD Disease Classification 5
| Differential expression pattern of antigen in diseases | ||
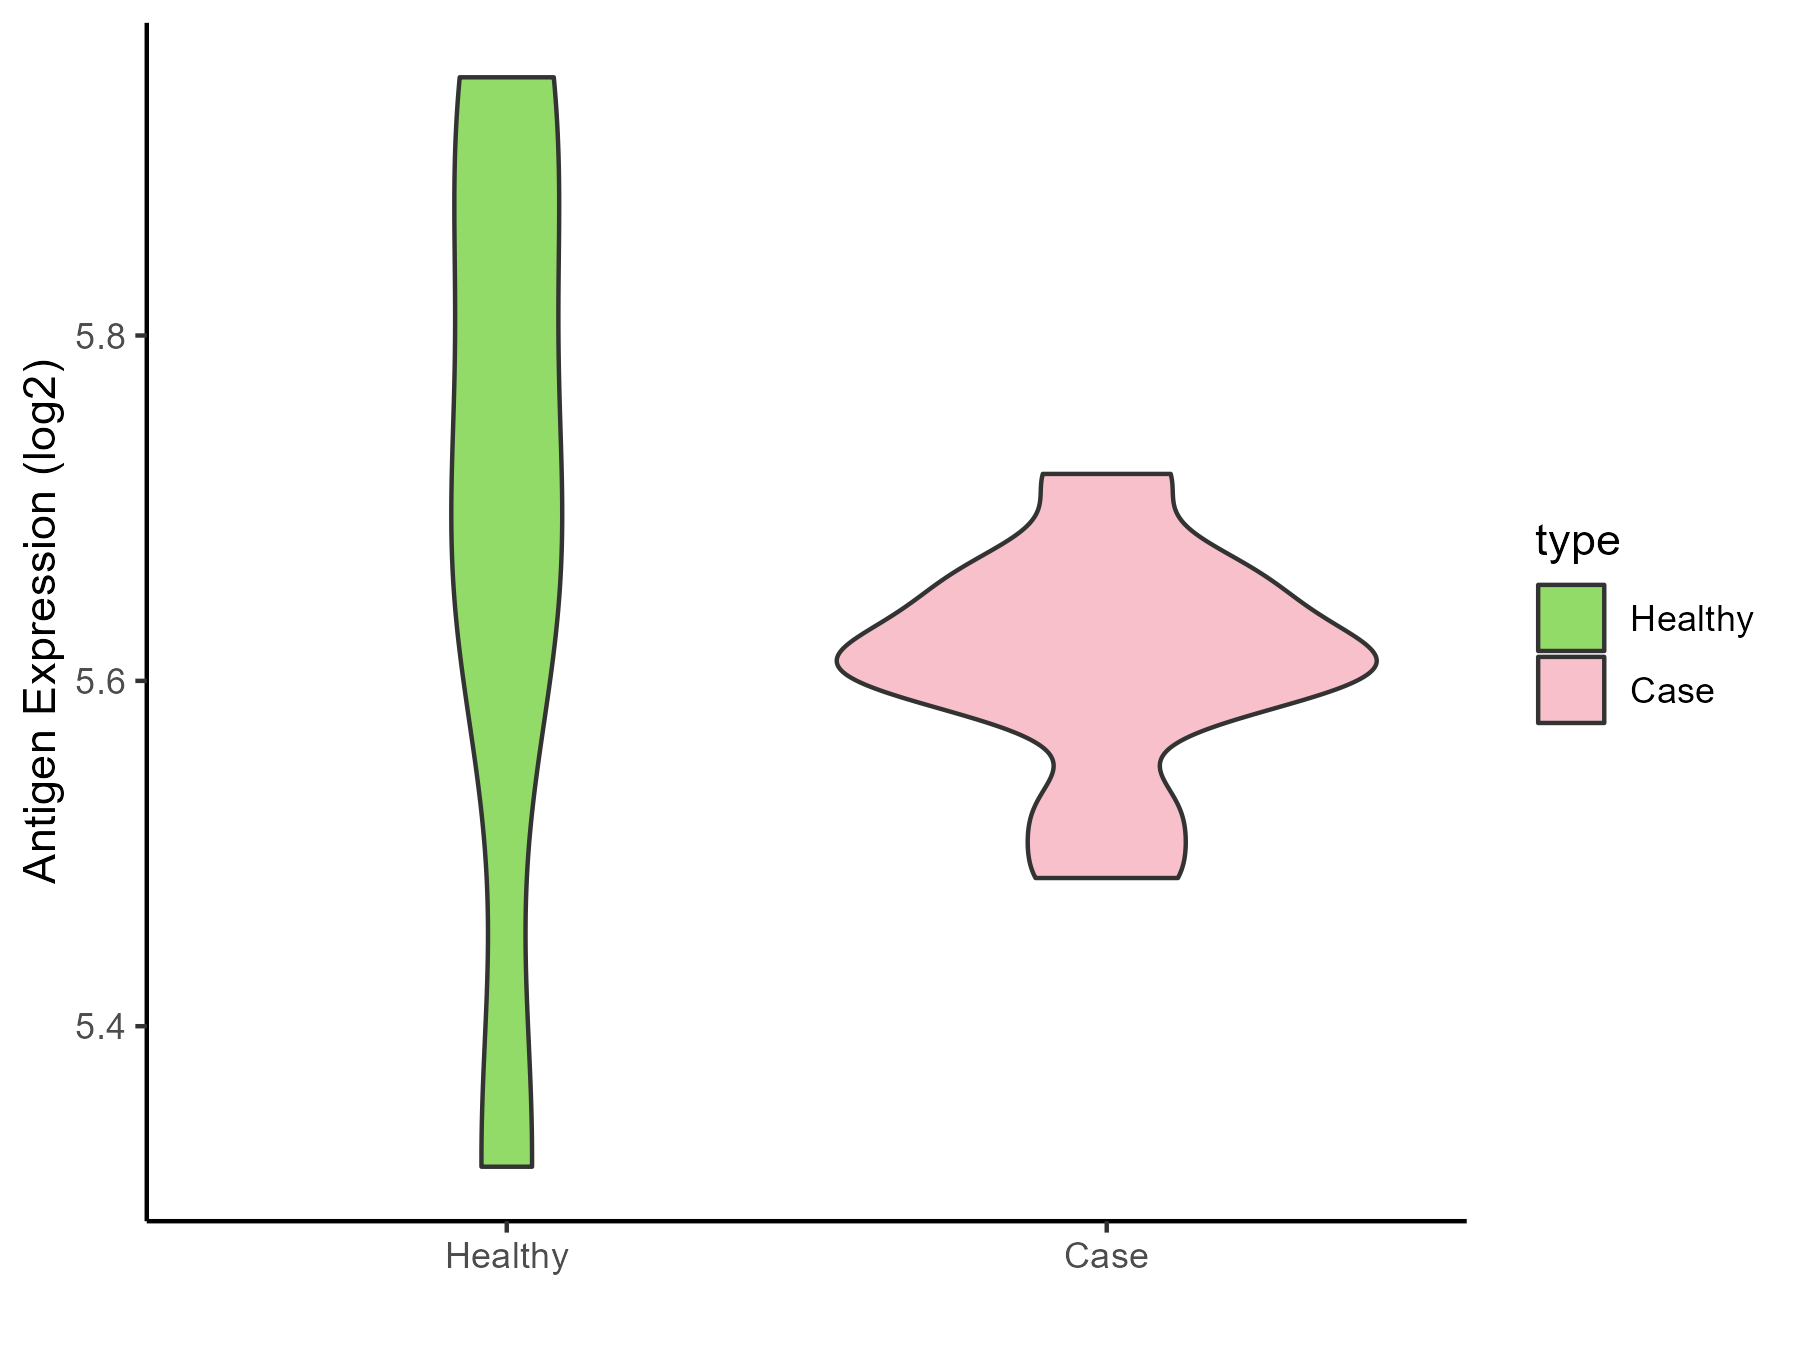
| The Studied Tissue | Liver | |
| The Specific Disease | Type 2 diabetes | |
| The Expression Level of Disease Section Compare with the Healthy Individual Tissue | p-value: 0.483557898; Fold-change: -0.06081849; Z-score: -0.246873123 | |
| Disease-specific Antigen Abundances |
|
Click to View the Clearer Original Diagram |
| Differential expression pattern of antigen in diseases | ||
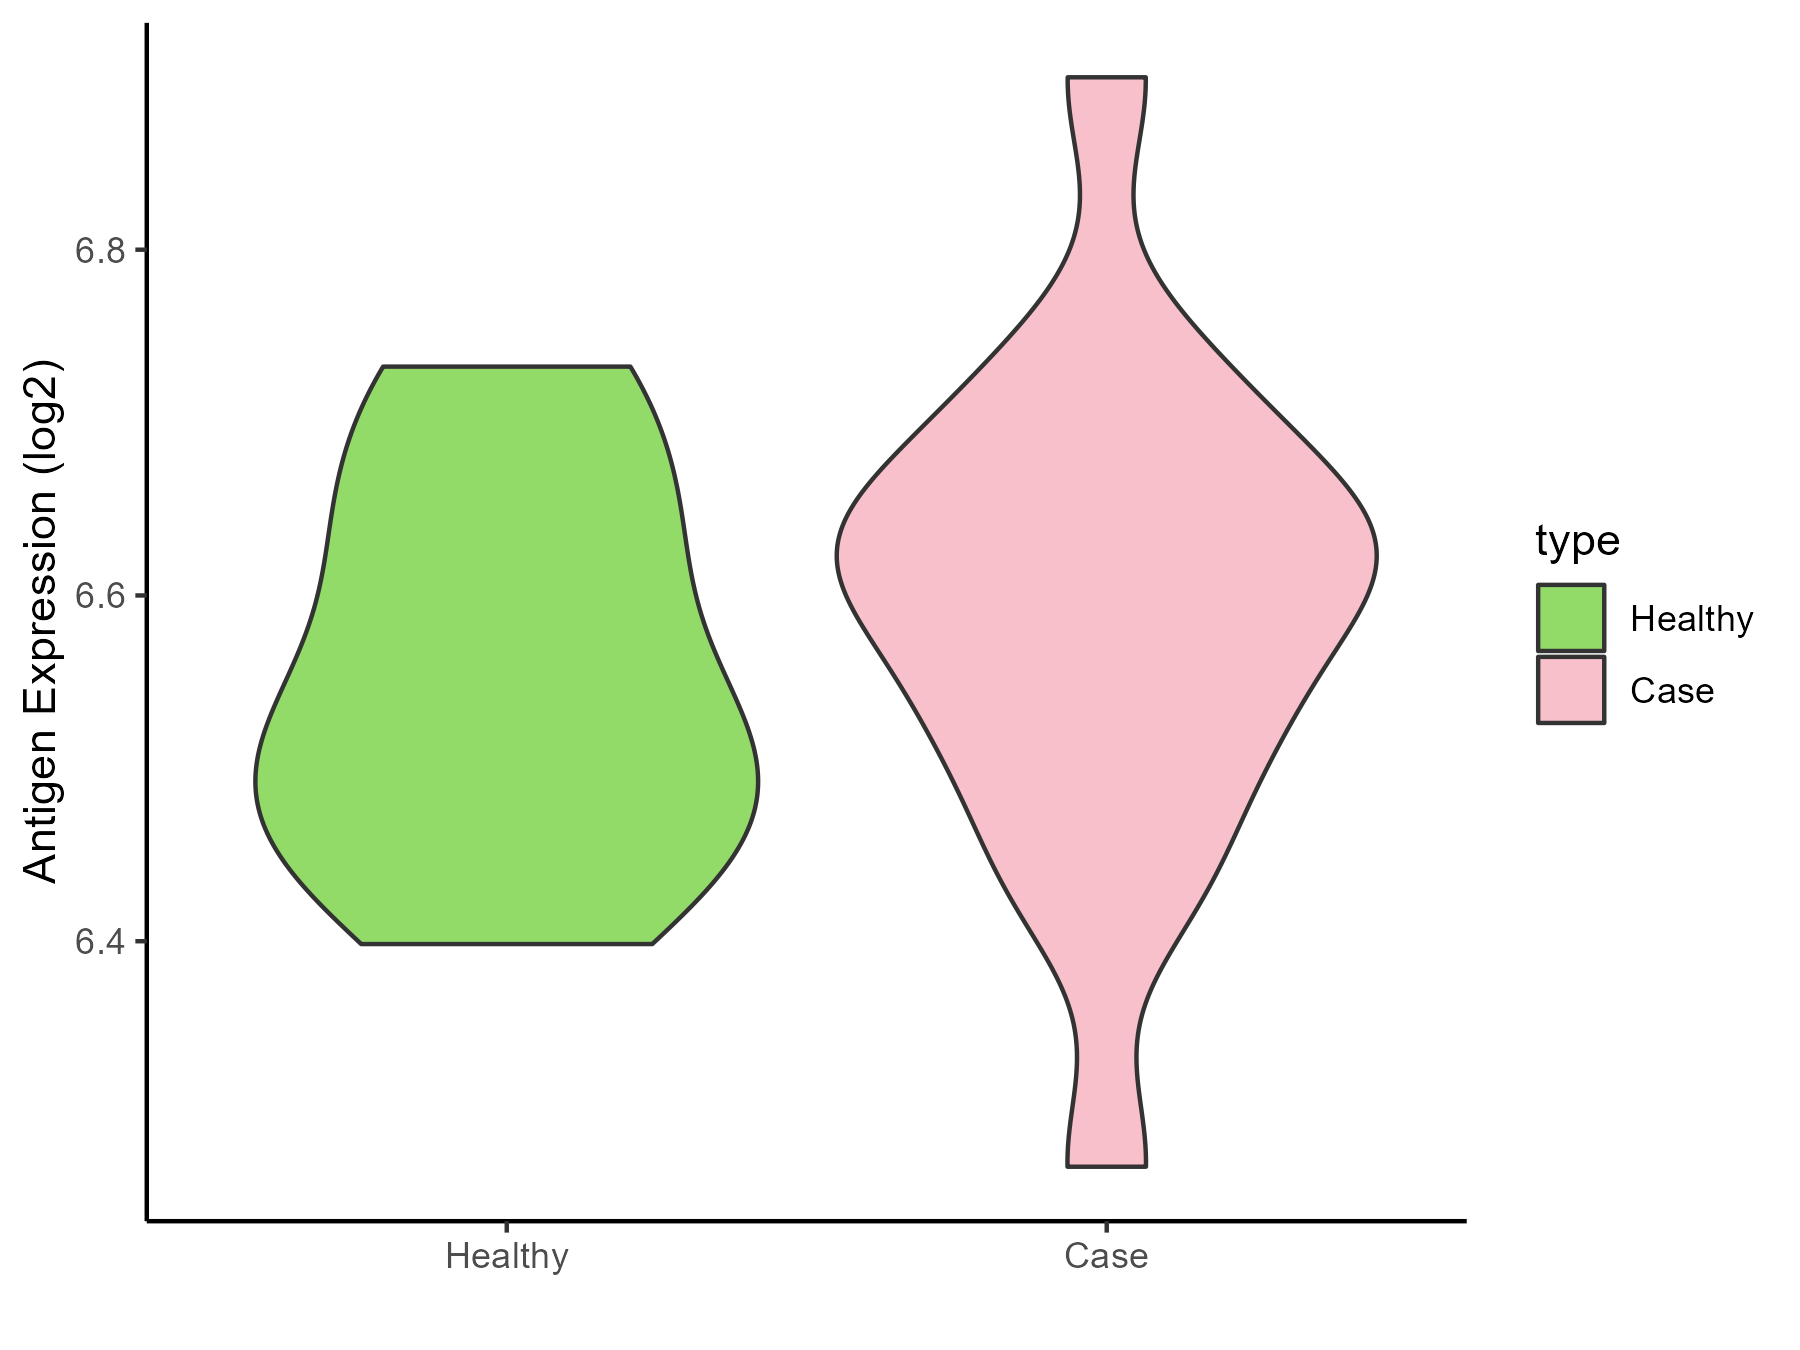
| The Studied Tissue | Vastus lateralis muscle | |
| The Specific Disease | Polycystic ovary syndrome | |
| The Expression Level of Disease Section Compare with the Healthy Individual Tissue | p-value: 0.475230346; Fold-change: 0.076379739; Z-score: 0.689626674 | |
| Disease-specific Antigen Abundances |
|
Click to View the Clearer Original Diagram |
| Differential expression pattern of antigen in diseases | ||
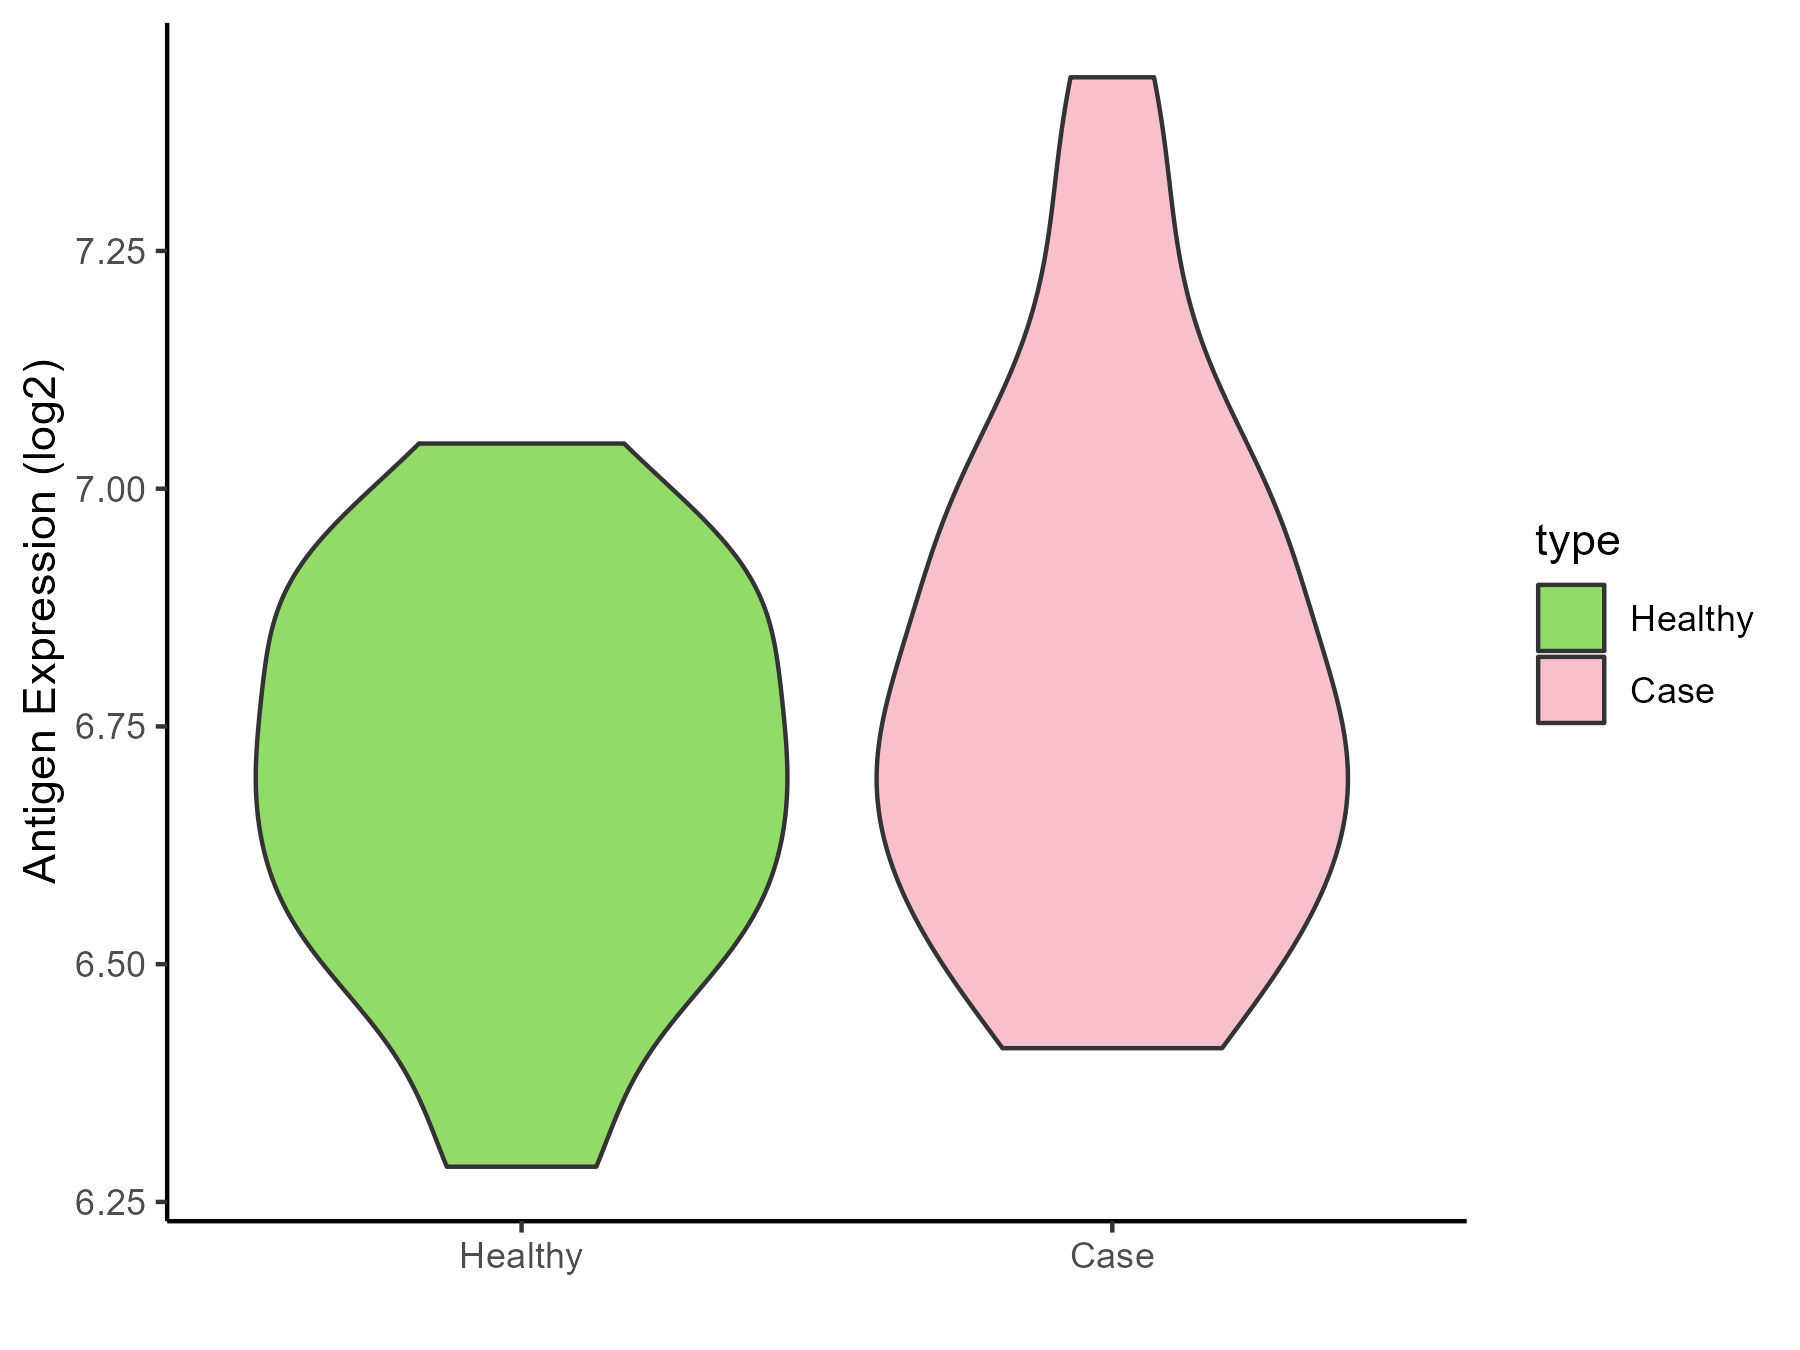
| The Studied Tissue | Subcutaneous Adipose | |
| The Specific Disease | Obesity | |
| The Expression Level of Disease Section Compare with the Healthy Individual Tissue | p-value: 0.089414707; Fold-change: 0.071597401; Z-score: 0.345682628 | |
| Disease-specific Antigen Abundances |
|
Click to View the Clearer Original Diagram |
| Differential expression pattern of antigen in diseases | ||
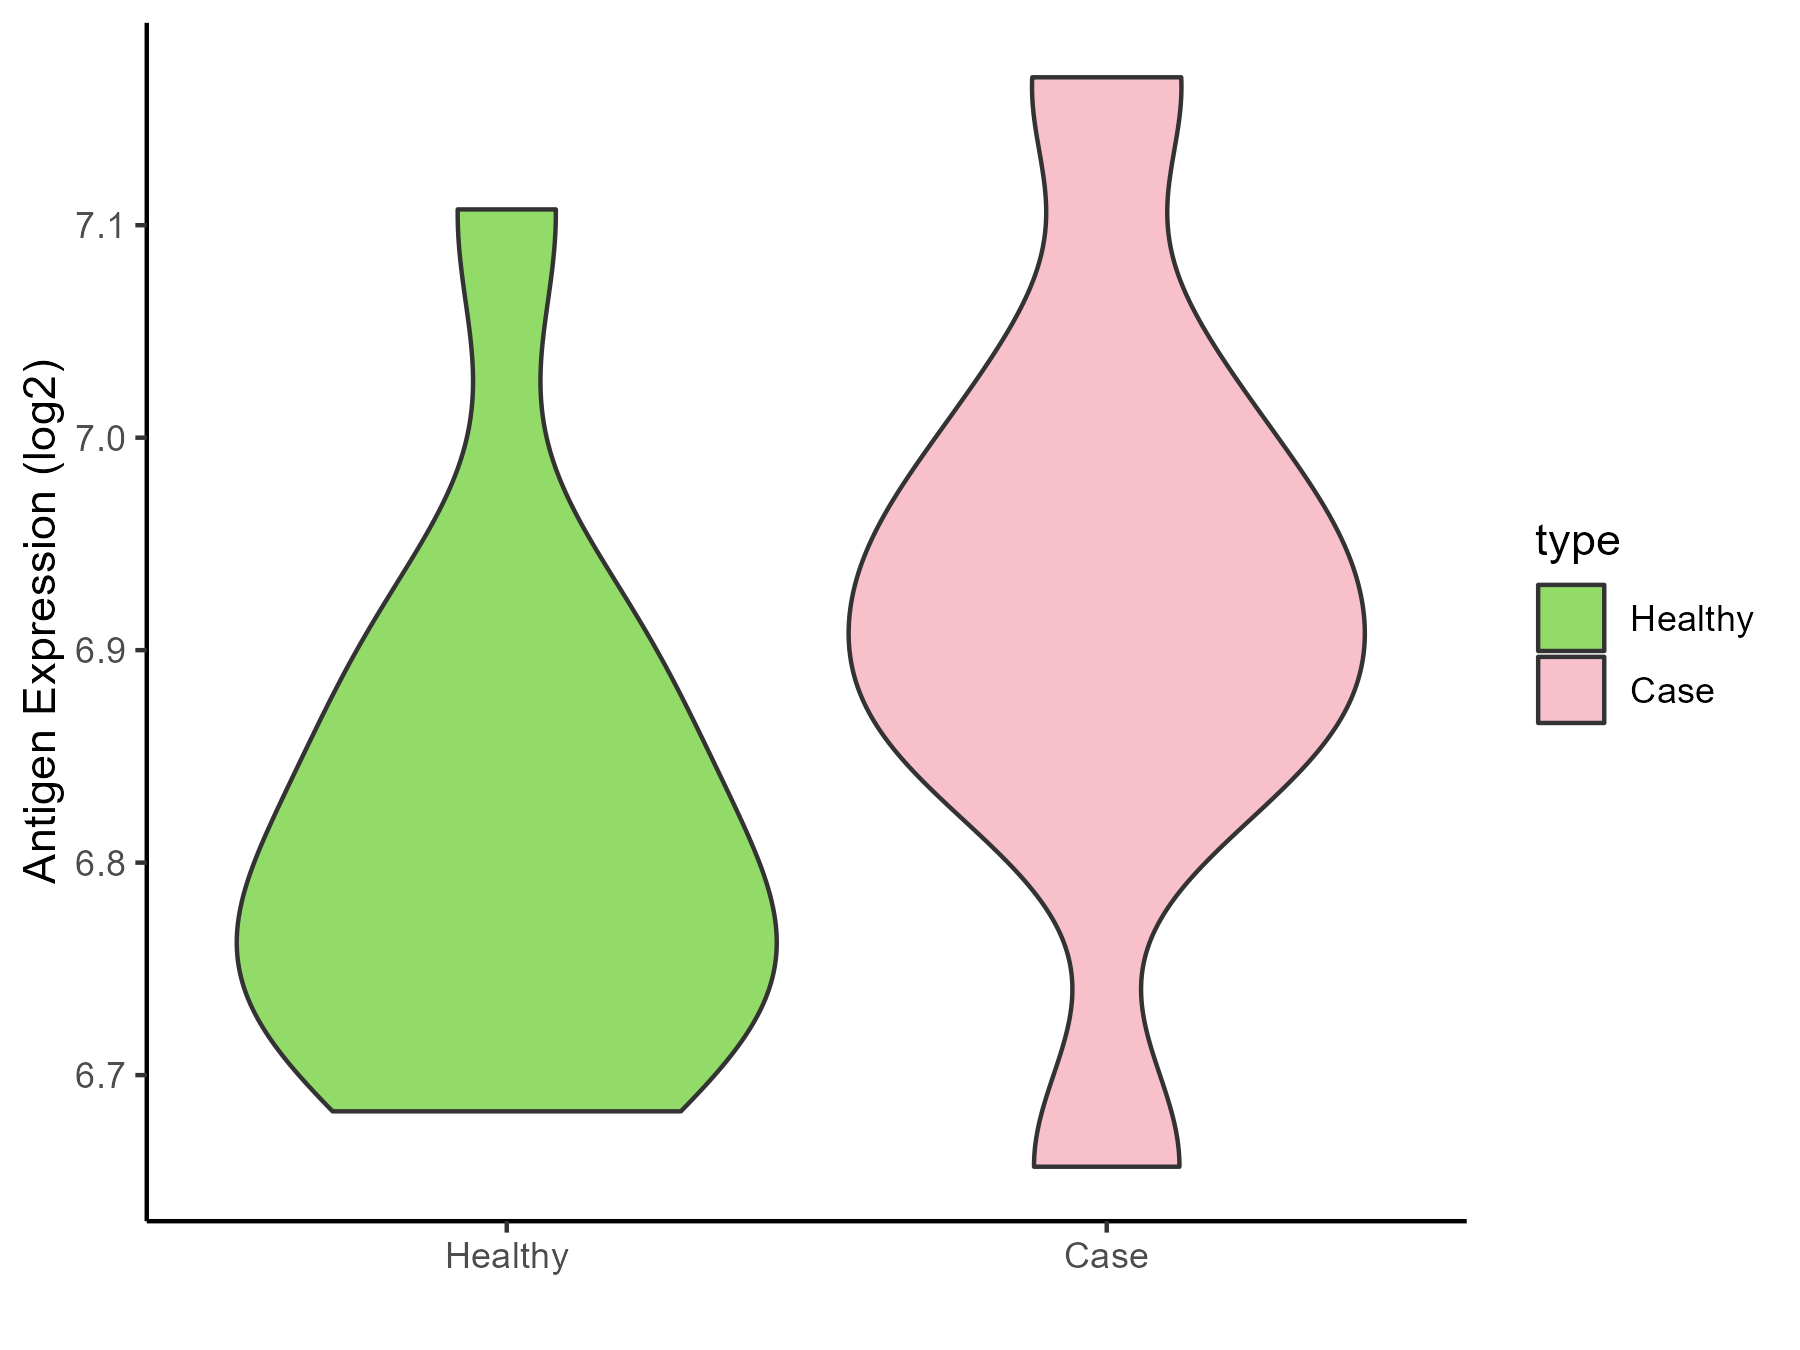
| The Studied Tissue | Biceps muscle | |
| The Specific Disease | Pompe disease | |
| The Expression Level of Disease Section Compare with the Healthy Individual Tissue | p-value: 0.152526112; Fold-change: 0.130022504; Z-score: 1.046784987 | |
| Disease-specific Antigen Abundances |
|
Click to View the Clearer Original Diagram |
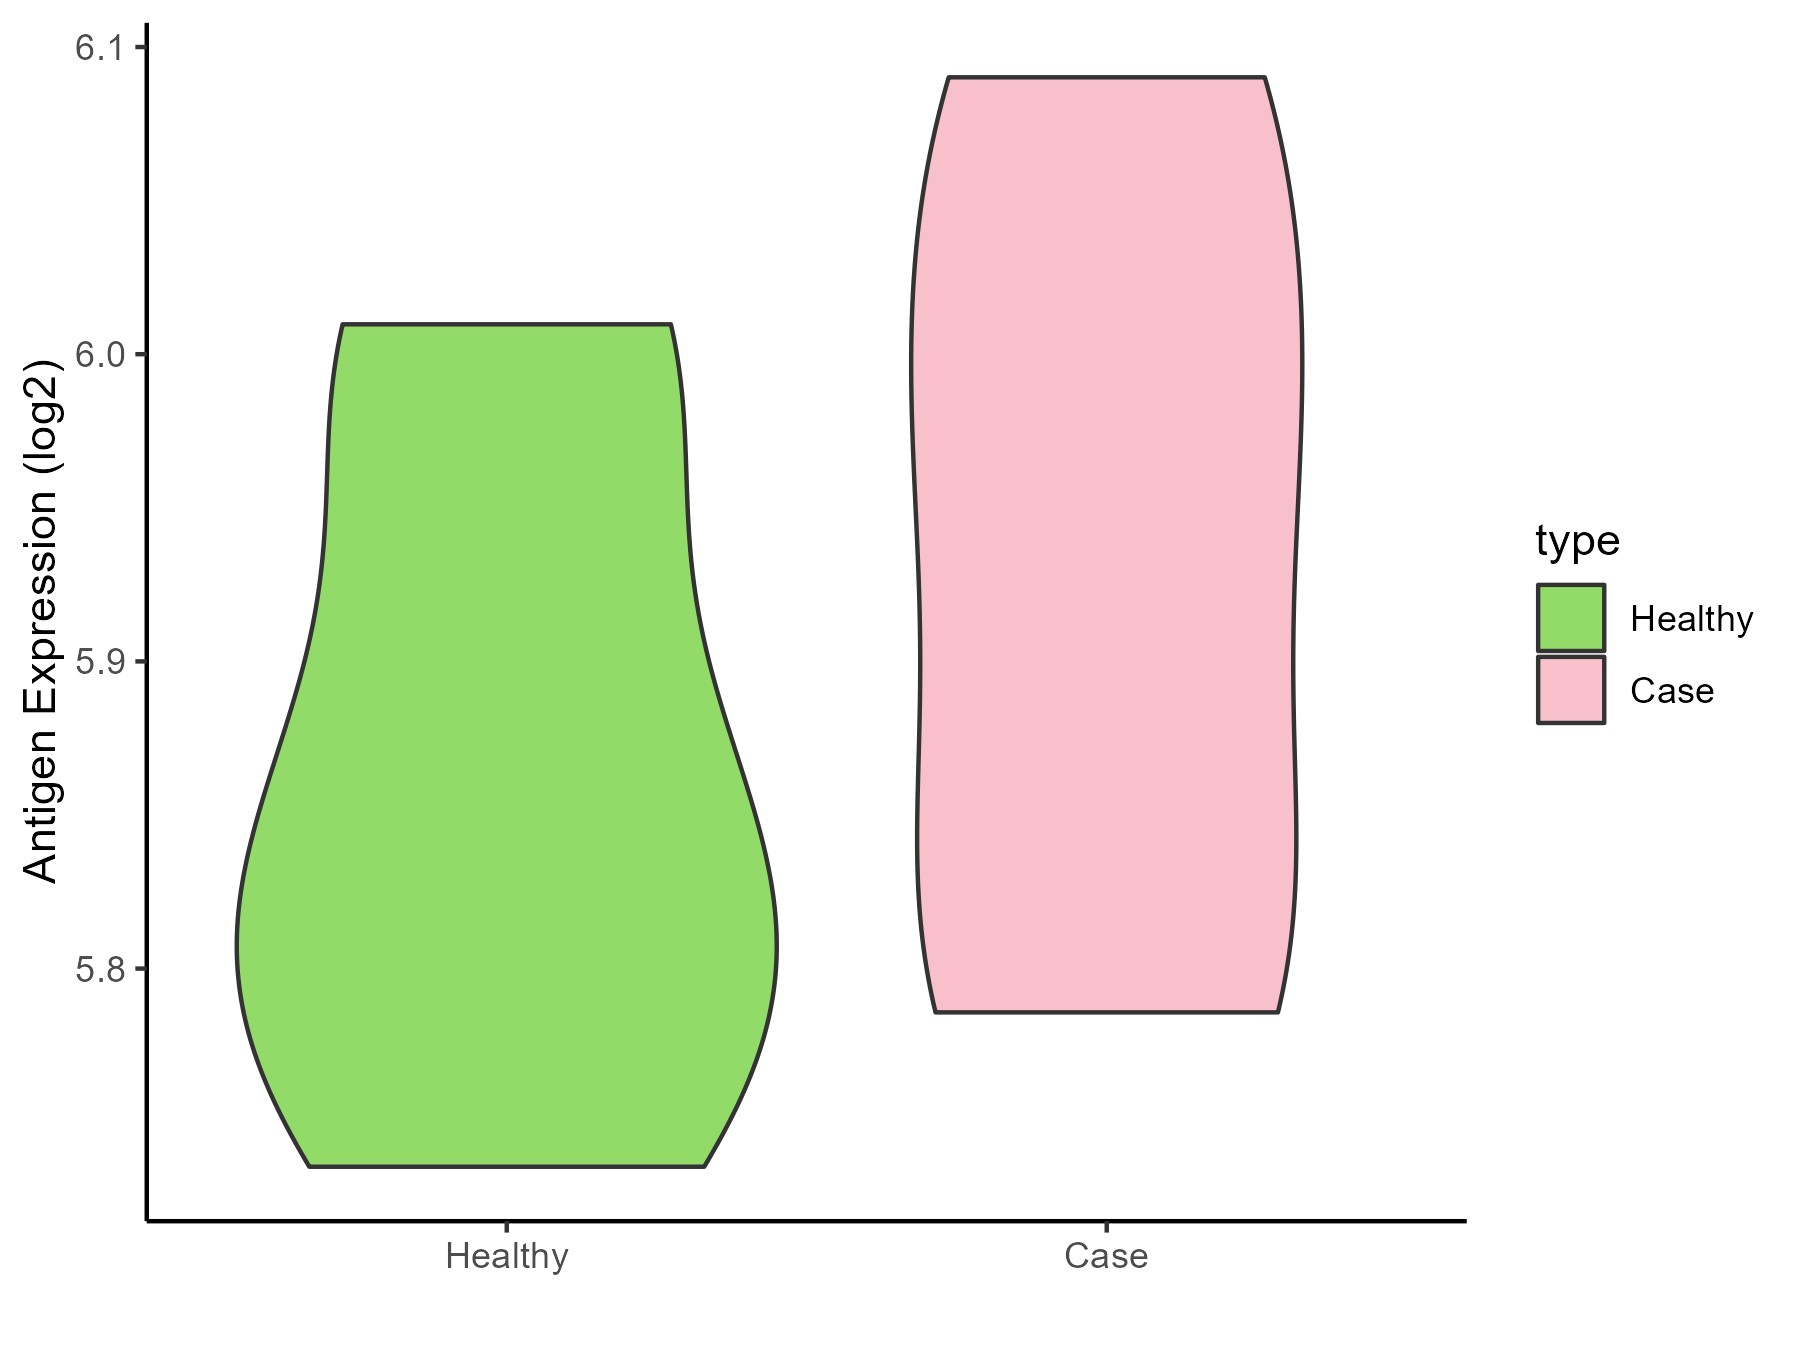
| Differential expression pattern of antigen in diseases | ||
| The Studied Tissue | Whole blood | |
| The Specific Disease | Batten disease | |
| The Expression Level of Disease Section Compare with the Healthy Individual Tissue | p-value: 0.310450986; Fold-change: 0.119333173; Z-score: 1.10876138 | |
| Disease-specific Antigen Abundances |
|
Click to View the Clearer Original Diagram |
ICD Disease Classification 6
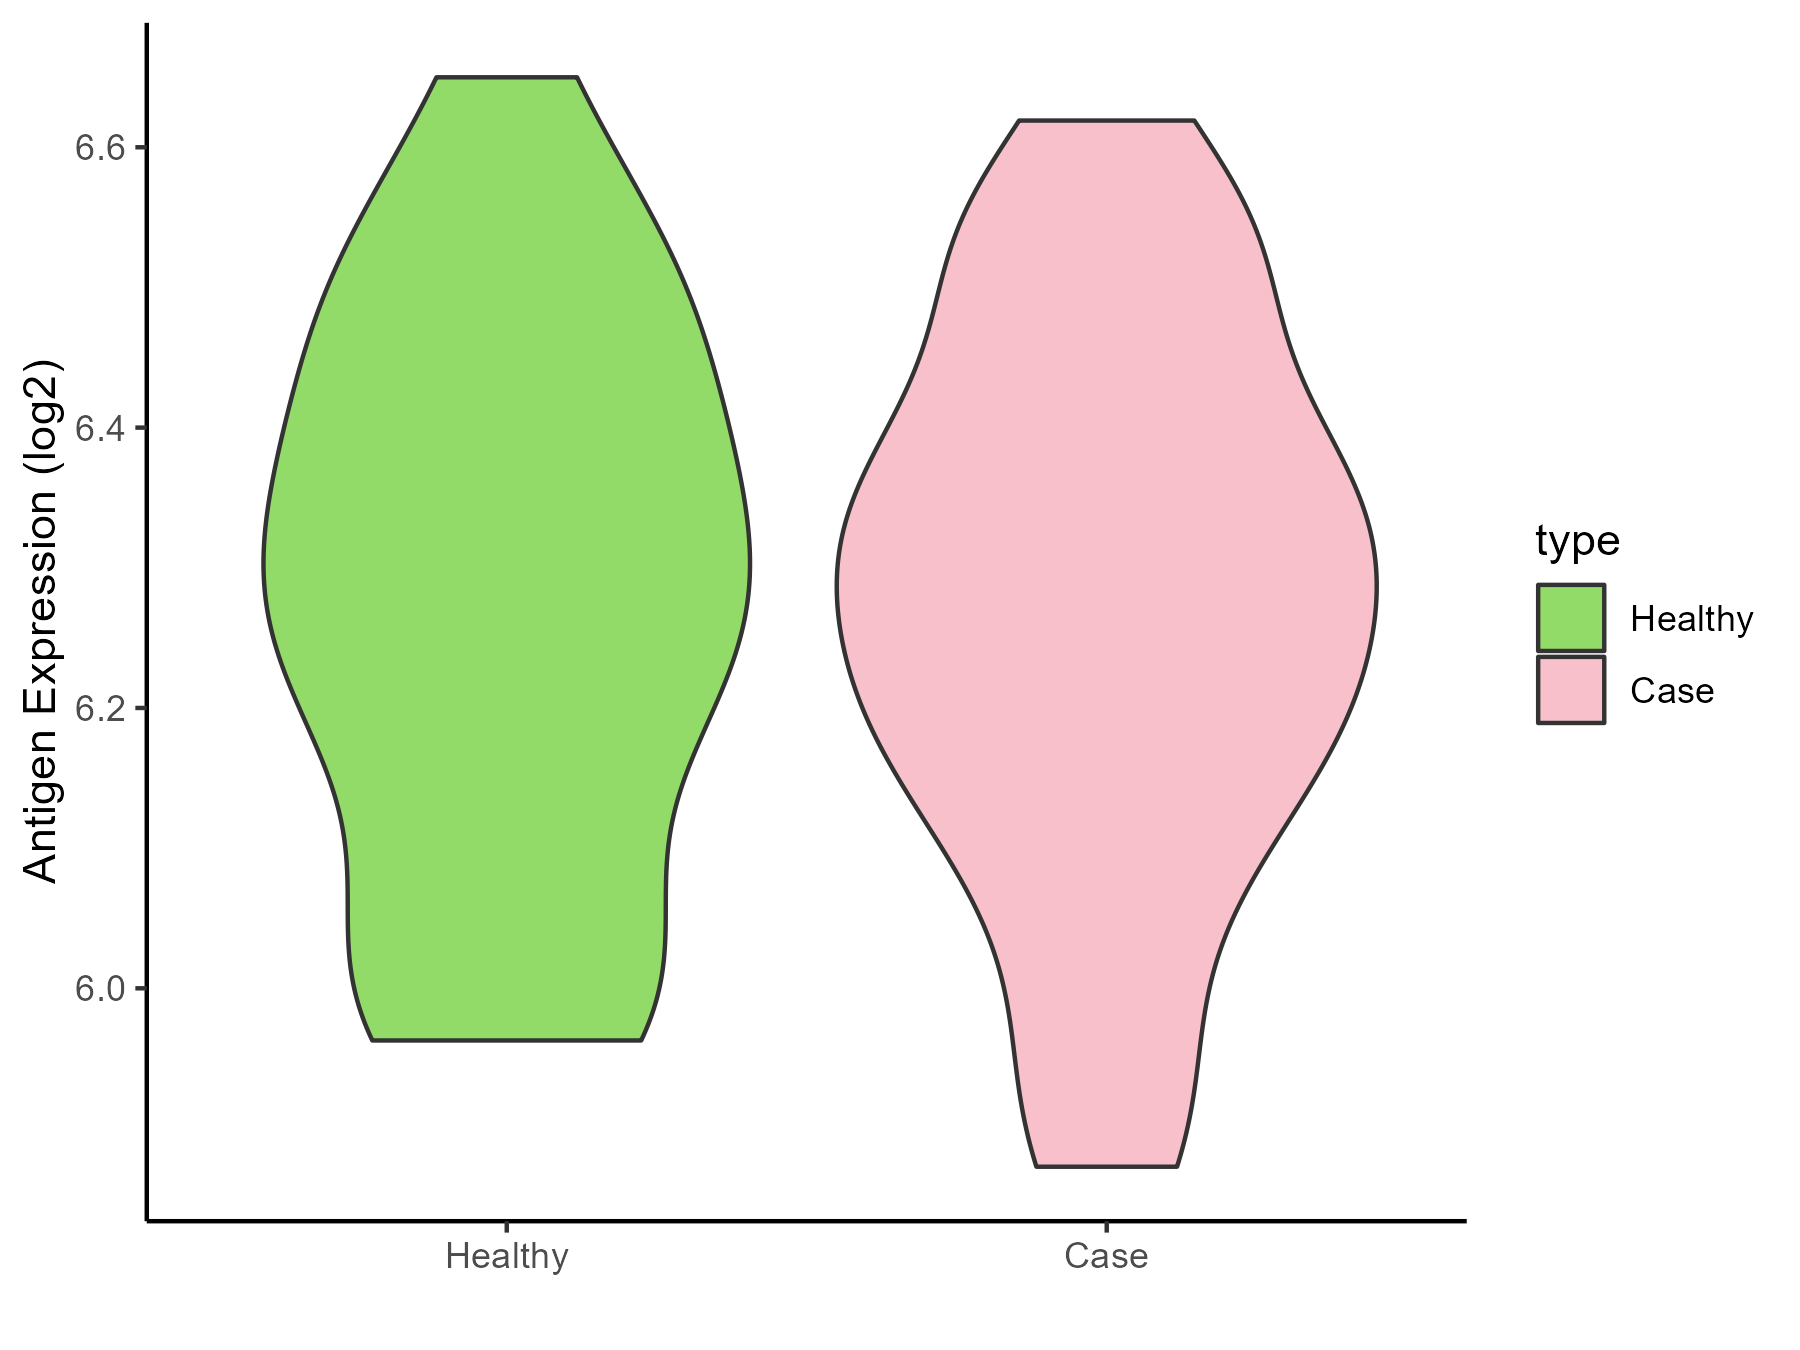
| Differential expression pattern of antigen in diseases | ||
| The Studied Tissue | Whole blood | |
| The Specific Disease | Autism | |
| The Expression Level of Disease Section Compare with the Healthy Individual Tissue | p-value: 0.870079819; Fold-change: -0.008078296; Z-score: -0.040363216 | |
| Disease-specific Antigen Abundances |
|
Click to View the Clearer Original Diagram |
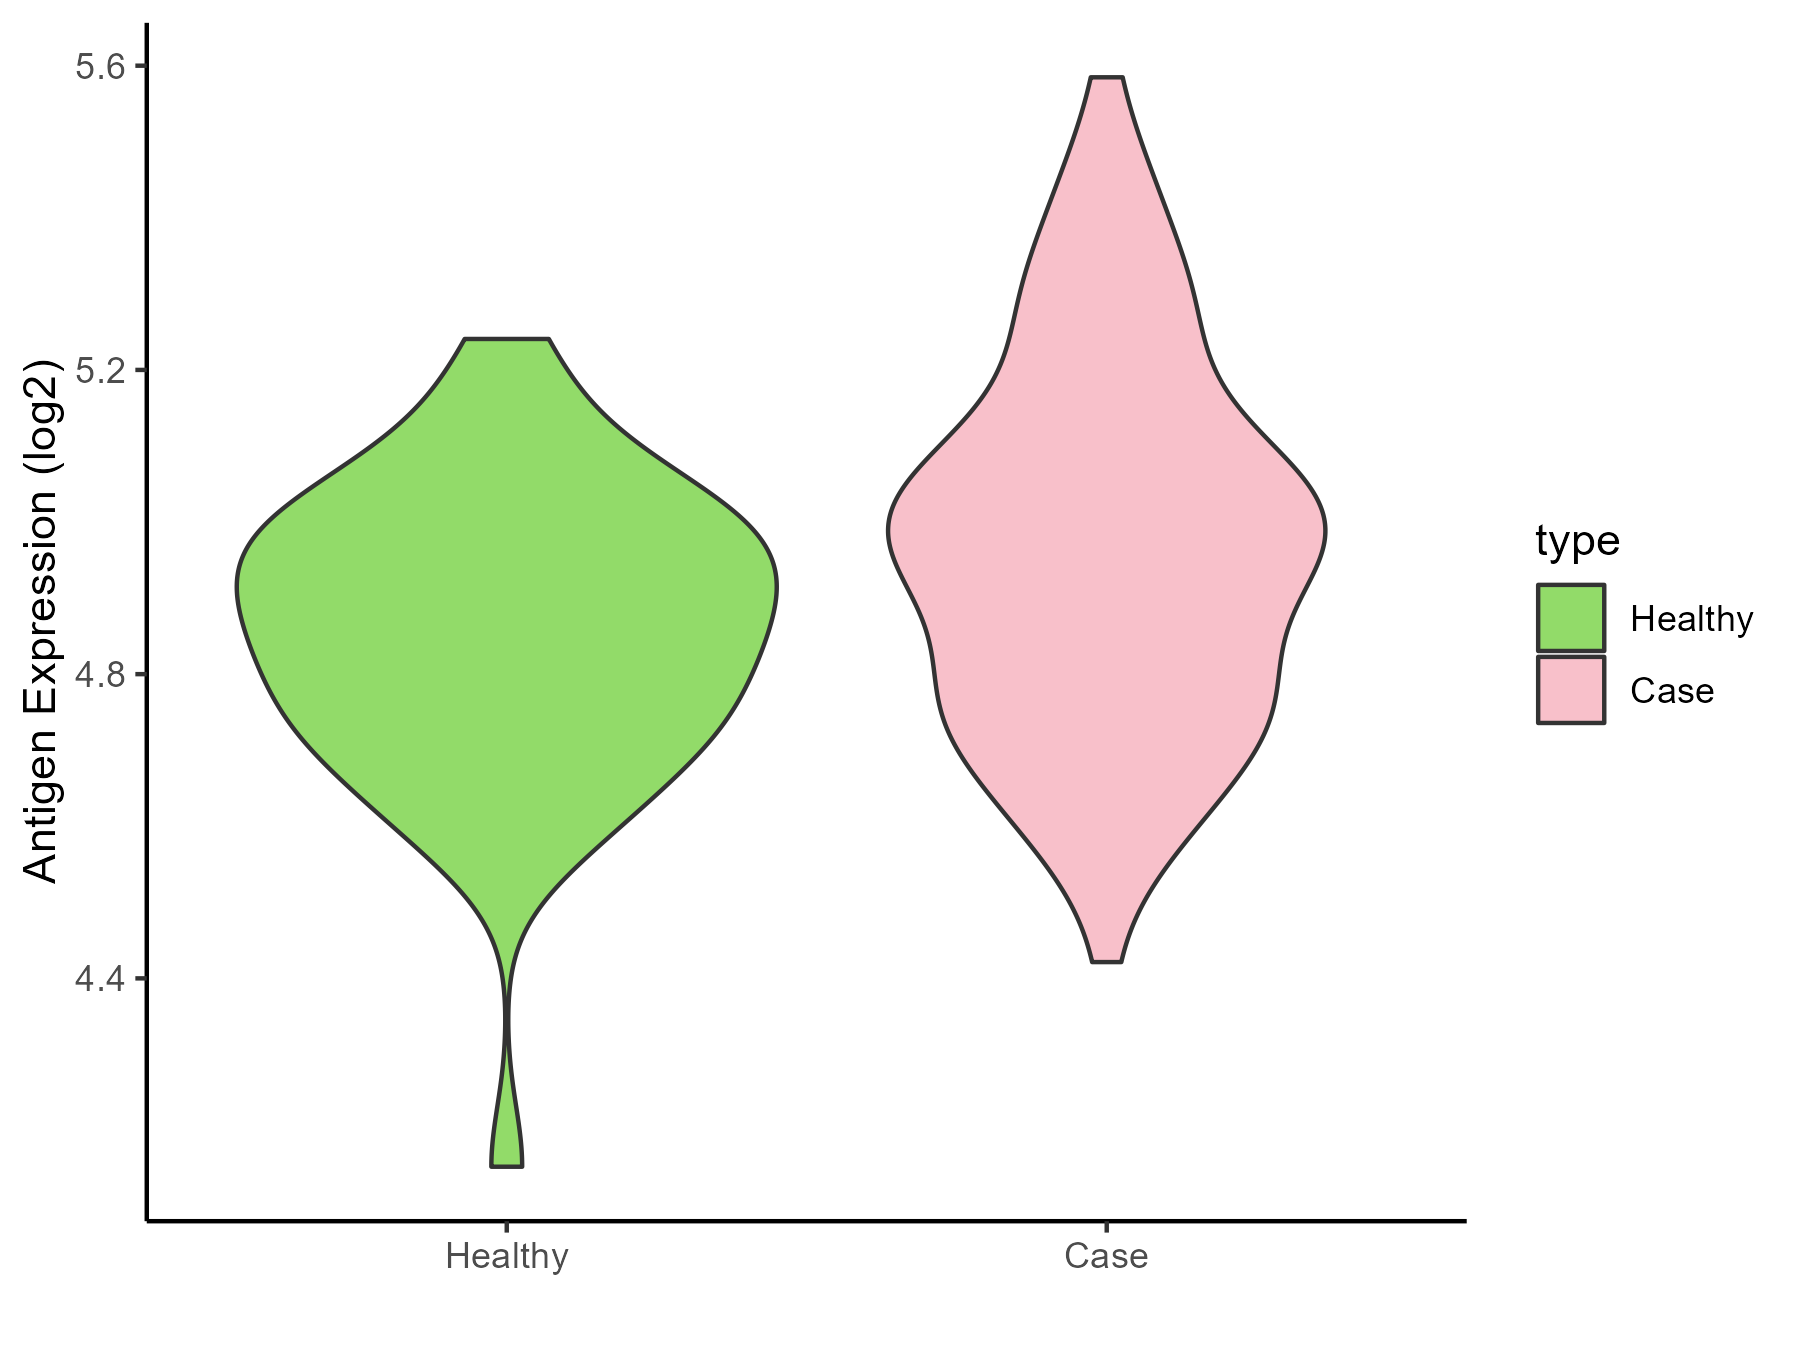
| Differential expression pattern of antigen in diseases | ||
| The Studied Tissue | Whole blood | |
| The Specific Disease | Anxiety disorder | |
| The Expression Level of Disease Section Compare with the Healthy Individual Tissue | p-value: 0.00531496; Fold-change: 0.091685175; Z-score: 0.467277485 | |
| Disease-specific Antigen Abundances |
|
Click to View the Clearer Original Diagram |
ICD Disease Classification 8
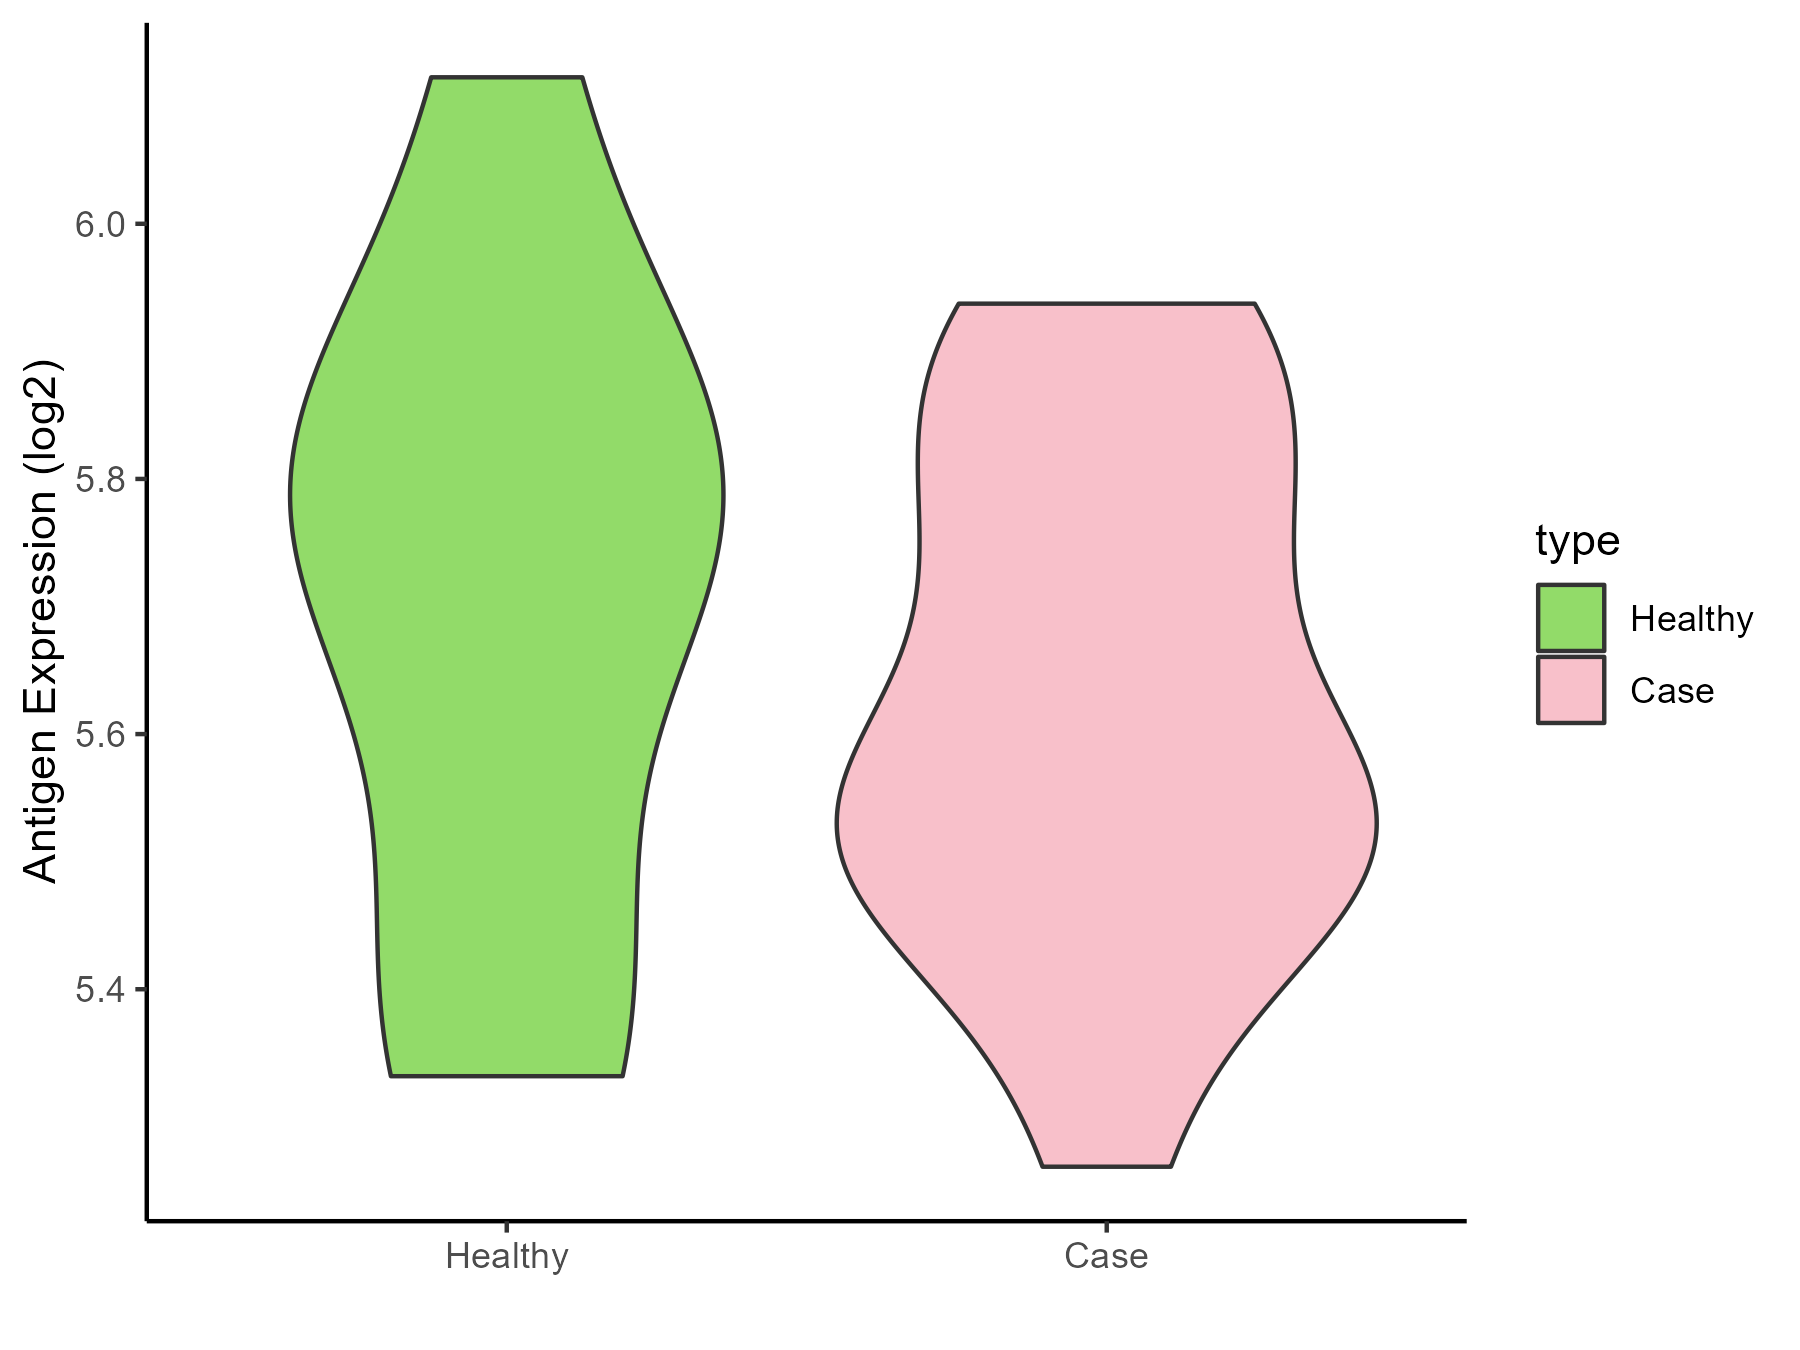
| Differential expression pattern of antigen in diseases | ||
| The Studied Tissue | Substantia nigra | |
| The Specific Disease | Parkinson disease | |
| The Expression Level of Disease Section Compare with the Healthy Individual Tissue | p-value: 0.534657054; Fold-change: -0.17510837; Z-score: -0.673620803 | |
| Disease-specific Antigen Abundances |
|
Click to View the Clearer Original Diagram |
| Differential expression pattern of antigen in diseases | ||
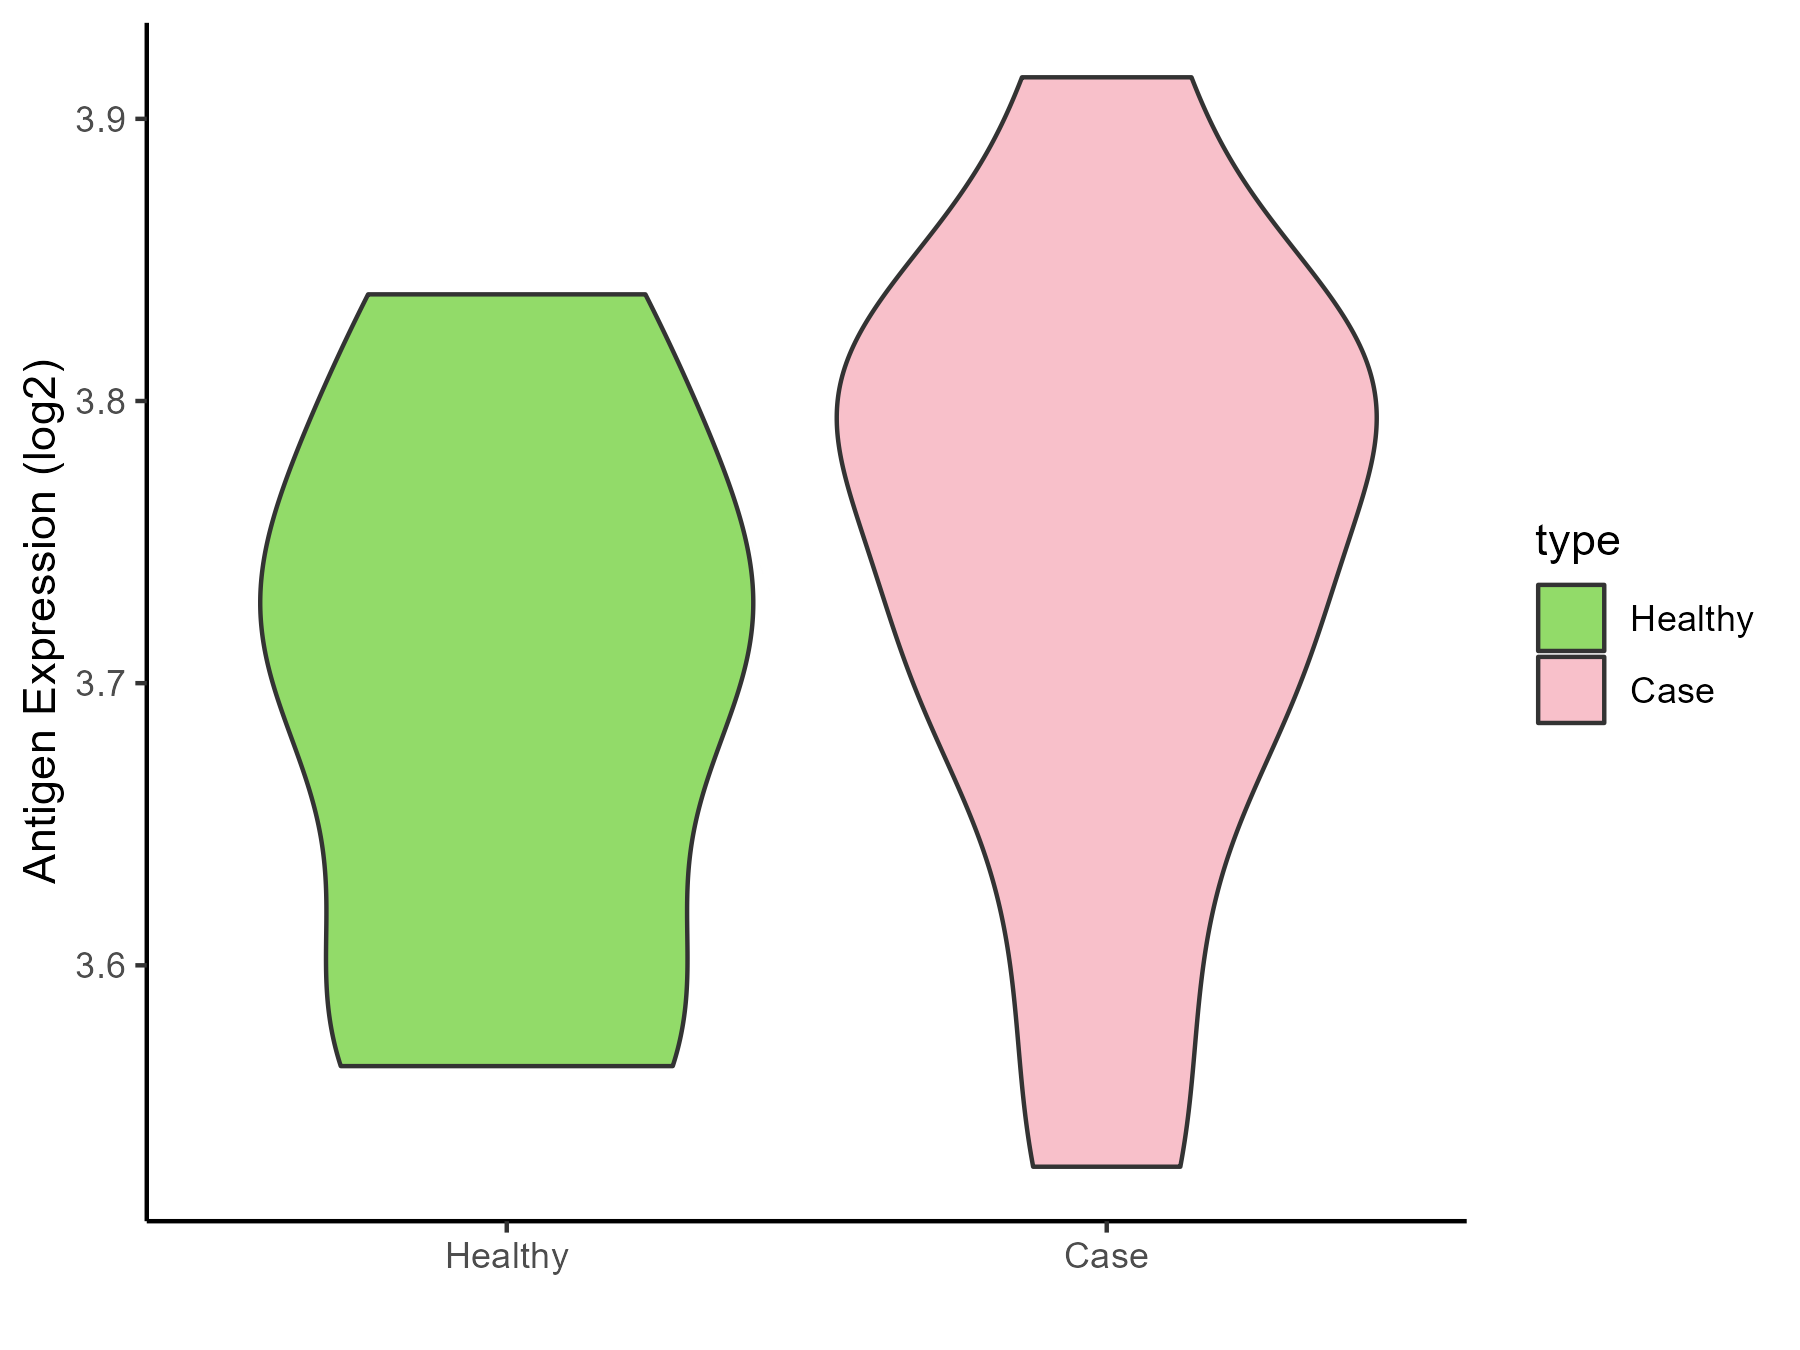
| The Studied Tissue | Whole blood | |
| The Specific Disease | Huntington disease | |
| The Expression Level of Disease Section Compare with the Healthy Individual Tissue | p-value: 0.355652513; Fold-change: 0.05668288; Z-score: 0.568420179 | |
| Disease-specific Antigen Abundances |
|
Click to View the Clearer Original Diagram |
| Differential expression pattern of antigen in diseases | ||
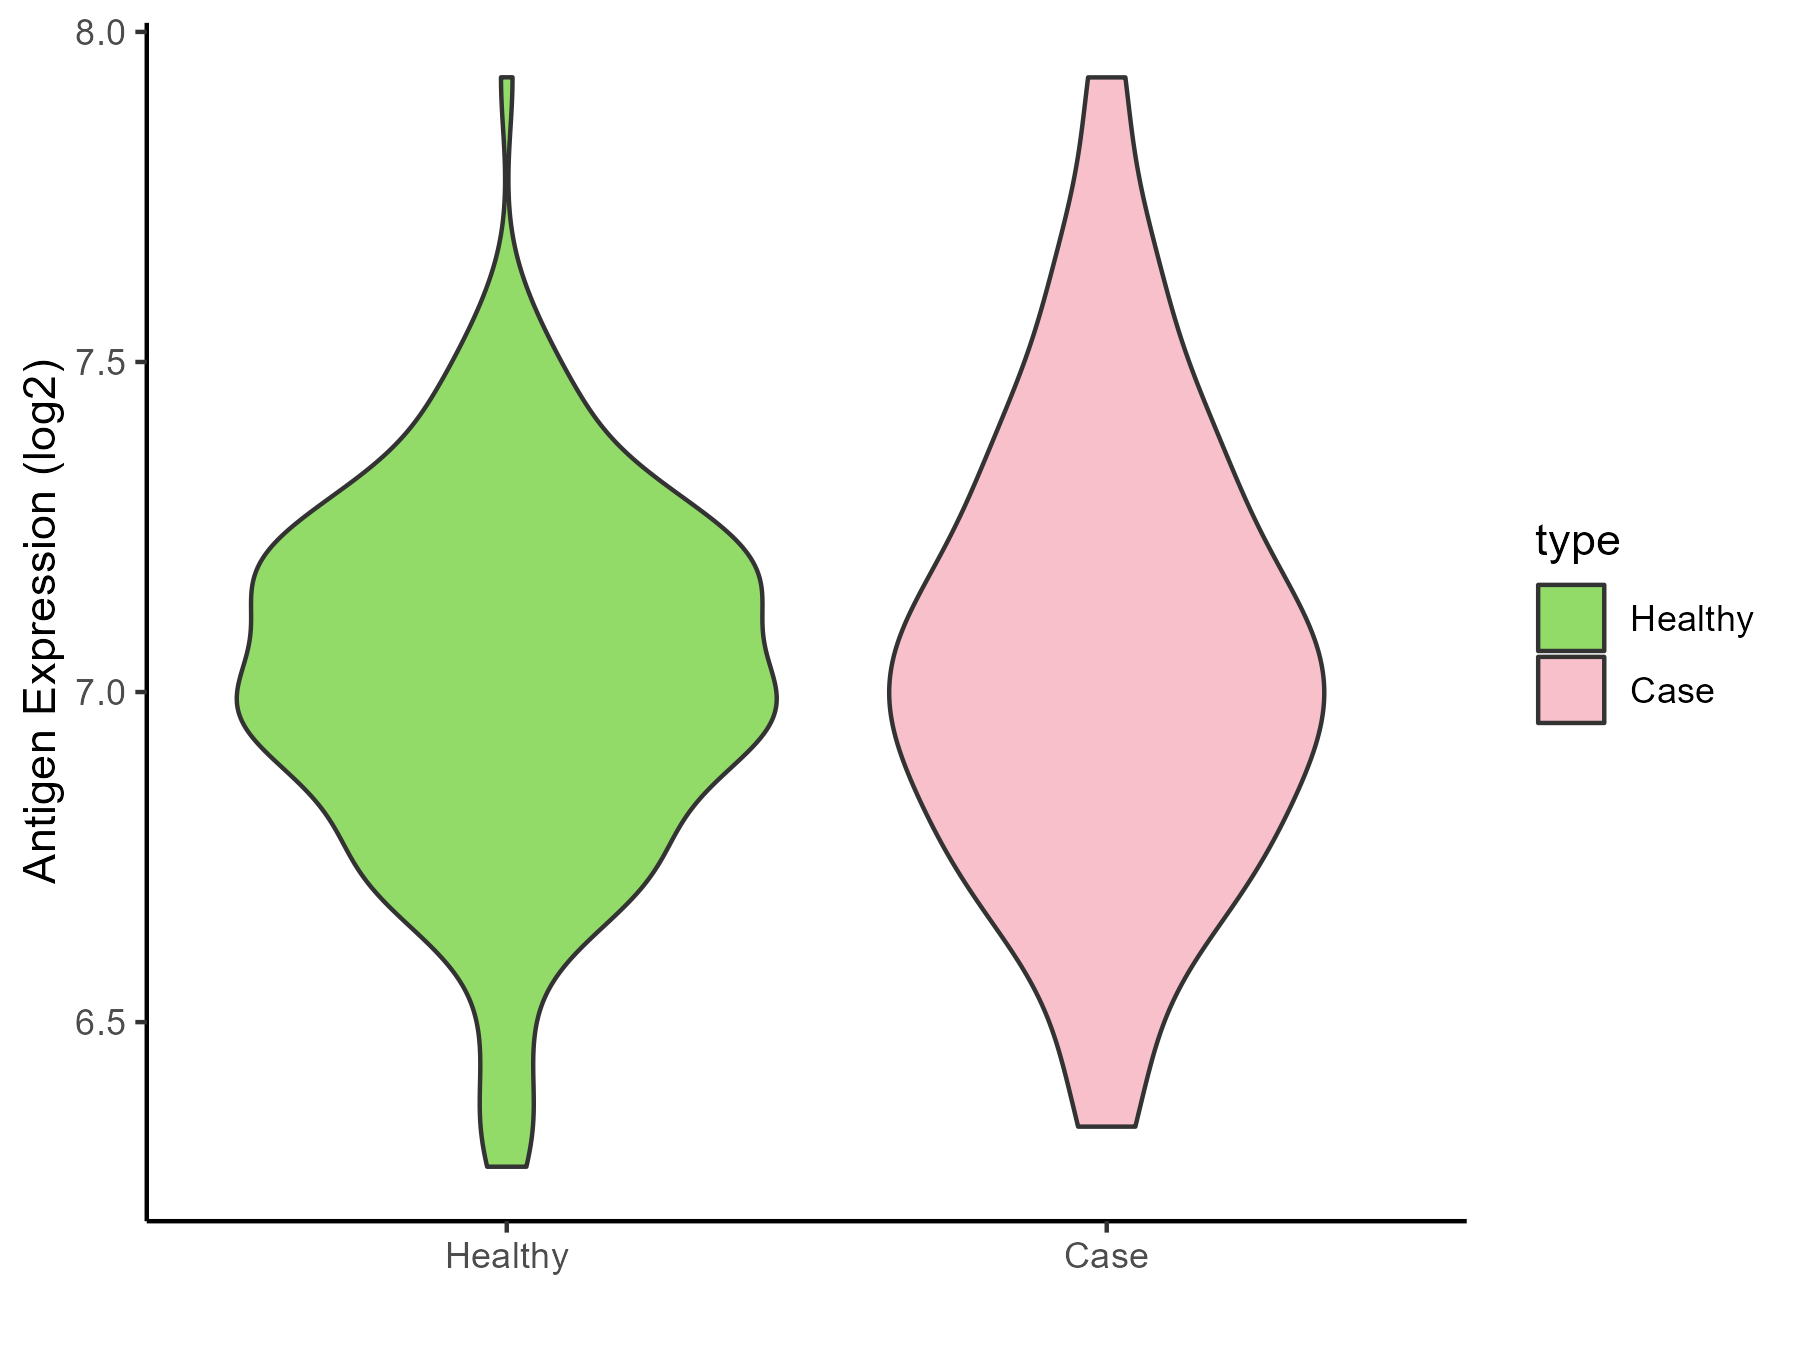
| The Studied Tissue | Entorhinal cortex | |
| The Specific Disease | Alzheimer disease | |
| The Expression Level of Disease Section Compare with the Healthy Individual Tissue | p-value: 0.481530062; Fold-change: 0.003900677; Z-score: 0.014561745 | |
| Disease-specific Antigen Abundances |
|
Click to View the Clearer Original Diagram |
| Differential expression pattern of antigen in diseases | ||
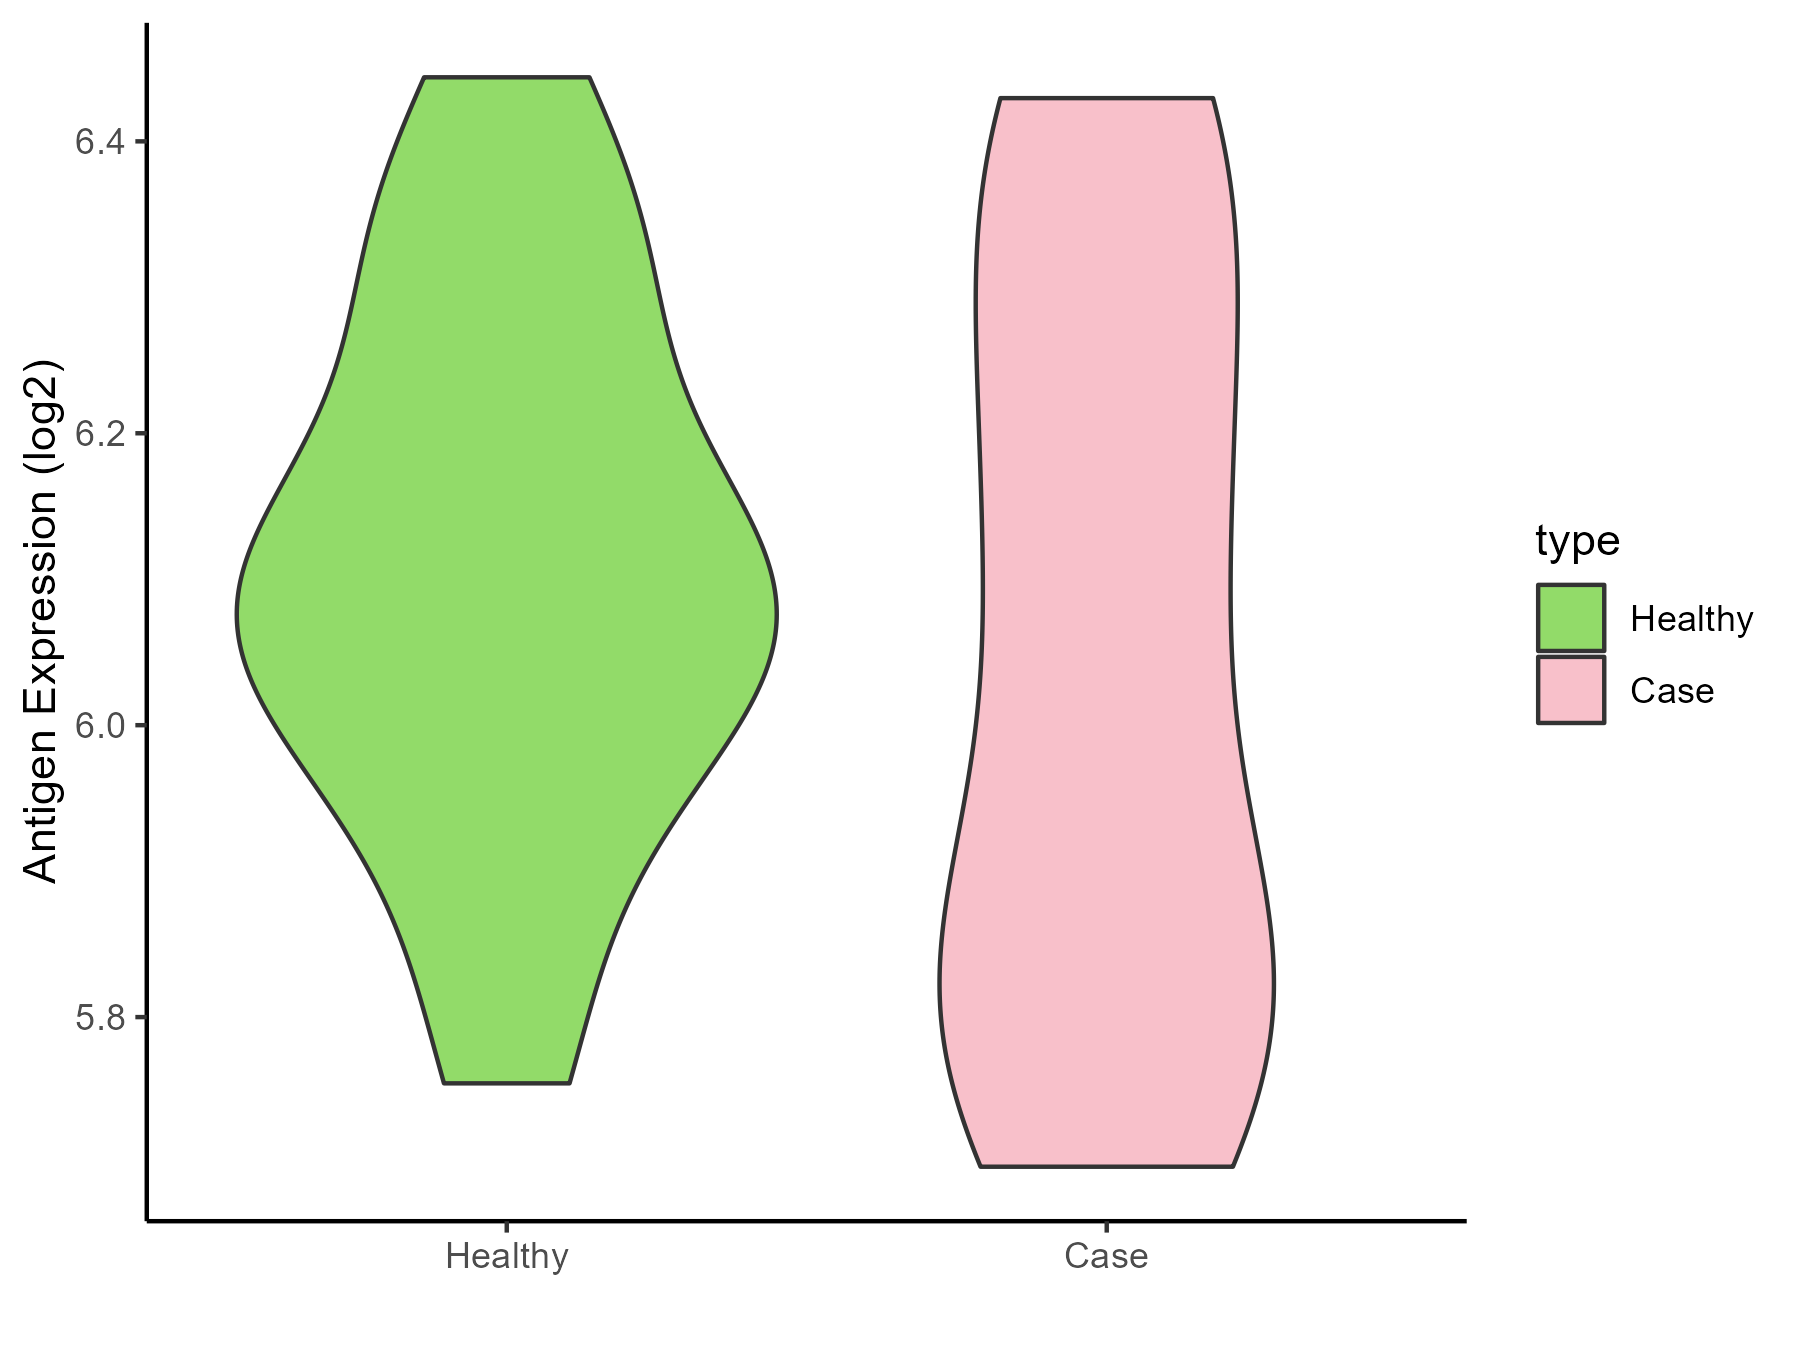
| The Studied Tissue | Whole blood | |
| The Specific Disease | Seizure | |
| The Expression Level of Disease Section Compare with the Healthy Individual Tissue | p-value: 0.452610985; Fold-change: -0.01721867; Z-score: -0.092606417 | |
| Disease-specific Antigen Abundances |
|
Click to View the Clearer Original Diagram |
| Differential expression pattern of antigen in diseases | ||
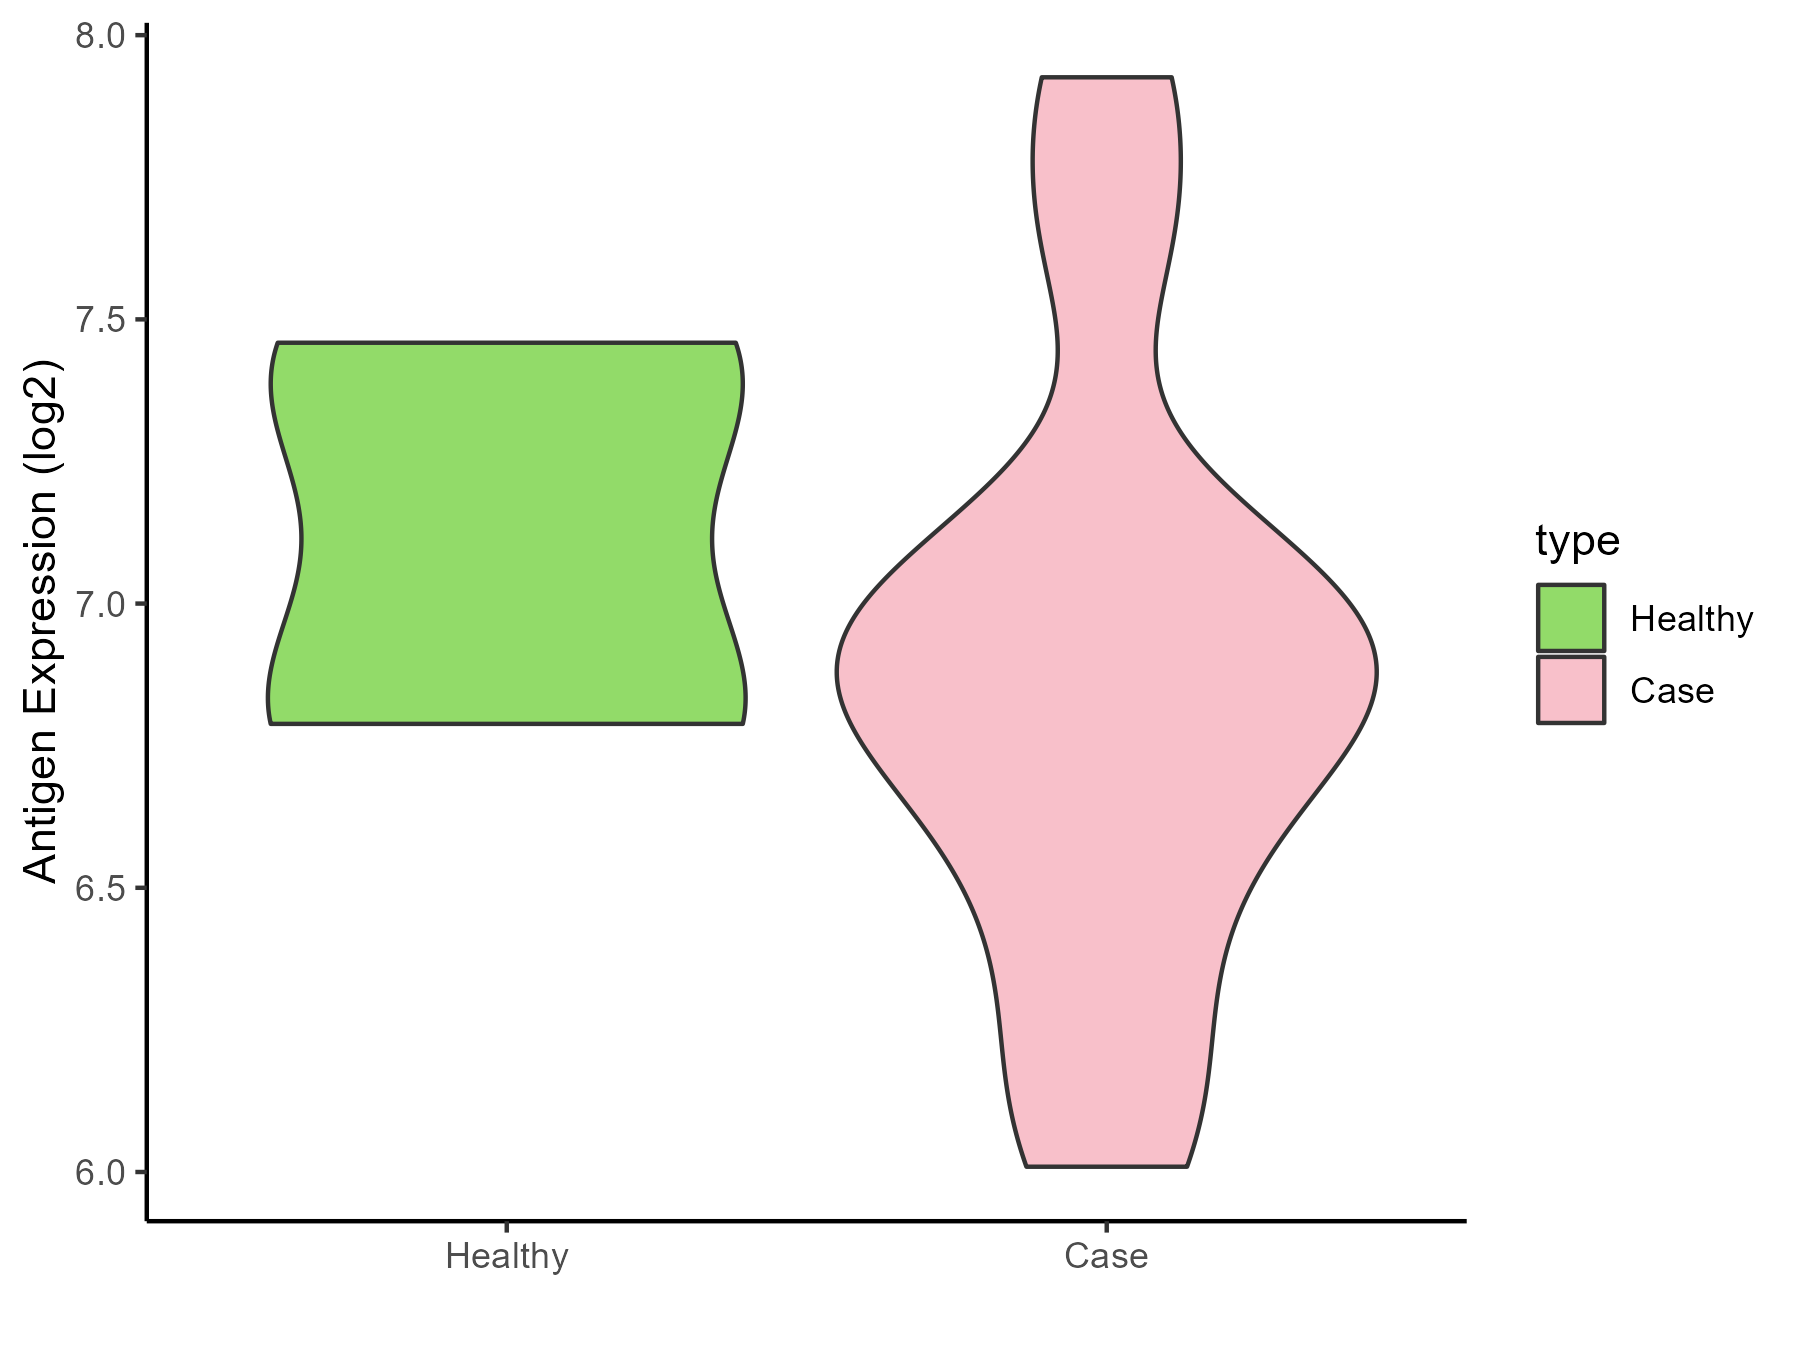
| The Studied Tissue | Skin | |
| The Specific Disease | Lateral sclerosis | |
| The Expression Level of Disease Section Compare with the Healthy Individual Tissue | p-value: 0.343560831; Fold-change: -0.219843096; Z-score: -0.607361637 | |
| Disease-specific Antigen Abundances |
|
Click to View the Clearer Original Diagram |
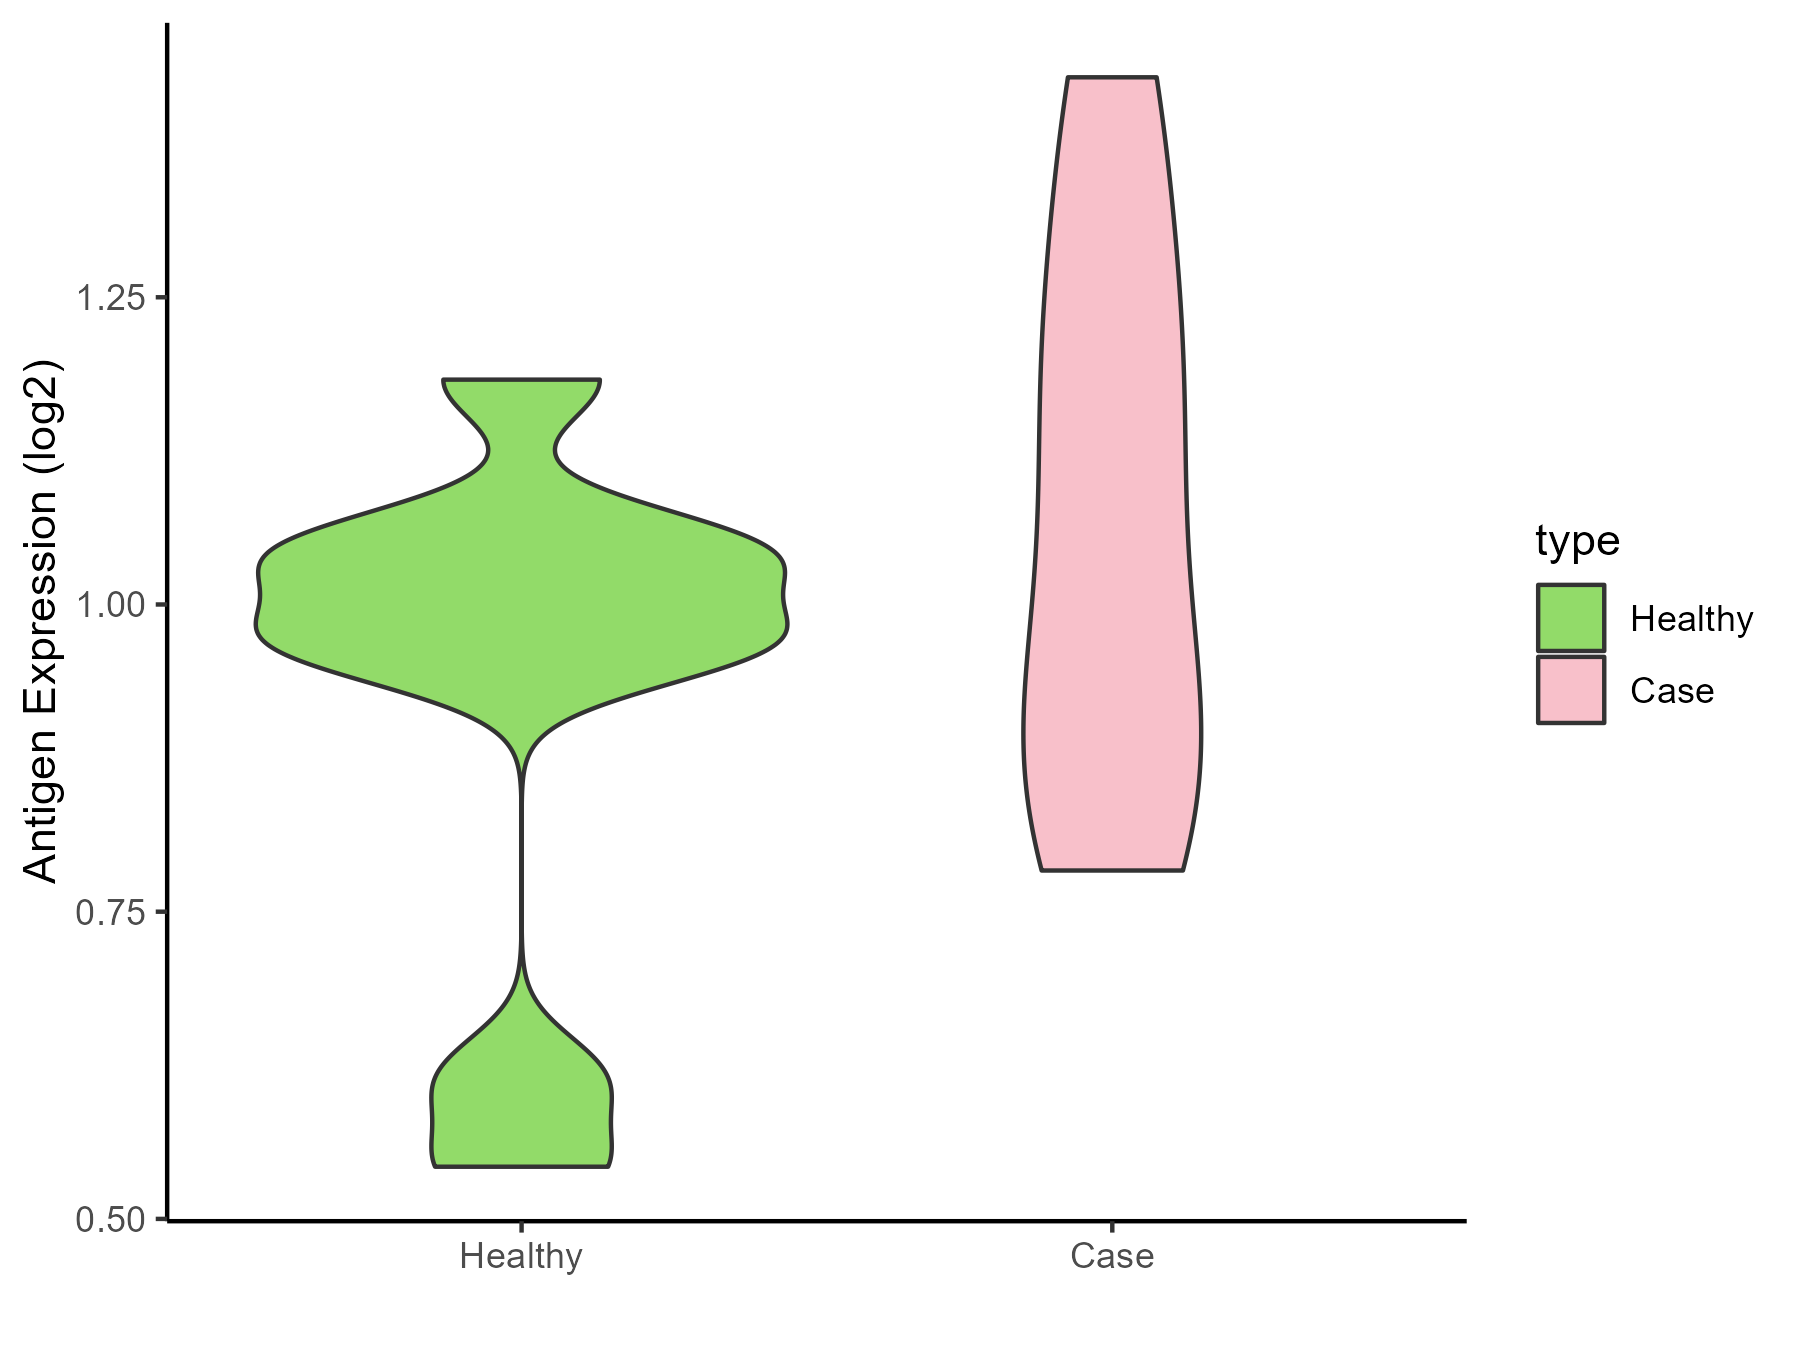
| The Studied Tissue | Cervical spinal cord | |
| The Specific Disease | Lateral sclerosis | |
| The Expression Level of Disease Section Compare with the Healthy Individual Tissue | p-value: 0.176618951; Fold-change: 0.082611338; Z-score: 0.391403752 | |
| Disease-specific Antigen Abundances |
|
Click to View the Clearer Original Diagram |
| Differential expression pattern of antigen in diseases | ||
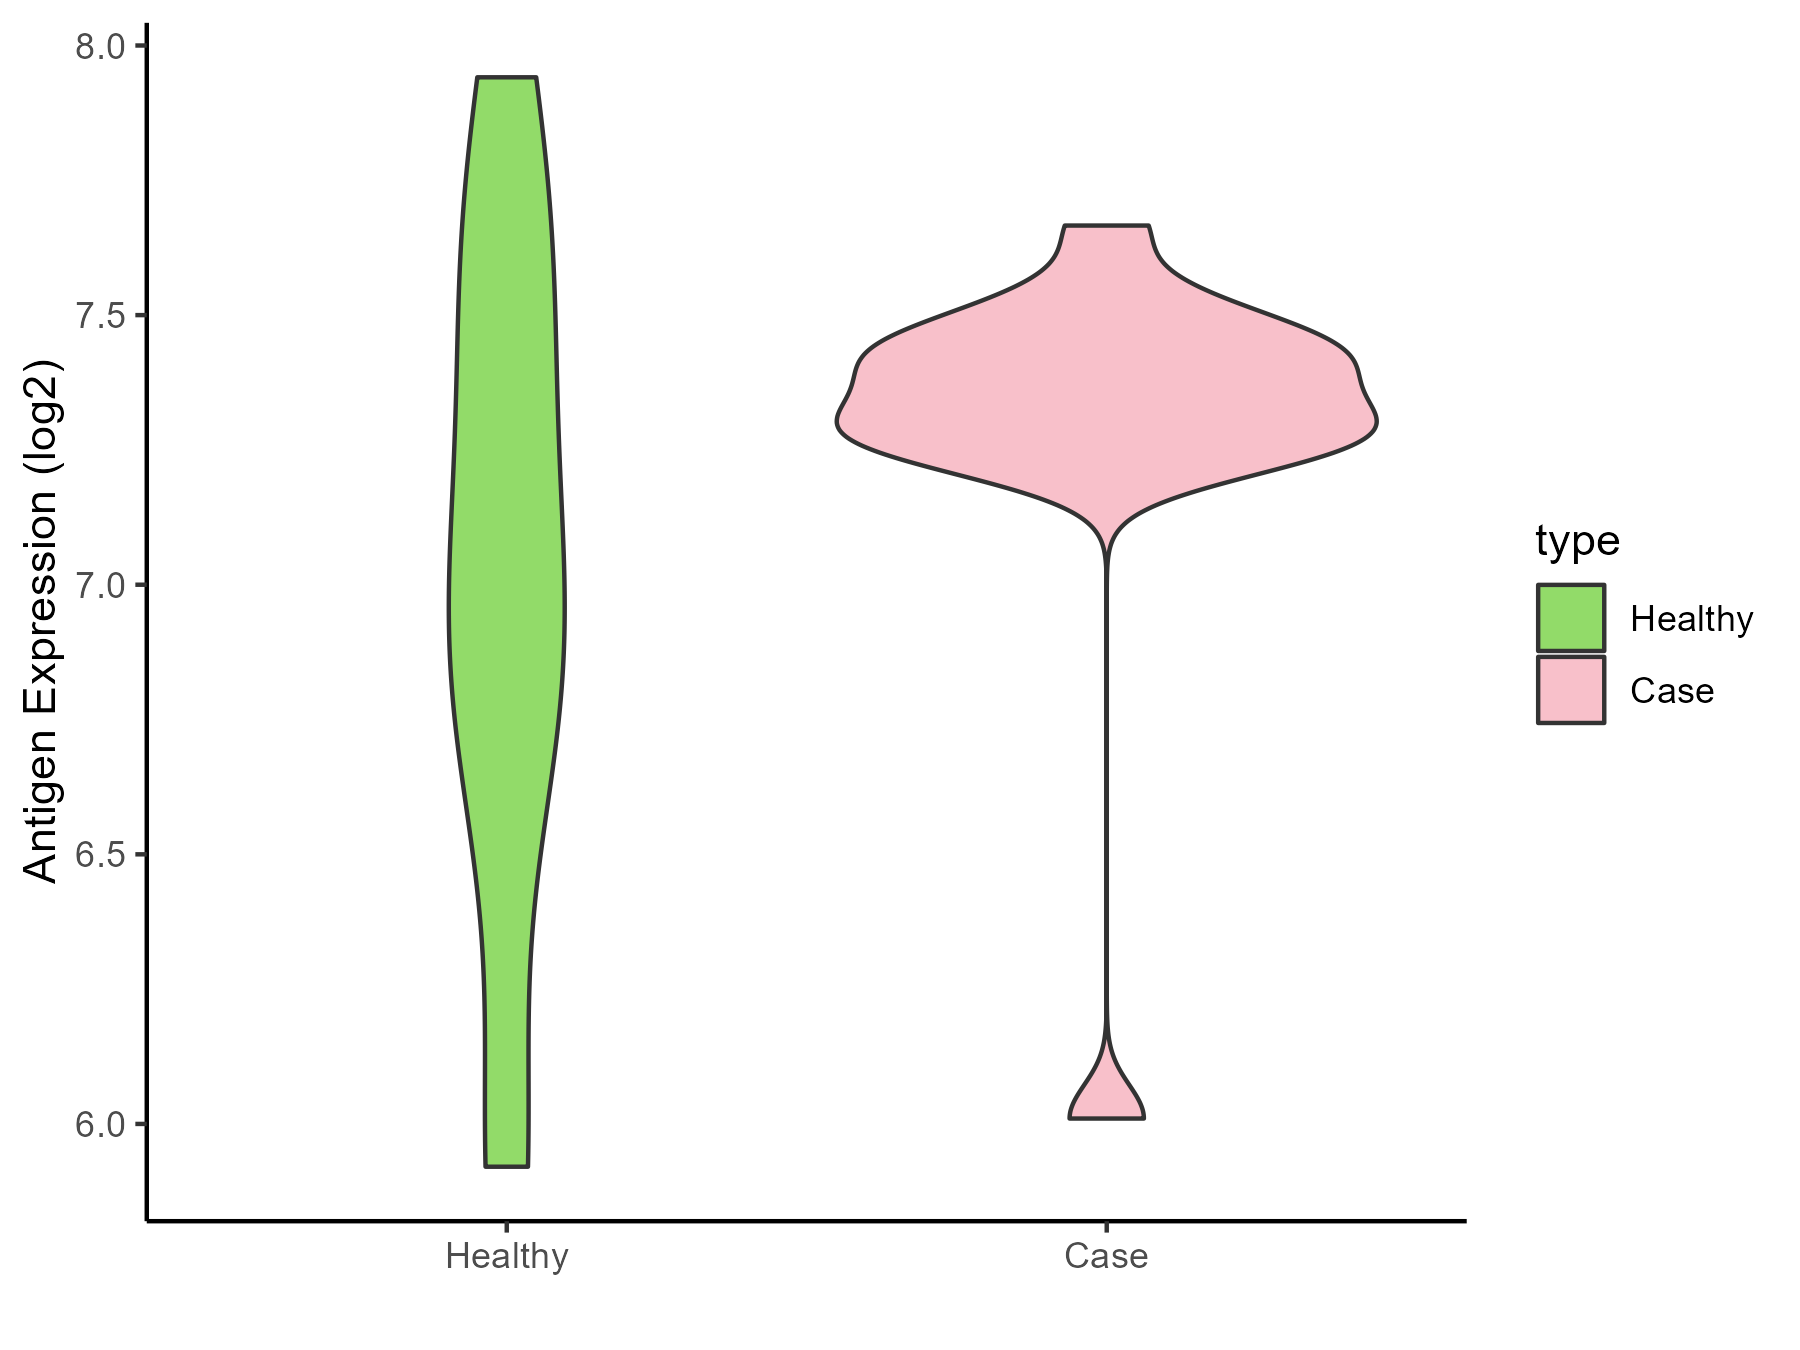
| The Studied Tissue | Muscle | |
| The Specific Disease | Muscular atrophy | |
| The Expression Level of Disease Section Compare with the Healthy Individual Tissue | p-value: 0.165716166; Fold-change: 0.342567658; Z-score: 0.542597205 | |
| Disease-specific Antigen Abundances |
|
Click to View the Clearer Original Diagram |
| Differential expression pattern of antigen in diseases | ||
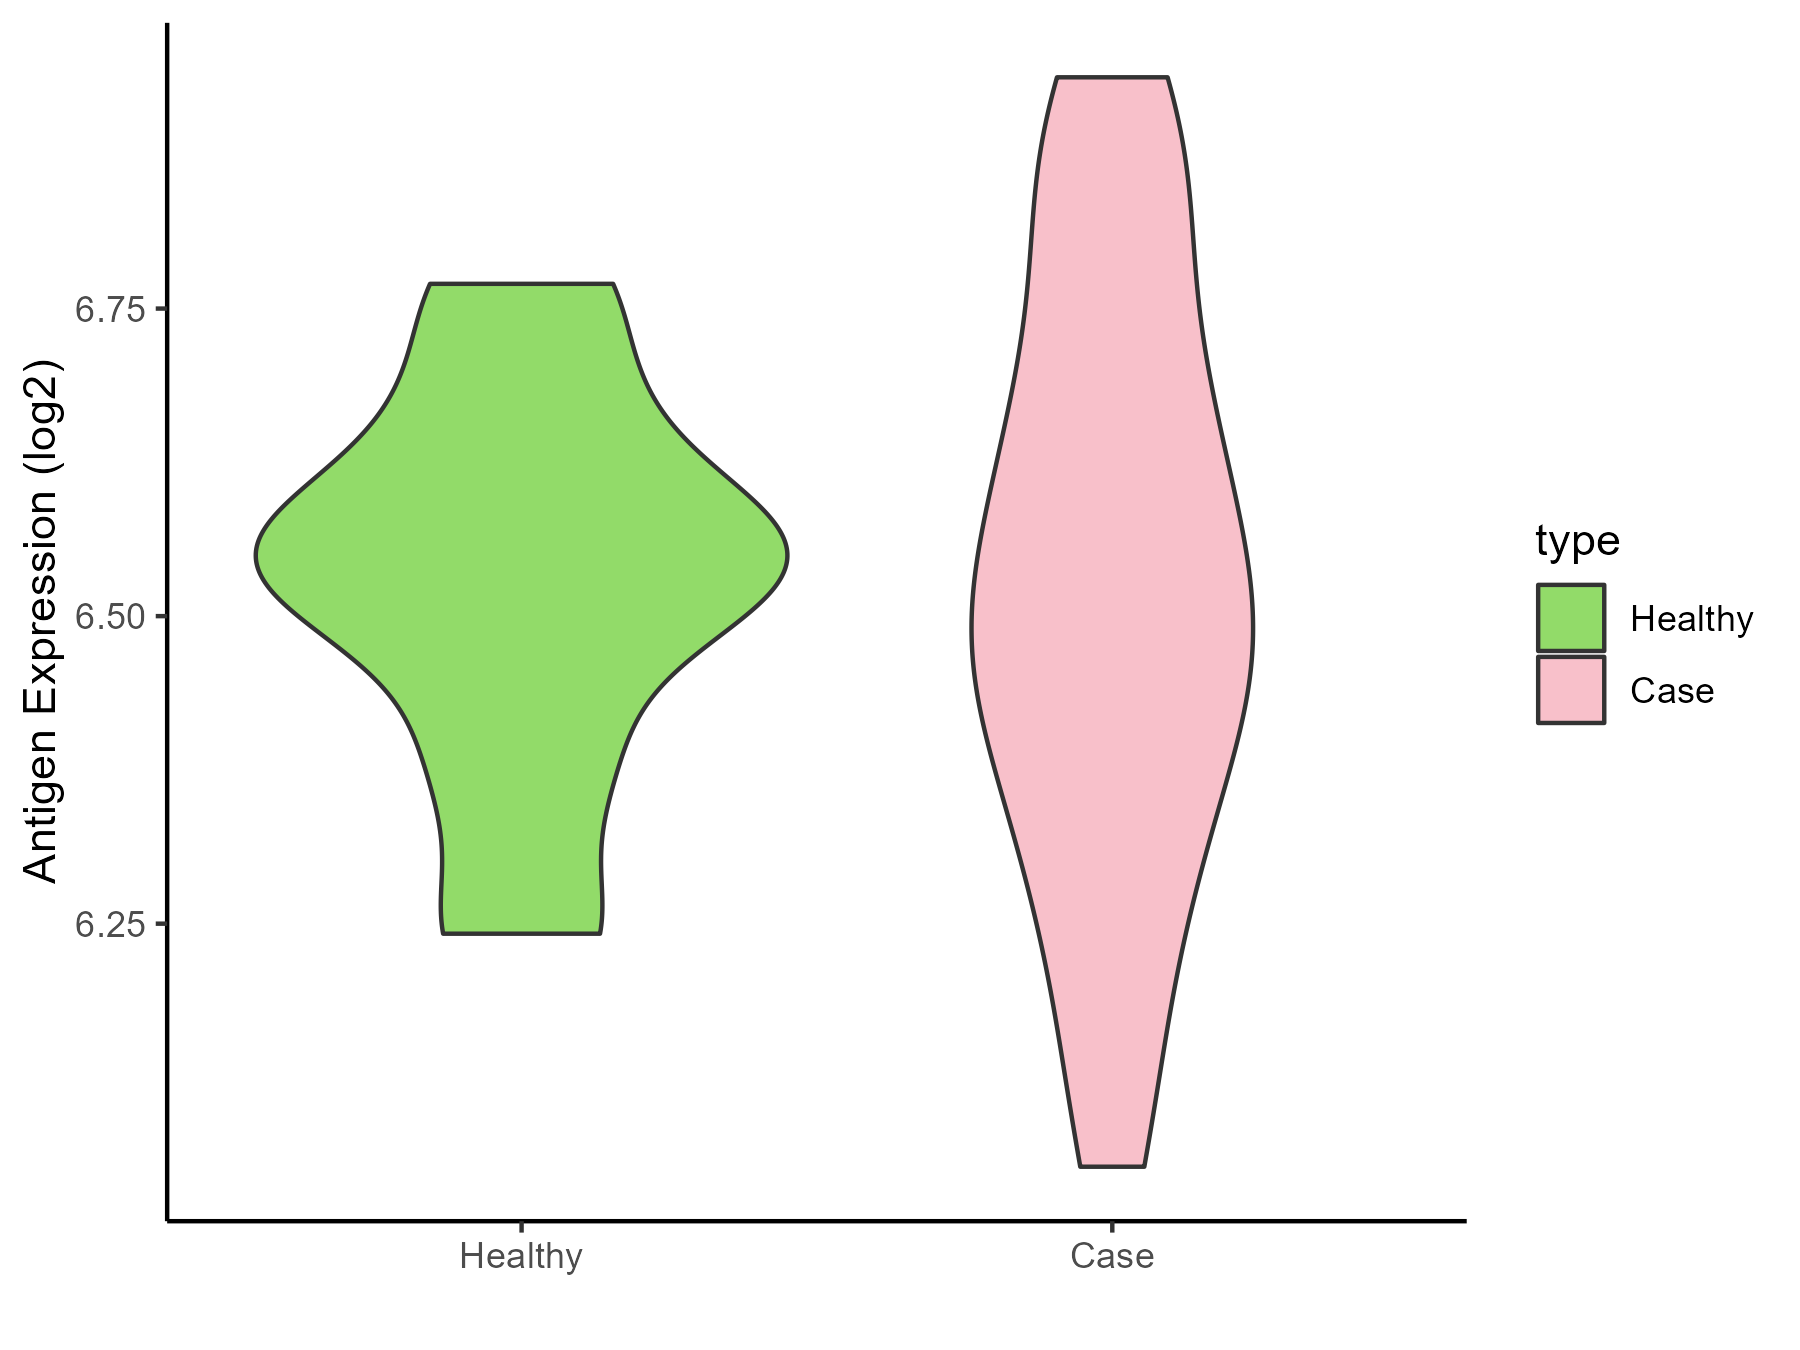
| The Studied Tissue | Muscle | |
| The Specific Disease | Myopathy | |
| The Expression Level of Disease Section Compare with the Healthy Individual Tissue | p-value: 0.985173375; Fold-change: -0.040571395; Z-score: -0.248041144 | |
| Disease-specific Antigen Abundances |
|
Click to View the Clearer Original Diagram |
References
