
Antigen Information
General Information of This Antigen
| Antigen ID | TAR0JUHTG |
|||||
|---|---|---|---|---|---|---|
| Antigen Name | Interleukin-3 receptor subunit alpha (IL3RA) |
|||||
| Gene Name | IL3RA |
|||||
| Gene ID | ||||||
| Synonym | IL3R; CD_antigen=CD123 |
|||||
| Sequence |
MVLLWLTLLLIALPCLLQTKEDPNPPITNLRMKAKAQQLTWDLNRNVTDIECVKDADYSM
PAVNNSYCQFGAISLCEVTNYTVRVANPPFSTWILFPENSGKPWAGAENLTCWIHDVDFL SCSWAVGPGAPADVQYDLYLNVANRRQQYECLHYKTDAQGTRIGCRFDDISRLSSGSQSS HILVRGRSAAFGIPCTDKFVVFSQIEILTPPNMTAKCNKTHSFMHWKMRSHFNRKFRYEL QIQKRMQPVITEQVRDRTSFQLLNPGTYTVQIRARERVYEFLSAWSTPQRFECDQEEGAN TRAWRTSLLIALGTLLALVCVFVICRRYLVMQRLFPRIPHMKDPIGDSFQNDKLVVWEAG KAGLEECLVTEVQVVQKT Click to Show/Hide
|
|||||
| Family | Cytokine receptor type I family |
|||||
| Function |
Cell surface receptor for IL3 expressed on hematopoietic progenitor cells, monocytes and B-lymphocytes that controls the production and differentiation of hematopoietic progenitor cells into lineage-restricted cells. Ligand stimulation rapidly induces hetrodimerization with IL3RB, phosphorylation and enzyme activity of effector proteins such as JAK2 and PI3K that play a role in signaling cell proliferation and differentiation. Activation of JAK2 leads to STAT5-mediated transcriptional program.
Click to Show/Hide
|
|||||
| Uniprot Entry | ||||||
| HGNC ID | ||||||
| KEGG ID | ||||||
Each Antibody-drug Conjuate AND It's Component Related to This Antigen
Full List of The ADC Related to This Antigen
A humanized anti-CD123 IgG1 antibody
| ADC Info | ADC Name | Payload | Target | Linker | Ref |
|---|---|---|---|---|---|
BYON-4413 |
seco-DUBA |
Human Deoxyribonucleic acid (hDNA) |
Mal-PEG2-Val-Cit-PABA-Cyclization Spacer |
[1] |
Anti-CD123 mAb h7G3ec
| ADC Info | ADC Name | Payload | Target | Linker | Ref |
|---|---|---|---|---|---|
SGN-CD123A |
SGD-1882 |
Human Deoxyribonucleic acid (hDNA) |
Mc-Val-Ala |
[2] |
Pivekimab
| ADC Info | ADC Name | Payload | Target | Linker | Ref |
|---|---|---|---|---|---|
Pivekimab sunirine |
sulfonated DGN462 |
Human Deoxyribonucleic acid (hDNA) |
Mal-adipamide-Ala-Ala |
[3] |
TPP-5969
| ADC Info | ADC Name | Payload | Target | Linker | Ref |
|---|---|---|---|---|---|
CN109310781A ADC-1 |
CN109310781A ADC-1 payload |
Undisclosed |
CN109310781A ADC-1 linker |
[4] | |
CN109310781A ADC-3 |
CN109310781A ADC-3 payload |
Undisclosed |
CN109310781A ADC-3 linker |
[4] |
TPP-6013
| ADC Info | ADC Name | Payload | Target | Linker | Ref |
|---|---|---|---|---|---|
CN109310781A ADC-2 |
CN109310781A ADC-2 payload |
Undisclosed |
CN109310781A ADC-2 linker |
[4] | |
CN109310781A ADC-4 |
CN109310781A ADC-4 payload |
Undisclosed |
CN109310781A ADC-4 linker |
[4] |
TPP-8987
| ADC Info | ADC Name | Payload | Target | Linker | Ref |
|---|---|---|---|---|---|
CN109310781A ADC-5 |
CN109310781A ADC-5 payload |
Undisclosed |
CN109310781A ADC-5 linker |
[4] |
TPP-8988
| ADC Info | ADC Name | Payload | Target | Linker | Ref |
|---|---|---|---|---|---|
CN109310781A ADC-6 |
CN109310781A ADC-6 payload |
Undisclosed |
CN109310781A ADC-6 linker |
[4] |
TPP-9476
| ADC Info | ADC Name | Payload | Target | Linker | Ref |
|---|---|---|---|---|---|
BAY-943 |
KSP inhibitor |
Kinesin-like protein KIF11 (KIF11) |
Protease cleavable linker |
[5] | |
CN109310781A ADC-7 |
CN109310781A ADC-7 payload |
Undisclosed |
CN109310781A ADC-7 linker |
[4] |
Undisclosed
| ADC Info | ADC Name | Payload | Target | Linker | Ref |
|---|---|---|---|---|---|
AZD-9829 |
AZ14170132 |
DNA topoisomerase 1 (TOP1) |
Undisclosed |
||
Anti-CD123 monoclonal antibody CPI conjugate |
Undisclosed |
Undisclosed |
Undisclosed |
[6] | |
CD123-CPI ADC (Pfizer) |
Cyclopropylpyrroloindoline (CPI) payload |
Human Deoxyribonucleic acid (hDNA) |
Undisclosed |
[7] | |
PYX-203 |
Cyclopropylpyrroloindole (CPI) DNA-damaging payload |
Human Deoxyribonucleic acid (hDNA) |
Lysosomal cleavable linker |
[8] |
Tissue/Disease specific Abundances of This Antigen
Tissue specific Abundances of This Antigen
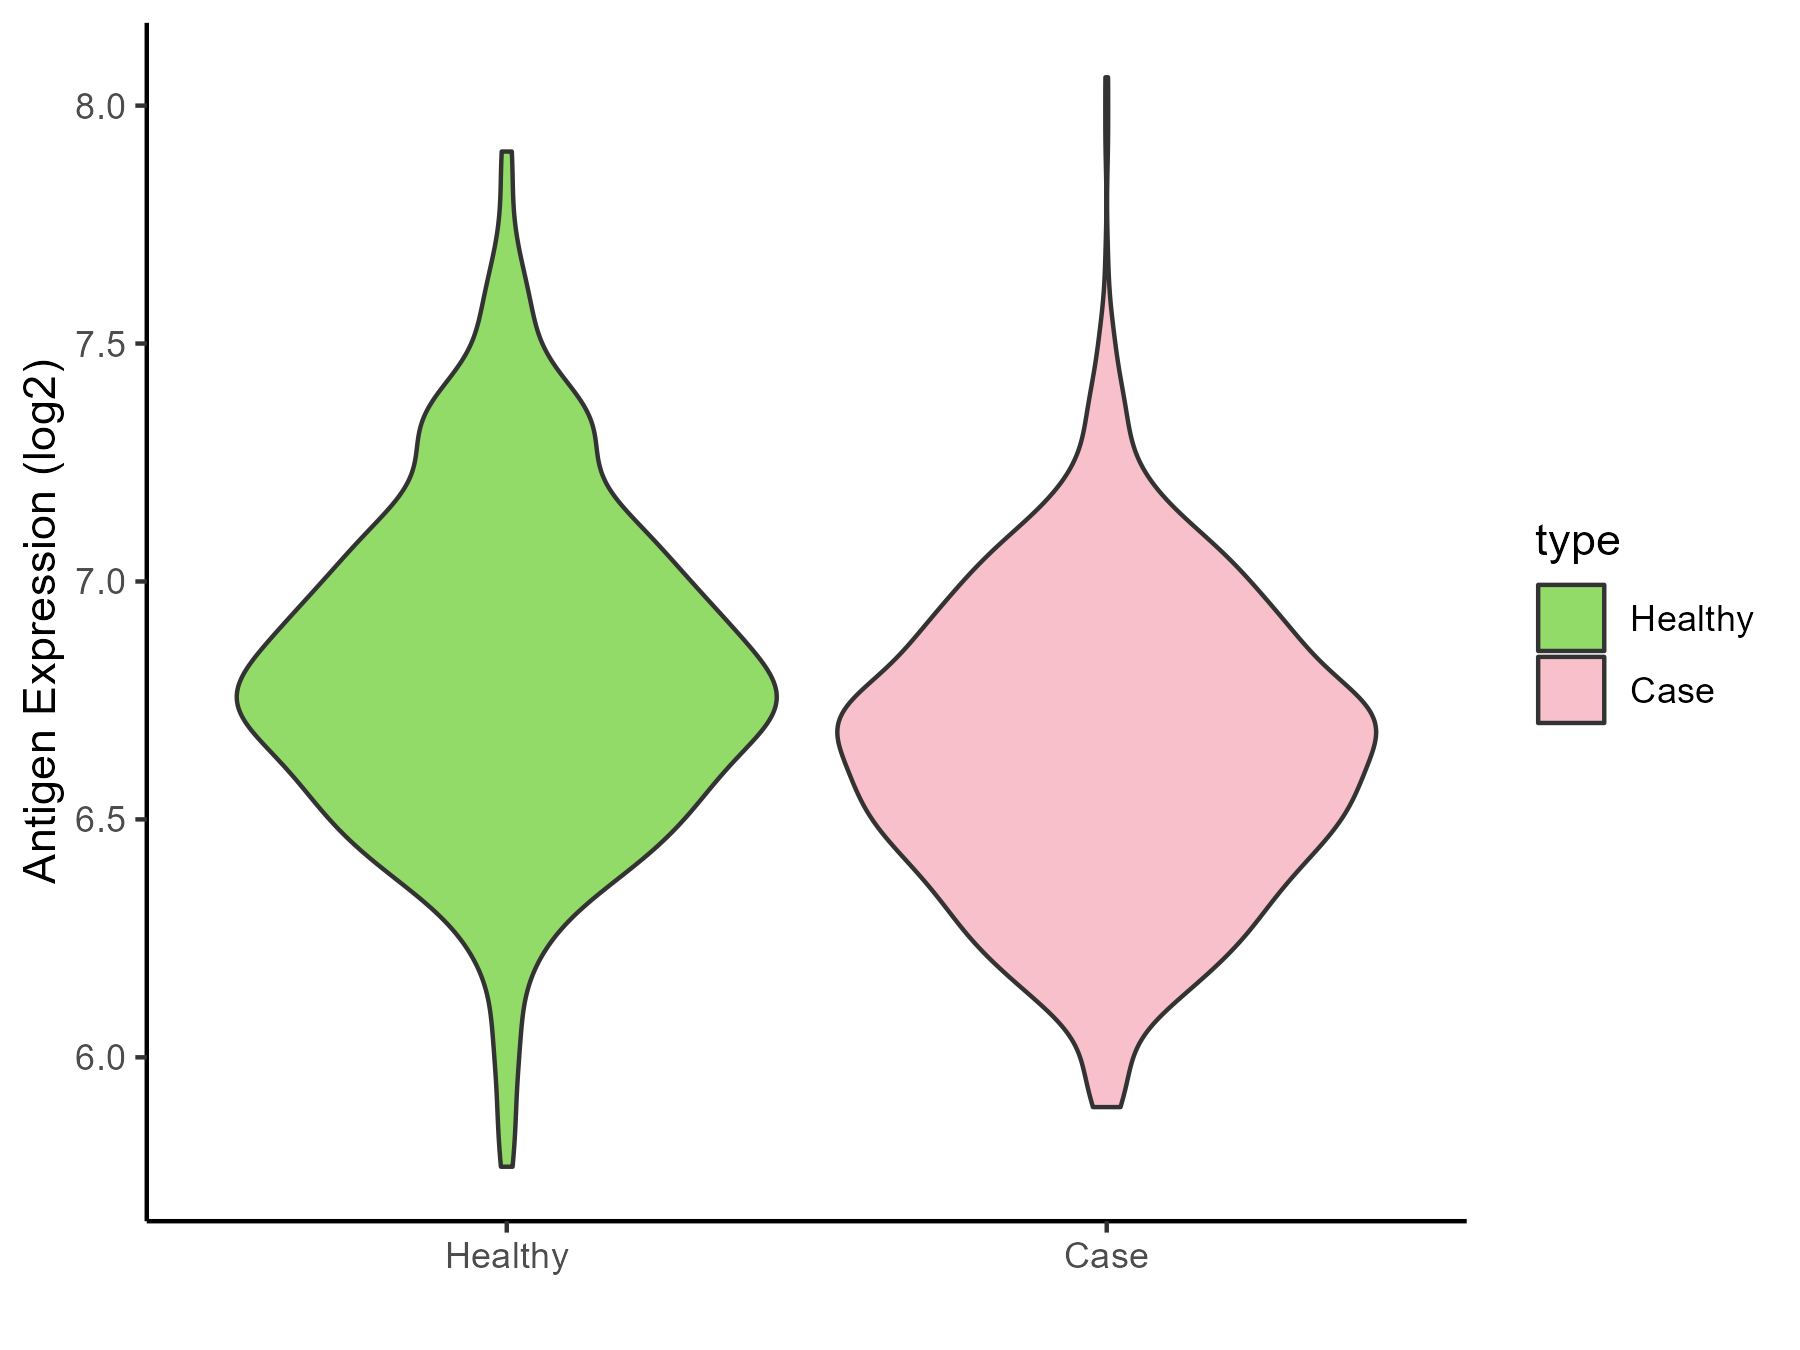
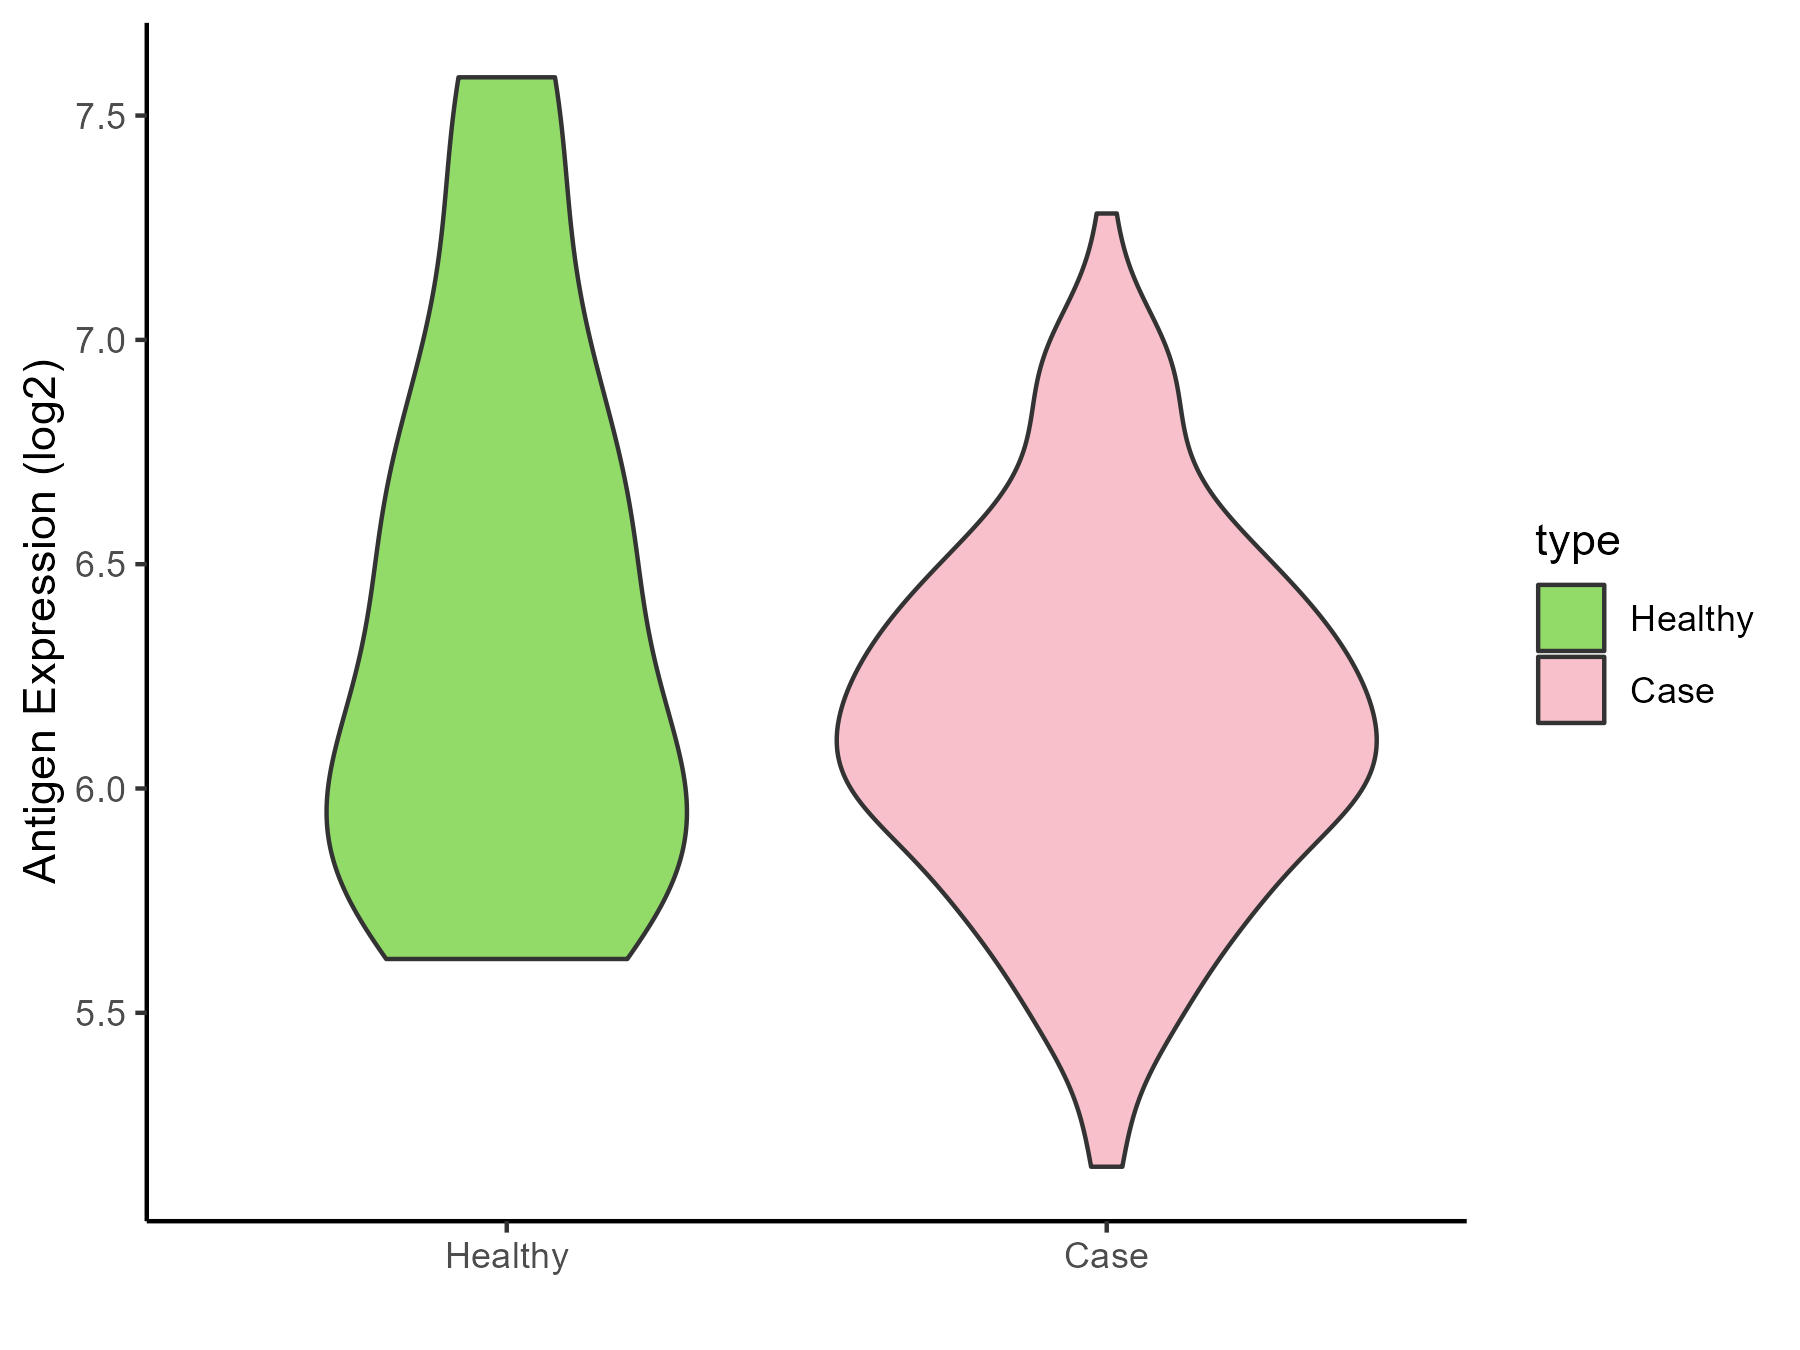
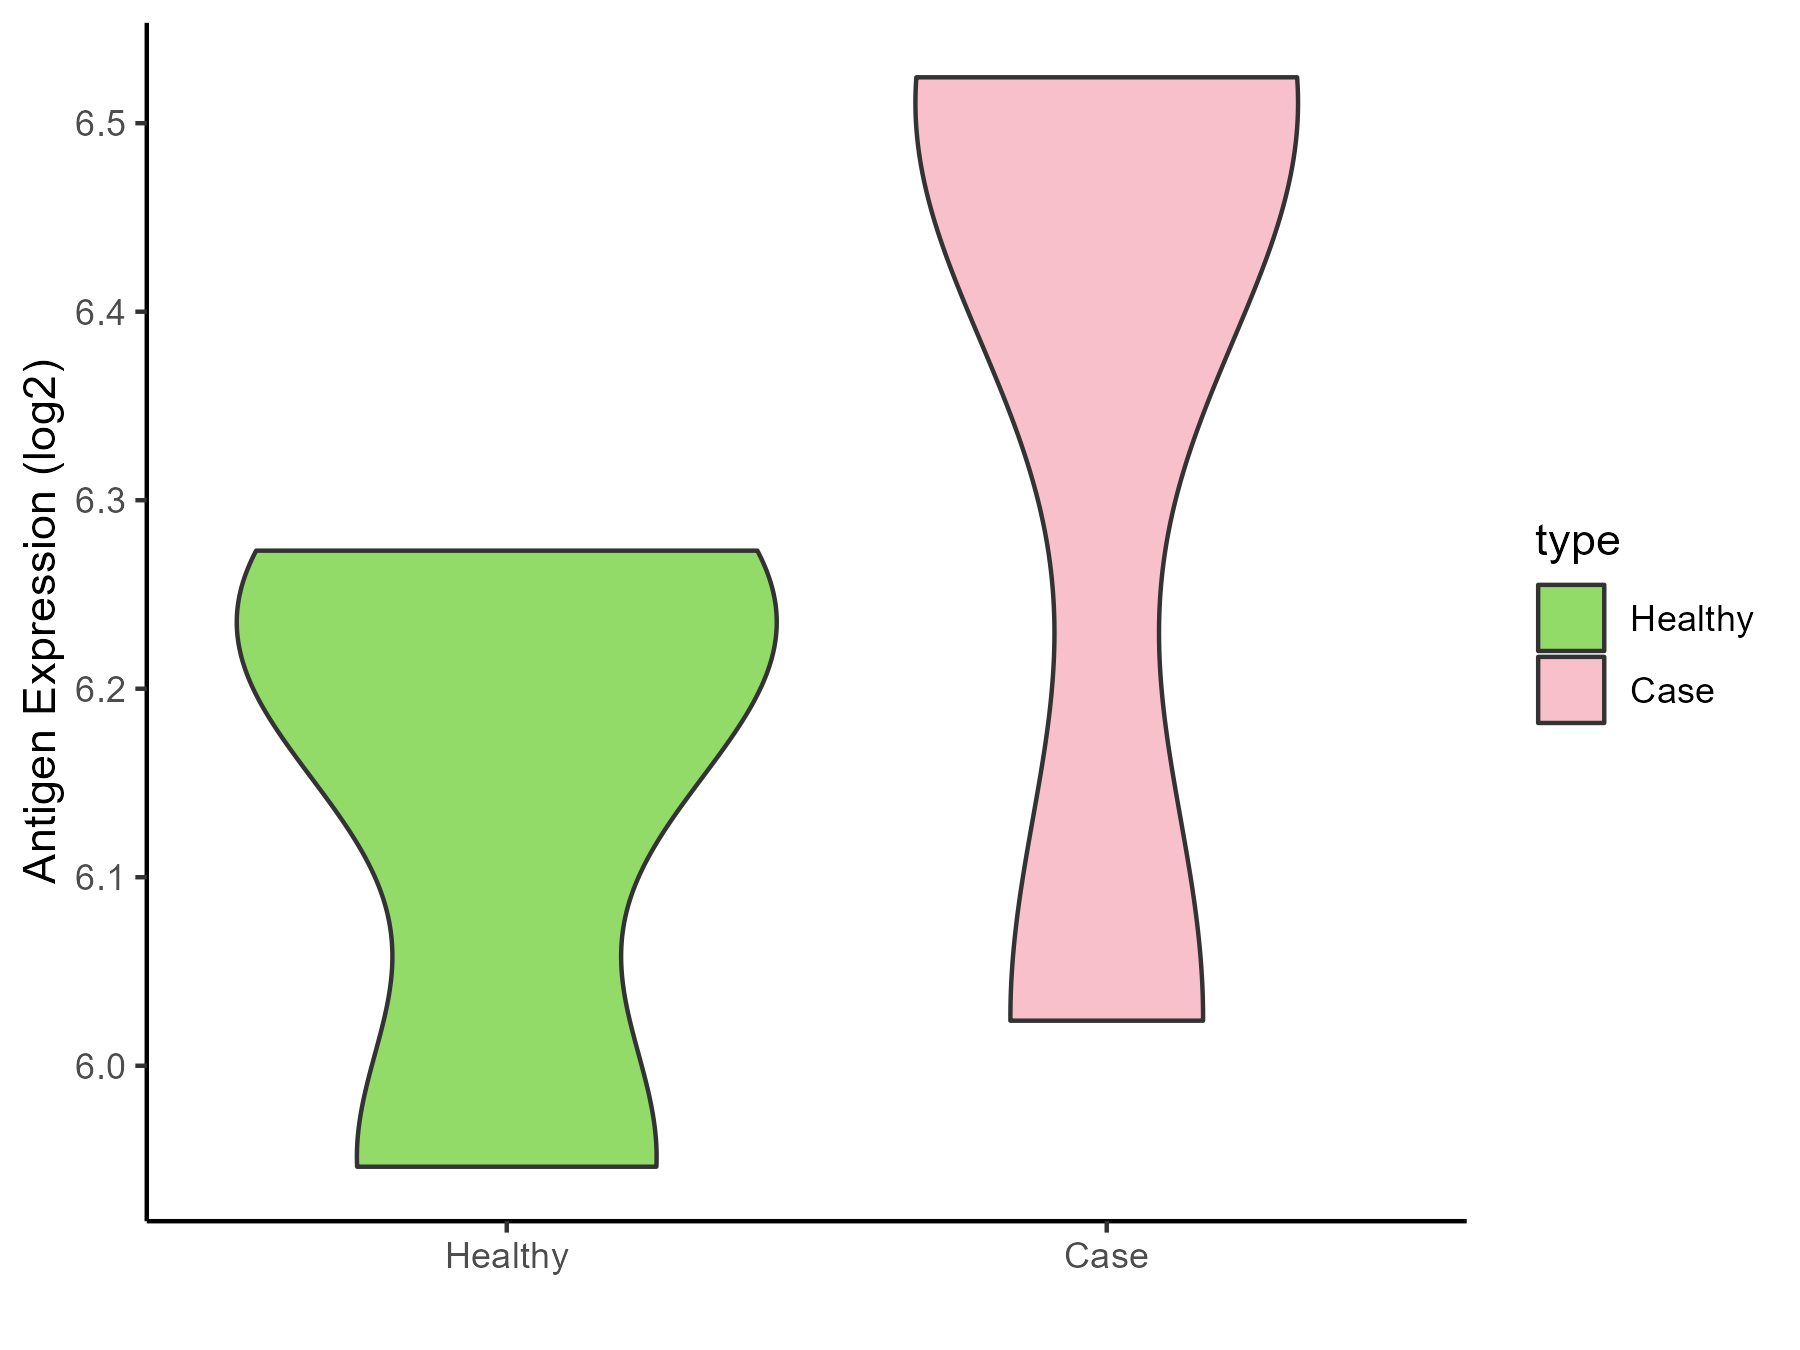
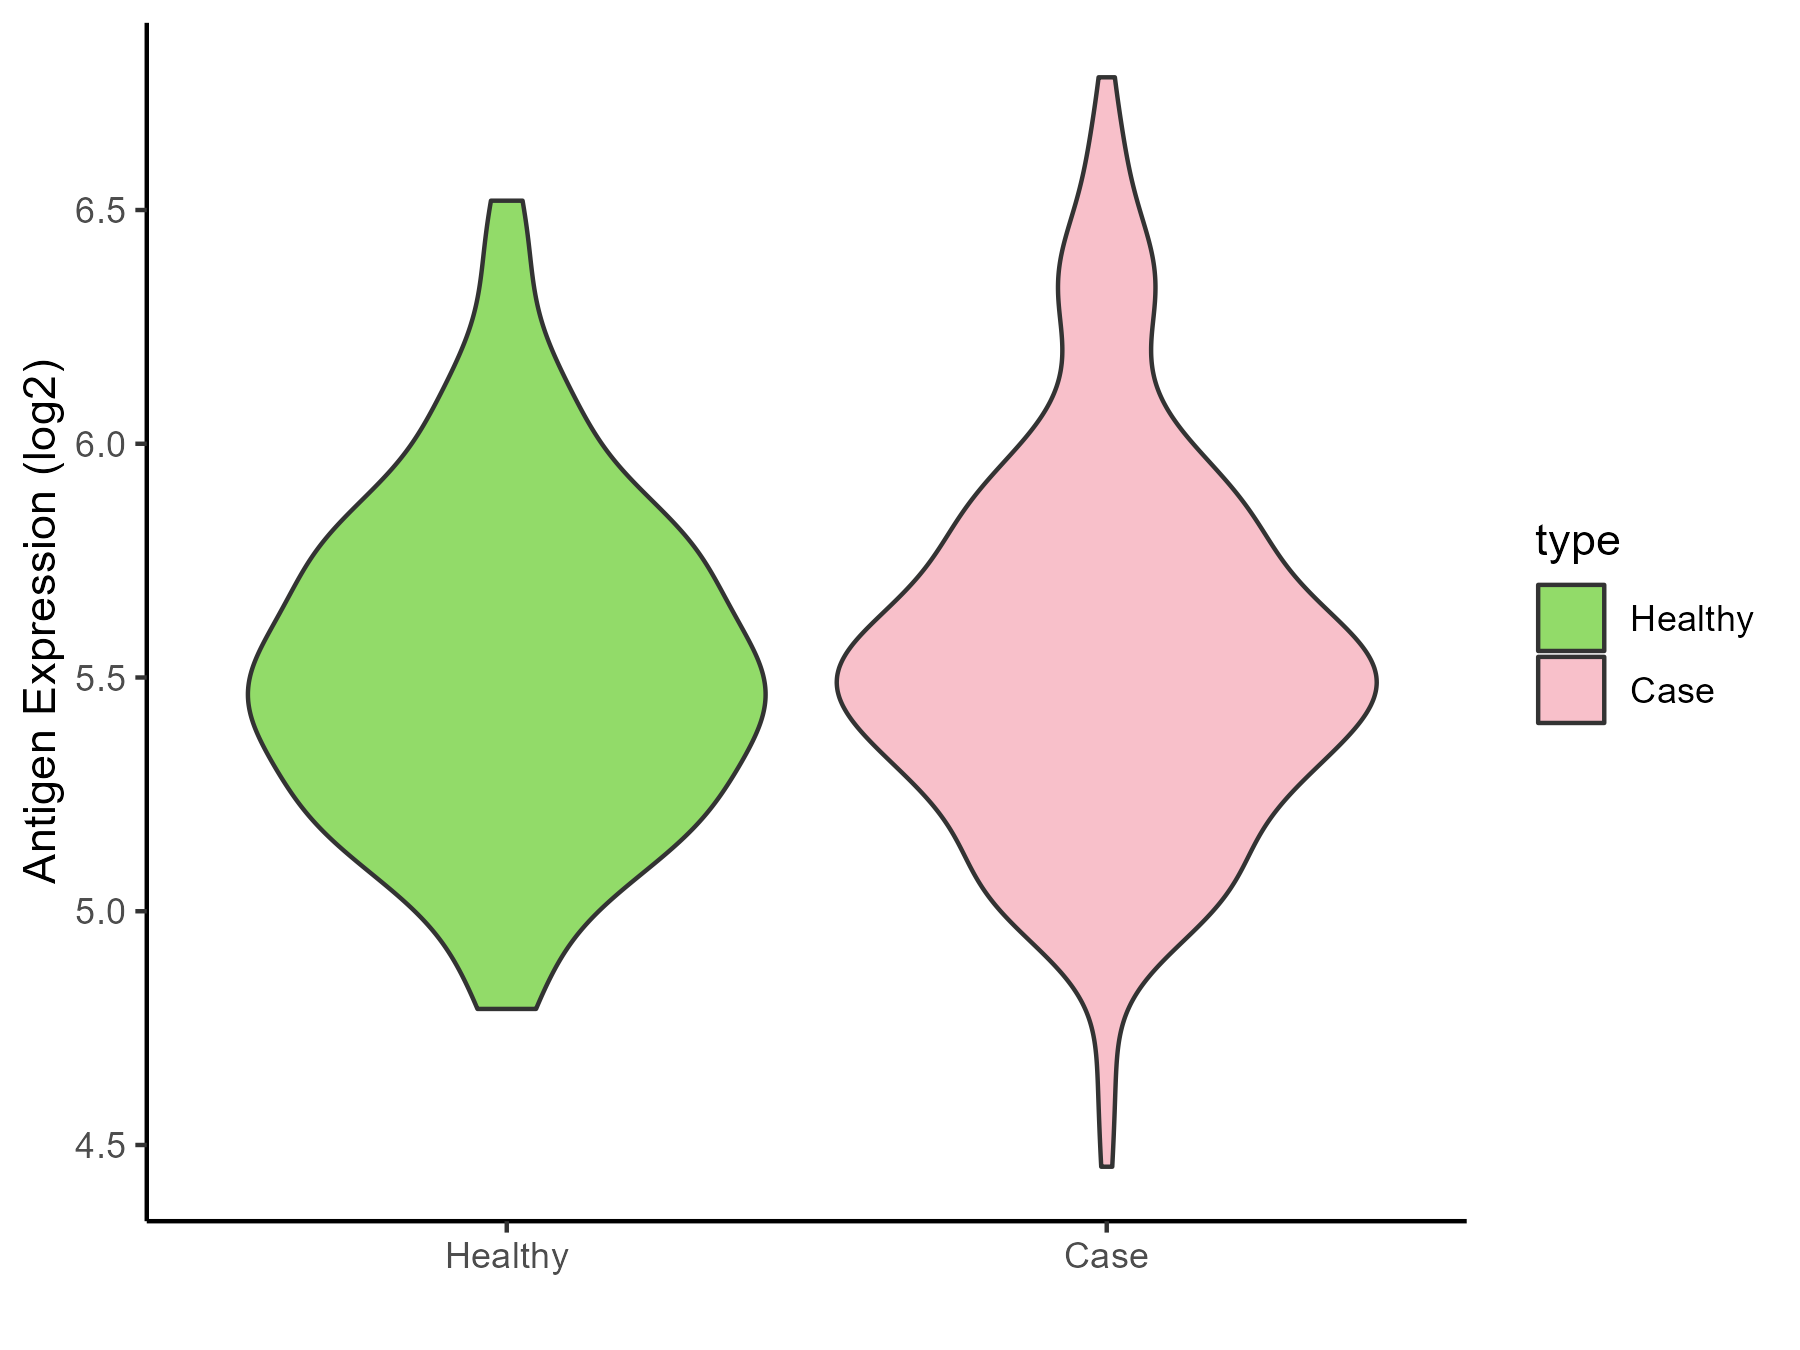
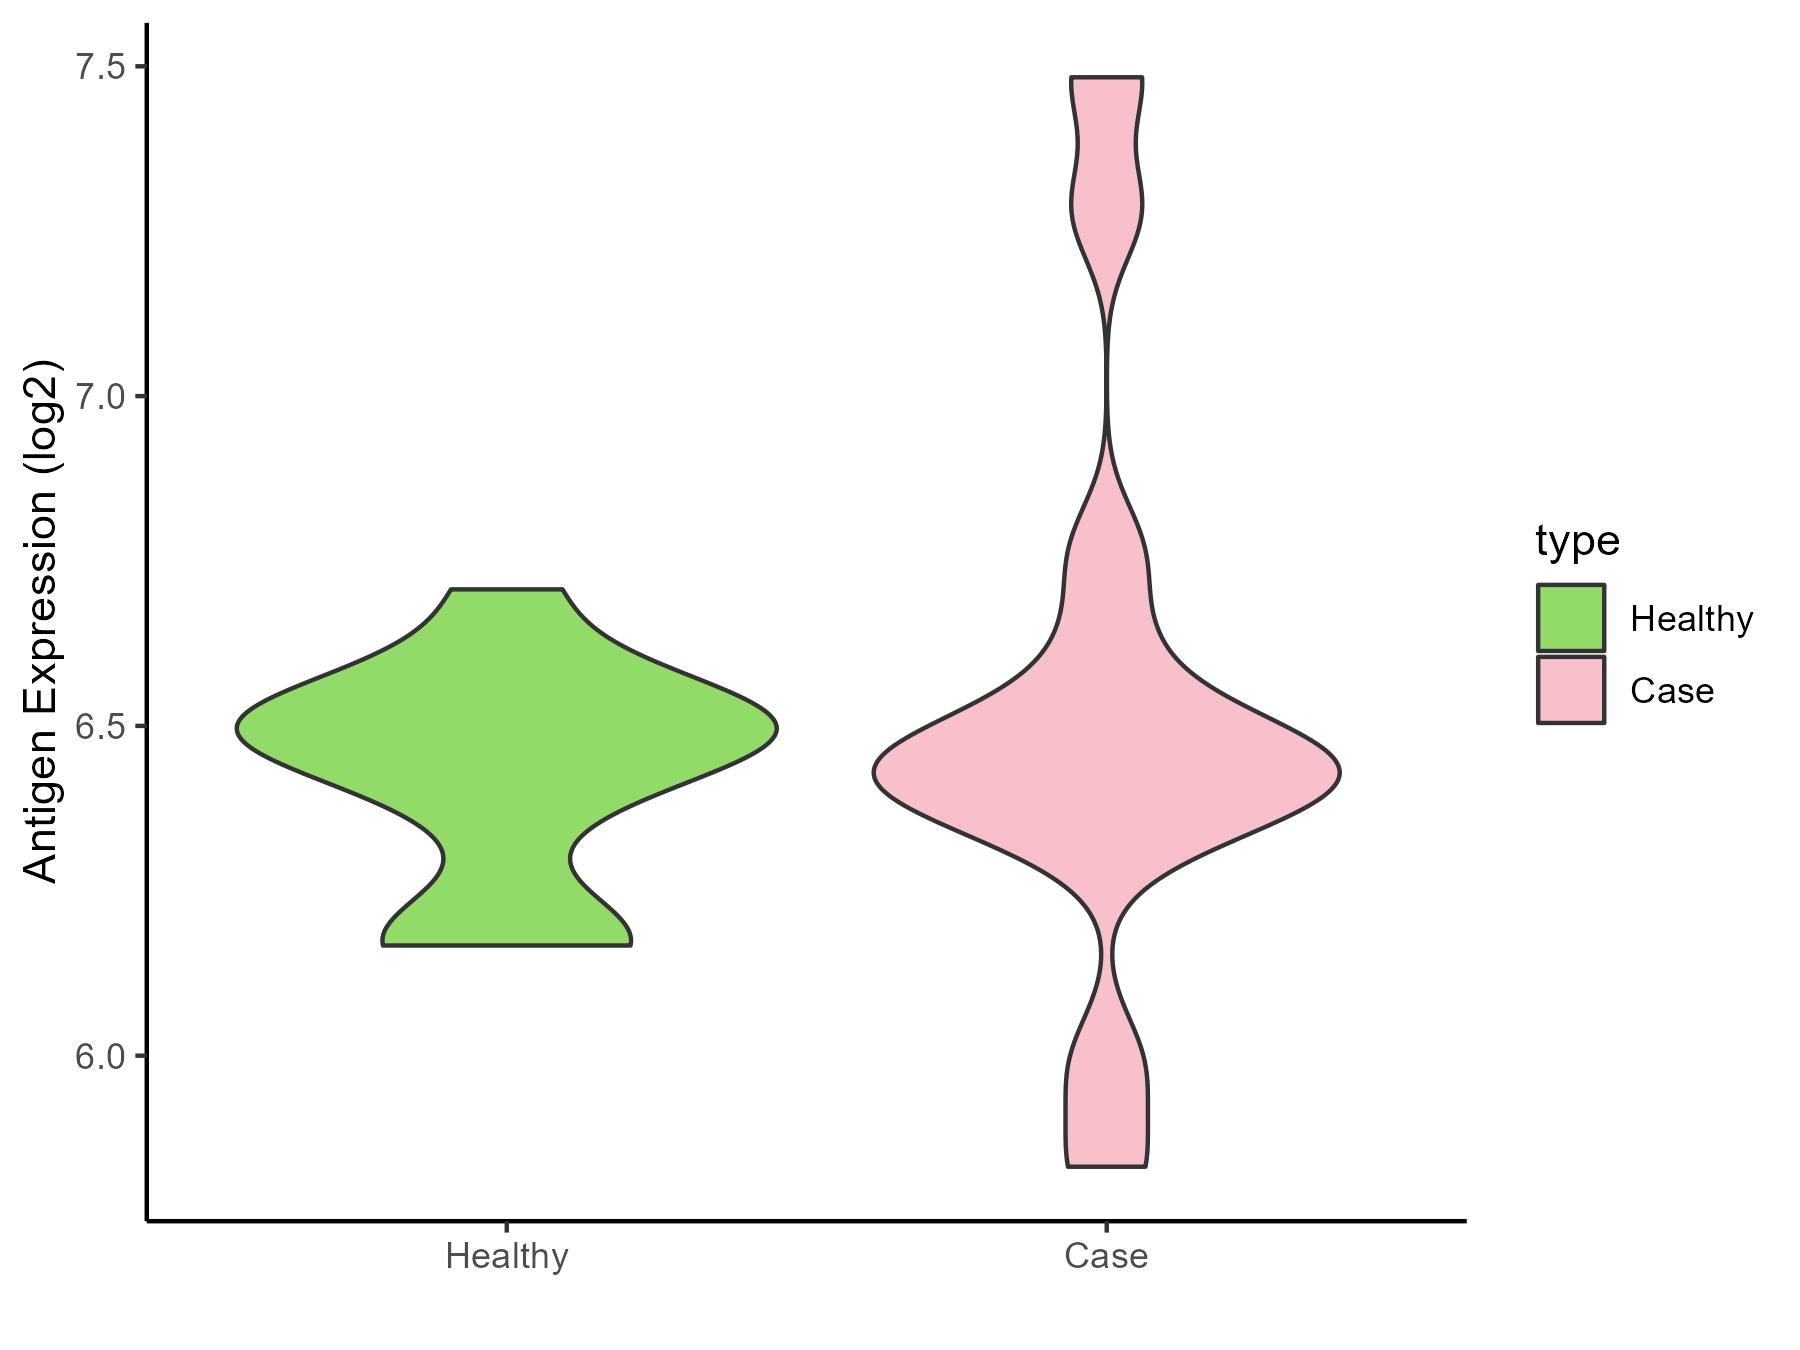
ICD Disease Classification 01
| Differential expression pattern of antigen in diseases | ||
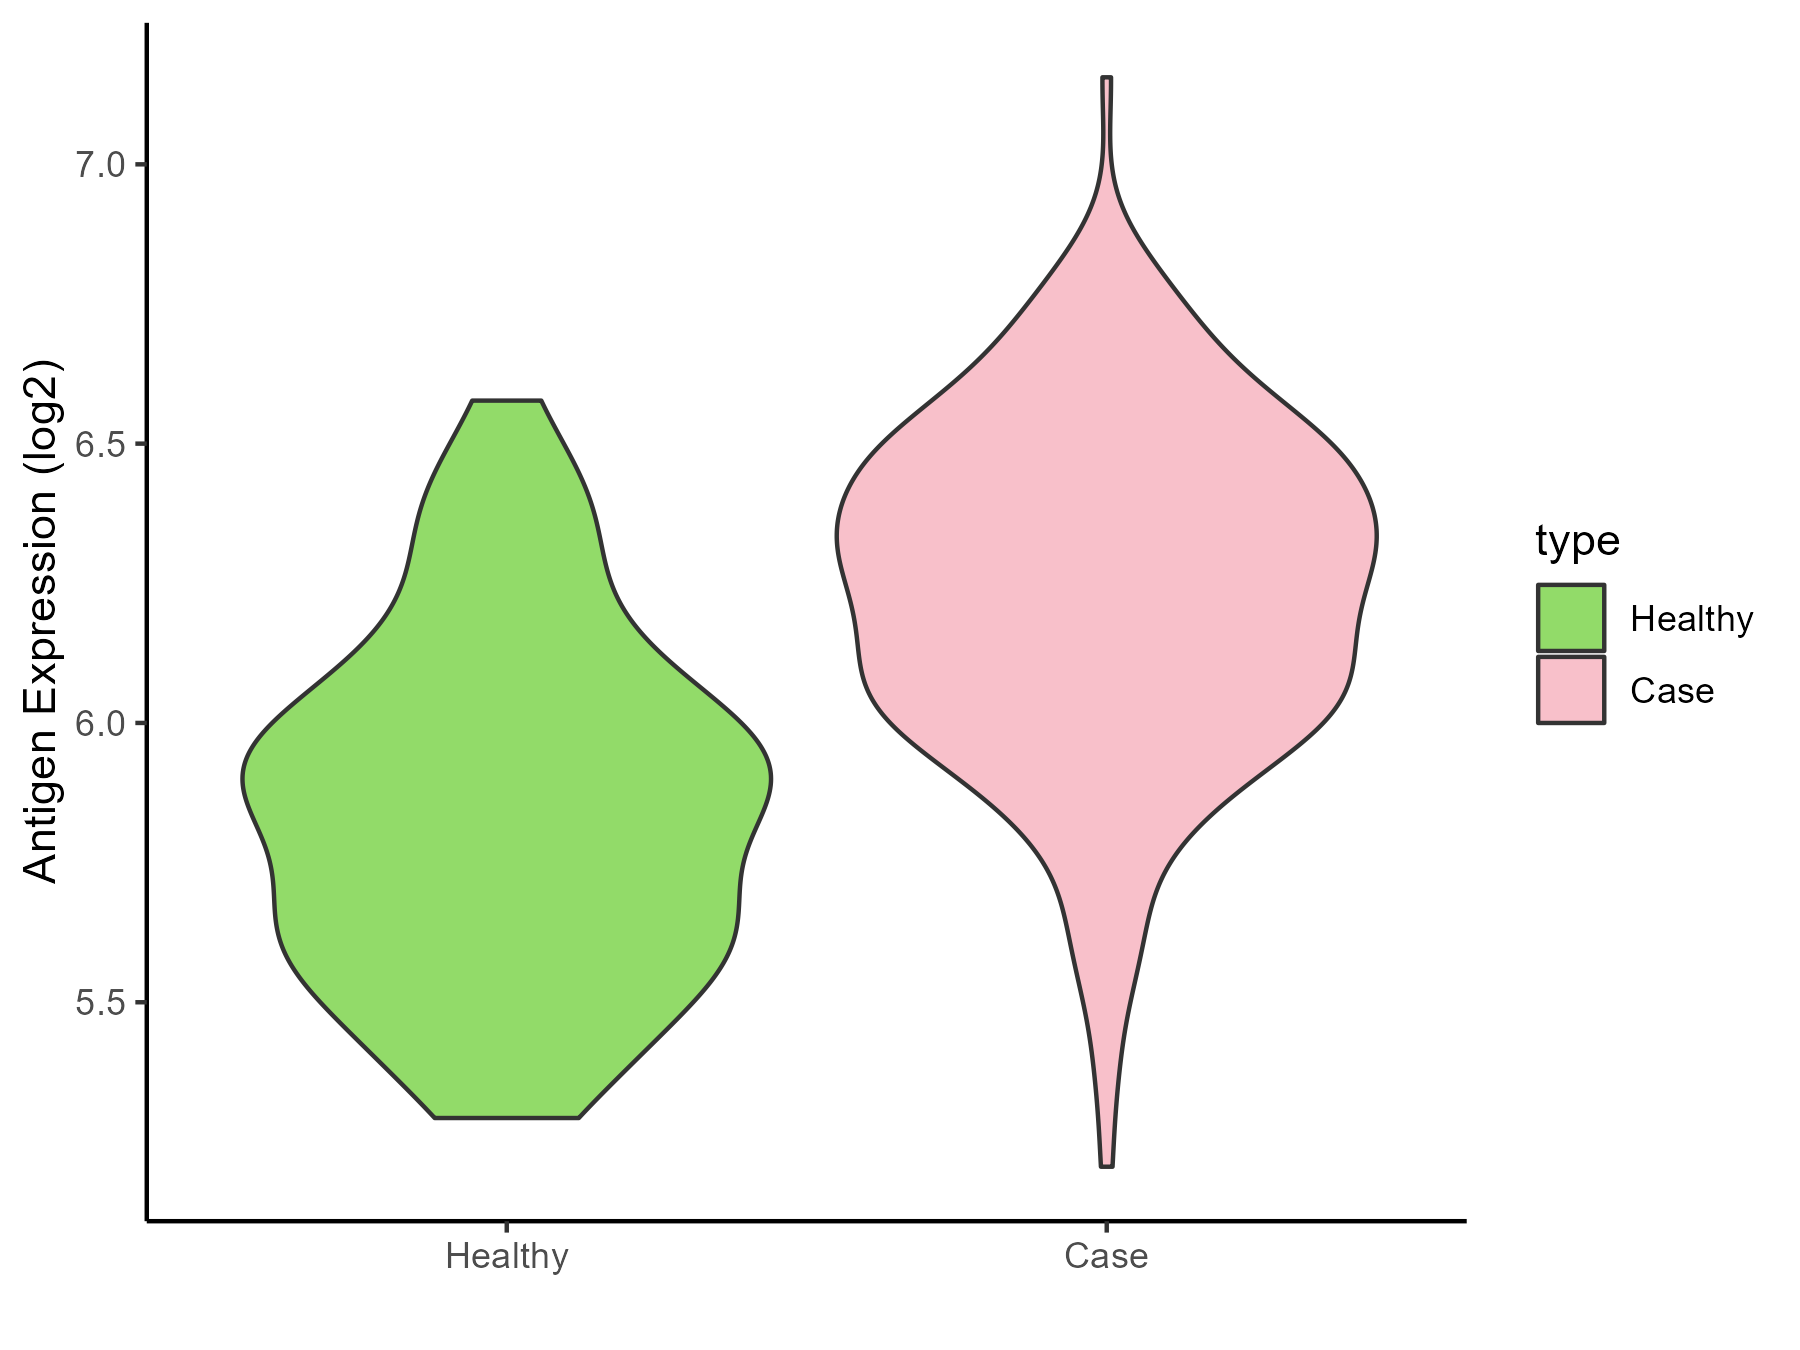
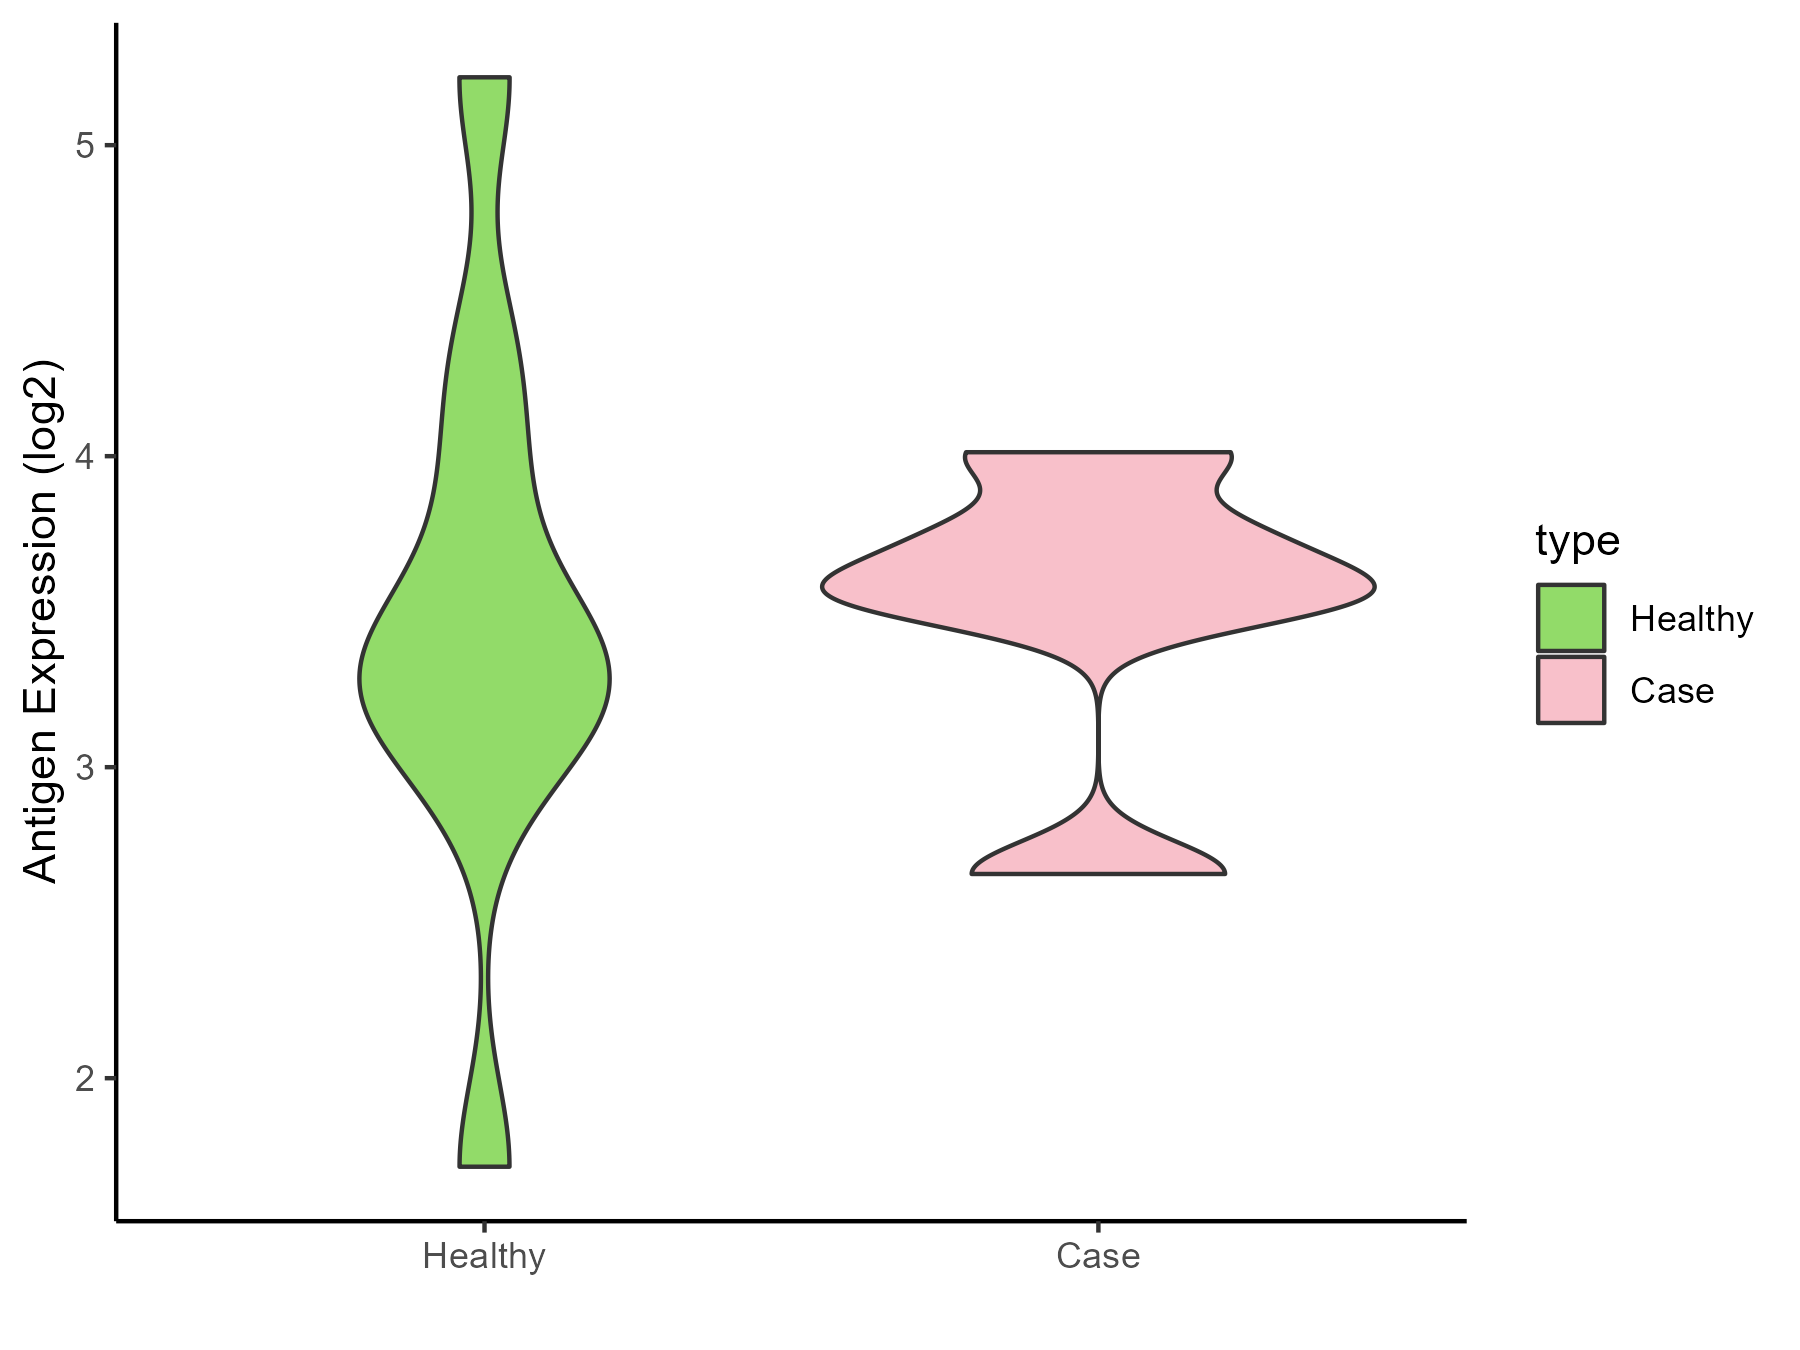
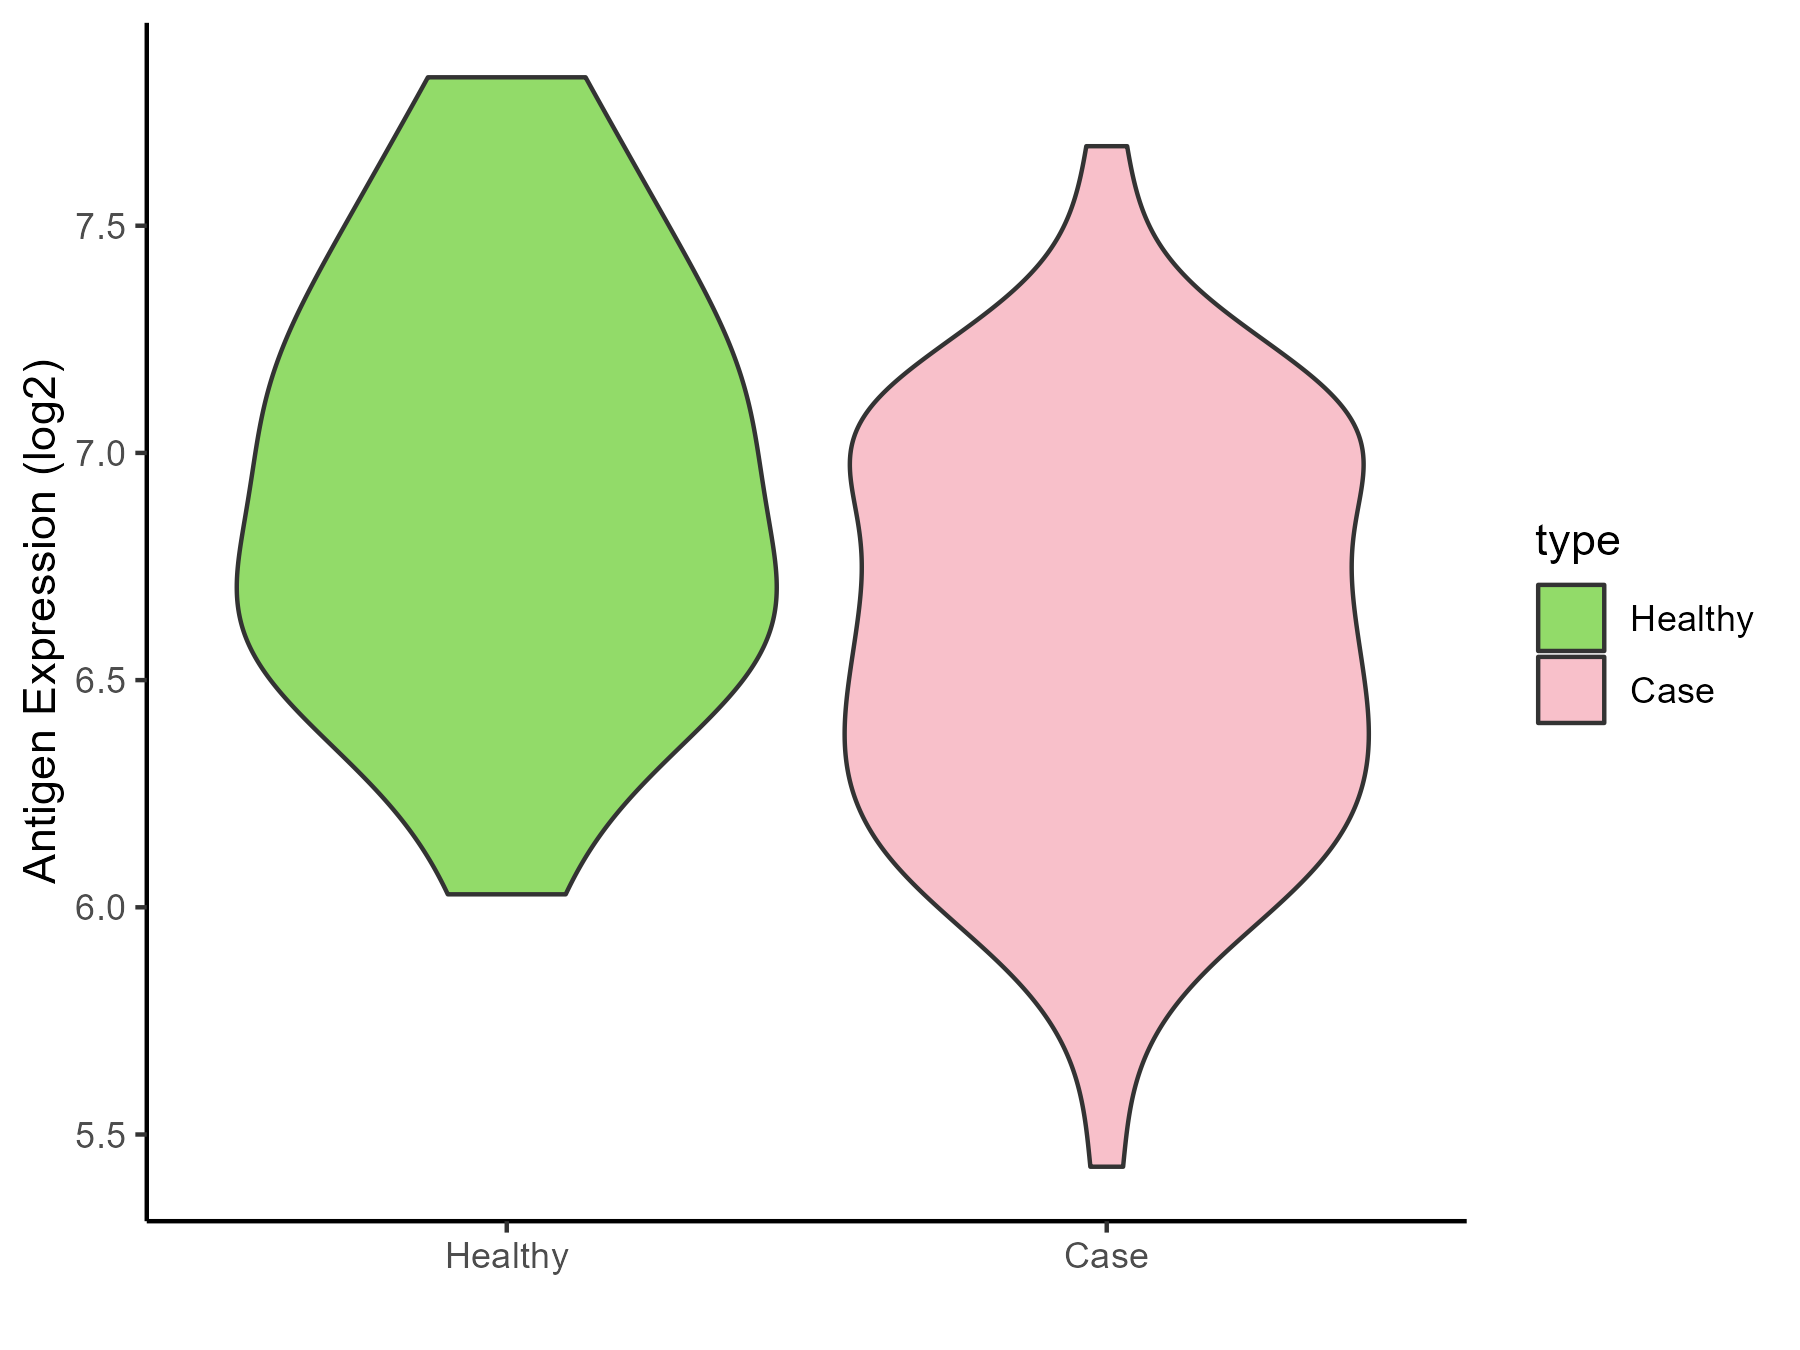
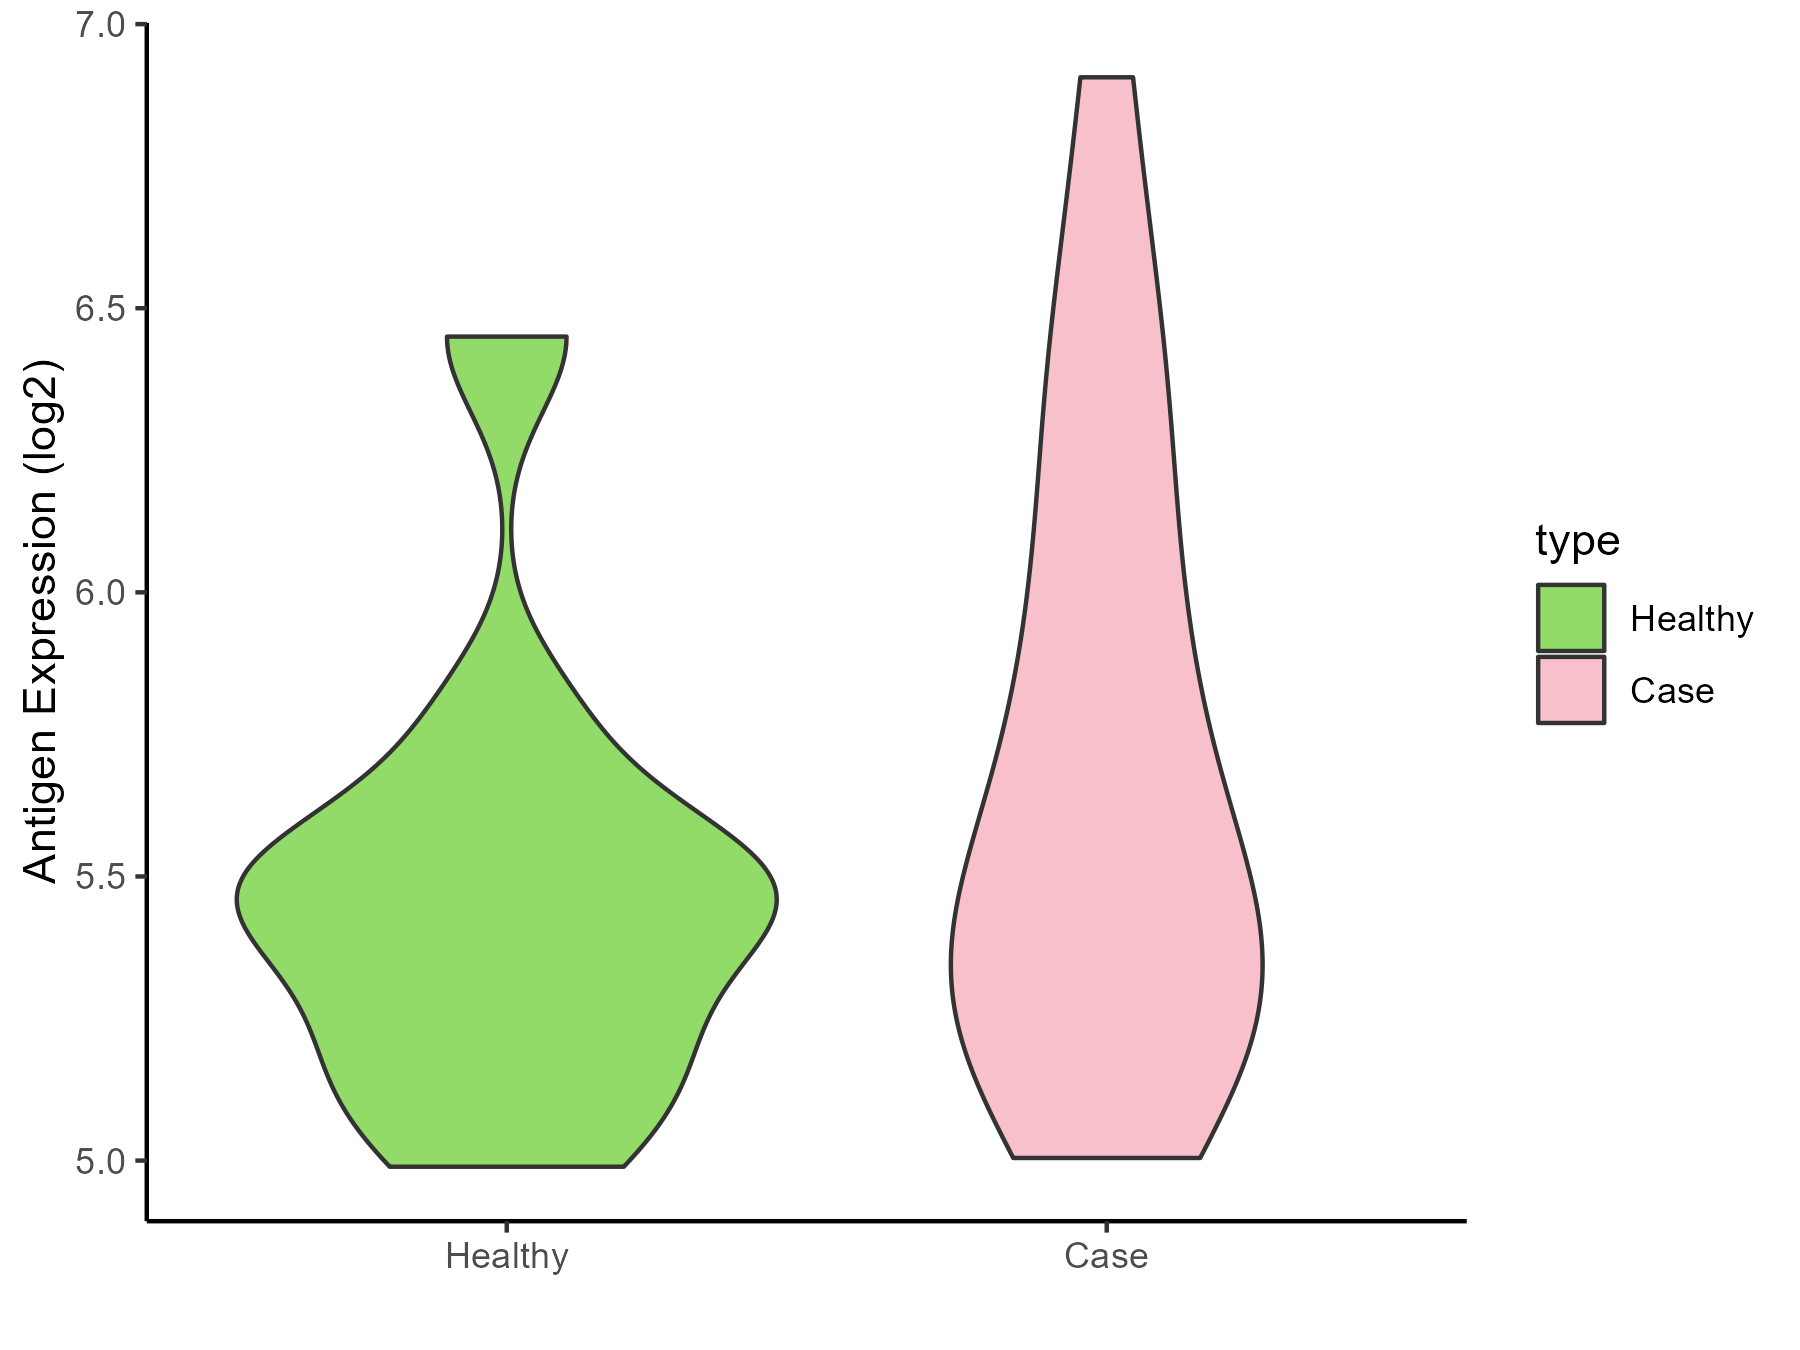
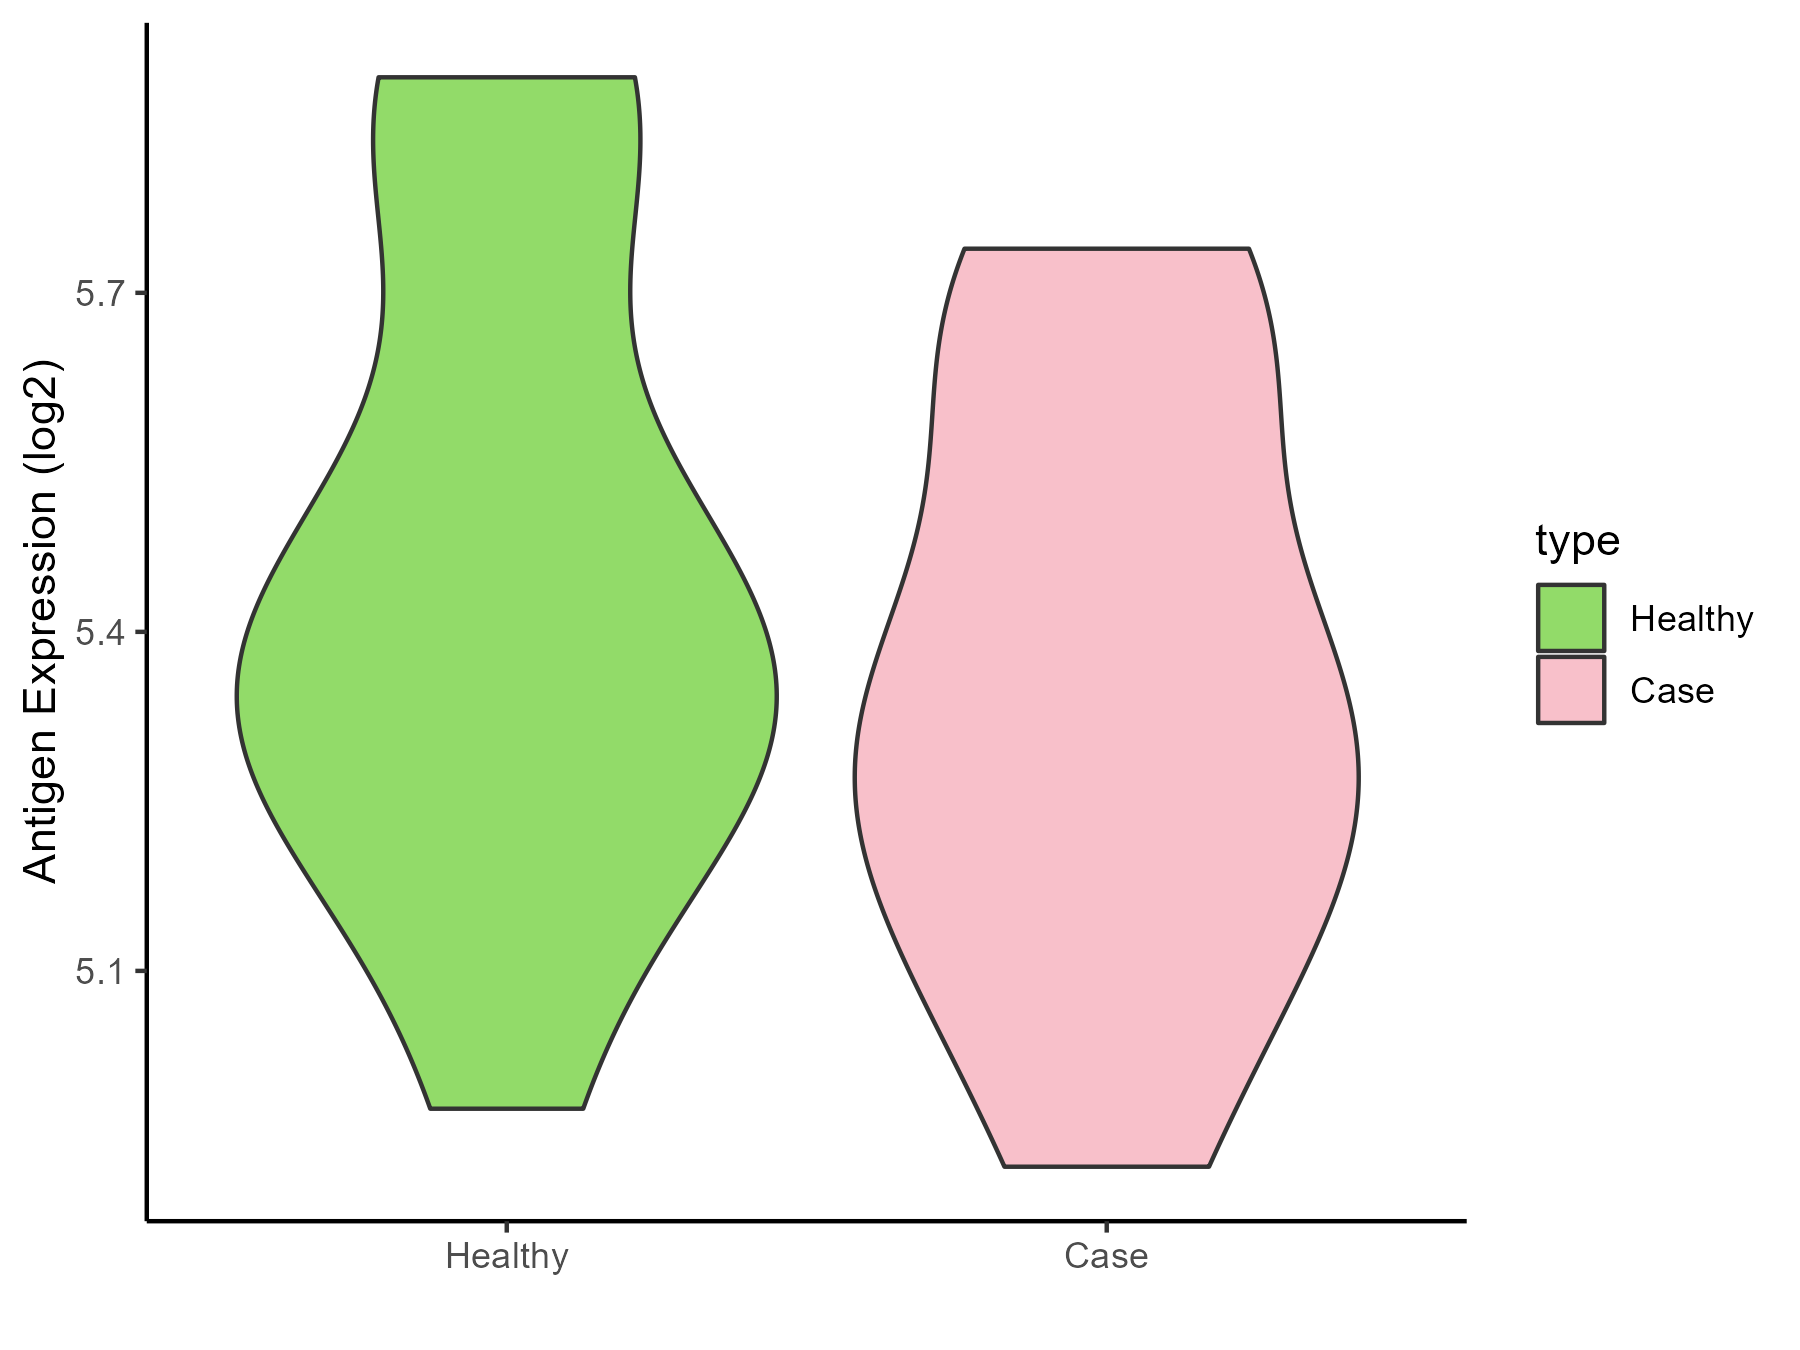
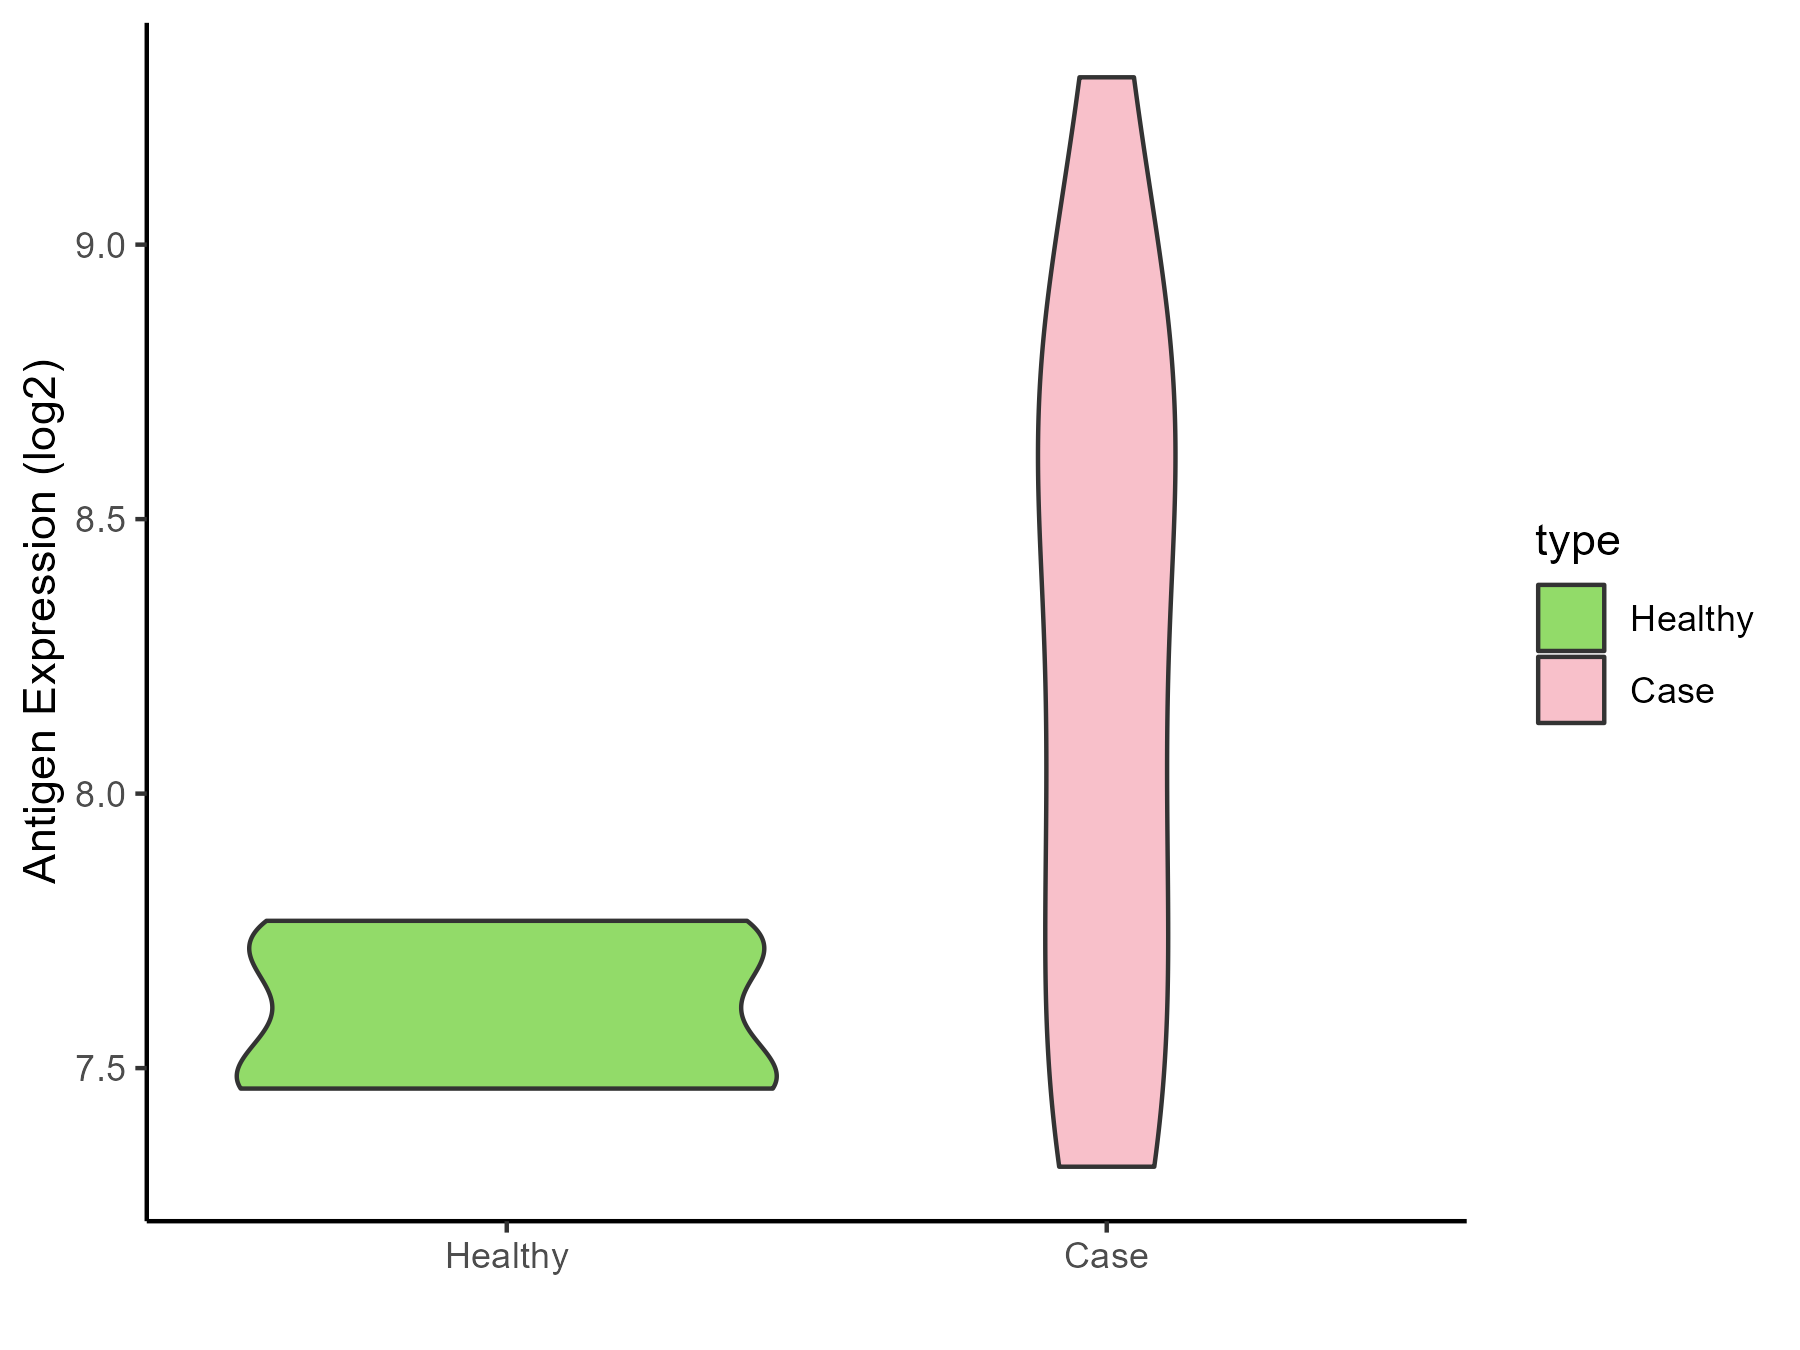
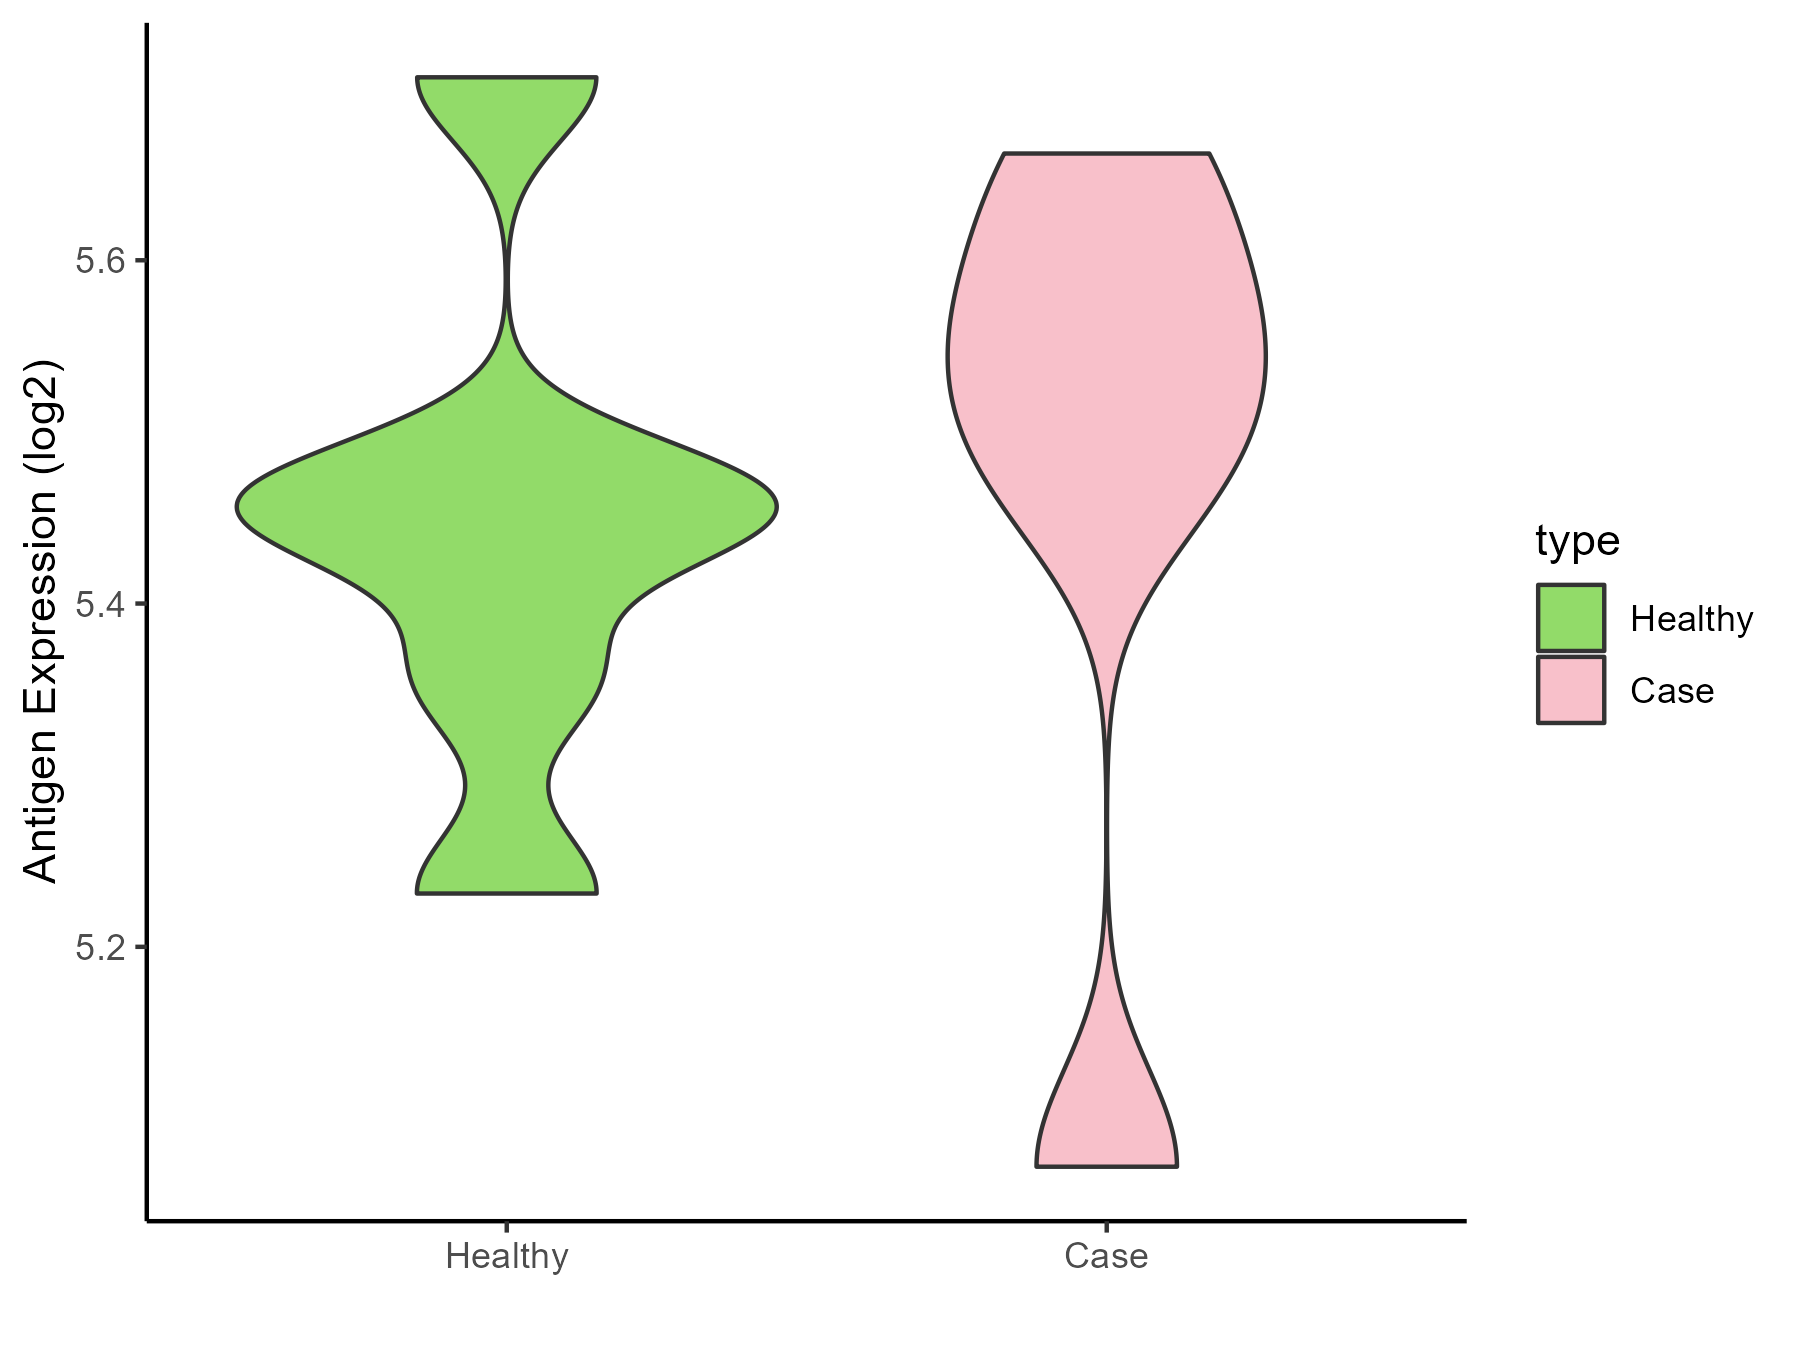
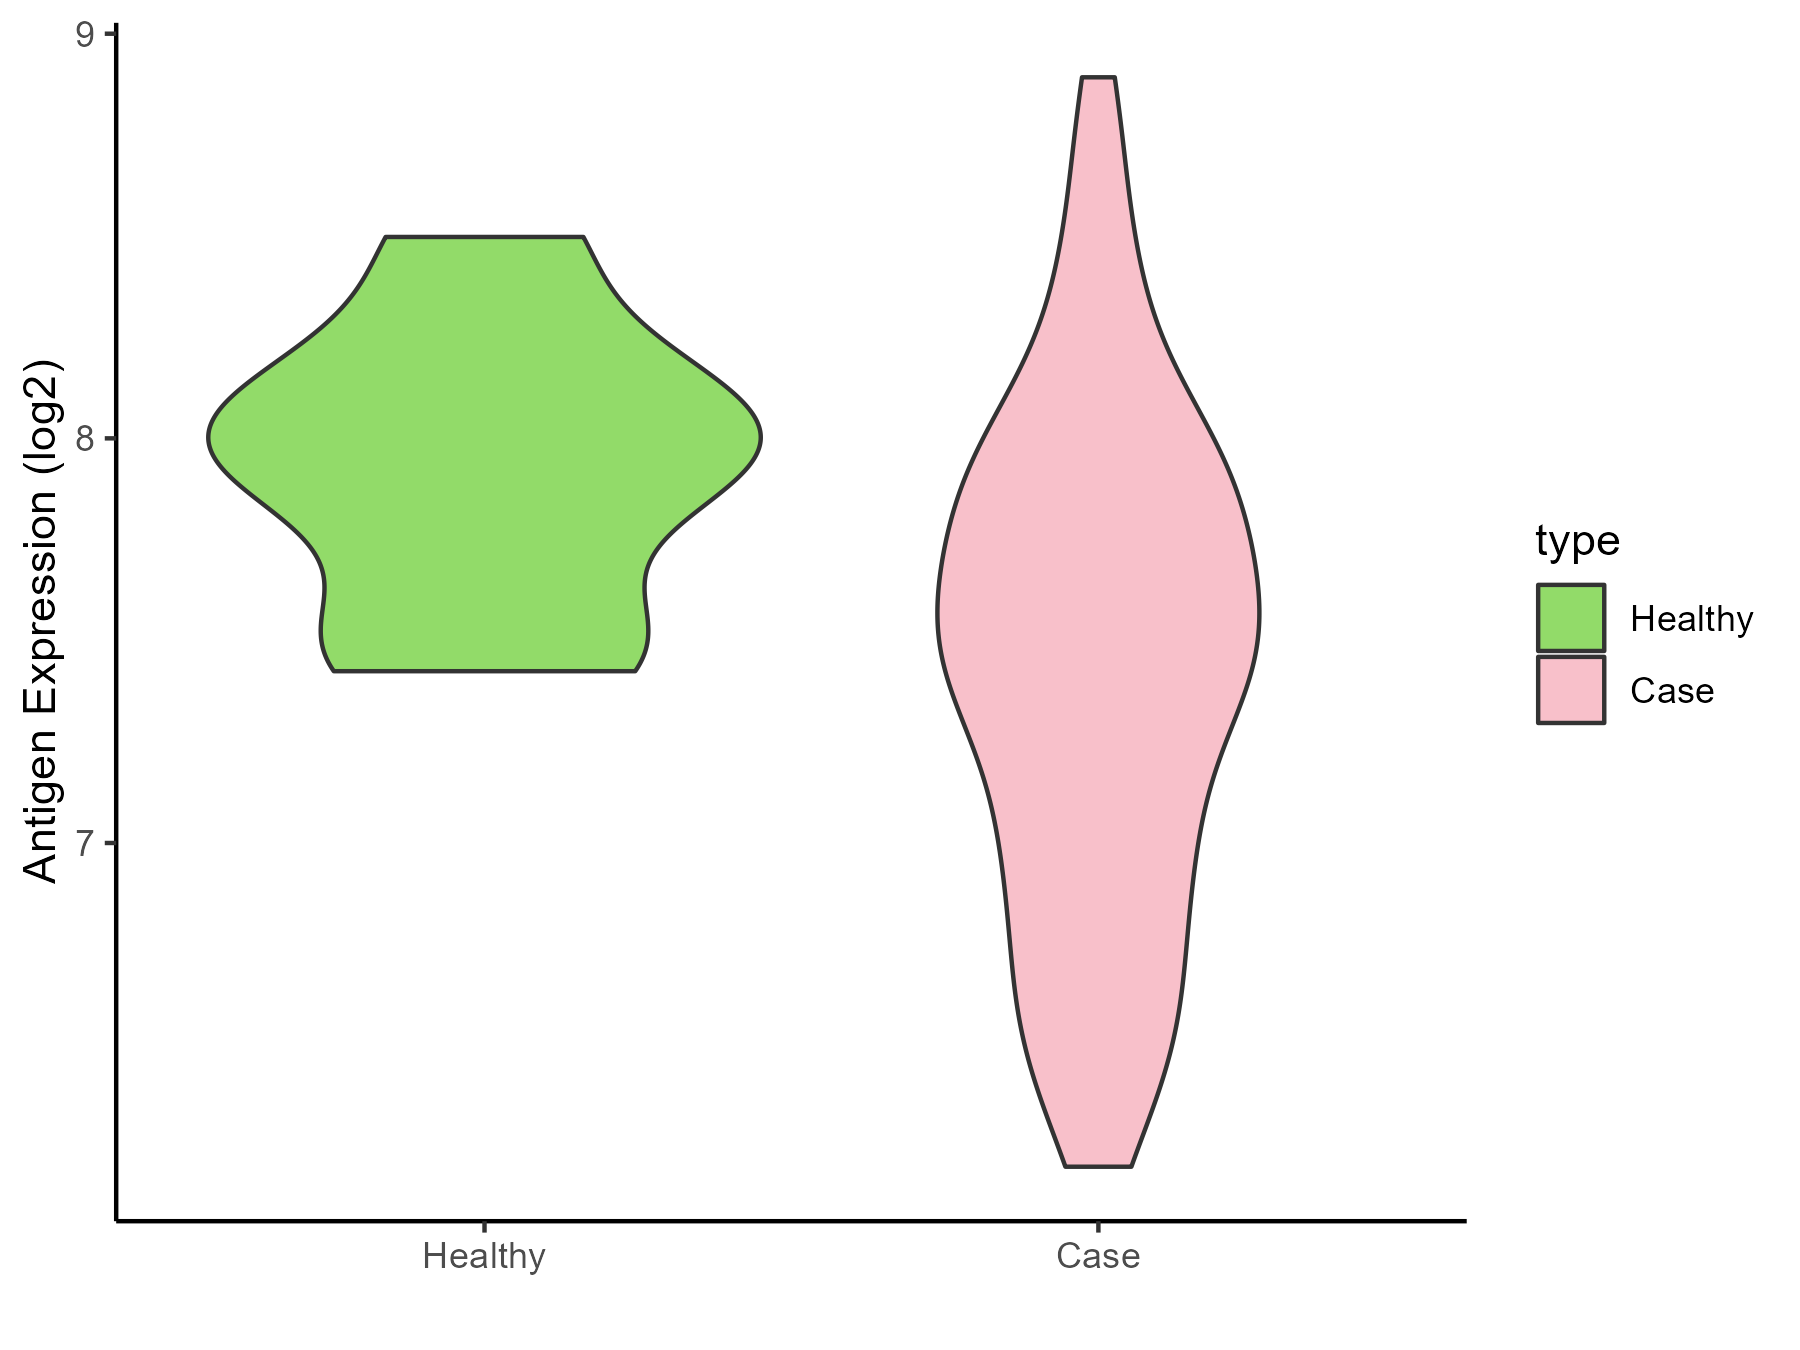
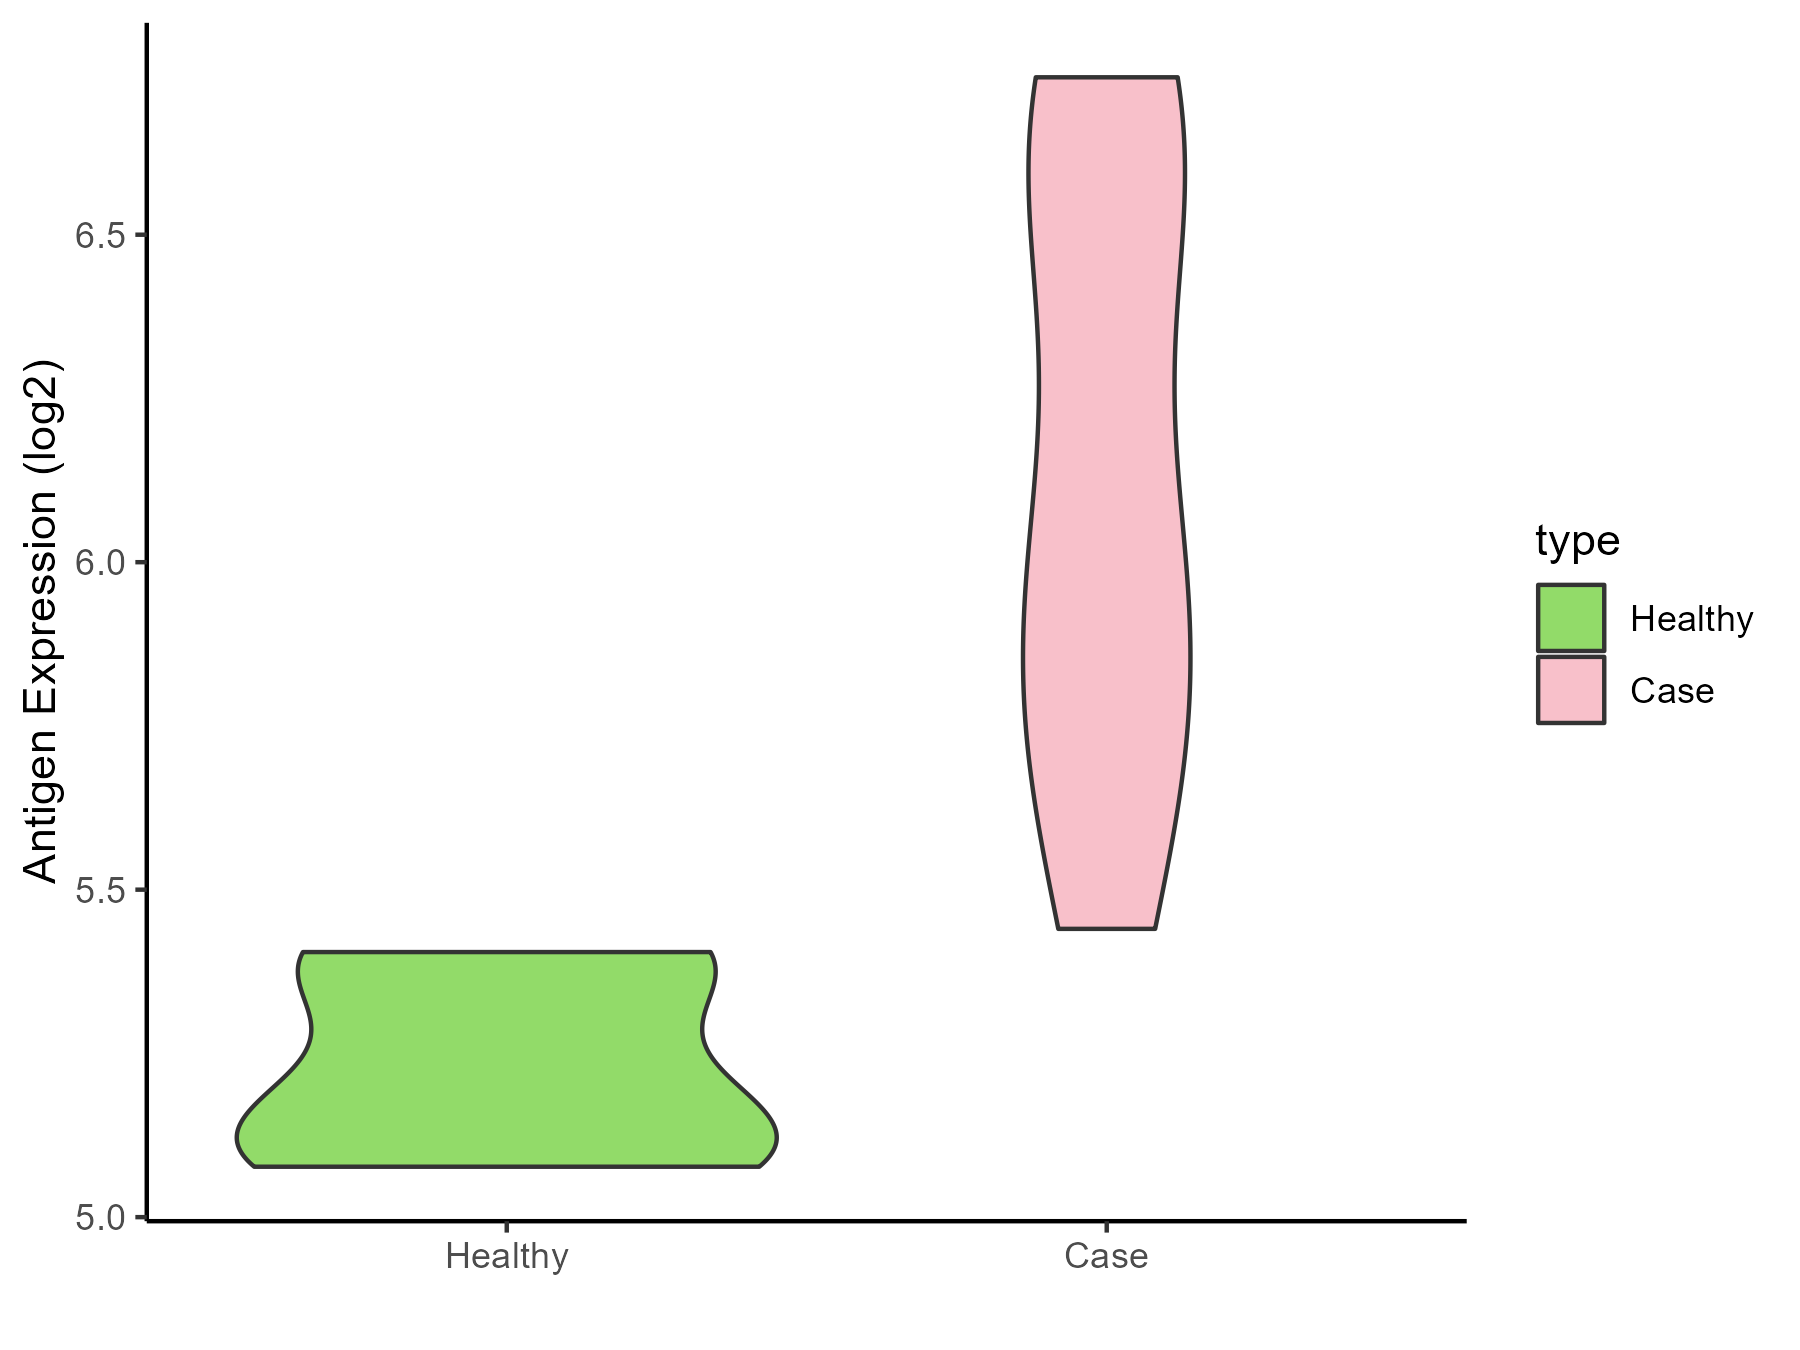
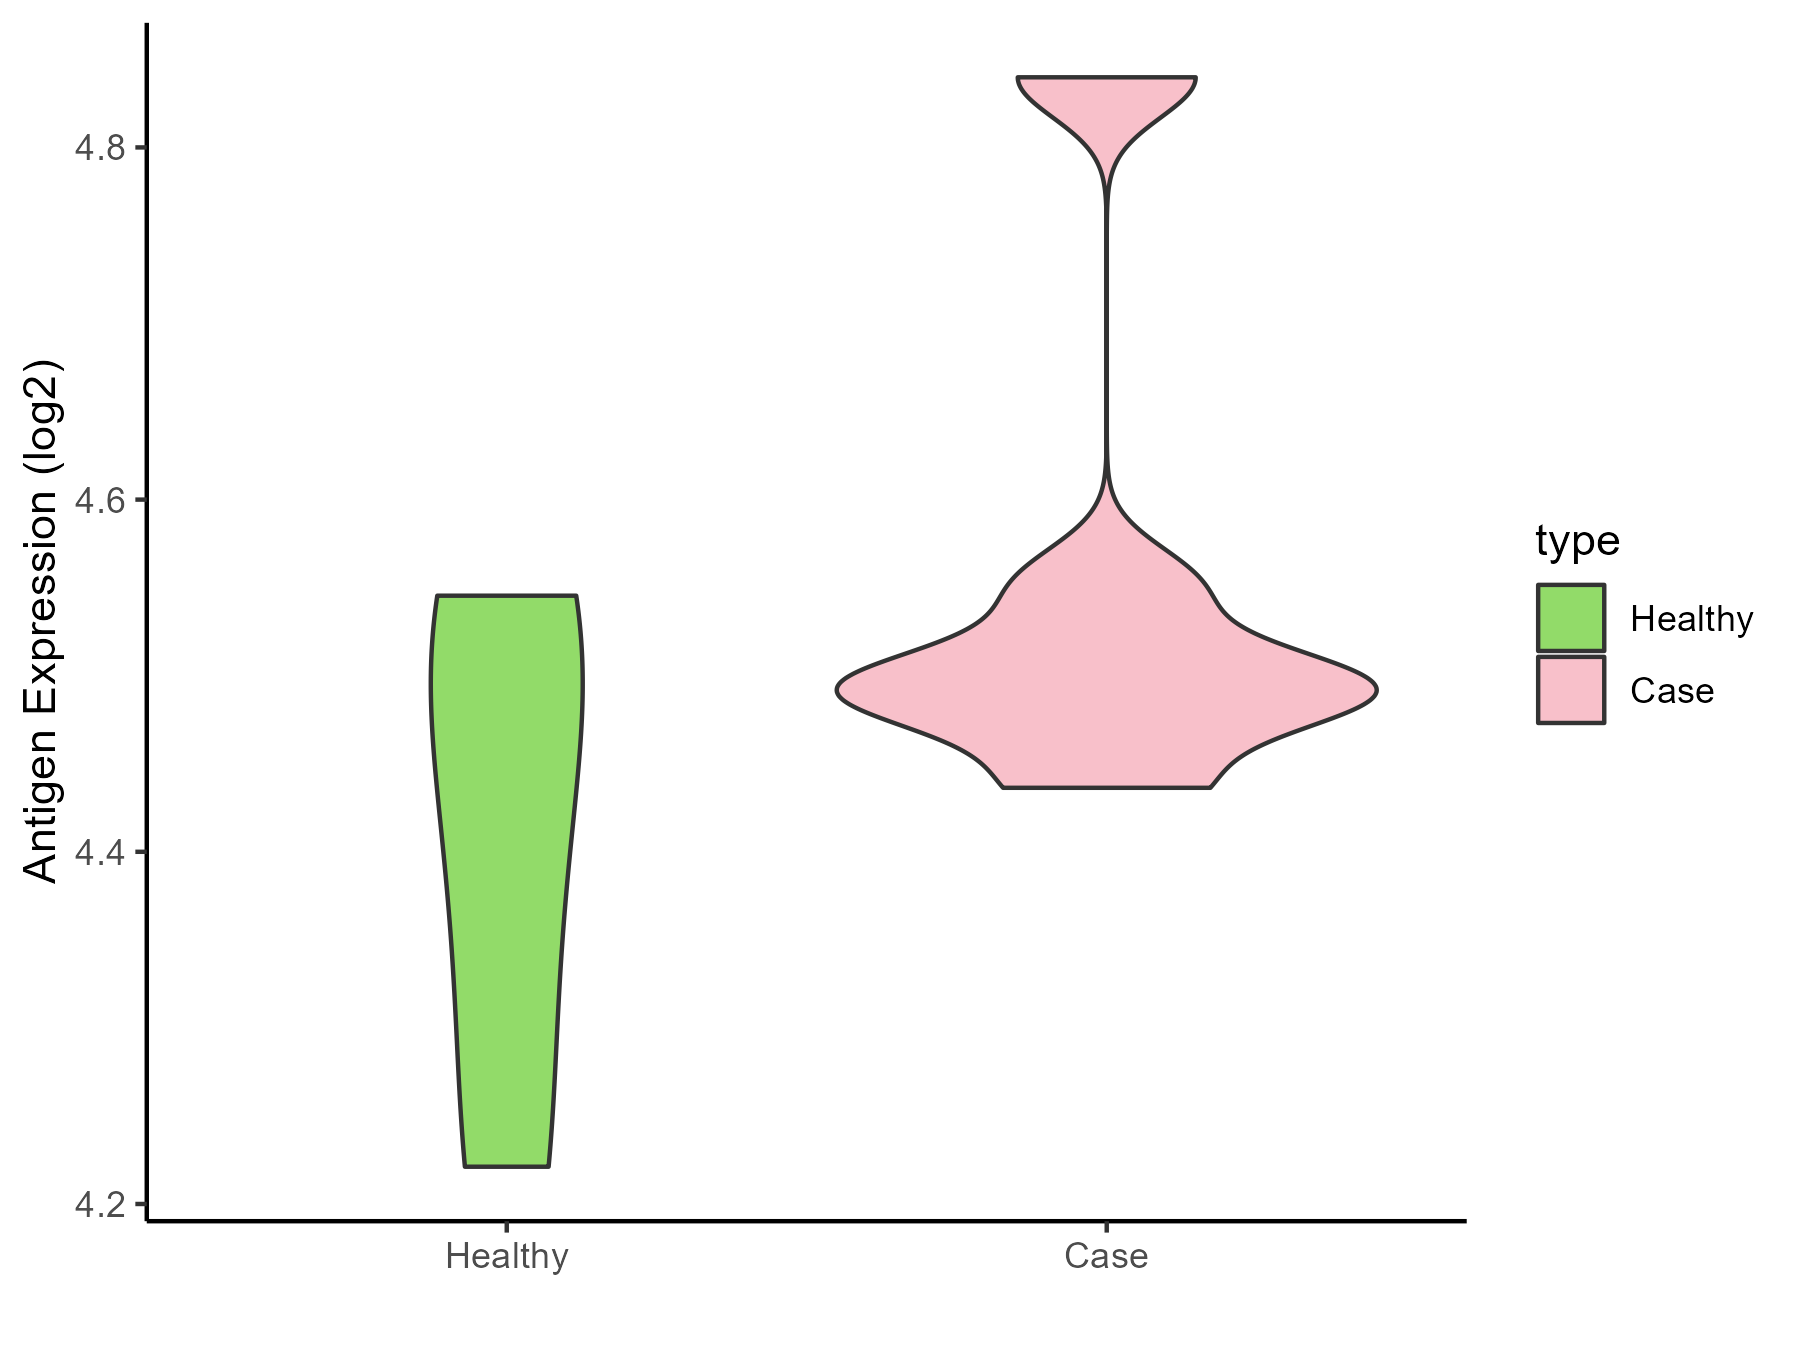
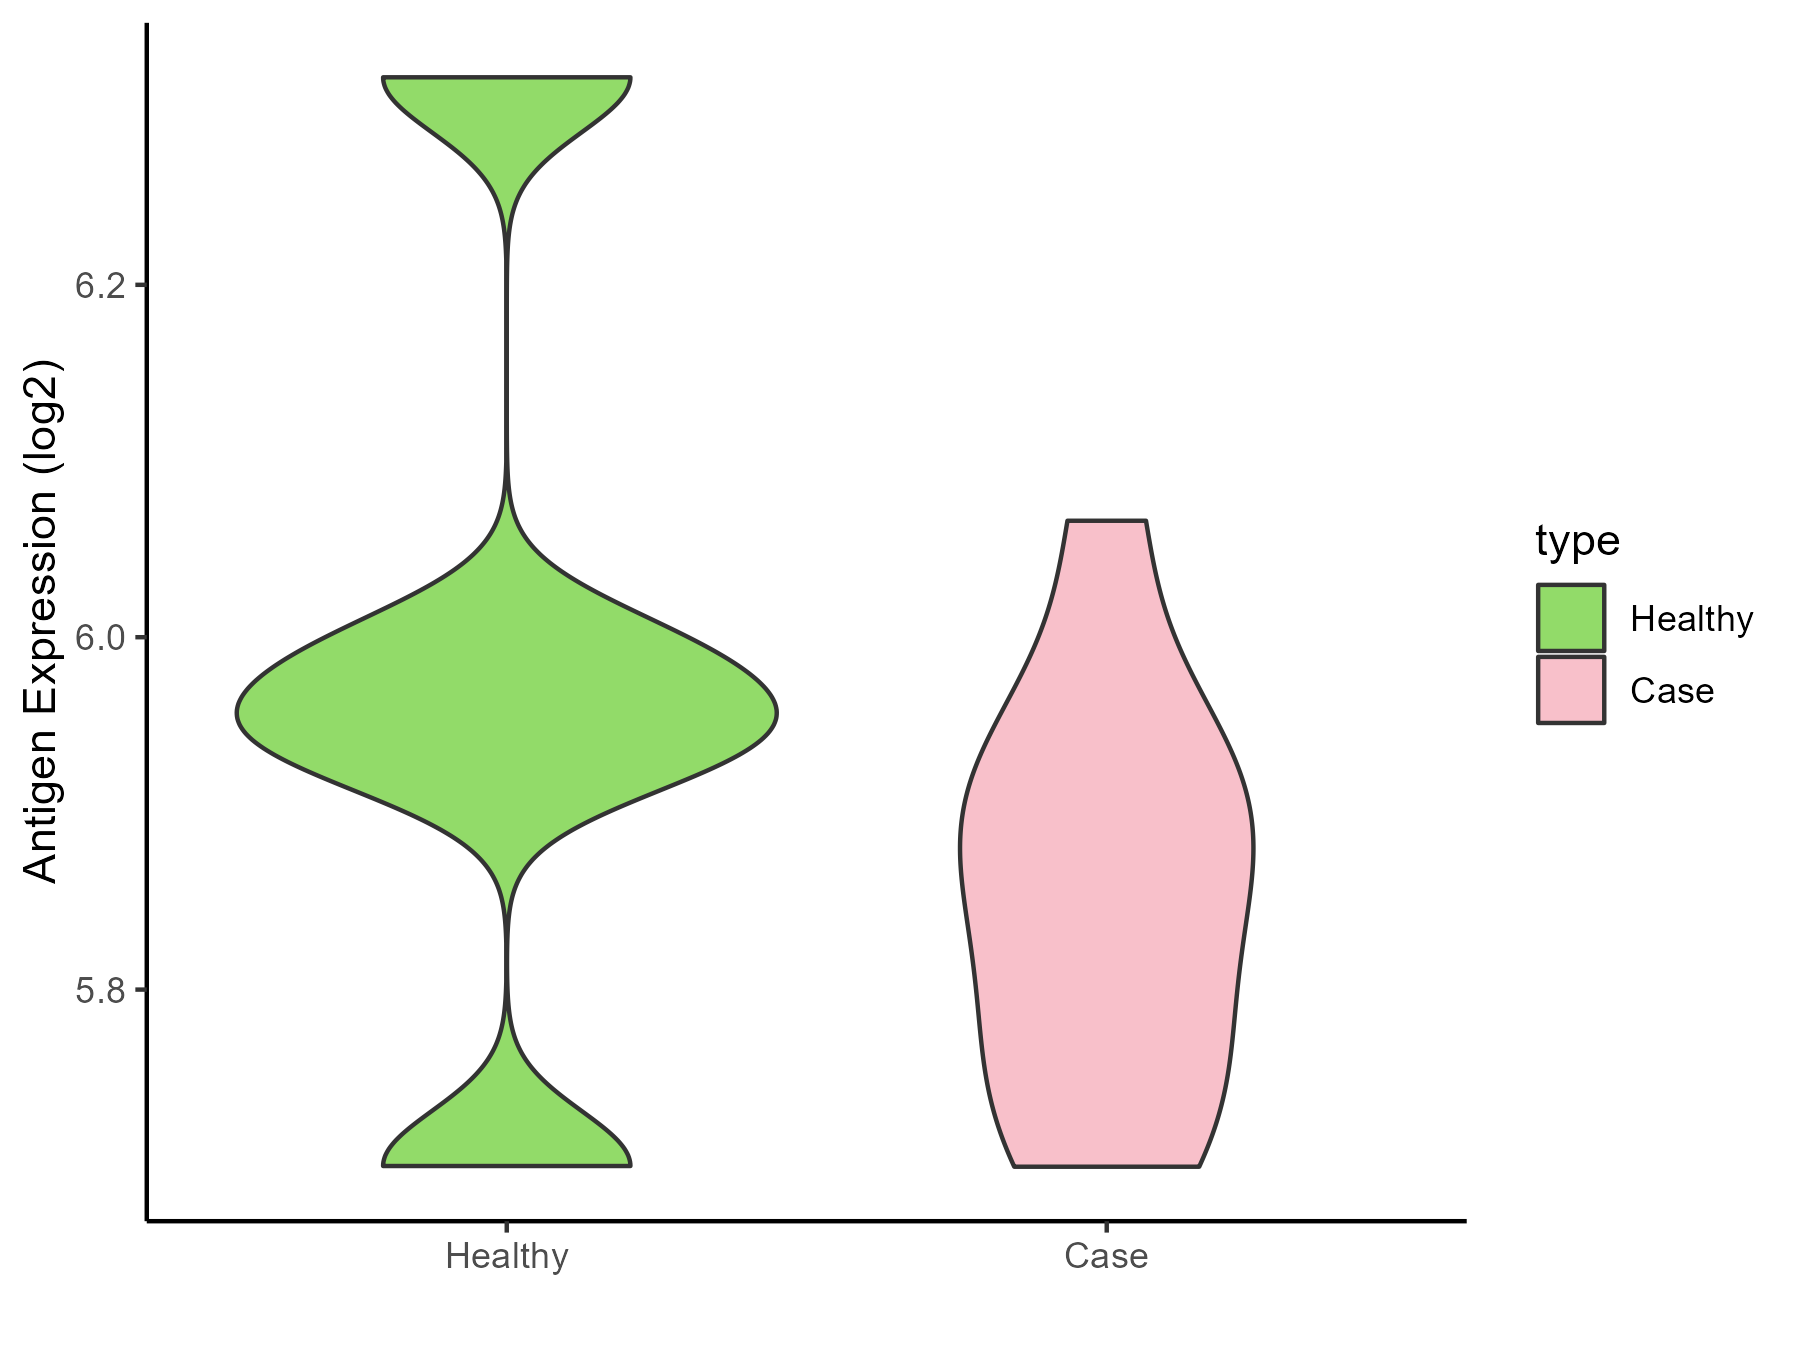
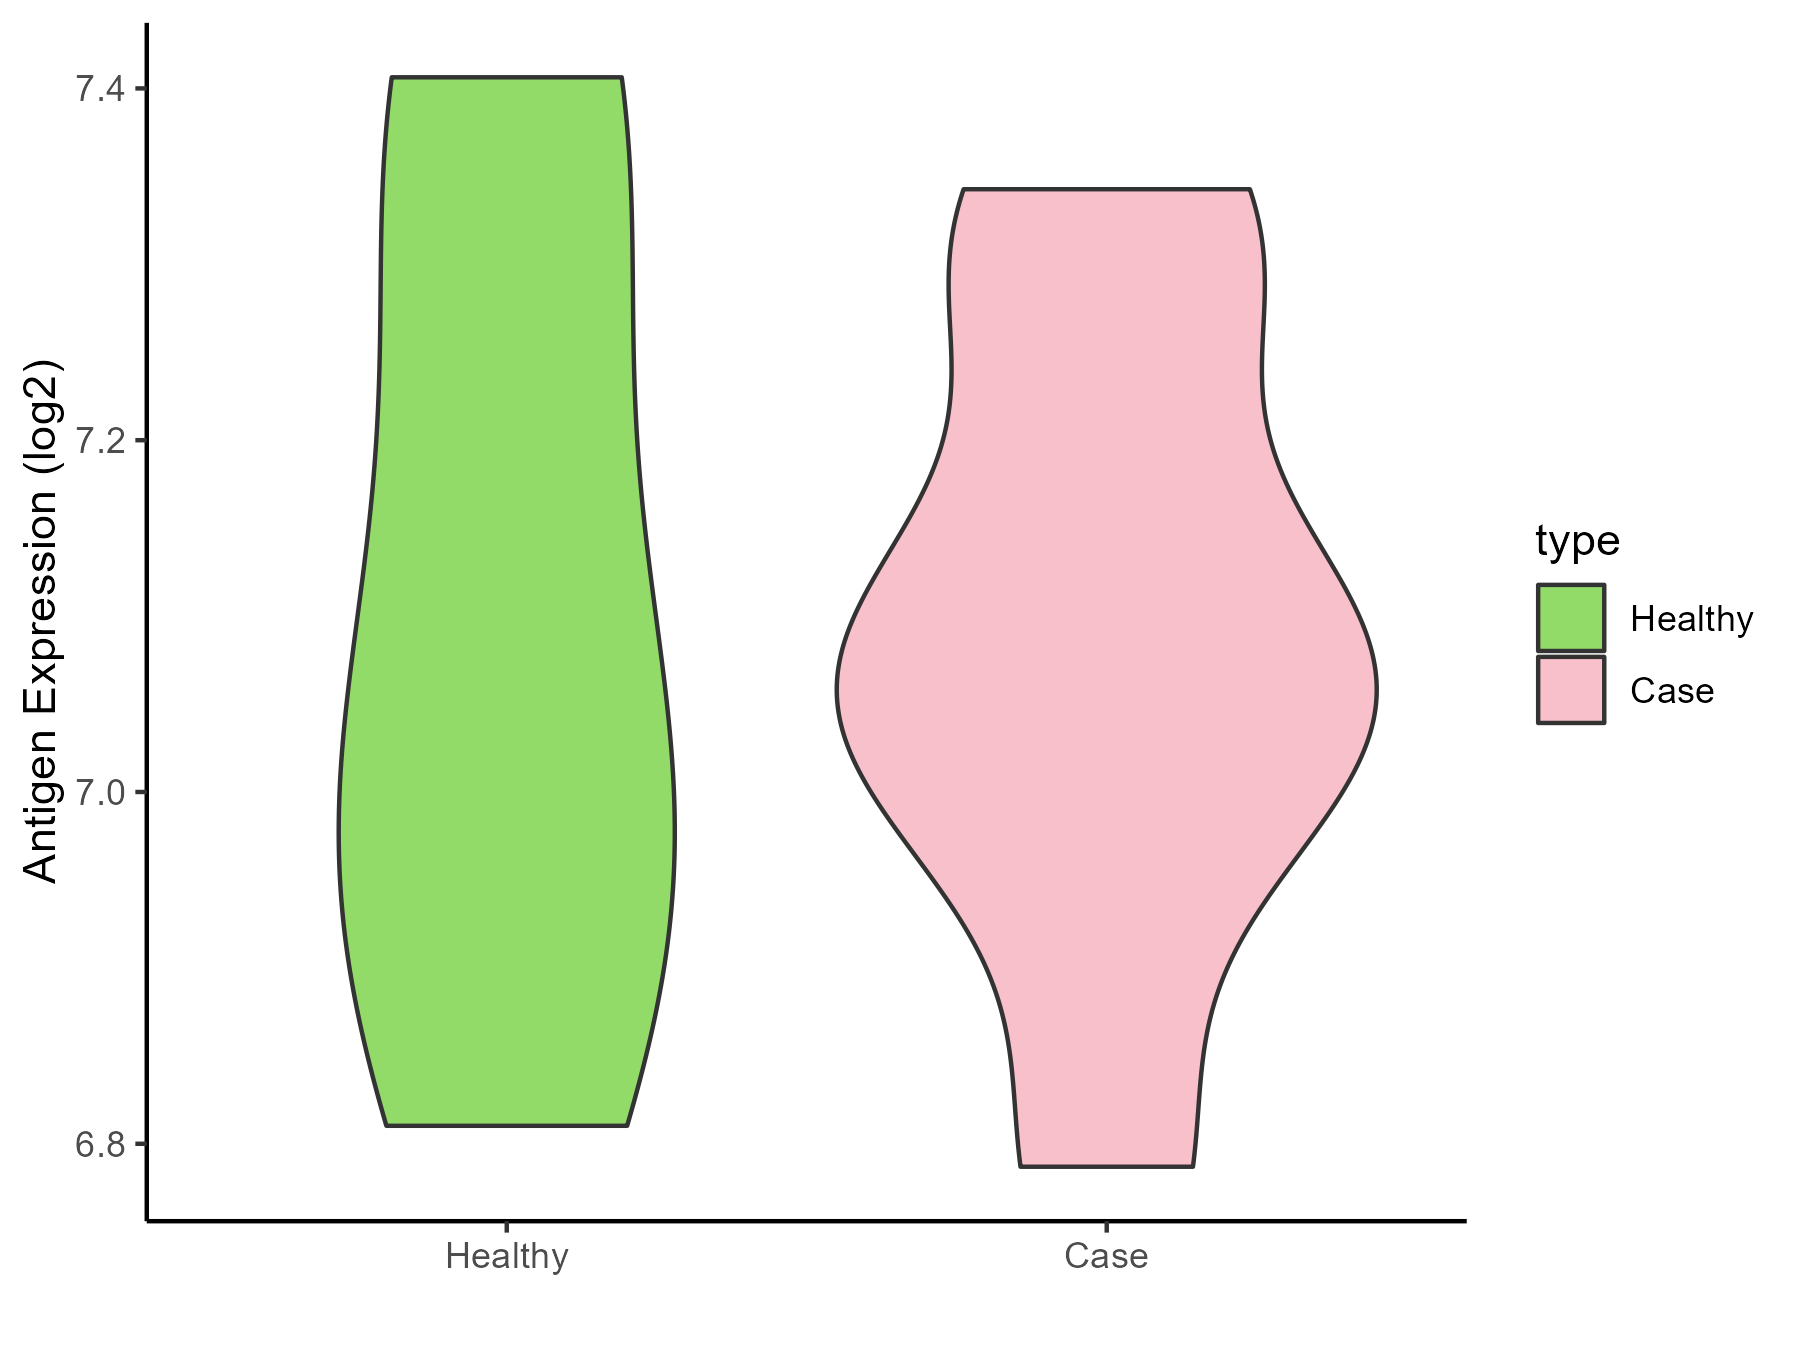
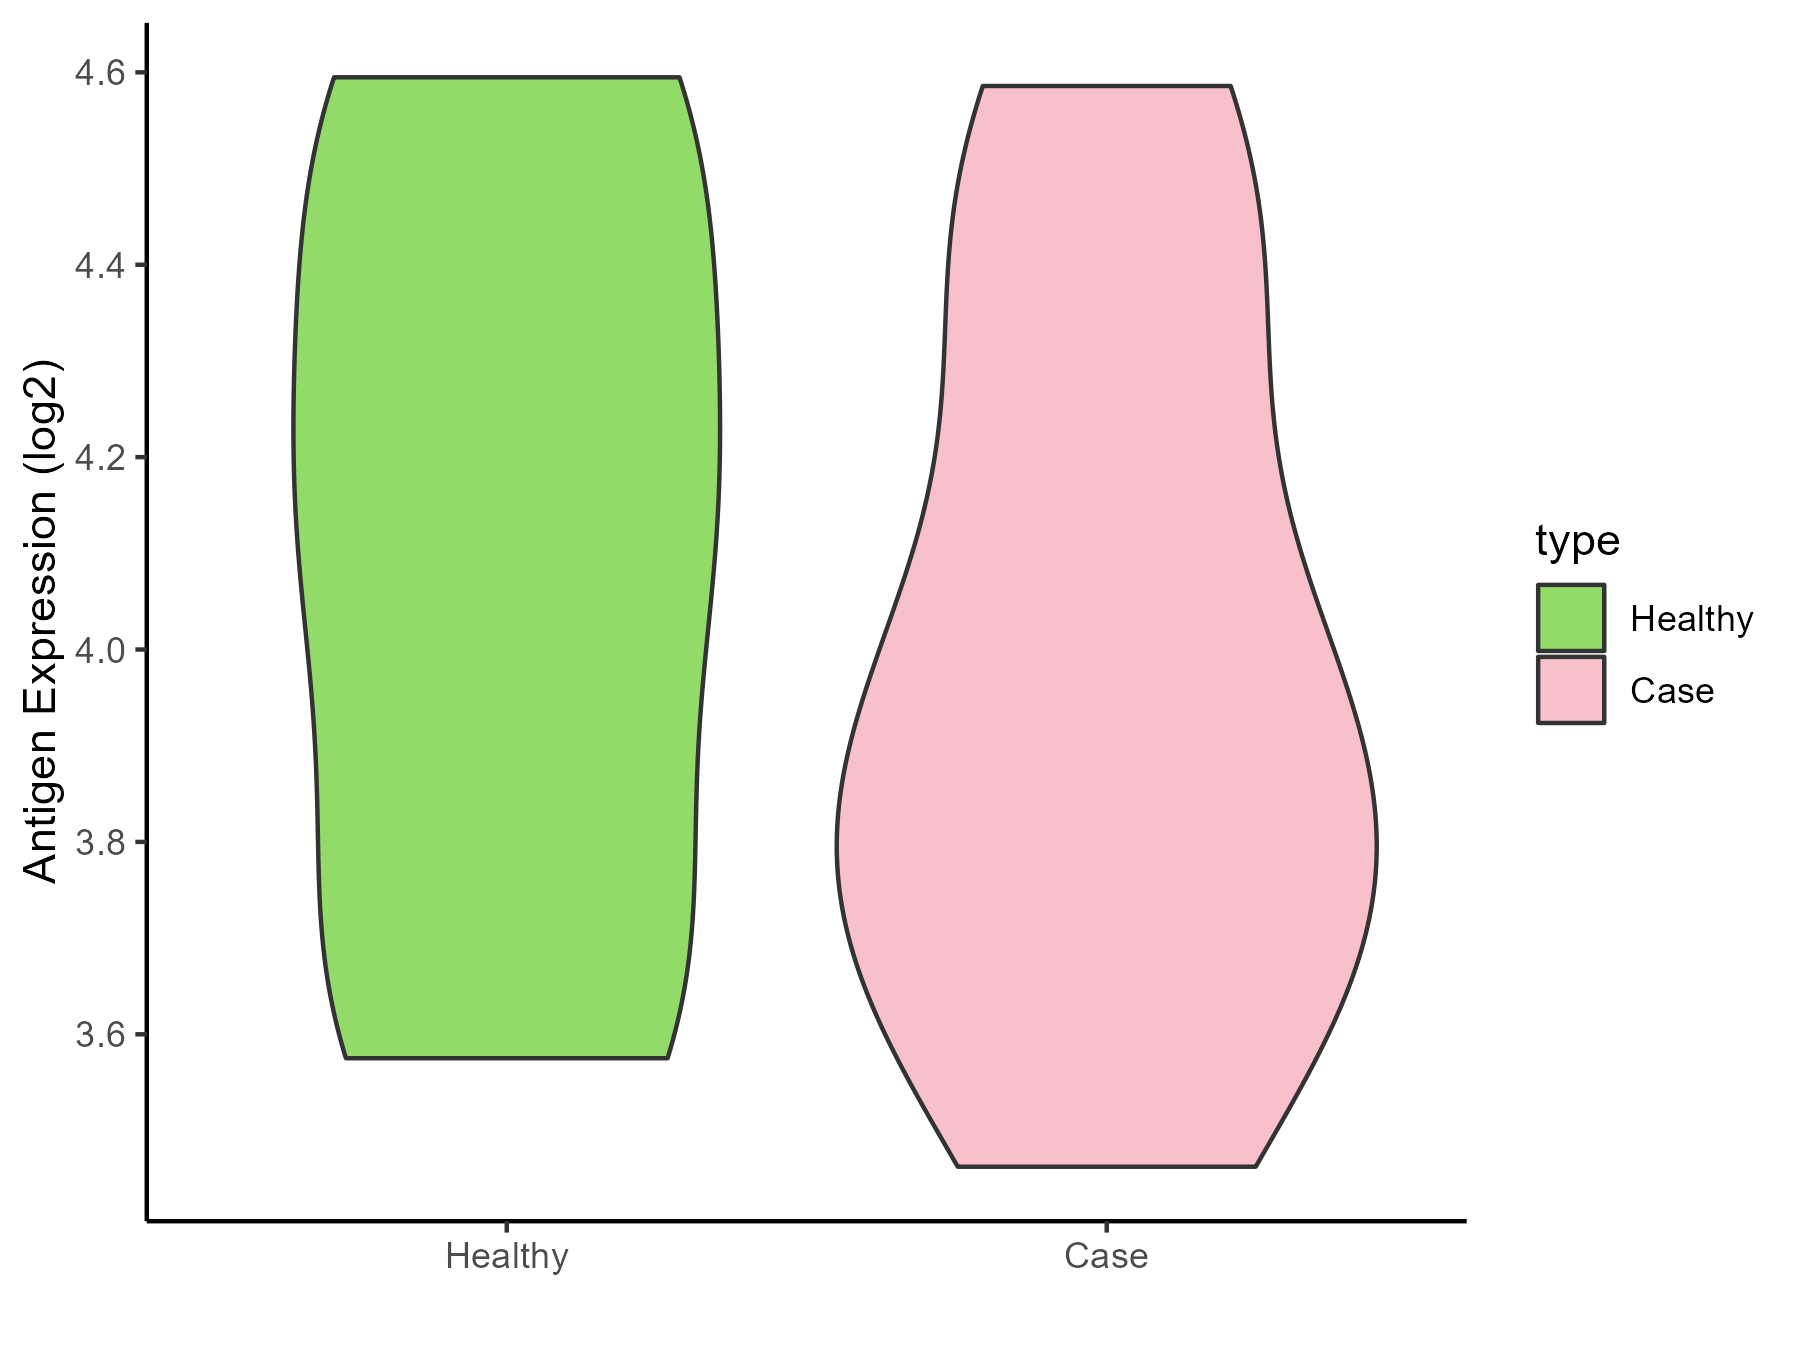
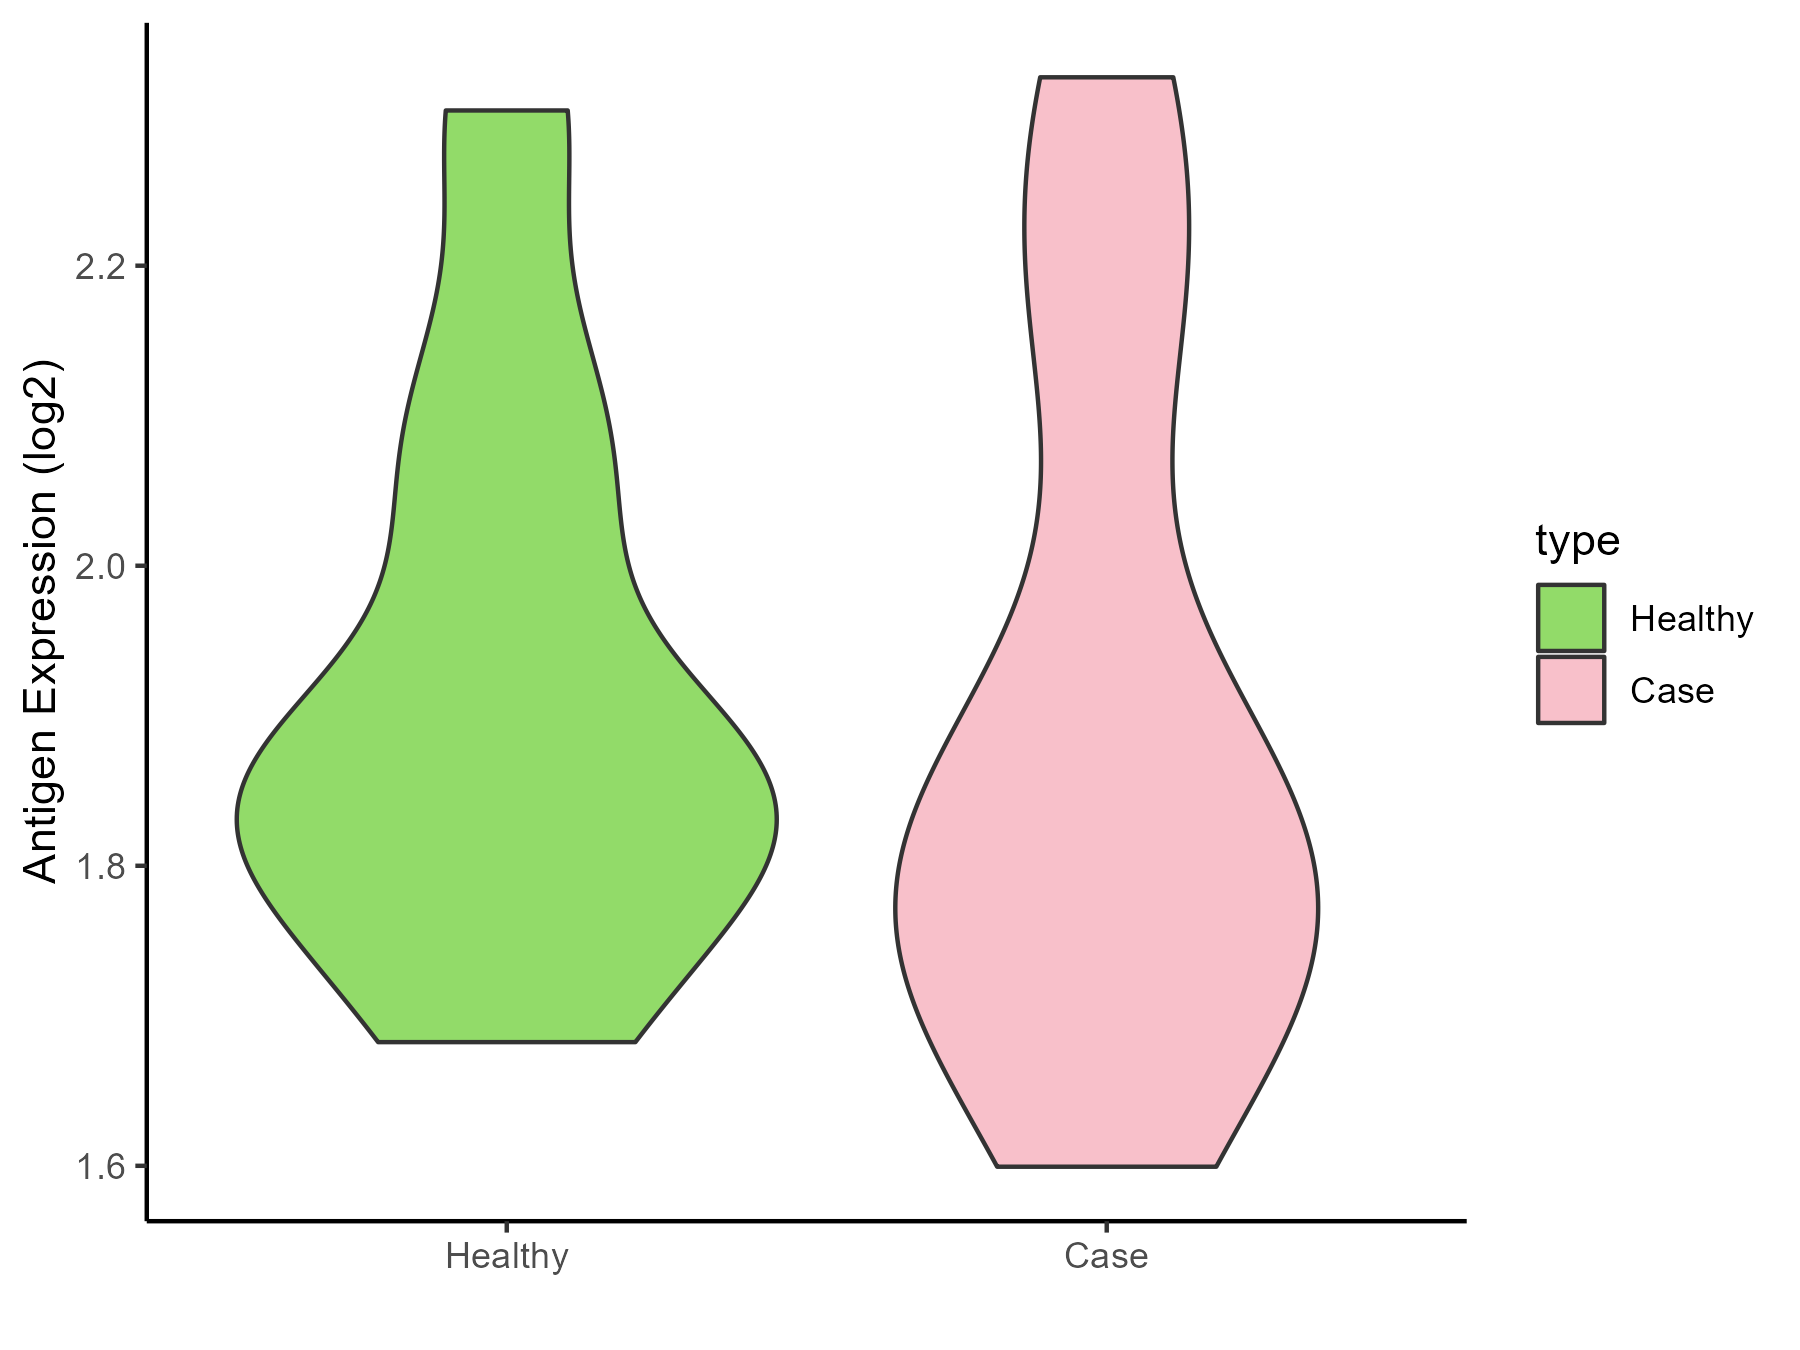
| The Studied Tissue | Gingival | |
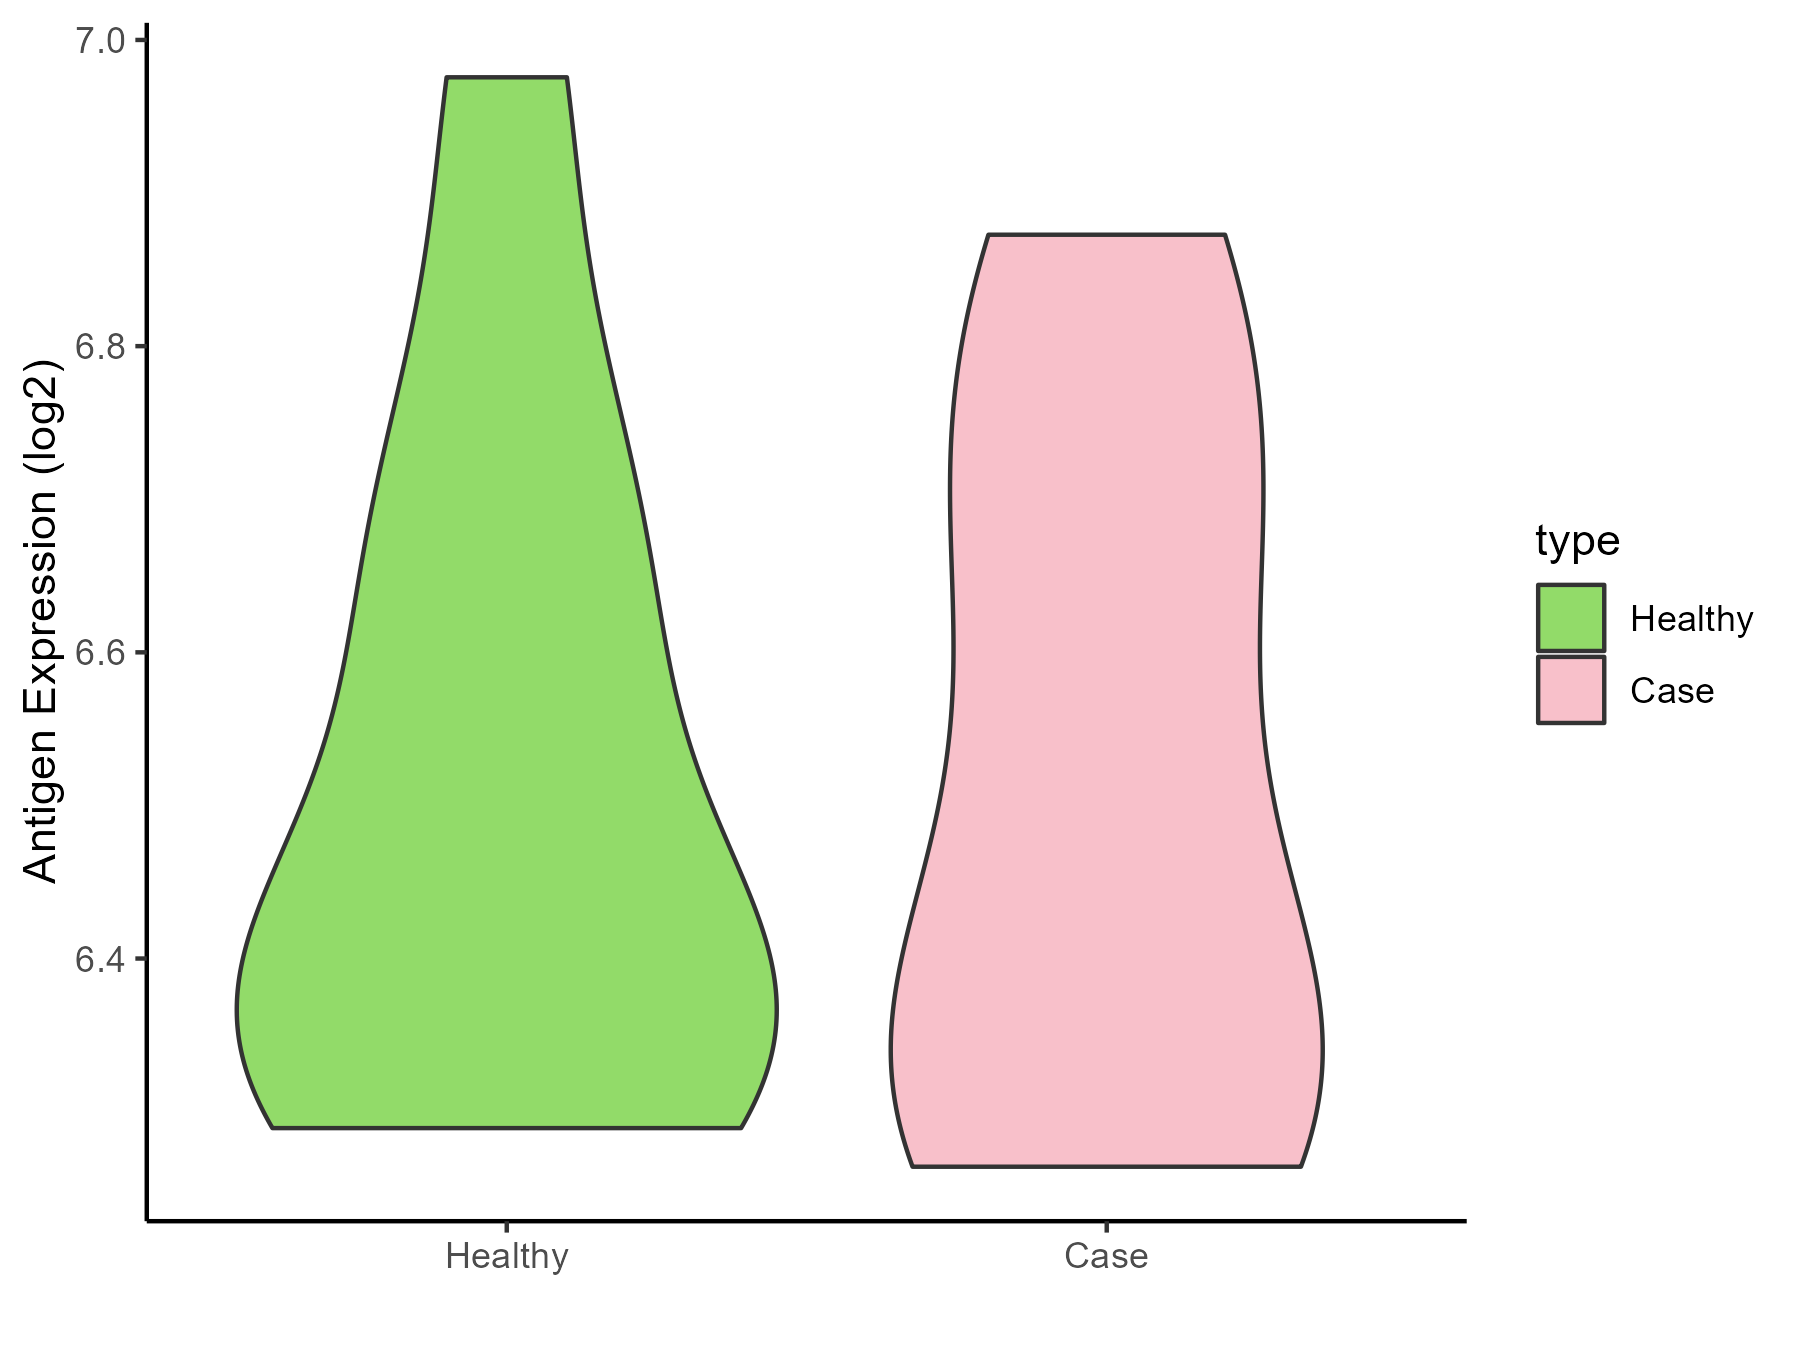
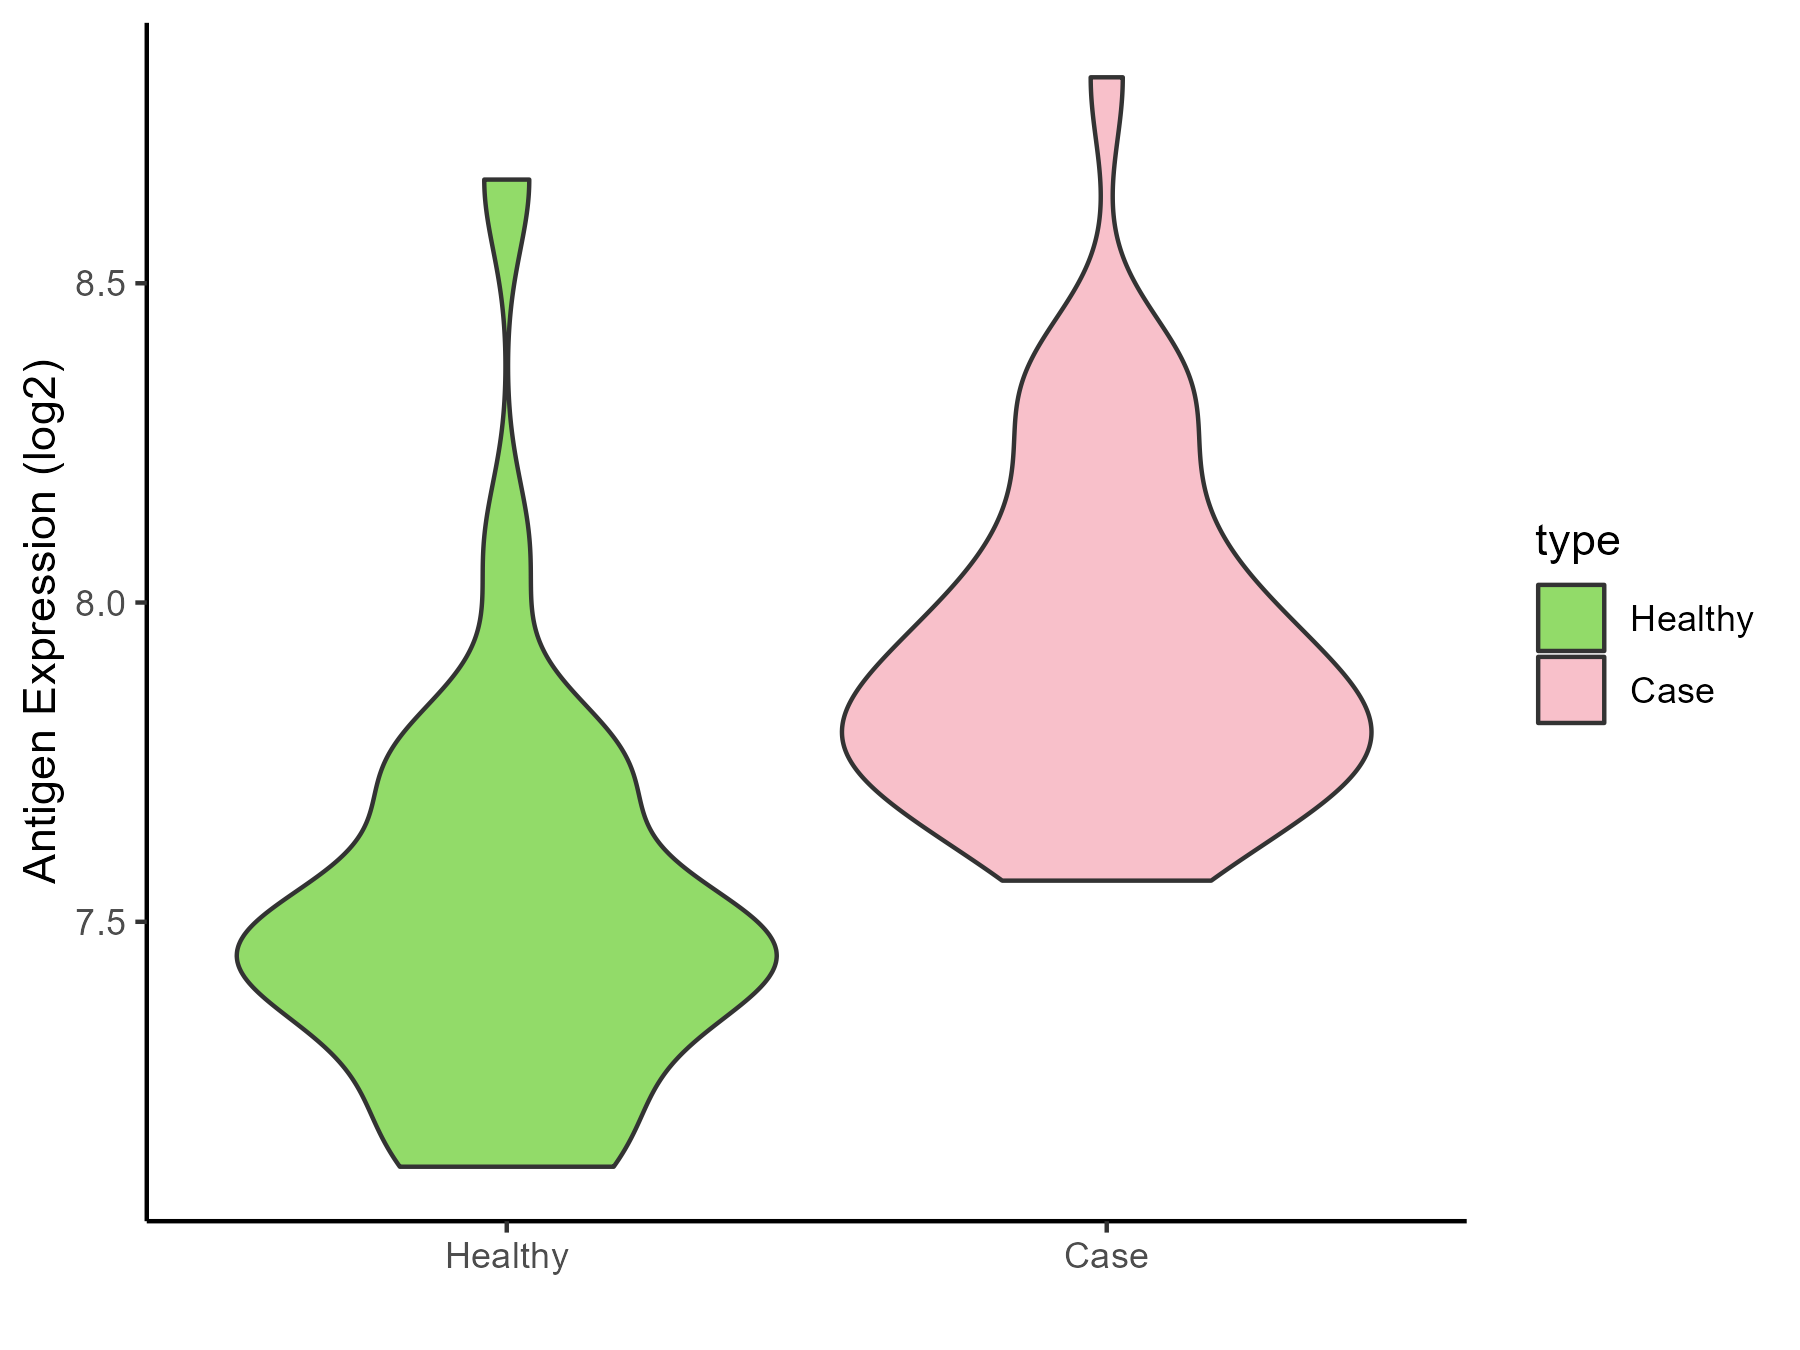
| The Specific Disease | Bacterial infection of gingival | |
| The Expression Level of Disease Section Compare with the Healthy Individual Tissue | p-value: 8.38E-14; Fold-change: 0.381893551; Z-score: 1.243237828 | |
| Disease-specific Antigen Abundances |
|
Click to View the Clearer Original Diagram |
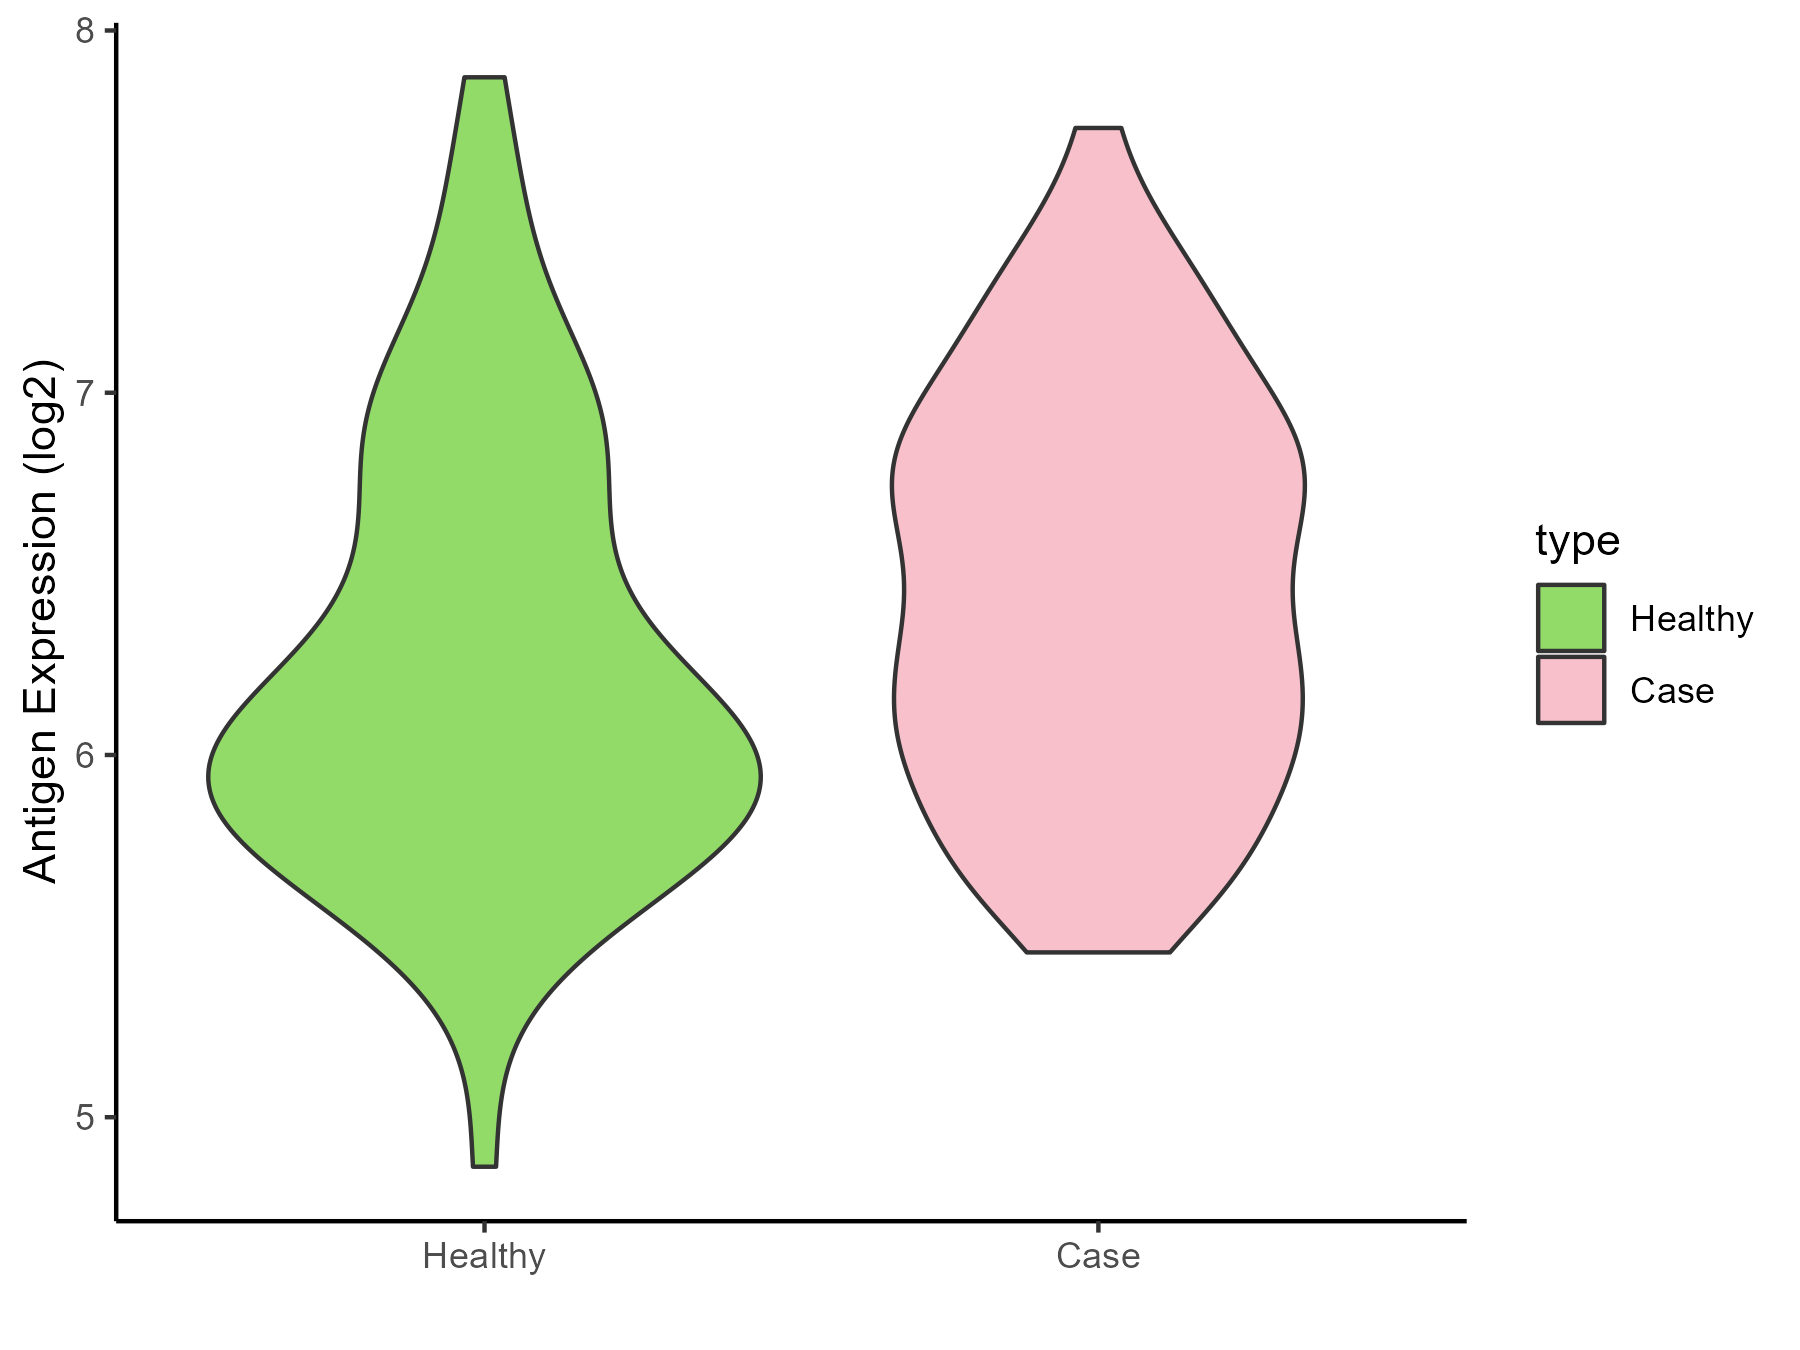
ICD Disease Classification 02
| Differential expression pattern of antigen in diseases | ||
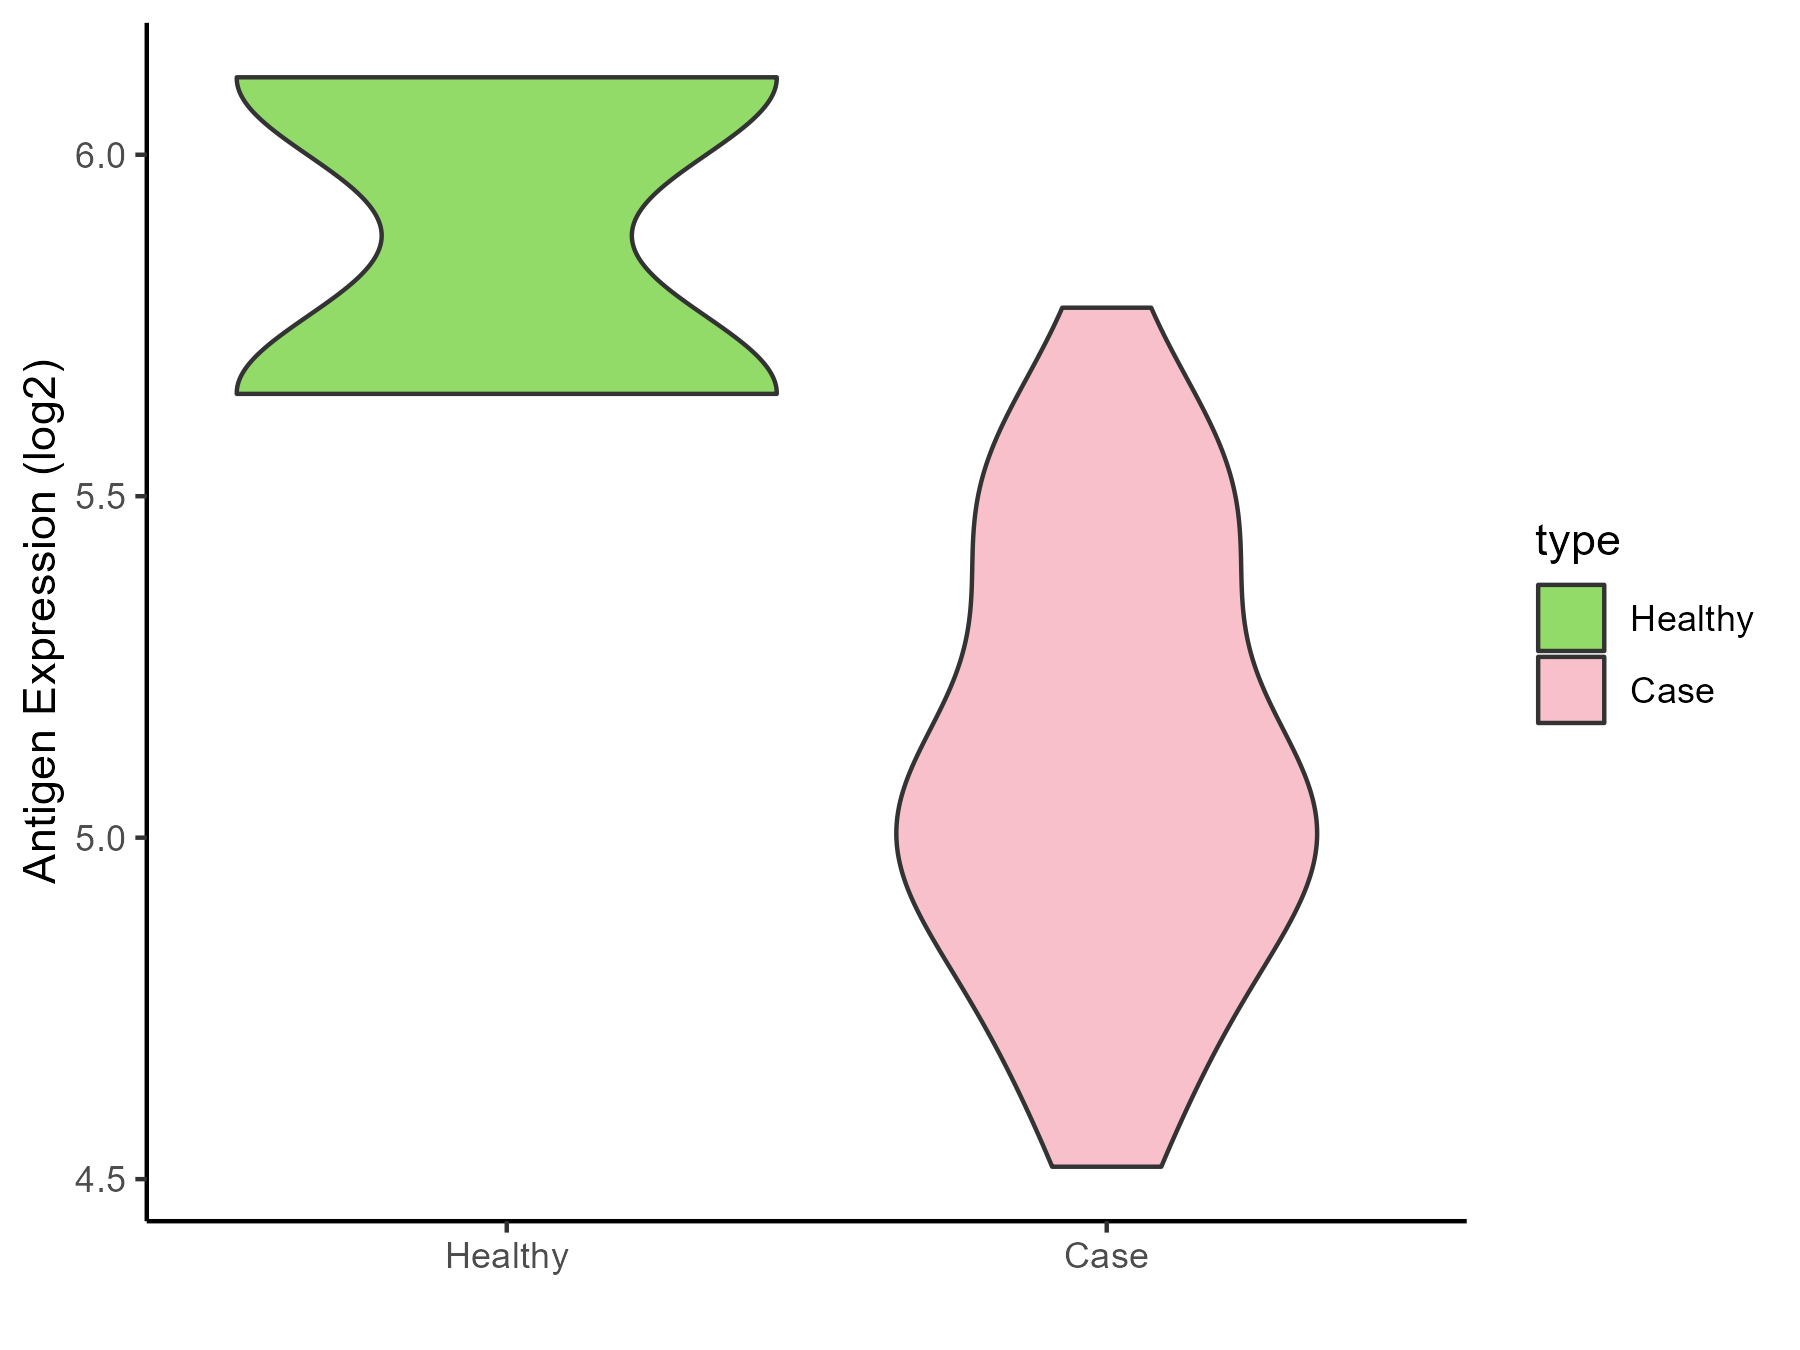
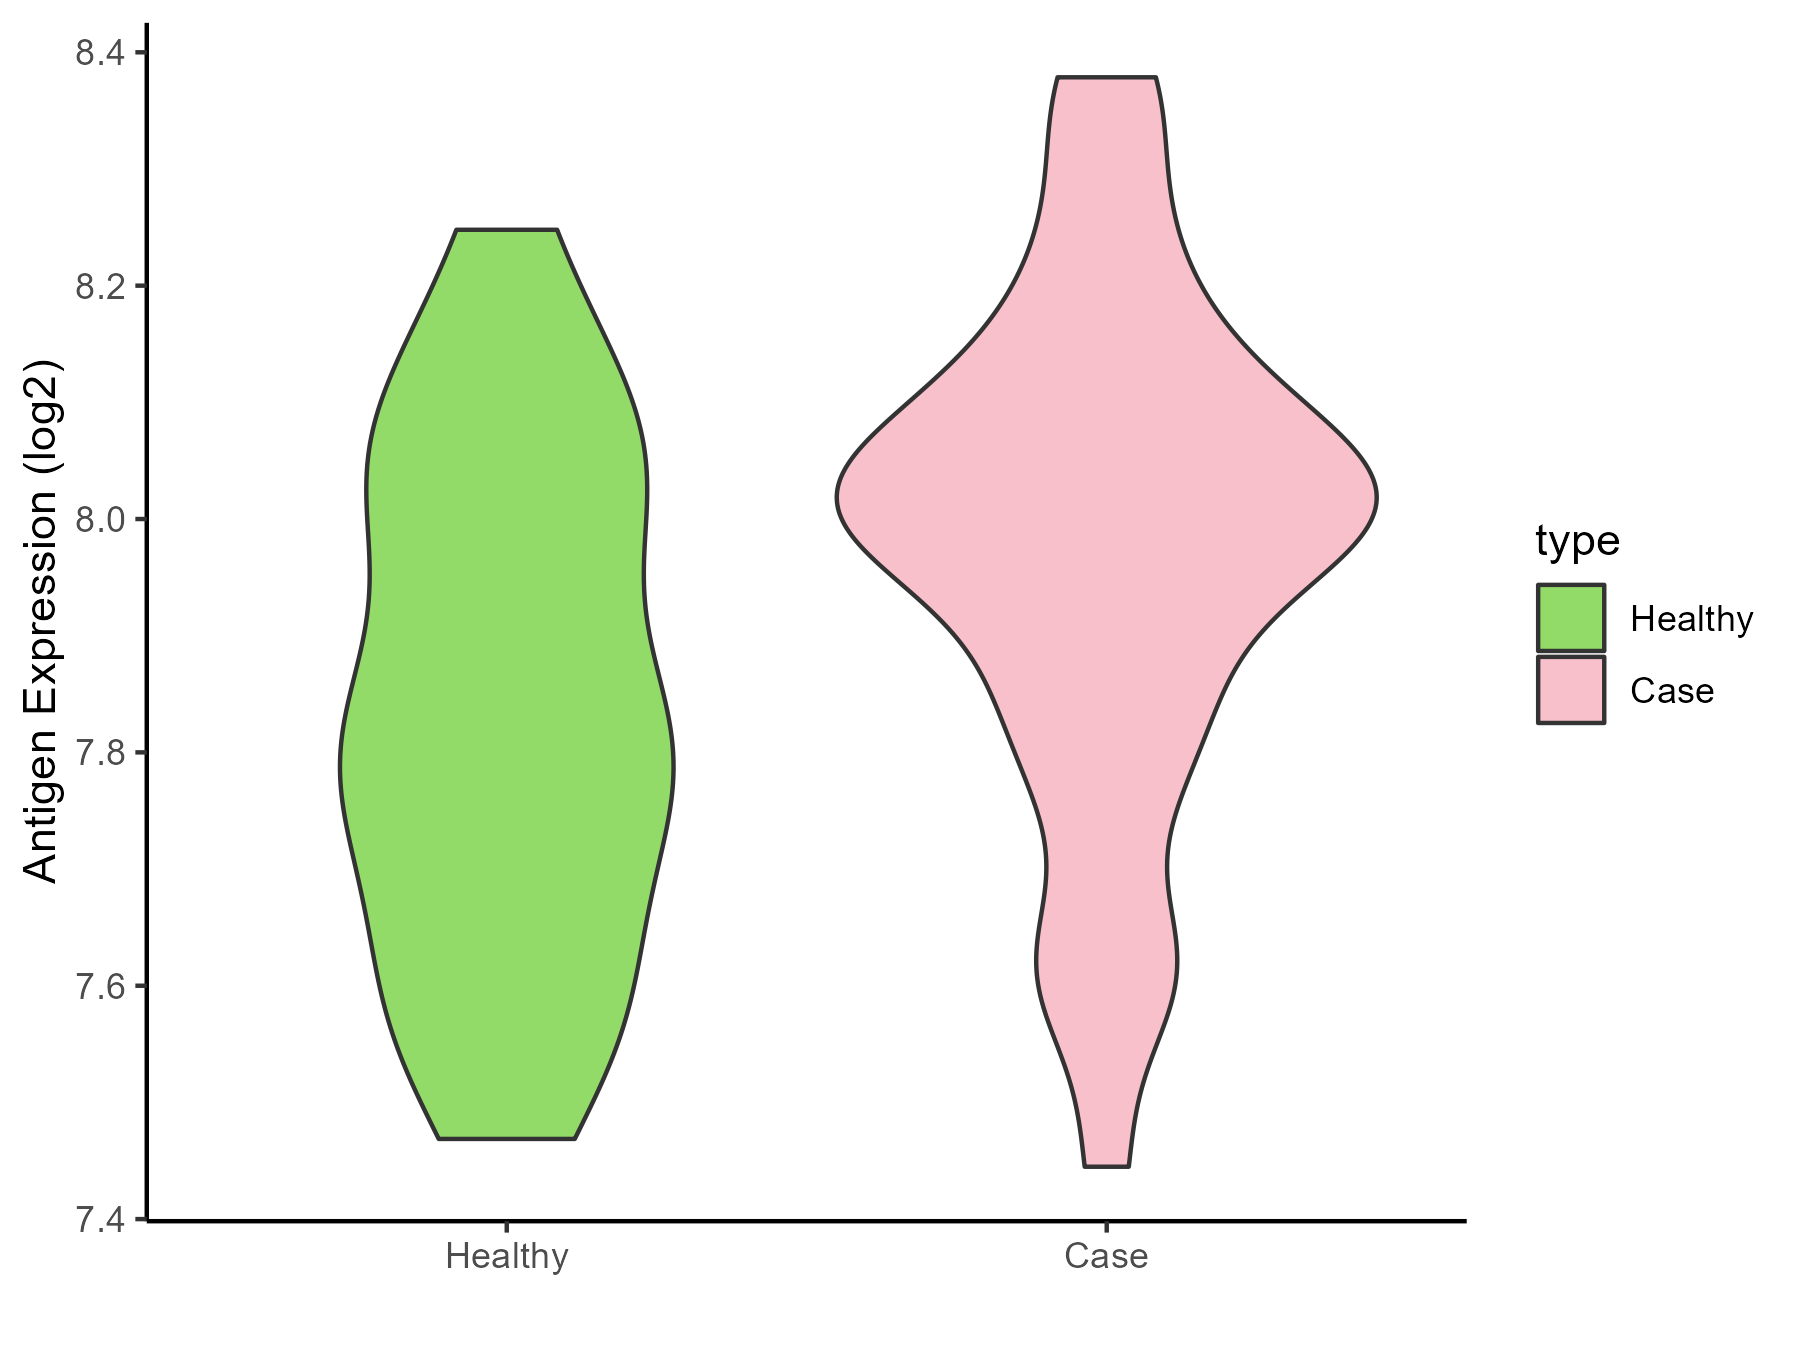
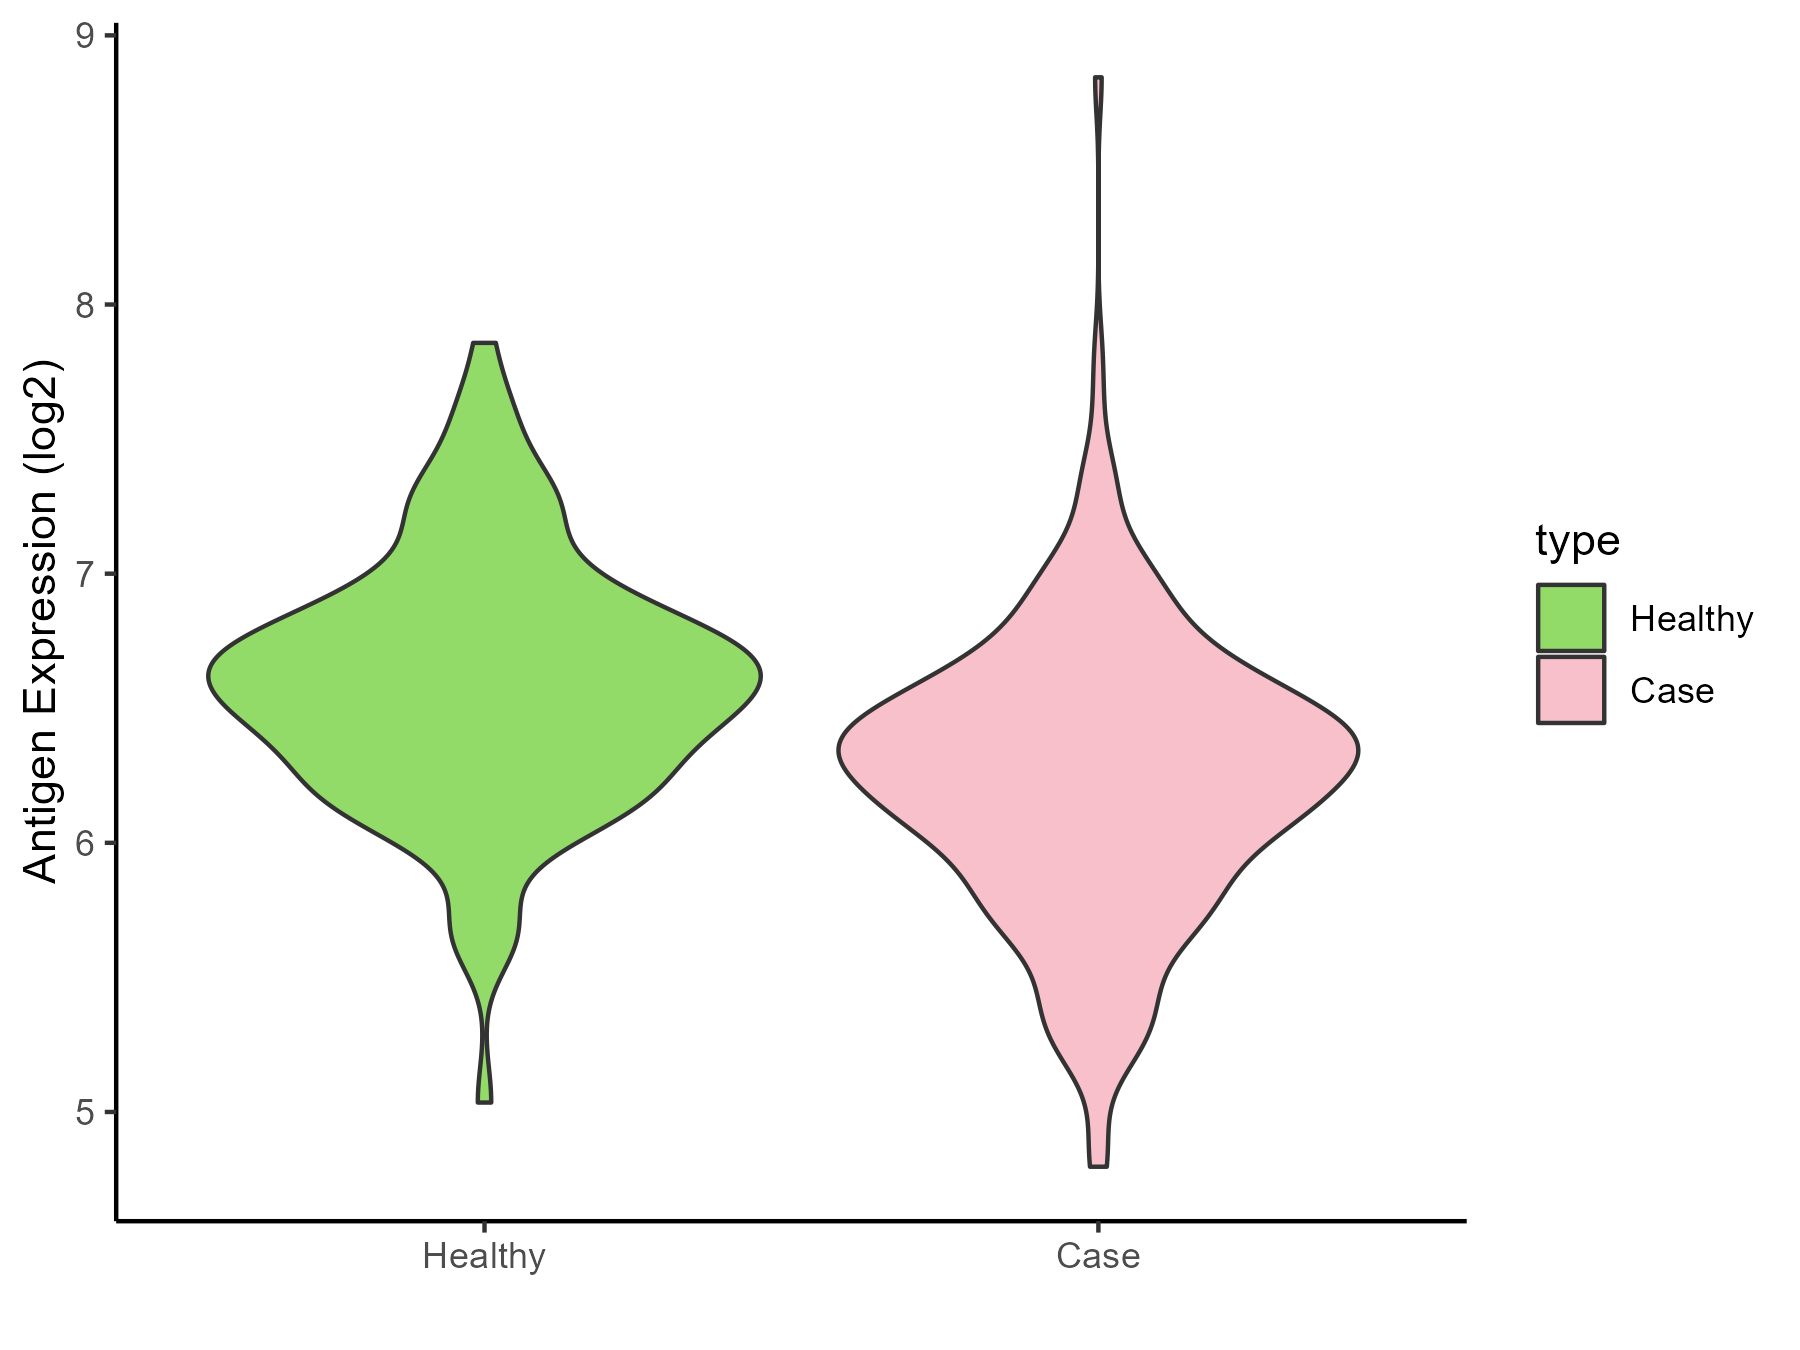
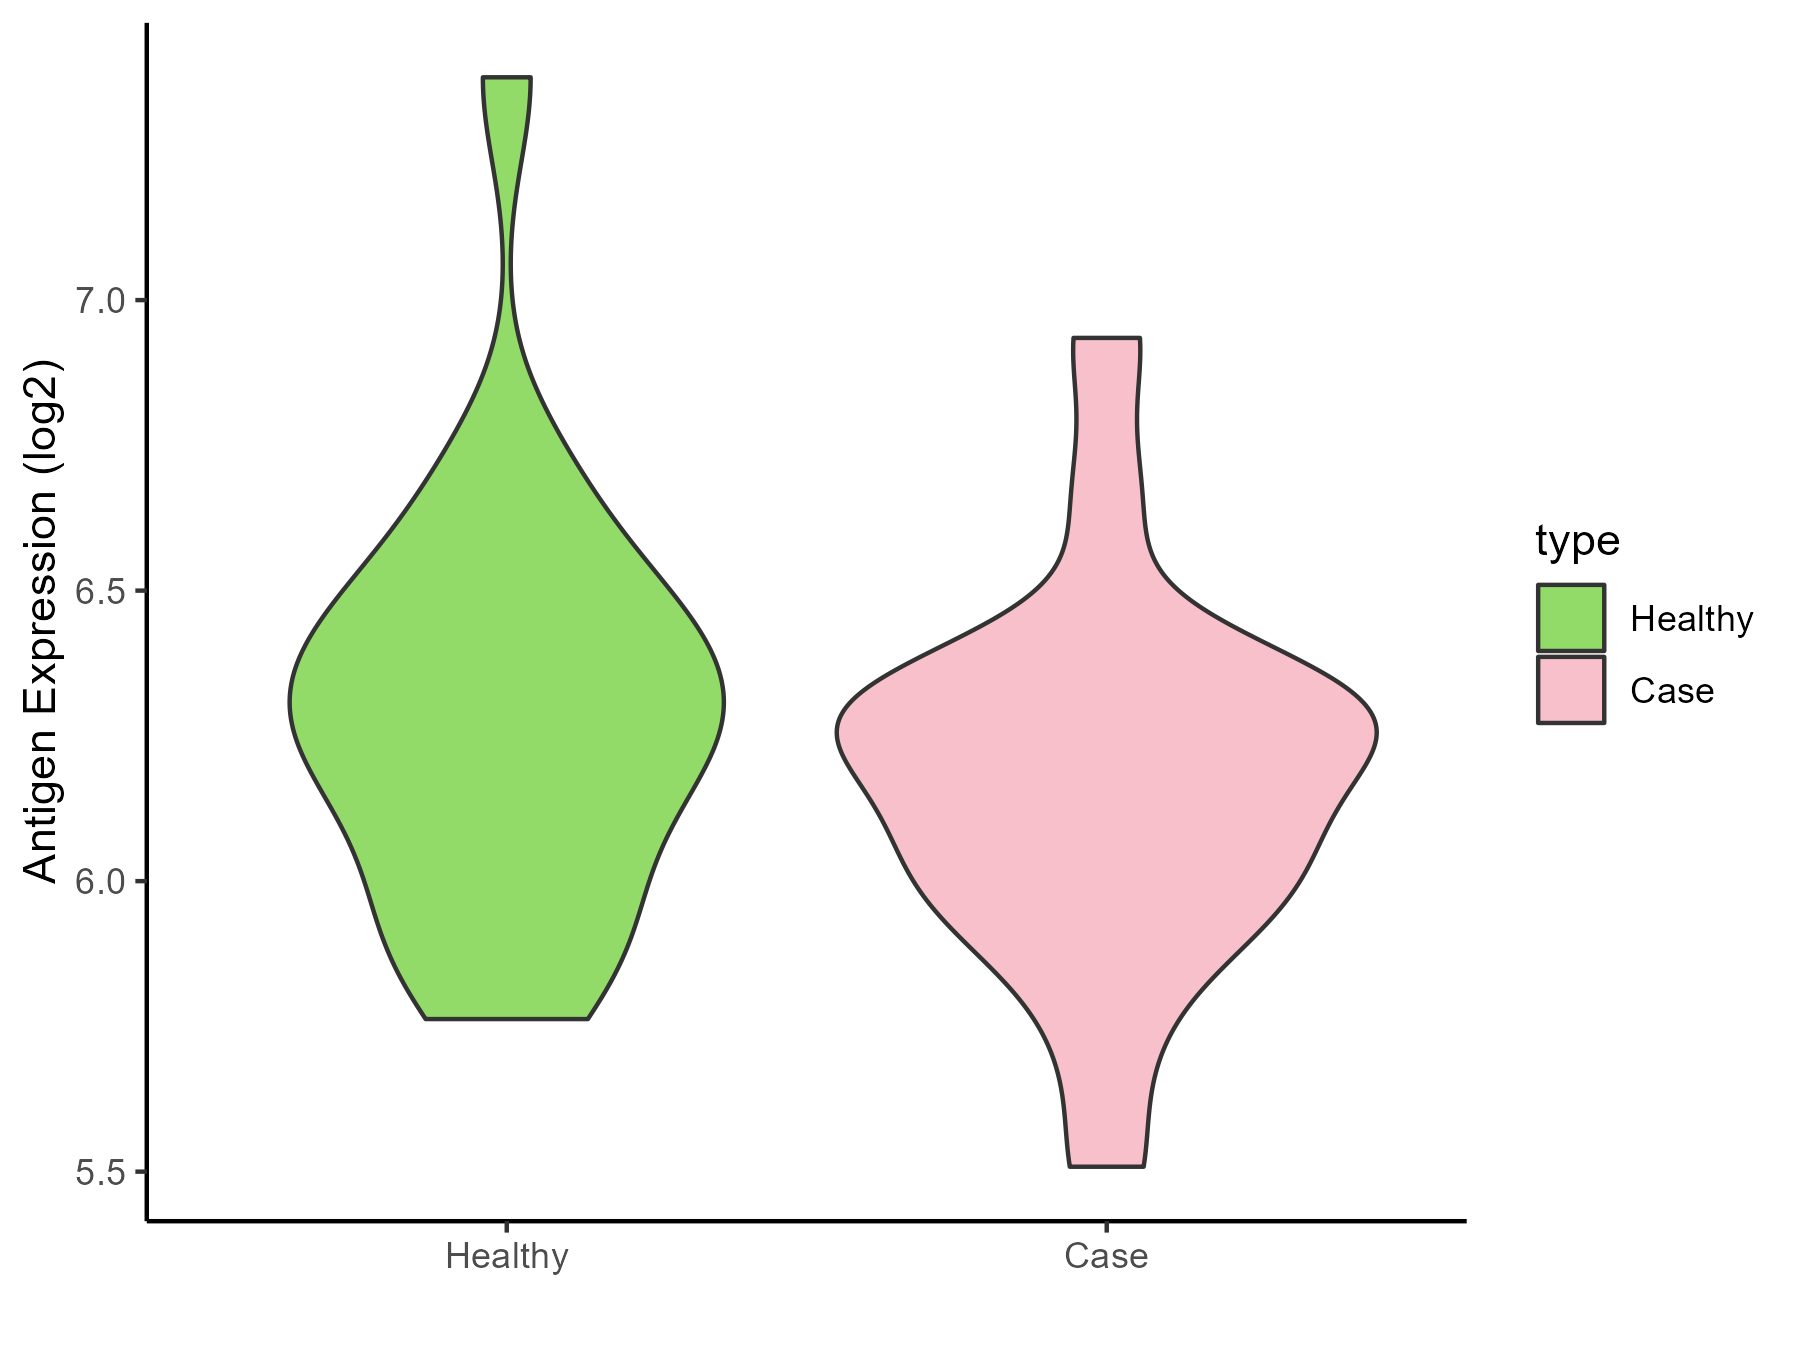
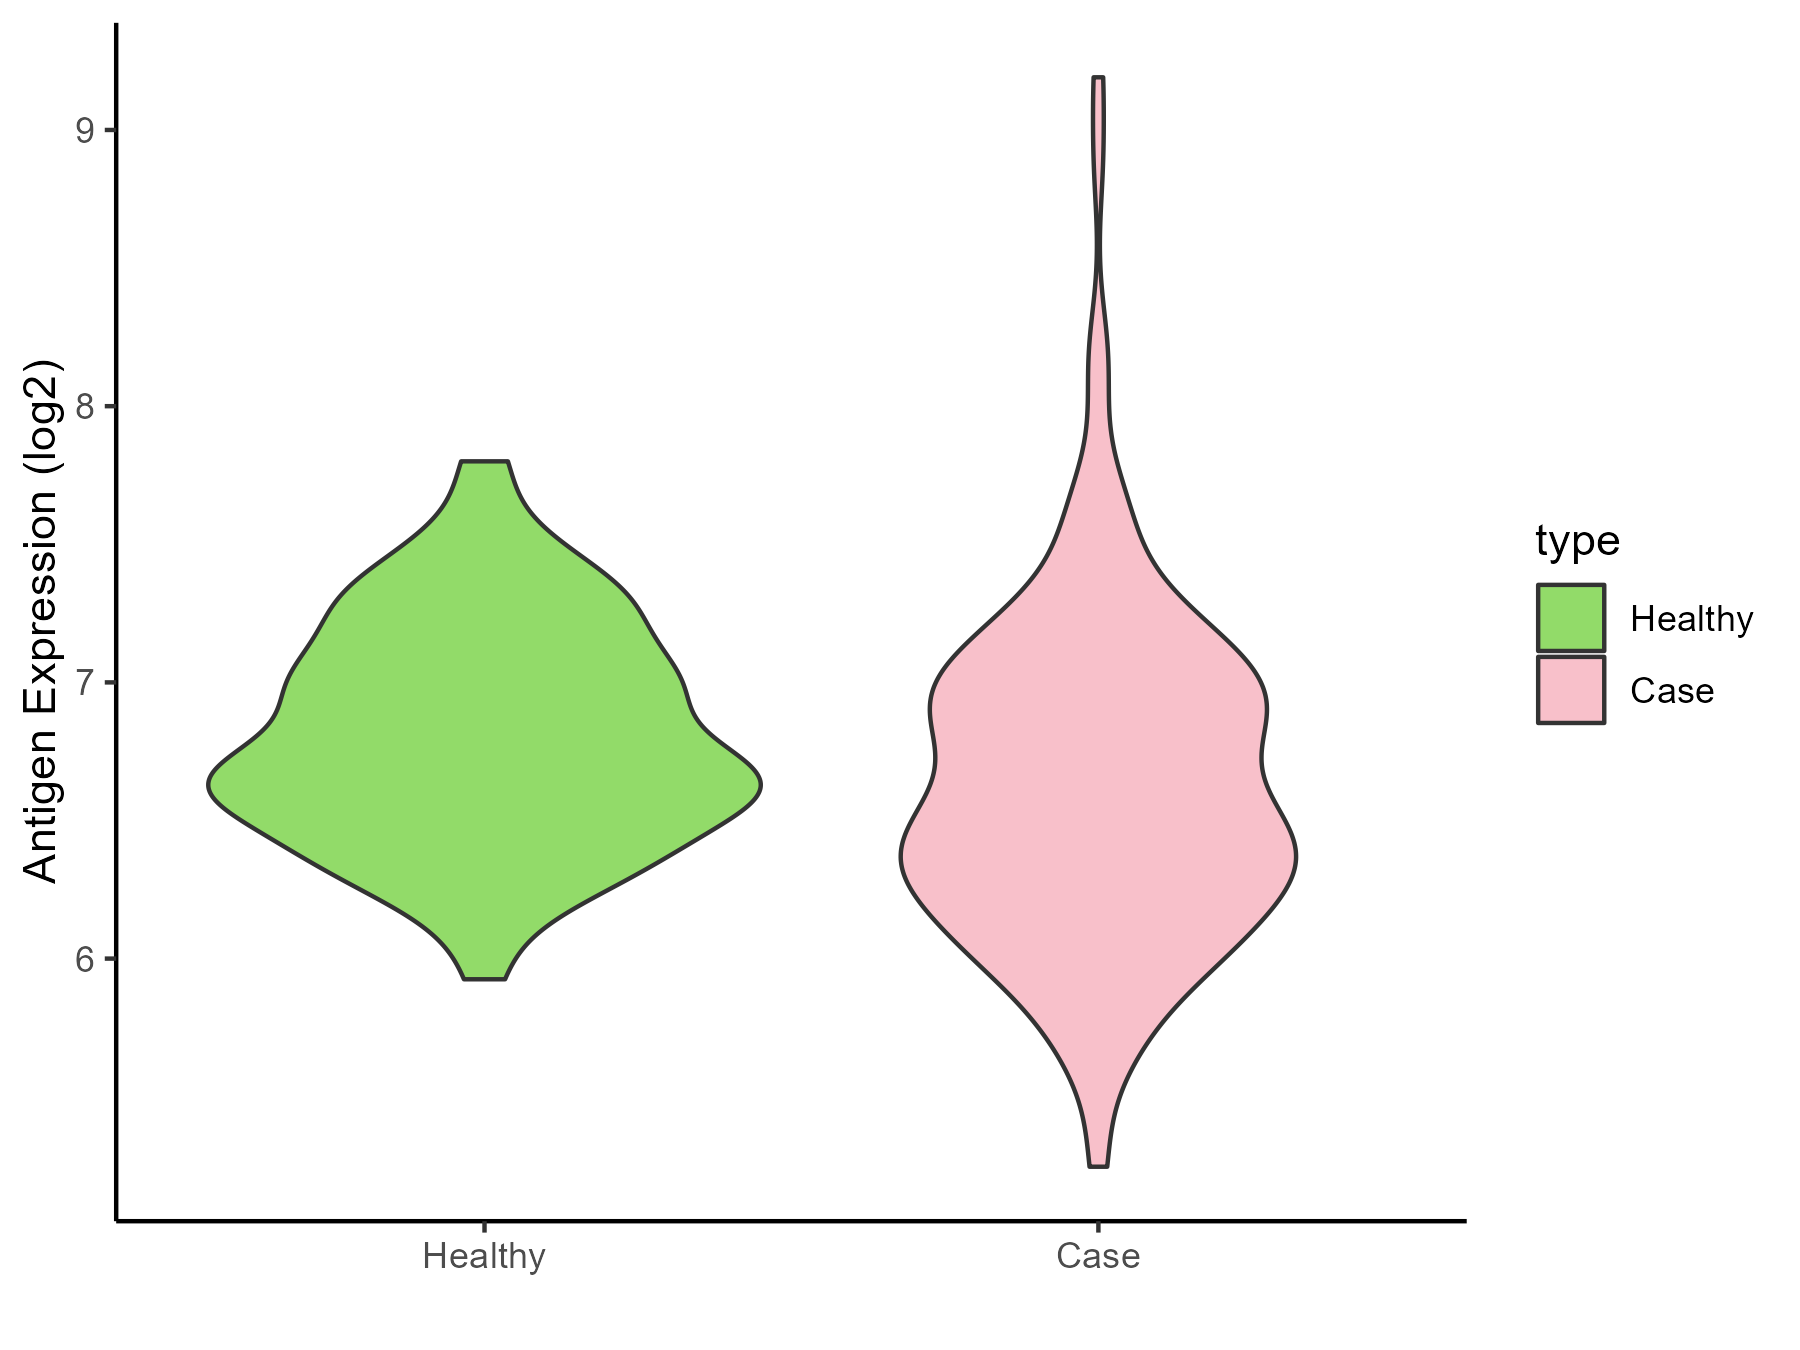
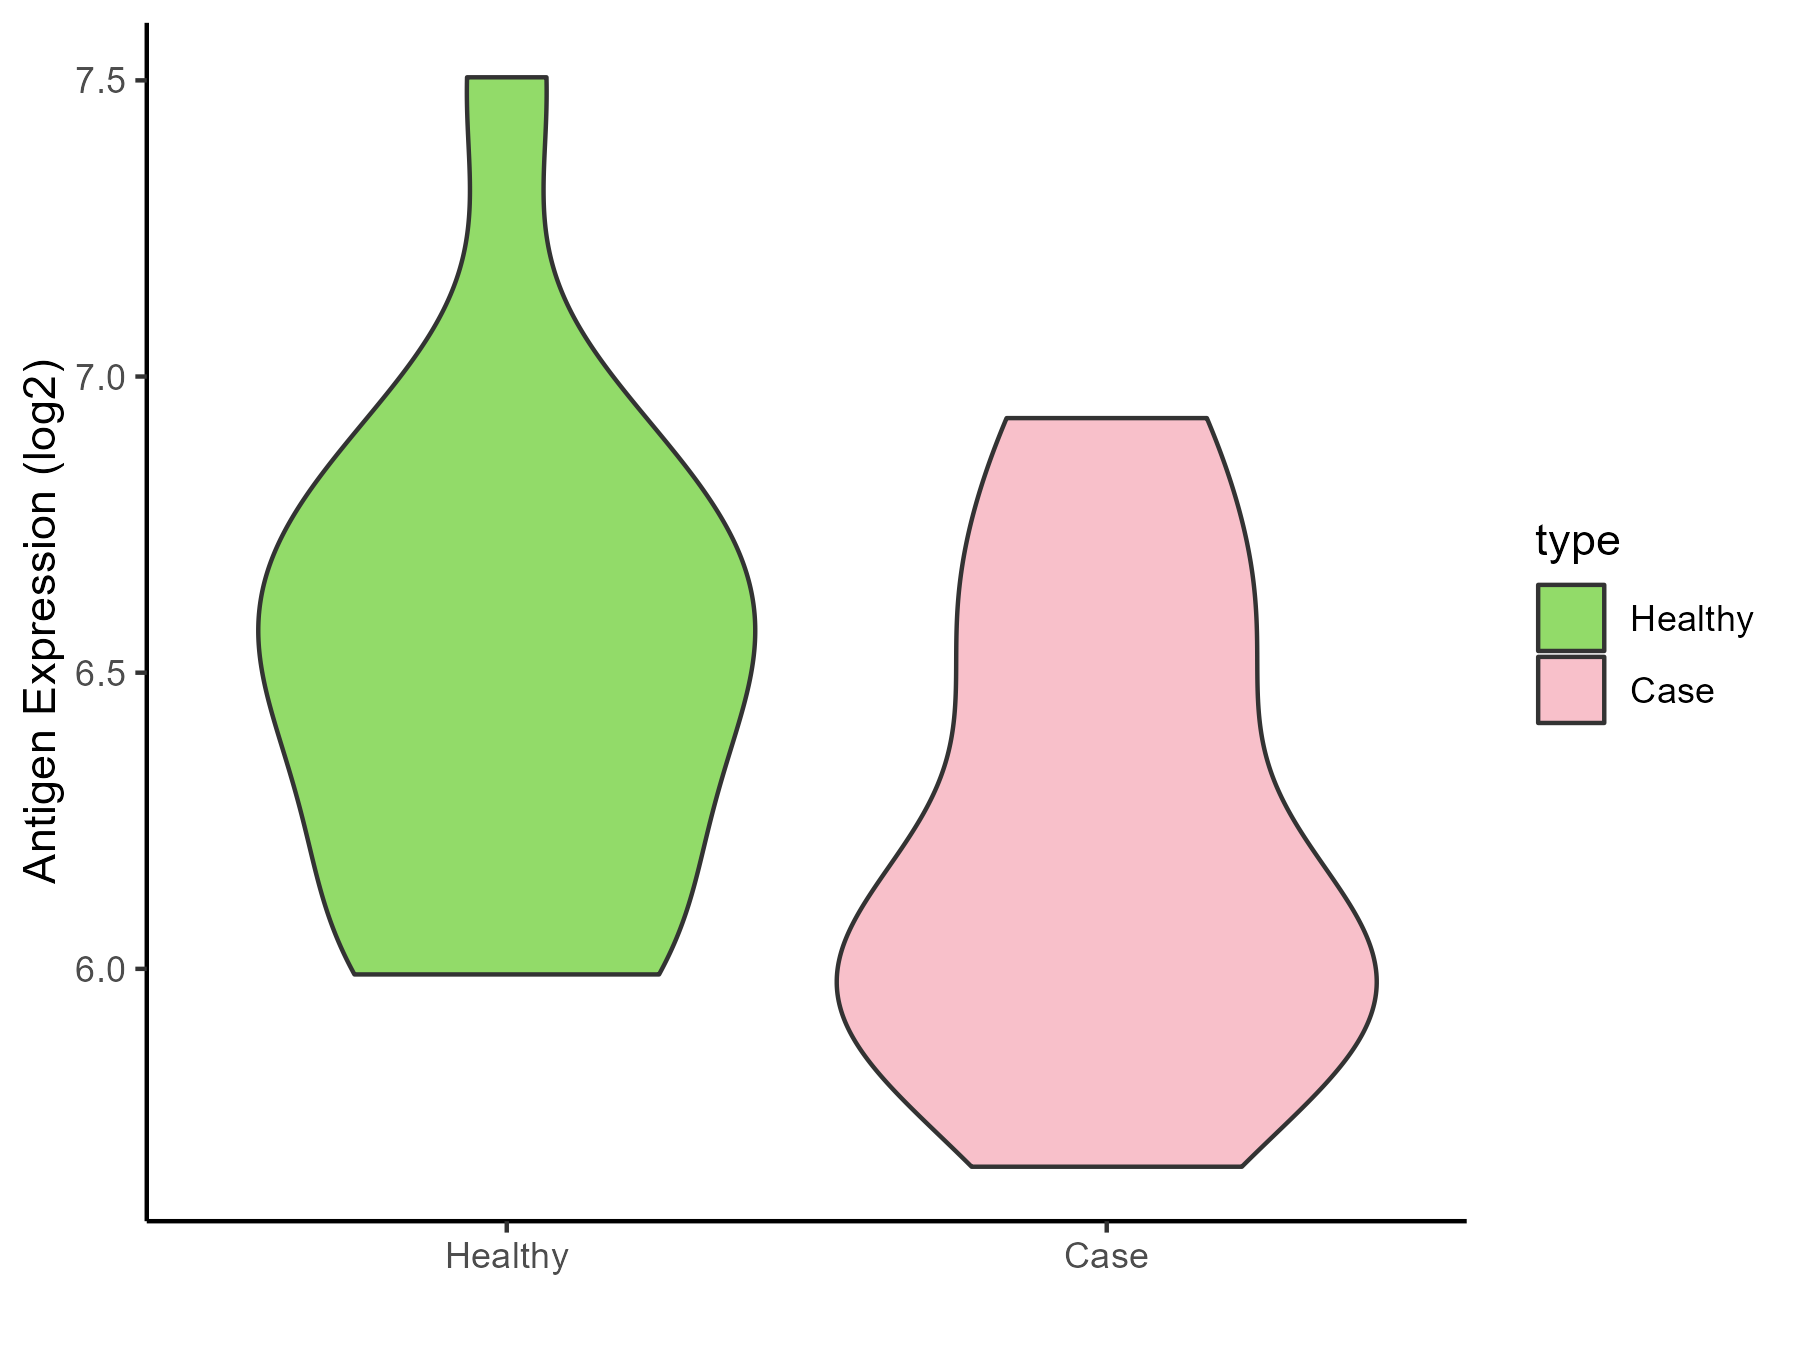
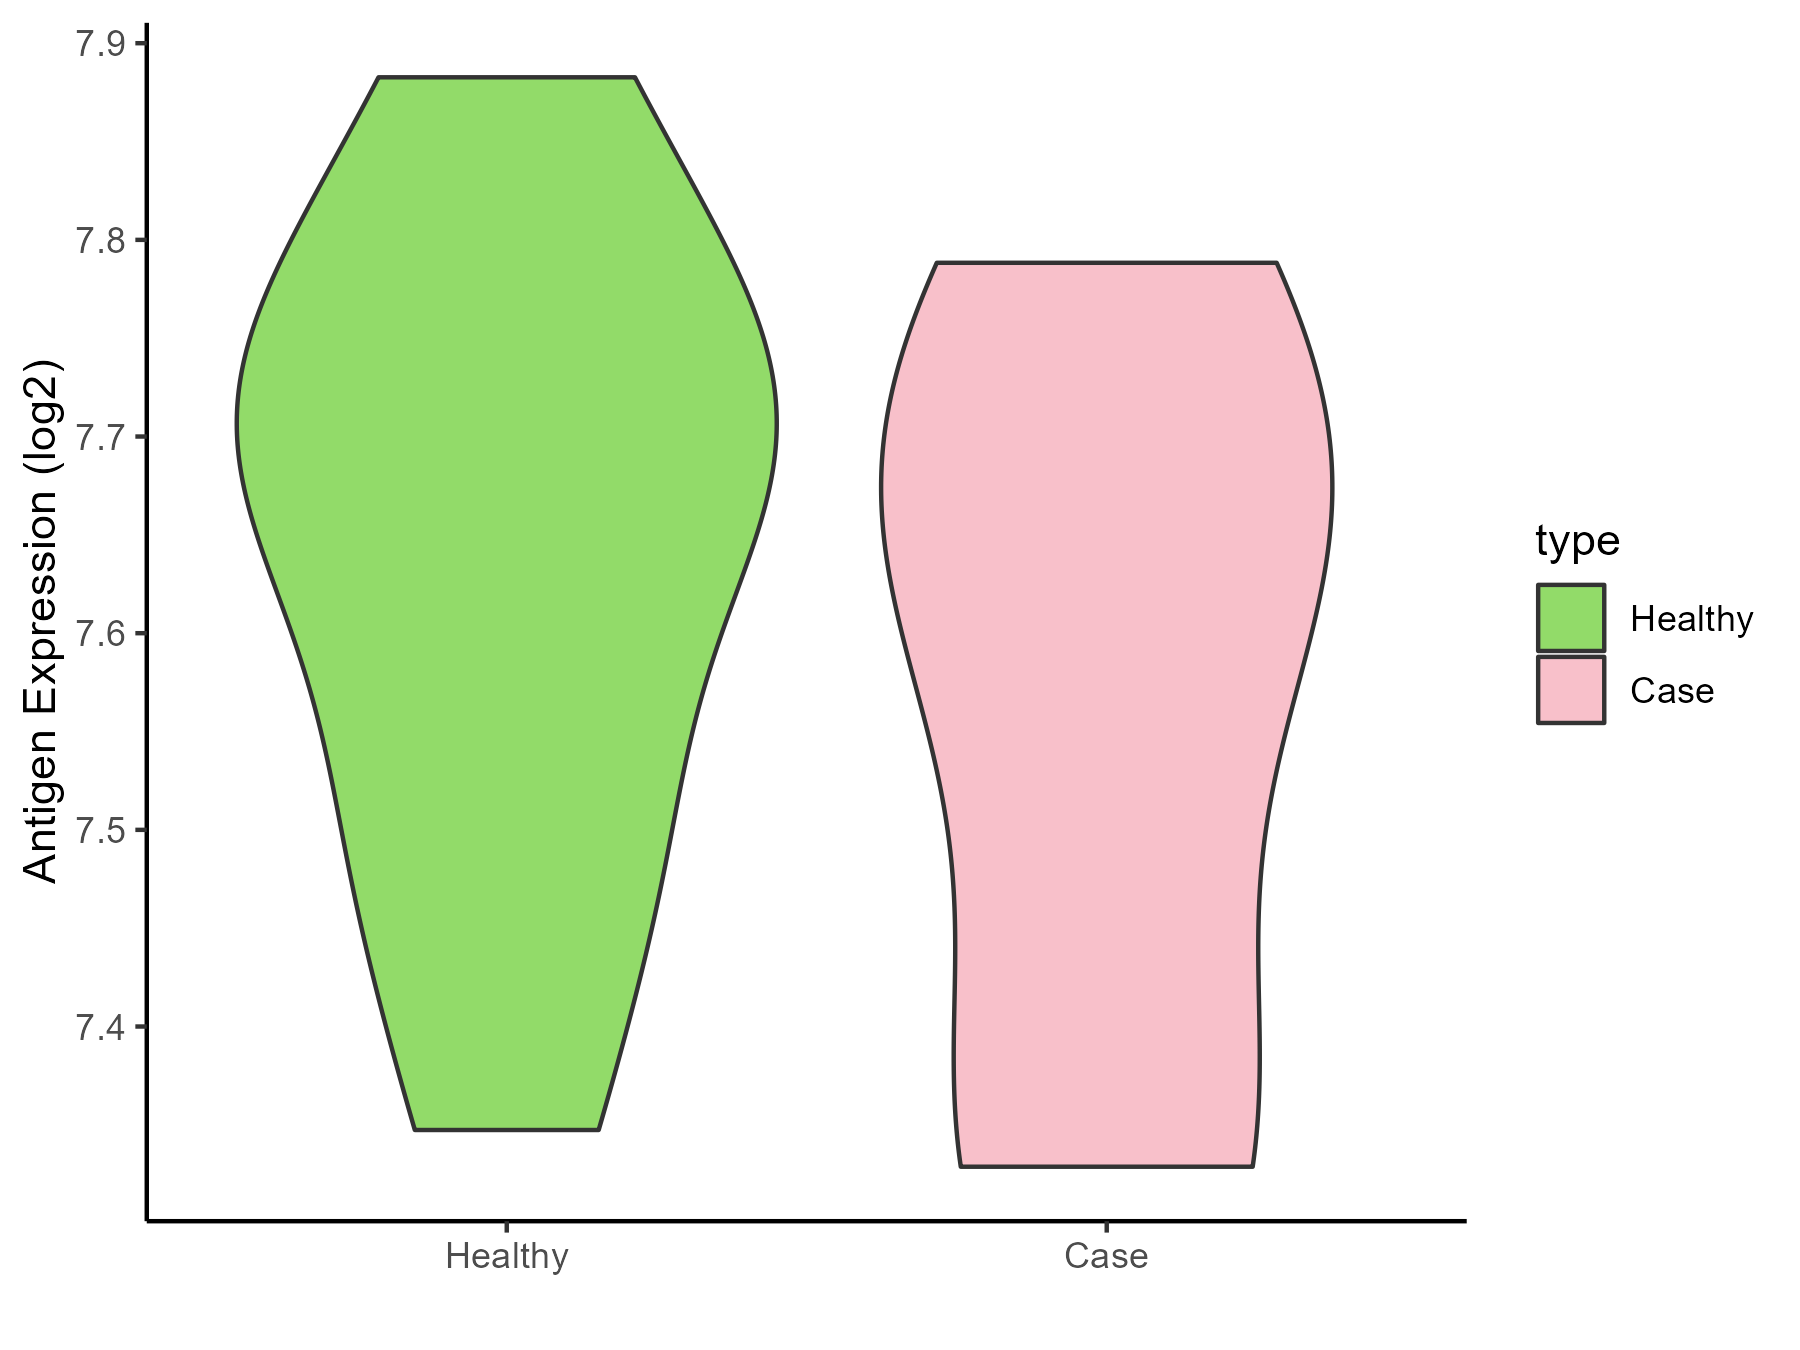
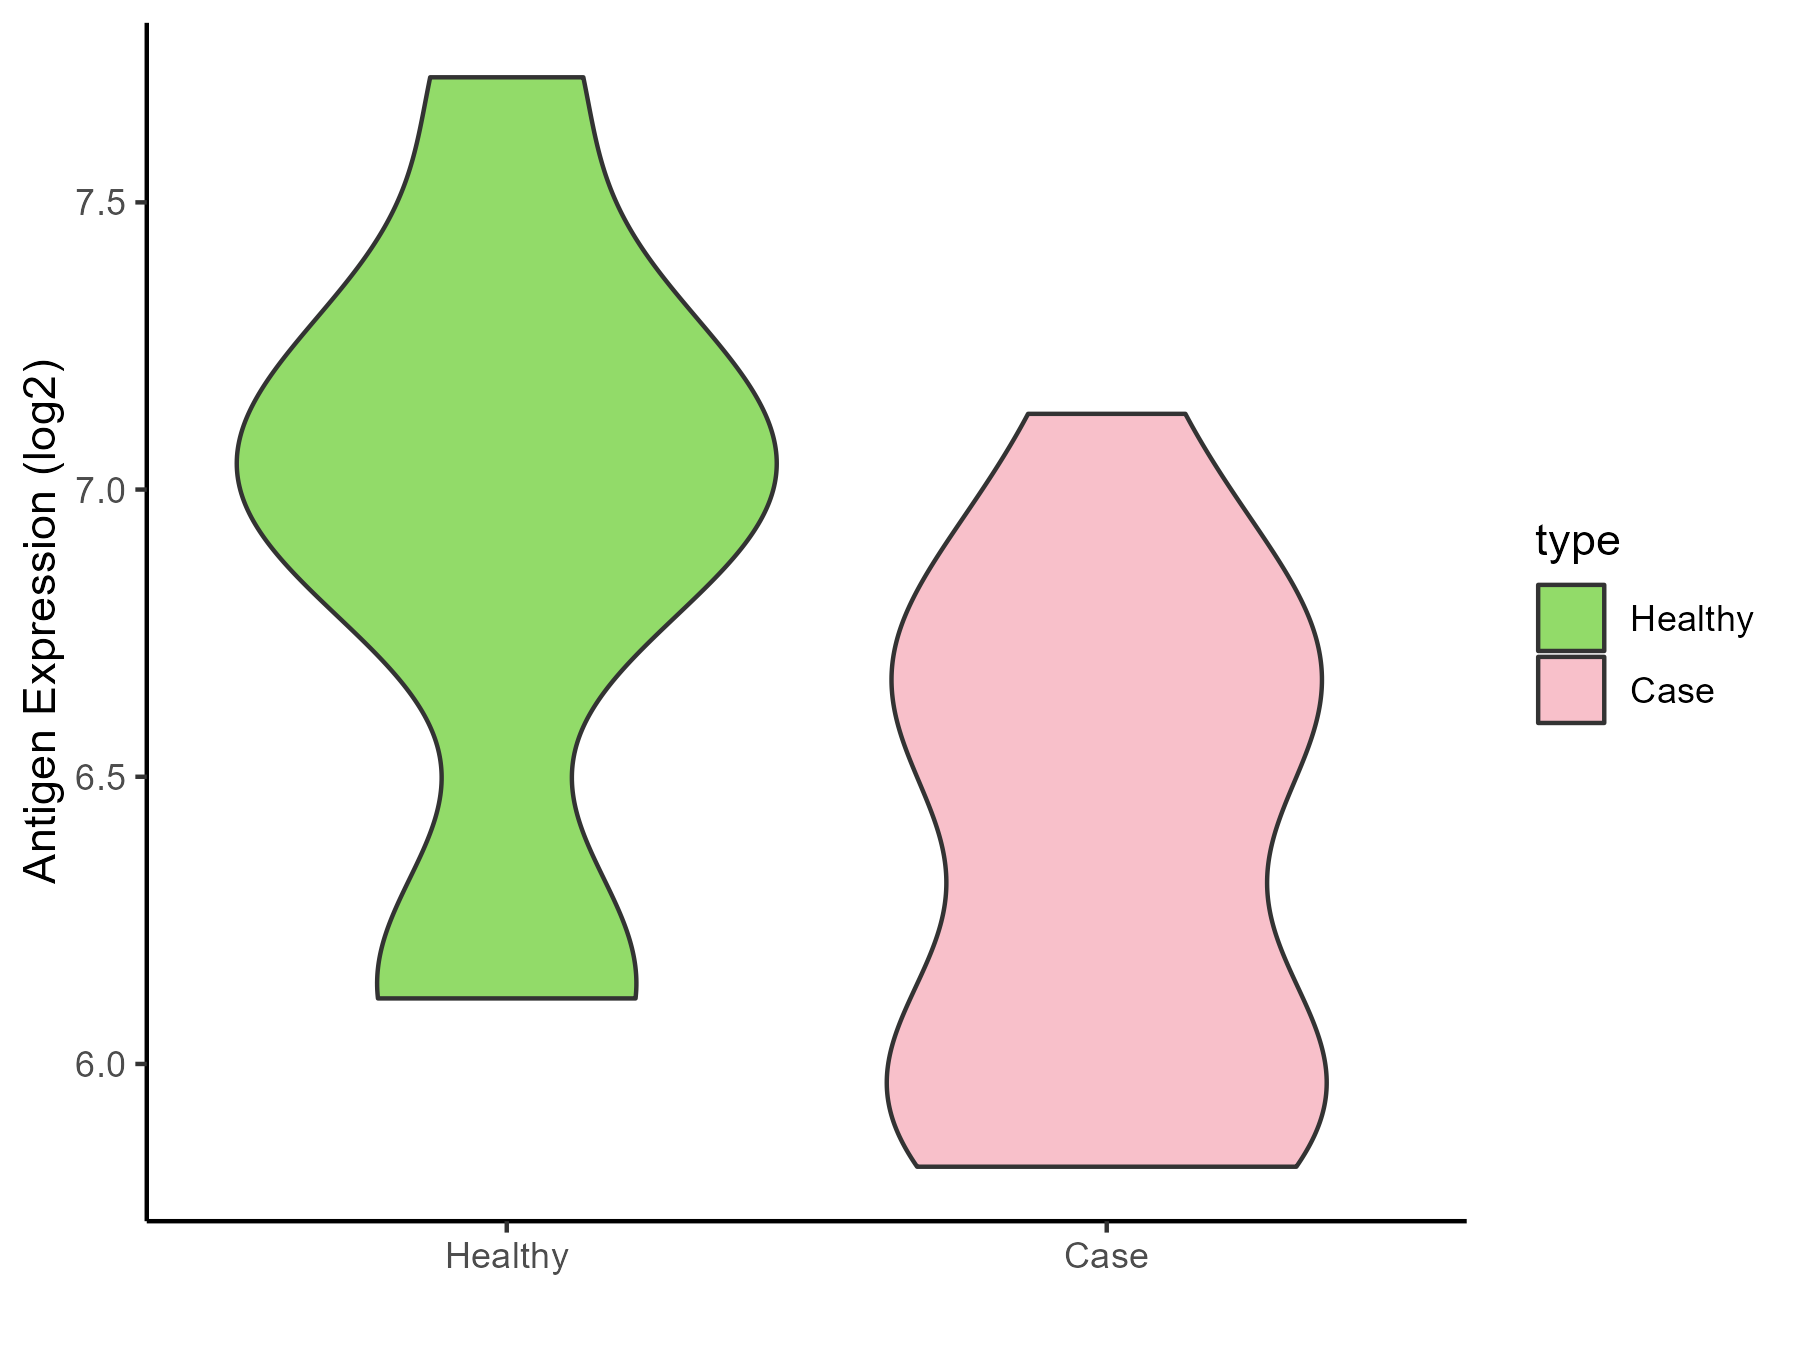
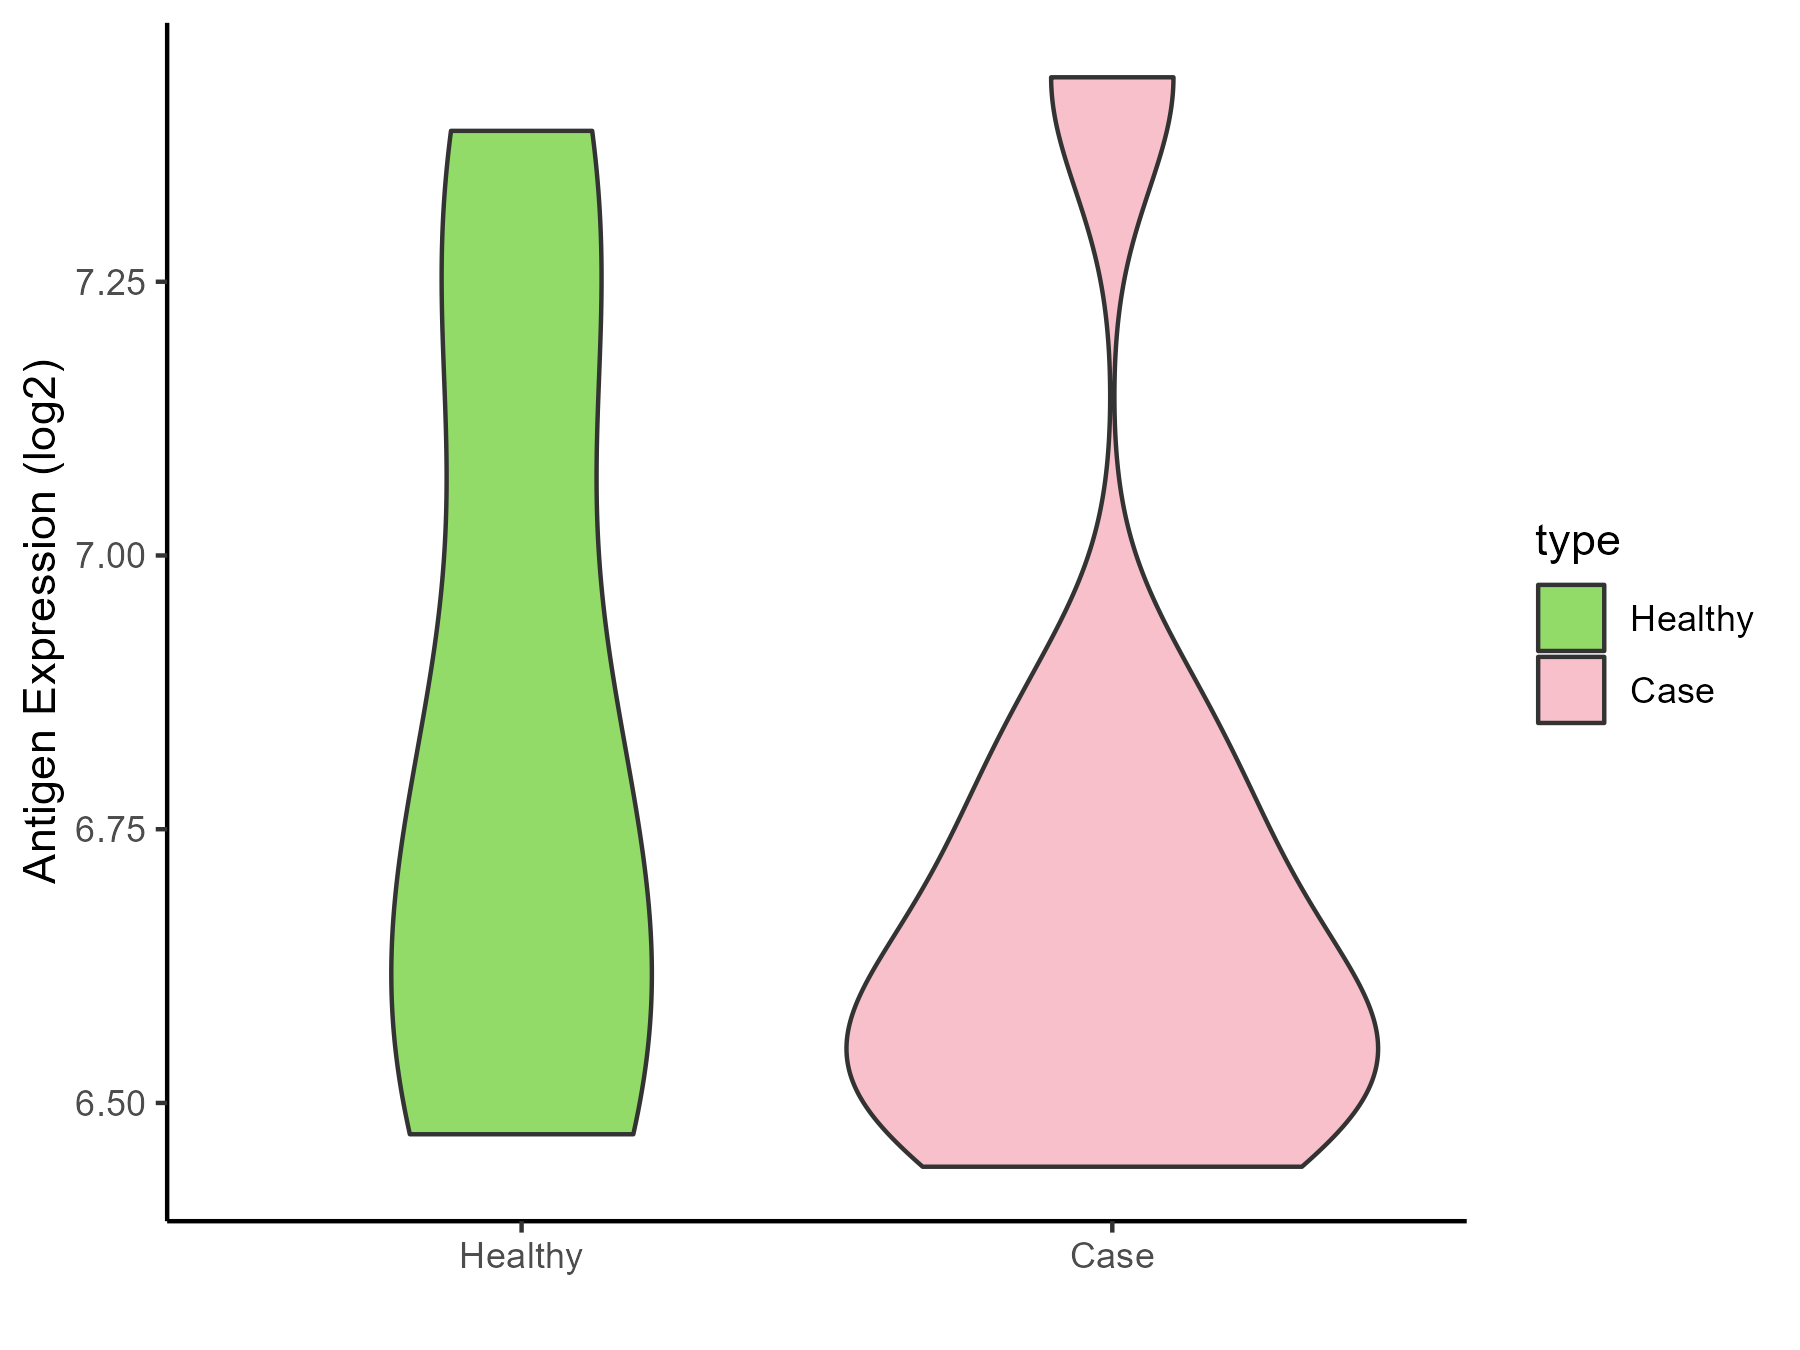
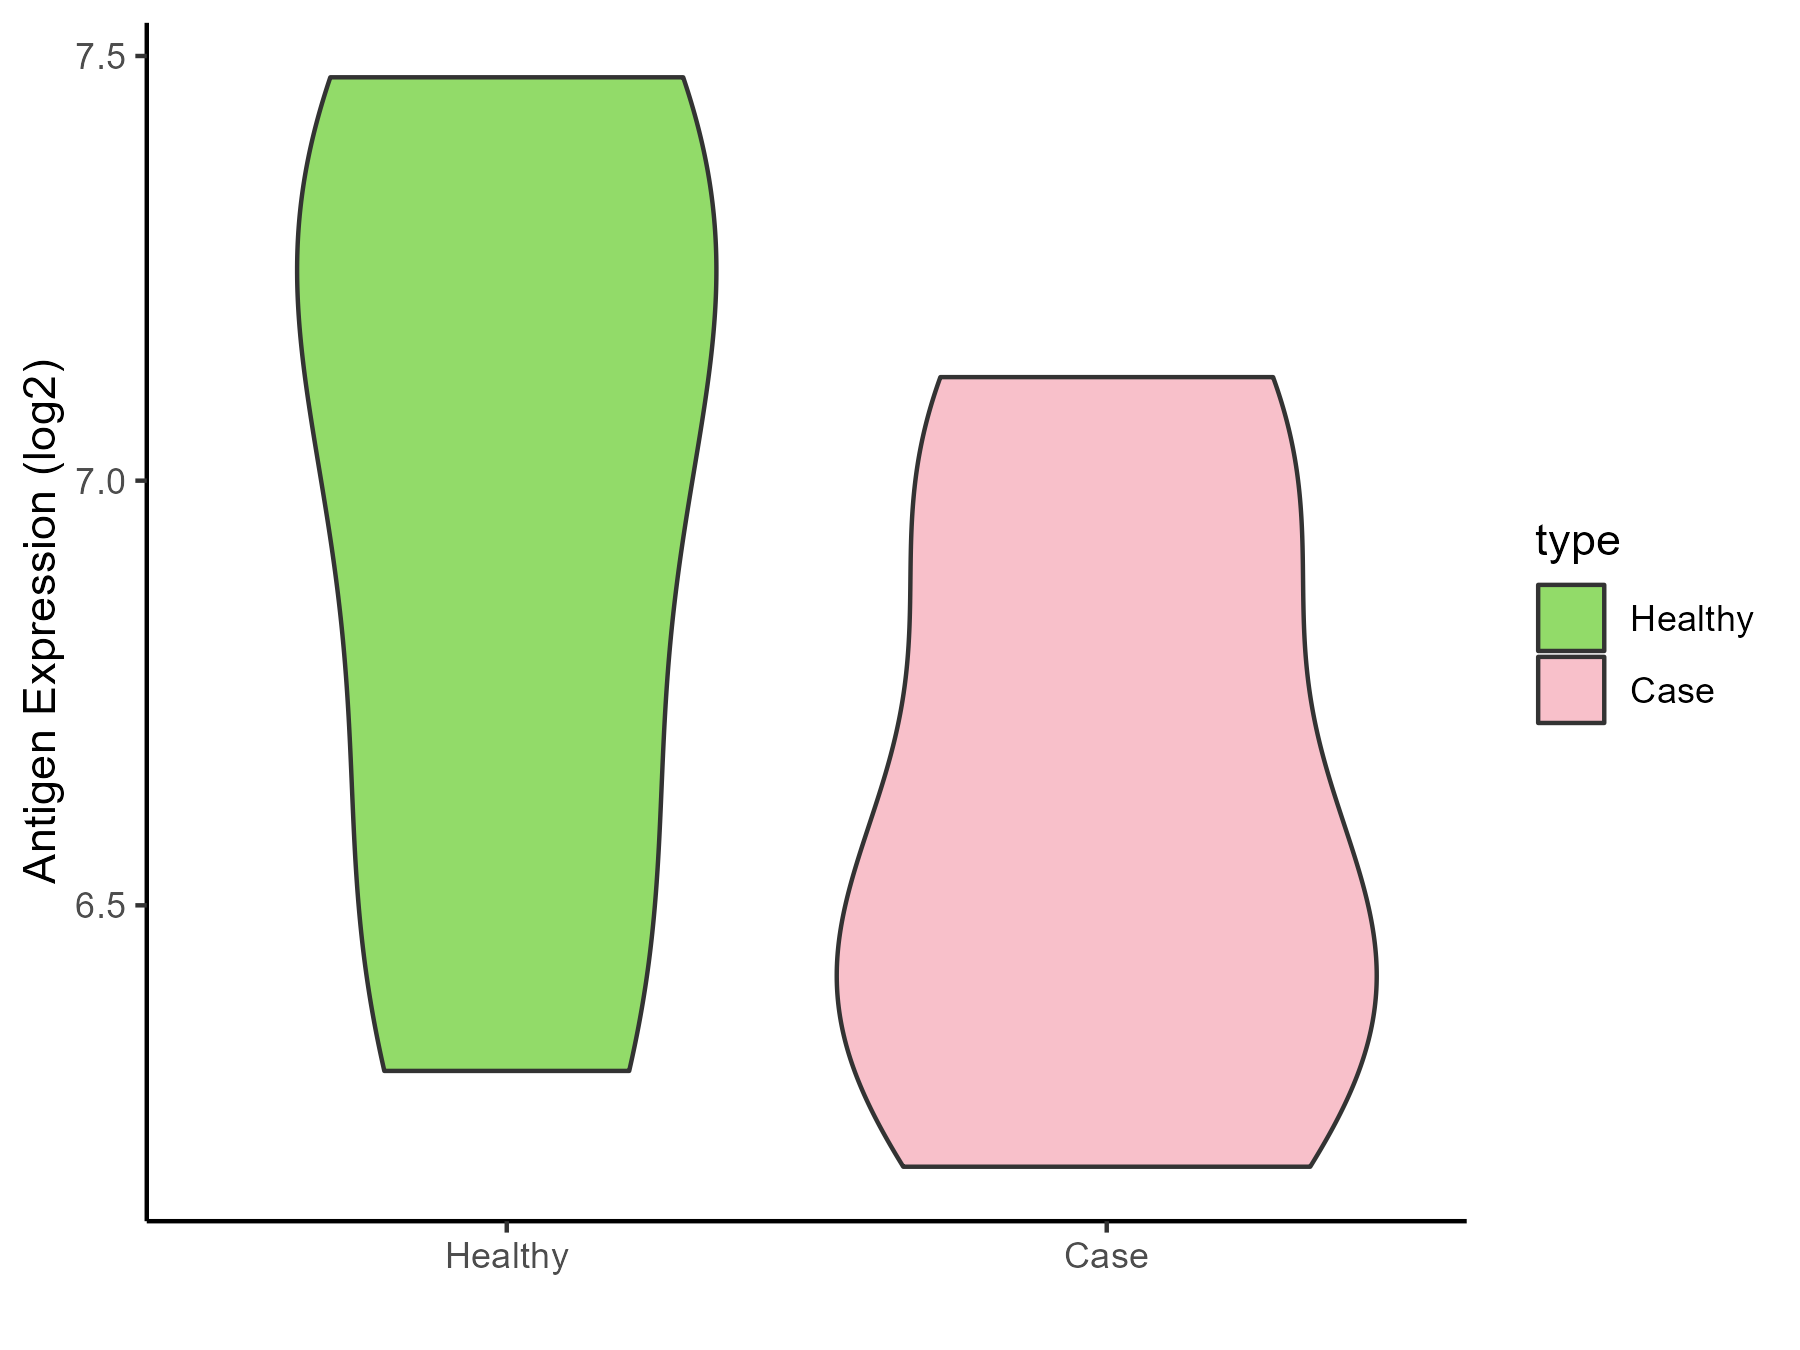
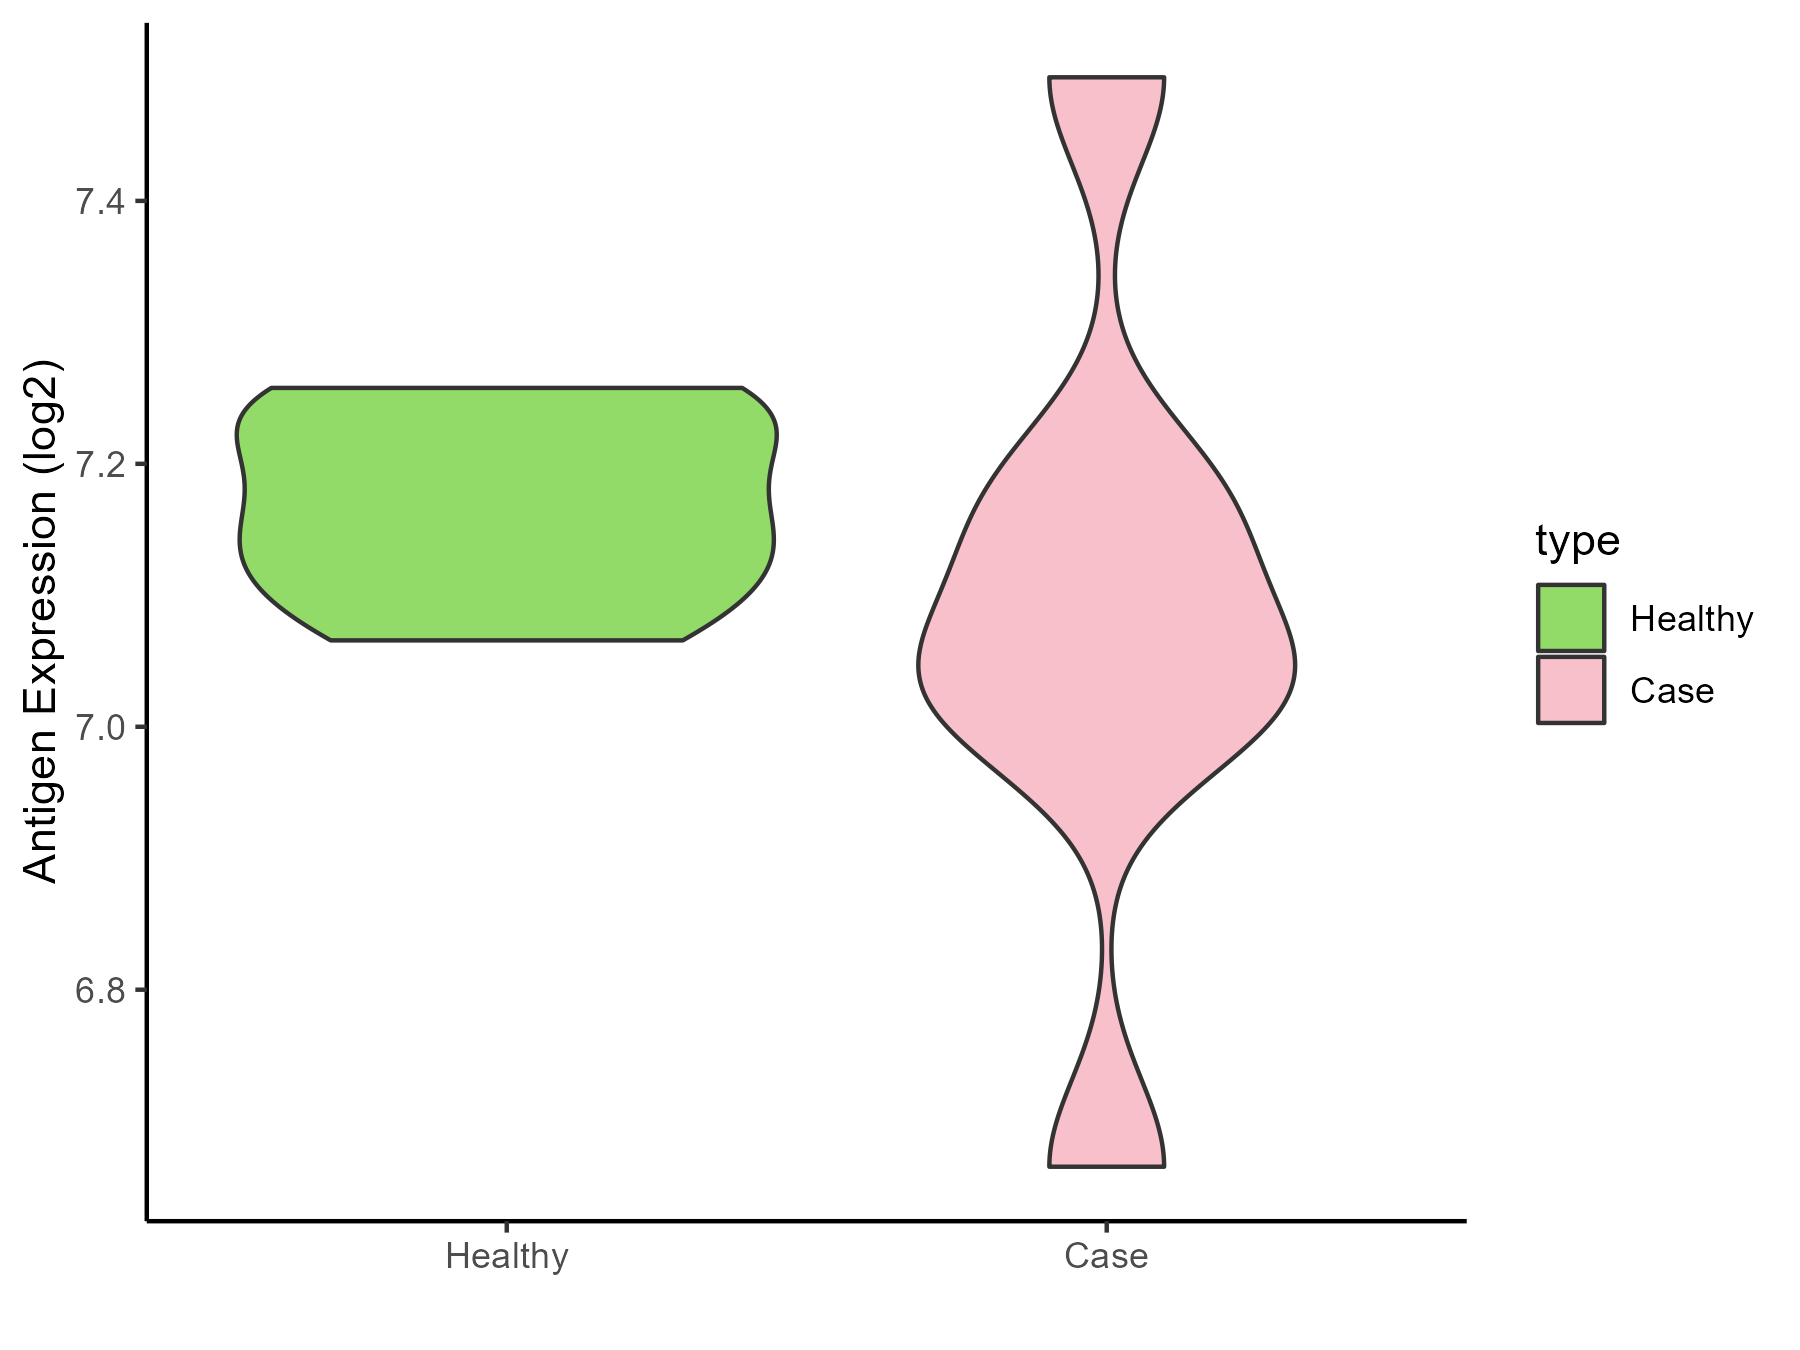
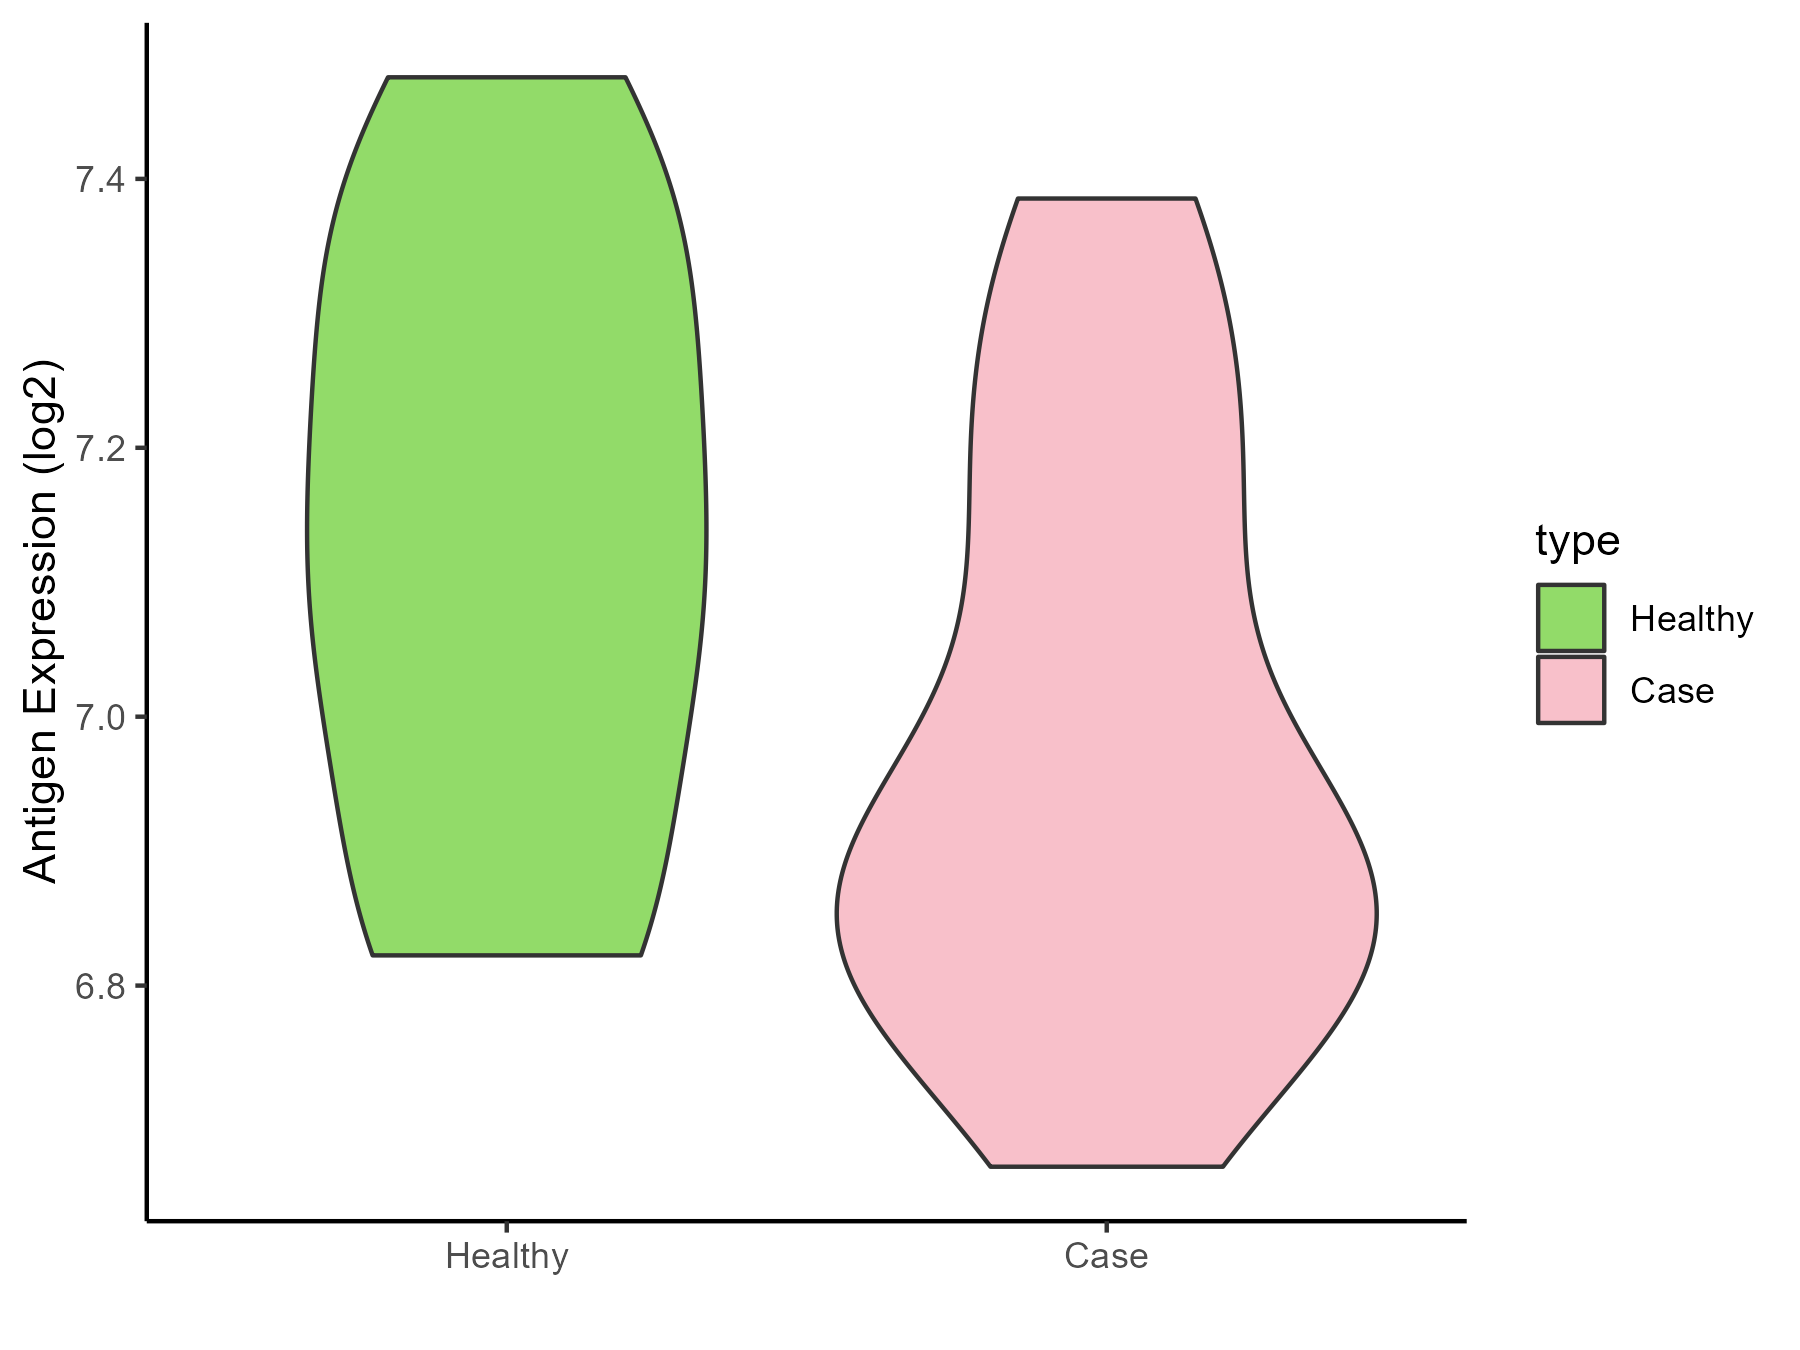
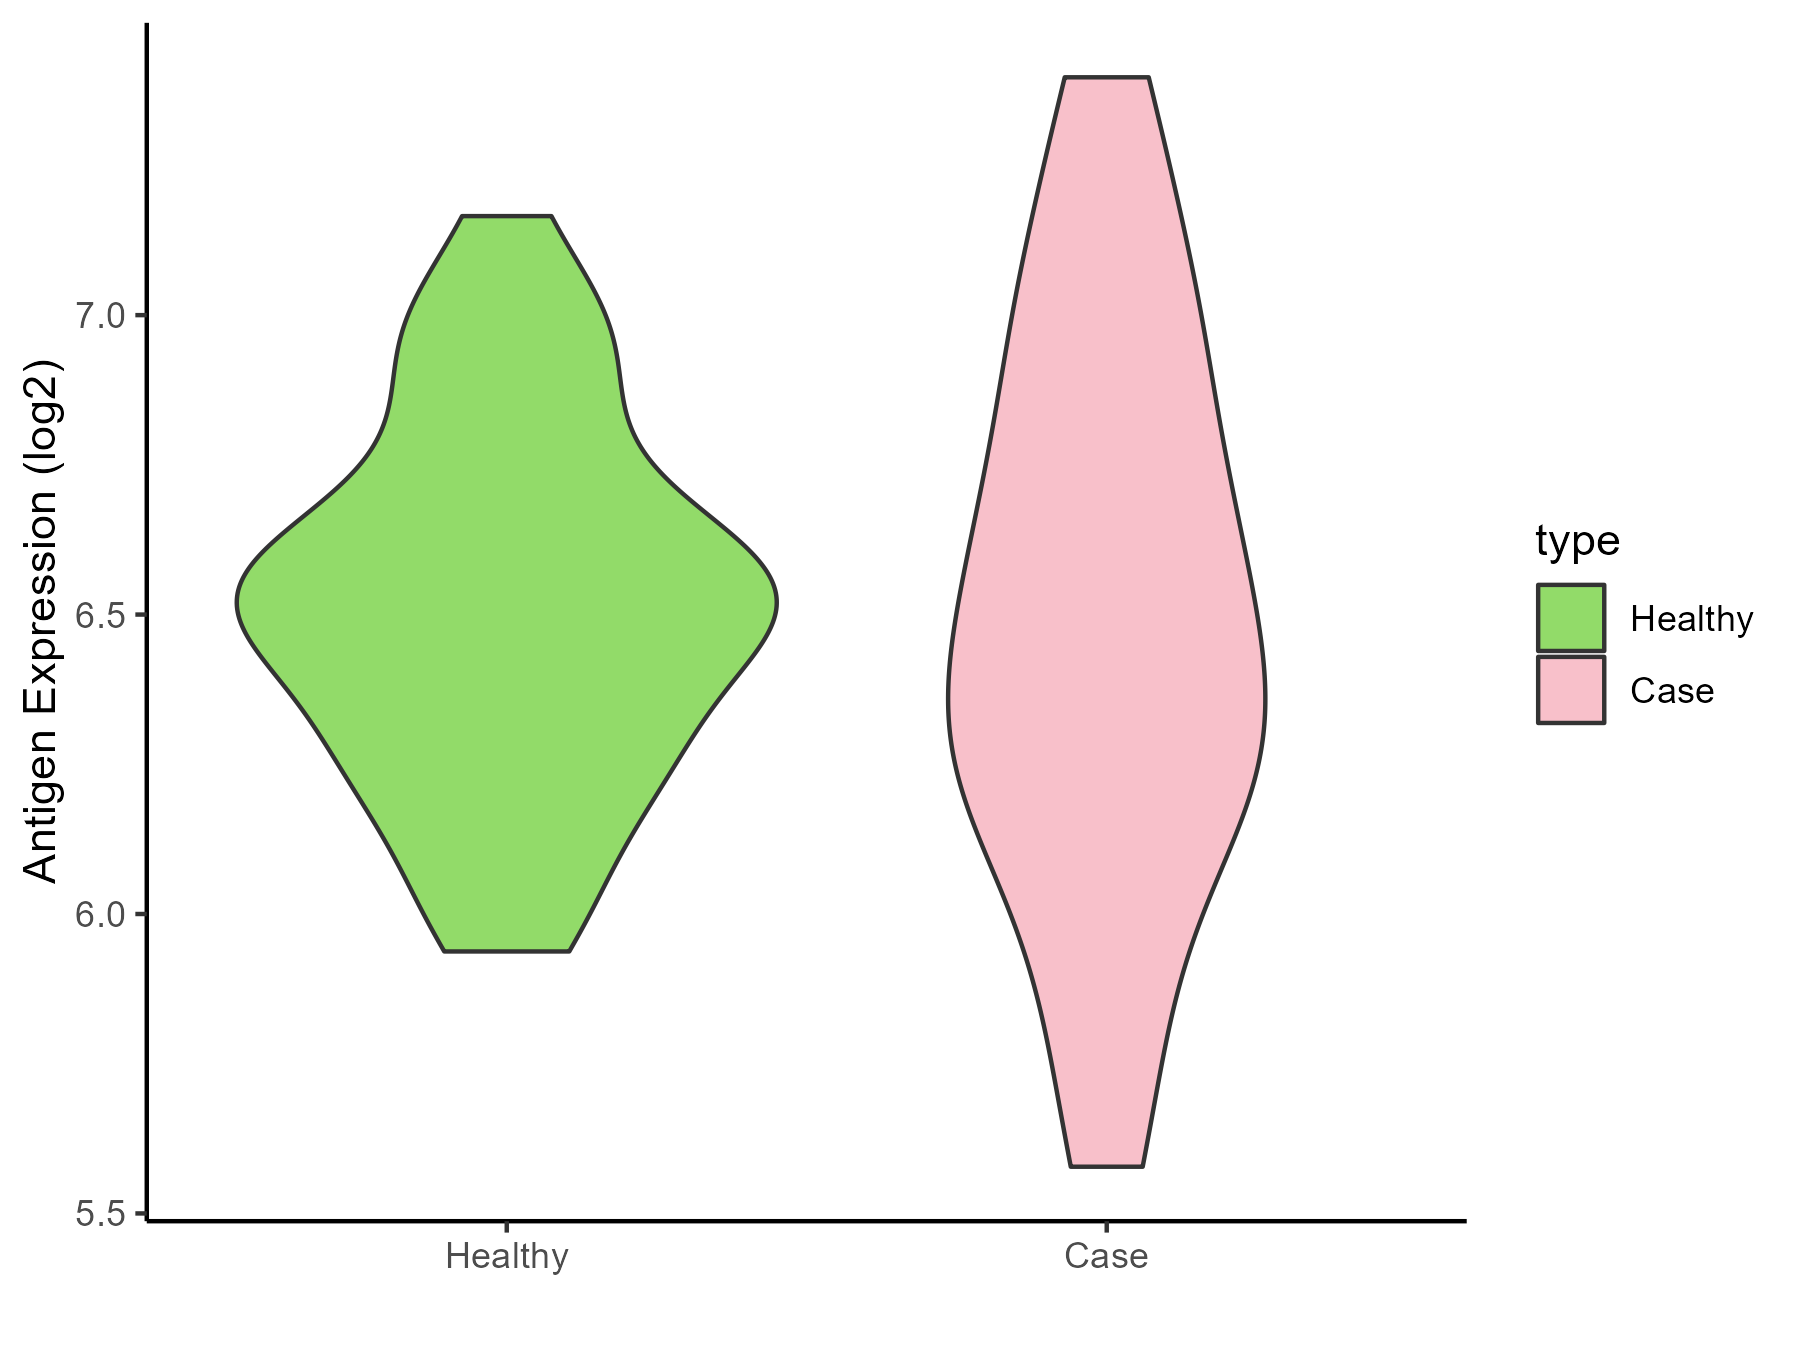
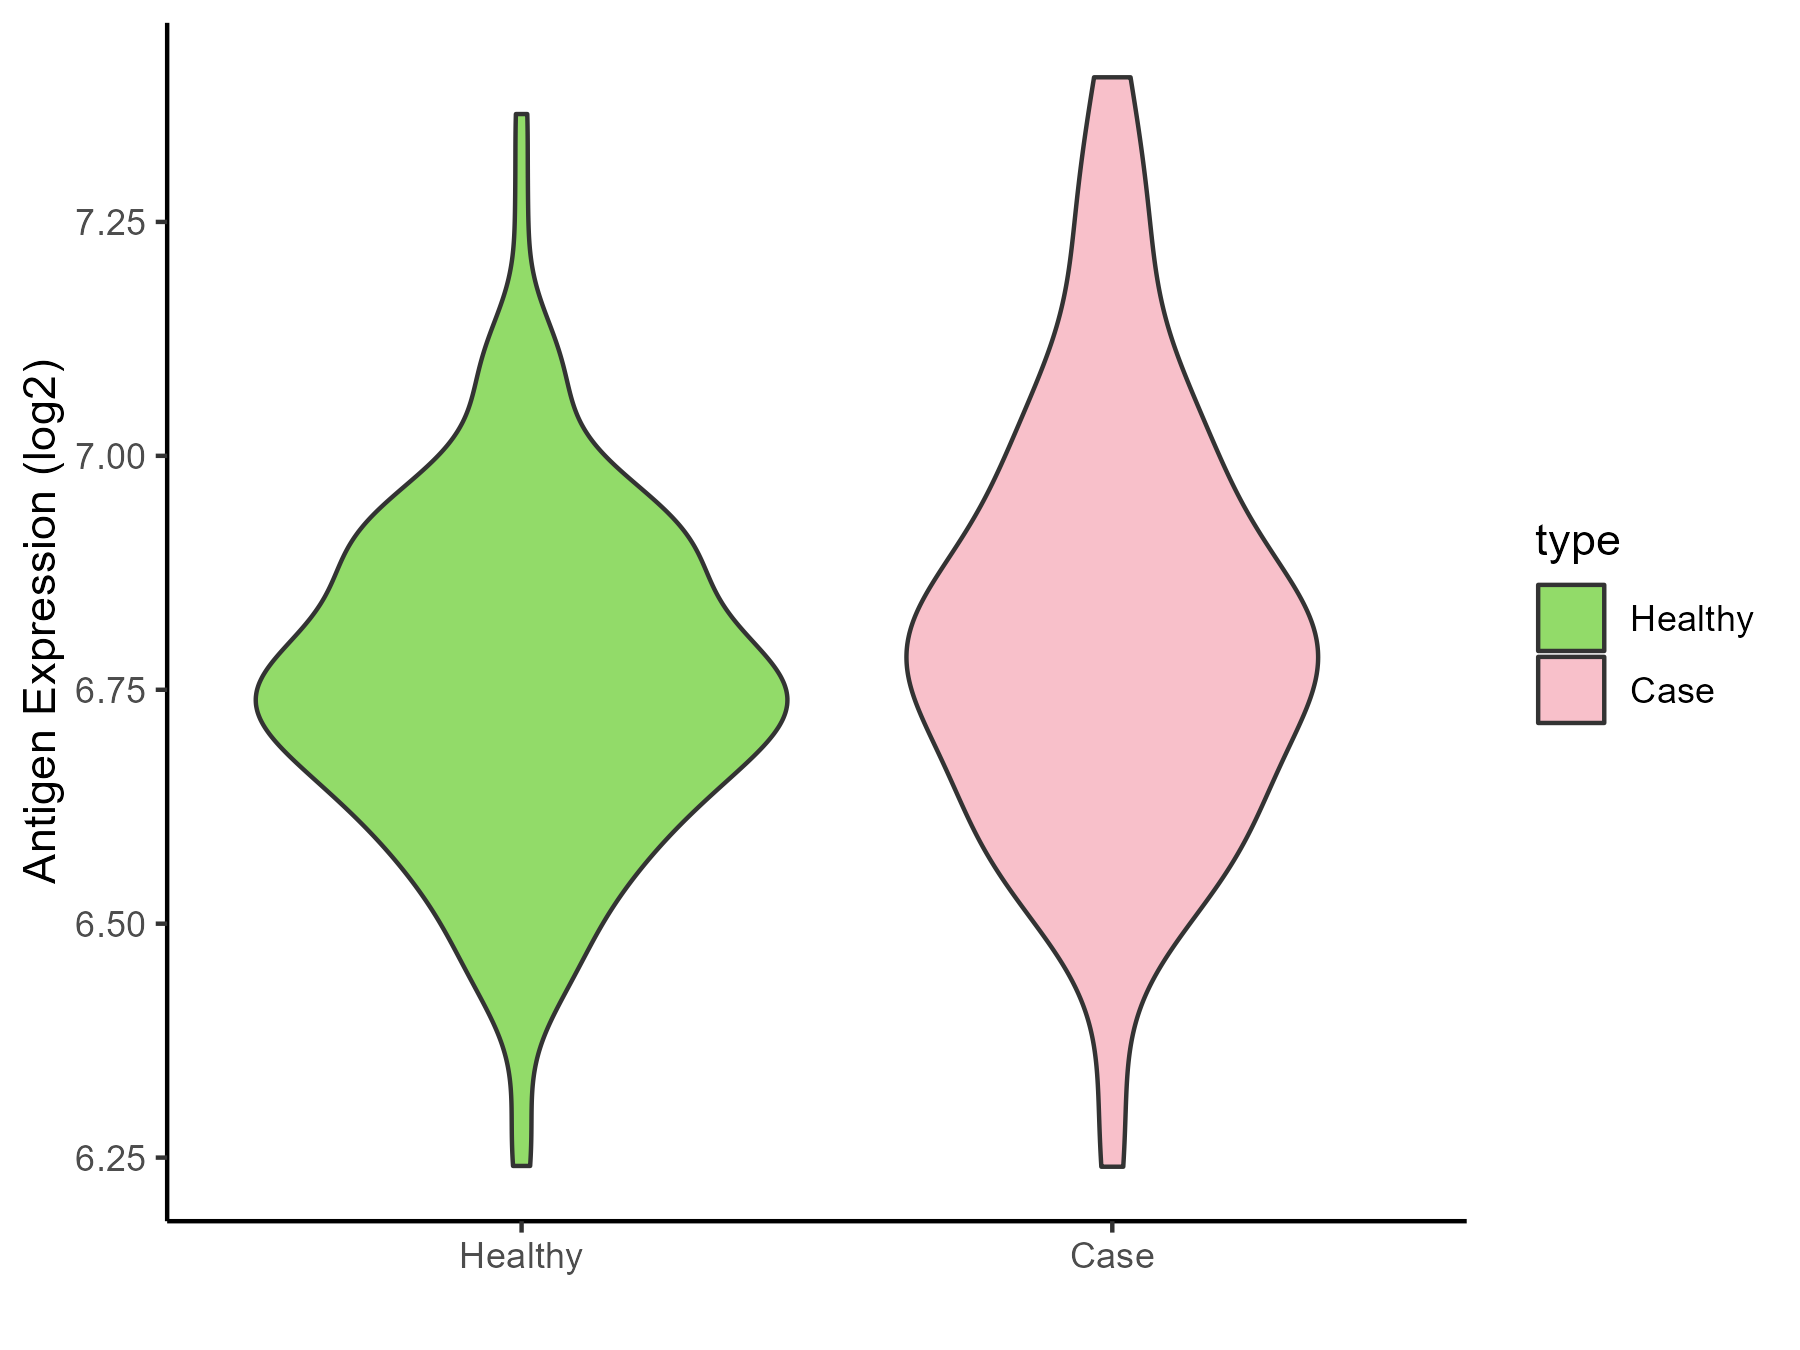
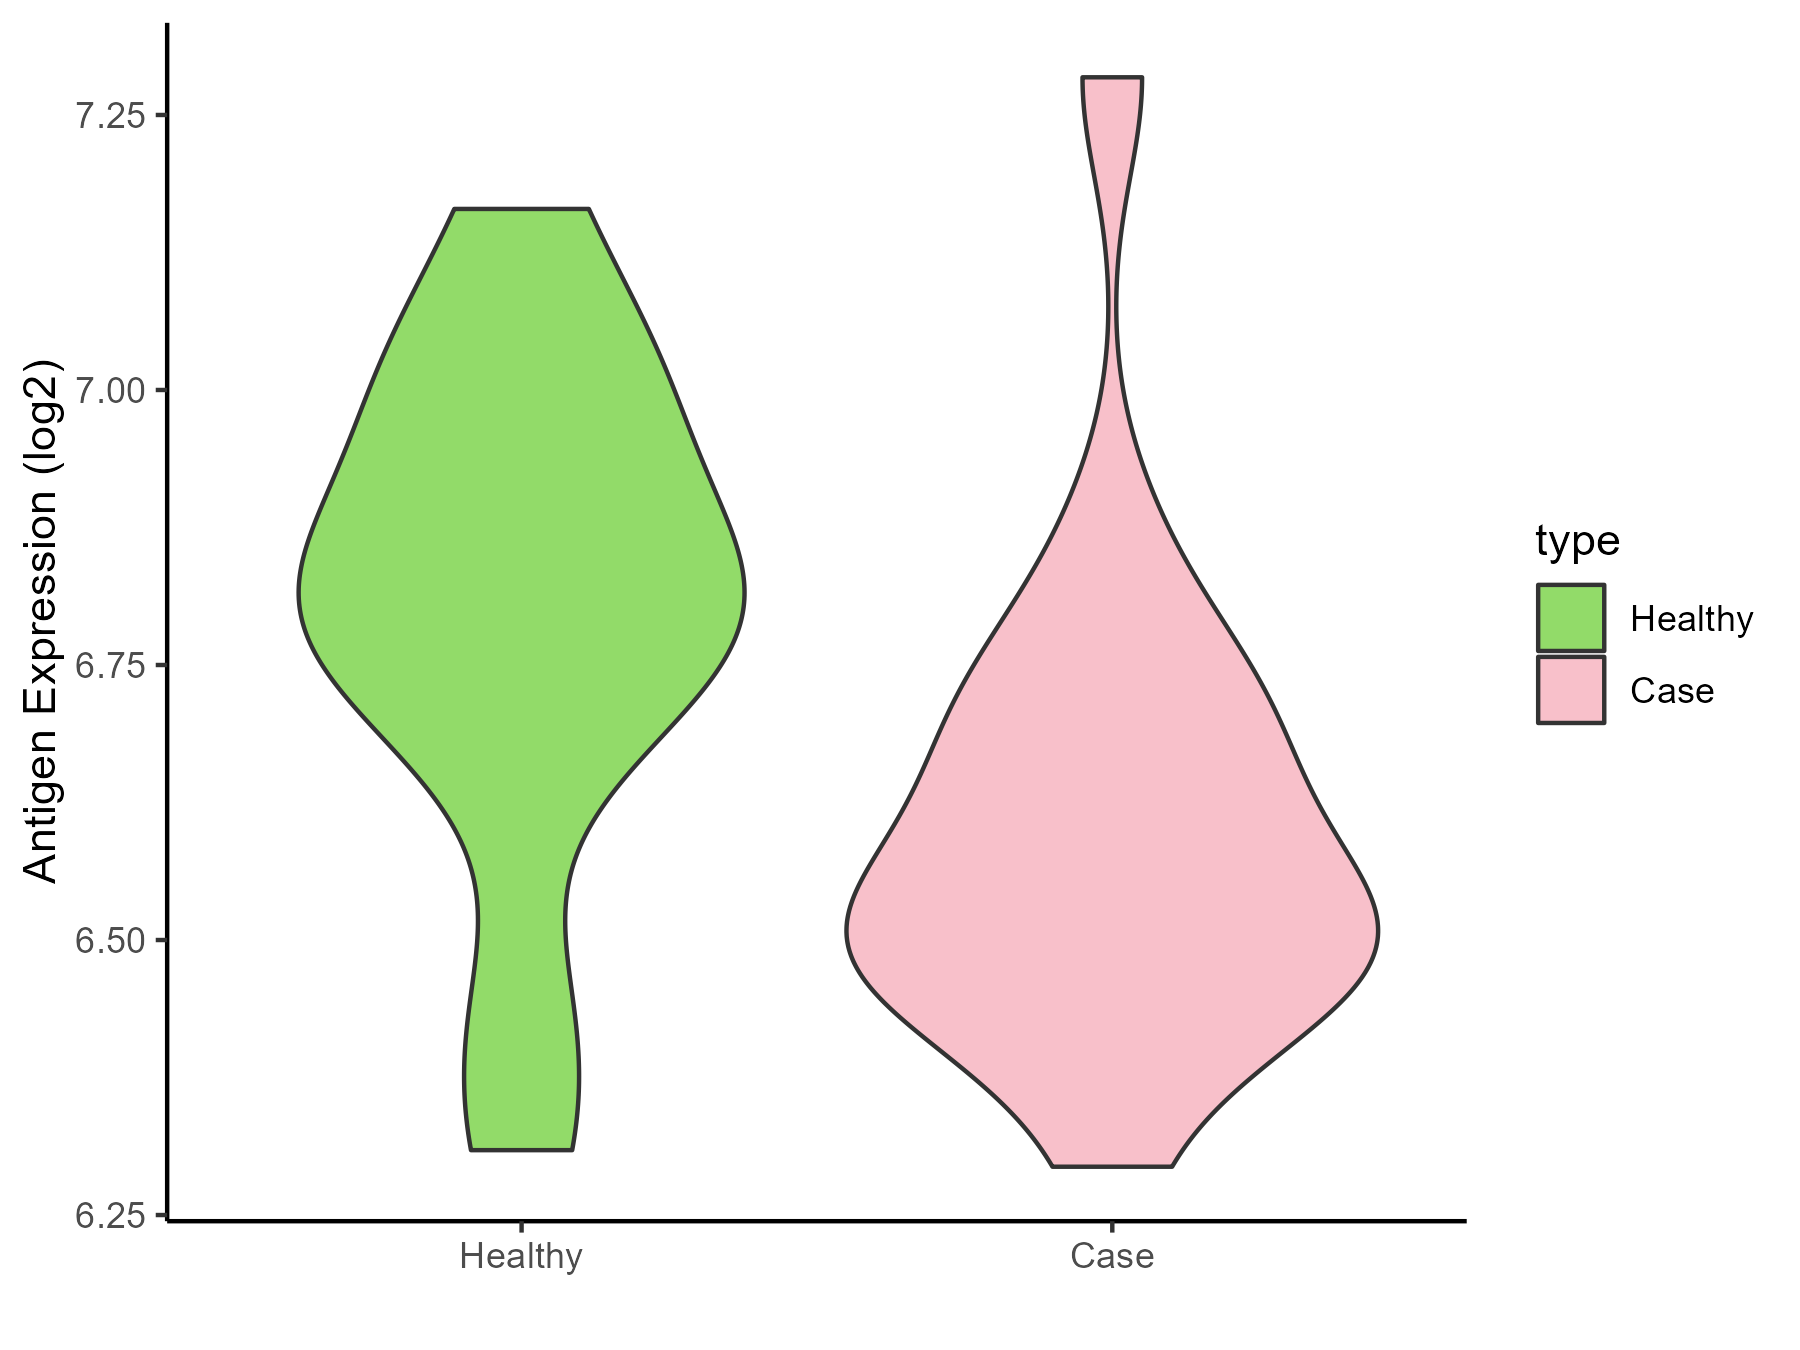
| The Studied Tissue | Brainstem | |
| The Specific Disease | Glioma | |
| The Expression Level of Disease Section Compare with the Healthy Individual Tissue | p-value: 0.170650866; Fold-change: -0.788455868; Z-score: -2.405431123 | |
| Disease-specific Antigen Abundances |
|
Click to View the Clearer Original Diagram |
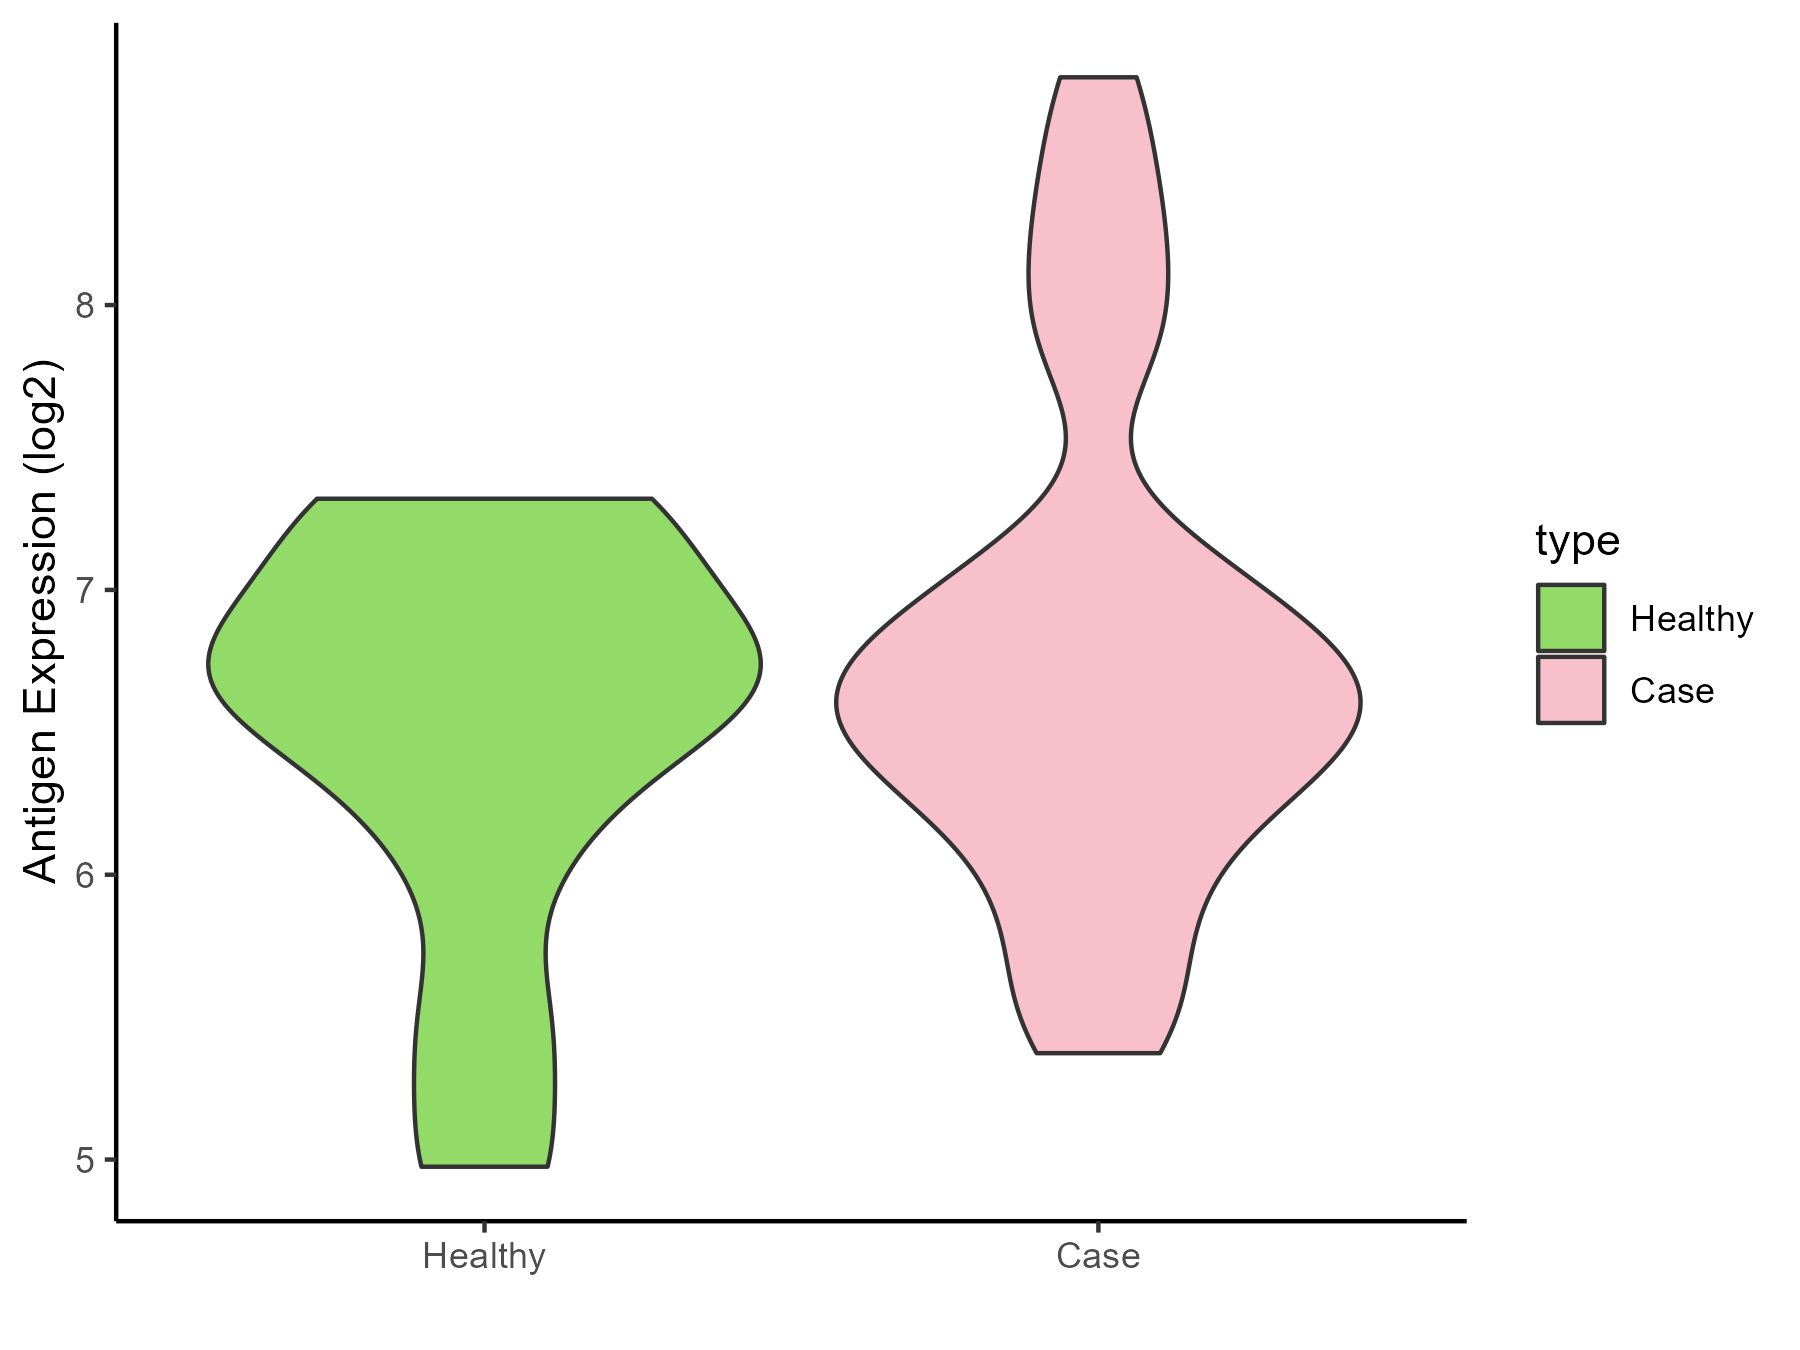
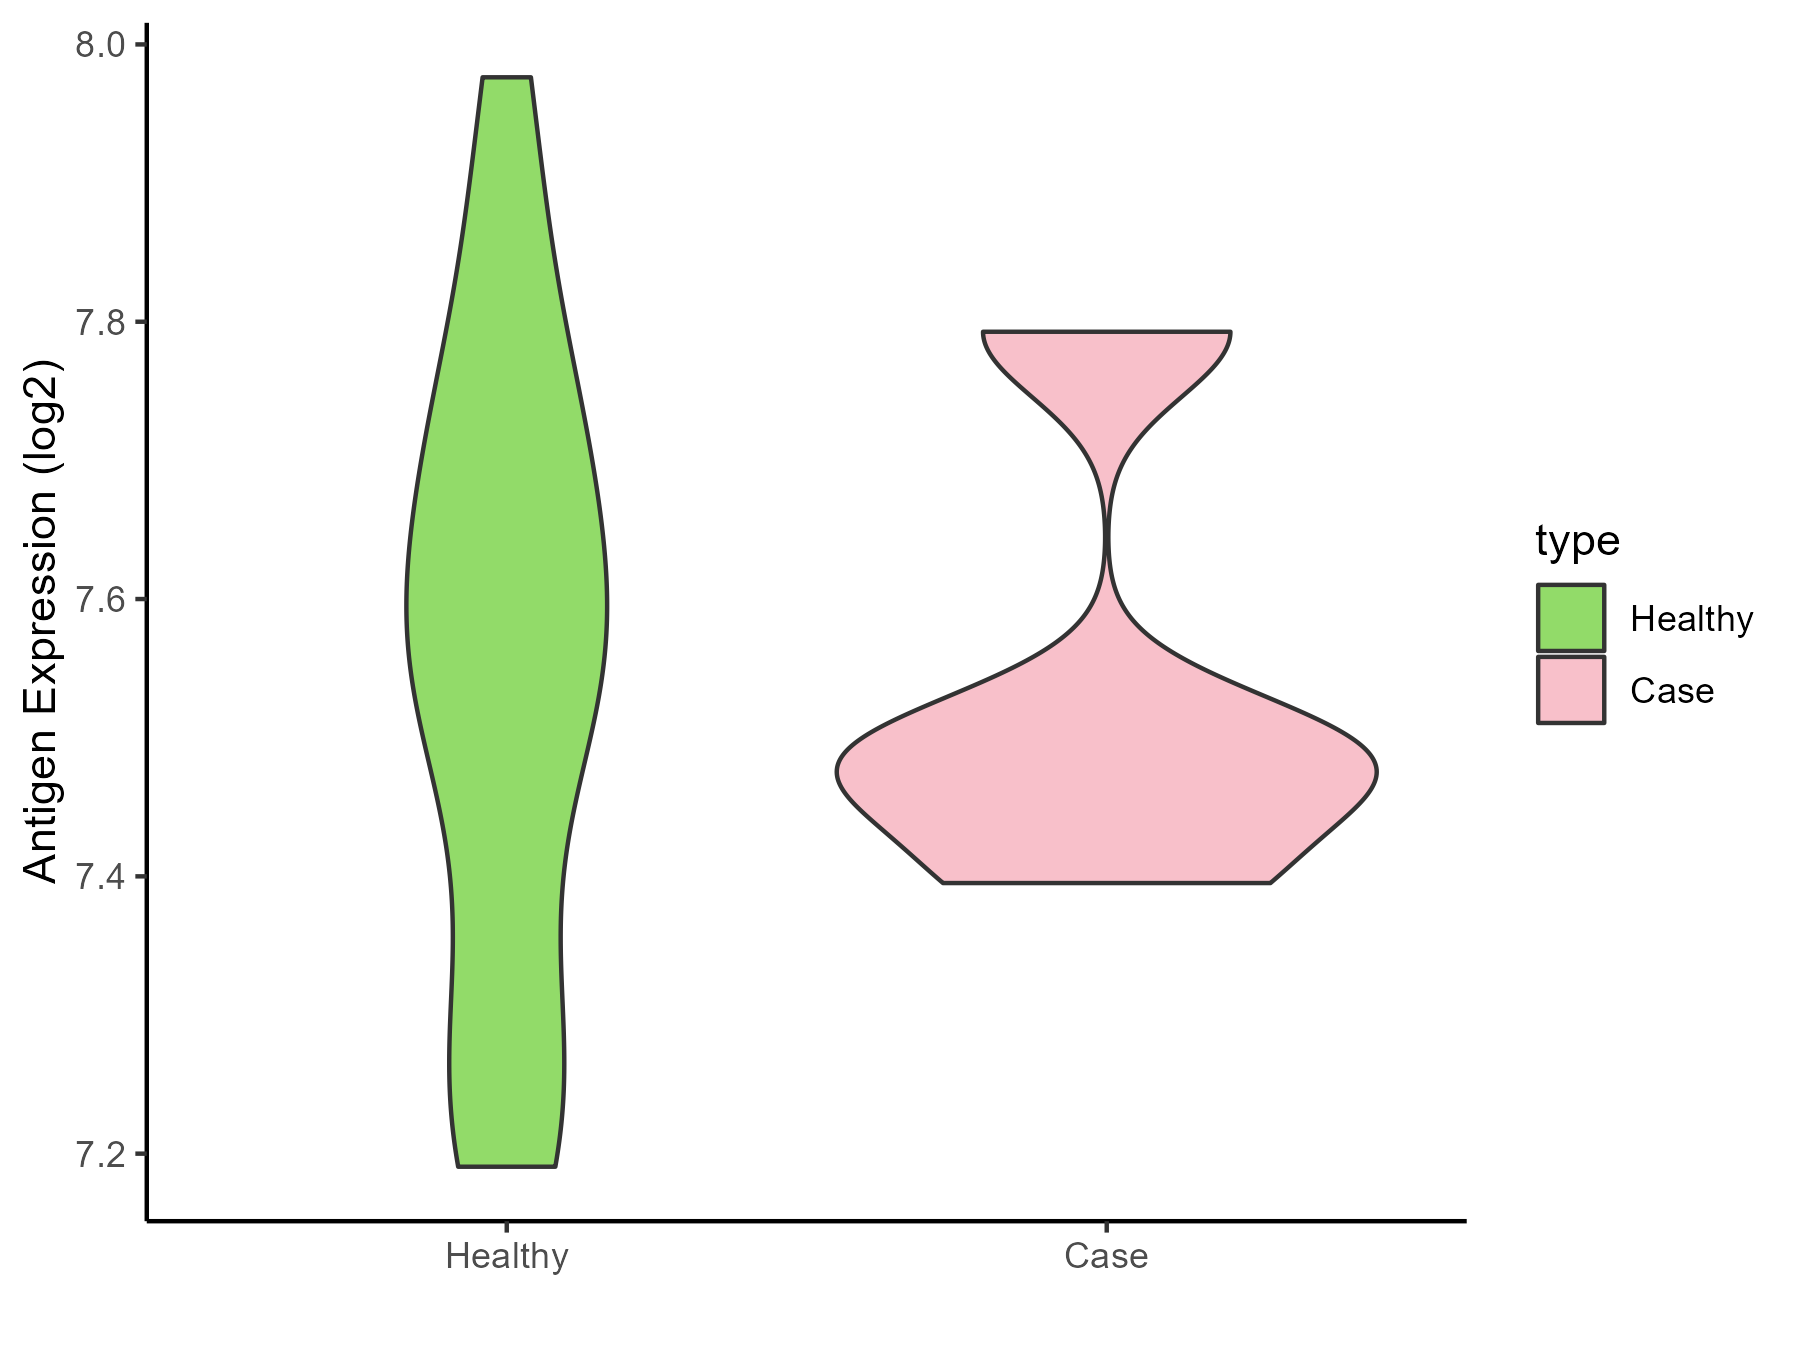
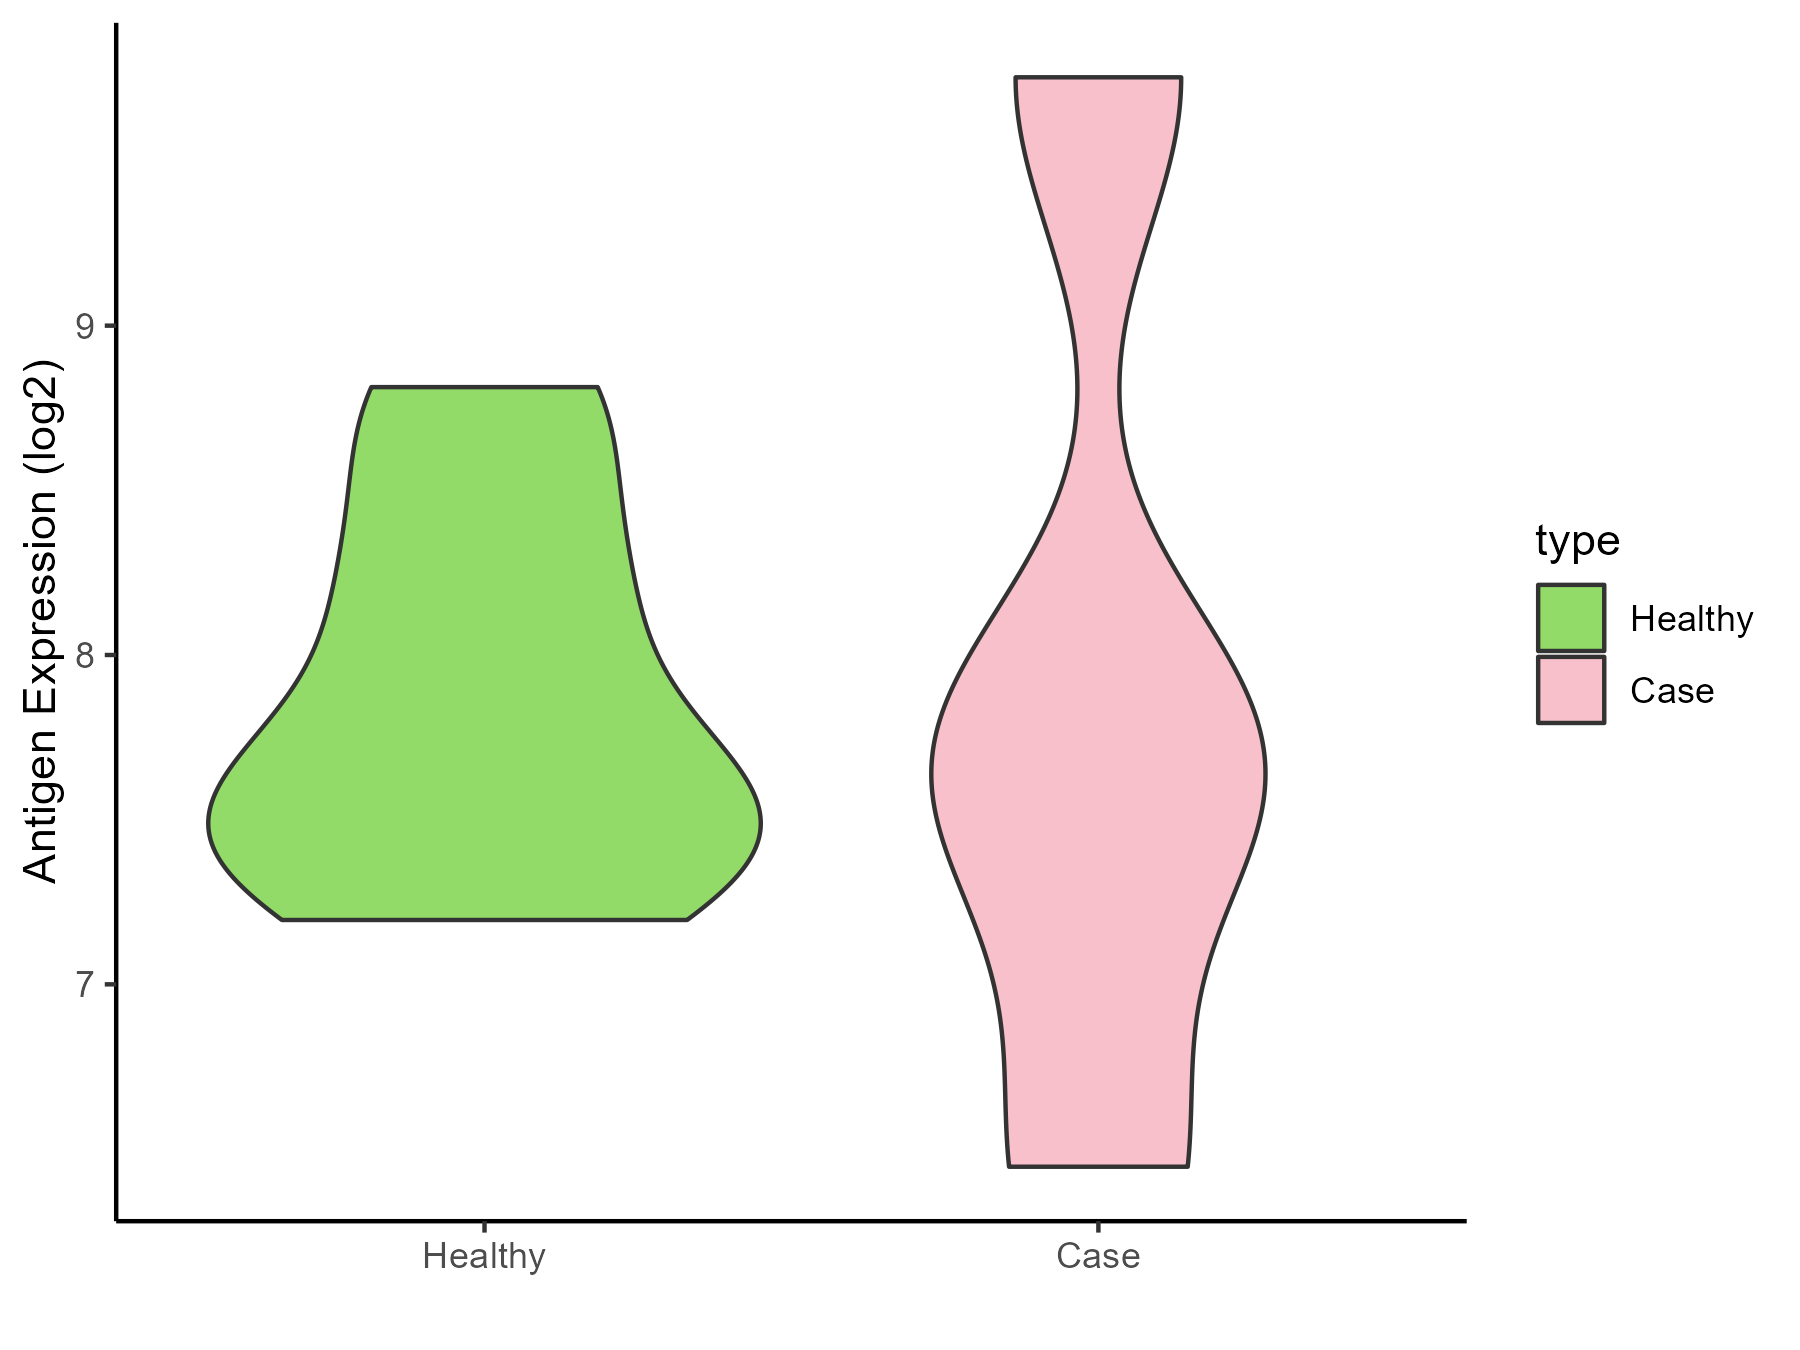
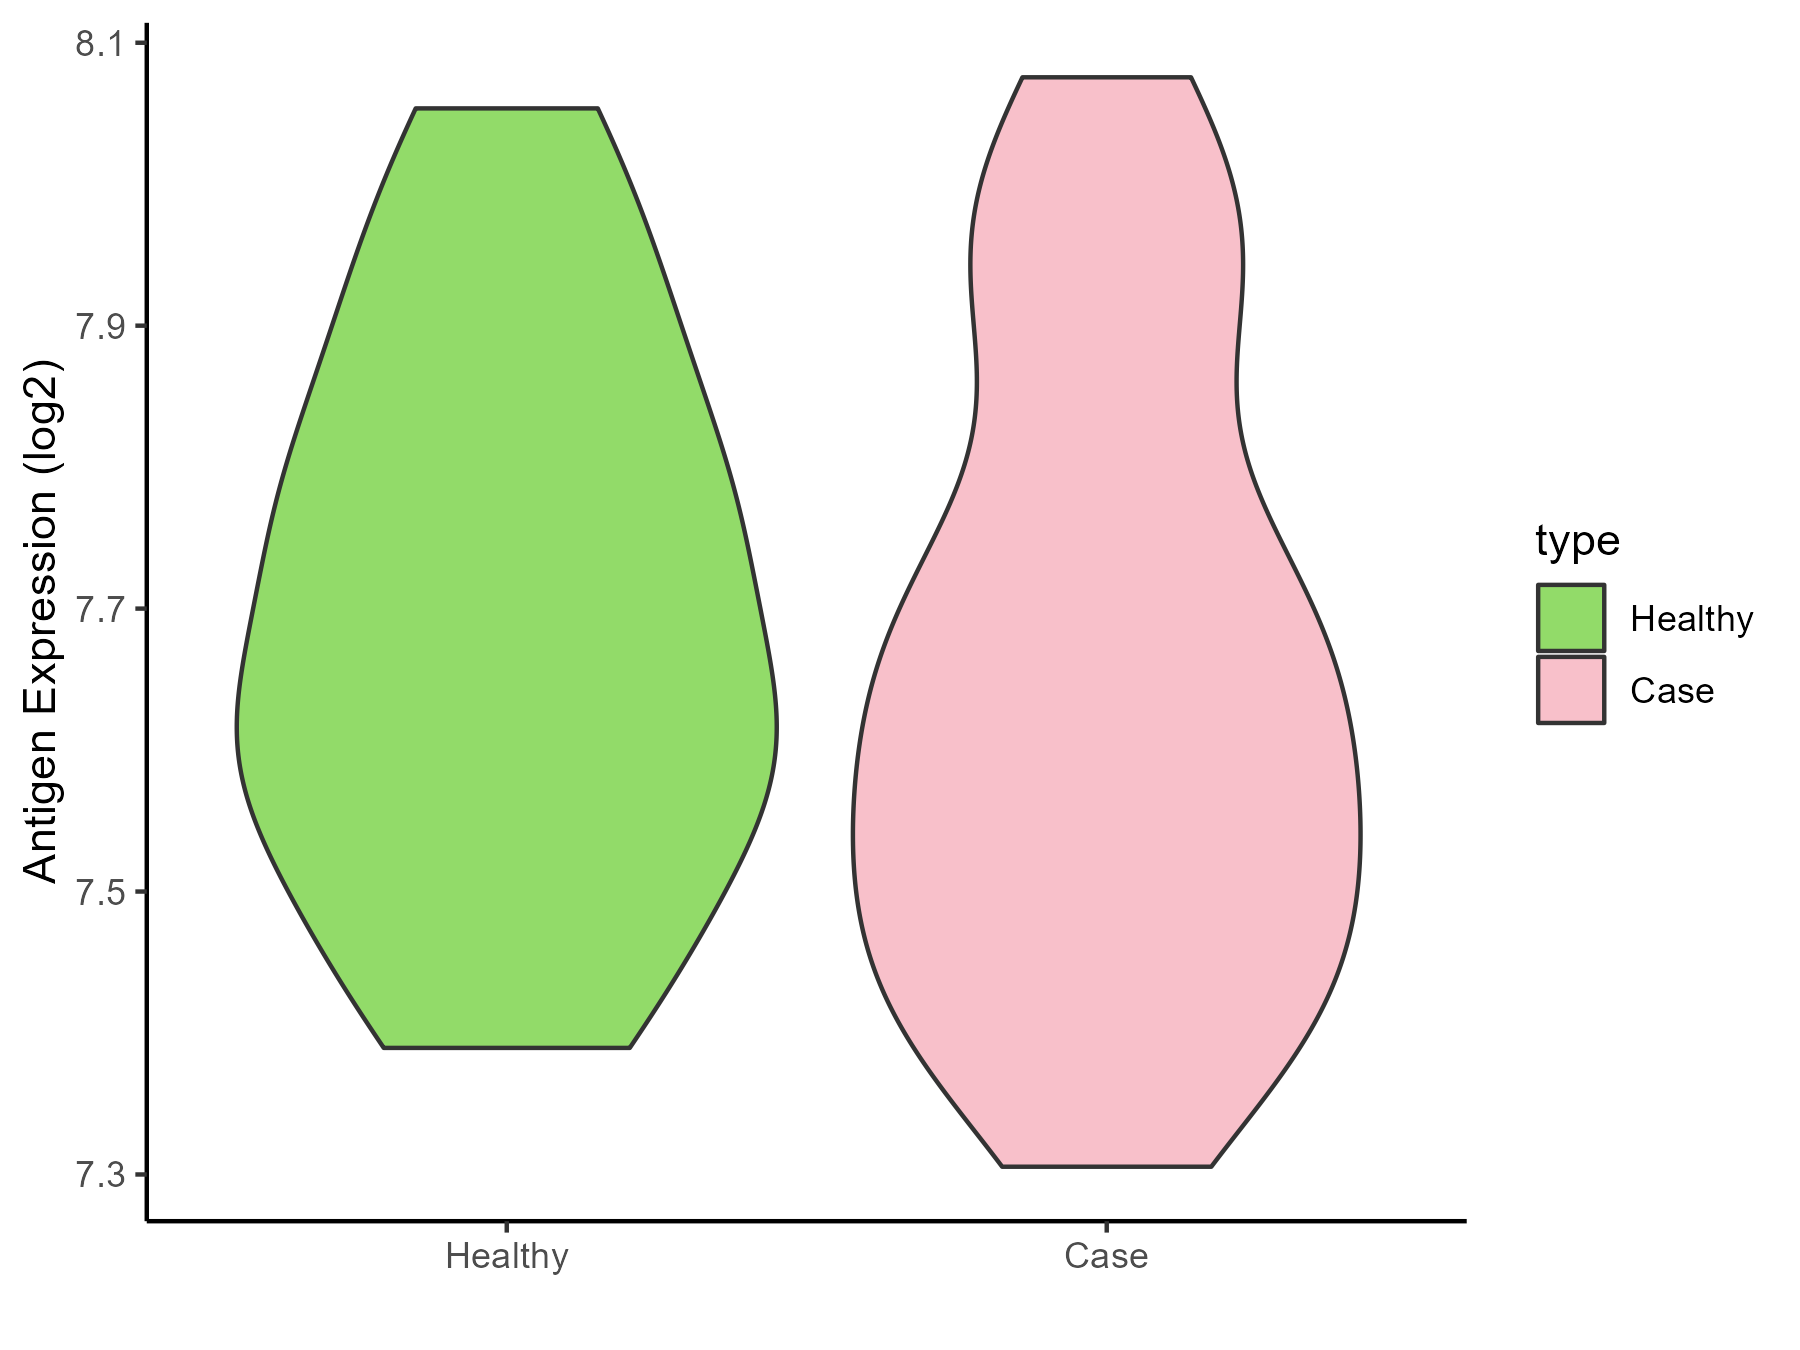
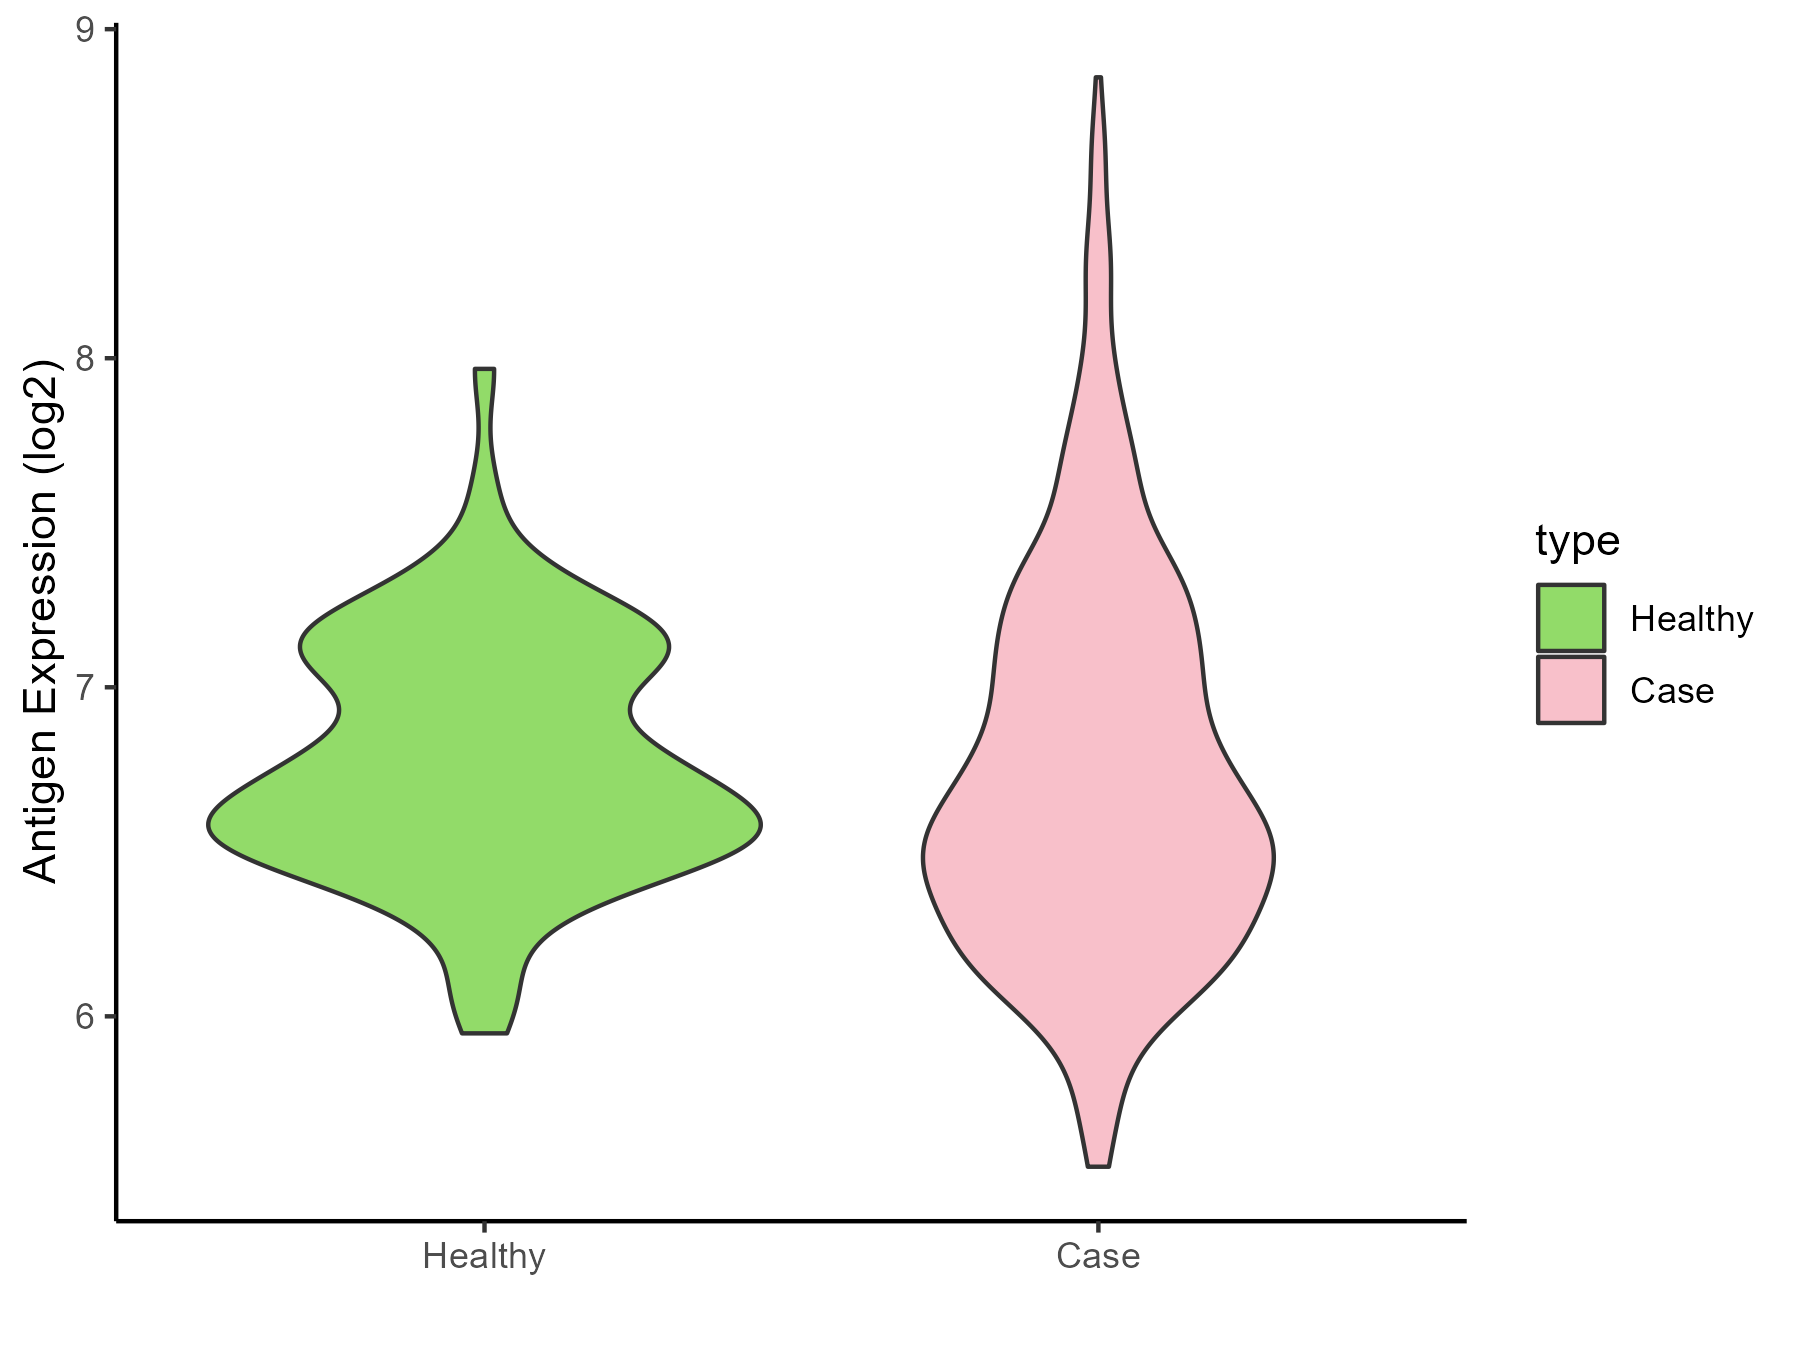
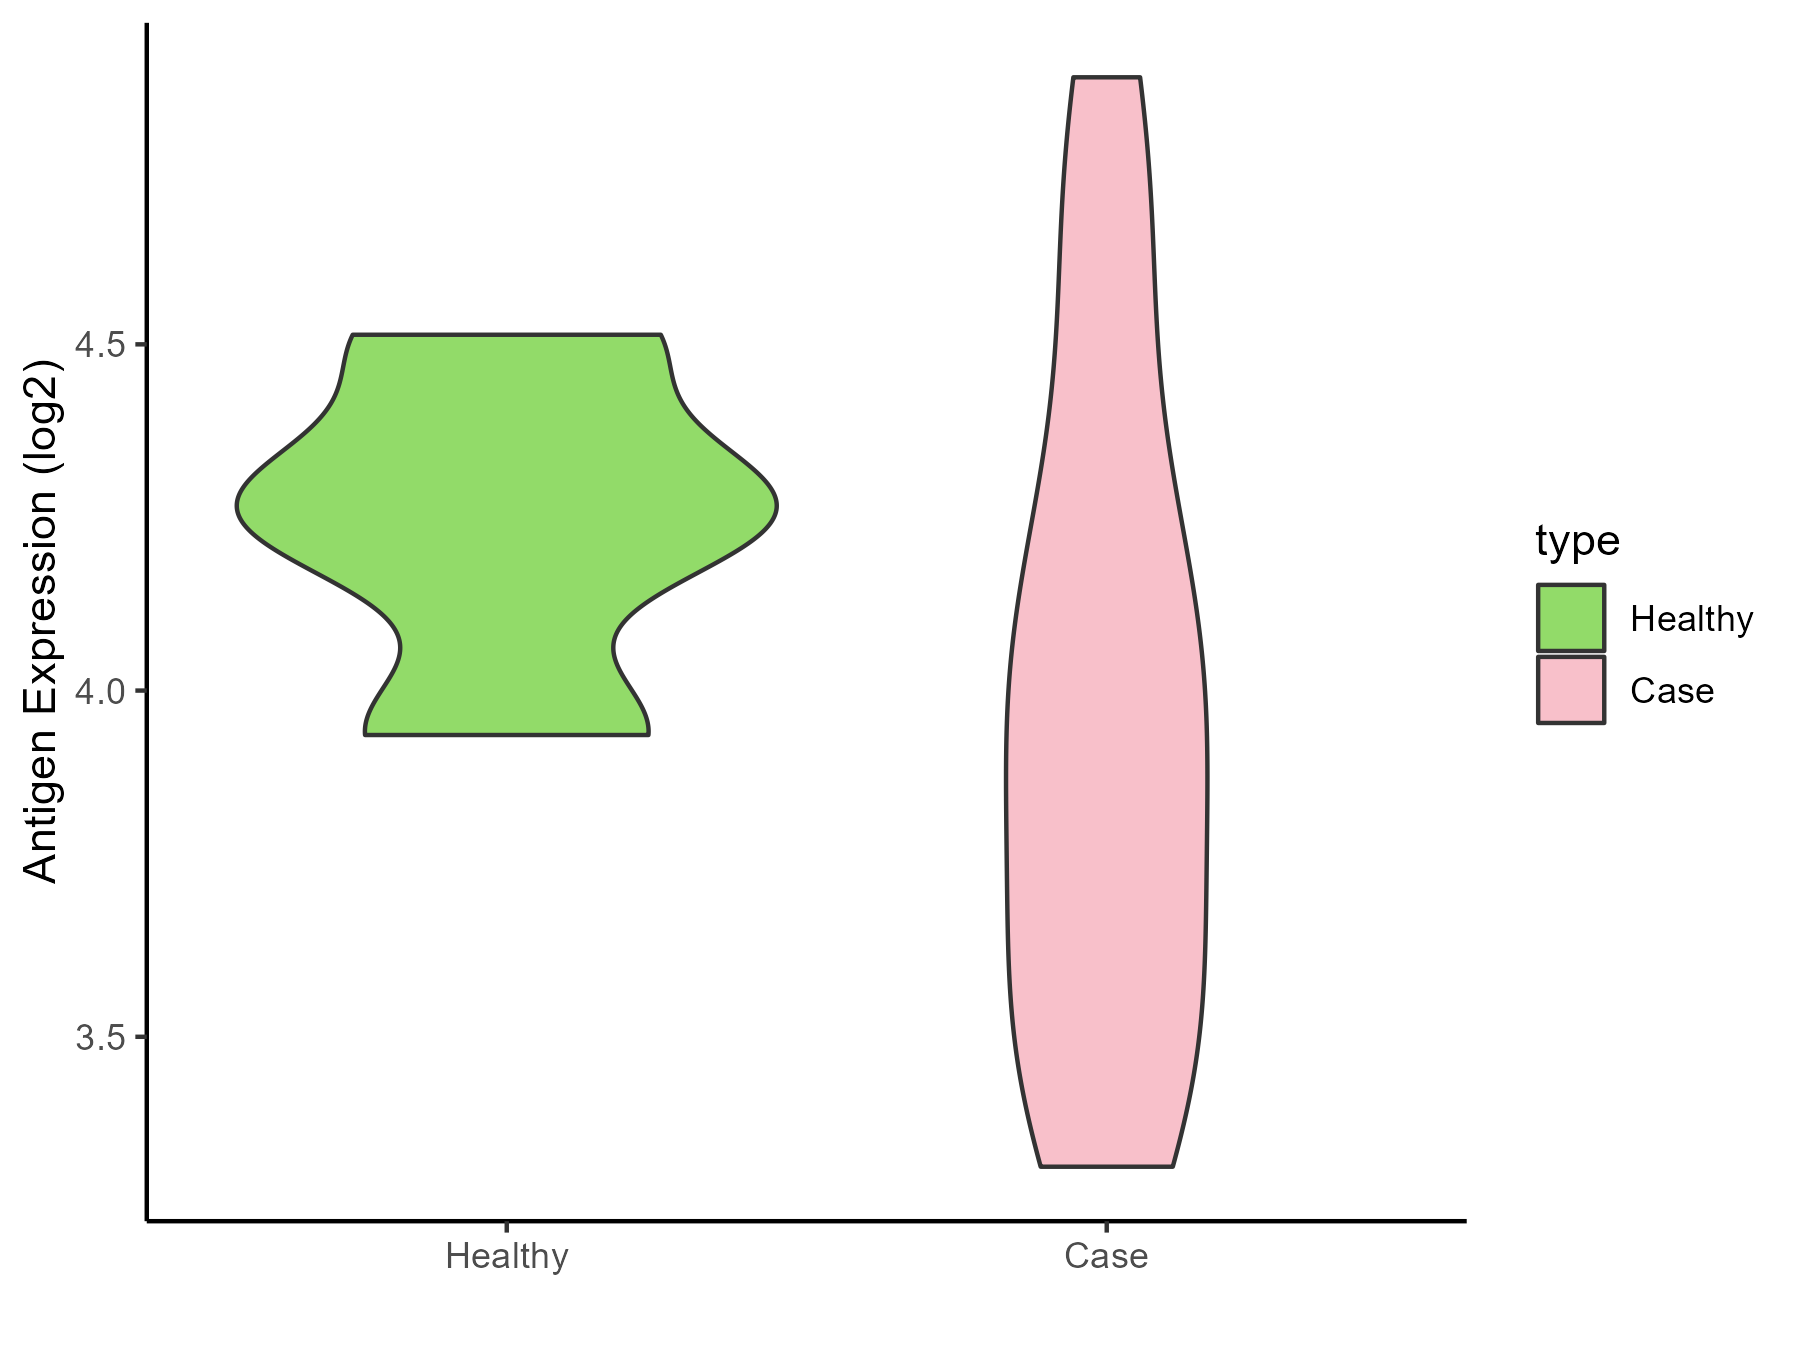
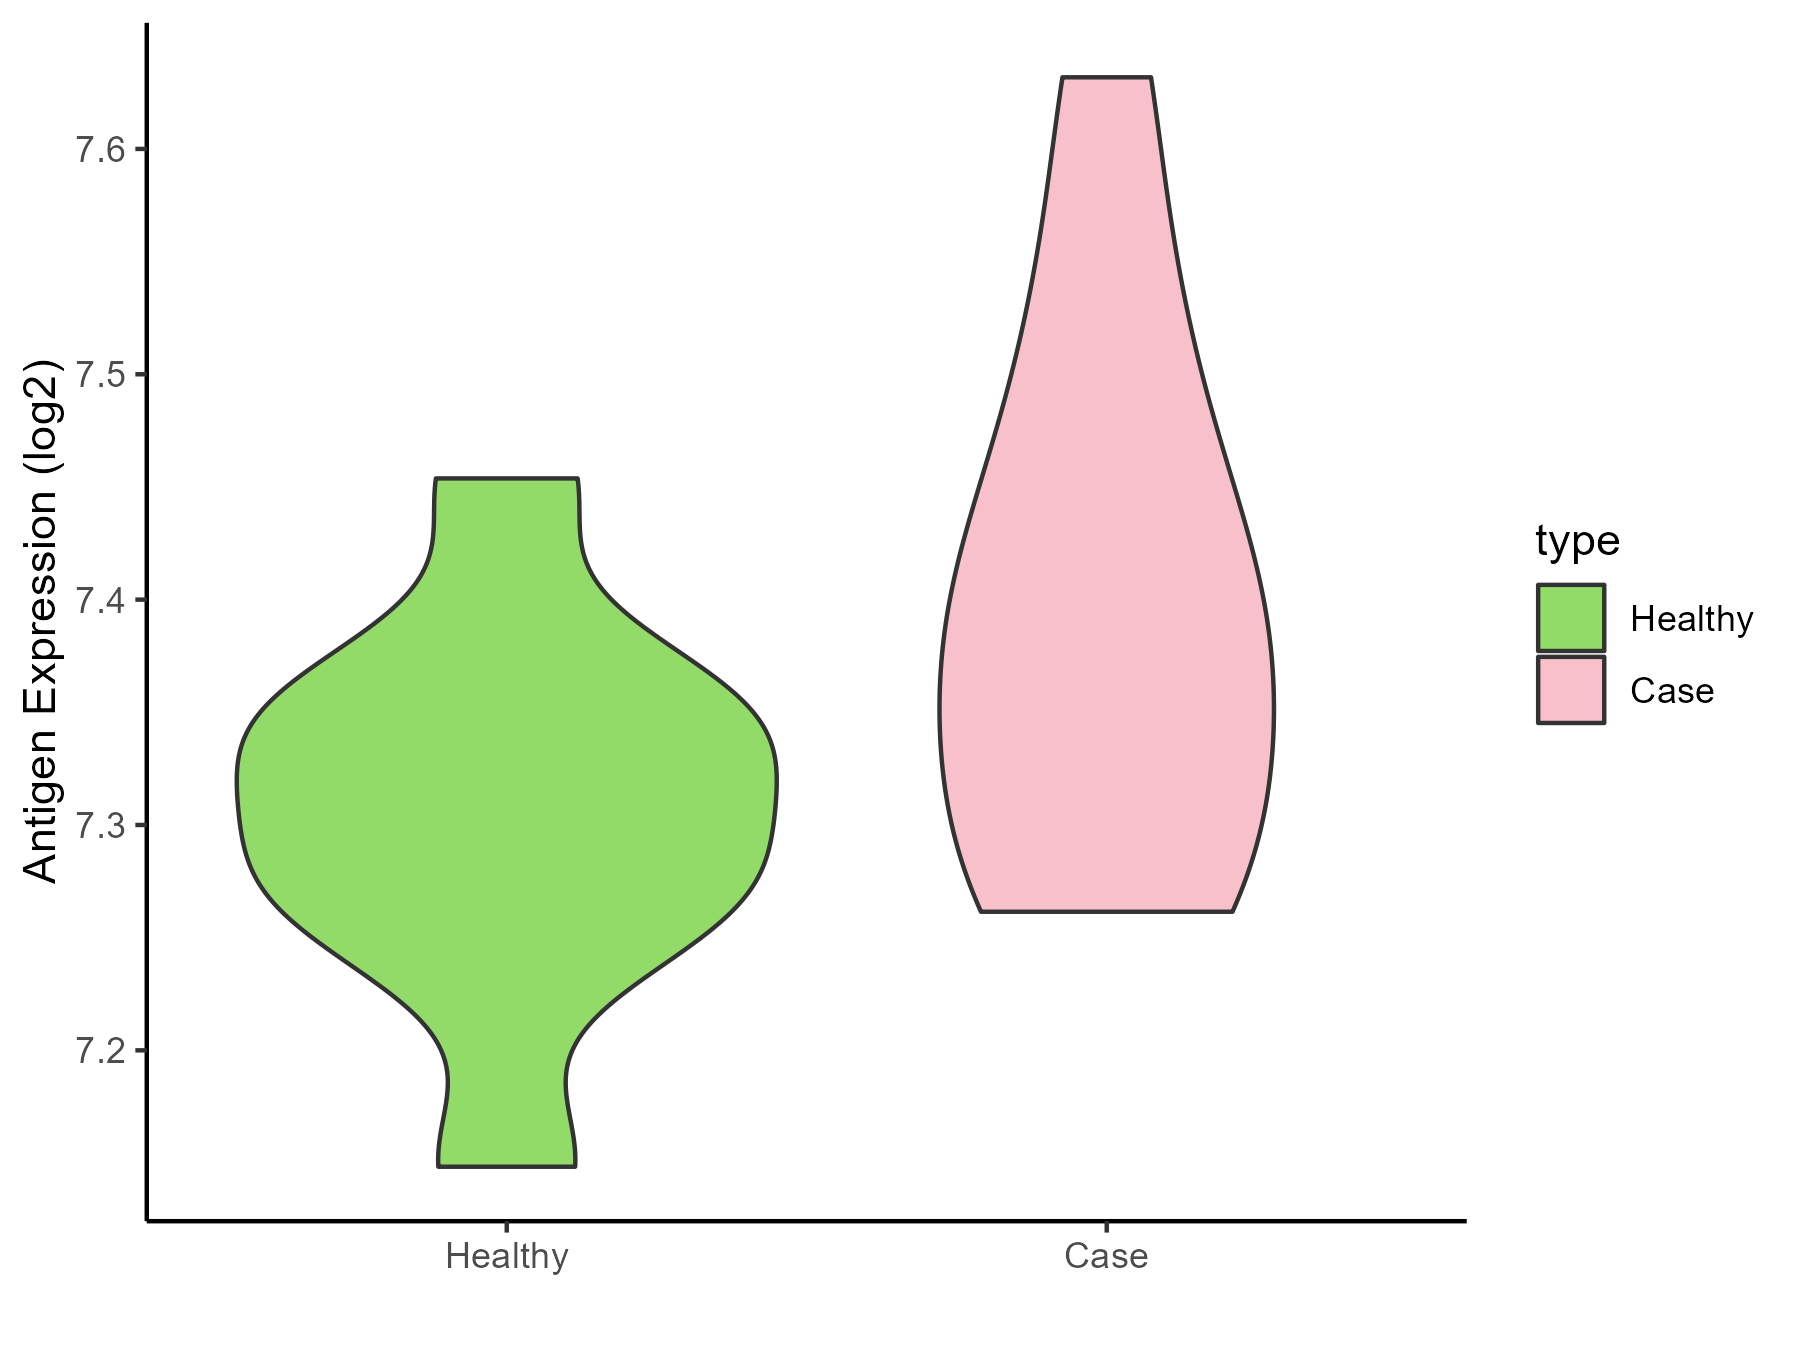
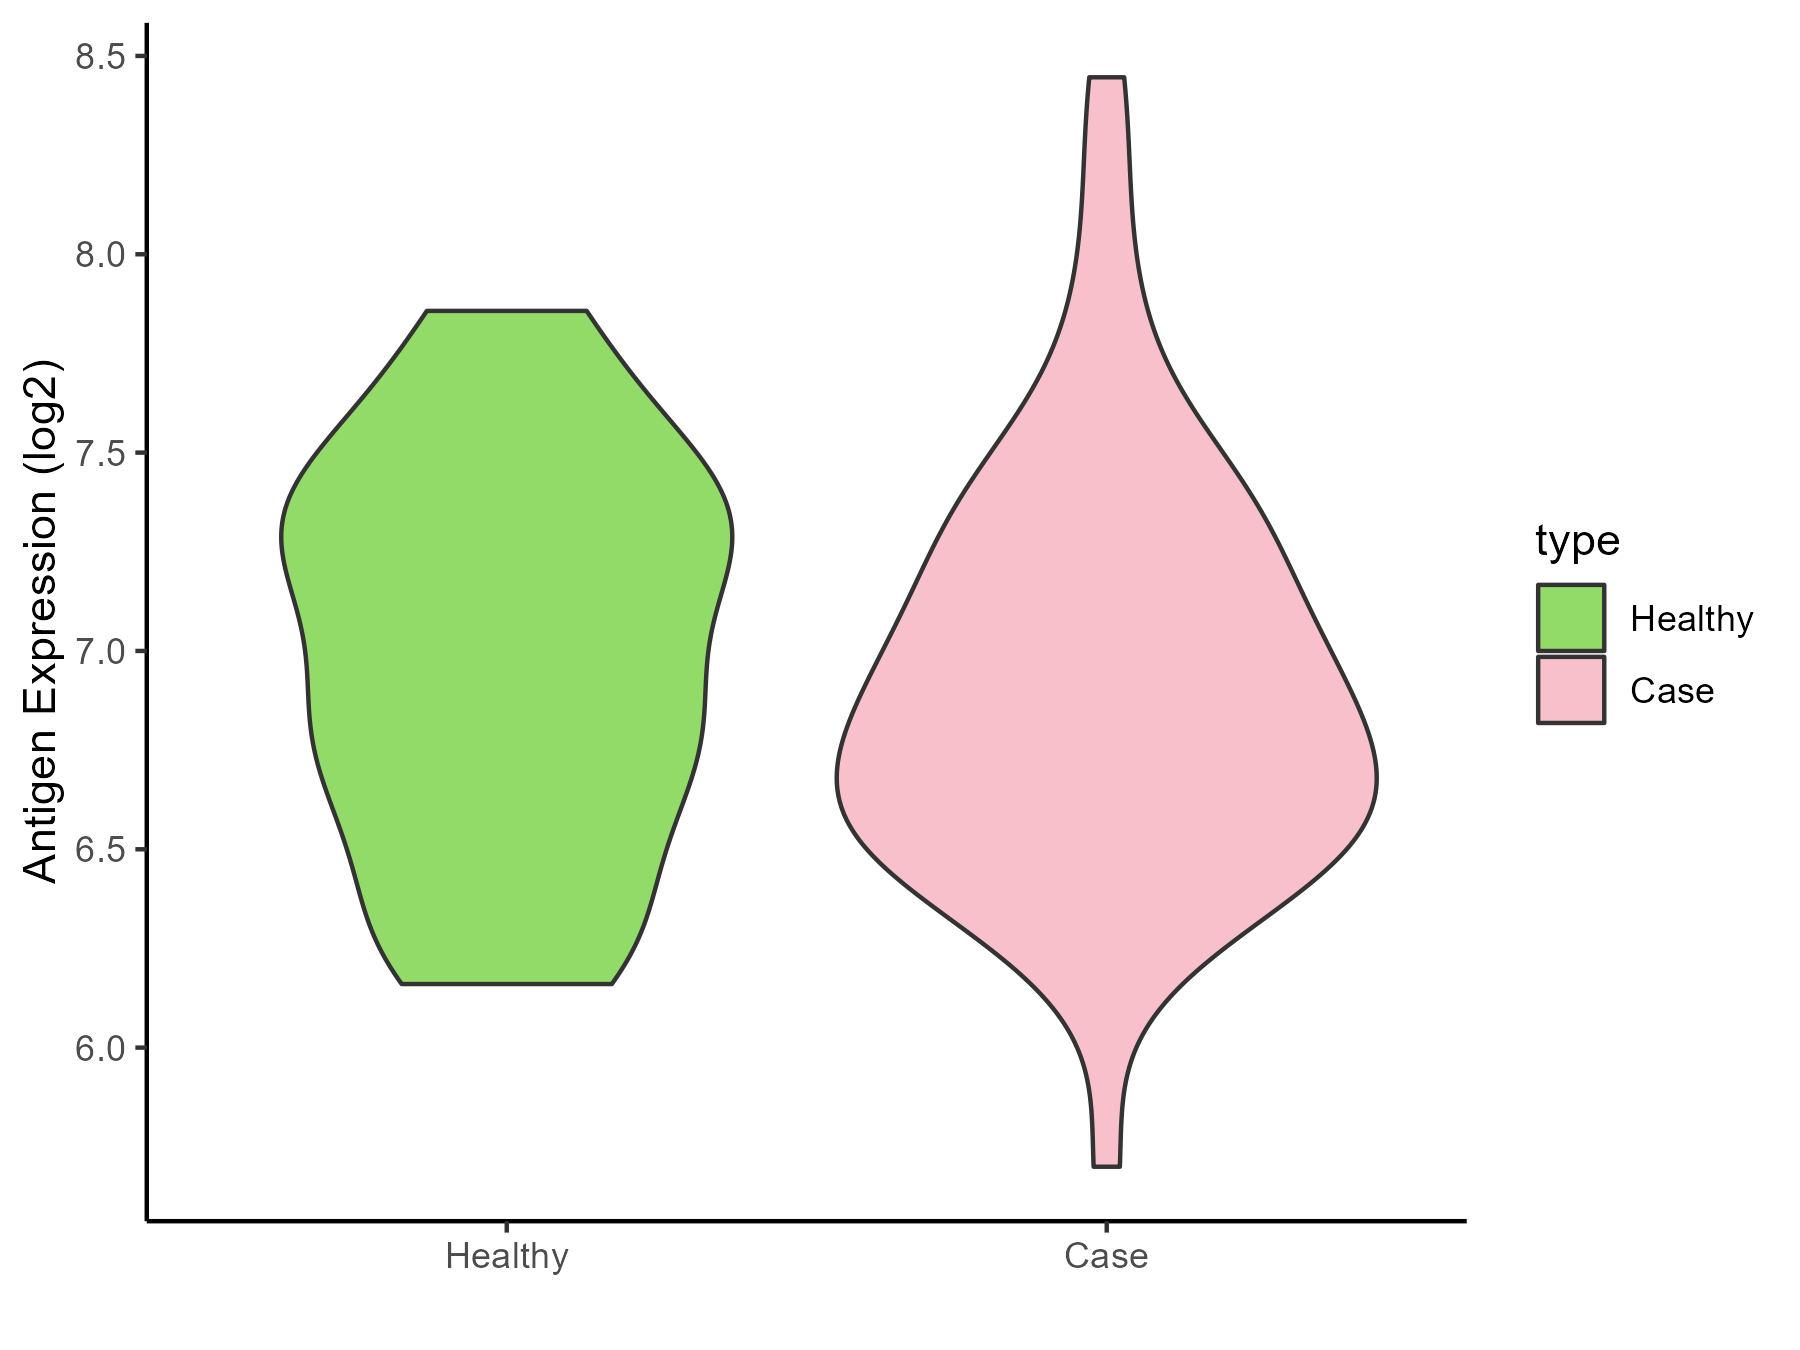
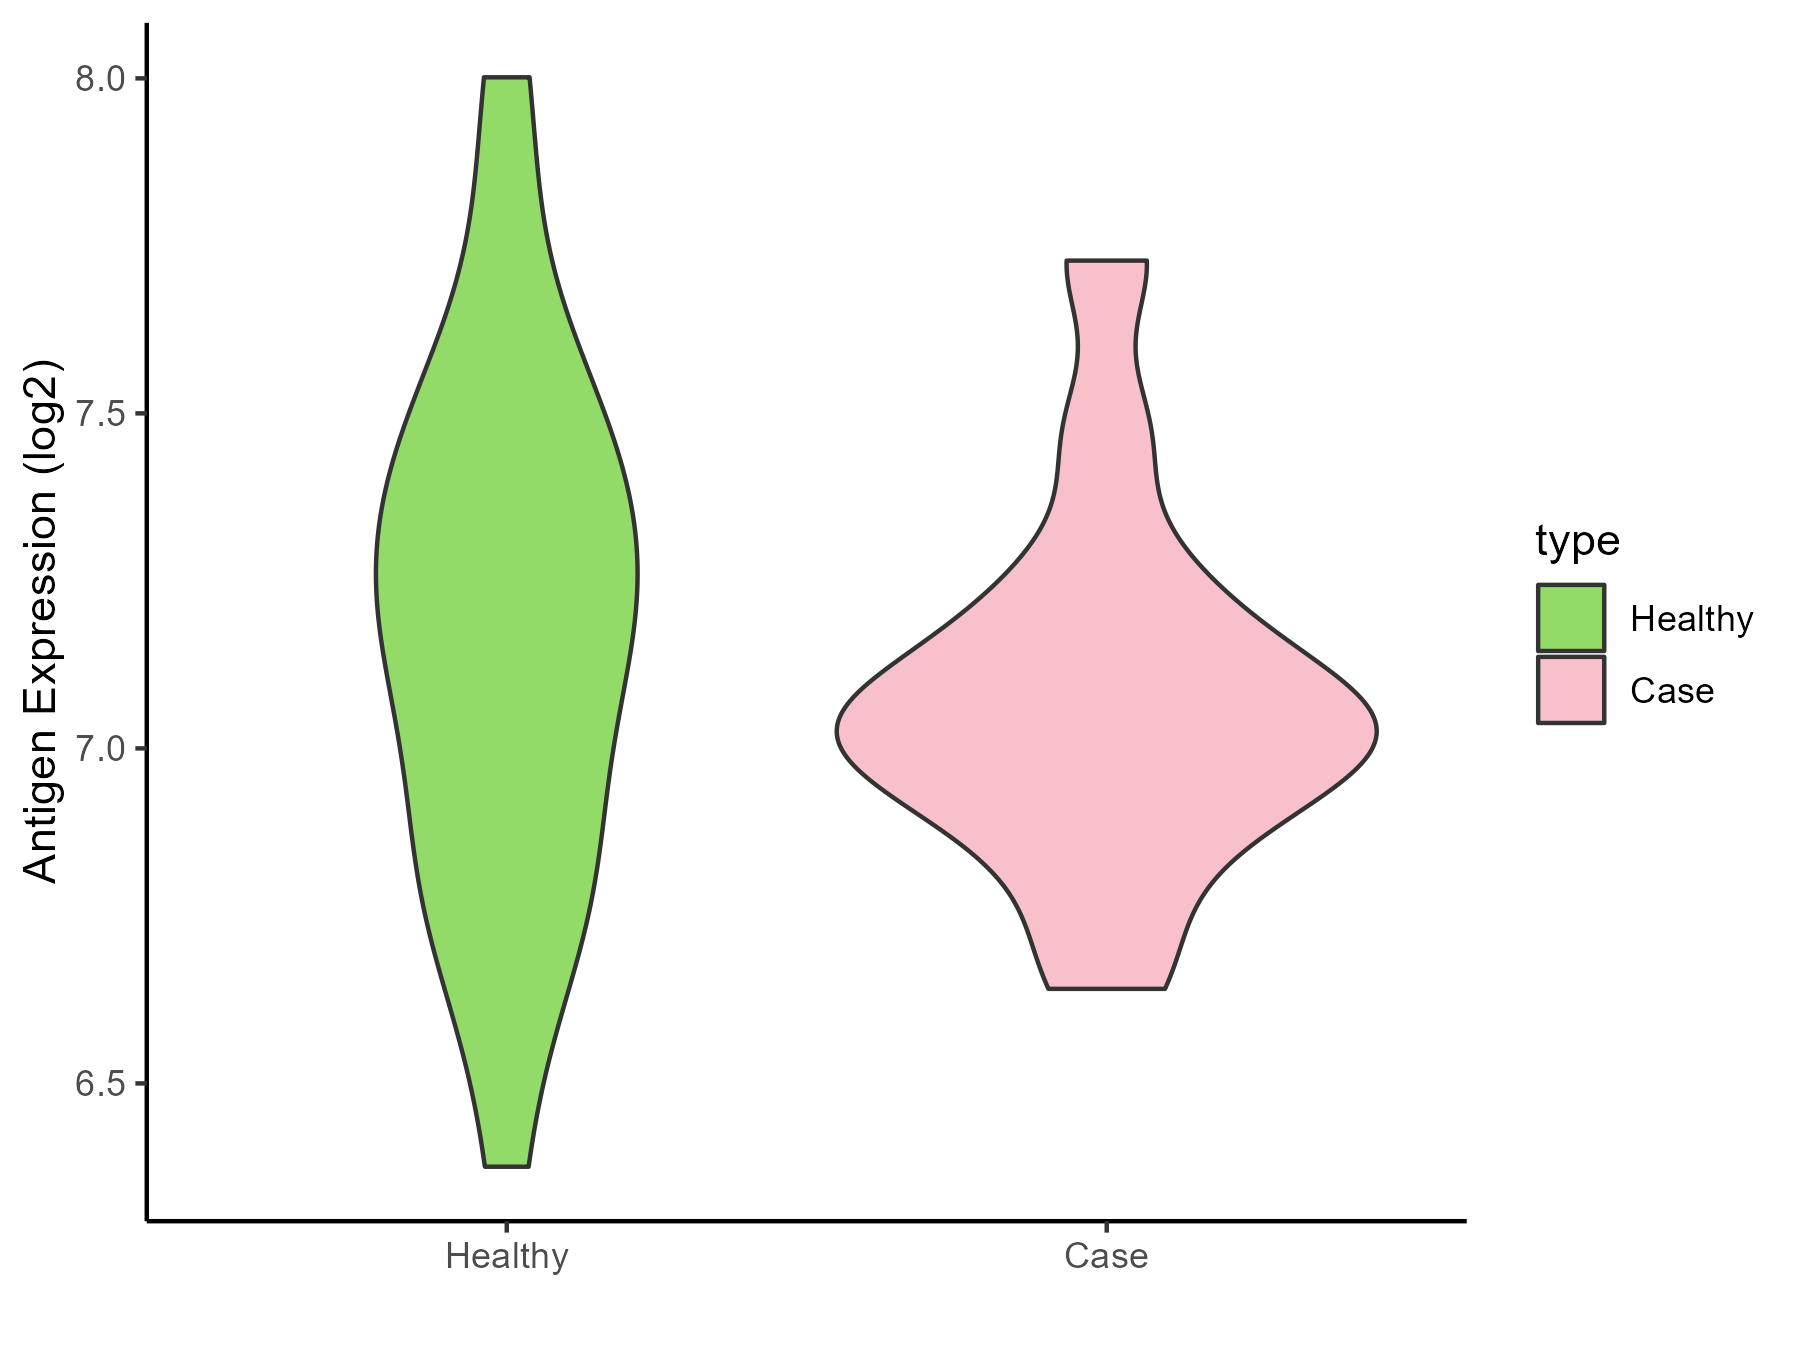
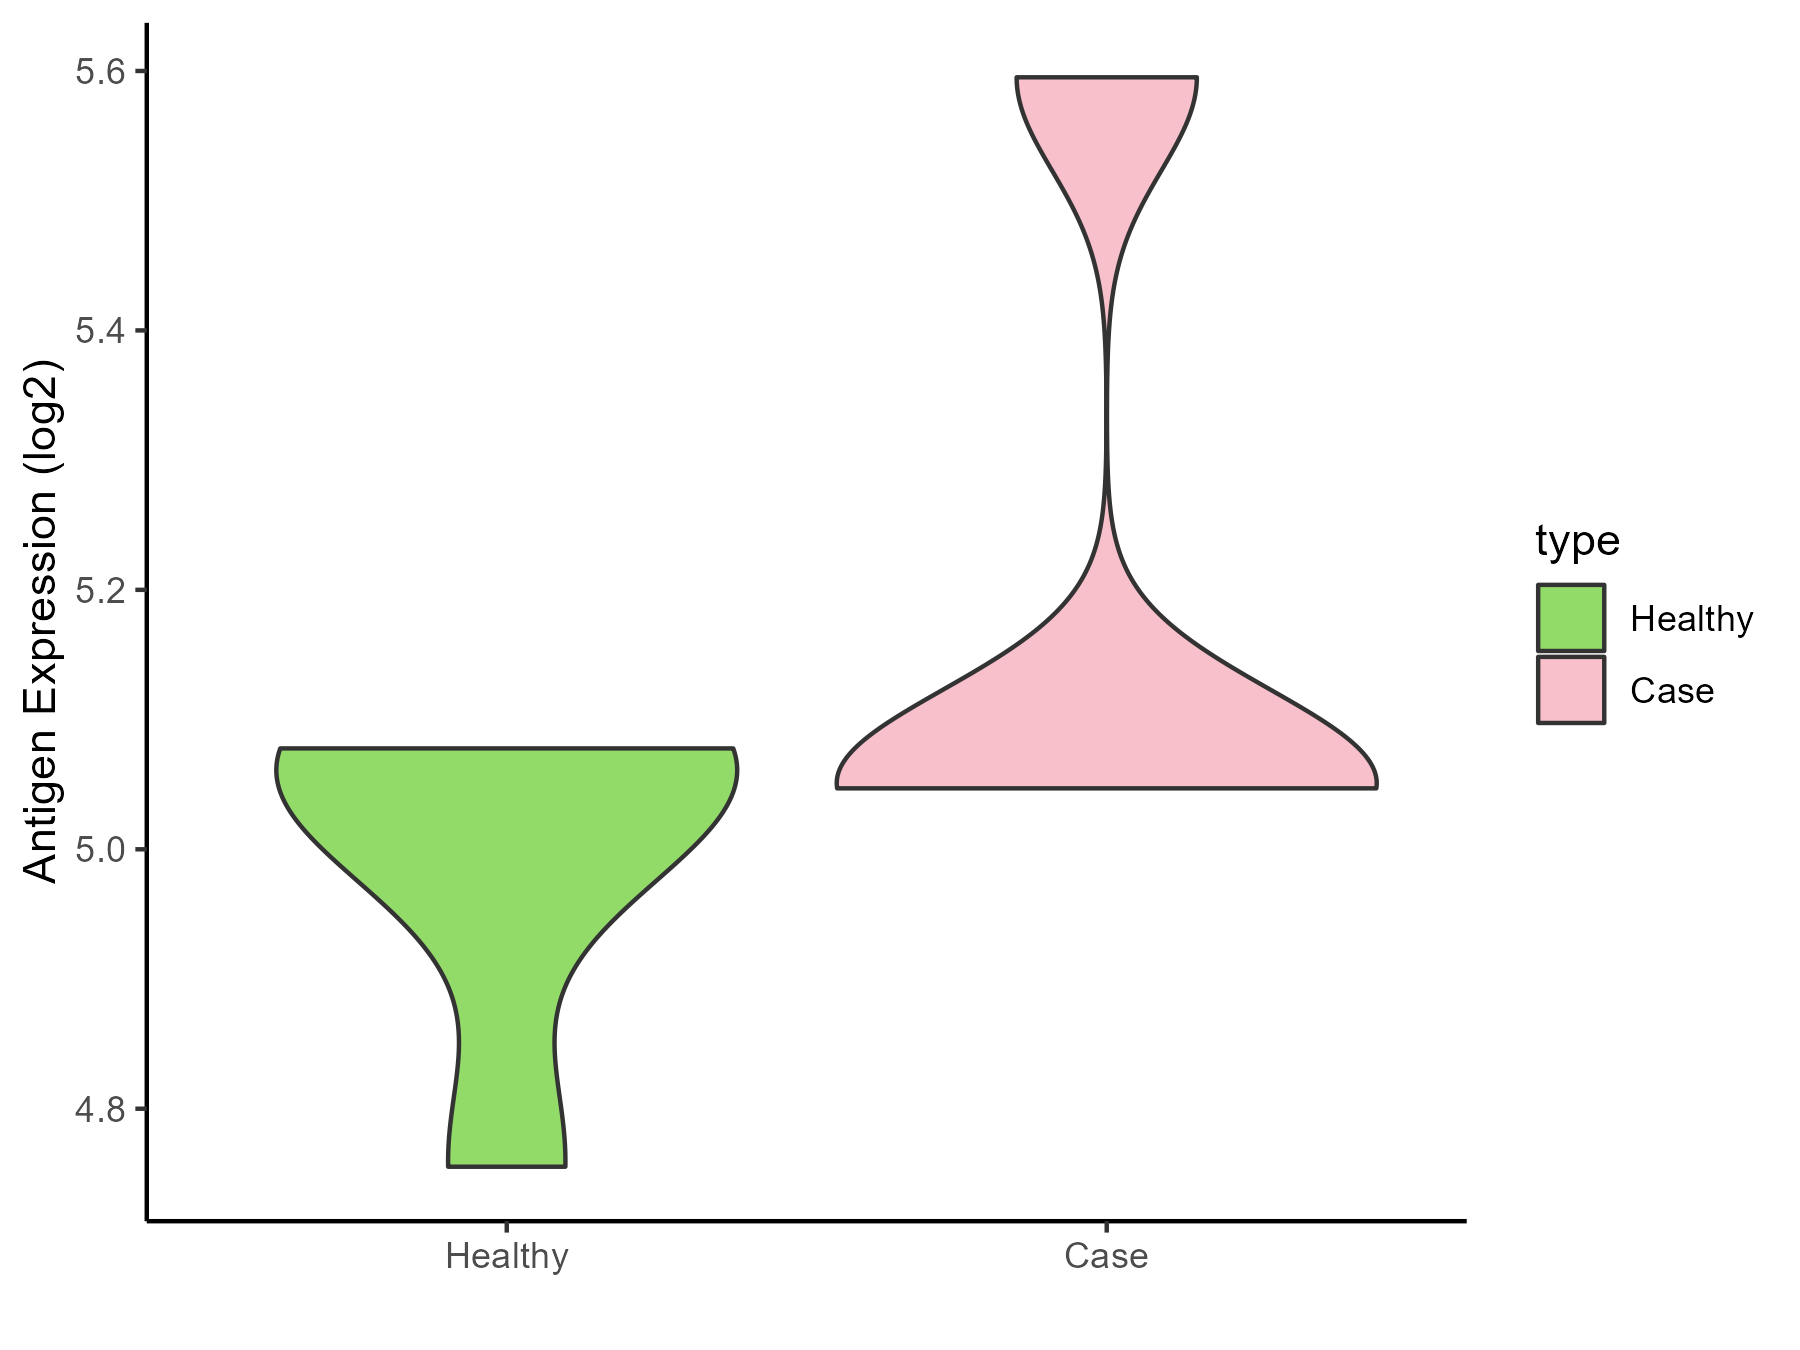
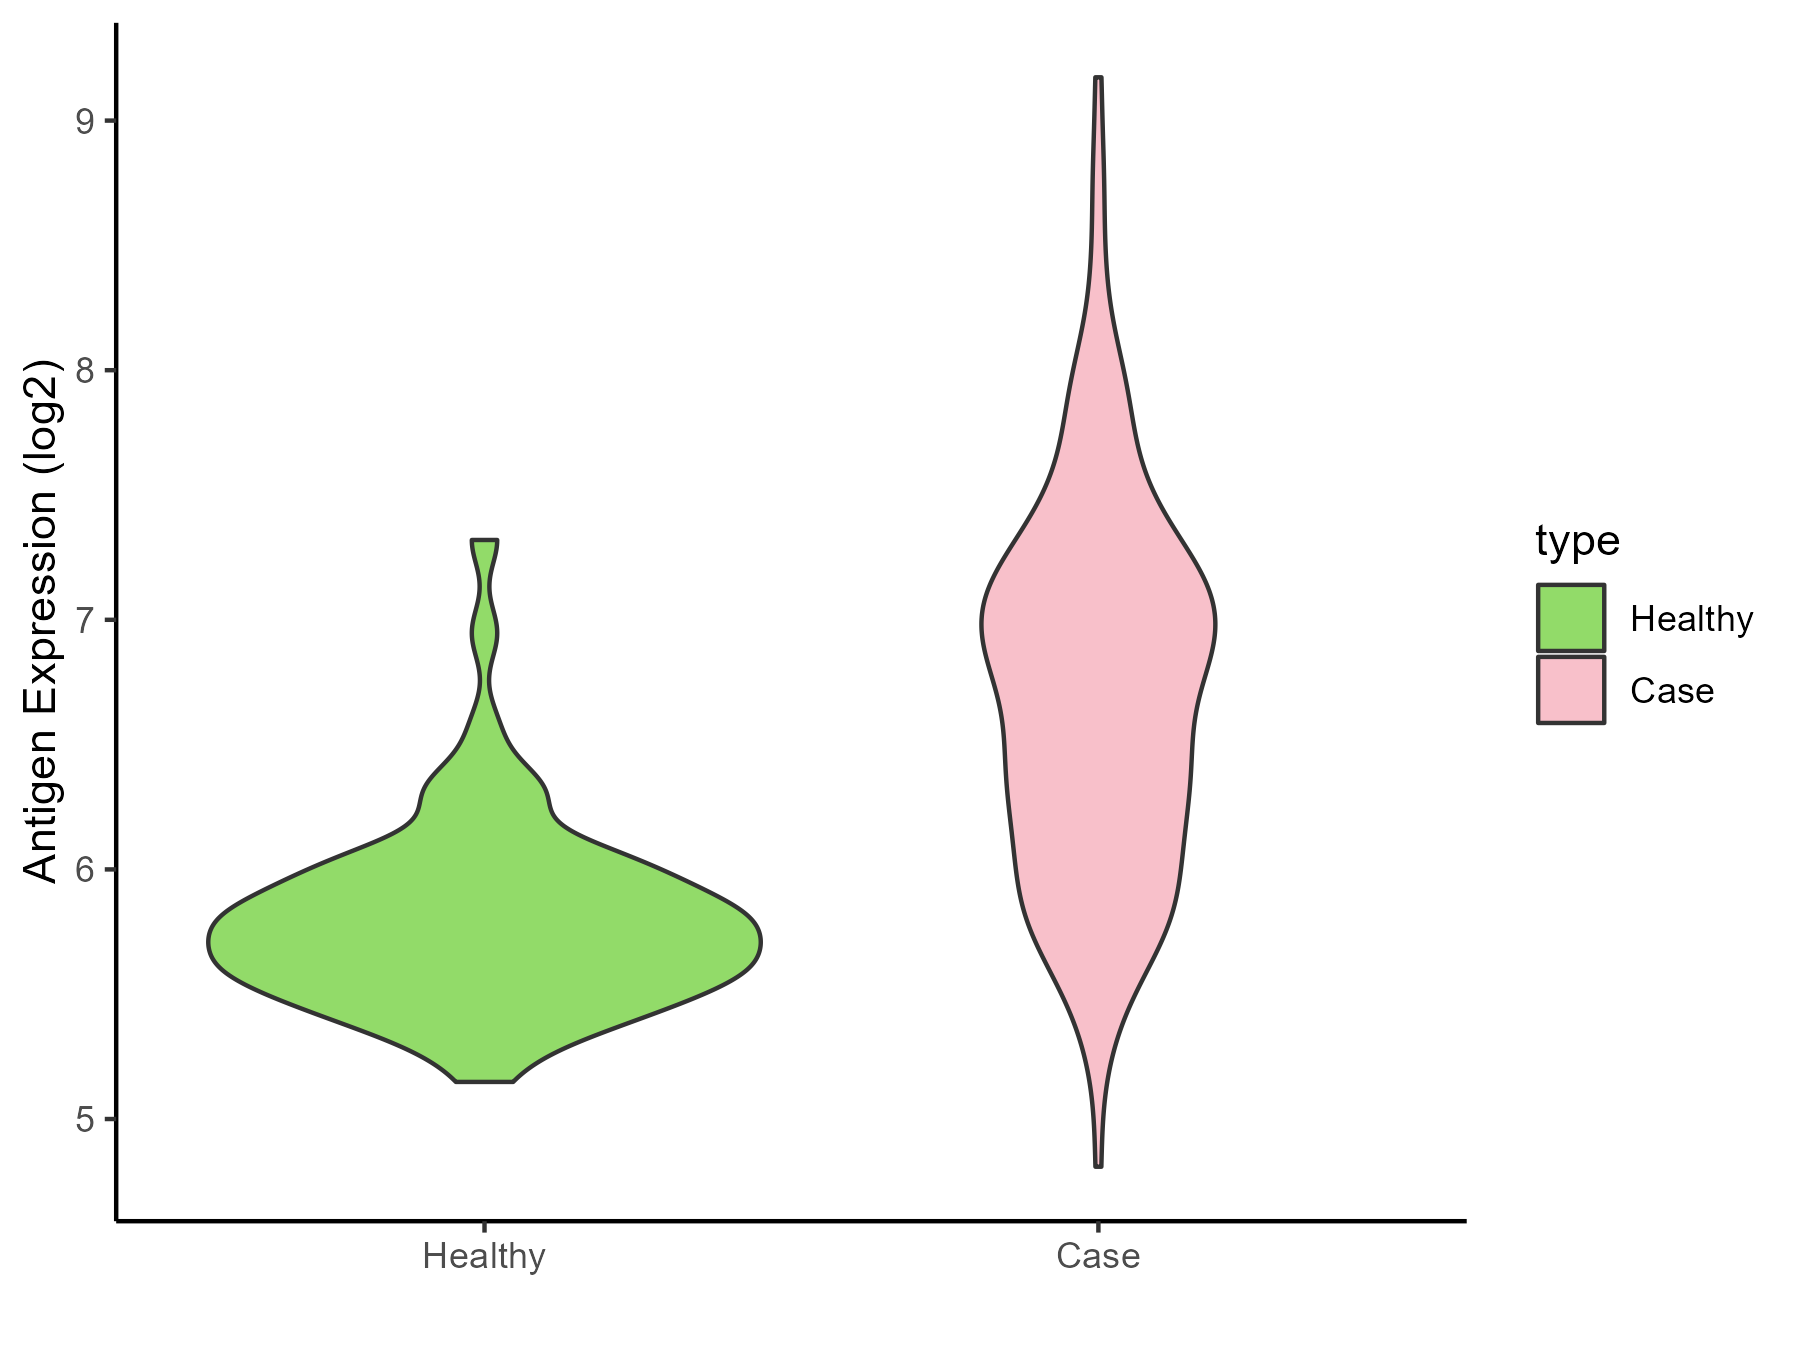
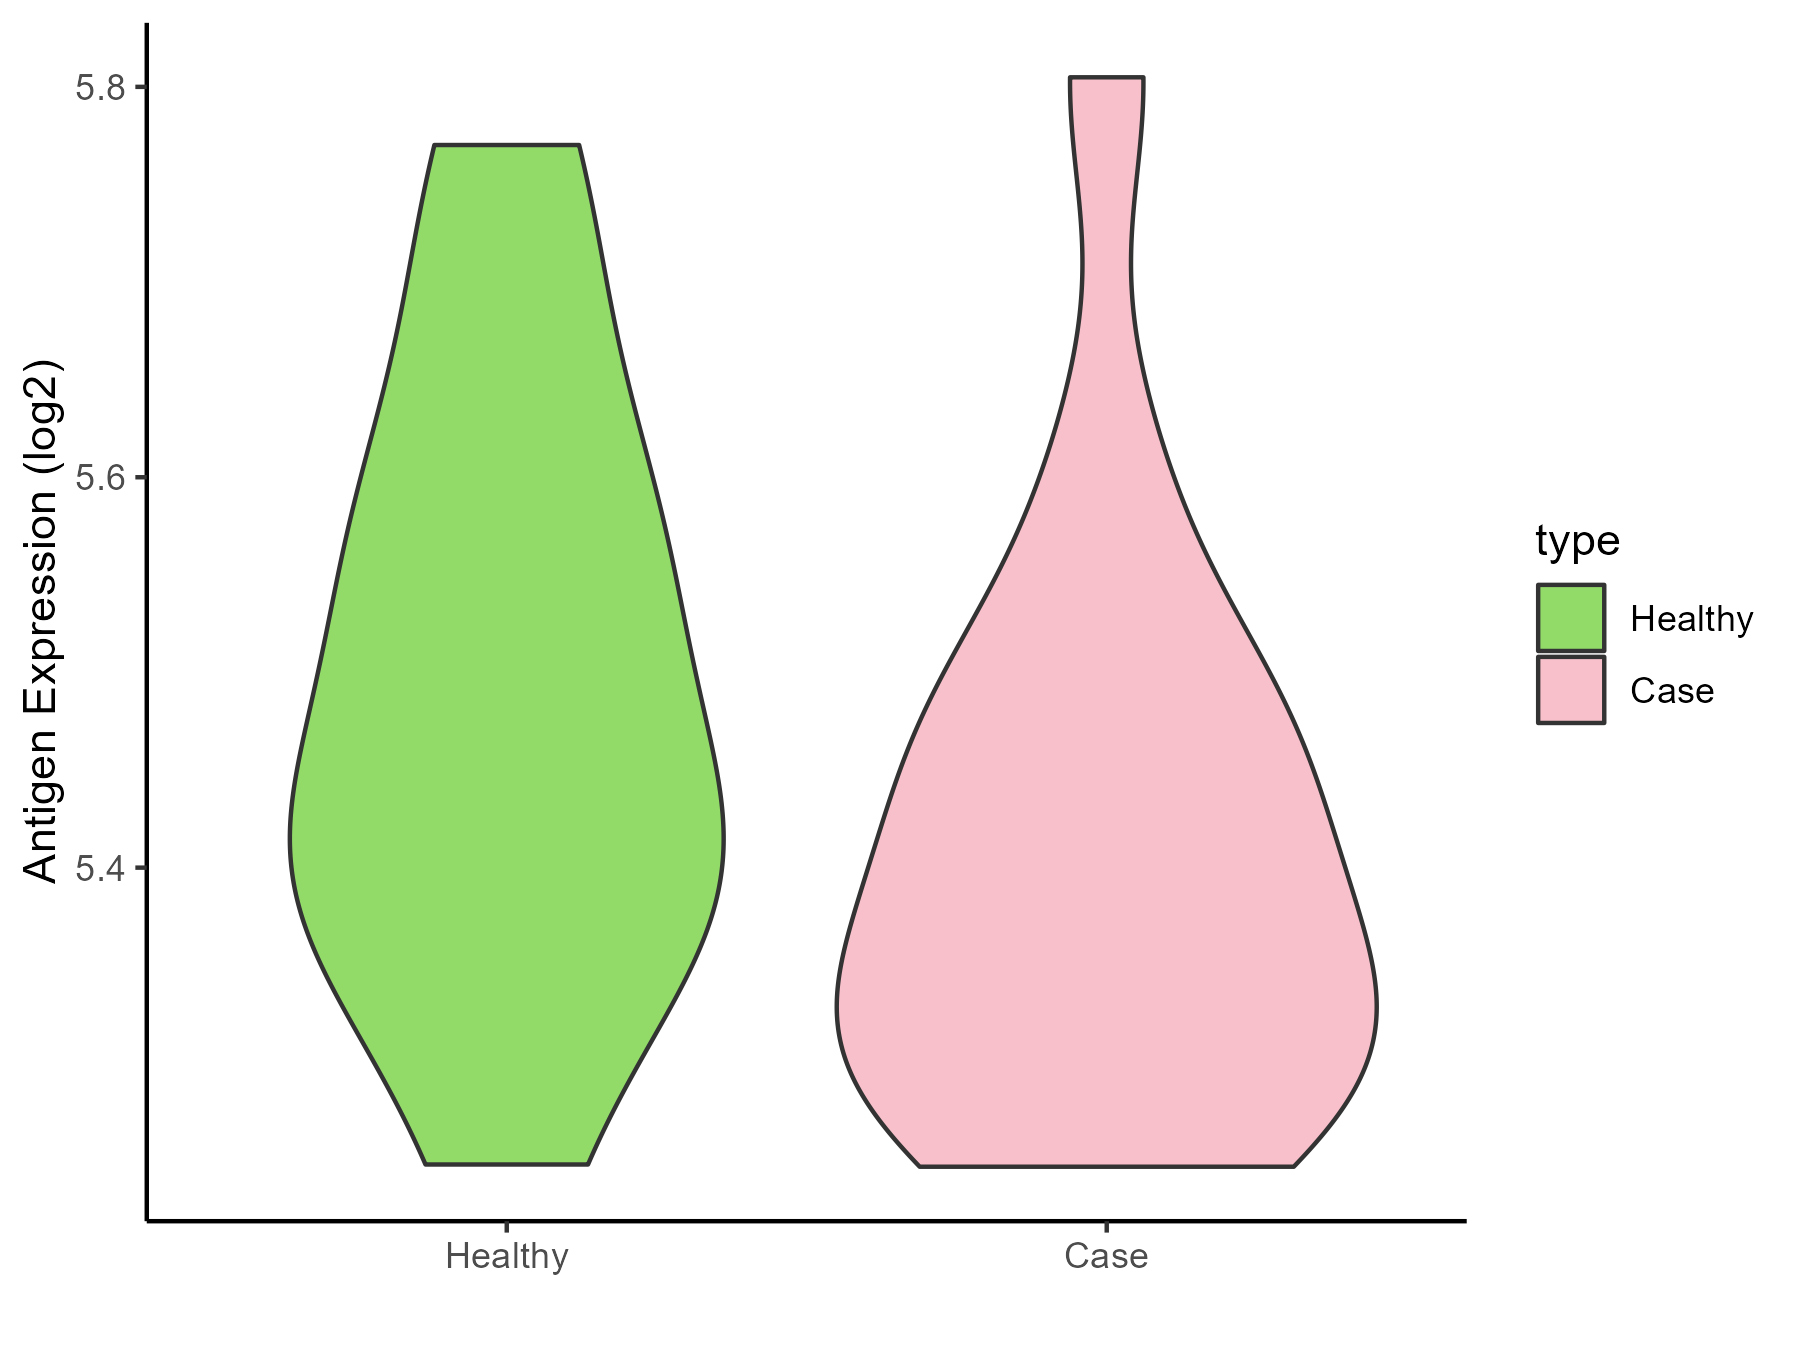
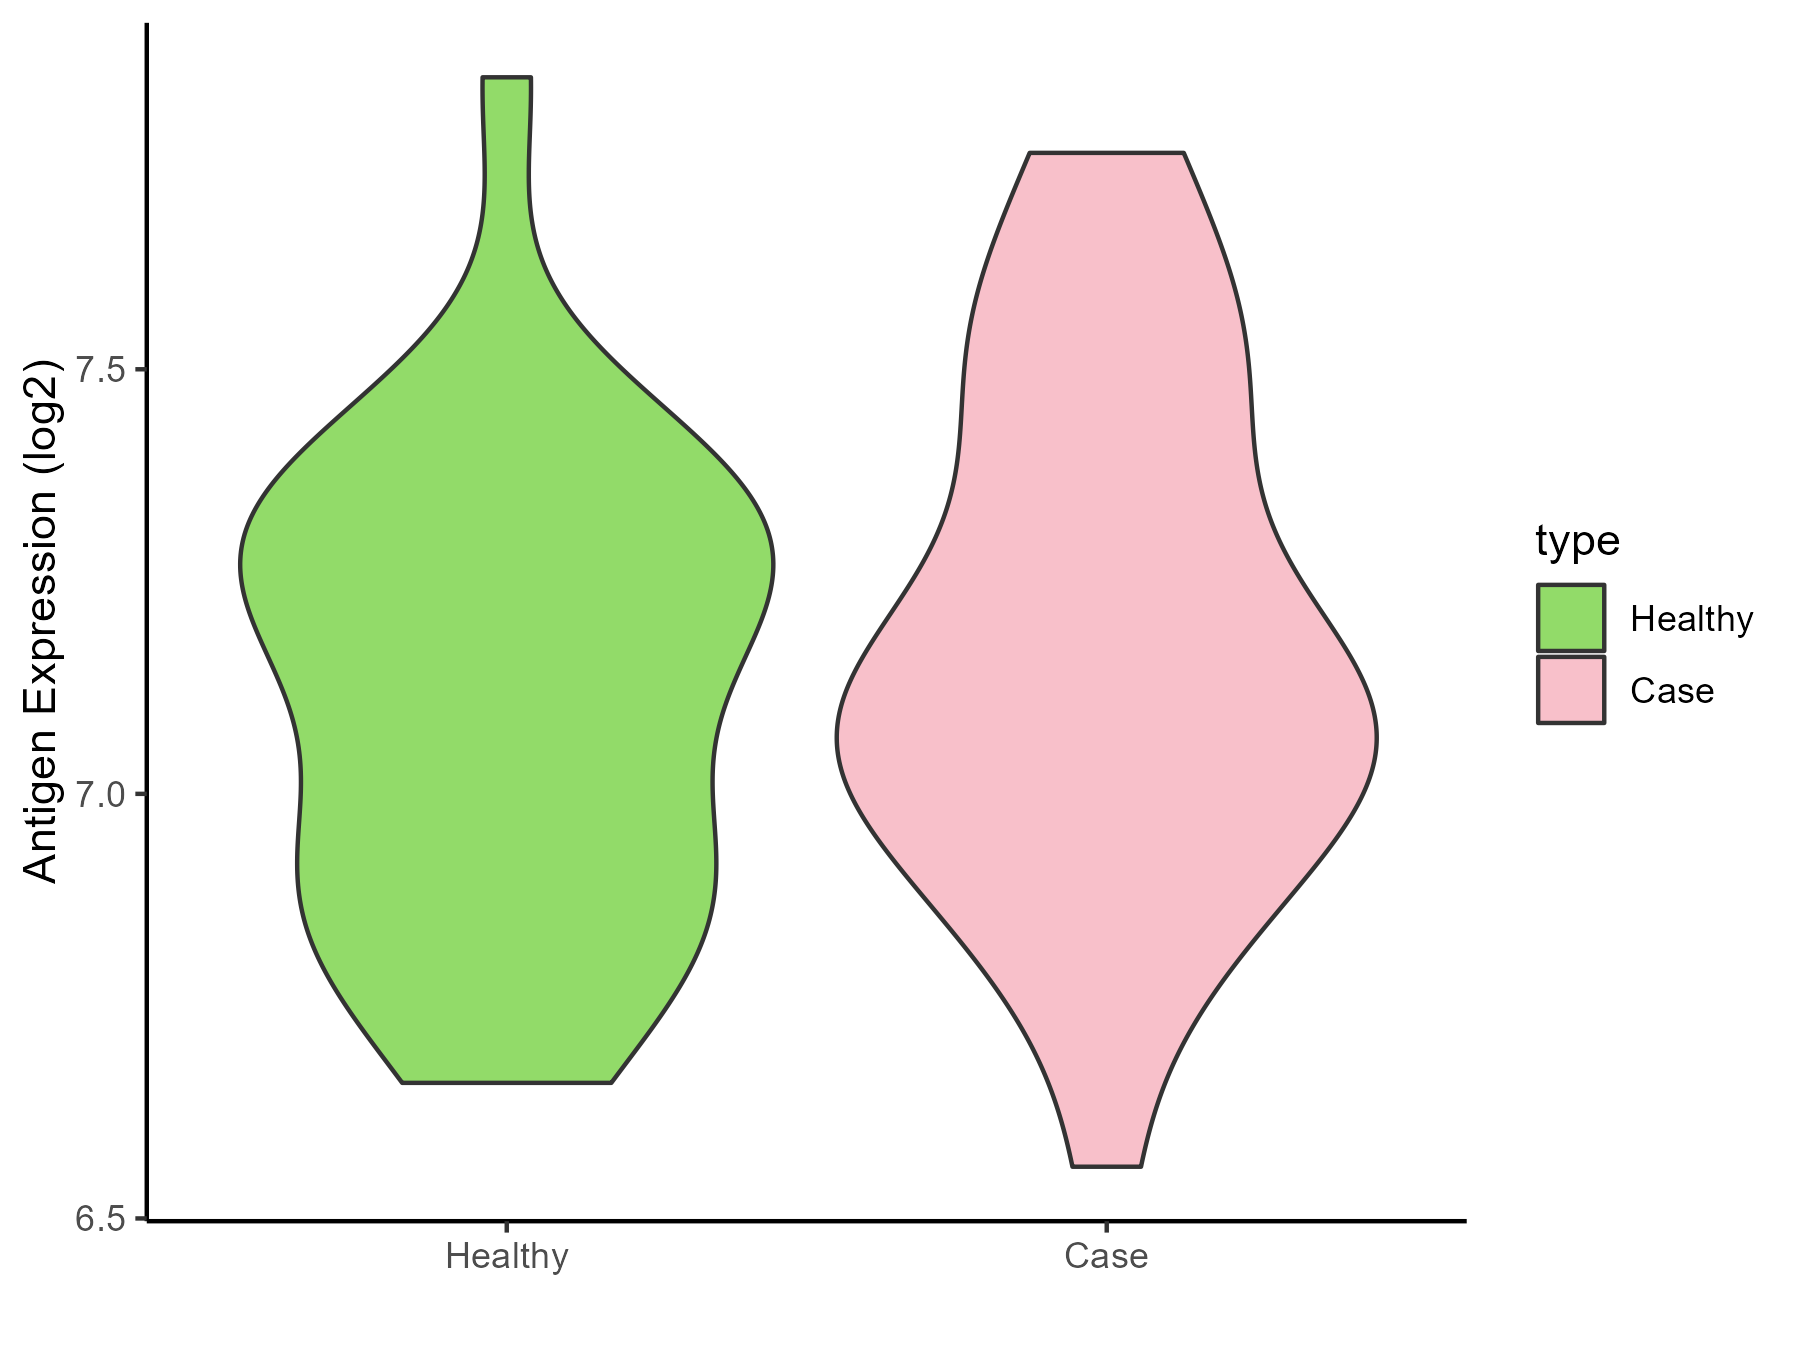
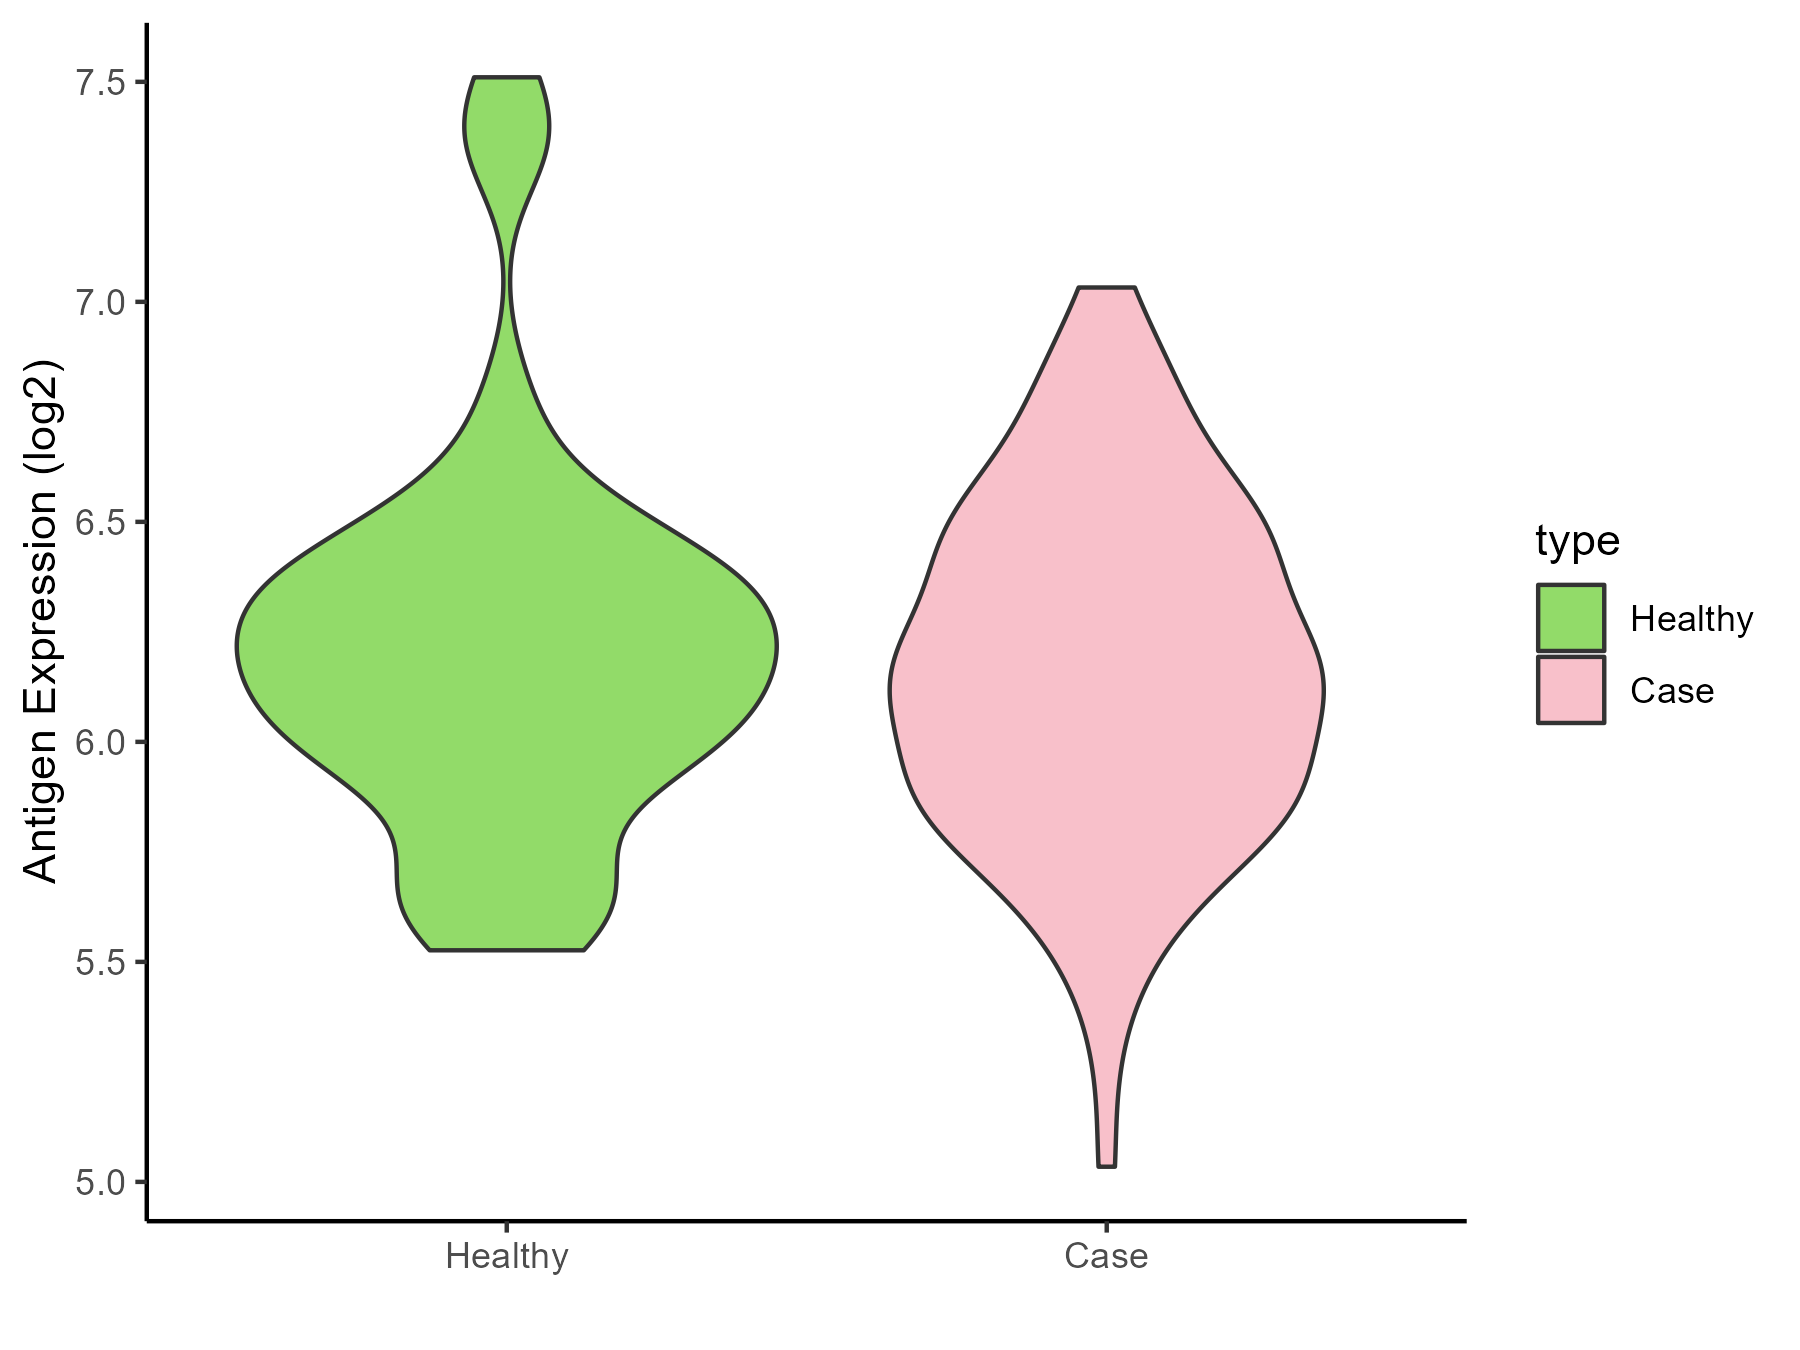
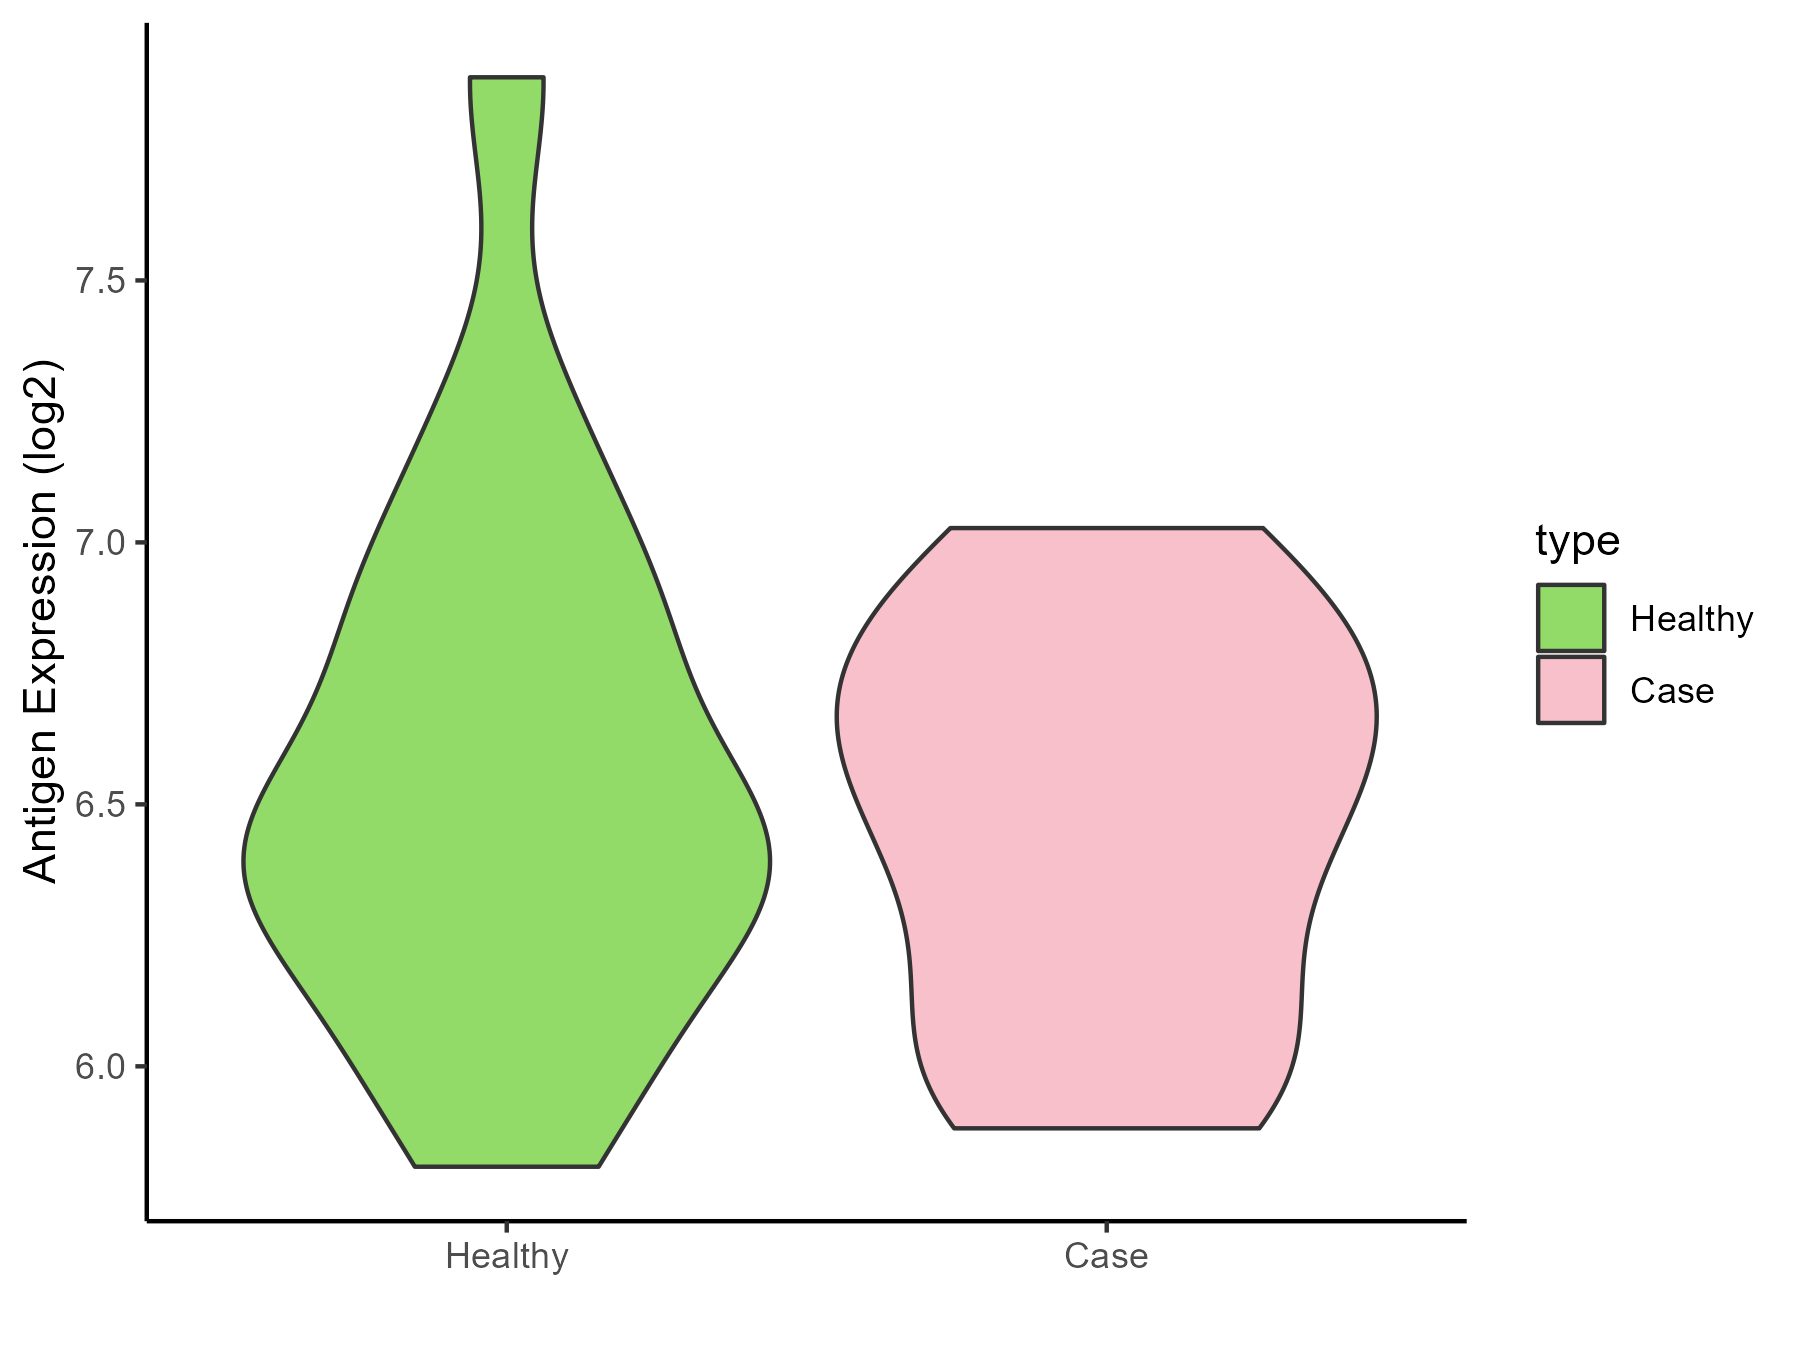
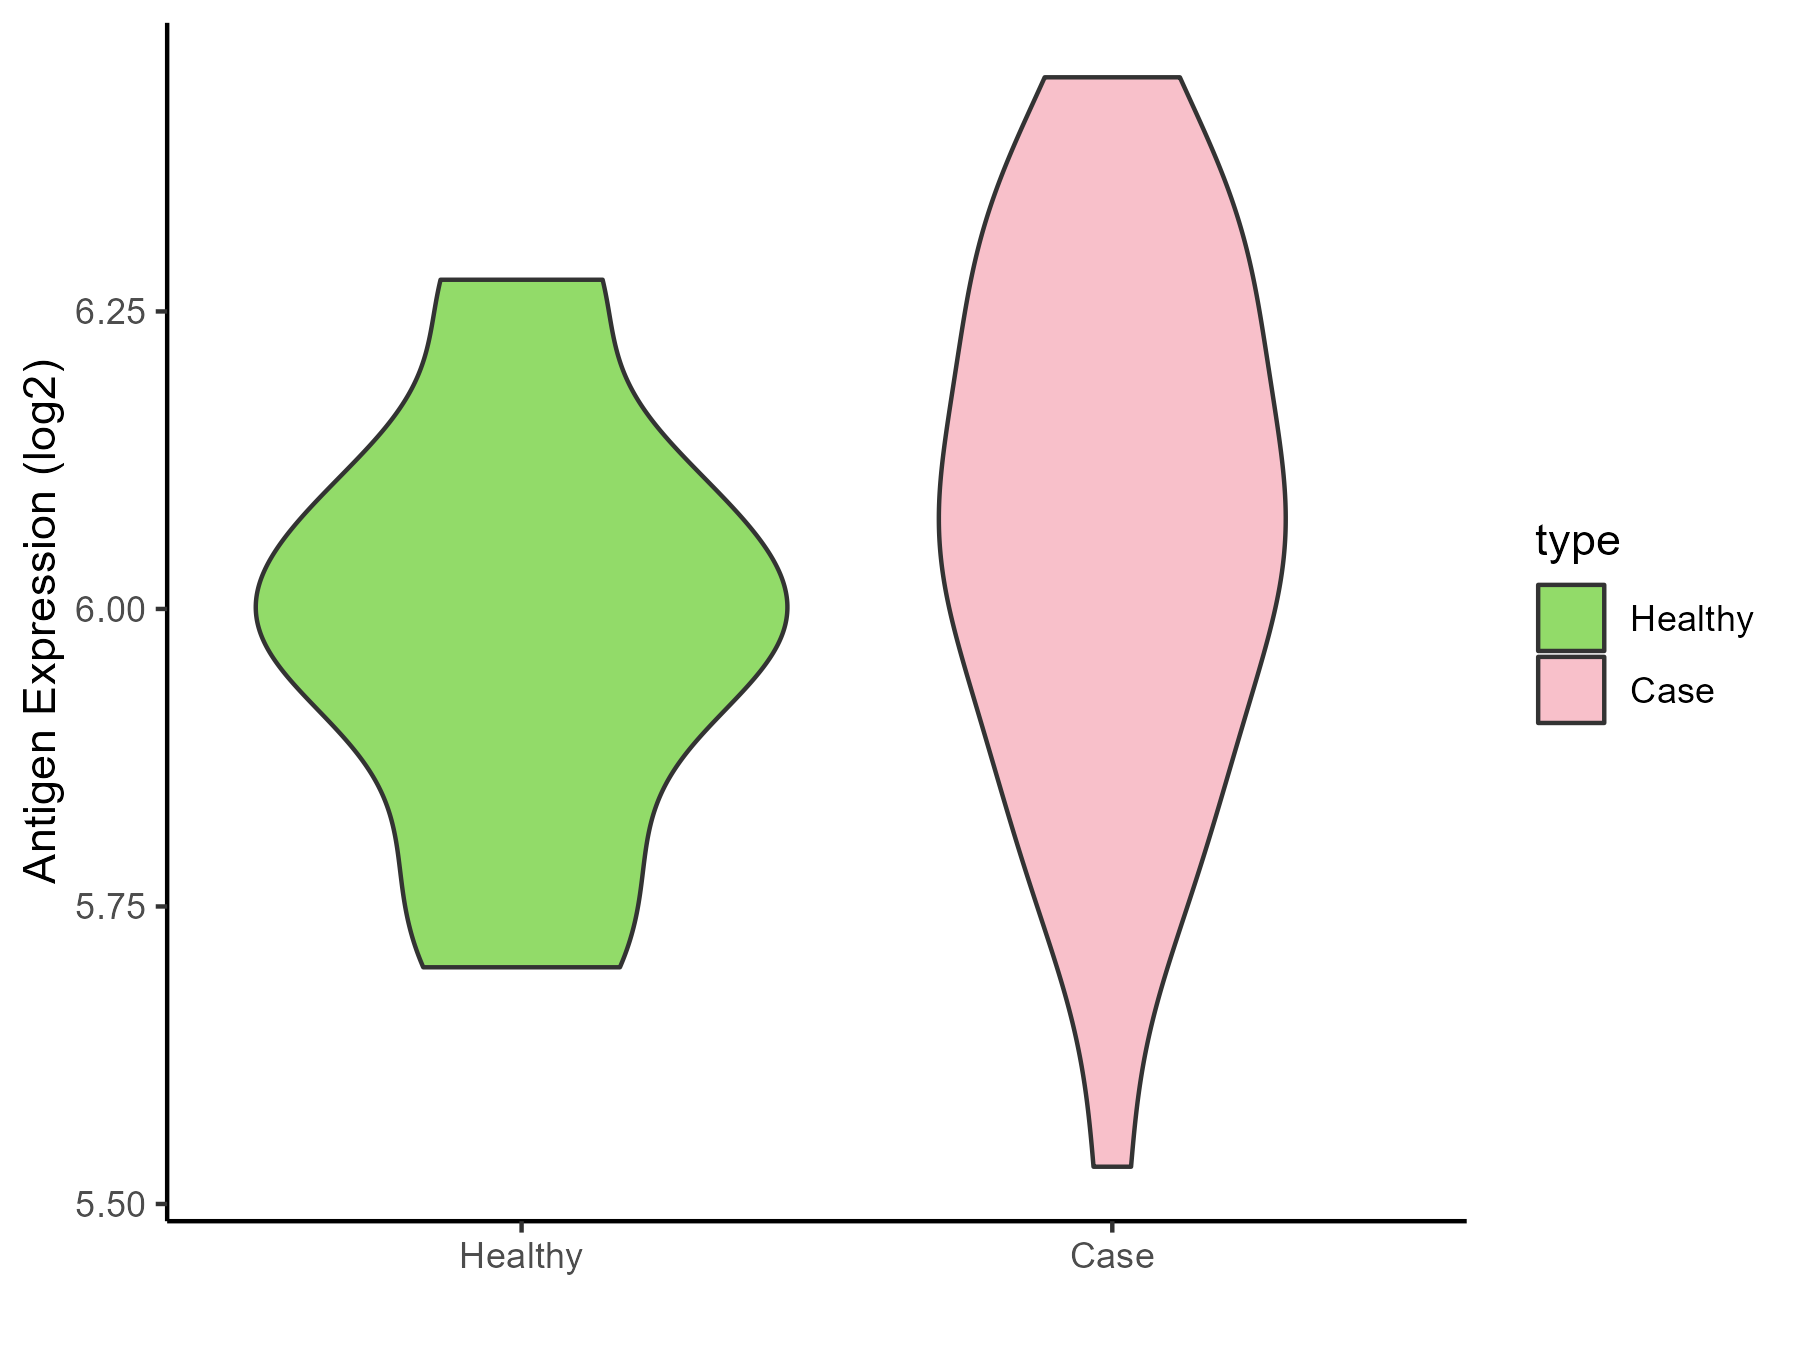
| The Studied Tissue | White matter | |
| The Specific Disease | Glioma | |
| The Expression Level of Disease Section Compare with the Healthy Individual Tissue | p-value: 0.304461003; Fold-change: -0.037540825; Z-score: -0.051021859 | |
| Disease-specific Antigen Abundances |
|
Click to View the Clearer Original Diagram |
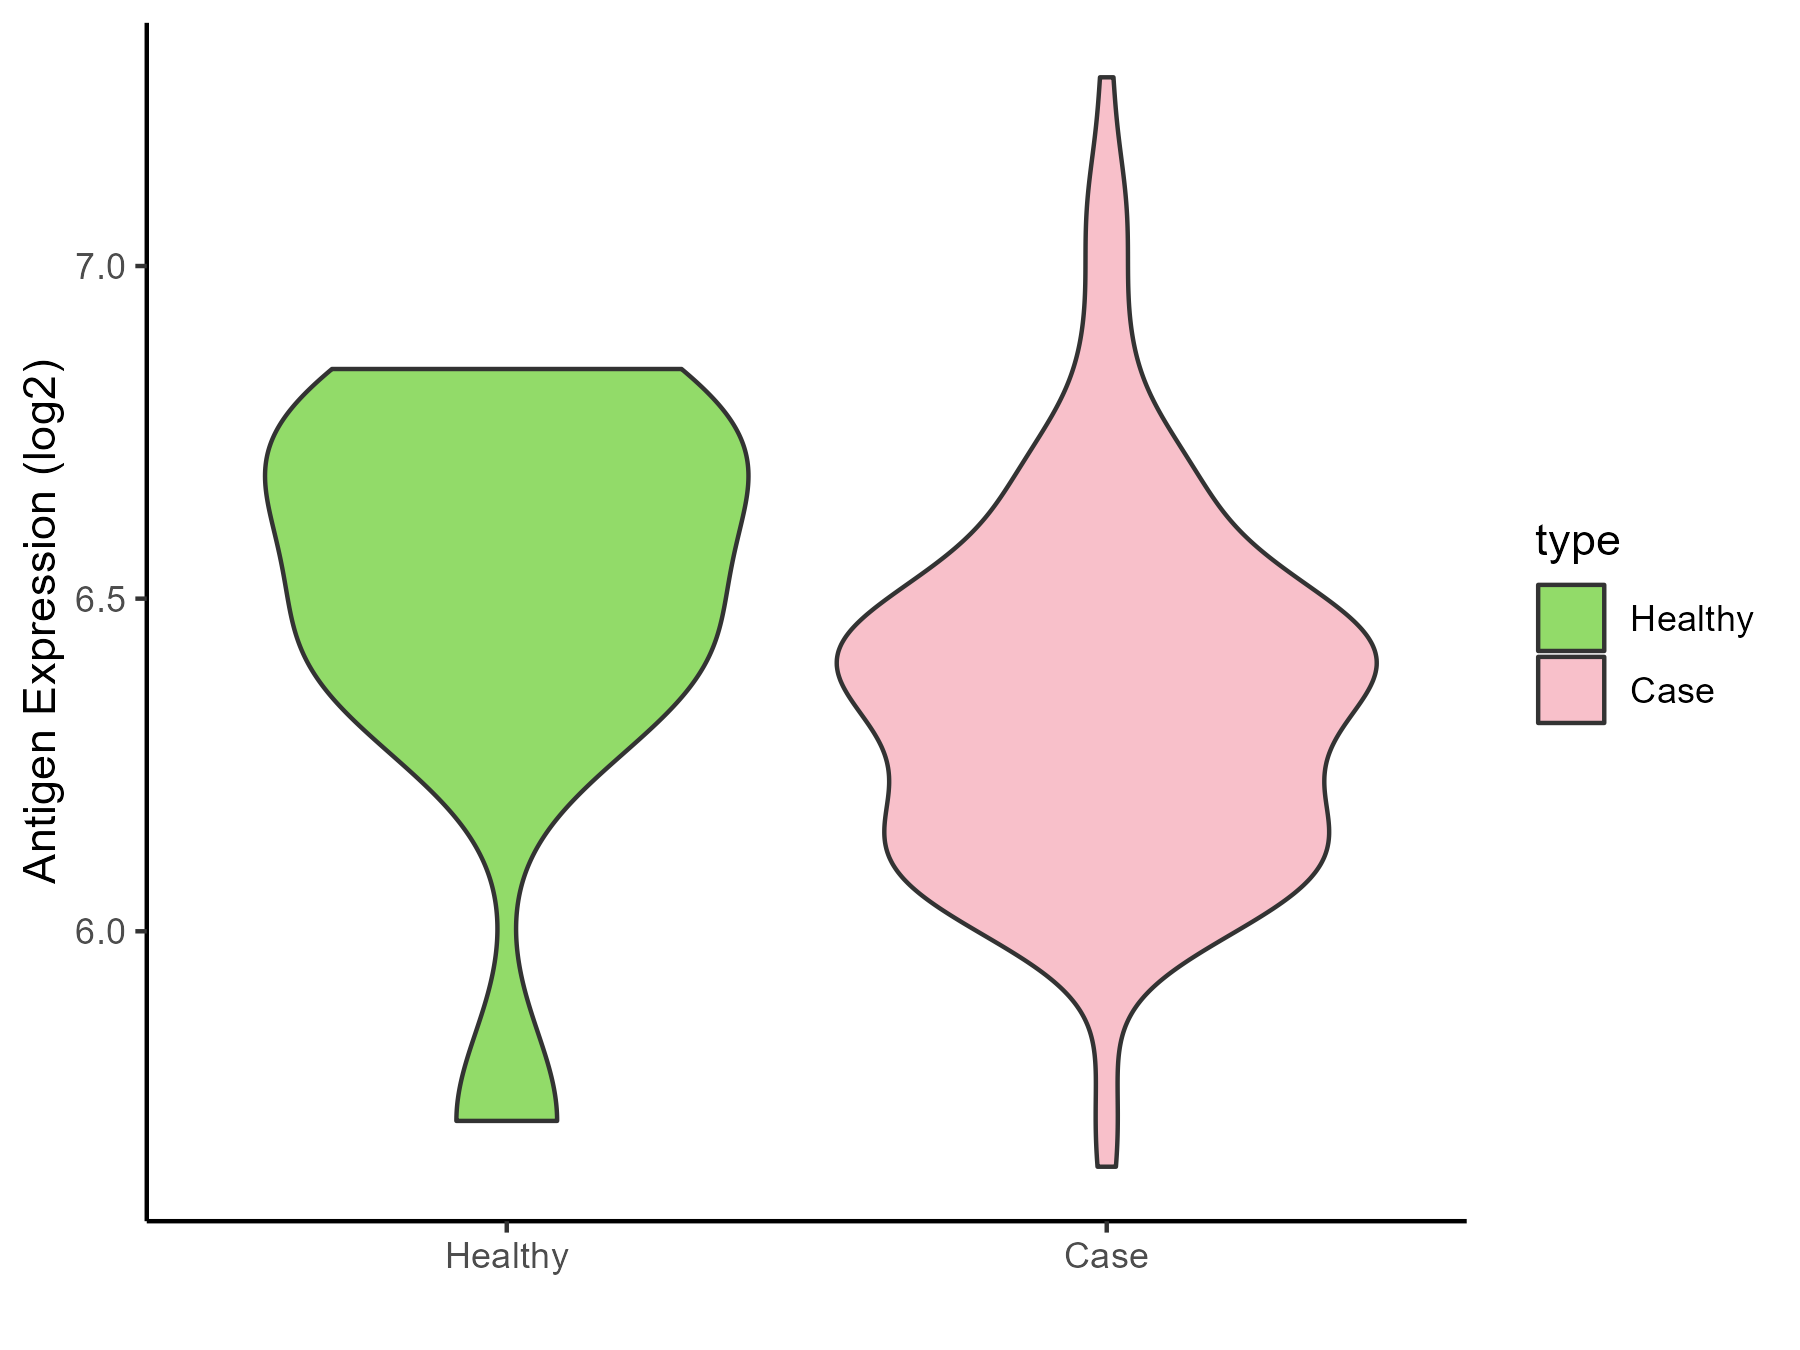
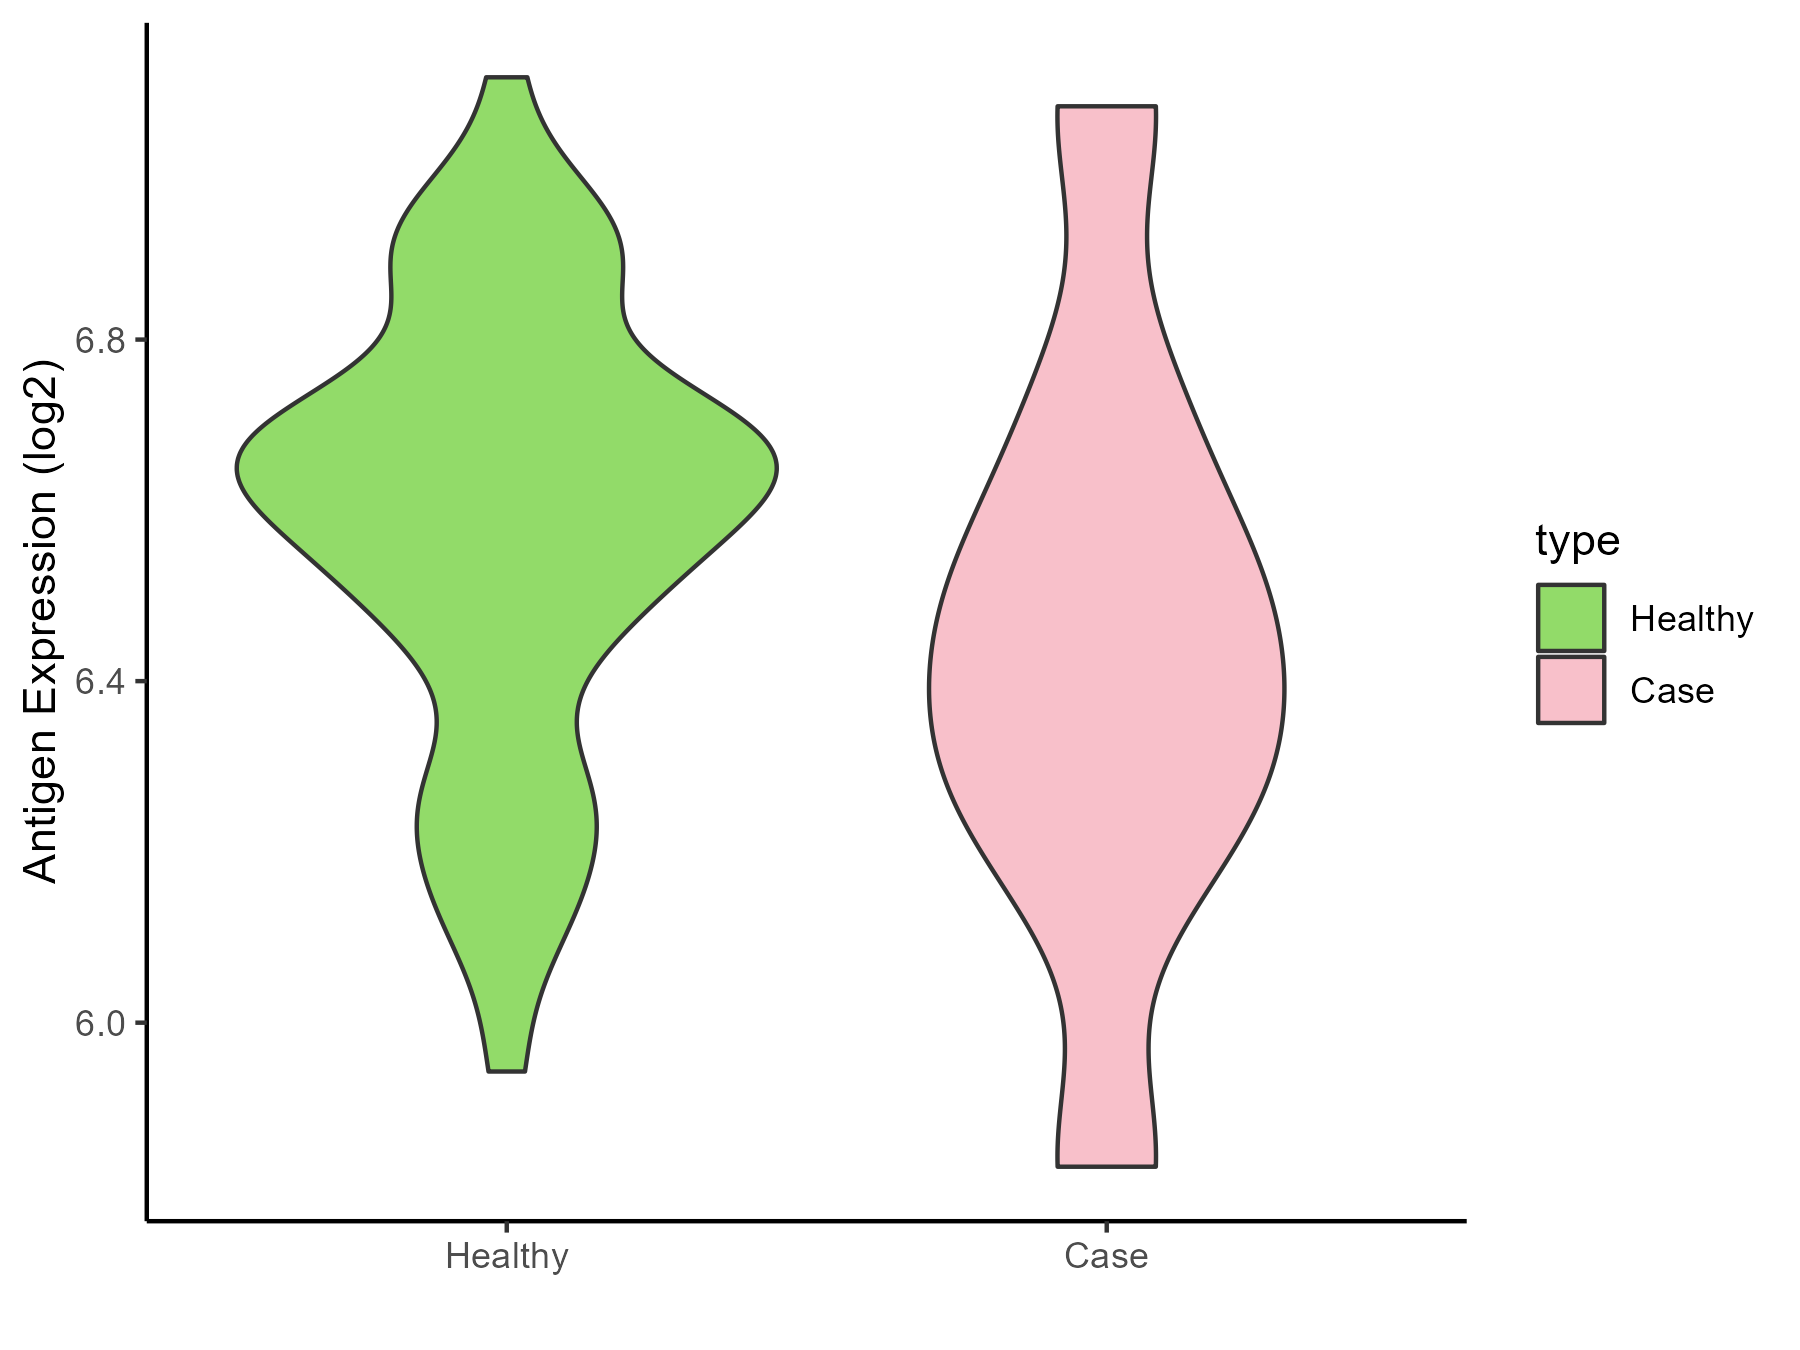
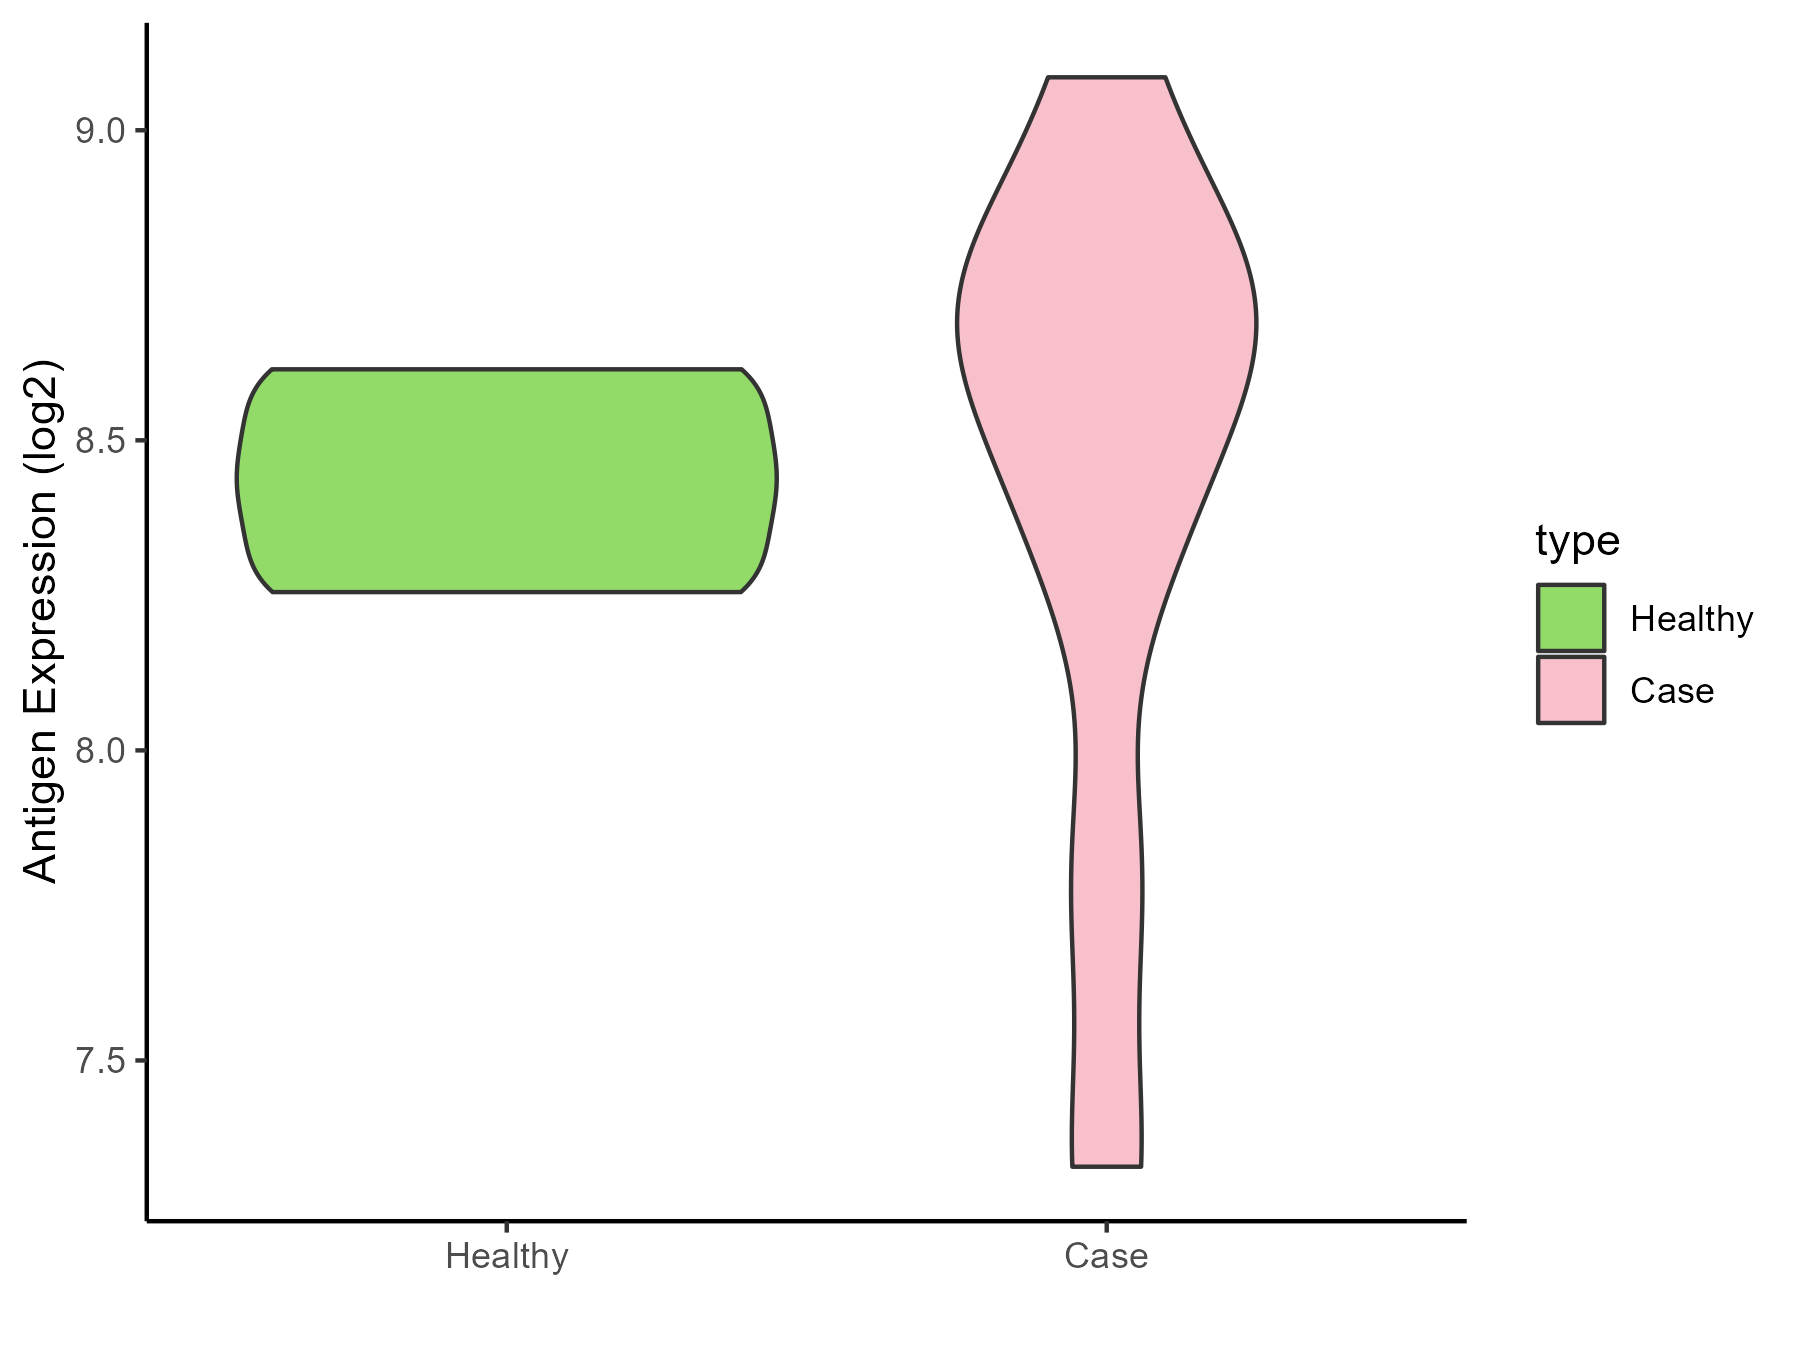
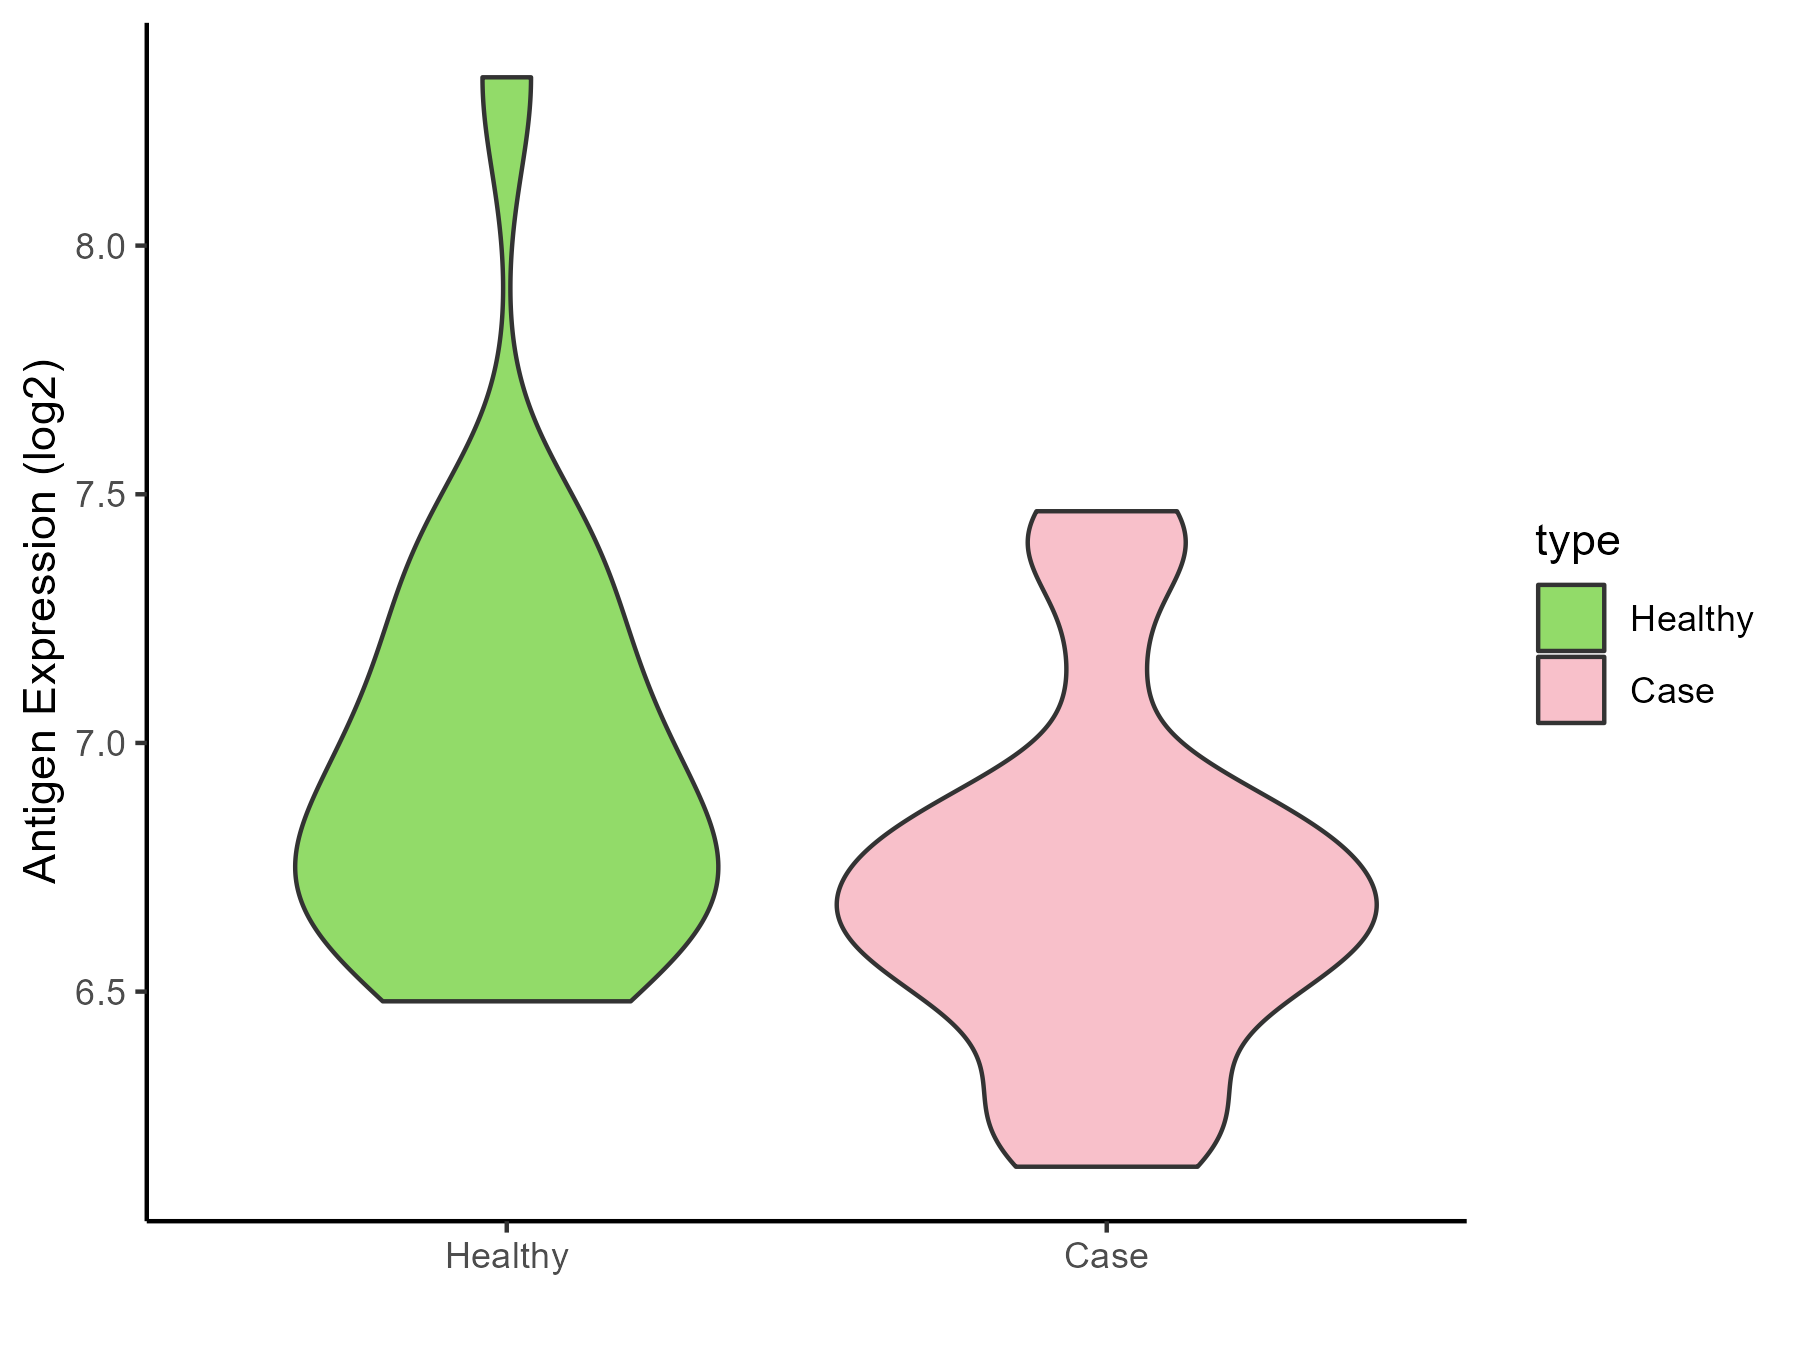
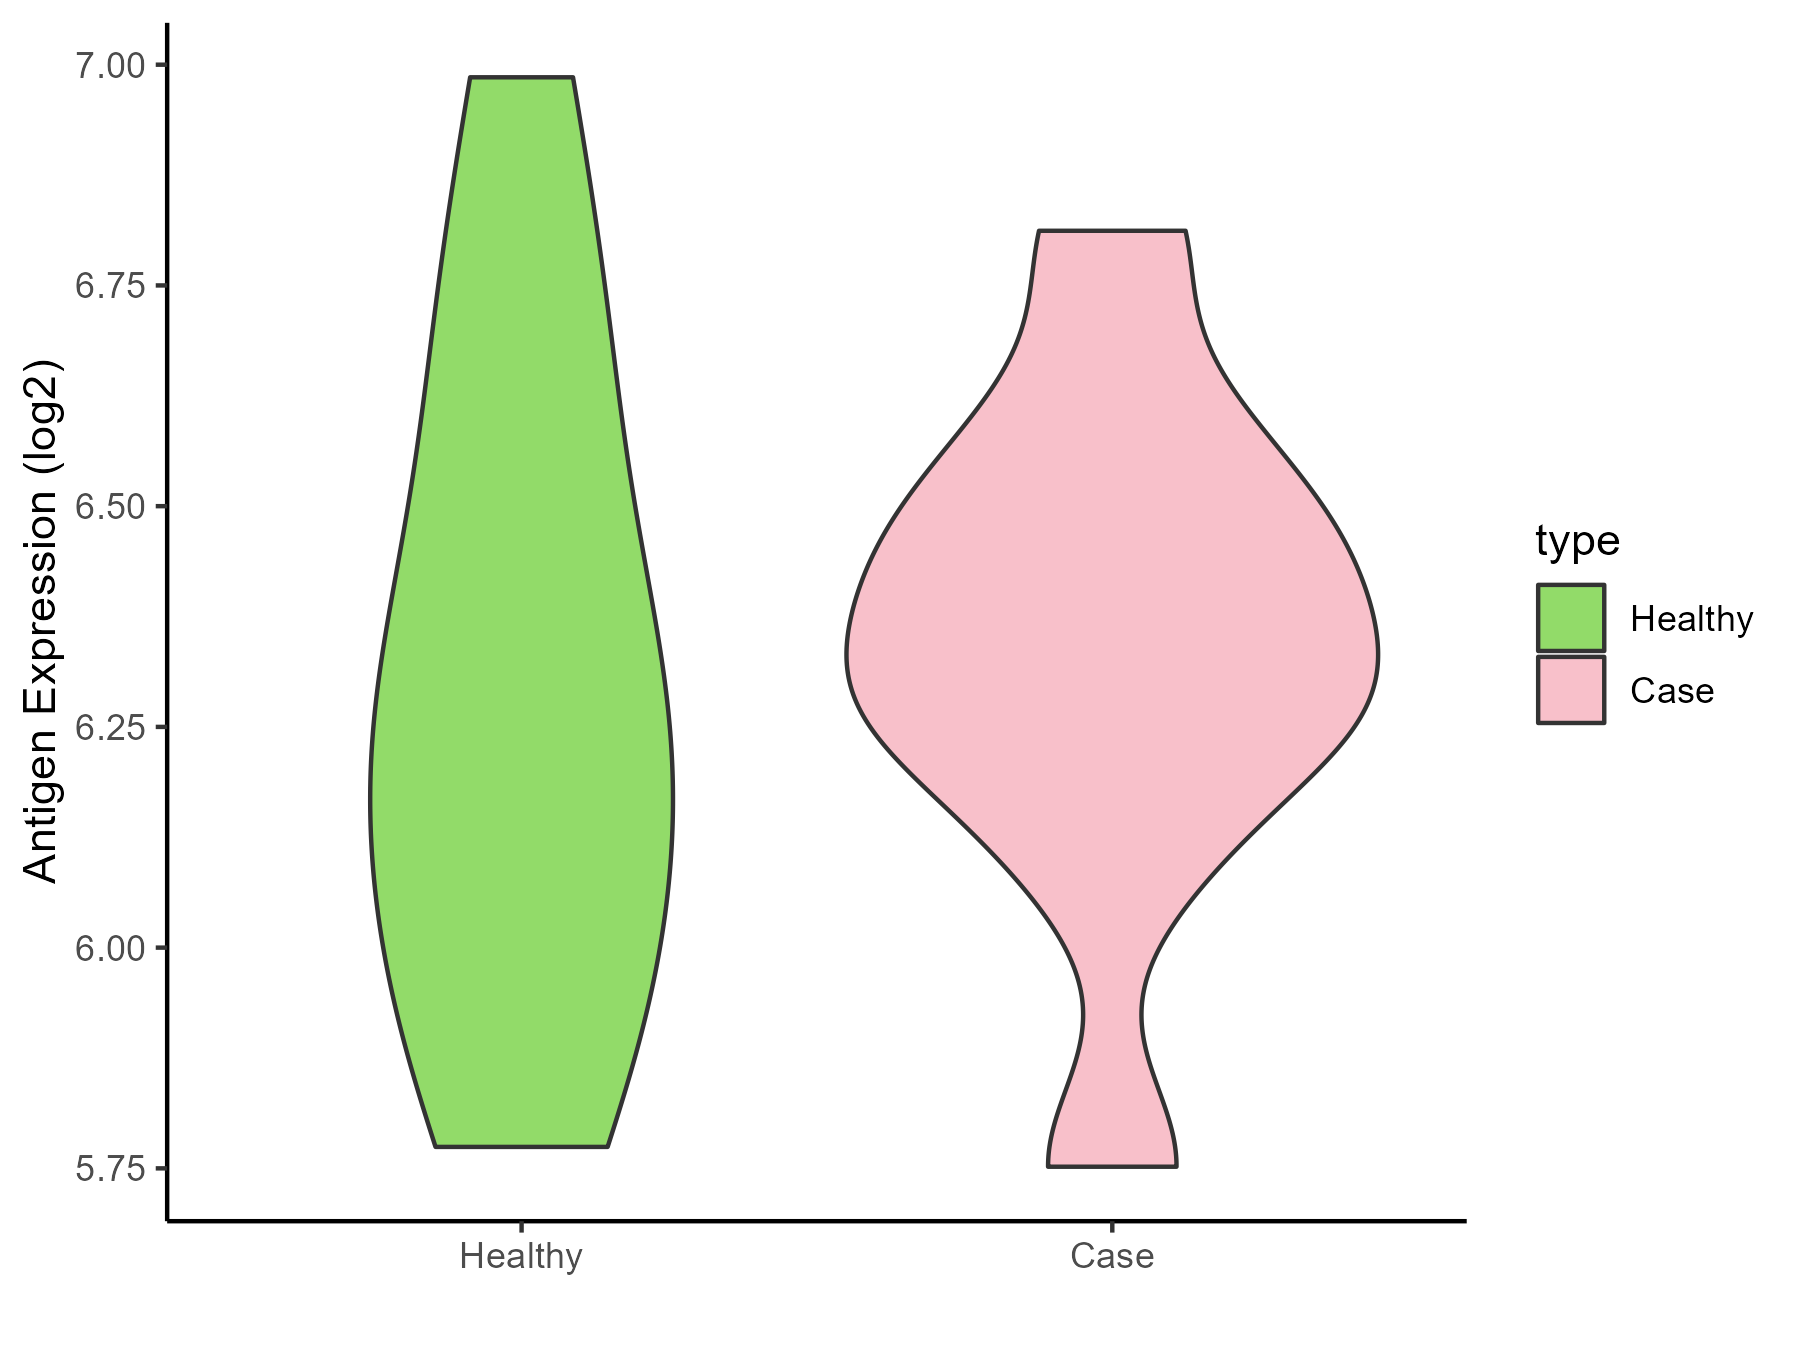
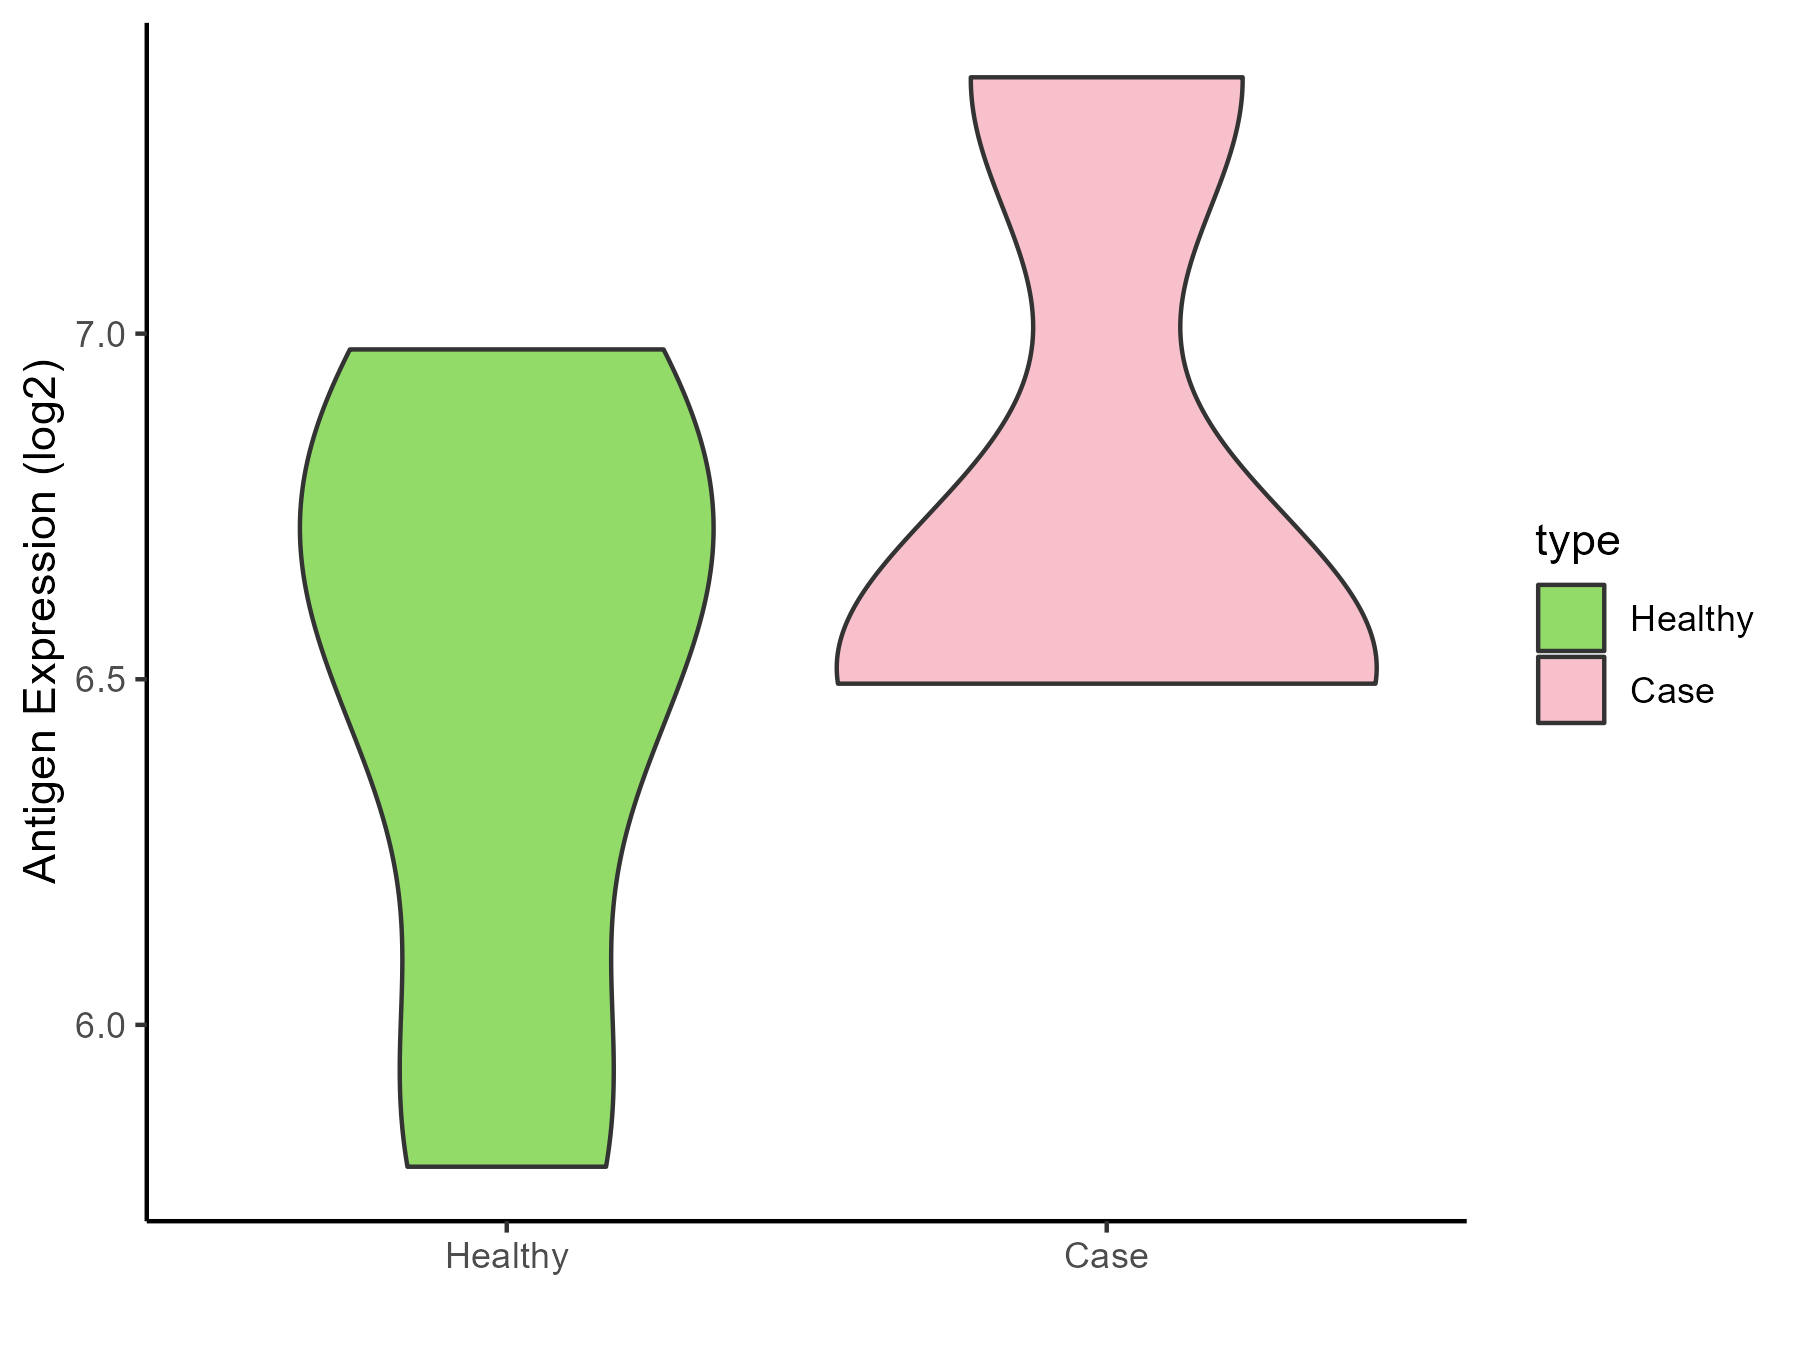
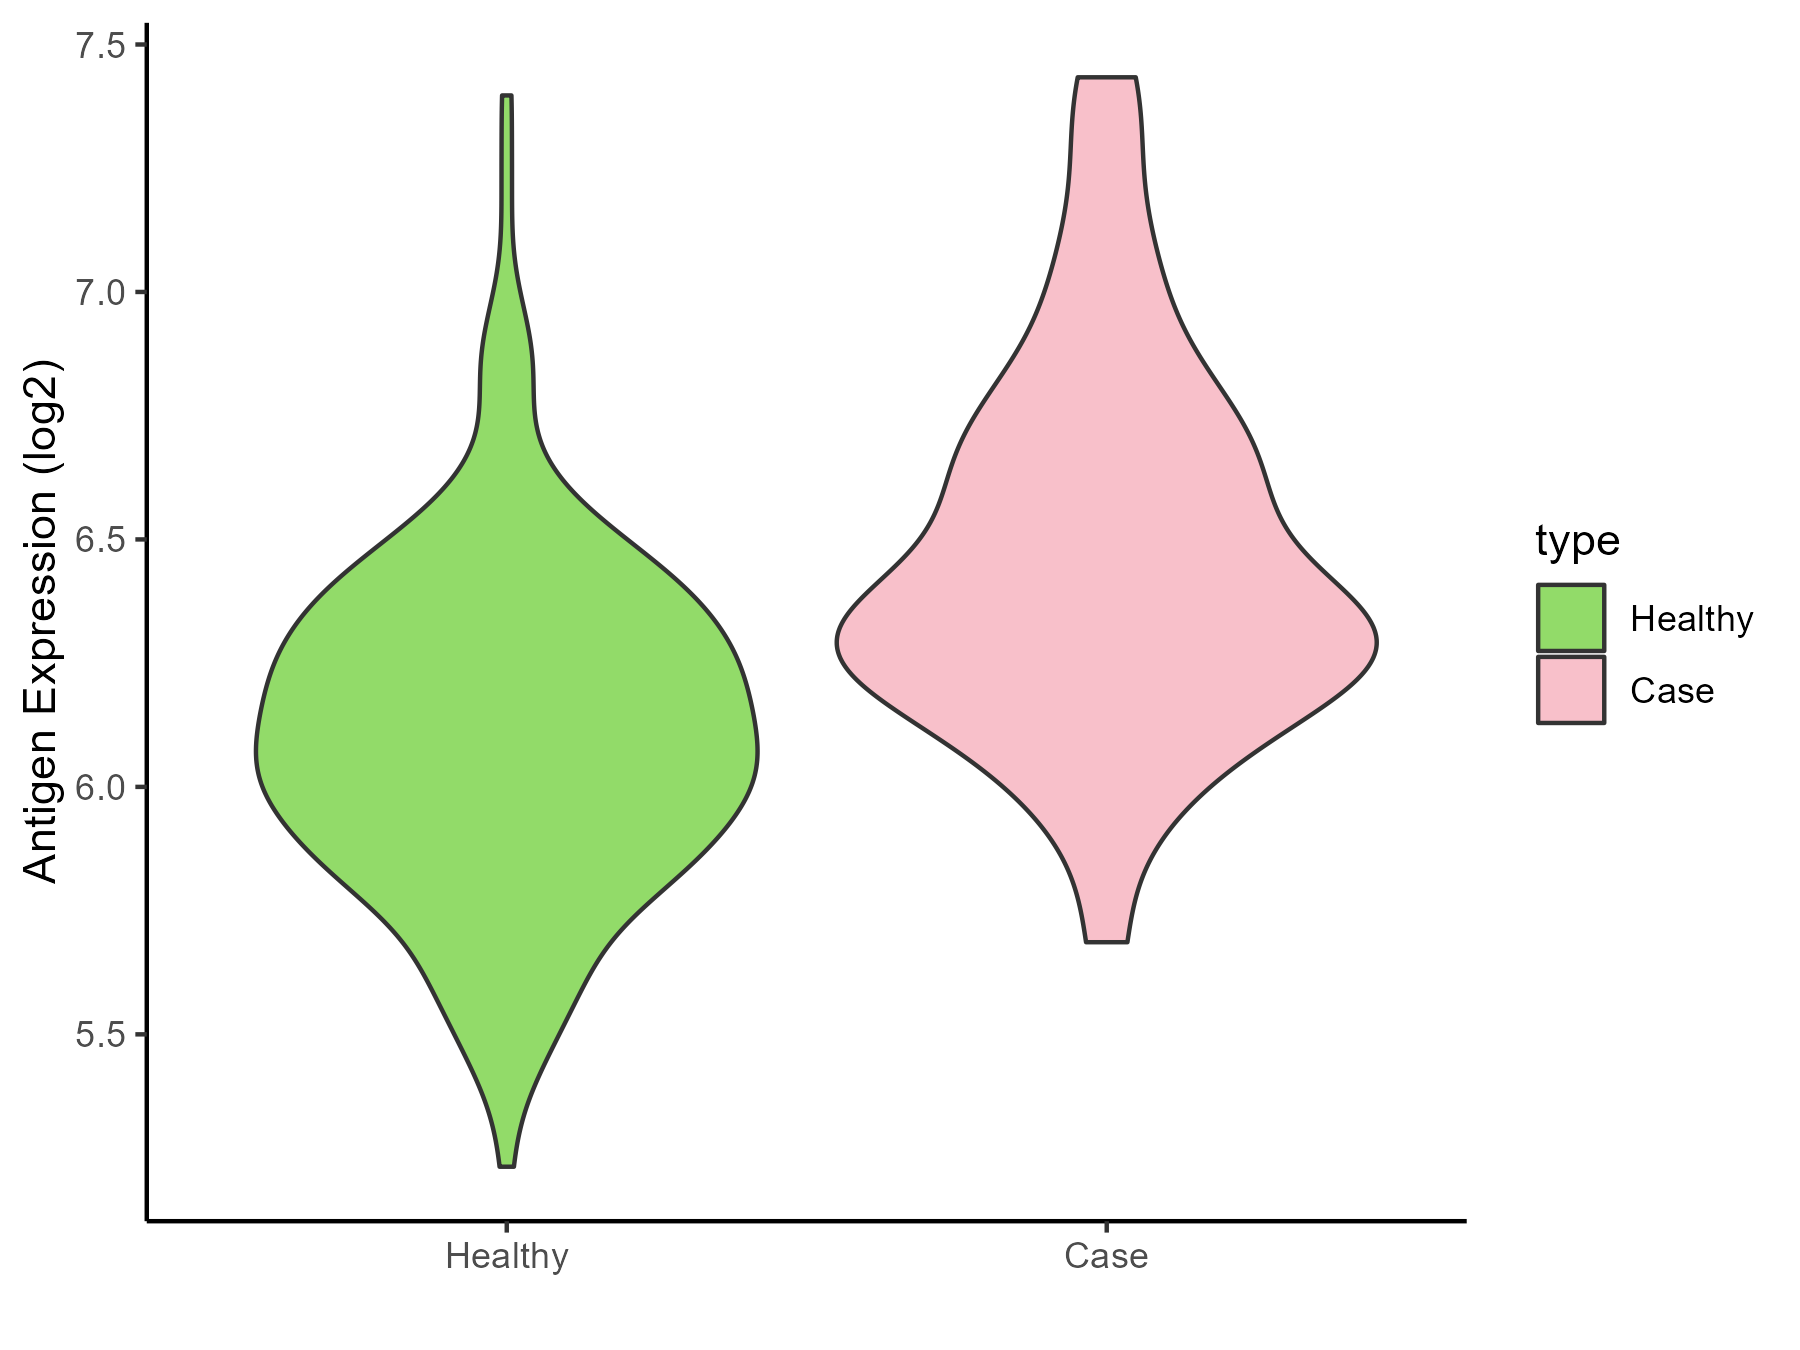
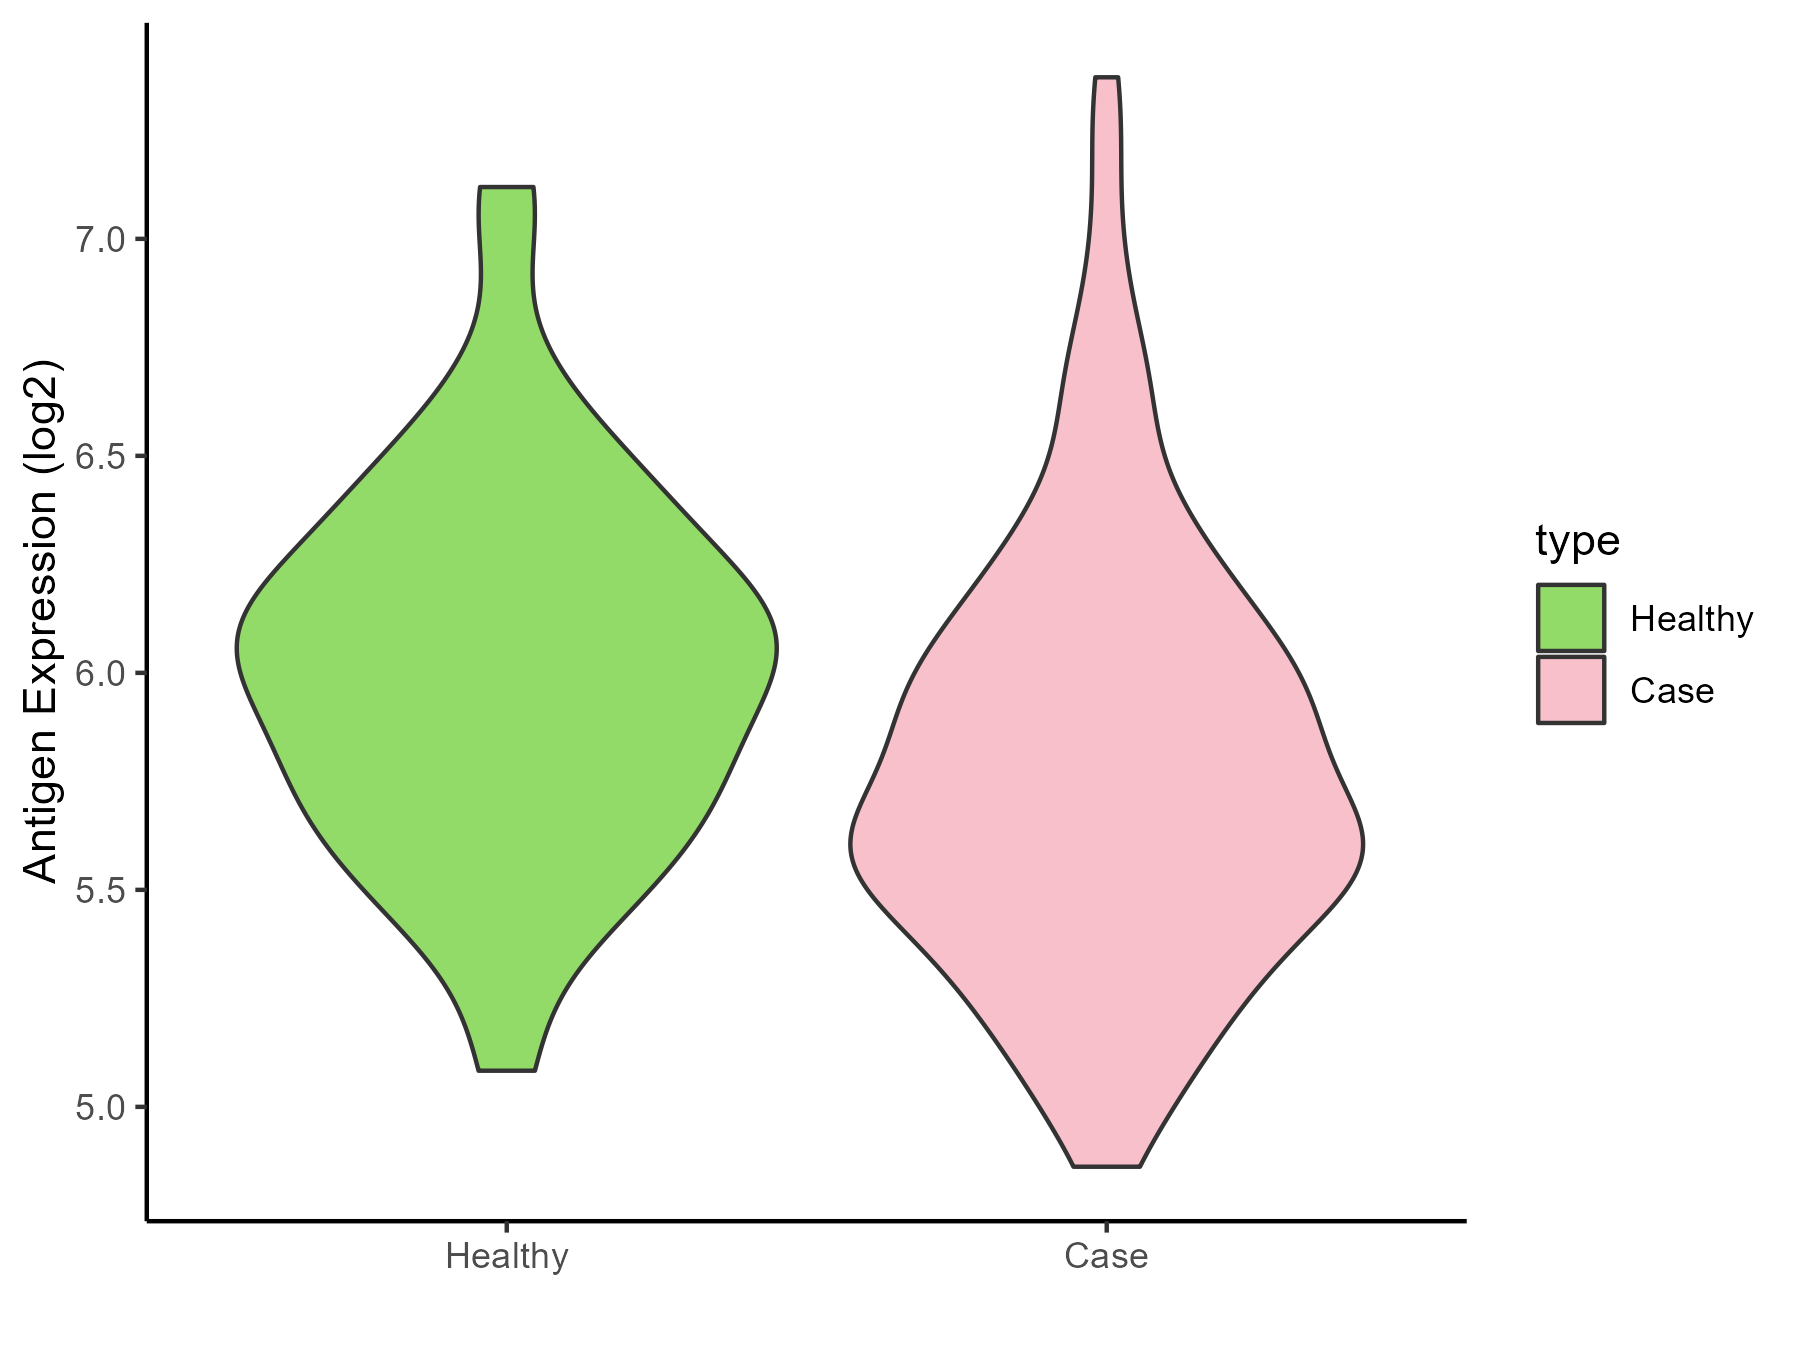
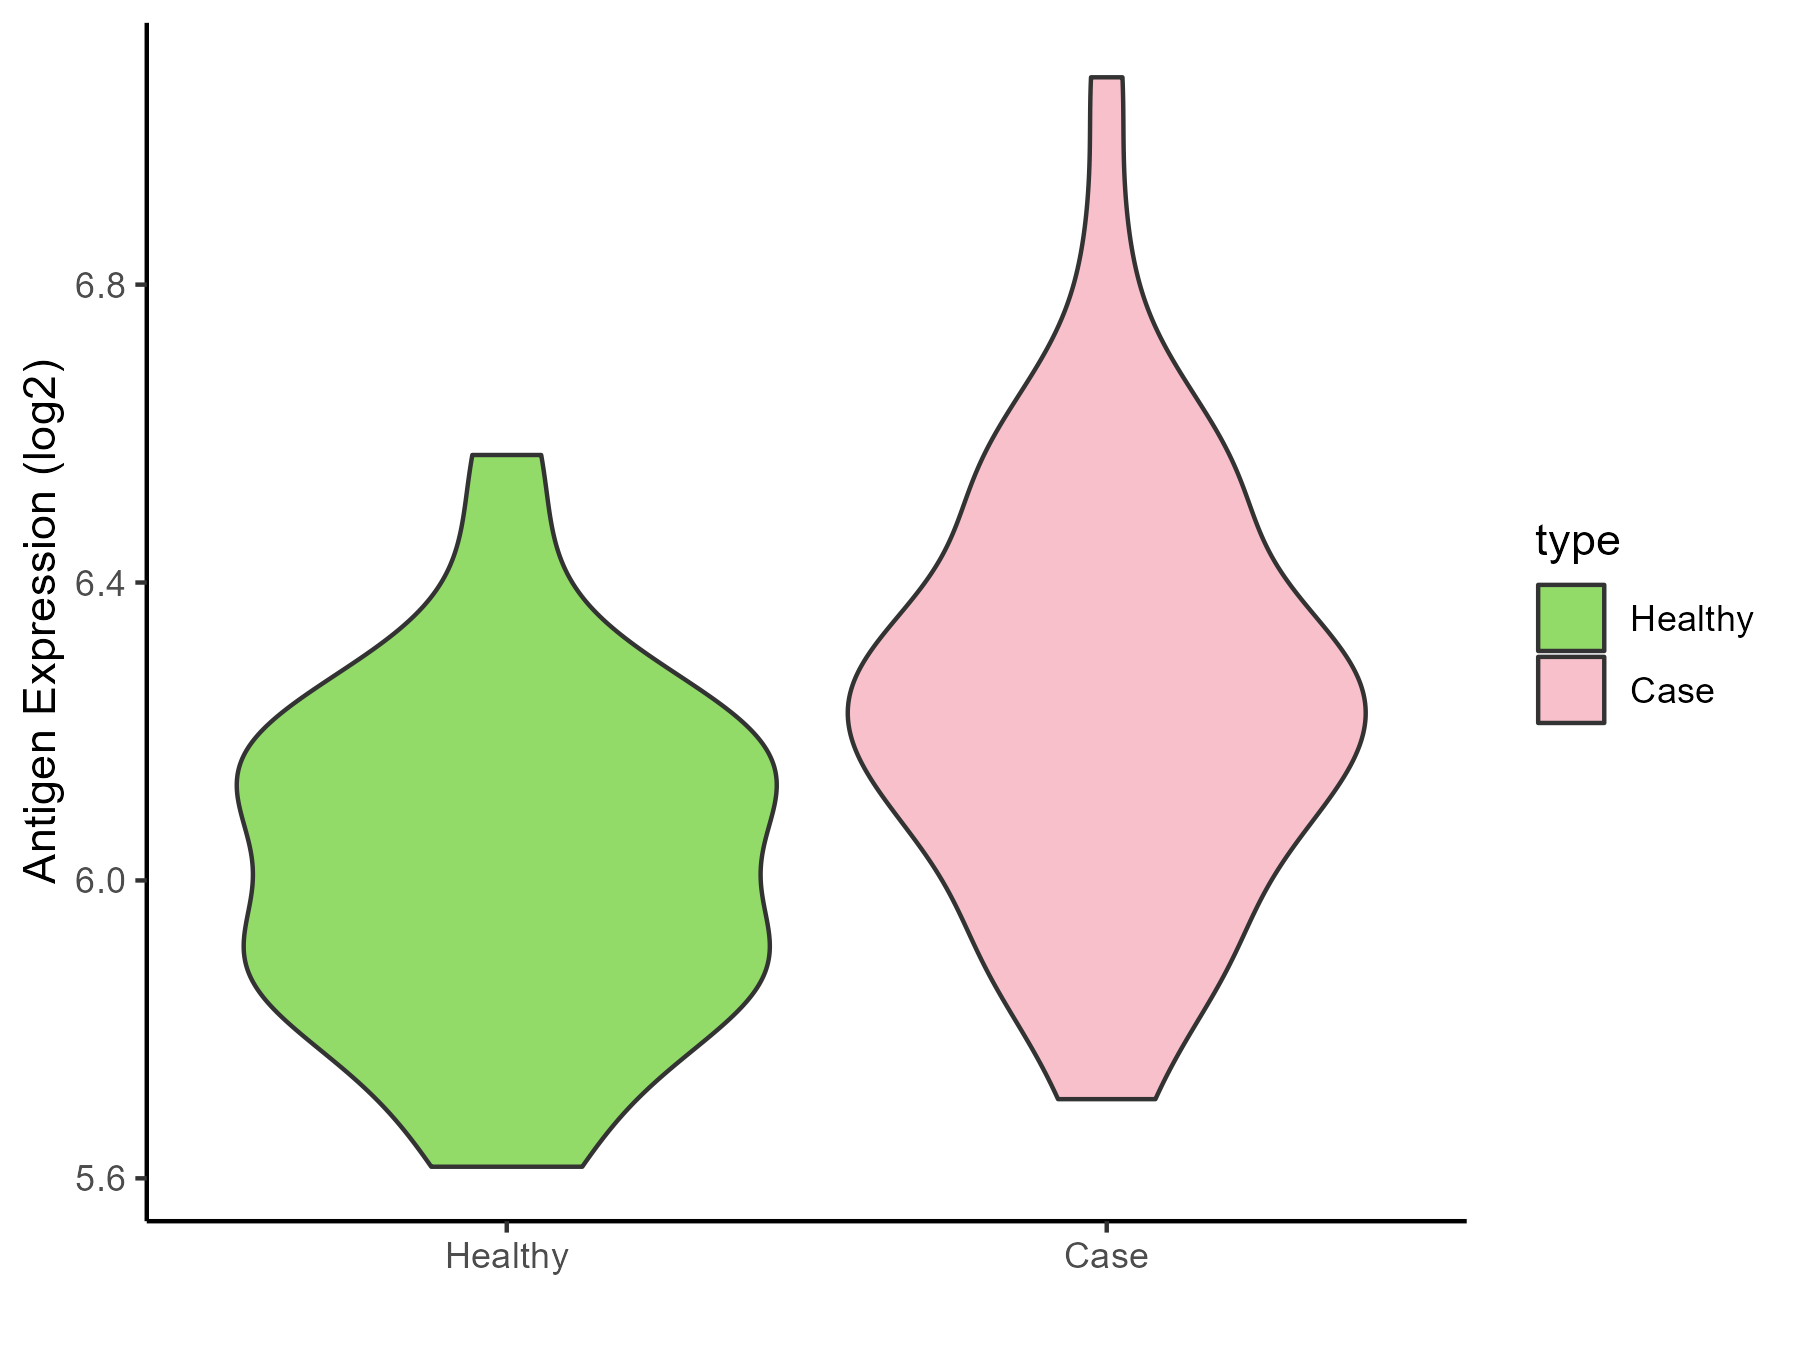
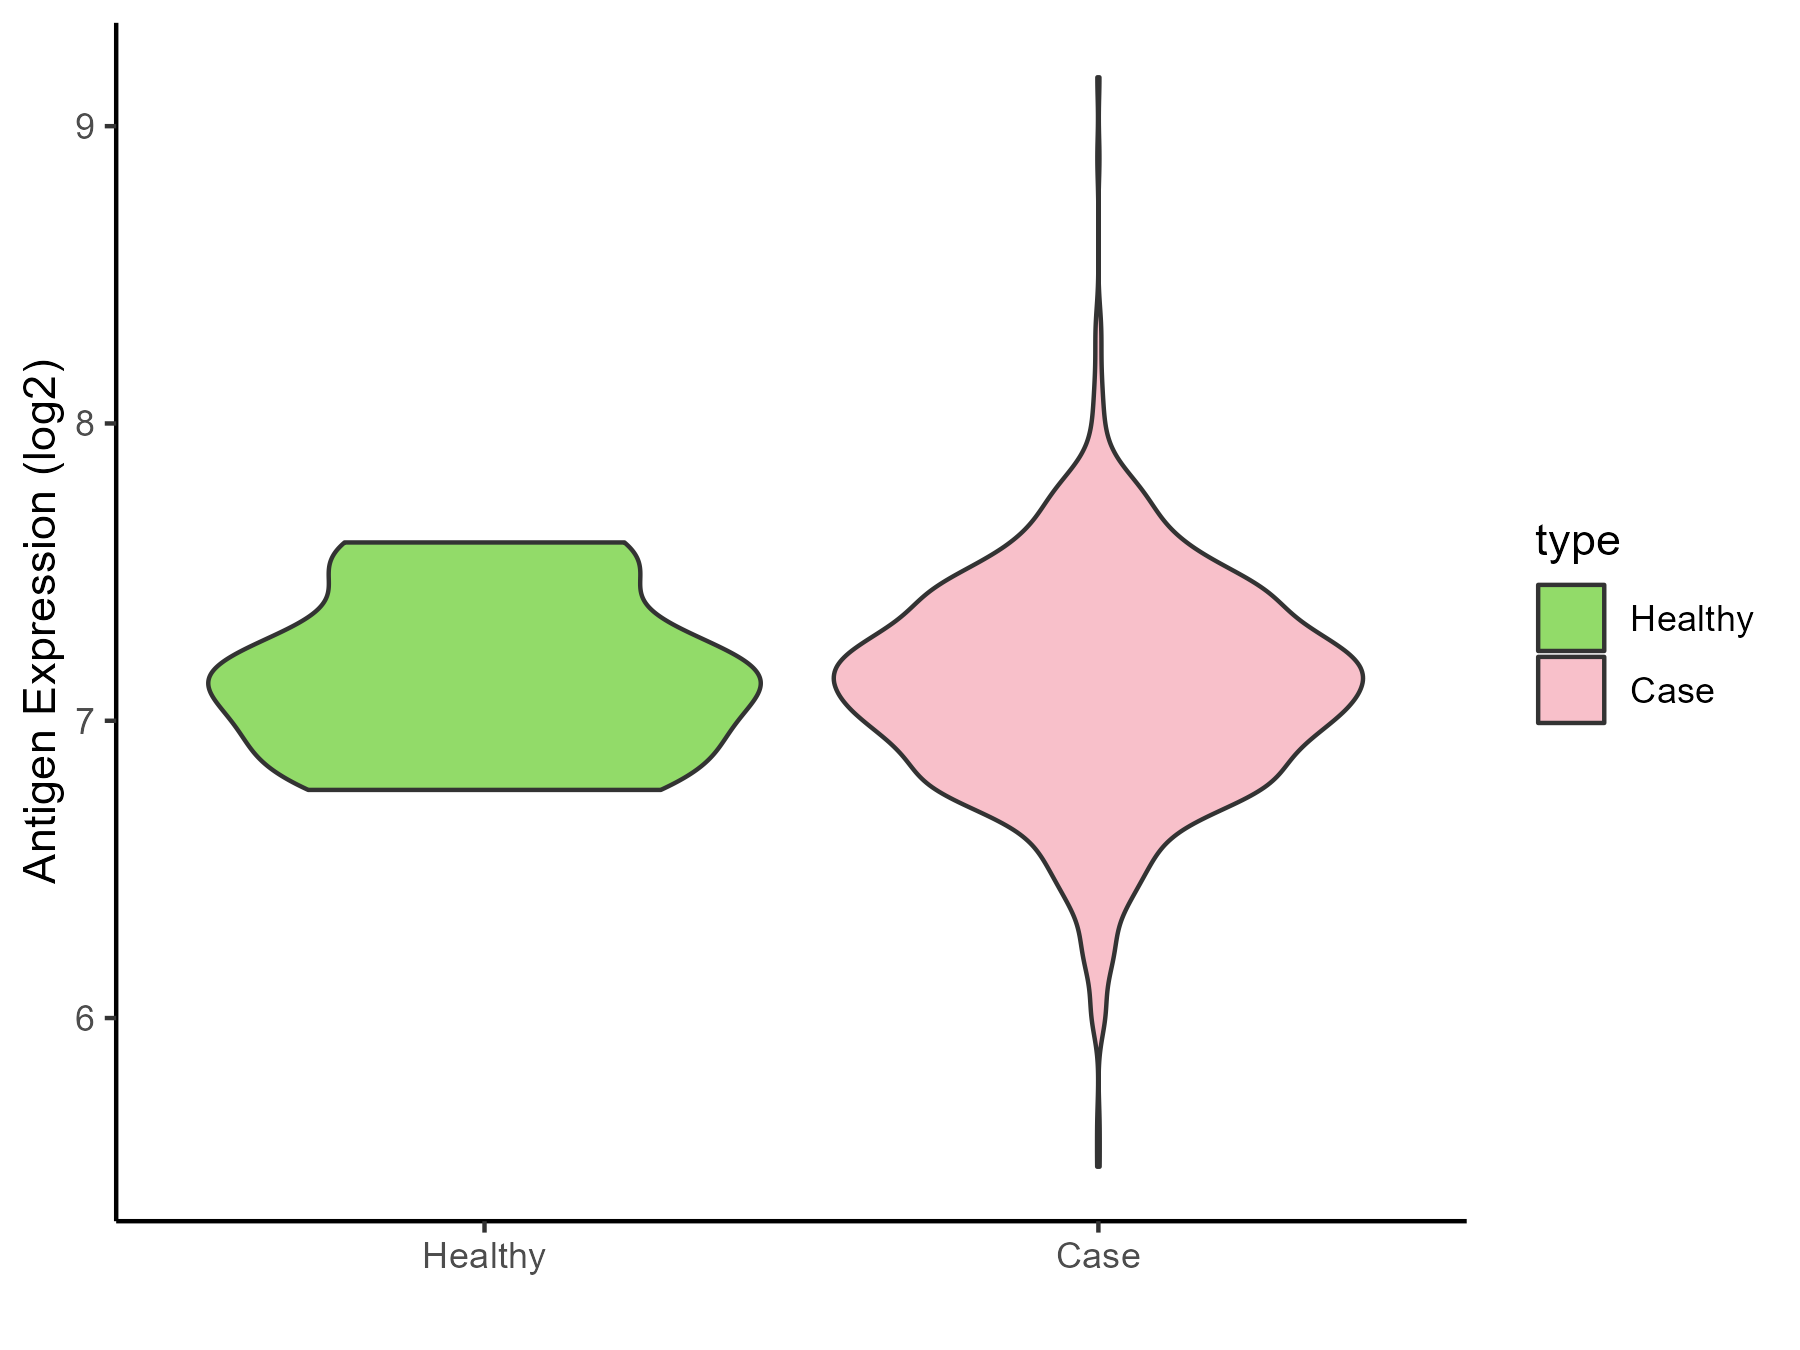
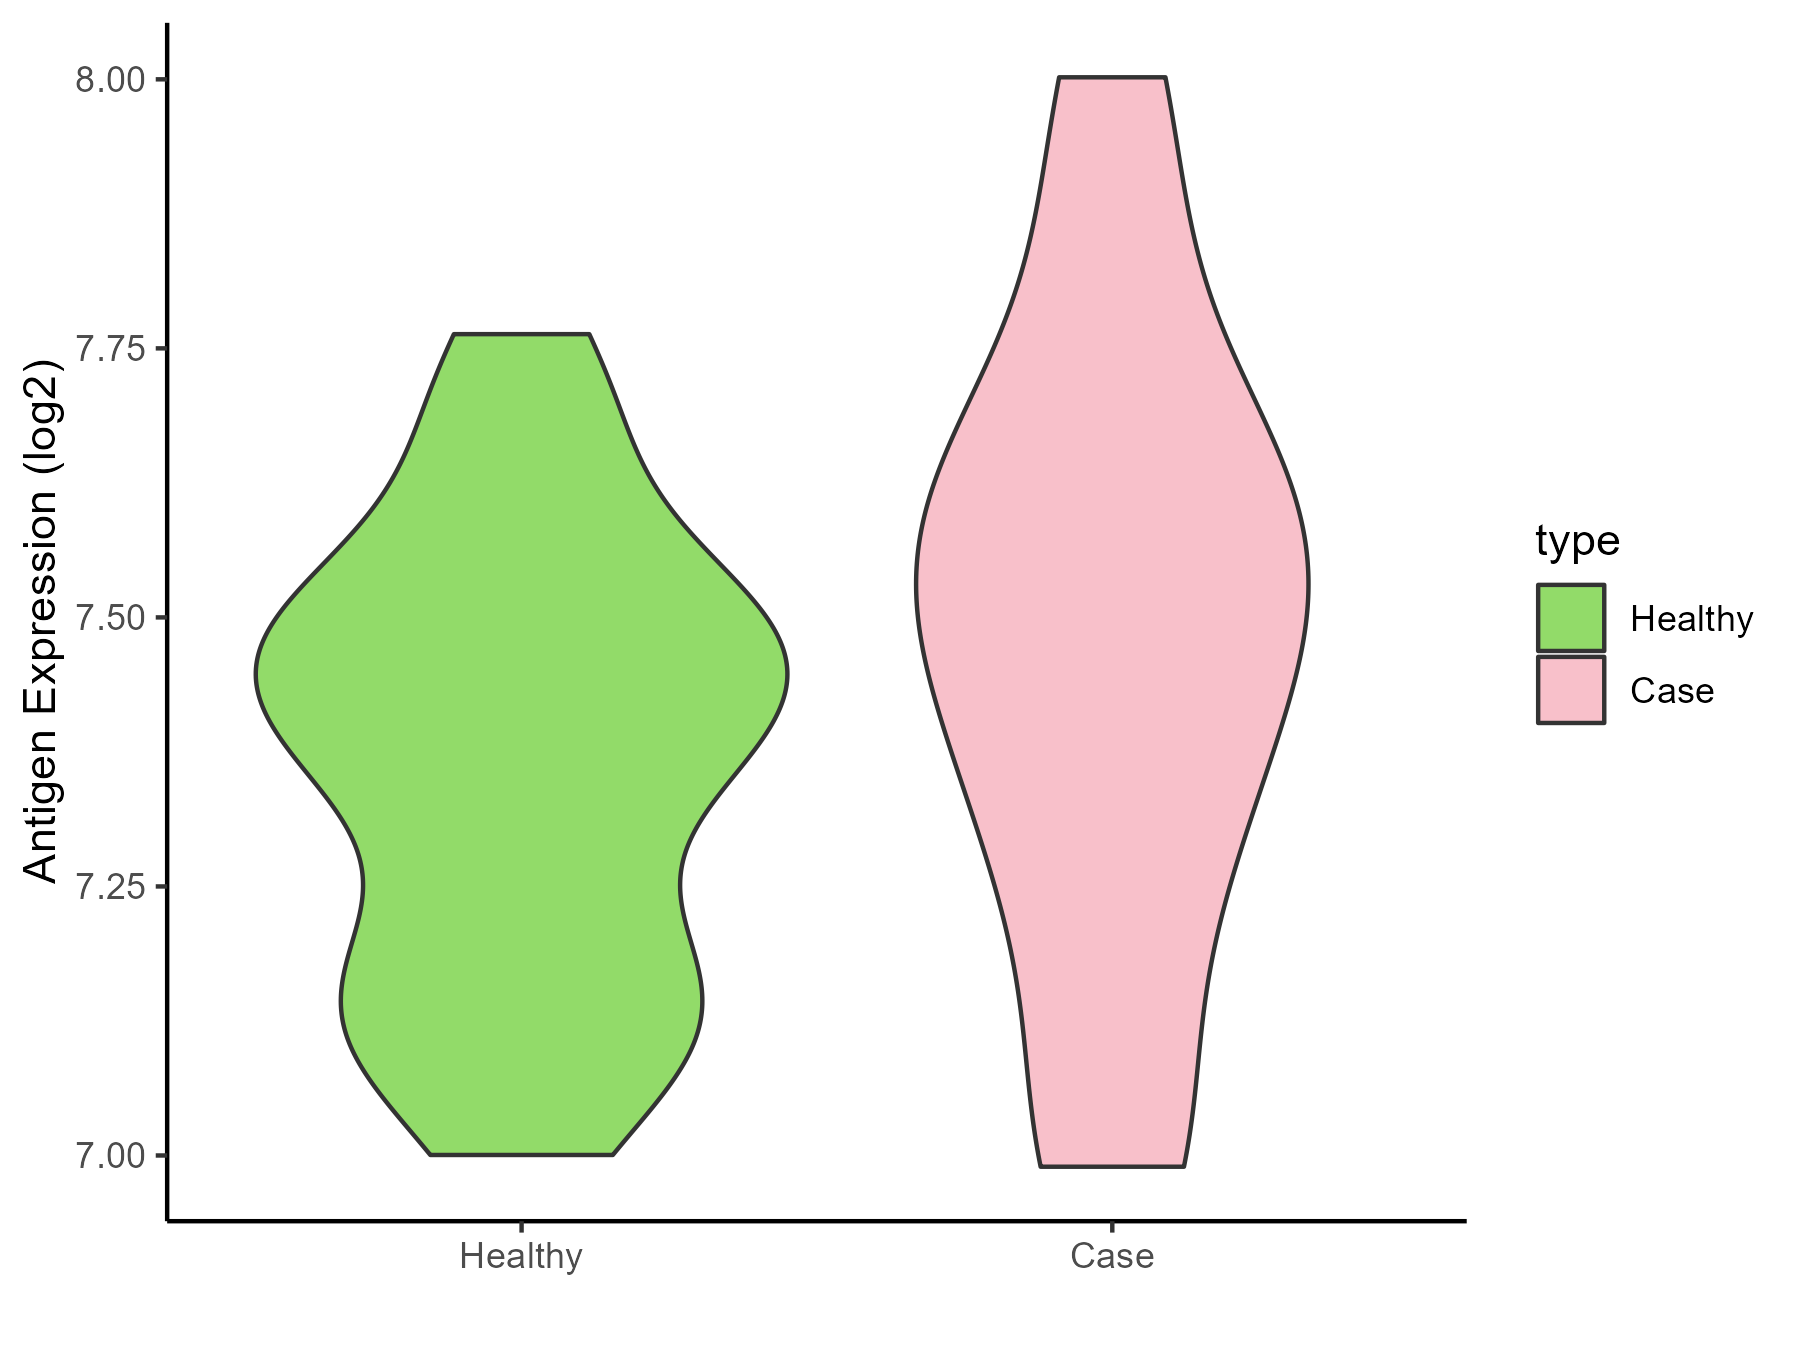
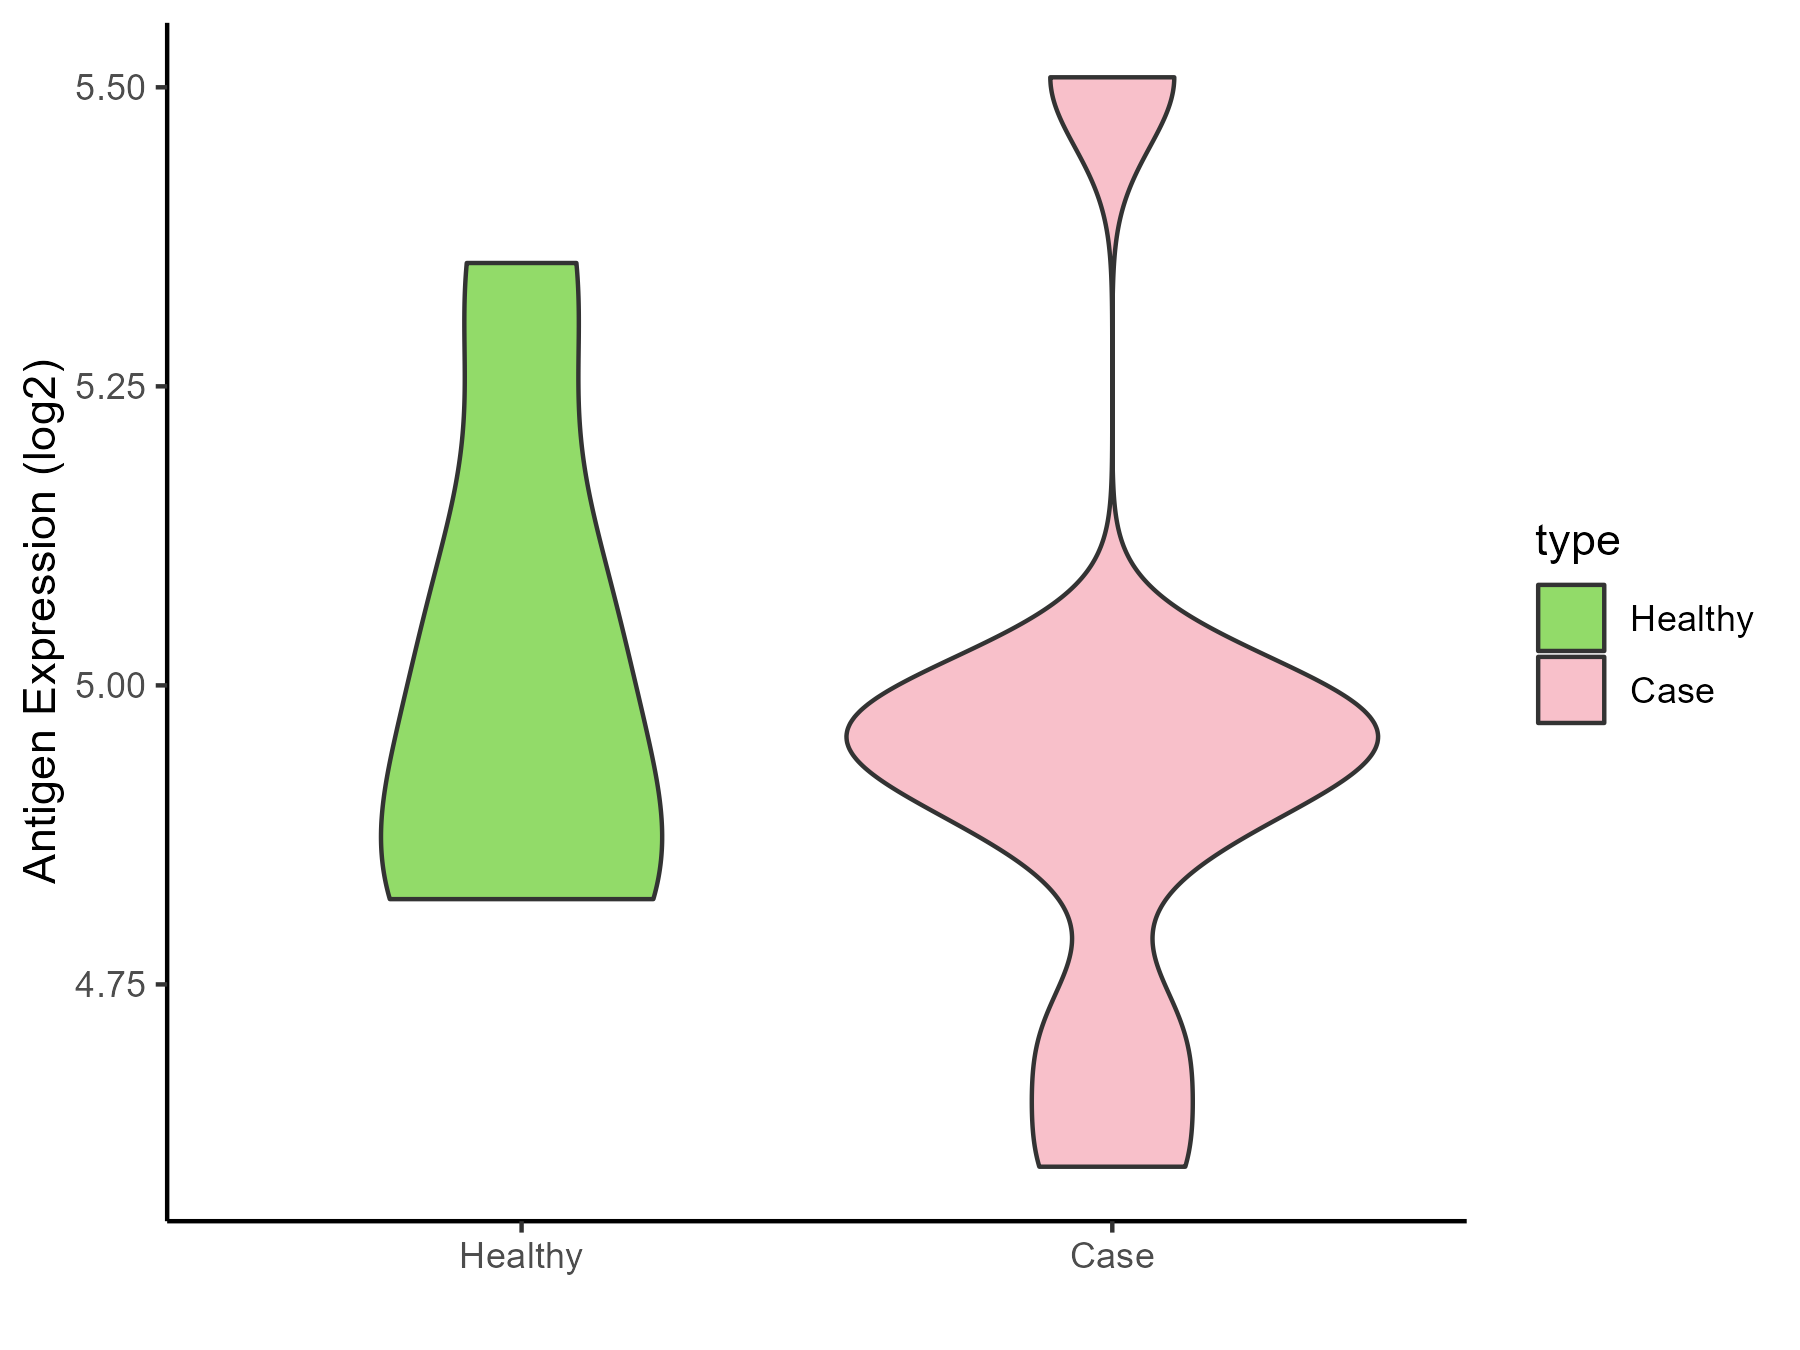
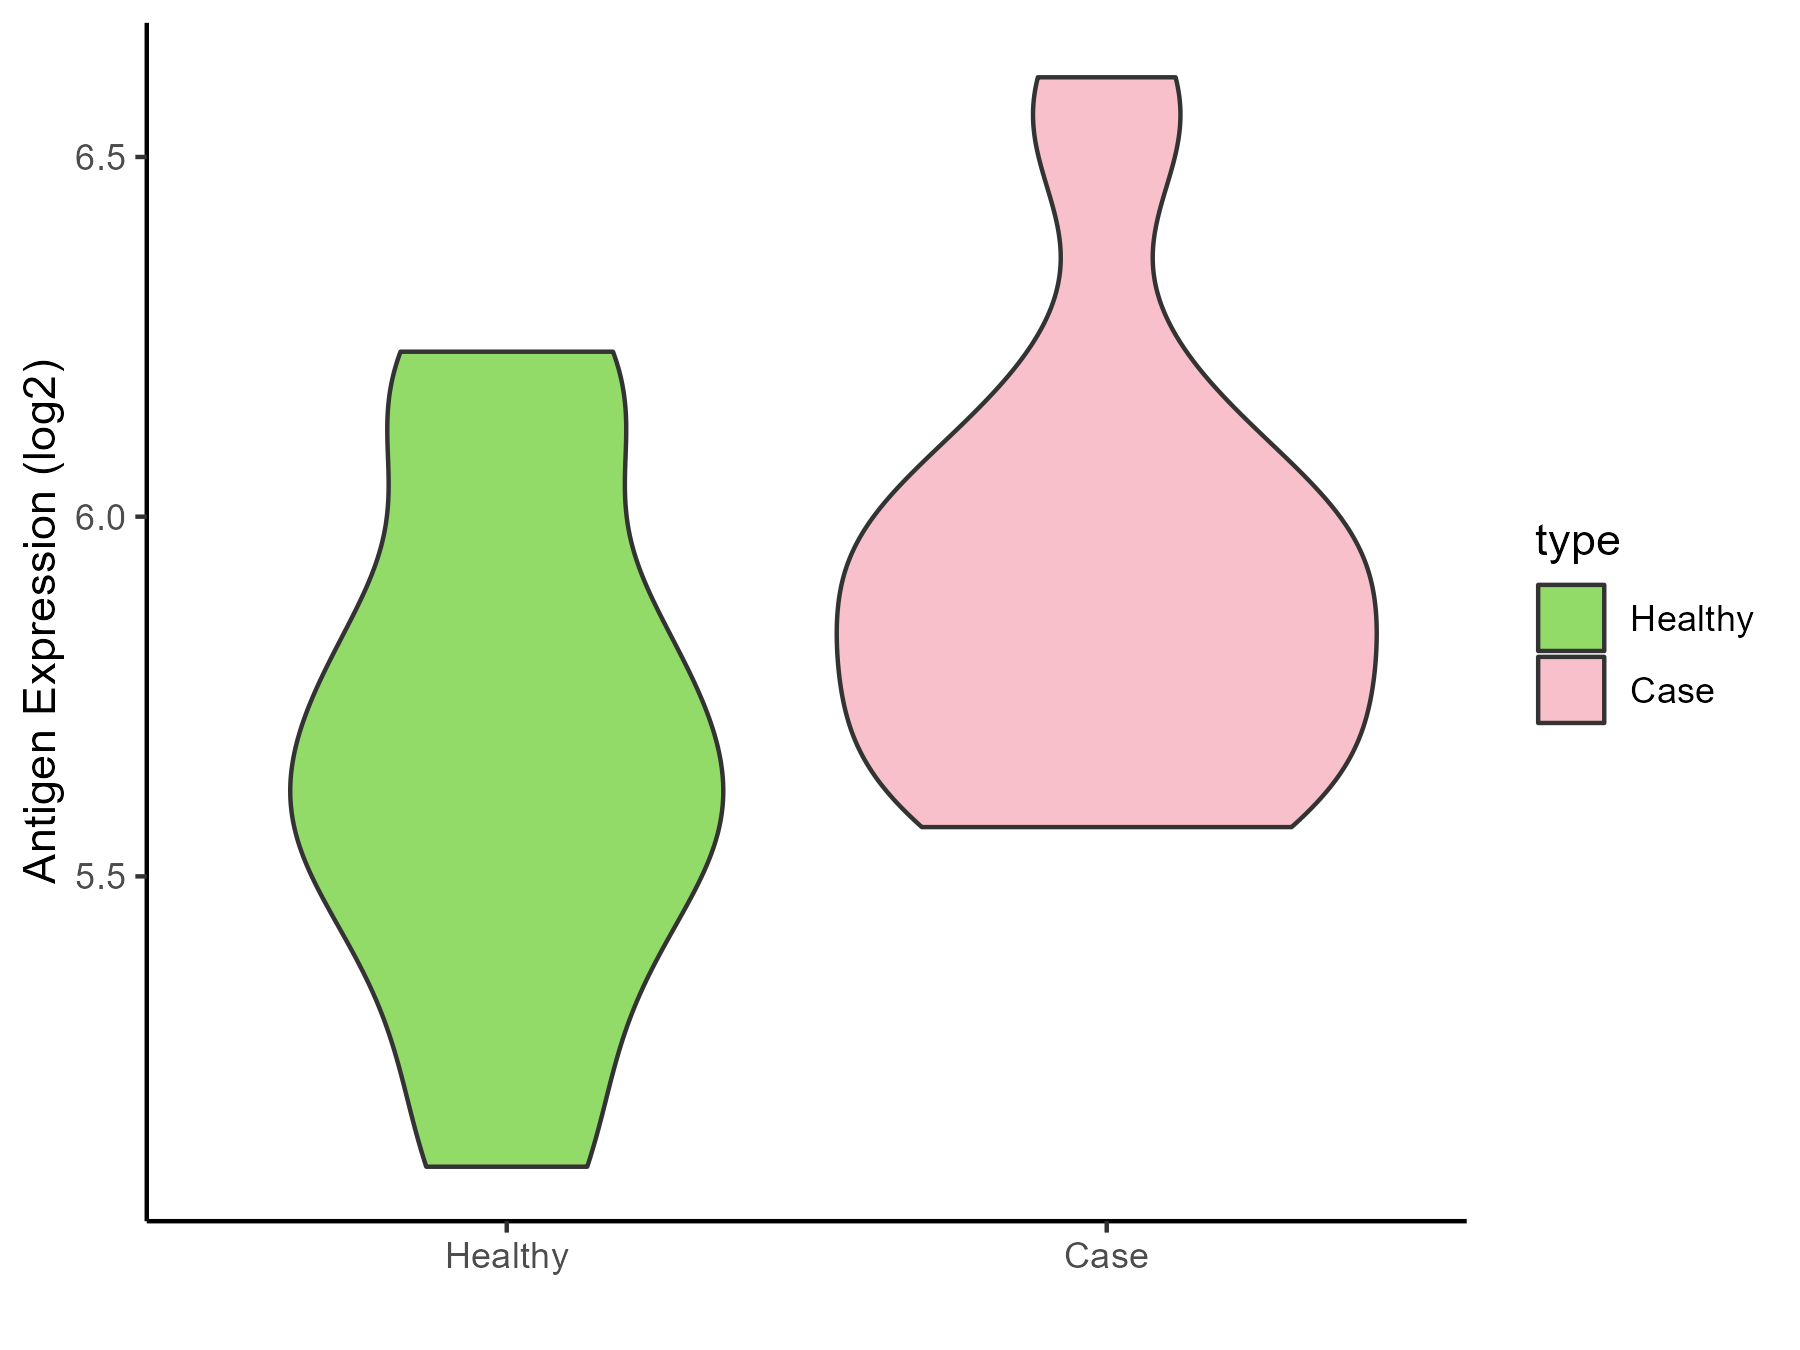
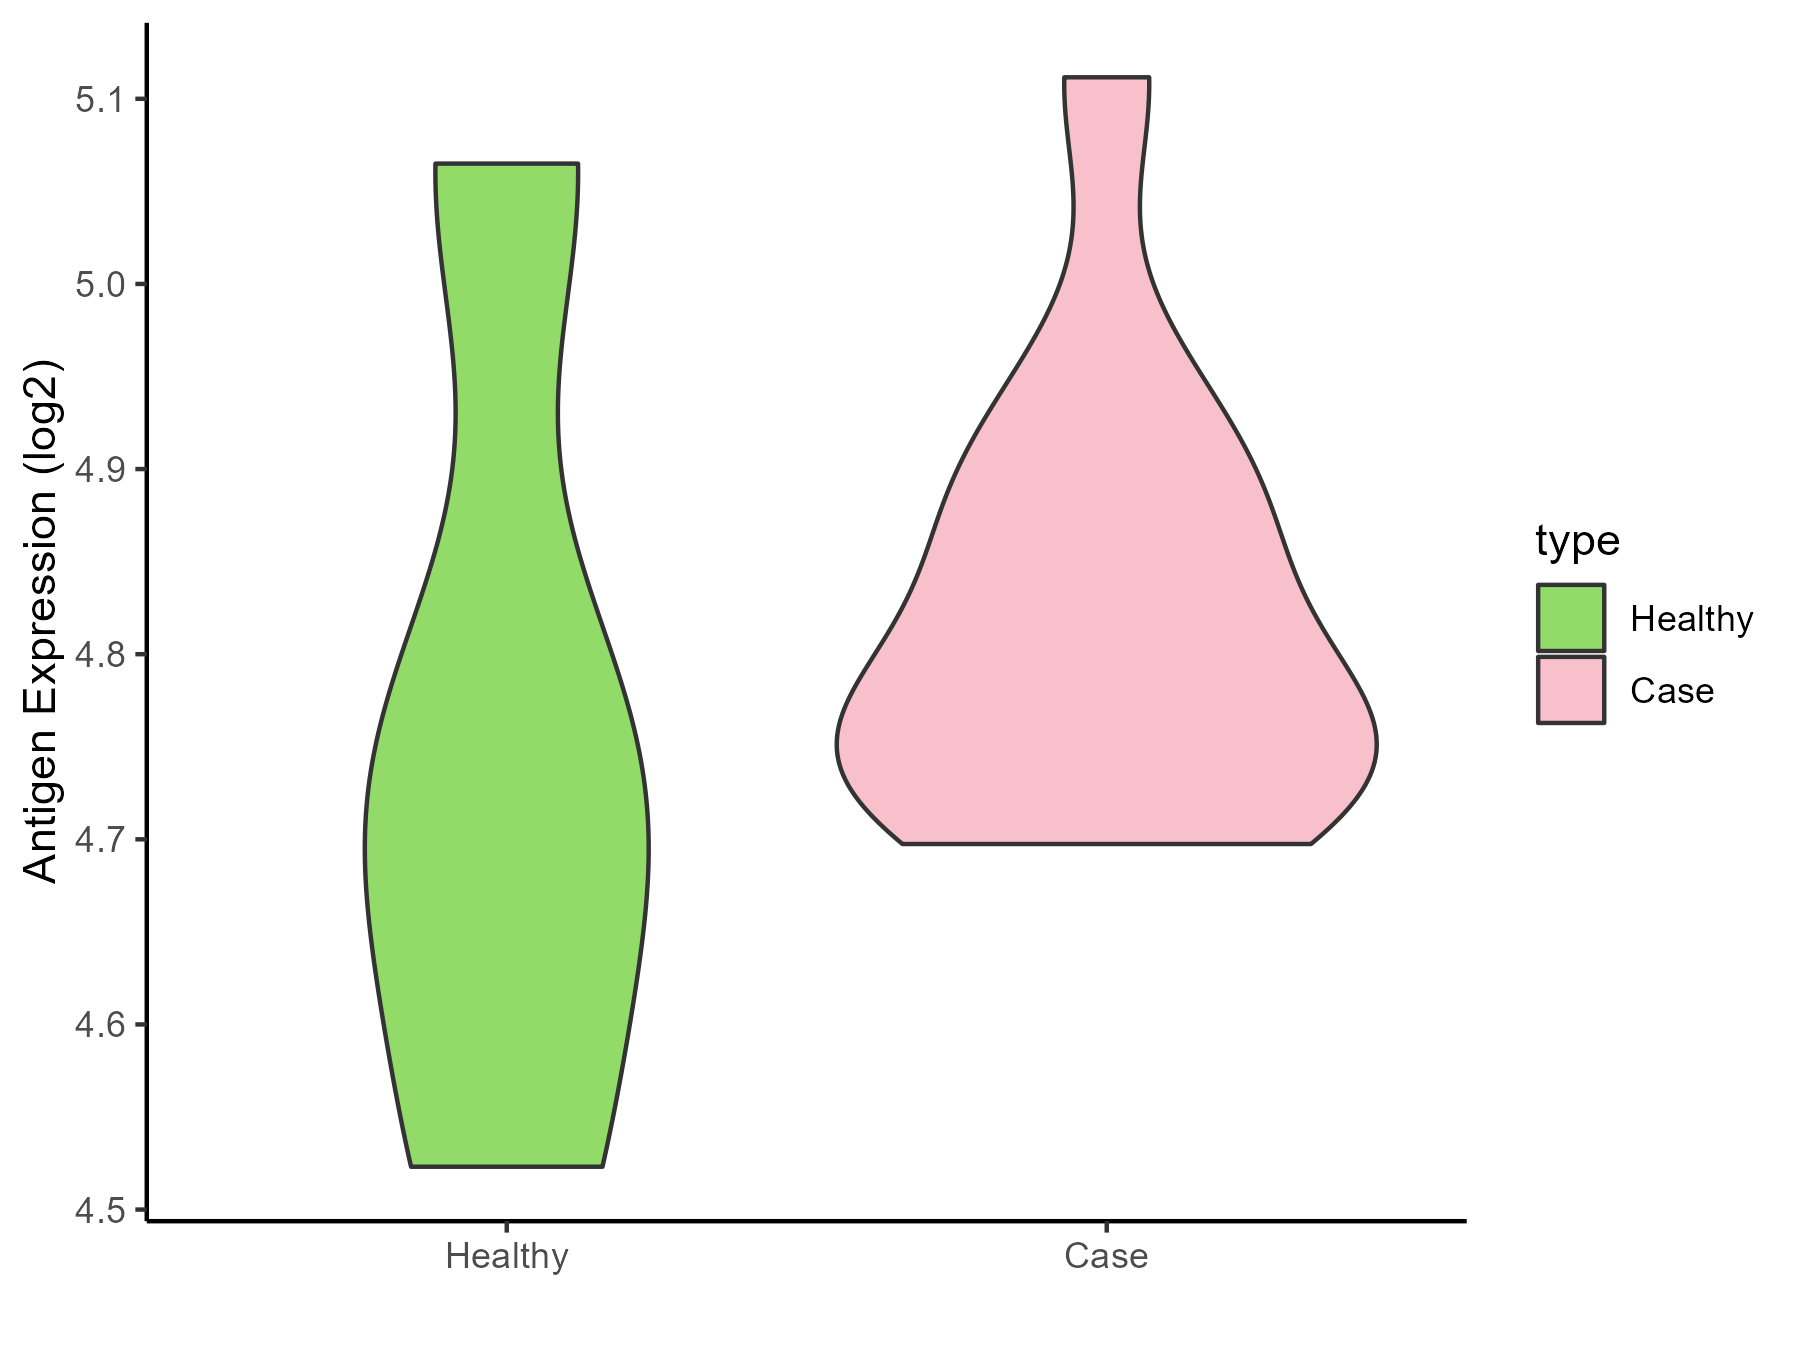
| The Studied Tissue | Brainstem | |
| The Specific Disease | Neuroectodermal tumor | |
| The Expression Level of Disease Section Compare with the Healthy Individual Tissue | p-value: 0.19208945; Fold-change: -0.20392115; Z-score: -0.618453335 | |
| Disease-specific Antigen Abundances |
|
Click to View the Clearer Original Diagram |
| The Studied Tissue | Nervous | |
| The Specific Disease | Brain cancer | |
| The Expression Level of Disease Section Compare with the Healthy Individual Tissue | p-value: 1.73E-16; Fold-change: -0.148023747; Z-score: -0.438300049 | |
| Disease-specific Antigen Abundances |
|
Click to View the Clearer Original Diagram |
| Differential expression pattern of antigen in diseases | ||
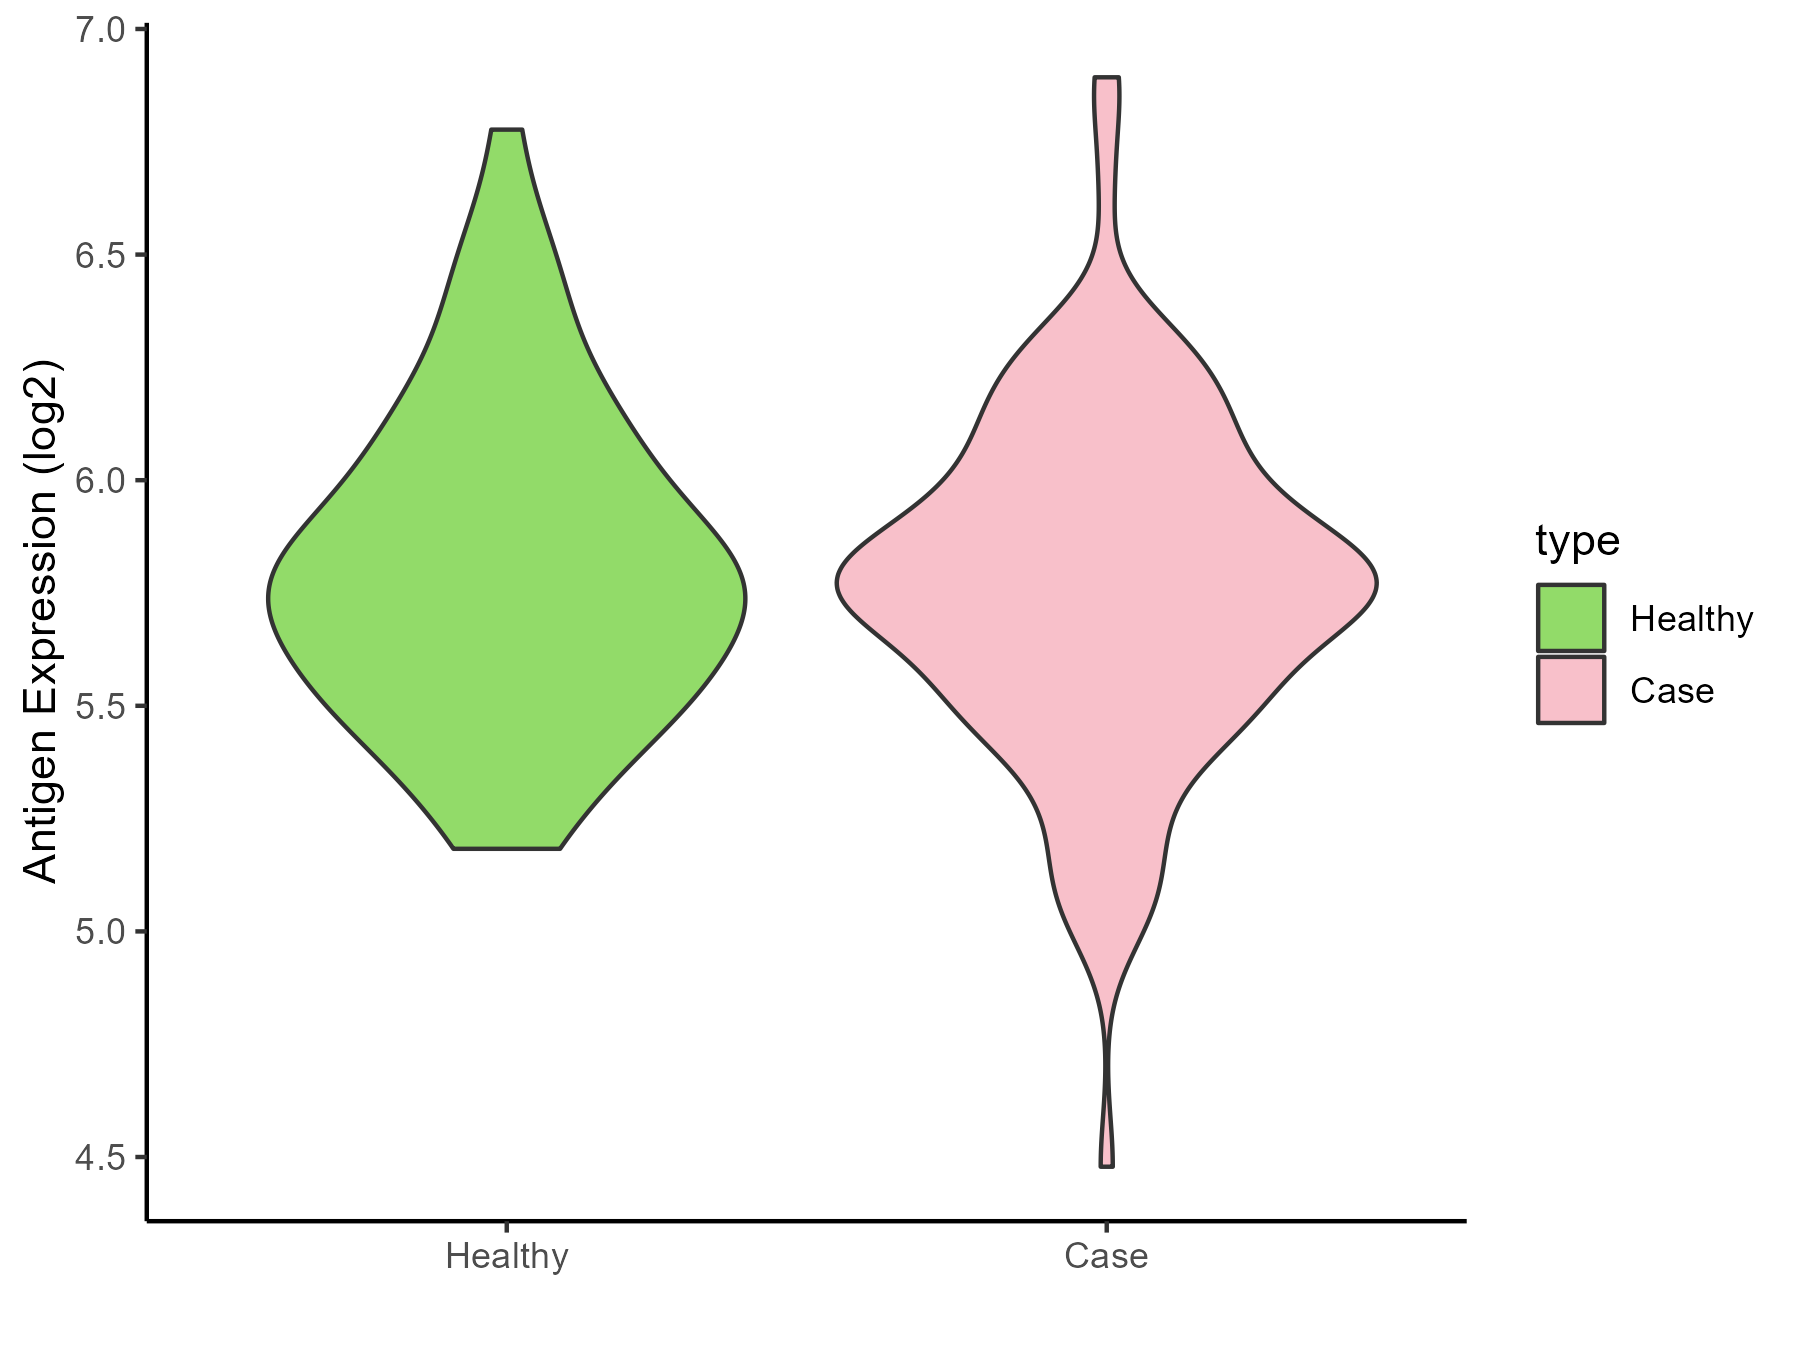
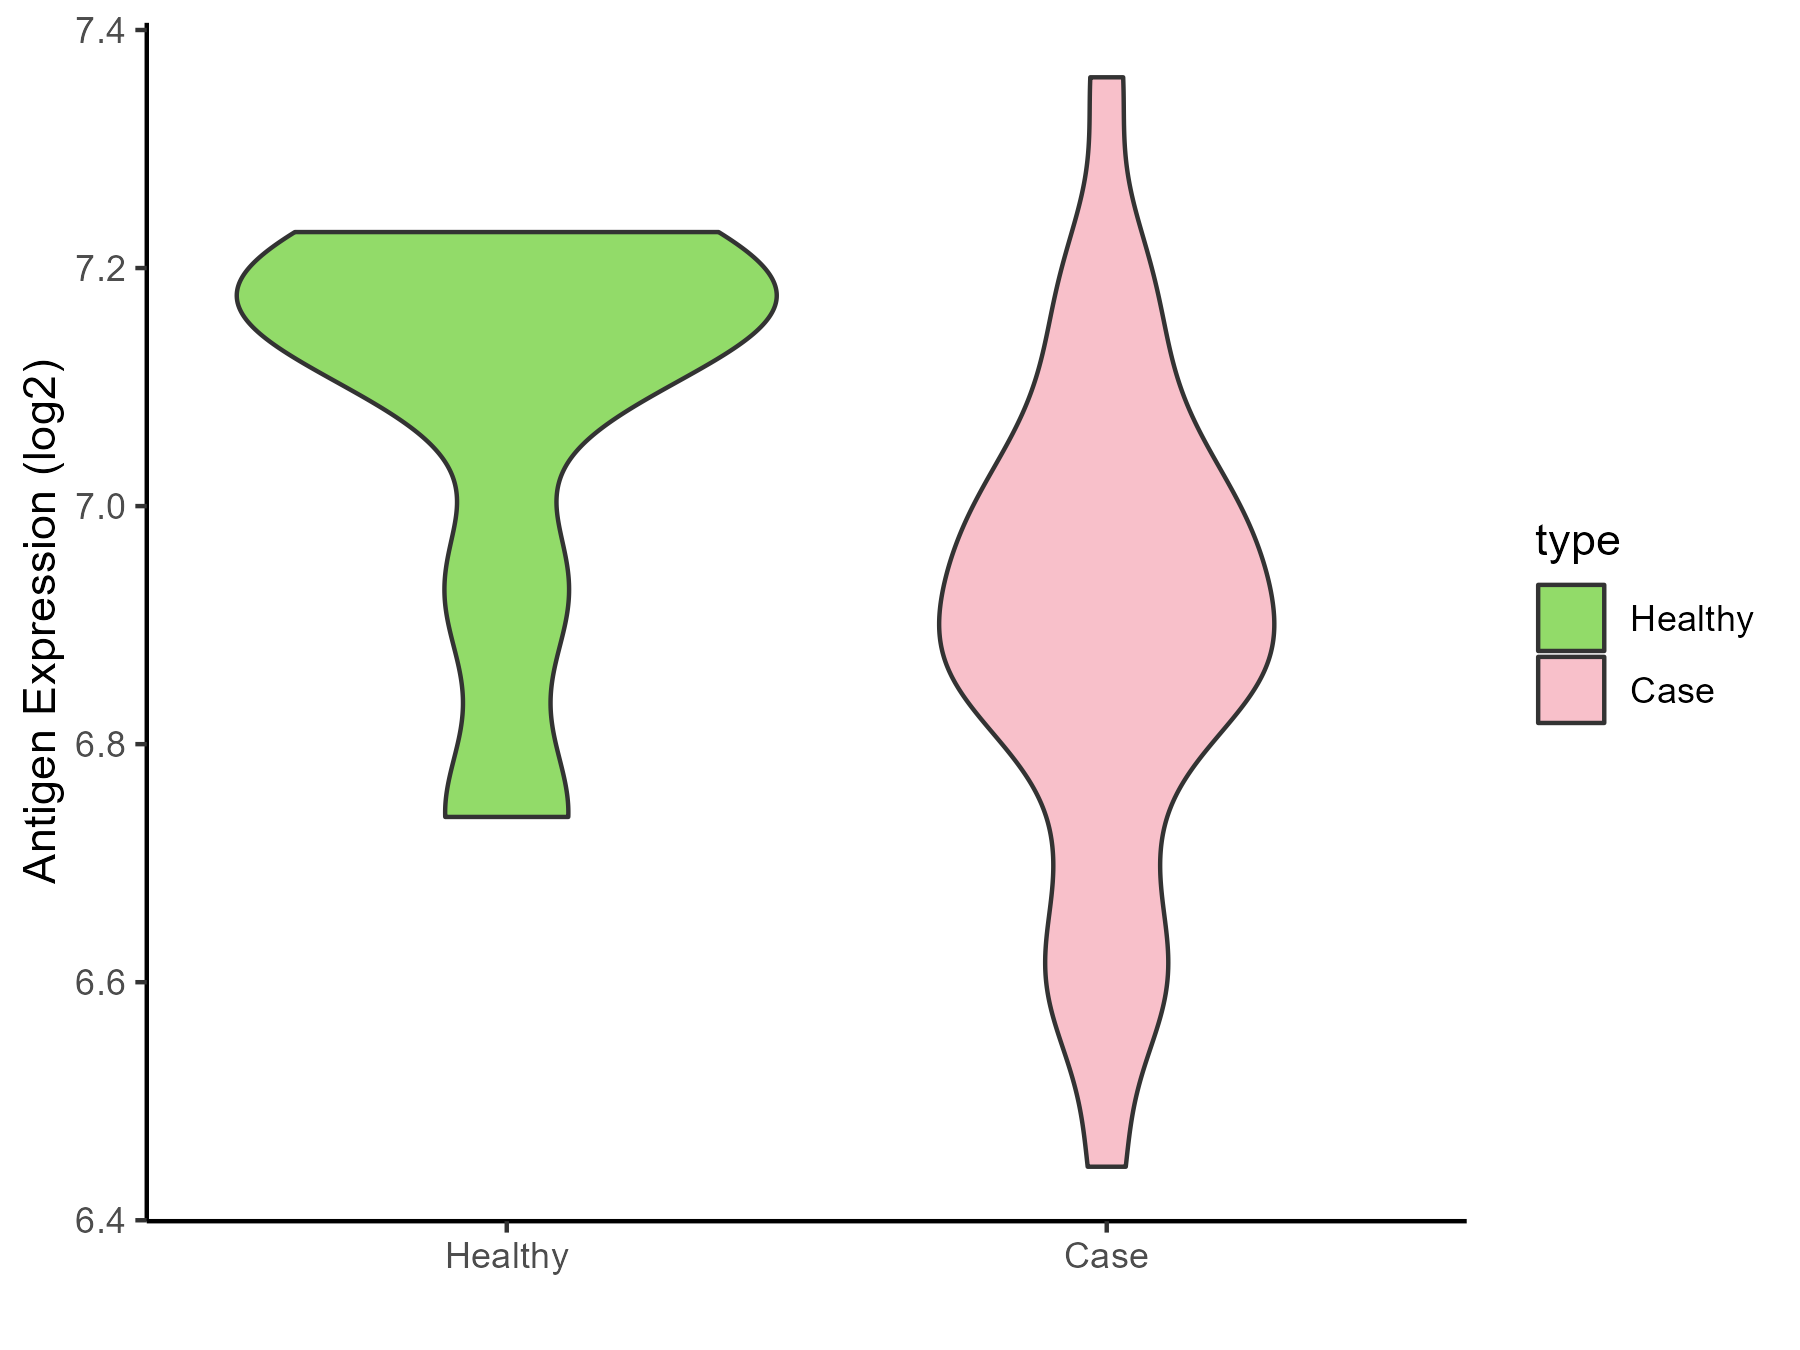
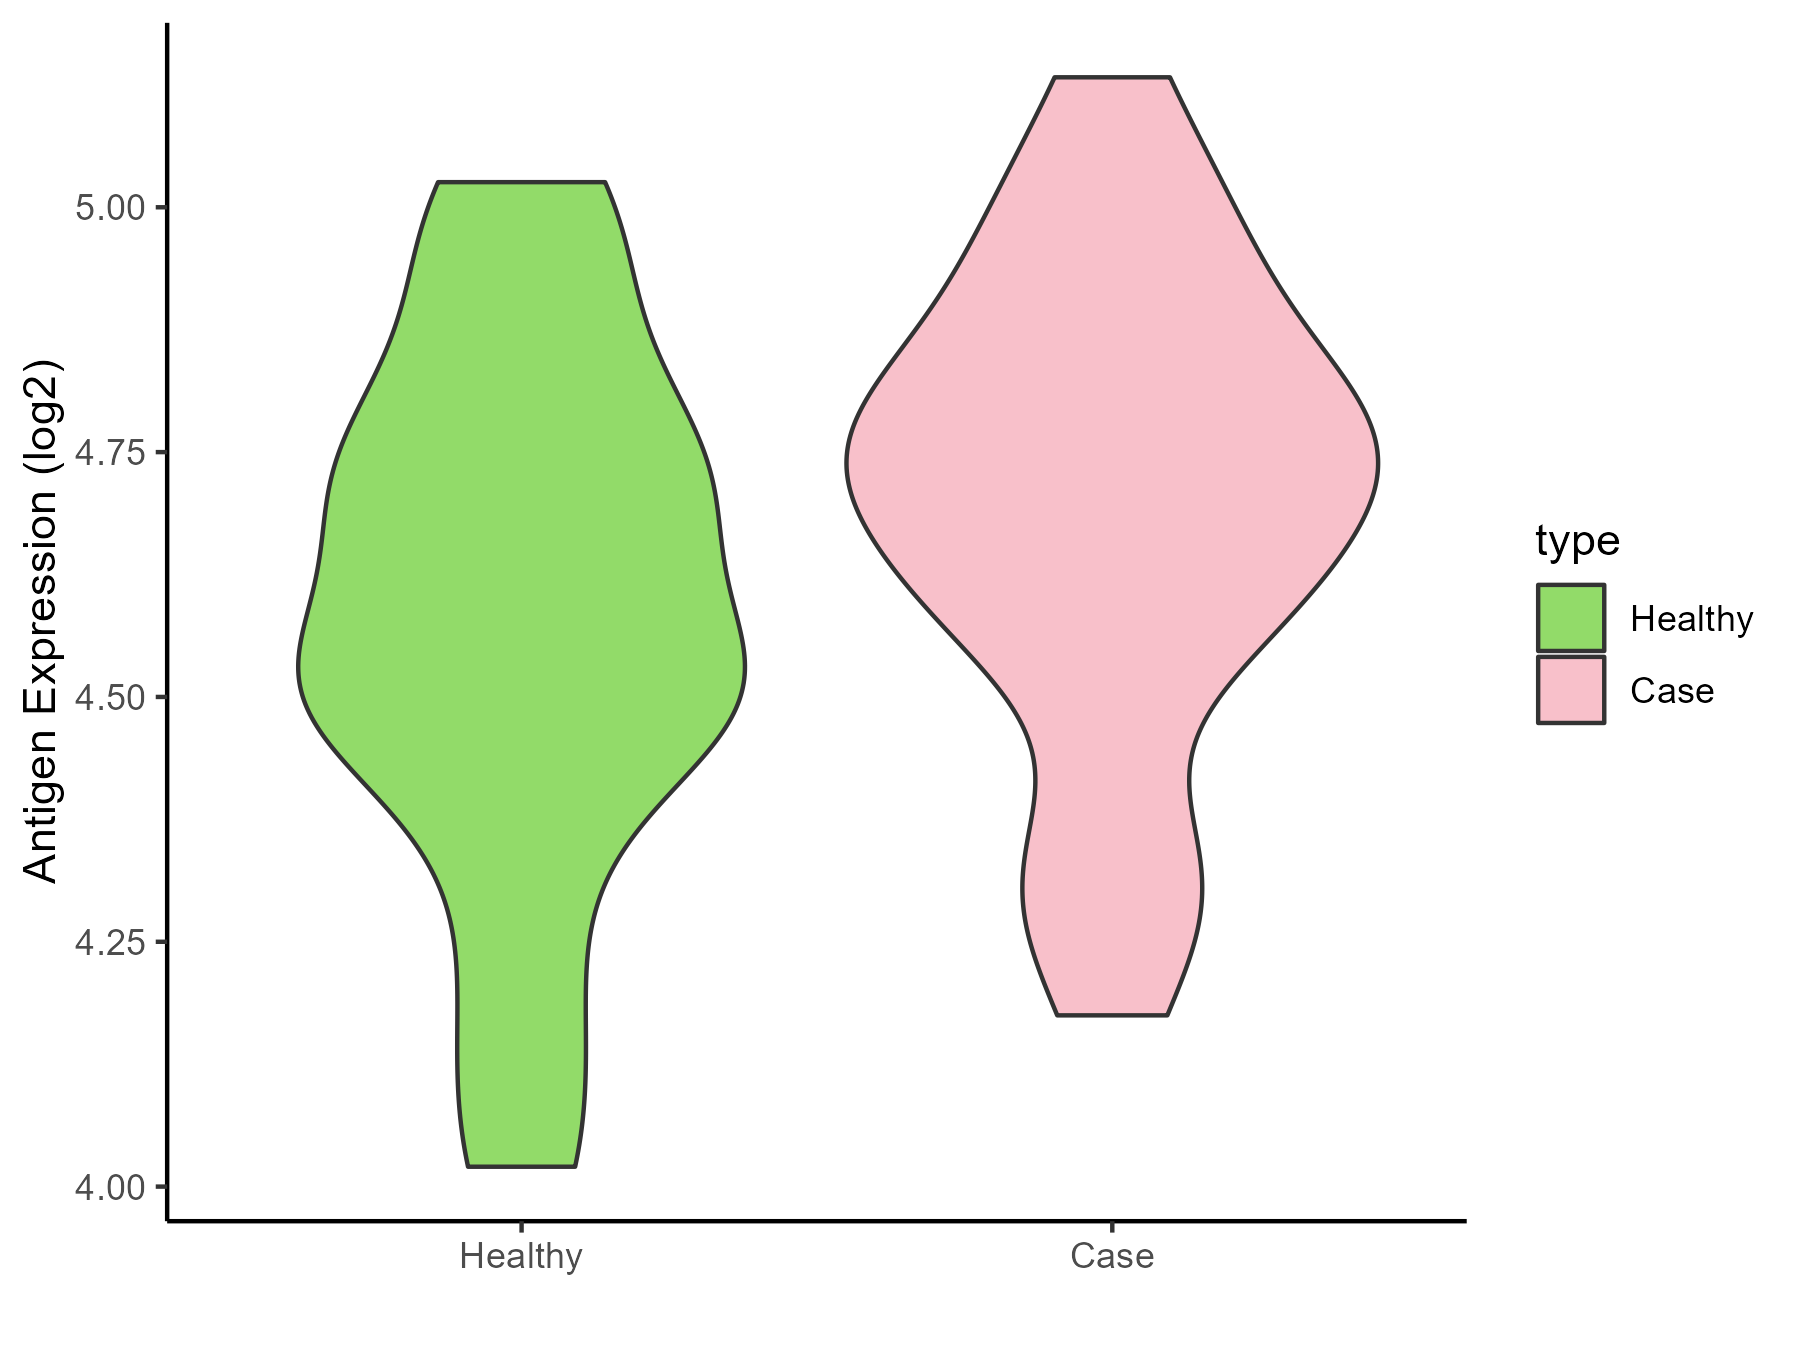
| The Studied Tissue | Whole blood | |
| The Specific Disease | Polycythemia vera | |
| The Expression Level of Disease Section Compare with the Healthy Individual Tissue | p-value: 0.002291219; Fold-change: 0.193153149; Z-score: 0.890191933 | |
| Disease-specific Antigen Abundances |
|
Click to View the Clearer Original Diagram |
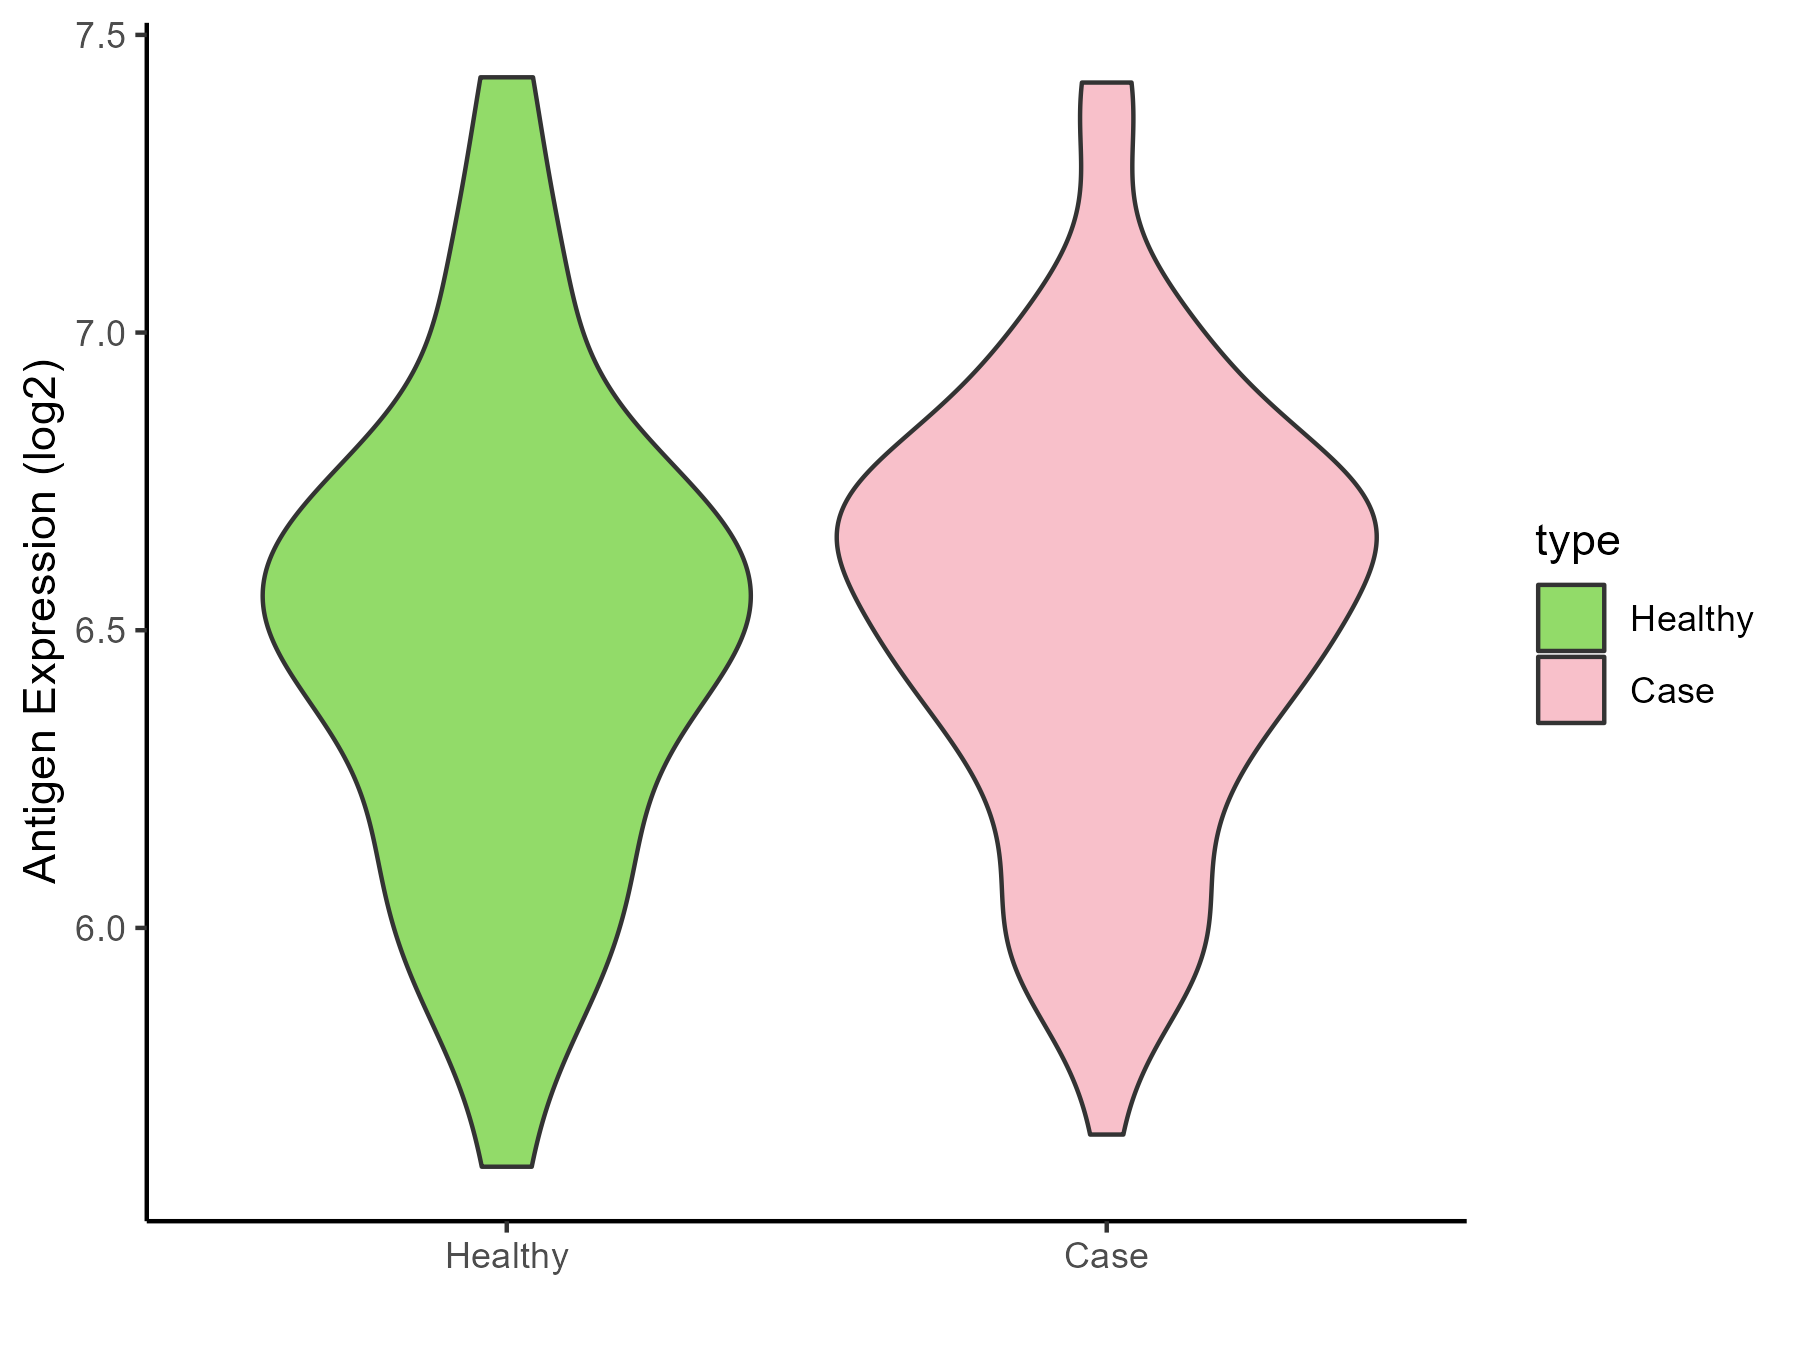
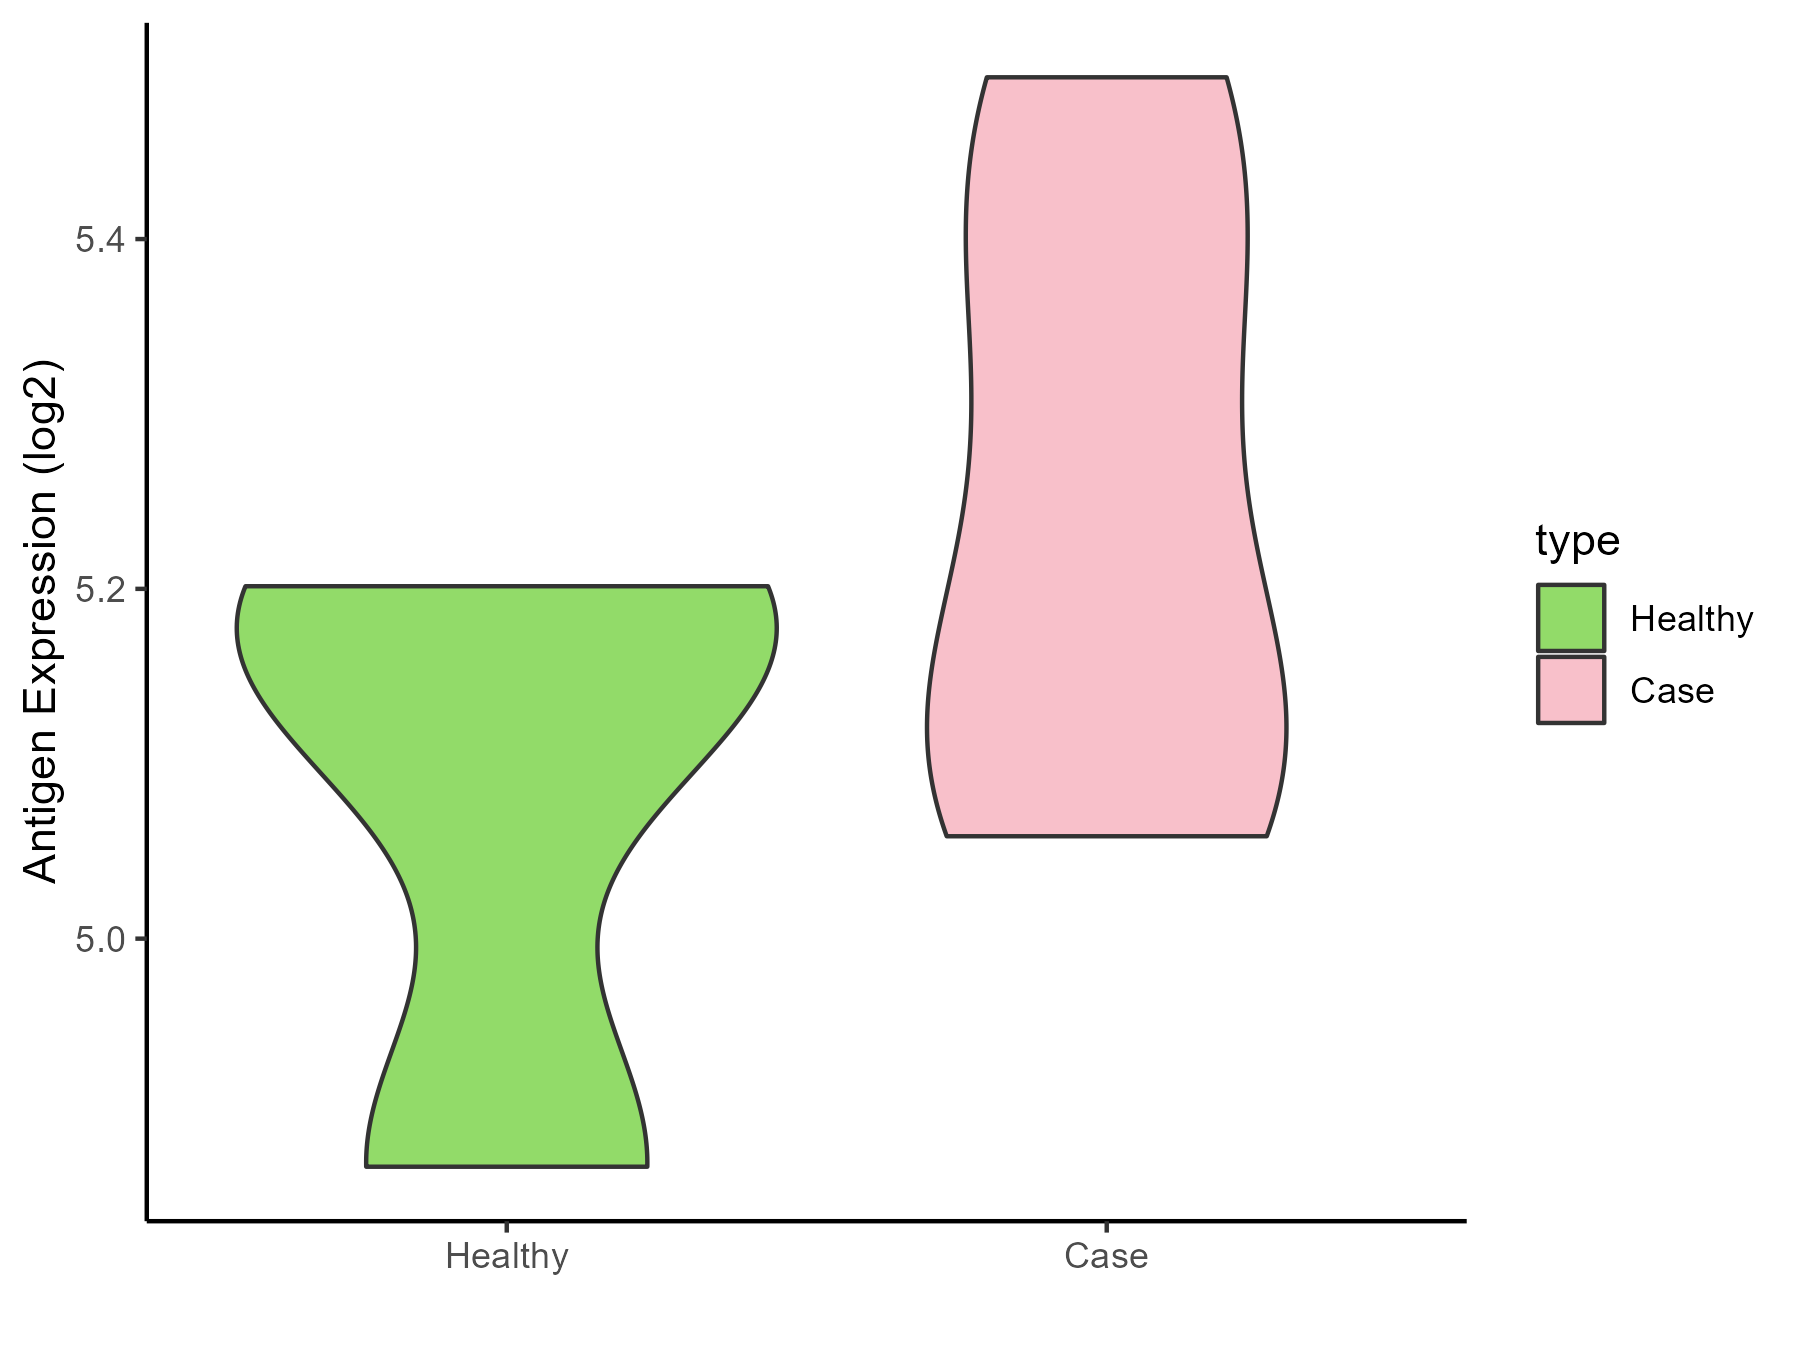
| The Studied Tissue | Whole blood | |
| The Specific Disease | Myelofibrosis | |
| The Expression Level of Disease Section Compare with the Healthy Individual Tissue | p-value: 0.825829538; Fold-change: -0.065692343; Z-score: -0.295314153 | |
| Disease-specific Antigen Abundances |
|
Click to View the Clearer Original Diagram |
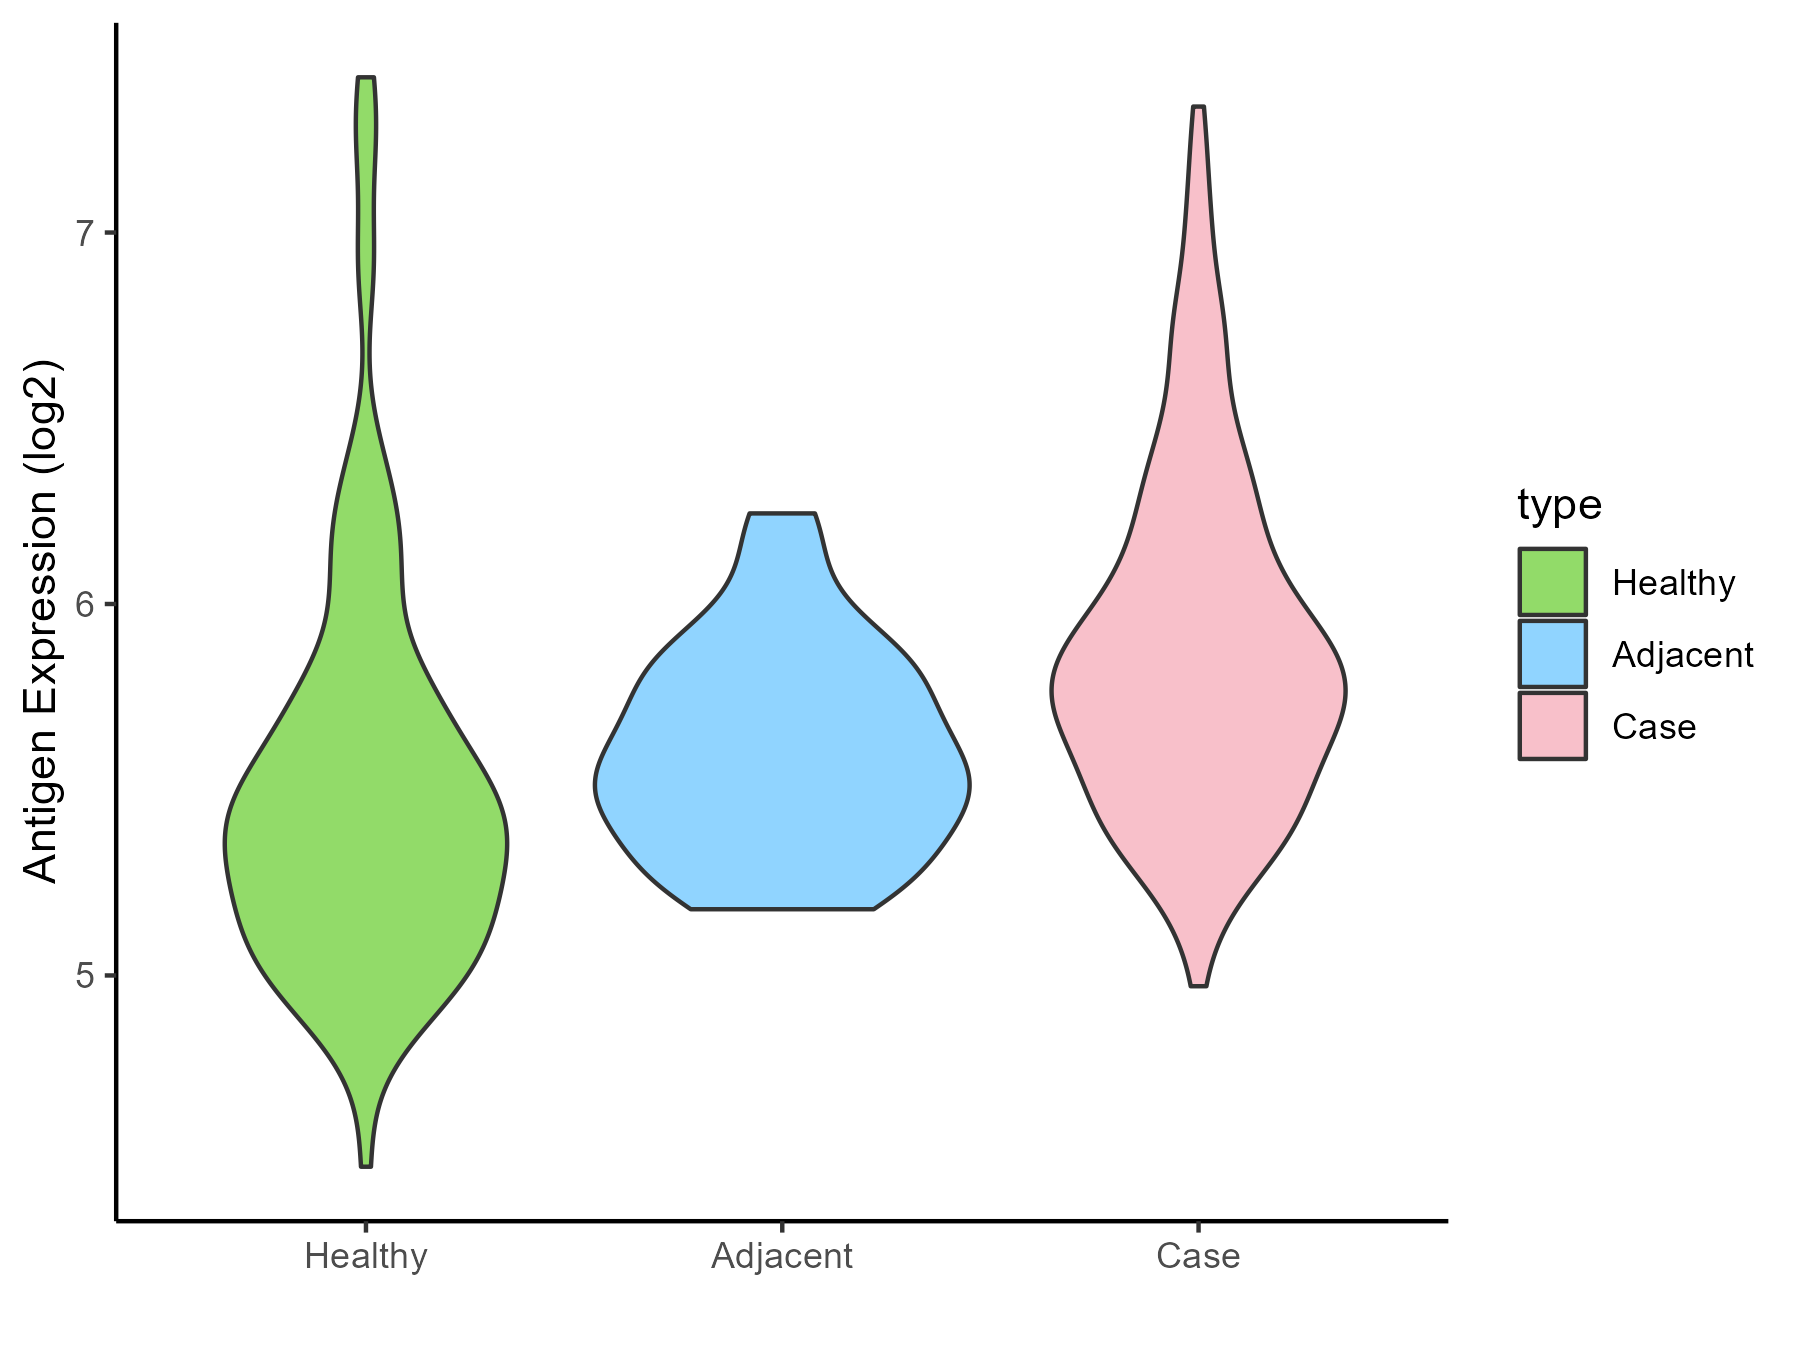
| Differential expression pattern of antigen in diseases | ||
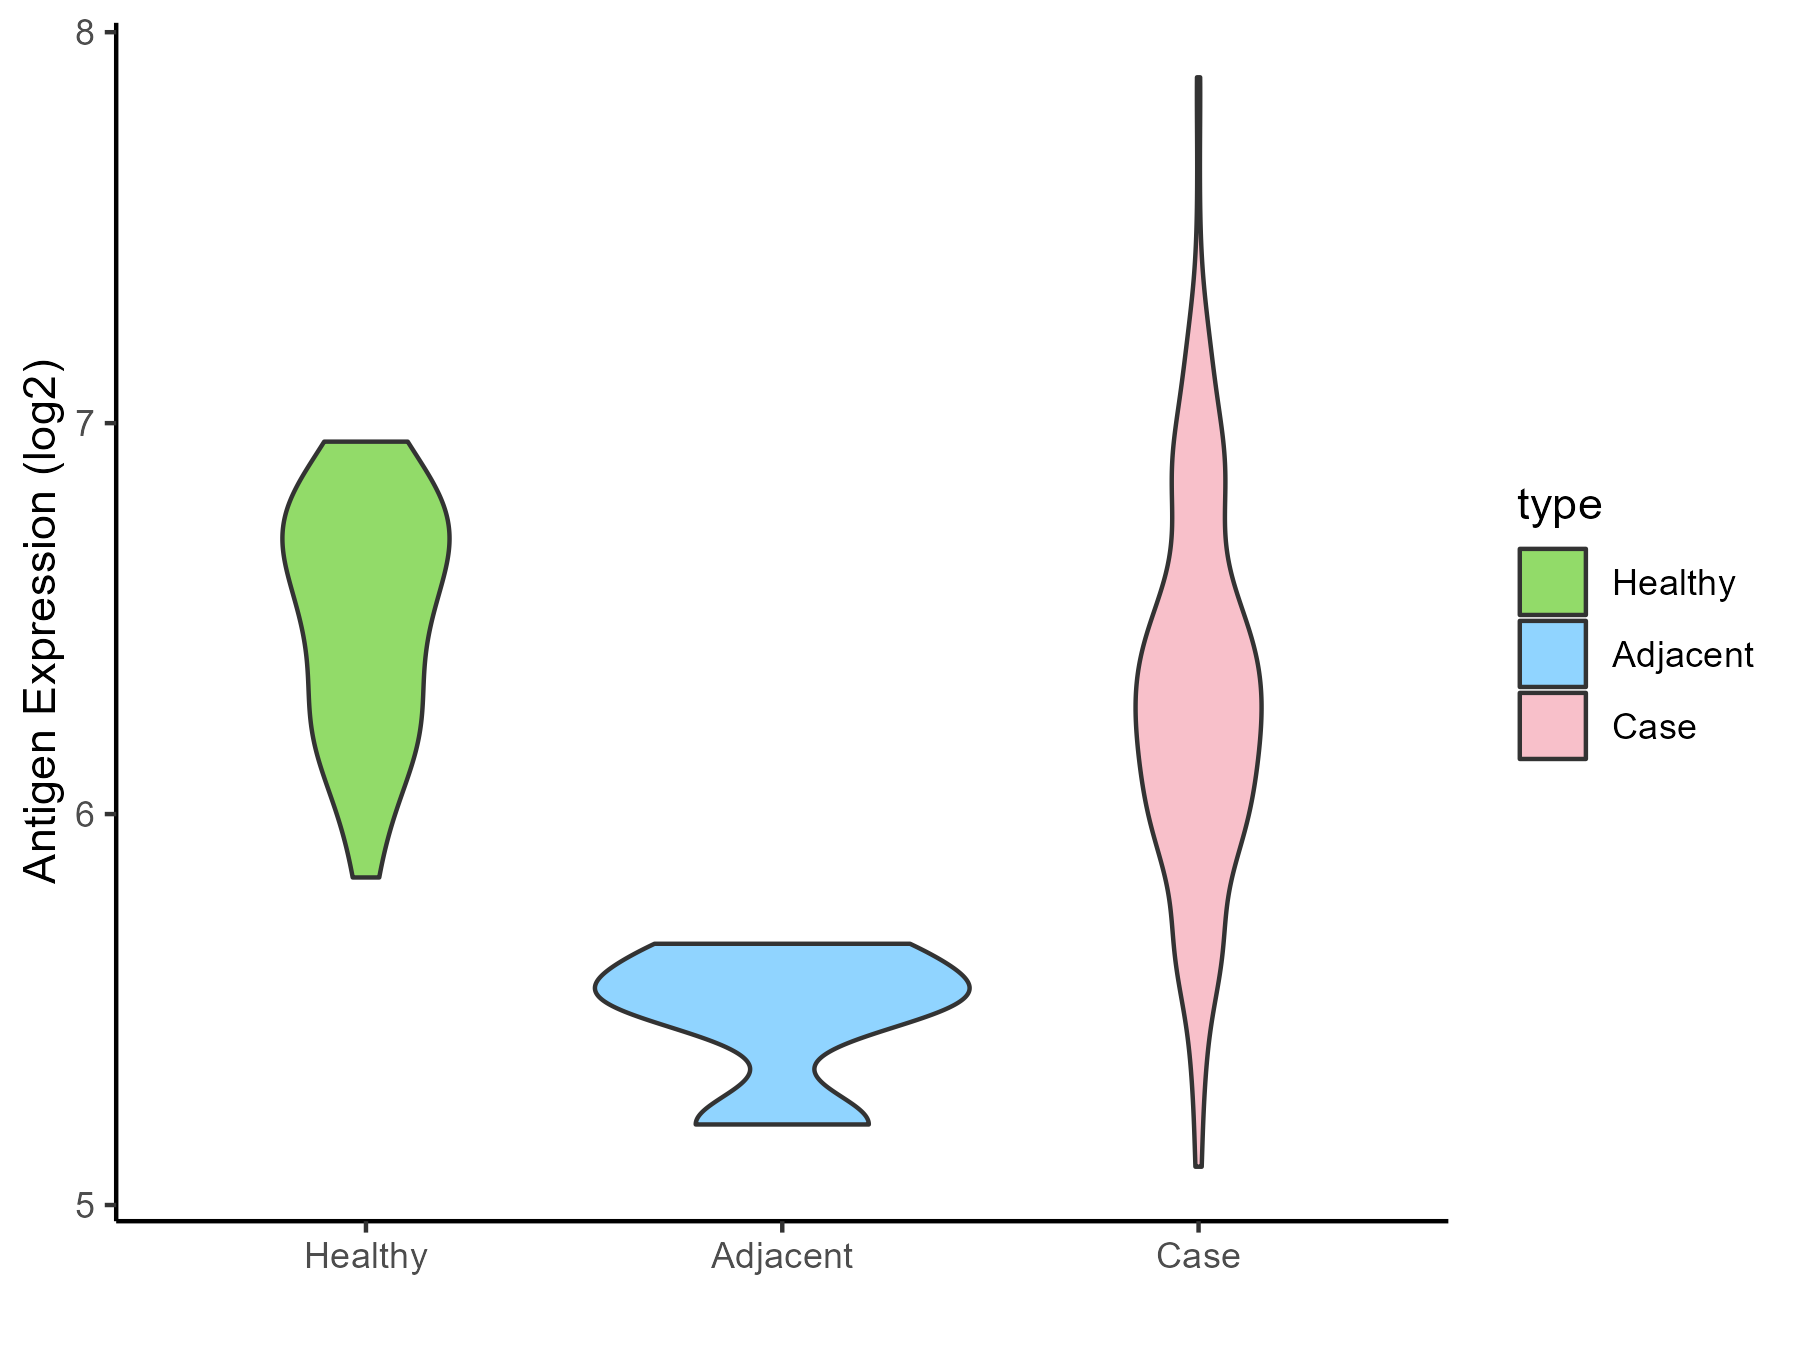
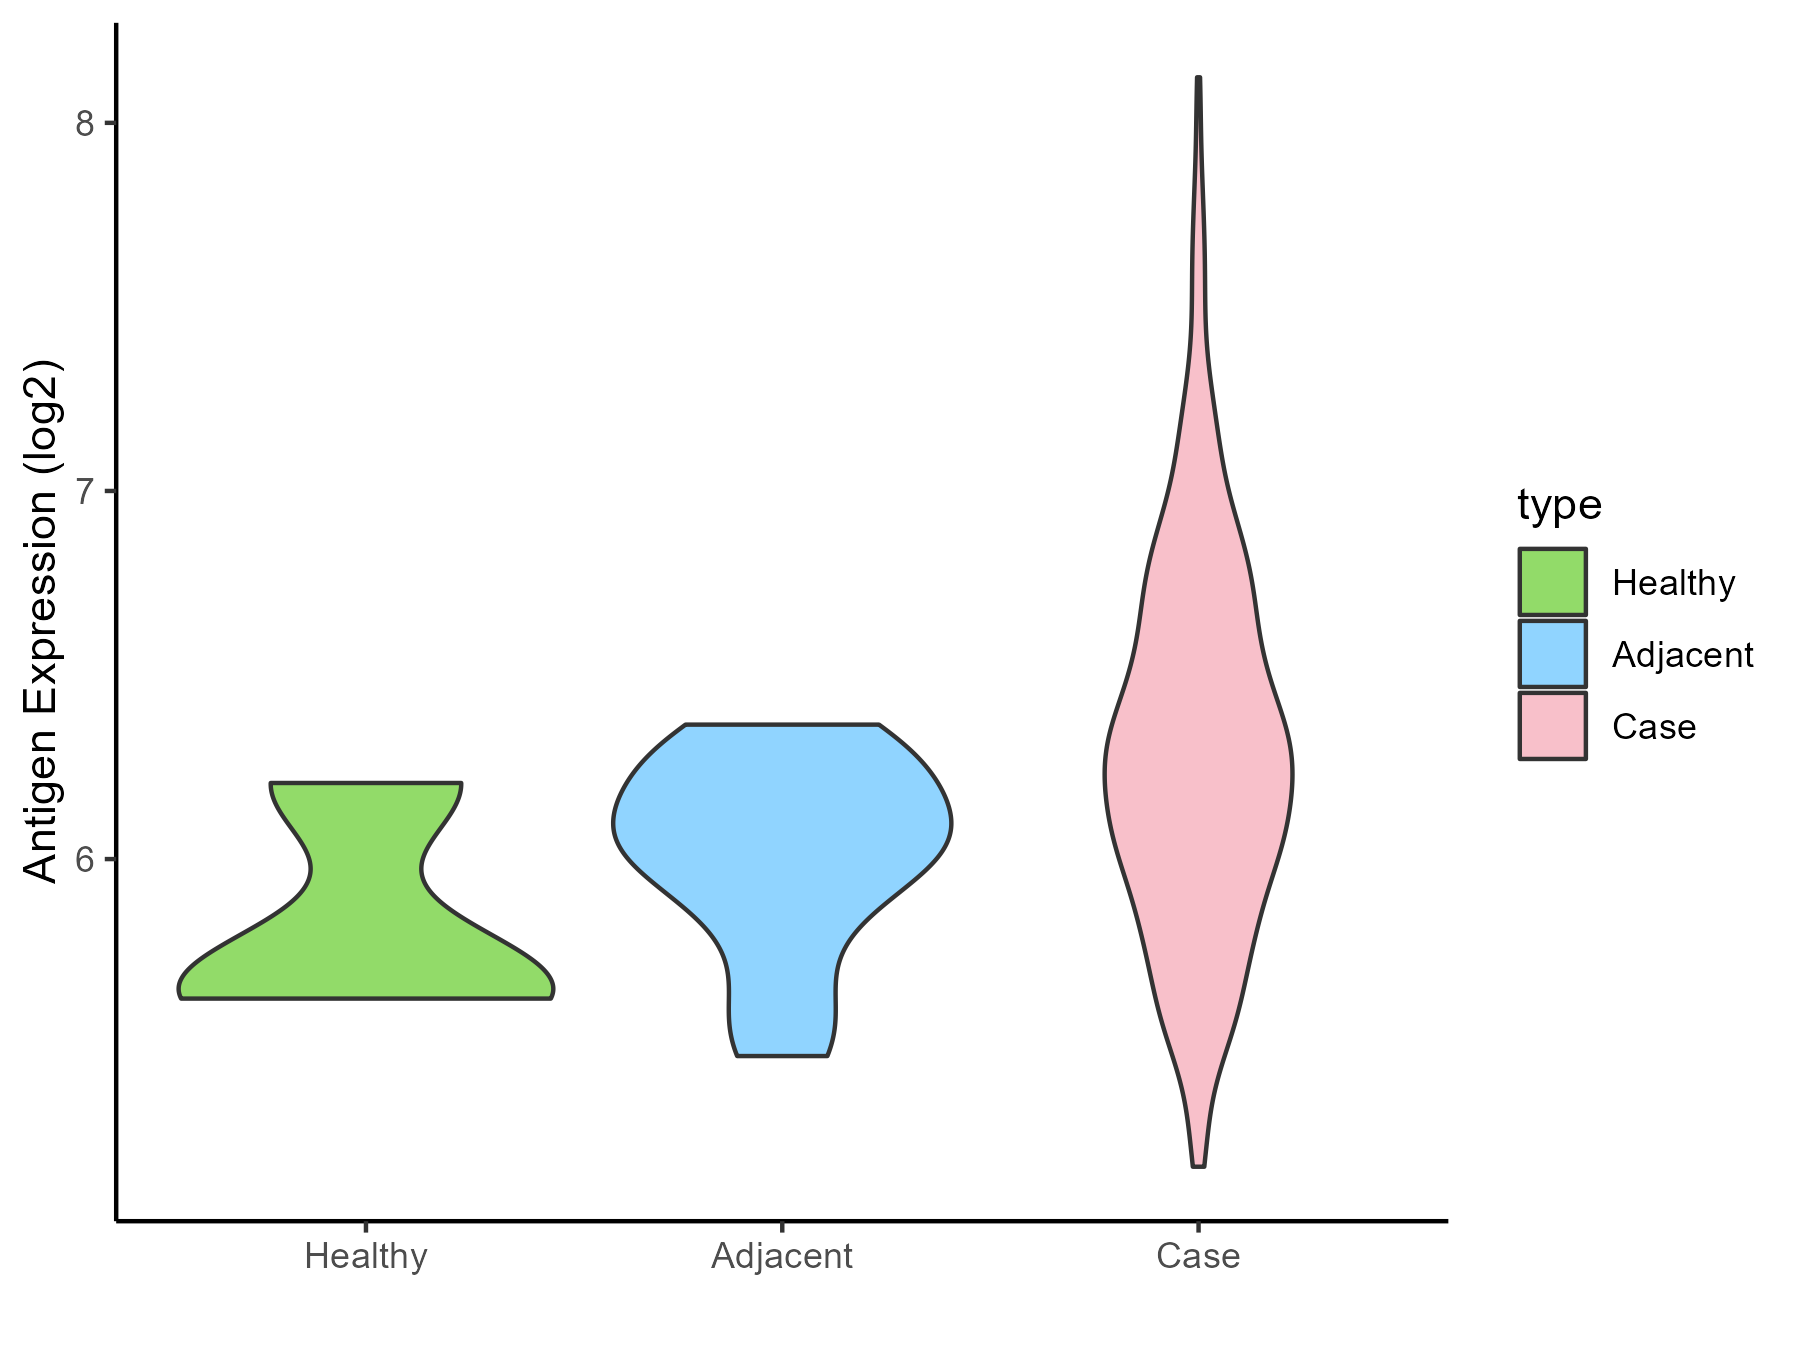
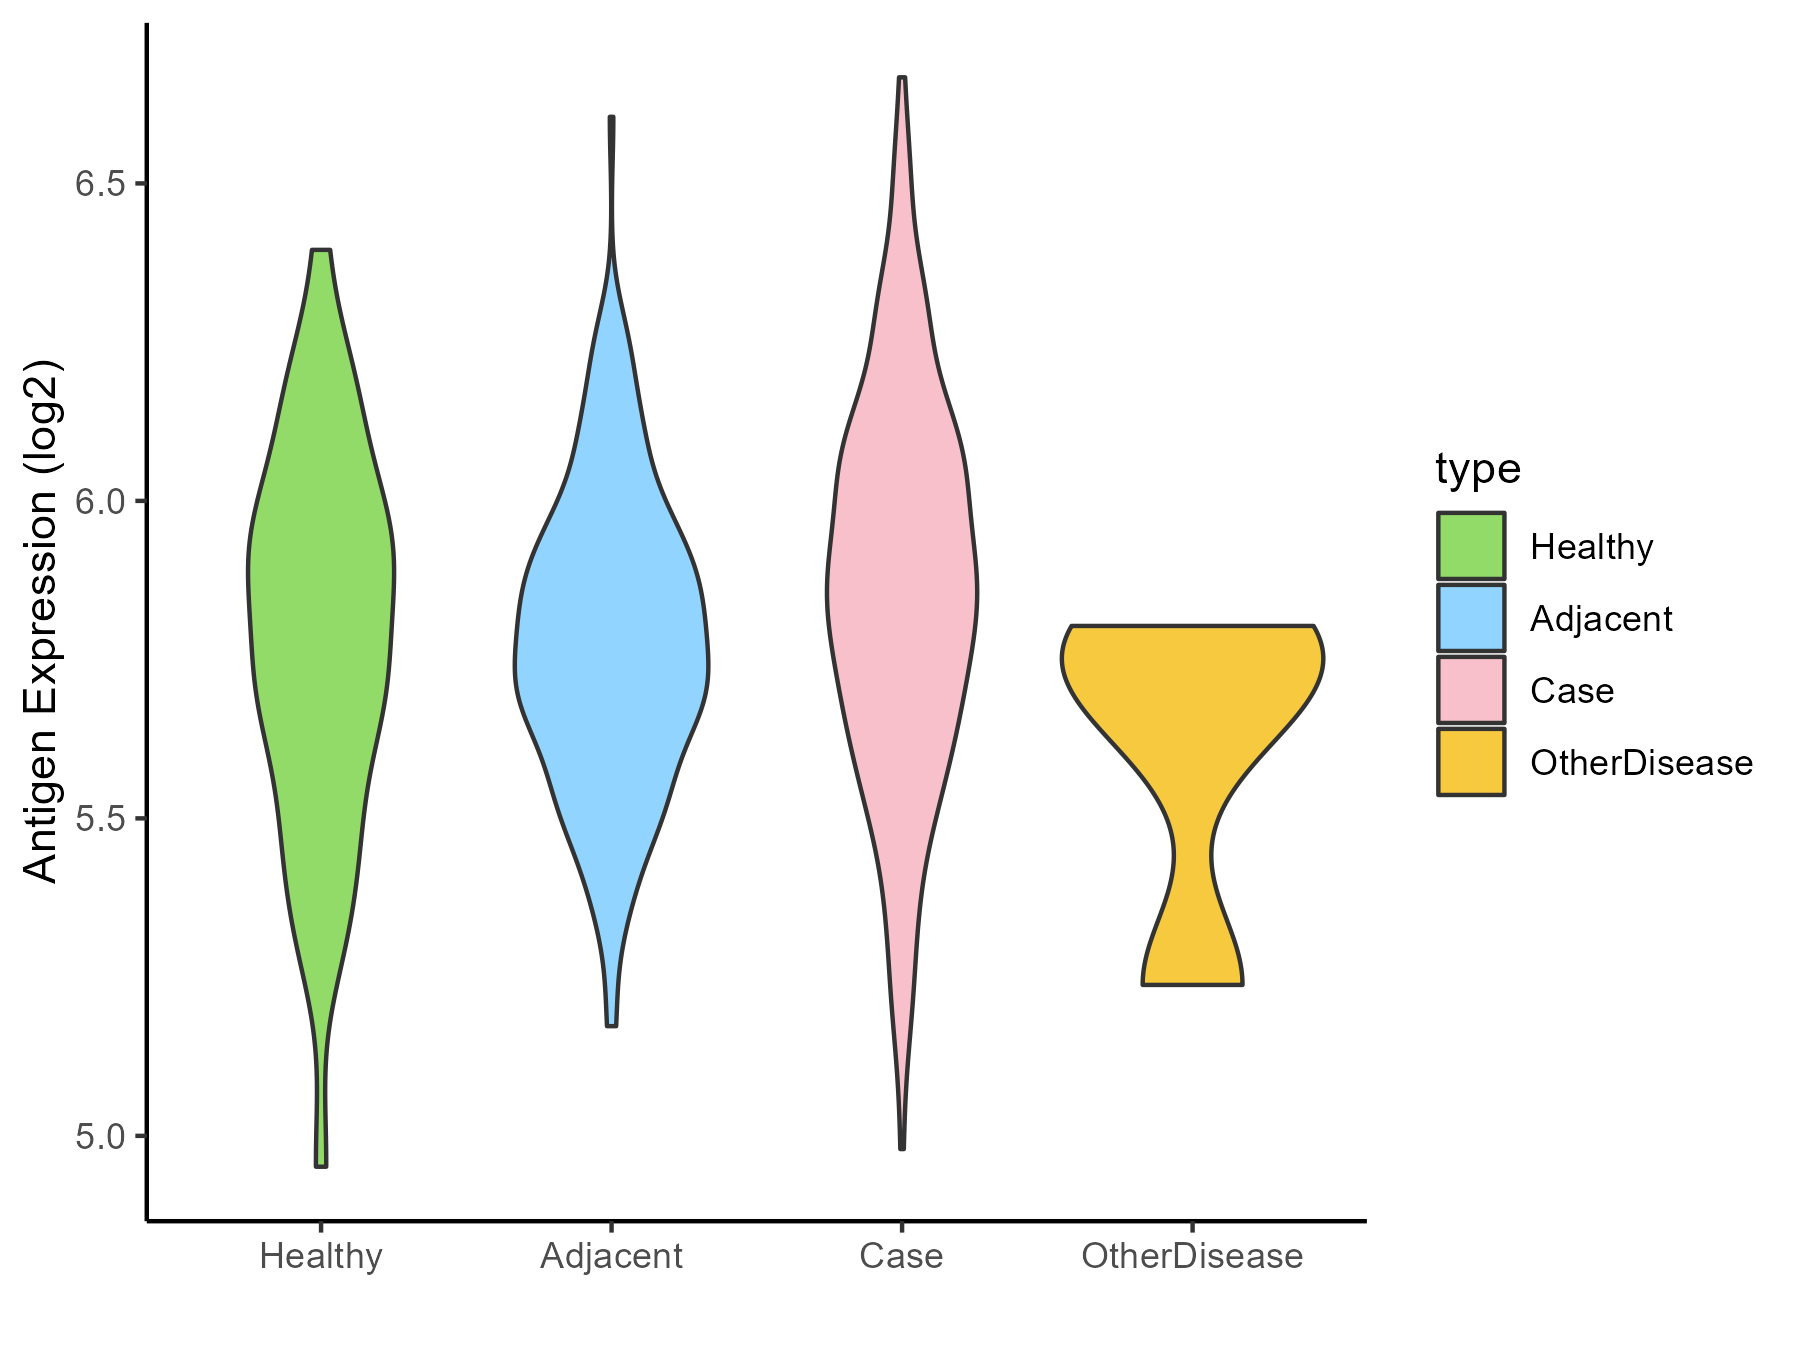
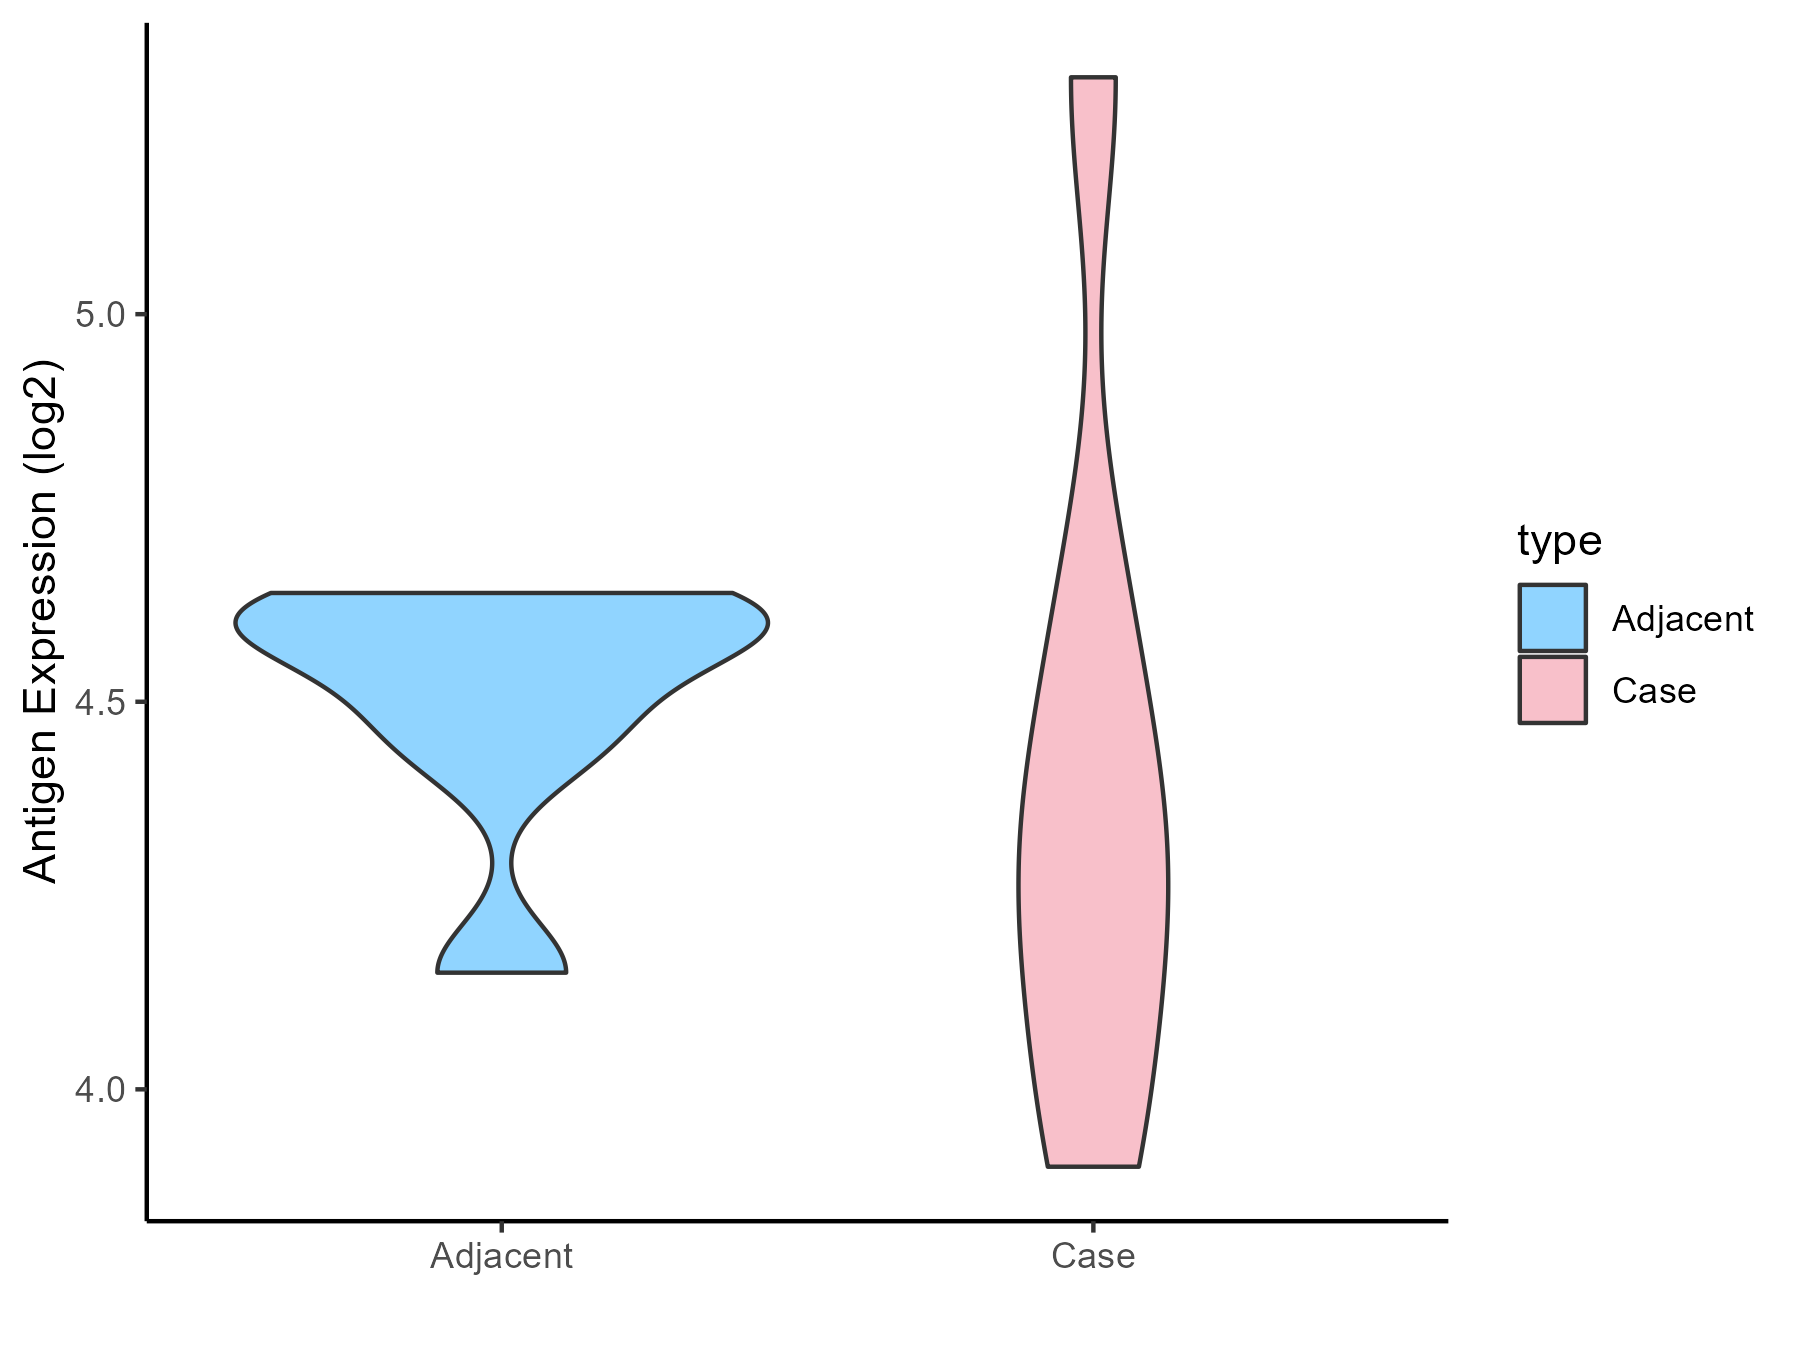
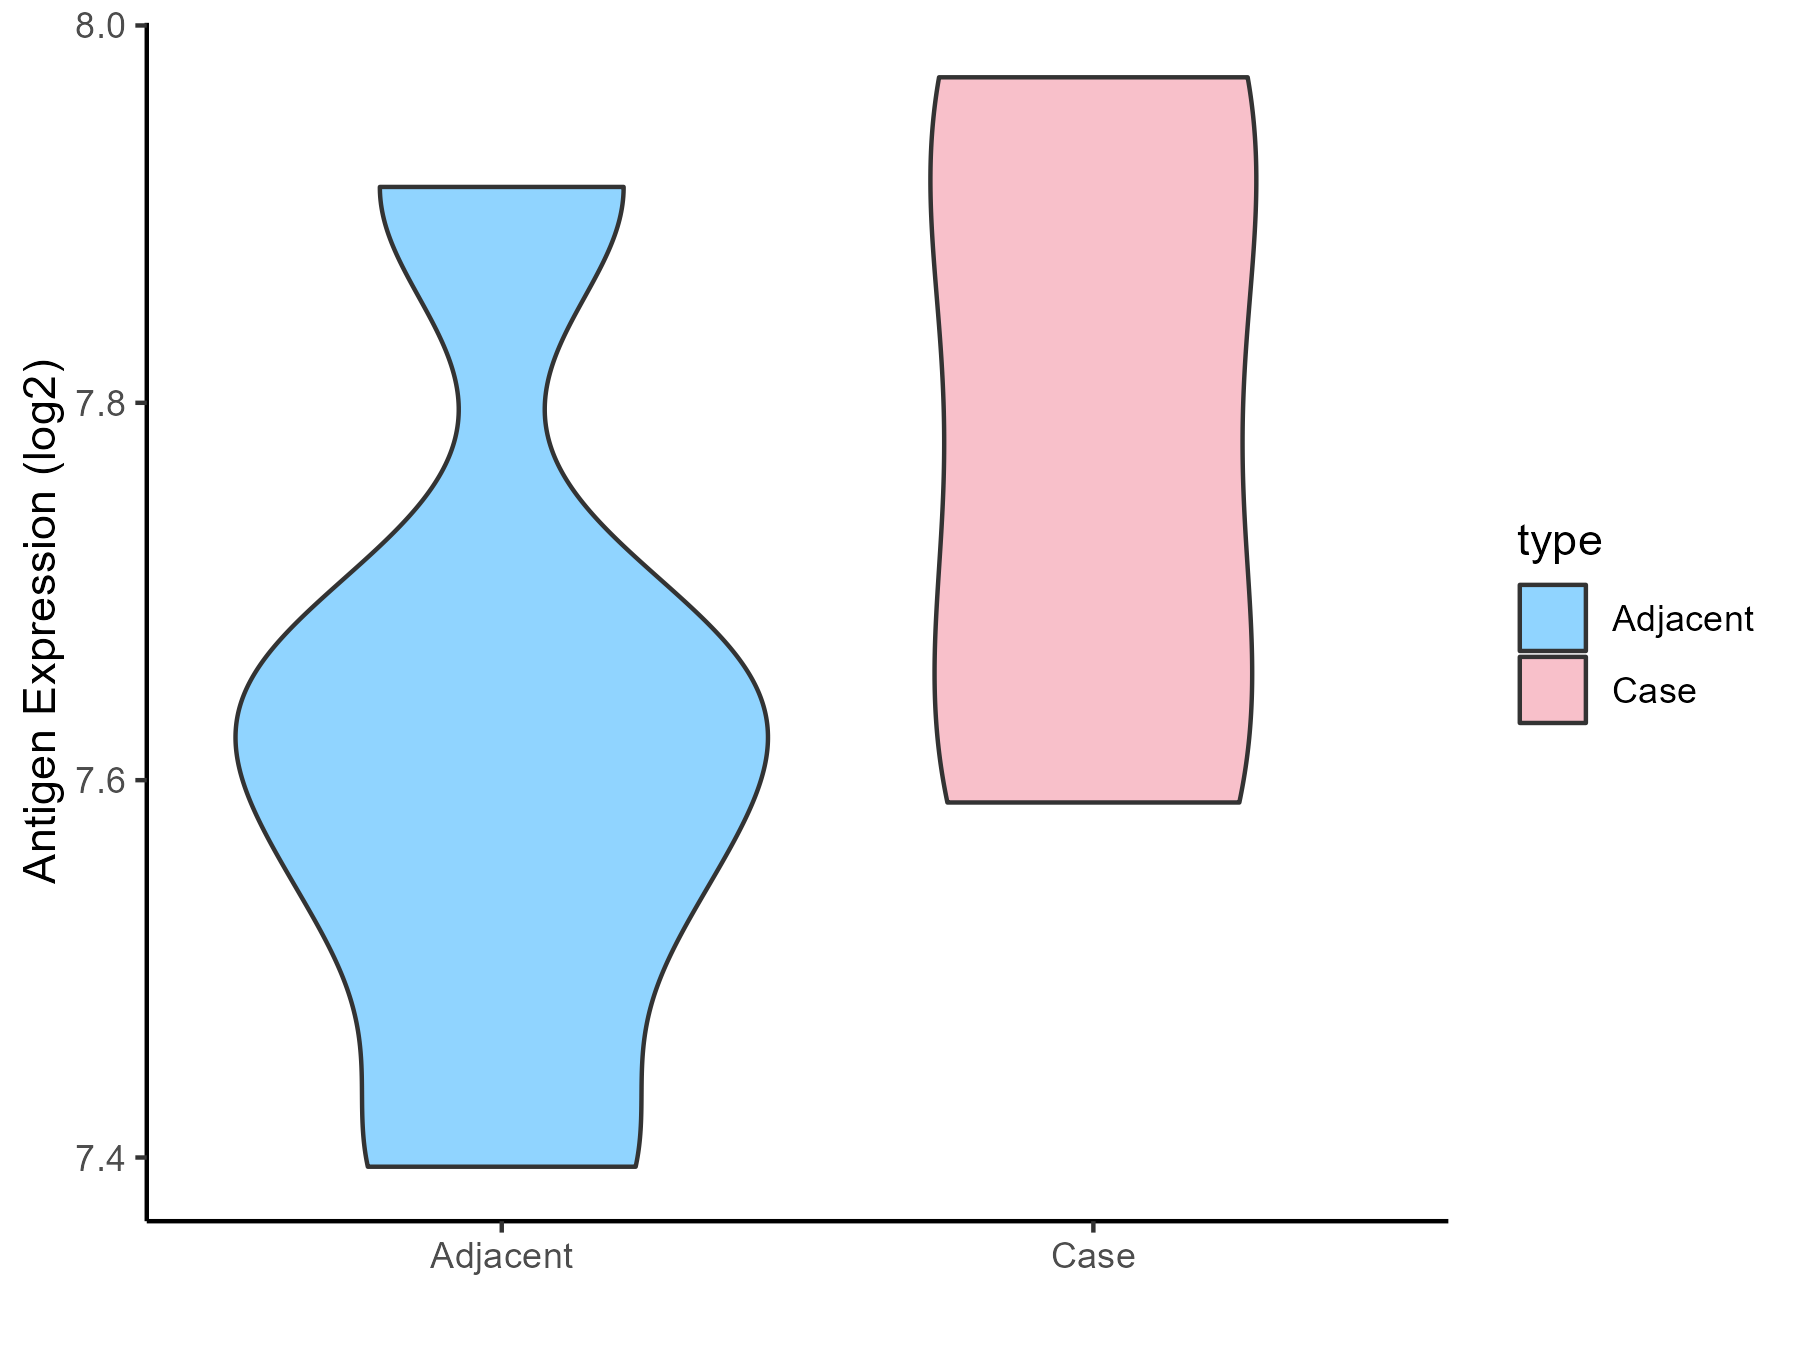
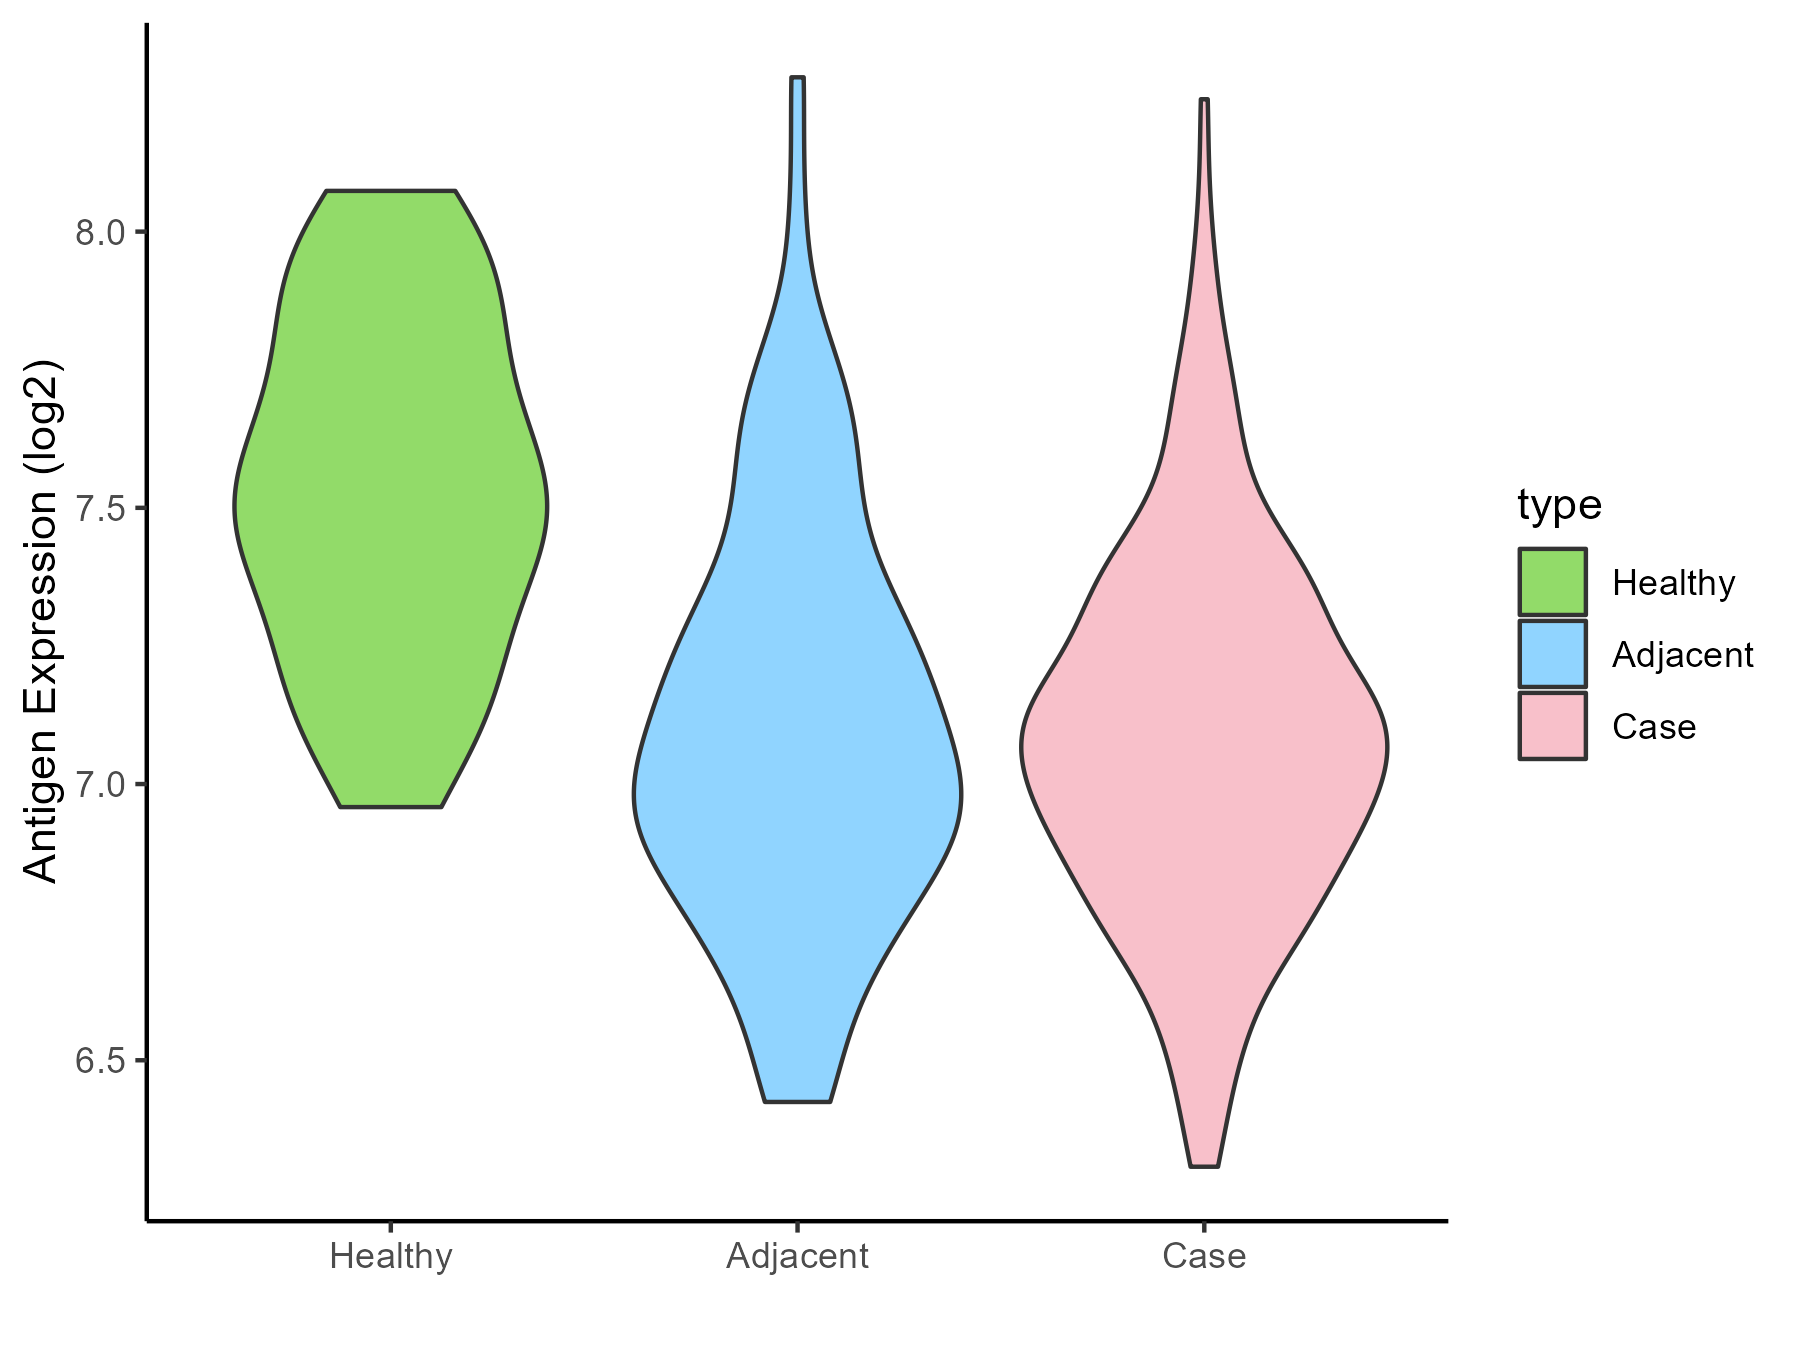
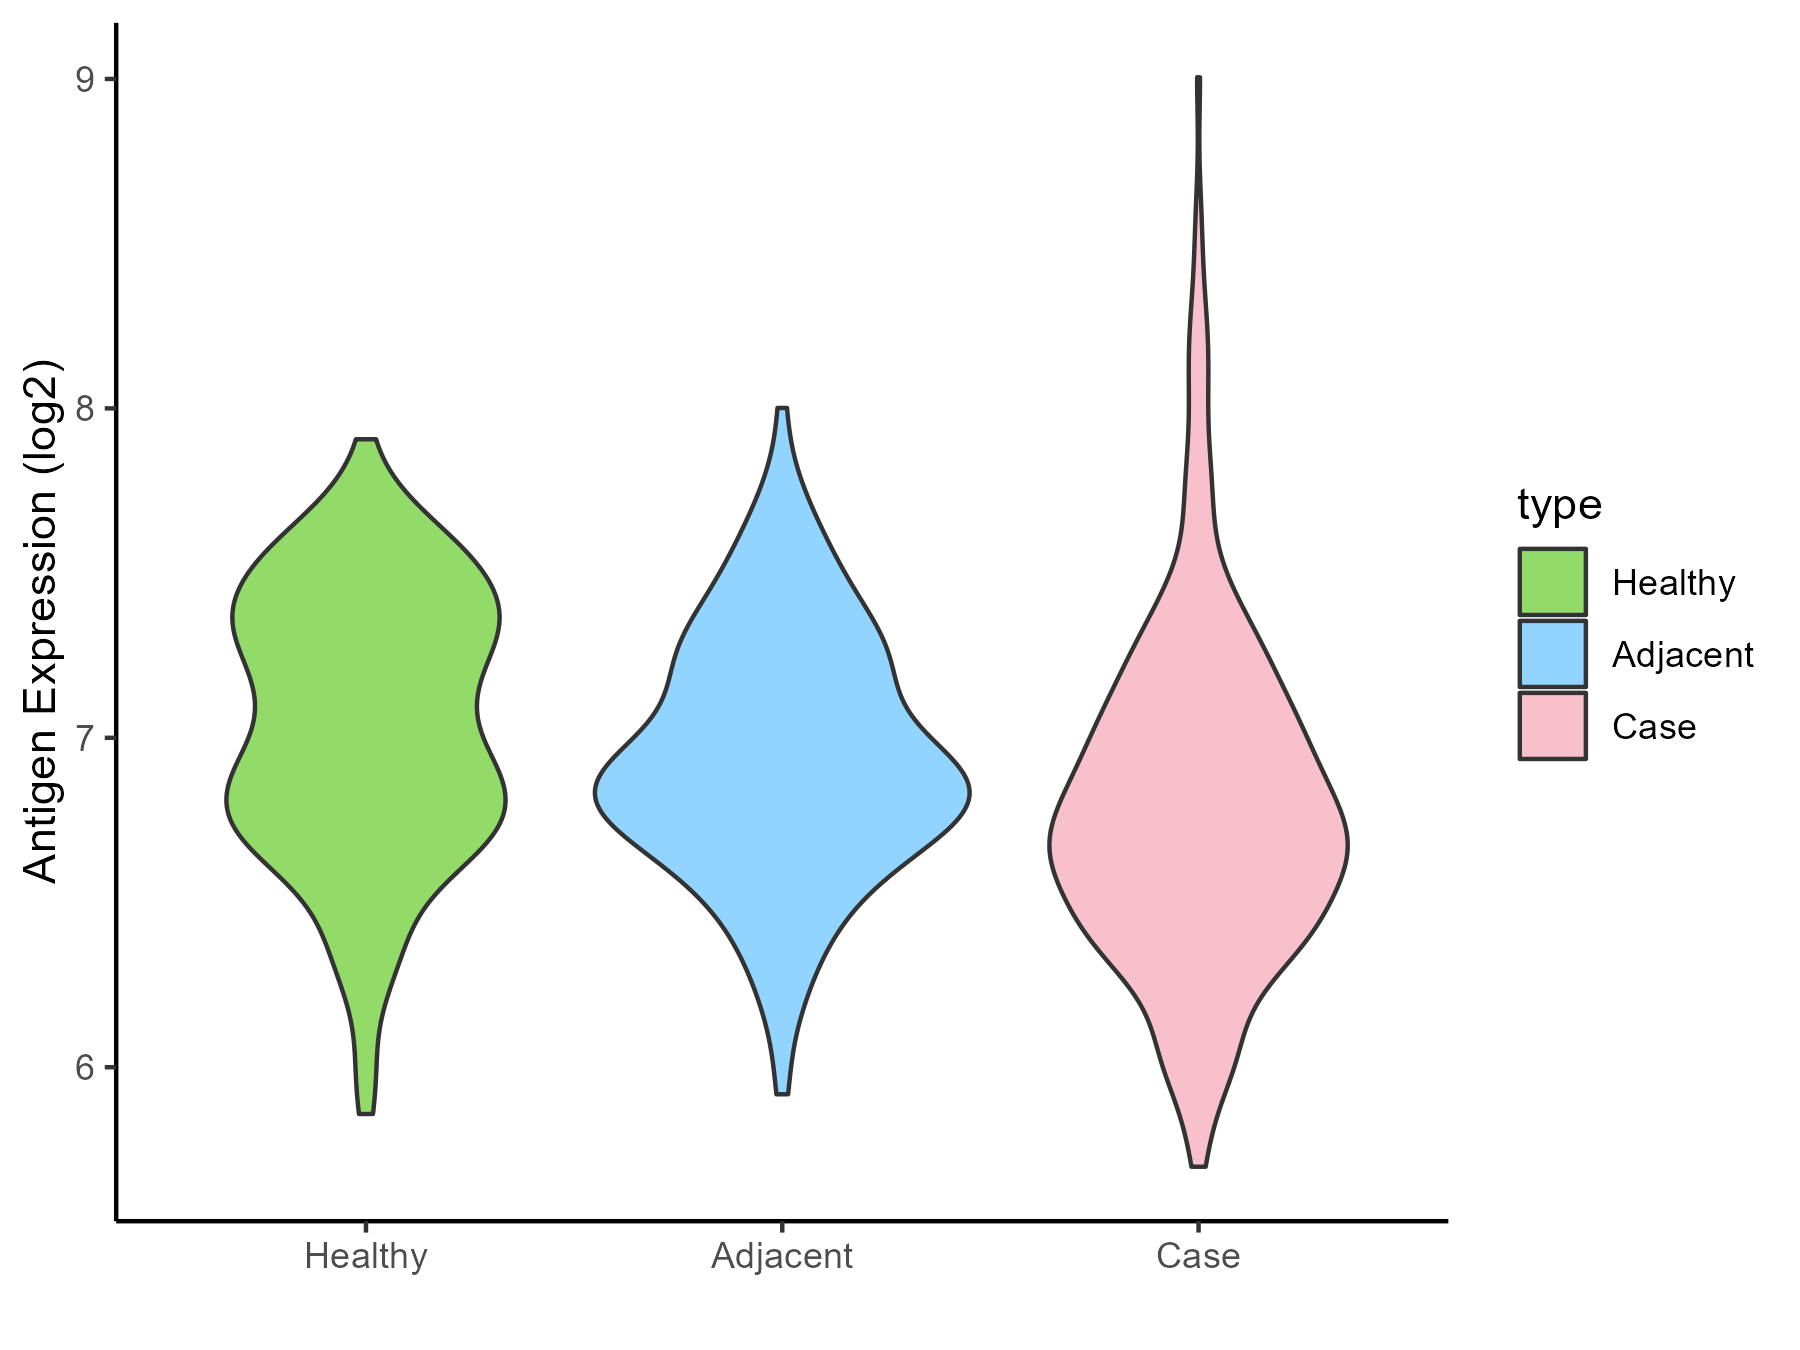
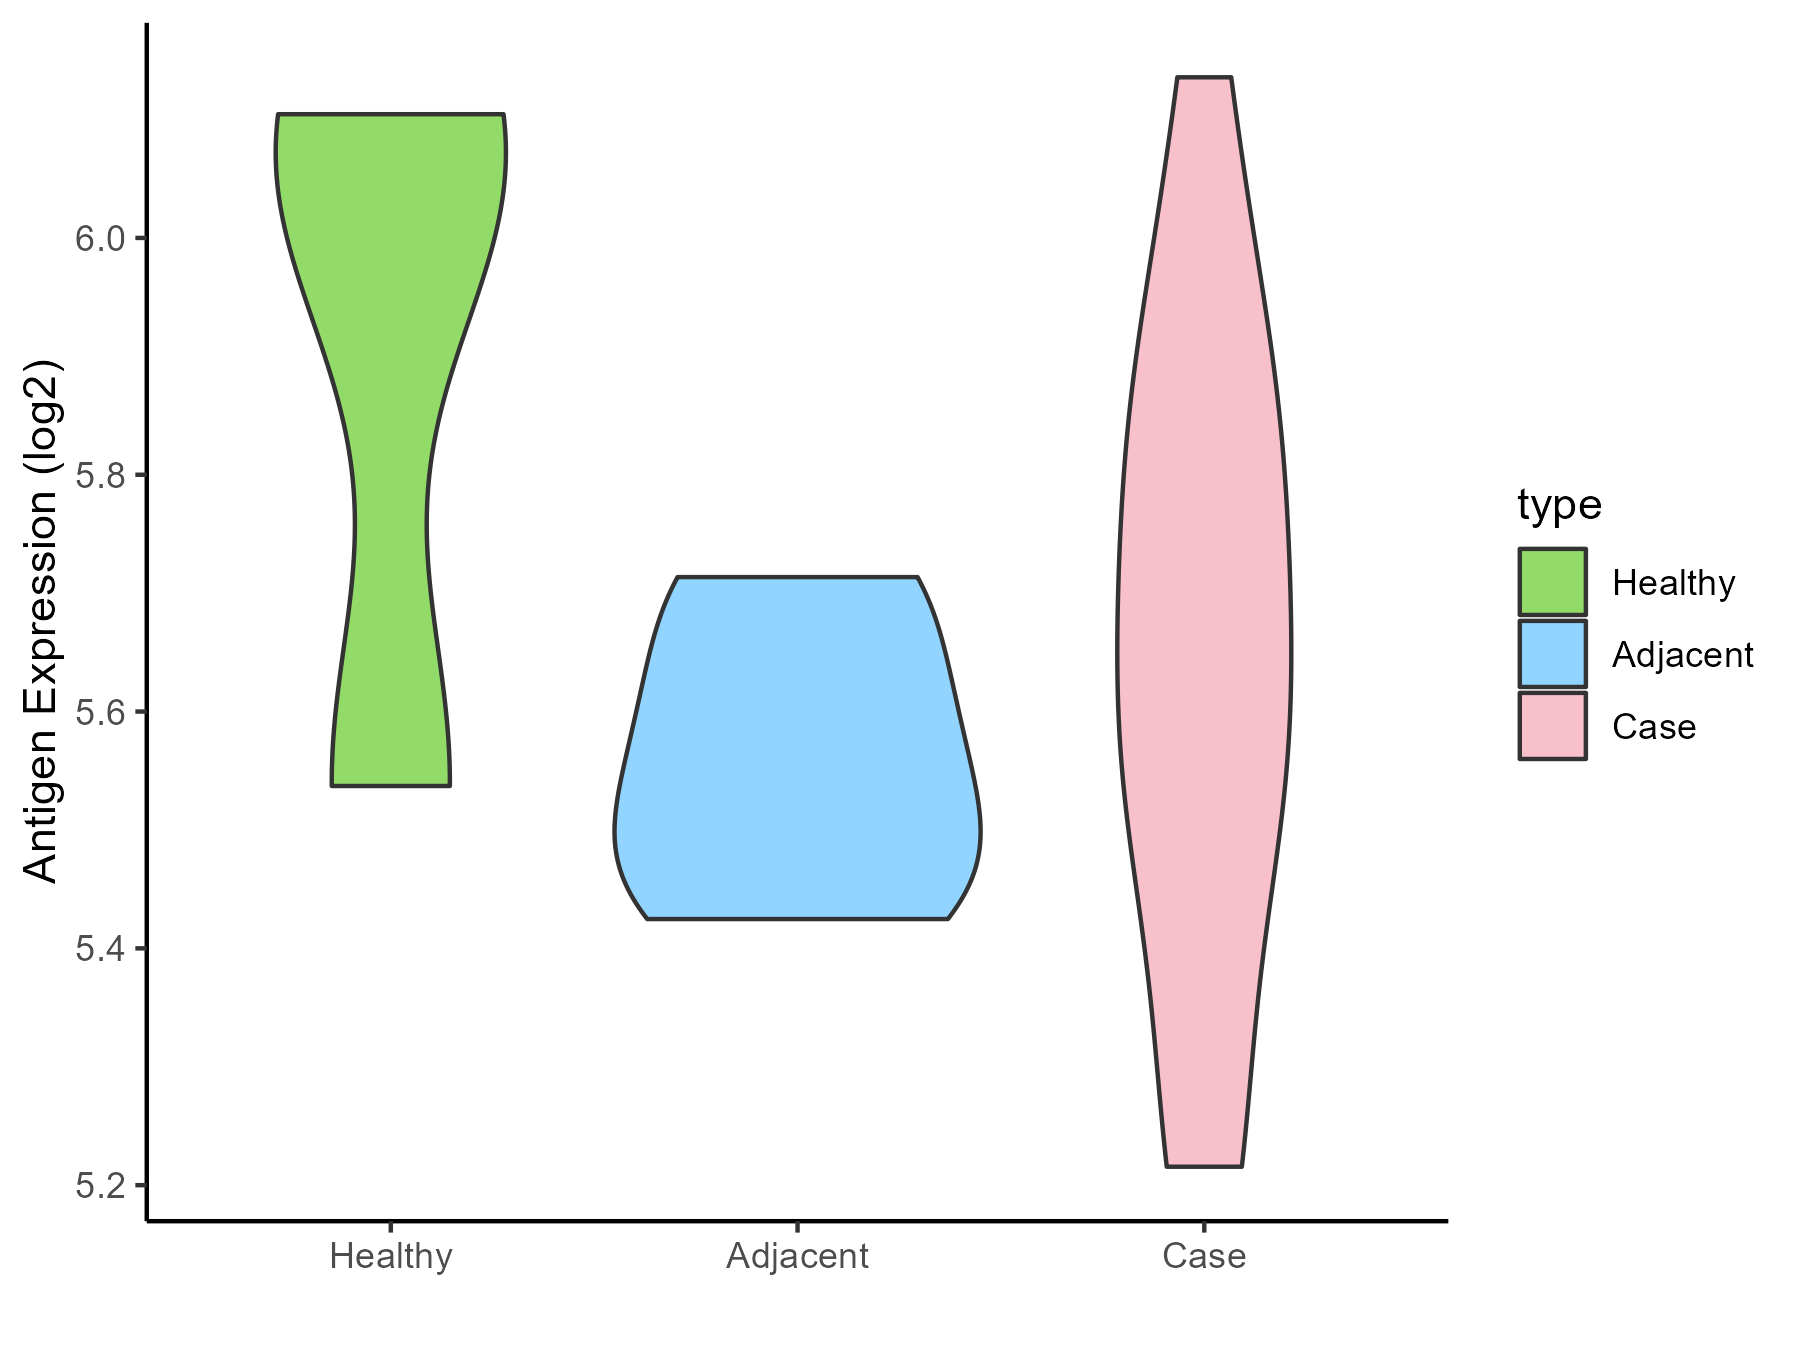
| The Studied Tissue | Bone marrow | |
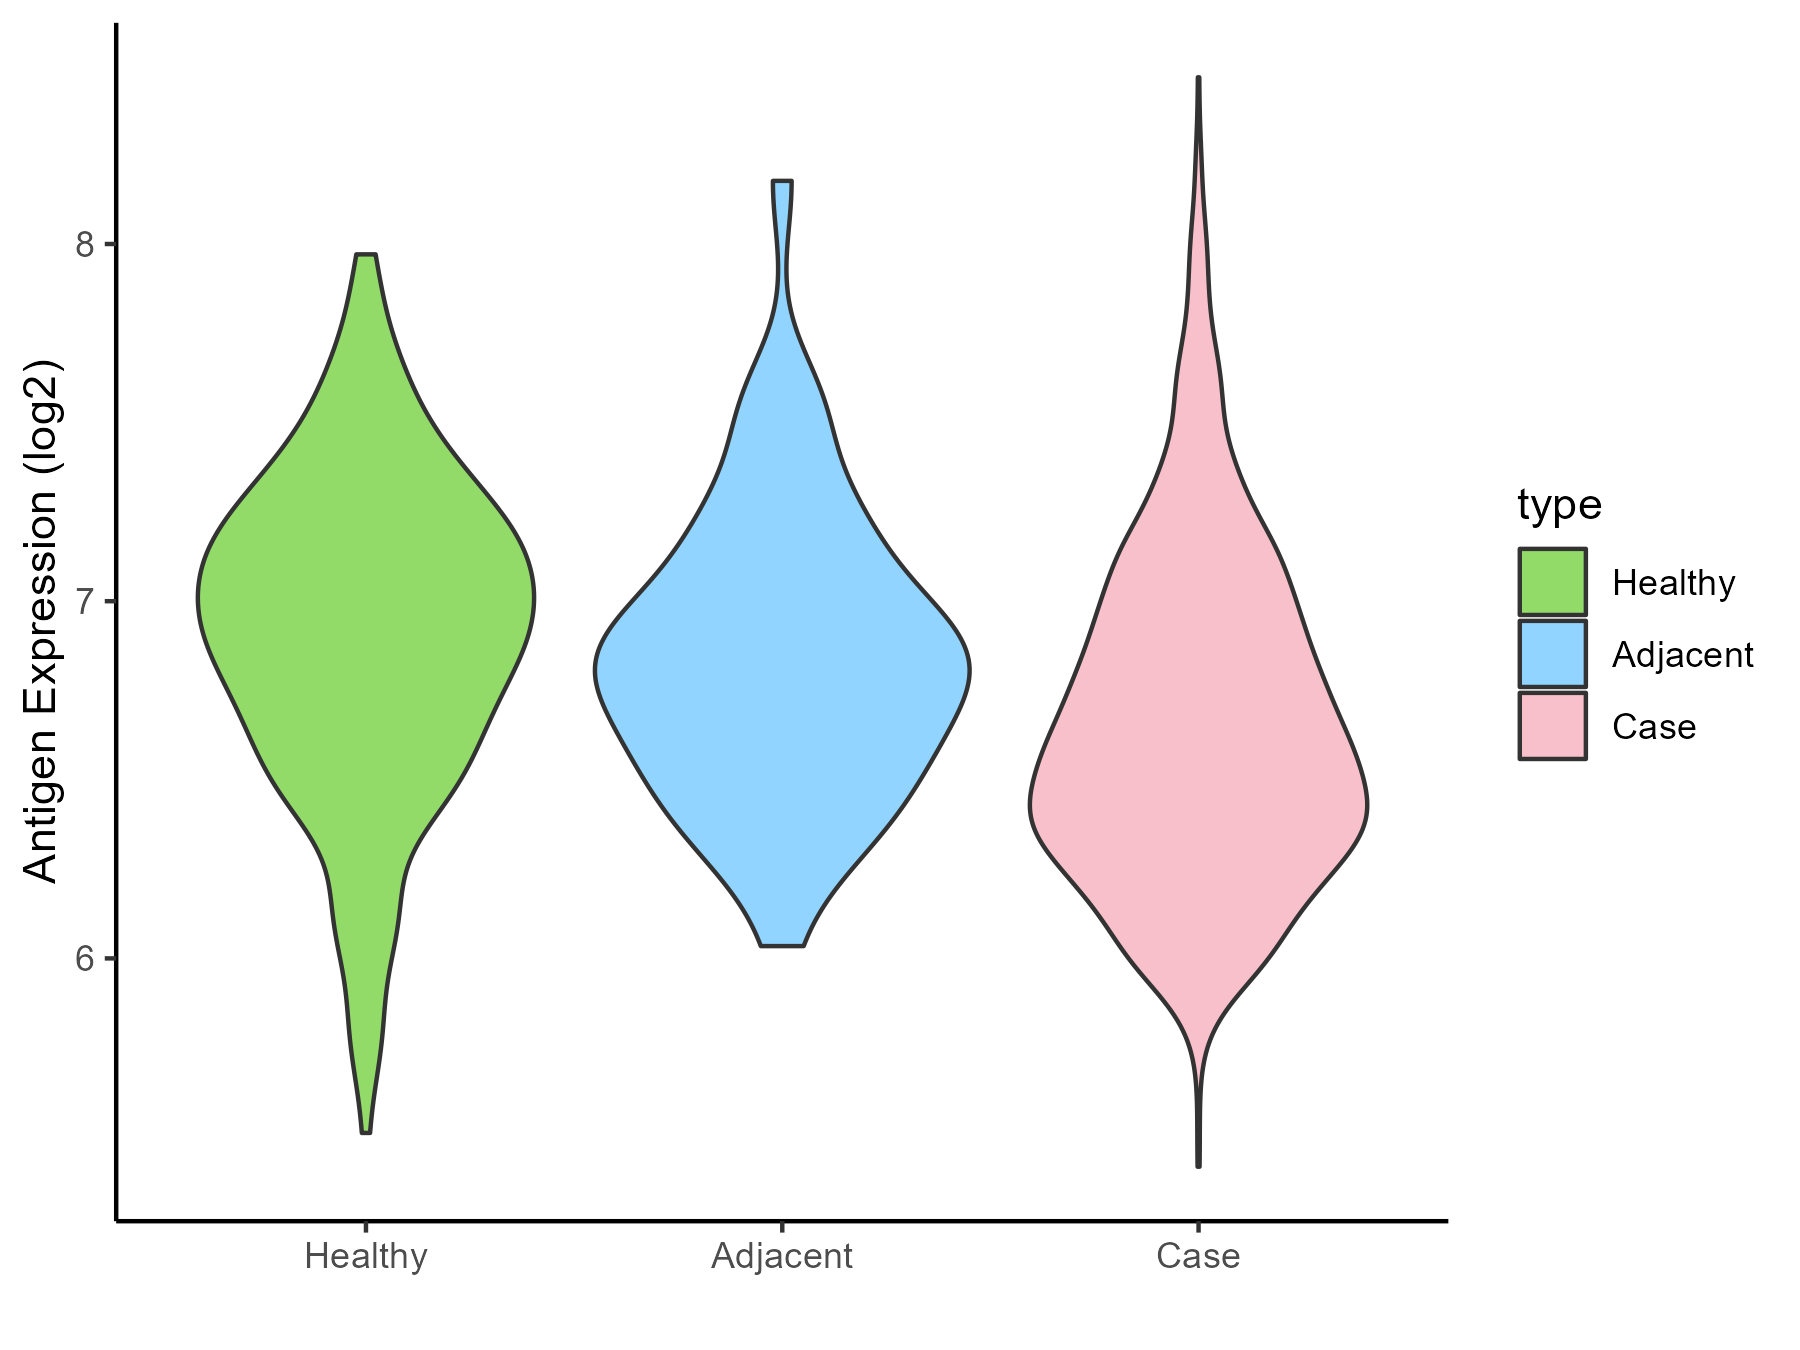
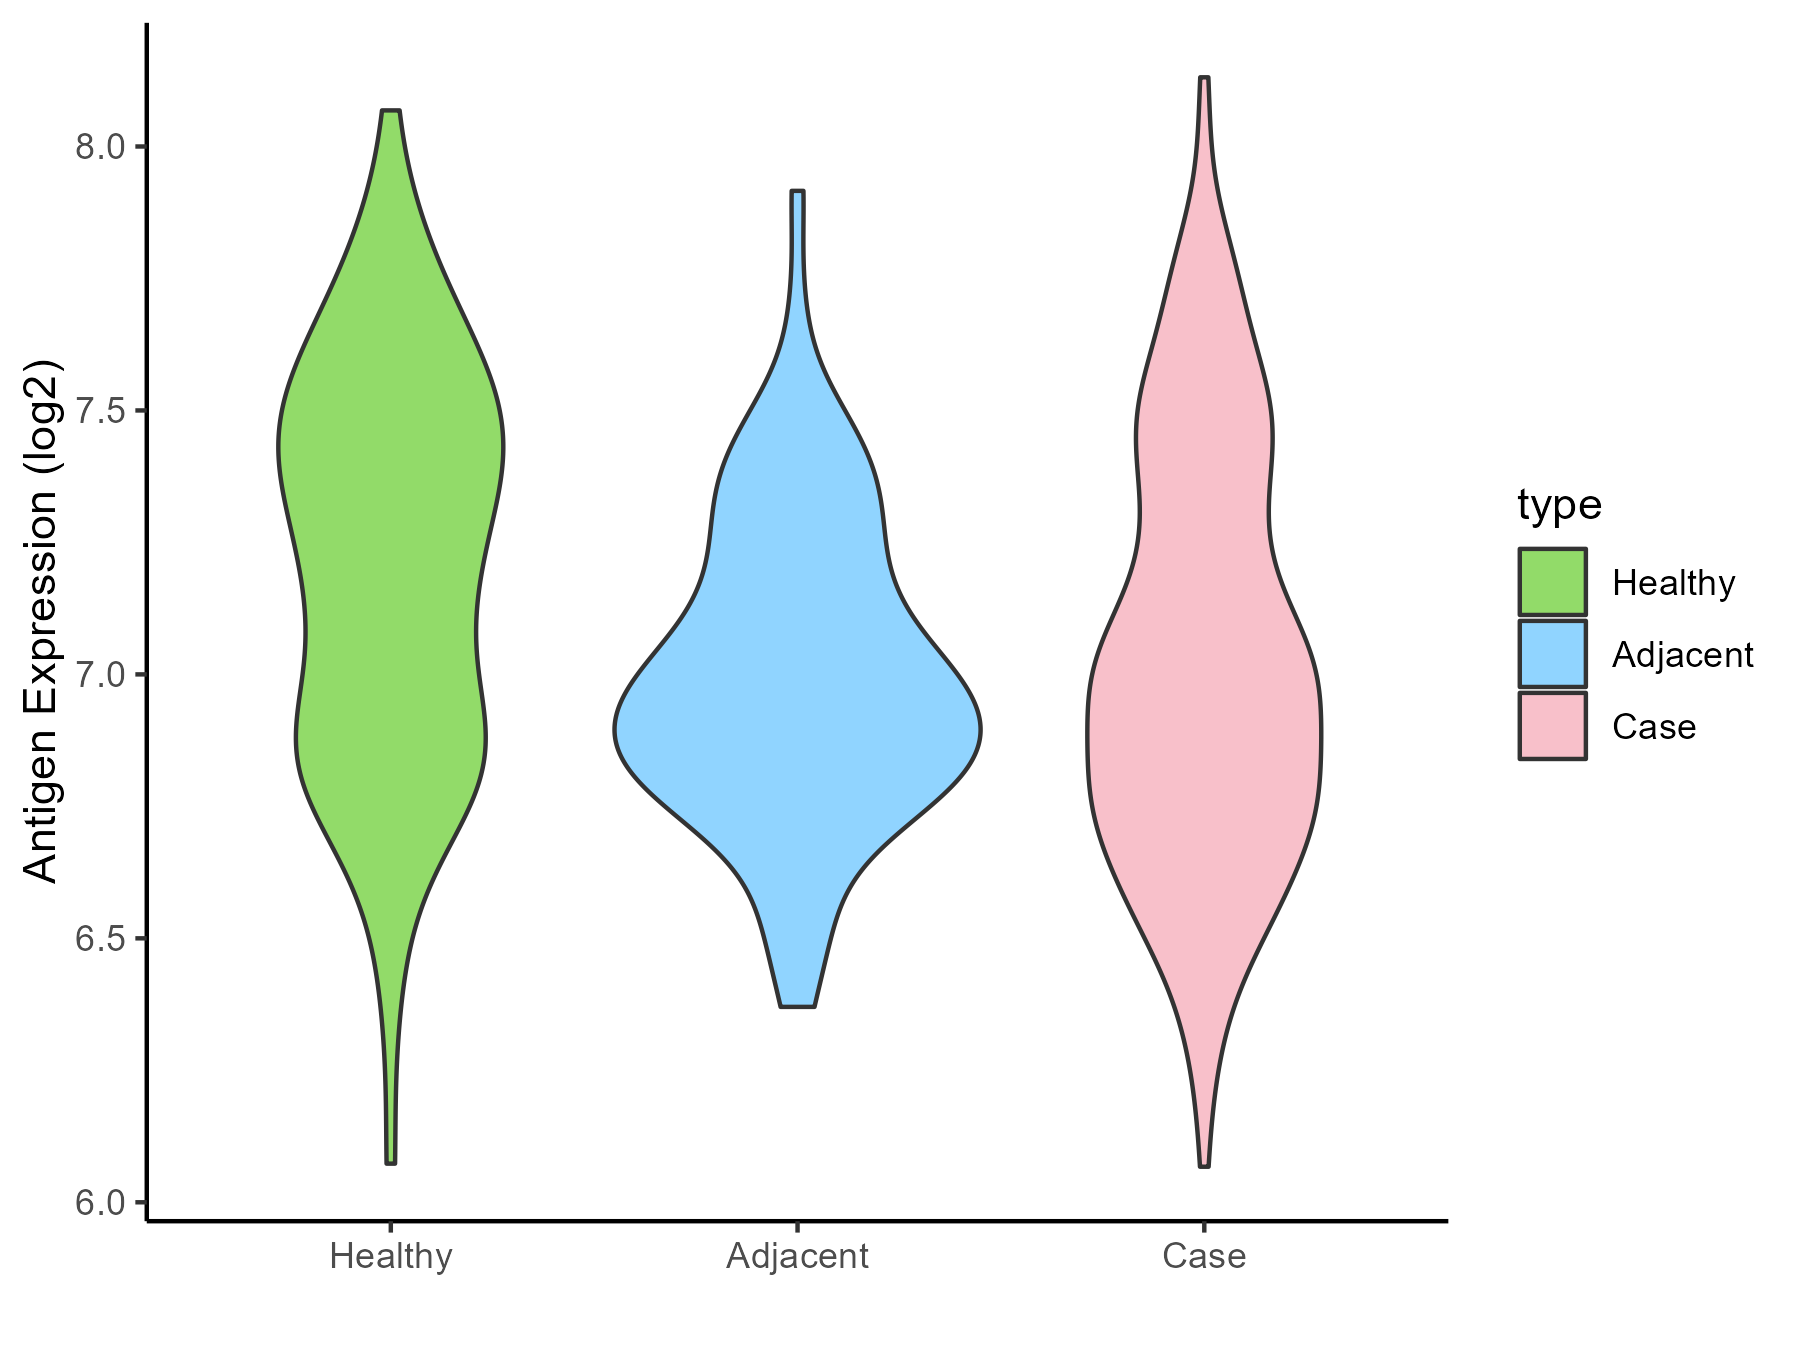
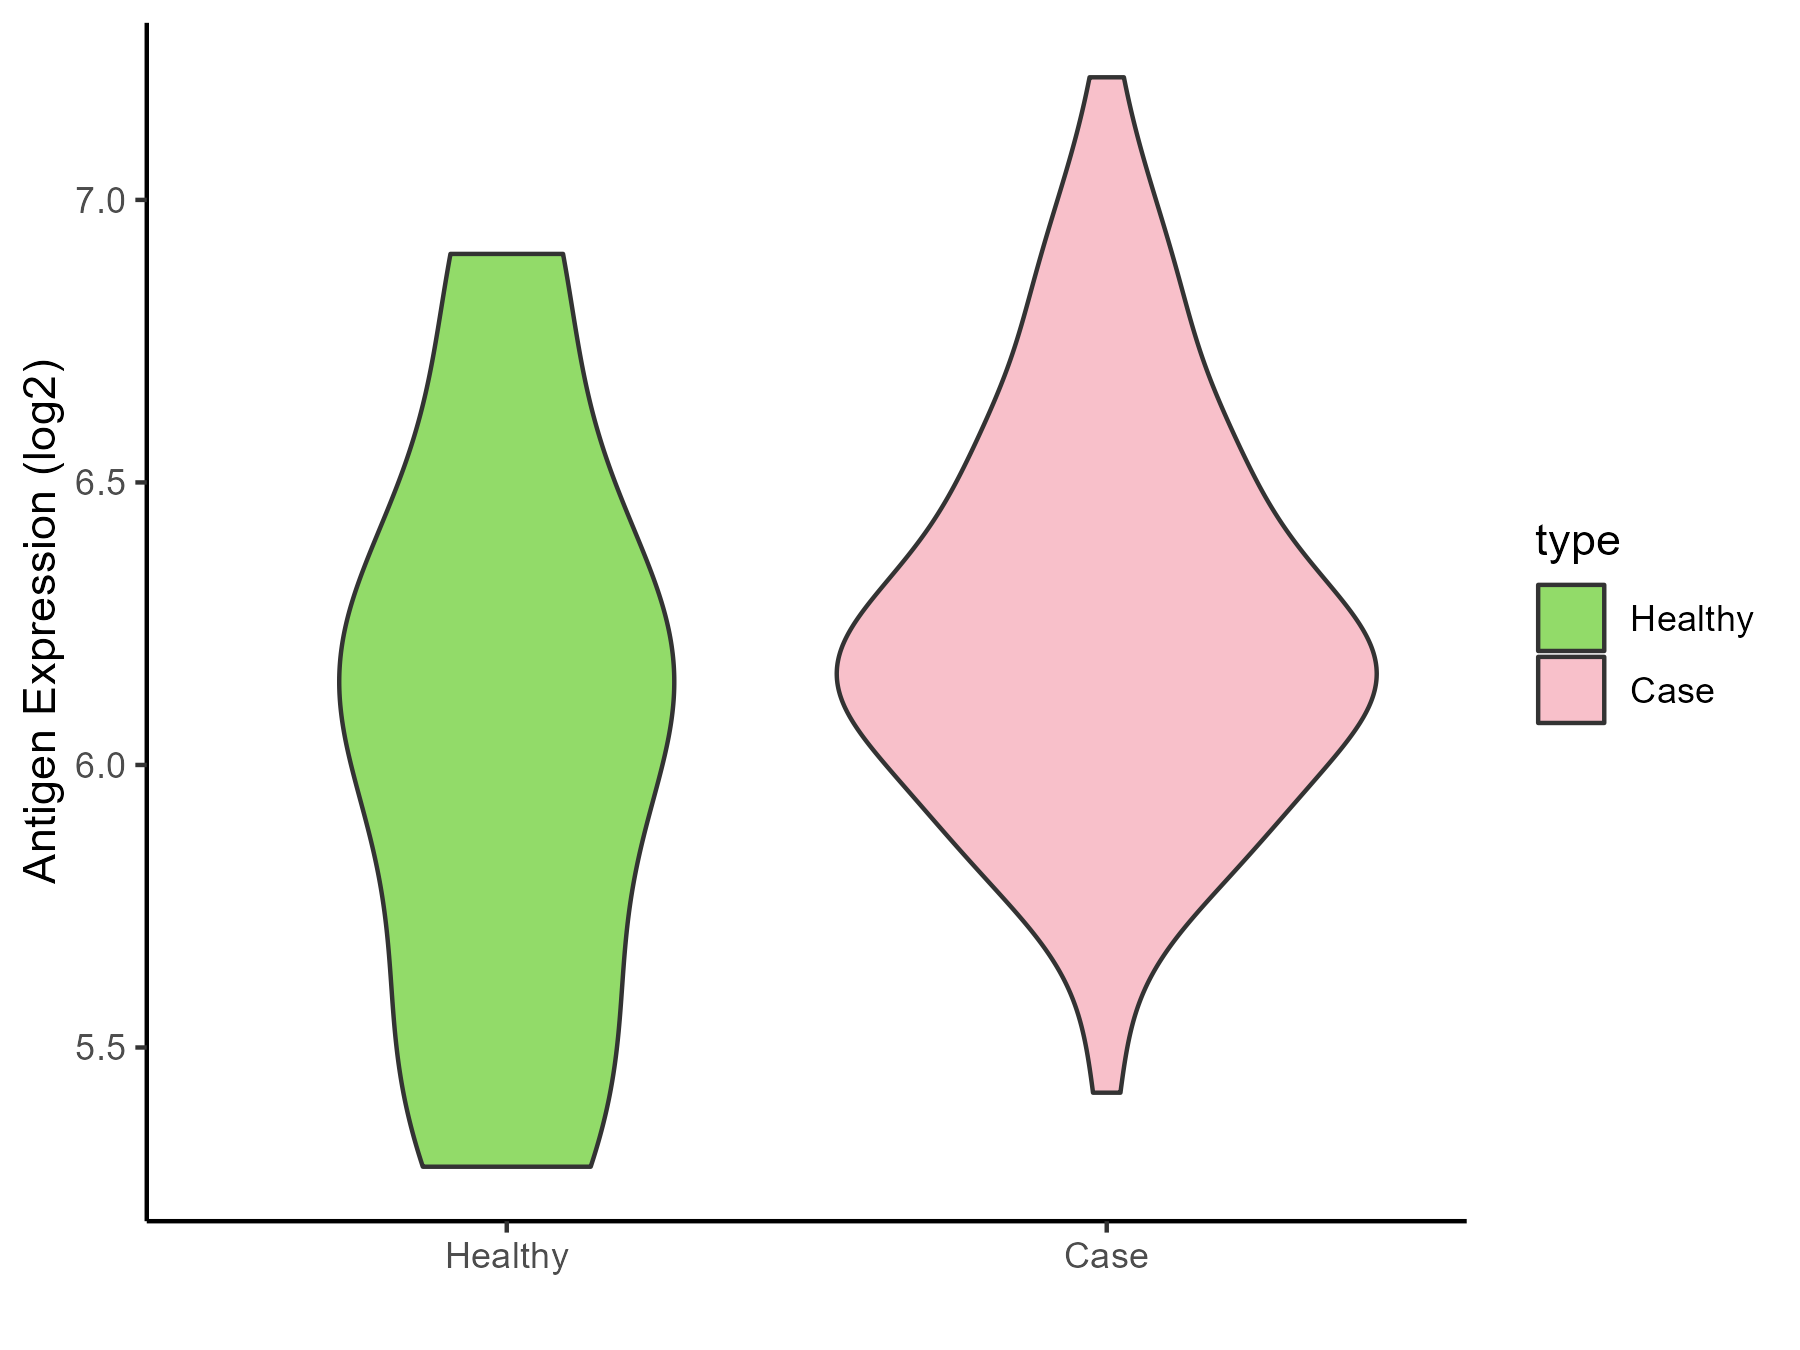
| The Specific Disease | Myelodysplastic syndromes | |
| The Expression Level of Disease Section Compare with the Healthy Individual Tissue | p-value: 0.001612966; Fold-change: -0.284349092; Z-score: -0.94412023 | |
| The Expression Level of Disease Section Compare with the Adjacent Tissue | p-value: 0.002363185; Fold-change: 0.744118678; Z-score: 3.771240998 | |
| Disease-specific Antigen Abundances |
|
Click to View the Clearer Original Diagram |
| Differential expression pattern of antigen in diseases | ||
| The Studied Tissue | Tonsil | |
| The Specific Disease | Lymphoma | |
| The Expression Level of Disease Section Compare with the Healthy Individual Tissue | p-value: 0.952163062; Fold-change: 0.039304712; Z-score: 0.172196429 | |
| Disease-specific Antigen Abundances |
|
Click to View the Clearer Original Diagram |
| Differential expression pattern of antigen in diseases | ||
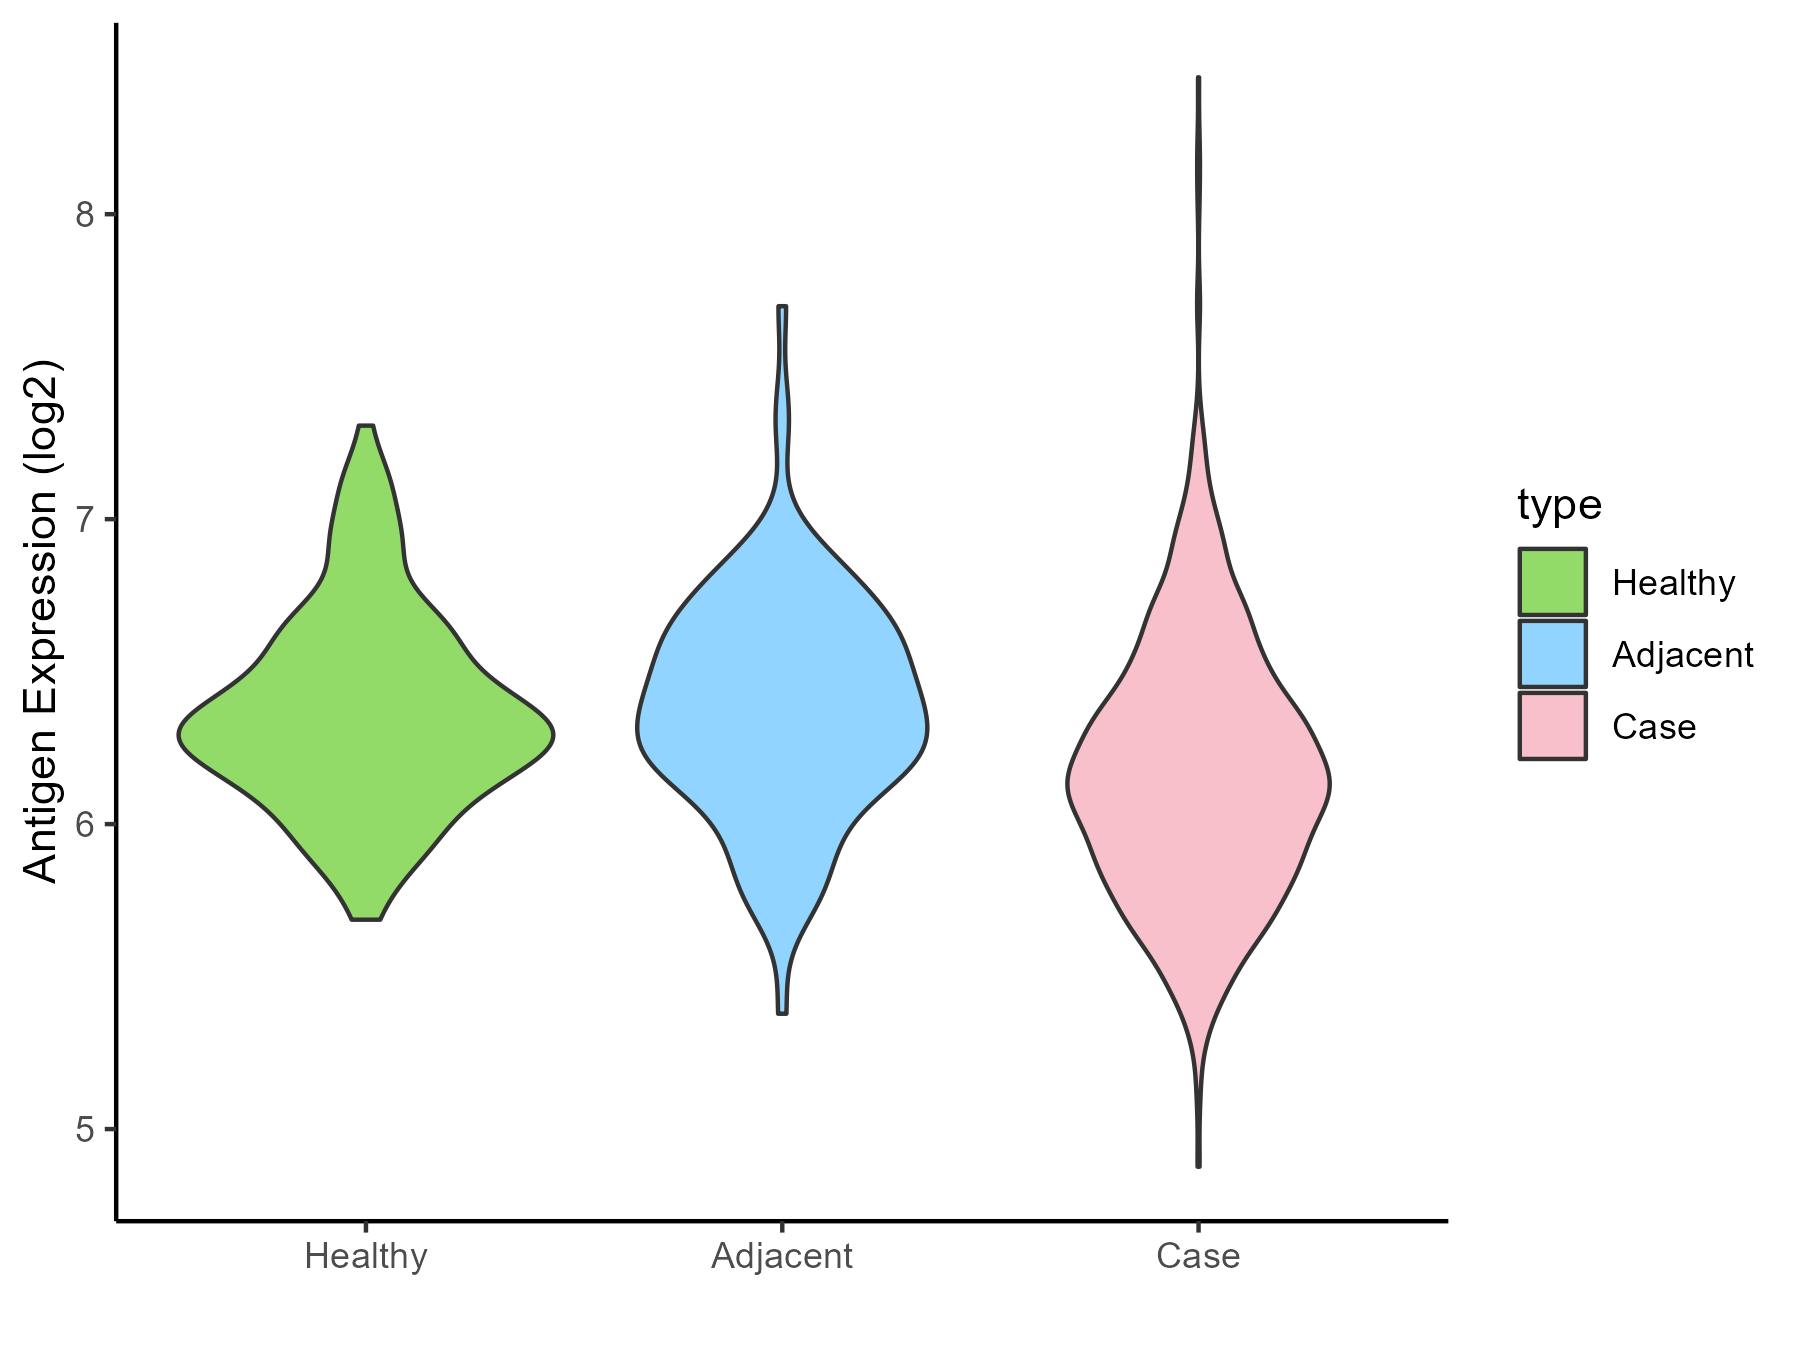
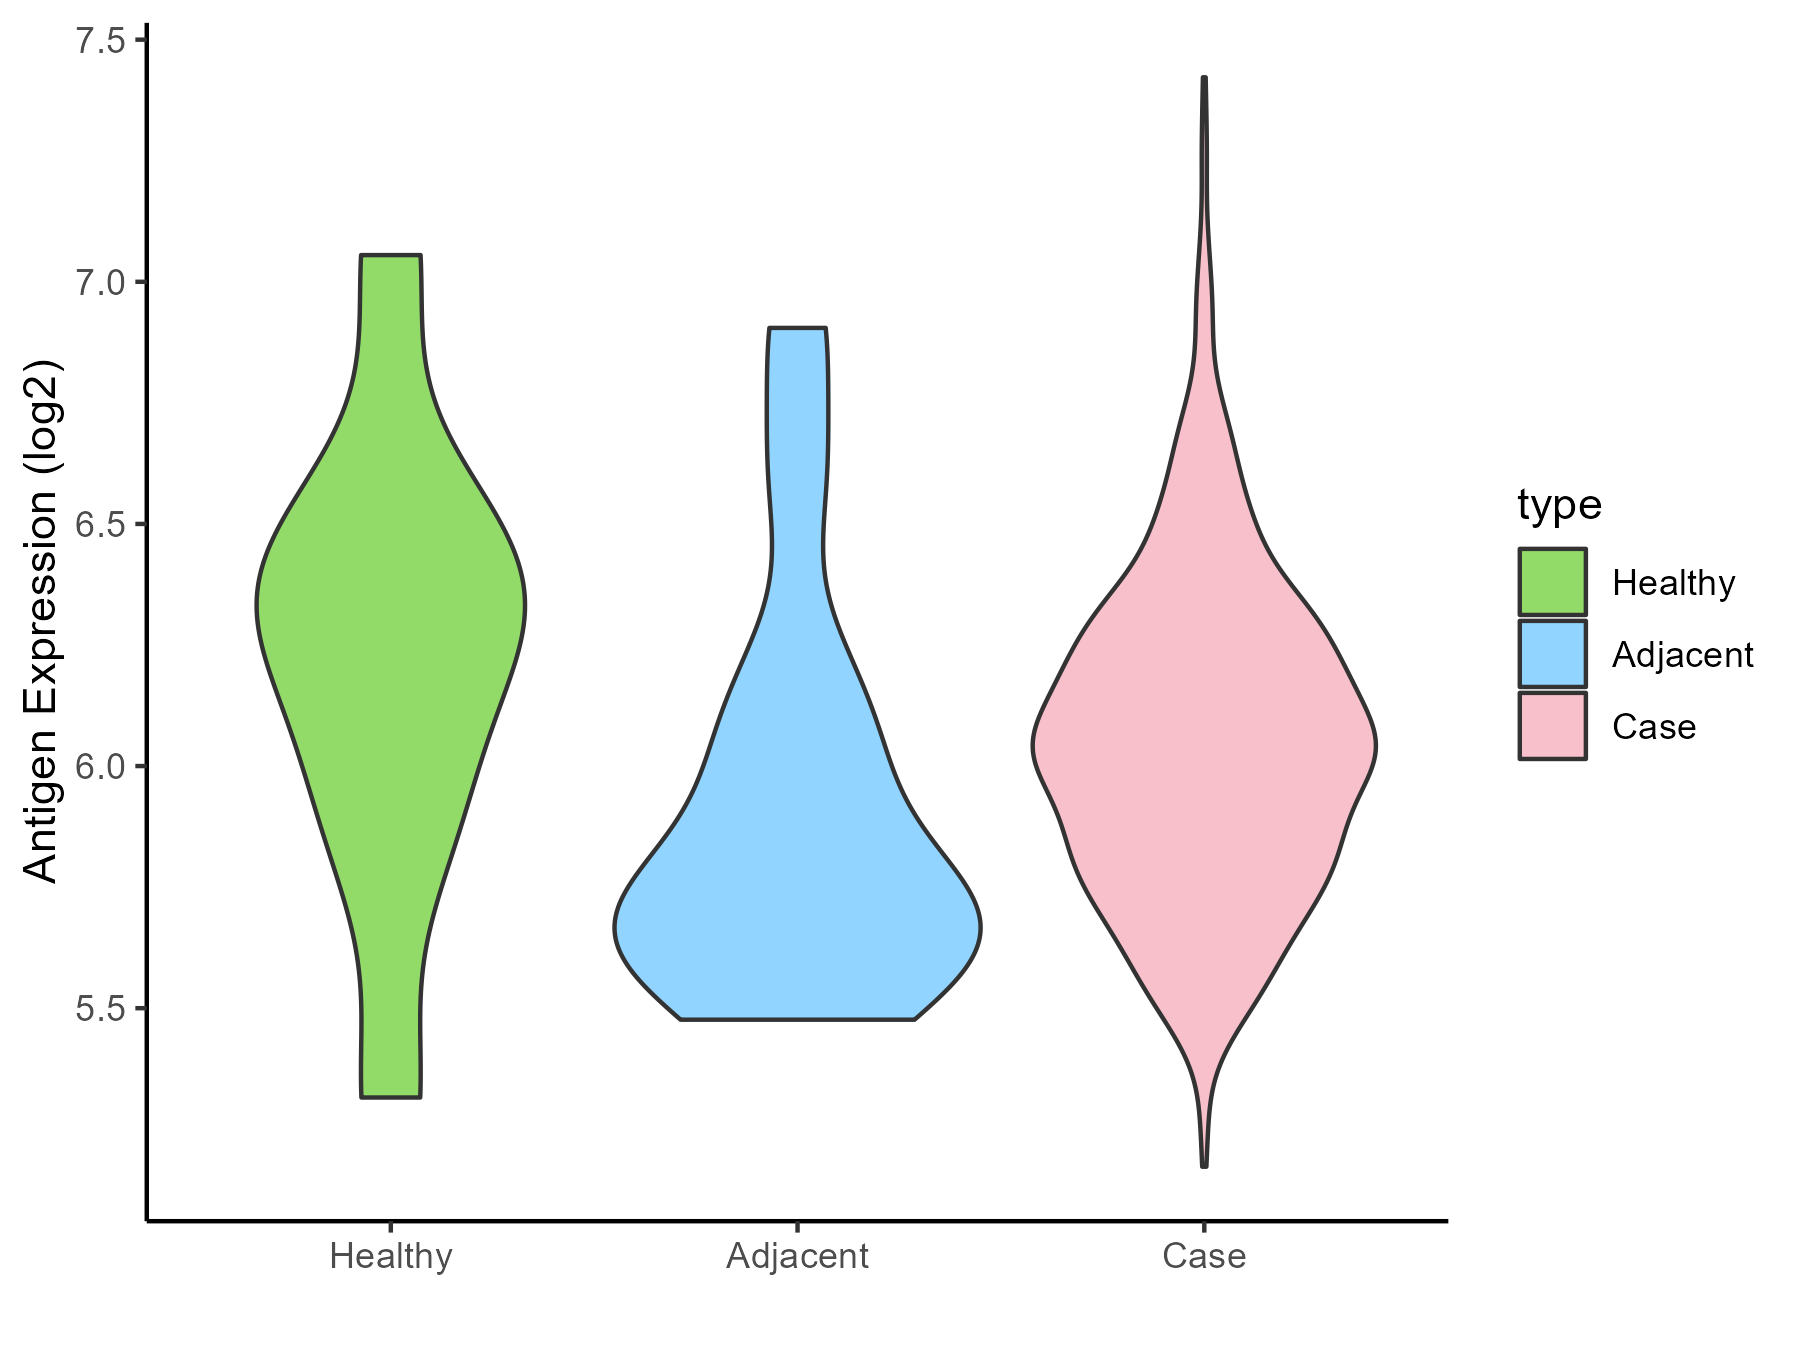
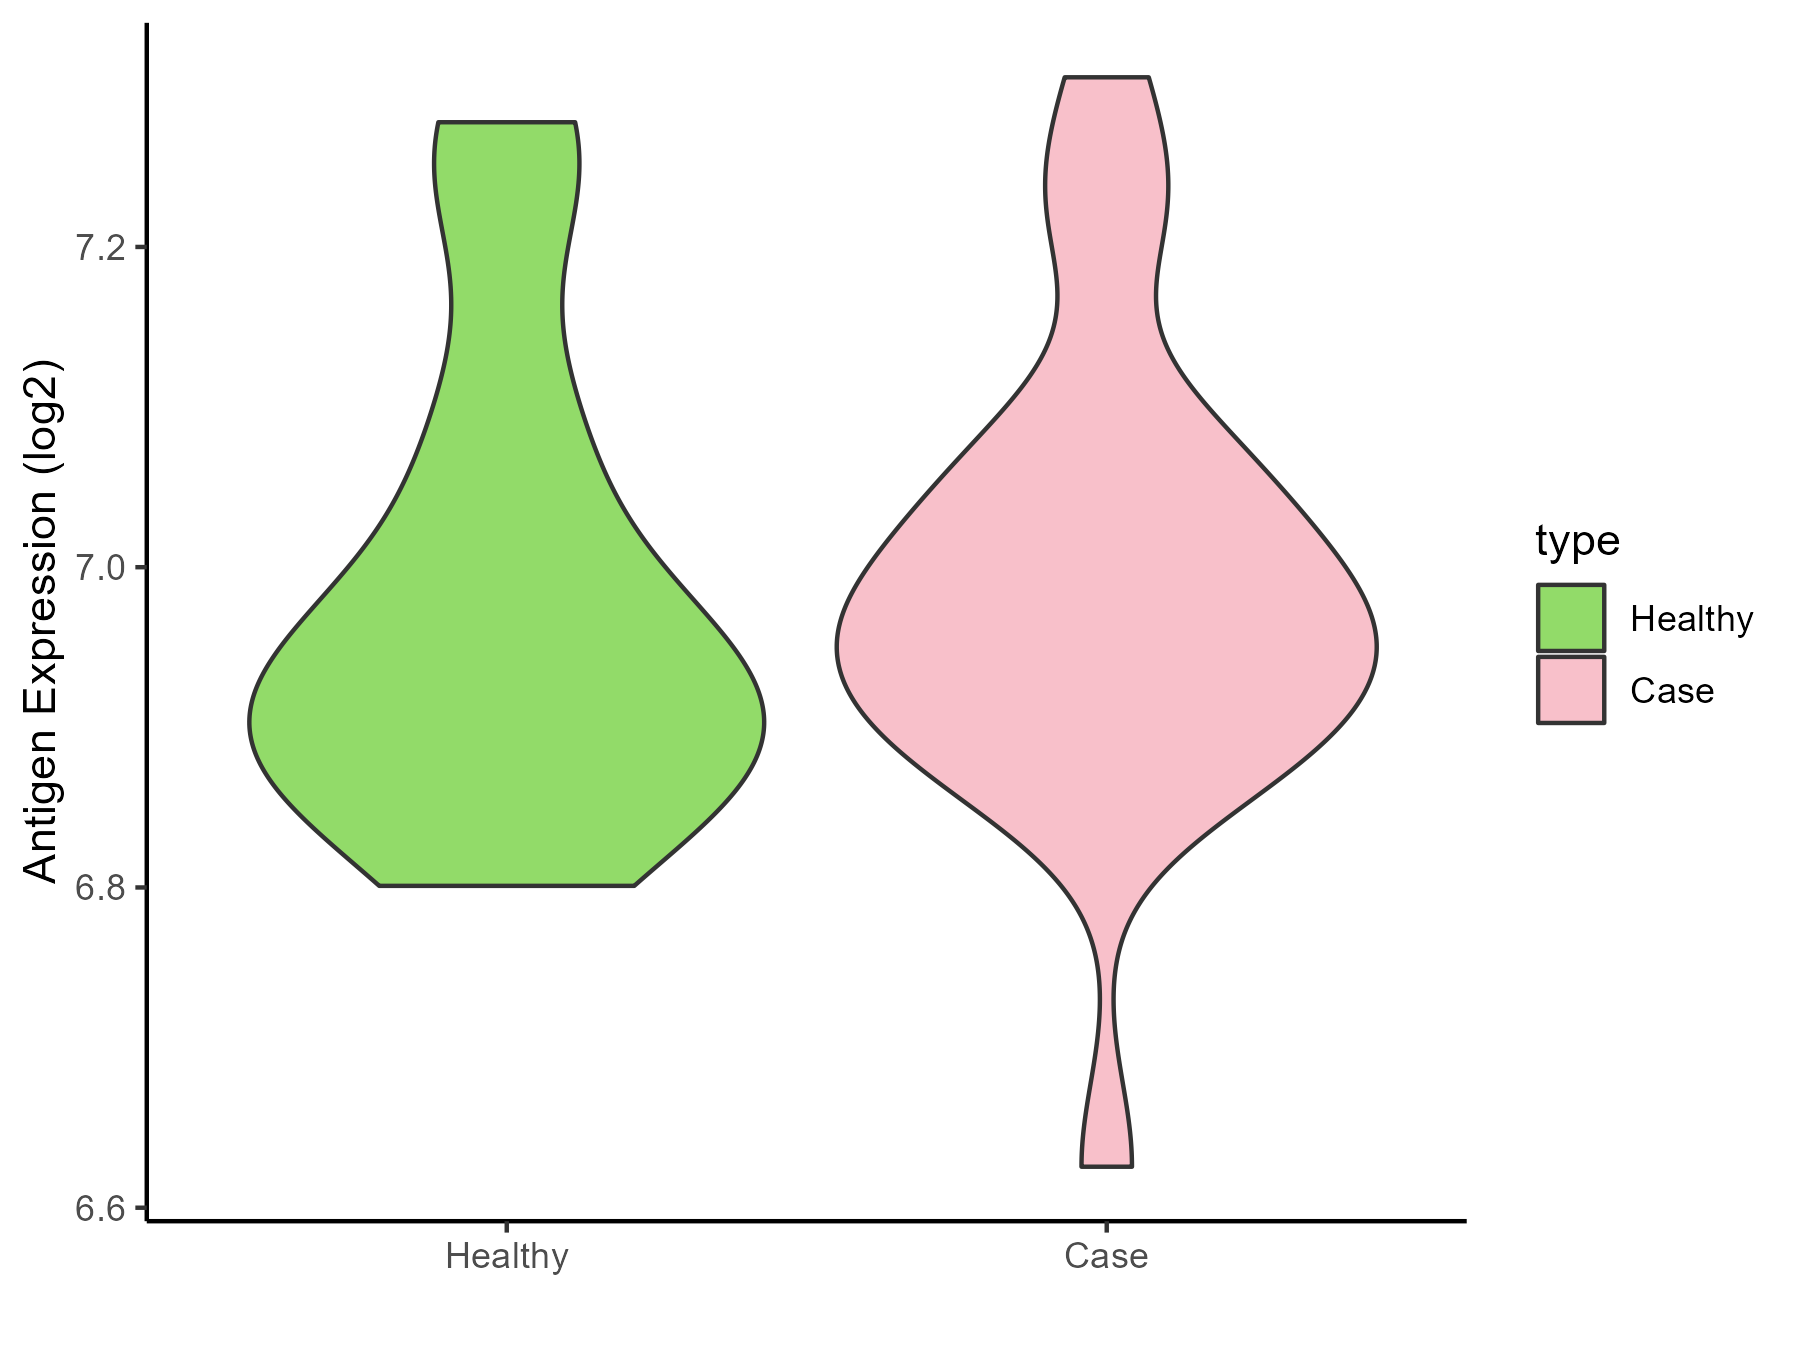
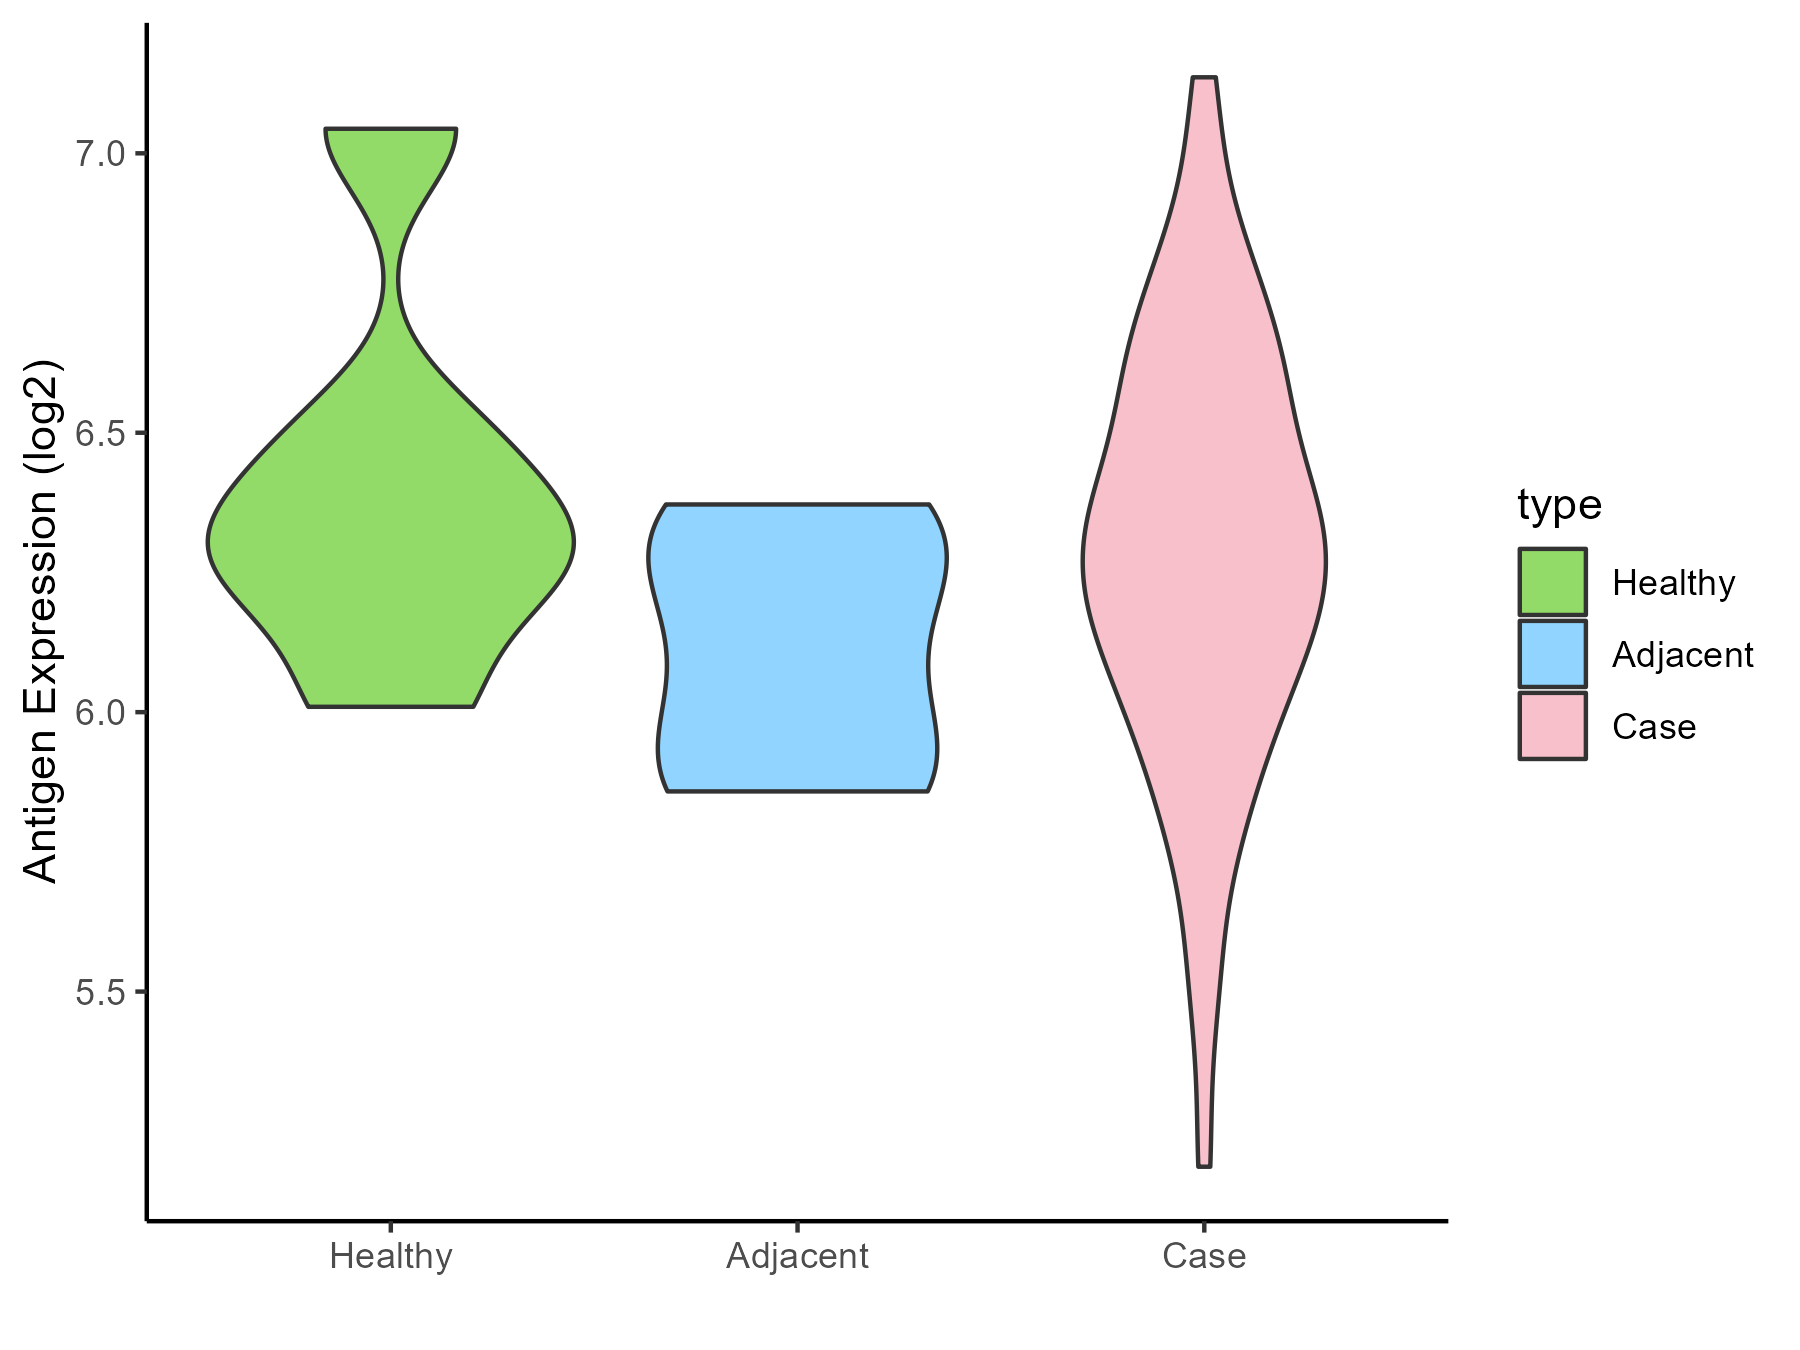
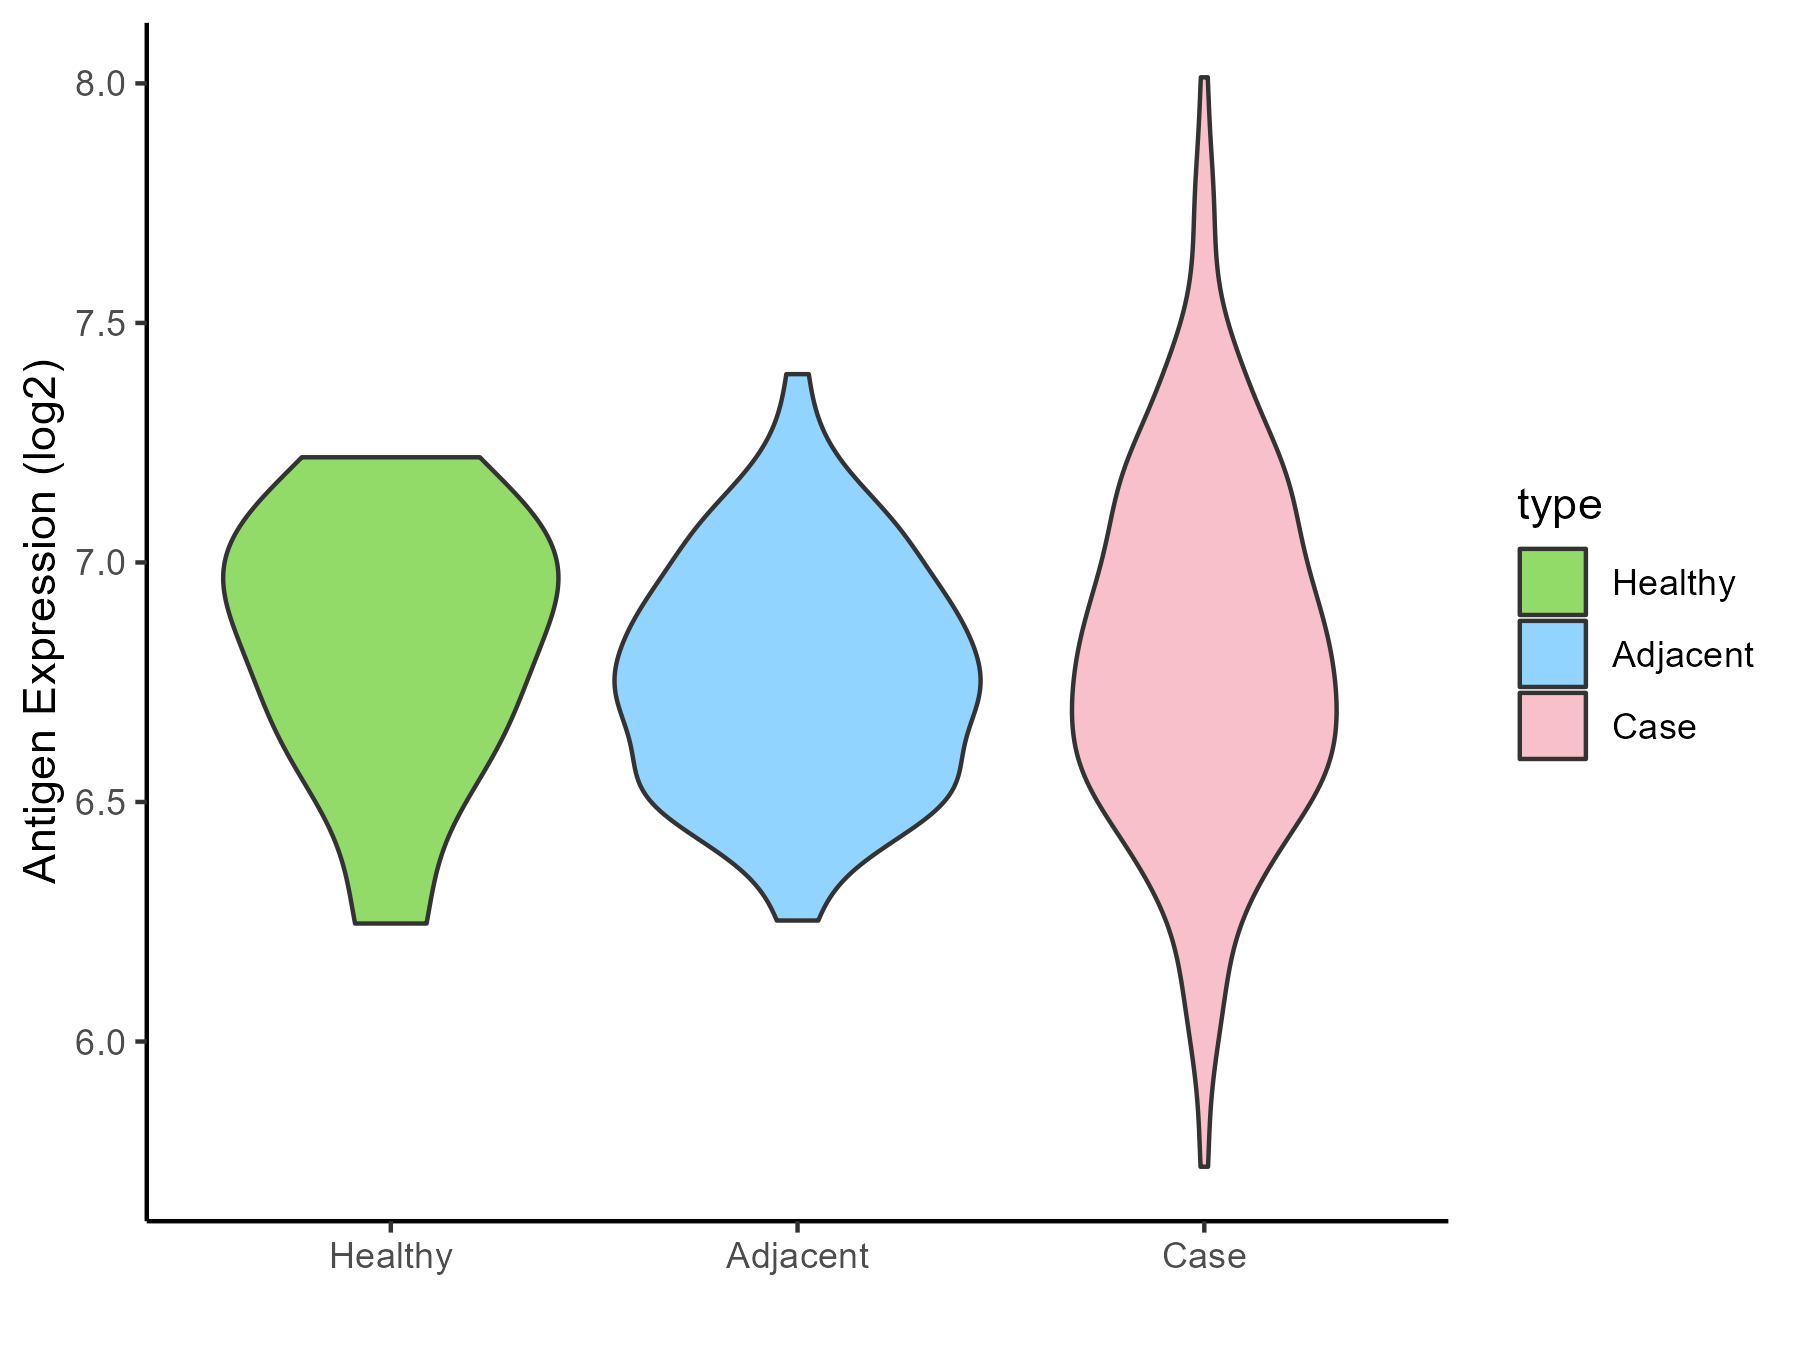
| The Studied Tissue | Gastric | |
| The Specific Disease | Gastric cancer | |
| The Expression Level of Disease Section Compare with the Healthy Individual Tissue | p-value: 0.127857581; Fold-change: 0.588386907; Z-score: 1.814601885 | |
| The Expression Level of Disease Section Compare with the Adjacent Tissue | p-value: 0.000454655; Fold-change: 0.222463434; Z-score: 0.830988582 | |
| Disease-specific Antigen Abundances |
|
Click to View the Clearer Original Diagram |
| Differential expression pattern of antigen in diseases | ||
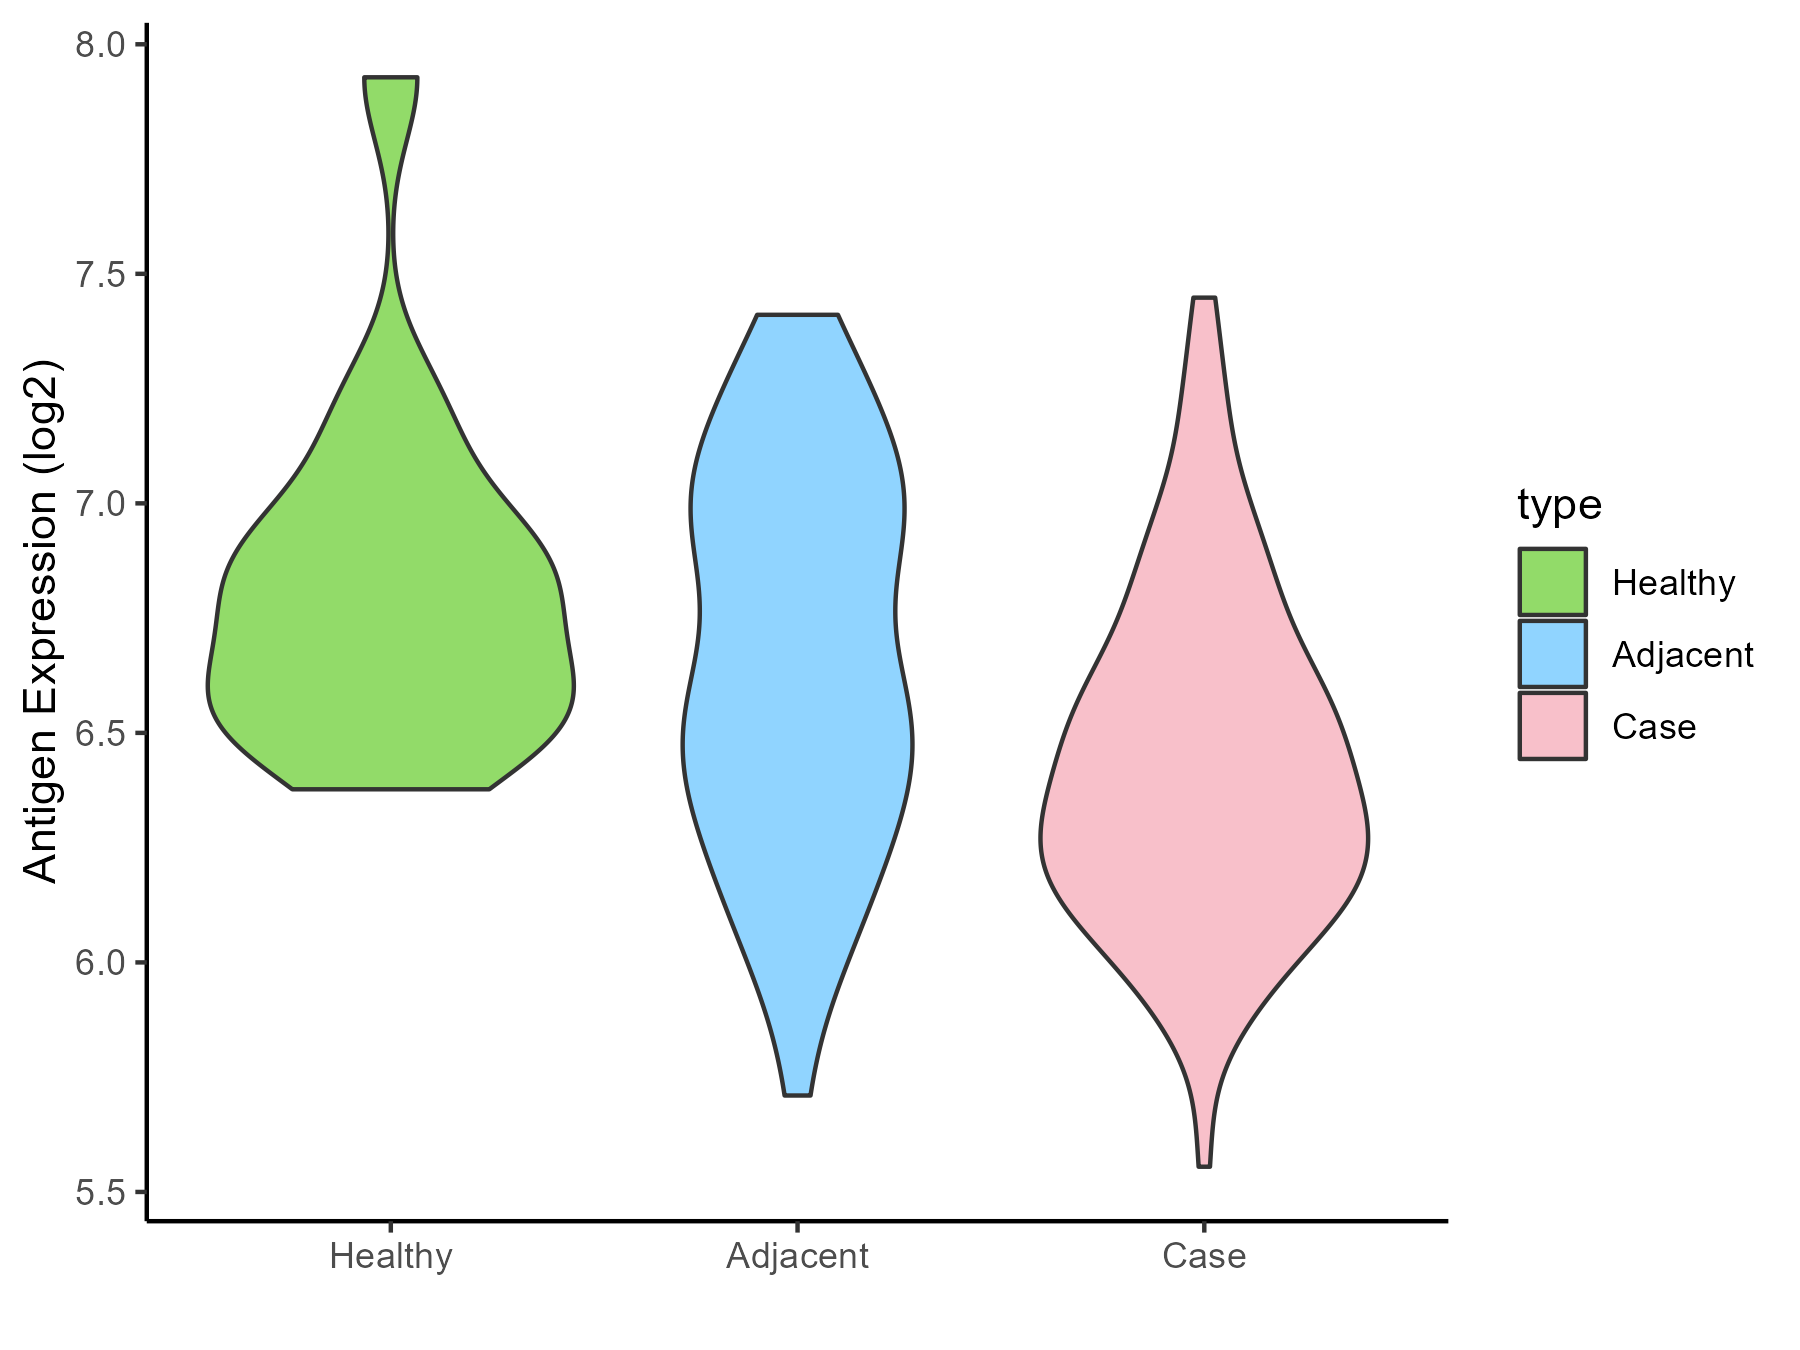
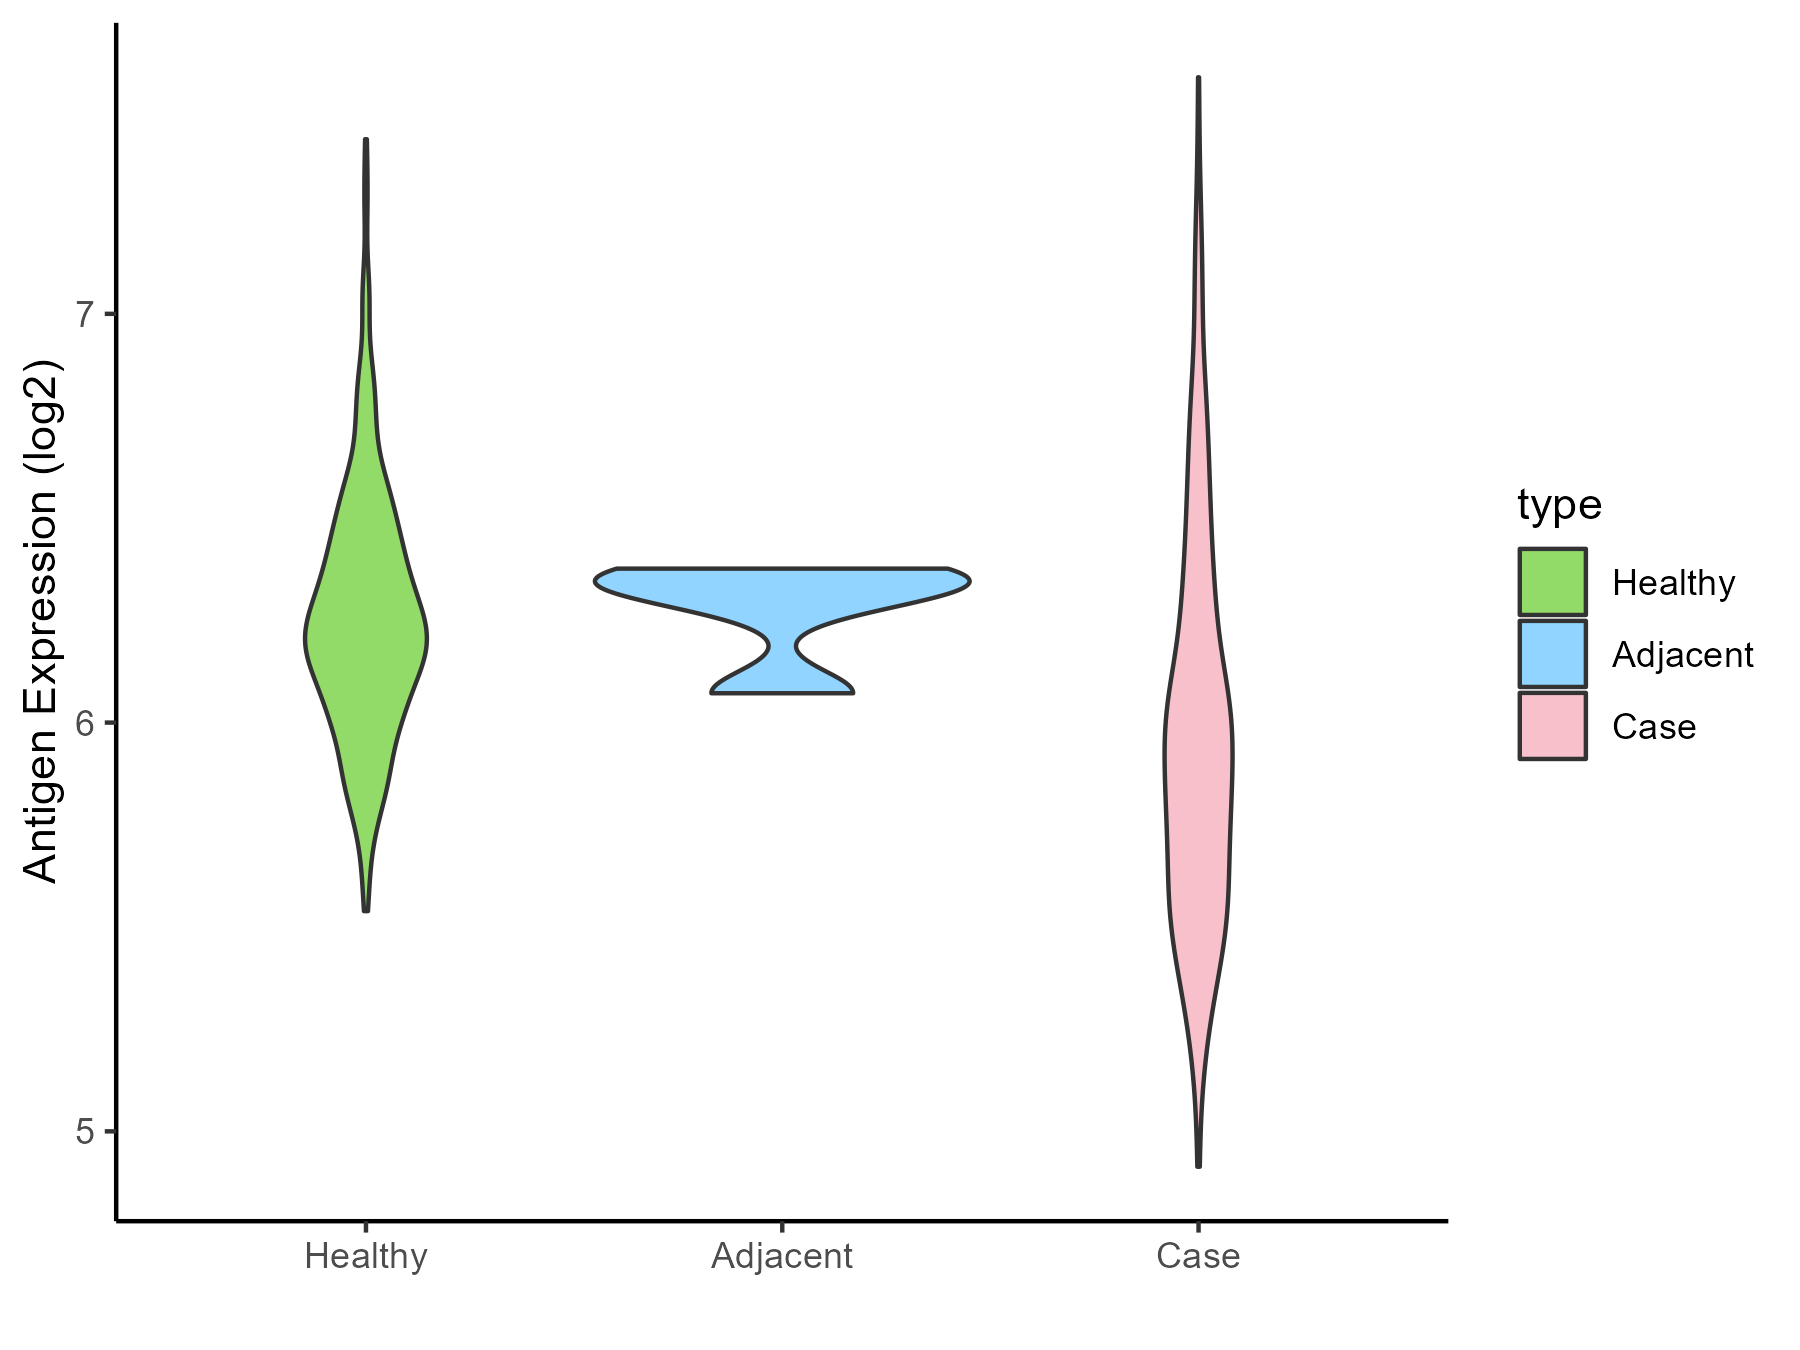
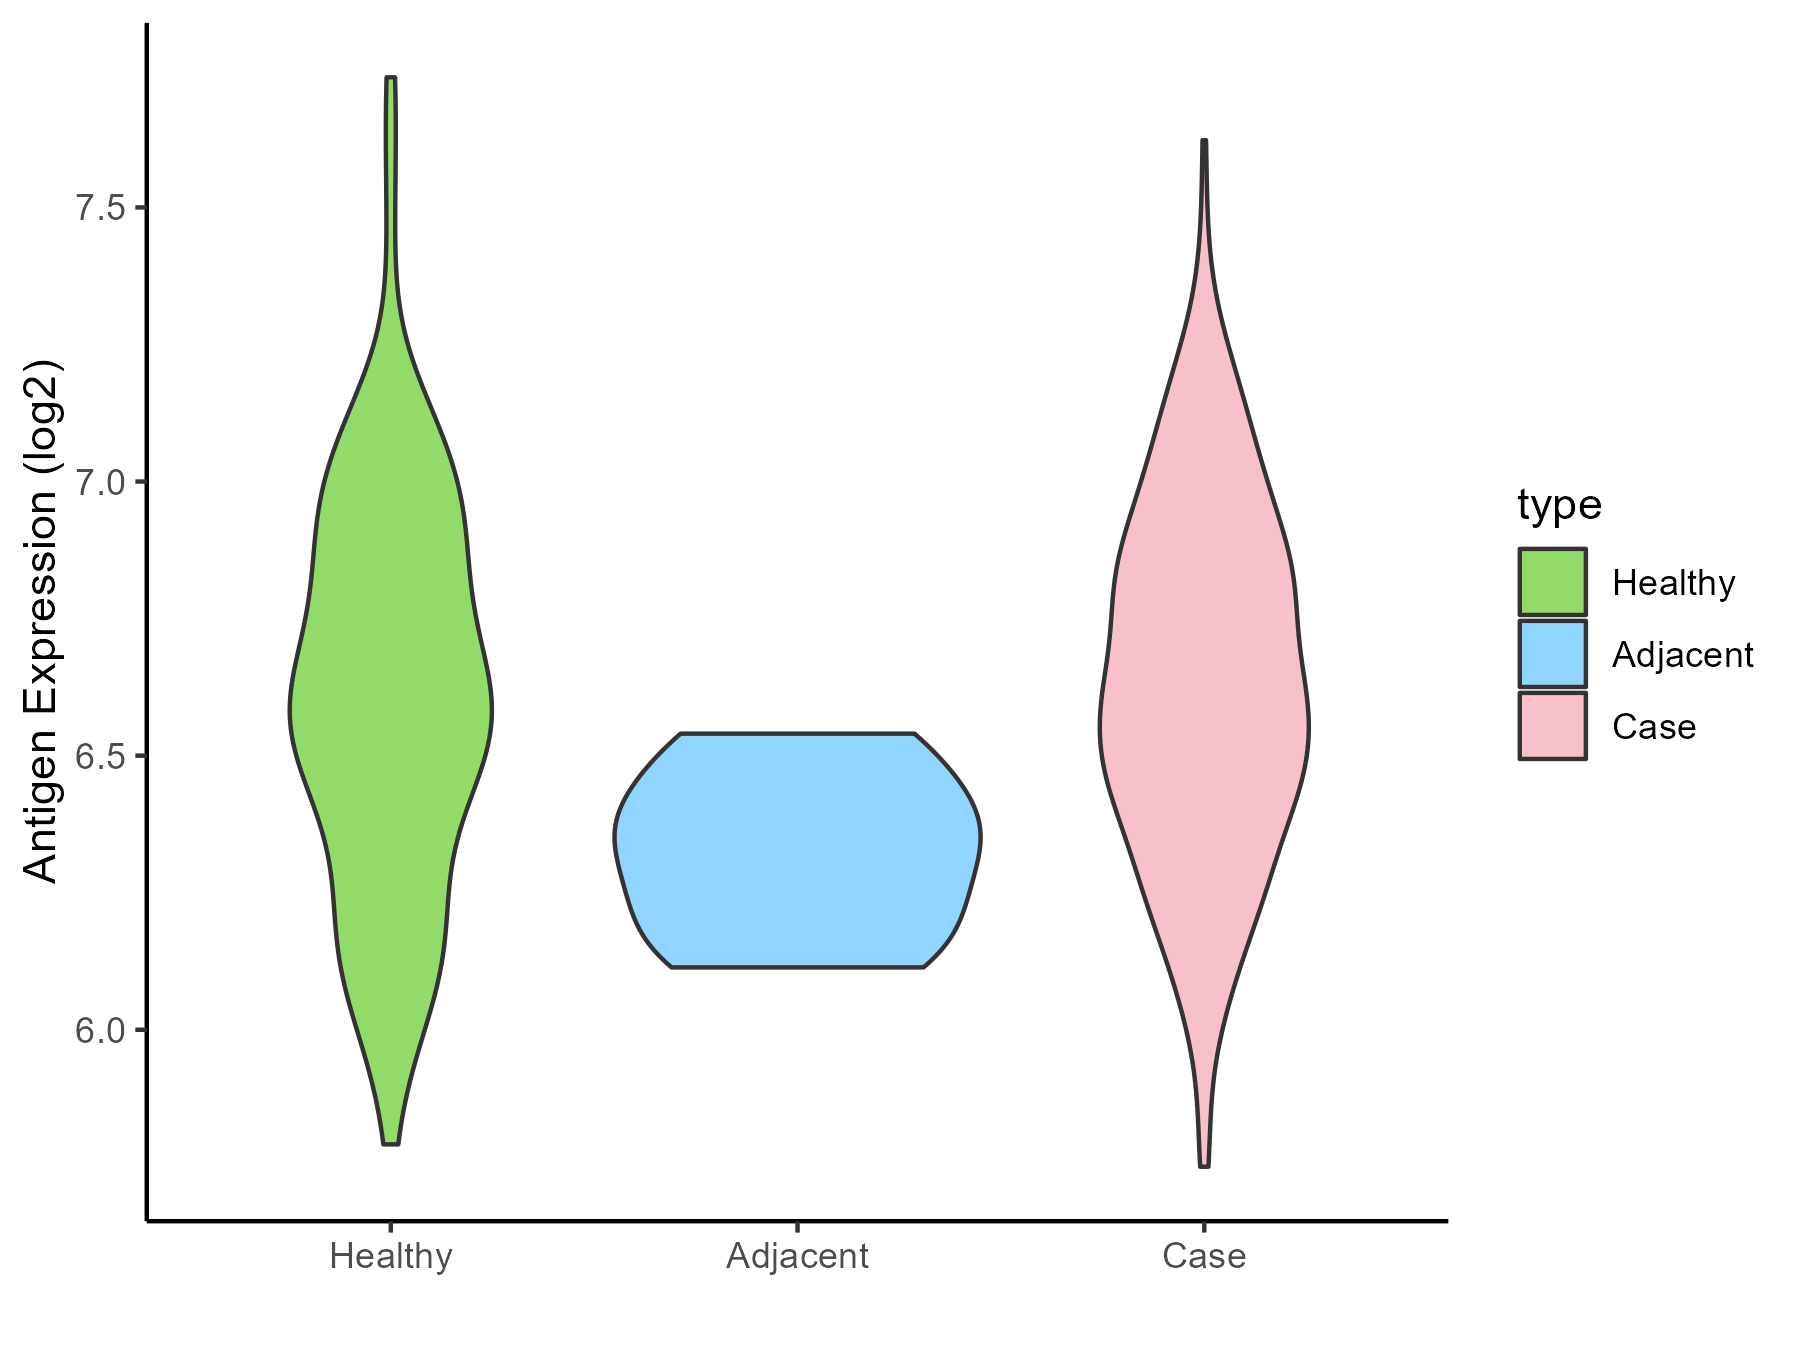
| The Studied Tissue | Colon | |
| The Specific Disease | Colon cancer | |
| The Expression Level of Disease Section Compare with the Healthy Individual Tissue | p-value: 4.25E-11; Fold-change: -0.172927737; Z-score: -0.53618154 | |
| The Expression Level of Disease Section Compare with the Adjacent Tissue | p-value: 7.59E-09; Fold-change: -0.236675474; Z-score: -0.657206801 | |
| Disease-specific Antigen Abundances |
|
Click to View the Clearer Original Diagram |
| Differential expression pattern of antigen in diseases | ||
| The Studied Tissue | Pancreas | |
| The Specific Disease | Pancreatic cancer | |
| The Expression Level of Disease Section Compare with the Healthy Individual Tissue | p-value: 0.001096011; Fold-change: -0.383383109; Z-score: -1.008651754 | |
| The Expression Level of Disease Section Compare with the Adjacent Tissue | p-value: 0.00043695; Fold-change: -0.249520367; Z-score: -0.597222578 | |
| Disease-specific Antigen Abundances |
|
Click to View the Clearer Original Diagram |
| Differential expression pattern of antigen in diseases | ||
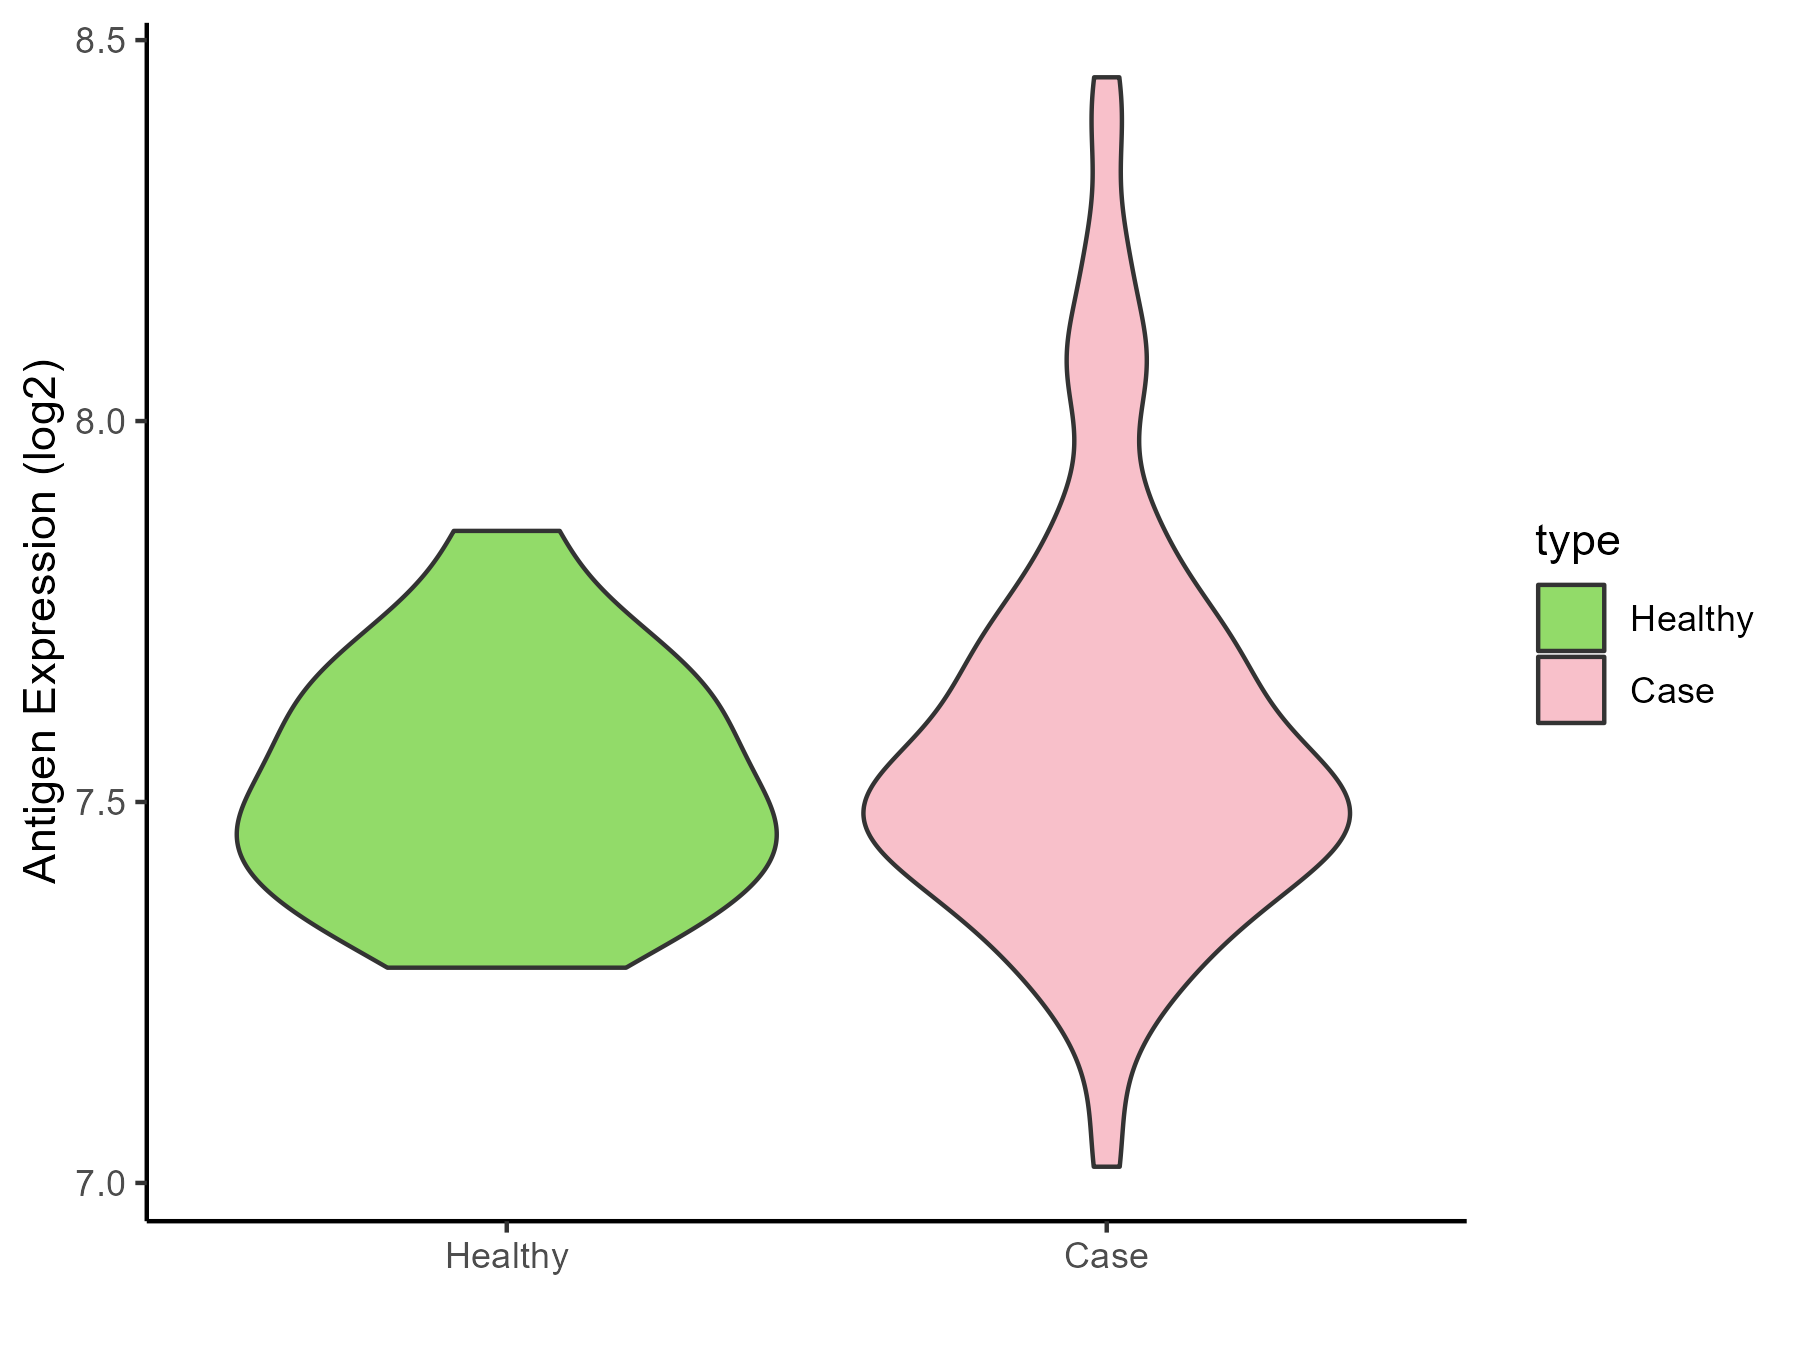
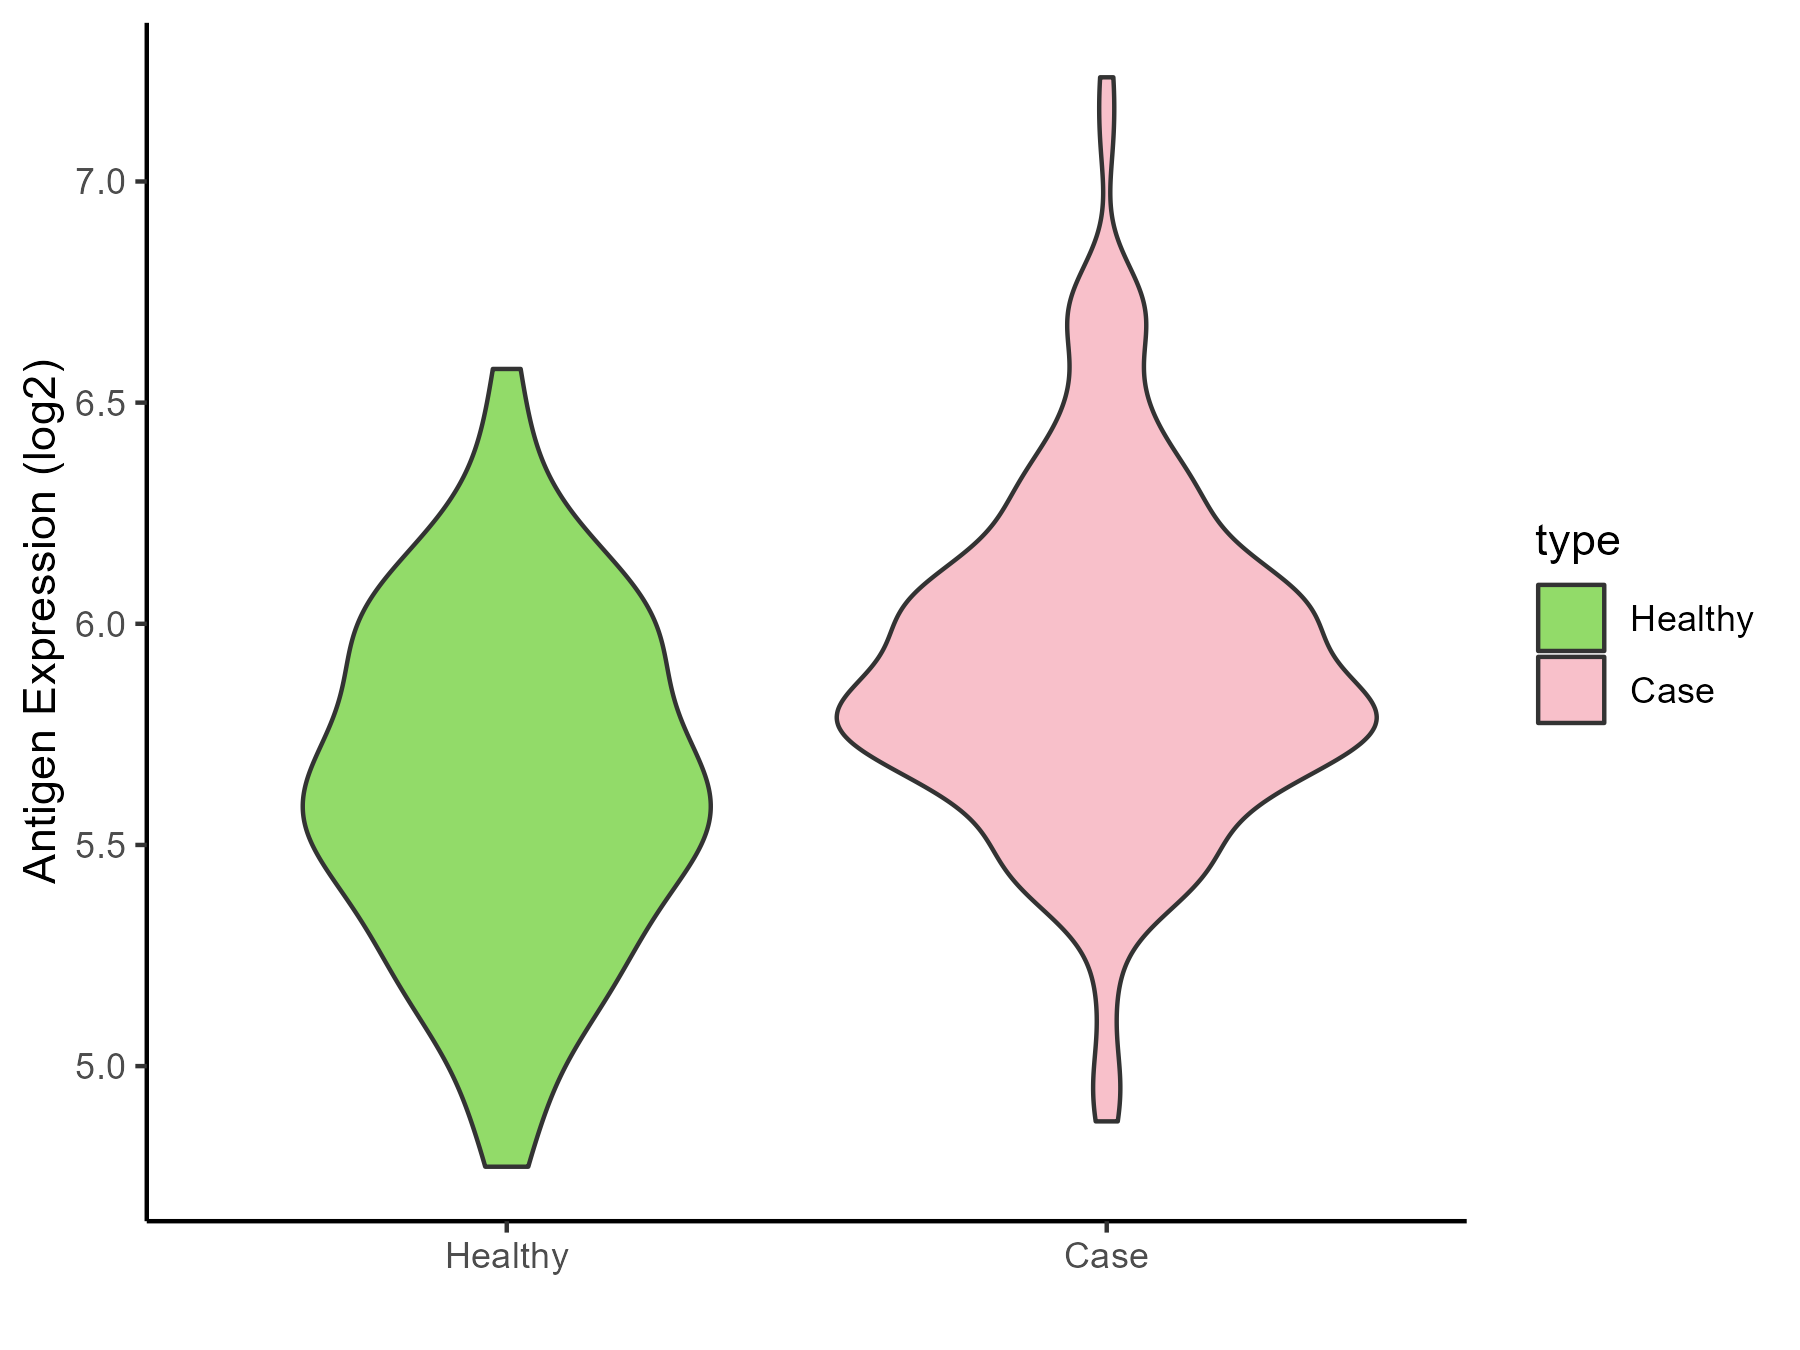
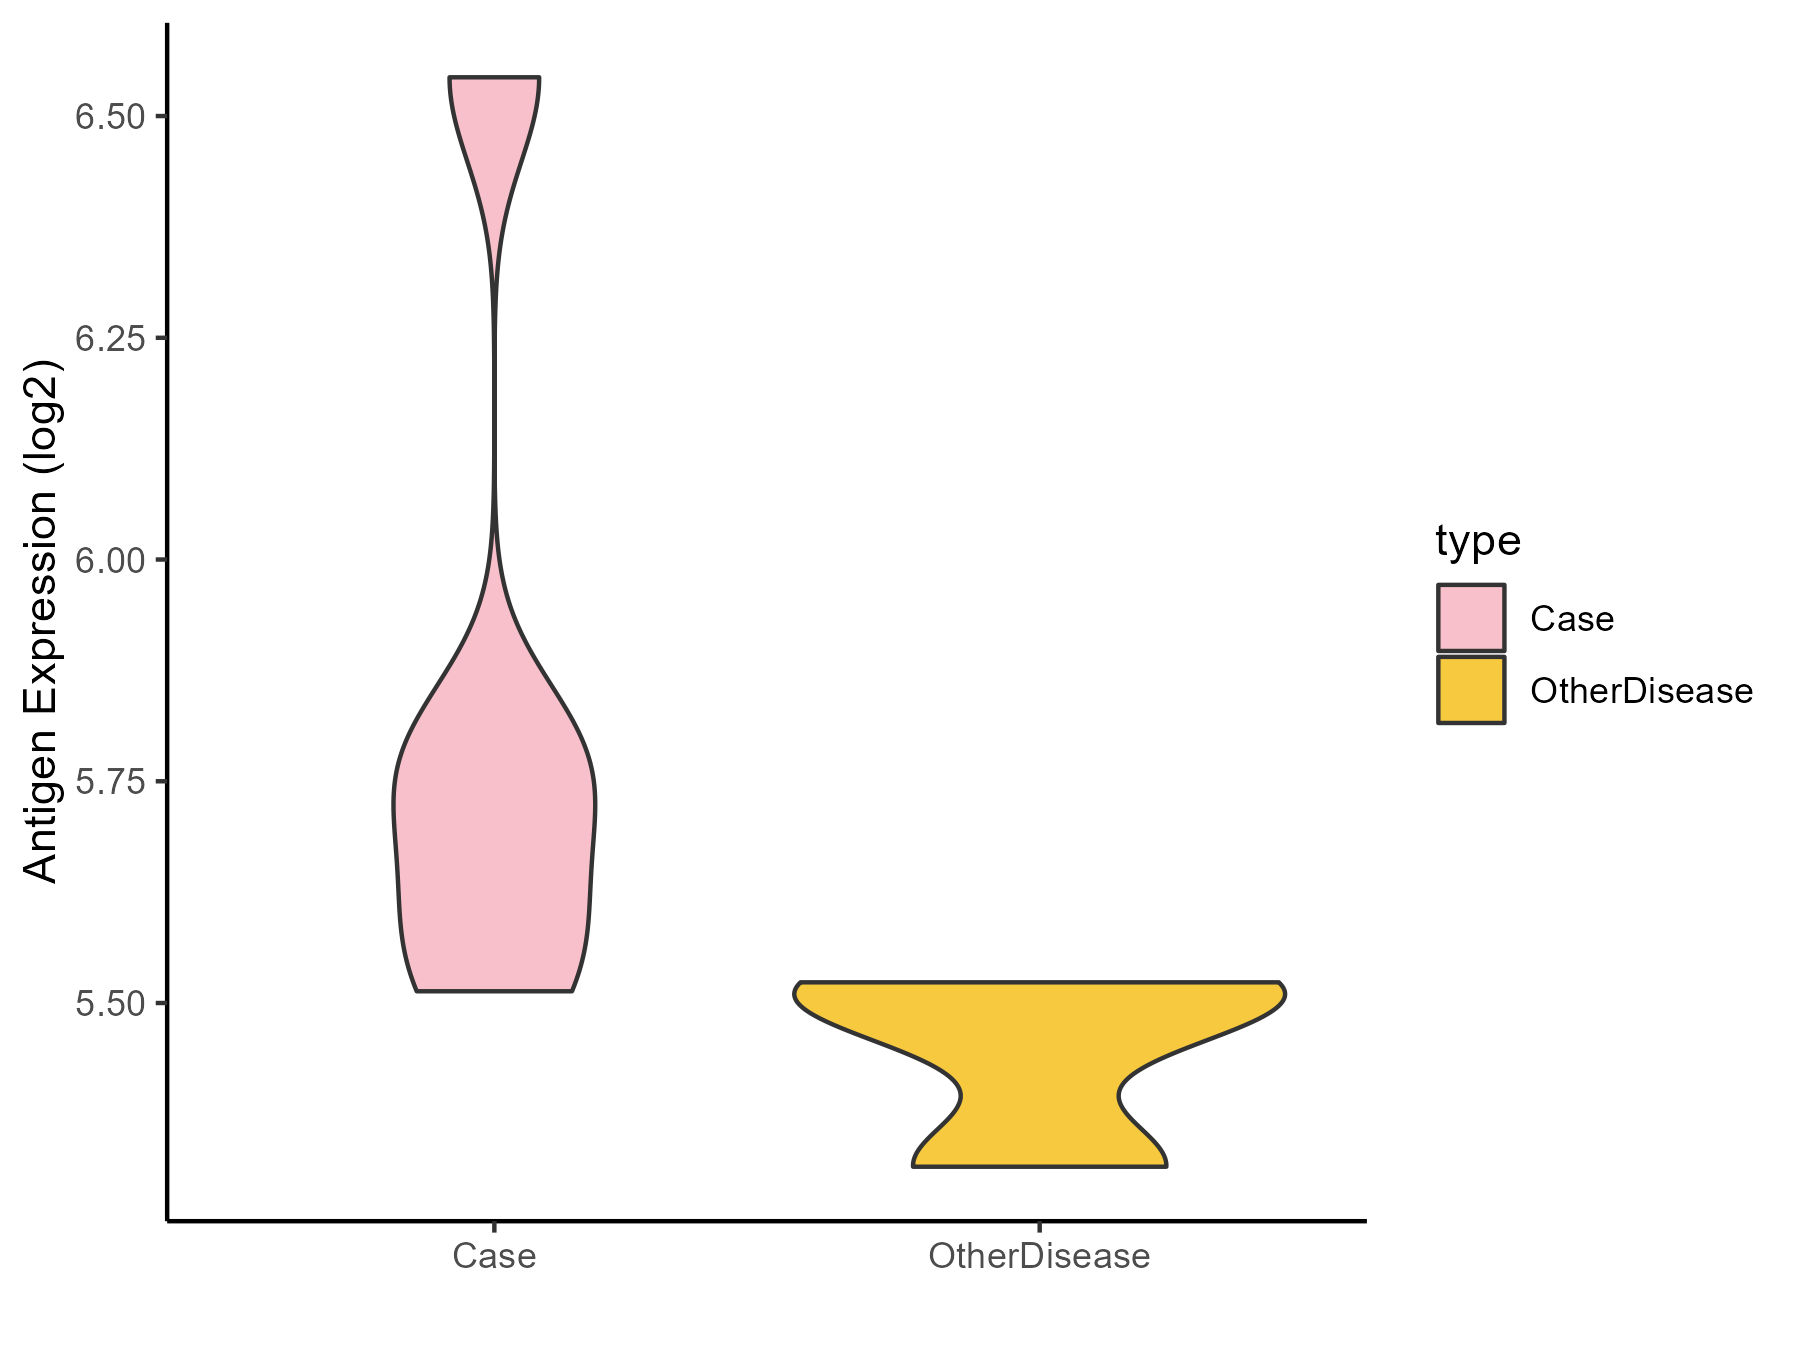
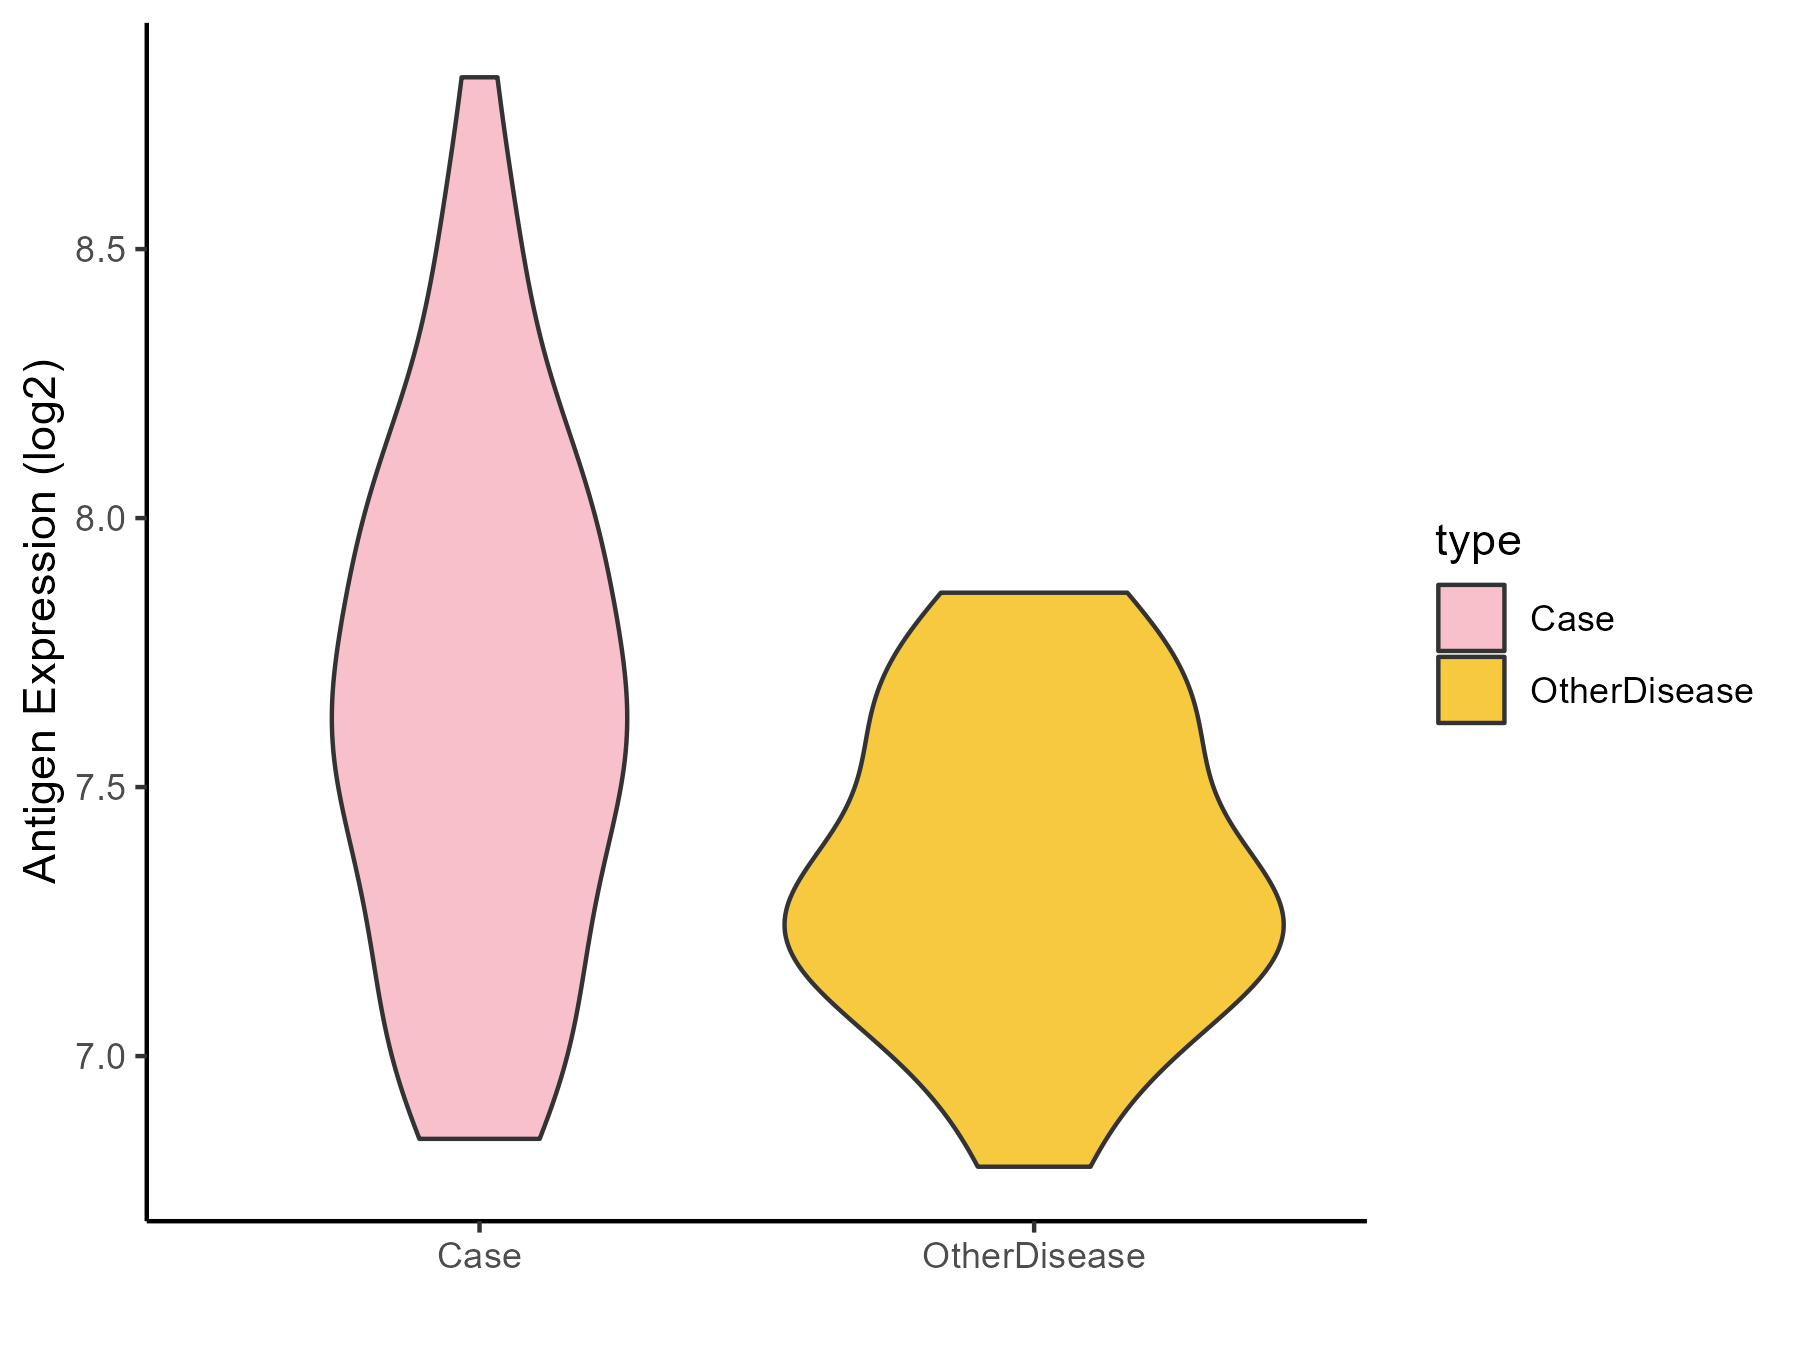
| The Studied Tissue | Liver | |
| The Specific Disease | Liver cancer | |
| The Expression Level of Disease Section Compare with the Healthy Individual Tissue | p-value: 0.107502509; Fold-change: 0.068563129; Z-score: 0.228025639 | |
| The Expression Level of Disease Section Compare with the Adjacent Tissue | p-value: 0.000251181; Fold-change: 0.092495682; Z-score: 0.395693079 | |
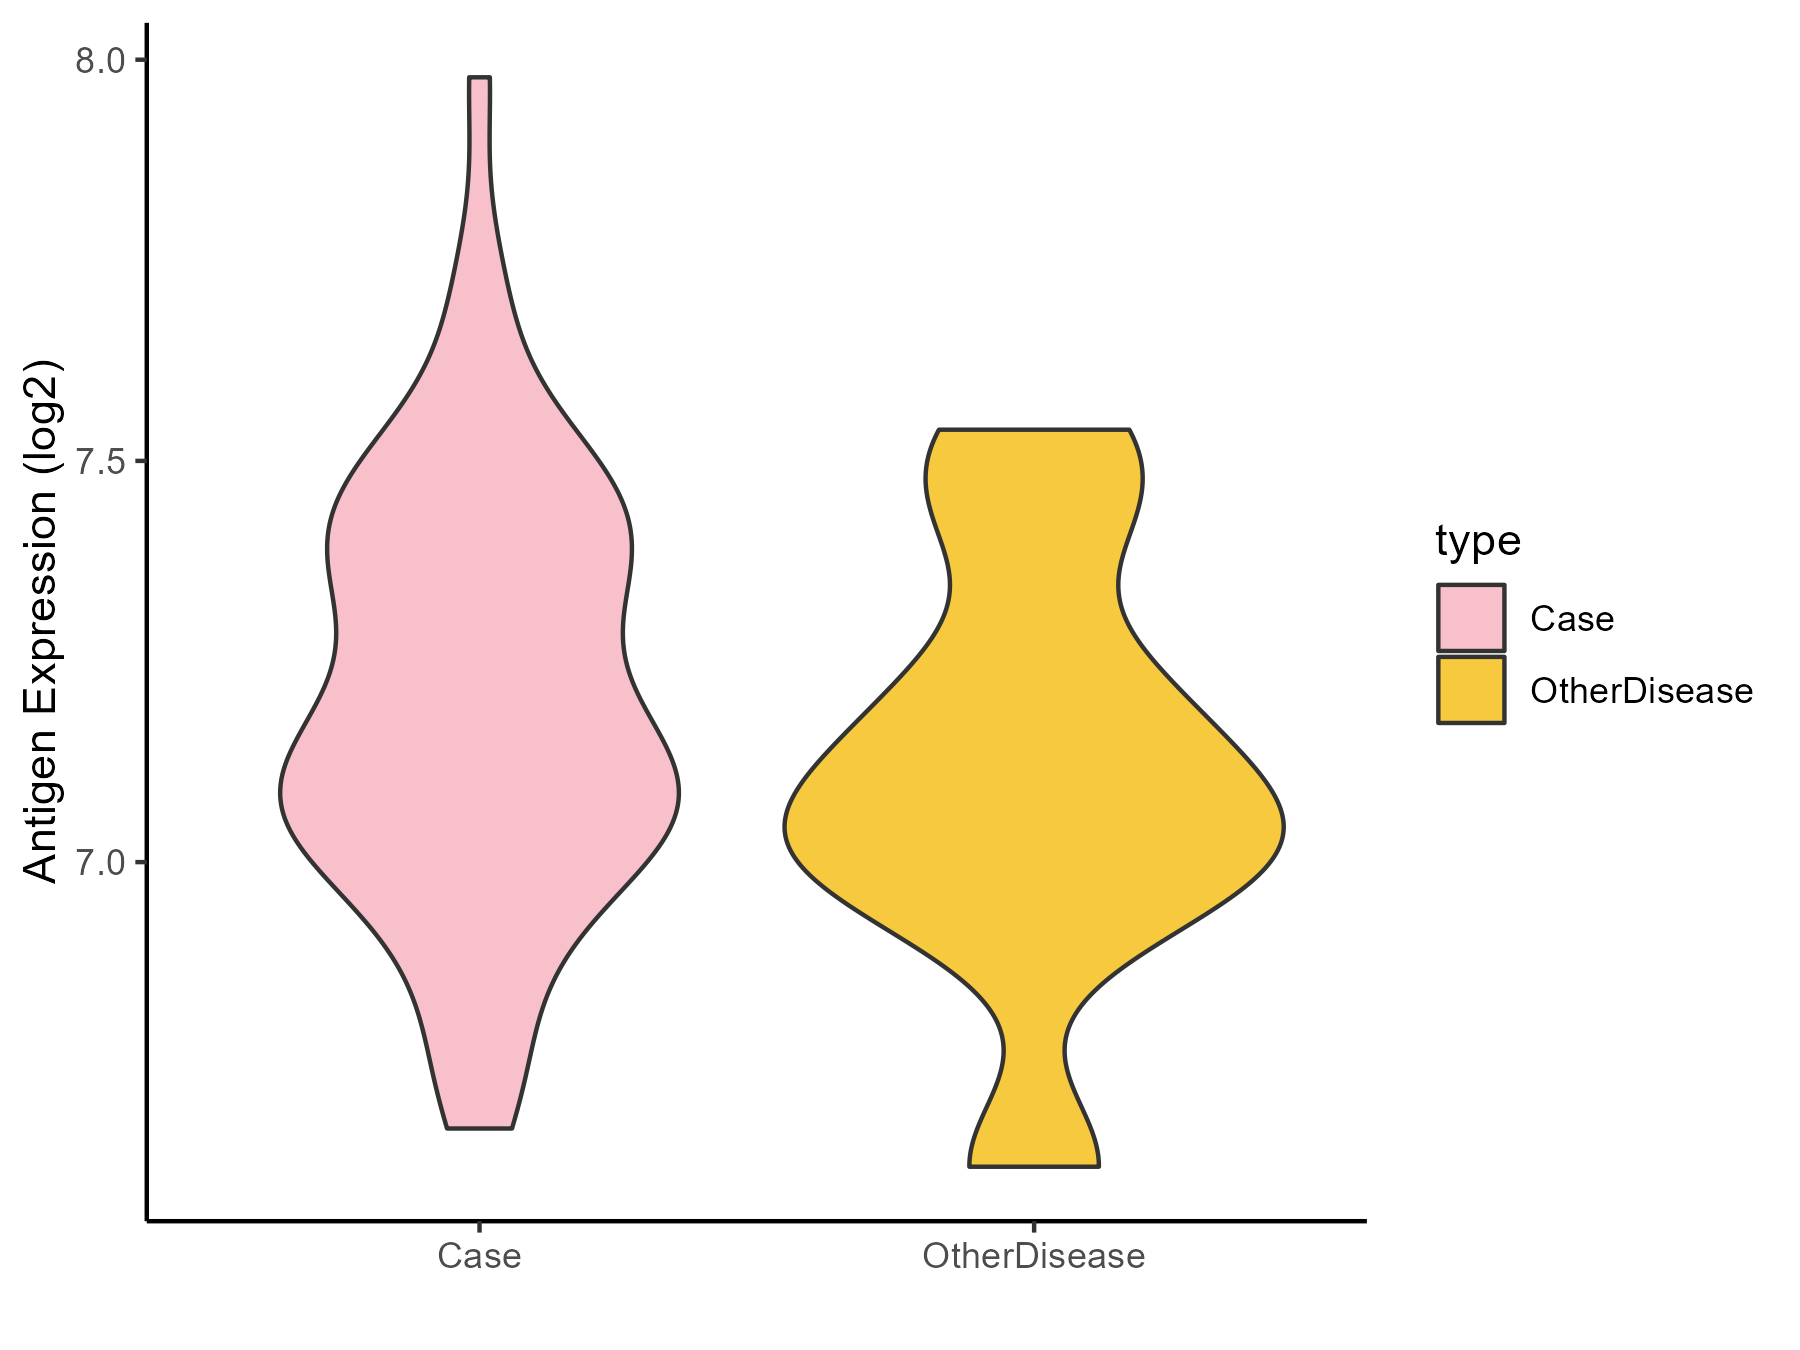
| The Expression Level of Disease Section Compare with the Other Disease Section | p-value: 0.158910148; Fold-change: 0.14823665; Z-score: 0.567927634 | |
| Disease-specific Antigen Abundances |
|
Click to View the Clearer Original Diagram |
| Differential expression pattern of antigen in diseases | ||
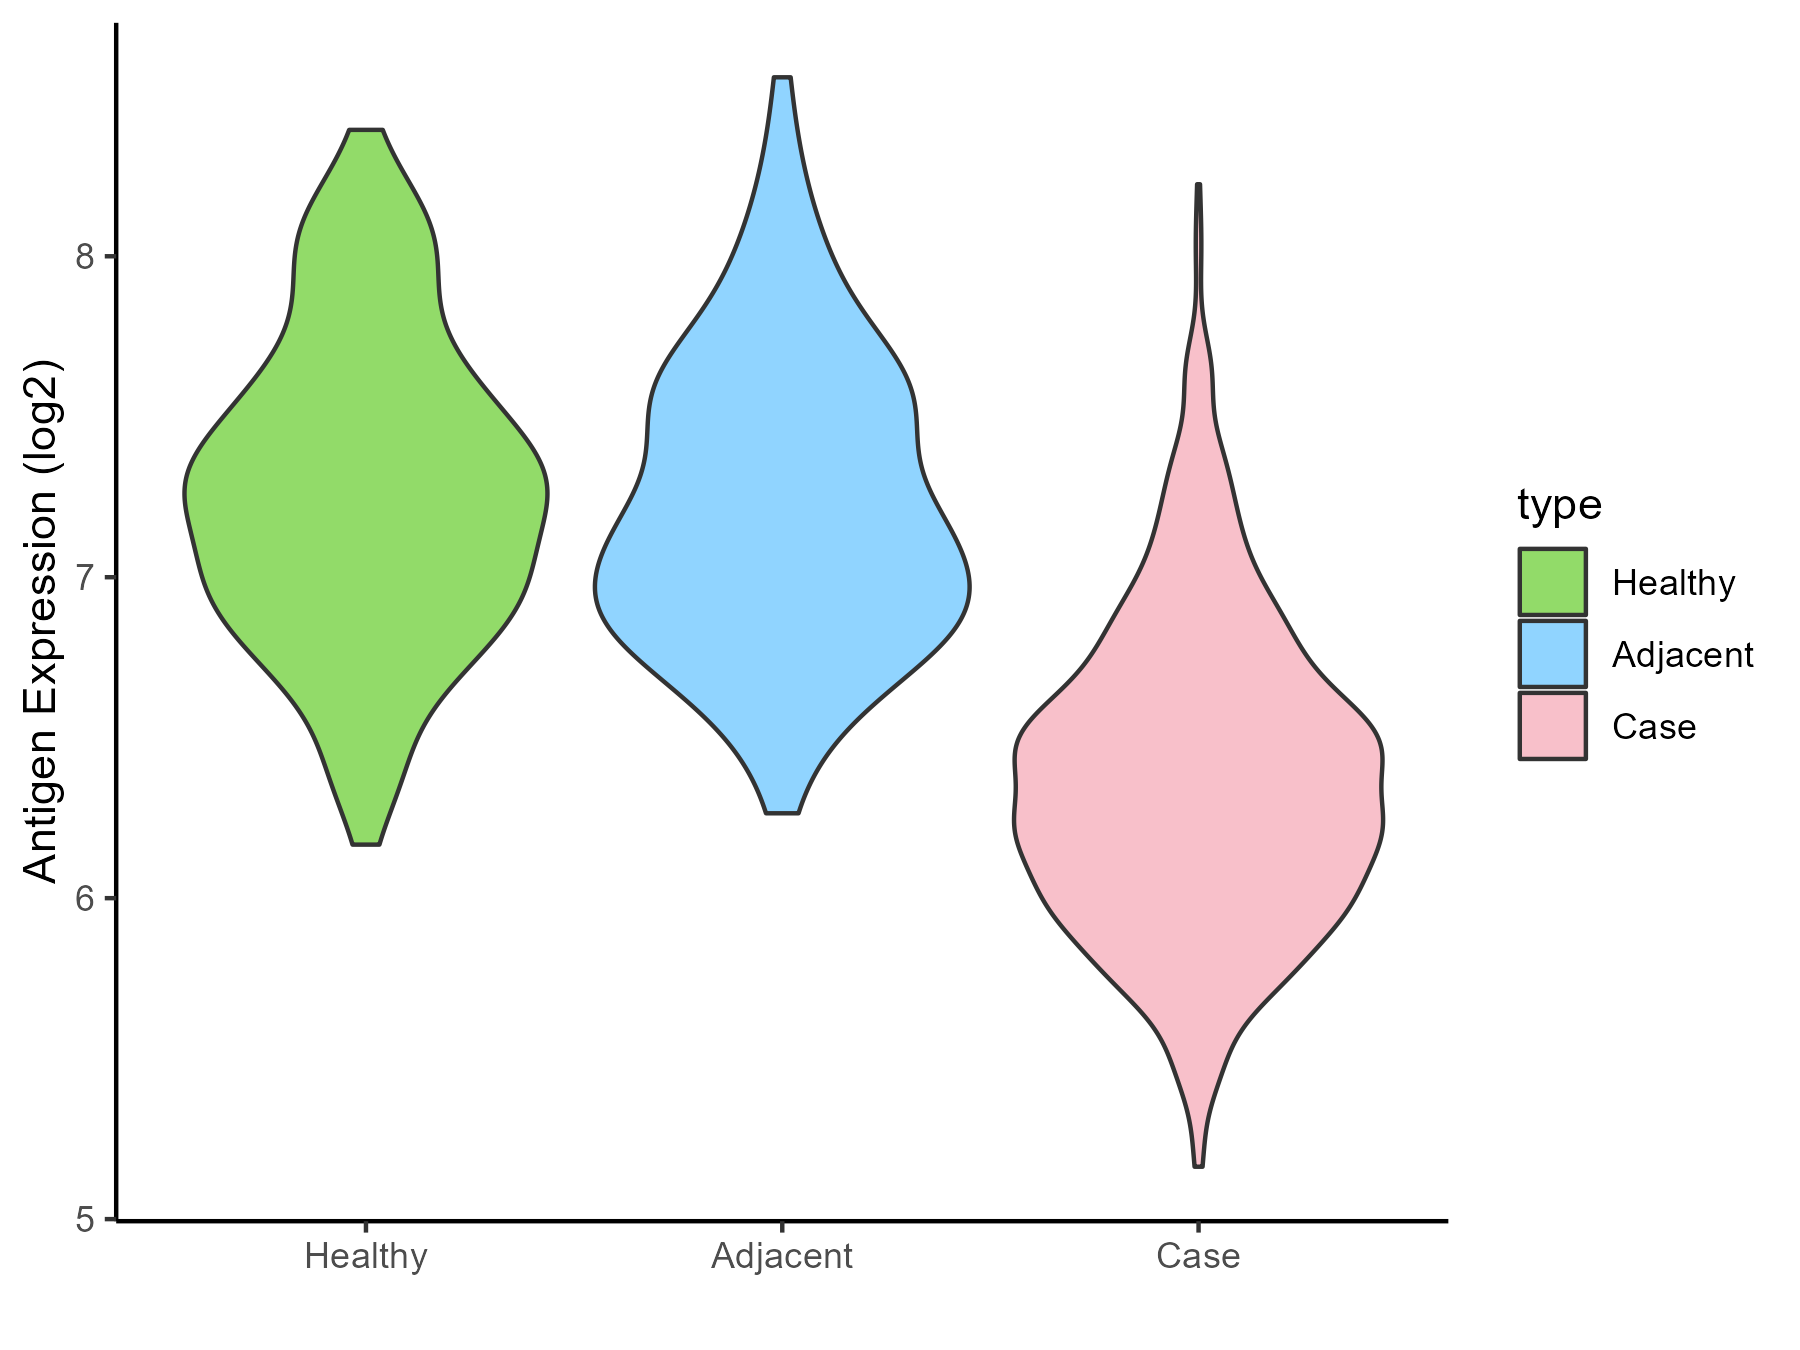
| The Studied Tissue | Lung | |
| The Specific Disease | Lung cancer | |
| The Expression Level of Disease Section Compare with the Healthy Individual Tissue | p-value: 1.06E-63; Fold-change: -0.917392959; Z-score: -1.936109978 | |
| The Expression Level of Disease Section Compare with the Adjacent Tissue | p-value: 1.59E-40; Fold-change: -0.807495579; Z-score: -1.757885595 | |
| Disease-specific Antigen Abundances |
|
Click to View the Clearer Original Diagram |
| Differential expression pattern of antigen in diseases | ||
| The Studied Tissue | Skin | |
| The Specific Disease | Melanoma | |
| The Expression Level of Disease Section Compare with the Healthy Individual Tissue | p-value: 0.065082565; Fold-change: 0.232999362; Z-score: 0.518382565 | |
| Disease-specific Antigen Abundances |
|
Click to View the Clearer Original Diagram |
| Differential expression pattern of antigen in diseases | ||
| The Studied Tissue | Muscle | |
| The Specific Disease | Sarcoma | |
| The Expression Level of Disease Section Compare with the Healthy Individual Tissue | p-value: 3.61E-32; Fold-change: -0.319356182; Z-score: -1.062959873 | |
| The Expression Level of Disease Section Compare with the Adjacent Tissue | p-value: 0.016015319; Fold-change: -0.419702127; Z-score: -3.011899073 | |
| Disease-specific Antigen Abundances |
|
Click to View the Clearer Original Diagram |
| Differential expression pattern of antigen in diseases | ||
| The Studied Tissue | Breast | |
| The Specific Disease | Breast cancer | |
| The Expression Level of Disease Section Compare with the Healthy Individual Tissue | p-value: 2.52E-15; Fold-change: -0.35505475; Z-score: -0.792299814 | |
| The Expression Level of Disease Section Compare with the Adjacent Tissue | p-value: 0.002120088; Fold-change: -0.219151004; Z-score: -0.538590094 | |
| Disease-specific Antigen Abundances |
|
Click to View the Clearer Original Diagram |
| Differential expression pattern of antigen in diseases | ||
| The Studied Tissue | Ovarian | |
| The Specific Disease | Ovarian cancer | |
| The Expression Level of Disease Section Compare with the Healthy Individual Tissue | p-value: 0.317901515; Fold-change: -0.251105318; Z-score: -0.519240833 | |
| The Expression Level of Disease Section Compare with the Adjacent Tissue | p-value: 0.21973956; Fold-change: 0.330716422; Z-score: 0.789629551 | |
| Disease-specific Antigen Abundances |
|
Click to View the Clearer Original Diagram |
| Differential expression pattern of antigen in diseases | ||
| The Studied Tissue | Cervical | |
| The Specific Disease | Cervical cancer | |
| The Expression Level of Disease Section Compare with the Healthy Individual Tissue | p-value: 0.145297357; Fold-change: 0.018627017; Z-score: 0.120528436 | |
| Disease-specific Antigen Abundances |
|
Click to View the Clearer Original Diagram |
| Differential expression pattern of antigen in diseases | ||
| The Studied Tissue | Endometrium | |
| The Specific Disease | Uterine cancer | |
| The Expression Level of Disease Section Compare with the Healthy Individual Tissue | p-value: 0.568096662; Fold-change: 0.028740939; Z-score: 0.079753395 | |
| The Expression Level of Disease Section Compare with the Adjacent Tissue | p-value: 0.011975024; Fold-change: 0.286265915; Z-score: 1.725590761 | |
| Disease-specific Antigen Abundances |
|
Click to View the Clearer Original Diagram |
| Differential expression pattern of antigen in diseases | ||
| The Studied Tissue | Prostate | |
| The Specific Disease | Prostate cancer | |
| The Expression Level of Disease Section Compare with the Healthy Individual Tissue | p-value: 0.118602607; Fold-change: -0.153415124; Z-score: -0.256387497 | |
| Disease-specific Antigen Abundances |
|
Click to View the Clearer Original Diagram |
| Differential expression pattern of antigen in diseases | ||
| The Studied Tissue | Bladder | |
| The Specific Disease | Bladder cancer | |
| The Expression Level of Disease Section Compare with the Healthy Individual Tissue | p-value: 0.033596355; Fold-change: 0.30681779; Z-score: 1.110842944 | |
| Disease-specific Antigen Abundances |
|
Click to View the Clearer Original Diagram |
| Differential expression pattern of antigen in diseases | ||
| The Studied Tissue | Uvea | |
| The Specific Disease | Retinoblastoma tumor | |
| The Expression Level of Disease Section Compare with the Healthy Individual Tissue | p-value: 0.715151177; Fold-change: 0.019816689; Z-score: 0.08586986 | |
| Disease-specific Antigen Abundances |
|
Click to View the Clearer Original Diagram |
| Differential expression pattern of antigen in diseases | ||
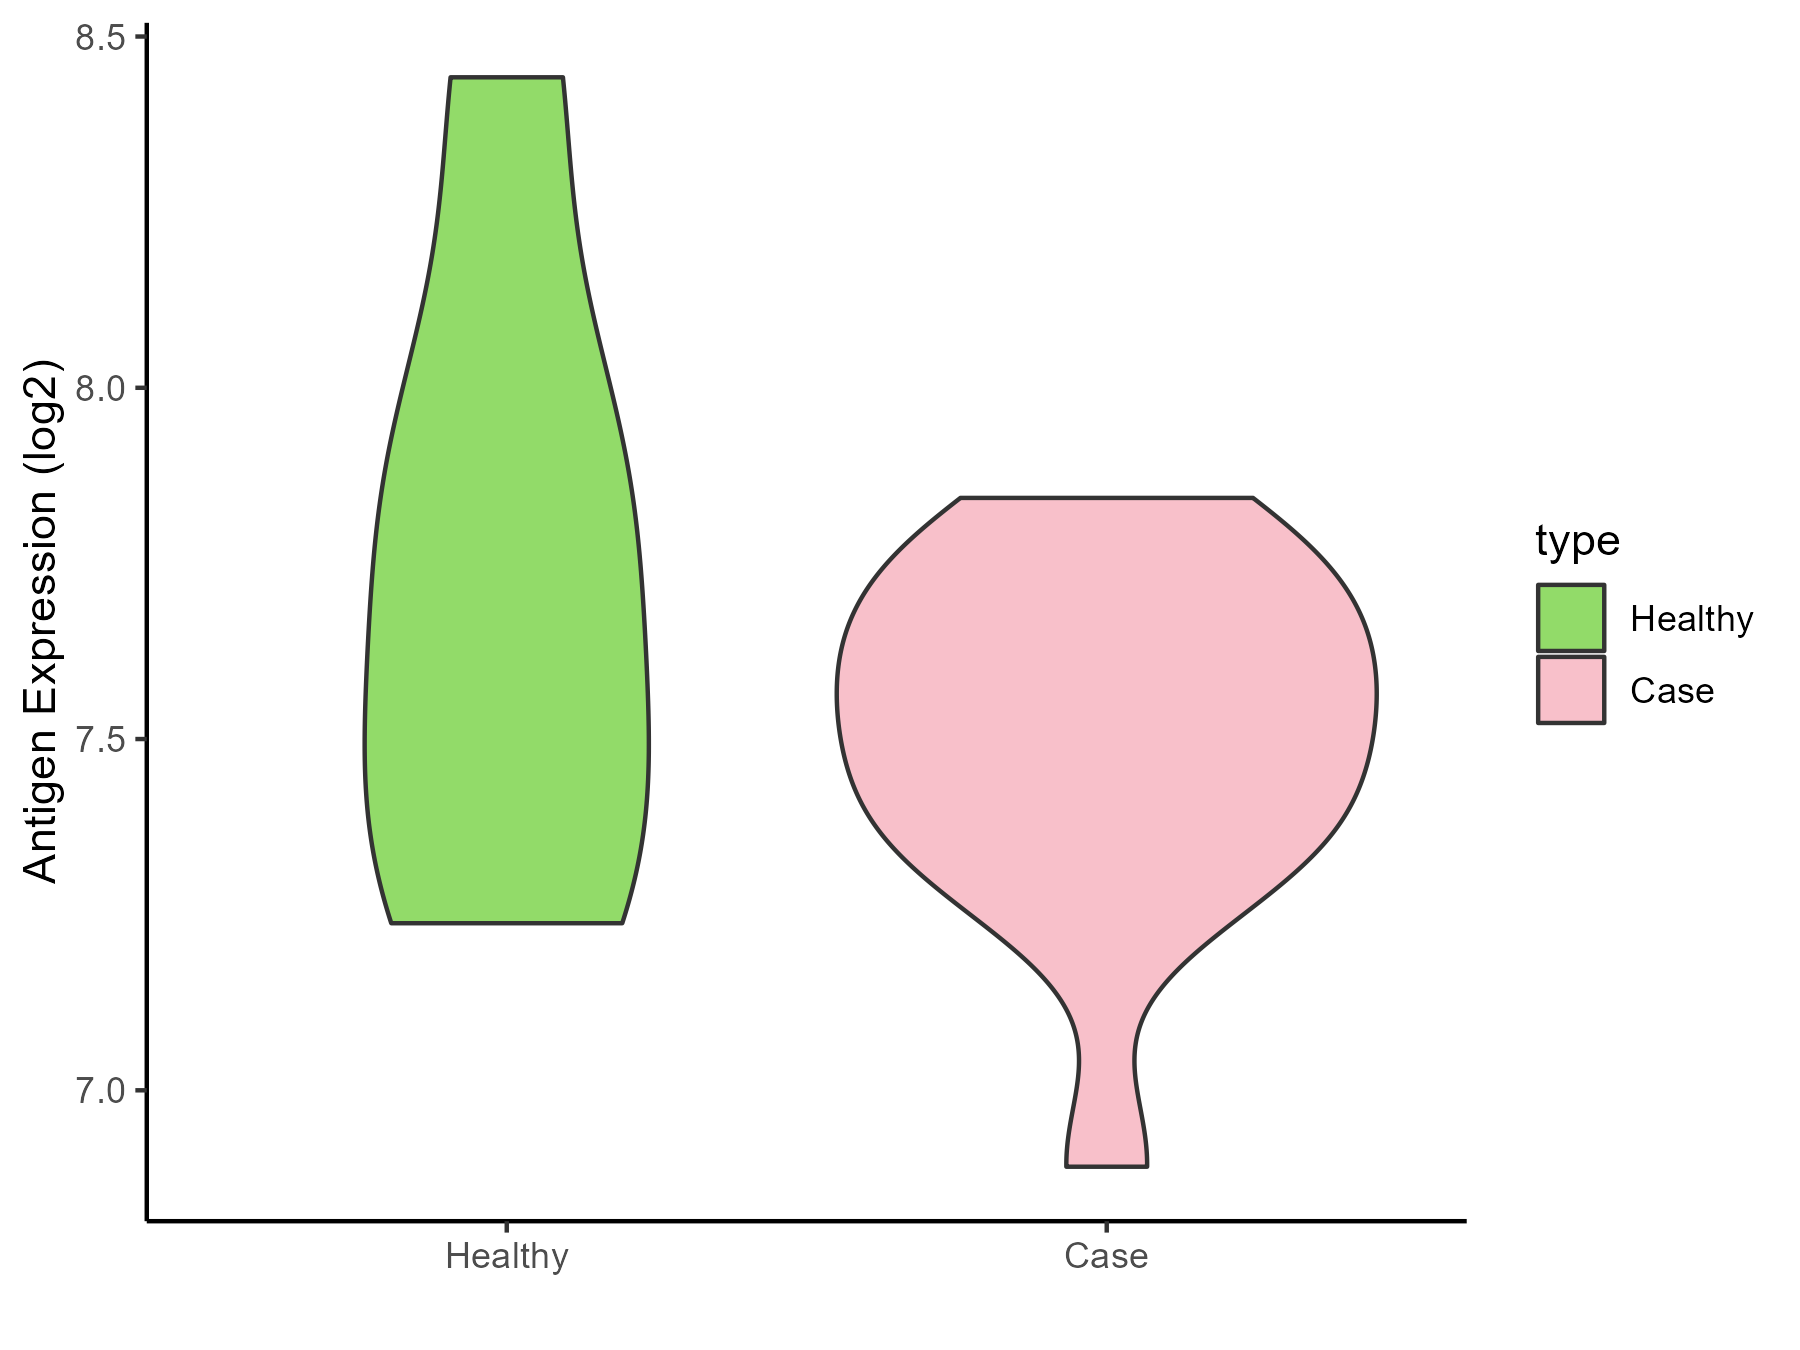
| The Studied Tissue | Thyroid | |
| The Specific Disease | Thyroid cancer | |
| The Expression Level of Disease Section Compare with the Healthy Individual Tissue | p-value: 1.30E-09; Fold-change: 0.407179384; Z-score: 0.763574827 | |
| The Expression Level of Disease Section Compare with the Adjacent Tissue | p-value: 6.29E-07; Fold-change: 0.251337446; Z-score: 0.903167498 | |
| Disease-specific Antigen Abundances |
|
Click to View the Clearer Original Diagram |
| Differential expression pattern of antigen in diseases | ||
| The Studied Tissue | Adrenal cortex | |
| The Specific Disease | Adrenocortical carcinoma | |
| The Expression Level of Disease Section Compare with the Other Disease Section | p-value: 0.16390846; Fold-change: 0.103187399; Z-score: 0.390455869 | |
| Disease-specific Antigen Abundances |
|
Click to View the Clearer Original Diagram |
| Differential expression pattern of antigen in diseases | ||
| The Studied Tissue | Head and neck | |
| The Specific Disease | Head and neck cancer | |
| The Expression Level of Disease Section Compare with the Healthy Individual Tissue | p-value: 2.26E-07; Fold-change: 0.2203102; Z-score: 0.588138476 | |
| Disease-specific Antigen Abundances |
|
Click to View the Clearer Original Diagram |
| Differential expression pattern of antigen in diseases | ||
| The Studied Tissue | Pituitary | |
| The Specific Disease | Pituitary gonadotrope tumor | |
| The Expression Level of Disease Section Compare with the Healthy Individual Tissue | p-value: 0.143691522; Fold-change: 0.158009766; Z-score: 0.432361722 | |
| Disease-specific Antigen Abundances |
|
Click to View the Clearer Original Diagram |
| The Studied Tissue | Pituitary | |
| The Specific Disease | Pituitary cancer | |
| The Expression Level of Disease Section Compare with the Healthy Individual Tissue | p-value: 0.001912967; Fold-change: 0.267537343; Z-score: 0.926348519 | |
| Disease-specific Antigen Abundances |
|
Click to View the Clearer Original Diagram |
ICD Disease Classification 03
| Differential expression pattern of antigen in diseases | ||
| The Studied Tissue | Whole blood | |
| The Specific Disease | Thrombocytopenia | |
| The Expression Level of Disease Section Compare with the Healthy Individual Tissue | p-value: 0.958182019; Fold-change: 0.26387174; Z-score: 0.288053196 | |
| Disease-specific Antigen Abundances |
|
Click to View the Clearer Original Diagram |
ICD Disease Classification 04
| Differential expression pattern of antigen in diseases | ||
| The Studied Tissue | Whole blood | |
| The Specific Disease | Lupus erythematosus | |
| The Expression Level of Disease Section Compare with the Healthy Individual Tissue | p-value: 4.07E-10; Fold-change: -0.336013982; Z-score: -0.730021591 | |
| Disease-specific Antigen Abundances |
|
Click to View the Clearer Original Diagram |
| Differential expression pattern of antigen in diseases | ||
| The Studied Tissue | Peripheral monocyte | |
| The Specific Disease | Autoimmune uveitis | |
| The Expression Level of Disease Section Compare with the Healthy Individual Tissue | p-value: 0.983181478; Fold-change: -0.058091935; Z-score: -0.102653332 | |
| Disease-specific Antigen Abundances |
|
Click to View the Clearer Original Diagram |
ICD Disease Classification 05
| Differential expression pattern of antigen in diseases | ||
| The Studied Tissue | Whole blood | |
| The Specific Disease | Familial hypercholesterolemia | |
| The Expression Level of Disease Section Compare with the Healthy Individual Tissue | p-value: 0.252622685; Fold-change: -0.202810569; Z-score: -0.788079542 | |
| Disease-specific Antigen Abundances |
|
Click to View the Clearer Original Diagram |
ICD Disease Classification 06
| Differential expression pattern of antigen in diseases | ||
| The Studied Tissue | Superior temporal cortex | |
| The Specific Disease | Schizophrenia | |
| The Expression Level of Disease Section Compare with the Healthy Individual Tissue | p-value: 0.85361812; Fold-change: 0.018697717; Z-score: 0.129031707 | |
| Disease-specific Antigen Abundances |
|
Click to View the Clearer Original Diagram |
ICD Disease Classification 08
| Differential expression pattern of antigen in diseases | ||
| The Studied Tissue | Spinal cord | |
| The Specific Disease | Multiple sclerosis | |
| The Expression Level of Disease Section Compare with the Adjacent Tissue | p-value: 0.599838119; Fold-change: -0.299745105; Z-score: -1.742772564 | |
| Disease-specific Antigen Abundances |
|
Click to View the Clearer Original Diagram |
| The Studied Tissue | Plasmacytoid dendritic cells | |
| The Specific Disease | Multiple sclerosis | |
| The Expression Level of Disease Section Compare with the Healthy Individual Tissue | p-value: 0.298345979; Fold-change: -0.17052945; Z-score: -0.384966176 | |
| Disease-specific Antigen Abundances |
|
Click to View the Clearer Original Diagram |
| Differential expression pattern of antigen in diseases | ||
| The Studied Tissue | Peritumoral cortex | |
| The Specific Disease | Epilepsy | |
| The Expression Level of Disease Section Compare with the Other Disease Section | p-value: 0.100761972; Fold-change: 0.243356321; Z-score: 2.148027543 | |
| Disease-specific Antigen Abundances |
|
Click to View the Clearer Original Diagram |
| Differential expression pattern of antigen in diseases | ||
| The Studied Tissue | Whole blood | |
| The Specific Disease | Cardioembolic Stroke | |
| The Expression Level of Disease Section Compare with the Healthy Individual Tissue | p-value: 0.007384578; Fold-change: -0.337429977; Z-score: -0.722590155 | |
| Disease-specific Antigen Abundances |
|
Click to View the Clearer Original Diagram |
| The Studied Tissue | Peripheral blood | |
| The Specific Disease | Ischemic stroke | |
| The Expression Level of Disease Section Compare with the Healthy Individual Tissue | p-value: 0.248267873; Fold-change: -0.067569781; Z-score: -0.184723486 | |
| Disease-specific Antigen Abundances |
|
Click to View the Clearer Original Diagram |
ICD Disease Classification 1
| Differential expression pattern of antigen in diseases | ||
| The Studied Tissue | White matter | |
| The Specific Disease | HIV | |
| The Expression Level of Disease Section Compare with the Healthy Individual Tissue | p-value: 0.460221656; Fold-change: -0.051274014; Z-score: -0.263773506 | |
| Disease-specific Antigen Abundances |
|
Click to View the Clearer Original Diagram |
| Differential expression pattern of antigen in diseases | ||
| The Studied Tissue | Whole blood | |
| The Specific Disease | Influenza | |
| The Expression Level of Disease Section Compare with the Healthy Individual Tissue | p-value: 0.980401322; Fold-change: 0.234209845; Z-score: 1.303910251 | |
| Disease-specific Antigen Abundances |
|
Click to View the Clearer Original Diagram |
| Differential expression pattern of antigen in diseases | ||
| The Studied Tissue | Whole blood | |
| The Specific Disease | Chronic hepatitis C | |
| The Expression Level of Disease Section Compare with the Healthy Individual Tissue | p-value: 0.259829369; Fold-change: -0.00428745; Z-score: -0.010464511 | |
| Disease-specific Antigen Abundances |
|
Click to View the Clearer Original Diagram |
| Differential expression pattern of antigen in diseases | ||
| The Studied Tissue | Whole blood | |
| The Specific Disease | Sepsis | |
| The Expression Level of Disease Section Compare with the Healthy Individual Tissue | p-value: 0.004716638; Fold-change: -0.193600864; Z-score: -0.483907247 | |
| Disease-specific Antigen Abundances |
|
Click to View the Clearer Original Diagram |
| Differential expression pattern of antigen in diseases | ||
| The Studied Tissue | Whole blood | |
| The Specific Disease | Septic shock | |
| The Expression Level of Disease Section Compare with the Healthy Individual Tissue | p-value: 0.364352853; Fold-change: -0.085251275; Z-score: -0.233435184 | |
| Disease-specific Antigen Abundances |
|
Click to View the Clearer Original Diagram |
| Differential expression pattern of antigen in diseases | ||
| The Studied Tissue | Peripheral blood | |
| The Specific Disease | Pediatric respiratory syncytial virus infection | |
| The Expression Level of Disease Section Compare with the Healthy Individual Tissue | p-value: 0.038402734; Fold-change: -0.211730506; Z-score: -0.468996987 | |
| Disease-specific Antigen Abundances |
|
Click to View the Clearer Original Diagram |
ICD Disease Classification 11
| Differential expression pattern of antigen in diseases | ||
| The Studied Tissue | Peripheral blood | |
| The Specific Disease | Essential hypertension | |
| The Expression Level of Disease Section Compare with the Healthy Individual Tissue | p-value: 0.345438452; Fold-change: 0.29890539; Z-score: 1.744361002 | |
| Disease-specific Antigen Abundances |
|
Click to View the Clearer Original Diagram |
| Differential expression pattern of antigen in diseases | ||
| The Studied Tissue | Peripheral blood | |
| The Specific Disease | Myocardial infarction | |
| The Expression Level of Disease Section Compare with the Healthy Individual Tissue | p-value: 0.059165474; Fold-change: 0.255985718; Z-score: 0.42275218 | |
| Disease-specific Antigen Abundances |
|
Click to View the Clearer Original Diagram |
| Differential expression pattern of antigen in diseases | ||
| The Studied Tissue | Peripheral blood | |
| The Specific Disease | Coronary artery disease | |
| The Expression Level of Disease Section Compare with the Healthy Individual Tissue | p-value: 0.11483141; Fold-change: -0.310406006; Z-score: -1.301466544 | |
| Disease-specific Antigen Abundances |
|
Click to View the Clearer Original Diagram |
| Differential expression pattern of antigen in diseases | ||
| The Studied Tissue | Calcified aortic valve | |
| The Specific Disease | Aortic stenosis | |
| The Expression Level of Disease Section Compare with the Healthy Individual Tissue | p-value: 0.786798952; Fold-change: 0.062040425; Z-score: 0.163669714 | |
| Disease-specific Antigen Abundances |
|
Click to View the Clearer Original Diagram |
| Differential expression pattern of antigen in diseases | ||
| The Studied Tissue | Peripheral blood | |
| The Specific Disease | Arteriosclerosis | |
| The Expression Level of Disease Section Compare with the Healthy Individual Tissue | p-value: 0.393603935; Fold-change: -0.050566668; Z-score: -0.175154603 | |
| Disease-specific Antigen Abundances |
|
Click to View the Clearer Original Diagram |
| Differential expression pattern of antigen in diseases | ||
| The Studied Tissue | Intracranial artery | |
| The Specific Disease | Aneurysm | |
| The Expression Level of Disease Section Compare with the Healthy Individual Tissue | p-value: 0.078721984; Fold-change: -0.486841022; Z-score: -1.153830039 | |
| Disease-specific Antigen Abundances |
|
Click to View the Clearer Original Diagram |
ICD Disease Classification 12
| Differential expression pattern of antigen in diseases | ||
| The Studied Tissue | Peripheral blood | |
| The Specific Disease | Immunodeficiency | |
| The Expression Level of Disease Section Compare with the Healthy Individual Tissue | p-value: 0.061118919; Fold-change: 0.063145853; Z-score: 0.739897762 | |
| Disease-specific Antigen Abundances |
|
Click to View the Clearer Original Diagram |
| Differential expression pattern of antigen in diseases | ||
| The Studied Tissue | Hyperplastic tonsil | |
| The Specific Disease | Apnea | |
| The Expression Level of Disease Section Compare with the Healthy Individual Tissue | p-value: 0.390369269; Fold-change: 0.013002294; Z-score: 0.028780667 | |
| Disease-specific Antigen Abundances |
|
Click to View the Clearer Original Diagram |
| Differential expression pattern of antigen in diseases | ||
| The Studied Tissue | Peripheral blood | |
| The Specific Disease | Olive pollen allergy | |
| The Expression Level of Disease Section Compare with the Healthy Individual Tissue | p-value: 0.003425814; Fold-change: 0.561731572; Z-score: 3.548372546 | |
| Disease-specific Antigen Abundances |
|
Click to View the Clearer Original Diagram |
| Differential expression pattern of antigen in diseases | ||
| The Studied Tissue | Sinus mucosa | |
| The Specific Disease | Chronic rhinosinusitis | |
| The Expression Level of Disease Section Compare with the Healthy Individual Tissue | p-value: 0.44218114; Fold-change: -0.073118485; Z-score: -0.435303799 | |
| Disease-specific Antigen Abundances |
|
Click to View the Clearer Original Diagram |
| Differential expression pattern of antigen in diseases | ||
| The Studied Tissue | Lung | |
| The Specific Disease | Chronic obstructive pulmonary disease | |
| The Expression Level of Disease Section Compare with the Healthy Individual Tissue | p-value: 0.474865578; Fold-change: -0.137879482; Z-score: -0.280090929 | |
| Disease-specific Antigen Abundances |
|
Click to View the Clearer Original Diagram |
| The Studied Tissue | Small airway epithelium | |
| The Specific Disease | Chronic obstructive pulmonary disease | |
| The Expression Level of Disease Section Compare with the Healthy Individual Tissue | p-value: 2.23E-06; Fold-change: 0.239283002; Z-score: 0.712588073 | |
| Disease-specific Antigen Abundances |
|
Click to View the Clearer Original Diagram |
| Differential expression pattern of antigen in diseases | ||
| The Studied Tissue | Nasal and bronchial airway | |
| The Specific Disease | Asthma | |
| The Expression Level of Disease Section Compare with the Healthy Individual Tissue | p-value: 0.522311931; Fold-change: 0.023078073; Z-score: 0.066548671 | |
| Disease-specific Antigen Abundances |
|
Click to View the Clearer Original Diagram |
| Differential expression pattern of antigen in diseases | ||
| The Studied Tissue | Nasal Epithelium | |
| The Specific Disease | Human rhinovirus infection | |
| The Expression Level of Disease Section Compare with the Healthy Individual Tissue | p-value: 0.077003185; Fold-change: 0.026417348; Z-score: 0.189436021 | |
| Disease-specific Antigen Abundances |
|
Click to View the Clearer Original Diagram |
| Differential expression pattern of antigen in diseases | ||
| The Studied Tissue | Lung | |
| The Specific Disease | Idiopathic pulmonary fibrosis | |
| The Expression Level of Disease Section Compare with the Healthy Individual Tissue | p-value: 0.33114627; Fold-change: -0.315555408; Z-score: -0.821164423 | |
| Disease-specific Antigen Abundances |
|
Click to View the Clearer Original Diagram |
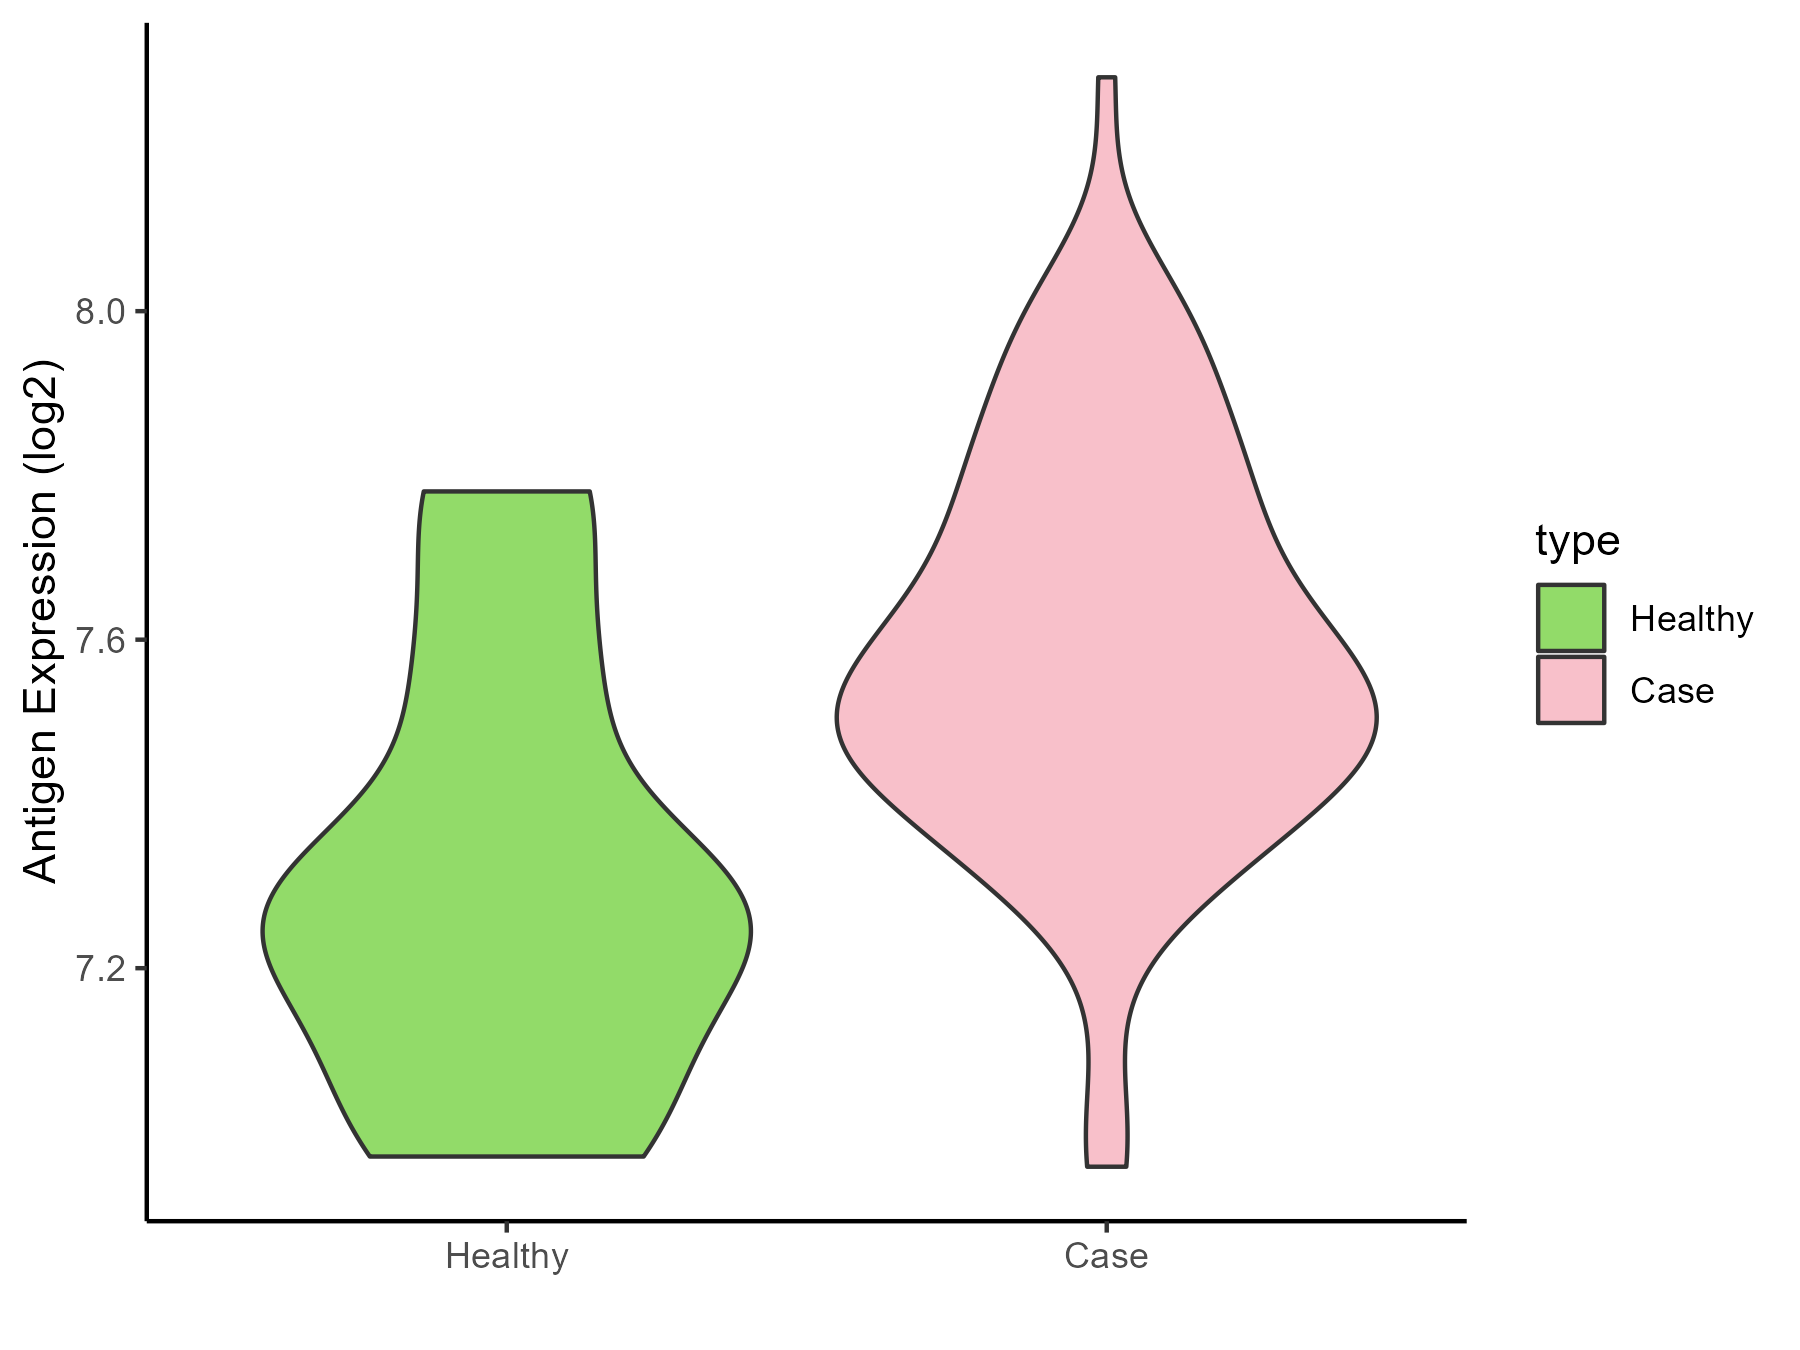
ICD Disease Classification 13
| Differential expression pattern of antigen in diseases | ||
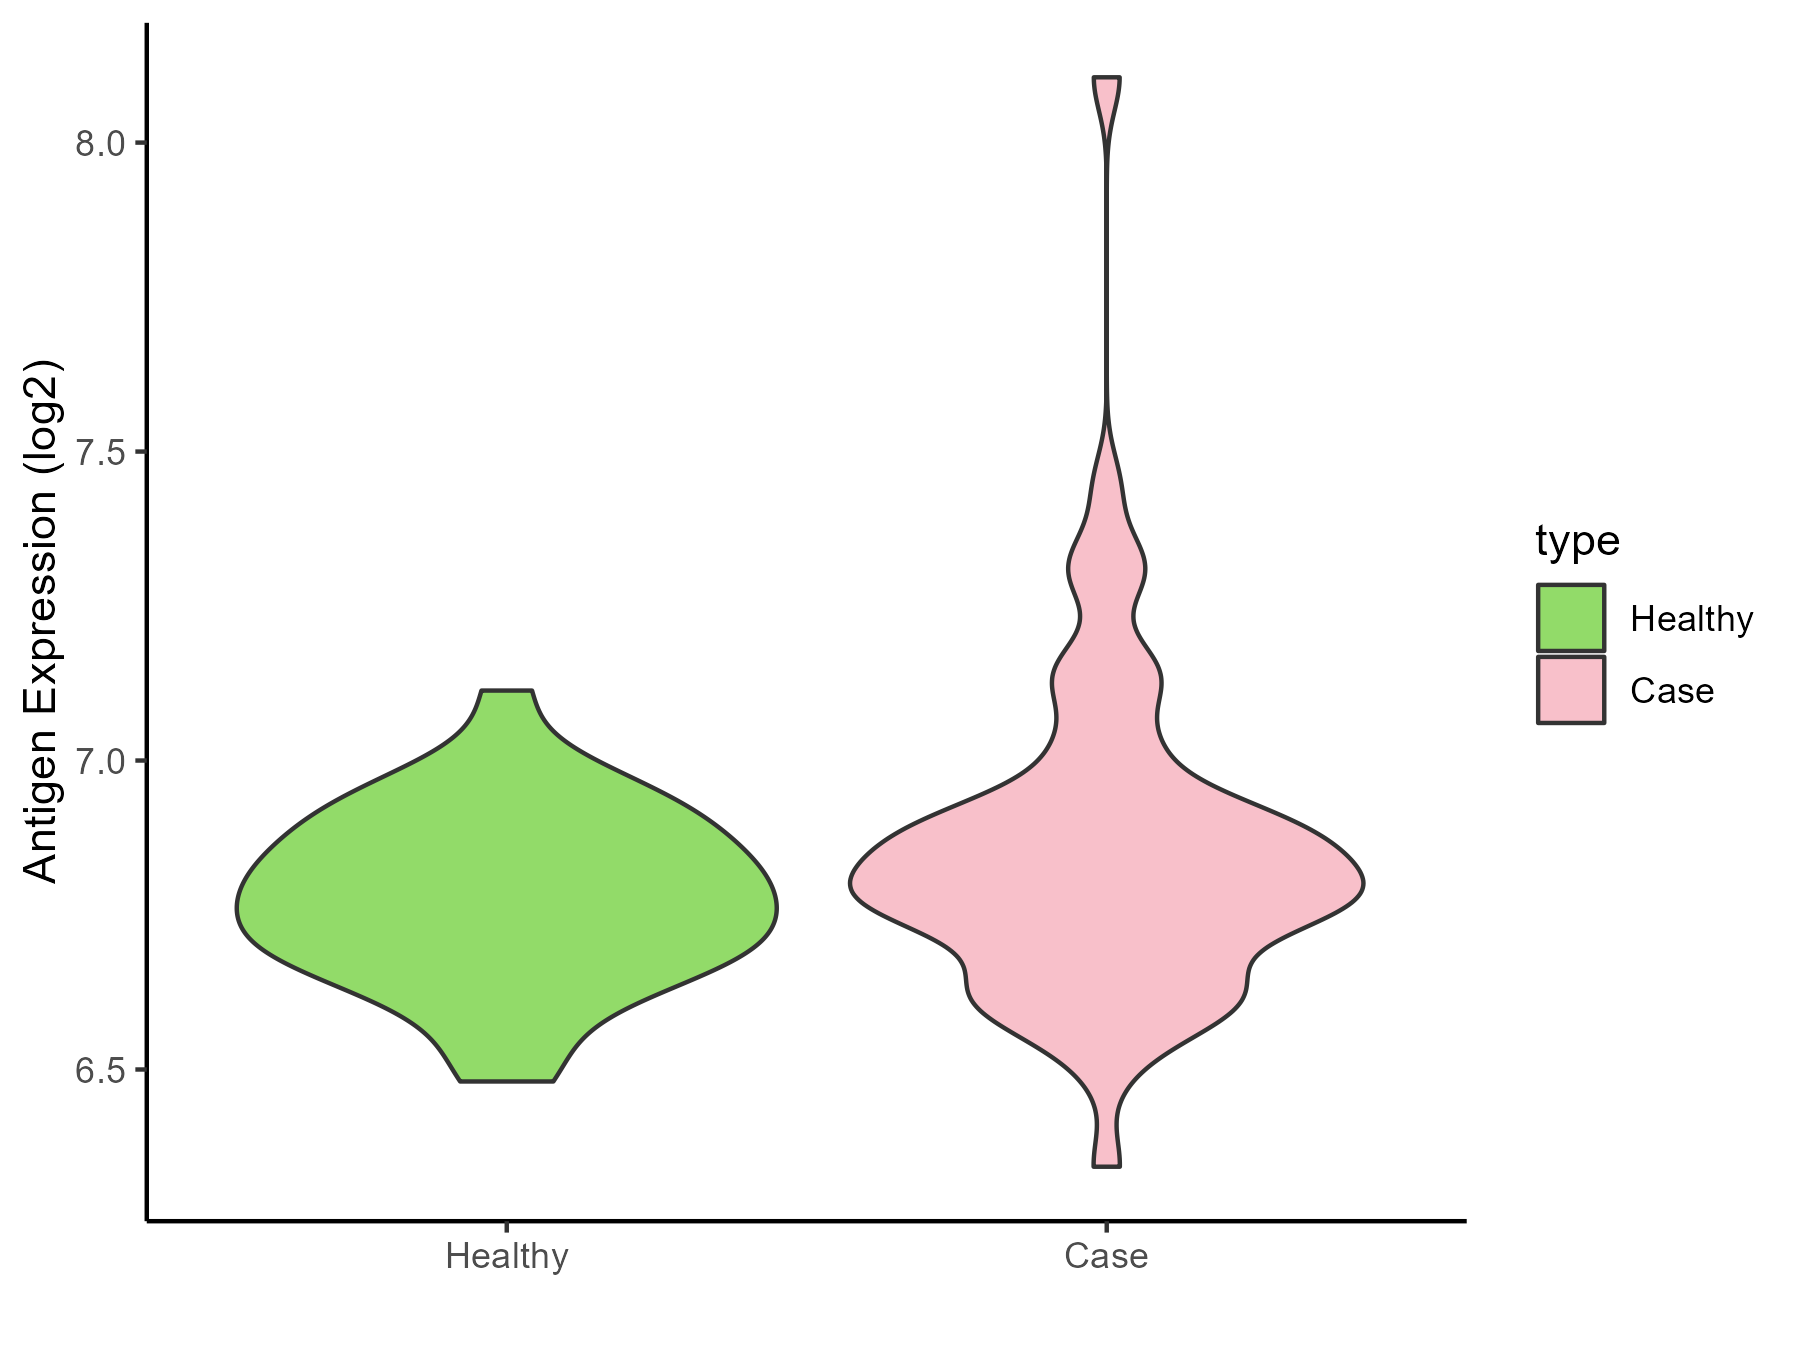
| The Studied Tissue | Gingival | |
| The Specific Disease | Periodontal disease | |
| The Expression Level of Disease Section Compare with the Adjacent Tissue | p-value: 5.80E-13; Fold-change: 0.392632579; Z-score: 1.26285272 | |
| Disease-specific Antigen Abundances |
|
Click to View the Clearer Original Diagram |
| Differential expression pattern of antigen in diseases | ||
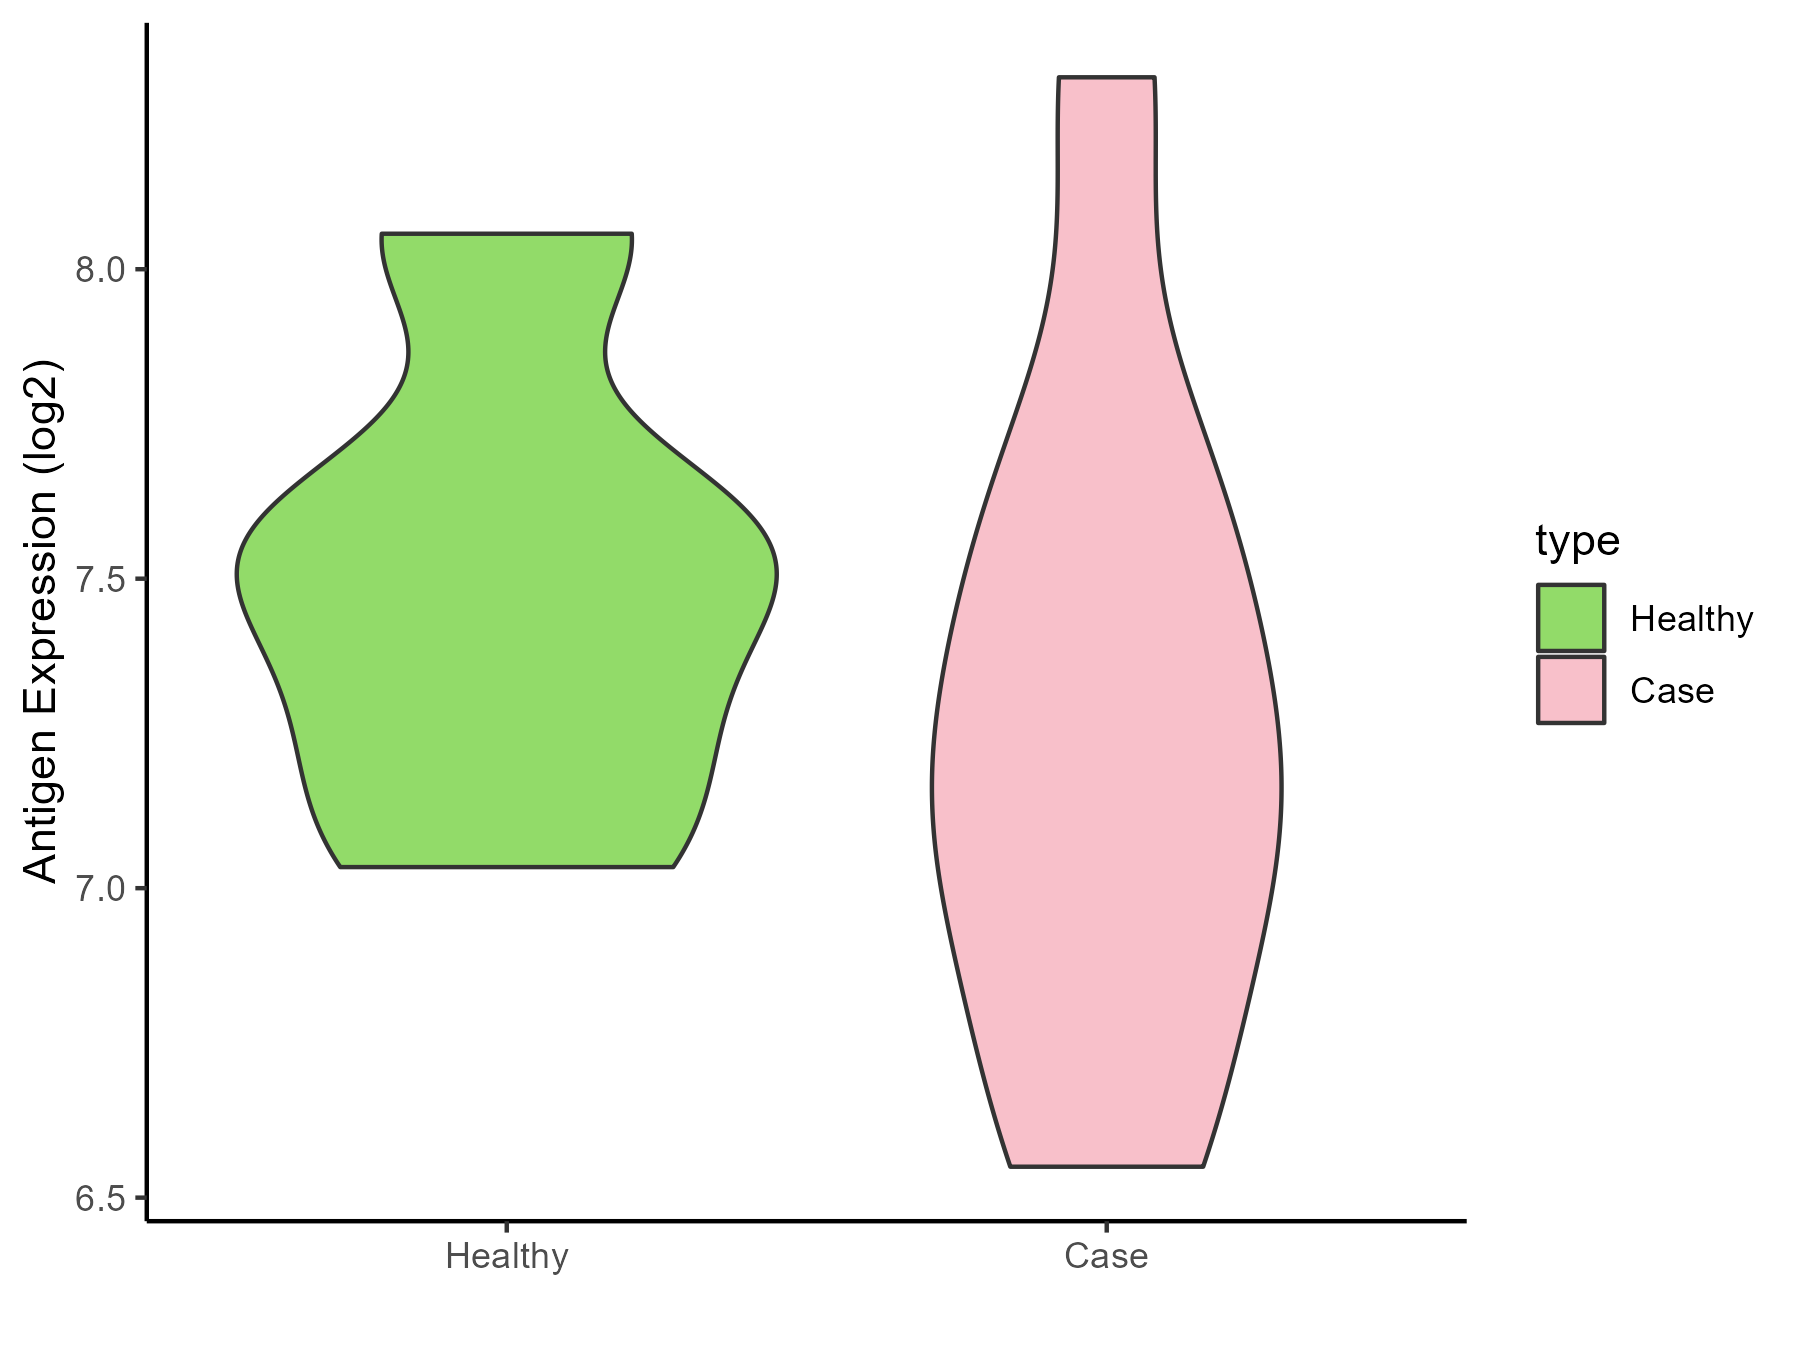
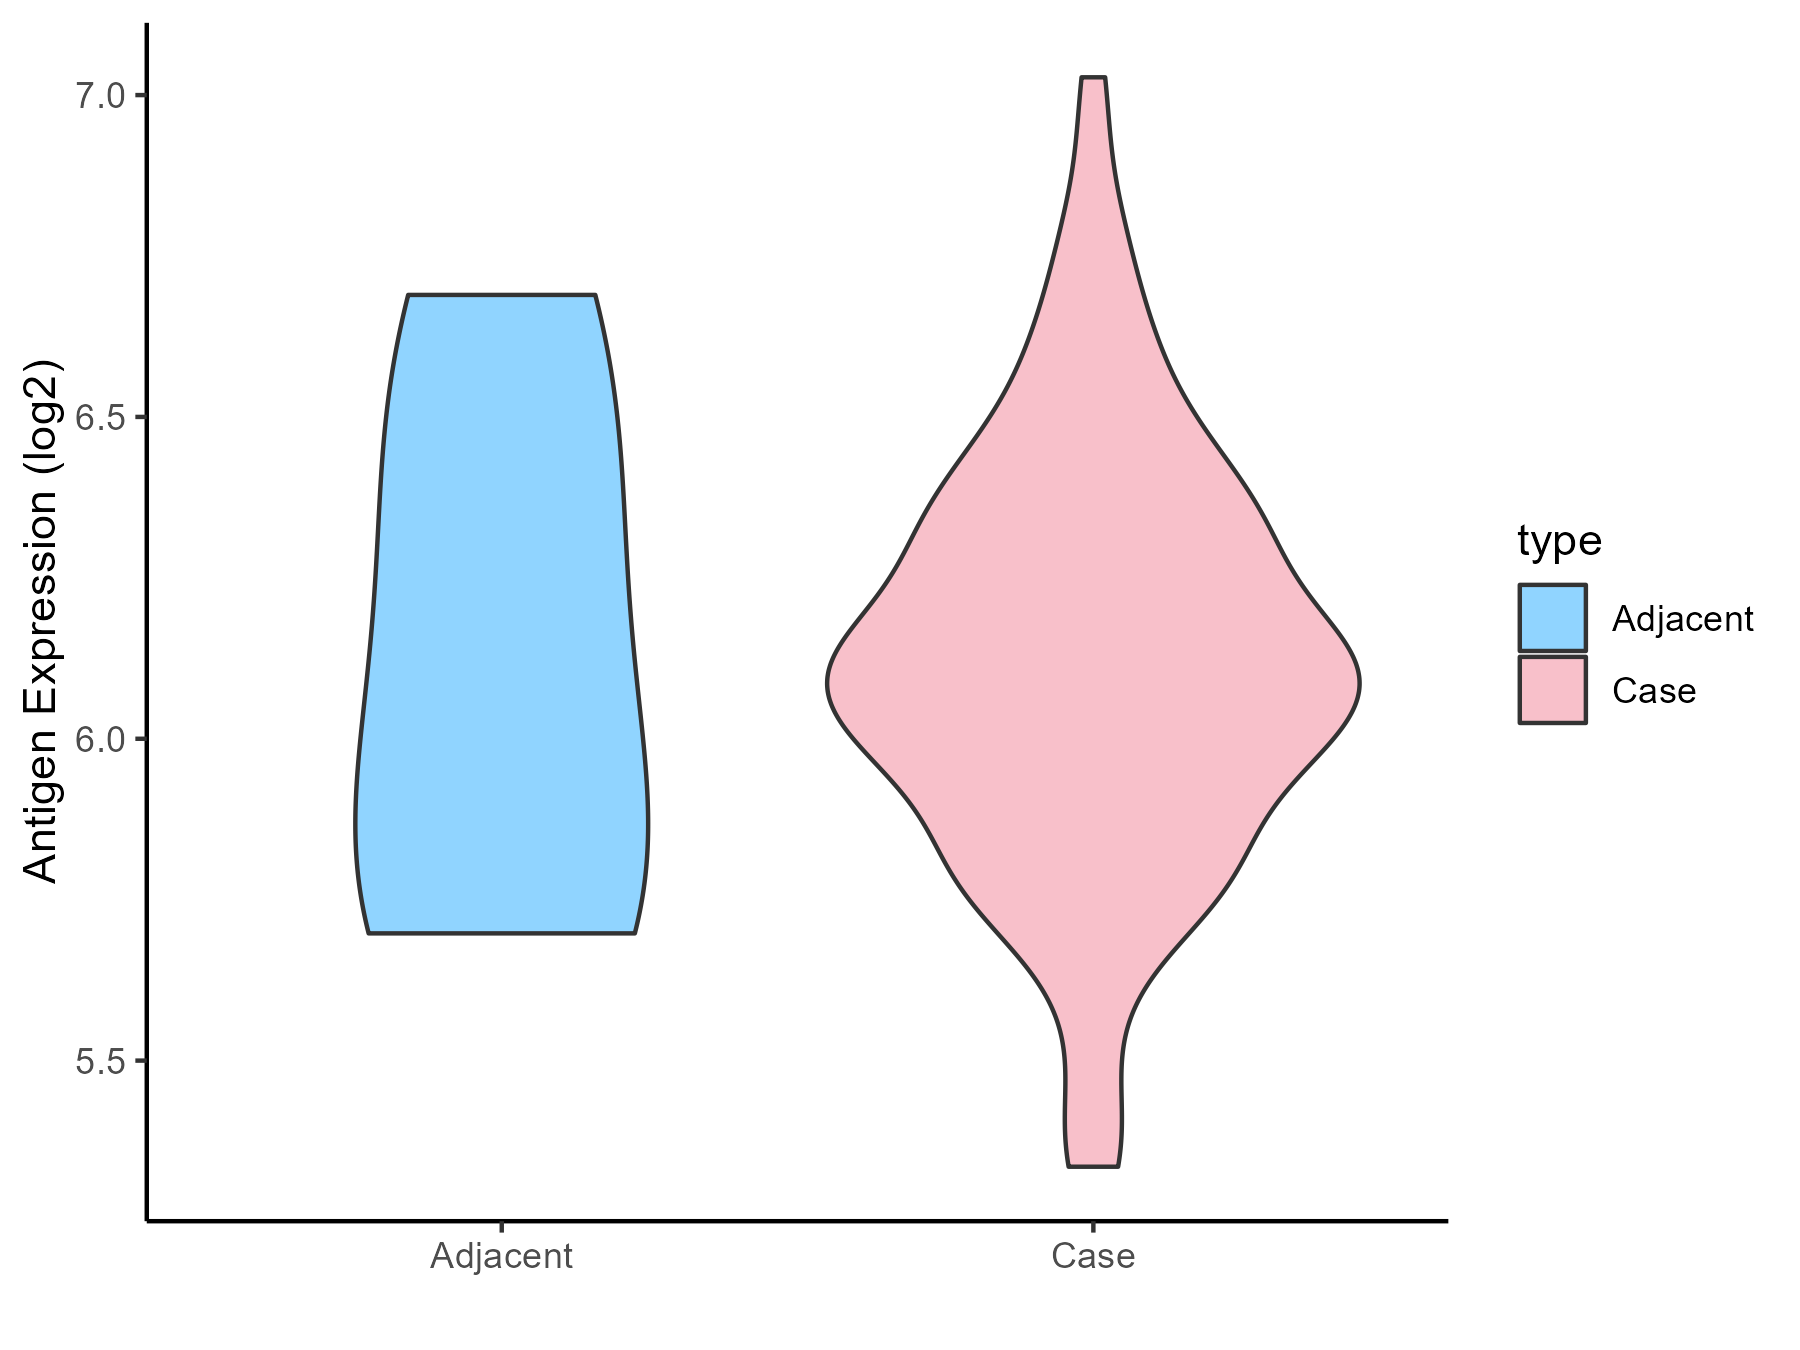
| The Studied Tissue | Gastric antrum | |
| The Specific Disease | Eosinophilic gastritis | |
| The Expression Level of Disease Section Compare with the Adjacent Tissue | p-value: 0.210248149; Fold-change: 0.16854092; Z-score: 0.880555311 | |
| Disease-specific Antigen Abundances |
|
Click to View the Clearer Original Diagram |
| Differential expression pattern of antigen in diseases | ||
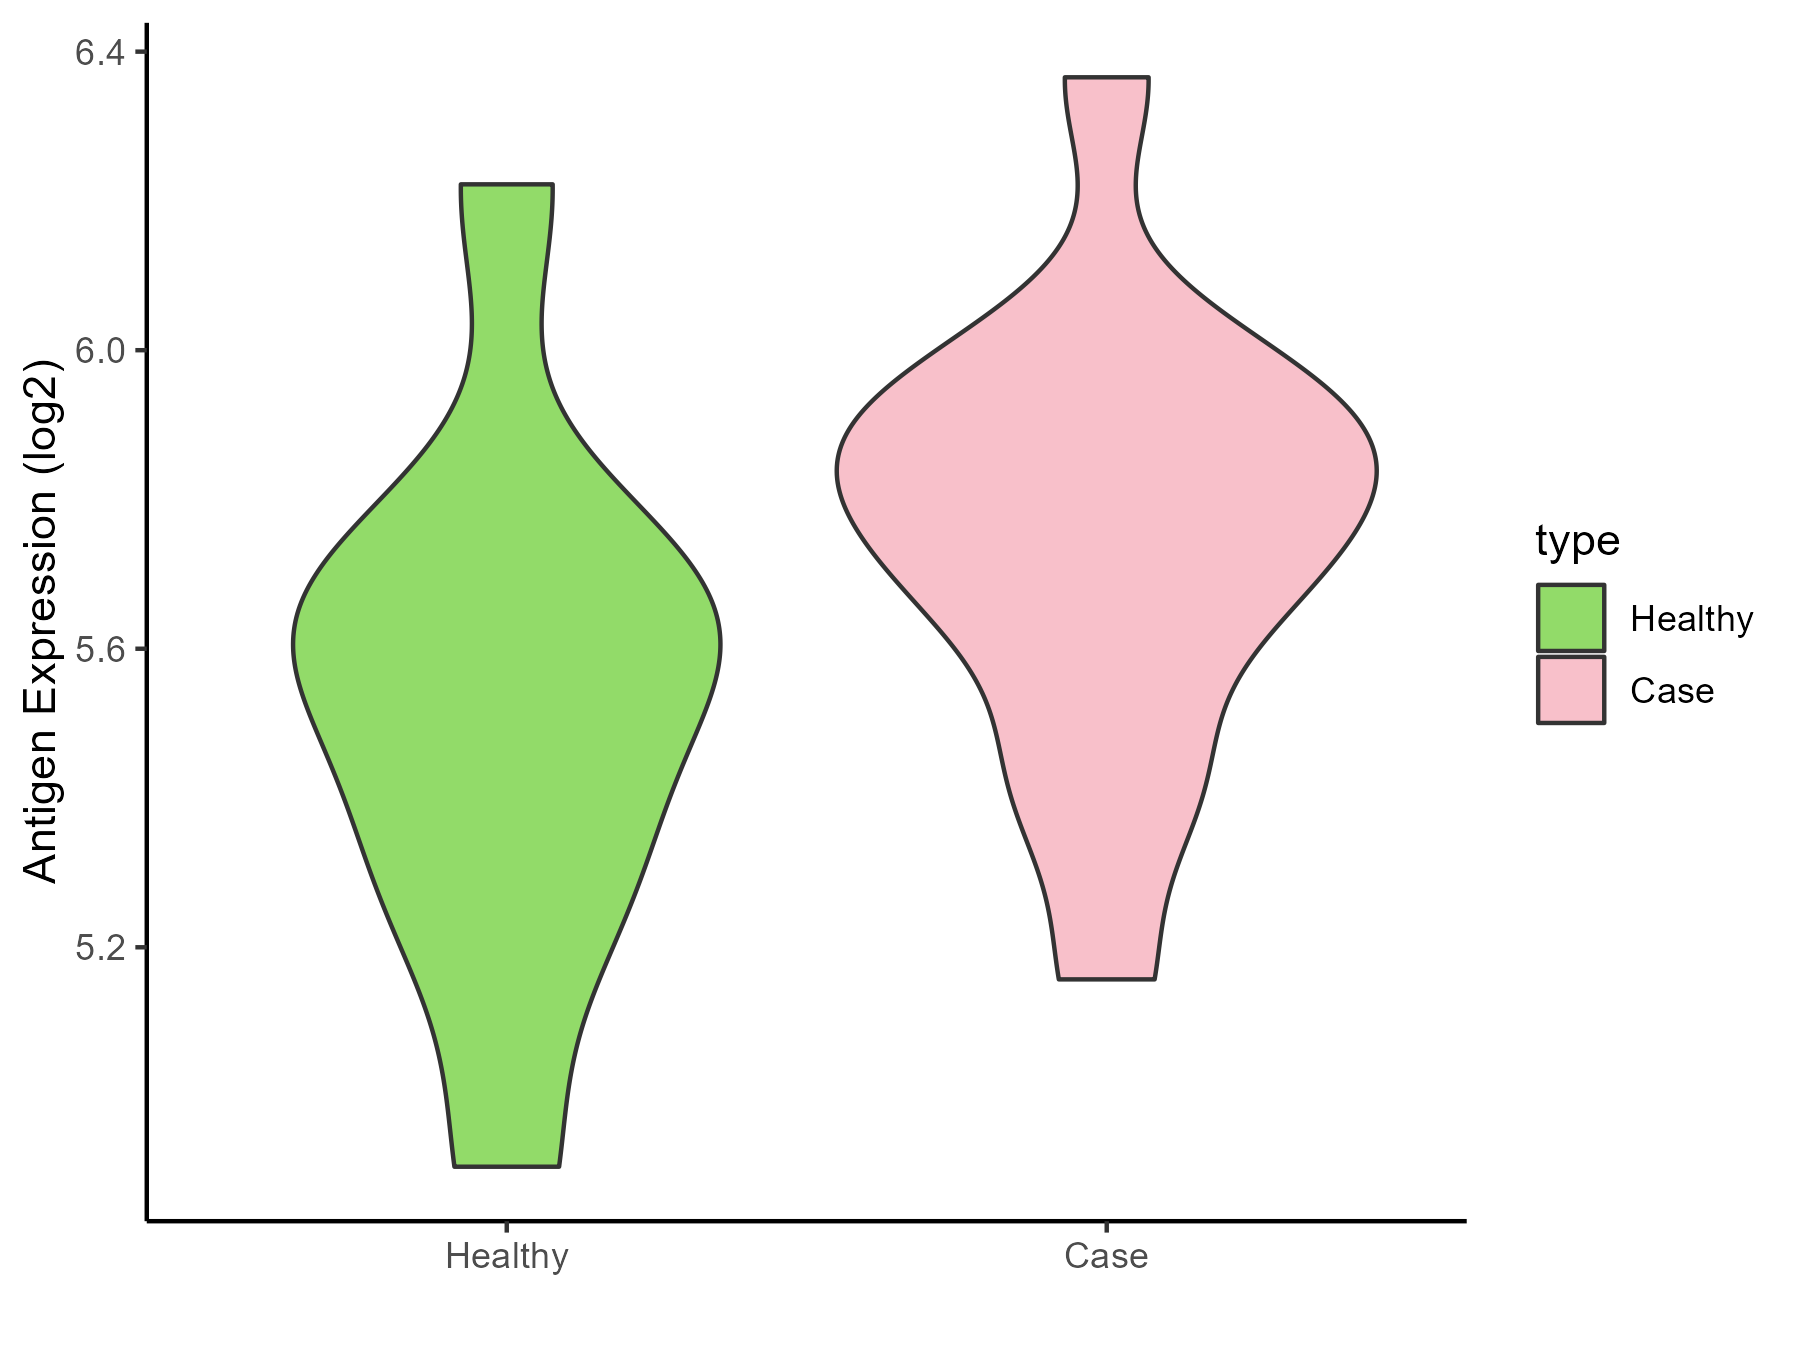
| The Studied Tissue | Liver | |
| The Specific Disease | Liver failure | |
| The Expression Level of Disease Section Compare with the Healthy Individual Tissue | p-value: 0.331891807; Fold-change: 0.13368268; Z-score: 0.337167969 | |
| Disease-specific Antigen Abundances |
|
Click to View the Clearer Original Diagram |
| Differential expression pattern of antigen in diseases | ||
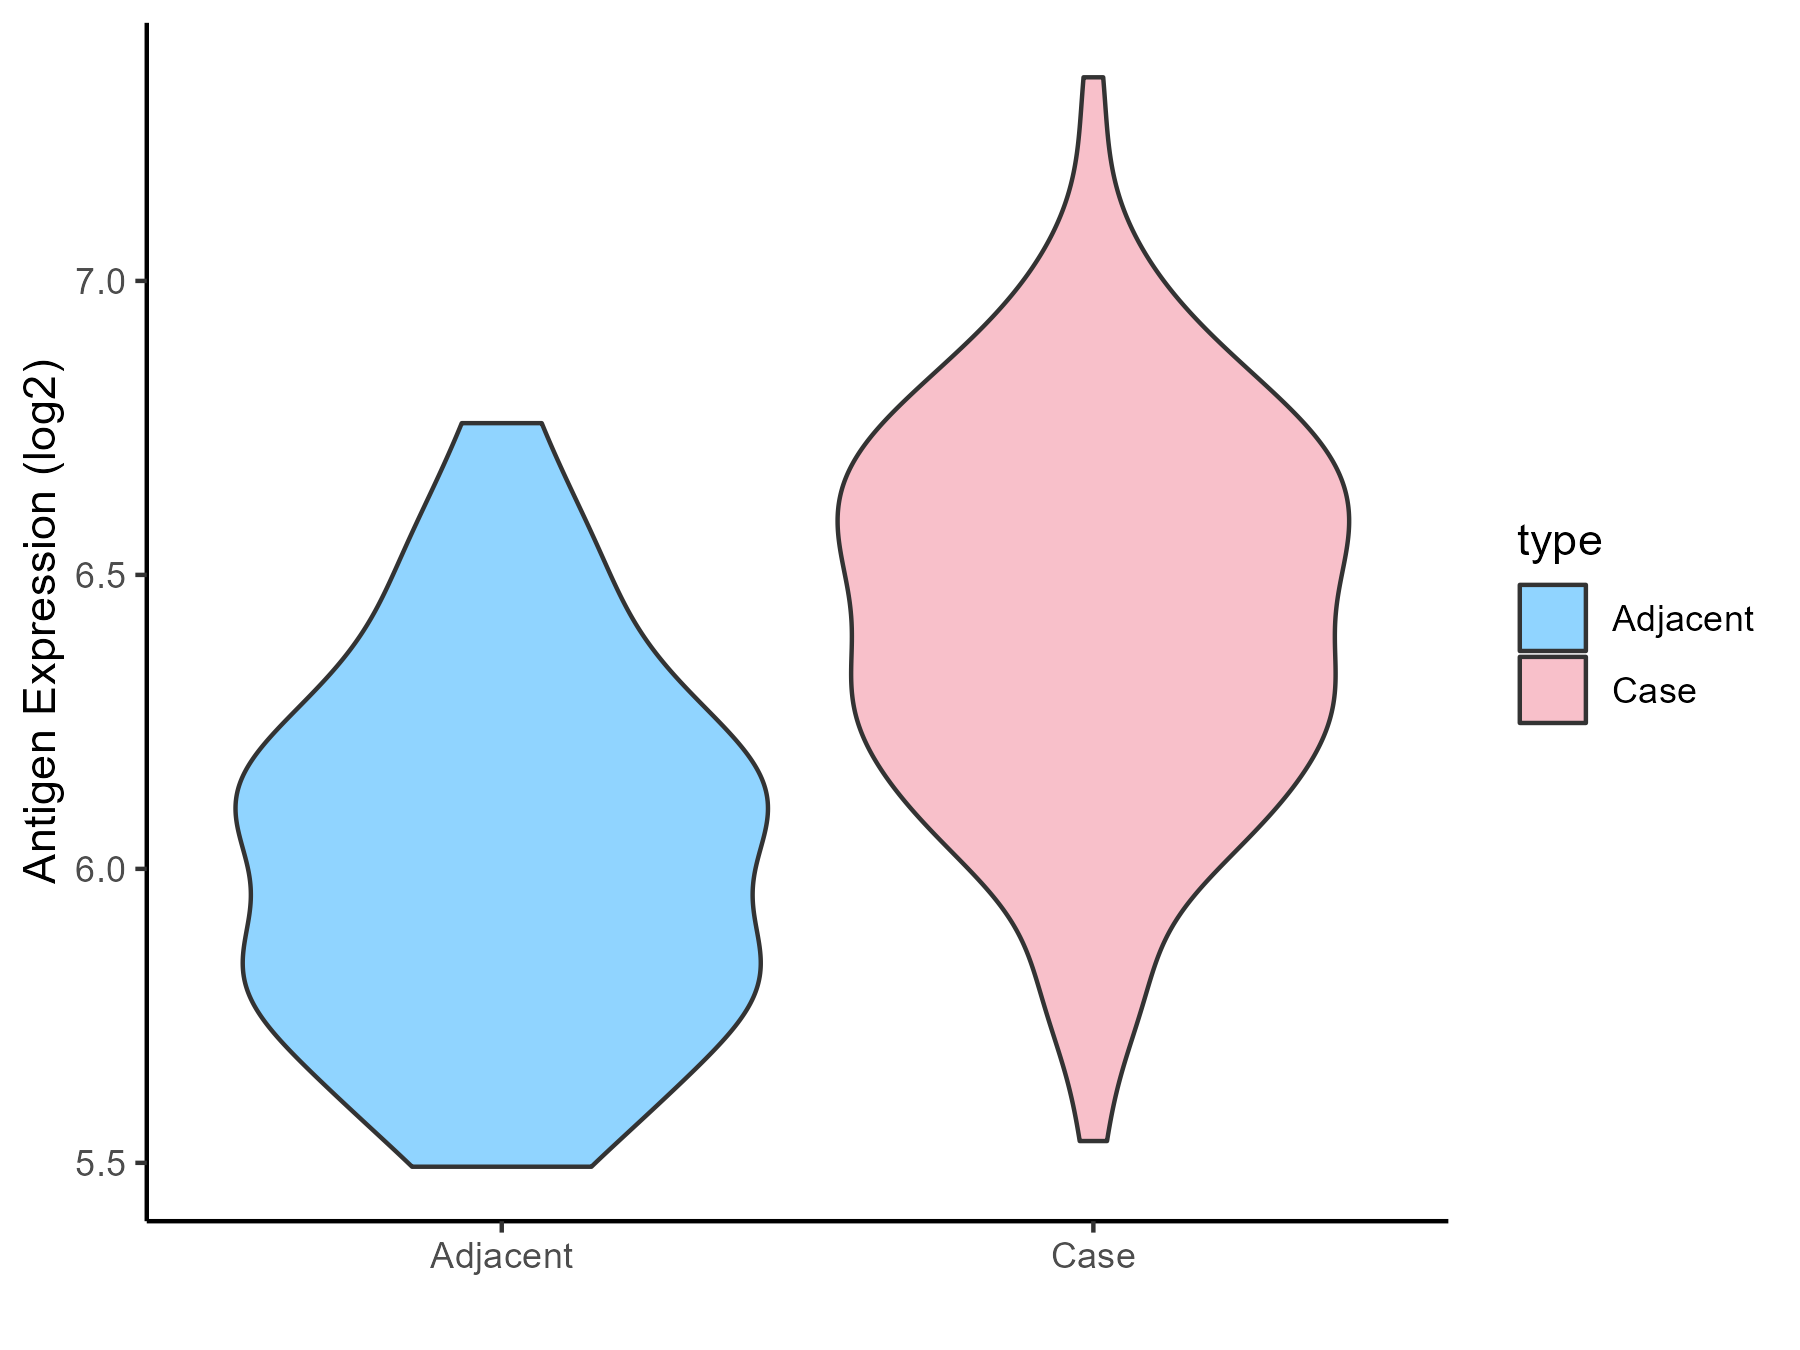
| The Studied Tissue | Colon mucosal | |
| The Specific Disease | Ulcerative colitis | |
| The Expression Level of Disease Section Compare with the Adjacent Tissue | p-value: 0.003737299; Fold-change: 0.320978519; Z-score: 1.098196733 | |
| Disease-specific Antigen Abundances |
|
Click to View the Clearer Original Diagram |
| Differential expression pattern of antigen in diseases | ||
| The Studied Tissue | Rectal colon | |
| The Specific Disease | Irritable bowel syndrome | |
| The Expression Level of Disease Section Compare with the Healthy Individual Tissue | p-value: 0.366864503; Fold-change: 0.01976774; Z-score: 0.056409624 | |
| Disease-specific Antigen Abundances |
|
Click to View the Clearer Original Diagram |
ICD Disease Classification 14
| Differential expression pattern of antigen in diseases | ||
| The Studied Tissue | Skin | |
| The Specific Disease | Atopic dermatitis | |
| The Expression Level of Disease Section Compare with the Healthy Individual Tissue | p-value: 4.94E-06; Fold-change: 0.391411782; Z-score: 1.17670837 | |
| Disease-specific Antigen Abundances |
|
Click to View the Clearer Original Diagram |
| Differential expression pattern of antigen in diseases | ||
| The Studied Tissue | Skin | |
| The Specific Disease | Psoriasis | |
| The Expression Level of Disease Section Compare with the Healthy Individual Tissue | p-value: 0.000274022; Fold-change: -0.248727076; Z-score: -0.647604529 | |
| The Expression Level of Disease Section Compare with the Adjacent Tissue | p-value: 0.498846233; Fold-change: 0.024512029; Z-score: 0.085061207 | |
| Disease-specific Antigen Abundances |
|
Click to View the Clearer Original Diagram |
| Differential expression pattern of antigen in diseases | ||
| The Studied Tissue | Skin | |
| The Specific Disease | Vitiligo | |
| The Expression Level of Disease Section Compare with the Healthy Individual Tissue | p-value: 0.039996227; Fold-change: -0.262127856; Z-score: -1.460686579 | |
| Disease-specific Antigen Abundances |
|
Click to View the Clearer Original Diagram |
| Differential expression pattern of antigen in diseases | ||
| The Studied Tissue | Skin from scalp | |
| The Specific Disease | Alopecia | |
| The Expression Level of Disease Section Compare with the Healthy Individual Tissue | p-value: 0.523411374; Fold-change: 0.071012994; Z-score: 0.178014625 | |
| Disease-specific Antigen Abundances |
|
Click to View the Clearer Original Diagram |
| Differential expression pattern of antigen in diseases | ||
| The Studied Tissue | Skin | |
| The Specific Disease | Sensitive skin | |
| The Expression Level of Disease Section Compare with the Healthy Individual Tissue | p-value: 0.879249232; Fold-change: 0.073780379; Z-score: 0.471582243 | |
| Disease-specific Antigen Abundances |
|
Click to View the Clearer Original Diagram |
ICD Disease Classification 15
| Differential expression pattern of antigen in diseases | ||
| The Studied Tissue | Synovial | |
| The Specific Disease | Osteoarthritis | |
| The Expression Level of Disease Section Compare with the Healthy Individual Tissue | p-value: 0.03138888; Fold-change: -0.486816385; Z-score: -0.900463125 | |
| Disease-specific Antigen Abundances |
|
Click to View the Clearer Original Diagram |
| Differential expression pattern of antigen in diseases | ||
| The Studied Tissue | Peripheral blood | |
| The Specific Disease | Arthropathy | |
| The Expression Level of Disease Section Compare with the Healthy Individual Tissue | p-value: 0.356121071; Fold-change: -0.122093148; Z-score: -0.315701153 | |
| Disease-specific Antigen Abundances |
|
Click to View the Clearer Original Diagram |
| Differential expression pattern of antigen in diseases | ||
| The Studied Tissue | Peripheral blood | |
| The Specific Disease | Arthritis | |
| The Expression Level of Disease Section Compare with the Healthy Individual Tissue | p-value: 0.000583327; Fold-change: -0.329885967; Z-score: -0.787124028 | |
| Disease-specific Antigen Abundances |
|
Click to View the Clearer Original Diagram |
| Differential expression pattern of antigen in diseases | ||
| The Studied Tissue | Synovial | |
| The Specific Disease | Rheumatoid arthritis | |
| The Expression Level of Disease Section Compare with the Healthy Individual Tissue | p-value: 0.011351211; Fold-change: -0.475196104; Z-score: -1.293495387 | |
| Disease-specific Antigen Abundances |
|
Click to View the Clearer Original Diagram |
| Differential expression pattern of antigen in diseases | ||
| The Studied Tissue | Pheripheral blood | |
| The Specific Disease | Ankylosing spondylitis | |
| The Expression Level of Disease Section Compare with the Healthy Individual Tissue | p-value: 0.418340722; Fold-change: -0.190335448; Z-score: -0.530911983 | |
| Disease-specific Antigen Abundances |
|
Click to View the Clearer Original Diagram |
| Differential expression pattern of antigen in diseases | ||
| The Studied Tissue | Bone marrow | |
| The Specific Disease | Osteoporosis | |
| The Expression Level of Disease Section Compare with the Healthy Individual Tissue | p-value: 0.275276611; Fold-change: -0.002732624; Z-score: -0.019921947 | |
| Disease-specific Antigen Abundances |
|
Click to View the Clearer Original Diagram |
ICD Disease Classification 16
| Differential expression pattern of antigen in diseases | ||
| The Studied Tissue | Endometrium | |
| The Specific Disease | Endometriosis | |
| The Expression Level of Disease Section Compare with the Healthy Individual Tissue | p-value: 0.000555776; Fold-change: 0.177706219; Z-score: 0.78641002 | |
| Disease-specific Antigen Abundances |
|
Click to View the Clearer Original Diagram |
| Differential expression pattern of antigen in diseases | ||
| The Studied Tissue | Bladder | |
| The Specific Disease | Interstitial cystitis | |
| The Expression Level of Disease Section Compare with the Healthy Individual Tissue | p-value: 0.000117196; Fold-change: 0.889075924; Z-score: 5.602726863 | |
| Disease-specific Antigen Abundances |
|
Click to View the Clearer Original Diagram |
ICD Disease Classification 19
| Differential expression pattern of antigen in diseases | ||
| The Studied Tissue | Myometrium | |
| The Specific Disease | Preterm birth | |
| The Expression Level of Disease Section Compare with the Healthy Individual Tissue | p-value: 0.221128466; Fold-change: -0.558988829; Z-score: -1.197803592 | |
| Disease-specific Antigen Abundances |
|
Click to View the Clearer Original Diagram |
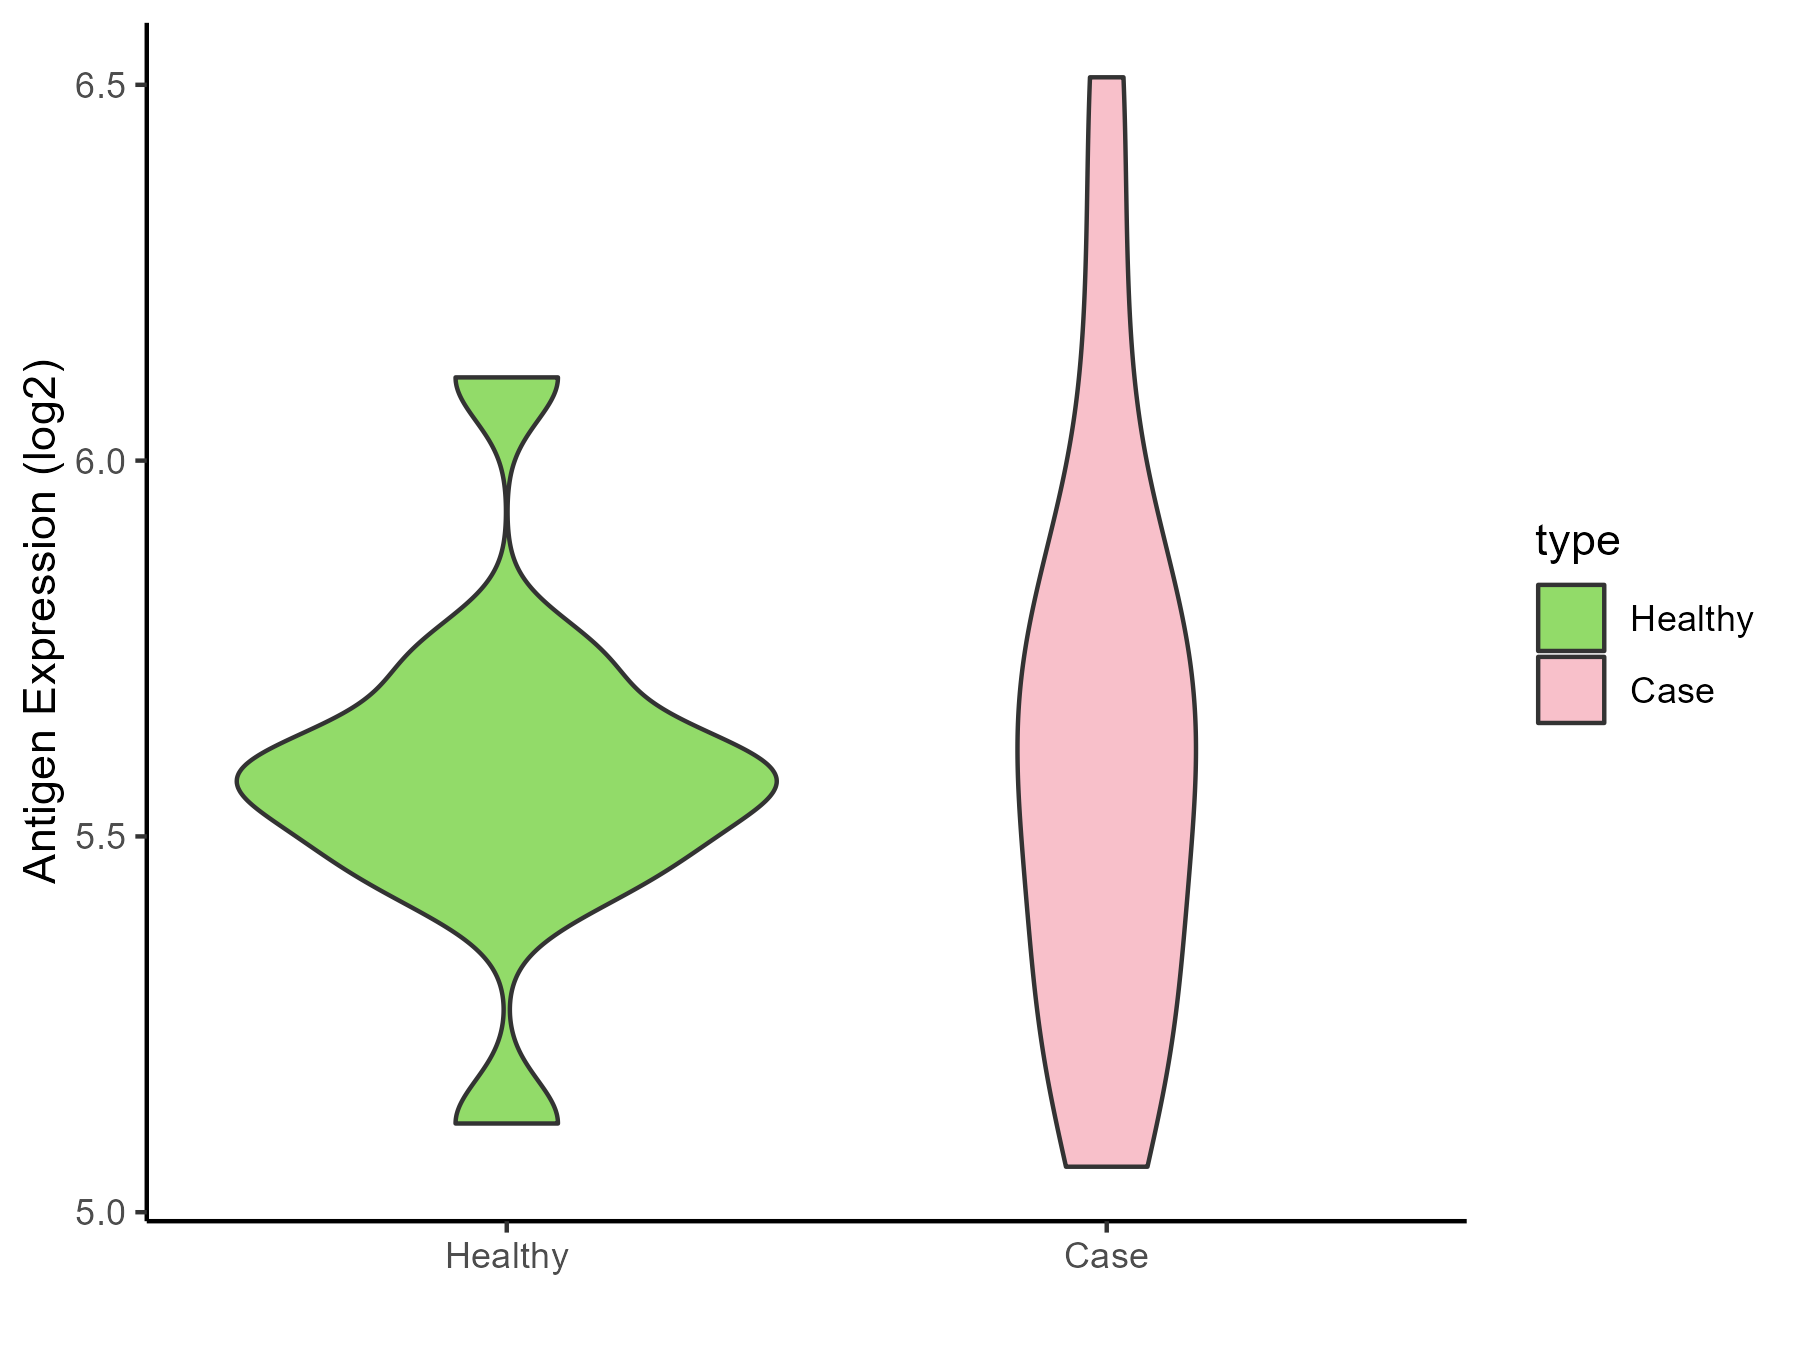
ICD Disease Classification 2
| Differential expression pattern of antigen in diseases | ||
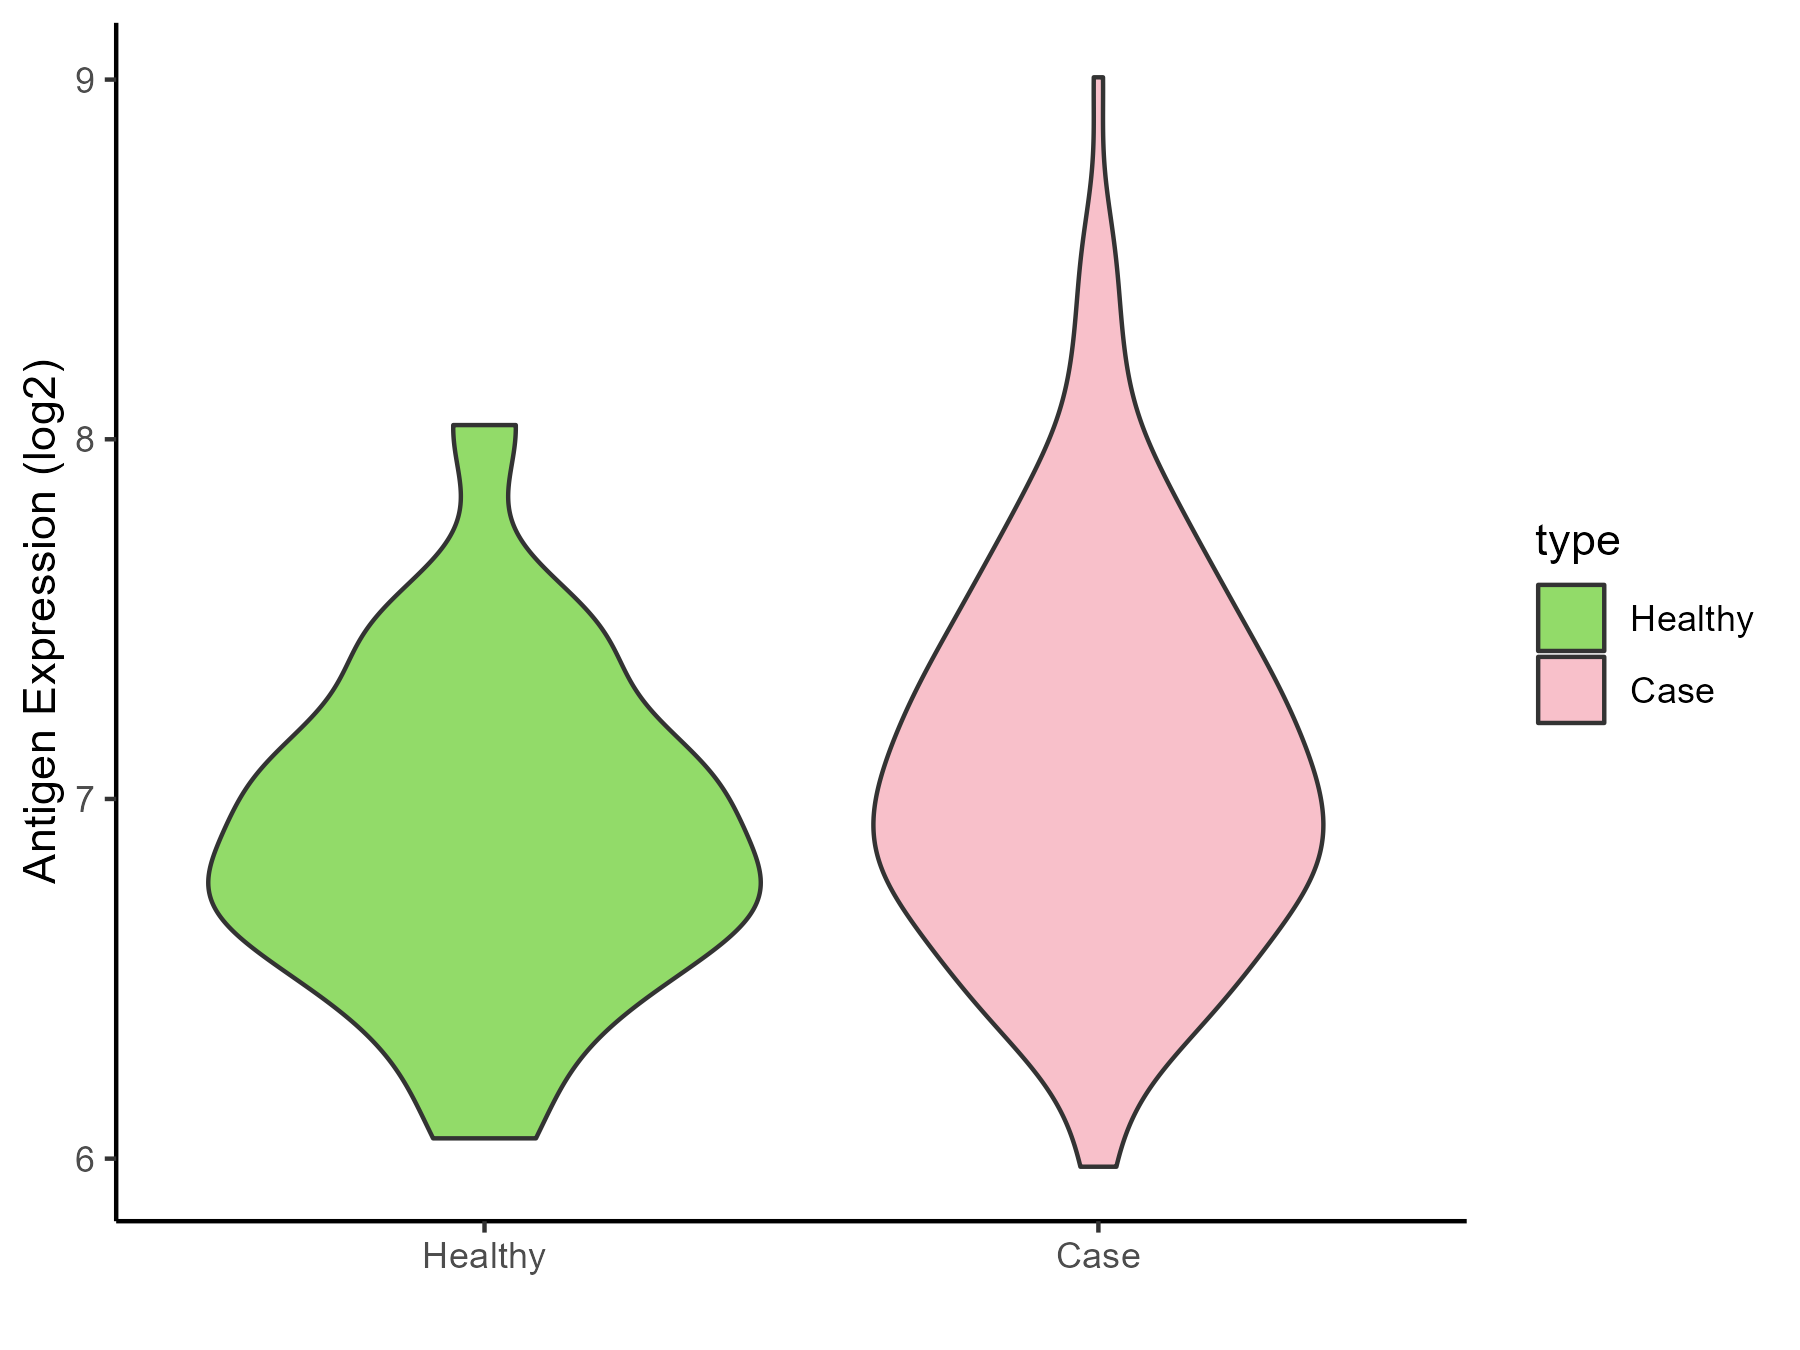
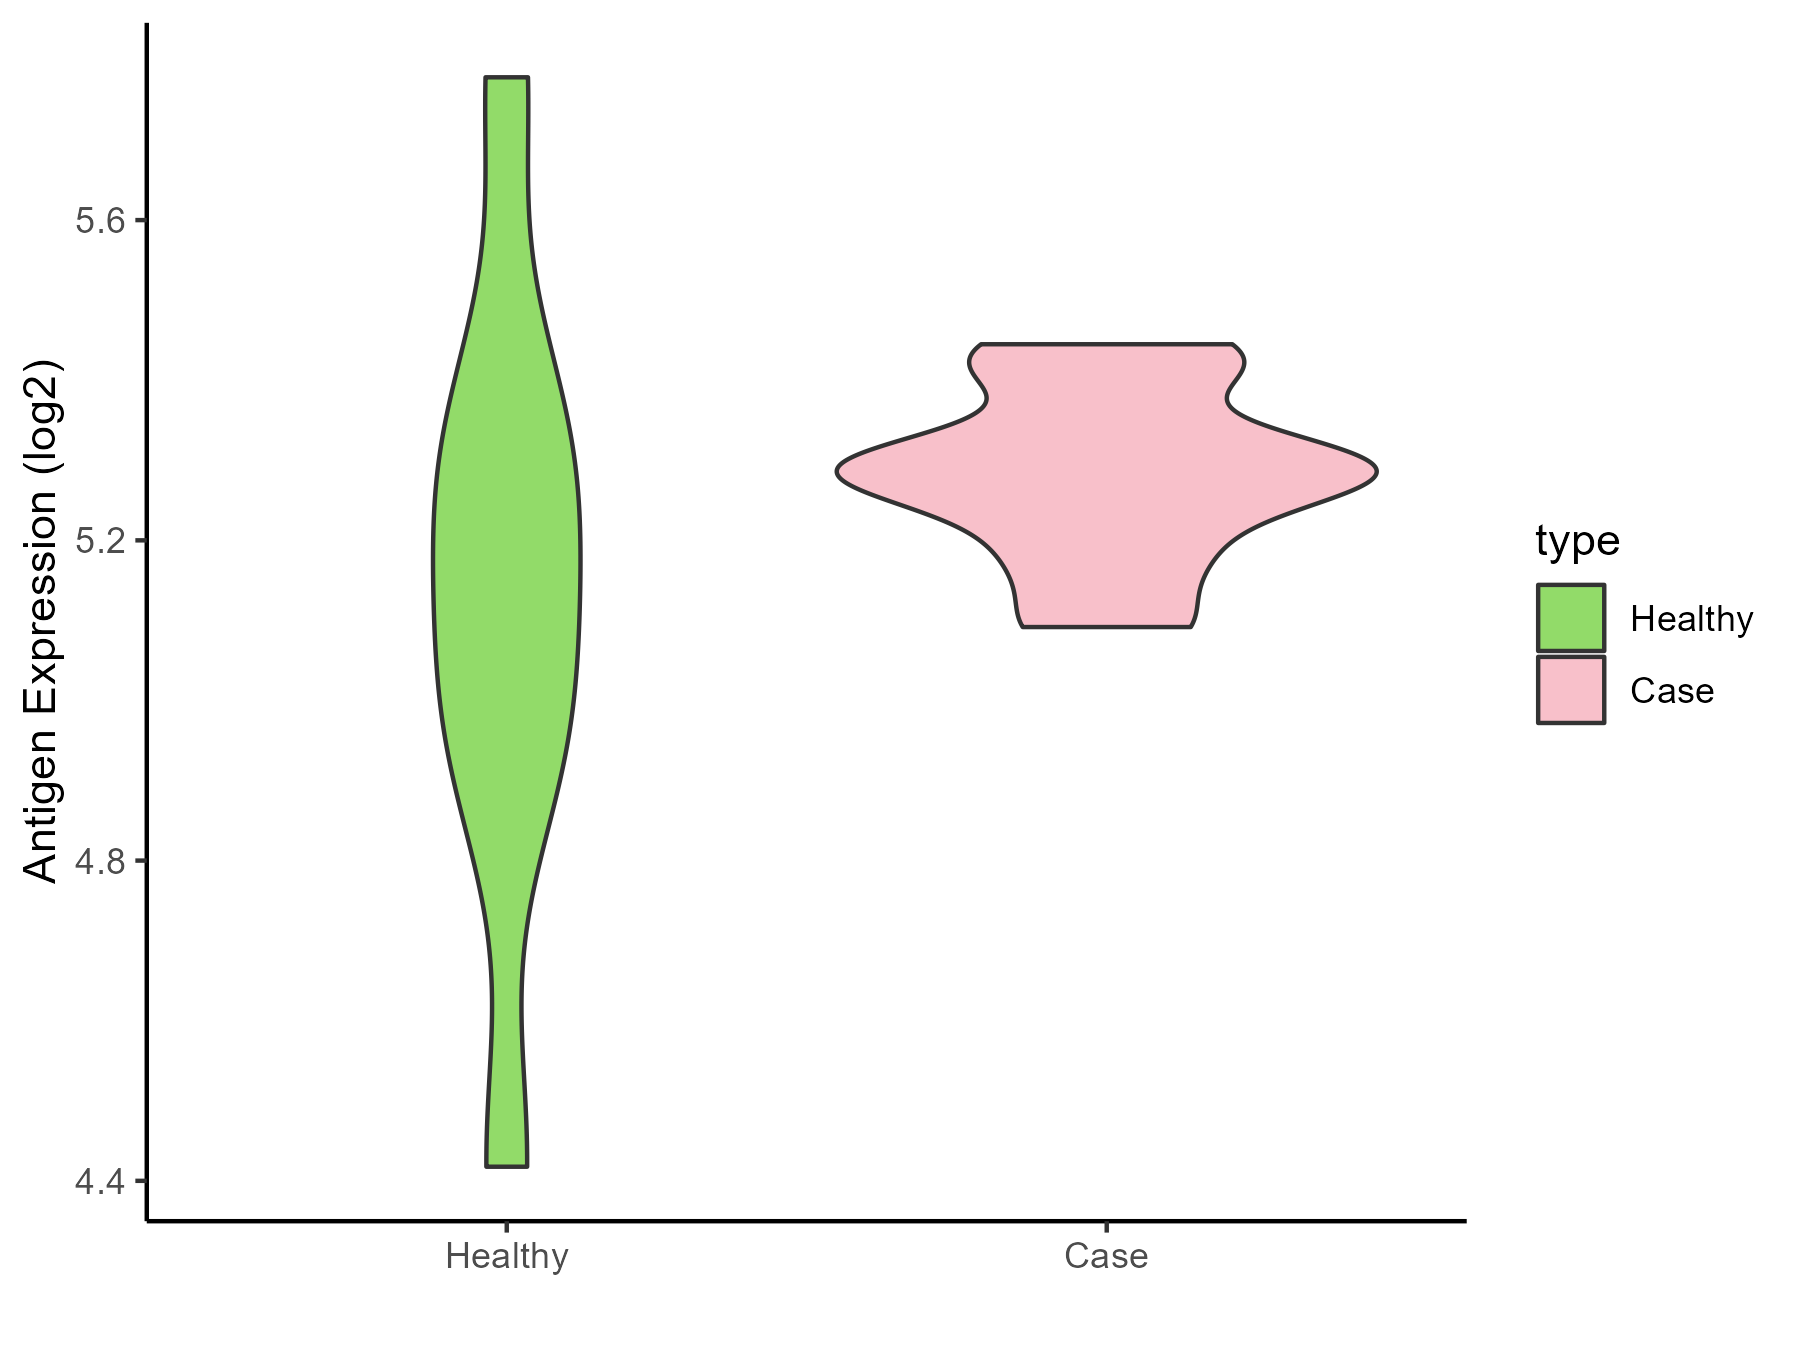
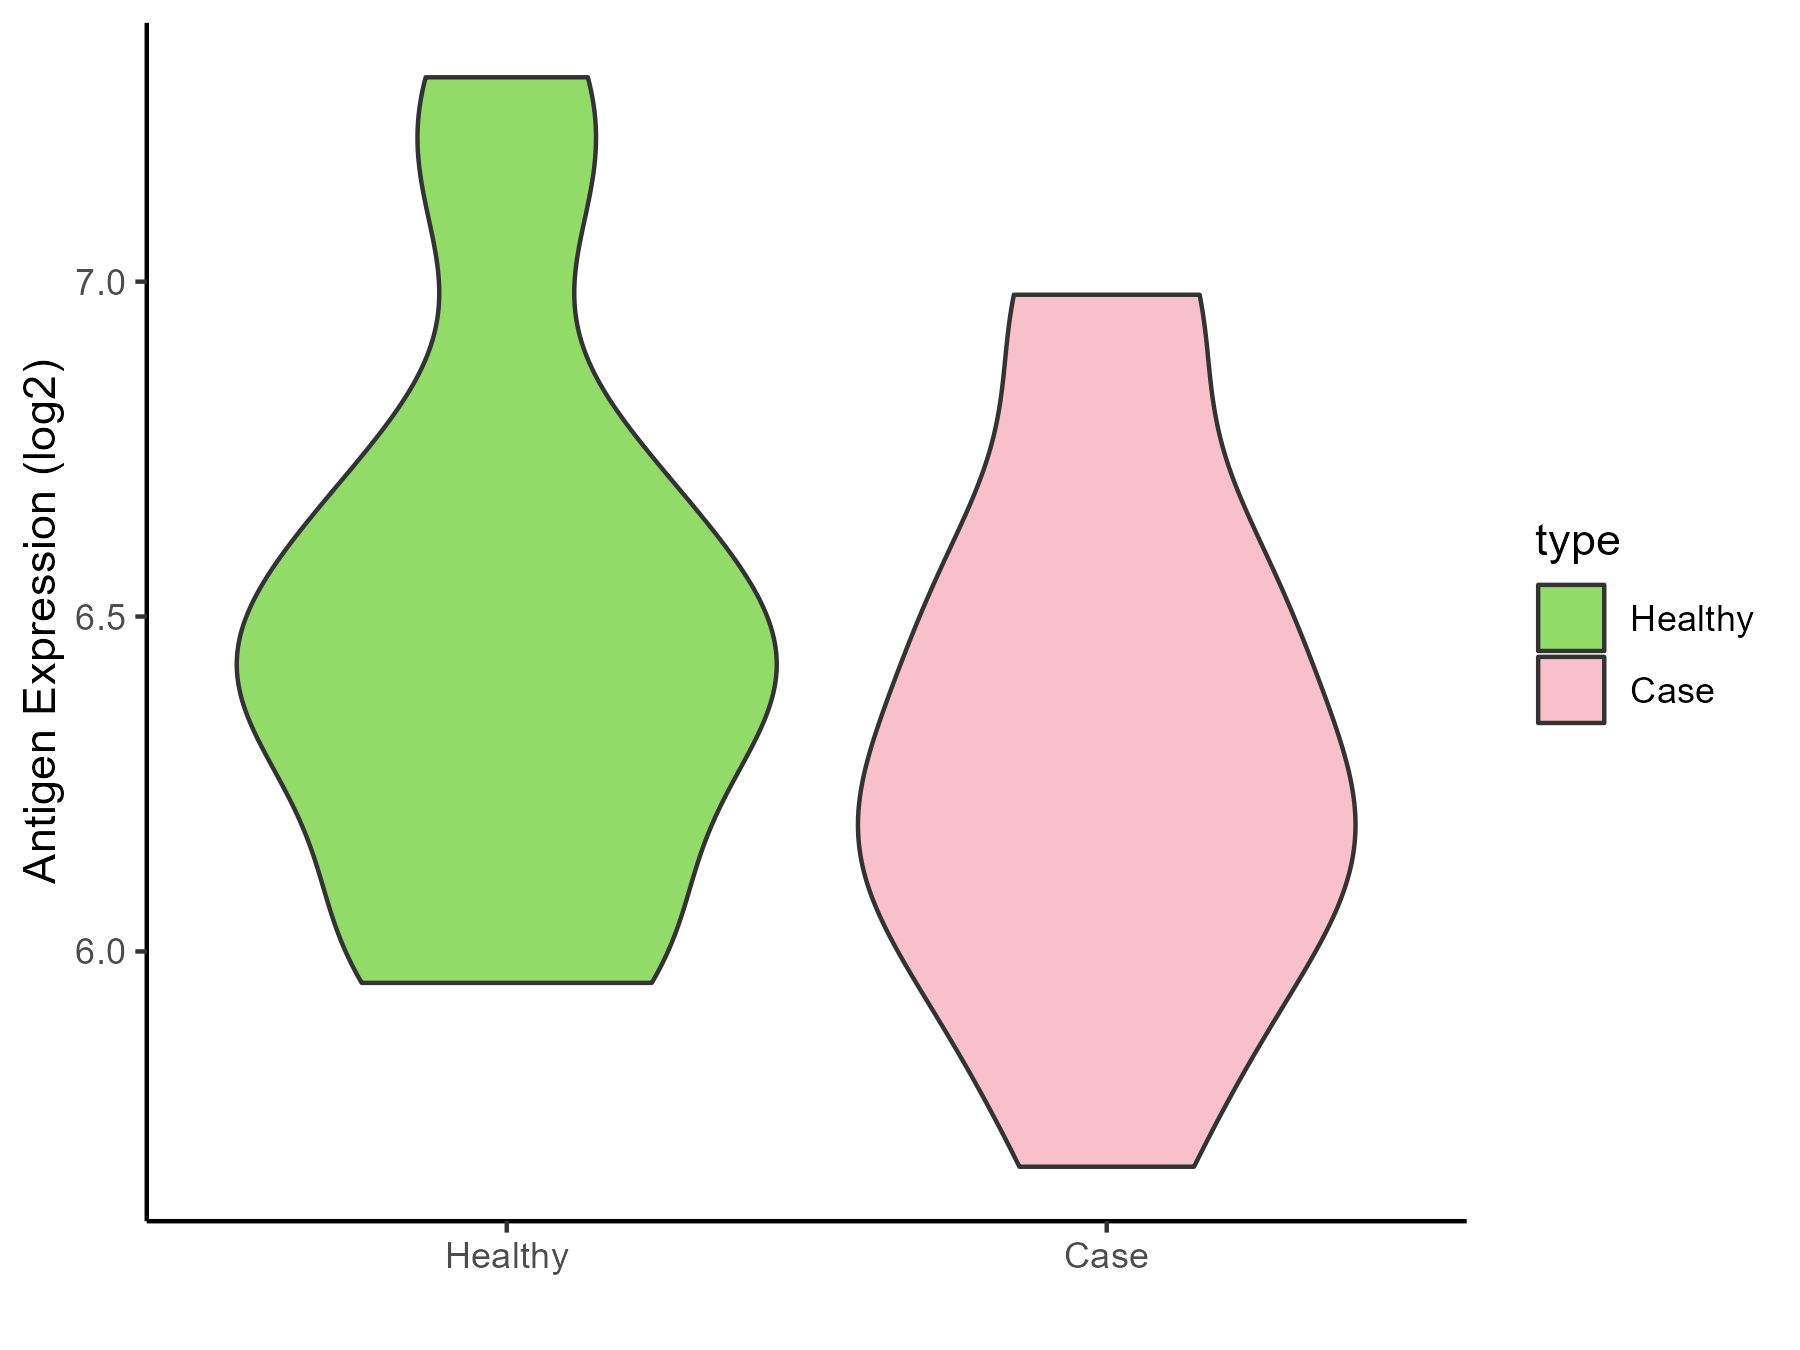
| The Studied Tissue | Bone marrow | |
| The Specific Disease | Acute myelocytic leukemia | |
| The Expression Level of Disease Section Compare with the Healthy Individual Tissue | p-value: 8.71E-54; Fold-change: 0.980540419; Z-score: 2.635154929 | |
| Disease-specific Antigen Abundances |
|
Click to View the Clearer Original Diagram |
| Differential expression pattern of antigen in diseases | ||
| The Studied Tissue | Bone marrow | |
| The Specific Disease | Myeloma | |
| The Expression Level of Disease Section Compare with the Healthy Individual Tissue | p-value: 0.687482533; Fold-change: -0.055449213; Z-score: -0.189991573 | |
| Disease-specific Antigen Abundances |
|
Click to View the Clearer Original Diagram |
| The Studied Tissue | Peripheral blood | |
| The Specific Disease | Myeloma | |
| The Expression Level of Disease Section Compare with the Healthy Individual Tissue | p-value: 0.451434258; Fold-change: -0.044931035; Z-score: -0.260369998 | |
| Disease-specific Antigen Abundances |
|
Click to View the Clearer Original Diagram |
| Differential expression pattern of antigen in diseases | ||
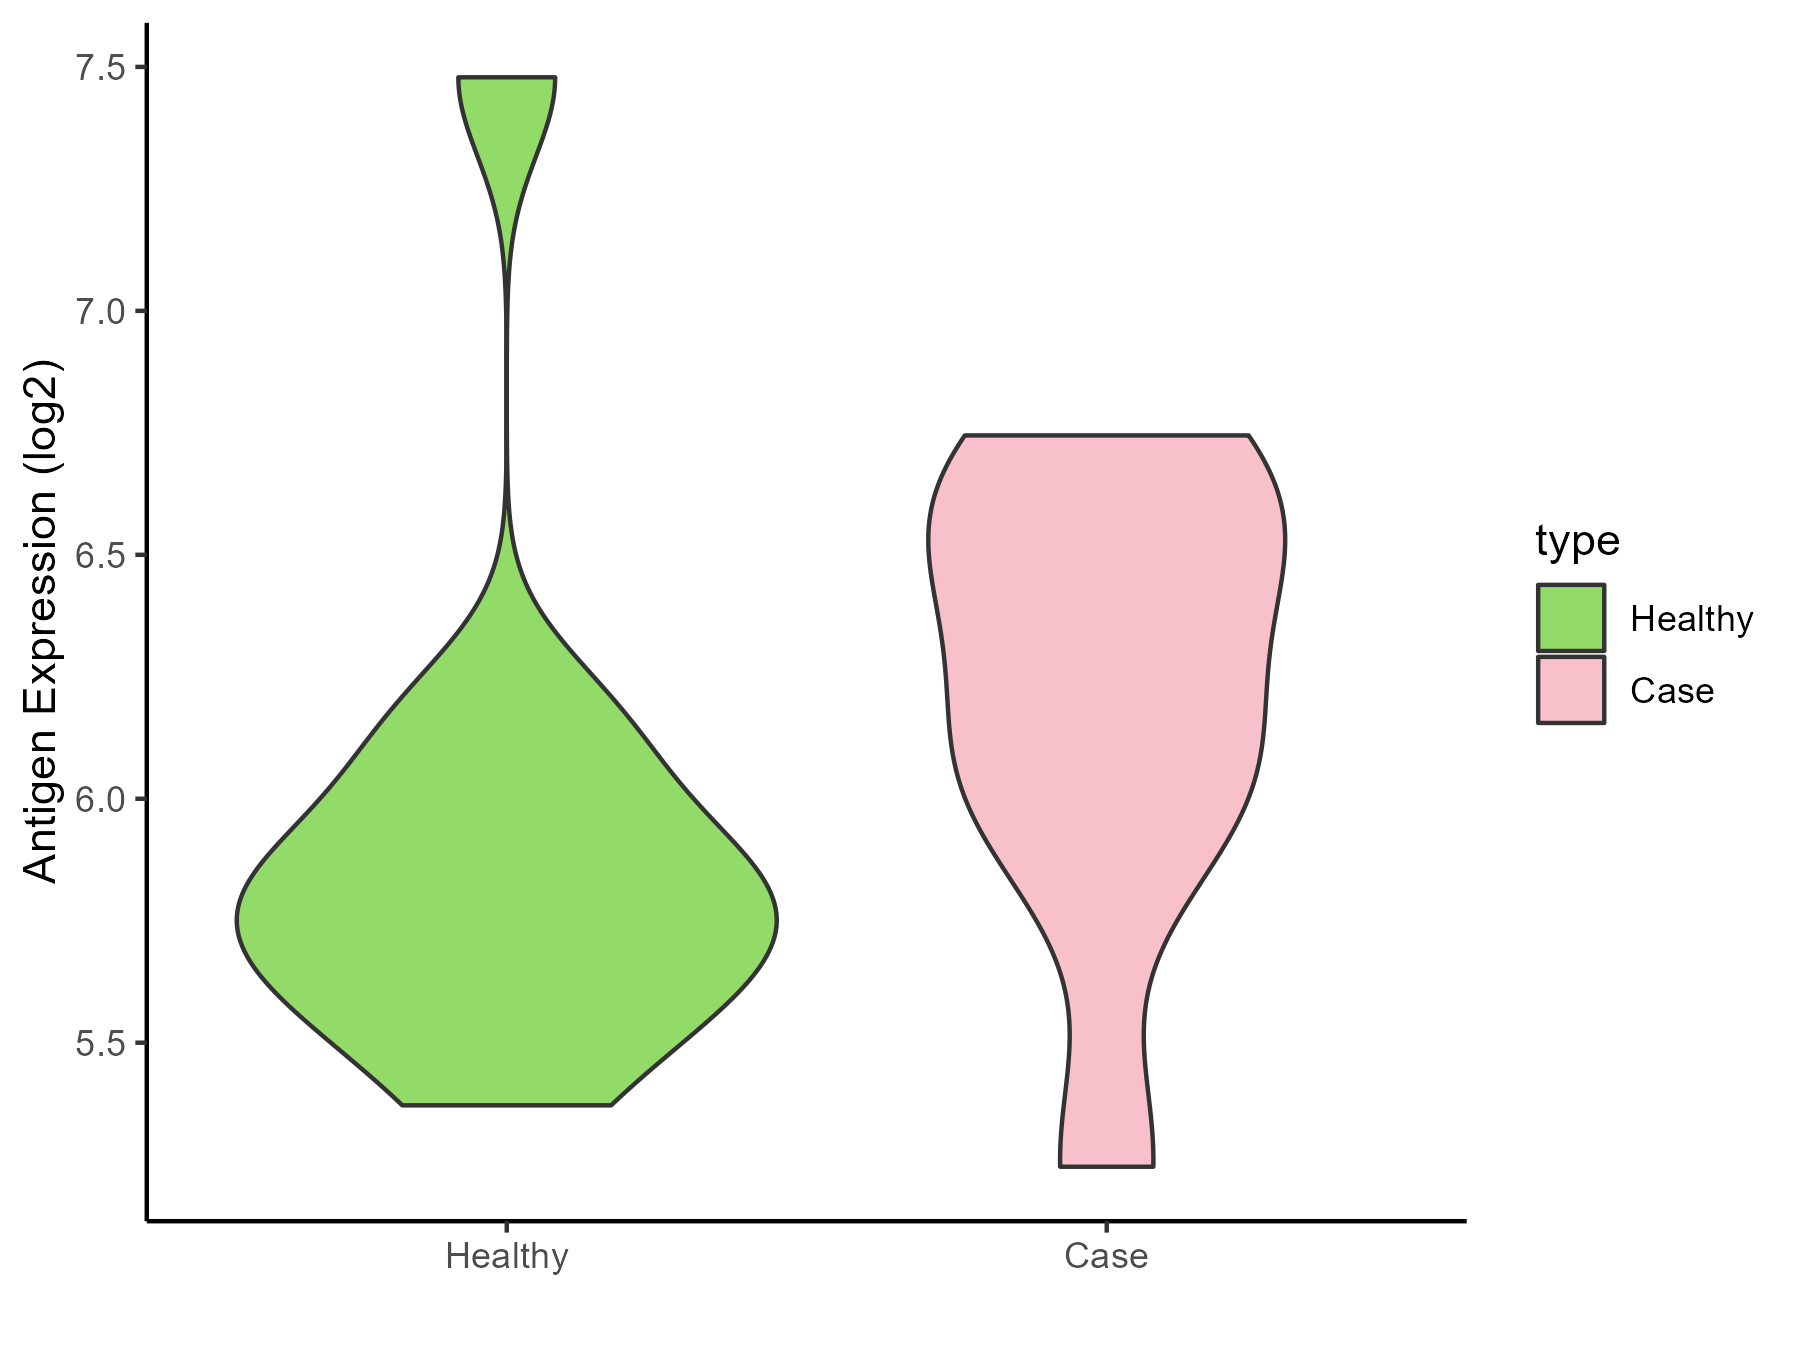
| The Studied Tissue | Oral | |
| The Specific Disease | Oral cancer | |
| The Expression Level of Disease Section Compare with the Healthy Individual Tissue | p-value: 5.57E-08; Fold-change: -0.415100388; Z-score: -1.329287609 | |
| The Expression Level of Disease Section Compare with the Adjacent Tissue | p-value: 0.691617434; Fold-change: 0.017350971; Z-score: 0.046682133 | |
| Disease-specific Antigen Abundances |
|
Click to View the Clearer Original Diagram |
| Differential expression pattern of antigen in diseases | ||
| The Studied Tissue | Esophagus | |
| The Specific Disease | Esophagal cancer | |
| The Expression Level of Disease Section Compare with the Adjacent Tissue | p-value: 0.989800106; Fold-change: 0.033783371; Z-score: 0.079278019 | |
| Disease-specific Antigen Abundances |
|
Click to View the Clearer Original Diagram |
| Differential expression pattern of antigen in diseases | ||
| The Studied Tissue | Rectal colon | |
| The Specific Disease | Rectal cancer | |
| The Expression Level of Disease Section Compare with the Healthy Individual Tissue | p-value: 0.472294366; Fold-change: -0.018301182; Z-score: -0.051625695 | |
| The Expression Level of Disease Section Compare with the Adjacent Tissue | p-value: 0.120183139; Fold-change: 0.184236553; Z-score: 0.810056543 | |
| Disease-specific Antigen Abundances |
|
Click to View the Clearer Original Diagram |
| Differential expression pattern of antigen in diseases | ||
| The Studied Tissue | Skin | |
| The Specific Disease | Skin cancer | |
| The Expression Level of Disease Section Compare with the Healthy Individual Tissue | p-value: 2.13E-10; Fold-change: -0.321394728; Z-score: -0.787983328 | |
| The Expression Level of Disease Section Compare with the Adjacent Tissue | p-value: 7.09E-05; Fold-change: -0.177316889; Z-score: -0.476181691 | |
| Disease-specific Antigen Abundances |
|
Click to View the Clearer Original Diagram |
| Differential expression pattern of antigen in diseases | ||
| The Studied Tissue | Kidney | |
| The Specific Disease | Renal cancer | |
| The Expression Level of Disease Section Compare with the Healthy Individual Tissue | p-value: 0.855352232; Fold-change: -0.118249232; Z-score: -0.419973924 | |
| The Expression Level of Disease Section Compare with the Adjacent Tissue | p-value: 0.137423173; Fold-change: 0.047229461; Z-score: 0.198032862 | |
| Disease-specific Antigen Abundances |
|
Click to View the Clearer Original Diagram |
| Differential expression pattern of antigen in diseases | ||
| The Studied Tissue | Urothelium | |
| The Specific Disease | Ureter cancer | |
| The Expression Level of Disease Section Compare with the Healthy Individual Tissue | p-value: 0.218394295; Fold-change: 0.222016041; Z-score: 0.800036989 | |
| Disease-specific Antigen Abundances |
|
Click to View the Clearer Original Diagram |
ICD Disease Classification 20
| Differential expression pattern of antigen in diseases | ||
| The Studied Tissue | Adipose | |
| The Specific Disease | Simpson golabi behmel syndrome | |
| The Expression Level of Disease Section Compare with the Healthy Individual Tissue | p-value: 0.218299482; Fold-change: 0.067874421; Z-score: 0.377895355 | |
| Disease-specific Antigen Abundances |
|
Click to View the Clearer Original Diagram |
| Differential expression pattern of antigen in diseases | ||
| The Studied Tissue | Perituberal | |
| The Specific Disease | Tuberous sclerosis complex | |
| The Expression Level of Disease Section Compare with the Healthy Individual Tissue | p-value: 0.18837579; Fold-change: 0.053807557; Z-score: 0.36696769 | |
| Disease-specific Antigen Abundances |
|
Click to View the Clearer Original Diagram |
ICD Disease Classification 3
| Differential expression pattern of antigen in diseases | ||
| The Studied Tissue | Bone marrow | |
| The Specific Disease | Anemia | |
| The Expression Level of Disease Section Compare with the Healthy Individual Tissue | p-value: 0.39798846; Fold-change: -0.112539778; Z-score: -1.528465274 | |
| Disease-specific Antigen Abundances |
|
Click to View the Clearer Original Diagram |
| Differential expression pattern of antigen in diseases | ||
| The Studied Tissue | Peripheral blood | |
| The Specific Disease | Sickle cell disease | |
| The Expression Level of Disease Section Compare with the Healthy Individual Tissue | p-value: 0.206883589; Fold-change: -0.080384224; Z-score: -0.517709875 | |
| Disease-specific Antigen Abundances |
|
Click to View the Clearer Original Diagram |
| Differential expression pattern of antigen in diseases | ||
| The Studied Tissue | Whole blood | |
| The Specific Disease | Thrombocythemia | |
| The Expression Level of Disease Section Compare with the Healthy Individual Tissue | p-value: 0.098606002; Fold-change: 0.095803744; Z-score: 0.458616371 | |
| Disease-specific Antigen Abundances |
|
Click to View the Clearer Original Diagram |
ICD Disease Classification 4
| Differential expression pattern of antigen in diseases | ||
| The Studied Tissue | Whole blood | |
| The Specific Disease | Scleroderma | |
| The Expression Level of Disease Section Compare with the Healthy Individual Tissue | p-value: 0.242229465; Fold-change: 0.038402628; Z-score: 0.07514632 | |
| Disease-specific Antigen Abundances |
|
Click to View the Clearer Original Diagram |
| Differential expression pattern of antigen in diseases | ||
| The Studied Tissue | Salivary gland | |
| The Specific Disease | Sjogren syndrome | |
| The Expression Level of Disease Section Compare with the Healthy Individual Tissue | p-value: 0.309326147; Fold-change: -0.391926986; Z-score: -1.260608004 | |
| The Expression Level of Disease Section Compare with the Adjacent Tissue | p-value: 0.309017185; Fold-change: 0.099399978; Z-score: 0.79366938 | |
| Disease-specific Antigen Abundances |
|
Click to View the Clearer Original Diagram |
| Differential expression pattern of antigen in diseases | ||
| The Studied Tissue | Peripheral blood | |
| The Specific Disease | Behcet disease | |
| The Expression Level of Disease Section Compare with the Healthy Individual Tissue | p-value: 0.280602815; Fold-change: -0.240336263; Z-score: -0.575700556 | |
| Disease-specific Antigen Abundances |
|
Click to View the Clearer Original Diagram |
| Differential expression pattern of antigen in diseases | ||
| The Studied Tissue | Whole blood | |
| The Specific Disease | Autosomal dominant monocytopenia | |
| The Expression Level of Disease Section Compare with the Healthy Individual Tissue | p-value: 0.261281824; Fold-change: 0.477207663; Z-score: 0.847838293 | |
| Disease-specific Antigen Abundances |
|
Click to View the Clearer Original Diagram |
ICD Disease Classification 5
| Differential expression pattern of antigen in diseases | ||
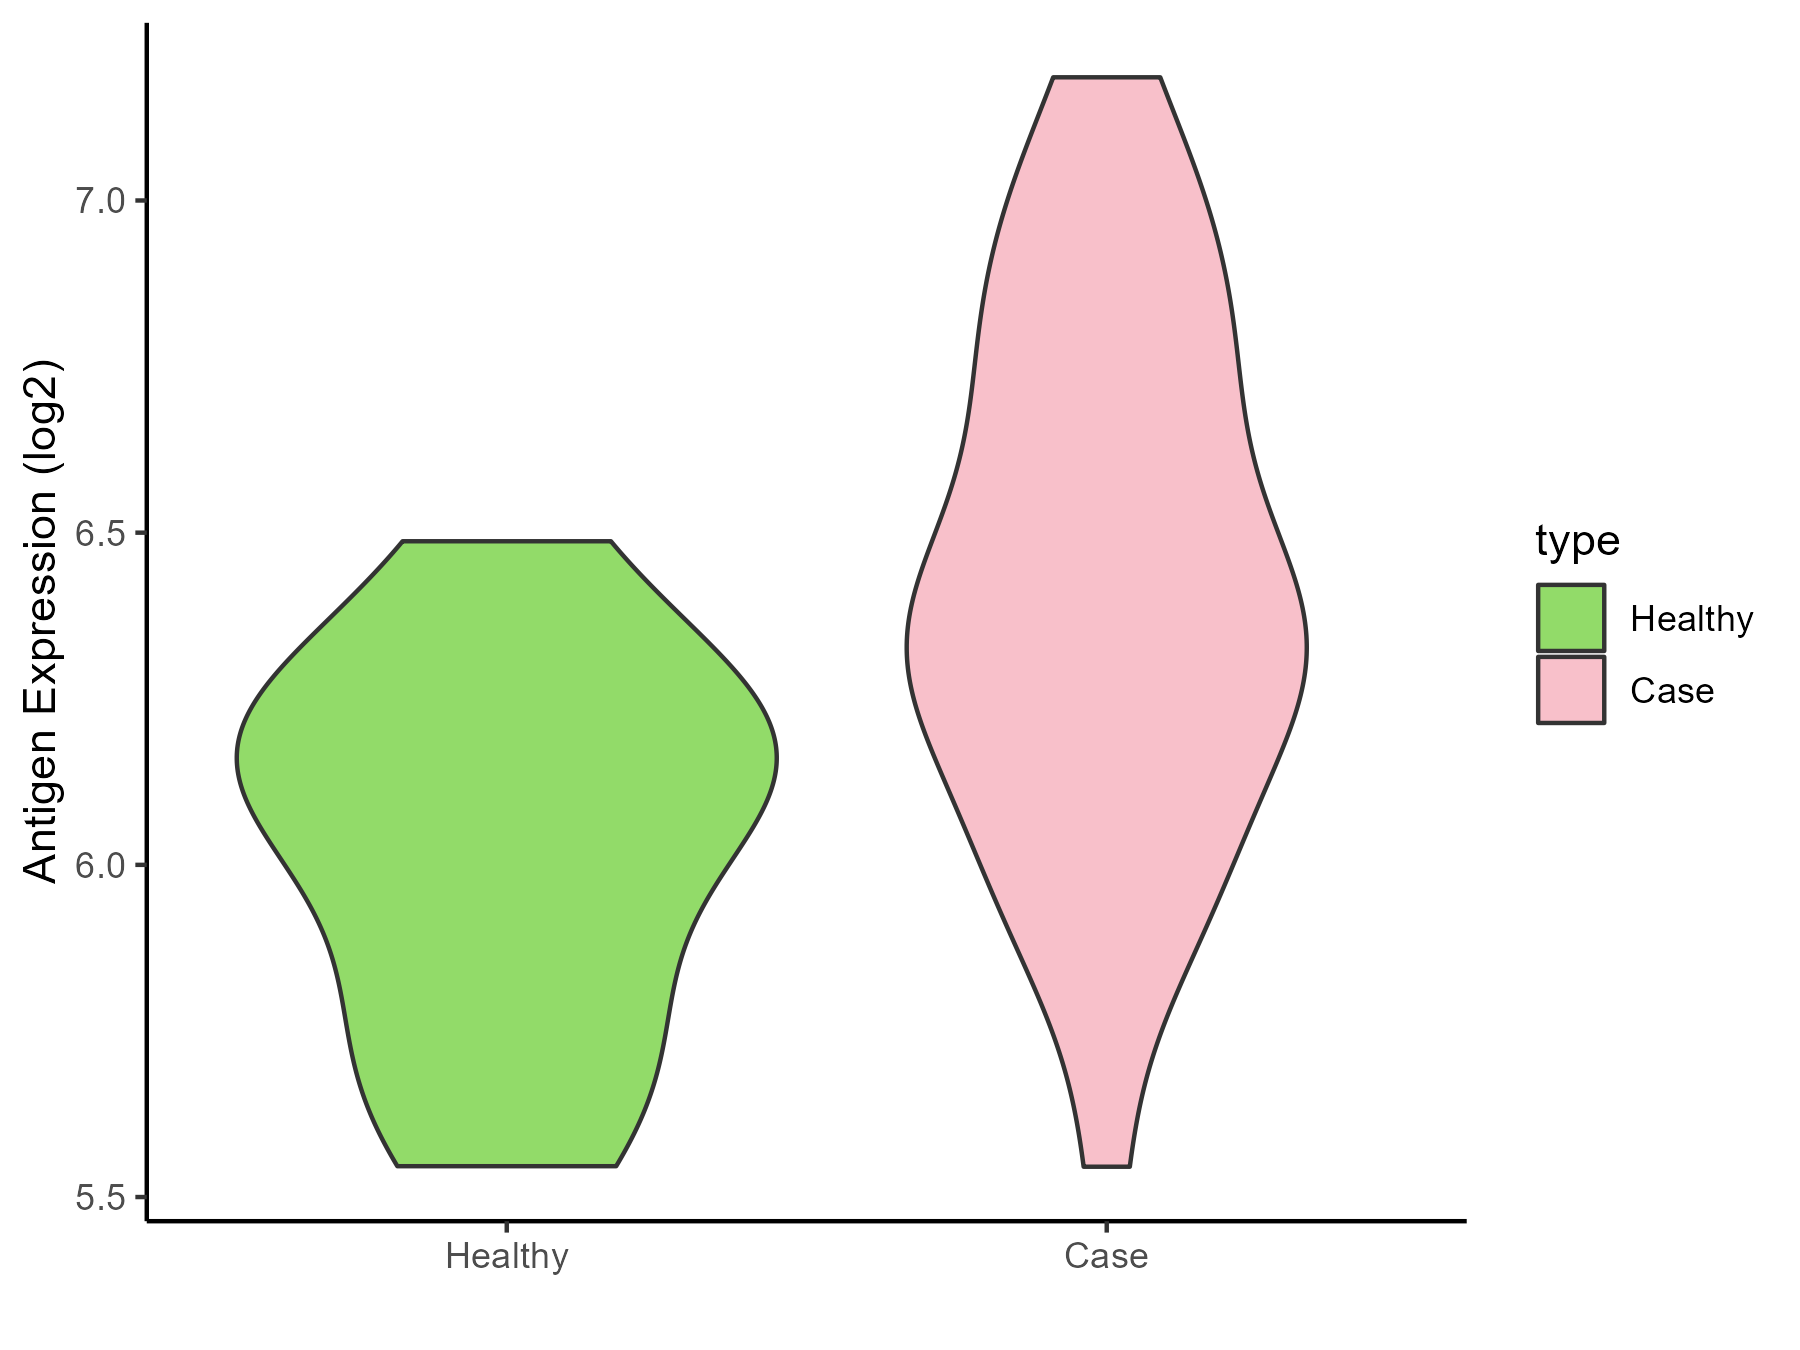
| The Studied Tissue | Liver | |
| The Specific Disease | Type 2 diabetes | |
| The Expression Level of Disease Section Compare with the Healthy Individual Tissue | p-value: 0.280376881; Fold-change: -0.100101776; Z-score: -0.452578502 | |
| Disease-specific Antigen Abundances |
|
Click to View the Clearer Original Diagram |
| Differential expression pattern of antigen in diseases | ||
| The Studied Tissue | Vastus lateralis muscle | |
| The Specific Disease | Polycystic ovary syndrome | |
| The Expression Level of Disease Section Compare with the Healthy Individual Tissue | p-value: 0.077917163; Fold-change: -0.248691421; Z-score: -1.116391223 | |
| Disease-specific Antigen Abundances |
|
Click to View the Clearer Original Diagram |
| Differential expression pattern of antigen in diseases | ||
| The Studied Tissue | Subcutaneous Adipose | |
| The Specific Disease | Obesity | |
| The Expression Level of Disease Section Compare with the Healthy Individual Tissue | p-value: 0.436956085; Fold-change: -0.080913164; Z-score: -0.289760918 | |
| Disease-specific Antigen Abundances |
|
Click to View the Clearer Original Diagram |
| Differential expression pattern of antigen in diseases | ||
| The Studied Tissue | Biceps muscle | |
| The Specific Disease | Pompe disease | |
| The Expression Level of Disease Section Compare with the Healthy Individual Tissue | p-value: 0.593463657; Fold-change: -0.011251781; Z-score: -0.05479566 | |
| Disease-specific Antigen Abundances |
|
Click to View the Clearer Original Diagram |
| Differential expression pattern of antigen in diseases | ||
| The Studied Tissue | Whole blood | |
| The Specific Disease | Batten disease | |
| The Expression Level of Disease Section Compare with the Healthy Individual Tissue | p-value: 0.863536269; Fold-change: 0.055529734; Z-score: 0.234629796 | |
| Disease-specific Antigen Abundances |
|
Click to View the Clearer Original Diagram |
ICD Disease Classification 6
| Differential expression pattern of antigen in diseases | ||
| The Studied Tissue | Whole blood | |
| The Specific Disease | Autism | |
| The Expression Level of Disease Section Compare with the Healthy Individual Tissue | p-value: 0.847139399; Fold-change: -0.015391687; Z-score: -0.050705102 | |
| Disease-specific Antigen Abundances |
|
Click to View the Clearer Original Diagram |
| Differential expression pattern of antigen in diseases | ||
| The Studied Tissue | Whole blood | |
| The Specific Disease | Anxiety disorder | |
| The Expression Level of Disease Section Compare with the Healthy Individual Tissue | p-value: 0.493076703; Fold-change: -0.025358652; Z-score: -0.057960891 | |
| Disease-specific Antigen Abundances |
|
Click to View the Clearer Original Diagram |
ICD Disease Classification 8
| Differential expression pattern of antigen in diseases | ||
| The Studied Tissue | Substantia nigra | |
| The Specific Disease | Parkinson disease | |
| The Expression Level of Disease Section Compare with the Healthy Individual Tissue | p-value: 0.10316013; Fold-change: 0.257293126; Z-score: 0.708805643 | |
| Disease-specific Antigen Abundances |
|
Click to View the Clearer Original Diagram |
| Differential expression pattern of antigen in diseases | ||
| The Studied Tissue | Whole blood | |
| The Specific Disease | Huntington disease | |
| The Expression Level of Disease Section Compare with the Healthy Individual Tissue | p-value: 0.498868396; Fold-change: -0.218481133; Z-score: -0.555953282 | |
| Disease-specific Antigen Abundances |
|
Click to View the Clearer Original Diagram |
| Differential expression pattern of antigen in diseases | ||
| The Studied Tissue | Entorhinal cortex | |
| The Specific Disease | Alzheimer disease | |
| The Expression Level of Disease Section Compare with the Healthy Individual Tissue | p-value: 0.071551426; Fold-change: 0.035579551; Z-score: 0.200472798 | |
| Disease-specific Antigen Abundances |
|
Click to View the Clearer Original Diagram |
| Differential expression pattern of antigen in diseases | ||
| The Studied Tissue | Whole blood | |
| The Specific Disease | Seizure | |
| The Expression Level of Disease Section Compare with the Healthy Individual Tissue | p-value: 0.537710134; Fold-change: 0.050604779; Z-score: 0.096423964 | |
| Disease-specific Antigen Abundances |
|
Click to View the Clearer Original Diagram |
| Differential expression pattern of antigen in diseases | ||
| The Studied Tissue | Skin | |
| The Specific Disease | Lateral sclerosis | |
| The Expression Level of Disease Section Compare with the Healthy Individual Tissue | p-value: 0.618881271; Fold-change: 0.054674032; Z-score: 0.240135999 | |
| Disease-specific Antigen Abundances |
|
Click to View the Clearer Original Diagram |
| The Studied Tissue | Cervical spinal cord | |
| The Specific Disease | Lateral sclerosis | |
| The Expression Level of Disease Section Compare with the Healthy Individual Tissue | p-value: 0.778630876; Fold-change: -0.044420008; Z-score: -0.228838674 | |
| Disease-specific Antigen Abundances |
|
Click to View the Clearer Original Diagram |
| Differential expression pattern of antigen in diseases | ||
| The Studied Tissue | Muscle | |
| The Specific Disease | Muscular atrophy | |
| The Expression Level of Disease Section Compare with the Healthy Individual Tissue | p-value: 0.030530895; Fold-change: -0.291167718; Z-score: -1.239626562 | |
| Disease-specific Antigen Abundances |
|
Click to View the Clearer Original Diagram |
| Differential expression pattern of antigen in diseases | ||
| The Studied Tissue | Muscle | |
| The Specific Disease | Myopathy | |
| The Expression Level of Disease Section Compare with the Healthy Individual Tissue | p-value: 0.251110595; Fold-change: 0.098062426; Z-score: 0.547599302 | |
| Disease-specific Antigen Abundances |
|
Click to View the Clearer Original Diagram |
References