
Payload Information
General Information of This Payload (ID: PAY0WTZYO)
| Name |
NMT inhibitor 1
|
|||||
|---|---|---|---|---|---|---|
| Synonyms |
NMT inhibitor 1
Click to Show/Hide
|
|||||
| Target | N-Myristoyltransferase (NMT) | |||||
| Structure |
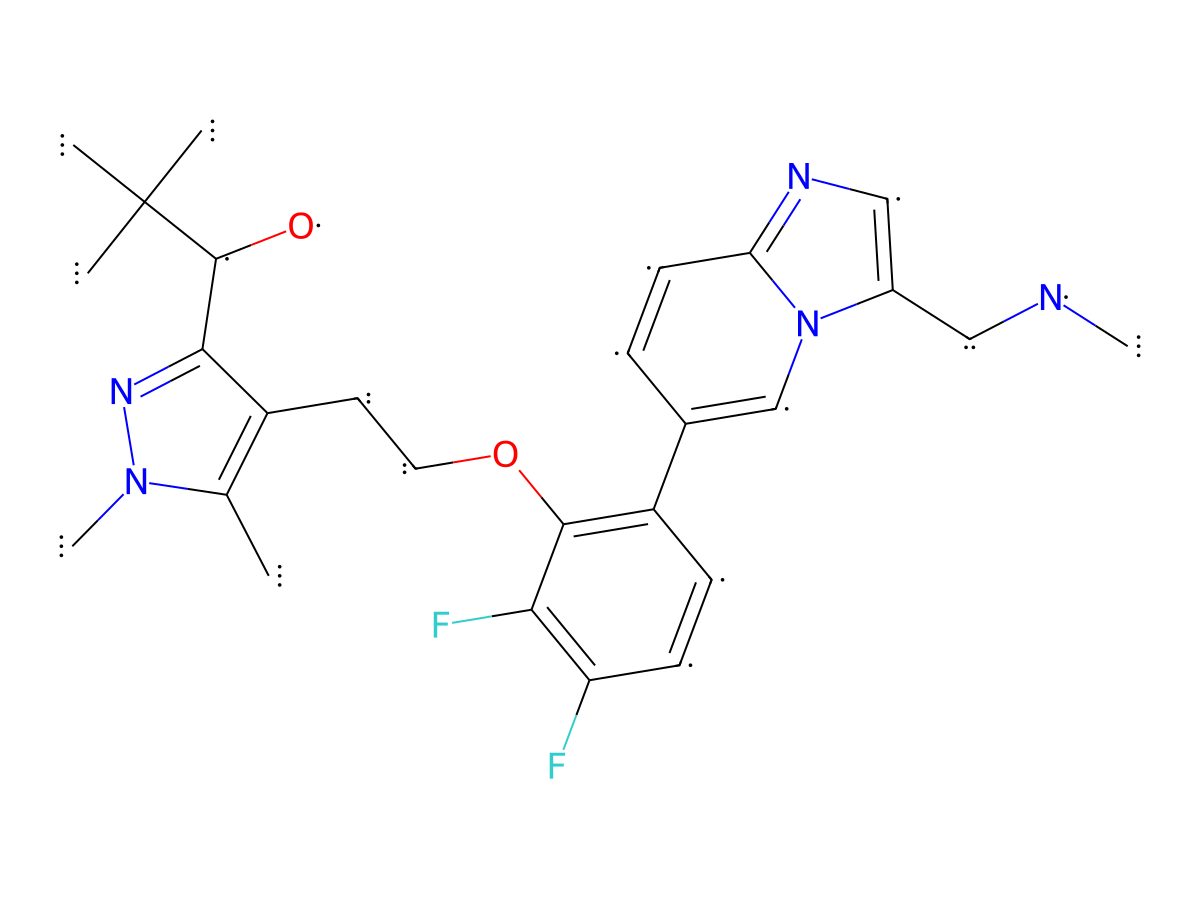
|
|||||
| Formula | C27H33F2N5O2 |
|||||
| Isosmiles | CN1C(C)=C(CCOC2=C(F)C(F)=CC=C2C3=CN4C(CNC)=CN=C4C=C3)C(C(O)C(C)(C)C)=N1 |
|||||
| PubChem CID | ||||||
| InChI |
InChI=1S/C27H33F2N5O2/c1-16-19(24(32-33(16)6)26(35)27(2,3)4)11-12-36-25-20(8-9-21(28)23(25)29)17-7-10-22-31-14-18(13-30-5)34(22)15-17/h7-10,14-15,26,30,35H,11-13H2,1-6H3
|
|||||
| InChIKey |
BXIHXITXQCGGOW-UHFFFAOYSA-N
|
|||||
| Pharmaceutical Properties | Molecule Weight |
497.59 |
Polar area |
76.61 |
||
Complexity |
1345.185515 |
xlogp Value |
4.74182 |
|||
Heavy Count |
36 |
Rot Bonds |
8 |
|||
Hbond acc |
7 |
Hbond Donor |
2 |
|||
Each Antibody-drug Conjugate Related to This Payload
Full Information of The Activity Data of The ADC(s) Related to This Payload
ZA202500415A-ADC Example 1 [Investigative]
Discovered Using Cell Line-derived Xenograft Model
| Experiment 1 Reporting the Activity Date of This ADC | [1] | ||||
| Efficacy Data | Tumor Growth lnhibition value (TGl) |
55%
|
Positive her2 expression (her2+++/++) | ||
| Method Description |
NOD/SCID mice were implanted with estrogen pellets (17p-estradiol, 60 day release, 0.36mg) subcutaneously in the right flank one day before the tumour inoculation.On day -8 each mouse was then inoculated in the right mammary fat pad with 1x10⁷ (BT474) tumor cells,and treatment with 2.5mpk ADC (once per week for four weeks)after tumor volume about 149.78mm3. Determined tumor volume after the experiment, measured at day 23.
Click to Show/Hide
|
||||
| In Vivo Model | BT474 xenograft model | ||||
| Experiment 2 Reporting the Activity Date of This ADC | [1] | ||||
| Efficacy Data | Tumor Growth lnhibition value (TGl) |
109%
|
Positive her2 expression (her2+++/++) | ||
| Method Description |
NOD/SCID mice were implanted with estrogen pellets (17p-estradiol, 60 day release, 0.36mg) subcutaneously in the right flank one day before the tumour inoculation.On day -8 each mouse was then inoculated in the right mammary fat pad with 1x10⁷ (BT474) tumor cells,and treatment with 5mpk ADC (once per week for four weeks)after tumor volume about 149.78mm3. Determined tumor volume after the experiment, measured at day 23.
Click to Show/Hide
|
||||
| In Vivo Model | BT474 xenograft model | ||||
Revealed Based on the Cell Line Data
| Experiment 1 Reporting the Activity Date of This ADC | [1] | ||||
| Efficacy Data | Half Maximal inhibitory Concentration (lC50) |
0.0004 uM
|
|||
| Method Description |
Patient derived gastric cancer organoids (PDXOs) GA0429B are sheared to uniform sizes and the required number of organoids are combined 1:1 with 50% Matrigel to produce the right size of the organoids to perform the screen. Add 40 pL of CTG 3D per well by Multidrop dispenser, mix the contents for 5 min on the plate shaker, and incubate the plates for 30 min at room temperature in dark. Read luminescent signal on Envision plate reader.
Click to Show/Hide
|
||||
| In Vitro Model | Gastric cancer | Patient derived gastric cancer cells | Homo sapiens | ||
| Experiment 2 Reporting the Activity Date of This ADC | [1] | ||||
| Efficacy Data | Half Maximal inhibitory Concentration (lC50) |
0.0005 uM
|
|||
| Method Description |
Patient derived gastric cancer organoids (PDXOs) GA0429B are sheared to uniform sizes and the required number of organoids are combined 1:1 with 50% Matrigel to produce the right size of the organoids to perform the screen. Add 40 pL of CTG 3D per well by Multidrop dispenser, mix the contents for 5 min on the plate shaker, and incubate the plates for 30 min at room temperature in dark. Read luminescent signal on Envision plate reader.
Click to Show/Hide
|
||||
| In Vitro Model | Gastric cancer | Patient derived gastric cancer cells | Homo sapiens | ||
| Experiment 3 Reporting the Activity Date of This ADC | [1] | ||||
| Efficacy Data | Half Maximal inhibitory Concentration (lC50) |
0.0007 uM
|
|||
| Method Description |
Patient derived gastric cancer organoids (PDXOs) GA0429B are sheared to uniform sizes and the required number of organoids are combined 1:1 with 50% Matrigel to produce the right size of the organoids to perform the screen. Add 40 pL of CTG 3D per well by Multidrop dispenser, mix the contents for 5 min on the plate shaker, and incubate the plates for 30 min at room temperature in dark. Read luminescent signal on Envision plate reader.
Click to Show/Hide
|
||||
| In Vitro Model | Gastric cancer | Patient derived gastric cancer cells | Homo sapiens | ||
| Experiment 4 Reporting the Activity Date of This ADC | [1] | ||||
| Efficacy Data | Half Maximal inhibitory Concentration (lC50) |
0.0008 uM
|
|||
| Method Description |
Patient derived gastric cancer organoids (PDXOs) GA0429B are sheared to uniform sizes and the required number of organoids are combined 1:1 with 50% Matrigel to produce the right size of the organoids to perform the screen. Add 40 pL of CTG 3D per well by Multidrop dispenser, mix the contents for 5 min on the plate shaker, and incubate the plates for 30 min at room temperature in dark. Read luminescent signal on Envision plate reader.
Click to Show/Hide
|
||||
| In Vitro Model | Gastric cancer | Patient derived gastric cancer cells | Homo sapiens | ||
| Experiment 5 Reporting the Activity Date of This ADC | [1] | ||||
| Efficacy Data | Half Maximal inhibitory Concentration (lC50) |
0.0022 uM
|
|||
| Method Description |
Patient derived gastric cancer organoids (PDXOs) GA0429B are sheared to uniform sizes and the required number of organoids are combined 1:1 with 50% Matrigel to produce the right size of the organoids to perform the screen. Add 40 pL of CTG 3D per well by Multidrop dispenser, mix the contents for 5 min on the plate shaker, and incubate the plates for 30 min at room temperature in dark. Read luminescent signal on Envision plate reader.
Click to Show/Hide
|
||||
| In Vitro Model | Gastric cancer | Patient derived gastric cancer cells | Homo sapiens | ||
| Experiment 6 Reporting the Activity Date of This ADC | [1] | ||||
| Efficacy Data | Half Maximal inhibitory Concentration (lC50) |
0.0029 uM
|
|||
| Method Description |
Patient derived gastric cancer organoids (PDXOs) GA0429B are sheared to uniform sizes and the required number of organoids are combined 1:1 with 50% Matrigel to produce the right size of the organoids to perform the screen. Add 40 pL of CTG 3D per well by Multidrop dispenser, mix the contents for 5 min on the plate shaker, and incubate the plates for 30 min at room temperature in dark. Read luminescent signal on Envision plate reader.
Click to Show/Hide
|
||||
| In Vitro Model | Gastric cancer | Patient derived gastric cancer cells | Homo sapiens | ||
| Experiment 7 Reporting the Activity Date of This ADC | [1] | ||||
| Efficacy Data | Half Maximal inhibitory Concentration (lC50) |
0.0037 uM
|
|||
| Method Description |
Patient derived gastric cancer organoids (PDXOs) GA0429B are sheared to uniform sizes and the required number of organoids are combined 1:1 with 50% Matrigel to produce the right size of the organoids to perform the screen. Add 40 pL of CTG 3D per well by Multidrop dispenser, mix the contents for 5 min on the plate shaker, and incubate the plates for 30 min at room temperature in dark. Read luminescent signal on Envision plate reader.
Click to Show/Hide
|
||||
| In Vitro Model | Gastric cancer | Patient derived gastric cancer cells | Homo sapiens | ||
| Experiment 8 Reporting the Activity Date of This ADC | [1] | ||||
| Efficacy Data | Half Maximal inhibitory Concentration (lC50) |
0.0044 uM
|
|||
| Method Description |
Patient derived gastric cancer organoids (PDXOs) GA0429B are sheared to uniform sizes and the required number of organoids are combined 1:1 with 50% Matrigel to produce the right size of the organoids to perform the screen. Add 40 pL of CTG 3D per well by Multidrop dispenser, mix the contents for 5 min on the plate shaker, and incubate the plates for 30 min at room temperature in dark. Read luminescent signal on Envision plate reader.
Click to Show/Hide
|
||||
| In Vitro Model | Gastric cancer | Patient derived gastric cancer cells | Homo sapiens | ||
| Experiment 9 Reporting the Activity Date of This ADC | [1] | ||||
| Efficacy Data | Half Maximal inhibitory Concentration (lC50) |
0.0046 uM
|
|||
| Method Description |
Patient derived gastric cancer organoids (PDXOs) GA0429B are sheared to uniform sizes and the required number of organoids are combined 1:1 with 50% Matrigel to produce the right size of the organoids to perform the screen. Add 40 pL of CTG 3D per well by Multidrop dispenser, mix the contents for 5 min on the plate shaker, and incubate the plates for 30 min at room temperature in dark. Read luminescent signal on Envision plate reader.
Click to Show/Hide
|
||||
| In Vitro Model | Gastric cancer | Patient derived gastric cancer cells | Homo sapiens | ||
| Experiment 10 Reporting the Activity Date of This ADC | [1] | ||||
| Efficacy Data | Half Maximal inhibitory Concentration (lC50) |
0.0068 uM
|
|||
| Method Description |
Patient derived gastric cancer organoids (PDXOs) GA0429B are sheared to uniform sizes and the required number of organoids are combined 1:1 with 50% Matrigel to produce the right size of the organoids to perform the screen. Add 40 pL of CTG 3D per well by Multidrop dispenser, mix the contents for 5 min on the plate shaker, and incubate the plates for 30 min at room temperature in dark. Read luminescent signal on Envision plate reader.
Click to Show/Hide
|
||||
| In Vitro Model | Gastric cancer | Patient derived gastric cancer cells | Homo sapiens | ||
| Experiment 11 Reporting the Activity Date of This ADC | [1] | ||||
| Efficacy Data | Half Maximal inhibitory Concentration (lC50) |
0.0093 uM
|
|||
| Method Description |
Patient derived gastric cancer organoids (PDXOs) GA0429B are sheared to uniform sizes and the required number of organoids are combined 1:1 with 50% Matrigel to produce the right size of the organoids to perform the screen. Add 40 pL of CTG 3D per well by Multidrop dispenser, mix the contents for 5 min on the plate shaker, and incubate the plates for 30 min at room temperature in dark. Read luminescent signal on Envision plate reader.
Click to Show/Hide
|
||||
| In Vitro Model | Gastric cancer | Patient derived gastric cancer cells | Homo sapiens | ||
| Experiment 12 Reporting the Activity Date of This ADC | [1] | ||||
| Efficacy Data | Half Maximal inhibitory Concentration (lC50) |
0.0187 uM
|
|||
| Method Description |
Patient derived gastric cancer organoids (PDXOs) GA0429B are sheared to uniform sizes and the required number of organoids are combined 1:1 with 50% Matrigel to produce the right size of the organoids to perform the screen. Add 40 pL of CTG 3D per well by Multidrop dispenser, mix the contents for 5 min on the plate shaker, and incubate the plates for 30 min at room temperature in dark. Read luminescent signal on Envision plate reader.
Click to Show/Hide
|
||||
| In Vitro Model | Gastric cancer | Patient derived gastric cancer cells | Homo sapiens | ||
| Experiment 13 Reporting the Activity Date of This ADC | [1] | ||||
| Efficacy Data | Half Maximal inhibitory Concentration (lC50) |
0.0226 uM
|
|||
| Method Description |
Patient derived gastric cancer organoids (PDXOs) GA0429B are sheared to uniform sizes and the required number of organoids are combined 1:1 with 50% Matrigel to produce the right size of the organoids to perform the screen. Add 40 pL of CTG 3D per well by Multidrop dispenser, mix the contents for 5 min on the plate shaker, and incubate the plates for 30 min at room temperature in dark. Read luminescent signal on Envision plate reader.
Click to Show/Hide
|
||||
| In Vitro Model | Gastric cancer | Patient derived gastric cancer cells | Homo sapiens | ||
| Experiment 14 Reporting the Activity Date of This ADC | [1] | ||||
| Efficacy Data | Half Maximal inhibitory Concentration (lC50) | > 0.05 uM | |||
| Method Description |
Patient derived gastric cancer organoids (PDXOs) GA0429B are sheared to uniform sizes and the required number of organoids are combined 1:1 with 50% Matrigel to produce the right size of the organoids to perform the screen. Add 40 pL of CTG 3D per well by Multidrop dispenser, mix the contents for 5 min on the plate shaker, and incubate the plates for 30 min at room temperature in dark. Read luminescent signal on Envision plate reader.
Click to Show/Hide
|
||||
| In Vitro Model | Gastric cancer | Patient derived gastric cancer cells | Homo sapiens | ||
| Experiment 15 Reporting the Activity Date of This ADC | [1] | ||||
| Efficacy Data | Half Maximal inhibitory Concentration (lC50) | > 0.05 uM | |||
| Method Description |
Patient derived gastric cancer organoids (PDXOs) GA0429B are sheared to uniform sizes and the required number of organoids are combined 1:1 with 50% Matrigel to produce the right size of the organoids to perform the screen. Add 40 pL of CTG 3D per well by Multidrop dispenser, mix the contents for 5 min on the plate shaker, and incubate the plates for 30 min at room temperature in dark. Read luminescent signal on Envision plate reader.
Click to Show/Hide
|
||||
| In Vitro Model | Gastric cancer | Patient derived gastric cancer cells | Homo sapiens | ||
| Experiment 16 Reporting the Activity Date of This ADC | [1] | ||||
| Efficacy Data | Half Maximal inhibitory Concentration (lC50) | > 0.05 uM | |||
| Method Description |
Patient derived gastric cancer organoids (PDXOs) GA0429B are sheared to uniform sizes and the required number of organoids are combined 1:1 with 50% Matrigel to produce the right size of the organoids to perform the screen. Add 40 pL of CTG 3D per well by Multidrop dispenser, mix the contents for 5 min on the plate shaker, and incubate the plates for 30 min at room temperature in dark. Read luminescent signal on Envision plate reader.
Click to Show/Hide
|
||||
| In Vitro Model | Gastric cancer | Patient derived gastric cancer cells | Homo sapiens | ||
| Experiment 17 Reporting the Activity Date of This ADC | [1] | ||||
| Efficacy Data | Half Maximal inhibitory Concentration (lC50) |
0.172 uM
|
Positive her2 expression (her2+++/++) | ||
| Method Description |
BT-474 cells were plated at set initial densities in 96 well flat bottom plates in the appropriate growth media. 24 hours later, dosing solutions were added at serial dilutions of each test compound spanning a concentration range of either 50 nM to 0.005 nM for the various ADCs. Cell proliferation was measured after 144 hours exposure, by CellTiter-Glo 2.0 Solution Cell Viability Assay.
Click to Show/Hide
|
||||
| In Vitro Model | Invasive breast carcinoma | BT-474 cells | CVCL_0179 | ||
| Experiment 18 Reporting the Activity Date of This ADC | [1] | ||||
| Efficacy Data | Half Maximal inhibitory Concentration (lC50) | < 0.2 uM | |||
| Method Description |
ZR-75-30 Cells were plated at set initial densities in 96 well flat bottom plates in the appropriate growth media. 24 hours later, dosing solutions were added at serial dilutions of each test compound spanning a concentration range of either 50 nM to 0.005 nM for the various ADCs. Cell proliferation was measured after 144 hours exposure, by CellTiter-Glo 2.0 Solution Cell Viability Assay.
Click to Show/Hide
|
||||
| In Vitro Model | Breast carcinoma | ZR-75-30 cells | CVCL_1661 | ||
| Experiment 19 Reporting the Activity Date of This ADC | [1] | ||||
| Efficacy Data | Half Maximal inhibitory Concentration (lC50) |
0.791 uM
|
Positive her2 expression (her2+++/++) | ||
| Method Description |
NCI N87 Cells were plated at set initial densities in 96 well flat bottom plates in the appropriate growth media. 24 hours later, dosing solutions were added at serial dilutions of each test compound spanning a concentration range of either 50 nM to 0.005 nM for the various ADCs. Cell proliferation was measured after 144 hours exposure, by CellTiter-Glo 2.0 Solution Cell Viability Assay.
Click to Show/Hide
|
||||
| In Vitro Model | Gastric tubular adenocarcinoma | NCI-N87 cells | CVCL_1603 | ||
| Experiment 20 Reporting the Activity Date of This ADC | [1] | ||||
| Efficacy Data | Half Maximal inhibitory Concentration (lC50) |
1.581 uM
|
|||
| Method Description |
NCI H2170 Cells were plated at set initial densities in 96 well flat bottom plates in the appropriate growth media. 24 hours later, dosing solutions were added at serial dilutions of each test compound spanning a concentration range of either 50 nM to 0.005 nM for the various ADCs. Cell proliferation was measured after 144 hours exposure, by CellTiter-Glo 2.0 Solution Cell Viability Assay.
Click to Show/Hide
|
||||
| In Vitro Model | Lung squamous cell carcinoma | NCI-H2170 cells | CVCL_1535 | ||
| Experiment 21 Reporting the Activity Date of This ADC | [1] | ||||
| Efficacy Data | Half Maximal inhibitory Concentration (lC50) |
52.07 uM
|
Positive her2 expression (her2+++/++) | ||
| Method Description |
JIMT 1 Cells were plated at set initial densities in 96 well flat bottom plates in the appropriate growth media. 24 hours later, dosing solutions were added at serial dilutions of each test compound spanning a concentration range of either 50 nM to 0.005 nM for the various ADCs. Cell proliferation was measured after 144 hours exposure, by CellTiter-Glo 2.0 Solution Cell Viability Assay.
Click to Show/Hide
|
||||
| In Vitro Model | Breast ductal carcinoma | JIMT-1 cells | CVCL_2077 | ||
| Experiment 22 Reporting the Activity Date of This ADC | [1] | ||||
| Efficacy Data | Half Maximal inhibitory Concentration (lC50) |
153.55 uM
|
Positive her2 expression (her2+++/++) | ||
| Method Description |
Cell line-derived xenograft models were established in female nude mice (BALB/C),by subcutaneous injection of 1x10⁷ (NCI-N87) tumor cells, and treatment with 2.5mg/kg (QWƦ) ADC after tumor volume about 168.08mm3. Determined tumor volume after the experiment, measured at day 35.
|
||||
| In Vitro Model | Gastric tubular adenocarcinoma | NCI-N87 cells | CVCL_1603 | ||
| Experiment 23 Reporting the Activity Date of This ADC | [1] | ||||
| Efficacy Data | Half Maximal inhibitory Concentration (lC50) |
224.01 uM
|
Positive her2 expression (her2+++/++) | ||
| Method Description |
Cell line-derived xenograft models were established in female nude mice (BALB/C),by subcutaneous injection of 1x10⁷ (NCI-N87) tumor cells, and treatment with 5mg/kg (QWƦ) ADC after tumor volume about 168.08mm3. Determined tumor volume after the experiment, measured at day 35.
|
||||
| In Vitro Model | Gastric tubular adenocarcinoma | NCI-N87 cells | CVCL_1603 | ||
ZA202500415A-ADC Example 3 [Investigative]
Discovered Using Cell Line-derived Xenograft Model
| Experiment 1 Reporting the Activity Date of This ADC | [1] | ||||
| Efficacy Data | Tumor Growth lnhibition value (TGl) |
74.76%
|
|||
| Method Description |
Cell line-derived xenograft models were established in female NOD/SCID mice, by subcutaneous injection of 5x10⁶ (JIMT-1) tumor cells, and treatmen with 2.5mg/kg ADC (QwƦ) after tumor volume about 160.66mm3. Determined tumor volume after the experiment, measured at day 27.
|
||||
| In Vivo Model | JIMT-1 Breast cancer xenograft model | ||||
| Experiment 2 Reporting the Activity Date of This ADC | [1] | ||||
| Efficacy Data | Tumor Growth lnhibition value (TGl) |
121.55%
|
|||
| Method Description |
Cell line-derived xenograft models were established in female NOD/SCID mice, by subcutaneous injection of 5x10⁶ (JIMT-1) tumor cells, and treatmen with 10mg/kg ADC (QwƦ) after tumor volume about 160.66mm3. Determined tumor volume after the experiment, measured at day 27.
|
||||
| In Vivo Model | JIMT-1 Breast cancer xenograft model | ||||
| Experiment 3 Reporting the Activity Date of This ADC | [1] | ||||
| Efficacy Data | Tumor Growth lnhibition value (TGl) |
122.04%
|
|||
| Method Description |
Cell line-derived xenograft models were established in female NOD/SCID mice, by subcutaneous injection of 5x10⁶ (JIMT-1) tumor cells, and treatmen with 5mg/kg ADC (QwƦ) after tumor volume about 160.66mm3. Determined tumor volume after the experiment, measured at day 27.
|
||||
| In Vivo Model | JIMT-1 Breast cancer xenograft model | ||||
Revealed Based on the Cell Line Data
| Experiment 1 Reporting the Activity Date of This ADC | [1] | ||||
| Efficacy Data | Half Maximal inhibitory Concentration (lC50) |
0.423 uM
|
|||
| Method Description |
IM95-m Cells were plated at set initial densities in 96 well flat bottom plates in the appropriate growth media. 24 hours later, dosing solutions were added at serial dilutions of each test compound spanning a concentration range of either 50 nM to 0.005 nM for the various ADCs. Cell proliferation was measured after 144 hours exposure, by CellTiter-Glo 2.0 Solution Cell Viability Assay.
Click to Show/Hide
|
||||
| In Vitro Model | Gastric adenocarcinoma | IM95-m cells | CVCL_2962 | ||
| Experiment 2 Reporting the Activity Date of This ADC | [1] | ||||
| Efficacy Data | Half Maximal inhibitory Concentration (lC50) |
0.486 uM
|
Positive her2 expression (her2+++/++) | ||
| Method Description |
JIMT 1 Cells were plated at set initial densities in 96 well flat bottom plates in the appropriate growth media. 24 hours later, dosing solutions were added at serial dilutions of each test compound spanning a concentration range of either 50 nM to 0.005 nM for the various ADCs. Cell proliferation was measured after 144 hours exposure, by CellTiter-Glo 2.0 Solution Cell Viability Assay.
Click to Show/Hide
|
||||
| In Vitro Model | Breast ductal carcinoma | JIMT-1 cells | CVCL_2077 | ||
| Experiment 3 Reporting the Activity Date of This ADC | [1] | ||||
| Efficacy Data | Half Maximal inhibitory Concentration (lC50) |
0.544 uM
|
|||
| Method Description |
NCI H292 Cells were plated at set initial densities in 96 well flat bottom plates in the appropriate growth media. 24 hours later, dosing solutions were added at serial dilutions of each test compound spanning a concentration range of either 50 nM to 0.005 nM for the various ADCs. Cell proliferation was measured after 144 hours exposure, by CellTiter-Glo 2.0 Solution Cell Viability Assay.
Click to Show/Hide
|
||||
| In Vitro Model | Lung mucoepidermoid carcinoma | NCI-H292 cells | CVCL_0455 | ||
| Experiment 4 Reporting the Activity Date of This ADC | [1] | ||||
| Efficacy Data | Half Maximal inhibitory Concentration (lC50) |
3.999 uM
|
Positive her2 expression (her2+++/++) | ||
| Method Description |
NCI N87 Cells were plated at set initial densities in 96 well flat bottom plates in the appropriate growth media. 24 hours later, dosing solutions were added at serial dilutions of each test compound spanning a concentration range of either 50 nM to 0.005 nM for the various ADCs. Cell proliferation was measured after 144 hours exposure, by CellTiter-Glo 2.0 Solution Cell Viability Assay.
Click to Show/Hide
|
||||
| In Vitro Model | Gastric tubular adenocarcinoma | NCI-N87 cells | CVCL_1603 | ||
| Experiment 5 Reporting the Activity Date of This ADC | [1] | ||||
| Efficacy Data | Half Maximal inhibitory Concentration (lC50) |
51.61 uM
|
|||
| Method Description |
NCI H2170 Cells were plated at set initial densities in 96 well flat bottom plates in the appropriate growth media. 24 hours later, dosing solutions were added at serial dilutions of each test compound spanning a concentration range of either 50 nM to 0.005 nM for the various ADCs. Cell proliferation was measured after 144 hours exposure, by CellTiter-Glo 2.0 Solution Cell Viability Assay.
Click to Show/Hide
|
||||
| In Vitro Model | Lung squamous cell carcinoma | NCI-H2170 cells | CVCL_1535 | ||
ZA202500415A-ADC Example 4 [Investigative]
Discovered Using Cell Line-derived Xenograft Model
| Experiment 1 Reporting the Activity Date of This ADC | [1] | ||||
| Efficacy Data | Tumor Growth lnhibition value (TGl) |
104.40%
|
|||
| Method Description |
Cell line-derived xenograft models were established in male NOD SCID mice, by subcutaneous injection of 1x10⁷ (LNCaP) tumor cells, and treatmen with 5mg/kg ADC (Q7DƧ) after tumor volume about 80-100mm3. Determined tumor volume after the experiment, measured at day 28.
|
||||
| In Vivo Model | LNCaP prostate cancer xenograft model | ||||
| Experiment 2 Reporting the Activity Date of This ADC | [1] | ||||
| Efficacy Data | Tumor Growth lnhibition value (TGl) |
108.31%
|
|||
| Method Description |
Cell line-derived xenograft models were established in non-castrated male CB17/SCID mice, by subcutaneous injection of 1x10⁷ (VCaP) tumor cells, and treatmen with 2.5mg/kg ADC (QWƦ) after tumor volume about 162.16mm3. Determined tumor volume after the experiment, measured at day 17.
|
||||
| In Vivo Model | VCaP prostate cancer xenograft model | ||||
| Experiment 3 Reporting the Activity Date of This ADC | [1] | ||||
| Efficacy Data | Tumor Growth lnhibition value (TGl) |
112.40%
|
|||
| Method Description |
Cell line-derived xenograft models were established in male NOD SCID mice, by subcutaneous injection of 1x10⁷ (LNCaP) tumor cells, and treatmen with 10mg/kg ADC (Q7DƧ) after tumor volume about 80-100mm3. Determined tumor volume after the experiment, measured at day 28.
|
||||
| In Vivo Model | LNCaP prostate cancer xenograft model | ||||
| Experiment 4 Reporting the Activity Date of This ADC | [1] | ||||
| Efficacy Data | Tumor Growth lnhibition value (TGl) |
114.03%
|
|||
| Method Description |
Cell line-derived xenograft models were established in non-castrated male CB17/SCID mice, by subcutaneous injection of 1x10⁷ (VCaP) tumor cells, and treatmen with 10mg/kg ADC (QWƦ) after tumor volume about 162.16mm3. Determined tumor volume after the experiment, measured at day 17.
|
||||
| In Vivo Model | VCaP prostate cancer xenograft model | ||||
| Experiment 5 Reporting the Activity Date of This ADC | [1] | ||||
| Efficacy Data | Tumor Growth lnhibition value (TGl) |
114.69%
|
|||
| Method Description |
Cell line-derived xenograft models were established in non-castrated male CB17/SCID mice, by subcutaneous injection of 1x10⁷ (VCaP) tumor cells, and treatmen with 5mg/kg ADC (QWƦ) after tumor volume about 162.16mm3. Determined tumor volume after the experiment, measured at day 17.
|
||||
| In Vivo Model | VCaP prostate cancer xenograft model | ||||
Revealed Based on the Cell Line Data
| Experiment 1 Reporting the Activity Date of This ADC | [1] | ||||
| Efficacy Data | Half Maximal inhibitory Concentration (lC50) |
0.154 uM
|
|||
| Method Description |
LNCaP Cells were plated at set initial densities in 96 well flat bottom plates in the appropriate growth media. 24 hours later, dosing solutions were added at serial dilutions of each test compound spanning a concentration range of either 50 nM to 0.005 nM for the various ADCs. Cell proliferation was measured after 144 hours exposure, by CellTiter-Glo 2.0 Solution Cell Viability Assay.
Click to Show/Hide
|
||||
| In Vitro Model | Prostate carcinoma | LNCaP cells | CVCL_0395 | ||
| Experiment 2 Reporting the Activity Date of This ADC | [1] | ||||
| Efficacy Data | Half Maximal inhibitory Concentration (lC50) |
0.158 uM
|
|||
| Method Description |
VCaP Cells were plated at set initial densities in 96 well flat bottom plates in the appropriate growth media. 24 hours later, dosing solutions were added at serial dilutions of each test compound spanning a concentration range of either 50 nM to 0.005 nM for the various ADCs. Cell proliferation was measured after 144 hours exposure, by CellTiter-Glo 2.2 Solution Cell Viability Assay.
Click to Show/Hide
|
||||
| In Vitro Model | Prostate carcinoma | VCaP cells | CVCL_2235 | ||
| Experiment 3 Reporting the Activity Date of This ADC | [1] | ||||
| Efficacy Data | Half Maximal inhibitory Concentration (lC50) |
1.345 uM
|
|||
| Method Description |
C42 Cells were plated at set initial densities in 96 well flat bottom plates in the appropriate growth media. 24 hours later, dosing solutions were added at serial dilutions of each test compound spanning a concentration range of either 50 nM to 0.005 nM for the various ADCs. Cell proliferation was measured after 144 hours exposure, by CellTiter-Glo 2.1 Solution Cell Viability Assay.
Click to Show/Hide
|
||||
| In Vitro Model | Prostate carcinoma | C4-2 cells | CVCL_4782 | ||