
Payload Information
General Information of This Payload (ID: PAY0ABISK)
| Name |
SB743921
|
|||||
|---|---|---|---|---|---|---|
| Synonyms |
SB-743291; SCHEMBL647316; CHEMBL4590257; NSC773261
Click to Show/Hide
|
|||||
| Target | Kinesin spindle protein (KSP) | |||||
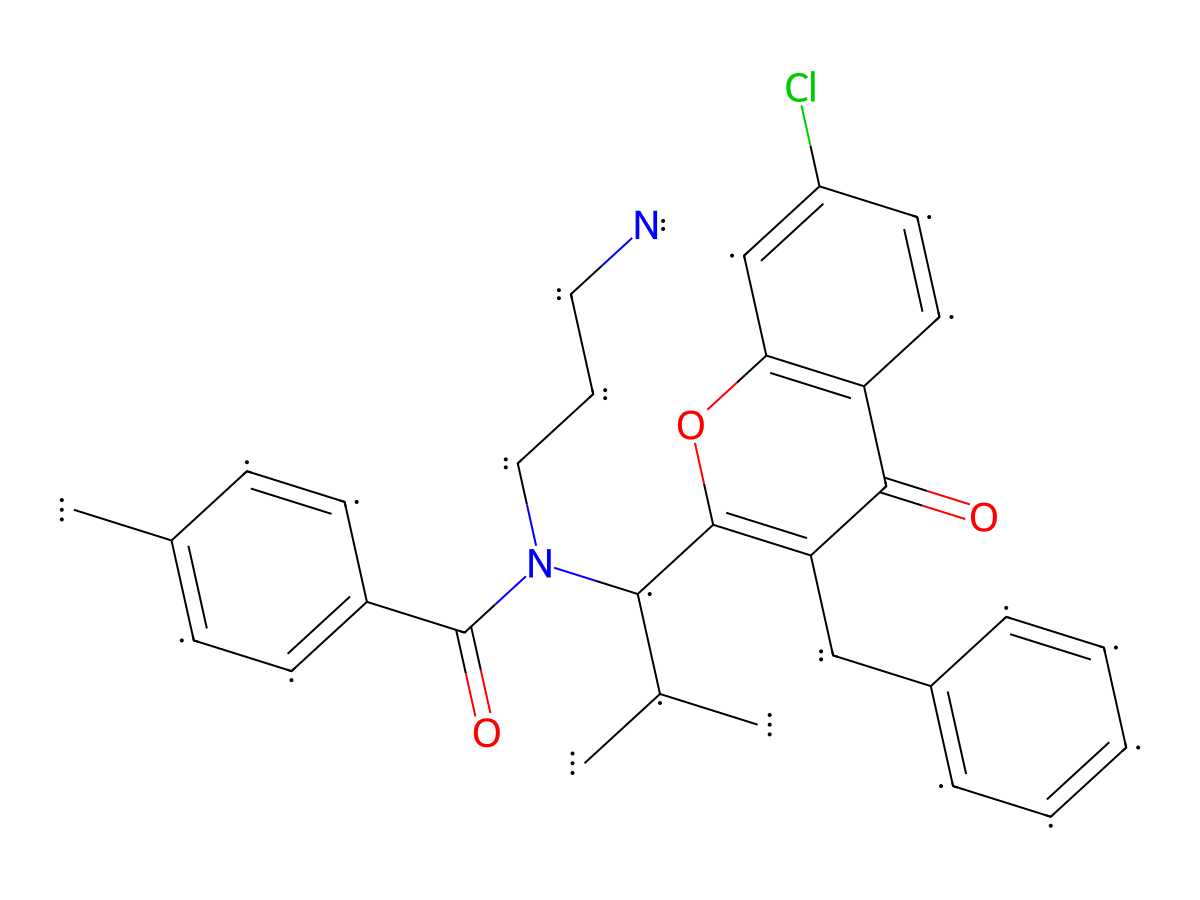
| Structure |
|
|||||
| Formula | C31H33ClN2O3 |
|||||
| Isosmiles | CC1=CC=C(C(N(C(C2=C(C(C3=CC=C(Cl)C=C3O2)=O)CC4=CC=CC=C4)C(C)C)CCCN)=O)C=C1 |
|||||
| PubChem CID | ||||||
| InChI |
InChI=1S/C31H33ClN2O3/c1-20(2)28(34(17-7-16-33)31(36)23-12-10-21(3)11-13-23)30-26(18-22-8-5-4-6-9-22)29(35)25-15-14-24(32)19-27(25)37-30/h4-6,8-15,19-20,28H,7,16-18,33H2,1-3H3
|
|||||
| InChIKey |
PGXYIBJJCLWJST-UHFFFAOYSA-N
|
|||||
| Pharmaceutical Properties | Molecule Weight |
517.069 |
Polar area |
76.54 |
||
Complexity |
1396.644789 |
xlogp Value |
6.53392 |
|||
Heavy Count |
37 |
Rot Bonds |
9 |
|||
Hbond acc |
4 |
Hbond Donor |
1 |
|||
The activity data of This Payload
| Standard Type | Value | Units | Cell line | Disease Model | Cell line ID | Reference |
|---|---|---|---|---|---|---|
| Cell-based Percent Inhibition (%) | -0.3 | % |
Vero C1008 cells
|
Normal
|
||
| Cell-based Percent Inhibition (%) | -0.3 | % |
Vero C1008 cells
|
Normal
|
||
| Half maximal Inhibitory Concentration (IC50) | ≈0.2 | log10 ng/mL |
SK-BR-3 cells
|
Breast adenocarcinoma
|
[1] | |
| Half maximal Inhibitory Concentration (IC50) | ≈0.2 | log10 ng/mL |
SK-BR-3 cells
|
Breast adenocarcinoma
|
[1] | |
| Half maximal Inhibitory Concentration (IC50) | ≈0.3 | log10 ng/mL |
IOSE80 cells
|
Normal
|
[1] | |
| Half maximal Inhibitory Concentration (IC50) | ≈0.3 | log10 ng/mL |
IOSE80 cells
|
Normal
|
[1] | |
| Half maximal Inhibitory Concentration (IC50) | ≈0.5 | log10 ng/mL |
SKOV-3 cells
|
Ovarian serous adenocarcinoma
|
[1] | |
| Half maximal Inhibitory Concentration (IC50) | ≈0.5 | log10 ng/mL |
SKOV-3 cells
|
Ovarian serous adenocarcinoma
|
[1] | |
| Half maximal Inhibitory Concentration (IC50) | ≈1 | log10 ng/mL |
BT-474 cells
|
Invasive breast carcinoma
|
[1] | |
| Half maximal Inhibitory Concentration (IC50) | ≈1 | log10 ng/mL |
BT-474 cells
|
Invasive breast carcinoma
|
[1] | |
| Half maximal Inhibitory Concentration (IC50) | ≈1 | log10 ng/mL |
MDA-MB-468 cells
|
Breast adenocarcinoma
|
[1] | |
| Half maximal Inhibitory Concentration (IC50) | ≈1 | log10 ng/mL |
MDA-MB-468 cells
|
Breast adenocarcinoma
|
[1] | |
| Half maximal Inhibitory Concentration (IC50) | ≈1.7 | log10 ng/mL |
NCI-N87 cells
|
Gastric tubular adenocarcinoma
|
[1] | |
| Half maximal Inhibitory Concentration (IC50) | ≈1.7 | log10 ng/mL |
NCI-N87 cells
|
Gastric tubular adenocarcinoma
|
[1] | |
| Half maximal Inhibitory Concentration (IC50) | ≈3 | log10 ng/mL |
GES?1 cells
|
Normal
|
[1] | |
| Half maximal Inhibitory Concentration (IC50) | ≈3 | log10 ng/mL |
GES?1 cells
|
Normal
|
[1] | |
| Cell-based Percent Inhibition (%) | 6.82 | % | Undisclosed | Undisclosed | Undisclosed |
Each Antibody-drug Conjugate Related to This Payload
Full Information of The Activity Data of The ADC(s) Related to This Payload
H2-921 [Investigative]
Discovered Using Cell Line-derived Xenograft Model
| Experiment 1 Reporting the Activity Date of This ADC | [1] | ||||
| Efficacy Data | Tumor Growth lnhibition value (TGl) | ≈ 73.30% | Positive HER2 expression (HER2+++/++) | ||
| Method Description |
Female nude mice (5 ~ 6 weeks old, weight about 20g) were included in the experiment after 1 week of adaptive feeding. It's going to be about 5 x 10Six SKOV-3 cells were inoculated under the skin of the right hind limb of mice to observe the tumor formation. When the tumor volume reached 120mm3, the mice were randomly divided into treatment group and control group (n = 6 groups). H2-921 at 0.5 mg/kg, T-DM1 (1.5 mg/kg, positive control) and PBS (control) were administered at day 0, 7 and 14, respectively. Animal weight was monitored every 3 days and animal behavior was observed daily.Tumor volume was monitored every 3 days during treatment and calculated using the formula TV = a× B2/3, where a represents the long diameter of each tumor and b represents the short diameter of each tumor.
Click to Show/Hide
|
||||
| In Vivo Model | SKOV3 tumor bearing female nude mouse model | ||||
| Experiment 2 Reporting the Activity Date of This ADC | [1] | ||||
| Efficacy Data | Tumor Growth lnhibition value (TGl) | ≈ 83.30% | Positive HER2 expression (HER2+++/++) | ||
| Method Description |
Female nude mice (5 ~ 6 weeks old, weight about 20g) were included in the experiment after 1 week of adaptive feeding. It's going to be about 5 x 10Six SKOV-3 cells were inoculated under the skin of the right hind limb of mice to observe the tumor formation. When the tumor volume reached 120mm3, the mice were randomly divided into treatment group and control group (n = 6 groups). H2-921 at 1.5 mg/kg, T-DM1 (1.5 mg/kg, positive control) and PBS (control) were administered at day 0, 7 and 14, respectively. Animal weight was monitored every 3 days and animal behavior was observed daily.Tumor volume was monitored every 3 days during treatment and calculated using the formula TV = a× B2/3, where a represents the long diameter of each tumor and b represents the short diameter of each tumor.
Click to Show/Hide
|
||||
| In Vivo Model | SKOV3 tumor bearing female nude mouse model | ||||
| Experiment 3 Reporting the Activity Date of This ADC | [1] | ||||
| Efficacy Data | Tumor Growth lnhibition value (TGl) | ≈ 99.60% | Positive HER2 expression (HER2+++/++) | ||
| Method Description |
Female nude mice (5 ~ 6 weeks old, weight about 20g) were included in the experiment after 1 week of adaptive feeding. It's going to be about 5 x 10Six SKOV-3 cells were inoculated under the skin of the right hind limb of mice to observe the tumor formation. When the tumor volume reached 120mm3, the mice were randomly divided into treatment group and control group (n = 6 groups). H2-921 at 4.5 mg/kg, T-DM1 (1.5 mg/kg, positive control) and PBS (control) were administered at day 0, 7 and 14, respectively. Animal weight was monitored every 3 days and animal behavior was observed daily.Tumor volume was monitored every 3 days during treatment and calculated using the formula TV = a× B2/3, where a represents the long diameter of each tumor and b represents the short diameter of each tumor.
Click to Show/Hide
|
||||
| In Vivo Model | SKOV3 tumor bearing female nude mouse model | ||||
Revealed Based on the Cell Line Data
| Experiment 1 Reporting the Activity Date of This ADC | [1] | ||||
| Efficacy Data | Half Maximal inhibitory Concentration (lC50) |
. log10 ng/mL
|
Positive HER2 expression (HER2+++/++) | ||
| Method Description |
BT-474 cells were inoculated in 96-well plates with 5×10³ cells/wells and cultured overnight at 37°C with 5% CO2. Then trastuzumab, SB743921, linker+SB743921 or H were added at concentrations of 100ug/ml, 10ug/ml, 1ug/ml, 100ng/ml, 10ng/ml, 1ng/ml, 100pg/ml, 10pg/ml, 1pg/ml or 0mg/ml, respectively 2-921. After culture at 37°C and 5% CO2 for 48h, 10ul CCK-8 solution was added to each well. After 2 ~ 4h, the absorbance at 450nm was measured by enzymograph, and the cell survival rate was calculated.
Click to Show/Hide
|
||||
| In Vitro Model | Invasive breast carcinoma | BT-474 cells | CVCL_0179 | ||
| Experiment 2 Reporting the Activity Date of This ADC | [1] | ||||
| Efficacy Data | Half Maximal inhibitory Concentration (lC50) |
. log10 ng/mL
|
Negative HER2 expression (HER2-) | ||
| Method Description |
IOSE80 cells were inoculated in 96-well plates with 5×10³ cells/wells and cultured overnight at 37°C with 5% CO2. Then trastuzumab, SB743921, linker+SB743921 or H were added at concentrations of 100ug/ml, 10ug/ml, 1ug/ml, 100ng/ml, 10ng/ml, 1ng/ml, 100pg/ml, 10pg/ml, 1pg/ml or 0mg/ml, respectively 2-921. After culture at 37°C and 5% CO2 for 48h, 10ul CCK-8 solution was added to each well. After 2 ~ 4h, the absorbance at 450nm was measured by enzymograph, and the cell survival rate was calculated.
Click to Show/Hide
|
||||
| In Vitro Model | Normal | IOSE80 cells | CVCL_5546 | ||
| Experiment 3 Reporting the Activity Date of This ADC | [1] | ||||
| Efficacy Data | Half Maximal inhibitory Concentration (lC50) |
. log10 ng/mL
|
Negative HER2 expression (HER2-) | ||
| Method Description |
GES-1 cells were inoculated in 96-well plates with 5×10³ cells/Wells and cultured overnight at 37°C with 5% CO2. Then trastuzumab, SB743921, linker+SB743921 or H were added at concentrations of 100ug/ml, 10ug/ml, 1ug/ml, 100ng/ml, 10ng/ml, 1ng/ml, 100pg/ml, 10pg/ml, 1pg/ml or 0mg/ml, respectively 2-921. After culture at 37°C and 5% CO2 for 48h, 10ul CCK-8 solution was added to each well. After 2 ~ 4h, the absorbance at 450nm was measured by enzymograph, and the cell survival rate was calculated.
Click to Show/Hide
|
||||
| In Vitro Model | Normal | GES-1 cells | CVCL_EQ22 | ||
| Experiment 4 Reporting the Activity Date of This ADC | [1] | ||||
| Efficacy Data | Half Maximal inhibitory Concentration (lC50) |
. log10 ng/mL
|
Negative HER2 expression (HER2-) | ||
| Method Description |
MDA-MB-468 cells were inoculated in 96-well plates with 5×10³ cells/wells and cultured overnight at 37°C with 5% CO2. Then trastuzumab, SB743921, linker+SB743921 or H were added at concentrations of 100ug/ml, 10ug/ml, 1ug/ml, 100ng/ml, 10ng/ml, 1ng/ml, 100pg/ml, 10pg/ml, 1pg/ml or 0mg/ml, respectively 2-921. After culture at 37°C and 5% CO2 for 48h, 10ul CCK-8 solution was added to each well. After 2 ~ 4h, the absorbance at 450nm was measured by enzymograph, and the cell survival rate was calculated.
Click to Show/Hide
|
||||
| In Vitro Model | Breast adenocarcinoma | MDA-MB-468 cells | CVCL_0419 | ||
| Experiment 5 Reporting the Activity Date of This ADC | [1] | ||||
| Efficacy Data | Half Maximal inhibitory Concentration (lC50) |
1.8 log10 ng/mL
|
Positive HER2 expression (HER2+++/++) | ||
| Method Description |
SKOV-3 cells were inoculated in 96-well plates at 5×10³ cells/wells and cultured overnight at 37°C with 5% CO2. Then trastuzumab, SB743921, linker+SB743921 or H were added at concentrations of 100ug/ml, 10ug/ml, 1ug/ml, 100ng/ml, 10ng/ml, 1ng/ml, 100pg/ml, 10pg/ml, 1pg/ml or 0mg/ml, respectively 2-921. After culture at 37°C and 5% CO2 for 48h, 10ul CCK-8 solution was added to each well. After 2 ~ 4h, the absorbance at 450nm was measured by enzymograph, and the cell survival rate was calculated.
Click to Show/Hide
|
||||
| In Vitro Model | Ovarian serous adenocarcinoma | SKOV-3 cells | CVCL_0532 | ||
| Experiment 6 Reporting the Activity Date of This ADC | [1] | ||||
| Efficacy Data | Half Maximal inhibitory Concentration (lC50) |
3.5 log10 ng/mL
|
Positive HER2 expression (HER2+++/++) | ||
| Method Description |
SK-BR-3 cells were inoculated in 96-well plates with 5×10³ cells/wells and cultured overnight at 37°C with 5% CO2. Then trastuzumab, SB743921, linker+SB743921 or H were added at concentrations of 100ug/ml, 10ug/ml, 1ug/ml, 100ng/ml, 10ng/ml, 1ng/ml, 100pg/ml, 10pg/ml, 1pg/ml or 0mg/ml, respectively 2-921. After culture at 37°C and 5% CO2 for 48h, 10ul CCK-8 solution was added to each well. After 2 ~ 4h, the absorbance at 450nm was measured by enzymograph, and the cell survival rate was calculated.
Click to Show/Hide
|
||||
| In Vitro Model | Breast adenocarcinoma | SK-BR-3 cells | CVCL_0033 | ||
| Experiment 7 Reporting the Activity Date of This ADC | [1] | ||||
| Efficacy Data | Half Maximal inhibitory Concentration (lC50) |
5 log10 ng/mL
|
Positive HER2 expression (HER2+++/++) | ||
| Method Description |
NCI-N87 were inoculated in 96-well plates at 5×10³ cells/wells and cultured overnight at 37°C with 5% CO2. Then trastuzumab, SB743921, linker+SB743921 or H were added at concentrations of 100ug/ml, 10ug/ml, 1ug/ml, 100ng/ml, 10ng/ml, 1ng/ml, 100pg/ml, 10pg/ml, 1pg/ml or 0mg/ml, respectively 2-921. After culture at 37°C and 5% CO2 for 48h, 10ul CCK-8 solution was added to each well. After 2 ~ 4h, the absorbance at 450nm was measured by enzymograph, and the cell survival rate was calculated.
Click to Show/Hide
|
||||
| In Vitro Model | Gastric tubular adenocarcinoma | NCI-N87 cells | CVCL_1603 | ||
| Experiment 8 Reporting the Activity Date of This ADC | [1] | ||||
| Efficacy Data | apoptosis |
24.05%
|
Positive HER2 expression (HER2+++/++) | ||
| Method Description |
SKOV-3 cells were inoculated in 6-well plates at about 1×10⁶ cells per well and incubated overnight at 37°C with 5% CO2. The cells were then treated with 1 ug/ml H2-921 for 48 hours. The cells were then collected, suspended with pre-cooled 70% alcohol and fixed overnight at 4 °C. The cells were then incubated with RNase A at 37 °C, RNase A was removed again, and the cells were suspended with propyl iodide (PI) staining solution. 30min dull staining and FACSCalibur flow cytometry. For apoptosis analysis, the cells were treated as described above, and apoptosis was detected by Annexin V-FITC/PI double staining apoptosis kit (Dojindo, Japan) after 48h. Cell cycle distribution and apoptosis were detected by FACSCalibur flow cytometry.
Click to Show/Hide
|
||||
| In Vitro Model | Ovarian serous adenocarcinoma | SKOV-3 cells | CVCL_0532 | ||
| Experiment 9 Reporting the Activity Date of This ADC | [1] | ||||
| Efficacy Data | apoptosis |
38.19%
|
Positive HER2 expression (HER2+++/++) | ||
| Method Description |
NCI-N87 cells were inoculated in 6-well plates at about 1×10⁶ cells per well and incubated overnight at 37°C with 5% CO2. The cells were then treated with 1 ug/ml H2-921 for 48 hours. The cells were then collected, suspended with pre-cooled 70% alcohol and fixed overnight at 4 °C. The cells were then incubated with RNase A at 37 °C, RNase A was removed again, and the cells were suspended with propyl iodide (PI) staining solution. 30min dull staining and FACSCalibur flow cytometry. For apoptosis analysis, the cells were treated as described above, and apoptosis was detected by Annexin V-FITC/PI double staining apoptosis kit (Dojindo, Japan) after 48h. Cell cycle distribution and apoptosis were detected by FACSCalibur flow cytometry.
Click to Show/Hide
|
||||
| In Vitro Model | Gastric tubular adenocarcinoma | NCI-N87 cells | CVCL_1603 | ||
| Experiment 10 Reporting the Activity Date of This ADC | [1] | ||||
| Efficacy Data | apoptosis |
51.63%
|
Positive HER2 expression (HER2+++/++) | ||
| Method Description |
NCI-N87 cells were inoculated in 6-well plates at about 1×10⁶ cells per well and incubated overnight at 37°C with 5% CO2. The cells were then treated with 10 ug/ml H2-921 for 48 hours. The cells were then collected, suspended with pre-cooled 70% alcohol and fixed overnight at 4 °C. The cells were then incubated with RNase A at 37 °C, RNase A was removed again, and the cells were suspended with propyl iodide (PI) staining solution. 30min dull staining and FACSCalibur flow cytometry. For apoptosis analysis, the cells were treated as described above, and apoptosis was detected by Annexin V-FITC/PI double staining apoptosis kit (Dojindo, Japan) after 48h. Cell cycle distribution and apoptosis were detected by FACSCalibur flow cytometry.
Click to Show/Hide
|
||||
| In Vitro Model | Gastric tubular adenocarcinoma | NCI-N87 cells | CVCL_1603 | ||
| Experiment 11 Reporting the Activity Date of This ADC | [1] | ||||
| Efficacy Data | apoptosis |
58.87%
|
Positive HER2 expression (HER2+++/++) | ||
| Method Description |
NCI-N87 cells were inoculated in 6-well plates at about 1×10⁶ cells per well and incubated overnight at 37°C with 5% CO2. The cells were then treated with 100 ug/ml H2-921 for 48 hours. The cells were then collected, suspended with pre-cooled 70% alcohol and fixed overnight at 4 °C. The cells were then incubated with RNase A at 37 °C, RNase A was removed again, and the cells were suspended with propyl iodide (PI) staining solution. 30min dull staining and FACSCalibur flow cytometry. For apoptosis analysis, the cells were treated as described above, and apoptosis was detected by Annexin V-FITC/PI double staining apoptosis kit (Dojindo, Japan) after 48h. Cell cycle distribution and apoptosis were detected by FACSCalibur flow cytometry.
Click to Show/Hide
|
||||
| In Vitro Model | Gastric tubular adenocarcinoma | NCI-N87 cells | CVCL_1603 | ||
| Experiment 12 Reporting the Activity Date of This ADC | [1] | ||||
| Efficacy Data | apoptosis |
78.59%
|
Positive HER2 expression (HER2+++/++) | ||
| Method Description |
SKOV-3 cells were inoculated in 6-well plates at about 1×10⁶ cells per well and incubated overnight at 37°C with 5% CO2. The cells were then treated with 10 ug/ml H2-921 for 48 hours. The cells were then collected, suspended with pre-cooled 70% alcohol and fixed overnight at 4 °C. The cells were then incubated with RNase A at 37 °C, RNase A was removed again, and the cells were suspended with propyl iodide (PI) staining solution. 30min dull staining and FACSCalibur flow cytometry. For apoptosis analysis, the cells were treated as described above, and apoptosis was detected by Annexin V-FITC/PI double staining apoptosis kit (Dojindo, Japan) after 48h. Cell cycle distribution and apoptosis were detected by FACSCalibur flow cytometry.
Click to Show/Hide
|
||||
| In Vitro Model | Ovarian serous adenocarcinoma | SKOV-3 cells | CVCL_0532 | ||
| Experiment 13 Reporting the Activity Date of This ADC | [1] | ||||
| Efficacy Data | apoptosis |
82.56%
|
Positive HER2 expression (HER2+++/++) | ||
| Method Description |
SKOV-3 cells were inoculated in 6-well plates at about 1×10⁶ cells per well and incubated overnight at 37°C with 5% CO2. The cells were then treated with 100 ug/ml H2-921 for 48 hours. The cells were then collected, suspended with pre-cooled 70% alcohol and fixed overnight at 4 °C. The cells were then incubated with RNase A at 37 °C, RNase A was removed again, and the cells were suspended with propyl iodide (PI) staining solution. 30min dull staining and FACSCalibur flow cytometry. For apoptosis analysis, the cells were treated as described above, and apoptosis was detected by Annexin V-FITC/PI double staining apoptosis kit (Dojindo, Japan) after 48h. Cell cycle distribution and apoptosis were detected by FACSCalibur flow cytometry.
Click to Show/Hide
|
||||
| In Vitro Model | Ovarian serous adenocarcinoma | SKOV-3 cells | CVCL_0532 | ||