
Linker Information
General Information of This Linker (ID: LIN0REOIZ)
| Name |
CN113943310A, ADC-12, Linker
|
|||||
|---|---|---|---|---|---|---|
| Linker Type |
Cathepsin-cleavable linker
|
|||||
| Antibody-Linker Relation |
Cleavable
|
|||||
| Structure |
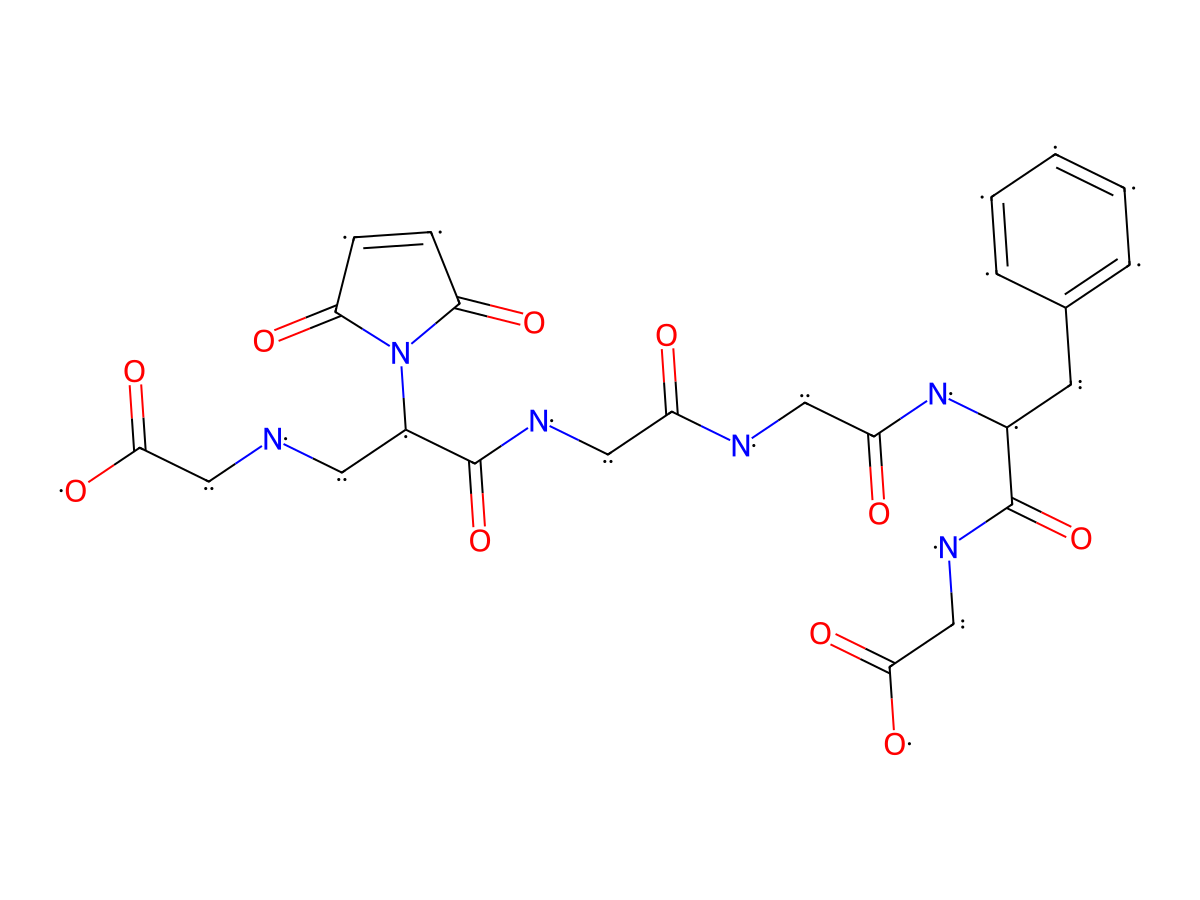
|
|||||
| Formula |
C24H28N6O10
|
|||||
| Isosmiles |
O=C(N1[C@@H](CNCC(O)=O)C(NCC(NCC(N[C@H](C(NCC(O)=O)=O)CC2=CC=CC=C2)=O)=O)=O)C=CC1=O
|
|||||
| InChI |
InChI=1S/C24H28N6O10/c31-17(10-27-24(40)16(9-25-12-21(35)36)30-19(33)6-7-20(30)34)26-11-18(32)29-15(23(39)28-13-22(37)38)8-14-4-2-1-3-5-14/h1-7,15-16,25H,8-13H2,(H,26,31)(H,27,40)(H,28,39)(H,29,32)(H,35,36)(H,37,38)/t15-,16-/m0/s1
|
|||||
| InChIKey |
LYEUNXNIQUMXBE-HOTGVXAUSA-N
|
|||||
| Pharmaceutical Properties |
Molecule Weight
|
560.52
|
Polar area
|
240.41
|
||
|
Complexity
|
1113.738212
|
xlogp Value
|
-3.8851
|
|||
|
Heavy Count
|
40
|
Rot Bonds
|
16
|
|||
|
Hbond acc
|
9
|
Hbond Donor
|
7
|
|||
Each Antibody-drug Conjugate Related to This Linker
Full Information of The Activity Data of The ADC(s) Related to This Linker
CN113943310A ADC-15 [Investigative]
Discovered Using Cell Line-derived Xenograft Model
| Experiment 1 Reporting the Activity Date of This ADC | [1] | ||||
| Efficacy Data | Tumor Growth lnhibition value (TGl) |
95.96%
|
Positive HER2 expression (HER2+++/++) | ||
| Method Description |
3x10⁴ A431 cells were injected subcutaneously into the right shoulder of 4-6-week-old BALB/c nude mice, and when the average tumor size of the mice grew to 140 ~ 150mm3, they were randomly divided into 5 cells in each group. At day 0, day 7, day 14, day 21, intravenous injection of a blank control (blank buffer solution) and a dose of 10mg/kg antibody drug conjugate was administered. The tumor volume was measured at day 0, day 7, day 14, day 21, day 24, day 28, day 32, day 36 and the tumor growth inhibition rate on day 28 of d was calculated.
Click to Show/Hide
|
||||
| In Vivo Model | A431 tumor bearing nude mouse model | ||||
CN113943310A ADC-13 [Investigative]
Discovered Using Cell Line-derived Xenograft Model
| Experiment 1 Reporting the Activity Date of This ADC | [1] | ||||
| Efficacy Data | Tumor Growth lnhibition value (TGl) |
96.69%
|
Positive HER2 expression (HER2+++/++) | ||
| Method Description |
3x10⁴ A431 cells were injected subcutaneously into the right shoulder of 4-6-week-old BALB/c nude mice, and when the average tumor size of the mice grew to 140 ~ 150mm3, they were randomly divided into 5 cells in each group. At day 0, day 7, day 14, day 21, intravenous injection of a blank control (blank buffer solution) and a dose of 10mg/kg antibody drug conjugate was administered. The tumor volume was measured at day 0, day 7, day 14, day 21, day 24, day 28, day 32, day 36 and the tumor growth inhibition rate on day 28 of d was calculated.
Click to Show/Hide
|
||||
| In Vivo Model | A431 tumor bearing nude mouse model | ||||
Revealed Based on the Cell Line Data
| Experiment 1 Reporting the Activity Date of This ADC | [1] | ||||
| Efficacy Data | Half Maximal inhibitory Concentration (lC62) |
3.71 nM
|
Positive HER2 and EGFR expression (HER2 and EGFR+++/++) | ||
| Method Description |
SW620 cells were used as in vitro pharmacodynamic detection systems. An appropriate number of tumor cell lines were inoculated in 96-well plates, incubated in carbon dioxide incubators for 24 hours, and then treated with medicine. The drug was diluted in a medium (the initial concentration of ADC drug was 500nM, the dilution factor was 7 times, there were 8 concentration points, the theoretical coupling ratio (DAR) of toxin and antibody was 8:1, and the actual coupling ratio was roughly 7.5:1, so the initial concentration of toxin was 4.0 uM, 7 times concentration gradient dilution, 8 concentration points). After mixing, it was added into the corresponding cell holes and incubated at 37°C in carbon dioxide incubator for 5 days. After 5 days, 20uL MTS was added to each well (Promega, G3581) reacted for 2 hours, and the absorption value reading at 490nm was taken with an enzyme label. By detecting the activity of dehydrogenase in mitochondria, IC50 was calculated to evaluate the inhibitory effect of ADC drugs on the proliferation of tumor cells.
Click to Show/Hide
|
||||
| In Vitro Model | Colon adenocarcinoma | SW620 cells | CVCL_0547 | ||
| Experiment 2 Reporting the Activity Date of This ADC | [1] | ||||
| Efficacy Data | Half Maximal inhibitory Concentration (lC62) |
7.81 nM
|
Positive HER2 expression (HER2+++/++) | ||
| Method Description |
Fadu cells were used as in vitro pharmacodynamic detection systems. An appropriate number of tumor cell lines were inoculated in 96-well plates, incubated in carbon dioxide incubators for 24 hours, and then treated with medicine. The drug was diluted in a medium (the initial concentration of ADC drug was 500nM, the dilution factor was 7 times, there were 8 concentration points, the theoretical coupling ratio (DAR) of toxin and antibody was 8:1, and the actual coupling ratio was roughly 7.5:1, so the initial concentration of toxin was 4.0 uM, 7 times concentration gradient dilution, 8 concentration points). After mixing, it was added into the corresponding cell holes and incubated at 37°C in carbon dioxide incubator for 5 days. After 5 days, 20uL MTS was added to each well (Promega, G3581) reacted for 2 hours, and the absorption value reading at 490nm was taken with an enzyme label. By detecting the activity of dehydrogenase in mitochondria, IC50 was calculated to evaluate the inhibitory effect of ADC drugs on the proliferation of tumor cells.
Click to Show/Hide
|
||||
| In Vitro Model | Hypopharyngeal squamous cell carcinoma | FaDu cells | CVCL_1218 | ||
| Experiment 3 Reporting the Activity Date of This ADC | [1] | ||||
| Efficacy Data | Half Maximal inhibitory Concentration (lC62) |
18.32 nM
|
Positive HER2 expression (HER2+++/++) | ||
| Method Description |
N87 cells were used as in vitro pharmacodynamic detection systems. An appropriate number of tumor cell lines were inoculated in 96-well plates, incubated in carbon dioxide incubators for 24 hours, and then treated with medicine. The drug was diluted in a medium (the initial concentration of ADC drug was 500nM, the dilution factor was 7 times, there were 8 concentration points, the theoretical coupling ratio (DAR) of toxin and antibody was 8:1, and the actual coupling ratio was roughly 7.5:1, so the initial concentration of toxin was 4.0 uM, 7 times concentration gradient dilution, 8 concentration points). After mixing, it was added into the corresponding cell holes and incubated at 37°C in carbon dioxide incubator for 5 days. After 5 days, 20uL MTS was added to each well (Promega, G3581) reacted for 2 hours, and the absorption value reading at 490nm was taken with an enzyme label. By detecting the activity of dehydrogenase in mitochondria, IC50 was calculated to evaluate the inhibitory effect of ADC drugs on the proliferation of tumor cells.
Click to Show/Hide
|
||||
| In Vitro Model | Gastric tubular adenocarcinoma | N87 cells | CVCL_1603 | ||
| Experiment 4 Reporting the Activity Date of This ADC | [1] | ||||
| Efficacy Data | Half Maximal inhibitory Concentration (lC62) |
25.72 nM
|
Positive HER2 expression (HER2+++/++) | ||
| Method Description |
BXPC-3 cells were used as in vitro pharmacodynamic detection systems. An appropriate number of tumor cell lines were inoculated in 96-well plates, incubated in carbon dioxide incubators for 24 hours, and then treated with medicine. The drug was diluted in a medium (the initial concentration of ADC drug was 500nM, the dilution factor was 7 times, there were 8 concentration points, the theoretical coupling ratio (DAR) of toxin and antibody was 8:1, and the actual coupling ratio was roughly 7.5:1, so the initial concentration of toxin was 4.0 uM, 7 times concentration gradient dilution, 8 concentration points). After mixing, it was added into the corresponding cell holes and incubated at 37°C in carbon dioxide incubator for 5 days. After 5 days, 20uL MTS was added to each well (Promega, G3581) reacted for 2 hours, and the absorption value reading at 490nm was taken with an enzyme label. By detecting the activity of dehydrogenase in mitochondria, IC50 was calculated to evaluate the inhibitory effect of ADC drugs on the proliferation of tumor cells.
Click to Show/Hide
|
||||
| In Vitro Model | Pancreatic ductal adenocarcinoma | BxPC-3 cells | CVCL_0186 | ||
| Experiment 5 Reporting the Activity Date of This ADC | [1] | ||||
| Efficacy Data | Half Maximal inhibitory Concentration (lC62) |
43.16 nM
|
Positive HER2 and EGFR expression (HER2 and EGFR+++/++) | ||
| Method Description |
A431 cells were used as in vitro pharmacodynamic detection systems. An appropriate number of tumor cell lines were inoculated in 96-well plates, incubated in carbon dioxide incubators for 24 hours, and then treated with medicine. The drug was diluted in a medium (the initial concentration of ADC drug was 500nM, the dilution factor was 7 times, there were 8 concentration points, the theoretical coupling ratio (DAR) of toxin and antibody was 8:1, and the actual coupling ratio was roughly 7.5:1, so the initial concentration of toxin was 4.0 uM, 7 times concentration gradient dilution, 8 concentration points). After mixing, it was added into the corresponding cell holes and incubated at 37°C in carbon dioxide incubator for 5 days. After 5 days, 20uL MTS was added to each well (Promega, G3581) reacted for 2 hours, and the absorption value reading at 490nm was taken with an enzyme label. By detecting the activity of dehydrogenase in mitochondria, IC50 was calculated to evaluate the inhibitory effect of ADC drugs on the proliferation of tumor cells.
Click to Show/Hide
|
||||
| In Vitro Model | Skin squamous cell carcinoma | A431 cells | CVCL_0037 | ||
CN113943310A ADC-12 [Investigative]
Discovered Using Cell Line-derived Xenograft Model
| Experiment 1 Reporting the Activity Date of This ADC | [1] | ||||
| Efficacy Data | Tumor Growth lnhibition value (TGl) |
96.85%
|
Positive HER2 expression (HER2+++/++) | ||
| Method Description |
3x10⁴ A431 cells were injected subcutaneously into the right shoulder of 4-6-week-old BALB/c nude mice, and when the average tumor size of the mice grew to 140 ~ 150mm3, they were randomly divided into 5 cells in each group. At day 0, day 7, day 14, day 21, intravenous injection of a blank control (blank buffer solution) and a dose of 10mg/kg antibody drug conjugate was administered. The tumor volume was measured at day 0, day 7, day 14, day 21, day 24, day 28, day 32, day 36 and the tumor growth inhibition rate on day 28 of d was calculated.
Click to Show/Hide
|
||||
| In Vivo Model | A431 tumor bearing nude mouse model | ||||
Revealed Based on the Cell Line Data
| Experiment 1 Reporting the Activity Date of This ADC | [1] | ||||
| Efficacy Data | Half Maximal inhibitory Concentration (lC61) |
13.7 nM
|
Positive HER2 expression (HER2+++/++) | ||
| Method Description |
N87 cells were used as in vitro pharmacodynamic detection systems. An appropriate number of tumor cell lines were inoculated in 96-well plates, incubated in carbon dioxide incubators for 24 hours, and then treated with medicine. The drug was diluted in a medium (the initial concentration of ADC drug was 500nM, the dilution factor was 7 times, there were 8 concentration points, the theoretical coupling ratio (DAR) of toxin and antibody was 8:1, and the actual coupling ratio was roughly 7.5:1, so the initial concentration of toxin was 4.0 uM, 7 times concentration gradient dilution, 8 concentration points). After mixing, it was added into the corresponding cell holes and incubated at 37°C in carbon dioxide incubator for 5 days. After 5 days, 20uL MTS was added to each well (Promega, G3581) reacted for 2 hours, and the absorption value reading at 490nm was taken with an enzyme label. By detecting the activity of dehydrogenase in mitochondria, IC50 was calculated to evaluate the inhibitory effect of ADC drugs on the proliferation of tumor cells.
Click to Show/Hide
|
||||
| In Vitro Model | Gastric tubular adenocarcinoma | N87 cells | CVCL_1603 | ||
| Experiment 2 Reporting the Activity Date of This ADC | [1] | ||||
| Efficacy Data | Half Maximal inhibitory Concentration (lC61) |
15.09 nM
|
Positive HER2 and EGFR expression (HER2 and EGFR+++/++) | ||
| Method Description |
SW620 cells were used as in vitro pharmacodynamic detection systems. An appropriate number of tumor cell lines were inoculated in 96-well plates, incubated in carbon dioxide incubators for 24 hours, and then treated with medicine. The drug was diluted in a medium (the initial concentration of ADC drug was 500nM, the dilution factor was 7 times, there were 8 concentration points, the theoretical coupling ratio (DAR) of toxin and antibody was 8:1, and the actual coupling ratio was roughly 7.5:1, so the initial concentration of toxin was 4.0 uM, 7 times concentration gradient dilution, 8 concentration points). After mixing, it was added into the corresponding cell holes and incubated at 37°C in carbon dioxide incubator for 5 days. After 5 days, 20uL MTS was added to each well (Promega, G3581) reacted for 2 hours, and the absorption value reading at 490nm was taken with an enzyme label. By detecting the activity of dehydrogenase in mitochondria, IC50 was calculated to evaluate the inhibitory effect of ADC drugs on the proliferation of tumor cells.
Click to Show/Hide
|
||||
| In Vitro Model | Colon adenocarcinoma | SW620 cells | CVCL_0547 | ||
| Experiment 3 Reporting the Activity Date of This ADC | [1] | ||||
| Efficacy Data | Half Maximal inhibitory Concentration (lC61) |
18.92 nM
|
Positive HER2 expression (HER2+++/++) | ||
| Method Description |
Fadu cells were used as in vitro pharmacodynamic detection systems. An appropriate number of tumor cell lines were inoculated in 96-well plates, incubated in carbon dioxide incubators for 24 hours, and then treated with medicine. The drug was diluted in a medium (the initial concentration of ADC drug was 500nM, the dilution factor was 7 times, there were 8 concentration points, the theoretical coupling ratio (DAR) of toxin and antibody was 8:1, and the actual coupling ratio was roughly 7.5:1, so the initial concentration of toxin was 4.0 uM, 7 times concentration gradient dilution, 8 concentration points). After mixing, it was added into the corresponding cell holes and incubated at 37°C in carbon dioxide incubator for 5 days. After 5 days, 20uL MTS was added to each well (Promega, G3581) reacted for 2 hours, and the absorption value reading at 490nm was taken with an enzyme label. By detecting the activity of dehydrogenase in mitochondria, IC50 was calculated to evaluate the inhibitory effect of ADC drugs on the proliferation of tumor cells.
Click to Show/Hide
|
||||
| In Vitro Model | Hypopharyngeal squamous cell carcinoma | FaDu cells | CVCL_1218 | ||
| Experiment 4 Reporting the Activity Date of This ADC | [1] | ||||
| Efficacy Data | Half Maximal inhibitory Concentration (lC61) |
49.85 nM
|
Positive HER2 expression (HER2+++/++) | ||
| Method Description |
BXPC-3 cells were used as in vitro pharmacodynamic detection systems. An appropriate number of tumor cell lines were inoculated in 96-well plates, incubated in carbon dioxide incubators for 24 hours, and then treated with medicine. The drug was diluted in a medium (the initial concentration of ADC drug was 500nM, the dilution factor was 7 times, there were 8 concentration points, the theoretical coupling ratio (DAR) of toxin and antibody was 8:1, and the actual coupling ratio was roughly 7.5:1, so the initial concentration of toxin was 4.0 uM, 7 times concentration gradient dilution, 8 concentration points). After mixing, it was added into the corresponding cell holes and incubated at 37°C in carbon dioxide incubator for 5 days. After 5 days, 20uL MTS was added to each well (Promega, G3581) reacted for 2 hours, and the absorption value reading at 490nm was taken with an enzyme label. By detecting the activity of dehydrogenase in mitochondria, IC50 was calculated to evaluate the inhibitory effect of ADC drugs on the proliferation of tumor cells.
Click to Show/Hide
|
||||
| In Vitro Model | Pancreatic ductal adenocarcinoma | BxPC-3 cells | CVCL_0186 | ||
| Experiment 5 Reporting the Activity Date of This ADC | [1] | ||||
| Efficacy Data | Half Maximal inhibitory Concentration (lC61) |
56.7 nM
|
Positive HER2 and EGFR expression (HER2 and EGFR+++/++) | ||
| Method Description |
A431 cells were used as in vitro pharmacodynamic detection systems. An appropriate number of tumor cell lines were inoculated in 96-well plates, incubated in carbon dioxide incubators for 24 hours, and then treated with medicine. The drug was diluted in a medium (the initial concentration of ADC drug was 500nM, the dilution factor was 7 times, there were 8 concentration points, the theoretical coupling ratio (DAR) of toxin and antibody was 8:1, and the actual coupling ratio was roughly 7.5:1, so the initial concentration of toxin was 4.0 uM, 7 times concentration gradient dilution, 8 concentration points). After mixing, it was added into the corresponding cell holes and incubated at 37°C in carbon dioxide incubator for 5 days. After 5 days, 20uL MTS was added to each well (Promega, G3581) reacted for 2 hours, and the absorption value reading at 490nm was taken with an enzyme label. By detecting the activity of dehydrogenase in mitochondria, IC50 was calculated to evaluate the inhibitory effect of ADC drugs on the proliferation of tumor cells.
Click to Show/Hide
|
||||
| In Vitro Model | Skin squamous cell carcinoma | A431 cells | CVCL_0037 | ||
CN113943310A ADC-14 [Investigative]
Revealed Based on the Cell Line Data
| Experiment 1 Reporting the Activity Date of This ADC | [1] | ||||
| Efficacy Data | Half Maximal inhibitory Concentration (lC63) |
13.08 nM
|
Positive HER2 and EGFR expression (HER2 and EGFR+++/++) | ||
| Method Description |
SW620 cells were used as in vitro pharmacodynamic detection systems. An appropriate number of tumor cell lines were inoculated in 96-well plates, incubated in carbon dioxide incubators for 24 hours, and then treated with medicine. The drug was diluted in a medium (the initial concentration of ADC drug was 500nM, the dilution factor was 7 times, there were 8 concentration points, the theoretical coupling ratio (DAR) of toxin and antibody was 8:1, and the actual coupling ratio was roughly 7.5:1, so the initial concentration of toxin was 4.0 uM, 7 times concentration gradient dilution, 8 concentration points). After mixing, it was added into the corresponding cell holes and incubated at 37°C in carbon dioxide incubator for 5 days. After 5 days, 20uL MTS was added to each well (Promega, G3581) reacted for 2 hours, and the absorption value reading at 490nm was taken with an enzyme label. By detecting the activity of dehydrogenase in mitochondria, IC50 was calculated to evaluate the inhibitory effect of ADC drugs on the proliferation of tumor cells.
Click to Show/Hide
|
||||
| In Vitro Model | Colon adenocarcinoma | SW620 cells | CVCL_0547 | ||
| Experiment 2 Reporting the Activity Date of This ADC | [1] | ||||
| Efficacy Data | Half Maximal inhibitory Concentration (lC63) |
15.98 nM
|
Positive HER2 expression (HER2+++/++) | ||
| Method Description |
Fadu cells were used as in vitro pharmacodynamic detection systems. An appropriate number of tumor cell lines were inoculated in 96-well plates, incubated in carbon dioxide incubators for 24 hours, and then treated with medicine. The drug was diluted in a medium (the initial concentration of ADC drug was 500nM, the dilution factor was 7 times, there were 8 concentration points, the theoretical coupling ratio (DAR) of toxin and antibody was 8:1, and the actual coupling ratio was roughly 7.5:1, so the initial concentration of toxin was 4.0 uM, 7 times concentration gradient dilution, 8 concentration points). After mixing, it was added into the corresponding cell holes and incubated at 37°C in carbon dioxide incubator for 5 days. After 5 days, 20uL MTS was added to each well (Promega, G3581) reacted for 2 hours, and the absorption value reading at 490nm was taken with an enzyme label. By detecting the activity of dehydrogenase in mitochondria, IC50 was calculated to evaluate the inhibitory effect of ADC drugs on the proliferation of tumor cells.
Click to Show/Hide
|
||||
| In Vitro Model | Hypopharyngeal squamous cell carcinoma | FaDu cells | CVCL_1218 | ||
| Experiment 3 Reporting the Activity Date of This ADC | [1] | ||||
| Efficacy Data | Half Maximal inhibitory Concentration (lC63) |
21.2 nM
|
Positive HER2 expression (HER2+++/++) | ||
| Method Description |
N87 cells were used as in vitro pharmacodynamic detection systems. An appropriate number of tumor cell lines were inoculated in 96-well plates, incubated in carbon dioxide incubators for 24 hours, and then treated with medicine. The drug was diluted in a medium (the initial concentration of ADC drug was 500nM, the dilution factor was 7 times, there were 8 concentration points, the theoretical coupling ratio (DAR) of toxin and antibody was 8:1, and the actual coupling ratio was roughly 7.5:1, so the initial concentration of toxin was 4.0 uM, 7 times concentration gradient dilution, 8 concentration points). After mixing, it was added into the corresponding cell holes and incubated at 37°C in carbon dioxide incubator for 5 days. After 5 days, 20uL MTS was added to each well (Promega, G3581) reacted for 2 hours, and the absorption value reading at 490nm was taken with an enzyme label. By detecting the activity of dehydrogenase in mitochondria, IC50 was calculated to evaluate the inhibitory effect of ADC drugs on the proliferation of tumor cells.
Click to Show/Hide
|
||||
| In Vitro Model | Gastric tubular adenocarcinoma | N87 cells | CVCL_1603 | ||
| Experiment 4 Reporting the Activity Date of This ADC | [1] | ||||
| Efficacy Data | Half Maximal inhibitory Concentration (lC63) |
23.21 nM
|
Positive HER2 expression (HER2+++/++) | ||
| Method Description |
BXPC-3 cells were used as in vitro pharmacodynamic detection systems. An appropriate number of tumor cell lines were inoculated in 96-well plates, incubated in carbon dioxide incubators for 24 hours, and then treated with medicine. The drug was diluted in a medium (the initial concentration of ADC drug was 500nM, the dilution factor was 7 times, there were 8 concentration points, the theoretical coupling ratio (DAR) of toxin and antibody was 8:1, and the actual coupling ratio was roughly 7.5:1, so the initial concentration of toxin was 4.0 uM, 7 times concentration gradient dilution, 8 concentration points). After mixing, it was added into the corresponding cell holes and incubated at 37°C in carbon dioxide incubator for 5 days. After 5 days, 20uL MTS was added to each well (Promega, G3581) reacted for 2 hours, and the absorption value reading at 490nm was taken with an enzyme label. By detecting the activity of dehydrogenase in mitochondria, IC50 was calculated to evaluate the inhibitory effect of ADC drugs on the proliferation of tumor cells.
Click to Show/Hide
|
||||
| In Vitro Model | Pancreatic ductal adenocarcinoma | BxPC-3 cells | CVCL_0186 | ||
| Experiment 5 Reporting the Activity Date of This ADC | [1] | ||||
| Efficacy Data | Half Maximal inhibitory Concentration (lC63) |
36.49 nM
|
Positive HER2 and EGFR expression (HER2 and EGFR+++/++) | ||
| Method Description |
A431 cells were used as in vitro pharmacodynamic detection systems. An appropriate number of tumor cell lines were inoculated in 96-well plates, incubated in carbon dioxide incubators for 24 hours, and then treated with medicine. The drug was diluted in a medium (the initial concentration of ADC drug was 500nM, the dilution factor was 7 times, there were 8 concentration points, the theoretical coupling ratio (DAR) of toxin and antibody was 8:1, and the actual coupling ratio was roughly 7.5:1, so the initial concentration of toxin was 4.0 uM, 7 times concentration gradient dilution, 8 concentration points). After mixing, it was added into the corresponding cell holes and incubated at 37°C in carbon dioxide incubator for 5 days. After 5 days, 20uL MTS was added to each well (Promega, G3581) reacted for 2 hours, and the absorption value reading at 490nm was taken with an enzyme label. By detecting the activity of dehydrogenase in mitochondria, IC50 was calculated to evaluate the inhibitory effect of ADC drugs on the proliferation of tumor cells.
Click to Show/Hide
|
||||
| In Vitro Model | Skin squamous cell carcinoma | A431 cells | CVCL_0037 | ||