
Linker Information
General Information of This Linker (ID: LIN0DSBFC)
| Name |
6-Maleimidocaproic acid
|
|||||
|---|---|---|---|---|---|---|
| Linker Type |
Flexible reactive (thiol) linker
|
|||||
| Antibody-Linker Relation |
Uncleavable
|
|||||
| Structure |
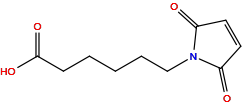
|
|||||
| Formula |
C10H13NO4
|
|||||
| Isosmiles |
C1=CC(=O)N(C1=O)CCCCCC(=O)O
|
|||||
| PubChem CID | ||||||
| InChI |
InChI=1S/C10H13NO4/c12-8-5-6-9(13)11(8)7-3-1-2-4-10(14)15/h5-6H,1-4,7H2,(H,14,15)
|
|||||
| InChIKey |
WOJKKJKETHYEAC-UHFFFAOYSA-N
|
|||||
| IUPAC Name |
6-(2,5-dioxopyrrol-1-yl)hexanoic acid
|
|||||
| Pharmaceutical Properties |
Molecule Weight
|
211.21
|
Polar area
|
74.7
|
||
|
Complexity
|
291
|
xlogp Value
|
1.1
|
|||
|
Heavy Count
|
15
|
Rot Bonds
|
6
|
|||
|
Hbond acc
|
4
|
Hbond Donor
|
1
|
|||
Each Antibody-drug Conjugate Related to This Linker
Full Information of The Activity Data of The ADC(s) Related to This Linker
AU2023308528A1 ADC2 [Investigative]
Discovered Using Cell Line-derived Xenograft Model
| Experiment 1 Reporting the Activity Date of This ADC | [1] | ||||
| Efficacy Data | Tumor Growth lnhibition value (TGl) | > 50% | |||
| Method Description |
mean tumour volume versus time after multiple doses of ADC2 (either Days 1, 8 and 15 or Days 1, 22 and 43) against MDA-MB-231 at 5 mg/kg.
|
||||
| In Vivo Model | MDA-MB-231 Xenograft Model | ||||
| Experiment 2 Reporting the Activity Date of This ADC | [1] | ||||
| Efficacy Data | Tumor Growth lnhibition value (TGl) | > 75% | |||
| Method Description |
one dose of ADC2 (Day 1) against MDA-MB-231 at 5 mg/kg, single IV.
|
||||
| In Vivo Model | MDA-MB-231 Xenograft Model | ||||
| Experiment 3 Reporting the Activity Date of This ADC | [1] | ||||
| Efficacy Data | Complete Remission (CR) | . . . | |||
| Method Description |
one dose of ADC2 (Day 1) against MDA-MB-231 at 10 mg/kg, single IV.
|
||||
| In Vivo Model | MDA-MB-231 Xenograft Model | ||||
| Experiment 4 Reporting the Activity Date of This ADC | [1] | ||||
| Efficacy Data | Complete Remission (CR) | . . . | |||
| Method Description |
mean tumour volume versus time after multiple doses of ADC2 (either Days 1, 8 and 15 or Days 1, 22 and 43) against MDA-MB-231 at 10 mg/kg.
|
||||
| In Vivo Model | MDA-MB-231 Xenograft Model | ||||
MORAb-003 ADC8 [Investigative]
Revealed Based on the Cell Line Data
| Experiment 1 Reporting the Activity Date of This ADC | [2] | ||||
| Efficacy Data | Half Maximal inhibitory Concentration (lC50) | > 100 nM | High FRA expression (FRA +++) | ||
| Method Description |
Use crystal violet analysis to evaluate the in vitro efficacy of the prepared ADCs. Initially screen all MORAb003 ADCs on IGROV1 (FRi (+++)) and SJSA - 1 (FReg (-)) cells.
|
||||
| In Vitro Model | Osteosarcoma | SJSA-1 cells | CVCL_1697 | ||
EP4471061A1 17c10_MC-Dxd [Investigative]
Revealed Based on the Cell Line Data
| Experiment 1 Reporting the Activity Date of This ADC | [3] | ||||
| Efficacy Data | Half Maximal inhibitory Concentration (lC50) |
5- 2 × 10 -5 ug/mL
|
Positive ASCT2 expression (ASCT2+++/++) | ||
| Method Description |
Target cells were seeded in triplicates into flat-bottom 384-wells plate (400 cells for HCT116 cells). Cells were incubated for 3 to 4 hours at 37°C before addition of an equivalent volume of 2X concentrated ADC or free drug-linker dose range (see table 1 for details). Cells were then incubated into a live cell imaging instrument (Incucyte®) for 6 to 8 days and their confluency was monitored all along the culture.
Click to Show/Hide
|
||||
| In Vitro Model | Colon carcinoma | HCT116 cells | CVCL_0291 | ||
| Experiment 2 Reporting the Activity Date of This ADC | [3] | ||||
| Efficacy Data | Half Maximal inhibitory Concentration (lC50) |
135- 6.9 × 10 -3 g/mL
|
Positive ASCT2 expression (ASCT2+++/++) | ||
| Method Description |
Target cells were seeded in triplicates into flat-bottom 384-wells plate (400 cells for HCT116 cells). Cells were incubated for 3 to 4 hours at 37°C before addition of an equivalent volume of 2X concentrated ADC or free drug-linker dose range (see table 1 for details). Cells were then incubated into a live cell imaging instrument (Incucyte®) for 6 to 8 days and their confluency was monitored all along the culture.
Click to Show/Hide
|
||||
| In Vitro Model | Colon adenocarcinoma | WiDr cells | CVCL_2760 | ||
ICT_MC-Dxd (Isotype control) [Investigative]
Revealed Based on the Cell Line Data
| Experiment 1 Reporting the Activity Date of This ADC | [3] | ||||
| Efficacy Data | Half Maximal inhibitory Concentration (lC50) |
5- 2 × 10 -5 ug/mL
|
Positive ASCT2 expression (ASCT2+++/++) | ||
| Method Description |
Target cells were seeded in triplicates into flat-bottom 384-wells plate (400 cells for HCT116 cells). Cells were incubated for 3 to 4 hours at 37°C before addition of an equivalent volume of 2X concentrated ADC or free drug-linker dose range (see table 1 for details). Cells were then incubated into a live cell imaging instrument (Incucyte®) for 6 to 8 days and their confluency was monitored all along the culture.
Click to Show/Hide
|
||||
| In Vitro Model | Colon carcinoma | HCT116 cells | CVCL_0291 | ||
| Experiment 2 Reporting the Activity Date of This ADC | [3] | ||||
| Efficacy Data | Half Maximal inhibitory Concentration (lC50) |
135- 6.9 × 10 -3 g/mL
|
Positive ASCT2 expression (ASCT2+++/++) | ||
| Method Description |
Target cells were seeded in triplicates into flat-bottom 384-wells plate (400 cells for HCT116 cells). Cells were incubated for 3 to 4 hours at 37°C before addition of an equivalent volume of 2X concentrated ADC or free drug-linker dose range (see table 1 for details). Cells were then incubated into a live cell imaging instrument (Incucyte®) for 6 to 8 days and their confluency was monitored all along the culture.
Click to Show/Hide
|
||||
| In Vitro Model | Colon adenocarcinoma | WiDr cells | CVCL_2760 | ||
EP4471061A1 MC_Dxd [Investigative]
Revealed Based on the Cell Line Data
| Experiment 1 Reporting the Activity Date of This ADC | [3] | ||||
| Efficacy Data | Half Maximal inhibitory Concentration (lC50) |
9- 4.6 × 10 -4 ug/mL
|
Positive ASCT2 expression (ASCT2+++/++) | ||
| Method Description |
Target cells were seeded in triplicates into flat-bottom 384-wells plate (400 cells for HCT116 cells). Cells were incubated for 3 to 4 hours at 37°C before addition of an equivalent volume of 2X concentrated ADC or free drug-linker dose range (see table 1 for details). Cells were then incubated into a live cell imaging instrument (Incucyte®) for 6 to 8 days and their confluency was monitored all along the culture.
Click to Show/Hide
|
||||
| In Vitro Model | Colon carcinoma | HCT116 cells | CVCL_0291 | ||
| Experiment 2 Reporting the Activity Date of This ADC | [3] | ||||
| Efficacy Data | Half Maximal inhibitory Concentration (lC50) |
9- 4.6 × 10 -4 ug/mL
|
Positive ASCT2 expression (ASCT2+++/++) | ||
| Method Description |
Target cells were seeded in triplicates into flat-bottom 384-wells plate (400 cells for HCT116 cells). Cells were incubated for 3 to 4 hours at 37°C before addition of an equivalent volume of 2X concentrated ADC or free drug-linker dose range (see table 1 for details). Cells were then incubated into a live cell imaging instrument (Incucyte®) for 6 to 8 days and their confluency was monitored all along the culture.
Click to Show/Hide
|
||||
| In Vitro Model | Colon adenocarcinoma | WiDr cells | CVCL_2760 | ||
References