
Linker Information
General Information of This Linker (ID: LIN0BSKSQ)
| Name |
Mal-Val-Ala-PAB
|
|||||
|---|---|---|---|---|---|---|
| Linker Type |
Cathepsin-cleavable linker
|
|||||
| Antibody-Linker Relation |
Cleavable
|
|||||
| Structure |
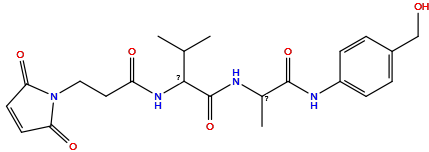
|
|||||
| Formula |
C22H28N4O6
|
|||||
| Isosmiles |
CC(NC(=O)C(NC(=O)CCN1C(=O)C=CC1=O)C(C)C)C(=O)Nc1ccc(CO)cc1
|
|||||
| InChI |
InChI=1S/C22H28N4O6/c1-13(2)20(25-17(28)10-11-26-18(29)8-9-19(26)30)22(32)23-14(3)21(31)24-16-6-4-15(12-27)5-7-16/h4-9,13-14,20,27H,10-12H2,1-3H3,(H,23,32)(H,24,31)(H,25,28)
|
|||||
| InChIKey |
NSHZSEBCOJNZHE-UHFFFAOYSA-N
|
|||||
| Pharmaceutical Properties |
Molecule Weight
|
444.488
|
Polar area
|
144.91
|
||
|
Complexity
|
32
|
xlogp Value
|
0.078
|
|||
|
Heavy Count
|
32
|
Rot Bonds
|
10
|
|||
|
Hbond acc
|
6
|
Hbond Donor
|
4
|
|||
Each Antibody-drug Conjugate Related to This Linker
Full Information of The Activity Data of The ADC(s) Related to This Linker
Pamlectabart tismanitin [Phase 1/2]
Identified from the Human Clinical Data
| Experiment 1 Reporting the Activity Date of This ADC | [1] | ||||
| Patients Enrolled |
Eligibility requires adults (≥18) with IMWG-defined active MM after ≥3 prior lines (IMiD/PI/anti-CD38) who are transplant-ineligible/post-SCT, excluding those with plasma cell leukemia, active CNS/other malignancies, uncontrolled infections (HIV/HBV/HCV), or recent SCT/radiotherapy (<12/<21 weeks). Phase 2a specifically excludes prior BCMA-targeted therapy exposure.
Click to Show/Hide
|
||||
| Administration Dosage |
Participants will receive HDP-101 intravenously in a 21 day cycle until disease progression, intolerable toxicity, Investigator's discretion or patient withdrawal.During the phase 1 tolerability of different dose levels will be evaluated. During the phase 2a dose expansion part the recommended phase 2 dose (RP2D) of HDP-101 will be administered.
|
||||
| Related Clinical Trial | |||||
| NCT Number | NCT04879043 | Clinical Status | PHASE1|||PHASE2 | ||
| Clinical Description |
A Phase 1/2a, First-in-human Study to Evaluate the Safety, Tolerability, Pharmacokinetics, and Efficacy of HDP-101 in Patients With Plasma Cell Disorders Including Multiple Myeloma
|
||||
| Primary Endpoint |
Primary endpoints evaluate safety (dose-limiting toxicities during first 21-day cycle) and efficacy (objective response rate per IMWG criteria including sCR/CR/VGPR/PR) in relapsed/refractory multiple myeloma patients over approximately 1 year.
|
||||
| Other Endpoint |
Secondary objectives include comprehensive safety assessment (CTCAE v5.0 graded AEs) and clinical activity measures (PFS/OS) to characterize HDP-101's therapeutic profile, with all endpoints monitored throughout the 1-year study duration.
|
||||
Revealed Based on the Cell Line Data
| Experiment 1 Reporting the Activity Date of This ADC | [2] | ||||
| Efficacy Data | Half Maximal Inhibitory Concentration (IC50) |
0.01 nM
|
|||
| Method Description |
The inhibitory activity of HDP-101 against cancer cell growth was evaluated in various human cancer cell lines in vitro. The cells were treated 2 or 4 days.
|
||||
| In Vitro Model | Plasma cell myeloma | U266B1 cells | CVCL_0566 | ||
| Experiment 2 Reporting the Activity Date of This ADC | [2] | ||||
| Efficacy Data | Half Maximal Inhibitory Concentration (IC50) |
0.04 nM
|
|||
| Method Description |
The inhibitory activity of HDP-101 against cancer cell growth was evaluated in various human cancer cell lines in vitro. The cells were treated 2 or 4 days.
|
||||
| In Vitro Model | Plasma cell myeloma | NCI-H929 cells | CVCL_1600 | ||
| Experiment 3 Reporting the Activity Date of This ADC | [2] | ||||
| Efficacy Data | Half Maximal Inhibitory Concentration (IC50) |
0.16 nM
|
|||
| Method Description |
The inhibitory activity of HDP-101 against cancer cell growth was evaluated in various human cancer cell lines in vitro. The cells were treated 2 or 4 days.
|
||||
| In Vitro Model | Plasma cell myeloma | MM1.S cells | CVCL_8792 | ||
| Experiment 4 Reporting the Activity Date of This ADC | [2] | ||||
| Efficacy Data | Half Maximal Inhibitory Concentration (IC50) |
0.18 nM
|
|||
| Method Description |
The inhibitory activity of HDP-101 against cancer cell growth was evaluated in various human cancer cell lines in vitro. The cells were treated 2 or 4 days.
|
||||
| In Vitro Model | Plasma cell myeloma | INA-6 cells | CVCL_5209 | ||
| Experiment 5 Reporting the Activity Date of This ADC | [2] | ||||
| Efficacy Data | Half Maximal Inhibitory Concentration (IC50) |
0.3 nM
|
|||
| Method Description |
The inhibitory activity of HDP-101 against cancer cell growth was evaluated in various human cancer cell lines in vitro. The cells were treated 2 or 4 days.
|
||||
| In Vitro Model | Plasma cell myeloma | LP-1 cells | CVCL_0012 | ||
| Experiment 6 Reporting the Activity Date of This ADC | [2] | ||||
| Efficacy Data | Half Maximal Inhibitory Concentration (IC50) |
0.34 nM
|
|||
| Method Description |
The inhibitory activity of HDP-101 against cancer cell growth was evaluated in various human cancer cell lines in vitro. The cells were treated 2 or 4 days.
|
||||
| In Vitro Model | Multiple myeloma | SK-MM-1 cells | CVCL_A478 | ||
| Experiment 7 Reporting the Activity Date of This ADC | [2] | ||||
| Efficacy Data | Half Maximal Inhibitory Concentration (IC50) |
4.83 nM
|
|||
| Method Description |
The inhibitory activity of HDP-101 against cancer cell growth was evaluated in various human cancer cell lines in vitro. The cells were treated 2 or 4 days.
|
||||
| In Vitro Model | Plasma cell myeloma | L-363 cells | CVCL_1357 | ||
| Experiment 8 Reporting the Activity Date of This ADC | [2] | ||||
| Efficacy Data | Half Maximal Inhibitory Concentration (IC50) |
34.2 nM
|
|||
| Method Description |
The inhibitory activity of HDP-101 against cancer cell growth was evaluated in various human cancer cell lines in vitro. The cells were treated 2 or 4 days.
|
||||
| In Vitro Model | Plasma cell myeloma | OPM-2 cells | CVCL_1625 | ||
| Experiment 9 Reporting the Activity Date of This ADC | [2] | ||||
| Efficacy Data | Half Maximal Inhibitory Concentration (IC50) |
142 nM
|
|||
| Method Description |
The inhibitory activity of HDP-101 against cancer cell growth was evaluated in various human cancer cell lines in vitro. The cells were treated 2 or 4 days.
|
||||
| In Vitro Model | Plasma cell myeloma | RPMI-8226 cells | CVCL_0014 | ||
| Experiment 10 Reporting the Activity Date of This ADC | [2] | ||||
| Efficacy Data | Half Maximal Inhibitory Concentration (IC50) | > 1000 nM | |||
| Method Description |
The inhibitory activity of HDP-101 against cancer cell growth was evaluated in various human cancer cell lines in vitro. The cells were treated 2 or 4 days.
|
||||
| In Vitro Model | Osteosarcoma | U2OS cells | CVCL_0042 | ||
| Experiment 11 Reporting the Activity Date of This ADC | [2] | ||||
| Efficacy Data | Half Maximal Inhibitory Concentration (IC50) | > 1000 nM | |||
| Method Description |
The inhibitory activity of HDP-101 against cancer cell growth was evaluated in various human cancer cell lines in vitro. The cells were treated 2 or 4 days.
|
||||
| In Vitro Model | Normal | HS-5 cells | CVCL_3720 | ||
Cetuximab-SNS-032 ADC [Investigative]
Revealed Based on the Cell Line Data
| Experiment 1 Reporting the Activity Date of This ADC | [3] | ||||
| Efficacy Data | Half Maximal inhibitory Concentration (lC50) |
0.79 nM
|
Low HER2 expression (HER2+) | ||
| Method Description |
To measure cell viability, 5,000 cells per well were plated in 96-well plates and incubated with cetuximab, isotype ADC, ADC, or free inhibitor for 96 hours at 37°C. Cell viabilities were detected by CellTiter 96 AQueous One Solution Cell Proliferation Assay (Promega) according to the manufacturer's instructions. Optical absorbance was read on a FLUOstar Omega spectrophotometer (BMG Labtech; RRID:SCR_025024).
Click to Show/Hide
|
||||
| In Vitro Model | Breast adenocarcinoma | MDA-MB-468 cells | CVCL_0419 | ||
hRS7 ATAC 1 [Investigative]
Revealed Based on the Cell Line Data
| Experiment 1 Reporting the Activity Date of This ADC | [4] | ||||
| Efficacy Data | Half Maximal Effective Concentration (EC50) |
0.04 nM
|
Moderate TROP2 expression (TROP2++) | ||
| Method Description |
Cells were seeded at a density of 2 × 10³ cells/well in 90 uL of the respective culture medium. On the following day, cells were exposed to ATACs and incubated at 37°C and 5% CO2 with serial dilutions from 1 × 10⁻⁷ mol/L to 1.28 × 10⁻¹² mol/L of the ATACs for 96 hours. Cell proliferation was assessed by the BrdU chemiluminescent ELISA assay (Roche; Sigma-Aldrich/Merck, Cat. # 1669915001), according to the manufacturer's instructions. Luminescence signal intensities were measured directly in a microplate reader (BMG CLARIOstar). Triplicate wells were used for each treatment, and viability was normalized to untreated cells. Error was calculated as the SEM of three independent experiments.
Click to Show/Hide
|
||||
| In Vitro Model | Pancreatic ductal adenocarcinoma | Capan-2 cells | CVCL_0026 | ||
| Experiment 2 Reporting the Activity Date of This ADC | [4] | ||||
| Efficacy Data | Half Maximal Effective Concentration (EC50) |
0.05 nM
|
High TROP2 expression (TROP2 +++) | ||
| Method Description |
Cells were seeded at a density of 2 × 10³ cells/well in 90 uL of the respective culture medium. On the following day, cells were exposed to ATACs and incubated at 37°C and 5% CO2 with serial dilutions from 1 × 10⁻⁷ mol/L to 1.28 × 10⁻¹² mol/L of the ATACs for 96 hours. Cell proliferation was assessed by the BrdU chemiluminescent ELISA assay (Roche; Sigma-Aldrich/Merck, Cat. # 1669915001), according to the manufacturer's instructions. Luminescence signal intensities were measured directly in a microplate reader (BMG CLARIOstar). Triplicate wells were used for each treatment, and viability was normalized to untreated cells. Error was calculated as the SEM of three independent experiments.
Click to Show/Hide
|
||||
| In Vitro Model | Pancreatic ductal adenocarcinoma | BxPC-3 cells | CVCL_0186 | ||
| Experiment 3 Reporting the Activity Date of This ADC | [4] | ||||
| Efficacy Data | Half Maximal Effective Concentration (EC50) |
0.06 nM
|
High TROP2 expression (TROP2 +++) | ||
| Method Description |
Cells were seeded at a density of 2 × 10³ cells/well in 90 uL of the respective culture medium. On the following day, cells were exposed to ATACs and incubated at 37°C and 5% CO2 with serial dilutions from 1 × 10⁻⁷ mol/L to 1.28 × 10⁻¹² mol/L of the ATACs for 96 hours. Cell proliferation was assessed by the BrdU chemiluminescent ELISA assay (Roche; Sigma-Aldrich/Merck, Cat. # 1669915001), according to the manufacturer's instructions. Luminescence signal intensities were measured directly in a microplate reader (BMG CLARIOstar). Triplicate wells were used for each treatment, and viability was normalized to untreated cells. Error was calculated as the SEM of three independent experiments.
Click to Show/Hide
|
||||
| In Vitro Model | Pancreatic ductal adenocarcinoma | Capan-1 cells | CVCL_0237 | ||
| Experiment 4 Reporting the Activity Date of This ADC | [4] | ||||
| Efficacy Data | Half Maximal Effective Concentration (EC50) | > 100 nM | Moderate TROP2 expression (TROP2++) | ||
| Method Description |
Cells were seeded at a density of 2 × 10³ cells/well in 90 uL of the respective culture medium. On the following day, cells were exposed to ATACs and incubated at 37°C and 5% CO2 with serial dilutions from 1 × 10⁻⁷ mol/L to 1.28 × 10⁻¹² mol/L of the ATACs for 96 hours. Cell proliferation was assessed by the BrdU chemiluminescent ELISA assay (Roche; Sigma-Aldrich/Merck, Cat. # 1669915001), according to the manufacturer's instructions. Luminescence signal intensities were measured directly in a microplate reader (BMG CLARIOstar). Triplicate wells were used for each treatment, and viability was normalized to untreated cells. Error was calculated as the SEM of three independent experiments.
Click to Show/Hide
|
||||
| In Vitro Model | Pancreatic ductal adenocarcinoma | Capan-2 cells | CVCL_0026 | ||
HER2-17 [Investigative]
Revealed Based on the Cell Line Data
| Experiment 1 Reporting the Activity Date of This ADC | [5] | ||||
| Efficacy Data | Half Maximal Effective Concentration (EC50) |
142.21䔾.91 ng/mL
|
High HER2 expression (HER2+++; >300,000 HER2 molecules/cell) | ||
| Method Description |
Cells were distributed into 96-well white round-bottom plates, with each well receiving 1000 cells in RPMI-1640 medium supplemented with 10% FBS. Following a 24-hour incubation period, diluted compounds were introduced to the wells. After 144 hours, a CellTiter-Glo luminescent cell viability assay (Promega, Madison, WI, USA) was performed to assess cell viability. The luminescent readings were normalized as percentages relative to untreated cells, and the IC50 values for each compound were determined.
Click to Show/Hide
|
||||
| In Vitro Model | Gastric tubular adenocarcinoma | NCI-N87 cells | CVCL_1603 | ||
HER2-14 [Investigative]
Revealed Based on the Cell Line Data
| Experiment 1 Reporting the Activity Date of This ADC | [5] | ||||
| Efficacy Data | Half Maximal Effective Concentration (EC50) |
145.43䔿.69 ng/mL
|
High HER2 expression (HER2+++; >300,000 HER2 molecules/cell) | ||
| Method Description |
Cells were distributed into 96-well white round-bottom plates, with each well receiving 1000 cells in RPMI-1640 medium supplemented with 10% FBS. Following a 24-hour incubation period, diluted compounds were introduced to the wells. After 144 hours, a CellTiter-Glo luminescent cell viability assay (Promega, Madison, WI, USA) was performed to assess cell viability. The luminescent readings were normalized as percentages relative to untreated cells, and the IC50 values for each compound were determined.
Click to Show/Hide
|
||||
| In Vitro Model | Gastric tubular adenocarcinoma | NCI-N87 cells | CVCL_1603 | ||
References