
Antibody-drug Conjugate Information
General Information of This Antibody-drug Conjugate (ADC)
| ADC ID |
DRG0YJVVL
|
|||||
|---|---|---|---|---|---|---|
| ADC Name |
RAA22/B09-AZ1508
|
|||||
| Synonyms |
RAA22/B09 AZ1508
Click to Show/Hide
|
|||||
| Organization |
AstraZeneca PLC
|
|||||
| Drug Status |
Investigative
|
|||||
| Drug-to-Antibody Ratio |
2
|
|||||
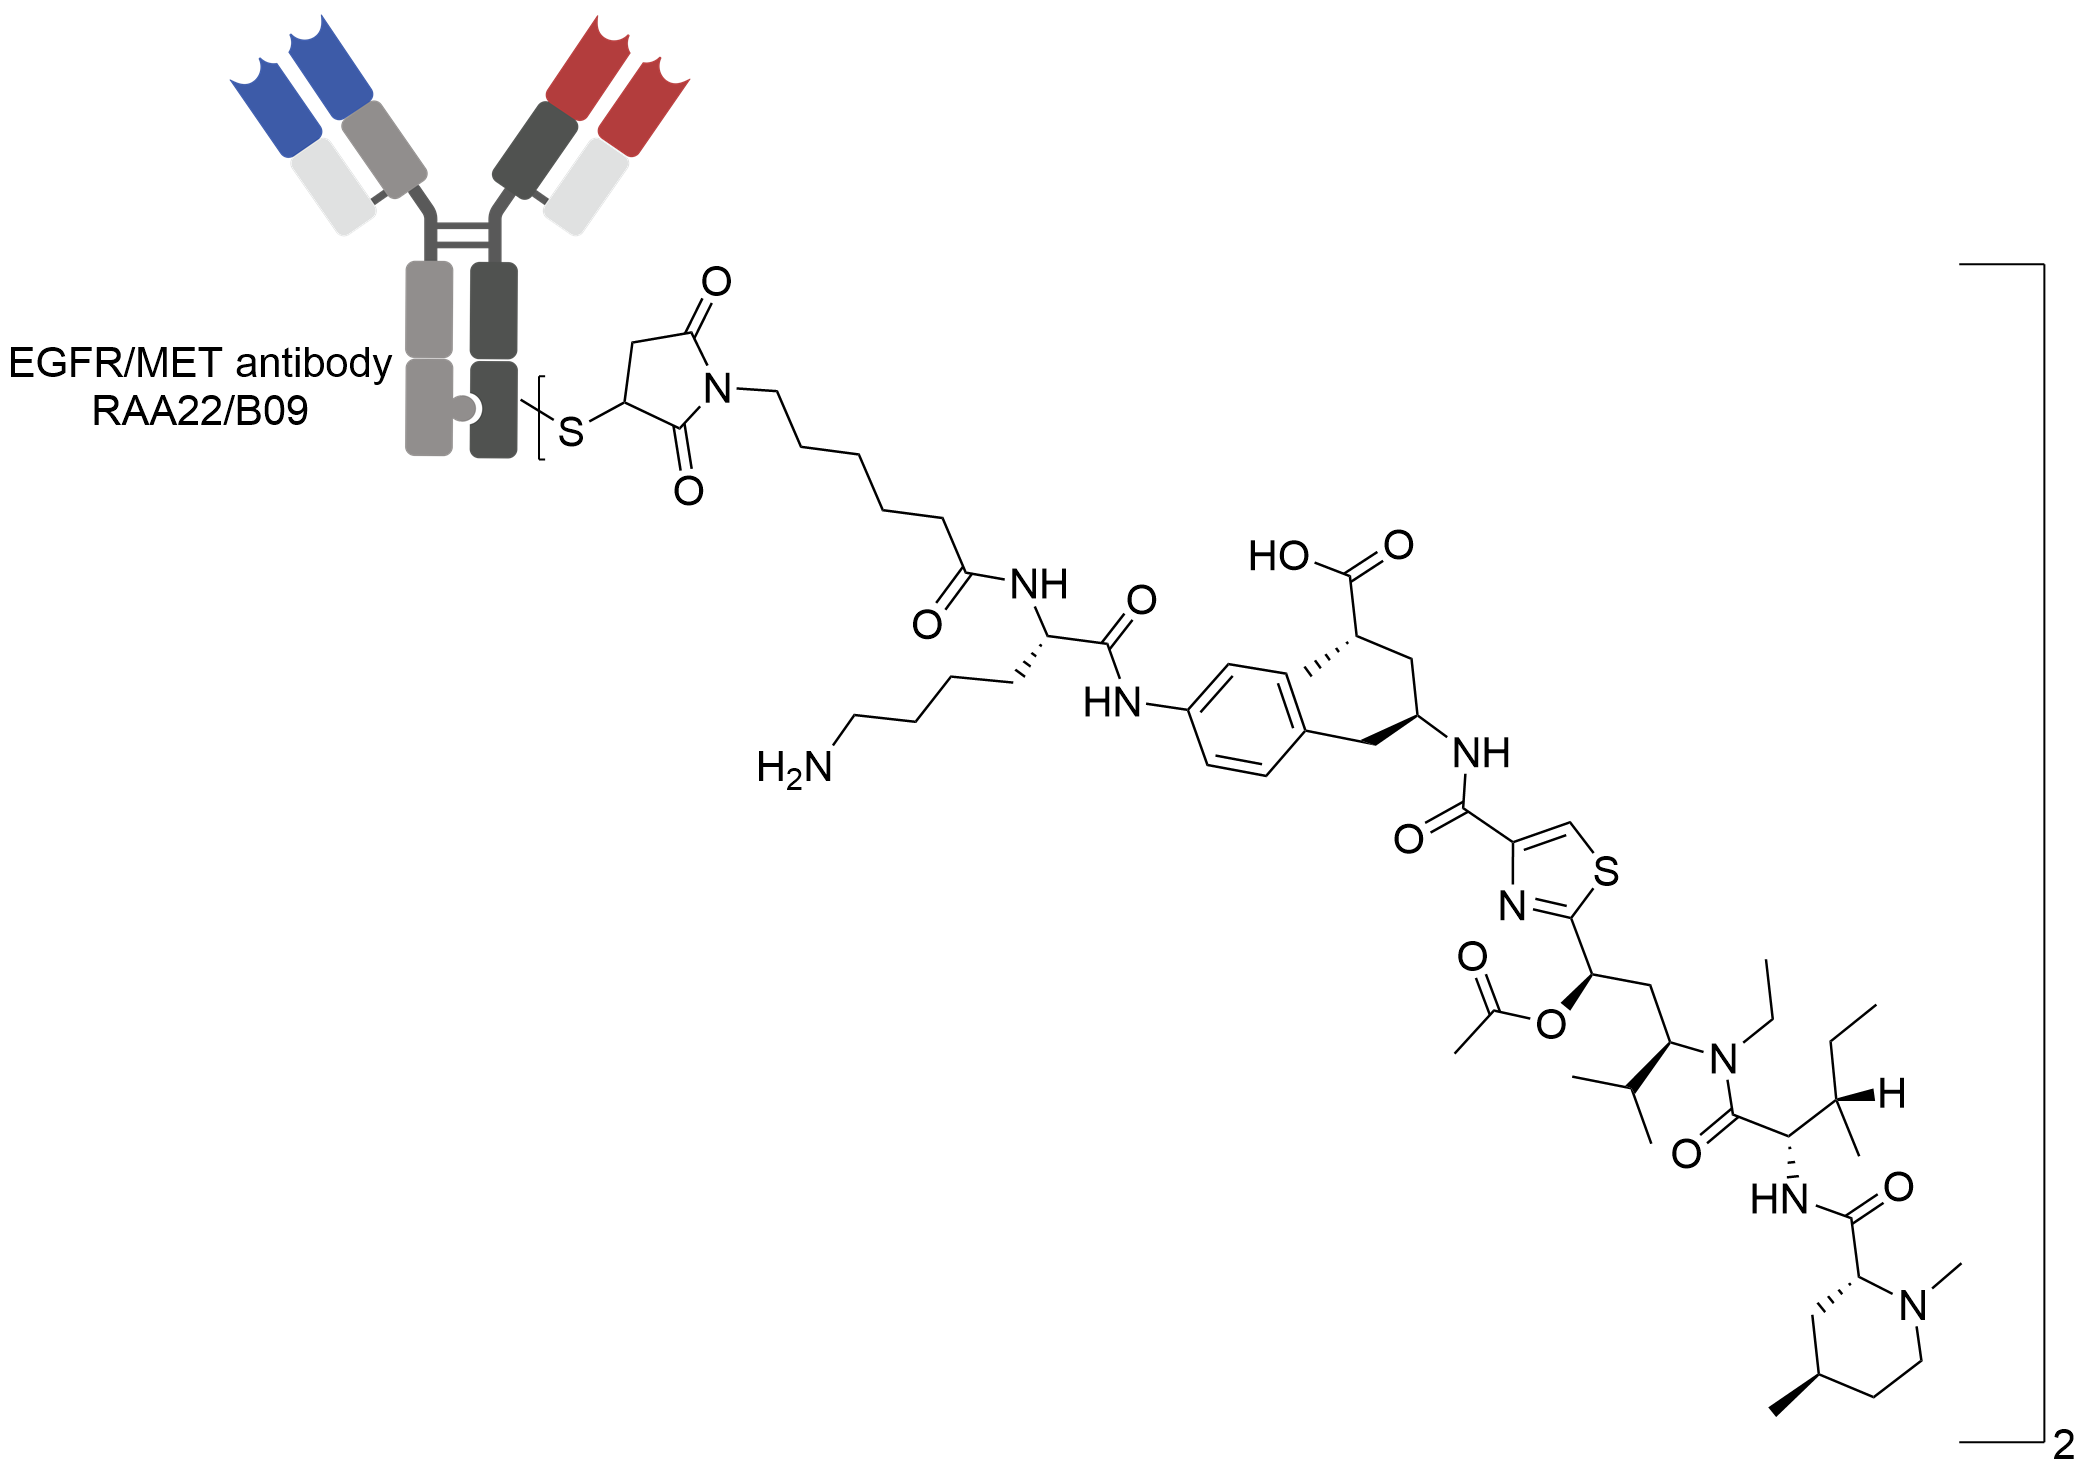
| Structure |
|
|||||
| Antibody Name |
RAA22/B09
|
Antibody Info | ||||
| Antigen Name |
Epidermal growth factor receptor (EGFR); Hepatocyte growth factor receptor (MET)
|
Antigen Info | ||||
| Payload Name |
RAA22/B09-AZ1508
|
Payload Info | ||||
| Therapeutic Target |
Microtubule (MT)
|
Target Info | ||||
| Linker Name |
RAA22/B09-AZ1508
|
Linker Info | ||||
| Conjugate Type |
Site-specific conjugation through reduced inter-chain cysteines.
|
|||||
| Combination Type |
AZ1508
|
|||||
General Information of The Activity Data Related to This ADC
Discovered Using Patient-derived Xenograft Model
Revealed Based on the Cell Line Data
Full List of Activity Data of This Antibody-drug Conjugate
Discovered Using Patient-derived Xenograft Model
| Experiment 1 Reporting the Activity Date of This ADC | [1] | ||||
| Efficacy Data | Tumor Growth Inhibition value (TGI) | ≈ 0% | |||
| Method Description |
When tumors reached the appropriate Tumor Volume lnitiation (TVl) range (125-250 mm3), animalswere randomized into treatment and control groups and intravenous (lV) dosing was initiated (Day 0). lnitial dosing began on Day 0; animals in allgroups were dosed l.V. by weight (0.01 ml per gram; 10 ml/kg). Drug treated animals were dosed every 7days for a total of 4 doses.
Click to Show/Hide
|
||||
| In Vivo Model | Lung cancer PDX model (PDX: ST599) | ||||
| Experiment 2 Reporting the Activity Date of This ADC | [1] | ||||
| Efficacy Data | Tumor Growth Inhibition value (TGI) | ≈ 0% | |||
| Method Description |
When tumors reached the appropriate Tumor Volume lnitiation (TVl) range (125-250 mm3), animalswere randomized into treatment and control groups and intravenous (lV) dosing was initiated (Day 0). lnitial dosing began on Day 0; animals in allgroups were dosed l.V. by weight (0.01 ml per gram; 10 ml/kg). Drug treated animals were dosed every 7days for a total of 4 doses.
Click to Show/Hide
|
||||
| In Vivo Model | Lung cancer PDX model (PDX: ST1506) | ||||
| Experiment 3 Reporting the Activity Date of This ADC | [1] | ||||
| Efficacy Data | Tumor Growth Inhibition value (TGI) | ≈ 0% | |||
| Method Description |
When tumors reached the appropriate Tumor Volume lnitiation (TVl) range (125-250 mm3), animalswere randomized into treatment and control groups and intravenous (lV) dosing was initiated (Day 0). lnitial dosing began on Day 0; animals in allgroups were dosed l.V. by weight (0.01 ml per gram; 10 ml/kg). Drug treated animals were dosed every 7days for a total of 4 doses.
Click to Show/Hide
|
||||
| In Vivo Model | Lung cancer PDX model (PDX: ST551C) | ||||
| Experiment 4 Reporting the Activity Date of This ADC | [1] | ||||
| Efficacy Data | Tumor Growth Inhibition value (TGI) | ≈ 0% | |||
| Method Description |
When tumors reached the appropriate Tumor Volume lnitiation (TVl) range (125-250 mm3), animalswere randomized into treatment and control groups and intravenous (lV) dosing was initiated (Day 0). lnitial dosing began on Day 0; animals in allgroups were dosed l.V. by weight (0.01 ml per gram; 10 ml/kg). Drug treated animals were dosed every 7days for a total of 4 doses.
Click to Show/Hide
|
||||
| In Vivo Model | Lung cancer PDX model (PDX: ST551) | ||||
| Experiment 5 Reporting the Activity Date of This ADC | [1] | ||||
| Efficacy Data | Tumor Growth Inhibition value (TGI) | ≈ 0% | |||
| Method Description |
When tumors reached the appropriate Tumor Volume lnitiation (TVl) range (125-250 mm3), animalswere randomized into treatment and control groups and intravenous (lV) dosing was initiated (Day 0). lnitial dosing began on Day 0; animals in allgroups were dosed l.V. by weight (0.01 ml per gram; 10 ml/kg). Drug treated animals were dosed every 7days for a total of 4 doses.
Click to Show/Hide
|
||||
| In Vivo Model | Lung cancer PDX model (PDX: ST115) | ||||
| Experiment 6 Reporting the Activity Date of This ADC | [1] | ||||
| Efficacy Data | Tumor Growth Inhibition value (TGI) | ≈ 0% | |||
| Method Description |
When tumors reached the appropriate Tumor Volume lnitiation (TVl) range (125-250 mm3), animalswere randomized into treatment and control groups and intravenous (lV) dosing was initiated (Day 0). lnitial dosing began on Day 0; animals in allgroups were dosed l.V. by weight (0.01 ml per gram; 10 ml/kg). Drug treated animals were dosed every 7days for a total of 4 doses.
Click to Show/Hide
|
||||
| In Vivo Model | Lung cancer PDX model (PDX: ST1976B) | ||||
| Experiment 7 Reporting the Activity Date of This ADC | [1] | ||||
| Efficacy Data | Tumor Growth Inhibition value (TGI) | ≈ 0% | |||
| Method Description |
When tumors reached the appropriate Tumor Volume lnitiation (TVl) range (125-250 mm3), animalswere randomized into treatment and control groups and intravenous (lV) dosing was initiated (Day 0). lnitial dosing began on Day 0; animals in allgroups were dosed l.V. by weight (0.01 ml per gram; 10 ml/kg). Drug treated animals were dosed every 7days for a total of 4 doses.
Click to Show/Hide
|
||||
| In Vivo Model | Lung cancer PDX model (PDX: ST1092B) | ||||
| Experiment 8 Reporting the Activity Date of This ADC | [1] | ||||
| Efficacy Data | Tumor Growth Inhibition value (TGI) | ≈ 0% | |||
| Method Description |
When tumors reached the appropriate Tumor Volume lnitiation (TVl) range (125-250 mm3), animalswere randomized into treatment and control groups and intravenous (lV) dosing was initiated (Day 0). lnitial dosing began on Day 0; animals in allgroups were dosed l.V. by weight (0.01 ml per gram; 10 ml/kg). Drug treated animals were dosed every 7days for a total of 4 doses.
Click to Show/Hide
|
||||
| In Vivo Model | Lung cancer PDX model (PDX: ST2891) | ||||
| Experiment 9 Reporting the Activity Date of This ADC | [1] | ||||
| Efficacy Data | Tumor Growth Inhibition value (TGI) | ≈ 0% | |||
| Method Description |
When tumors reached the appropriate Tumor Volume lnitiation (TVl) range (125-250 mm3), animalswere randomized into treatment and control groups and intravenous (lV) dosing was initiated (Day 0). lnitial dosing began on Day 0; animals in allgroups were dosed l.V. by weight (0.01 ml per gram; 10 ml/kg). Drug treated animals were dosed every 7days for a total of 4 doses.
Click to Show/Hide
|
||||
| In Vivo Model | Lung cancer PDX model (PDX: ST374) | ||||
| Experiment 10 Reporting the Activity Date of This ADC | [1] | ||||
| Efficacy Data | Tumor Growth Inhibition value (TGI) | ≈ 0% | |||
| Method Description |
When tumors reached the appropriate Tumor Volume lnitiation (TVl) range (125-250 mm3), animalswere randomized into treatment and control groups and intravenous (lV) dosing was initiated (Day 0). lnitial dosing began on Day 0; animals in allgroups were dosed l.V. by weight (0.01 ml per gram; 10 ml/kg). Drug treated animals were dosed every 7days for a total of 4 doses.
Click to Show/Hide
|
||||
| In Vivo Model | Lung cancer PDX model (PDX: ST751) | ||||
| Experiment 11 Reporting the Activity Date of This ADC | [1] | ||||
| Efficacy Data | Tumor Growth Inhibition value (TGI) | ≈ 0% | |||
| Method Description |
When tumors reached the appropriate Tumor Volume lnitiation (TVl) range (125-250 mm3), animalswere randomized into treatment and control groups and intravenous (lV) dosing was initiated (Day 0). lnitial dosing began on Day 0; animals in allgroups were dosed l.V. by weight (0.01 ml per gram; 10 ml/kg). Drug treated animals were dosed every 7days for a total of 4 doses.
Click to Show/Hide
|
||||
| In Vivo Model | Lung cancer PDX model (PDX: ST2081) | ||||
| Experiment 12 Reporting the Activity Date of This ADC | [1] | ||||
| Efficacy Data | Tumor Growth Inhibition value (TGI) | ≈ 0% | |||
| Method Description |
When tumors reached the appropriate Tumor Volume lnitiation (TVl) range (125-250 mm3), animalswere randomized into treatment and control groups and intravenous (lV) dosing was initiated (Day 0). lnitial dosing began on Day 0; animals in allgroups were dosed l.V. by weight (0.01 ml per gram; 10 ml/kg). Drug treated animals were dosed every 7days for a total of 4 doses.
Click to Show/Hide
|
||||
| In Vivo Model | Lung cancer PDX model (PDX: ST935B) | ||||
| Experiment 13 Reporting the Activity Date of This ADC | [1] | ||||
| Efficacy Data | Tumor Growth Inhibition value (TGI) | ≈ 0% | |||
| Method Description |
When tumors reached the appropriate Tumor Volume lnitiation (TVl) range (125-250 mm3), animalswere randomized into treatment and control groups and intravenous (lV) dosing was initiated (Day 0). lnitial dosing began on Day 0; animals in allgroups were dosed l.V. by weight (0.01 ml per gram; 10 ml/kg). Drug treated animals were dosed every 7days for a total of 4 doses.
Click to Show/Hide
|
||||
| In Vivo Model | Lung cancer PDX model (PDX: ST2495) | ||||
| Experiment 14 Reporting the Activity Date of This ADC | [1] | ||||
| Efficacy Data | Tumor Growth Inhibition value (TGI) | ≈ 0% | |||
| Method Description |
When tumors reached the appropriate Tumor Volume lnitiation (TVl) range (125-250 mm3), animalswere randomized into treatment and control groups and intravenous (lV) dosing was initiated (Day 0). lnitial dosing began on Day 0; animals in allgroups were dosed l.V. by weight (0.01 ml per gram; 10 ml/kg). Drug treated animals were dosed every 7days for a total of 4 doses.
Click to Show/Hide
|
||||
| In Vivo Model | Lung cancer PDX model (PDX: ST1749) | ||||
| Experiment 15 Reporting the Activity Date of This ADC | [1] | ||||
| Efficacy Data | Tumor Growth Inhibition value (TGI) | ≈ 0% | |||
| Method Description |
When tumors reached the appropriate Tumor Volume lnitiation (TVl) range (125-250 mm3), animalswere randomized into treatment and control groups and intravenous (lV) dosing was initiated (Day 0). lnitial dosing began on Day 0; animals in allgroups were dosed l.V. by weight (0.01 ml per gram; 10 ml/kg). Drug treated animals were dosed every 7days for a total of 4 doses.
Click to Show/Hide
|
||||
| In Vivo Model | Lung cancer PDX model (PDX: ST742) | ||||
| Experiment 16 Reporting the Activity Date of This ADC | [1] | ||||
| Efficacy Data | Tumor Growth Inhibition value (TGI) | ≈ 0% | |||
| Method Description |
When tumors reached the appropriate Tumor Volume lnitiation (TVl) range (125-250 mm3), animalswere randomized into treatment and control groups and intravenous (lV) dosing was initiated (Day 0). lnitial dosing began on Day 0; animals in allgroups were dosed l.V. by weight (0.01 ml per gram; 10 ml/kg). Drug treated animals were dosed every 7days for a total of 4 doses.
Click to Show/Hide
|
||||
| In Vivo Model | Lung cancer PDX model (PDX: ST1104B) | ||||
| Experiment 17 Reporting the Activity Date of This ADC | [1] | ||||
| Efficacy Data | Tumor Growth Inhibition value (TGI) | ≈ 0-10 % | |||
| Method Description |
When tumors reached the appropriate Tumor Volume lnitiation (TVl) range (125-250 mm3), animalswere randomized into treatment and control groups and intravenous (lV) dosing was initiated (Day 0). lnitial dosing began on Day 0; animals in allgroups were dosed l.V. by weight (0.01 ml per gram; 10 ml/kg). Drug treated animals were dosed every 7days for a total of 4 doses.
Click to Show/Hide
|
||||
| In Vivo Model | Lung cancer PDX model (PDX: ST1328) | ||||
| Experiment 18 Reporting the Activity Date of This ADC | [1] | ||||
| Efficacy Data | Tumor Growth Inhibition value (TGI) | ≈ 0-10 % | |||
| Method Description |
When tumors reached the appropriate Tumor Volume lnitiation (TVl) range (125-250 mm3), animalswere randomized into treatment and control groups and intravenous (lV) dosing was initiated (Day 0). lnitial dosing began on Day 0; animals in allgroups were dosed l.V. by weight (0.01 ml per gram; 10 ml/kg). Drug treated animals were dosed every 7days for a total of 4 doses.
Click to Show/Hide
|
||||
| In Vivo Model | Lung cancer PDX model (PDX: ST1885) | ||||
| Experiment 19 Reporting the Activity Date of This ADC | [1] | ||||
| Efficacy Data | Tumor Growth Inhibition value (TGI) | ≈ 1.80% | |||
| Method Description |
To assist in the selection of the appropriate EGFR affinity combination for the EGFR-CMET bispecific ADC, high and low affinity EGFR-CMET bispecific ADCs (1 mg/kg.) were compared in an in vivo eficacy study usingthe MEDI-PANC-08 pancreatic PDX model.
|
||||
| In Vivo Model | Pancreatic PDX model (PDX: MEDI-PANC-08) | ||||
| Experiment 20 Reporting the Activity Date of This ADC | [1] | ||||
| Efficacy Data | Tumor Growth Inhibition value (TGI) | ≈ 10% | |||
| Method Description |
When tumors reached the appropriate Tumor Volume lnitiation (TVl) range (125-250 mm3), animalswere randomized into treatment and control groups and intravenous (lV) dosing was initiated (Day 0). lnitial dosing began on Day 0; animals in allgroups were dosed l.V. by weight (0.01 ml per gram; 10 ml/kg). Drug treated animals were dosed every 7days for a total of 4 doses.
Click to Show/Hide
|
||||
| In Vivo Model | Lung cancer PDX model (PDX: ST379) | ||||
| Experiment 21 Reporting the Activity Date of This ADC | [1] | ||||
| Efficacy Data | Tumor Growth Inhibition value (TGI) | ≈ 11.16% | |||
| Method Description |
To assist in the selection of the appropriate EGFR affinity combination for the EGFR-CMET bispecific ADC, high and low affinity EGFR-CMET bispecific ADCs (2 mg/kg.) were compared in an in vivo eficacy study usingthe MEDI-PANC-08 pancreatic PDX model.
|
||||
| In Vivo Model | Pancreatic PDX model (PDX: MEDI-PANC-08) | ||||
| Experiment 22 Reporting the Activity Date of This ADC | [1] | ||||
| Efficacy Data | Tumor Growth Inhibition value (TGI) | ≈ 20% | |||
| Method Description |
When tumors reached the appropriate Tumor Volume lnitiation (TVl) range (125-250 mm3), animalswere randomized into treatment and control groups and intravenous (lV) dosing was initiated (Day 0). lnitial dosing began on Day 0; animals in allgroups were dosed l.V. by weight (0.01 ml per gram; 10 ml/kg). Drug treated animals were dosed every 7days for a total of 4 doses.
Click to Show/Hide
|
||||
| In Vivo Model | Lung cancer PDX model (PDX: ST1151) | ||||
| Experiment 23 Reporting the Activity Date of This ADC | [1] | ||||
| Efficacy Data | Tumor Growth Inhibition value (TGI) | ≈ 20% | |||
| Method Description |
When tumors reached the appropriate Tumor Volume lnitiation (TVl) range (125-250 mm3), animalswere randomized into treatment and control groups and intravenous (lV) dosing was initiated (Day 0). lnitial dosing began on Day 0; animals in allgroups were dosed l.V. by weight (0.01 ml per gram; 10 ml/kg). Drug treated animals were dosed every 7days for a total of 4 doses.
Click to Show/Hide
|
||||
| In Vivo Model | Lung cancer PDX model (PDX: ST1989) | ||||
| Experiment 24 Reporting the Activity Date of This ADC | [1] | ||||
| Efficacy Data | Tumor Growth Inhibition value (TGI) | ≈ 20% | |||
| Method Description |
When tumors reached the appropriate Tumor Volume lnitiation (TVl) range (125-250 mm3), animalswere randomized into treatment and control groups and intravenous (lV) dosing was initiated (Day 0). lnitial dosing began on Day 0; animals in allgroups were dosed l.V. by weight (0.01 ml per gram; 10 ml/kg). Drug treated animals were dosed every 7days for a total of 4 doses.
Click to Show/Hide
|
||||
| In Vivo Model | Lung cancer PDX model (PDX: ST140) | ||||
| Experiment 25 Reporting the Activity Date of This ADC | [1] | ||||
| Efficacy Data | Tumor Growth Inhibition value (TGI) | ≈ 20% | |||
| Method Description |
When tumors reached the appropriate Tumor Volume lnitiation (TVl) range (125-250 mm3), animalswere randomized into treatment and control groups and intravenous (lV) dosing was initiated (Day 0). lnitial dosing began on Day 0; animals in allgroups were dosed l.V. by weight (0.01 ml per gram; 10 ml/kg). Drug treated animals were dosed every 7days for a total of 4 doses.
Click to Show/Hide
|
||||
| In Vivo Model | Lung cancer PDX model (PDX: ST396) | ||||
| Experiment 26 Reporting the Activity Date of This ADC | [1] | ||||
| Efficacy Data | Tumor Growth Inhibition value (TGI) | ≈ 20% | |||
| Method Description |
When tumors reached the appropriate Tumor Volume lnitiation (TVl) range (125-250 mm3), animalswere randomized into treatment and control groups and intravenous (lV) dosing was initiated (Day 0). lnitial dosing began on Day 0; animals in allgroups were dosed l.V. by weight (0.01 ml per gram; 10 ml/kg). Drug treated animals were dosed every 7days for a total of 4 doses.
Click to Show/Hide
|
||||
| In Vivo Model | Lung cancer PDX model (PDX: ST1035B) | ||||
| Experiment 27 Reporting the Activity Date of This ADC | [1] | ||||
| Efficacy Data | Tumor Growth Inhibition value (TGI) | ≈ 30% | |||
| Method Description |
When tumors reached the appropriate Tumor Volume lnitiation (TVl) range (125-250 mm3), animalswere randomized into treatment and control groups and intravenous (lV) dosing was initiated (Day 0). lnitial dosing began on Day 0; animals in allgroups were dosed l.V. by weight (0.01 ml per gram; 10 ml/kg). Drug treated animals were dosed every 7days for a total of 4 doses.
Click to Show/Hide
|
||||
| In Vivo Model | Lung cancer PDX model (PDX: ST1092B) | ||||
| Experiment 28 Reporting the Activity Date of This ADC | [1] | ||||
| Efficacy Data | Tumor Growth Inhibition value (TGI) | ≈ 40% | |||
| Method Description |
When tumors reached the appropriate Tumor Volume lnitiation (TVl) range (125-250 mm3), animalswere randomized into treatment and control groups and intravenous (lV) dosing was initiated (Day 0). lnitial dosing began on Day 0; animals in allgroups were dosed l.V. by weight (0.01 ml per gram; 10 ml/kg). Drug treated animals were dosed every 7days for a total of 4 doses.
Click to Show/Hide
|
||||
| In Vivo Model | Lung cancer PDX model (PDX: ST1271) | ||||
| Experiment 29 Reporting the Activity Date of This ADC | [1] | ||||
| Efficacy Data | Tumor Growth Inhibition value (TGI) | ≈ 50% | |||
| Method Description |
When tumors reached the appropriate Tumor Volume lnitiation (TVl) range (125-250 mm3), animalswere randomized into treatment and control groups and intravenous (lV) dosing was initiated (Day 0). lnitial dosing began on Day 0; animals in allgroups were dosed l.V. by weight (0.01 ml per gram; 10 ml/kg). Drug treated animals were dosed every 7days for a total of 4 doses.
Click to Show/Hide
|
||||
| In Vivo Model | Lung cancer PDX model (PDX: ST1684) | ||||
| Experiment 30 Reporting the Activity Date of This ADC | [1] | ||||
| Efficacy Data | Tumor Growth Inhibition value (TGI) | ≈ 50% | |||
| Method Description |
When tumors reached the appropriate Tumor Volume lnitiation (TVl) range (125-250 mm3), animalswere randomized into treatment and control groups and intravenous (lV) dosing was initiated (Day 0). lnitial dosing began on Day 0; animals in allgroups were dosed l.V. by weight (0.01 ml per gram; 10 ml/kg). Drug treated animals were dosed every 7days for a total of 4 doses.
Click to Show/Hide
|
||||
| In Vivo Model | Lung cancer PDX model (PDX: ST1243) | ||||
| Experiment 31 Reporting the Activity Date of This ADC | [1] | ||||
| Efficacy Data | Tumor Growth Inhibition value (TGI) | ≈ 70% | |||
| Method Description |
When tumors reached the appropriate Tumor Volume lnitiation (TVl) range (125-250 mm3), animalswere randomized into treatment and control groups and intravenous (lV) dosing was initiated (Day 0). lnitial dosing began on Day 0; animals in allgroups were dosed l.V. by weight (0.01 ml per gram; 10 ml/kg). Drug treated animals were dosed every 7days for a total of 4 doses.
Click to Show/Hide
|
||||
| In Vivo Model | Lung cancer PDX model (PDX: ST2822B) | ||||
| Experiment 32 Reporting the Activity Date of This ADC | [1] | ||||
| Efficacy Data | Tumor Growth Inhibition value (TGI) | ≈ 79.28% | |||
| Method Description |
To assist in the selection of the appropriate EGFR affinity combination for the EGFR-CMET bispecific ADC, high and low affinity EGFR-CMET bispecific ADCs (3 mg/kg.) were compared in an in vivo eficacy study usingthe MEDI-PANC-08 pancreatic PDX model.
|
||||
| In Vivo Model | Pancreatic PDX model (PDX: MEDI-PANC-08) | ||||
| Experiment 33 Reporting the Activity Date of This ADC | [1] | ||||
| Efficacy Data | Tumor Growth Inhibition value (TGI) | ≈ 80% | |||
| Method Description |
When tumors reached the appropriate Tumor Volume lnitiation (TVl) range (125-250 mm3), animalswere randomized into treatment and control groups and intravenous (lV) dosing was initiated (Day 0). lnitial dosing began on Day 0; animals in allgroups were dosed l.V. by weight (0.01 ml per gram; 10 ml/kg). Drug treated animals were dosed every 7days for a total of 4 doses.
Click to Show/Hide
|
||||
| In Vivo Model | Lung cancer PDX model (PDX: ST1437) | ||||
| Experiment 34 Reporting the Activity Date of This ADC | [1] | ||||
| Efficacy Data | Tumor Growth Inhibition value (TGI) | ≈ 80% | |||
| Method Description |
When tumors reached the appropriate Tumor Volume lnitiation (TVl) range (125-250 mm3), animalswere randomized into treatment and control groups and intravenous (lV) dosing was initiated (Day 0). lnitial dosing began on Day 0; animals in allgroups were dosed l.V. by weight (0.01 ml per gram; 10 ml/kg). Drug treated animals were dosed every 7days for a total of 4 doses.
Click to Show/Hide
|
||||
| In Vivo Model | Lung cancer PDX model (PDX: ST137) | ||||
| Experiment 35 Reporting the Activity Date of This ADC | [1] | ||||
| Efficacy Data | Tumor Growth Inhibition value (TGI) | ≈ 100% | |||
| Method Description |
When tumors reached the appropriate Tumor Volume lnitiation (TVl) range (125-250 mm3), animalswere randomized into treatment and control groups and intravenous (lV) dosing was initiated (Day 0). lnitial dosing began on Day 0; animals in allgroups were dosed l.V. by weight (0.01 ml per gram; 10 ml/kg). Drug treated animals were dosed every 7days for a total of 4 doses.
Click to Show/Hide
|
||||
| In Vivo Model | Lung cancer PDX model (PDX: ST2869) | ||||
| Experiment 36 Reporting the Activity Date of This ADC | [1] | ||||
| Efficacy Data | Tumor Growth Inhibition value (TGI) | ≈ 100% | |||
| Method Description |
When tumors reached the appropriate Tumor Volume lnitiation (TVl) range (125-250 mm3), animalswere randomized into treatment and control groups and intravenous (lV) dosing was initiated (Day 0). lnitial dosing began on Day 0; animals in allgroups were dosed l.V. by weight (0.01 ml per gram; 10 ml/kg). Drug treated animals were dosed every 7days for a total of 4 doses.
Click to Show/Hide
|
||||
| In Vivo Model | Lung cancer PDX model (PDX: ST1906) | ||||
| Experiment 37 Reporting the Activity Date of This ADC | [1] | ||||
| Efficacy Data | Tumor Growth Inhibition value (TGI) | ≈ 100% | |||
| Method Description |
When tumors reached the appropriate Tumor Volume lnitiation (TVl) range (125-250 mm3), animalswere randomized into treatment and control groups and intravenous (lV) dosing was initiated (Day 0). lnitial dosing began on Day 0; animals in allgroups were dosed l.V. by weight (0.01 ml per gram; 10 ml/kg). Drug treated animals were dosed every 7days for a total of 4 doses.
Click to Show/Hide
|
||||
| In Vivo Model | Lung cancer PDX model (PDX: ST1976C) | ||||
| Experiment 38 Reporting the Activity Date of This ADC | [1] | ||||
| Efficacy Data | Tumor Growth Inhibition value (TGI) | ≈ 100% | |||
| Method Description |
When tumors reached the appropriate Tumor Volume lnitiation (TVl) range (125-250 mm3), animalswere randomized into treatment and control groups and intravenous (lV) dosing was initiated (Day 0). lnitial dosing began on Day 0; animals in allgroups were dosed l.V. by weight (0.01 ml per gram; 10 ml/kg). Drug treated animals were dosed every 7days for a total of 4 doses.
Click to Show/Hide
|
||||
| In Vivo Model | Lung cancer PDX model (PDX: ST698B) | ||||
| Experiment 39 Reporting the Activity Date of This ADC | [1] | ||||
| Efficacy Data | Tumor Growth Inhibition value (TGI) | ≈ 100% | |||
| Method Description |
When tumors reached the appropriate Tumor Volume lnitiation (TVl) range (125-250 mm3), animalswere randomized into treatment and control groups and intravenous (lV) dosing was initiated (Day 0). lnitial dosing began on Day 0; animals in allgroups were dosed l.V. by weight (0.01 ml per gram; 10 ml/kg). Drug treated animals were dosed every 7days for a total of 4 doses.
Click to Show/Hide
|
||||
| In Vivo Model | Lung cancer PDX model (PDX: ST1229) | ||||
Revealed Based on the Cell Line Data
| Experiment 1 Reporting the Activity Date of This ADC | [1] | ||||
| Efficacy Data | Maximum inhibition efficiency (MIE) | 10% | Negative EGFR expression (EGFR ++); Negative MET expression (MET -) | ||
| Method Description |
The in vitro potency of EGFR/CMET bispecific ADC's was measured in a panel of cancer cell lines usingthe CellTiter-Glo Luminescent Viability Assay.
|
||||
| In Vitro Model | Lung large cell carcinoma | NCI-H661 cells | CVCL_1577 | ||
| Experiment 2 Reporting the Activity Date of This ADC | [1] | ||||
| Efficacy Data | Maximum inhibition efficiency (MIE) | 30% | Moderate EGFR expression (EGFR ++); Moderate MET expression (MET ++) | ||
| Method Description |
The in vitro potency of EGFR/CMET bispecific ADC's was measured in a panel of cancer cell lines usingthe CellTiter-Glo Luminescent Viability Assay.
|
||||
| In Vitro Model | Minimally invasive lung adenocarcinoma | NCI-H358 cells | CVCL_1559 | ||
| Experiment 3 Reporting the Activity Date of This ADC | [1] | ||||
| Efficacy Data | Maximum inhibition efficiency (MIE) | 36% | Moderate EGFR expression (EGFR ++); Moderate MET expression (MET ++) | ||
| Method Description |
The in vitro potency of EGFR/CMET bispecific ADC's was measured in a panel of cancer cell lines usingthe CellTiter-Glo Luminescent Viability Assay.
|
||||
| In Vitro Model | Lung adenocarcinoma | A-549 cells | CVCL_0023 | ||
| Experiment 4 Reporting the Activity Date of This ADC | [1] | ||||
| Efficacy Data | Maximum inhibition efficiency (MIE) | 46% | Low EGFR expression (EGFR ++); Moderate MET expression (MET ++) | ||
| Method Description |
The in vitro potency of EGFR/CMET bispecific ADC's was measured in a panel of cancer cell lines usingthe CellTiter-Glo Luminescent Viability Assay.
|
||||
| In Vitro Model | Lung adenocarcinoma | NCI-H23 cells | CVCL_1547 | ||
| Experiment 5 Reporting the Activity Date of This ADC | [1] | ||||
| Efficacy Data | Maximum inhibition efficiency (MIE) | 55% | High EGFR expression (EGFR +++); High MET expression (MET +++) | ||
| Method Description |
The in vitro potency of EGFR/CMET bispecific ADC's was measured in a panel of cancer cell lines usingthe CellTiter-Glo Luminescent Viability Assay.
|
||||
| In Vitro Model | Lung adenocarcinoma | HCC827 cells | CVCL_2063 | ||
| Experiment 6 Reporting the Activity Date of This ADC | [1] | ||||
| Efficacy Data | Maximum inhibition efficiency (MIE) | 58% | Moderate EGFR expression (EGFR ++); Low MET expression (MET +) | ||
| Method Description |
The in vitro potency of EGFR/CMET bispecific ADC's was measured in a panel of cancer cell lines usingthe CellTiter-Glo Luminescent Viability Assay.
|
||||
| In Vitro Model | Lung carcinoma | A-427 cells | CVCL_1055 | ||
| Experiment 7 Reporting the Activity Date of This ADC | [1] | ||||
| Efficacy Data | Maximum inhibition efficiency (MIE) | 59% | High EGFR expression (EGFR +++); High MET expression (MET +++) | ||
| Method Description |
The in vitro potency of EGFR/CMET bispecific ADC's was measured in a panel of cancer cell lines usingthe CellTiter-Glo Luminescent Viability Assay.
|
||||
| In Vitro Model | Lung adenocarcinoma | HCC827-GR-step cells | CVCL_S705 | ||
| Experiment 8 Reporting the Activity Date of This ADC | [1] | ||||
| Efficacy Data | Maximum inhibition efficiency (MIE) | 62% | Moderate EGFR expression (EGFR ++); Moderate MET expression (MET ++) | ||
| Method Description |
The in vitro potency of EGFR/CMET bispecific ADC's was measured in a panel of cancer cell lines usingthe CellTiter-Glo Luminescent Viability Assay.
|
||||
| In Vitro Model | Lung mucoepidermoid carcinoma | NCI-H292 cells | CVCL_0455 | ||
| Experiment 9 Reporting the Activity Date of This ADC | [1] | ||||
| Efficacy Data | Maximum inhibition efficiency (MIE) | 65% | Moderate EGFR expression (EGFR ++); Moderate MET expression (MET ++) | ||
| Method Description |
The in vitro potency of EGFR/CMET bispecific ADC's was measured in a panel of cancer cell lines usingthe CellTiter-Glo Luminescent Viability Assay.
|
||||
| In Vitro Model | Lung adenocarcinoma | NCI-H1975 cells | CVCL_1511 | ||
| Experiment 10 Reporting the Activity Date of This ADC | [1] | ||||
| Efficacy Data | Maximum inhibition efficiency (MIE) | 67% | High EGFR expression (EGFR +++); Moderate MET expression (MET ++) | ||
| Method Description |
The in vitro potency of EGFR/CMET bispecific ADC's was measured in a panel of cancer cell lines usingthe CellTiter-Glo Luminescent Viability Assay.
|
||||
| In Vitro Model | Lung adenosquamous carcinoma | NCI-H596 cells | CVCL_1571 | ||
| Experiment 11 Reporting the Activity Date of This ADC | [1] | ||||
| Efficacy Data | Maximum inhibition efficiency (MIE) | 81% | Moderate EGFR expression (EGFR ++); Moderate MET expression (MET ++) | ||
| Method Description |
The in vitro potency of EGFR/CMET bispecific ADC's was measured in a panel of cancer cell lines usingthe CellTiter-Glo Luminescent Viability Assay.
|
||||
| In Vitro Model | Lung adenocarcinoma | NCI-H1792 cells | CVCL_1495 | ||
| Experiment 12 Reporting the Activity Date of This ADC | [1] | ||||
| Efficacy Data | Half Maximal Inhibitory Concentration (IC50) | 0.13 nM | High EGFR expression (EGFR +++); High MET expression (MET +++) | ||
| Method Description |
The in vitro potency of EGFR/CMET bispecific ADC's was measured in a panel of cancer cell lines usingthe CellTiter-Glo Luminescent Viability Assay.
|
||||
| In Vitro Model | Lung adenocarcinoma | HCC827 cells | CVCL_2063 | ||
| Experiment 13 Reporting the Activity Date of This ADC | [1] | ||||
| Efficacy Data | Half Maximal Inhibitory Concentration (IC50) | 0.17 nM | High EGFR expression (EGFR +++); High MET expression (MET +++) | ||
| Method Description |
The in vitro potency of EGFR/CMET bispecific ADC's was measured in a panel of cancer cell lines usingthe CellTiter-Glo Luminescent Viability Assay.
|
||||
| In Vitro Model | Lung adenocarcinoma | HCC827-GR-step cells | CVCL_S705 | ||
| Experiment 14 Reporting the Activity Date of This ADC | [1] | ||||
| Efficacy Data | Half Maximal Inhibitory Concentration (IC50) | 0.2 nM | Moderate EGFR expression (EGFR ++); Moderate MET expression (MET ++) | ||
| Method Description |
The in vitro potency of EGFR/CMET bispecific ADC's was measured in a panel of cancer cell lines usingthe CellTiter-Glo Luminescent Viability Assay.
|
||||
| In Vitro Model | Lung adenocarcinoma | NCI-H1792 cells | CVCL_1495 | ||
| Experiment 15 Reporting the Activity Date of This ADC | [1] | ||||
| Efficacy Data | Half Maximal Inhibitory Concentration (IC50) | 0.26 nM | Moderate EGFR expression (EGFR ++); Moderate MET expression (MET ++) | ||
| Method Description |
The in vitro potency of EGFR/CMET bispecific ADC's was measured in a panel of cancer cell lines usingthe CellTiter-Glo Luminescent Viability Assay.
|
||||
| In Vitro Model | Lung adenocarcinoma | NCI-H1975 cells | CVCL_1511 | ||
| Experiment 16 Reporting the Activity Date of This ADC | [1] | ||||
| Efficacy Data | Half Maximal Inhibitory Concentration (IC50) | 0.27 nM | Moderate EGFR expression (EGFR ++); Moderate MET expression (MET ++) | ||
| Method Description |
The in vitro potency of EGFR/CMET bispecific ADC's was measured in a panel of cancer cell lines usingthe CellTiter-Glo Luminescent Viability Assay.
|
||||
| In Vitro Model | Lung mucoepidermoid carcinoma | NCI-H292 cells | CVCL_0455 | ||
| Experiment 17 Reporting the Activity Date of This ADC | [1] | ||||
| Efficacy Data | Half Maximal Inhibitory Concentration (IC50) | 0.67 nM | Moderate EGFR expression (EGFR ++); Moderate MET expression (MET ++) | ||
| Method Description |
The in vitro potency of EGFR/CMET bispecific ADC's was measured in a panel of cancer cell lines usingthe CellTiter-Glo Luminescent Viability Assay.
|
||||
| In Vitro Model | Lung adenocarcinoma | A-549 cells | CVCL_0023 | ||
| Experiment 18 Reporting the Activity Date of This ADC | [1] | ||||
| Efficacy Data | Half Maximal Inhibitory Concentration (IC50) | 0.68 nM | Moderate EGFR expression (EGFR ++); Moderate MET expression (MET ++); | ||
| Method Description |
The in vitro potency of EGFR/CMET bispecific ADC's was measured in a panel of cancer cell lines usingthe CellTiter-Glo Luminescent Viability Assay. In the representative experiment, pre-treatment of NCI-H1975 cells with MET IgG RAA22.
|
||||
| In Vitro Model | Lung adenocarcinoma | NCI-H1975 cells | CVCL_1511 | ||
| Experiment 19 Reporting the Activity Date of This ADC | [1] | ||||
| Efficacy Data | Half Maximal Inhibitory Concentration (IC50) | 2.77 nM | Moderate EGFR expression (EGFR ++); Moderate MET expression (MET ++); | ||
| Method Description |
The in vitro potency of EGFR/CMET bispecific ADC's was measured in a panel of cancer cell lines usingthe CellTiter-Glo Luminescent Viability Assay. In the representative experiment, pre-treatment of NCI-H1975 cells with MET IgG B09.
|
||||
| In Vitro Model | Lung adenocarcinoma | NCI-H1975 cells | CVCL_1511 | ||
| Experiment 20 Reporting the Activity Date of This ADC | [1] | ||||
| Efficacy Data | Half Maximal Inhibitory Concentration (IC50) | 3.02 nM | Moderate EGFR expression (EGFR ++); Moderate MET expression (MET ++) | ||
| Method Description |
The in vitro potency of EGFR/CMET bispecific ADC's was measured in a panel of cancer cell lines usingthe CellTiter-Glo Luminescent Viability Assay.
|
||||
| In Vitro Model | Minimally invasive lung adenocarcinoma | NCI-H358 cells | CVCL_1559 | ||
| Experiment 21 Reporting the Activity Date of This ADC | [1] | ||||
| Efficacy Data | Half Maximal Inhibitory Concentration (IC50) | 3.24 nM | High EGFR expression (EGFR +++); Moderate MET expression (MET ++) | ||
| Method Description |
The in vitro potency of EGFR/CMET bispecific ADC's was measured in a panel of cancer cell lines usingthe CellTiter-Glo Luminescent Viability Assay.
|
||||
| In Vitro Model | Lung adenosquamous carcinoma | NCI-H596 cells | CVCL_1571 | ||
| Experiment 22 Reporting the Activity Date of This ADC | [1] | ||||
| Efficacy Data | Half Maximal Inhibitory Concentration (IC50) | 8.1 nM | Low EGFR expression (EGFR ++); Moderate MET expression (MET ++) | ||
| Method Description |
The in vitro potency of EGFR/CMET bispecific ADC's was measured in a panel of cancer cell lines usingthe CellTiter-Glo Luminescent Viability Assay.
|
||||
| In Vitro Model | Lung adenocarcinoma | NCI-H23 cells | CVCL_1547 | ||
| Experiment 23 Reporting the Activity Date of This ADC | [1] | ||||
| Efficacy Data | Half Maximal Inhibitory Concentration (IC50) | 40.22 nM | Moderate EGFR expression (EGFR ++); Low MET expression (MET +) | ||
| Method Description |
The in vitro potency of EGFR/CMET bispecific ADC's was measured in a panel of cancer cell lines usingthe CellTiter-Glo Luminescent Viability Assay.
|
||||
| In Vitro Model | Lung carcinoma | A-427 cells | CVCL_1055 | ||
| Experiment 24 Reporting the Activity Date of This ADC | [1] | ||||
| Efficacy Data | Half Maximal Inhibitory Concentration (IC50) | > 66.67 nM | Negative EGFR expression (EGFR ++); Negative MET expression (MET -) | ||
| Method Description |
The in vitro potency of EGFR/CMET bispecific ADC's was measured in a panel of cancer cell lines usingthe CellTiter-Glo Luminescent Viability Assay.
|
||||
| In Vitro Model | Lung large cell carcinoma | NCI-H661 cells | CVCL_1577 | ||