
Antibody-drug Conjugate Information
General Information of This Antibody-drug Conjugate (ID: DRG0FOJKK)
| ADC Name |
Bevacizumab-DOX-PDT-2
|
|||||
|---|---|---|---|---|---|---|
| Synonyms |
Bevacizumab-DOX-PDT-2; ADC 2
Click to Show/Hide
|
|||||
| Organization |
Xi'an Jiaotong University.
|
|||||
| Drug Status |
Investigative
|
|||||
| Structure |
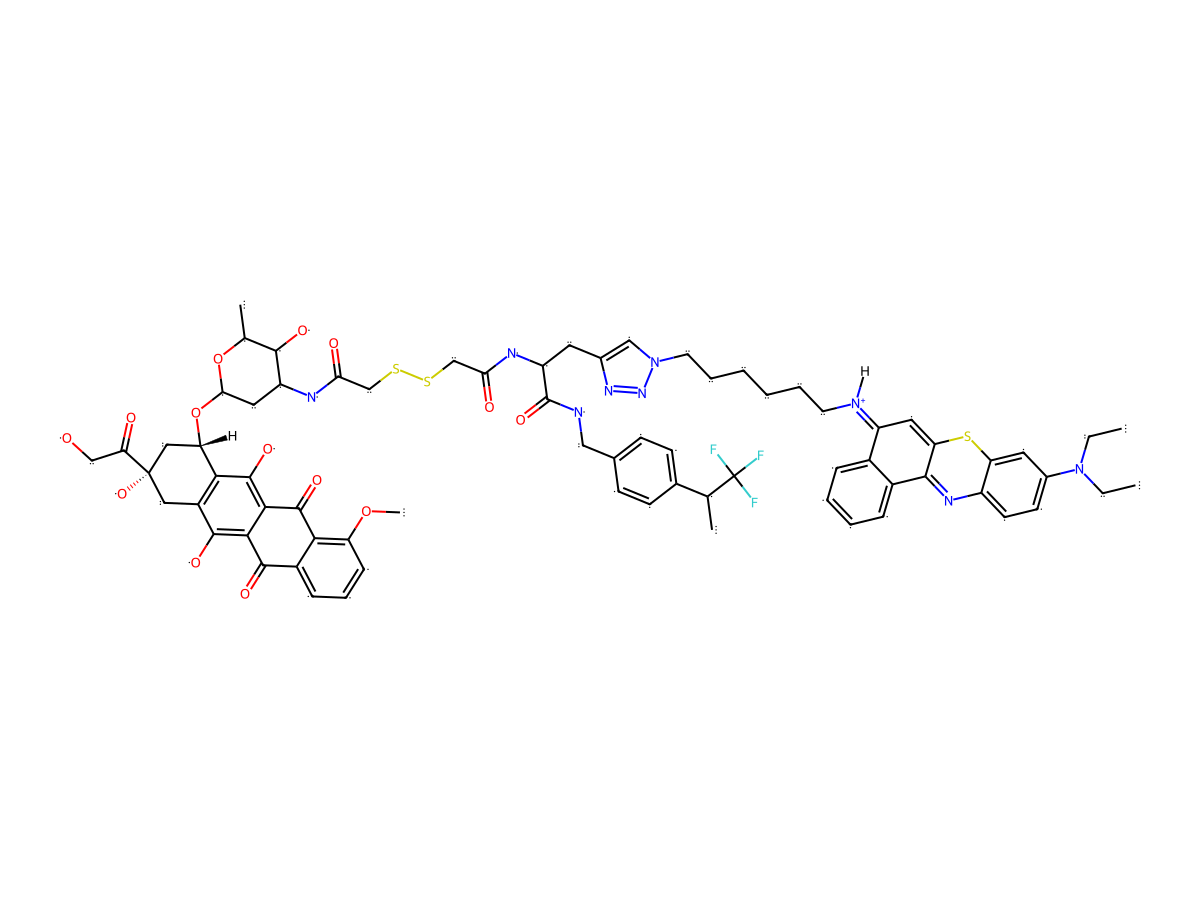
|
|||||
| Antibody Name |
Bevacizumab
|
Antibody Info | ||||
| Antigen Name |
Vascular endothelial growth factor A (VEGFA)
|
Antigen Info | ||||
| Payload Name |
Doxorubicin; PDT
|
Payload Info | ||||
| Linker Name |
Undisclosed
|
|||||
| Conjugate Type |
Random conjugation through reduced inter-chain cysteines.
|
|||||
General Information of The Activity Data Related to This ADC
Revealed Based on the Cell Line Data
Full List of Activity Data of This Antibody-drug Conjugate
Revealed Based on the Cell Line Data
| Experiment 1 Reporting the Activity Date of This ADC | [1] | ||||
| Efficacy Data | Half Maximal inhibitory Concentration (lC50) | 0.2428۪.3175 ug/mL | Positive VEGFA expression ( VEGFA+++/++) | ||
| Method Description |
In vitro activity evaluation mainly included antitumor cell proliferation, apoptosis, cell cycle, anticell migration, and in vitro antiangiogenesis activity evaluation. In this study, HT-29, A549, and HepG2 cells were selected as experimental cell lines to evaluate the antitumor activity in vitro. The antiproliferative activity of ADC was evaluated based on the CCK-8 method, with the concentration range set to 0-10 ug/mL, and the illumination time set to 15 min. Annexin V-FITC/PI double staining and technique. The concentration was 10 ug/mL at the initial screening, the concentration range was 0-20 ug/mL in a concentration-dependent setting, and the light time was 15 min. The cell cycle arrest activity was assessed using PI staining. The concentration was 5 ug/mL at the initial screening, the concentration range was 0-10 ug/mL in a concentration-dependent study, and the illumination time was 15 min. In the evaluation of anticell migration activity, the concentration of ADC was set to 10 ug/mL, and the illumination time was set to 15 min. The evaluation of antiangiogenesis activity in vitro included assessing the toxicity of ADC to HUVEC cells and evaluating anti-HUVEC cell migration activity. Cytotoxicity was evaluated using the CCK-8 method and the Ca-AM/PI method, respectively. In the evaluation of anti-HUVEC cell migration activity, the ADC concentration was set at 10 ug/mL.
Click to Show/Hide
|
||||
| In Vitro Model | Hepatoblastoma | HepG2 cells (+hv) | CVCL_0027 | ||
| Experiment 2 Reporting the Activity Date of This ADC | [1] | ||||
| Efficacy Data | Half Maximal inhibitory Concentration (lC50) | 2.028۪.4680 ug/mL | Positive VEGFA expression ( VEGFA+++/++) | ||
| Method Description |
In vitro activity evaluation mainly included antitumor cell proliferation, apoptosis, cell cycle, anticell migration, and in vitro antiangiogenesis activity evaluation. In this study, HT-29, A549, and HepG2 cells were selected as experimental cell lines to evaluate the antitumor activity in vitro. The antiproliferative activity of ADC was evaluated based on the CCK-8 method, with the concentration range set to 0-10 ug/mL, and the illumination time set to 15 min. Annexin V-FITC/PI double staining and technique. The concentration was 10 ug/mL at the initial screening, the concentration range was 0-20 ug/mL in a concentration-dependent setting, and the light time was 15 min. The cell cycle arrest activity was assessed using PI staining. The concentration was 5 ug/mL at the initial screening, the concentration range was 0-10 ug/mL in a concentration-dependent study, and the illumination time was 15 min. In the evaluation of anticell migration activity, the concentration of ADC was set to 10 ug/mL, and the illumination time was set to 15 min. The evaluation of antiangiogenesis activity in vitro included assessing the toxicity of ADC to HUVEC cells and evaluating anti-HUVEC cell migration activity. Cytotoxicity was evaluated using the CCK-8 method and the Ca-AM/PI method, respectively. In the evaluation of anti-HUVEC cell migration activity, the ADC concentration was set at 10 ug/mL.
Click to Show/Hide
|
||||
| In Vitro Model | Colon adenocarcinoma | HT-29 cells (+hv) | CVCL_0320 | ||
| Experiment 3 Reporting the Activity Date of This ADC | [1] | ||||
| Efficacy Data | Half Maximal inhibitory Concentration (lC50) | 2.061۪.2655 ug/mL | Positive VEGFA expression ( VEGFA+++/++) | ||
| Method Description |
In vitro activity evaluation mainly included antitumor cell proliferation, apoptosis, cell cycle, anticell migration, and in vitro antiangiogenesis activity evaluation. In this study, HT-29, A549, and HepG2 cells were selected as experimental cell lines to evaluate the antitumor activity in vitro. The antiproliferative activity of ADC was evaluated based on the CCK-8 method, with the concentration range set to 0-10 ug/mL, and the illumination time set to 15 min. Annexin V-FITC/PI double staining and technique. The concentration was 10 ug/mL at the initial screening, the concentration range was 0-20 ug/mL in a concentration-dependent setting, and the light time was 15 min. The cell cycle arrest activity was assessed using PI staining. The concentration was 5 ug/mL at the initial screening, the concentration range was 0-10 ug/mL in a concentration-dependent study, and the illumination time was 15 min. In the evaluation of anticell migration activity, the concentration of ADC was set to 10 ug/mL, and the illumination time was set to 15 min. The evaluation of antiangiogenesis activity in vitro included assessing the toxicity of ADC to HUVEC cells and evaluating anti-HUVEC cell migration activity. Cytotoxicity was evaluated using the CCK-8 method and the Ca-AM/PI method, respectively. In the evaluation of anti-HUVEC cell migration activity, the ADC concentration was set at 10 ug/mL.
Click to Show/Hide
|
||||
| In Vitro Model | Lung adenocarcinoma | A549 cells (+hv) | CVCL_0023 | ||
| Experiment 4 Reporting the Activity Date of This ADC | [1] | ||||
| Efficacy Data | Half Maximal inhibitory Concentration (lC50) | 3.135۪.2752 ug/mL | Positive VEGFA expression ( VEGFA+++/++) | ||
| Method Description |
In vitro activity evaluation mainly included antitumor cell proliferation, apoptosis, cell cycle, anticell migration, and in vitro antiangiogenesis activity evaluation. In this study, HT-29, A549, and HepG2 cells were selected as experimental cell lines to evaluate the antitumor activity in vitro. The antiproliferative activity of ADC was evaluated based on the CCK-8 method, with the concentration range set to 0-10 ug/mL, and the illumination time set to 15 min. Annexin V-FITC/PI double staining and technique. The concentration was 10 ug/mL at the initial screening, the concentration range was 0-20 ug/mL in a concentration-dependent setting, and the light time was 15 min. The cell cycle arrest activity was assessed using PI staining. The concentration was 5 ug/mL at the initial screening, the concentration range was 0-10 ug/mL in a concentration-dependent study, and the illumination time was 15 min. In the evaluation of anticell migration activity, the concentration of ADC was set to 10 ug/mL, and the illumination time was set to 15 min. The evaluation of antiangiogenesis activity in vitro included assessing the toxicity of ADC to HUVEC cells and evaluating anti-HUVEC cell migration activity. Cytotoxicity was evaluated using the CCK-8 method and the Ca-AM/PI method, respectively. In the evaluation of anti-HUVEC cell migration activity, the ADC concentration was set at 10 ug/mL.
Click to Show/Hide
|
||||
| In Vitro Model | Hepatoblastoma | HepG2 cells (-hv) | CVCL_0027 | ||
| Experiment 5 Reporting the Activity Date of This ADC | [1] | ||||
| Efficacy Data | Half Maximal inhibitory Concentration (lC50) | 3.908۪.3628 ug/mL | Positive VEGFA expression ( VEGFA+++/++) | ||
| Method Description |
In vitro activity evaluation mainly included antitumor cell proliferation, apoptosis, cell cycle, anticell migration, and in vitro antiangiogenesis activity evaluation. In this study, HT-29, A549, and HepG2 cells were selected as experimental cell lines to evaluate the antitumor activity in vitro. The antiproliferative activity of ADC was evaluated based on the CCK-8 method, with the concentration range set to 0-10 ug/mL, and the illumination time set to 15 min. Annexin V-FITC/PI double staining and technique. The concentration was 10 ug/mL at the initial screening, the concentration range was 0-20 ug/mL in a concentration-dependent setting, and the light time was 15 min. The cell cycle arrest activity was assessed using PI staining. The concentration was 5 ug/mL at the initial screening, the concentration range was 0-10 ug/mL in a concentration-dependent study, and the illumination time was 15 min. In the evaluation of anticell migration activity, the concentration of ADC was set to 10 ug/mL, and the illumination time was set to 15 min. The evaluation of antiangiogenesis activity in vitro included assessing the toxicity of ADC to HUVEC cells and evaluating anti-HUVEC cell migration activity. Cytotoxicity was evaluated using the CCK-8 method and the Ca-AM/PI method, respectively. In the evaluation of anti-HUVEC cell migration activity, the ADC concentration was set at 10 ug/mL.
Click to Show/Hide
|
||||
| In Vitro Model | Colon adenocarcinoma | HT-29 cells (-hv) | CVCL_0320 | ||
| Experiment 6 Reporting the Activity Date of This ADC | [1] | ||||
| Efficacy Data | Half Maximal inhibitory Concentration (lC50) | 7.437۪.2055 ug/mL | Positive VEGFA expression ( VEGFA+++/++) | ||
| Method Description |
In vitro activity evaluation mainly included antitumor cell proliferation, apoptosis, cell cycle, anticell migration, and in vitro antiangiogenesis activity evaluation. In this study, HT-29, A549, and HepG2 cells were selected as experimental cell lines to evaluate the antitumor activity in vitro. The antiproliferative activity of ADC was evaluated based on the CCK-8 method, with the concentration range set to 0-10 ug/mL, and the illumination time set to 15 min. Annexin V-FITC/PI double staining and technique. The concentration was 10 ug/mL at the initial screening, the concentration range was 0-20 ug/mL in a concentration-dependent setting, and the light time was 15 min. The cell cycle arrest activity was assessed using PI staining. The concentration was 5 ug/mL at the initial screening, the concentration range was 0-10 ug/mL in a concentration-dependent study, and the illumination time was 15 min. In the evaluation of anticell migration activity, the concentration of ADC was set to 10 ug/mL, and the illumination time was set to 15 min. The evaluation of antiangiogenesis activity in vitro included assessing the toxicity of ADC to HUVEC cells and evaluating anti-HUVEC cell migration activity. Cytotoxicity was evaluated using the CCK-8 method and the Ca-AM/PI method, respectively. In the evaluation of anti-HUVEC cell migration activity, the ADC concentration was set at 10 ug/mL.
Click to Show/Hide
|
||||
| In Vitro Model | Lung adenocarcinoma | A549 cells (-hv) | CVCL_0023 | ||
References